

Compact Muon Solenoid
LHC, CERN
| CMS-TOP-12-039 ; CERN-EP-2016-324 | ||
| Search for associated production of a Z boson with a single top quark and for tZ flavour-changing interactions in pp collisions at $ \sqrt{s} = $ 8 TeV | ||
| CMS Collaboration | ||
| 5 February 2017 | ||
| JHEP 07 (2017) 003 | ||
| Abstract: A search for the production of a single top quark in association with a Z boson is presented, both to identify the expected standard model process and to search for flavour-changing neutral current interactions. The data sample corresponds to an integrated luminosity of 19.7 fb$^{-1}$ recorded by the CMS experiment at the LHC in proton-proton collisions at $ \sqrt{s} = $ 8 TeV. Final states with three leptons (electrons or muons) and at least one jet are investigated. An events yield compatible with tZq standard model production is observed, and the corresponding cross section is measured to be $\sigma(\mathrm{ p }\mathrm{ p } \to \mathrm{ t } \mathrm{ Z } \mathrm{ q } \to \ell \nu \mathrm{ b } \ell^+ \ell^- \mathrm{ q }) = $ 10$^{+8}_{-7}$ fb with a significance of 2.4 standard deviations. No presence of flavour-changing neutral current production of tZq is observed. Exclusion limits at 95% confidence level on the branching fractions of a top quark decaying to a Z boson and an up or a charm quark are found to be $ { \cal{B} }( \mathrm{ t } \rightarrow \mathrm{ Z } \mathrm{u} ) < $ 0.022% and $ { \cal{B} }( \mathrm{ t } \rightarrow \mathrm{ Z c } ) < $ 0.049%. | ||
| Links: e-print arXiv:1702.01404 [hep-ex] (PDF) ; CDS record ; inSPIRE record ; CADI line (restricted) ; | ||
| Figures | |
png pdf |
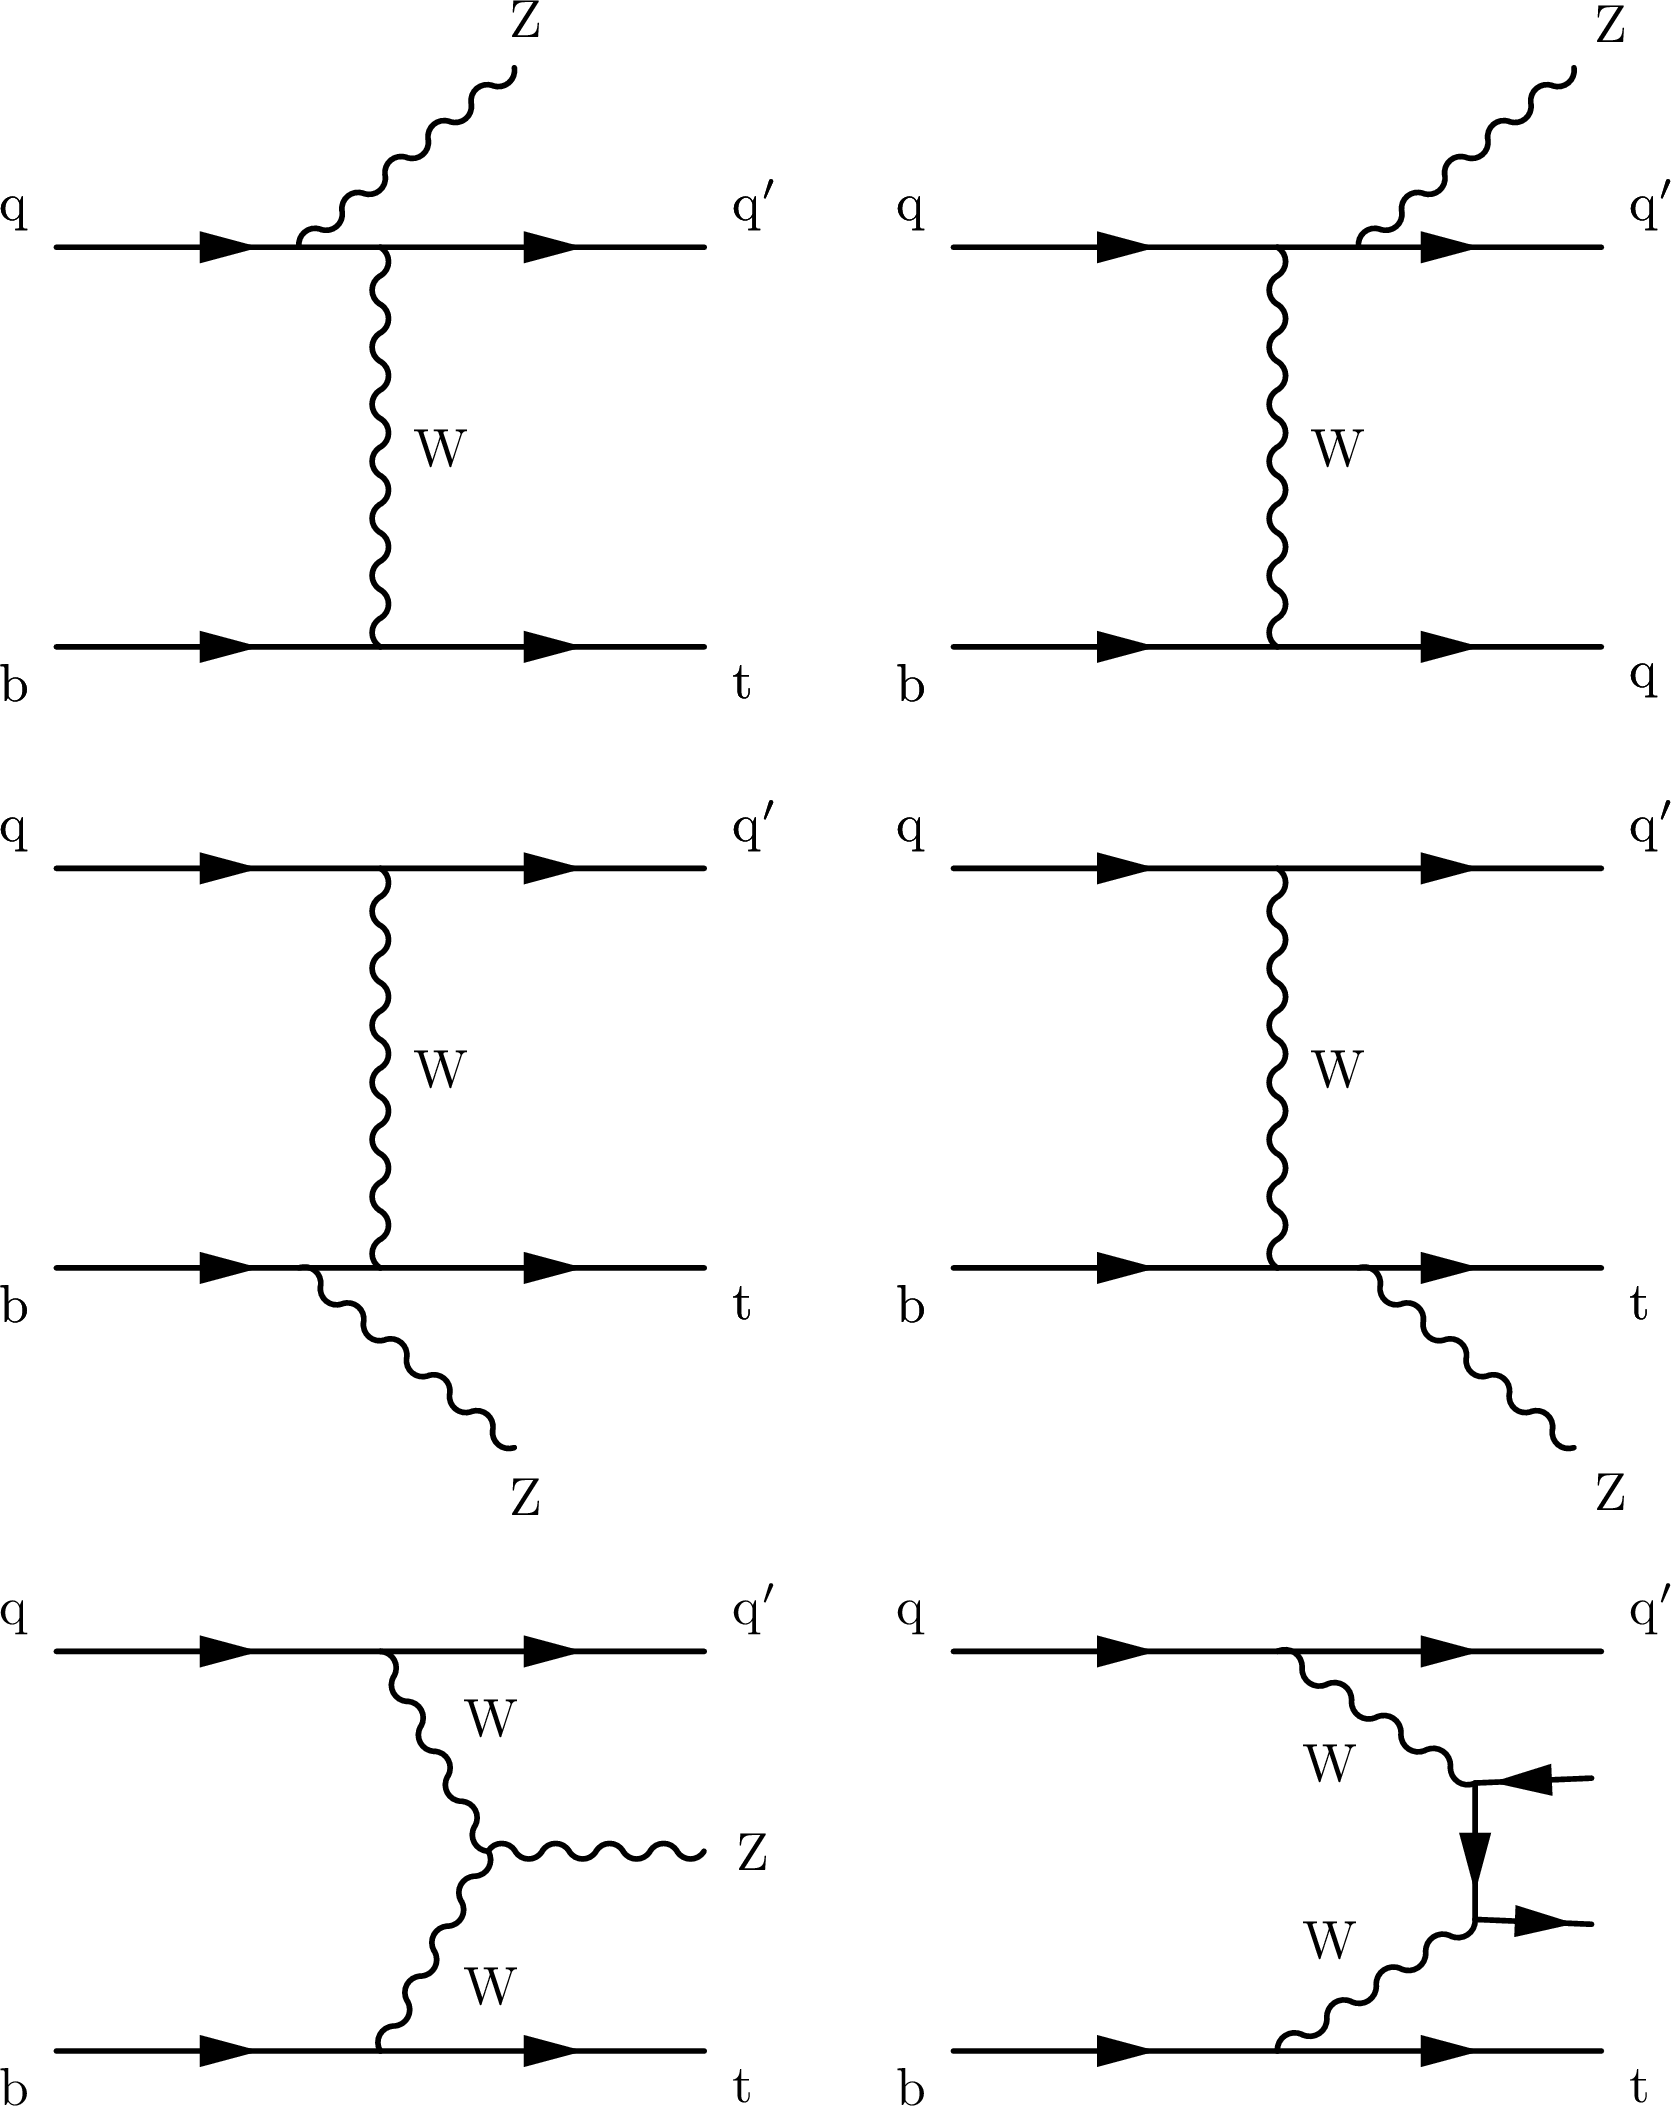
Figure 1:
Leading-order tZq production Feynman diagrams (all but bottom-right). The initial- and final-state quarks denoted $\mathrm{ q } $ and $\mathrm{ q } ^\prime $ are predominantly first generation quarks, although there are smaller additional contributions from strange- and charm-initiated diagrams. The bottom-right diagram represents the NLO nonresonant contribution to the tZq process. |

png pdf |
Figure 1-a:
Leading-order tZq production Feynman diagram. The initial- and final-state quarks denoted $\mathrm{ q } $ and $\mathrm{ q } ^\prime $ are predominantly first generation quarks, although there are smaller additional contributions from strange- and charm-initiated diagrams. |

png pdf |
Figure 1-b:
Leading-order tZq production Feynman diagram. The initial- and final-state quarks denoted $\mathrm{ q } $ and $\mathrm{ q } ^\prime $ are predominantly first generation quarks, although there are smaller additional contributions from strange- and charm-initiated diagrams. |

png pdf |
Figure 1-c:
Leading-order tZq production Feynman diagram. The initial- and final-state quarks denoted $\mathrm{ q } $ and $\mathrm{ q } ^\prime $ are predominantly first generation quarks, although there are smaller additional contributions from strange- and charm-initiated diagrams. |

png pdf |
Figure 1-d:
Leading-order tZq production Feynman diagram. The initial- and final-state quarks denoted $\mathrm{ q } $ and $\mathrm{ q } ^\prime $ are predominantly first generation quarks, although there are smaller additional contributions from strange- and charm-initiated diagrams. |

png pdf |
Figure 1-e:
Leading-order tZq production Feynman diagram. The initial- and final-state quarks denoted $\mathrm{ q } $ and $\mathrm{ q } ^\prime $ are predominantly first generation quarks, although there are smaller additional contributions from strange- and charm-initiated diagrams. |

png pdf |
Figure 1-f:
Diagram representing the NLO nonresonant contribution to the tZq process. |

png pdf |
Figure 2:
Feynman diagrams for the production of tZ in tZ-FCNC channels. |

png pdf |
Figure 2-a:
Feynman diagram for the production of tZ in a tZ-FCNC channel. |

png pdf |
Figure 2-b:
Feynman diagram for the production of tZ in a tZ-FCNC channel. |

png pdf |
Figure 2-c:
Feynman diagram for the production of tZ in a tZ-FCNC channel. |

png pdf |
Figure 2-d:
Feynman diagram for the production of tZ in a tZ-FCNC channel. |
png pdf |
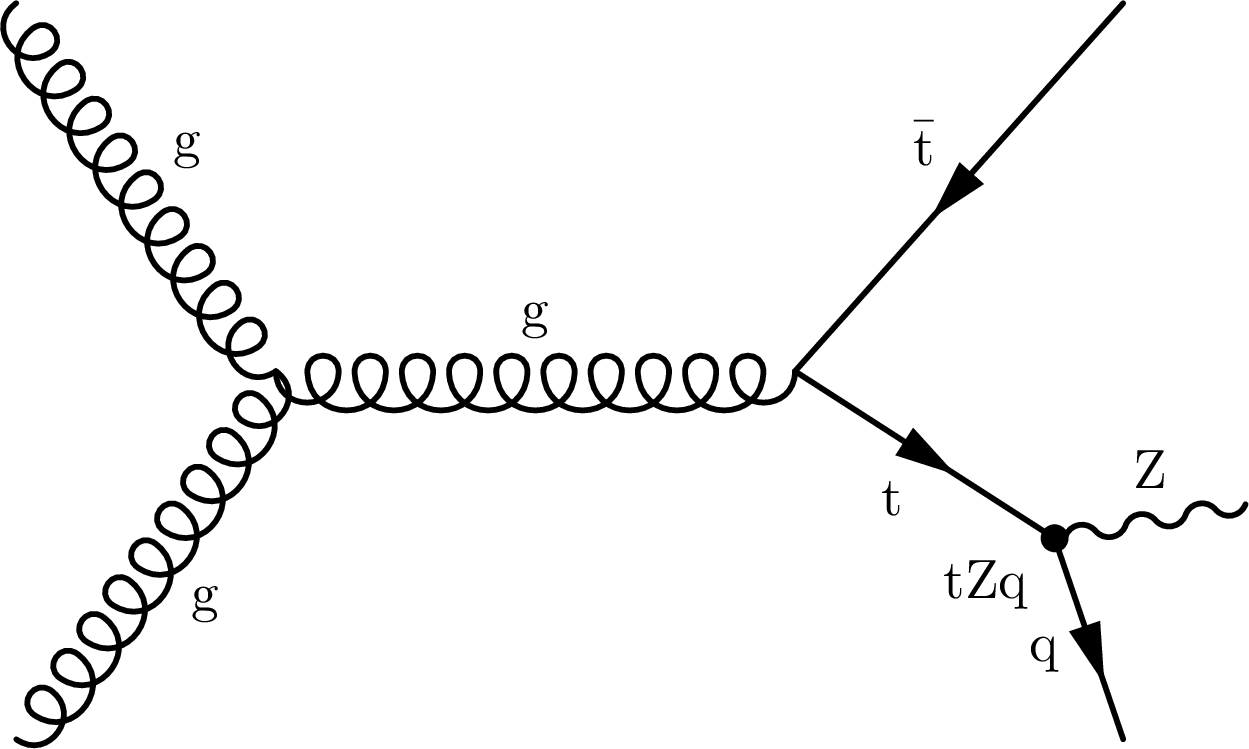
Figure 3:
Feynman diagram for the production of tZq in the ${\mathrm{ t } \mathrm{ \bar{t} } } $-FCNC channel. |

png pdf |
Figure 4:
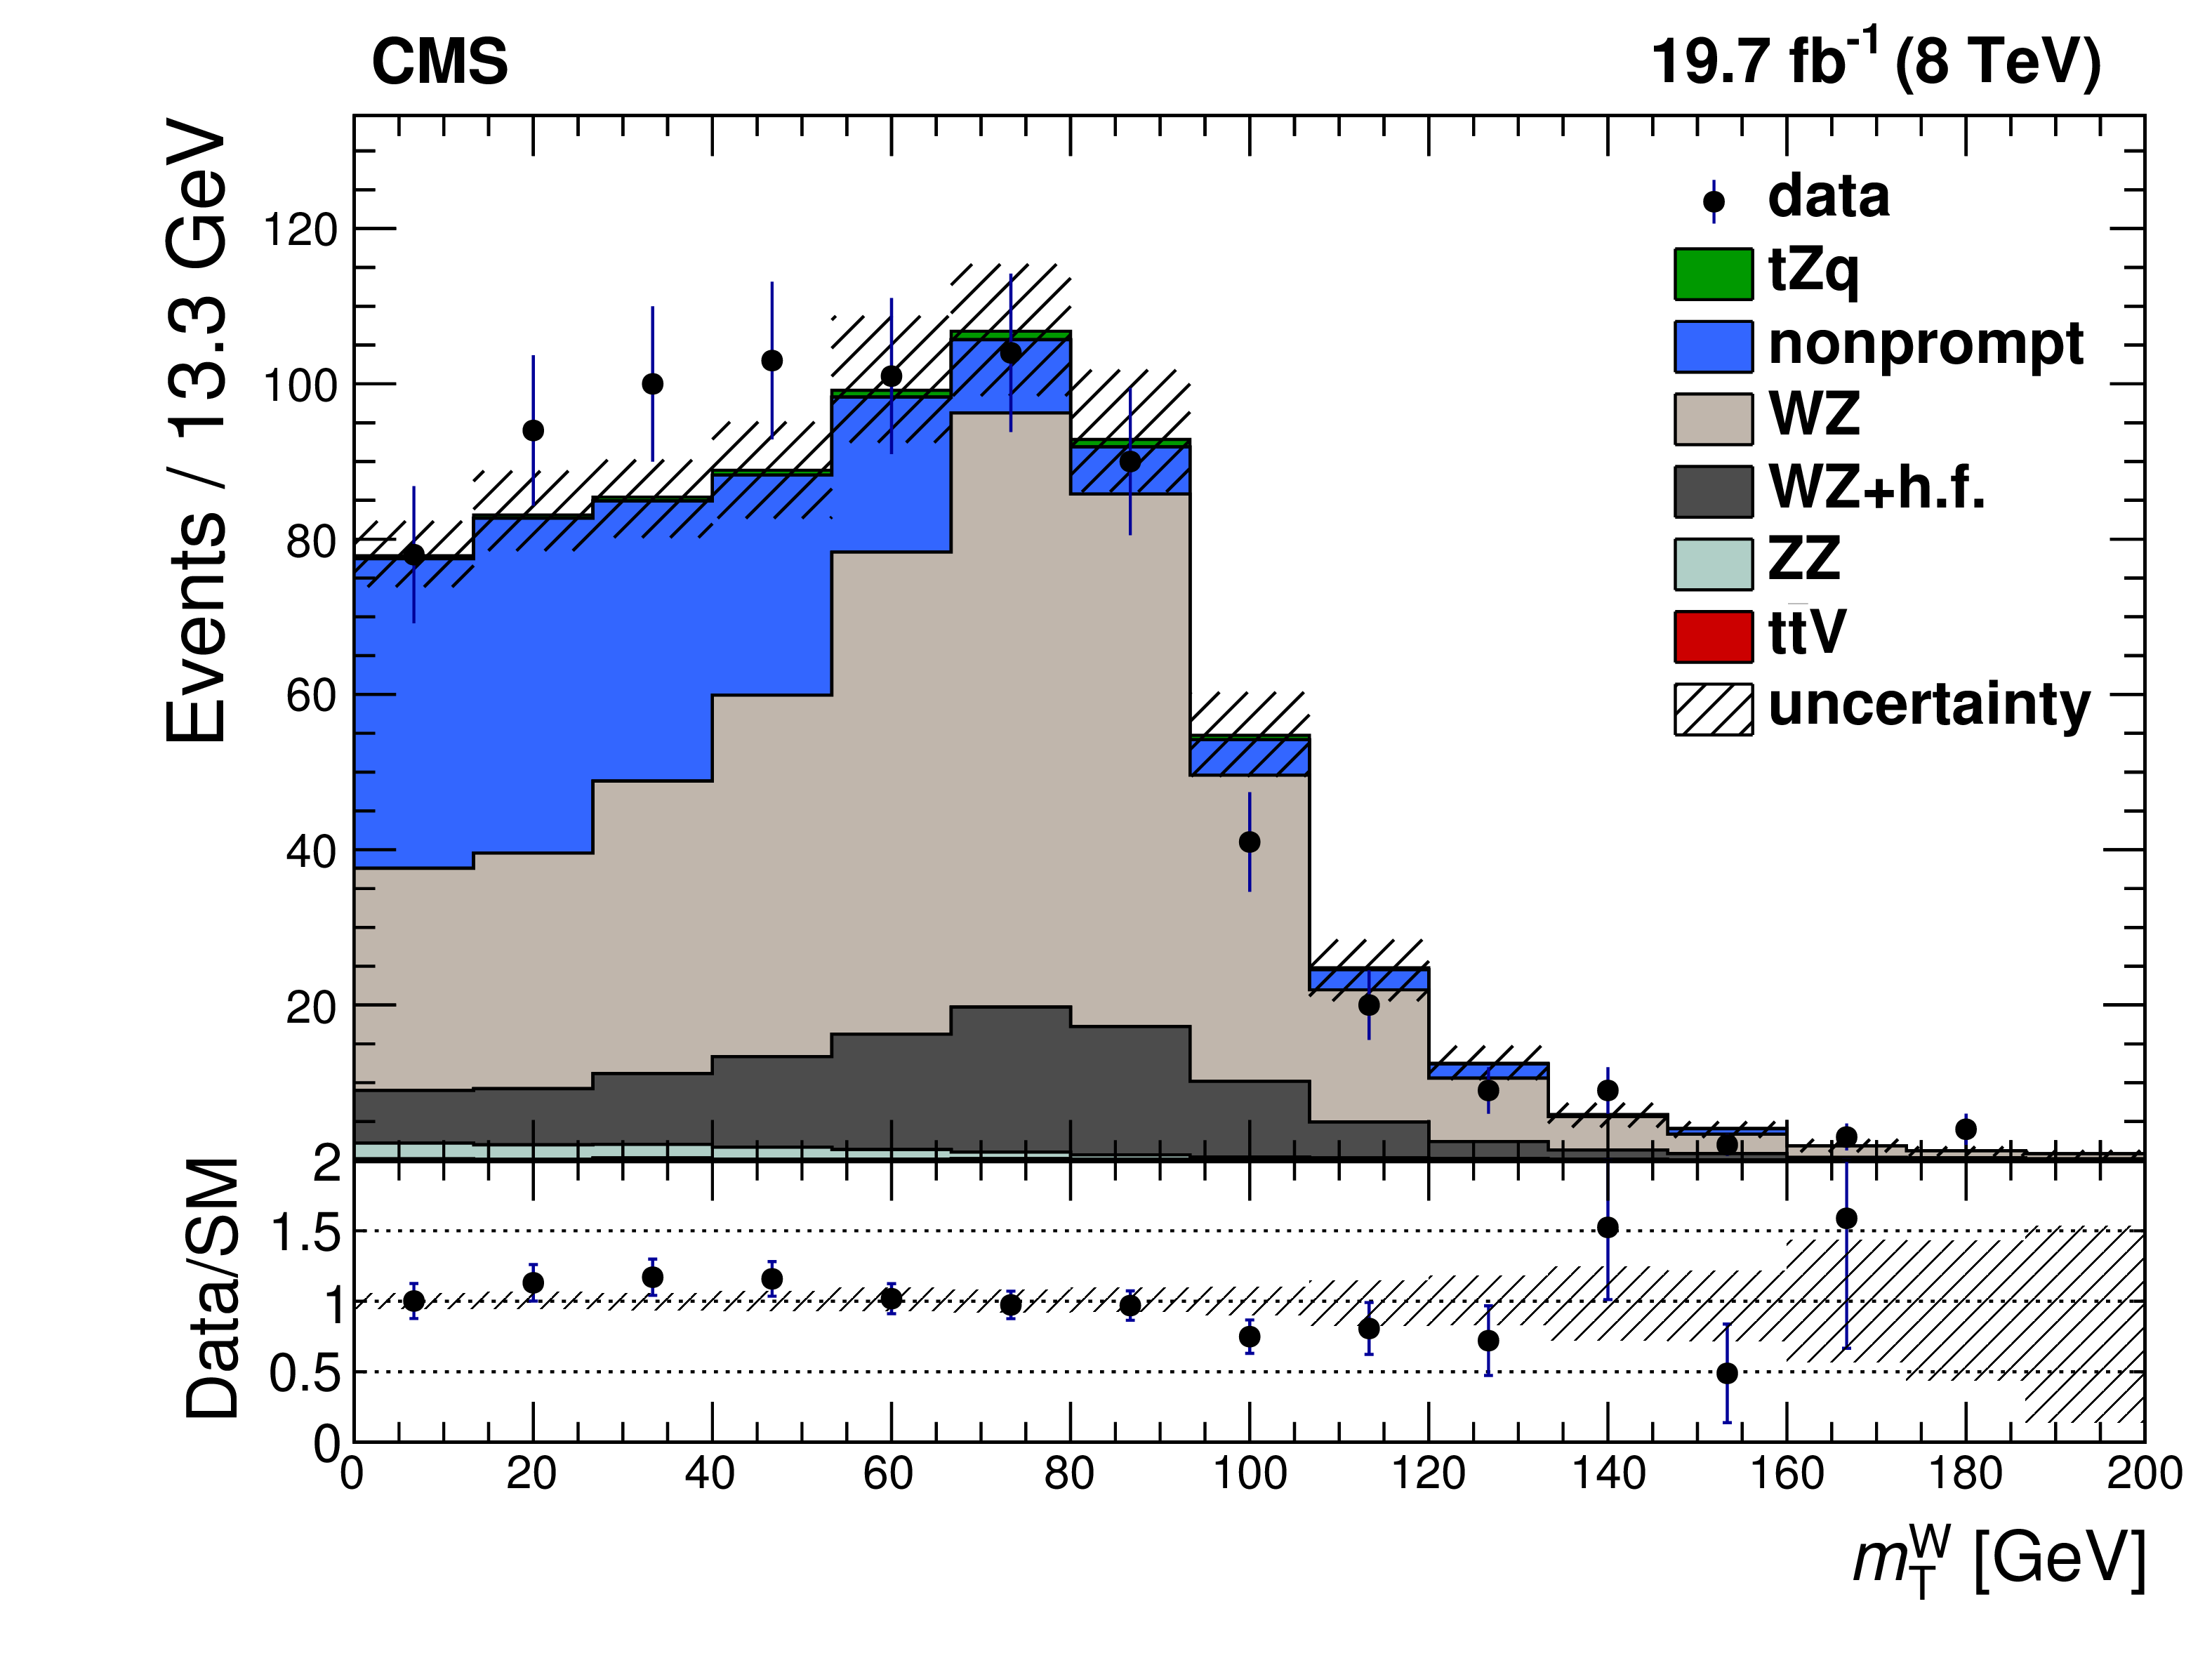
Data-to-prediction comparisons after performing the fit for ${m_{\mathrm {T}}^{\mathrm {W}}}$ distribution in the control region (left) and for the BDT$_{\mathrm {tZq}\text {-SM}}$ responses in the signal region (right). The four lepton channels are combined. The lower panels show the ratio between observed and predicted yields, including the total uncertainty on the prediction. |
png pdf |
Figure 4-a:
Data-to-prediction comparison after performing the fit for ${m_{\mathrm {T}}^{\mathrm {W}}}$ distribution in the control region. The four lepton channels are combined. The lower panel shows the ratio between observed and predicted yields, including the total uncertainty on the prediction. |

png pdf |
Figure 4-b:
Data-to-prediction comparison after performing the fit for the BDT$_{\mathrm {tZq}\text {-SM}}$ responses in the signal region. The four lepton channels are combined. The lower panel shows the ratio between observed and predicted yields, including the total uncertainty on the prediction. |

png pdf |
Figure 5:
Data-to-prediction comparisons for the tZ-FCNC search after performing the fit for ${m_{\mathrm {T}}^{\mathrm {W}}}$ distribution in the control region (top-left), and for the BDT responses in the single top quark (BDT$_{\text {tZ-FCNC}}$) (top-right), and $ {\mathrm{ t } {}\mathrm{ \bar{t} } }$ (BDT$_{\mathrm{ t \bar{t} }\text{-FCNC}} $) (bottom), signal regions. An example of the predicted signal contribution for a value ${ \cal {B} }(\mathrm{ t } \rightarrow \mathrm{ Z } \mathrm{ u } ) = $ 0.1% (FCNC) is shown for illustration. The four channels are combined. The lower panels show the ratio between observed and predicted yields, including the total uncertainty on the prediction. |

png pdf |
Figure 5-a:
Data-to-prediction comparison for the tZ-FCNC search after performing the fit for ${m_{\mathrm {T}}^{\mathrm {W}}}$ distribution in the control region. An example of the predicted signal contribution for a value ${ \cal {B} }(\mathrm{ t } \rightarrow \mathrm{ Z } \mathrm{ u } ) = $ 0.1% (FCNC) is shown for illustration. The four channels are combined. The lower panel shows the ratio between observed and predicted yields, including the total uncertainty on the prediction. |

png pdf |
Figure 5-b:
Data-to-prediction comparison for the tZ-FCNC search after performing the fit for the BDT response in the single top quark (BDT$_{\text {tZ-FCNC}}$) signal region. An example of the predicted signal contribution for a value ${ \cal {B} }(\mathrm{ t } \rightarrow \mathrm{ Z } \mathrm{ u } ) = $ 0.1% (FCNC) is shown for illustration. The four channels are combined. The lower panel shows the ratio between observed and predicted yields, including the total uncertainty on the prediction. |

png pdf |
Figure 5-c:
Data-to-prediction comparison for the tZ-FCNC search after performing the fit for the BDT response in the $ {\mathrm{ t } {}\mathrm{ \bar{t} } }$ (BDT$_{\mathrm{ t \bar{t} }\text{-FCNC}} $) signal region. An example of the predicted signal contribution for a value ${ \cal {B} }(\mathrm{ t } \rightarrow \mathrm{ Z } \mathrm{ u } ) = $ 0.1% (FCNC) is shown for illustration. The four channels are combined. The lower panel shows the ratio between observed and predicted yields, including the total uncertainty on the prediction. |

png pdf |
Figure 6:
Data-to-prediction comparisons in the background-enriched samples, after applying background normalisation scaling factors as described in the text, of the ${p_{\mathrm {T}}}$ of the lepton from the W boson (top-left), ${ {p_{\mathrm {T}}} ^\text {miss}} $ (top-right), and $m _{\ell \ell }$ (bottom). The four channels are combined. The lower panels show the ratio between observed and predicted yields, including the total uncertainty on the prediction. The distributions shown here are for the tZ-FCNC search, where WZ + h.f. denotes WZ + heavy flavour. |

png pdf |
Figure 6-a:
Data-to-prediction comparison in the background-enriched samples, after applying background normalisation scaling factors as described in the text, of the ${p_{\mathrm {T}}}$ of the lepton from the W boson. The four channels are combined. The lower panel shows the ratio between observed and predicted yields, including the total uncertainty on the prediction. The distribution shown here are for the tZ-FCNC search, where WZ + h.f. denotes WZ + heavy flavour. |

png pdf |
Figure 6-b:
Data-to-prediction comparison in the background-enriched samples, after applying background normalisation scaling factors as described in the text, of ${ {p_{\mathrm {T}}} ^\text {miss}} $. The four channels are combined. The lower panel shows the ratio between observed and predicted yields, including the total uncertainty on the prediction. The distribution shown here are for the tZ-FCNC search, where WZ + h.f. denotes WZ + heavy flavour. |

png pdf |
Figure 6-c:
Data-to-prediction comparison in the background-enriched samples, after applying background normalisation scaling factors as described in the text, of $m _{\ell \ell }$. The four channels are combined. The lower panel shows the ratio between observed and predicted yields, including the total uncertainty on the prediction. The distribution shown here are for the tZ-FCNC search, where WZ + h.f. denotes WZ + heavy flavour. |

png pdf |
Figure 7:
Data-to-prediction comparisons after performing the fit for the $|\eta |$ distribution of the recoiling jet in the control region (left), and the signal region (right). The four lepton channels are combined. The lower panels show the ratio between observed and predicted yields, including the total uncertainty on the prediction. |

png pdf |
Figure 7-a:
Data-to-prediction comparison after performing the fit for the $|\eta |$ distribution of the recoiling jet in the control region. The four lepton channels are combined. The lower panel shows the ratio between observed and predicted yields, including the total uncertainty on the prediction. |

png pdf |
Figure 7-b:
Data-to-prediction comparison after performing the fit for the $|\eta |$ distribution of the recoiling jet in the signal region. The four lepton channels are combined. The lower panel shows the ratio between observed and predicted yields, including the total uncertainty on the prediction. |

png pdf |
Figure 8:
The expected and observed exclusion limits at 95% CL on ${ \cal {B} } (\mathrm{ t } \rightarrow \mathrm{ Z } \mathrm{c} )$ as a function of the limits on $ {\cal {B}}( \mathrm{ t } \rightarrow \mathrm{ Z } \mathrm{ u } )$. The expected 68% CL is also shown. |
| Tables | |
png pdf |
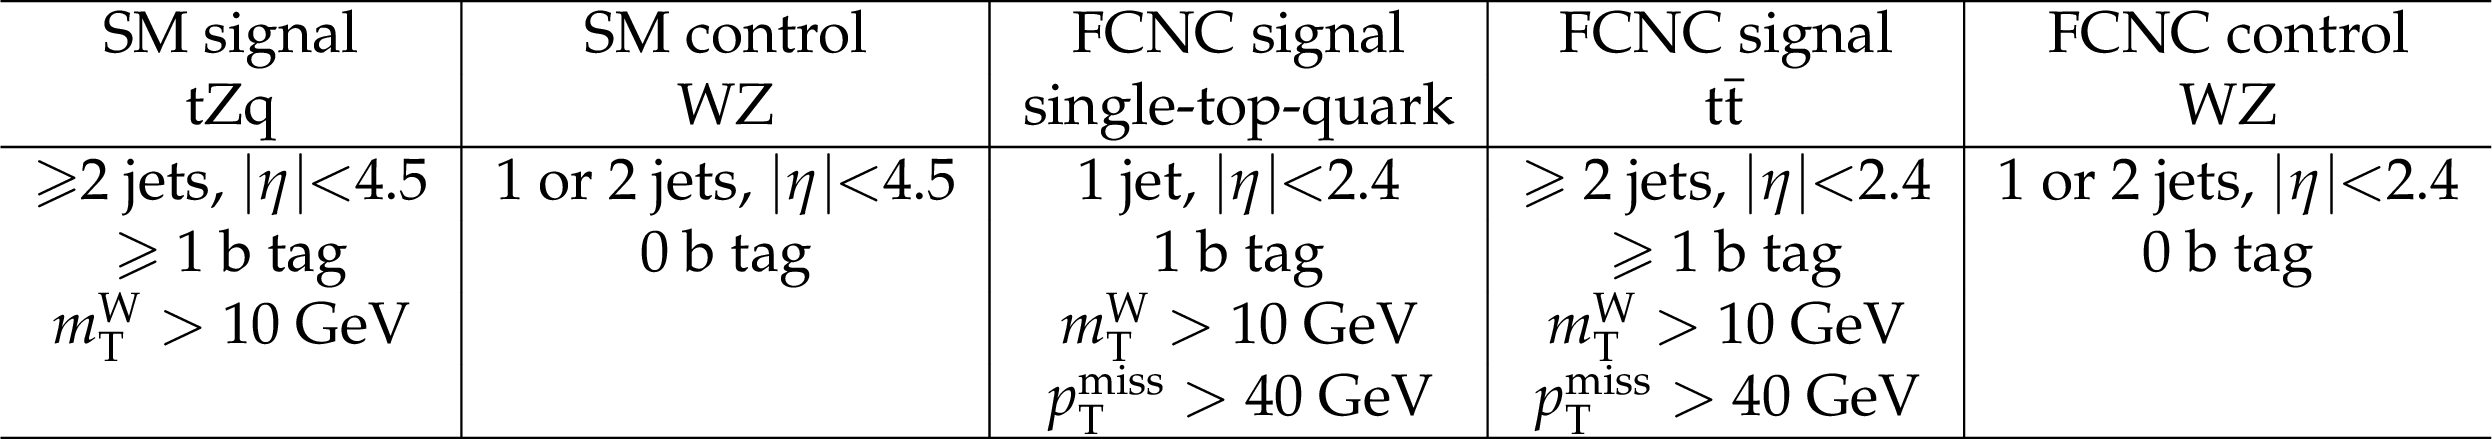
Table 1:
The event selections for the signal and control regions for the SM and FCNC analyses. |

png pdf |
Table 2:
The number of events remaining for each process, after all selections have been applied, in the control and signal regions for the tZq-SM shape analysis. WZ+h.f. denotes WZ + heavy flavour. |

png pdf |
Table 3:
The systematic sources, variation and type, which represent how the uncertainty is treated in the likelihood fit. |

png pdf |
Table 4:
The measured cross sections, together with their total uncertainties, for the individual channels and the channels combined for the BDT-based analysis. |

png pdf |
Table 5:
The measured cross sections for the individual channels and the channels combined for the counting analysis. |

png pdf |
Table 6:
Expected and observed 95% exclusion limits on the branching fraction of the tZ-FCNC couplings. |
| Summary |
| A search for the associated production of a top quark and a Z boson, as predicted by the standard model was performed with the full CMS data set collected at 8 TeV, corresponding to an integrated luminosity of 19.7 fb$^{-1}$. An events yield compatible with tZq standard model production is observed, and the corresponding cross section is measured to be 10$^{+8}_{-7}$ fb. The corresponding observed and expected significances are 2.4 and 1.8 standard deviations, respectively. A search for tZ production produced via flavour-changing neutral current interactions, either in single-top-quark or $\mathrm{ t \bar{t} }$ production modes, was also performed. For this search the standard model tZq process was considered as a background. No evidence for tZ-FCNC interactions is found, and limits at 95% confidence level are set on the branching fraction for the decay of a top quark into a Z boson and a quark. The limits are ${ \cal{B} } ( \mathrm{ t } \rightarrow \mathrm{ Z } \mathrm{u} ) < $ 0.022% and ${ \cal{B} } ( \mathrm{ t } \rightarrow \mathrm{ Z c }) < $ 0.049%, which improve the previous limits set by the CMS Collaboration by about a factor of two. |
| References | ||||
| 1 | CDF Collaboration | Observation of top quark production in $ p\bar{p} $ collisions | PRL 74 (1995) 2626 | hep-ph/9503002 |
| 2 | D0 Collaboration | Observation of the top quark | PRL 74 (1995) 2632 | hep-ph/9503003 |
| 3 | CMS Collaboration | Measurement of the $ t $-channel single top quark production cross section in pp collisions at $ \sqrt{s} = $ 7 TeV | PRL 107 (2011) 091802 | CMS-TOP-10-008 1106.3052 |
| 4 | CMS Collaboration | Measurement of the single-top-quark $ t $-channel cross section in pp collisions at $ \sqrt{s} = $ 7 TeV | JHEP 12 (2012) 035 | CMS-TOP-11-021 1209.4533 |
| 5 | CMS Collaboration | Measurement of the $ t $-channel single-top-quark production cross section and of the $ | V_{\mathrm{tb}} | $ CKM matrix element in pp collisions at $ \sqrt{s} = $ 8 TeV | JHEP 06 (2014) 090 | CMS-TOP-12-038 1403.7366 |
| 6 | ATLAS Collaboration | Comprehensive measurements of $ t $-channel single top-quark production cross sections at $ \sqrt{s} = $ 7 TeV with the ATLAS detector | PRD 90 (2014) 112006 | 1406.7844 |
| 7 | CMS Collaboration | Observation of the associated production of a single top quark and a W boson in pp collisions at $ \sqrt{s} = $ 8 TeV | PRL 112 (2014) 231802 | CMS-TOP-12-040 1401.2942 |
| 8 | ATLAS Collaboration | Measurement of the production cross-section of a single top quark in association with a W boson at 8 TeV with the ATLAS experiment | JHEP 01 (2016) 064 | 1510.03752 |
| 9 | ATLAS Collaboration | Evidence for single top-quark production in the $ s $-channel in proton-proton collisions at $ \sqrt{s} = $ 8 TeV with the ATLAS detector using the matrix element method | PLB 756 (2016) 228 | 1511.05980 |
| 10 | CMS Collaboration | Search for $ s $-channel single top quark production in pp collisions at $ \sqrt{s} = $ 7 et 8 TeV | JHEP 09 (2016) 027 | CMS-TOP-13-009 1603.02555 |
| 11 | J. M. Campbell, R. K. Ellis, and R. Roentsch | Single top production in association with a Z boson at the LHC | PRD 87 (2013) 114006 | 1302.3856 |
| 12 | J. Pumplin et al. | New generation of parton distributions with uncertainties from global QCD analysis | JHEP 07 (2002) 012 | hep-ph/0201195 |
| 13 | J. Alwall et al. | The automated computation of tree-level and next-to-leading order differential cross sections, and their matching to parton shower simulations | JHEP 07 (2014) 079 | 1405.0301 |
| 14 | NNPDF Collaboration | Parton distributions with LHC data | Nucl. Phys. B 867 (2013) 244 | 1207.1303 |
| 15 | ATLAS Collaboration | Measurement of the $ t\overline{t}W $ and $ t\overline{t}Z $ production cross sections in $ pp $ collisions at $ \sqrt{s} = $ 8 TeV with the ATLAS detector | JHEP 11 (2015) 172 | 1509.05276 |
| 16 | CMS Collaboration | Observation of top pairs produced in association with a vector boson in pp collisions at $ \sqrt{s} = $ 8 TeV | JHEP 01 (2016) 096 | CMS-TOP-14-021 1510.01131 |
| 17 | CMS Collaboration | Measurement of top quark-antiquark pair production in association with a W or Z boson in pp collisions at $ \sqrt{s} = $ 8 TeV | EPJC 74 (2014) 3060 | CMS-TOP-12-036 1406.7830 |
| 18 | ATLAS Collaboration | Measurement of the $ t\bar{t}Z $ and $ t\bar{t}W $ production cross sections in multilepton final states using 3.2 fb$^{-1}$ of $ pp $ collisions at $ \sqrt{s} = $ 13 TeV with the ATLAS detector | Submitted to EPJC | 1609.01599 |
| 19 | S. L. Glashow, J. Iliopoulos, and L. Maiani | Weak interactions with lepton hadron symmetry | PRD 2 (1970) 1285 | |
| 20 | J. M. Yang, B.-L. Young, and X. Zhang | Flavor changing top quark decays in R-parity-violating SUSY | PRD 58 (1998) 055001 | hep-ph/9705341v3 |
| 21 | G.-R. Lu, F.-R. Yin, X.-L. Wang, and L.-D. Wan | Rare top quark decays $ \mathrm{t} \rightarrow \mathrm{ cV } $ in the topcolor assisted technicolor model | PRD 68 (2003) 015002 | hep-ph/0303122 |
| 22 | J. Aguilar-Saavedra | Effects of mixing with quark singlets | PRD 67 (2003) 035003 | hep-ph/0210112 |
| 23 | J. Aguilar-Saavedra | Top flavor-changing neutral interactions: Theoretical expectations and experimental detection | Acta Phys. Polon. B. 35 (2004) 2695 | hep-ph/0409342 |
| 24 | F. del Aguila, J. Aguilar-Saavedra, and L. Ametller | Zt and $ \gamma $t production via top flavor changing neutral couplings at the Fermilab Tevatron | PLB. 462 (1999) 310 | hep-ph/9906462 |
| 25 | J.-L. Agram et al. | Probing top anomalous couplings at the LHC with trilepton signatures in the single top mode | PLB. 725 (2013) 123 | 1304.5551 |
| 26 | CDF Collaboration | Search for the flavour-changing neutral-current decay $ \mathrm{t} \rightarrow \mathrm{Zq} $ in $ \mathrm{ p\bar{p} } $ collisions at $ \sqrt{s} = $ 1.96 TeV | PRL 101 (2008) 192002 | 0805.2109 |
| 27 | D0 Collaboration | Search for flavor changing neutral currents via quark-gluon couplings in single top quark production using 2.3$ fb$^{-1}$ $ of $ p\bar{p} $ collisions | PLB 693 (2010) 81 | 1006.3575 |
| 28 | ATLAS Collaboration | Search for single top-quark production via flavour-changing neutral currents at 8 TeV with the ATLAS detector | EPJC 76 (2016) 55 | 1509.00294 |
| 29 | CMS Collaboration | Search for anomalous single top quark production in association with a photon in pp collisions at $ \sqrt{s} = $ 8 TeV | JHEP 04 (2016) 035 | CMS-TOP-14-003 1511.03951 |
| 30 | ATLAS Collaboration | Search for flavour-changing neutral current top-quark decays to $ qZ $ in $ pp $ collision data collected with the ATLAS detector at $\sqrt{s} = $ 8 TeV | EPJC 76 (2016) 12 | 1508.05796 |
| 31 | CMS Collaboration | Search for flavor-changing neutral currents in top-quark decays t to Zq in pp collisions at $ \sqrt{s} = $ 8 TeV | PRL 112 (2014) 171802 | CMS-TOP-12-037 1312.4194 |
| 32 | CMS Collaboration | Performance of electron reconstruction and selection with the CMS detector in proton-proton collisions at $ \sqrt{s} = $ 8 TeV | JINST 10 (2015) P06005 | CMS-EGM-13-001 1502.02701 |
| 33 | CMS Collaboration | Performance of CMS muon reconstruction in pp collision events at $ \sqrt{s} = $ 7 TeV | JINST 7 (2012) P10002 | CMS-MUO-10-004 1206.4071 |
| 34 | CMS Collaboration | The performance of the CMS muon detector in proton-proton collisions at $ \sqrt{s} = $ 7 TeV at the LHC | JINST 8 (2013) P11002 | CMS-MUO-11-001 1306.6905 |
| 35 | CMS Collaboration | The CMS trigger system | Submitted to JINST | CMS-TRG-12-001 1609.02366 |
| 36 | CMS Collaboration | The CMS experiment at the CERN LHC | JINST 3 (2008) S08004 | CMS-00-001 |
| 37 | T. Sjostrand et al. | An introduction to PYTHIA 8.2 | CPC 191 (2015) 159 | 1410.3012 |
| 38 | T. Sjostrand, S. Mrenna, and P. Skands | PYTHIA 6.4 physics and manual | JHEP 05 (2006) 026 | hep-ph/0603175 |
| 39 | E. Re | Single-top Wt-channel production matched with parton showers using the POWHEG method | EPJC 71 (2011) 1547 | 1009.2450 |
| 40 | S. Alioli, P. Nason, C. Oleari, and E. Re | A general framework for implementing NLO calculations in shower Monte Carlo programs: the POWHEG BOX | JHEP 06 (2010) 043 | 1002.2581 |
| 41 | S. Alioli, P. Nason, C. Oleari, and E. Re | NLO single-top production matched with shower in POWHEG: $ s $- and $ t $-channel contributions | JHEP 09 (2009) 111 | 0907.4076 |
| 42 | S. Frixione, P. Nason, and C. Oleari | Matching NLO QCD computations with parton shower simulations: the POWHEG method | JHEP 11 (2007) 070 | 0709.2092 |
| 43 | A. Alloul et al. | FeynRules 2.0---A complete toolbox for tree-level phenomenology | CPC 185 (2014) 2250 | 1310.1921 |
| 44 | C. Degrande et al. | UFO---The Universal FeynRules Output | CPC 183 (2012) 1201 | 1108.2040 |
| 45 | M. Guzzi et al. | CT10 parton distributions and other developments in the global QCD analysis | 1101.0561 | |
| 46 | CMS Collaboration | Study of the underlying event at forward rapidity in pp collisions at $ \sqrt{s} = $ 0.9, 2.76, and 7 TeV | JHEP 04 (2013) 072 | CMS-FWD-11-003 1302.2394 |
| 47 | CMS Collaboration | Event generator tunes obtained from underlying event and multiparton scattering measurements | EPJC 76 (2016) 155 | CMS-GEN-14-001 1512.00815 |
| 48 | M. Czakon and A. Mitov | Top++: a program for the calculation of the top-pair cross-section at hadron colliders | CPC 185 (2014) 2930 | 1112.5675 |
| 49 | K. Melnikov and F. Petriello | Electroweak gauge boson production at hadron colliders through $ \mathcal{O}(\alpha_s^2) $ | PRD 74 (2006) 114017 | hep-ph/0609070 |
| 50 | N. Kidonakis | Two-loop soft anomalous dimensions for single top quark associated production with a $ \mathrm{W}^- $ or $ \mathrm{H}^- $ | PRD 82 (2010) 054018 | 1005.4451 |
| 51 | J. M. Campbell, R. K. Ellis, and C. Williams | Vector boson pair production at the LHC | JHEP 07 (2011) 018 | 1105.0020 |
| 52 | J. M. Campbell and R. K. Ellis | $ \mathrm{ t \bar{t} W^{\pm} } $ production and decay at NLO | JHEP 07 (2012) 052 | 1204.5678 |
| 53 | M. V. Garzelli, A. Kardos, C. G. Papadopoulos, and Z. Trocsanyi | $ \mathrm{ t \bar{t} W^{\pm} } $ and $ \mathrm{ t \bar{t} Z } $ hadroproduction at NLO accuracy in QCD with parton shower and hadronization effects | JHEP 11 (2012) 056 | 1208.2665 |
| 54 | GEANT4 Collaboration | GEANT4---a simulation toolkit | NIMA 506 (2003) 250 | |
| 55 | A. Giammanco | The fast simulation of the CMS experiment | J. Phys. Conf. Ser. 513 (2014) 022012 | |
| 56 | CMS Collaboration | Particle--flow event reconstruction in CMS and performance for jets, taus, and $ E_{\mathrm{T}}^{\text{miss}} $ | CDS | |
| 57 | CMS Collaboration | Commissioning of the particle--flow event reconstruction with the first LHC collisions recorded in the CMS detector | CDS | |
| 58 | A. Perloff | Pileup measurement and mitigation techniques in CMS | J. Phys. Conf. Ser. 404 (2012) 012045,.%% %% | |
| 59 | CMS Collaboration | Measurement of inclusive W and Z boson production cross sections in pp collisions at $ \sqrt{s} = $ 8 TeV | PRL 112 (2014) 191802 | CMS-SMP-12-011 1402.0923 |
| 60 | M. Cacciari, G. P. Salam, and G. Soyez | The anti-$ k_t $ jet clustering algorithm | JHEP 04 (2008) 063 | 0802.1189 |
| 61 | M. Cacciari, G. P. Salam, and G. Soyez | FastJet user manual | EPJC 72 (2012) 1896 | 1111.6097 |
| 62 | CMS Collaboration | Performance of b tagging at $ \sqrt{s} = $ 8 TeV in multijet, $ \mathrm{t \bar{t}} $ and boosted topology events | CMS-PAS-BTV-13-001 | CMS-PAS-BTV-13-001 |
| 63 | L. Breiman, J. Friedman, C. J. Stone, and R. A. Olshen | Classification and regression trees | Chapman \& Hall, New York | |
| 64 | H. Voss, A. Hocker, J. Stelzer, and F. Tegenfeldt | TMVA, the toolkit for multivariate data analysis with ROOT | in XIth International Workshop on Advanced Computing and Analysis Techniques in Physics Research (ACAT), p. 40 2007 | physics/0703039 |
| 65 | CMS Collaboration | CMS luminosity based on pixel cluster counting --- Summer 2013 update | CMS-PAS-LUM-13-001 | CMS-PAS-LUM-13-001 |
| 66 | CMS Collaboration | Determination of jet energy calibration and transverse momentum resolution in CMS | JINST 6 (2011) P11002 | CMS-JME-10-011 1107.4277 |
| 67 | CMS Collaboration | Identification of b-quark jets with the CMS experiment | JINST 8 (2013) P04013 | CMS-BTV-12-001 1211.4462 |
| 68 | R. Barlow and C. Beeston | Fitting using finite Monte Carlo samples | CPC 77 (1993) 219 | |
| 69 | T. Muller, J. Ott, and J. Wagner-Kuhr | Theta---a framework for template-based statistical modeling and inference | IEKP-KA-CMS/2012-1 | |
| 70 | L. Moneta et al. | The RooStats project | in 13th International Workshop on Advanced Computing and Analysis Techniques in Physics Research (ACAT2010) SISSA, 2010 PoS(ACAT2010)057 | 1009.1003 |
|
|
Compact Muon Solenoid LHC, CERN |
|

|

|

|

|

|