

Compact Muon Solenoid
LHC, CERN
| CMS-TOP-14-013 ; CERN-EP-2017-030 | ||
| Measurement of double-differential cross sections for top quark pair production in pp collisions at $\sqrt{s} = $ 8 TeV and impact on parton distribution functions | ||
| CMS Collaboration | ||
| 5 March 2017 | ||
| EPJC 77 (2017) 459 | ||
| Abstract: Normalized double-differential cross sections for top quark pair ($ \mathrm{ t \bar{t} } $) production are measured in pp collisions at a centre-of-mass energy of 8 TeV with the CMS experiment at the LHC. The analyzed data correspond to an integrated luminosity of 19.7 fb$^{-1}$. The measurement is performed in the dilepton $\mathrm{ e }^{\pm}\mu^{\mp}$ final state. The $ \mathrm{ t \bar{t} } $ cross section is determined as a function of various pairs of observables characterizing the kinematics of the top quark and $ \mathrm{ t \bar{t} } $ system. The data are compared to calculations using perturbative quantum chromodynamics at next-to-leading and approximate next-to-next-to-leading orders. They are also compared to predictions of Monte Carlo event generators that complement fixed-order computations with parton showers, hadronization, and multiple-parton interactions. Overall agreement is observed with the predictions, which is improved when the latest global sets of proton parton distribution functions are used. The inclusion of the measured $ \mathrm{ t \bar{t} } $ cross sections in a fit of parametrized parton distribution functions is shown to have significant impact on the gluon distribution. | ||
| Links: e-print arXiv:1703.01630 [hep-ex] (PDF) ; CDS record ; inSPIRE record ; HepData record ; CADI line (restricted) ; | ||
| Figures | |
png pdf |
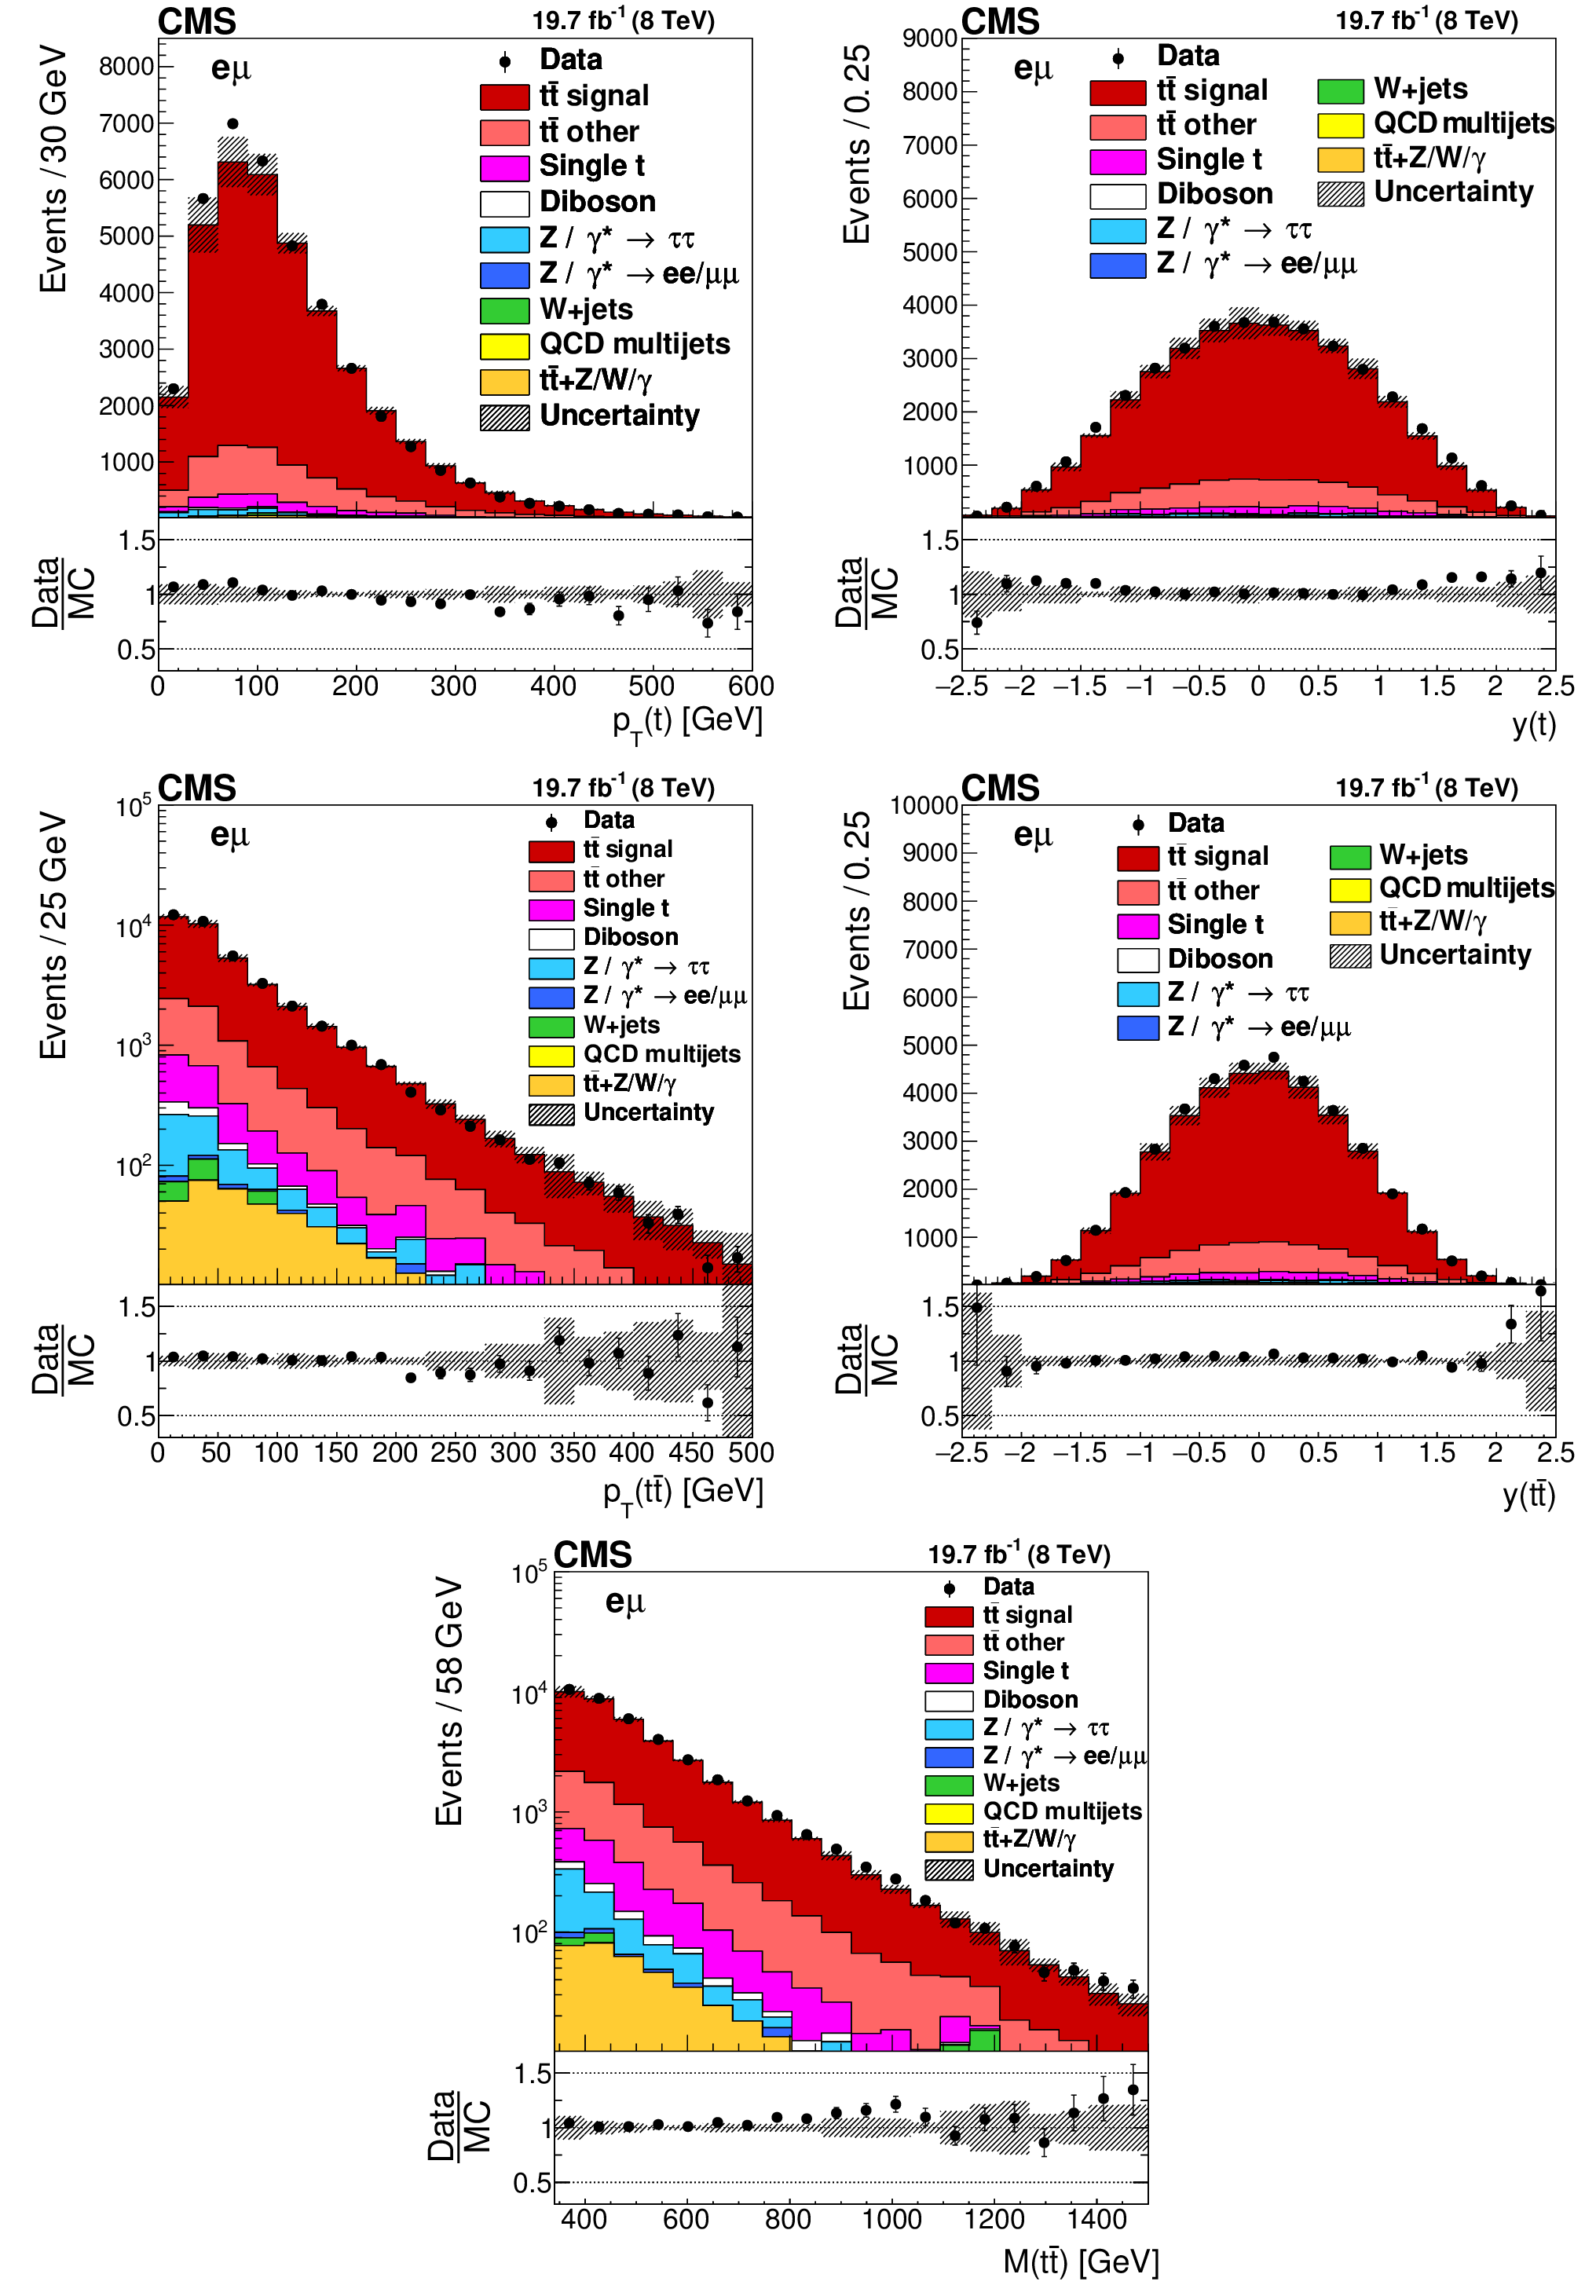
Figure 1:
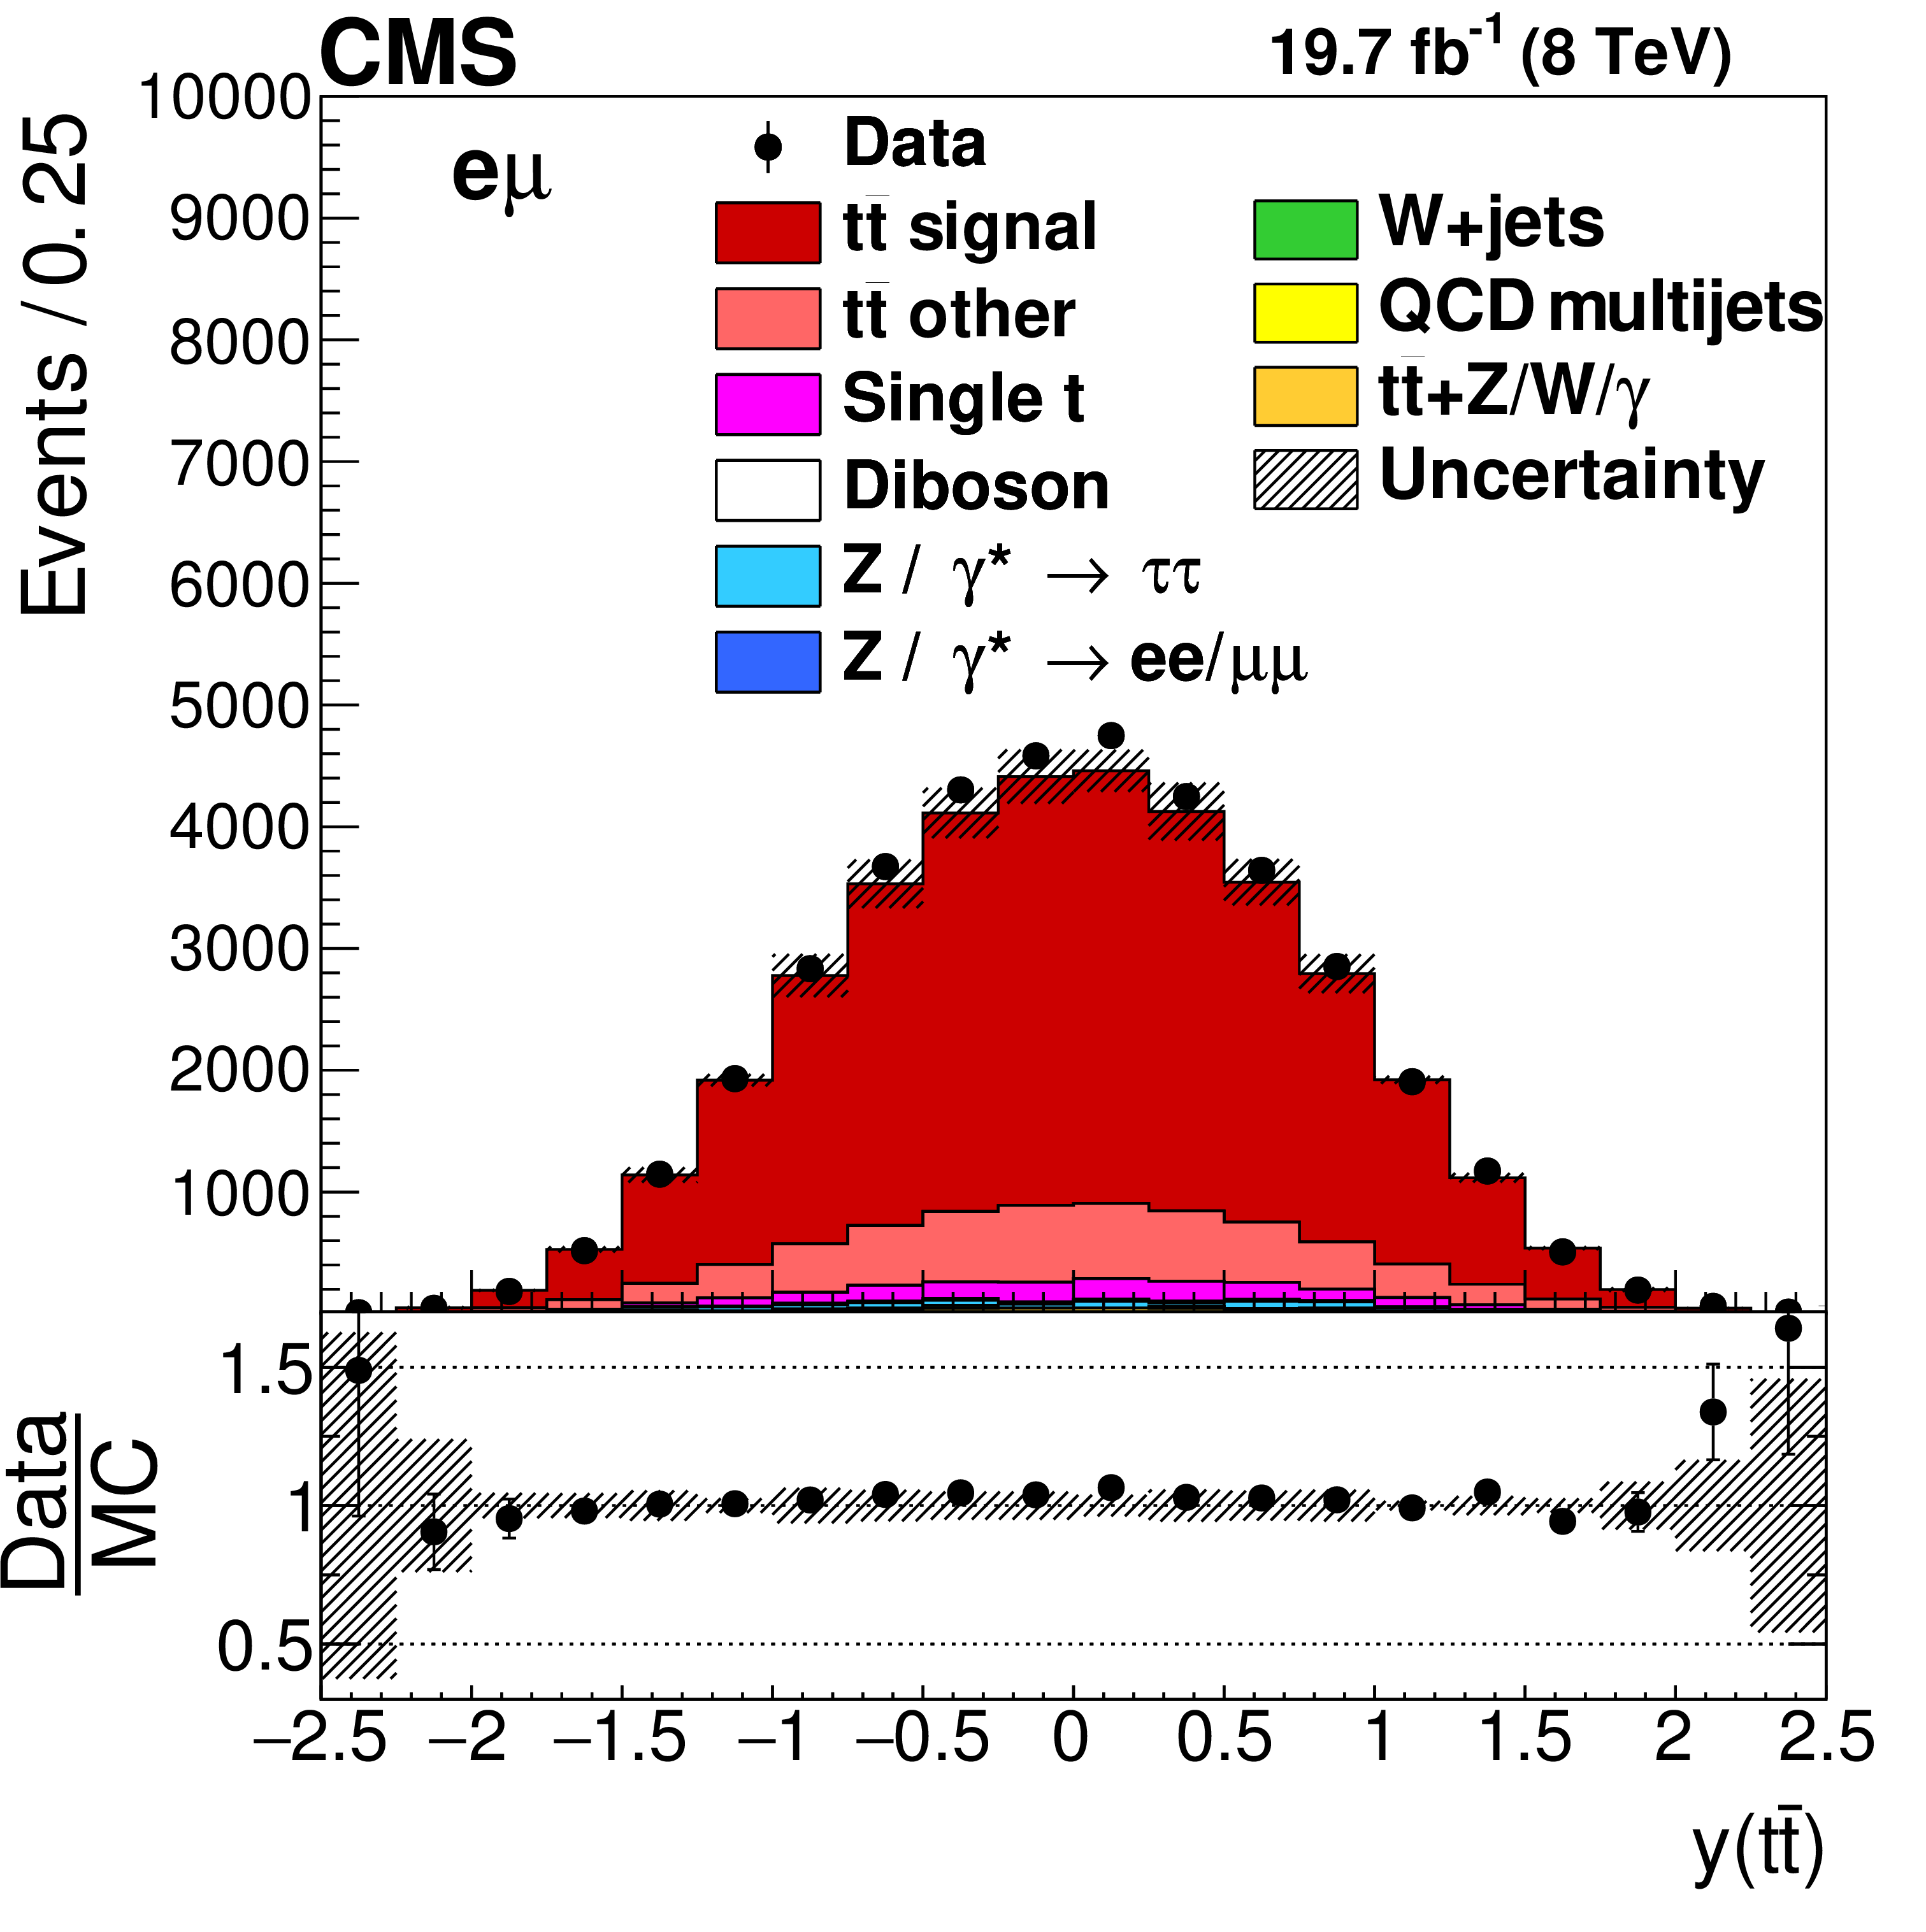
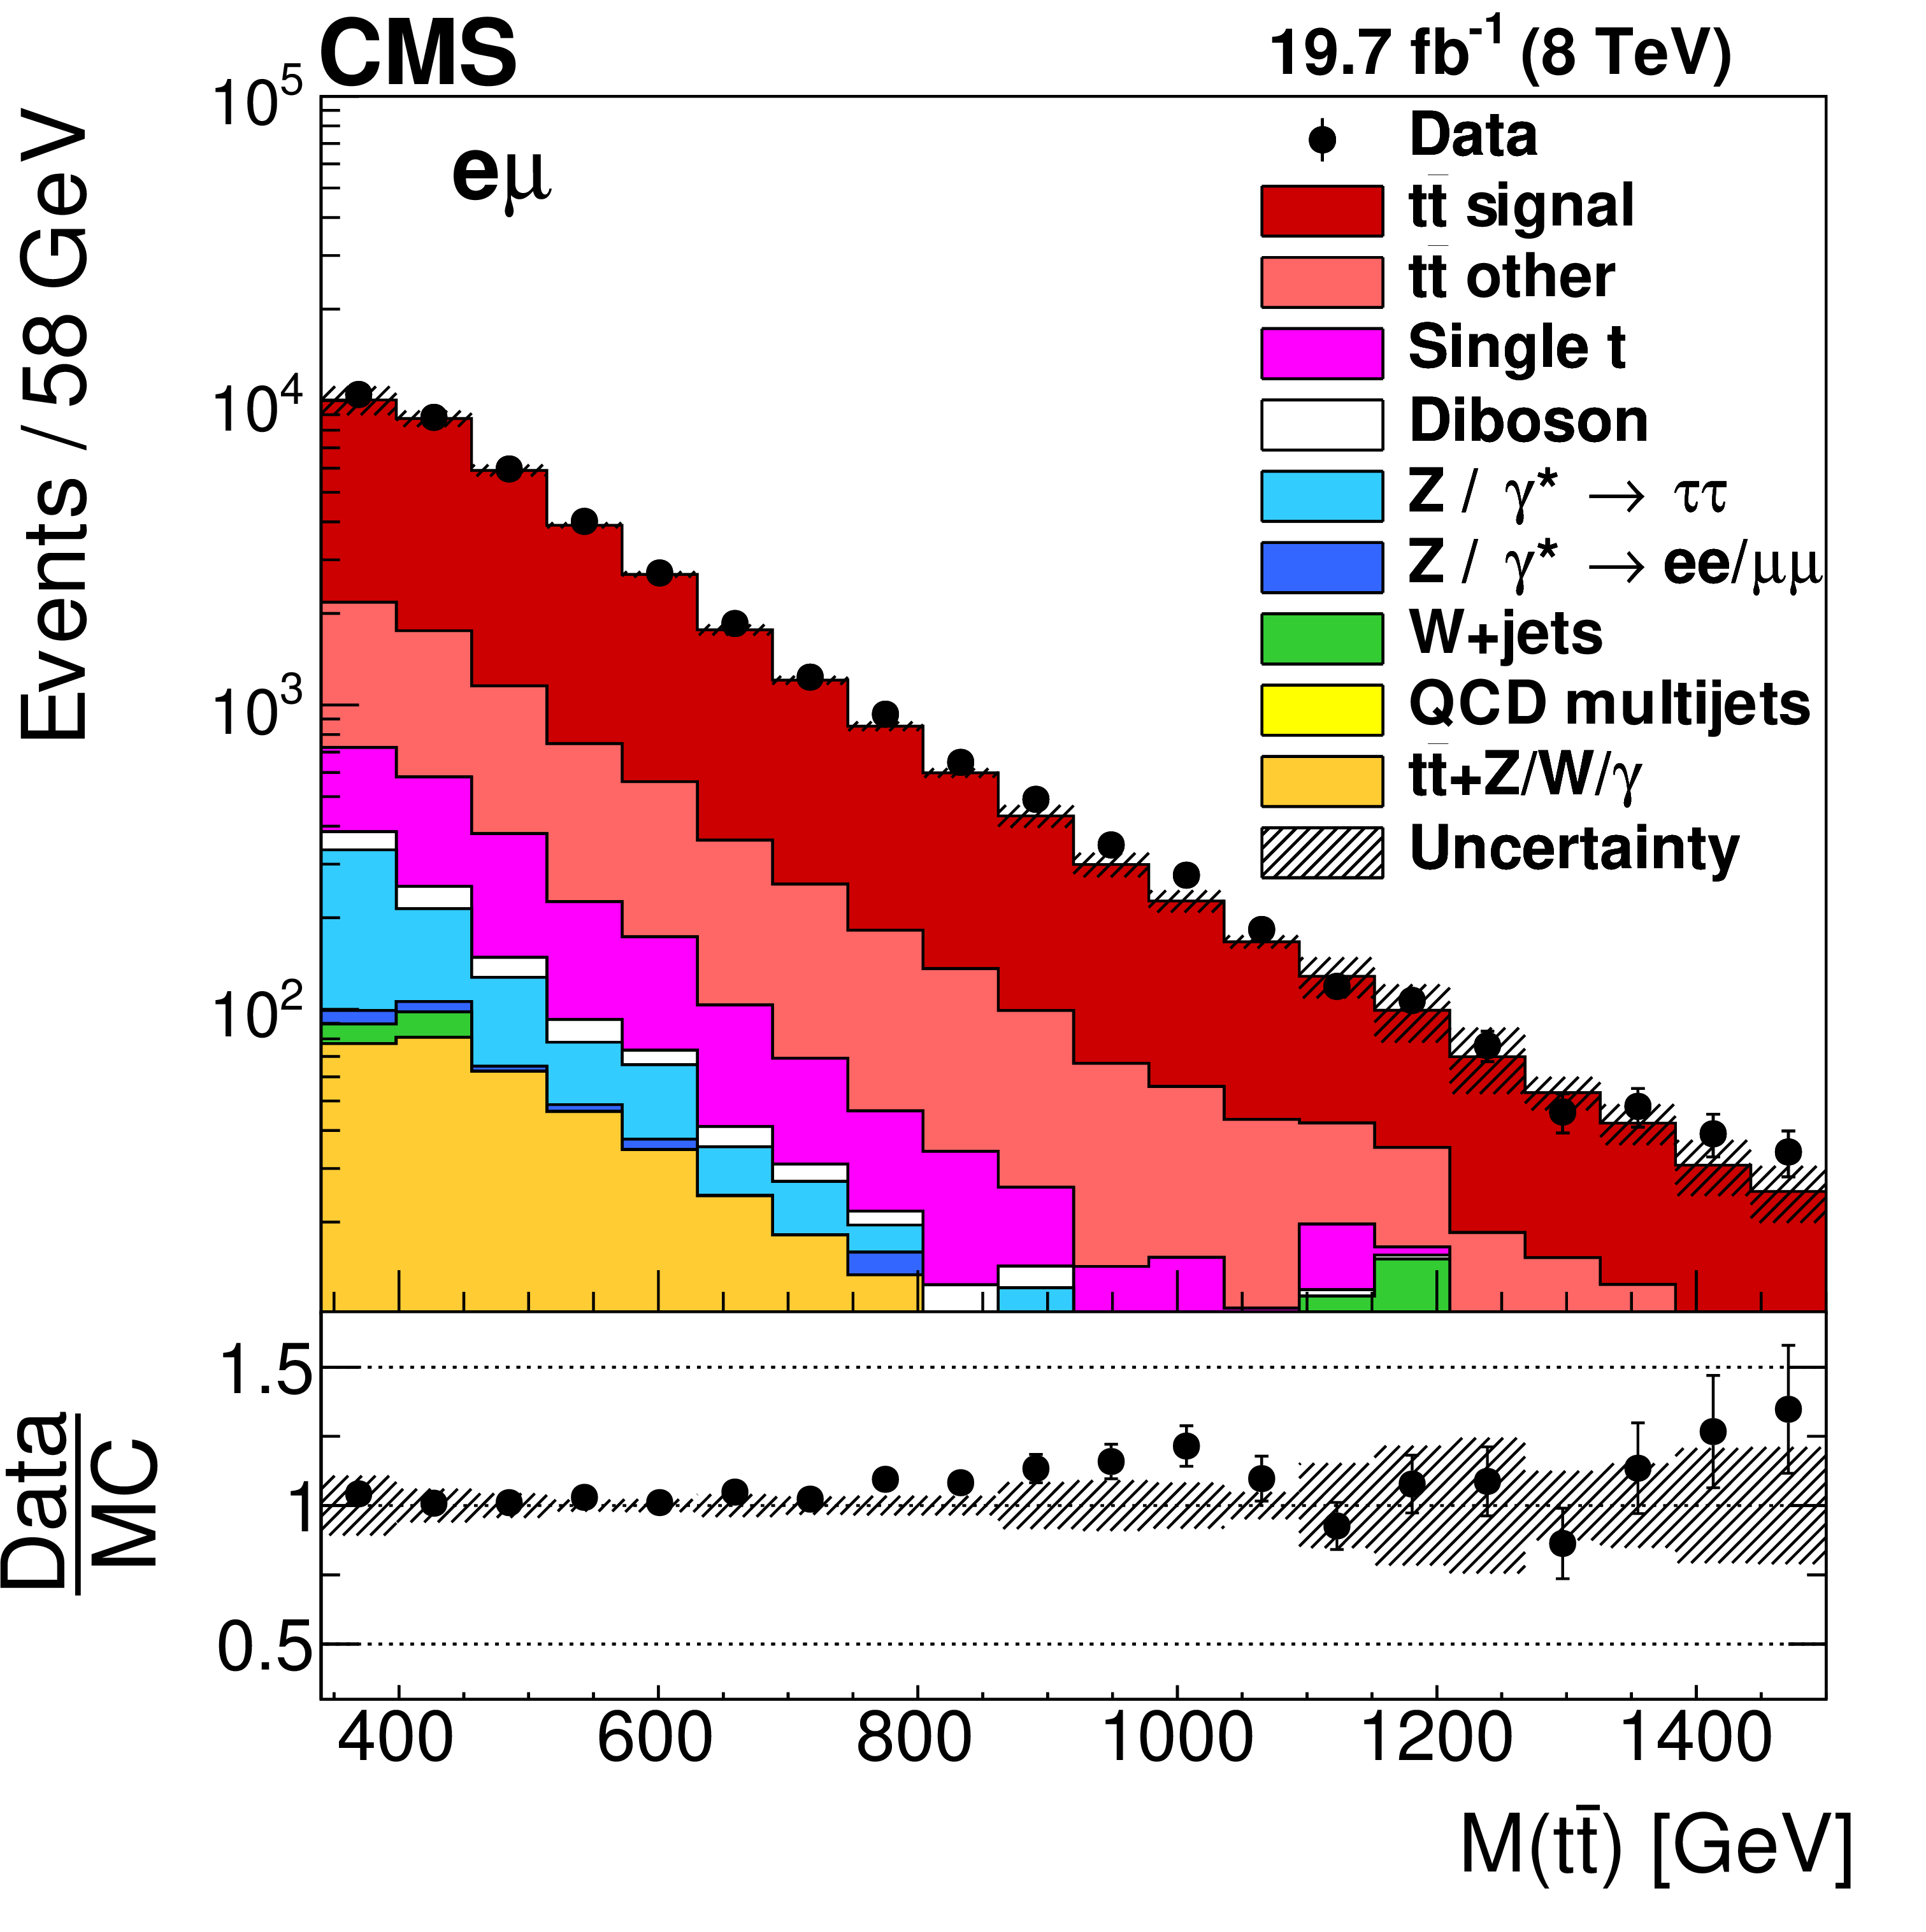
Distributions of $ {p_{\mathrm {T}}} (\mathrm{ t } )$ (upper left), $y(\mathrm{ t } )$ (upper right), $ {p_{\mathrm {T}}} ({\mathrm{ t } {}\mathrm{ \bar{t} } } )$ (middle left), $y({\mathrm{ t } {}\mathrm{ \bar{t} } } )$ (middle right), and ${M({\mathrm{ t } {}\mathrm{ \bar{t} } } )}$ (lower) in selected events after the kinematic reconstruction. The experimental data with the vertical bars corresponding to their statistical uncertainties are plotted together with distributions of simulated signal and different background processes. The hatched regions correspond to the shape uncertainties in the signal and backgrounds (cf. Section 7). The lower panel in each plot shows the ratio of the observed data event yields to those expected in the simulation. |
png pdf |
Figure 1-a:
Distributions of $ {p_{\mathrm {T}}} (\mathrm{ t } )$ in selected events after the kinematic reconstruction. The experimental data with the vertical bars corresponding to their statistical uncertainties are plotted together with distributions of simulated signal and different background processes. The hatched regions correspond to the shape uncertainties in the signal and backgrounds (cf. Section 7). The lower panel shows the ratio of the observed data event yields to those expected in the simulation. |
png pdf |
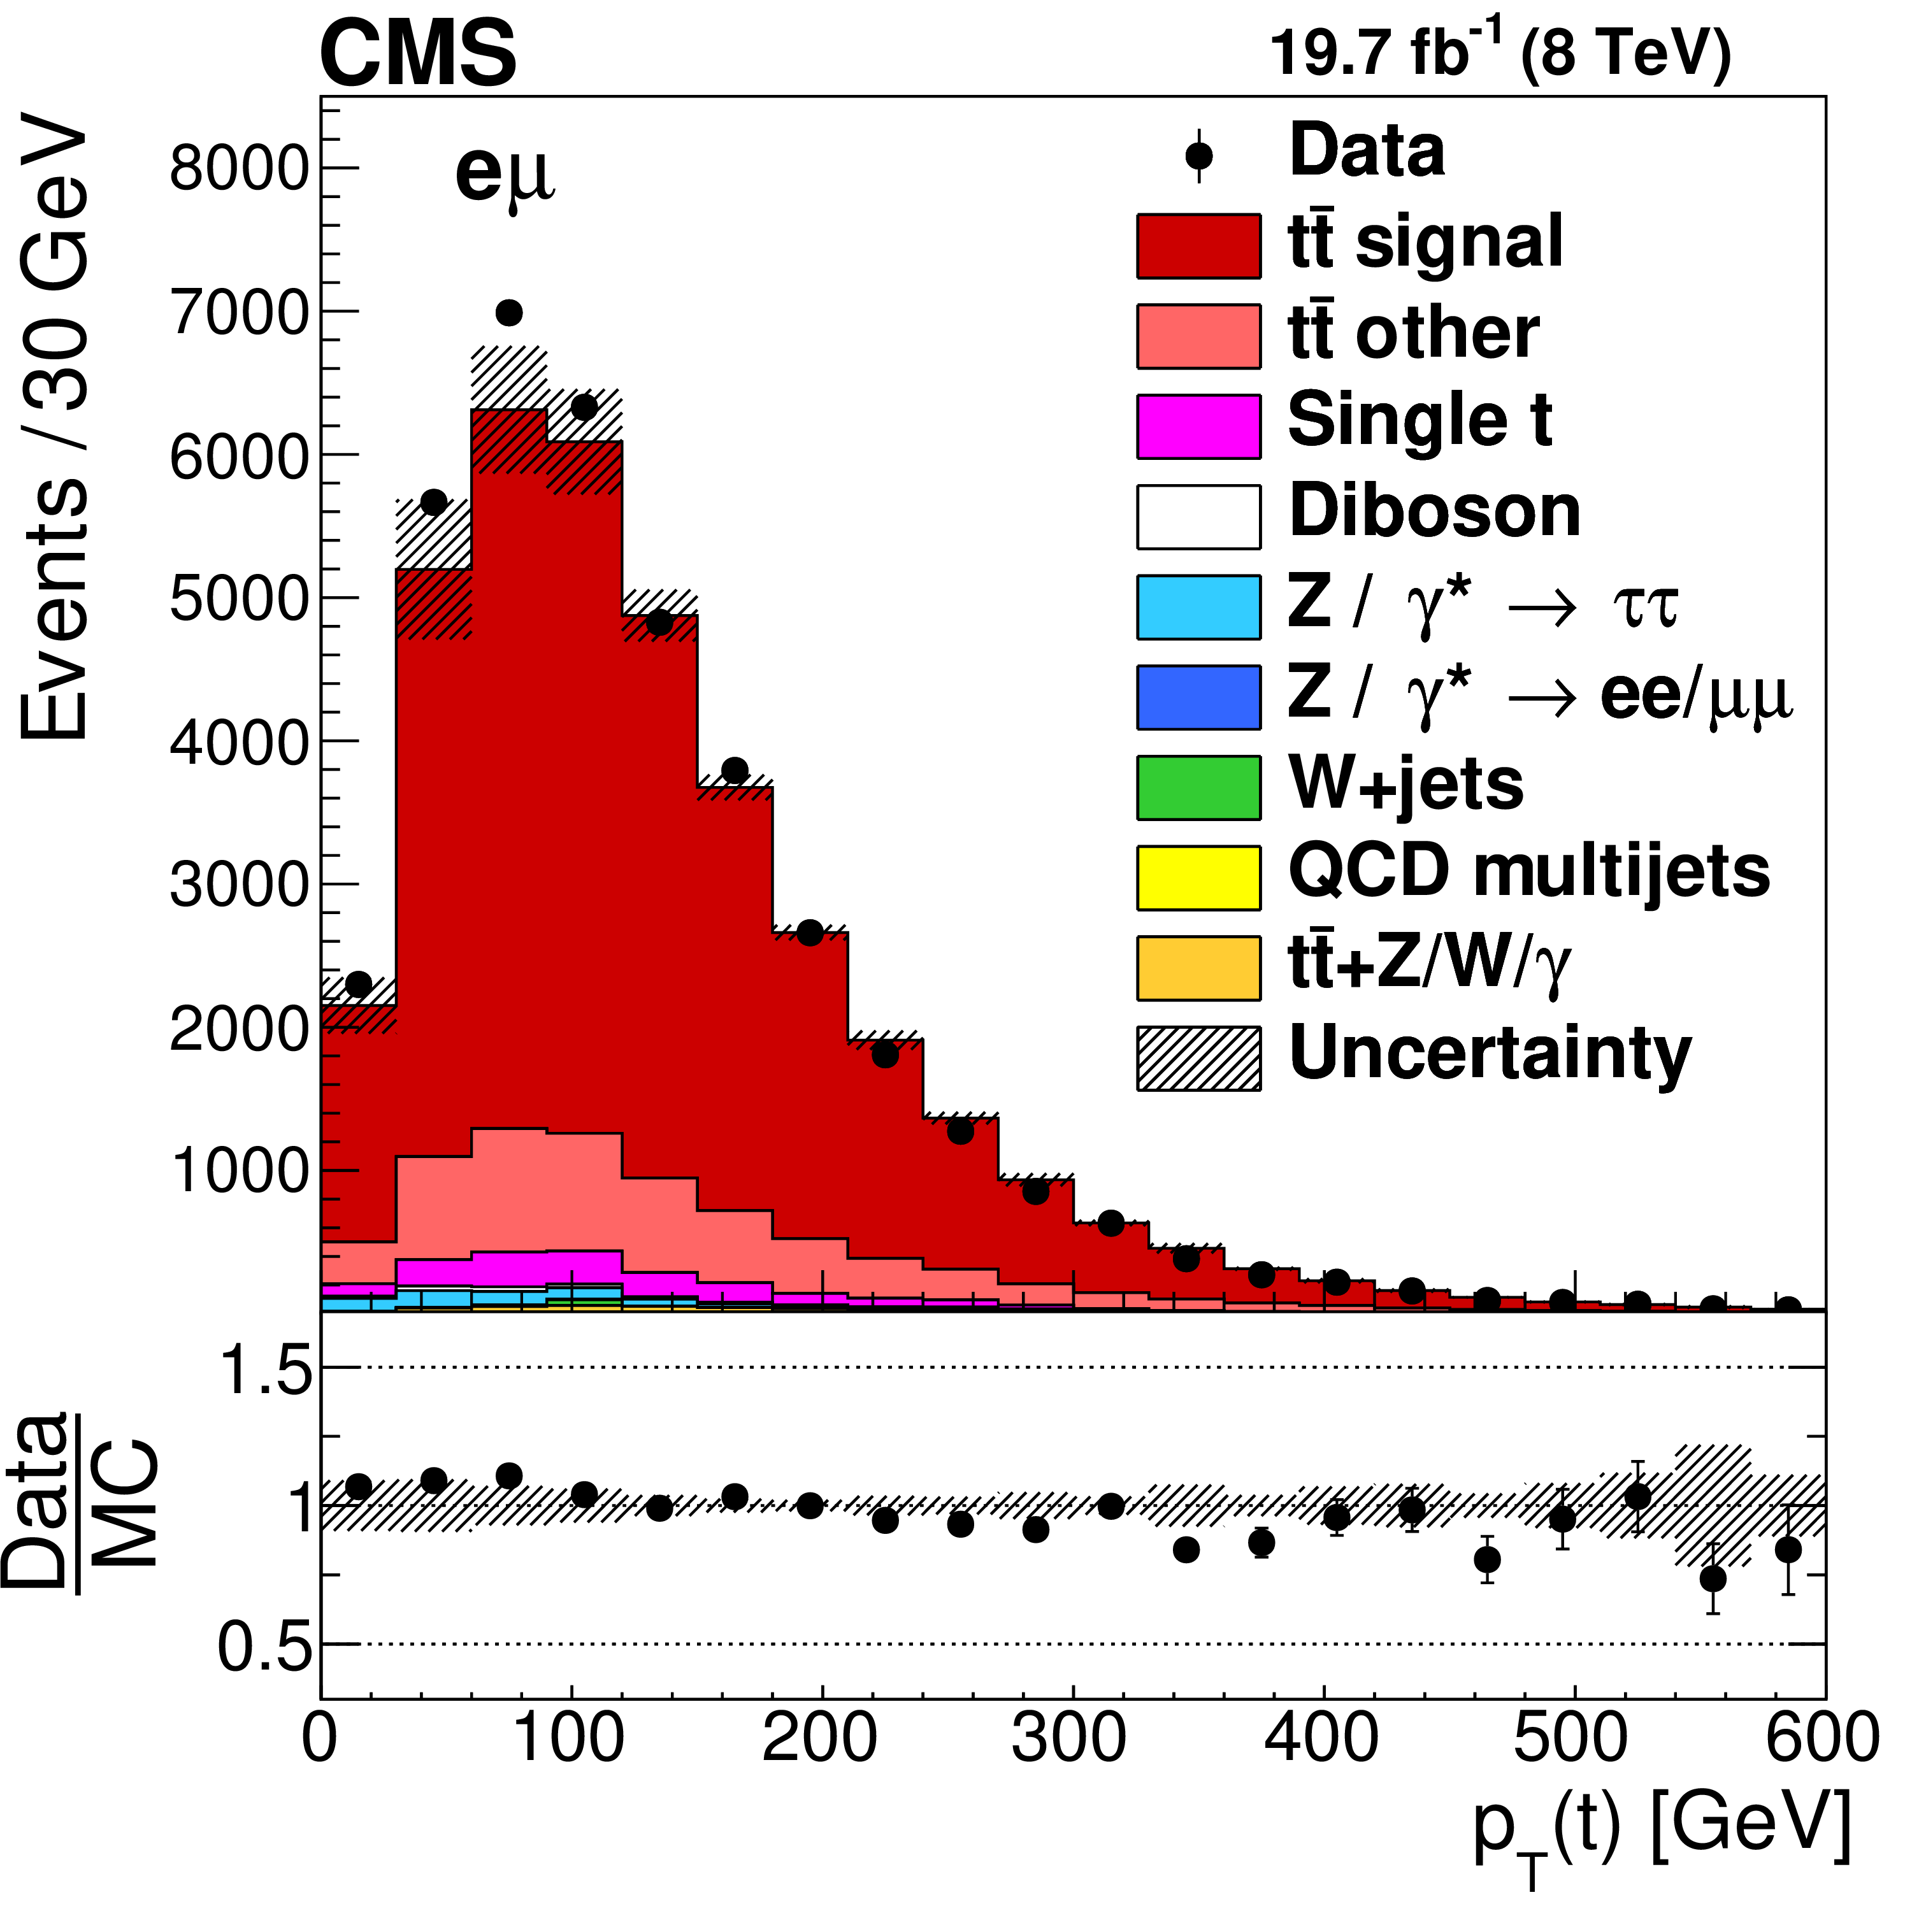
Figure 1-b:
Distributions of $y(\mathrm{ t } )$ in selected events after the kinematic reconstruction. The experimental data with the vertical bars corresponding to their statistical uncertainties are plotted together with distributions of simulated signal and different background processes. The hatched regions correspond to the shape uncertainties in the signal and backgrounds (cf. Section 7). The lower panel shows the ratio of the observed data event yields to those expected in the simulation. |
png pdf |
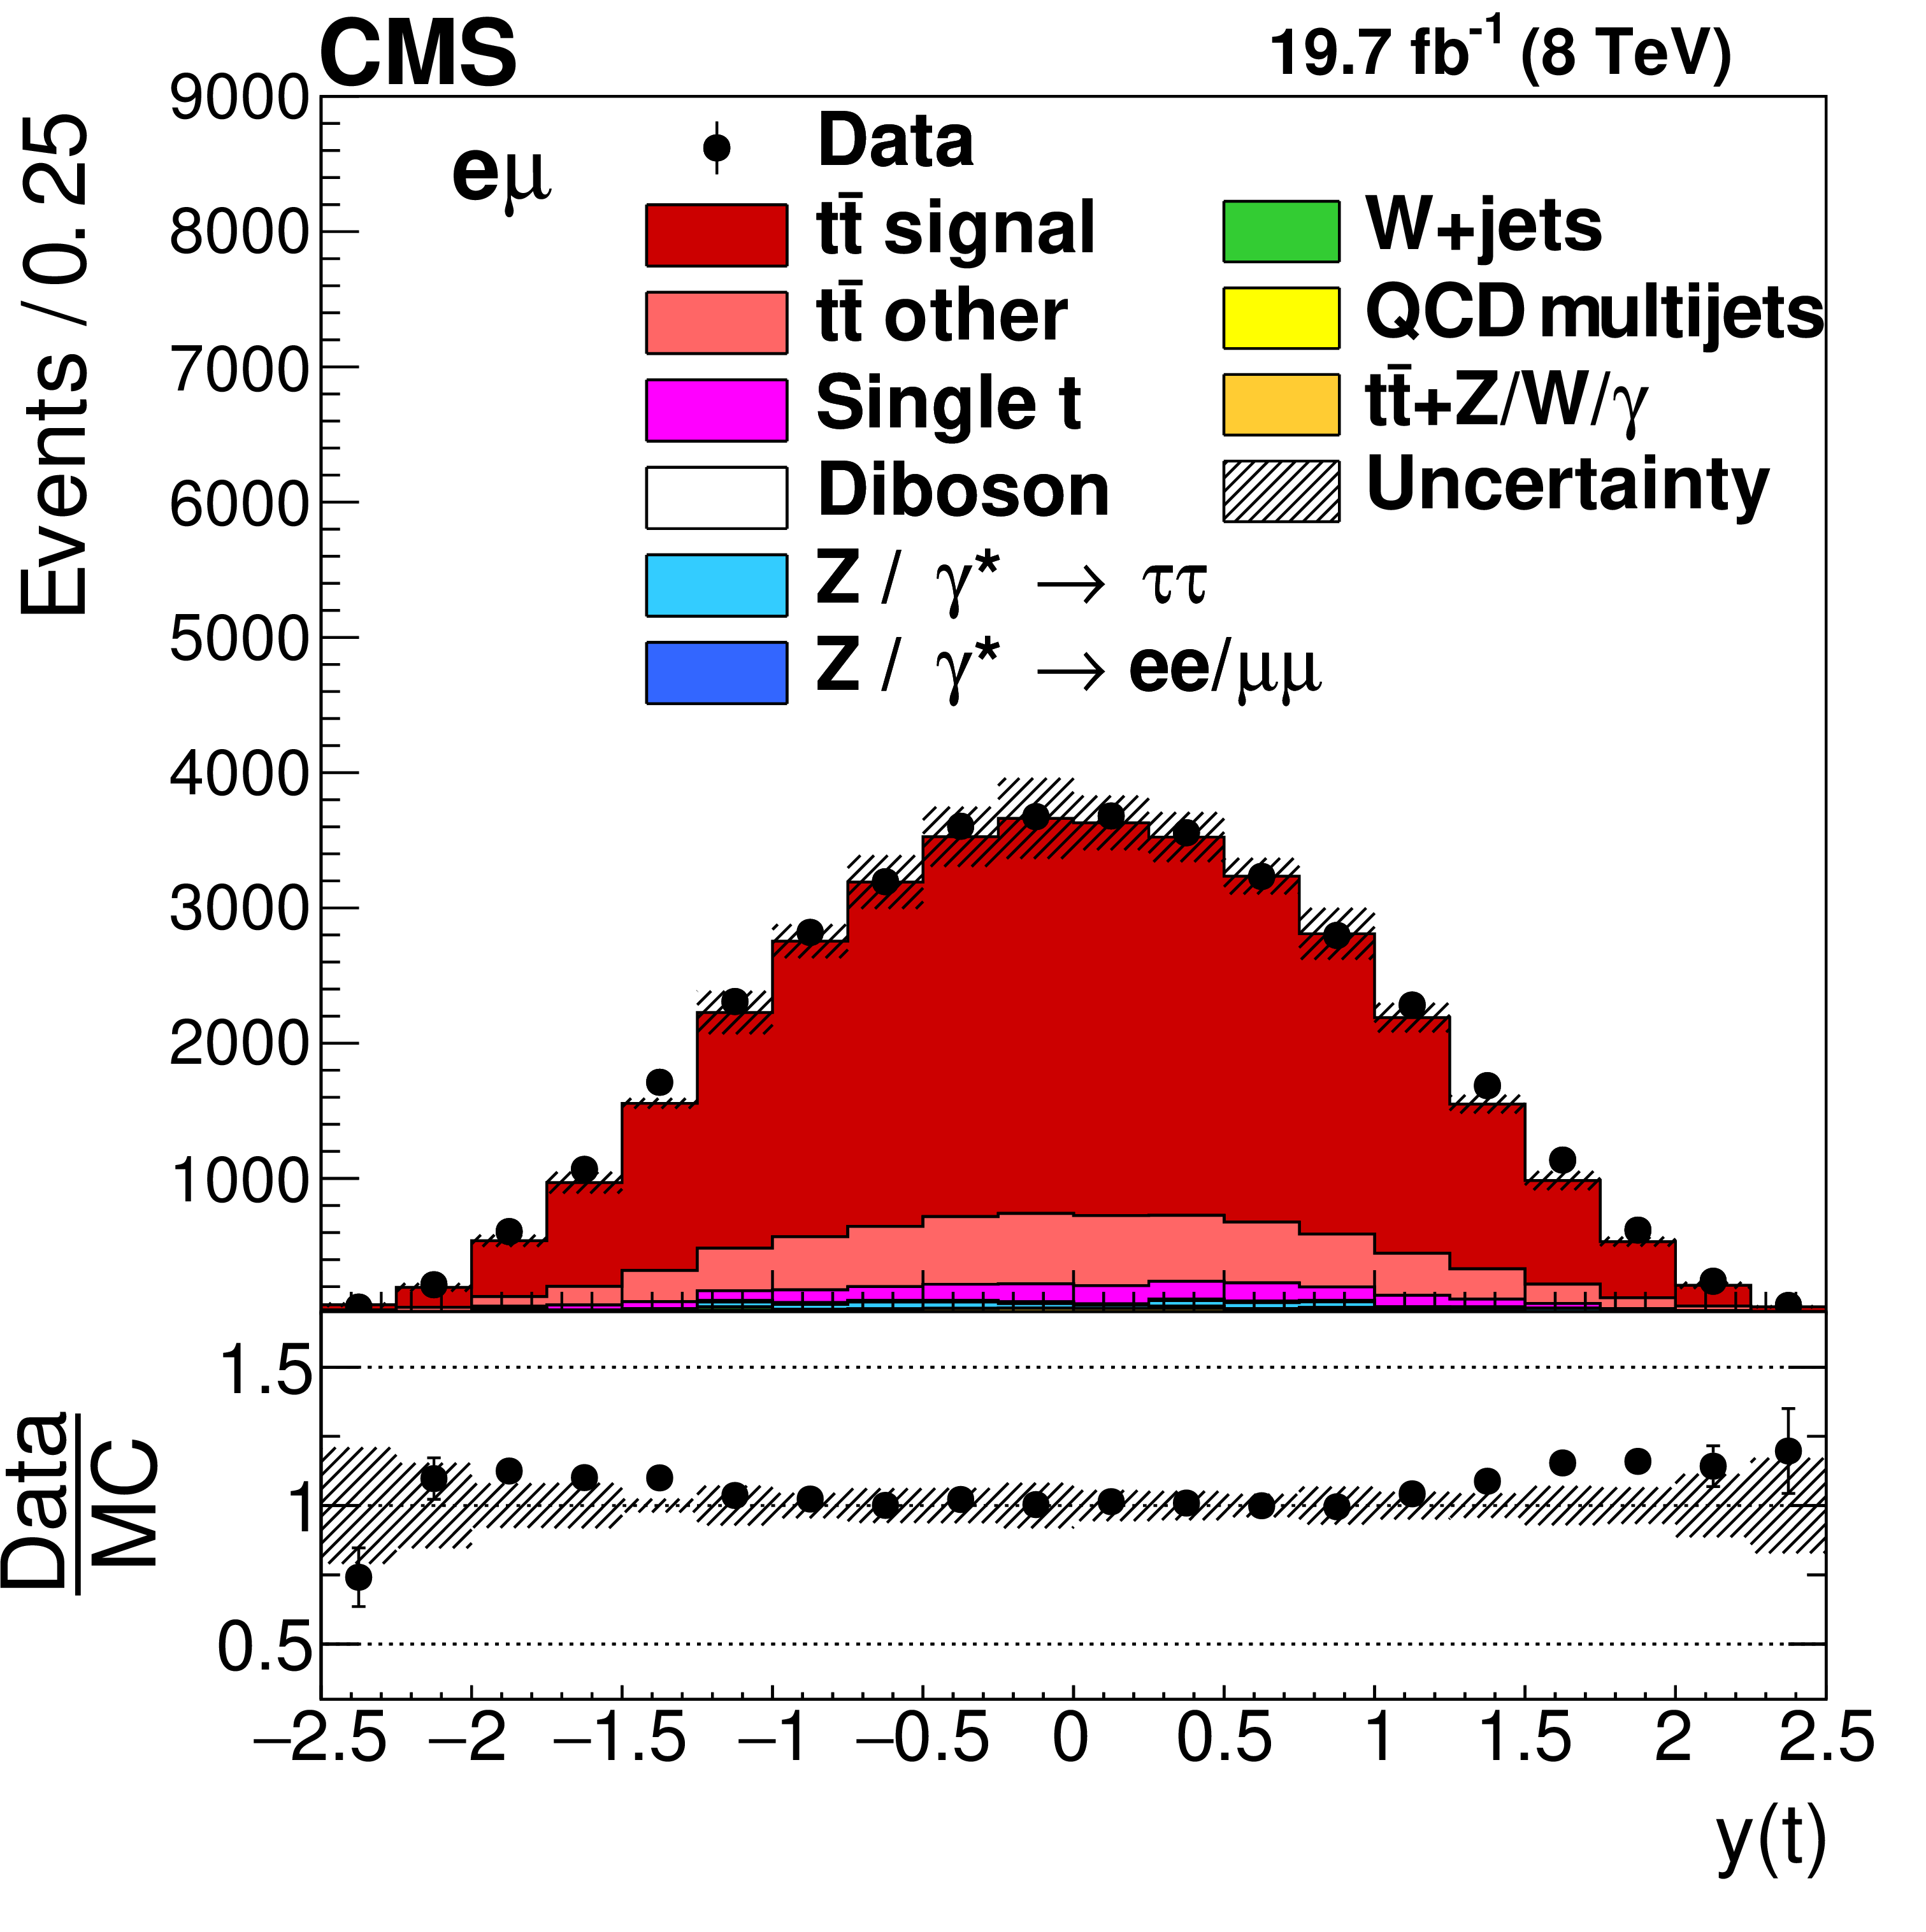
Figure 1-c:
Distributions of $ {p_{\mathrm {T}}} ({\mathrm{ t } {}\mathrm{ \bar{t} } } )$ in selected events after the kinematic reconstruction. The experimental data with the vertical bars corresponding to their statistical uncertainties are plotted together with distributions of simulated signal and different background processes. The hatched regions correspond to the shape uncertainties in the signal and backgrounds (cf. Section 7). The lower panel shows the ratio of the observed data event yields to those expected in the simulation. |
png pdf |
Figure 1-d:
Distributions of $y({\mathrm{ t } {}\mathrm{ \bar{t} } } )$ in selected events after the kinematic reconstruction. The experimental data with the vertical bars corresponding to their statistical uncertainties are plotted together with distributions of simulated signal and different background processes. The hatched regions correspond to the shape uncertainties in the signal and backgrounds (cf. Section 7). The lower panel shows the ratio of the observed data event yields to those expected in the simulation. |
png pdf |
Figure 1-e:
Distributions of ${M({\mathrm{ t } {}\mathrm{ \bar{t} } } )}$ in selected events after the kinematic reconstruction. The experimental data with the vertical bars corresponding to their statistical uncertainties are plotted together with distributions of simulated signal and different background processes. The hatched regions correspond to the shape uncertainties in the signal and backgrounds (cf. Section 7). The lower panel shows the ratio of the observed data event yields to those expected in the simulation. |
png pdf |
Figure 2:
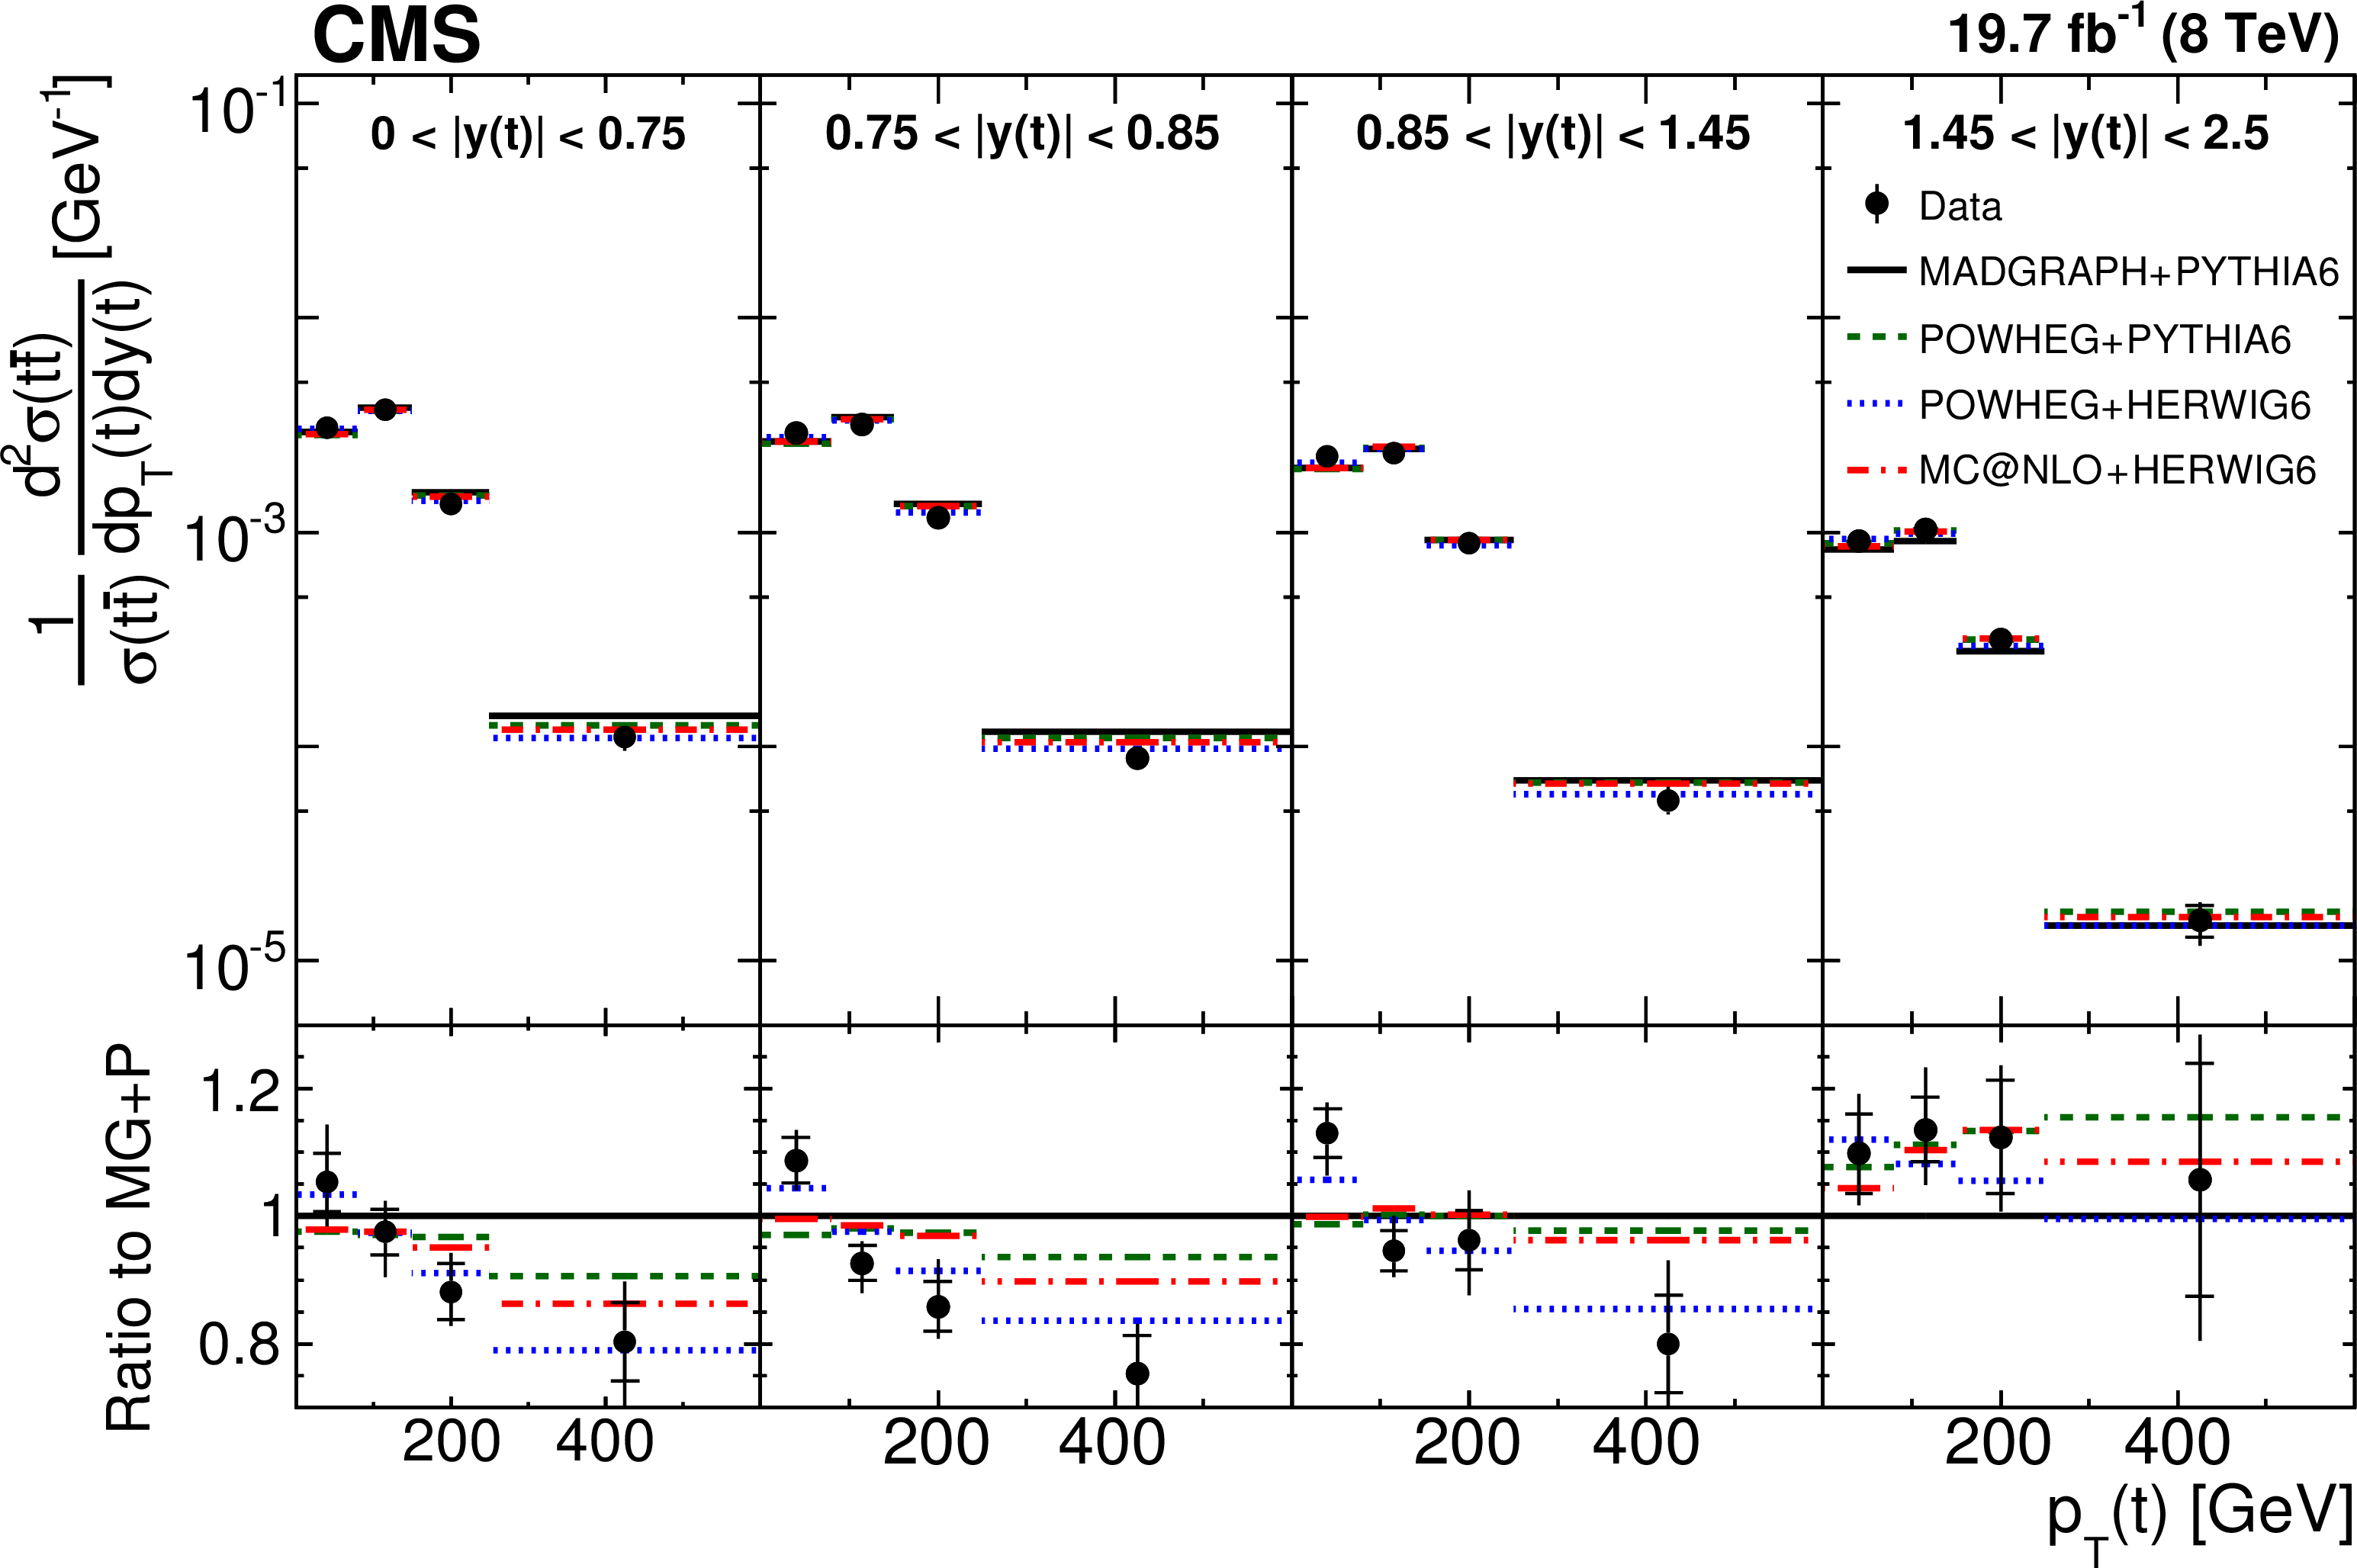
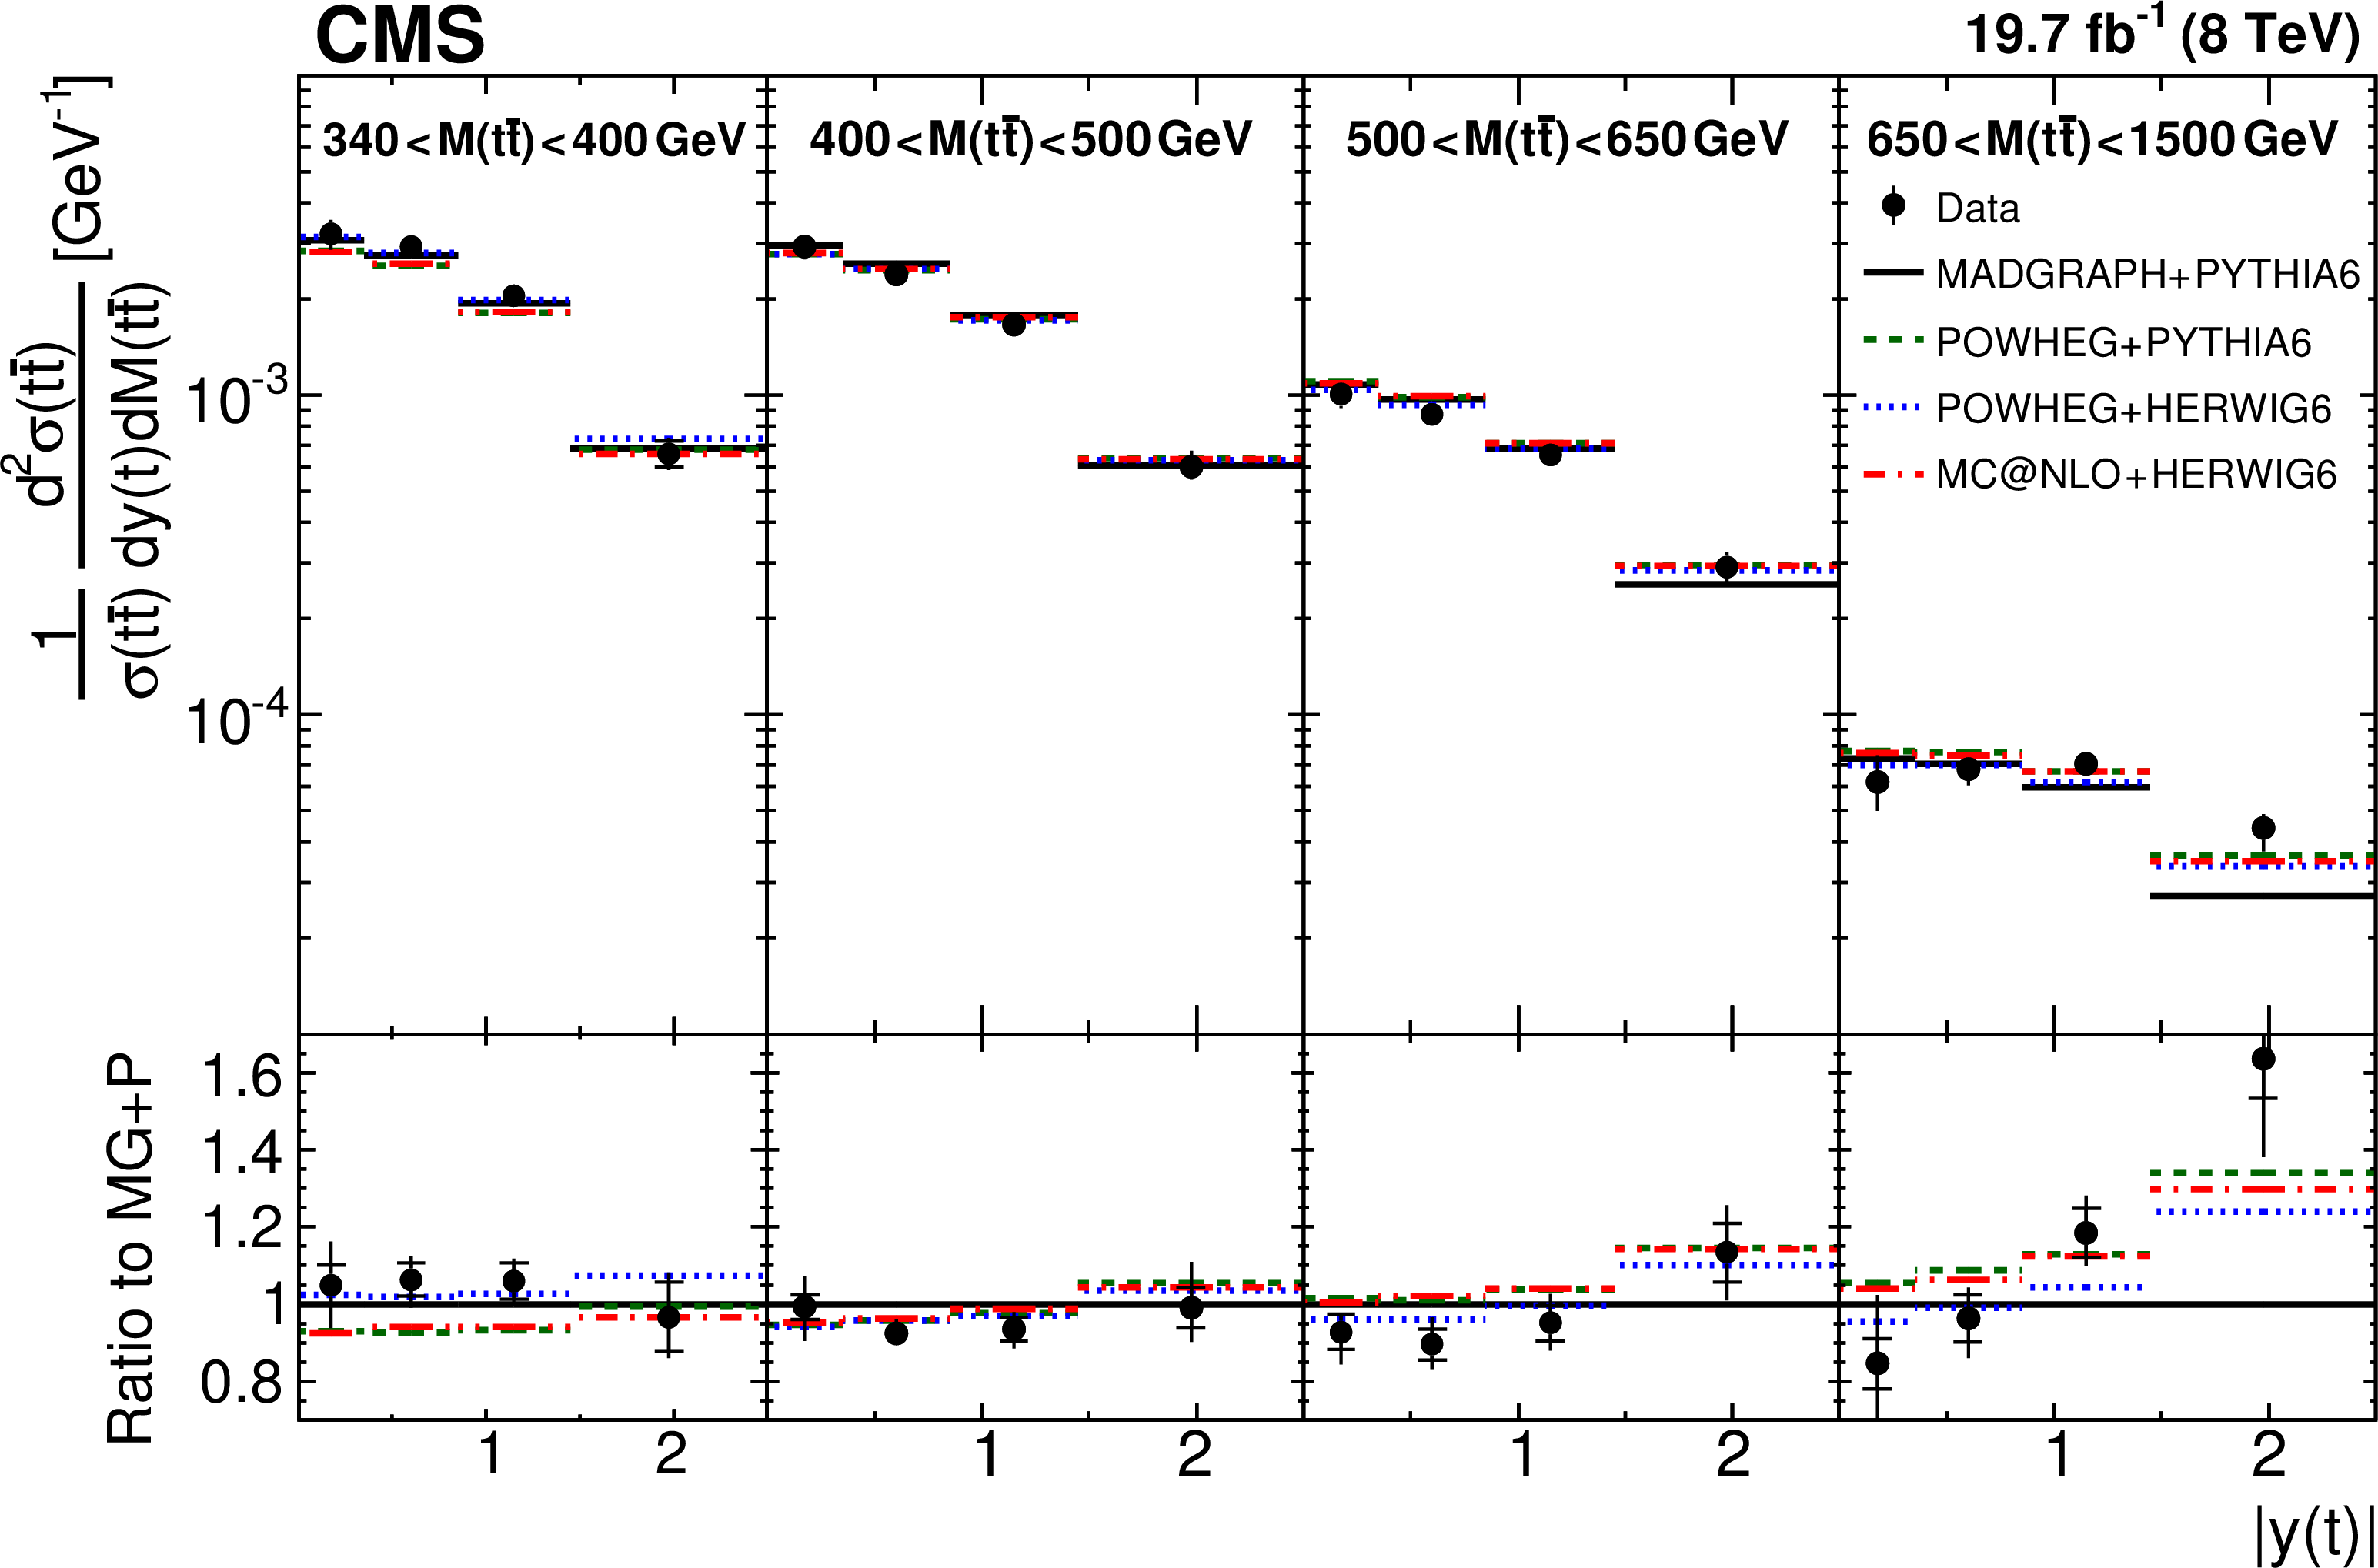
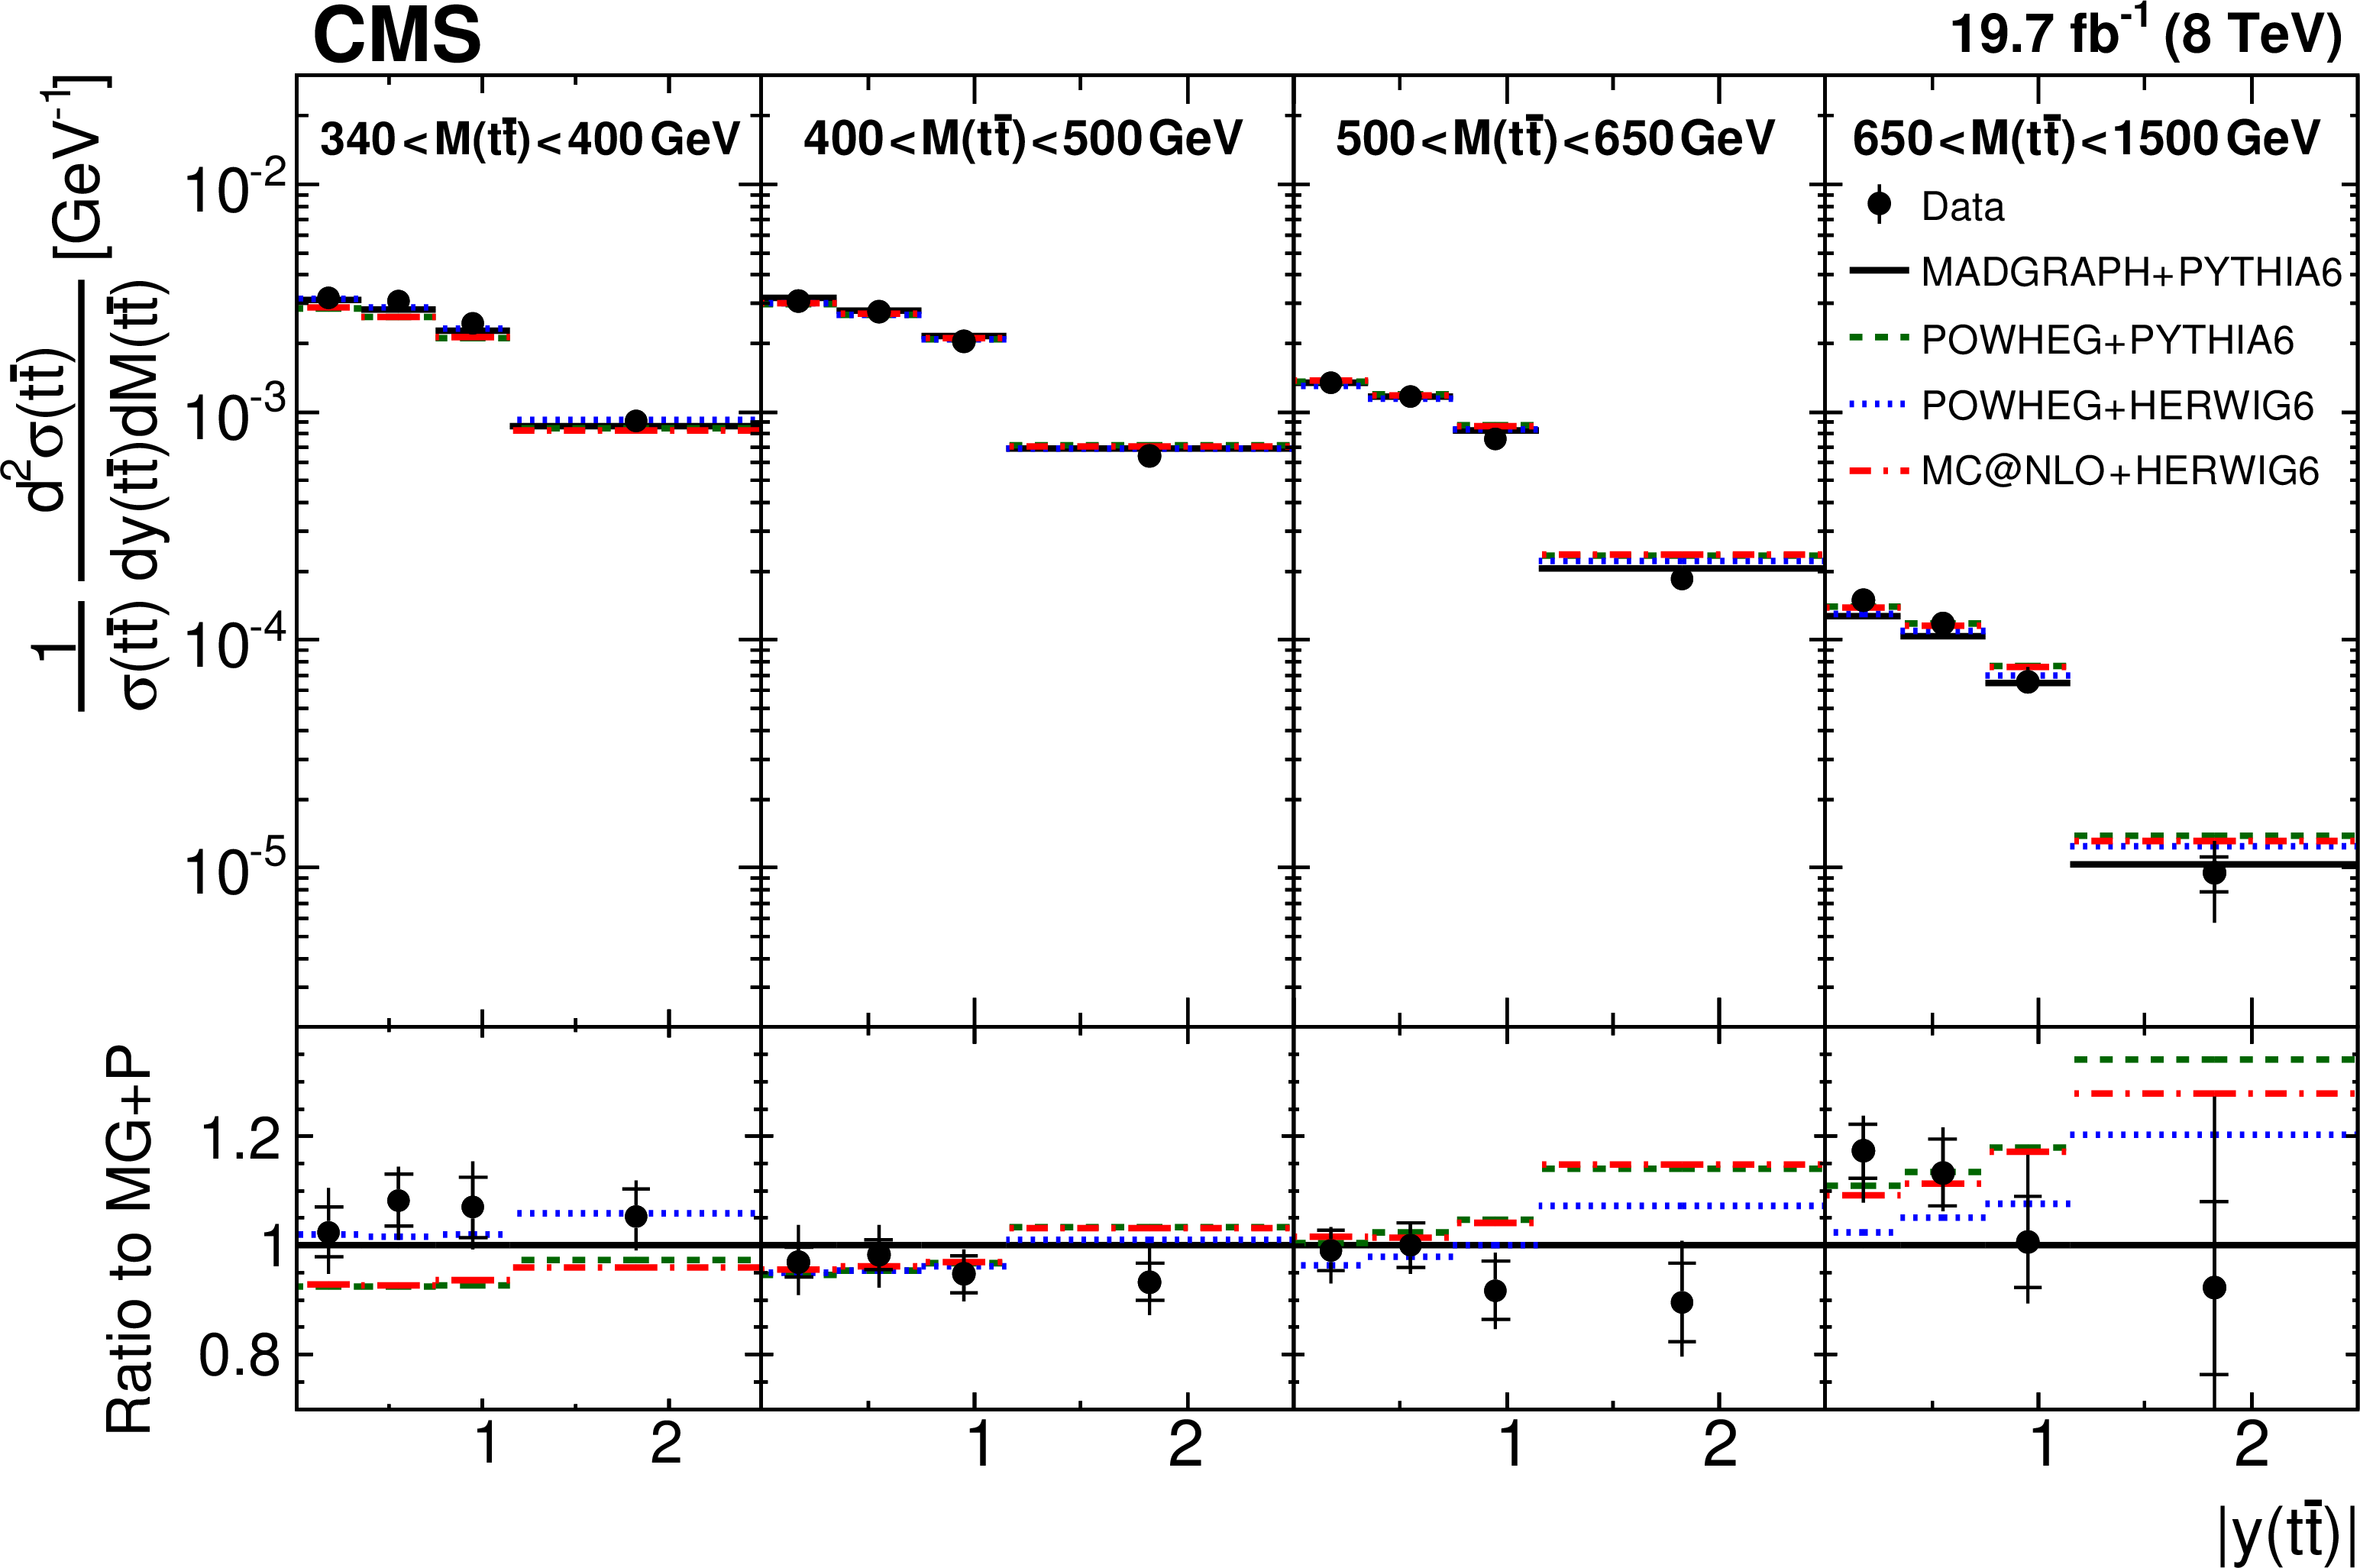
Comparison of the measured normalized $ {\mathrm{ t } {}\mathrm{ \bar{t} } } $ double-differential cross section as a function of $ { {p_{\mathrm {T}}} (\mathrm{ t } )} $ in different $ {| {y(\mathrm{ t } )} | }$ ranges to MC predictions calculated using MadGraph+PYTHIA6 , POWHEG+PYTHIA6 , POWHEG+HERWIG6 , and MC@NLO+HERWIG6 . The inner vertical bars on the data points represent the statistical uncertainties and the full bars include also the systematic uncertainties added in quadrature. In the bottom panel, the ratios of the data and other simulations to the MadGraph+PYTHIA6 (MG+P) predictions are shown. |
png pdf |
Figure 3:
Comparison of the measured normalized $ {\mathrm{ t } {}\mathrm{ \bar{t} } } $ double-differential cross section as a function of $ {| {y(\mathrm{ t } )} | }$ in different $ {M({\mathrm{ t } {}\mathrm{ \bar{t} } } )} $ ranges to MC predictions. Details can be found in the caption of Fig. 2. |
png pdf |
Figure 4:
Comparison of the measured normalized $ {\mathrm{ t } {}\mathrm{ \bar{t} } } $ double-differential cross section as a function of $ {| {y({\mathrm{ t } {}\mathrm{ \bar{t} } } )} | }$ in different of $ {M({\mathrm{ t } {}\mathrm{ \bar{t} } } )} $ ranges to MC predictions. Details can be found in the caption of Fig. 2. |
png pdf |
Figure 5:
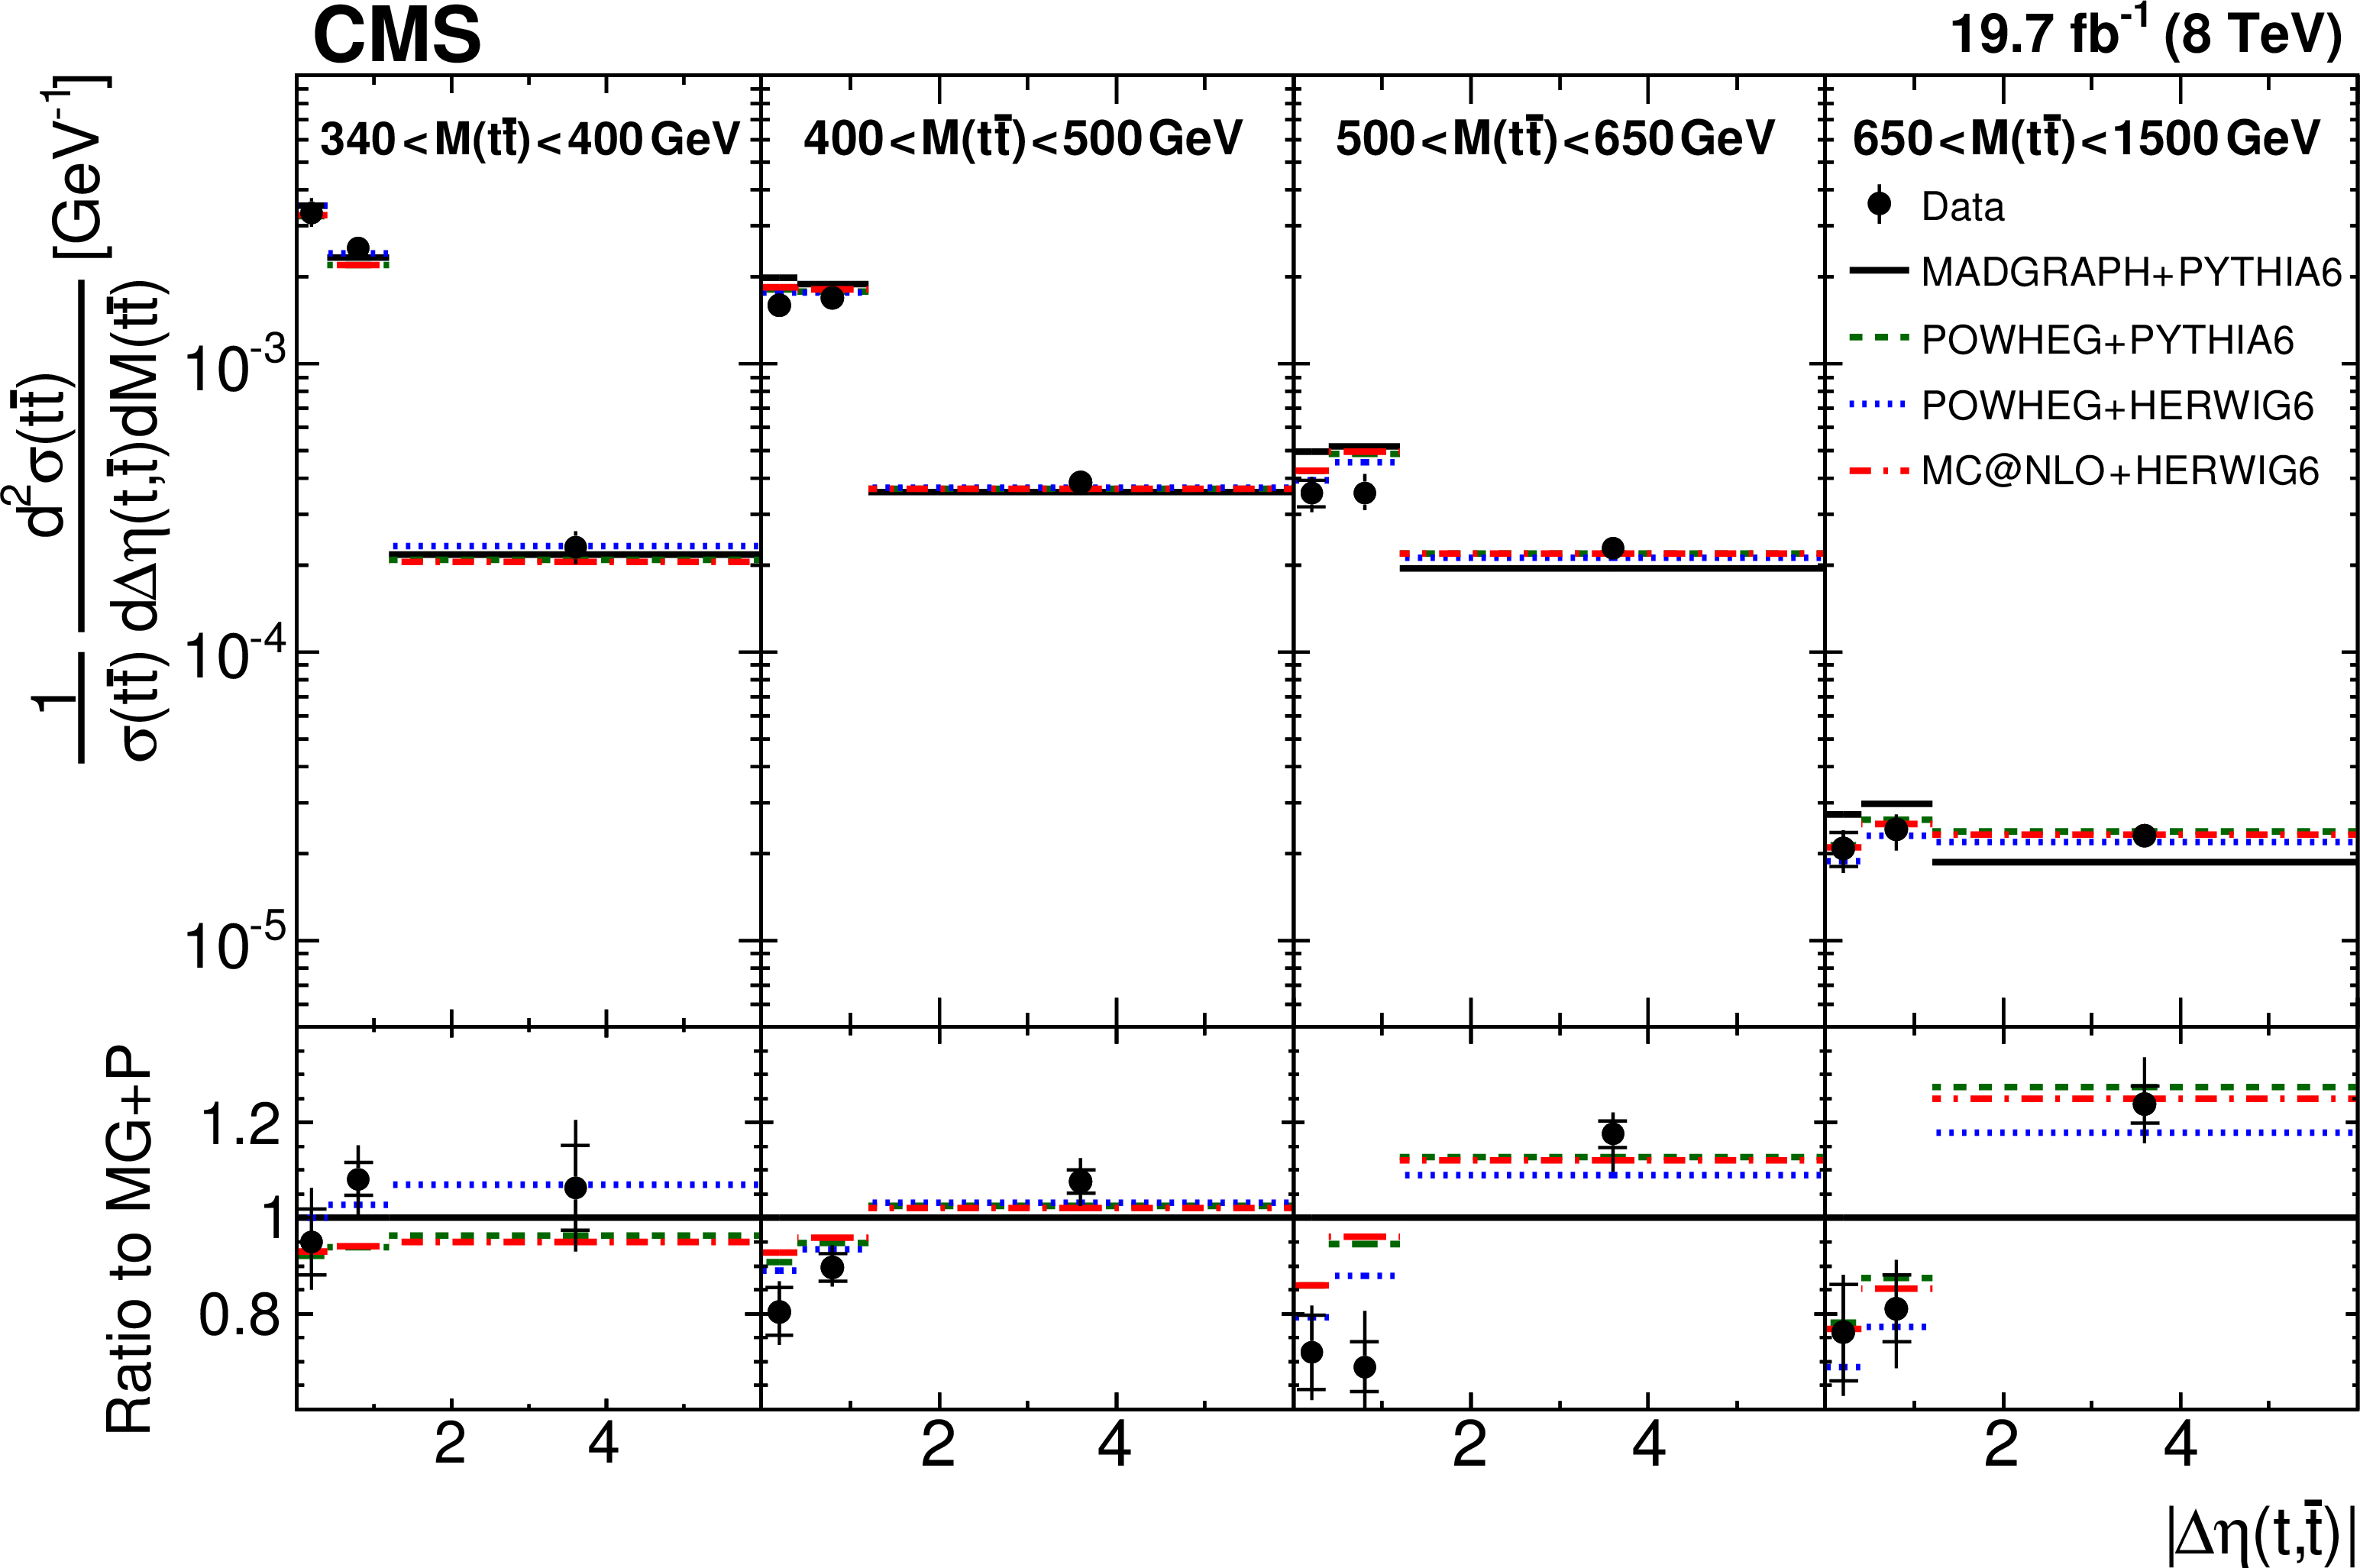
Comparison of the measured normalized $ {\mathrm{ t } {}\mathrm{ \bar{t} } } $ double-differential cross section as a function of $ {\Delta \eta (\mathrm{ t } ,\mathrm{ \bar{t} } )} $ in different $ {M({\mathrm{ t } {}\mathrm{ \bar{t} } } )} $ ranges to MC predictions. Details can be found in the caption of Fig. 2. |

png pdf |
Figure 6:
Comparison of the measured normalized $ {\mathrm{ t } {}\mathrm{ \bar{t} } } $ double-differential cross section as a function of $ { {p_{\mathrm {T}}} ({\mathrm{ t } {}\mathrm{ \bar{t} } } )} $ in different $ {M({\mathrm{ t } {}\mathrm{ \bar{t} } } )} $ ranges to MC predictions. Details can be found in the caption of Fig. 2. |
png pdf |
Figure 7:
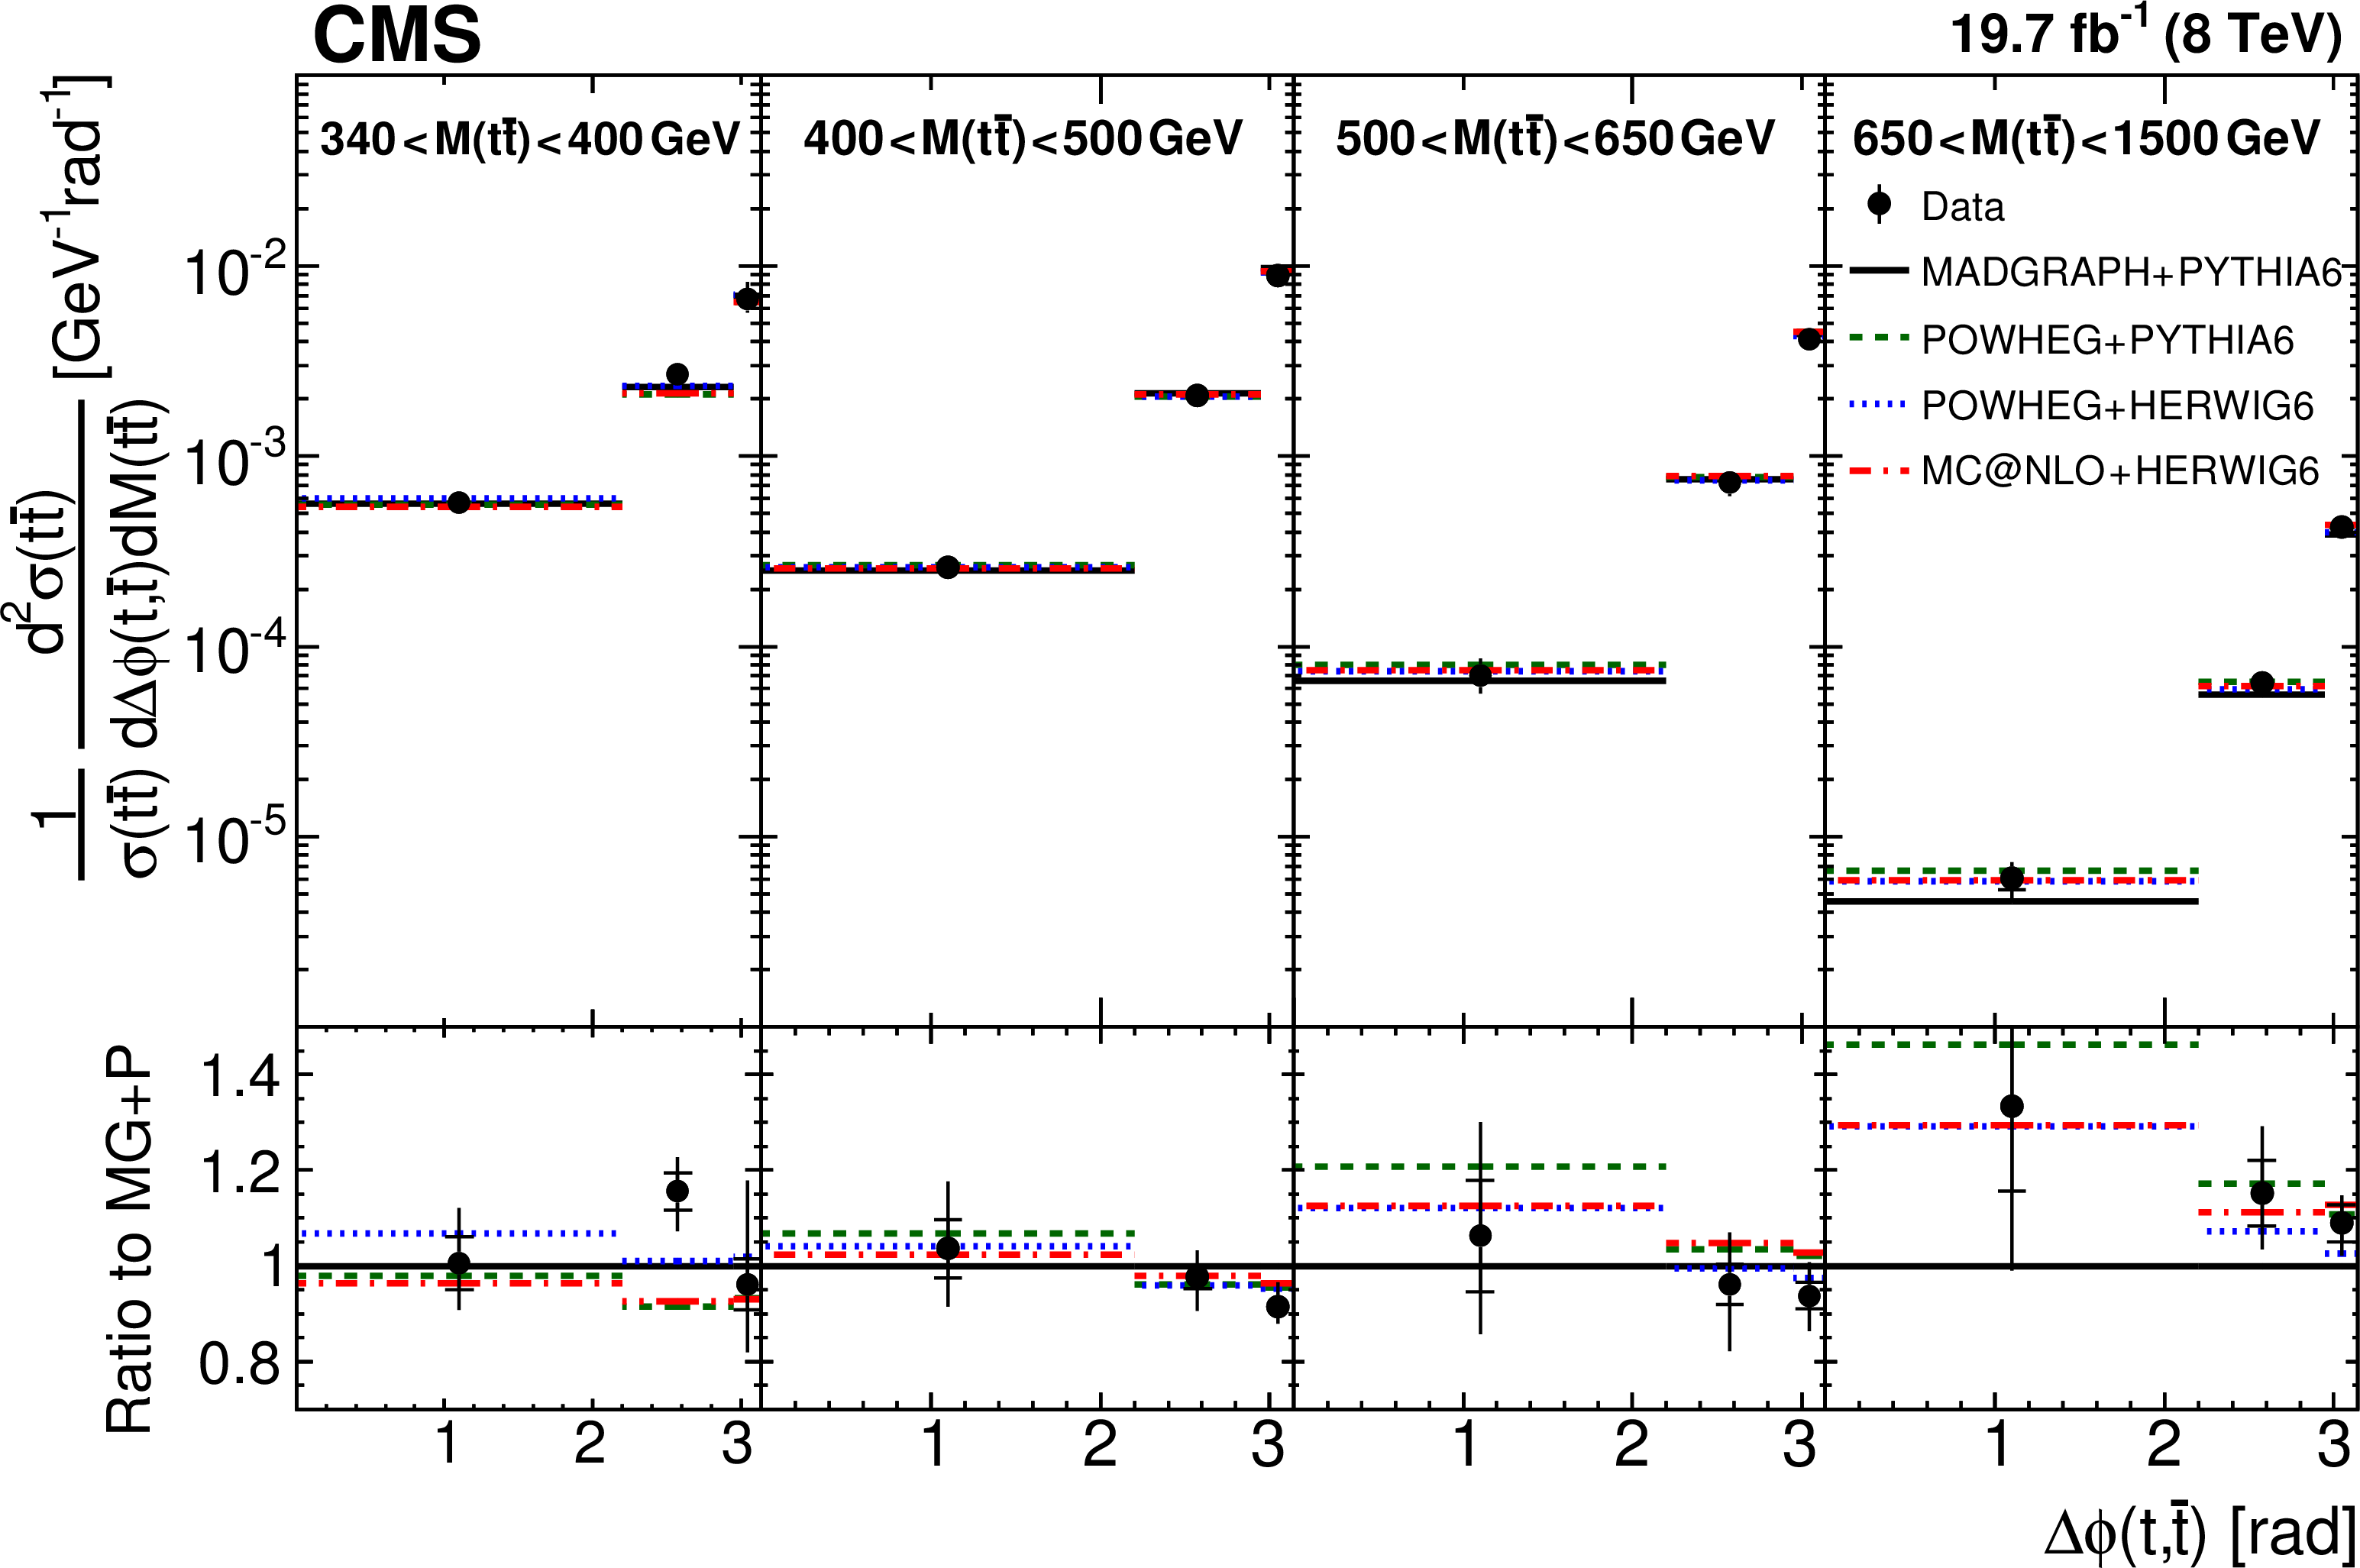
Comparison of the measured normalized $ {\mathrm{ t } {}\mathrm{ \bar{t} } } $ double-differential cross section as a function of $ {\Delta \phi (\mathrm{ t } ,\mathrm{ \bar{t} } )} $ in different $ {M({\mathrm{ t } {}\mathrm{ \bar{t} } } )} $ ranges to MC predictions. Details can be found in the caption of Fig. 2. |
png pdf |
Figure 8:
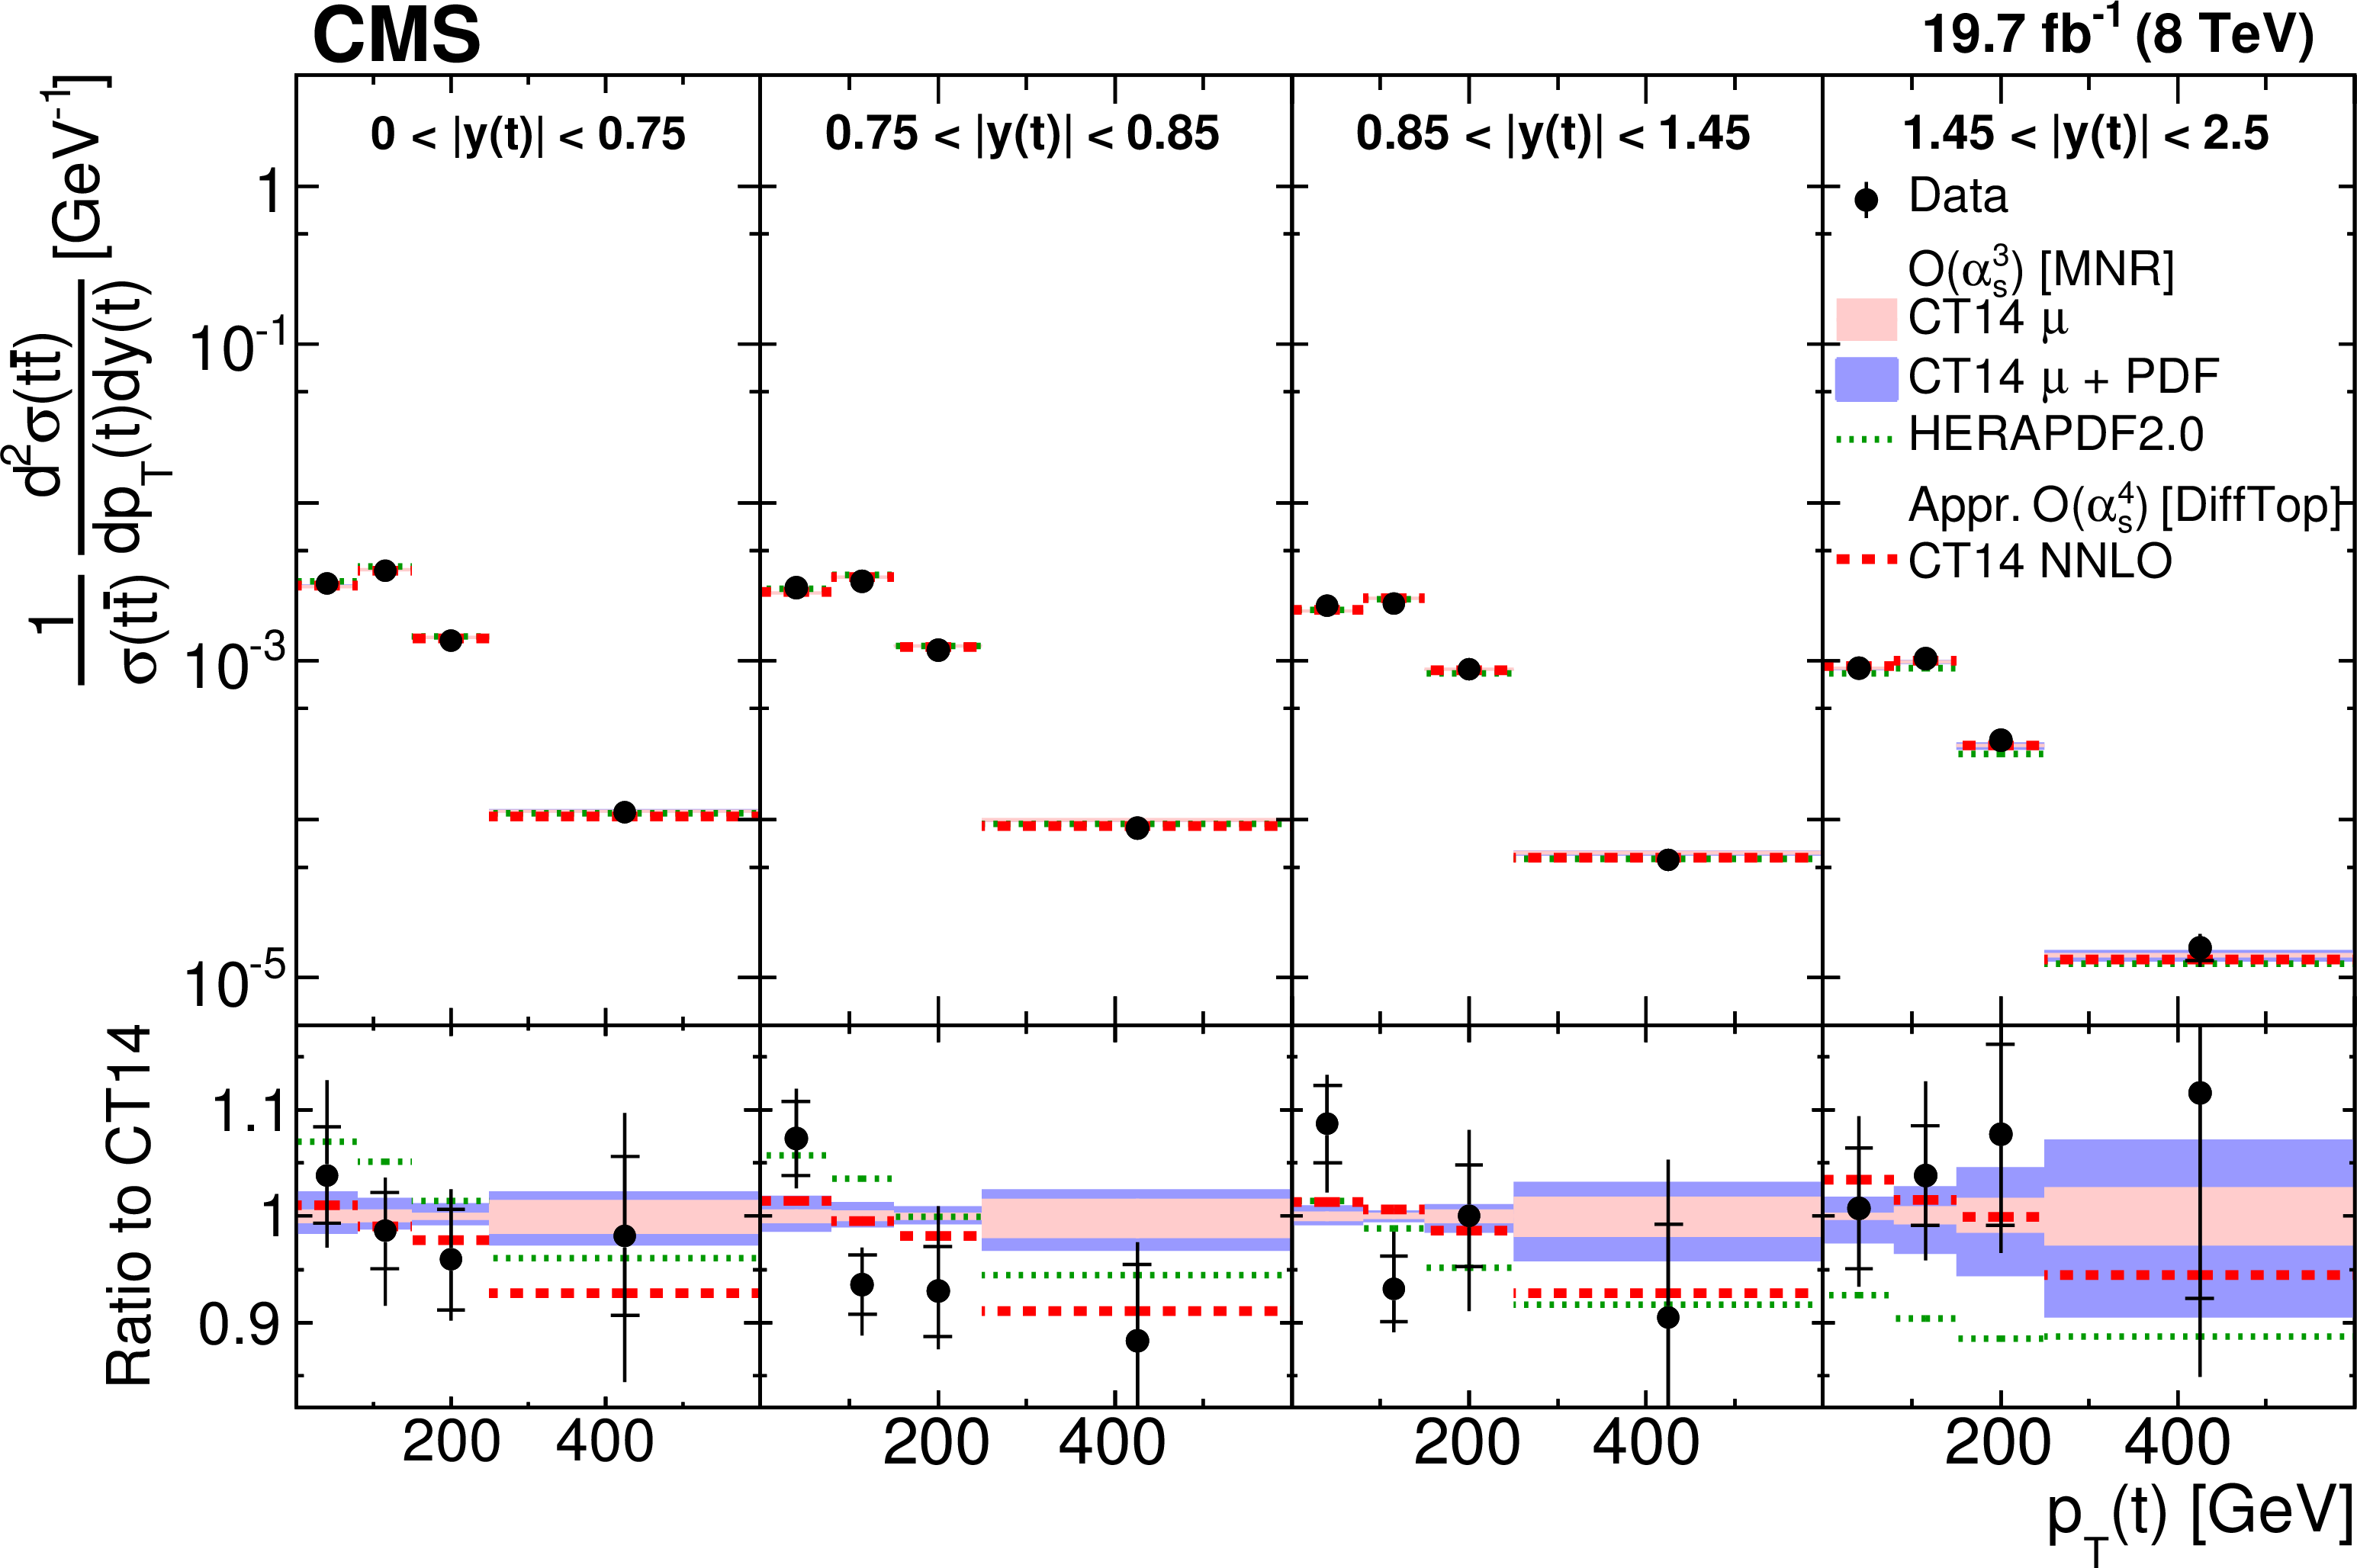
Comparison of the measured normalized $ {\mathrm{ t } {}\mathrm{ \bar{t} } } $ double-differential cross section as a function of $ { {p_{\mathrm {T}}} (\mathrm{ t } )} $ in different $ {| {y(\mathrm{ t } )} | }$ ranges to NLO $\mathcal{O}(\alpha _s^3)$ (MNR) predictions calculated with CT14 and HERAPDF2.0 , and approximate NNLO $\mathcal{O}(\alpha _s^4)$ (DiffTop) prediction calculated with CT14 . The inner vertical bars on the data points represent the statistical uncertainties and the full bars include also the systematic uncertainties added in quadrature. The light band shows the scale uncertainties ($\mu $) for the NLO predictions using CT14 , while the dark band includes also the PDF uncertainties added in quadrature ($\mu + \mathrm {PDF}$). The dotted line shows the NLO predictions calculated with HERAPDF2.0 . The dashed line shows the approximate NNLO predictions calculated with CT14 . In the bottom panel, the ratios of the data and other calculations to the NLO prediction using CT14 are shown. |
png pdf |
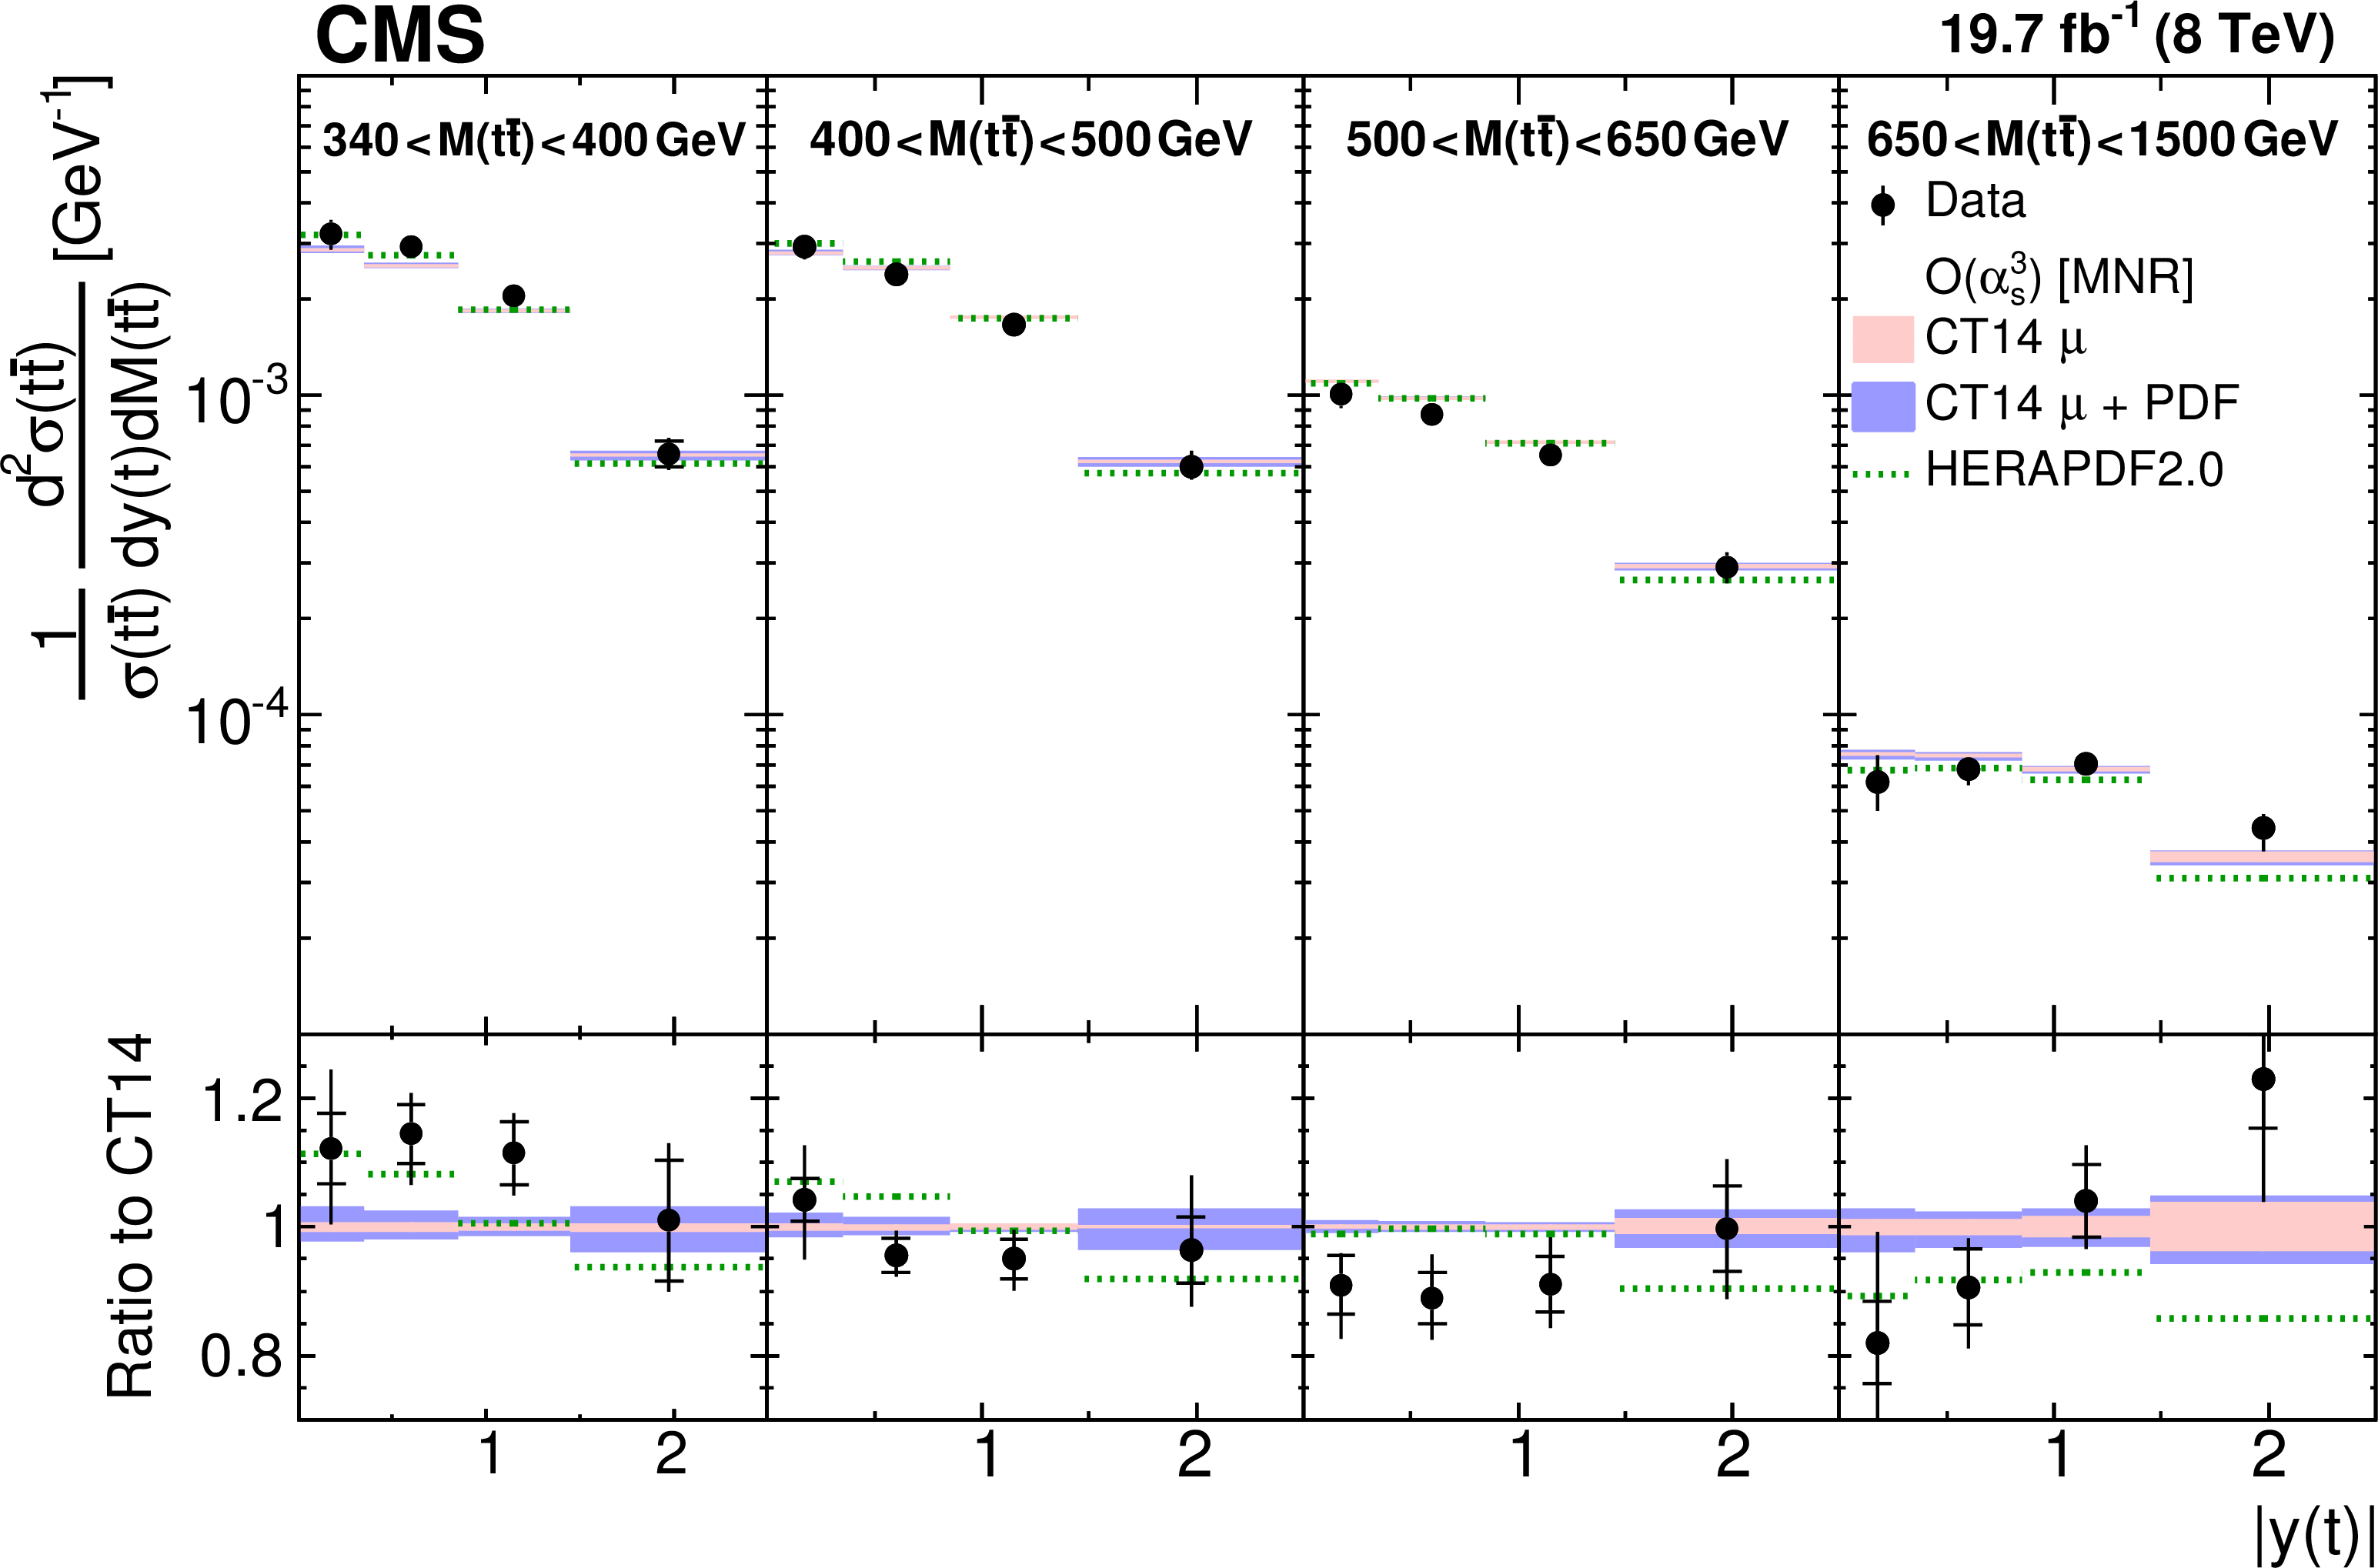
Figure 9:
Comparison of the measured normalized $ {\mathrm{ t } {}\mathrm{ \bar{t} } } $ double-differential cross section as a function of $ {| {y(\mathrm{ t } )} | }$ in different $ {M({\mathrm{ t } {}\mathrm{ \bar{t} } } )} $ ranges to NLO $\mathcal{O}(\alpha _s^3)$ predictions. Details can be found in the caption of Fig. 8. Approximate NNLO $\mathcal{O}(\alpha _s^4)$ predictions are not available for this cross section. |
png pdf |
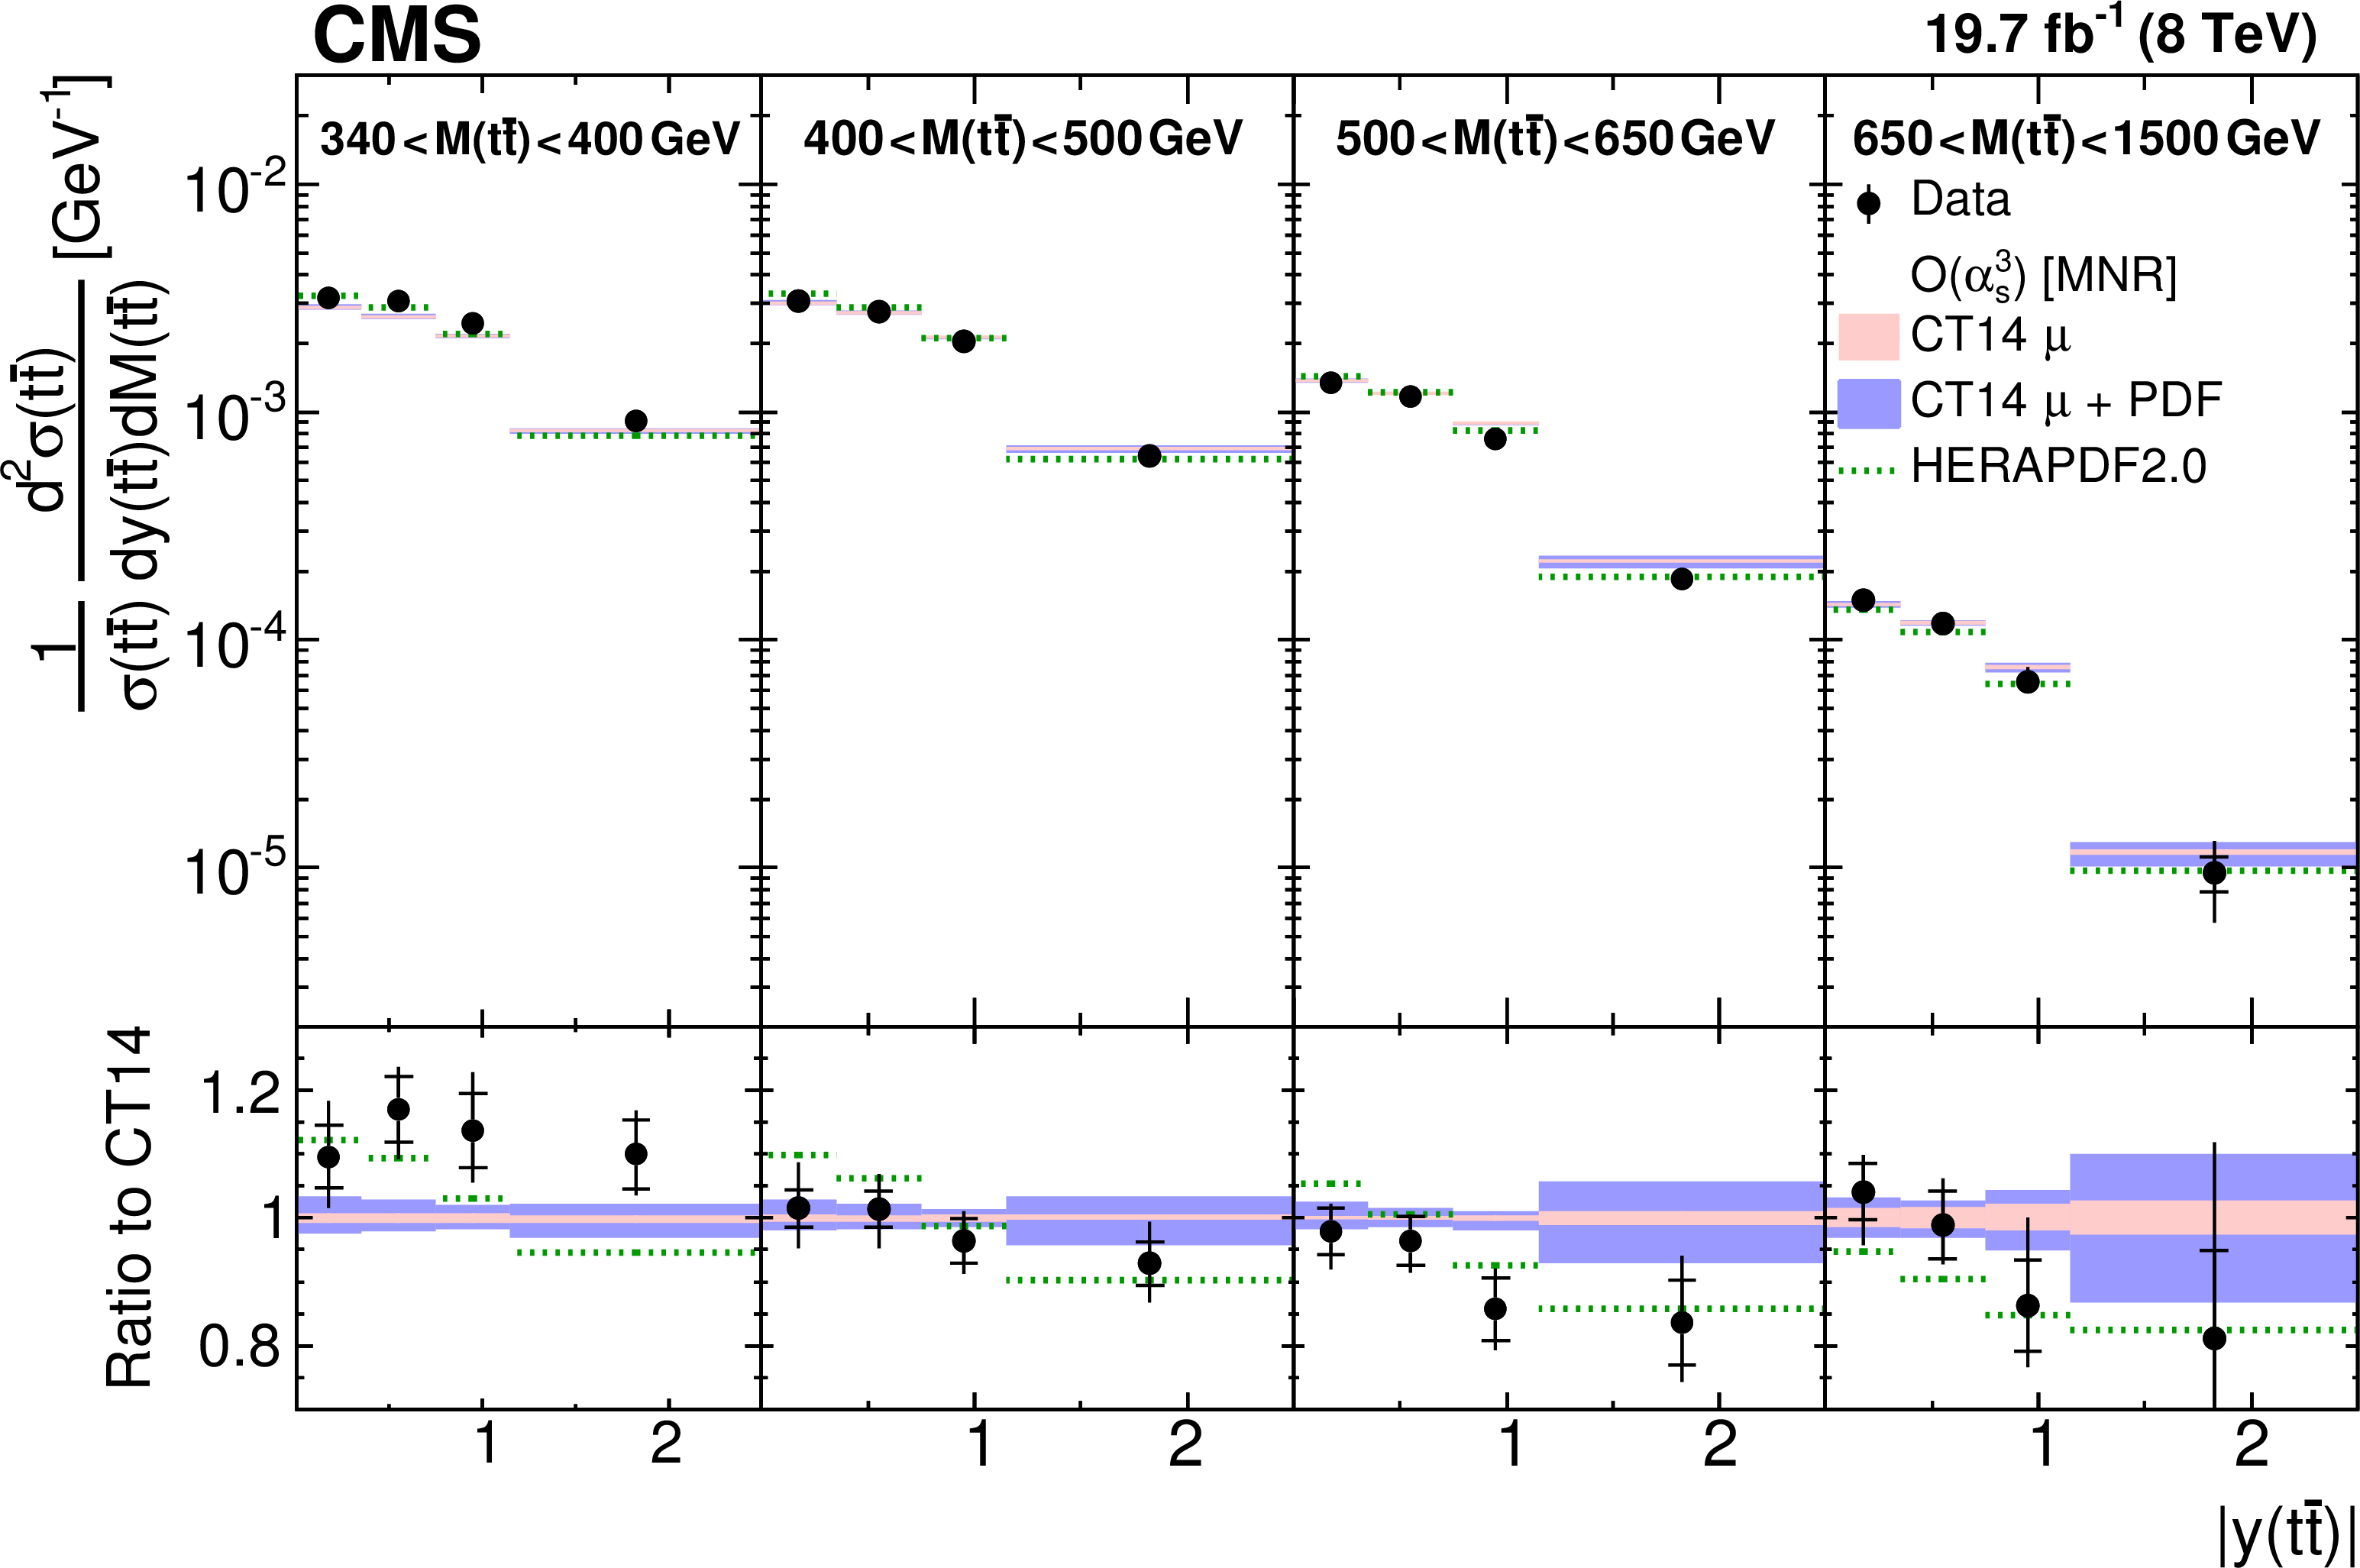
Figure 10:
Comparison of the measured normalized $ {\mathrm{ t } {}\mathrm{ \bar{t} } } $ double-differential cross section as a function of $ {| {y({\mathrm{ t } {}\mathrm{ \bar{t} } } )} | }$ in different $ {M({\mathrm{ t } {}\mathrm{ \bar{t} } } )} $ ranges to NLO $\mathcal{O}(\alpha _s^3)$ predictions. Details can be found in the caption of Fig. 8. Approximate NNLO $\mathcal{O}(\alpha _s^4)$ predictions are not available for this cross section. |
png pdf |
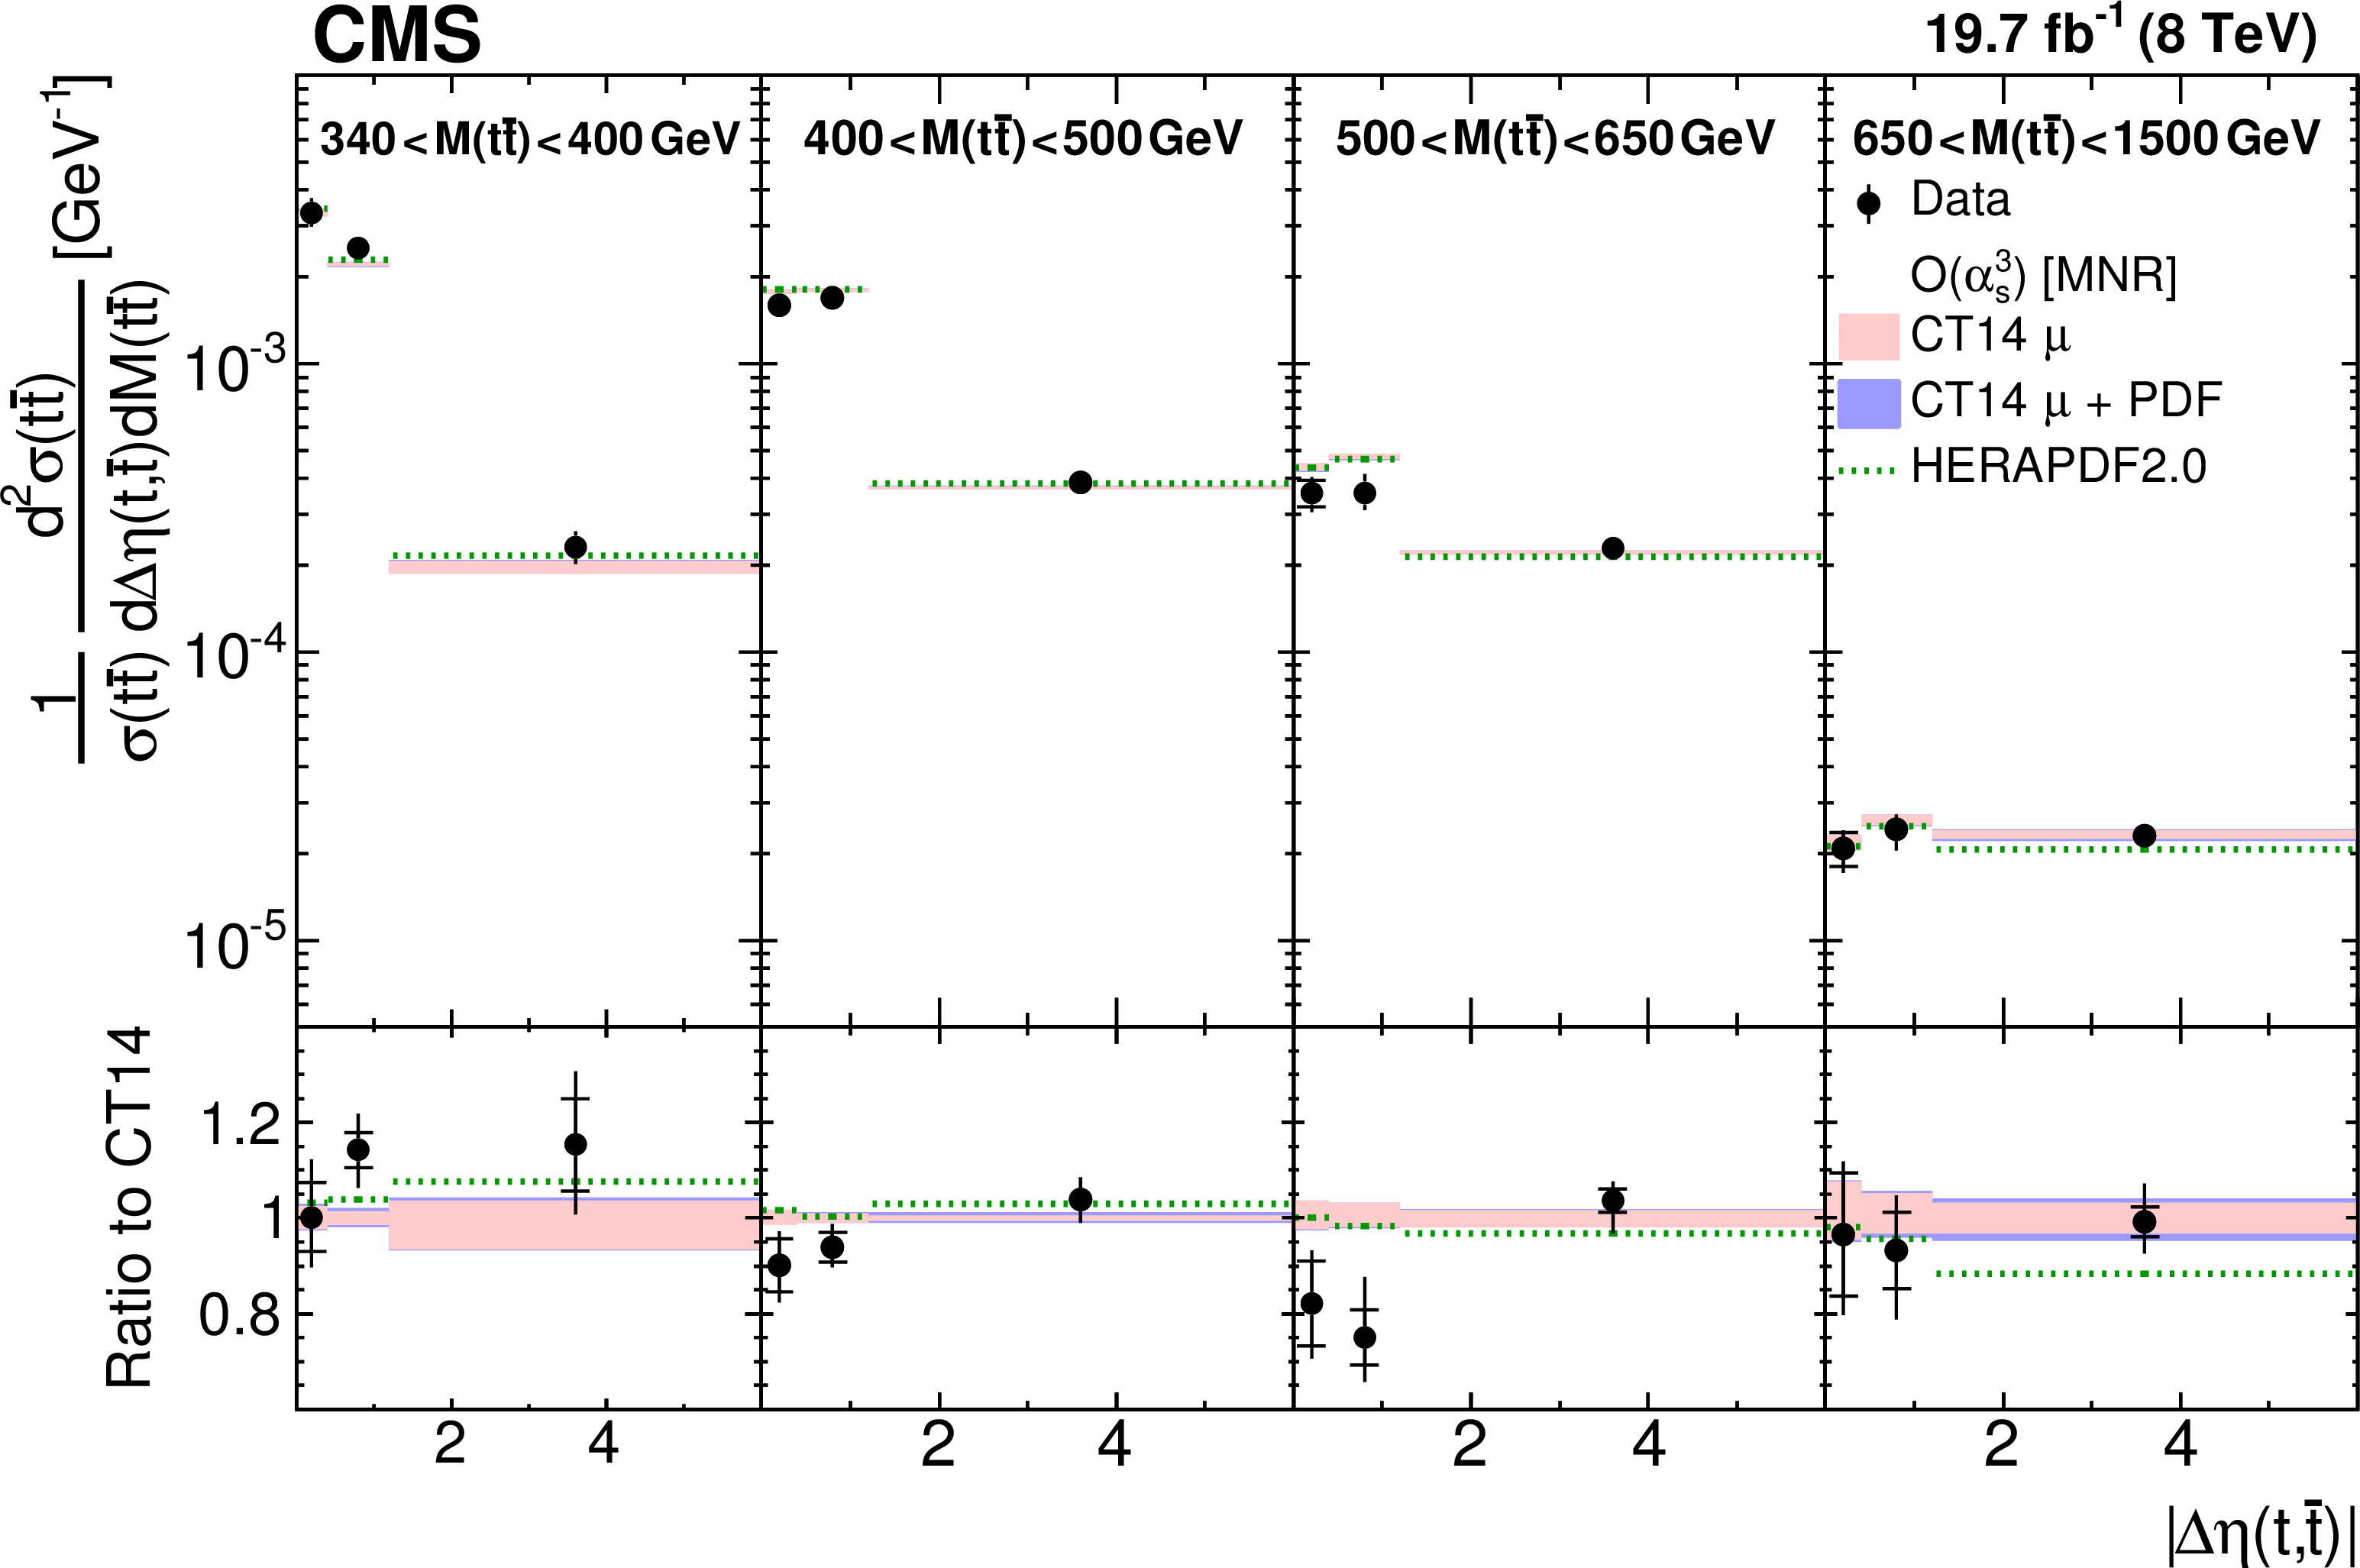
Figure 11:
Comparison of the measured normalized $ {\mathrm{ t } {}\mathrm{ \bar{t} } } $ double-differential cross section as a function of $ {\Delta \eta (\mathrm{ t } ,\mathrm{ \bar{t} } )} $ in different $ {M({\mathrm{ t } {}\mathrm{ \bar{t} } } )} $ ranges to NLO $\mathcal{O}(\alpha _s^3)$ predictions. Details can be found in the caption of Fig. 8. Approximate NNLO $\mathcal{O}(\alpha _s^4)$ predictions are not available for this cross section. |
png pdf |
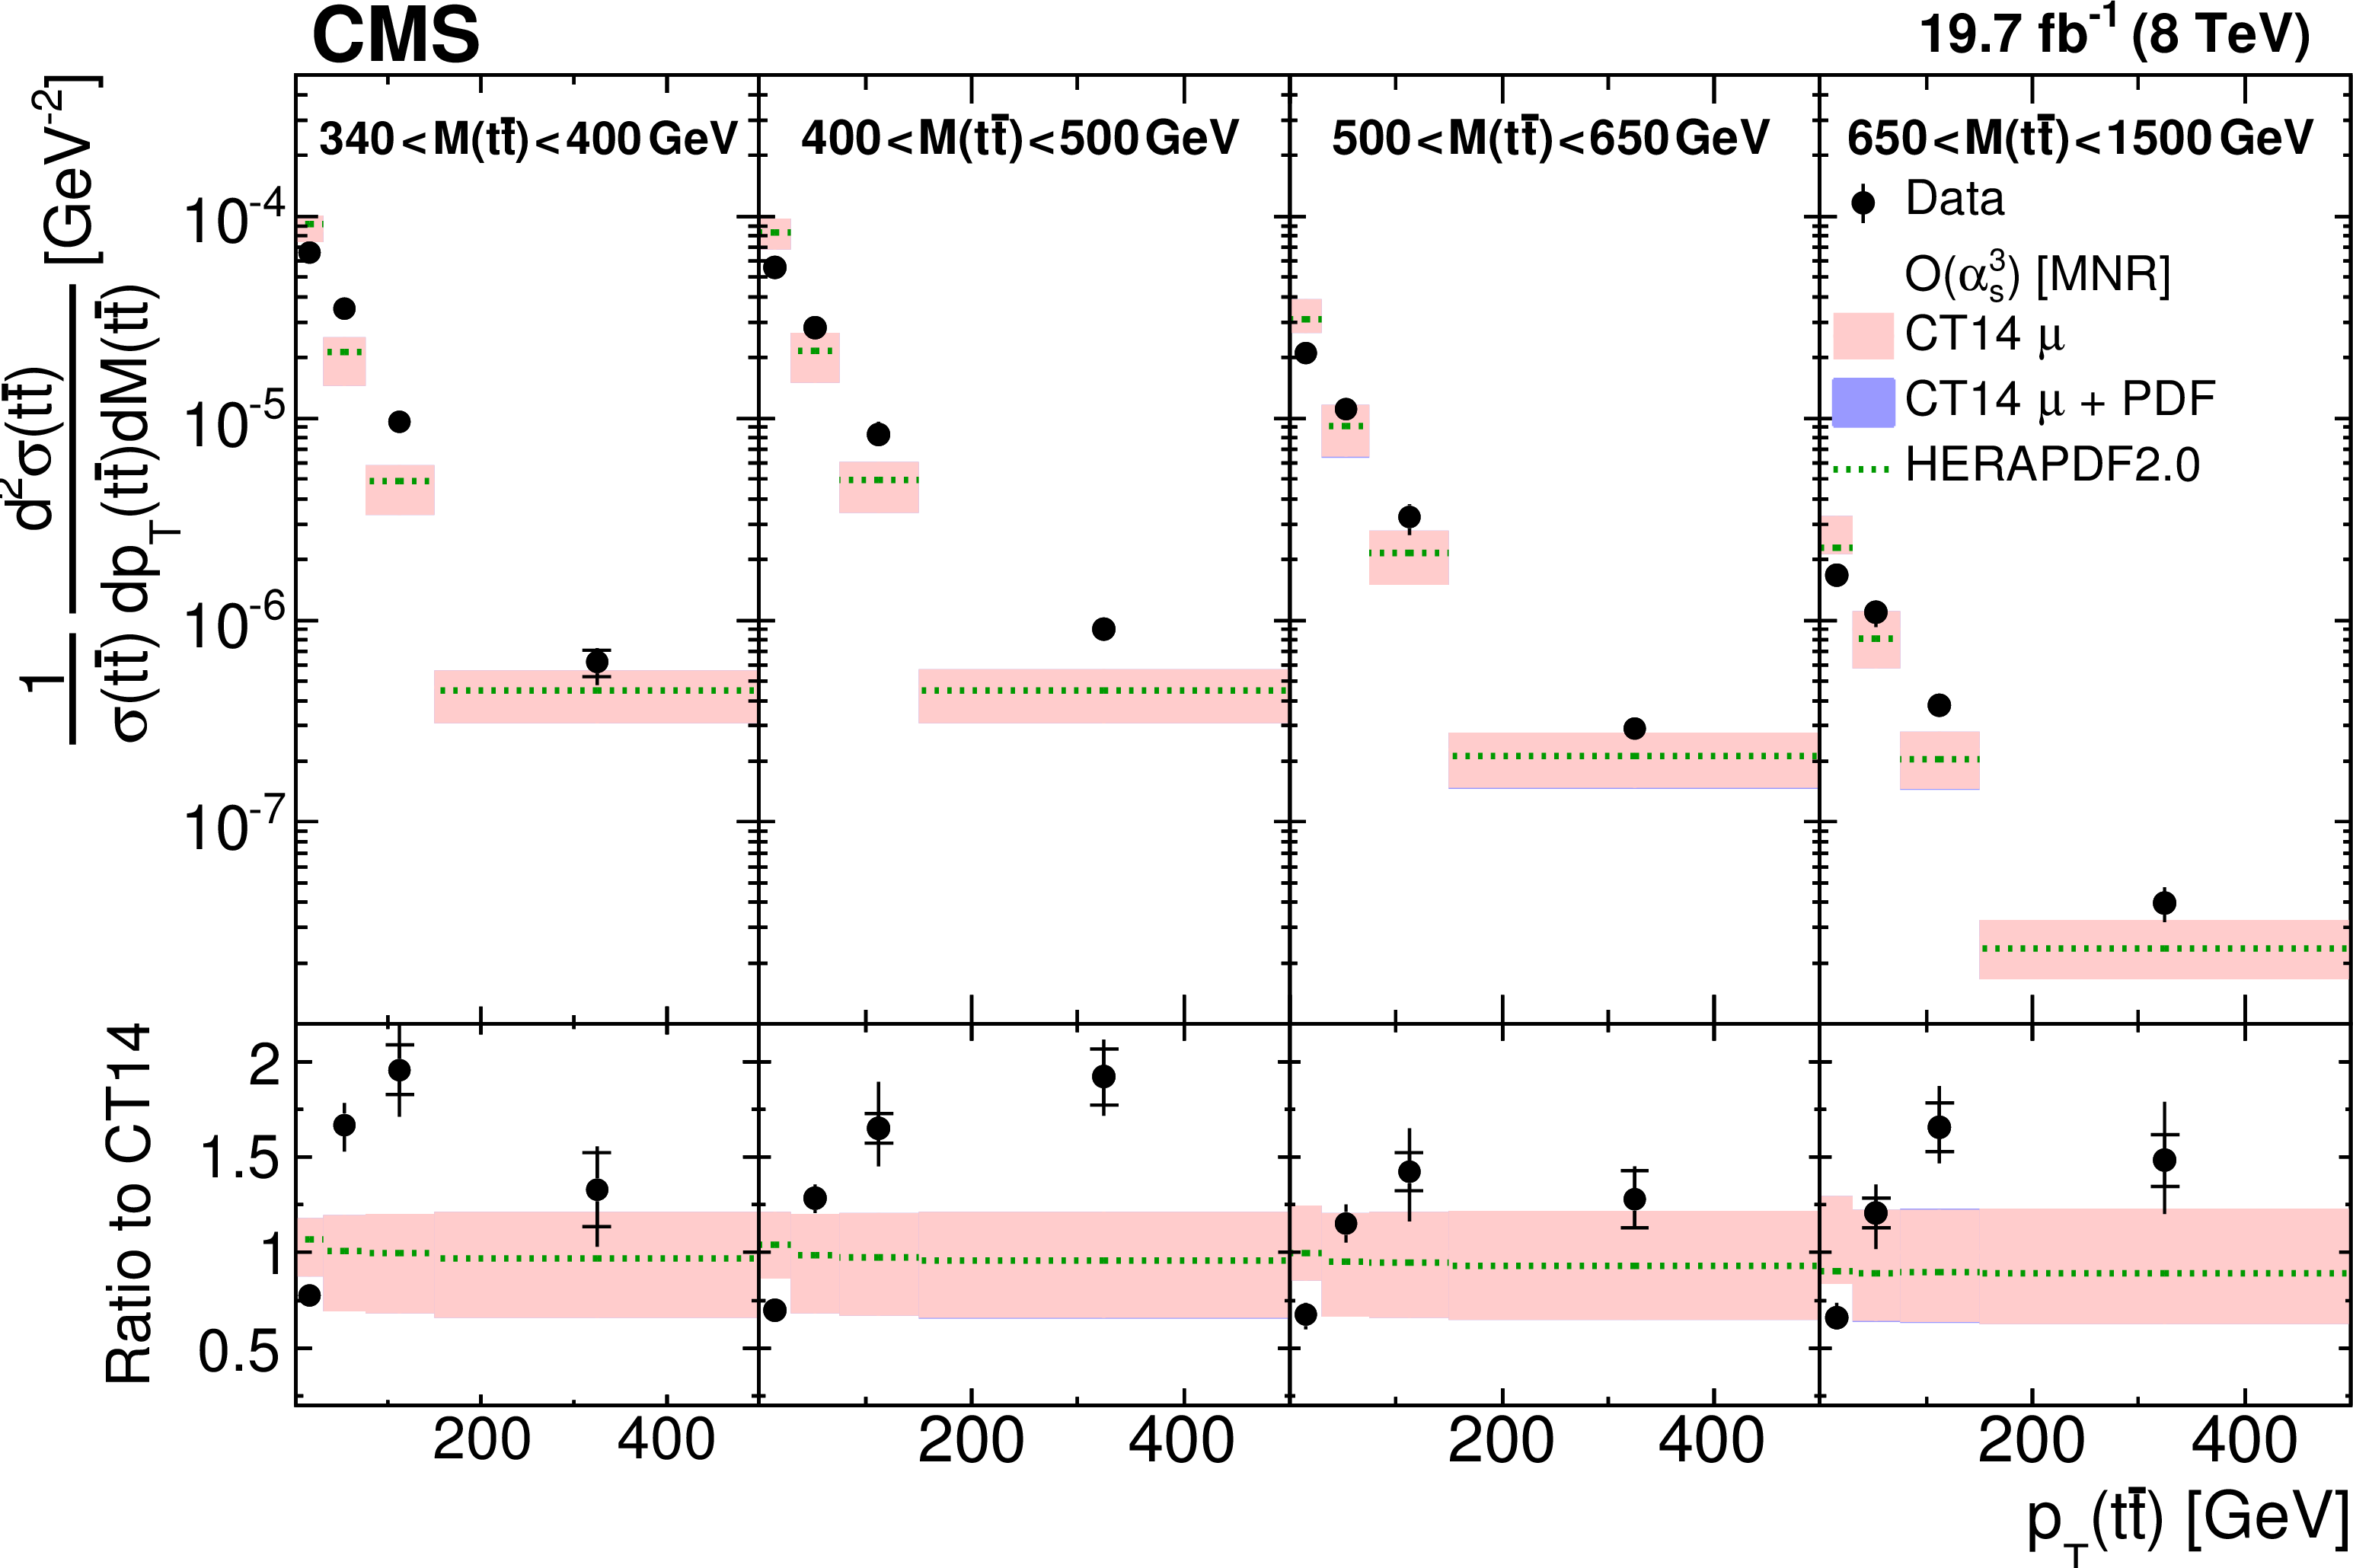
Figure 12:
Comparison of the measured normalized $ {\mathrm{ t } {}\mathrm{ \bar{t} } } $ double-differential cross section as a function of $ { {p_{\mathrm {T}}} ({\mathrm{ t } {}\mathrm{ \bar{t} } } )} $ in different $ {M({\mathrm{ t } {}\mathrm{ \bar{t} } } )} $ ranges to NLO $\mathcal{O}(\alpha _s^3)$ predictions. Details can be found in the caption of Fig. 8. Approximate NNLO $\mathcal{O}(\alpha _s^4)$ predictions are not available for this cross section. |
png pdf |
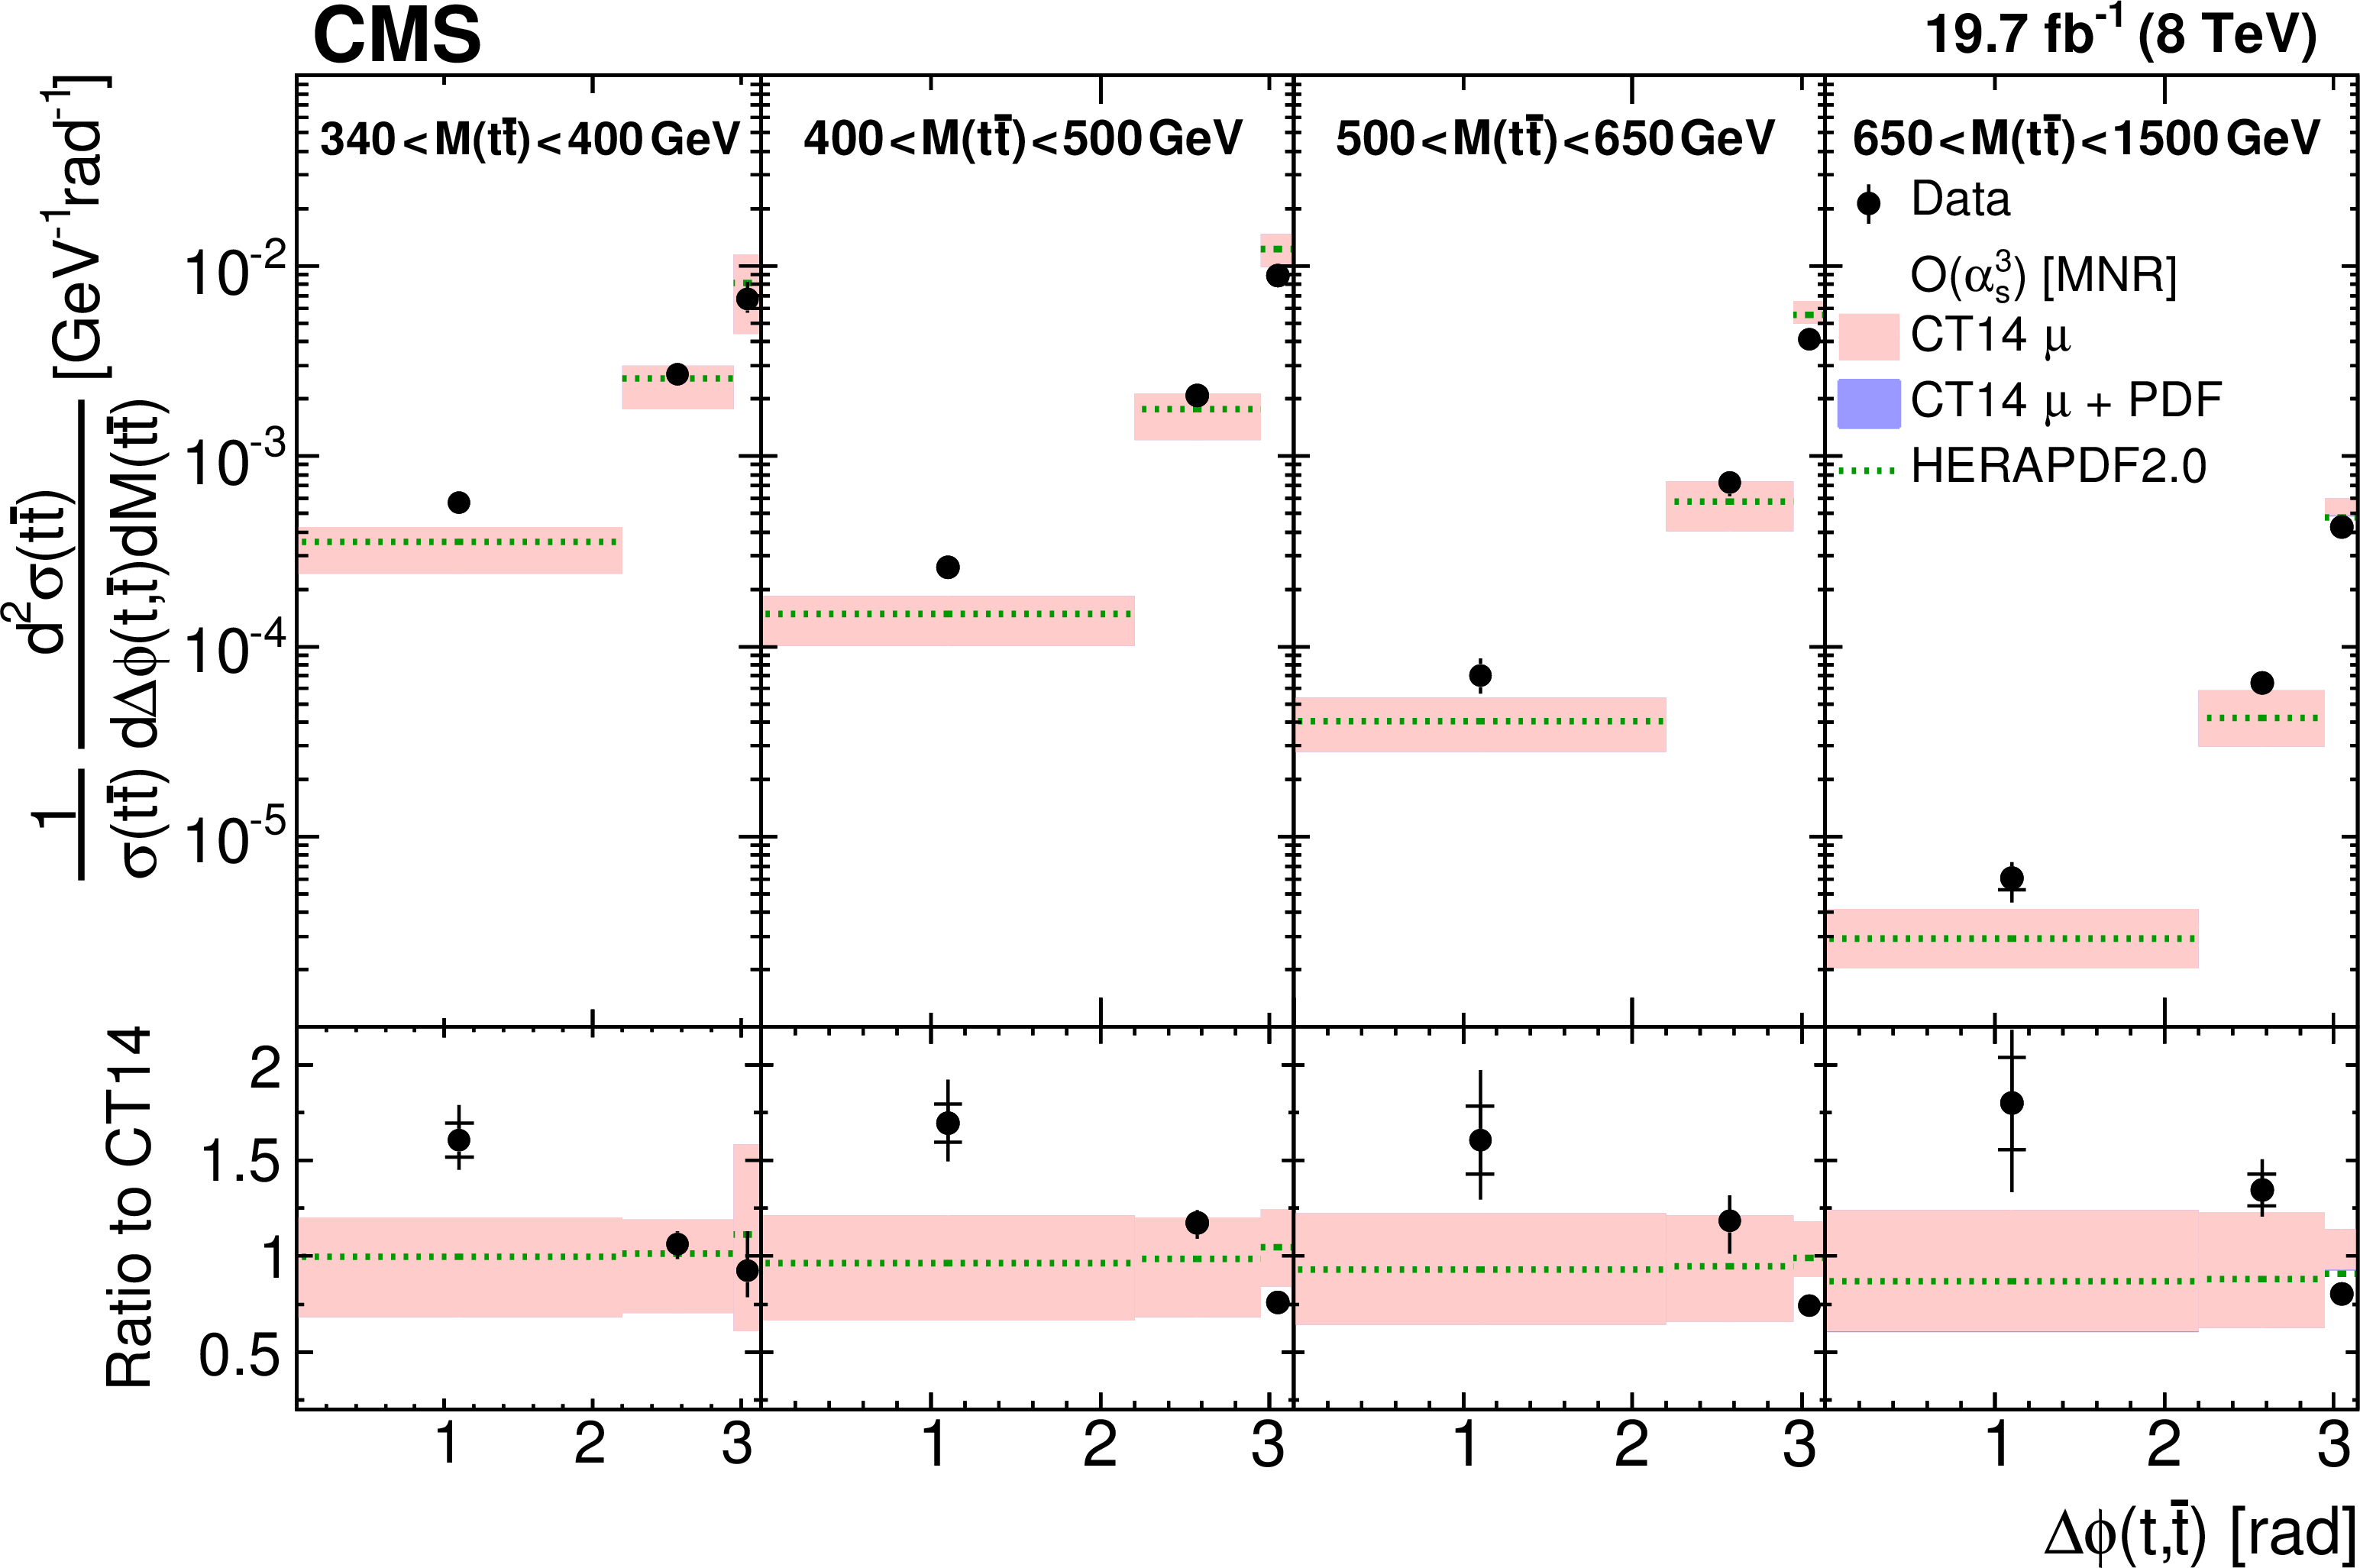
Figure 13:
Comparison of the measured normalized $ {\mathrm{ t } {}\mathrm{ \bar{t} } } $ double-differential cross section as a function of $ {\Delta \phi (\mathrm{ t } ,\mathrm{ \bar{t} } )} $ in different $ {M({\mathrm{ t } {}\mathrm{ \bar{t} } } )} $ ranges to NLO $\mathcal{O}(\alpha _s^3)$ predictions. Details can be found in the caption of Fig. 8. Approximate NNLO $\mathcal{O}(\alpha _s^4)$ predictions are not available for this cross section. |
png pdf |
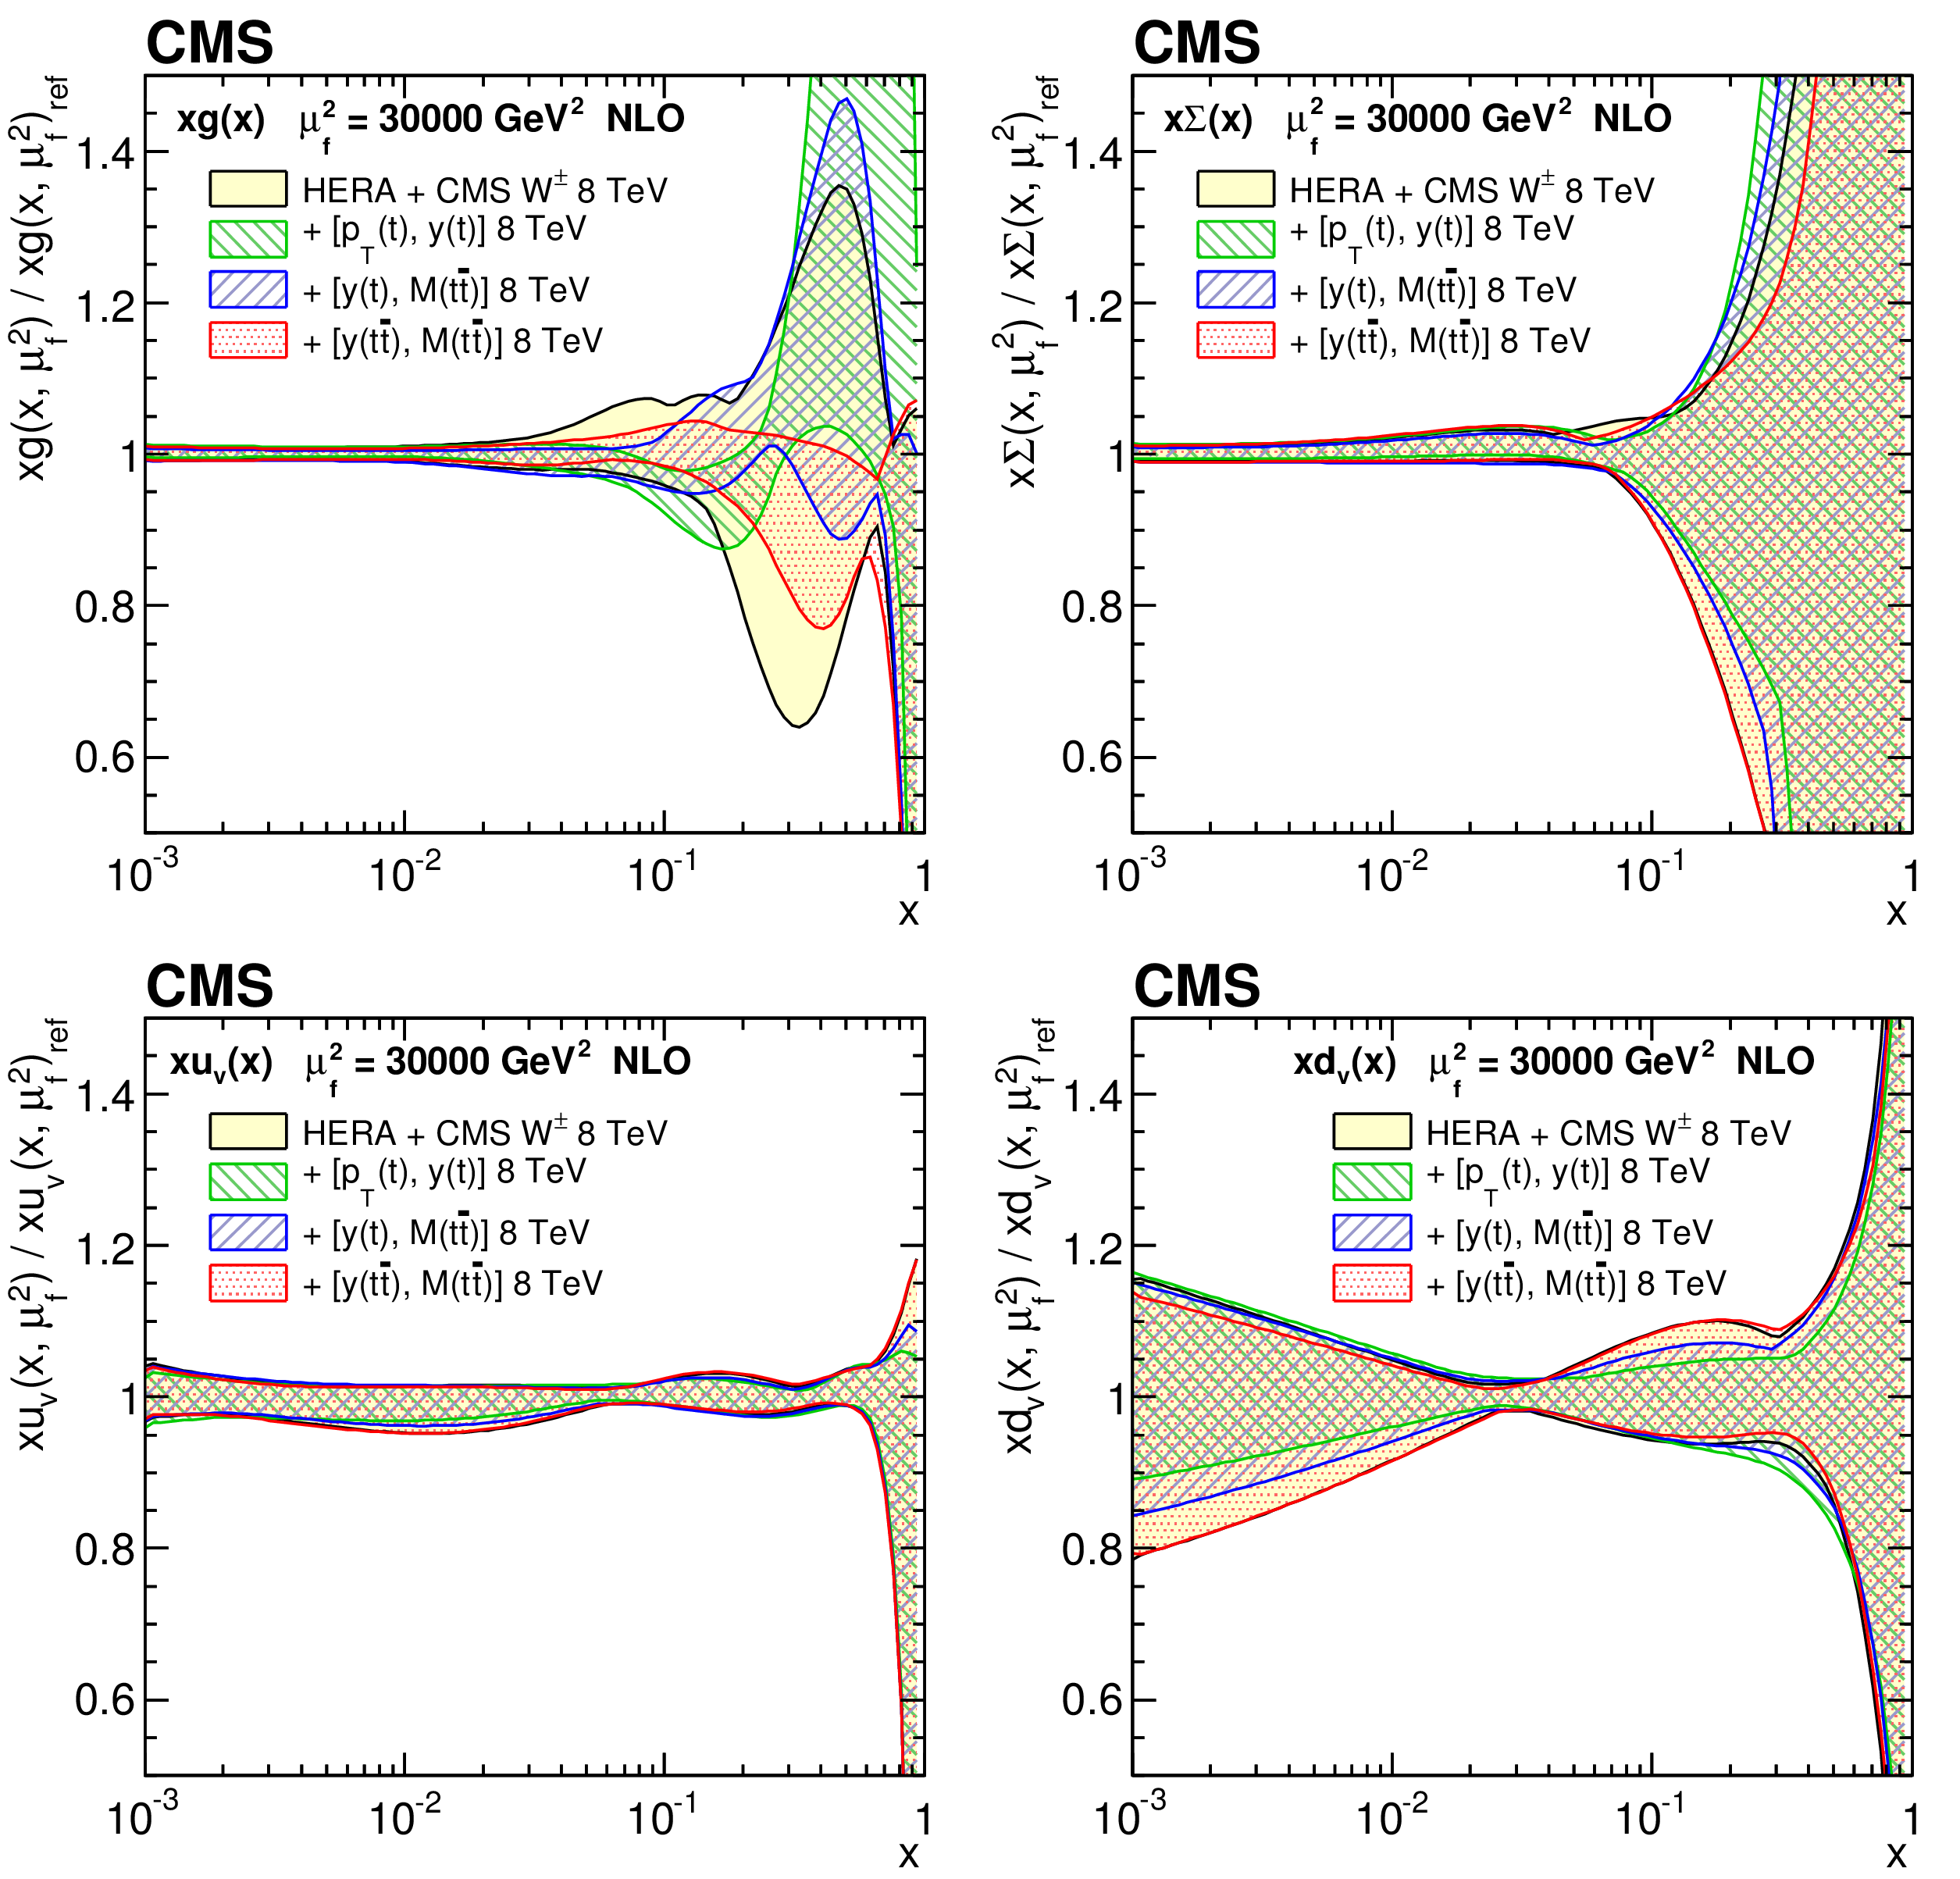
Figure 14:
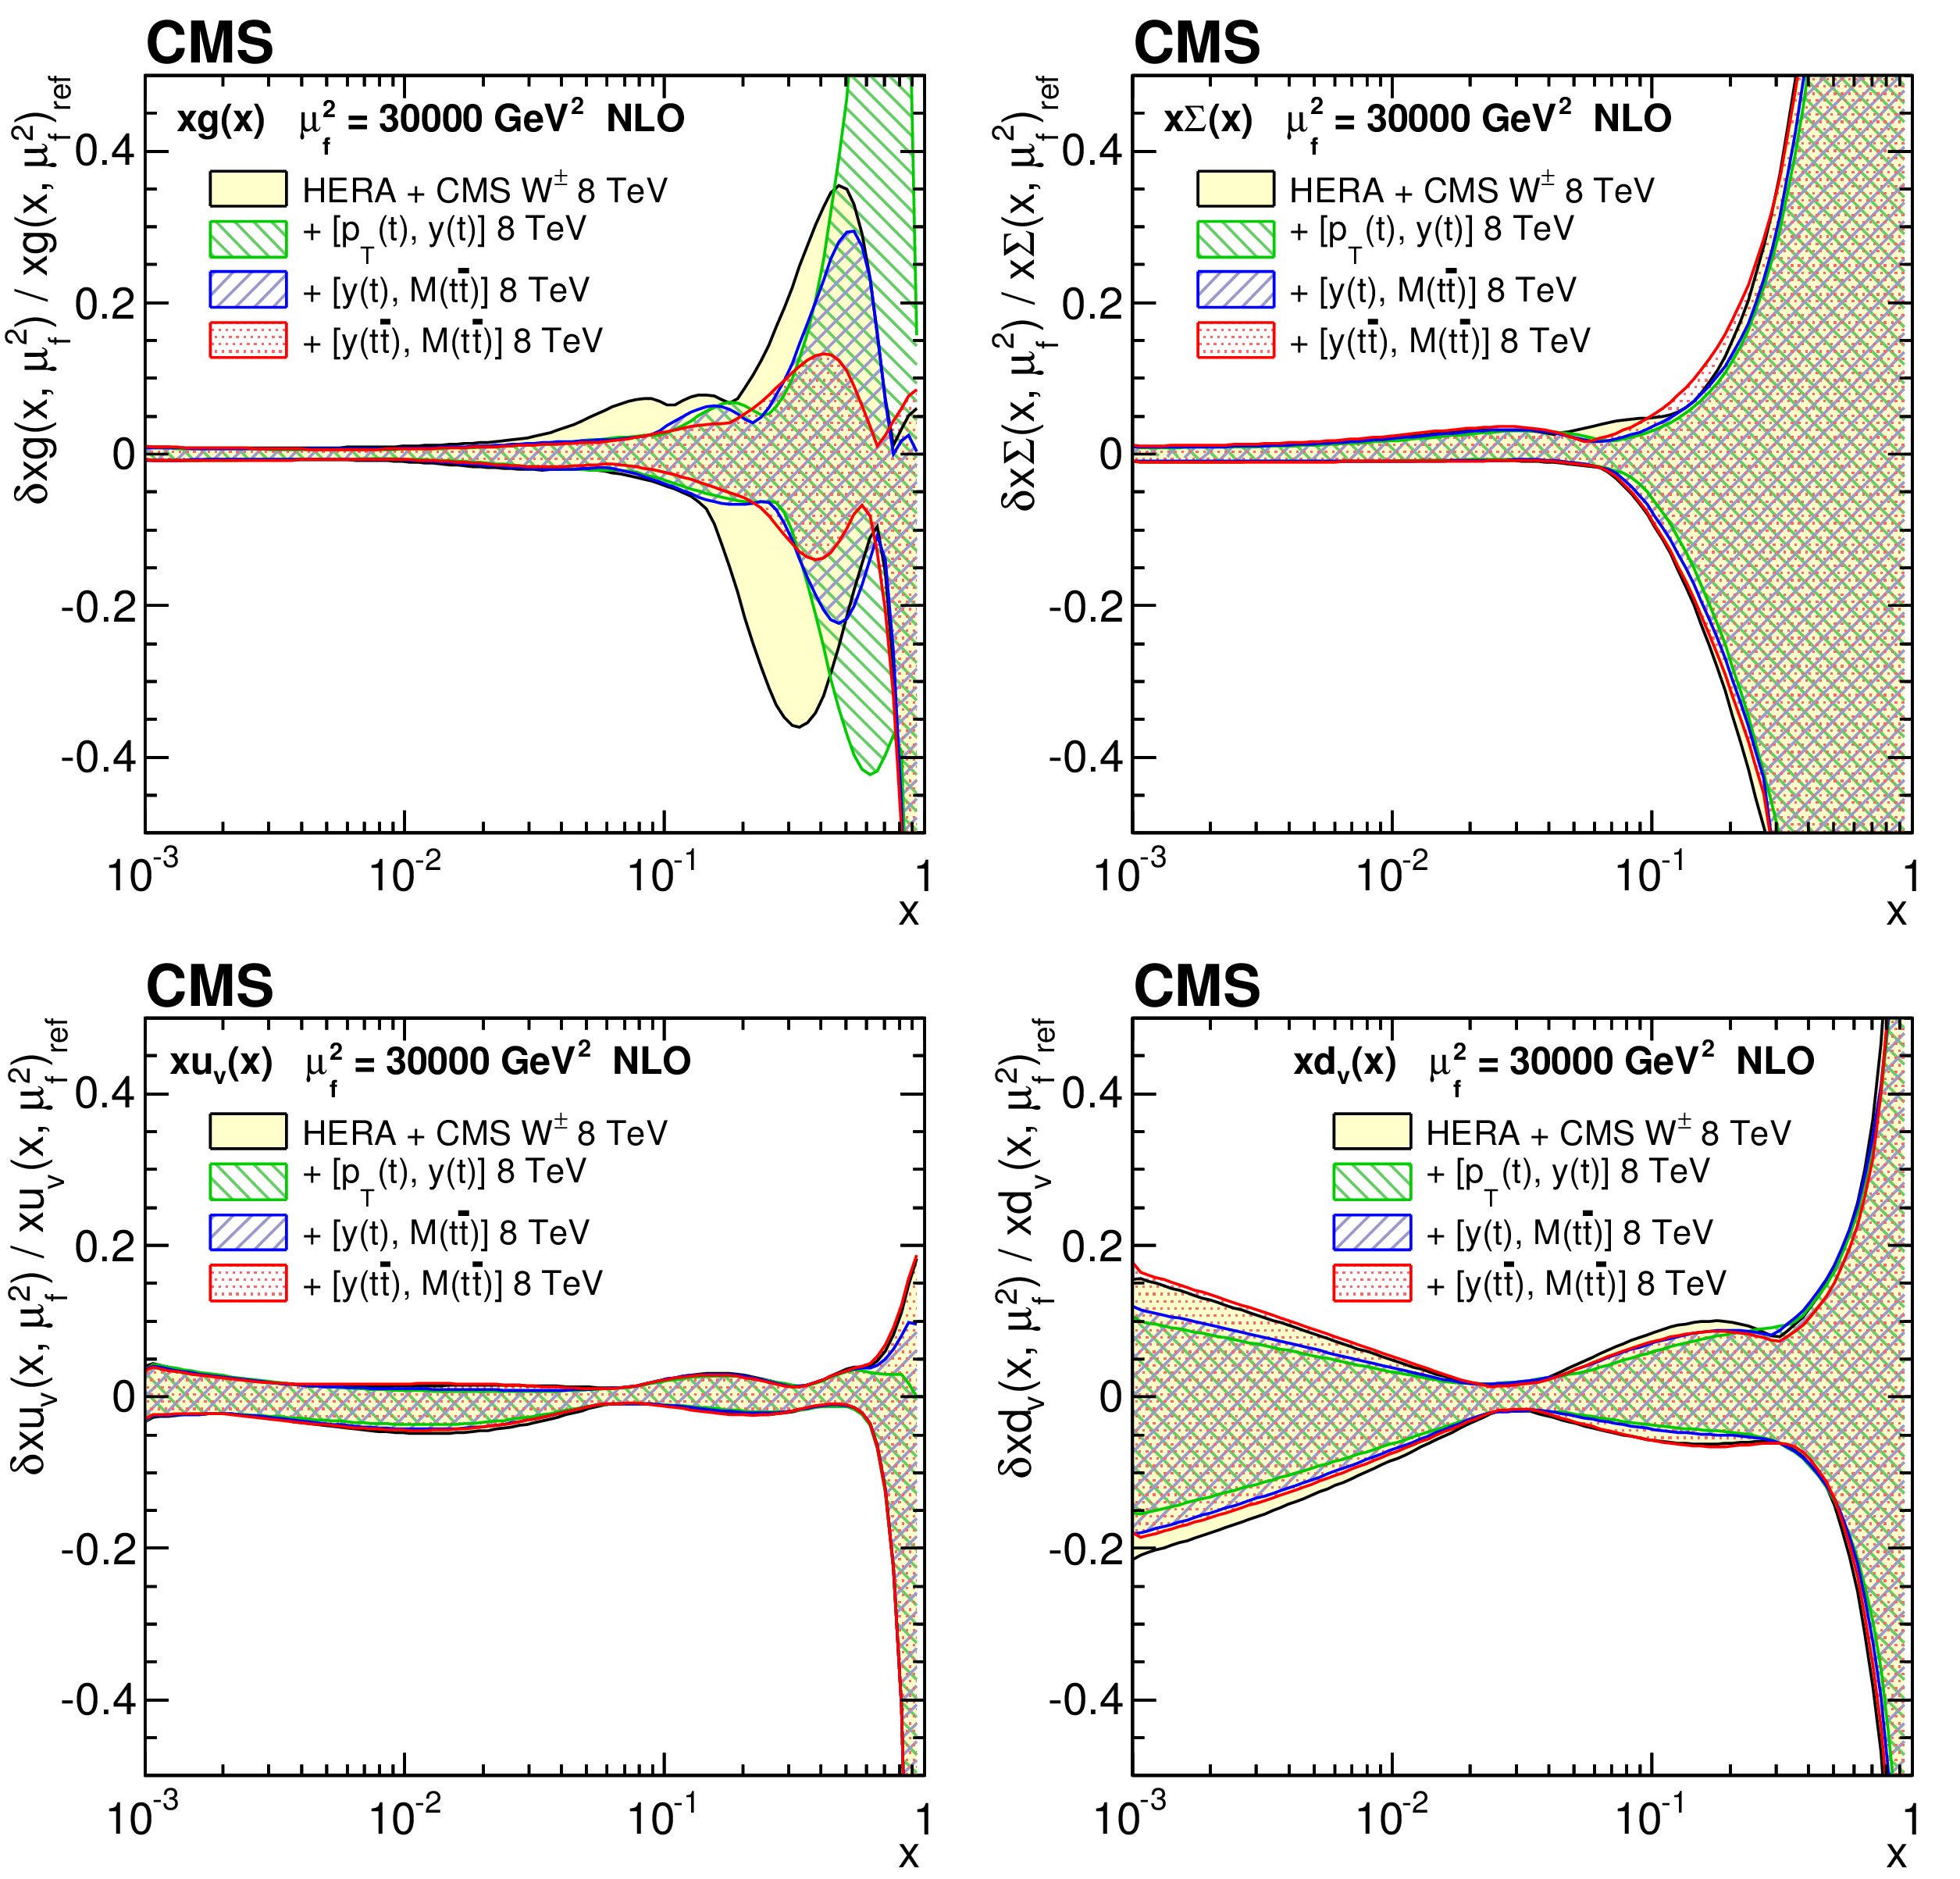
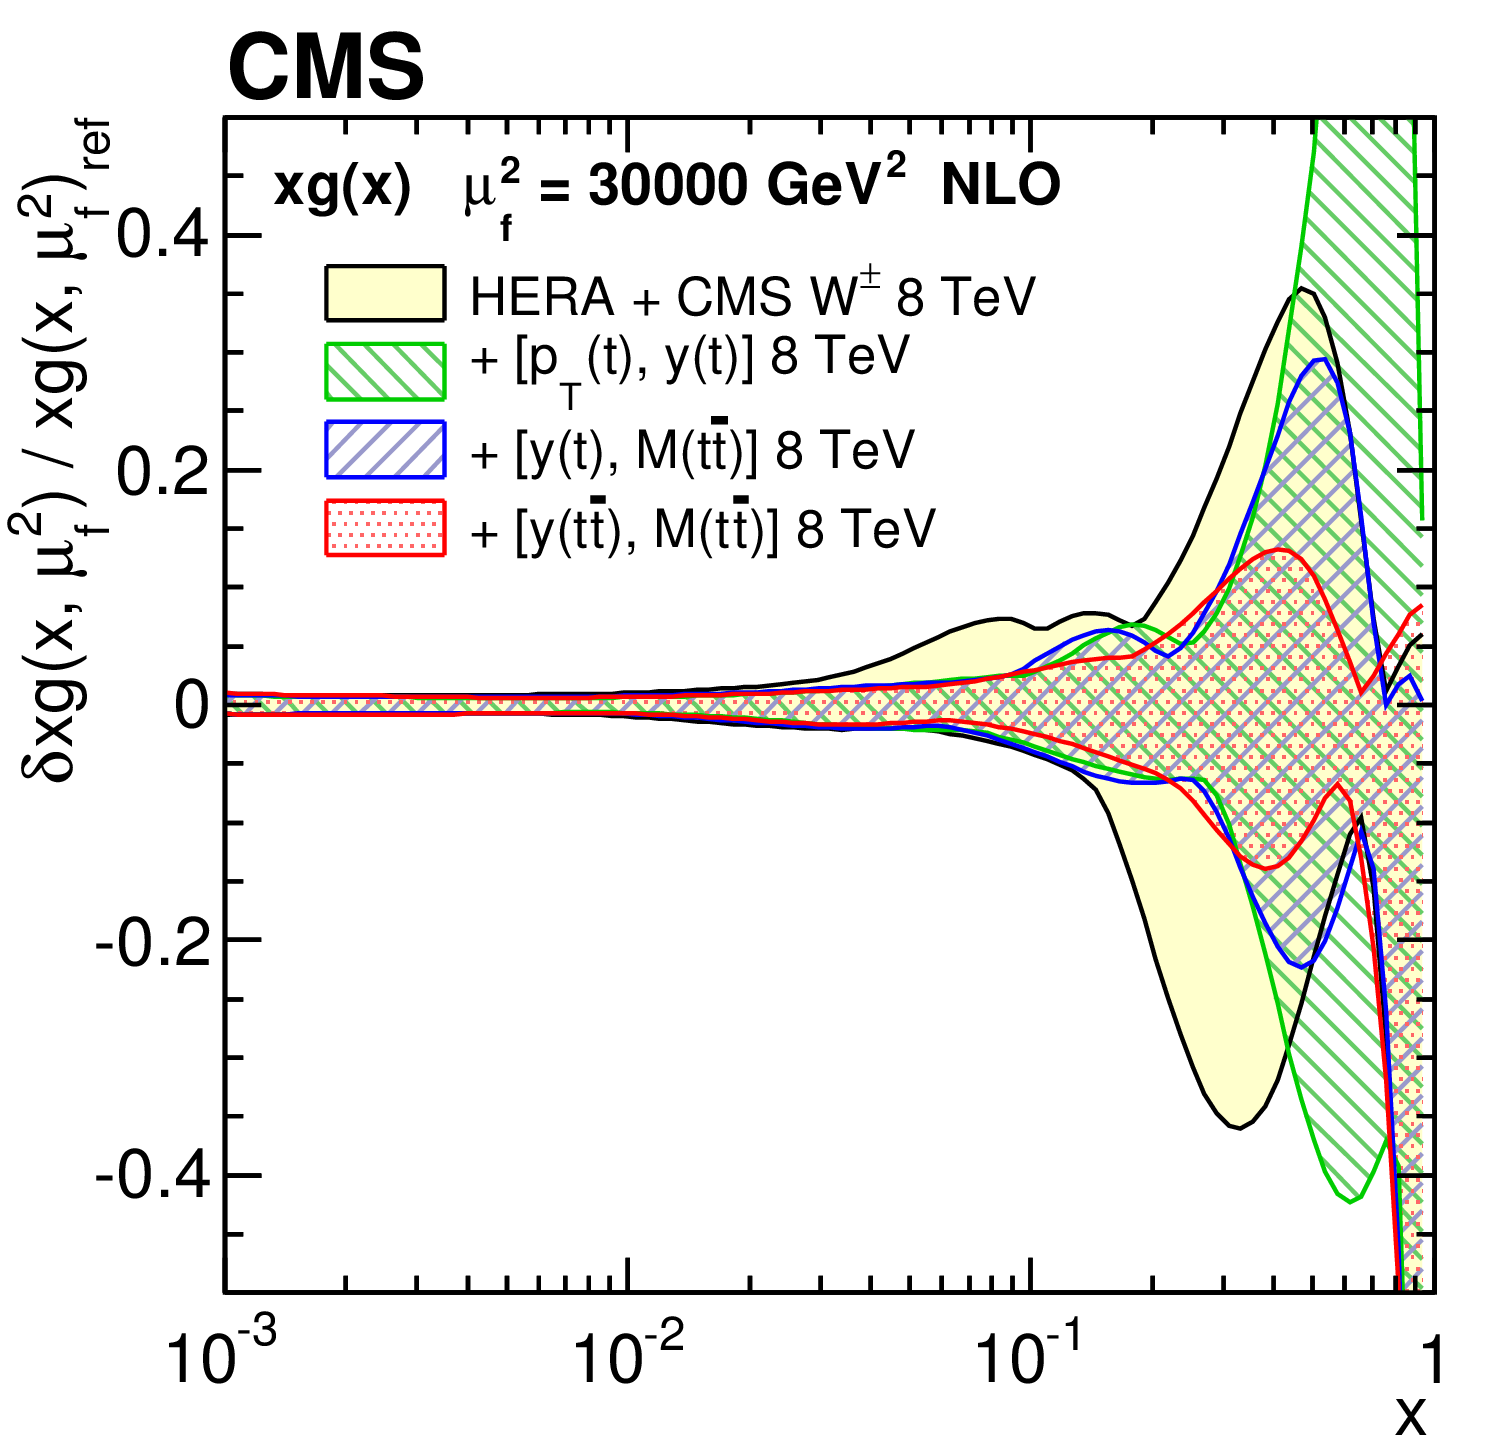
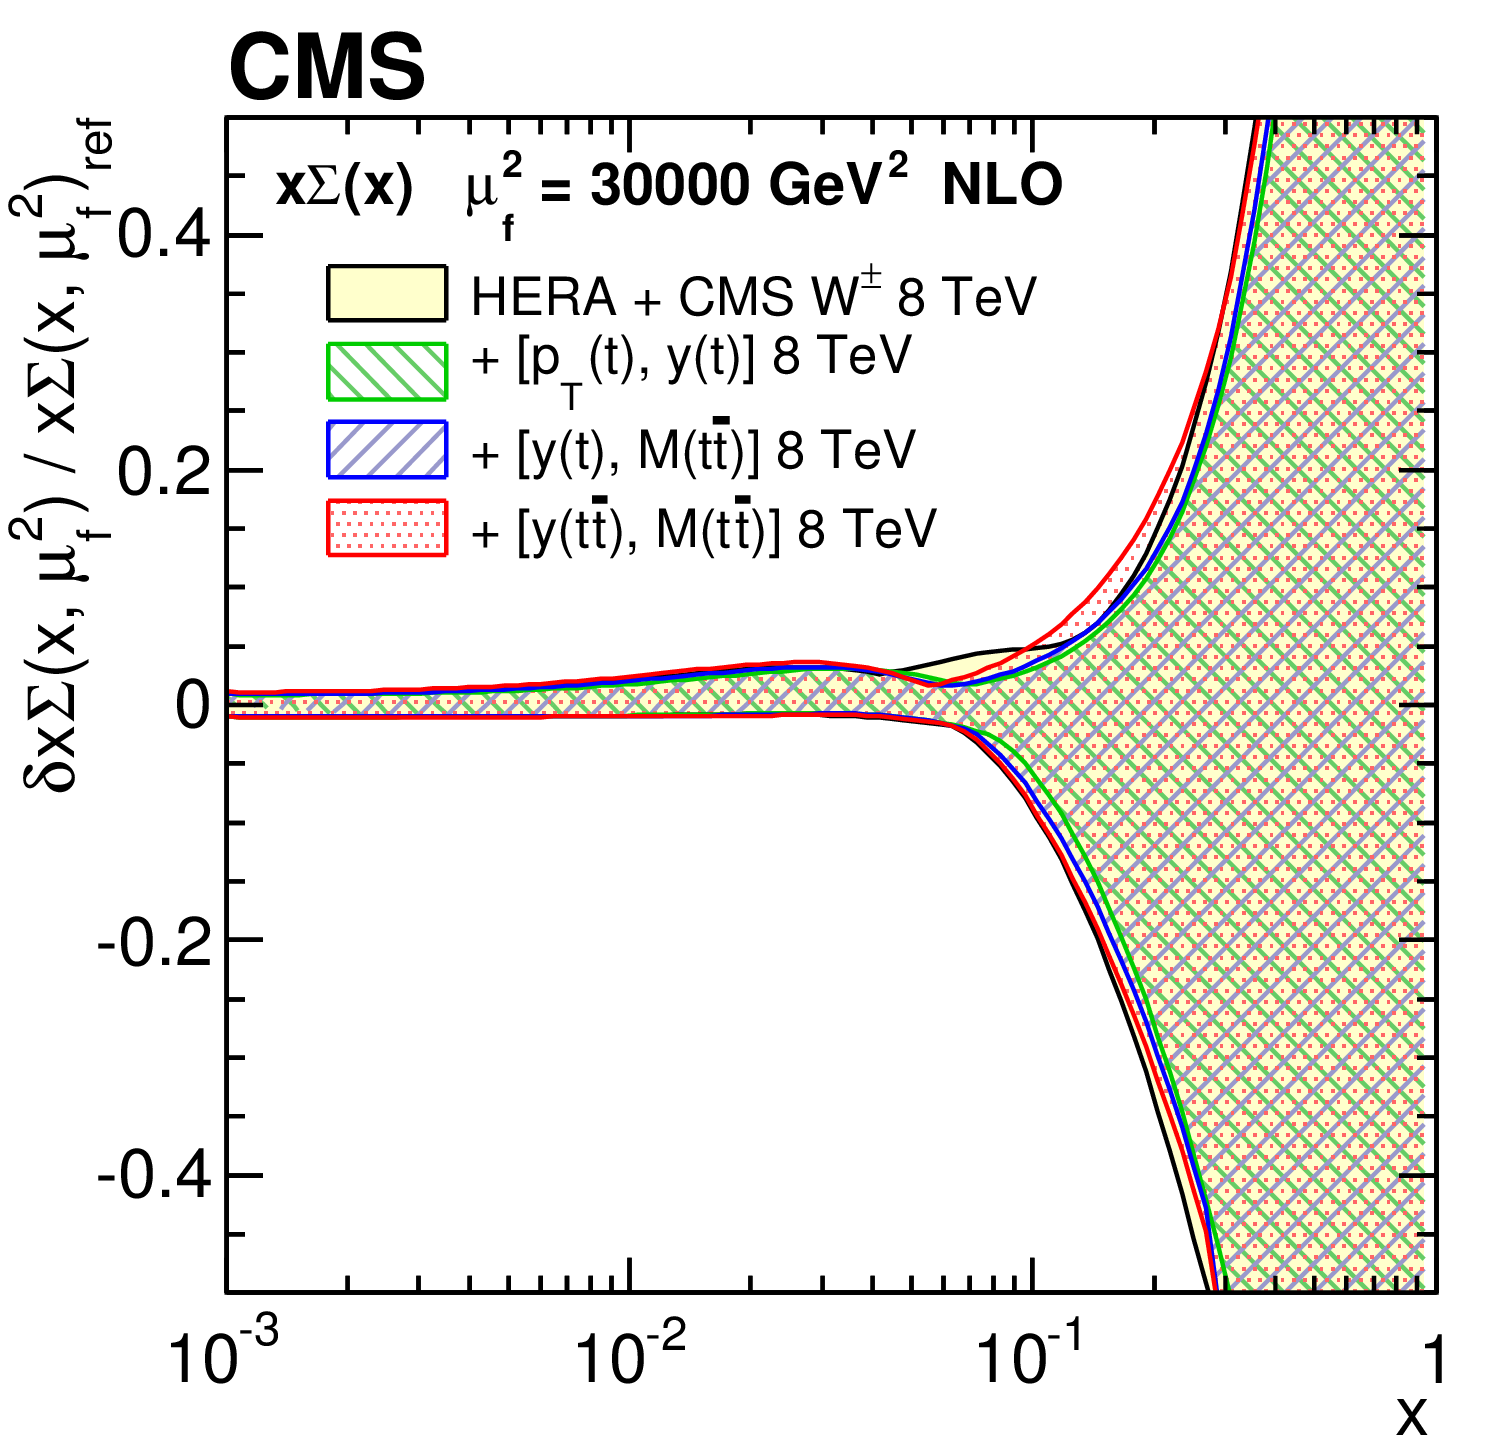
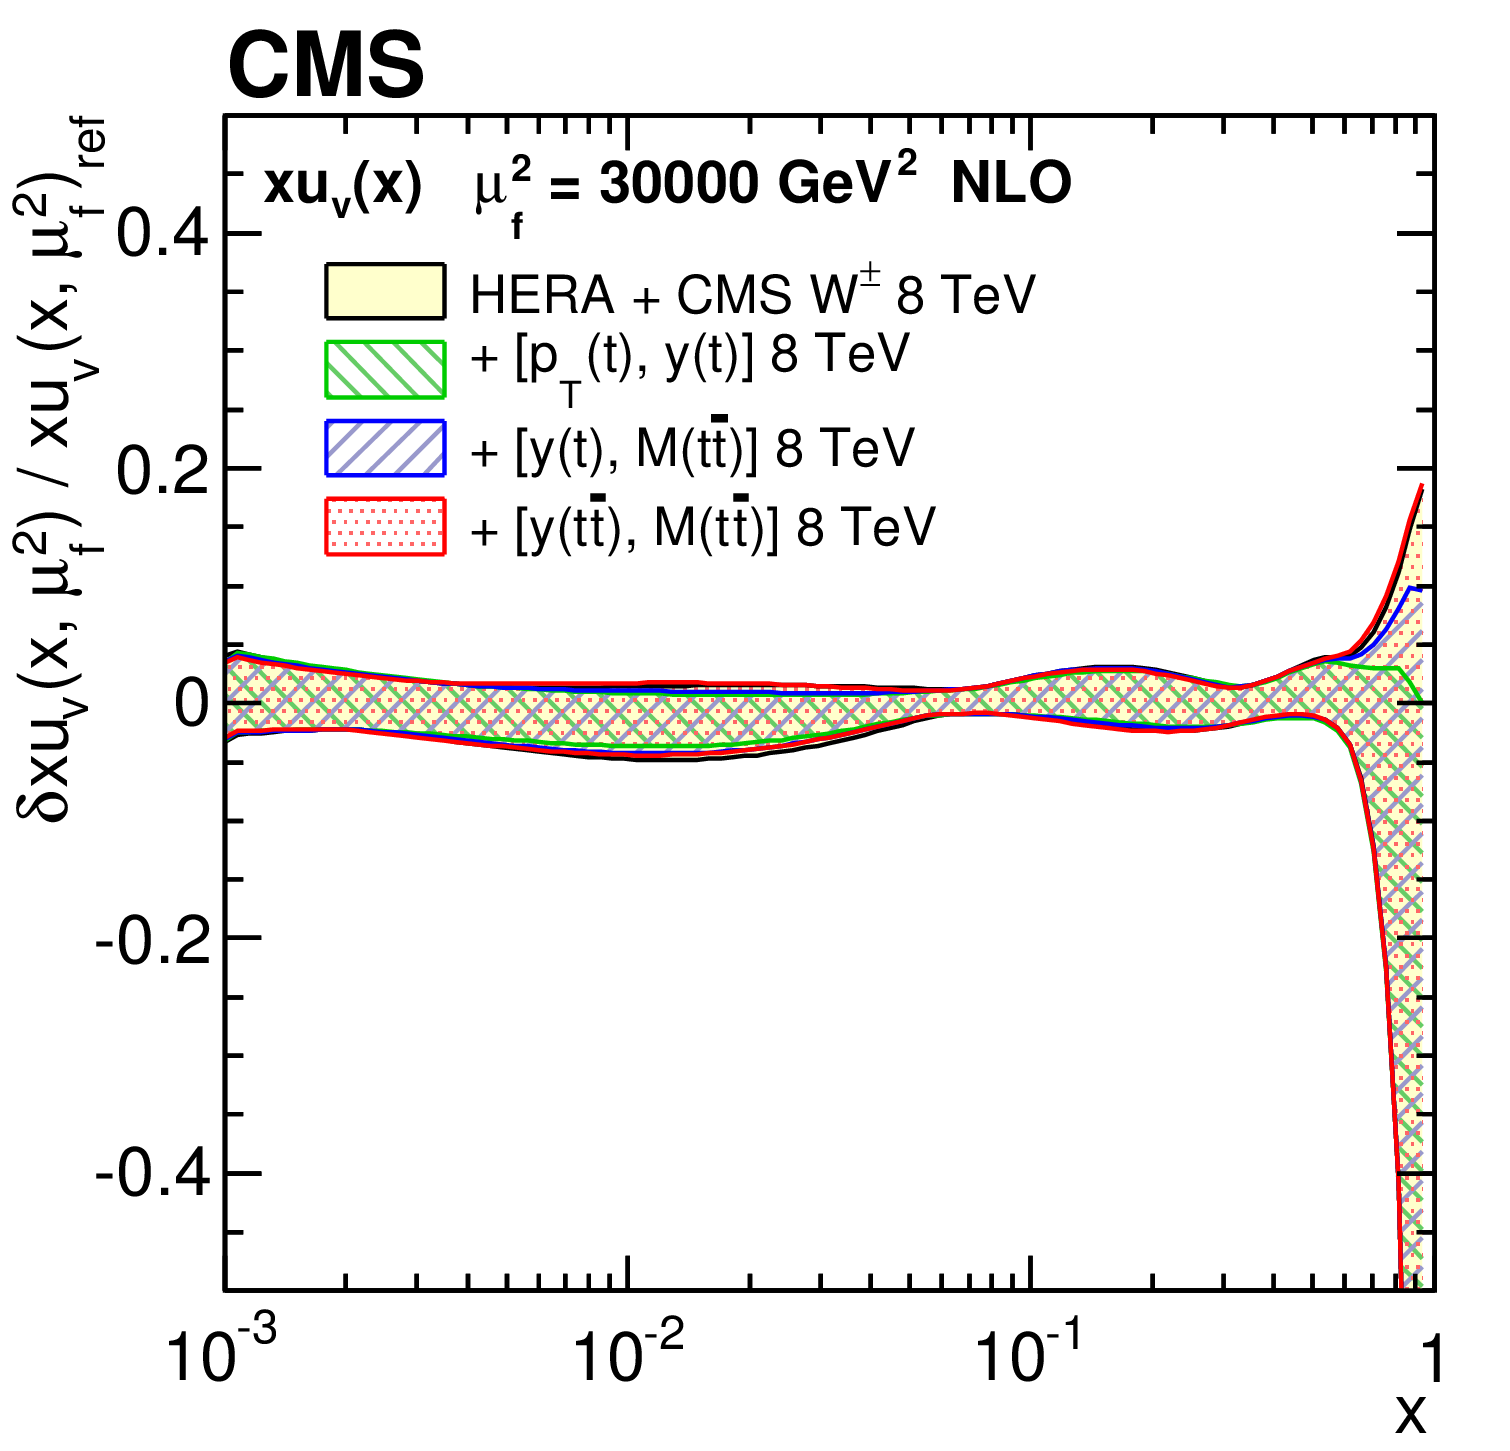
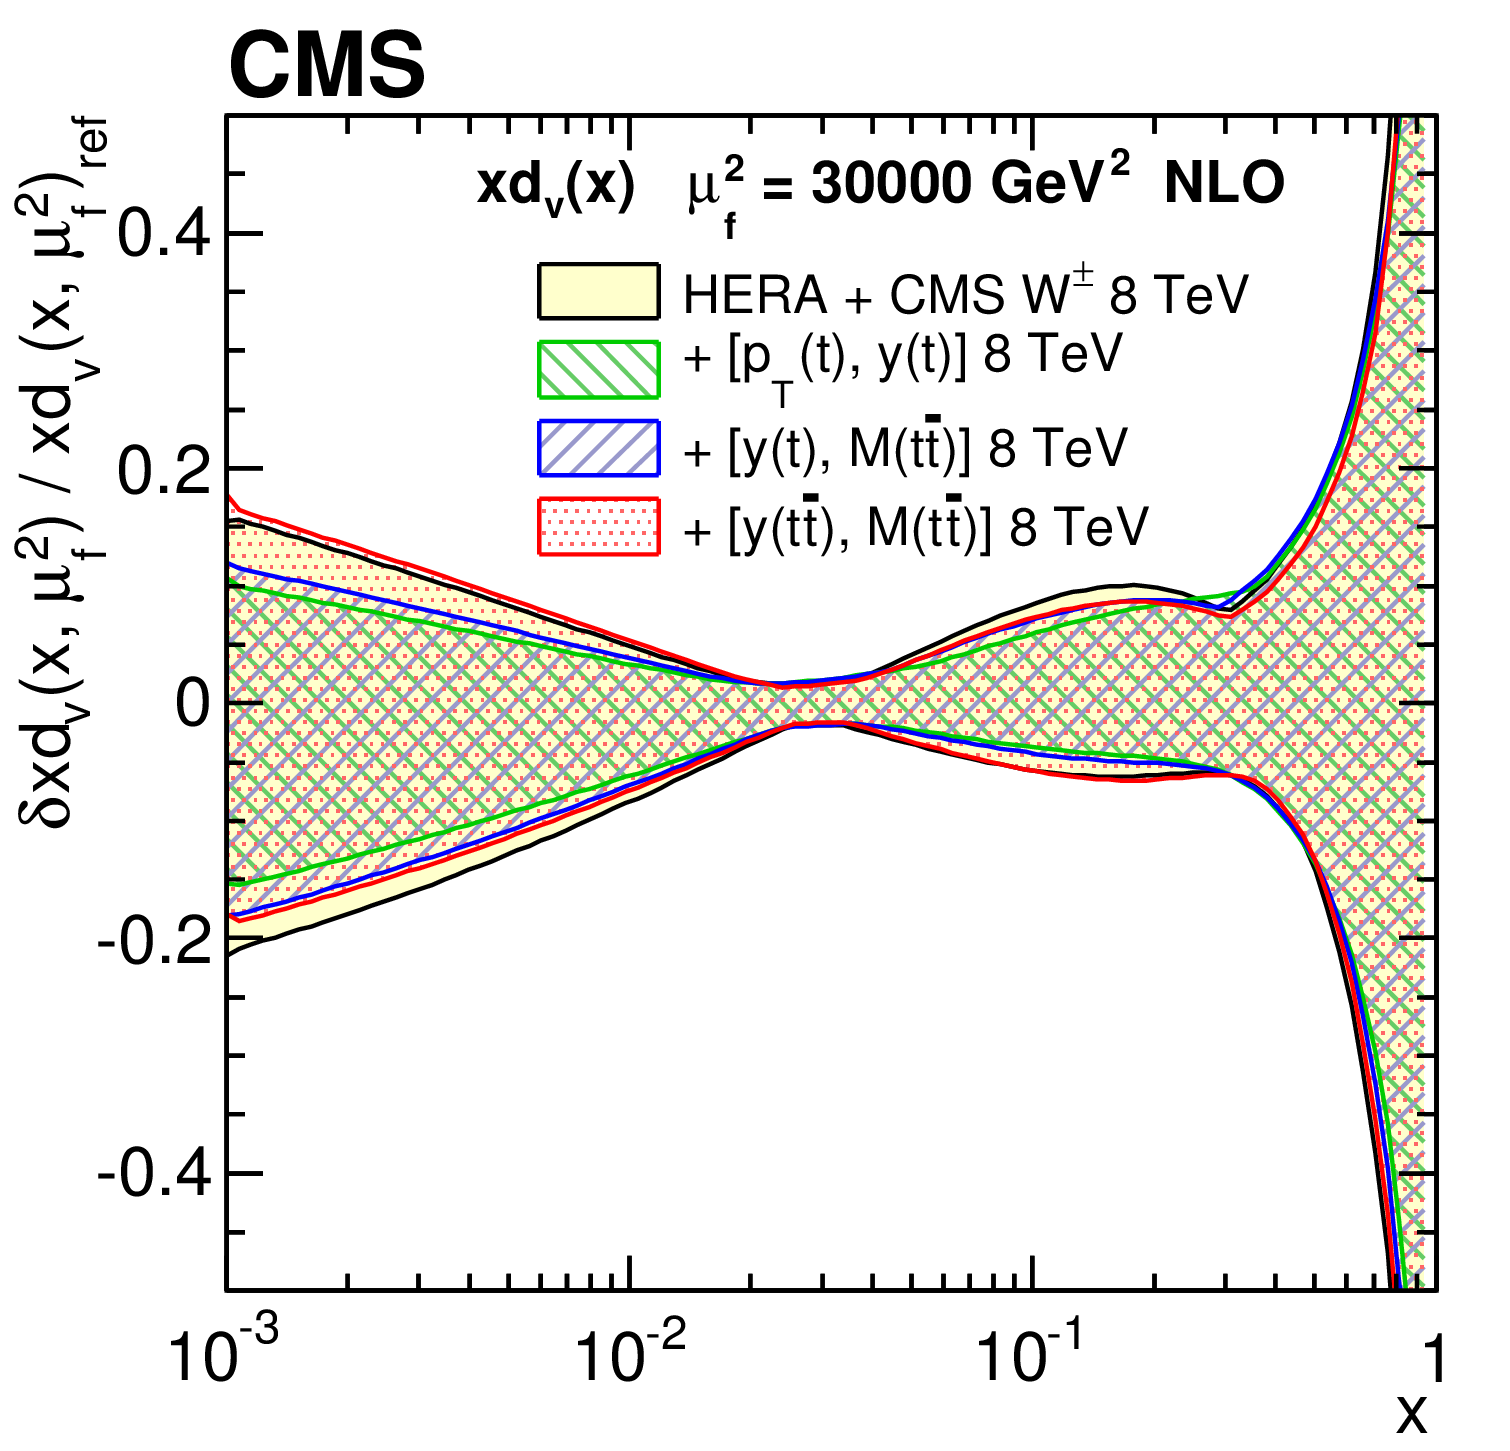
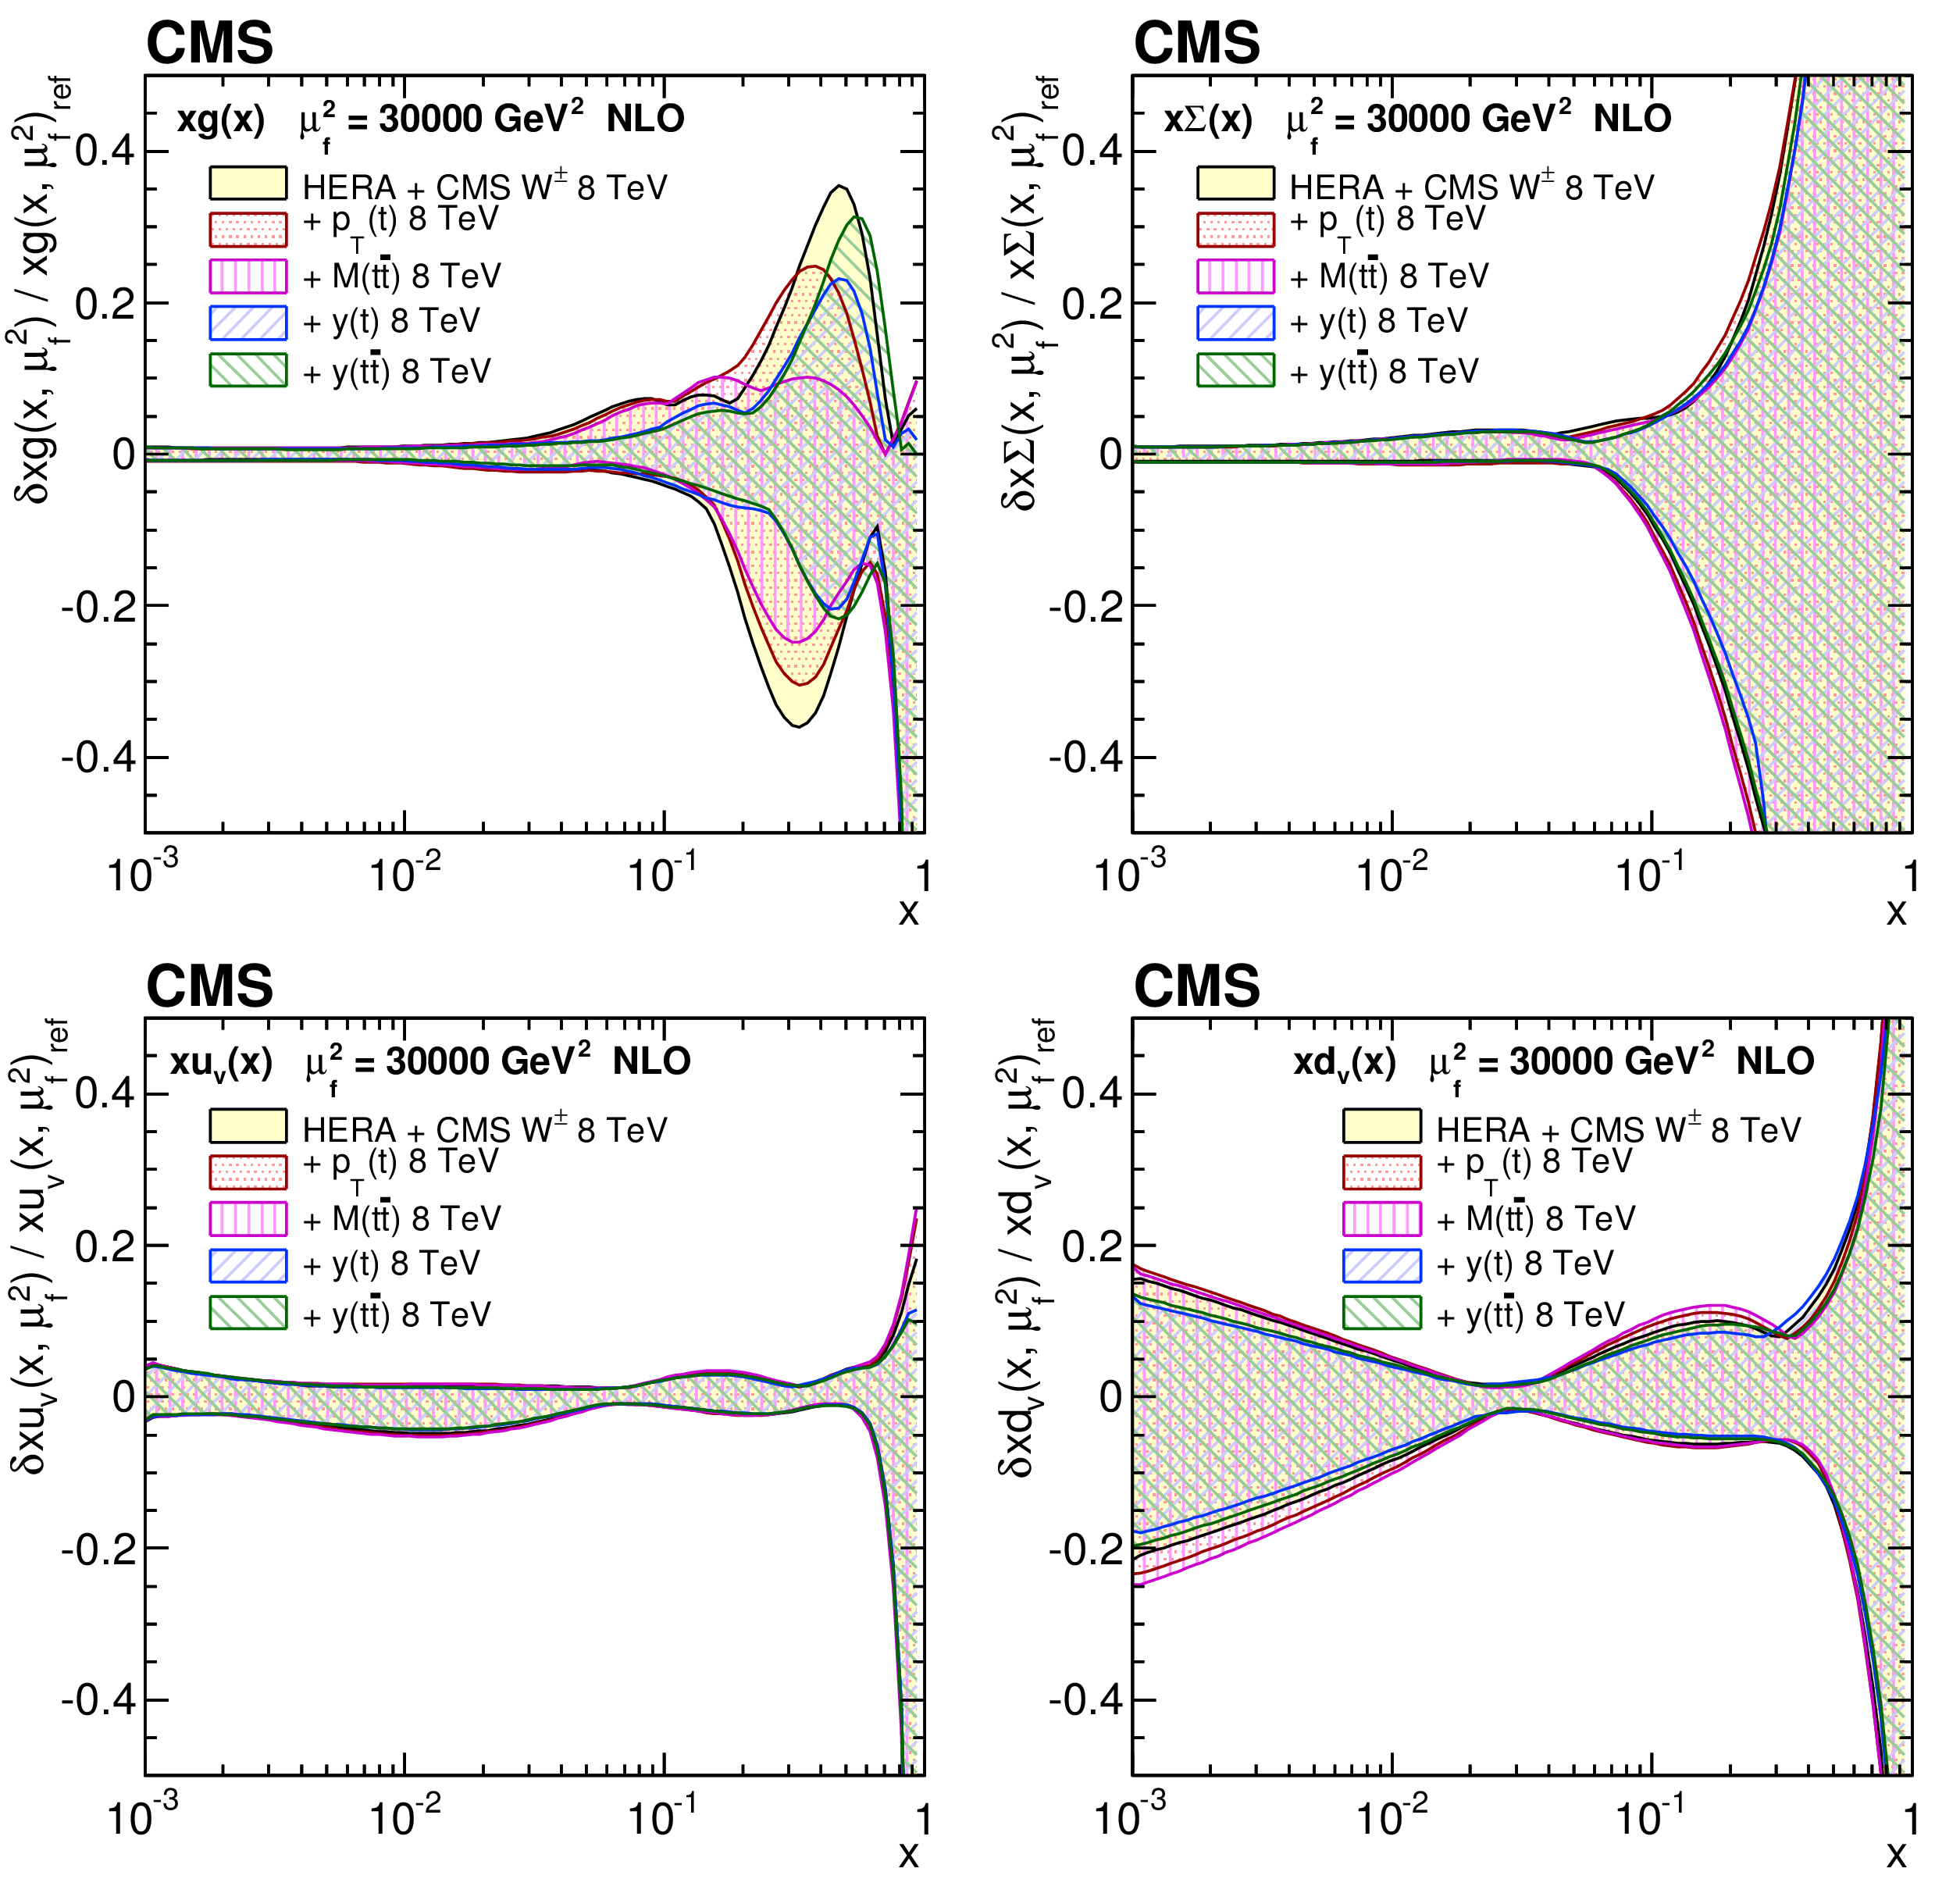
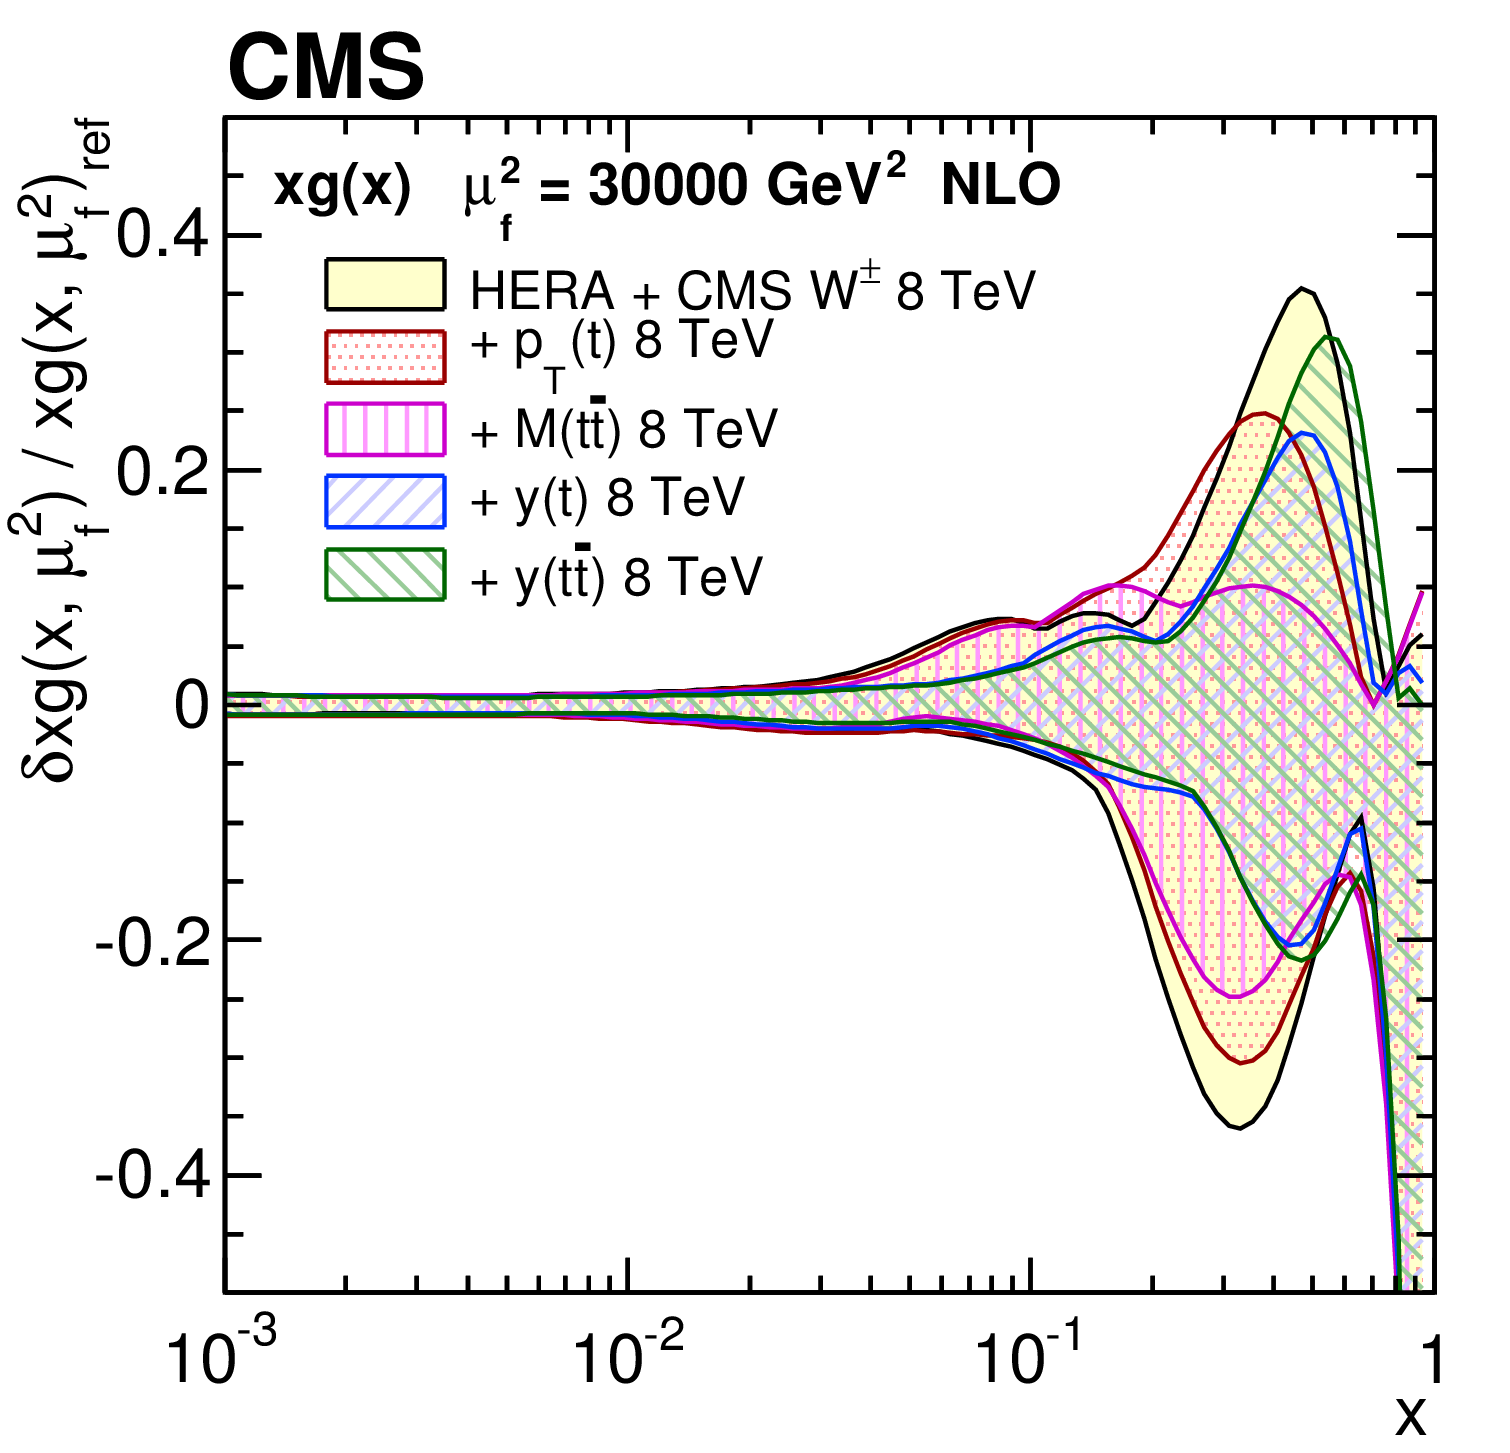
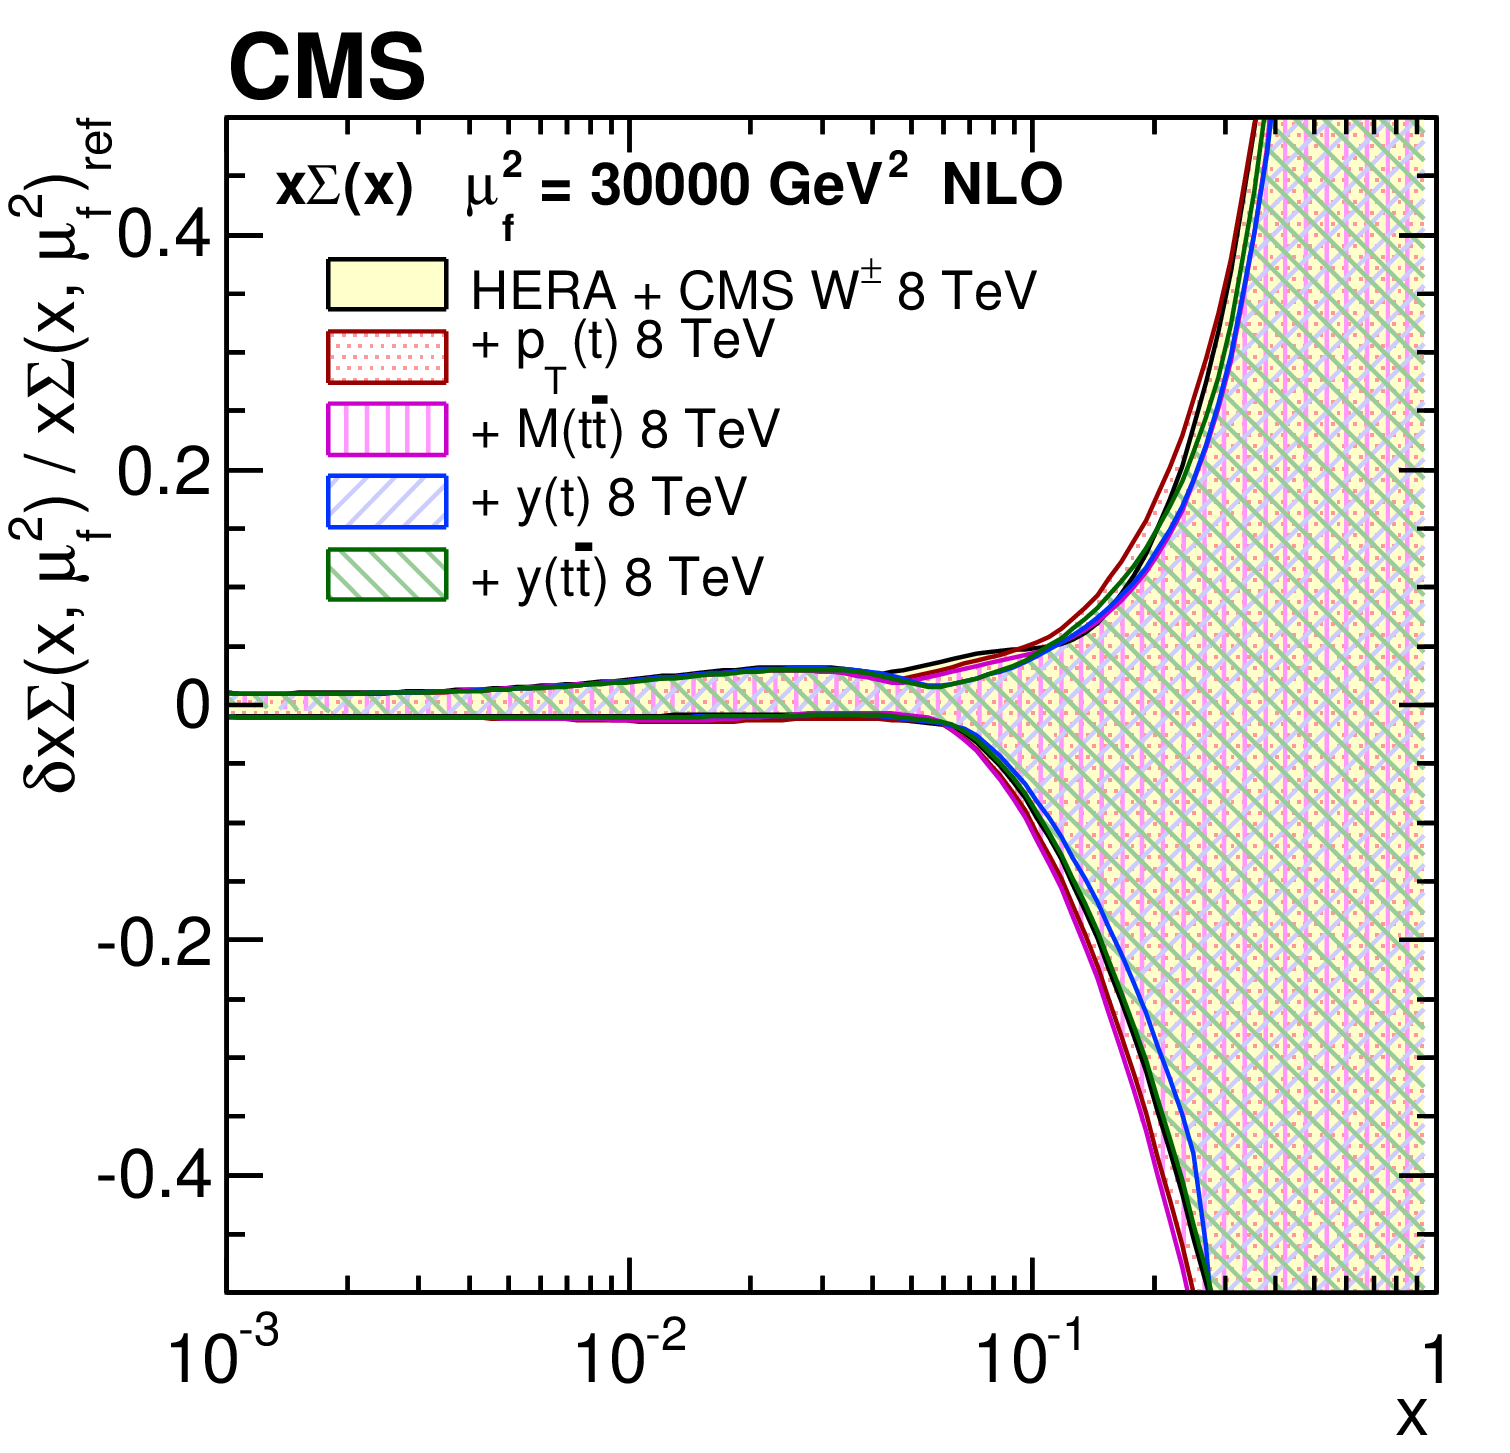
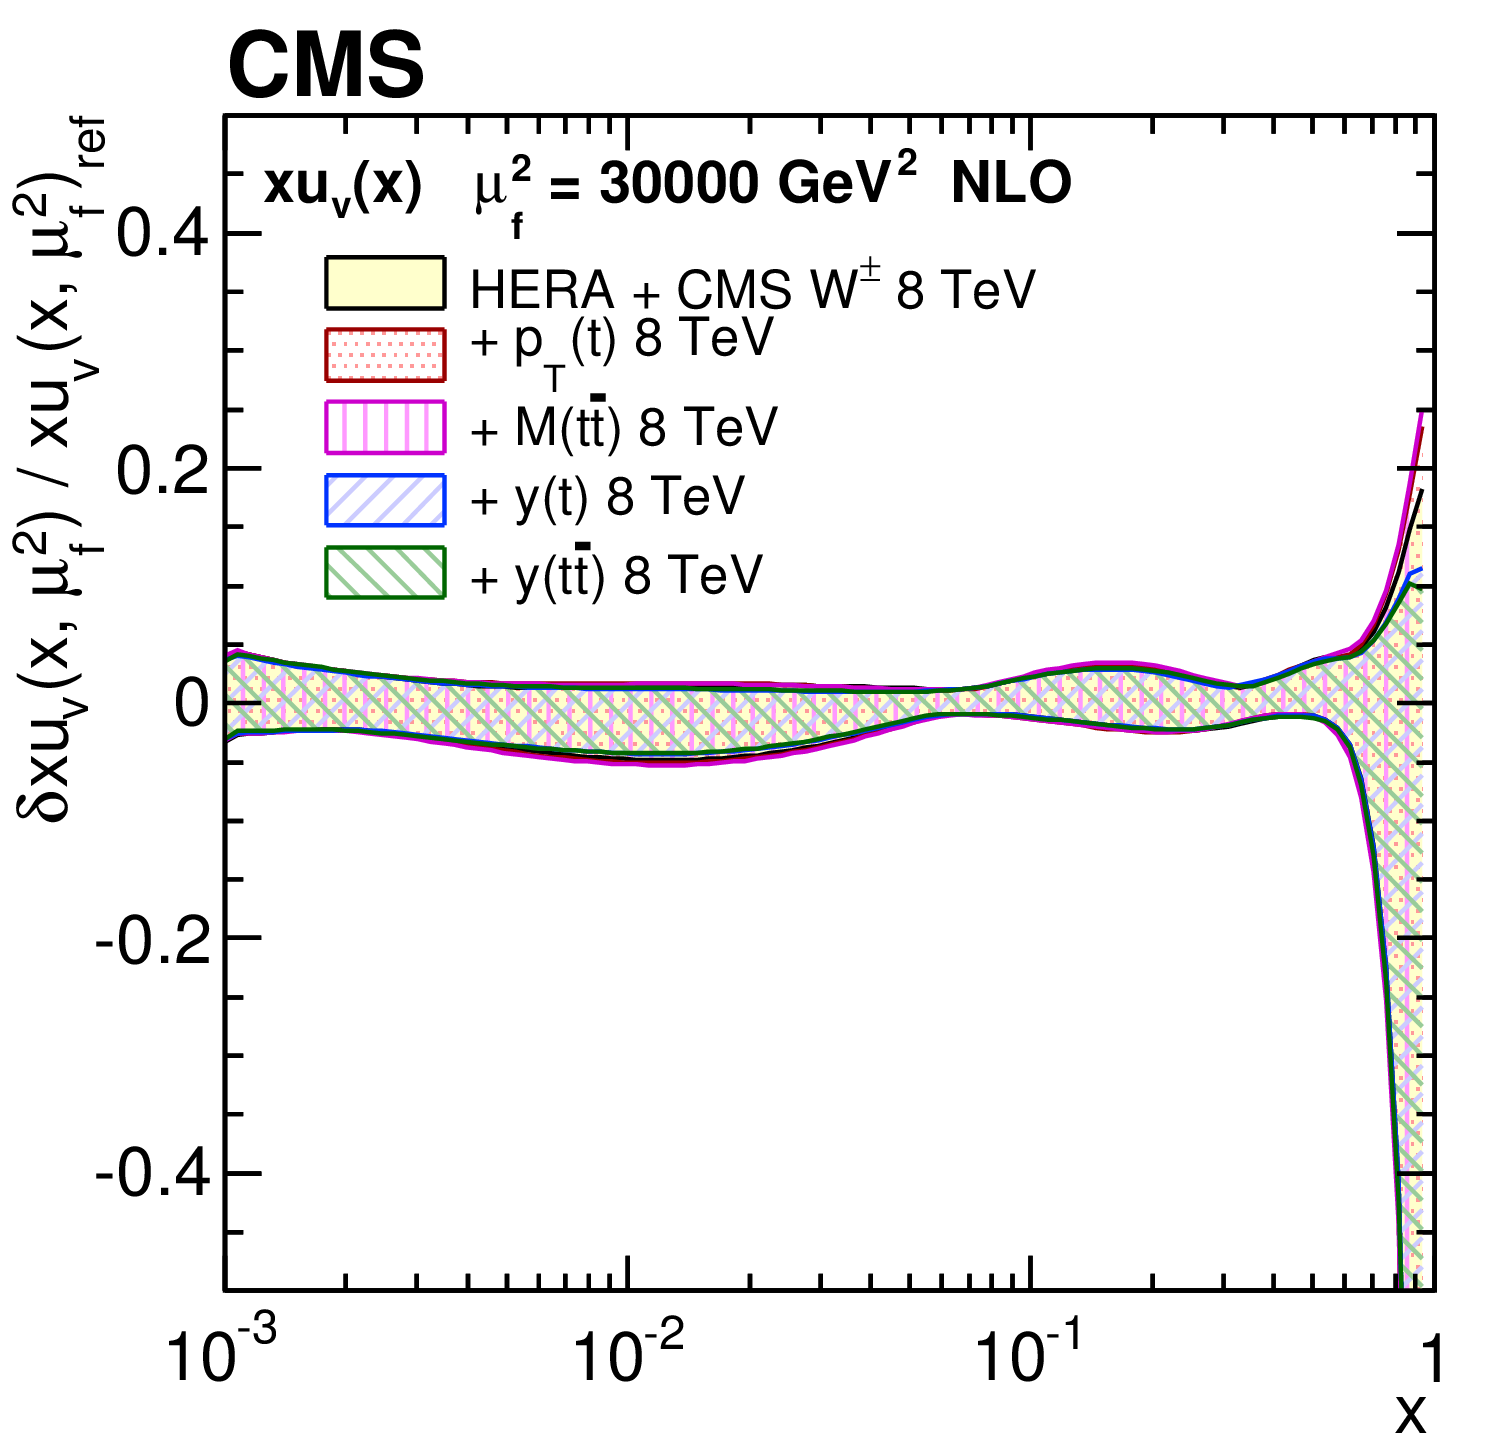
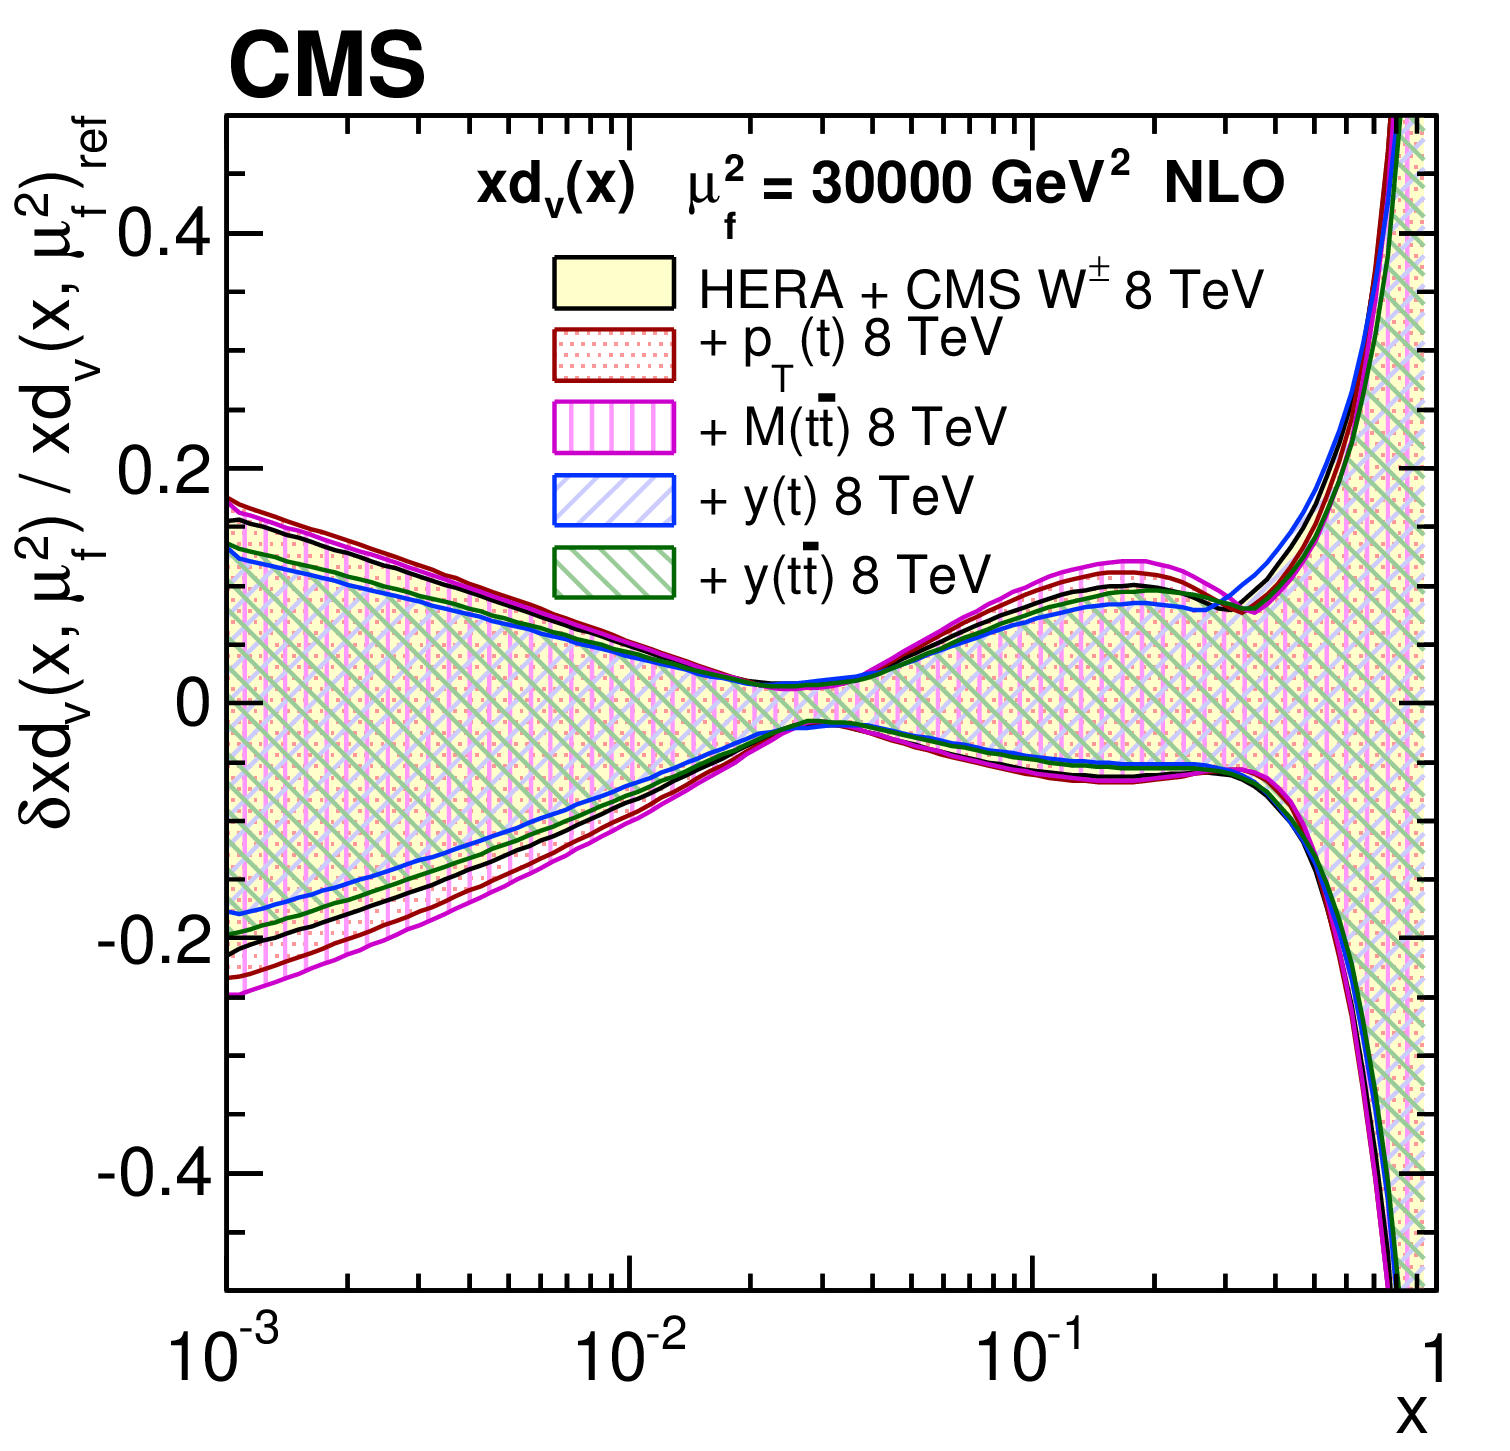
The gluon (upper left), sea quark (upper right), u valence quark (lower left), and d valence quark (lower right) PDFs at $\mu _\mathrm {f}^2= $ 30 000 GeV$ ^2$, as obtained in all variants of the PDF fit, normalized to the results from the fit using the HERA DIS and CMS $ {\mathrm{ W } ^\pm } $ boson charge asymmetry measurements only. The shaded, hatched, and dotted areas represent the total uncertainty in each of the fits. |

png pdf |
Figure 14-a:
The gluon PDF at $\mu _\mathrm {f}^2= $ 30 000 GeV$ ^2$, as obtained in all variants of the PDF fit, normalized to the results from the fit using the HERA DIS and CMS $ {\mathrm{ W } ^\pm } $ boson charge asymmetry measurements only. The shaded, hatched, and dotted areas represent the total uncertainty in each of the fits. |

png pdf |
Figure 14-b:
The sea quark PDF at $\mu _\mathrm {f}^2= $ 30 000 GeV$ ^2$, as obtained in all variants of the PDF fit, normalized to the results from the fit using the HERA DIS and CMS $ {\mathrm{ W } ^\pm } $ boson charge asymmetry measurements only. The shaded, hatched, and dotted areas represent the total uncertainty in each of the fits. |
png pdf |
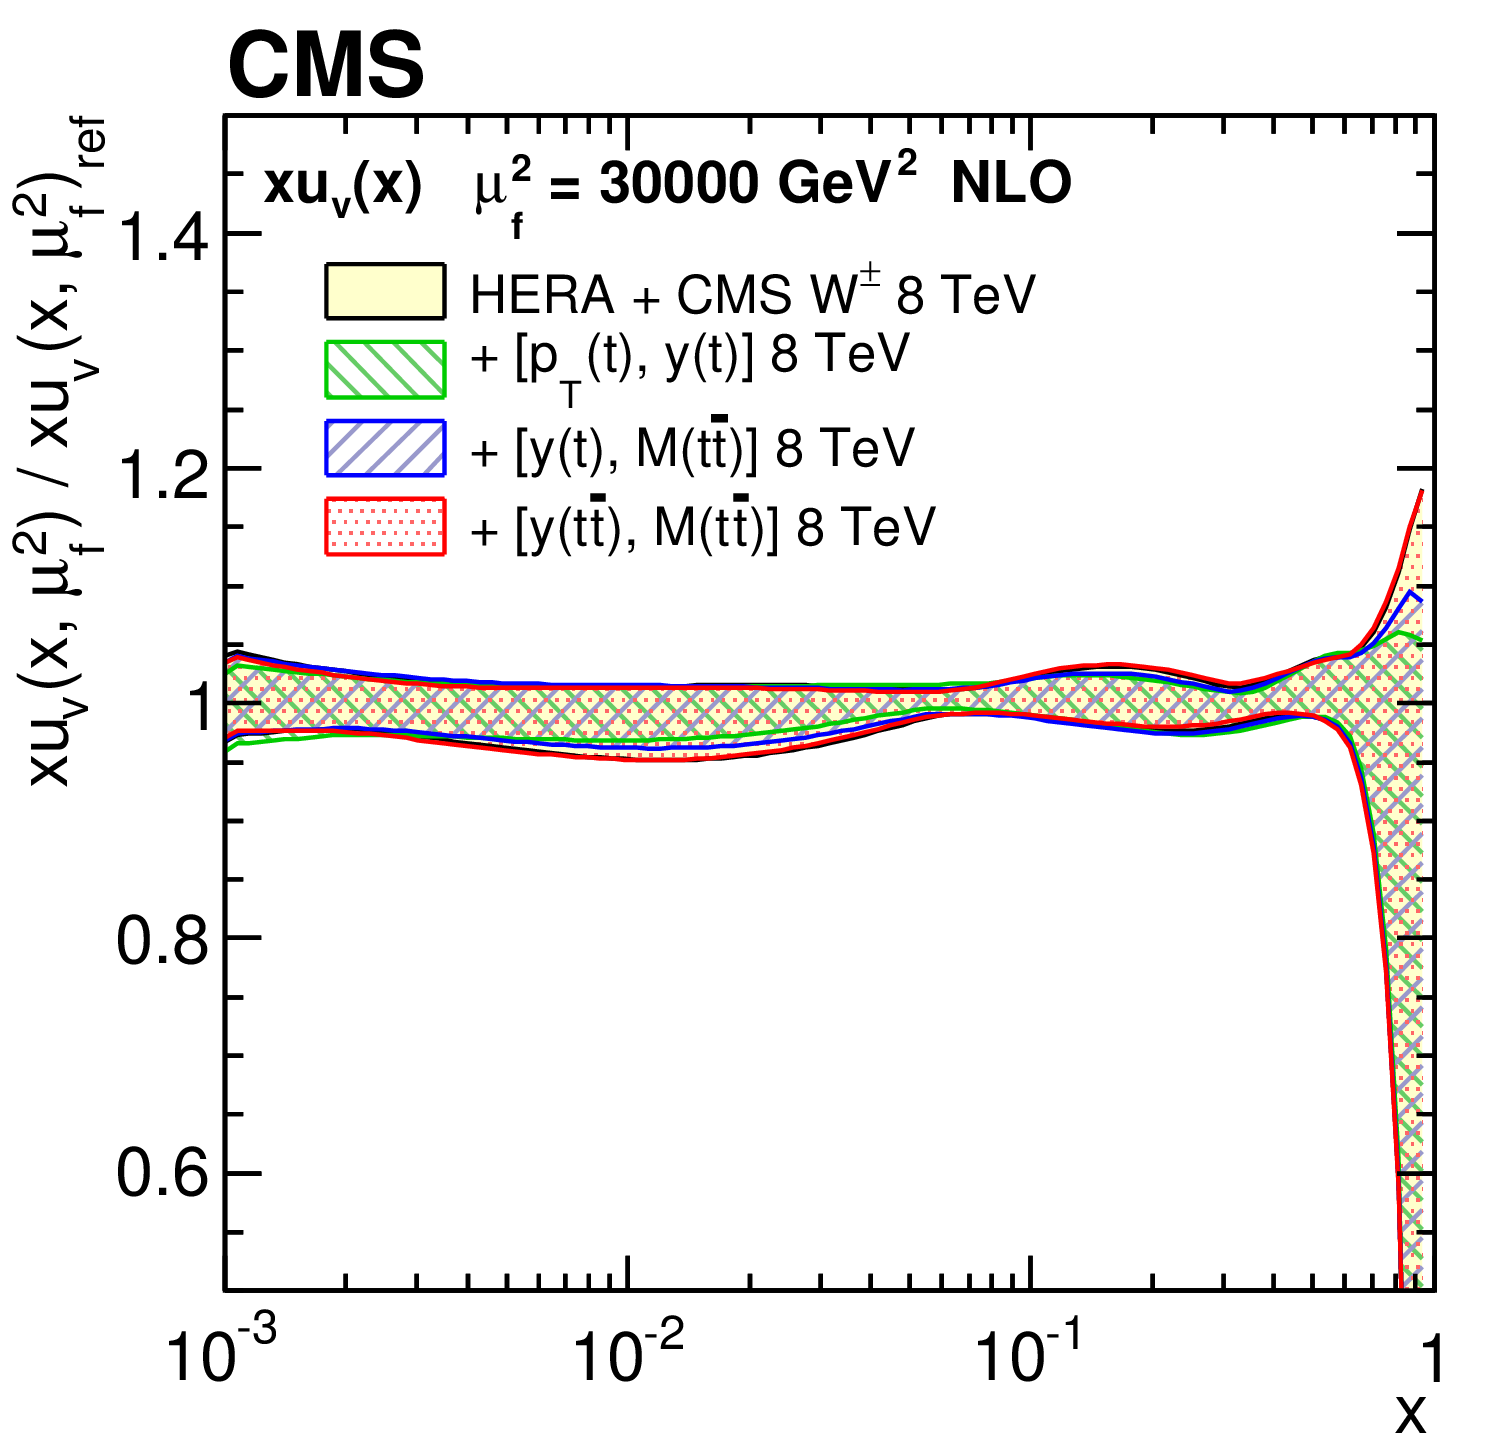
Figure 14-c:
The u valence quark PDF at $\mu _\mathrm {f}^2= $ 30 000 GeV$ ^2$, as obtained in all variants of the PDF fit, normalized to the results from the fit using the HERA DIS and CMS $ {\mathrm{ W } ^\pm } $ boson charge asymmetry measurements only. The shaded, hatched, and dotted areas represent the total uncertainty in each of the fits. |
png pdf |
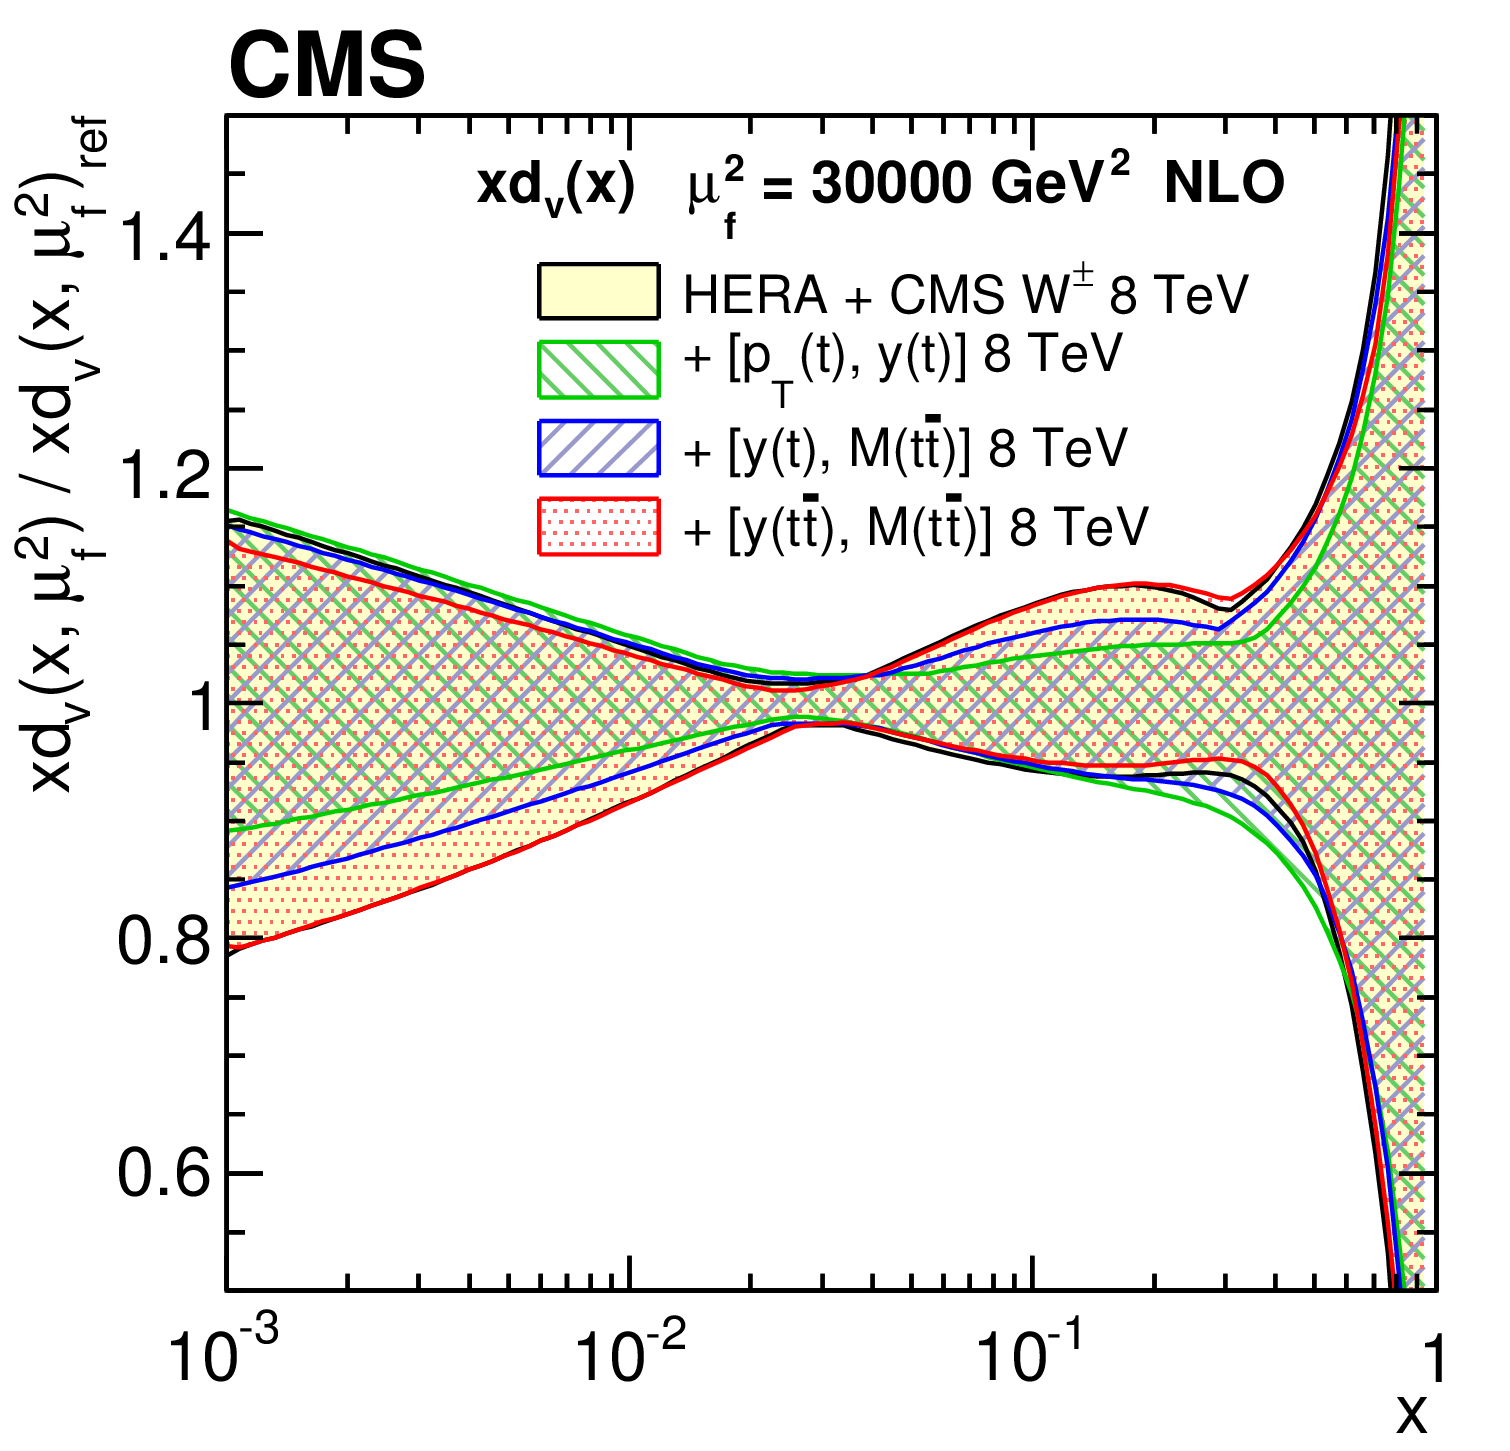
Figure 14-d:
The d valence quark PDF at $\mu _\mathrm {f}^2= $ 30 000 GeV$ ^2$, as obtained in all variants of the PDF fit, normalized to the results from the fit using the HERA DIS and CMS $ {\mathrm{ W } ^\pm } $ boson charge asymmetry measurements only. The shaded, hatched, and dotted areas represent the total uncertainty in each of the fits. |
png pdf |
Figure 15:
Relative total uncertainties of the gluon (upper left), sea quark (upper right), u valence quark (lower left), and d valence quark (lower right) distributions at $\mu _\mathrm {f}^2= $ 30 000 GeV$ ^2$, shown by shaded, hatched, and dotted areas, as obtained in all variants of the PDF fit. |
png pdf |
Figure 15-a:
Relative total uncertainties of the gluon distribution at $\mu _\mathrm {f}^2= $ 30 000 GeV$ ^2$, shown by shaded, hatched, and dotted areas, as obtained in all variants of the PDF fit. |
png pdf |
Figure 15-b:
Relative total uncertainties of the sea quark distribution at $\mu _\mathrm {f}^2= $ 30 000 GeV$ ^2$, shown by shaded, hatched, and dotted areas, as obtained in all variants of the PDF fit. |
png pdf |
Figure 15-c:
Relative total uncertainties of the u valence quark distribution at $\mu _\mathrm {f}^2= $ 30 000 GeV$ ^2$, shown by shaded, hatched, and dotted areas, as obtained in all variants of the PDF fit. |
png pdf |
Figure 15-d:
Relative total uncertainties of the d valence quark distribution at $\mu _\mathrm {f}^2= $ 30 000 GeV$ ^2$, shown by shaded, hatched, and dotted areas, as obtained in all variants of the PDF fit. |
png pdf |
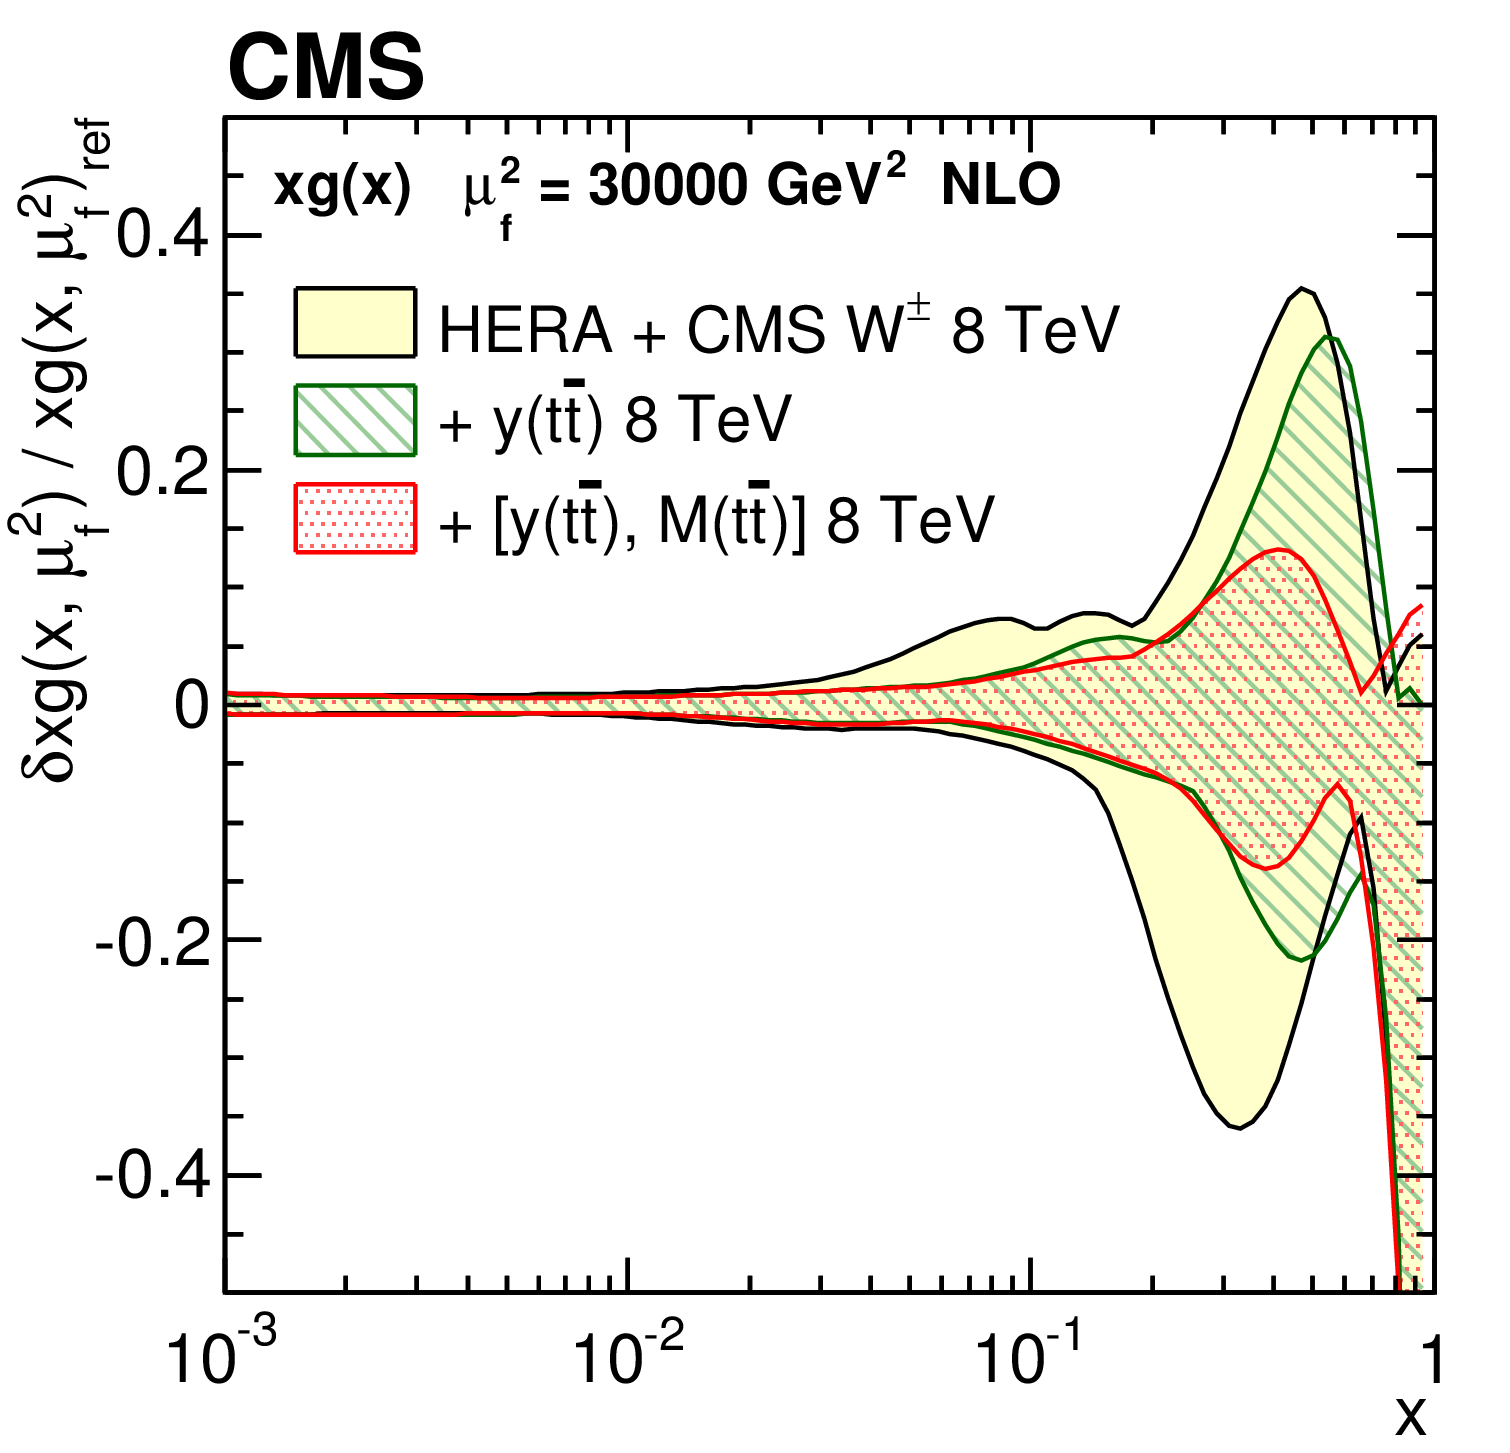
Figure 16:
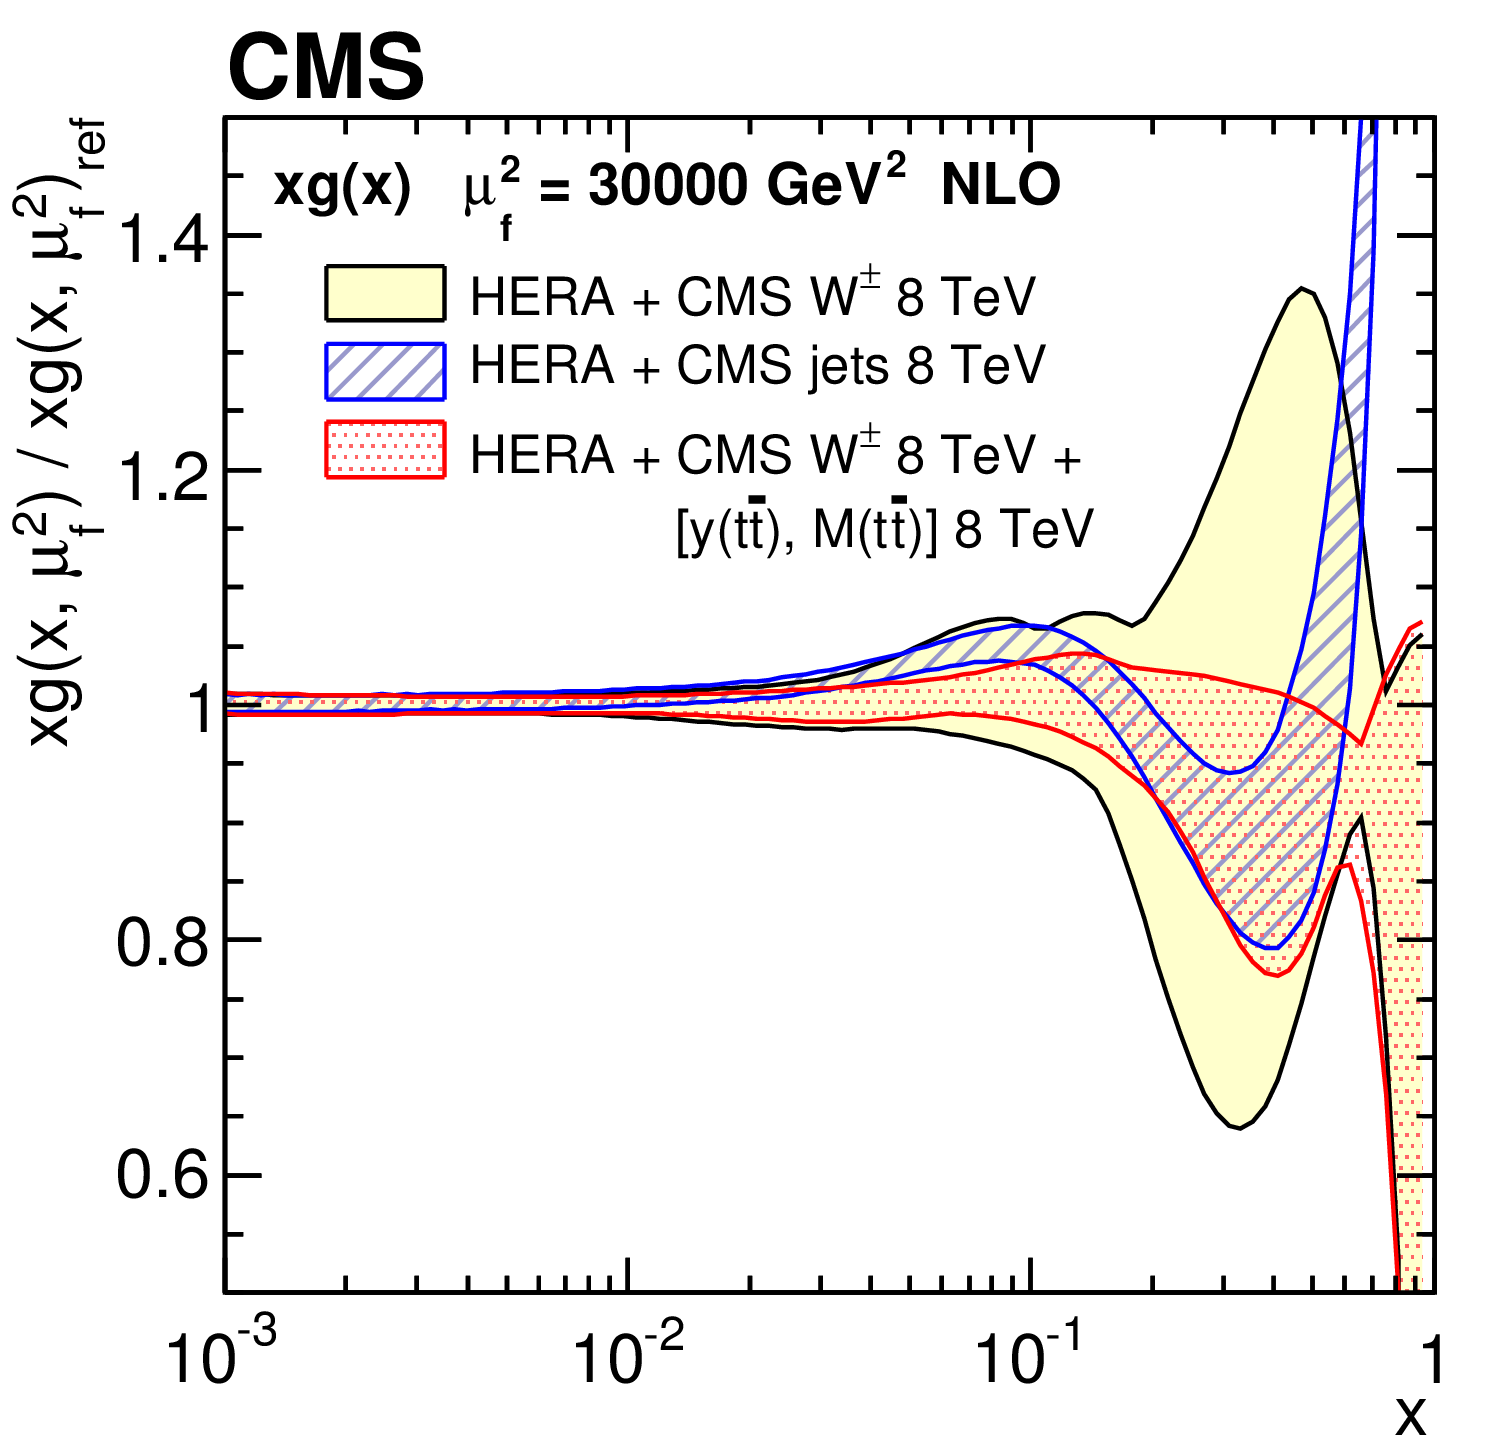
The gluon distribution at $\mu _\mathrm {f}^2= $ 30 000 GeV$ ^2$, as obtained from the PDF fit to the HERA DIS data and CMS $ {\mathrm{ W } ^\pm } $ boson charge asymmetry measurements (shaded area), the CMS inclusive jet production cross sections (hatched area), and the $ {\mathrm{ W } ^\pm } $ boson charge asymmetry plus the double-differential $ {\mathrm{ t } {}\mathrm{ \bar{t} } } $ cross section (dotted area). All presented PDFs are normalized to the results from the fit using the DIS and $ {\mathrm{ W } ^\pm } $ boson charge asymmetry measurements. The shaded, hatched, and dotted areas represent the total uncertainty in each of the fits. |
png pdf |
Figure 17:
The same as in Fig. 15 for the variants of the PDF fit using the single-differential $ {\mathrm{ t } {}\mathrm{ \bar{t} } } $ cross sections. |
png pdf |
Figure 17-a:
The same as in Fig. 15-a for the variants of the PDF fit using the single-differential $ {\mathrm{ t } {}\mathrm{ \bar{t} } } $ cross sections. |
png pdf |
Figure 17-b:
The same as in Fig. 15-b for the variants of the PDF fit using the single-differential $ {\mathrm{ t } {}\mathrm{ \bar{t} } } $ cross sections. |
png pdf |
Figure 17-c:
The same as in Fig. 15-c for the variants of the PDF fit using the single-differential $ {\mathrm{ t } {}\mathrm{ \bar{t} } } $ cross sections. |
png pdf |
Figure 17-d:
The same as in Fig. 15-d for the variants of the PDF fit using the single-differential $ {\mathrm{ t } {}\mathrm{ \bar{t} } } $ cross sections. |
png pdf |
Figure 18:
Relative total uncertainties of the gluon distribution at $\mu _\mathrm {f}^2= $ 30 000 GeV$^2$, shown by shaded (or hatched) bands, as obtained in the PDF fit using the DIS and $ {\mathrm{ W } ^\pm } $ boson charge asymmetry data only, as well as single- and double-differential $ {\mathrm{ t } {}\mathrm{ \bar{t} } } $ cross sections. |

png pdf |
Figure 19:
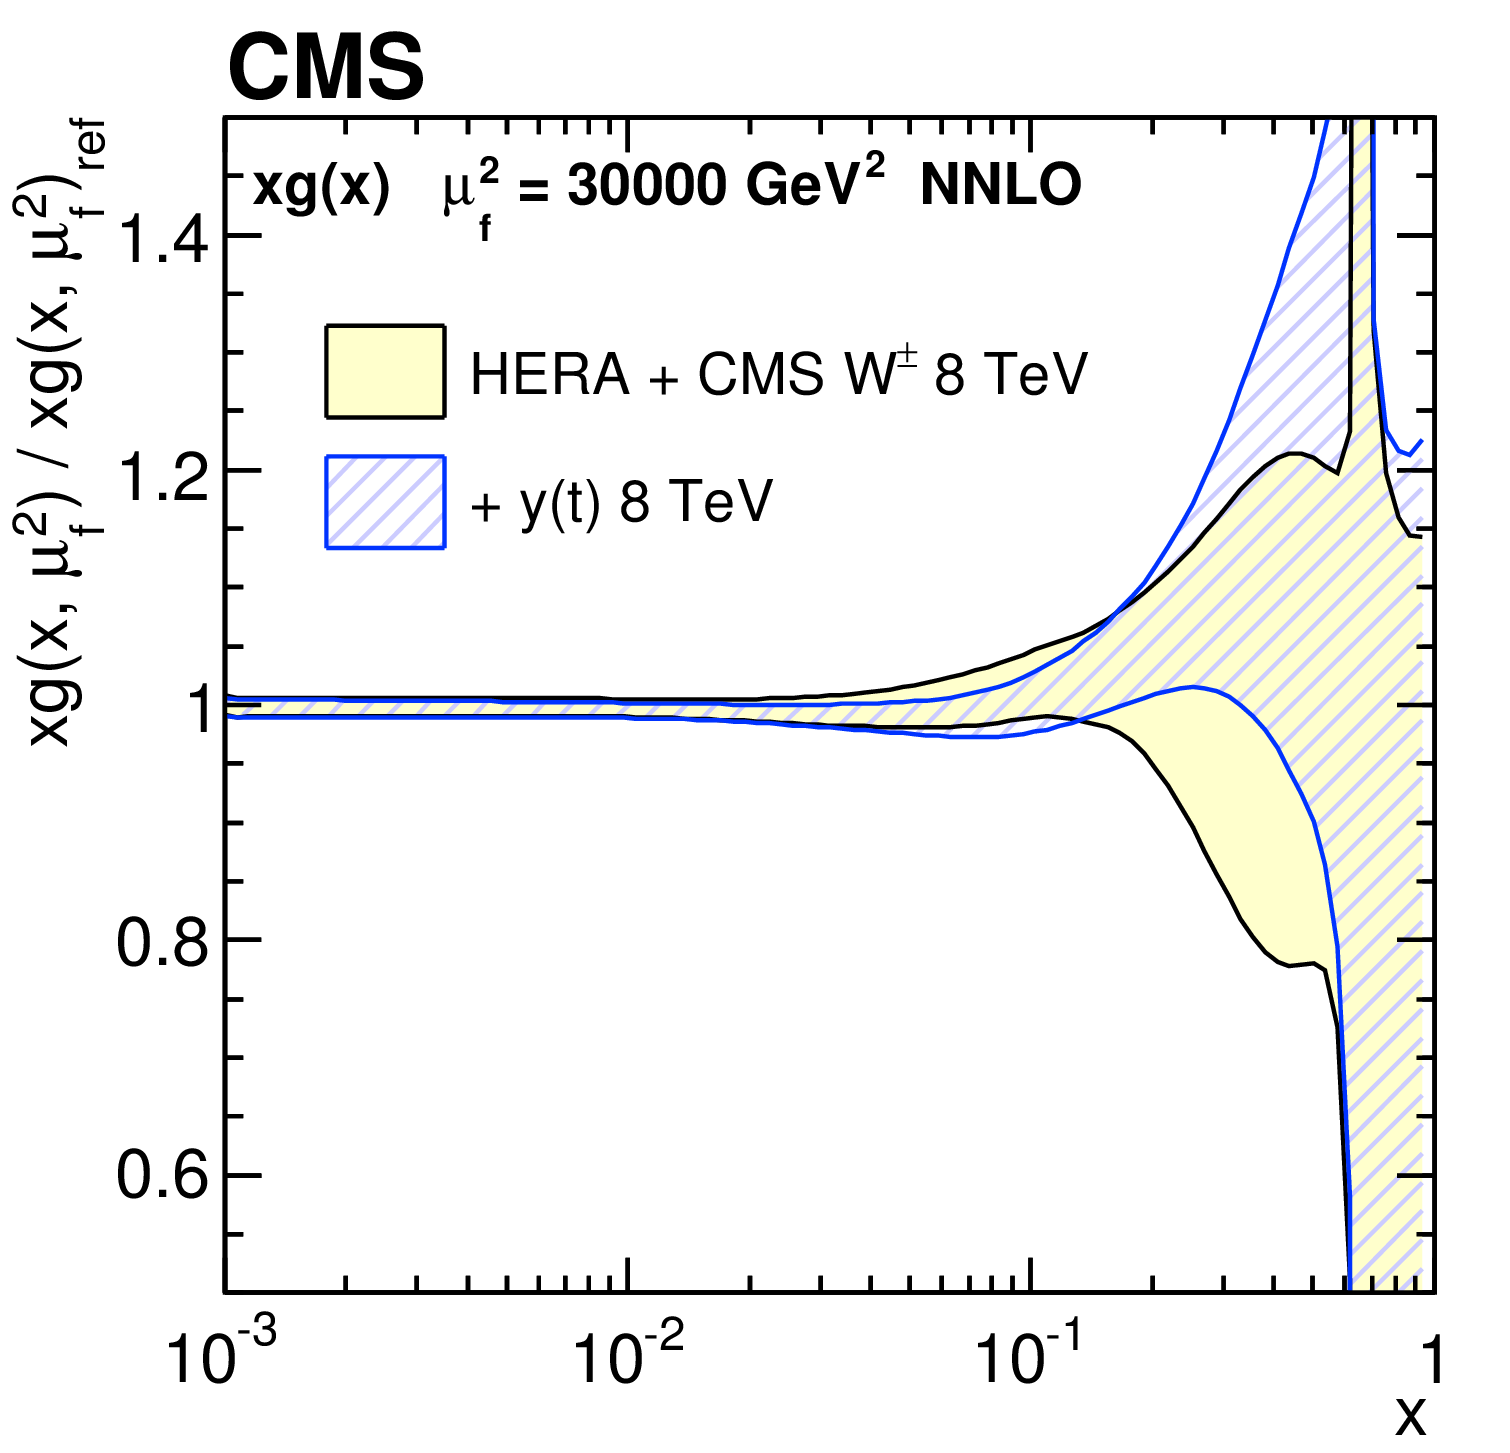
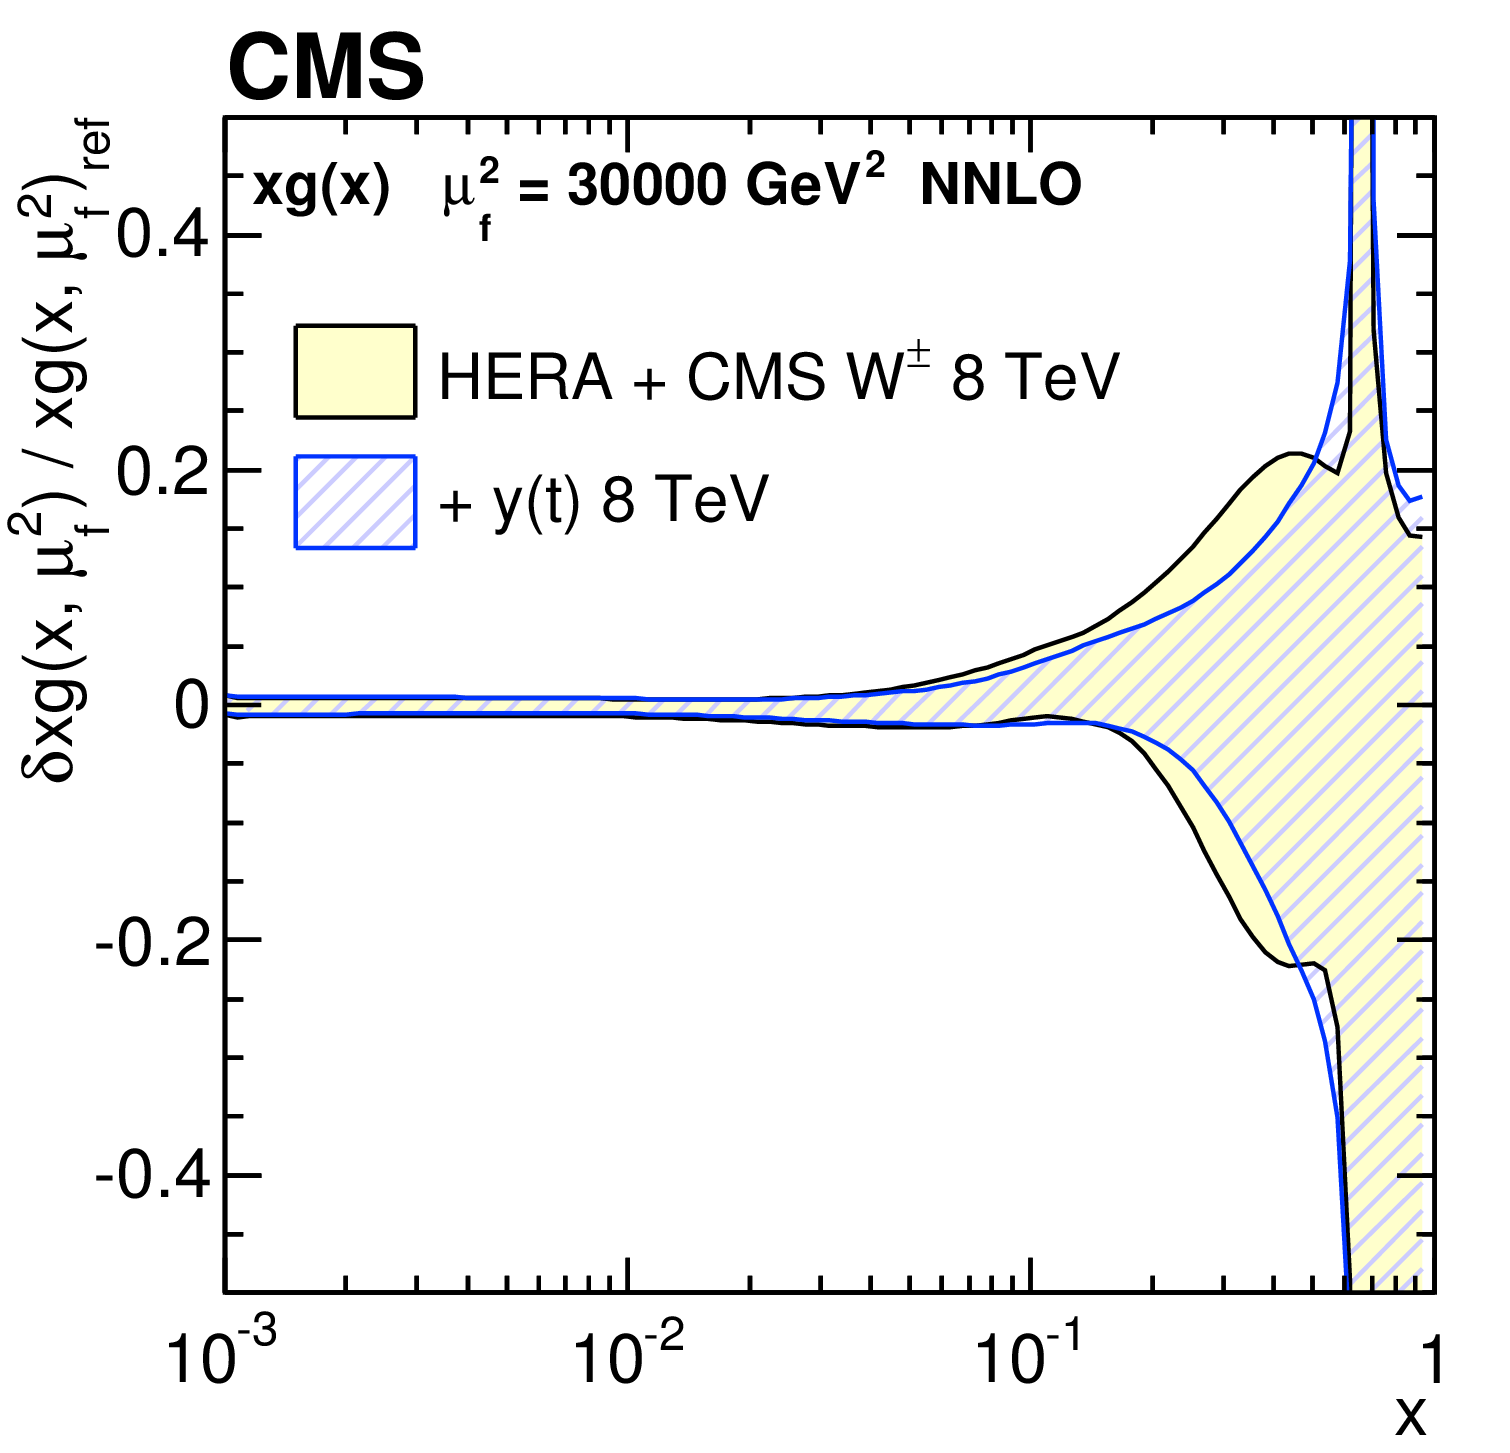
The gluon distribution (left) and its fractional total uncertainty (right) at $\mu _\mathrm {f}^2= $ 30 000 GeV$ ^2$, as obtained in the PDF fit at NNLO using the DIS and $ {\mathrm{ W } ^\pm } $ boson charge asymmetry data only, as well as $ {y(\mathrm{ t } )} $ cross sections. The distributions shown in the left panel are normalized to the results from the fit using the DIS and $ {\mathrm{ W } ^\pm } $ boson charge asymmetry data only. The total uncertainty of each distribution is shown by a shaded (or hatched) band. |
png pdf |
Figure 19-a:
The gluon distribution at $\mu _\mathrm {f}^2= $ 30 000 GeV$ ^2$, as obtained in the PDF fit at NNLO using the DIS and $ {\mathrm{ W } ^\pm } $ boson charge asymmetry data only, as well as $ {y(\mathrm{ t } )} $ cross sections. The distributions shown are normalized to the results from the fit using the DIS and $ {\mathrm{ W } ^\pm } $ boson charge asymmetry data only. The total uncertainty of each distribution is shown by a shaded (or hatched) band. |
png pdf |
Figure 19-b:
The fractional total uncertainty of the gluon distribution at $\mu _\mathrm {f}^2= $ 30 000 GeV$ ^2$, as obtained in the PDF fit at NNLO using the DIS and $ {\mathrm{ W } ^\pm } $ boson charge asymmetry data only, as well as $ {y(\mathrm{ t } )} $ cross sections. The total uncertainty of each distribution is shown by a shaded (or hatched) band. |
| Tables | |
png pdf |
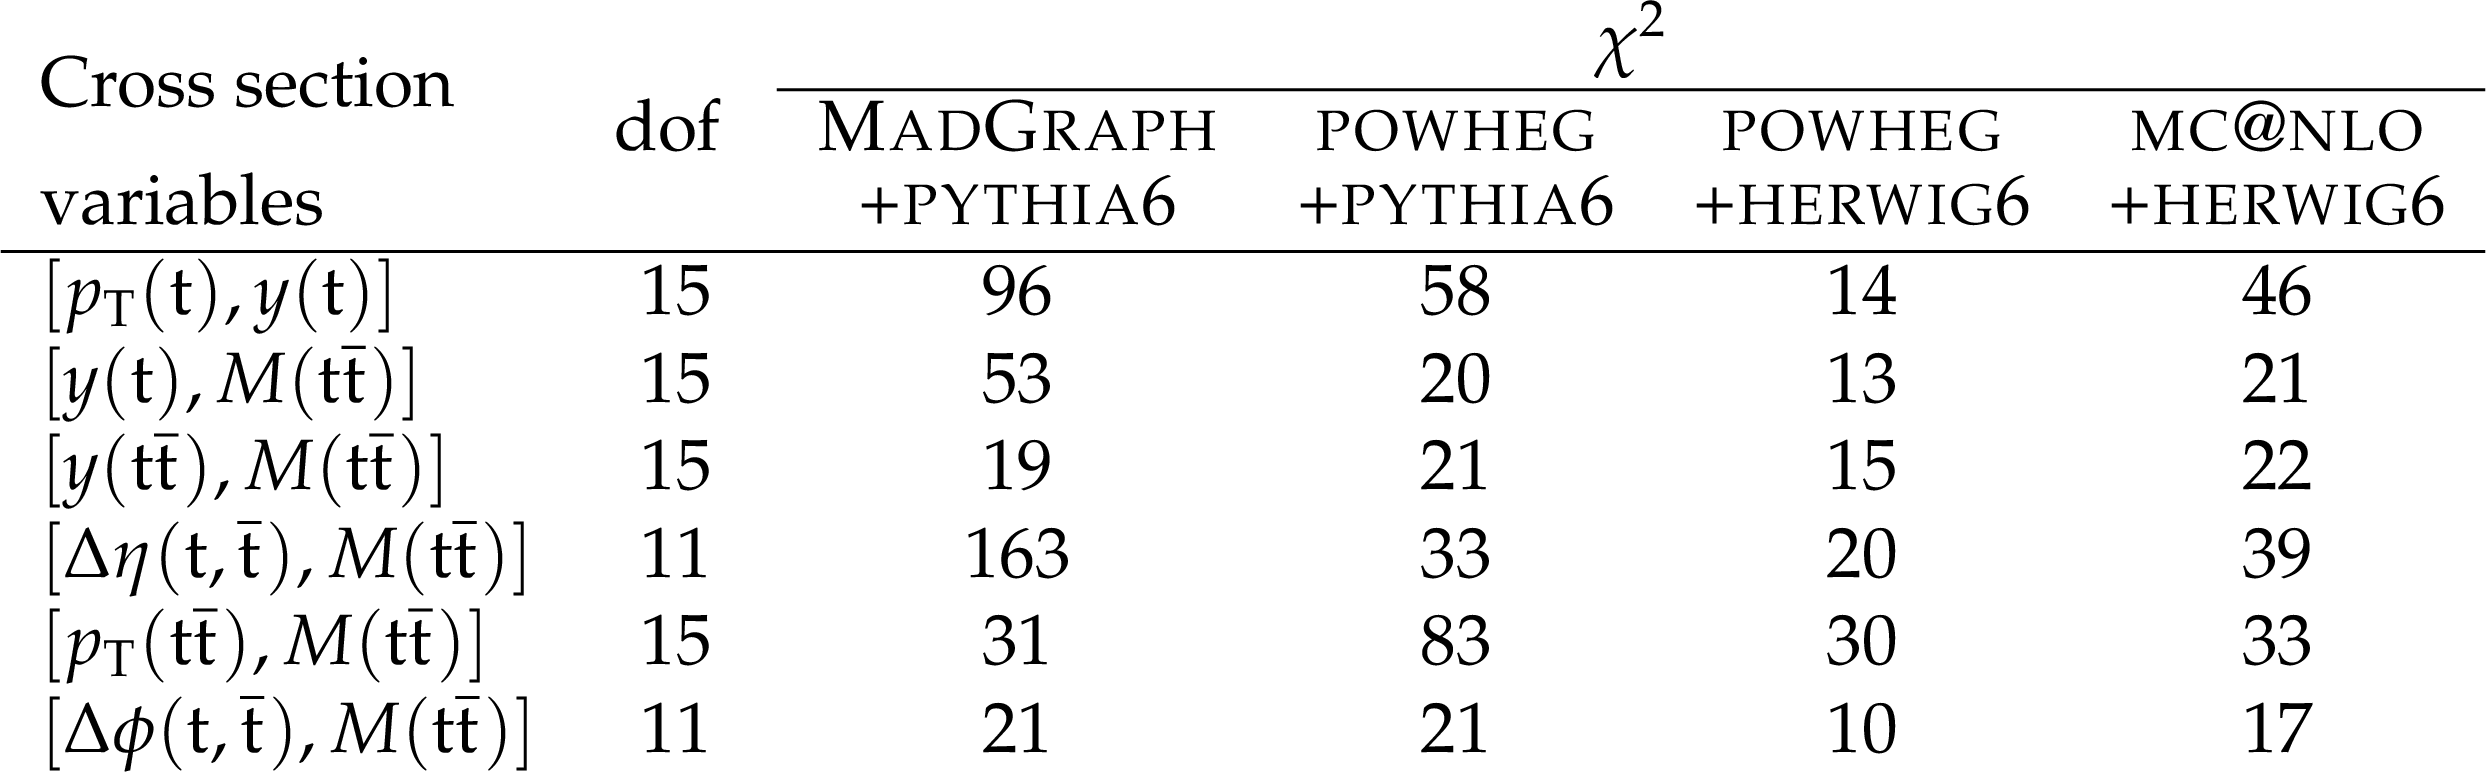
Table 1:
The $ {\chi ^2} $ values and dof of the measured normalized double-differential $ {\mathrm{ t } {}\mathrm{ \bar{t} } } $ cross sections with respect to the various MC predictions. |
png pdf |
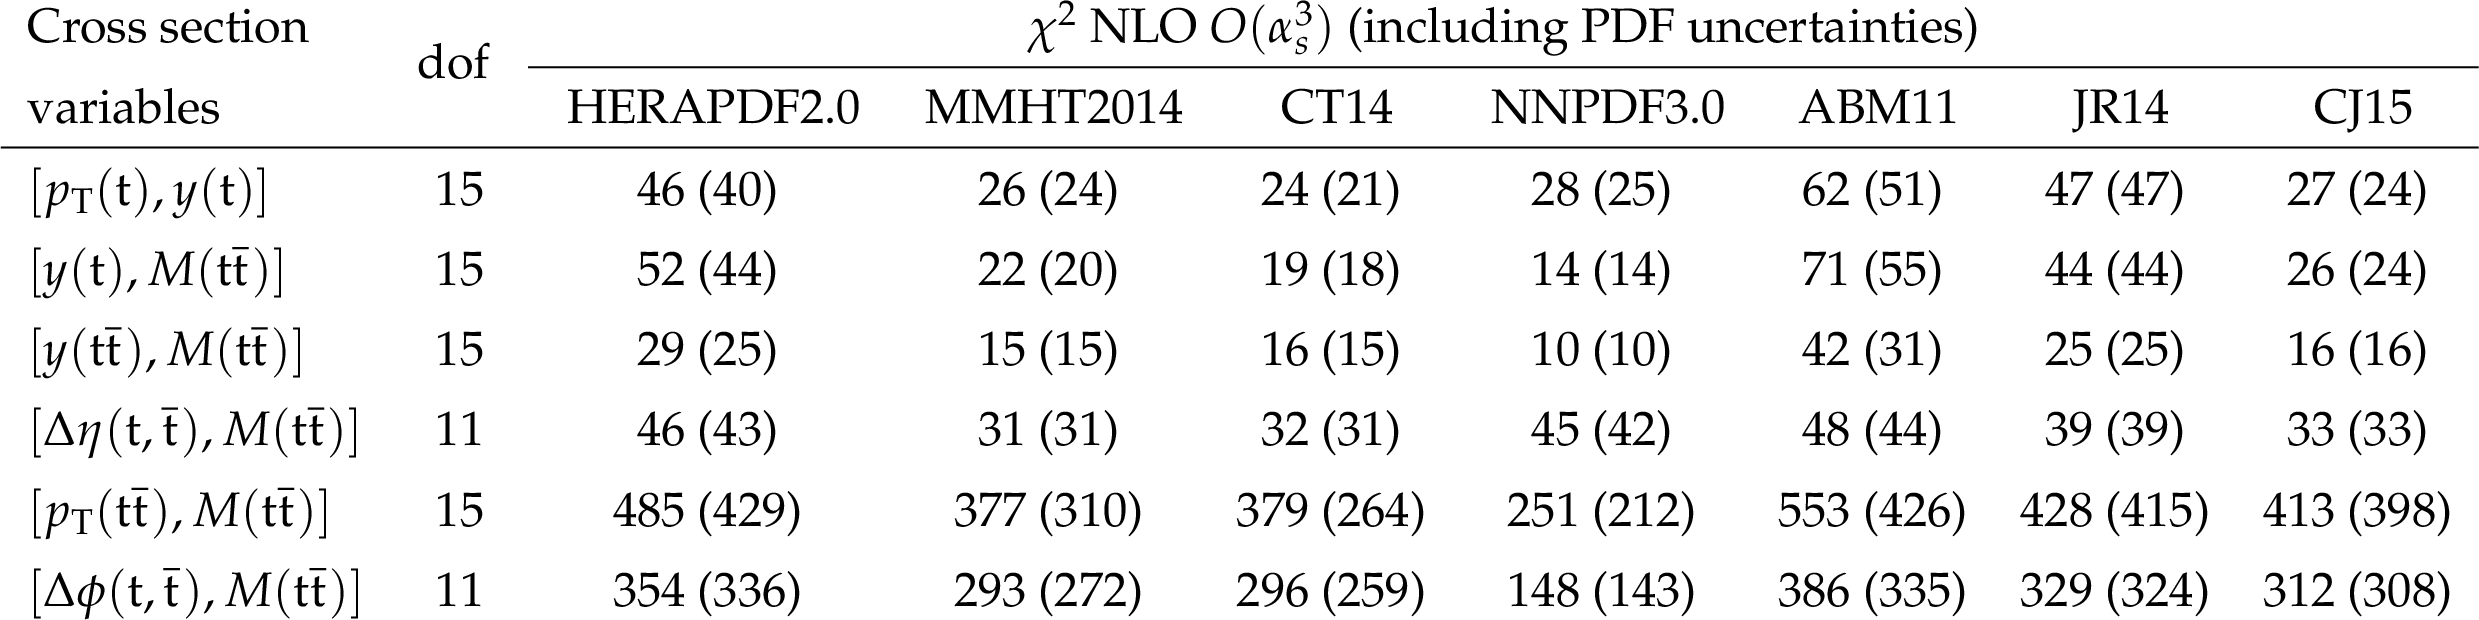
Table 2:
The $ {\chi ^2} $ values and dof of the double-differential normalized $ {\mathrm{ t } {}\mathrm{ \bar{t} } } $ cross sections with respect to NLO $\mathcal{O}(\alpha _s^3)$ theoretical calculations [18] using different PDF sets. The $ {\chi ^2} $ values that include PDF uncertainties are shown in parentheses. |

png pdf |
Table 3:
The $ {\chi ^2} $ values and dof of the double-differential normalized $ {\mathrm{ t } {}\mathrm{ \bar{t} } } $ cross sections with respect to approximate NNLO $\mathcal{O}(\alpha _s^4)$ theoretical calculations [19,4,69,70] using different PDF sets. |
png pdf |
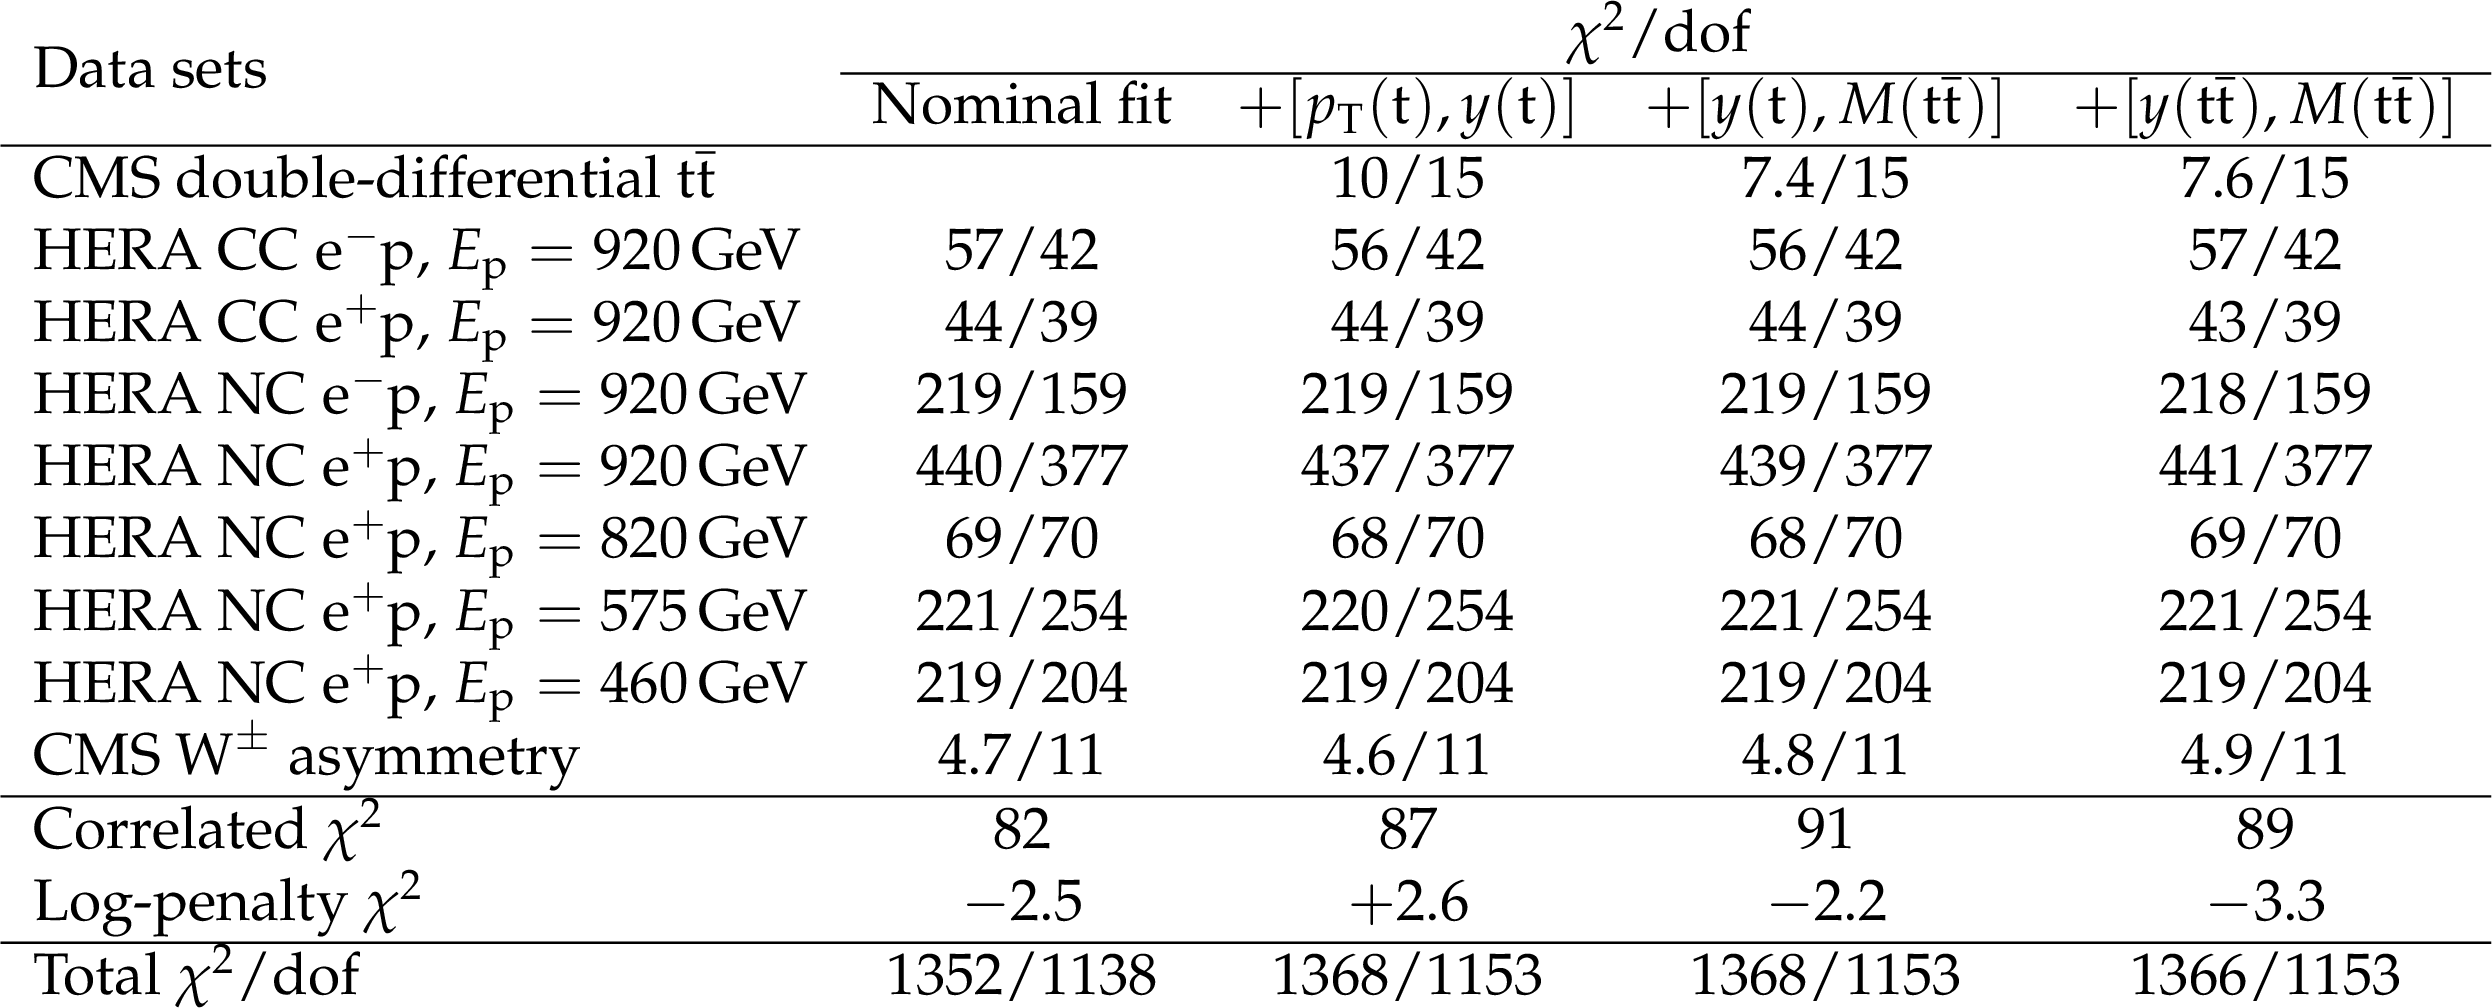
Table 4:
The global and partial $ {\chi ^2} $/dof values for all variants of the PDF fit. The variant of the fit that uses the DIS and $ {\mathrm{ W } ^\pm } $ boson charge asymmetry data only is denoted as `Nominal fit'. Each double-differential $ {\mathrm{ t } {}\mathrm{ \bar{t} } } $ cross section is added ($+$) to the nominal data, one at a time. For the HERA measurements, the energy of the proton beam, $E_{\mathrm{ p } }$, is listed for each data set, with the electron energy being $E_{\mathrm{ e } }=27.5 GeV $, CC and NC stand for charged and neutral current, respectively. The correlated $ {\chi ^2} $ and the log-penalty $\chi ^2$ entries refer to the $ {\chi ^2} $ contributions from the nuisance parameters and from the logarithmic term, respectively, as described in the text. |
png pdf |
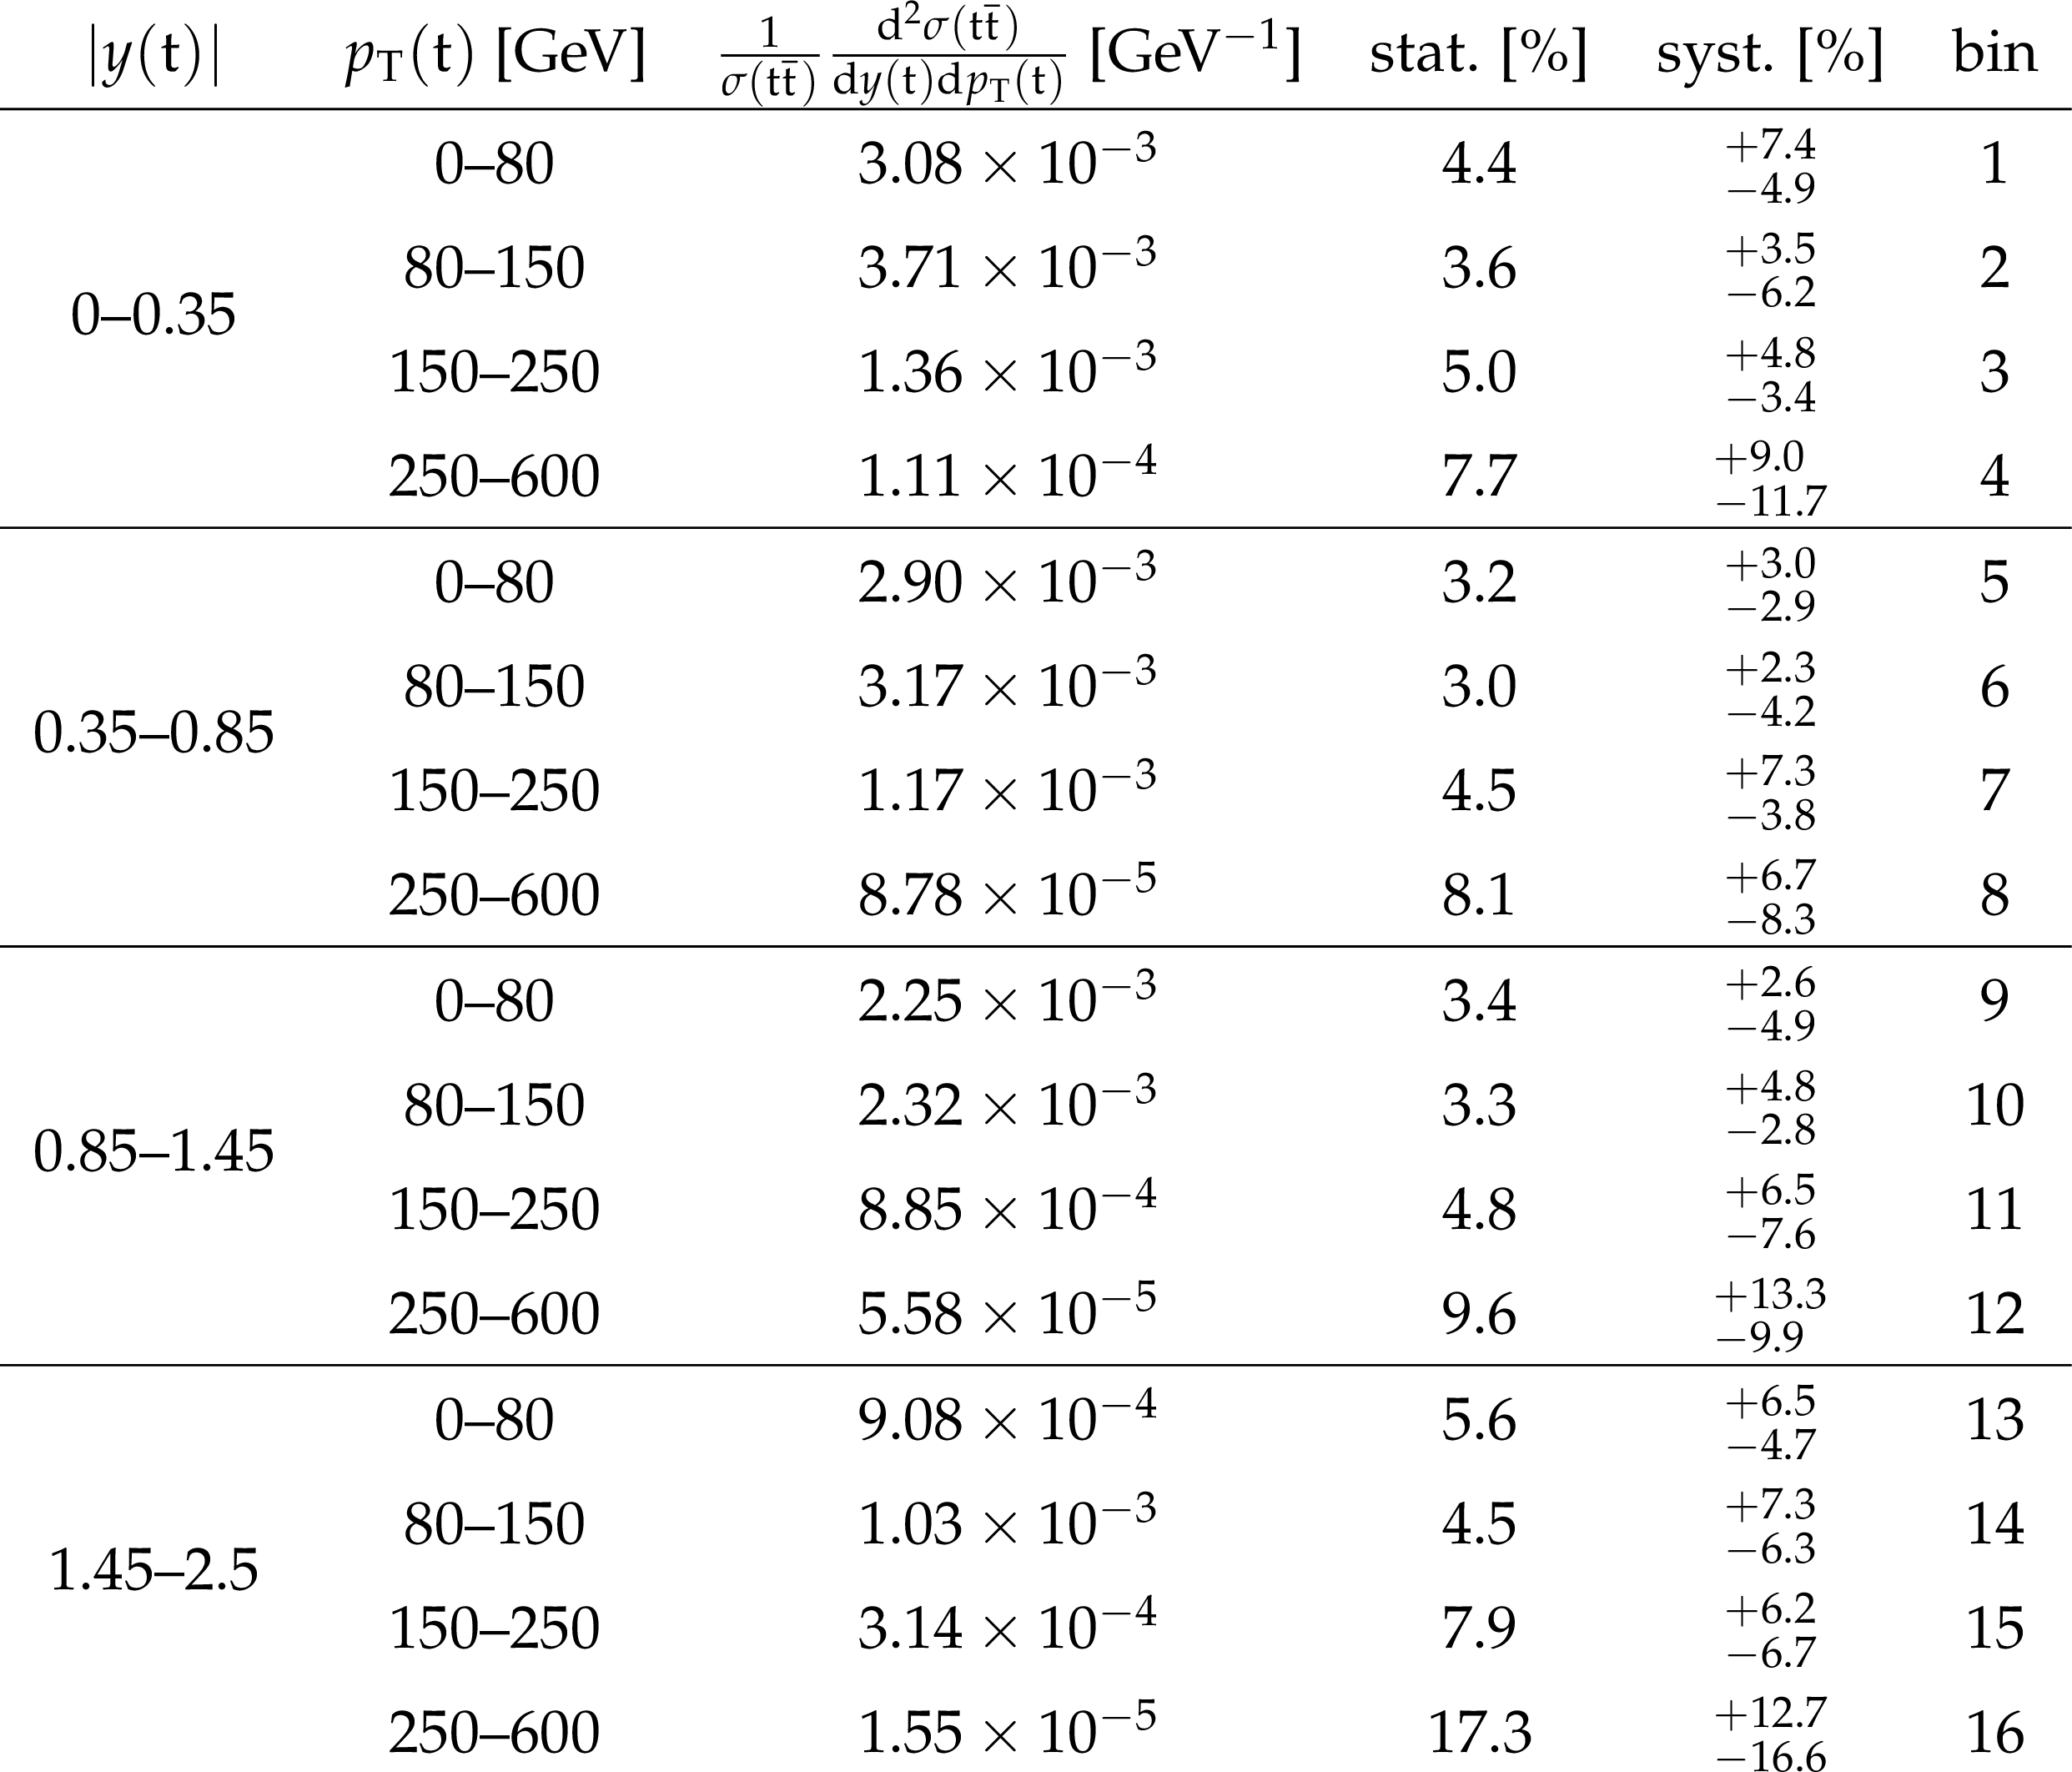
Table 5:
The measured normalized $ {\mathrm{ t } {}\mathrm{ \bar{t} } } $ double-differential cross sections in different bins of $ {y(\mathrm{ t } )} $ and $ { {p_{\mathrm {T}}} (\mathrm{ t } )} $ , along with their relative statistical and systematic uncertainties. |

png pdf |
Table 6:
The correlation matrix of statistical uncertainties for the normalized $ {\mathrm{ t } {}\mathrm{ \bar{t} } } $ double-differential cross sections as a function of $ {y(\mathrm{ t } )} $ and $ { {p_{\mathrm {T}}} (\mathrm{ t } )} $ . The values are expressed as percentages. For bin indices see Table 5. |

png pdf |
Table 7:
Sources and values of the relative systematic uncertainties in percent of the measured normalized $ {\mathrm{ t } {}\mathrm{ \bar{t} } } $ double-differential cross sections as a function of $ {y(\mathrm{ t } )} $ and $ { {p_{\mathrm {T}}} (\mathrm{ t } )} $ . For bin indices see Table 5. |
png pdf |
Table 8:
The measured normalized $ {\mathrm{ t } {}\mathrm{ \bar{t} } } $ double-differential cross sections in different bins of $ {M({\mathrm{ t } {}\mathrm{ \bar{t} } } )} $ and $ {y(\mathrm{ t } )} $ , along with their relative statistical and systematic uncertainties. |
png pdf |
Table 9:
The correlation matrix of statistical uncertainties for the normalized $ {\mathrm{ t } {}\mathrm{ \bar{t} } } $ double-differential cross sections as a function of $ {M({\mathrm{ t } {}\mathrm{ \bar{t} } } )} $ and $ {y(\mathrm{ t } )} $ . The values are expressed as percentages. For bin indices see Table 8. |
png pdf |
Table 10:
Sources and values of the relative systematic uncertainties in percent of the measured normalized $ {\mathrm{ t } {}\mathrm{ \bar{t} } } $ double-differential cross sections as a function of $ {M({\mathrm{ t } {}\mathrm{ \bar{t} } } )} $ and $ {y(\mathrm{ t } )} $ . For bin indices see Table 8. |
png pdf |
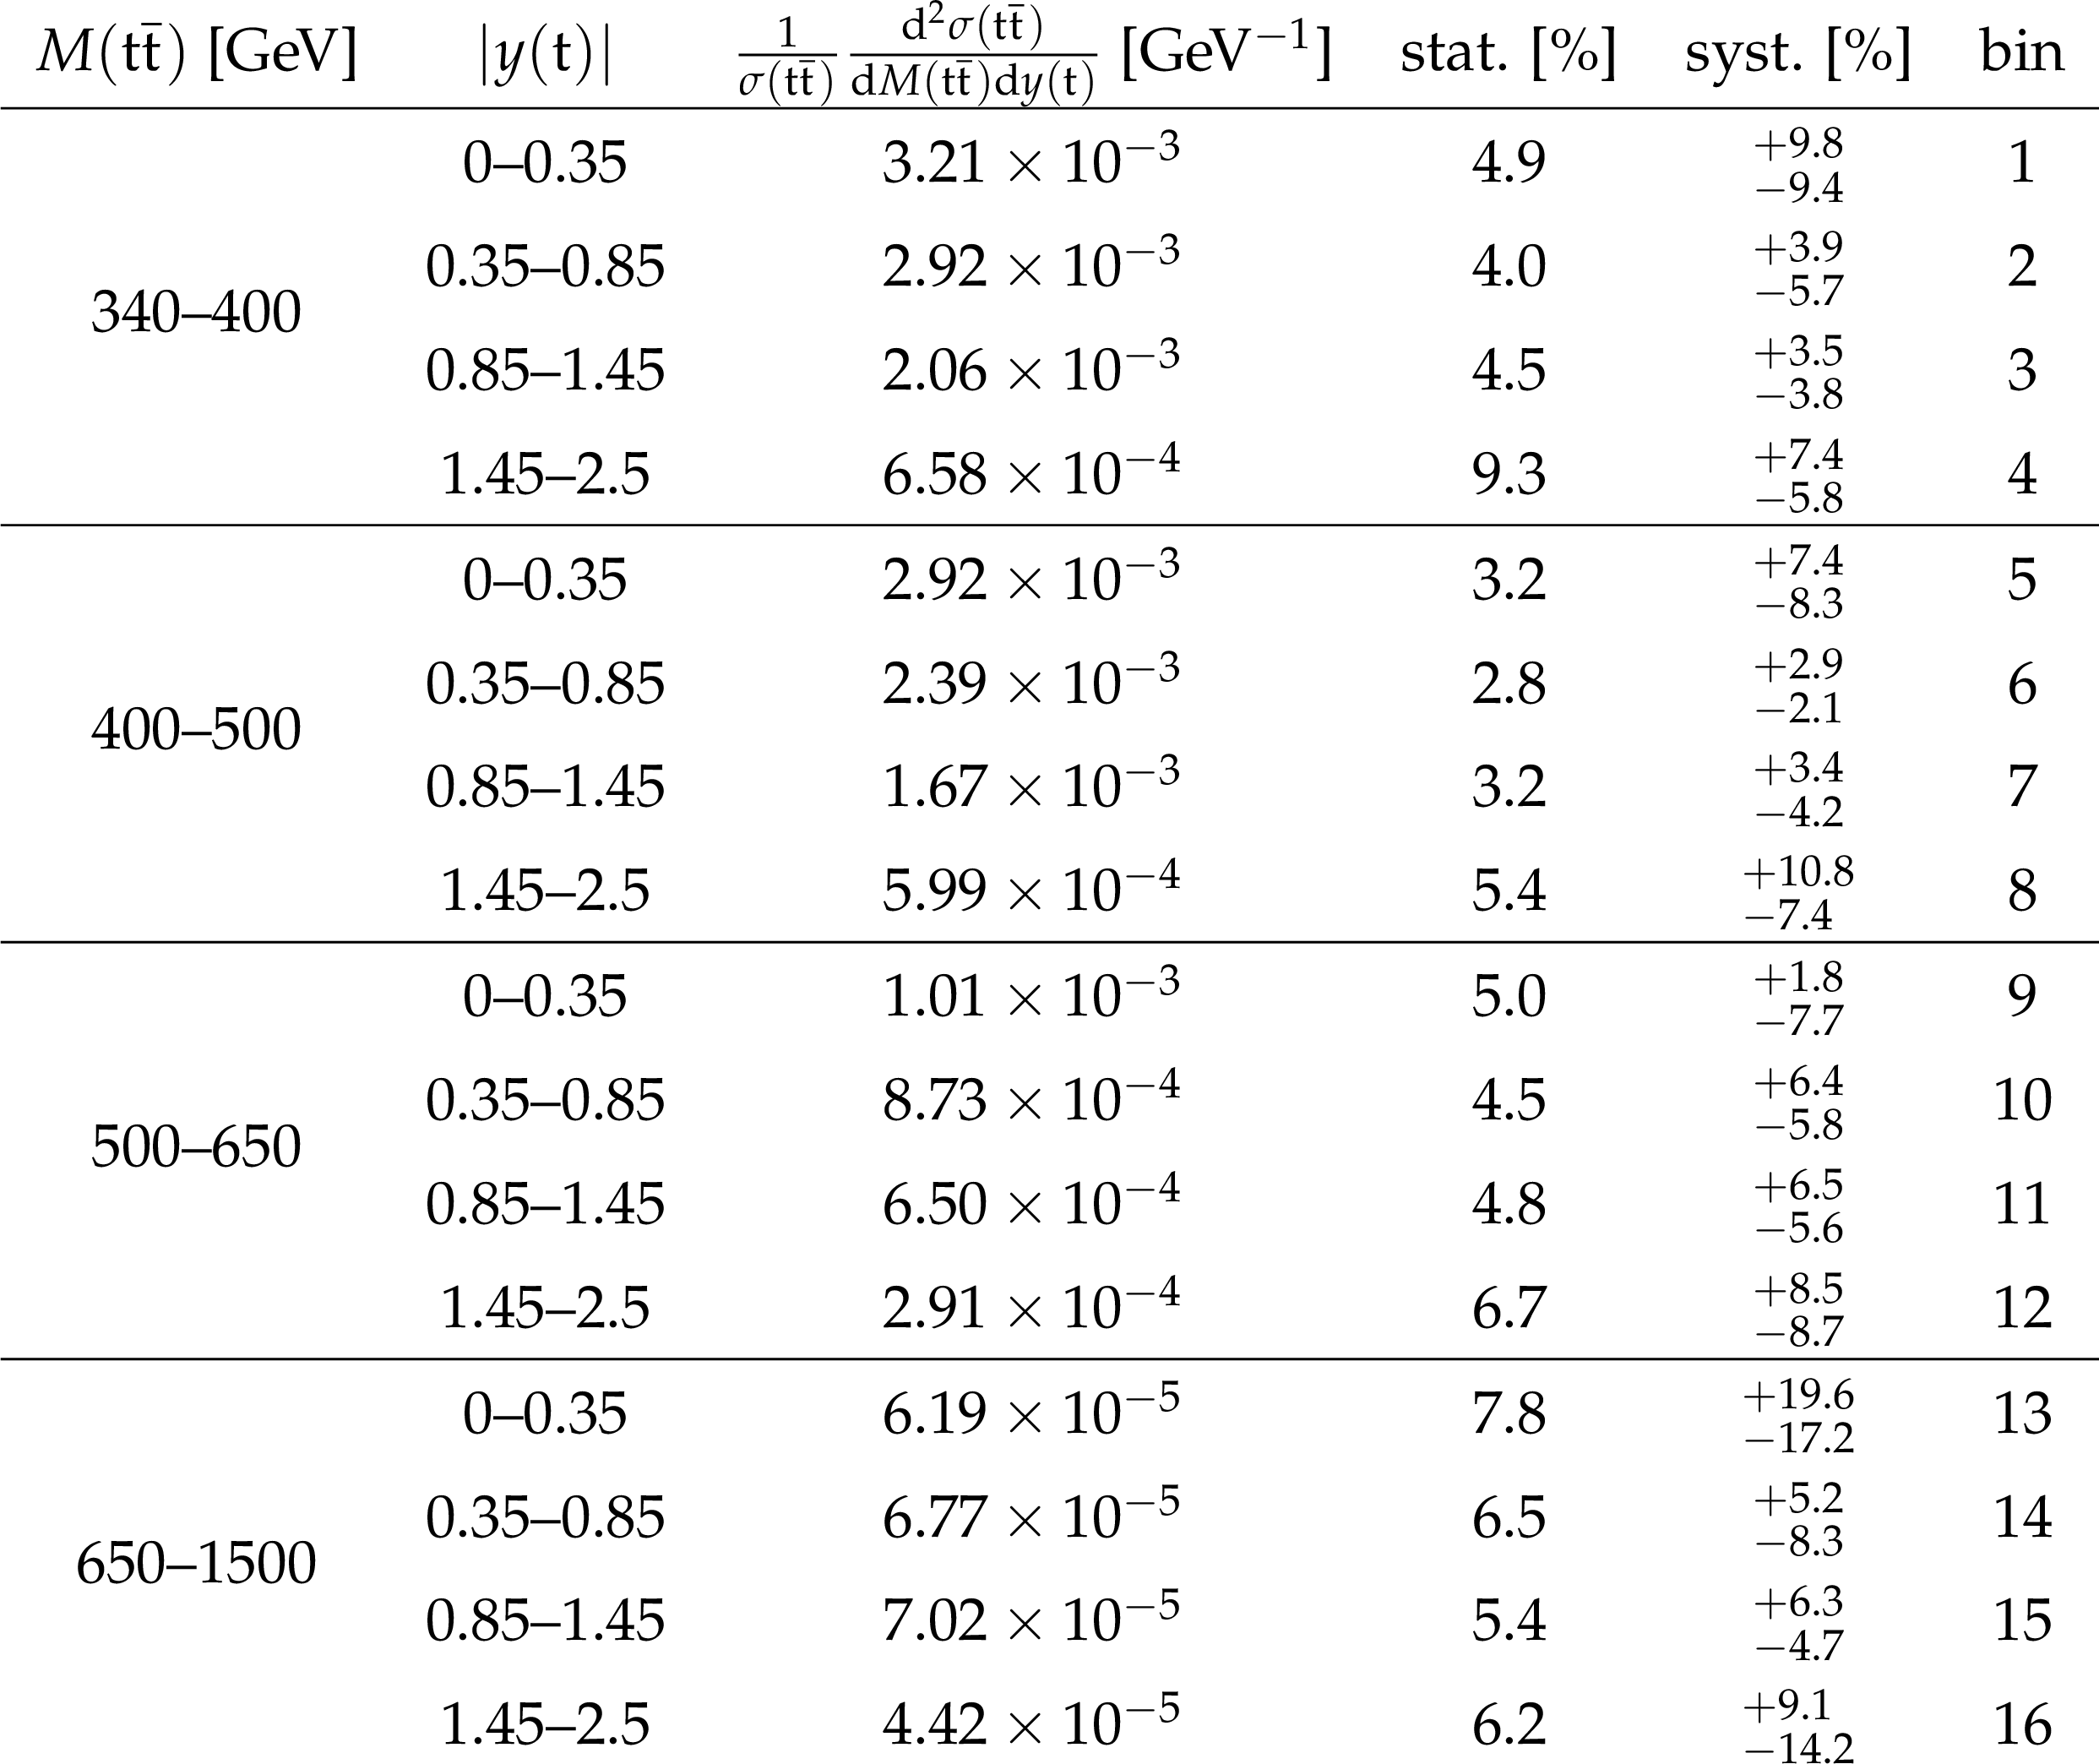
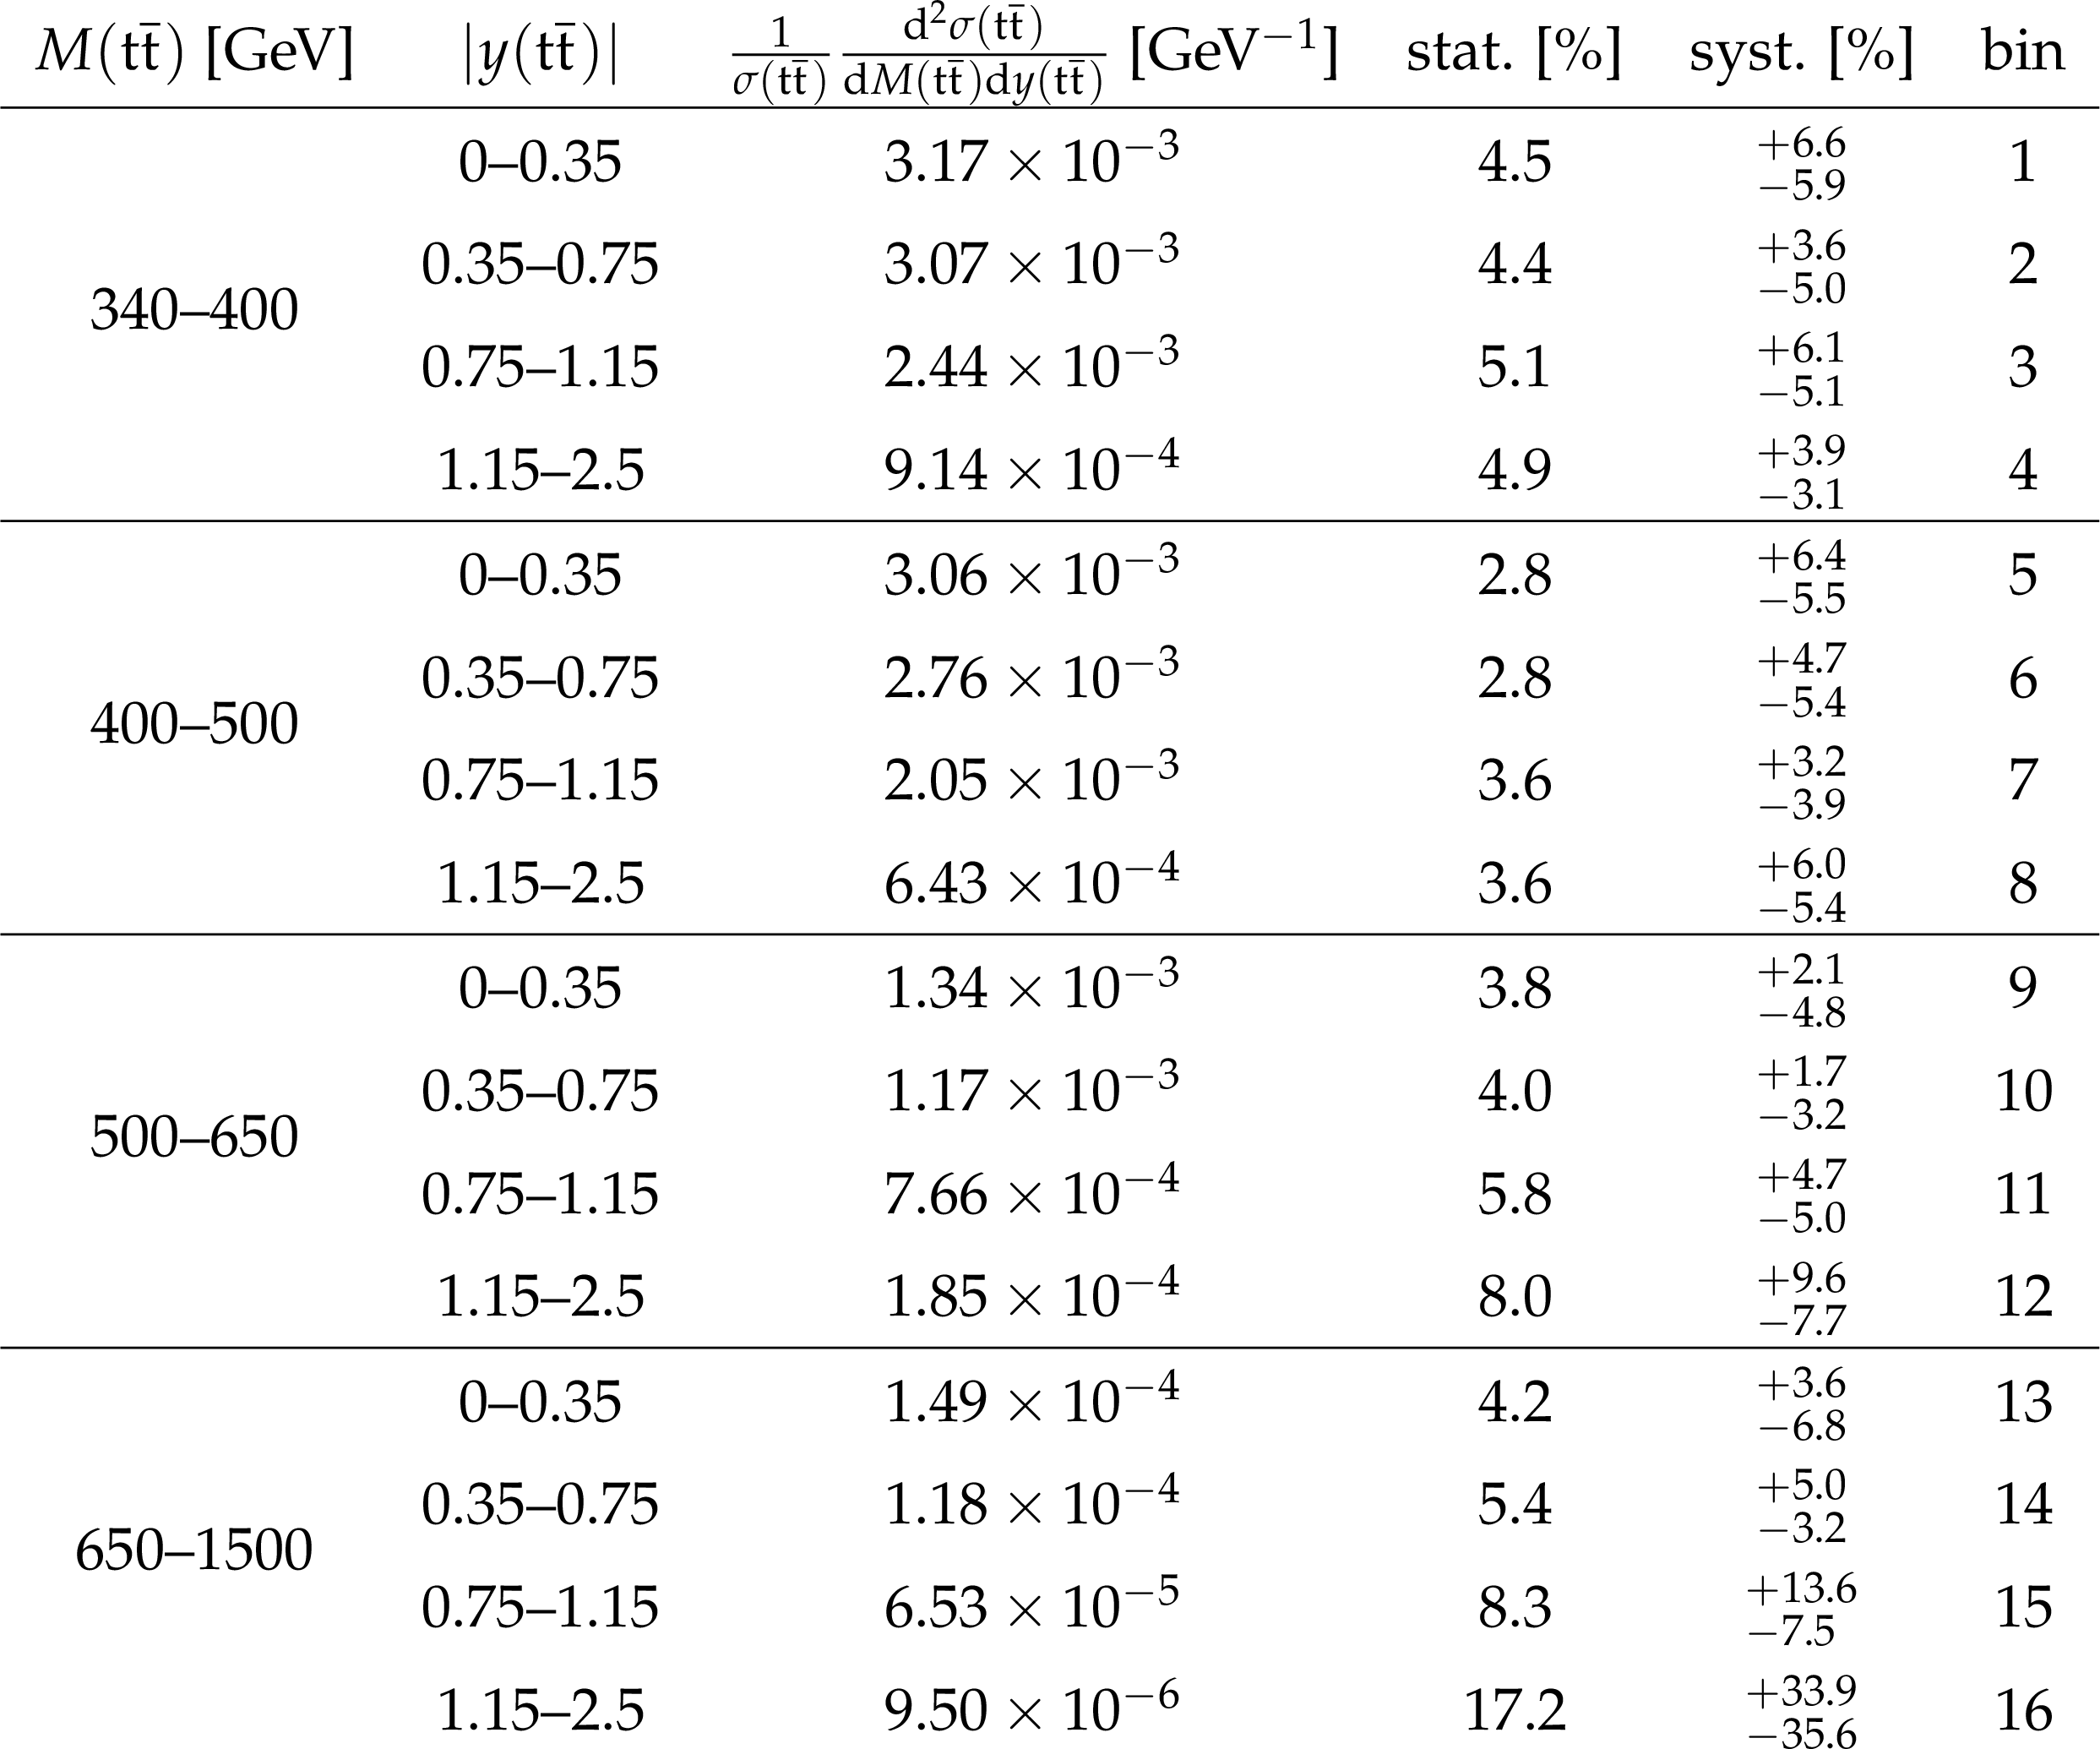
Table 11:
The measured normalized $ {\mathrm{ t } {}\mathrm{ \bar{t} } } $ double-differential cross sections in different bins of $ {M({\mathrm{ t } {}\mathrm{ \bar{t} } } )} $ and $ {y({\mathrm{ t } {}\mathrm{ \bar{t} } } )} $ , along with their relative statistical and systematic uncertainties. |
png pdf |
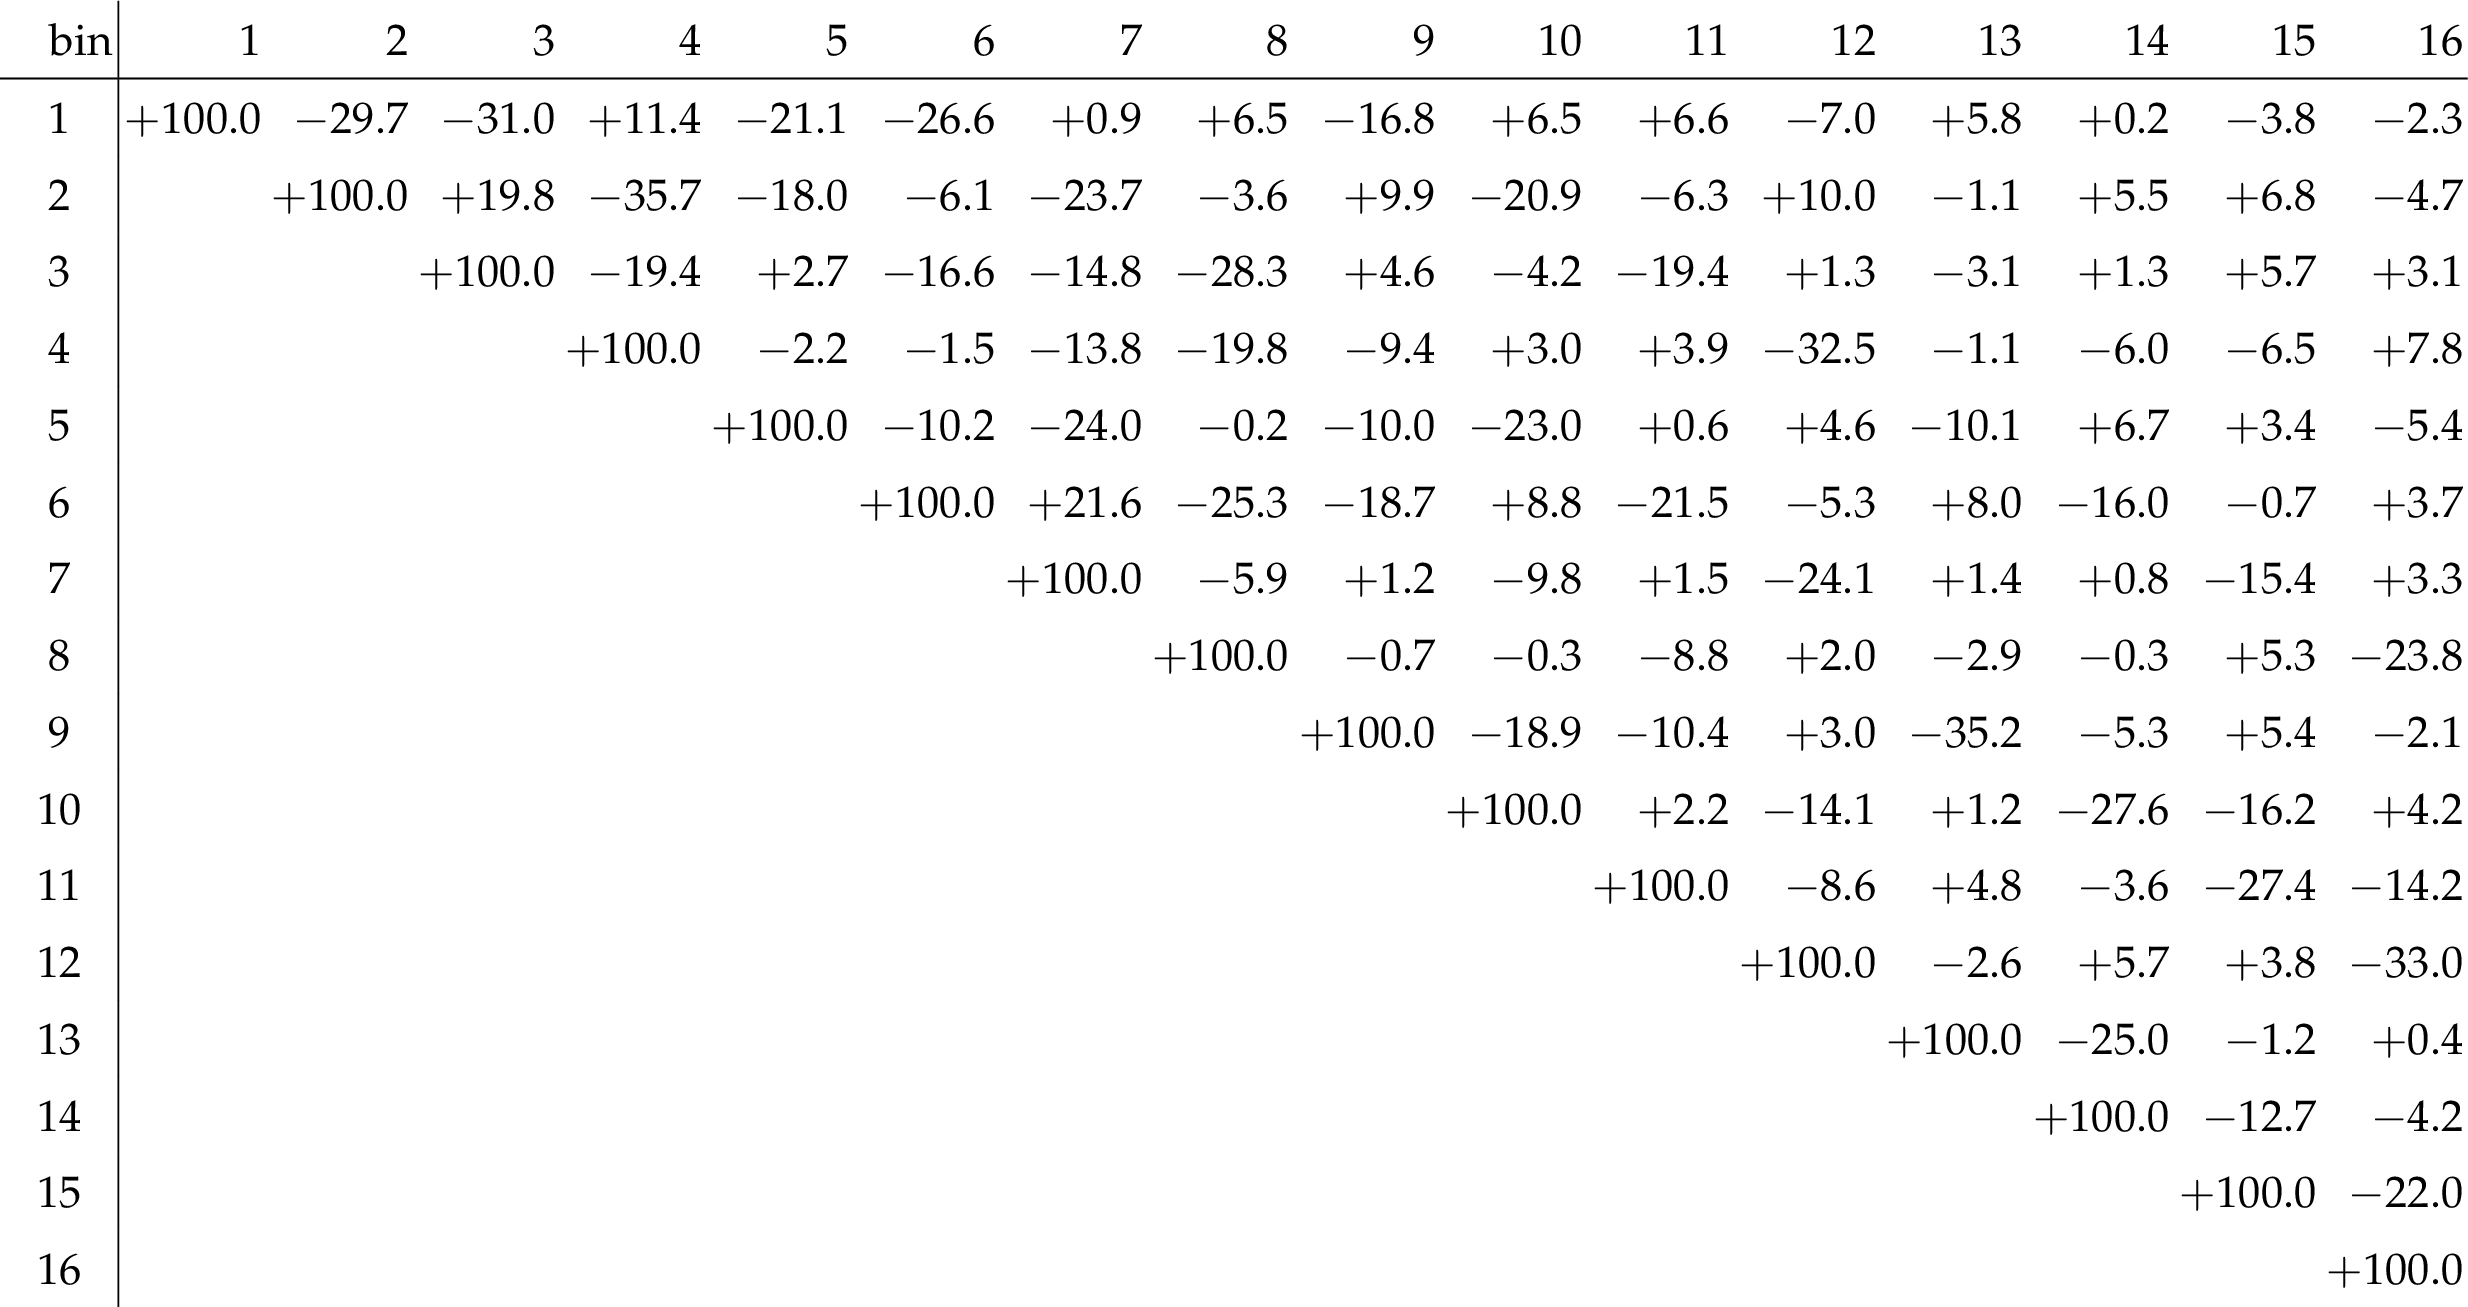
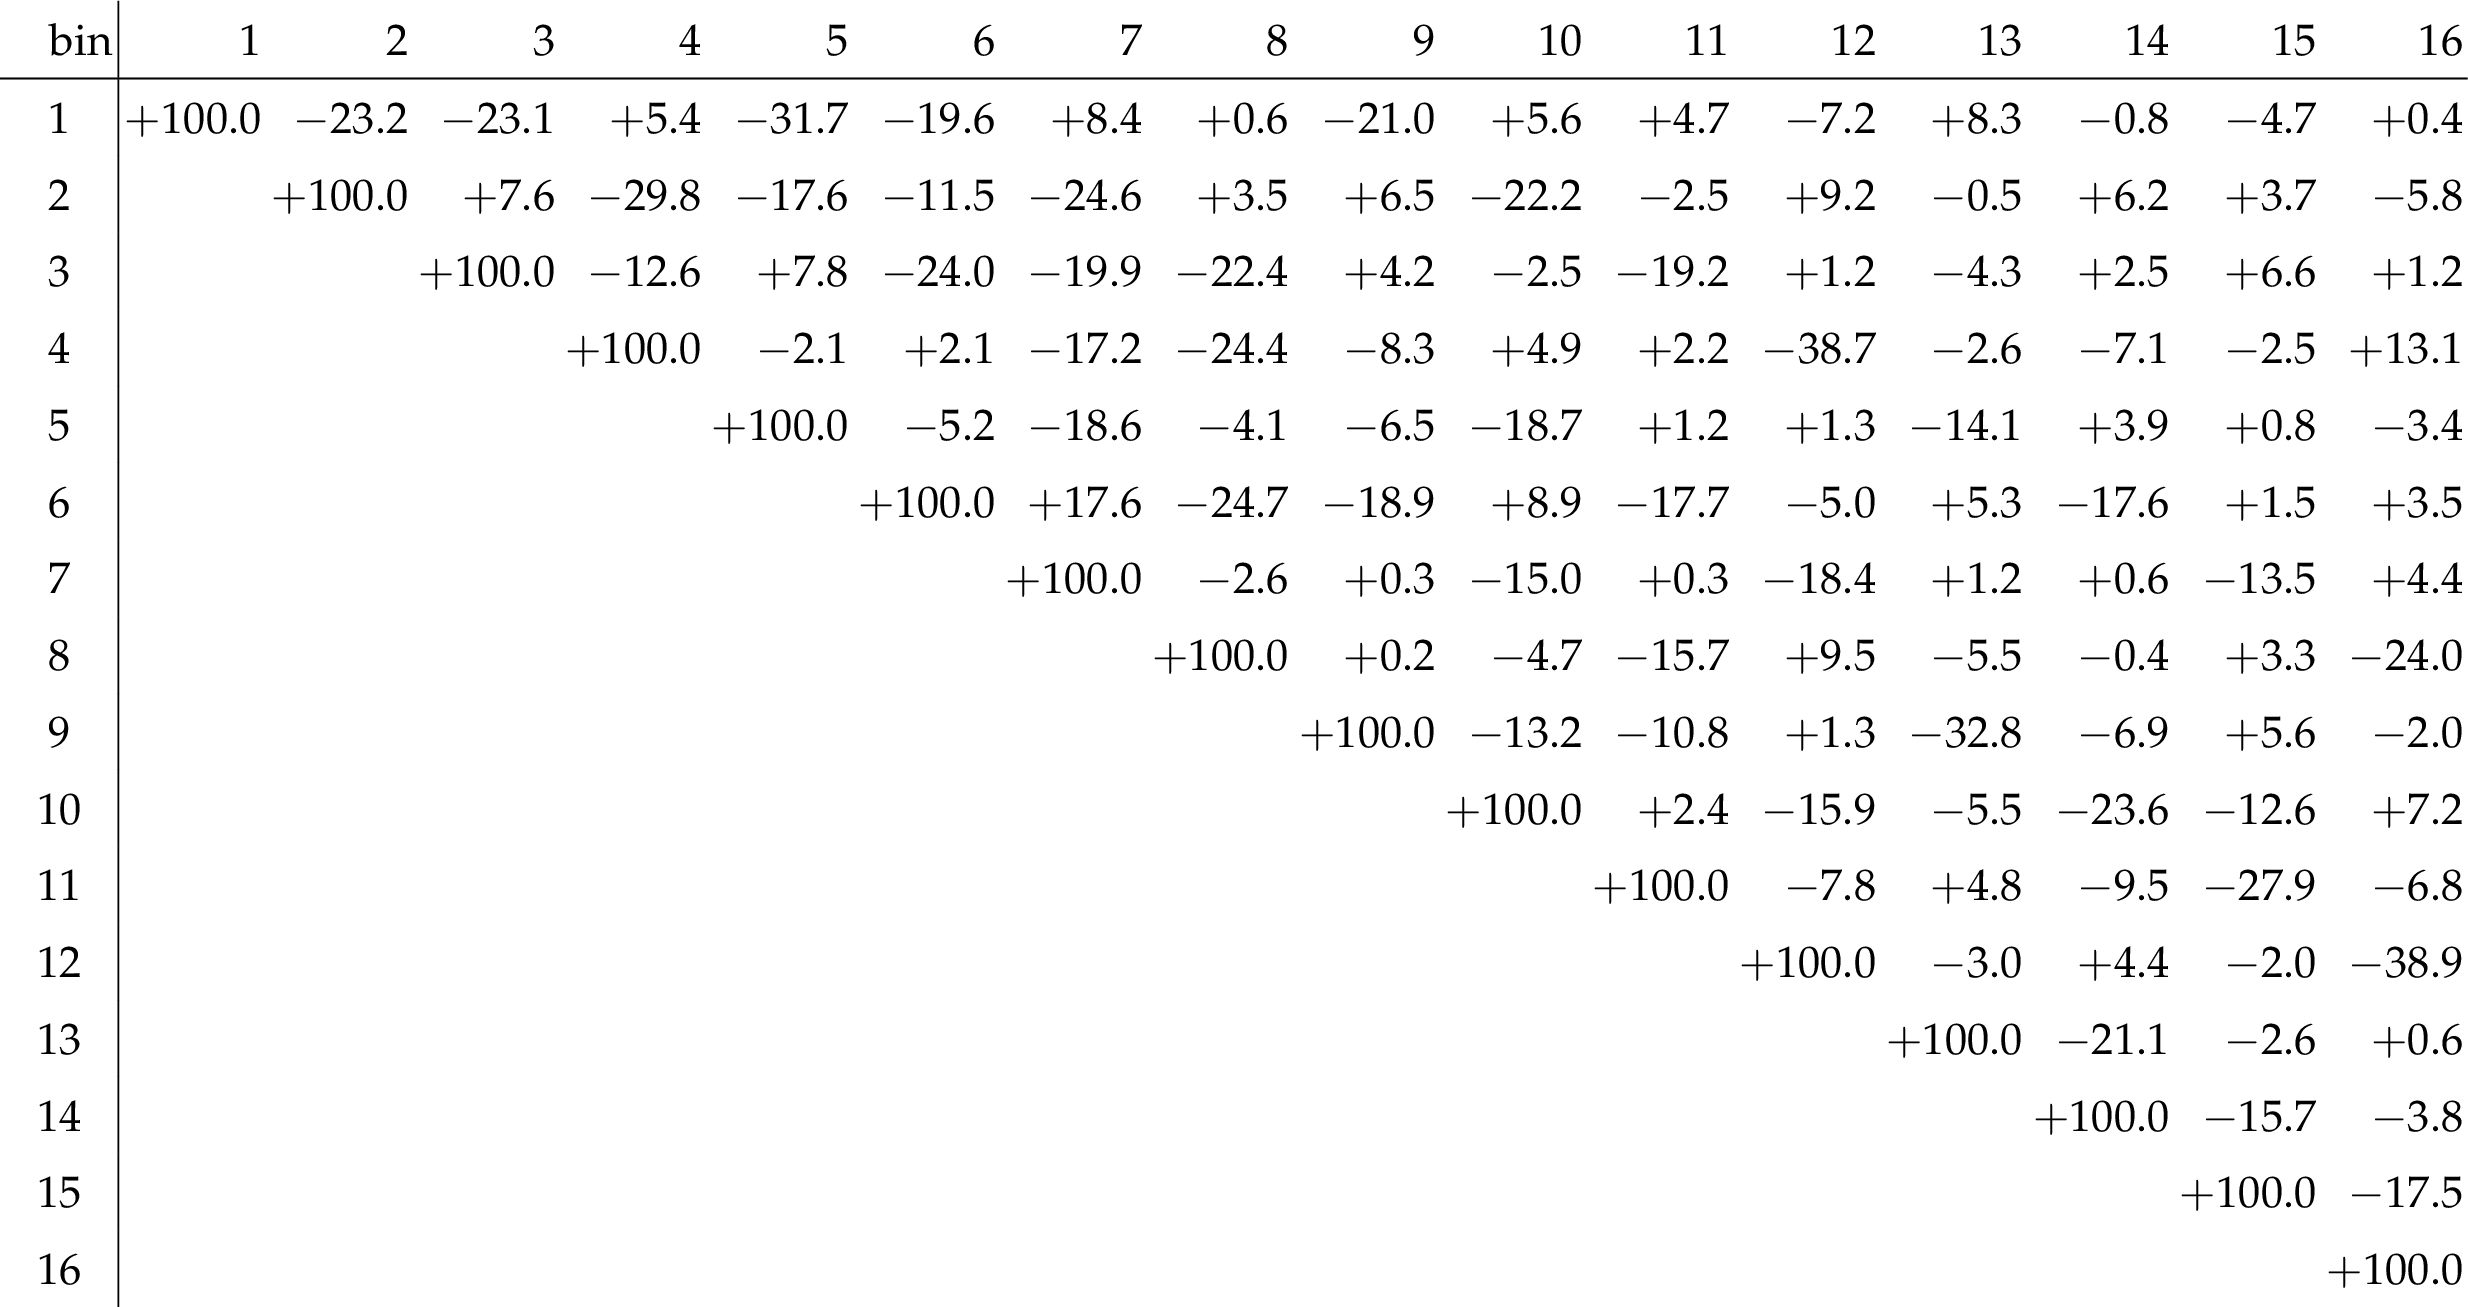
Table 12:
The correlation matrix of statistical uncertainties for the normalized $ {\mathrm{ t } {}\mathrm{ \bar{t} } } $ double-differential cross sections as a function of $ {M({\mathrm{ t } {}\mathrm{ \bar{t} } } )} $ and $ {y({\mathrm{ t } {}\mathrm{ \bar{t} } } )} $ . The values are expressed as percentages. For bin indices see Table 11. |
png pdf |
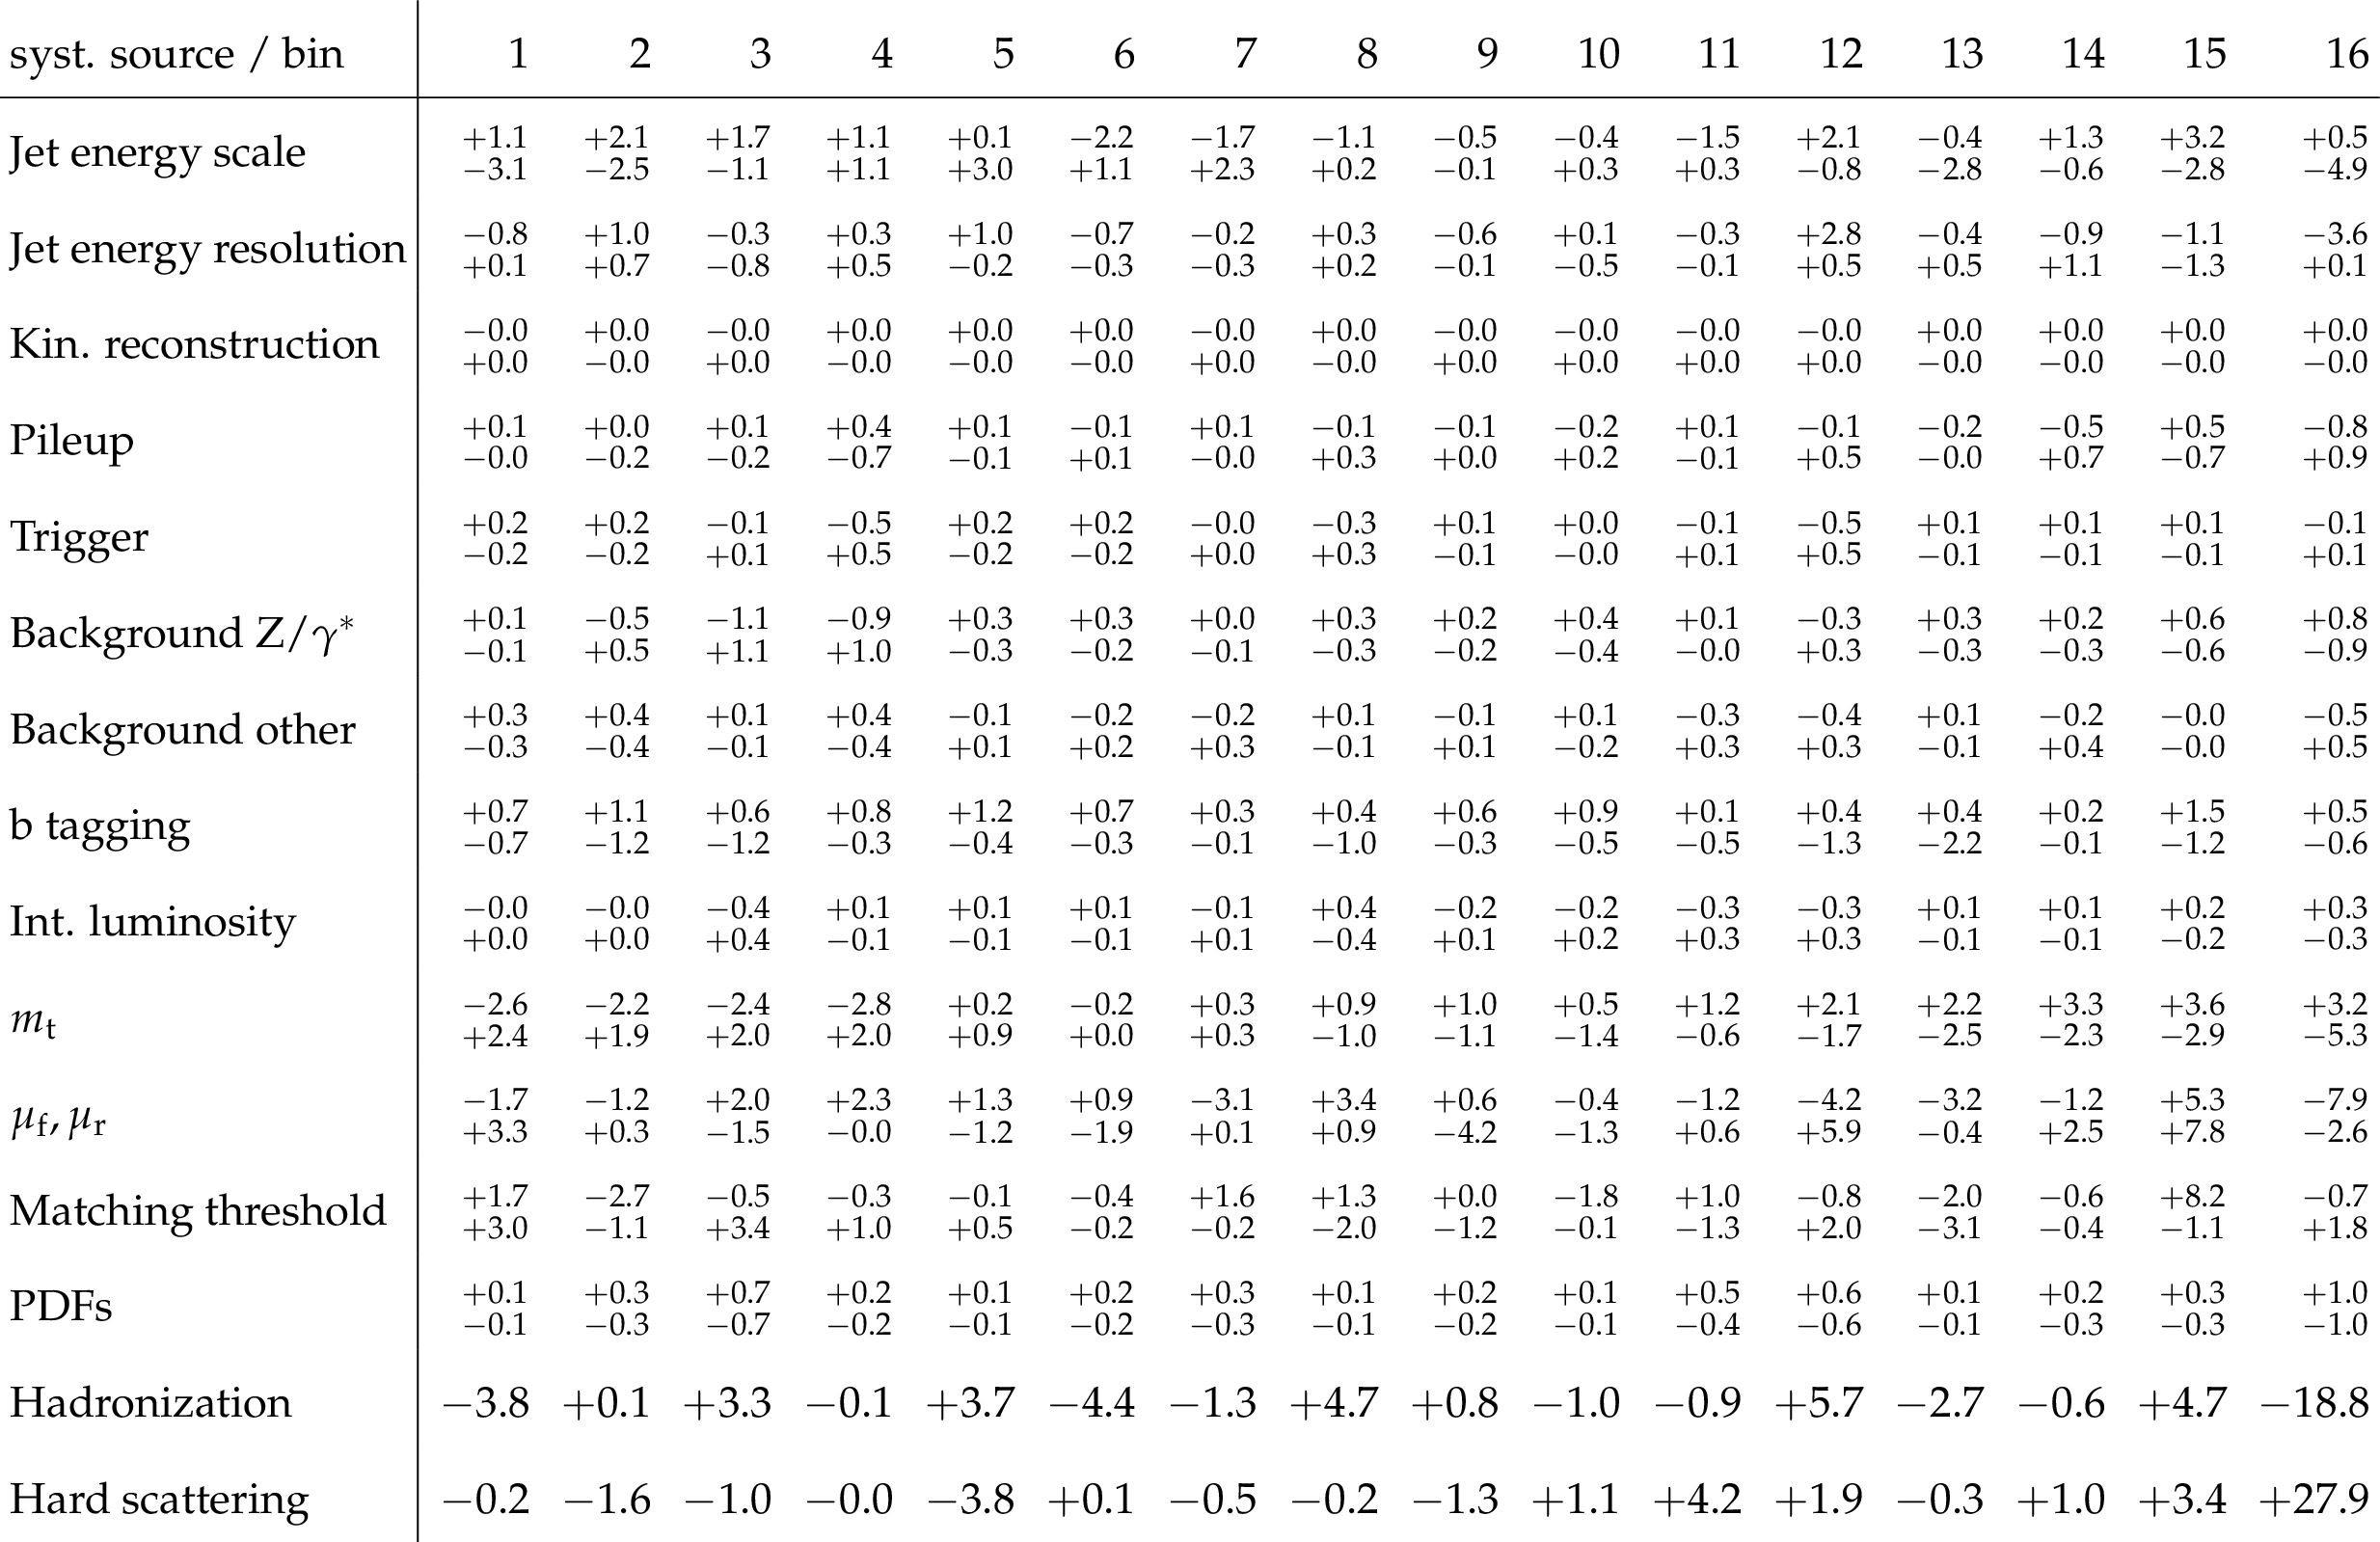
Table 13:
Sources and values of the relative systematic uncertainties in percent of the measured normalized $ {\mathrm{ t } {}\mathrm{ \bar{t} } } $ double-differential cross sections as a function of $ {M({\mathrm{ t } {}\mathrm{ \bar{t} } } )} $ and $ {y({\mathrm{ t } {}\mathrm{ \bar{t} } } )} $ . For bin indices see Table 11. |
png pdf |
Table 14:
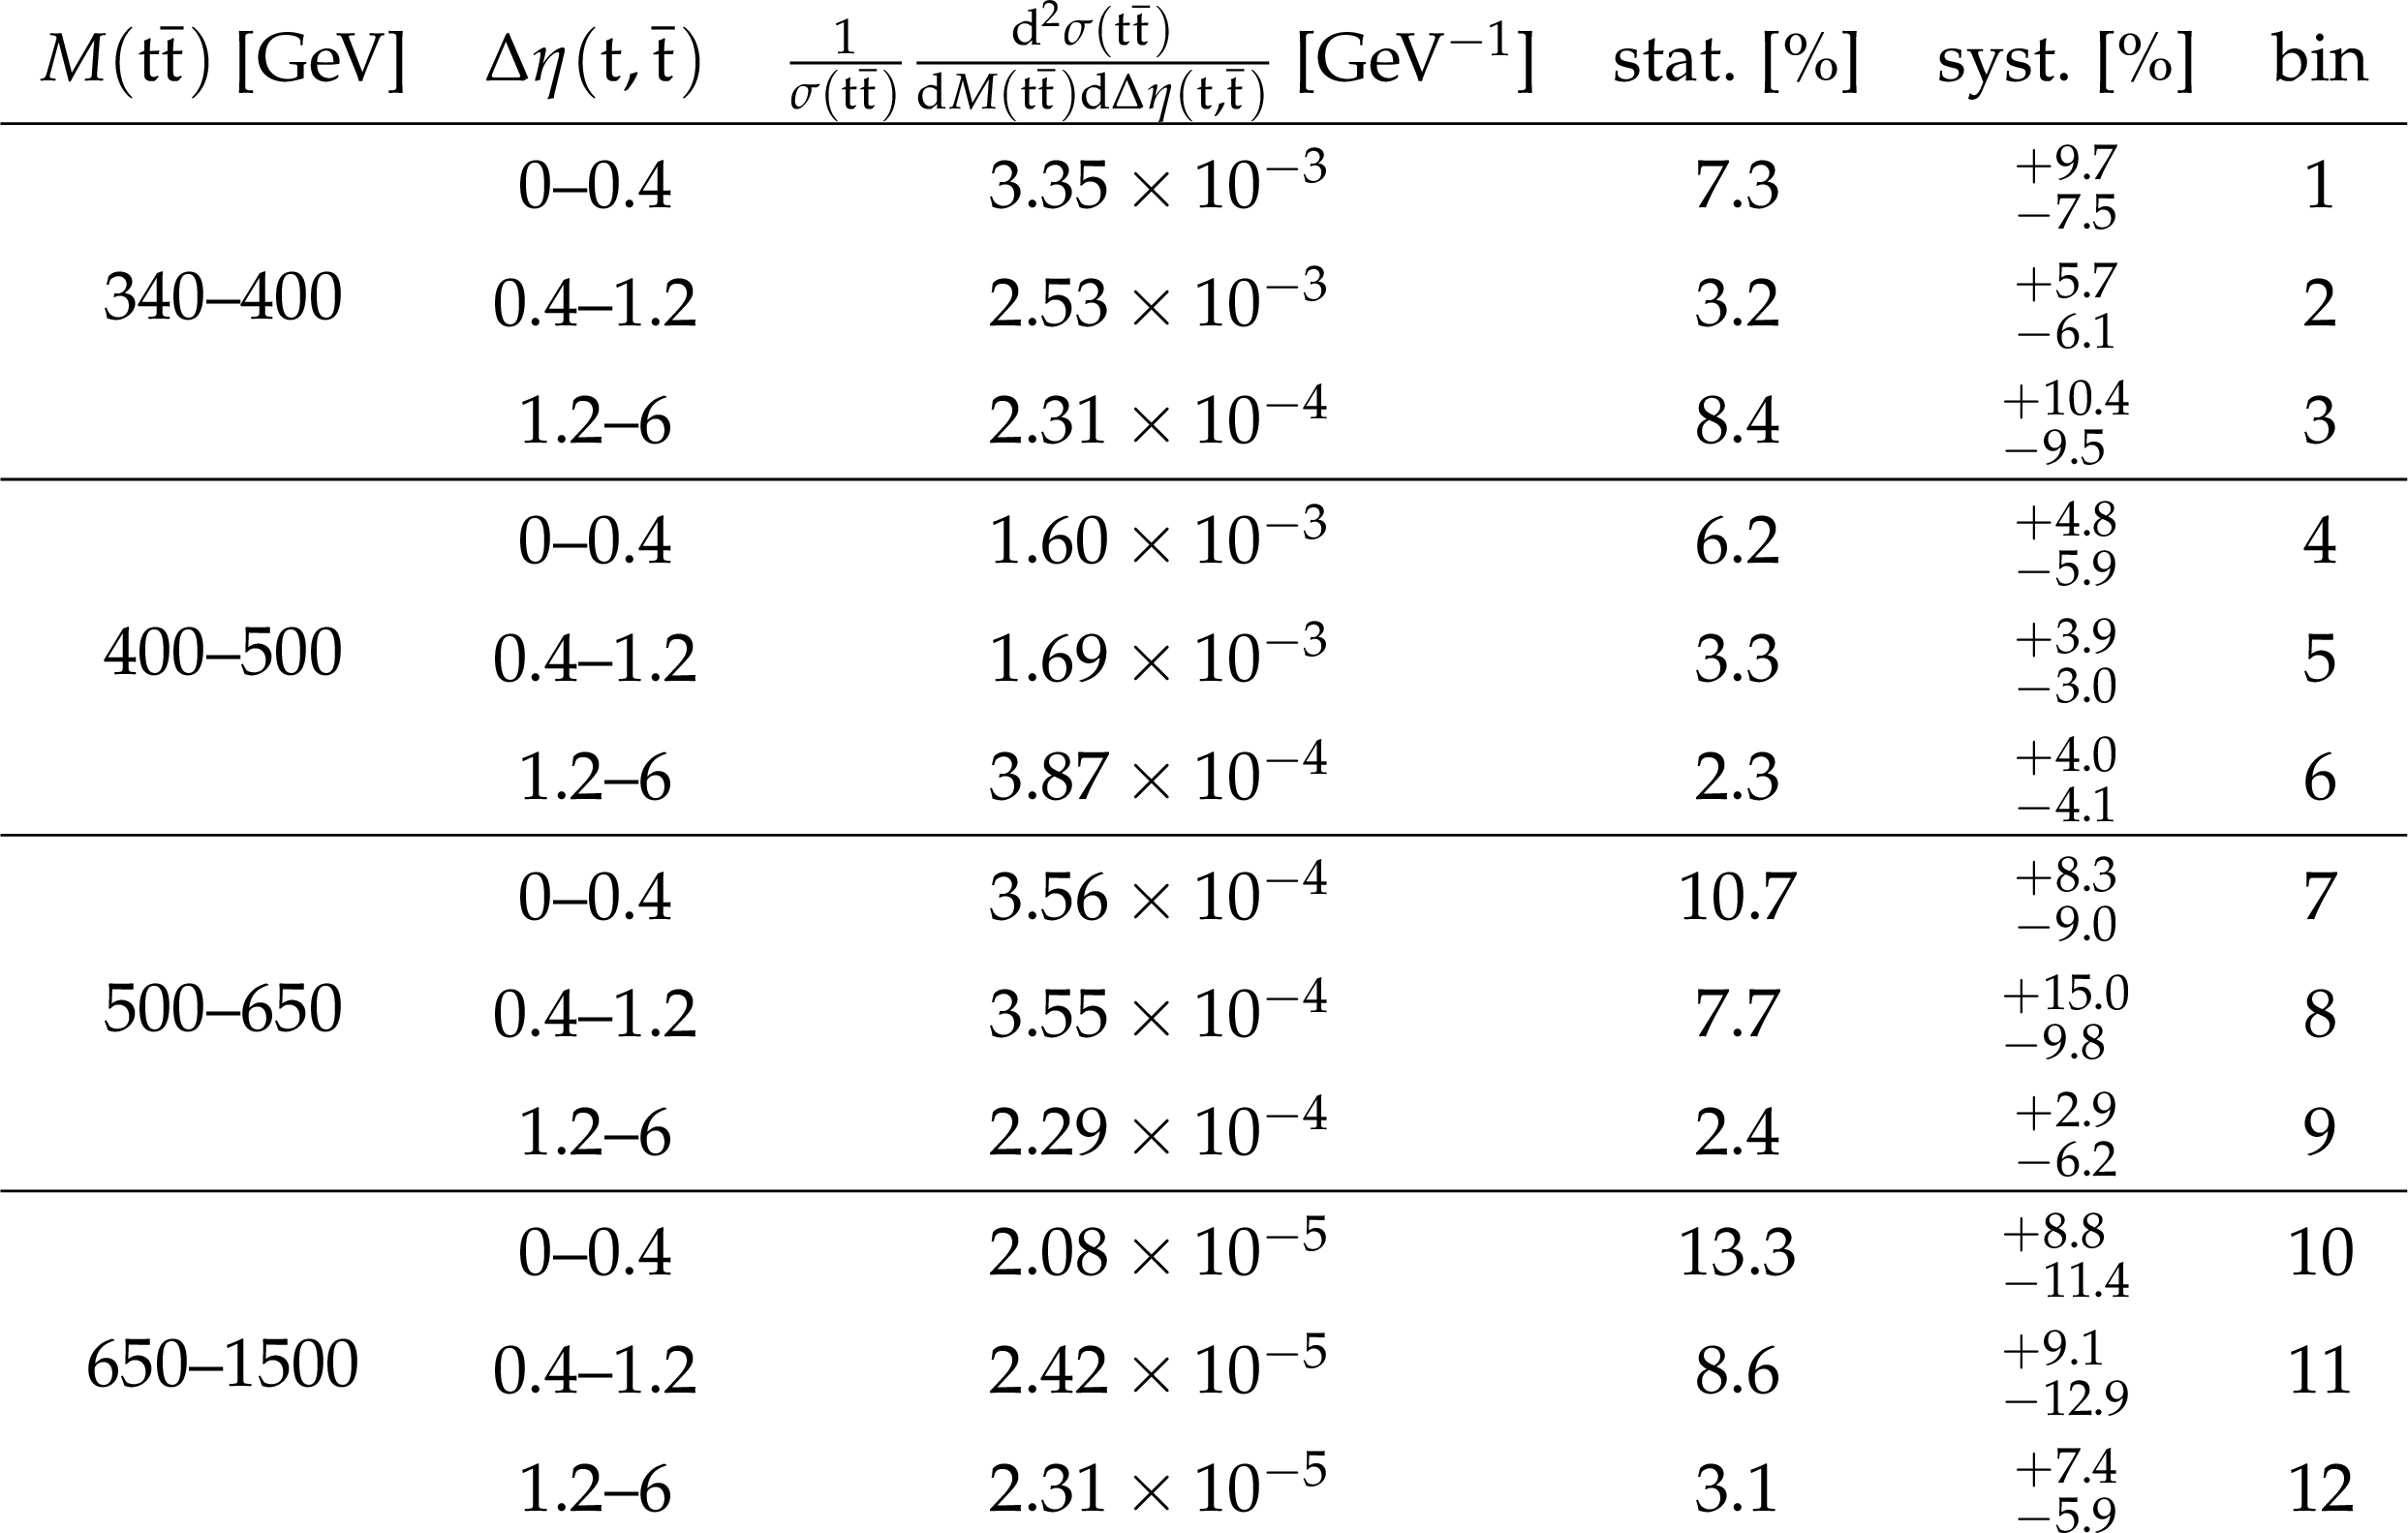
The measured normalized $ {\mathrm{ t } {}\mathrm{ \bar{t} } } $ double-differential cross sections in different bins of $ {M({\mathrm{ t } {}\mathrm{ \bar{t} } } )} $ and $ {\Delta \eta (\mathrm{ t } ,\mathrm{ \bar{t} } )} $ , along with their relative statistical and systematic uncertainties. |
png pdf |
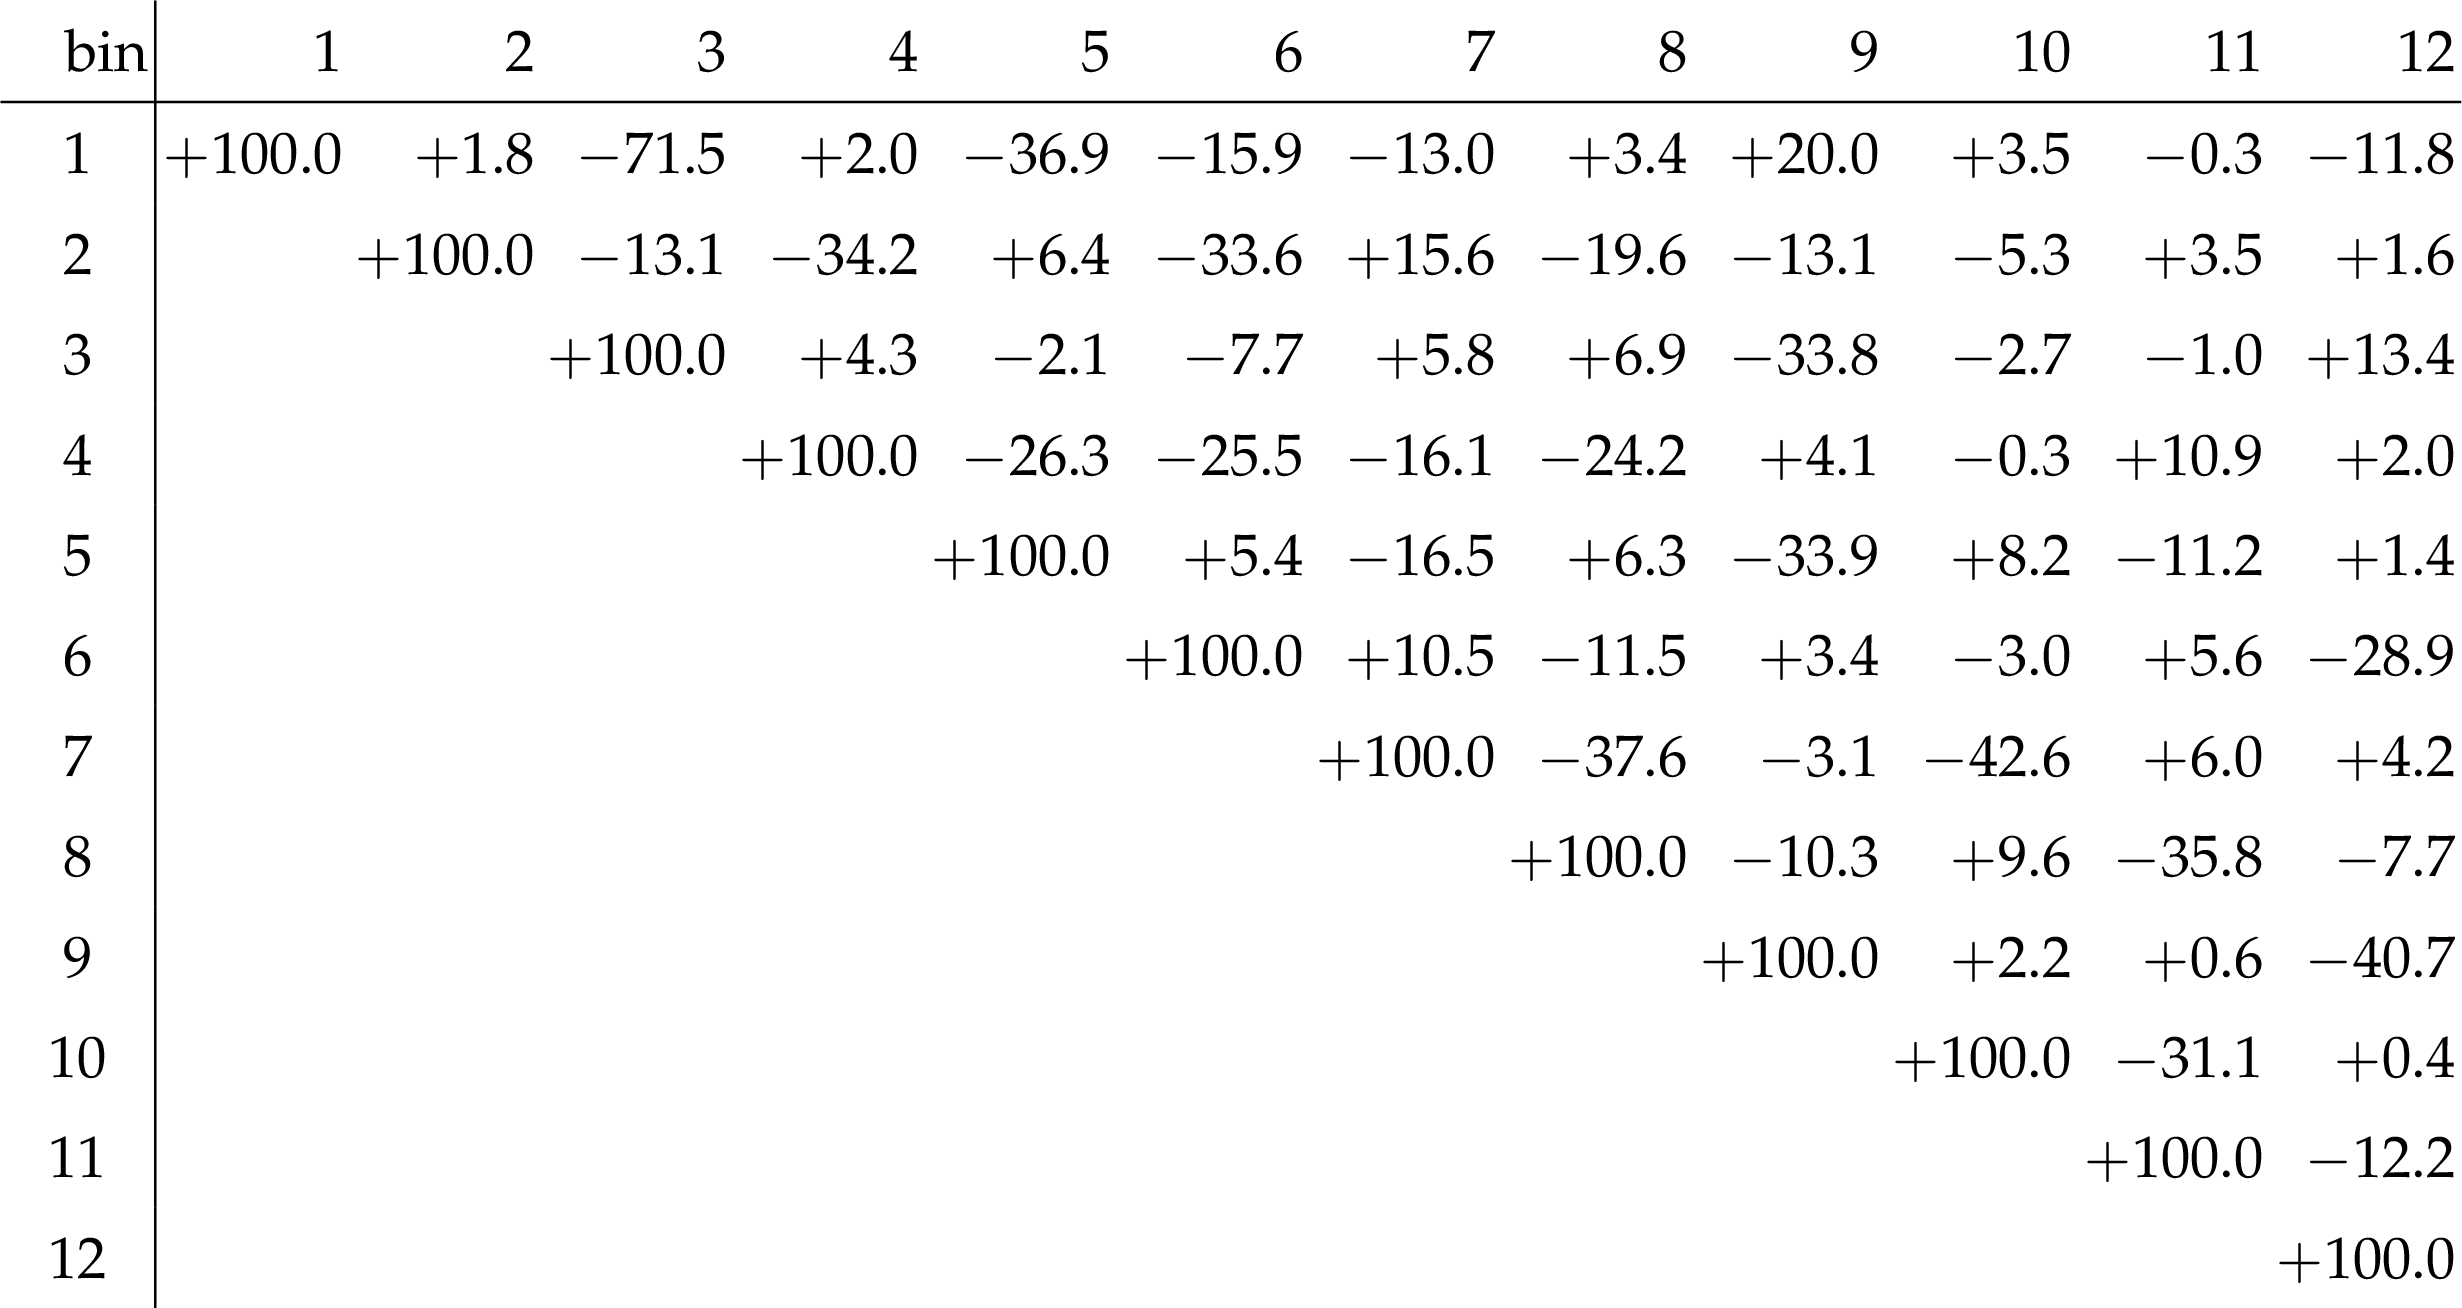
Table 15:
The correlation matrix of statistical uncertainties for the normalized $ {\mathrm{ t } {}\mathrm{ \bar{t} } } $ double-differential cross sections as a function of $ {M({\mathrm{ t } {}\mathrm{ \bar{t} } } )} $ and $ {\Delta \eta (\mathrm{ t } ,\mathrm{ \bar{t} } )} $ . The values are expressed as percentages. For bin indices see Table 14. |
png pdf |
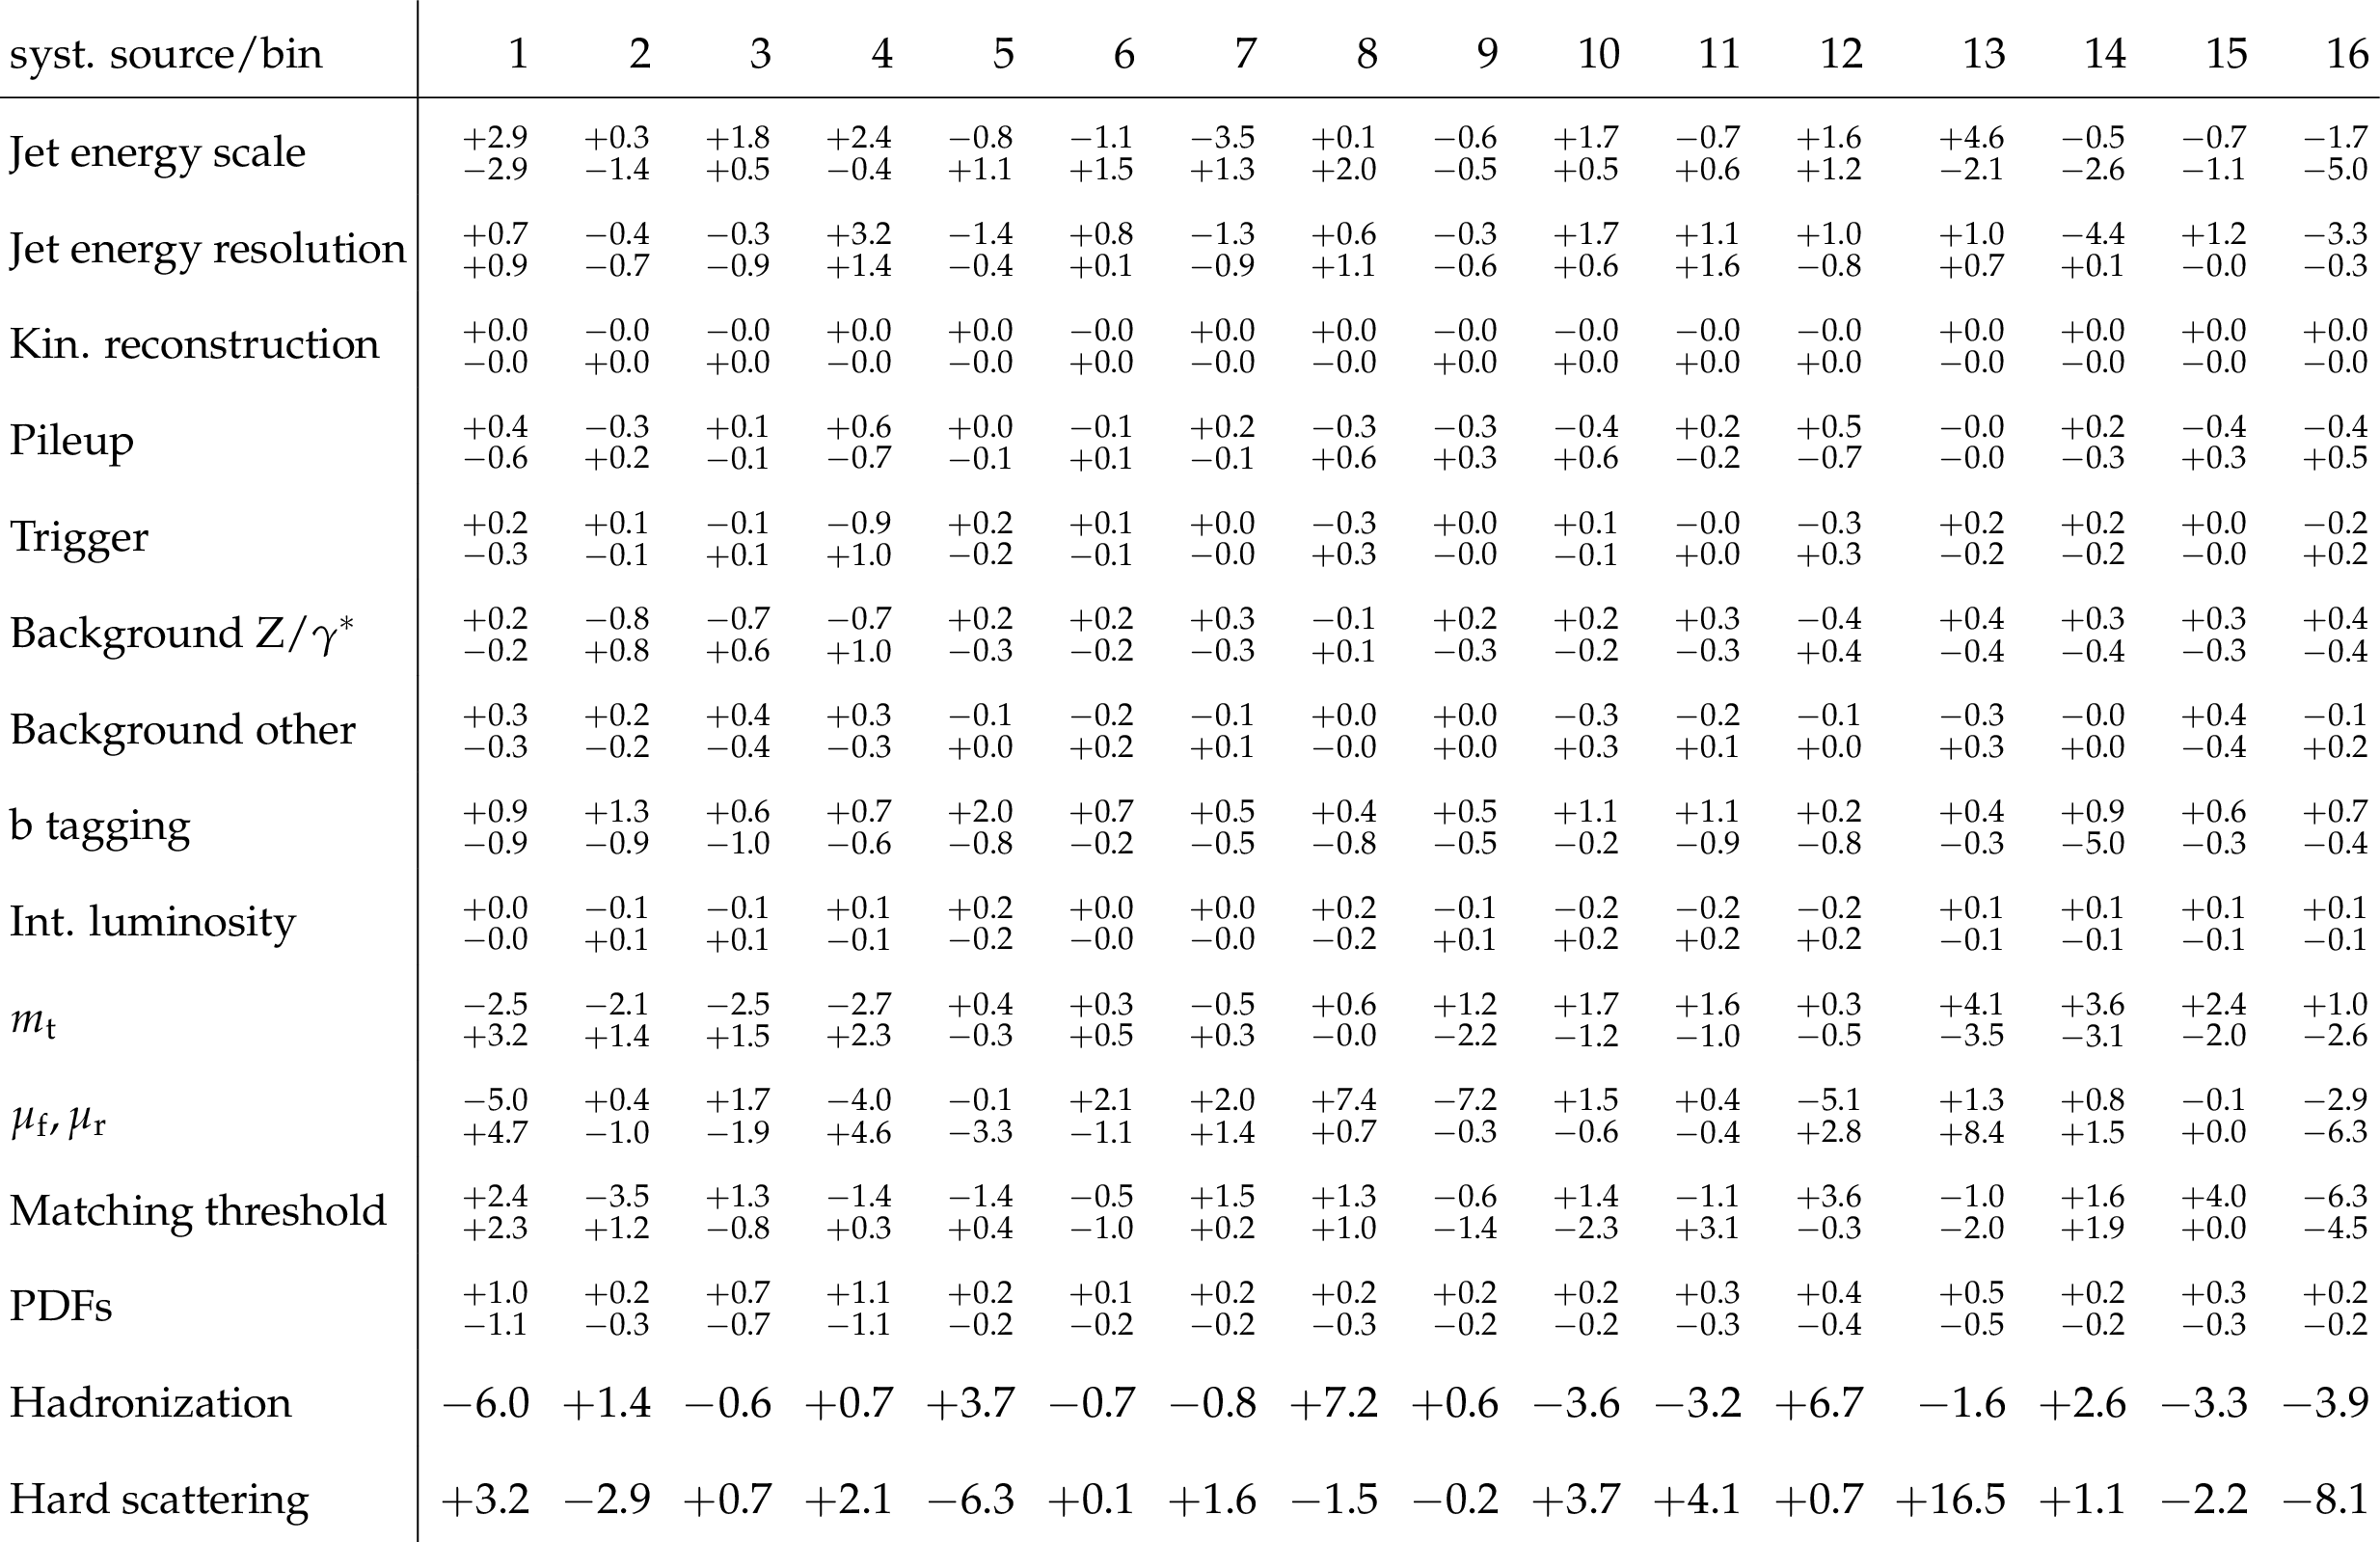
Table 16:
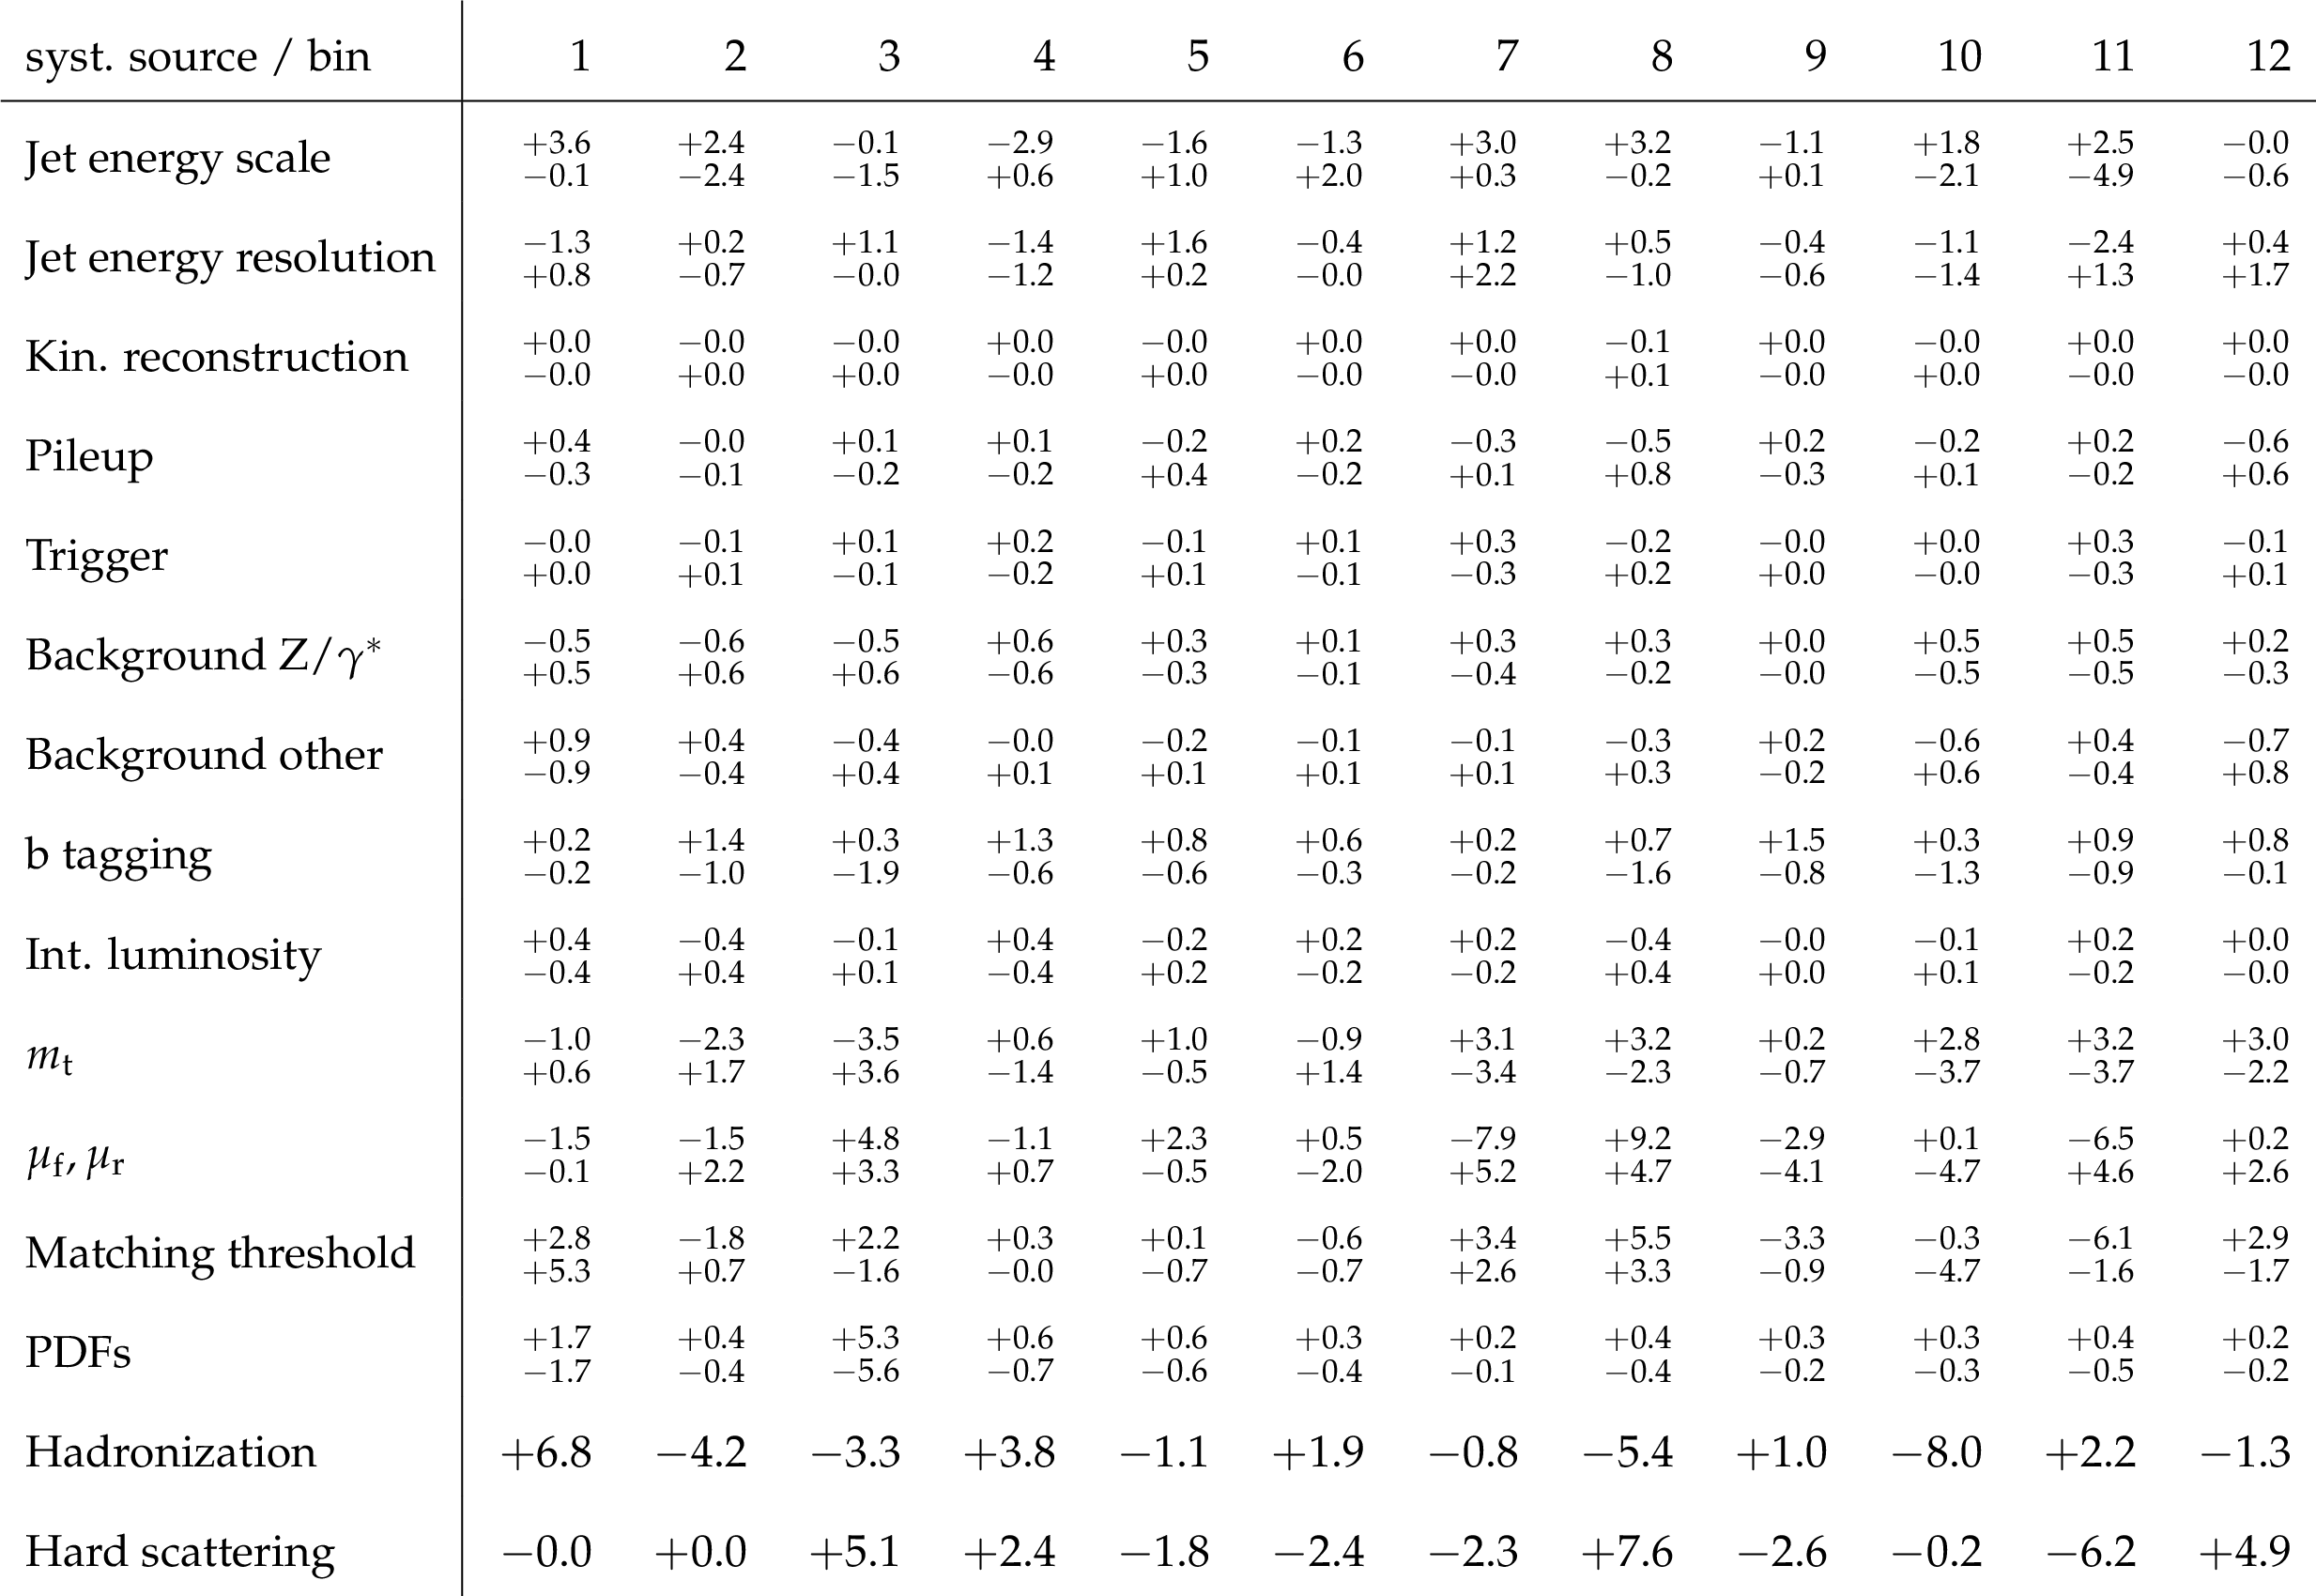
Sources and values of the relative systematic uncertainties in percent of the measured normalized $ {\mathrm{ t } {}\mathrm{ \bar{t} } } $ double-differential cross sections as a function of $ {M({\mathrm{ t } {}\mathrm{ \bar{t} } } )} $ and $ {\Delta \eta (\mathrm{ t } ,\mathrm{ \bar{t} } )} $ . For bin indices see Table 14. |
png pdf |
Table 17:
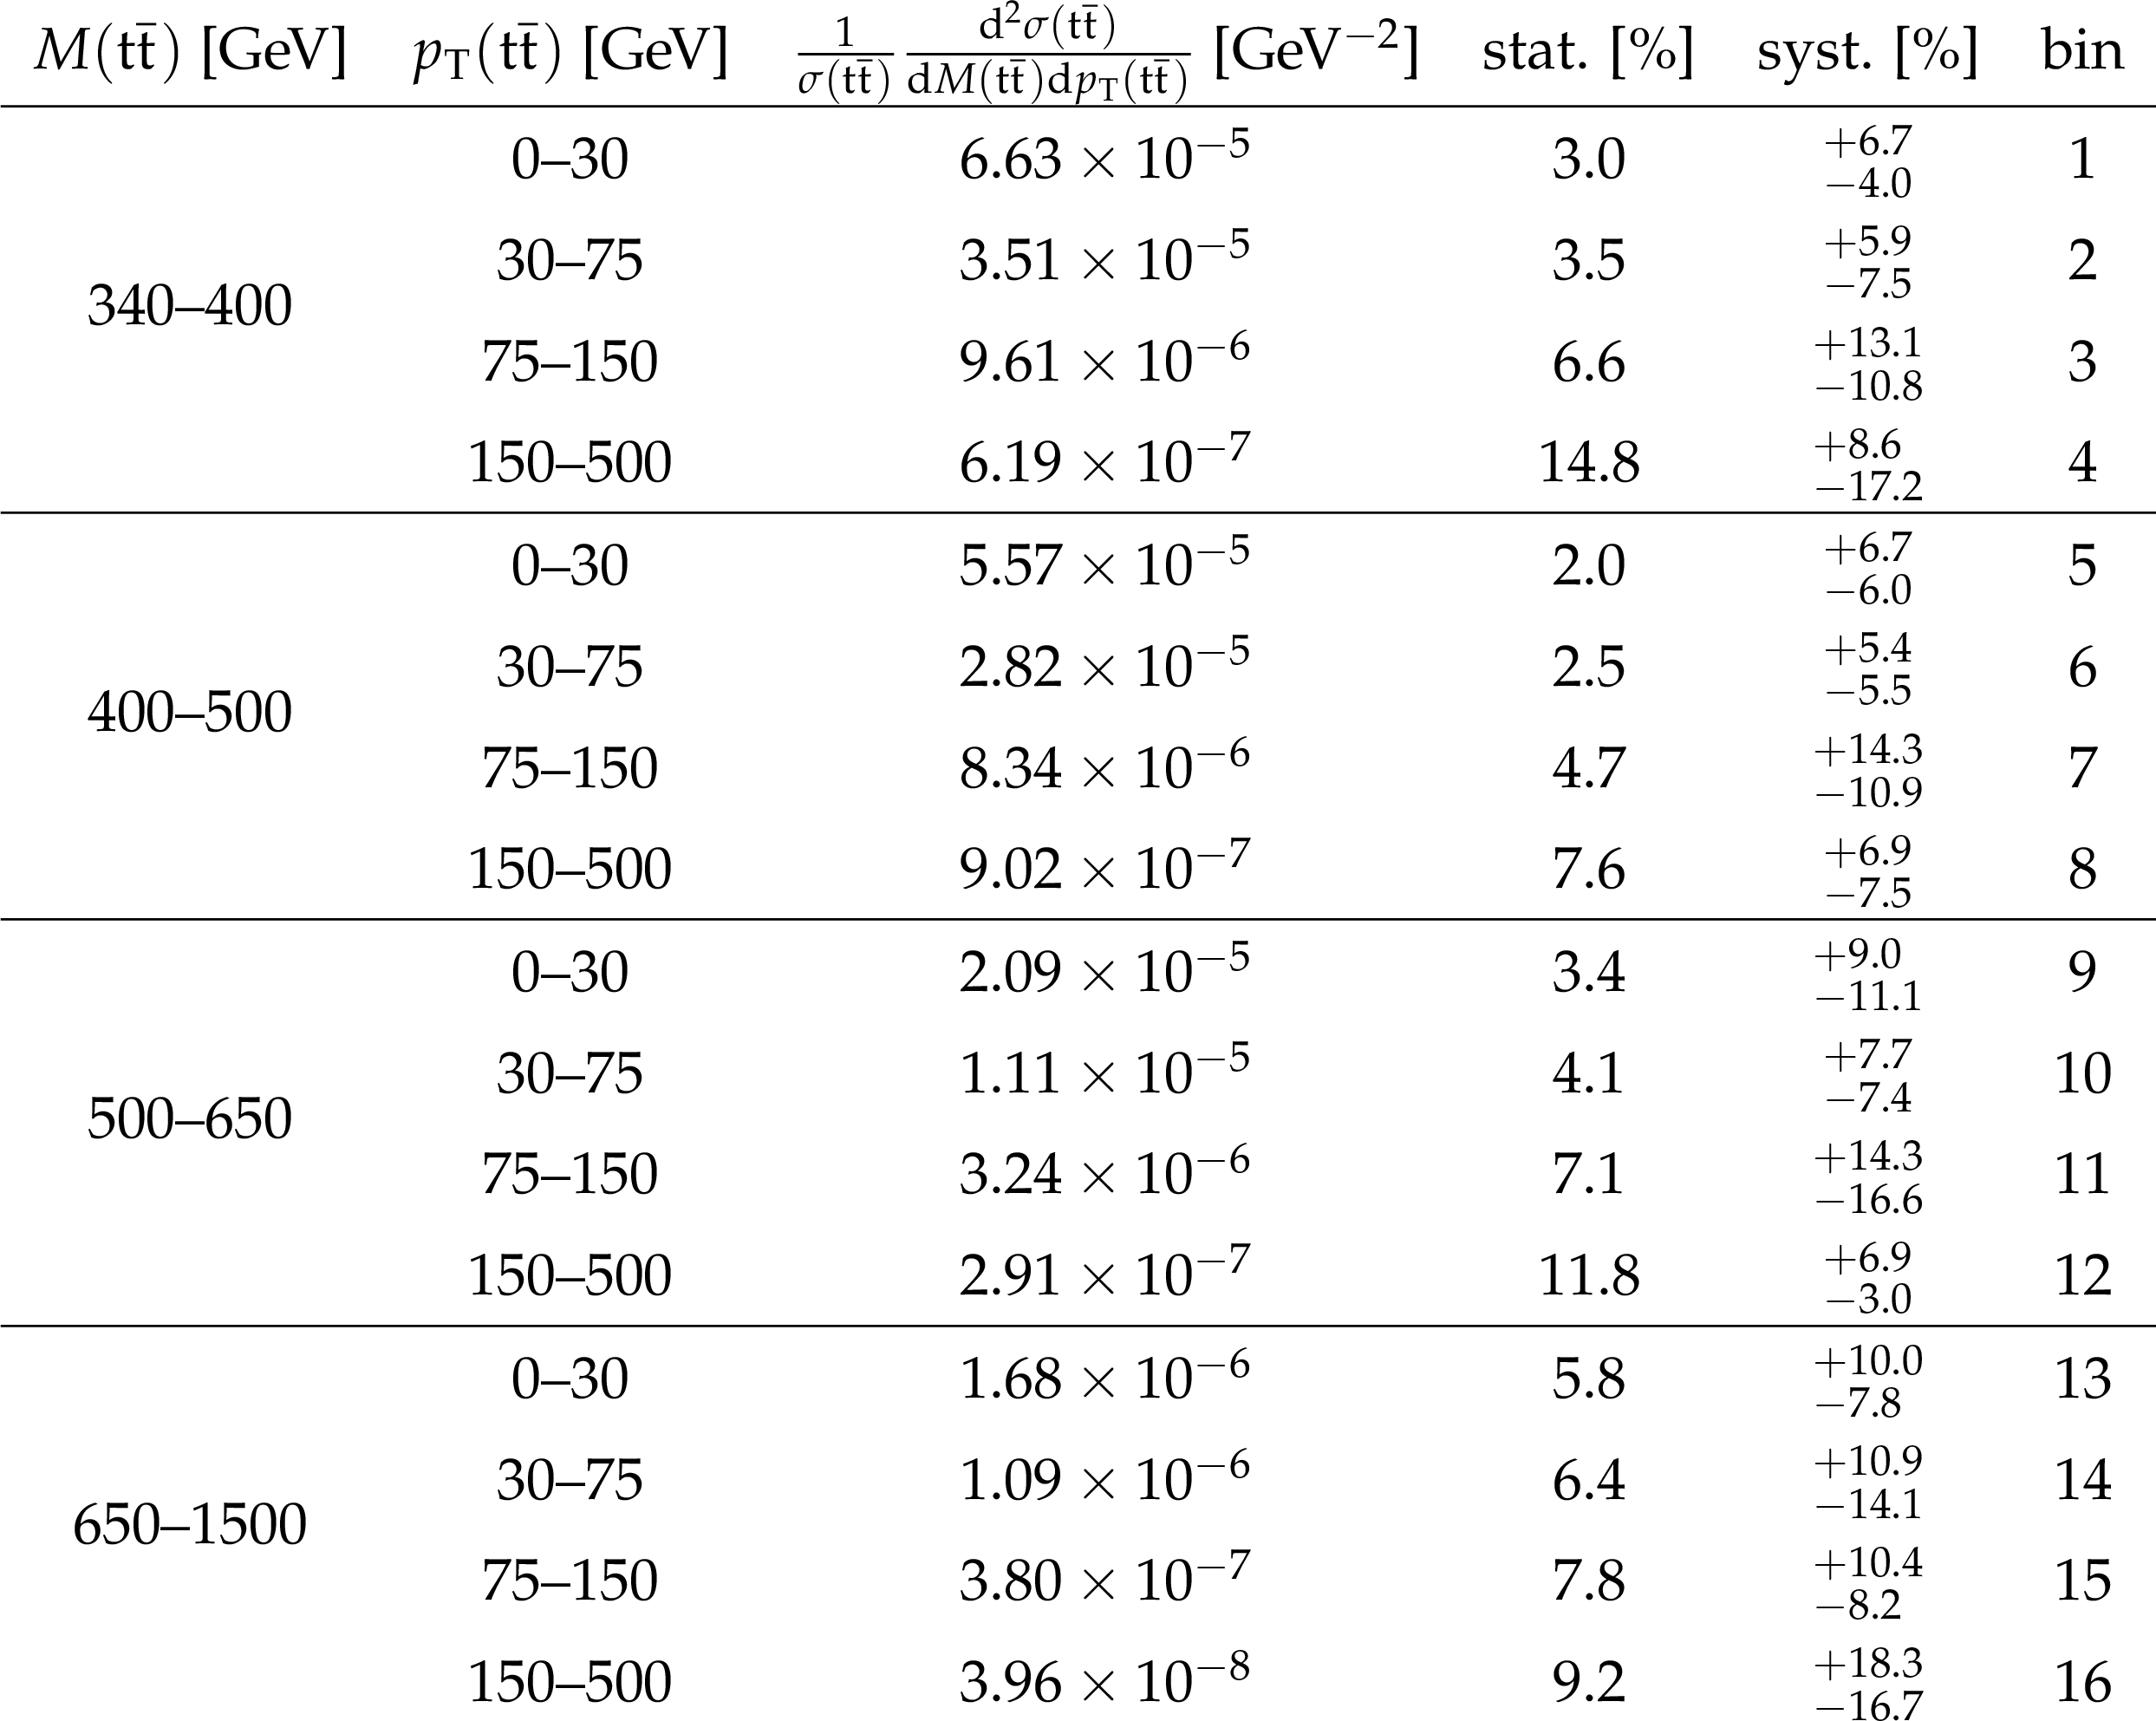
The measured normalized $ {\mathrm{ t } {}\mathrm{ \bar{t} } } $ double-differential cross sections in different bins of $ {M({\mathrm{ t } {}\mathrm{ \bar{t} } } )} $ and $ { {p_{\mathrm {T}}} ({\mathrm{ t } {}\mathrm{ \bar{t} } } )} $ , along with their relative statistical and systematic uncertainties. |

png pdf |
Table 18:
The correlation matrix of statistical uncertainties for the normalized $ {\mathrm{ t } {}\mathrm{ \bar{t} } } $ double-differential cross sections as a function of $ {M({\mathrm{ t } {}\mathrm{ \bar{t} } } )} $ and $ { {p_{\mathrm {T}}} ({\mathrm{ t } {}\mathrm{ \bar{t} } } )} $ . The values are expressed as percentages. For bin indices see Table 17. |
png pdf |
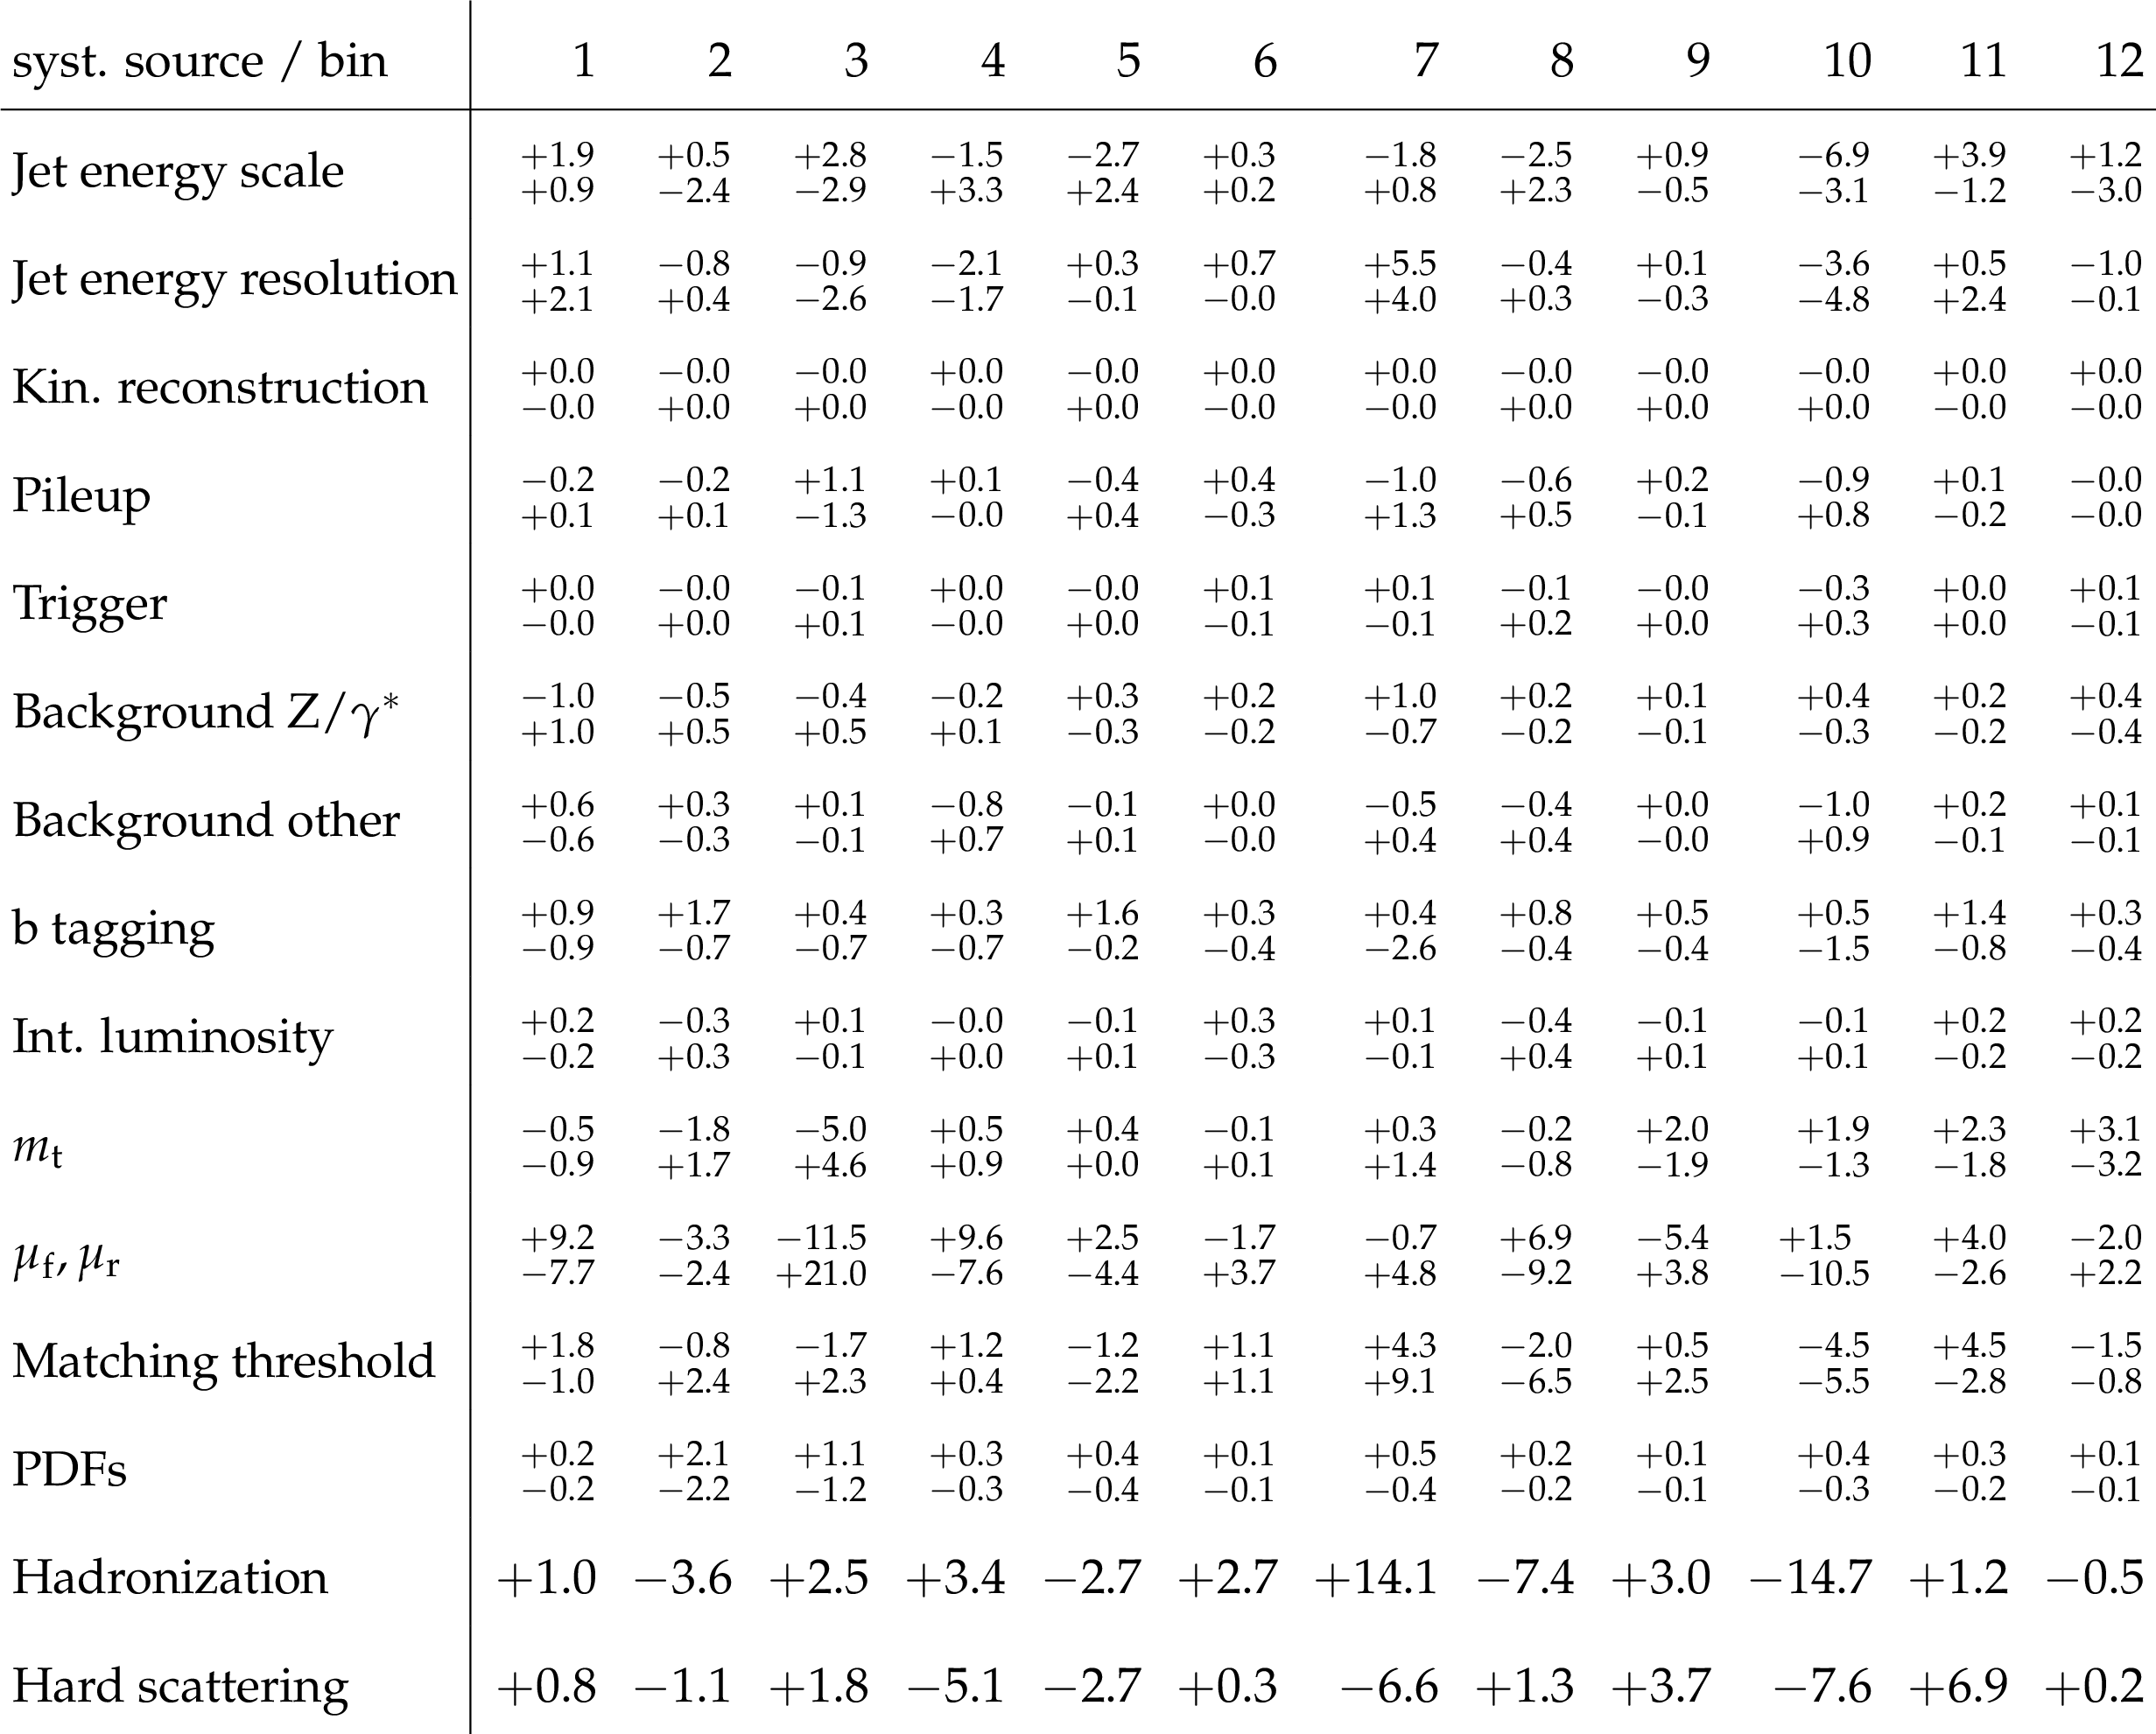
Table 19:
Sources and values of the relative systematic uncertainties in percent of the measured normalized $ {\mathrm{ t } {}\mathrm{ \bar{t} } } $ double-differential cross sections as a function of $ {M({\mathrm{ t } {}\mathrm{ \bar{t} } } )} $ and $ { {p_{\mathrm {T}}} ({\mathrm{ t } {}\mathrm{ \bar{t} } } )} $ . For bin indices see Table 17. |
png pdf |
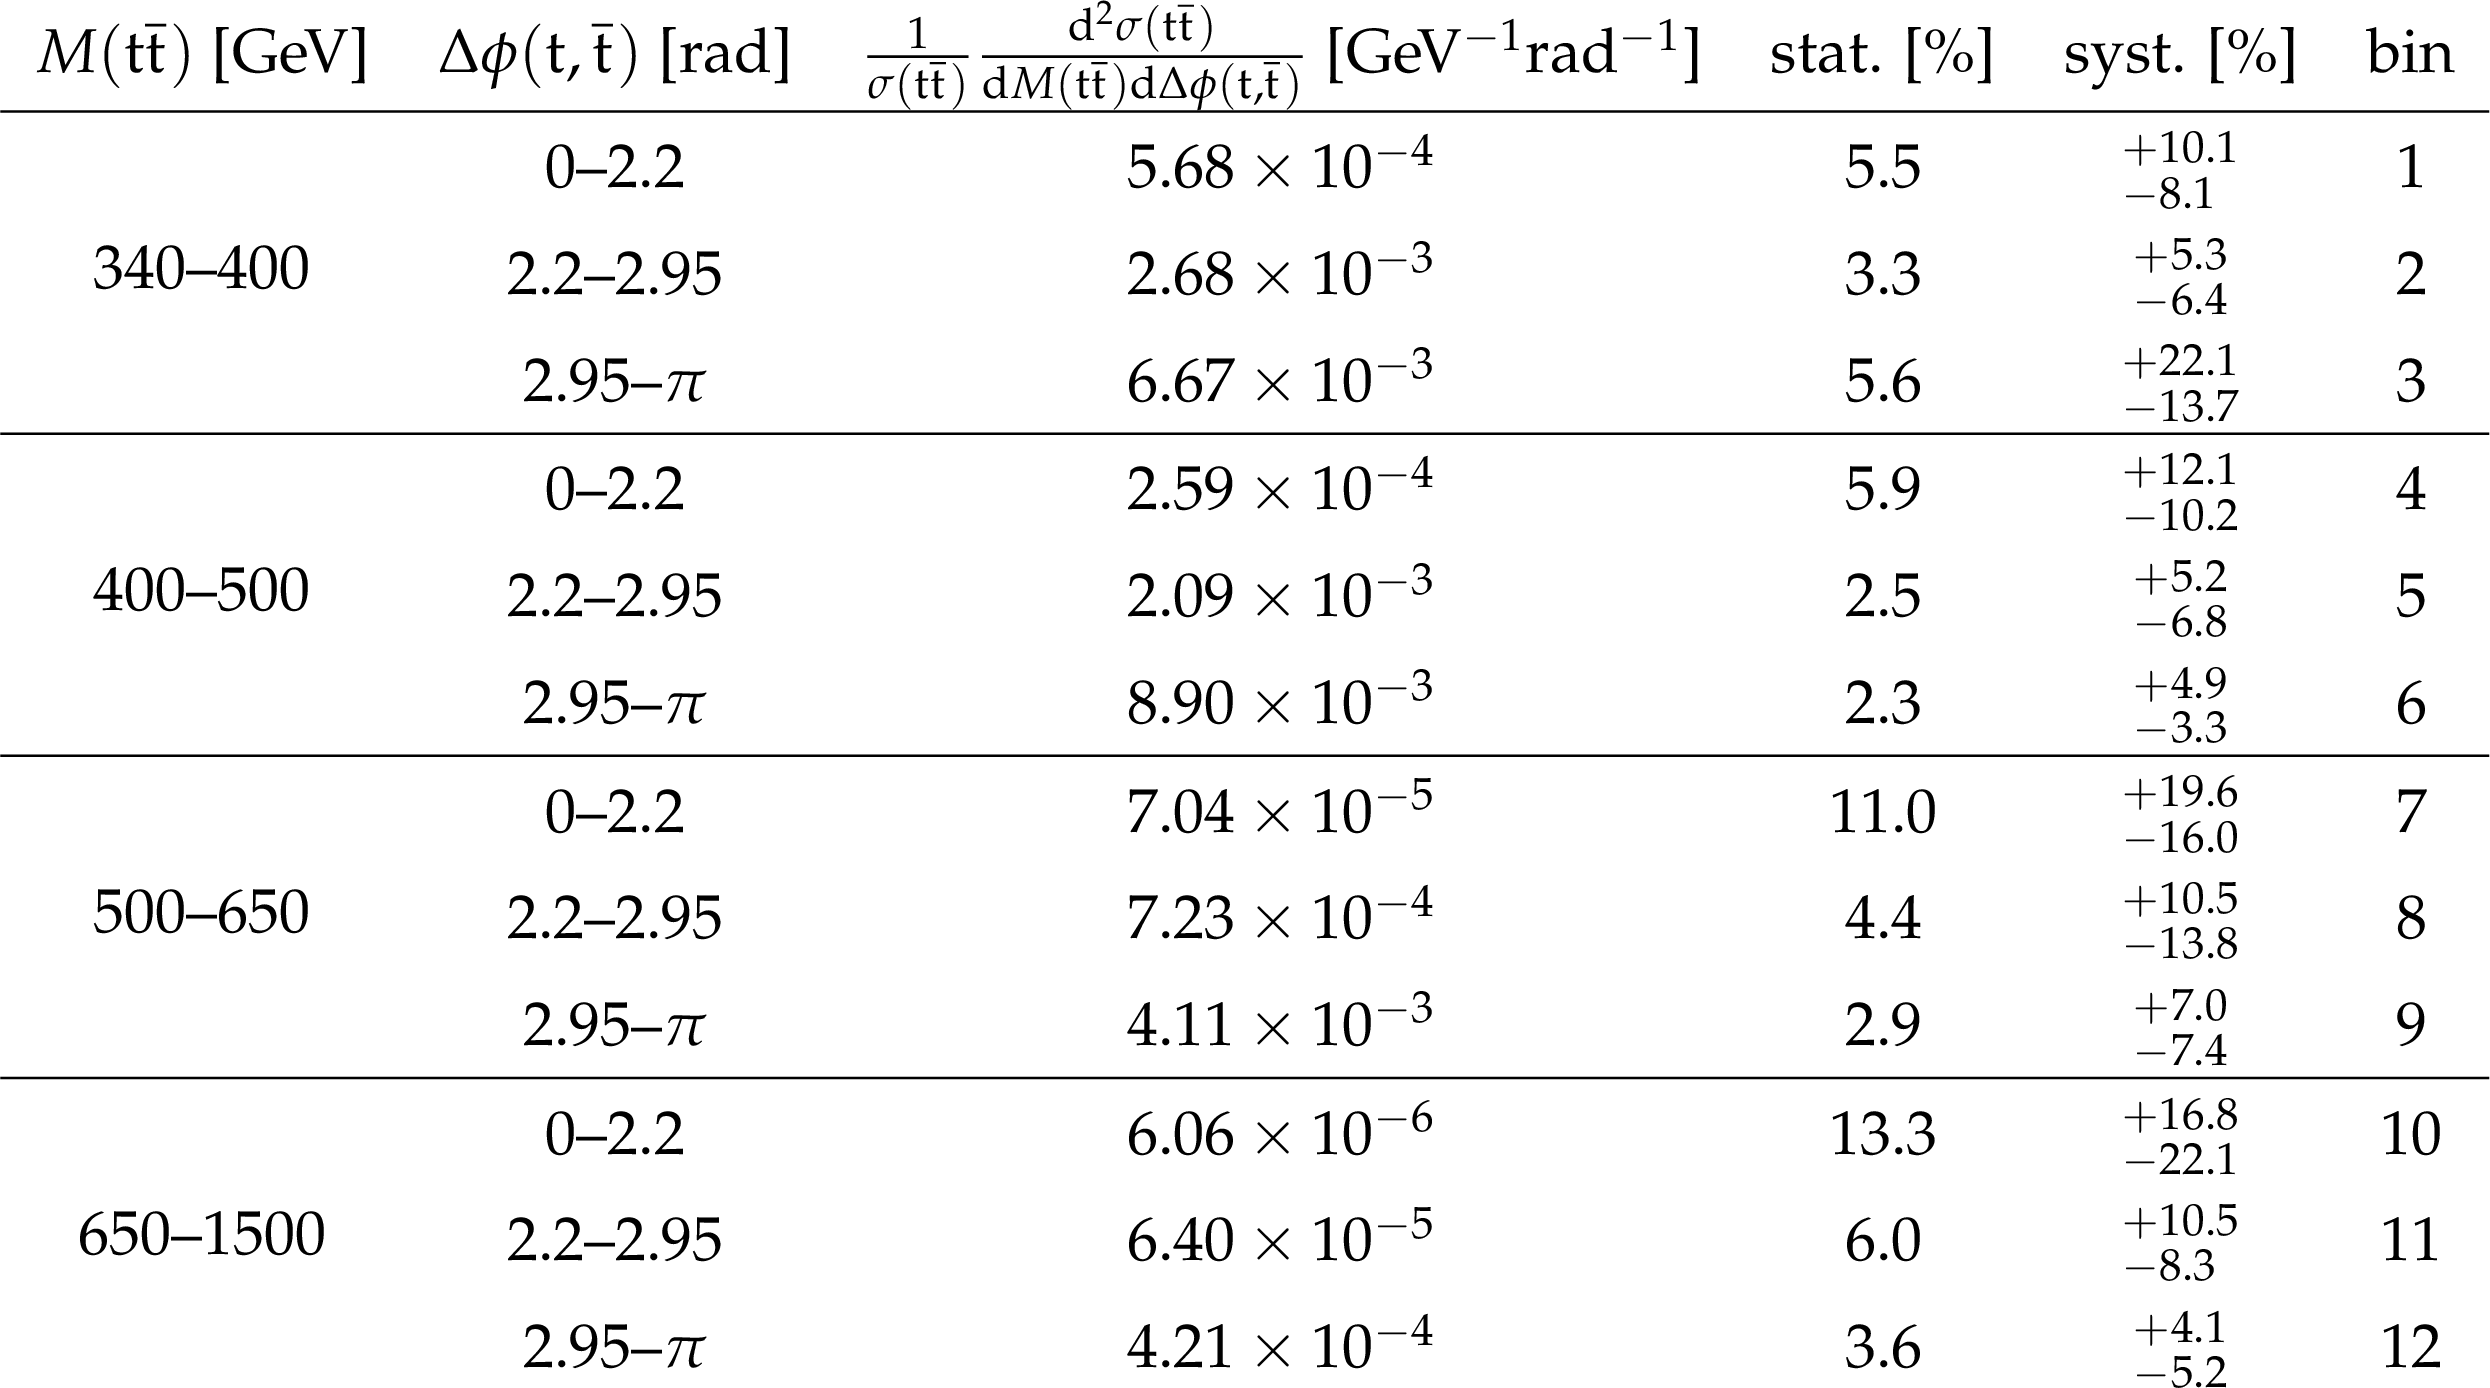
Table 20:
The measured normalized $ {\mathrm{ t } {}\mathrm{ \bar{t} } } $ double-differential cross sections in different bins of $ {M({\mathrm{ t } {}\mathrm{ \bar{t} } } )} $ and $ {\Delta \phi (\mathrm{ t } ,\mathrm{ \bar{t} } )} $ , along with their relative statistical and systematic uncertainties. |
png pdf |
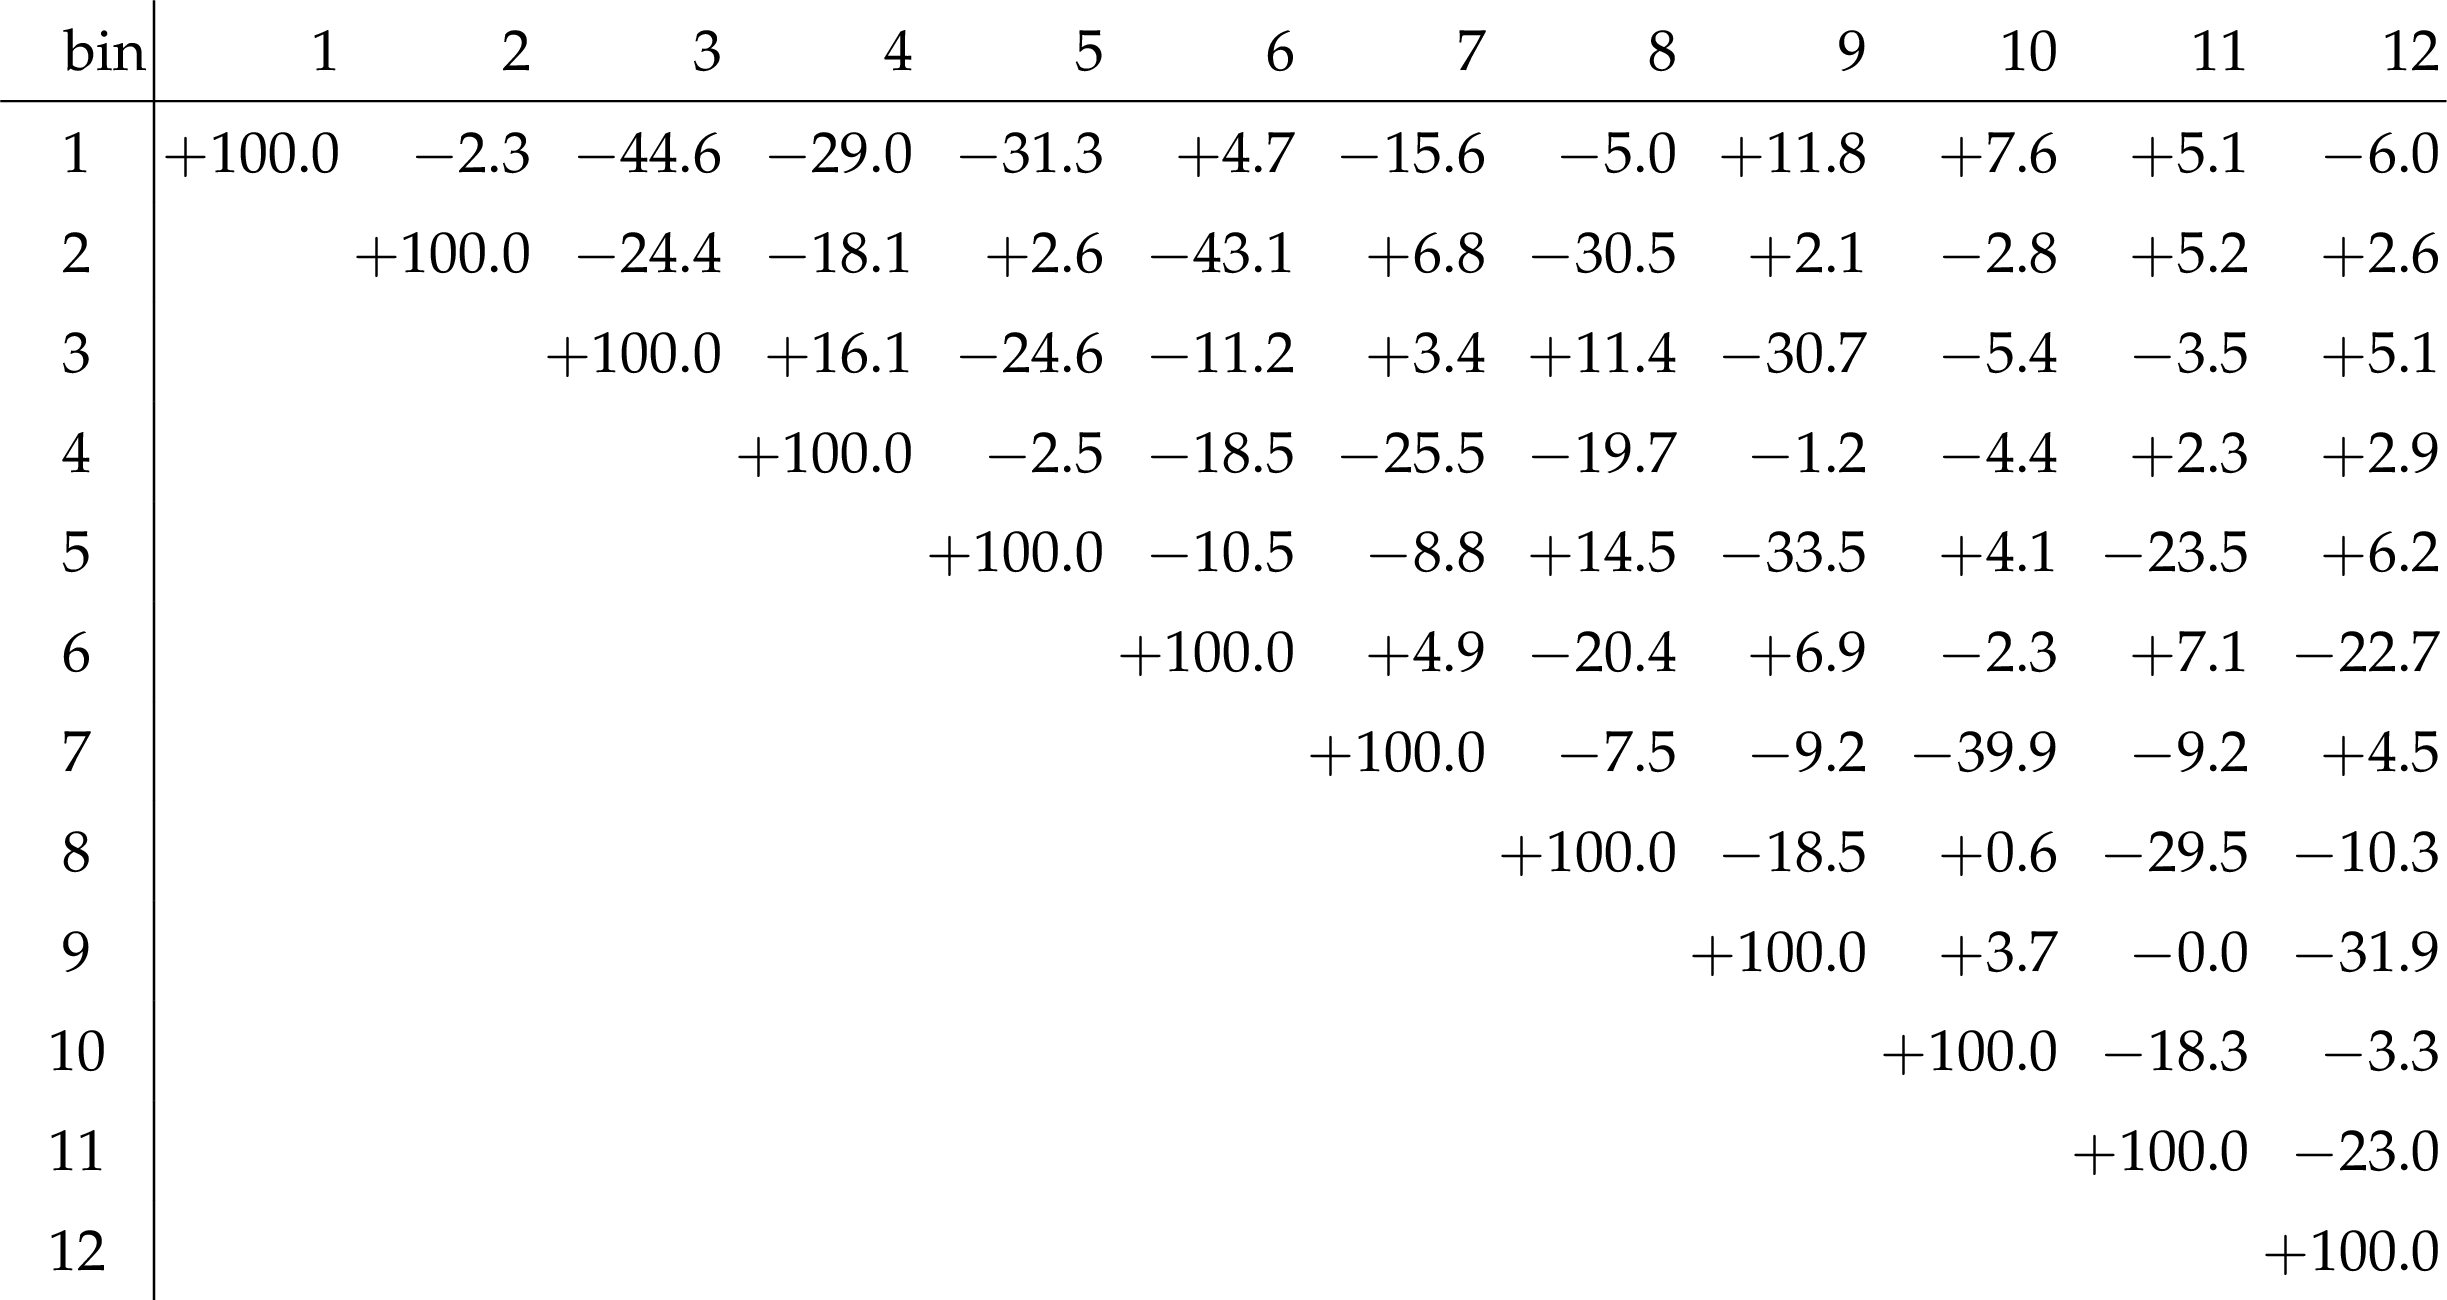
Table 21:
The correlation matrix of statistical uncertainties for the normalized $ {\mathrm{ t } {}\mathrm{ \bar{t} } } $ double-differential cross sections as a function of $ {M({\mathrm{ t } {}\mathrm{ \bar{t} } } )} $ and $ {\Delta \phi (\mathrm{ t } ,\mathrm{ \bar{t} } )} $ . The values are expressed as percentages. For bin indices see Table 20. |
png pdf |
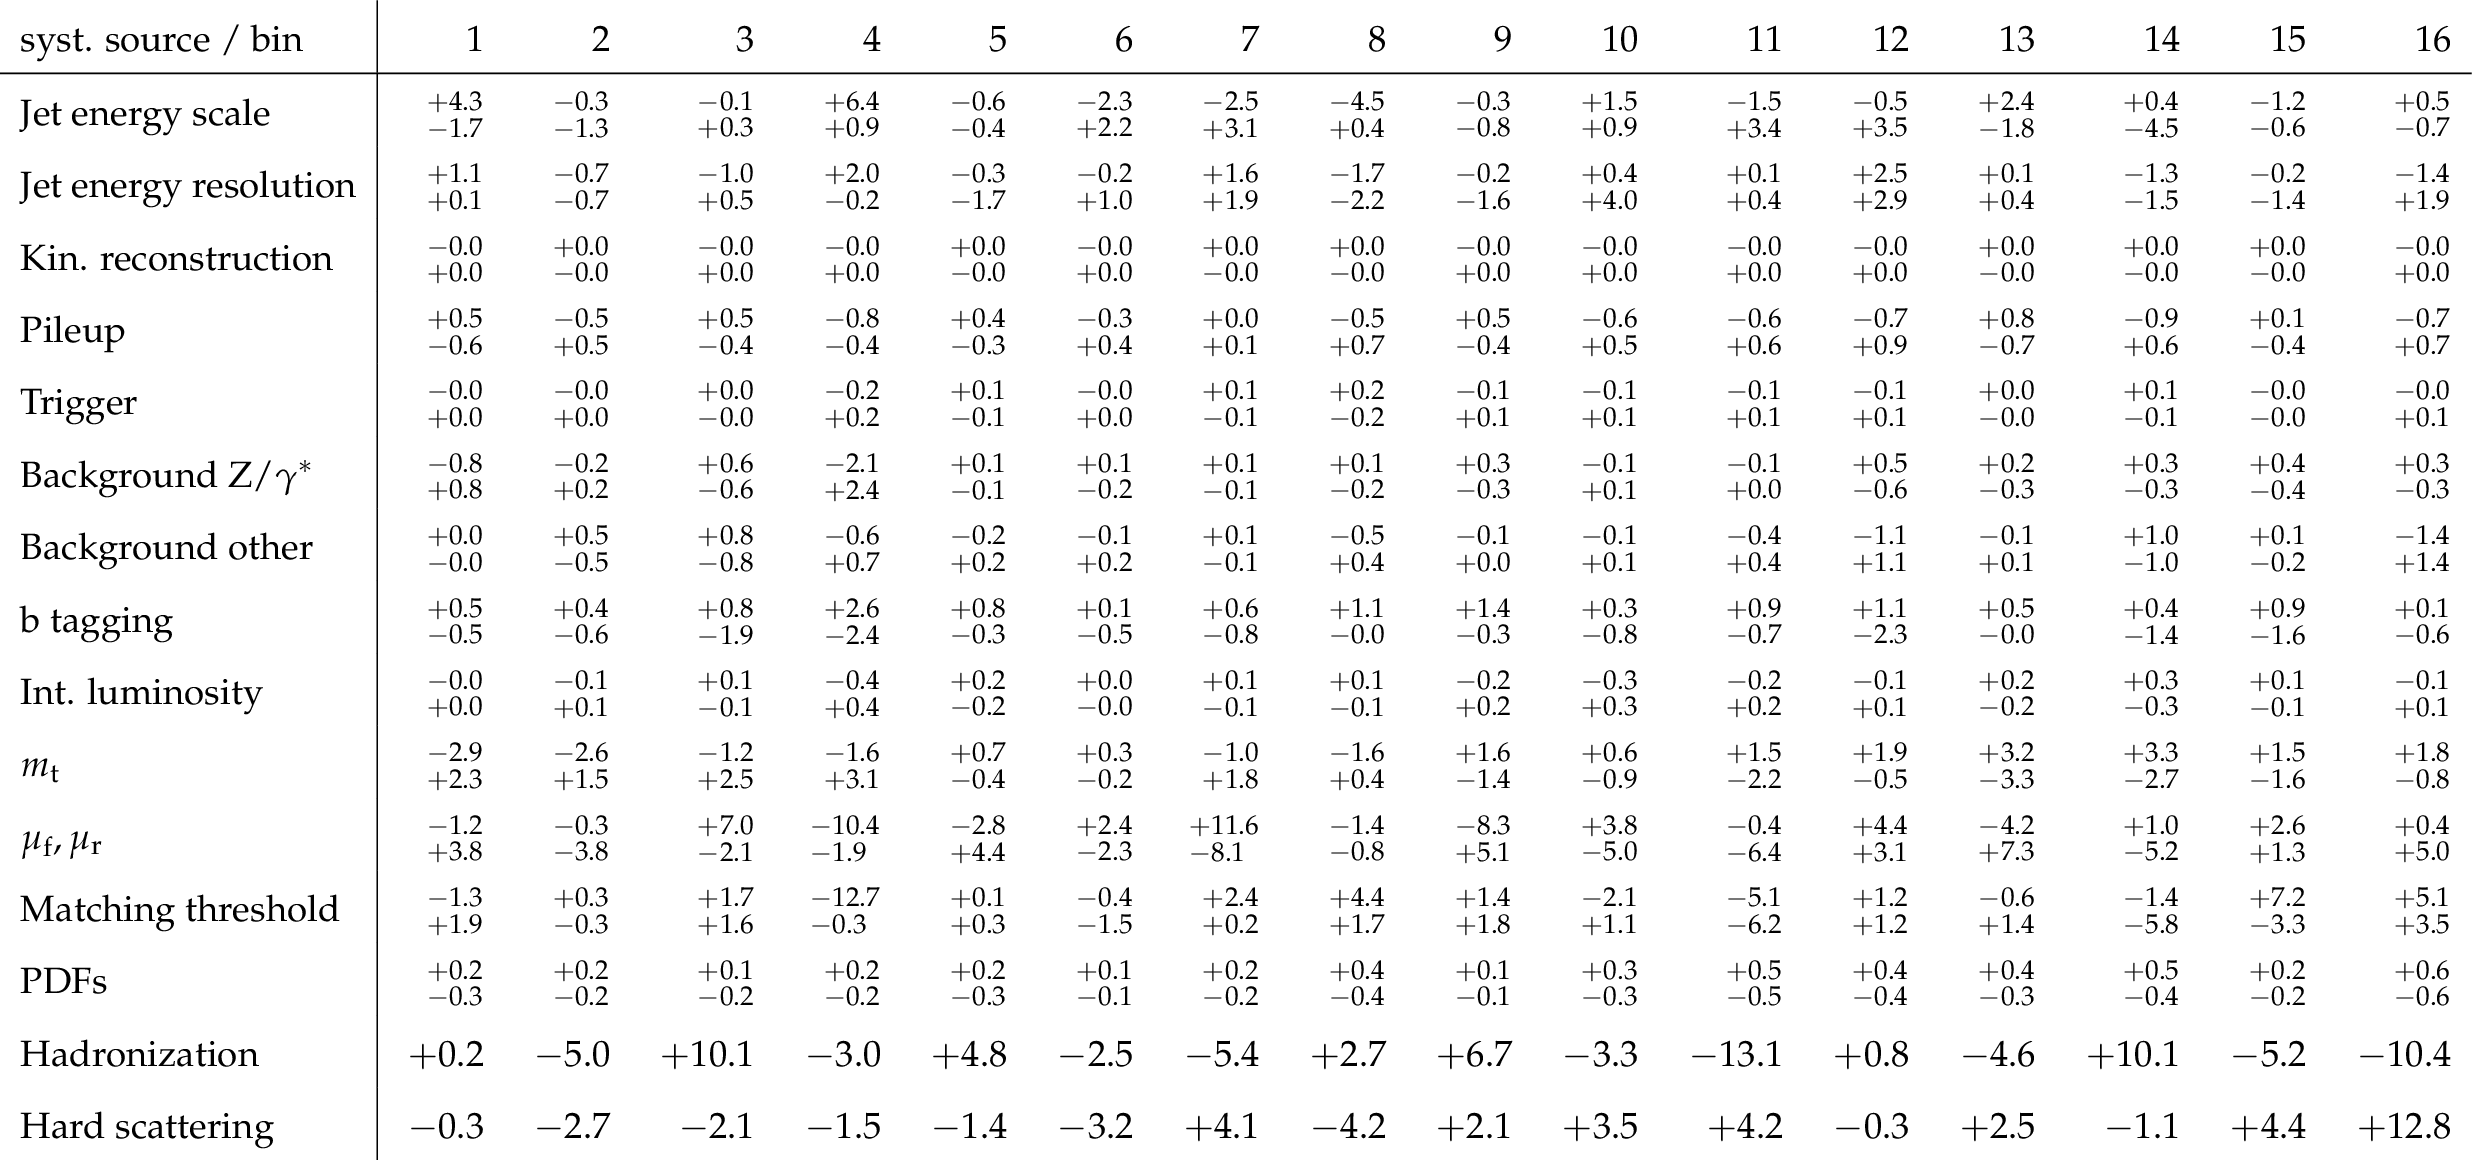
Table 22:
Sources and values of the relative systematic uncertainties in percent of the measured normalized $ {\mathrm{ t } {}\mathrm{ \bar{t} } } $ double-differential cross sections as a function of $ {M({\mathrm{ t } {}\mathrm{ \bar{t} } } )} $ and $ {\Delta \phi (\mathrm{ t } ,\mathrm{ \bar{t} } )} $ . For bin indices see Table 20. |
| Summary |
|
A measurement of normalized double-differential $ \mathrm{ t \bar{t} } $ production cross sections in pp collisions at $ \sqrt{s} = $ 8 TeV has been presented. The measurement is performed in the $\mathrm{ e }^{\pm}\mu^{\mp}$ final state, using data collected with the CMS detector at the LHC, corresponding to an integrated luminosity of 19.7 fb$^{-1}$. The normalized $ \mathrm{ t \bar{t} } $ cross section is measured in the full phase space as a function of different pairs of kinematic variables describing the top quark or $ \mathrm{ t \bar{t} } $ system. None of the tested MC models is able to correctly describe all the double-differential distributions. The data exhibit a softer transverse momentum $p_{\mathrm{T}}({\mathrm{t}})$ distribution, compared to the Monte Carlo predictions, as was reported in previous single-differential $ \mathrm{ t \bar{t} } $ cross section measurements. The double-differential studies reveal a broader distribution of rapidity $y({\mathrm{t}})$ at high $ \mathrm{ t \bar{t} } $ invariant mass $ M(\mathrm{ t \bar{t} }) $ and a larger pseudorapidity separation $ \Delta \eta (\mathrm{ t \bar{t} }) $ at moderate $ M(\mathrm{ t \bar{t} }) $ in data compared to simulation. The data are in reasonable agreement with next-to-leading-order predictions of quantum chromodynamics using recent sets of parton distribution functions (PDFs). The measured double-differential cross sections have been incorporated into a PDF fit, together with other data from HERA and the LHC. Including the $ \mathrm{ t \bar{t} } $ data, one observes a significant reduction in the uncertainties in the gluon distribution at large values of parton momentum fraction $x$, in particular when using the double-differential $ \mathrm{ t \bar{t} } $ cross section as a function of $ y (\mathrm{ t \bar{t} }) $ and $ M(\mathrm{ t \bar{t} }) $. The constraints provided by these data are competitive with those from inclusive jet data. This improvement exceeds that from using single-differential $ \mathrm{ t \bar{t} } $ cross section data, thus strongly suggesting the use of the double-differential $ \mathrm{ t \bar{t} } $ measurements in PDF fits. |
| References | ||||
| 1 | D0 Collaboration | Observation of the Top Quark | PRL 74 (1995) 2632 | hep-ex/9503003 |
| 2 | CDF Collaboration | Observation of Top Quark Production in $ {\bar{p}p} $ Collisions | PRL 74 (1995) 2626 | hep-ex/9503002 |
| 3 | M. Czakon, M. L. Mangano, A. Mitov, and J. Rojo | Constraints on the gluon PDF from top quark pair production at hadron colliders | JHEP 07 (2013) 167 | 1303.7215 |
| 4 | M. Guzzi, K. Lipka, and S. Moch | Top-quark pair production at hadron colliders: differential cross section and phenomenological applications with DIFFTOP | JHEP 01 (2015) 082 | 1406.0386 |
| 5 | M. Czakon et al. | Pinning down the large-x gluon with NNLO top-quark pair differential distributions | 1611.08609 | |
| 6 | CMS Collaboration | Measurements of differential jet cross sections in proton-proton collisions at $ \sqrt{s}= $ 7 TeV with the CMS detector | PRD 87 (2013) 112002 | CMS-QCD-11-004 1212.6660 |
| 7 | CMS Collaboration | Constraints on parton distribution functions and extraction of the strong coupling constant from the inclusive jet cross section in pp collisions at $ \sqrt{s}= $ 7 TeV | EPJC 75 (2015) 288 | CMS-SMP-12-028 1410.6765 |
| 8 | CMS Collaboration | Measurement and QCD analysis of double-differential inclusive jet cross-sections in pp collisions at $ \sqrt{s} = $ 8 TeV and ratios to 2.76 and 7 TeV | Submitted to JHEP | CMS-SMP-14-001 1609.05331 |
| 9 | CDF Collaboration | First Measurement of the $ {t{\bar t}} $ Differential Cross Section $ d\sigma/dM_{{t{\bar t}}} $ in $ {p{\bar p}} $ Collisions at $ \sqrt{s} = $ 1.96 TeV | PRL 102 (2009) 222003 | 0903.2850 |
| 10 | D0 Collaboration | Measurement of differential $ \rm{t\bar{t}} $ production cross sections in $ \rm{p\bar{p}} $ collisions | PRD 90 (2014) 092006 | 1401.5785 |
| 11 | ATLAS Collaboration | Measurements of top quark pair relative differential cross-sections with ATLAS in pp collisions at $ \sqrt{s} = $ 7 TeV | EPJC 73 (2013) 2261 | 1207.5644 |
| 12 | CMS Collaboration | Measurement of differential top-quark pair production cross sections in pp collisions at $ \sqrt{s} = $ 7 TeV | EPJC 73 (2013) 2339 | CMS-TOP-11-013 1211.2220 |
| 13 | ATLAS Collaboration | Measurements of normalized differential cross-sections for $ {t{\bar t}} $ production in pp collisions at $ \sqrt{s} = $ 7 TeV using the ATLAS detector | PRD 90 (2014) 072004 | 1407.0371 |
| 14 | ATLAS Collaboration | Measurement of top quark pair differential cross-sections in the dilepton channel in pp collisions at $ \sqrt{s} = $ 7 and 8 TeV with ATLAS | PRD 94 (2016) 092003 | 1607.07281 |
| 15 | CMS Collaboration | Measurement of the differential cross section for top quark pair production in pp collisions at $ \sqrt{s} = $ 8 TeV | EPJC 75 (2015) 542 | CMS-TOP-12-028 1505.04480 |
| 16 | ATLAS Collaboration | Measurements of top-quark pair differential cross-sections in the lepton+jets channel in pp collisions at $ \sqrt{s} = $ 8 TeV using the ATLAS detector | EPJC 76 (2016) 538 | 1511.04716 |
| 17 | CMS Collaboration | Measurement of differential cross sections for top quark pair production using the lepton+jets final state in proton-proton collisions at 13 TeV | Submitted to PRD | CMS-TOP-16-008 1610.04191 |
| 18 | M. L. Mangano, P. Nason, and G. Ridolfi | Heavy quark correlations in hadron collisions at next-to-leading order | Nucl. Phys. B 373 (1992) 295 | |
| 19 | N. Kidonakis, E. Laenen, S. Moch, and R. Vogt | Sudakov resummation and finite order expansions of heavy quark hadroproduction cross-sections | PRD 64 (2001) 114001 | hep-ph/0105041 |
| 20 | CMS Collaboration | The CMS experiment at the CERN LHC | JINST 3 (2008) S08004 | CMS-00-001 |
| 21 | J. Alwall et al. | The automated computation of tree-level and next-to-leading order differential cross sections, and their matching to parton shower simulations | JHEP 07 (2014) 079 | 1405.0301 |
| 22 | P. Artoisenet, R. Frederix, O. Mattelaer, and R. Rietkerk | Automatic spin-entangled decays of heavy resonances in Monte Carlo simulations | JHEP 03 (2013) 015 | 1212.3460 |
| 23 | T. Sj\"ostrand, S. Mrenna, and P. Z. Skands | PYTHIA 6.4 physics and manual | JHEP 05 (2006) 026 | hep-ph/0603175 |
| 24 | J. Pumplin et al. | New generation of parton distributions with uncertainties from global QCD analysis | JHEP 07 (2002) 012 | hep-ph/0201195 |
| 25 | P. Nason | A New method for combining NLO QCD with shower Monte Carlo algorithms | JHEP 11 (2004) 040 | hep-ph/0409146 |
| 26 | S. Frixione, P. Nason, and C. Oleari | Matching NLO QCD computations with parton shower simulations: the POWHEG method | JHEP 11 (2007) 070 | 0709.2092 |
| 27 | S. Alioli, P. Nason, C. Oleari, and E. Re | A general framework for implementing NLO calculations in shower Monte Carlo programs: the POWHEG BOX | JHEP 06 (2010) 043 | 1002.2581 |
| 28 | G. Corcella et al. | HERWIG 6: an event generator for hadron emission reactions with interfering gluons (including supersymmetric processes) | JHEP 01 (2001) 010 | hep-ph/0011363 |
| 29 | S. Frixione and B. R. Webber | Matching NLO QCD computations and parton shower simulations | JHEP 06 (2002) 029 | hep-ph/0204244 |
| 30 | CMS Collaboration | Measurement of the underlying event activity at the LHC with $ \sqrt{s} = $ 7 TeV and comparison with $ \sqrt{s} = $ 0.9 TeV | JHEP 09 (2011) 109 | CMS-QCD-10-010 1107.0330 |
| 31 | ATLAS Collaboration | ATLAS tunes of PYTHIA 6 and Pythia 8 for MC11 | ATLAS PUB note ATL-PHYS-PUB-2011-009 | |
| 32 | H.-L. Lai et al. | New parton distributions for collider physics | PRD 82 (2010) 074024 | 1007.2241 |
| 33 | GEANT4 Collaboration | GEANT4---a simulation toolkit | NIMA 506 (2003) 250 | |
| 34 | CMS Collaboration | Particle--Flow Event Reconstruction in CMS and Performance for Jets, Taus, and $ E_{\mathrm{T}}^{\text{miss}} $ | CDS | |
| 35 | CMS Collaboration | Commissioning of the Particle-flow Event Reconstruction with the first LHC collisions recorded in the CMS detector | CDS | |
| 36 | CMS Collaboration | CMS tracking performance results from early LHC operation | EPJC 70 (2010) 1165 | CMS-TRK-10-001 1007.1988 |
| 37 | M. Cacciari, G. P. Salam, and G. Soyez | The catchment area of jets | JHEP 04 (2008) 005 | 0802.1188 |
| 38 | CMS Collaboration | Performance of electron reconstruction and selection with the CMS detector in proton-proton collisions at $ \sqrt{s} = $ 8 TeV | JINST 10 (2015) P06005 | CMS-EGM-13-001 1502.02701 |
| 39 | CMS Collaboration | Measurement of the Drell-Yan cross section in pp collisions at $ \sqrt{s}= $ 7 TeV | JHEP 10 (2011) 007 | CMS-EWK-10-007 1108.0566 |
| 40 | M. Cacciari, G. P. Salam, and G. Soyez | The anti-$ k_t $ jet clustering algorithm | JHEP 04 (2008) 063 | 0802.1189 |
| 41 | M. Cacciari, G. P. Salam, and G. Soyez | FastJet user manual | EPJC 72 (2012) 1896 | 1111.6097 |
| 42 | CMS Collaboration | Identification of b-quark jets with the CMS experiment | JINST 8 (2013) P04013 | CMS-BTV-12-001 1211.4462 |
| 43 | CMS Collaboration | Missing transverse energy performance of the CMS detector | JINST 6 (2011) P09001 | CMS-JME-10-009 1106.5048 |
| 44 | CMS Collaboration | Performance of missing transverse energy reconstruction by the CMS experiment in $ \sqrt{s}= $ 8 TeV pp data | JINST 10 (2015) P02006 | CMS-JME-13-003 1411.0511 |
| 45 | D0 Collaboration | Measurement of the Top Quark Mass Using Dilepton Events | PRL 80 (1998) 2063 | hep-ex/9706014 |
| 46 | L. Sonnenschein | Analytical solution of $ {\rm t}\bar{{\rm t}} $ dilepton equations | PRD 73 (2006) 054015 | hep-ph/0603011 |
| 47 | I. Korol | Measurement of Double Differential $\mathrm{ t \bar{t} }$ Production Cross Sections with the CMS Detector | PhD thesis, Universit\"at Hamburg, 2016 DESY-THESIS-2016-011 (2016) | |
| 48 | S. Schmitt | TUnfold: an algorithm for correcting migration effects in high energy physics | JINST 7 (2012) T10003 | 1205.6201 |
| 49 | A. N. Tikhonov | Solution of incorrectly formulated problems and the regularization method | Soviet Math. Dokl. 4 (1963) 1035 | |
| 50 | S. Schmitt | Data Unfolding Methods in High Energy Physics | 1611.01927 | |
| 51 | Particle Data Group Collaboration | Review of Particle Physics | CPC 40 (2016) 100001 | |
| 52 | TOTEM Collaboration | First measurement of the total proton-proton cross section at the LHC energy of $ \sqrt{s} = $ 7 TeV | Europhys. Lett. 96 (2011) 21002 | 1110.1395 |
| 53 | CMS Collaboration | Jet energy scale and resolution in the CMS experiment in pp collisions at 8 TeV | Submitted to JINST | CMS-JME-13-004 1607.03663 |
| 54 | CMS Collaboration | Determination of jet energy calibration and transverse momentum resolution in CMS | JINST 6 (2011) P11002 | CMS-JME-10-011 1107.4277 |
| 55 | CMS Collaboration | CMS Luminosity Based on Pixel Cluster Counting - Summer 2013 Update | CMS-PAS-LUM-13-001 | CMS-PAS-LUM-13-001 |
| 56 | M. Czakon, D. Heymes, and A. Mitov | High-precision differential predictions for top-quark pairs at the LHC | PRL 116 (2016) 082003 | 1511.00549 |
| 57 | M. Czakon, D. Heymes, and A. Mitov | Dynamical scales for multi-TeV top-pair production at the LHC | 1606.03350 | |
| 58 | N. Kidonakis | NNNLO soft-gluon corrections for the top-quark $ p_{\mathrm{T}} $ and rapidity distributions | PRD 91 (2015) 031501 | 1411.2633 |
| 59 | J. M. Campbell and R. K. Ellis | MCFM for the Tevatron and the LHC | NPPS 205-206 (2010) 10 | 1007.3492 |
| 60 | S. Alekhin, J. Bl\"umlein, and S. Moch | Parton distribution functions and benchmark cross sections at NNLO | PRD 86 (2012) 054009 | 1202.2281 |
| 61 | A. Accardi et al. | Constraints on large-$ x $ parton distributions from new weak boson production and deep-inelastic scattering data | PRD 93 (2016) 114017 | 1602.03154 |
| 62 | S. Dulat et al. | New parton distribution functions from a global analysis of quantum chromodynamics | PRD 93 (2016) 033006 | 1506.07443 |
| 63 | H1 and ZEUS Collaborations | Combination of measurements of inclusive deep inelastic $ {{\rm e}^{\pm}{\rm p}} $ scattering cross sections and QCD analysis of HERA data | EPJC 75 (2015) 580 | 1506.06042 |
| 64 | P. Jimenez-Delgado and E. Reya | Delineating parton distributions and the strong coupling | PRD 89 (2014) 074049 | 1403.1852 |
| 65 | L. A. Harland-Lang, A. D. Martin, P. Motylinski, and R. S. Thorne | Parton distributions in the LHC era: MMHT 2014 PDFs | EPJC 75 (2015) 204 | 1412.3989 |
| 66 | NNPDF Collaboration | Parton distributions for the LHC Run II | JHEP 04 (2015) 040 | 1410.8849 |
| 67 | A. Buckley et al. | LHAPDFf6: parton density access in the LHC precision era | EPJC 75 (2015) 132 | 1412.7420 |
| 68 | M. Cacciari et al. | Updated predictions for the total production cross sections of top and of heavier quark pairs at the Tevatron and at the LHC | JHEP 09 (2008) 127 | 0804.2800 |
| 69 | M. Guzzi, K. Lipka, and S. Moch | Differential cross sections for top pair production at the LHC | Nuclear and Particle Physics Proceedings (2015) NPPP601 | 1409.0444 |
| 70 | M. Guzzi, K. Lipka, and S. Moch | Top-quark production at the LHC: differential cross section and phenomenological applications | in Proceedings, 21st International Workshop on Deep-Inelastic Scattering and Related Subjects (DIS 2013), p. 049 2013 [PoS(DIS 2013)049] | 1308.1635 |
| 71 | S. Alekhin, J. Bl\"umlein, and S. Moch | The ABM parton distributions tuned to LHC data | PRD 89 (2014) 054028 | 1310.3059 |
| 72 | CMS Collaboration | Measurement of the differential cross section and charge asymmetry for inclusive $ \mathrm {p}\mathrm {p}\rightarrow \mathrm {W}^{\pm }+X $ production at $ \sqrt{s} = $ 8 TeV | EPJC 76 (2016) 469 | CMS-SMP-14-022 1603.01803 |
| 73 | S. Alekhin et al. | HERAFitter | EPJC 75 (2015) 304 | 1410.4412 |
| 74 | Y. L. Dokshitzer | Calculation of the Structure Functions for Deep Inelastic Scattering and e+ e- Annihilation by Perturbation Theory in Quantum Chromodynamics | Sov. Phys. JETP 46 (1977)641 | |
| 75 | V. N. Gribov and L. N. Lipatov | Deep inelastic ep scattering in perturbation theory | Sov. J. Nucl. Phys. 15 (1972)438 | |
| 76 | G. Altarelli and G. Parisi | Asymptotic freedom in parton language | Nucl. Phys. B 126 (1977) 298 | |
| 77 | G. Curci, W. Furmanski, and R. Petronzio | Evolution of parton densities beyond leading order: the nonsinglet case | Nucl. Phys. B 175 (1980) 27 | |
| 78 | W. Furmanski and R. Petronzio | Singlet parton densities beyond leading order | PLB 97 (1980) 437 | |
| 79 | S. Moch, J. A. M. Vermaseren, and A. Vogt | The three-loop splitting functions in QCD: the nonsinglet case | Nucl. Phys. B 688 (2004) 101 | hep-ph/0403192 |
| 80 | A. Vogt, S. Moch, and J. A. M. Vermaseren | The three-loop splitting functions in QCD: the singlet case | Nucl. Phys. B 691 (2004) 129 | hep-ph/0404111 |
| 81 | M. Botje | QCDNUM: Fast QCD evolution and convolution | CPC 182 (2011) 490 | 1005.1481 |
| 82 | R. S. Thorne and R. G. Roberts | An ordered analysis of heavy flavor production in deep inelastic scattering | PRD 57 (1998) 6871 | hep-ph/9709442 |
| 83 | R. S. Thorne | A variable-flavor number scheme for NNLO | PRD 73 (2006) 054019 | hep-ph/0601245 |
| 84 | R. S. Thorne | Effect of changes of variable flavor number scheme on parton distribution functions and predicted cross sections | PRD 86 (2012) 074017 | 1201.6180 |
| 85 | J. M. Campbell and R. K. Ellis | An update on vector boson pair production at hadron colliders | PRD 60 (1999) 113006 | hep-ph/9905386 |
| 86 | T. Carli et al. | A posteriori inclusion of parton density functions in NLO QCD final-state calculations at hadron colliders: The APPLGRIDproject | EPJC 66 (2010) 503 | 0911.2985 |
| 87 | A. D. Martin, W. J. Stirling, R. S. Thorne, and G. Watt | Parton distributions for the LHC | EPJC 63 (2009) 189 | 0901.0002 |
| 88 | CMS Collaboration | Measurement of the muon charge asymmetry in inclusive $ \rm{pp} \to \rm{W}+\rm{X} $ production at $ \sqrt{s} = $ 7 TeV and an improved determination of light parton distribution functions | PRD 90 (2014) 032004 | CMS-SMP-12-021 1312.6283 |
| 89 | H1 Collaboration | Inclusive deep inelastic scattering at high $ Q^2 $ with longitudinally polarised lepton beams at HERA | JHEP 09 (2012) 061 | 1206.7007 |
| 90 | D. Britzger, K. Rabbertz, F. Stober, and M. Wobisch | New features in version 2 of the FastNLO project | in Proceedings, XX. International Workshop on Deep-Inelastic Scattering and Related Subjects (DIS 2012) Bonn, Germany | 1208.3641 |
| 91 | Y. Li and F. Petriello | Combining QCD and electroweak corrections to dilepton production in FEWZ | PRD 86 (2012) 094034 | 1208.5967 |
|
|
Compact Muon Solenoid LHC, CERN |
|

|

|

|

|

|