

Compact Muon Solenoid
LHC, CERN
| CMS-SMP-14-001 ; CERN-EP-2016-196 | ||
| Measurement and QCD analysis of double-differential inclusive jet cross sections in pp collisions at $ \sqrt{s} = $ 8 TeV and ratios to 2.76 and 7 TeV | ||
| CMS Collaboration | ||
| 17 September 2016 | ||
| JHEP 03 (2017) 156 | ||
| Abstract: A measurement of the double-differential inclusive jet cross section as a function of the jet transverse momentum $p_{\mathrm{T}}$ and the absolute jet rapidity $|y|$ is presented. Data from LHC proton-proton collisions at $ \sqrt{s} = $ 8 TeV, corresponding to an integrated luminosity of 19.7 fb$^{-1}$, have been collected with the CMS detector. Jets are reconstructed using the anti-$k_{\mathrm{T}}$ clustering algorithm with a size parameter of 0.7 in a phase space region covering jet $p_{\mathrm{T}}$ from 74 GeV up to 2.5 TeV and jet absolute rapidity up to $|y|= $ 3.0. The low-$p_{\mathrm{T}}$ jet range between 21 and 74 GeV is also studied up to $|y|= $ 4.7, using a dedicated data sample corresponding to an integrated luminosity of 5.6 pb$^{-1}$. The measured jet cross section is corrected for detector effects and compared with the predictions from perturbative QCD at next-to-leading order (NLO) using various sets of parton distribution functions (PDF). Cross section ratios to the corresponding measurements performed at 2.76 and 7 TeV are presented. From the measured double-differential jet cross section, the value of the strong coupling constant evaluated at the Z mass is $\alpha_\mathrm{S}(M_{\mathrm{ Z }}) = 0.1164^{+0.0060}_{-0.0043}$, where the errors include the PDF, scale, nonperturbative effects and experimental uncertainties, using the CT10 NLO PDFs. Improved constraints on PDFs based on the inclusive jet cross section measurement are presented. | ||
| Links: e-print arXiv:1609.05331 [hep-ex] (PDF) ; CDS record ; inSPIRE record ; HepData record ; CADI line (restricted) ; | ||
| Figures | |
png pdf |
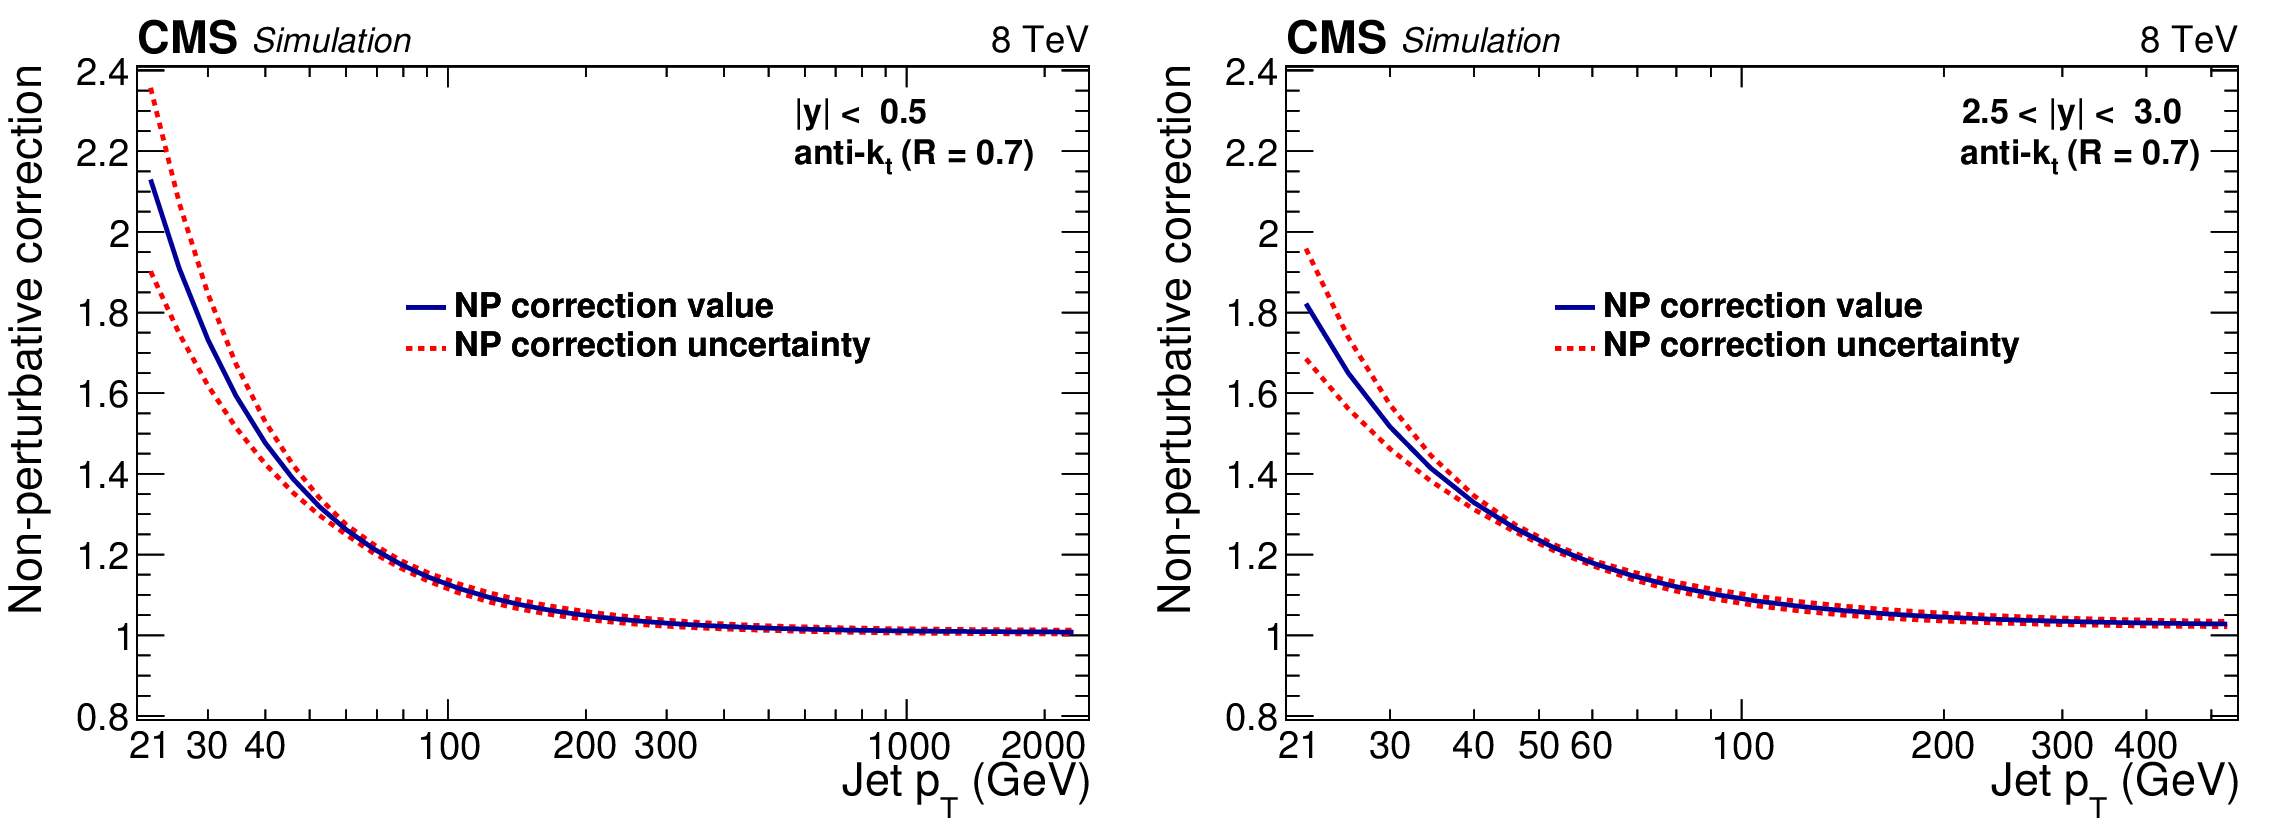
Figure 1:
The NP correction factor shown for the central (left) and outermost (right) absolute rapidity bins as a function of jet ${p_{\mathrm {T}}} $. The correction is obtained by averaging LO- and NLO-based predictions, and the envelope of these predictions is used as the uncertainty band. |
png pdf |
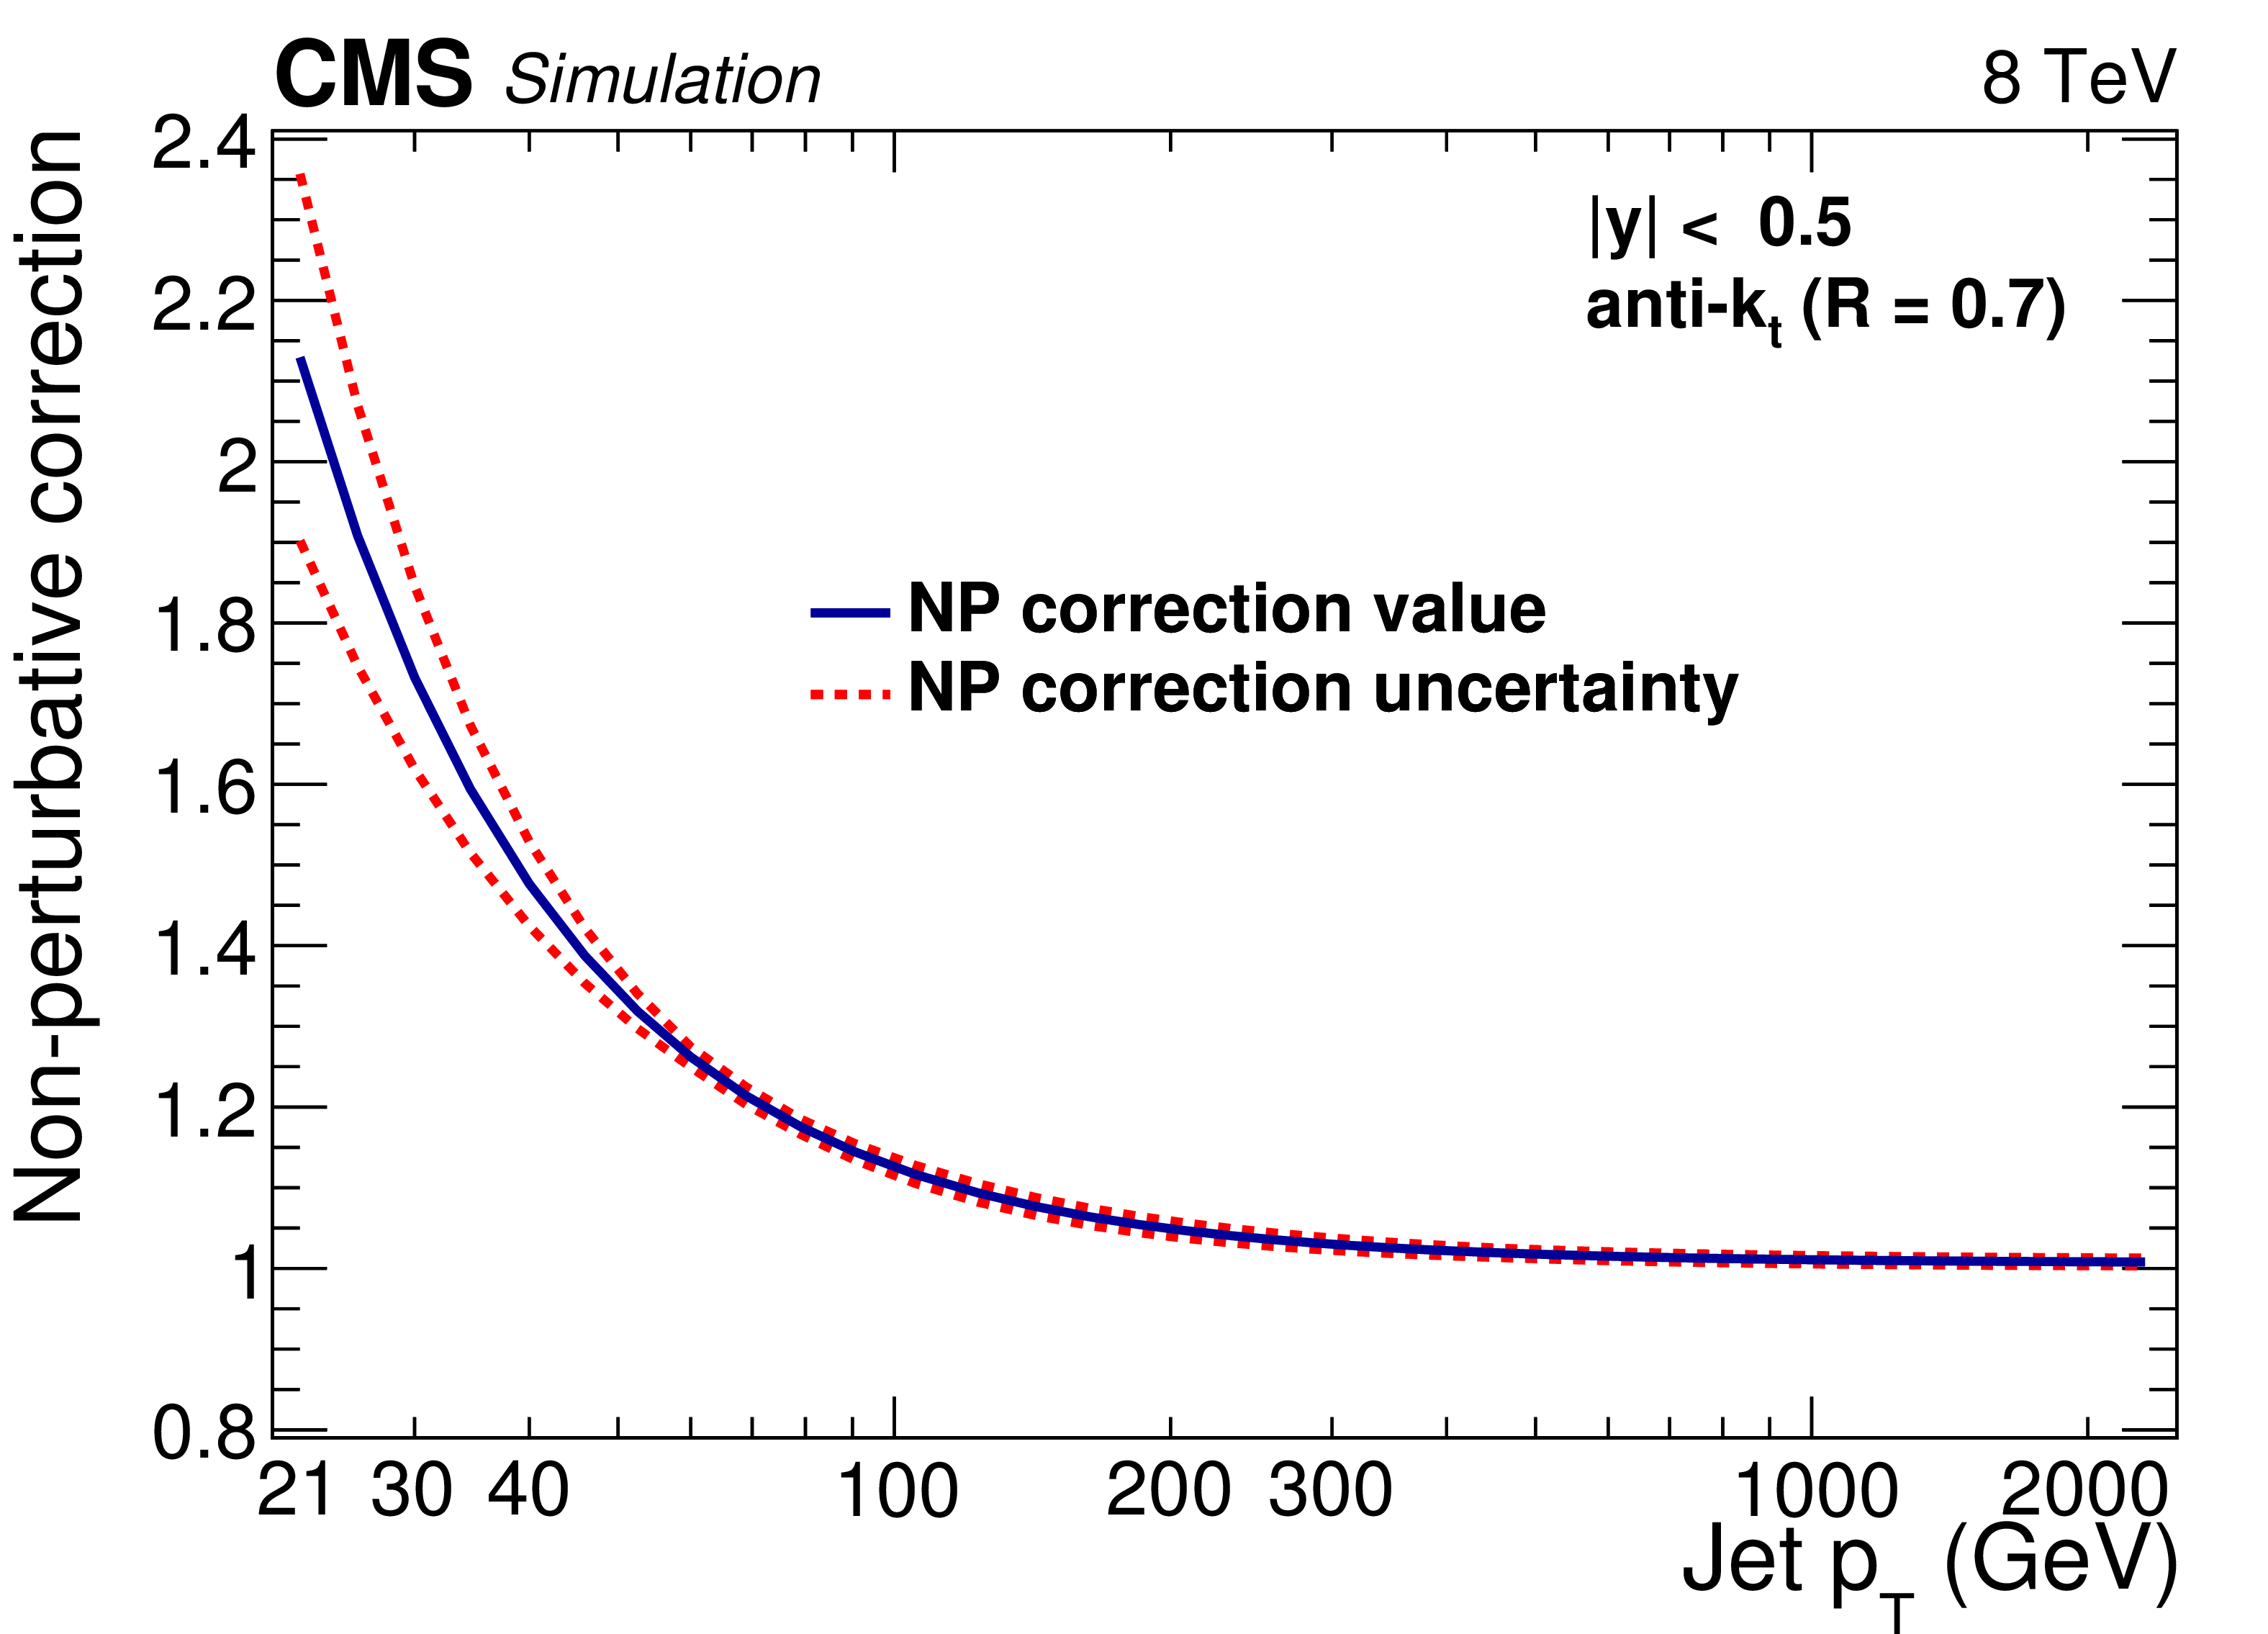
Figure 1-a:
The NP correction factor shown for the central absolute rapidity bins as a function of jet ${p_{\mathrm {T}}} $. The correction is obtained by averaging LO- and NLO-based predictions, and the envelope of these predictions is used as the uncertainty band. |
png pdf |
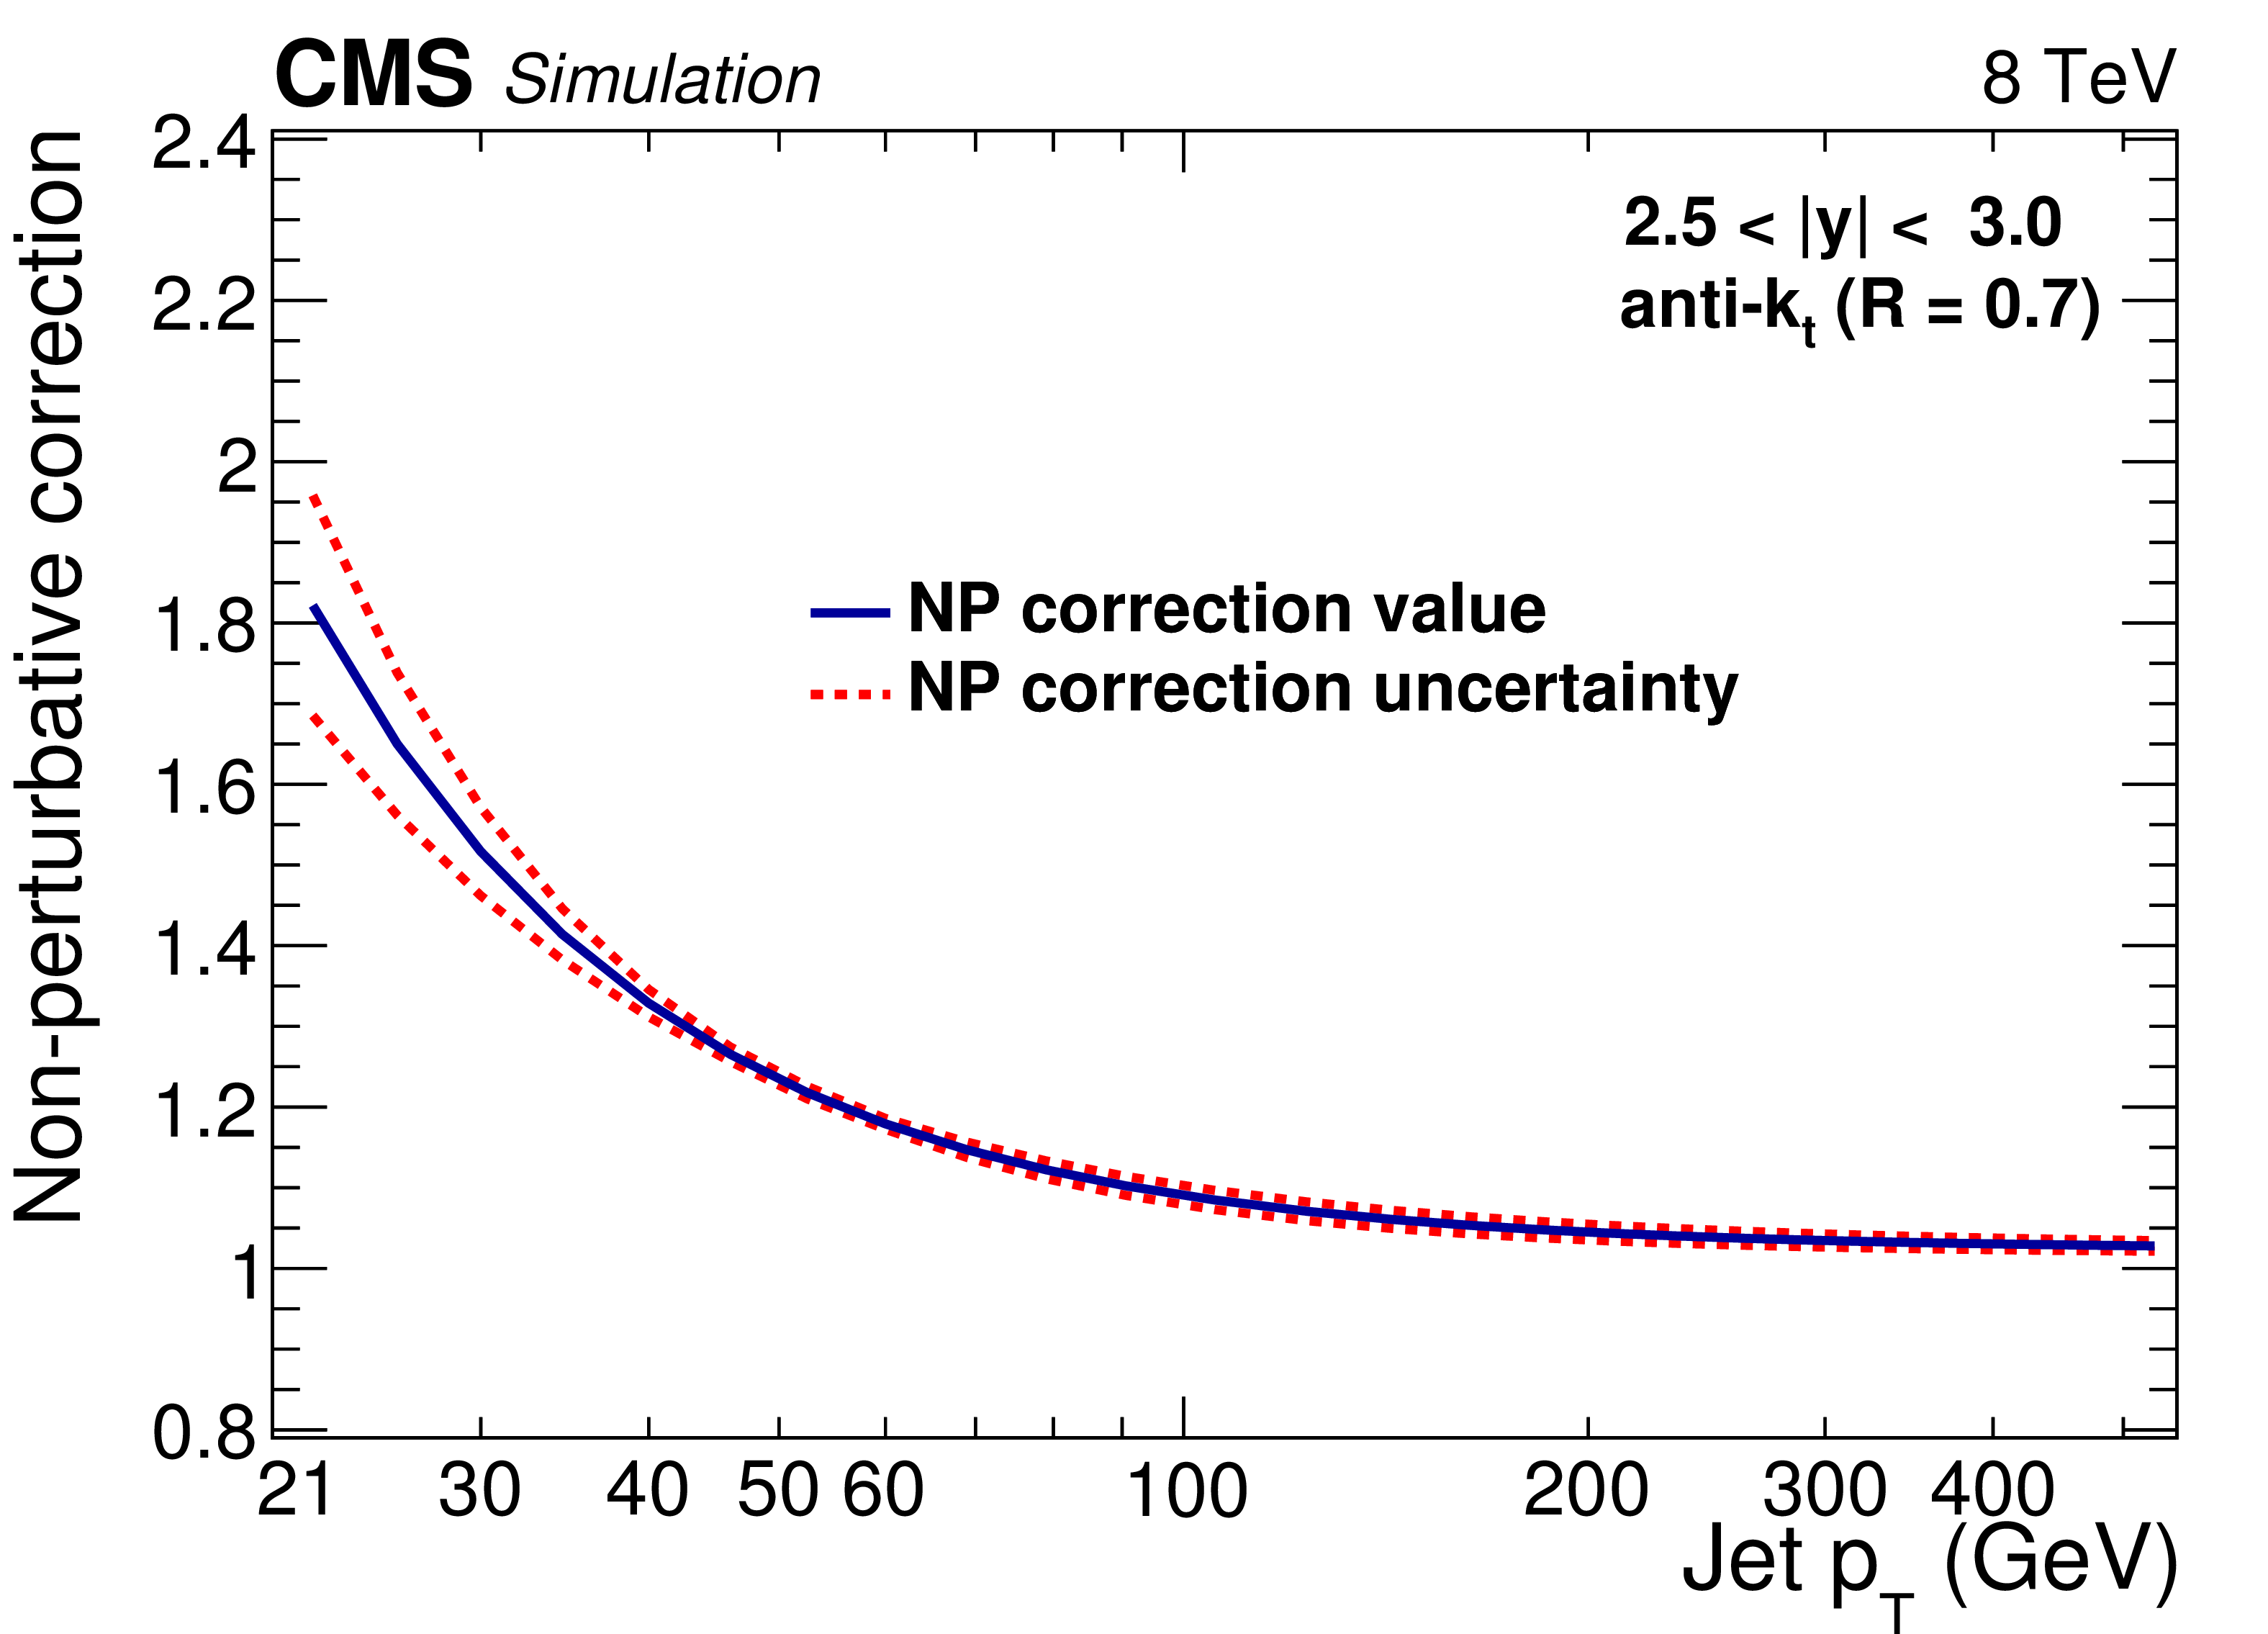
Figure 1-b:
The NP correction factor shown for the outermost absolute rapidity bins as a function of jet ${p_{\mathrm {T}}} $. The correction is obtained by averaging LO- and NLO-based predictions, and the envelope of these predictions is used as the uncertainty band. |
png pdf |
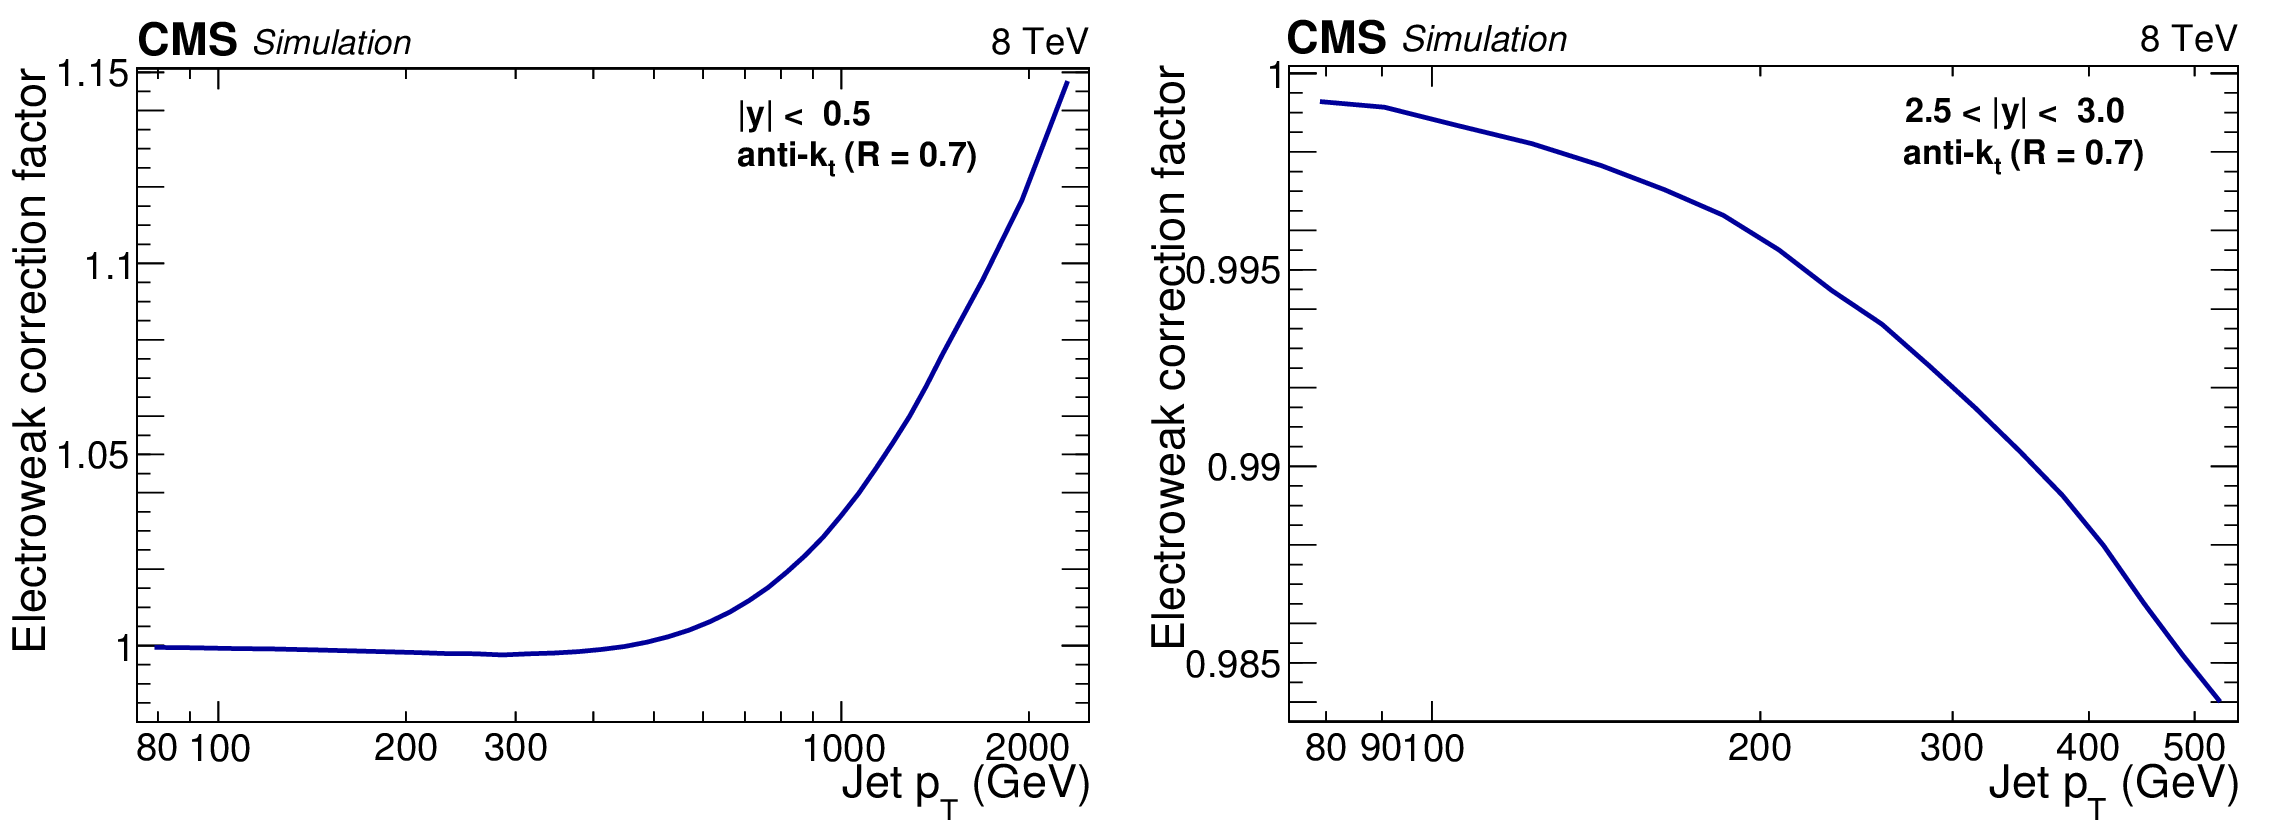
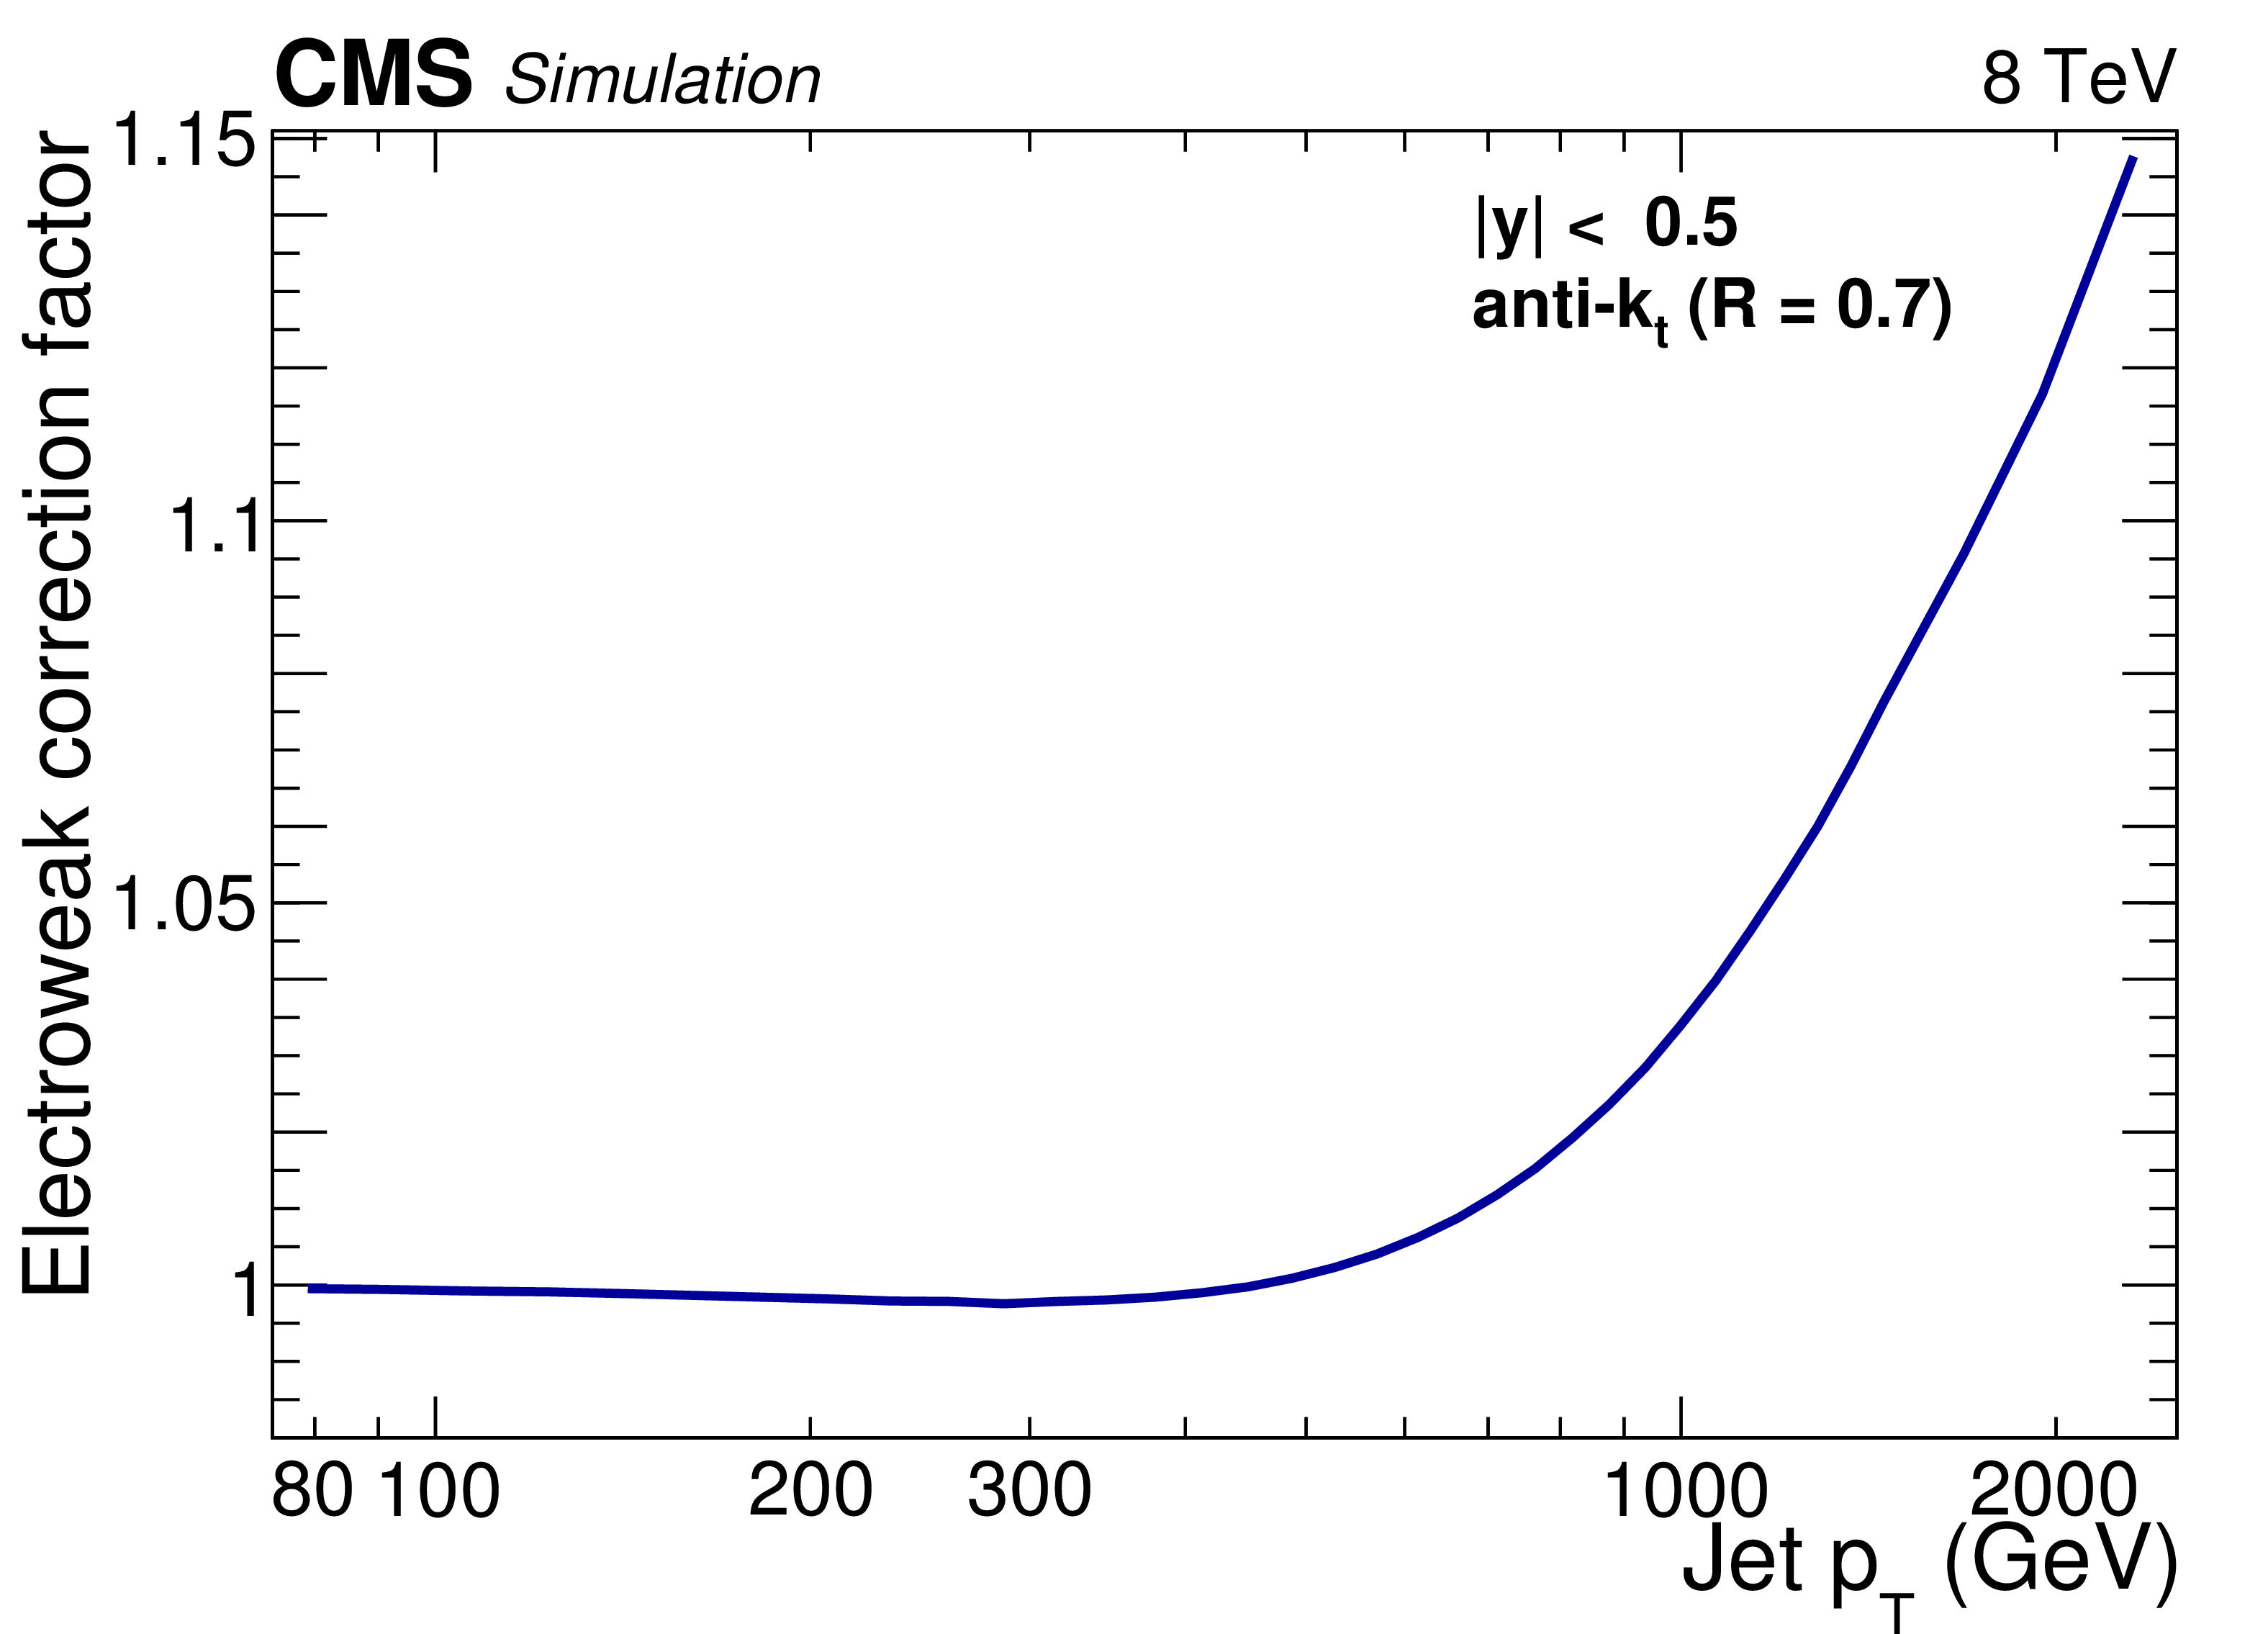
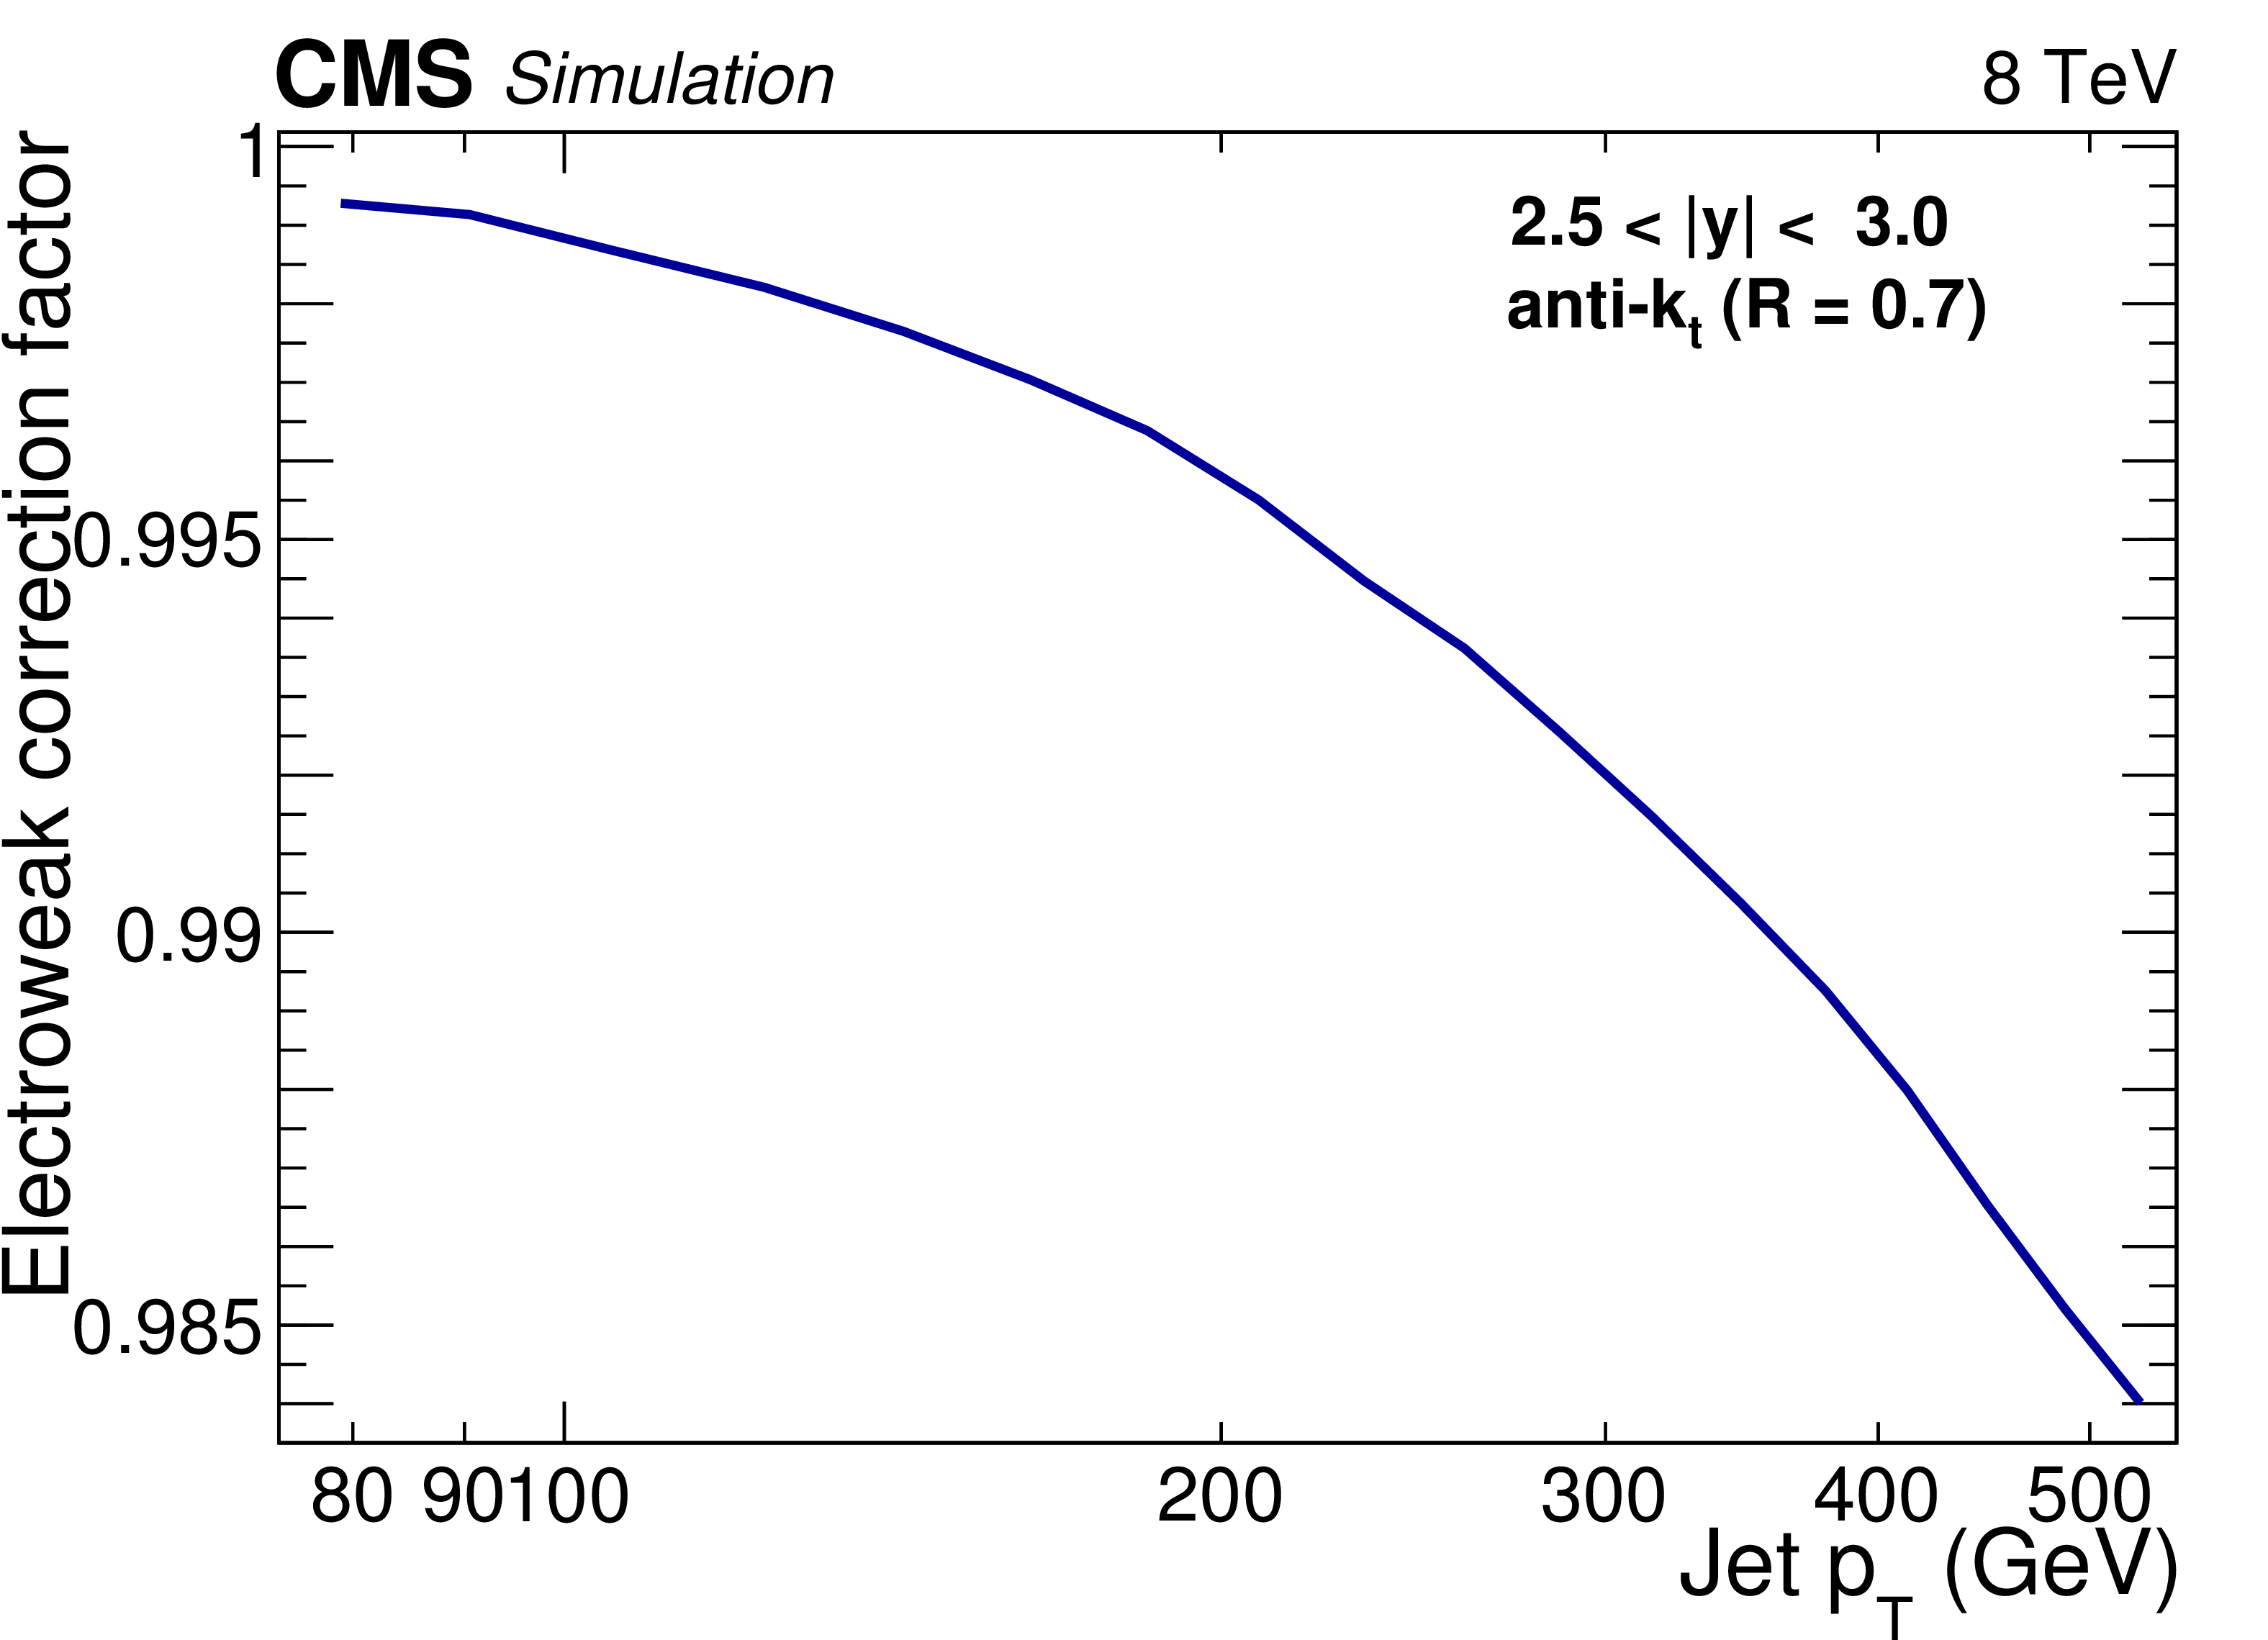
Figure 2:
Electroweak correction factor for the central (left) and outermost (right) rapidity bins as a function of jet ${p_{\mathrm {T}}} $. |
png pdf |
Figure 2-a:
Electroweak correction factor for the central rapidity bins as a function of jet ${p_{\mathrm {T}}} $. |
png pdf |
Figure 2-b:
Electroweak correction factor for the outermost rapidity bins as a function of jet ${p_{\mathrm {T}}} $. |
png pdf |
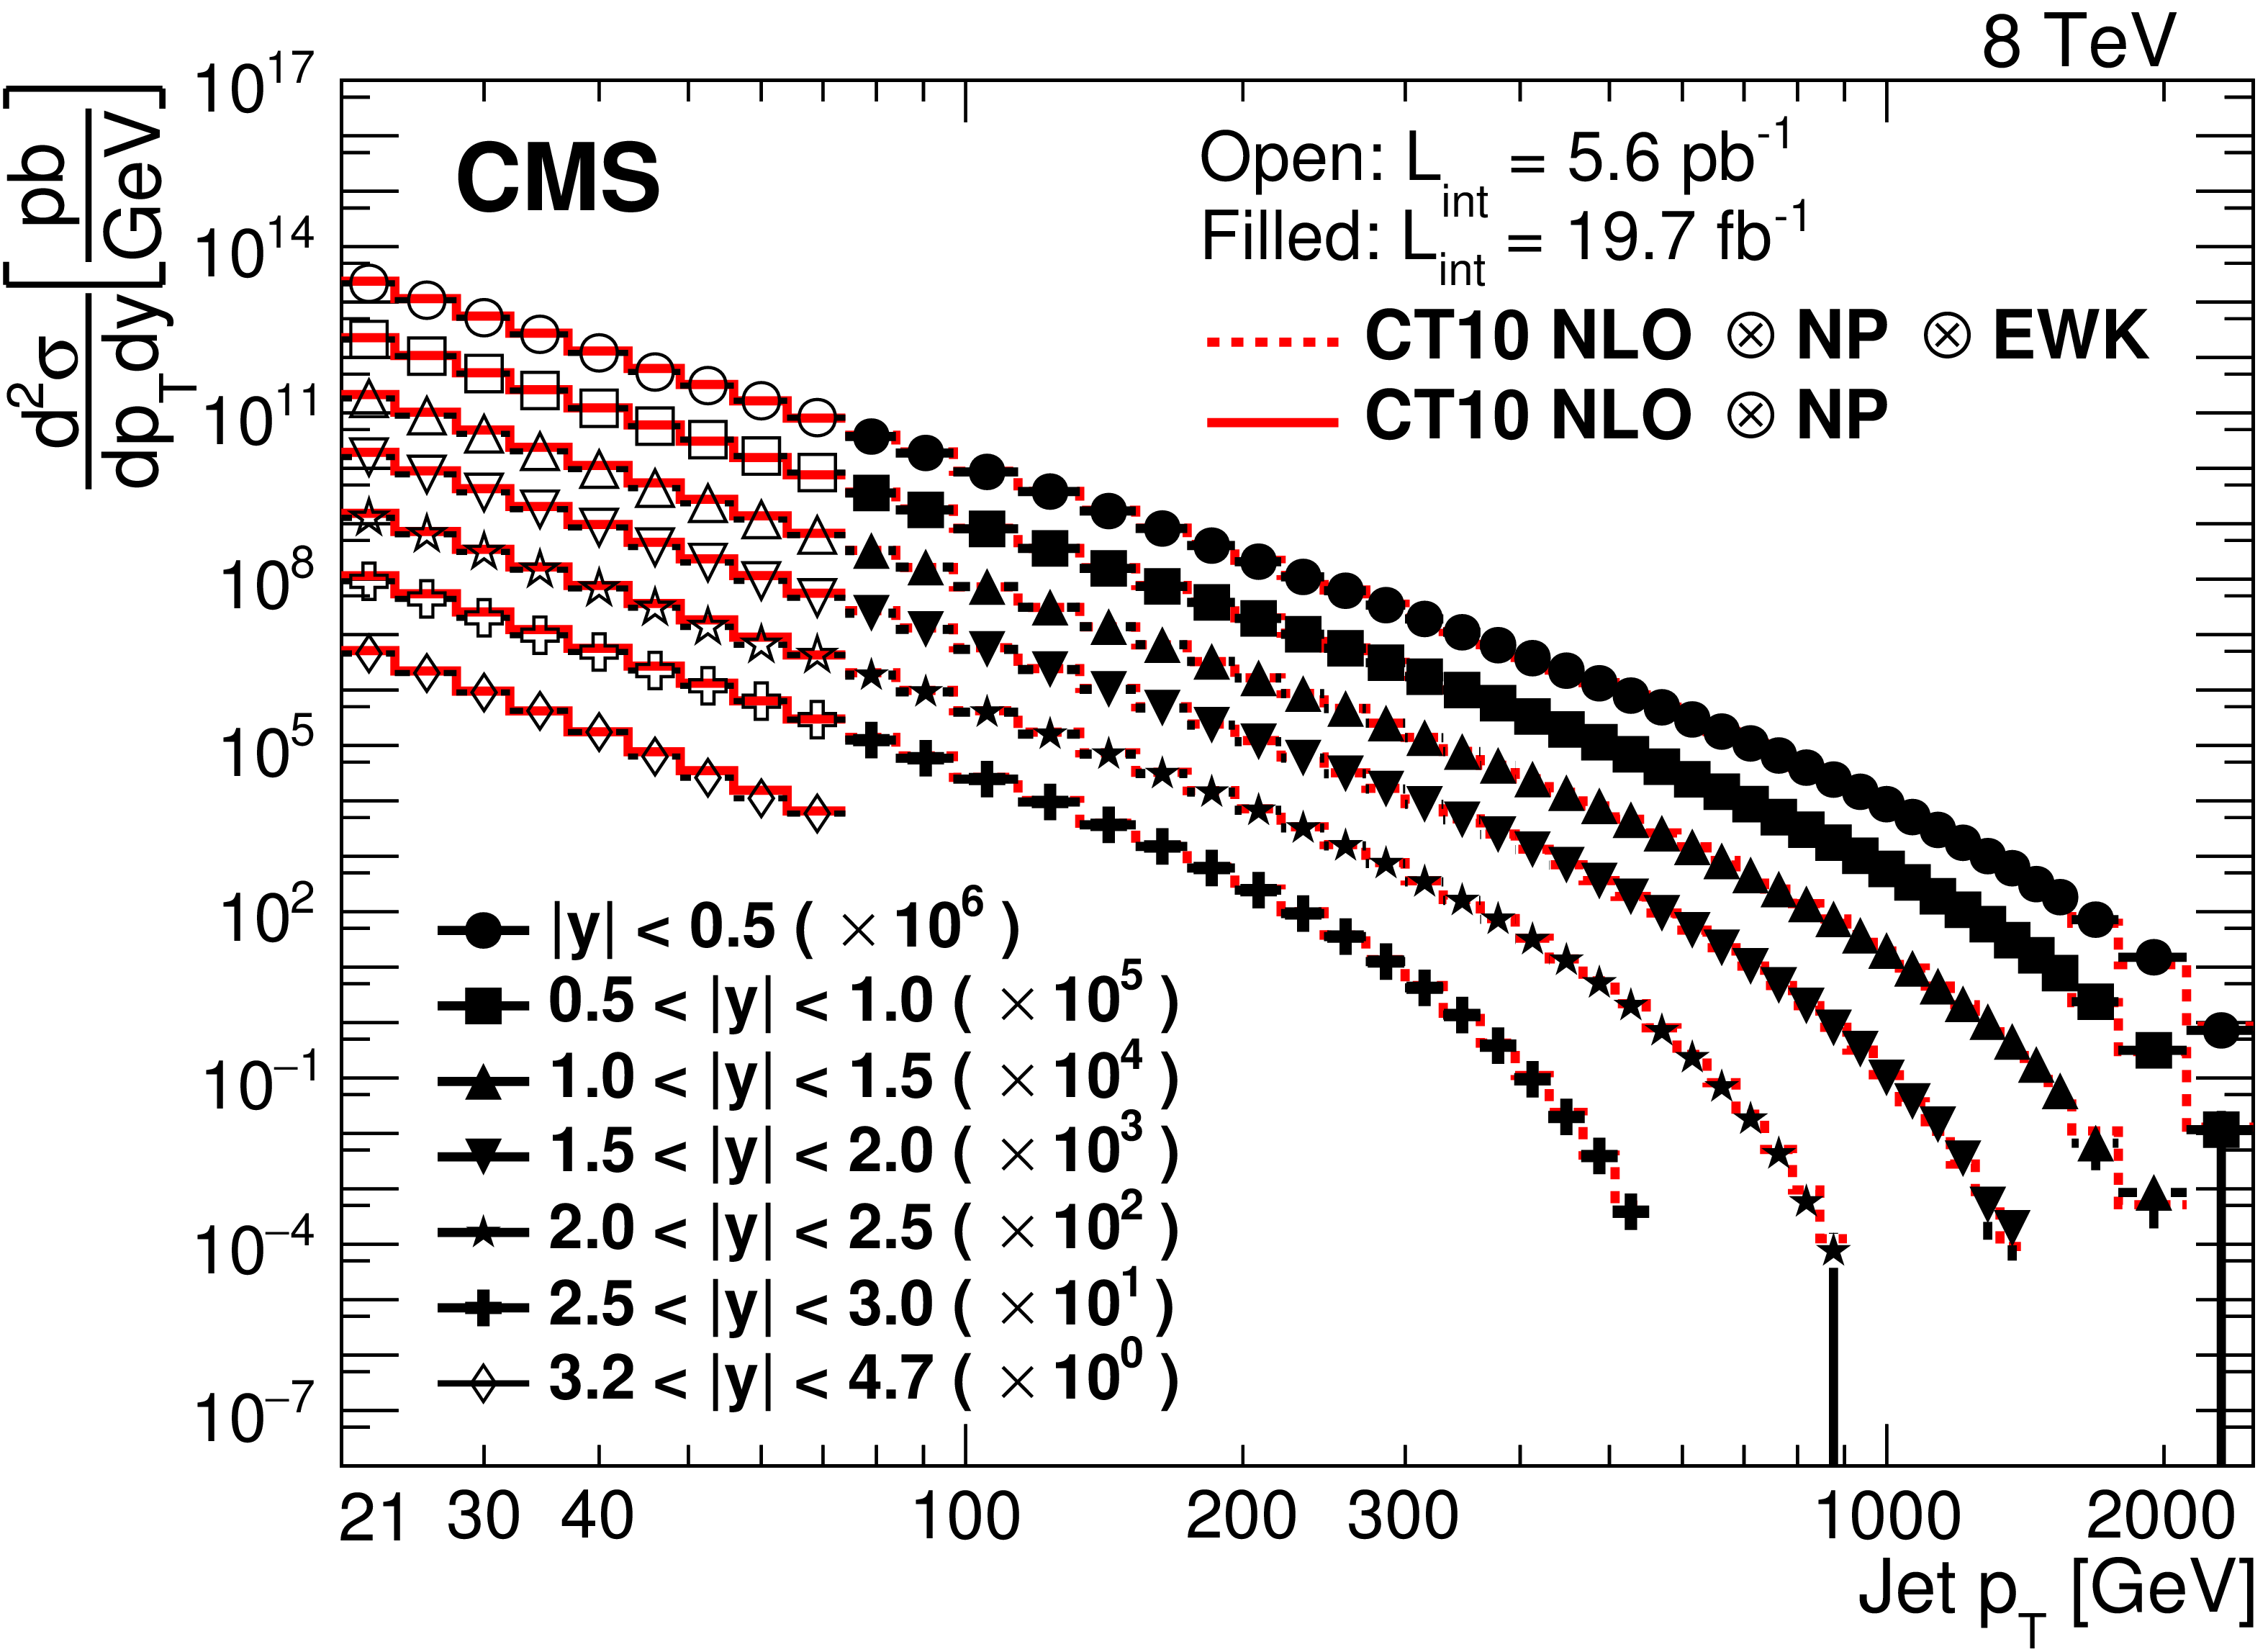
Figure 3:
Double-differential inclusive jet cross sections as function of jet ${p_{\mathrm {T}}} $. Data (open points for the low-$ {p_{\mathrm {T}}}$ analysis, filled points for the high-$ {p_{\mathrm {T}}}$ one) and NLO predictions based on the CT10 PDF set corrected for the NP factor for the low-$ {p_{\mathrm {T}}}$ data (solid line) and the NP and electroweak correction factors for the high-$ {p_{\mathrm {T}}}$ data (dashed line). The comparison is carried out for six different $|y|$ bins at an interval of $\Delta |y| =$ 0.5. |
png pdf |
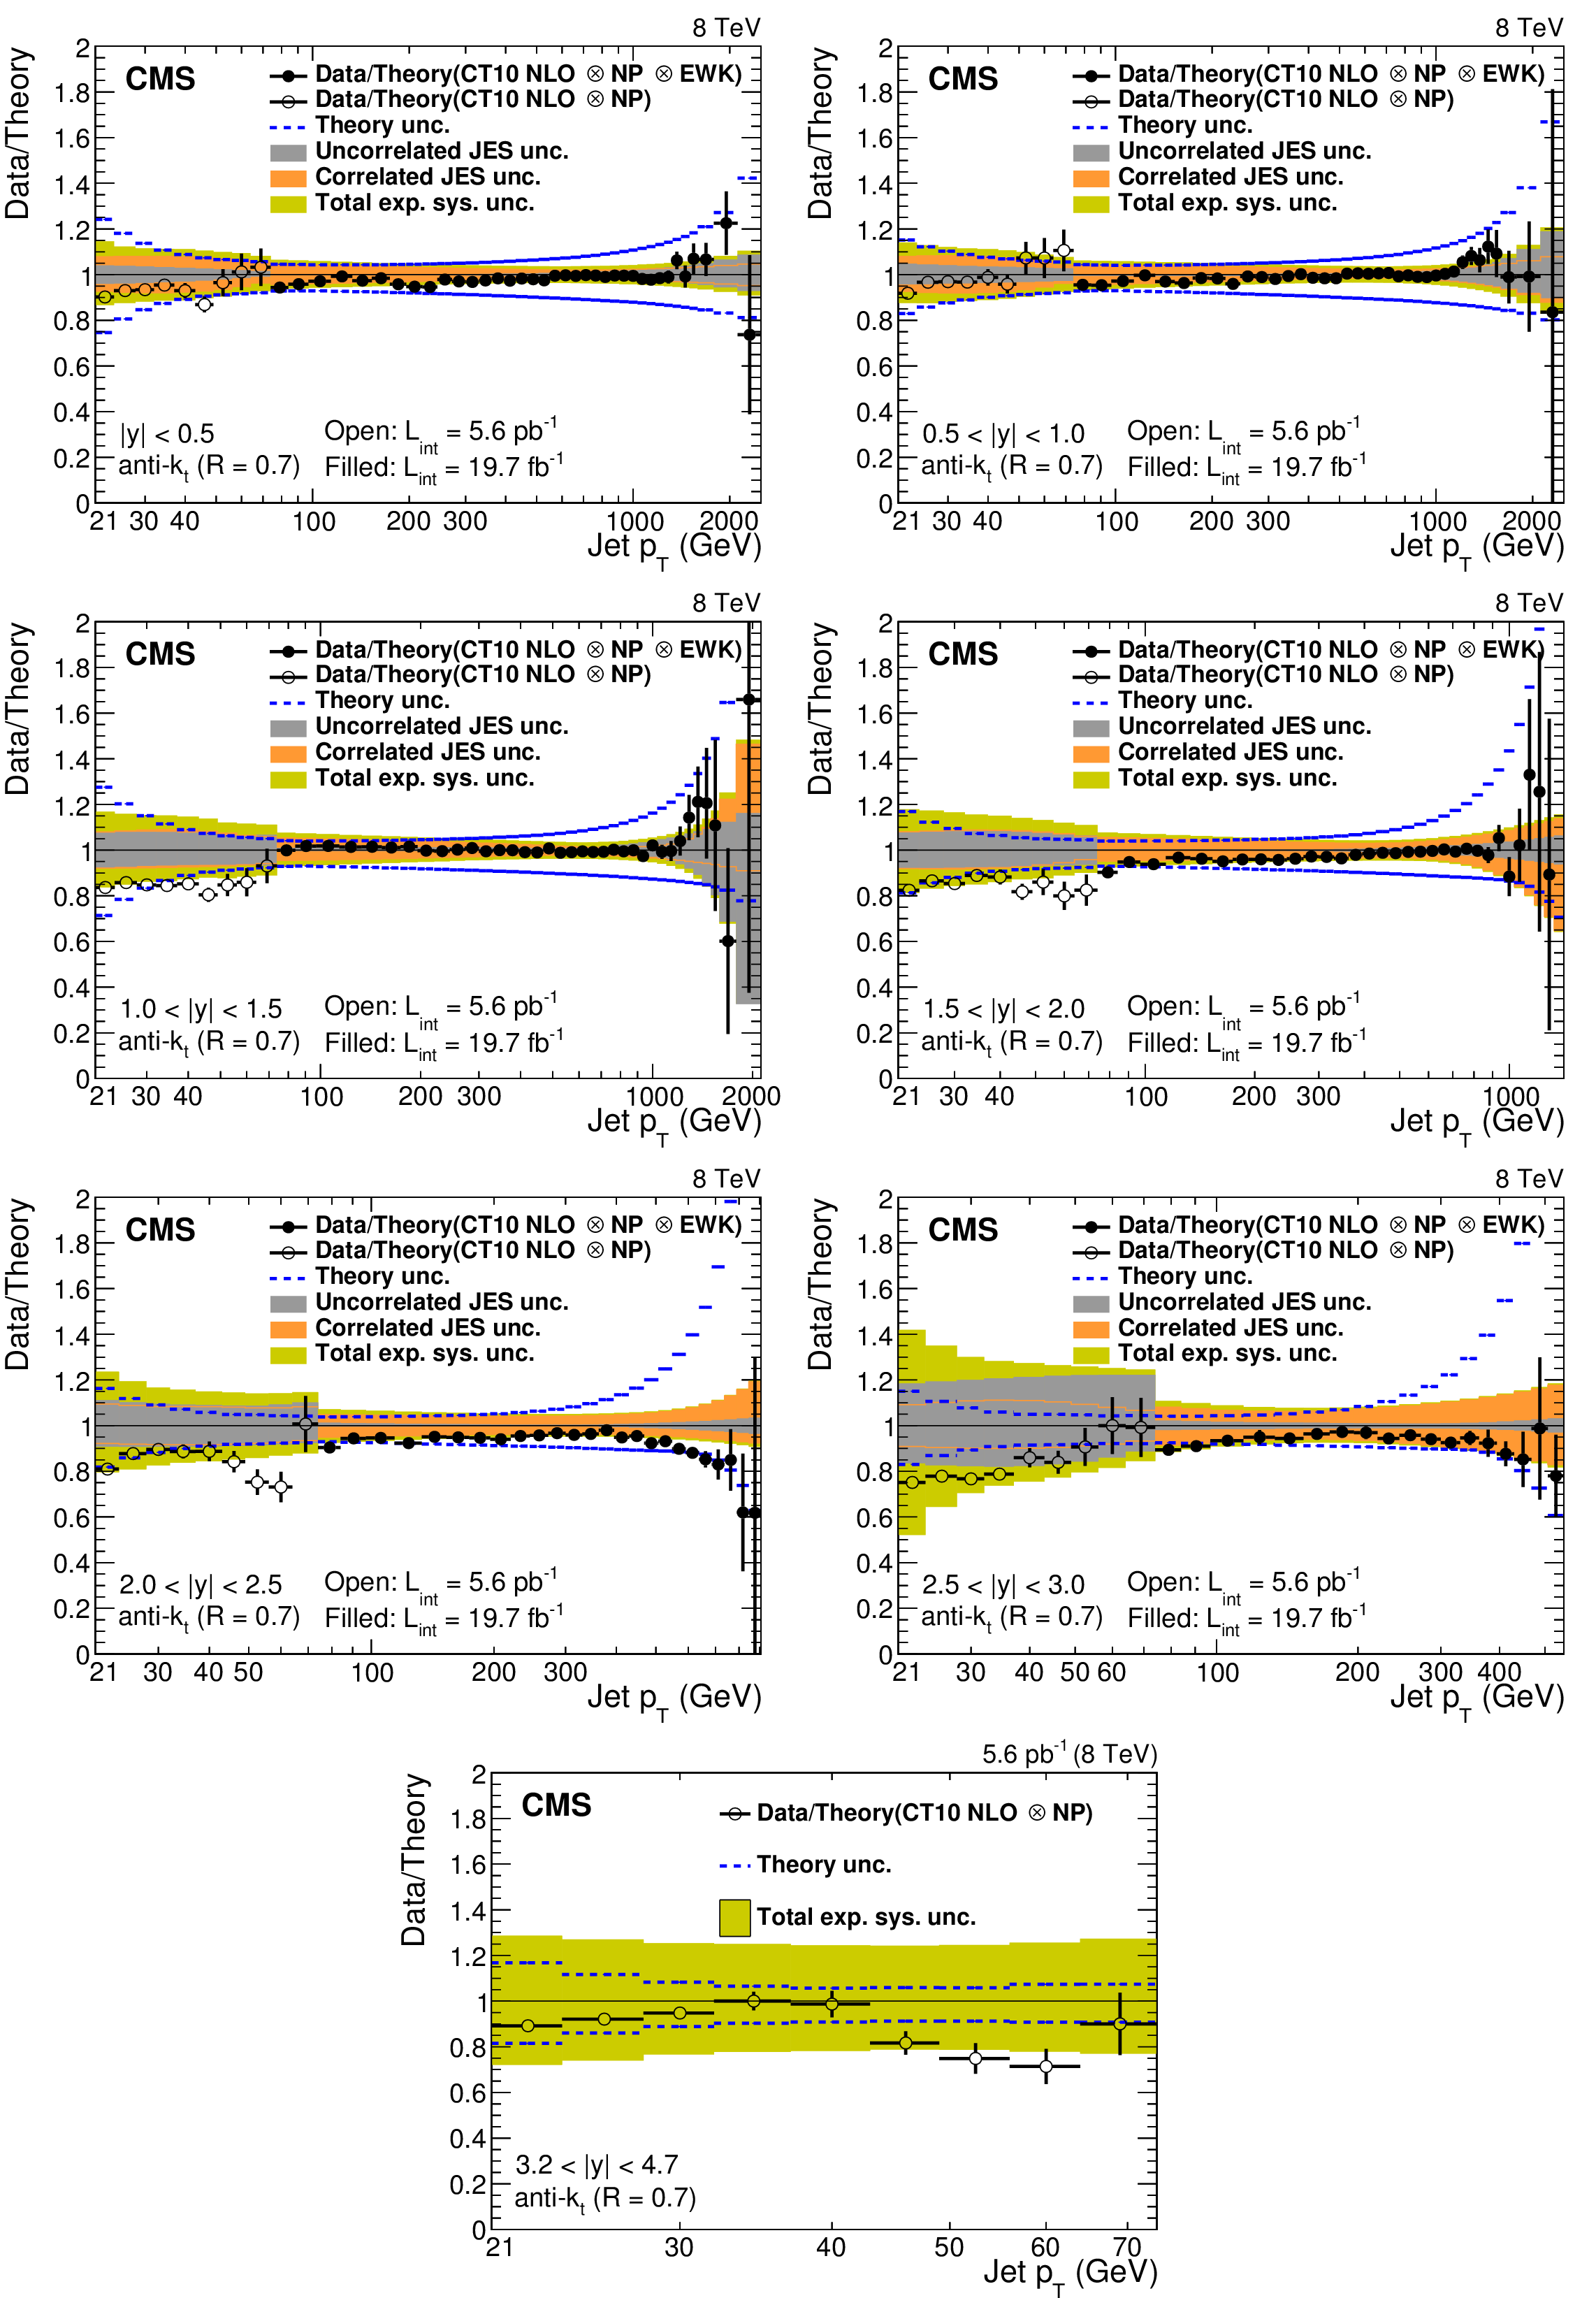
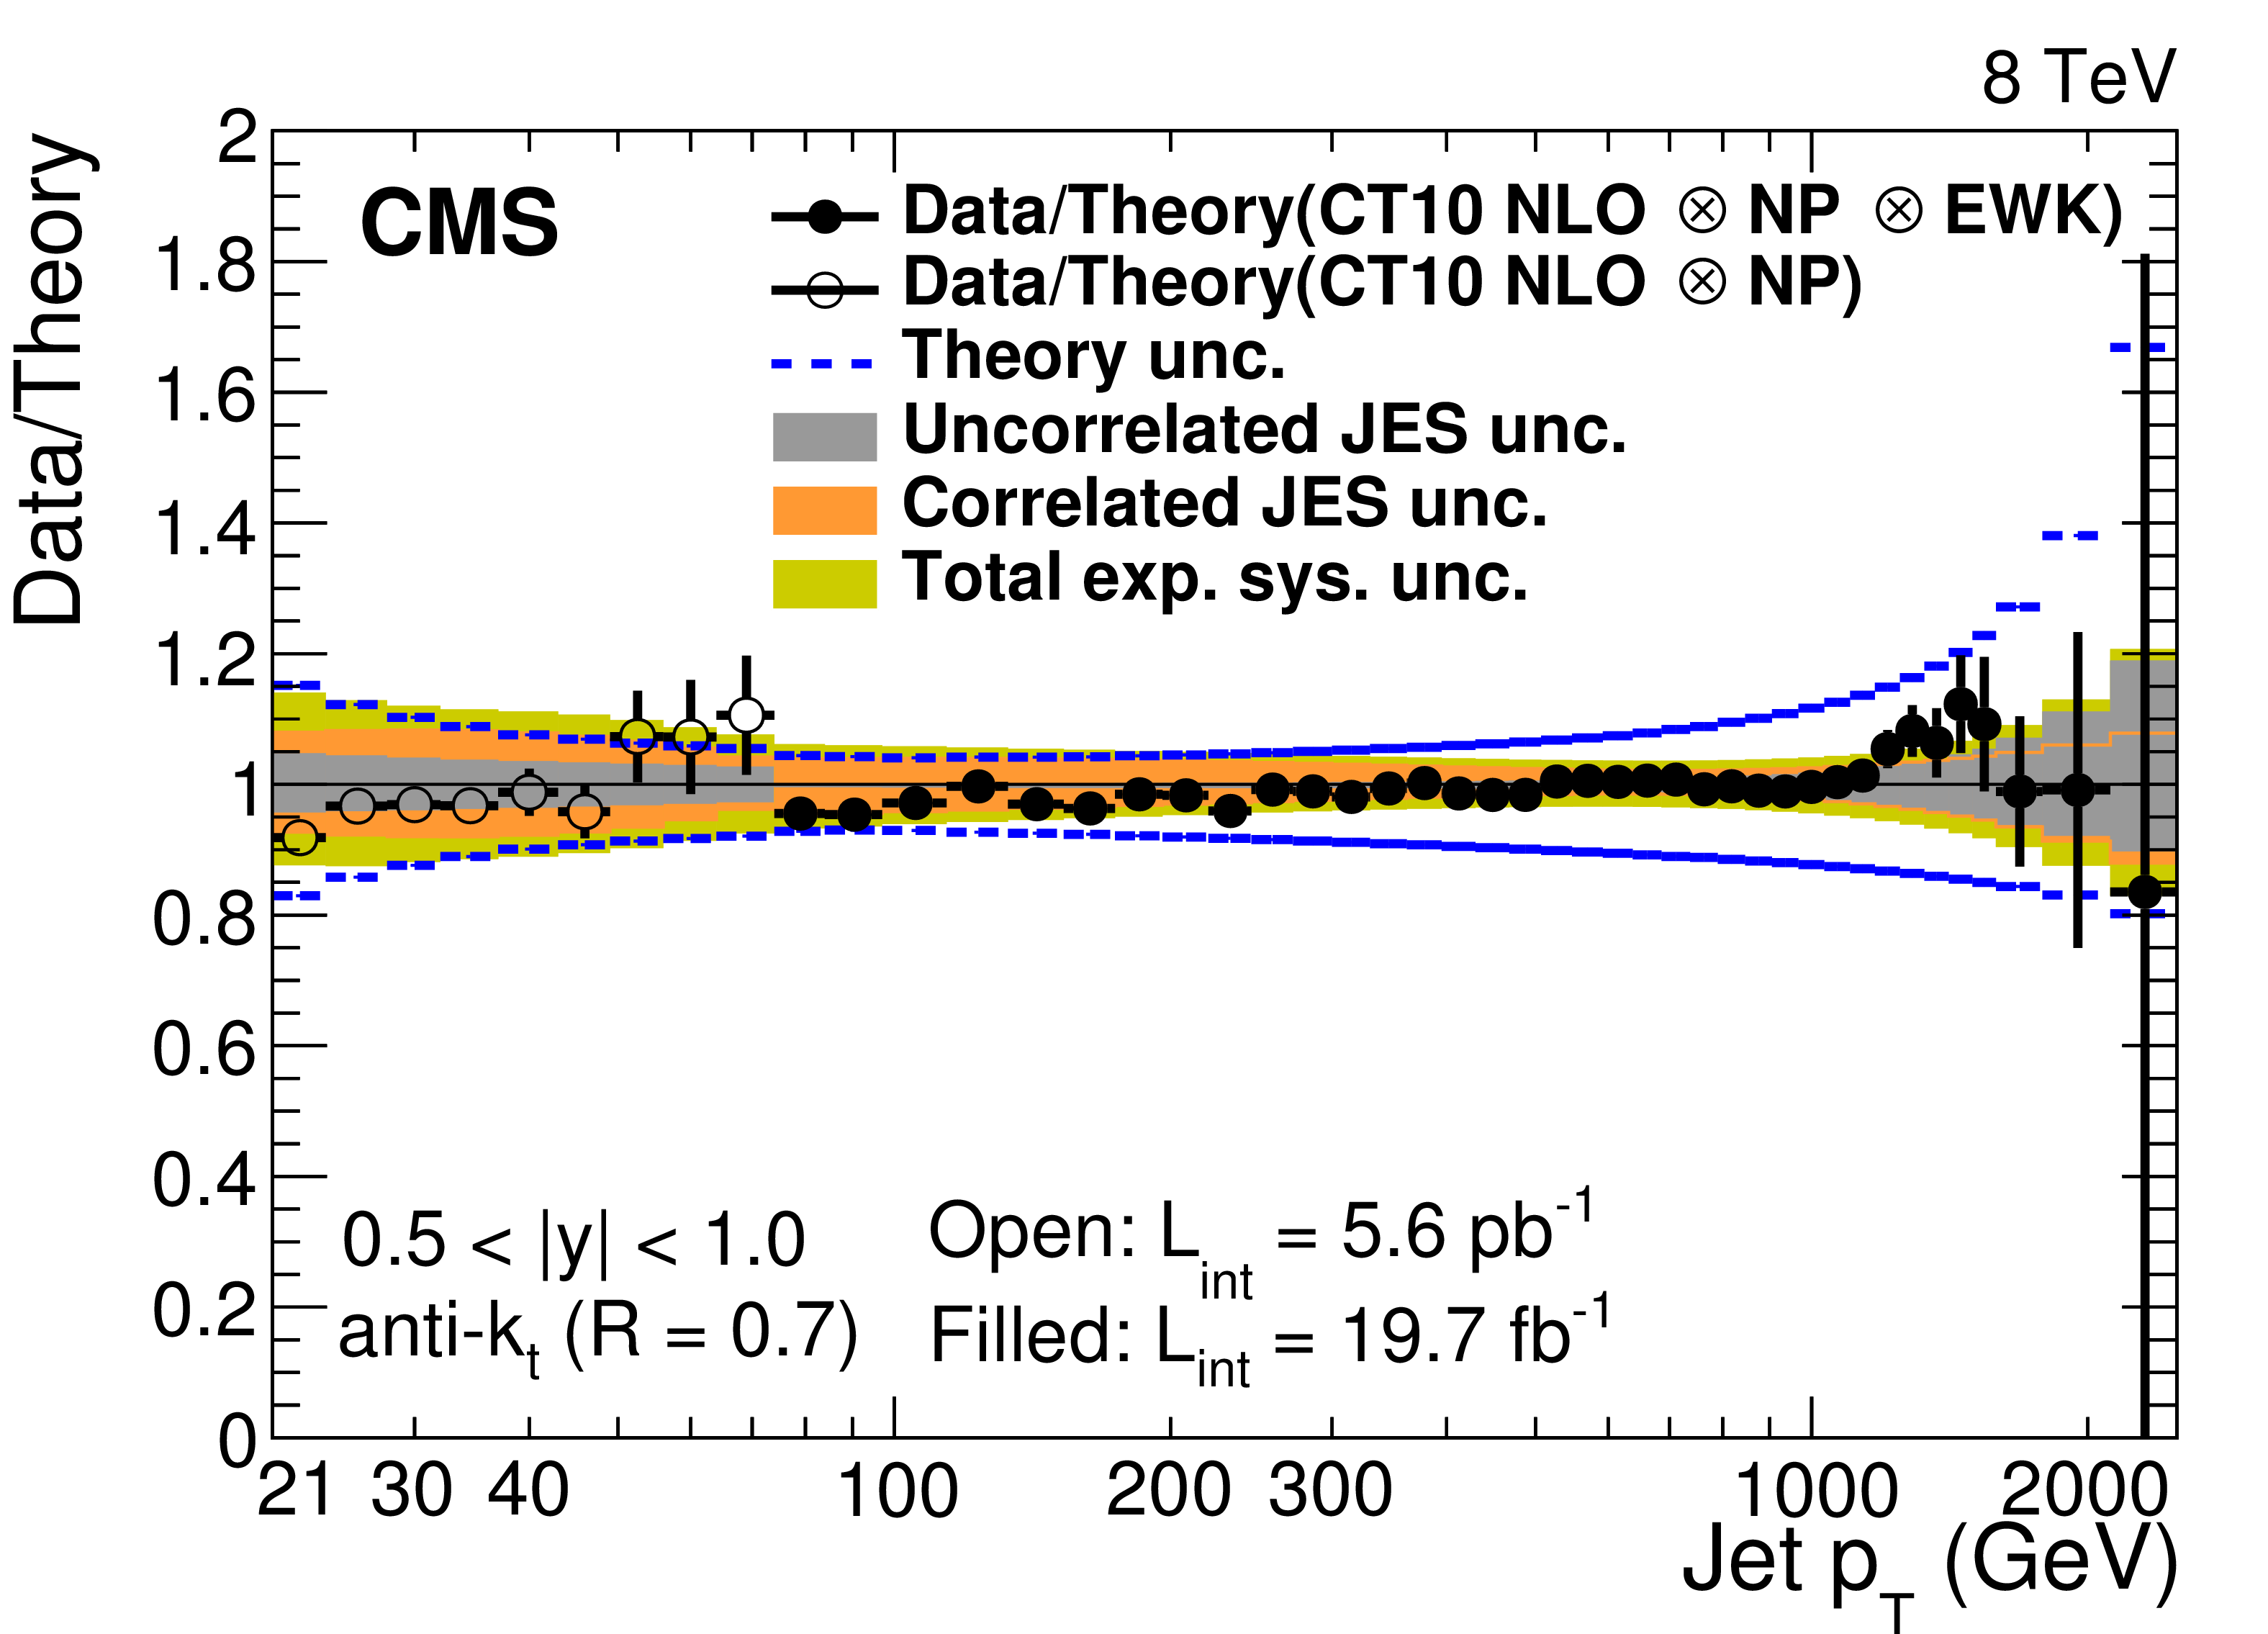
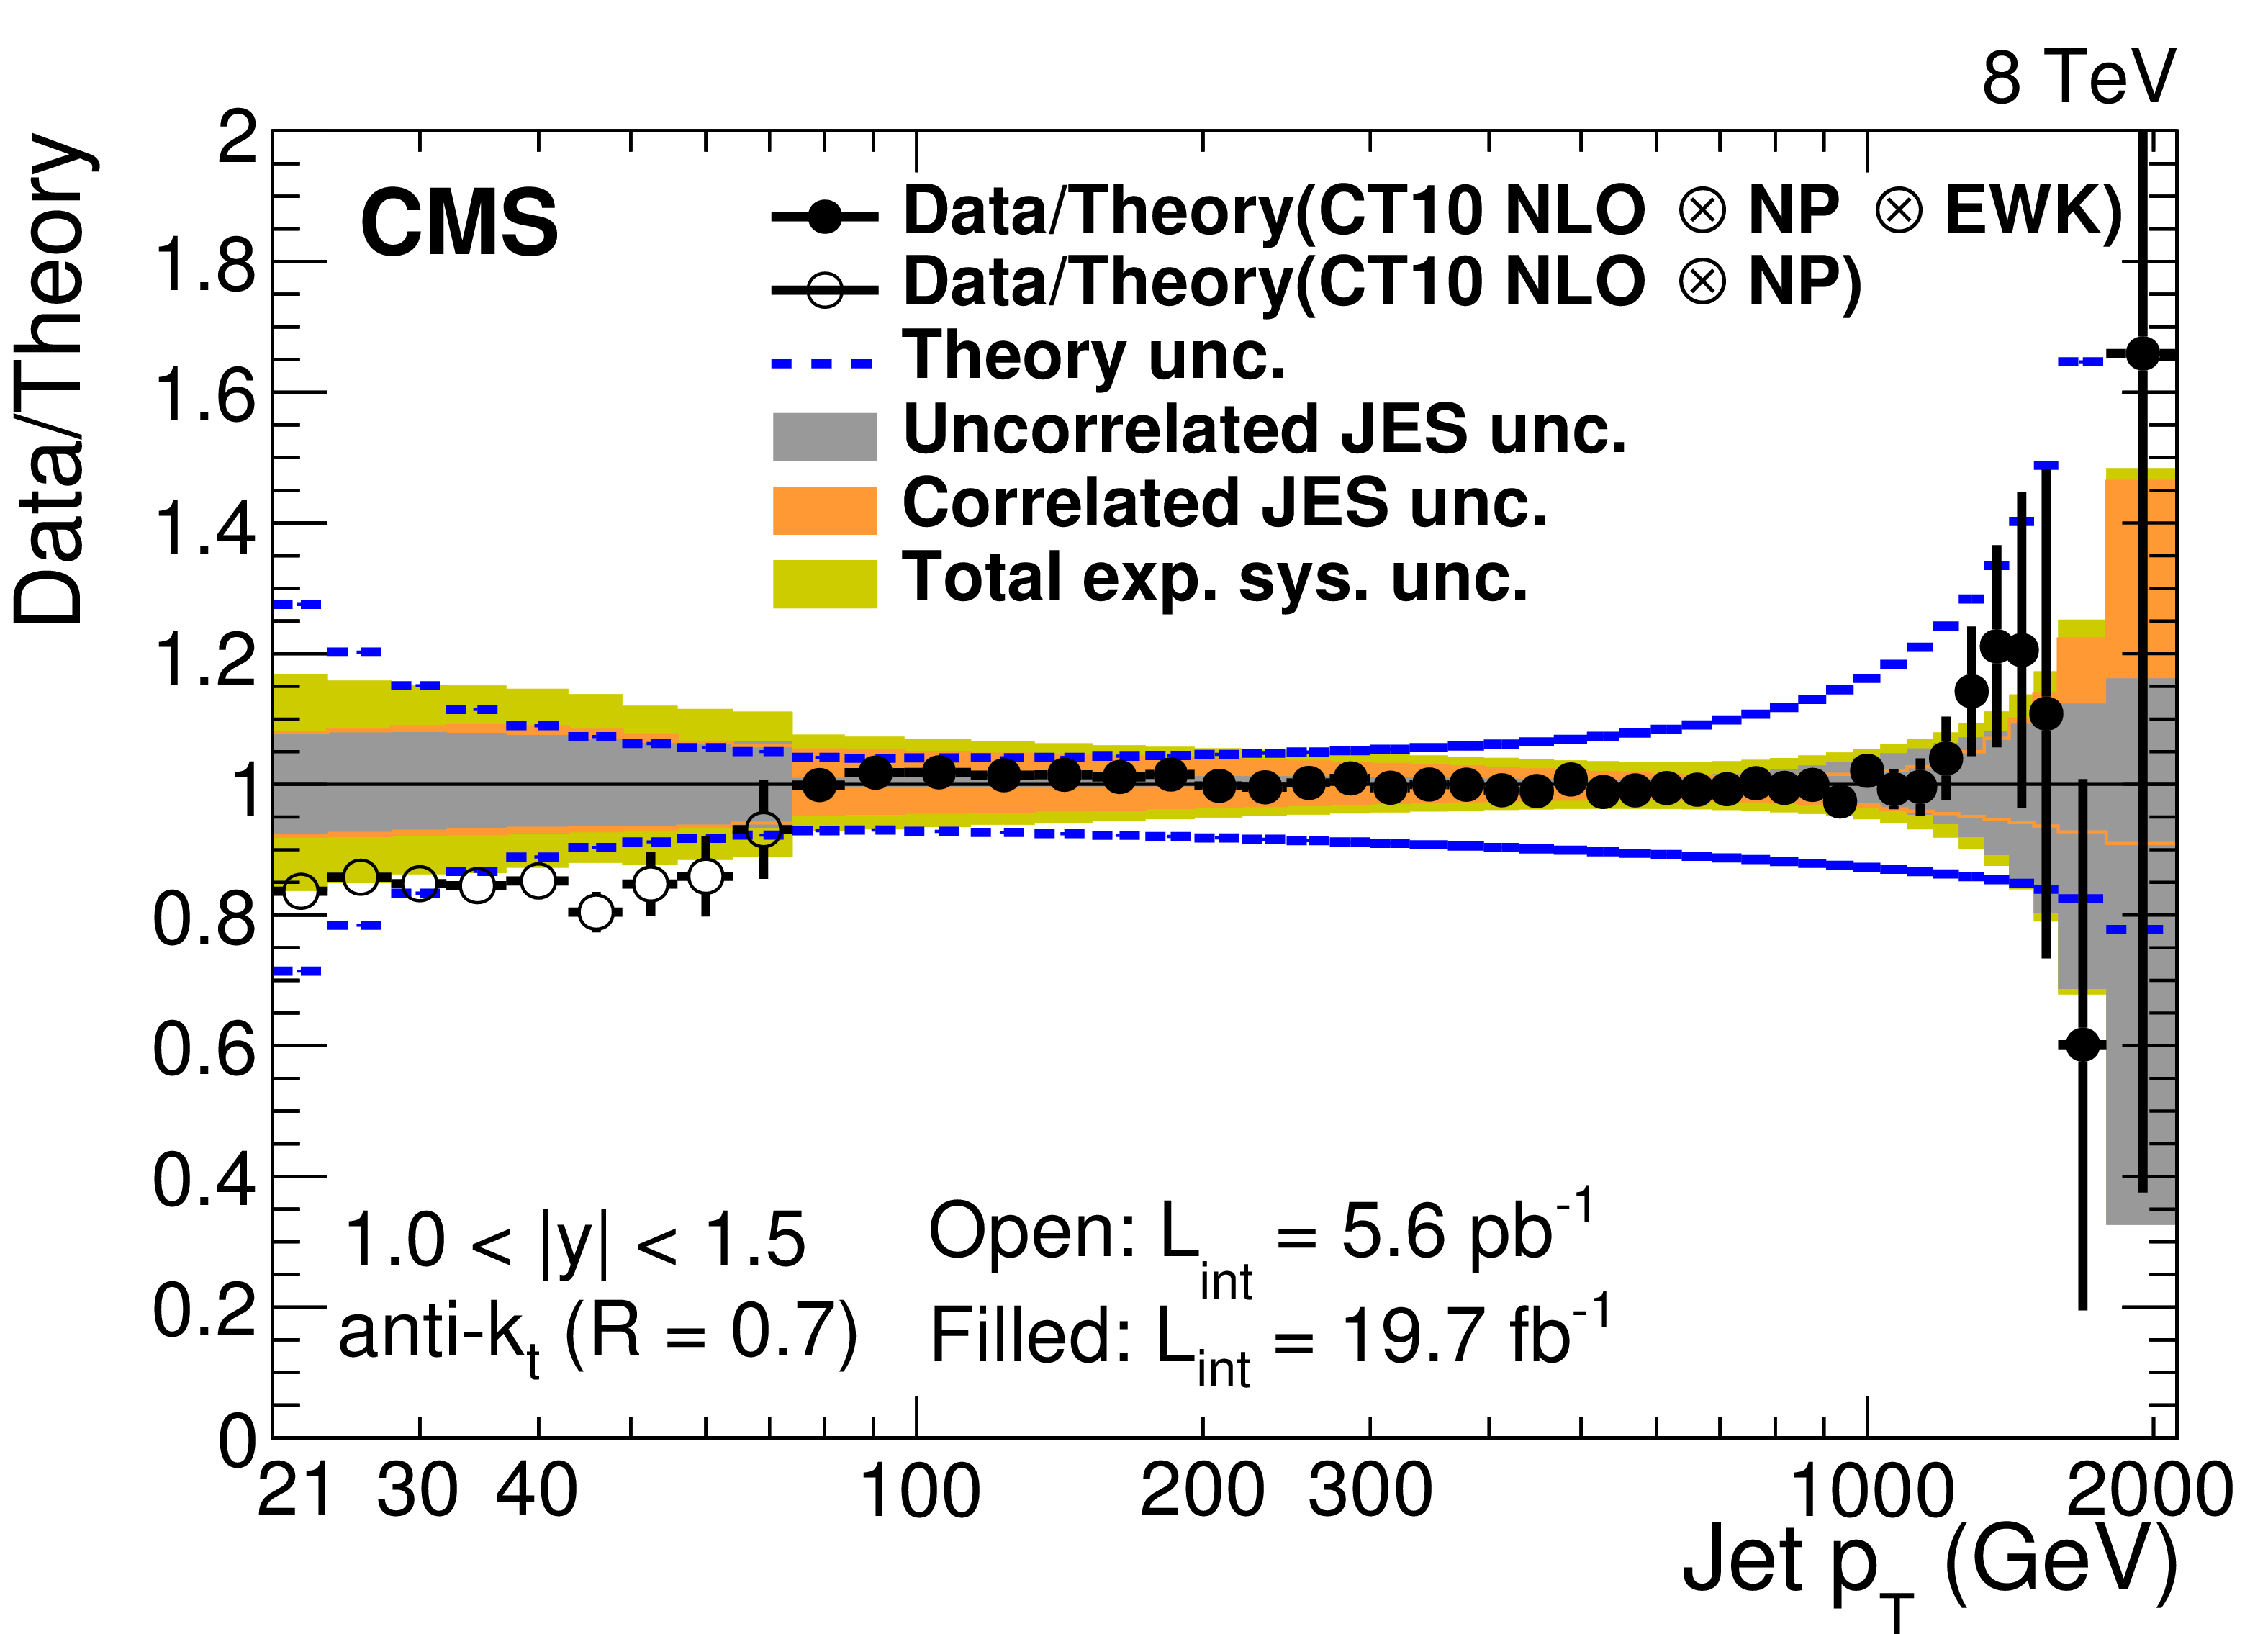
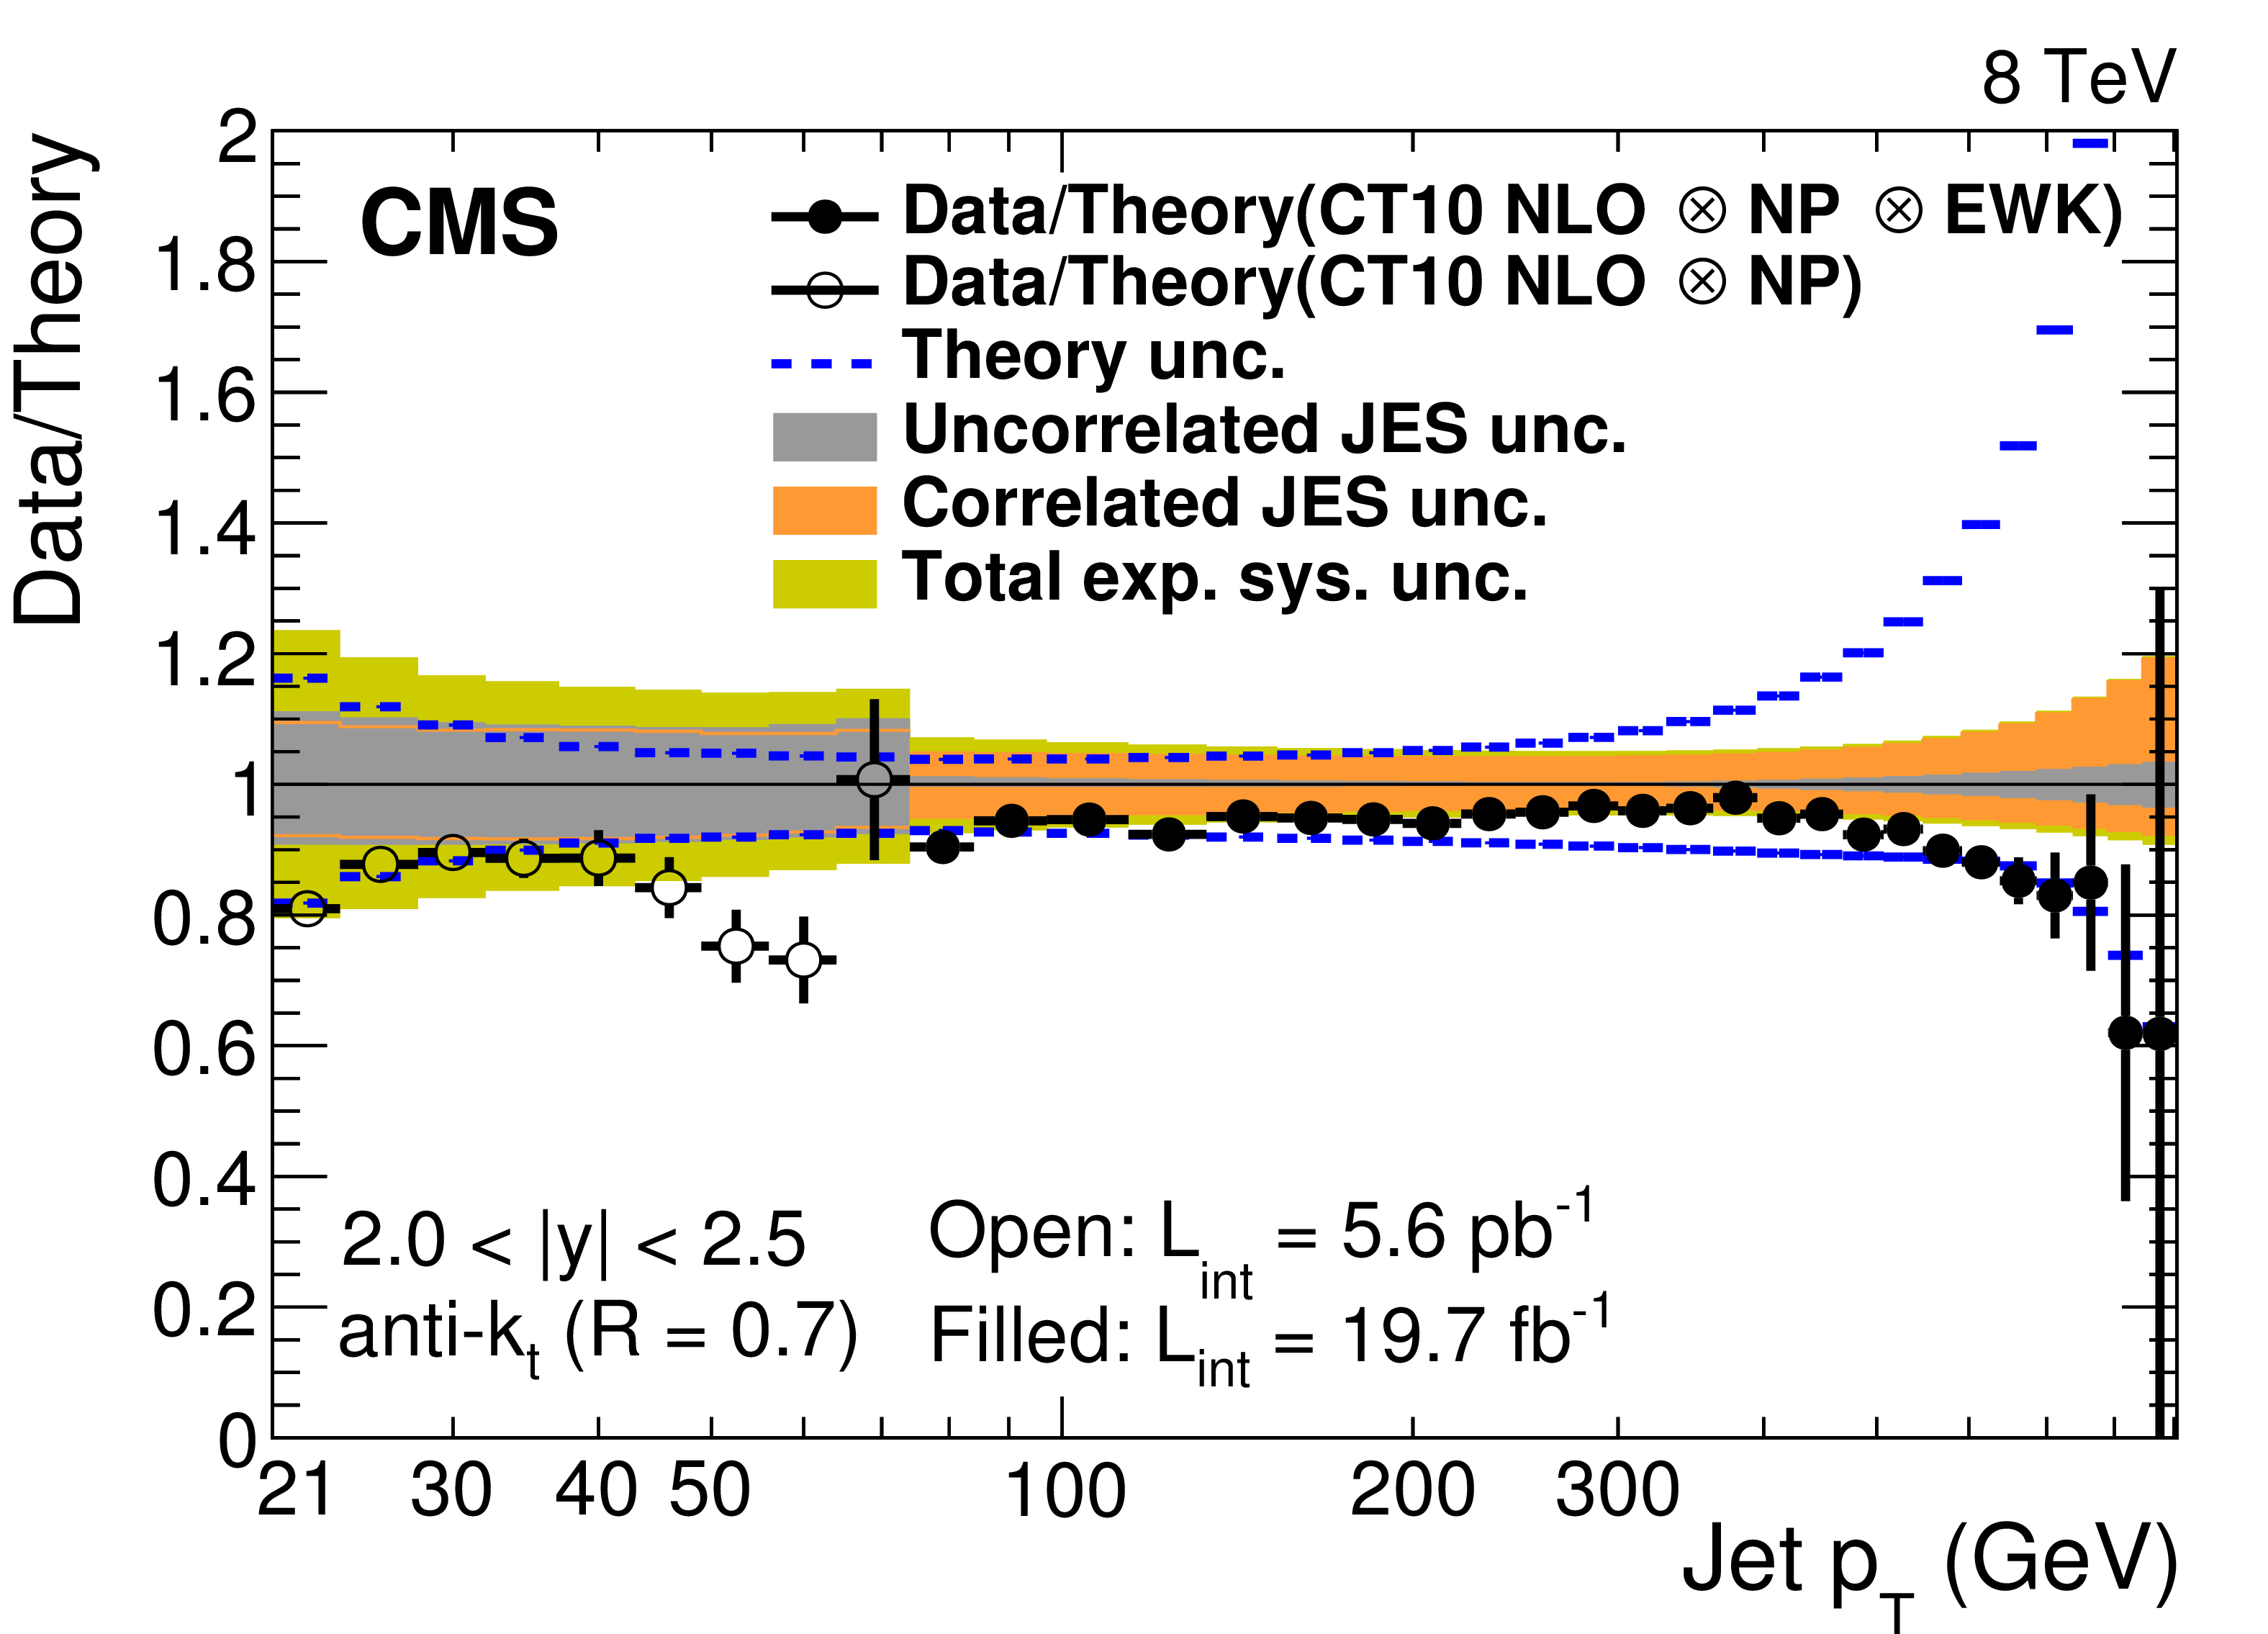
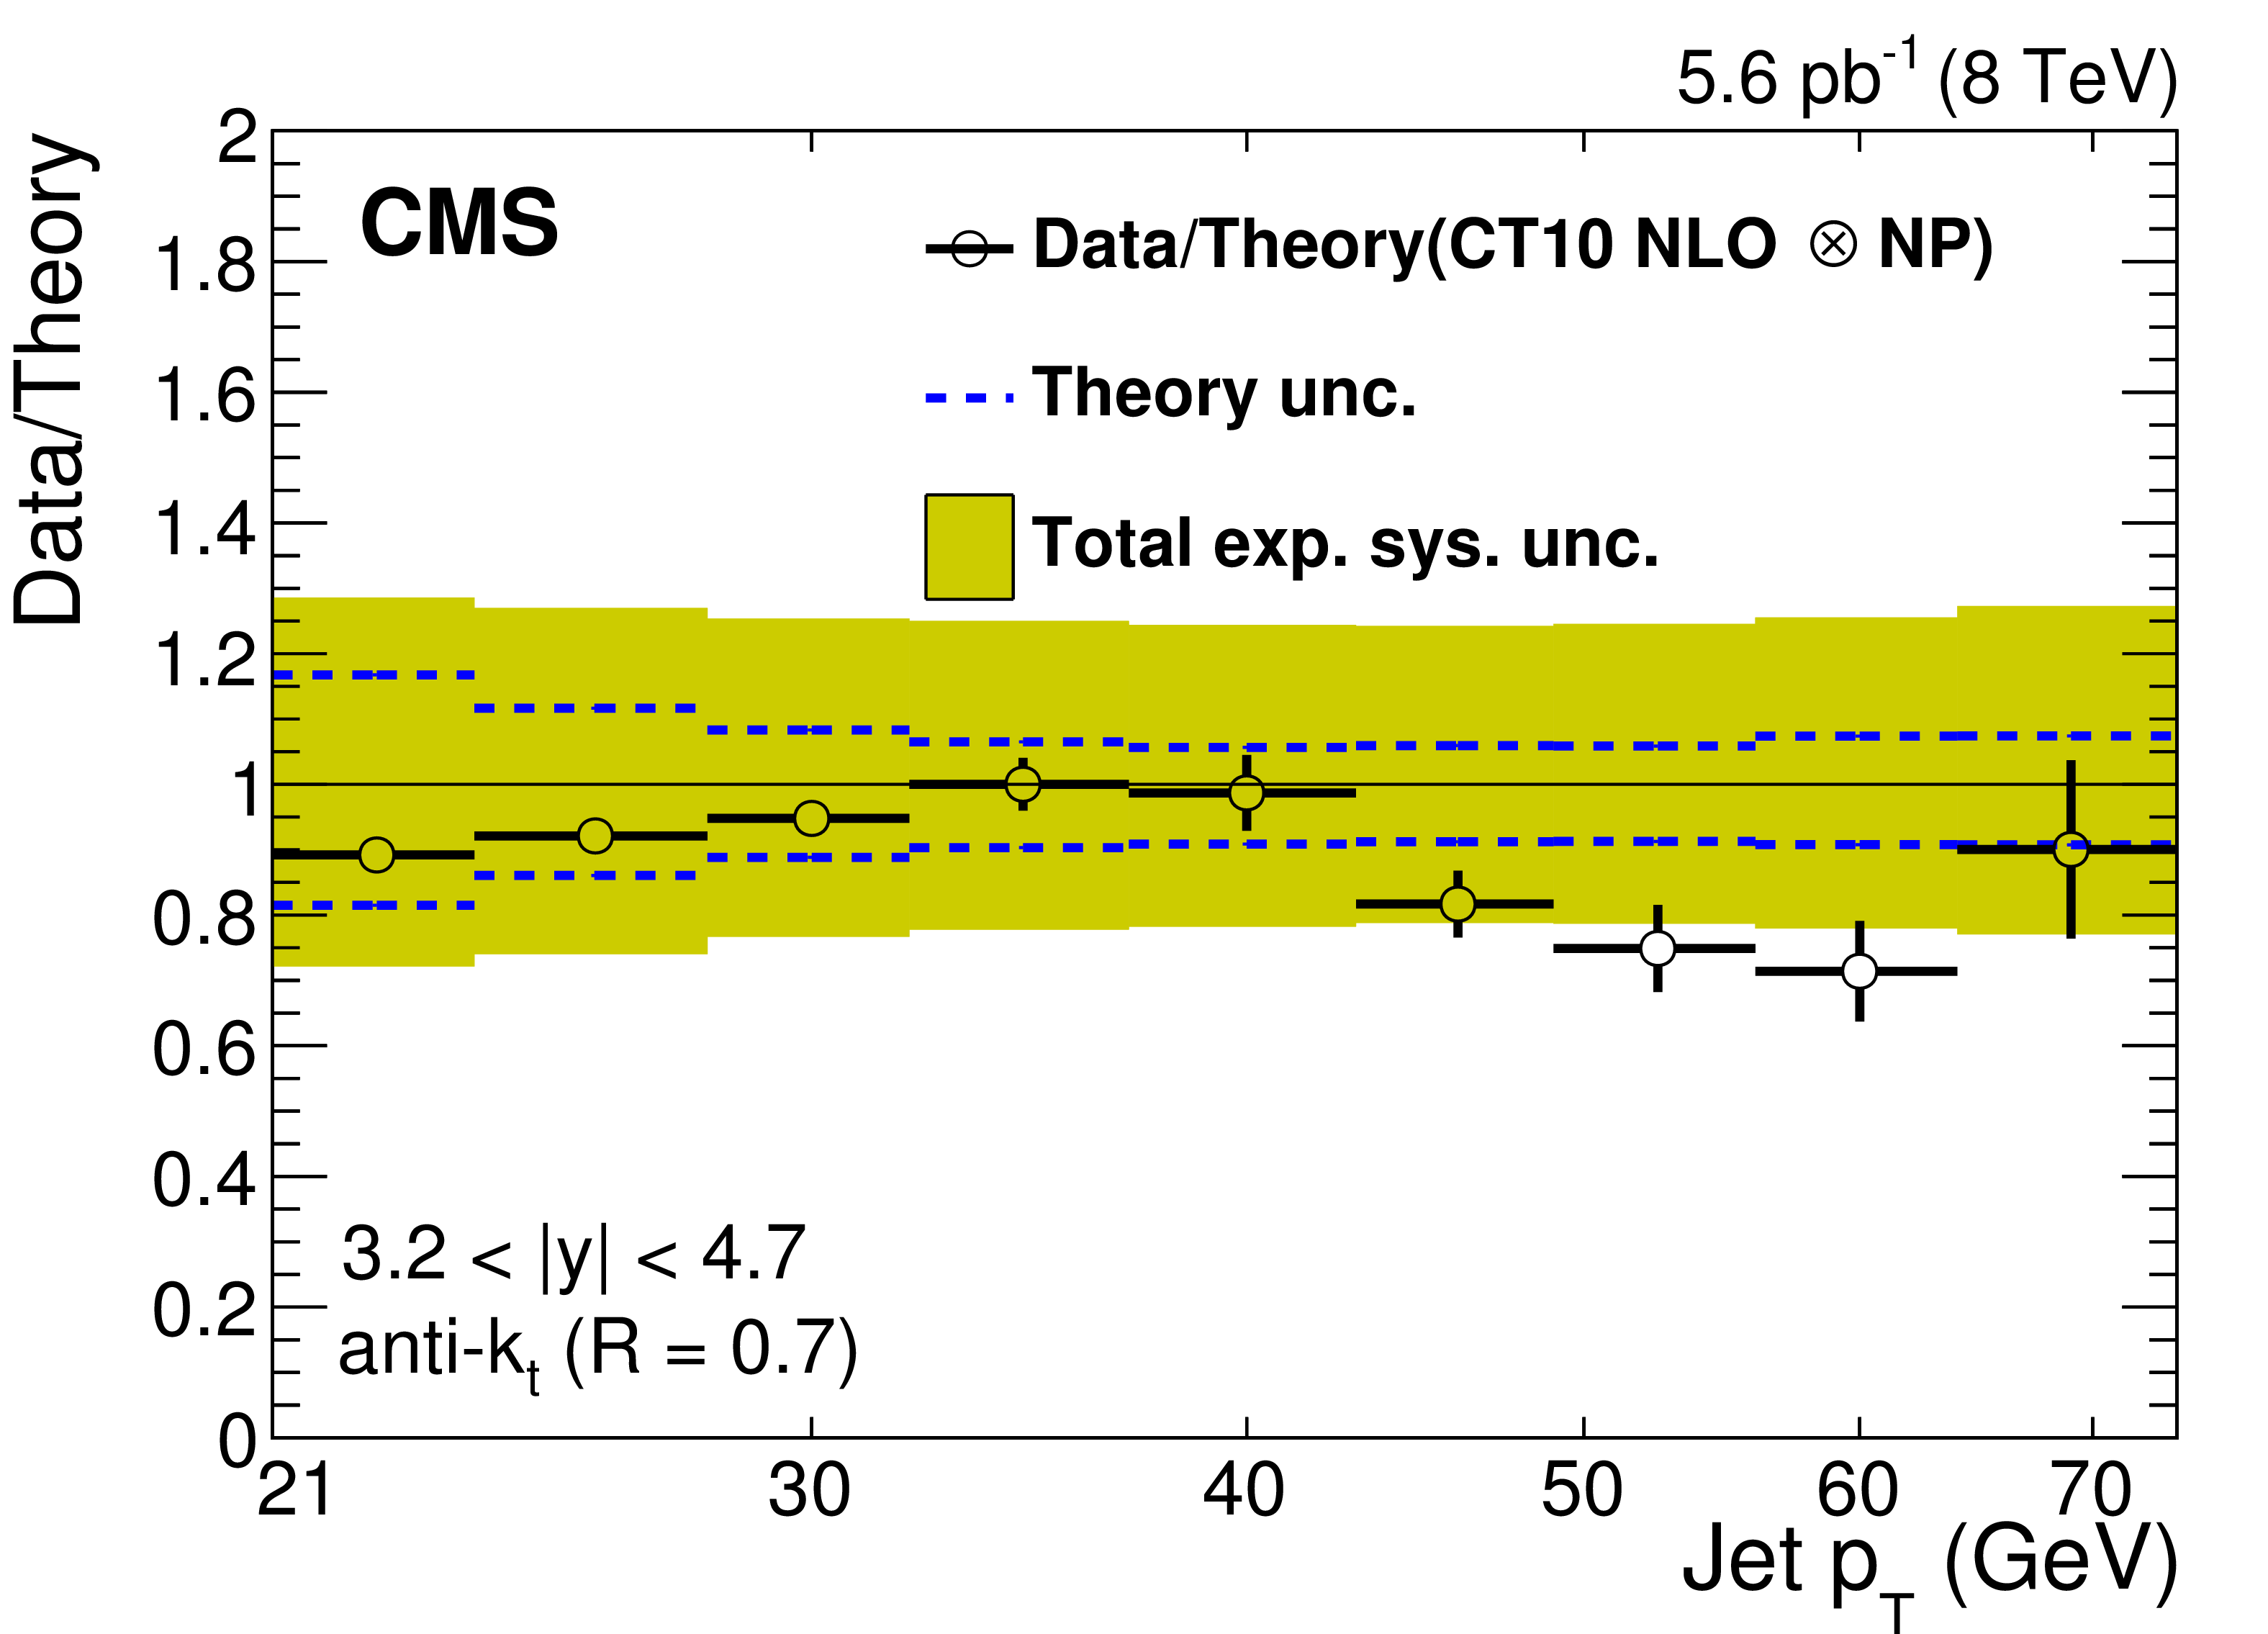
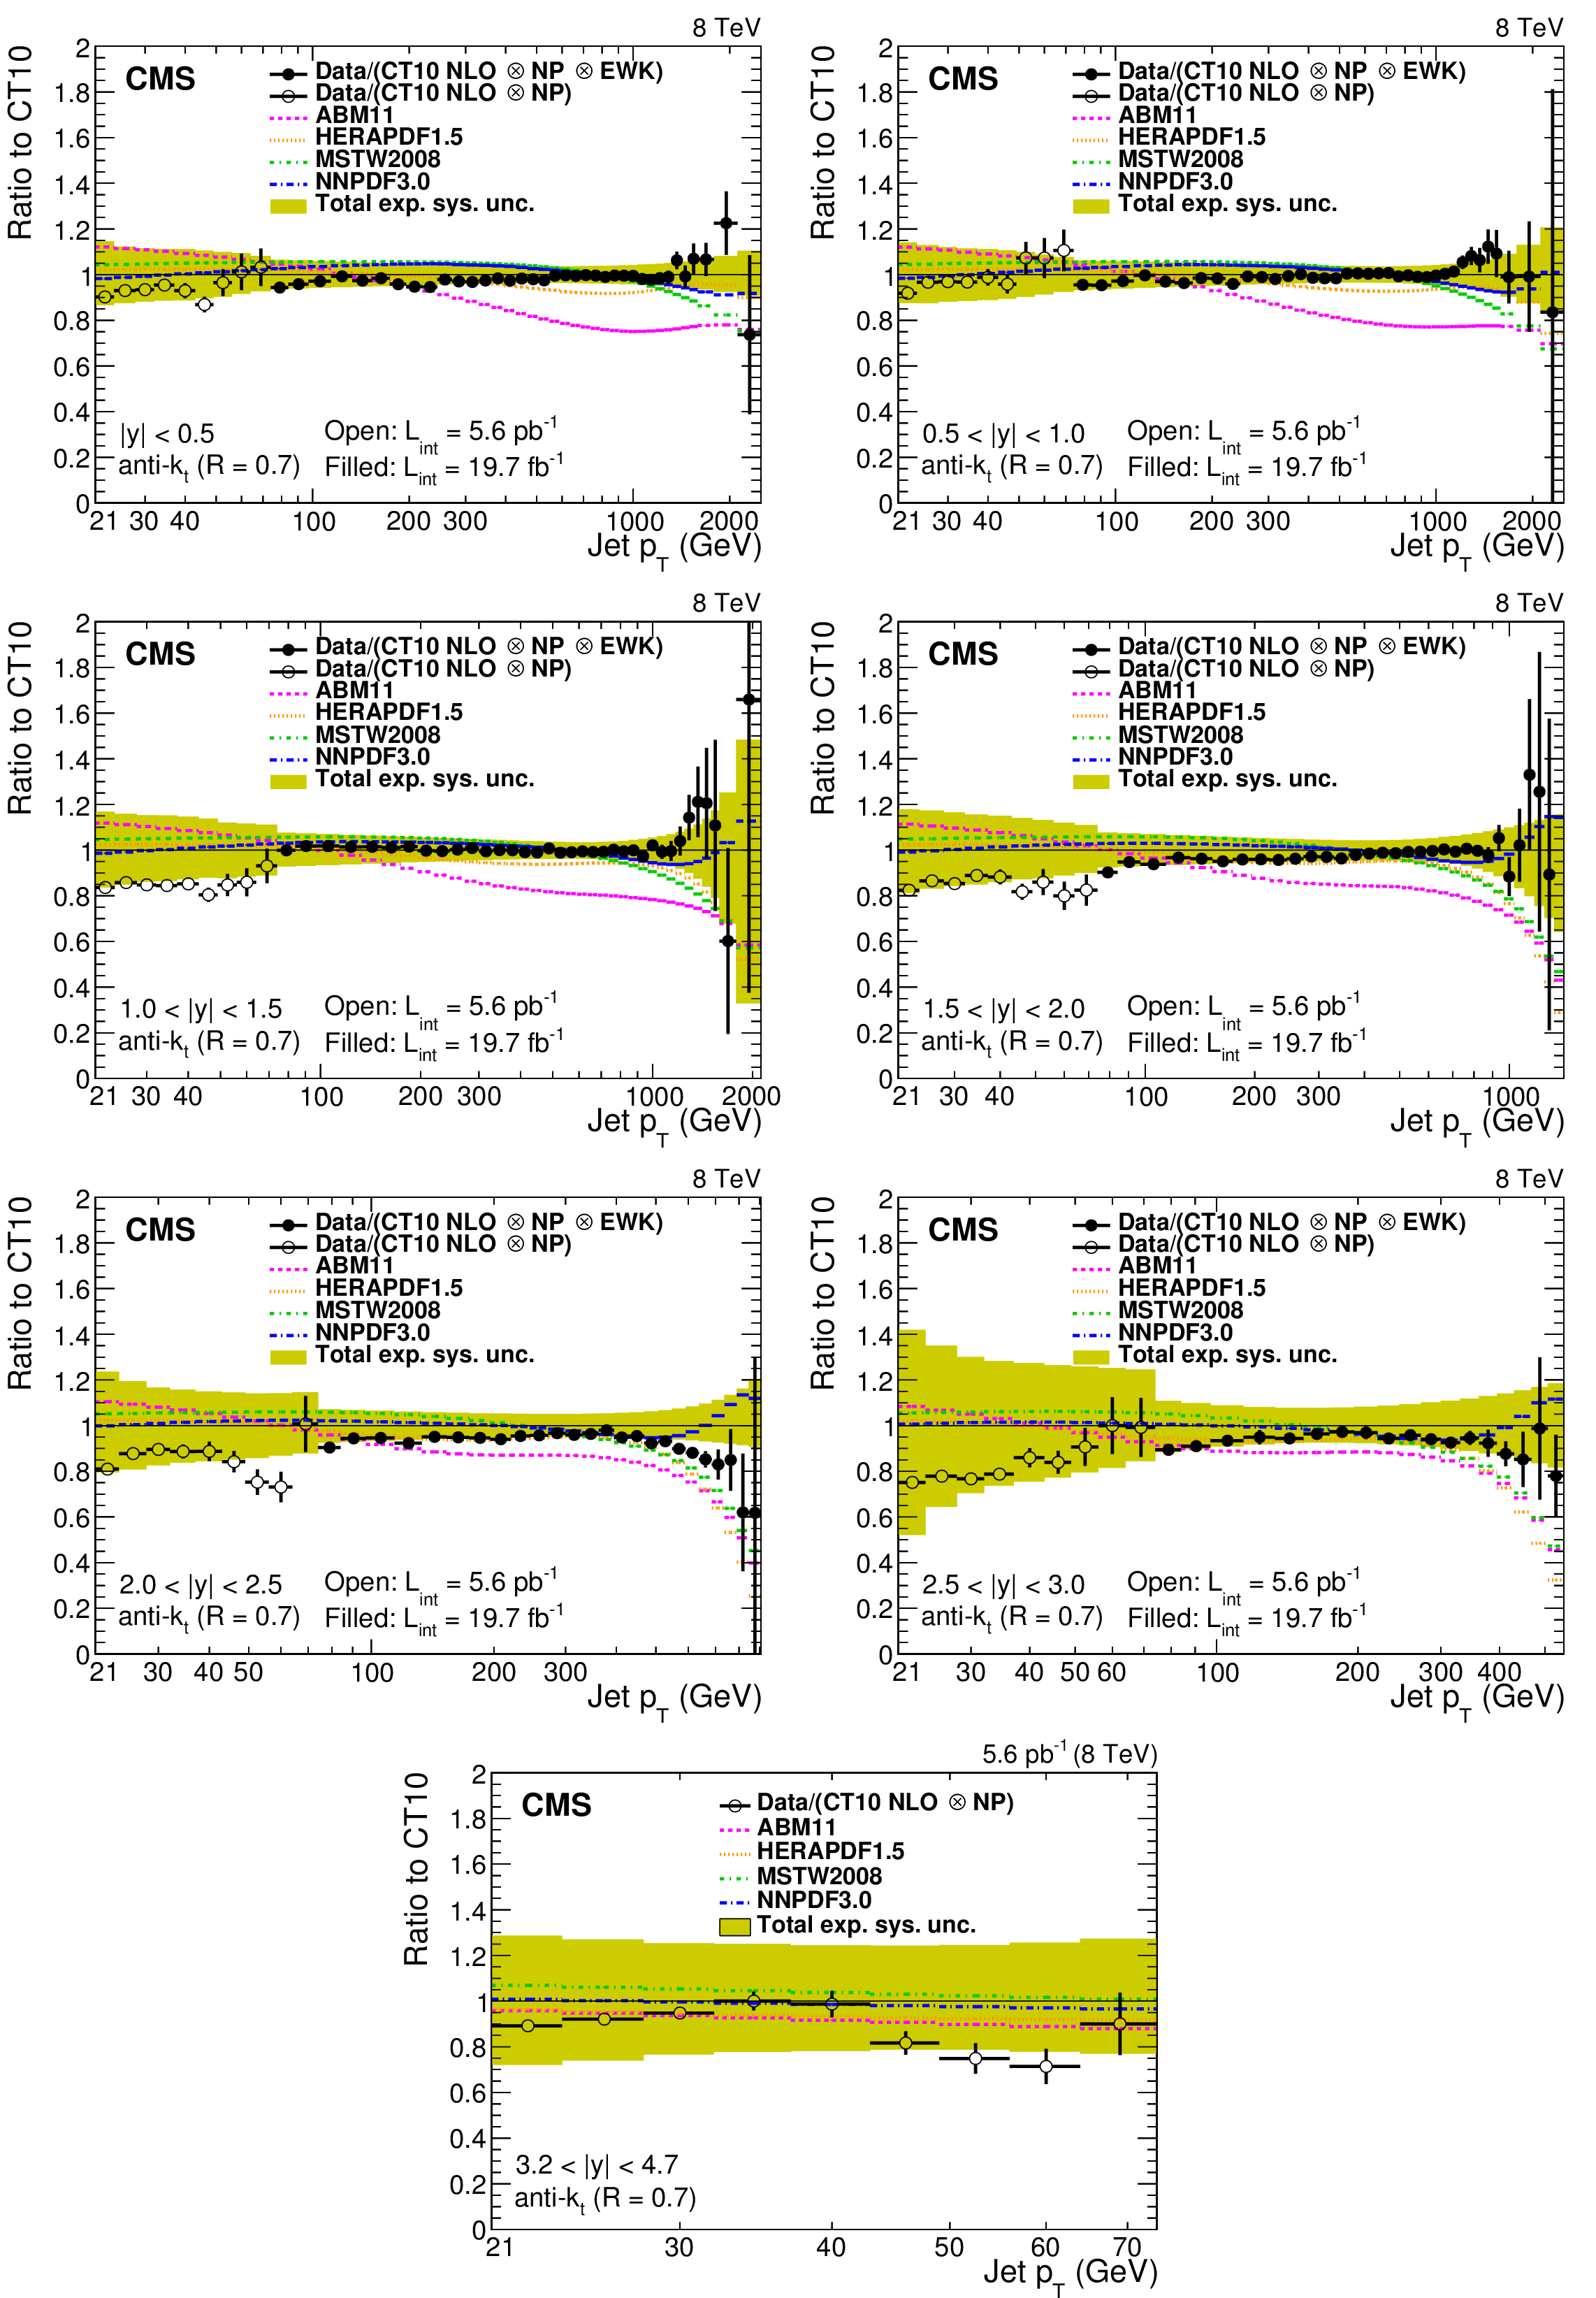
Figure 4:
Ratios of data to the theory prediction using the CT10 PDF set. For comparison, the total theoretical (band enclosed by dashed lines) and the total experimental systematic uncertainties (band enclosed by full lines) are shown as well. The error bars correspond to the statistical uncertainty in the data. |

png pdf |
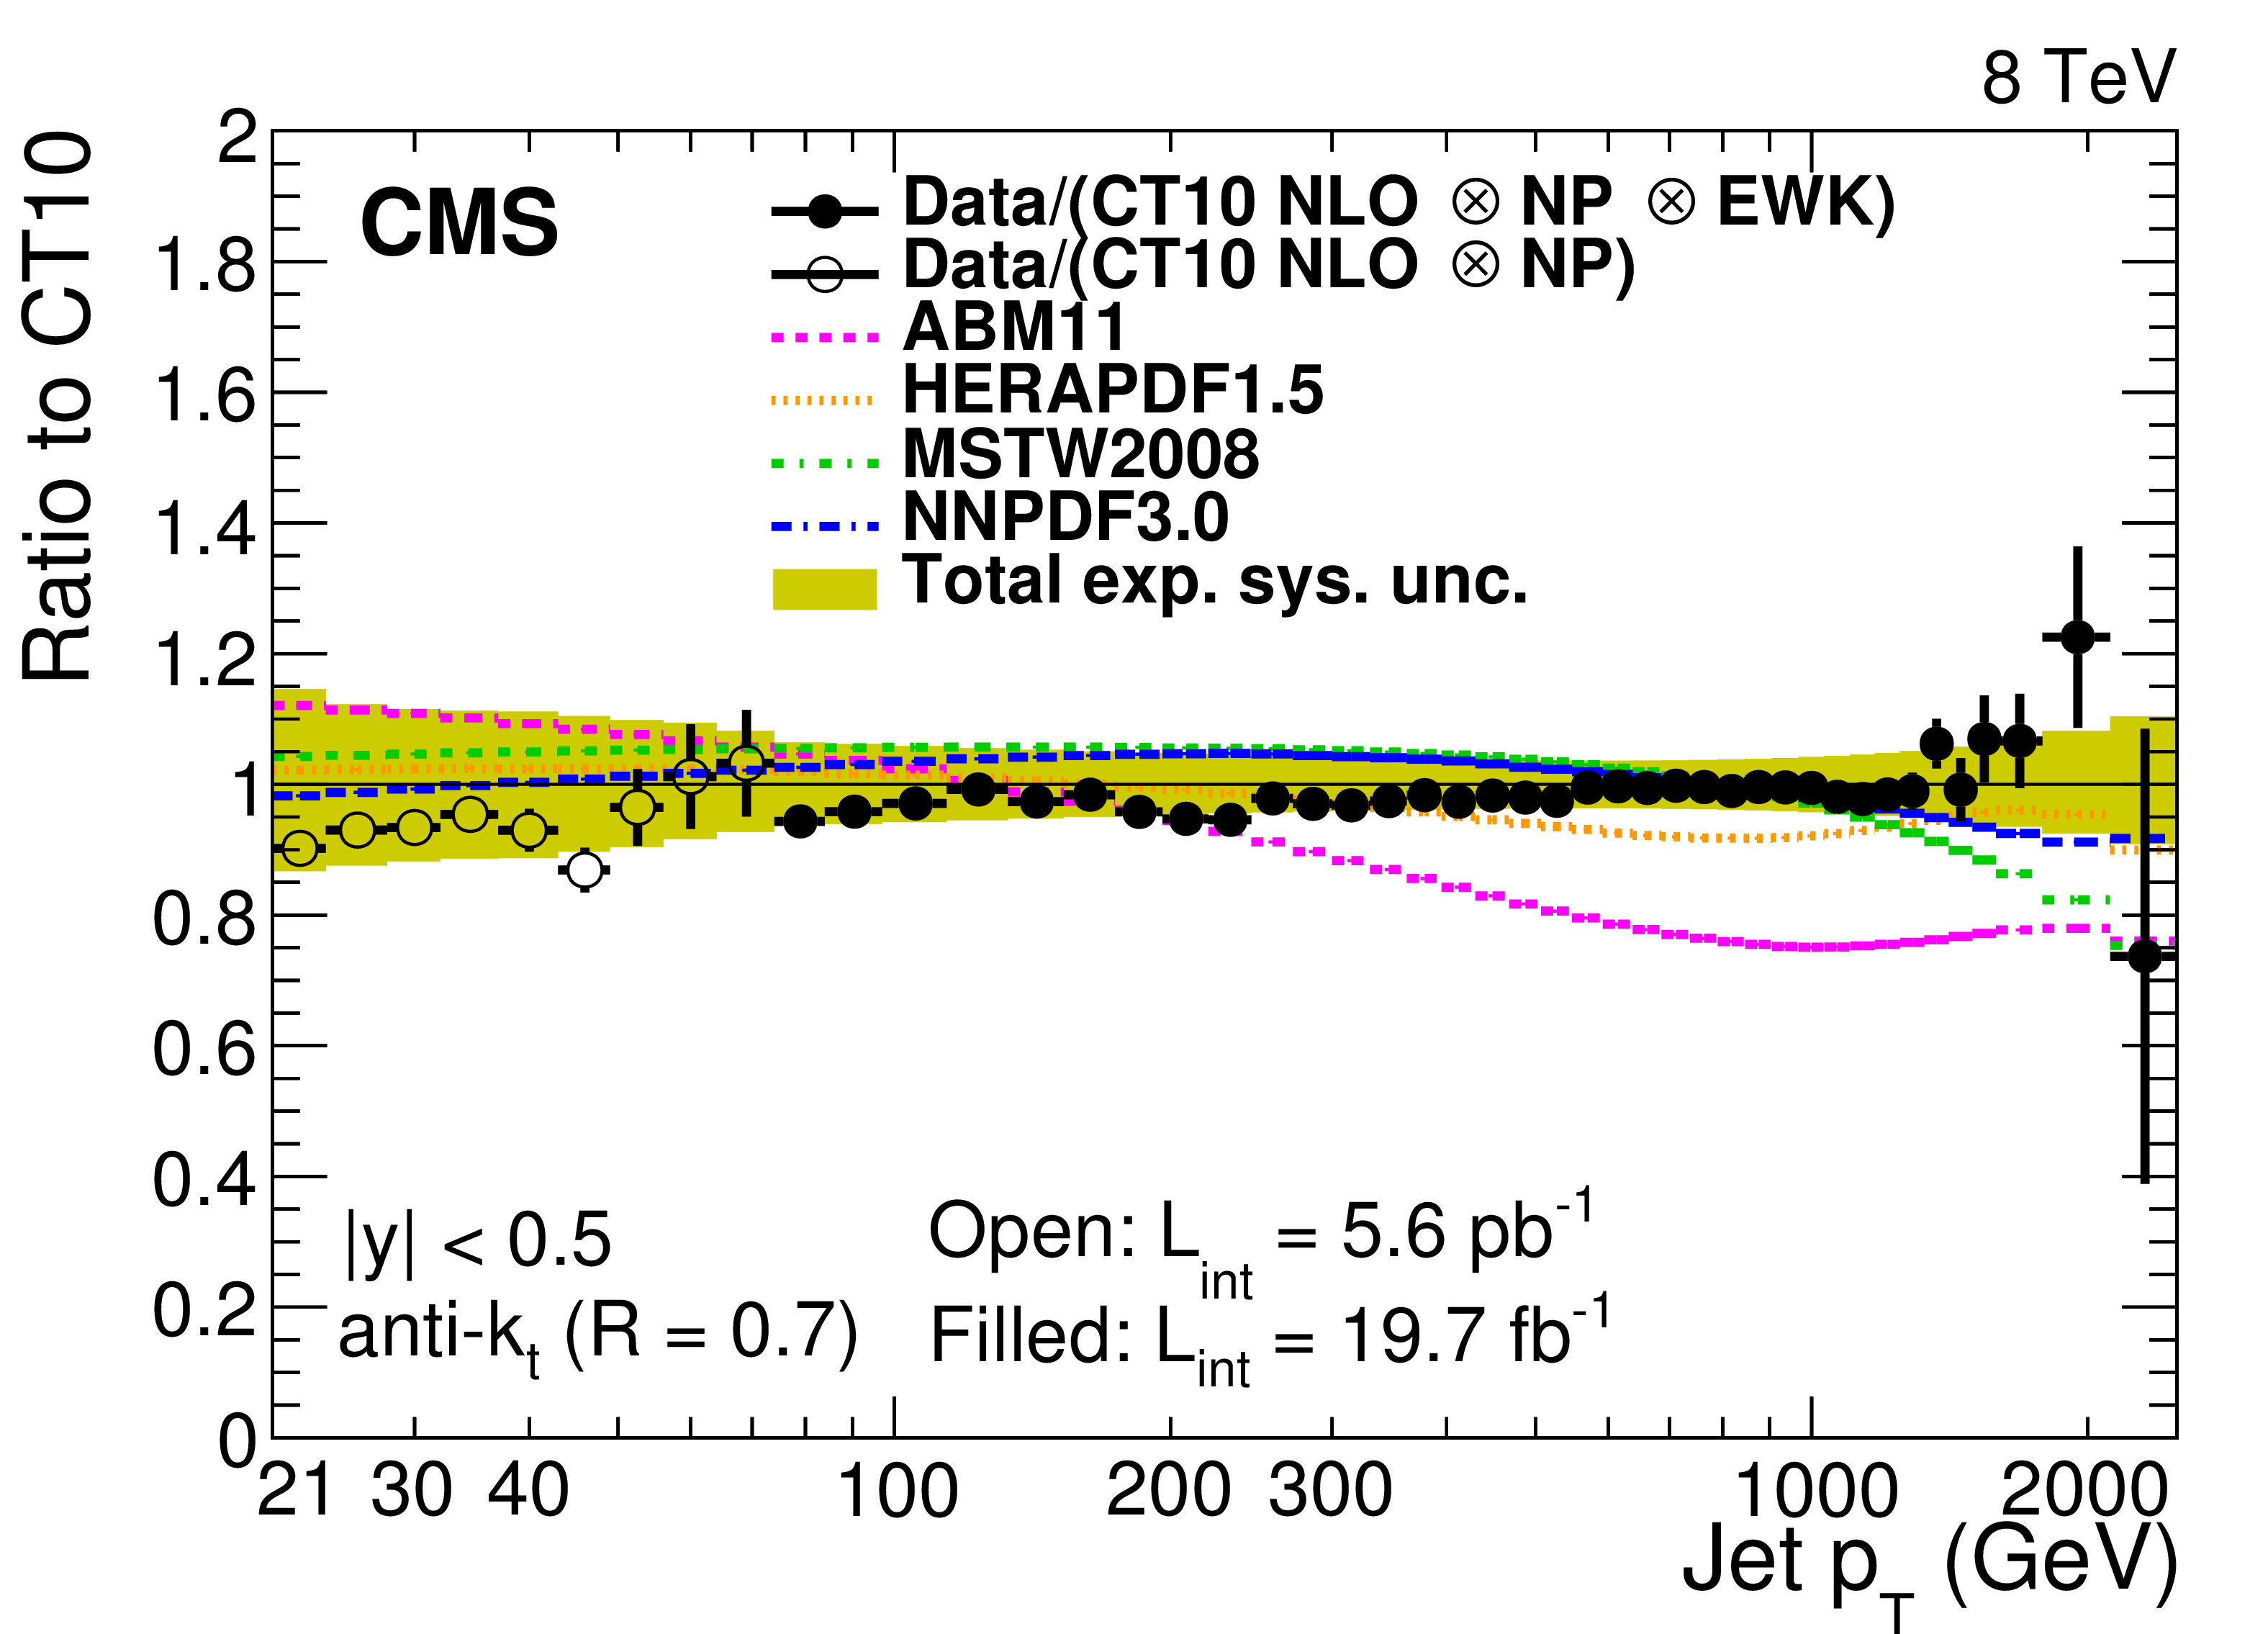
Figure 4-a:
Ratio of data to the theory prediction using the CT10 PDF set. For comparison, the total theoretical (band enclosed by dashed lines) and the total experimental systematic uncertainties (band enclosed by full lines) are shown as well. The error bars correspond to the statistical uncertainty in the data. |
png pdf |
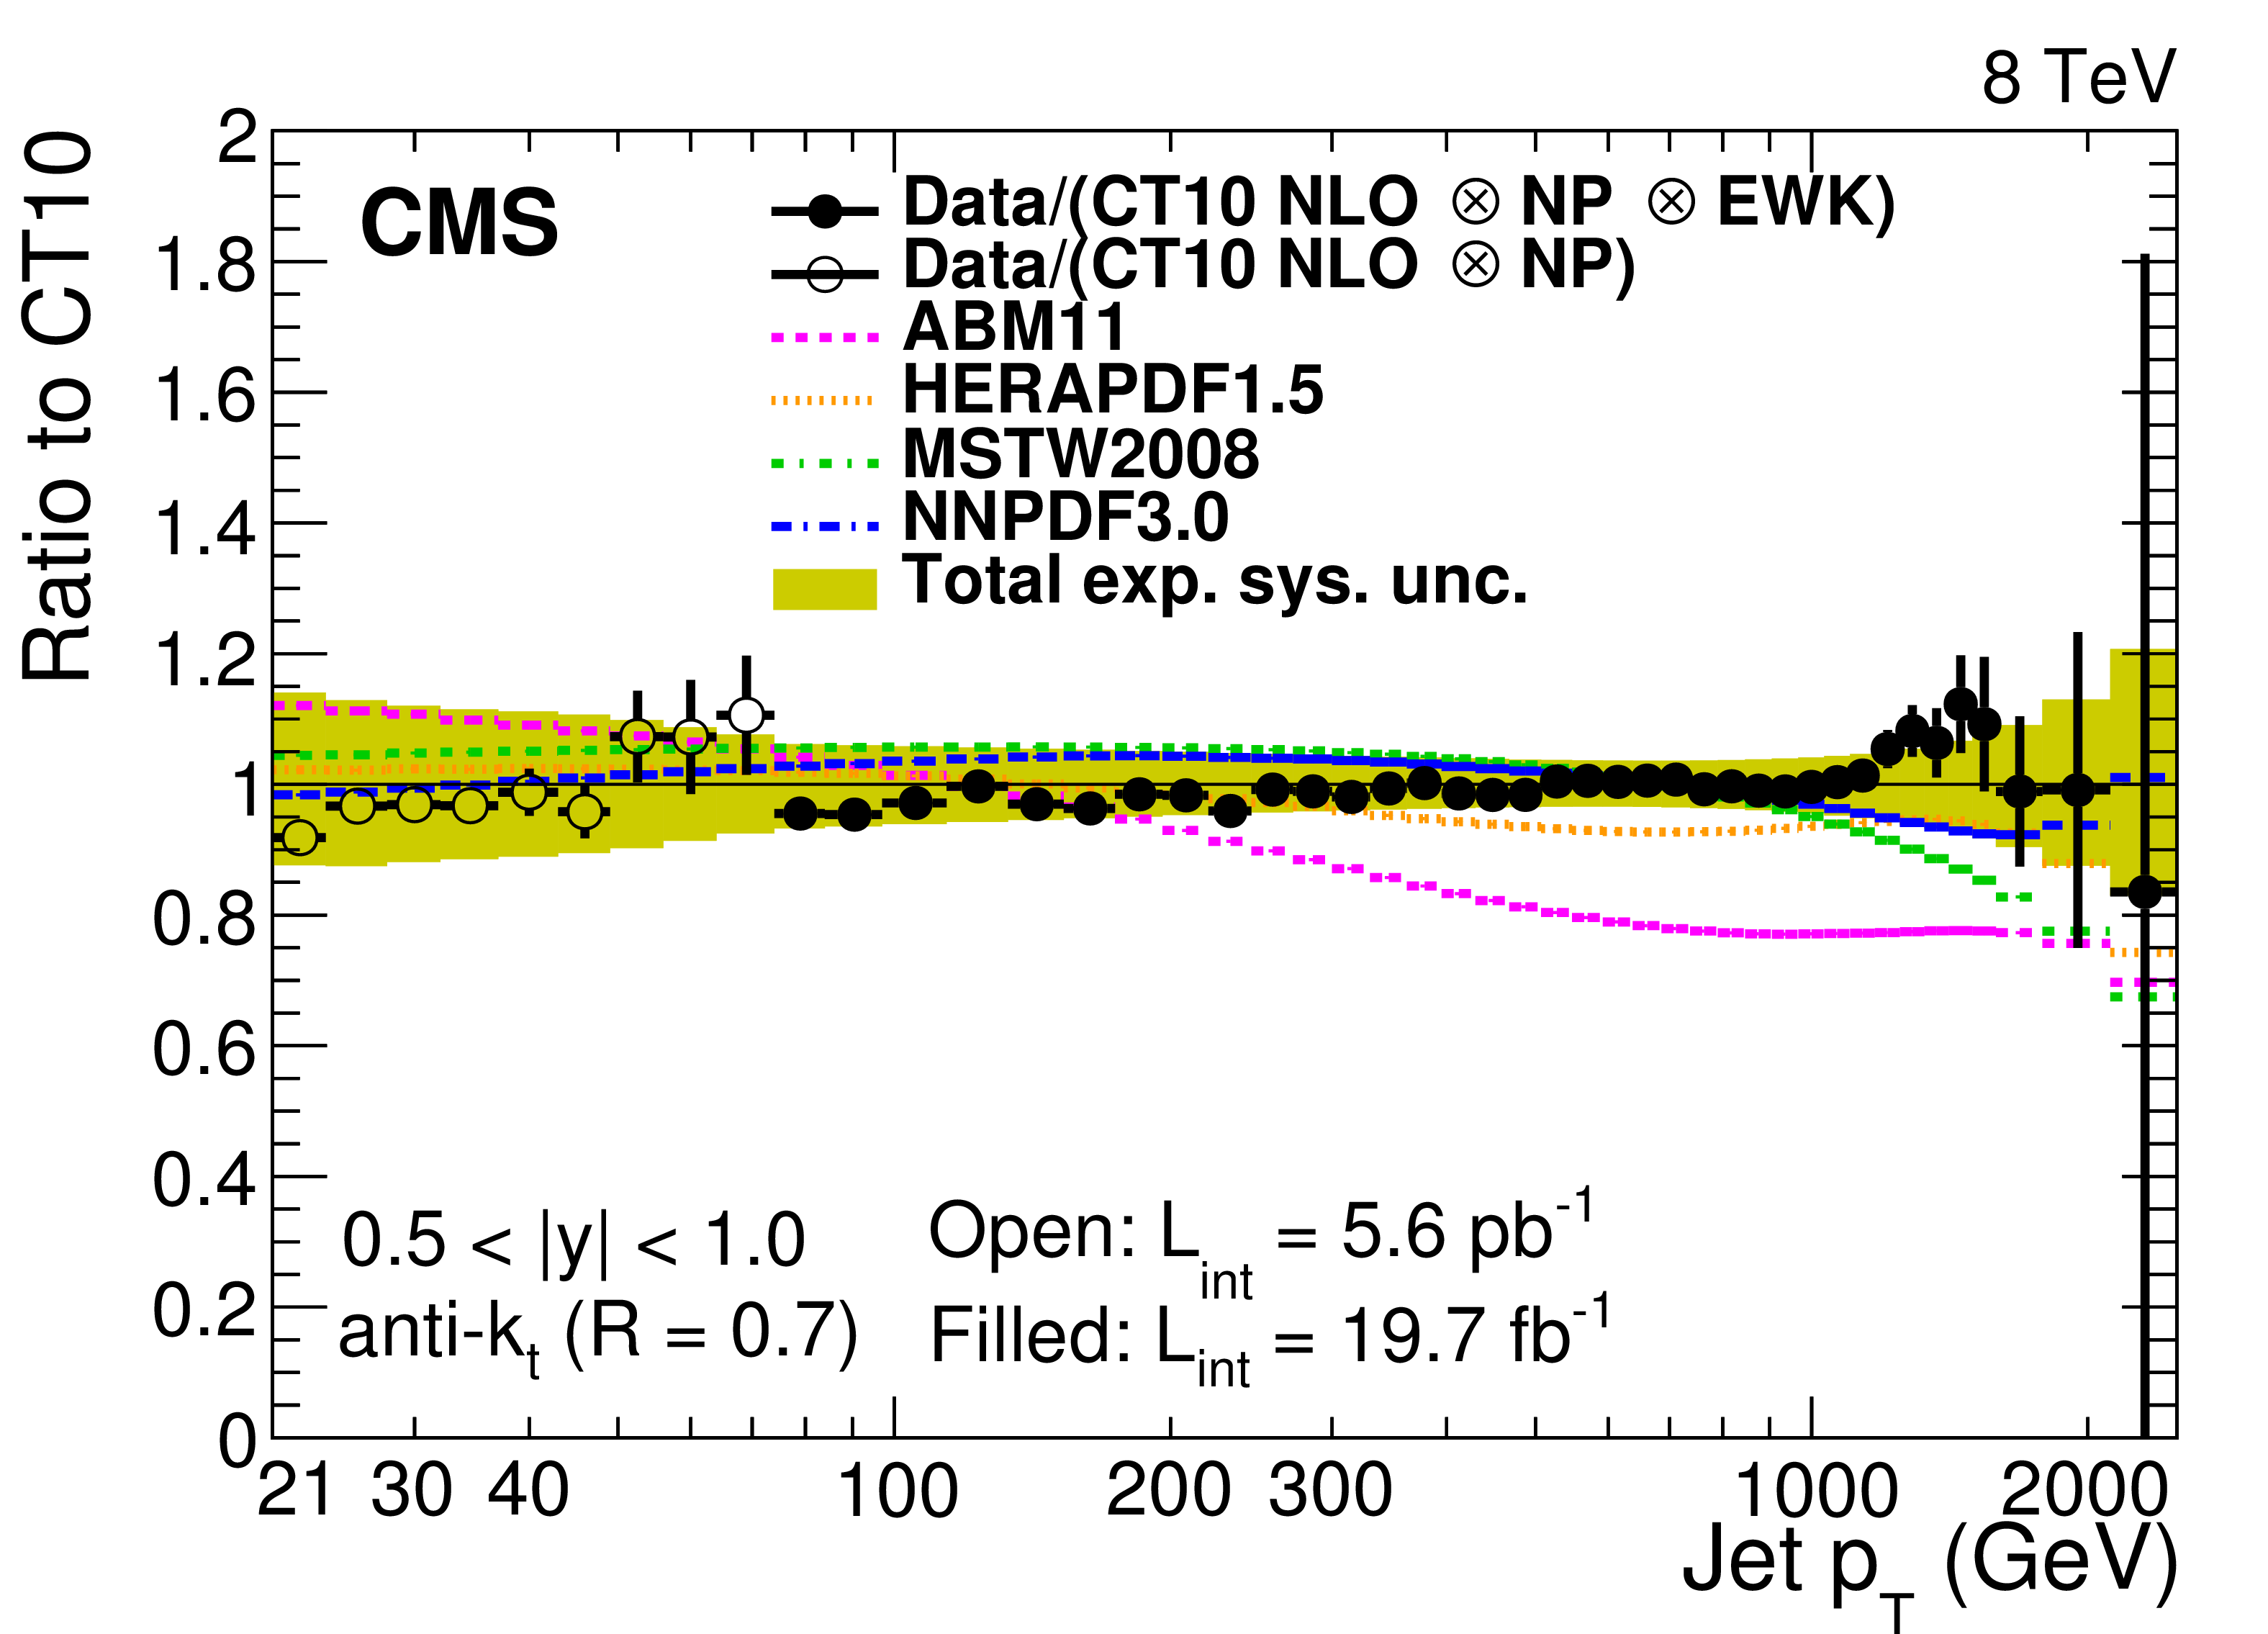
Figure 4-b:
Ratio of data to the theory prediction using the CT10 PDF set. For comparison, the total theoretical (band enclosed by dashed lines) and the total experimental systematic uncertainties (band enclosed by full lines) are shown as well. The error bars correspond to the statistical uncertainty in the data. |
png pdf |
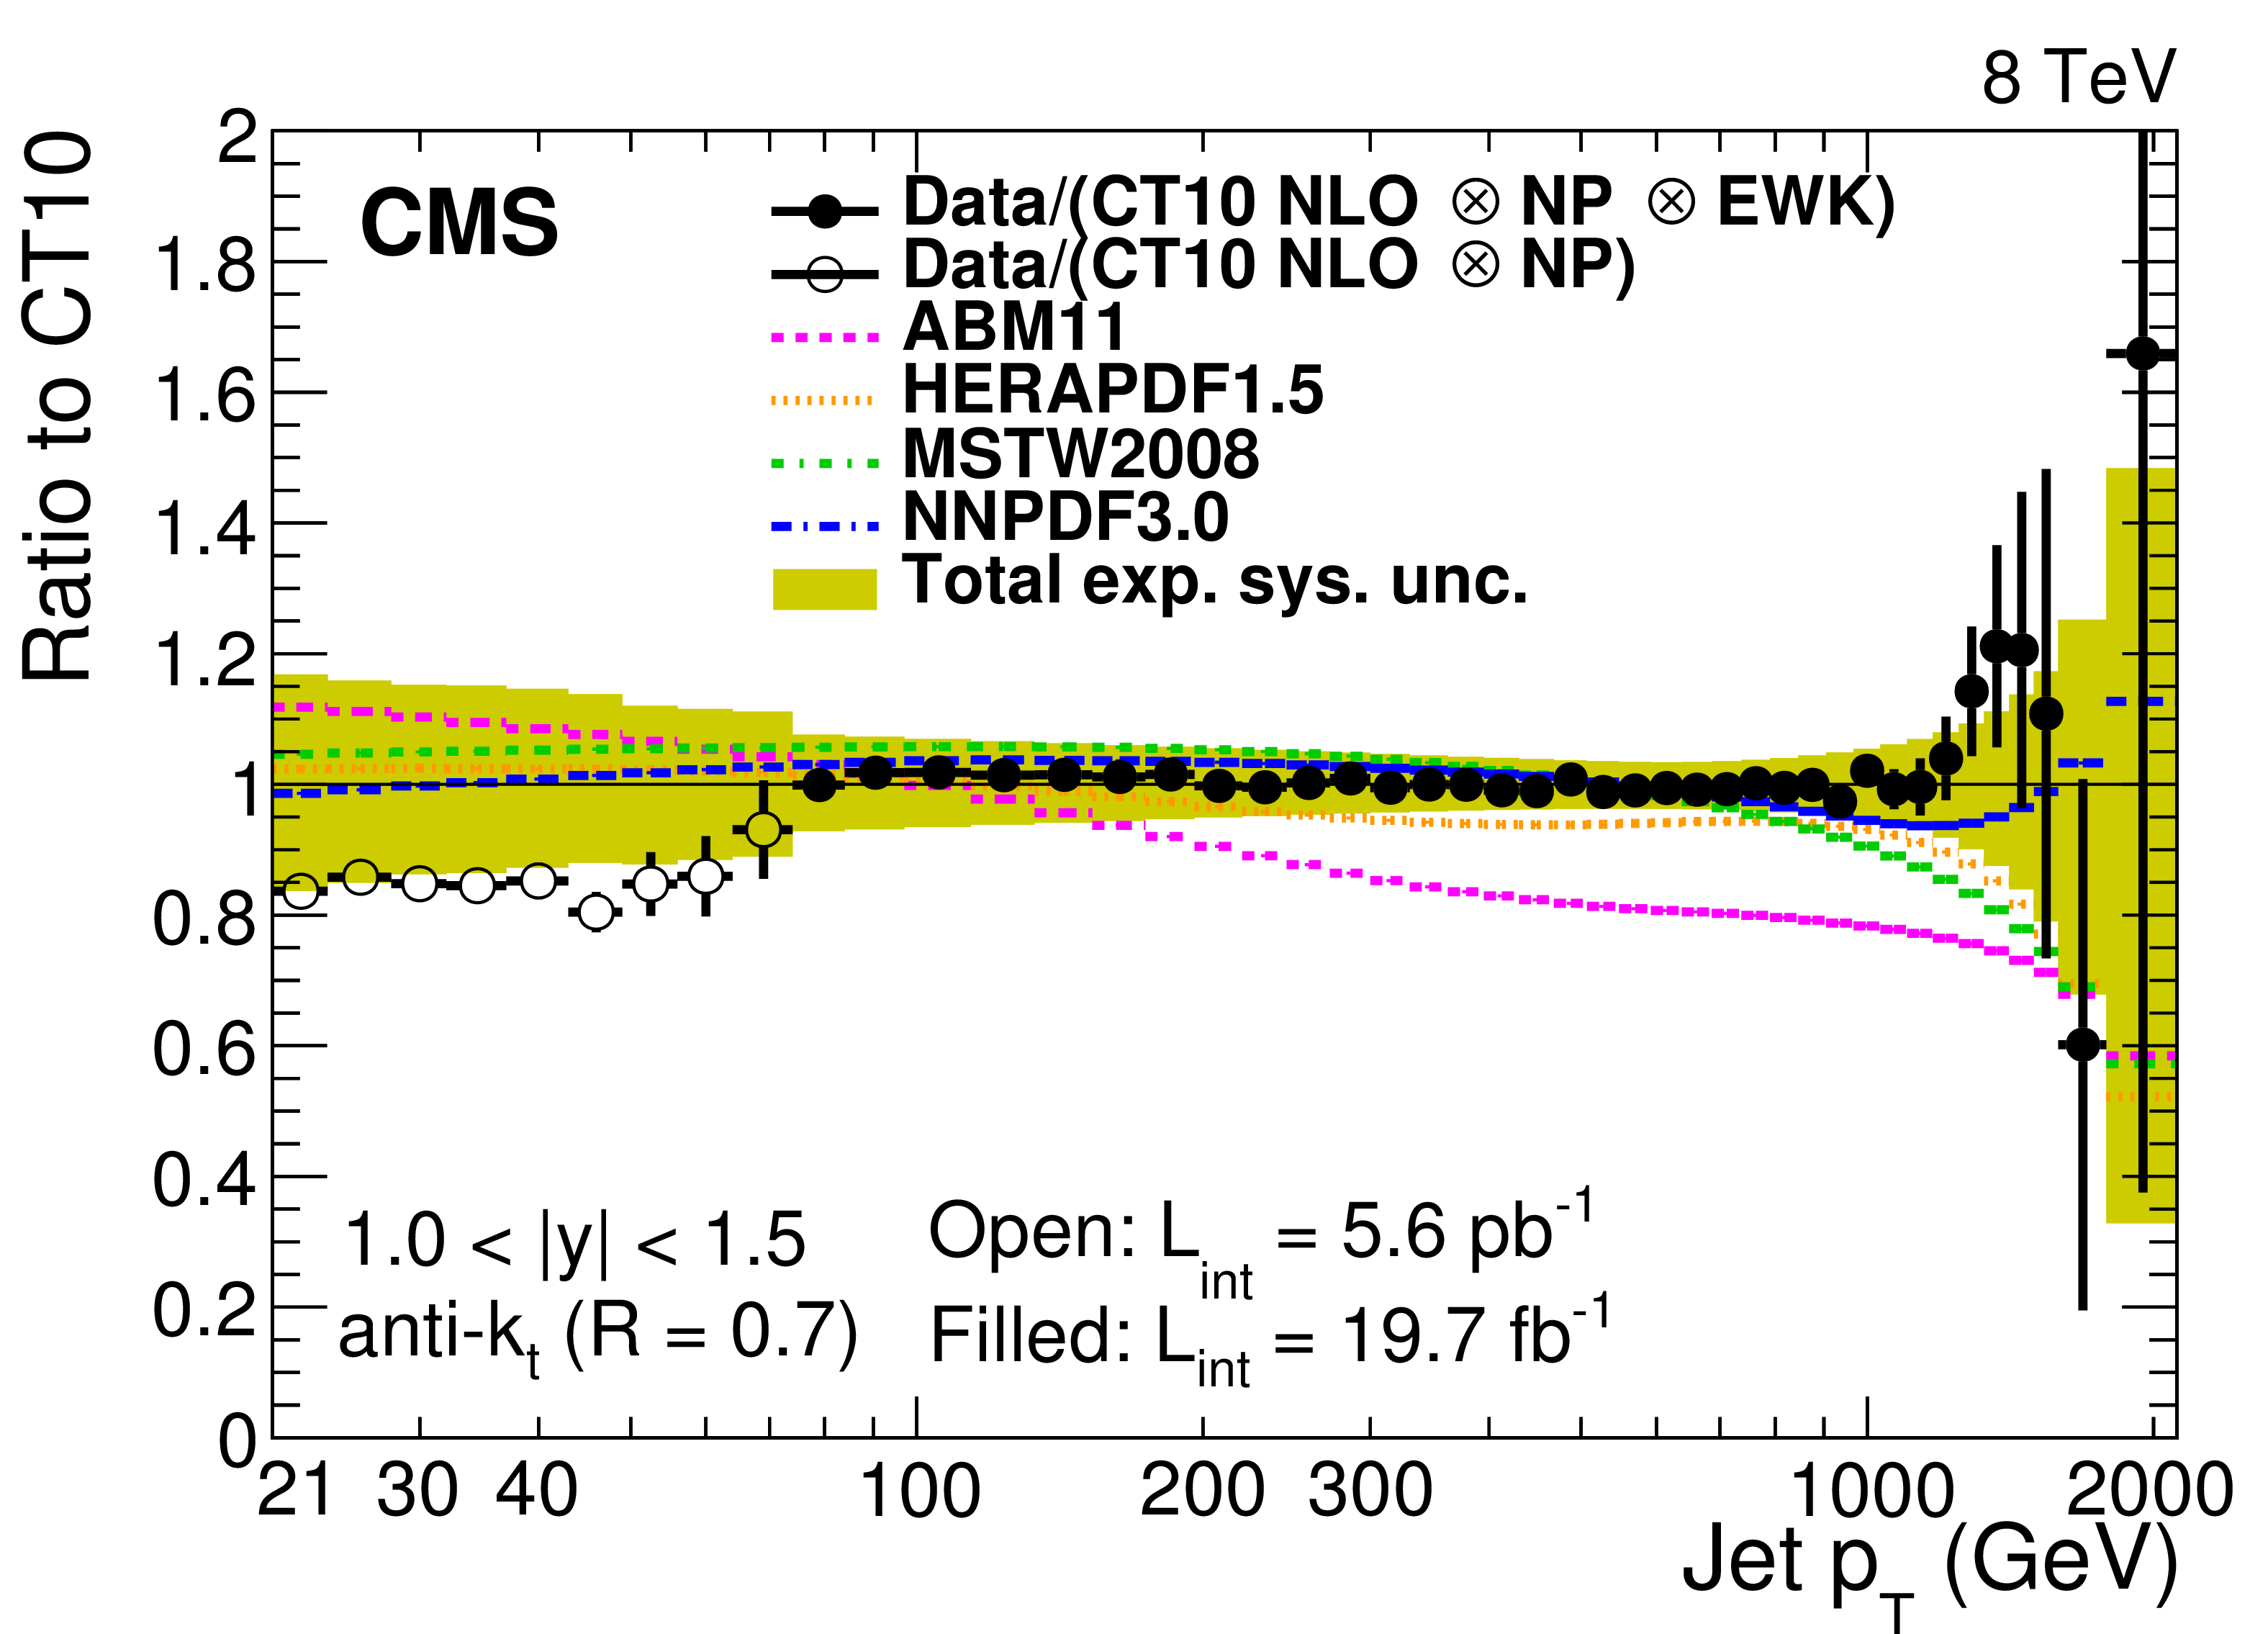
Figure 4-c:
Ratio of data to the theory prediction using the CT10 PDF set. For comparison, the total theoretical (band enclosed by dashed lines) and the total experimental systematic uncertainties (band enclosed by full lines) are shown as well. The error bars correspond to the statistical uncertainty in the data. |

png pdf |
Figure 4-d:
Ratio of data to the theory prediction using the CT10 PDF set. For comparison, the total theoretical (band enclosed by dashed lines) and the total experimental systematic uncertainties (band enclosed by full lines) are shown as well. The error bars correspond to the statistical uncertainty in the data. |
png pdf |
Figure 4-e:
Ratio of data to the theory prediction using the CT10 PDF set. For comparison, the total theoretical (band enclosed by dashed lines) and the total experimental systematic uncertainties (band enclosed by full lines) are shown as well. The error bars correspond to the statistical uncertainty in the data. |

png pdf |
Figure 4-f:
Ratio of data to the theory prediction using the CT10 PDF set. For comparison, the total theoretical (band enclosed by dashed lines) and the total experimental systematic uncertainties (band enclosed by full lines) are shown as well. The error bars correspond to the statistical uncertainty in the data. |
png pdf |
Figure 4-g:
Ratio of data to the theory prediction using the CT10 PDF set. For comparison, the total theoretical (band enclosed by dashed lines) and the total experimental systematic uncertainties (band enclosed by full lines) are shown as well. The error bars correspond to the statistical uncertainty in the data. |
png pdf |
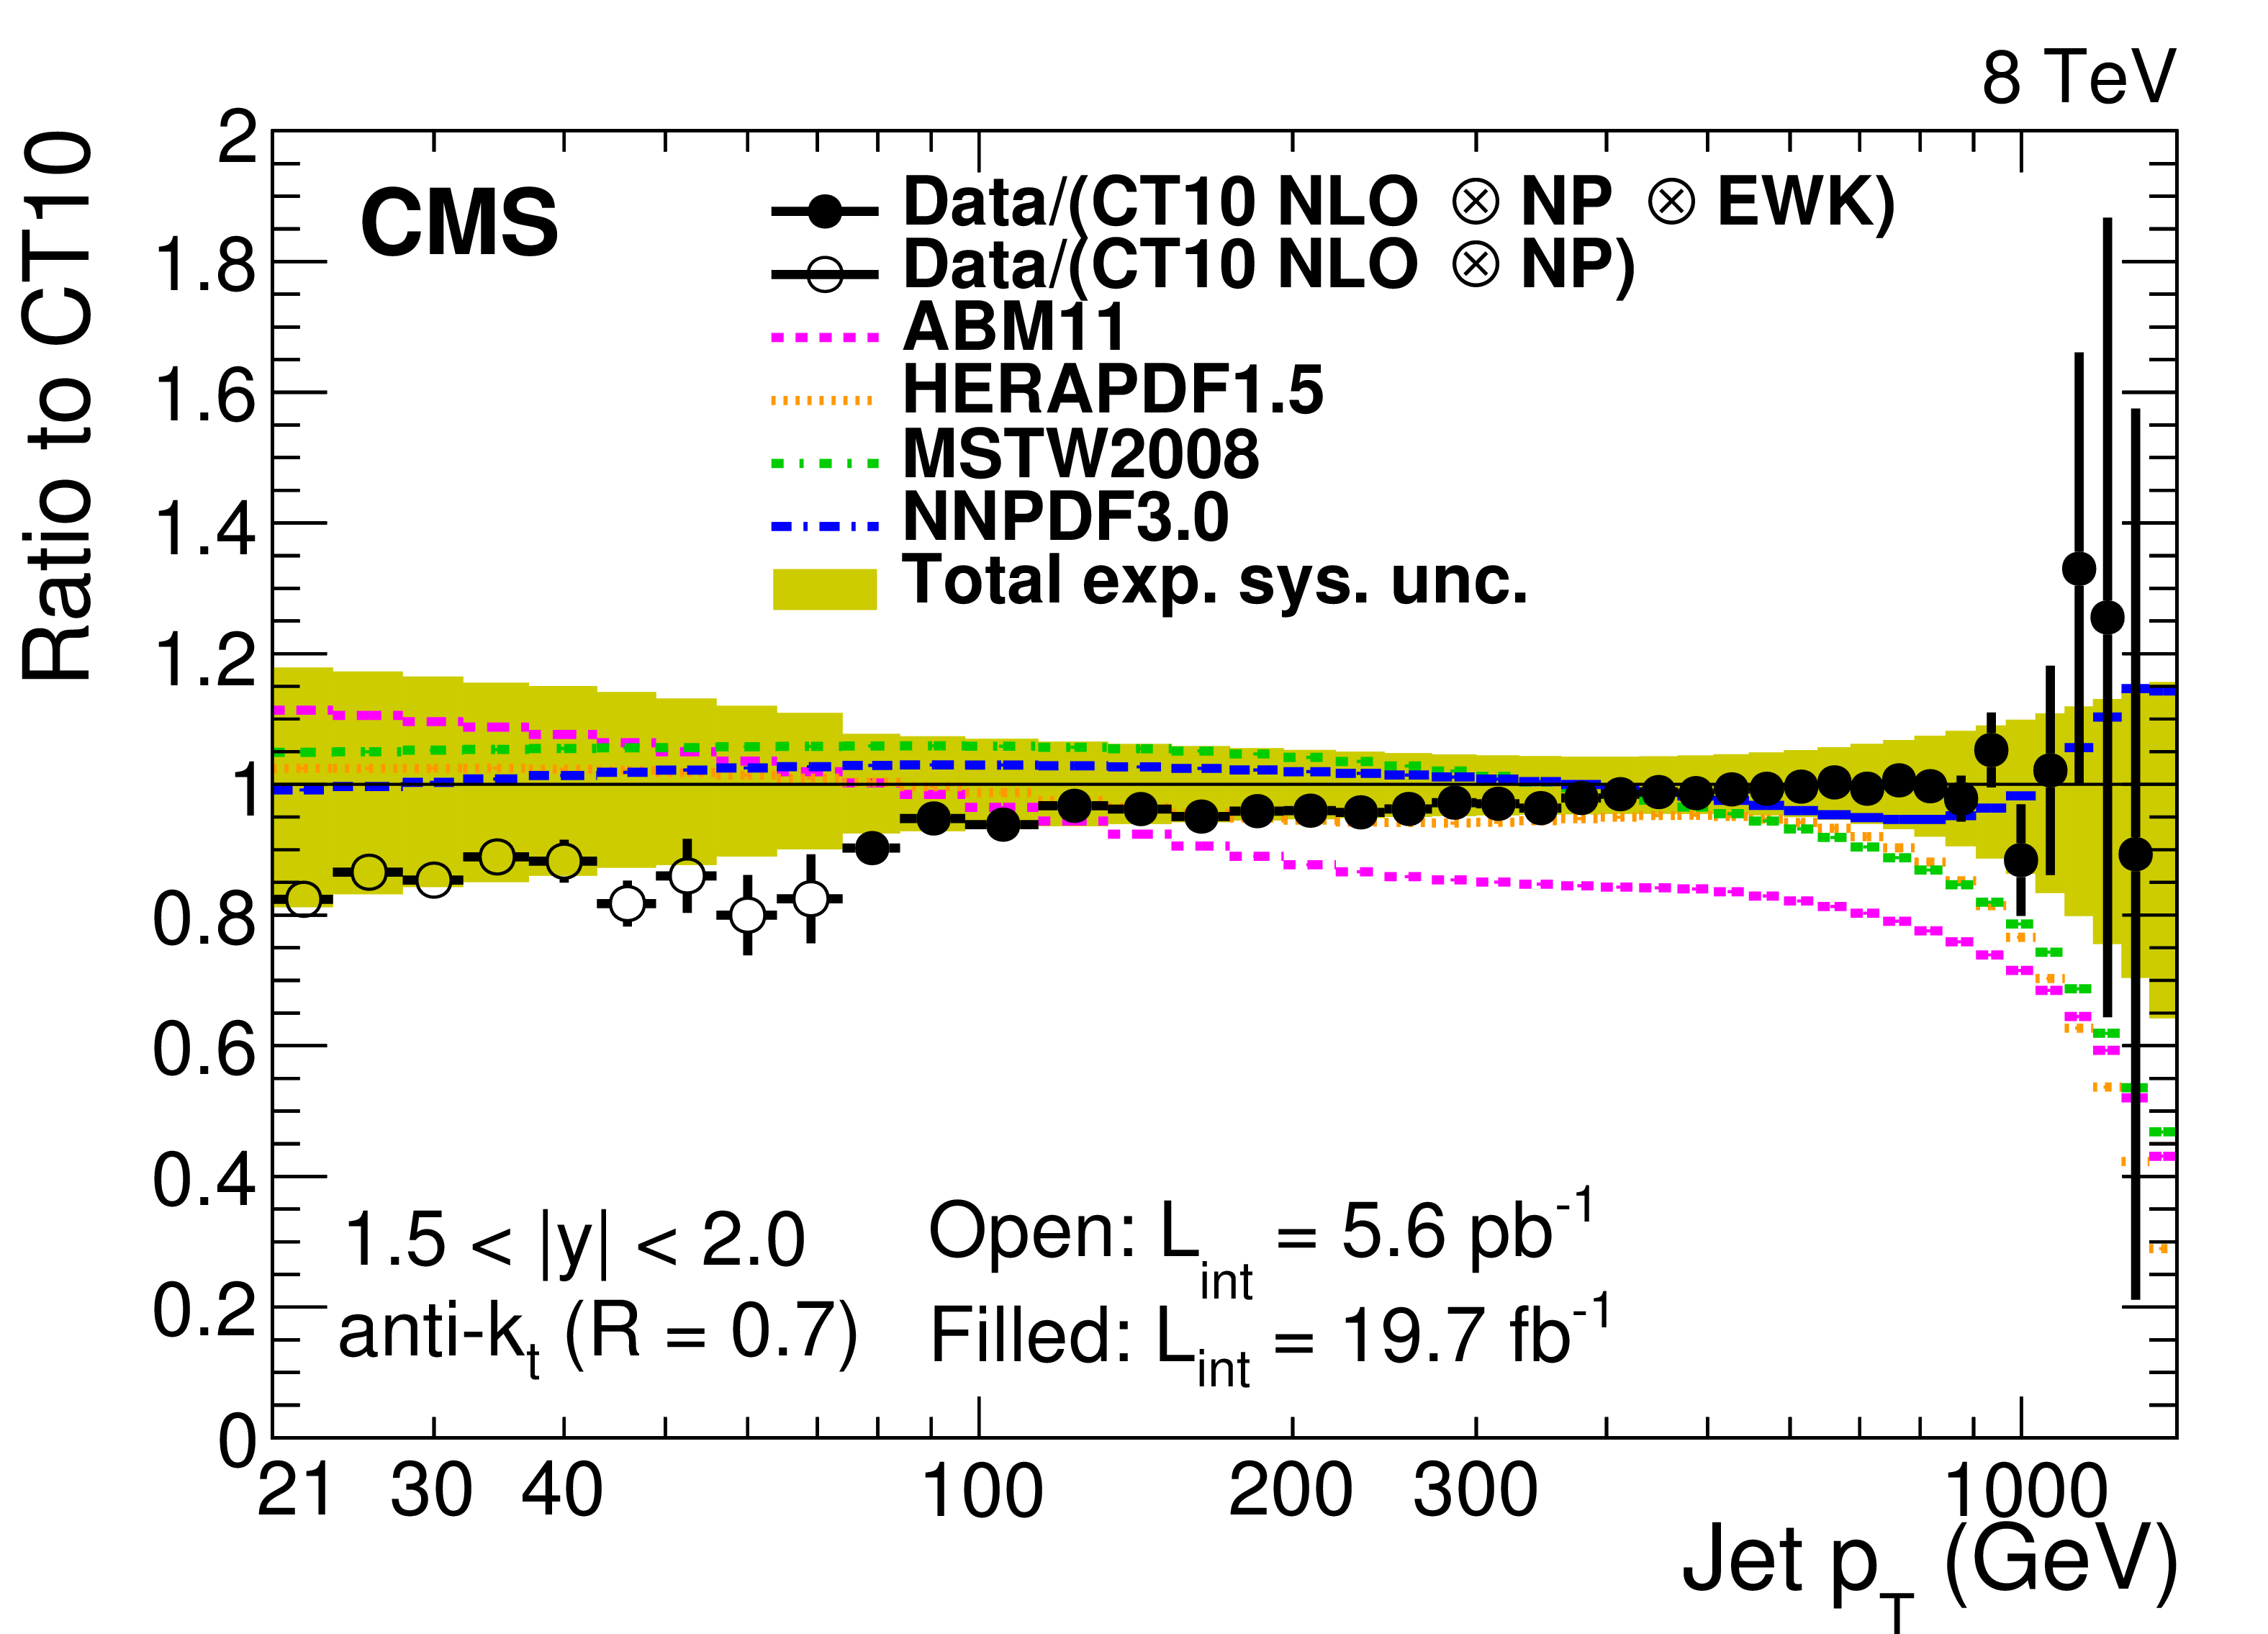
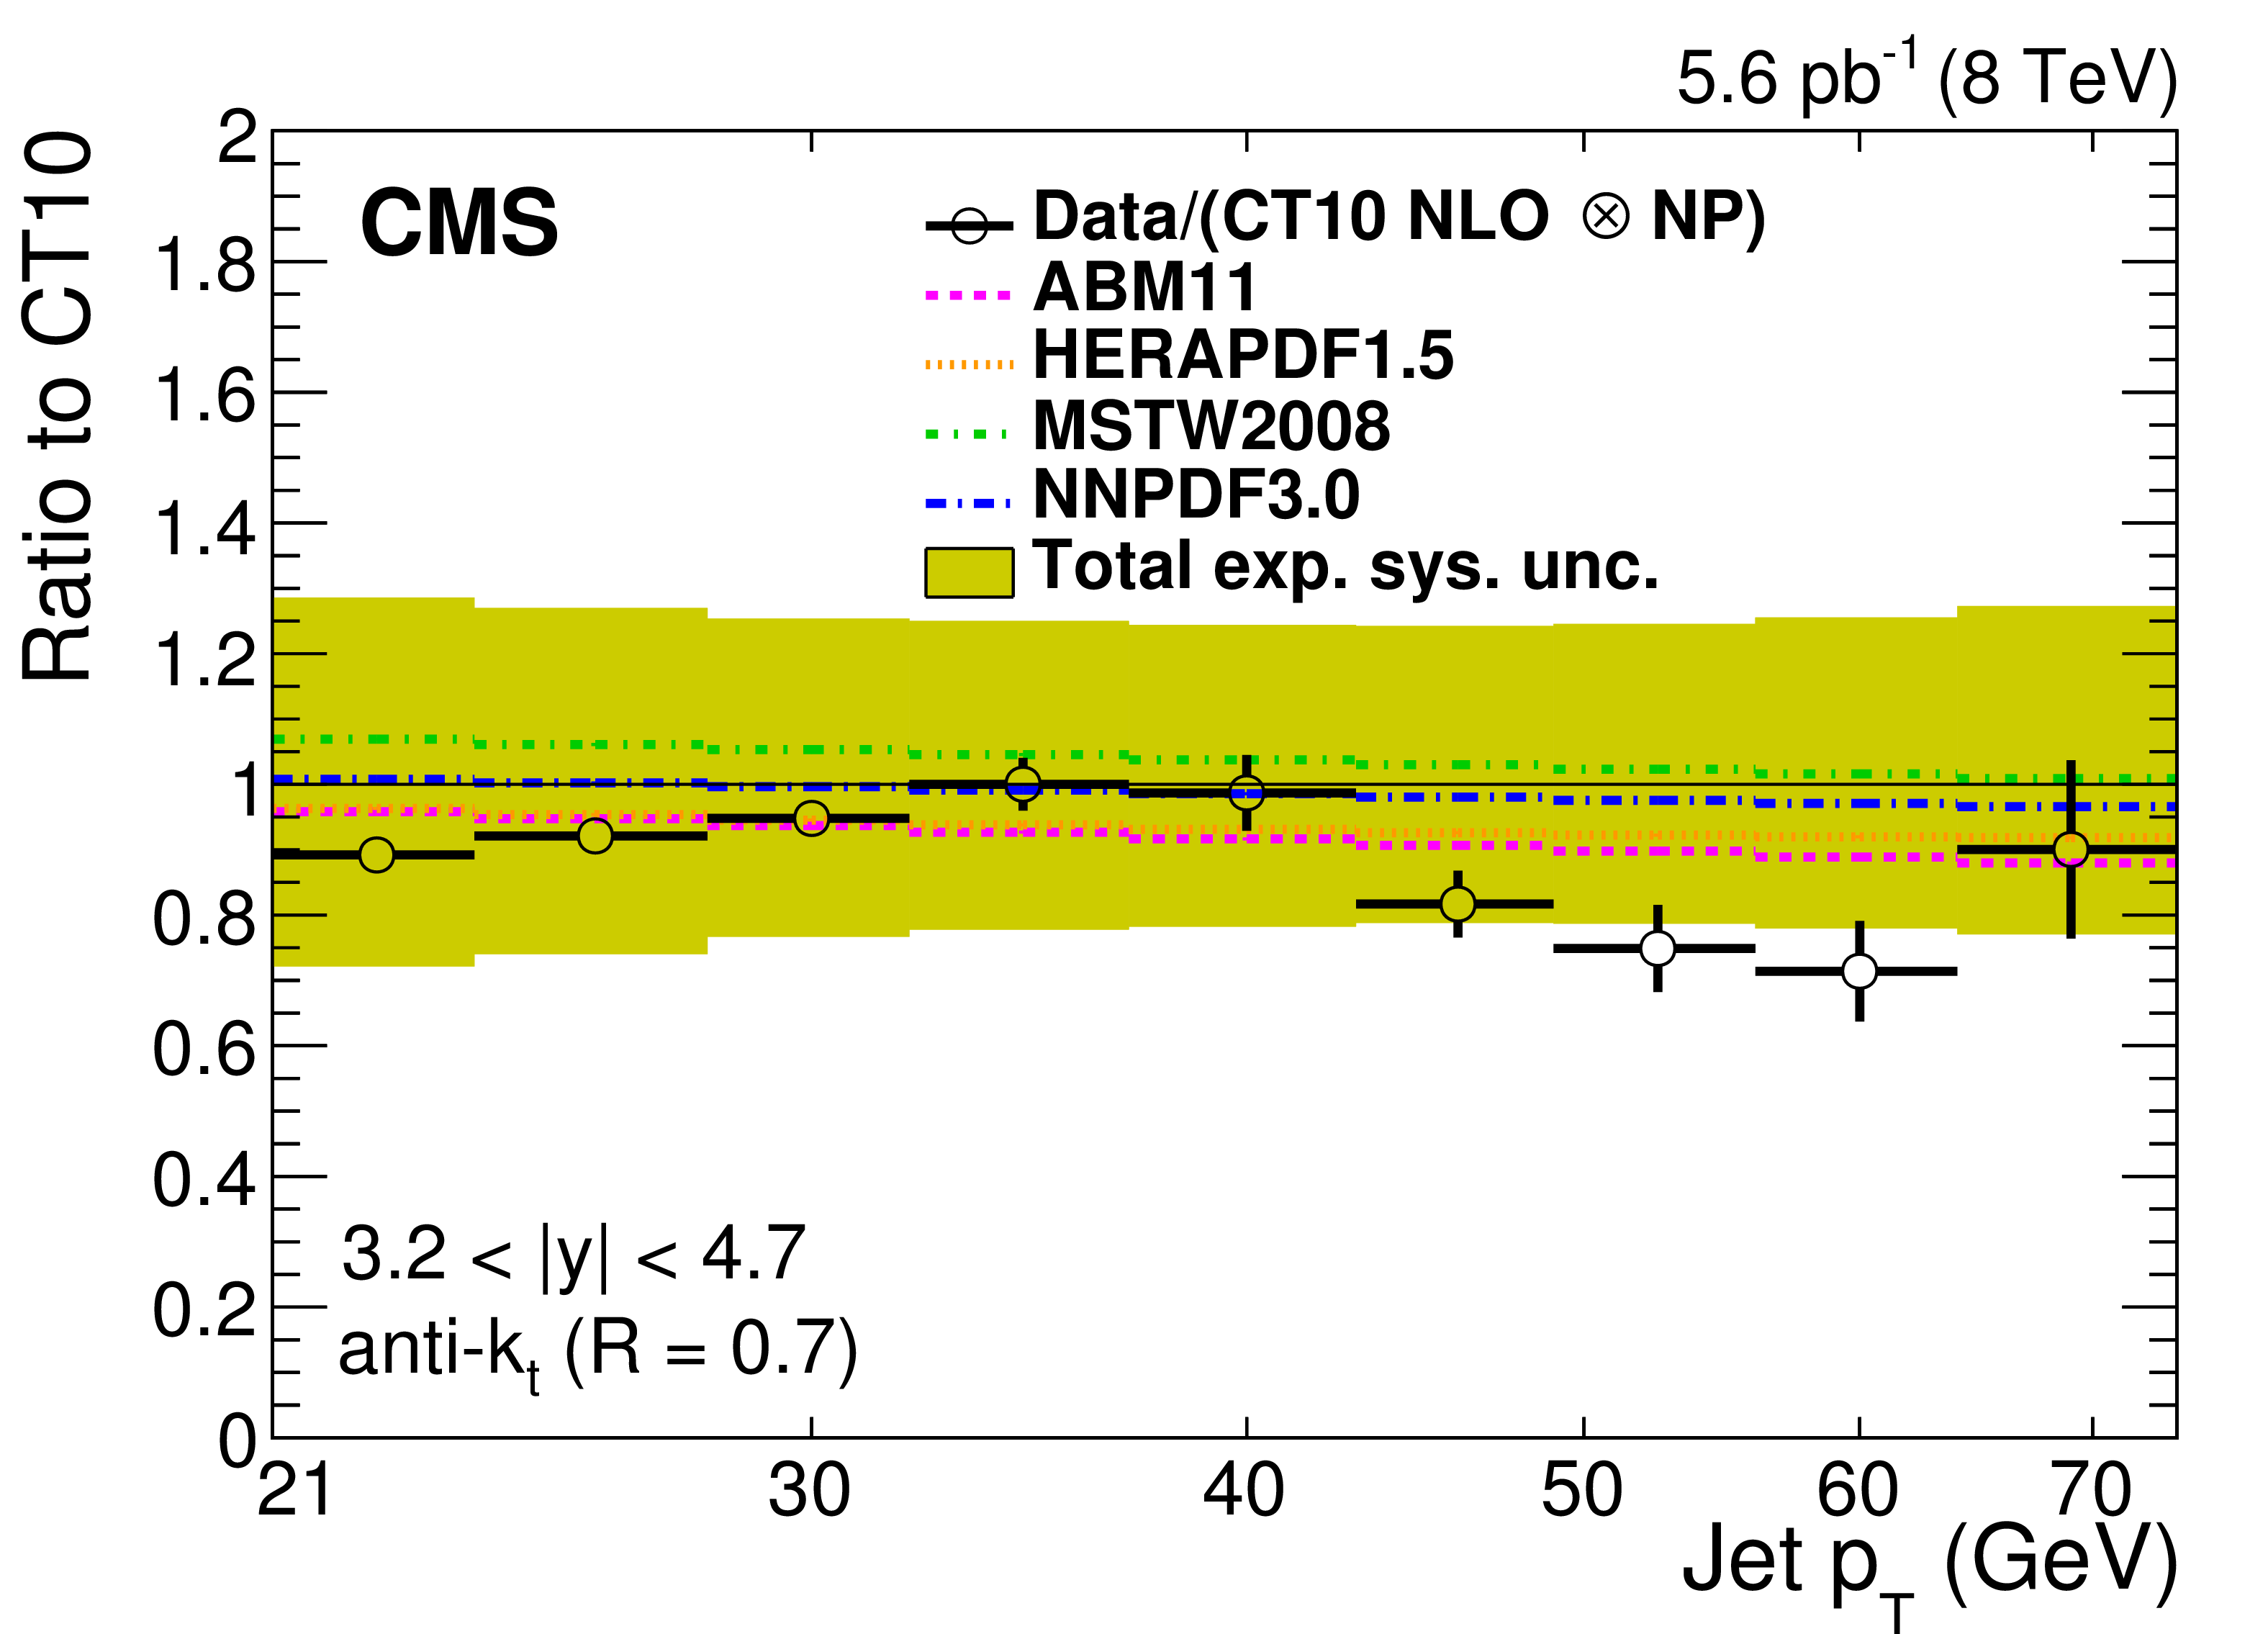
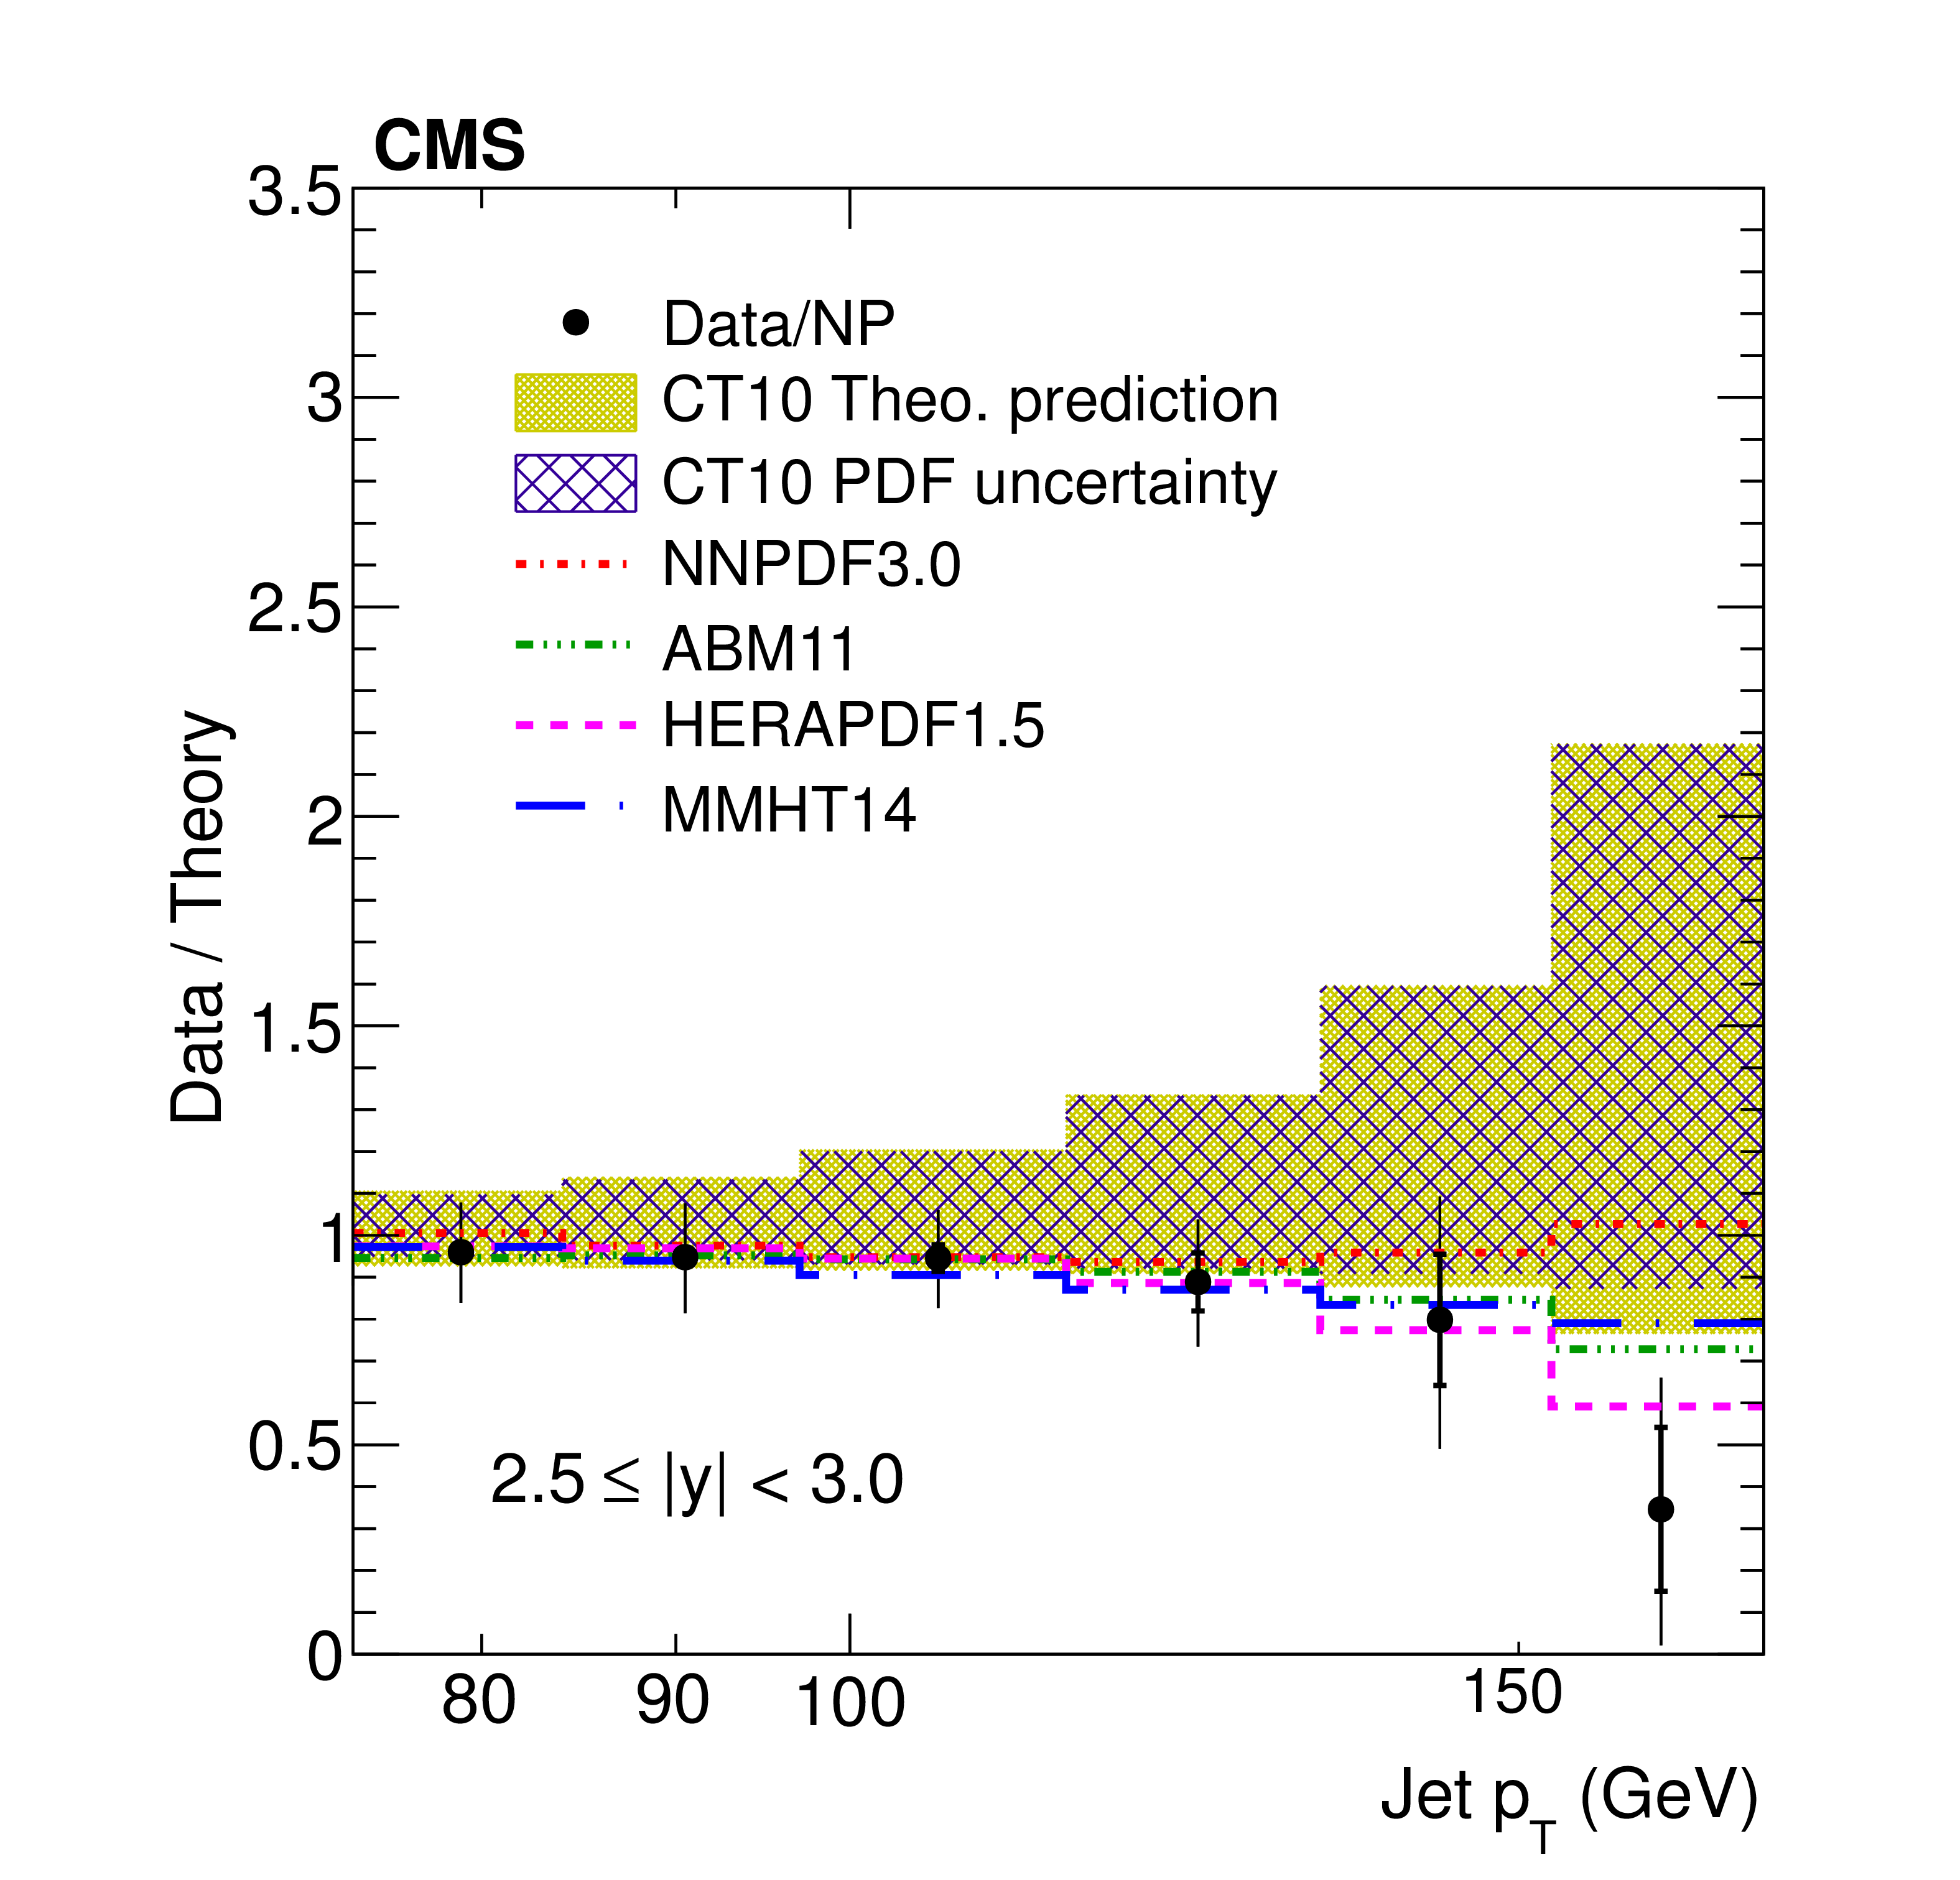
Figure 5:
Ratios of data and alternative predictions to the theory prediction using the CT10 PDF set. For comparison, predictions employing five other PDF sets are shown in addition to the total experimental systematic uncertainties (band enclosed by full lines). The error bars correspond to the statistical uncertainty in the data. |
png pdf |
Figure 5-a:
Ratio of data and alternative predictions to the theory prediction using the CT10 PDF set. For comparison, predictions employing five other PDF sets are shown in addition to the total experimental systematic uncertainties (band enclosed by full lines). The error bars correspond to the statistical uncertainty in the data. |
png pdf |
Figure 5-b:
Ratio of data and alternative predictions to the theory prediction using the CT10 PDF set. For comparison, predictions employing five other PDF sets are shown in addition to the total experimental systematic uncertainties (band enclosed by full lines). The error bars correspond to the statistical uncertainty in the data. |
png pdf |
Figure 5-c:
Ratio of data and alternative predictions to the theory prediction using the CT10 PDF set. For comparison, predictions employing five other PDF sets are shown in addition to the total experimental systematic uncertainties (band enclosed by full lines). The error bars correspond to the statistical uncertainty in the data. |
png pdf |
Figure 5-d:
Ratio of data and alternative predictions to the theory prediction using the CT10 PDF set. For comparison, predictions employing five other PDF sets are shown in addition to the total experimental systematic uncertainties (band enclosed by full lines). The error bars correspond to the statistical uncertainty in the data. |

png pdf |
Figure 5-e:
Ratio of data and alternative predictions to the theory prediction using the CT10 PDF set. For comparison, predictions employing five other PDF sets are shown in addition to the total experimental systematic uncertainties (band enclosed by full lines). The error bars correspond to the statistical uncertainty in the data. |

png pdf |
Figure 5-f:
Ratio of data and alternative predictions to the theory prediction using the CT10 PDF set. For comparison, predictions employing five other PDF sets are shown in addition to the total experimental systematic uncertainties (band enclosed by full lines). The error bars correspond to the statistical uncertainty in the data. |
png pdf |
Figure 5-g:
Ratio of data and alternative predictions to the theory prediction using the CT10 PDF set. For comparison, predictions employing five other PDF sets are shown in addition to the total experimental systematic uncertainties (band enclosed by full lines). The error bars correspond to the statistical uncertainty in the data. |
png pdf |
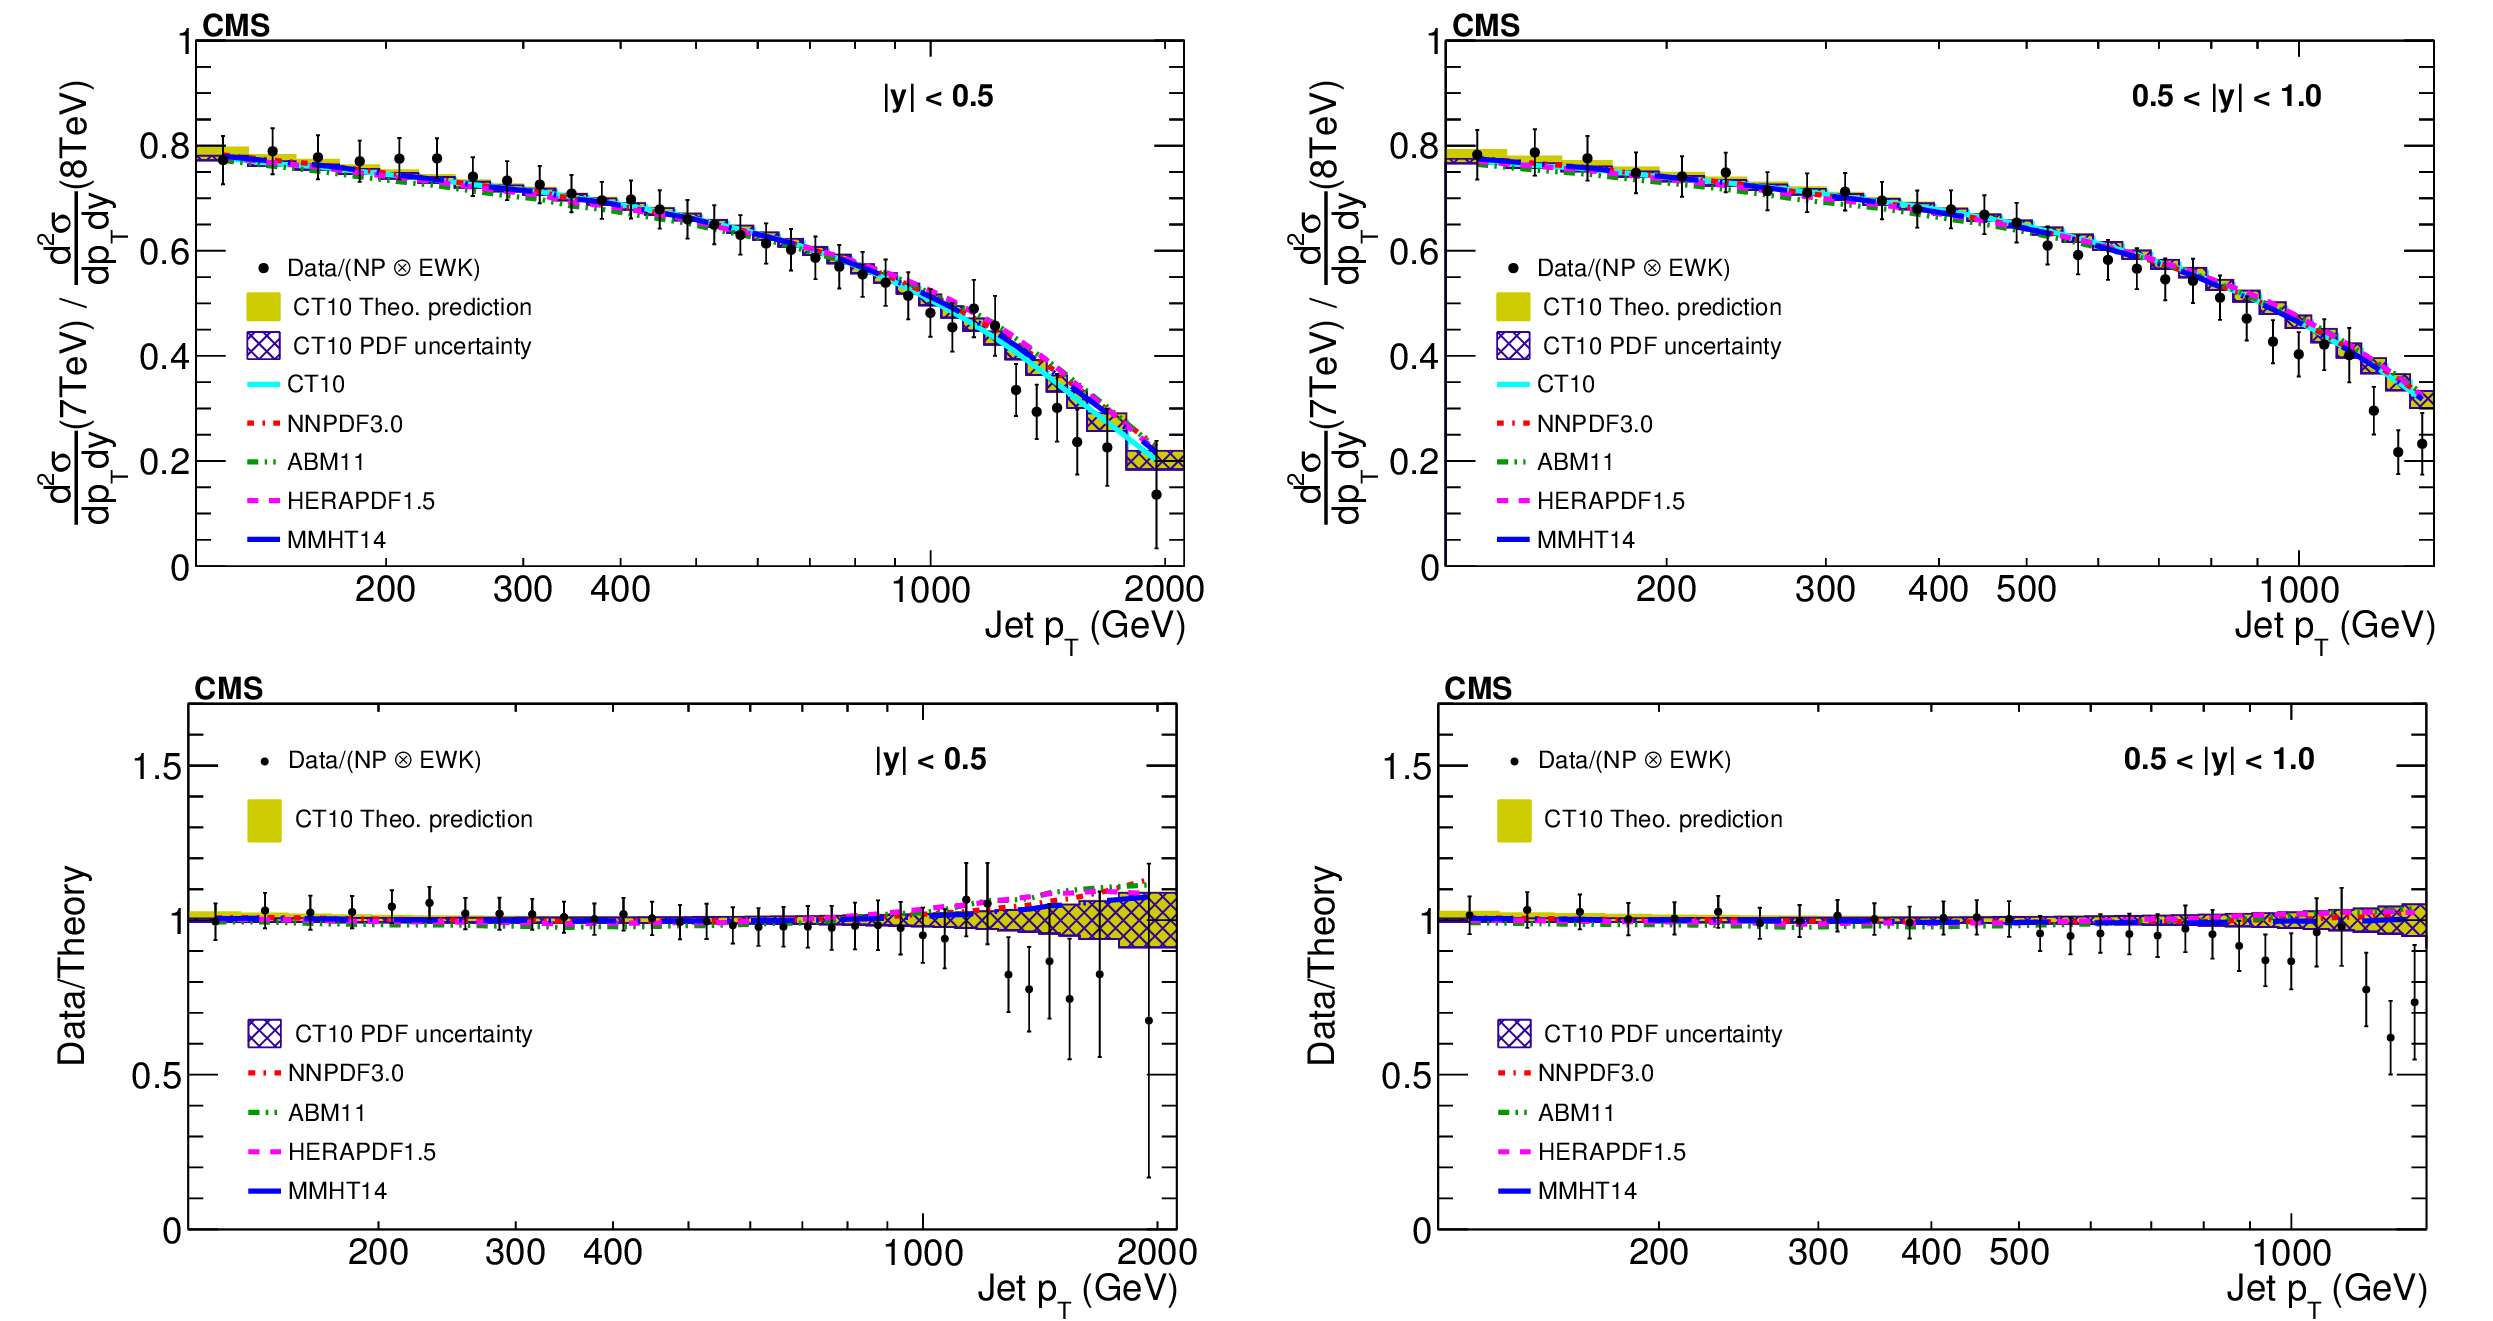
Figure 6:
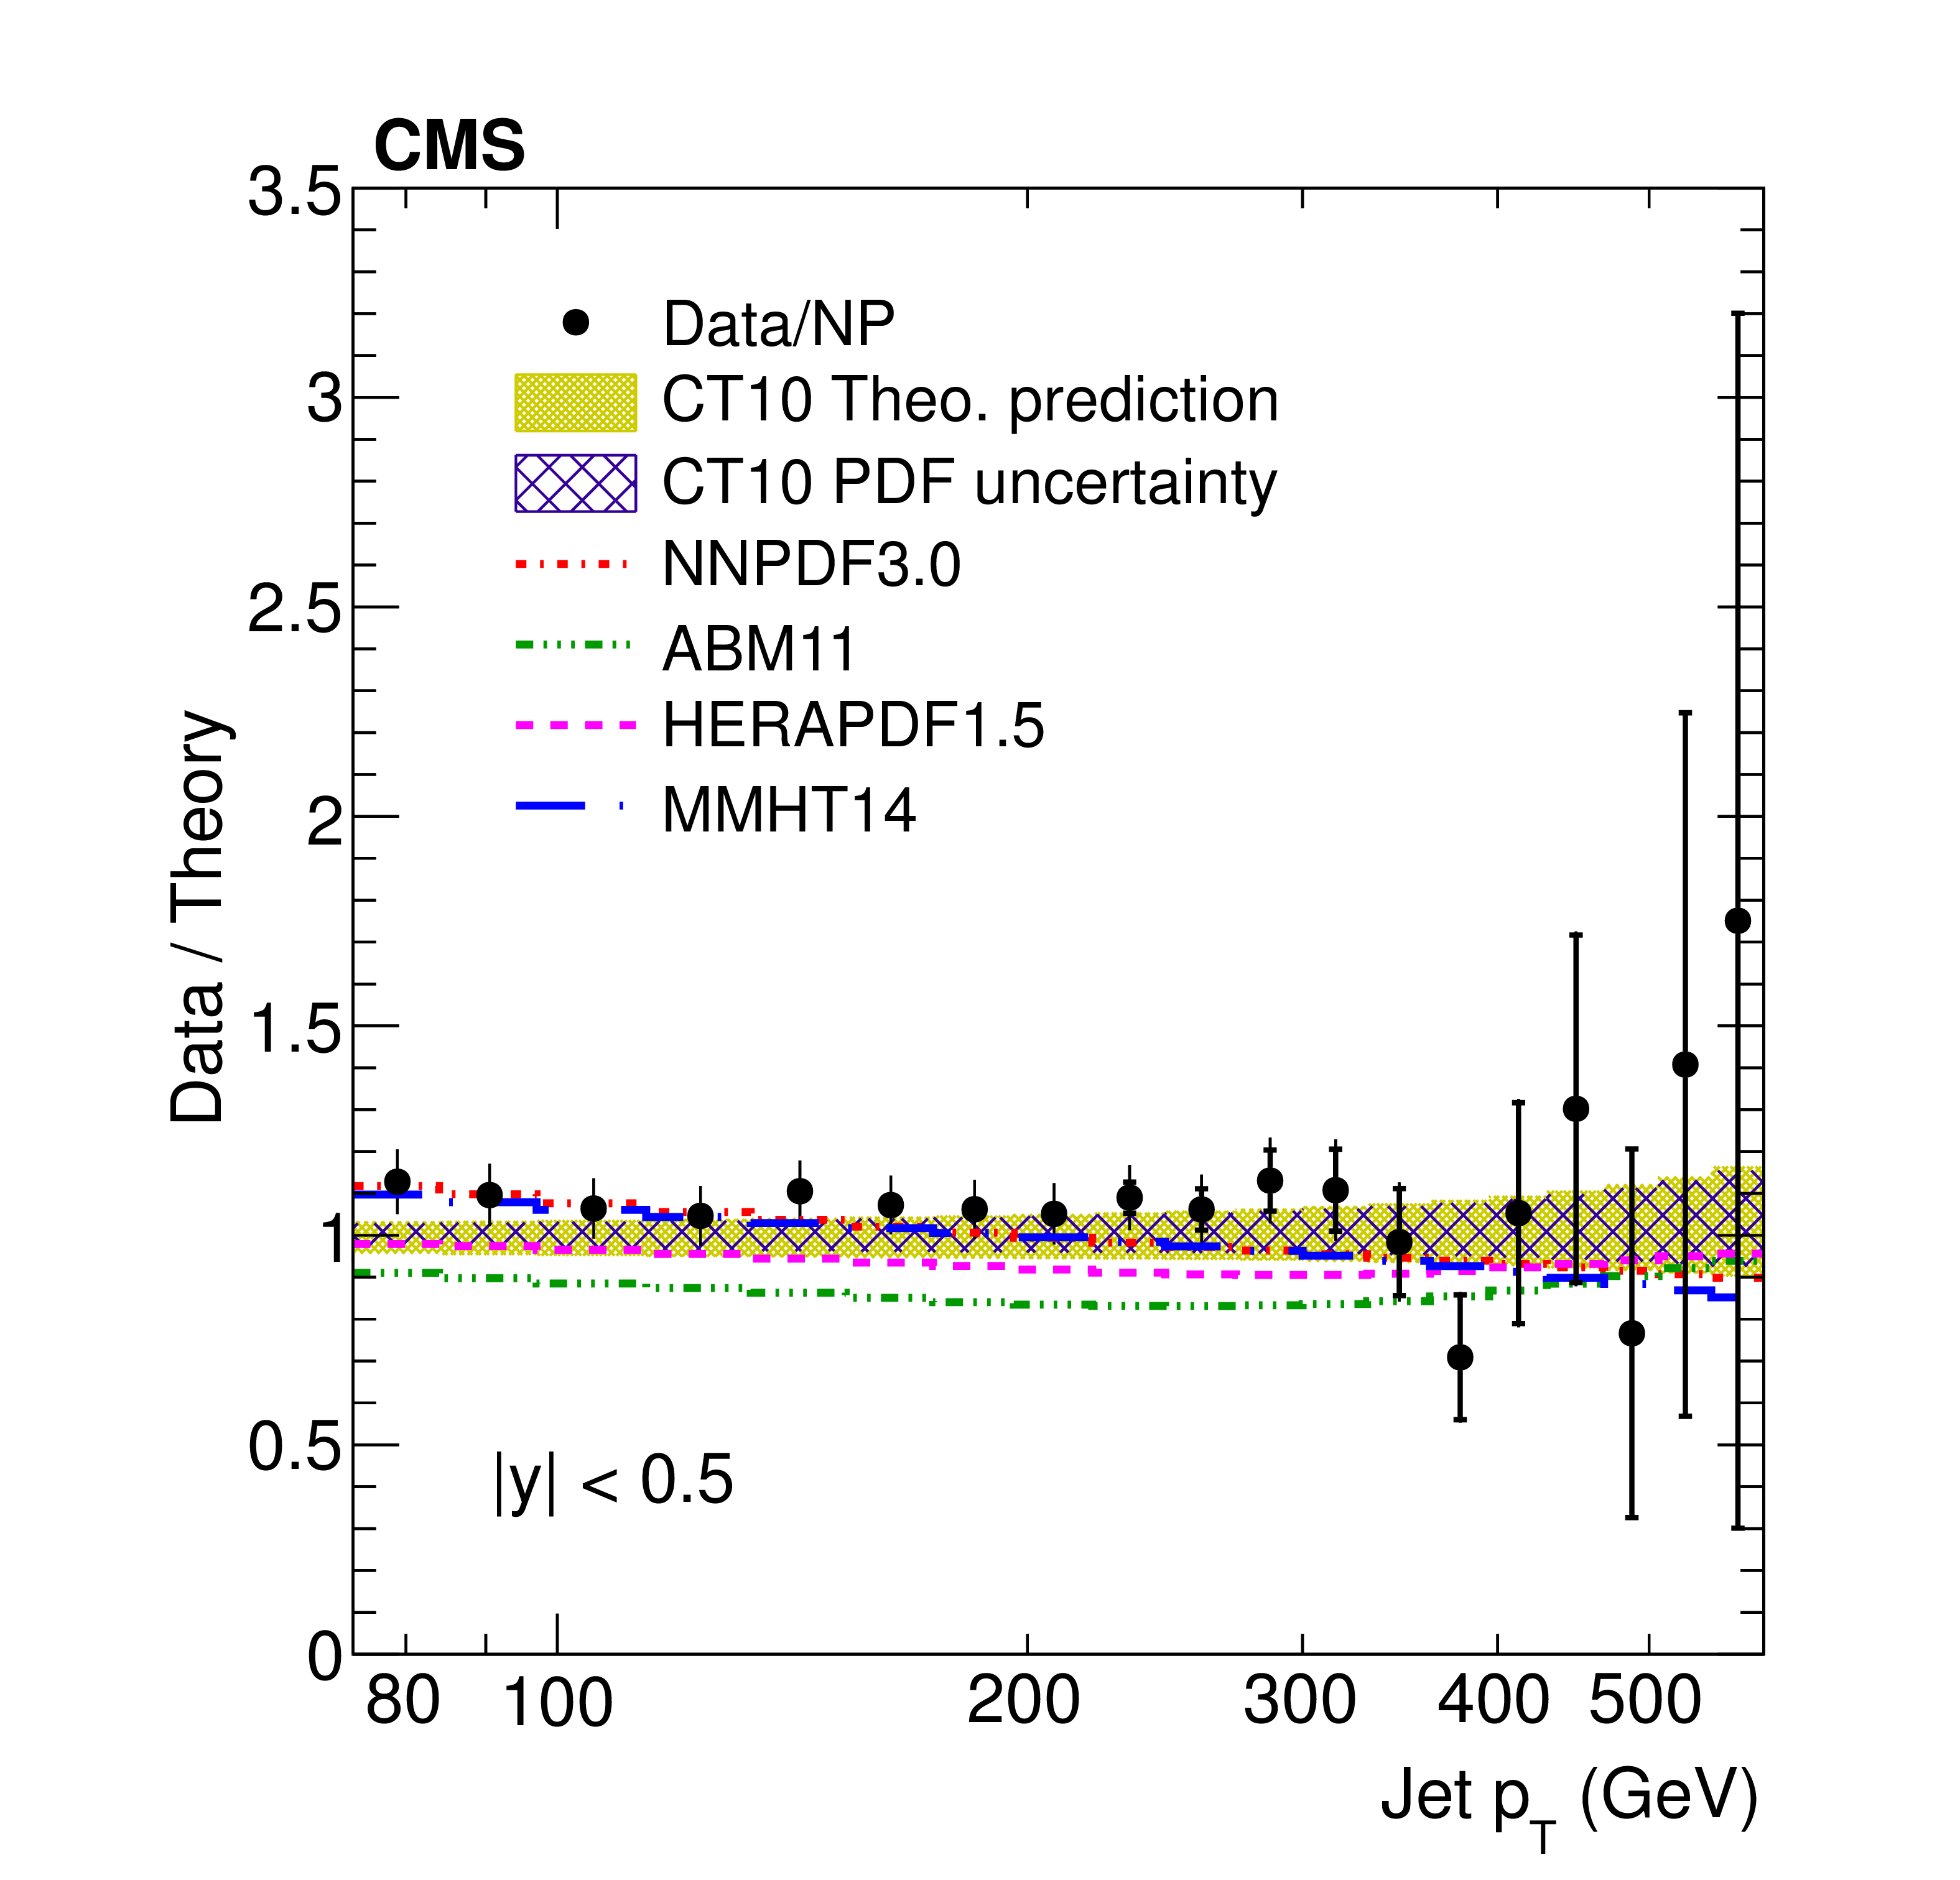
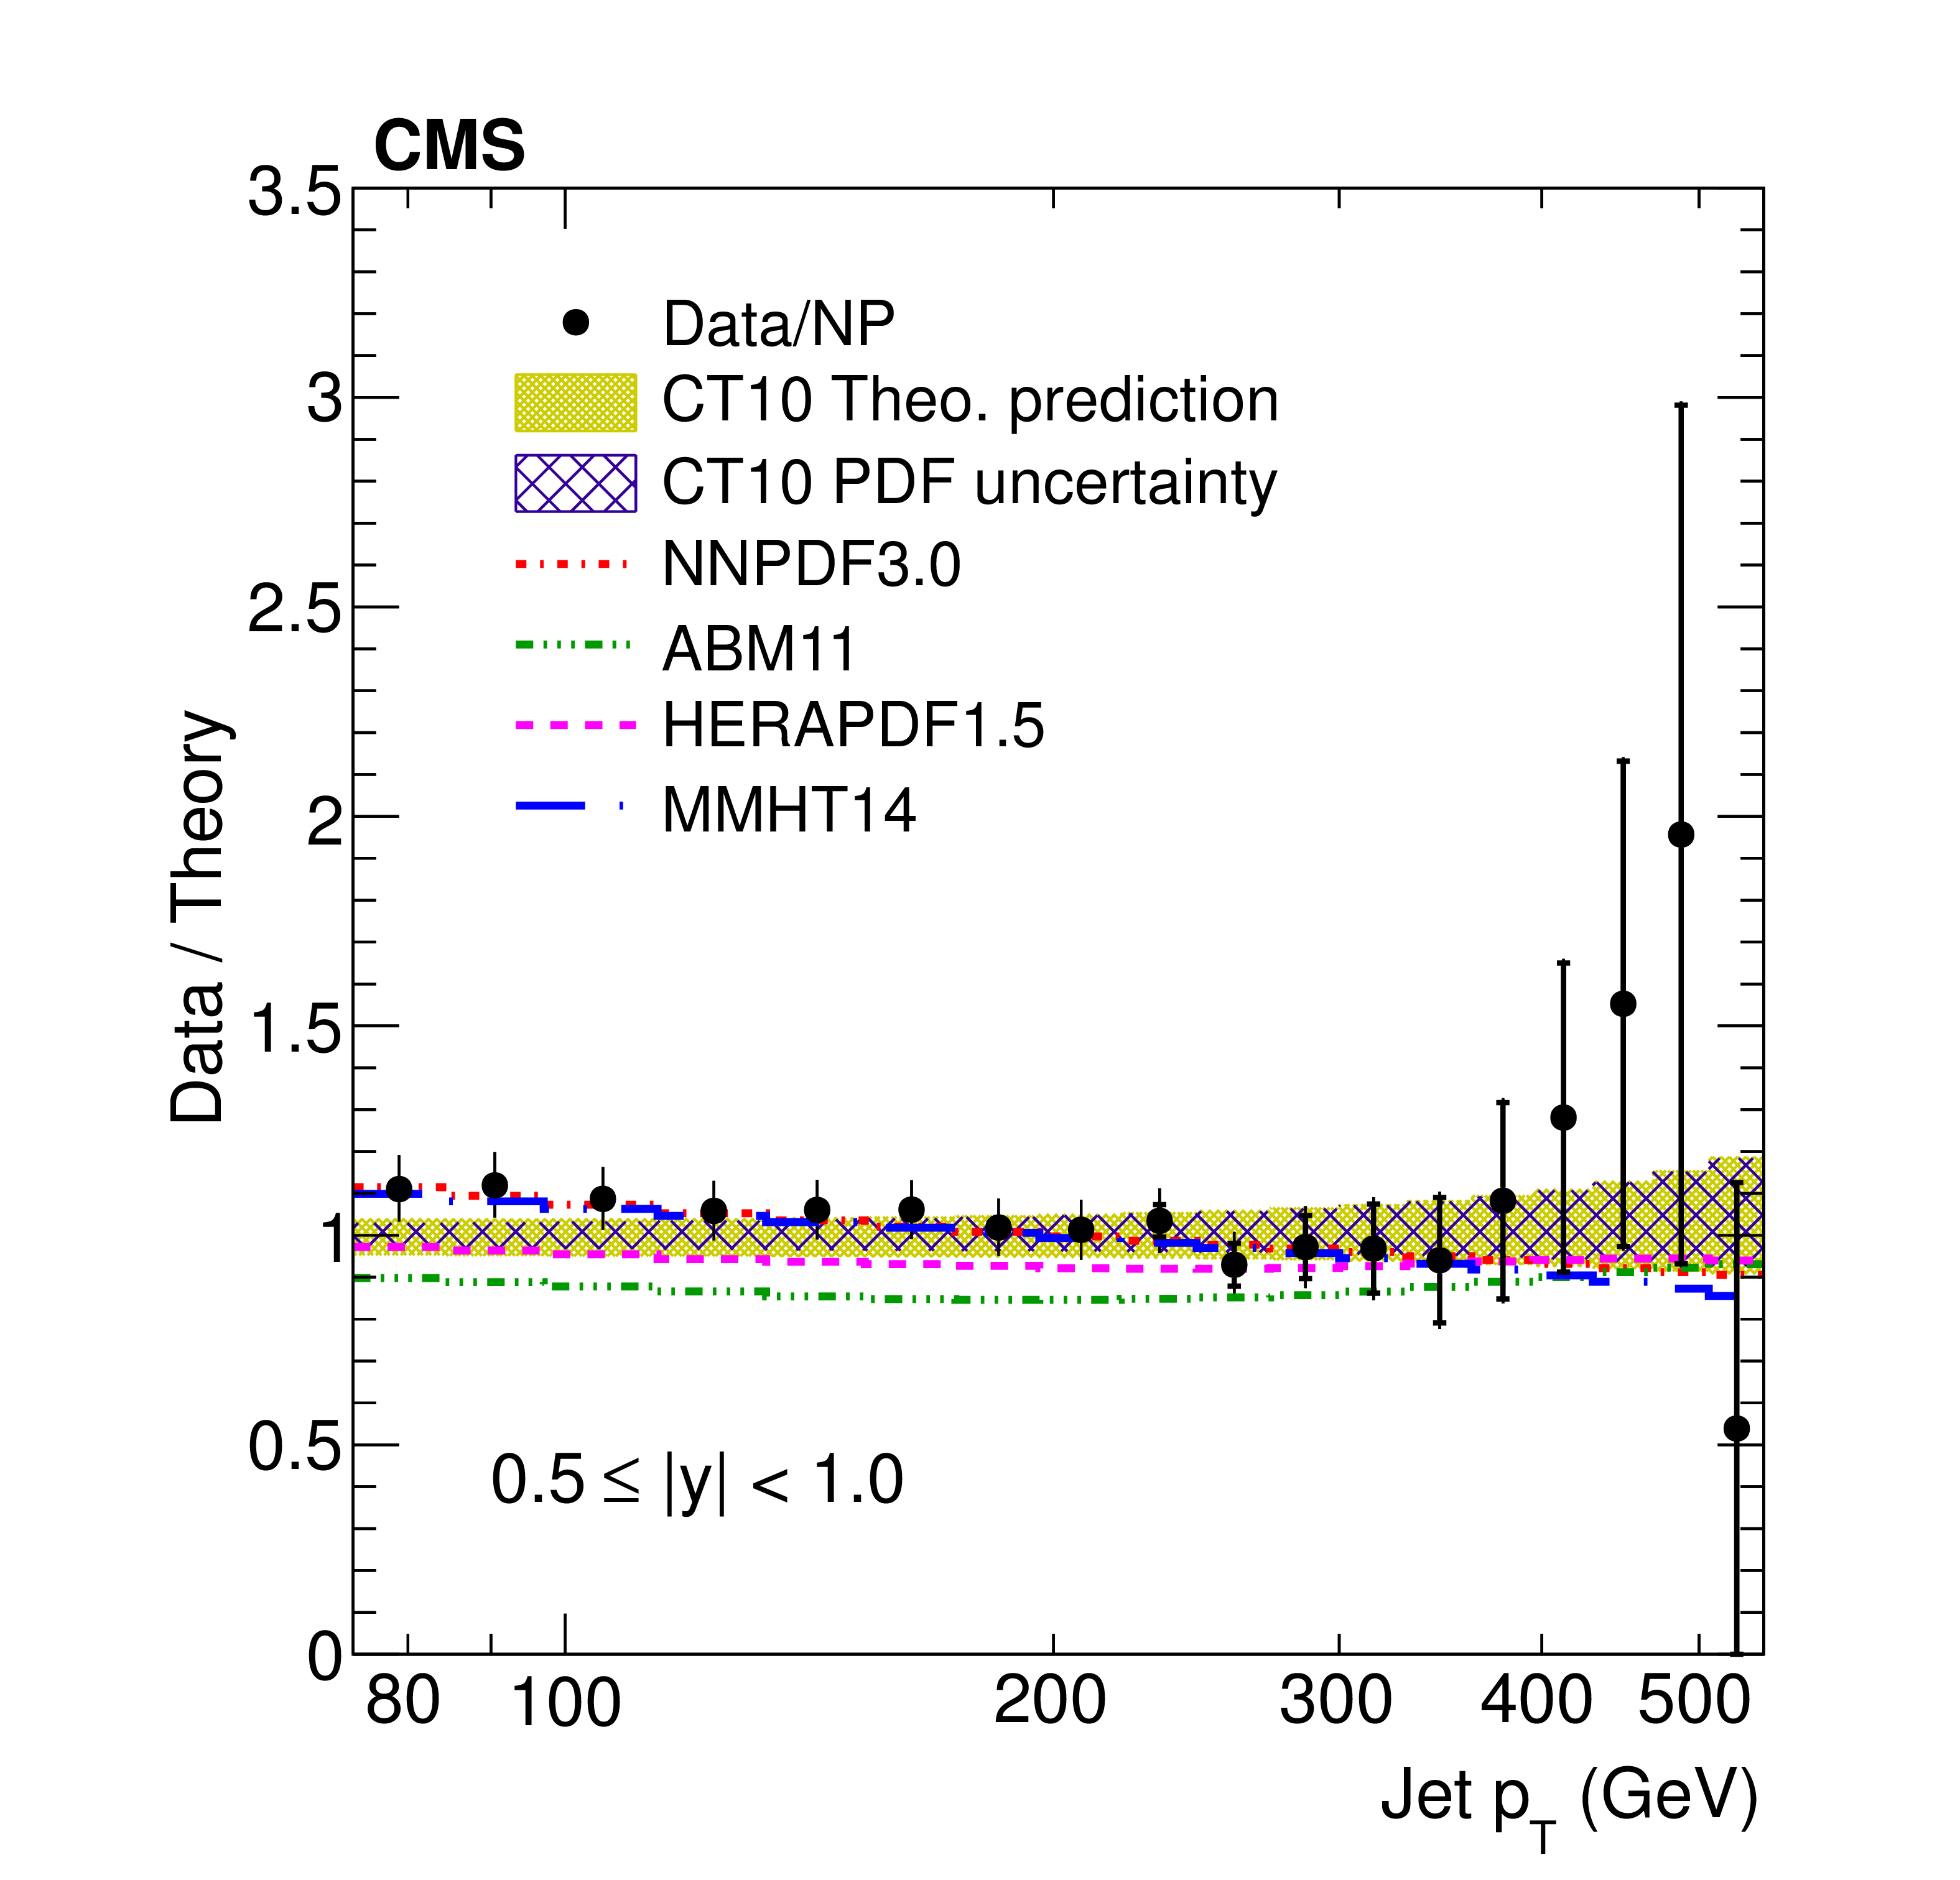
The ratios (top panels) of the inclusive jet production cross sections at $\sqrt {s}= $ 7 and 8 TeV, shown as a function of jet $p_T$ for the absolute rapidity $|y|< $ 0.5 (left) and 0.5 $ < |y| < $ 1.0 (right). The data (closed symbols) are shown with total uncertainties (vertical error bars). The NLO pQCD prediction using the CT10 PDF is shown with its total uncertainty (shaded band) and the contribution of the PDF uncertainty (hatched band). Predictions obtained using alternative PDF sets are shown by lines of different styles without uncertainties. The data to theory ratios (bottom panels) are shown by using the same notations for the respective rapidities. |

png pdf |
Figure 6-a:
Ratio of the inclusive jet production cross sections at $\sqrt {s}= $ 7 and 8 TeV, shown as a function of jet $p_T$ for the absolute rapidity $|y|< $ 0.5. The data (closed symbols) are shown with total uncertainties (vertical error bars). The NLO pQCD prediction using the CT10 PDF is shown with its total uncertainty (shaded band) and the contribution of the PDF uncertainty (hatched band). Predictions obtained using alternative PDF sets are shown by lines of different styles without uncertainties. |

png pdf |
Figure 6-b:
Ratio of the inclusive jet production cross sections at $\sqrt {s}= $ 7 and 8 TeV, shown as a function of jet $p_T$ for the absolute rapidity 0.5 $ < |y| < $ 1.0. The data (closed symbols) are shown with total uncertainties (vertical error bars). The NLO pQCD prediction using the CT10 PDF is shown with its total uncertainty (shaded band) and the contribution of the PDF uncertainty (hatched band). Predictions obtained using alternative PDF sets are shown by lines of different styles without uncertainties. |

png pdf |
Figure 6-c:
Data to theory ratio of ratio of the inclusive jet production cross sections at $\sqrt {s}= $ 7 and 8 TeV, shown as a function of jet $p_T$ for the absolute rapidity $|y|< $ 0.5. The data (closed symbols) are shown with total uncertainties (vertical error bars). The NLO pQCD prediction using the CT10 PDF is shown with its total uncertainty (shaded band) and the contribution of the PDF uncertainty (hatched band). Predictions obtained using alternative PDF sets are shown by lines of different styles without uncertainties. |
png pdf |
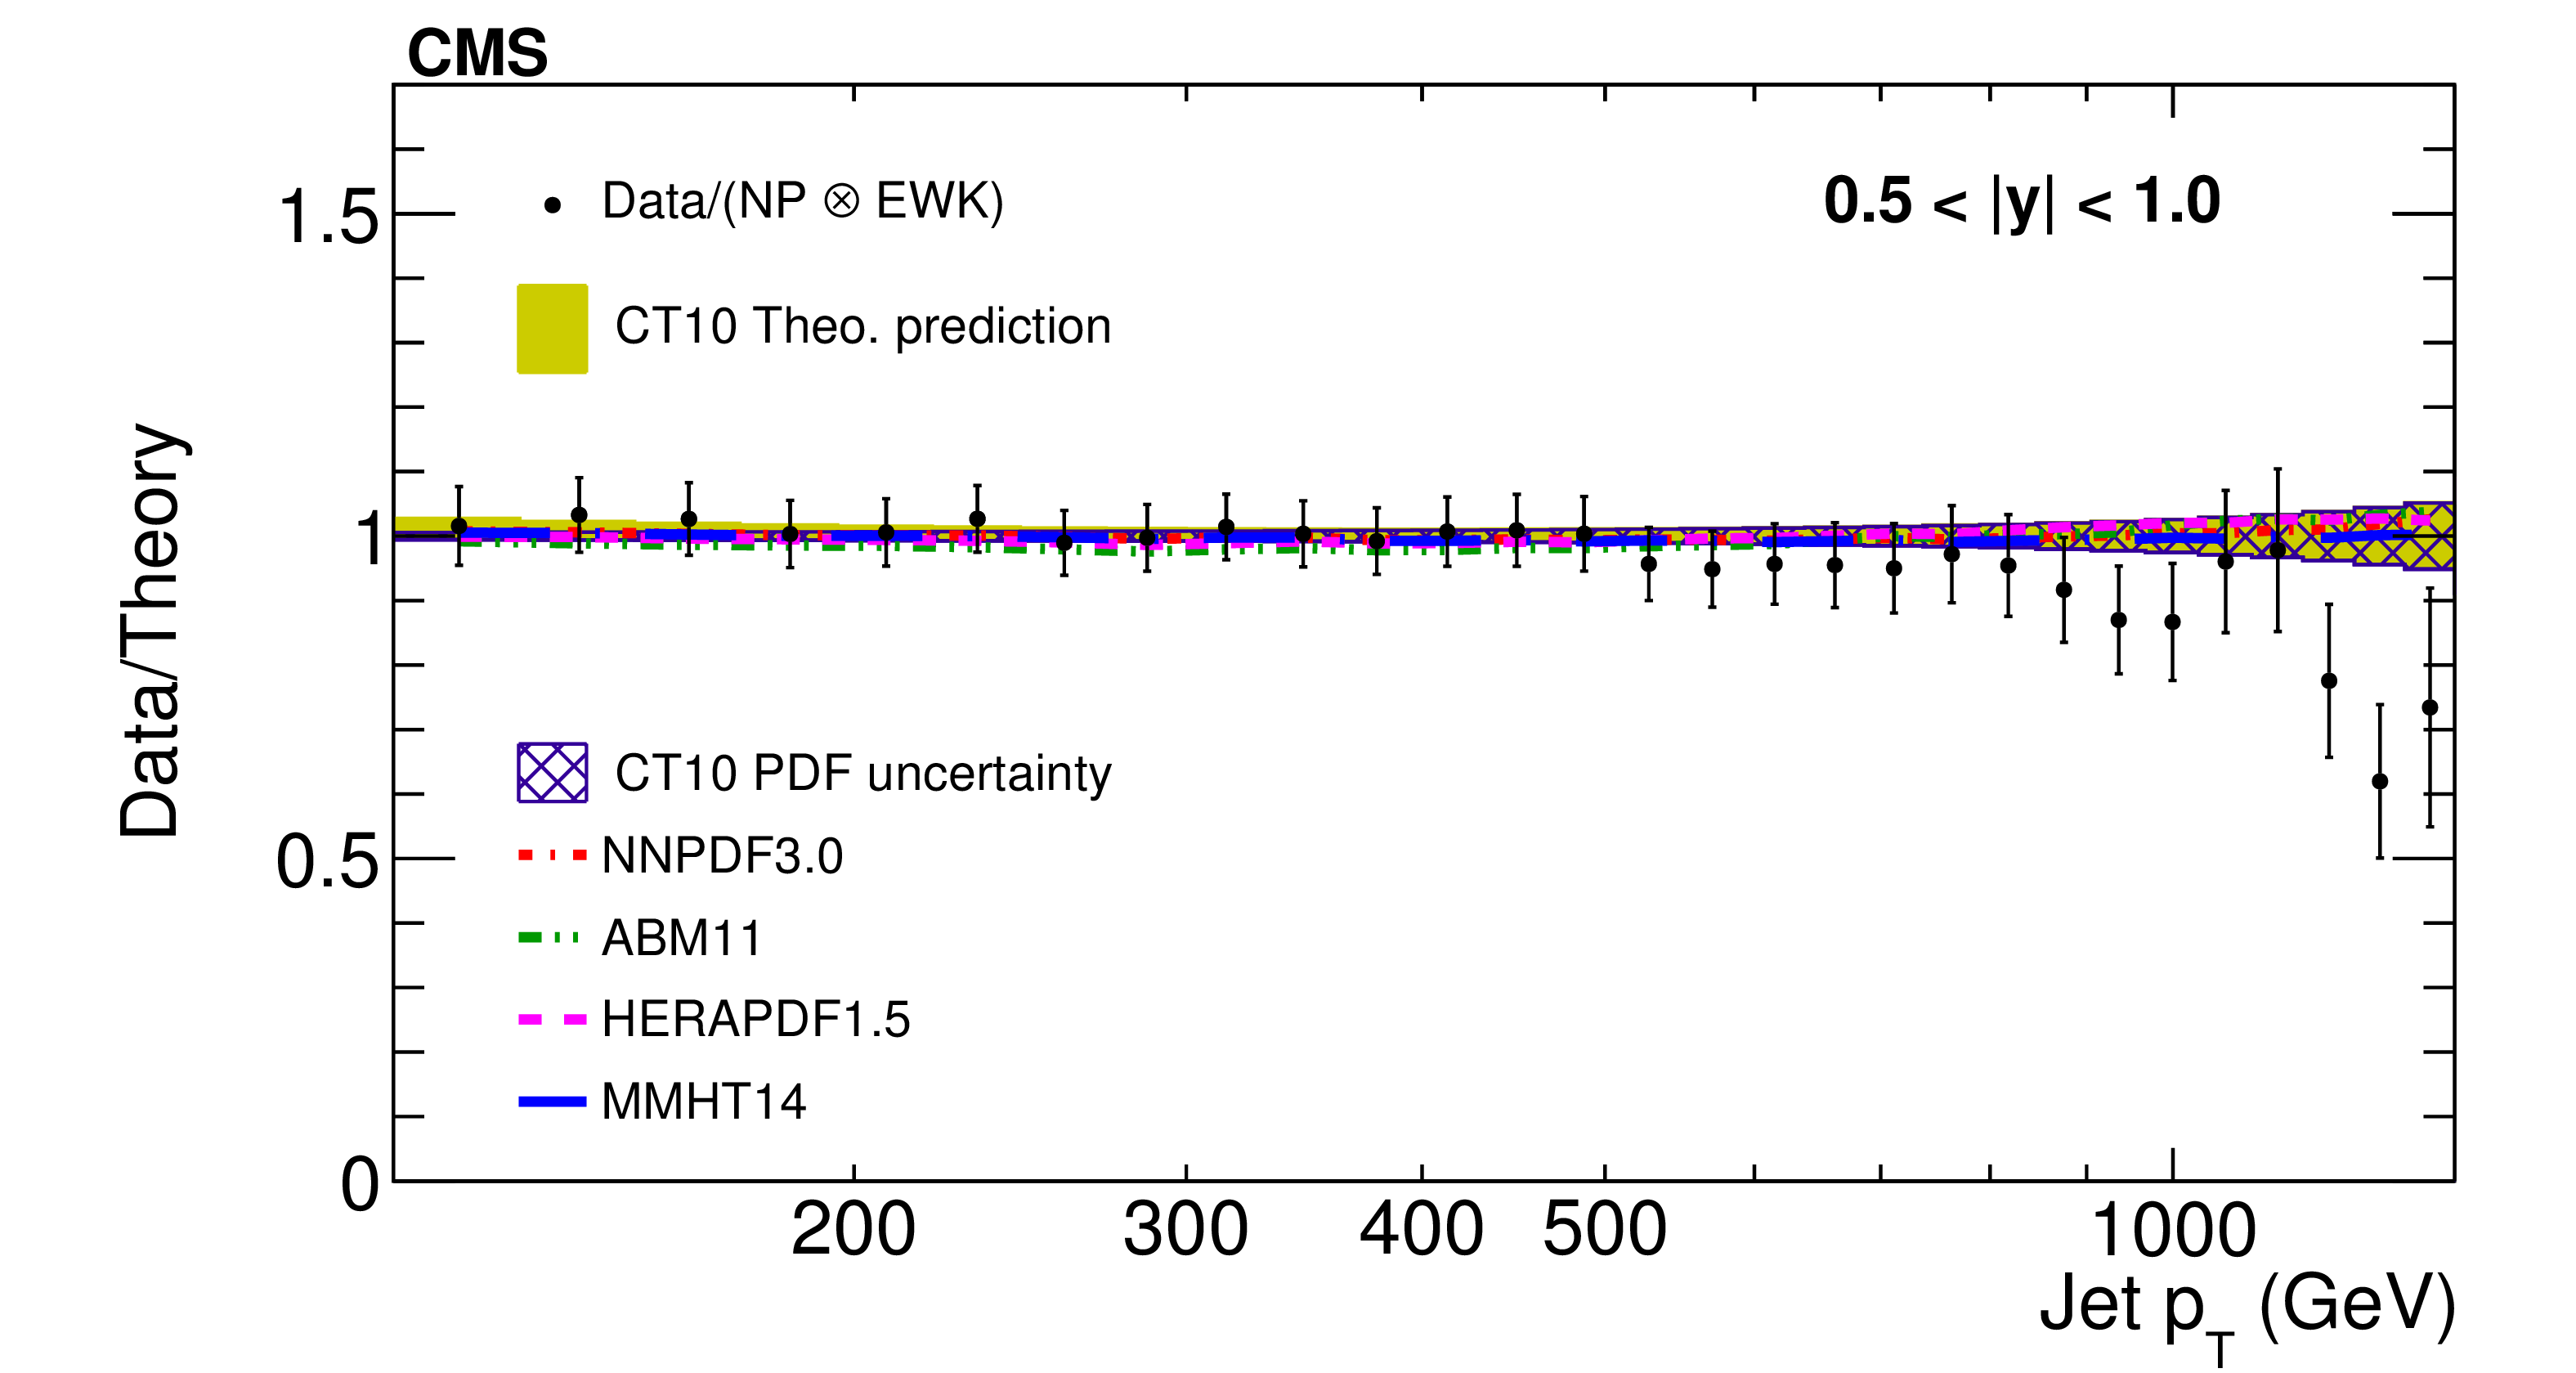
Figure 6-d:
Data to theory ratio of ratio of the inclusive jet production cross sections at $\sqrt {s}= $ 7 and 8 TeV, shown as a function of jet $p_T$ for the absolute rapidity 0.5 $ < |y| < $ 1.0. The data (closed symbols) are shown with total uncertainties (vertical error bars). The NLO pQCD prediction using the CT10 PDF is shown with its total uncertainty (shaded band) and the contribution of the PDF uncertainty (hatched band). Predictions obtained using alternative PDF sets are shown by lines of different styles without uncertainties. |
png pdf |
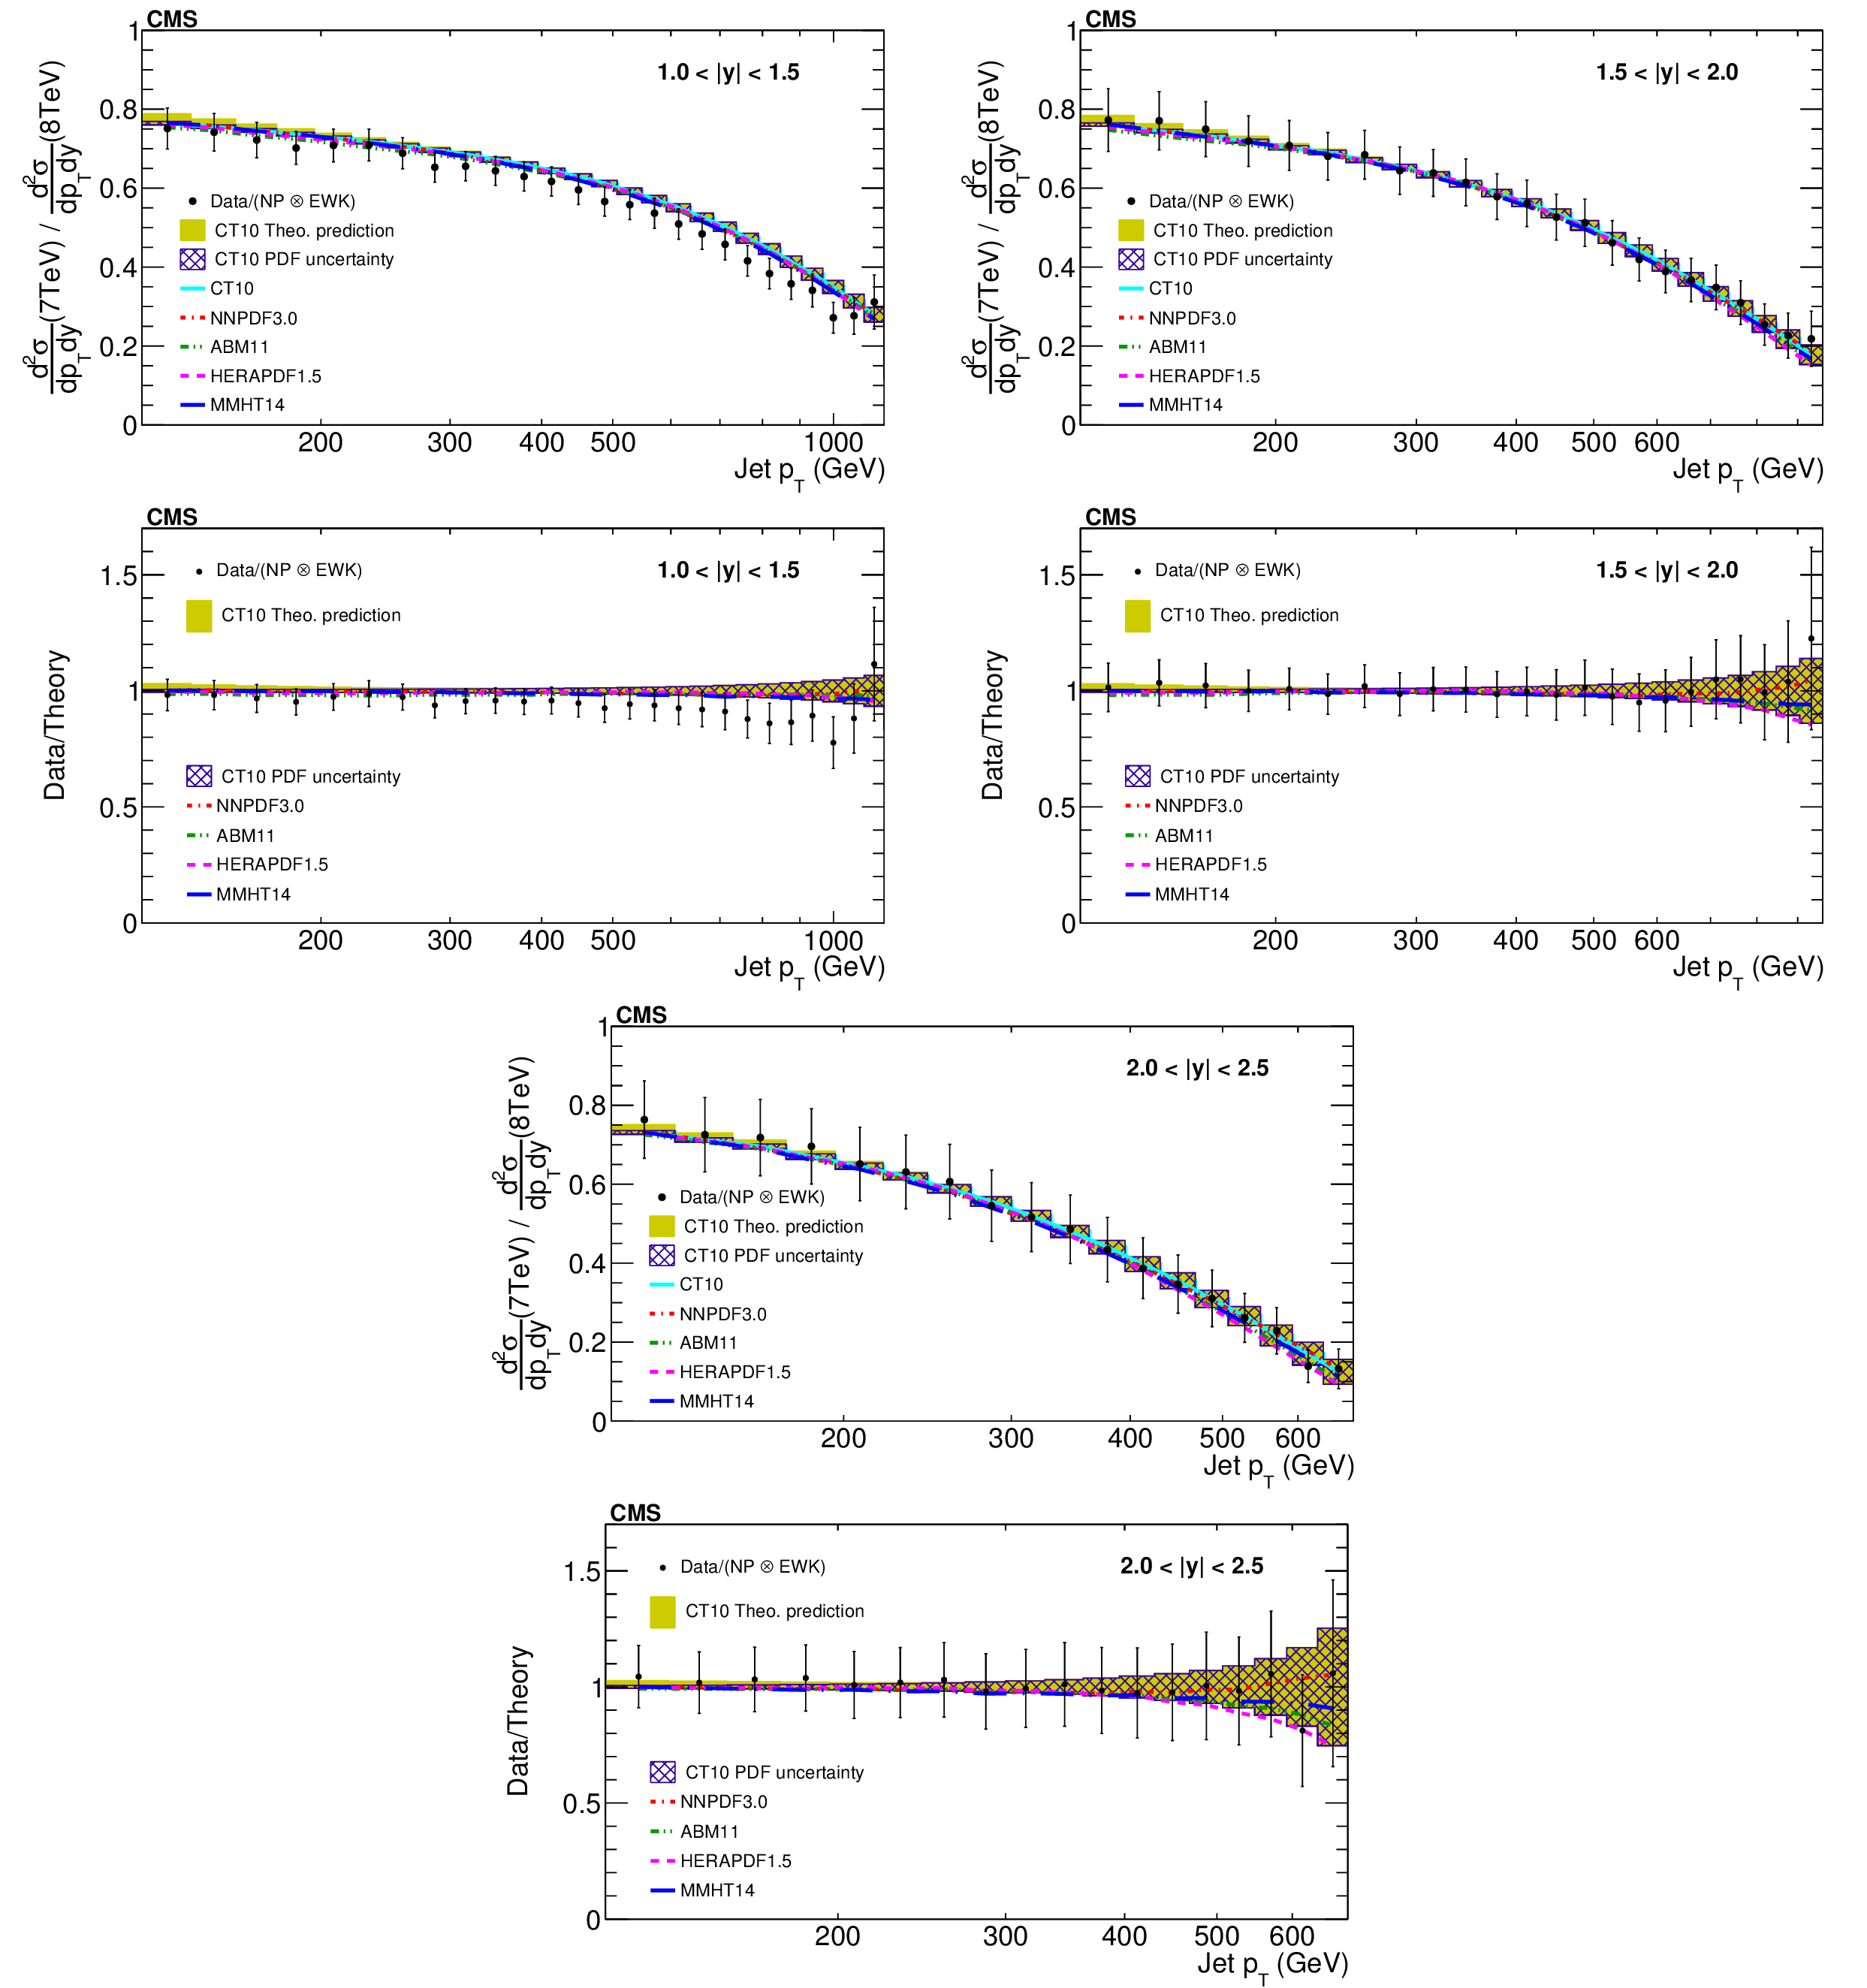
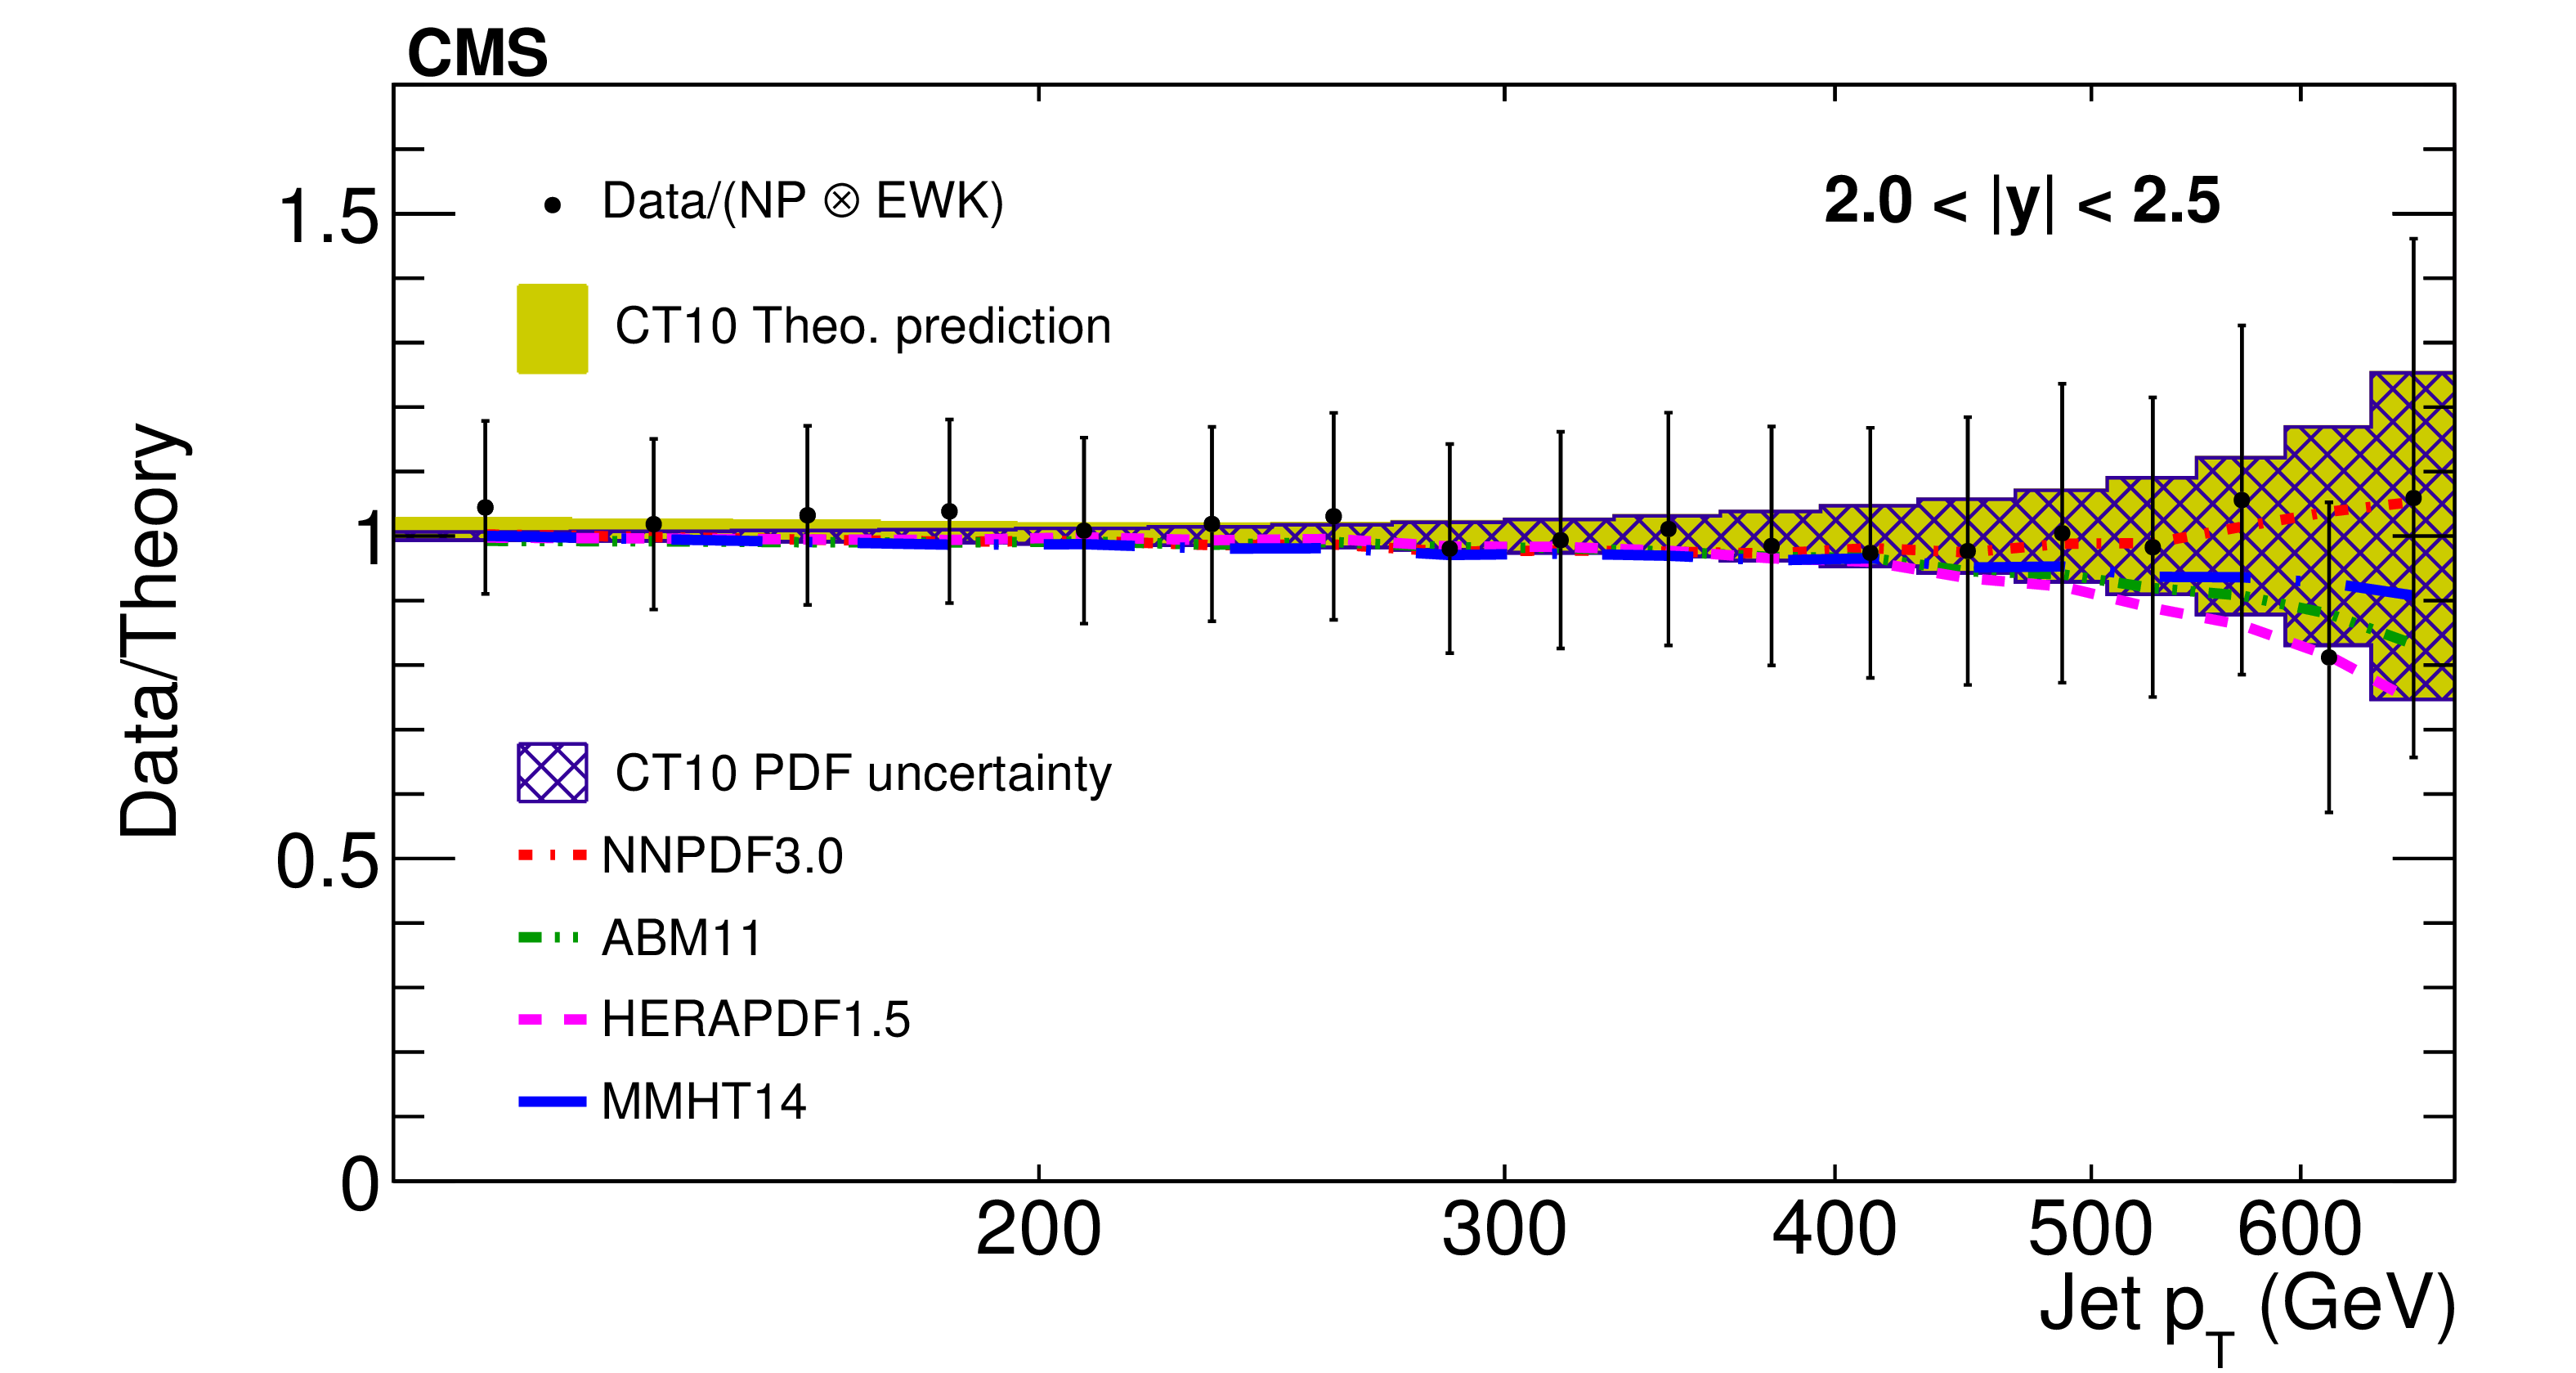
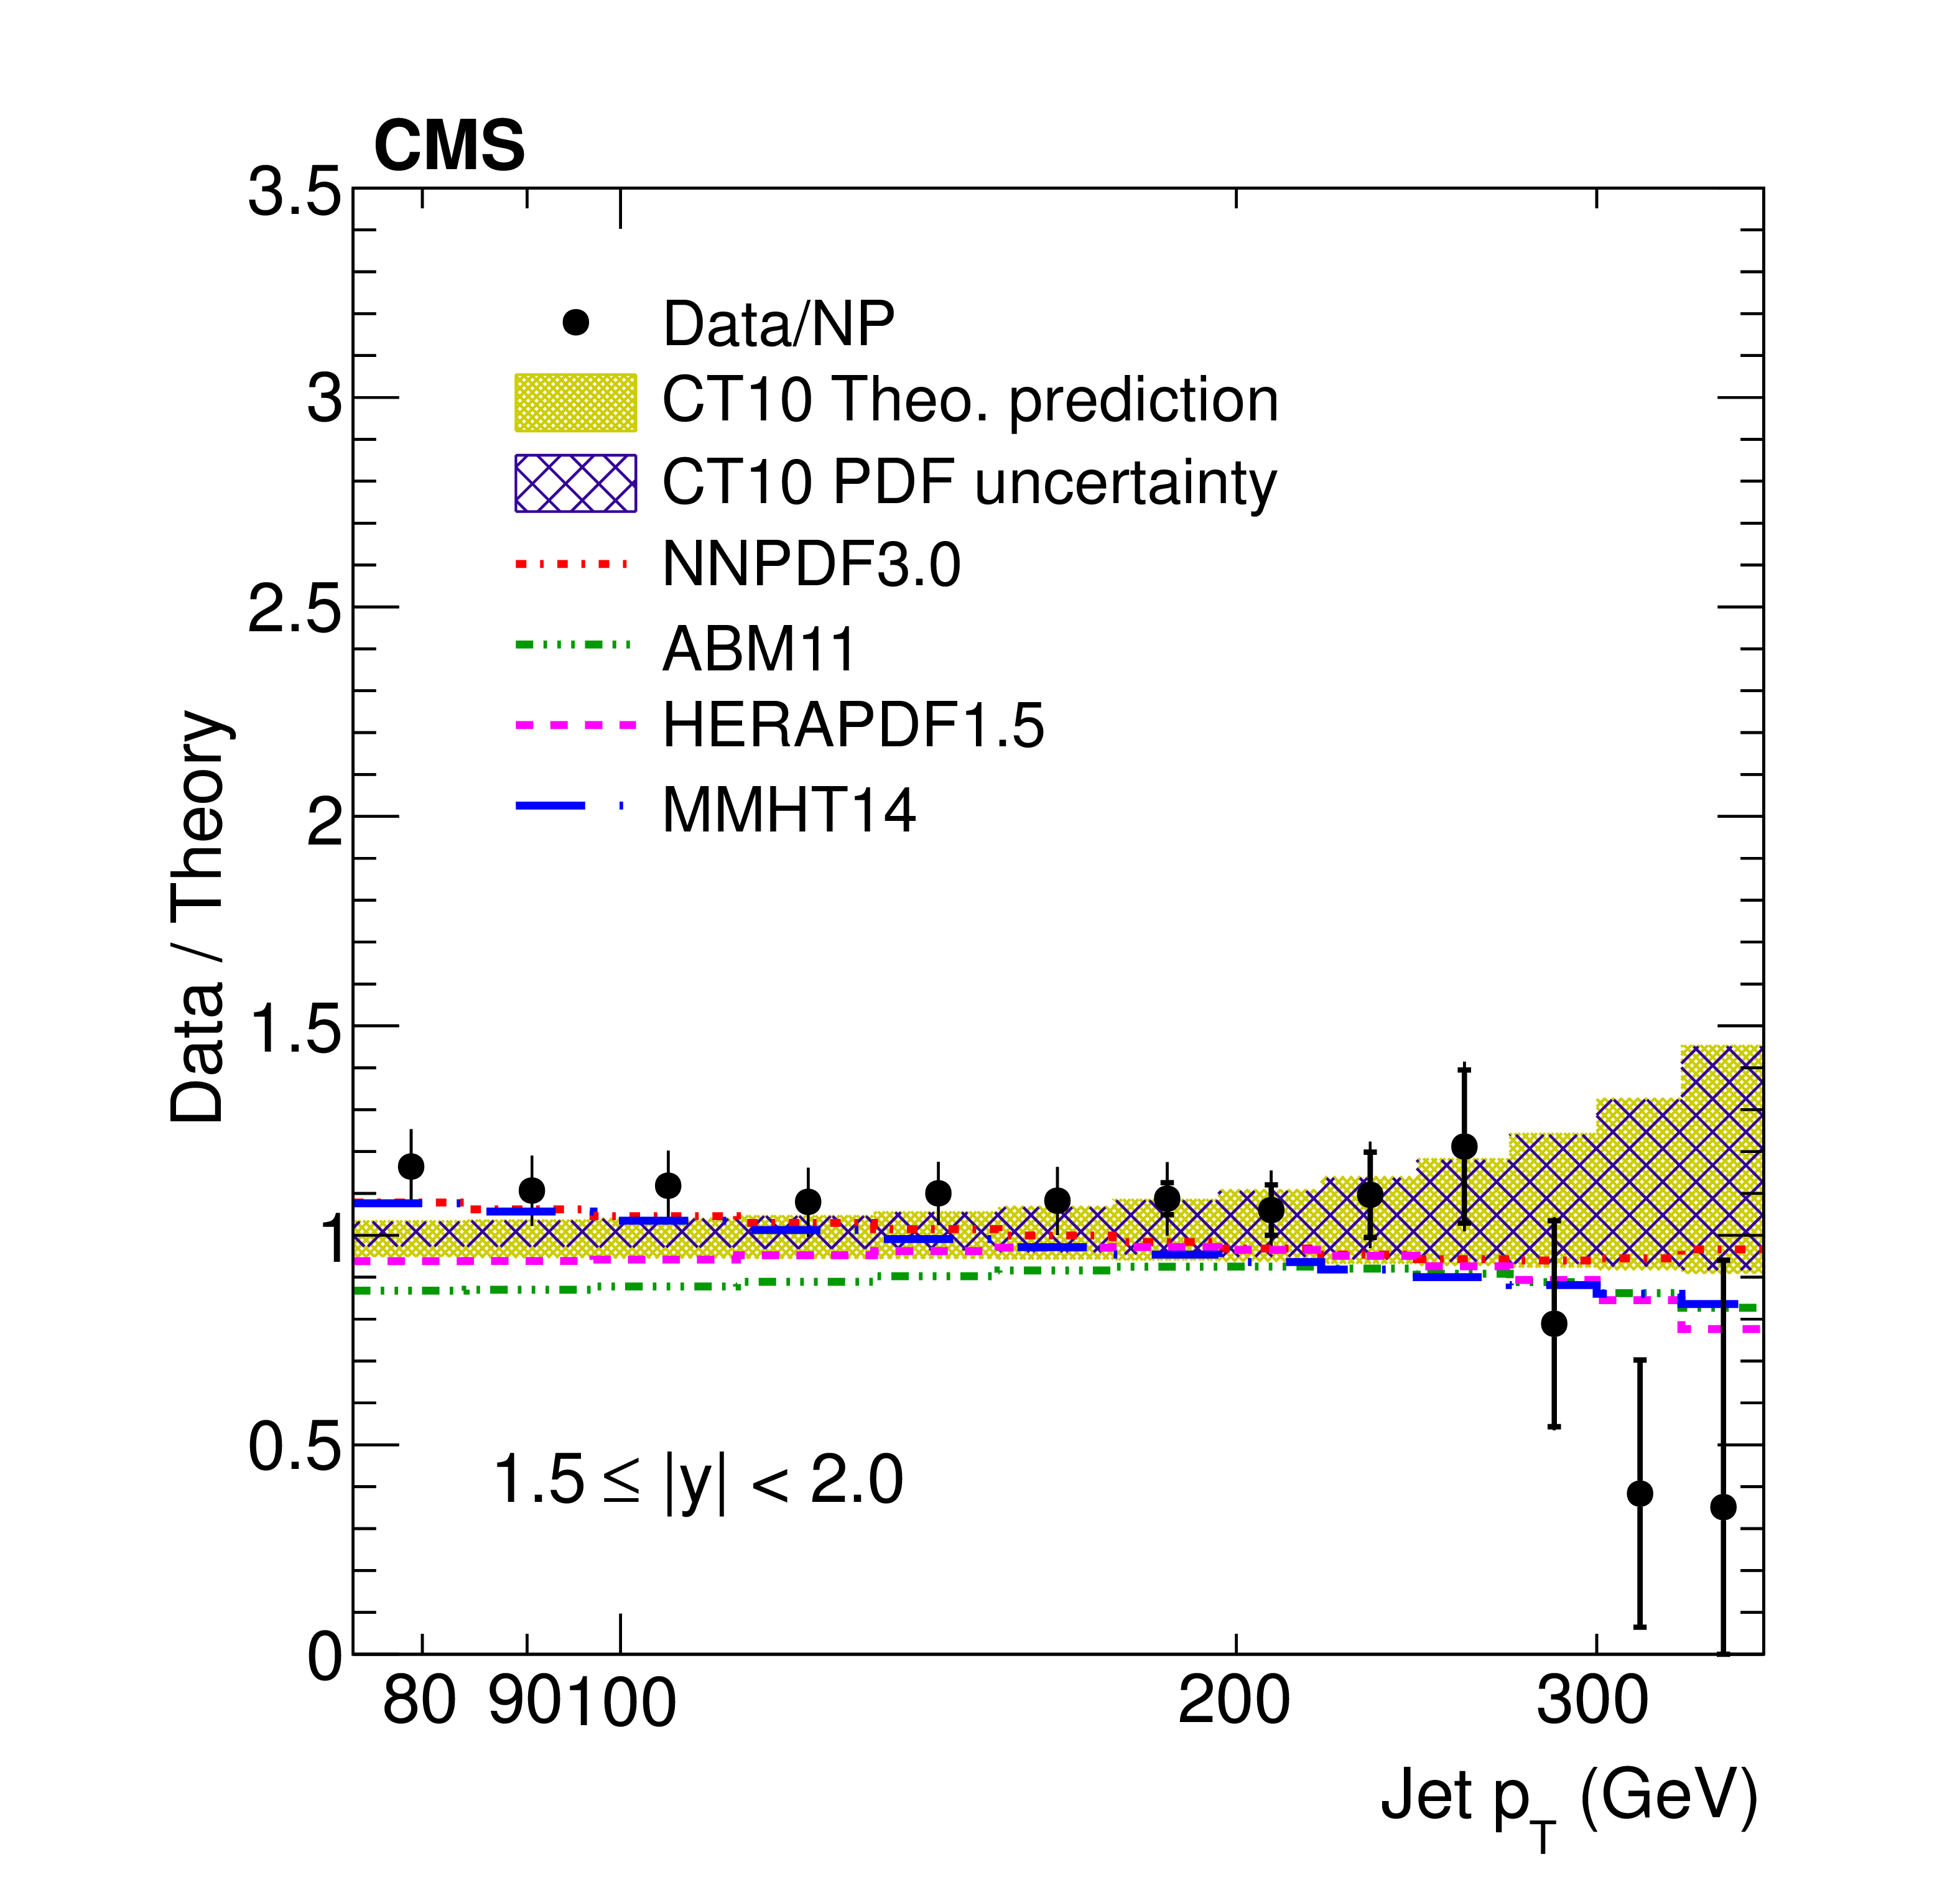
Figure 7:
The ratios of the inclusive jet production cross sections at $ \sqrt {s} =$ 7 and 8 TeV shown as a function of jet ${p_{\mathrm {T}}}$ for the absolute rapidity 1.0 $ < |y| < $ 1.5 (top left), 1.5 $ < |y| < $ 2.0 (top right) and 2.0 $ < |y| < $ 2.5 (bottom). |
png pdf |
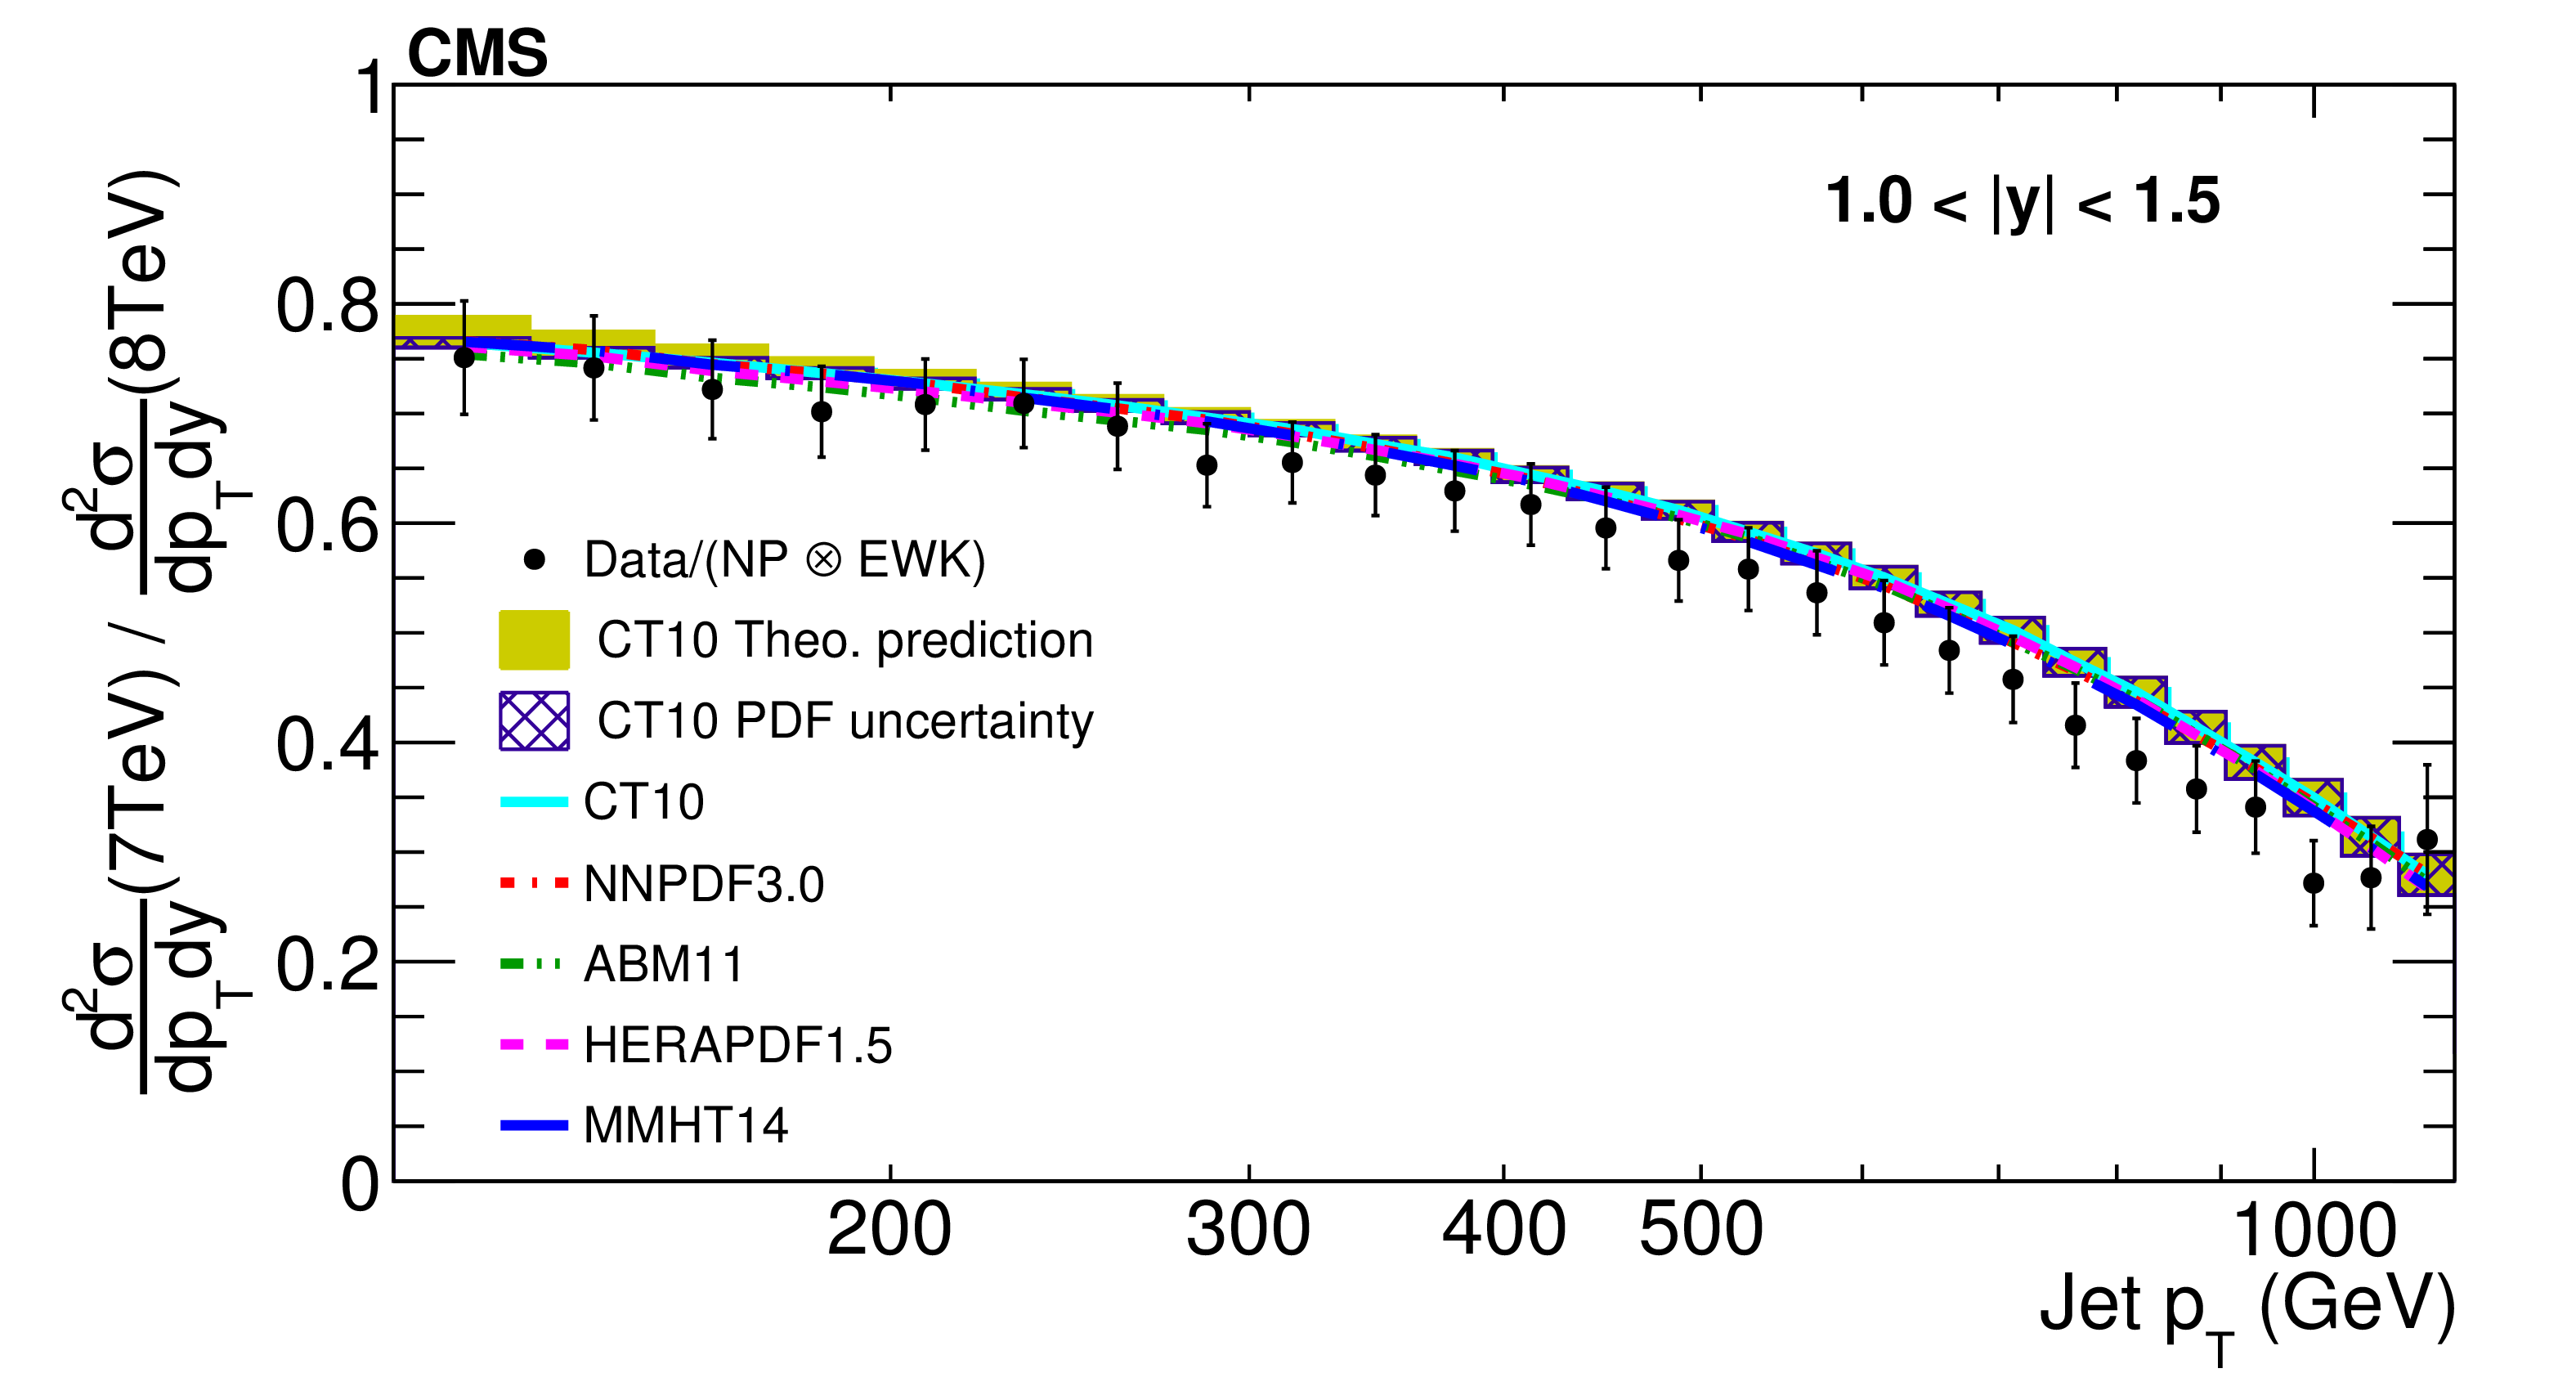
Figure 7-a:
Ratio of the inclusive jet production cross sections at $ \sqrt {s} =$ 7 and 8 TeV shown as a function of jet ${p_{\mathrm {T}}}$ for the absolute rapidity 1.0 $ < |y| < $ 1.5. |
png pdf |
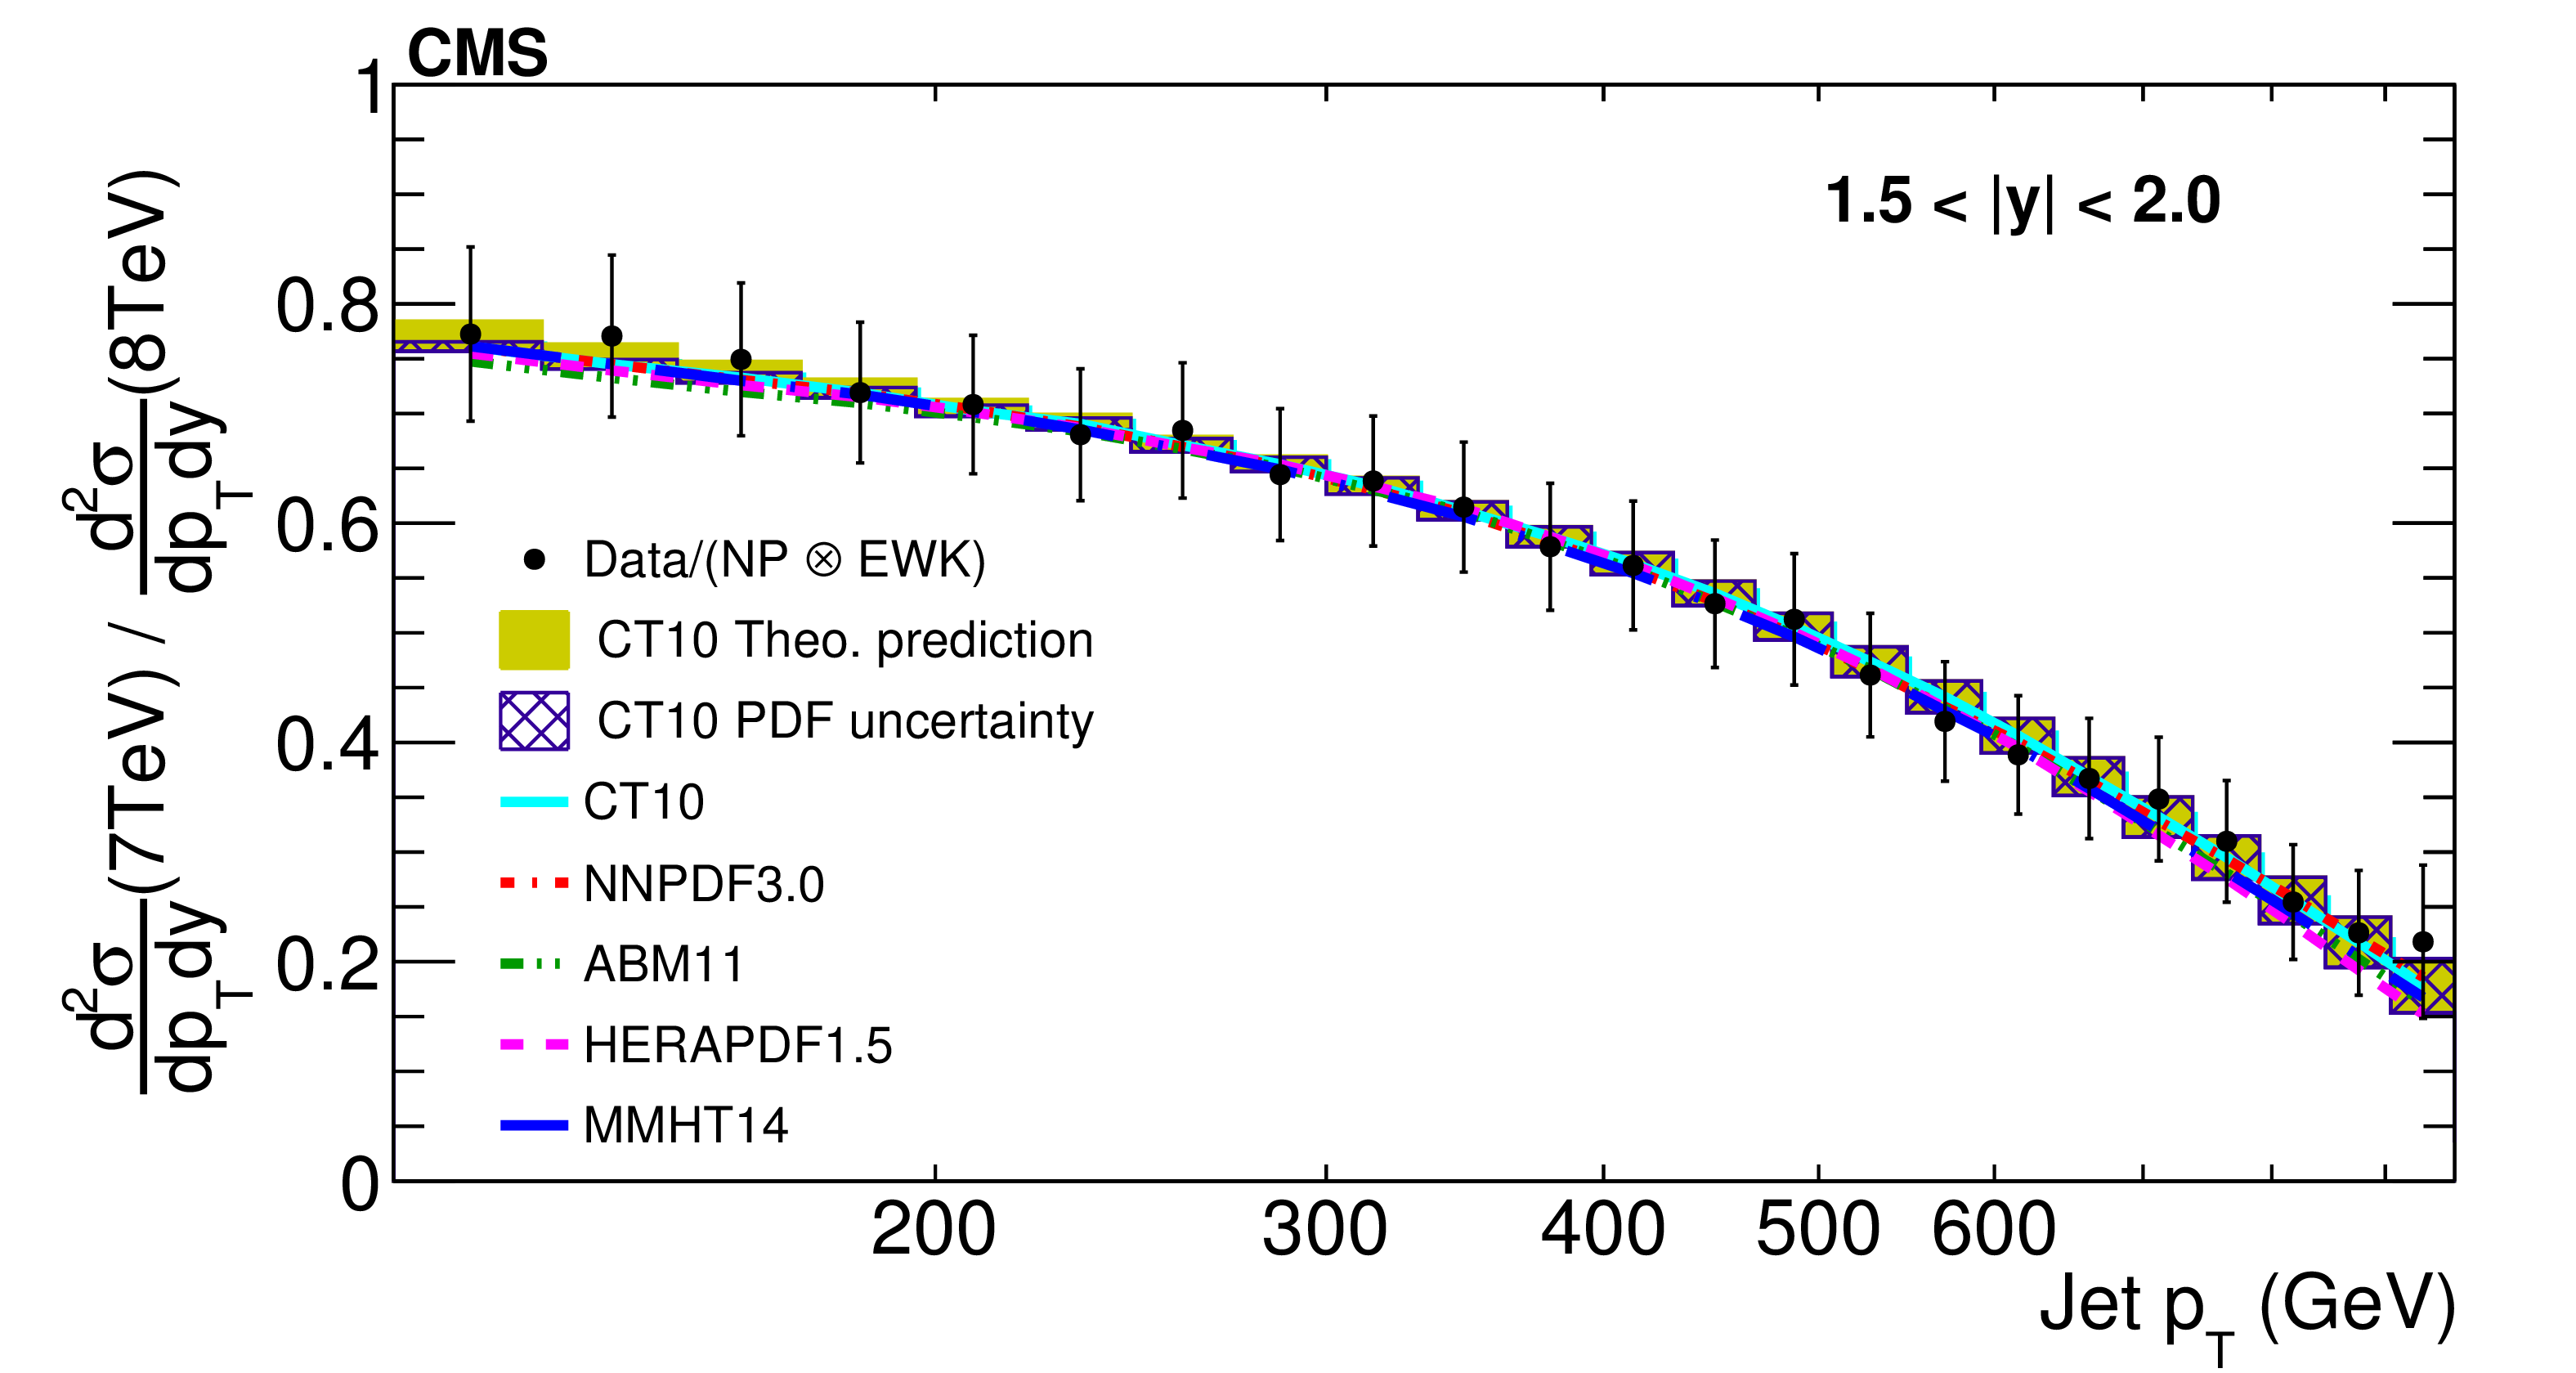
Figure 7-b:
Ratio of the inclusive jet production cross sections at $ \sqrt {s} =$ 7 and 8 TeV shown as a function of jet ${p_{\mathrm {T}}}$ for the absolute rapidity 1.5 $ < |y| < $ 2.0. |

png pdf |
Figure 7-c:
Data to theory ratio of ratio of the inclusive jet production cross sections at $ \sqrt {s} =$ 7 and 8 TeV shown as a function of jet ${p_{\mathrm {T}}}$ for the absolute rapidity 1.0 $ < |y| < $ 1.5. |
png pdf |
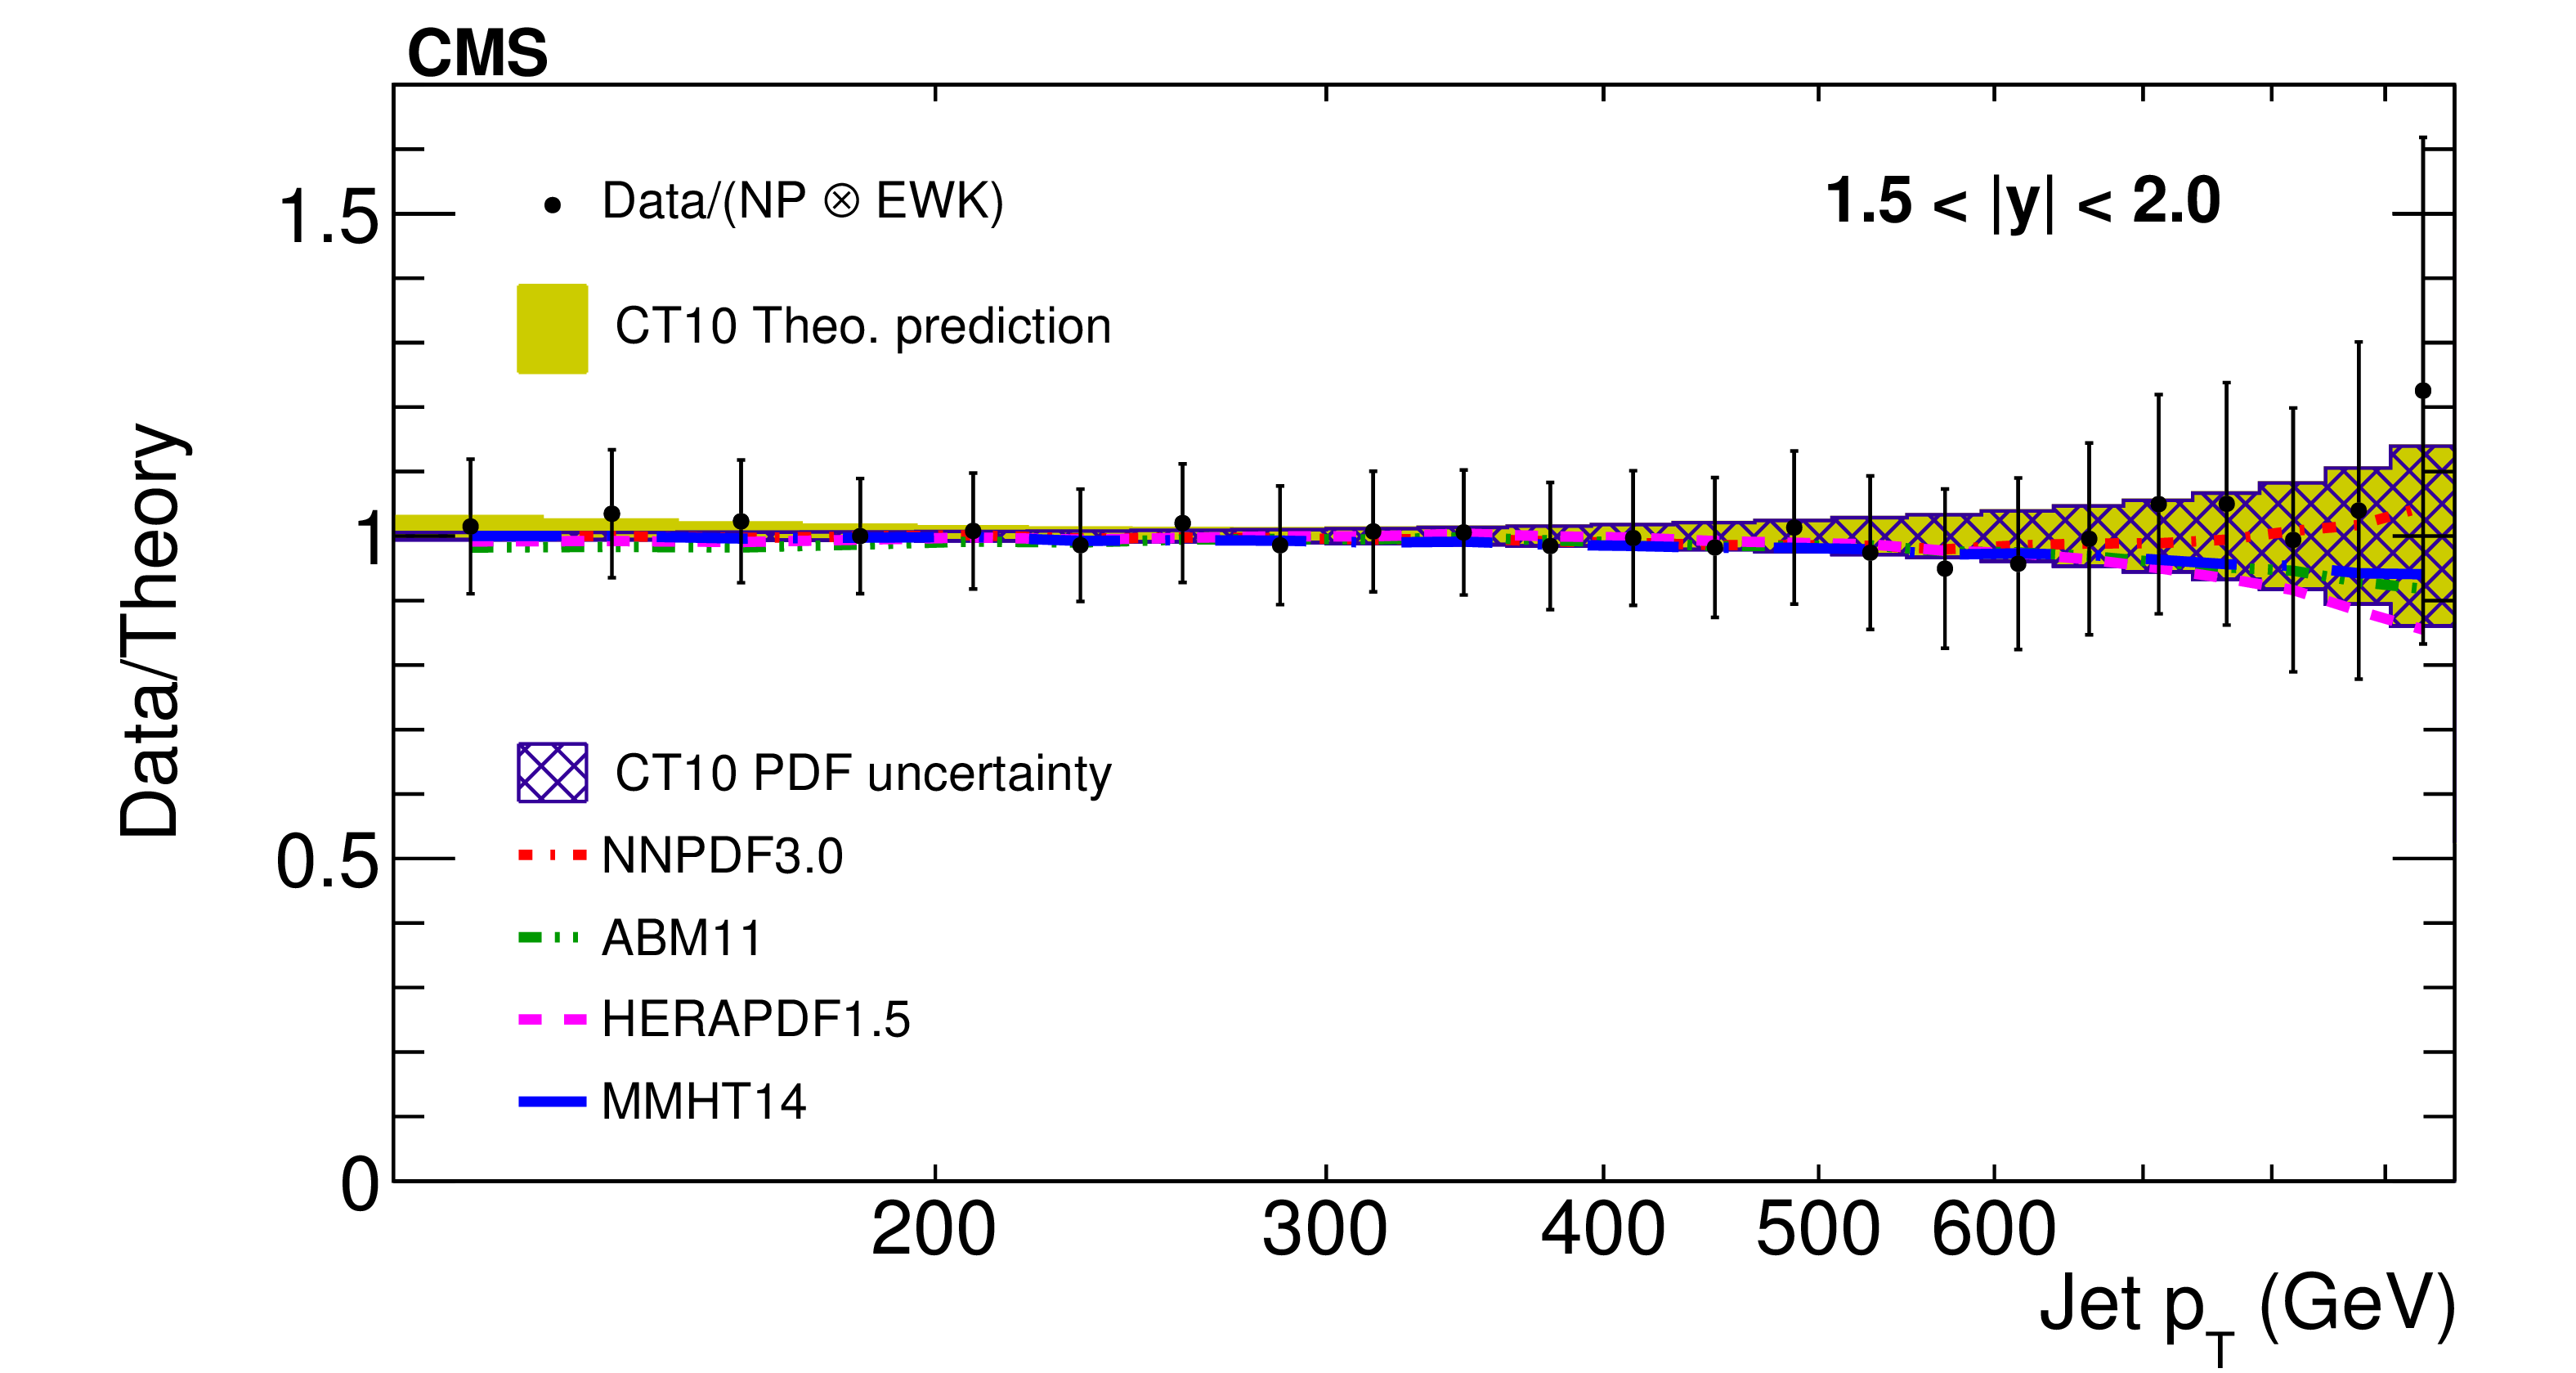
Figure 7-d:
Data to theory ratio of ratio of the inclusive jet production cross sections at $ \sqrt {s} =$ 7 and 8 TeV shown as a function of jet ${p_{\mathrm {T}}}$ for the absolute rapidity 1.5 $ < |y| < $ 2.0. |

png pdf |
Figure 7-e:
Ratio of the inclusive jet production cross sections at $ \sqrt {s} =$ 7 and 8 TeV shown as a function of jet ${p_{\mathrm {T}}}$ for the absolute rapidity 2.0 $ < |y| < $ 2.5. |
png pdf |
Figure 7-f:
Data to theory ratio of ratio of the inclusive jet production cross sections at $ \sqrt {s} =$ 7 and 8 TeV shown as a function of jet ${p_{\mathrm {T}}}$ for the absolute rapidity 2.0 $ < |y| < $ 2.5. |
png pdf |
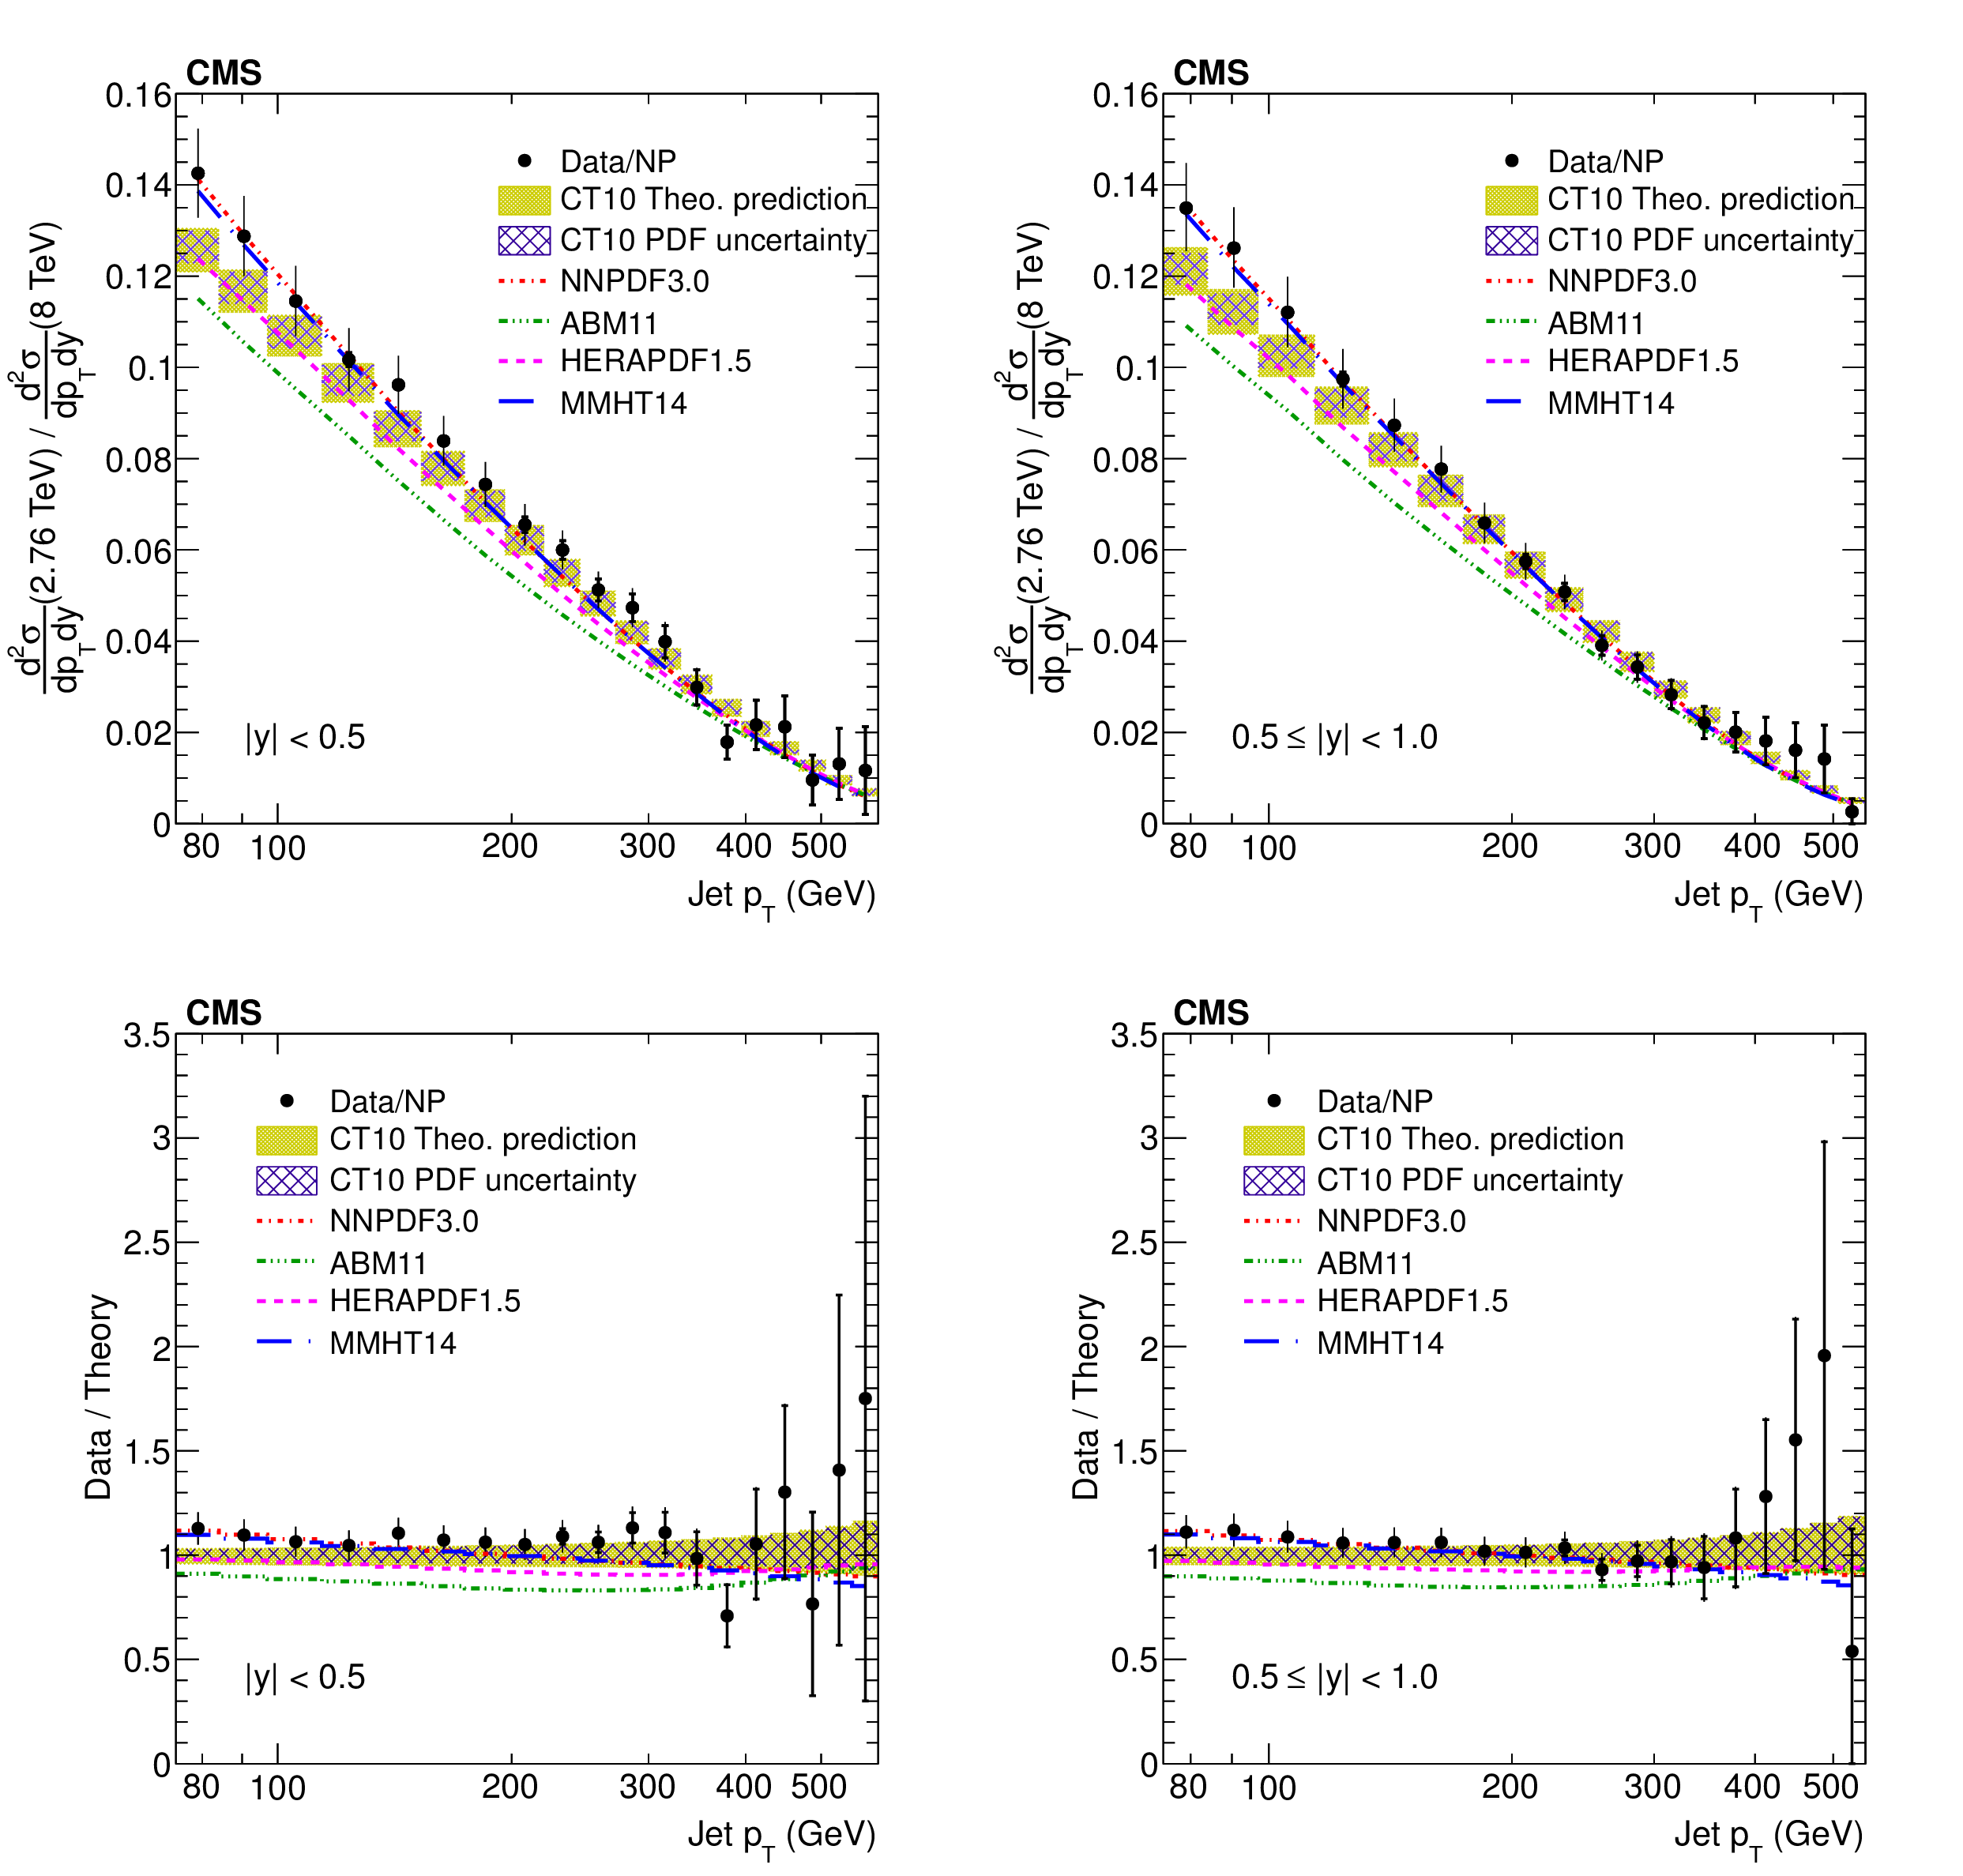
Figure 8:
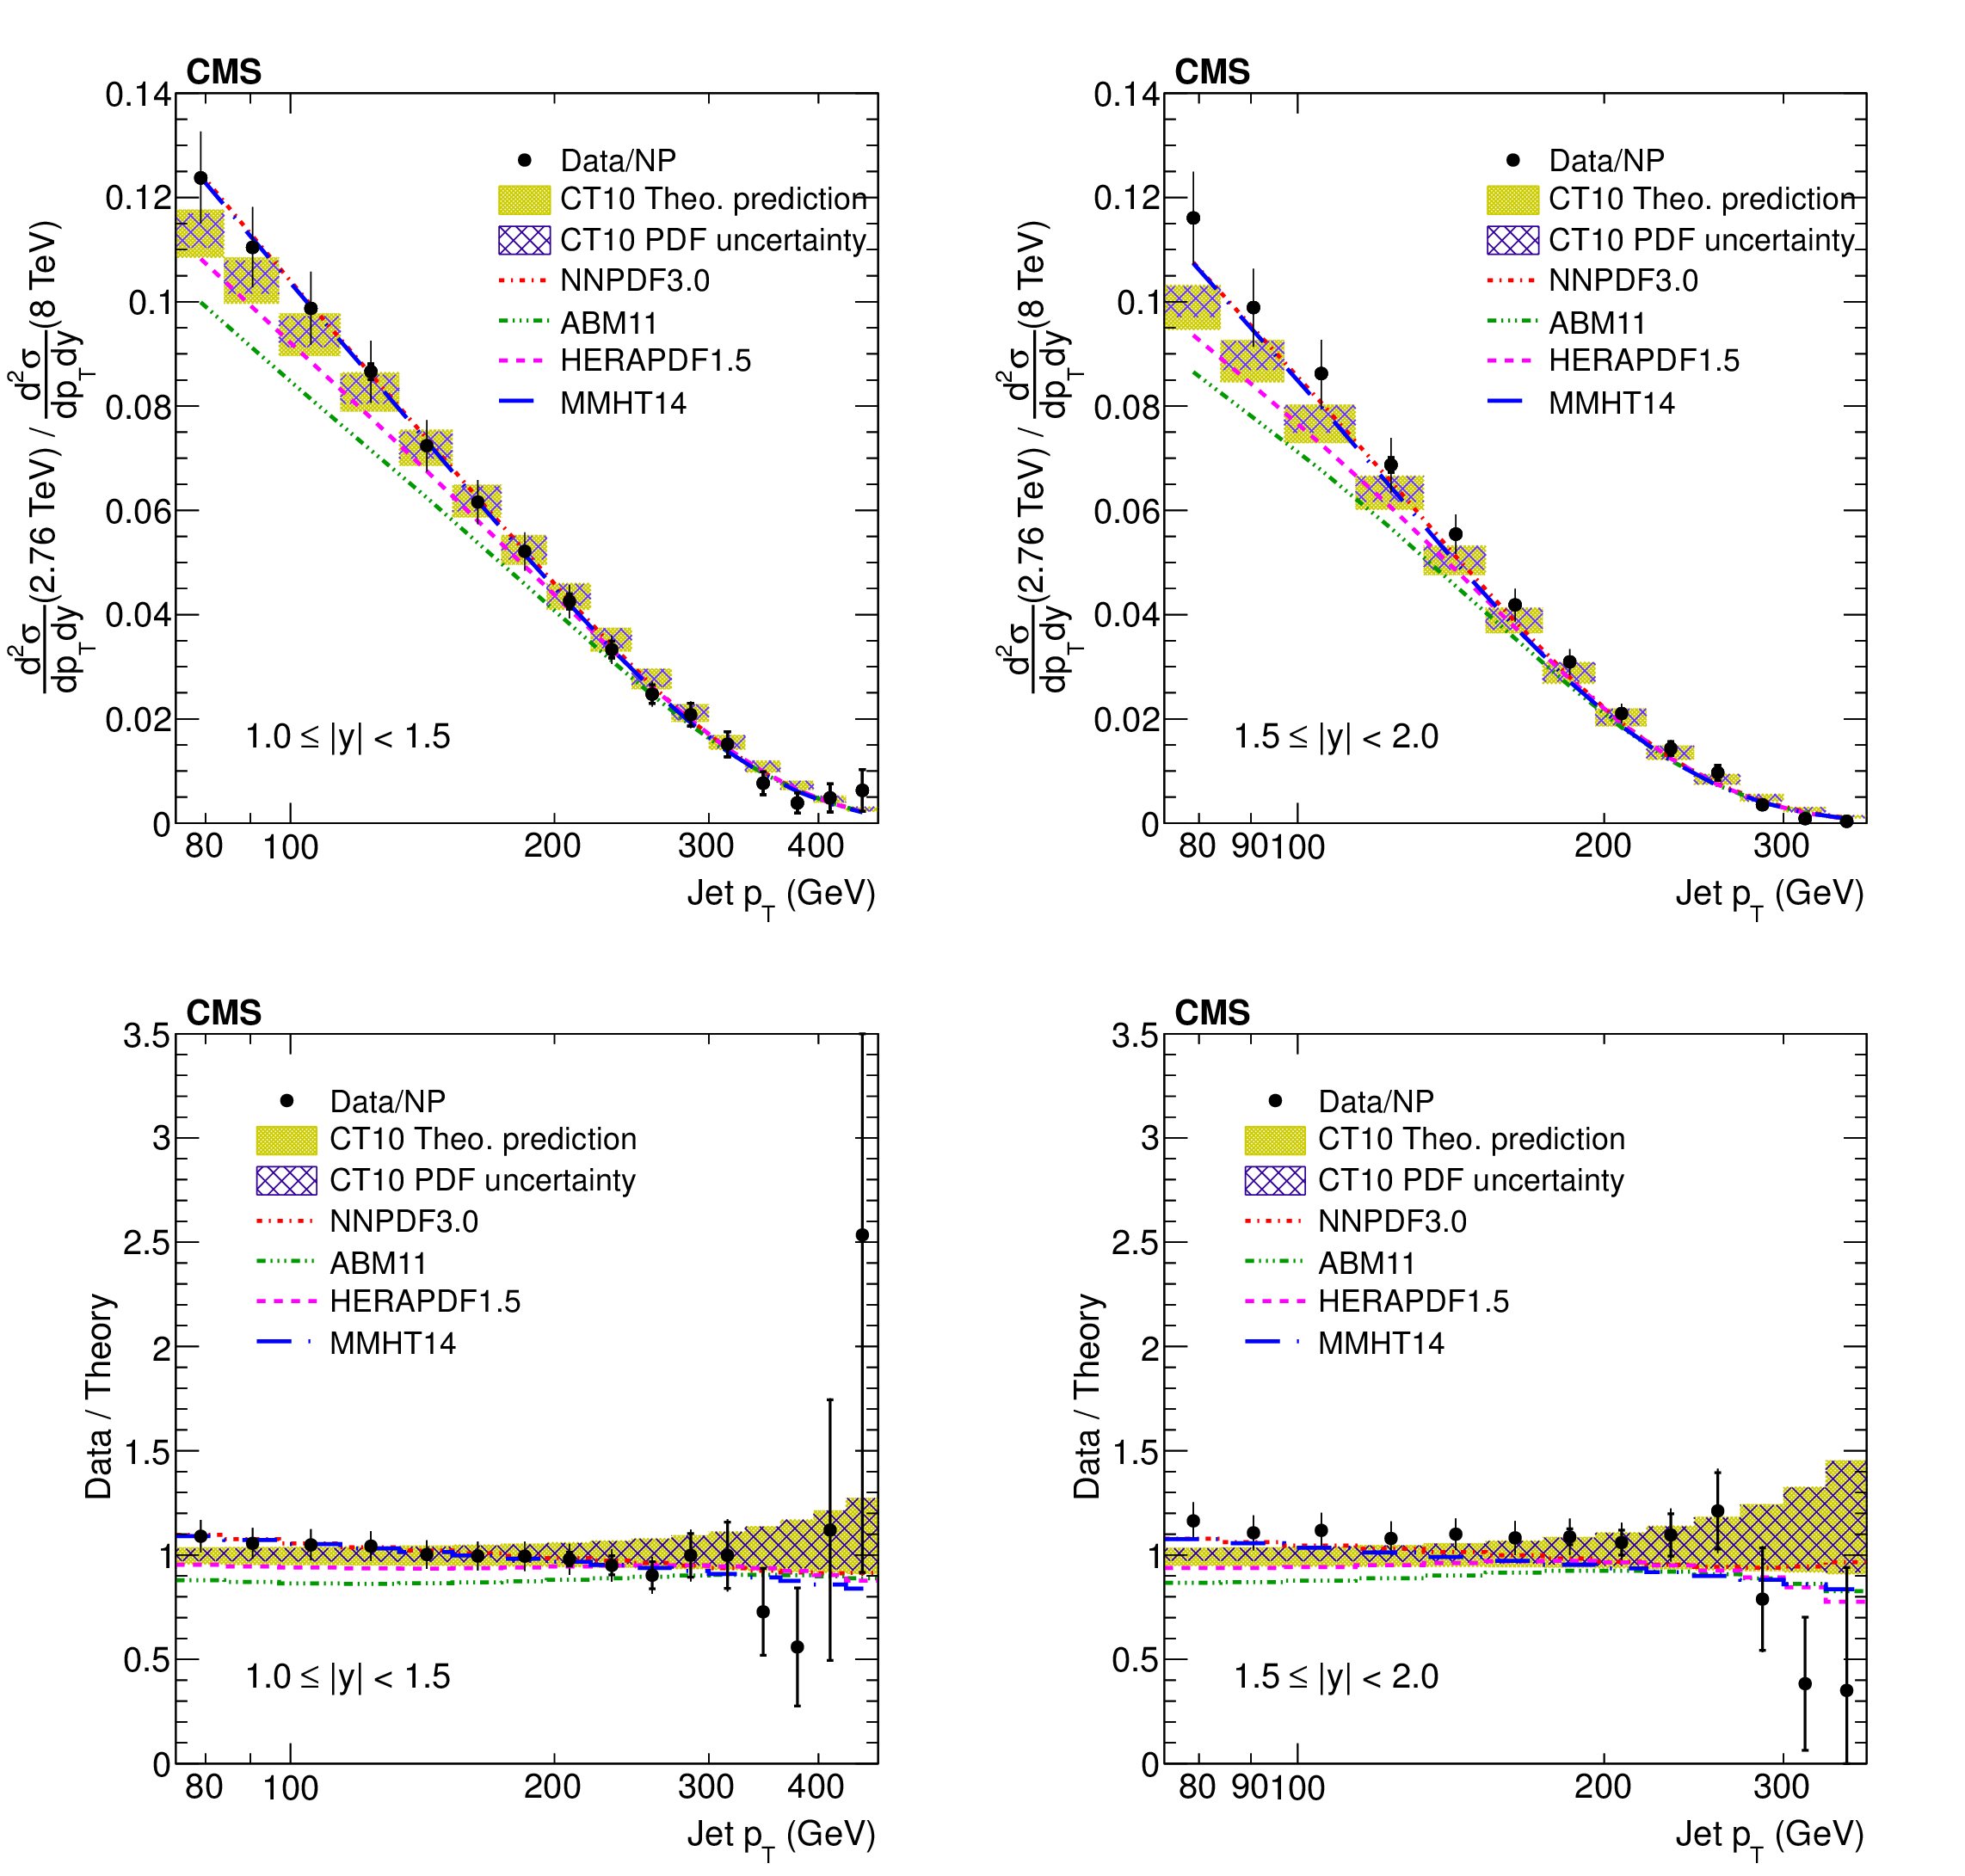
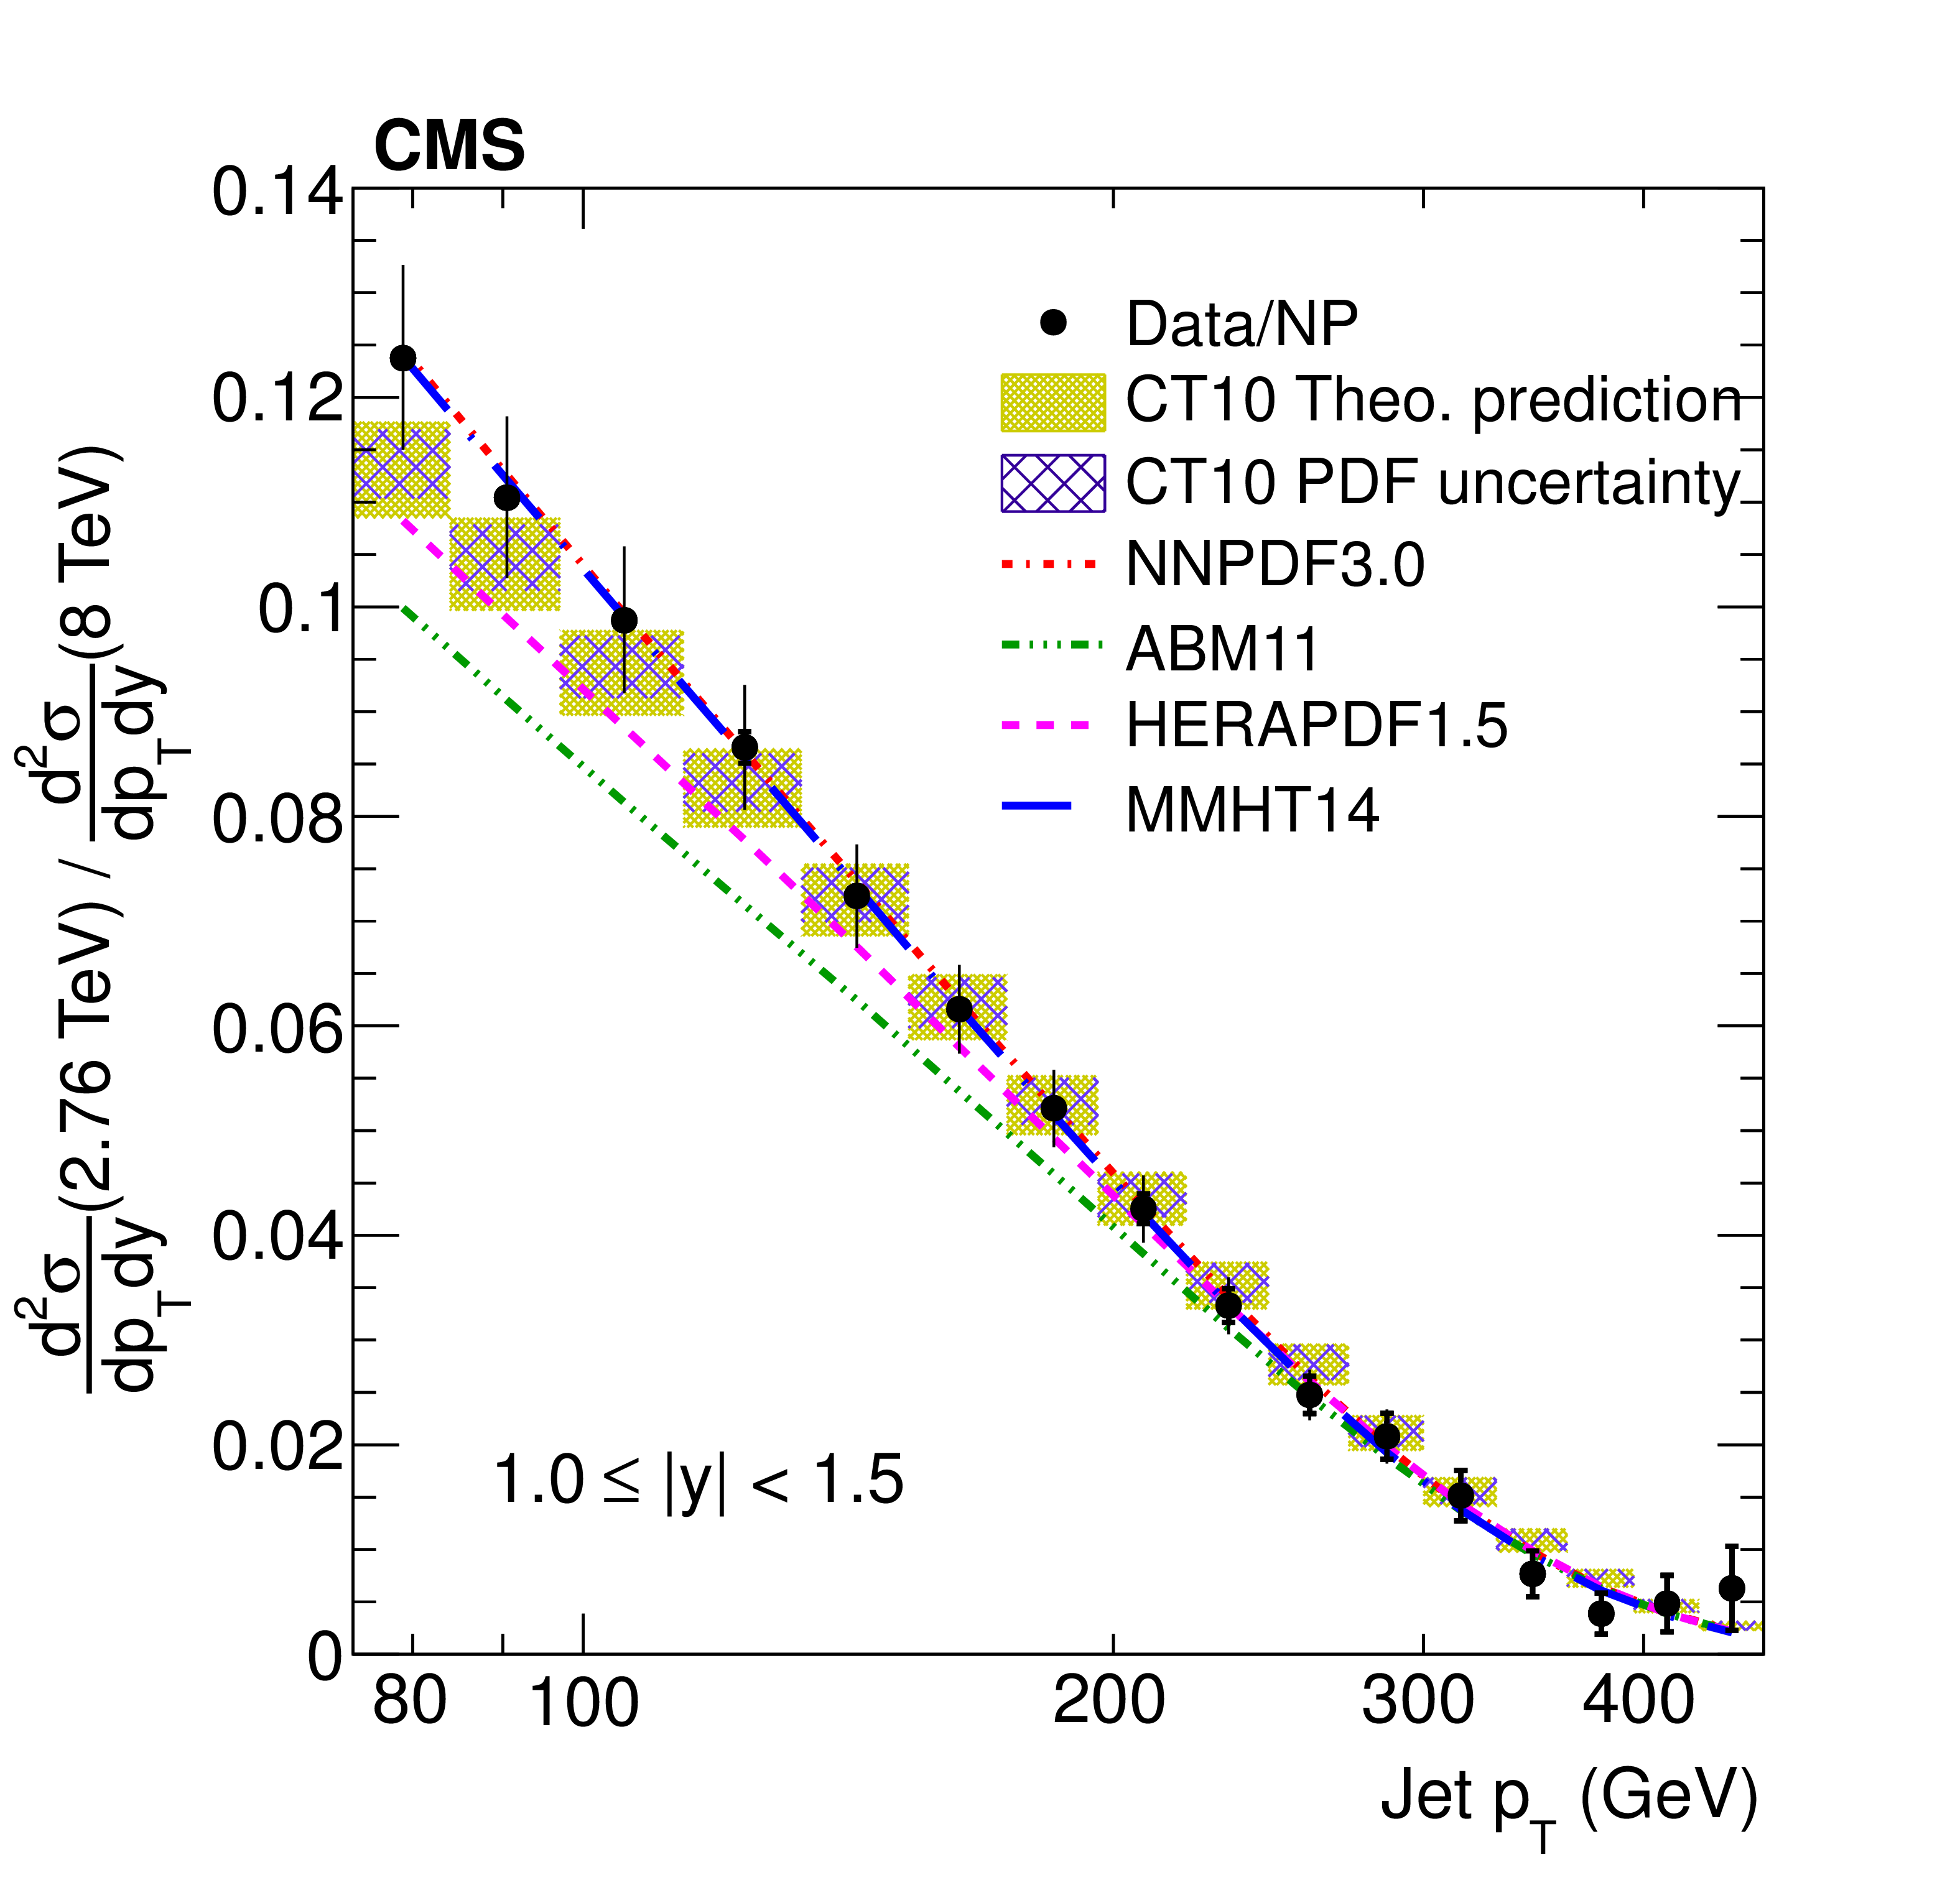
Ratio (top panels) of the inclusive jet production cross sections at $ \sqrt {s}= $ 2.76 and 8 TeV are shown as a function of jet ${p_{\mathrm {T}}}$ for the absolute rapidity range $|y| < $ 0.5 (left) and 0.5 $ < |y| < $ 1.0 (right). The data (closed symbols) are shown with their statistical (inner error bar) and total (outer error bar) uncertainties. For comparison, the NLO pQCD prediction by using the CT10 PDF is shown with its total uncertainty (light shaded band), while the contribution of the PDF uncertainty is presented by the hatched band. Predictions that use alternative PDF sets are shown by lines of different styles without uncertainties. The data to theory ratios (bottom panels) are shown using the same notations for the respective absolute rapidity ranges. |
png pdf |
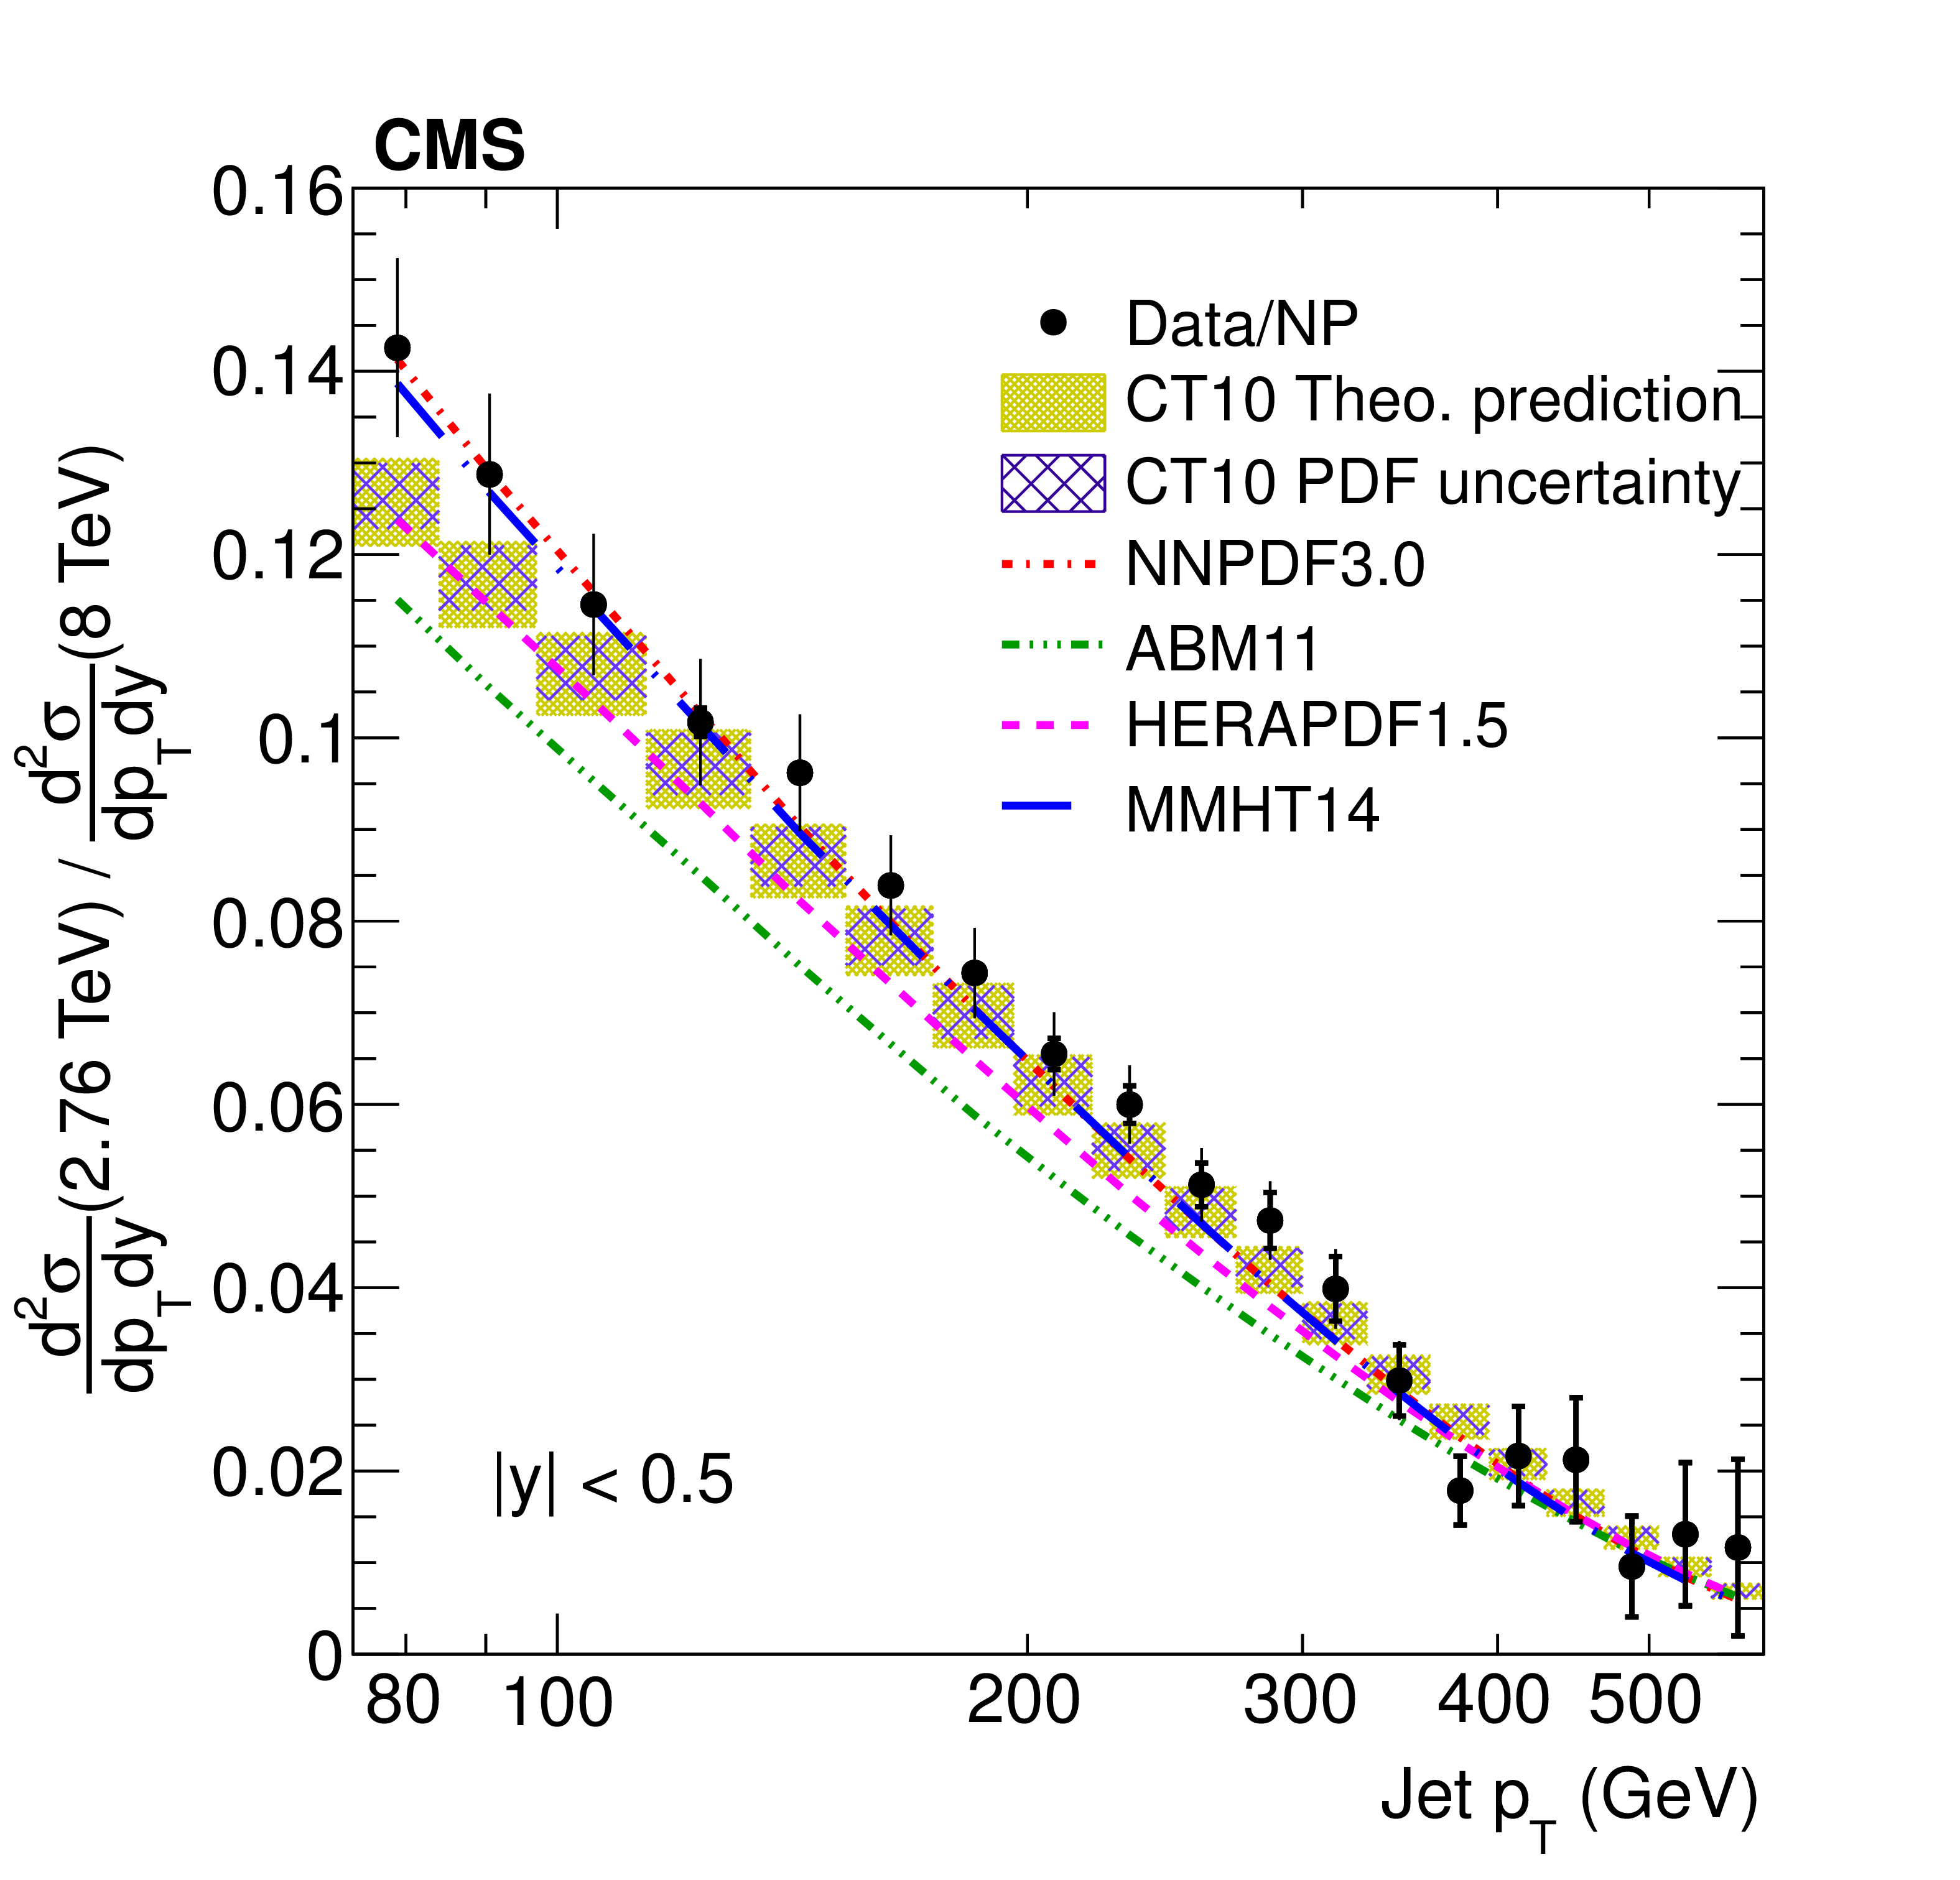
Figure 8-a:
Ratio of the inclusive jet production cross sections at $ \sqrt {s}= $ 2.76 and 8 TeV are shown as a function of jet ${p_{\mathrm {T}}}$ for the absolute rapidity range $|y| < $ 0.5. The data (closed symbols) are shown with their statistical (inner error bar) and total (outer error bar) uncertainties. For comparison, the NLO pQCD prediction by using the CT10 PDF is shown with its total uncertainty (light shaded band), while the contribution of the PDF uncertainty is presented by the hatched band. Predictions that use alternative PDF sets are shown by lines of different styles without uncertainties. |
png pdf |
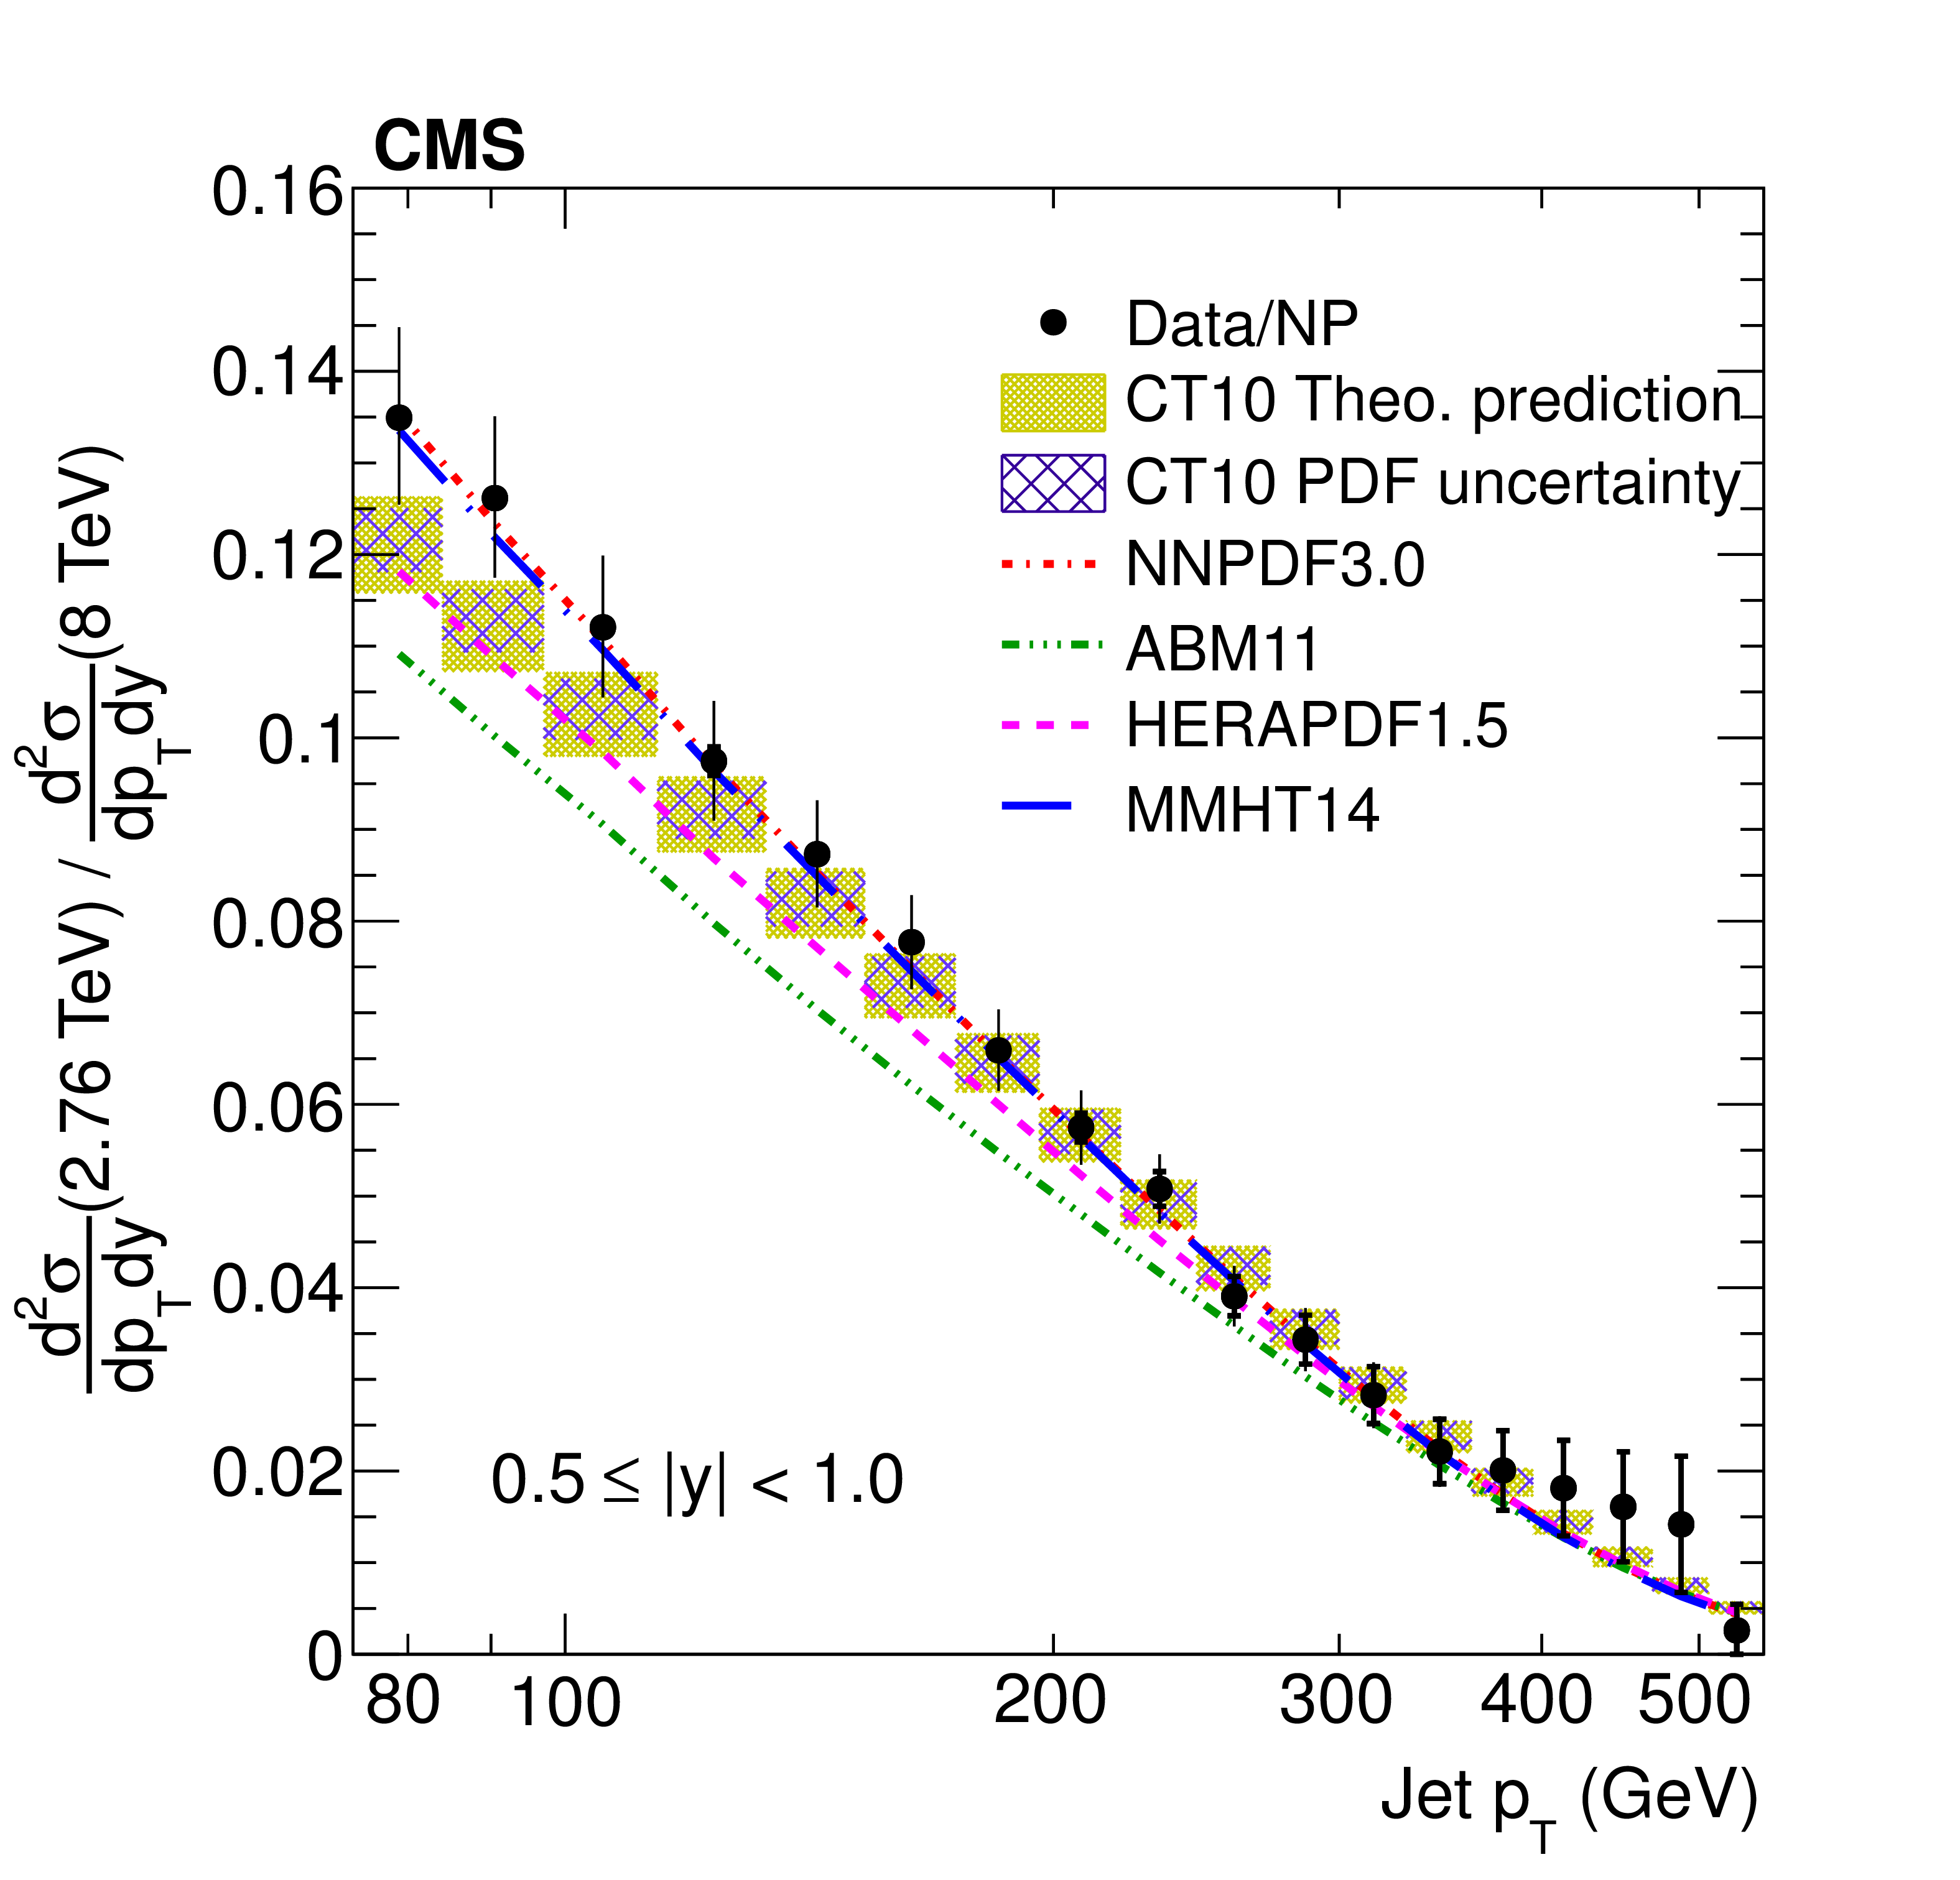
Figure 8-b:
Ratio of the inclusive jet production cross sections at $ \sqrt {s}= $ 2.76 and 8 TeV are shown as a function of jet ${p_{\mathrm {T}}}$ for the absolute rapidity range 0.5 $ < |y| < $ 1.0. The data (closed symbols) are shown with their statistical (inner error bar) and total (outer error bar) uncertainties. For comparison, the NLO pQCD prediction by using the CT10 PDF is shown with its total uncertainty (light shaded band), while the contribution of the PDF uncertainty is presented by the hatched band. Predictions that use alternative PDF sets are shown by lines of different styles without uncertainties. |
png pdf |
Figure 8-c:
Data to theory ratio of ratio of the inclusive jet production cross sections at $ \sqrt {s}= $ 2.76 and 8 TeV are shown as a function of jet ${p_{\mathrm {T}}}$ for the absolute rapidity range $|y| < $ 0.5. The data (closed symbols) are shown with their statistical (inner error bar) and total (outer error bar) uncertainties. For comparison, the NLO pQCD prediction by using the CT10 PDF is shown with its total uncertainty (light shaded band), while the contribution of the PDF uncertainty is presented by the hatched band. Predictions that use alternative PDF sets are shown by lines of different styles without uncertainties. |
png pdf |
Figure 8-d:
Data to theory ratio of ratio of the inclusive jet production cross sections at $ \sqrt {s}= $ 2.76 and 8 TeV are shown as a function of jet ${p_{\mathrm {T}}}$ for the absolute rapidity range 0.5 $ < |y| < $ 1.0. The data (closed symbols) are shown with their statistical (inner error bar) and total (outer error bar) uncertainties. For comparison, the NLO pQCD prediction by using the CT10 PDF is shown with its total uncertainty (light shaded band), while the contribution of the PDF uncertainty is presented by the hatched band. Predictions that use alternative PDF sets are shown by lines of different styles without uncertainties. |
png pdf |
Figure 9:
The ratios of the inclusive jet production cross sections at $\sqrt {s} =$ 2.76 and 8 TeV shown as a function of jet ${p_{\mathrm {T}}}$ for the absolute rapidity ranges 1.0 $ < |y| < $ 1.5 and 1.5 $ < |y| < $ 2.0. |
png pdf |
Figure 9-a:
Ratio of the inclusive jet production cross sections at $\sqrt {s} =$ 2.76 and 8 TeV shown as a function of jet ${p_{\mathrm {T}}}$ for the absolute rapidity ranges 1.0 $ < |y| < $ 1.5. |

png pdf |
Figure 9-b:
Ratio of the inclusive jet production cross sections at $\sqrt {s} =$ 2.76 and 8 TeV shown as a function of jet ${p_{\mathrm {T}}}$ for the absolute rapidity ranges 1.5 $ < |y| < $ 2.0. |

png pdf |
Figure 9-c:
Data to theory ratio of ratio of the inclusive jet production cross sections at $\sqrt {s} =$ 2.76 and 8 TeV shown as a function of jet ${p_{\mathrm {T}}}$ for the absolute rapidity ranges 1.0 $ < |y| < $ 1.5. |
png pdf |
Figure 9-d:
Data to theory ratio of ratio of the inclusive jet production cross sections at $\sqrt {s} =$ 2.76 and 8 TeV shown as a function of jet ${p_{\mathrm {T}}}$ for the absolute rapidity ranges 1.5 $ < |y| < $ 2.0. |

png pdf |
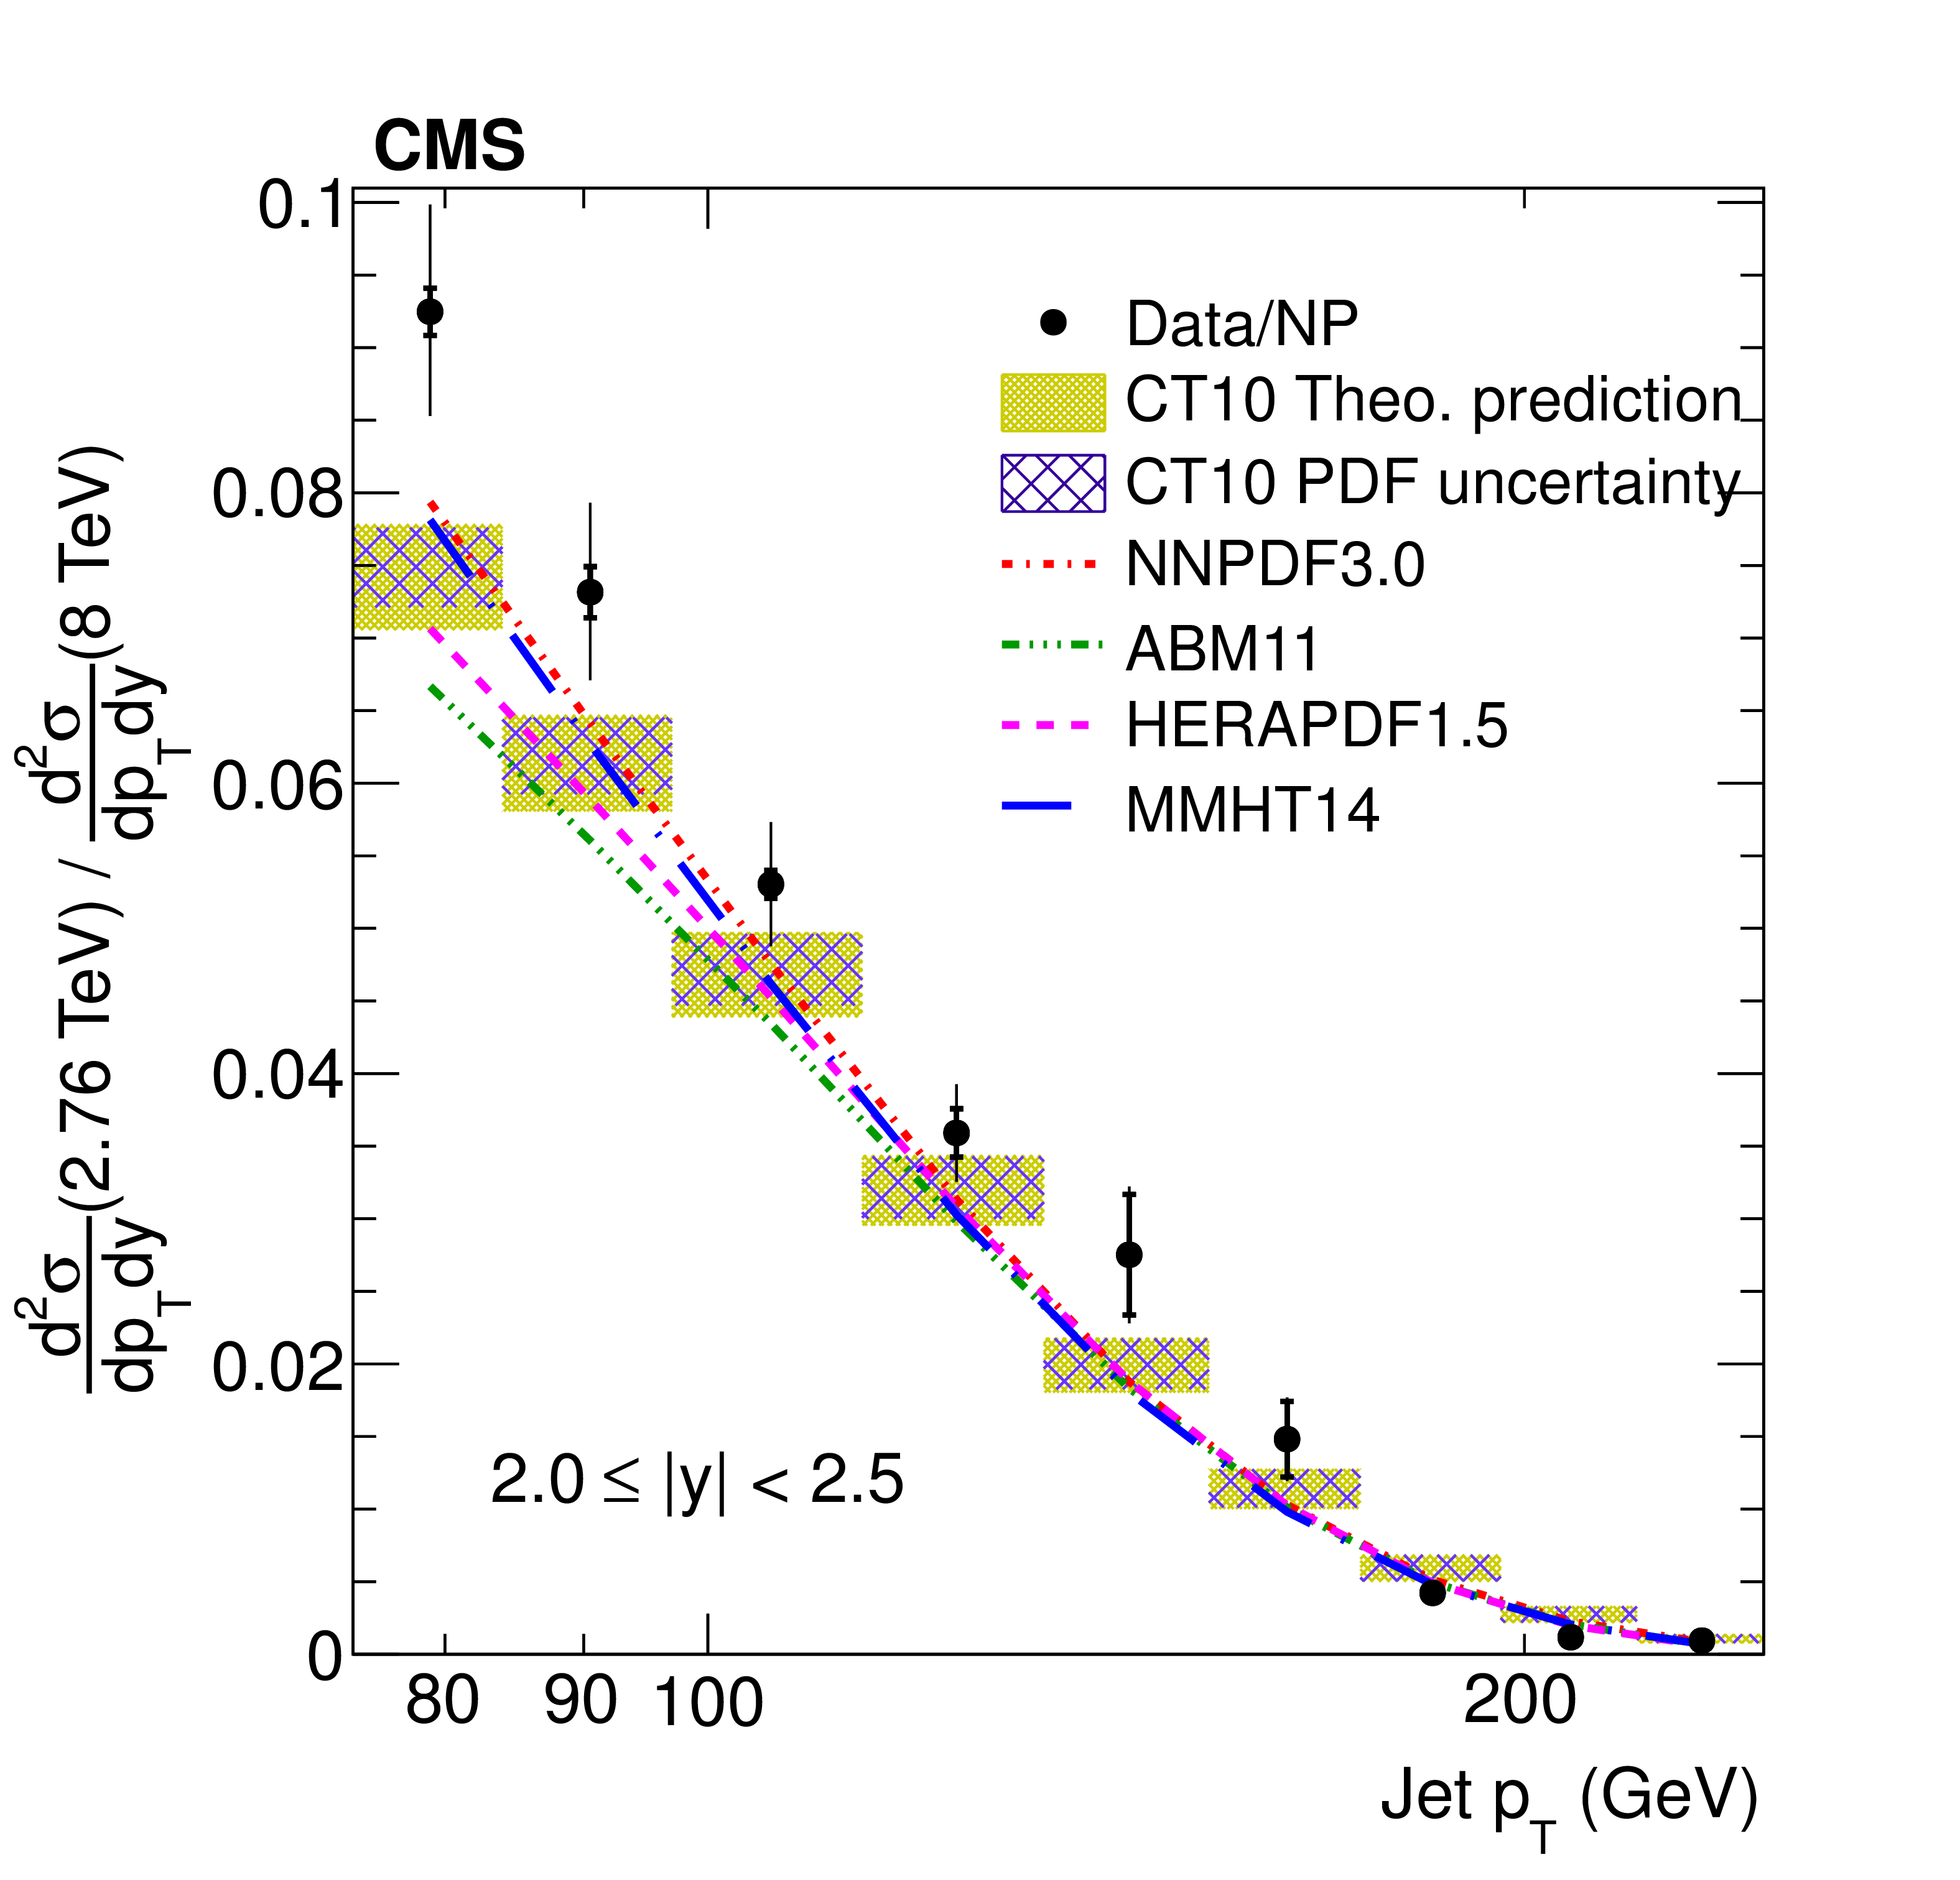
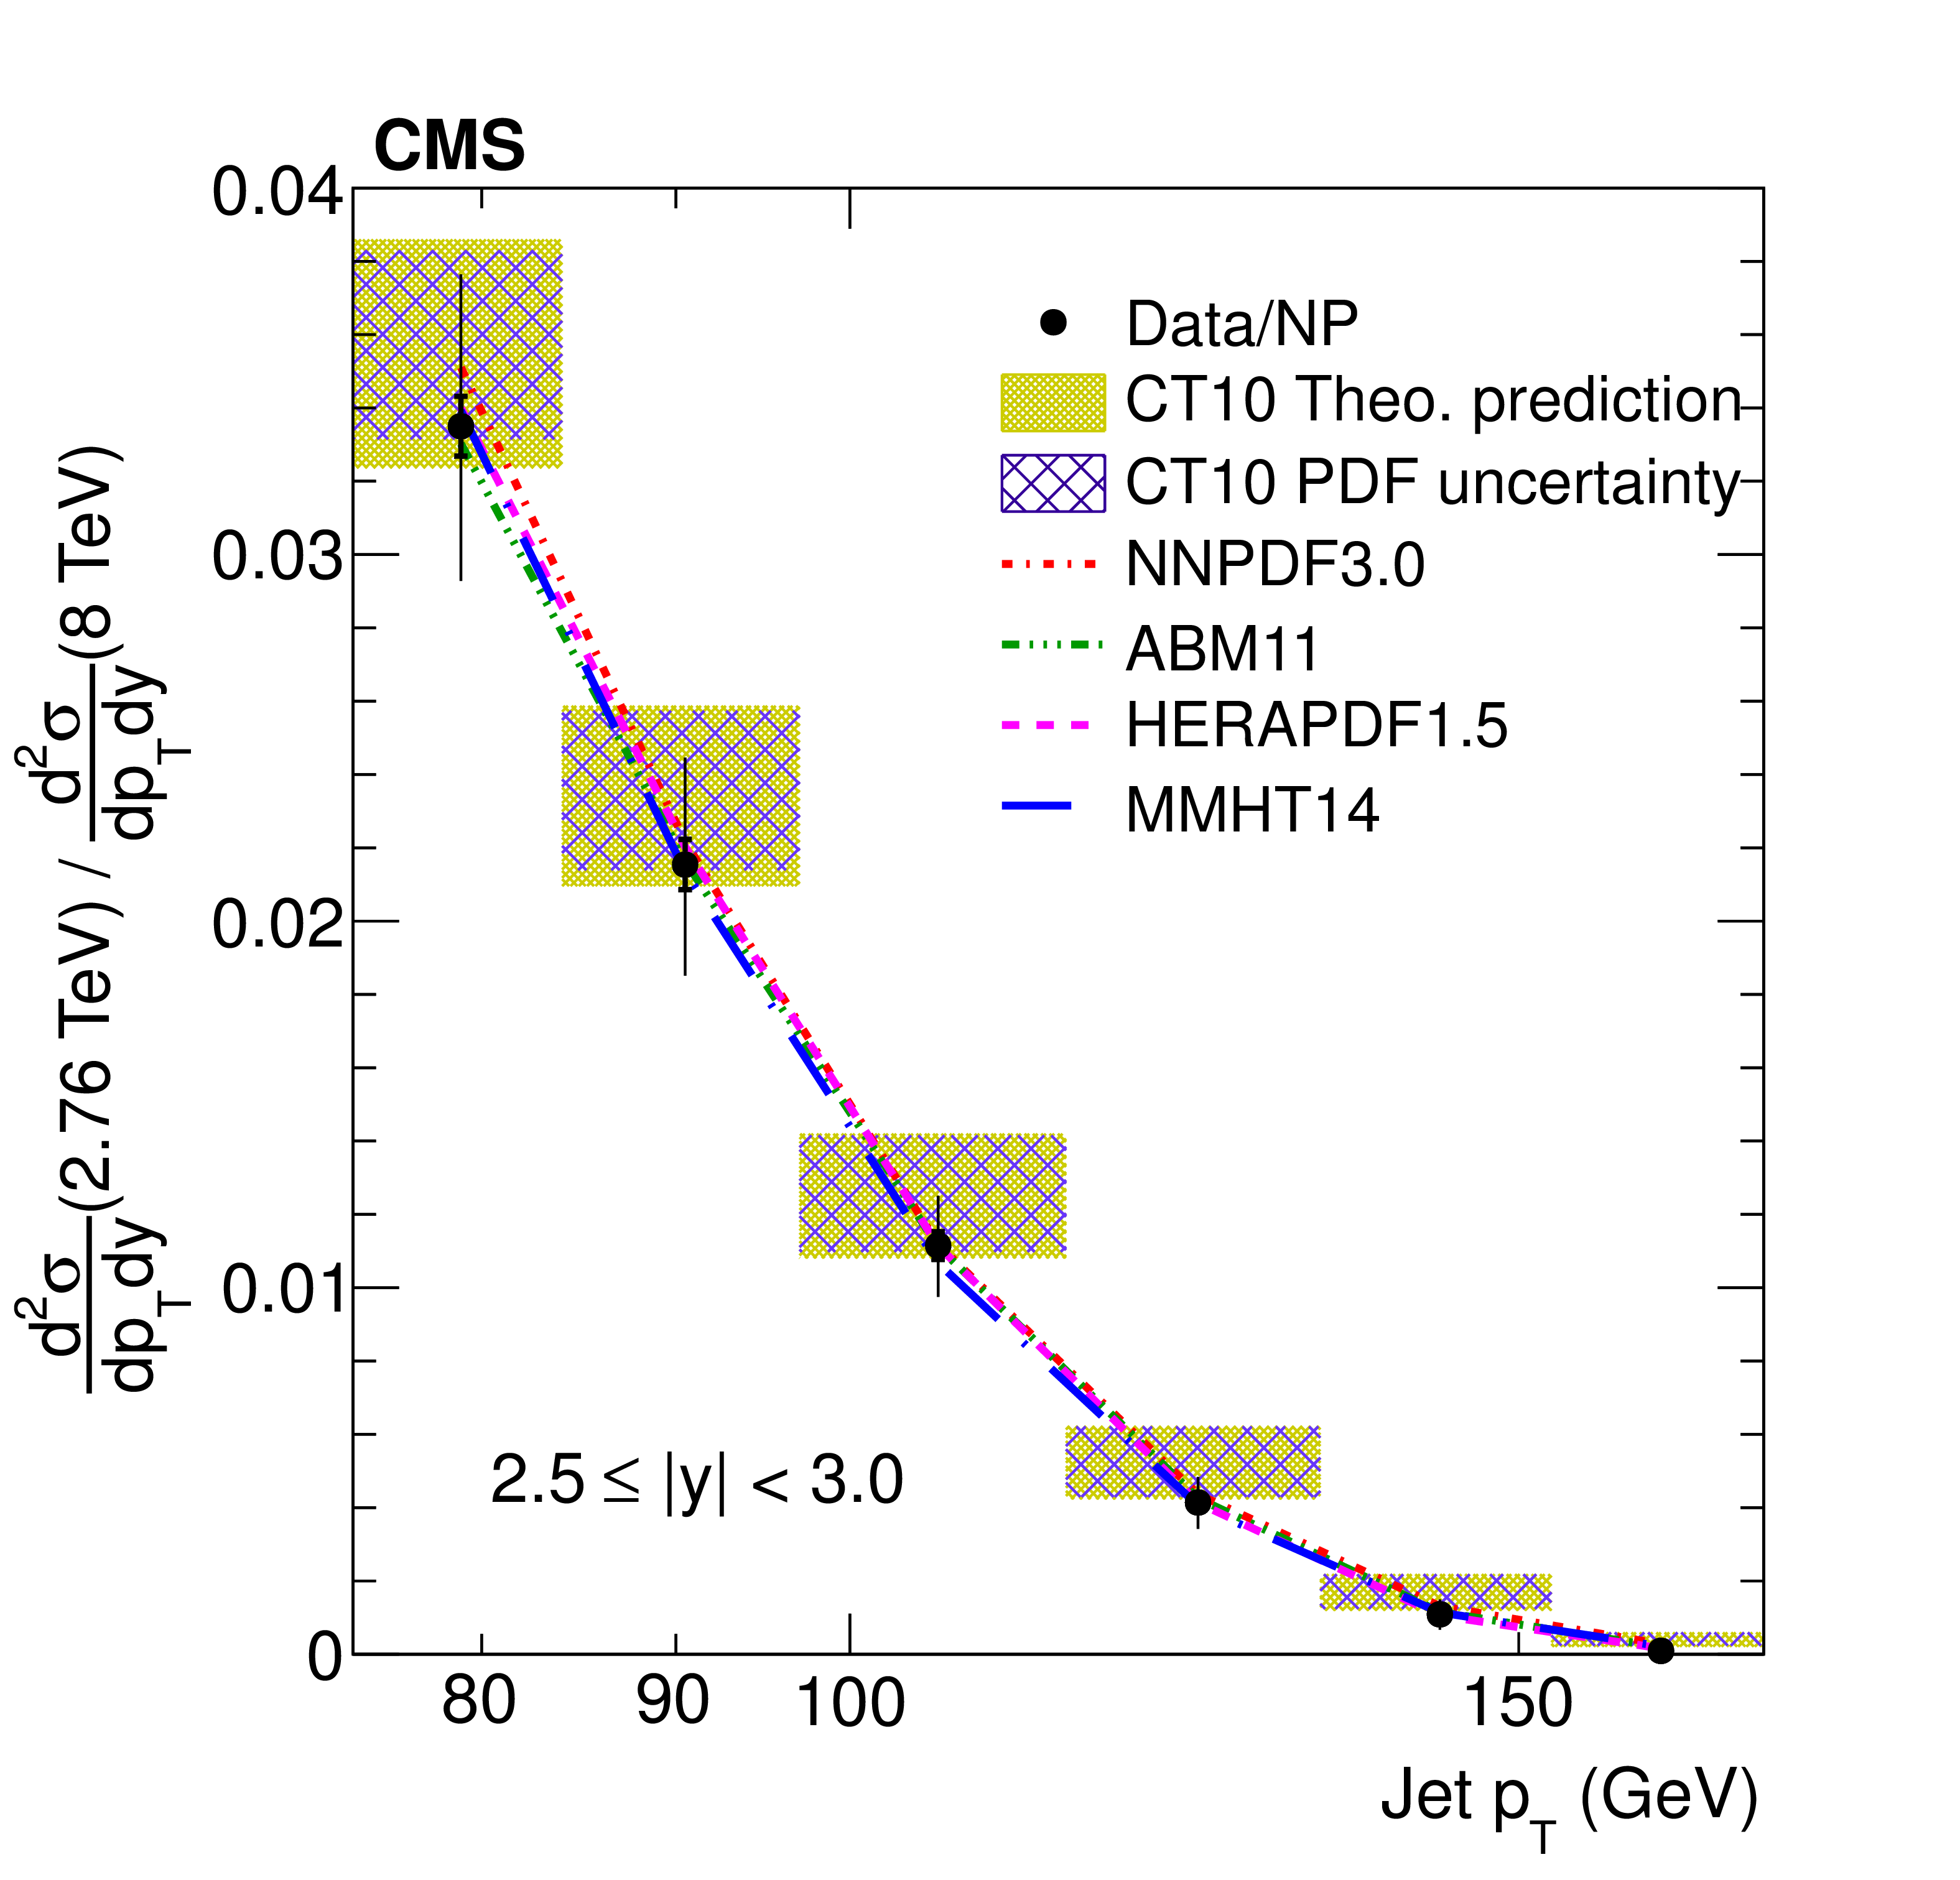
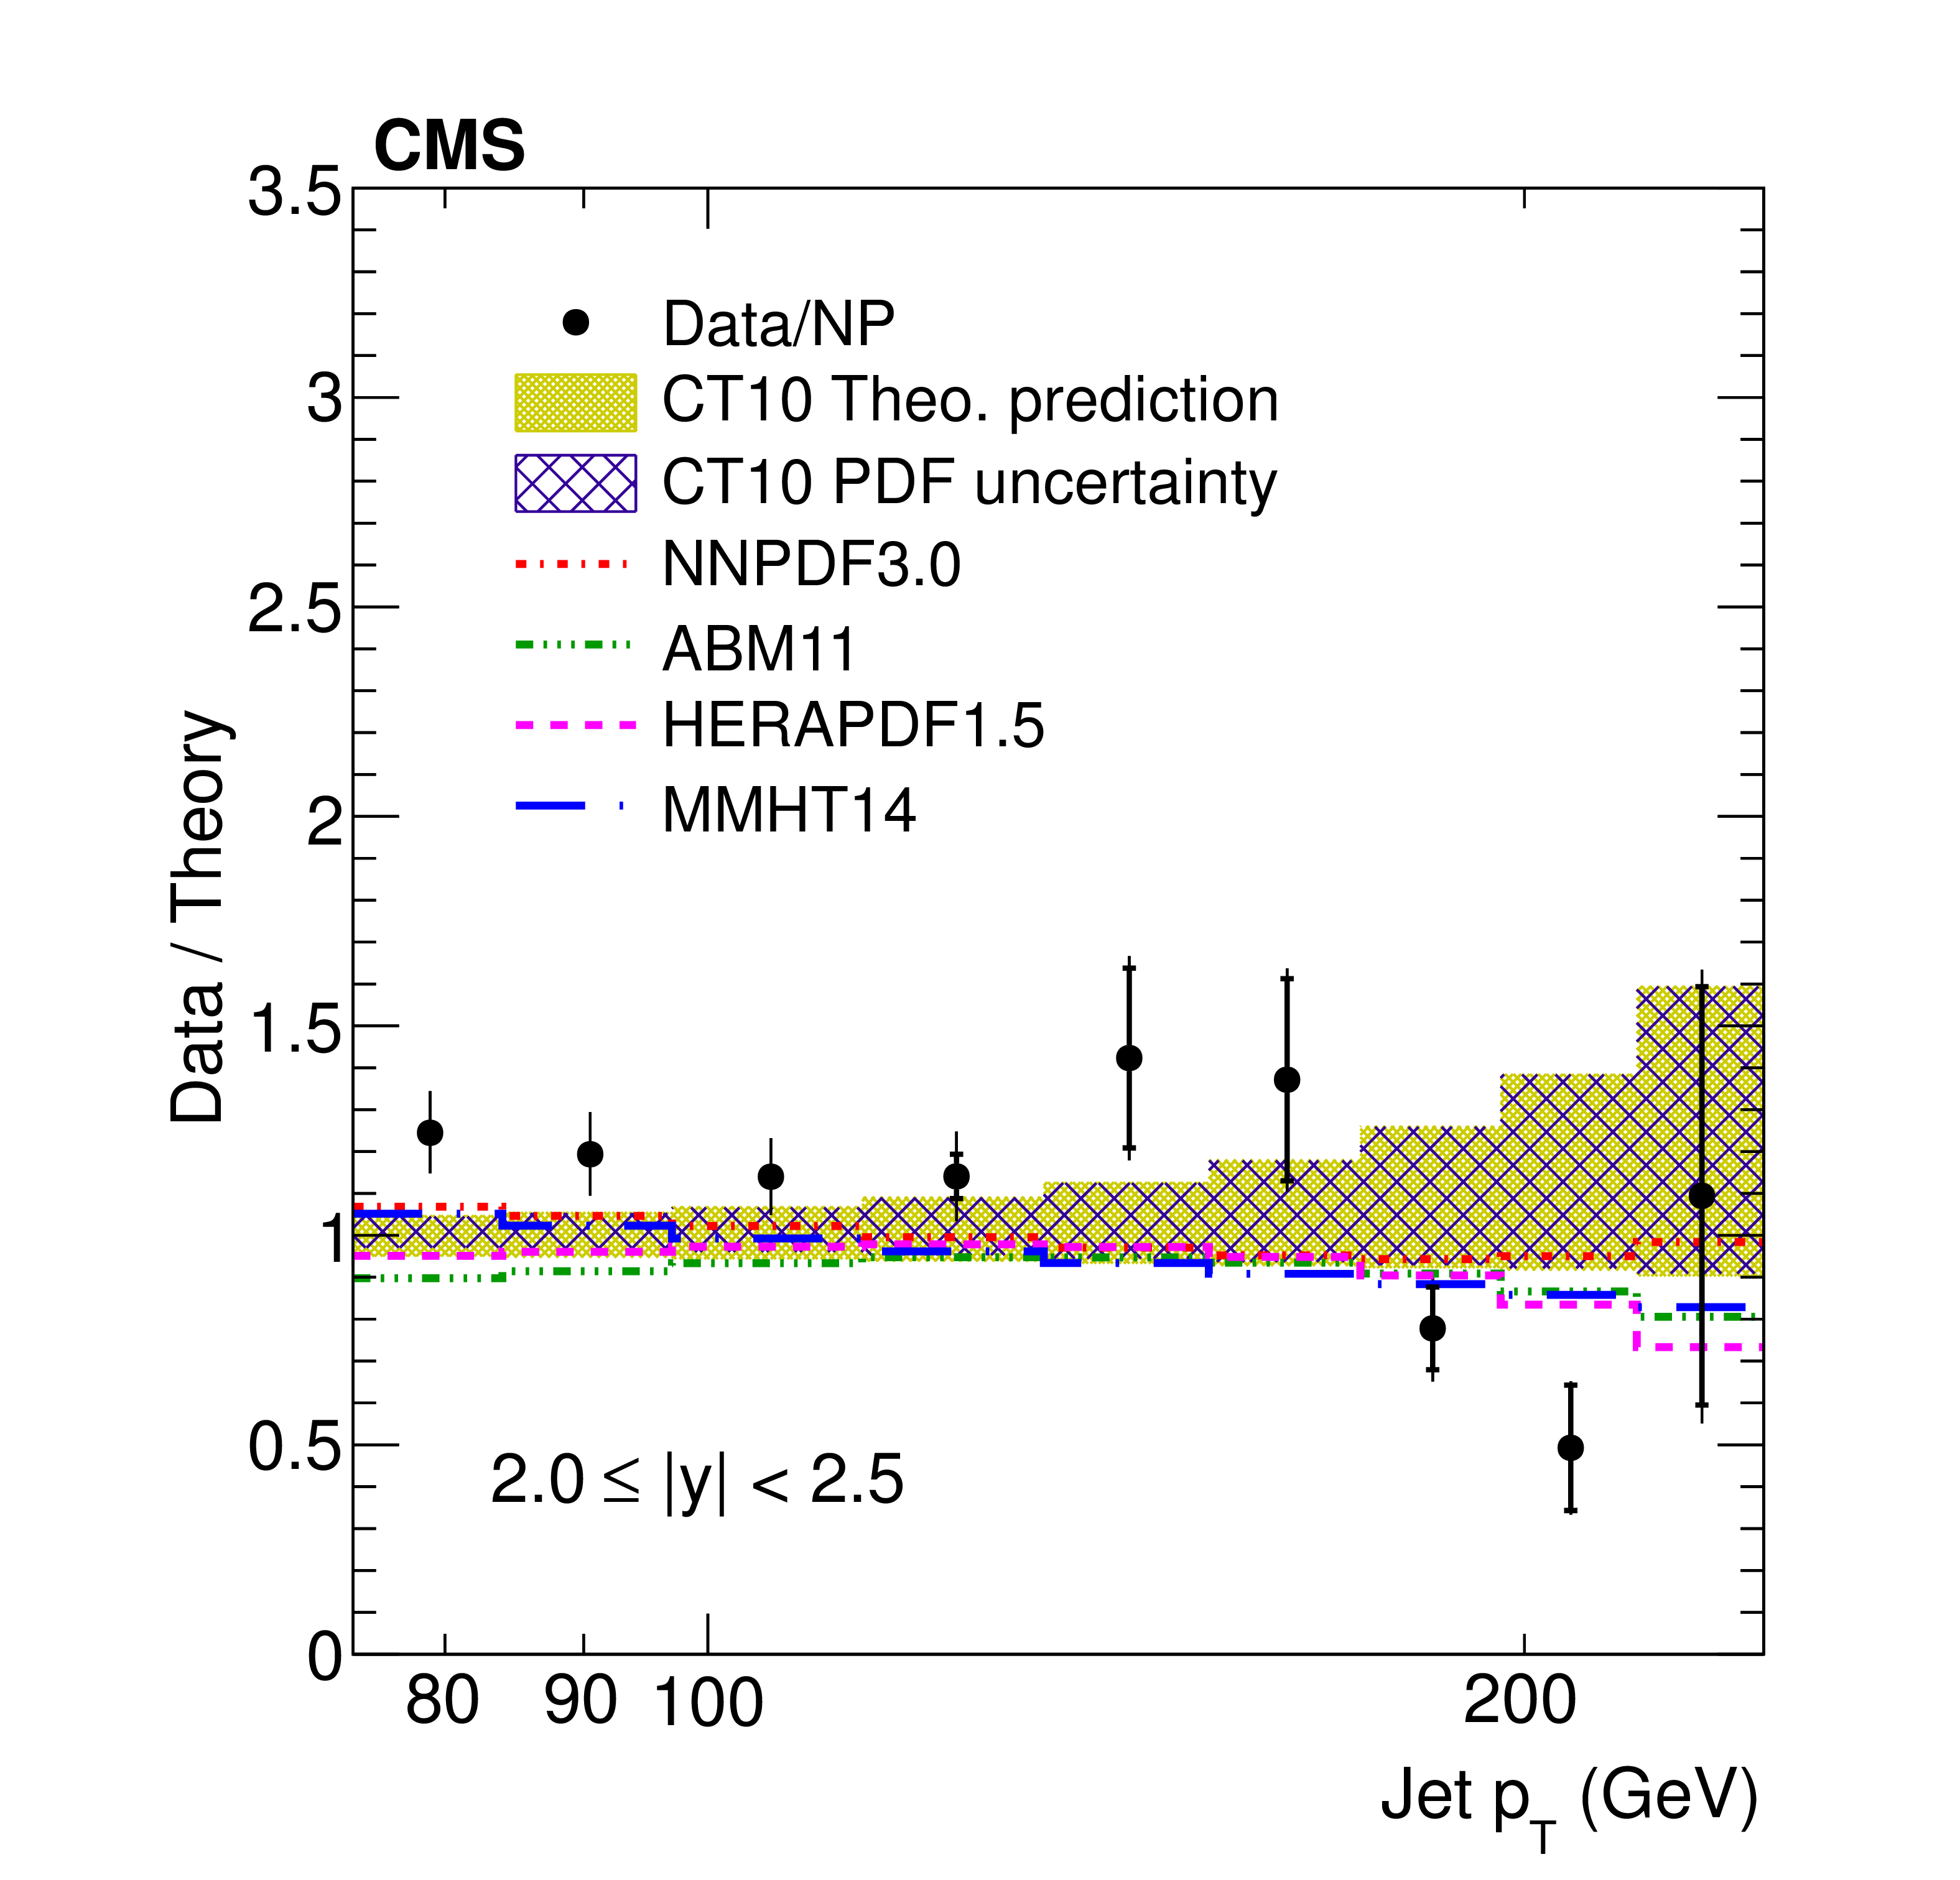
Figure 10:
The ratios of the inclusive jet production cross sections at $\sqrt {s} =$ 2.76 and 8 TeV shown as a function of jet ${p_{\mathrm {T}}}$ for the absolute rapidity ranges 2.0 $ < |y| < $ 2.5 and 2.5 $ < |y| < $ 3.0. |
png pdf |
Figure 10-a:
Ratio of the inclusive jet production cross sections at $\sqrt {s} =$ 2.76 and 8 TeV shown as a function of jet ${p_{\mathrm {T}}}$ for the absolute rapidity ranges 2.0 $ < |y| < $ 2.5. |
png pdf |
Figure 10-b:
Ratio of the inclusive jet production cross sections at $\sqrt {s} =$ 2.76 and 8 TeV shown as a function of jet ${p_{\mathrm {T}}}$ for the absolute rapidity ranges 2.5 $ < |y| < $ 3.0. |
png pdf |
Figure 10-c:
Data to theory ratio of ratio of the inclusive jet production cross sections at $\sqrt {s} =$ 2.76 and 8 TeV shown as a function of jet ${p_{\mathrm {T}}}$ for the absolute rapidity ranges 2.0 $ < |y| < $ 2.5. |
png pdf |
Figure 10-d:
Data to theory ratio of ratio of the inclusive jet production cross sections at $\sqrt {s} =$ 2.76 and 8 TeV shown as a function of jet ${p_{\mathrm {T}}}$ for the absolute rapidity ranges 2.5 $ < |y| < $ 3.0. |
png pdf |
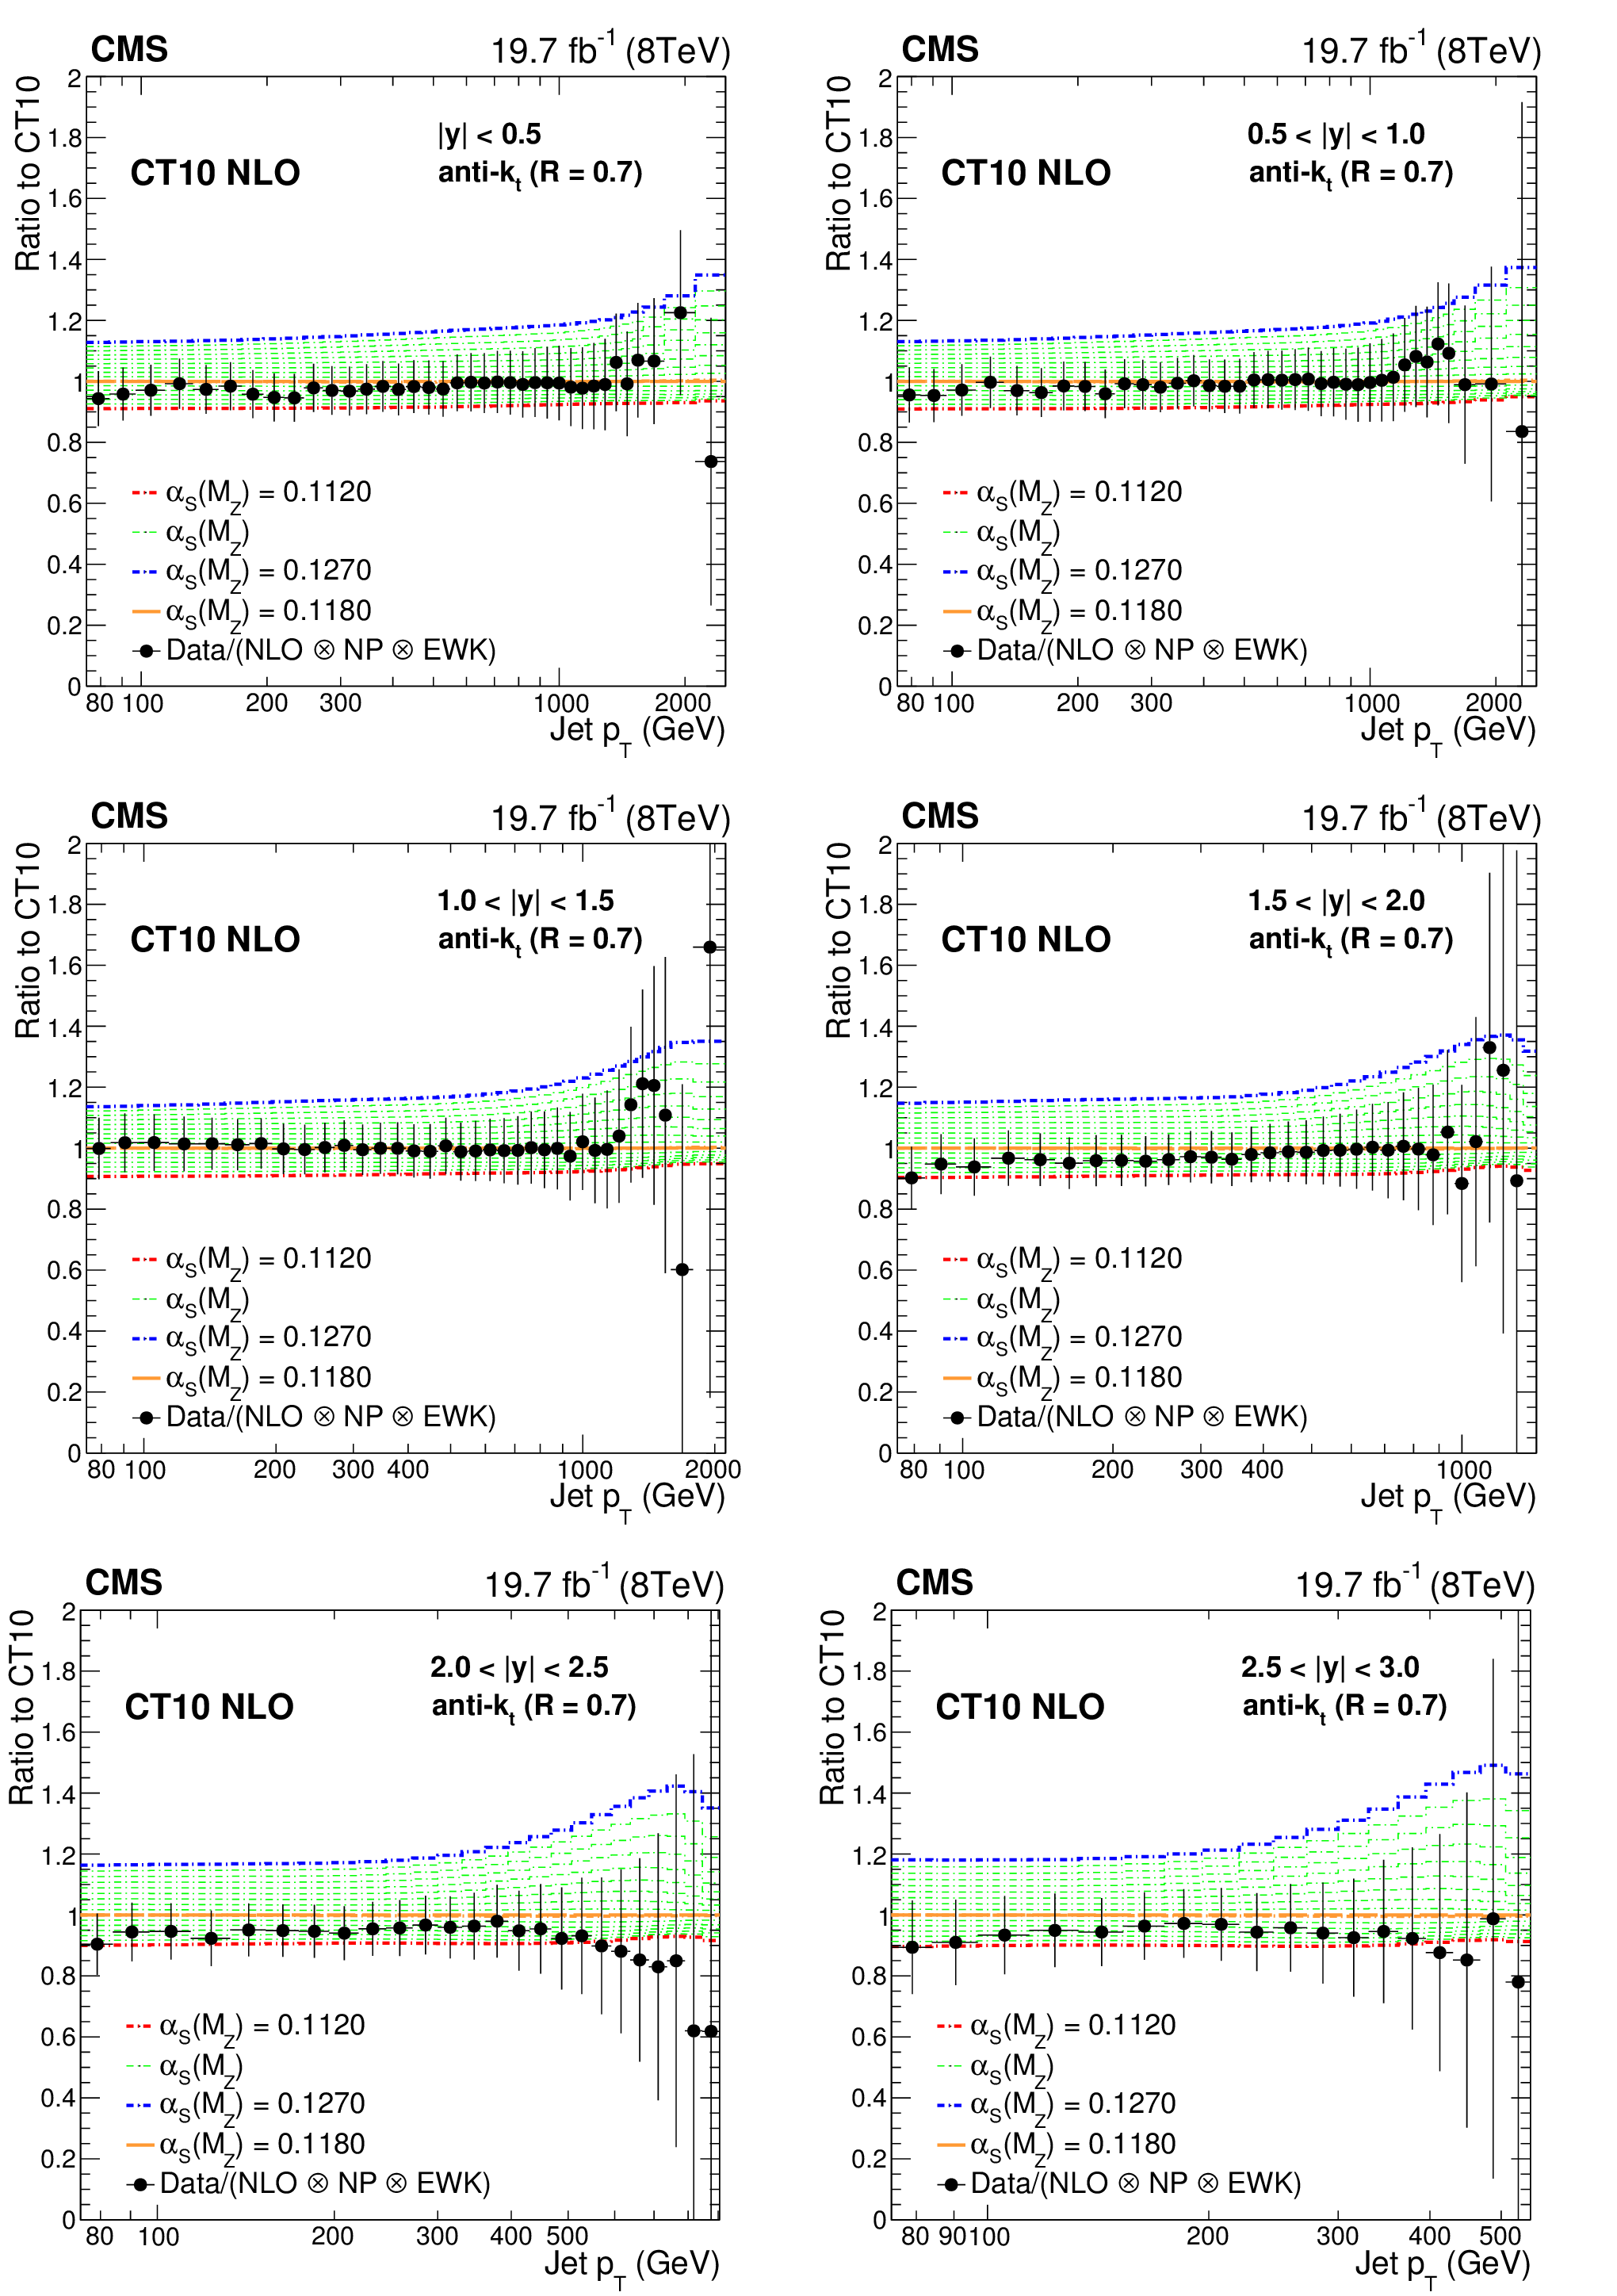
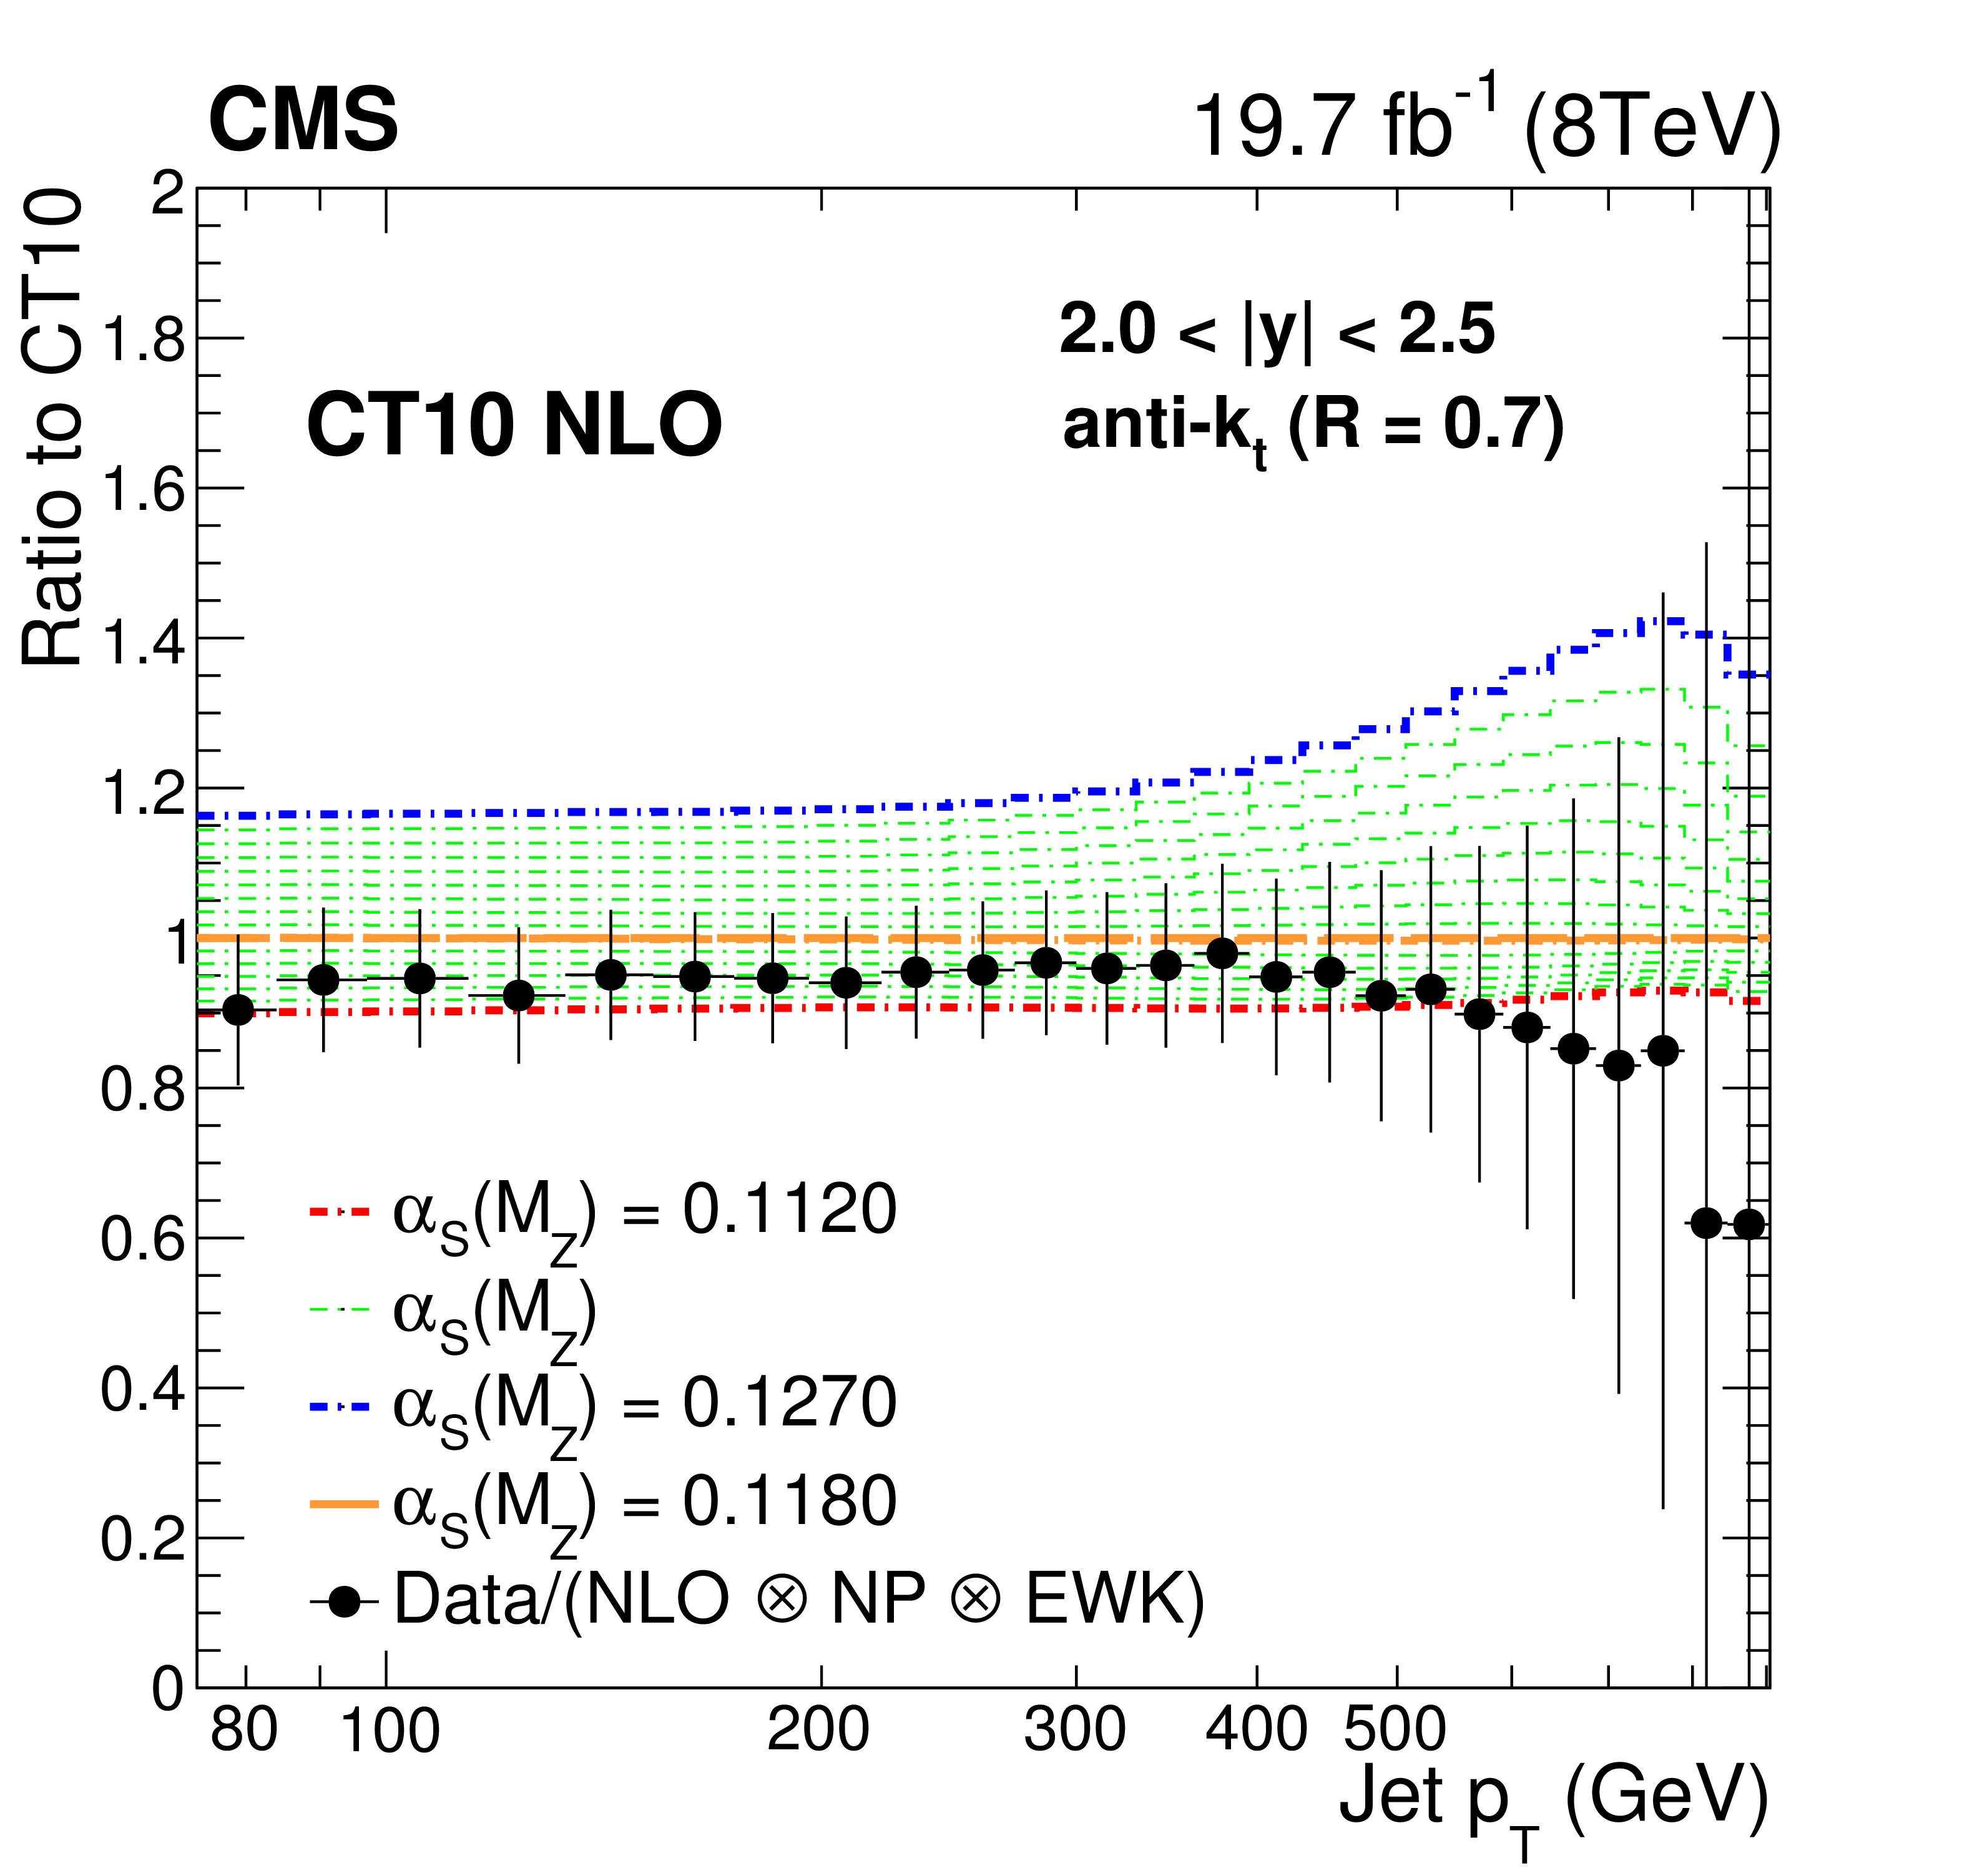
Figure 11:
Ratio of data over theory prediction (closed circles) using the CT10 NLO PDF set, with the default ${\alpha _\mathrm {S}(M_\mathrm {Z})}$ value of 0.118. Dashed lines represent the ratios of the predictions obtained with the CT10 PDF set evaluated with different ${\alpha _\mathrm {S}(M_\mathrm {Z})}$ values, to the central one. The error bars correspond to the total uncertainty of the data. |

png pdf |
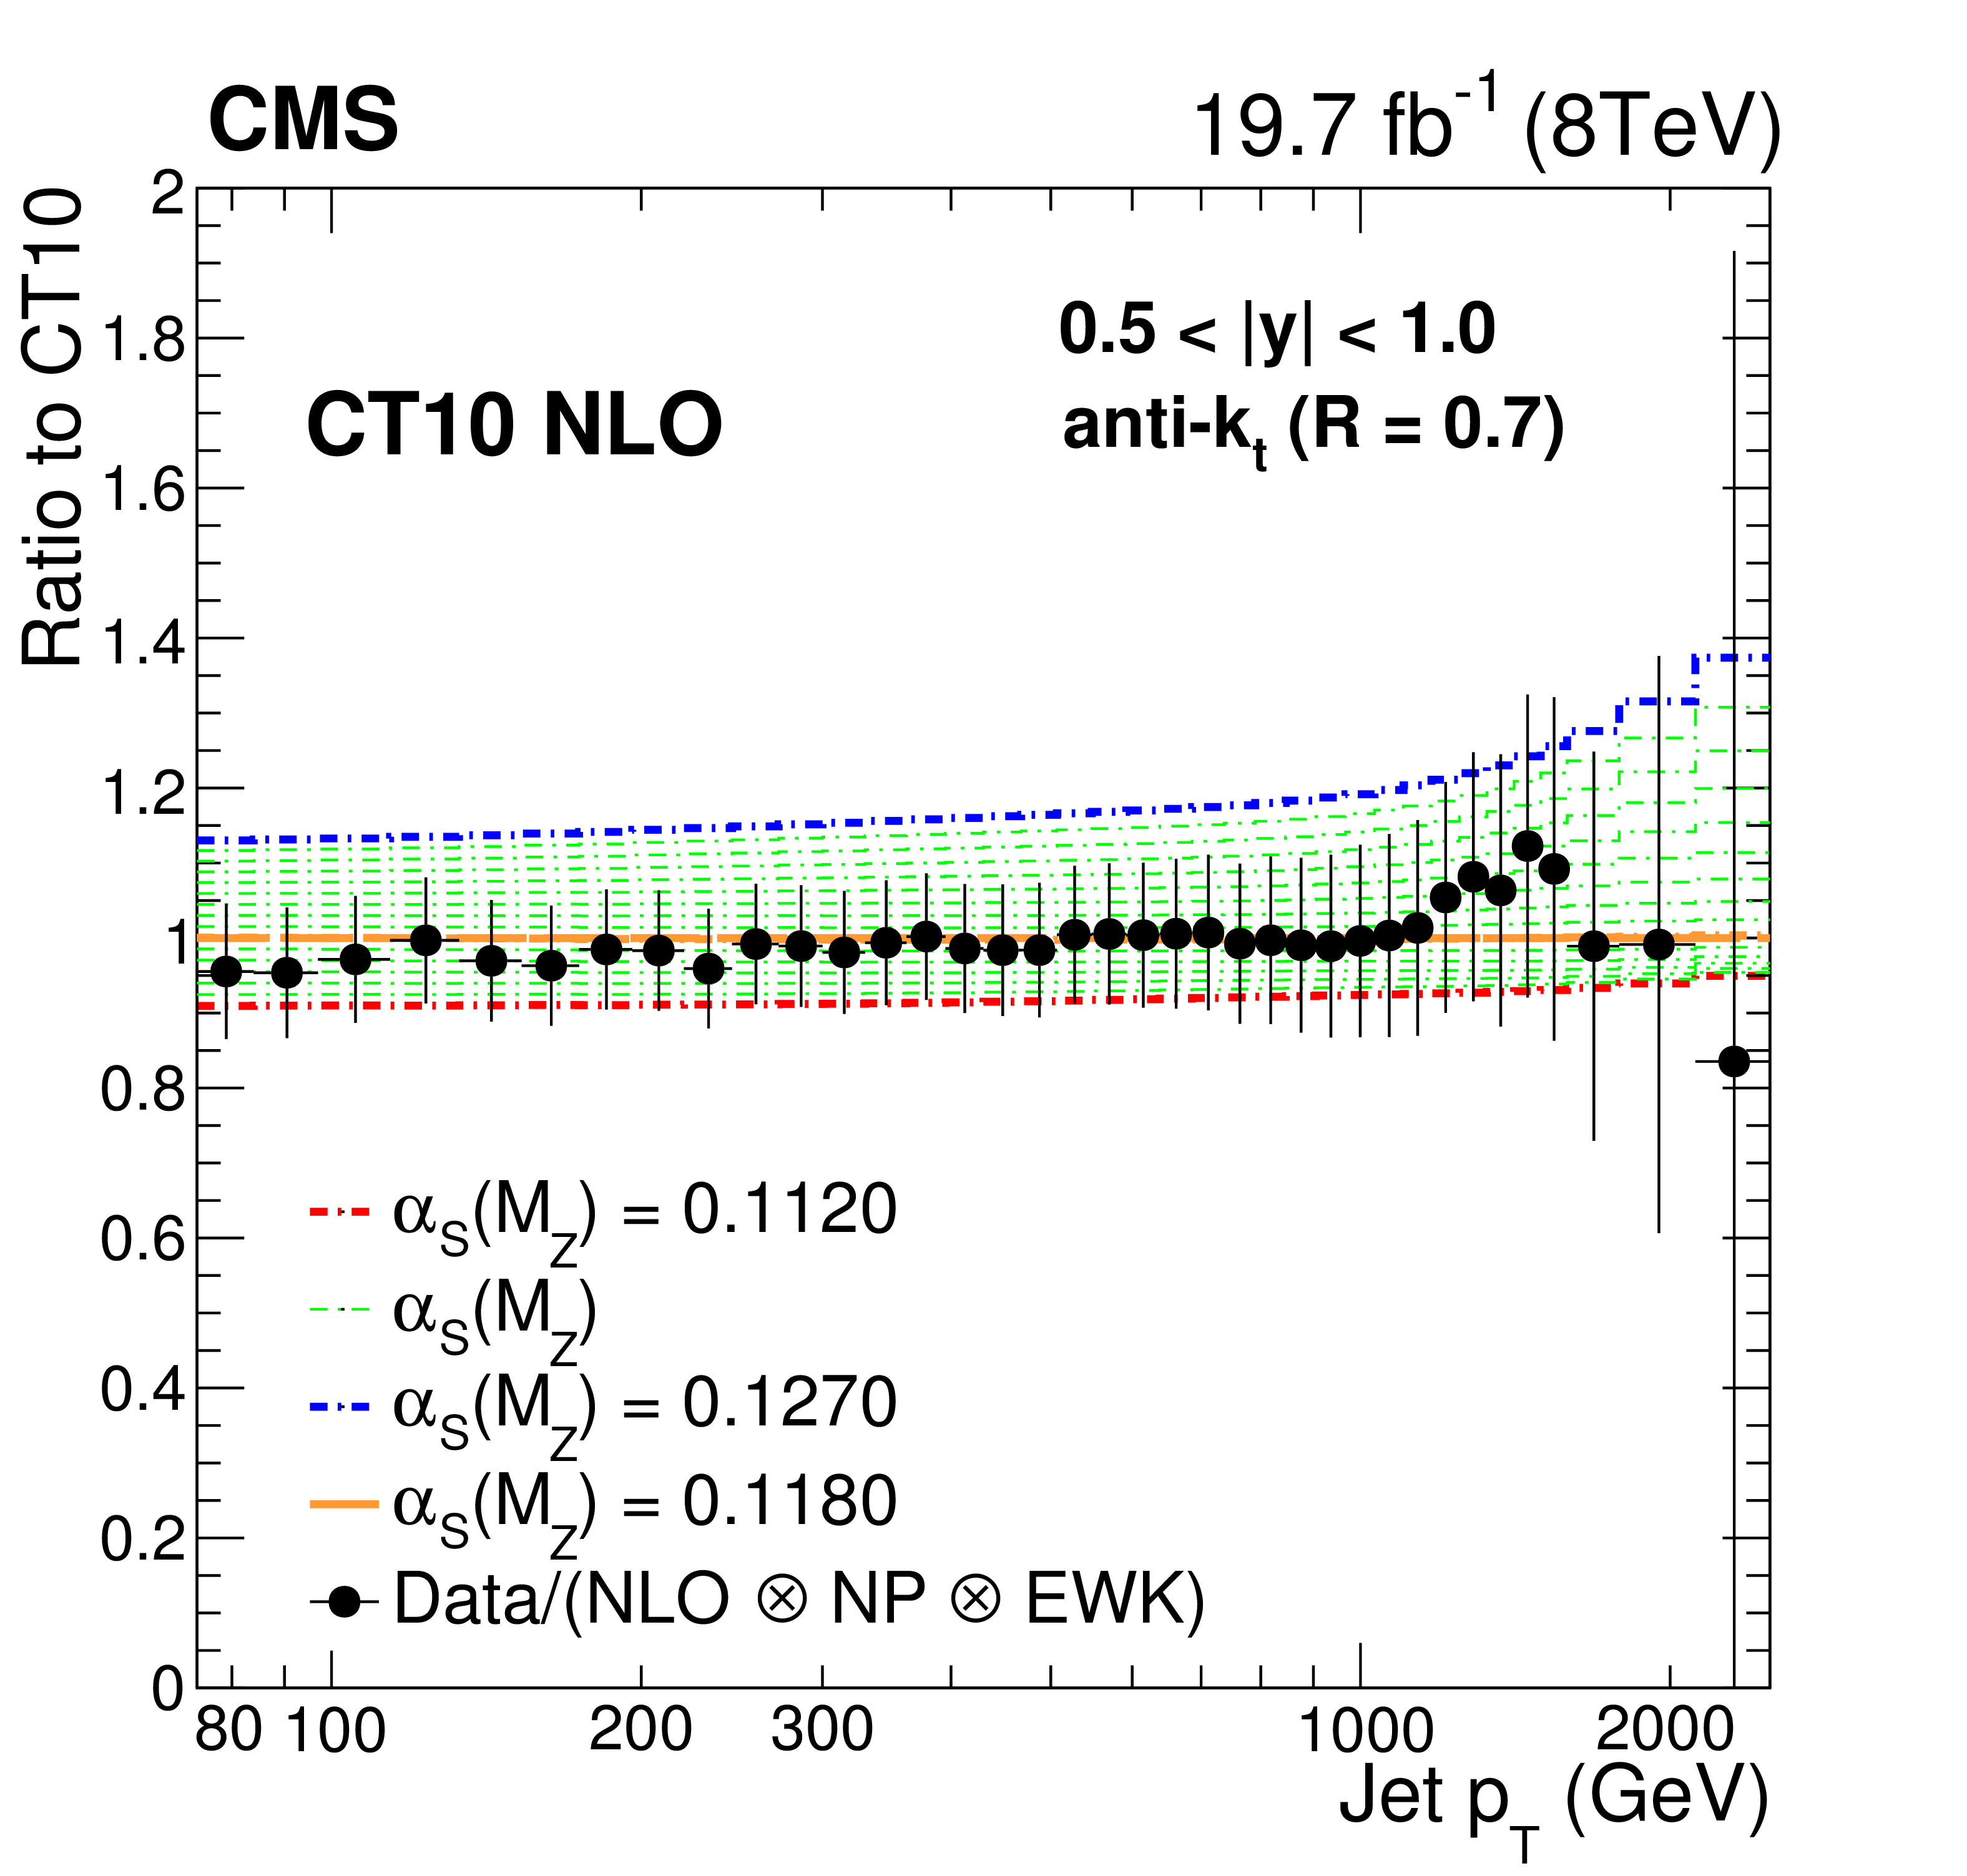
Figure 11-a:
Ratio of data over theory prediction (closed circles) using the CT10 NLO PDF set, with the default ${\alpha _\mathrm {S}(M_\mathrm {Z})}$ value of 0.118. Dashed lines represent the ratios of the predictions obtained with the CT10 PDF set evaluated with different ${\alpha _\mathrm {S}(M_\mathrm {Z})}$ values, to the central one. The error bars correspond to the total uncertainty of the data. |
png pdf |
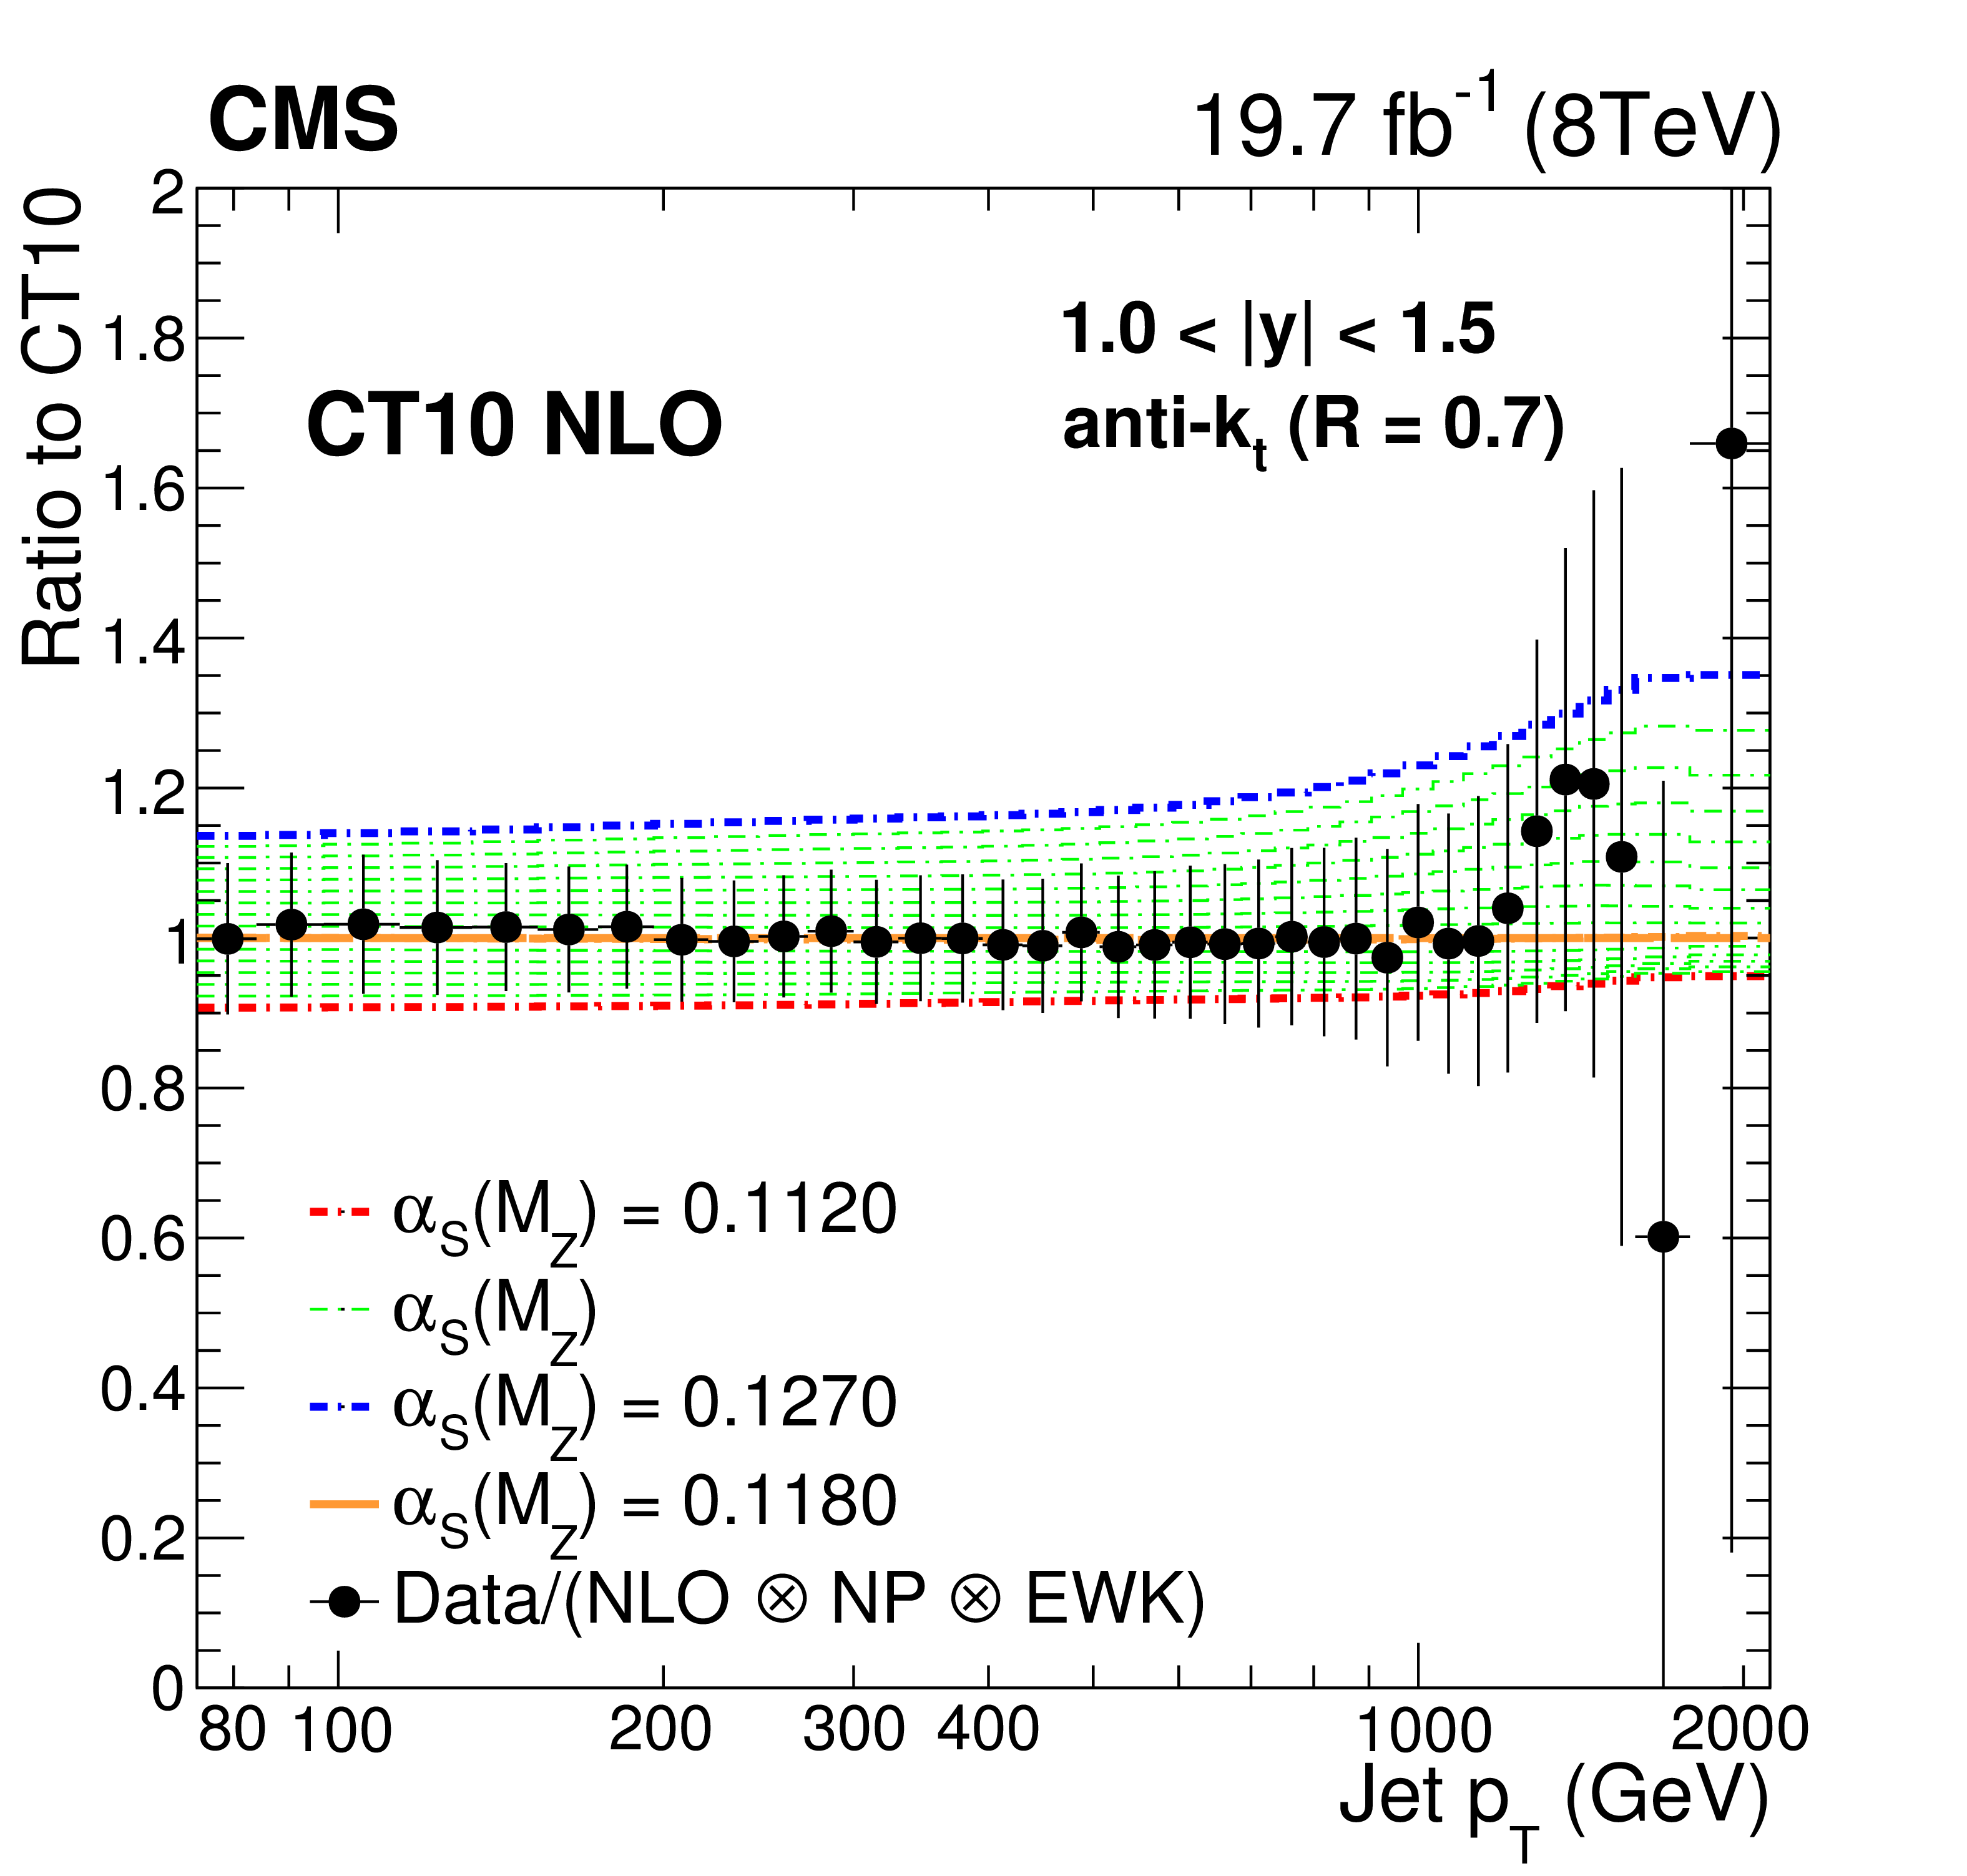
Figure 11-b:
Ratio of data over theory prediction (closed circles) using the CT10 NLO PDF set, with the default ${\alpha _\mathrm {S}(M_\mathrm {Z})}$ value of 0.118. Dashed lines represent the ratios of the predictions obtained with the CT10 PDF set evaluated with different ${\alpha _\mathrm {S}(M_\mathrm {Z})}$ values, to the central one. The error bars correspond to the total uncertainty of the data. |
png pdf |
Figure 11-c:
Ratio of data over theory prediction (closed circles) using the CT10 NLO PDF set, with the default ${\alpha _\mathrm {S}(M_\mathrm {Z})}$ value of 0.118. Dashed lines represent the ratios of the predictions obtained with the CT10 PDF set evaluated with different ${\alpha _\mathrm {S}(M_\mathrm {Z})}$ values, to the central one. The error bars correspond to the total uncertainty of the data. |

png pdf |
Figure 11-d:
Ratio of data over theory prediction (closed circles) using the CT10 NLO PDF set, with the default ${\alpha _\mathrm {S}(M_\mathrm {Z})}$ value of 0.118. Dashed lines represent the ratios of the predictions obtained with the CT10 PDF set evaluated with different ${\alpha _\mathrm {S}(M_\mathrm {Z})}$ values, to the central one. The error bars correspond to the total uncertainty of the data. |
png pdf |
Figure 11-e:
Ratio of data over theory prediction (closed circles) using the CT10 NLO PDF set, with the default ${\alpha _\mathrm {S}(M_\mathrm {Z})}$ value of 0.118. Dashed lines represent the ratios of the predictions obtained with the CT10 PDF set evaluated with different ${\alpha _\mathrm {S}(M_\mathrm {Z})}$ values, to the central one. The error bars correspond to the total uncertainty of the data. |

png pdf |
Figure 11-f:
Ratio of data over theory prediction (closed circles) using the CT10 NLO PDF set, with the default ${\alpha _\mathrm {S}(M_\mathrm {Z})}$ value of 0.118. Dashed lines represent the ratios of the predictions obtained with the CT10 PDF set evaluated with different ${\alpha _\mathrm {S}(M_\mathrm {Z})}$ values, to the central one. The error bars correspond to the total uncertainty of the data. |
png pdf |
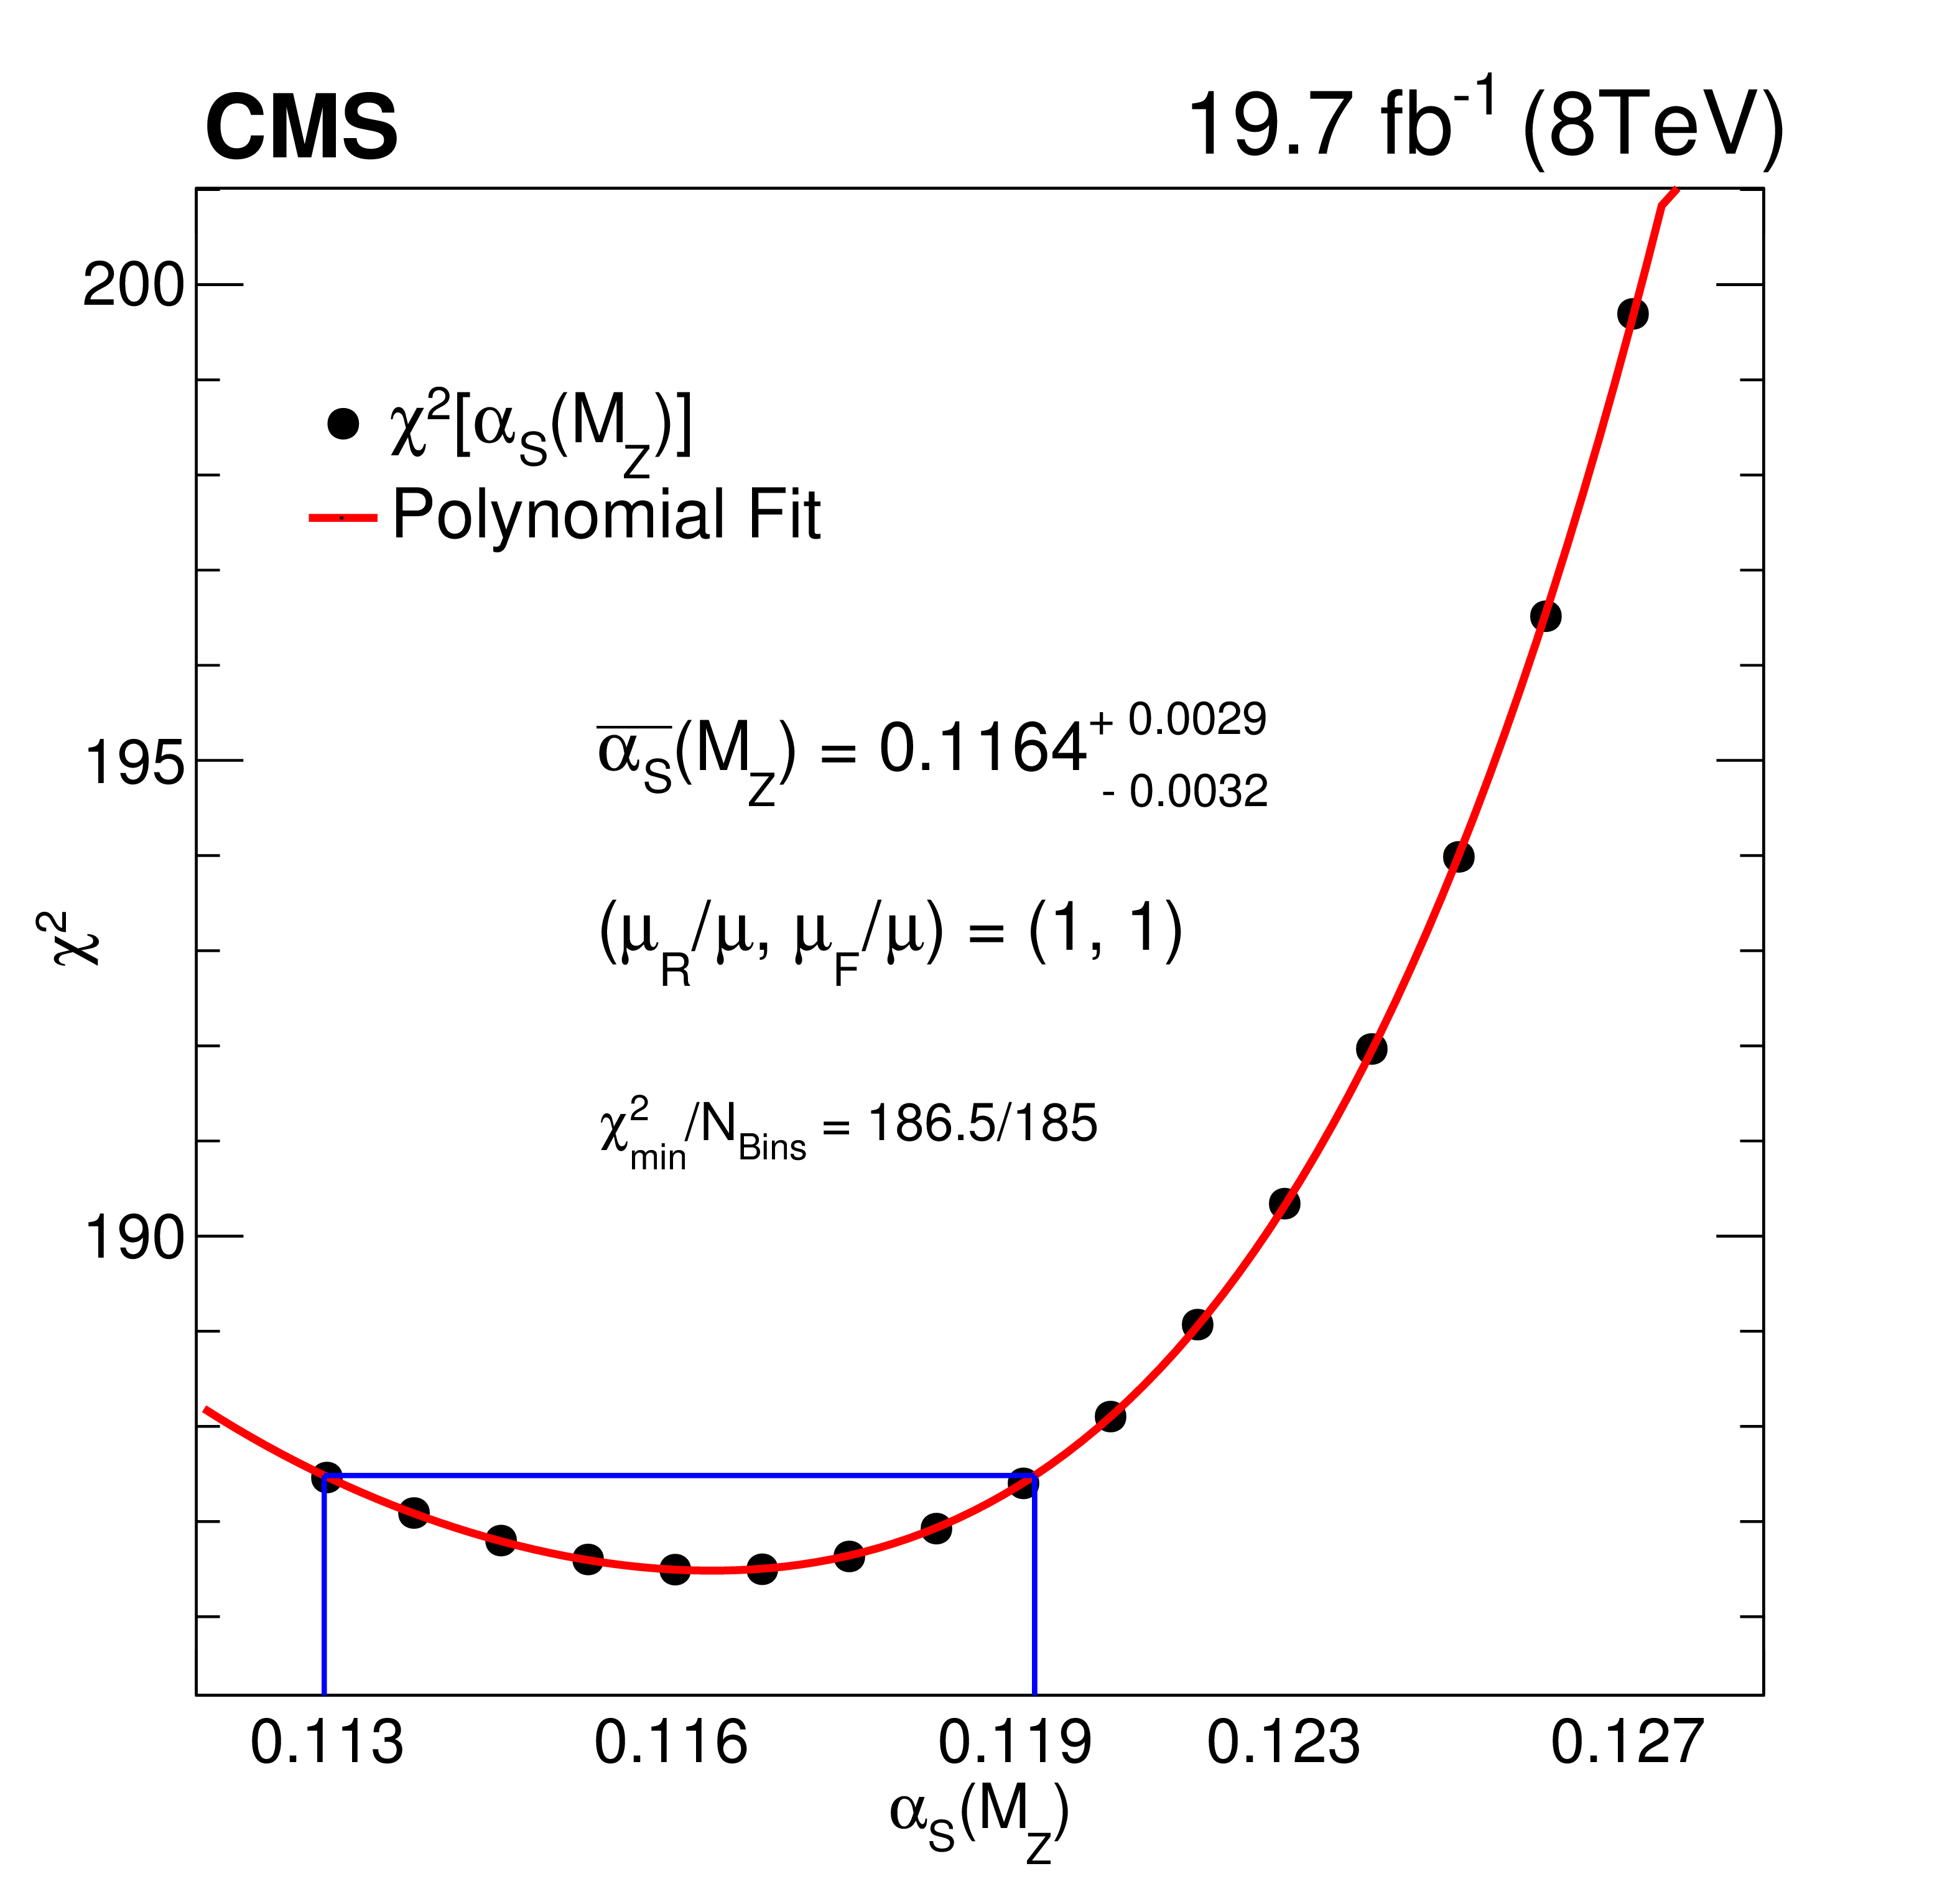
Figure 12:
The $\chi ^2$ minimization with respect to ${\alpha _\mathrm {S}(M_\mathrm {Z})}$ by using the CT10 NLO PDF set and data from all rapidity bins. The uncertainty is obtained from the ${\alpha _\mathrm {S}(M_\mathrm {Z})}$ values for which $\chi ^2$ is increased by one with respect to the minimum value, indicated by the box. The curve corresponds to a fourth-degree polynomial fit through the available $\chi ^2$ points. |
png pdf |
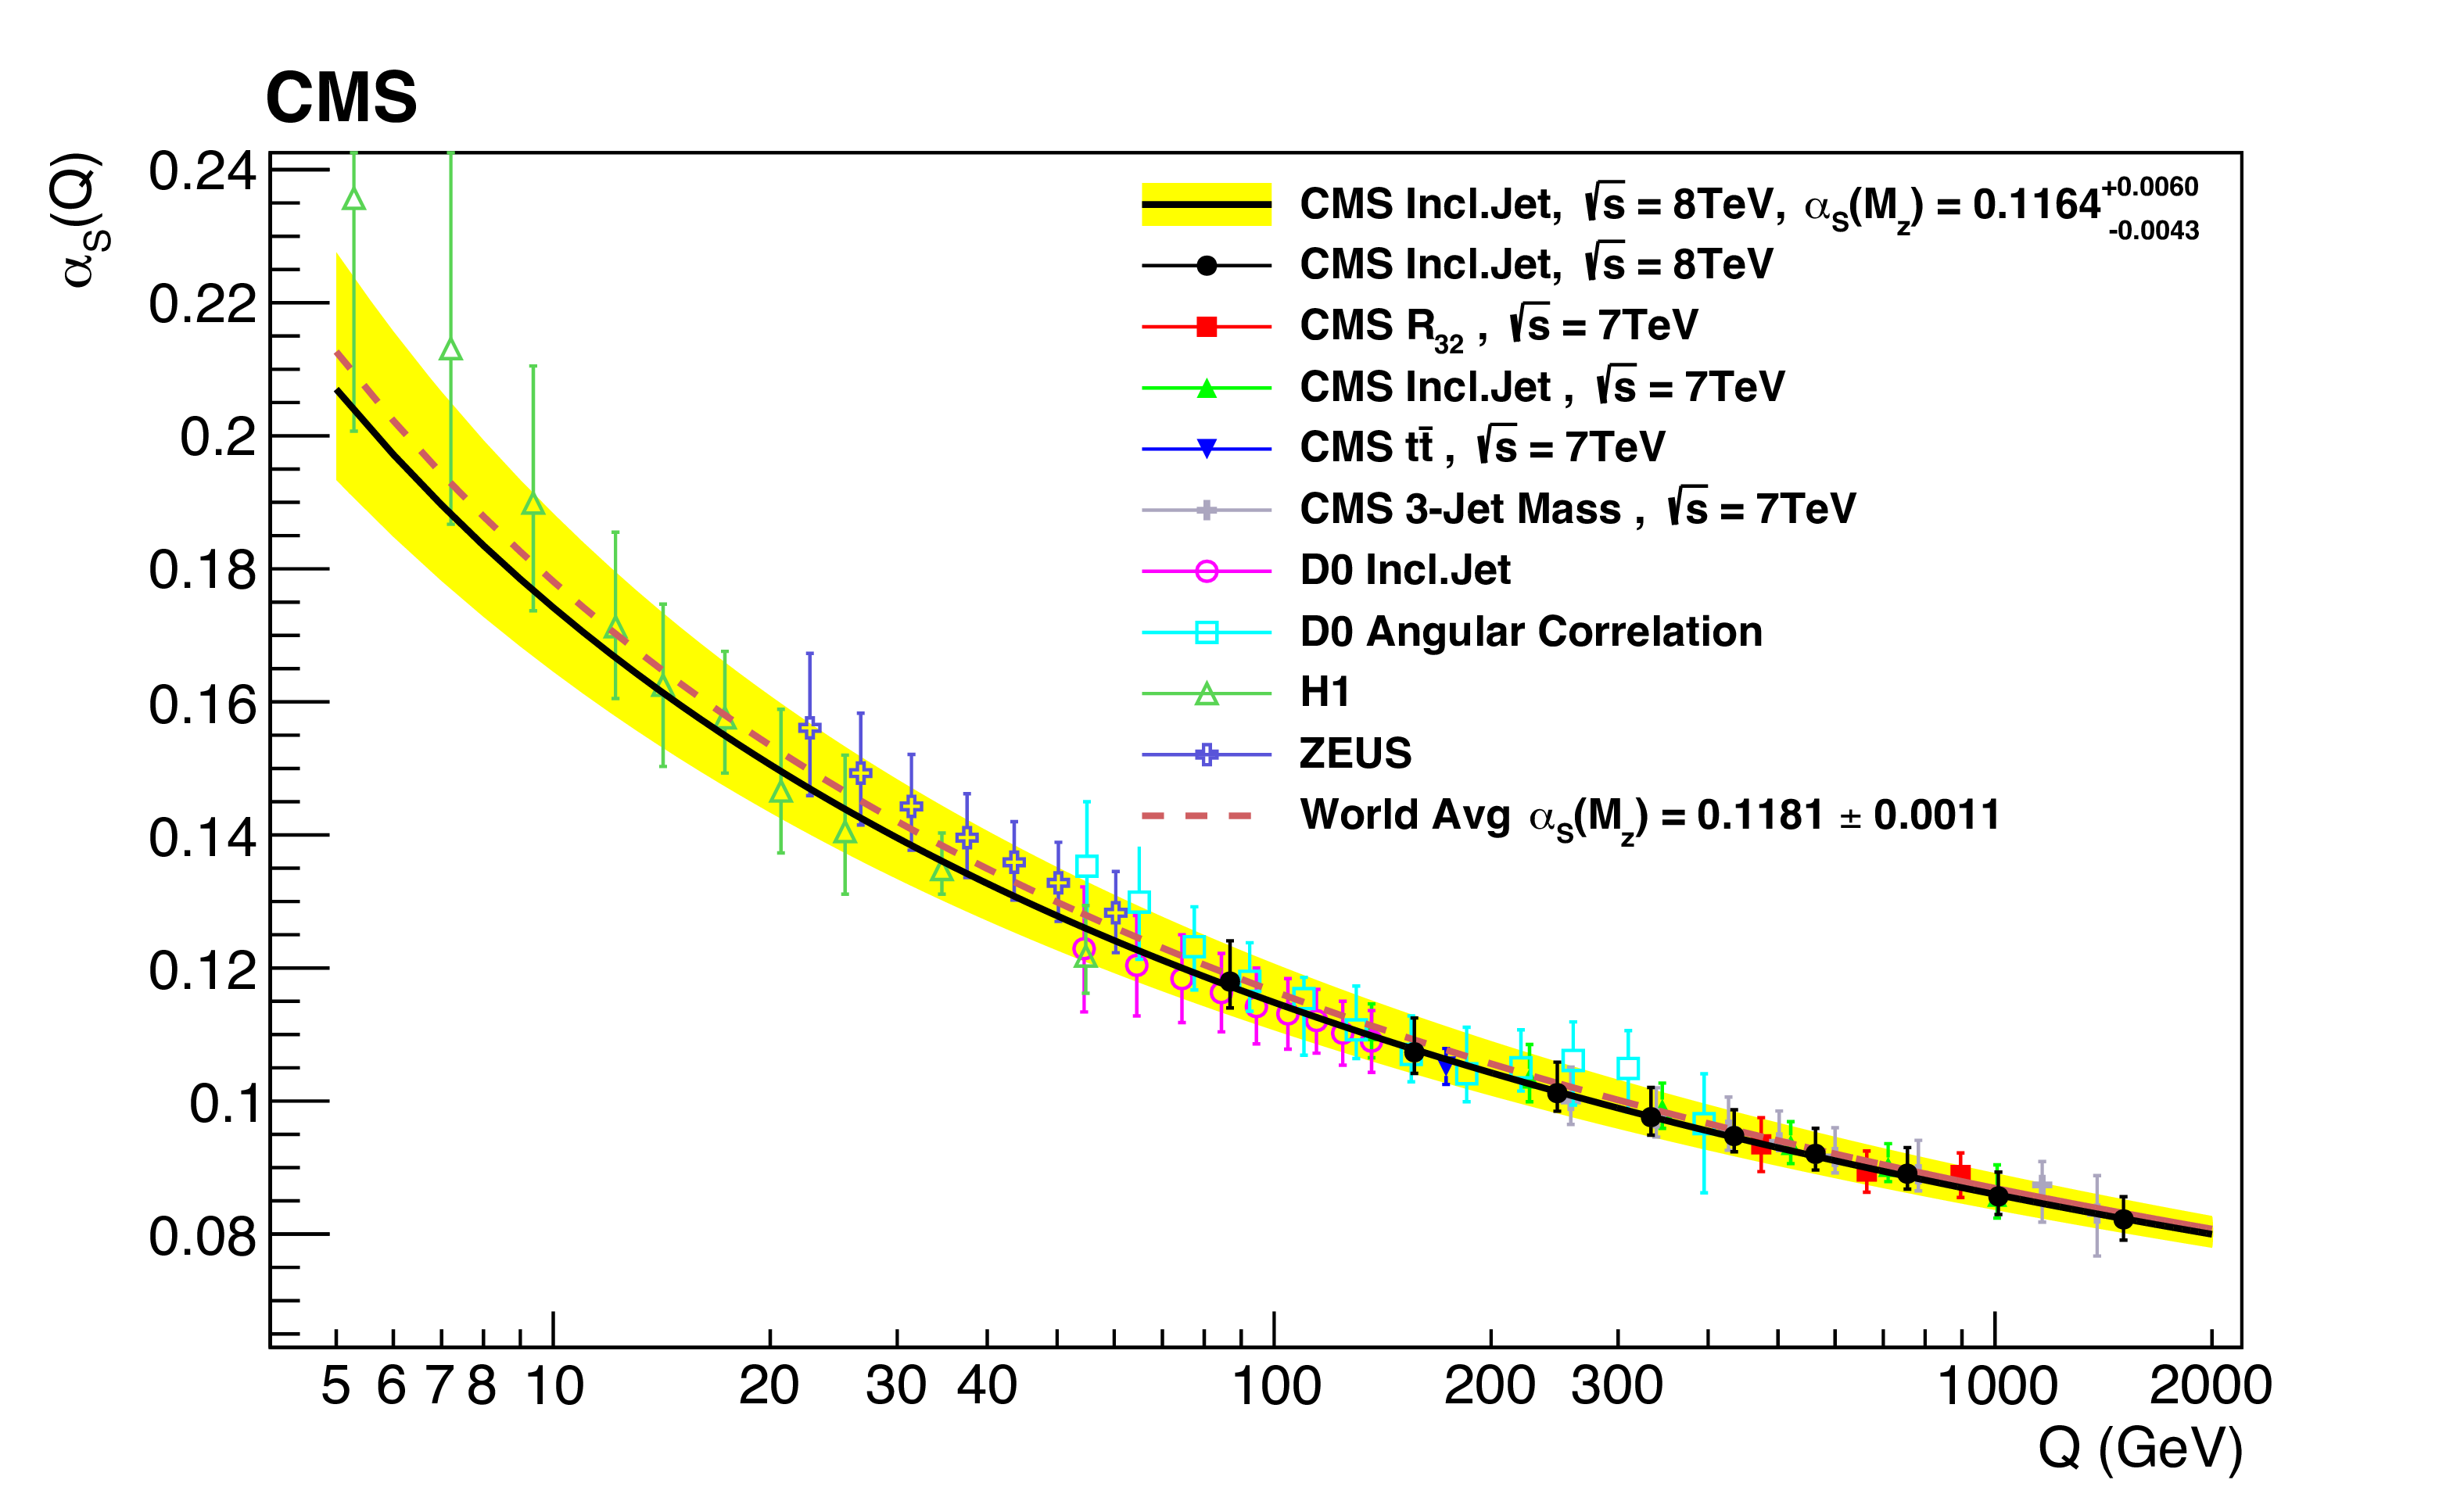
Figure 13:
The running ${\alpha _\mathrm {S}(Q)}$ as a function of the scale $Q$ is shown, as obtained by using the CT10 NLO PDF set. The solid line and the uncertainty band are obtained by evolving the extracted ${\alpha _\mathrm {S}(M_\mathrm {Z})}$ values by using the 2-loop 5-flavour renormalization group equations. The dashed line represents the evolution of the world average value. The black dots in the figure show the numbers obtained from the $ \sqrt{s} = $ 8 TeV inclusive jet measurement. Results from other CMS [53,54,55], D0 [49,50], H1 [56,57], and ZEUS [58] measurements are superimposed. |
png pdf |
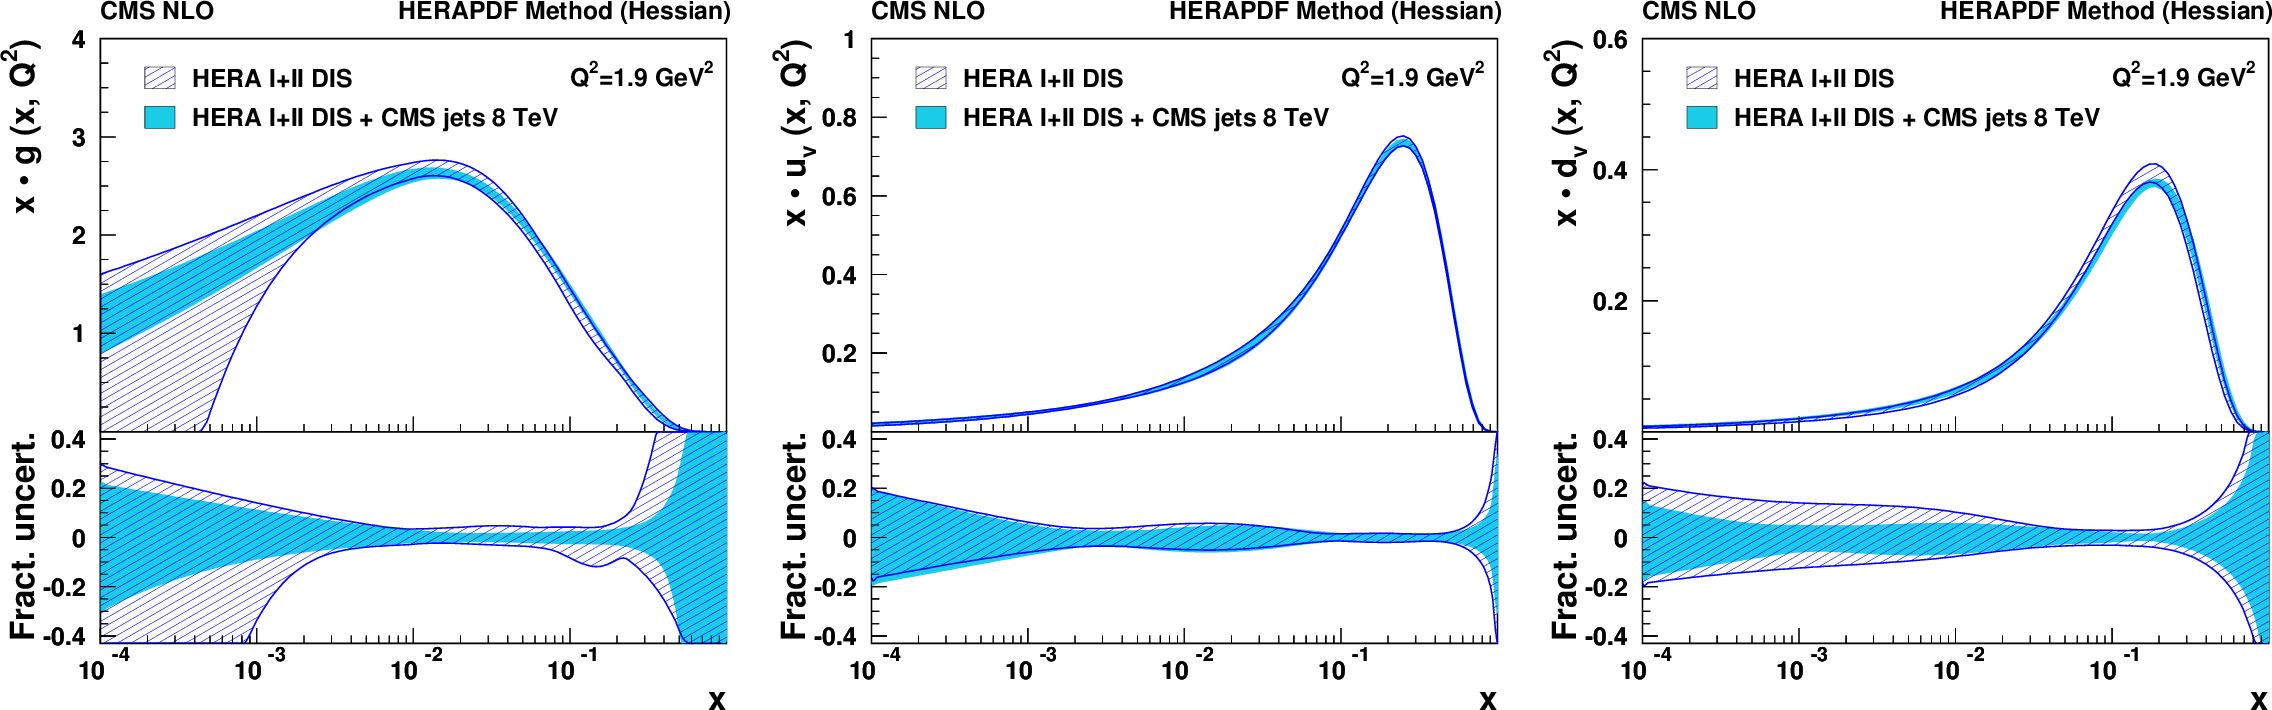
Figure 14:
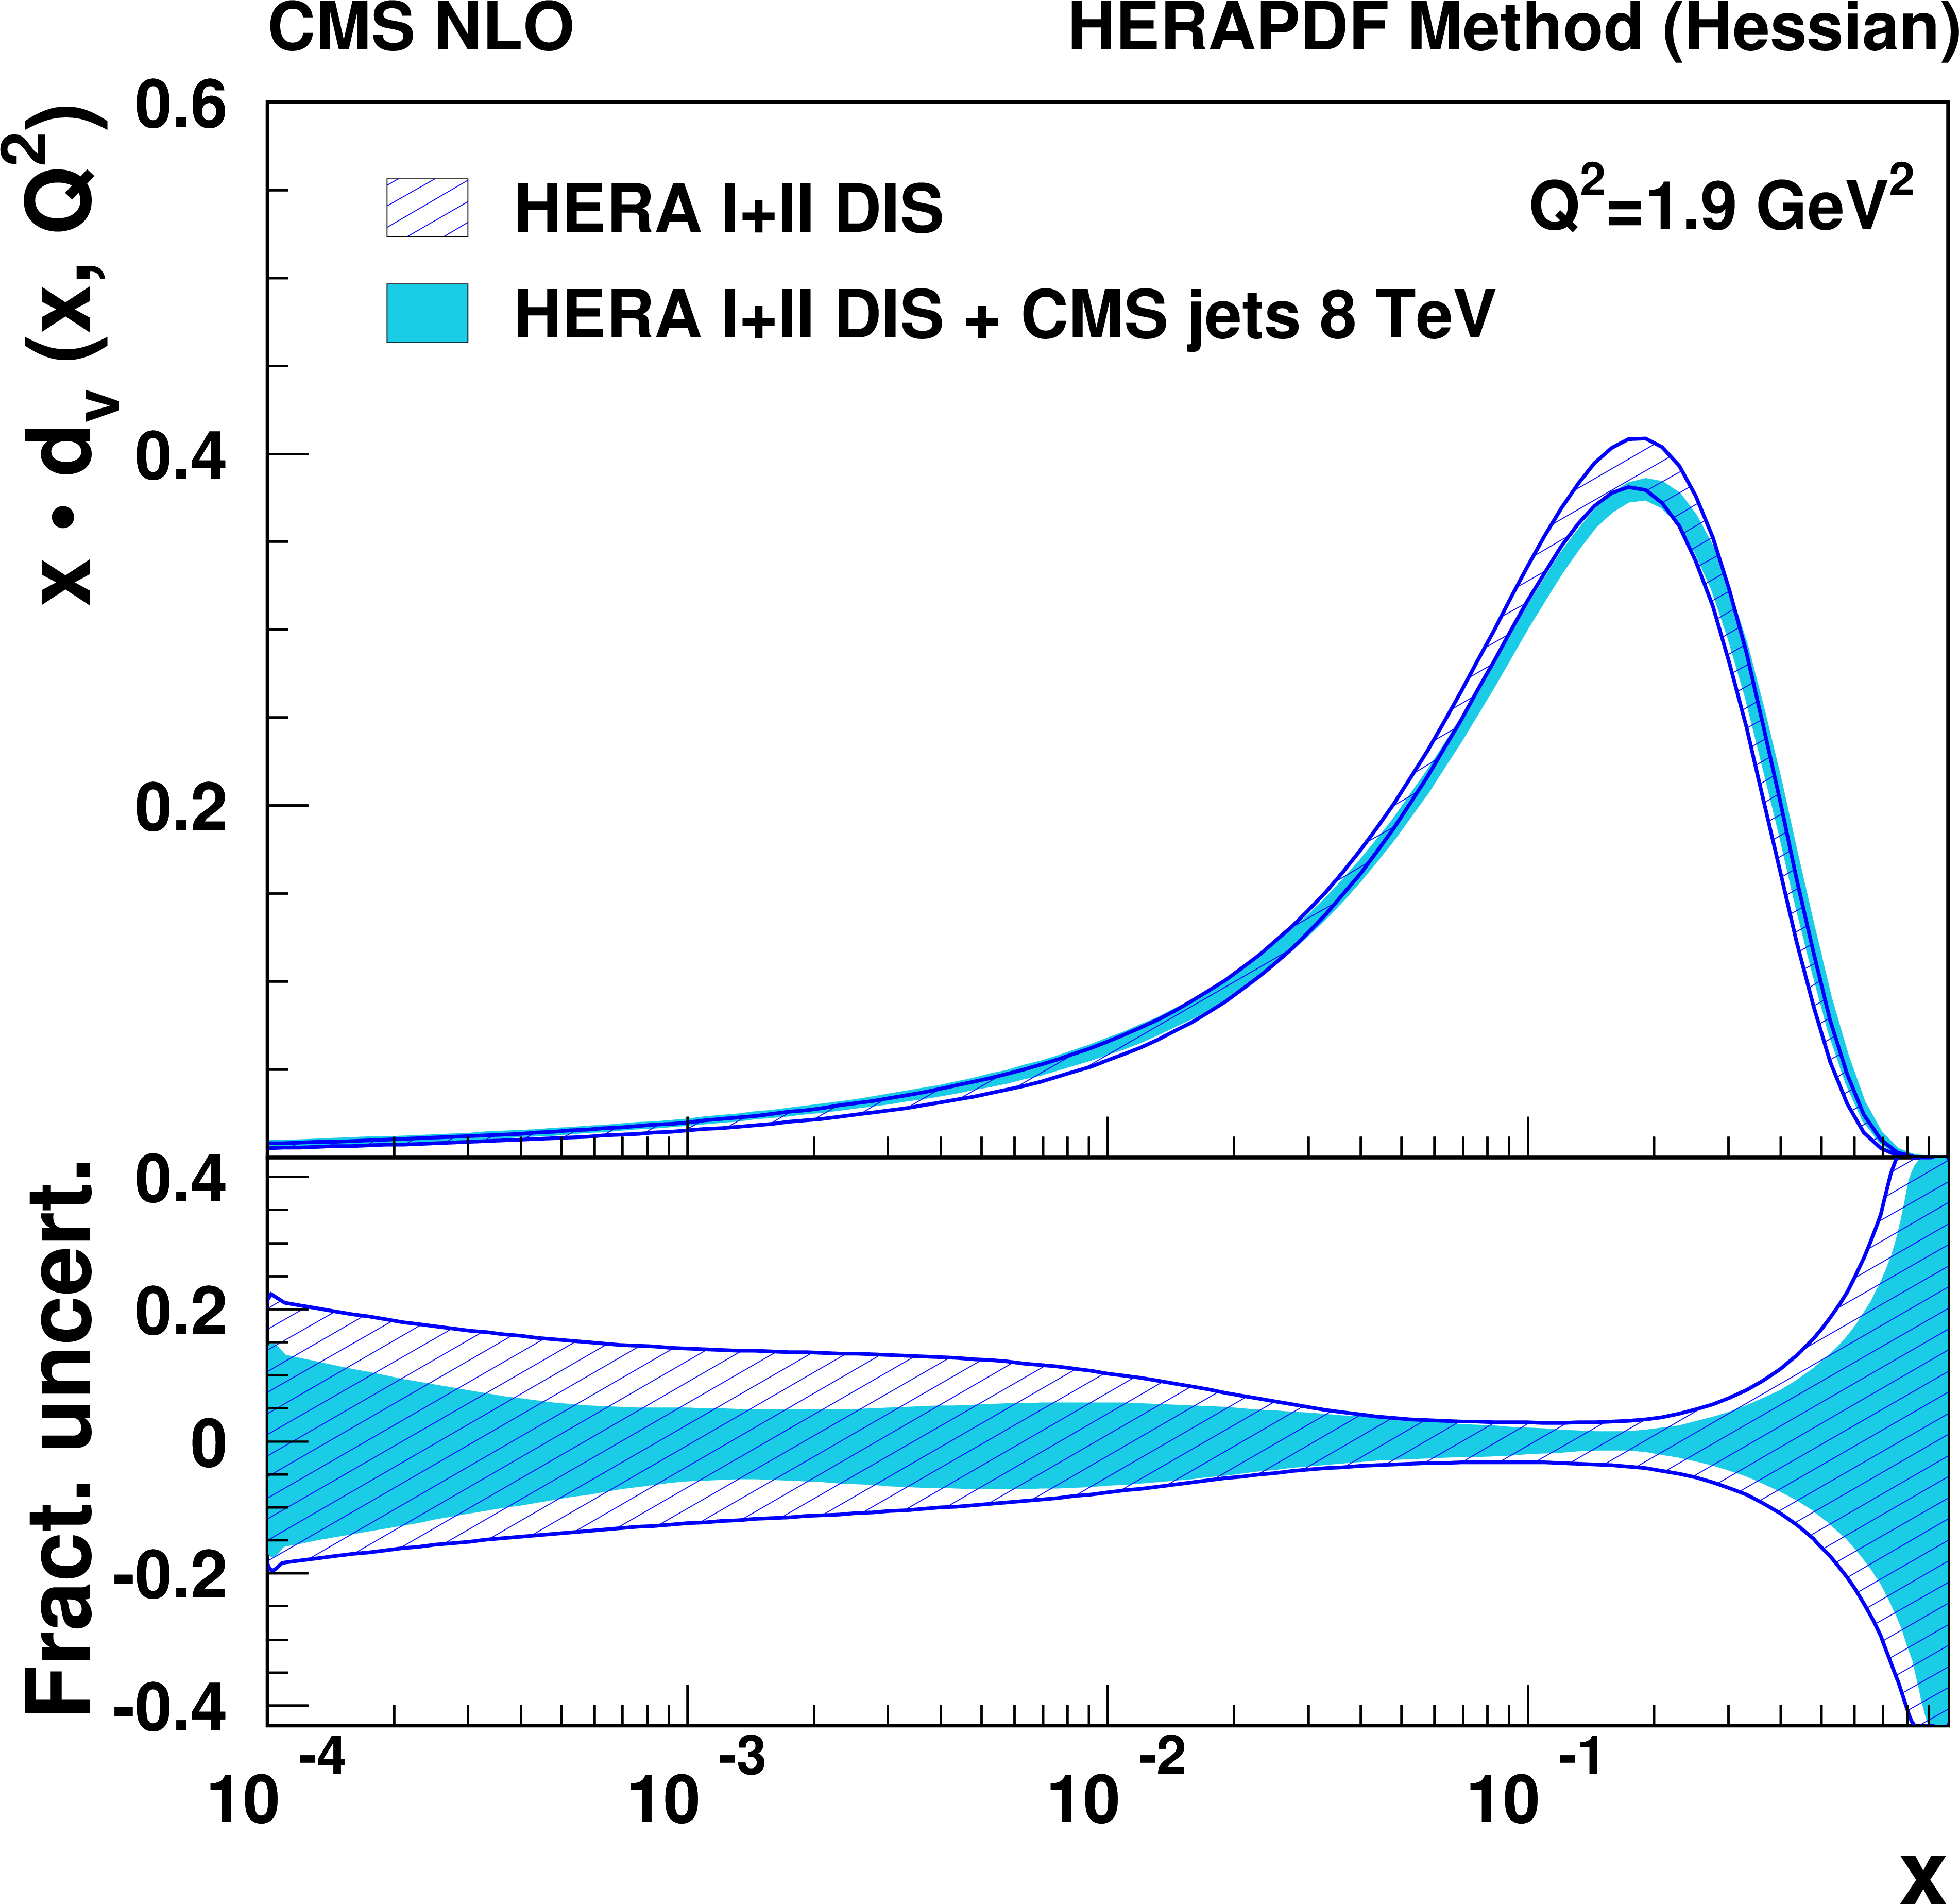
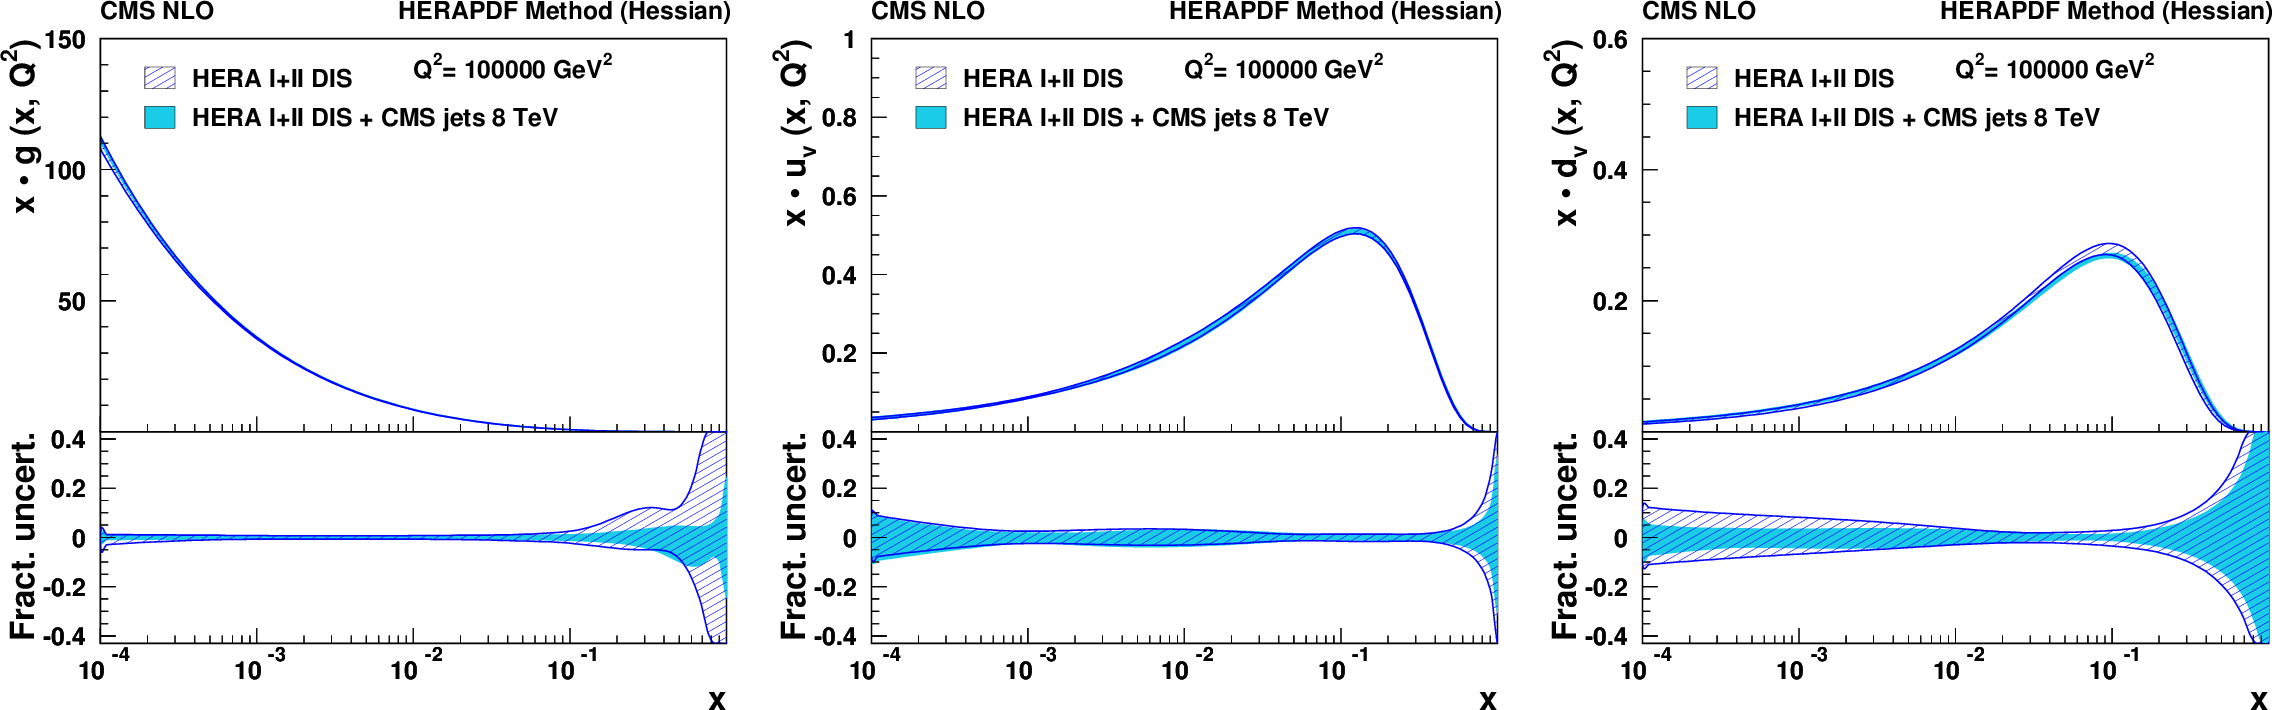
Gluon (left), u-valence quark (middle), and d-valence quark (right) distributions as functions of $x$ at the starting scale $Q^2=$ 1.9 GeV$ ^2$. The results of the fit to the HERA data and inclusive jet measurements at 8 TeV (shaded band), and to HERA data only (hatched band) are compared with their total uncertainties as determined by using the HERAPDF method. In the bottom panels the fractional uncertainties are shown. |

png pdf |
Figure 14-a:
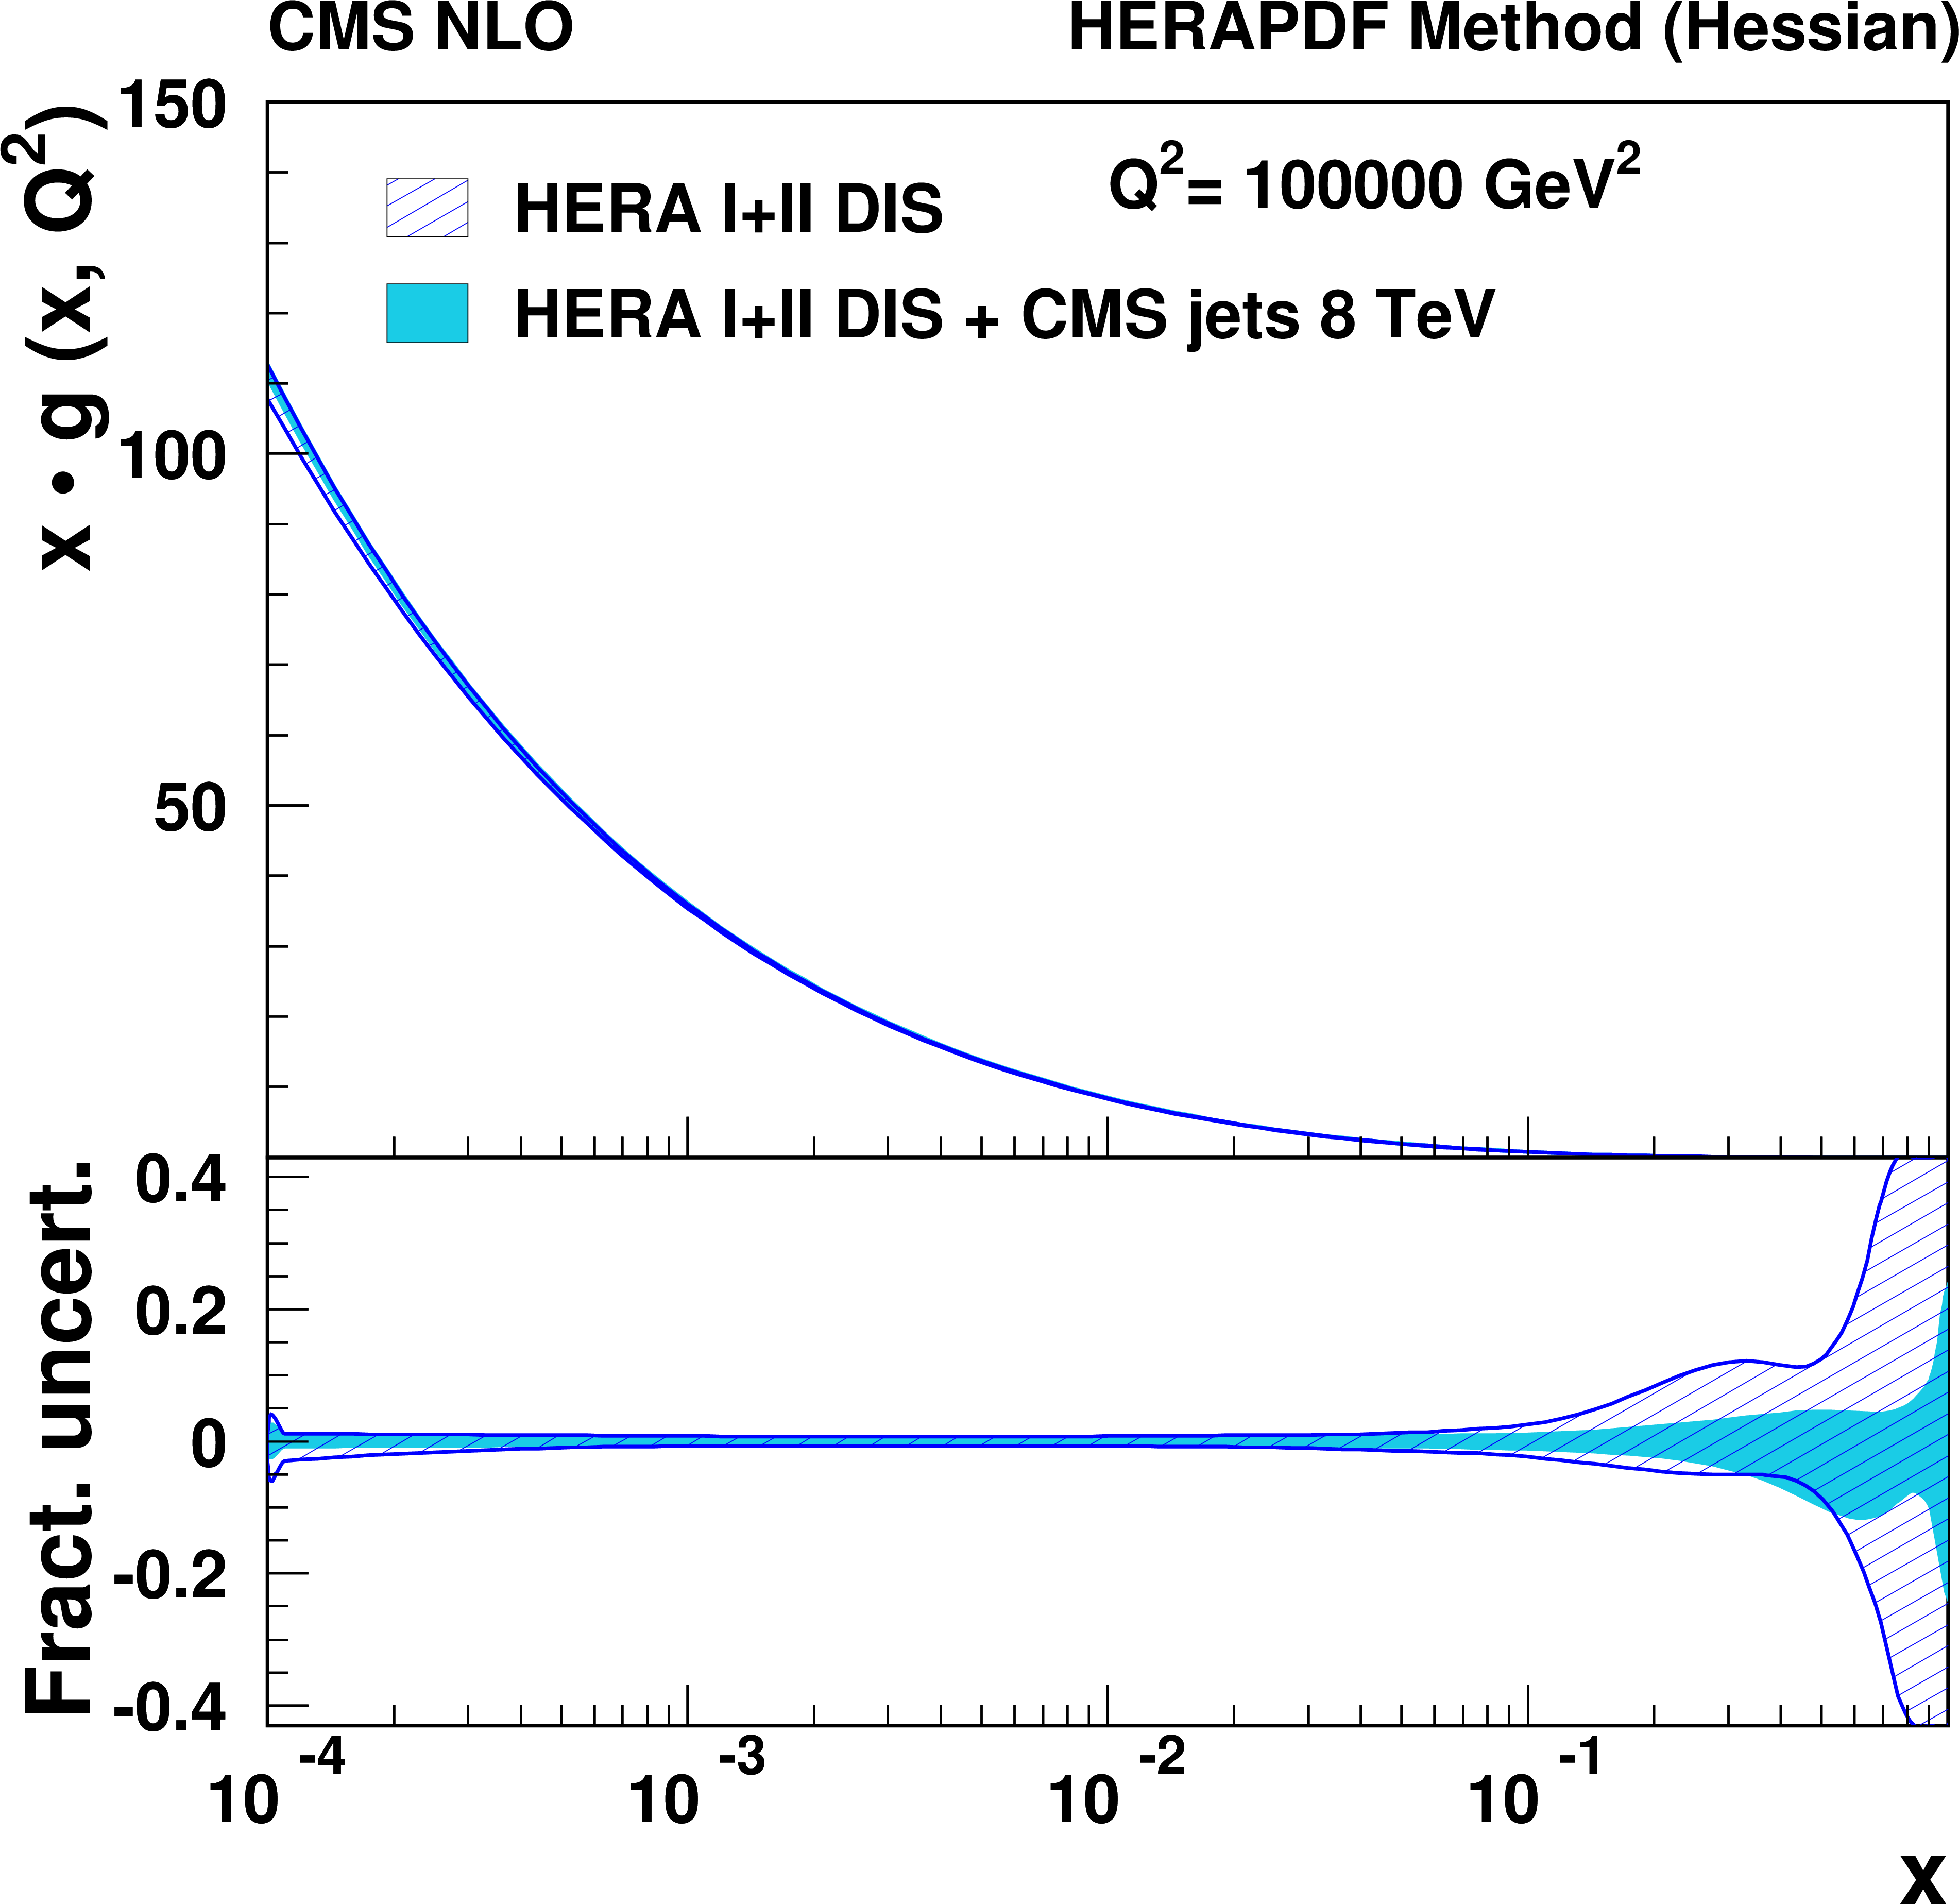
Gluon distribution as functions of $x$ at the starting scale $Q^2=$ 1.9 GeV$ ^2$. The results of the fit to the HERA data and inclusive jet measurements at 8 TeV (shaded band), and to HERA data only (hatched band) are compared with their total uncertainties as determined by using the HERAPDF method. In the bottom panel the fractional uncertainties are shown. |

png pdf |
Figure 14-b:
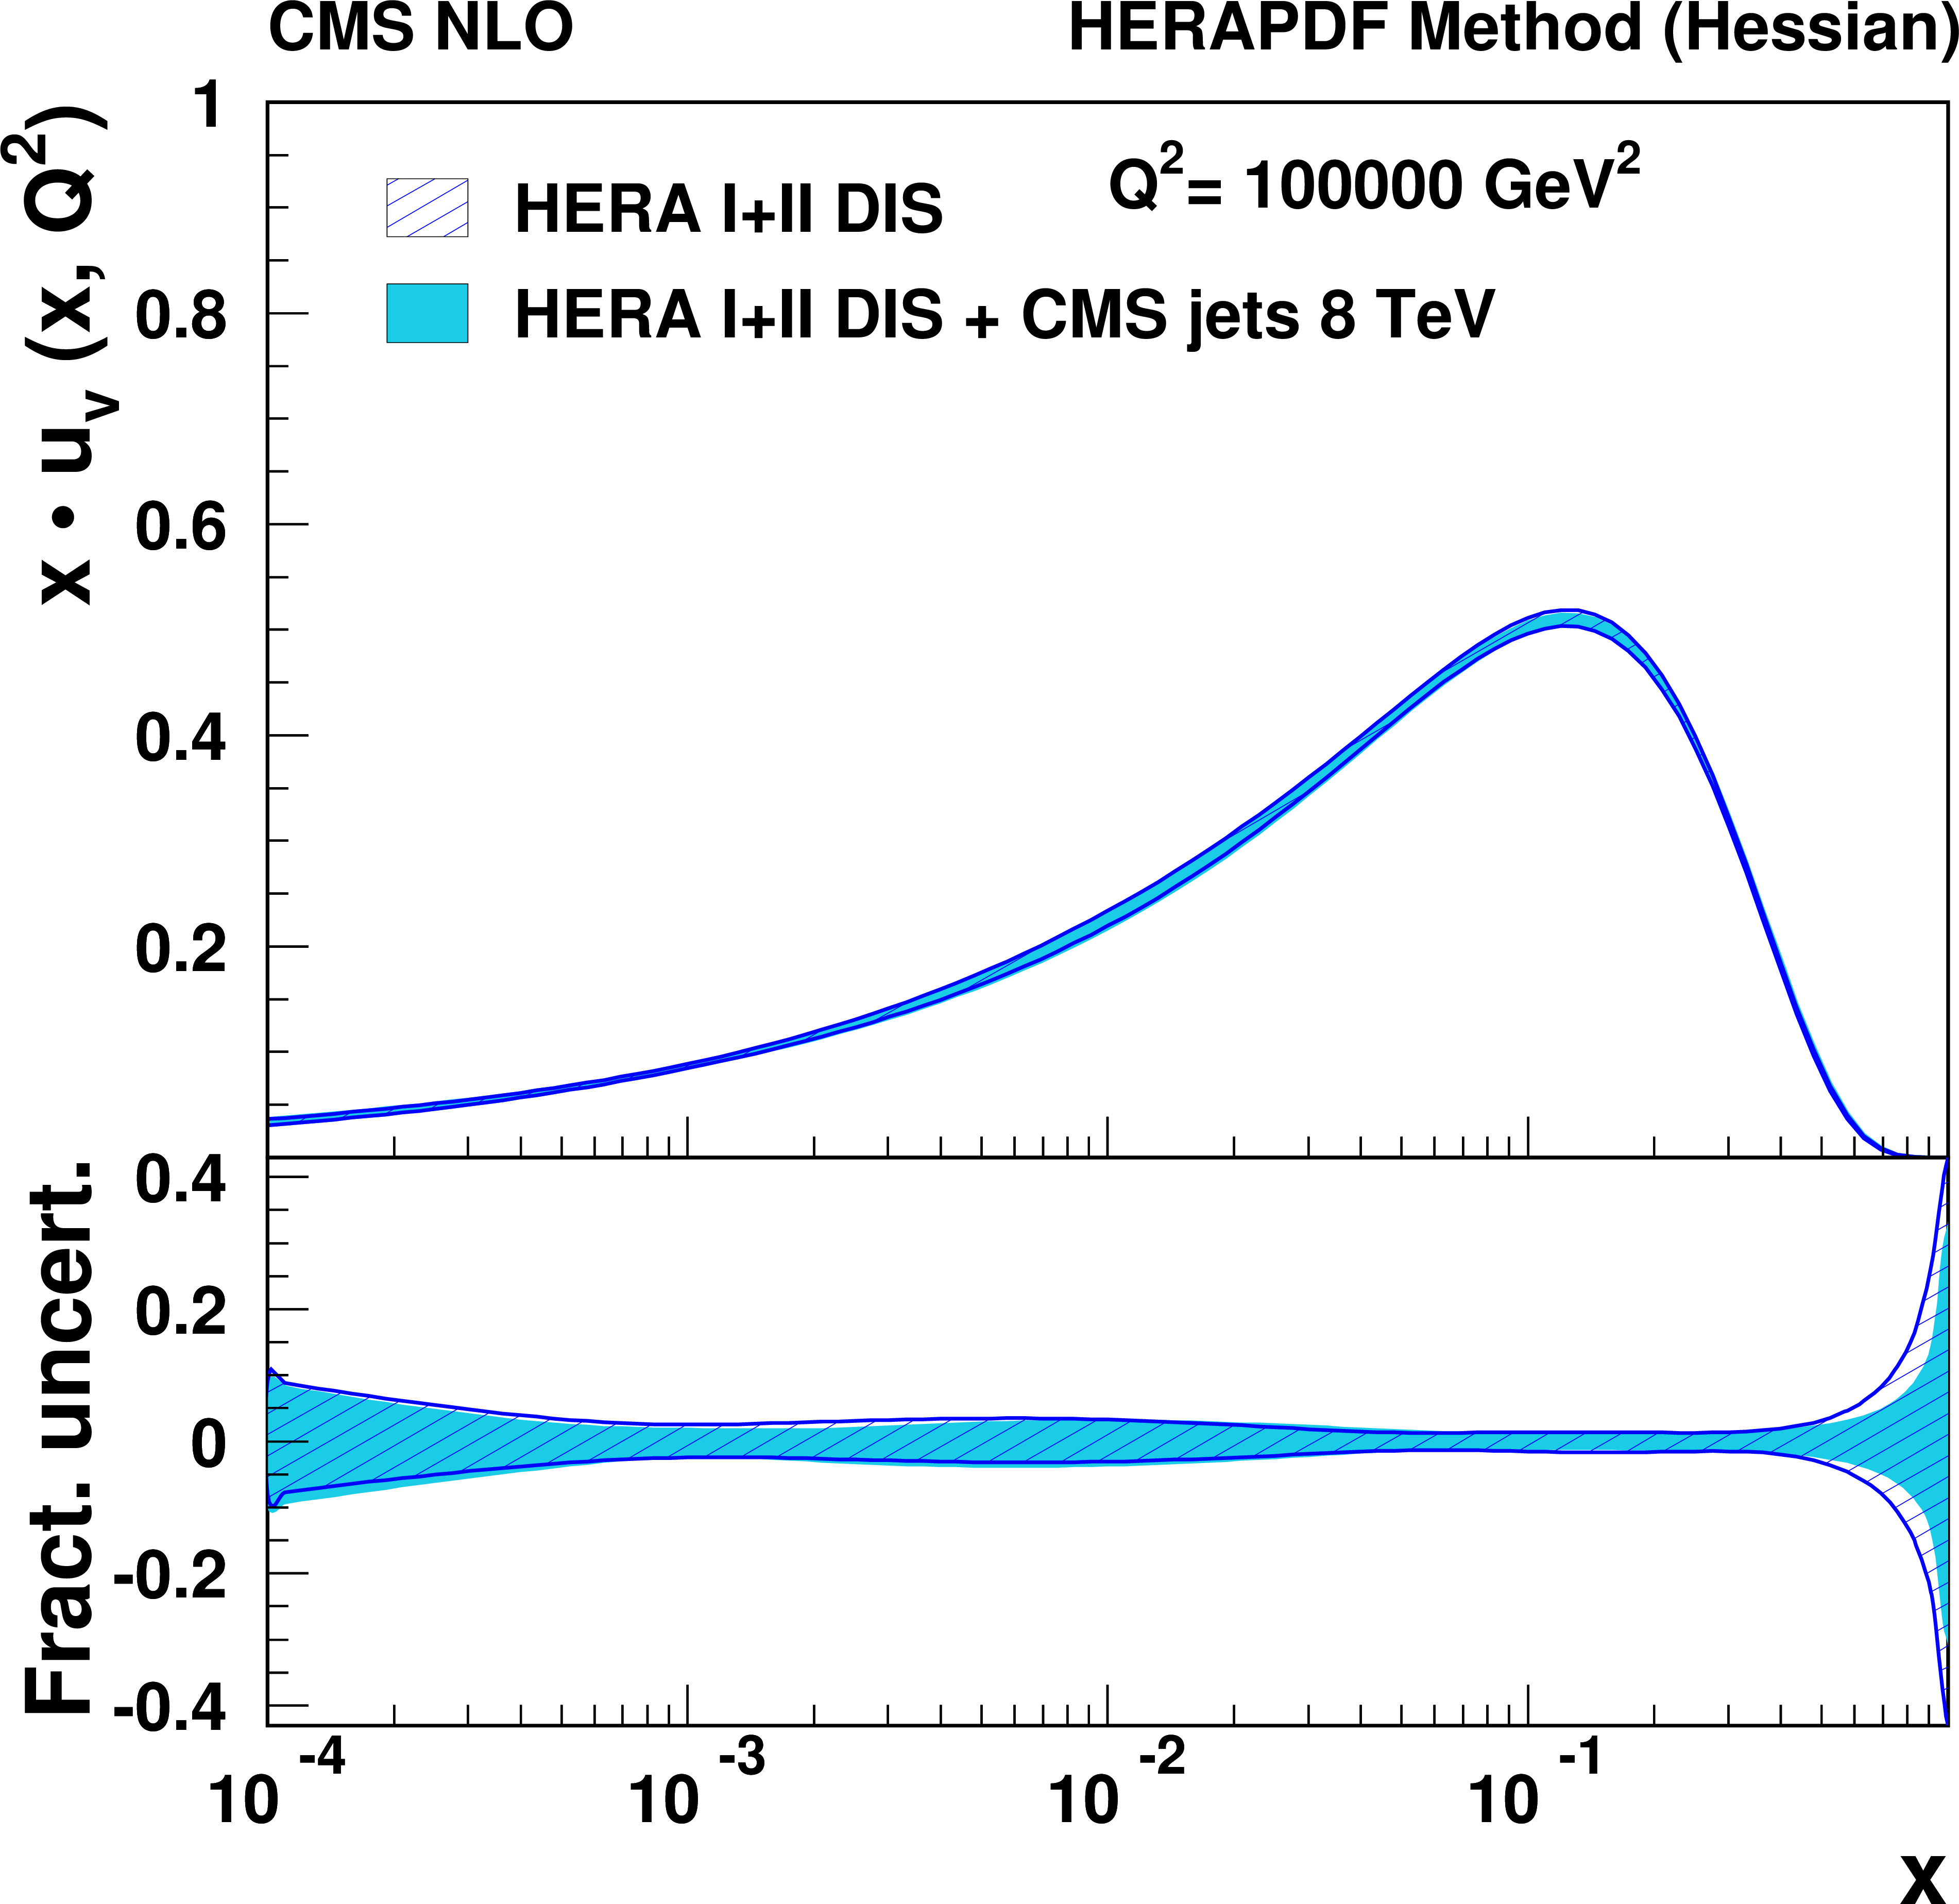
u-valence quark distribution as functions of $x$ at the starting scale $Q^2=$ 1.9 GeV$ ^2$. The results of the fit to the HERA data and inclusive jet measurements at 8 TeV (shaded band), and to HERA data only (hatched band) are compared with their total uncertainties as determined by using the HERAPDF method. In the bottom panel the fractional uncertainties are shown. |
png pdf |
Figure 14-c:
d-valence quark distribution as functions of $x$ at the starting scale $Q^2=$ 1.9 GeV$ ^2$. The results of the fit to the HERA data and inclusive jet measurements at 8 TeV (shaded band), and to HERA data only (hatched band) are compared with their total uncertainties as determined by using the HERAPDF method. In the bottom panel the fractional uncertainties are shown. |
png pdf |
Figure 15:
Same as Fig. 14, but for the scale of $Q^2=10^5$ GeV$ ^2$. |
png pdf |
Figure 15-a:
Same as Fig. 14-a, but for the scale of $Q^2=10^5$ GeV$ ^2$. |
png pdf |
Figure 15-b:
Same as Fig. 14-b, but for the scale of $Q^2=10^5$ GeV$ ^2$. |

png pdf |
Figure 15-c:
Same as Fig. 14-c, but for the scale of $Q^2=10^5$ GeV$ ^2$. |
png pdf |
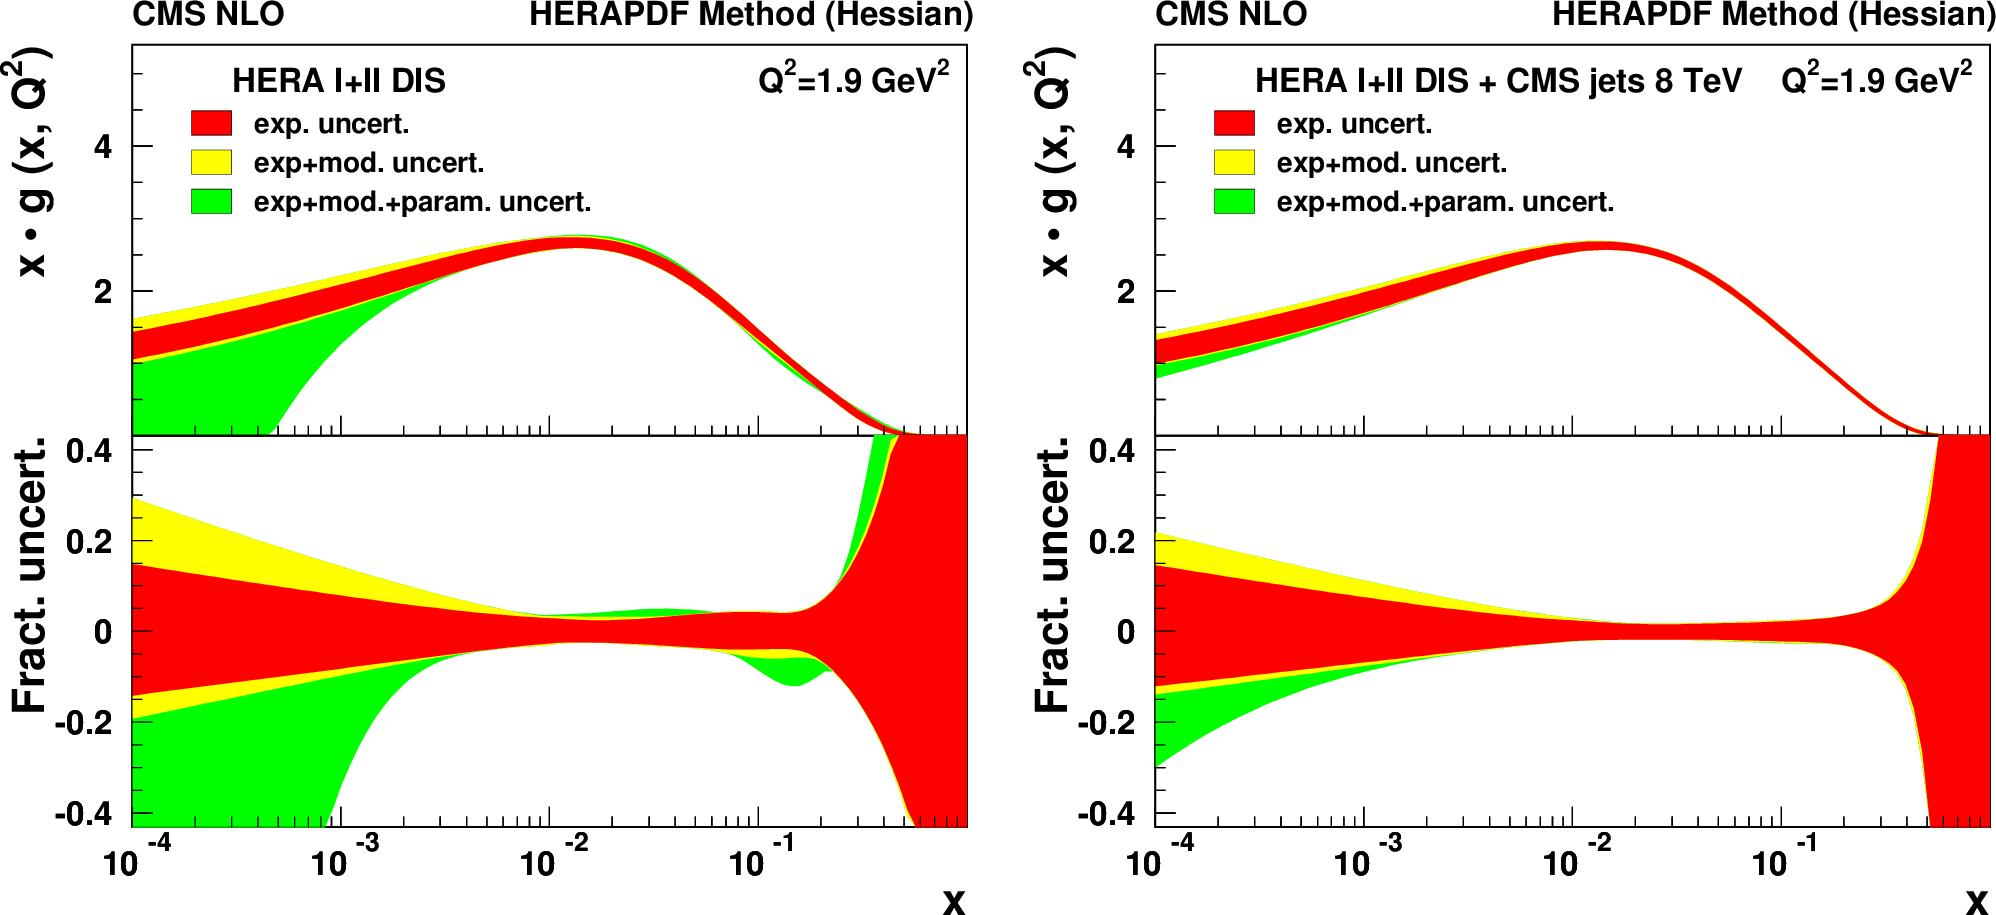
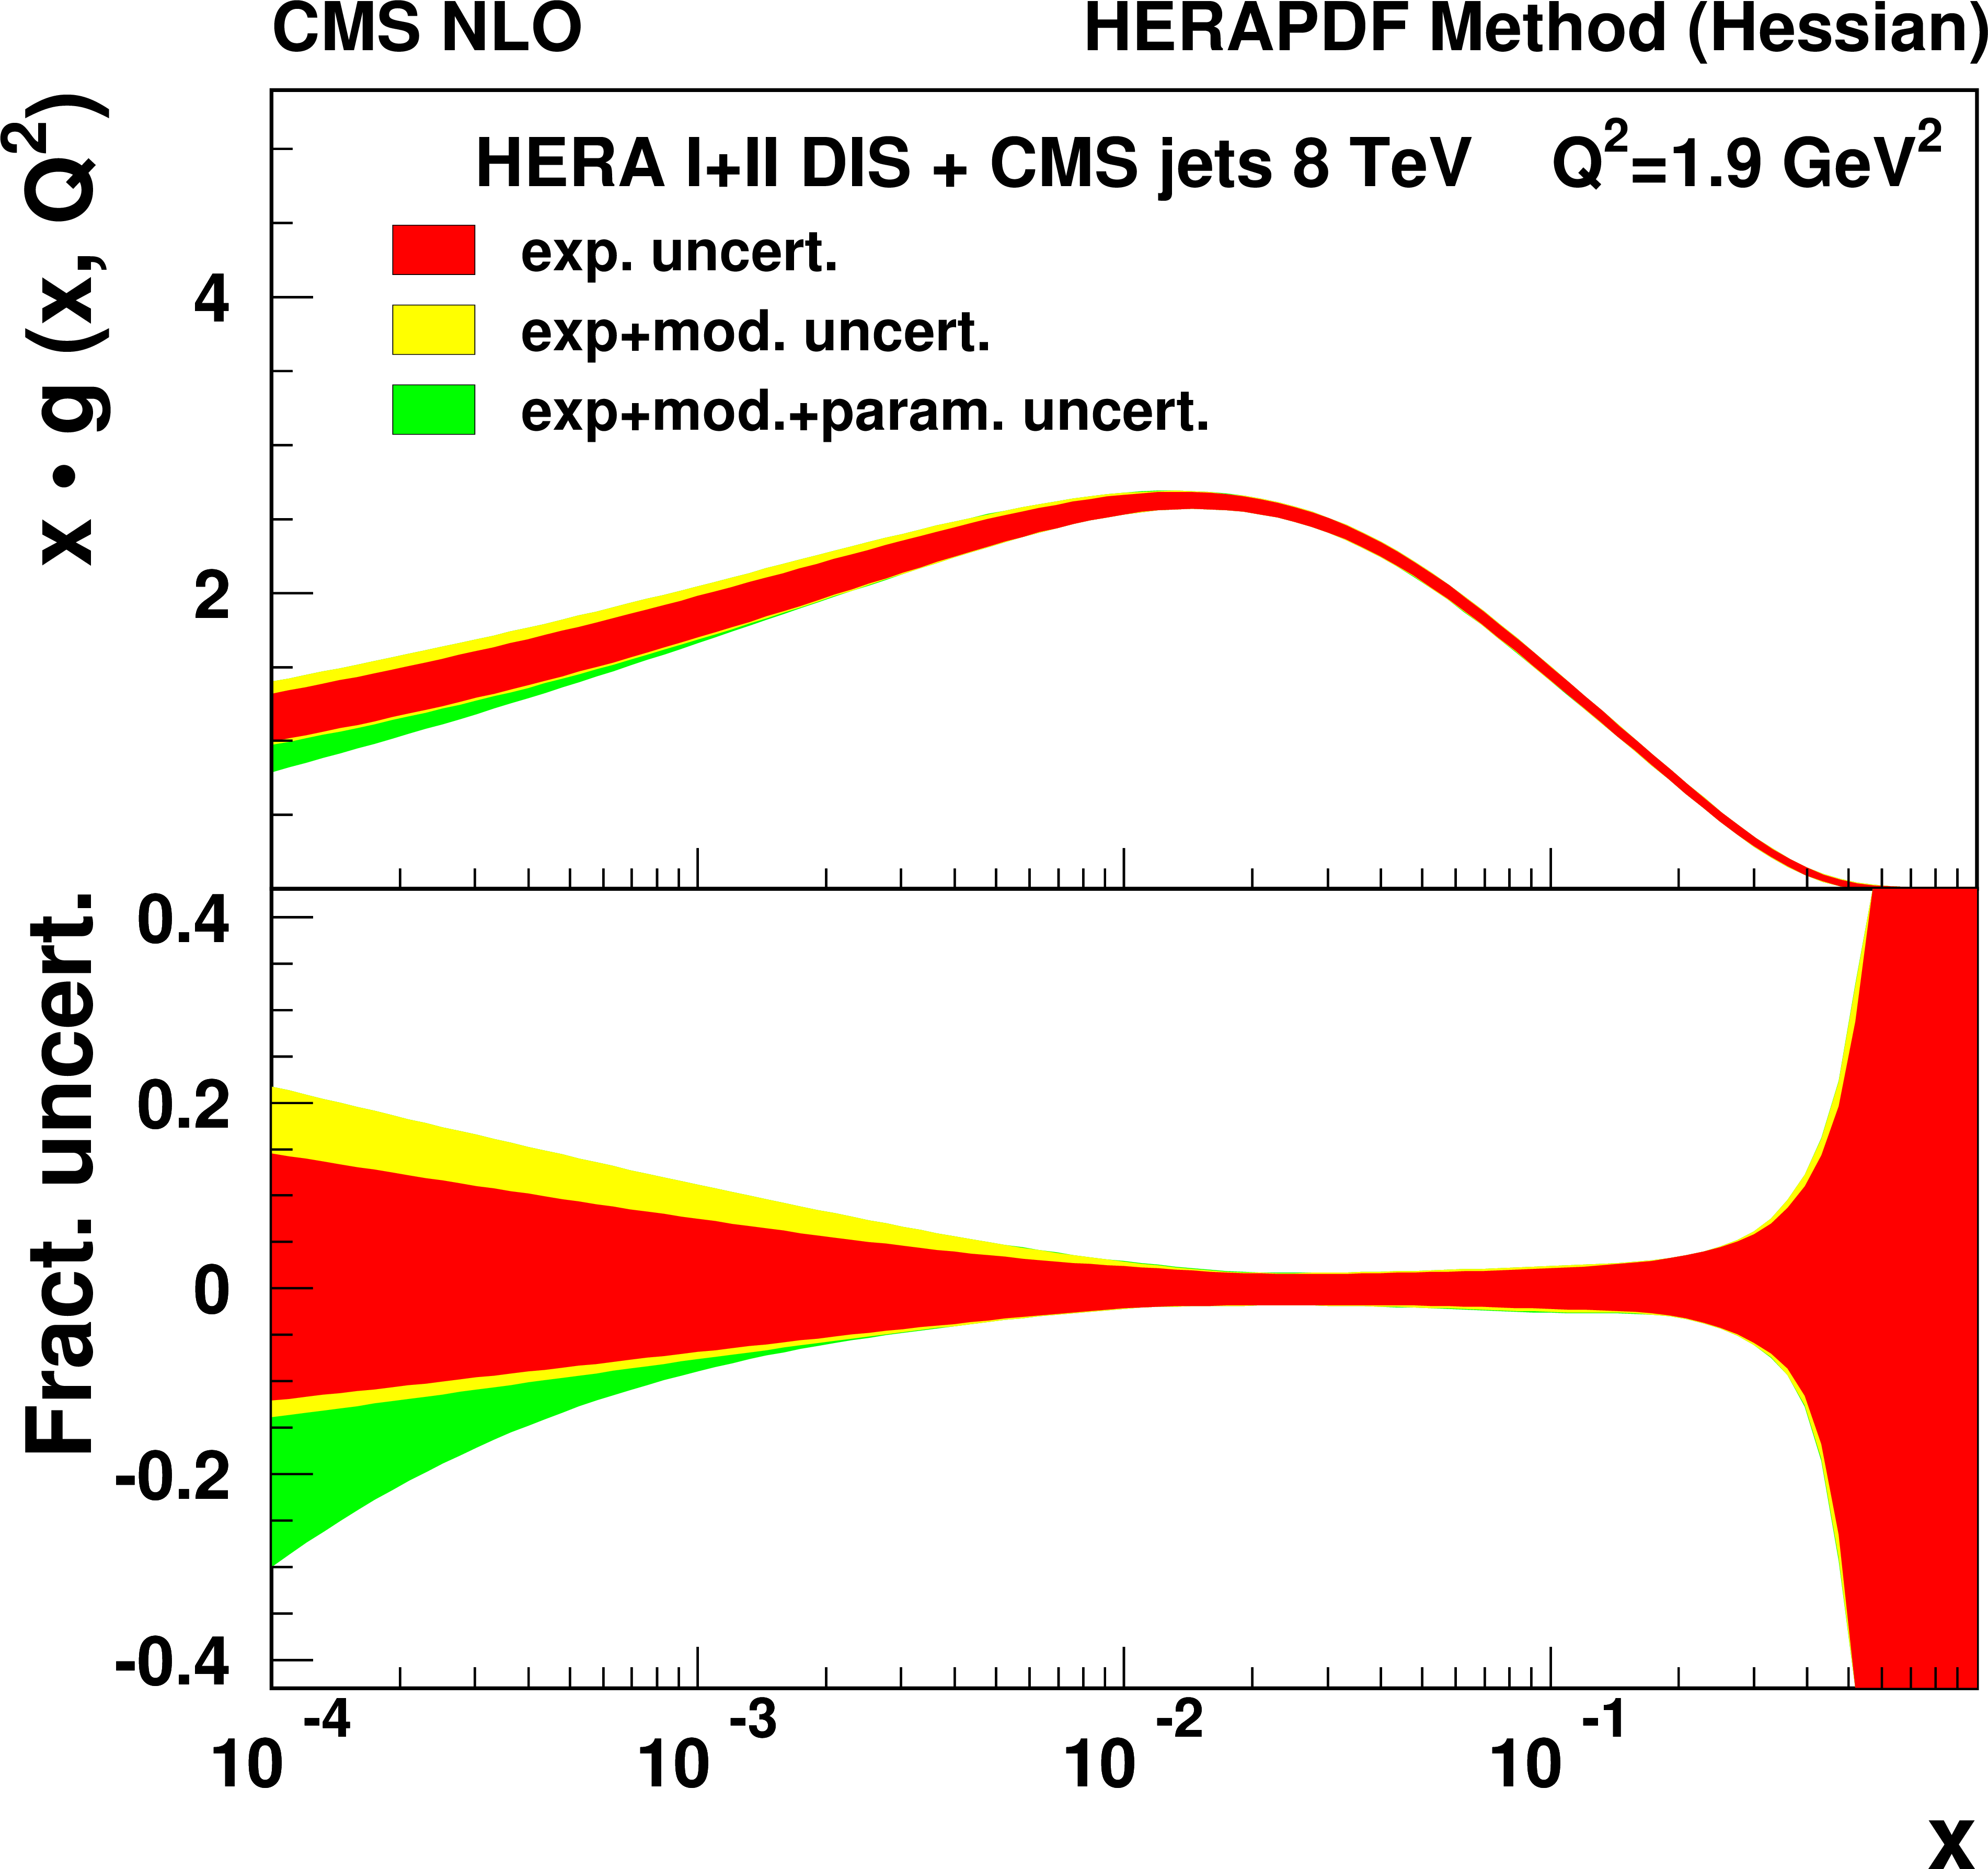
Figure 16:
Gluon PDF distribution as a function of $x$ at the starting scale $Q^2= $ 1.9 GeV$ ^2$ as derived from HERA inclusive DIS (left) and in combination with CMS inclusive jet data (right). Different contributions to the PDF uncertainty are represented by bands of different shades. In the bottom panels the fractional uncertainties are shown. |

png pdf |
Figure 16-a:
Gluon PDF distribution as a function of $x$ at the starting scale $Q^2= $ 1.9 GeV$ ^2$ as derived from HERA inclusive DIS. Different contributions to the PDF uncertainty are represented by bands of different shades. In the bottom panel the fractional uncertainties are shown. |
png pdf |
Figure 16-b:
Gluon PDF distribution as a function of $x$ at the starting scale $Q^2= $ 1.9 GeV$ ^2$ as derived from HERA inclusive DIS in combination with CMS inclusive jet data. Different contributions to the PDF uncertainty are represented by bands of different shades. In the bottom panel the fractional uncertainties are shown. |
png pdf |
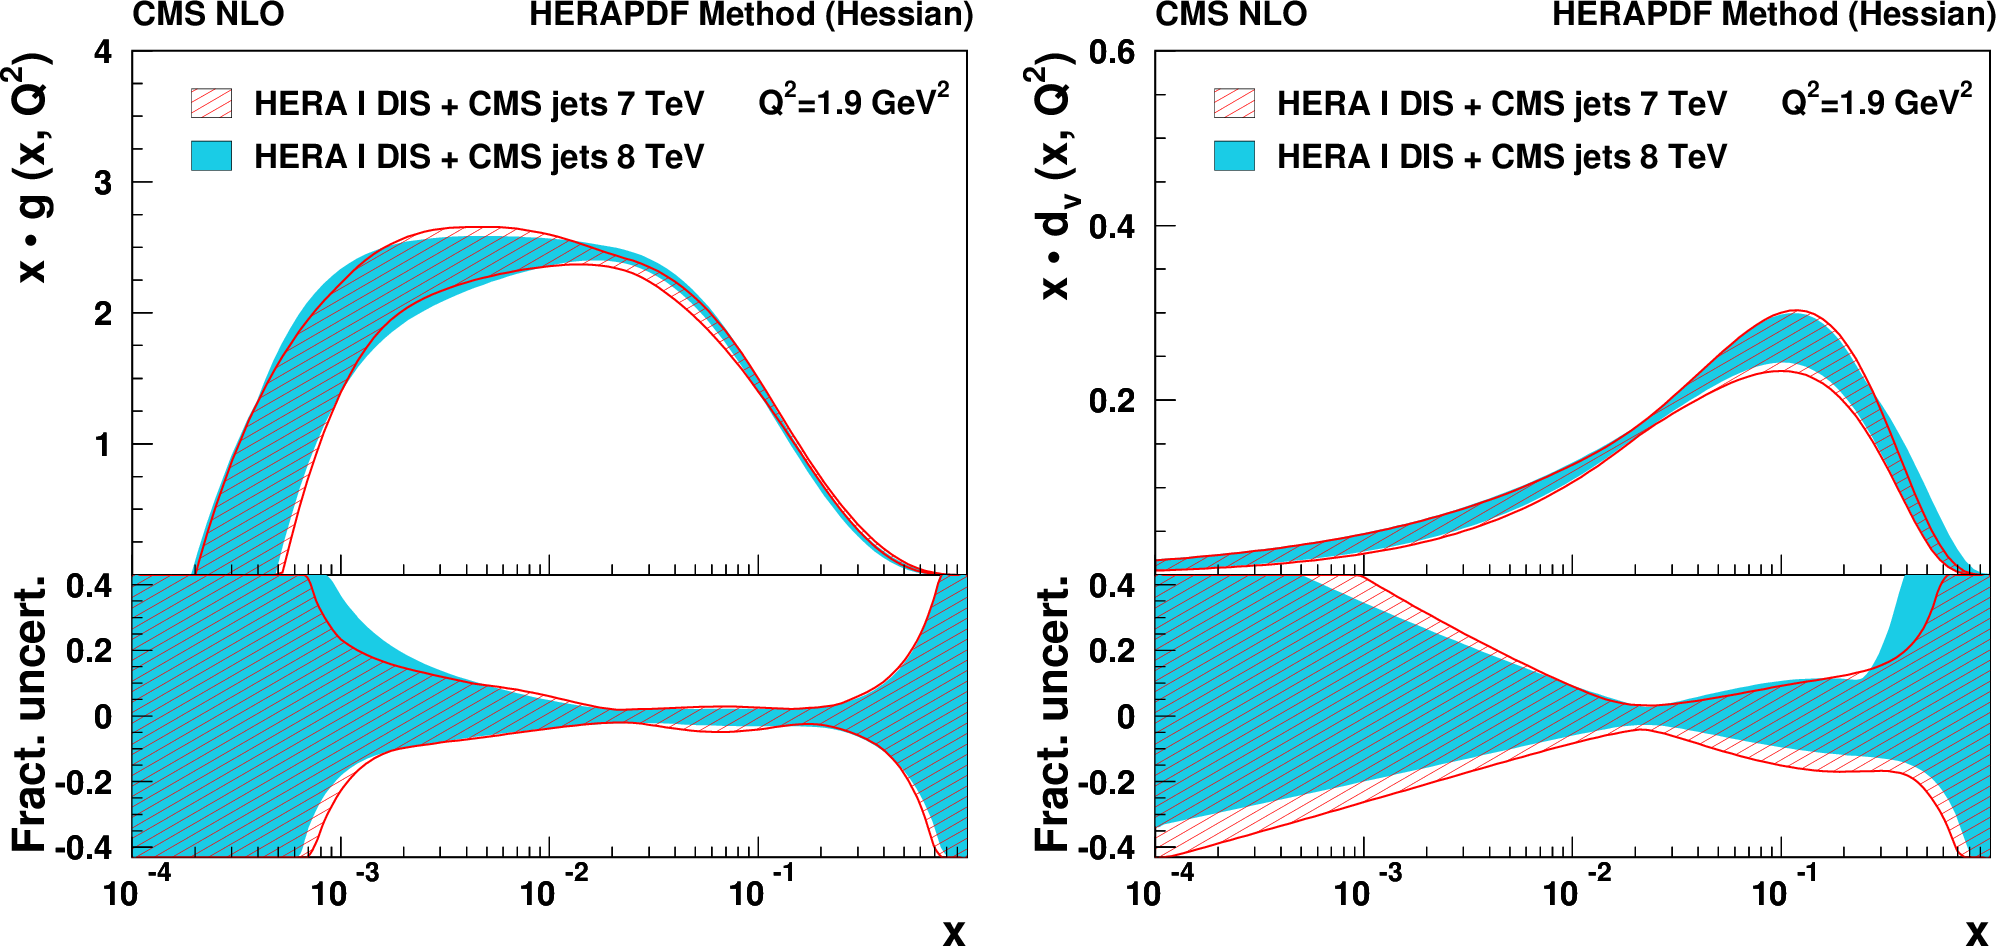
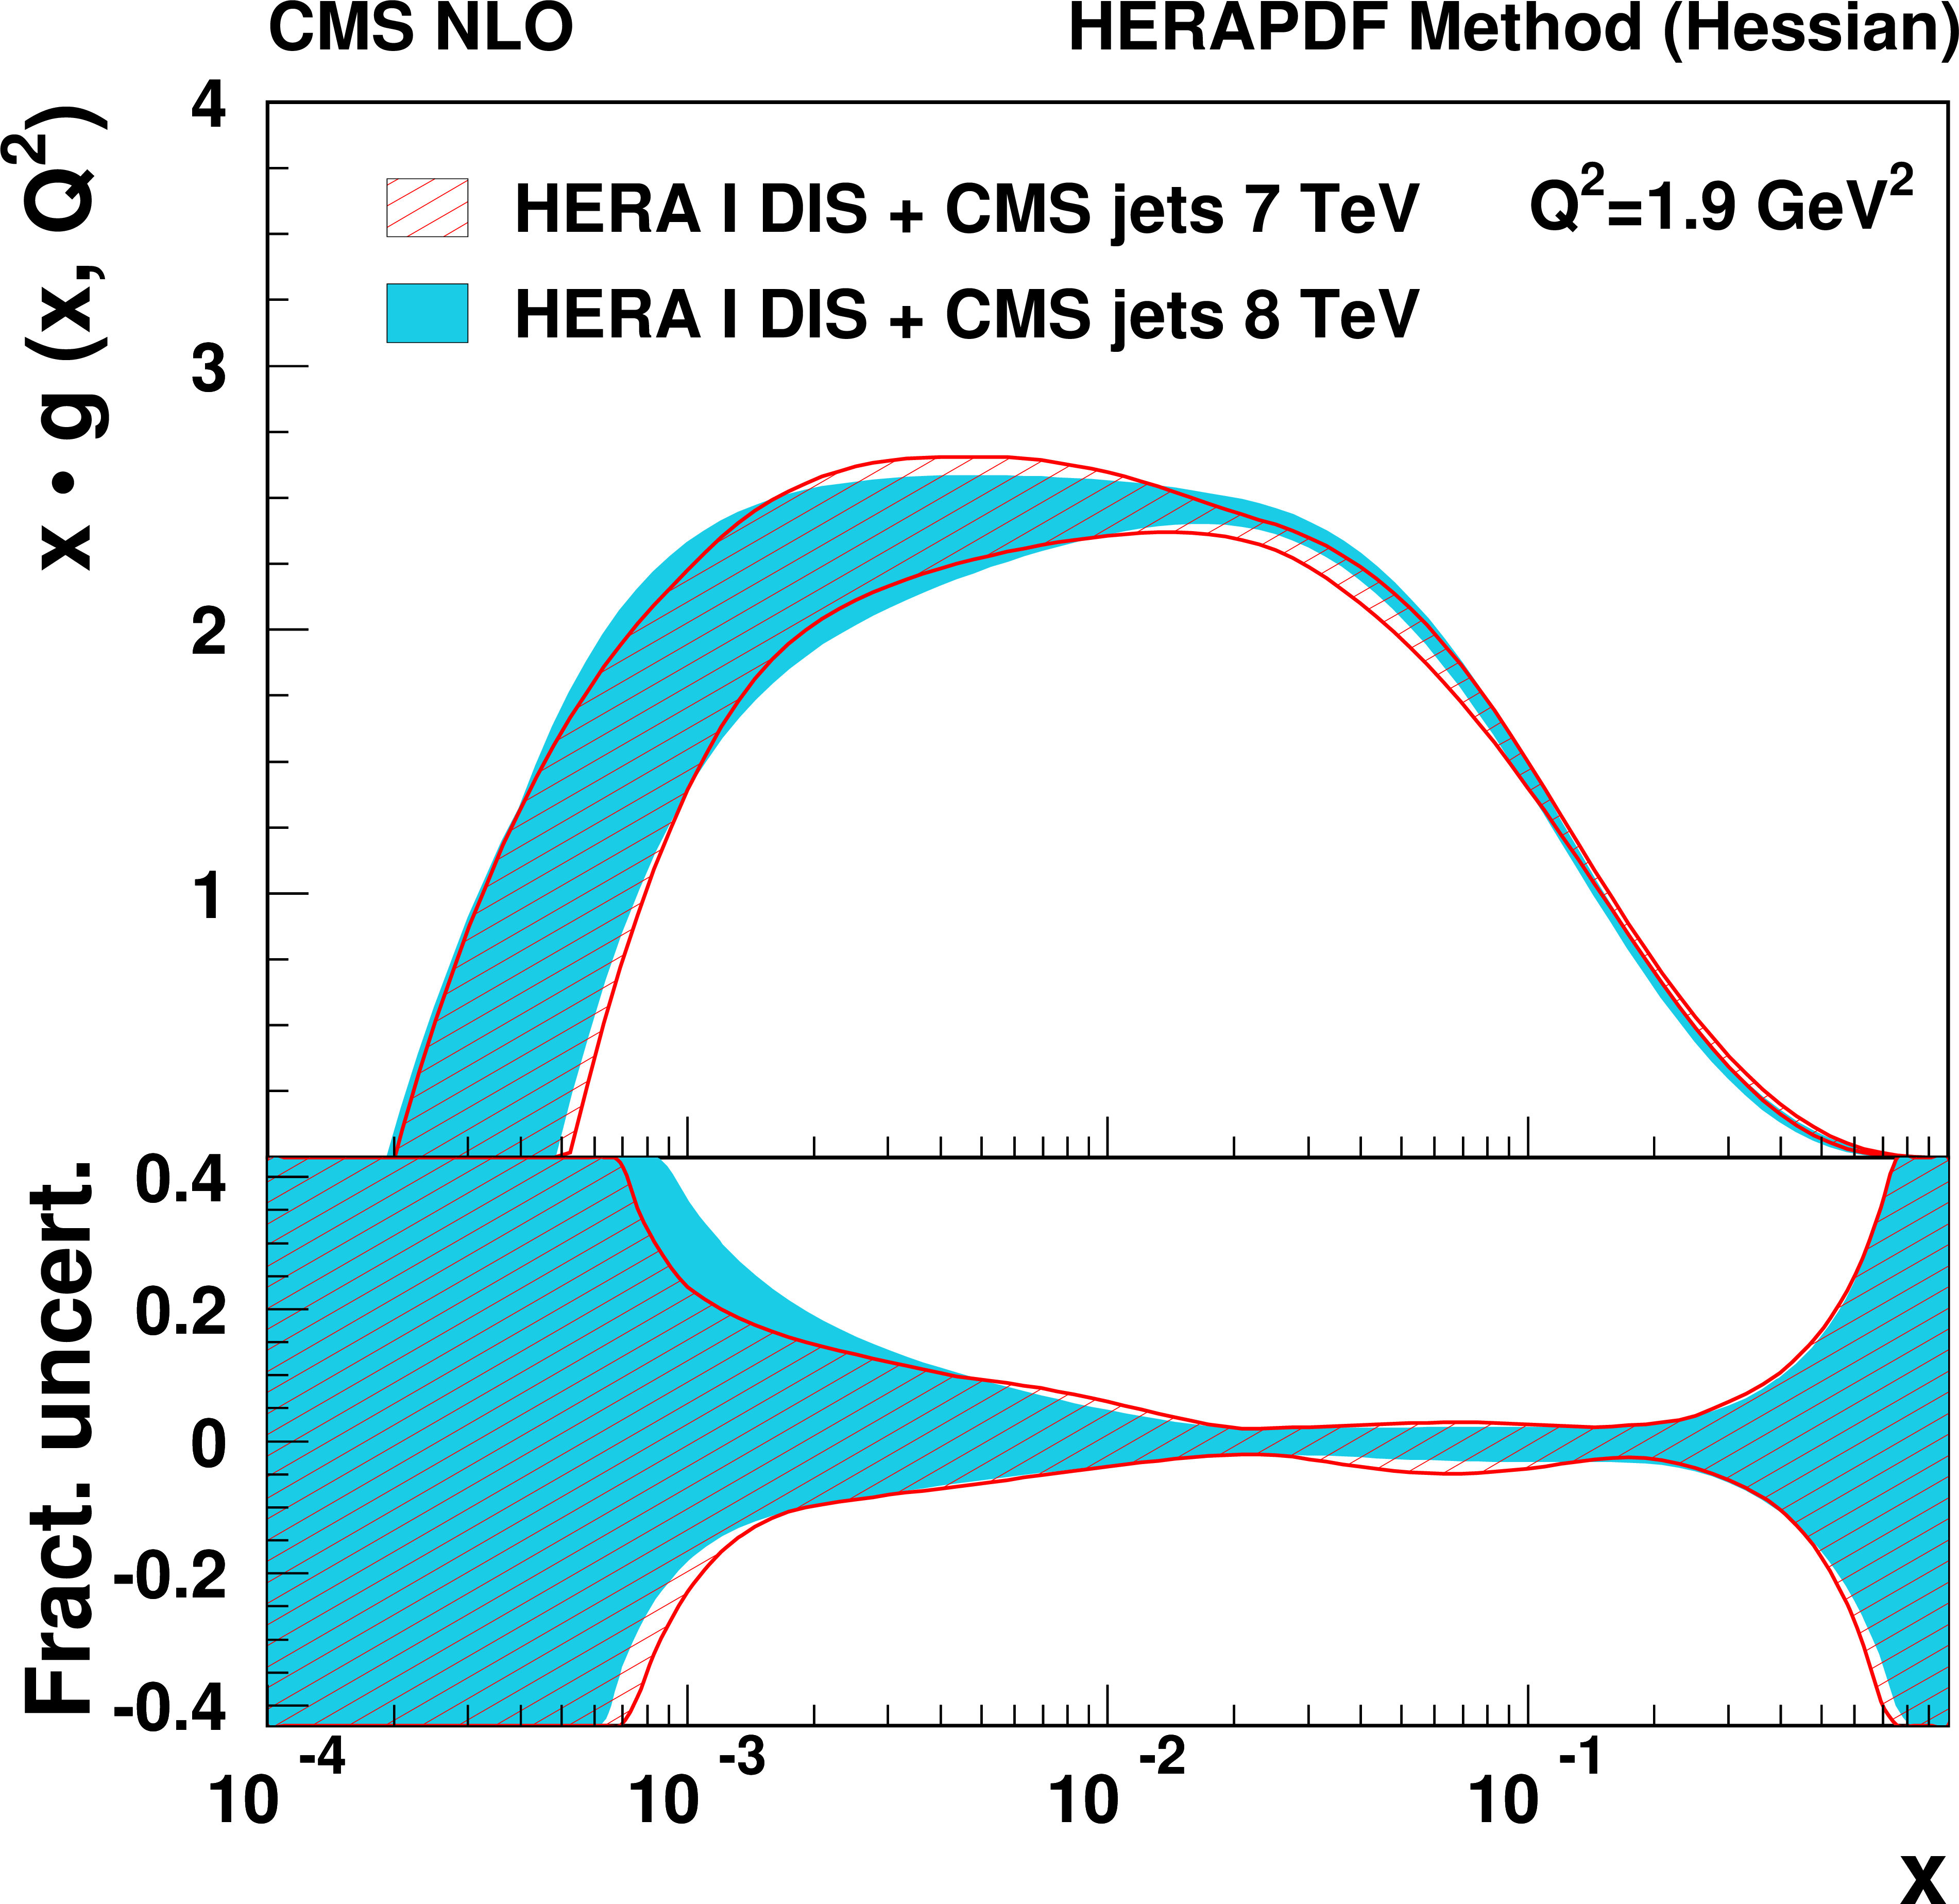
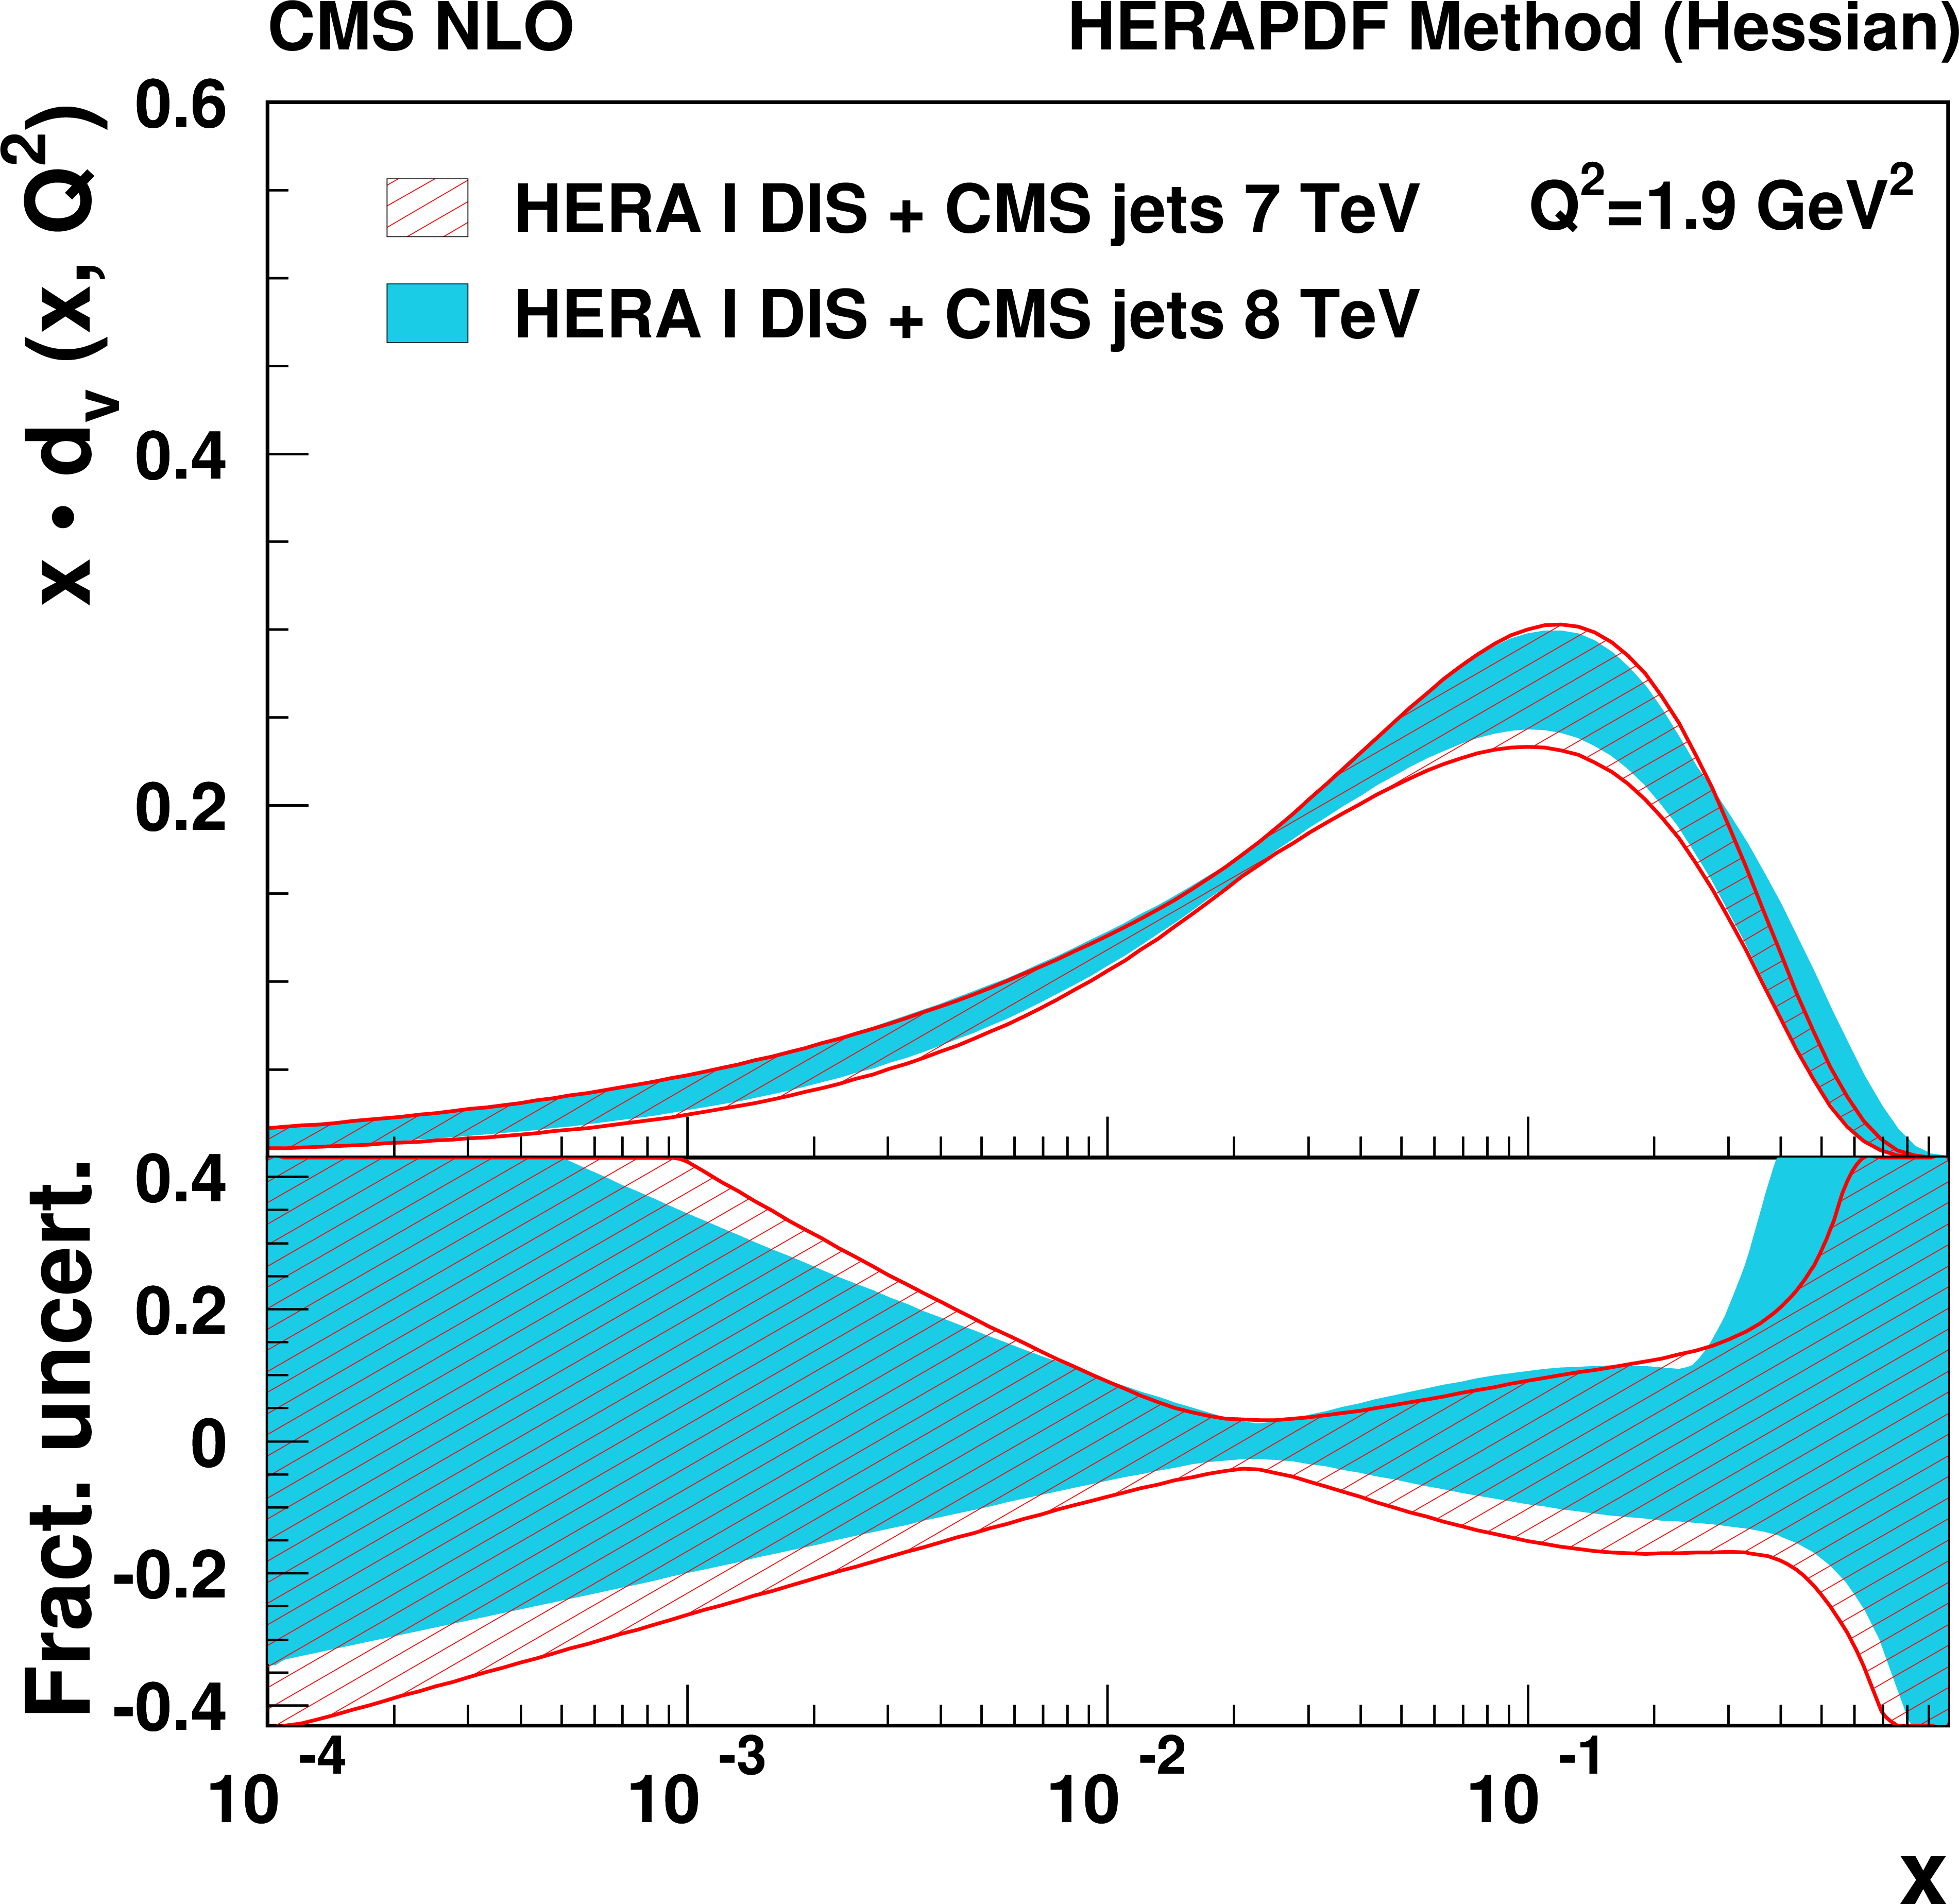
Figure 17:
Gluon (left) and d-valence quark (right) distributions as functions of $x$ at the starting scale $Q^2=$ 1.9 GeV$ ^2$. The results of the 13-parameter fit [29] to the subset [40] of the combined HERA data and inclusive jet measurements at 7 TeV (hatched band), and, alternatively, 8 TeV (shaded band) are compared with their total uncertainties, as determined by using the HERAPDF method. In the bottom panels the fractional uncertainties are shown. |
png pdf |
Figure 17-a:
Gluon distribution as functions of $x$ at the starting scale $Q^2=$ 1.9 GeV$ ^2$. The results of the 13-parameter fit [29] to the subset [40] of the combined HERA data and inclusive jet measurements at 7 TeV (hatched band), and, alternatively, 8 TeV (shaded band) are compared with their total uncertainties, as determined by using the HERAPDF method. In the bottom panel the fractional uncertainties are shown. |
png pdf |
Figure 17-b:
d-valence quark distribution as functions of $x$ at the starting scale $Q^2=$ 1.9 GeV$ ^2$. The results of the 13-parameter fit [29] to the subset [40] of the combined HERA data and inclusive jet measurements at 7 TeV (hatched band), and, alternatively, 8 TeV (shaded band) are compared with their total uncertainties, as determined by using the HERAPDF method. In the bottom panel the fractional uncertainties are shown. |
| Tables | |
png pdf |
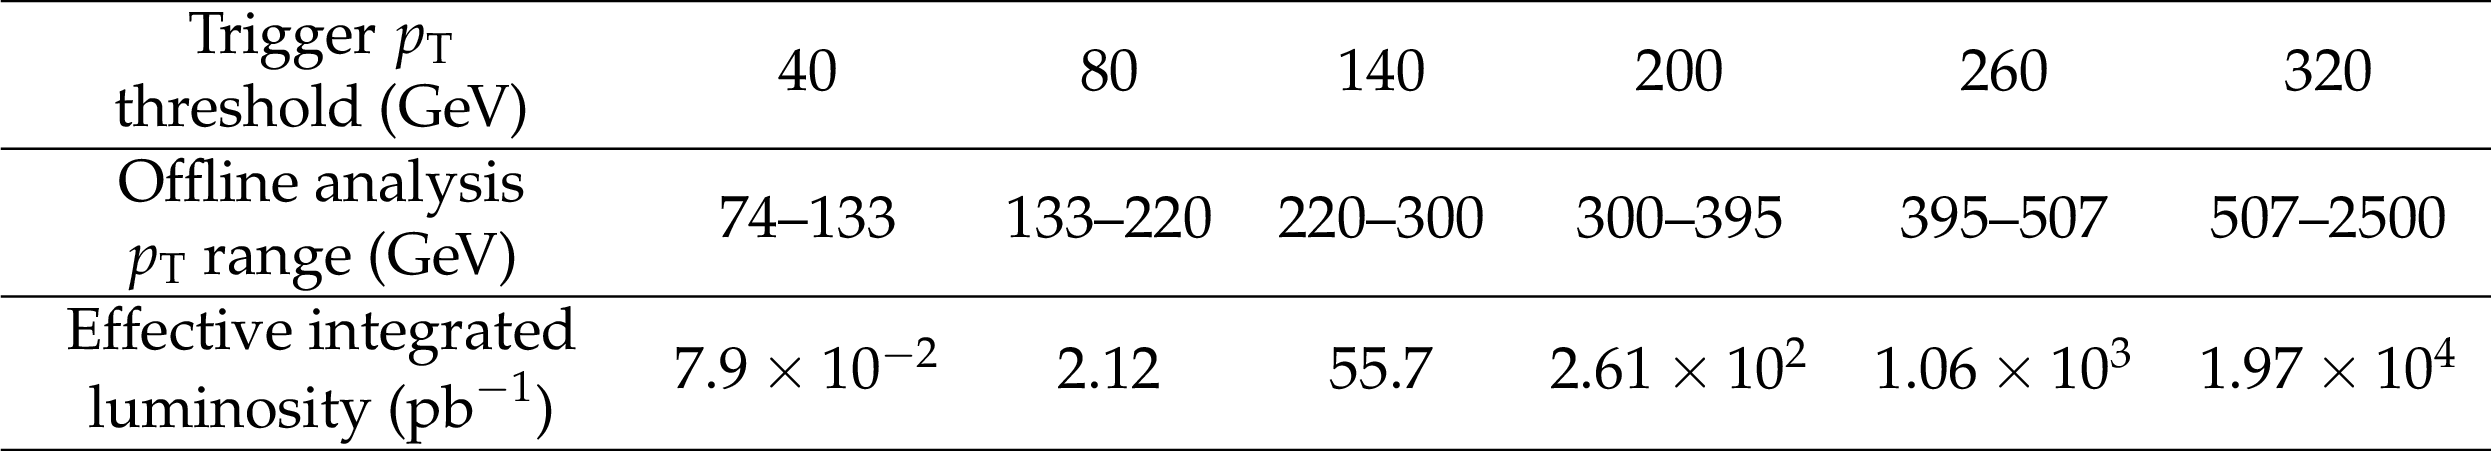
Table 1:
HLT trigger ranges and effective integrated luminosities used in the jet cross section measurement. The luminosity is known with a 2.6% uncertainty. |
png pdf |
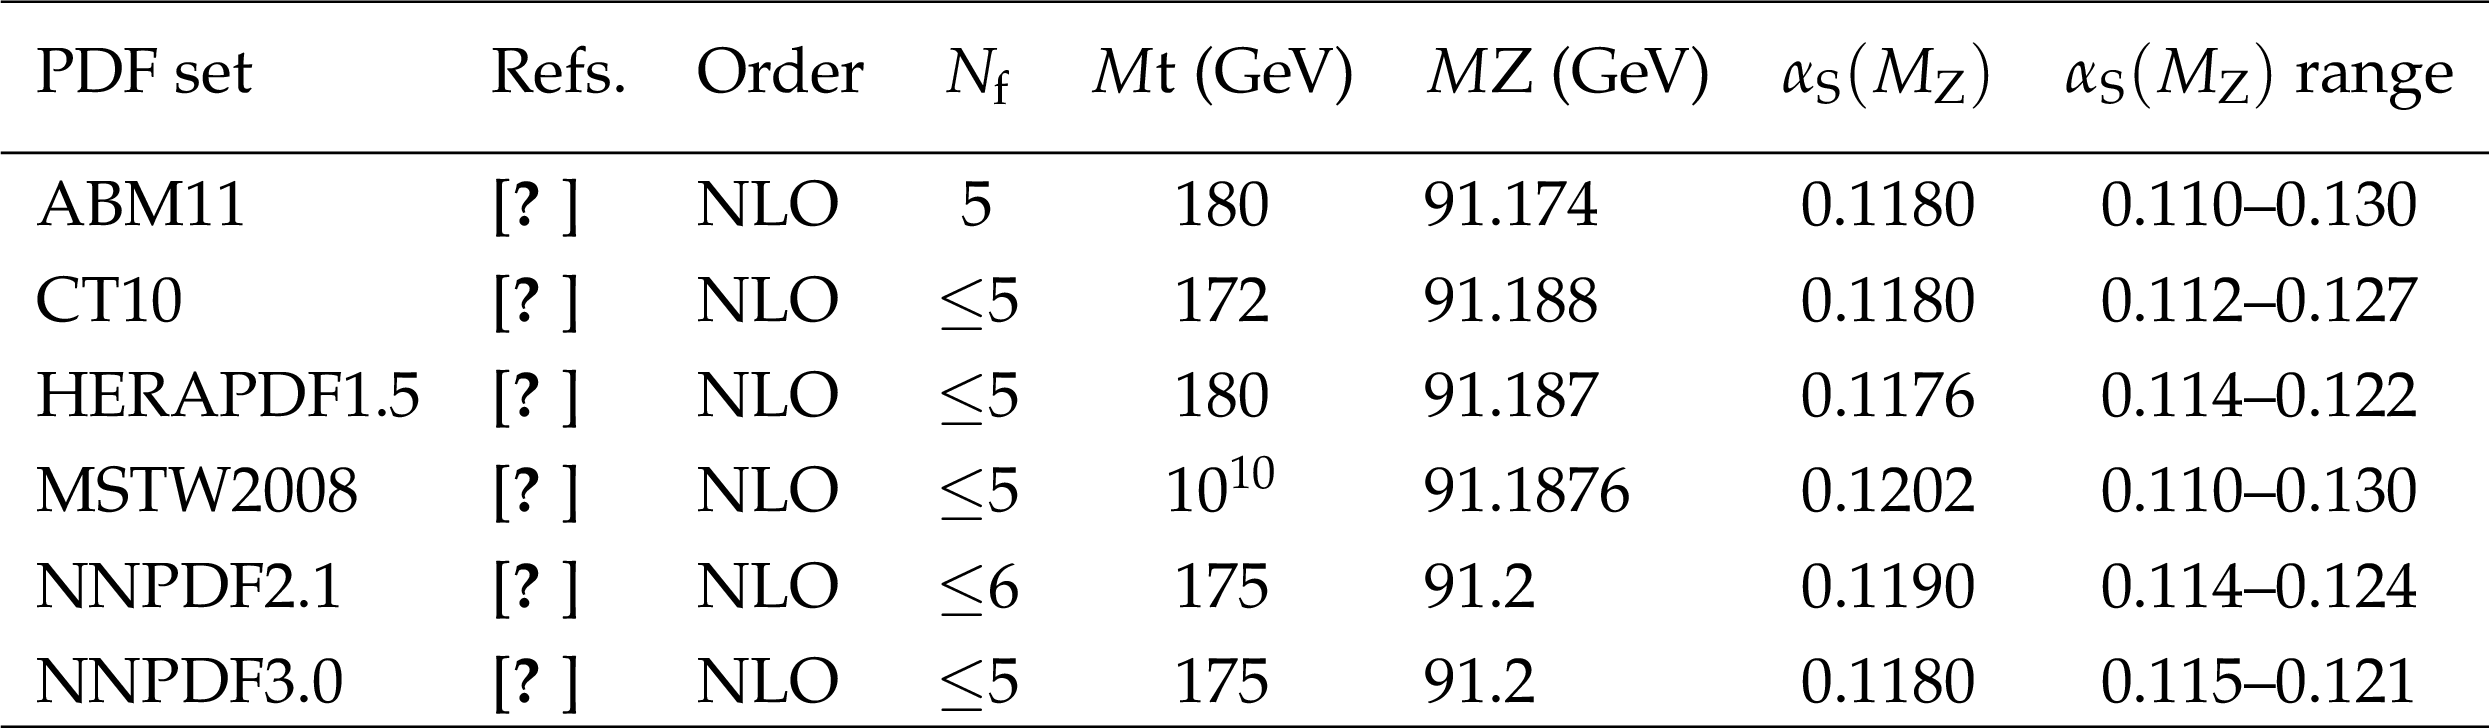
Table 2:
The PDF sets used in comparisons to the data together with the corresponding number of active flavours $N_\mathrm {f}$, the assumed masses $M_{\mathrm{ t } }$ and $M_{\mathrm{ Z } }$ of the top quark and Z boson, the default values of the strong coupling constant ${\alpha _\mathrm {S}(M_\mathrm {Z})} $, and the ranges in ${\alpha _\mathrm {S}(M_\mathrm {Z})}$ available for fits. For CT10 the updated versions of 2012 are used. |
png pdf |
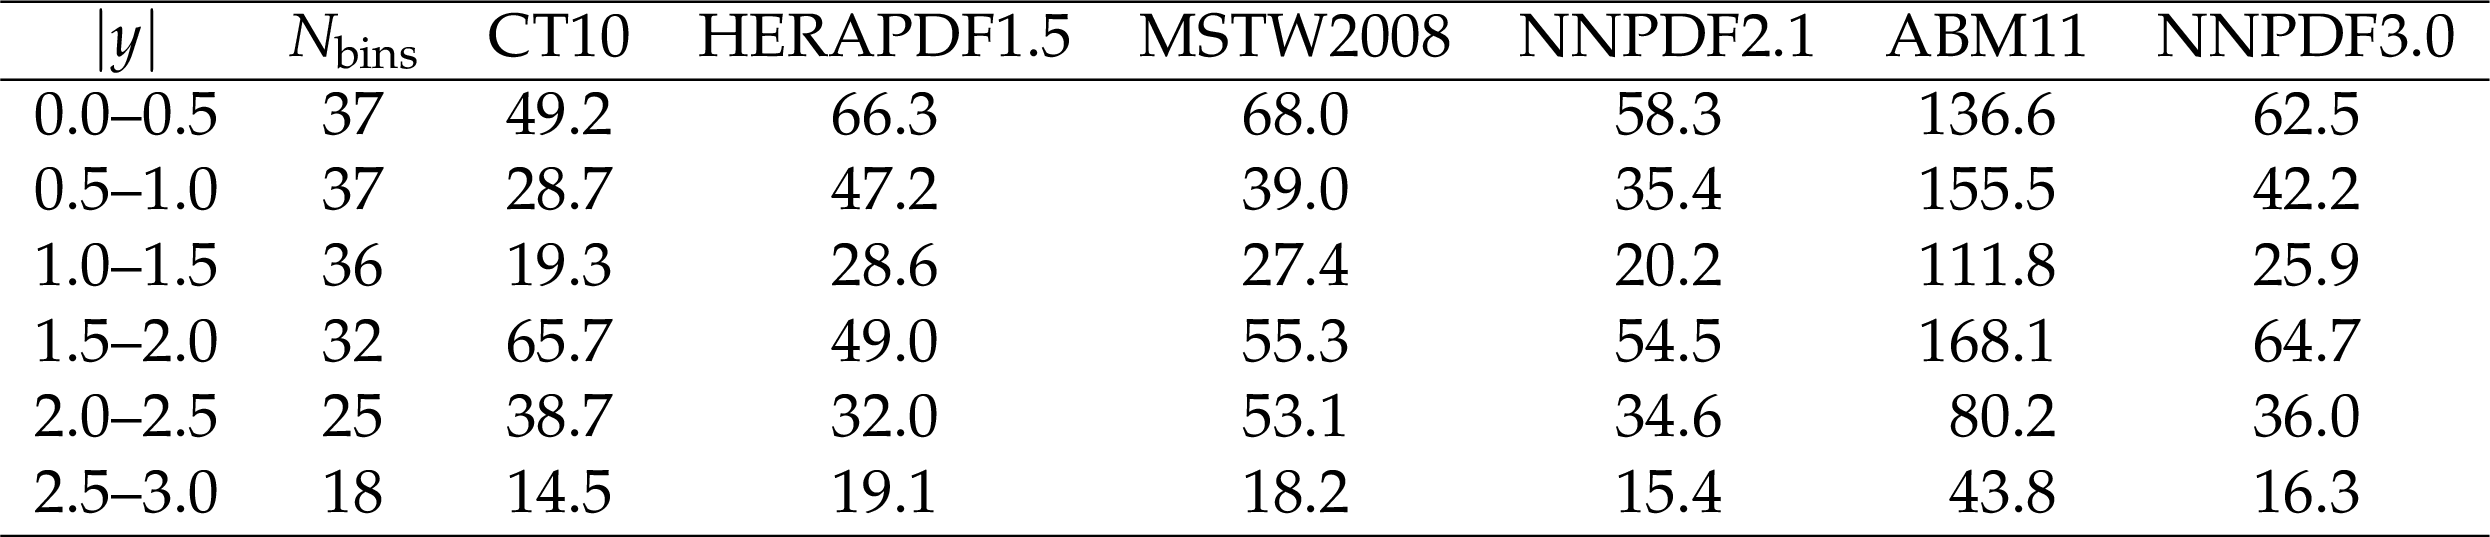
Table 3:
Summary of the $\chi ^2$ values for the comparison of data and theoretical predictions based on different PDF sets in each $|y|$ range, where cross sections are measured for a number of ${p_{\mathrm {T}}}$ ranges $N_{\mathrm {bins}}$. |
png pdf |
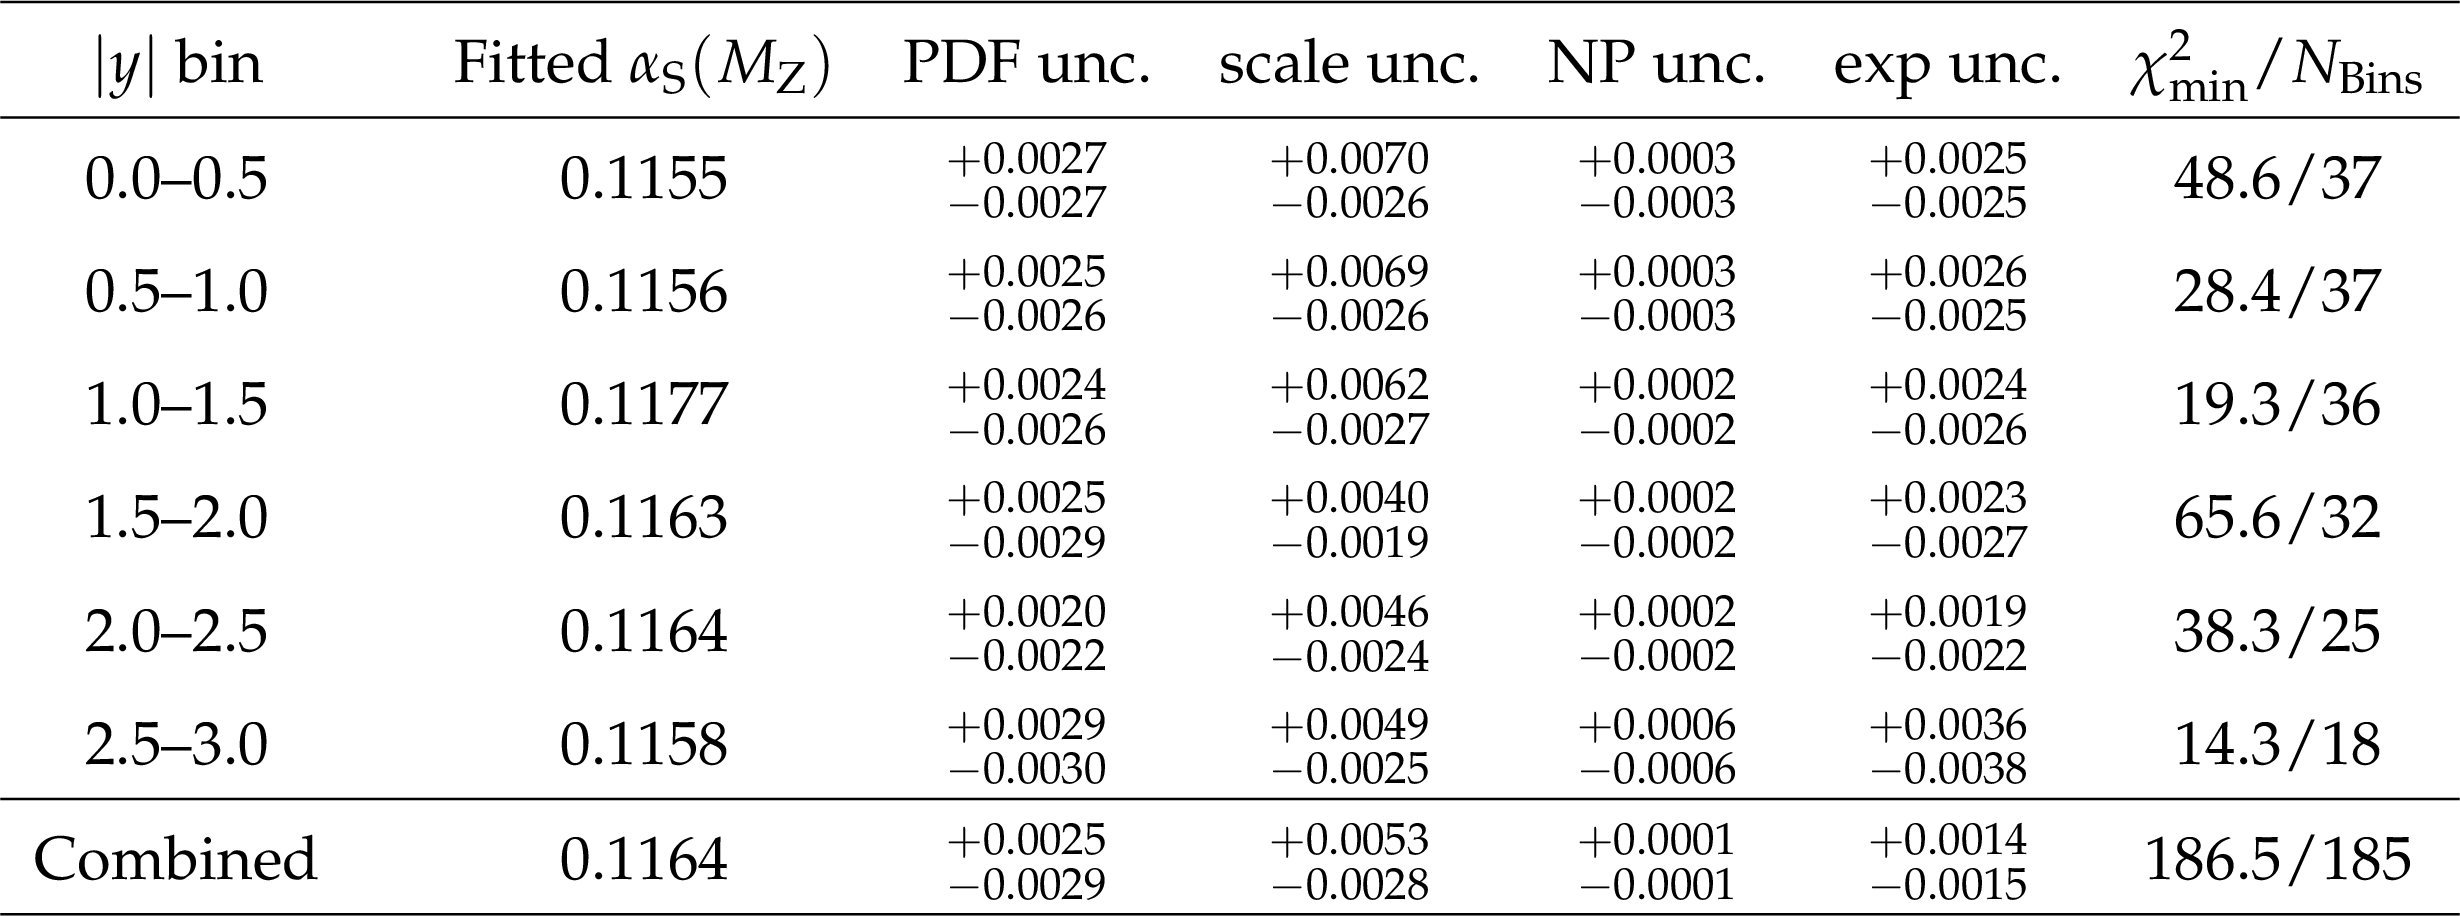
Table 4:
Results for ${\alpha _\mathrm {S}(M_\mathrm {Z})}$ extracted using the CT10 NLO PDF set. The fitted value for each $|y|$ bin; the corresponding uncertainty components due to PDF, scale, and NP corrections; and the total experimental uncertainty is shown. The last row of the table shows the results of combined fitting of all the $|y|$ bins simultaneously. |
png pdf |
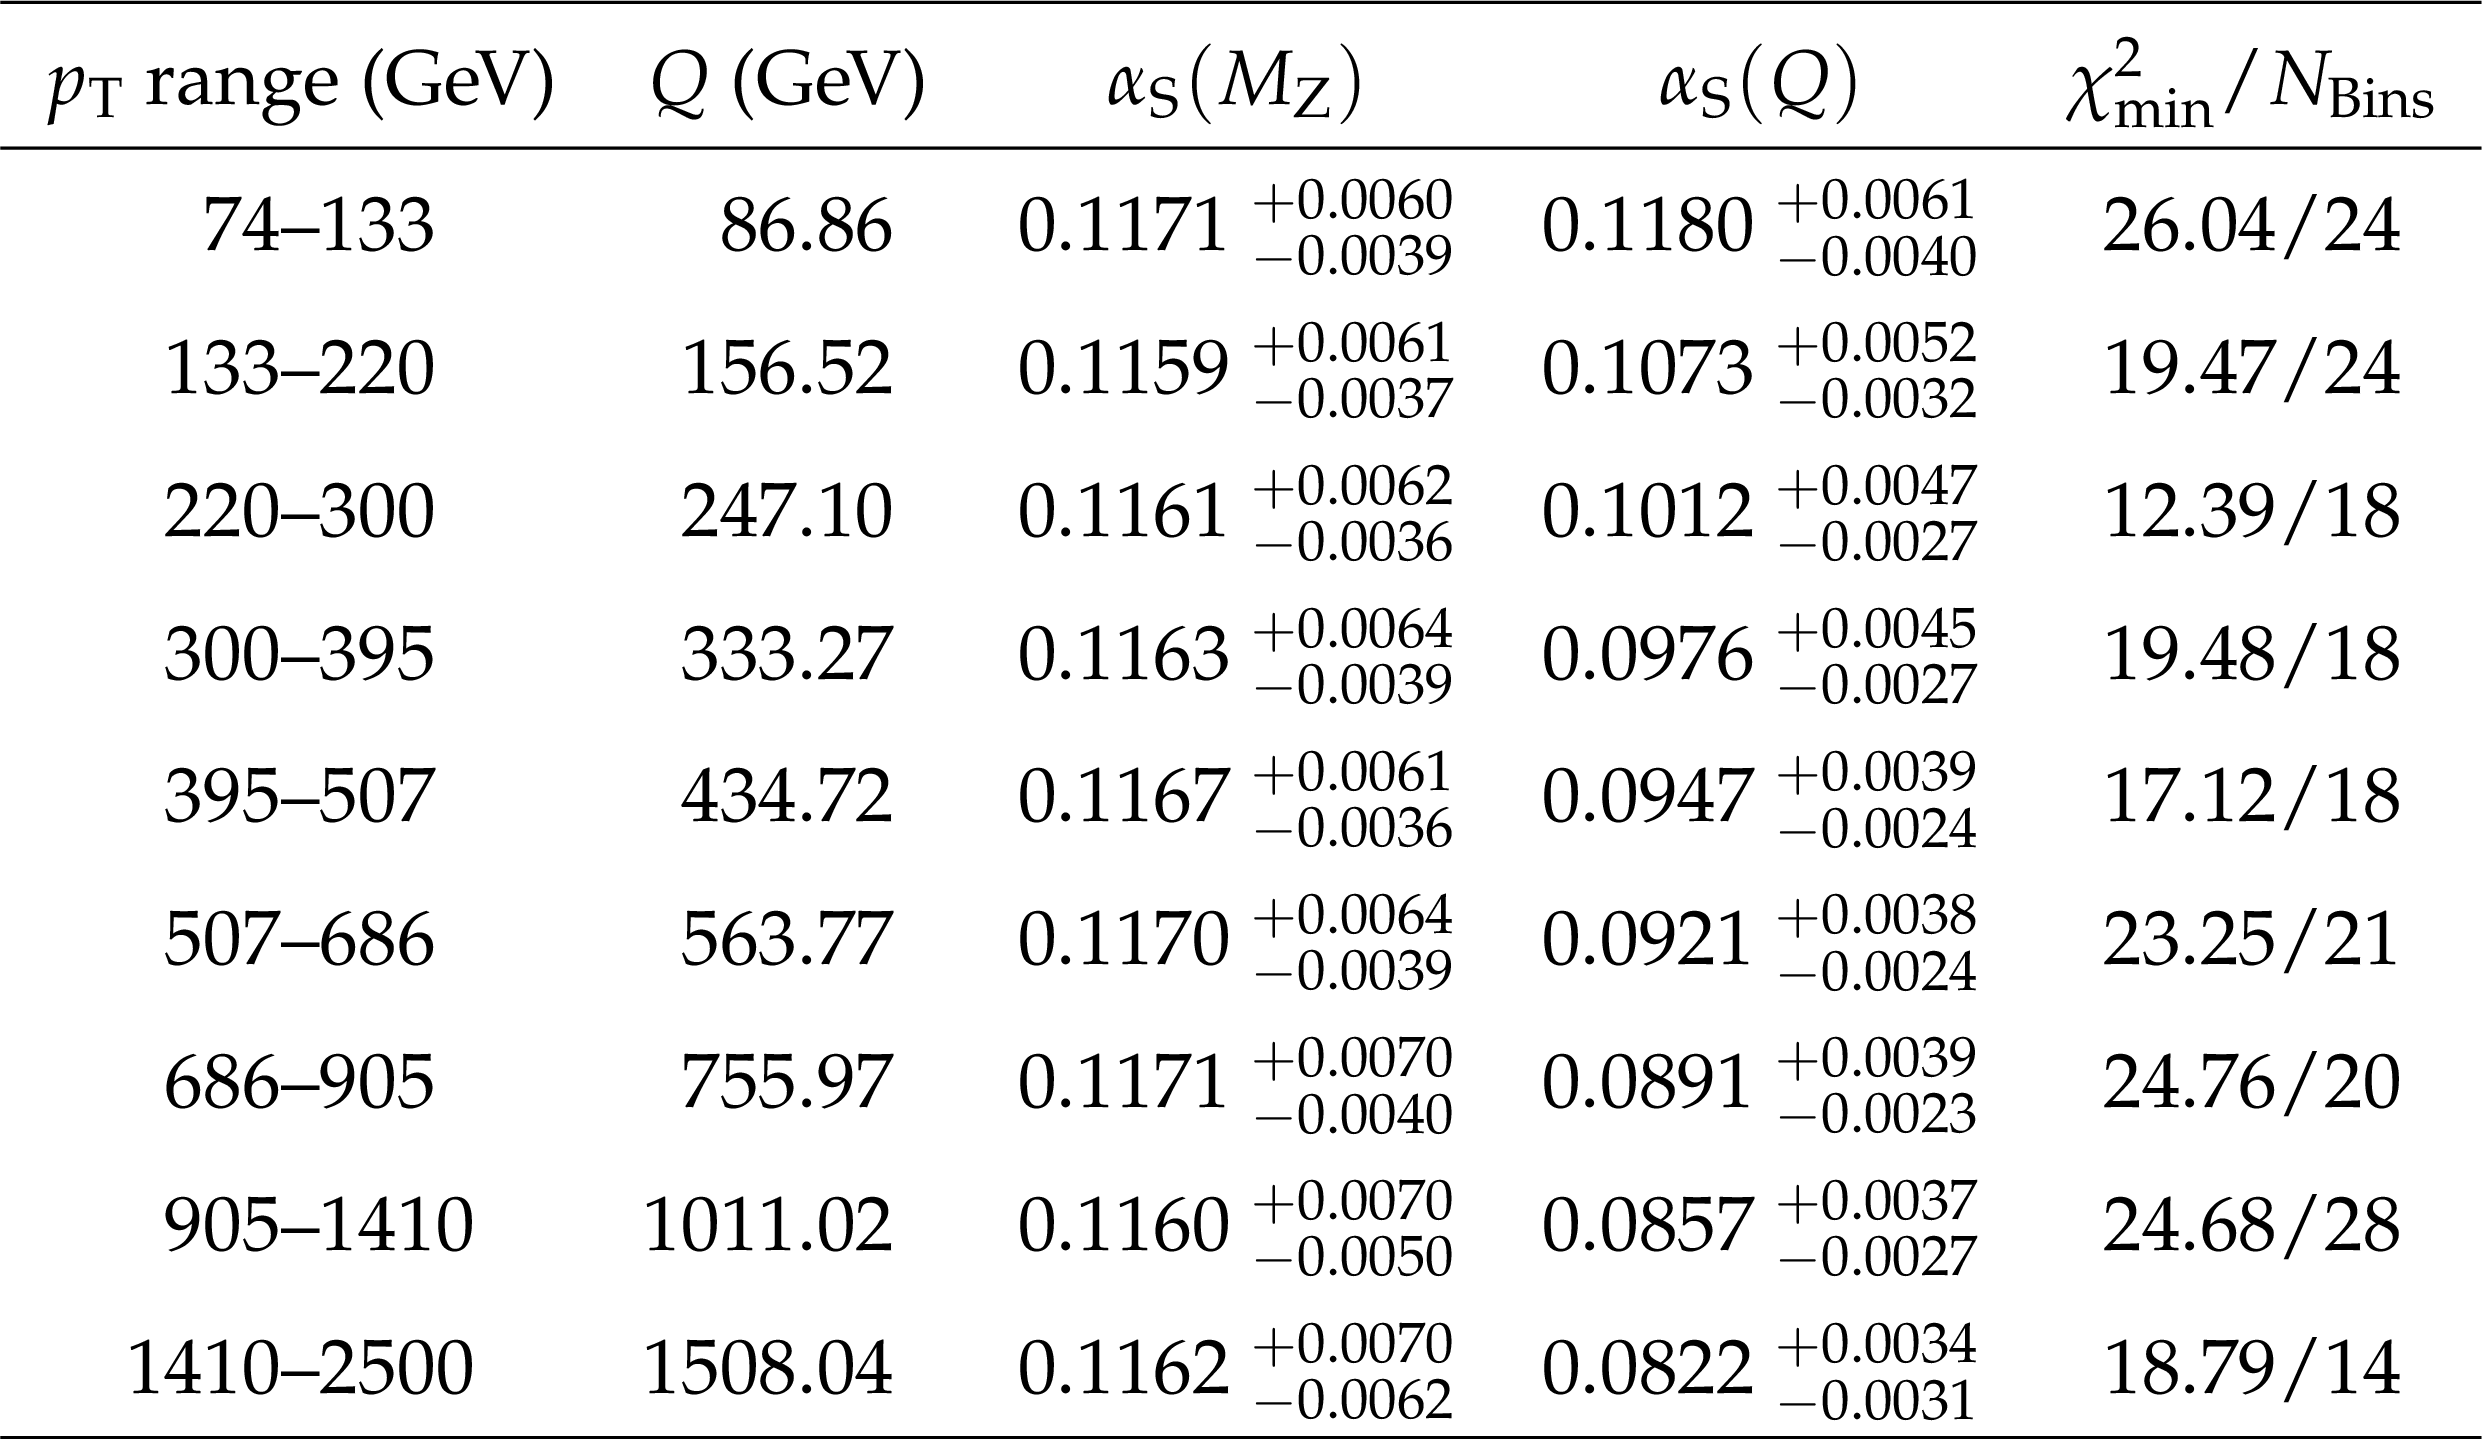
Table 5:
The extracted ${\alpha _\mathrm {S}(M_\mathrm {Z})}$ values, the corresponding ${\alpha _\mathrm {S}(Q)}$ values at the $Q$ scale for each ${p_{\mathrm {T}}}$ range, and $\chi ^{2}_{\mathrm {min}}/\mathrm {N_{Bins}}$ are shown. Uncertainties are given for both ${\alpha _\mathrm {S}}$ values. |
png pdf |
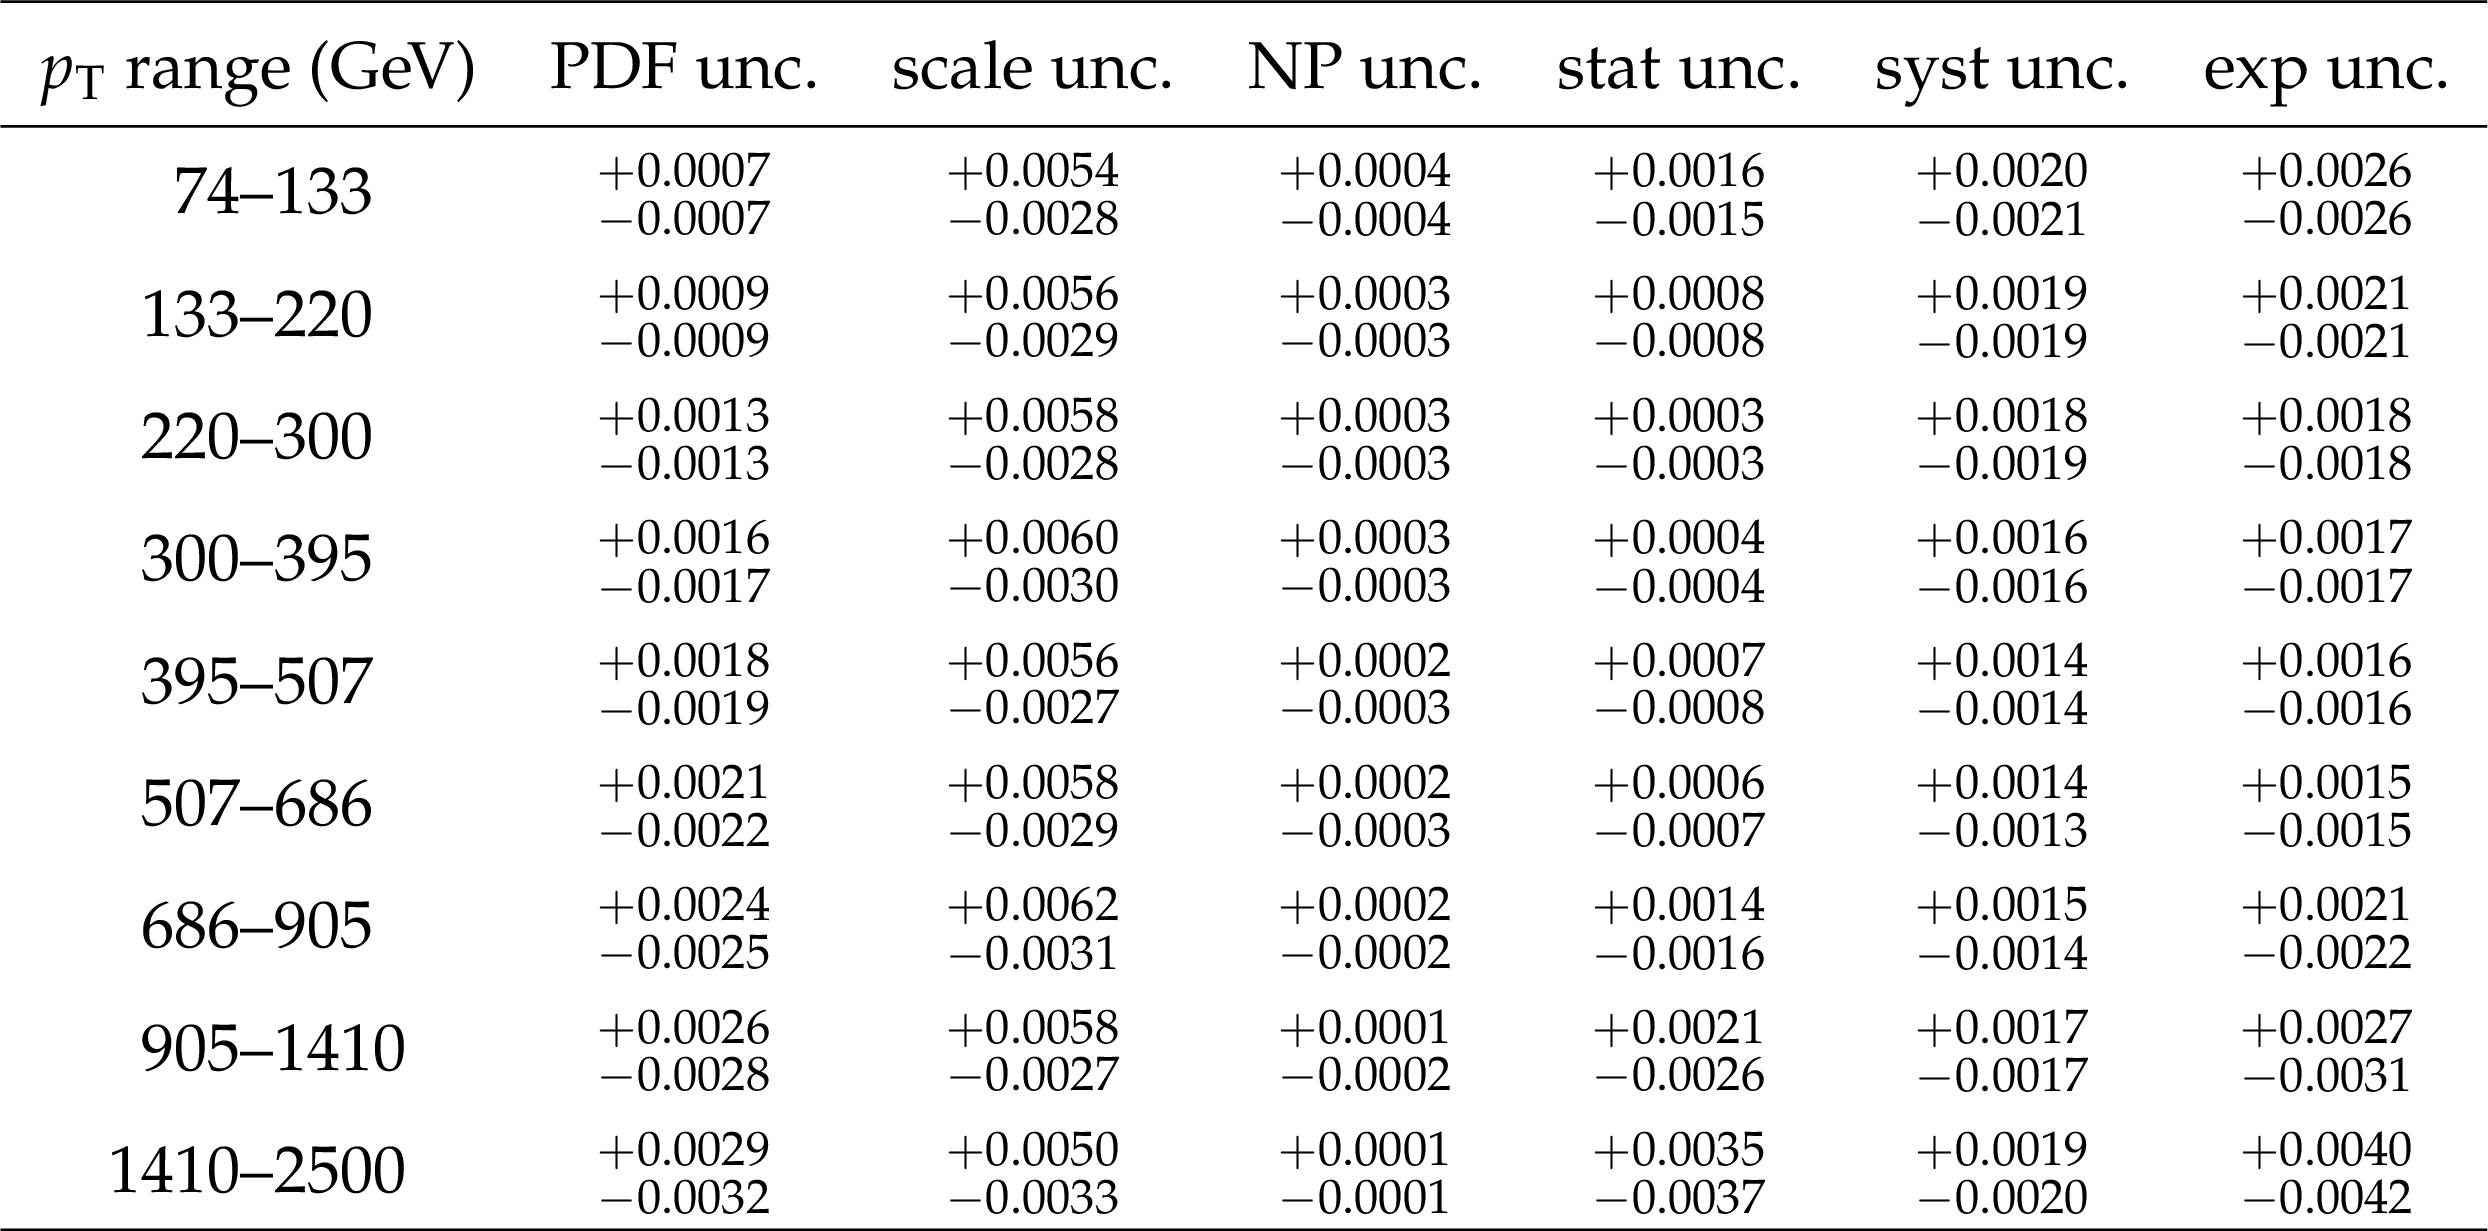
Table 6:
Composition of the uncertainty in ${\alpha _\mathrm {S}(M_\mathrm {Z})}$ fit results in ranges of ${p_{\mathrm {T}}} $. For each range, the corresponding statistical and experimental systematic uncertainties and the components of the theoretical uncertainty are shown. The numbers are obtained by using the CT10 NLO PDF set. |
png pdf |
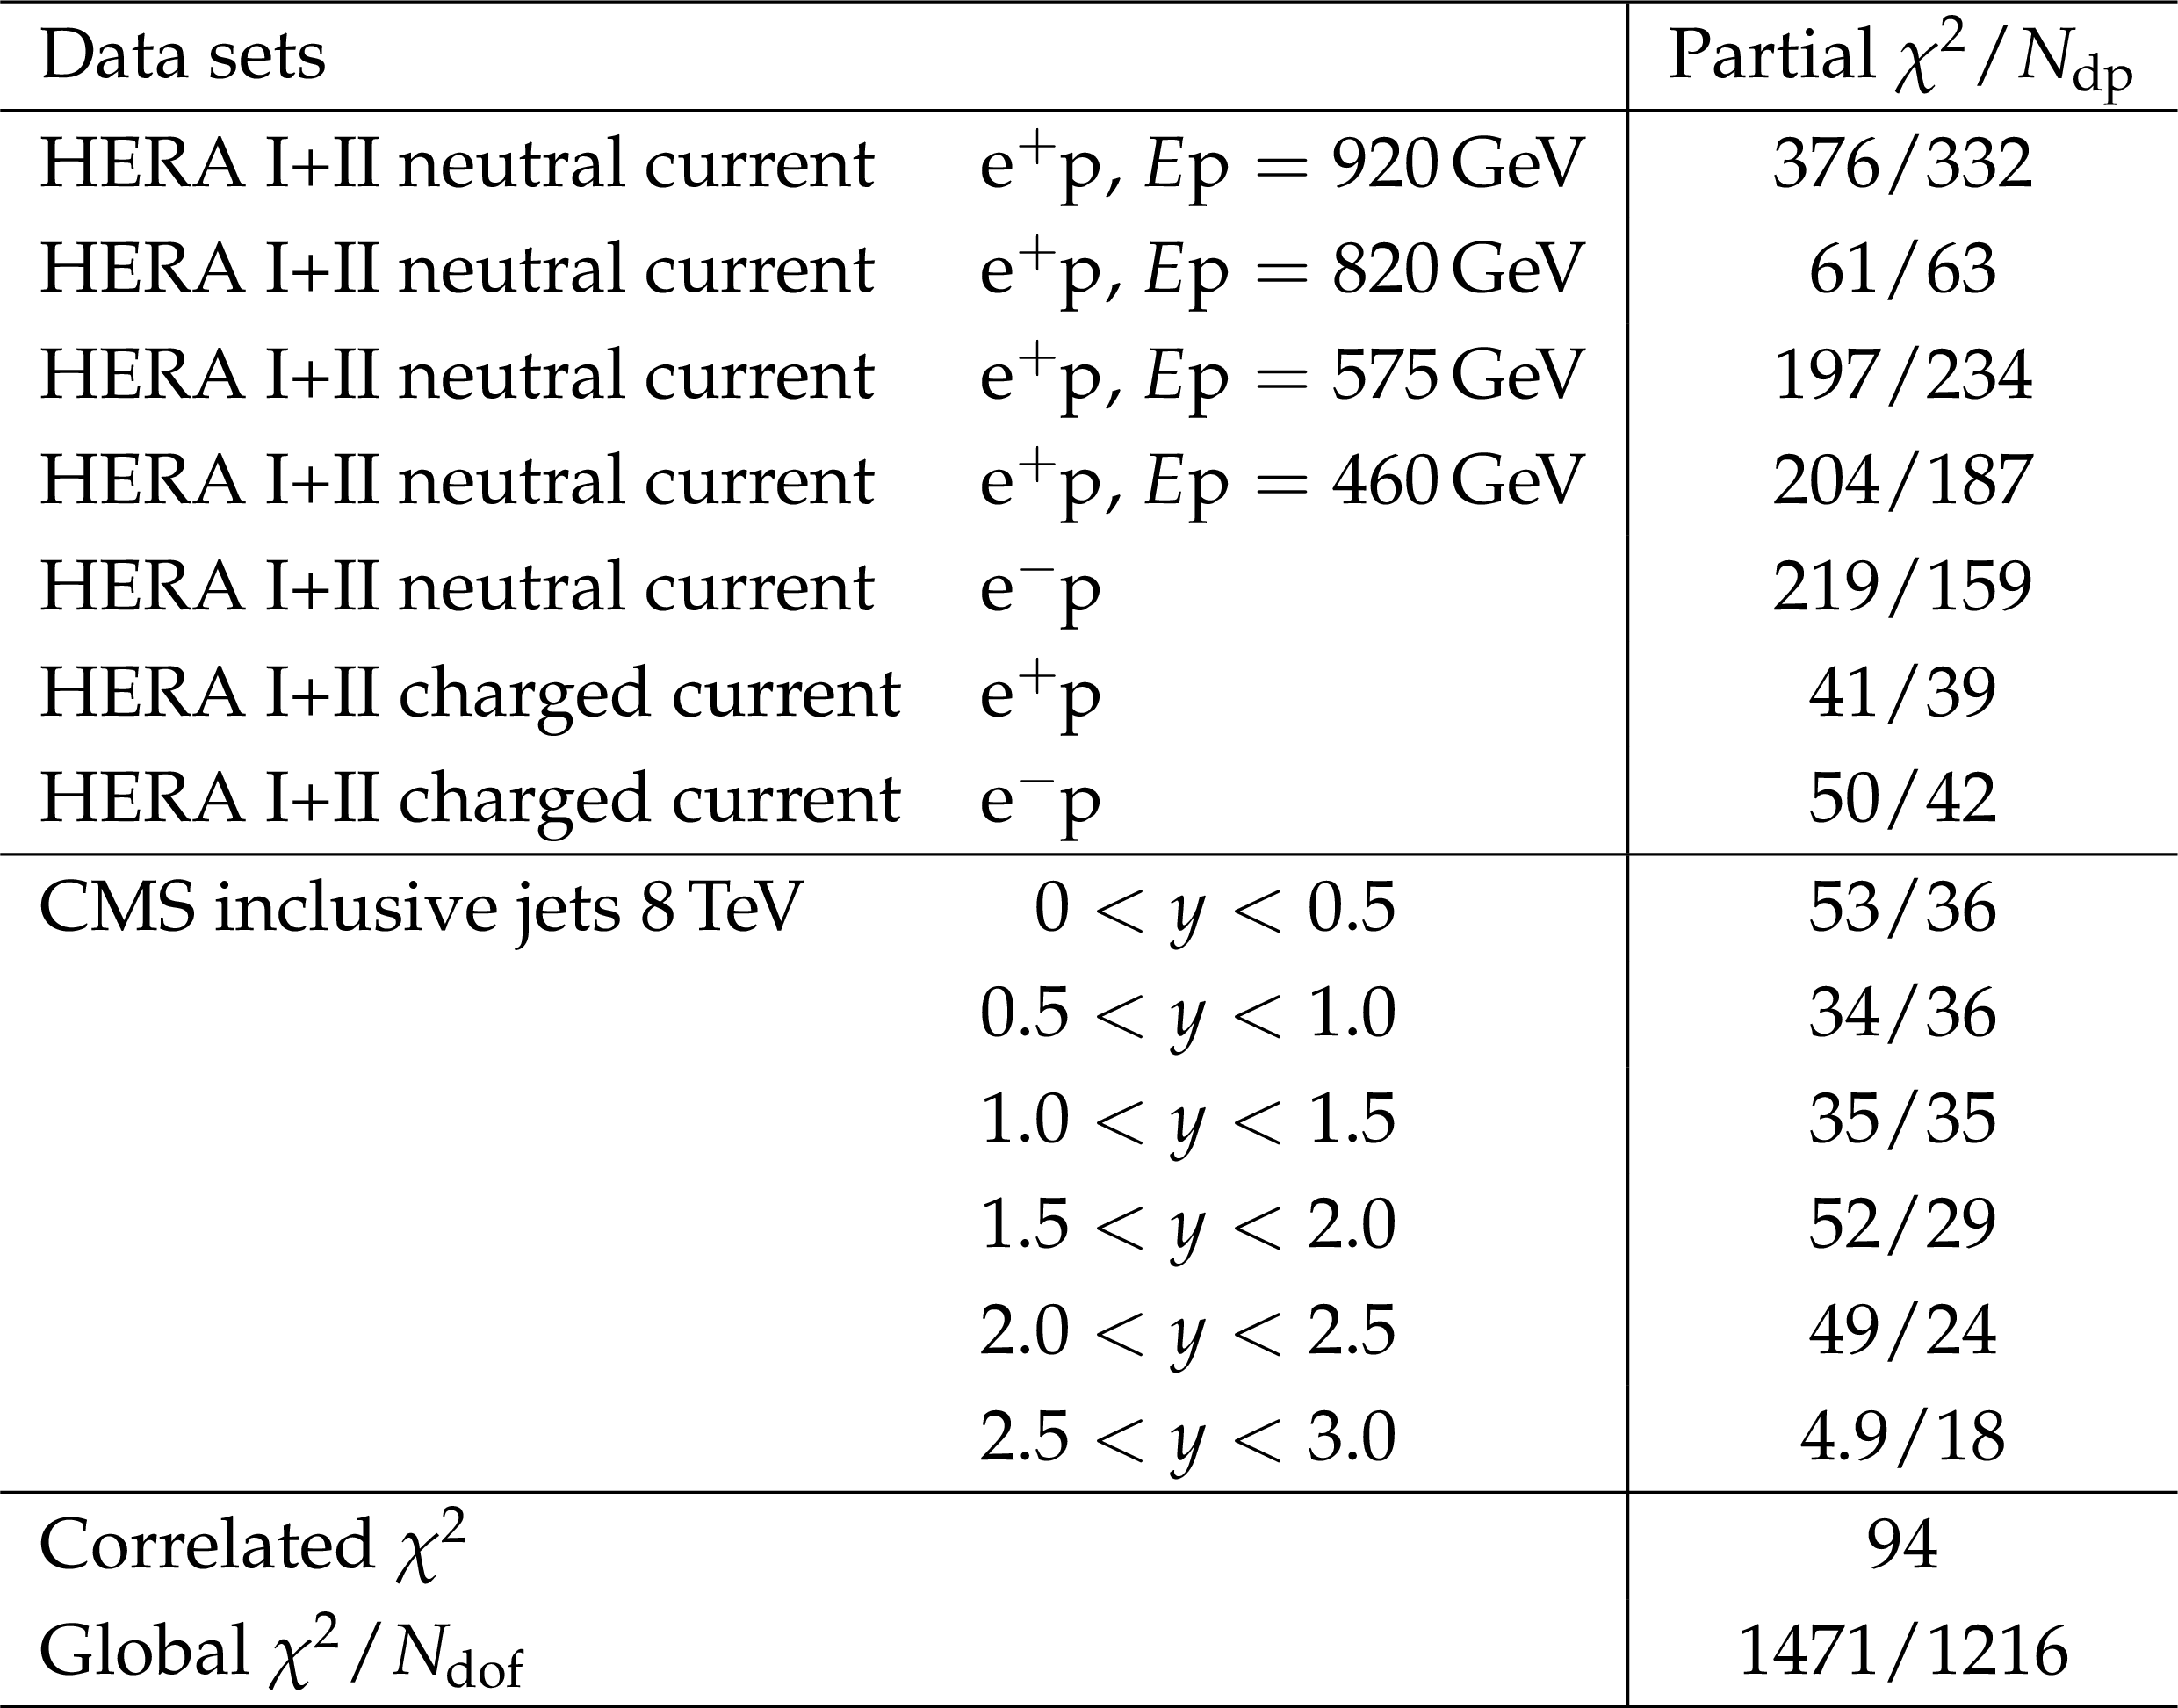
Table 7:
Partial $\chi ^2/N_{\text {dp}}$ per number of data points $N_{\textrm {dp}}$ and the global $\chi ^2$ per degree of freedom, $N_{\text {dof}}$, as obtained in the QCD analysis of HERA DIS data and the CMS measurements of inclusive jet production at $\sqrt {s}=$ 8 TeV. |
| Summary |
| A measurement of the double-differential inclusive jet cross section has been presented that uses data from proton-proton collisions at $ \sqrt{s} = $ 8 TeV collected with the CMS detector and corresponding to an integrated luminosity of 19.7 fb$^{-1}$. The result is presented as a function of jet transverse momentum $p_{\mathrm{T}}$ and absolute rapidity $|y|$ and covers a large range in jet $p_{\mathrm{T}}$ from 74 GeV up to 2.5 TeV, in six rapidity bins up to $|y|= $ 3.0. The region of low jet $p_{\mathrm{T}}$, in particular the range from 21 to 74 GeV, has also been studied up to $|y|= $ 4.7, by using a dedicated low-pileup 5.6 pb$^{-1}$ data sample. The ratios to the cross sections measured at 2.76 and 7 TeV have been also determined. Detailed studies of experimental and theoretical sources of uncertainty have been carried out. The dominant sources of experimental systematic uncertainty are due to the jet energy scale, unfolding, and the integrated luminosity measurement. These lead to uncertainties of 5-45% in the differential cross section measurement. The theoretical predictions are most affected by PDF uncertainties, and their range is strongly dependent on the $p_{\mathrm{T}}$ and rapidity interval; at low $p_{\mathrm{T}}$ they are about 7%, but their size increases up to 40% in the most central intervals and exceeds 200% in the outermost regions. Many uncertainties cancel in the ratio with the corresponding results at 2.76 and 7 TeV, leading to uncertainties ranging from 5% to 25%, both for the measurement and for the theoretical predictions. Perturbative QCD, supplemented by a small nonperturbative and electroweak corrections, describes the data over a wide range of jet $p_{\mathrm{T}}$ and $y$. The strong coupling constant is extracted from the high-$p_{\mathrm{T}}$ jet cross section measurements using the probed $p_{\mathrm{T}}$ range and six different rapidity bins. The best fitted value is $\alpha_\mathrm{S}(M_{\mathrm{Z}}) = 0.1164^{+0.0060}_{-0.0043}$ using the CT10 NLO PDF set. The running of the strong coupling constant as a function of the energy scale $Q$, ${\alpha_\mathrm{S}(Q)} $, measured for nine different values of energy scale between 86 GeV and 1.5 TeV, is in good agreement with previous experiments and extends the measurement to the highest values of the energy scale. This measurement of the double-differential jet cross section probes hadronic parton-parton interaction over a wide range of $x$ and $Q$. The QCD analysis of these data together with HERA DIS measurements illustrates the potential of the high-$p_{\mathrm{T}}$ jet cross sections to provide important constraints on the gluon PDF in a new kinematic regime. |
| References | ||||
| 1 | ATLAS Collaboration | Measurement of the inclusive jet cross section in pp collisions at $ \sqrt{s} = $ 2.76 TeV and comparison to the inclusive jet cross section at $ \sqrt{s} = $ 7 TeV using the ATLAS detector | EPJC 73 (2013) 2509 | 1304.4739 |
| 2 | CMS Collaboration | Measurement of the inclusive jet cross section in pp collisions at $ \sqrt{s} = $ 2.76 TeV | EPJC 76 (2016), no. 5, 265 | CMS-SMP-14-017 1512.06212 |
| 3 | ATLAS Collaboration | Measurement of inclusive jet and dijet cross sections in proton-proton collisions at 7 TeV centre-of-mass energy with the ATLAS detector | EPJC 71 (2011) 1512 | 1009.5908 |
| 4 | CMS Collaboration | Measurement of the inclusive jet cross section in pp collisions at 7 TeV | PRL 107 (2011) 132001 | CMS-QCD-10-011 1106.0208 |
| 5 | ATLAS Collaboration | Measurement of inclusive jet and dijet production in pp collisions at $ \sqrt{s} = $ 7 TeV using the ATLAS detector | PRD 86 (2012) 014022 | 1112.6297 |
| 6 | CMS Collaboration | Measurements of differential jet cross sections in proton-proton collisions at $ \sqrt{s} = $ 7 TeV with the CMS detector | PRD 87 (2013) 112002 | CMS-QCD-11-004 1212.6660 |
| 7 | UA2 Collaboration | Observation of very large transverse momentum jets at the CERN $ \mathrm{\bar{p}p} $ collider | PLB 118 (1982) 203 | |
| 8 | UA1 Collaboration | Hadronic jet production at the CERN proton-antiproton collider | PLB 132 (1983) 214 | |
| 9 | CDF Collaboration | Measurement of the inclusive jet cross section using the $ k_{\rm T} $ algorithm in $ \mathrm{p\overline{p}} $ collisions at $ \sqrt{s} = $ 1.96 TeV with the CDF II detector | PRD 75 (2007) 092006, , [Erratum: \DOI10.1103/PhysRevD.75.119901] | hep-ex/0701051 |
| 10 | D0 Collaboration | Measurement of the inclusive jet cross-section in $ \mathrm{p\bar{p}} $ collisions at $ \sqrt{s} = $ 1.96 TeV | PRL 101 (2008) 062001 | 0802.2400 |
| 11 | CDF Collaboration | Measurement of the inclusive jet cross section at the Fermilab Tevatron $ \mathrm{p\bar{p}} $ collider using a cone-based jet algorithm | PRD 78 (2008) 052006, , [Erratum: \DOI10.1103/PhysRevD.79.119902] | 0807.2204 |
| 12 | M. L. Mangano and J. Rojo | Cross section ratios between different CM energies at the LHC: opportunities for precision measurements and BSM sensitivity | JHEP 08 (2012) 010 | 1206.3557 |
| 13 | ZEUS and H1 Collaboration | Combination of measurements of inclusive deep inelastic $ \mathrm{e^{\pm }p} $ scattering cross sections and QCD analysis of HERA data | EPJC 75 (2015) 580 | 1506.06042 |
| 14 | CMS Collaboration | The CMS experiment at the CERN LHC | JINST 3 (2008) S08004 | CMS-00-001 |
| 15 | CMS Collaboration | Description and performance of track and primary-vertex reconstruction with the CMS tracker | JINST 9 (2014) P10009 | CMS-TRK-11-001 1405.6569 |
| 16 | CMS Collaboration | Particle-flow event reconstruction in CMS and performance for jets, taus, and $ E_{\mathrm{T}}^{\text{miss}} $ | CDS | |
| 17 | CMS Collaboration | Commissioning of the particle-flow event reconstruction with the first LHC collisions recorded in the CMS detector | CDS | |
| 18 | M. Cacciari, G. P. Salam, and G. Soyez | The anti-$ k_t $ jet clustering algorithm | JHEP 04 (2008) 063 | 0802.1189 |
| 19 | M. Cacciari, G. P. Salam, and G. Soyez | FastJet user manual | EPJC 72 (2012) 1896 | 1111.6097 |
| 20 | GEANT4 Collaboration | GEANT4---a simulation toolkit | Nucl. Inst. Meth. A 506 (2003) 250 | |
| 21 | CMS Collaboration | Determination of jet energy calibration and transverse momentum resolution in CMS | JINST 6 (2011) P11002 | CMS-JME-10-011 1107.4277 |
| 22 | CMS Collaboration | Jet energy scale and resolution in the CMS experiment in pp collisions at 8 TeV | Submitted to JINST | CMS-JME-13-004 1607.03663 |
| 23 | T. Sj\"ostrand, S. Mrenna, and P. Skands | PYTHIA 6.4 physics and manual | JHEP 05 (2006) 026 | hep-ph/0603175 |
| 24 | R. Field | Early LHC underlying event data - findings and surprises | in Hadron collider physics. Proceedings, 22nd Conference, HCP 2010, Toronto, Canada, August 23-27, 2010 2010 | 1010.3558 |
| 25 | J. Pumplin et al. | New generation of parton distributions with uncertainties from global QCD analysis | JHEP 07 (2002) 012 | hep-ph/0201195 |
| 26 | A. Buckley et al. | Systematic event generator tuning for the LHC | EPJC 65 (2010) 331 | 0907.2973 |
| 27 | G. D'Agostini | A multidimensional unfolding method based on Bayes' theorem | NIMA 362 (1995) 487 | |
| 28 | T. Adye | Unfolding algorithms and tests using RooUnfold | in Proceedings of the PHYSTAT 2011 Workshop, H. B. Prosper and L. Lyons, eds CERN, Geneva, Switzerland | 1105.1160 |
| 29 | CMS Collaboration | Constraints on parton distribution functions and extraction of the strong coupling constant from the inclusive jet cross section in pp collisions at $ \sqrt{s} = $ 7 TeV | EPJC 75 (2015) 288 | CMS-SMP-12-028 1410.6765 |
| 30 | CMS Collaboration | CMS luminosity based on pixel cluster counting --- Summer 2013 update | CMS-PAS-LUM-13-001 | CMS-PAS-LUM-13-001 |
| 31 | CMS Collaboration | CMS luminosity based on pixel cluster counting --- Summer 2012 update | CDS | |
| 32 | Z. Nagy | Three-jet cross sections in hadron-hadron collisions at next-to-leading order | PRL 88 (2002) 122003 | hep-ph/0110315 |
| 33 | Z. Nagy | Next-to-leading order calculation of three jet observables in hadron-hadron collision | PRD 68 (2003) 094002 | hep-ph/0307268 |
| 34 | S. Dittmaier, A. Huss, and C. Speckner | Weak radiative corrections to dijet production at hadron colliders | JHEP 11 (2012) 095 | 1210.0438 |
| 35 | D. Britzger, K. Rabbertz, F. Stober, and M. Wobisch | New features in version 2 of the fastNLO project | 1208.3641 | |
| 36 | H.-L. Lai et al. | New parton distributions for collider physics | PRD 82 (2010) 074024 | 1007.2241 |
| 37 | A. D. Martin, W. J. Stirling, R. S. Thorne, and G. Watt | Parton distributions for the LHC | EPJC 63 (2009) 189 | 0901.0002 |
| 38 | R. D. Ball et al. | A first unbiased global NLO determination of parton distributions and their uncertainties | Nucl. Phys. B 838 (2010) 136 | 1002.4407 |
| 39 | R. D. Ball et al. | Parton distributions for the LHC Run II | JHEP 04 (2015) 040 | 1410.8849 |
| 40 | H1 and ZEUS Collaboration | Combined measurement and QCD analysis of the inclusive $ \mathrm{e^{\pm}p} $ scattering cross sections at HERA | JHEP 01 (2010) 109 | 0911.0884 |
| 41 | S. Alekhin, J. Bl\"umlein, and S. Moch | Parton distribution functions and benchmark cross sections at NNLO | PRD 86 (2012) 054009 | 1202.2281 |
| 42 | M. B\"ahr et al. | Herwig++ physics and manual | EPJC 58 (2008) 639 | 0803.0883 |
| 43 | M. H. Seymour and A. Siodmok | Constraining MPI models using $ \sigma_{\mathrm{eff}} $ and recent Tevatron and LHC underlying event data | JHEP 10 (2013) 113 | 1307.5015 |
| 44 | P. Nason | A new method for combining NLO QCD with shower Monte Carlo algorithms | JHEP 11 (2004) 040 | hep-ph/0409146 |
| 45 | S. Frixione, P. Nason, and C. Oleari | Matching NLO QCD computations with parton shower simulations: the POWHEG method | JHEP 11 (2007) 070 | 0709.2092 |
| 46 | S. Alioli, P. Nason, C. Oleari, and E. Re | A general framework for implementing NLO calculations in shower Monte Carlo programs: the POWHEG BOX | JHEP 06 (2010) 043 | 1002.2581 |
| 47 | S. Alioli et al. | Jet pair production in POWHEG | JHEP 04 (2011) 081 | 1012.3380 |
| 48 | P. Z. Skands | Tuning Monte Carlo generators: the Perugia tunes | PRD 82 (2010) 074018 | 1005.3457 |
| 49 | D0 Collaboration | Determination of the strong coupling constant from the inclusive jet cross section in $ \mathrm{p\bar{p}} $ collisions at $ \sqrt{s} = $ 1.96 TeV | PRD 80 (2009) 111107 | 0911.2710 |
| 50 | D0 Collaboration | Measurement of angular correlations of jets at $ \sqrt{s} = $ 1.96 TeV and determination of the strong coupling at high momentum transfers | PLB 718 (2012) 56 | 1207.4957 |
| 51 | CDF Collaboration | Measurement of the strong coupling constant from inclusive jet production at the Tevatron $ \mathrm{\bar{p}p} $ collider | PRL 88 (2002) 042001 | hep-ex/0108034 |
| 52 | Particle Data Group, K. A. Olive et al. | Review of particle physics | CPC 38 (2014) 090001 | |
| 53 | CMS Collaboration | Measurement of the ratio of the inclusive 3-jet cross section to the inclusive 2-jet cross section in pp collisions at $ \sqrt{s} = $ 7 TeV and first determination of the strong coupling constant in the TeV range | EPJC 73 (2013) 2604 | CMS-QCD-11-003 1304.7498 |
| 54 | CMS Collaboration | Determination of the top-quark pole mass and strong coupling constant from the $ \mathrm{t\bar{t}} $ production cross section in pp collisions at $ \sqrt{s} = $ 7 TeV | PLB 728 (2014) 496 | CMS-TOP-12-022 1307.1907 |
| 55 | CMS Collaboration | Measurement of the inclusive 3-jet production differential cross section in proton-proton collisions at 7 TeV and determination of the strong coupling constant in the TeV range | EPJC 75 (2015) 186 | CMS-SMP-12-027 1412.1633 |
| 56 | H1 Collaboration | Jet production in ep collisions at high $ Q^2 $ and determination of $ \alpha_{\mathrm{s}} $ | EPJC 65 (2010) 363 | 0904.3870 |
| 57 | H1 Collaboration | Jet production in ep collisions at low $ Q^2 $ and determination of $ \alpha_{\mathrm{s}} $ | EPJC 67 (2010) 1 | 0911.5678 |
| 58 | ZEUS Collaboration | Inclusive-jet photoproduction at HERA and determination of $ \alpha_s $ | NPB 864 (2012) 1 | 1205.6153 |
| 59 | S. Alekhin et al. | HERAFitter, Open source QCD fit project | EPJC 75 (2015) 304 | 1410.4412 |
| 60 | Hera Fitter Group | HERA Fitter | HERAFitter Collaboration | |
| 61 | V. N. Gribov and L. N. Lipatov | Deep inelastic ep scattering in perturbation theory | Sov. J. Nucl. Phys. 15 (1972)438 | |
| 62 | G. Altarelli and G. Parisi | Asymptotic freedom in parton language | Nucl. Phys. B 126 (1977) 298 | |
| 63 | G. Curci, W. Furmanski, and R. Petronzio | Evolution of parton densities beyond leading order: The non-singlet case | Nucl. Phys. B 175 (1980) 27 | |
| 64 | W. Furmanski and R. Petronzio | Singlet parton densities beyond leading order | PLB 97 (1980) 437 | |
| 65 | S. Moch, J. A. M. Vermaseren, and A. Vogt | The three-loop splitting functions in QCD: the non-singlet case | Nucl. Phys. B 688 (2004) 101 | hep-ph/0403192 |
| 66 | A. Vogt, S. Moch, and J. A. M. Vermaseren | The three-loop splitting functions in QCD: the singlet case | Nucl. Phys. B 691 (2004) 129 | hep-ph/0404111 |
| 67 | M. Botje | QCDNUM: Fast QCD evolution and convolution | CPC 182 (2011) 490 | 1005.1481 |
| 68 | R. S. Thorne | Variable-flavor number scheme for NNLO | PRD 73 (2006) 054019 | hep-ph/0601245 |
| 69 | CMS Collaboration | Measurement of the muon charge asymmetry in inclusive $ \mathrm{pp \to W+X} $ production at $ \sqrt{s} = $ 7 TeV and an improved determination of light parton distribution functions | PRD 90 (2014) 032004 | CMS-SMP-12-021 1312.6283 |
| 70 | J. Pumplin et al. | Uncertainties of predictions from parton distribution functions. II. The Hessian method | PRD 65 (2001) 014013 | hep-ph/0101032 |
| 71 | W. T. Giele and S. Keller | Implications of hadron collider observables on parton distribution function uncertainties | PRD 58 (1998) 094023 | hep-ph/9803393 |
| 72 | W. T. Giele, S. A. Keller, and D. A. Kosower | Parton distribution function uncertainties | hep-ph/0104052 | |
|
|
Compact Muon Solenoid LHC, CERN |
|

|

|

|

|

|