

Compact Muon Solenoid
LHC, CERN
| CMS-SMP-20-010 ; CERN-EP-2021-161 | ||
| Study of quark and gluon jet substructure in Z+jet and dijet events from pp collisions | ||
| CMS Collaboration | ||
| 8 September 2021 | ||
| JHEP 01 (2022) 188 | ||
| Abstract: Measurements of jet substructure describing the composition of quark- and gluon-initiated jets are presented. Proton-proton (pp) collision data at $\sqrt{s} = $ 13 TeV collected with the CMS detector are used, corresponding to an integrated luminosity of 35.9 fb$^{-1}$. Generalized angularities are measured that characterize the jet substructure and distinguish quark- and gluon-initiated jets. These observables are sensitive to the distributions of transverse momenta and angular distances within a jet. The analysis is performed using a data sample of dijet events enriched in gluon-initiated jets, and, for the first time, a Z+jet event sample enriched in quark-initiated jets. The observables are measured in bins of jet transverse momentum, and as a function of the jet radius parameter. Each measurement is repeated applying a "soft drop" grooming procedure that removes soft and large angle radiation from the jet. Using these measurements, the ability of various models to describe jet substructure is assessed, showing a clear need for improvements in Monte Carlo generators. | ||
| Links: e-print arXiv:2109.03340 [hep-ex] (PDF) ; CDS record ; inSPIRE record ; HepData record ; CADI line (restricted) ; | ||
| Figures & Tables | Summary | Additional Figures | References | CMS Publications |
|---|
| Figures | |

png pdf |
Figure 1:
The five generalized angularities ${\lambda ^{\kappa}_{\beta}}$ used in this analysis, represented in the $(\kappa, \beta)$ plane. The Les Houches Angularity is denoted by LHA. Adapted from Ref. [46]. |
png pdf |
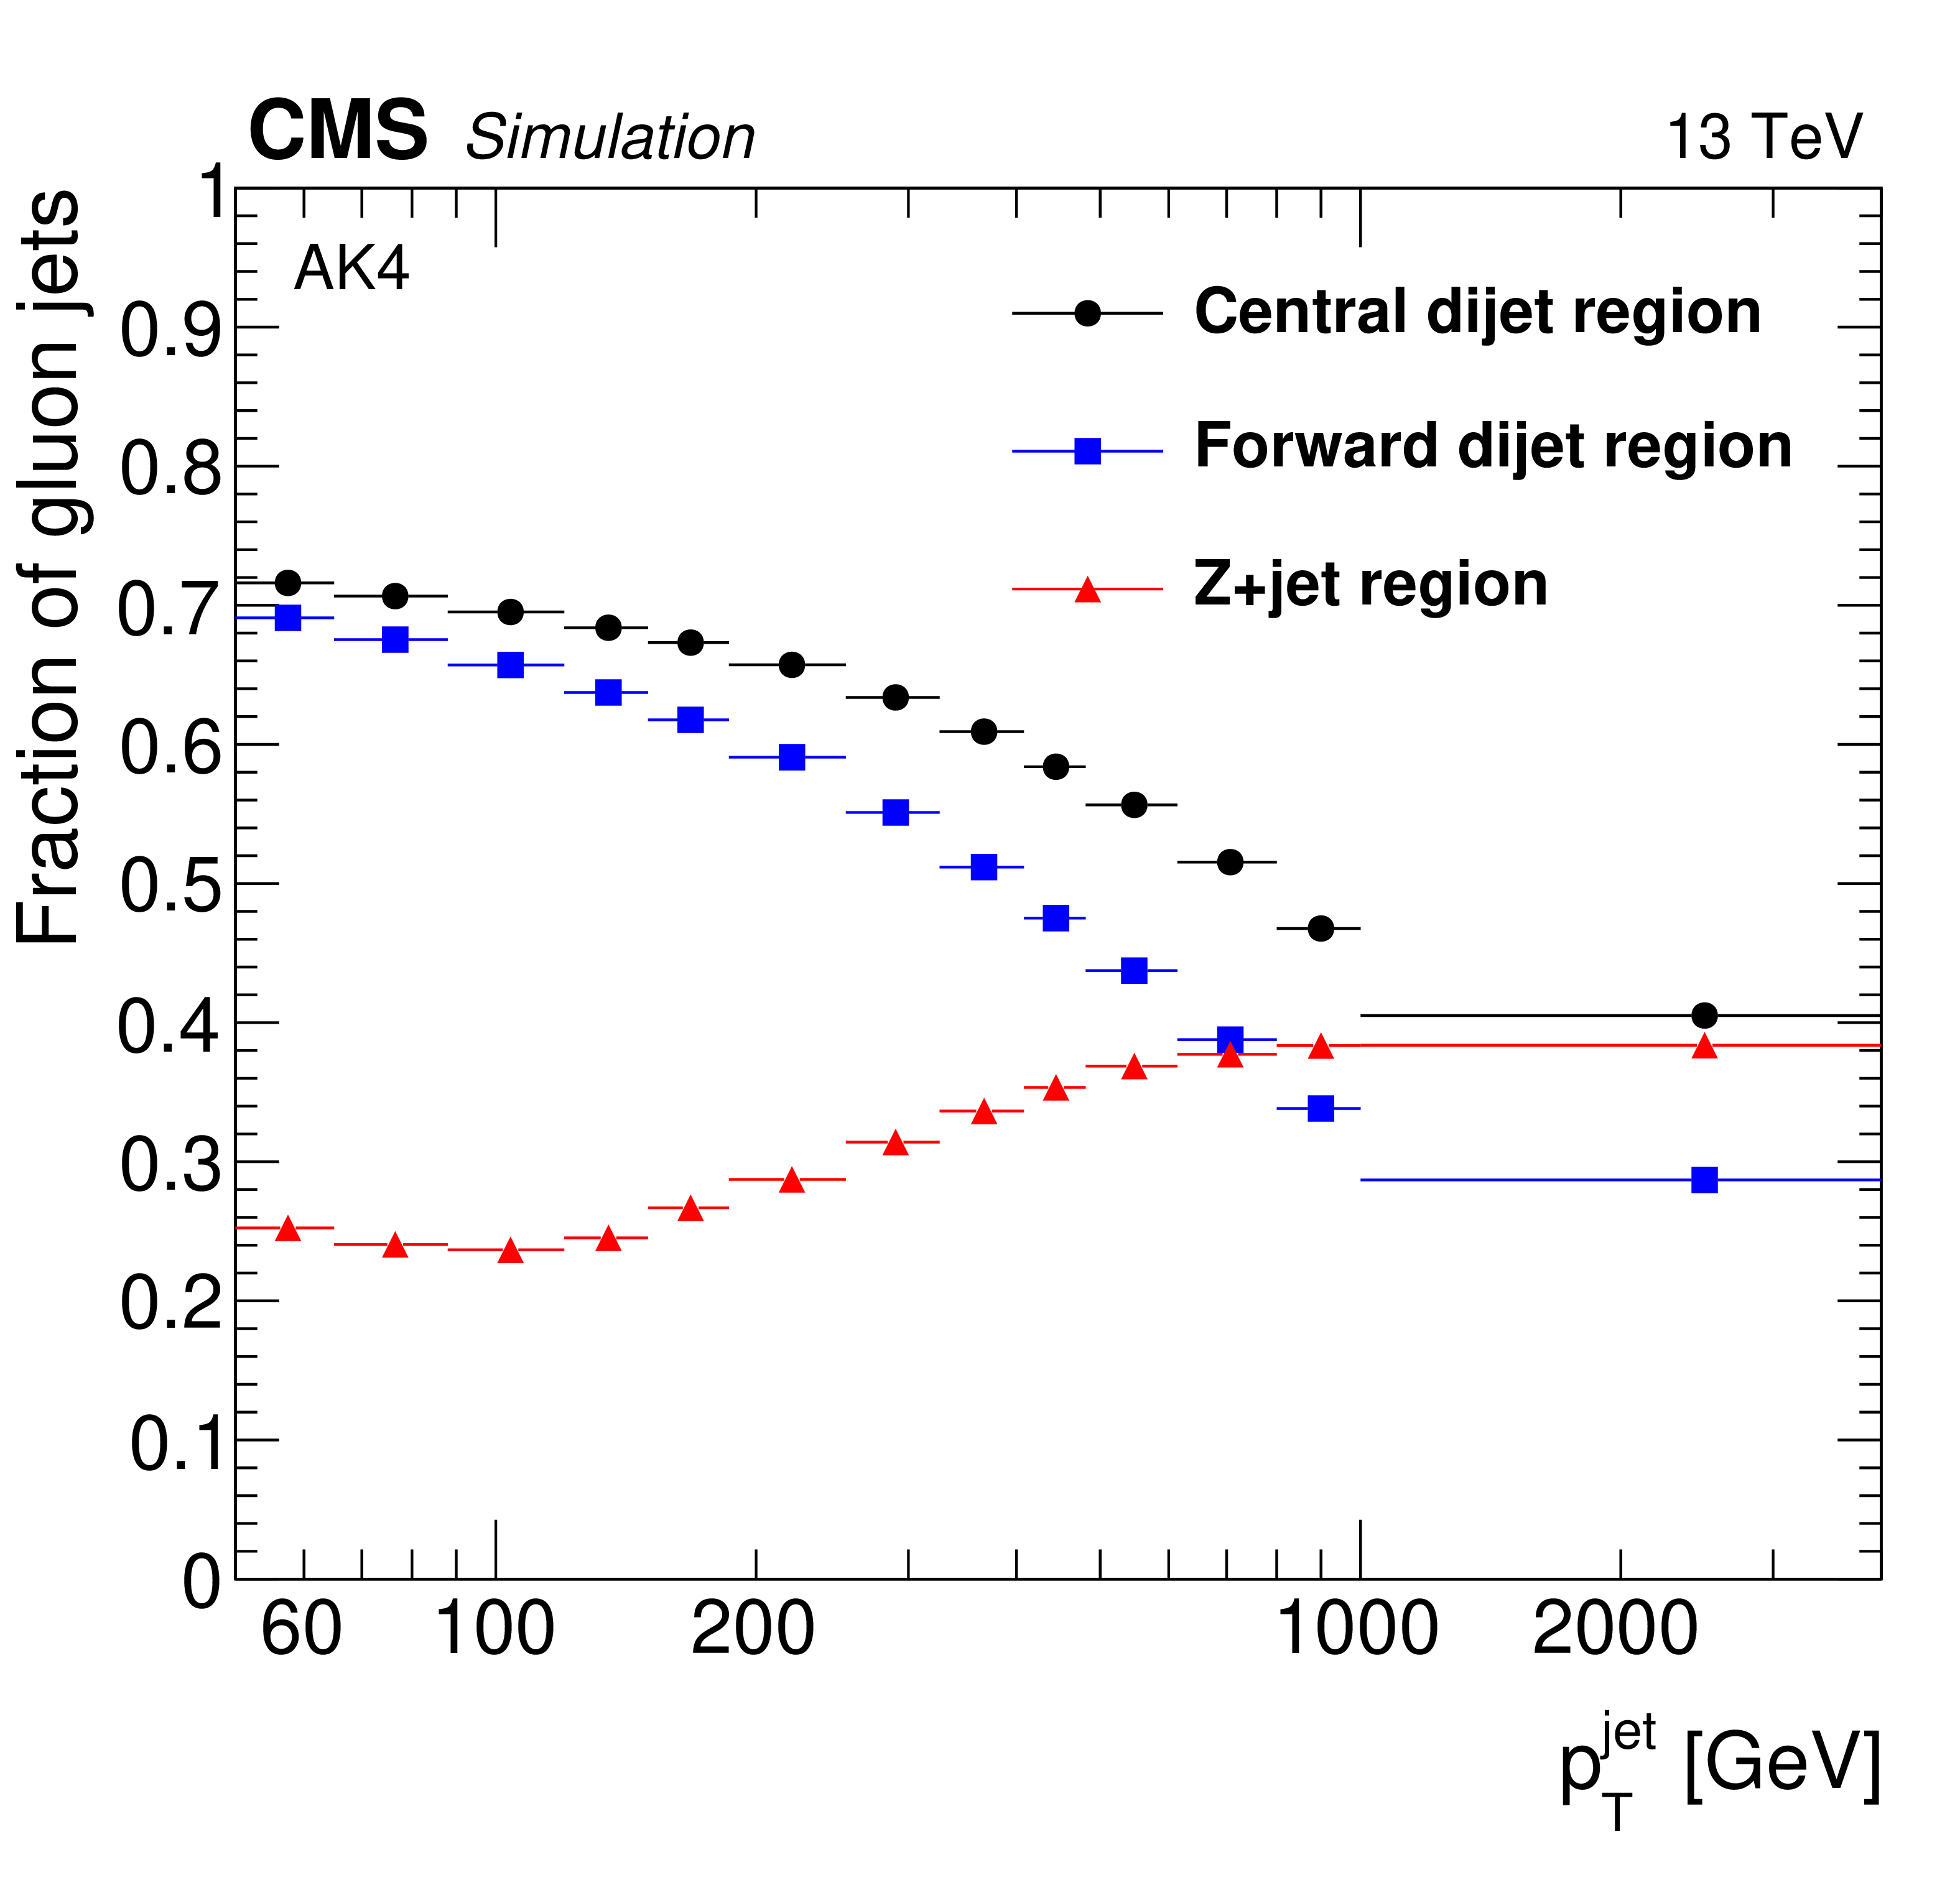
Figure 2:
Fraction of AK4 jets that are gluon jets in the Z+jet sample (red triangles), and the central (black circles) and forward (blue squares) dijet samples. The statistical uncertainty is negligible in the simulation. |

png pdf |
Figure 3:
Data to simulation comparisons of the jet ${p_{\mathrm {T}}}$ in the Z+jet (left) and central dijet (right) regions. The error bars correspond to the statistical uncertainties in the experimental data. The coarse-grained hashed region in each ratio plot indicates the statistical uncertainty in the experimental data, and the fine-grained hashed region represents the total uncertainty in the MC prediction. |

png pdf |
Figure 3-a:
Data to simulation comparisons of the jet ${p_{\mathrm {T}}}$ in the Z+jet region. The error bars correspond to the statistical uncertainties in the experimental data. The coarse-grained hashed region in each ratio plot indicates the statistical uncertainty in the experimental data, and the fine-grained hashed region represents the total uncertainty in the MC prediction. |

png pdf |
Figure 3-b:
Data to simulation comparisons of the jet ${p_{\mathrm {T}}}$ in the central dijet region. The error bars correspond to the statistical uncertainties in the experimental data. The coarse-grained hashed region in each ratio plot indicates the statistical uncertainty in the experimental data, and the fine-grained hashed region represents the total uncertainty in the MC prediction. |

png pdf |
Figure 4:
Detector-level and particle-level (unfolded) experimental data distributions of LHA (${\lambda ^{1}_{0.5}}$) (left) using charged+neutral constituents, and $(p_{\mathrm {T}}^{\mathrm {D}})^2$ ($\lambda ^{2}_{0}$) (right) using only charged constituents, for jets with 120 $ < {p_{\mathrm {T}}} < $ 150 GeV in the Z+jet (red) and central dijet (black) regions. The detector-level data uncertainties are statistical. The particle-level (unfolded) data uncertainties include the systematic components. Also shown is the mean of each distribution, calculated from the binned data. The ratio plots show the ratio of dijet to Z+jet distributions, for both the detector- and particle-level distributions. |

png pdf |
Figure 4-a:
Detector-level and particle-level (unfolded) experimental data distributions of LHA (${\lambda ^{1}_{0.5}}$) using charged+neutral constituents, for jets with 120 $ < {p_{\mathrm {T}}} < $ 150 GeV in the Z+jet (red) and central dijet (black) regions. The detector-level data uncertainties are statistical. The particle-level (unfolded) data uncertainties include the systematic components. Also shown is the mean of each distribution, calculated from the binned data. The ratio plot shows the ratio of dijet to Z+jet distributions, for both the detector- and particle-level distributions. |

png pdf |
Figure 4-b:
Detector-level and particle-level (unfolded) experimental data distributions of $(p_{\mathrm {T}}^{\mathrm {D}})^2$ ($\lambda ^{2}_{0}$) using only charged constituents, for jets with 120 $ < {p_{\mathrm {T}}} < $ 150 GeV in the Z+jet (red) and central dijet (black) regions. The detector-level data uncertainties are statistical. The particle-level (unfolded) data uncertainties include the systematic components. Also shown is the mean of each distribution, calculated from the binned data. The ratio plot shows the ratio of dijet to Z+jet distributions, for both the detector- and particle-level distributions. |
png pdf |
Figure 5:
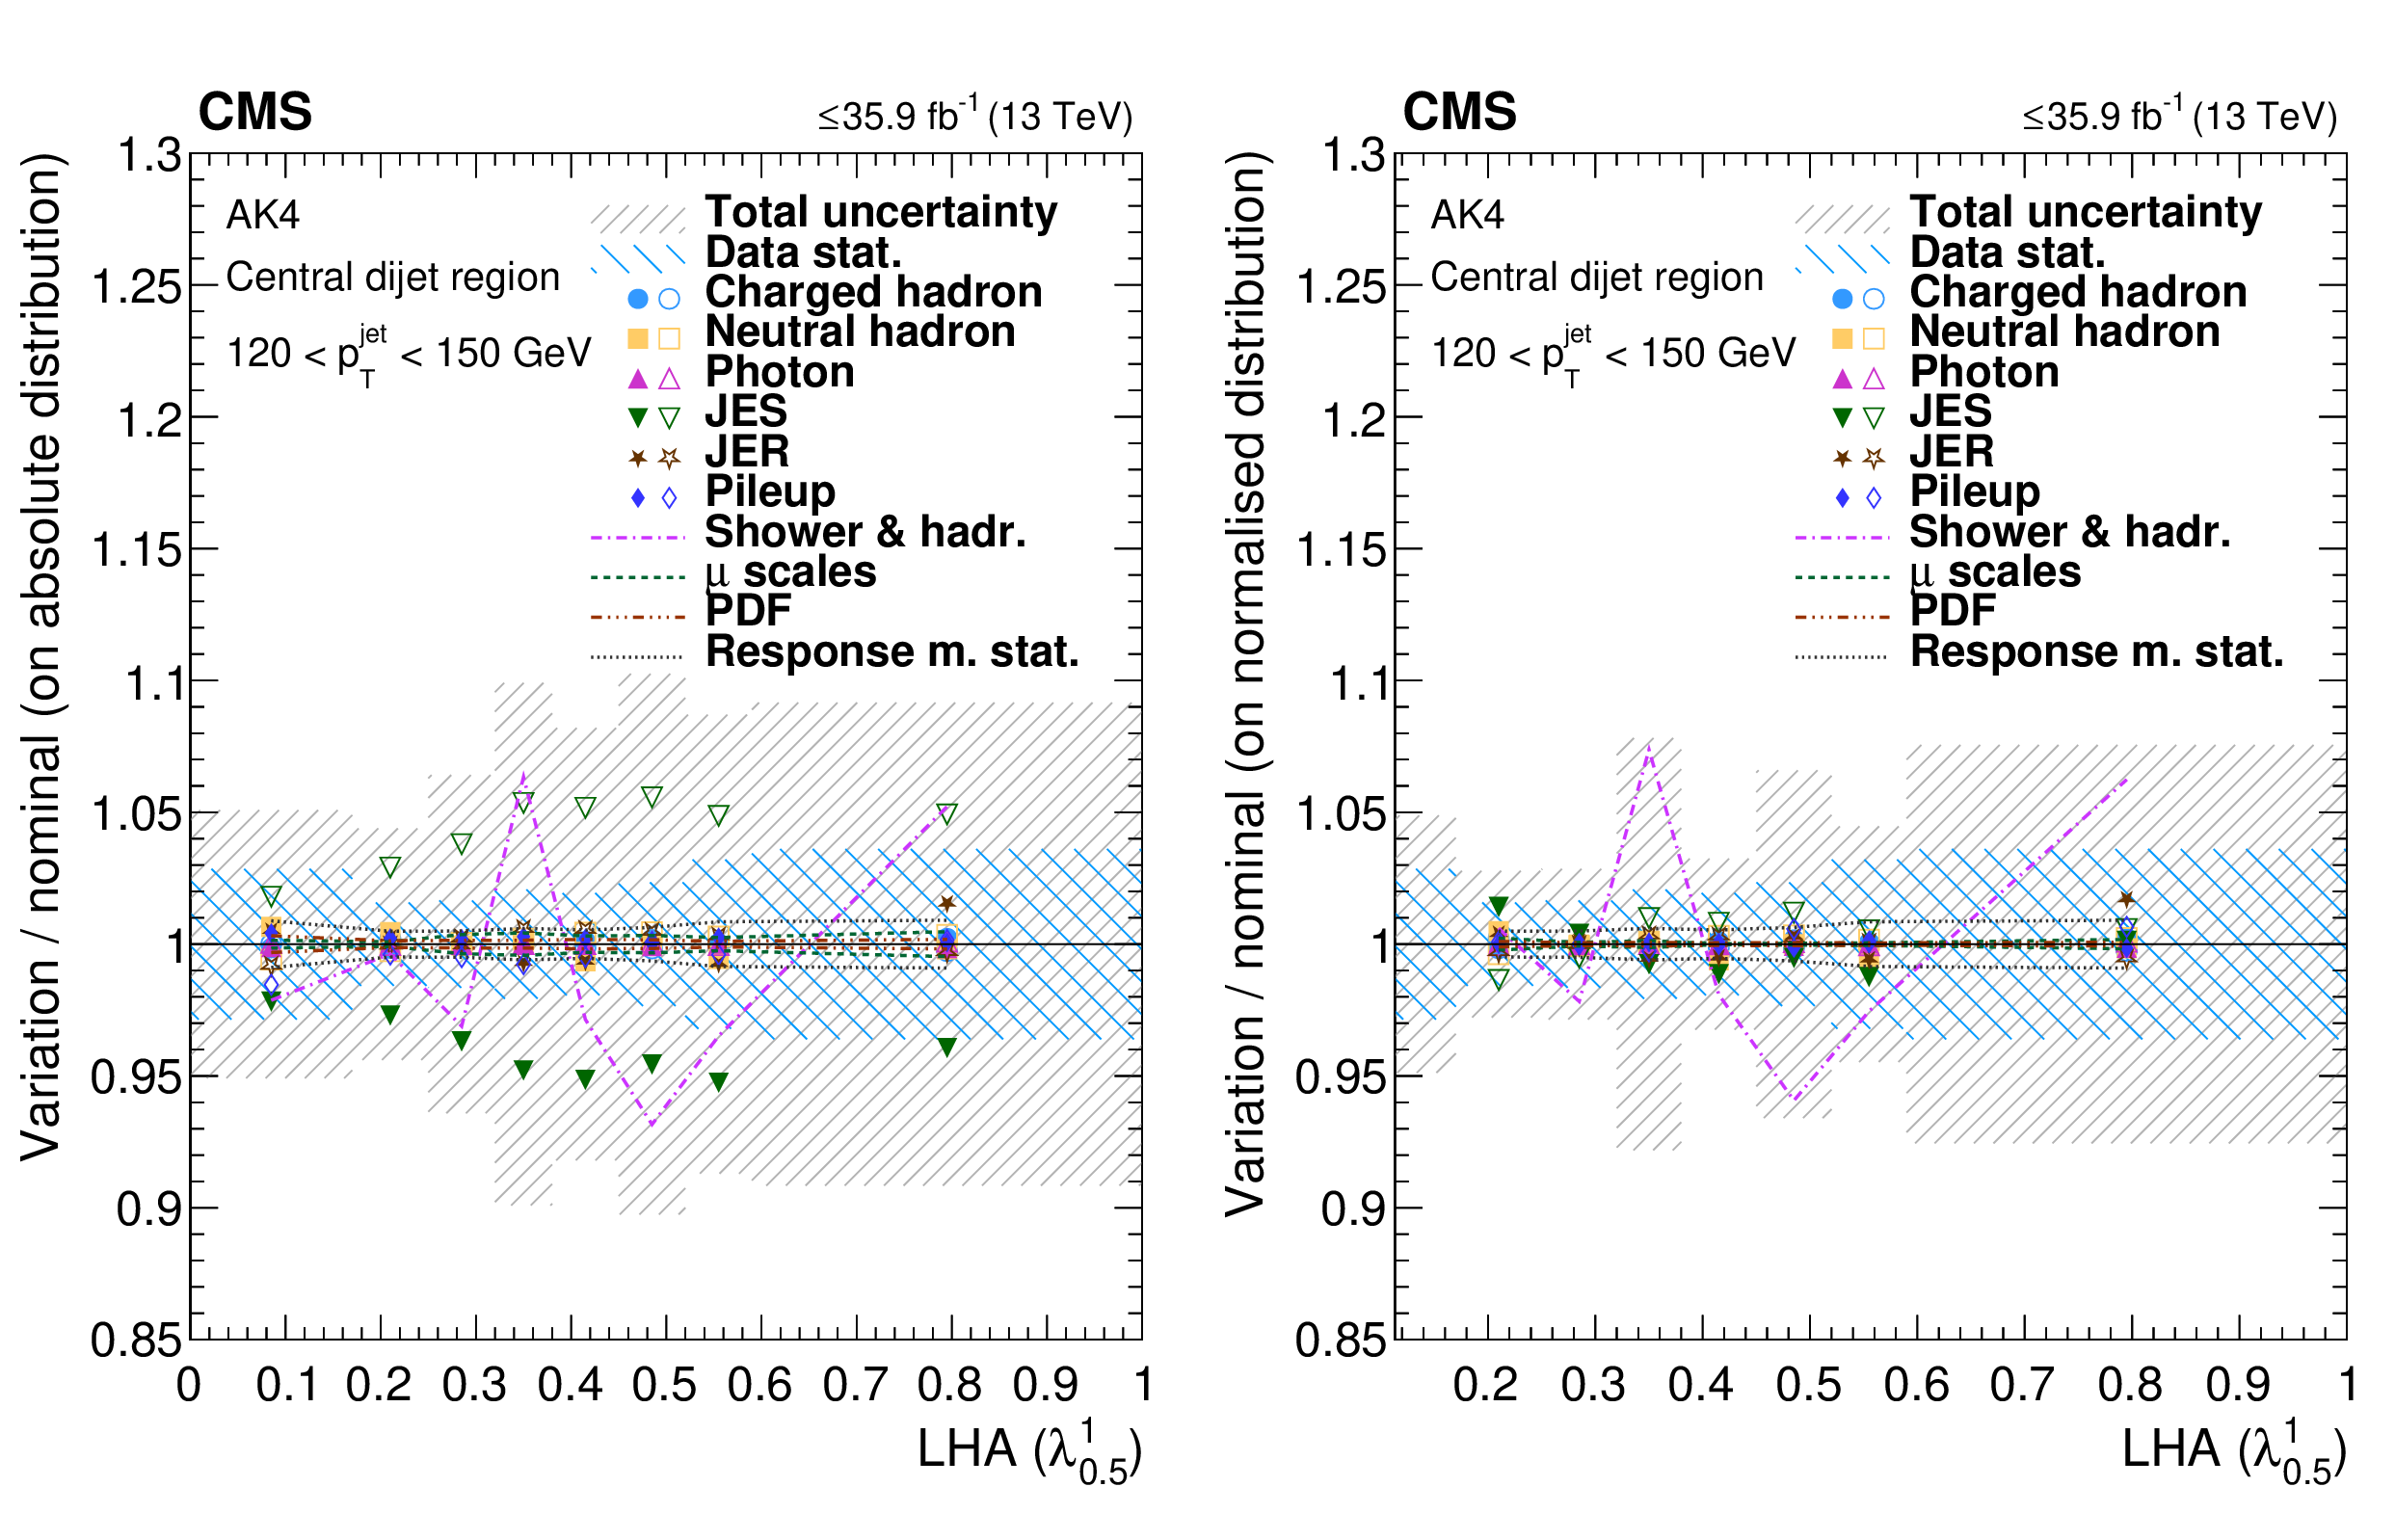
Ratio of the distribution that results from a varied response matrix to the nominal distribution of ungroomed LHA (${\lambda ^{1}_{0.5}}$) for AK4 jets with 120 $ < {p_{\mathrm {T}}} < $ 150 GeV in the central dijet region before (left) and after (right) normalization. Filled symbols correspond to upward variations, and the corresponding downward variations are represented by open symbols. The coarse-grained hashed region indicates the statistical uncertainty of the experimental data, and the fine-grained hashed region represents the total uncertainty, the sum in quadrature of statistical and systematic uncertainties. |
png pdf |
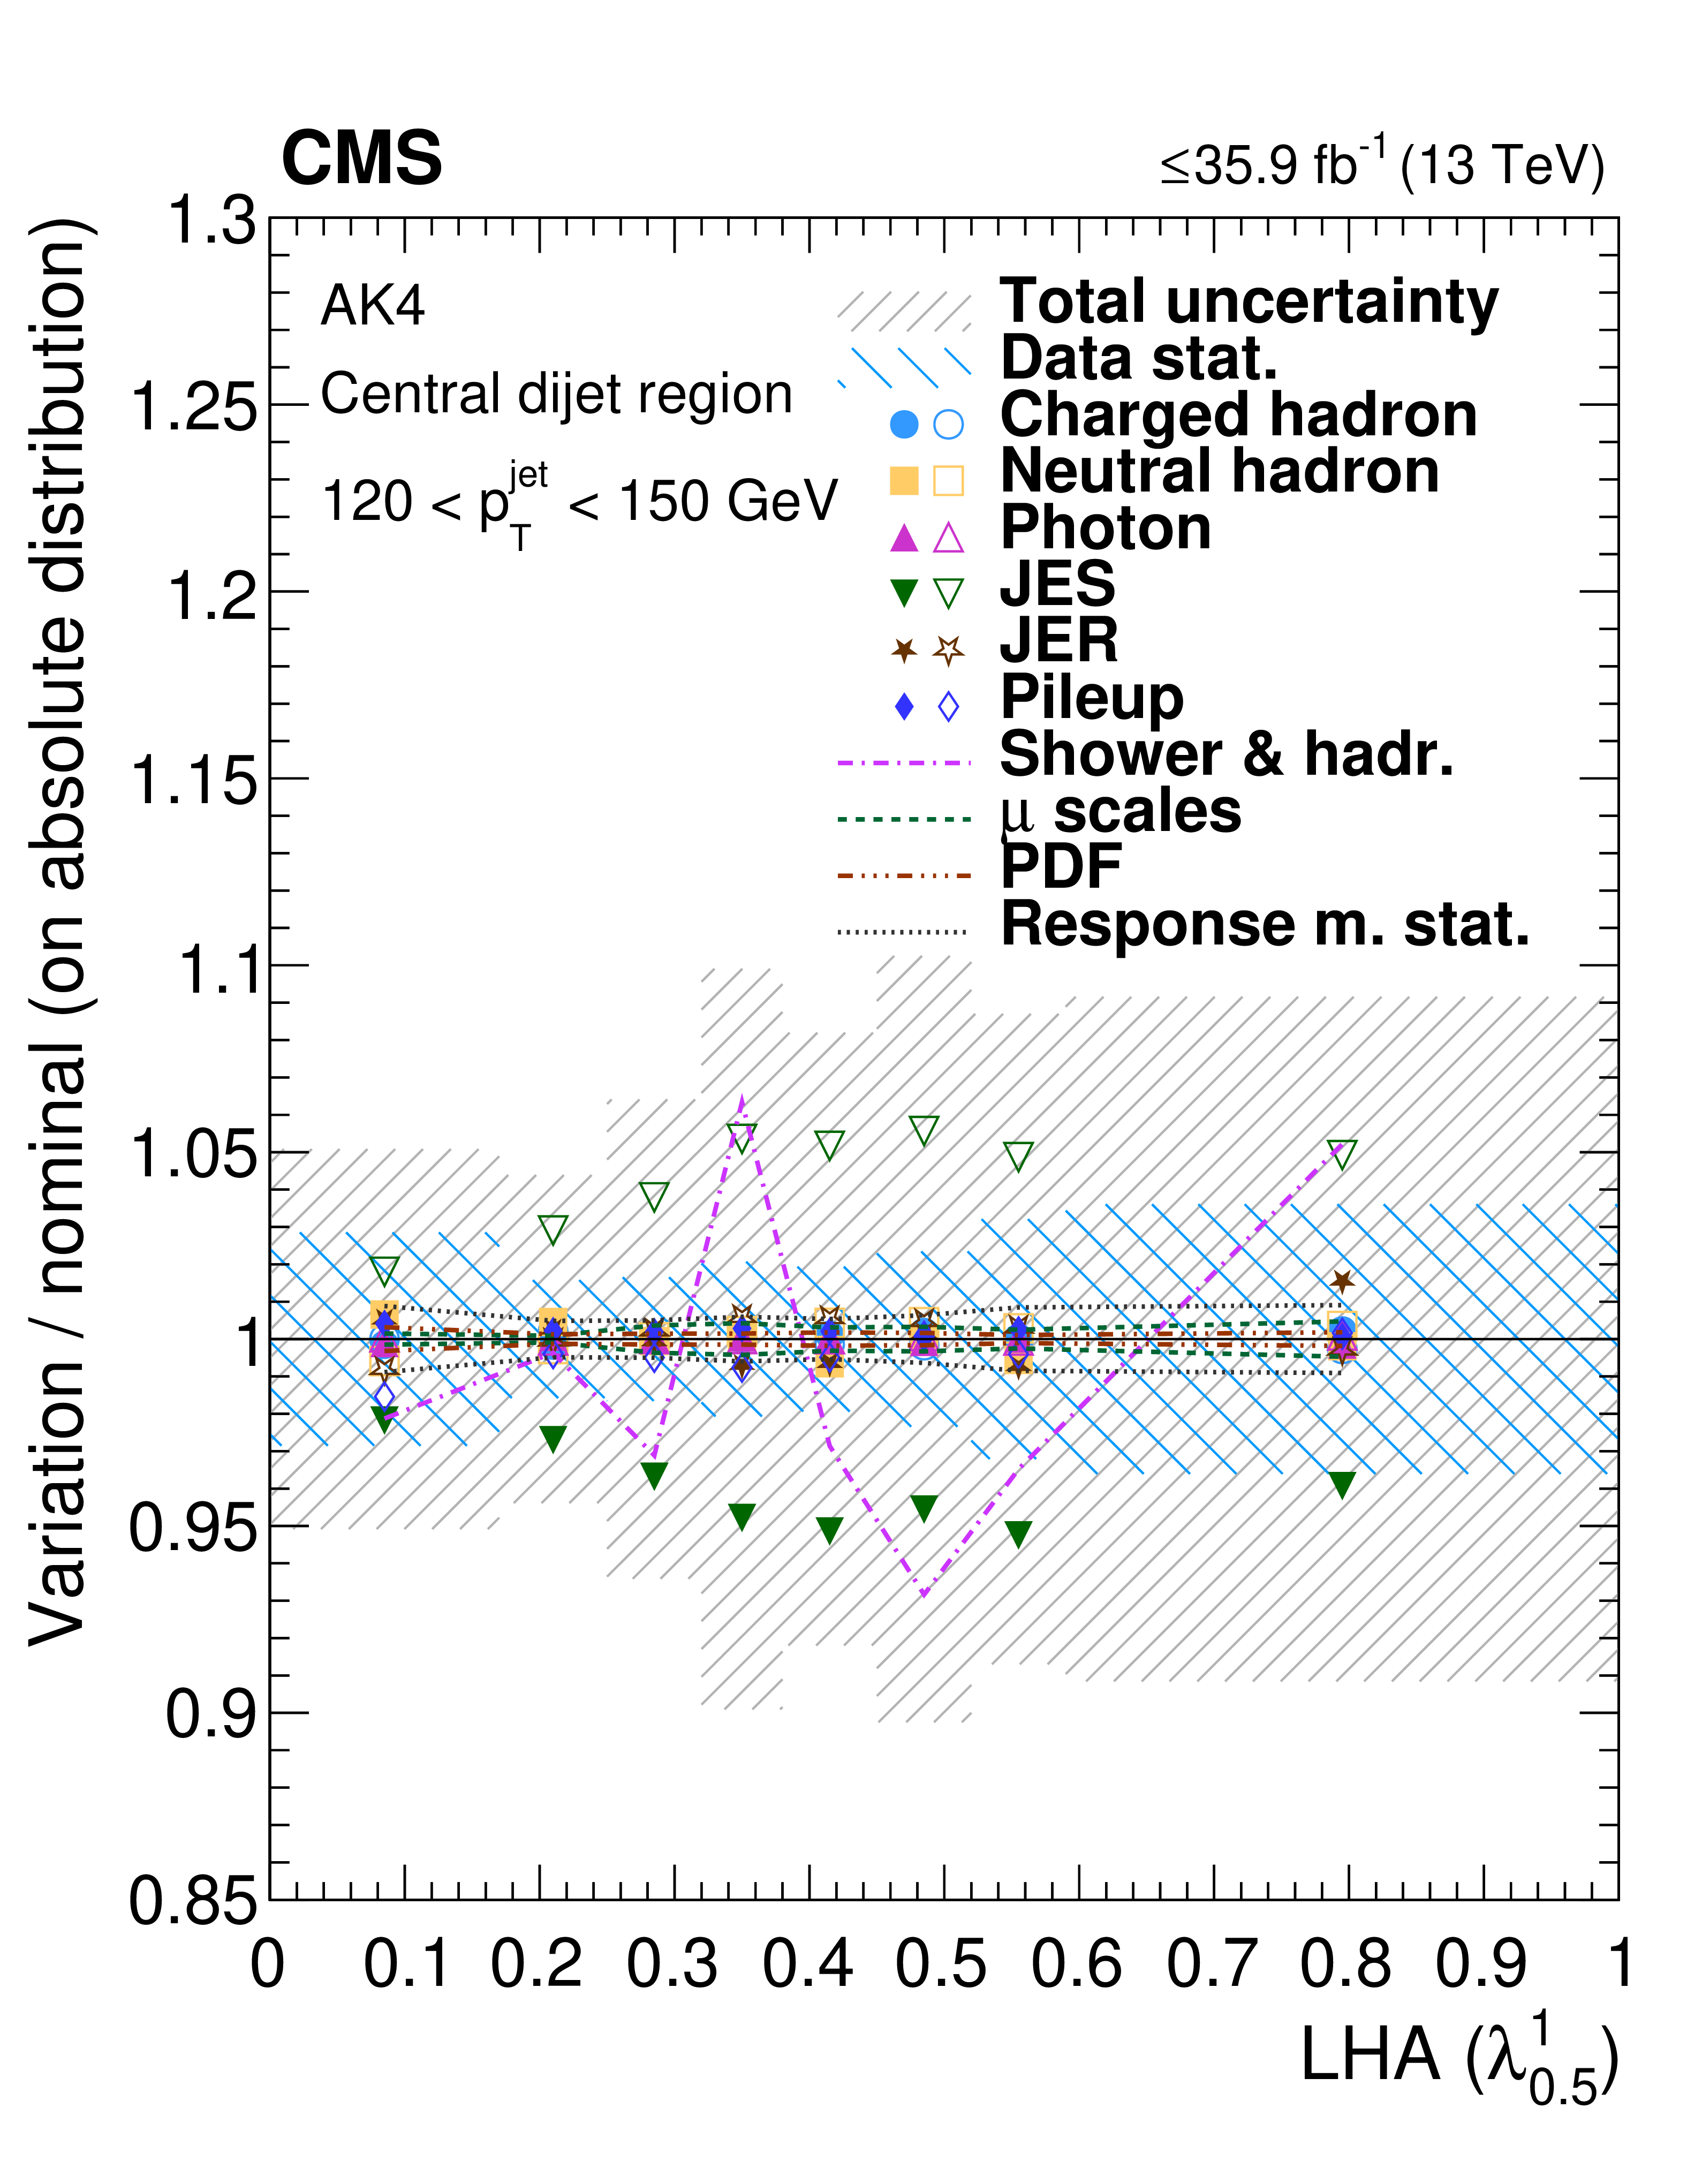
Figure 5-a:
Ratio of the distribution that results from a varied response matrix to the nominal distribution of ungroomed LHA (${\lambda ^{1}_{0.5}}$) for AK4 jets with 120 $ < {p_{\mathrm {T}}} < $ 150 GeV in the central dijet region before normalization. Filled symbols correspond to upward variations, and the corresponding downward variations are represented by open symbols. The coarse-grained hashed region indicates the statistical uncertainty of the experimental data, and the fine-grained hashed region represents the total uncertainty, the sum in quadrature of statistical and systematic uncertainties. |
png pdf |
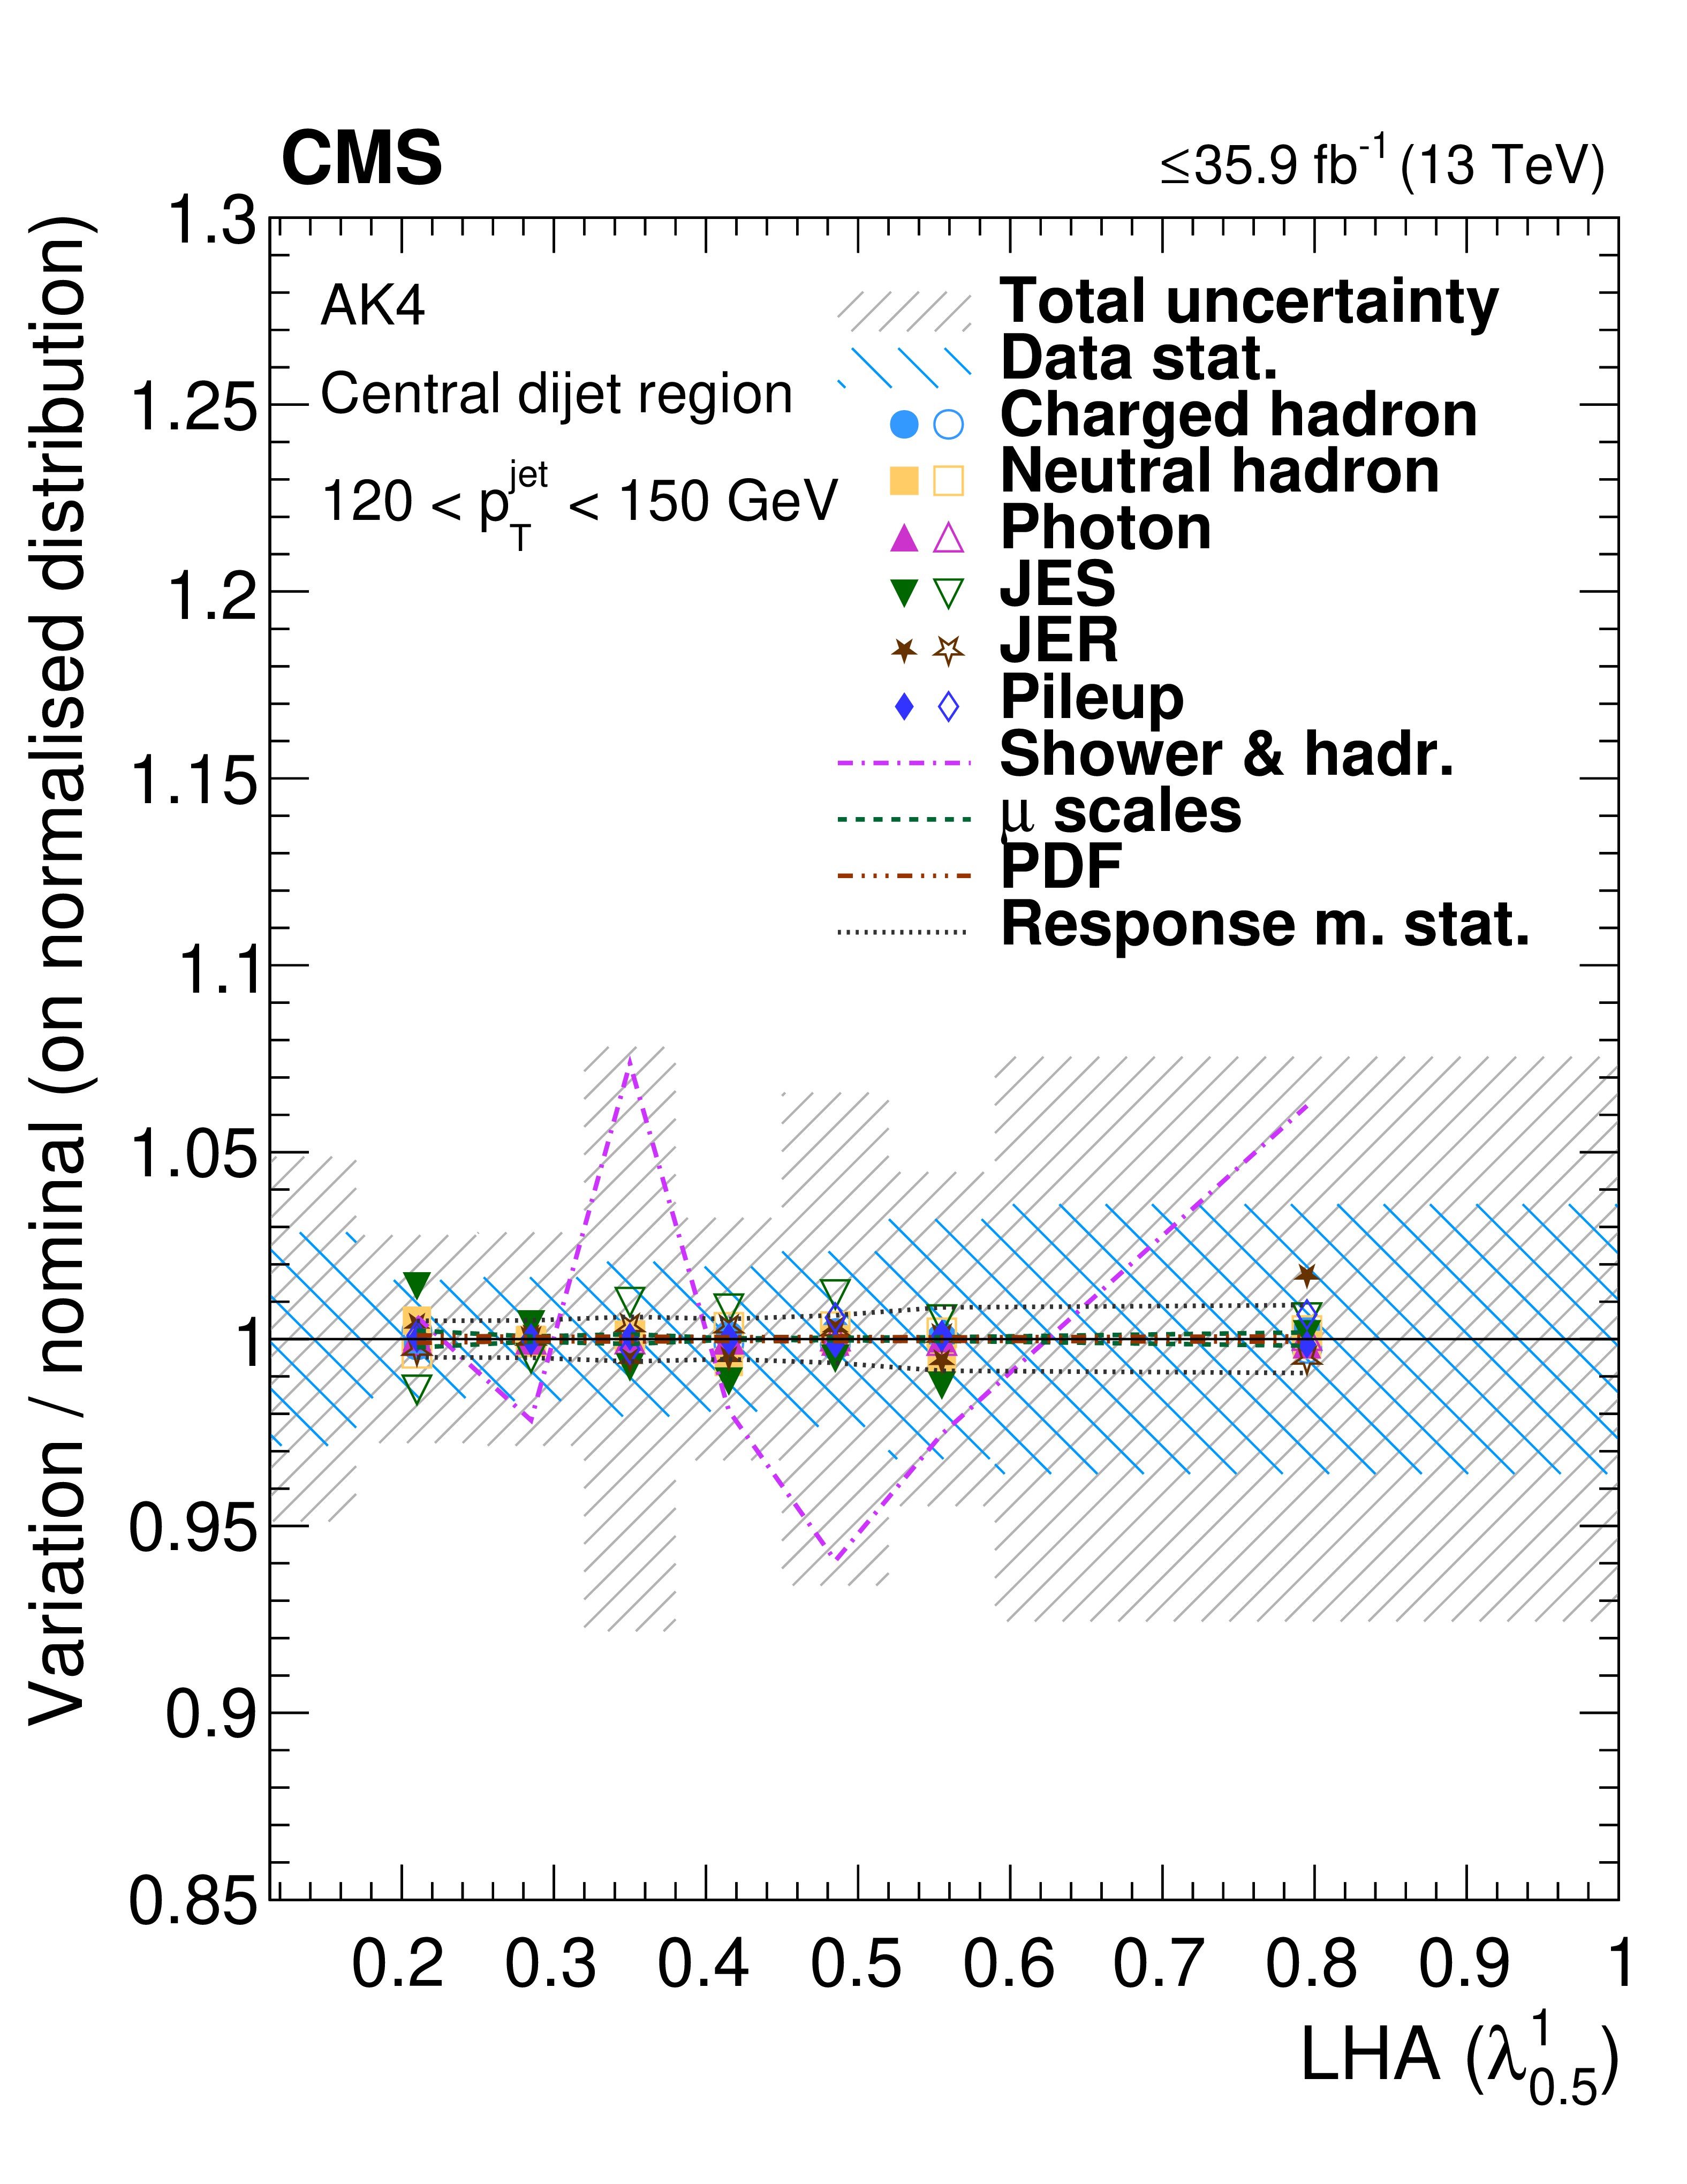
Figure 5-b:
Ratio of the distribution that results from a varied response matrix to the nominal distribution of ungroomed LHA (${\lambda ^{1}_{0.5}}$) for AK4 jets with 120 $ < {p_{\mathrm {T}}} < $ 150 GeV in the central dijet region after normalization. Filled symbols correspond to upward variations, and the corresponding downward variations are represented by open symbols. The coarse-grained hashed region indicates the statistical uncertainty of the experimental data, and the fine-grained hashed region represents the total uncertainty, the sum in quadrature of statistical and systematic uncertainties. |

png pdf |
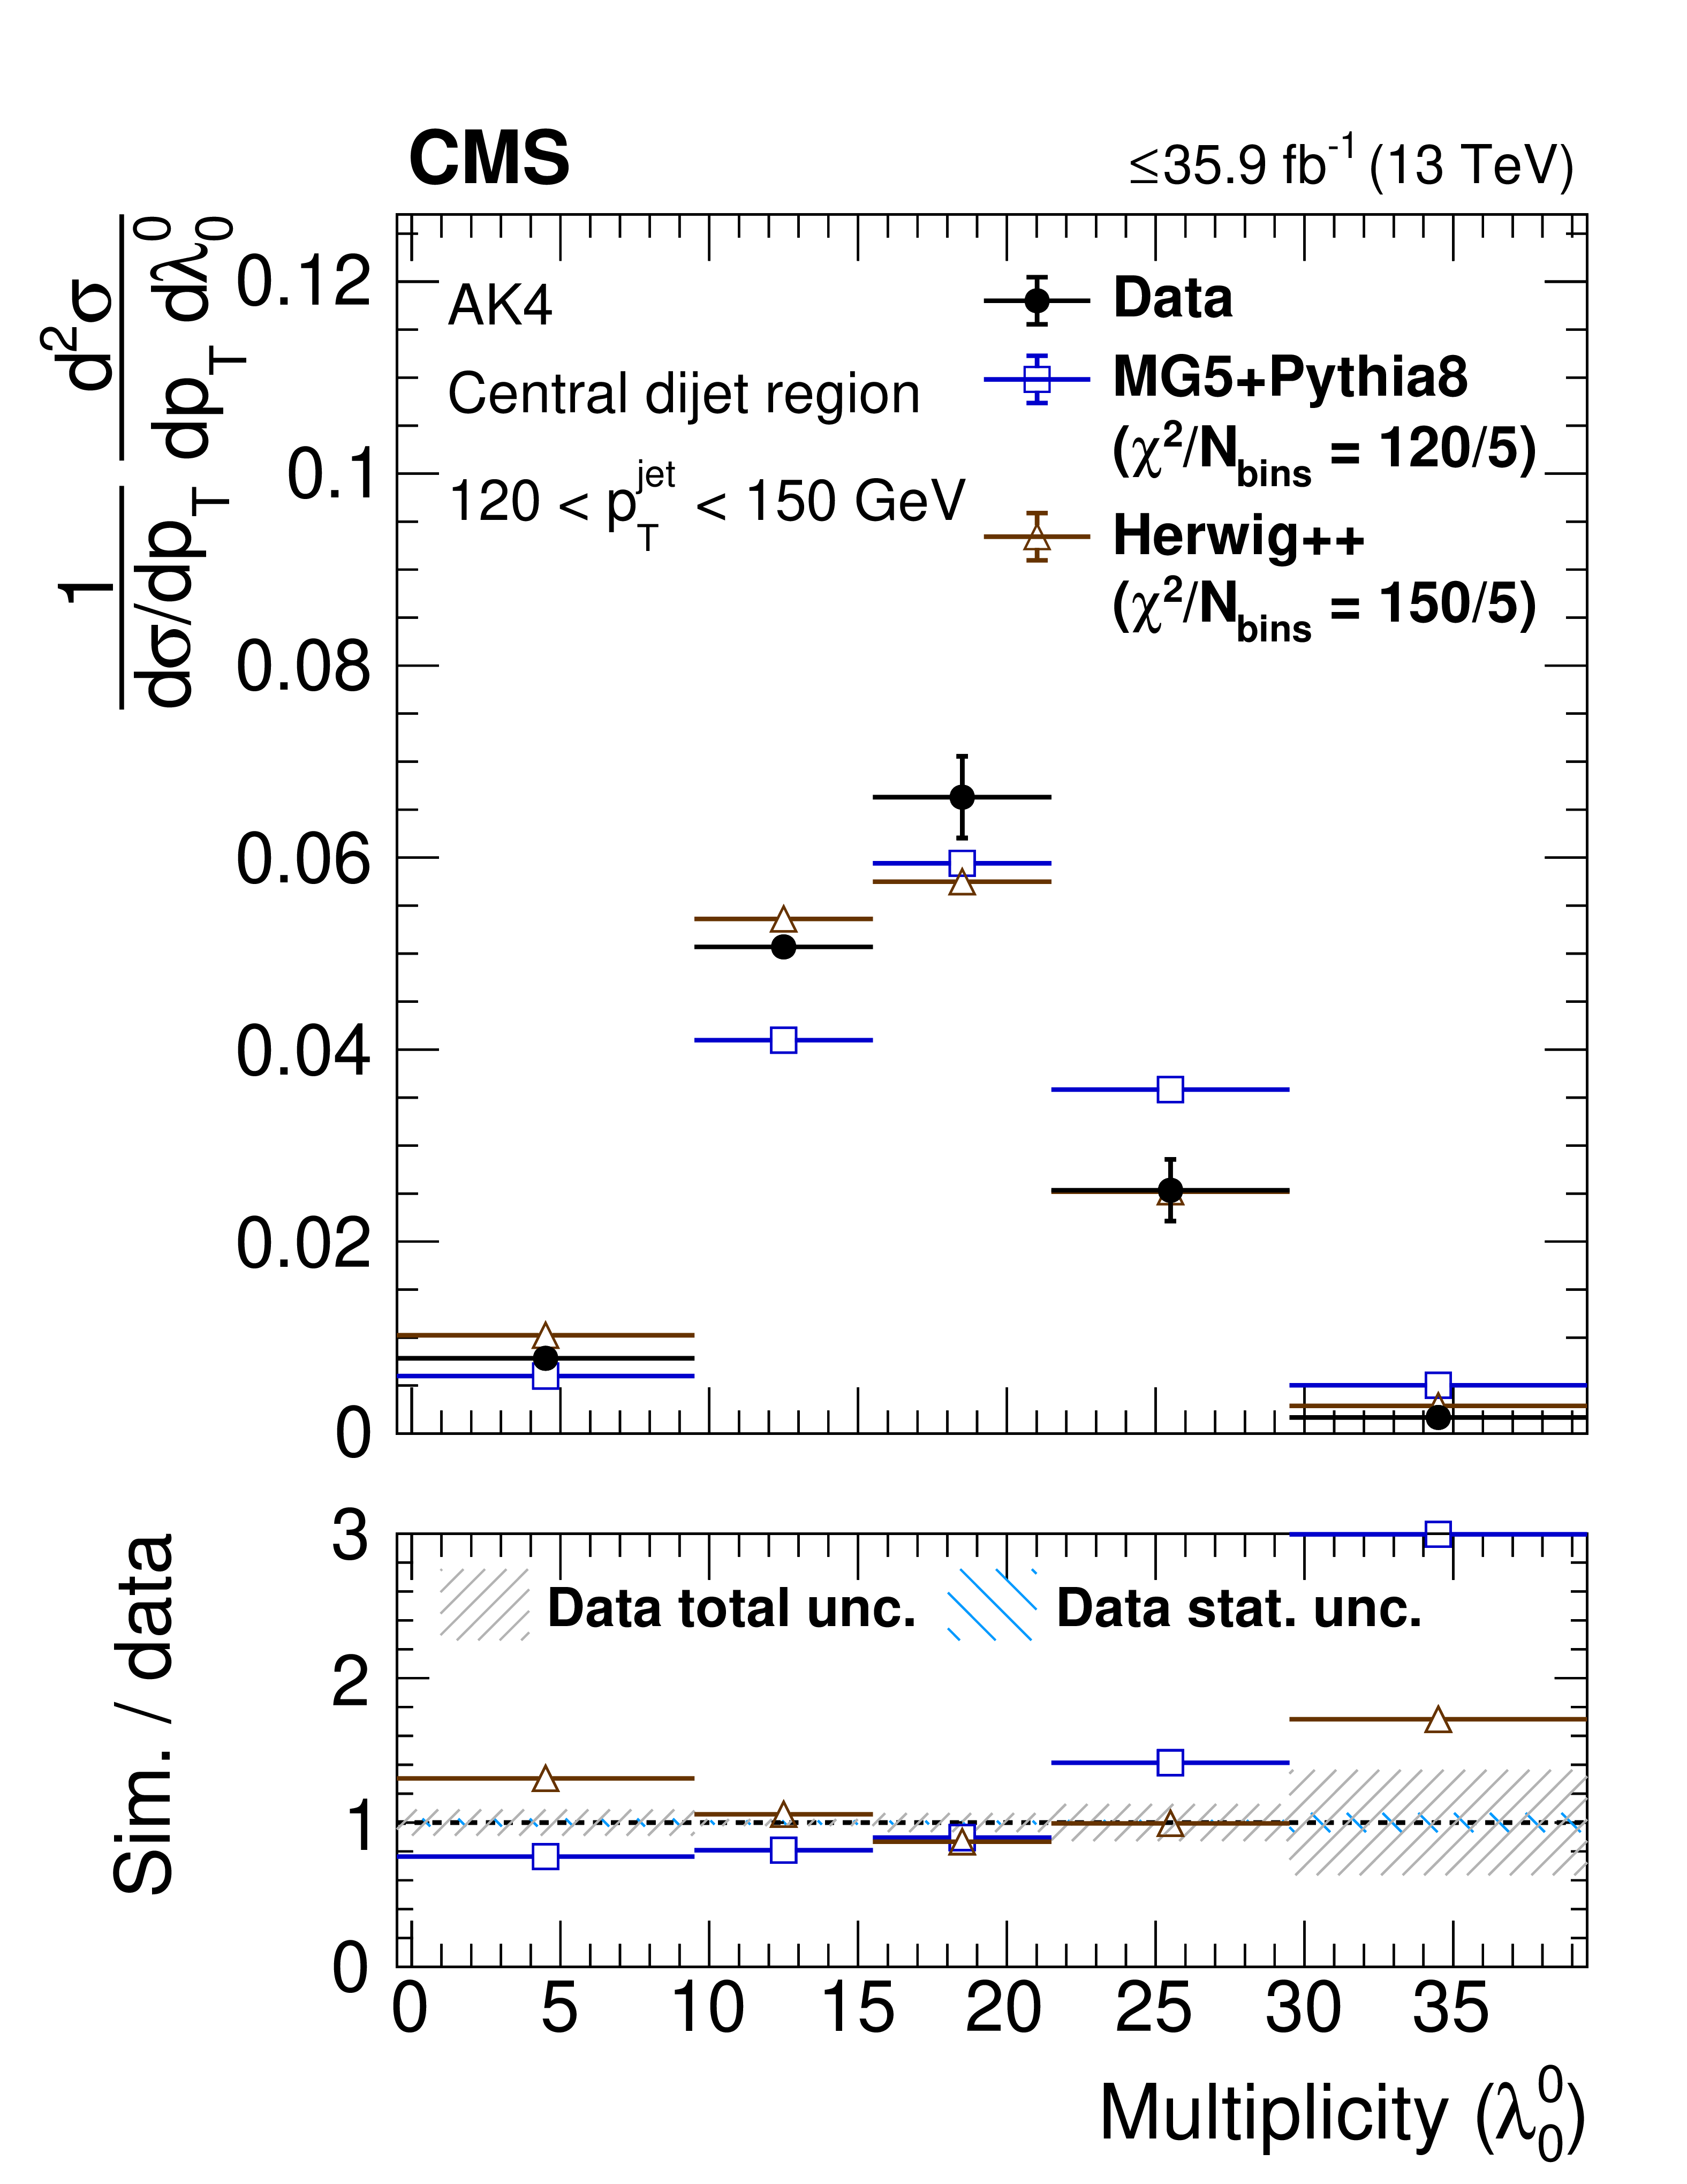
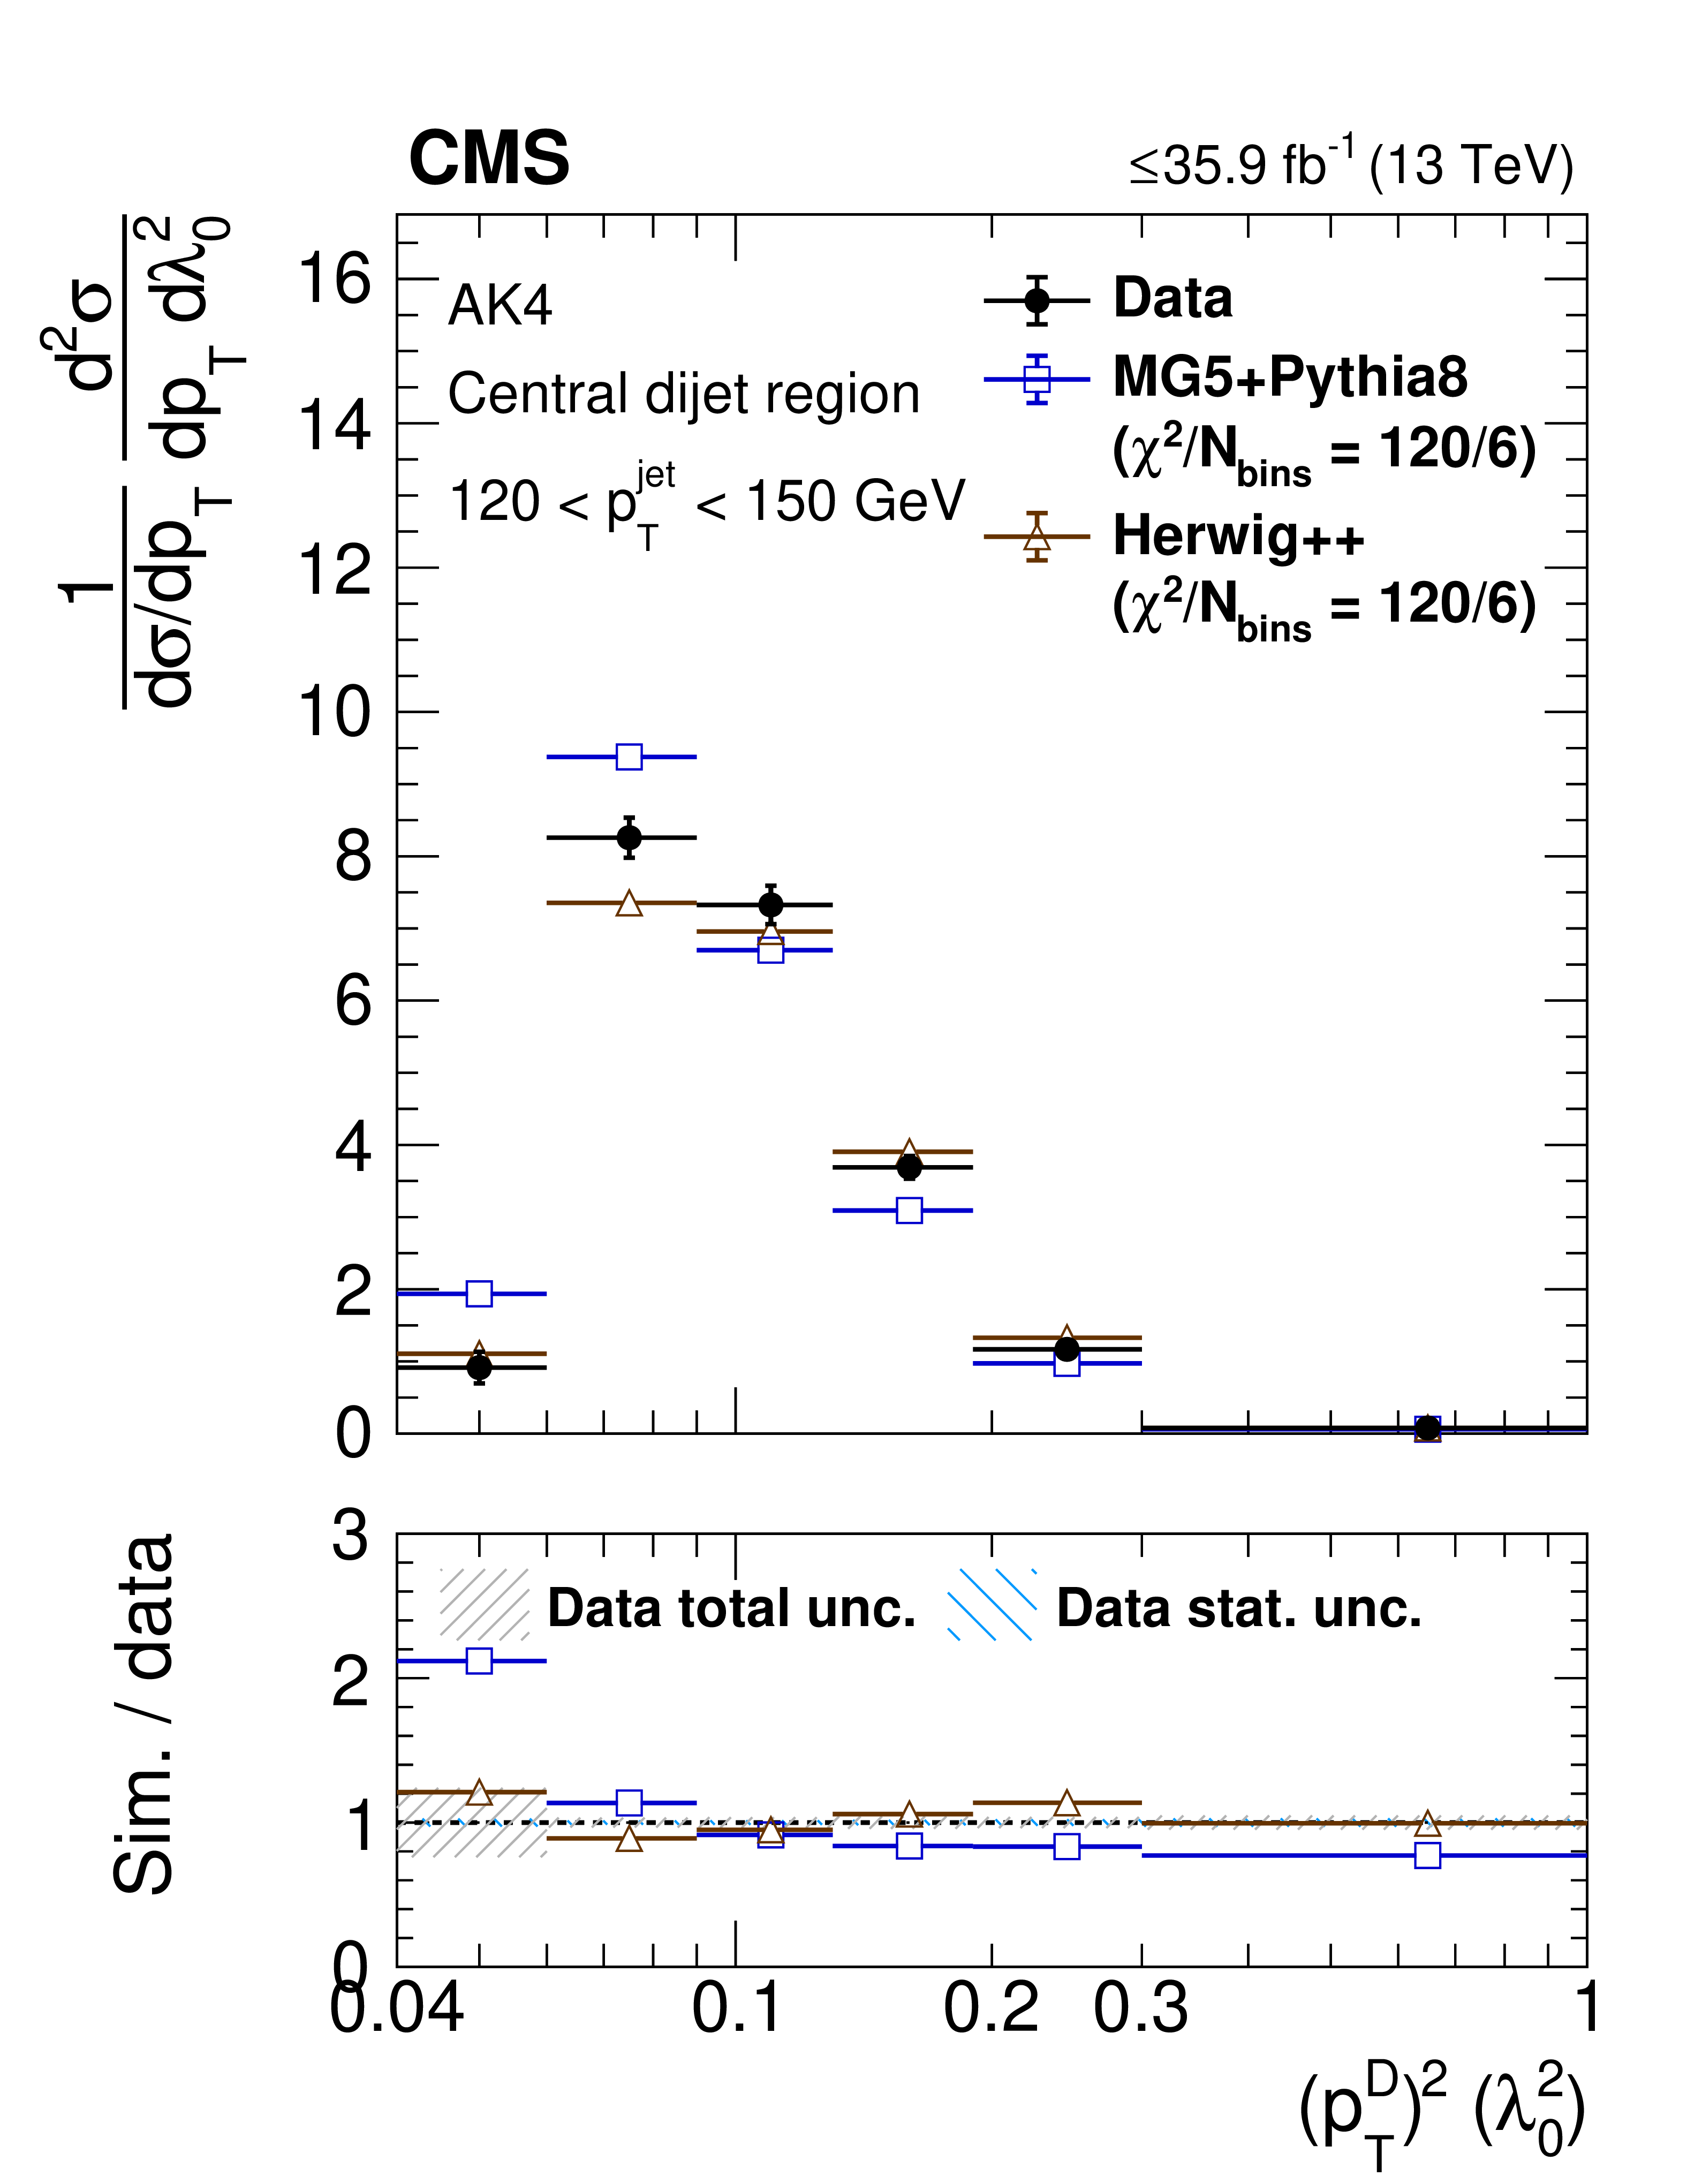
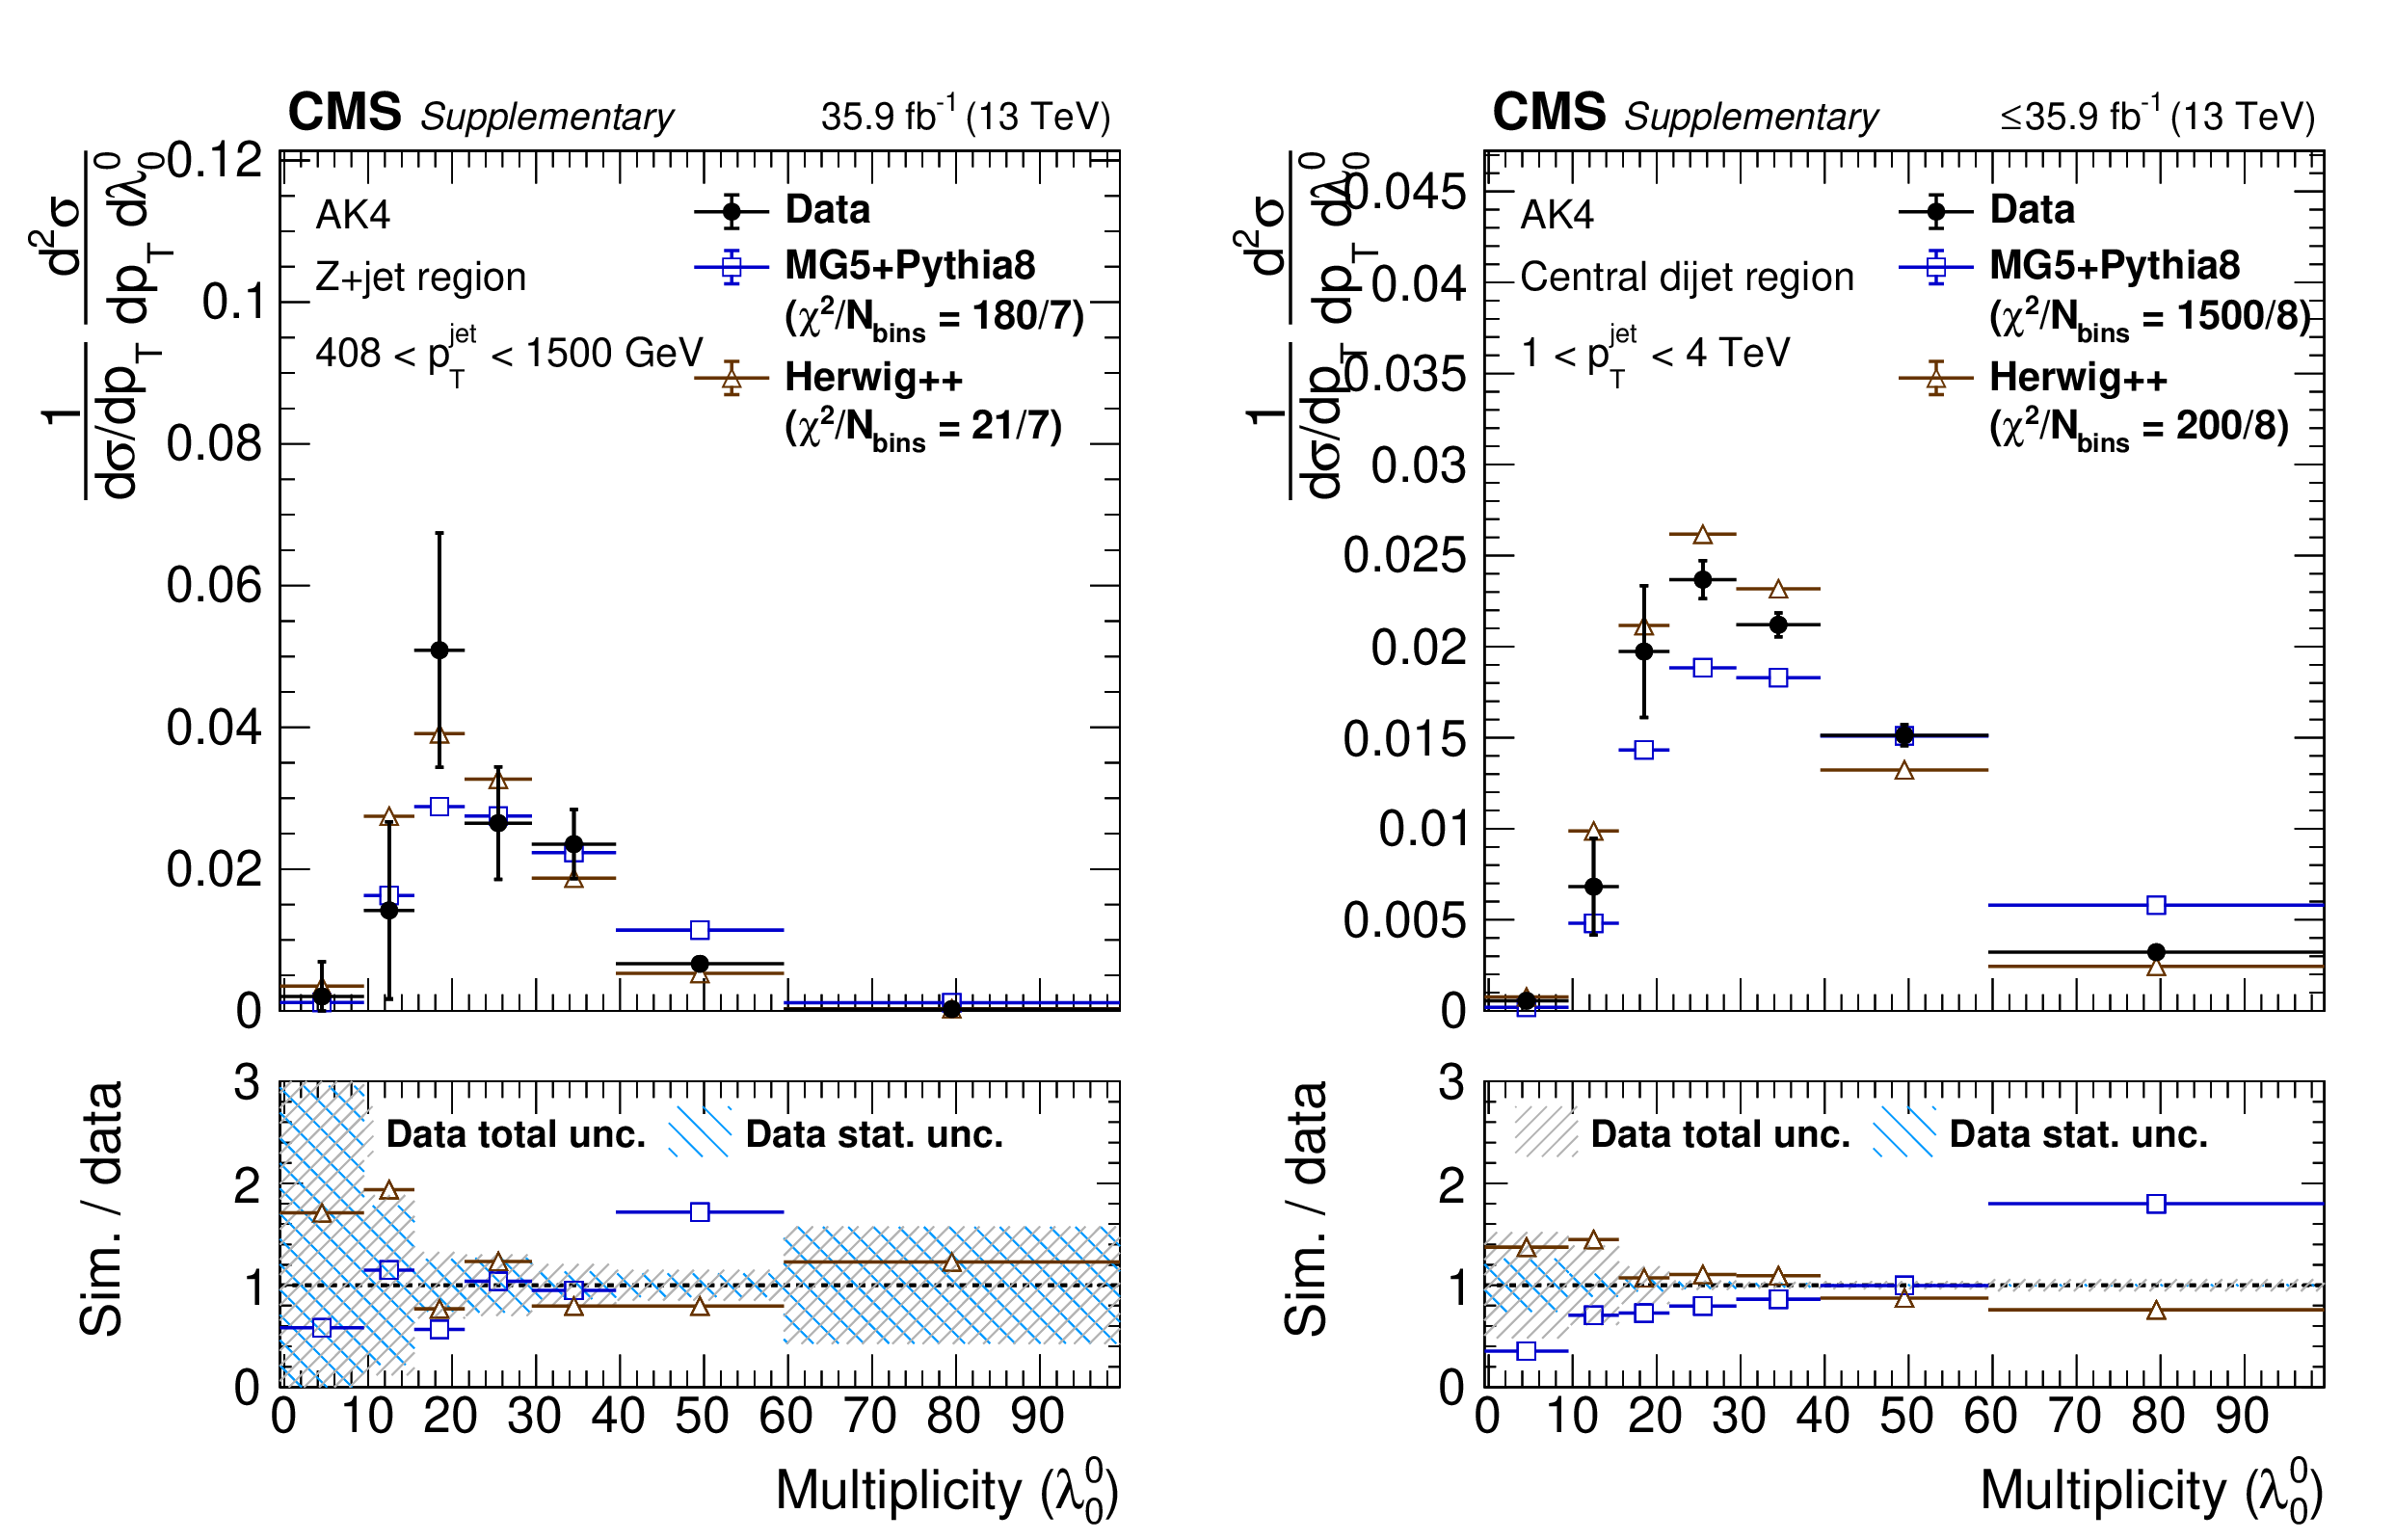
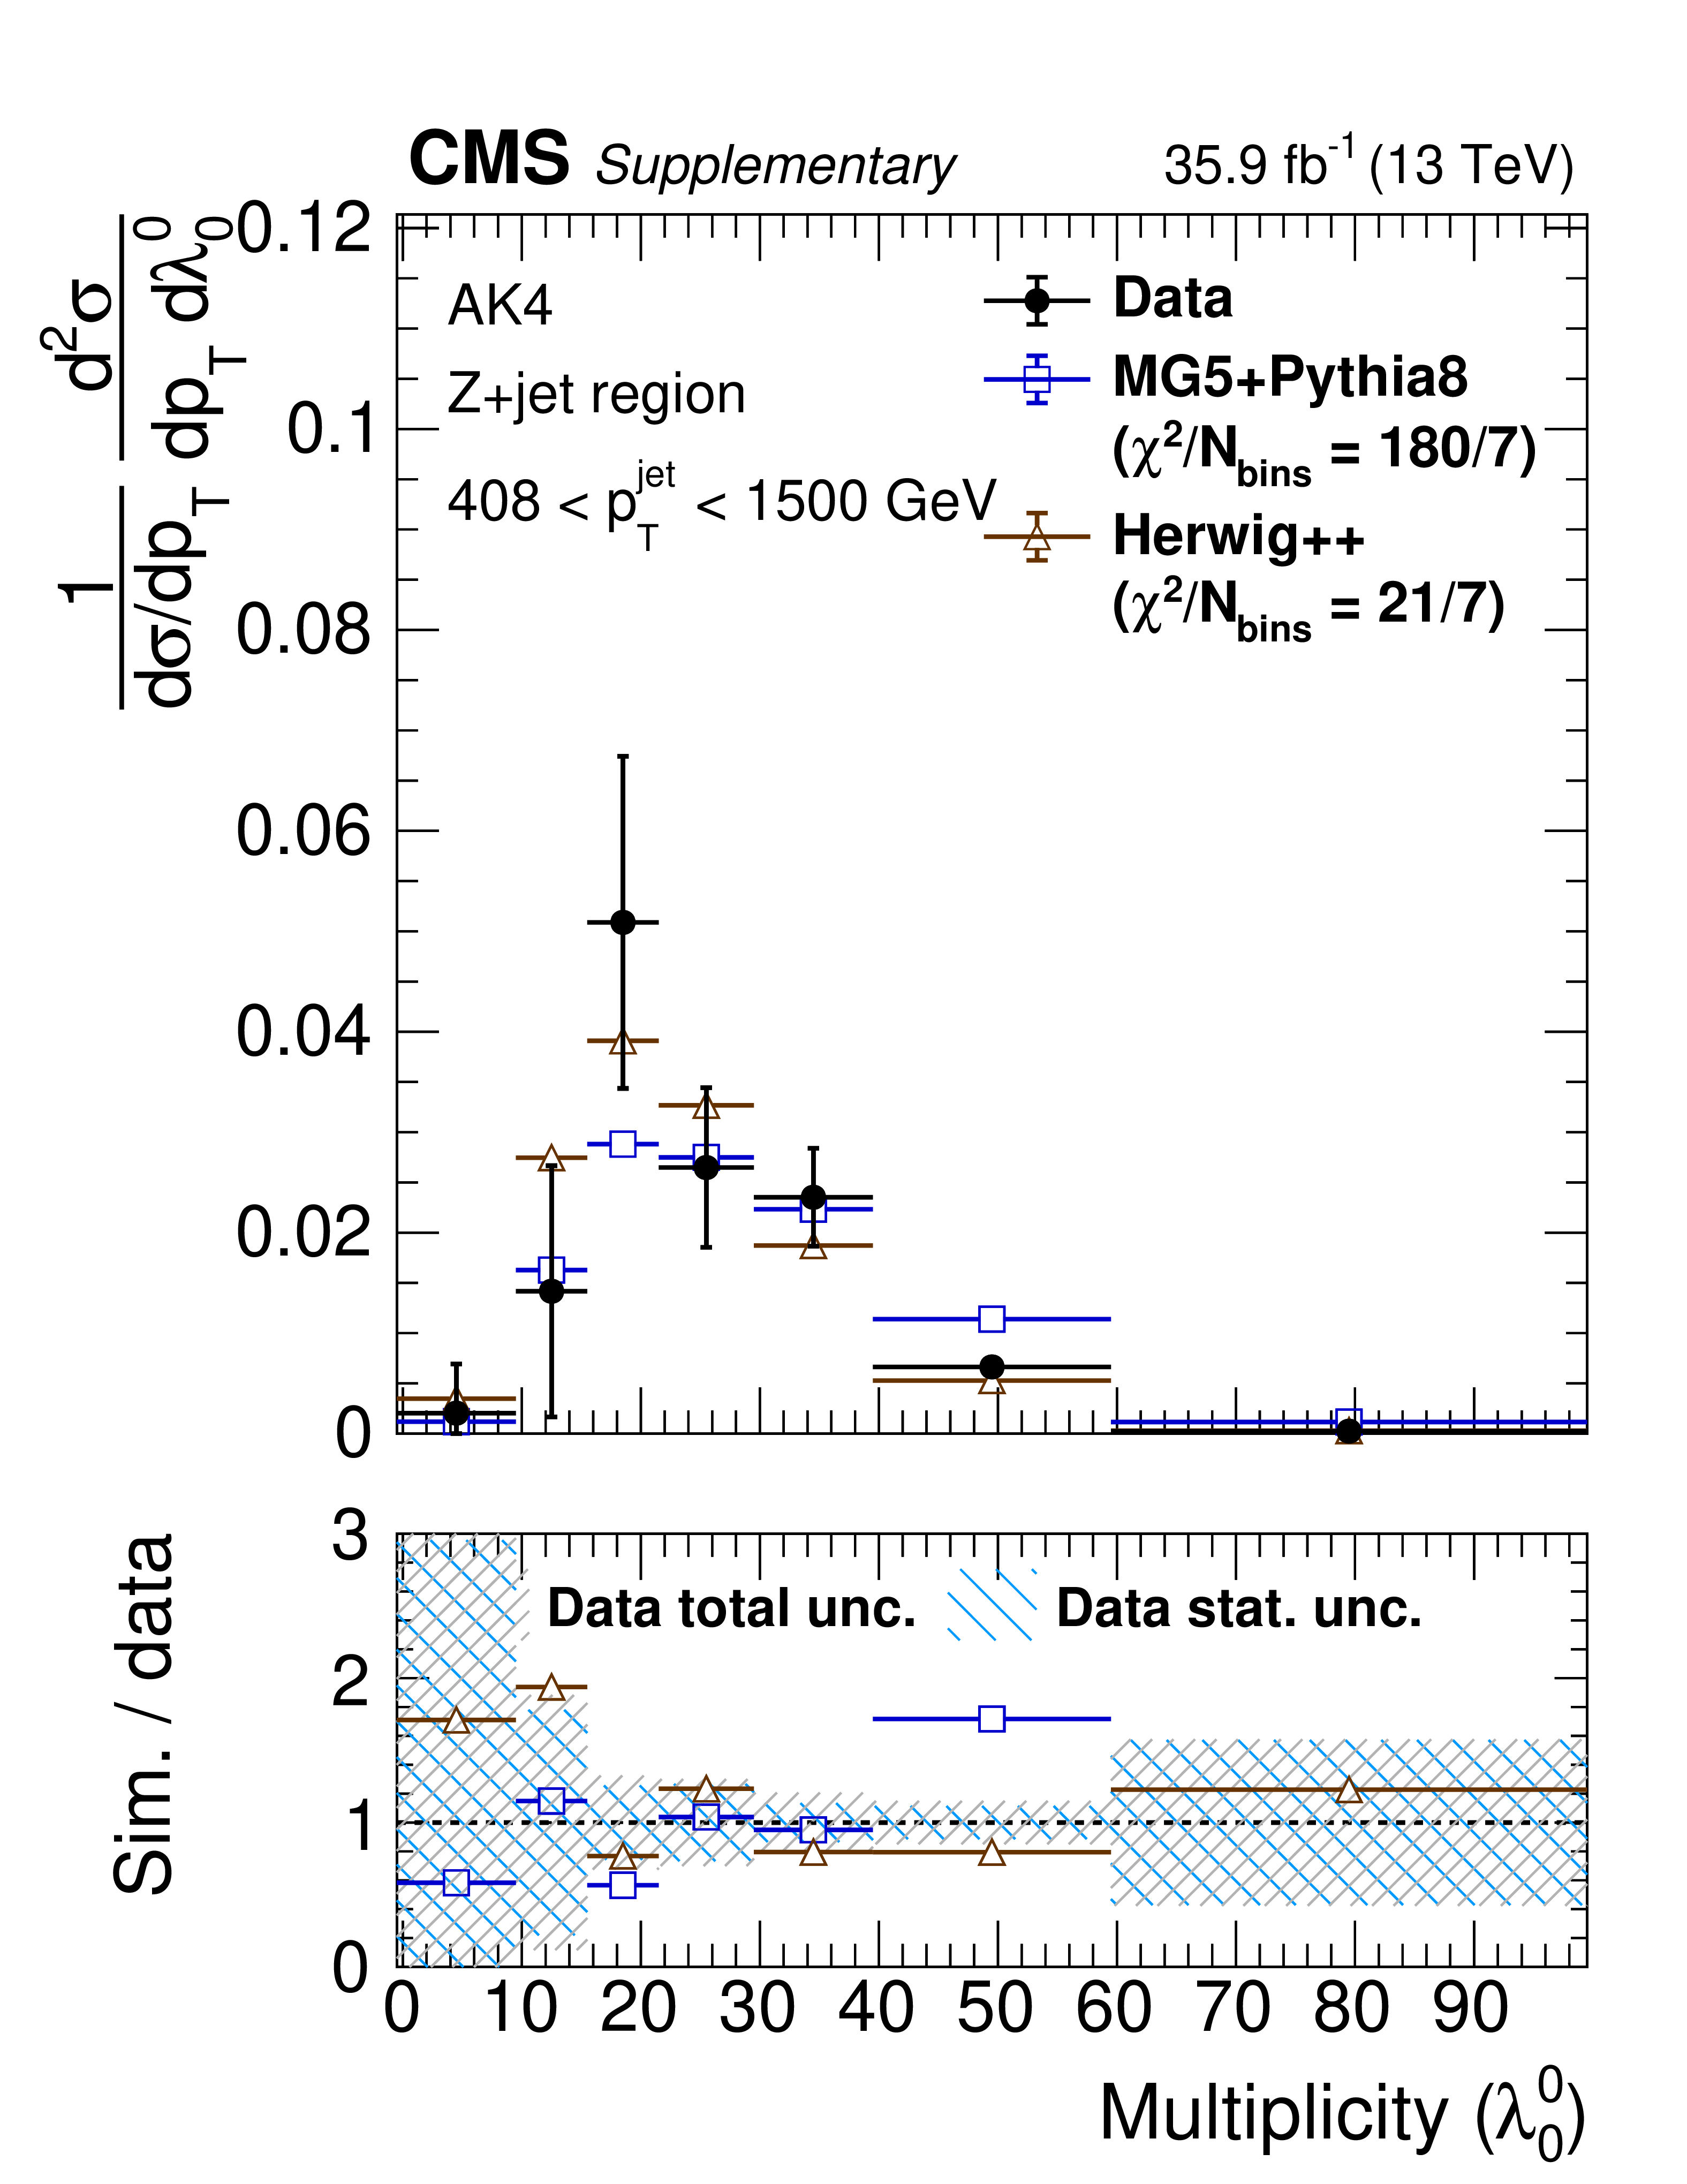
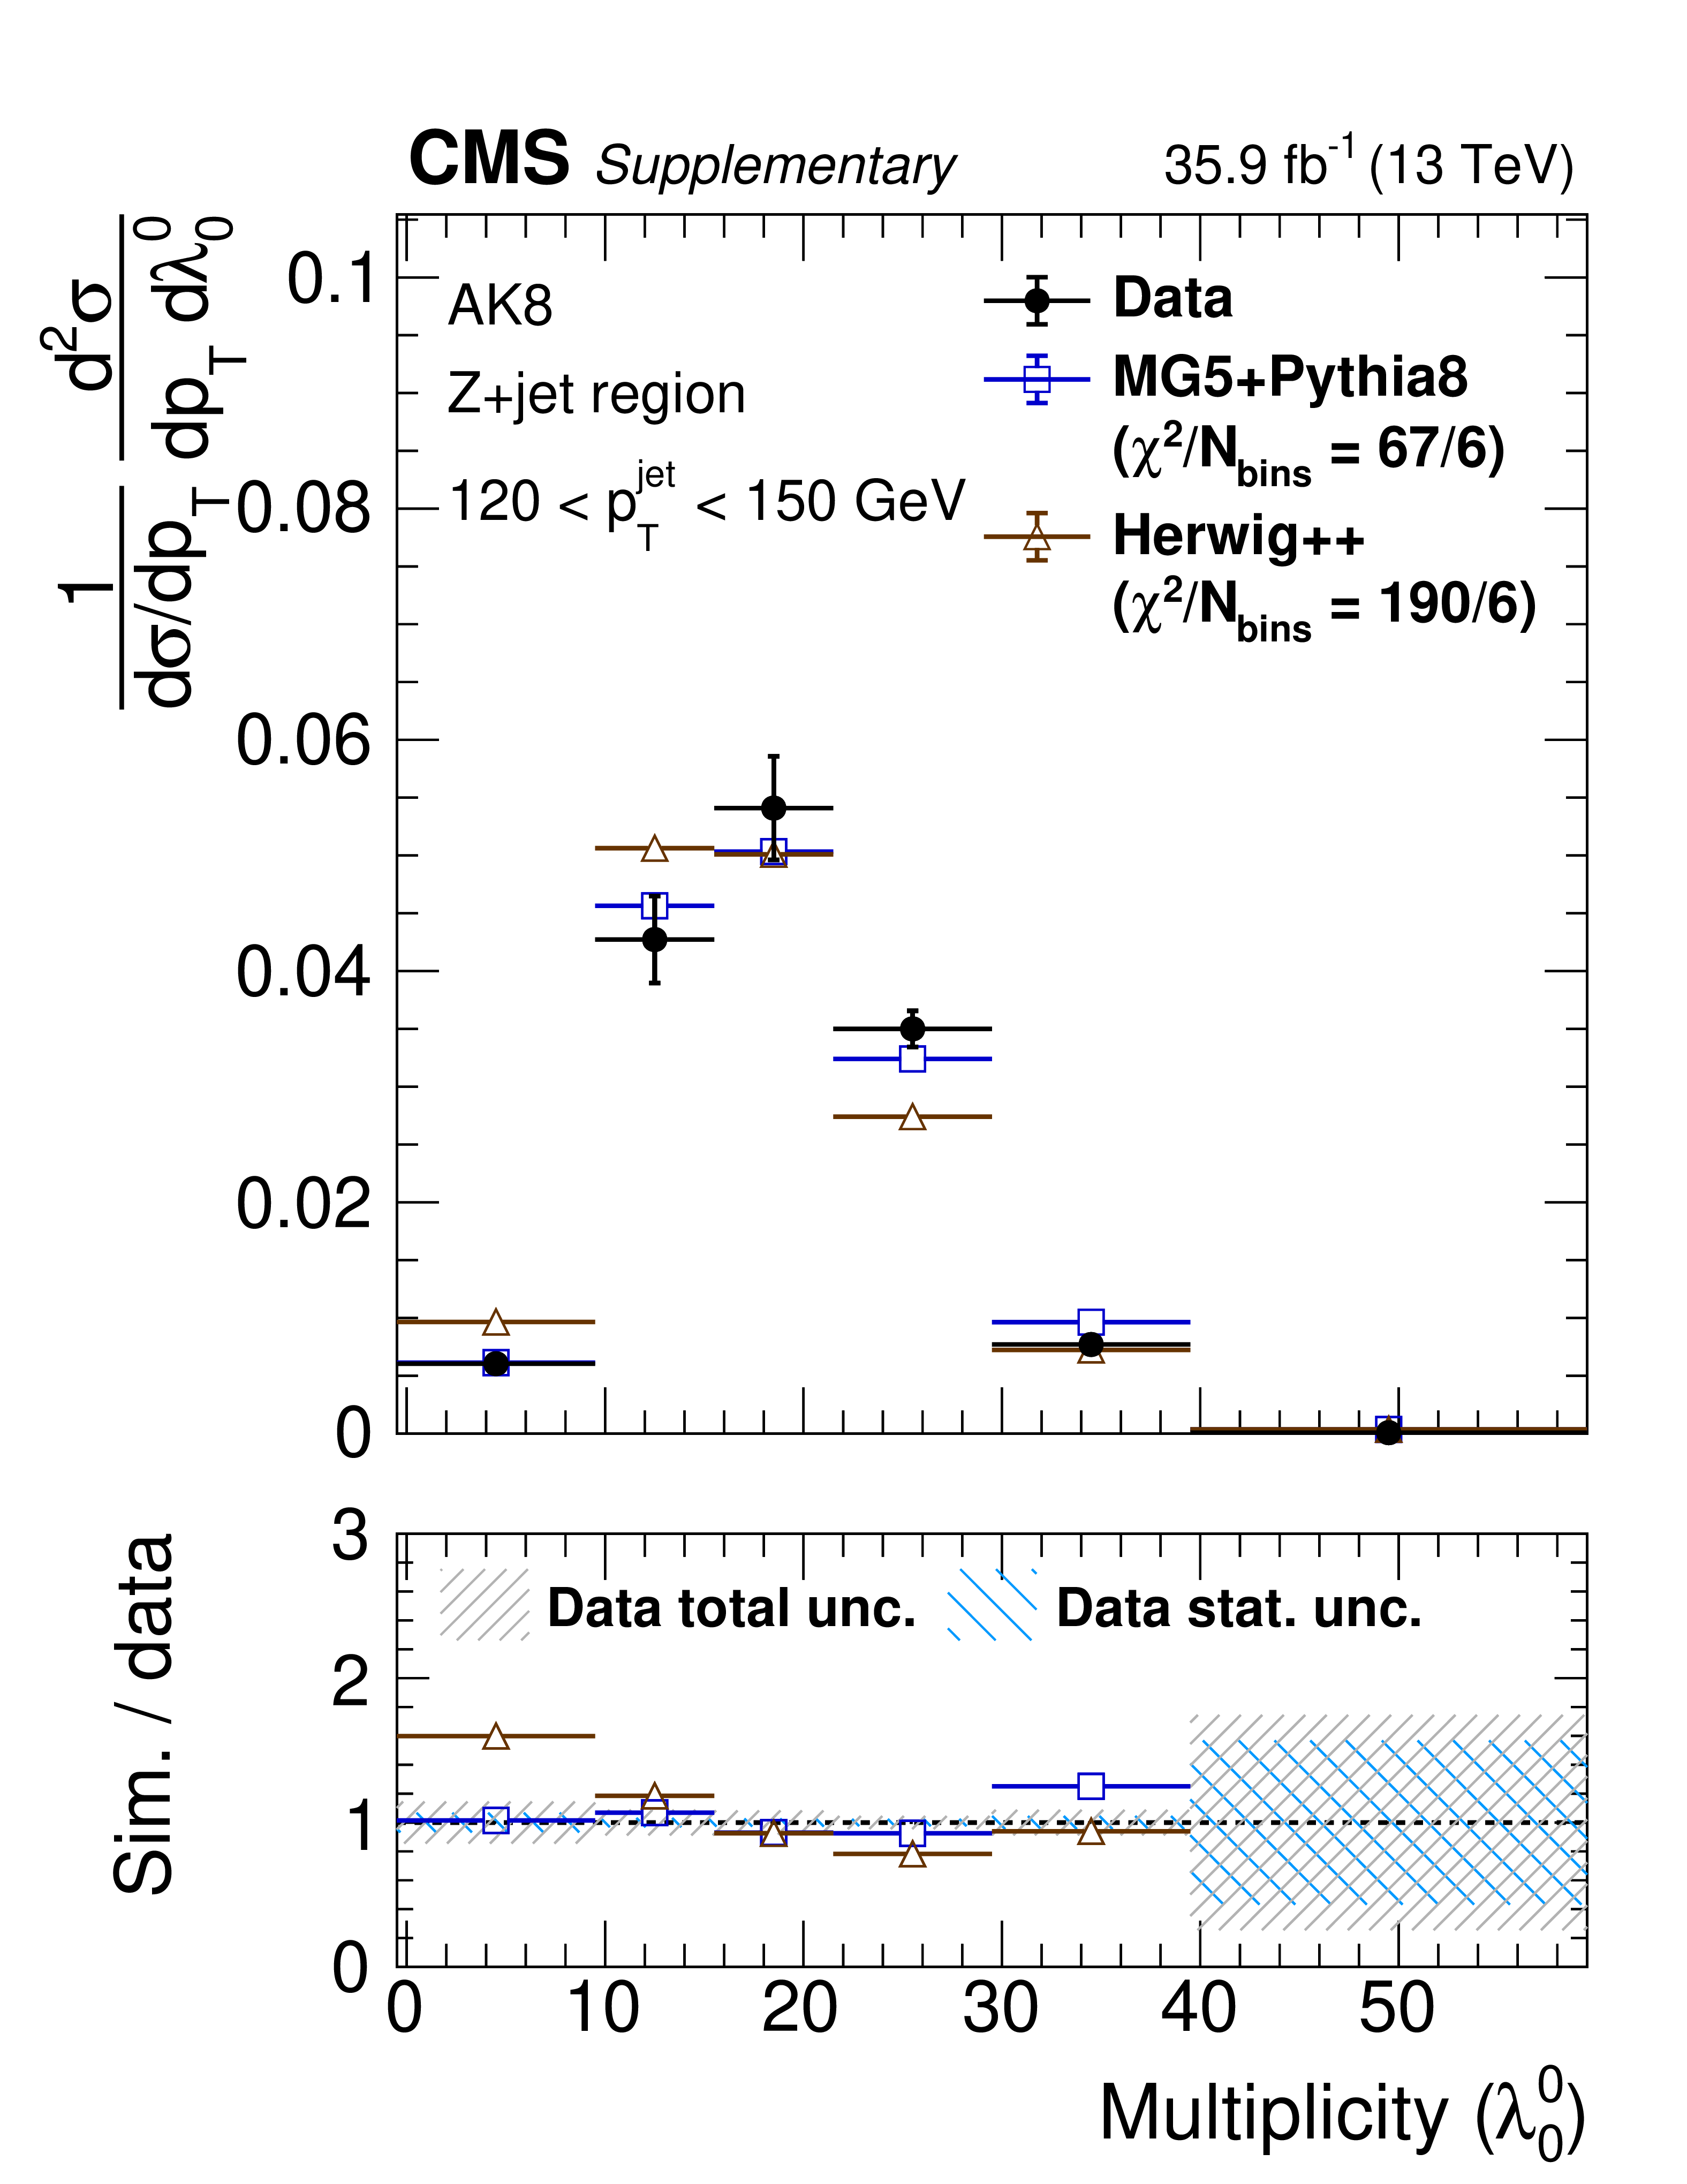
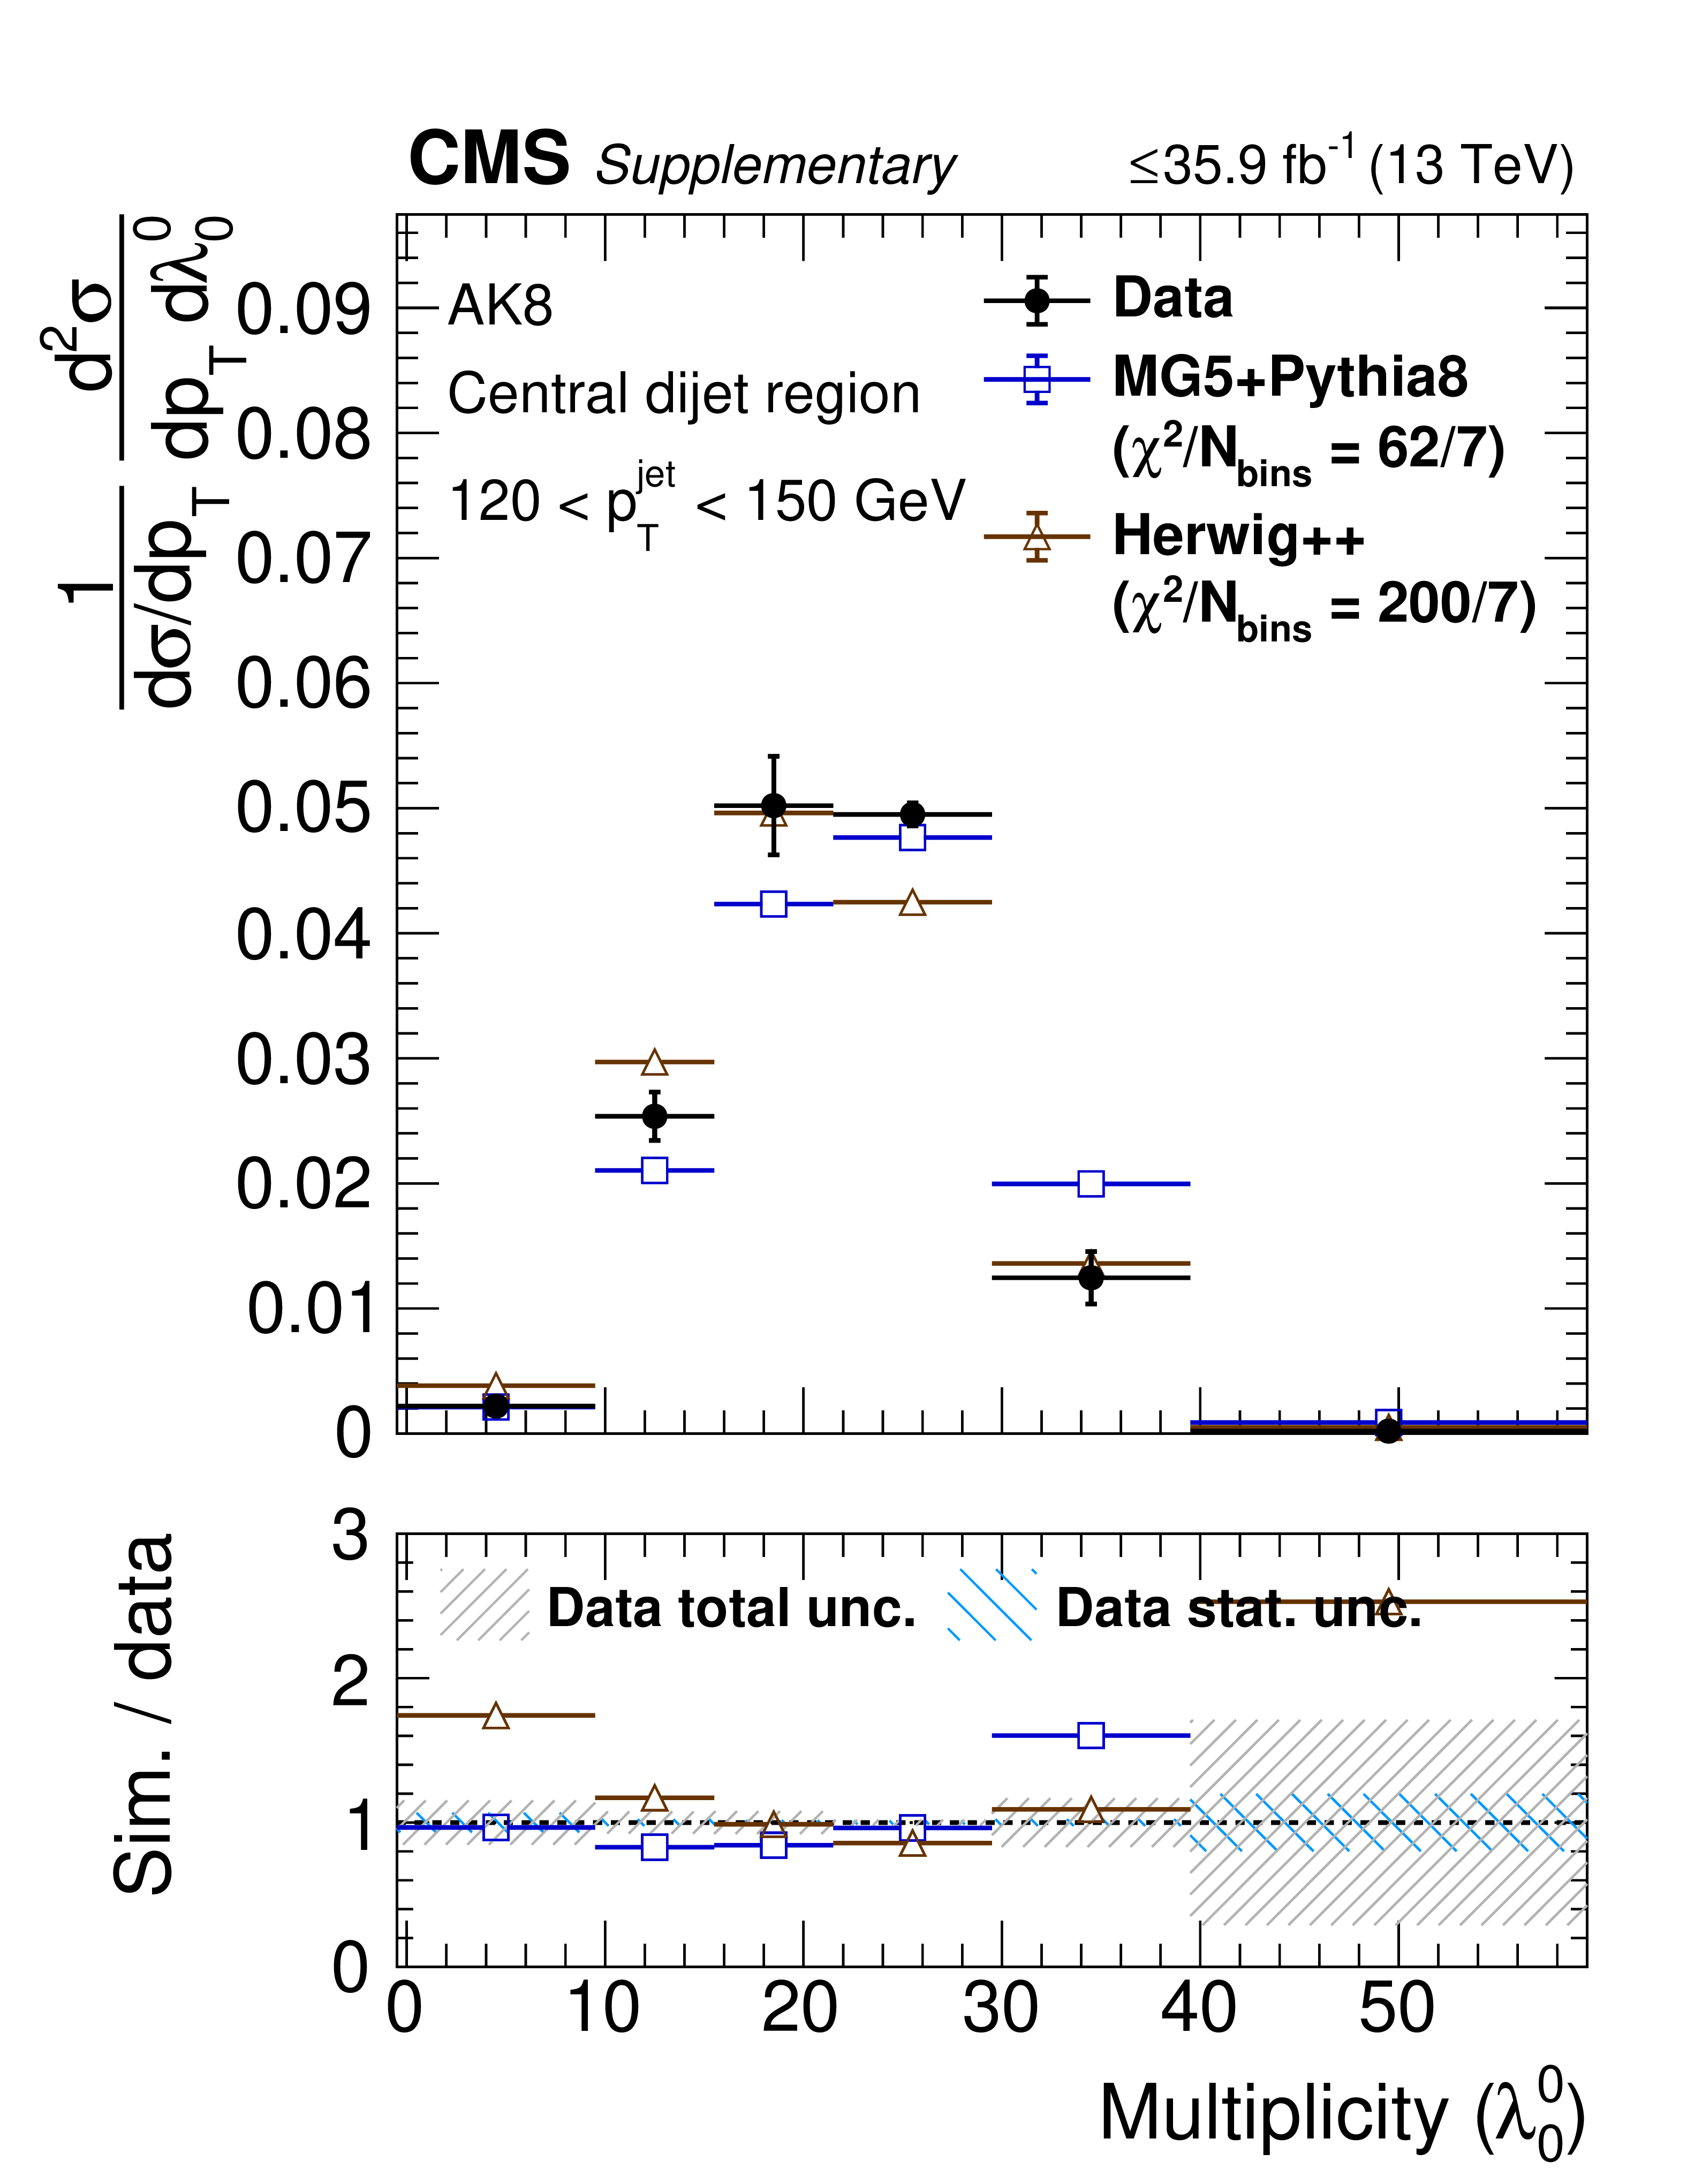
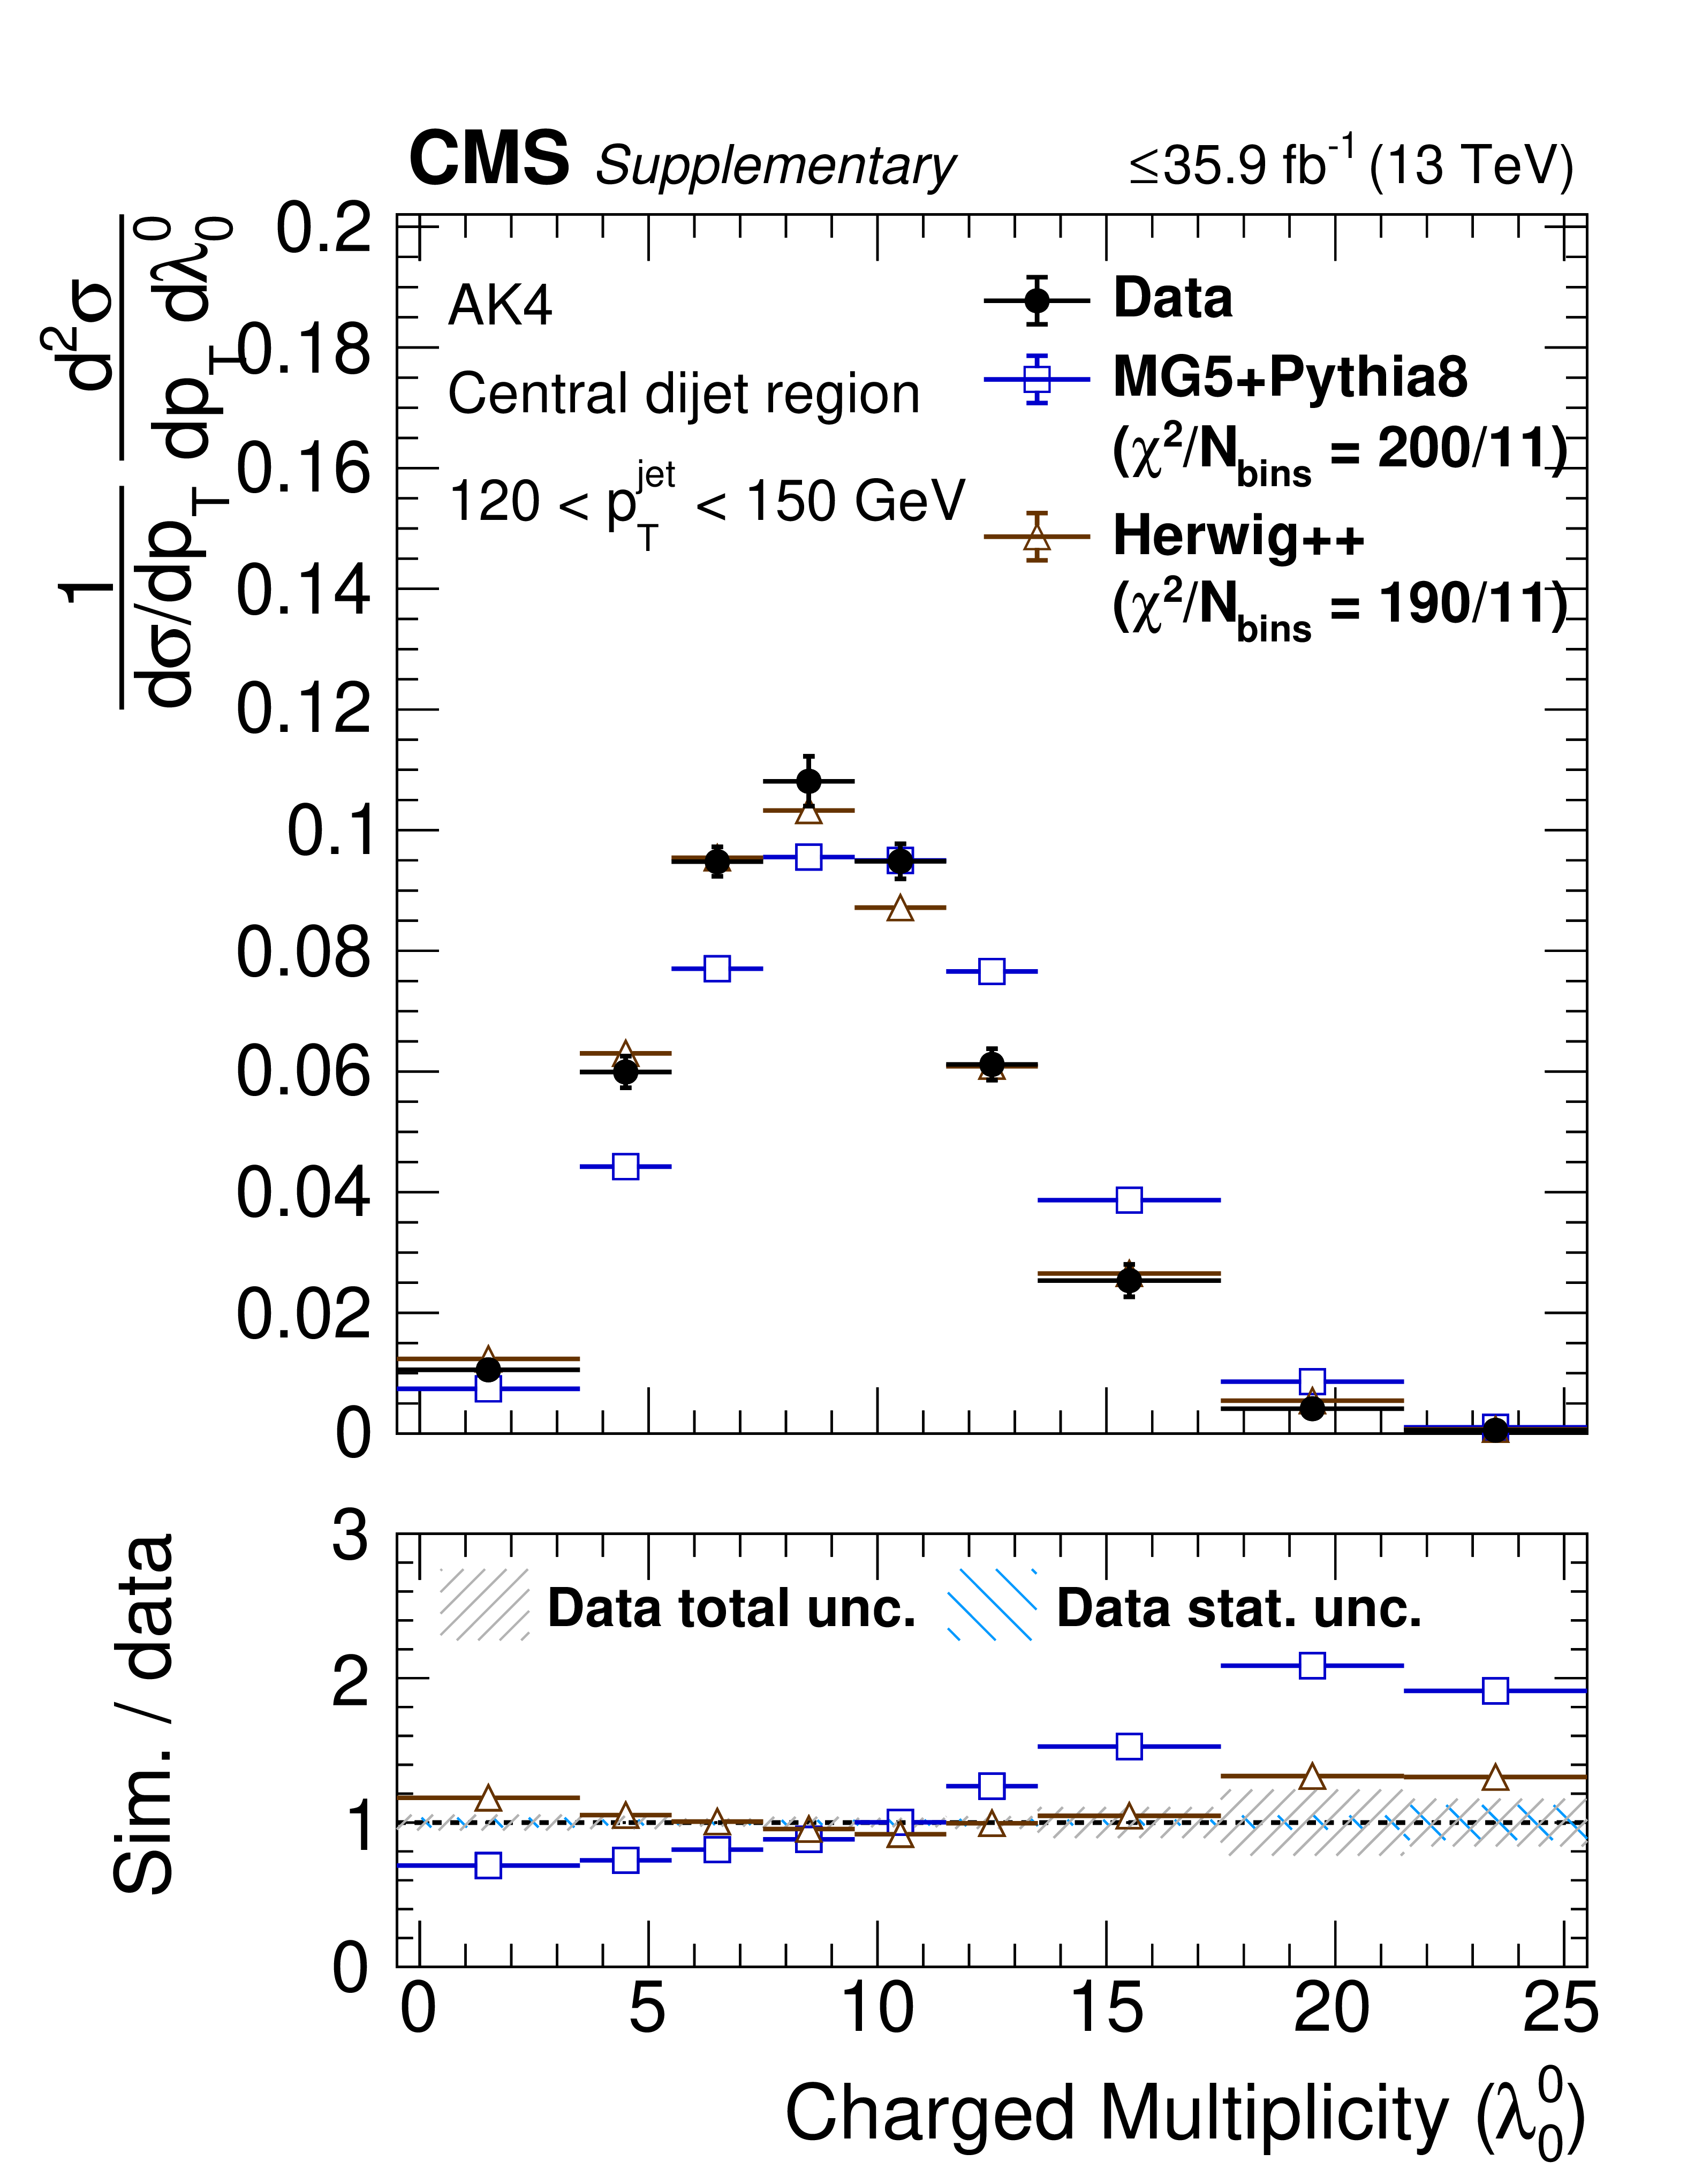
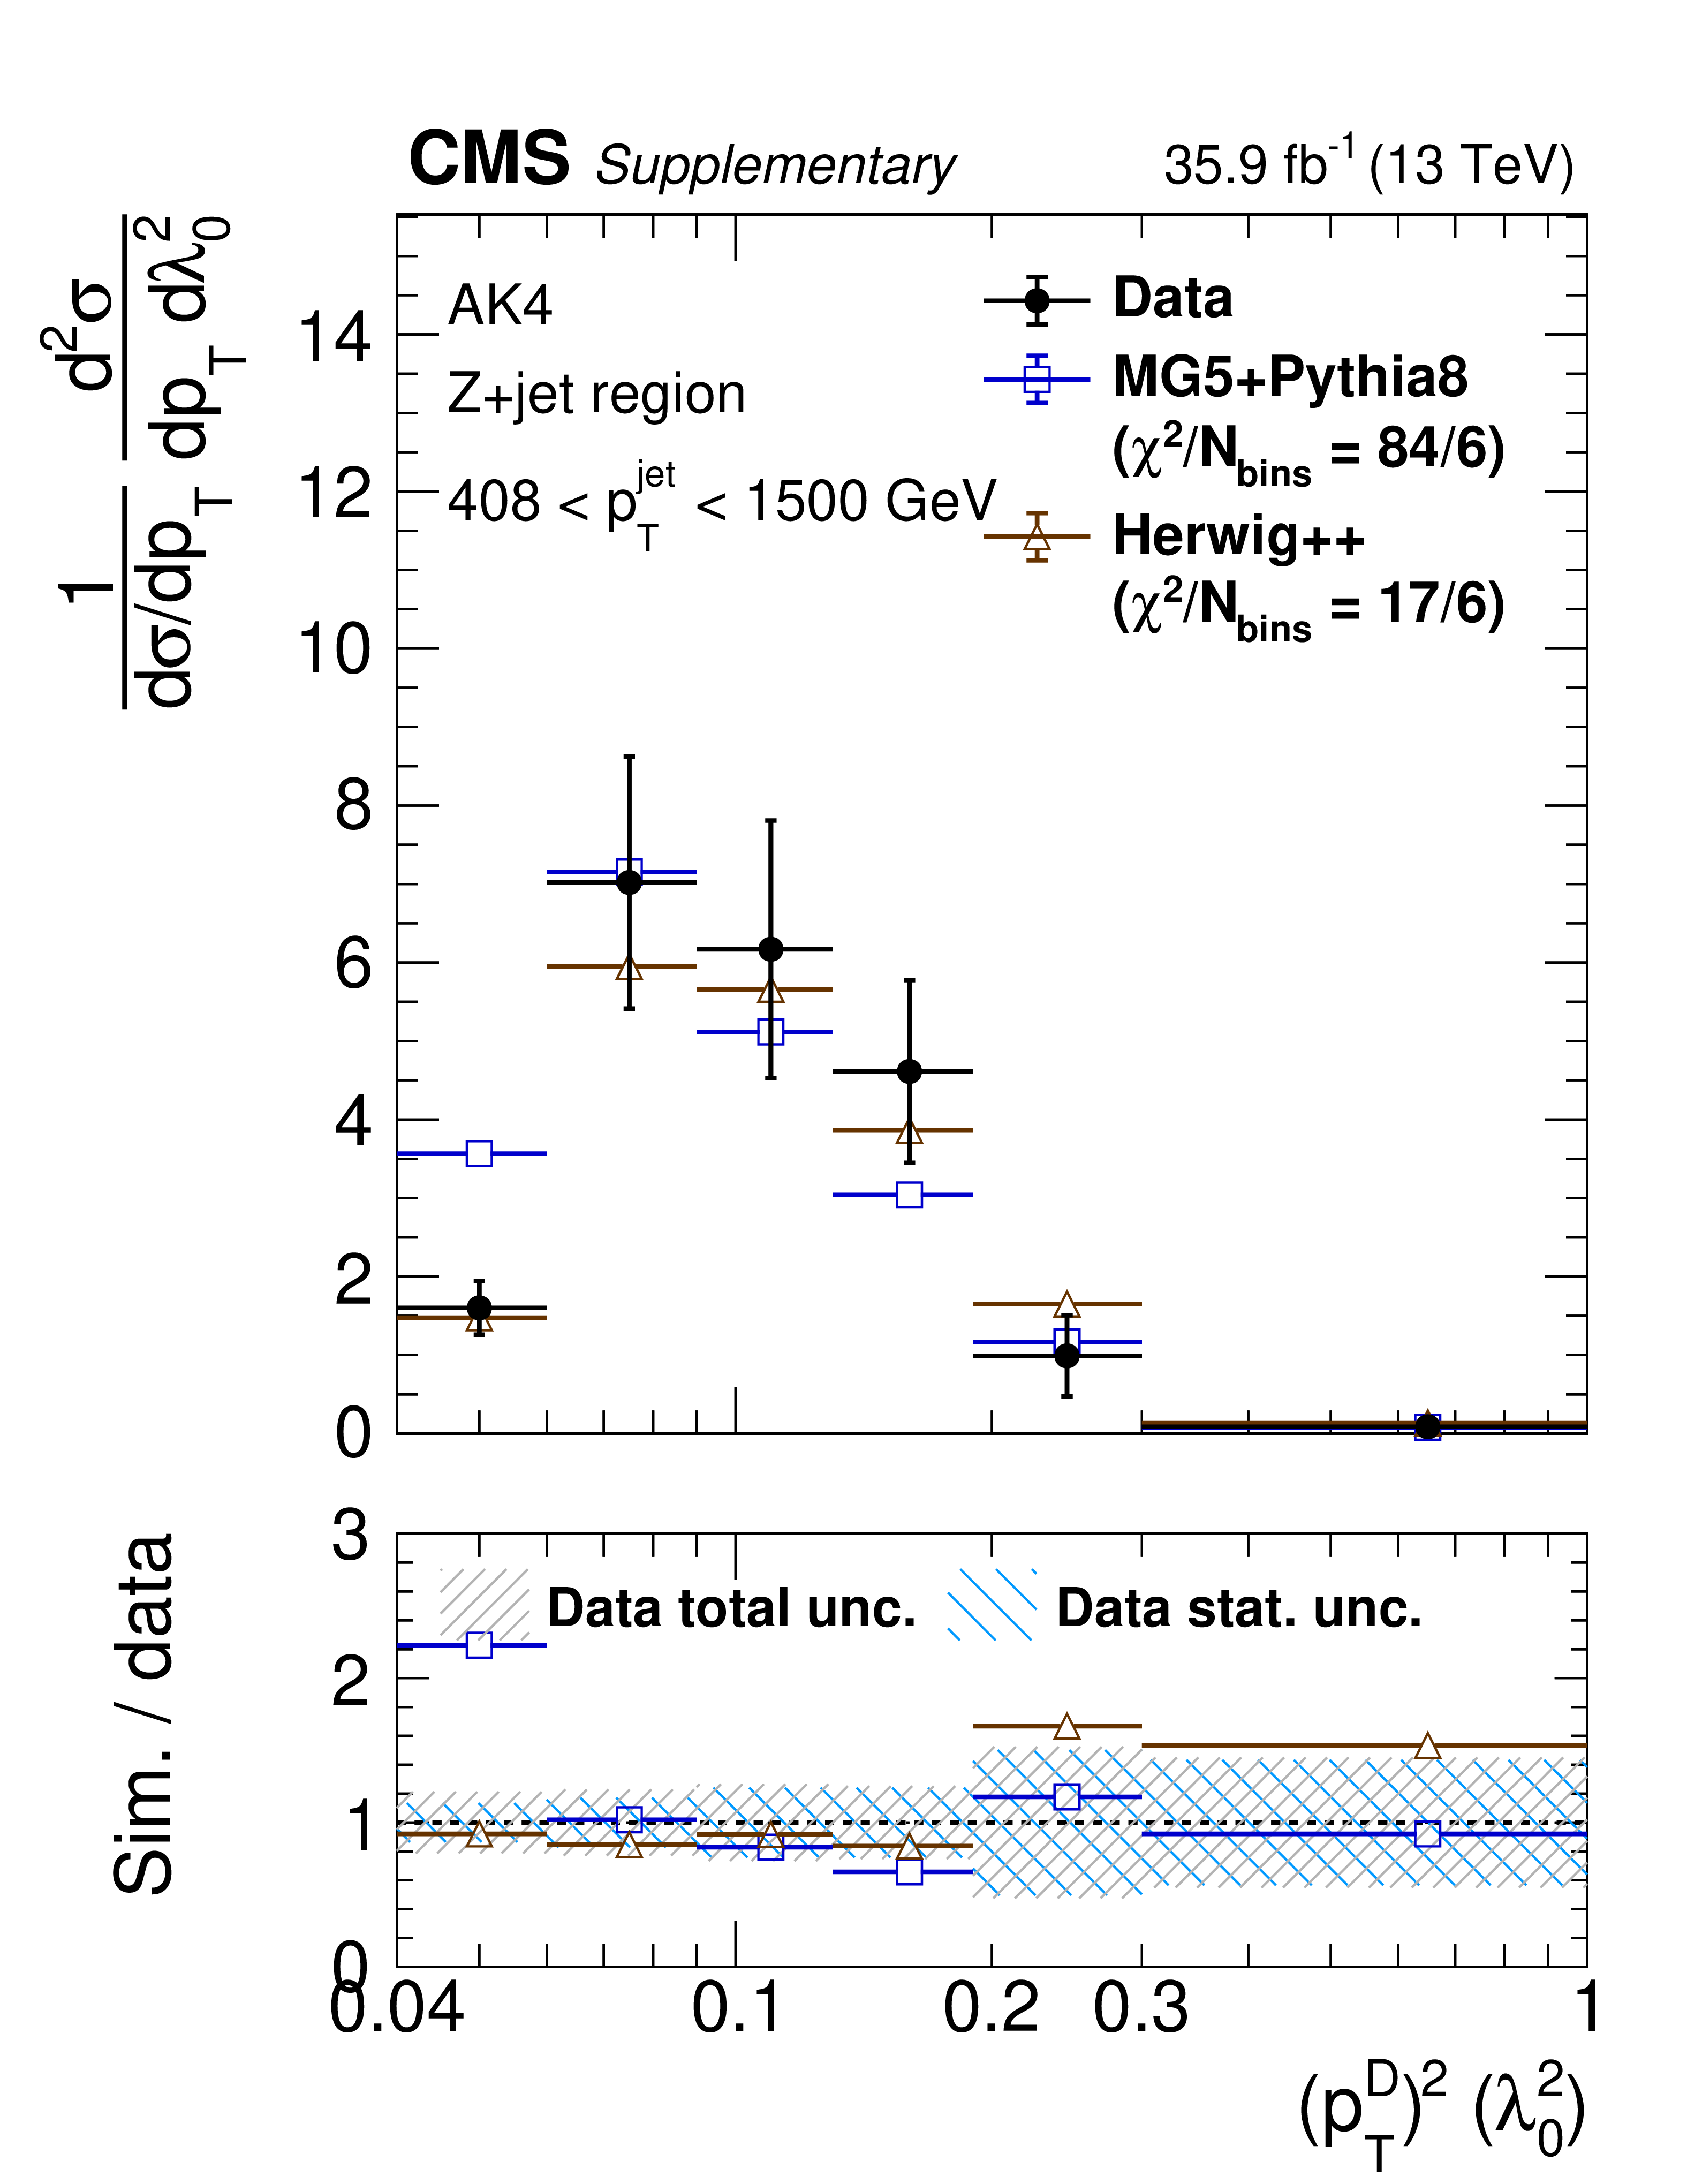
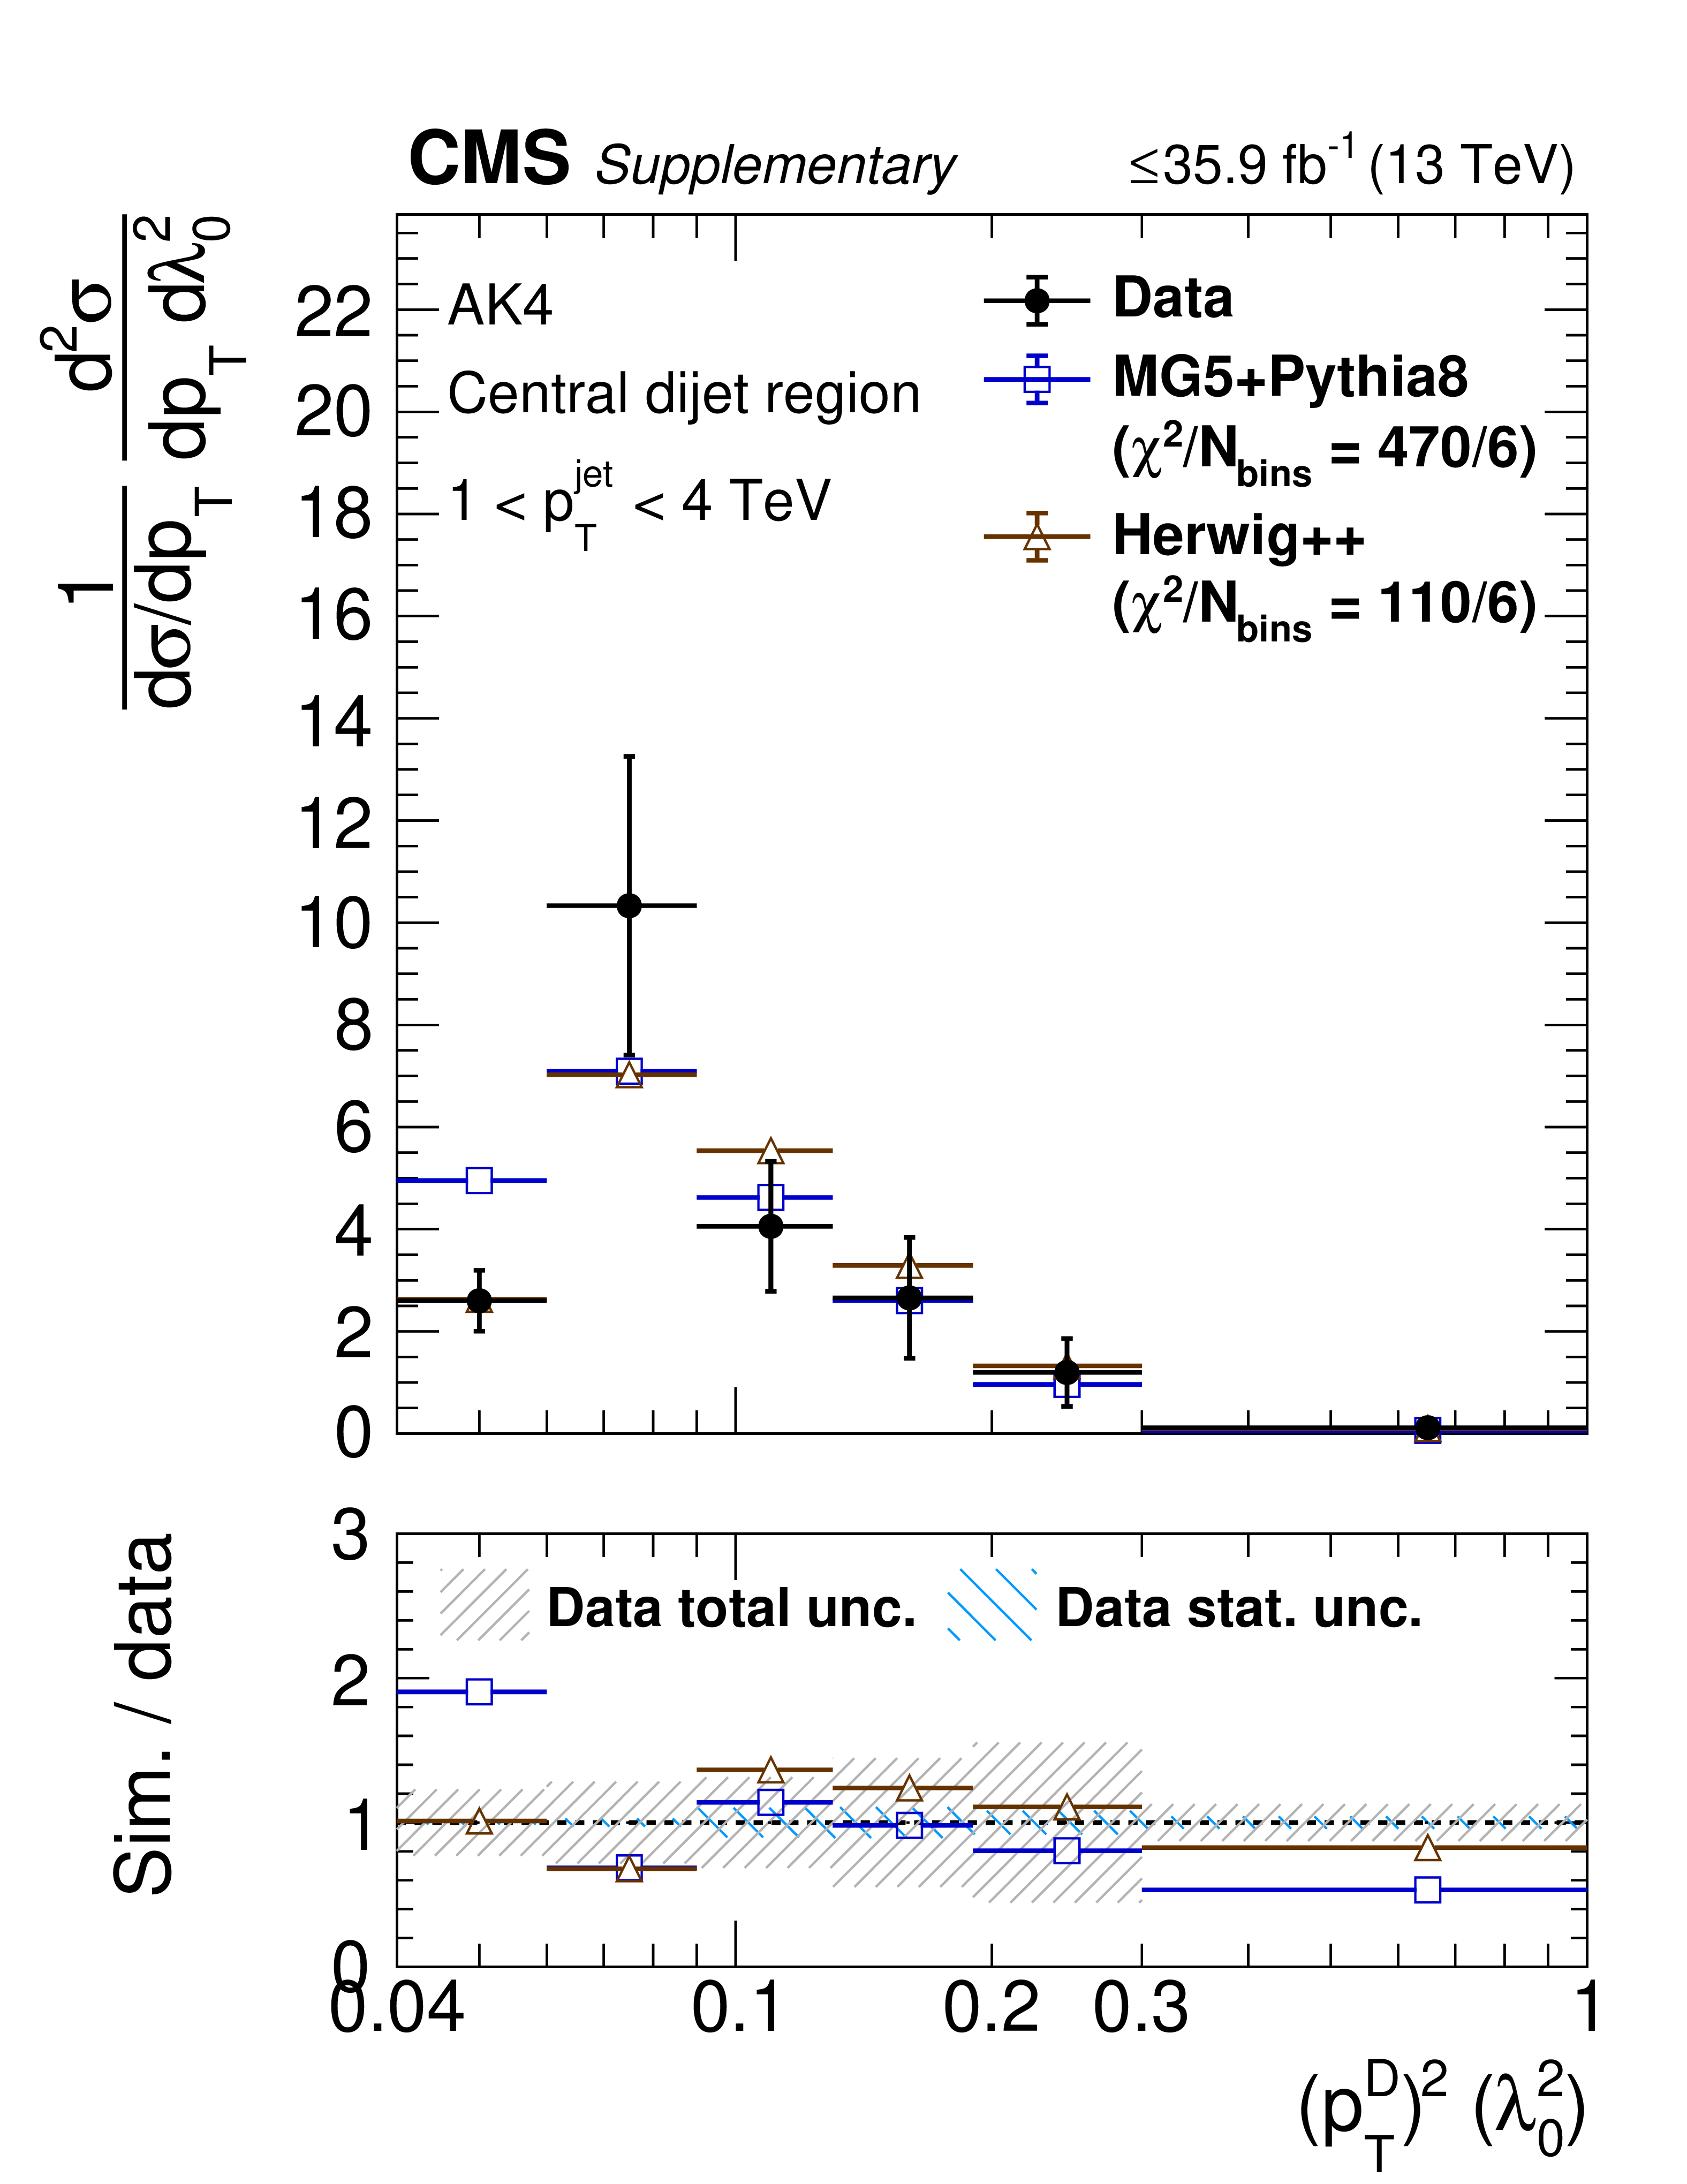
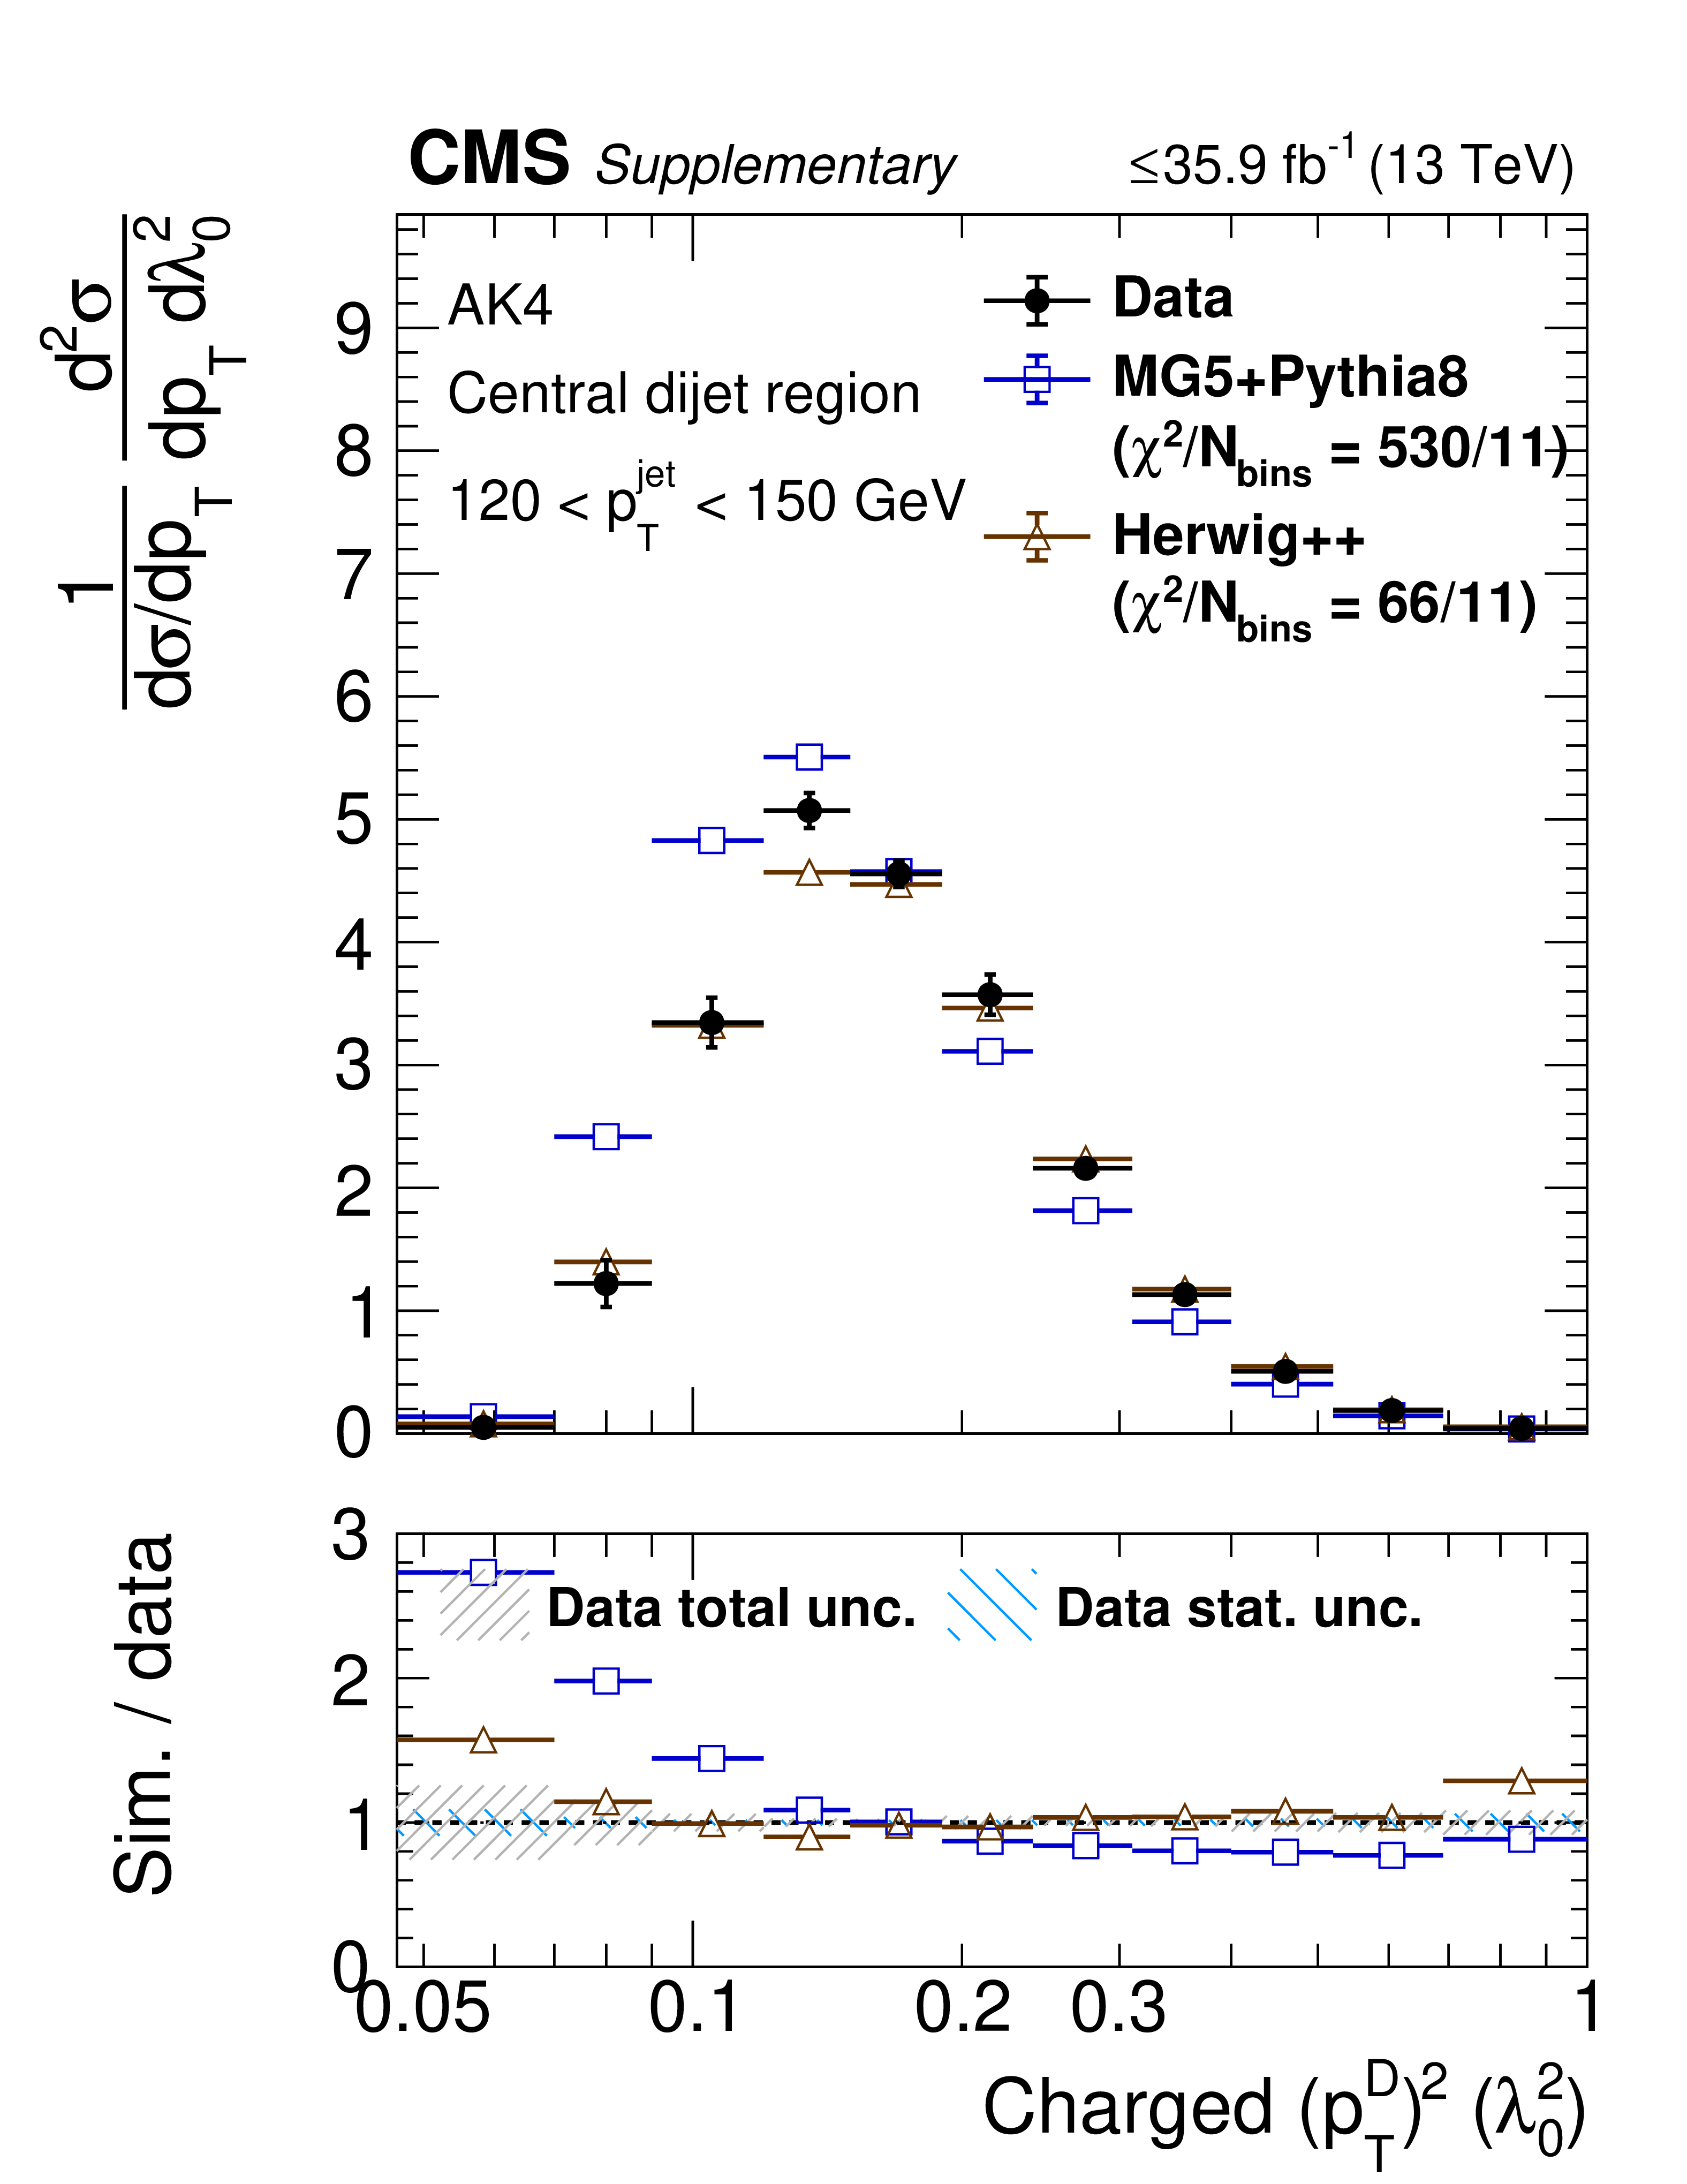
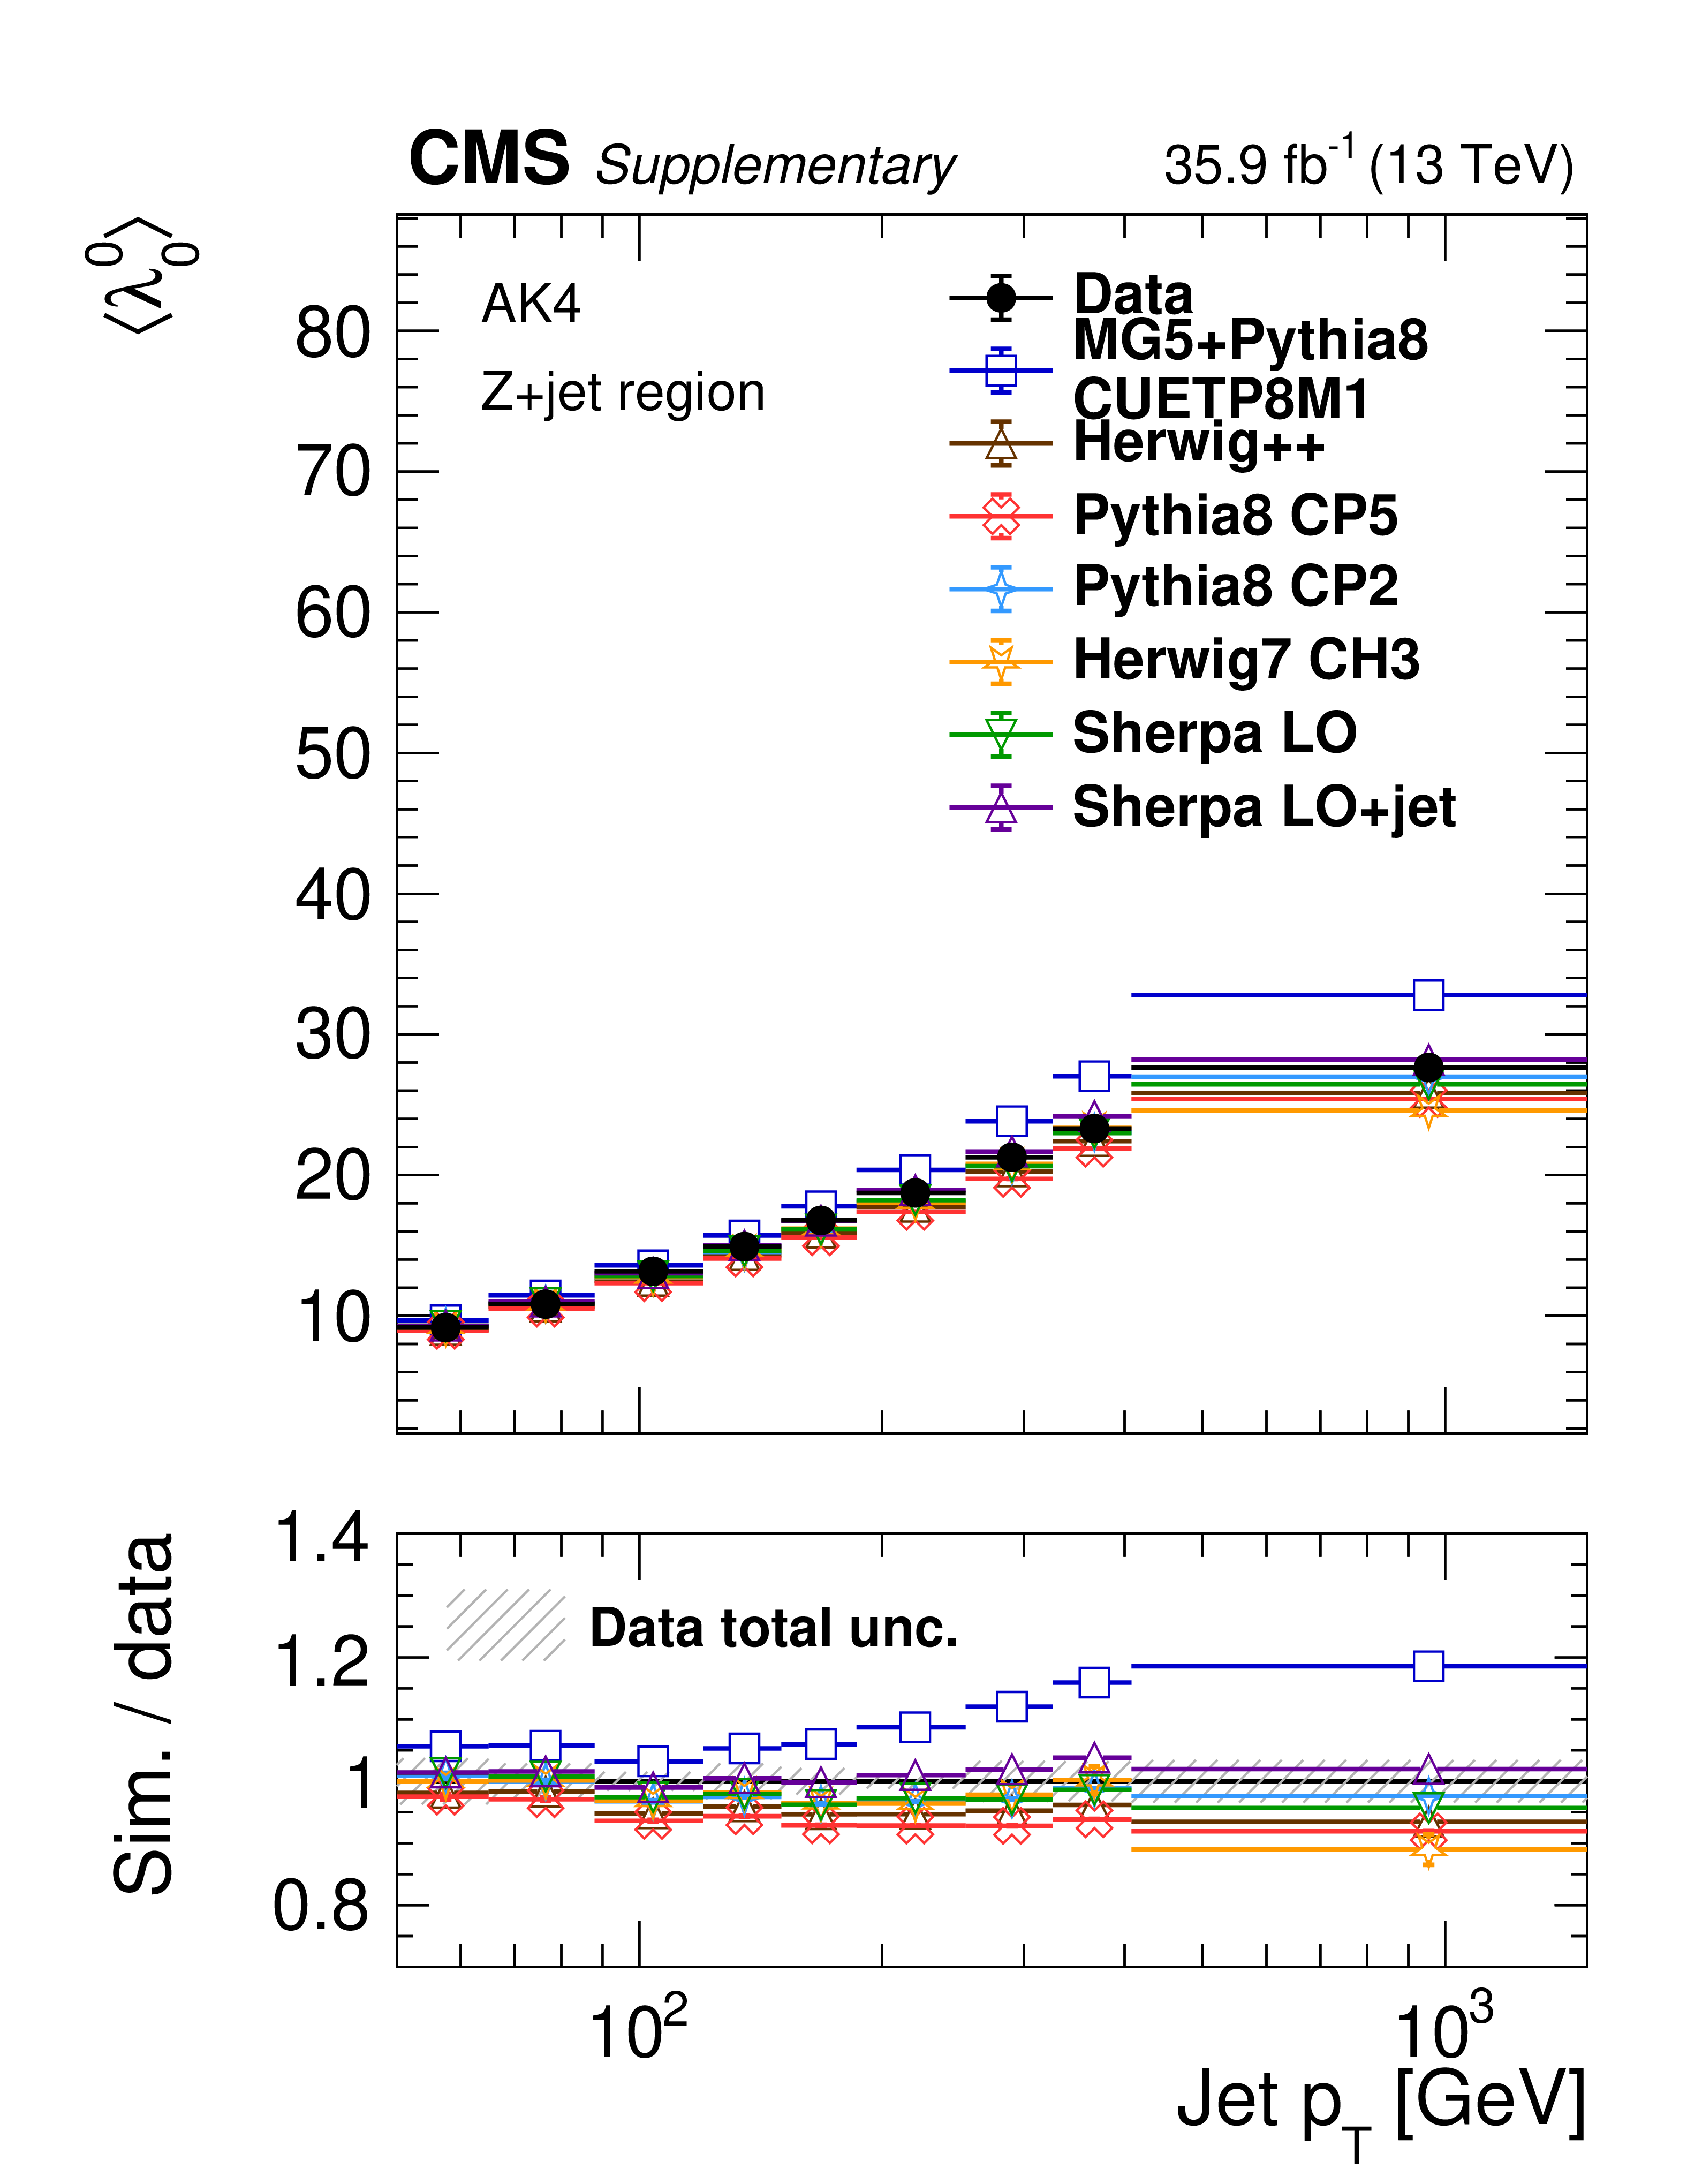
Figure 6:
Particle-level distributions of (upper) ungroomed multiplicity ($\lambda ^{0}_{0}$) and (lower) ungroomed $(p_{\mathrm {T}}^{\mathrm {D}})^2$ ($\lambda ^{2}_{0}$) in 120 $ < {p_{\mathrm {T}}} < $ 150 GeV in the Z+jet region (left) and central dijet region (right). The error bars on the data correspond to the total uncertainties. The coarse-grained blue hashed region in the ratio plot indicates the statistical uncertainty of the data, and the fine-grained grey hashed region represents the total uncertainty. The lowest bin extends down to $ {\lambda ^{\kappa}_{\beta}} \geq$ 0. |

png pdf |
Figure 6-a:
Particle-level distribution of ungroomed multiplicity ($\lambda ^{0}_{0}$) in 120 $ < {p_{\mathrm {T}}} < $ 150 GeV in the Z+jet egion. The error bars on the data correspond to the total uncertainties. The coarse-grained blue hashed region in the ratio plot indicates the statistical uncertainty of the data, and the fine-grained grey hashed region represents the total uncertainty. The lowest bin extends down to $ {\lambda ^{\kappa}_{\beta}} \geq$ 0. |
png pdf |
Figure 6-b:
Particle-level distribution of ungroomed multiplicity ($\lambda ^{0}_{0}$) in 120 $ < {p_{\mathrm {T}}} < $ 150 GeV in the central dijet region. The error bars on the data correspond to the total uncertainties. The coarse-grained blue hashed region in the ratio plot indicates the statistical uncertainty of the data, and the fine-grained grey hashed region represents the total uncertainty. The lowest bin extends down to $ {\lambda ^{\kappa}_{\beta}} \geq$ 0. |

png pdf |
Figure 6-c:
Particle-level distribution of ungroomed $(p_{\mathrm {T}}^{\mathrm {D}})^2$ ($\lambda ^{2}_{0}$) in 120 $ < {p_{\mathrm {T}}} < $ 150 GeV in the Z+jet region. The error bars on the data correspond to the total uncertainties. The coarse-grained blue hashed region in the ratio plot indicates the statistical uncertainty of the data, and the fine-grained grey hashed region represents the total uncertainty. The lowest bin extends down to $ {\lambda ^{\kappa}_{\beta}} \geq$ 0. |
png pdf |
Figure 6-d:
Particle-level distribution of ungroomed $(p_{\mathrm {T}}^{\mathrm {D}})^2$ ($\lambda ^{2}_{0}$) in 120 $ < {p_{\mathrm {T}}} < $ 150 GeV in the central dijet region. The error bars on the data correspond to the total uncertainties. The coarse-grained blue hashed region in the ratio plot indicates the statistical uncertainty of the data, and the fine-grained grey hashed region represents the total uncertainty. The lowest bin extends down to $ {\lambda ^{\kappa}_{\beta}} \geq$ 0. |

png pdf |
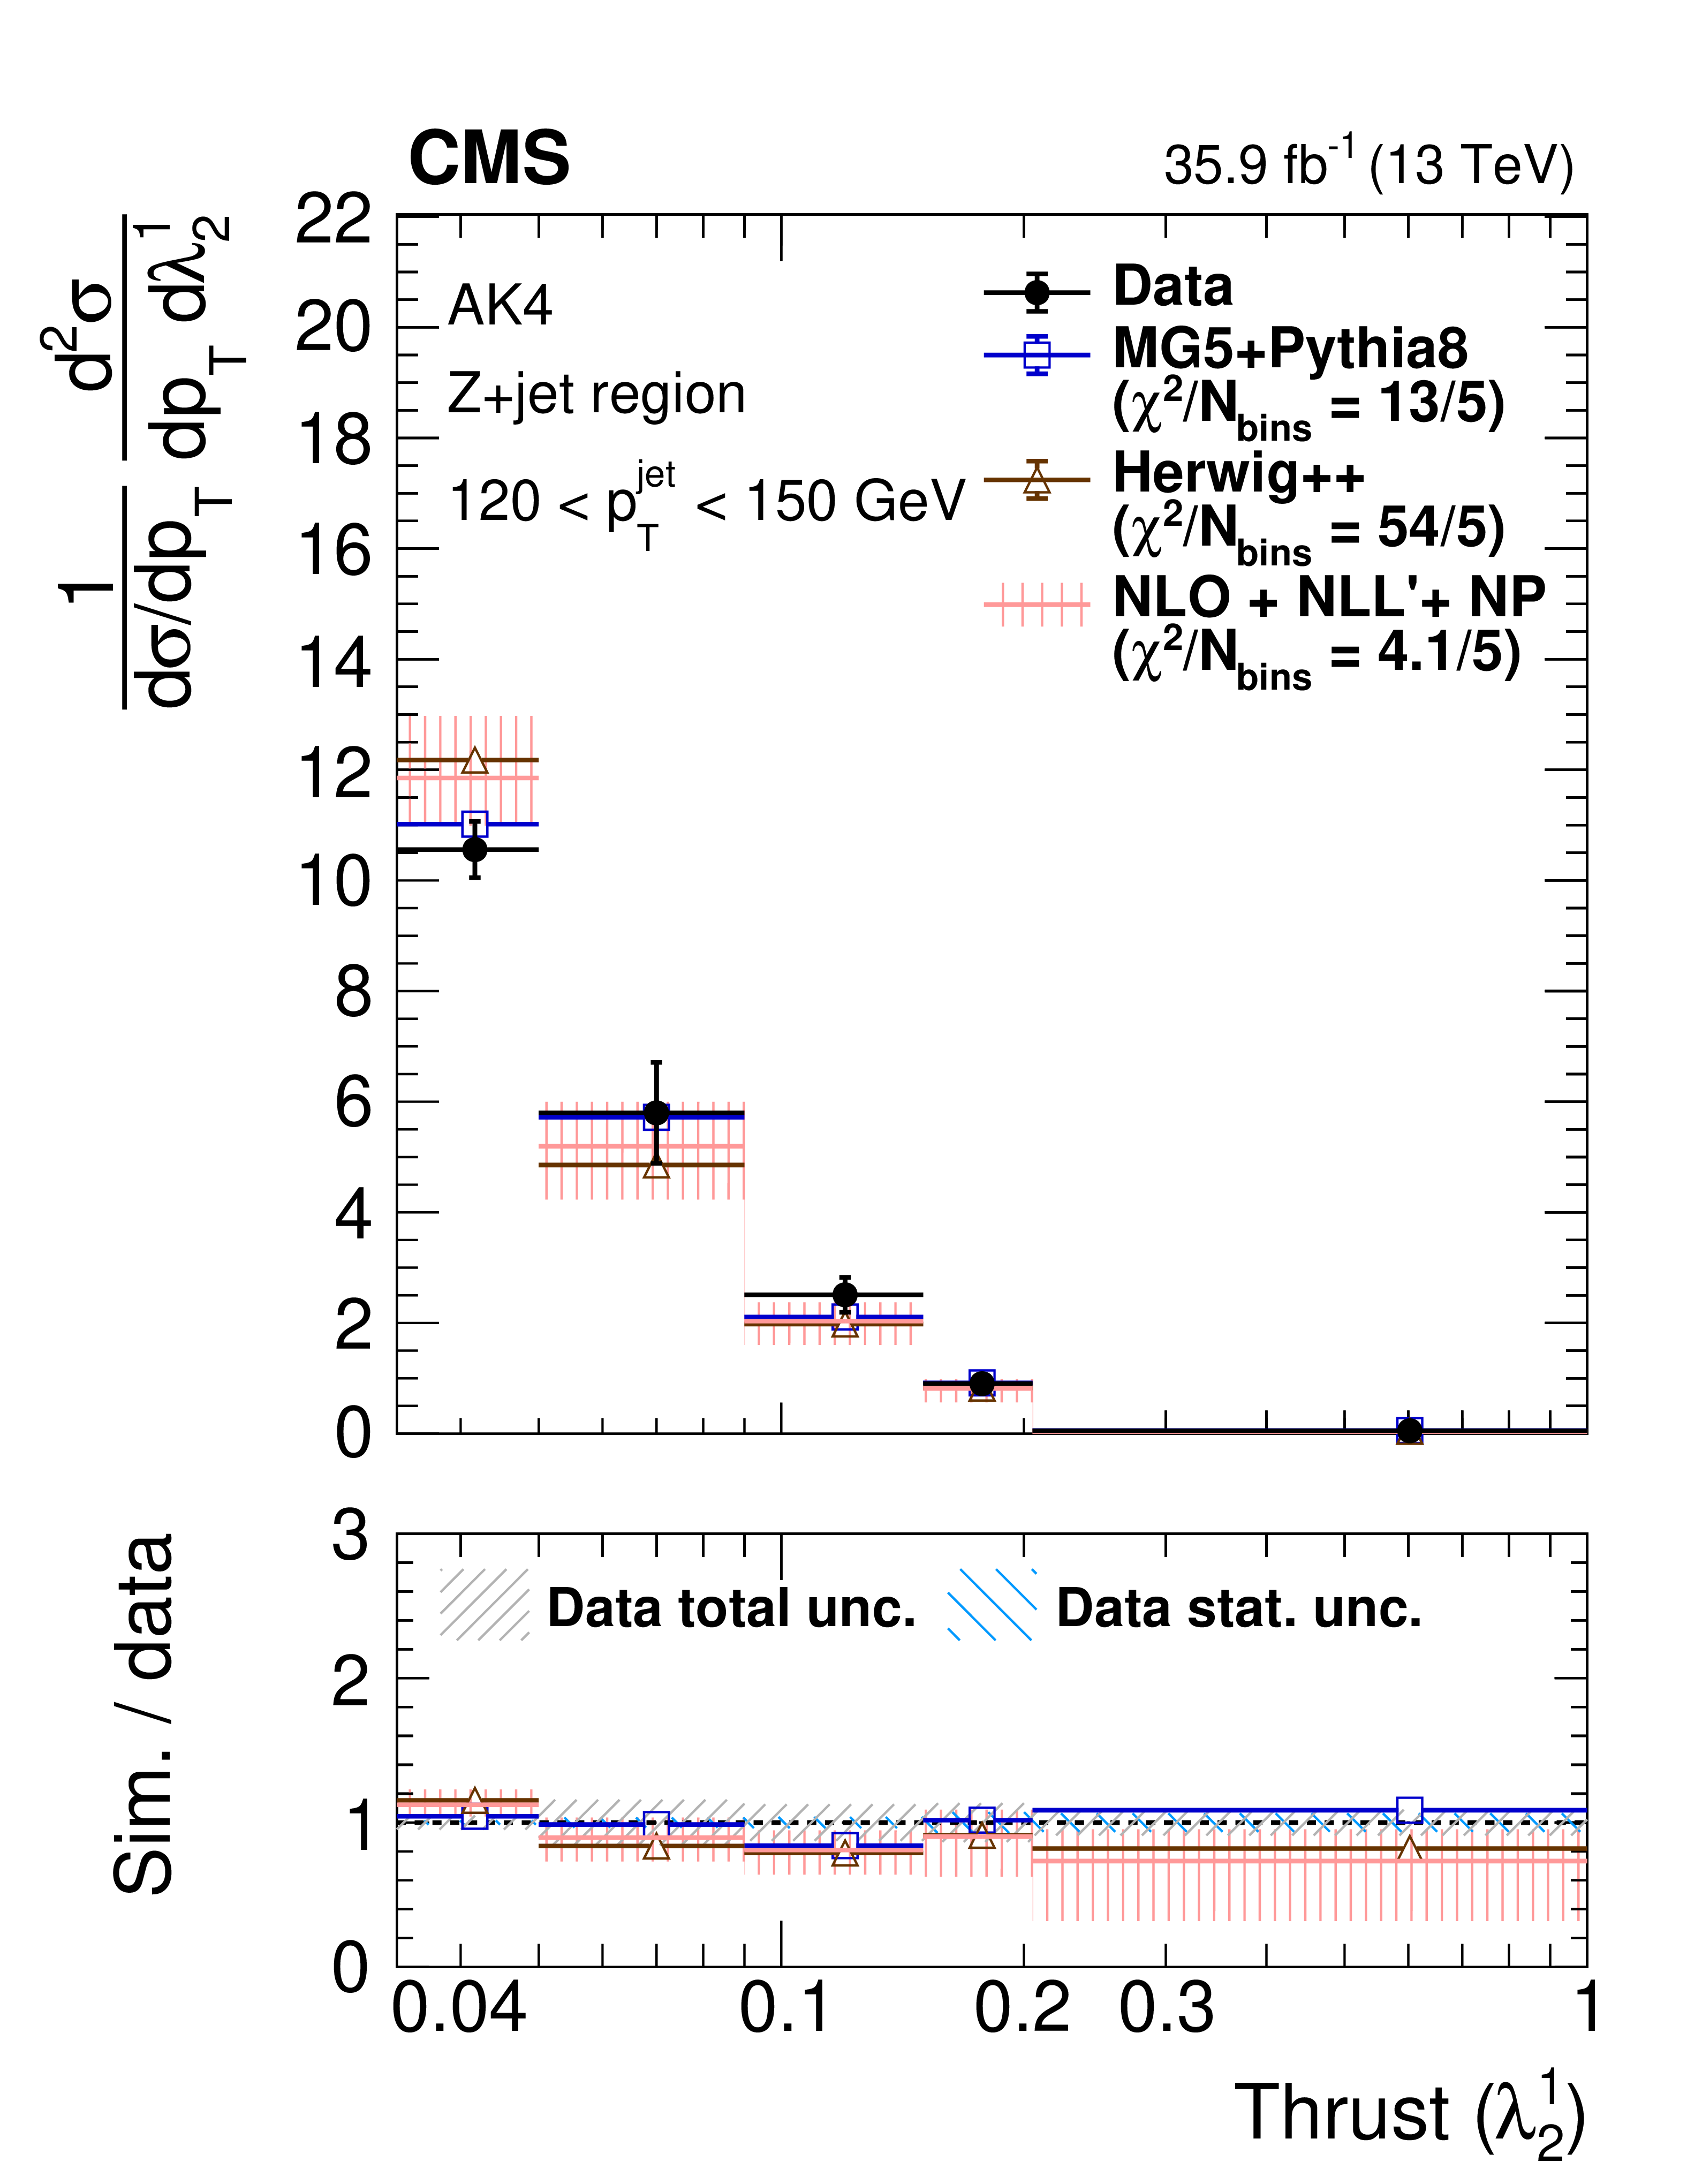
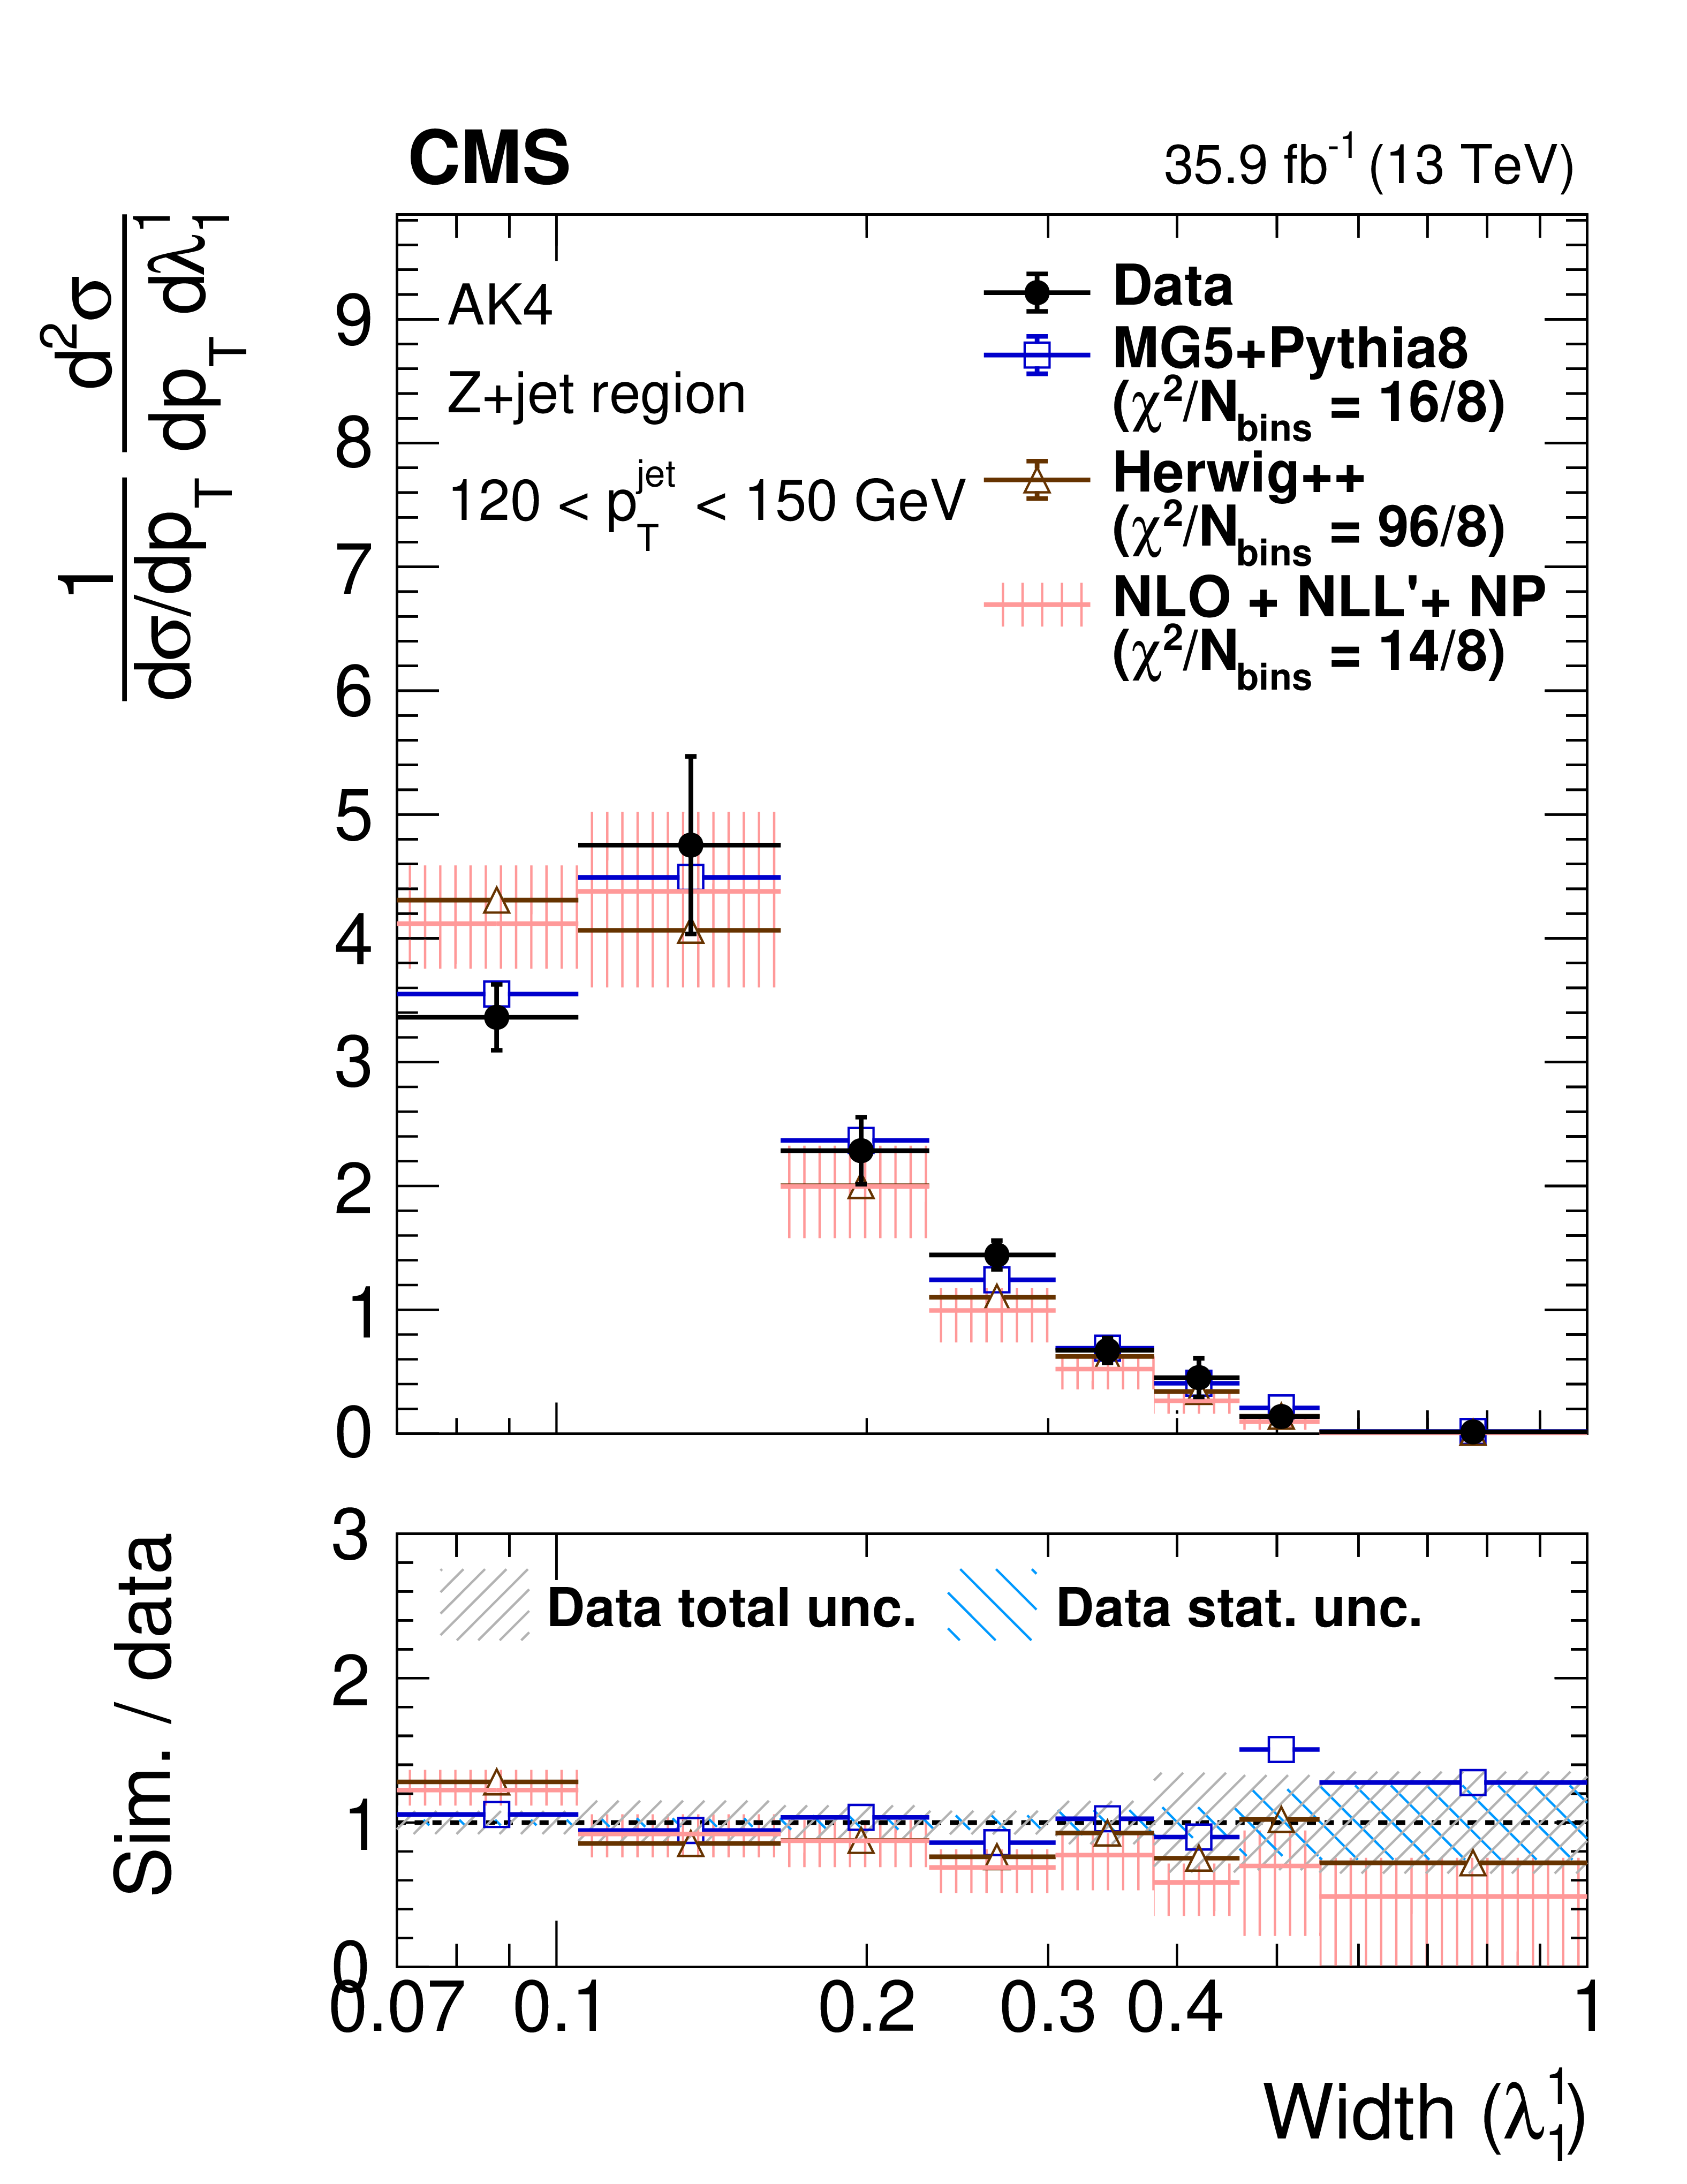
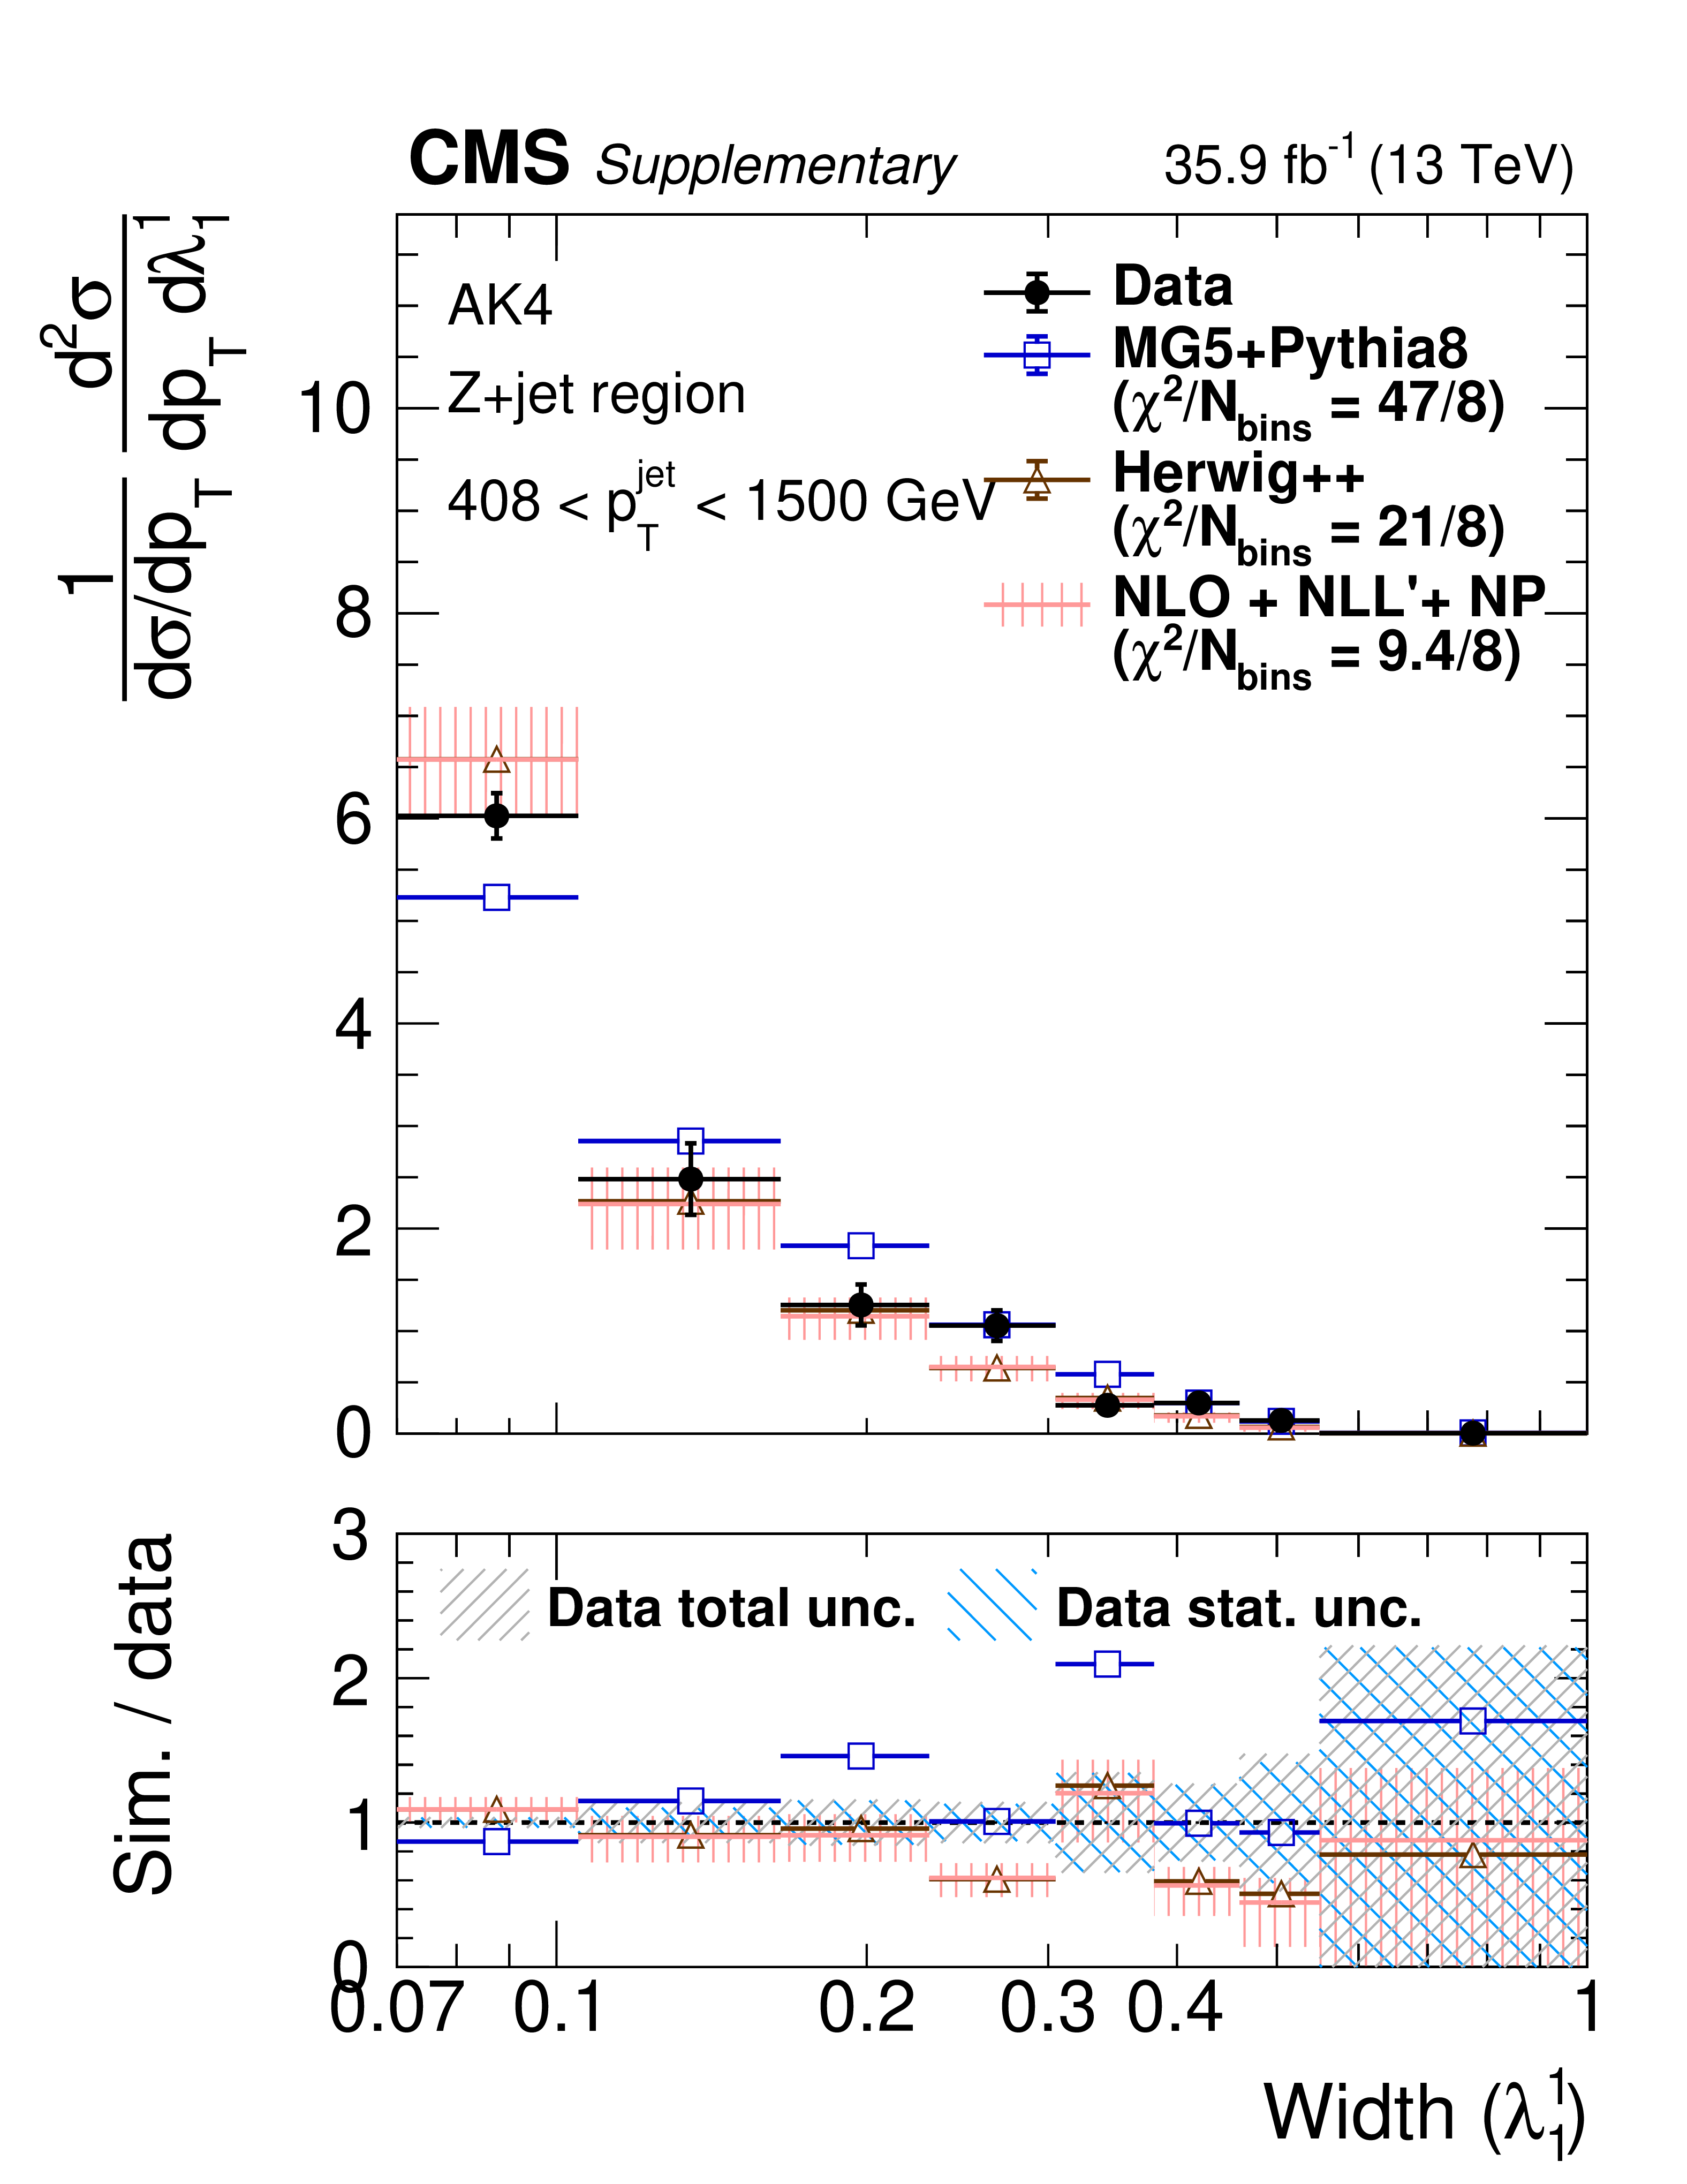
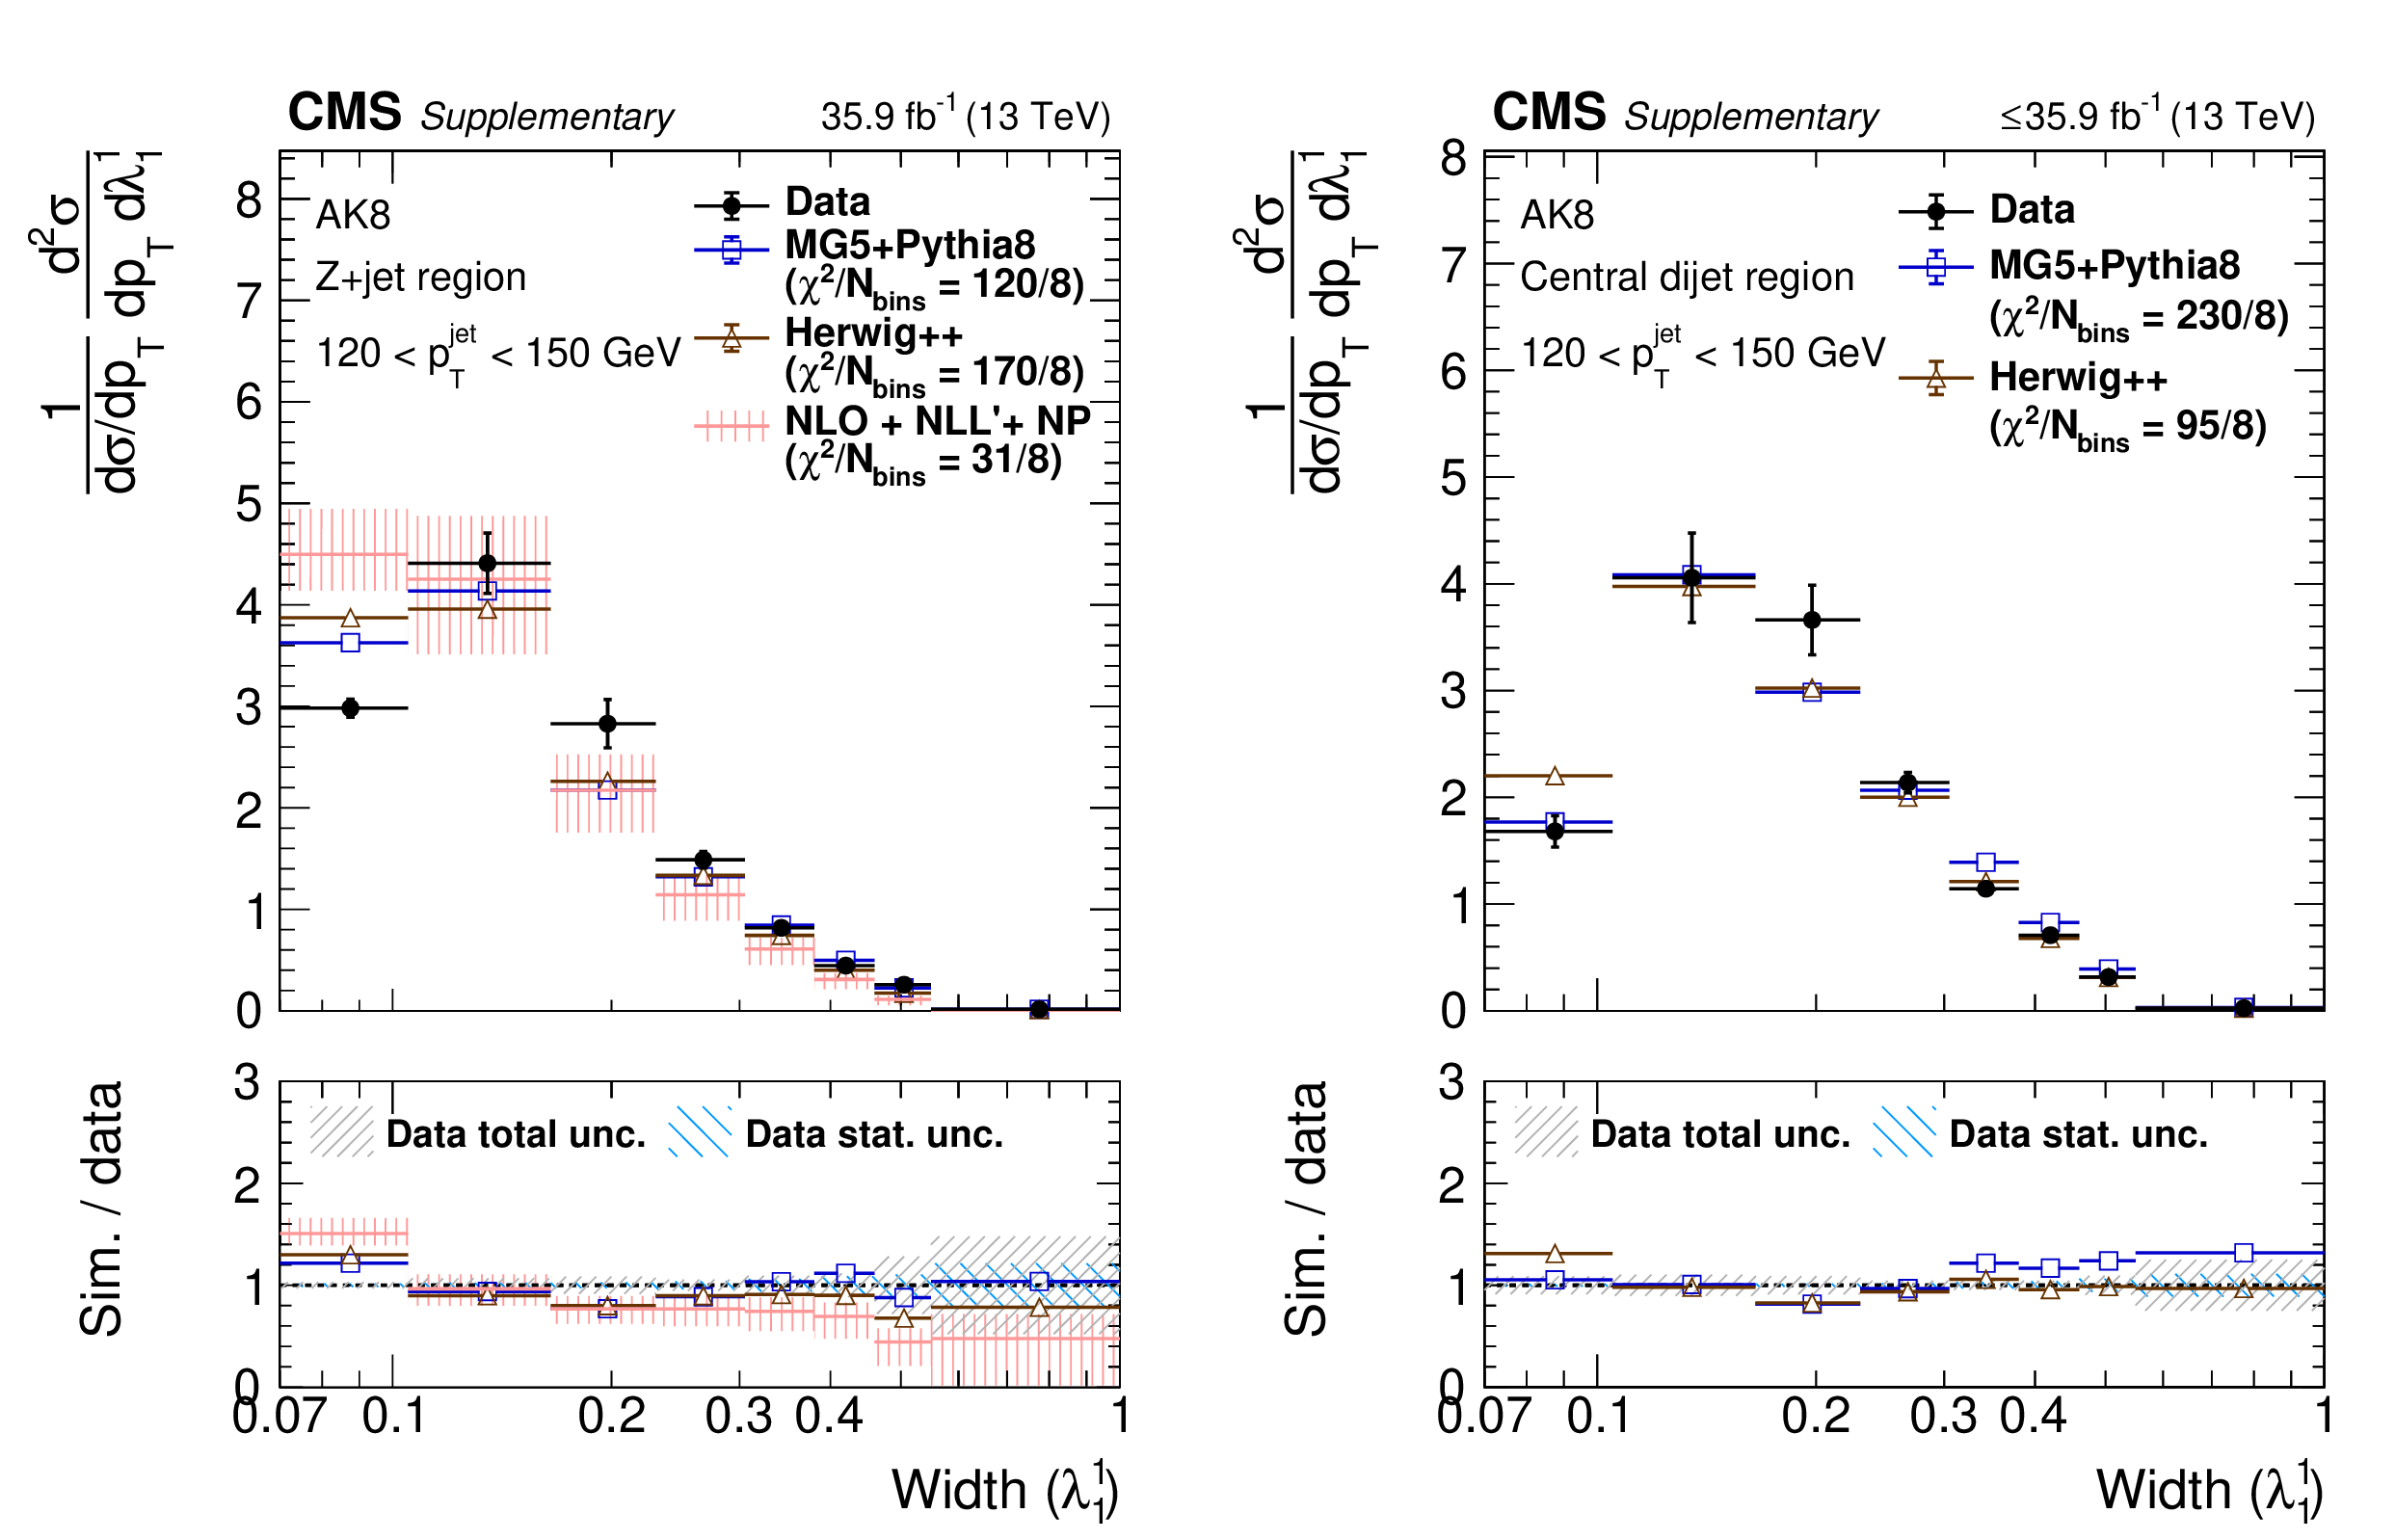
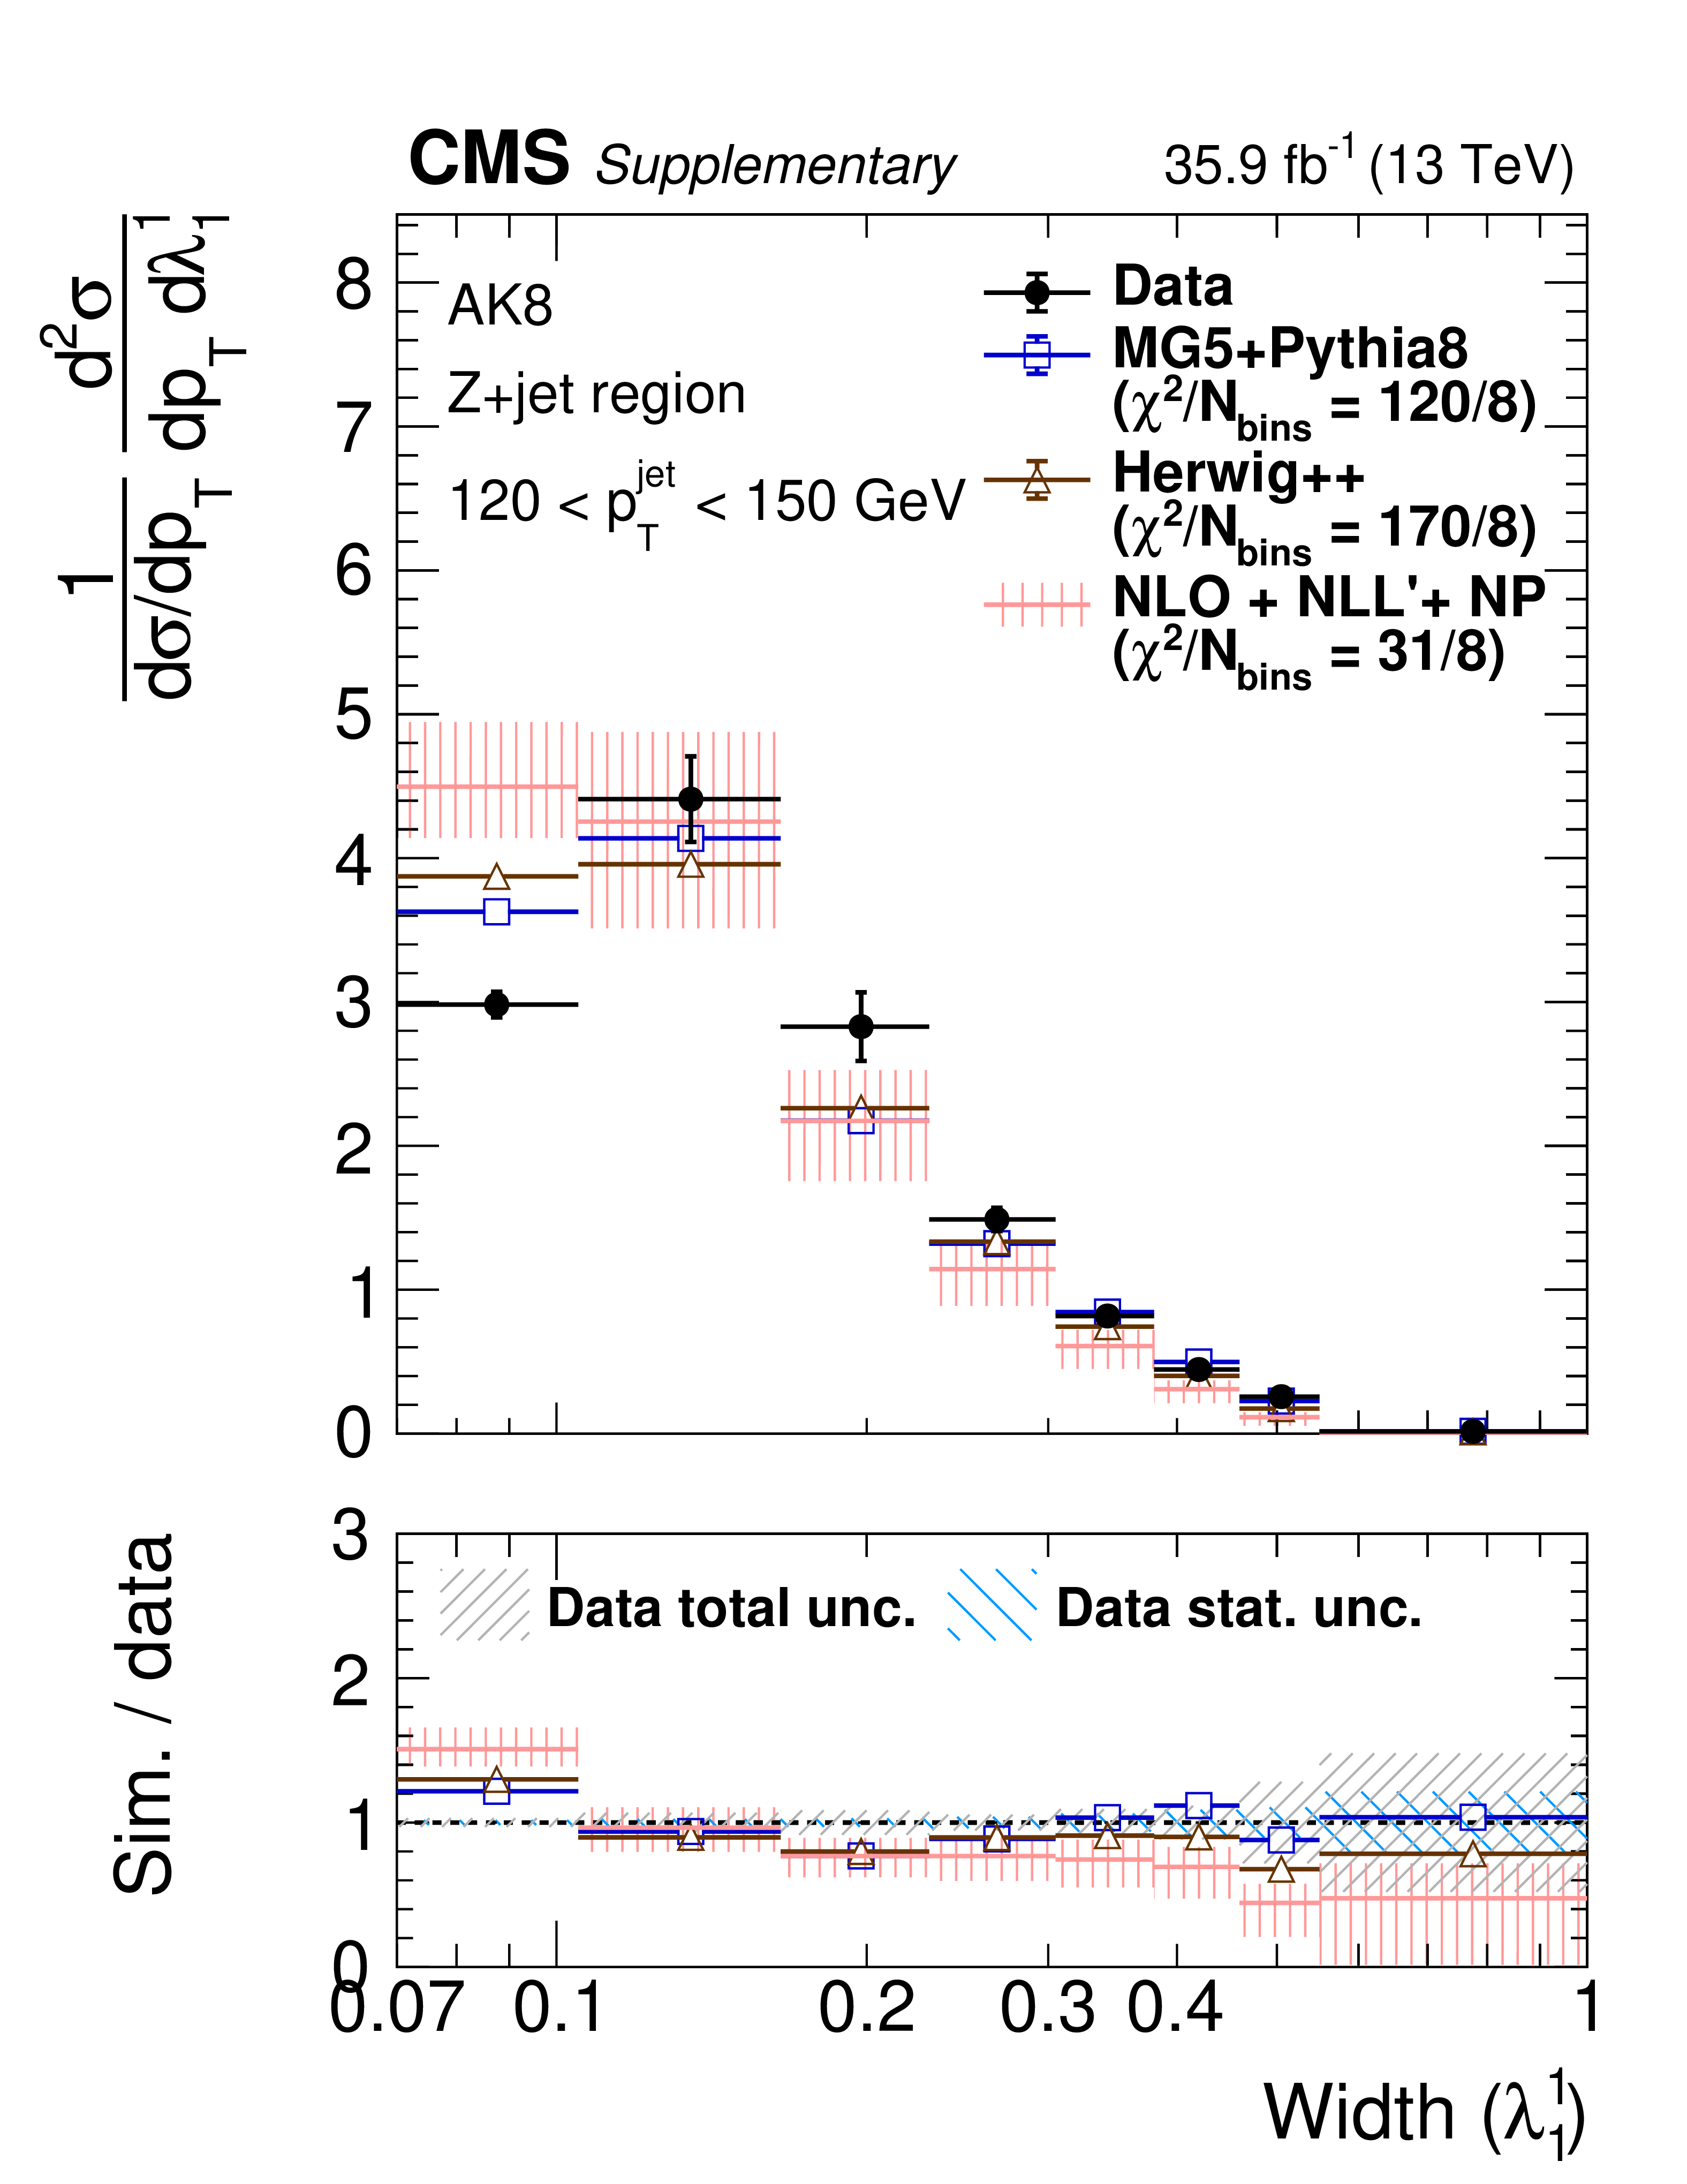
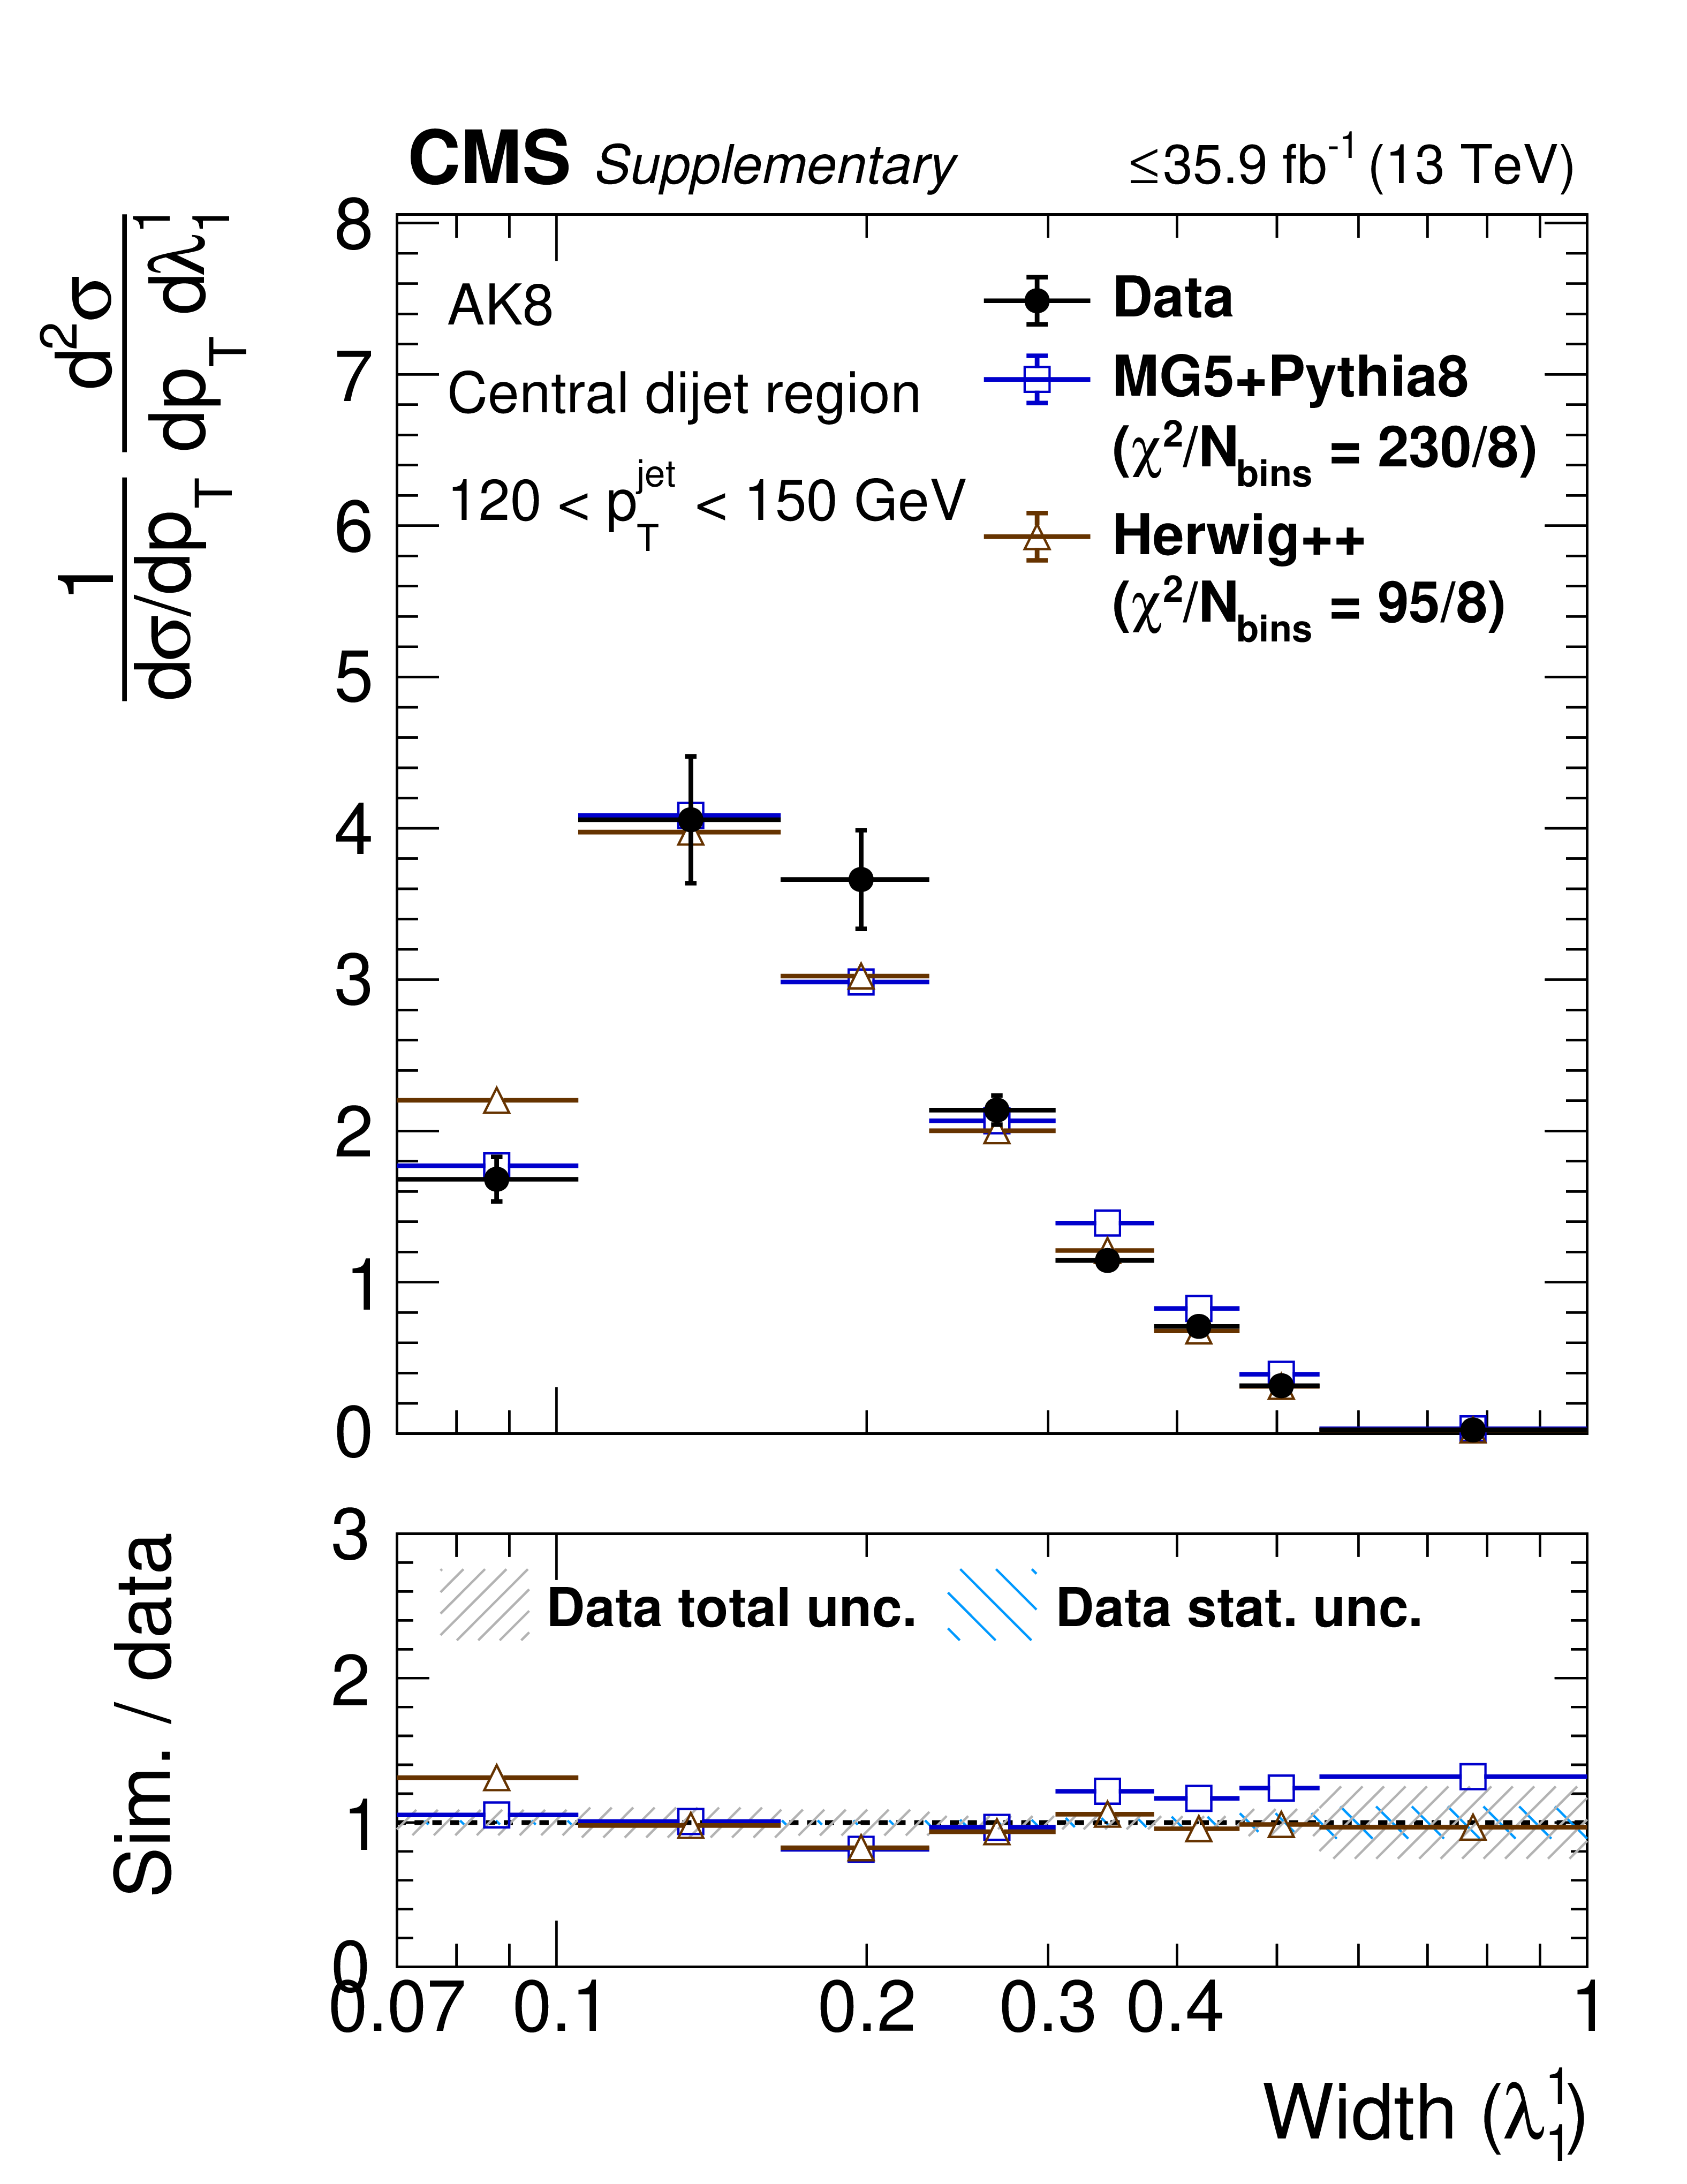
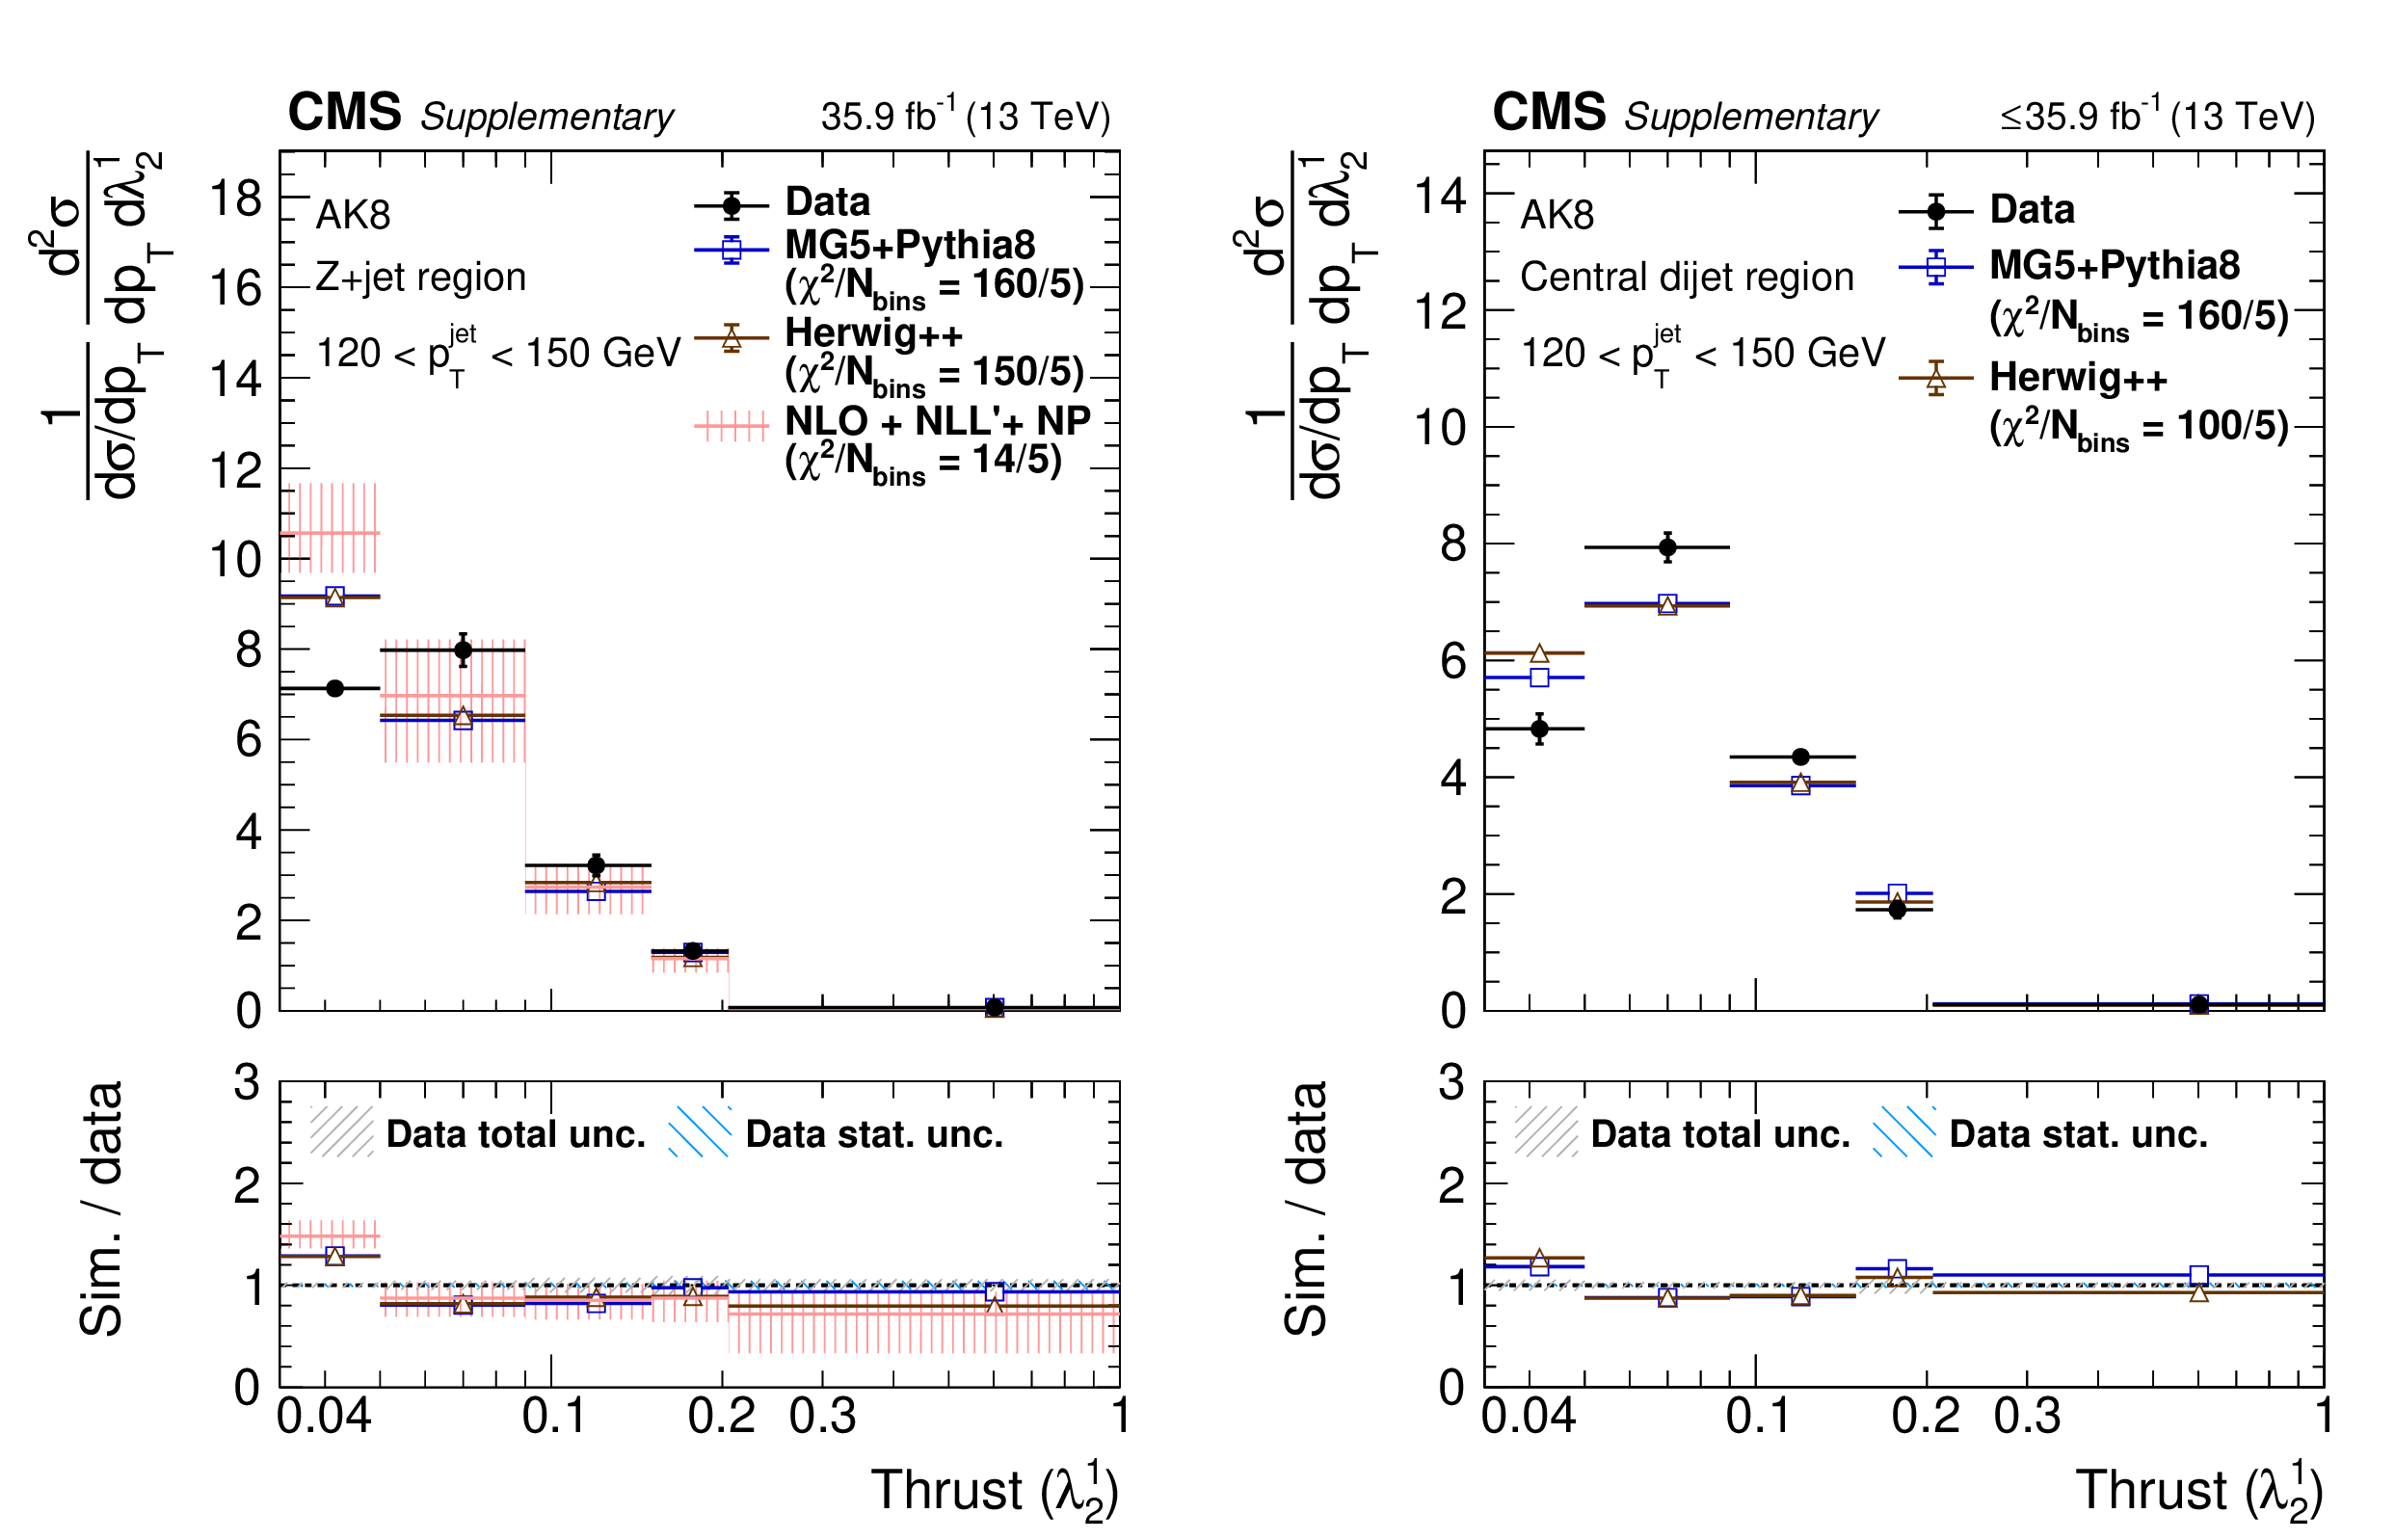
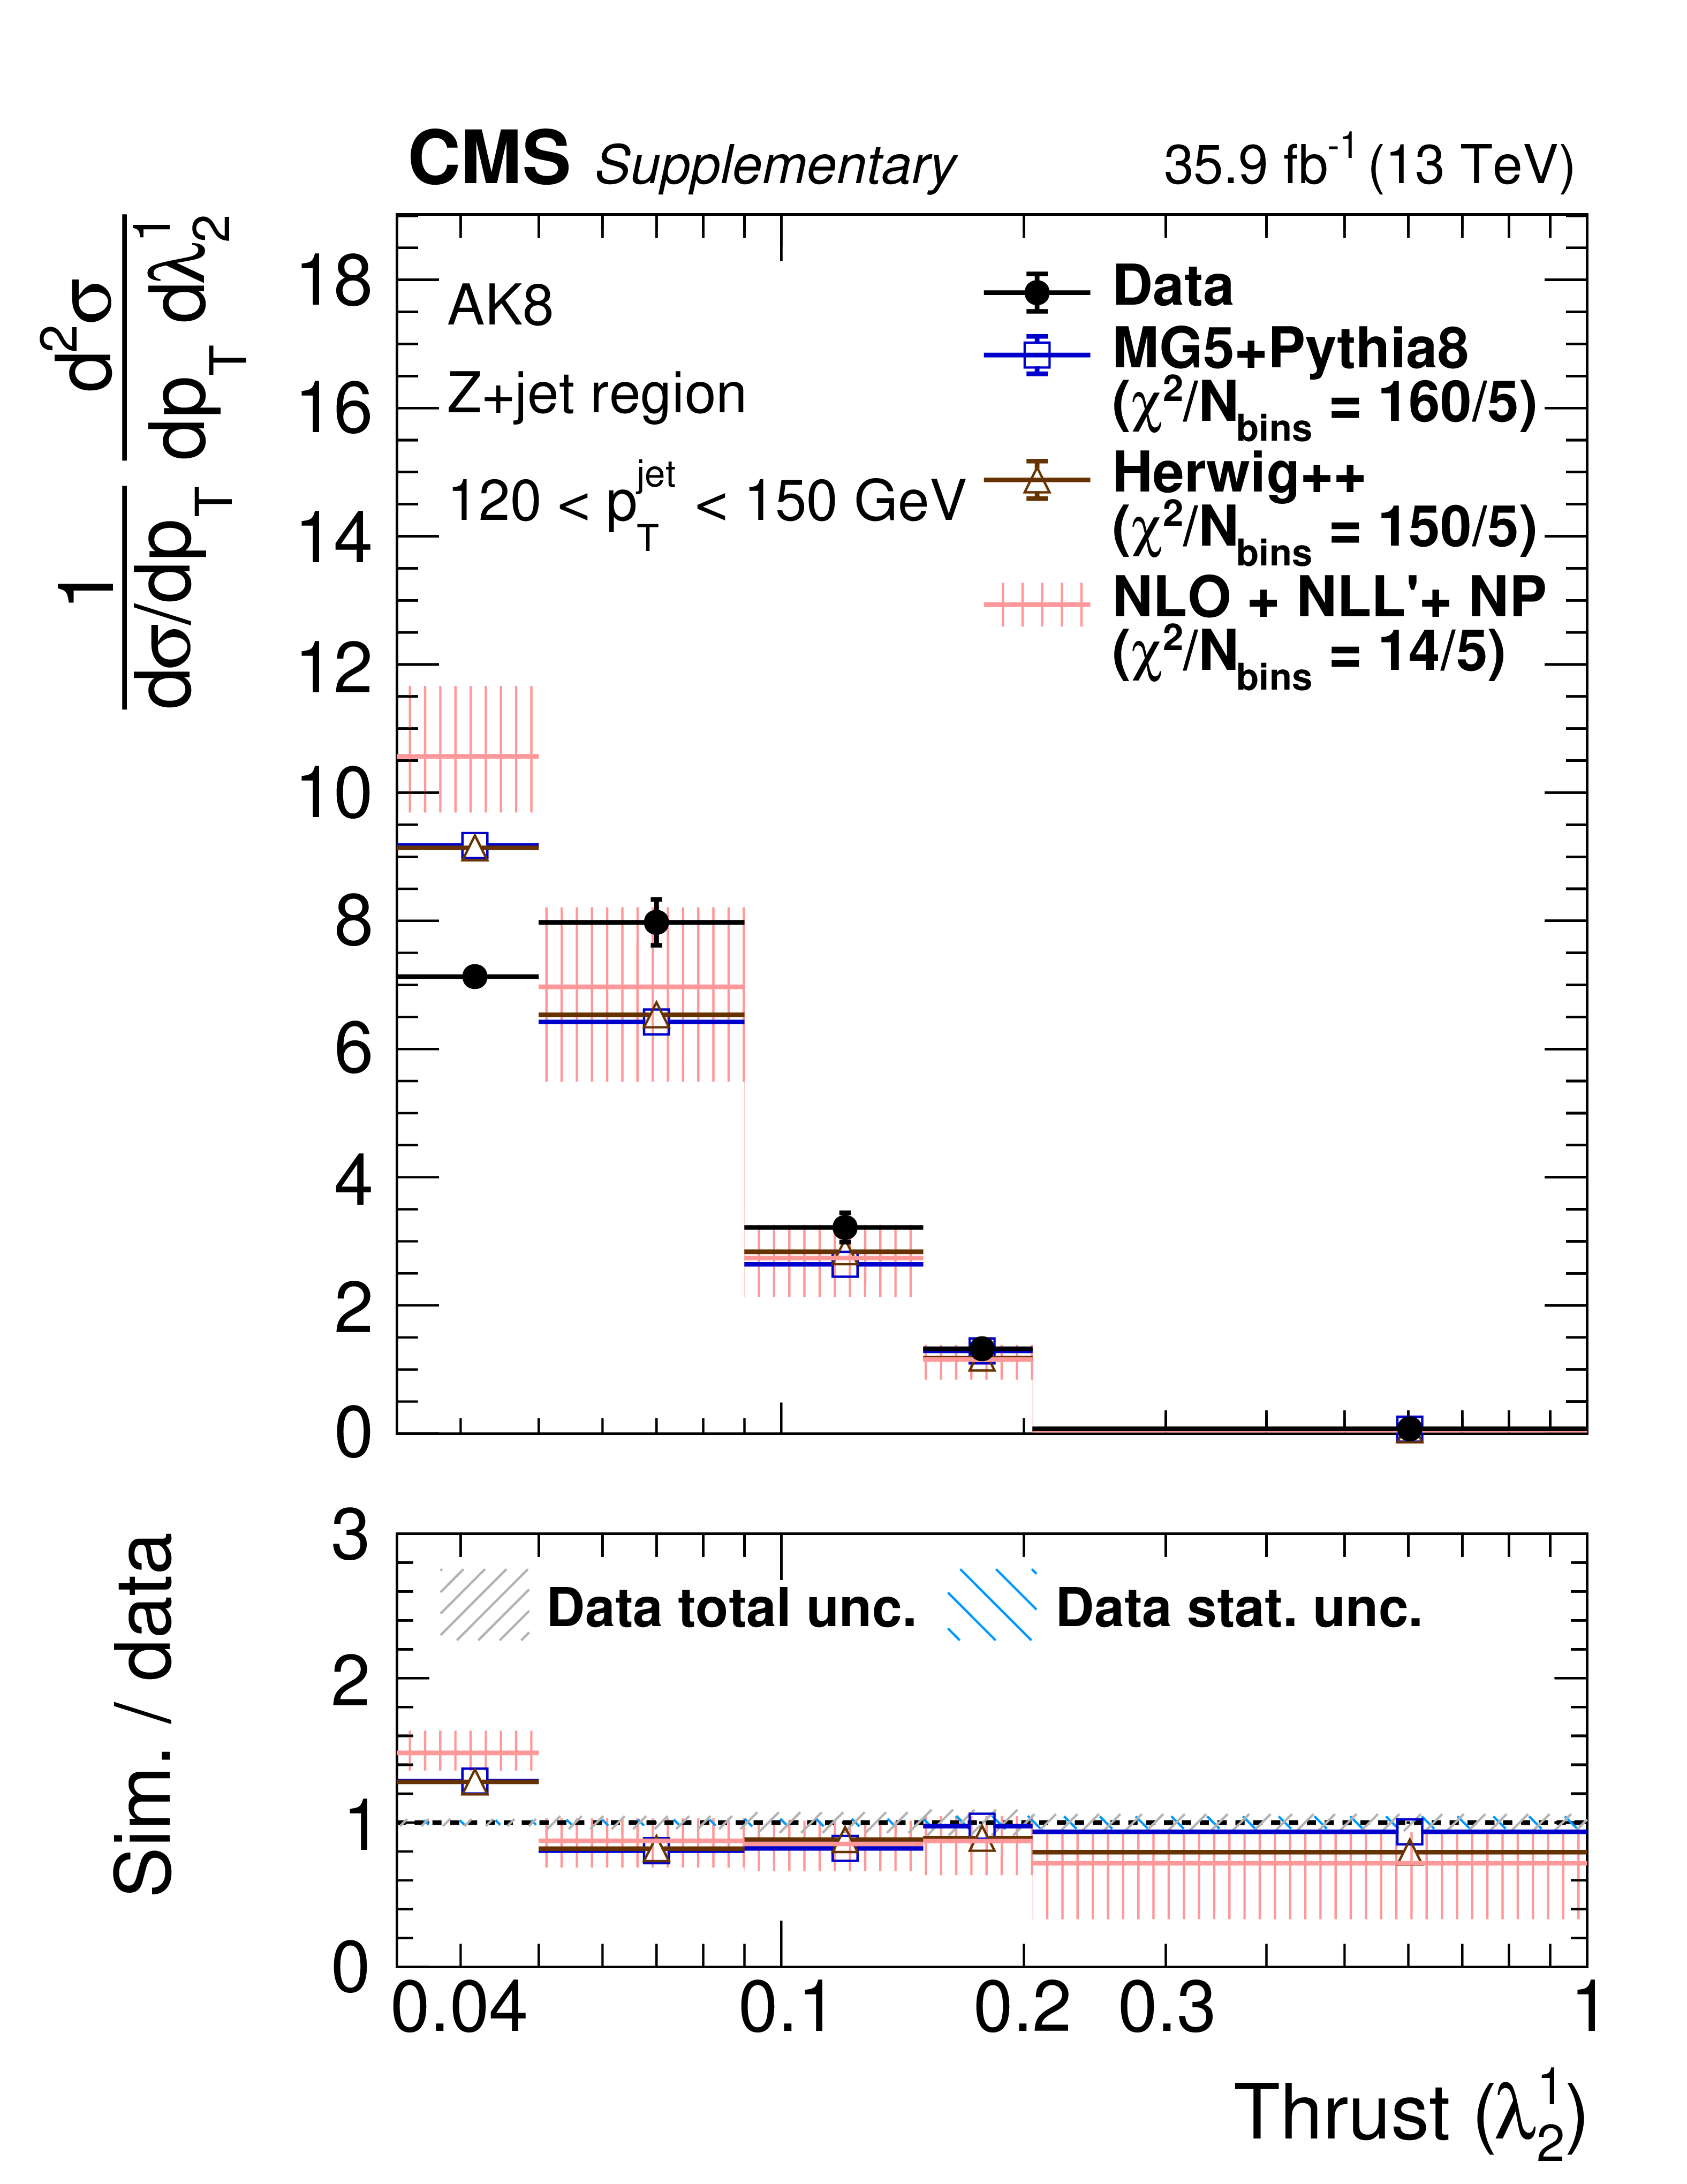
Figure 7:
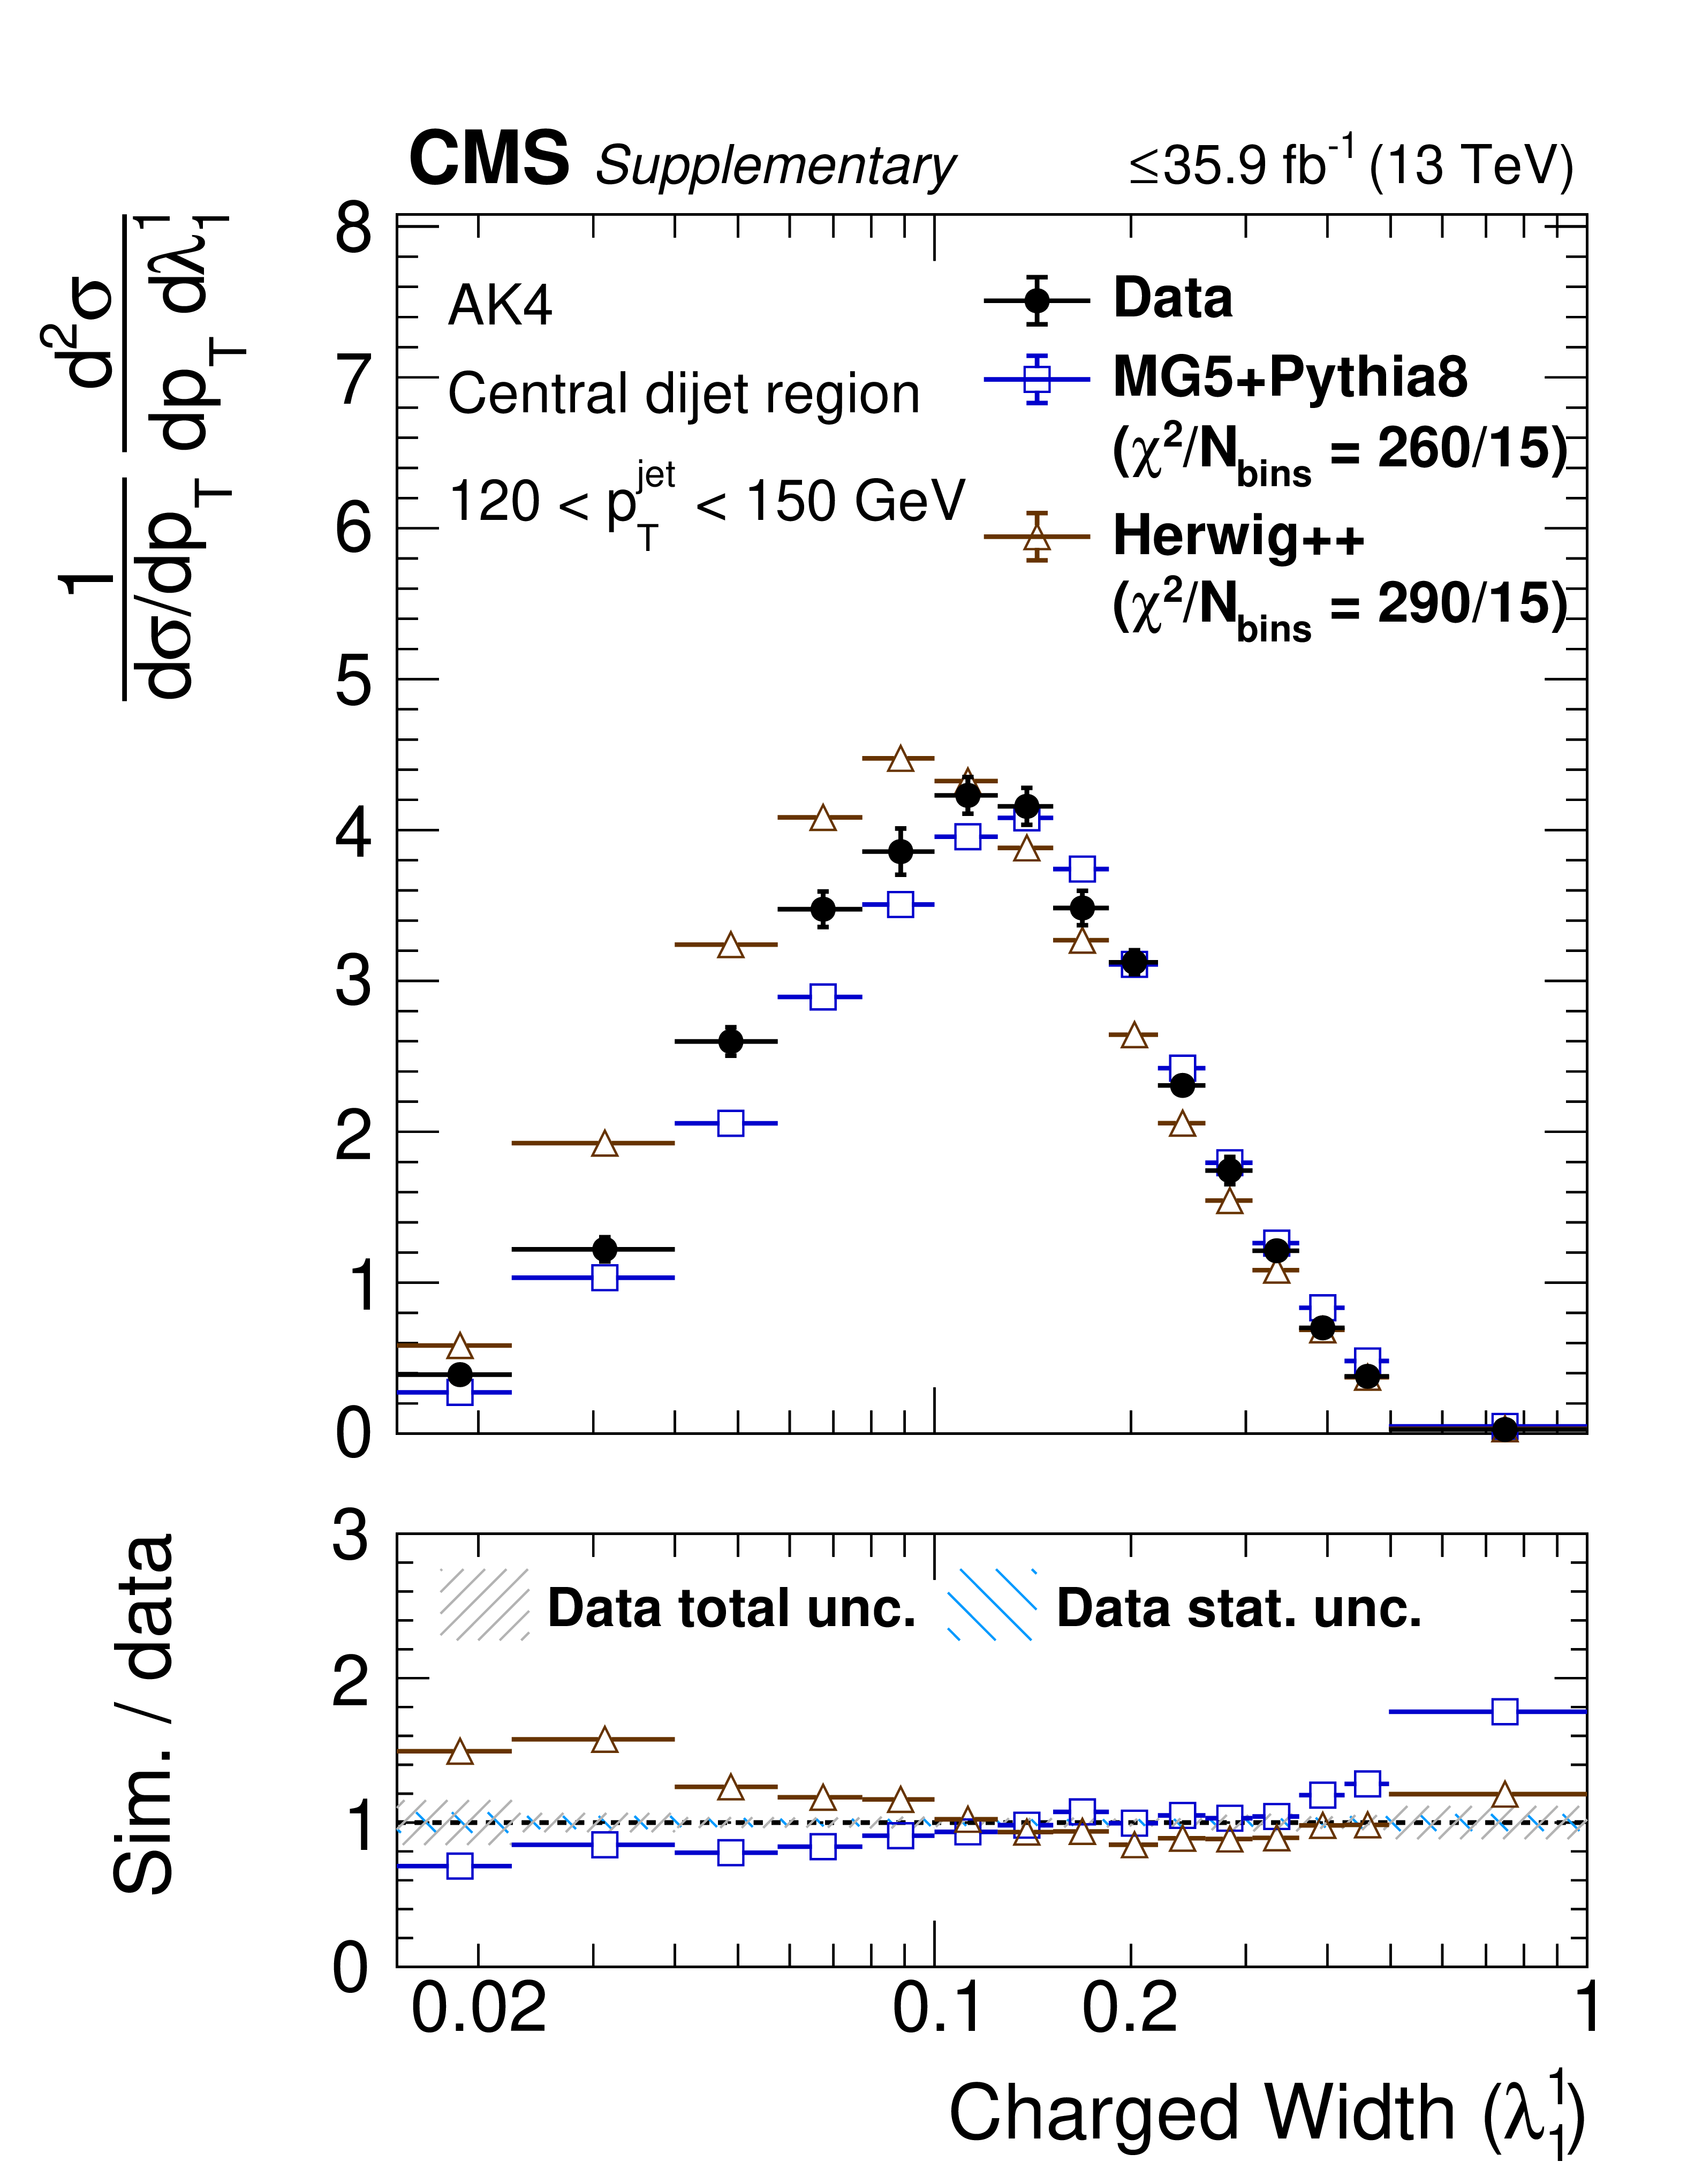
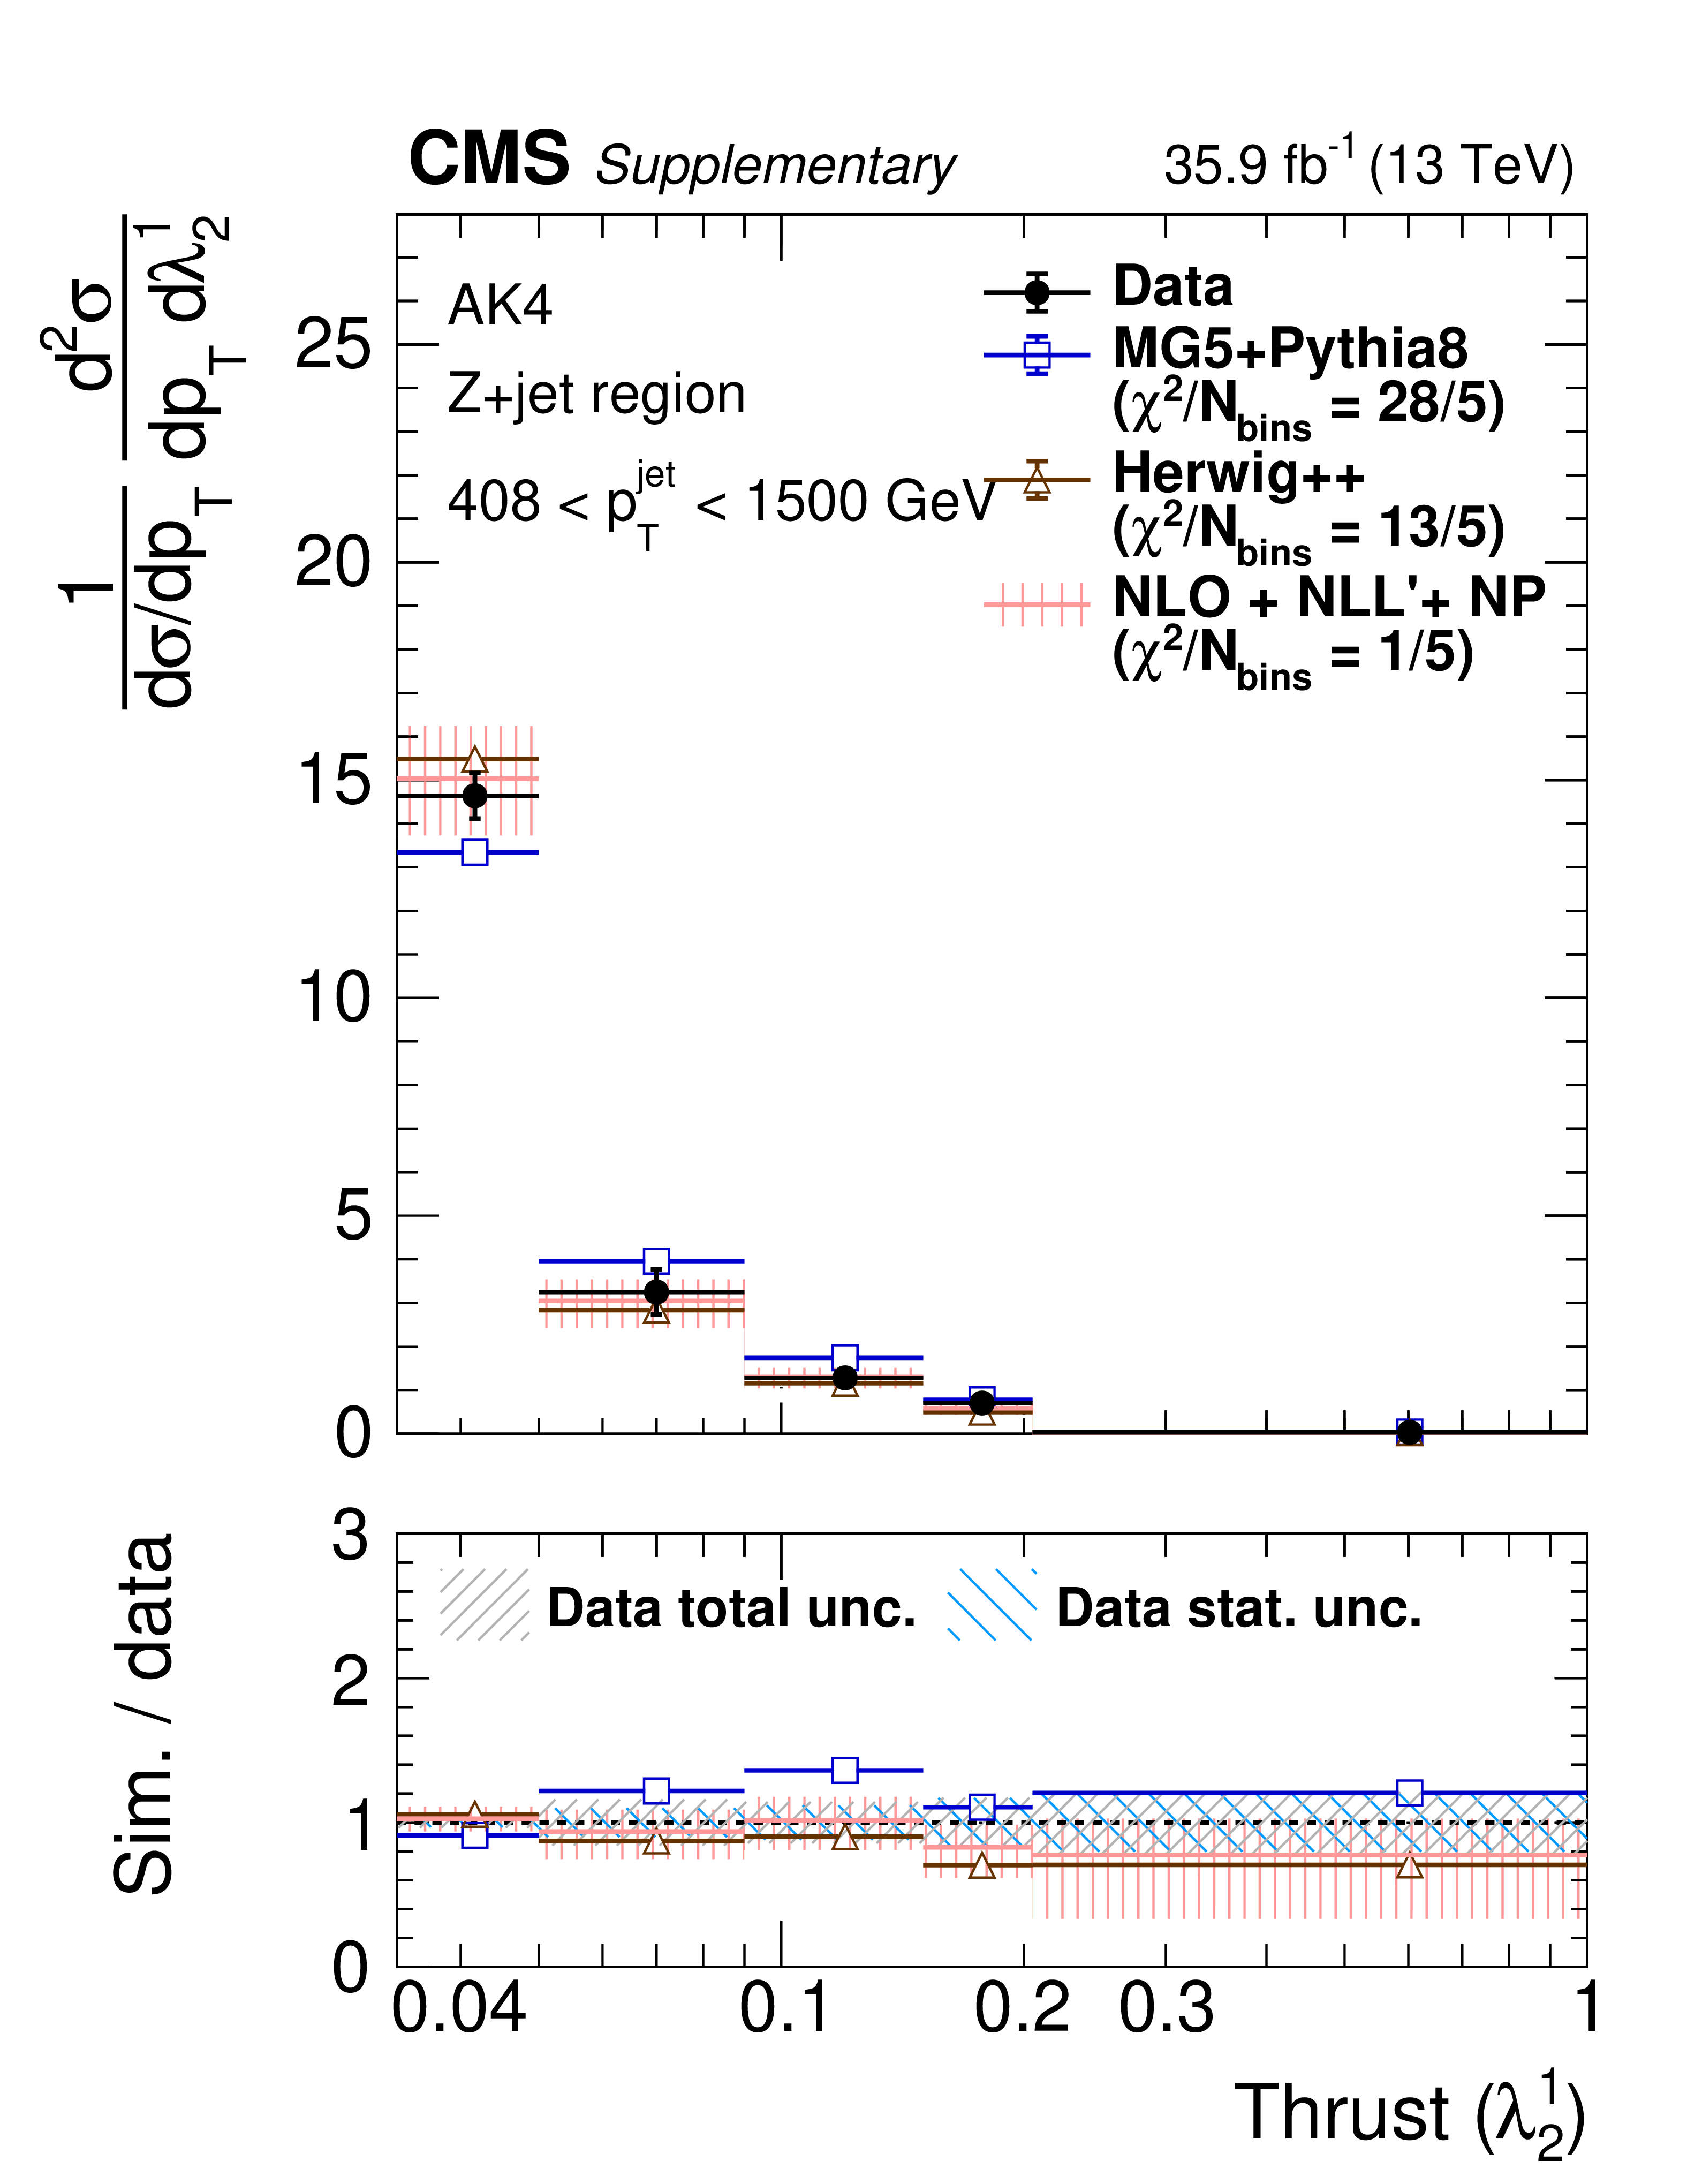
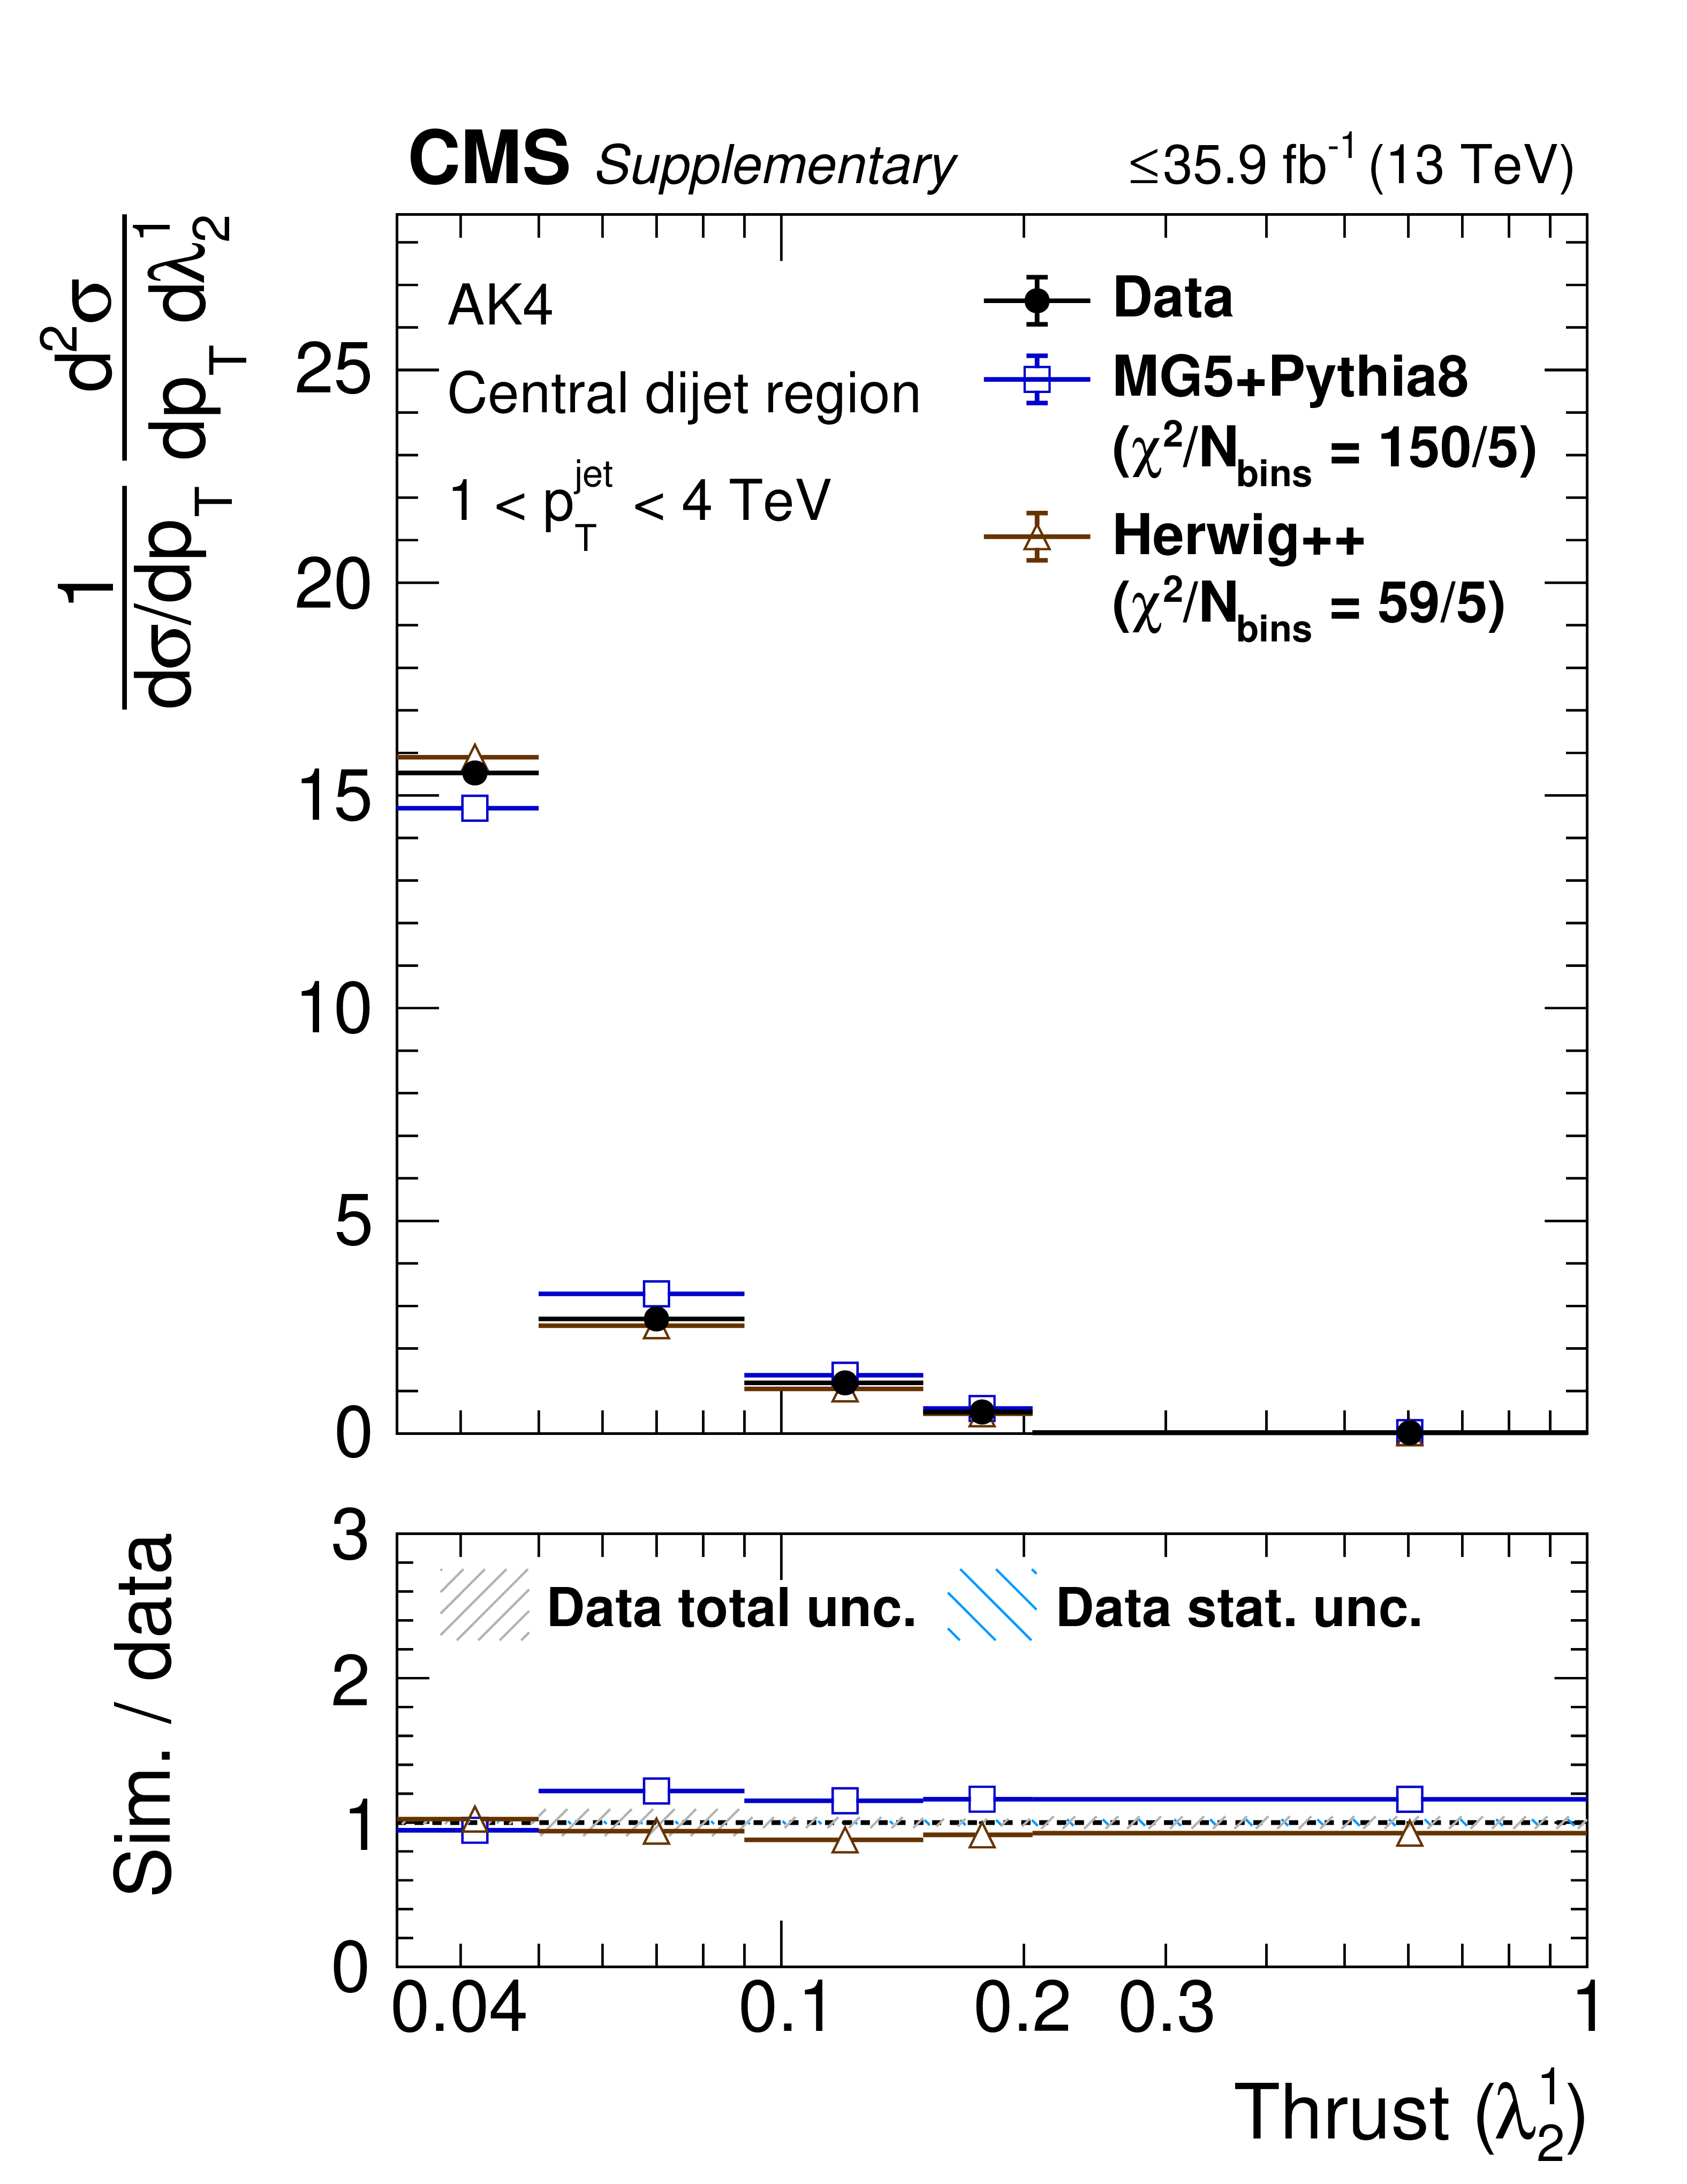
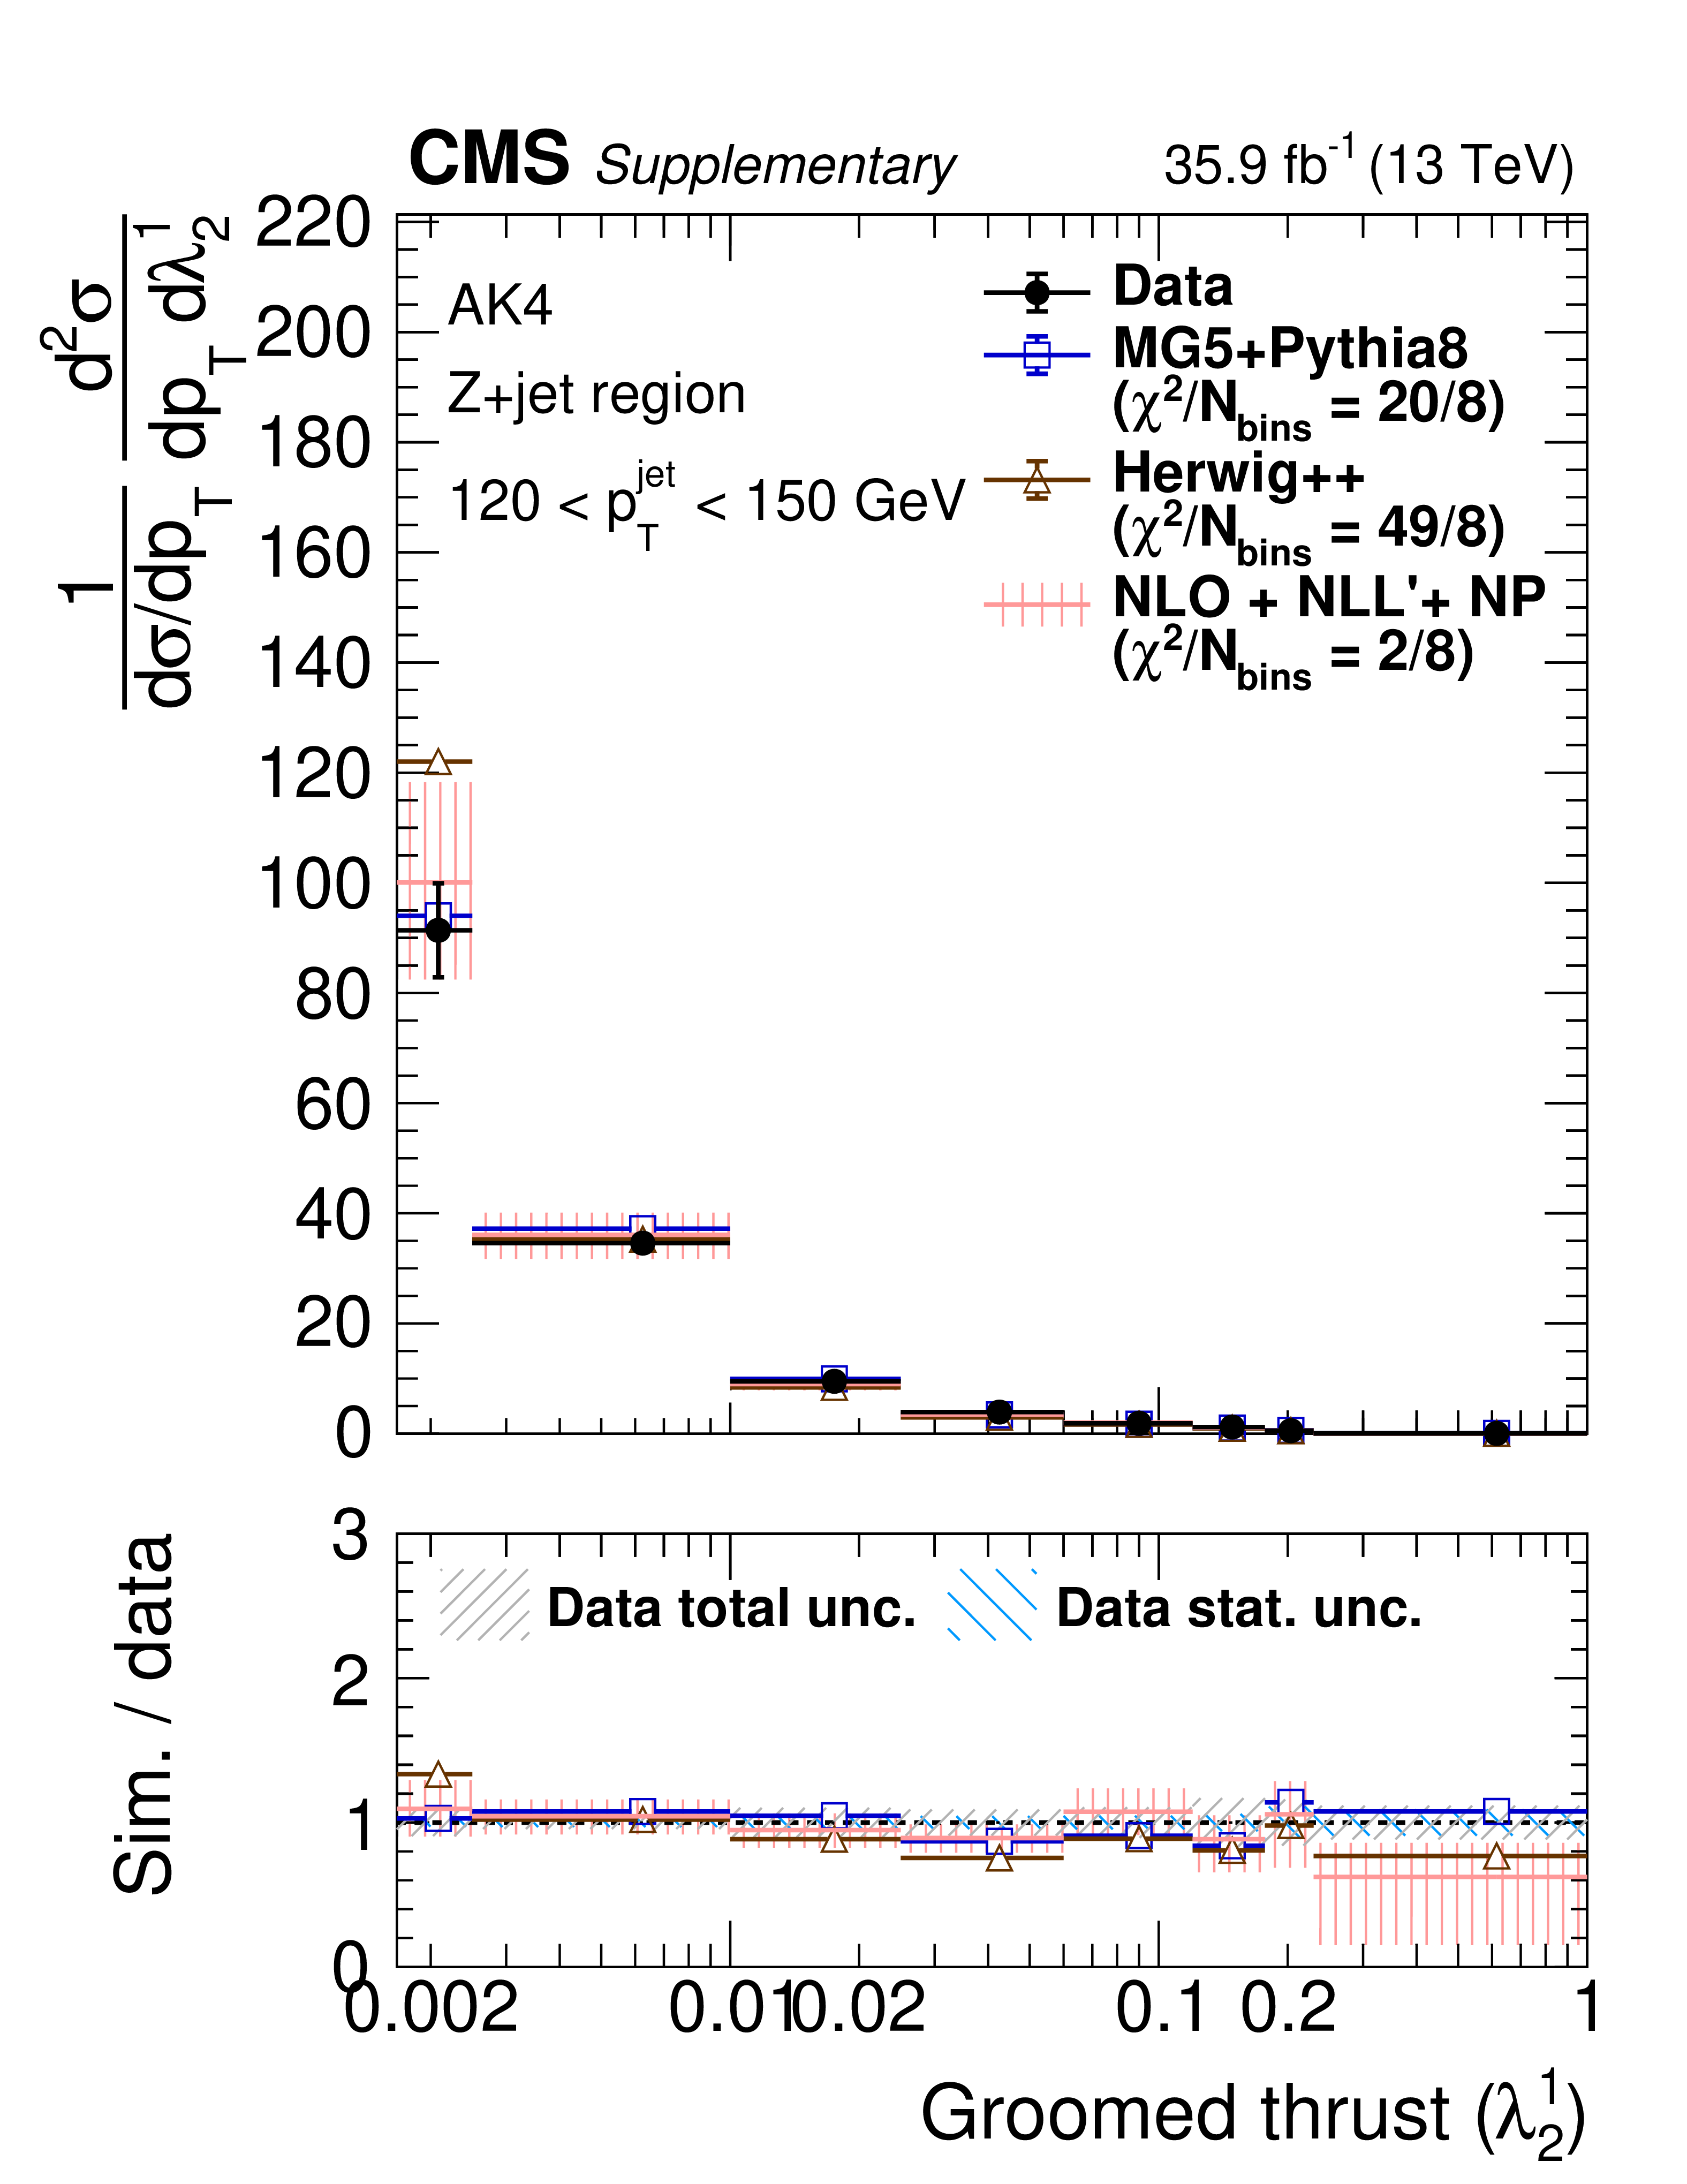
Particle-level distributions of (upper) ungroomed thrust ($\lambda ^{1}_{2}$) and (lower) ungroomed width ($\lambda ^{1}_{1}$) in 120 $ < {p_{\mathrm {T}}} < $ 150 GeV in the Z+jet region (left) and central dijet region (right). The error bars on the data correspond to the total uncertainties. For the NLO+NLL'+NP prediction, the theory uncertainty is displayed as a red hashed band. The coarse-grained blue hashed region in the ratio plot indicates the statistical uncertainty of the data, and the fine-grained grey hashed region represents the total uncertainty. The lowest bin extends down to $ {\lambda ^{\kappa}_{\beta}} \geq$ 0. |
png pdf |
Figure 7-a:
Particle-level distributions of ungroomed thrust ($\lambda ^{1}_{2}$) in 120 $ < {p_{\mathrm {T}}} < $ 150 GeV in the Z+jet region.The error bars on the data correspond to the total uncertainties. For the NLO+NLL'+NP prediction, the theory uncertainty is displayed as a red hashed band. The coarse-grained blue hashed region in the ratio plot indicates the statistical uncertainty of the data, and the fine-grained grey hashed region represents the total uncertainty. The lowest bin extends down to $ {\lambda ^{\kappa}_{\beta}} \geq$ 0. |

png pdf |
Figure 7-b:
Particle-level distributions of ungroomed thrust ($\lambda ^{1}_{2}$) in 120 $ < {p_{\mathrm {T}}} < $ 150 GeV in the central dijet region.The error bars on the data correspond to the total uncertainties. For the NLO+NLL'+NP prediction, the theory uncertainty is displayed as a red hashed band. The coarse-grained blue hashed region in the ratio plot indicates the statistical uncertainty of the data, and the fine-grained grey hashed region represents the total uncertainty. The lowest bin extends down to $ {\lambda ^{\kappa}_{\beta}} \geq$ 0. |
png pdf |
Figure 7-c:
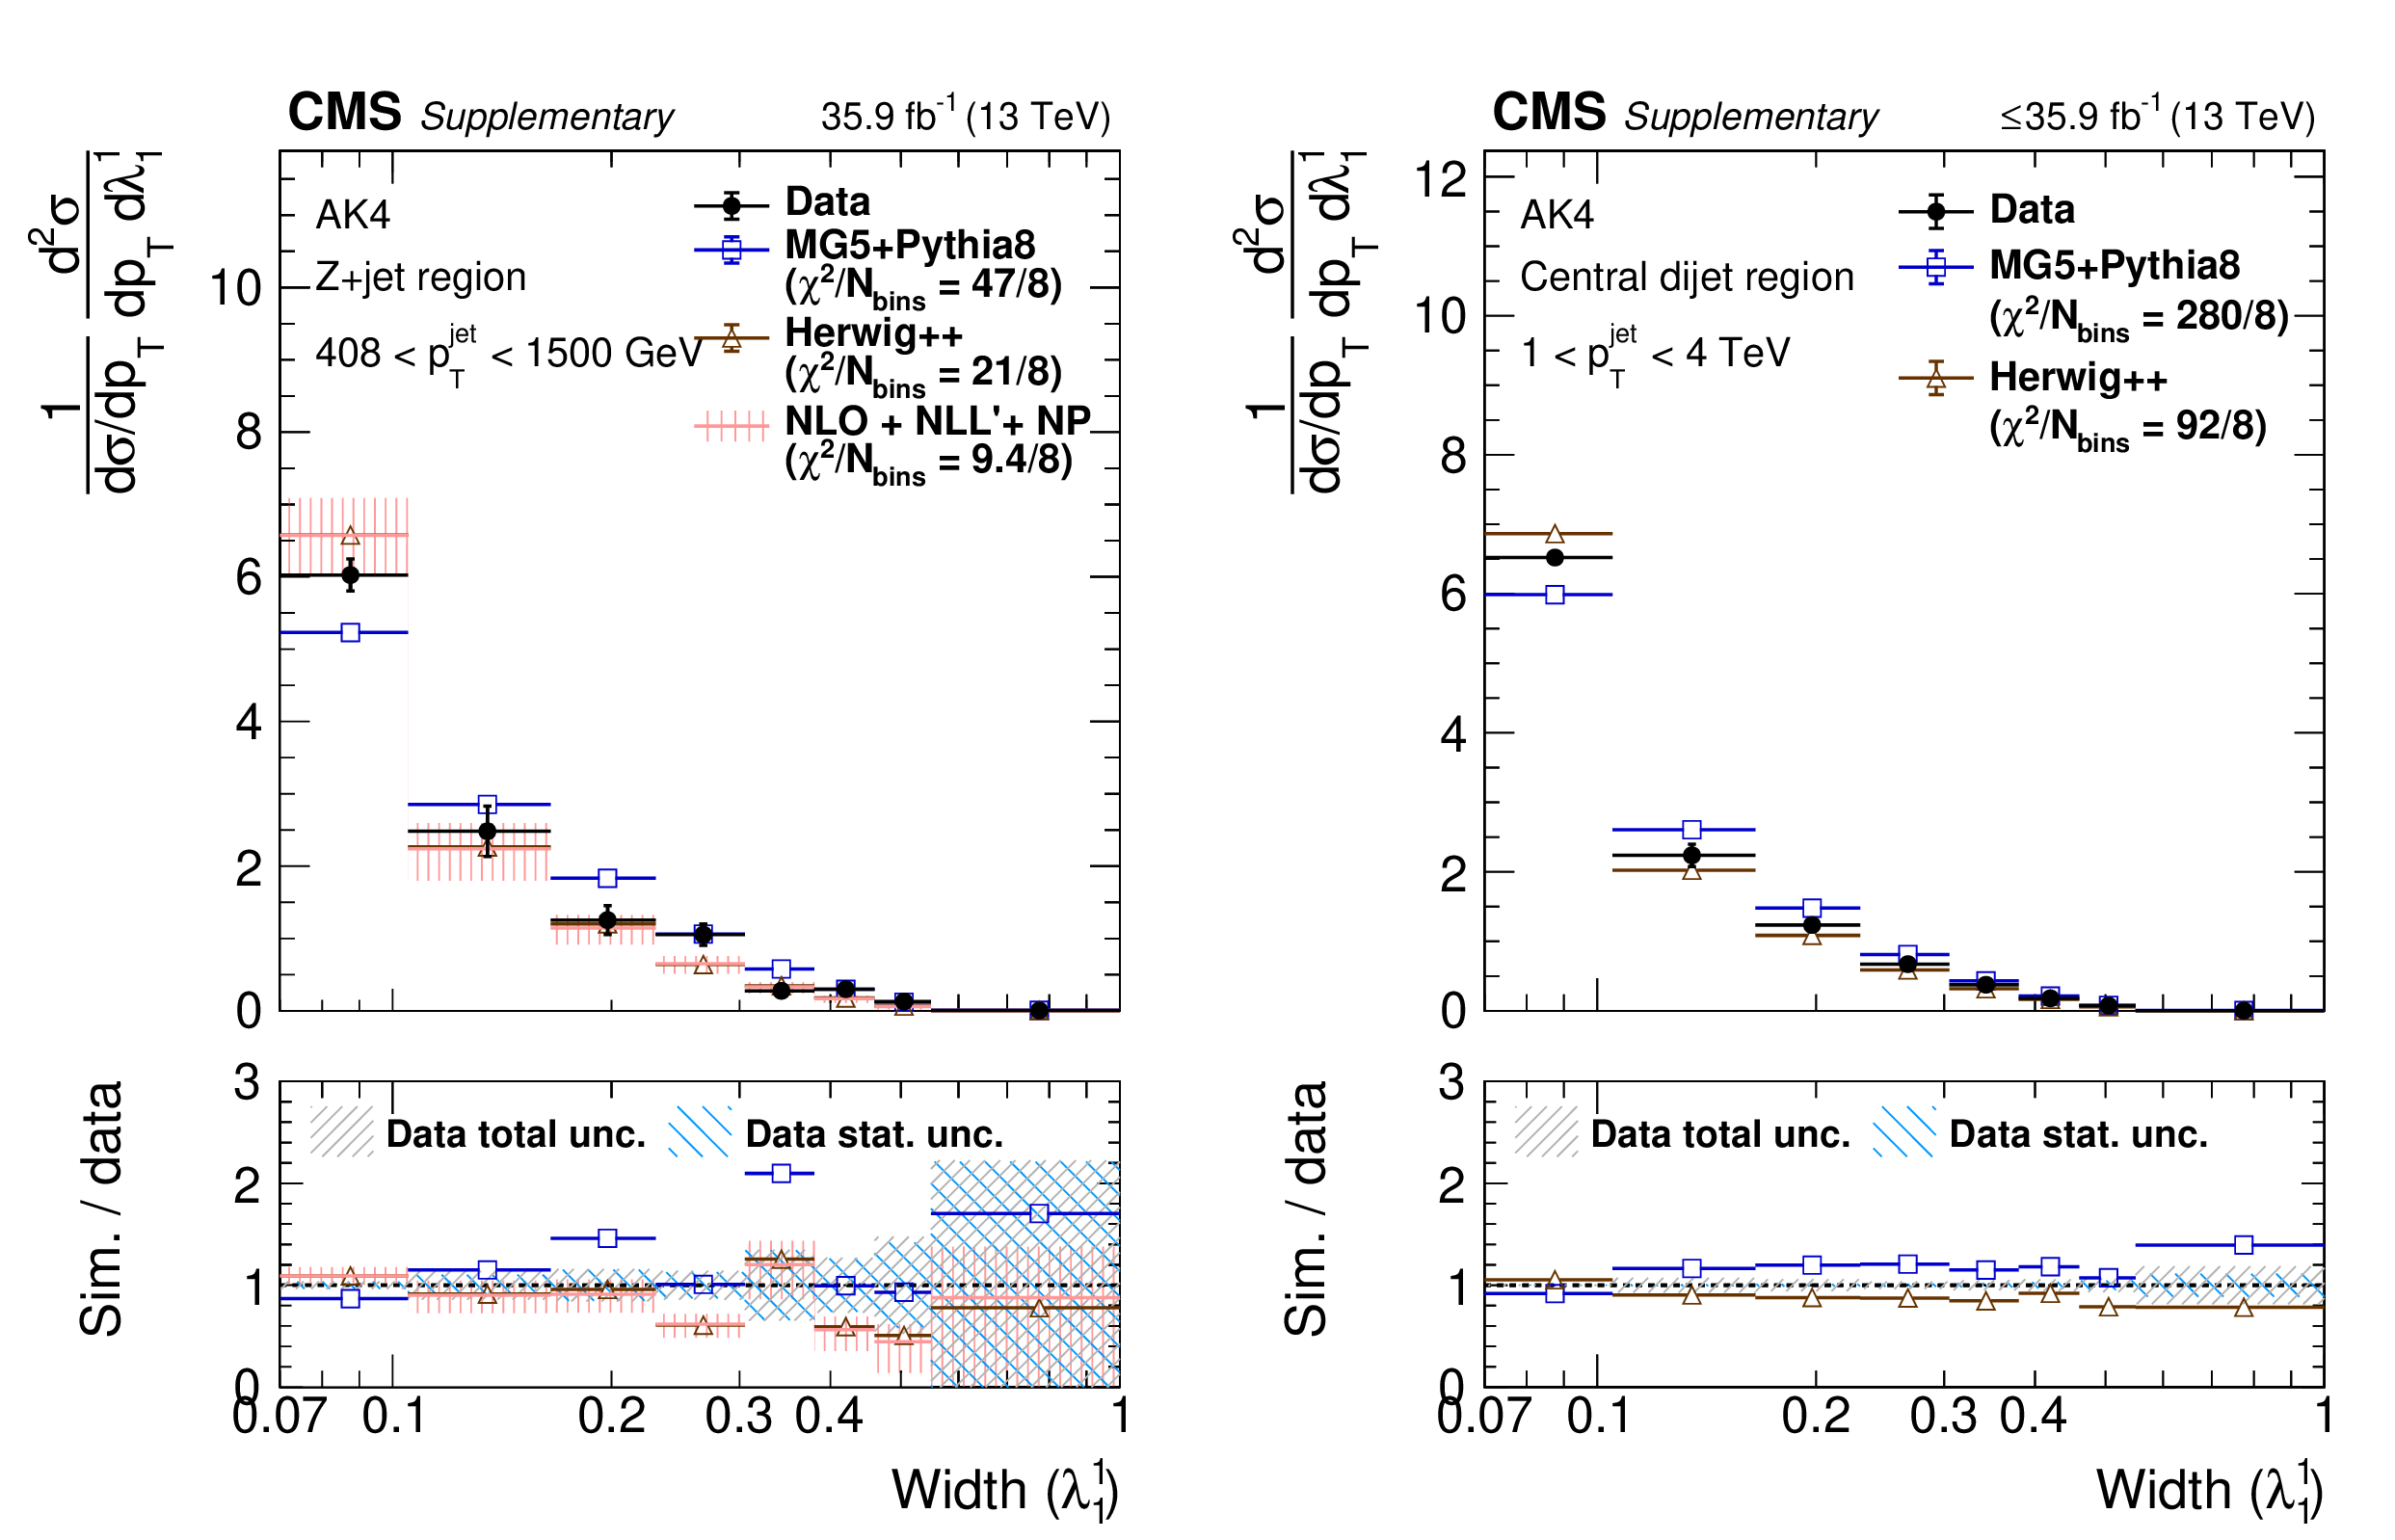
Particle-level distributions of ungroomed width ($\lambda ^{1}_{1}$) in 120 $ < {p_{\mathrm {T}}} < $ 150 GeV in the Z+jet region.The error bars on the data correspond to the total uncertainties. For the NLO+NLL'+NP prediction, the theory uncertainty is displayed as a red hashed band. The coarse-grained blue hashed region in the ratio plot indicates the statistical uncertainty of the data, and the fine-grained grey hashed region represents the total uncertainty. The lowest bin extends down to $ {\lambda ^{\kappa}_{\beta}} \geq$ 0. |
png pdf |
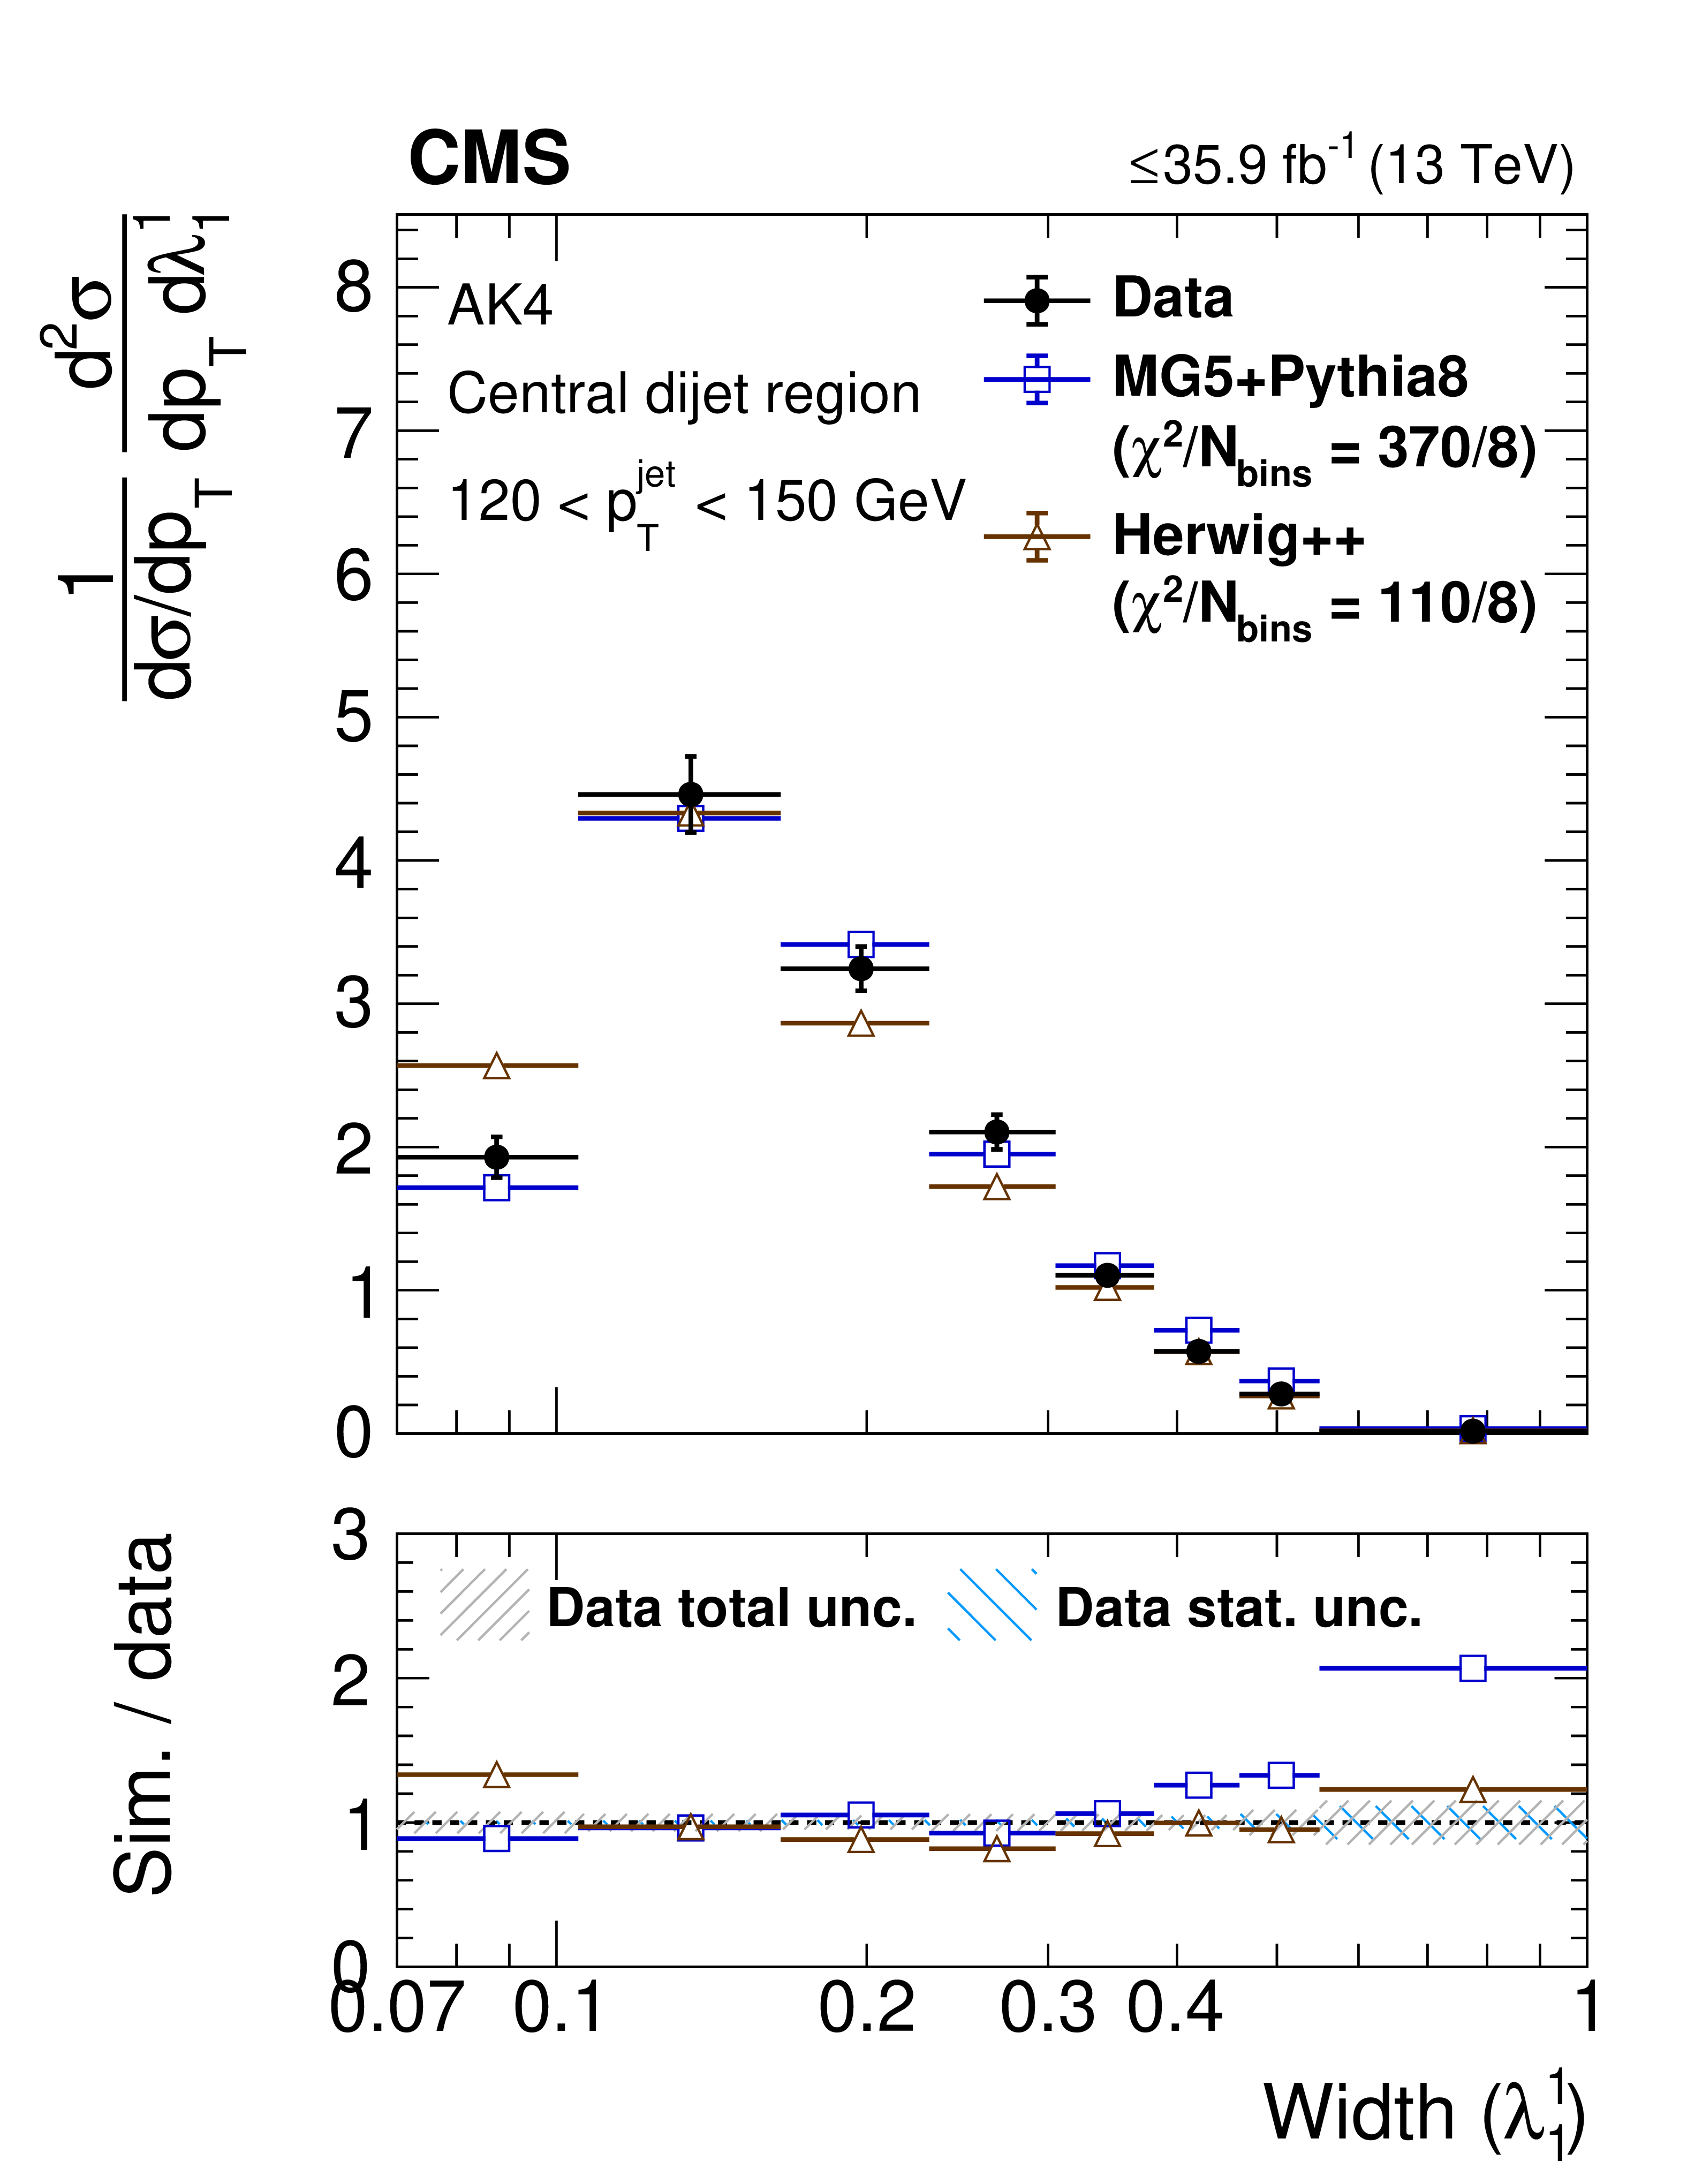
Figure 7-d:
Particle-level distributions of ungroomed width ($\lambda ^{1}_{1}$) in 120 $ < {p_{\mathrm {T}}} < $ 150 GeV in the central dijet region.The error bars on the data correspond to the total uncertainties. For the NLO+NLL'+NP prediction, the theory uncertainty is displayed as a red hashed band. The coarse-grained blue hashed region in the ratio plot indicates the statistical uncertainty of the data, and the fine-grained grey hashed region represents the total uncertainty. The lowest bin extends down to $ {\lambda ^{\kappa}_{\beta}} \geq$ 0. |
png pdf |
Figure 8:
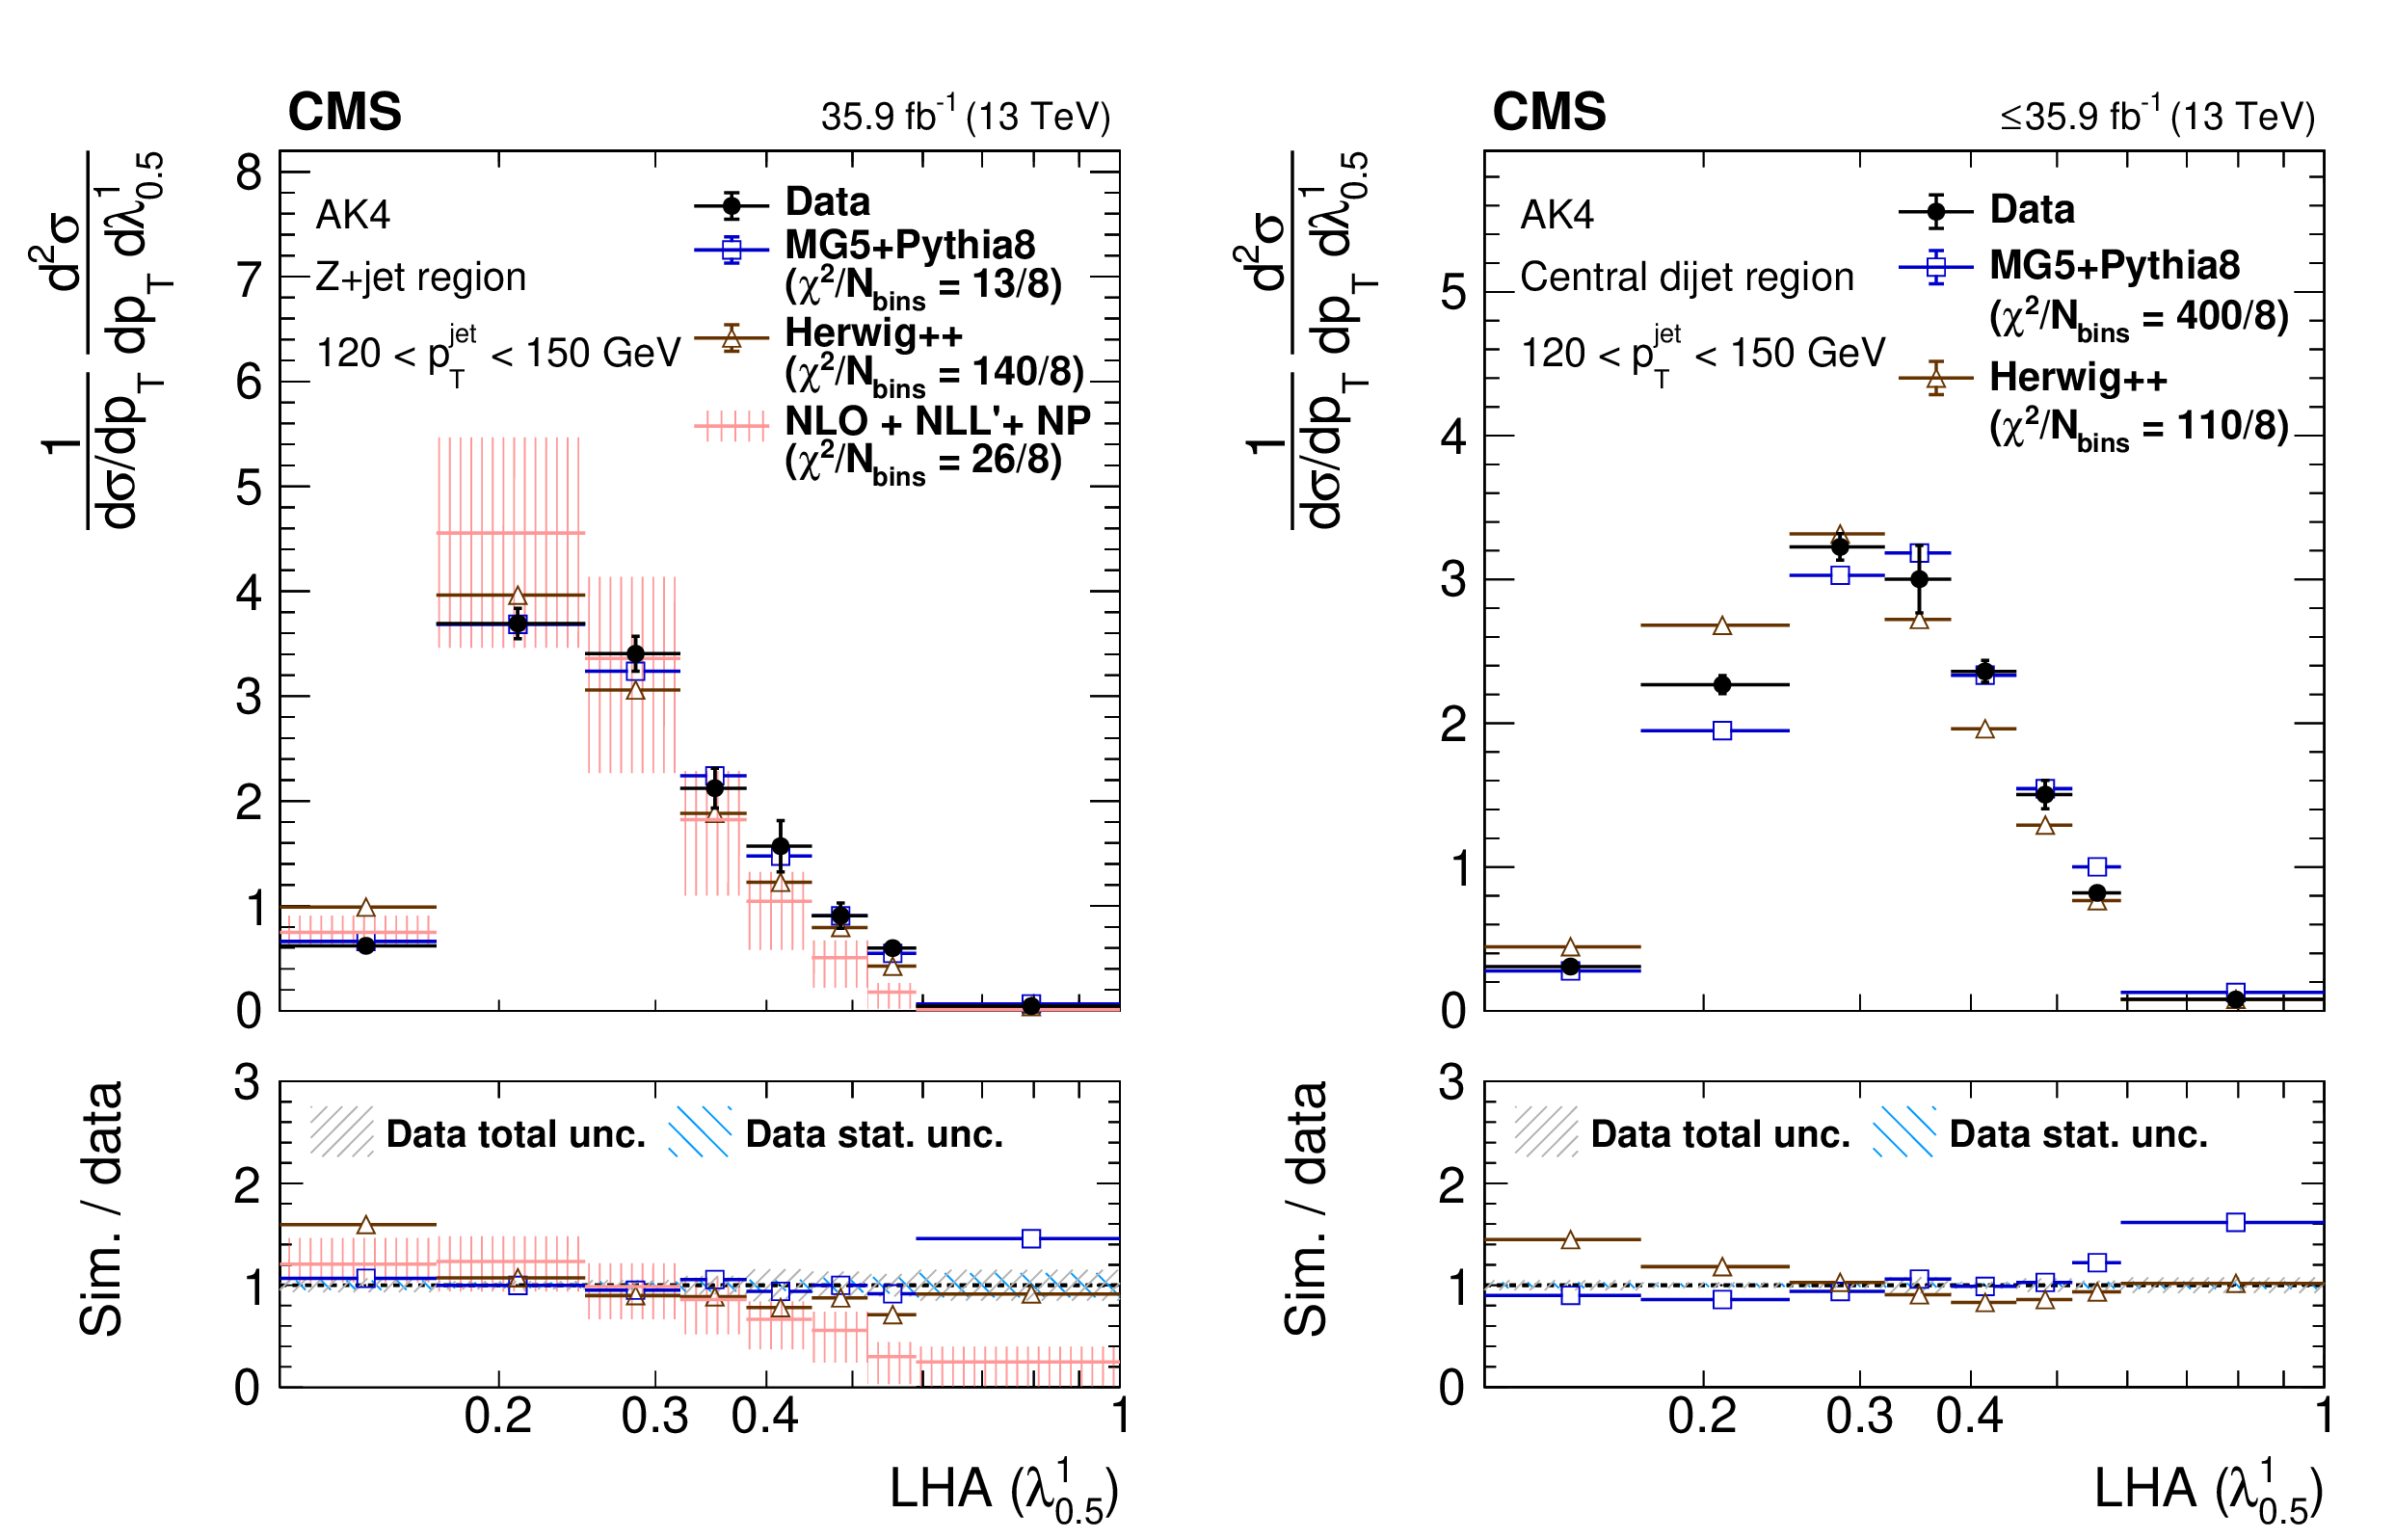
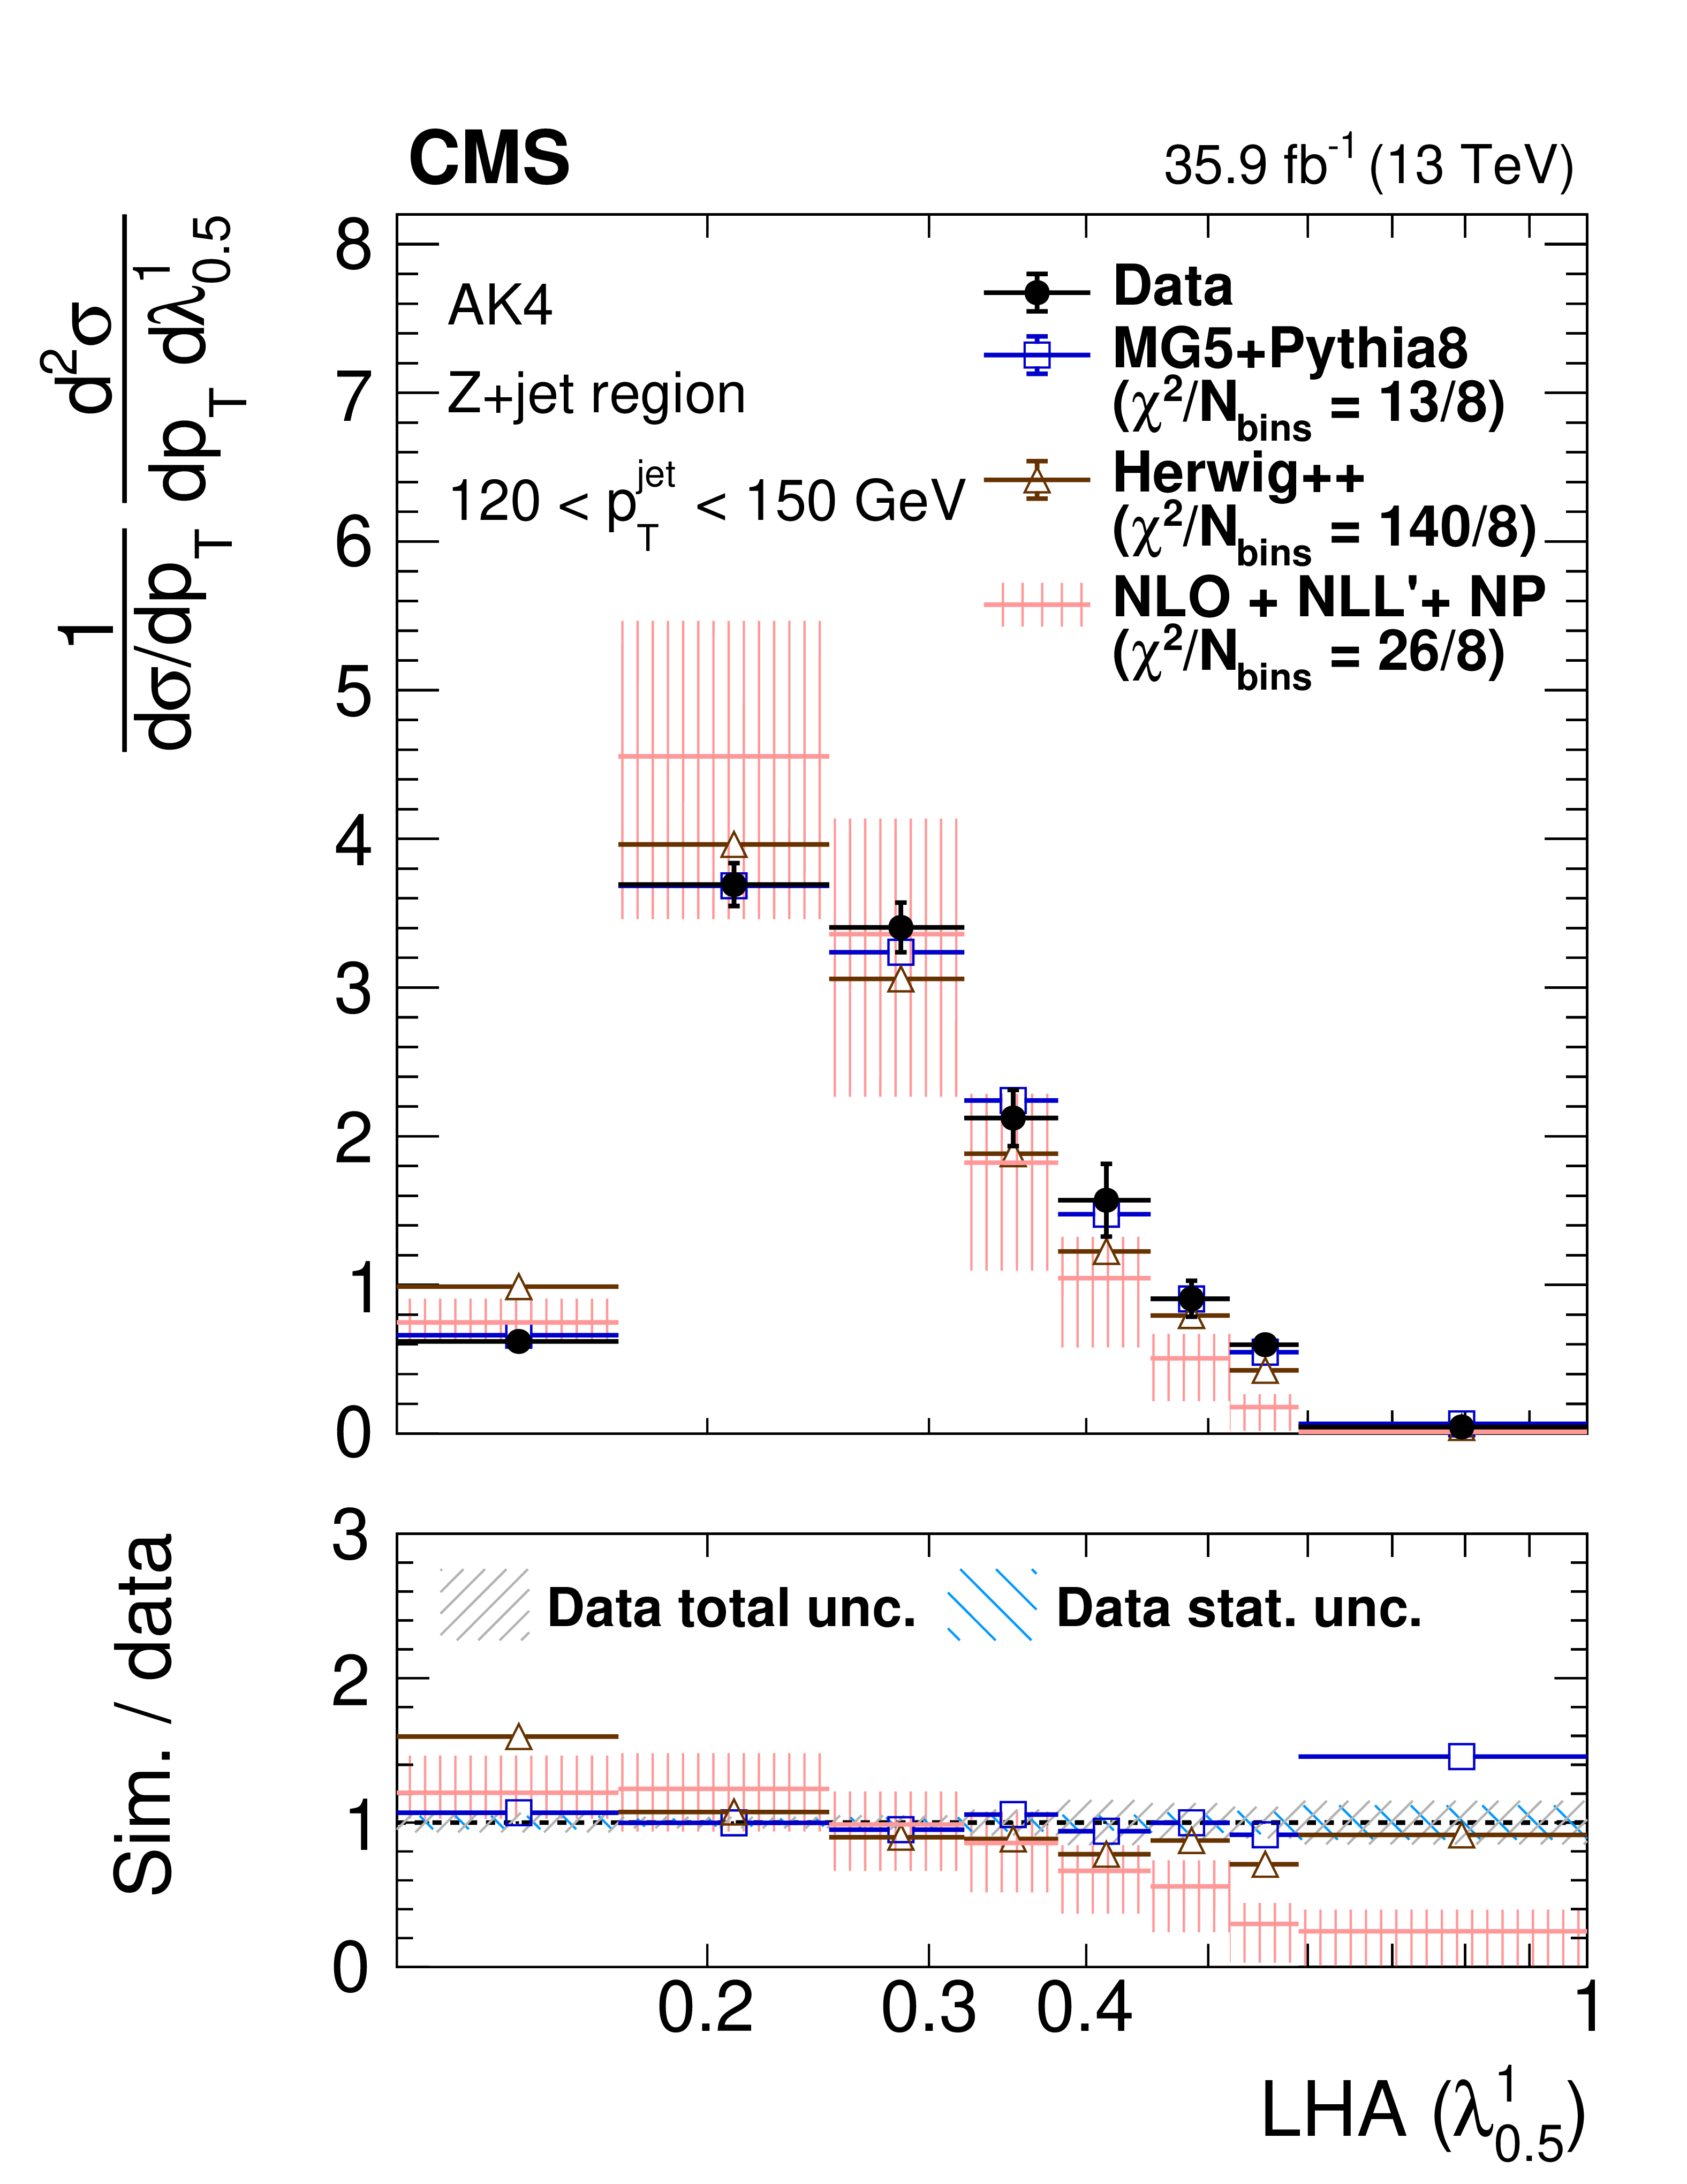
Particle-level distributions of ungroomed LHA (${\lambda ^{1}_{0.5}}$) in 120 $ < {p_{\mathrm {T}}} < $ 150 GeV in the Z+jet region (left) and central dijet region (right). The error bars on the data correspond to the total uncertainties. For the NLO+NLL'+NP prediction, the theory uncertainty is displayed as a red hashed band. The coarse-grained blue hashed region in the ratio plot indicates the statistical uncertainty of the data, and the fine-grained grey hashed region represents the total uncertainty. The lowest bin extends down to $ {\lambda ^{\kappa}_{\beta}} \geq$ 0. |
png pdf |
Figure 8-a:
Particle-level distributions of ungroomed LHA (${\lambda ^{1}_{0.5}}$) in 120 $ < {p_{\mathrm {T}}} < $ 150 GeV in the Z+jet region. The error bars on the data correspond to the total uncertainties. For the NLO+NLL'+NP prediction, the theory uncertainty is displayed as a red hashed band. The coarse-grained blue hashed region in the ratio plot indicates the statistical uncertainty of the data, and the fine-grained grey hashed region represents the total uncertainty. The lowest bin extends down to $ {\lambda ^{\kappa}_{\beta}} \geq$ 0. |

png pdf |
Figure 8-b:
Particle-level distributions of ungroomed LHA (${\lambda ^{1}_{0.5}}$) in 120 $ < {p_{\mathrm {T}}} < $ 150 GeV in the central dijet region. The error bars on the data correspond to the total uncertainties. For the NLO+NLL'+NP prediction, the theory uncertainty is displayed as a red hashed band. The coarse-grained blue hashed region in the ratio plot indicates the statistical uncertainty of the data, and the fine-grained grey hashed region represents the total uncertainty. The lowest bin extends down to $ {\lambda ^{\kappa}_{\beta}} \geq$ 0. |

png pdf |
Figure 9:
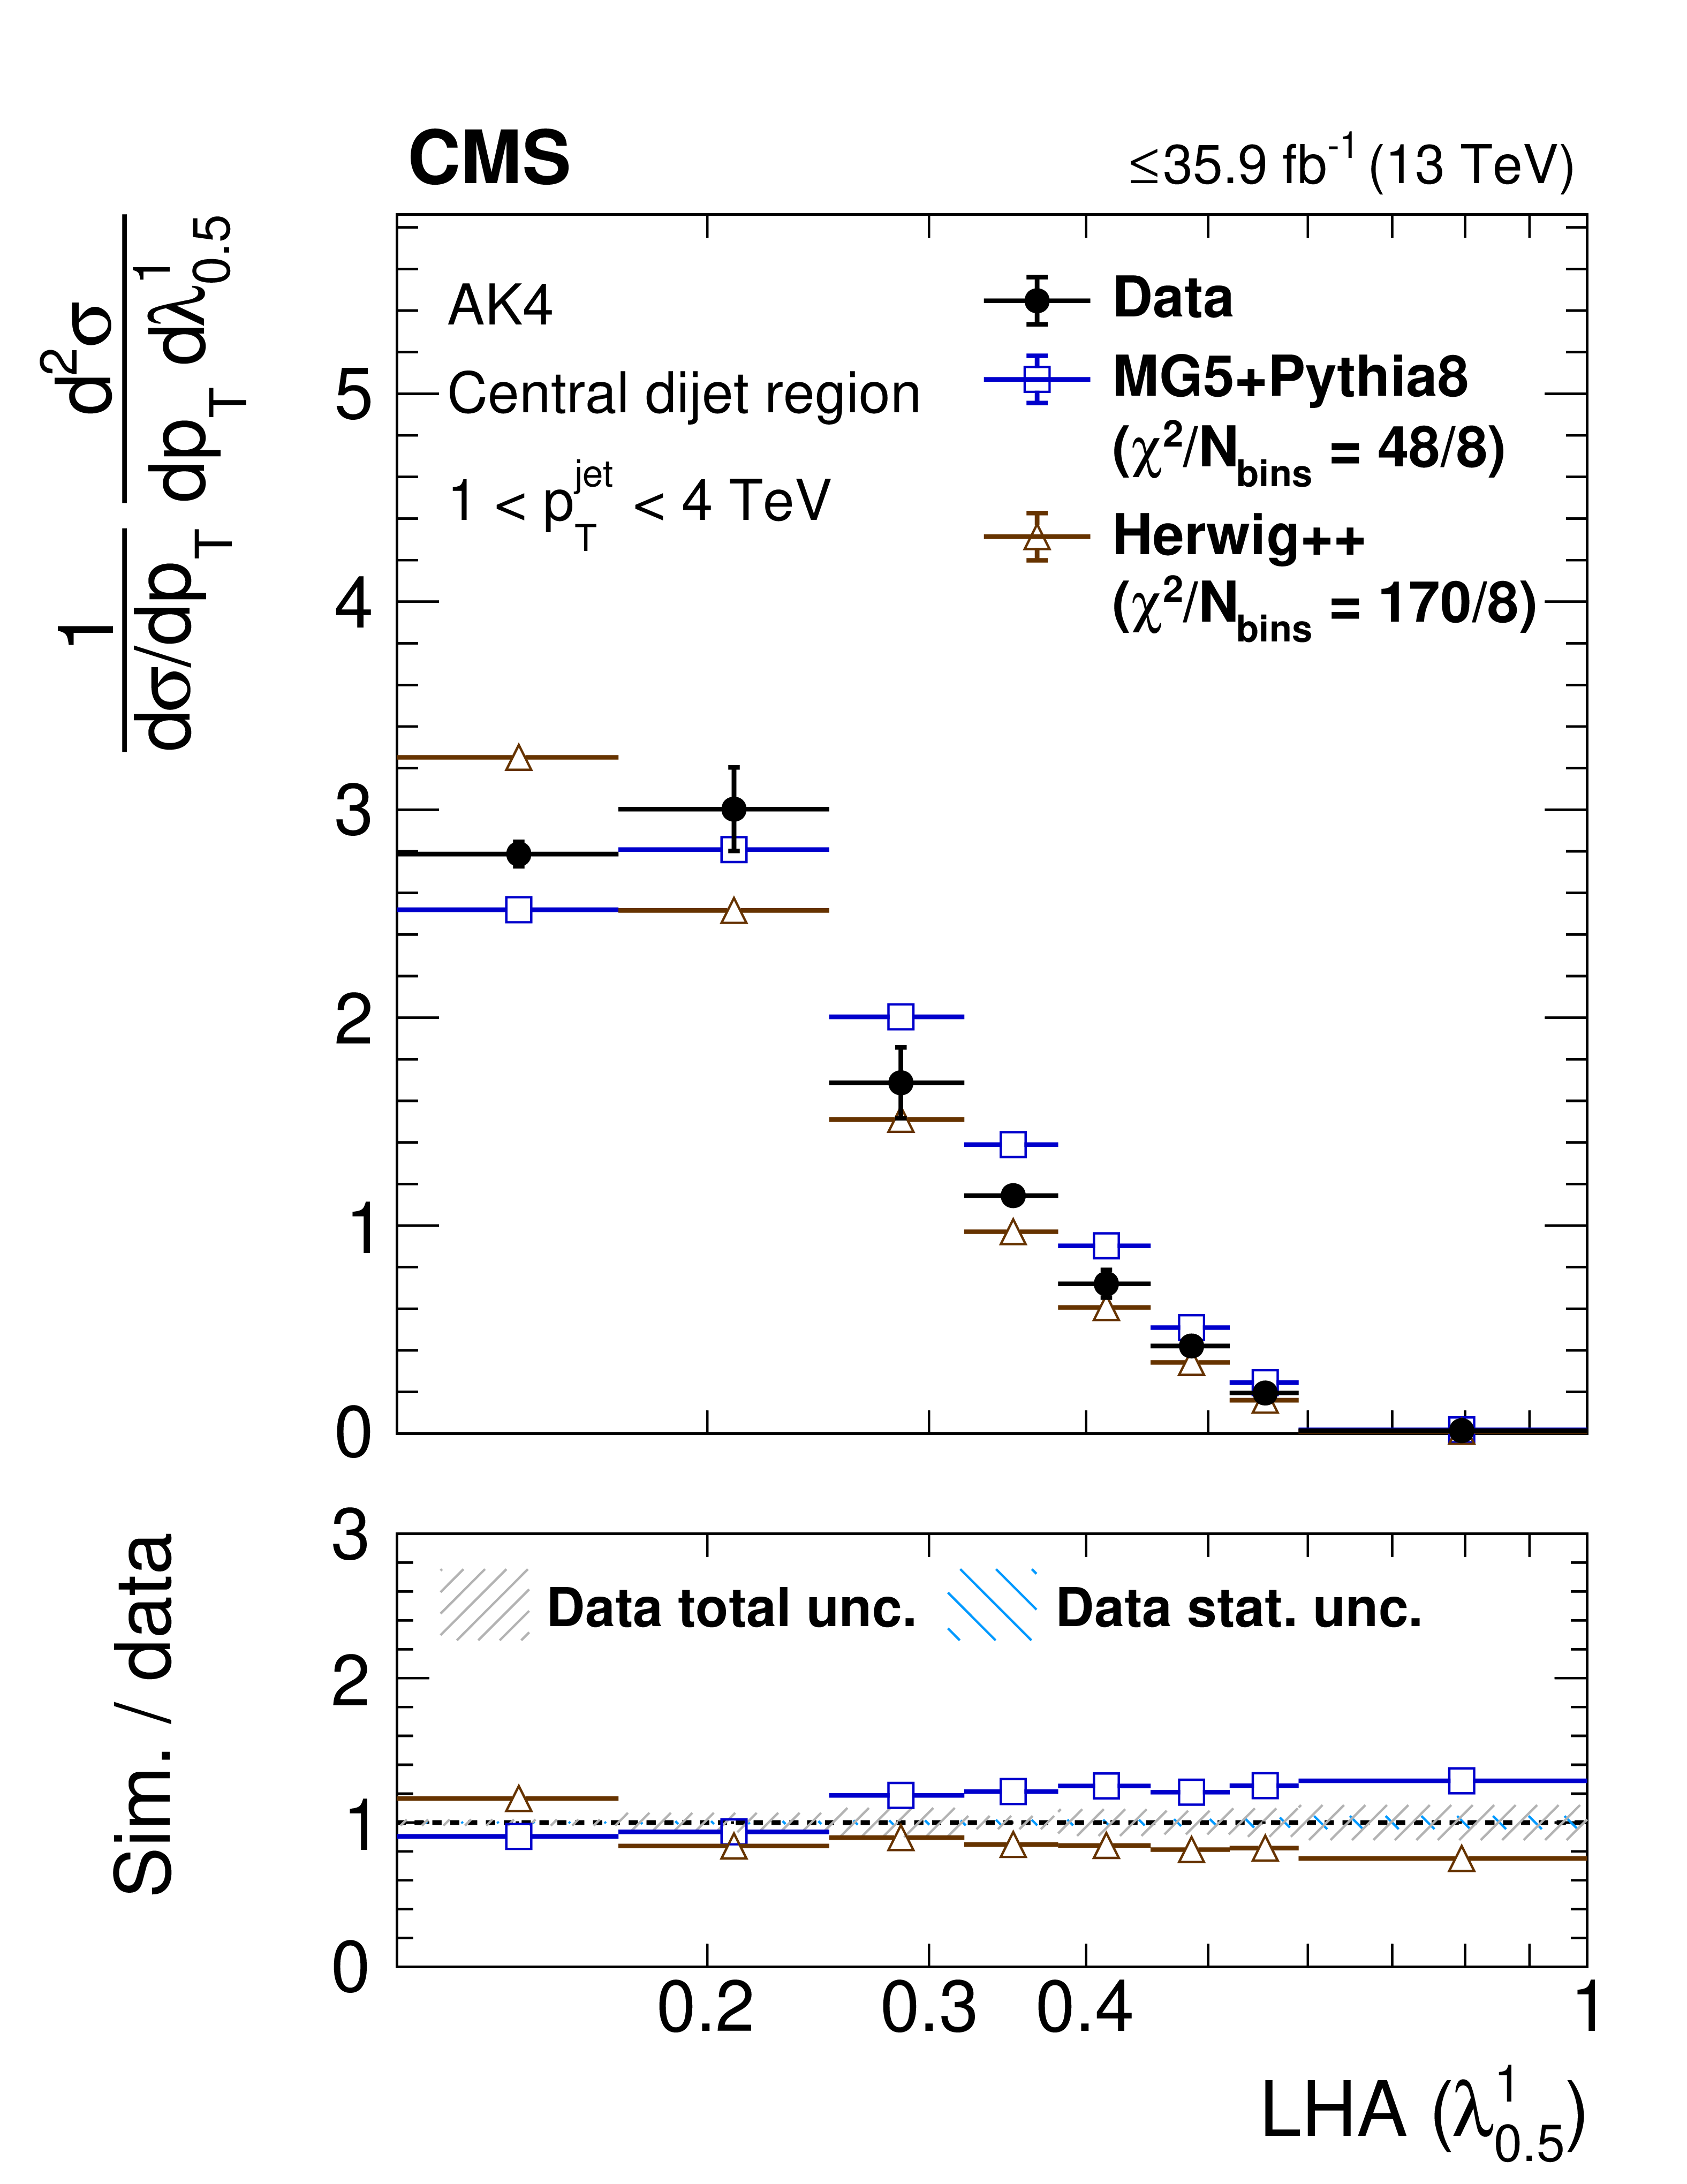
Particle-level distributions of (upper) ungroomed AK4 LHA (${\lambda ^{1}_{0.5}}$) in 408 $ < {p_{\mathrm {T}}} < $ 1500 GeV in the Z+jet region (left) and in 1 $ < {p_{\mathrm {T}}} < $ 4 TeV in the central dijet region (right) and (lower) ungroomed AK8 LHA (${\lambda ^{1}_{0.5}}$) in AK8 120 $ < {p_{\mathrm {T}}} < $ 150 GeV in the Z+jet region (left) and central dijet region (right). The error bars on the data correspond to the total uncertainties. For the NLO+NLL'+NP prediction, the theory uncertainty is displayed as a red hashed band. The coarse-grained blue hashed region in the ratio plot indicates the statistical uncertainty of the data, and the fine-grained grey hashed region represents the total uncertainty. The lowest bin extends down to $ {\lambda ^{\kappa}_{\beta}} \geq$ 0. |

png pdf |
Figure 9-a:
Particle-level distributions of ungroomed AK4 LHA (${\lambda ^{1}_{0.5}}$) in 408 $ < {p_{\mathrm {T}}} < $ 1500 GeV in the Z+jet region. The error bars on the data correspond to the total uncertainties. For the NLO+NLL'+NP prediction, the theory uncertainty is displayed as a red hashed band. The coarse-grained blue hashed region in the ratio plot indicates the statistical uncertainty of the data, and the fine-grained grey hashed region represents the total uncertainty. The lowest bin extends down to $ {\lambda ^{\kappa}_{\beta}} \geq$ 0. |
png pdf |
Figure 9-b:
Particle-level distributions of ungroomed AK4 LHA (${\lambda ^{1}_{0.5}}$) in 1 $ < {p_{\mathrm {T}}} < $ 4 TeV in the central dijet region. The error bars on the data correspond to the total uncertainties. For the NLO+NLL'+NP prediction, the theory uncertainty is displayed as a red hashed band. The coarse-grained blue hashed region in the ratio plot indicates the statistical uncertainty of the data, and the fine-grained grey hashed region represents the total uncertainty. The lowest bin extends down to $ {\lambda ^{\kappa}_{\beta}} \geq$ 0. |
png pdf |
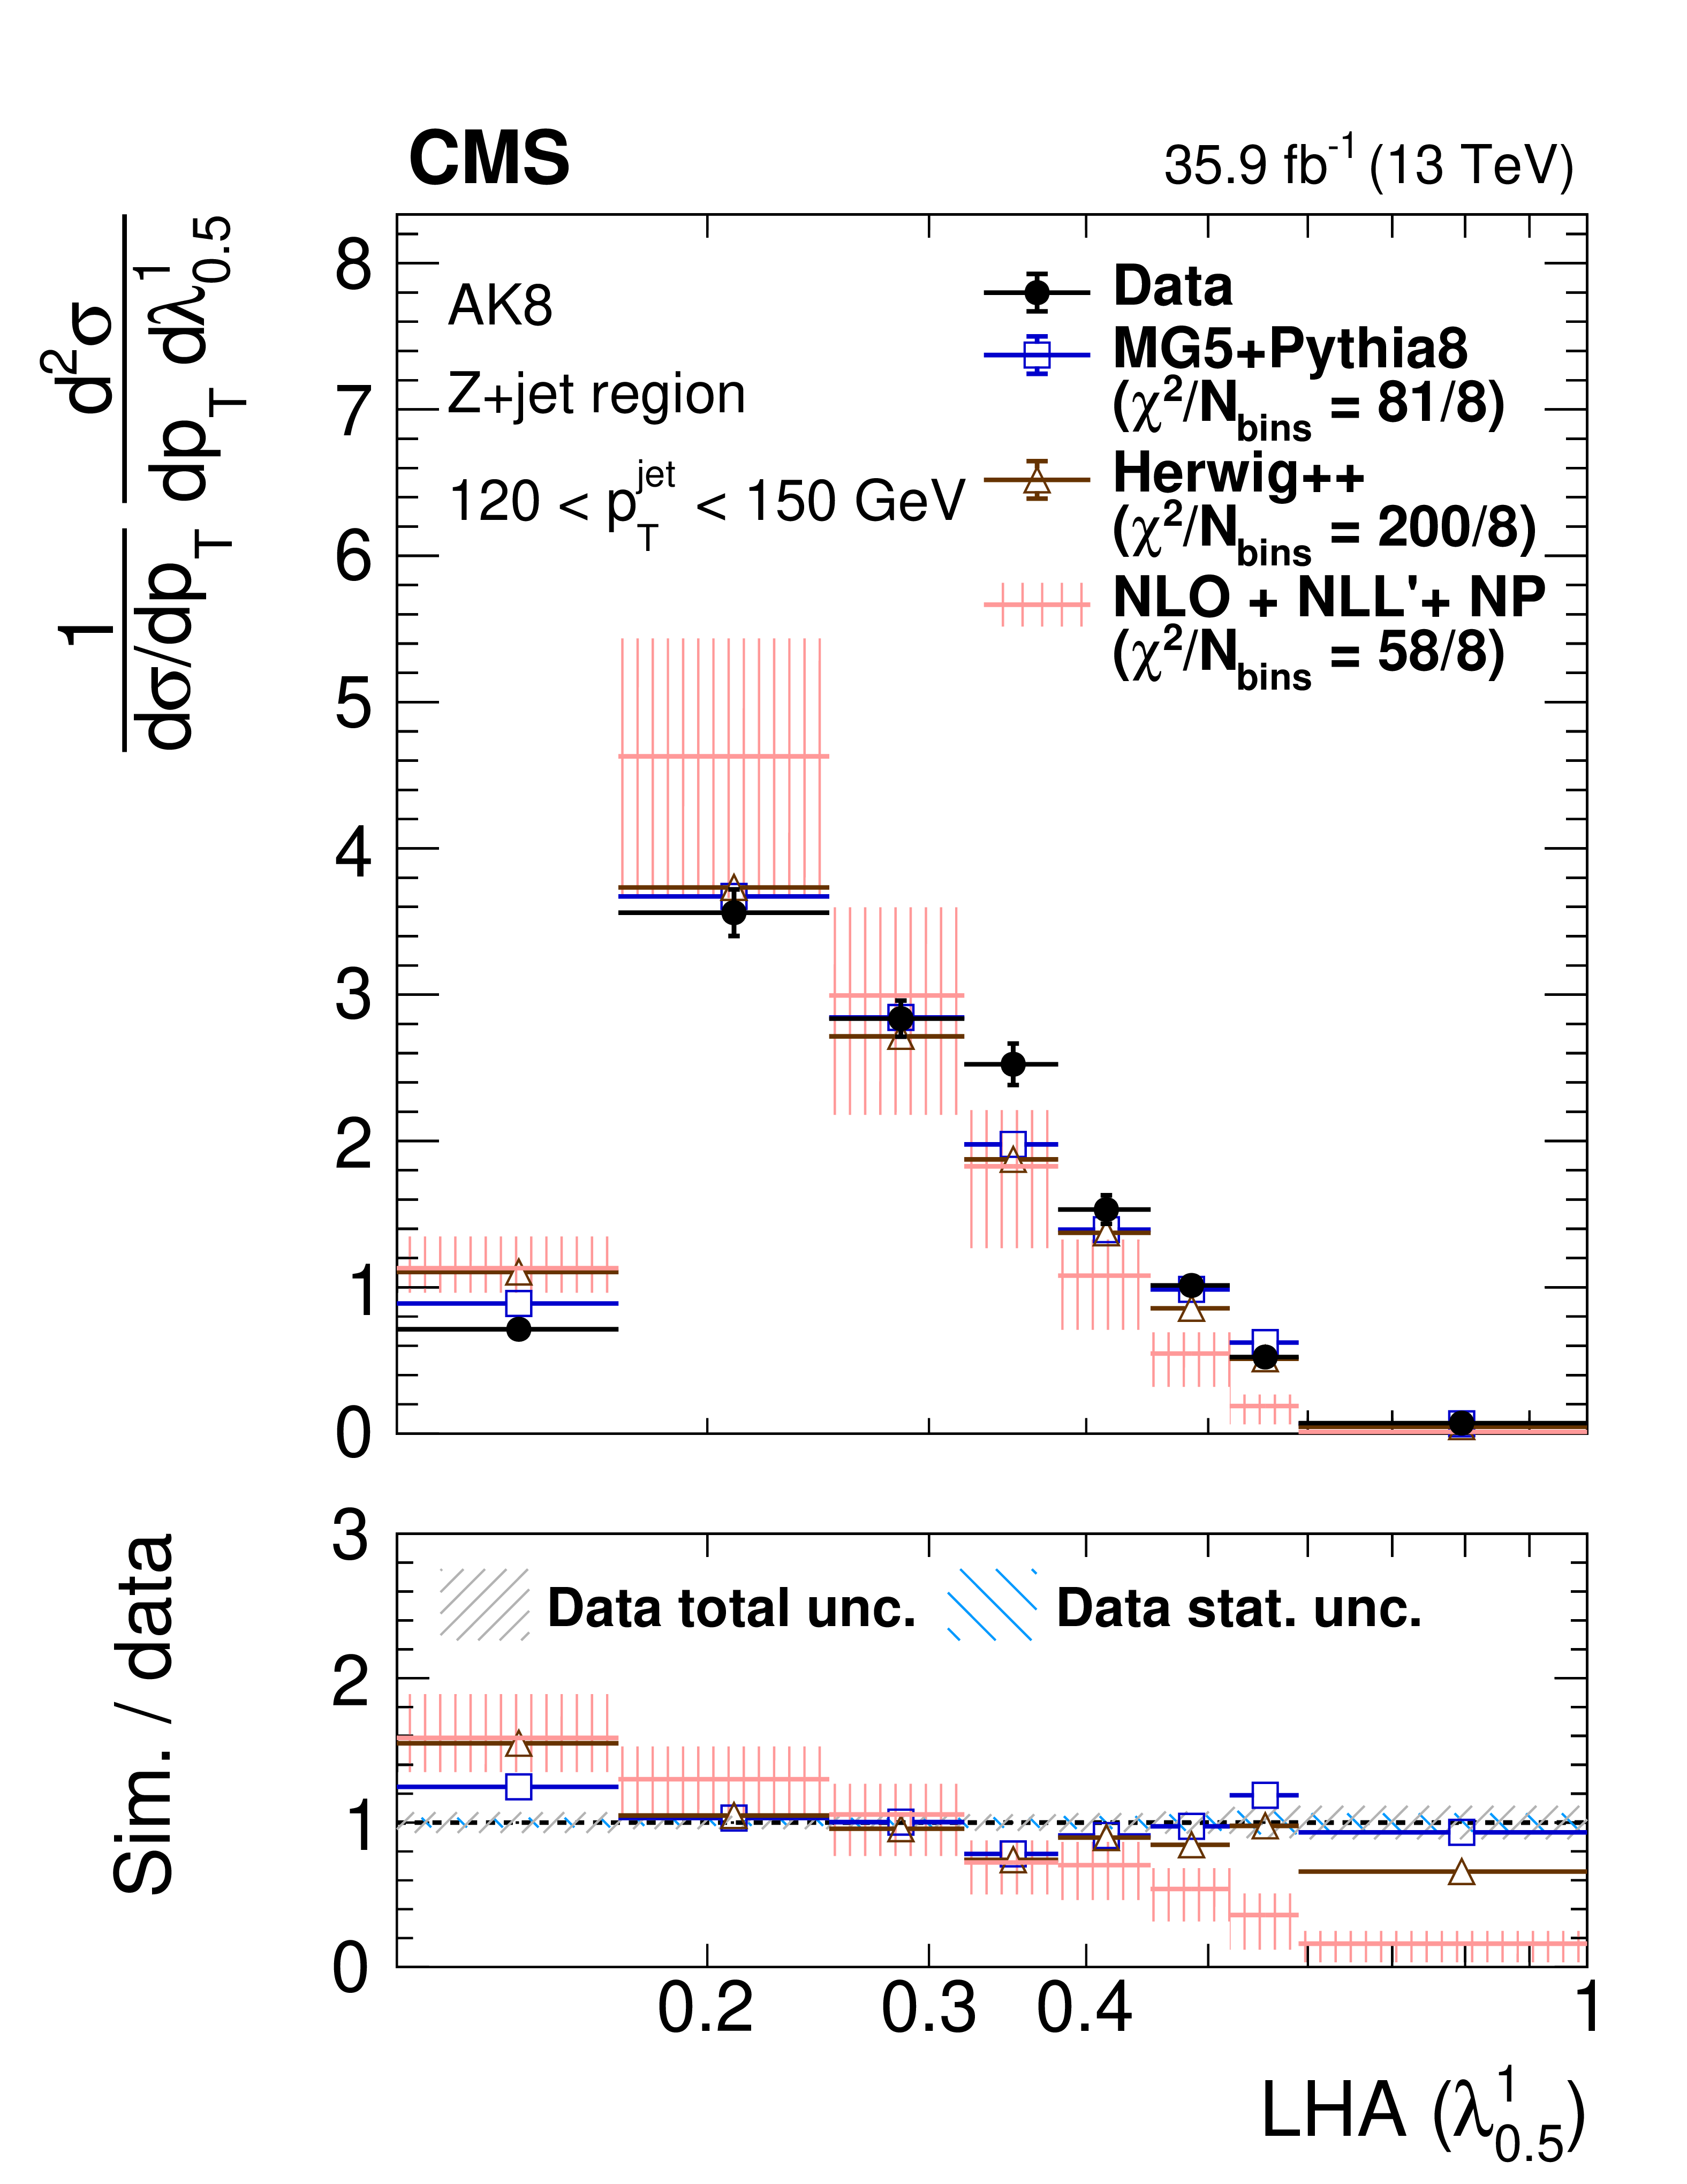
Figure 9-c:
Particle-level distributions of ungroomed AK8 LHA (${\lambda ^{1}_{0.5}}$) in AK8 120 $ < {p_{\mathrm {T}}} < $ 150 GeV in the Z+jet region. The error bars on the data correspond to the total uncertainties. For the NLO+NLL'+NP prediction, the theory uncertainty is displayed as a red hashed band. The coarse-grained blue hashed region in the ratio plot indicates the statistical uncertainty of the data, and the fine-grained grey hashed region represents the total uncertainty. The lowest bin extends down to $ {\lambda ^{\kappa}_{\beta}} \geq$ 0. |

png pdf |
Figure 9-d:
Particle-level distributions of ungroomed AK8 LHA (${\lambda ^{1}_{0.5}}$) in AK8 120 $ < {p_{\mathrm {T}}} < $ 150 GeV in the central dijet region. The error bars on the data correspond to the total uncertainties. For the NLO+NLL'+NP prediction, the theory uncertainty is displayed as a red hashed band. The coarse-grained blue hashed region in the ratio plot indicates the statistical uncertainty of the data, and the fine-grained grey hashed region represents the total uncertainty. The lowest bin extends down to $ {\lambda ^{\kappa}_{\beta}} \geq$ 0. |
png pdf |
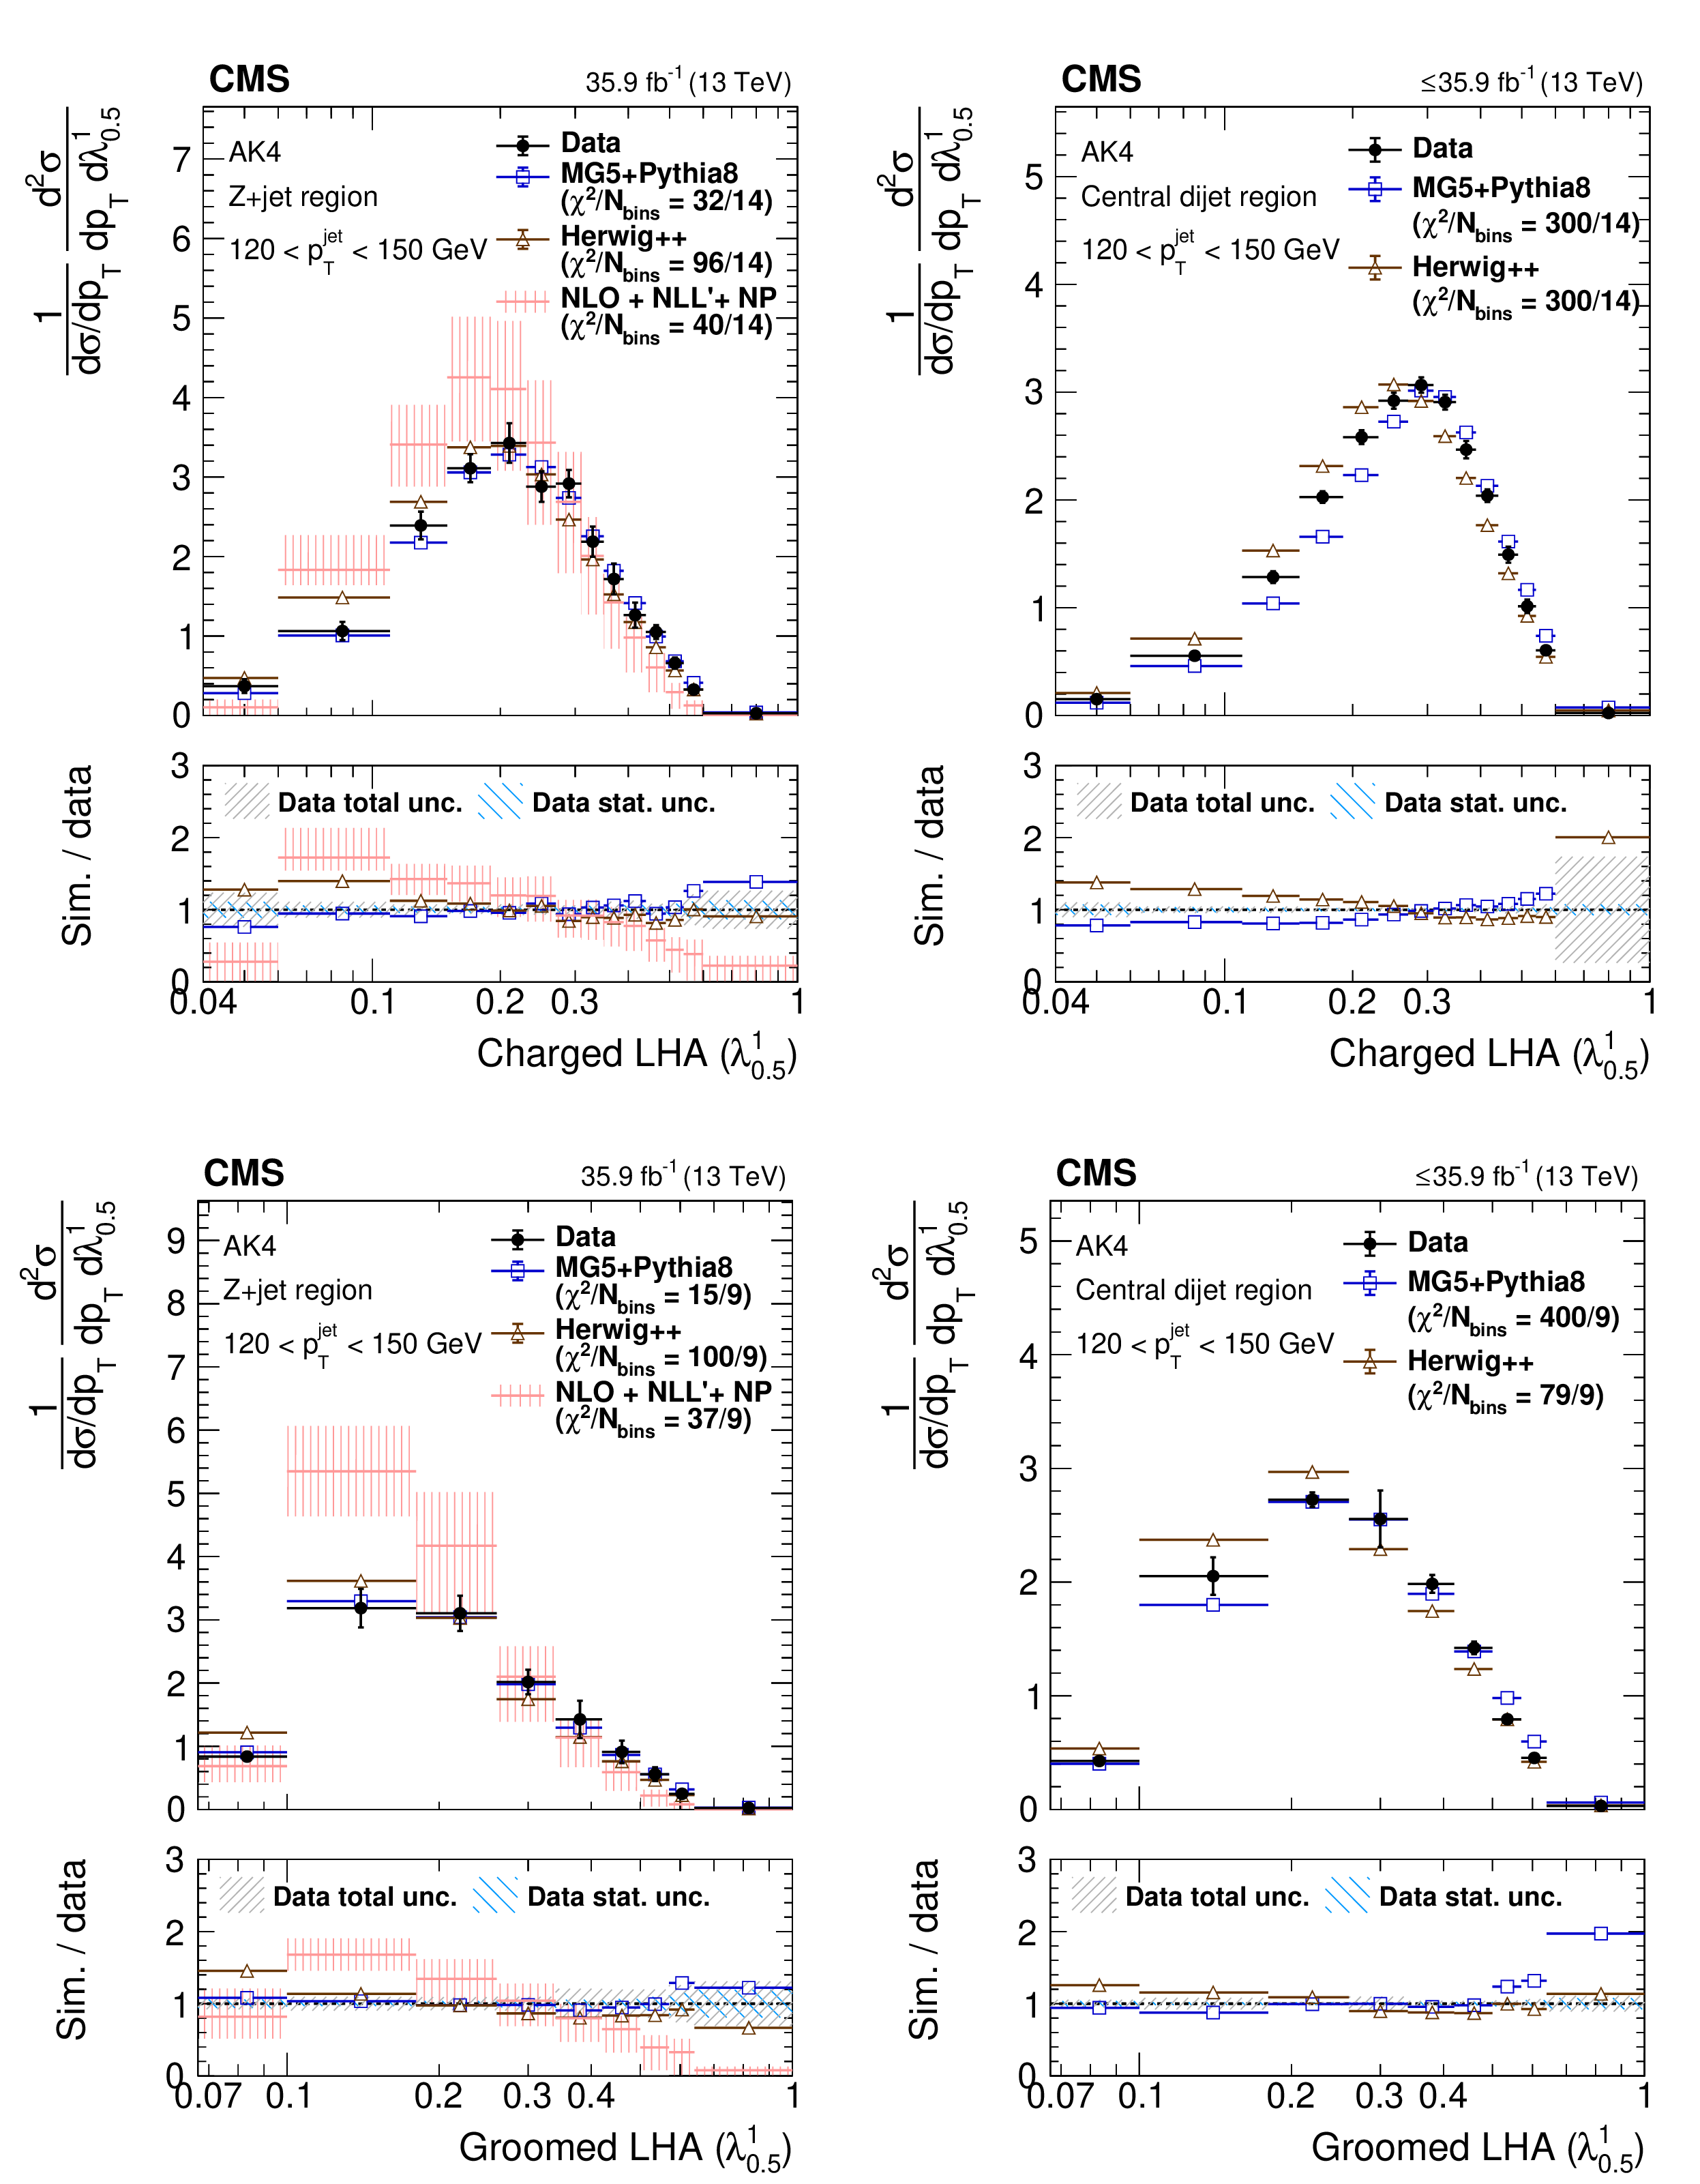
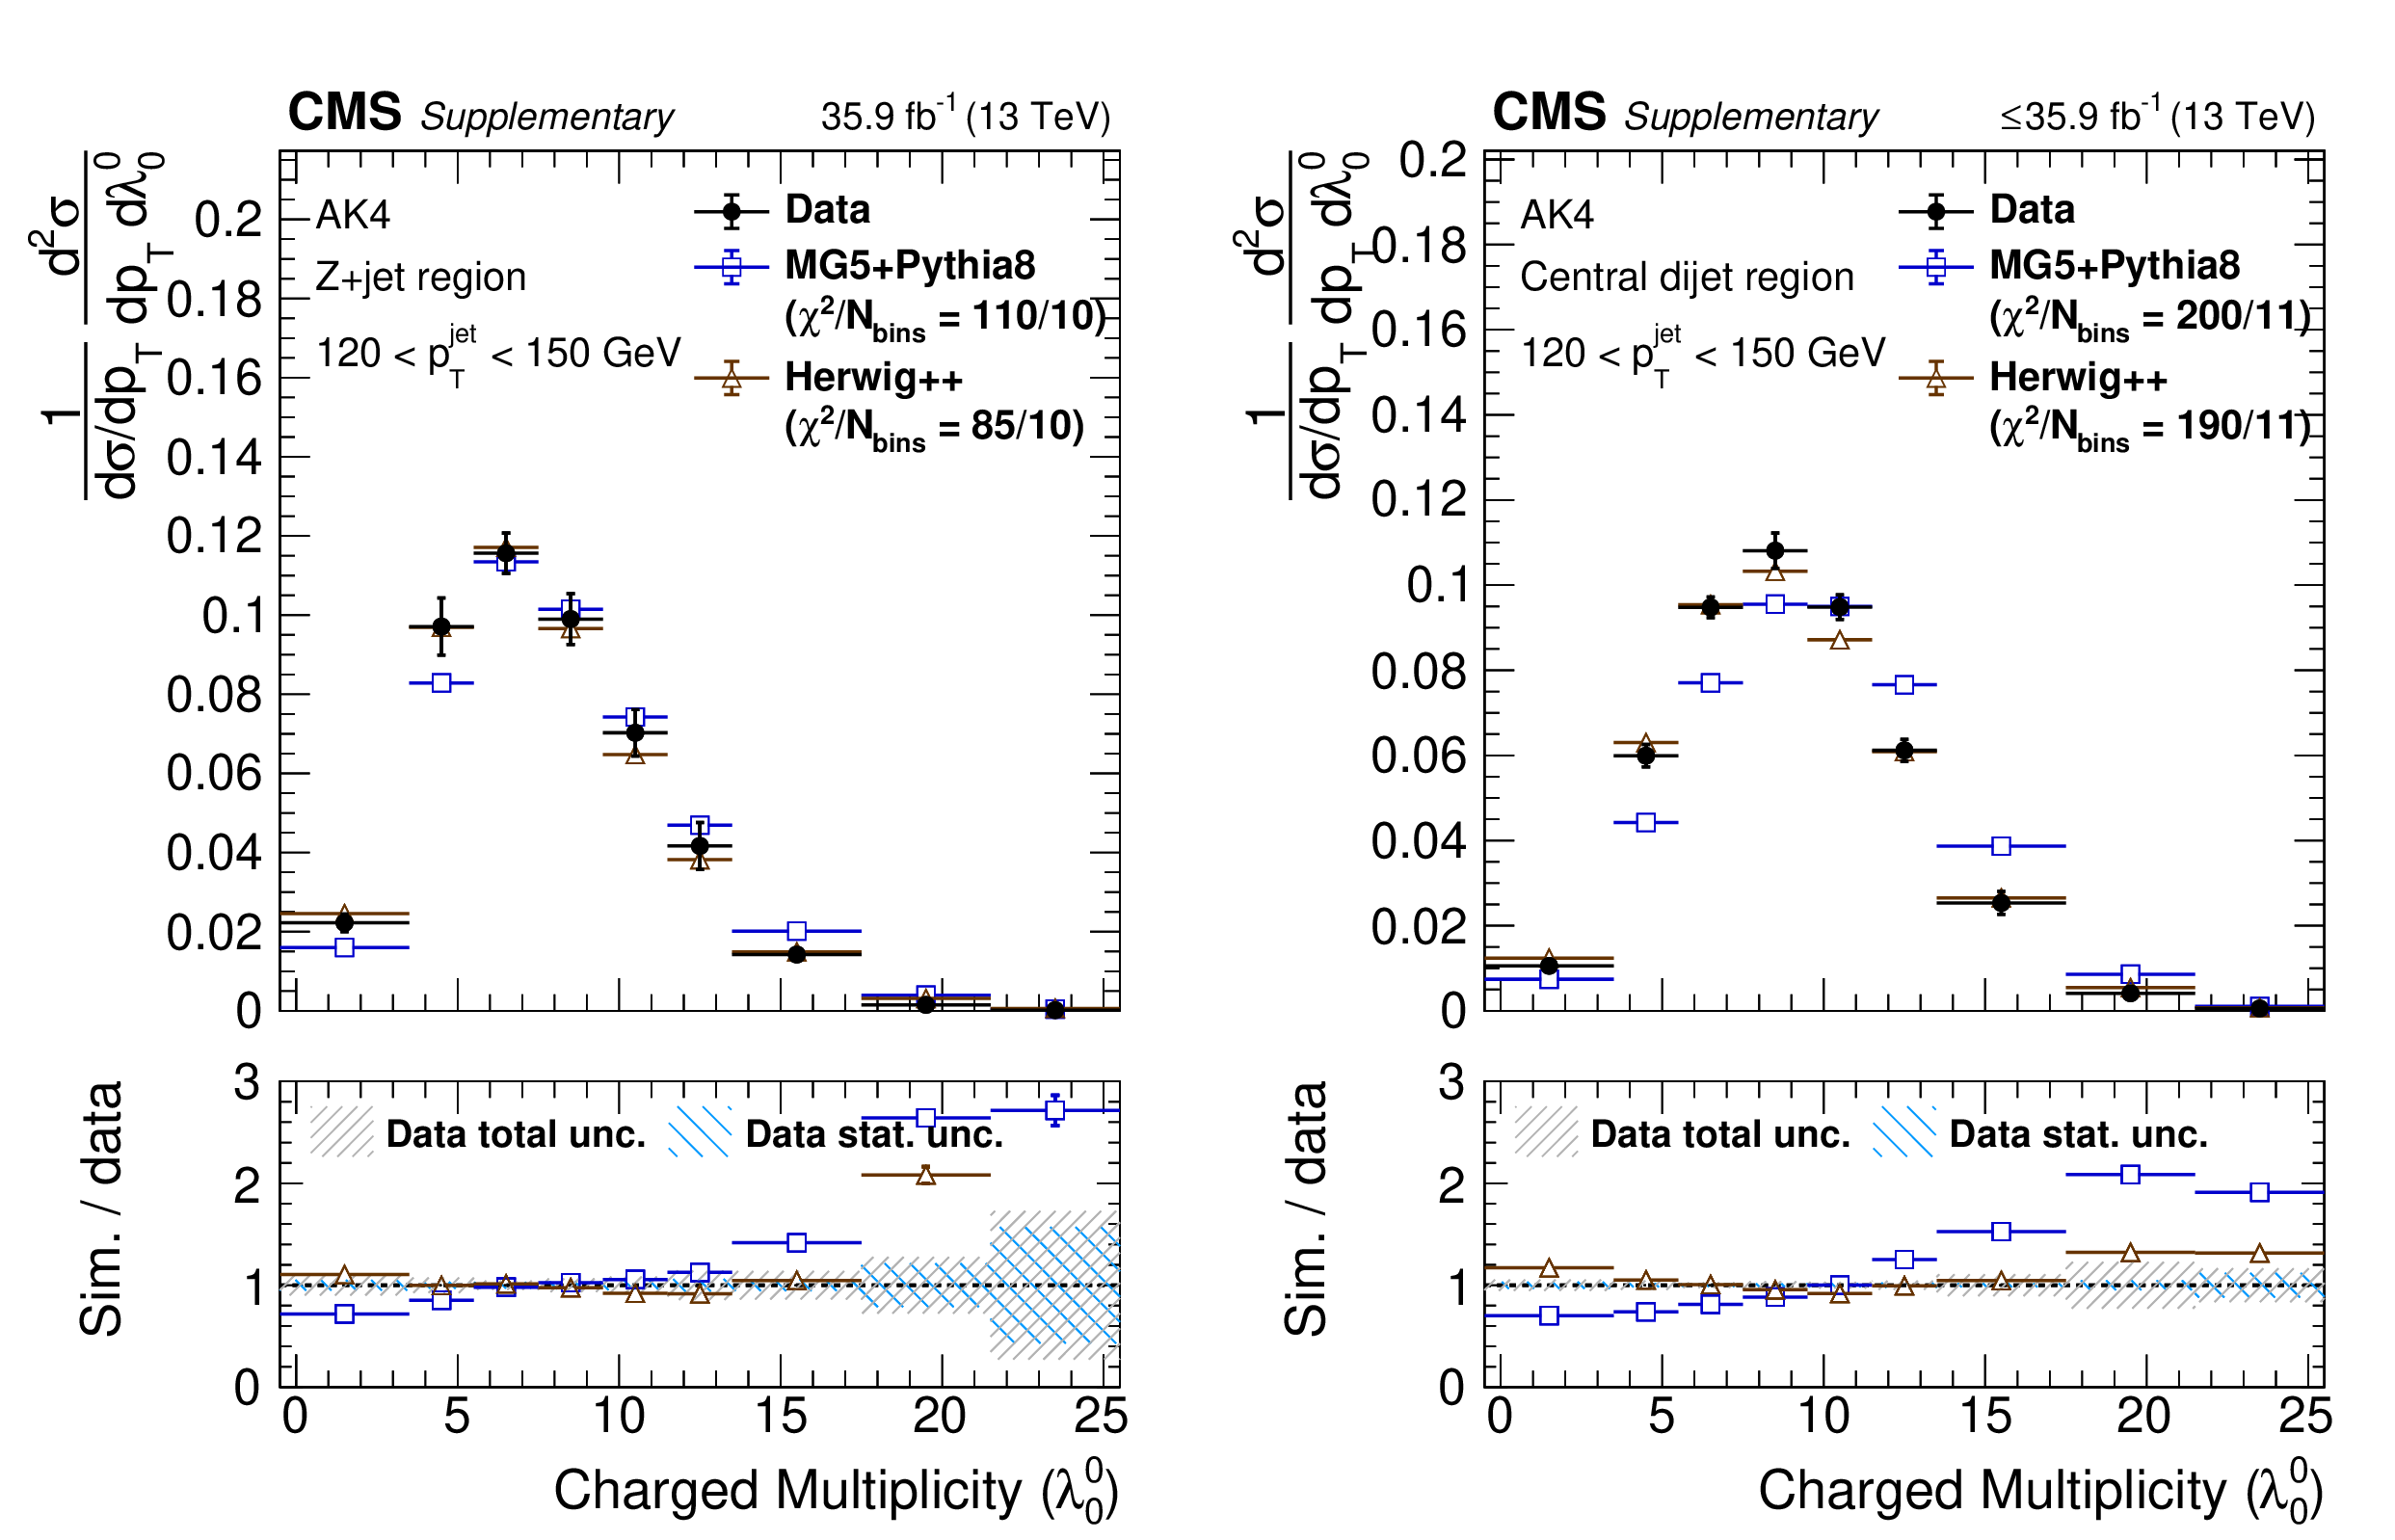
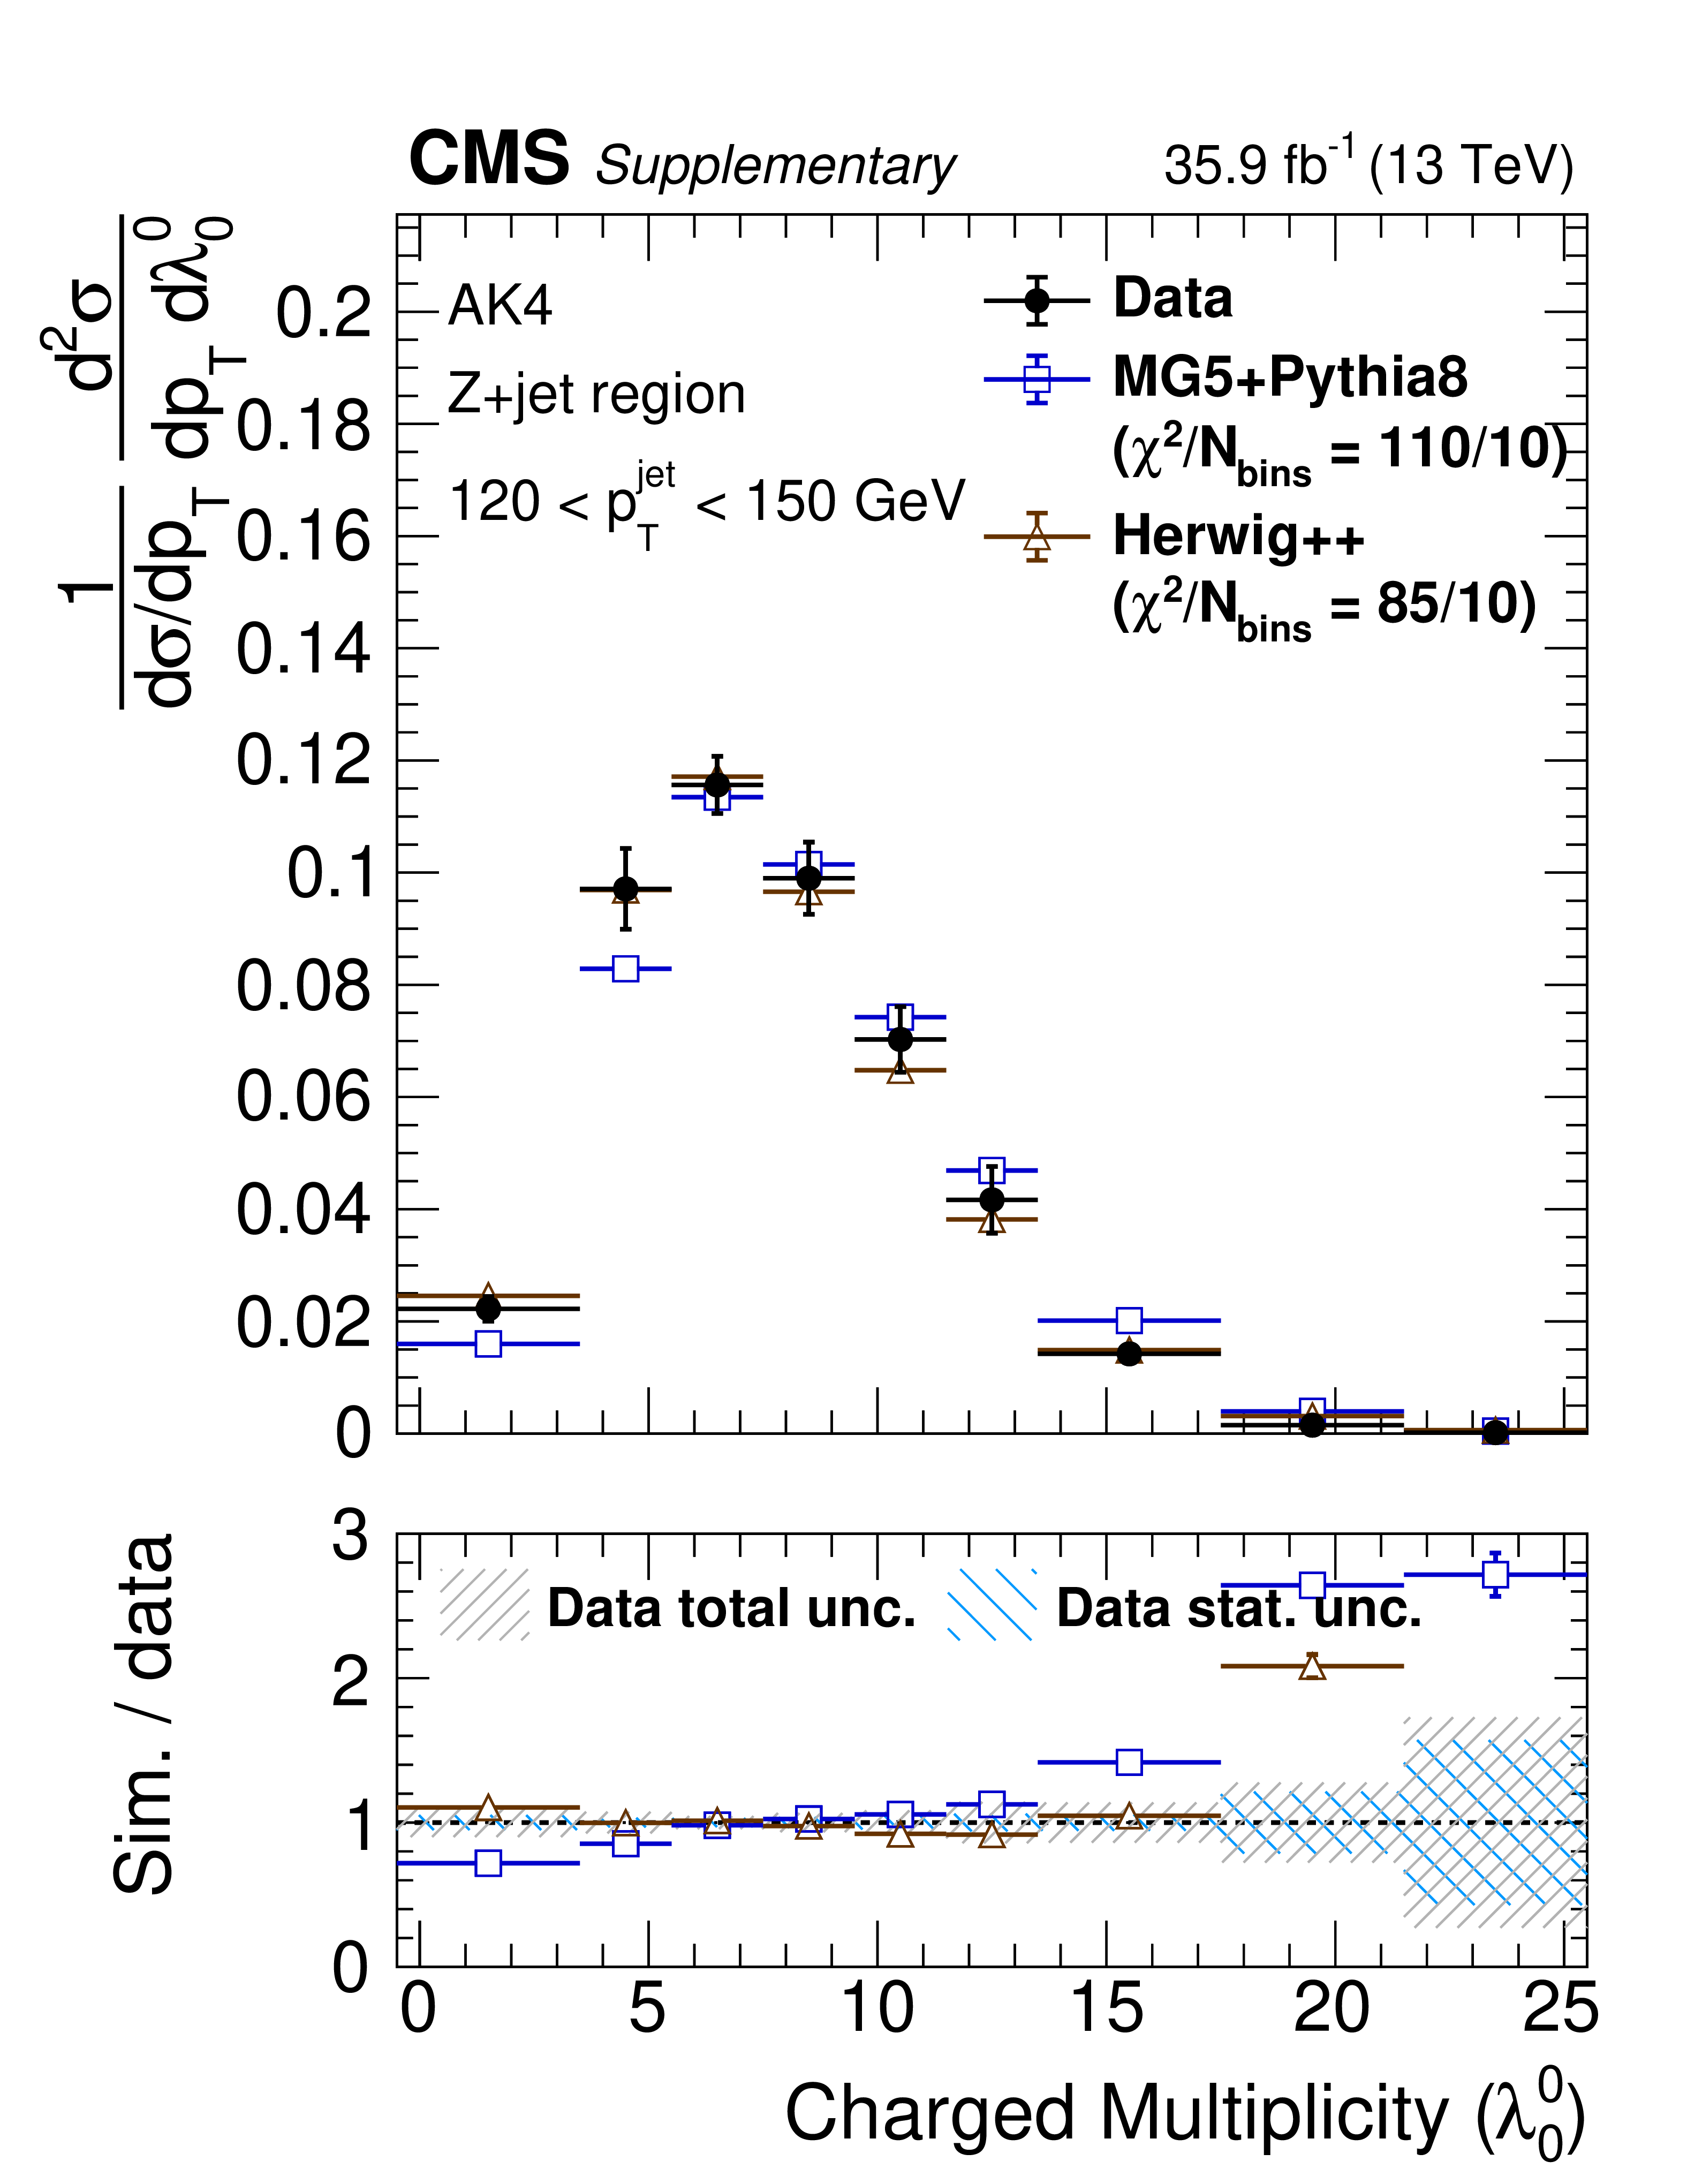
Figure 10:
Particle-level distributions of (upper) ungroomed charged AK4 LHA (${\lambda ^{1}_{0.5}}$) and (lower) groomed AK4 LHA (${\lambda ^{1}_{0.5}}$) in 120 $ < {p_{\mathrm {T}}} < $ 150 GeV in the Z+jet region (left) and central dijet region (right). The error bars on the data correspond to the total uncertainties. For the NLO+NLL'+NP prediction, the theory uncertainty is displayed as a red hashed band. The coarse-grained blue hashed region in the ratio plot indicates the statistical uncertainty of the data, and the fine-grained grey hashed region represents the total uncertainty. The lowest bin extends down to $ {\lambda ^{\kappa}_{\beta}} \geq$ 0. |

png pdf |
Figure 10-a:
Particle-level distributions of ungroomed charged AK4 LHA (${\lambda ^{1}_{0.5}}$) in 120 $ < {p_{\mathrm {T}}} < $ 150 GeV in the Z+jet region. The error bars on the data correspond to the total uncertainties. For the NLO+NLL'+NP prediction, the theory uncertainty is displayed as a red hashed band. The coarse-grained blue hashed region in the ratio plot indicates the statistical uncertainty of the data, and the fine-grained grey hashed region represents the total uncertainty. The lowest bin extends down to $ {\lambda ^{\kappa}_{\beta}} \geq$ 0. |

png pdf |
Figure 10-b:
Particle-level distributions of ungroomed charged AK4 LHA (${\lambda ^{1}_{0.5}}$) in 120 $ < {p_{\mathrm {T}}} < $ 150 GeV in the central dijet region. The error bars on the data correspond to the total uncertainties. For the NLO+NLL'+NP prediction, the theory uncertainty is displayed as a red hashed band. The coarse-grained blue hashed region in the ratio plot indicates the statistical uncertainty of the data, and the fine-grained grey hashed region represents the total uncertainty. The lowest bin extends down to $ {\lambda ^{\kappa}_{\beta}} \geq$ 0. |

png pdf |
Figure 10-c:
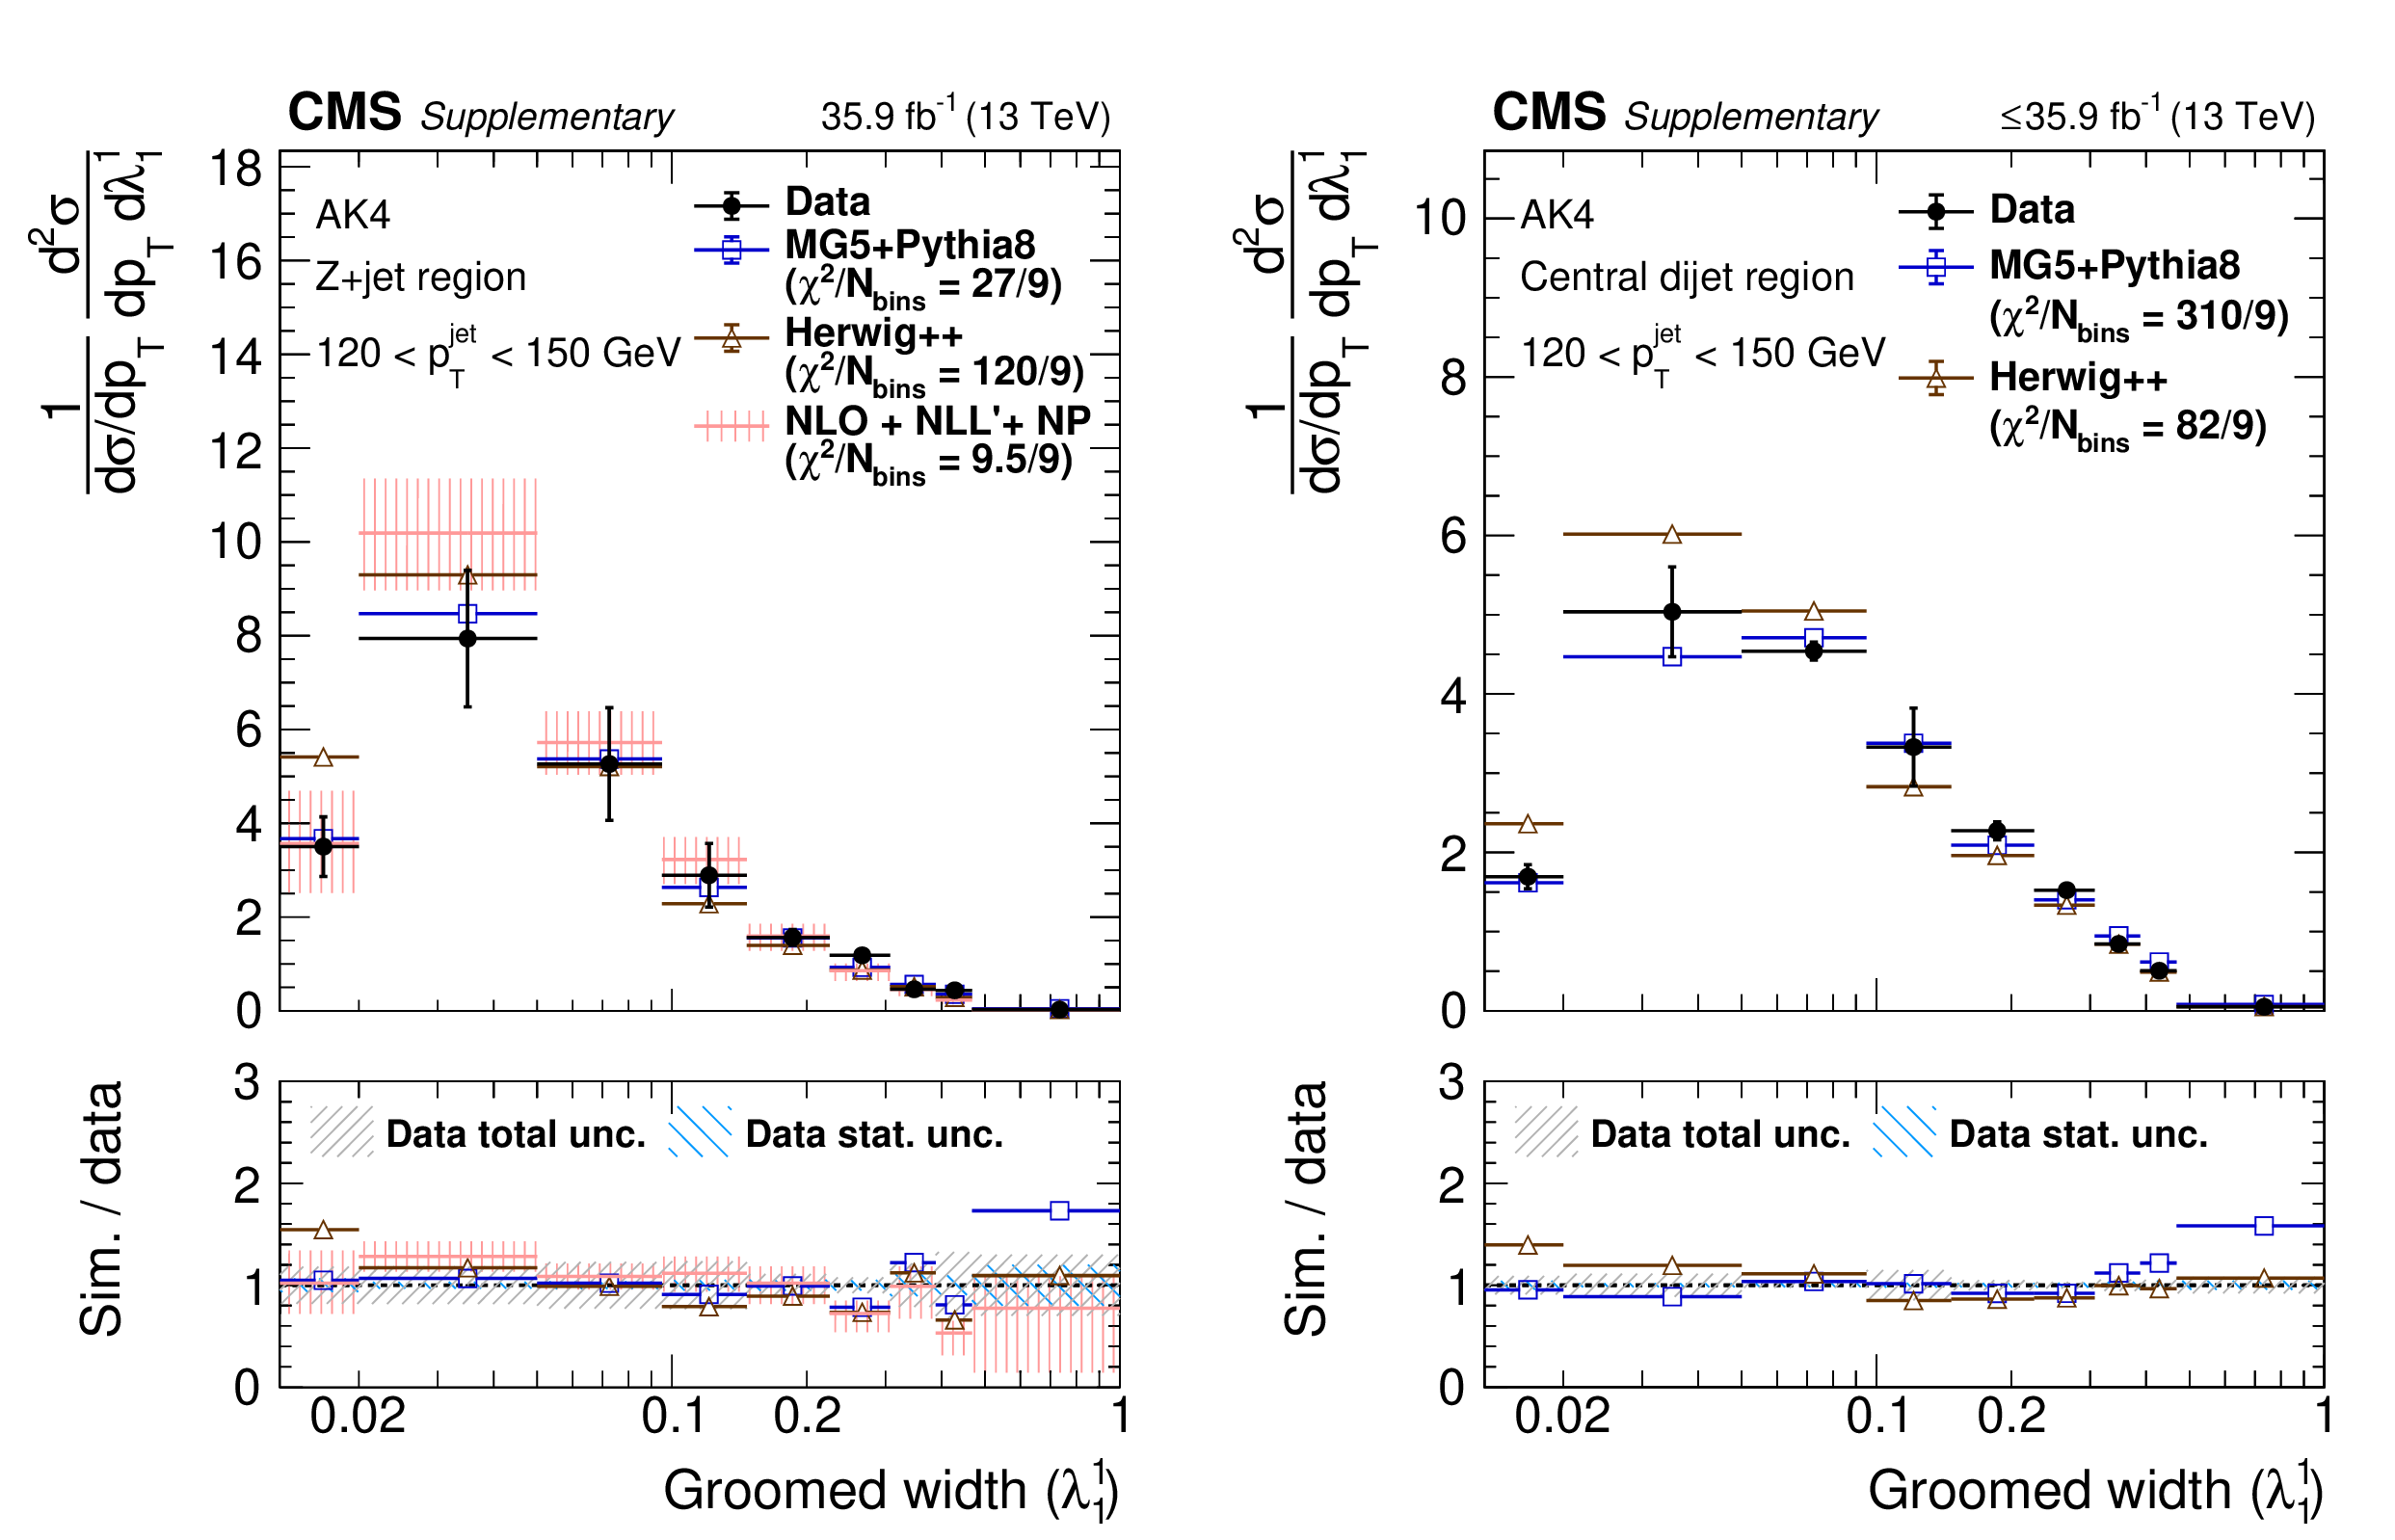
Particle-level distributions of groomed AK4 LHA (${\lambda ^{1}_{0.5}}$) in 120 $ < {p_{\mathrm {T}}} < $ 150 GeV in the Z+jet region. The error bars on the data correspond to the total uncertainties. For the NLO+NLL'+NP prediction, the theory uncertainty is displayed as a red hashed band. The coarse-grained blue hashed region in the ratio plot indicates the statistical uncertainty of the data, and the fine-grained grey hashed region represents the total uncertainty. The lowest bin extends down to $ {\lambda ^{\kappa}_{\beta}} \geq$ 0. |
png pdf |
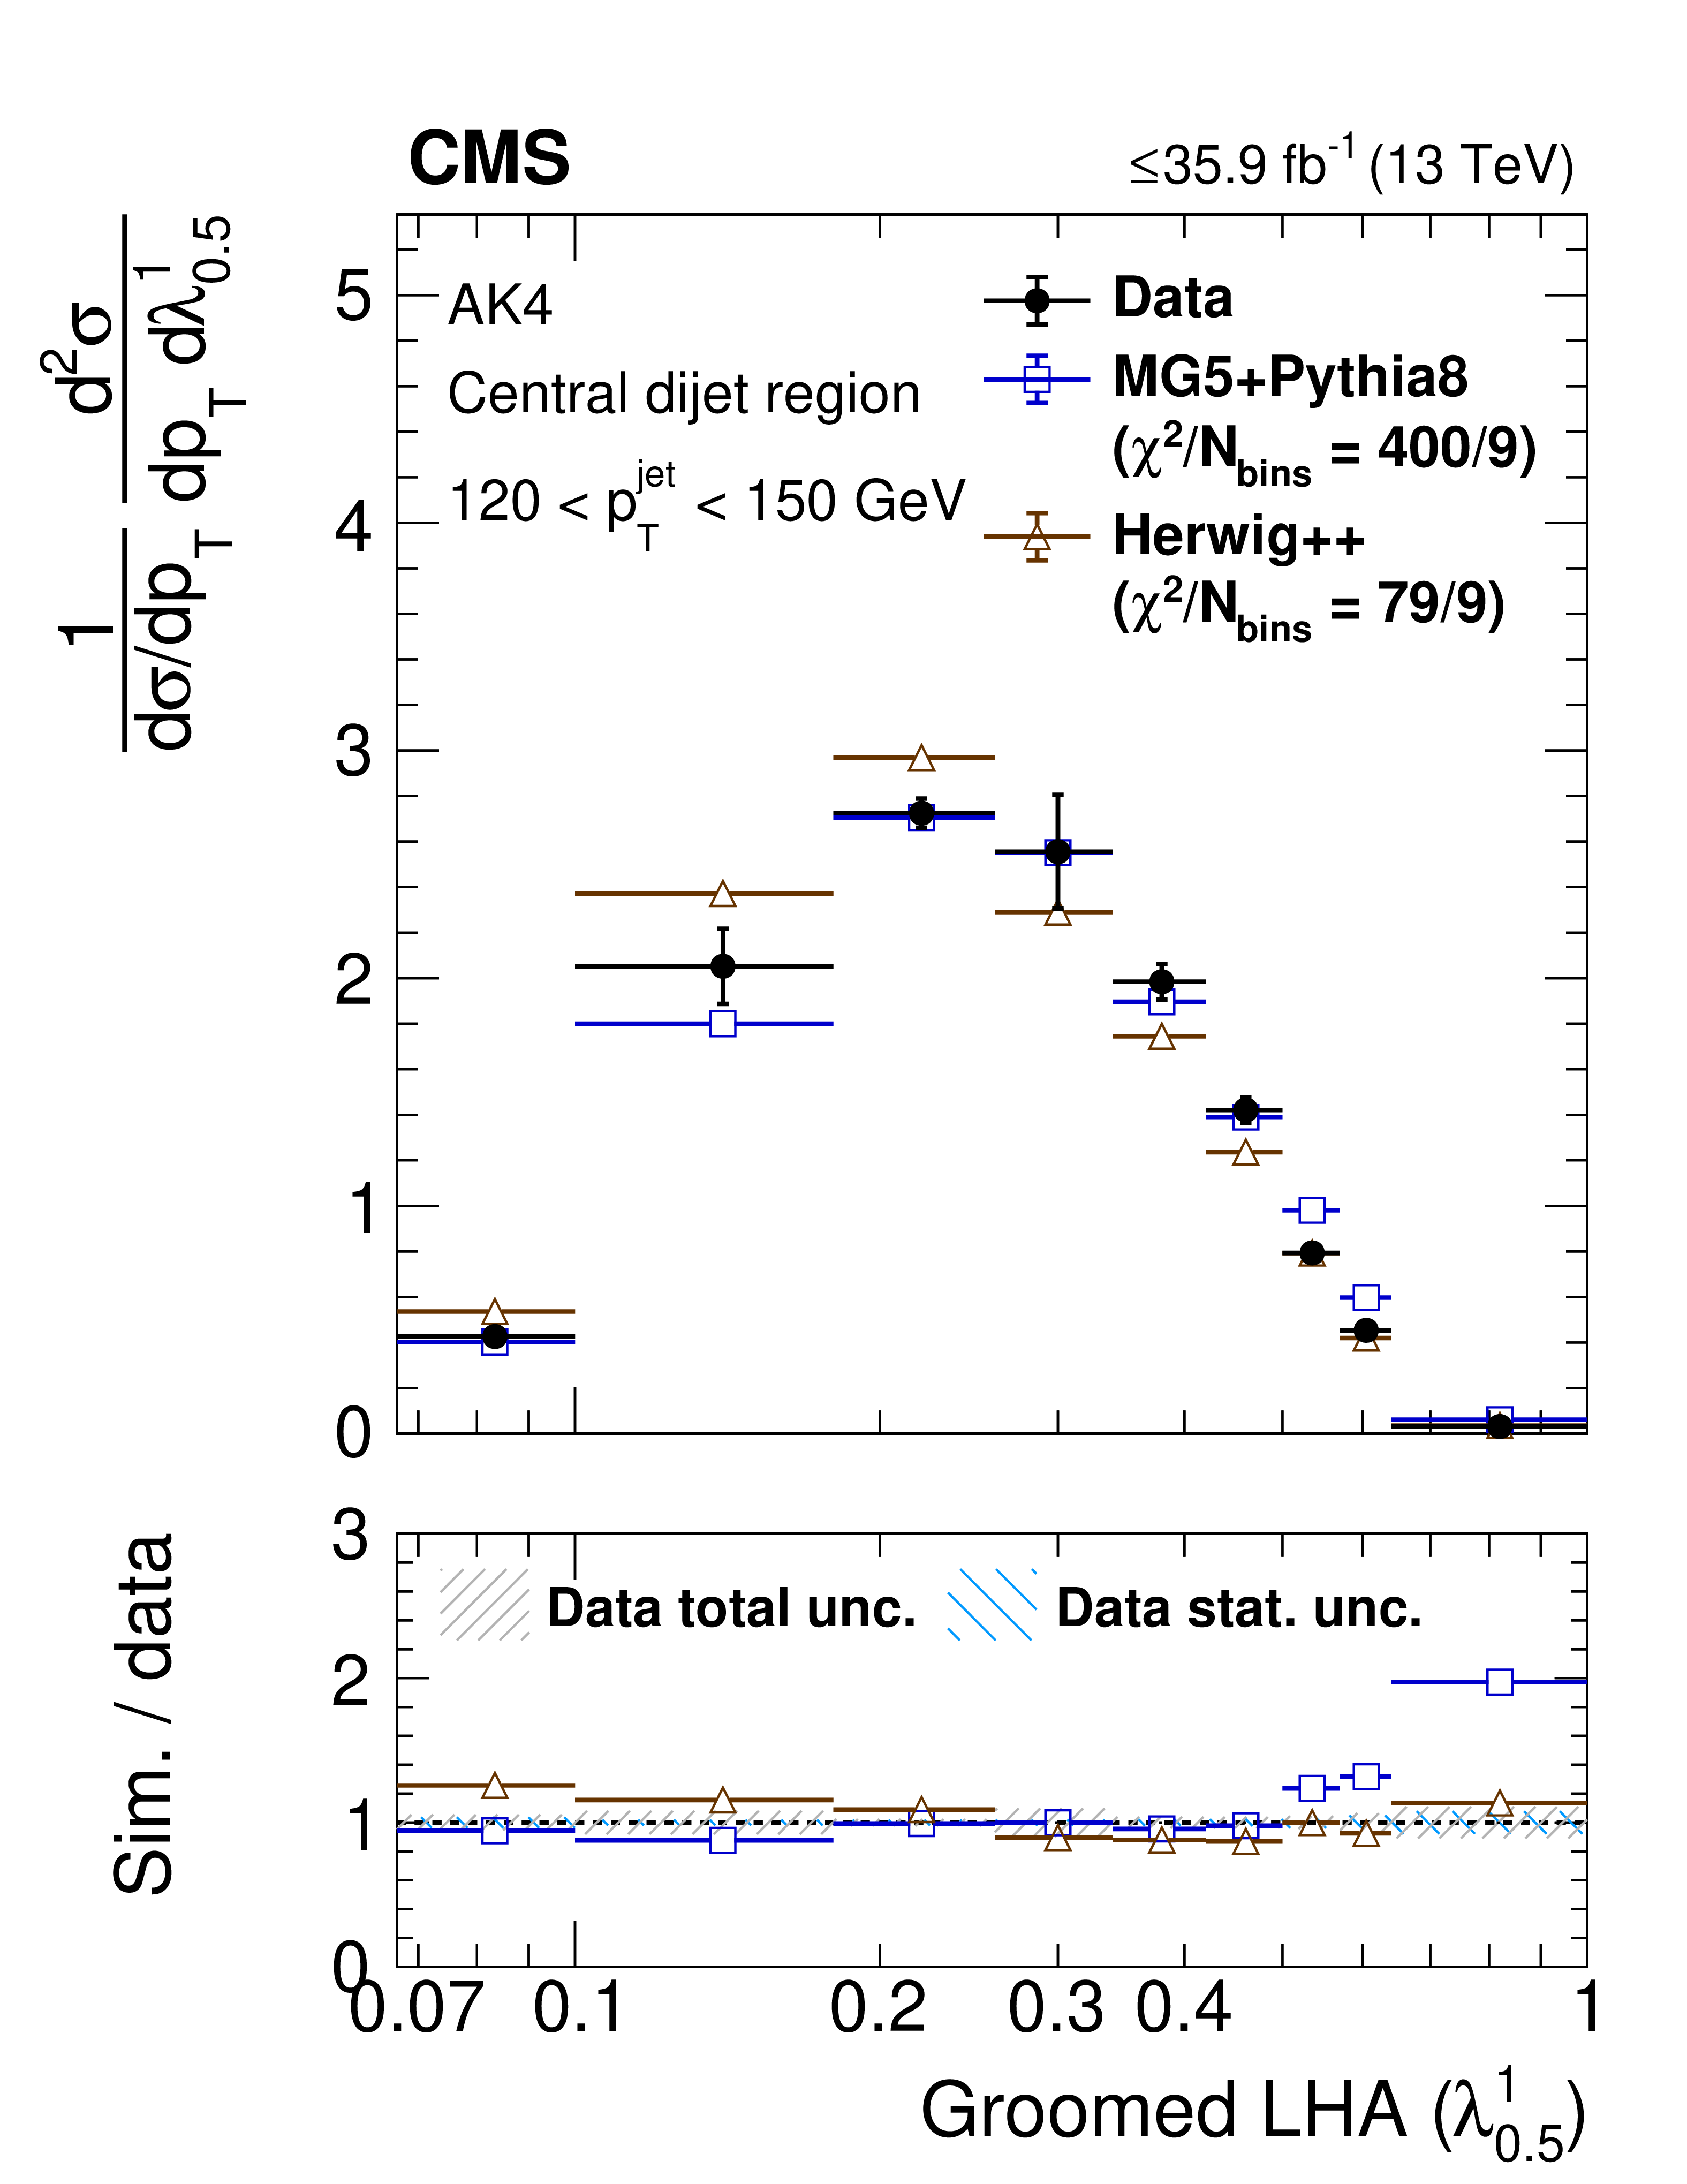
Figure 10-d:
Particle-level distributions of groomed AK4 LHA (${\lambda ^{1}_{0.5}}$) in 120 $ < {p_{\mathrm {T}}} < $ 150 GeV in the central dijet region. The error bars on the data correspond to the total uncertainties. For the NLO+NLL'+NP prediction, the theory uncertainty is displayed as a red hashed band. The coarse-grained blue hashed region in the ratio plot indicates the statistical uncertainty of the data, and the fine-grained grey hashed region represents the total uncertainty. The lowest bin extends down to $ {\lambda ^{\kappa}_{\beta}} \geq$ 0. |

png pdf |
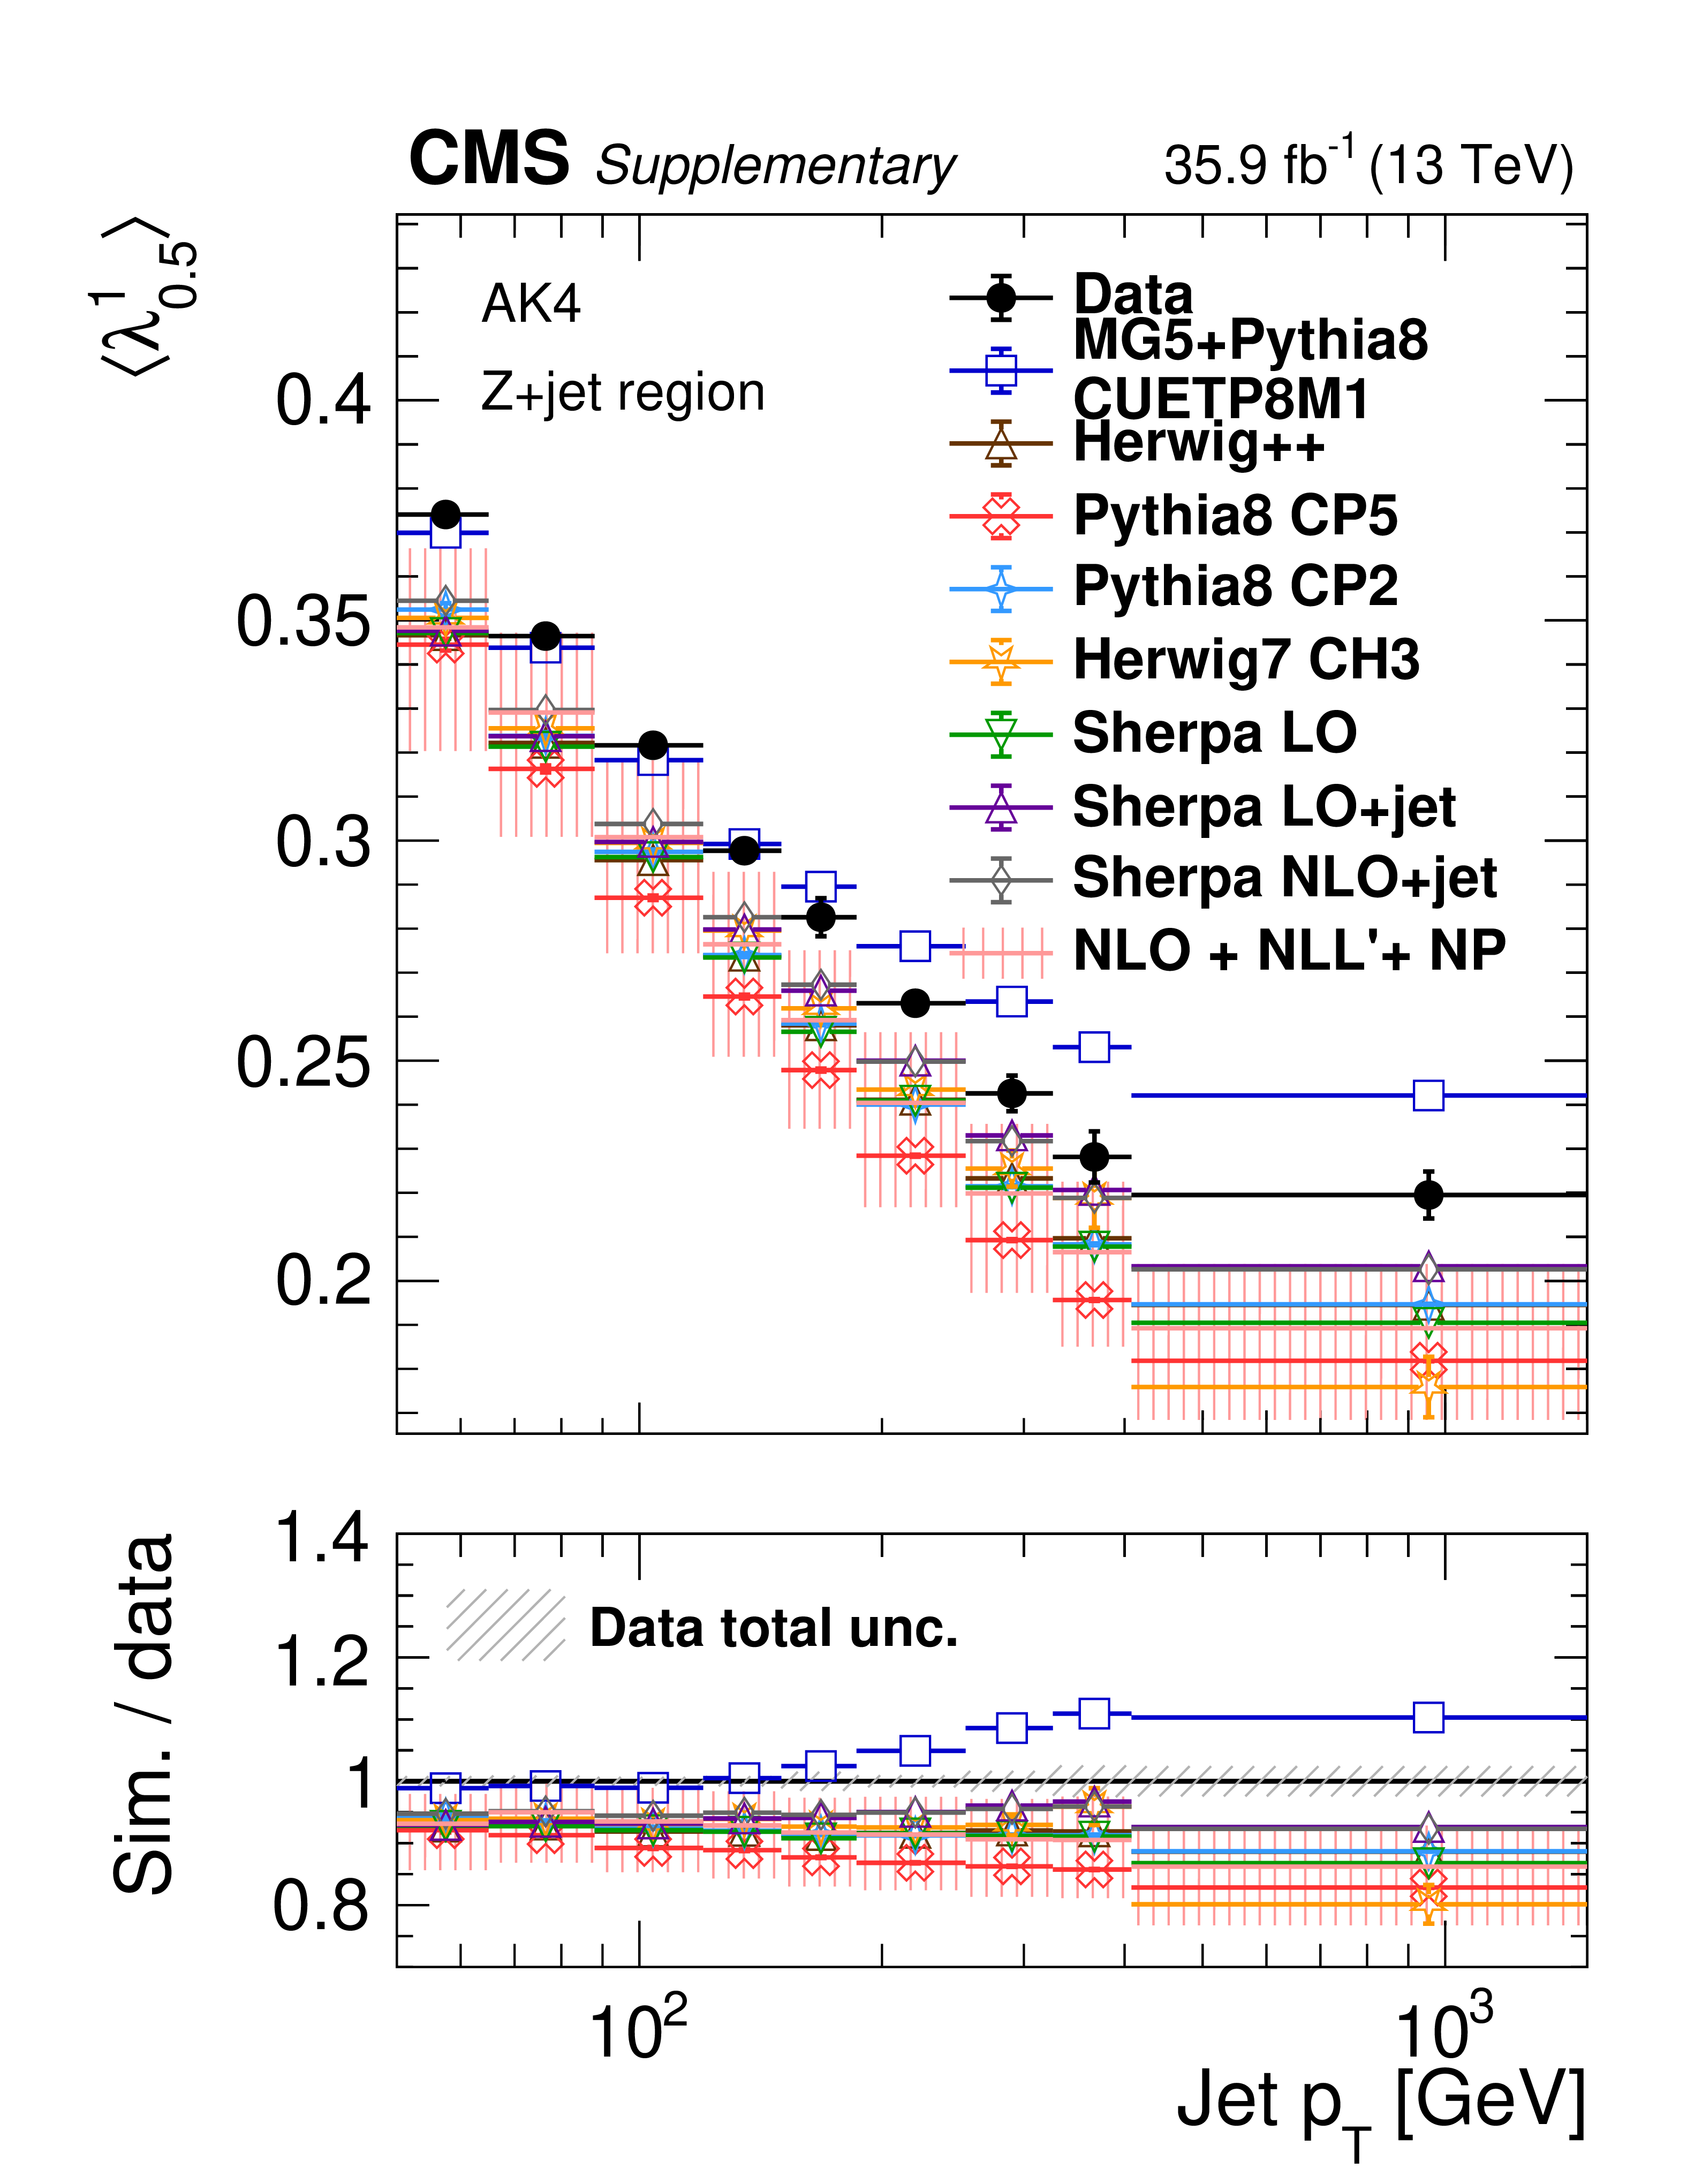
Figure 11:
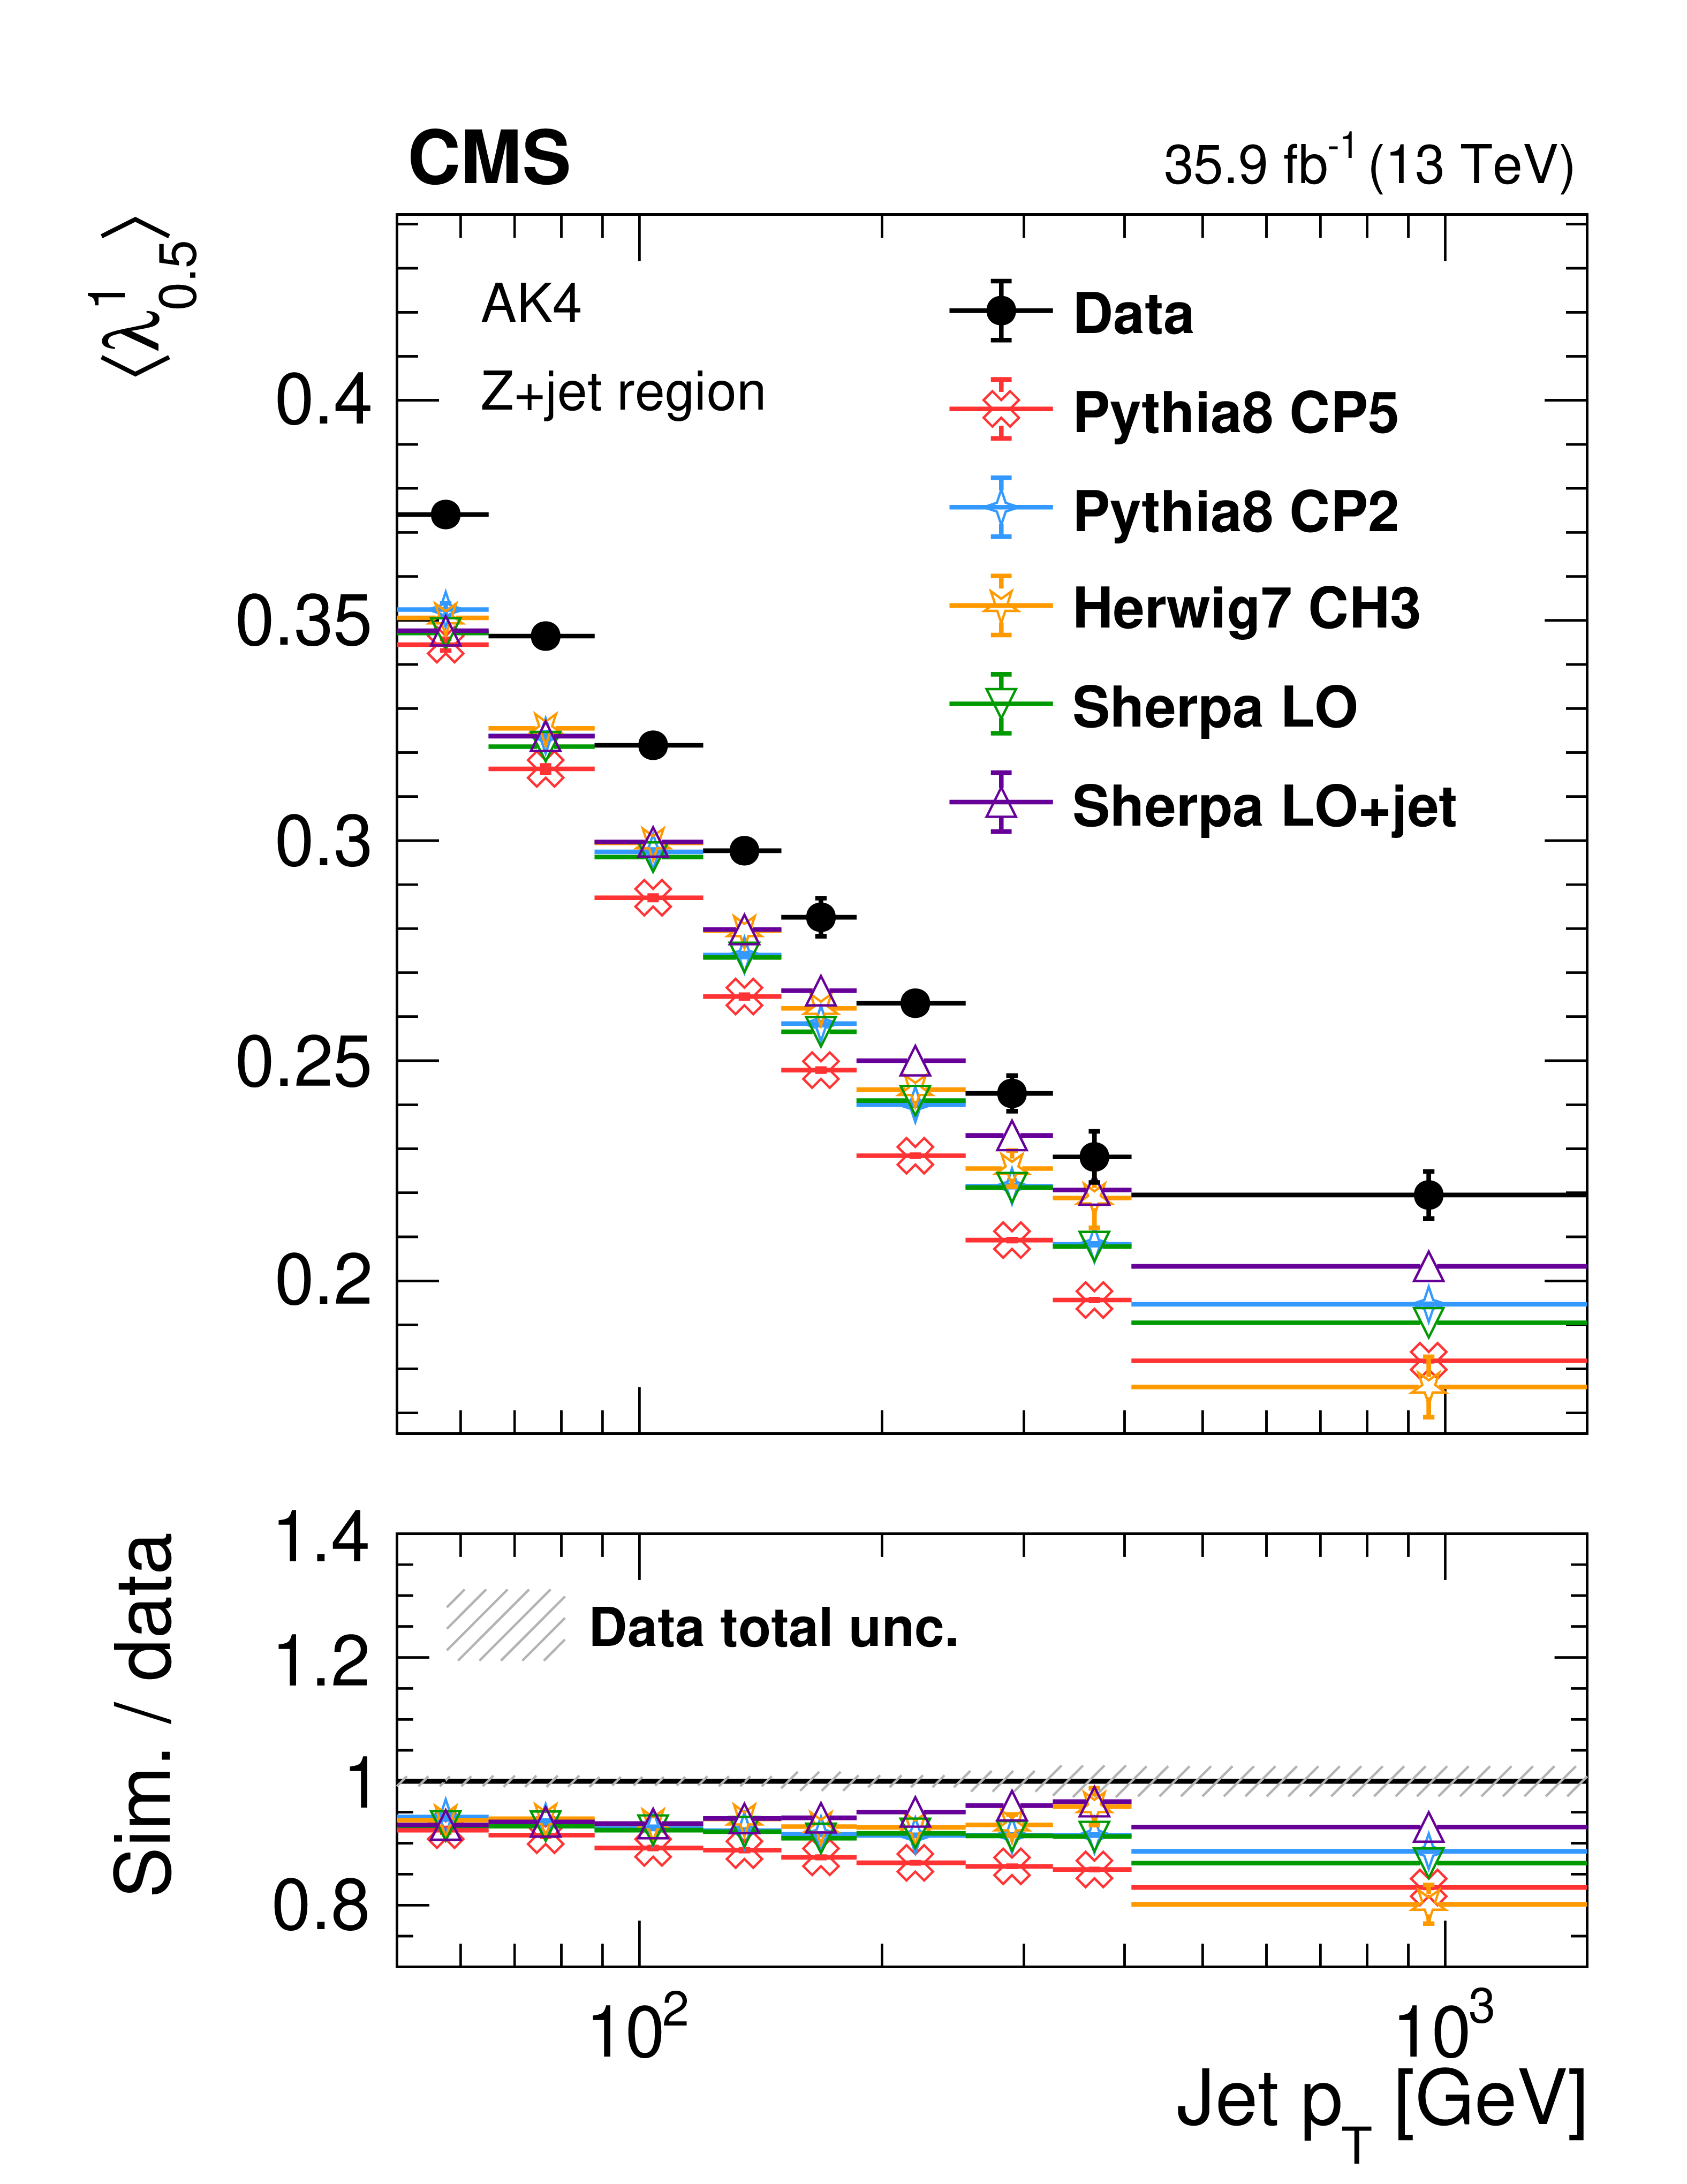
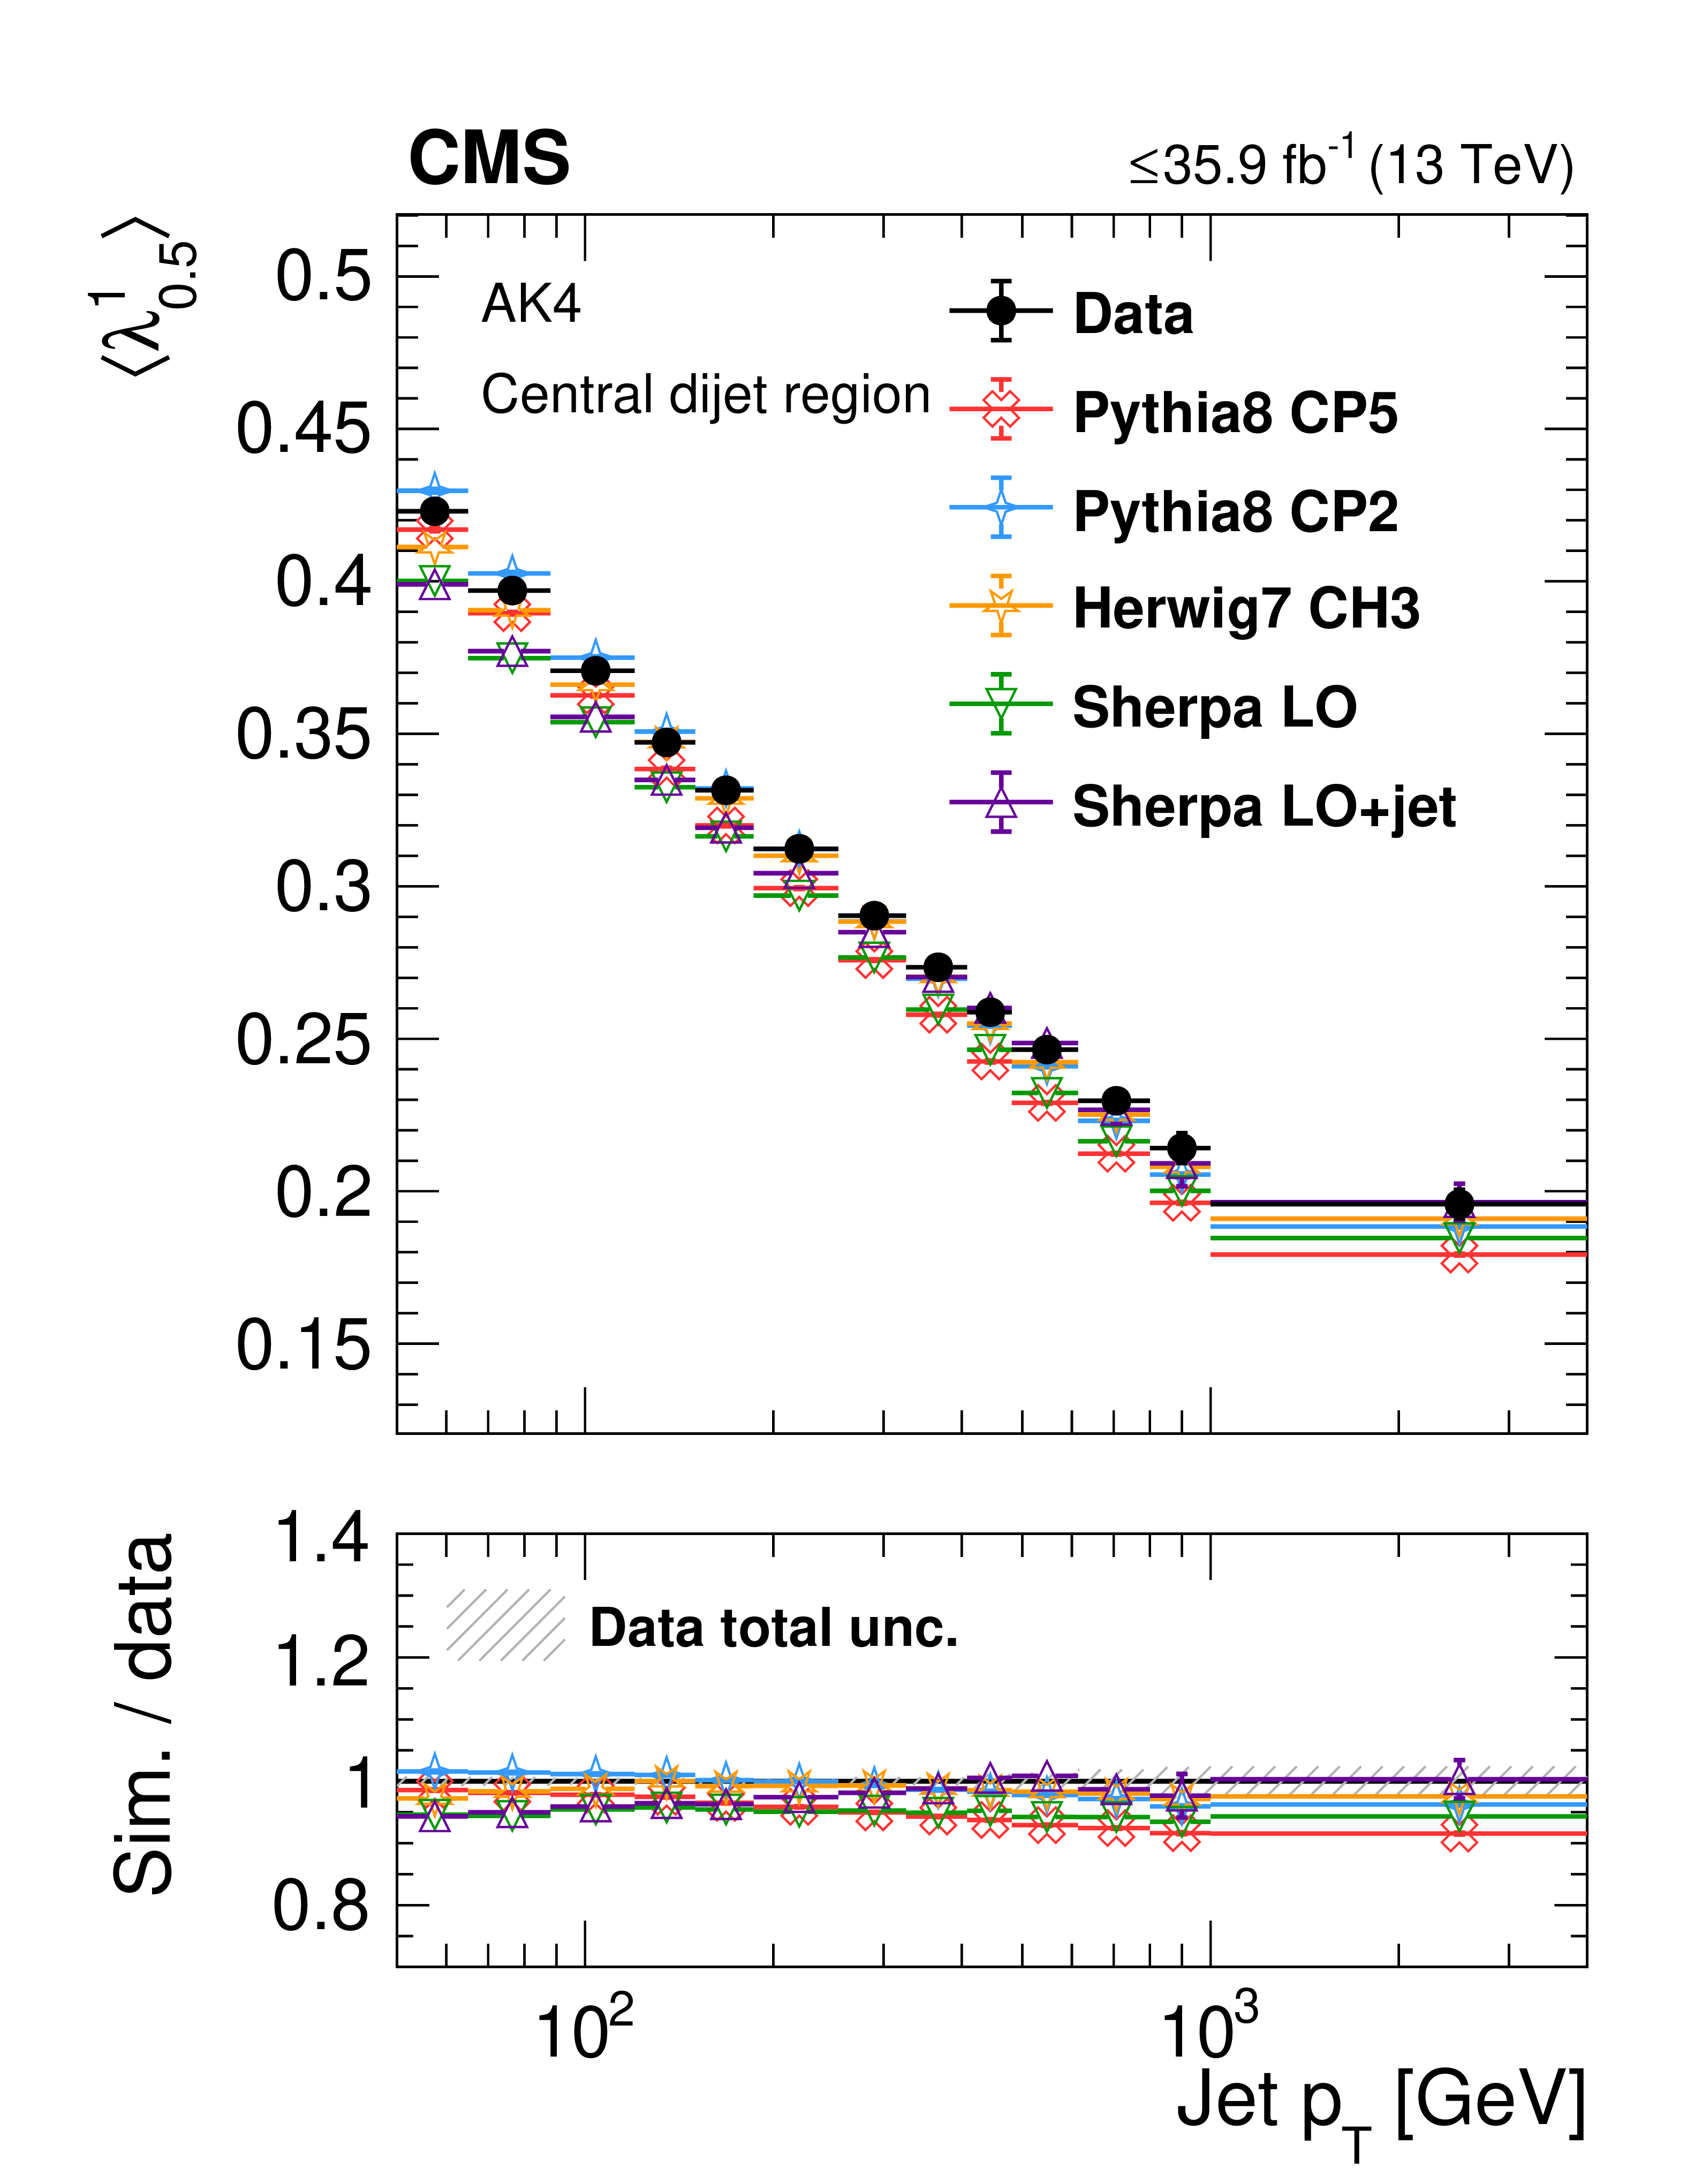
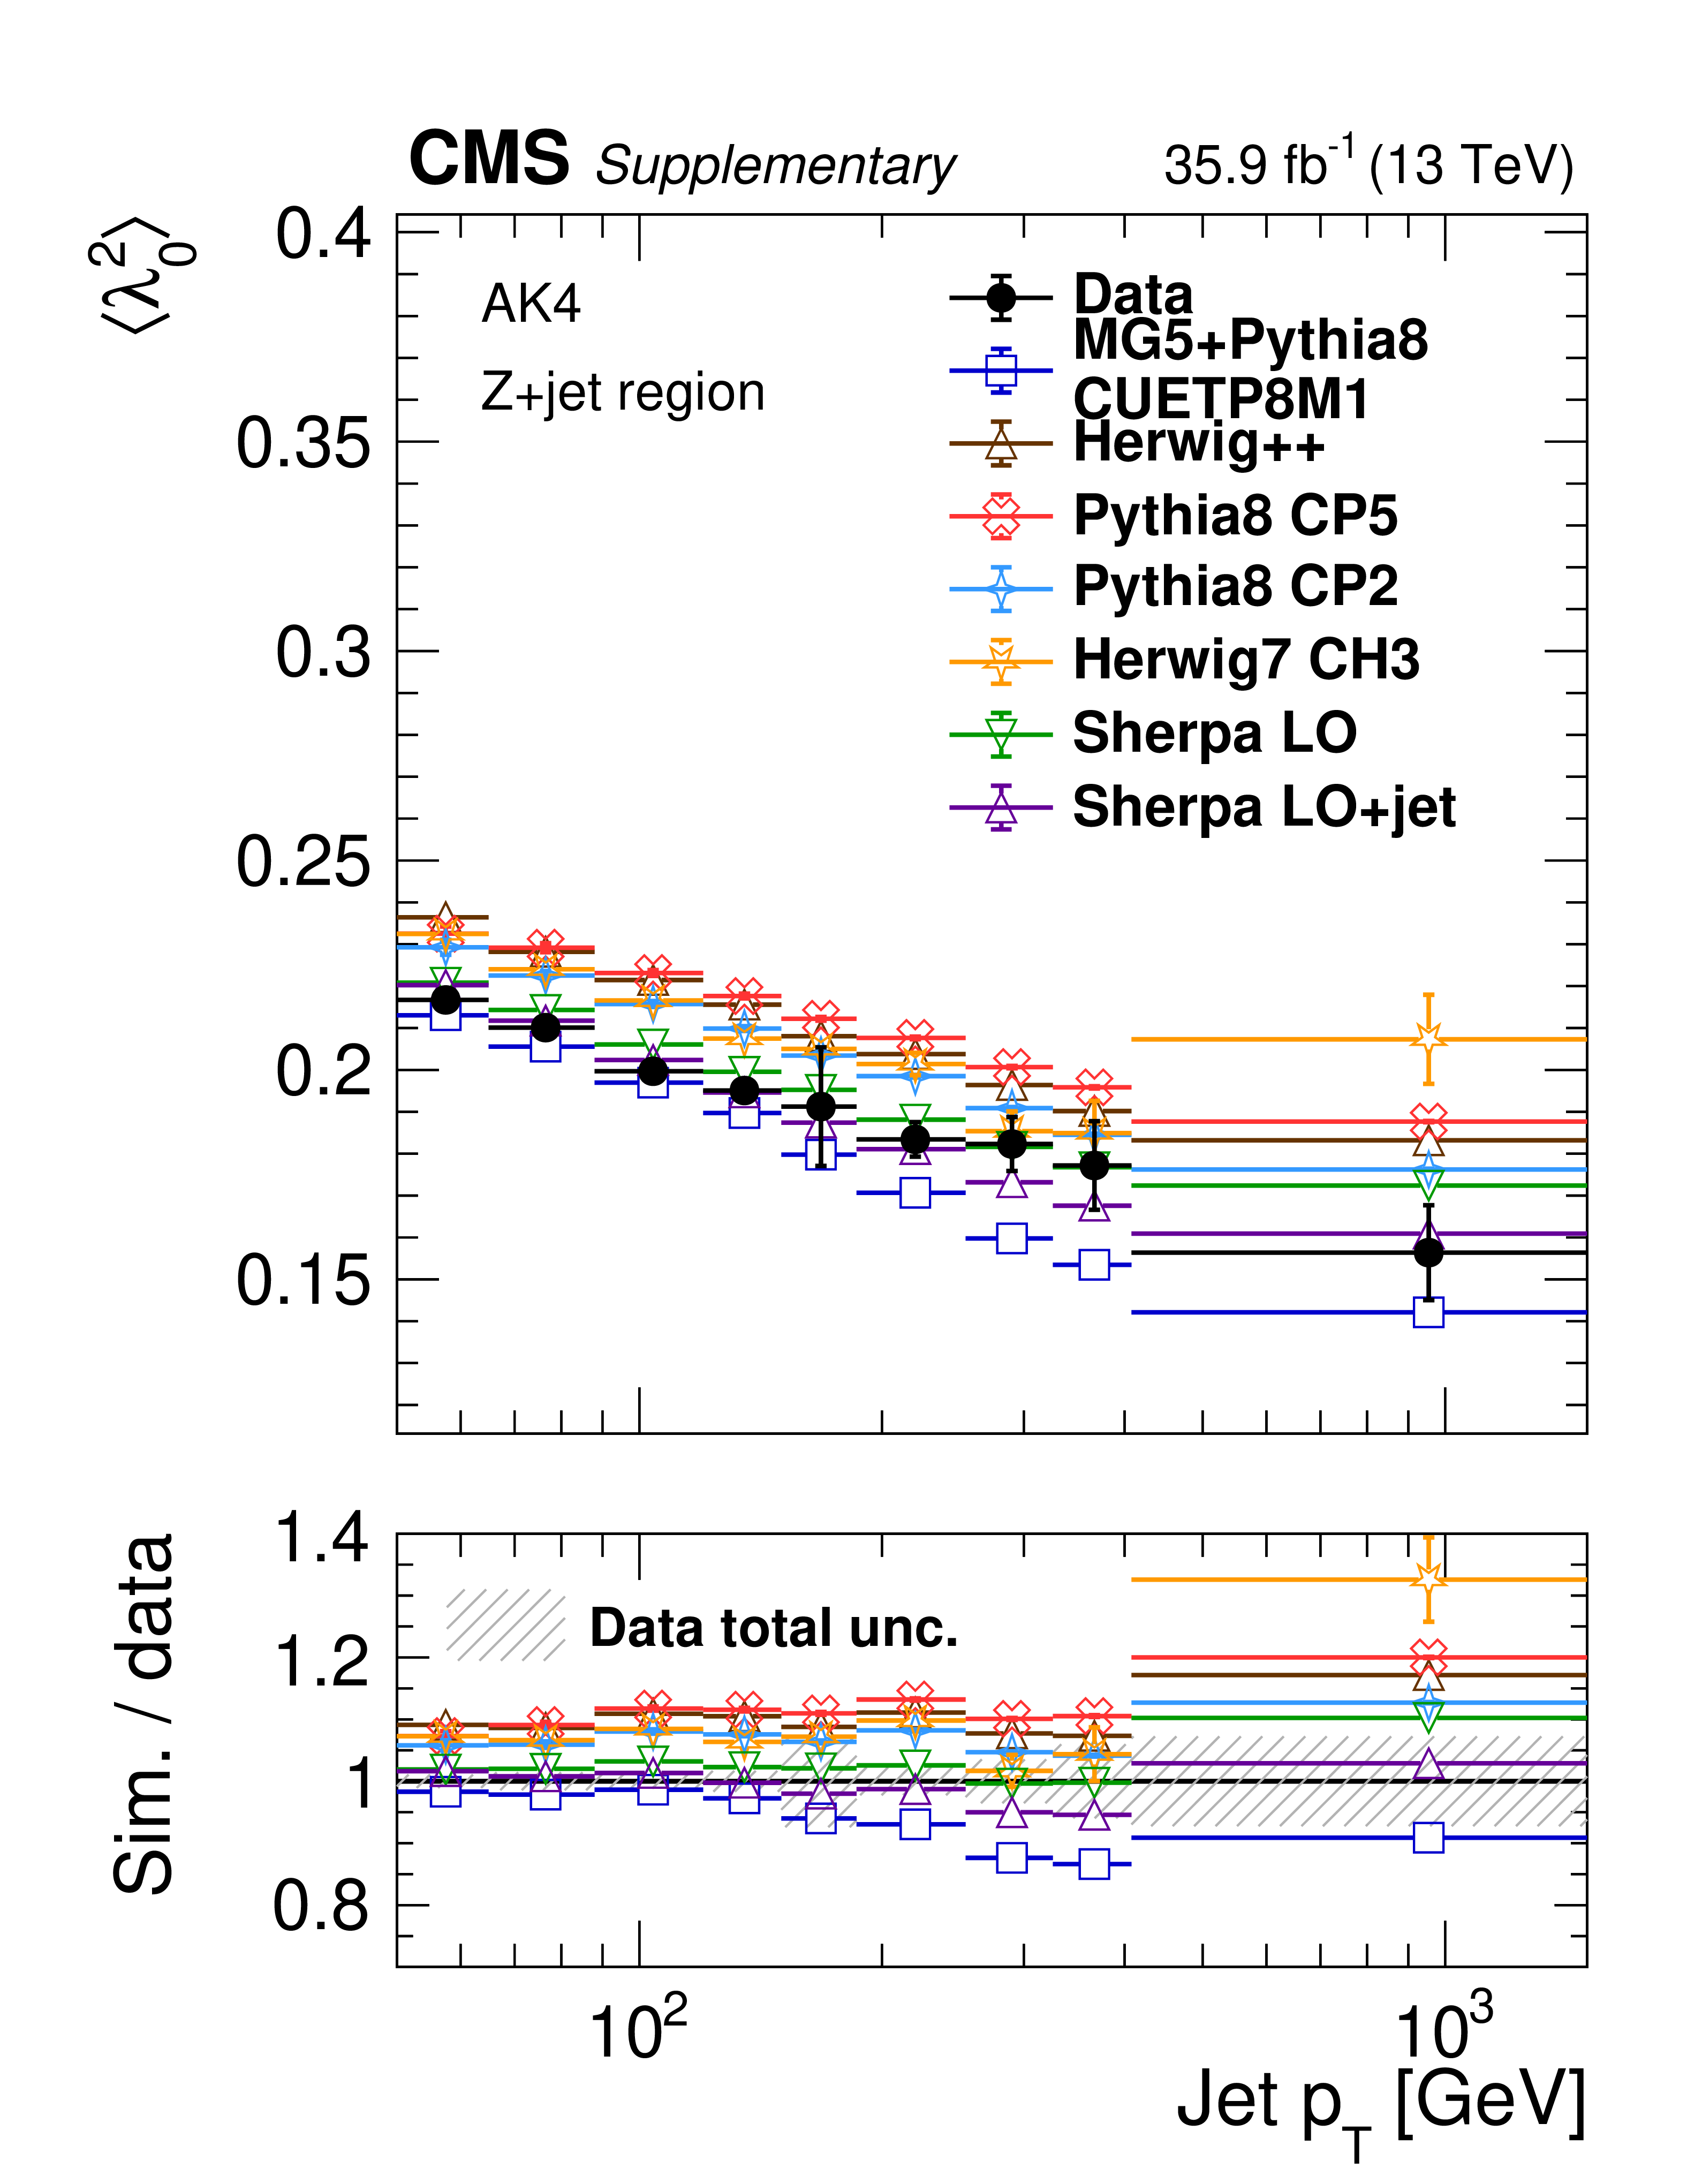
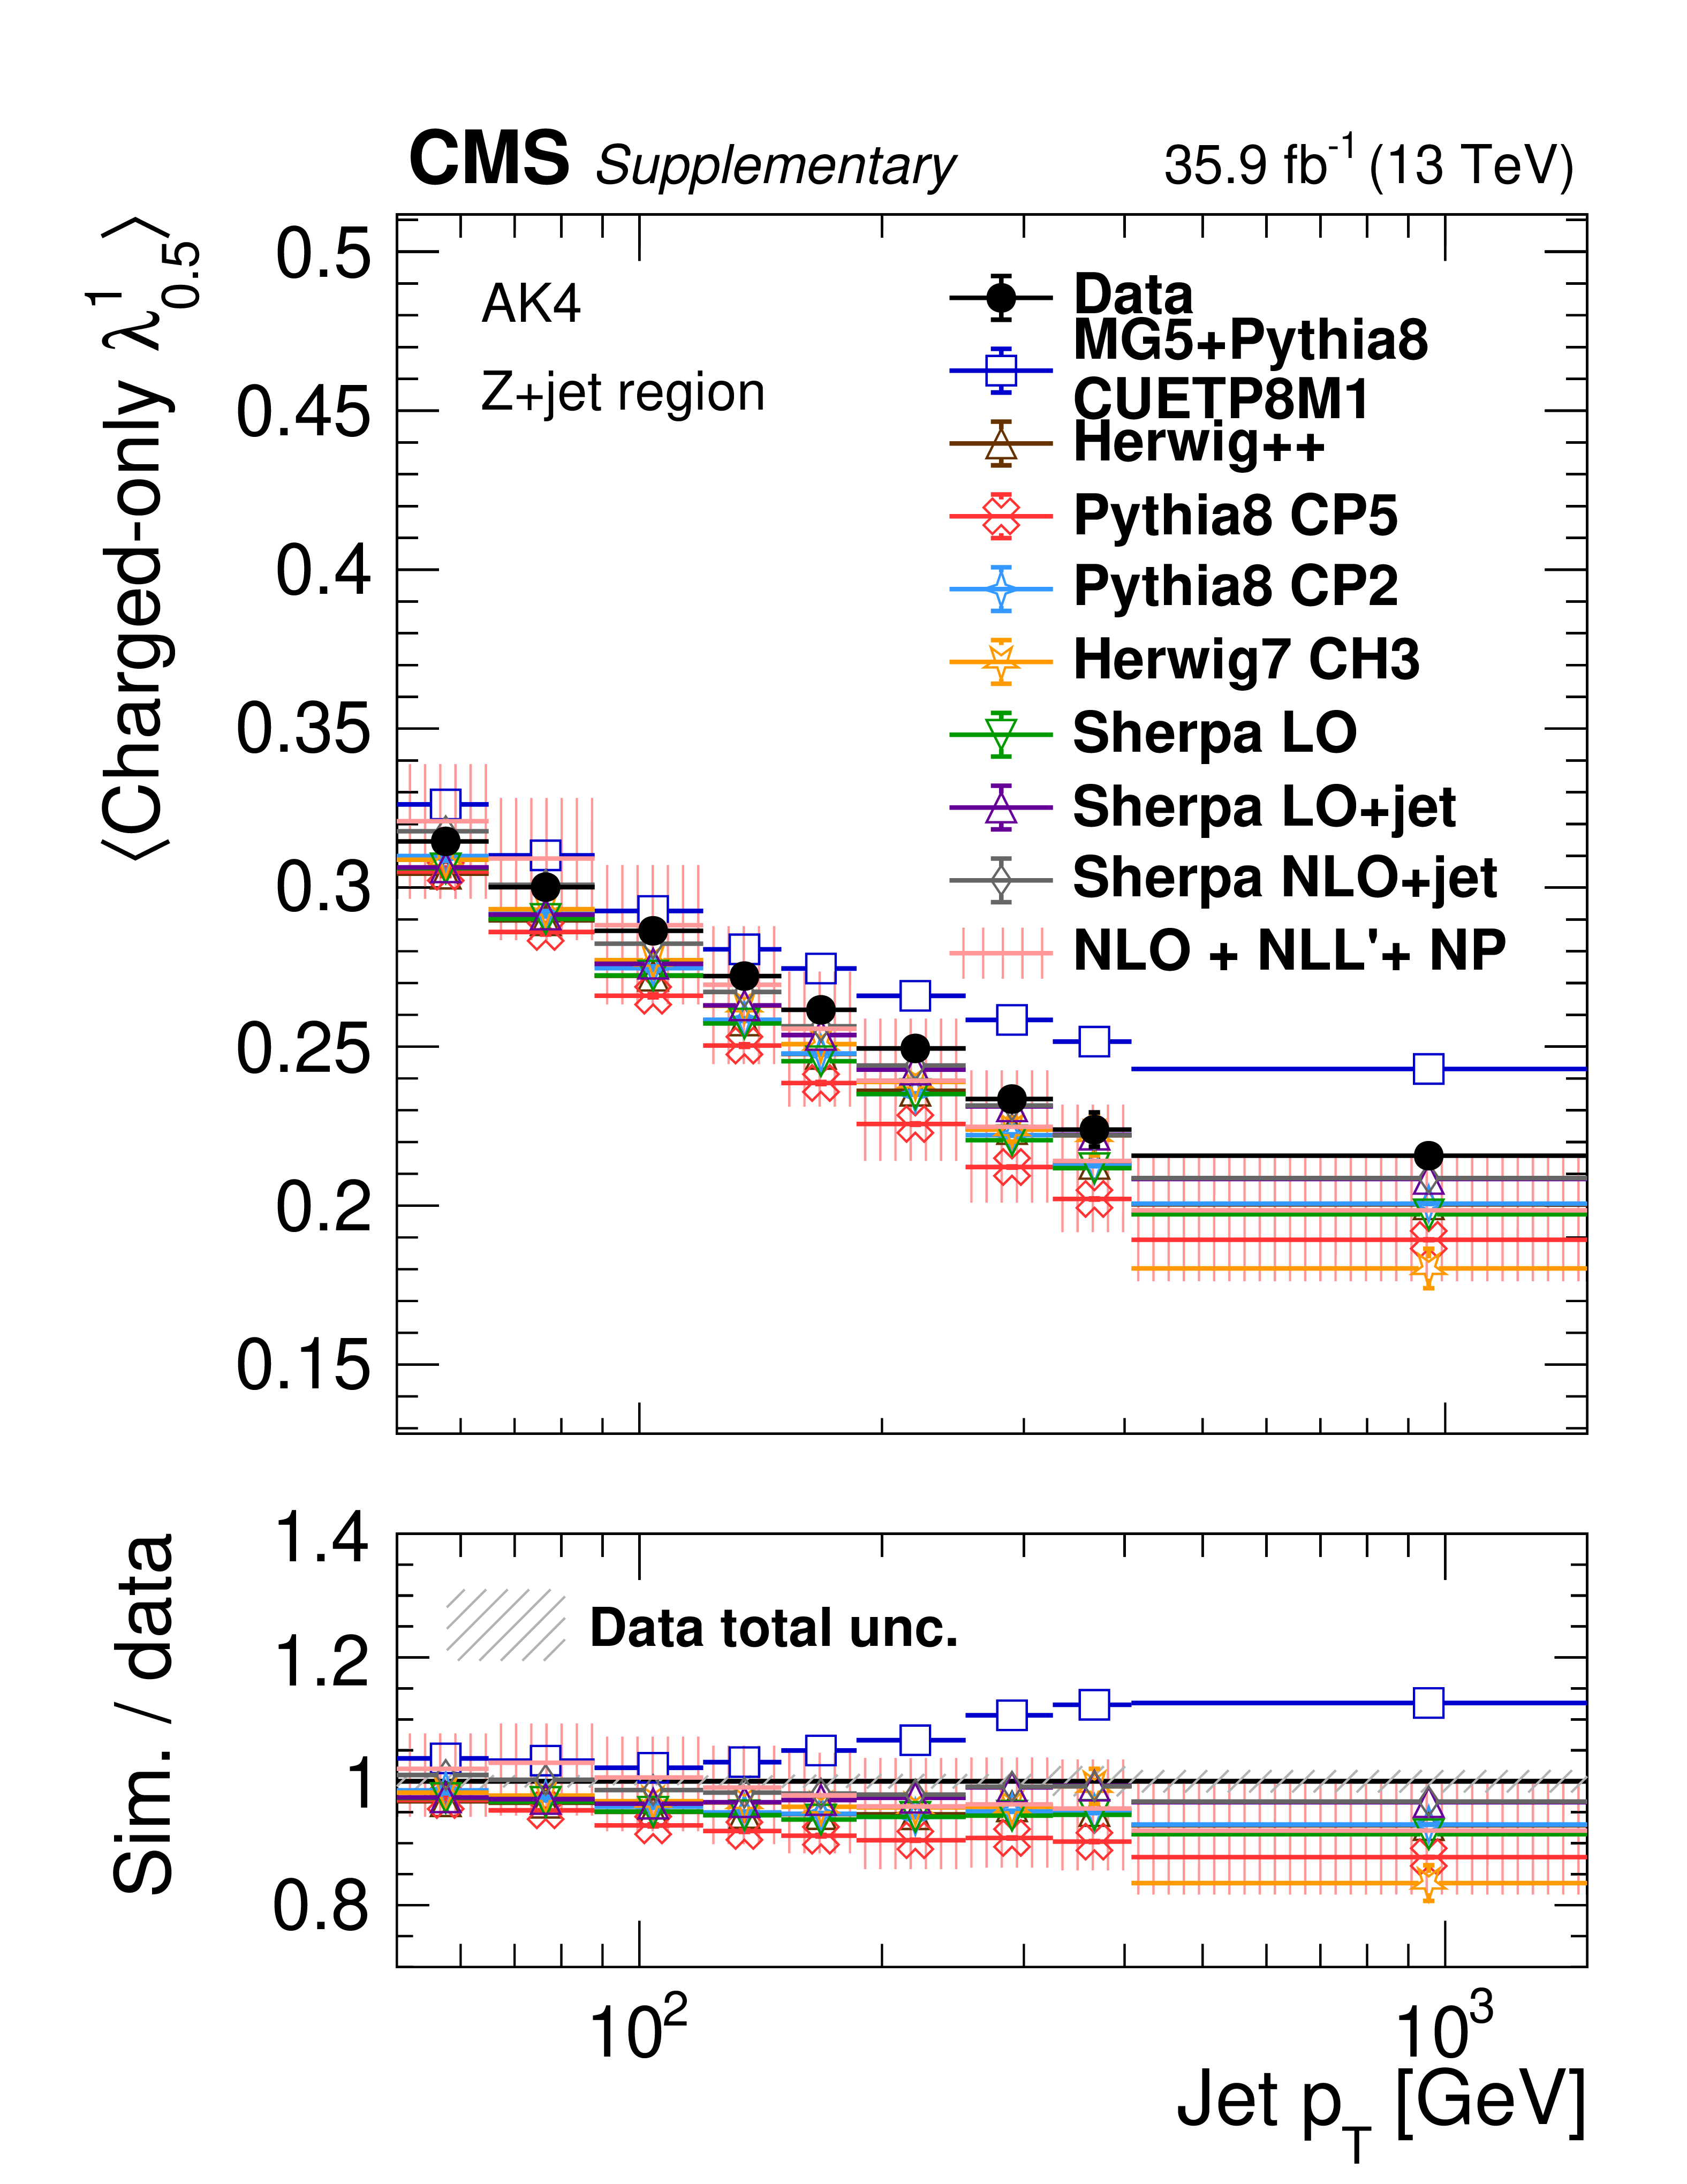
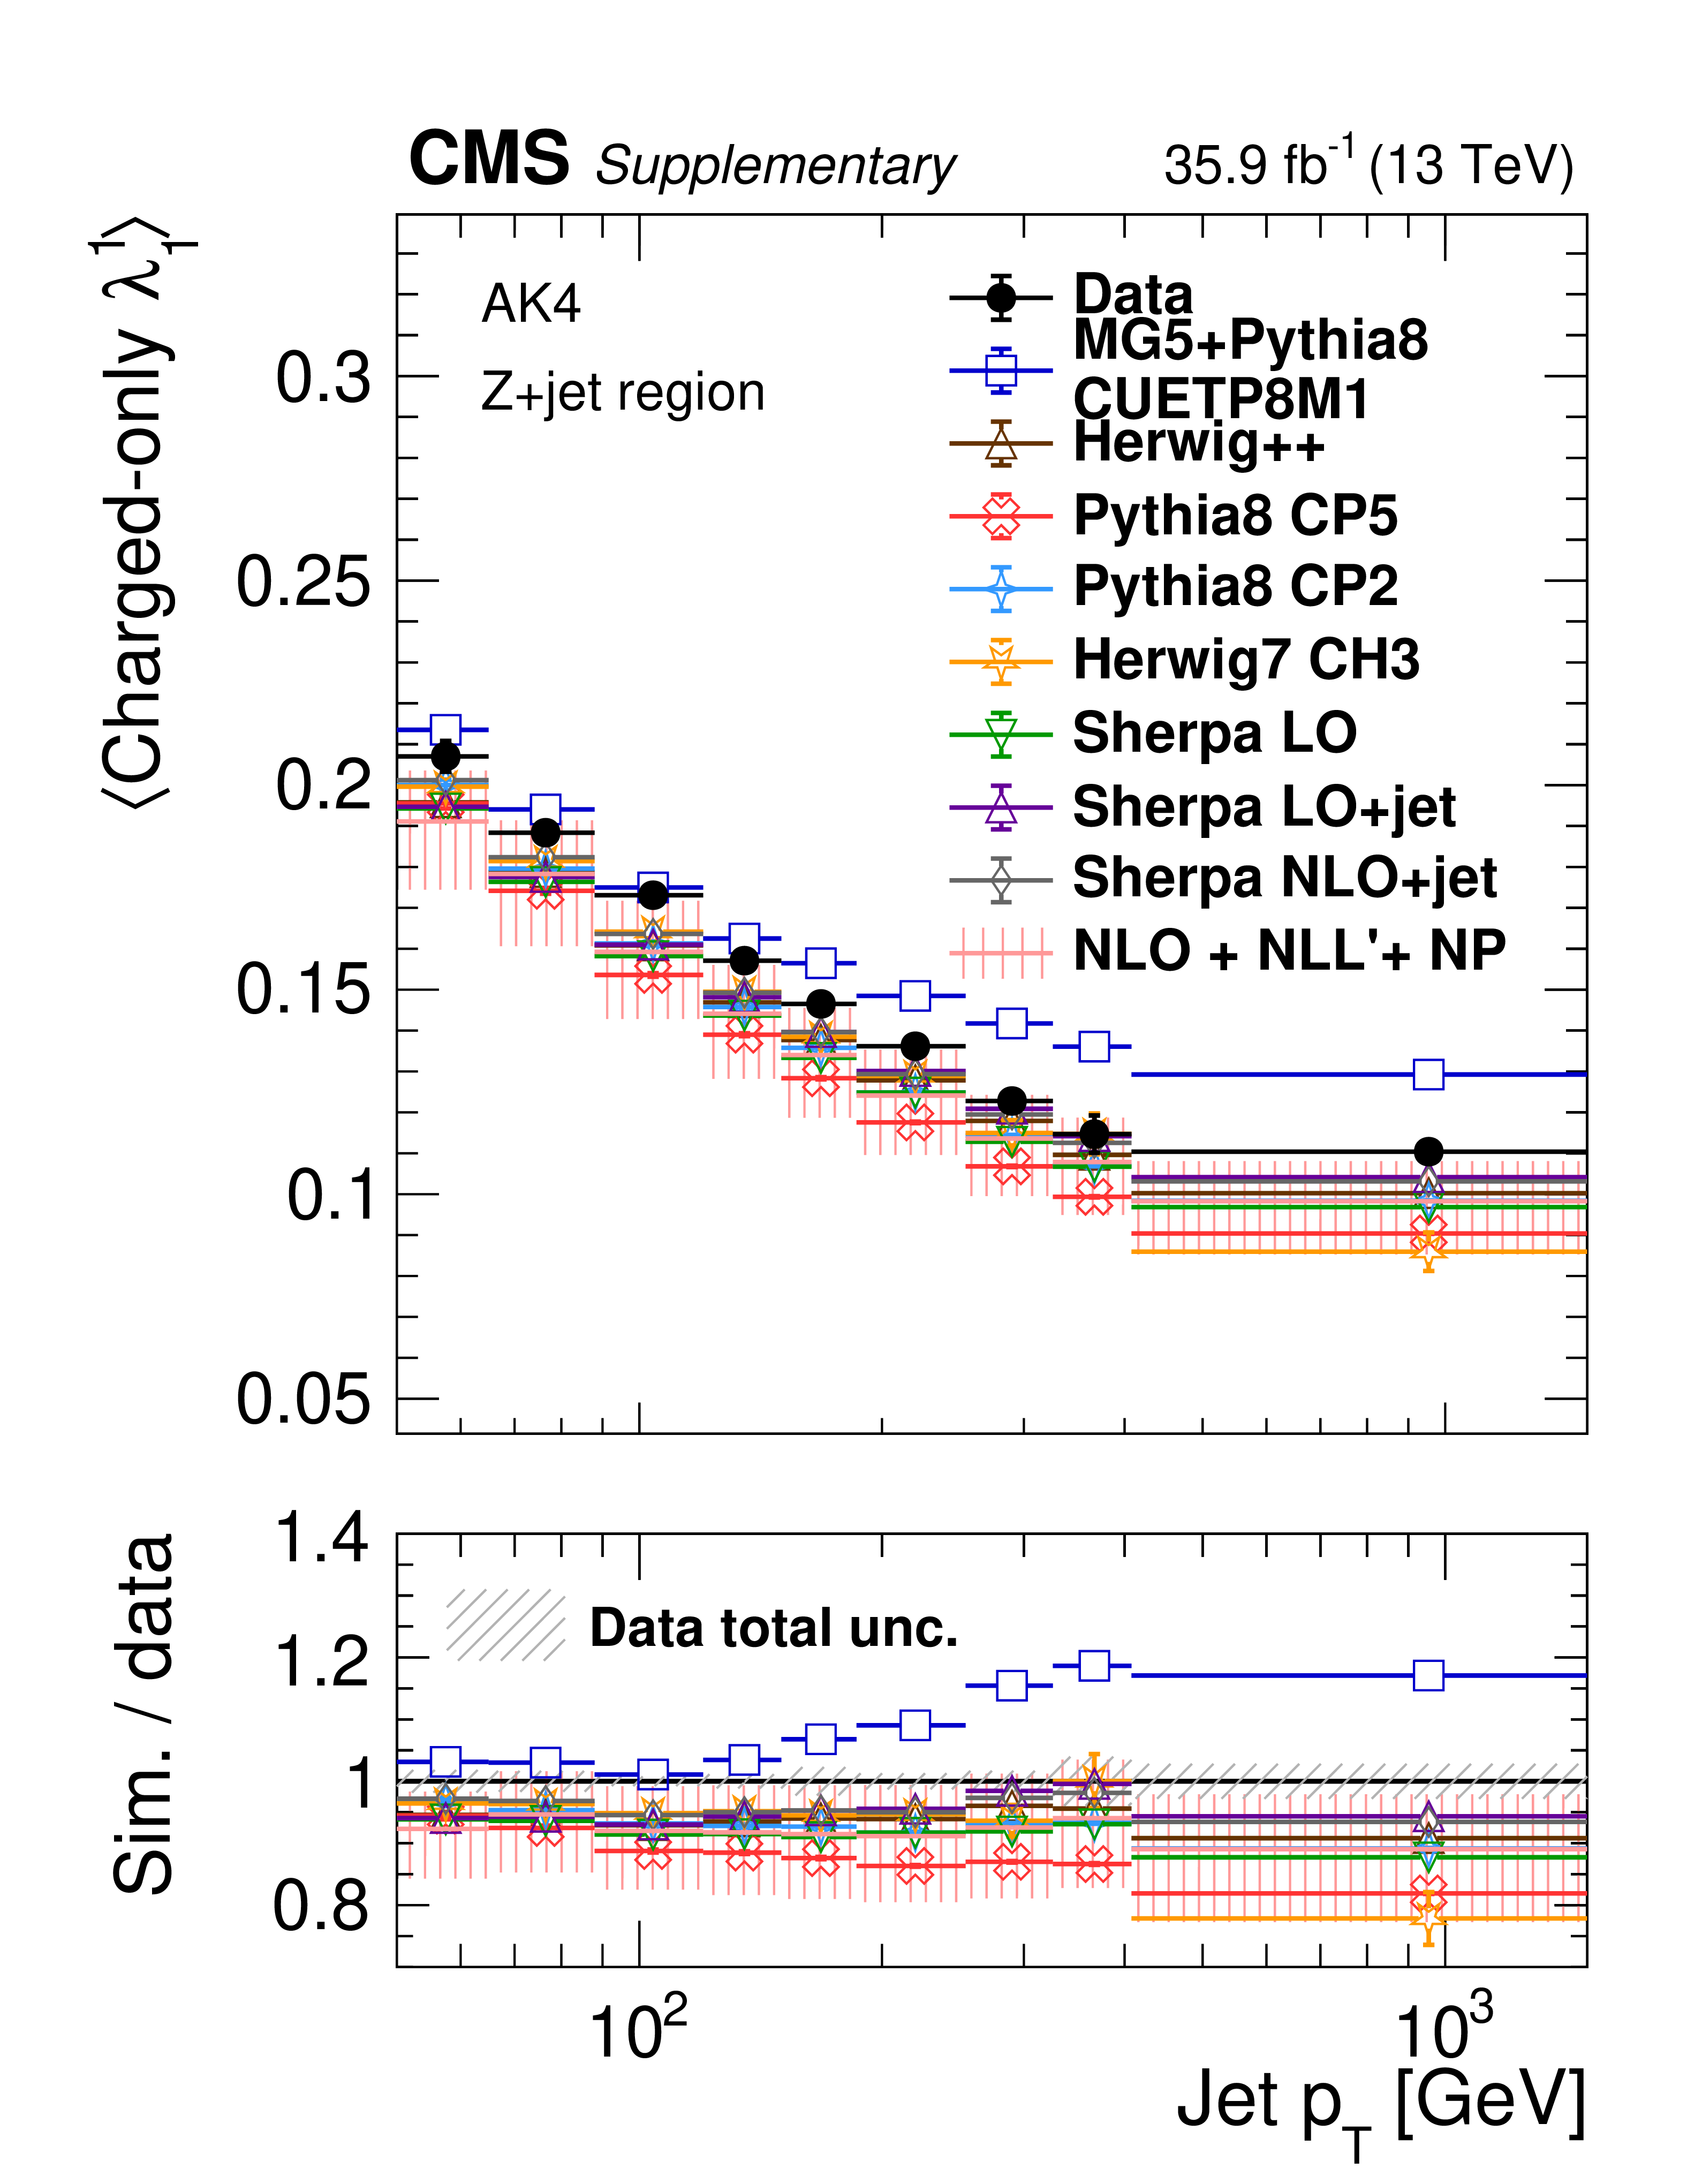
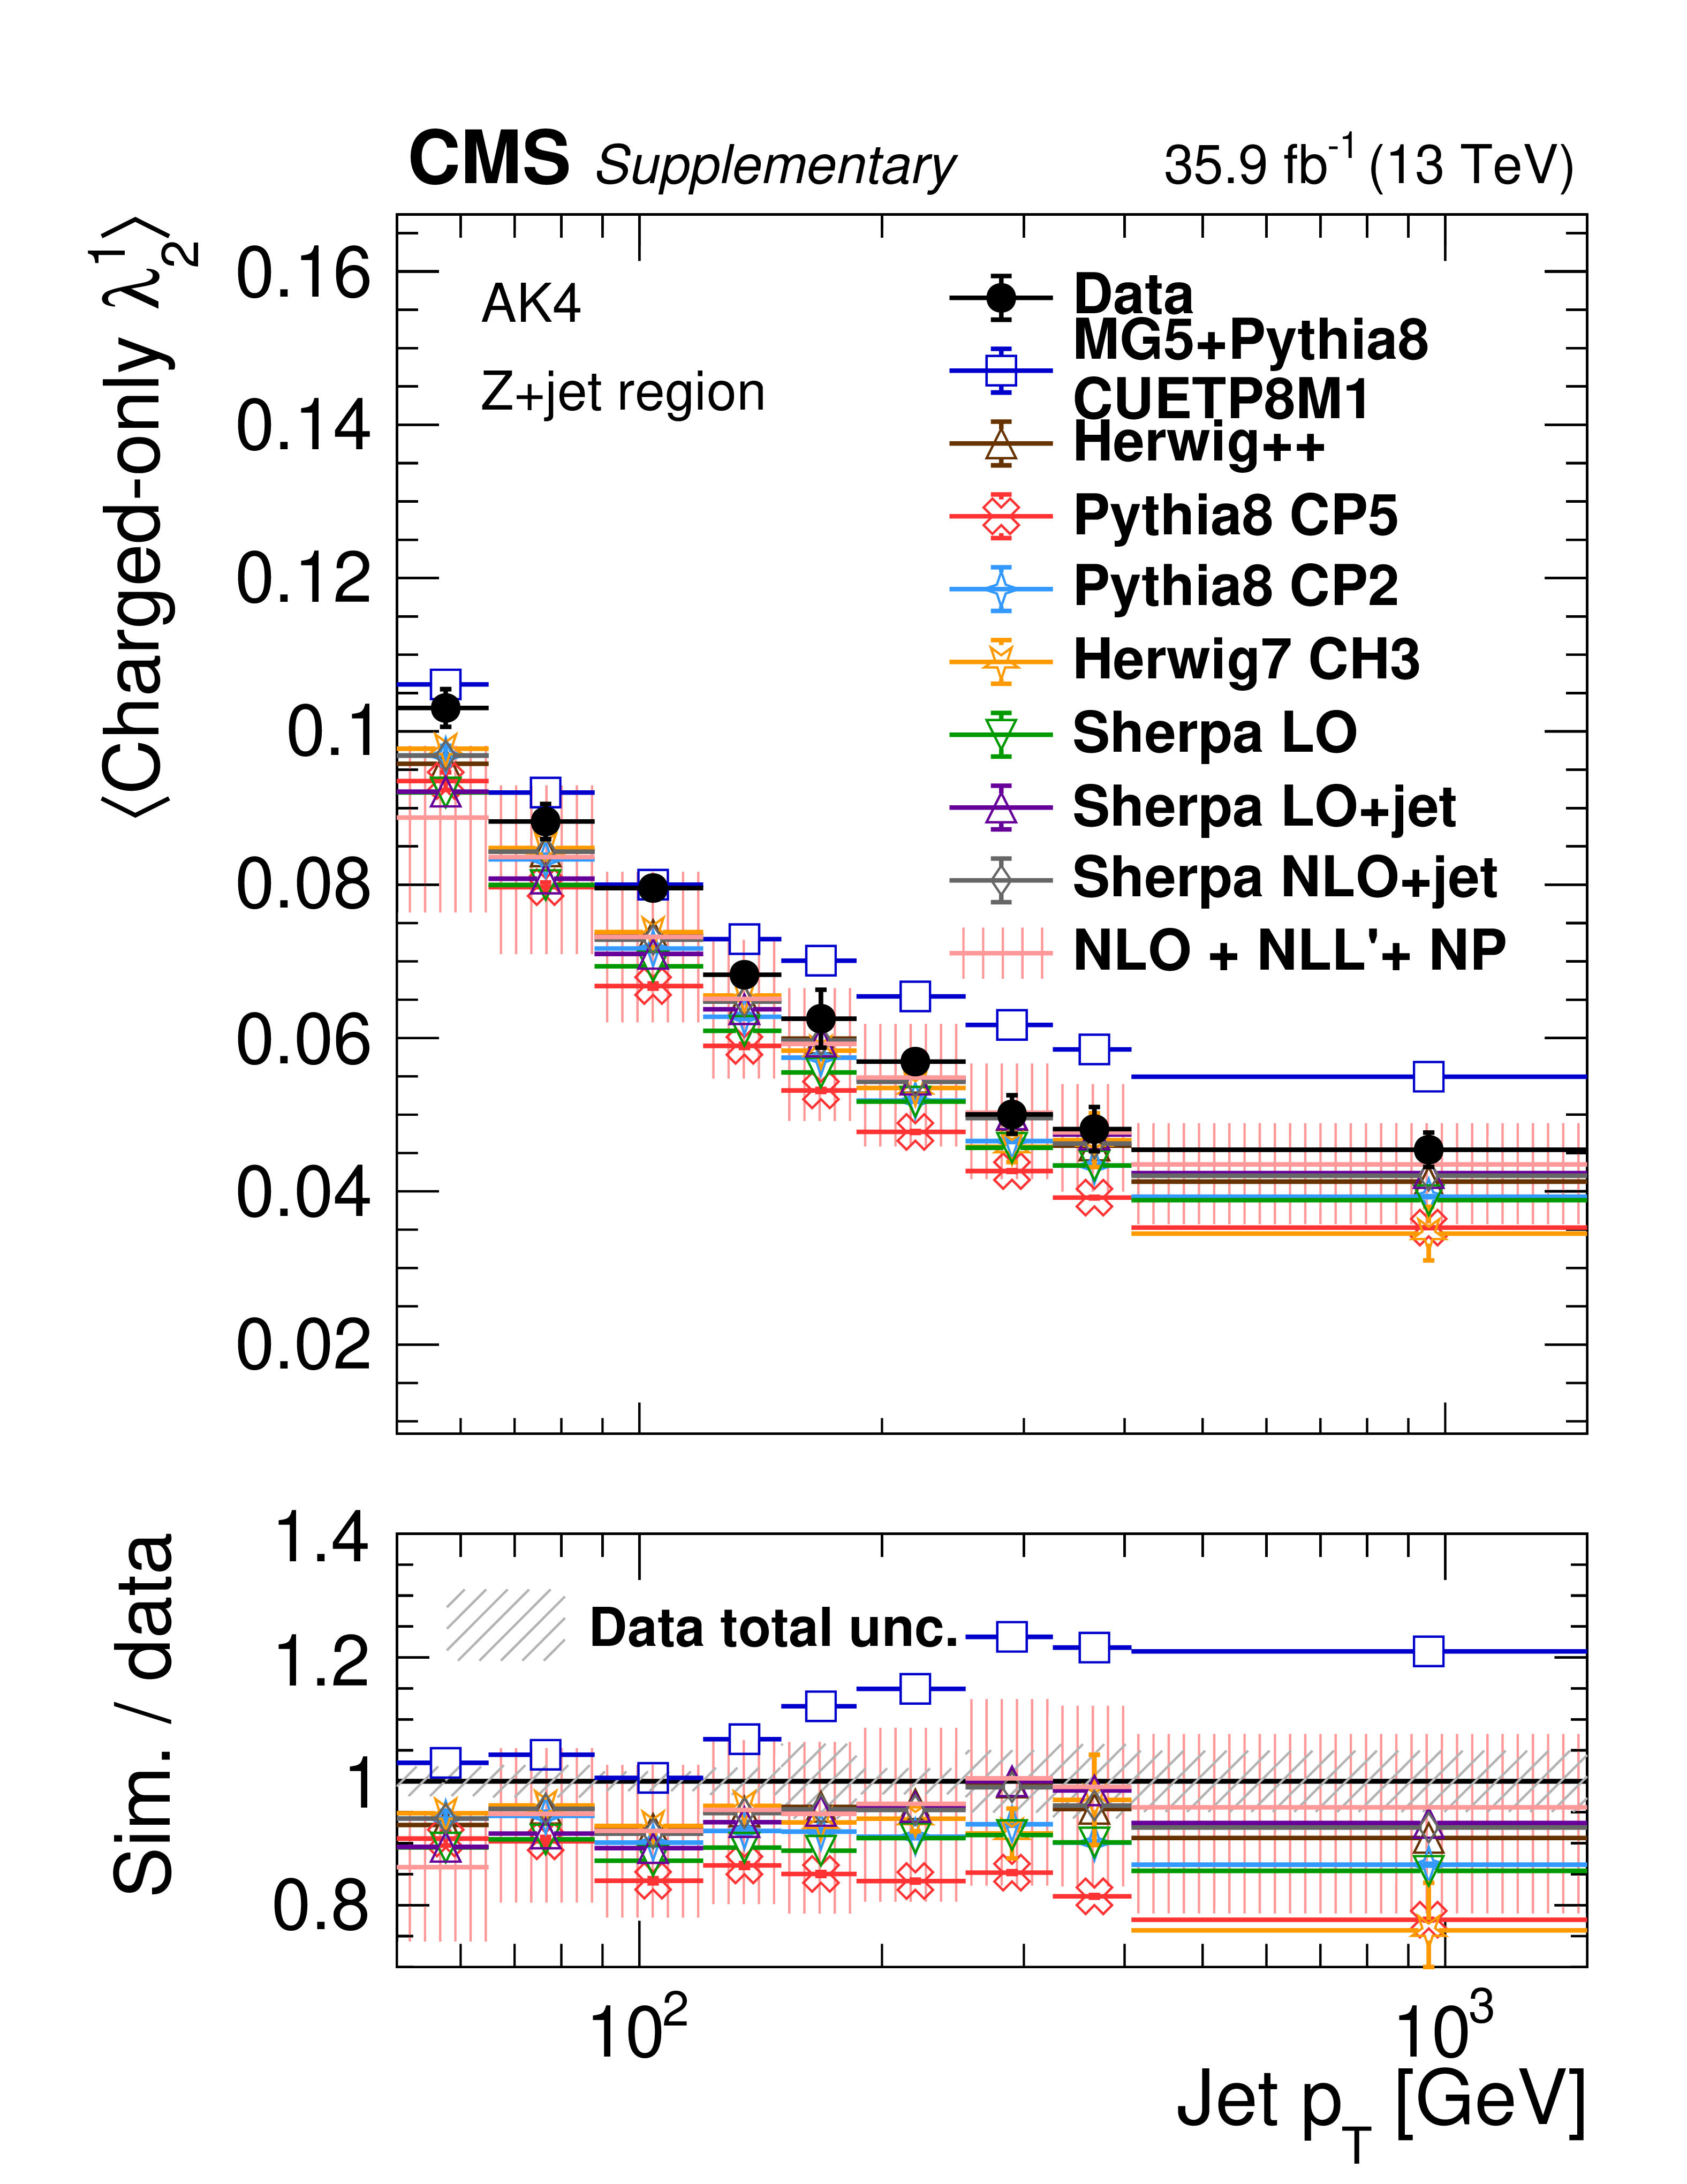
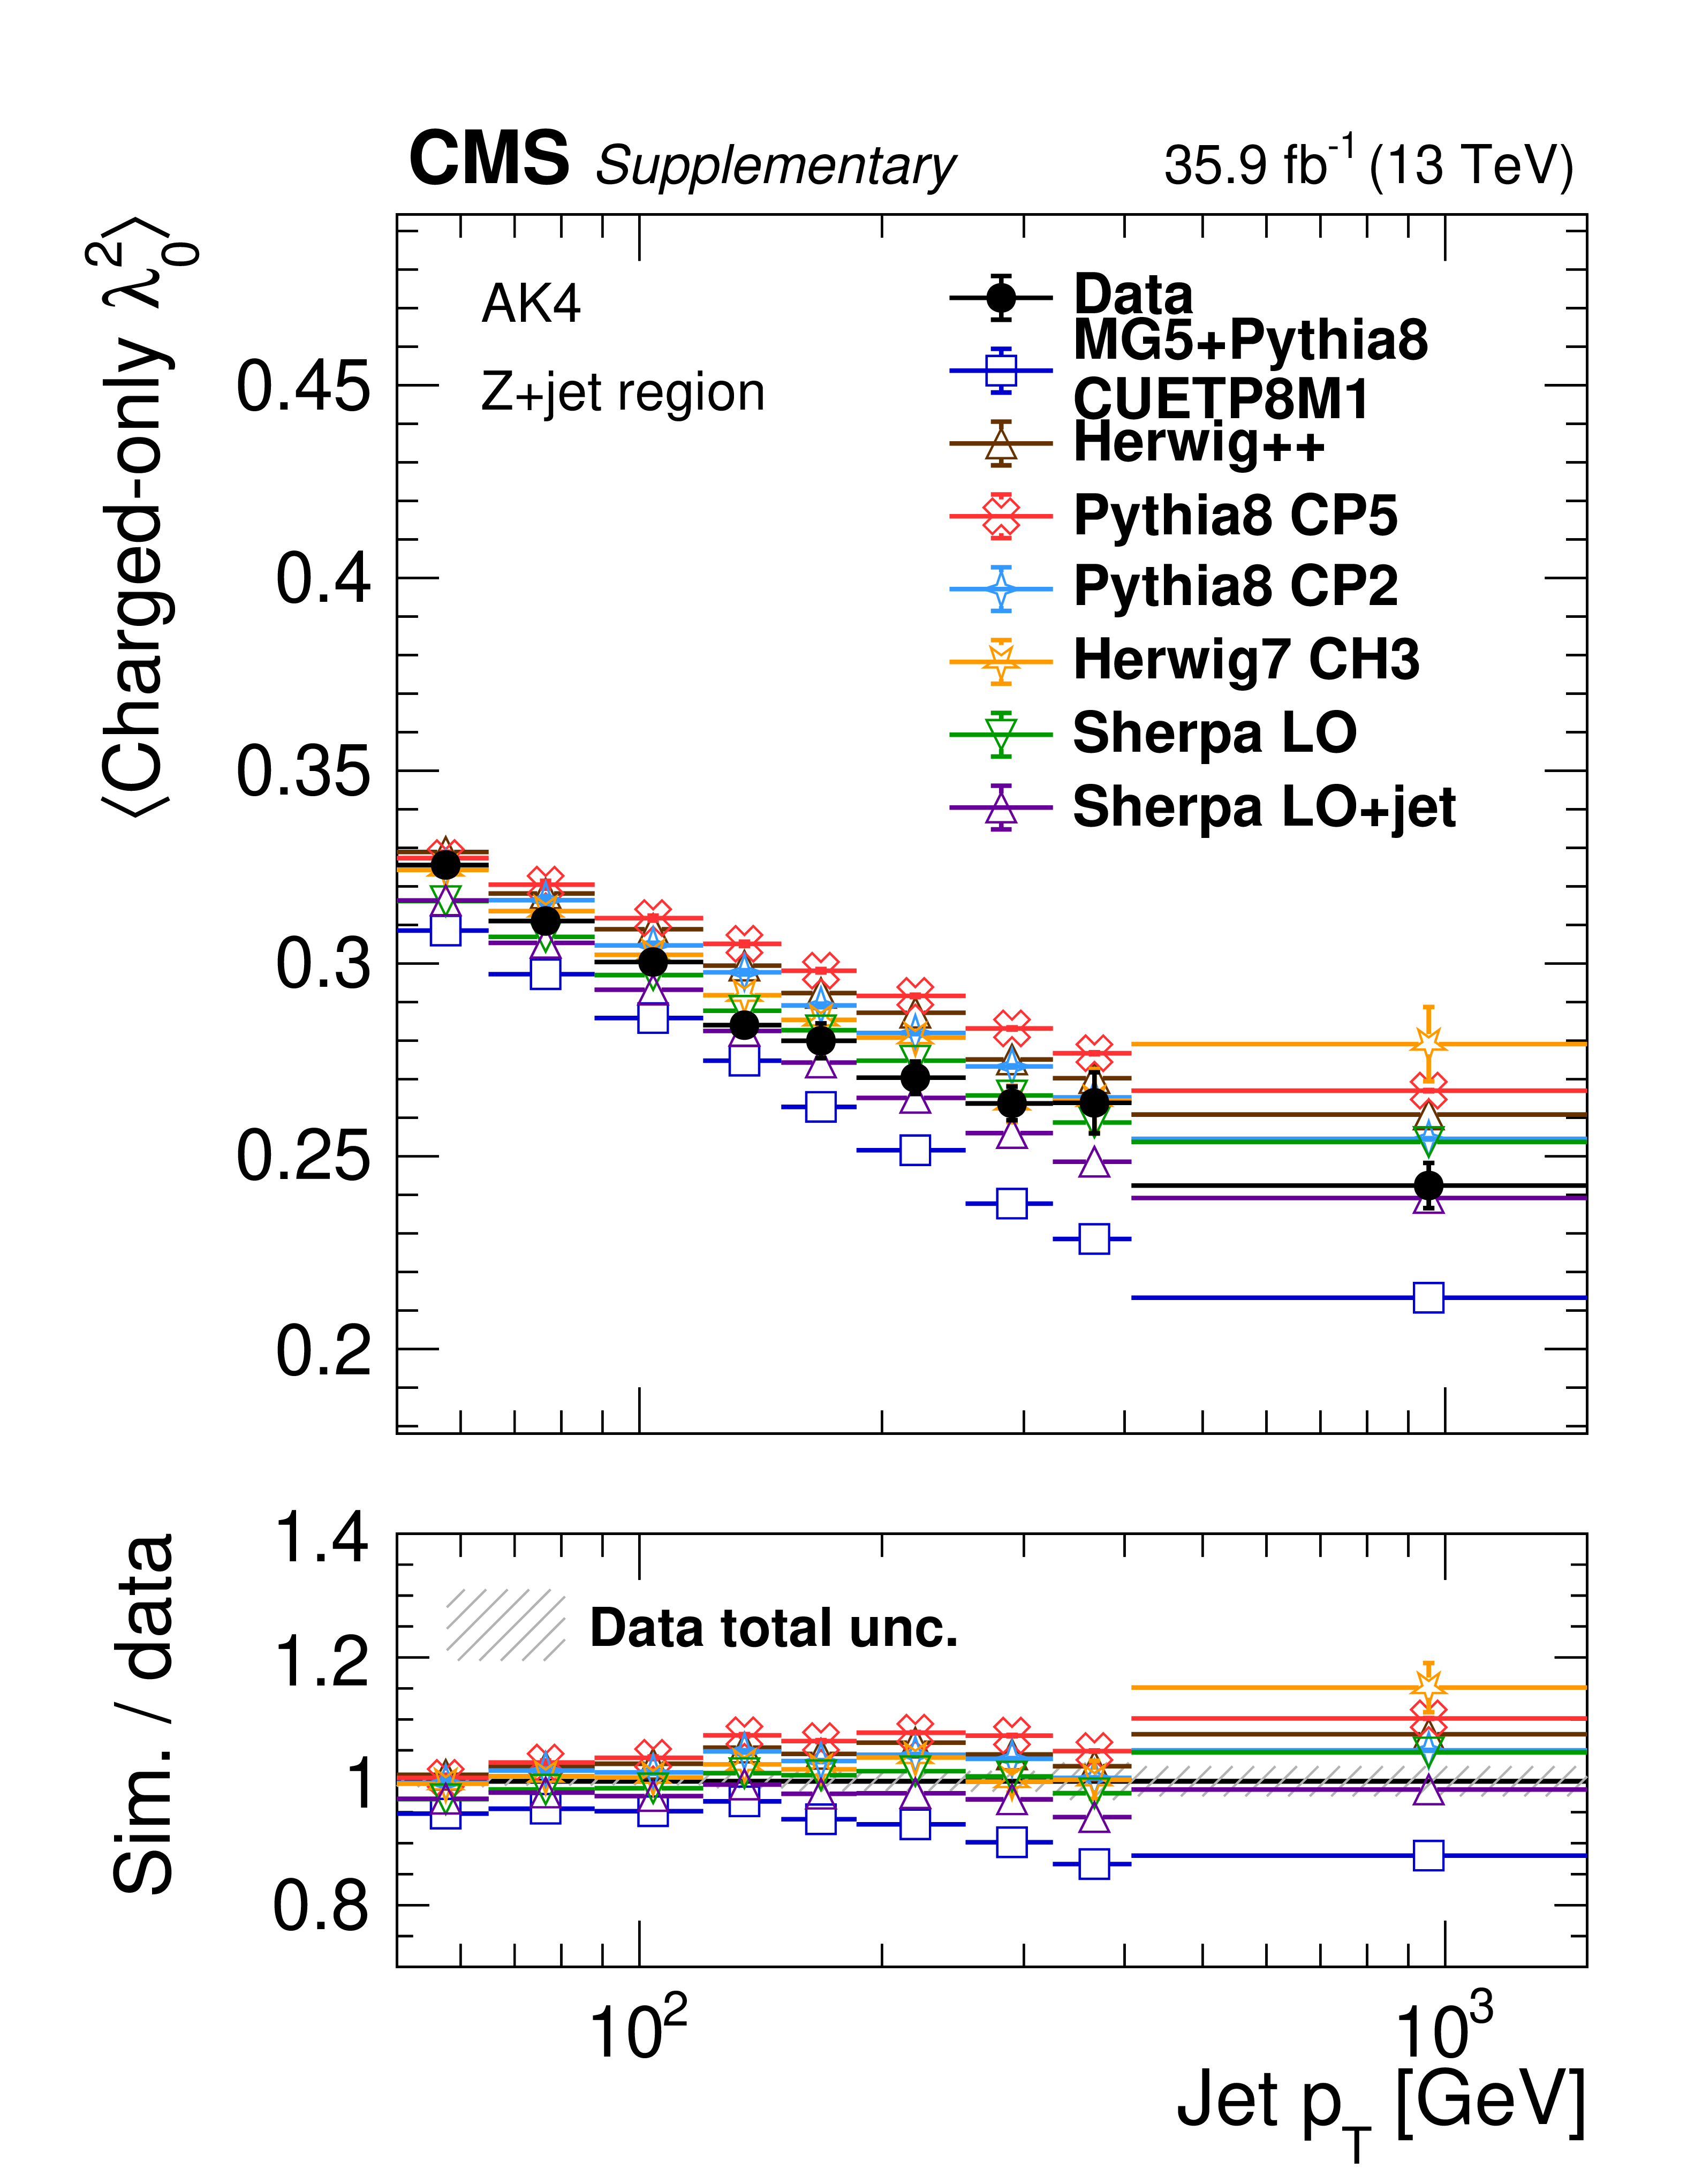
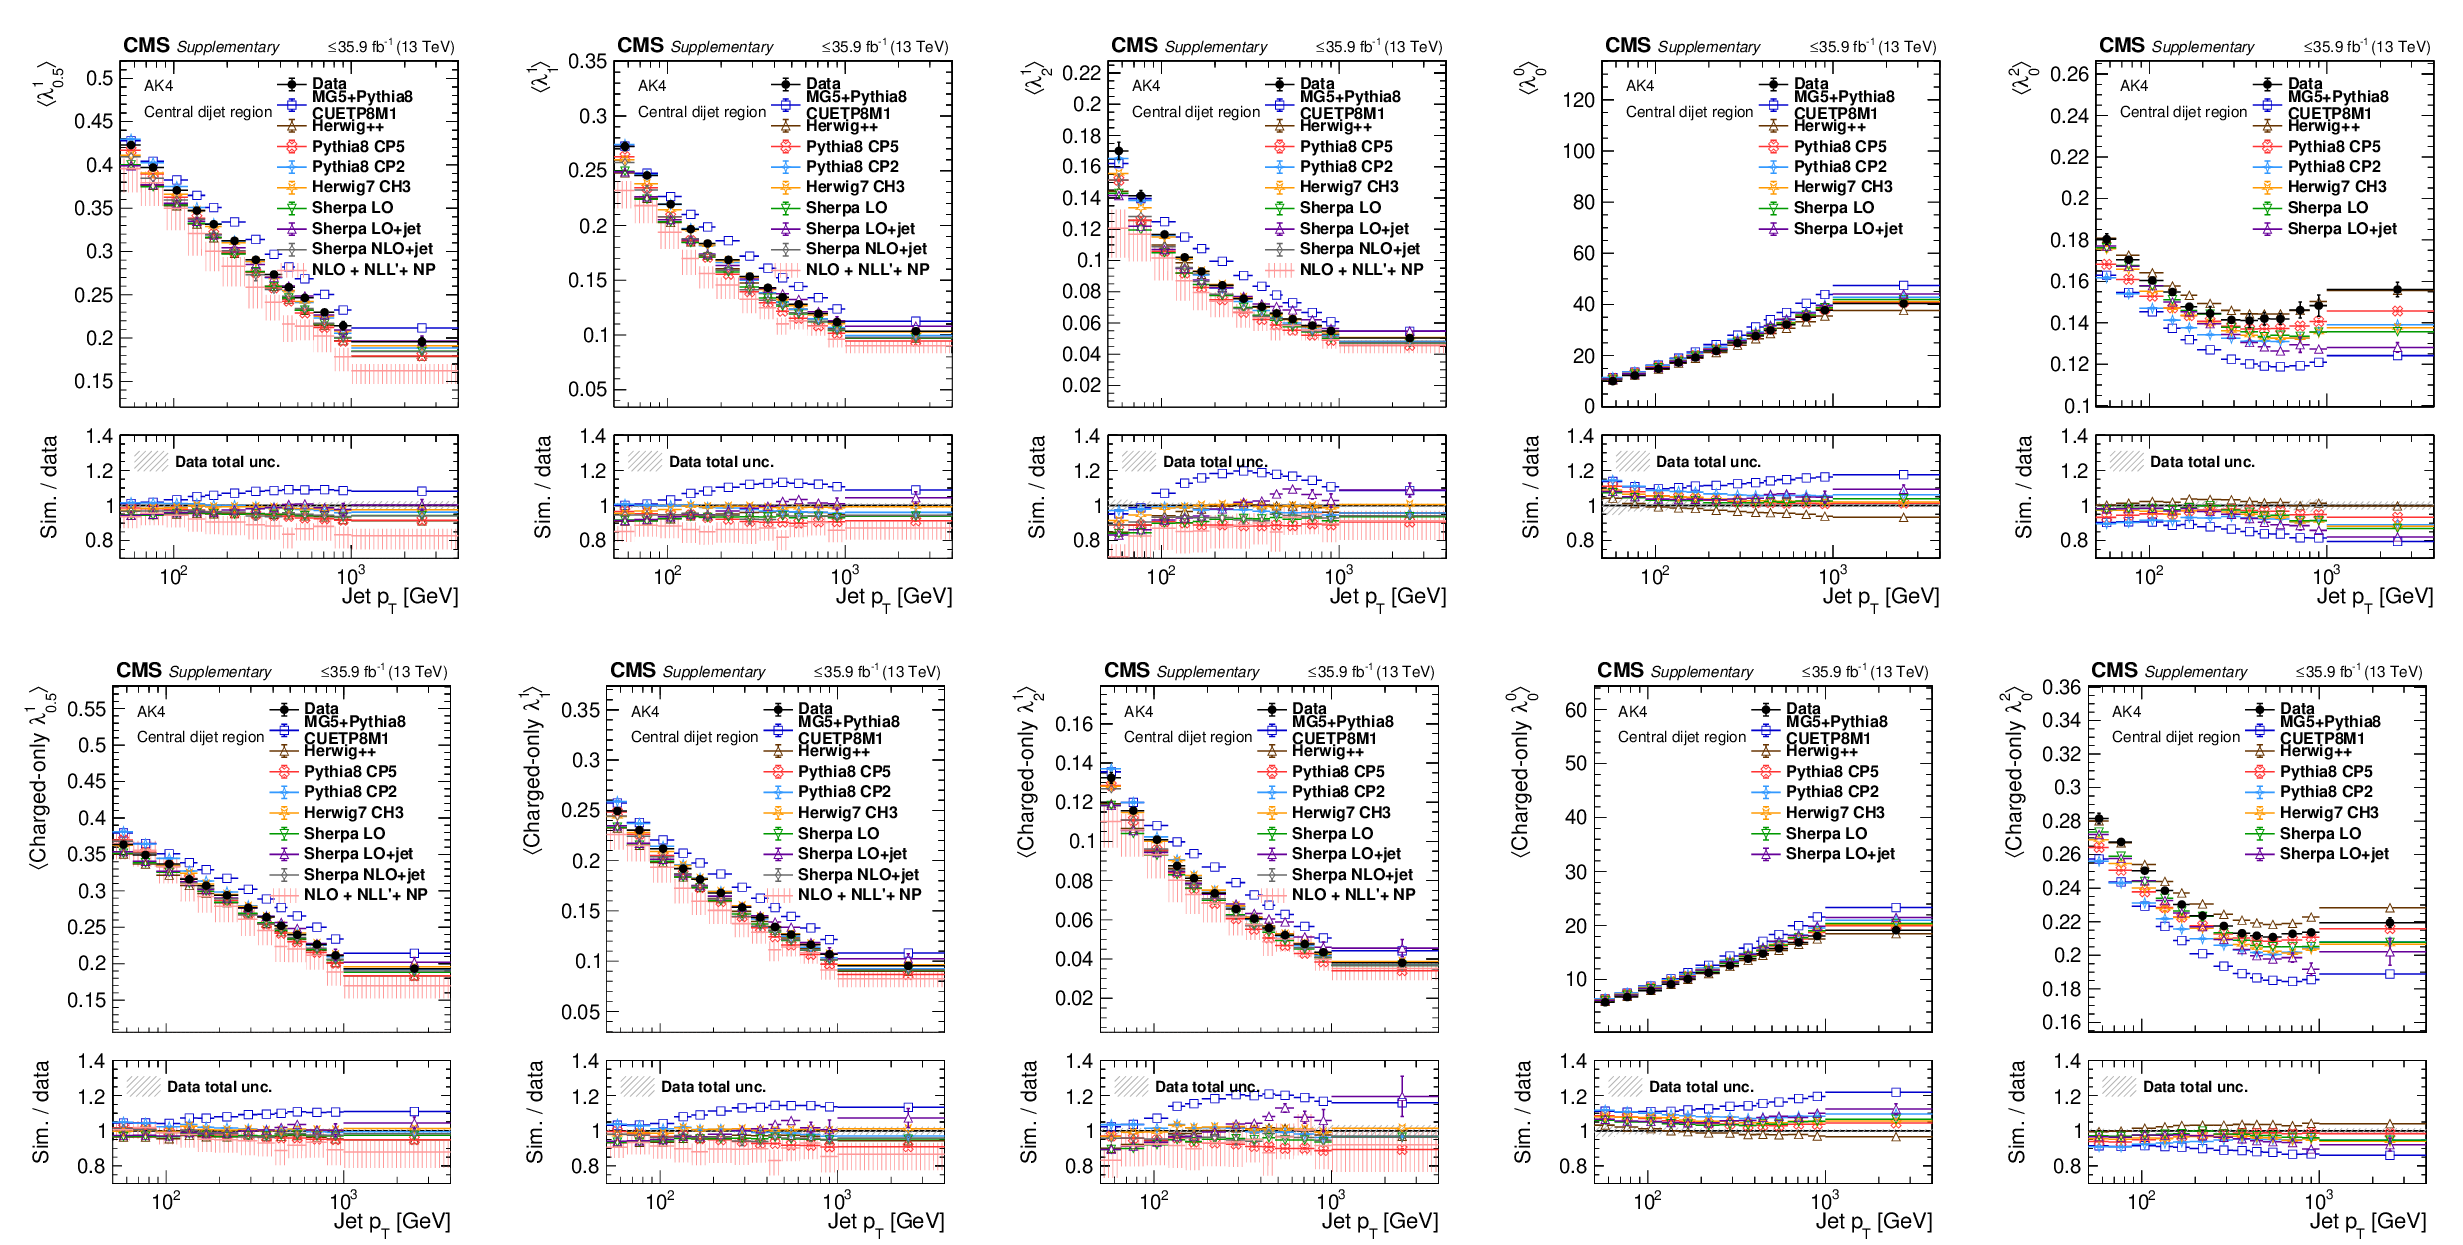
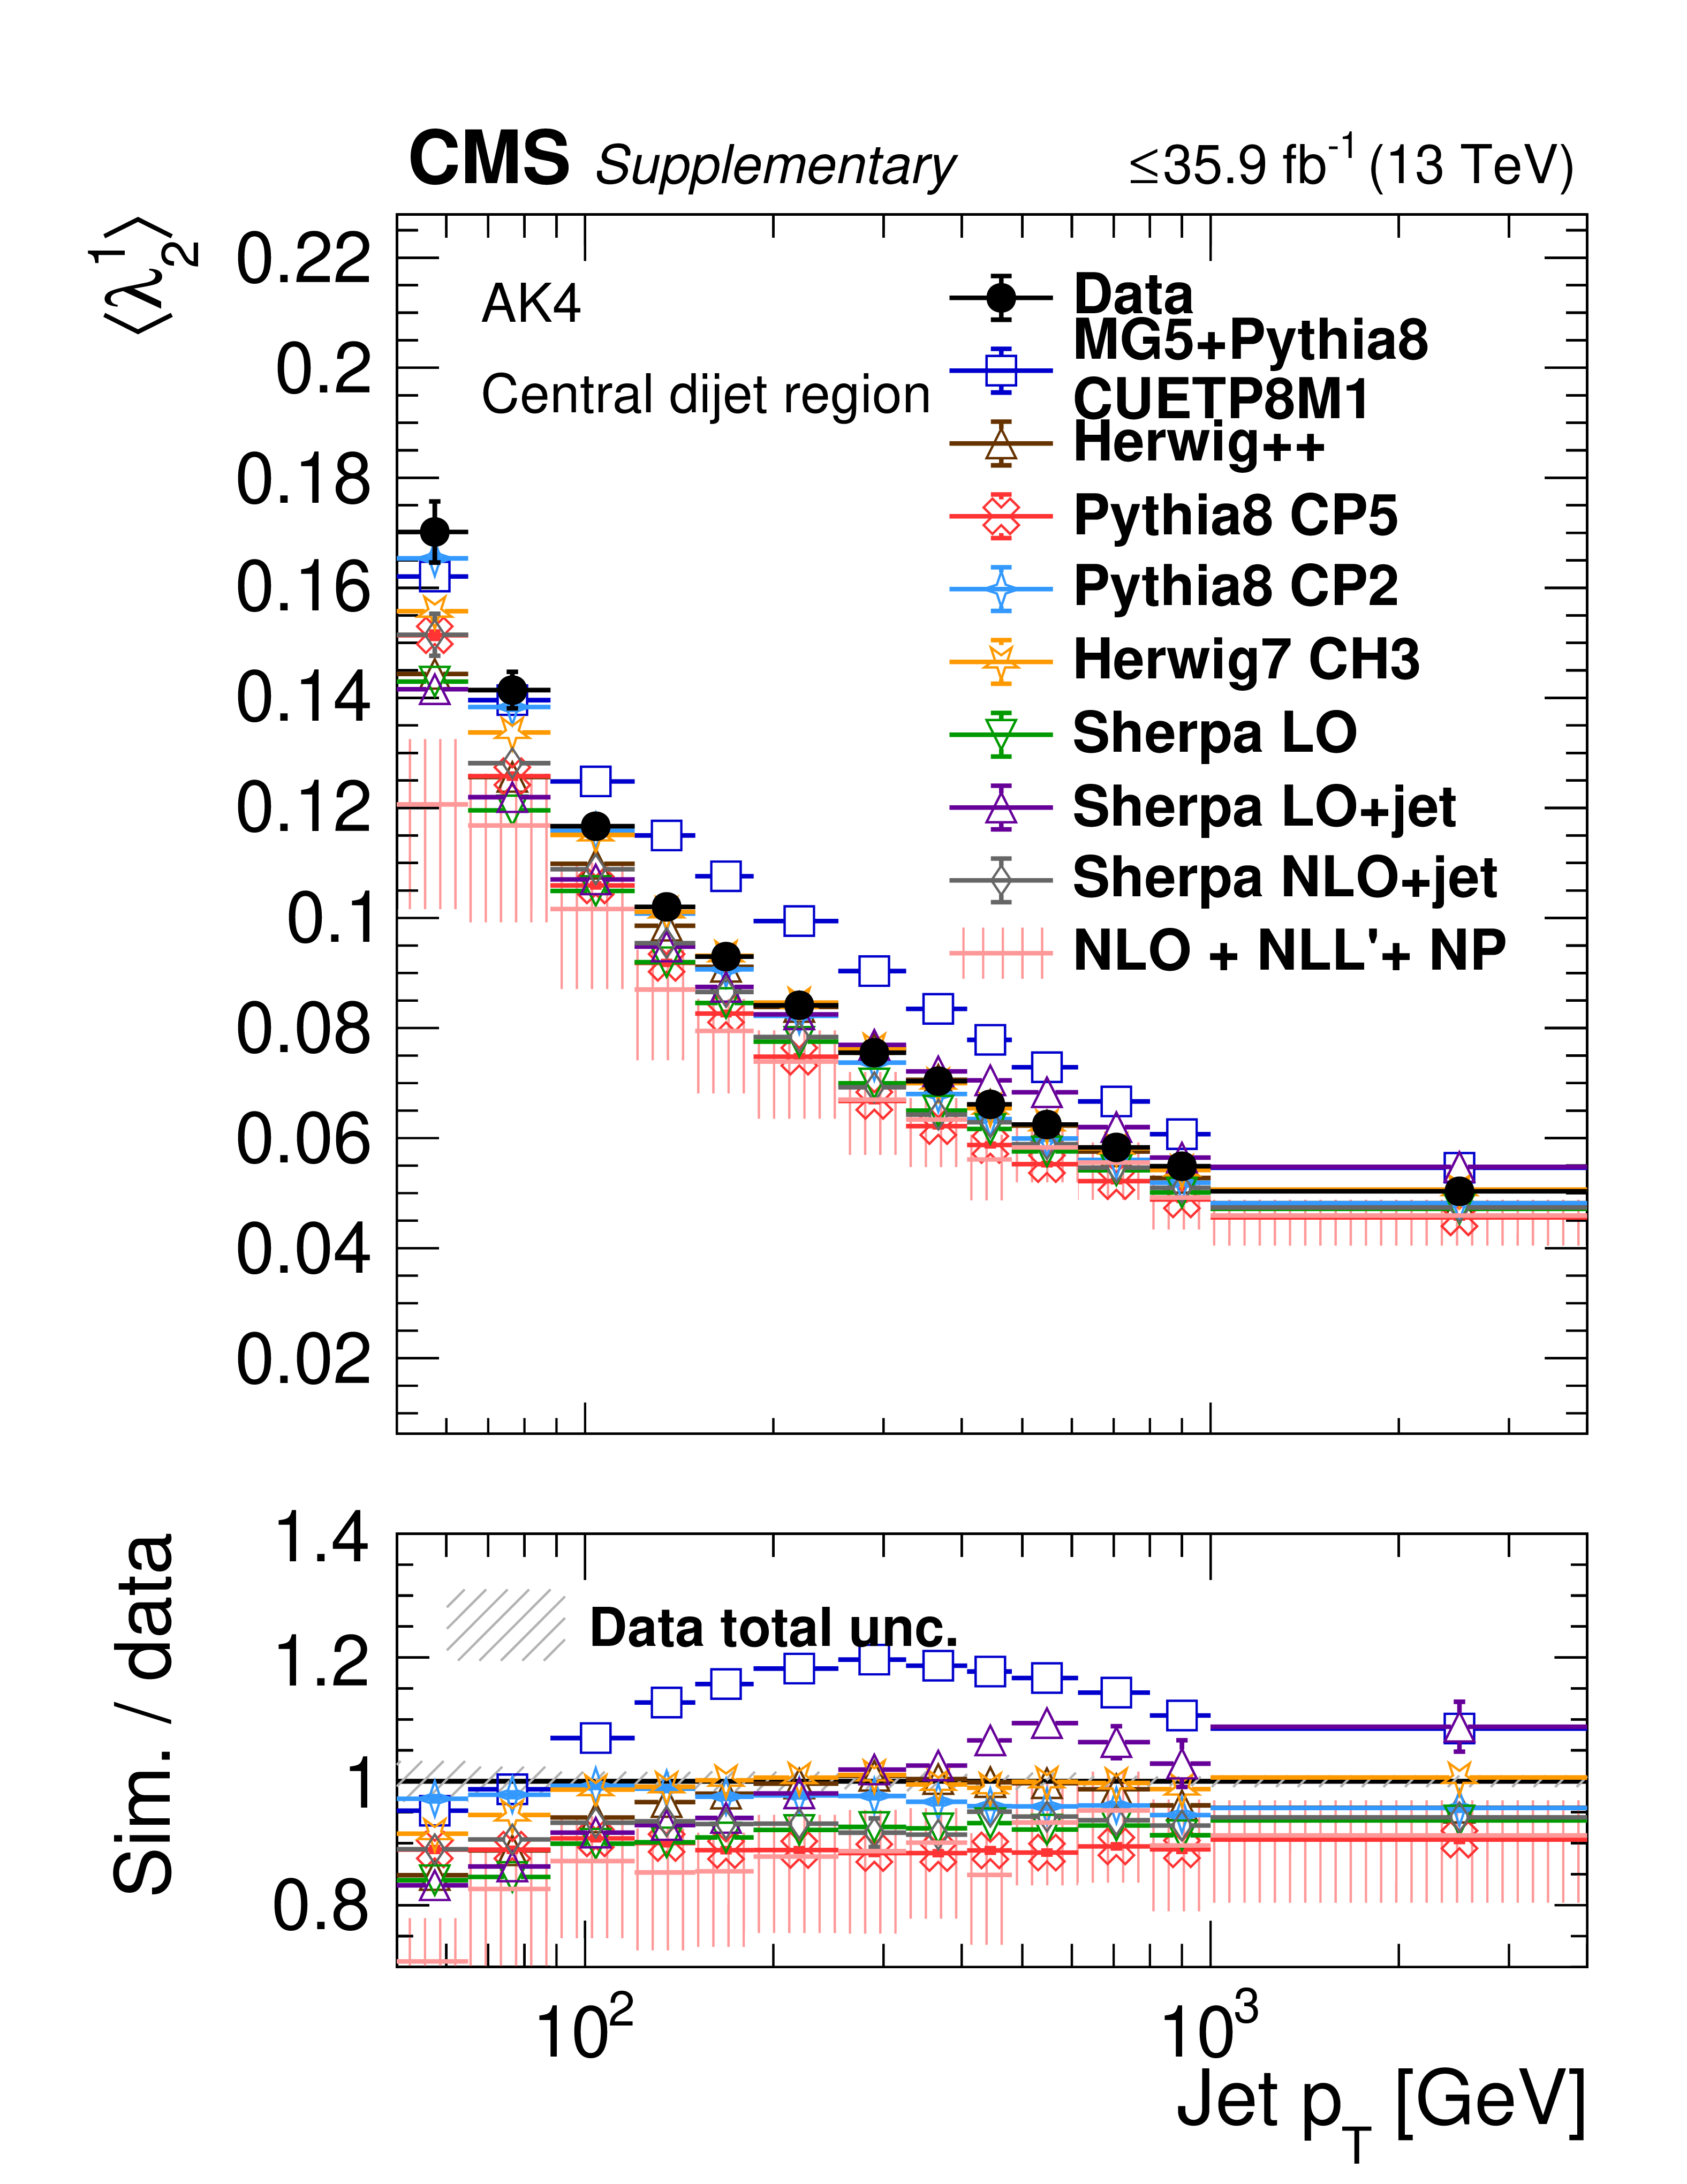
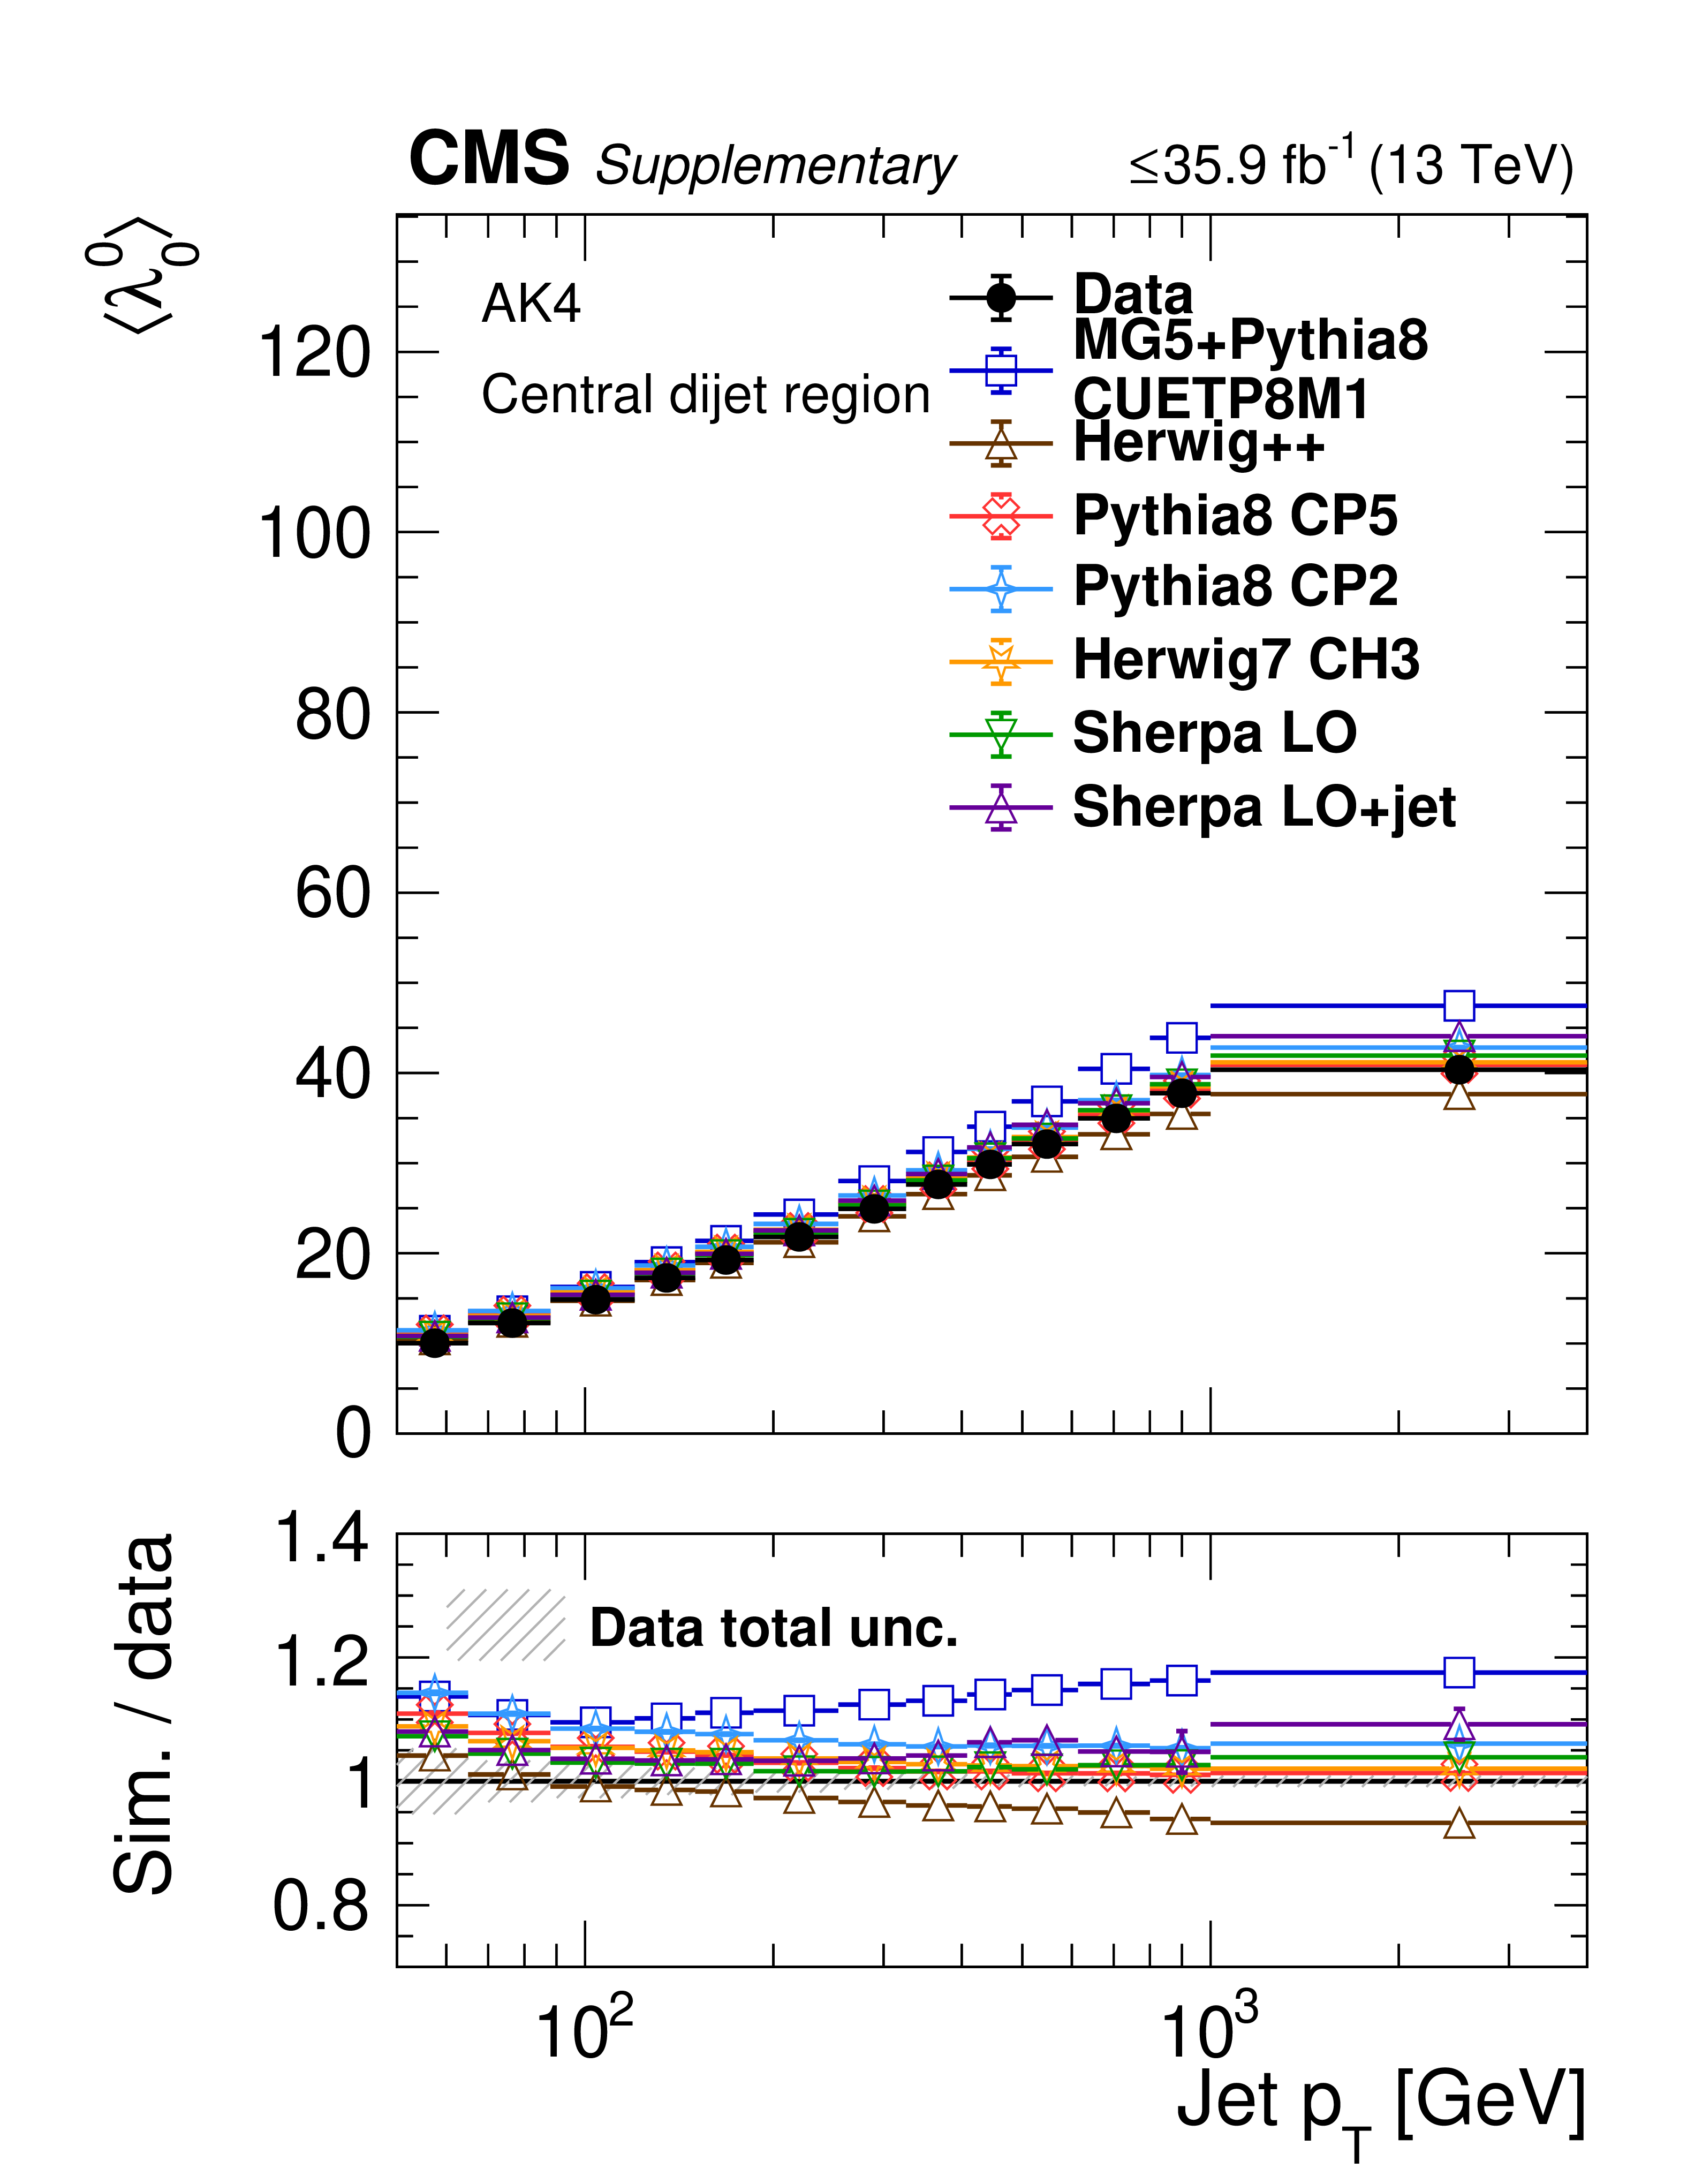
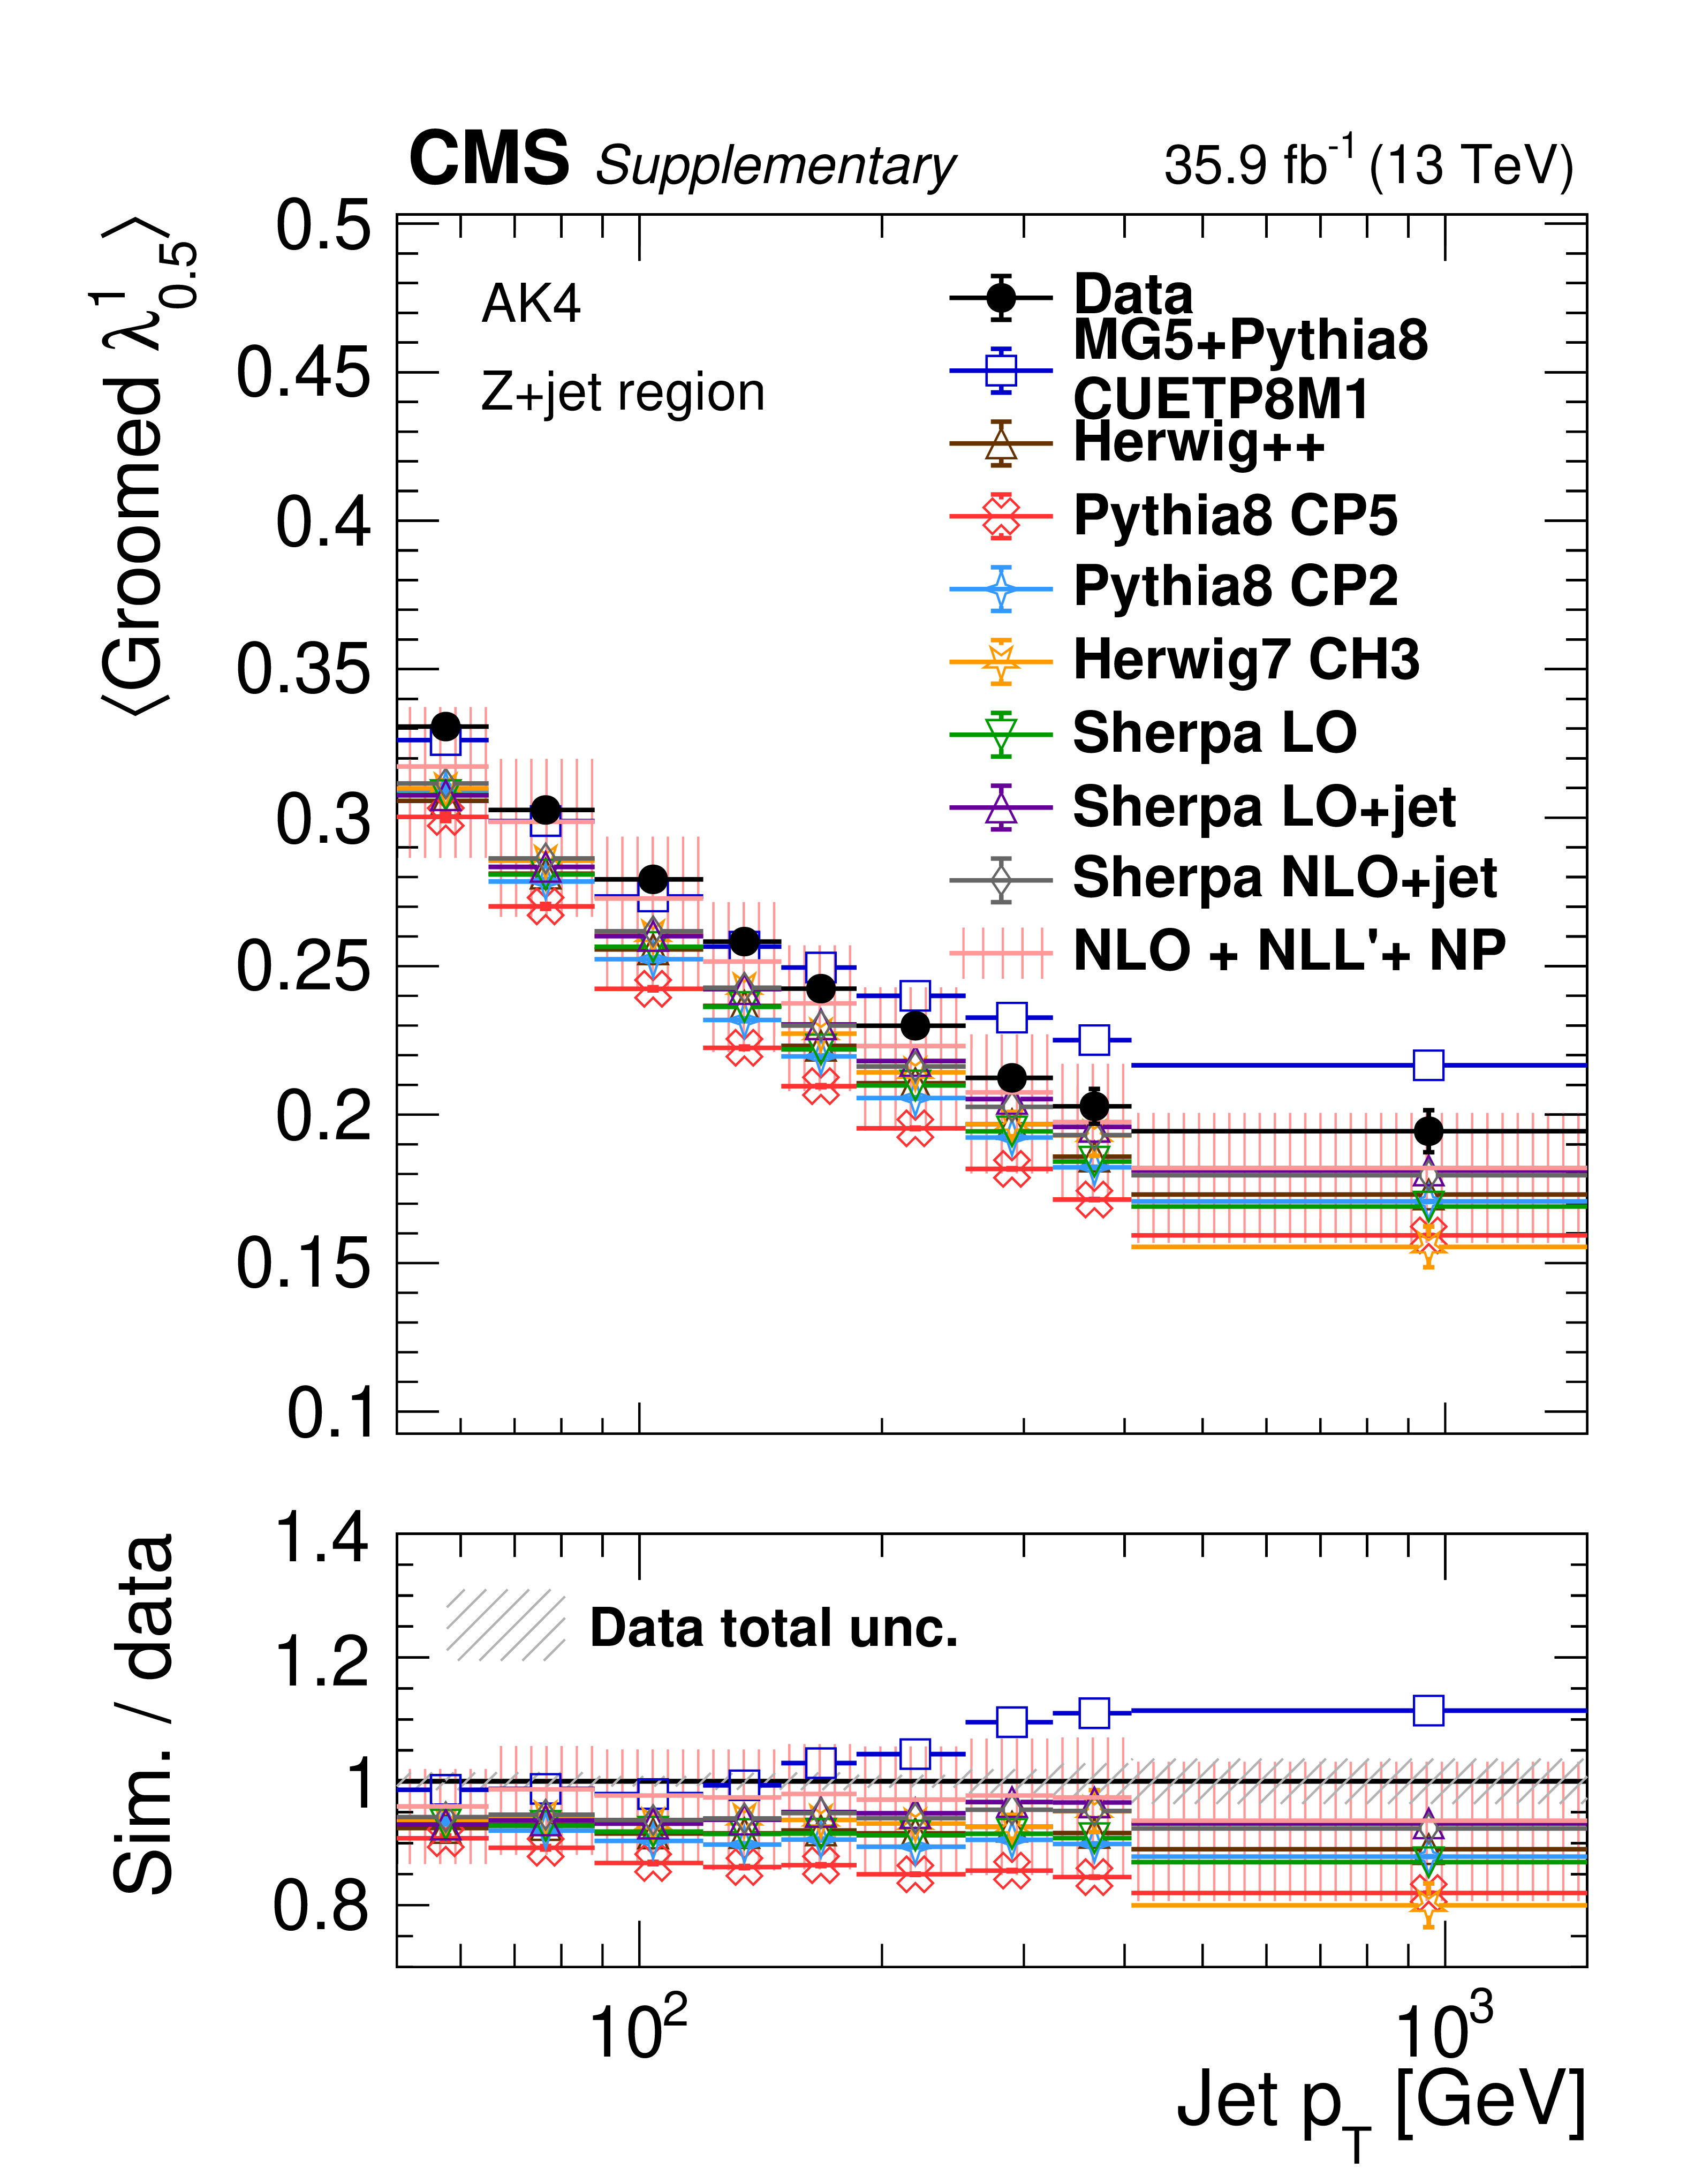
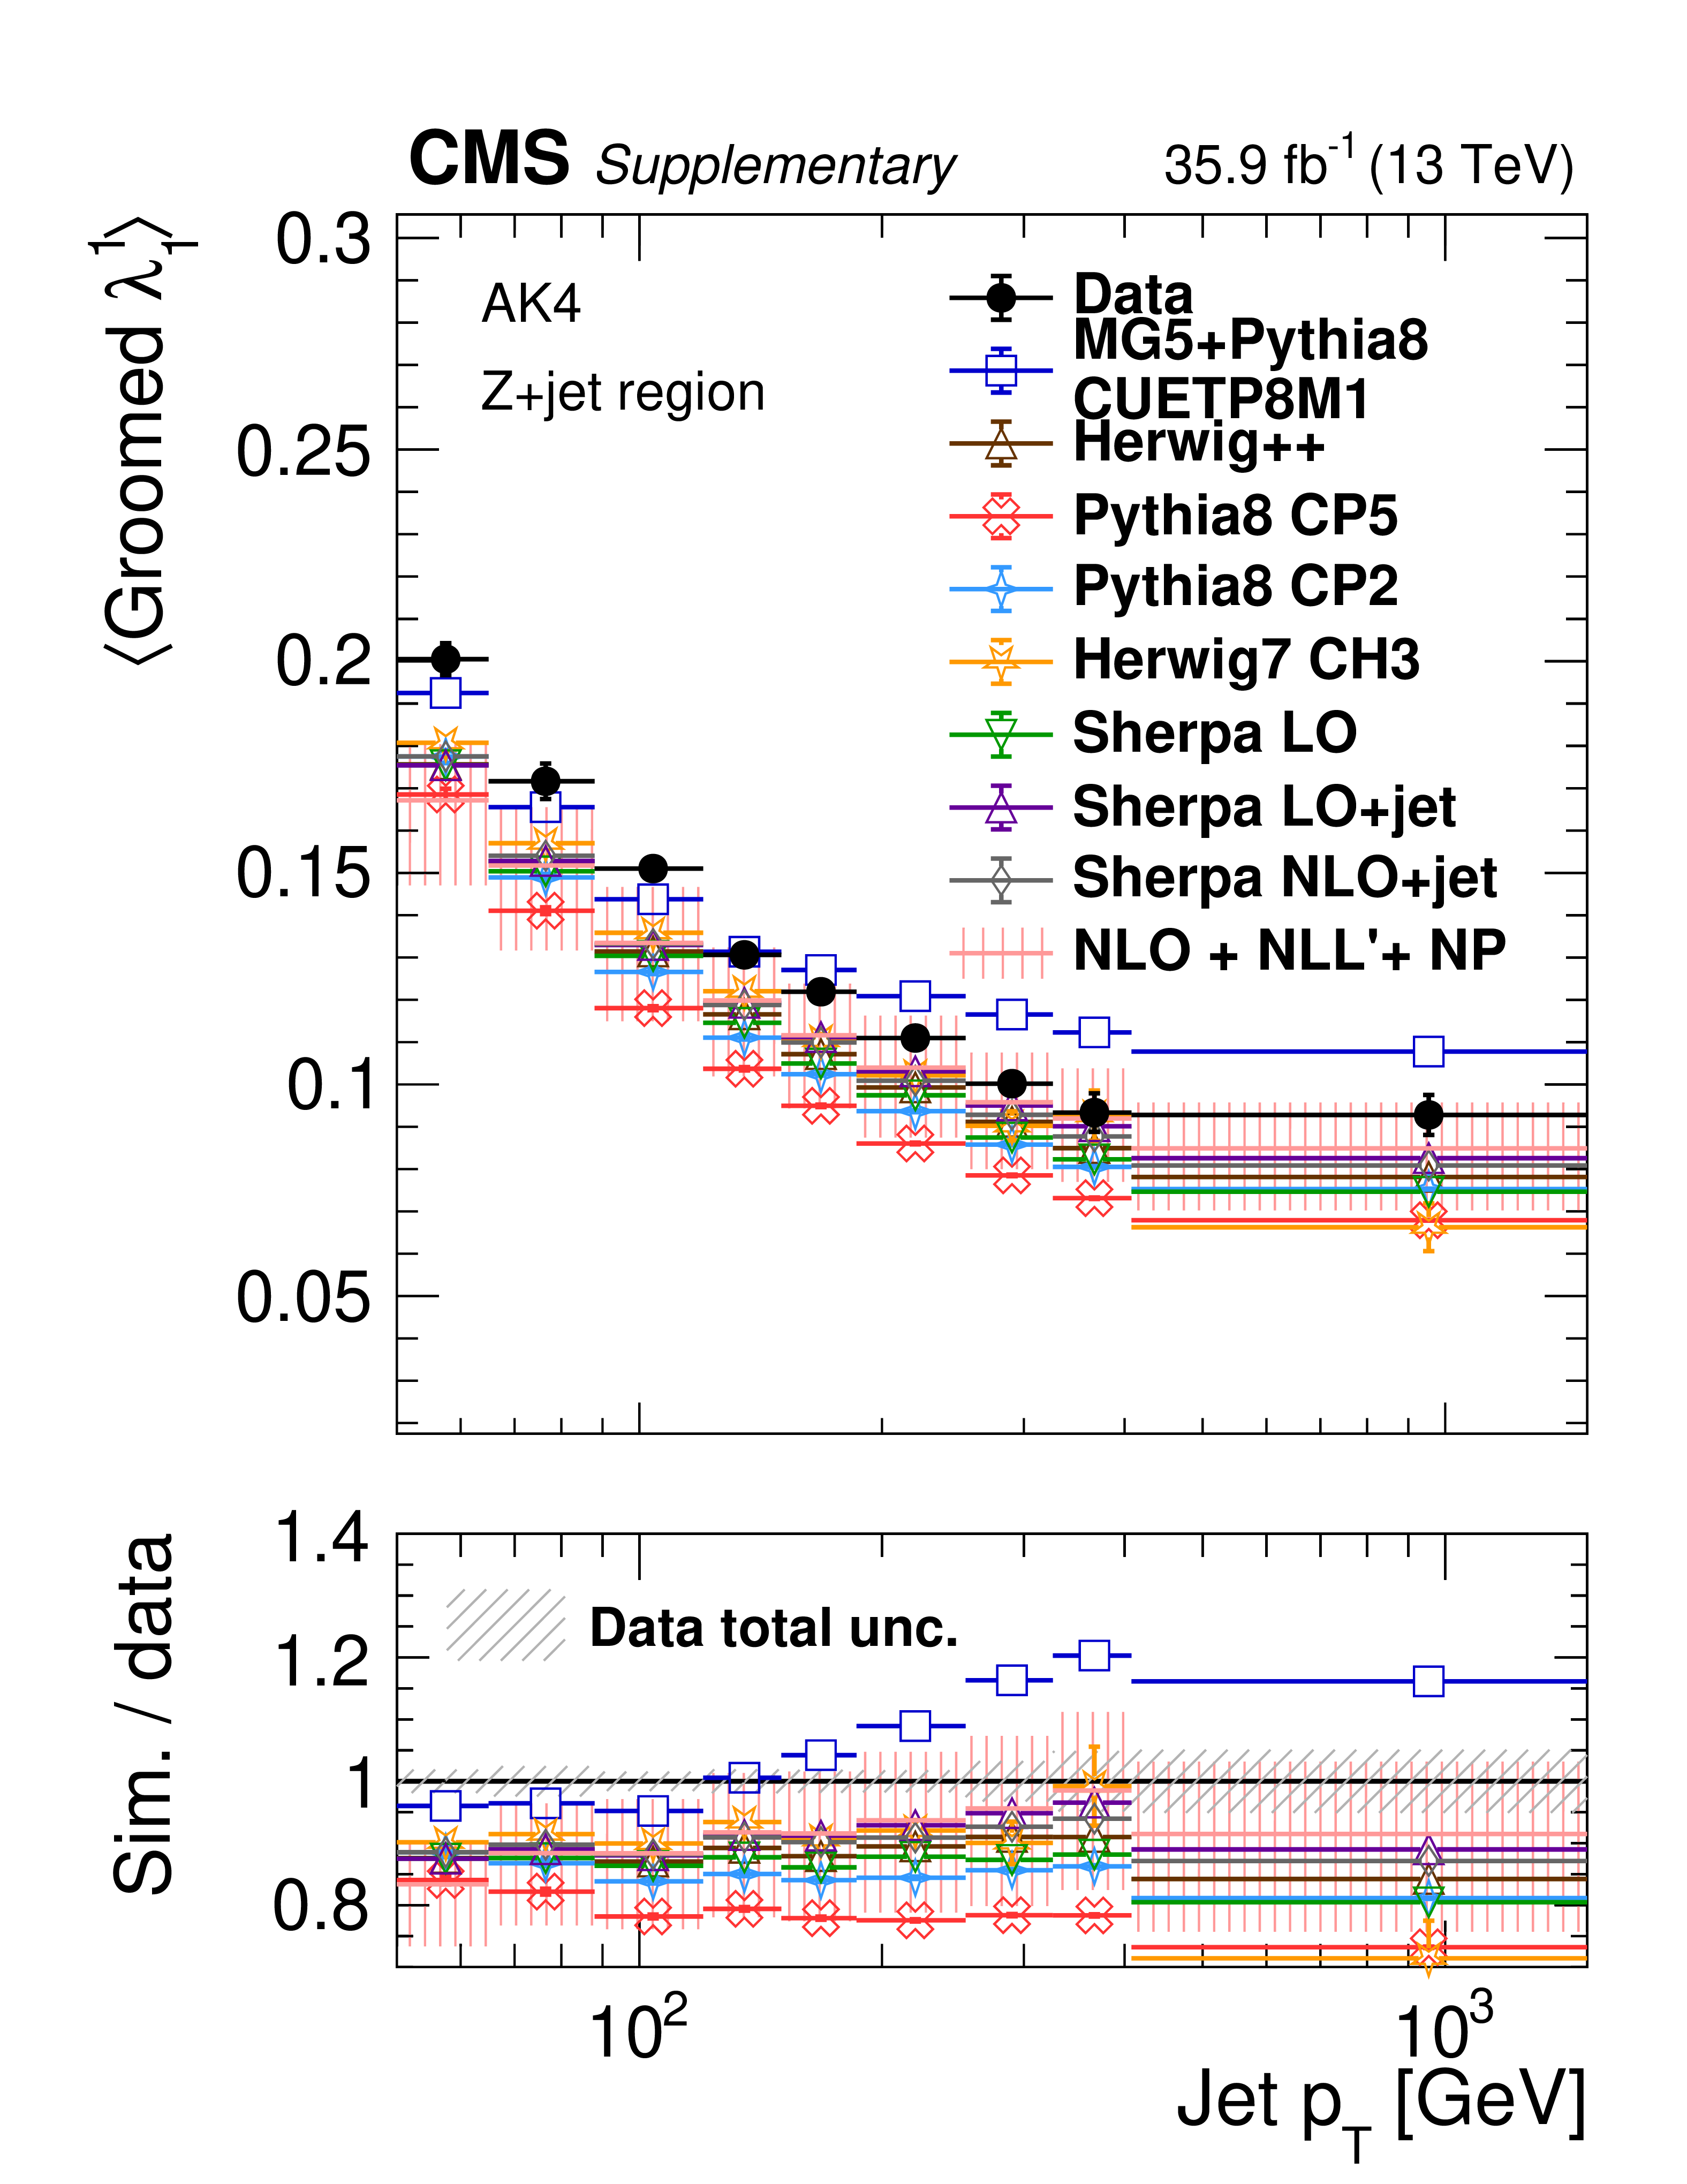
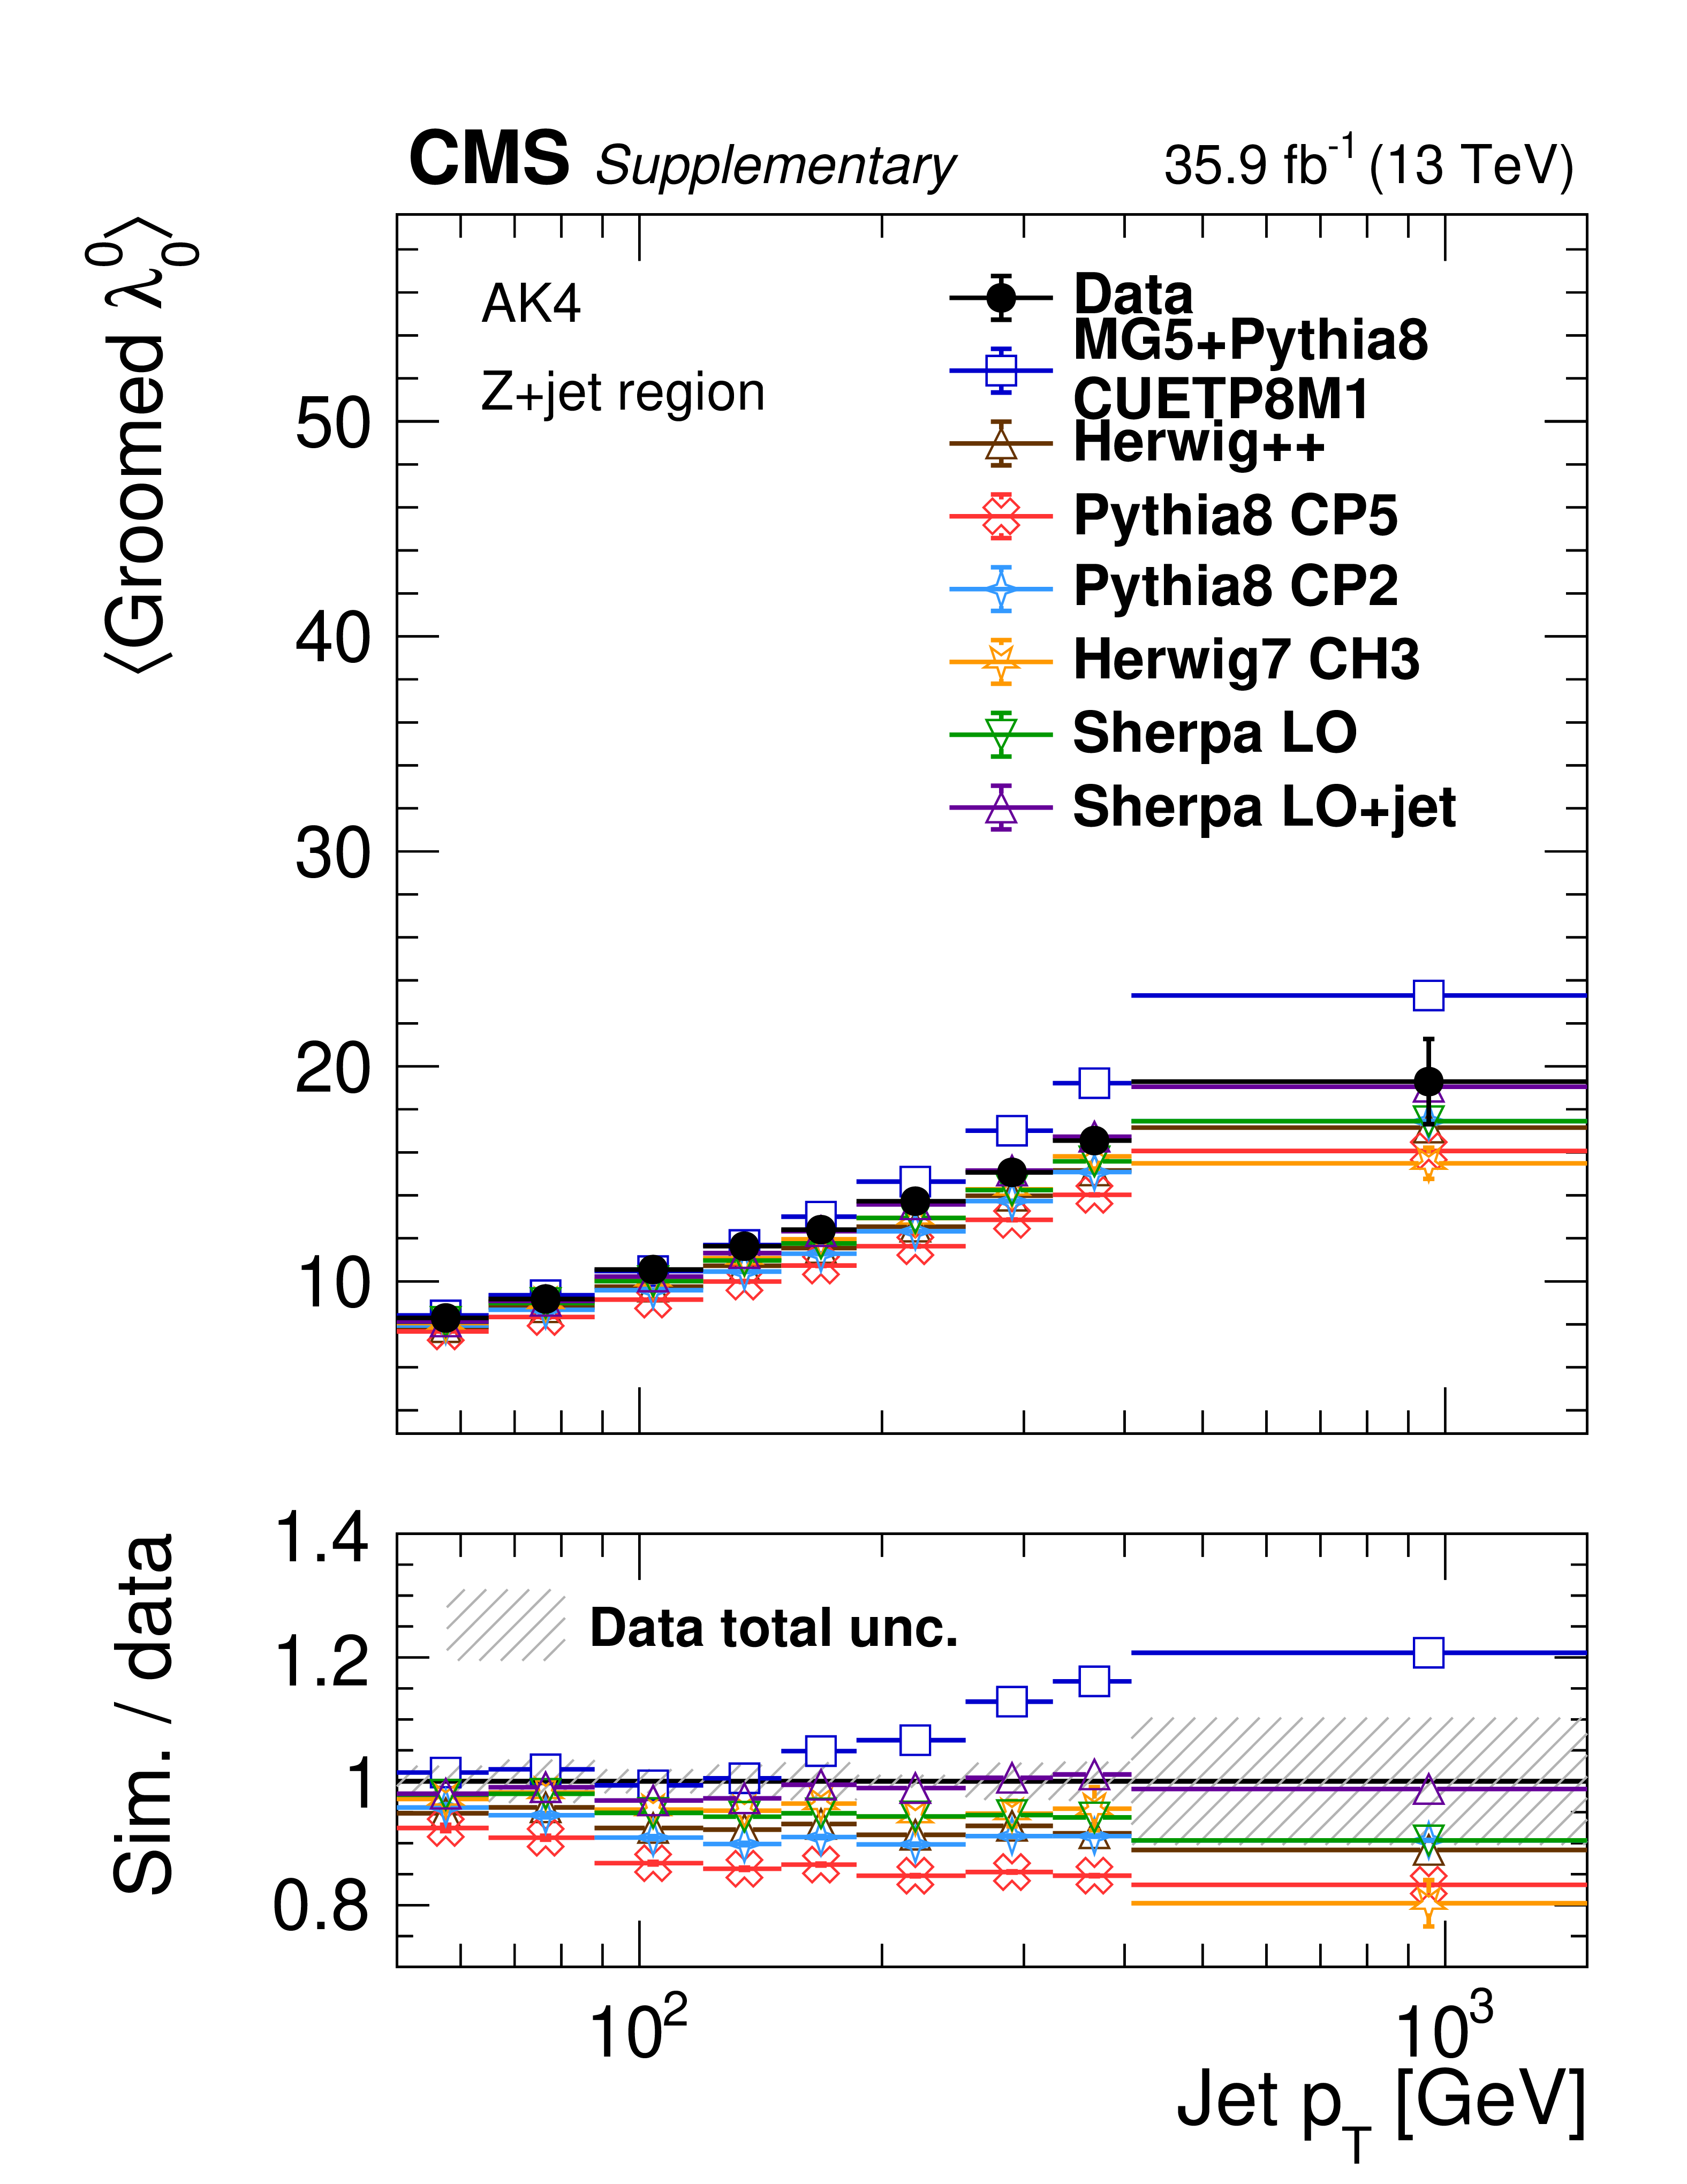
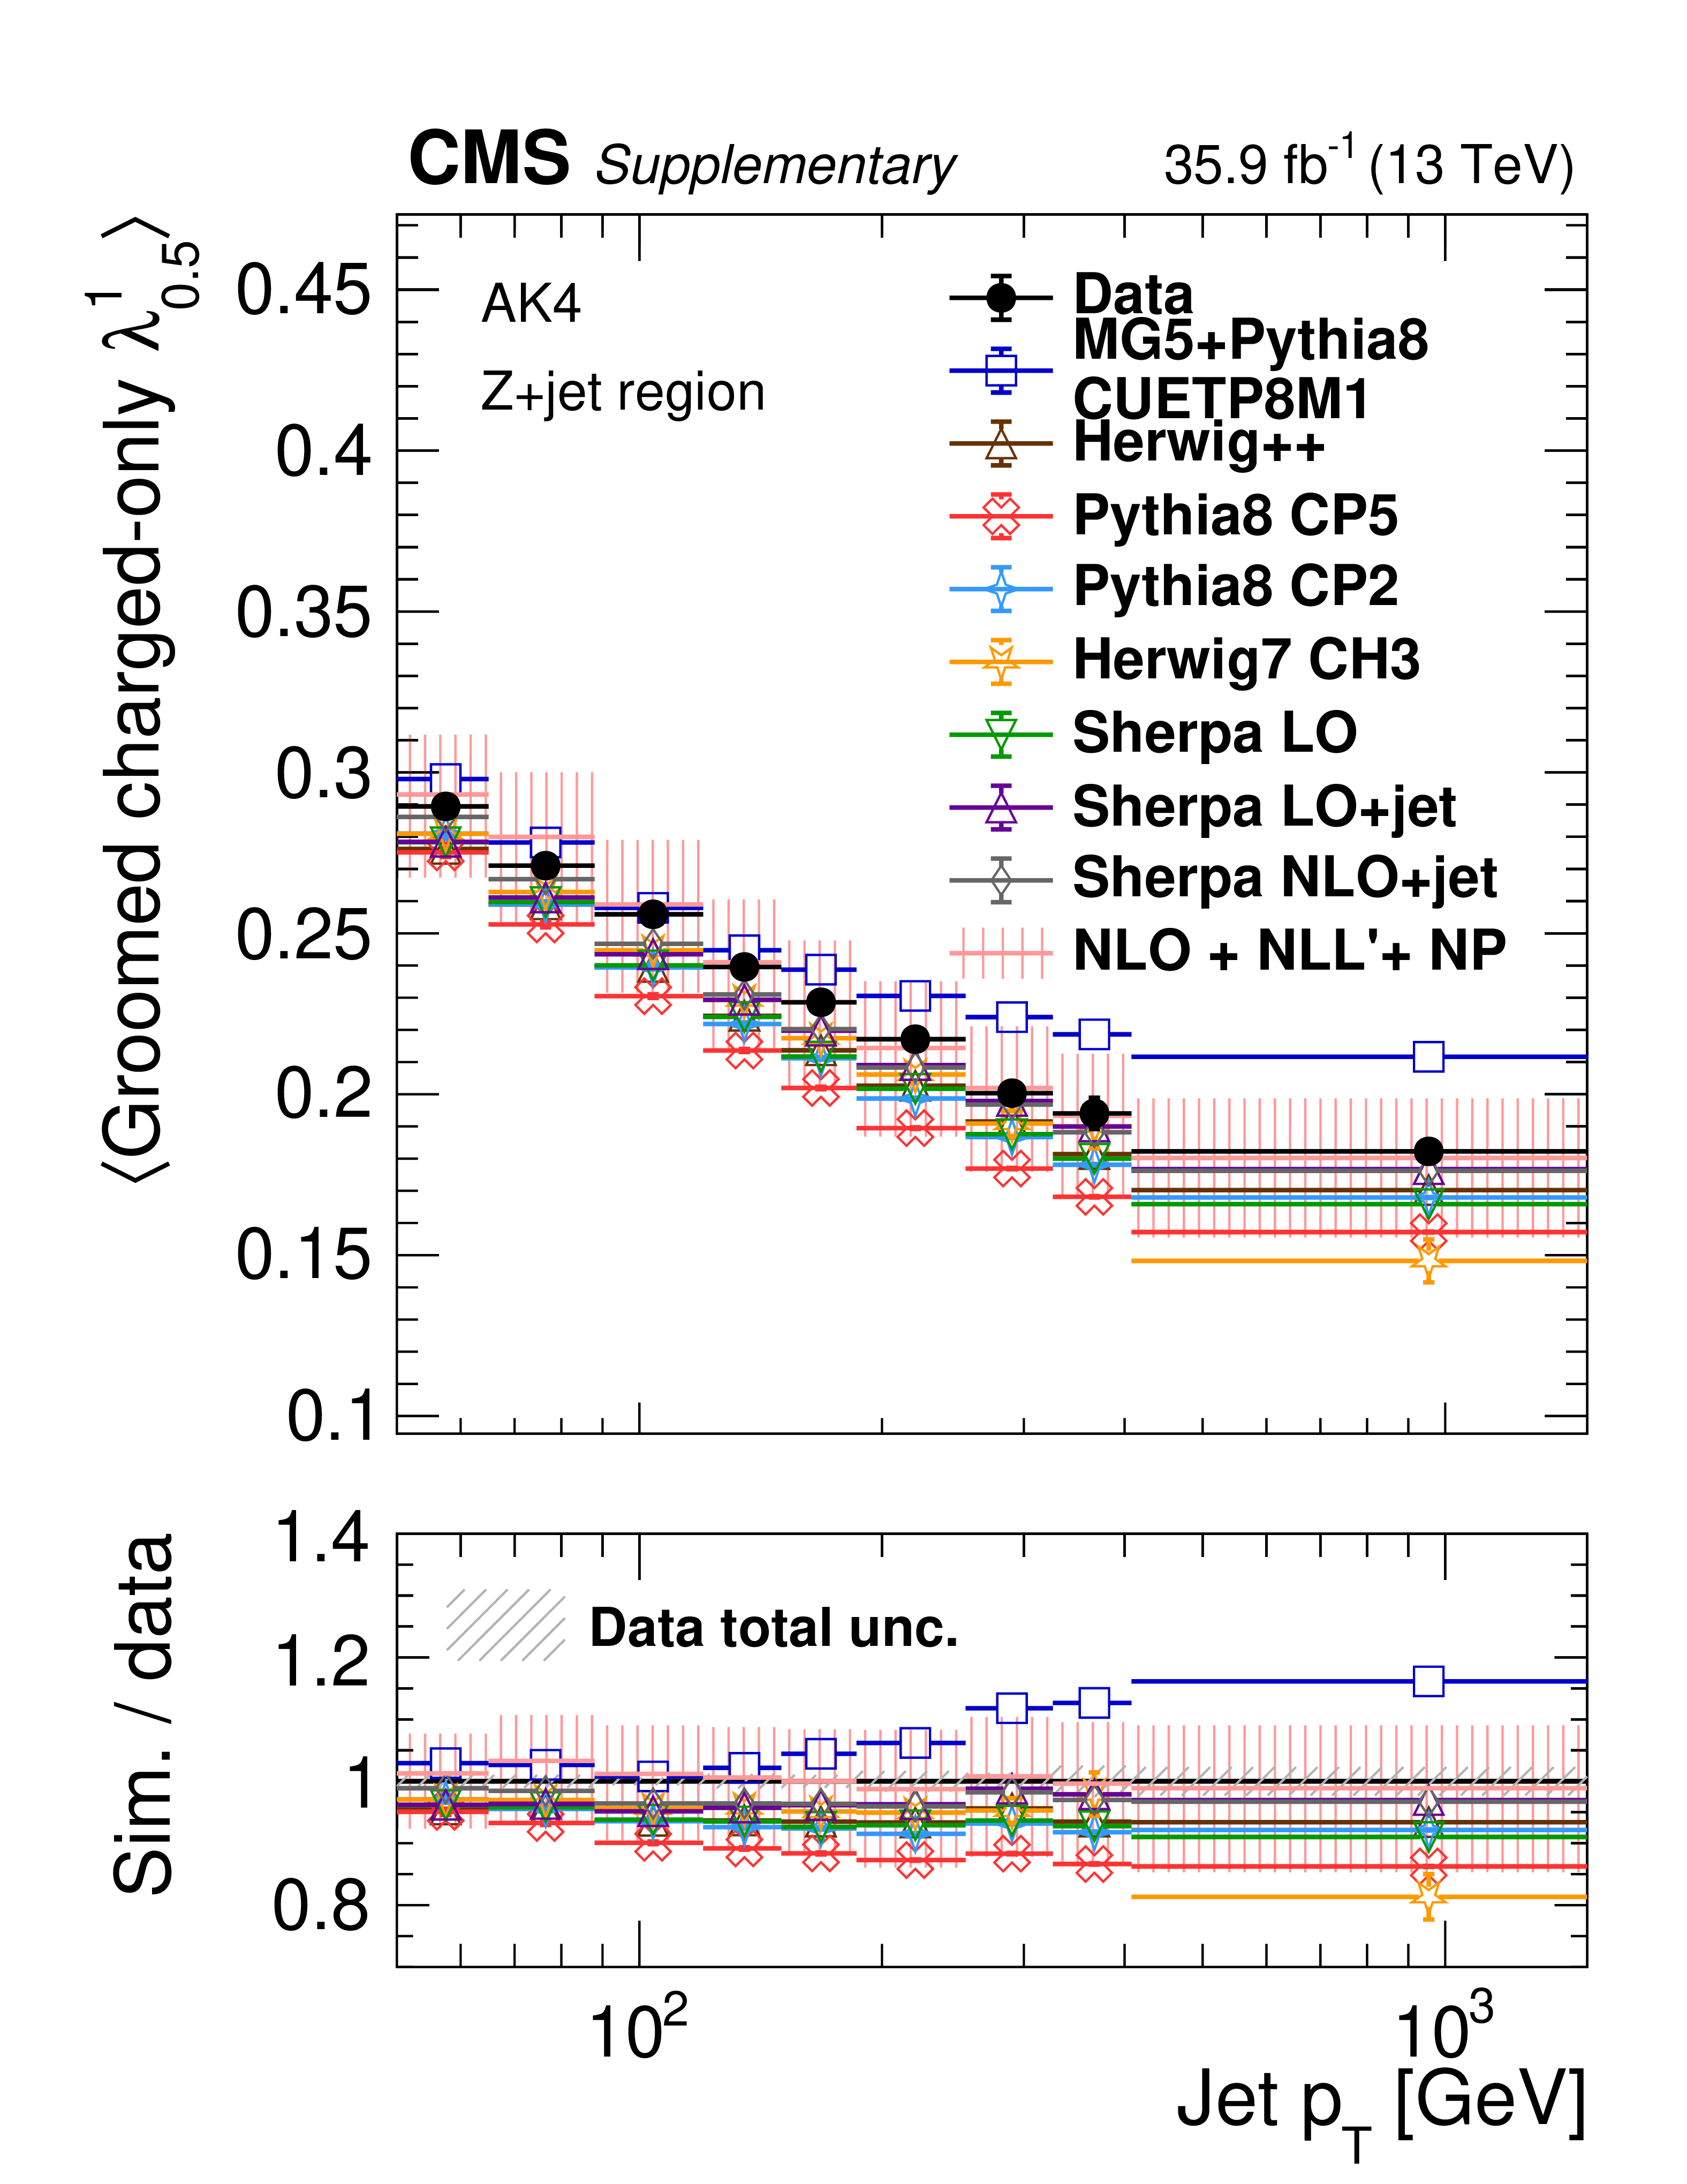
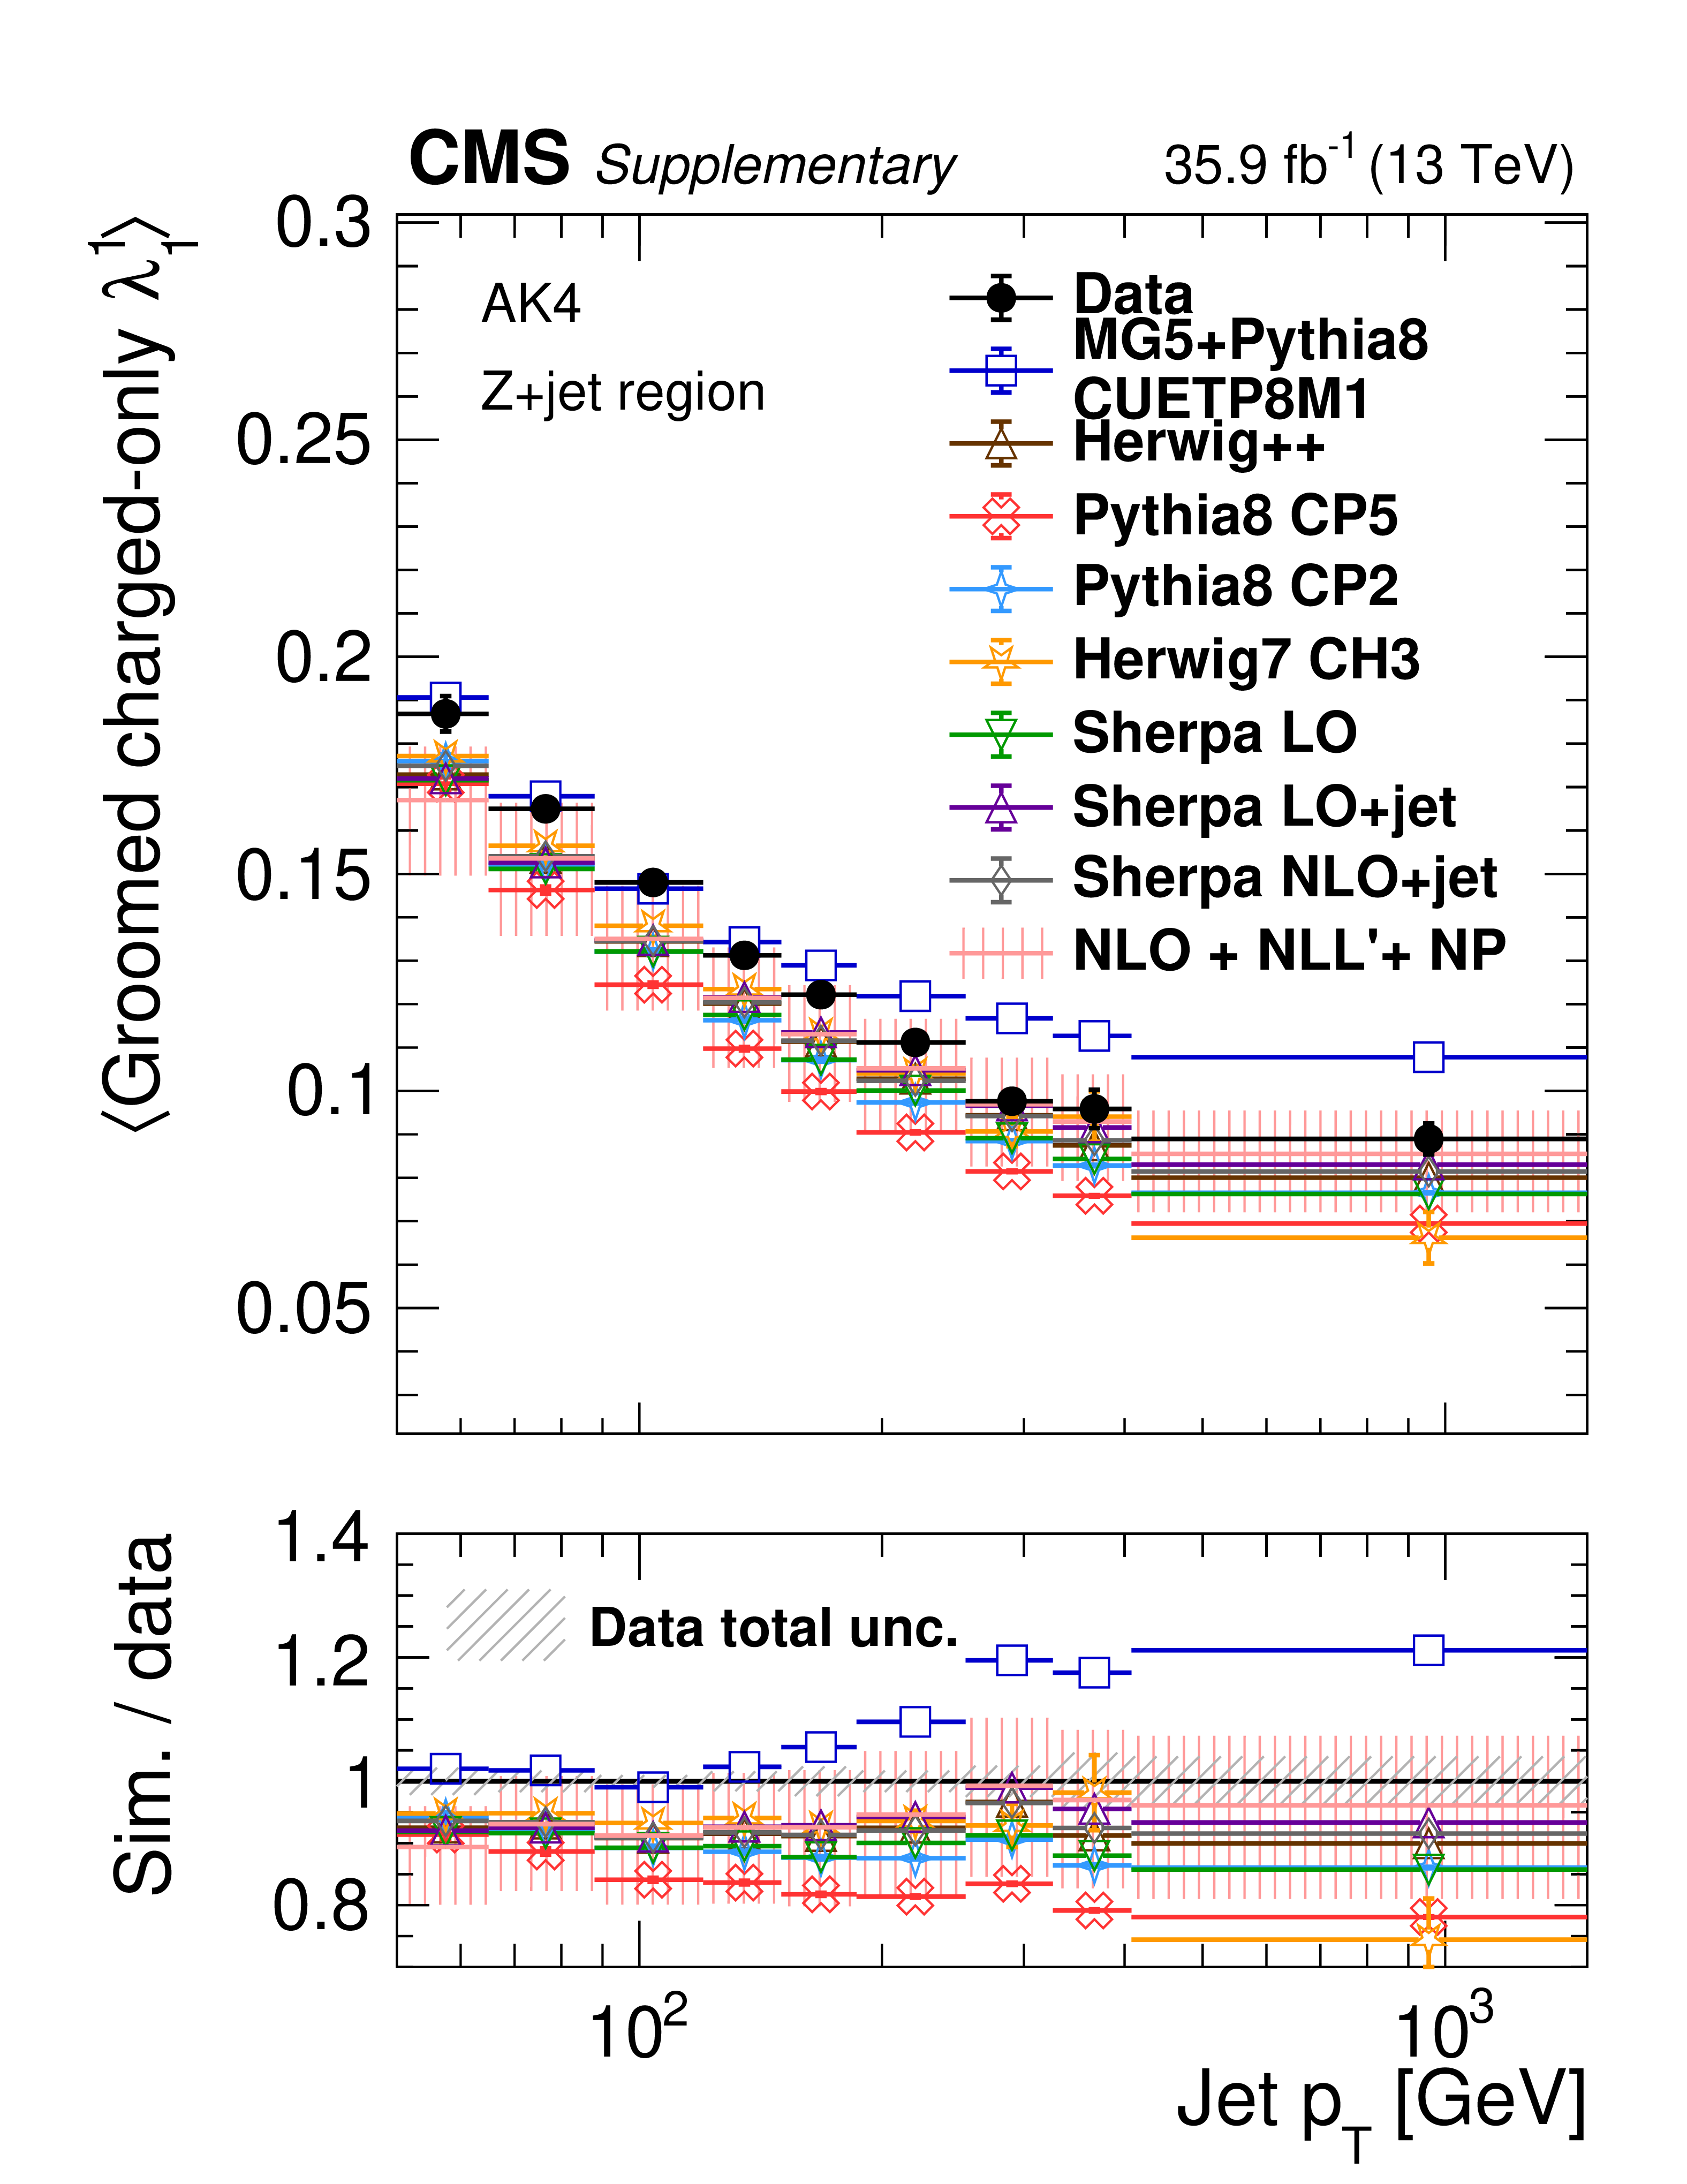
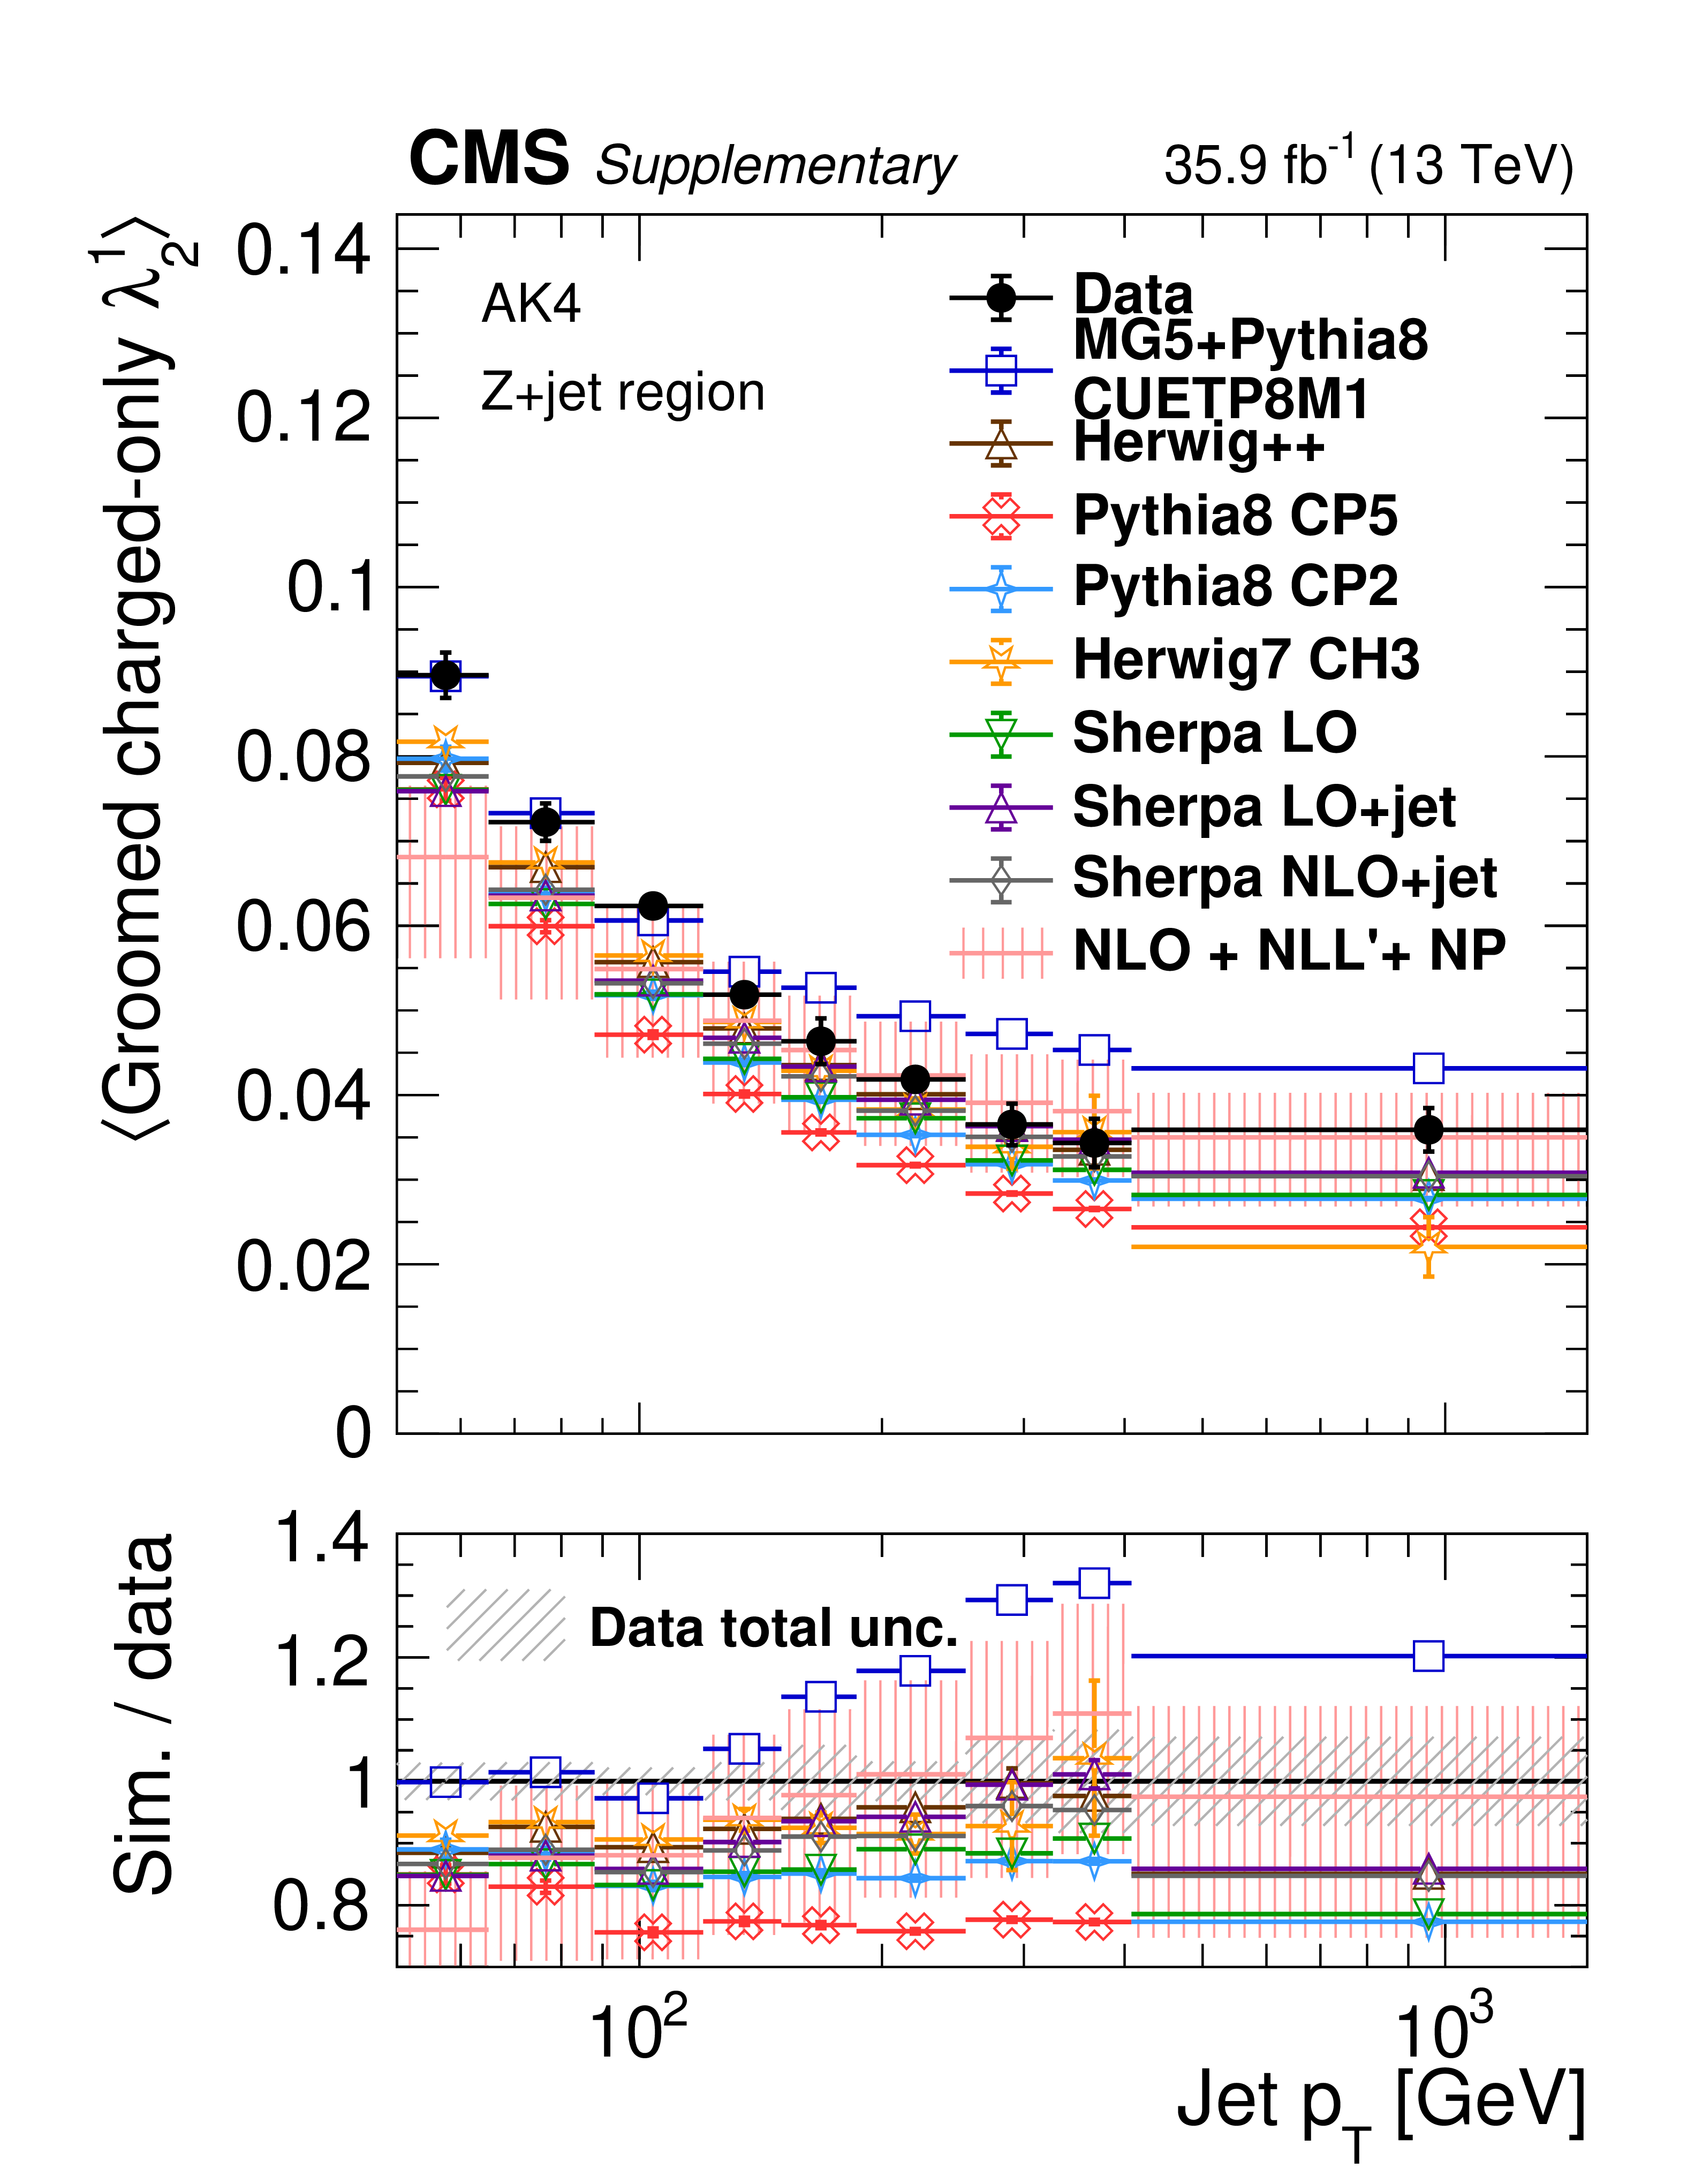
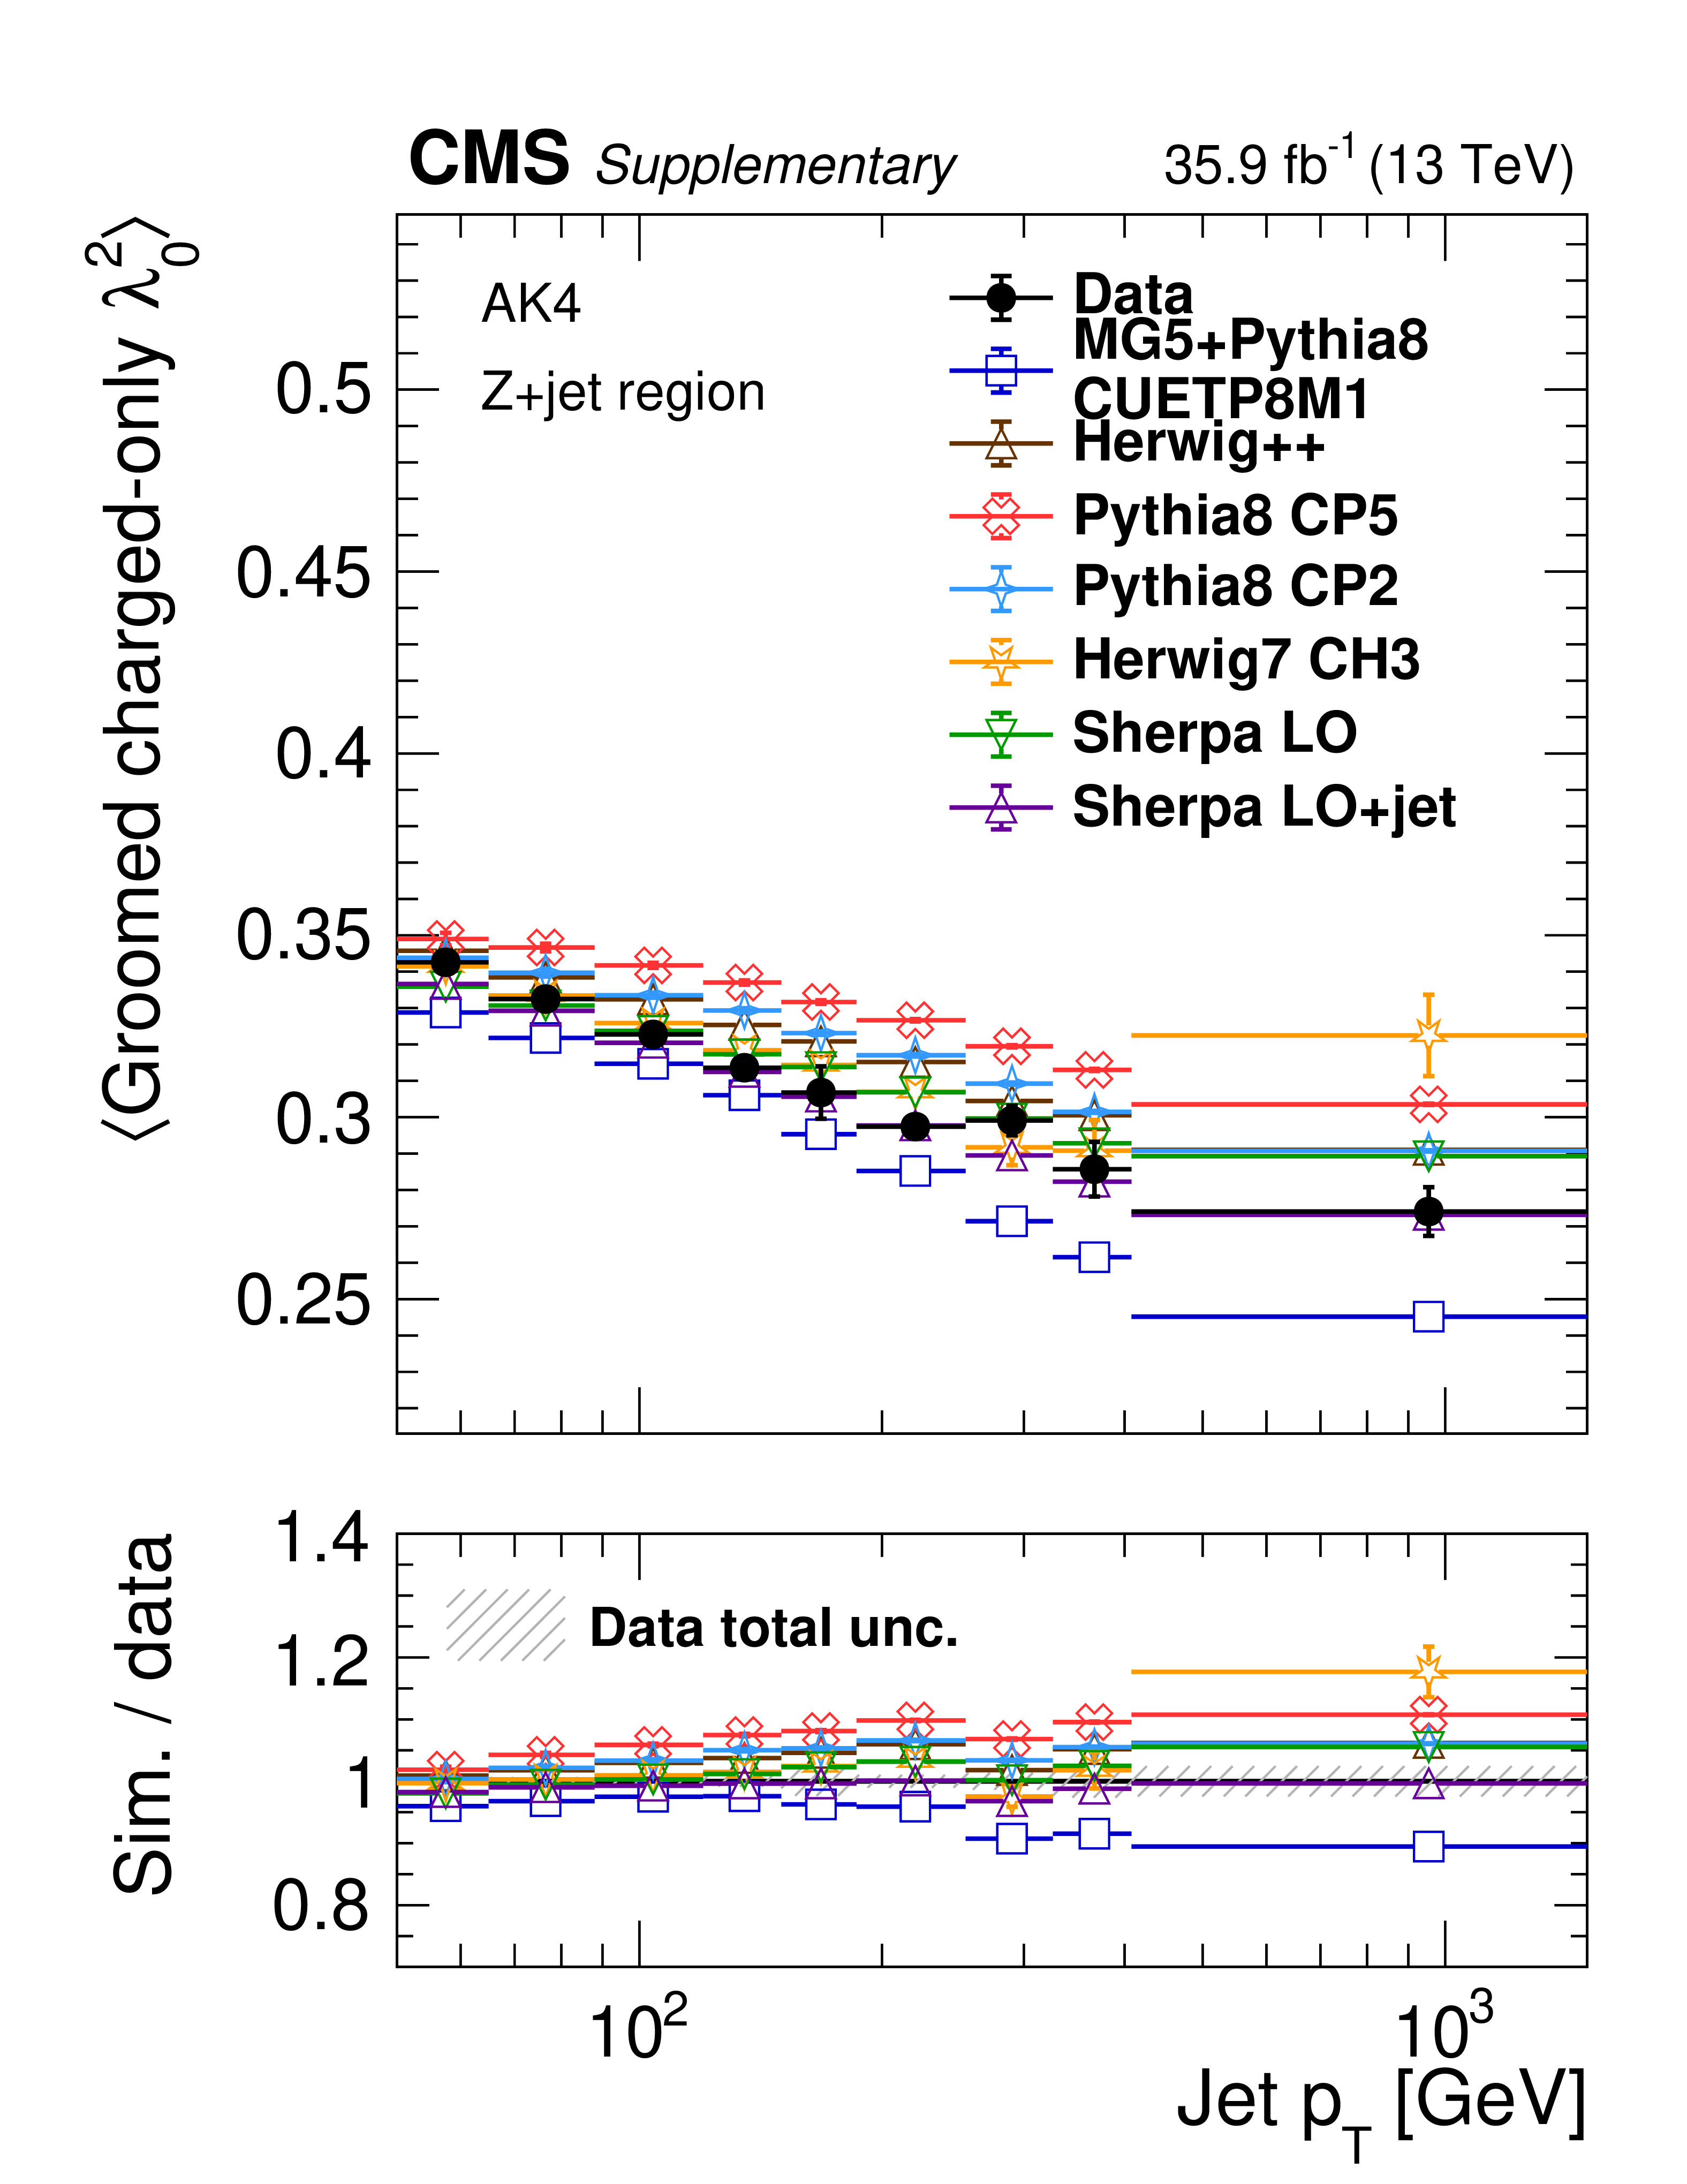
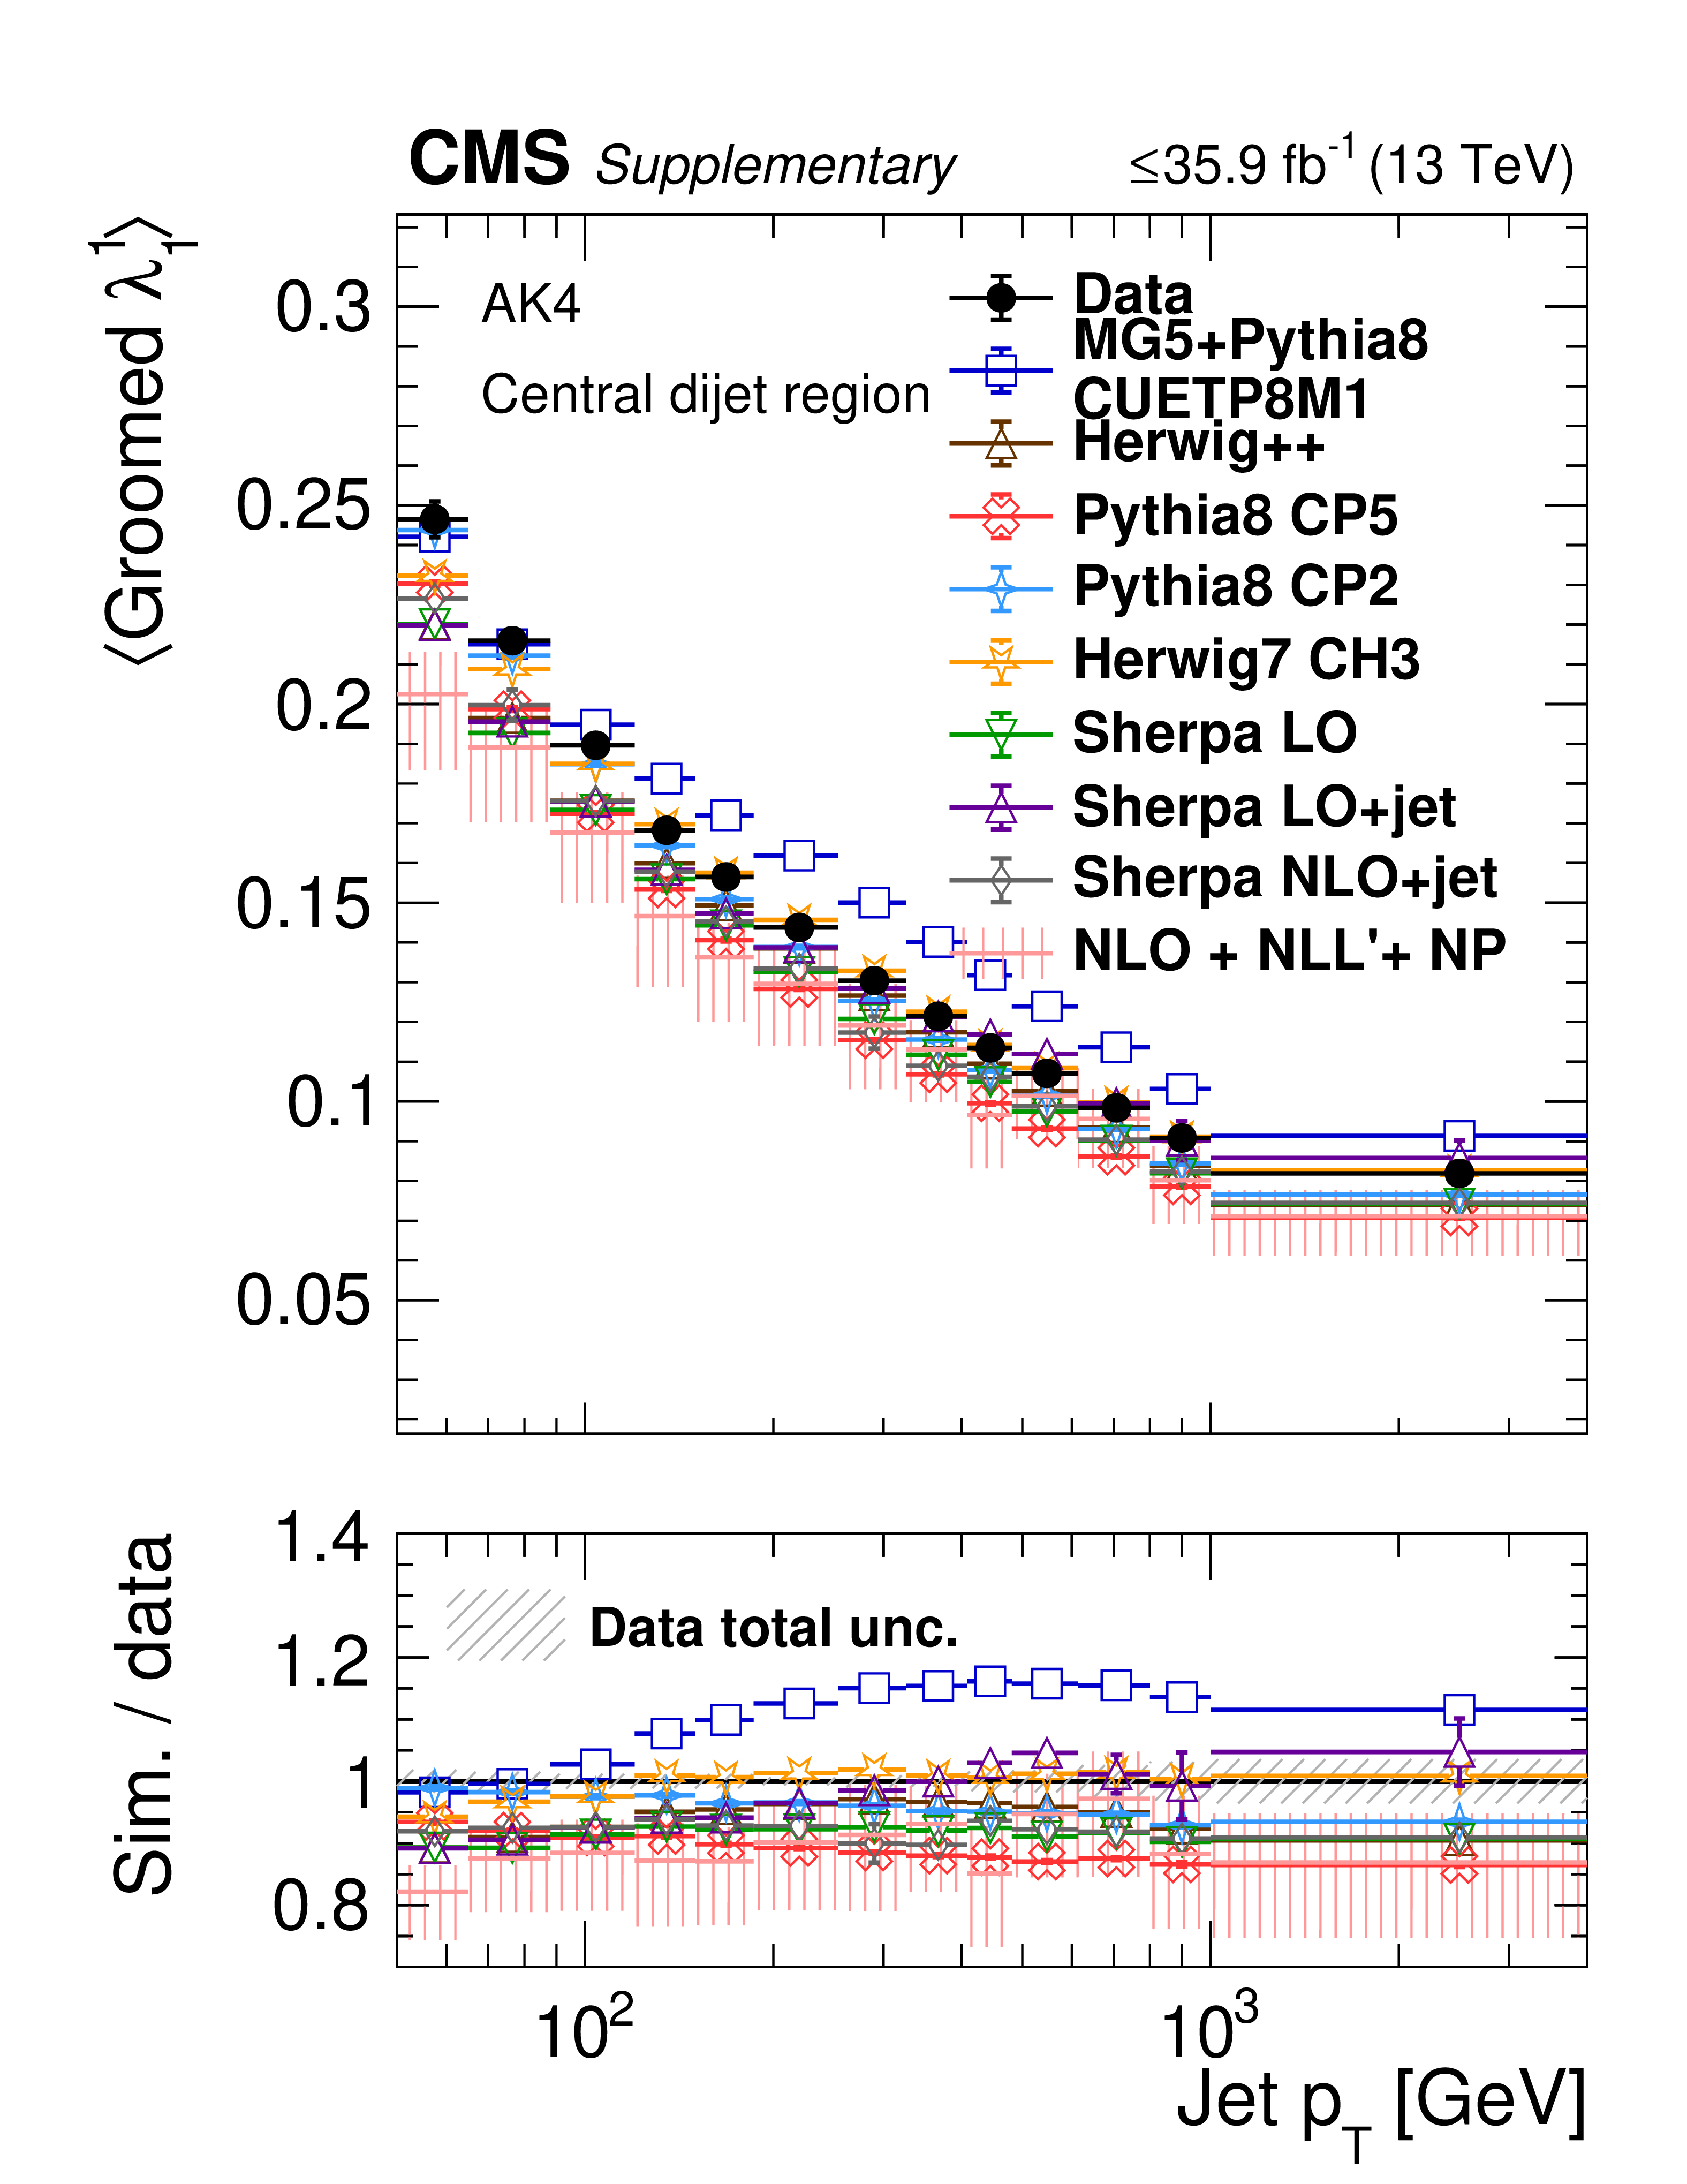
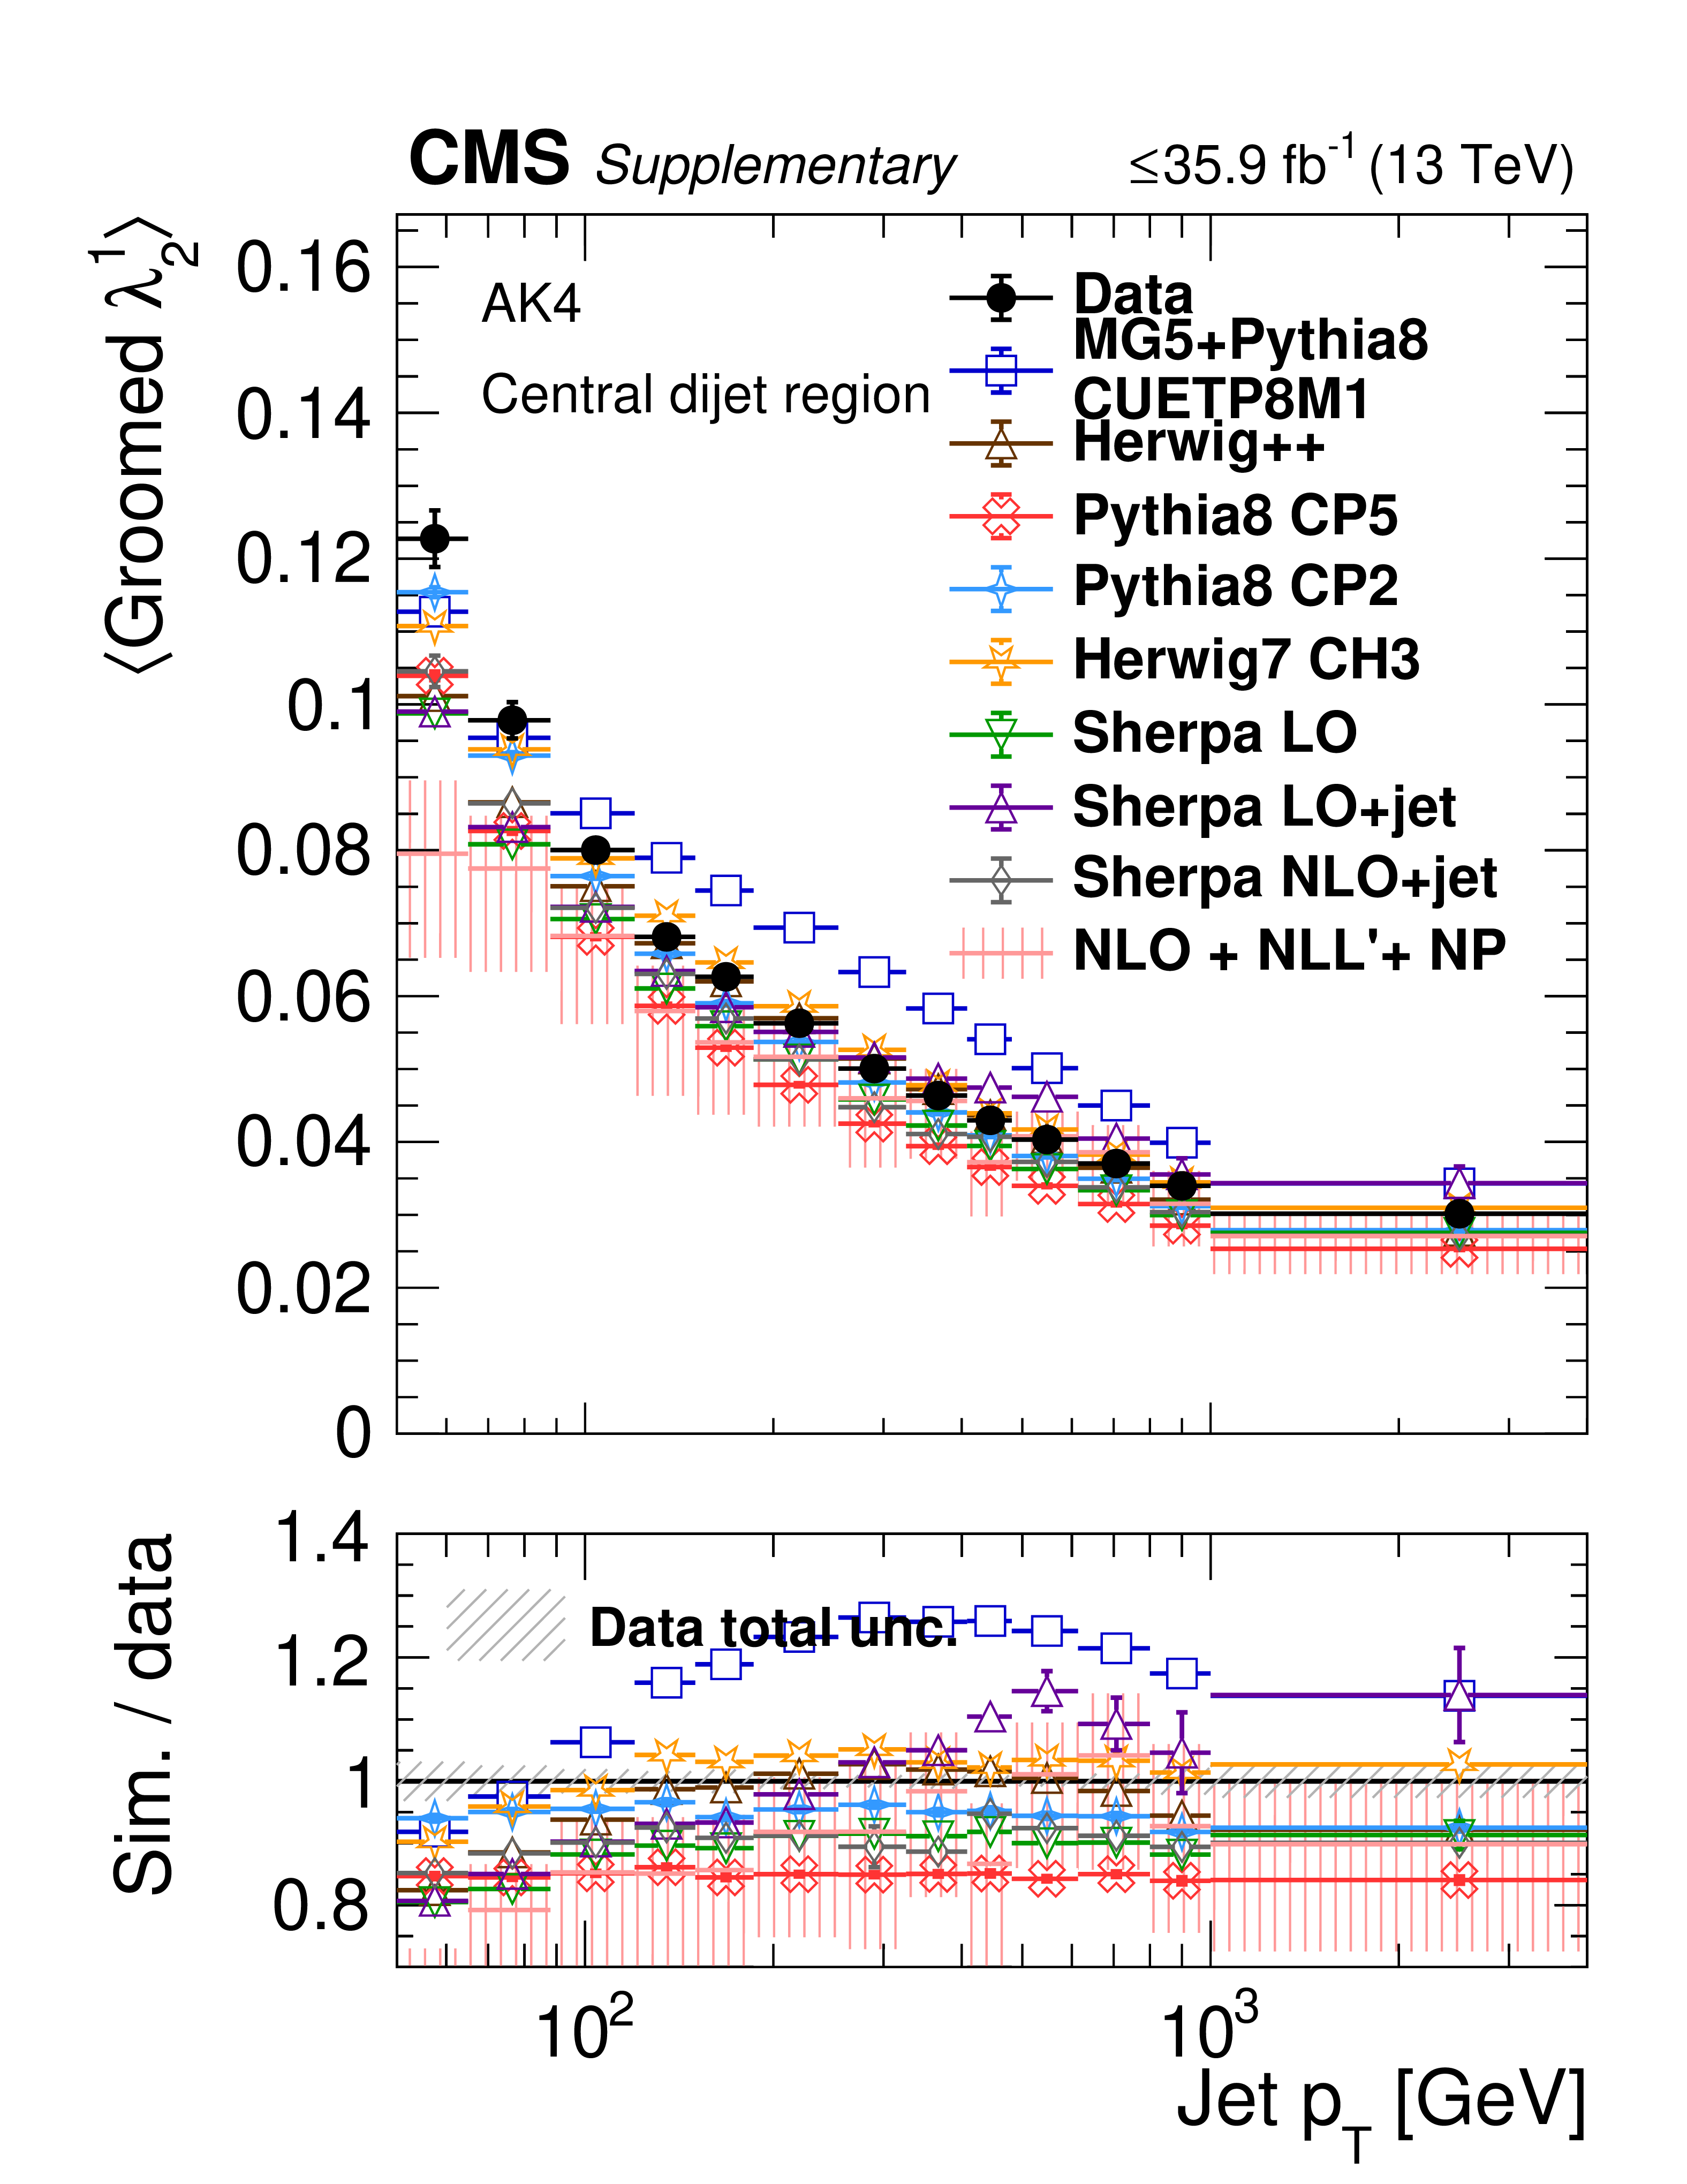
Mean value of ungroomed LHA (${\lambda ^{1}_{0.5}}$) for AK4 jets as a function of ${p_{\mathrm {T}}}$ in the Z+jet (left) and central dijet region (right) regions. The upper and lower plots show the same data distribution compared with different generator predictions. The error bars on the data and the hashed region in the ratio plot correspond to the total uncertainties of the experimental data. The error bars on the simulation correspond to the statistical uncertainties. |

png pdf |
Figure 11-a:
Mean value of ungroomed LHA (${\lambda ^{1}_{0.5}}$) for AK4 jets as a function of ${p_{\mathrm {T}}}$ in the Z+jet region. The plot shows the data distribution compared with different generator predictions. The error bars on the data and the hashed region in the ratio plot correspond to the total uncertainties of the experimental data. The error bars on the simulation correspond to the statistical uncertainties. |
png pdf |
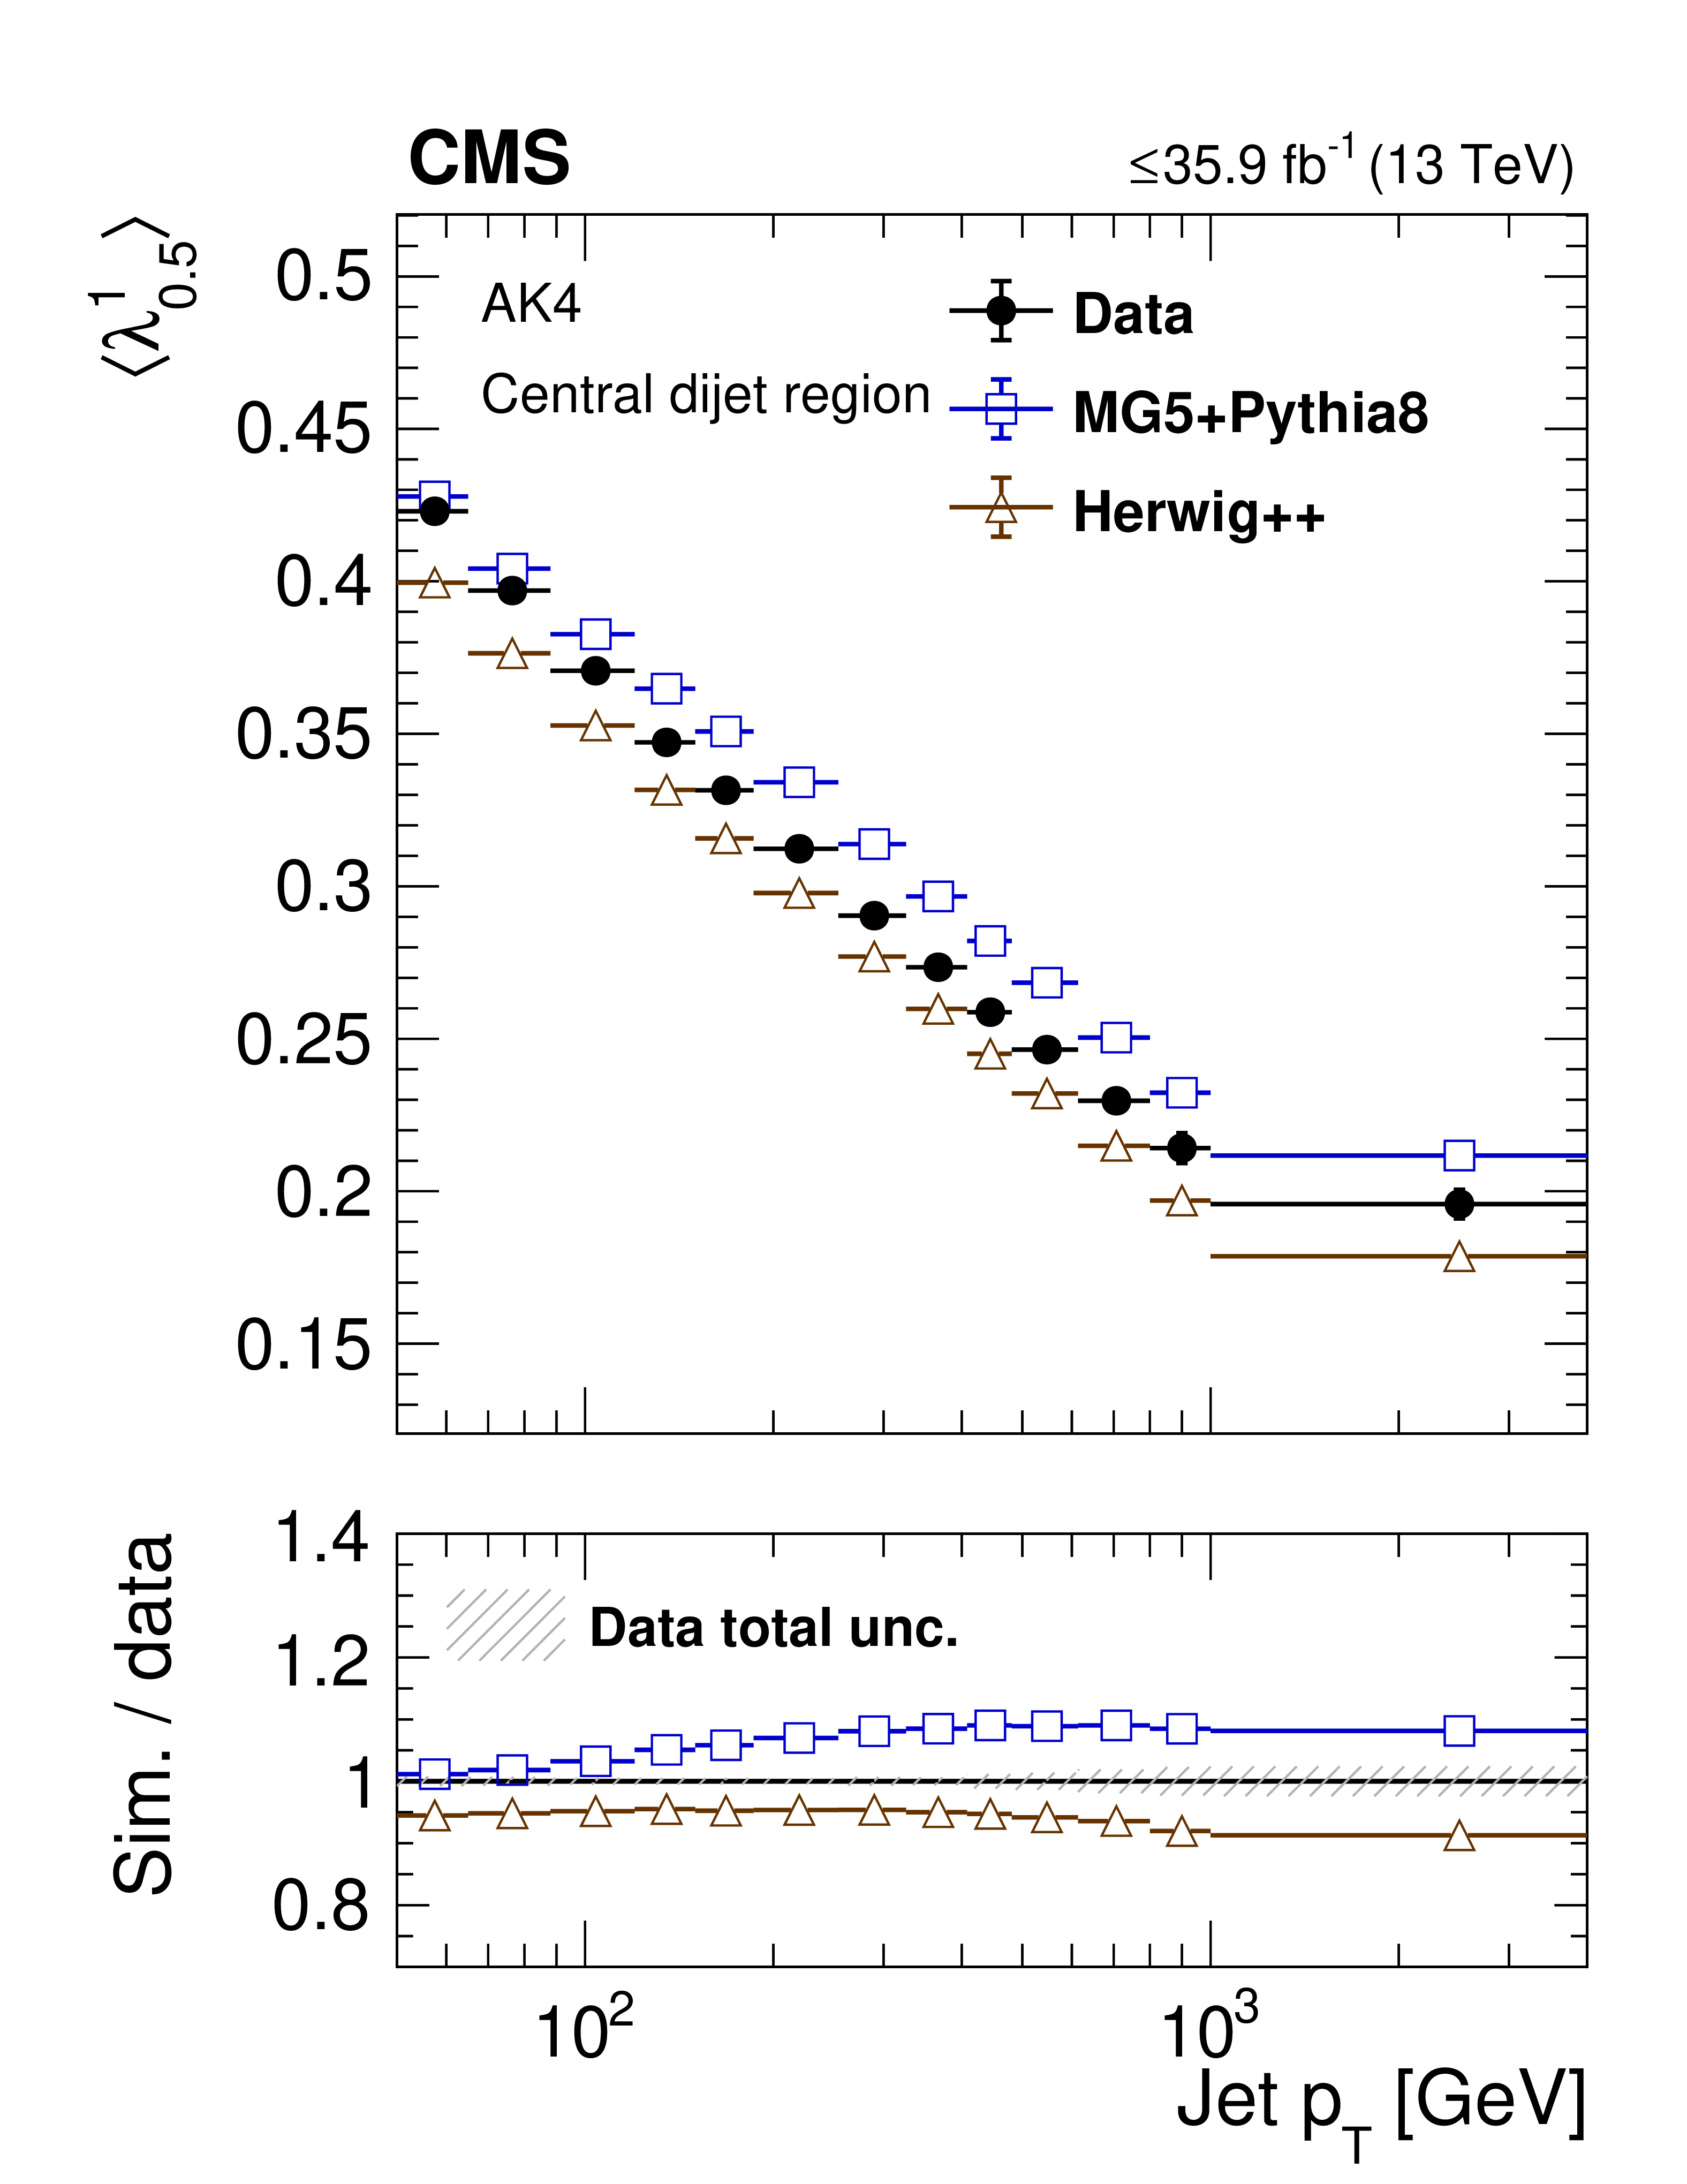
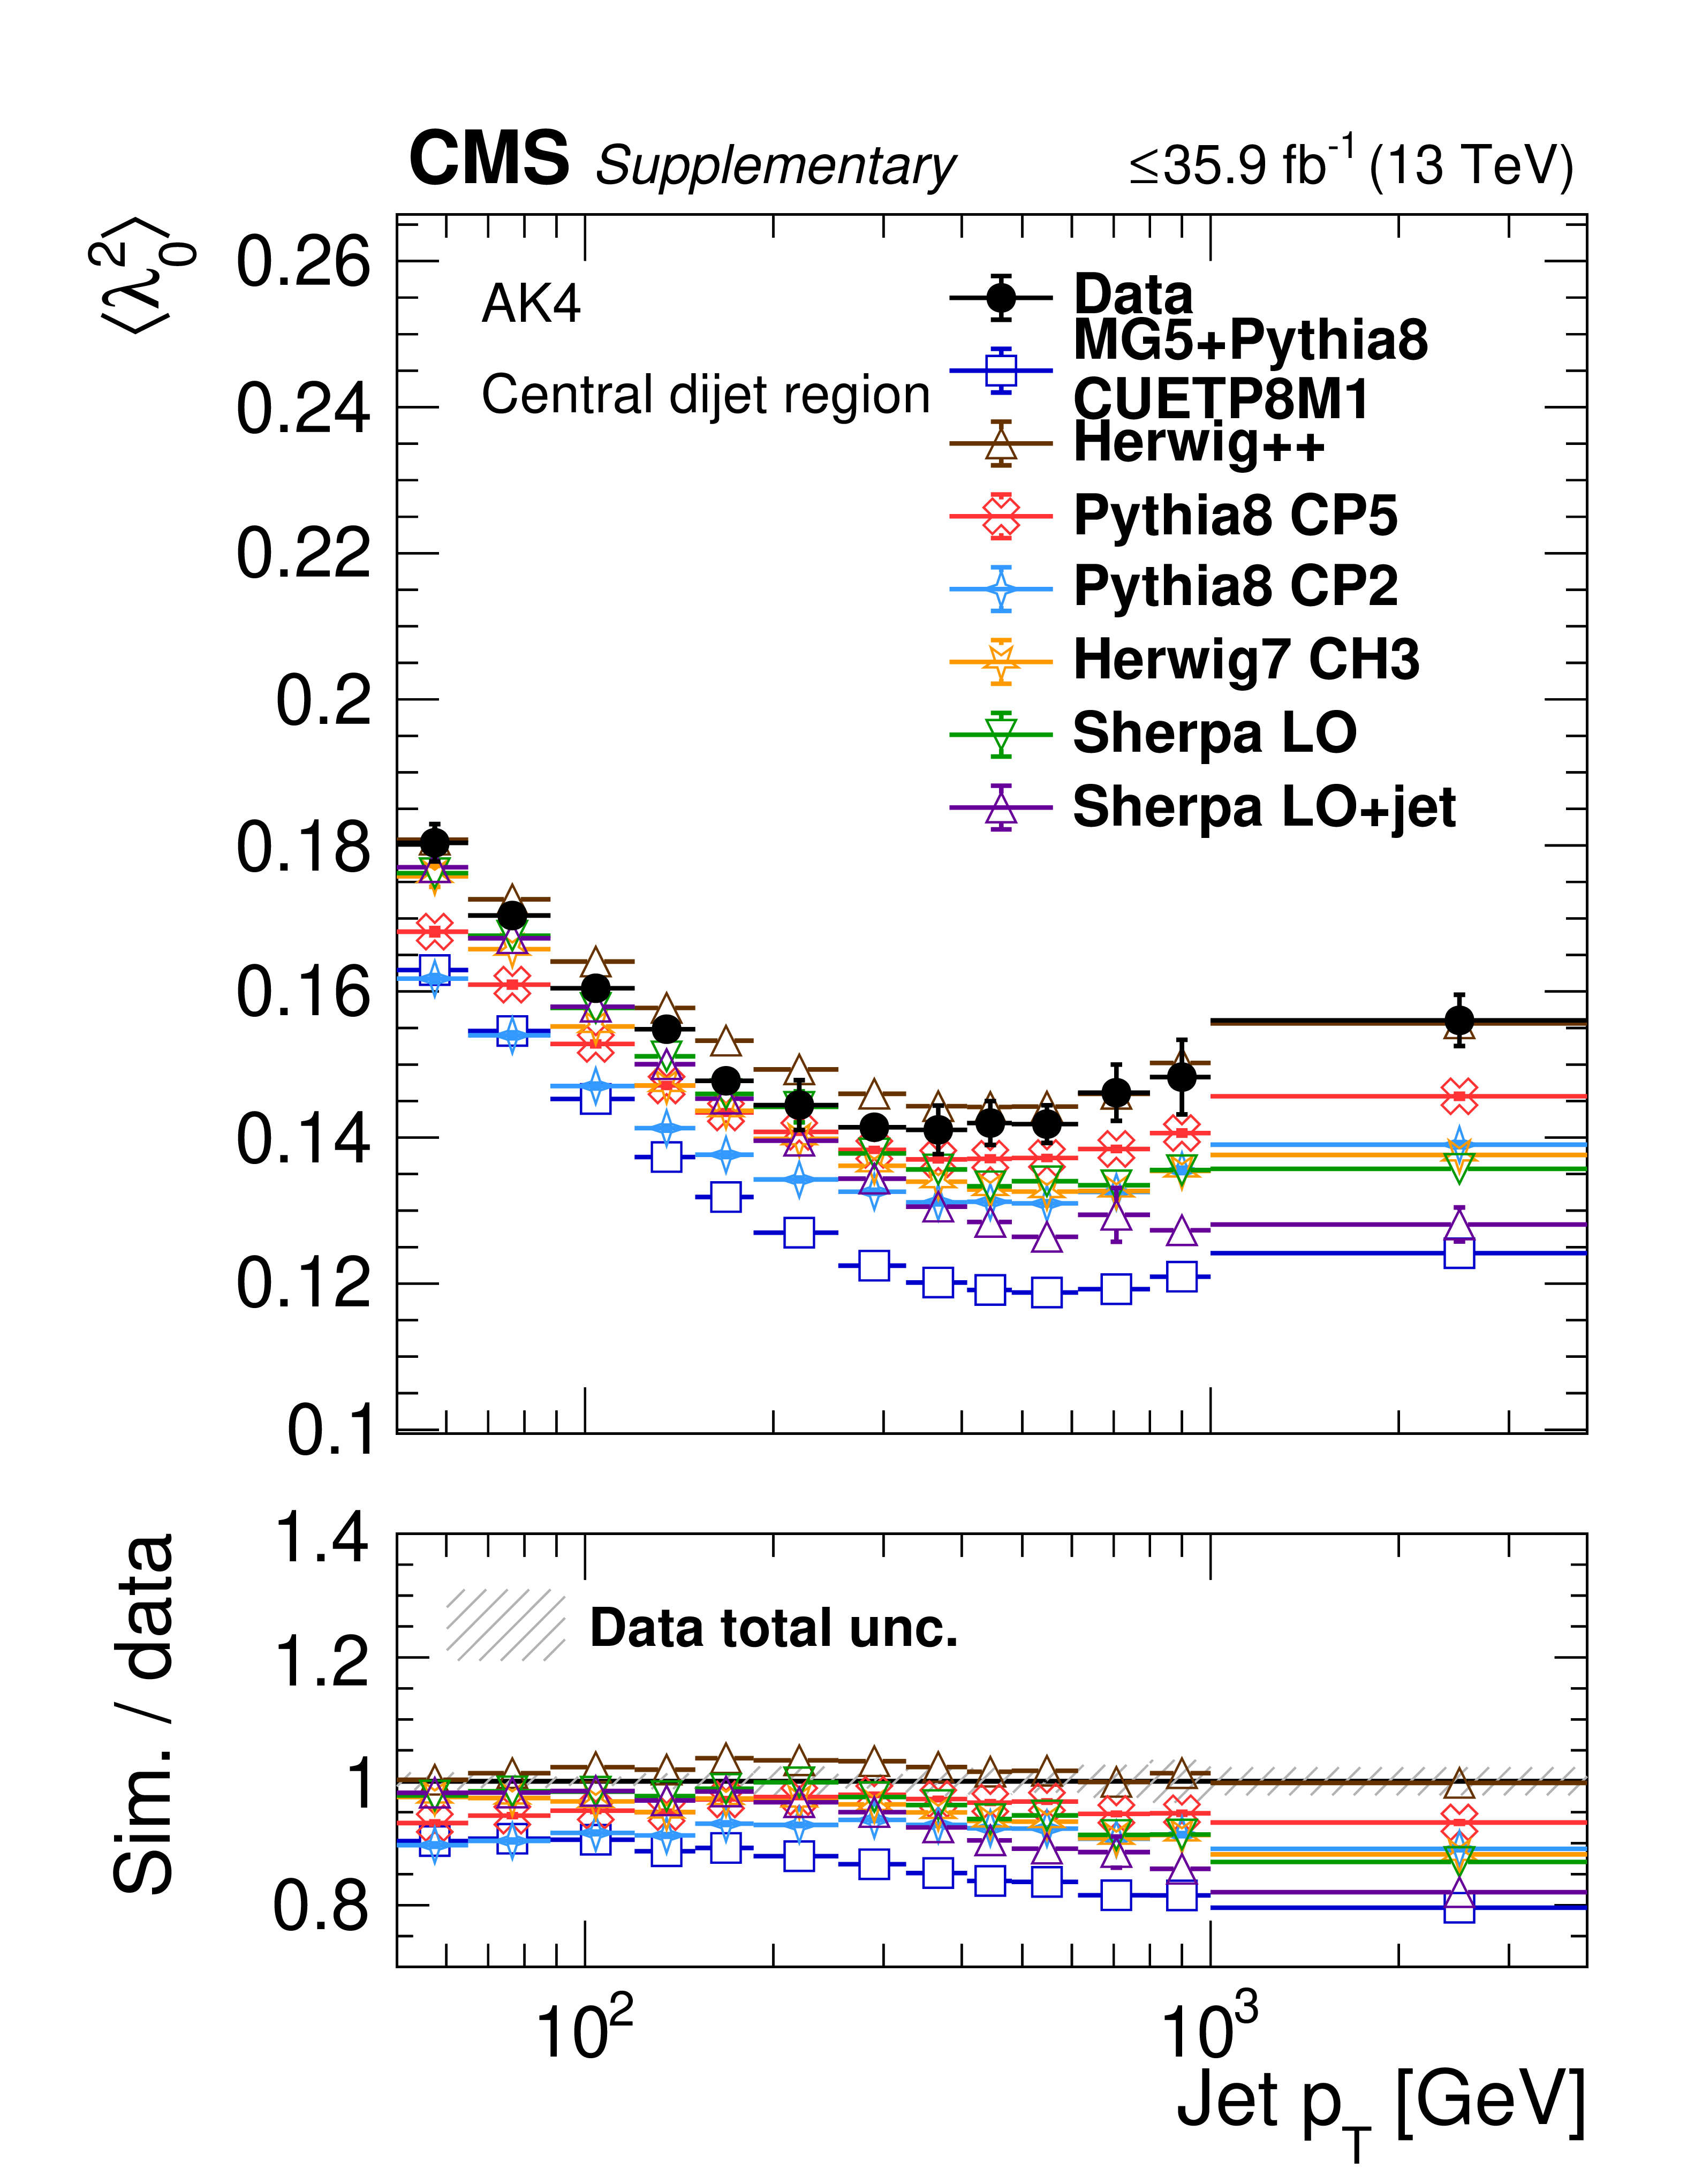
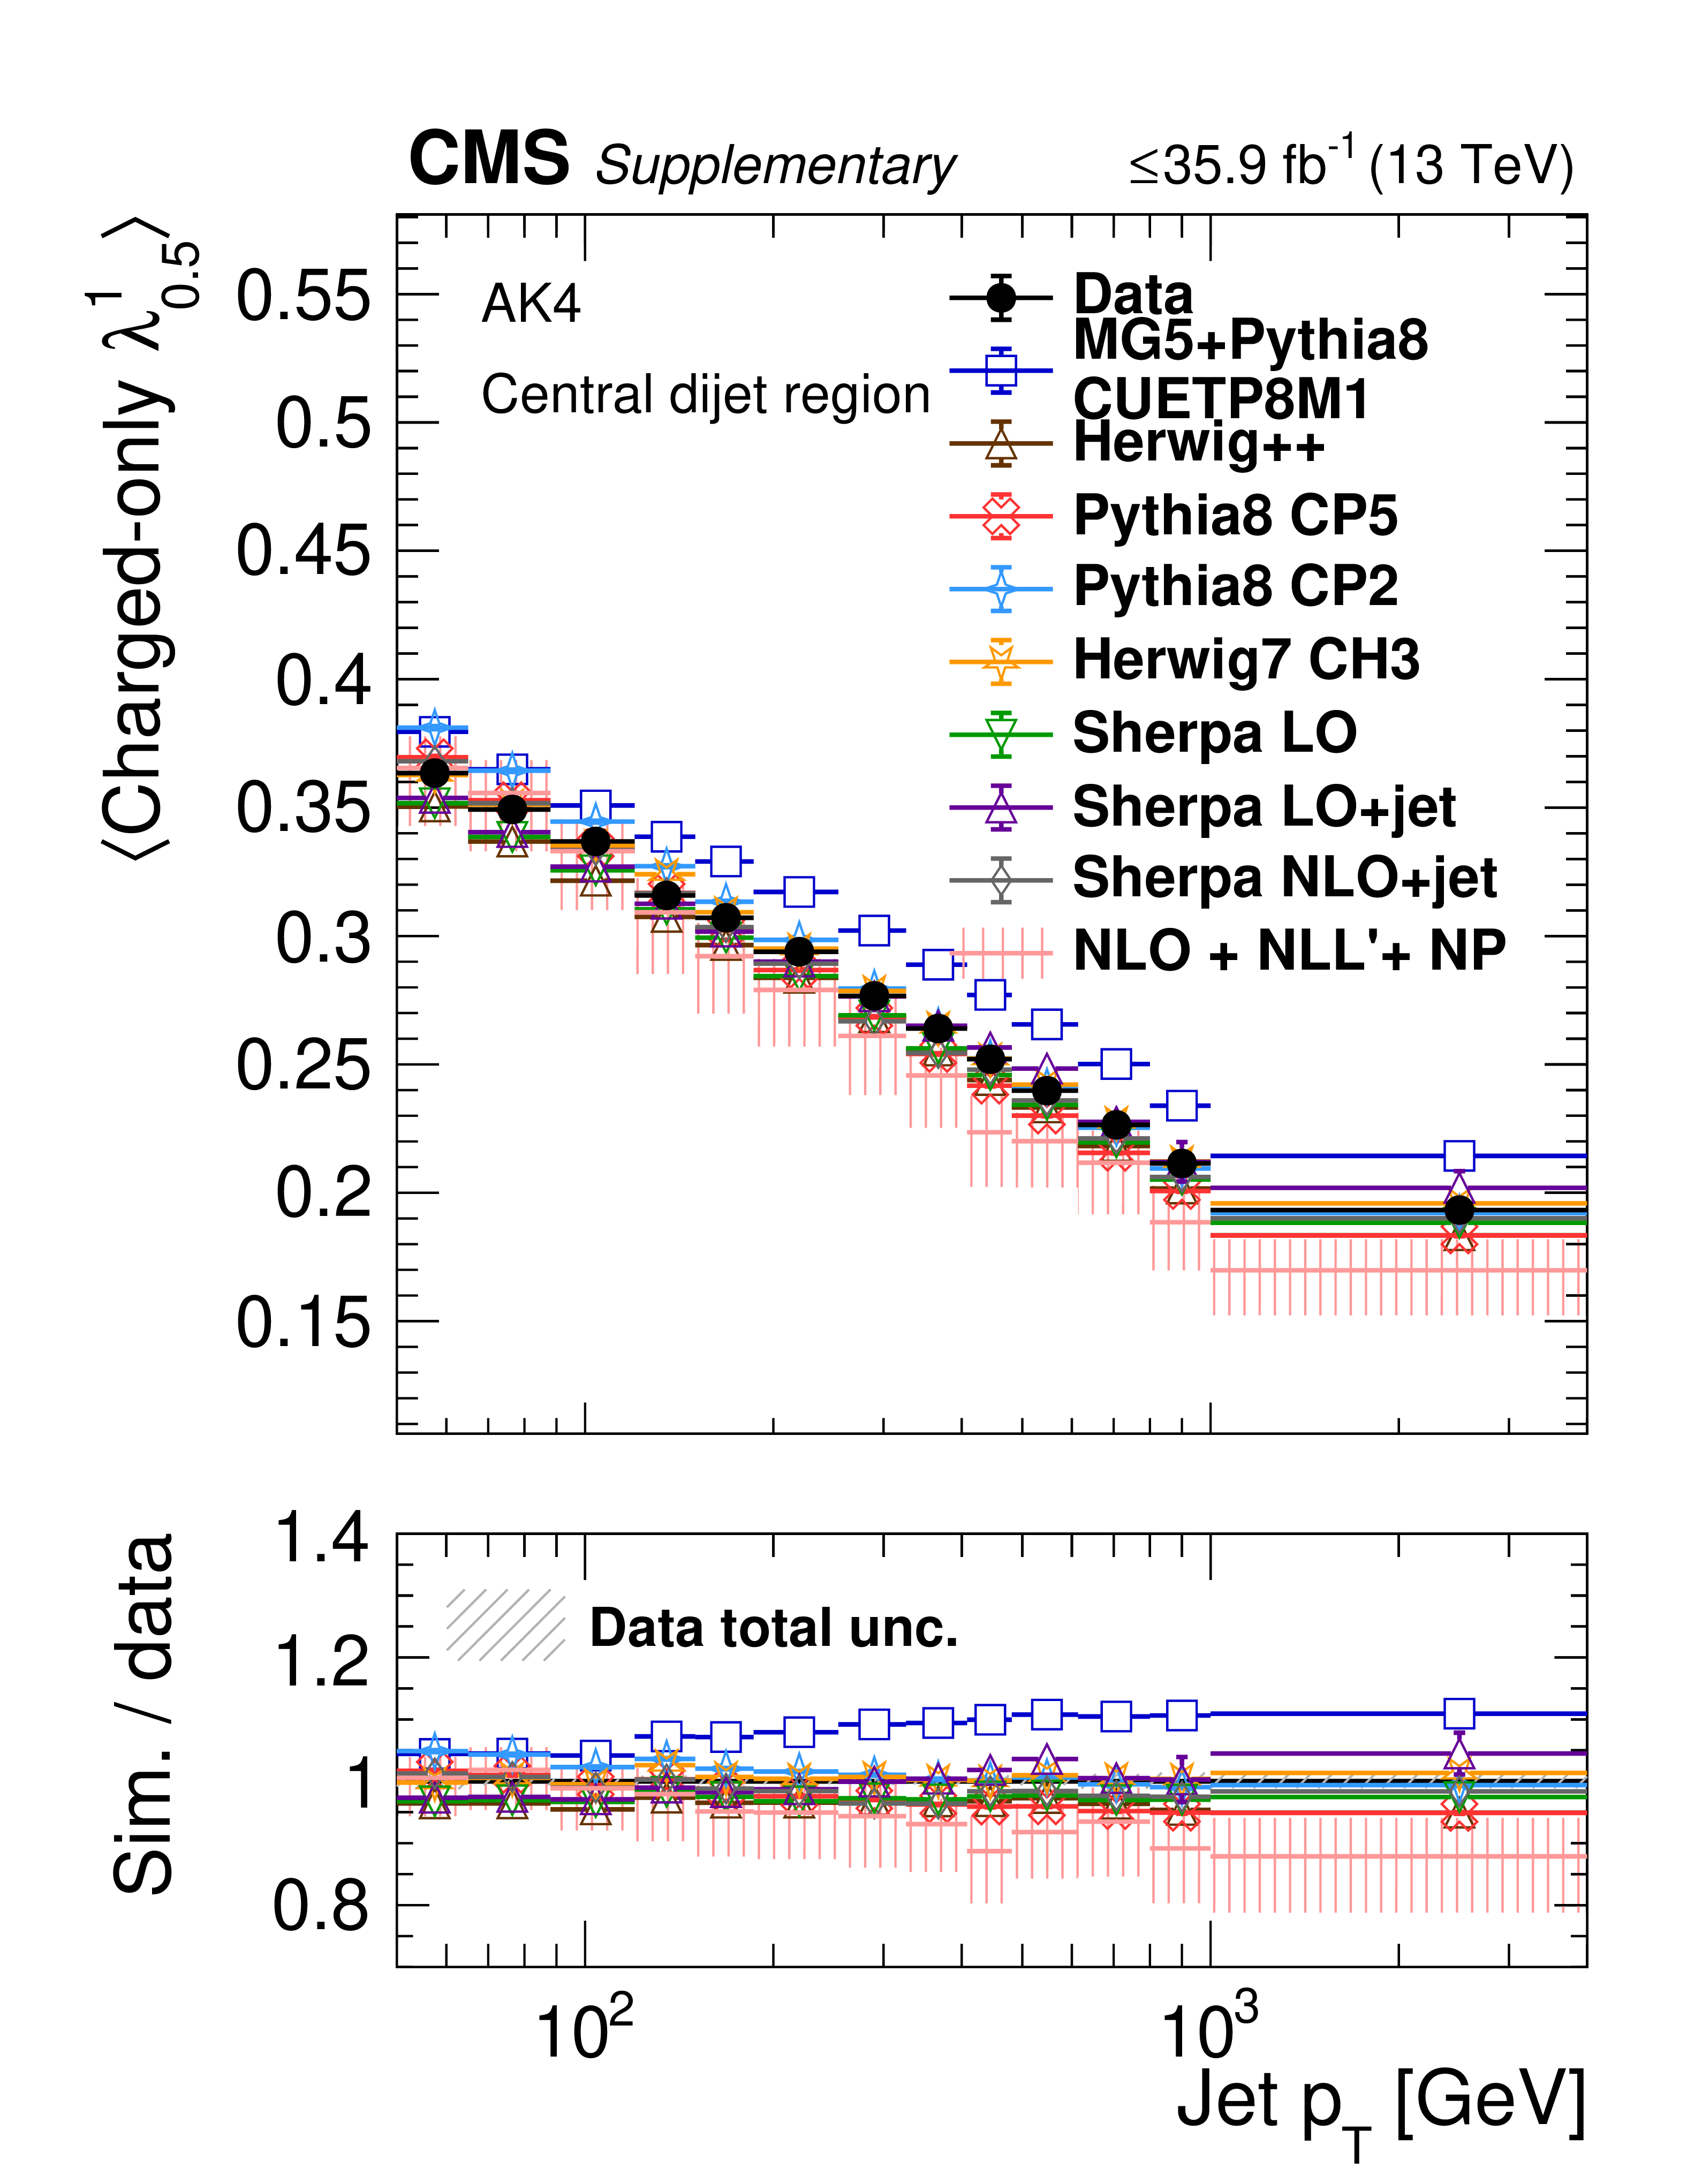
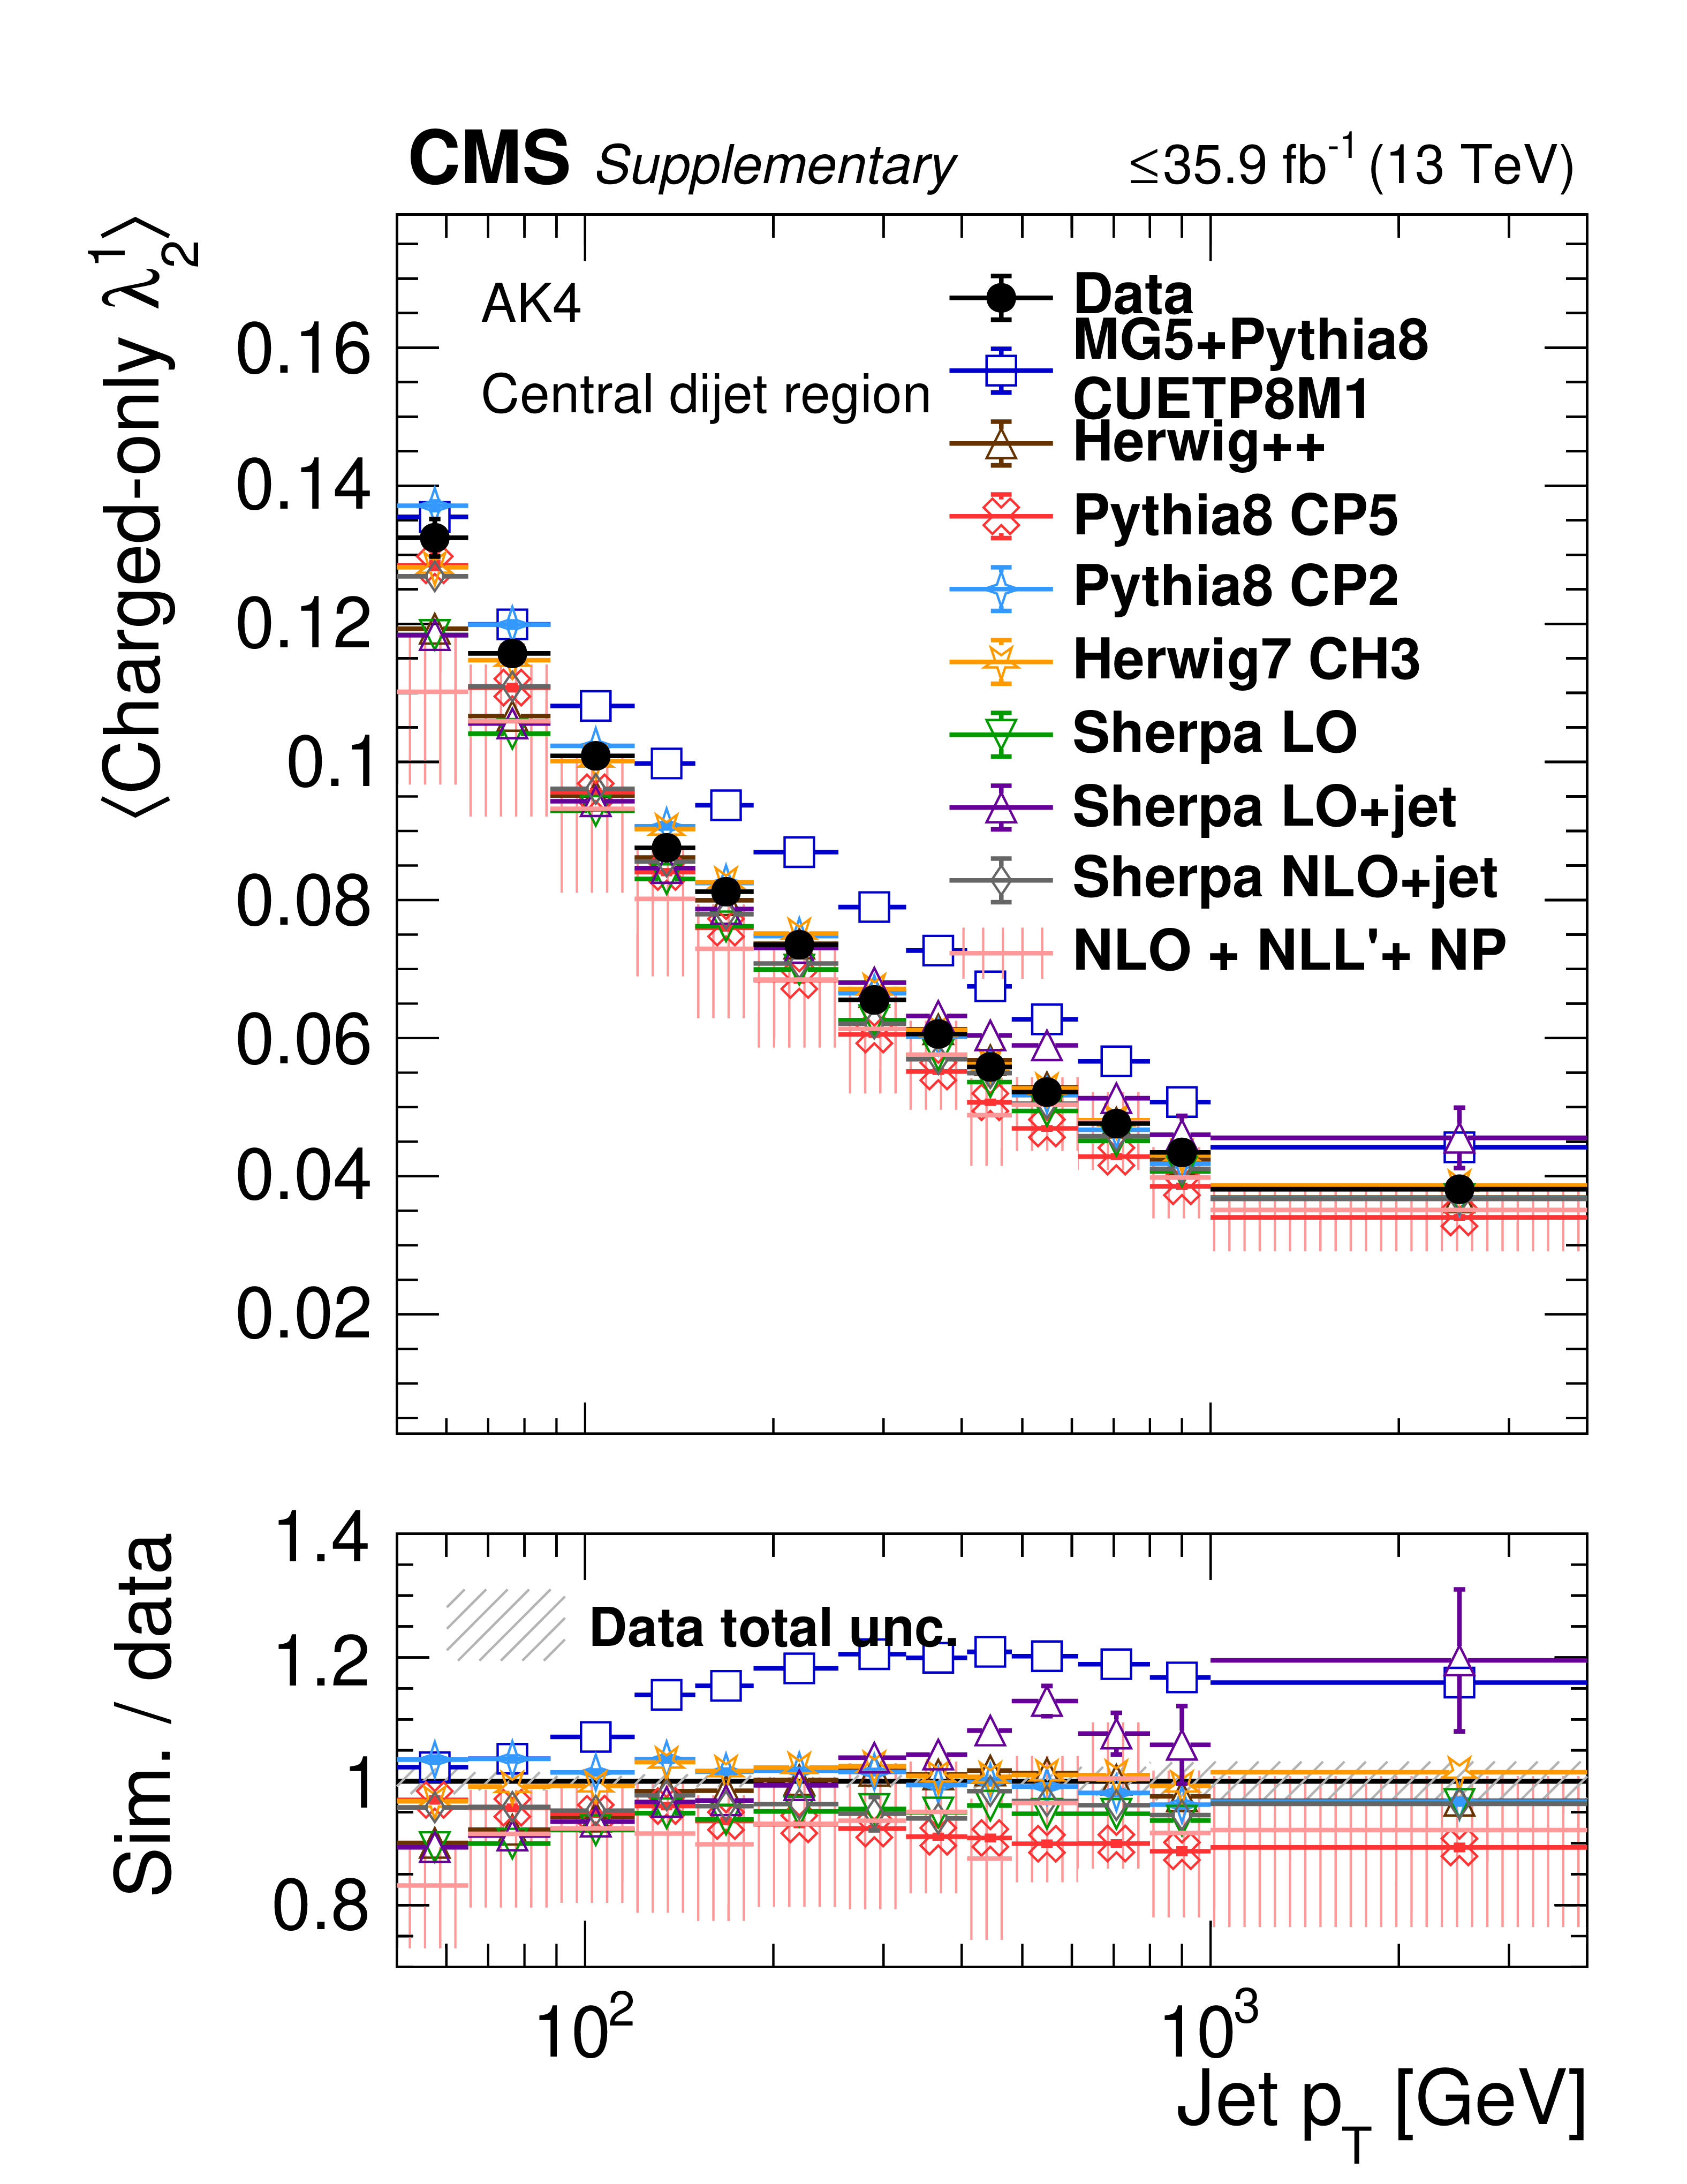
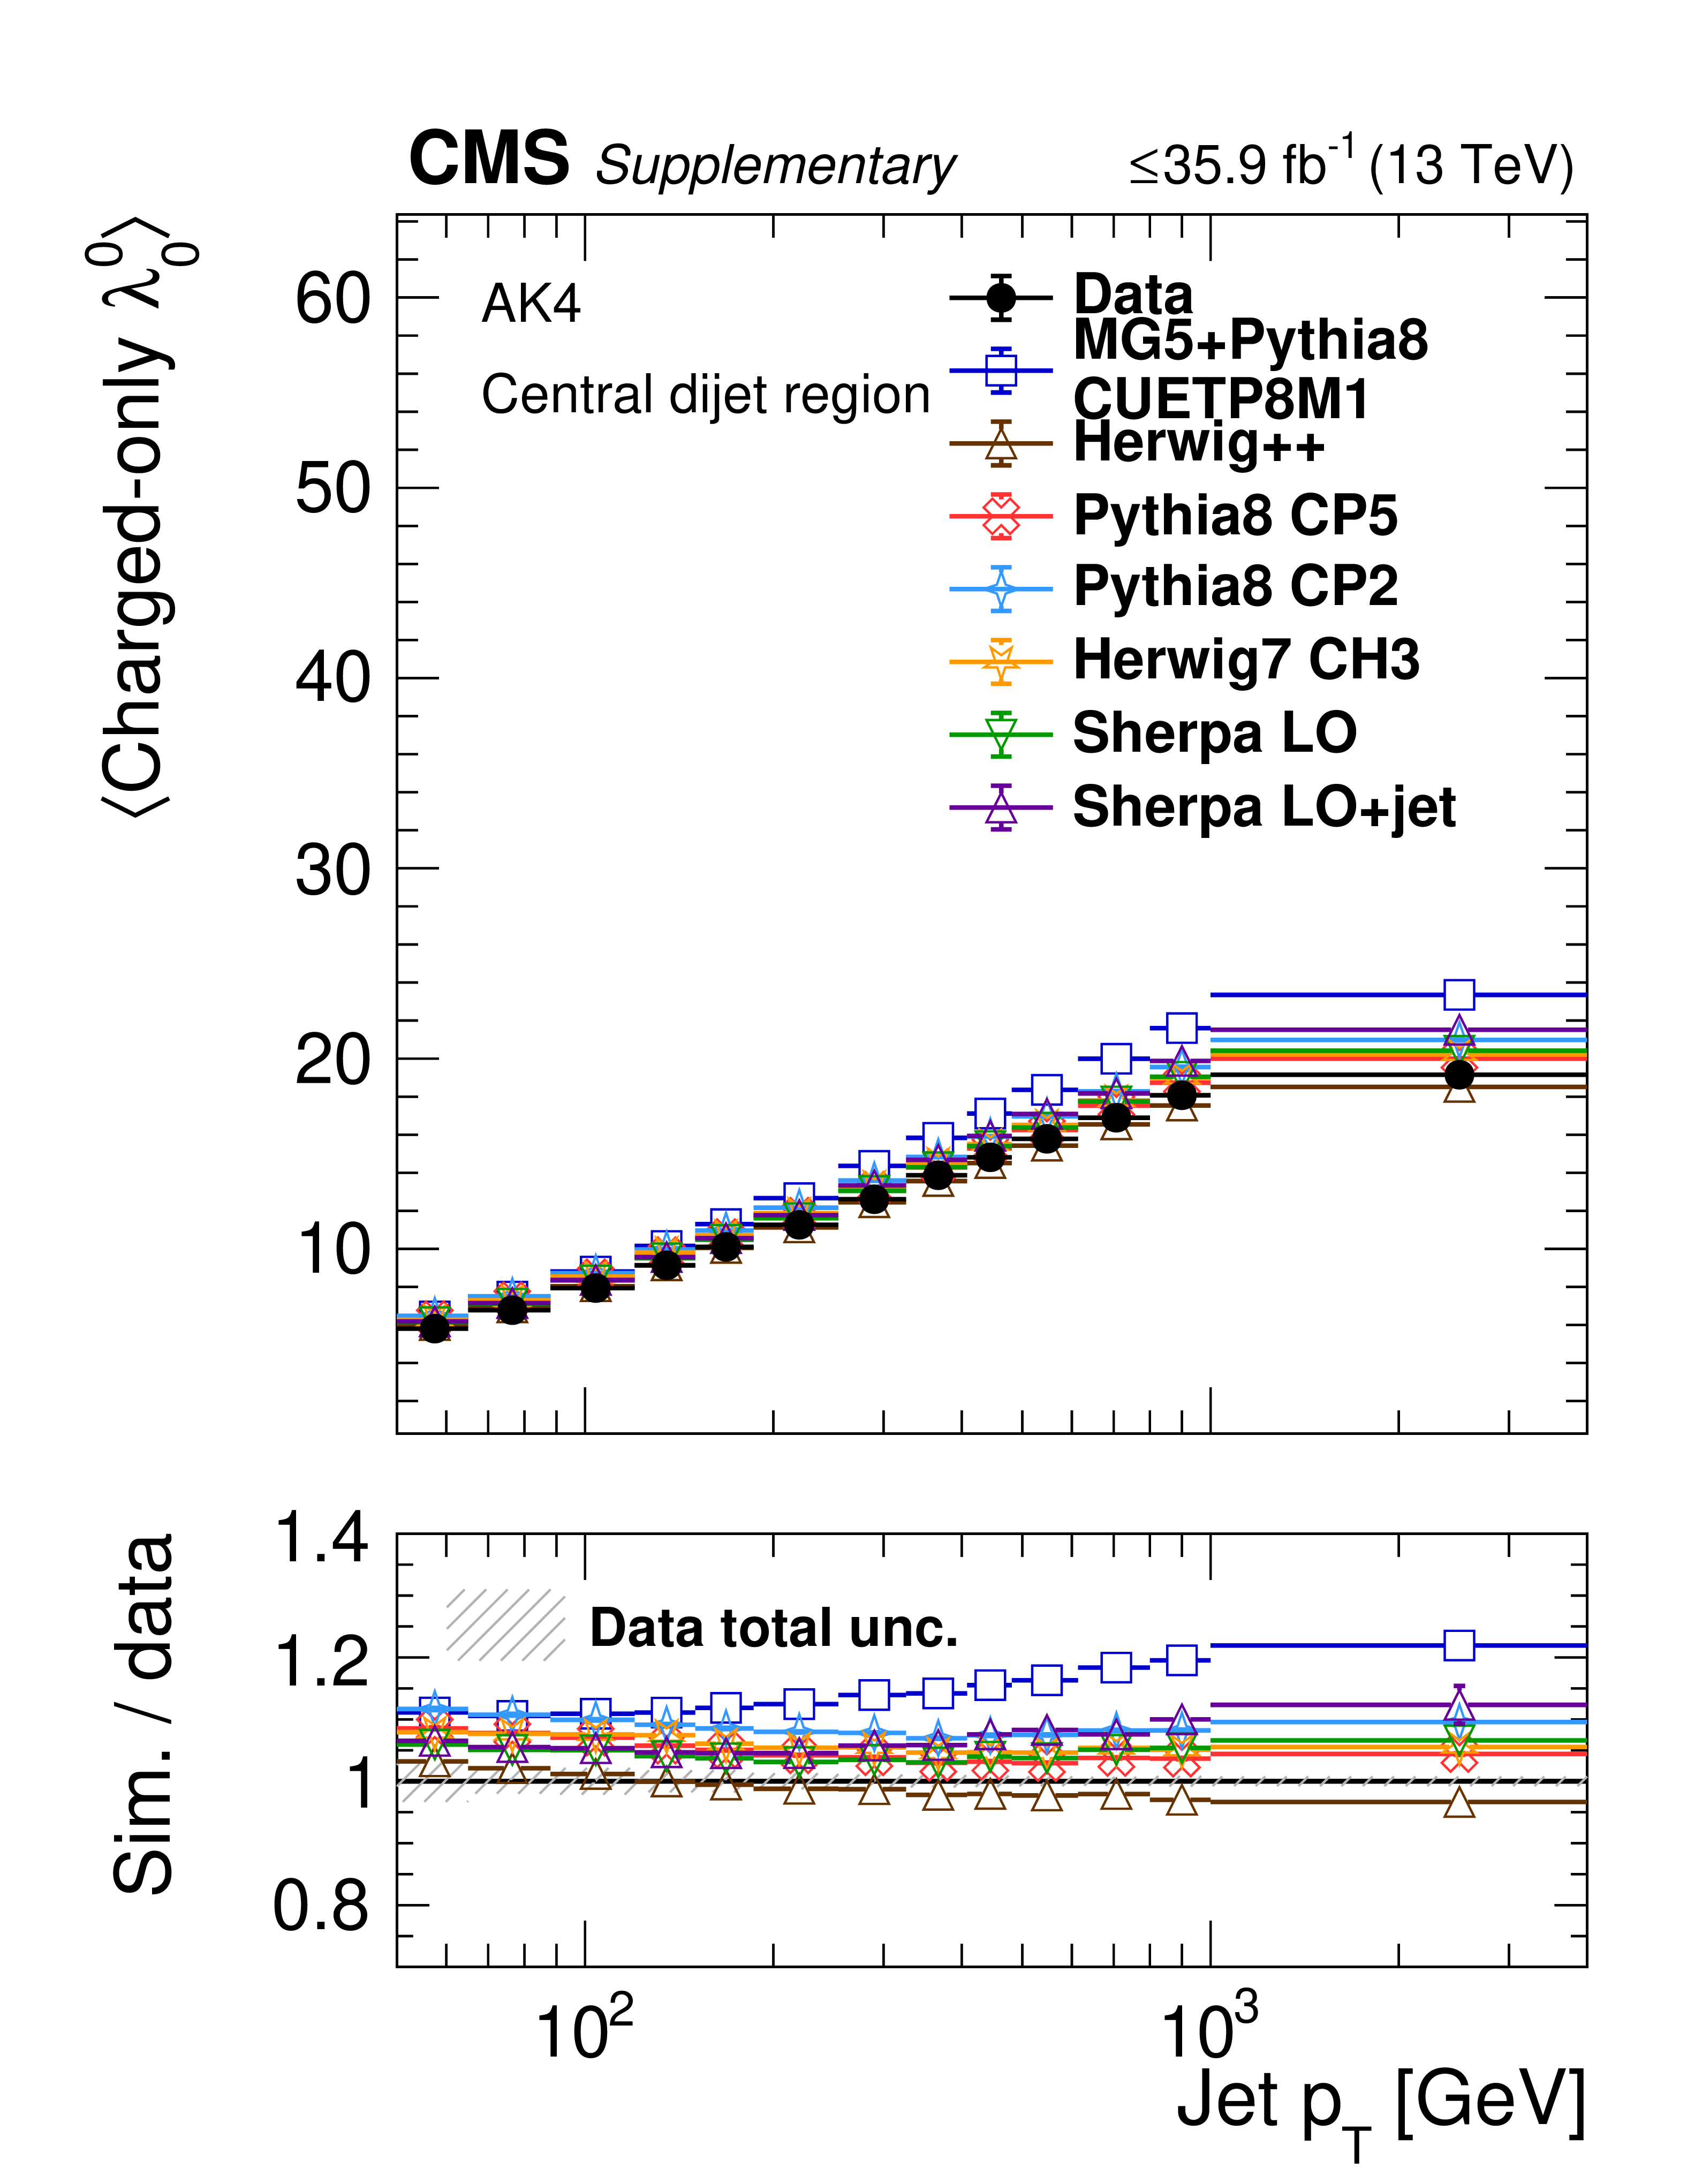
Figure 11-b:
Mean value of ungroomed LHA (${\lambda ^{1}_{0.5}}$) for AK4 jets as a function of ${p_{\mathrm {T}}}$ in the central dijet region. The plot shows the data distribution compared with different generator predictions. The error bars on the data and the hashed region in the ratio plot correspond to the total uncertainties of the experimental data. The error bars on the simulation correspond to the statistical uncertainties. |
png pdf |
Figure 11-c:
Mean value of ungroomed LHA (${\lambda ^{1}_{0.5}}$) for AK4 jets as a function of ${p_{\mathrm {T}}}$ in the Z+jet region. The plot shows the data distribution compared with different generator predictions. The error bars on the data and the hashed region in the ratio plot correspond to the total uncertainties of the experimental data. The error bars on the simulation correspond to the statistical uncertainties. |
png pdf |
Figure 11-d:
Mean value of ungroomed LHA (${\lambda ^{1}_{0.5}}$) for AK4 jets as a function of ${p_{\mathrm {T}}}$ in the central dijet region. The plot shows the data distribution compared with different generator predictions. The error bars on the data and the hashed region in the ratio plot correspond to the total uncertainties of the experimental data. The error bars on the simulation correspond to the statistical uncertainties. |
png pdf |
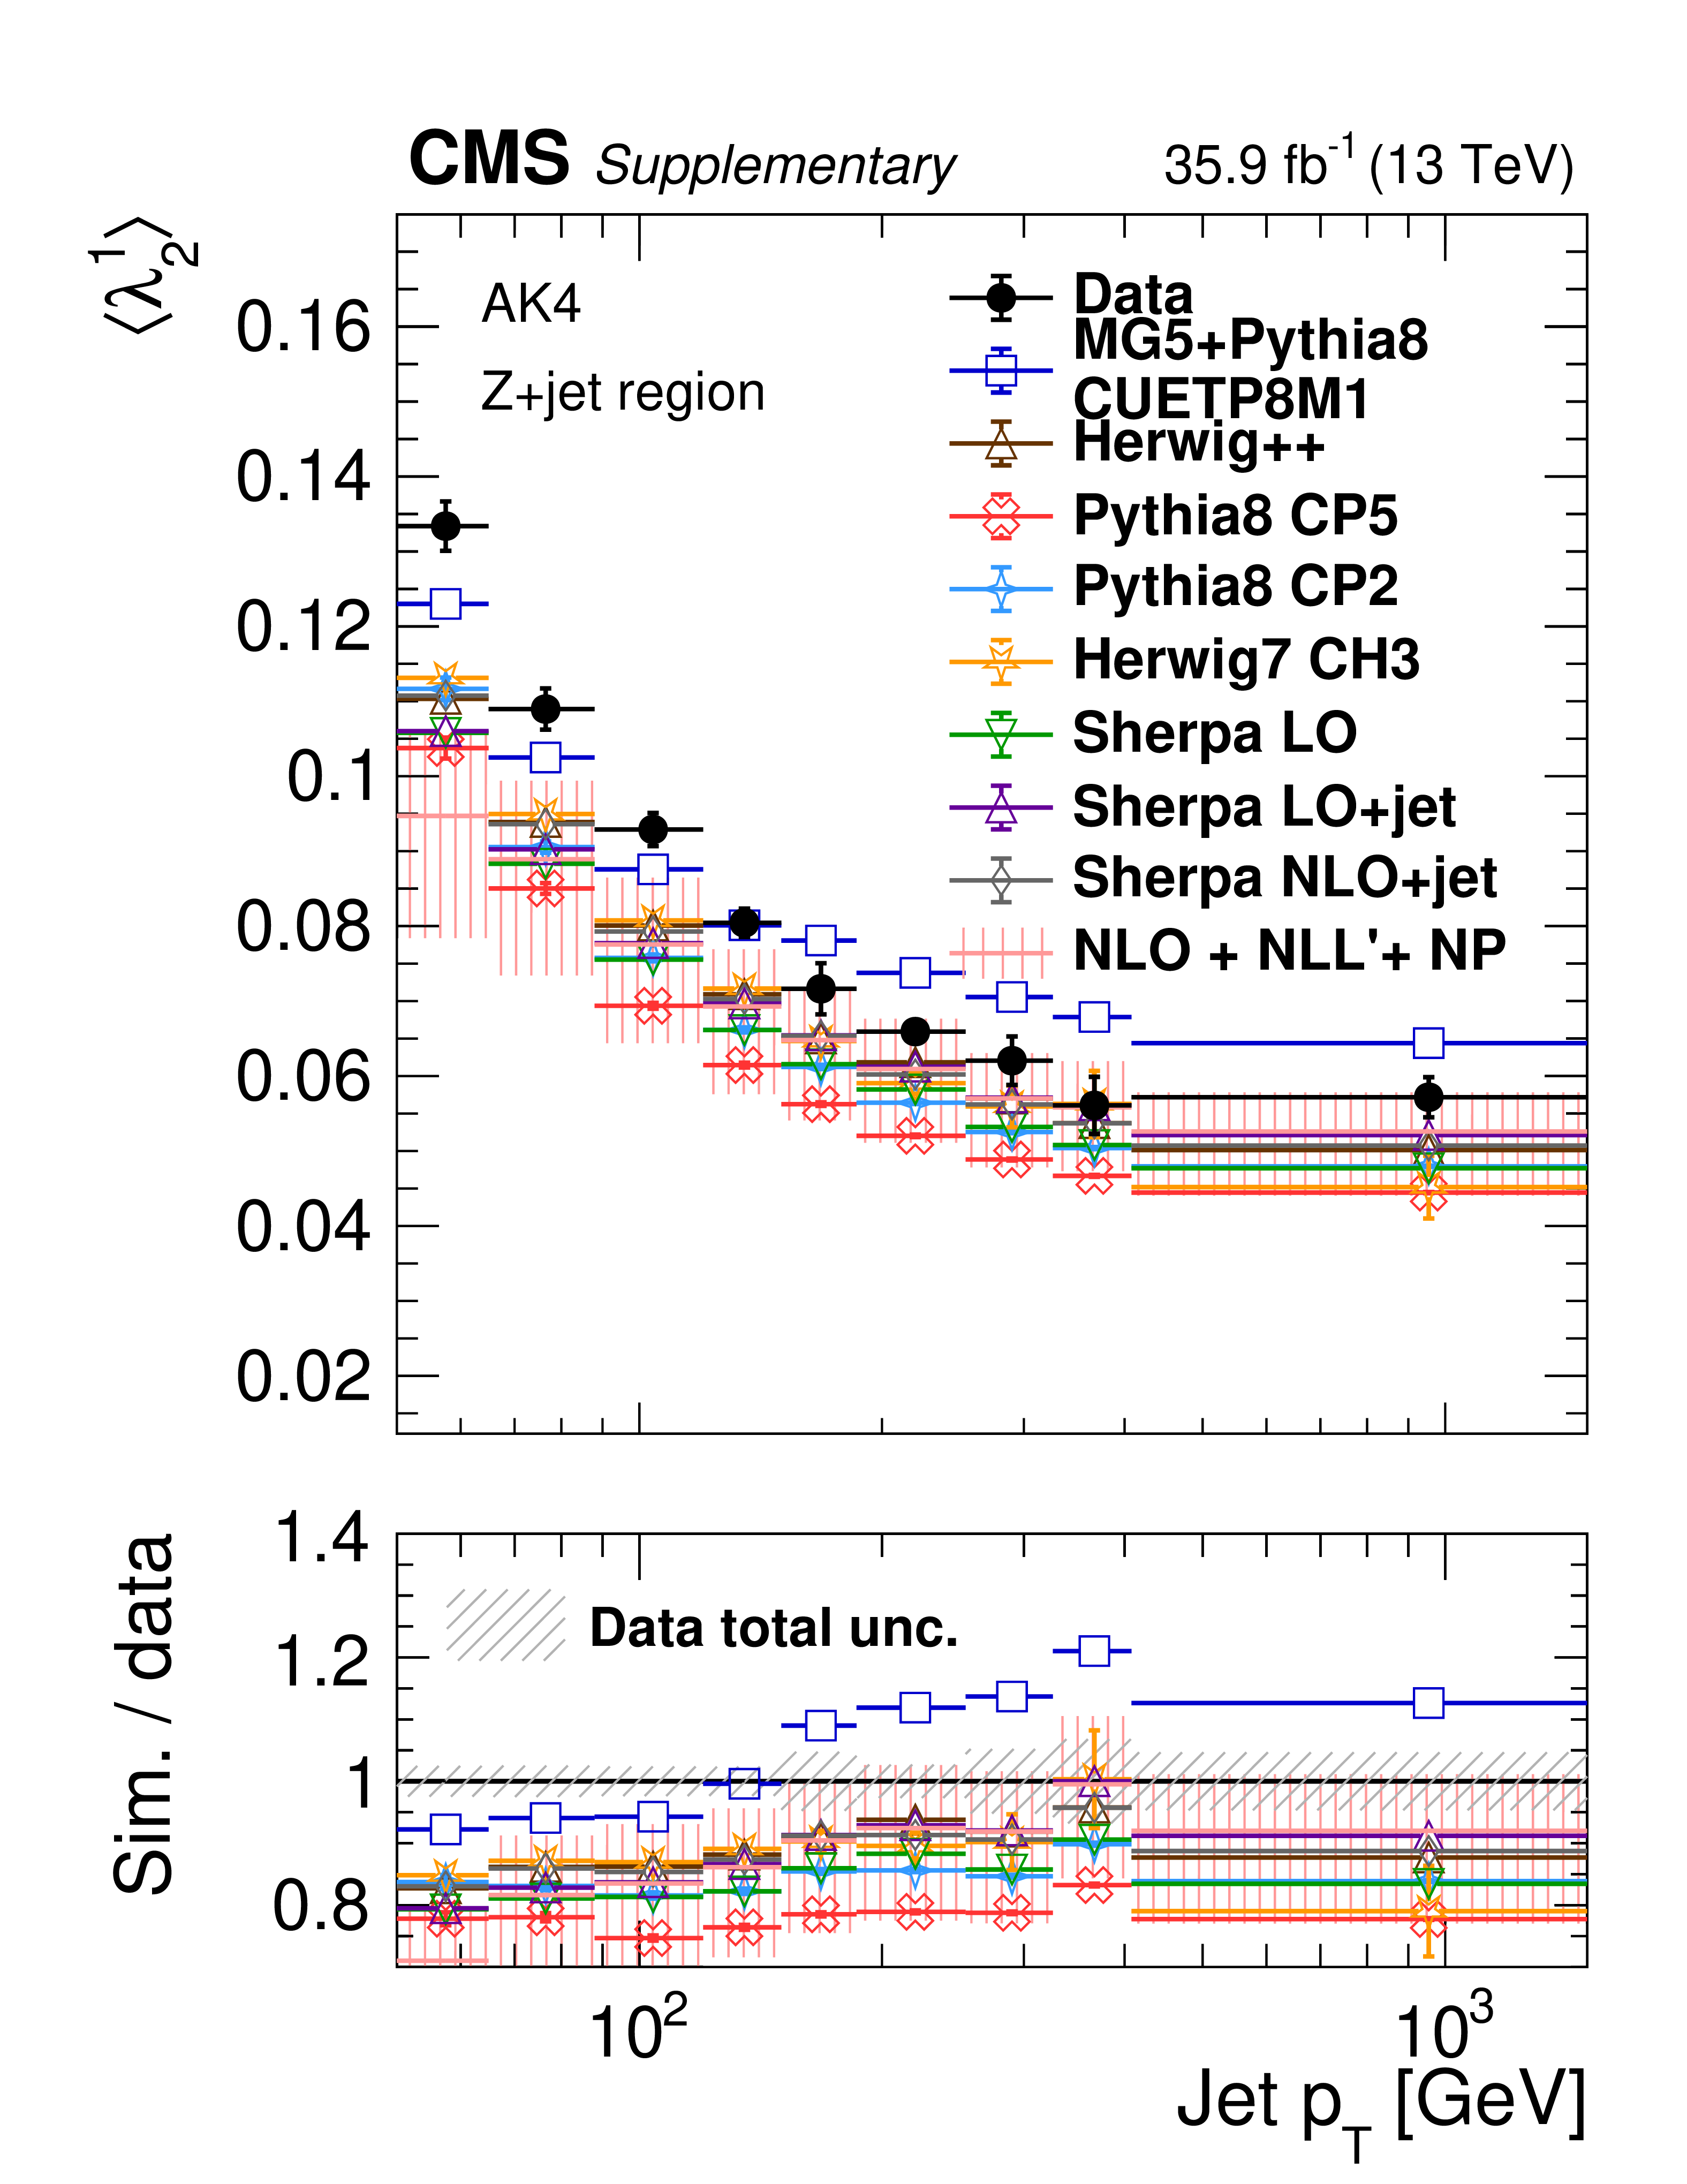
Figure 12:
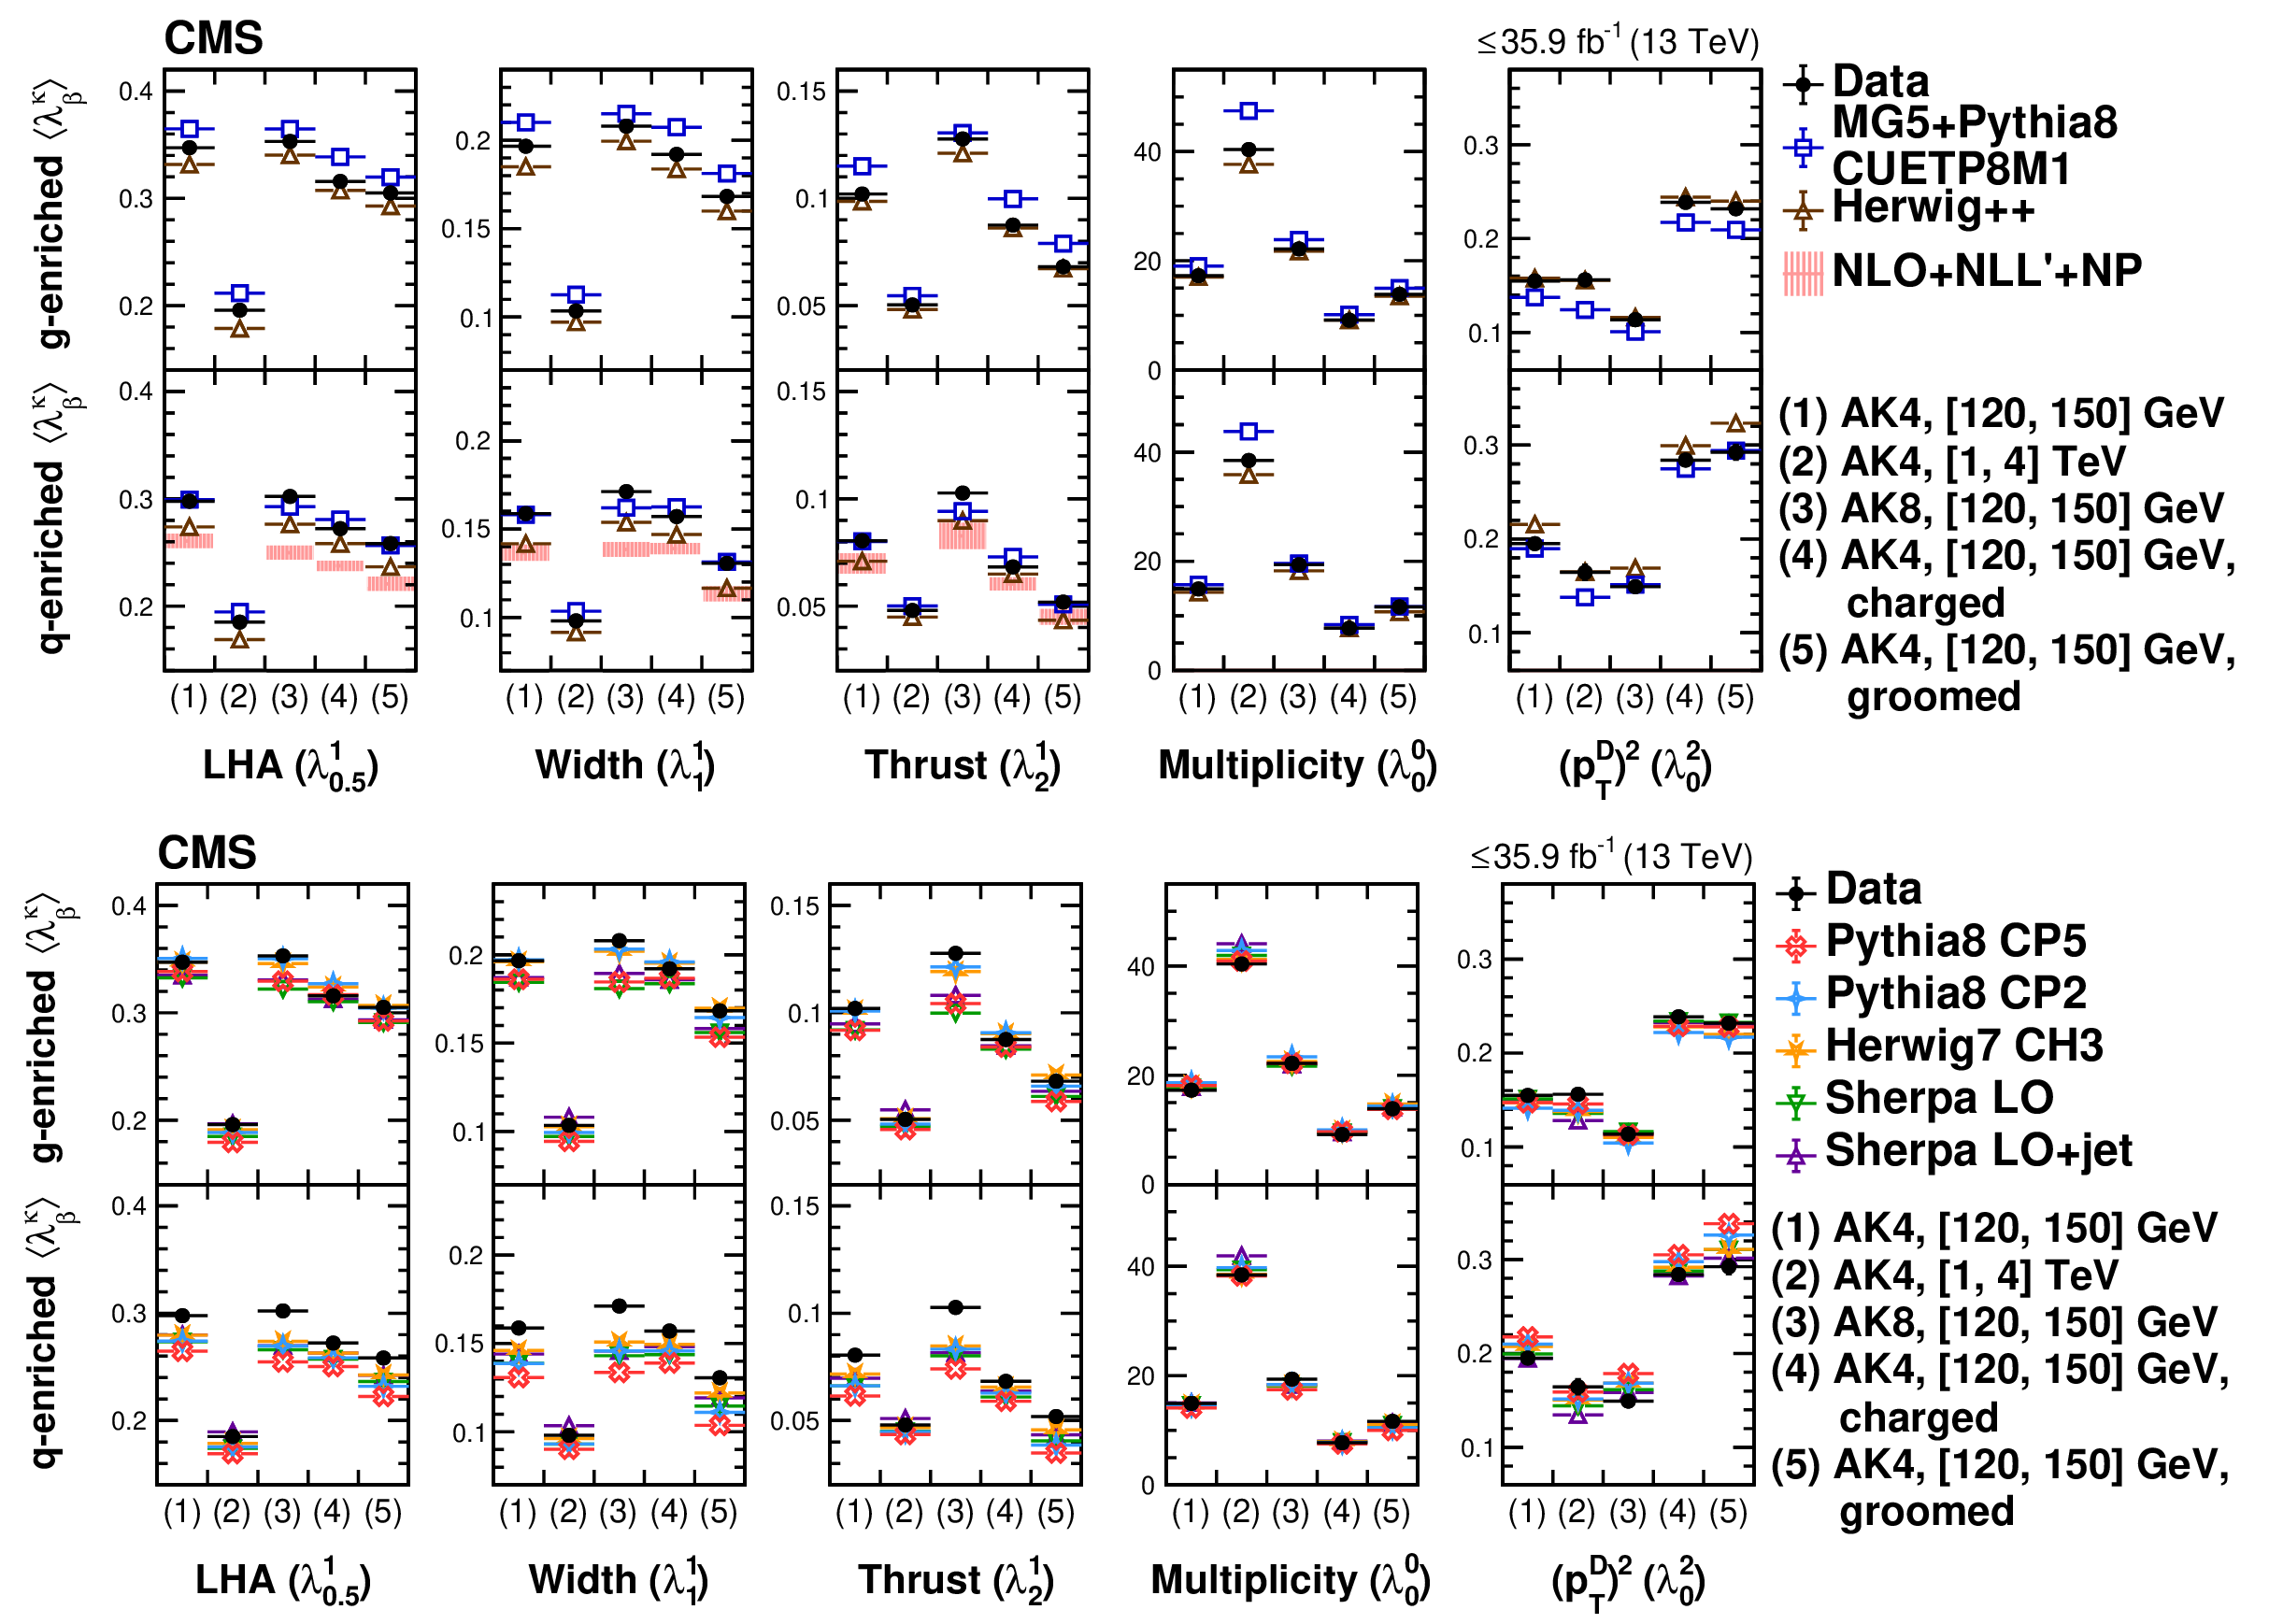
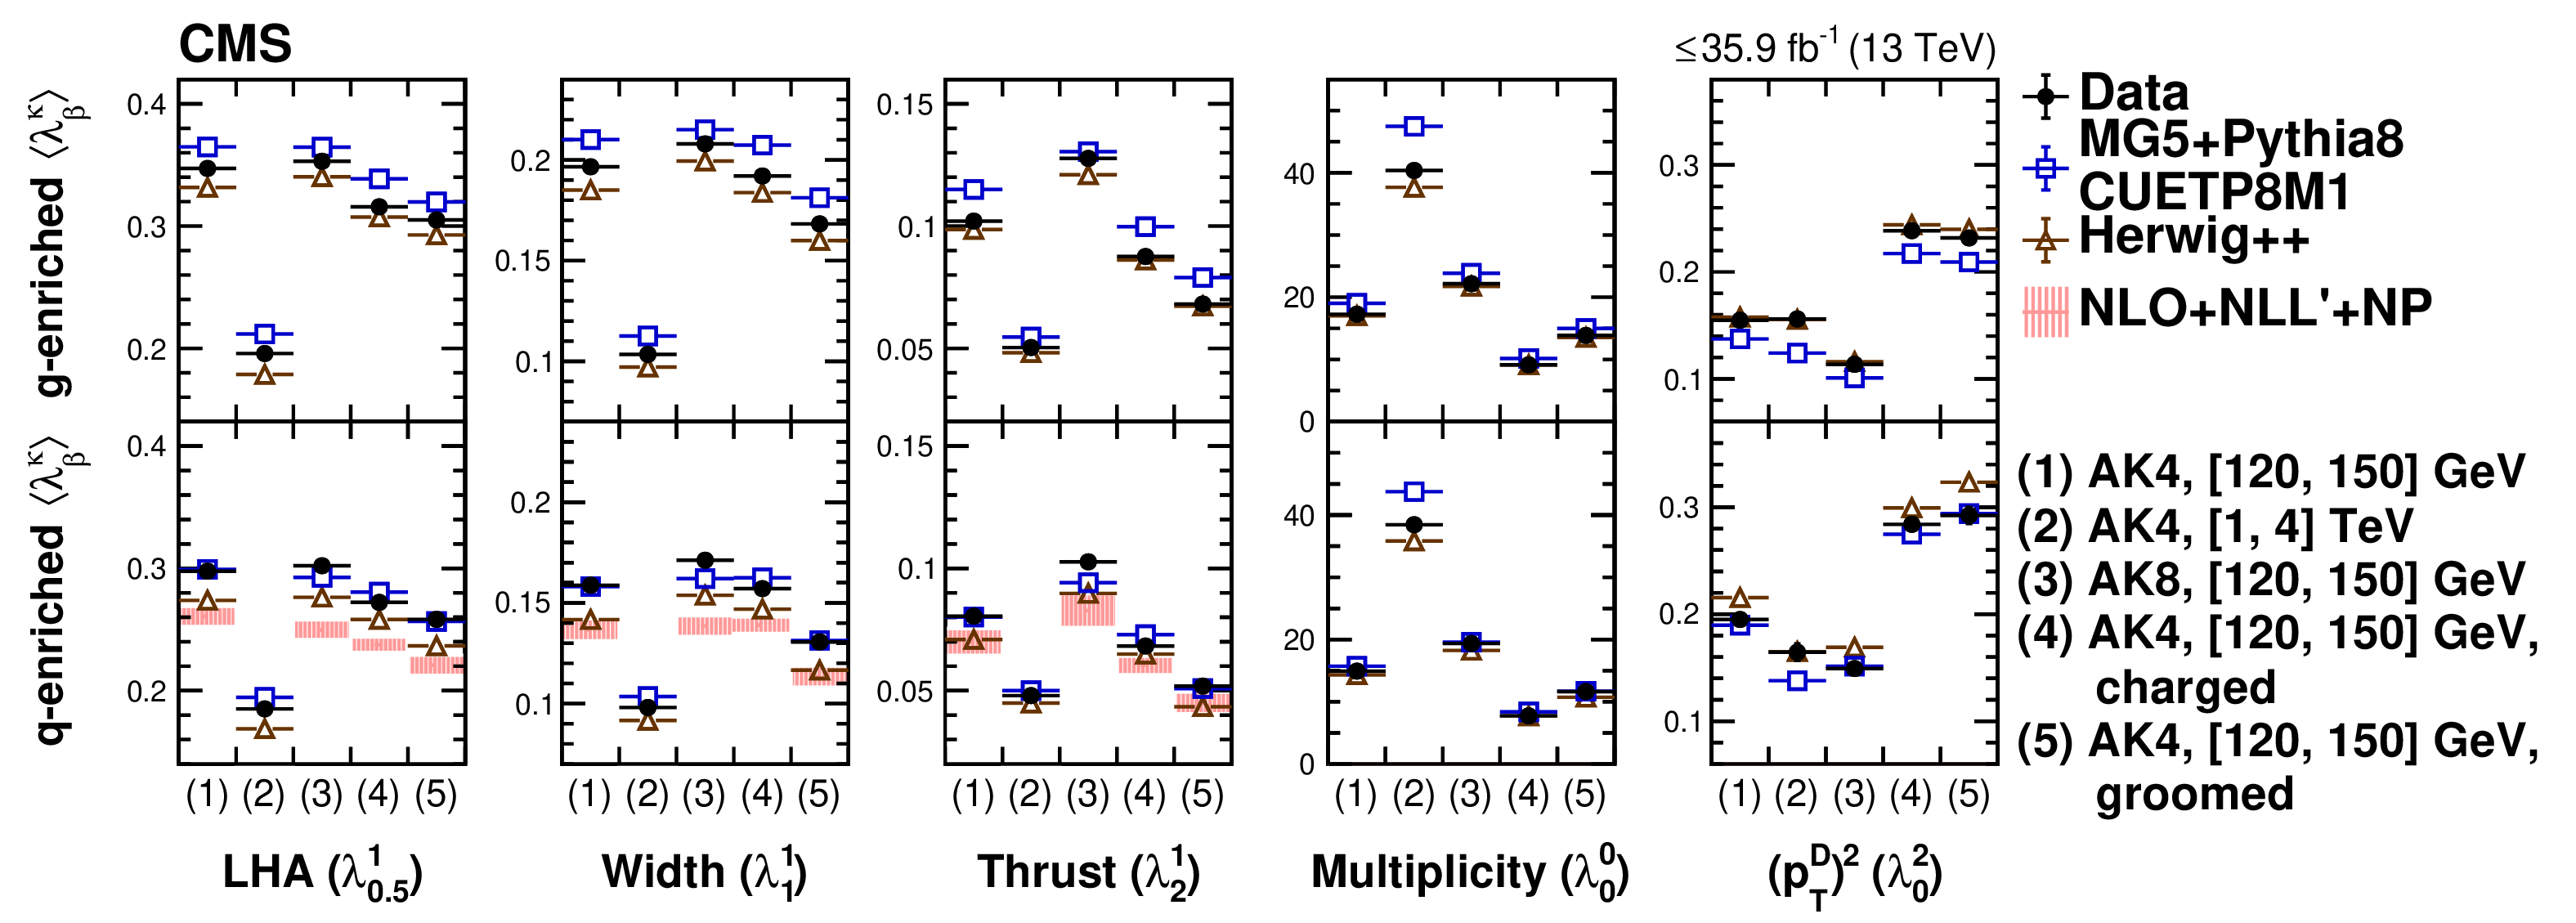
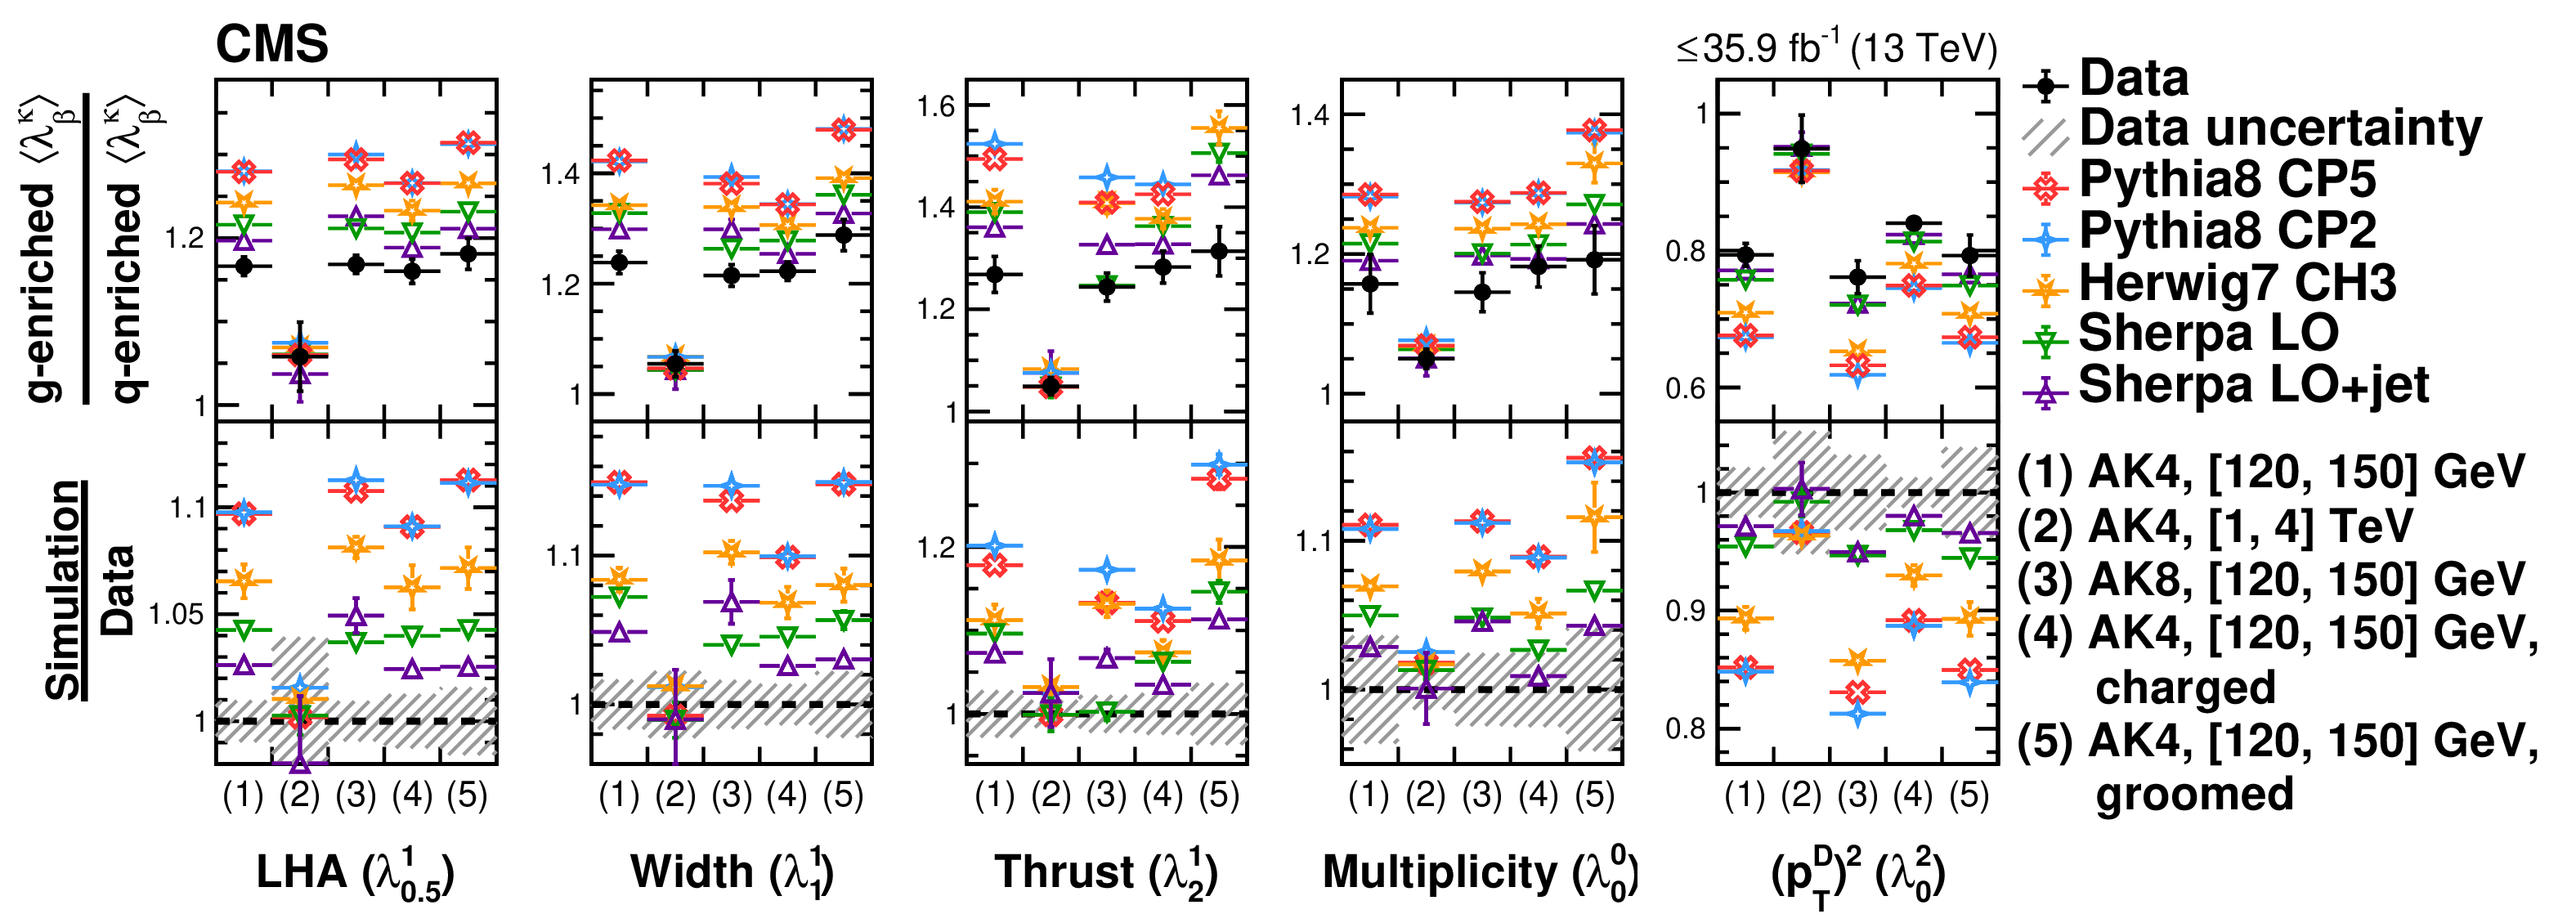
Mean value of substructure observables in regions with gluon-enriched and quark-enriched jets, for the following configurations: (1) ungroomed AK4 120 $ < {p_{\mathrm {T}}} < $ 150 GeV, (2) ungroomed AK4 1 $ < {p_{\mathrm {T}}} < $ 4 TeV, (3) ungroomed AK8 120 $ < {p_{\mathrm {T}}} < $ 150 GeV, (4) ungroomed charged AK4 120 $ < {p_{\mathrm {T}}} < $ 150 GeV, and (5) groomed AK4 120 $ < {p_{\mathrm {T}}} < $ 150 GeV; shown for each of the observables LHA (${\lambda ^{1}_{0.5}}$), width ($\lambda ^{1}_{1}$), thrust ($\lambda ^{1}_{2}$), multiplicity ($\lambda ^{0}_{0}$), and $(p_{\mathrm {T}}^{\mathrm {D}})^2$ ($\lambda ^{2}_{0}$). The central jet in the dijet region is used for the gluon-enriched sample, whereas for the quark-enriched sample the jet in the Z+jet region is used for 120 $ < {p_{\mathrm {T}}} < $ 150 GeV, and the forward jet in the dijet region is used for 1 $ < {p_{\mathrm {T}}} < $ 4 TeV. The upper and lower plots show the same data distribution compared with different generator predictions. The error bars on the data correspond to the total uncertainties. The error bars on the simulation correspond to the statistical uncertainties. |
png pdf |
Figure 12-a:
Mean value of substructure observables in regions with gluon-enriched and quark-enriched jets, for the following configurations: (1) ungroomed AK4 120 $ < {p_{\mathrm {T}}} < $ 150 GeV, (2) ungroomed AK4 1 $ < {p_{\mathrm {T}}} < $ 4 TeV, (3) ungroomed AK8 120 $ < {p_{\mathrm {T}}} < $ 150 GeV, (4) ungroomed charged AK4 120 $ < {p_{\mathrm {T}}} < $ 150 GeV, and (5) groomed AK4 120 $ < {p_{\mathrm {T}}} < $ 150 GeV; shown for each of the observables LHA (${\lambda ^{1}_{0.5}}$), width ($\lambda ^{1}_{1}$), thrust ($\lambda ^{1}_{2}$), multiplicity ($\lambda ^{0}_{0}$), and $(p_{\mathrm {T}}^{\mathrm {D}})^2$ ($\lambda ^{2}_{0}$). The central jet in the dijet region is used for the gluon-enriched sample, whereas for the quark-enriched sample the jet in the Z+jet region is used for 120 $ < {p_{\mathrm {T}}} < $ 150 GeV, and the forward jet in the dijet region is used for 1 $ < {p_{\mathrm {T}}} < $ 4 TeV. The plot shows the data distributions compared with different generator predictions. The error bars on the data correspond to the total uncertainties. The error bars on the simulation correspond to the statistical uncertainties. |

png pdf |
Figure 12-b:
Mean value of substructure observables in regions with gluon-enriched and quark-enriched jets, for the following configurations: (1) ungroomed AK4 120 $ < {p_{\mathrm {T}}} < $ 150 GeV, (2) ungroomed AK4 1 $ < {p_{\mathrm {T}}} < $ 4 TeV, (3) ungroomed AK8 120 $ < {p_{\mathrm {T}}} < $ 150 GeV, (4) ungroomed charged AK4 120 $ < {p_{\mathrm {T}}} < $ 150 GeV, and (5) groomed AK4 120 $ < {p_{\mathrm {T}}} < $ 150 GeV; shown for each of the observables LHA (${\lambda ^{1}_{0.5}}$), width ($\lambda ^{1}_{1}$), thrust ($\lambda ^{1}_{2}$), multiplicity ($\lambda ^{0}_{0}$), and $(p_{\mathrm {T}}^{\mathrm {D}})^2$ ($\lambda ^{2}_{0}$). The central jet in the dijet region is used for the gluon-enriched sample, whereas for the quark-enriched sample the jet in the Z+jet region is used for 120 $ < {p_{\mathrm {T}}} < $ 150 GeV, and the forward jet in the dijet region is used for 1 $ < {p_{\mathrm {T}}} < $ 4 TeV. The plot shows the data distributions compared with different generator predictions. The error bars on the data correspond to the total uncertainties. The error bars on the simulation correspond to the statistical uncertainties. |

png pdf |
Figure 13:
Ratio of the mean of substructure observables in regions with gluon- and quark-enriched jets, for the following configurations: (1) ungroomed AK4 120 $ < {p_{\mathrm {T}}} < $ 150 GeV, (2) ungroomed AK4 1 $ < {p_{\mathrm {T}}} < $ 4 TeV, (3) ungroomed AK8 120 $ < {p_{\mathrm {T}}} < $ 150 GeV, (4) ungroomed charged AK4 120 $ < {p_{\mathrm {T}}} < $ 150 GeV, and (5) groomed AK4 120 $ < {p_{\mathrm {T}}} < $ 150 GeV; for the observables LHA (${\lambda ^{1}_{0.5}}$), width ($\lambda ^{1}_{1}$), thrust ($\lambda ^{1}_{2}$), multiplicity ($\lambda ^{0}_{0}$), and $(p_{\mathrm {T}}^{\mathrm {D}})^2$ ($\lambda ^{2}_{0}$). The central jet in the dijet region is used for the gluon-enriched sample, whereas for the quark-enriched sample the jet in the Z+jet region is used for 120 $ < {p_{\mathrm {T}}} < $ 150 GeV, whereas the forward jet in the dijet region is used for 1 $ < {p_{\mathrm {T}}} < $ 4 TeV. The upper and lower plots show the same data distribution compared with different generator predictions. The error bars on the data correspond to the total uncertainties. The error bars on the simulation correspond to the statistical uncertainties. |

png pdf |
Figure 13-a:
Ratio of the mean of substructure observables in regions with gluon- and quark-enriched jets, for the following configurations: (1) ungroomed AK4 120 $ < {p_{\mathrm {T}}} < $ 150 GeV, (2) ungroomed AK4 1 $ < {p_{\mathrm {T}}} < $ 4 TeV, (3) ungroomed AK8 120 $ < {p_{\mathrm {T}}} < $ 150 GeV, (4) ungroomed charged AK4 120 $ < {p_{\mathrm {T}}} < $ 150 GeV, and (5) groomed AK4 120 $ < {p_{\mathrm {T}}} < $ 150 GeV; for the observables LHA (${\lambda ^{1}_{0.5}}$), width ($\lambda ^{1}_{1}$), thrust ($\lambda ^{1}_{2}$), multiplicity ($\lambda ^{0}_{0}$), and $(p_{\mathrm {T}}^{\mathrm {D}})^2$ ($\lambda ^{2}_{0}$). The central jet in the dijet region is used for the gluon-enriched sample, whereas for the quark-enriched sample the jet in the Z+jet region is used for 120 $ < {p_{\mathrm {T}}} < $ 150 GeV, whereas the forward jet in the dijet region is used for 1 $ < {p_{\mathrm {T}}} < $ 4 TeV. The plot shows the data distribution compared with different generator predictions. The error bars on the data correspond to the total uncertainties. The error bars on the simulation correspond to the statistical uncertainties. |
png pdf |
Figure 13-b:
Ratio of the mean of substructure observables in regions with gluon- and quark-enriched jets, for the following configurations: (1) ungroomed AK4 120 $ < {p_{\mathrm {T}}} < $ 150 GeV, (2) ungroomed AK4 1 $ < {p_{\mathrm {T}}} < $ 4 TeV, (3) ungroomed AK8 120 $ < {p_{\mathrm {T}}} < $ 150 GeV, (4) ungroomed charged AK4 120 $ < {p_{\mathrm {T}}} < $ 150 GeV, and (5) groomed AK4 120 $ < {p_{\mathrm {T}}} < $ 150 GeV; for the observables LHA (${\lambda ^{1}_{0.5}}$), width ($\lambda ^{1}_{1}$), thrust ($\lambda ^{1}_{2}$), multiplicity ($\lambda ^{0}_{0}$), and $(p_{\mathrm {T}}^{\mathrm {D}})^2$ ($\lambda ^{2}_{0}$). The central jet in the dijet region is used for the gluon-enriched sample, whereas for the quark-enriched sample the jet in the Z+jet region is used for 120 $ < {p_{\mathrm {T}}} < $ 150 GeV, whereas the forward jet in the dijet region is used for 1 $ < {p_{\mathrm {T}}} < $ 4 TeV. The plot shows the data distribution compared with different generator predictions. The error bars on the data correspond to the total uncertainties. The error bars on the simulation correspond to the statistical uncertainties. |
| Tables | |
png pdf |
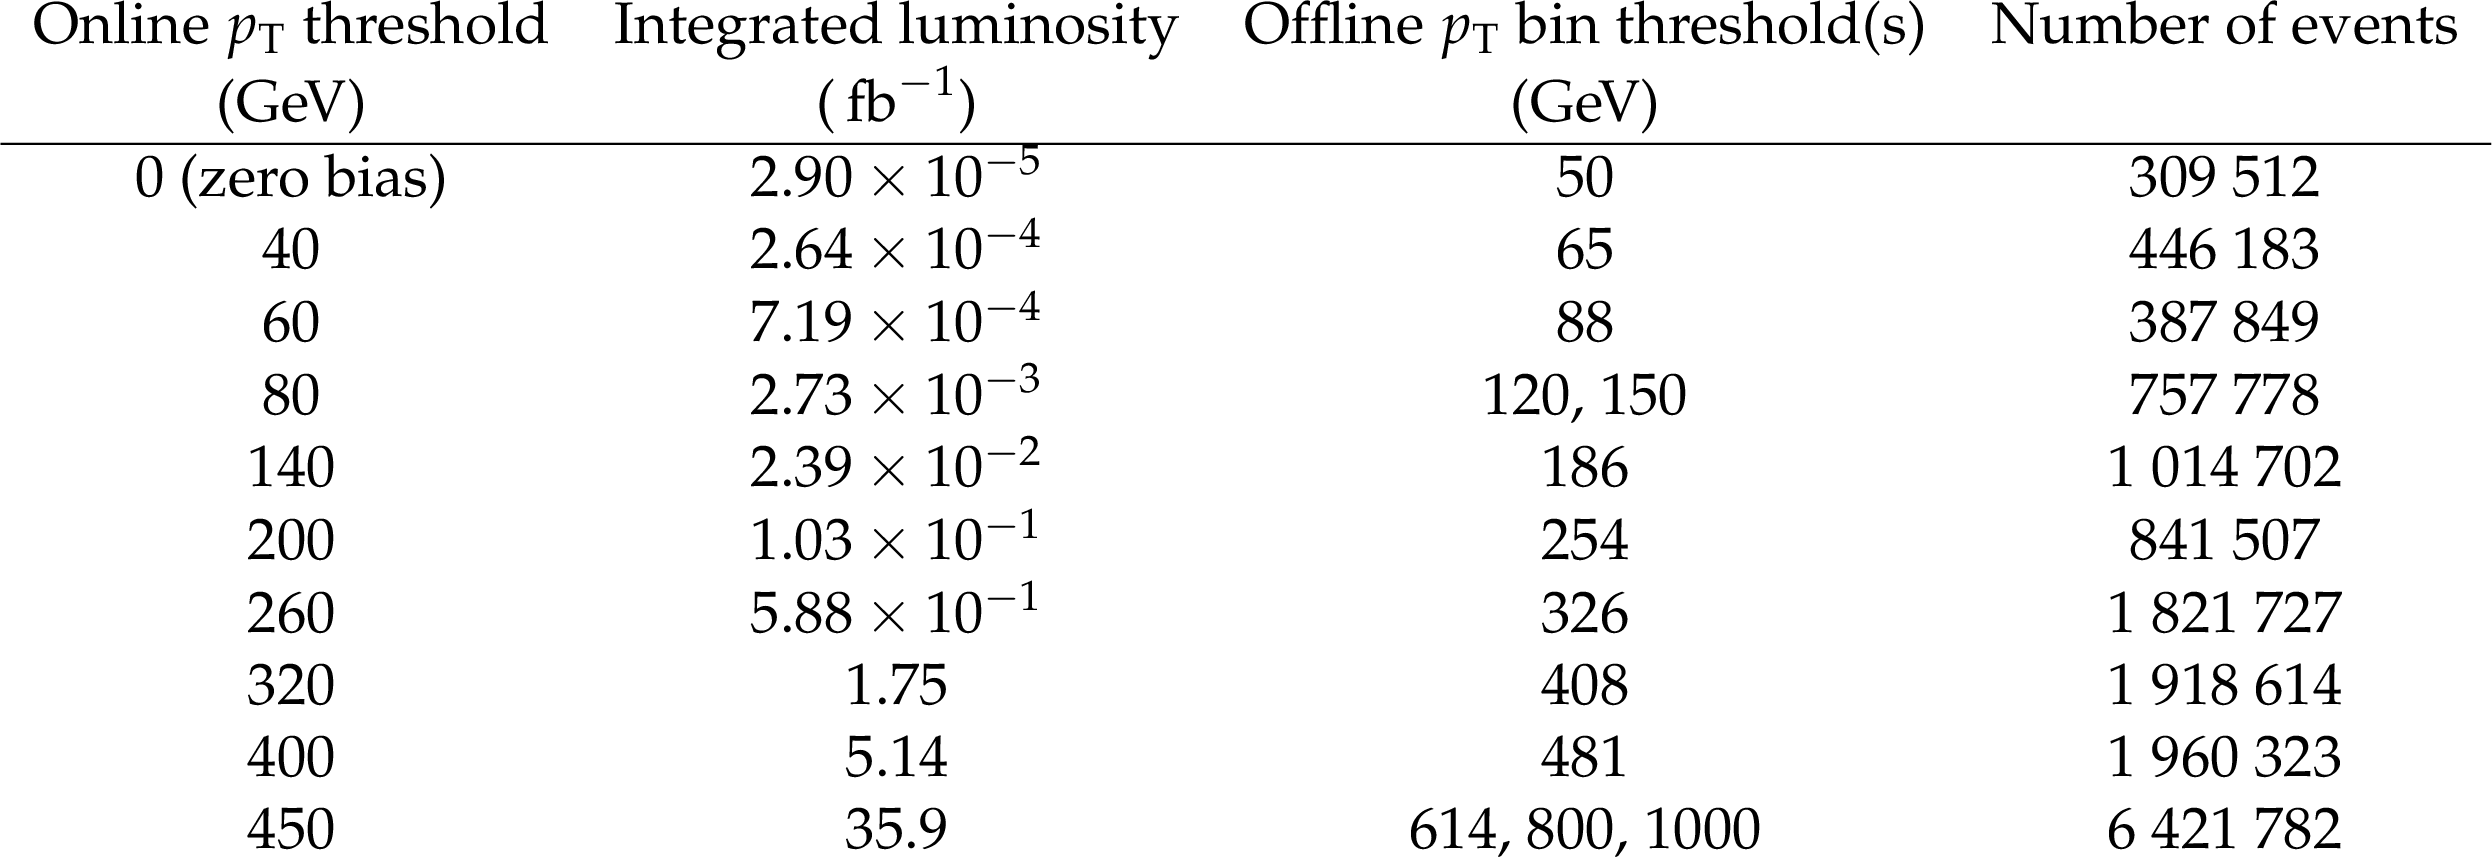
Table 1:
Summary of zero bias and jet triggers used in the analysis for the dijet region. For each trigger, the integrated luminosity and number of events collected by it are given. The offline ${p_{\mathrm {T}}}$ bin threshold(s) indicate the lower edge of the ${p_{\mathrm {T}}}$ bin(s) measured with data from a given trigger. |

png pdf |
Table 2:
Summary of the selection criteria for the Z+jet and dijet event samples. |
png pdf |
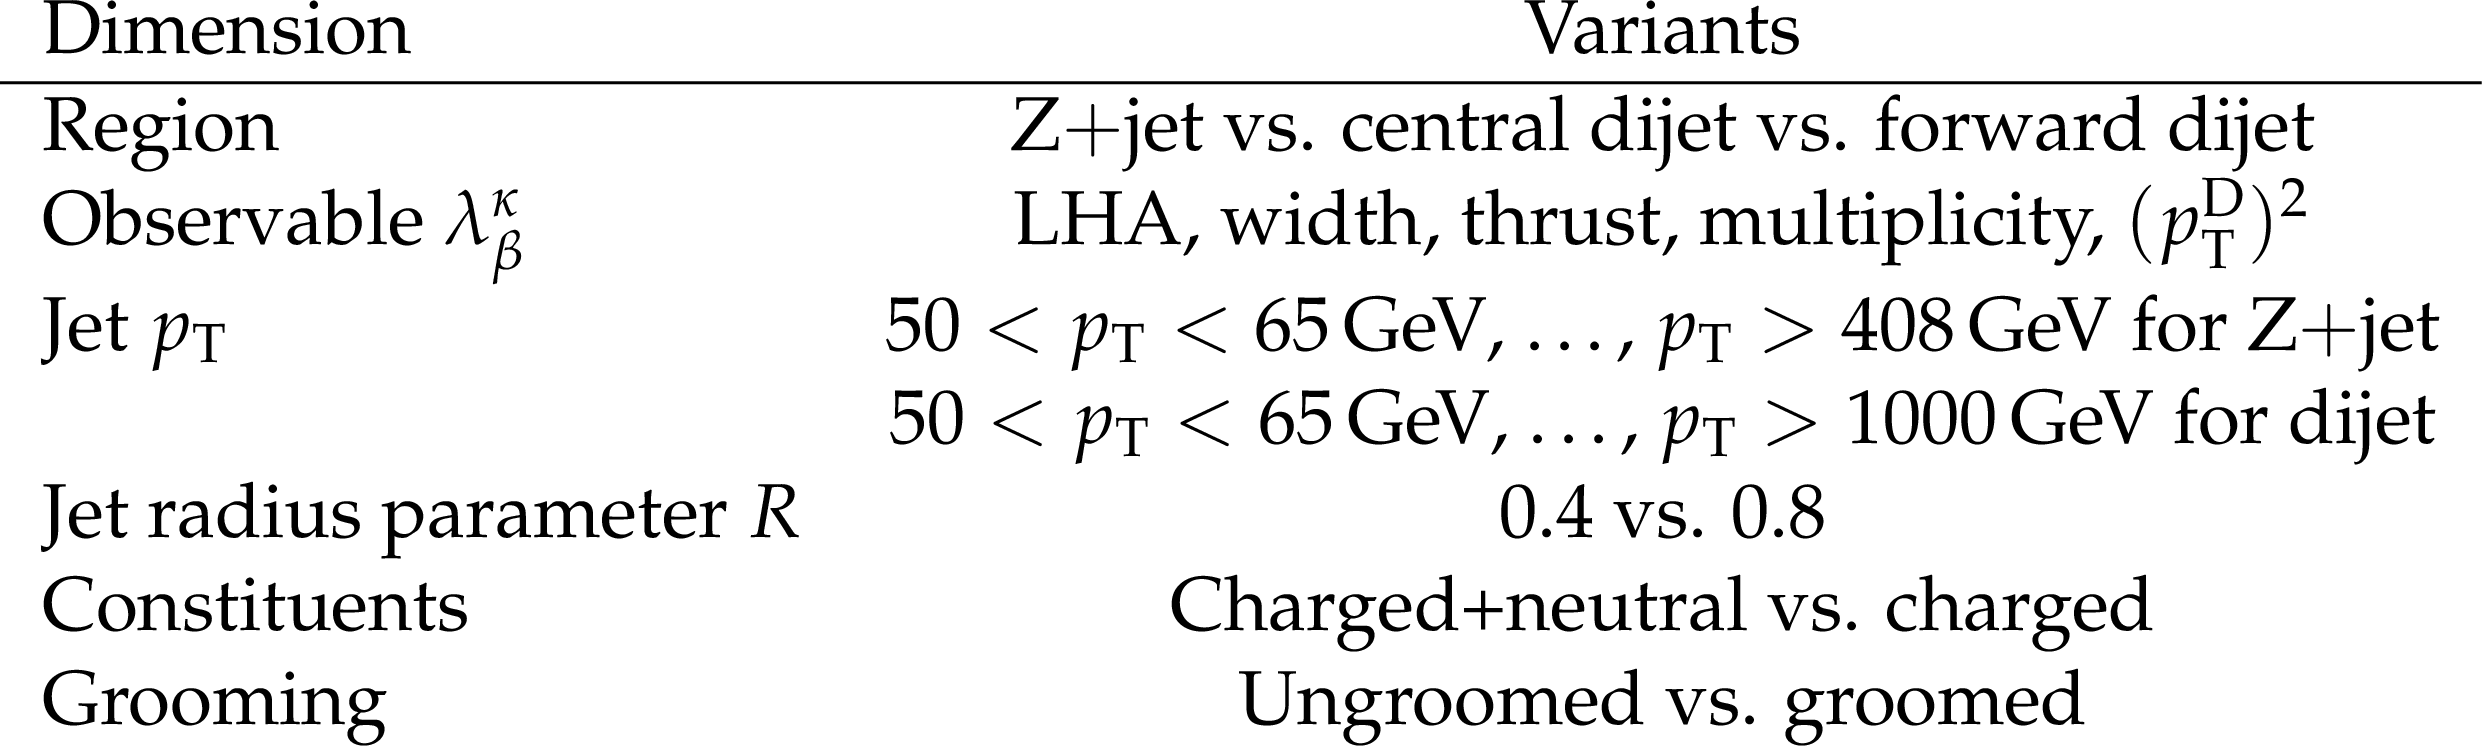
Table 3:
Summary of the variants of observables measured in this paper. |
| Summary |
| Measurements of distributions of generalized jet angularities in proton-proton collision data taken by the CMS detector at $\sqrt{s} = $ 13 TeV in dijet and, for the first time, also in Z+jet topologies have been presented. Whereas the dijet topology allows access to a sample of jets that predominantly originate from gluon fragmentation, the Z+jet topology yields a sample enriched in quark-initiated jets. Five generalized angularities are measured to study different features in the modelling of jet substructure. Three infrared- and collinear-safe angularities are particularly sensitive to perturbative emissions in jets, whereas the other two have larger contributions from nonperturbative effects. For the first time, a measurement of angularities with different jet radii, both with and without the application of a grooming algorithm, was carried out to further discriminate between different features in the modelling. Although a subset of these distributions was discussed in this paper, the full range of measurements is made public in HEPData record [98]. The measurements for quark and gluon jets yield values in between the predictions from the MadGraph5+MCatNLO+PYTHIA-8 and HERWIG++ simulations. The quality of modelling for the infrared- and collinear-safe angularities is sensitive to the quark and gluon composition of the sample of jets. It is also largely independent of whether a grooming algorithm is applied, suggesting that the quality depends mainly on the perturbative emissions in jets, rather than nonperturbative effects. A calculation based on analytic resummation of large logarithms of the collinear-safe angularities in the Z+jet topology at next-to-leading order + next-to-leading logarithm (NLO+NLL') accuracy including nonperturbative effects best describes the thrust with a $\chi^2/N_{\text{bins}}$ (where $N_{\text{bins}}$ is the number of bins of the distribution) as low as 4.1/5.0, whereas the Les Houches Angularity was described significantly worse with $\chi^2/N_{\text{bins}}$ up to 58/8. A comparison of the means of the angularities in quark- and gluon-enriched data samples demonstrated their discrimination power, which was overestimated by all generators under study, showing a clear need for improvements in the simulation. |
| Additional Figures | |
png pdf |
Additional Figure 1:
Particle-level distributions of ungroomed AK4 width (${\lambda ^{1}_{1}}$) in 408 $ < {p_{\mathrm {T}}} < $ 4000 GeV in the Z+jet region (left) and in 1000 $ < {p_{\mathrm {T}}} < $ 4000 GeV in the central dijet region (right). |
png pdf |
Additional Figure 1-a:
Particle-level distributions of ungroomed AK4 width (${\lambda ^{1}_{1}}$) in 408 $ < {p_{\mathrm {T}}} < $ 4000 GeV in the Z+jet region (left) and in 1000 $ < {p_{\mathrm {T}}} < $ 4000 GeV in the central dijet region (right). |

png pdf |
Additional Figure 1-b:
Particle-level distributions of ungroomed AK4 width (${\lambda ^{1}_{1}}$) in 408 $ < {p_{\mathrm {T}}} < $ 4000 GeV in the Z+jet region (left) and in 1000 $ < {p_{\mathrm {T}}} < $ 4000 GeV in the central dijet region (right). |
png pdf |
Additional Figure 2:
Particle-level distributions of ungroomed AK8 width (${\lambda ^{1}_{1}}$) in AK8 120 $ < {p_{\mathrm {T}}} < $ 150 GeV in the Z+jet region (left) and central dijet region (right). |
png pdf |
Additional Figure 2-a:
Particle-level distributions of ungroomed AK8 width (${\lambda ^{1}_{1}}$) in AK8 120 $ < {p_{\mathrm {T}}} < $ 150 GeV in the Z+jet region (left) and central dijet region (right). |
png pdf |
Additional Figure 2-b:
Particle-level distributions of ungroomed AK8 width (${\lambda ^{1}_{1}}$) in AK8 120 $ < {p_{\mathrm {T}}} < $ 150 GeV in the Z+jet region (left) and central dijet region (right). |

png pdf |
Additional Figure 3:
Particle-level distributions of ungroomed charged-only AK4 width (${\lambda ^{1}_{1}}$) 120 $ < {p_{\mathrm {T}}} < $ 150 GeV in the Z+jet region (left) and central dijet region (right). |

png pdf |
Additional Figure 3-a:
Particle-level distributions of ungroomed charged-only AK4 width (${\lambda ^{1}_{1}}$) 120 $ < {p_{\mathrm {T}}} < $ 150 GeV in the Z+jet region (left) and central dijet region (right). |
png pdf |
Additional Figure 3-b:
Particle-level distributions of ungroomed charged-only AK4 width (${\lambda ^{1}_{1}}$) 120 $ < {p_{\mathrm {T}}} < $ 150 GeV in the Z+jet region (left) and central dijet region (right). |
png pdf |
Additional Figure 4:
Particle-level distributions of groomed AK4 width (${\lambda ^{1}_{1}}$) 120 $ < {p_{\mathrm {T}}} < $ 150 GeV in the Z+jet region (left) and central dijet region (right). |

png pdf |
Additional Figure 4-a:
Particle-level distributions of groomed AK4 width (${\lambda ^{1}_{1}}$) 120 $ < {p_{\mathrm {T}}} < $ 150 GeV in the Z+jet region (left) and central dijet region (right). |

png pdf |
Additional Figure 4-b:
Particle-level distributions of groomed AK4 width (${\lambda ^{1}_{1}}$) 120 $ < {p_{\mathrm {T}}} < $ 150 GeV in the Z+jet region (left) and central dijet region (right). |

png pdf |
Additional Figure 5:
Particle-level distributions of ungroomed AK4 thrust (${\lambda ^{1}_{2}}$) in 408 $ < {p_{\mathrm {T}}} < $ 4000 GeV in the Z+jet region (left) and in 1000 $ < {p_{\mathrm {T}}} < $ 4000 GeV in the central dijet region (right). |
png pdf |
Additional Figure 5-a:
Particle-level distributions of ungroomed AK4 thrust (${\lambda ^{1}_{2}}$) in 408 $ < {p_{\mathrm {T}}} < $ 4000 GeV in the Z+jet region (left) and in 1000 $ < {p_{\mathrm {T}}} < $ 4000 GeV in the central dijet region (right). |
png pdf |
Additional Figure 5-b:
Particle-level distributions of ungroomed AK4 thrust (${\lambda ^{1}_{2}}$) in 408 $ < {p_{\mathrm {T}}} < $ 4000 GeV in the Z+jet region (left) and in 1000 $ < {p_{\mathrm {T}}} < $ 4000 GeV in the central dijet region (right). |
png pdf |
Additional Figure 6:
Particle-level distributions of ungroomed AK8 thrust (${\lambda ^{1}_{2}}$) in AK8 120 $ < {p_{\mathrm {T}}} < $ 150 GeV in the Z+jet region (left) and central dijet region (right). |
png pdf |
Additional Figure 6-a:
Particle-level distributions of ungroomed AK8 thrust (${\lambda ^{1}_{2}}$) in AK8 120 $ < {p_{\mathrm {T}}} < $ 150 GeV in the Z+jet region (left) and central dijet region (right). |

png pdf |
Additional Figure 6-b:
Particle-level distributions of ungroomed AK8 thrust (${\lambda ^{1}_{2}}$) in AK8 120 $ < {p_{\mathrm {T}}} < $ 150 GeV in the Z+jet region (left) and central dijet region (right). |
png pdf |
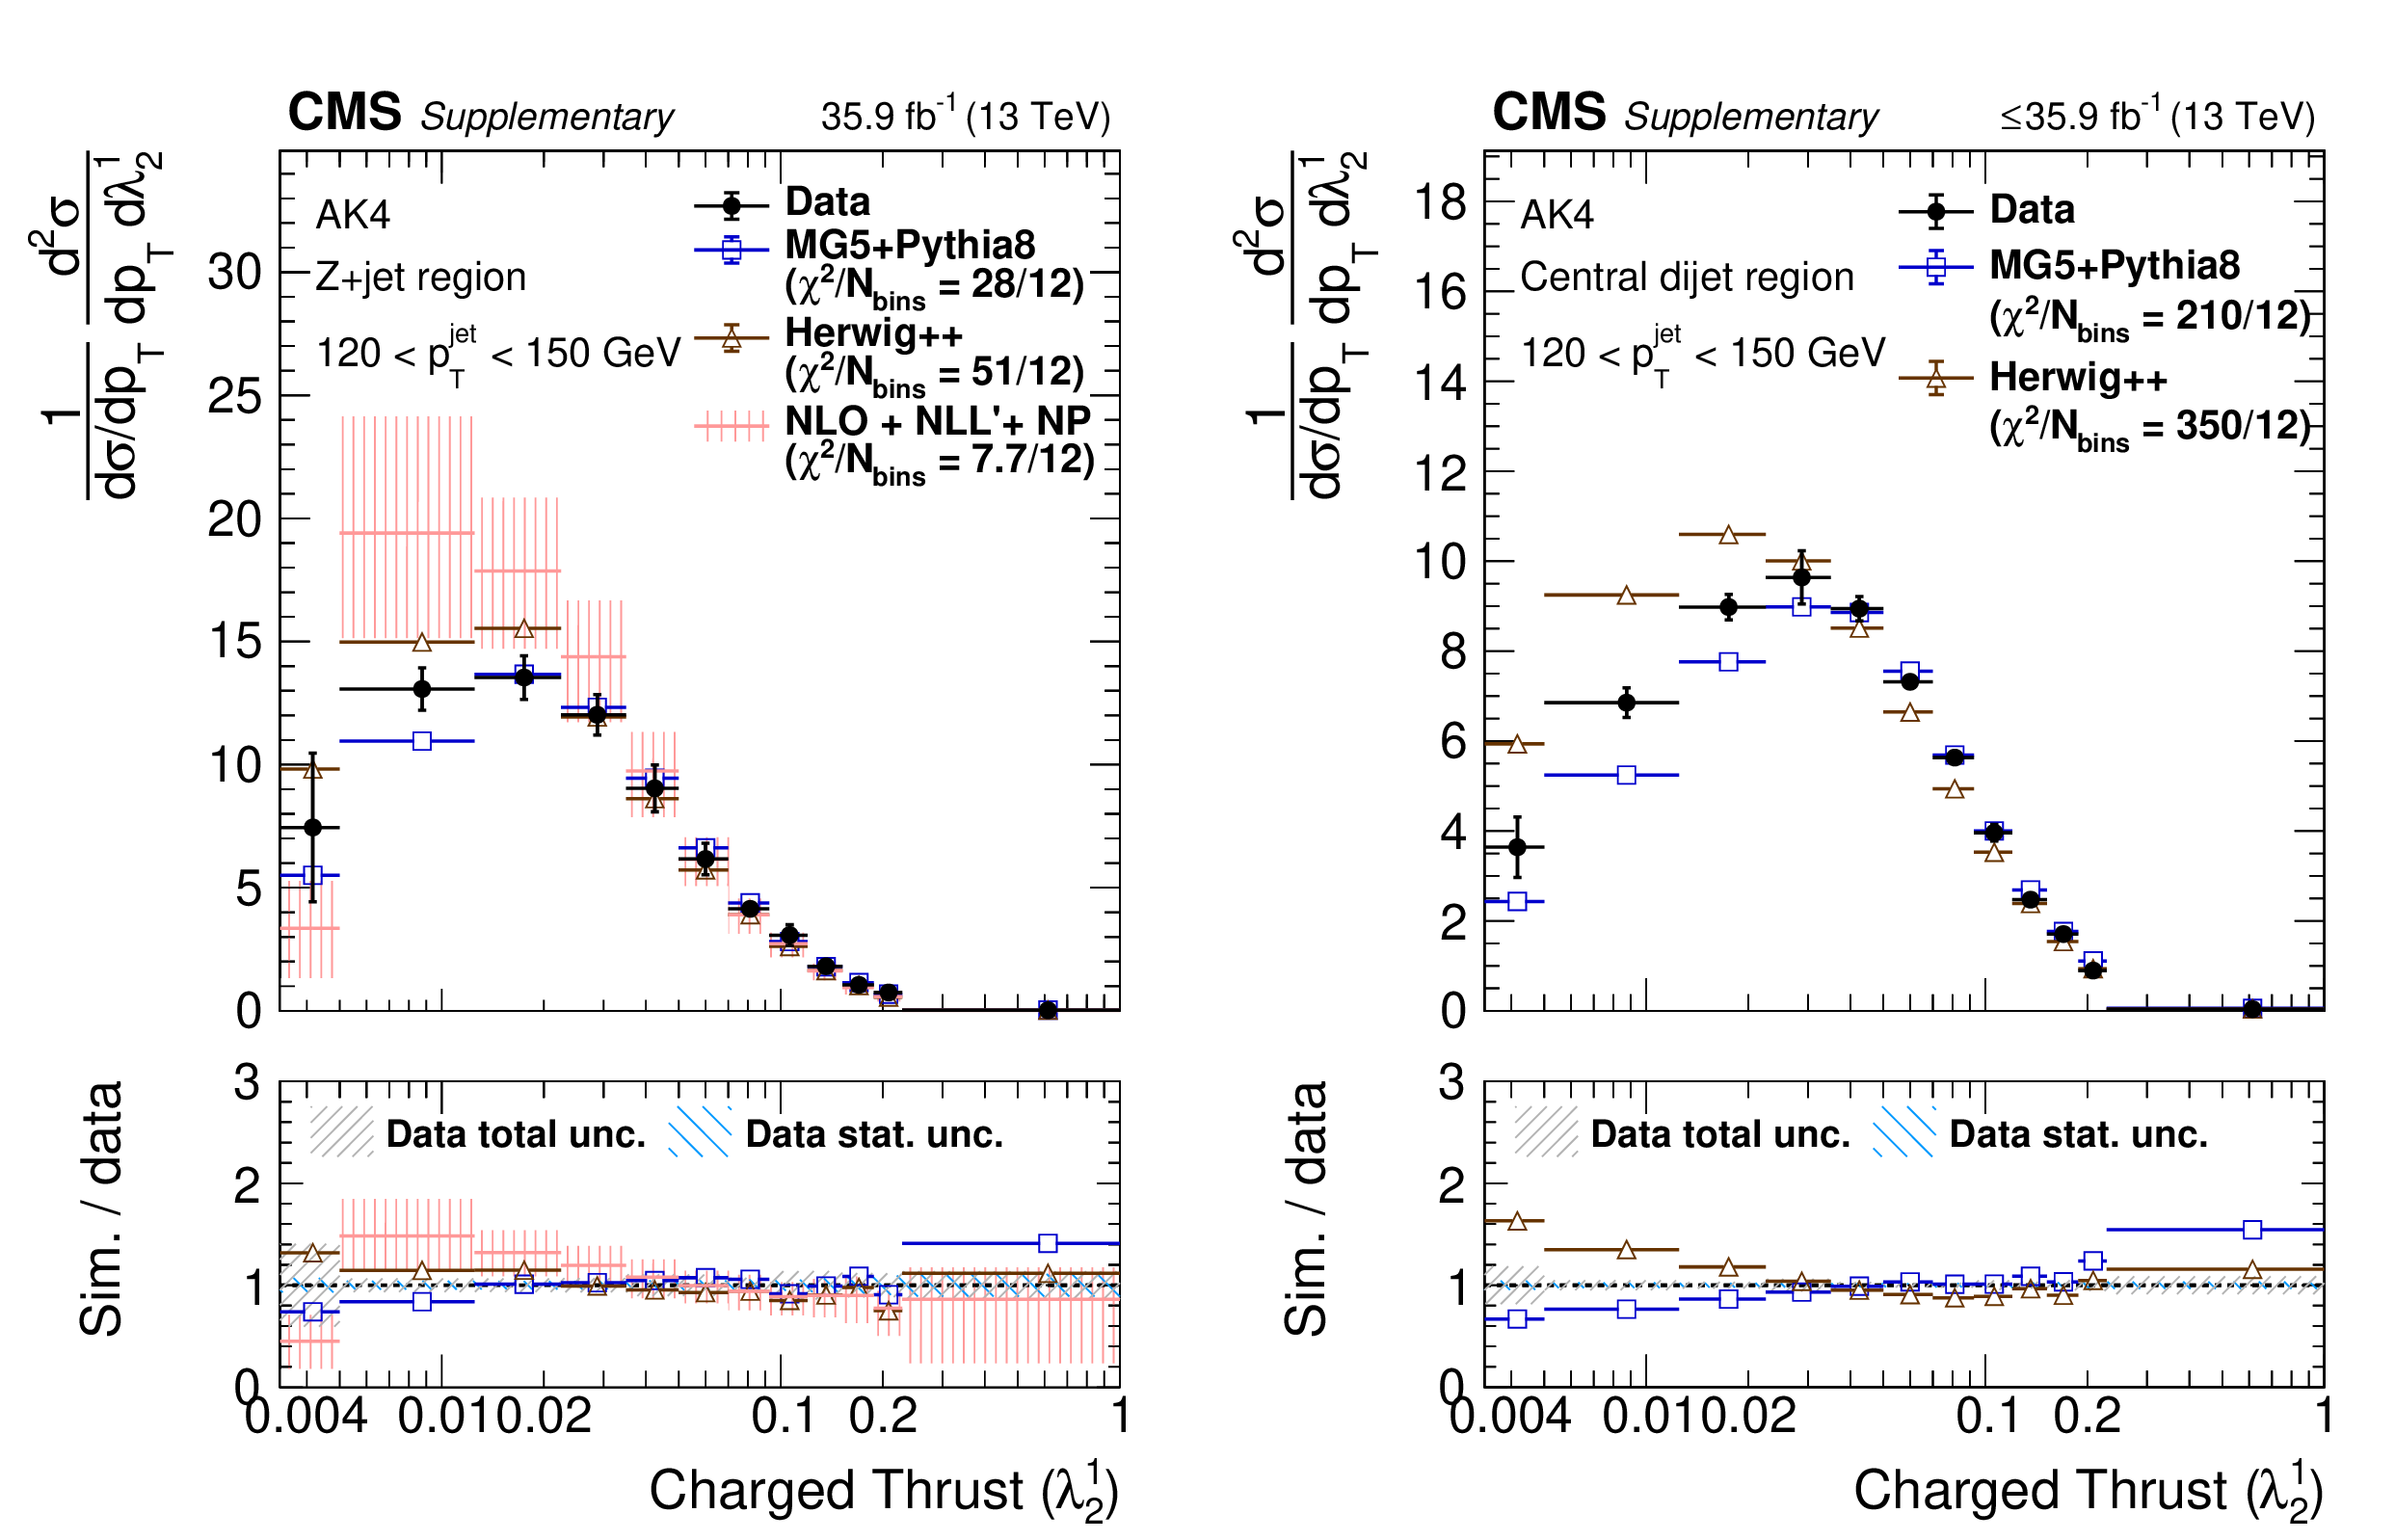
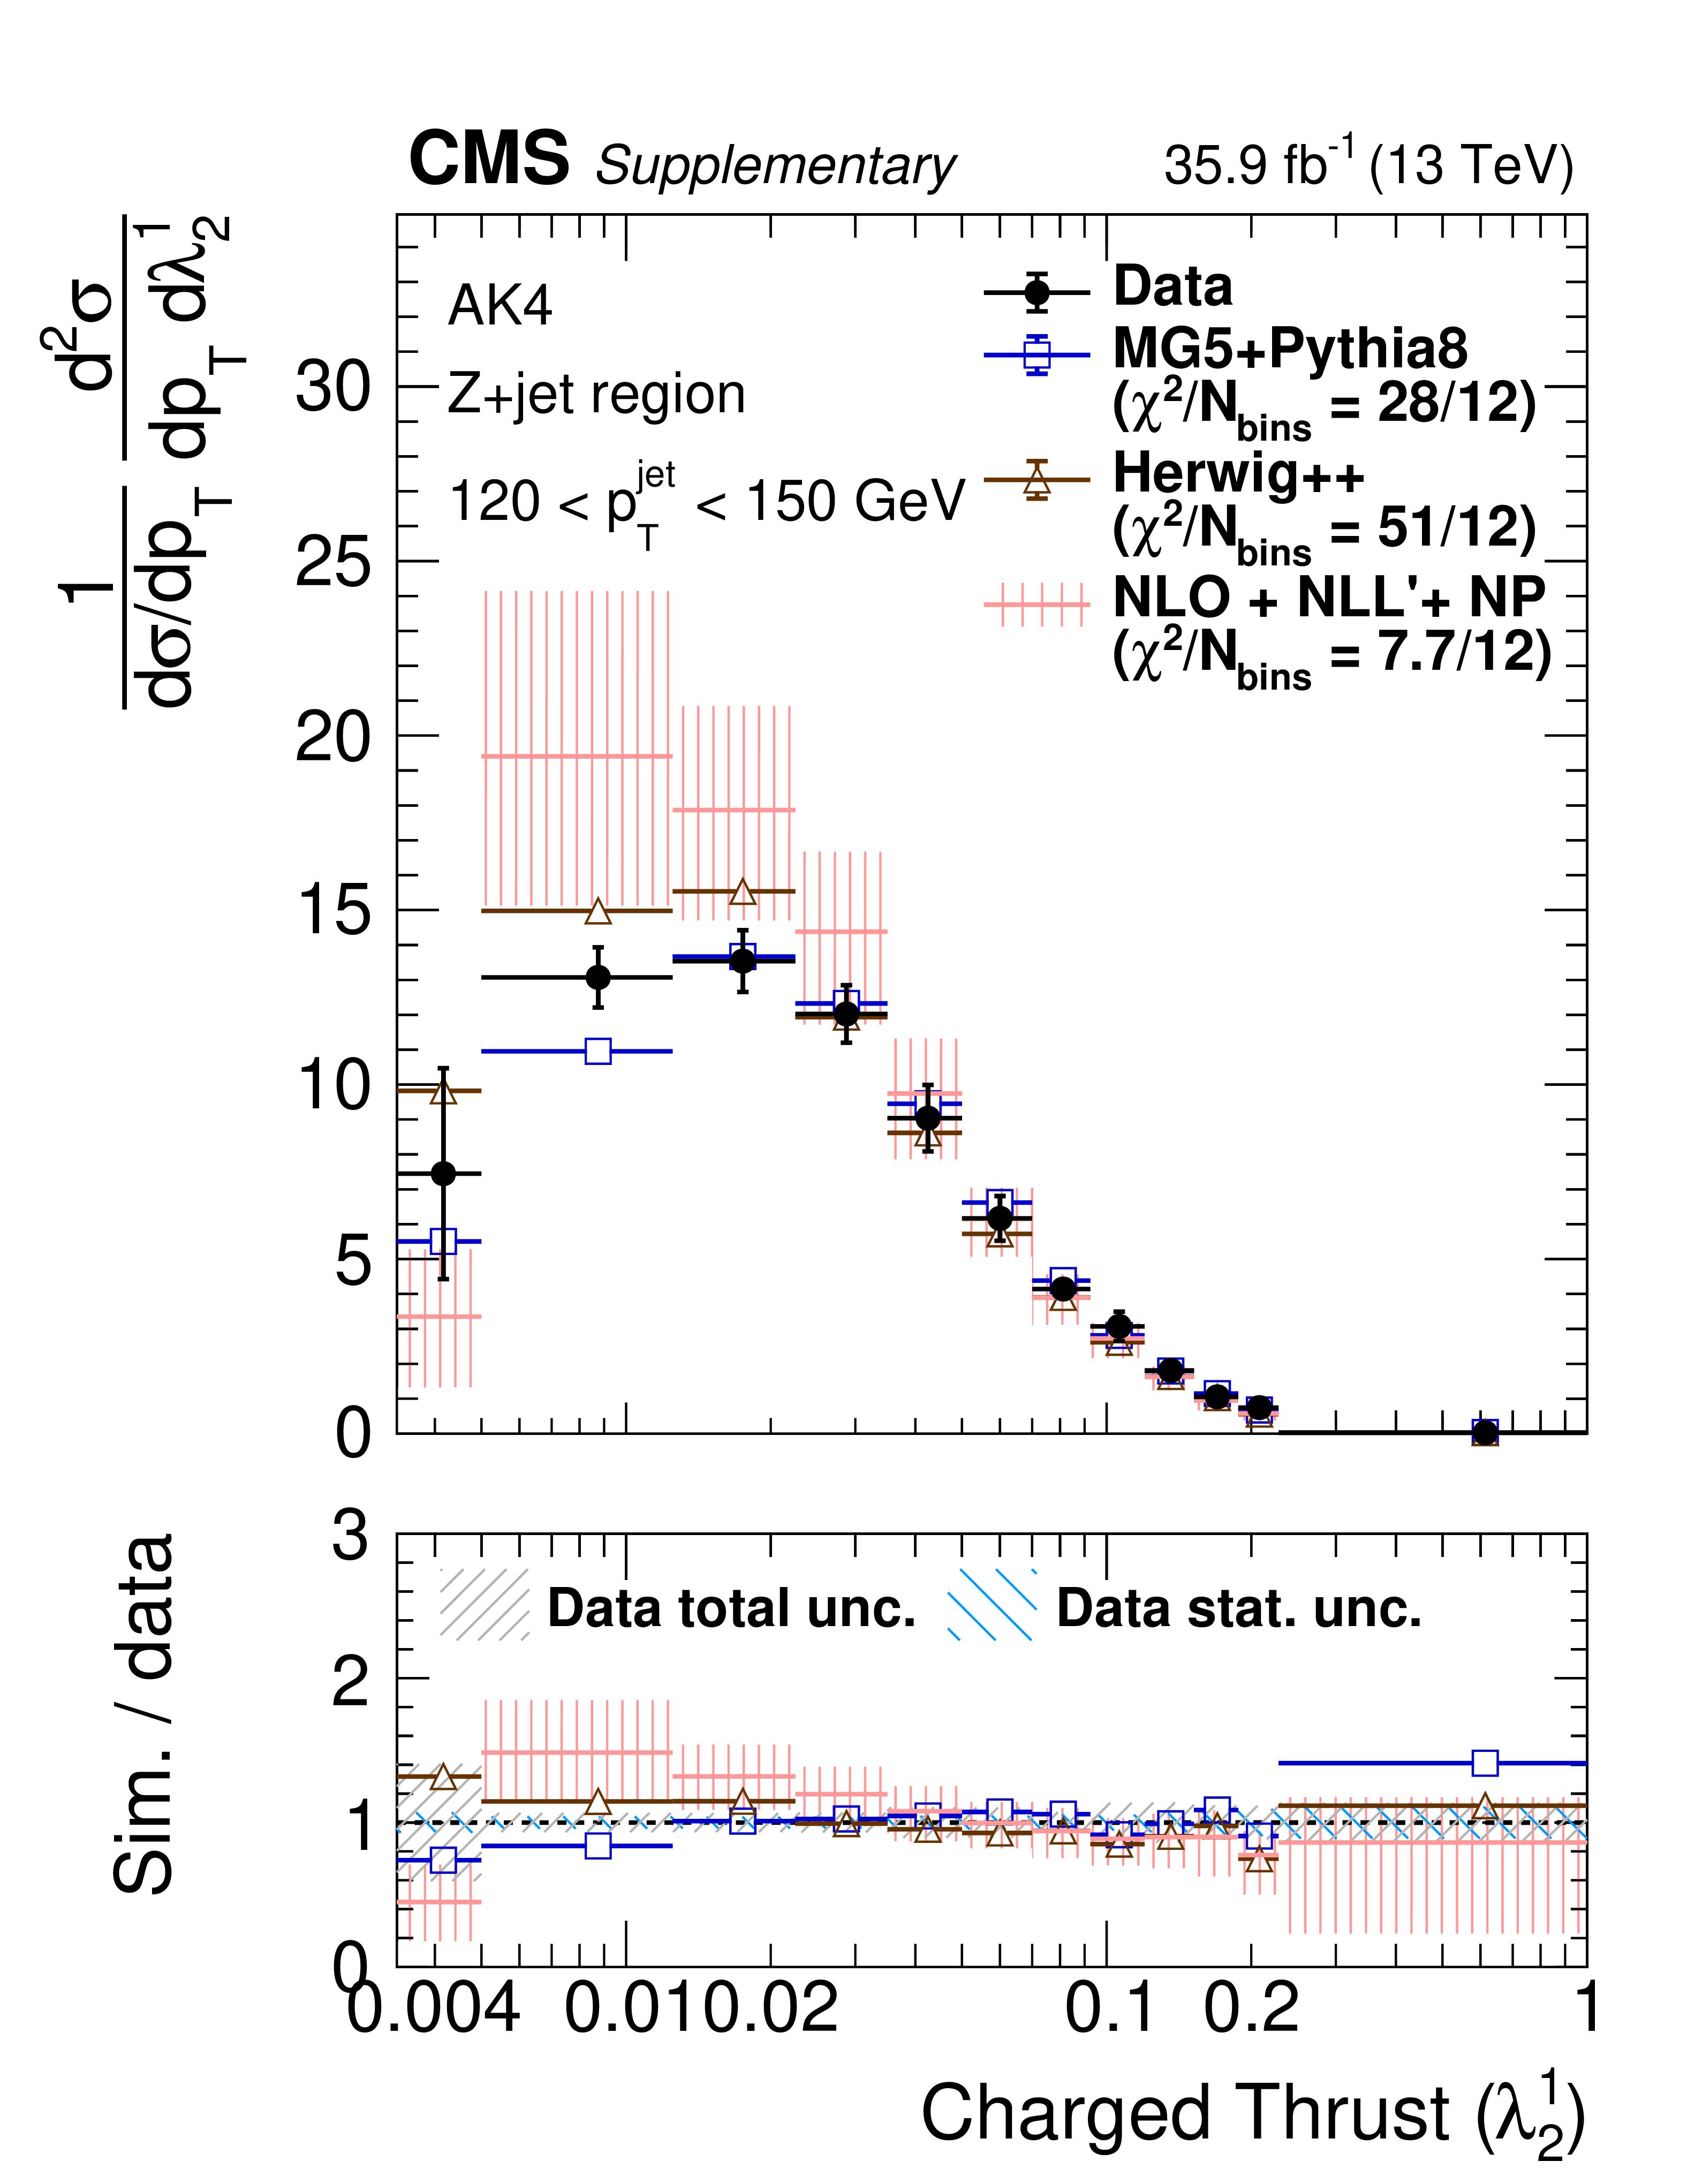
Additional Figure 7:
Particle-level distributions of ungroomed charged-only AK4 thrust (${\lambda ^{1}_{2}}$) 120 $ < {p_{\mathrm {T}}} < $ 150 GeV in the Z+jet region (left) and central dijet region (right). |
png pdf |
Additional Figure 7-a:
Particle-level distributions of ungroomed charged-only AK4 thrust (${\lambda ^{1}_{2}}$) 120 $ < {p_{\mathrm {T}}} < $ 150 GeV in the Z+jet region (left) and central dijet region (right). |

png pdf |
Additional Figure 7-b:
Particle-level distributions of ungroomed charged-only AK4 thrust (${\lambda ^{1}_{2}}$) 120 $ < {p_{\mathrm {T}}} < $ 150 GeV in the Z+jet region (left) and central dijet region (right). |

png pdf |
Additional Figure 8:
Particle-level distributions of groomed AK4 thrust (${\lambda ^{1}_{2}}$) 120 $ < {p_{\mathrm {T}}} < $ 150 GeV in the Z+jet region (left) and central dijet region (right). |
png pdf |
Additional Figure 8-a:
Particle-level distributions of groomed AK4 thrust (${\lambda ^{1}_{2}}$) 120 $ < {p_{\mathrm {T}}} < $ 150 GeV in the Z+jet region (left) and central dijet region (right). |

png pdf |
Additional Figure 8-b:
Particle-level distributions of groomed AK4 thrust (${\lambda ^{1}_{2}}$) 120 $ < {p_{\mathrm {T}}} < $ 150 GeV in the Z+jet region (left) and central dijet region (right). |
png pdf |
Additional Figure 9:
Particle-level distributions of ungroomed AK4 multiplicity (${\lambda ^{0}_{0}}$) in 408 $ < {p_{\mathrm {T}}} < $ 4000 GeV in the Z+jet region (left) and in 1000 $ < {p_{\mathrm {T}}} < $ 4000 GeV in the central dijet region (right). |
png pdf |
Additional Figure 9-a:
Particle-level distributions of ungroomed AK4 multiplicity (${\lambda ^{0}_{0}}$) in 408 $ < {p_{\mathrm {T}}} < $ 4000 GeV in the Z+jet region (left) and in 1000 $ < {p_{\mathrm {T}}} < $ 4000 GeV in the central dijet region (right). |

png pdf |
Additional Figure 9-b:
Particle-level distributions of ungroomed AK4 multiplicity (${\lambda ^{0}_{0}}$) in 408 $ < {p_{\mathrm {T}}} < $ 4000 GeV in the Z+jet region (left) and in 1000 $ < {p_{\mathrm {T}}} < $ 4000 GeV in the central dijet region (right). |
png pdf |
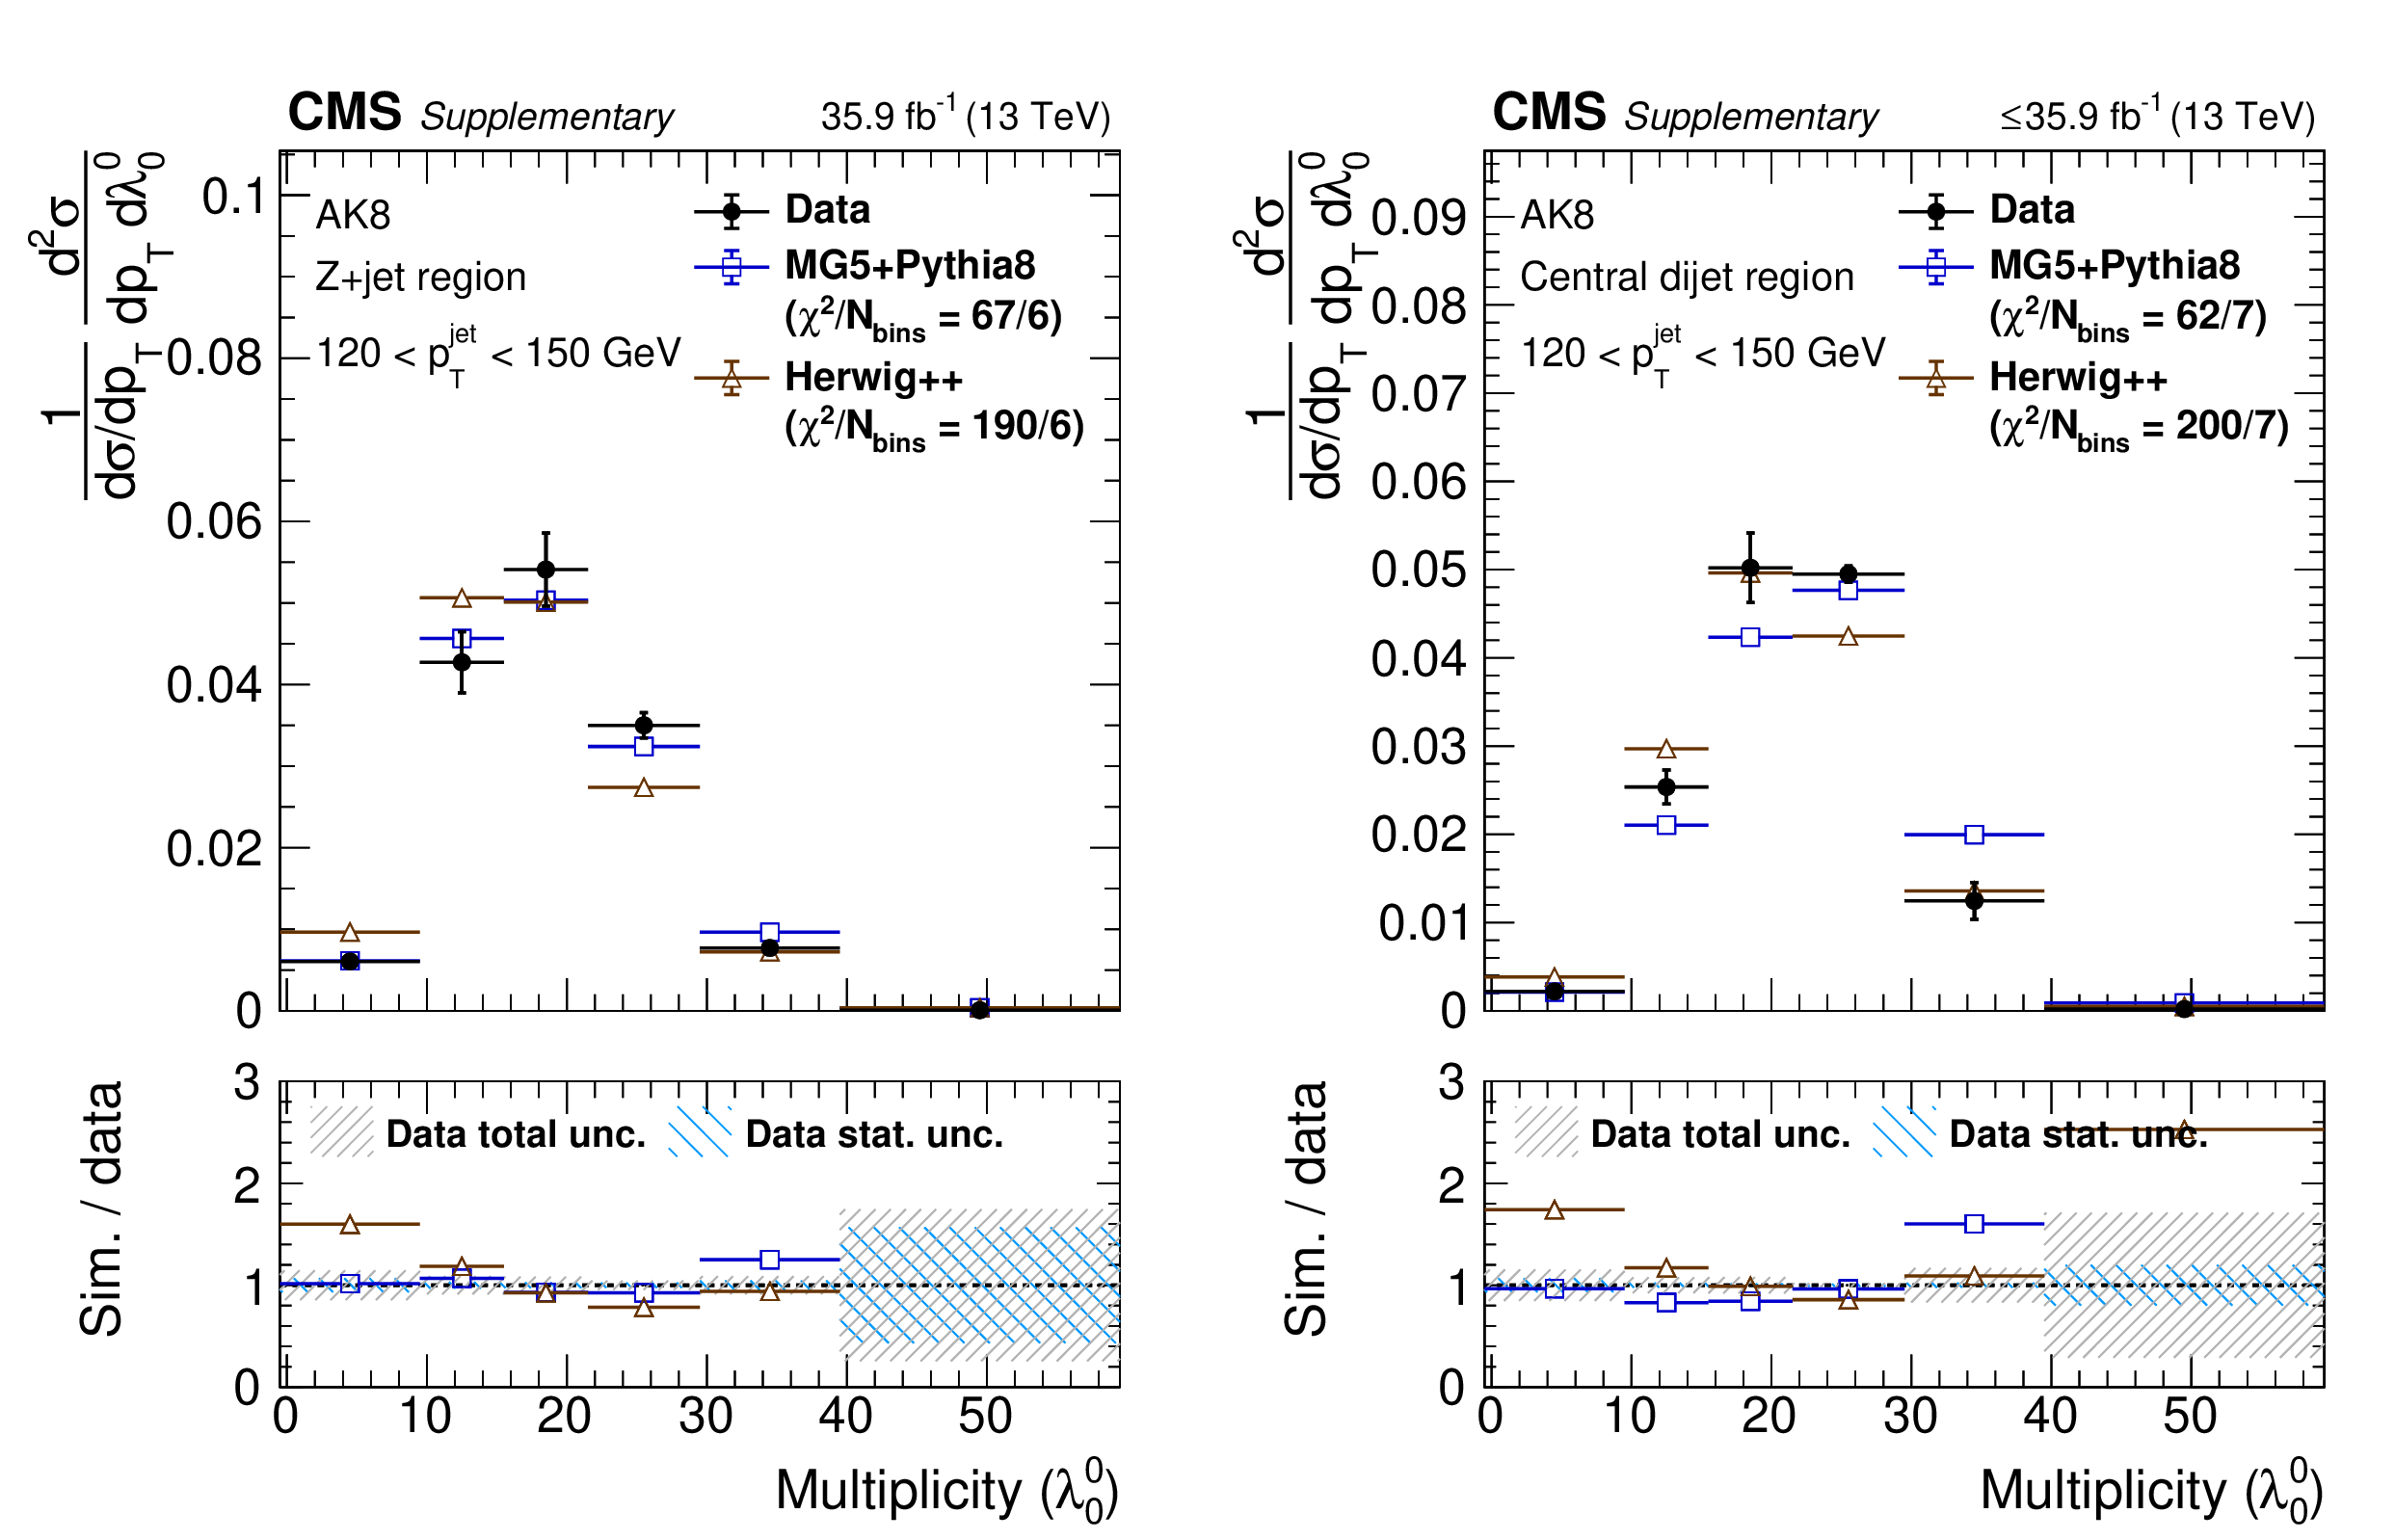
Additional Figure 10:
Particle-level distributions of ungroomed AK8 multiplicity (${\lambda ^{0}_{0}}$) in AK8 120 $ < {p_{\mathrm {T}}} < $ 150 GeV in the Z+jet region (left) and central dijet region (right). |
png pdf |
Additional Figure 10-a:
Particle-level distributions of ungroomed AK8 multiplicity (${\lambda ^{0}_{0}}$) in AK8 120 $ < {p_{\mathrm {T}}} < $ 150 GeV in the Z+jet region (left) and central dijet region (right). |
png pdf |
Additional Figure 10-b:
Particle-level distributions of ungroomed AK8 multiplicity (${\lambda ^{0}_{0}}$) in AK8 120 $ < {p_{\mathrm {T}}} < $ 150 GeV in the Z+jet region (left) and central dijet region (right). |
png pdf |
Additional Figure 11:
Particle-level distributions of ungroomed charged-only AK4 multiplicity (${\lambda ^{0}_{0}}$) 120 $ < {p_{\mathrm {T}}} < $ 150 GeV in the Z+jet region (left) and central dijet region (right). |
png pdf |
Additional Figure 11-a:
Particle-level distributions of ungroomed charged-only AK4 multiplicity (${\lambda ^{0}_{0}}$) 120 $ < {p_{\mathrm {T}}} < $ 150 GeV in the Z+jet region (left) and central dijet region (right). |
png pdf |
Additional Figure 11-b:
Particle-level distributions of ungroomed charged-only AK4 multiplicity (${\lambda ^{0}_{0}}$) 120 $ < {p_{\mathrm {T}}} < $ 150 GeV in the Z+jet region (left) and central dijet region (right). |

png pdf |
Additional Figure 12:
Particle-level distributions of groomed AK4 multiplicity (${\lambda ^{0}_{0}}$) 120 $ < {p_{\mathrm {T}}} < $ 150 GeV in the Z+jet region (left) and central dijet region (right). |

png pdf |
Additional Figure 12-a:
Particle-level distributions of groomed AK4 multiplicity (${\lambda ^{0}_{0}}$) 120 $ < {p_{\mathrm {T}}} < $ 150 GeV in the Z+jet region (left) and central dijet region (right). |

png pdf |
Additional Figure 12-b:
Particle-level distributions of groomed AK4 multiplicity (${\lambda ^{0}_{0}}$) 120 $ < {p_{\mathrm {T}}} < $ 150 GeV in the Z+jet region (left) and central dijet region (right). |

png pdf |
Additional Figure 13:
Particle-level distributions of ungroomed AK4 ${(p_{\mathrm {T}}^{\mathrm {D}})^2}$ (${\lambda ^{2}_{0}}$) in 408 $ < {p_{\mathrm {T}}} < $ 4000 GeV in the Z+jet region (left) and in 1000 $ < {p_{\mathrm {T}}} < $ 4000 GeV in the central dijet region (right). |
png pdf |
Additional Figure 13-a:
Particle-level distributions of ungroomed AK4 ${(p_{\mathrm {T}}^{\mathrm {D}})^2}$ (${\lambda ^{2}_{0}}$) in 408 $ < {p_{\mathrm {T}}} < $ 4000 GeV in the Z+jet region (left) and in 1000 $ < {p_{\mathrm {T}}} < $ 4000 GeV in the central dijet region (right). |
png pdf |
Additional Figure 13-b:
Particle-level distributions of ungroomed AK4 ${(p_{\mathrm {T}}^{\mathrm {D}})^2}$ (${\lambda ^{2}_{0}}$) in 408 $ < {p_{\mathrm {T}}} < $ 4000 GeV in the Z+jet region (left) and in 1000 $ < {p_{\mathrm {T}}} < $ 4000 GeV in the central dijet region (right). |

png pdf |
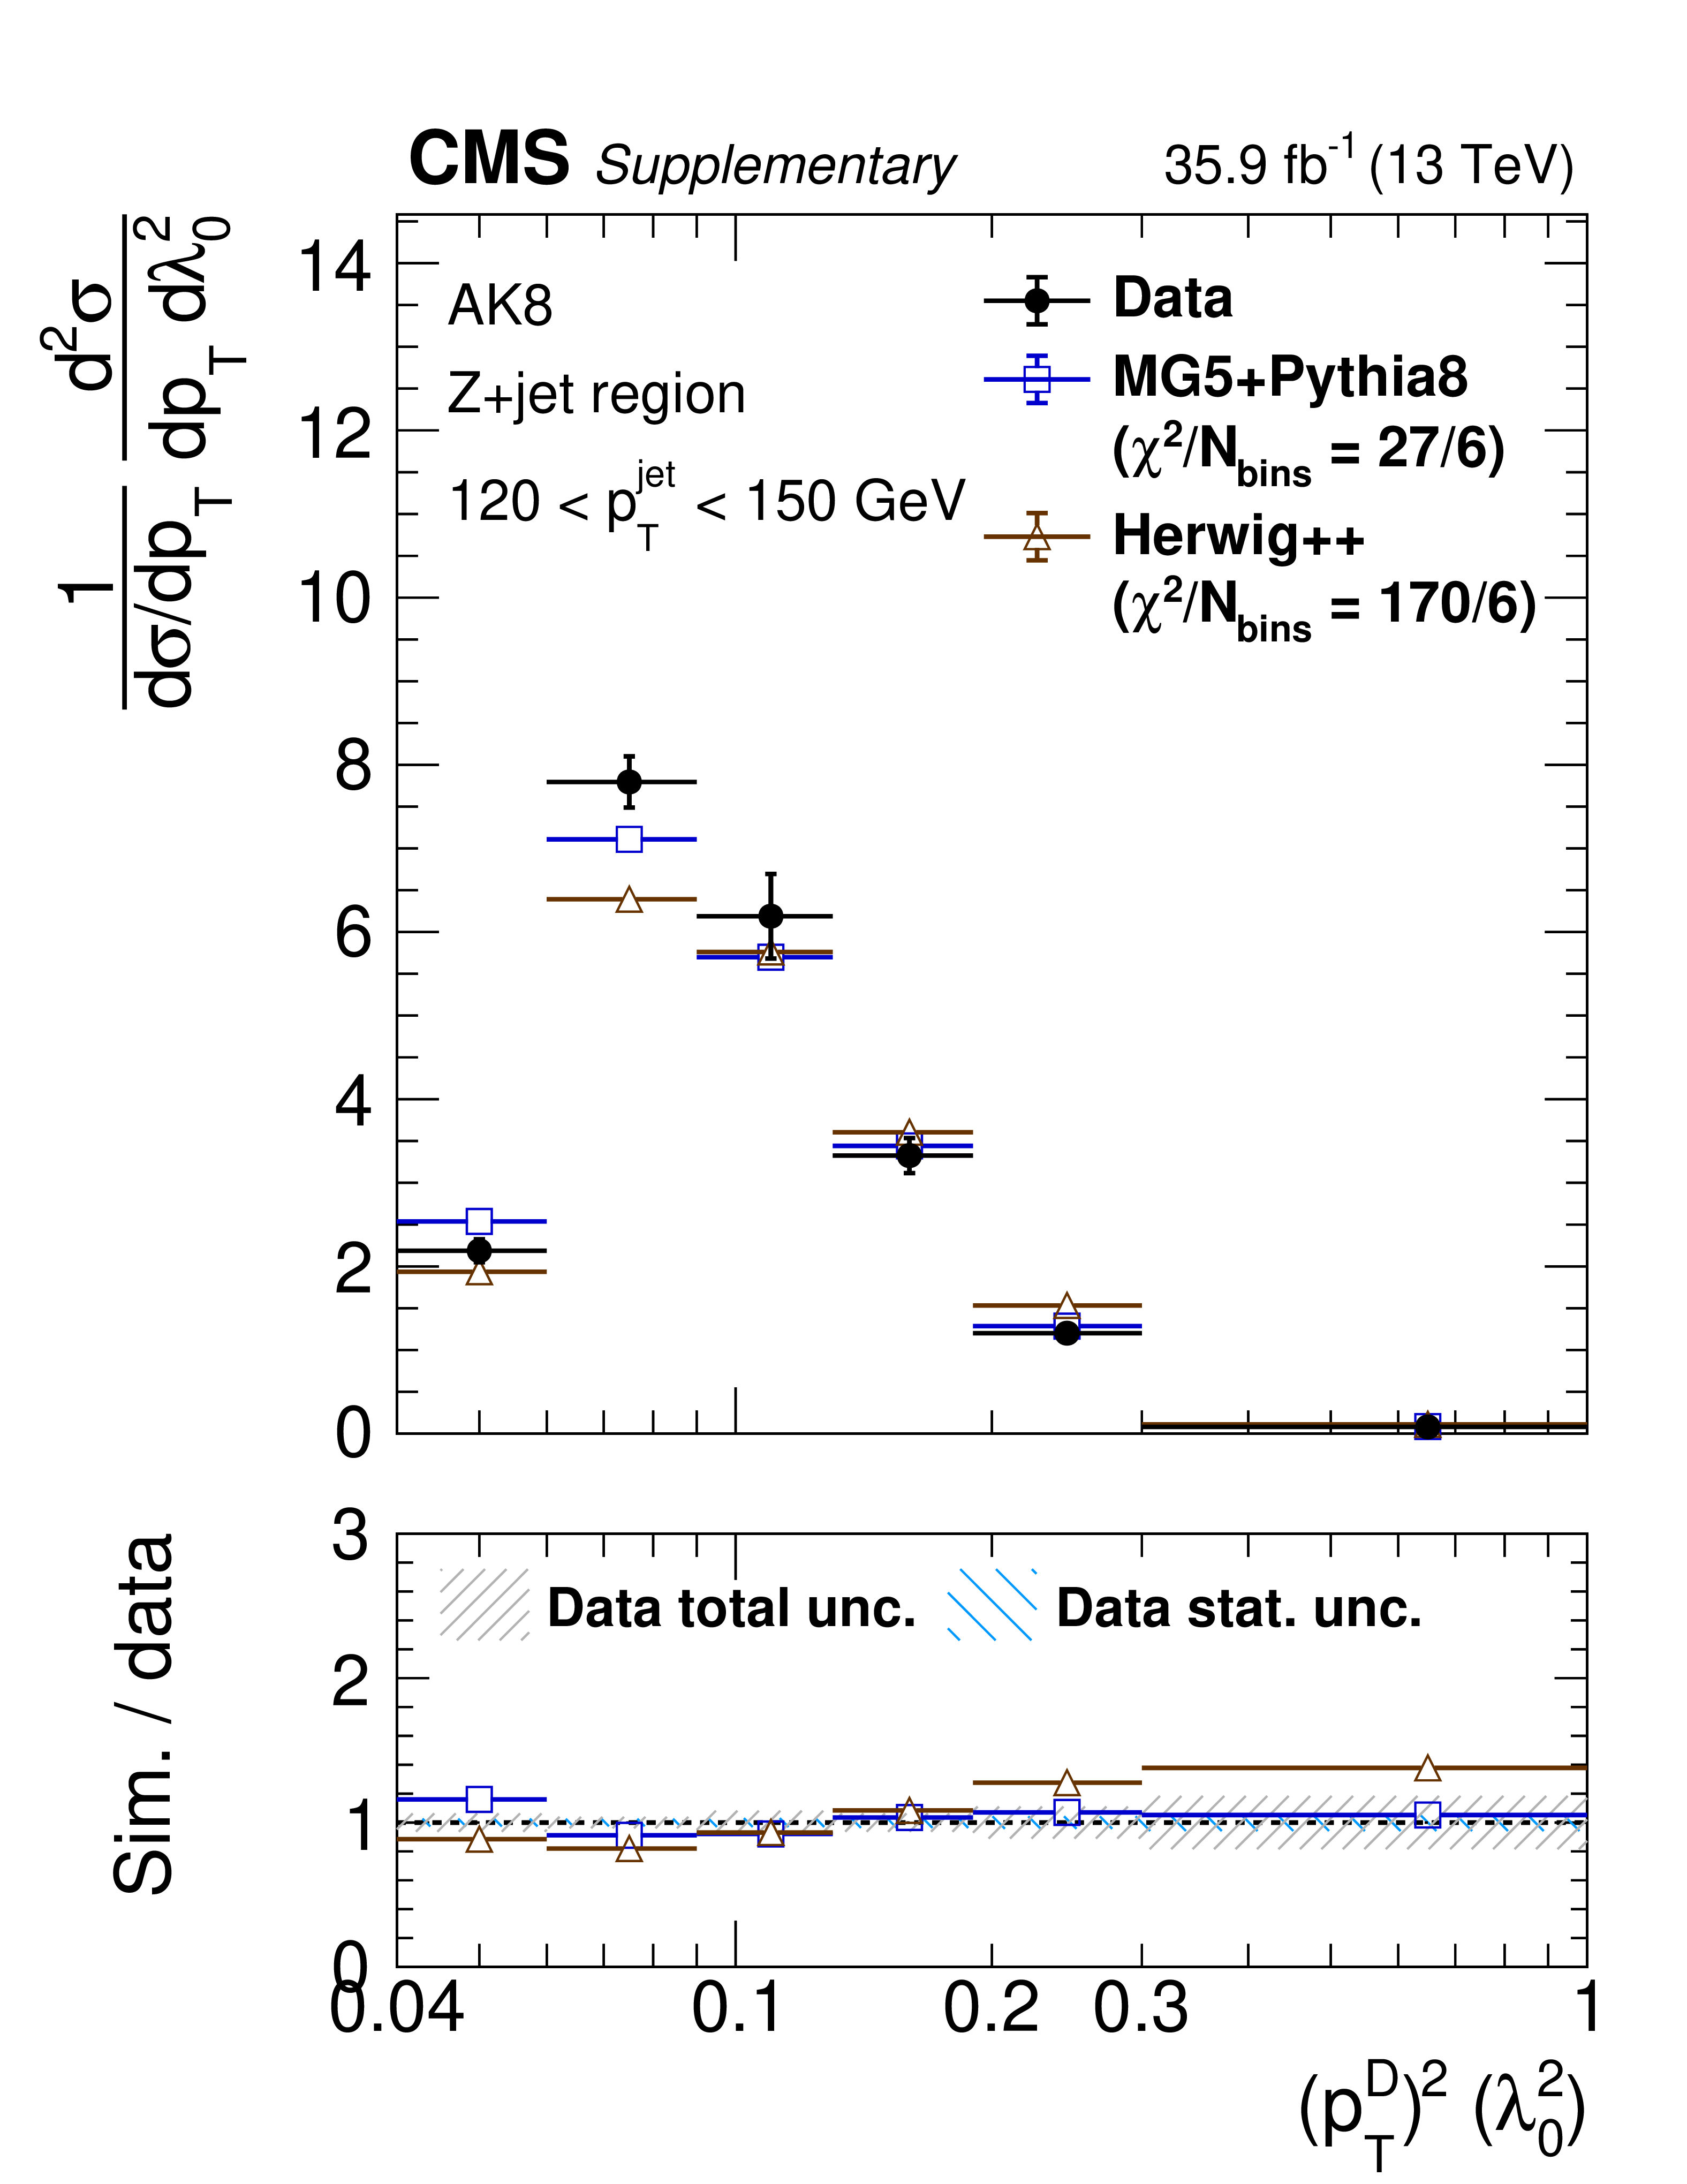
Additional Figure 14:
Particle-level distributions of ungroomed AK8 ${(p_{\mathrm {T}}^{\mathrm {D}})^2}$ (${\lambda ^{2}_{0}}$) in AK8 120 $ < {p_{\mathrm {T}}} < $ 150 GeV in the Z+jet region (left) and central dijet region (right). |
png pdf |
Additional Figure 14-a:
Particle-level distributions of ungroomed AK8 ${(p_{\mathrm {T}}^{\mathrm {D}})^2}$ (${\lambda ^{2}_{0}}$) in AK8 120 $ < {p_{\mathrm {T}}} < $ 150 GeV in the Z+jet region (left) and central dijet region (right). |

png pdf |
Additional Figure 14-b:
Particle-level distributions of ungroomed AK8 ${(p_{\mathrm {T}}^{\mathrm {D}})^2}$ (${\lambda ^{2}_{0}}$) in AK8 120 $ < {p_{\mathrm {T}}} < $ 150 GeV in the Z+jet region (left) and central dijet region (right). |

png pdf |
Additional Figure 15:
Particle-level distributions of ungroomed charged-only AK4 ${(p_{\mathrm {T}}^{\mathrm {D}})^2}$ (${\lambda ^{2}_{0}}$) 120 $ < {p_{\mathrm {T}}} < $ 150 GeV in the Z+jet region (left) and central dijet region (right). |

png pdf |
Additional Figure 15-a:
Particle-level distributions of ungroomed charged-only AK4 ${(p_{\mathrm {T}}^{\mathrm {D}})^2}$ (${\lambda ^{2}_{0}}$) 120 $ < {p_{\mathrm {T}}} < $ 150 GeV in the Z+jet region (left) and central dijet region (right). |
png pdf |
Additional Figure 15-b:
Particle-level distributions of ungroomed charged-only AK4 ${(p_{\mathrm {T}}^{\mathrm {D}})^2}$ (${\lambda ^{2}_{0}}$) 120 $ < {p_{\mathrm {T}}} < $ 150 GeV in the Z+jet region (left) and central dijet region (right). |

png pdf |
Additional Figure 16:
Particle-level distributions of groomed AK4 ${(p_{\mathrm {T}}^{\mathrm {D}})^2}$ (${\lambda ^{2}_{0}}$) 120 $ < {p_{\mathrm {T}}} < $ 150 GeV in the Z+jet region (left) and central dijet region (right). |

png pdf |
Additional Figure 16-a:
Particle-level distributions of groomed AK4 ${(p_{\mathrm {T}}^{\mathrm {D}})^2}$ (${\lambda ^{2}_{0}}$) 120 $ < {p_{\mathrm {T}}} < $ 150 GeV in the Z+jet region (left) and central dijet region (right). |

png pdf |
Additional Figure 16-b:
Particle-level distributions of groomed AK4 ${(p_{\mathrm {T}}^{\mathrm {D}})^2}$ (${\lambda ^{2}_{0}}$) 120 $ < {p_{\mathrm {T}}} < $ 150 GeV in the Z+jet region (left) and central dijet region (right). |

png pdf |
Additional Figure 17:
Plots of distribution mean for ungroomed AK4 jets in the Z+jet region, comparing unfolded data to MC. Upper row is charged+neutral variables, lower row is charged-only variables. The Sherpa NLO+jet (merging of Z+1jet at NLO and Z+2jets at NLO) and NLO+NLL'+NP predictions are taken from arXiv:2104.06920. |
png pdf |
Additional Figure 17-a:
Plots of distribution mean for ungroomed AK4 jets in the Z+jet region, comparing unfolded data to MC. Upper row is charged+neutral variables, lower row is charged-only variables. The Sherpa NLO+jet (merging of Z+1jet at NLO and Z+2jets at NLO) and NLO+NLL'+NP predictions are taken from arXiv:2104.06920. |

png pdf |
Additional Figure 17-b:
Plots of distribution mean for ungroomed AK4 jets in the Z+jet region, comparing unfolded data to MC. Upper row is charged+neutral variables, lower row is charged-only variables. The Sherpa NLO+jet (merging of Z+1jet at NLO and Z+2jets at NLO) and NLO+NLL'+NP predictions are taken from arXiv:2104.06920. |
png pdf |
Additional Figure 17-c:
Plots of distribution mean for ungroomed AK4 jets in the Z+jet region, comparing unfolded data to MC. Upper row is charged+neutral variables, lower row is charged-only variables. The Sherpa NLO+jet (merging of Z+1jet at NLO and Z+2jets at NLO) and NLO+NLL'+NP predictions are taken from arXiv:2104.06920. |
png pdf |
Additional Figure 17-d:
Plots of distribution mean for ungroomed AK4 jets in the Z+jet region, comparing unfolded data to MC. Upper row is charged+neutral variables, lower row is charged-only variables. The Sherpa NLO+jet (merging of Z+1jet at NLO and Z+2jets at NLO) and NLO+NLL'+NP predictions are taken from arXiv:2104.06920. |
png pdf |
Additional Figure 17-e:
Plots of distribution mean for ungroomed AK4 jets in the Z+jet region, comparing unfolded data to MC. Upper row is charged+neutral variables, lower row is charged-only variables. The Sherpa NLO+jet (merging of Z+1jet at NLO and Z+2jets at NLO) and NLO+NLL'+NP predictions are taken from arXiv:2104.06920. |
png pdf |
Additional Figure 17-f:
Plots of distribution mean for ungroomed AK4 jets in the Z+jet region, comparing unfolded data to MC. Upper row is charged+neutral variables, lower row is charged-only variables. The Sherpa NLO+jet (merging of Z+1jet at NLO and Z+2jets at NLO) and NLO+NLL'+NP predictions are taken from arXiv:2104.06920. |
png pdf |
Additional Figure 17-g:
Plots of distribution mean for ungroomed AK4 jets in the Z+jet region, comparing unfolded data to MC. Upper row is charged+neutral variables, lower row is charged-only variables. The Sherpa NLO+jet (merging of Z+1jet at NLO and Z+2jets at NLO) and NLO+NLL'+NP predictions are taken from arXiv:2104.06920. |
png pdf |
Additional Figure 17-h:
Plots of distribution mean for ungroomed AK4 jets in the Z+jet region, comparing unfolded data to MC. Upper row is charged+neutral variables, lower row is charged-only variables. The Sherpa NLO+jet (merging of Z+1jet at NLO and Z+2jets at NLO) and NLO+NLL'+NP predictions are taken from arXiv:2104.06920. |

png pdf |
Additional Figure 17-i:
Plots of distribution mean for ungroomed AK4 jets in the Z+jet region, comparing unfolded data to MC. Upper row is charged+neutral variables, lower row is charged-only variables. The Sherpa NLO+jet (merging of Z+1jet at NLO and Z+2jets at NLO) and NLO+NLL'+NP predictions are taken from arXiv:2104.06920. |
png pdf |
Additional Figure 17-j:
Plots of distribution mean for ungroomed AK4 jets in the Z+jet region, comparing unfolded data to MC. Upper row is charged+neutral variables, lower row is charged-only variables. The Sherpa NLO+jet (merging of Z+1jet at NLO and Z+2jets at NLO) and NLO+NLL'+NP predictions are taken from arXiv:2104.06920. |
png pdf |
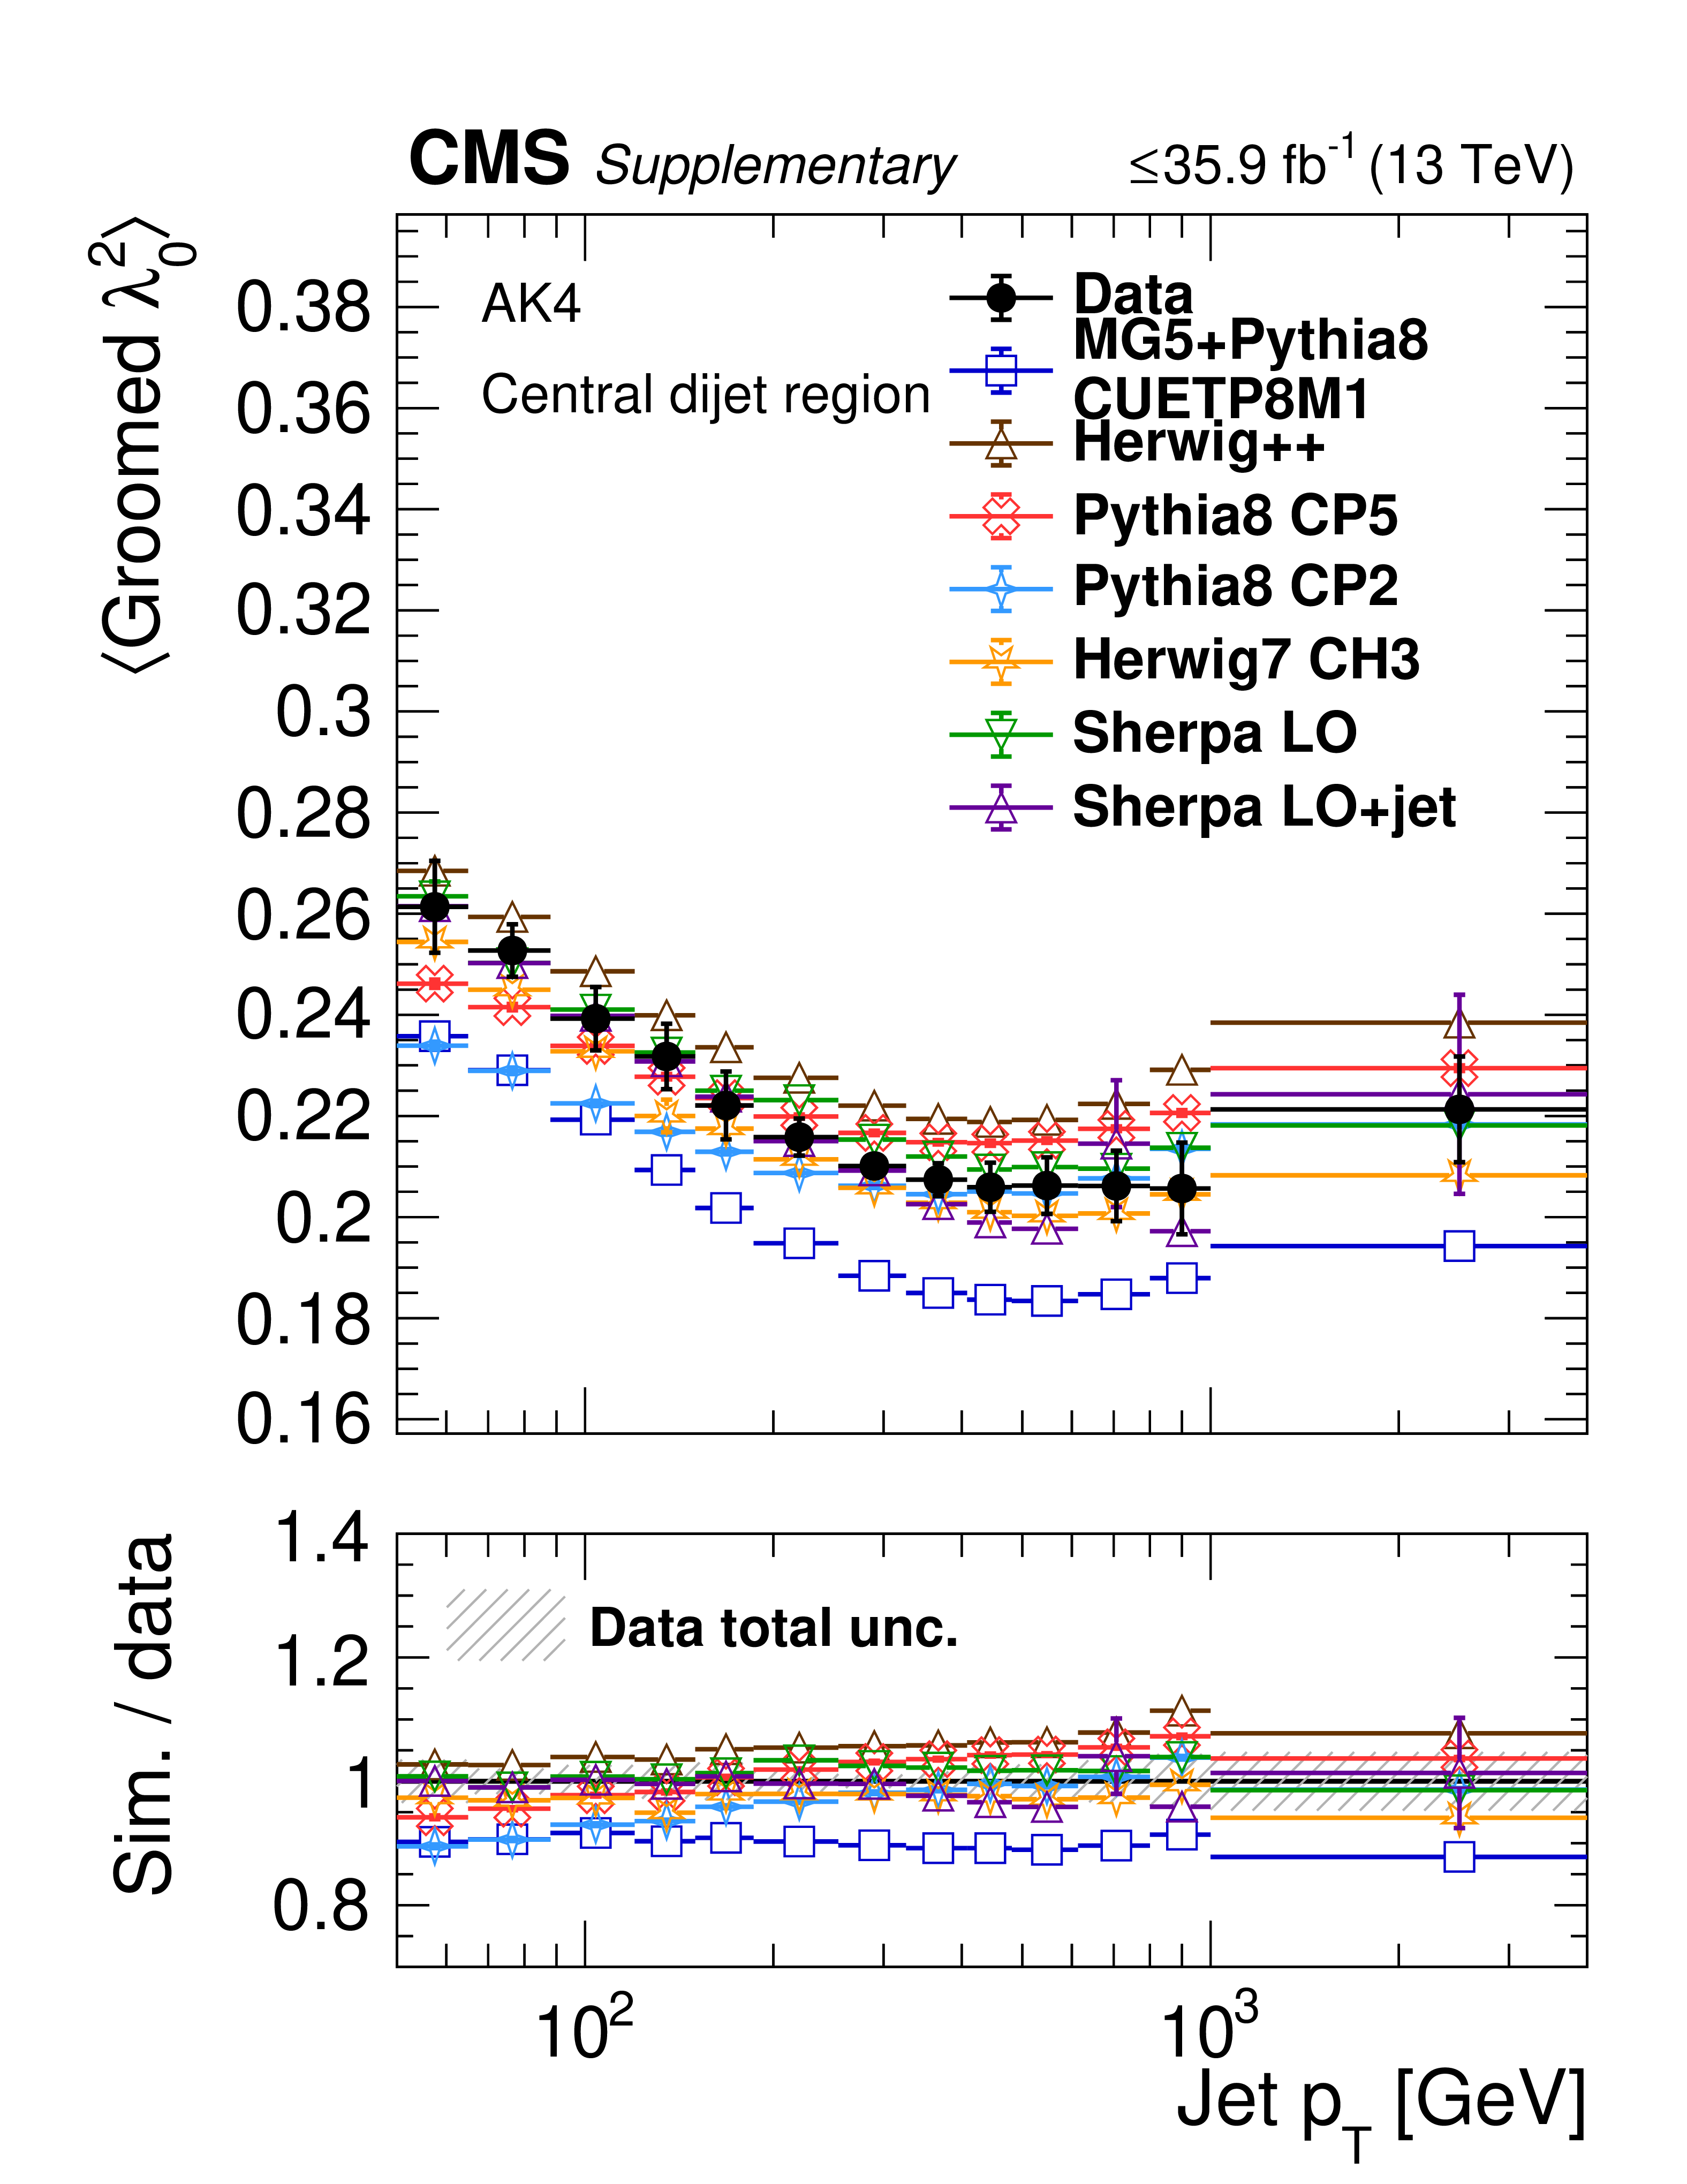
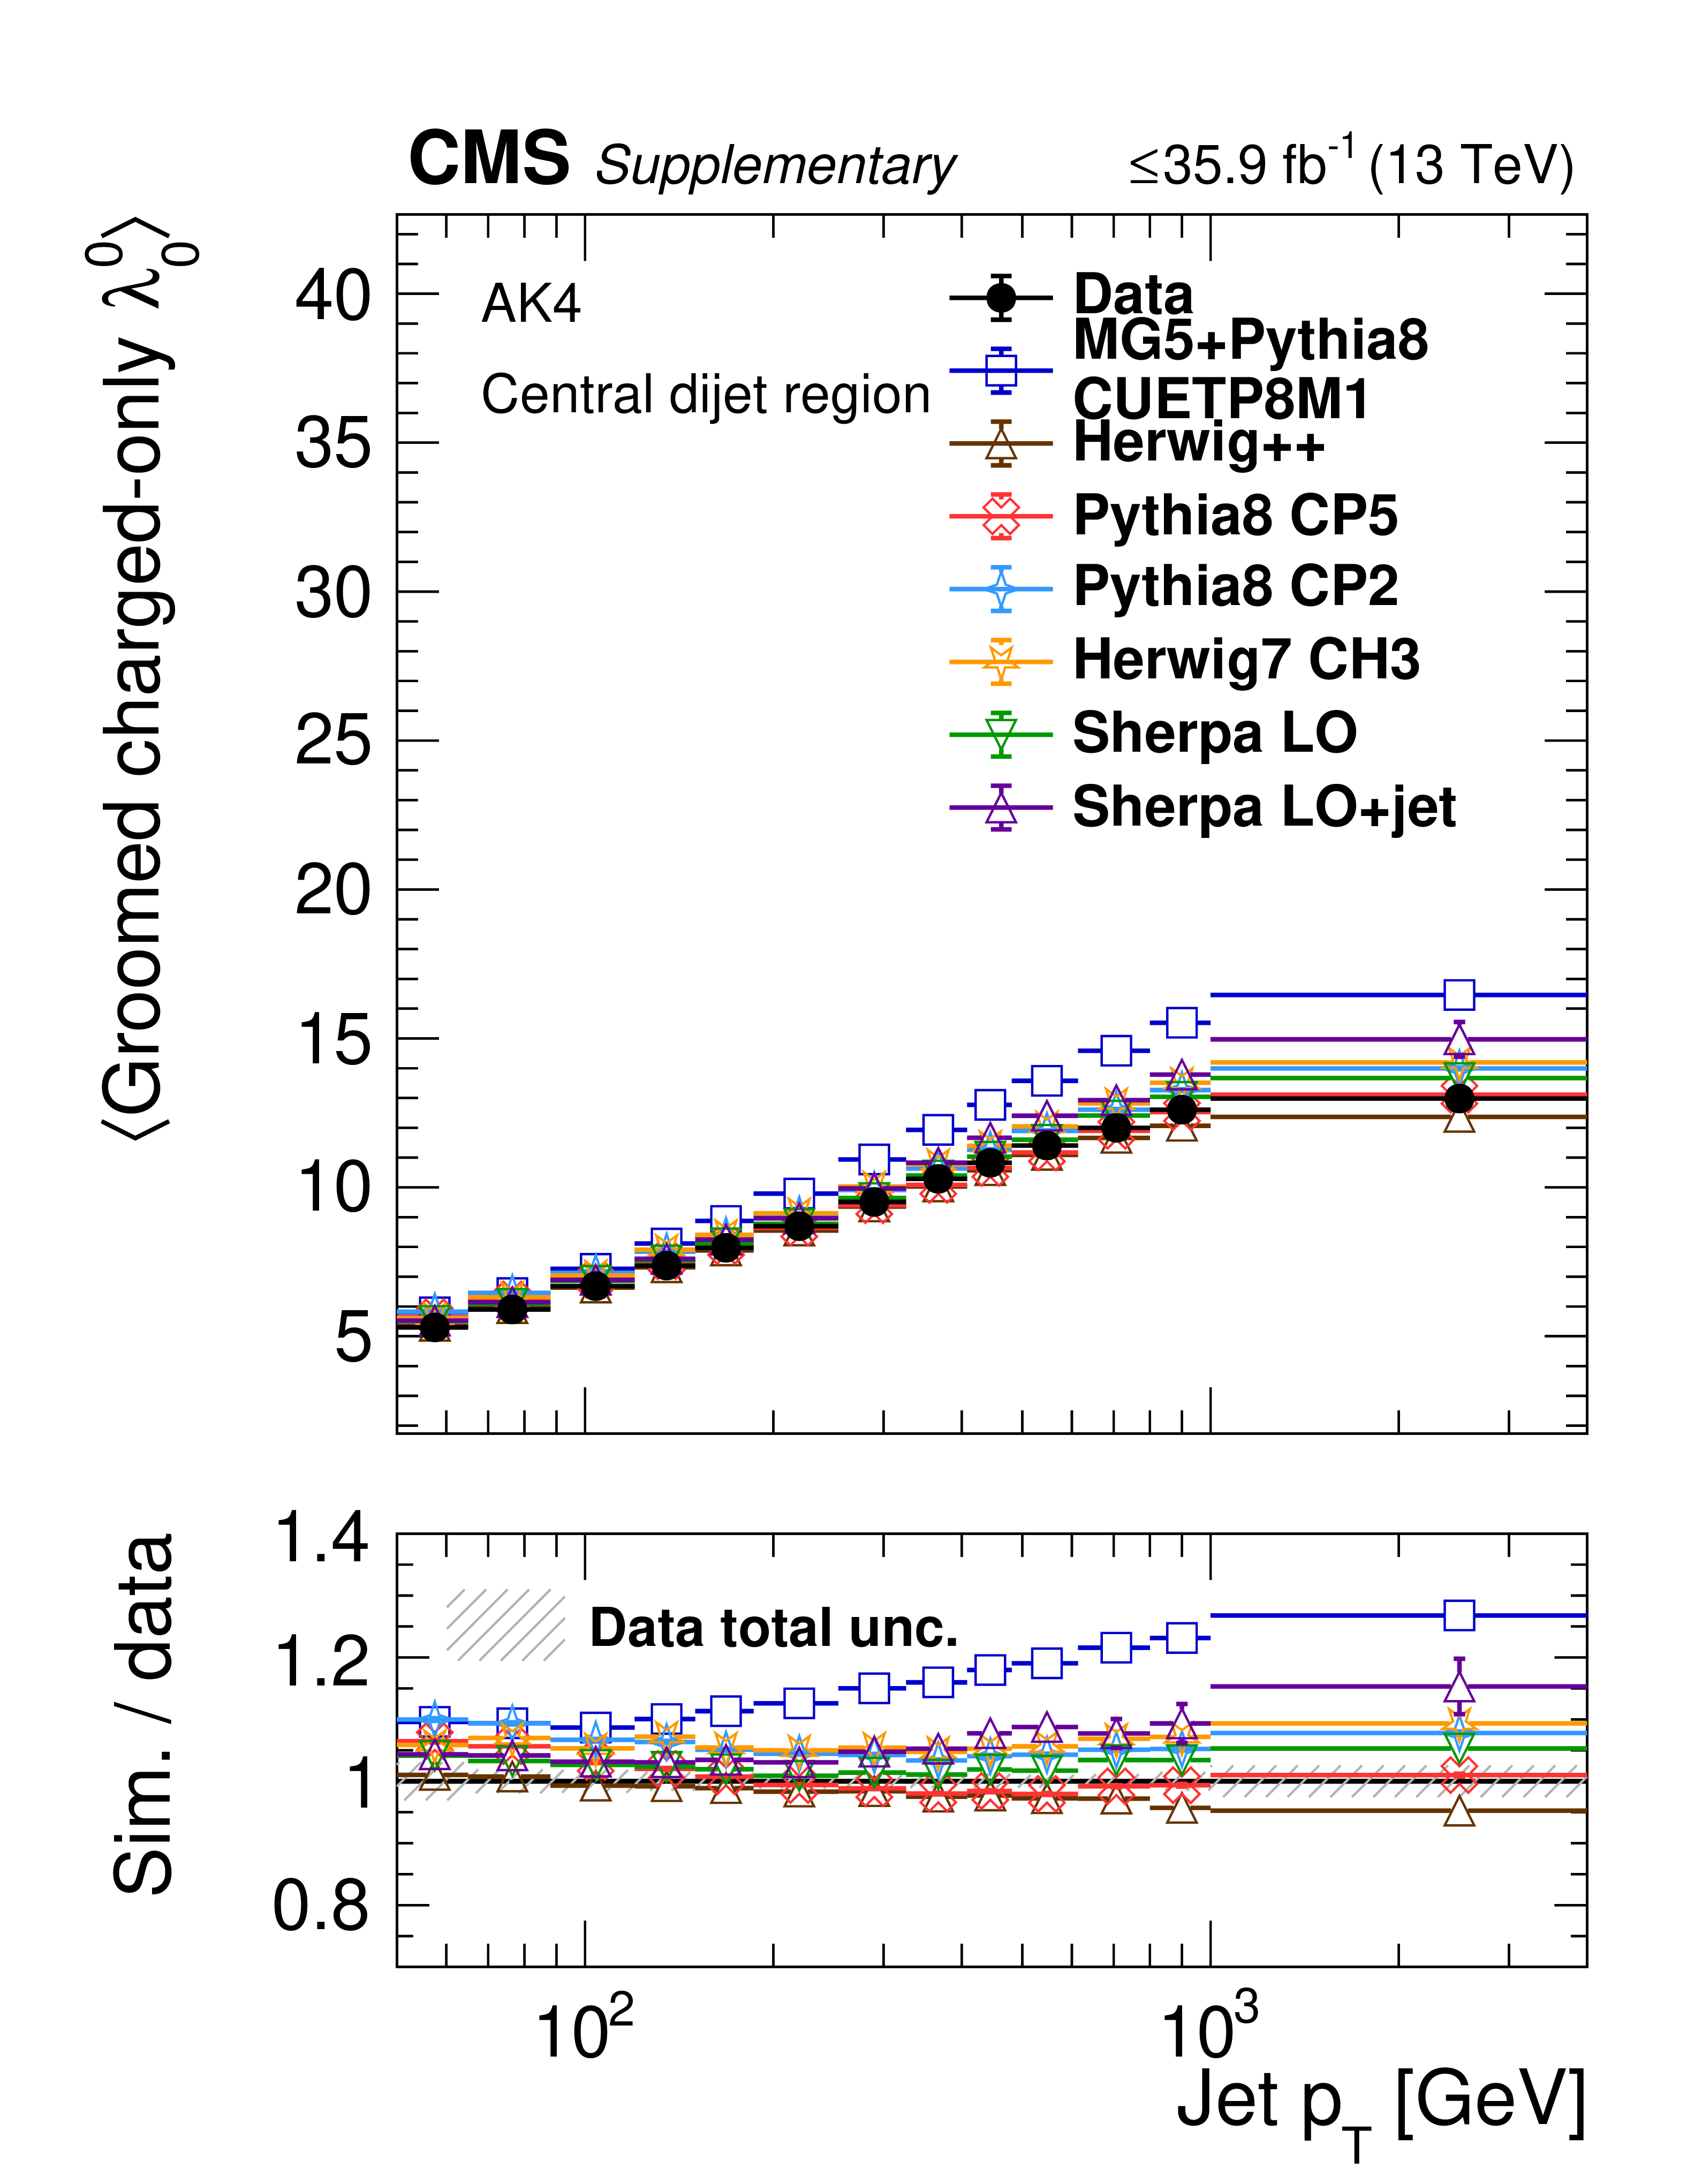
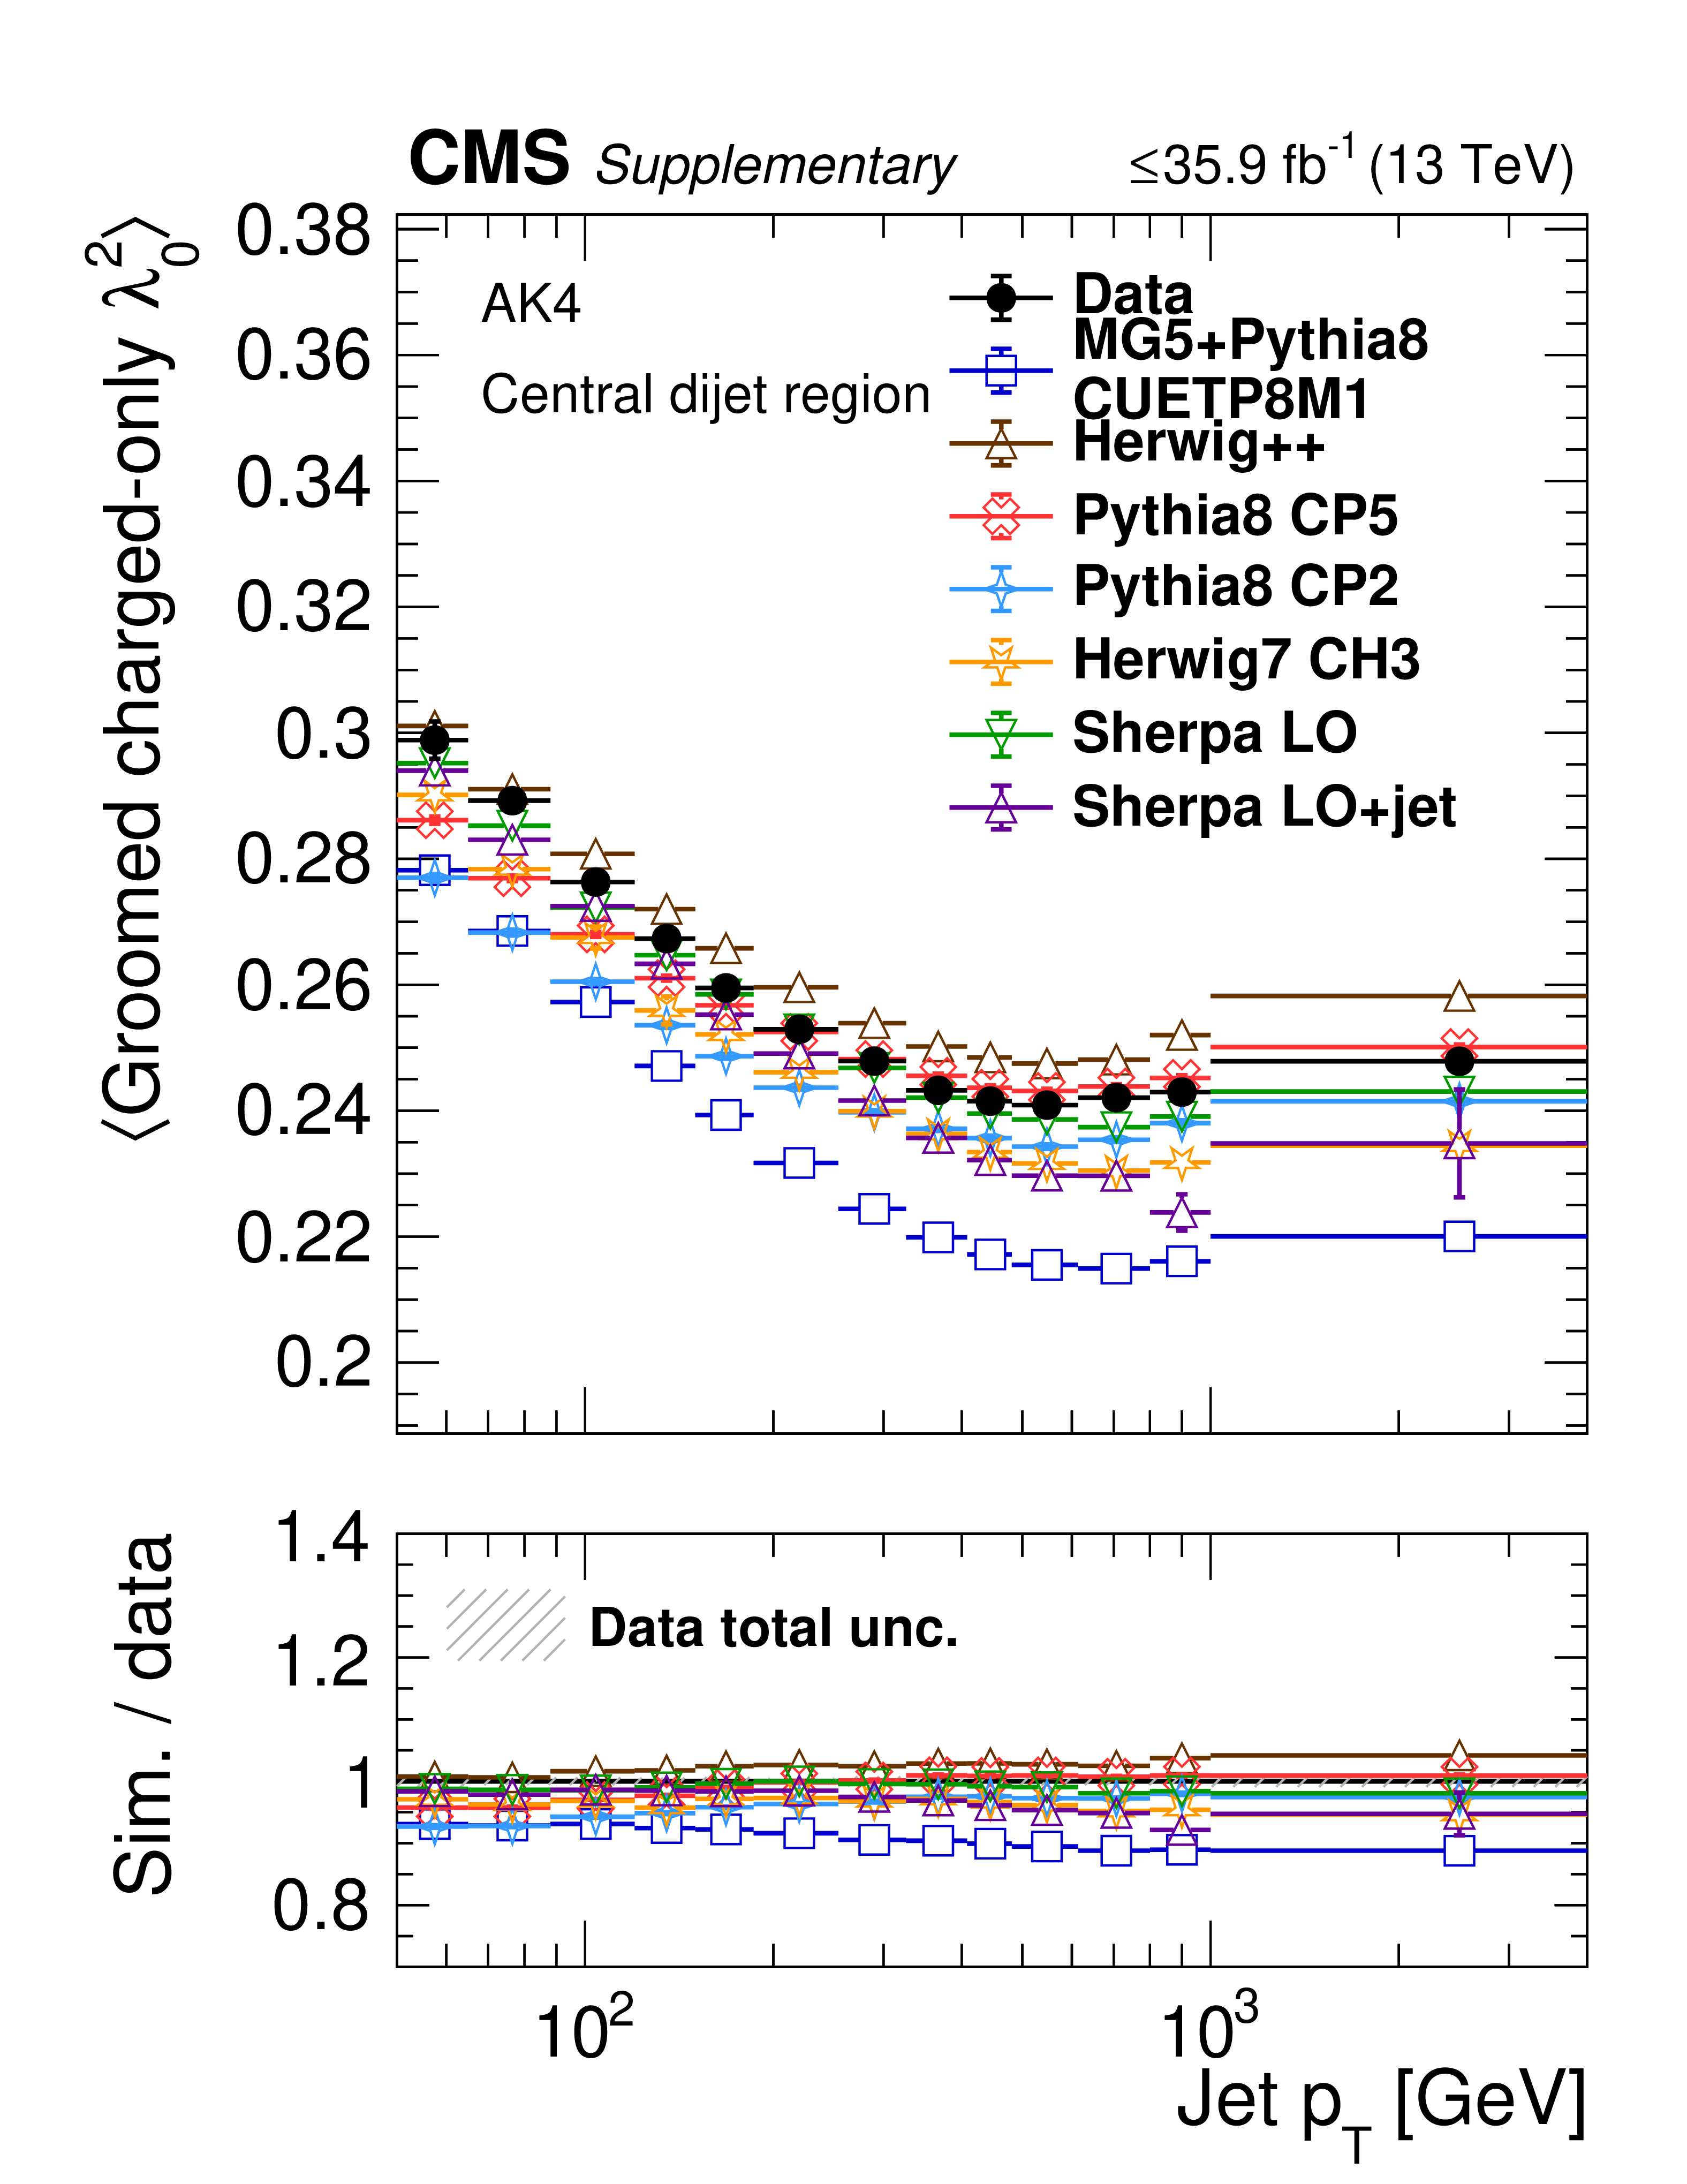
Additional Figure 18:
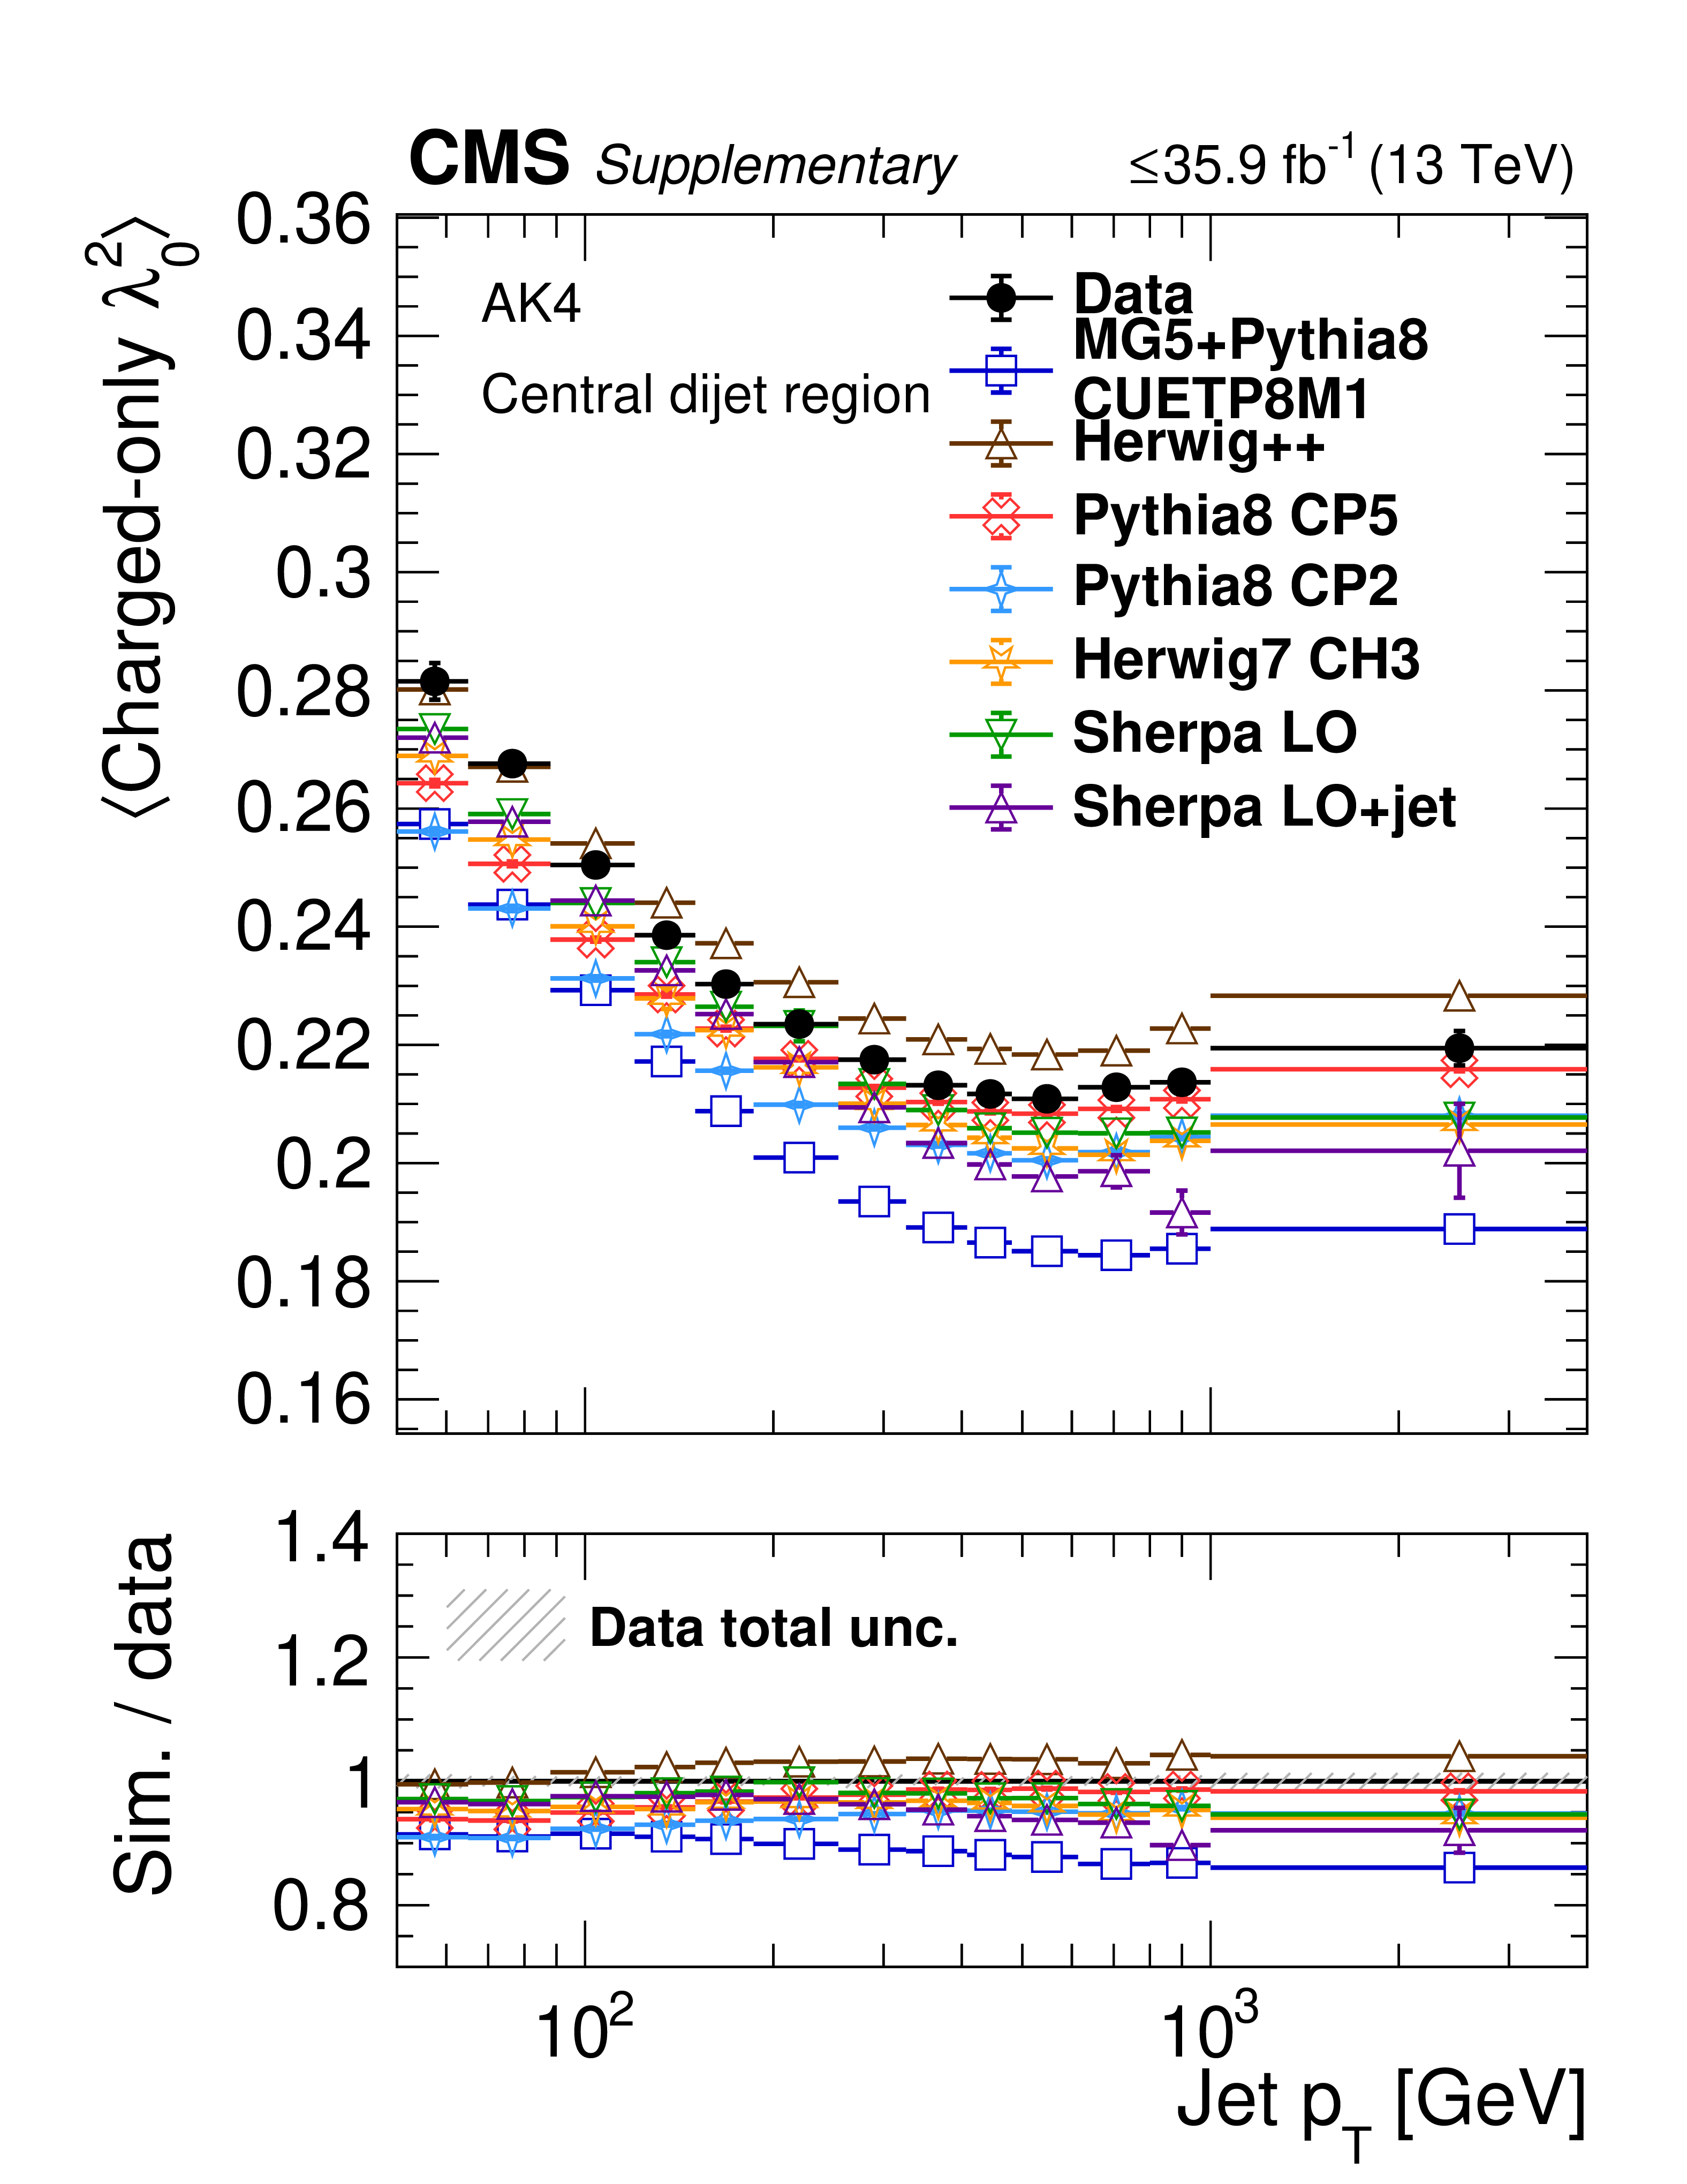
Plots of distribution mean for ungroomed AK4 jets in the central dijet region, comparing unfolded data to MC. Upper row is charged+neutral variables, lower row is charged-only variables. |

png pdf |
Additional Figure 18-a:
Plots of distribution mean for ungroomed AK4 jets in the central dijet region, comparing unfolded data to MC. Upper row is charged+neutral variables, lower row is charged-only variables. |

png pdf |
Additional Figure 18-b:
Plots of distribution mean for ungroomed AK4 jets in the central dijet region, comparing unfolded data to MC. Upper row is charged+neutral variables, lower row is charged-only variables. |
png pdf |
Additional Figure 18-c:
Plots of distribution mean for ungroomed AK4 jets in the central dijet region, comparing unfolded data to MC. Upper row is charged+neutral variables, lower row is charged-only variables. |
png pdf |
Additional Figure 18-d:
Plots of distribution mean for ungroomed AK4 jets in the central dijet region, comparing unfolded data to MC. Upper row is charged+neutral variables, lower row is charged-only variables. |
png pdf |
Additional Figure 18-e:
Plots of distribution mean for ungroomed AK4 jets in the central dijet region, comparing unfolded data to MC. Upper row is charged+neutral variables, lower row is charged-only variables. |
png pdf |
Additional Figure 18-f:
Plots of distribution mean for ungroomed AK4 jets in the central dijet region, comparing unfolded data to MC. Upper row is charged+neutral variables, lower row is charged-only variables. |

png pdf |
Additional Figure 18-g:
Plots of distribution mean for ungroomed AK4 jets in the central dijet region, comparing unfolded data to MC. Upper row is charged+neutral variables, lower row is charged-only variables. |
png pdf |
Additional Figure 18-h:
Plots of distribution mean for ungroomed AK4 jets in the central dijet region, comparing unfolded data to MC. Upper row is charged+neutral variables, lower row is charged-only variables. |
png pdf |
Additional Figure 18-i:
Plots of distribution mean for ungroomed AK4 jets in the central dijet region, comparing unfolded data to MC. Upper row is charged+neutral variables, lower row is charged-only variables. |
png pdf |
Additional Figure 18-j:
Plots of distribution mean for ungroomed AK4 jets in the central dijet region, comparing unfolded data to MC. Upper row is charged+neutral variables, lower row is charged-only variables. |
png pdf |
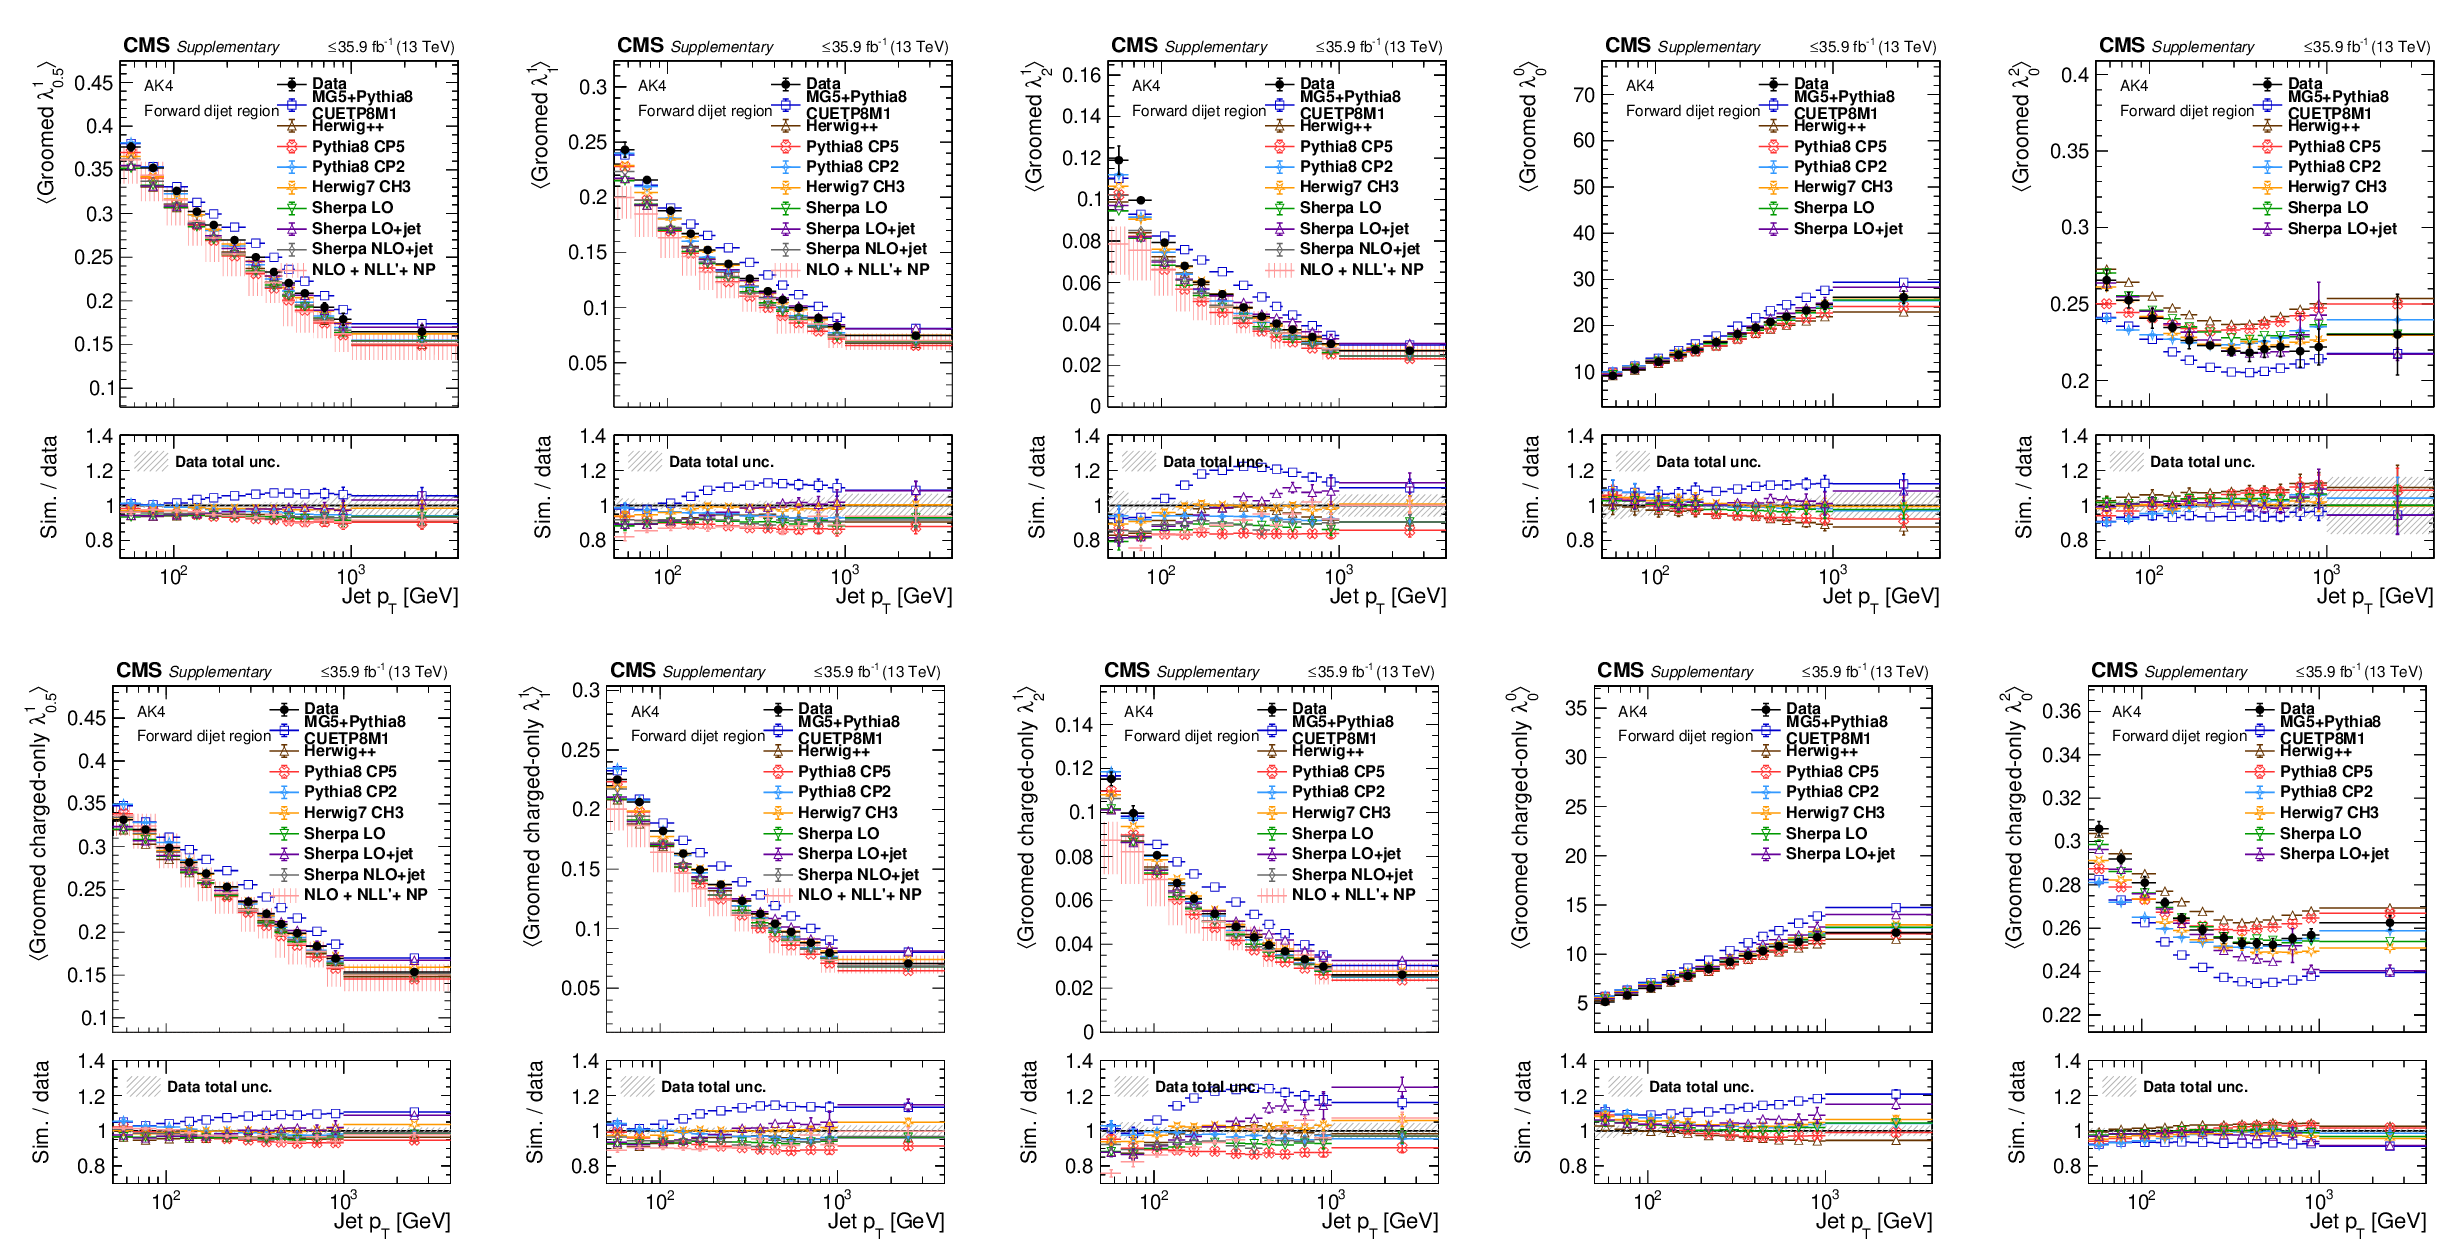
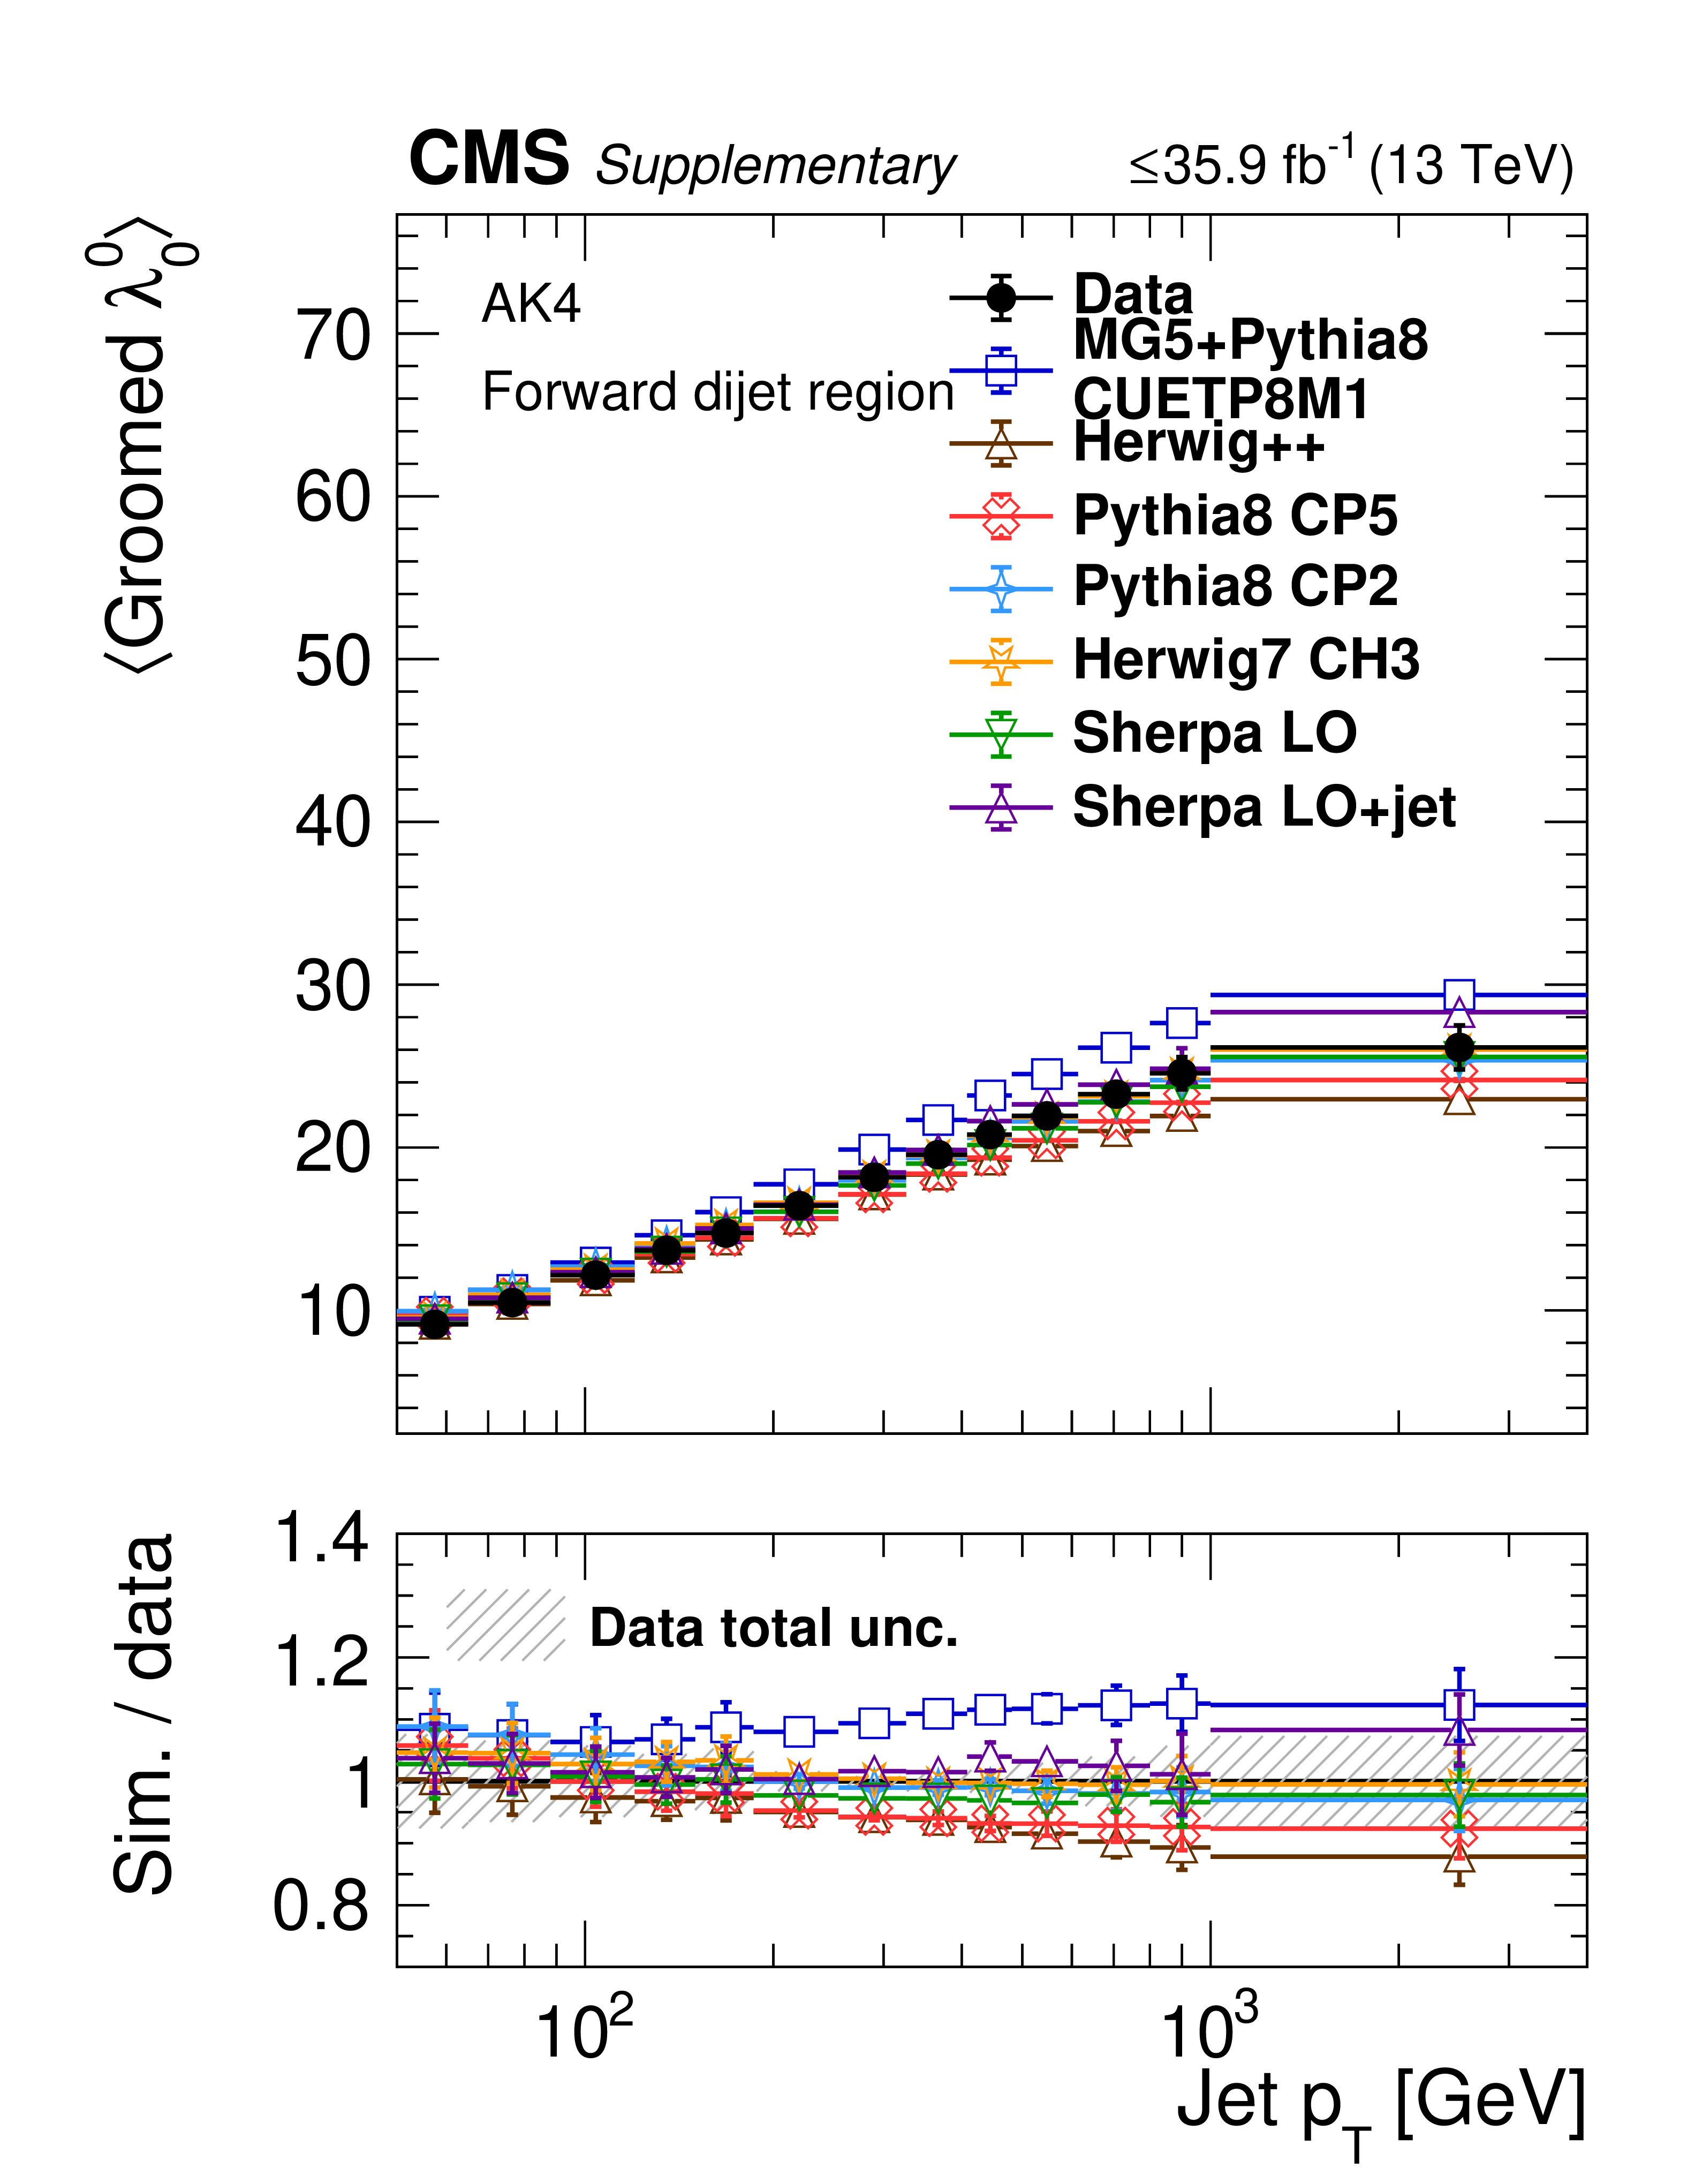
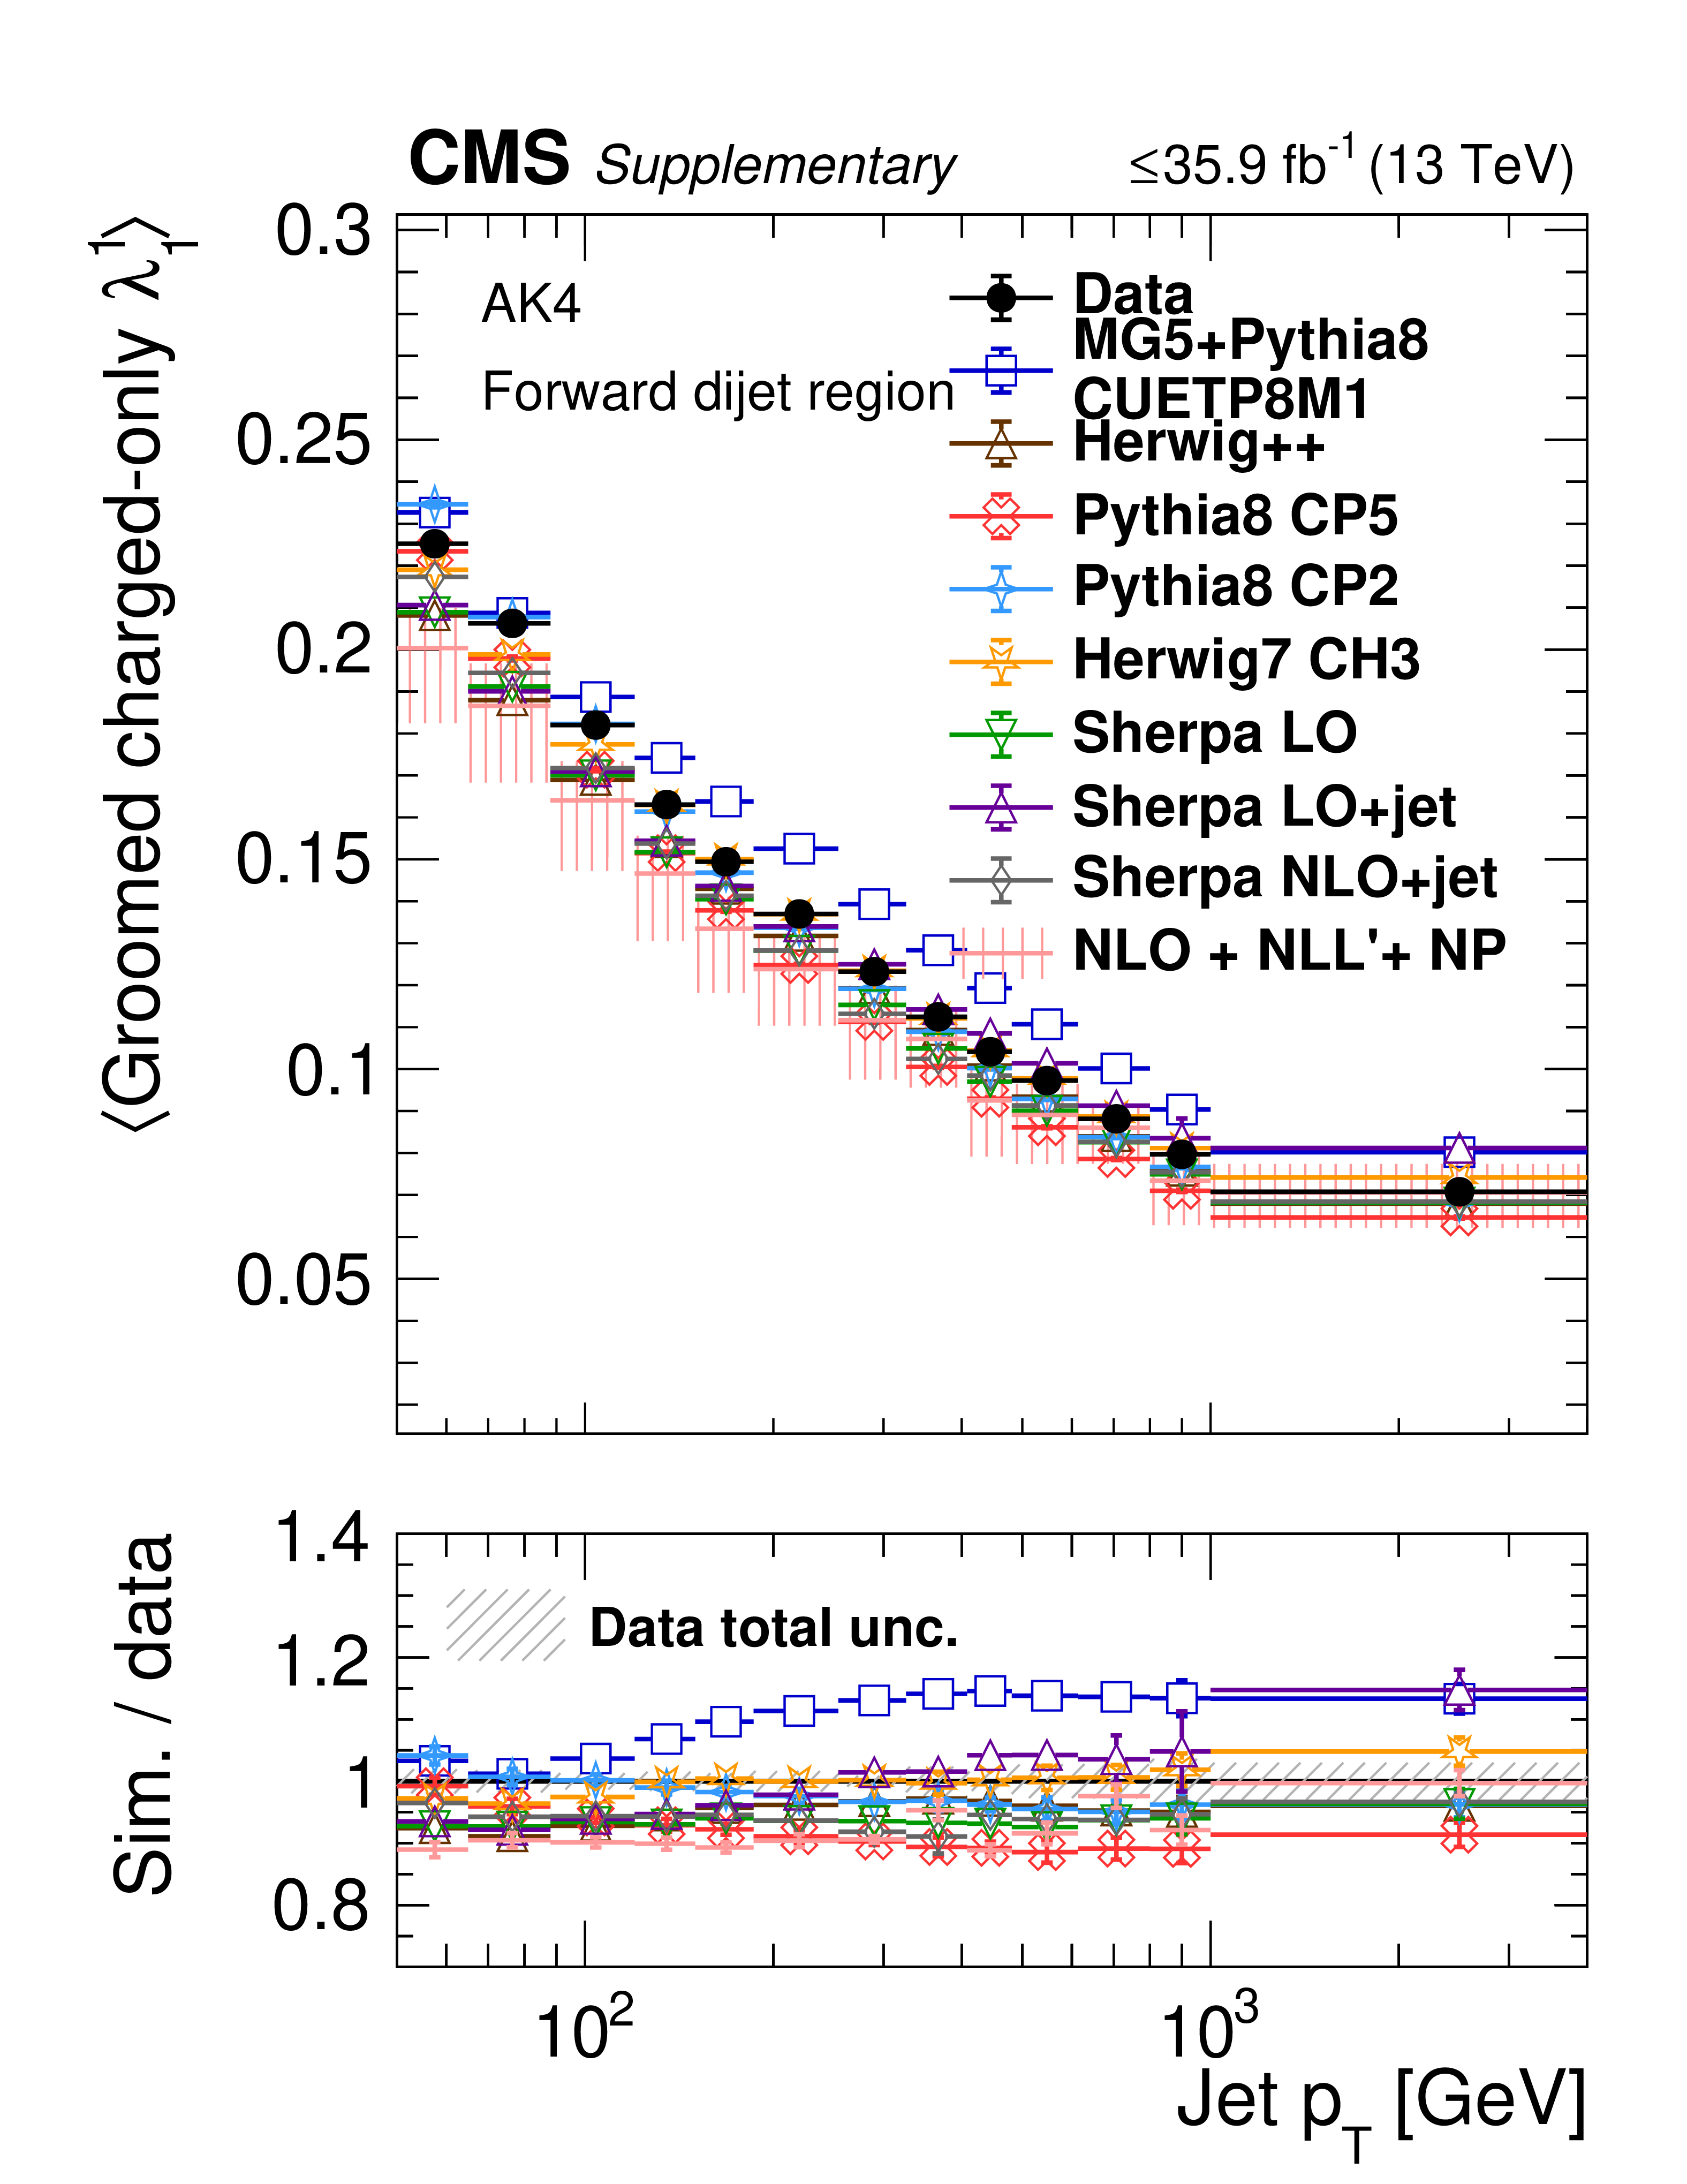
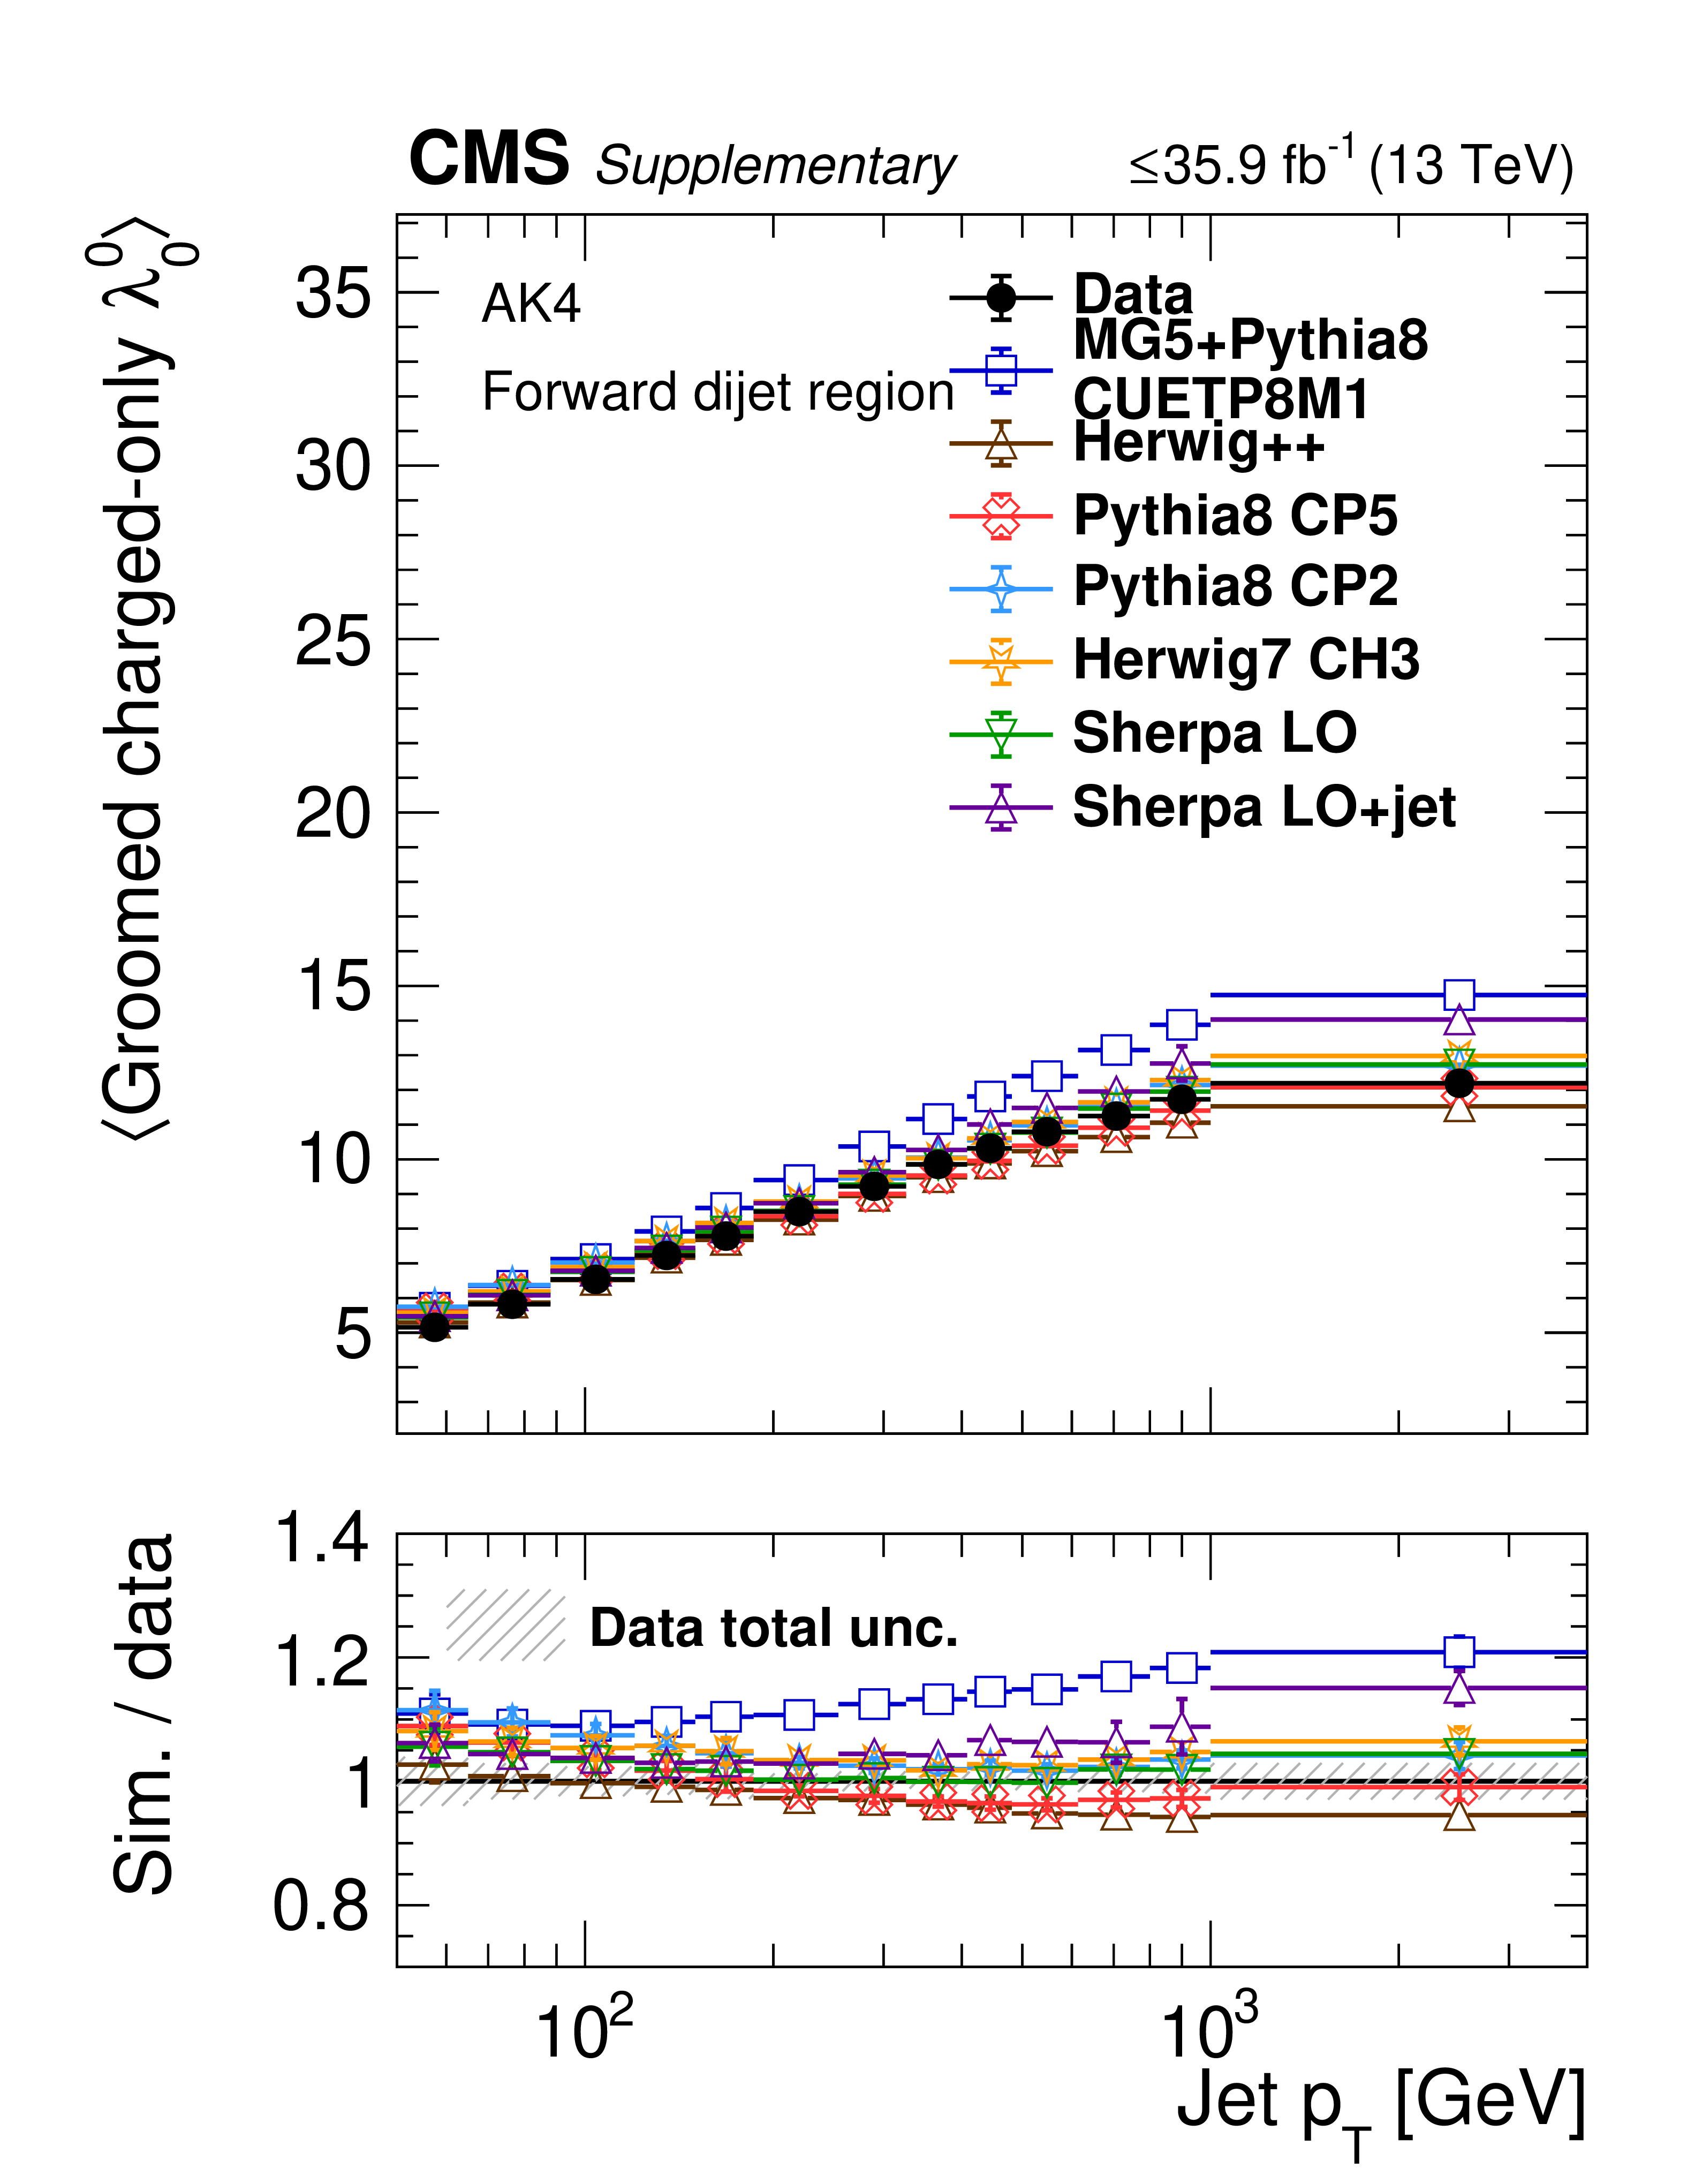
Additional Figure 19:
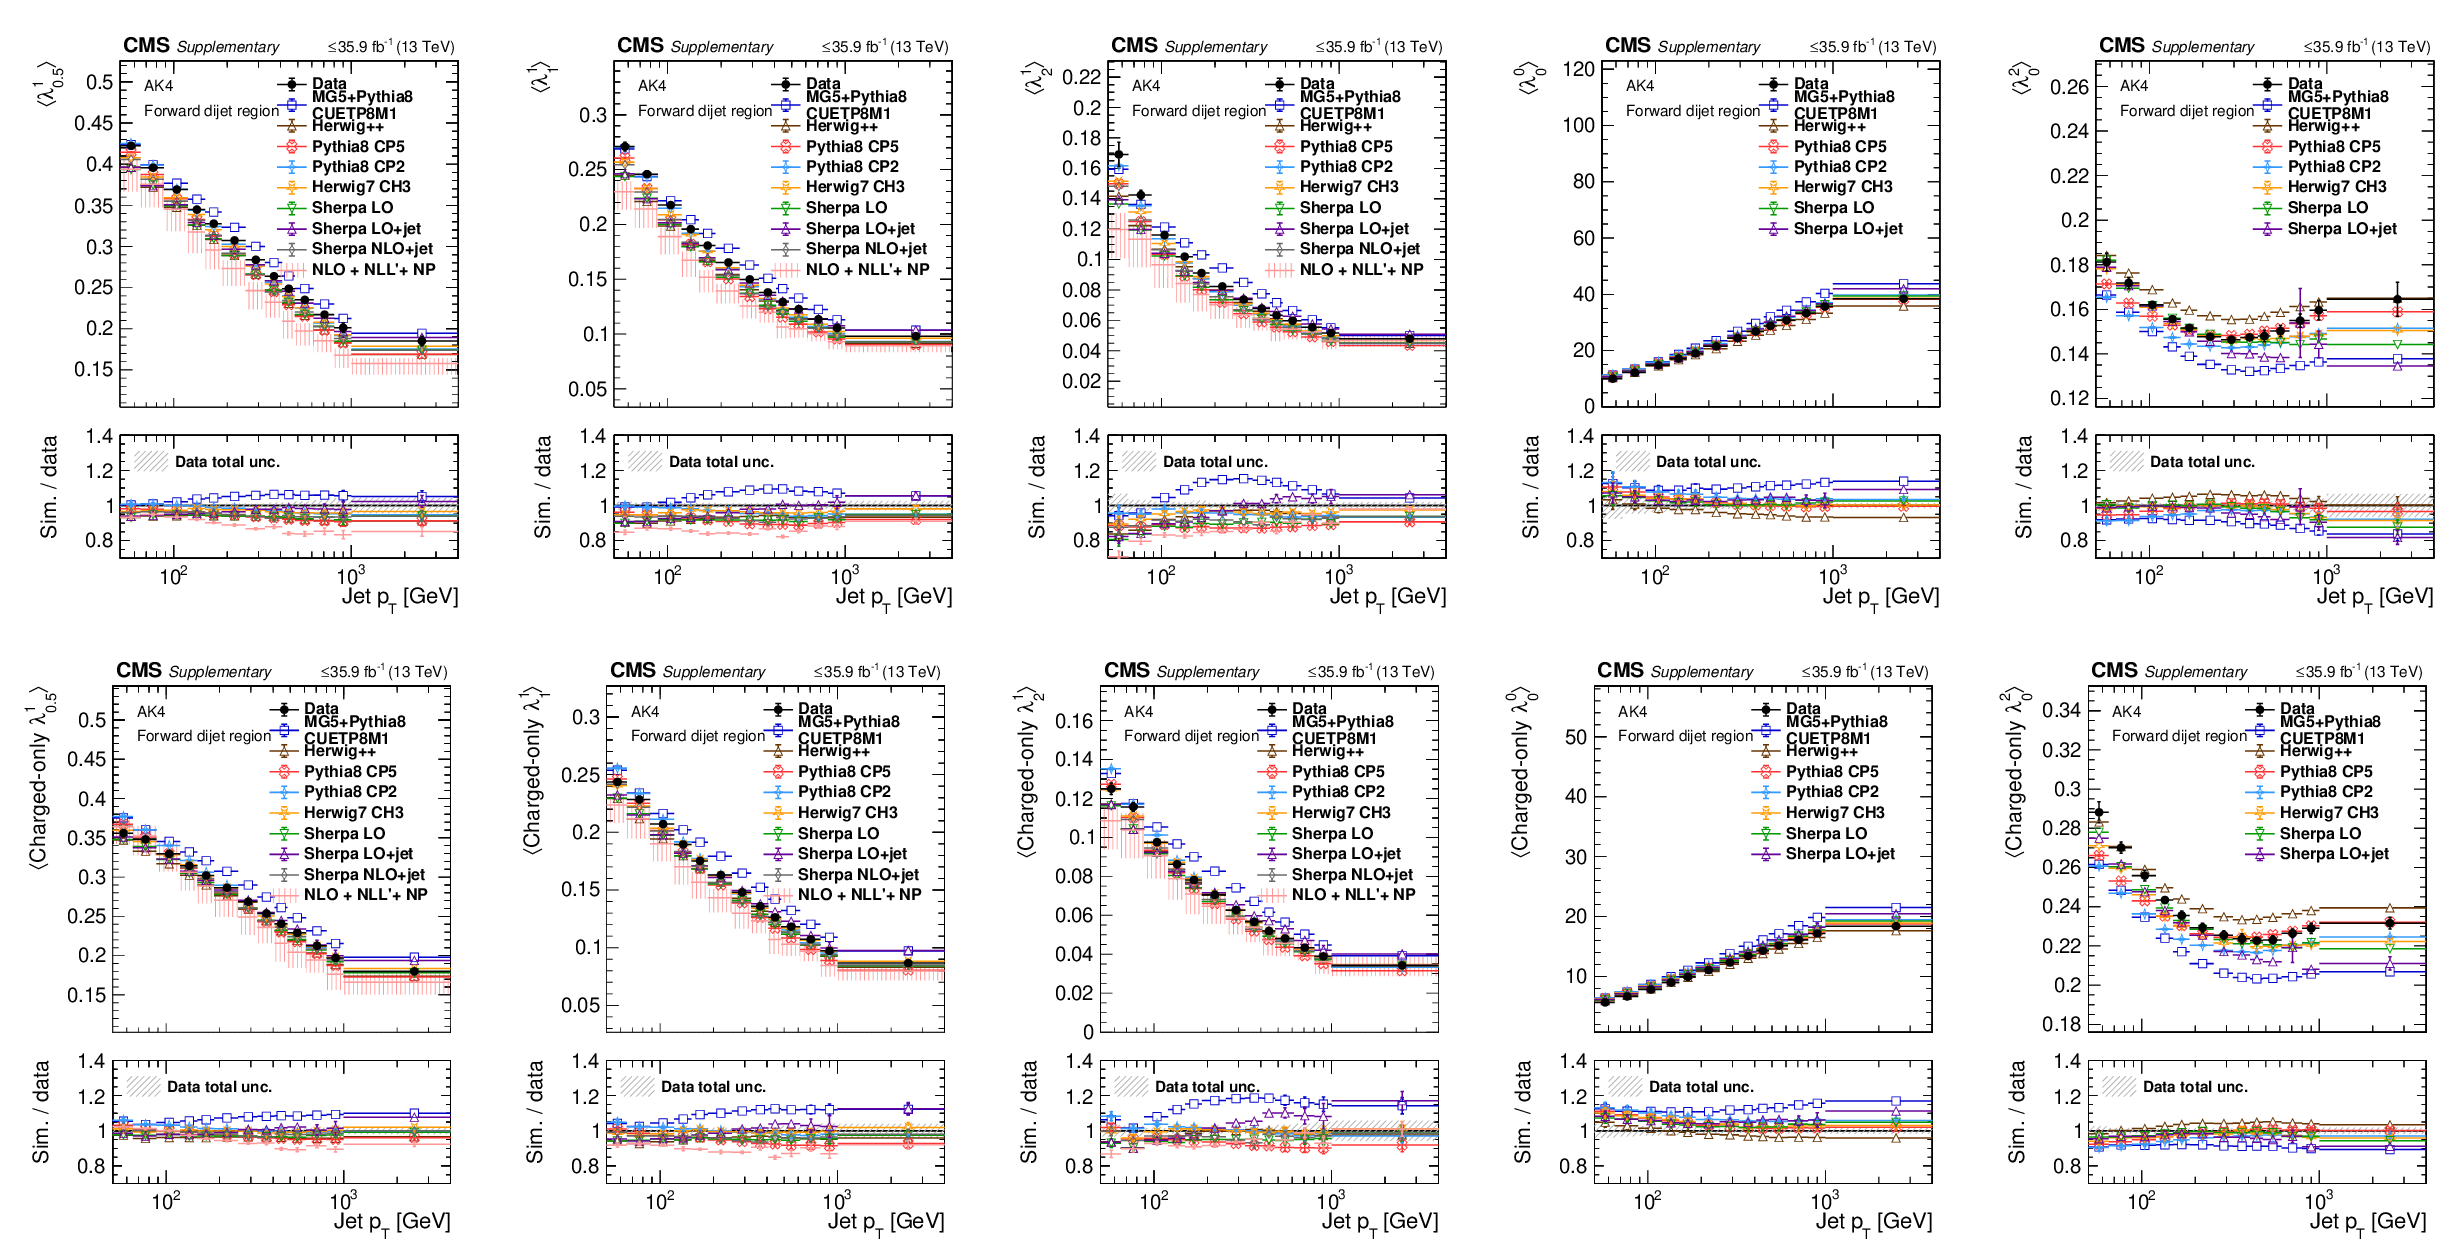
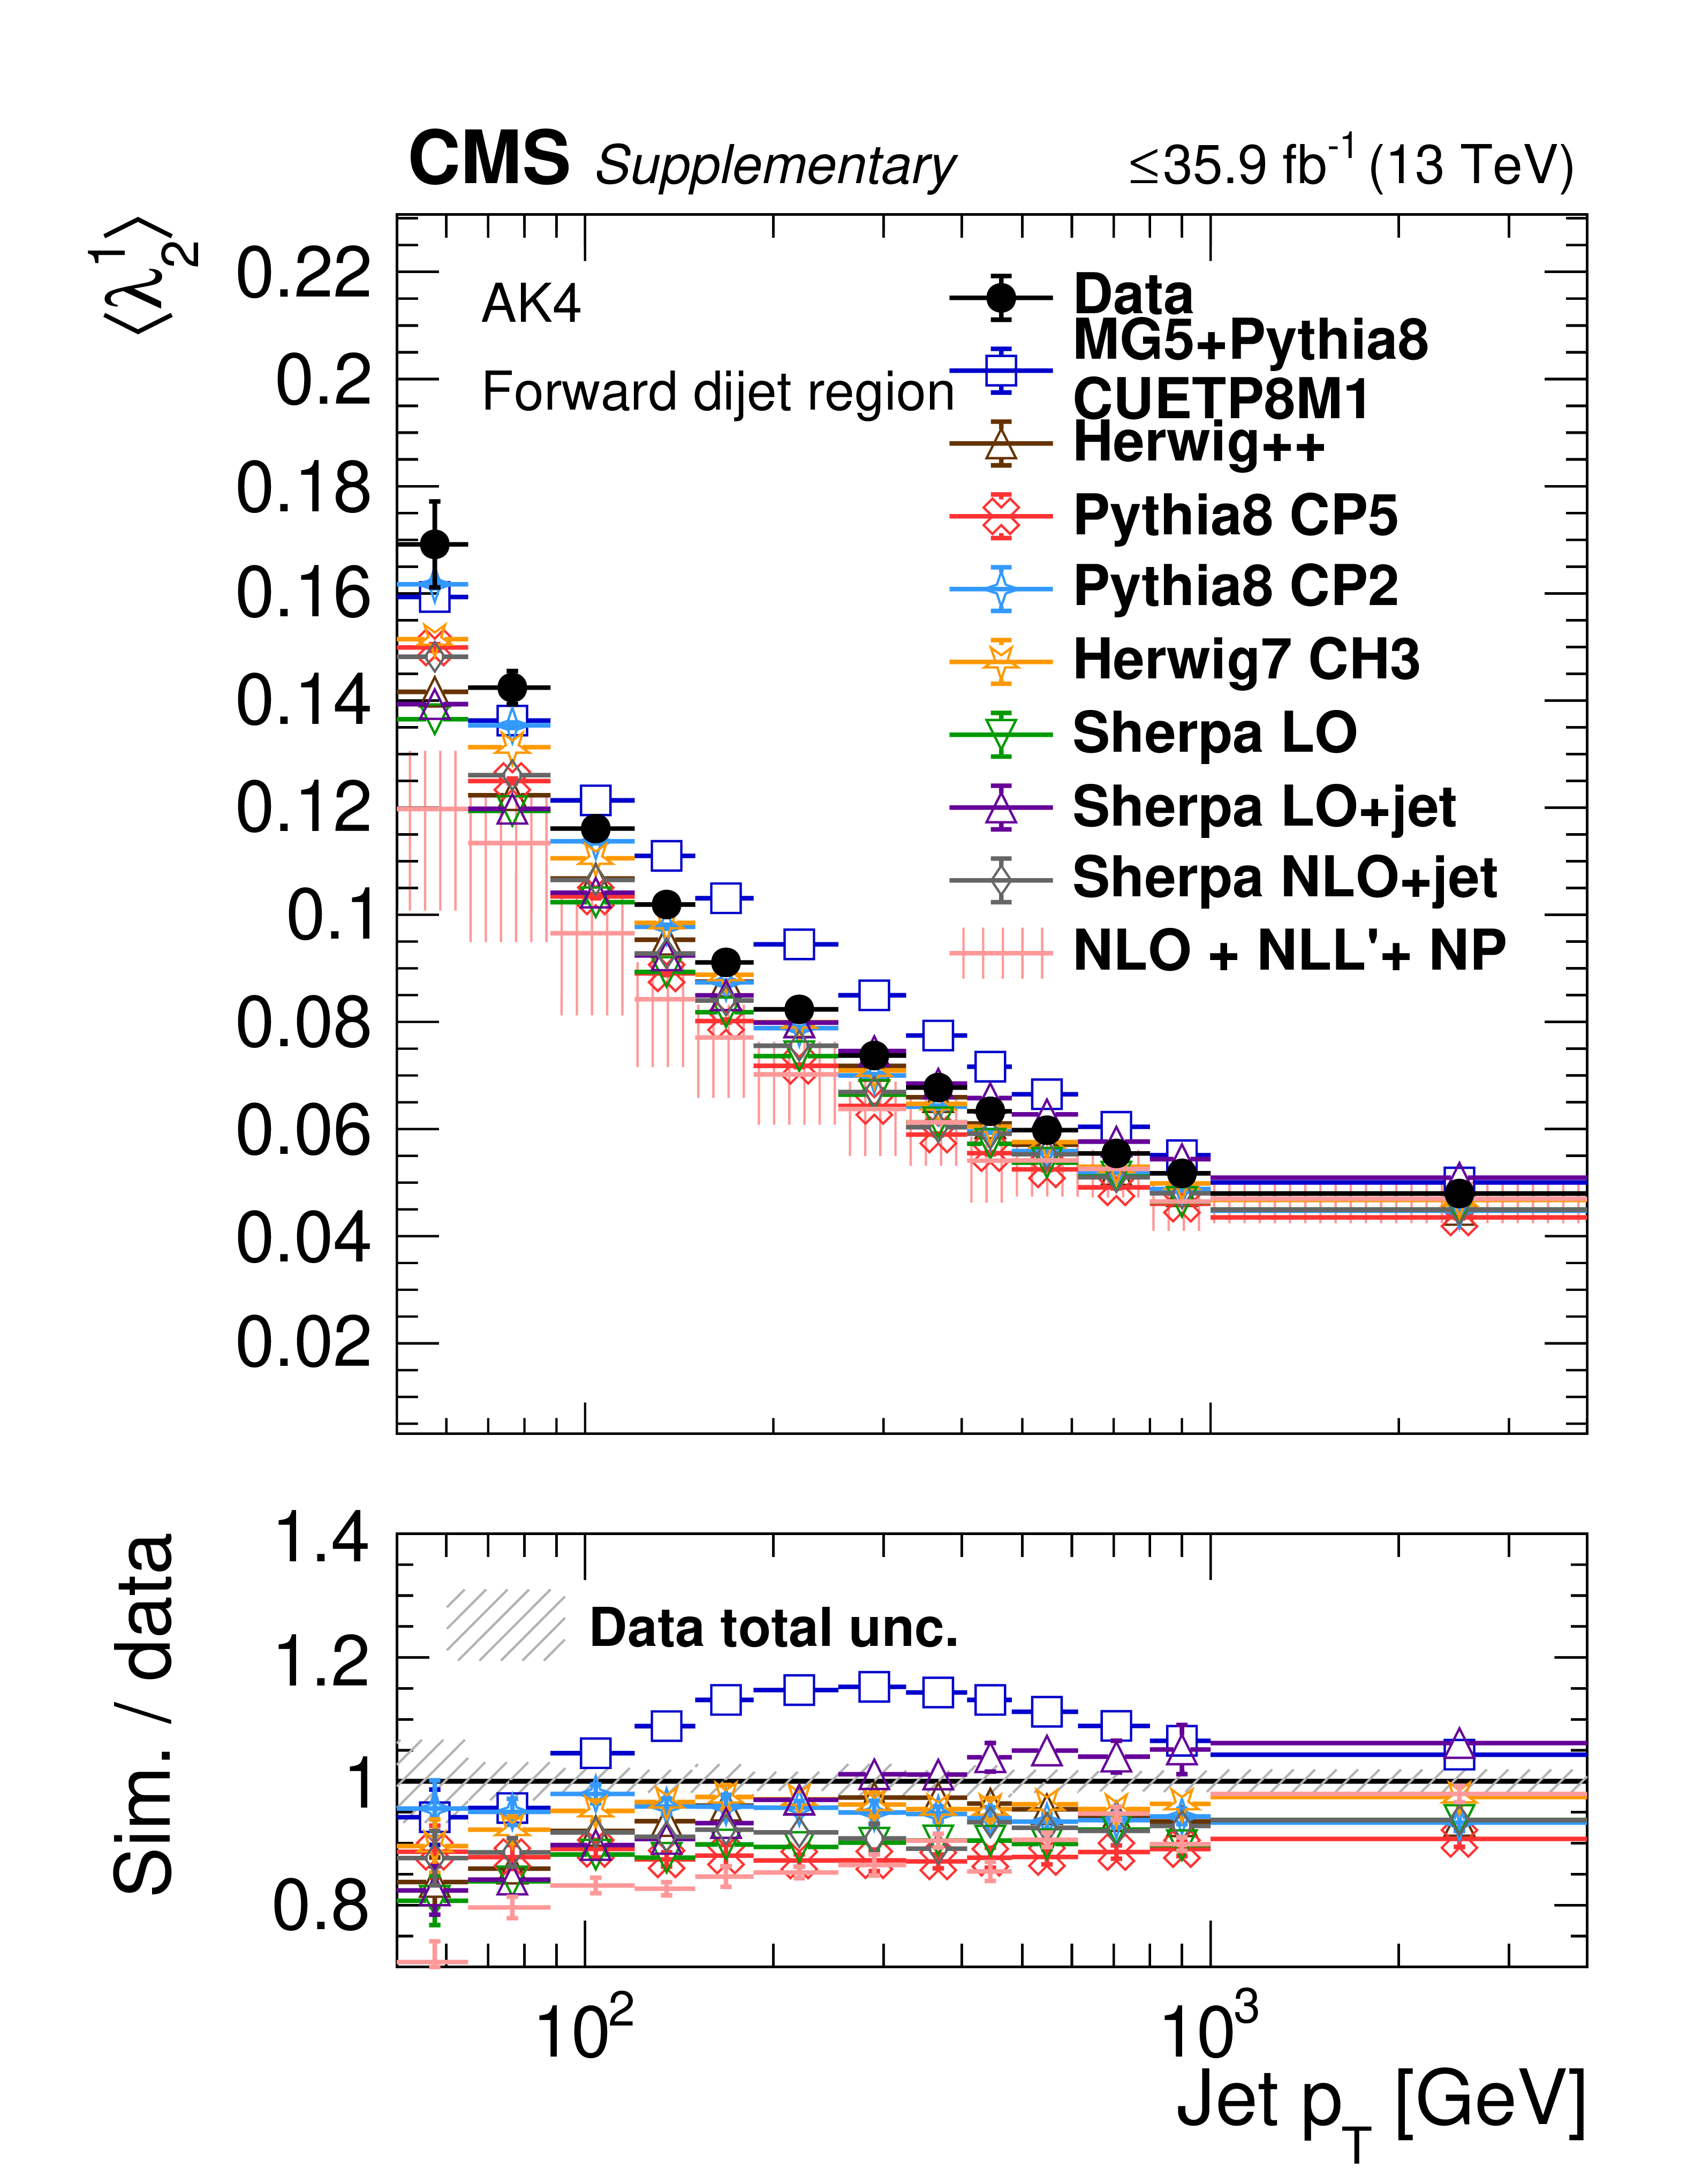
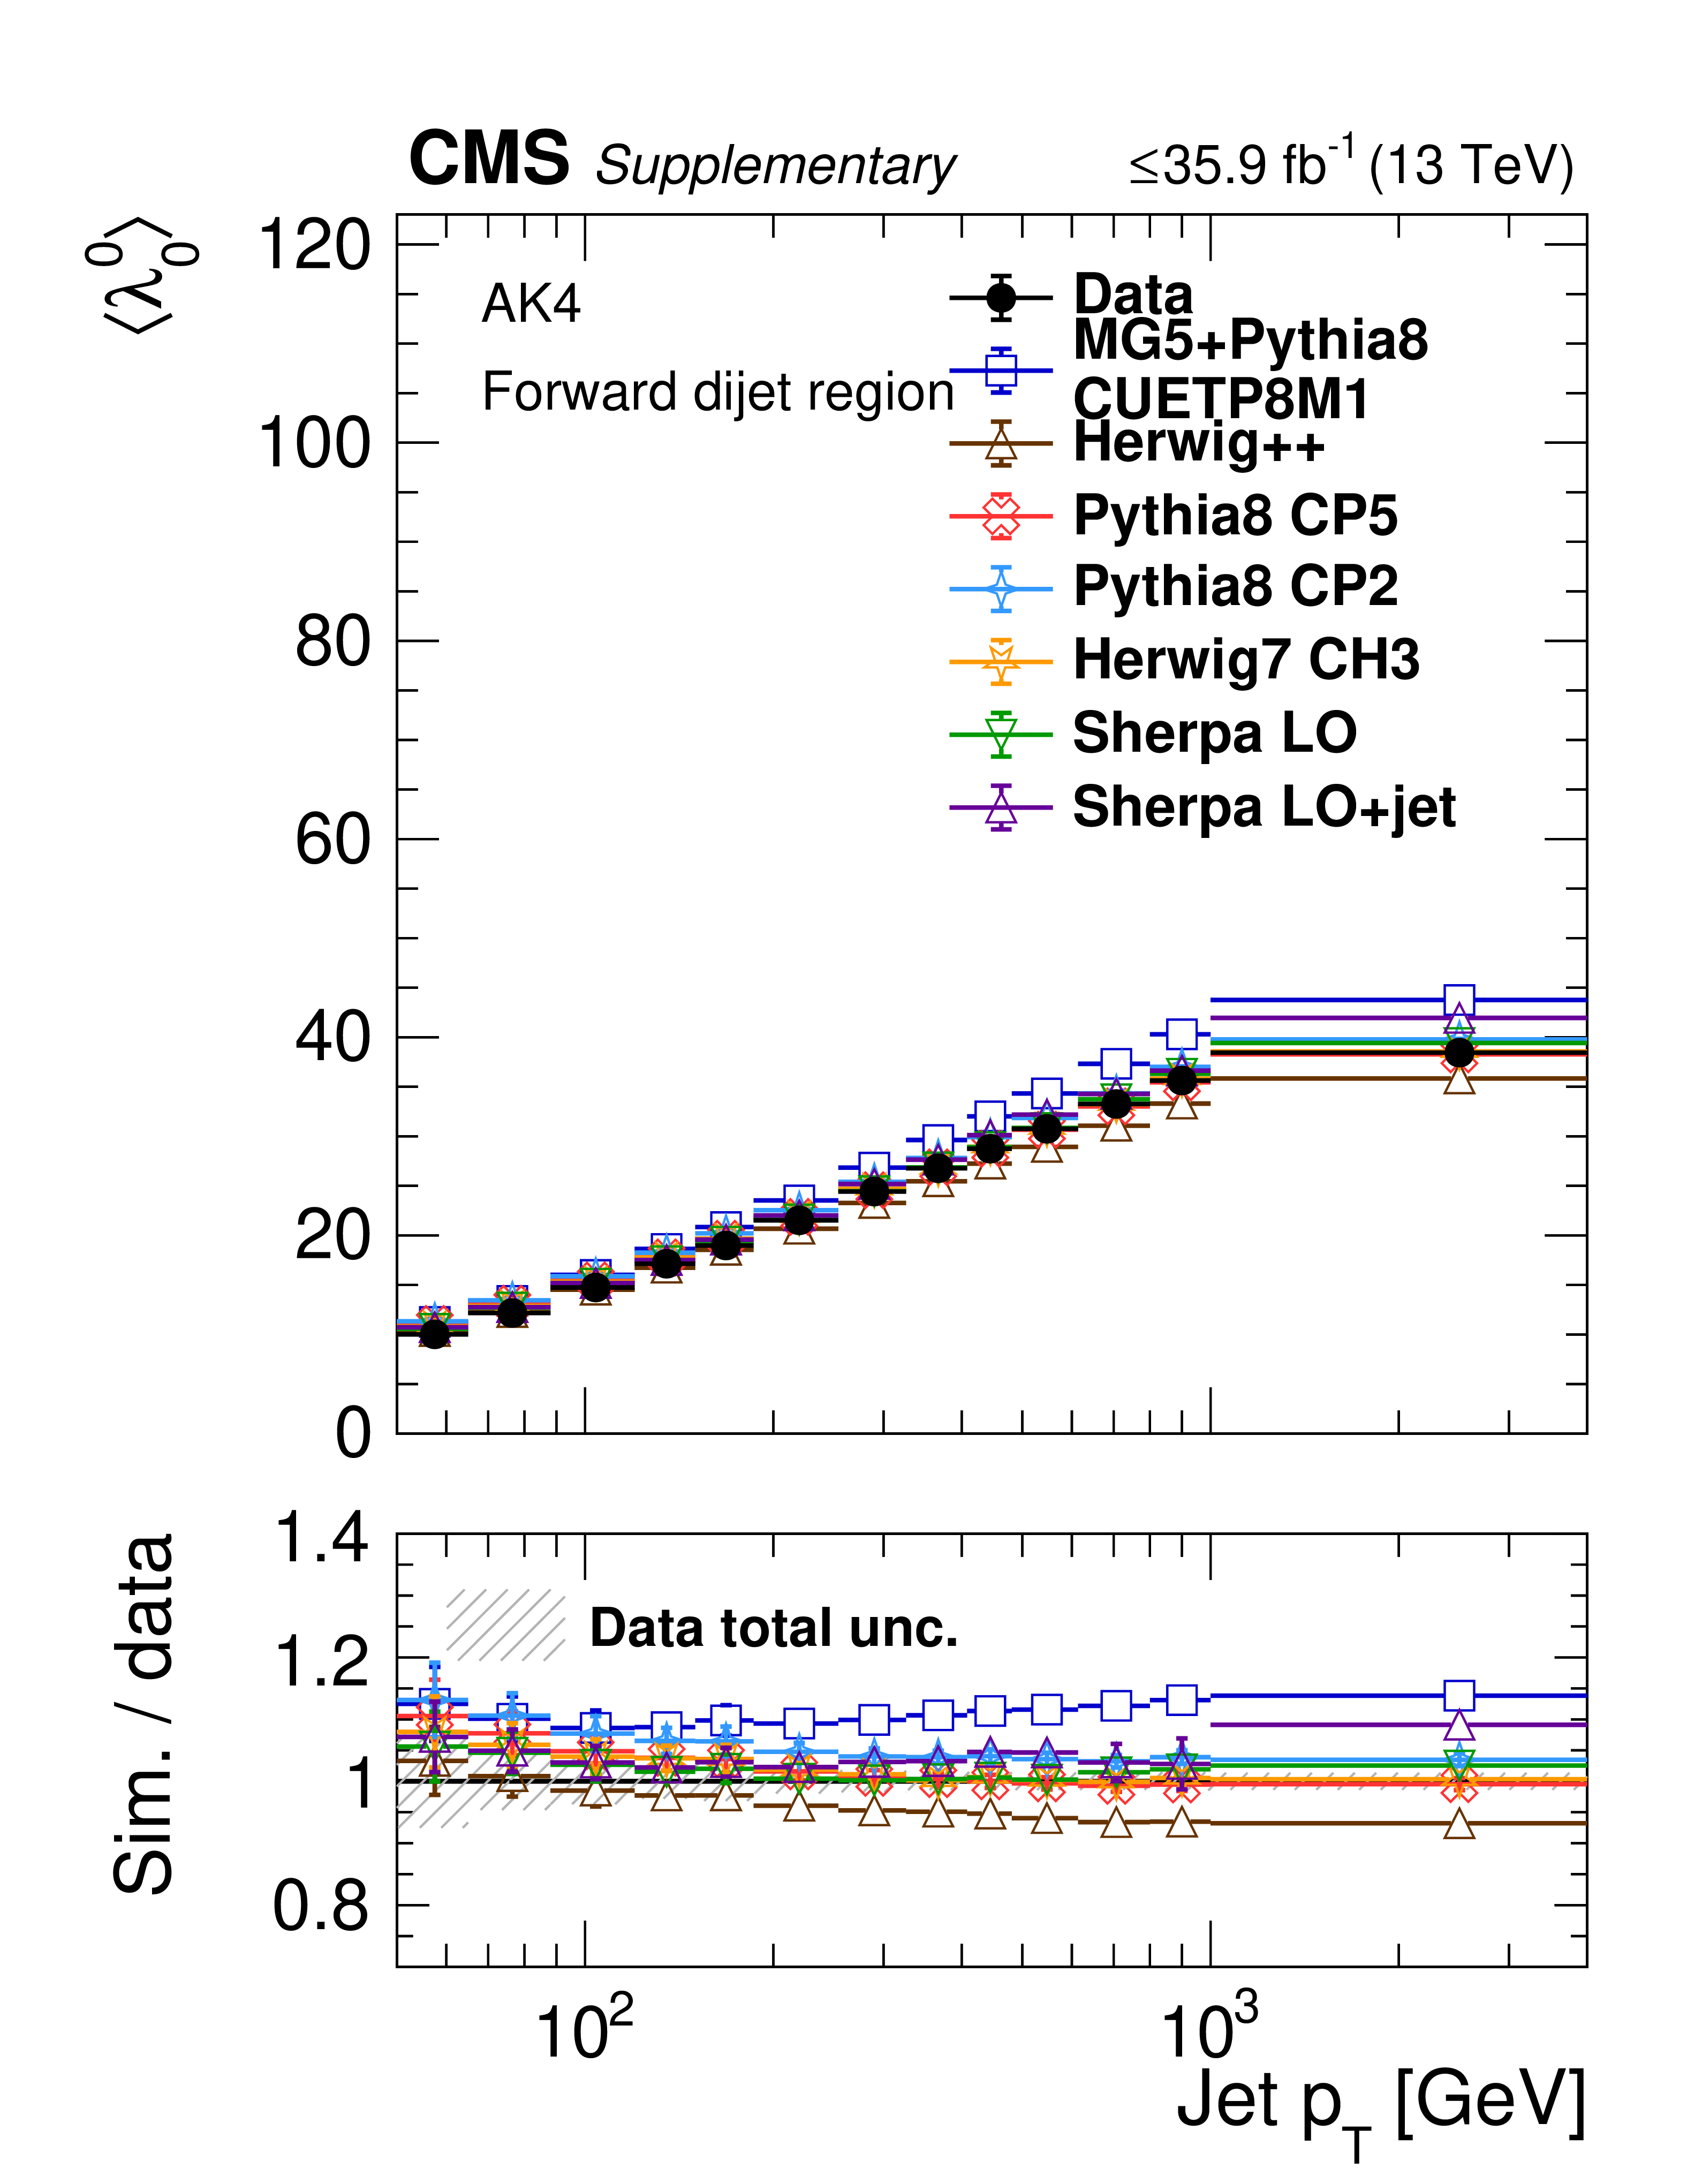
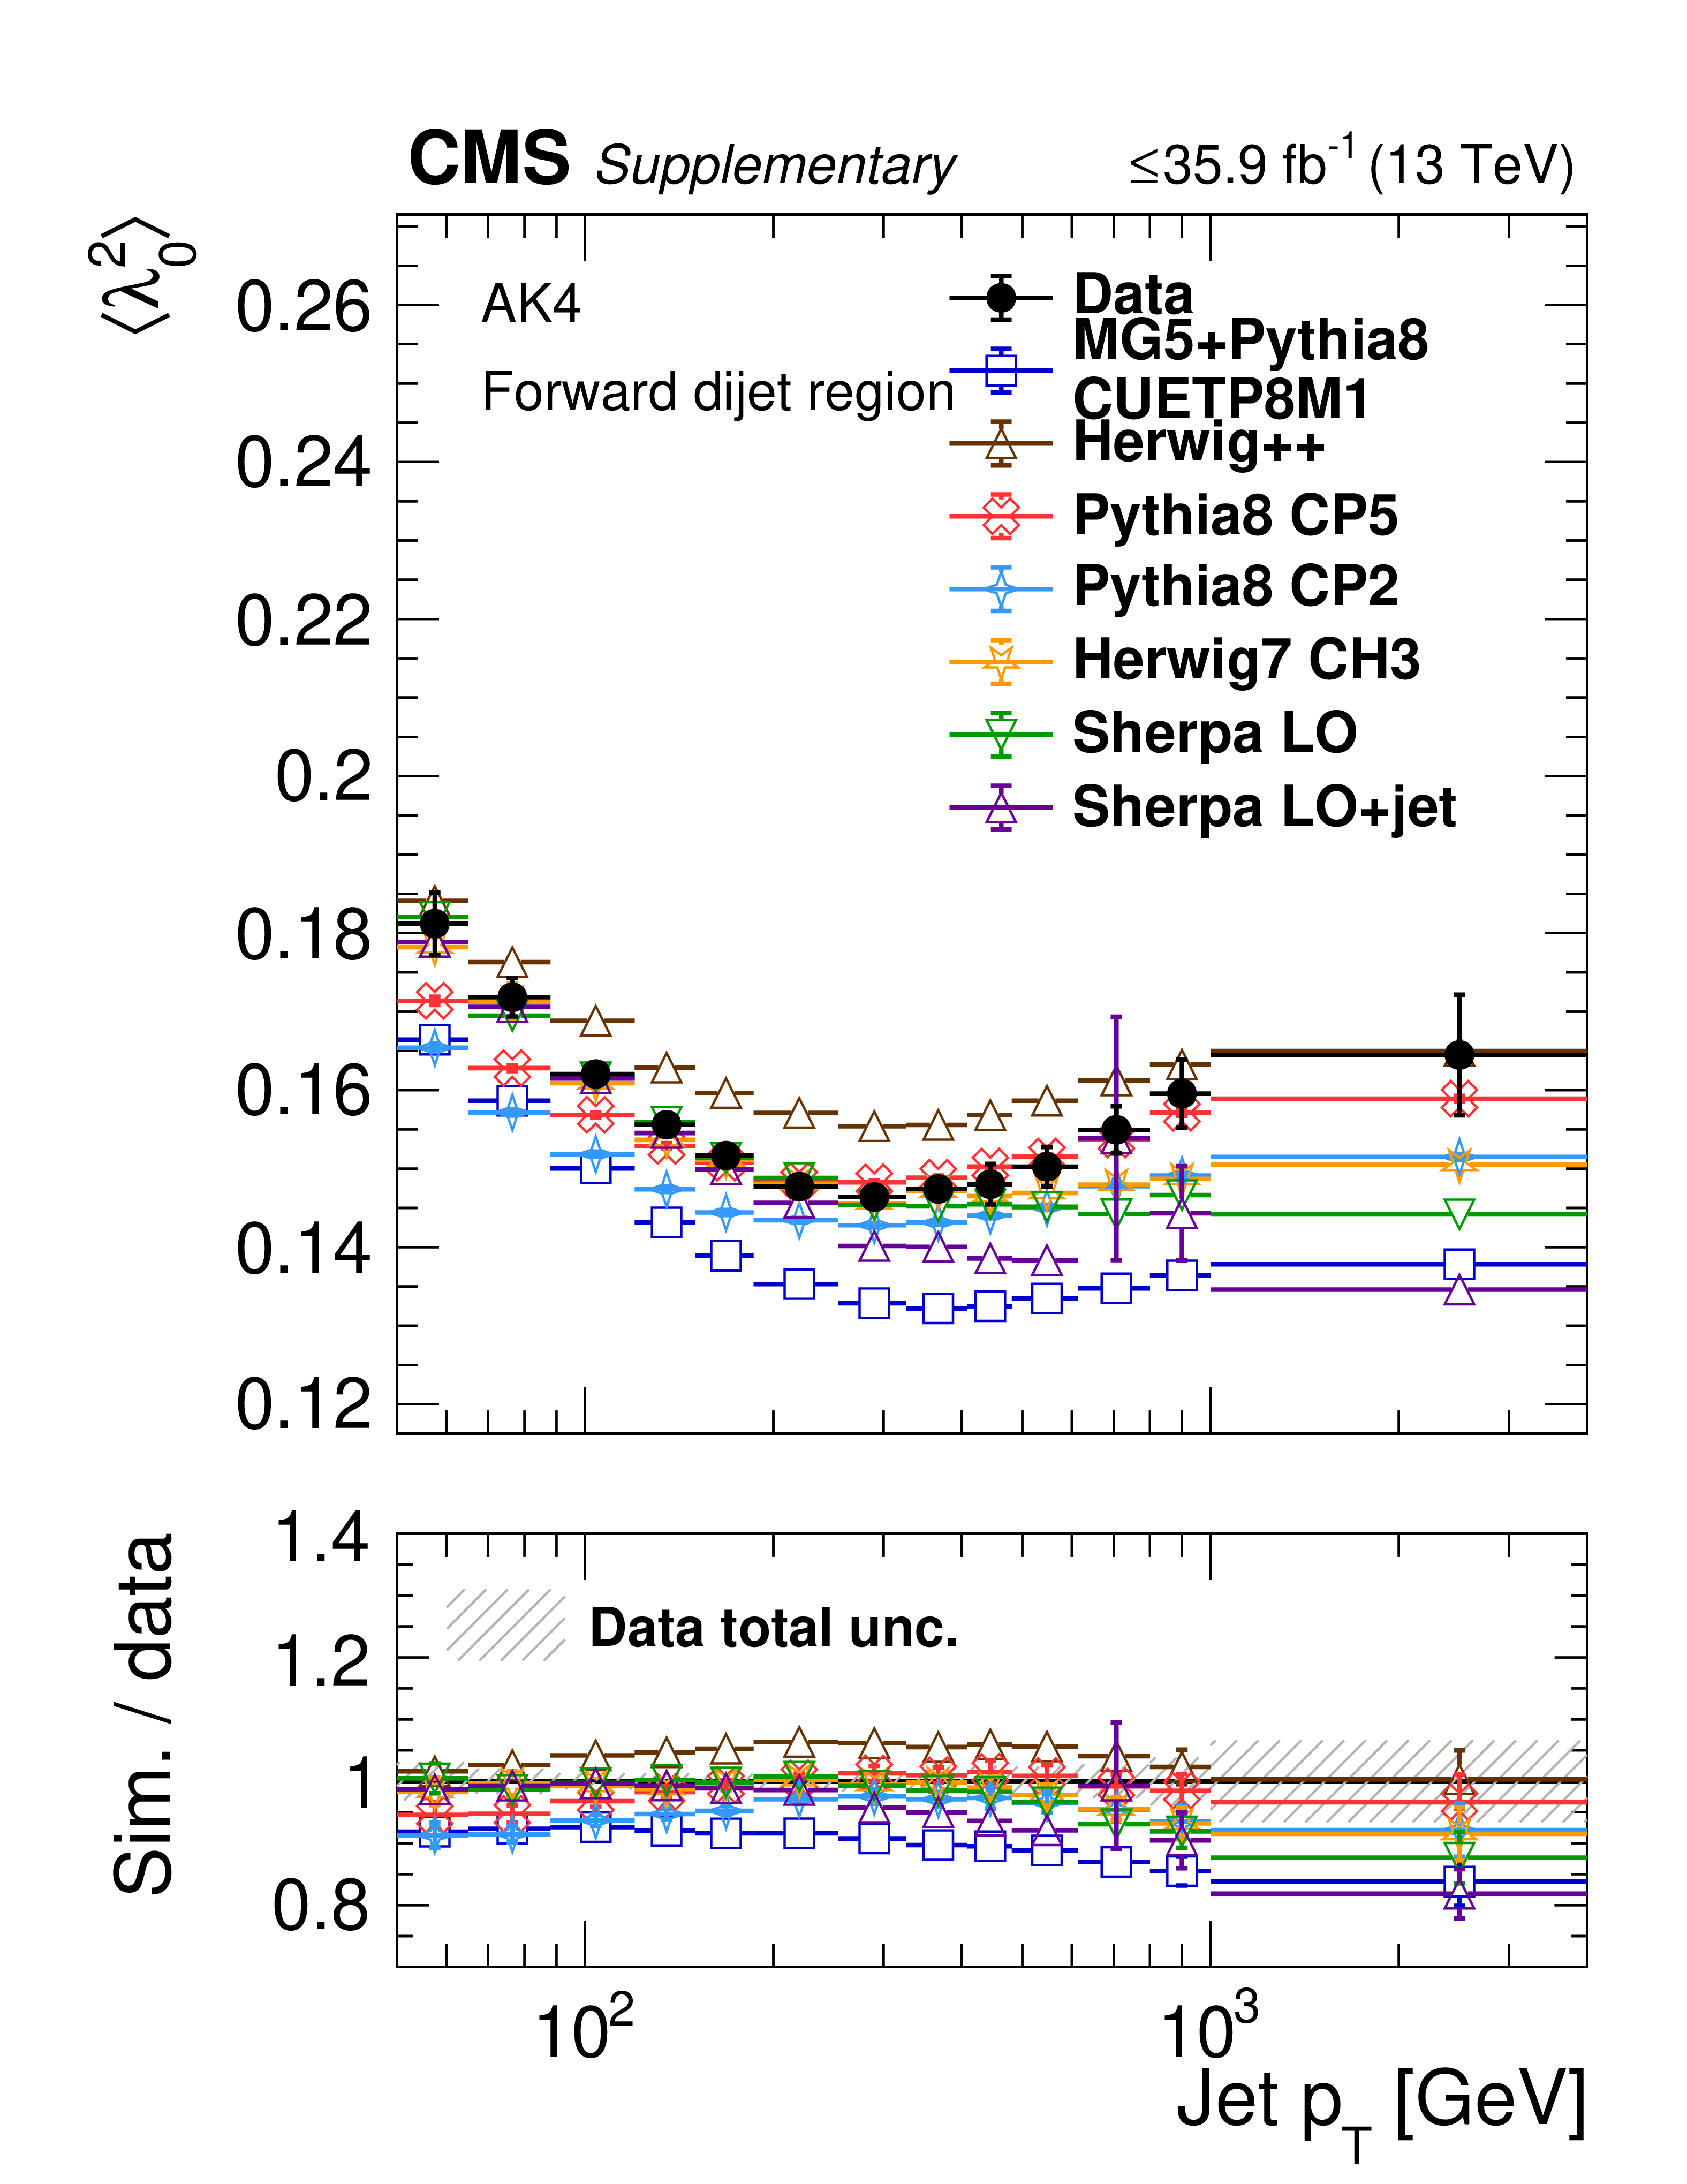
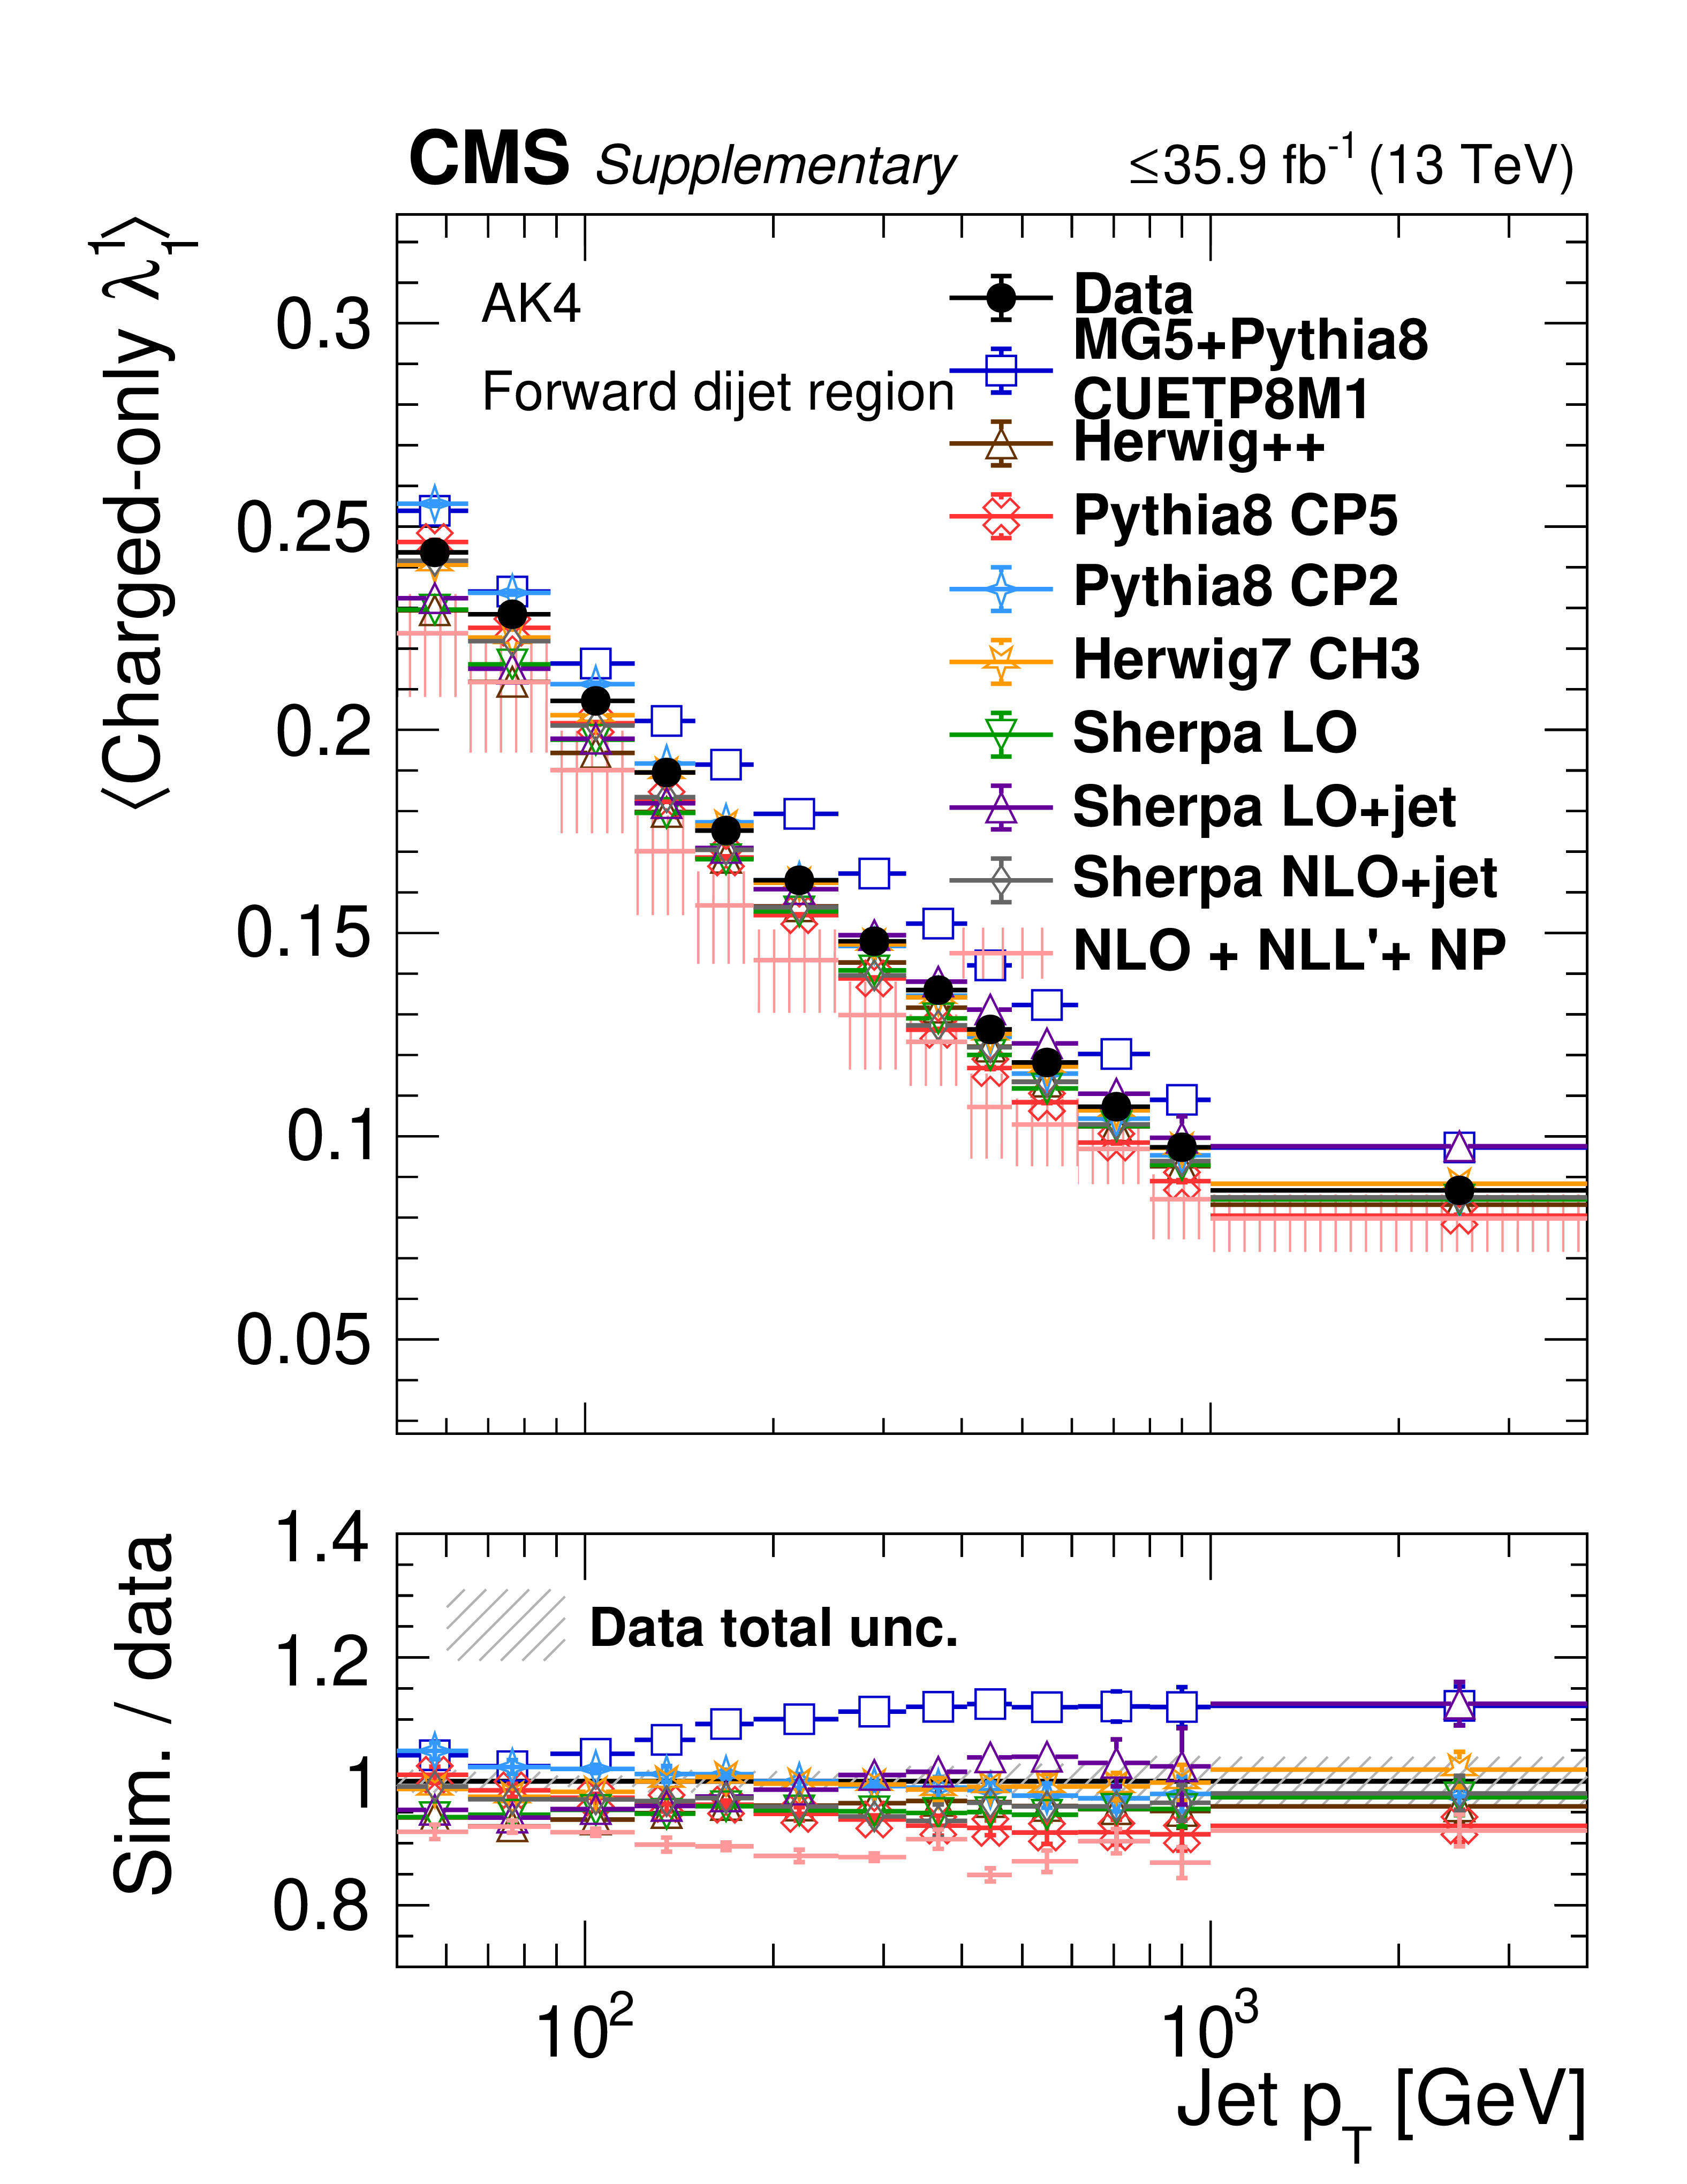
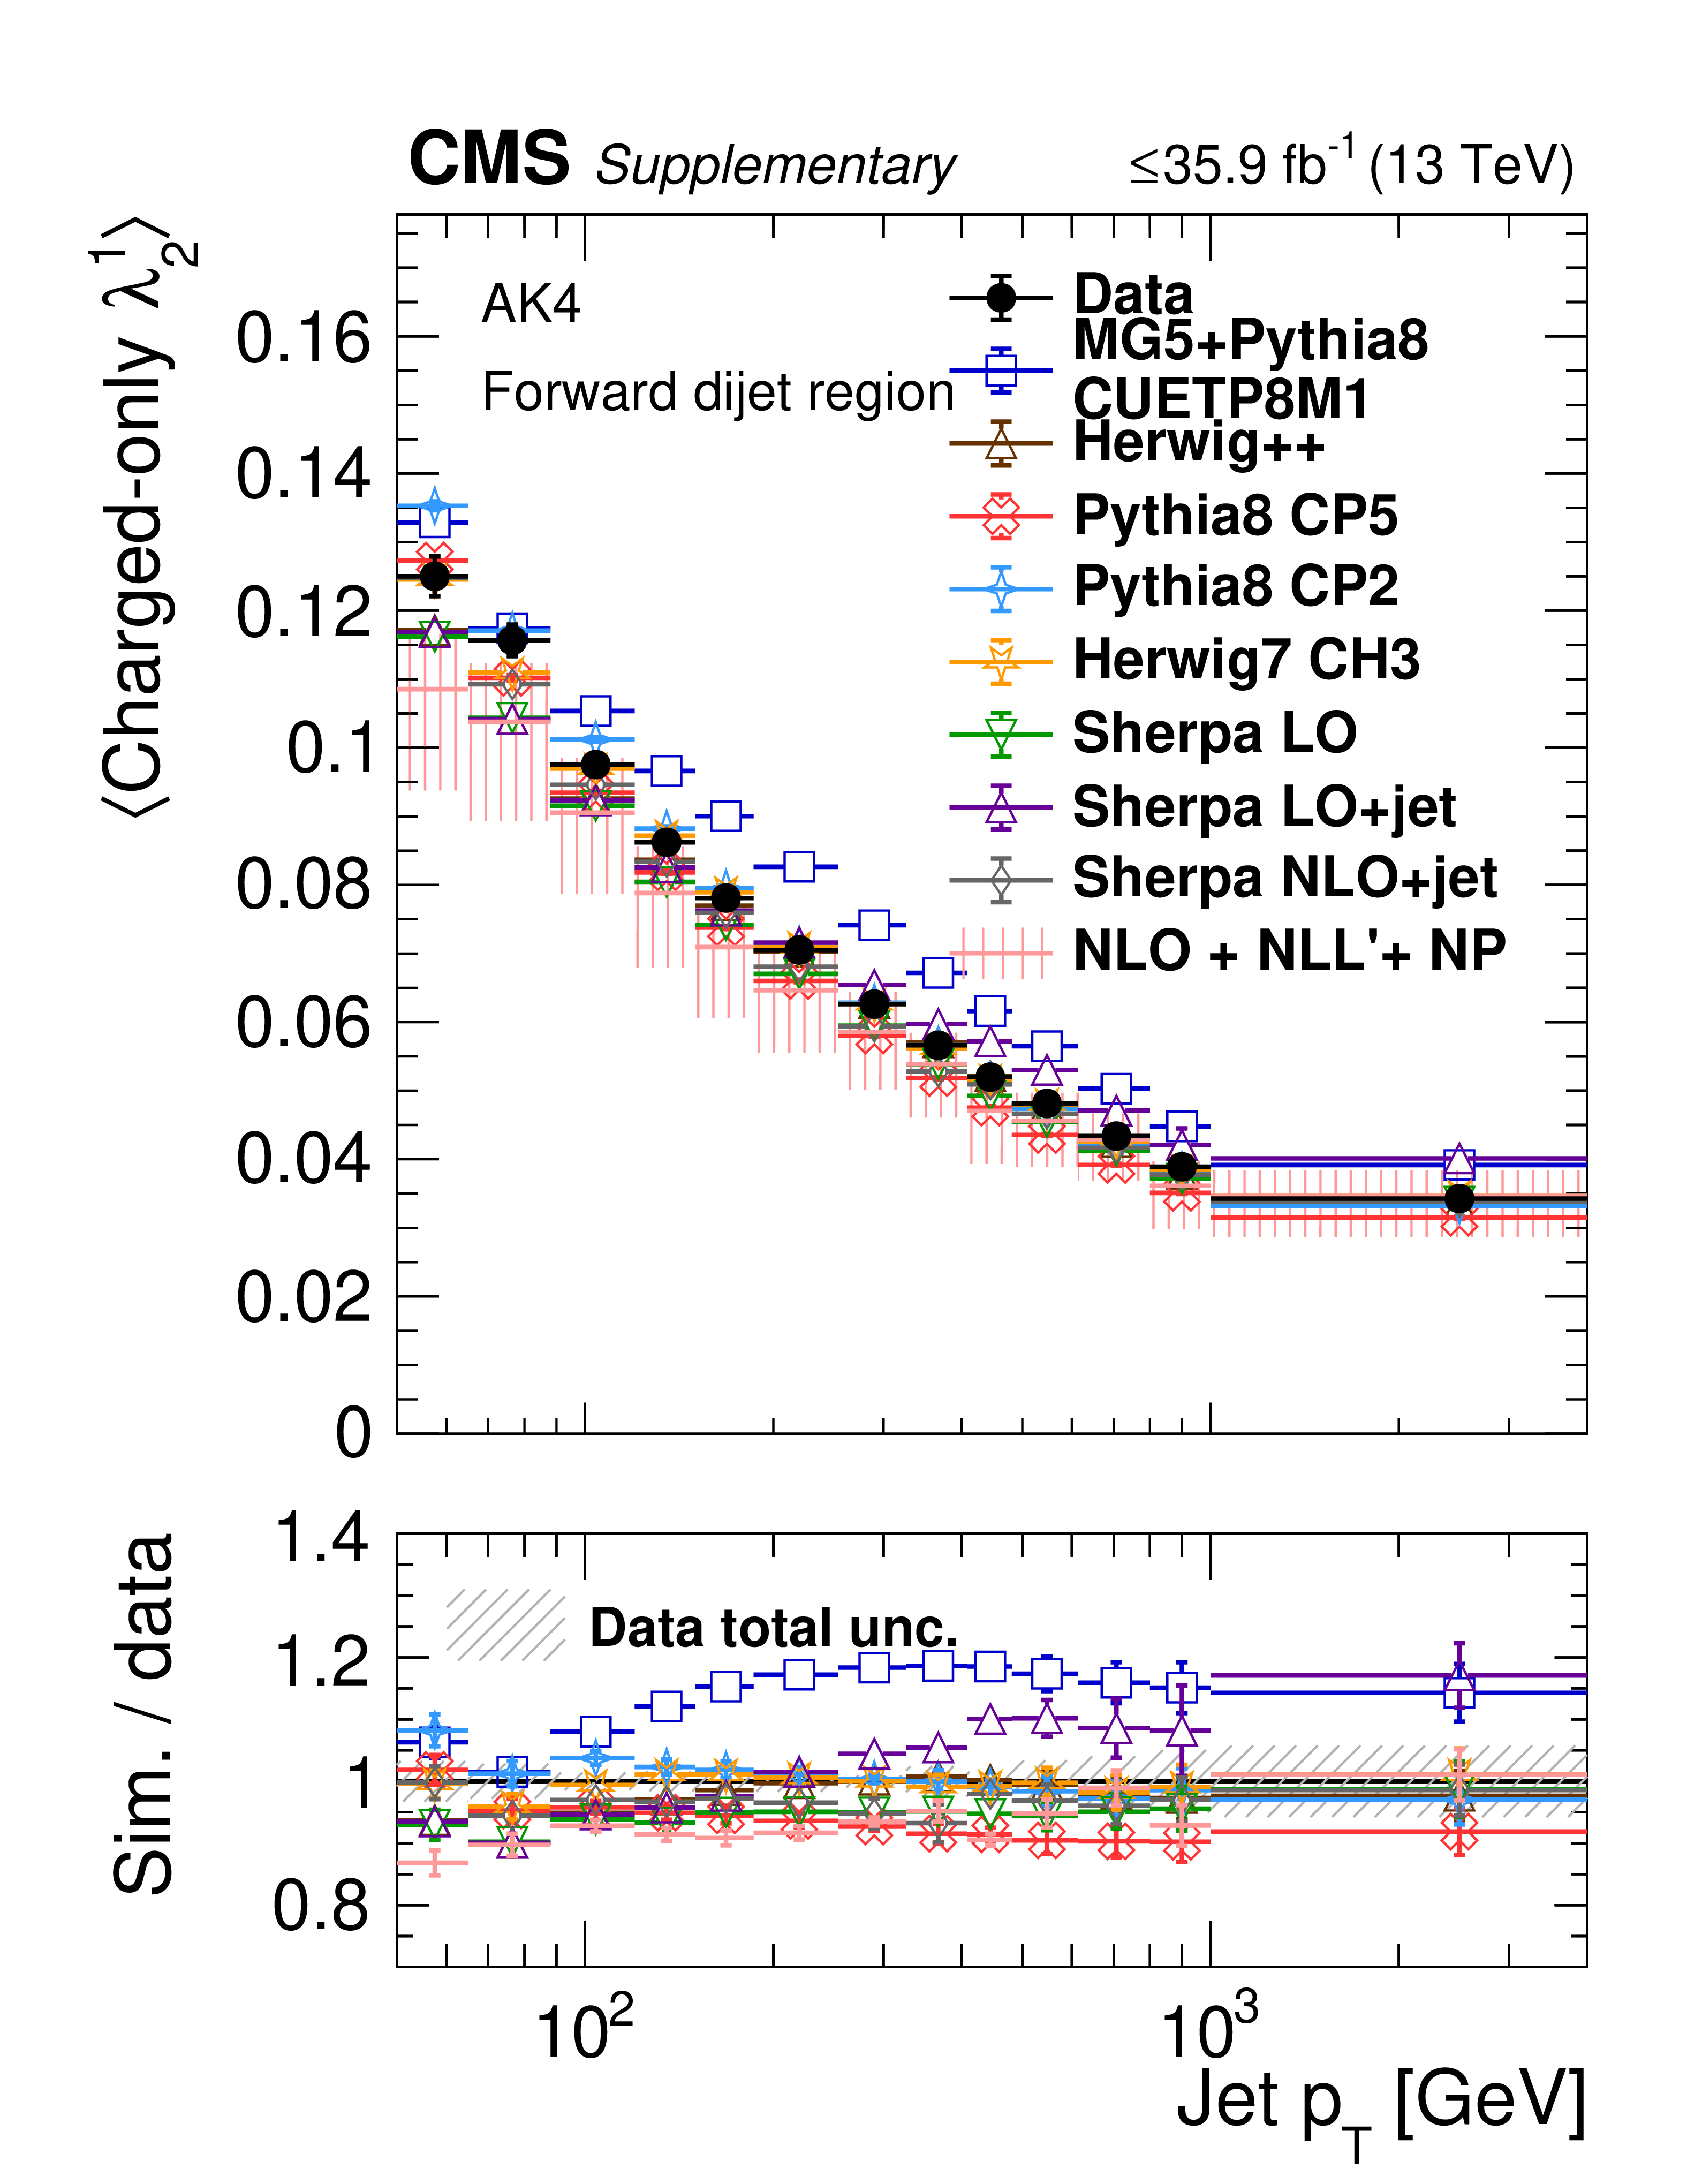
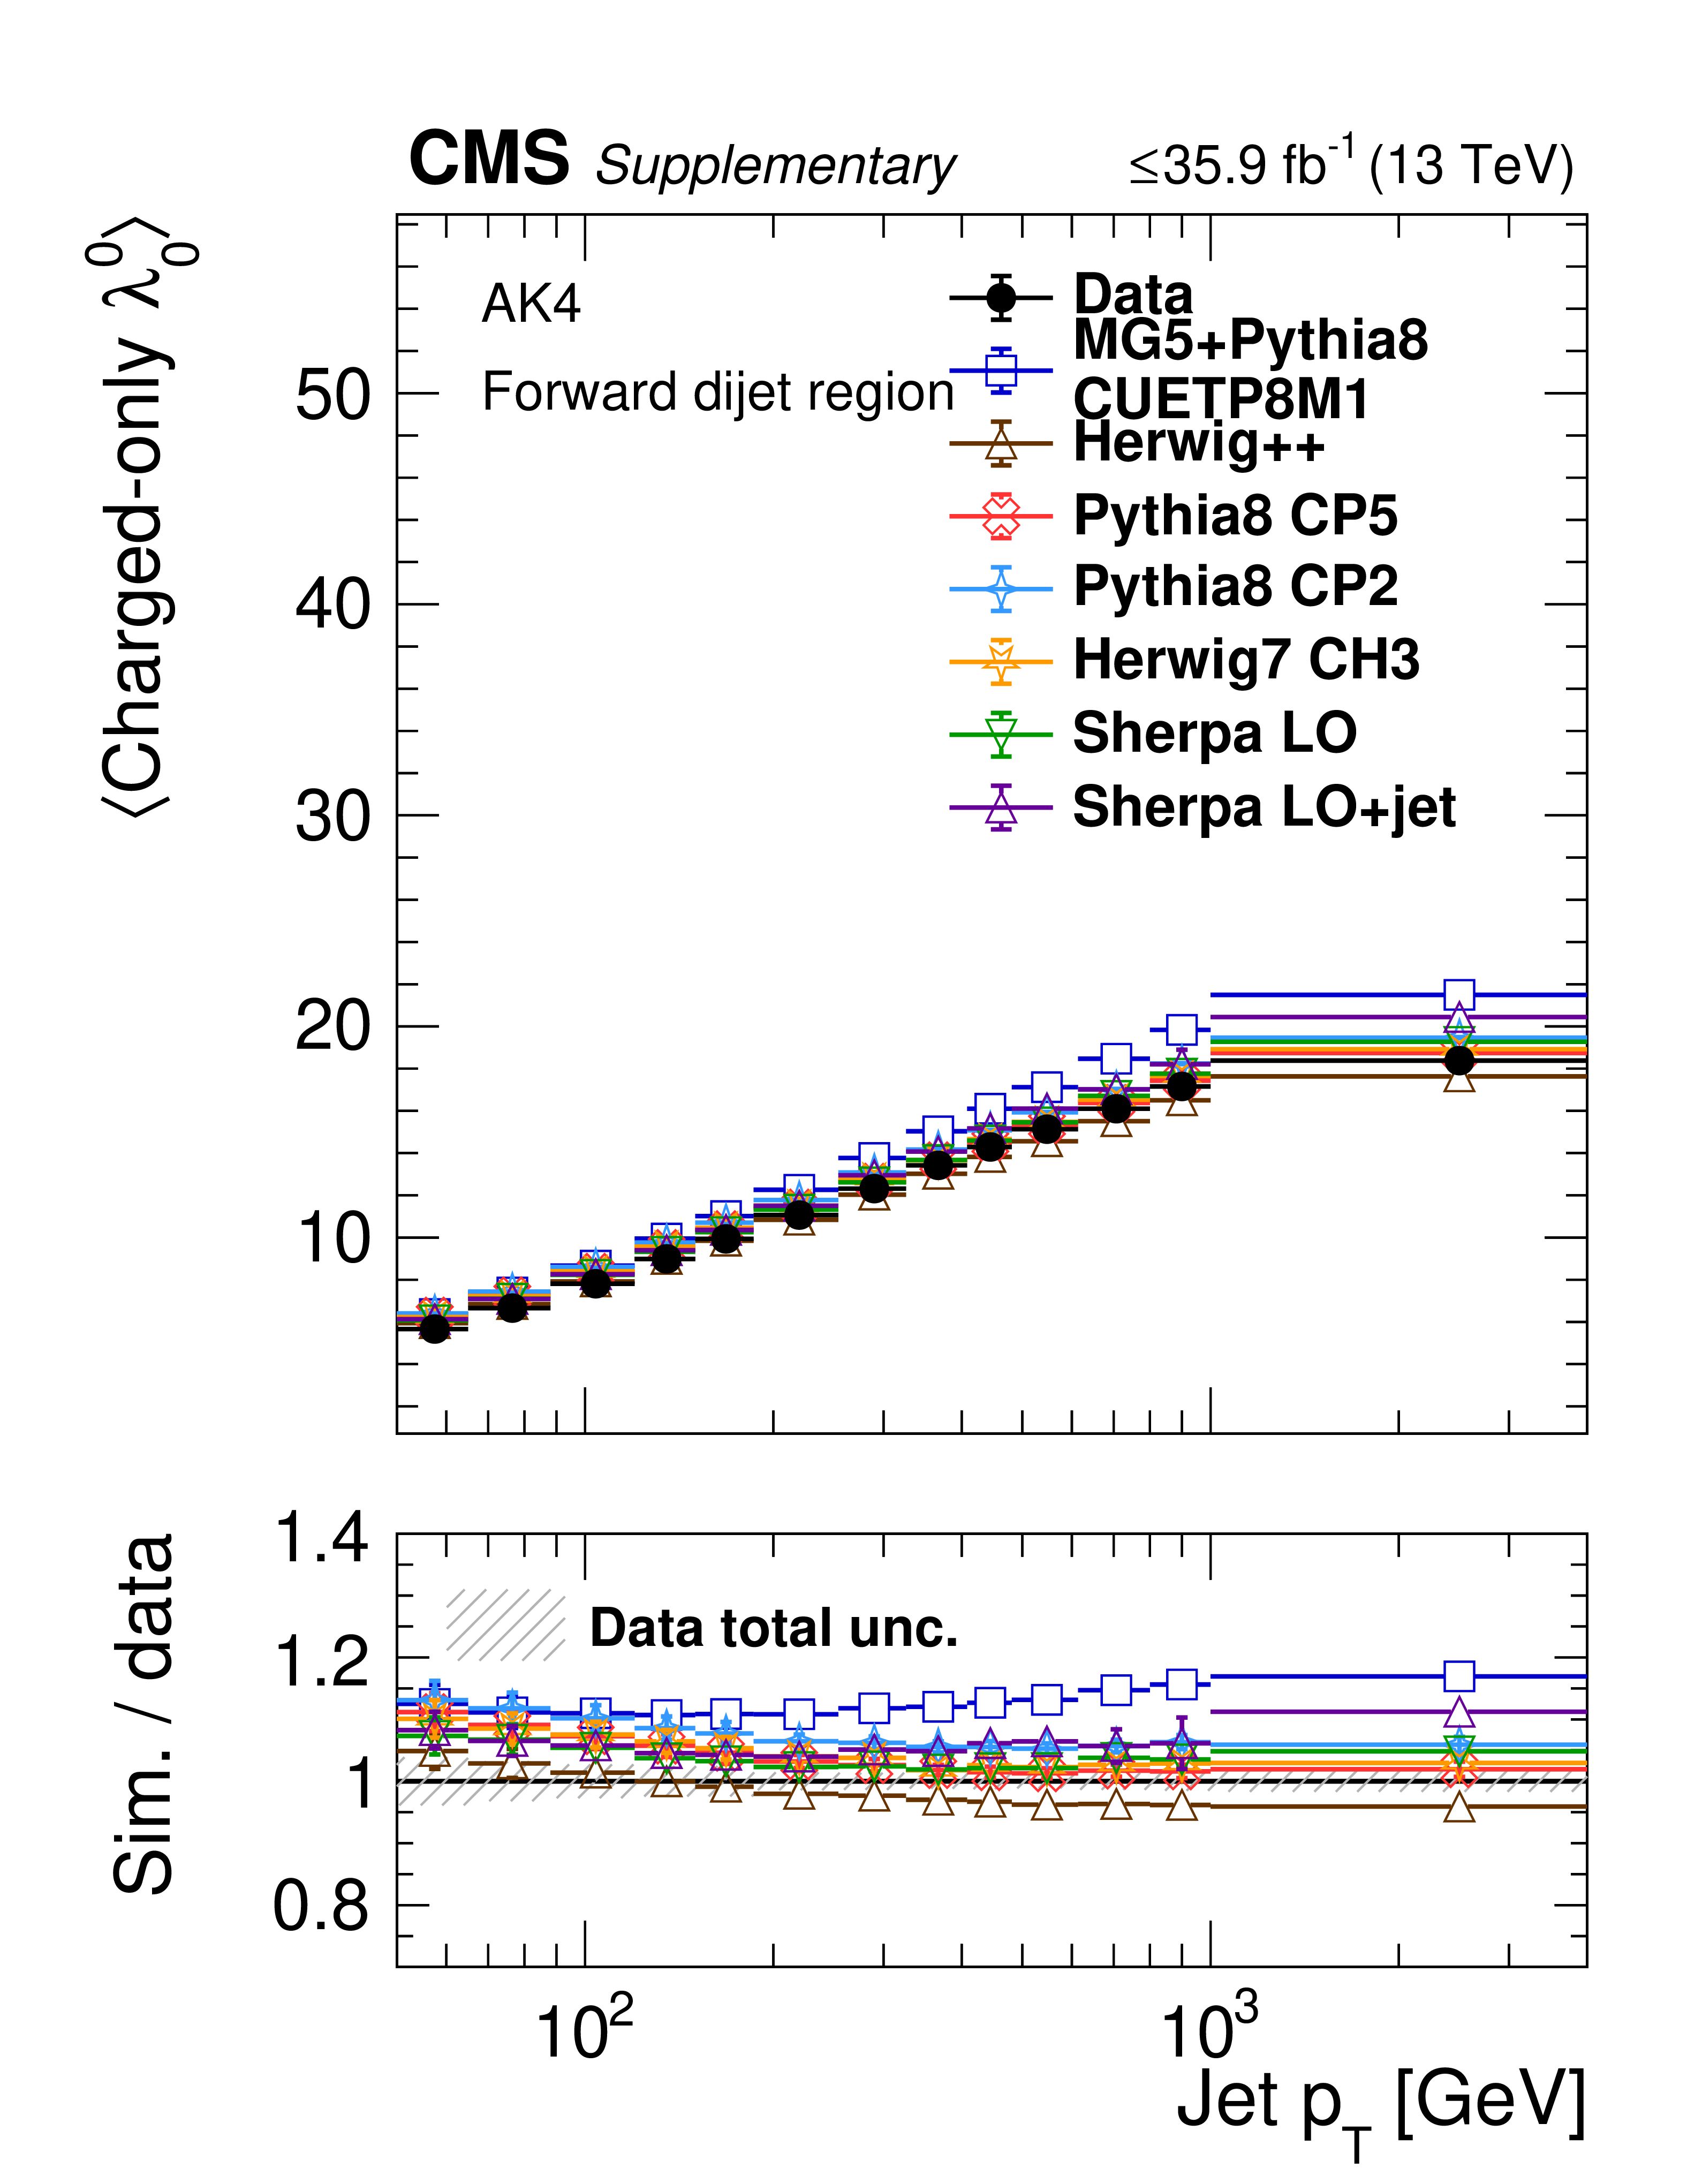
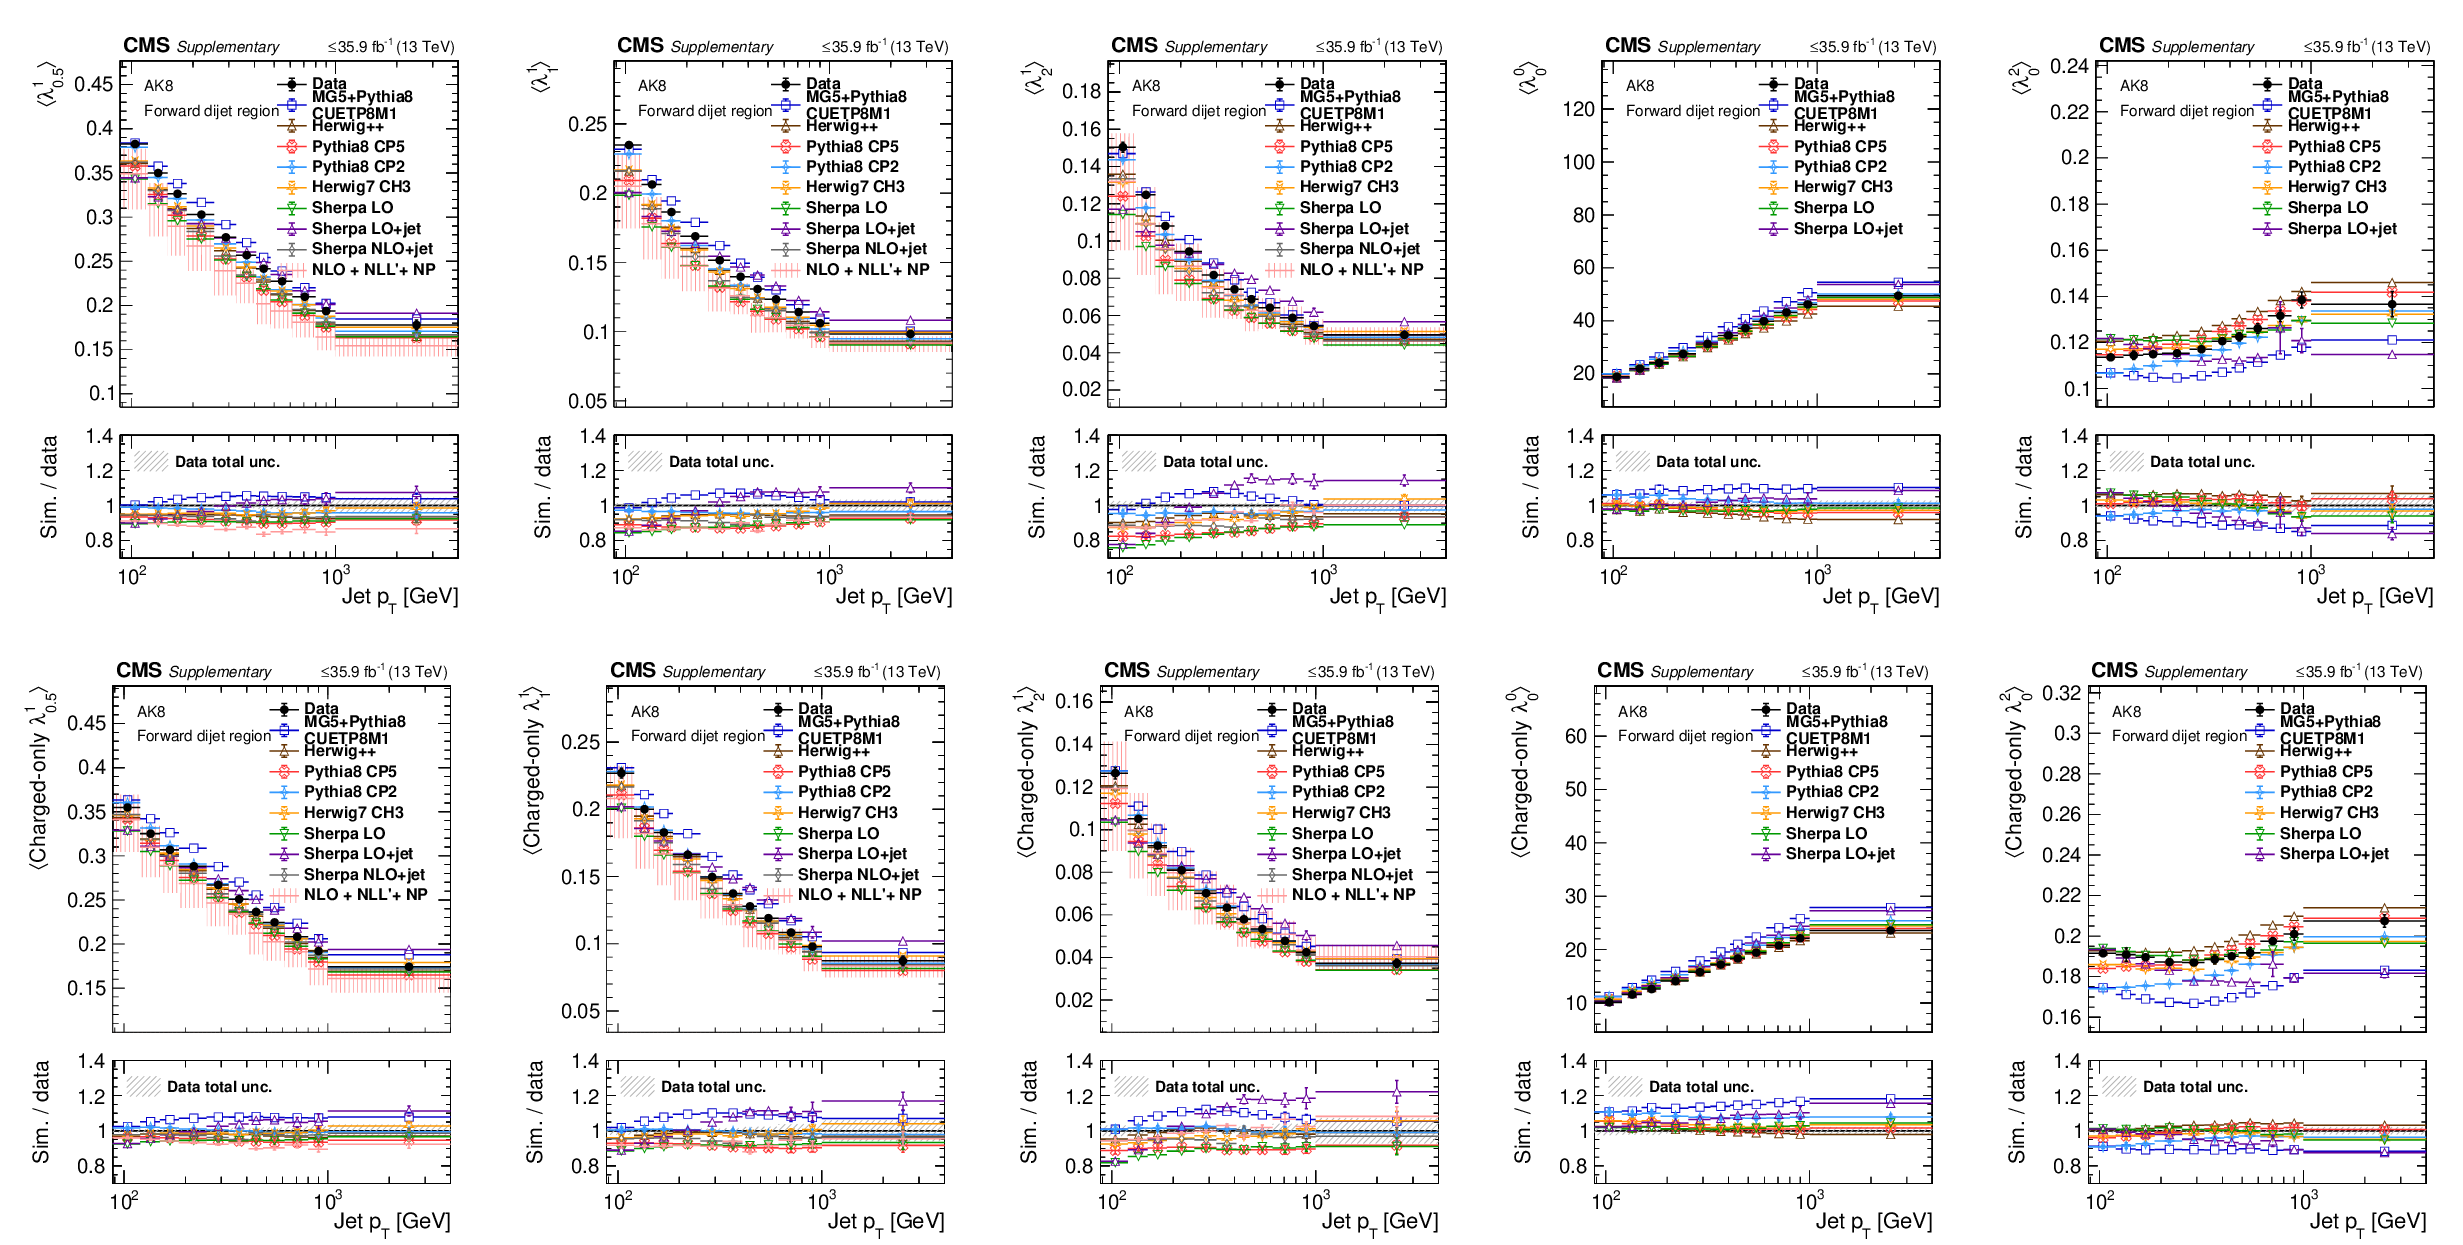
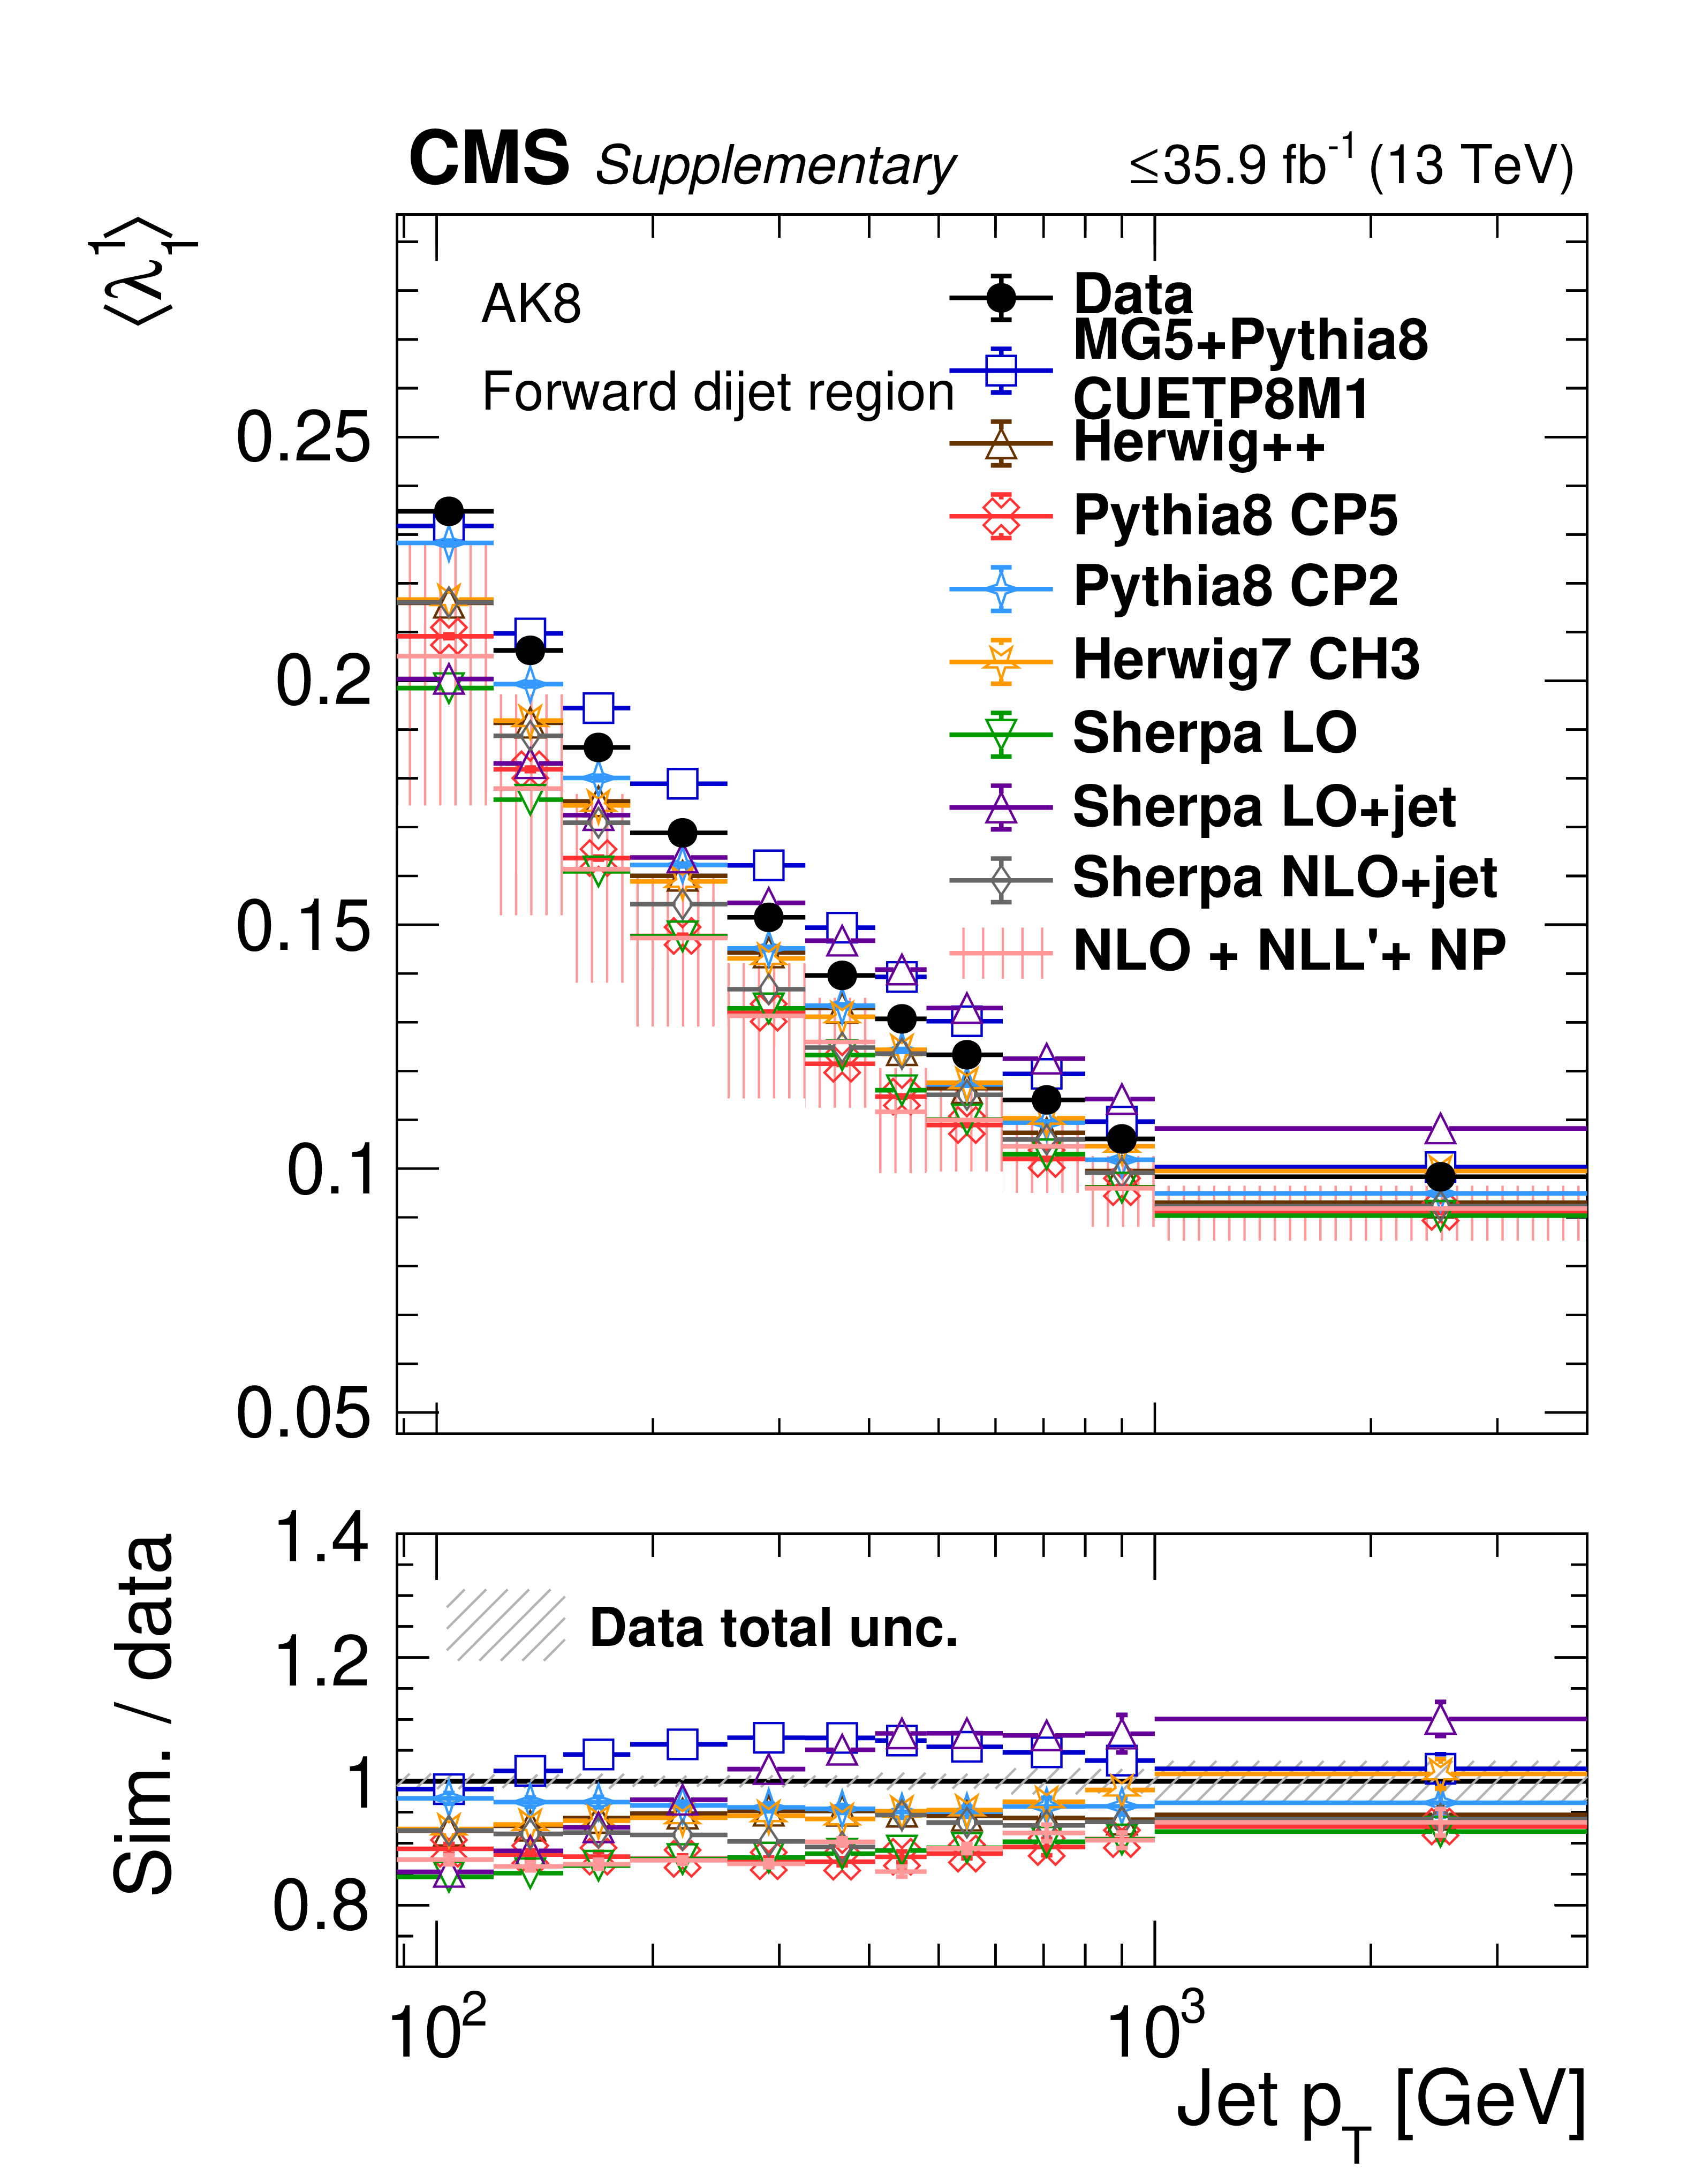
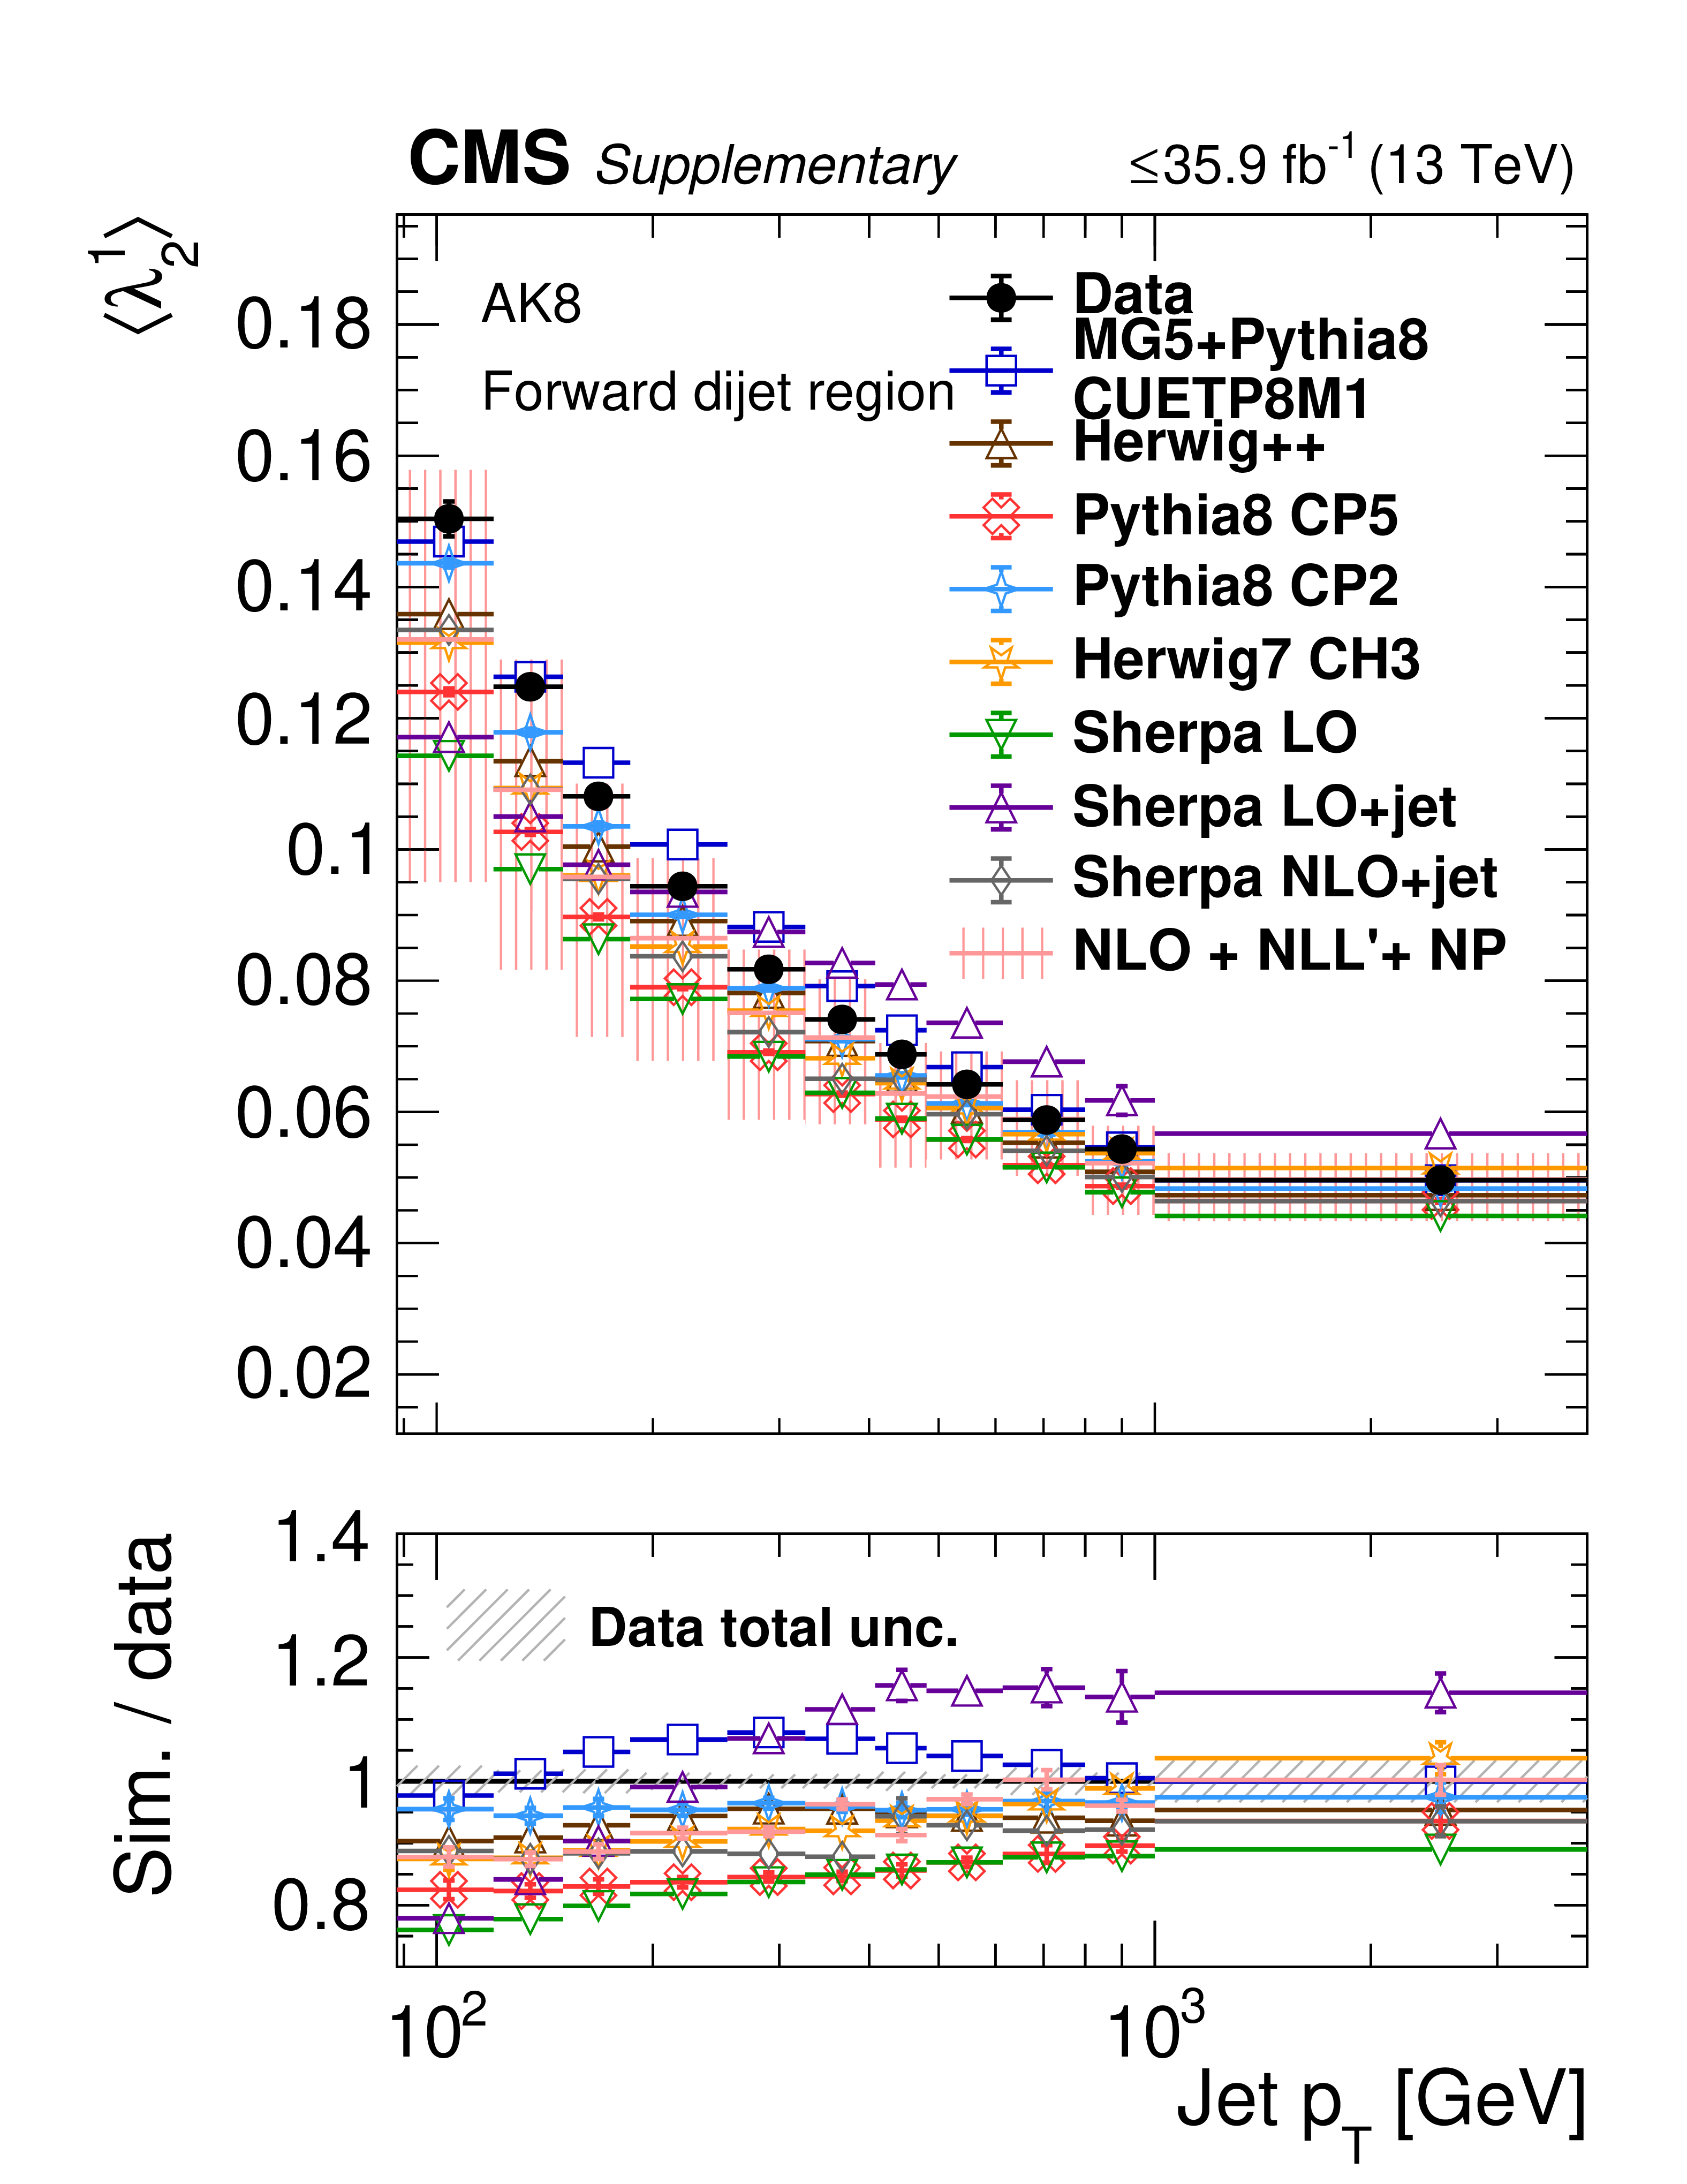
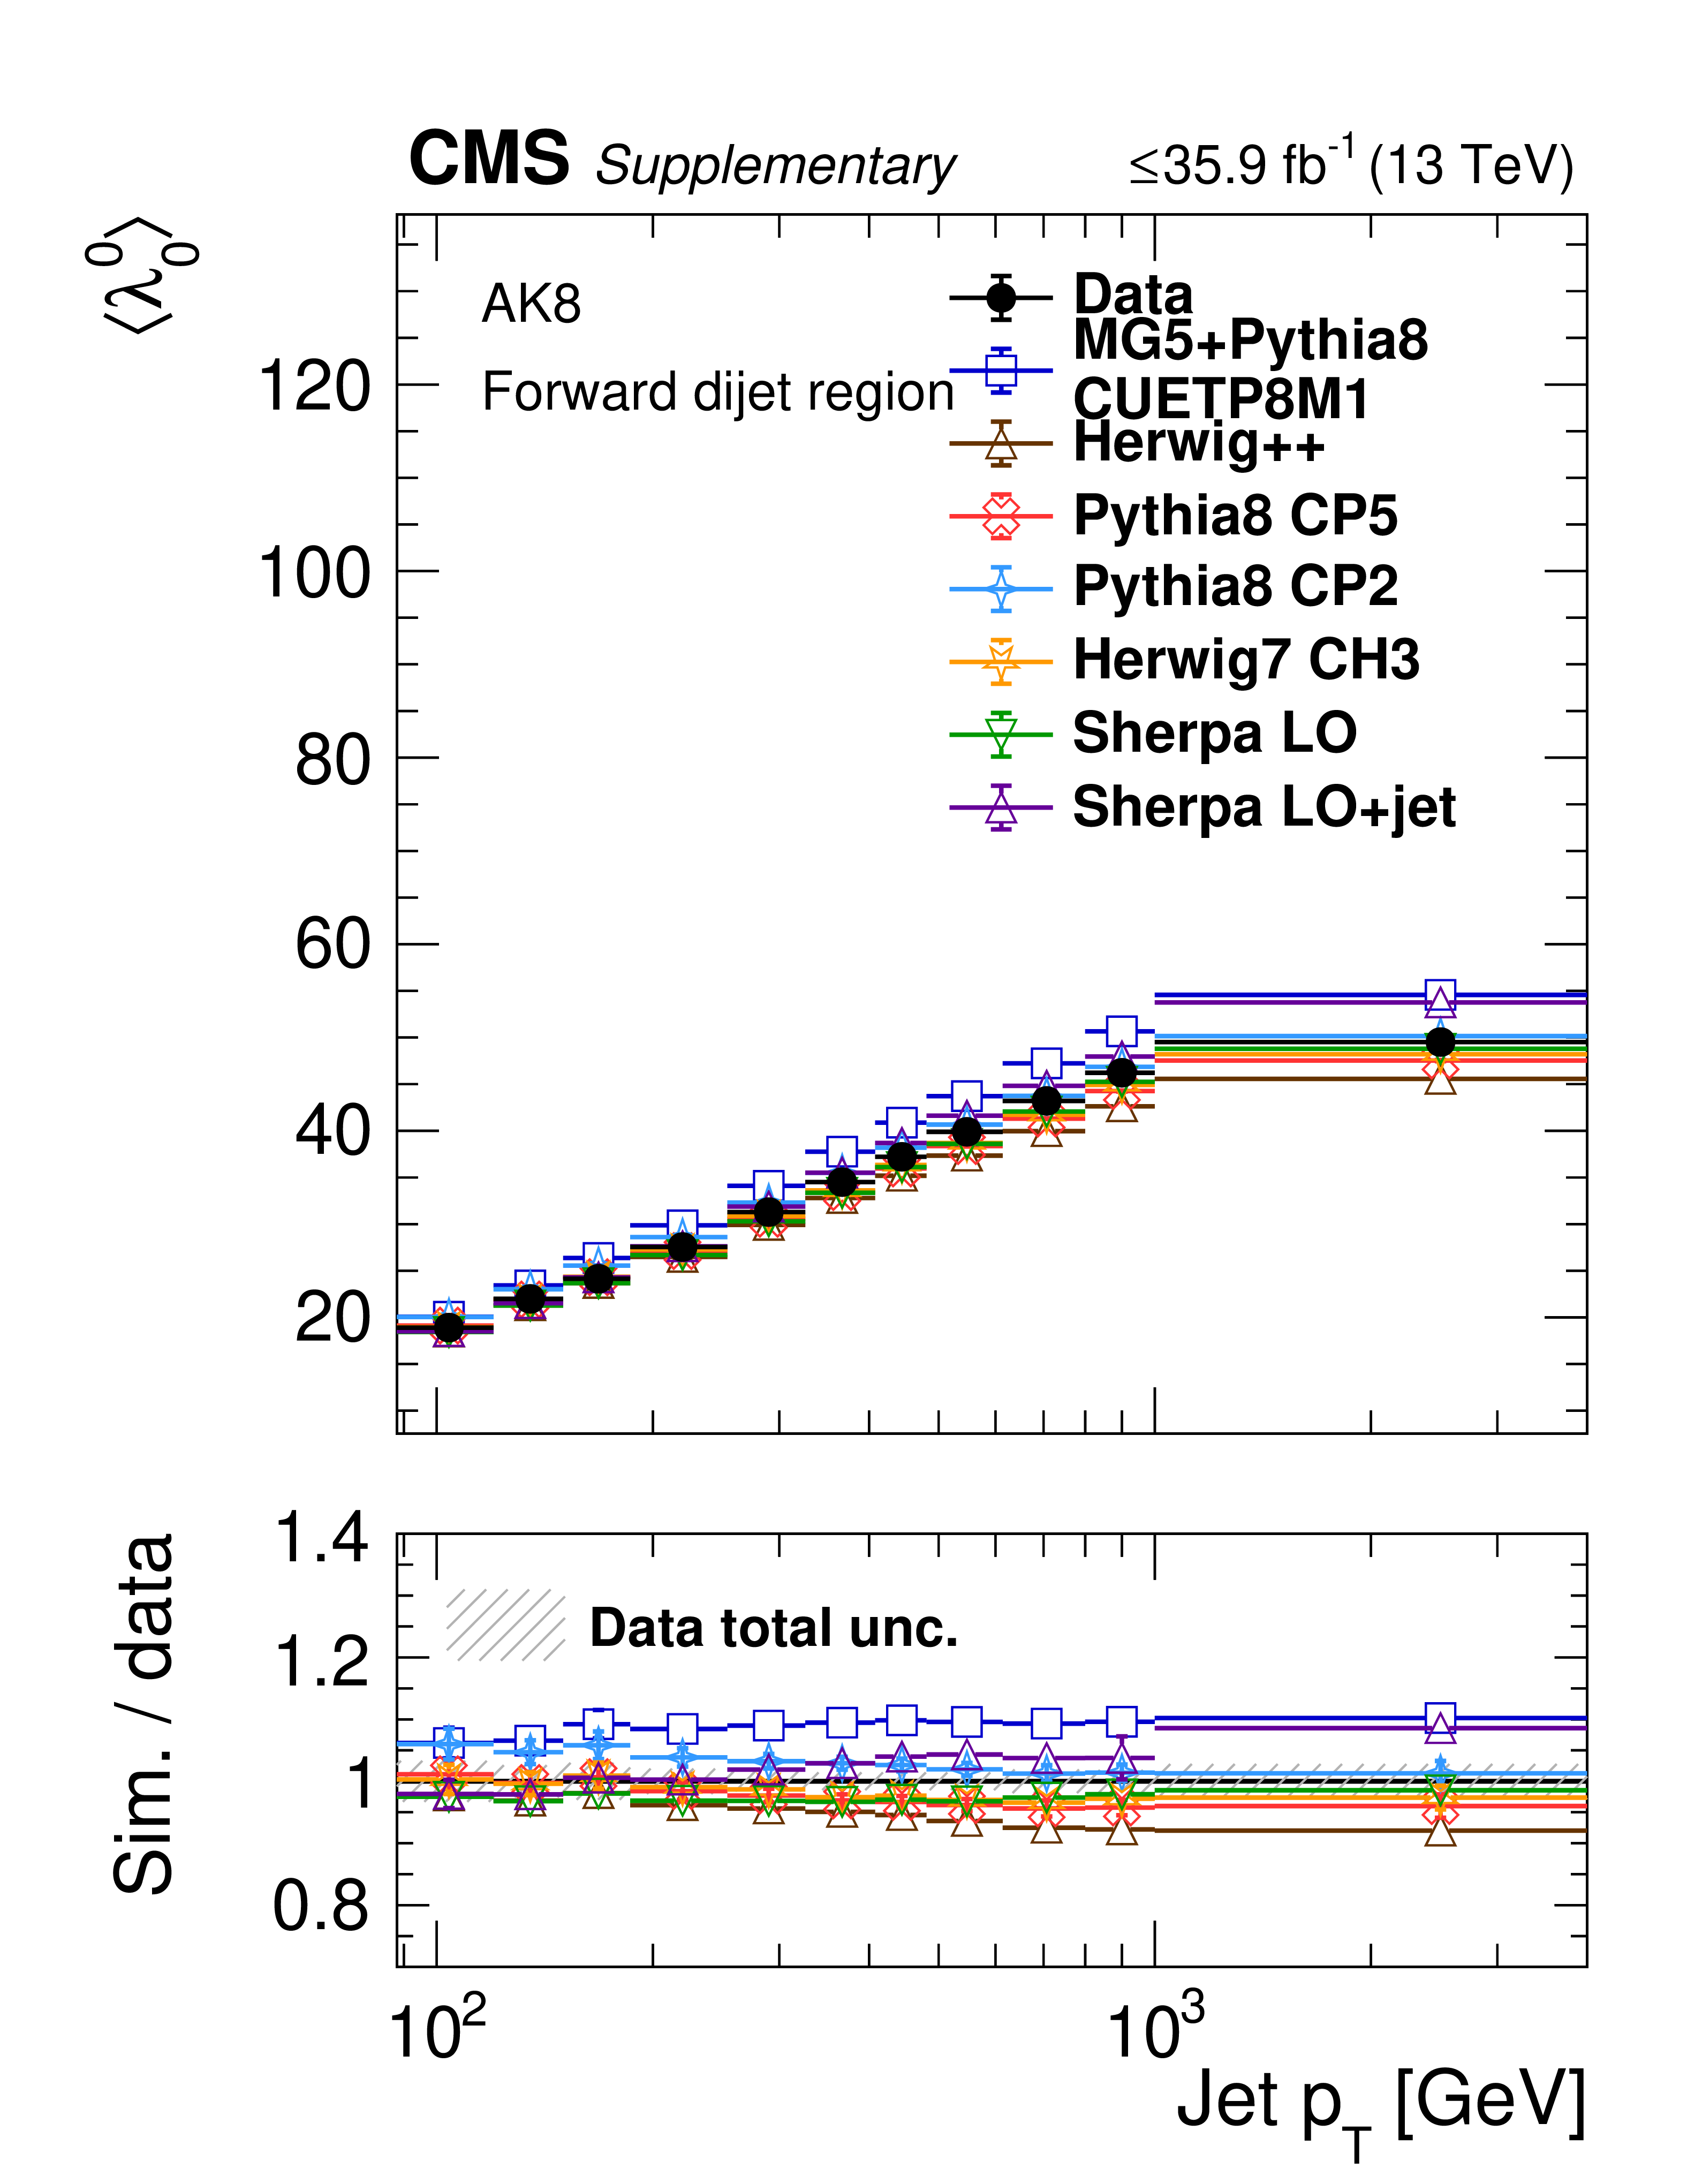
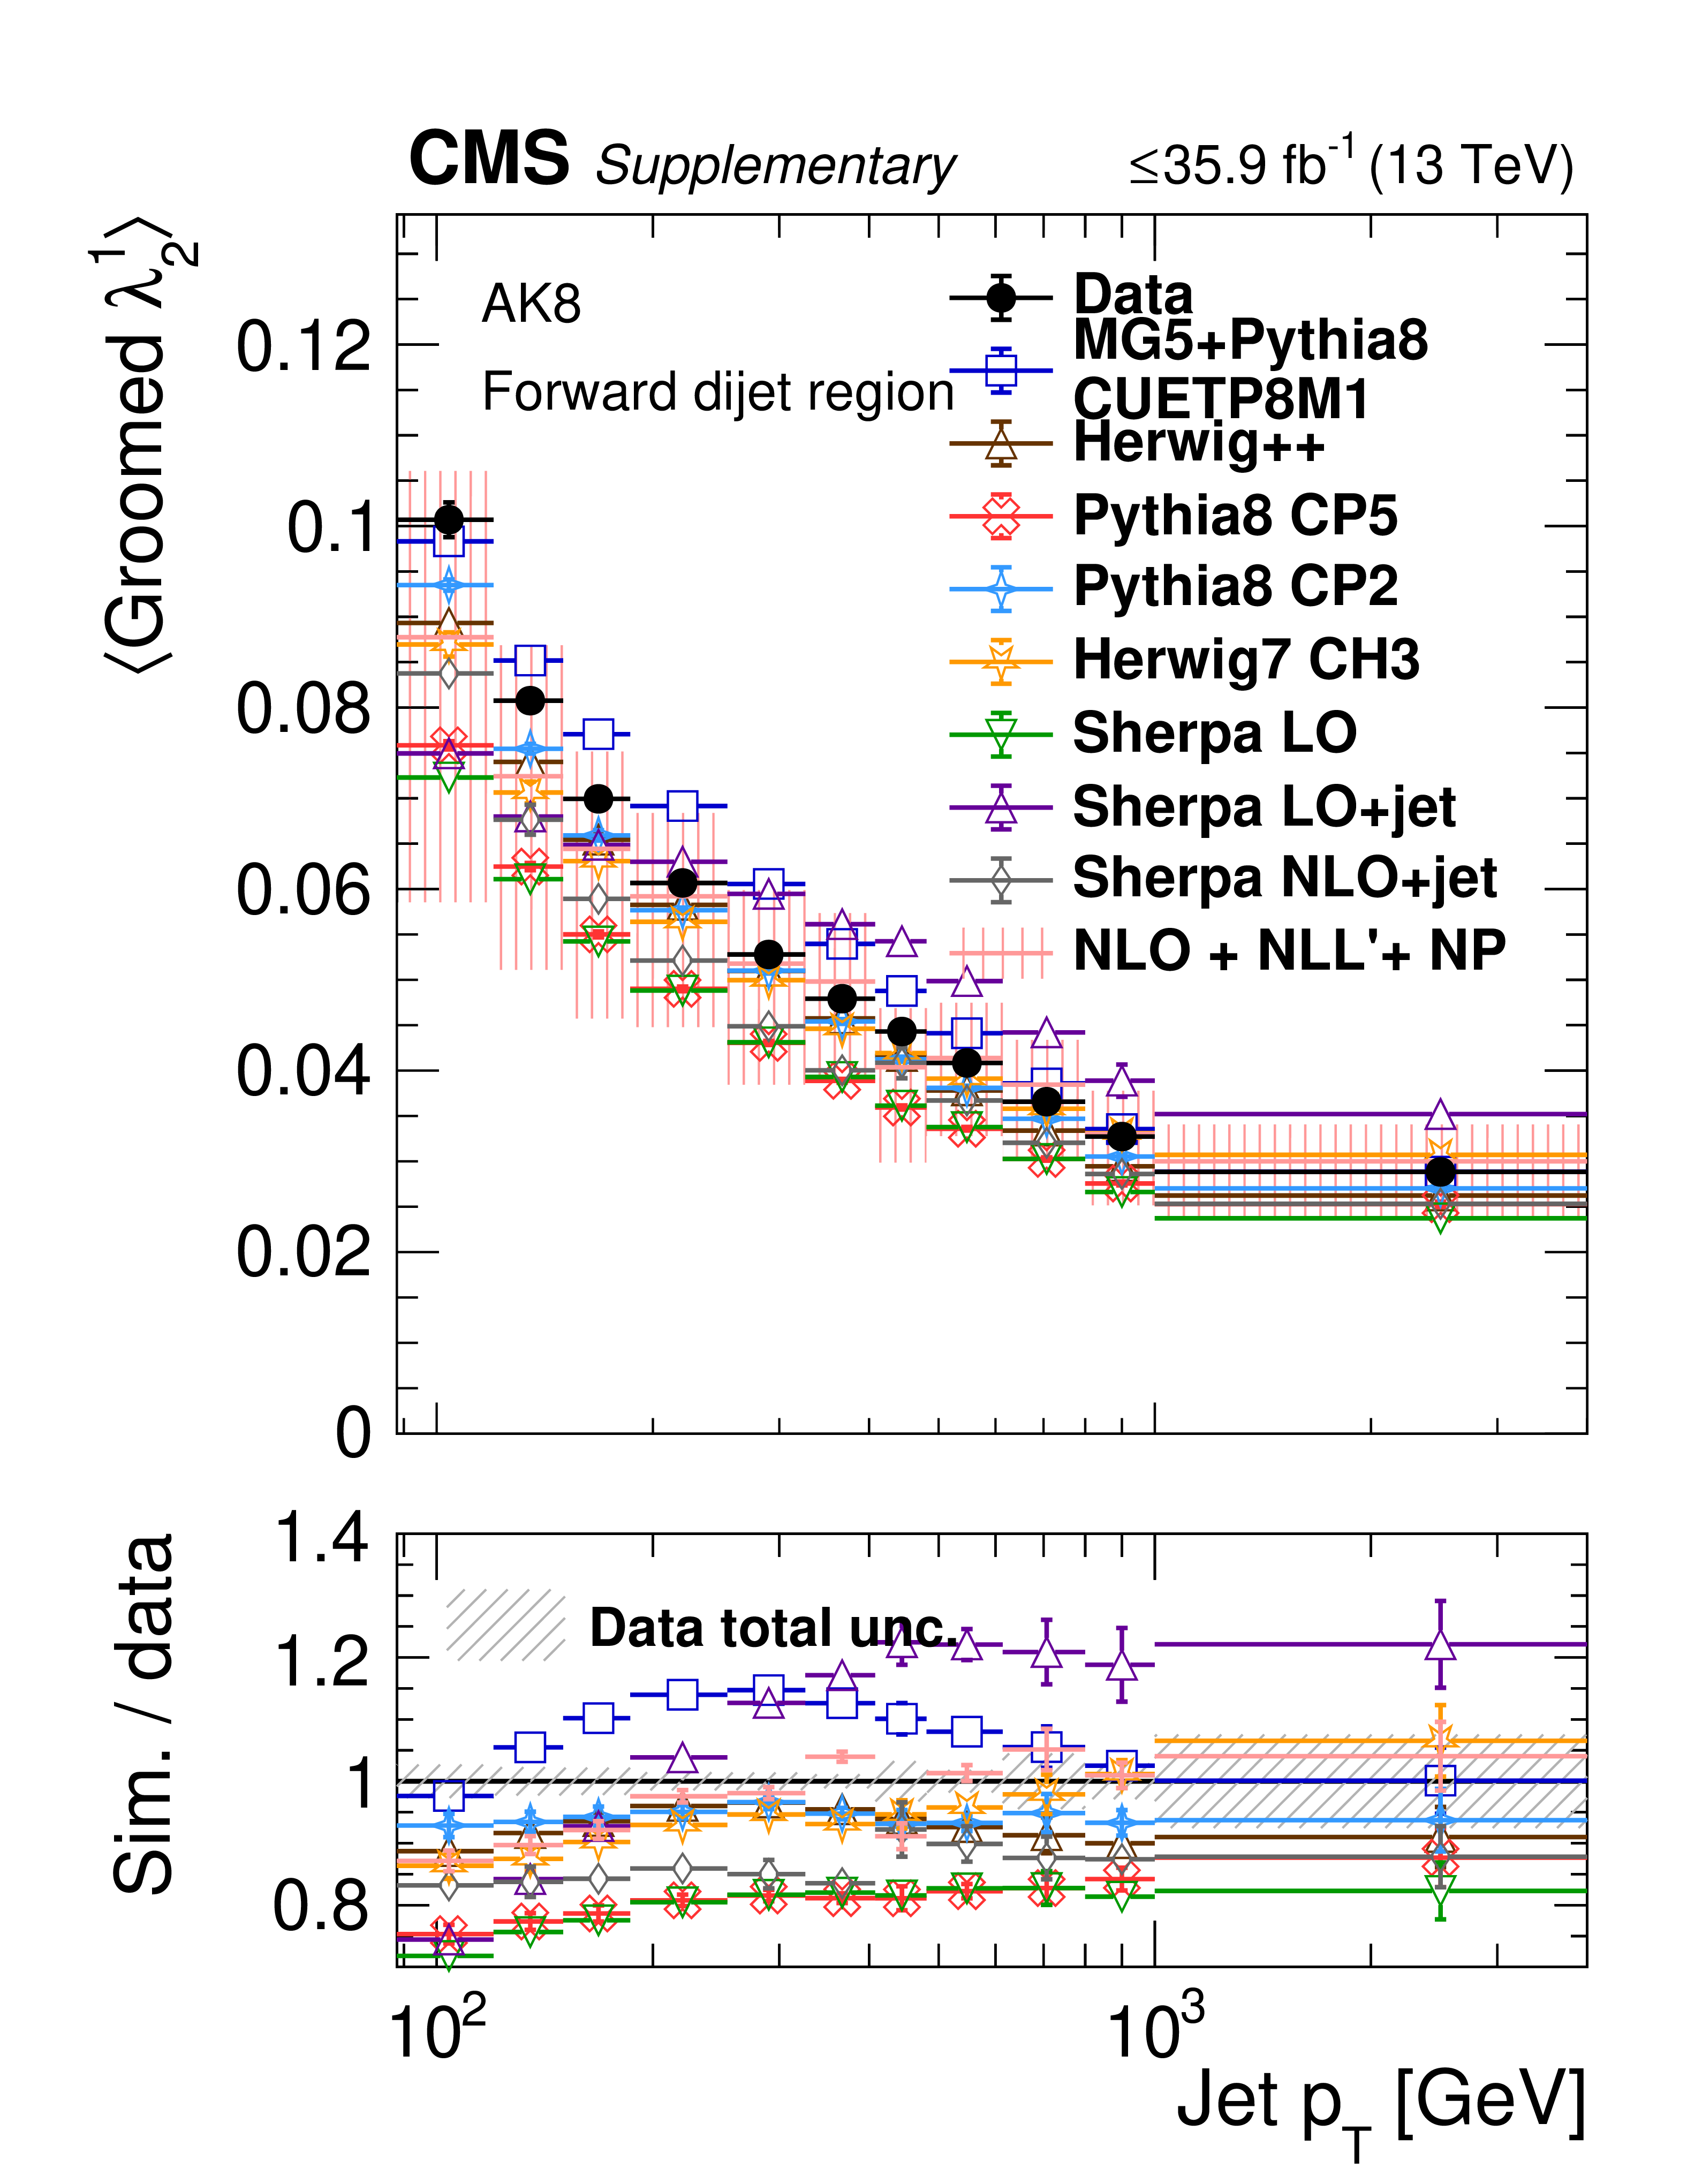
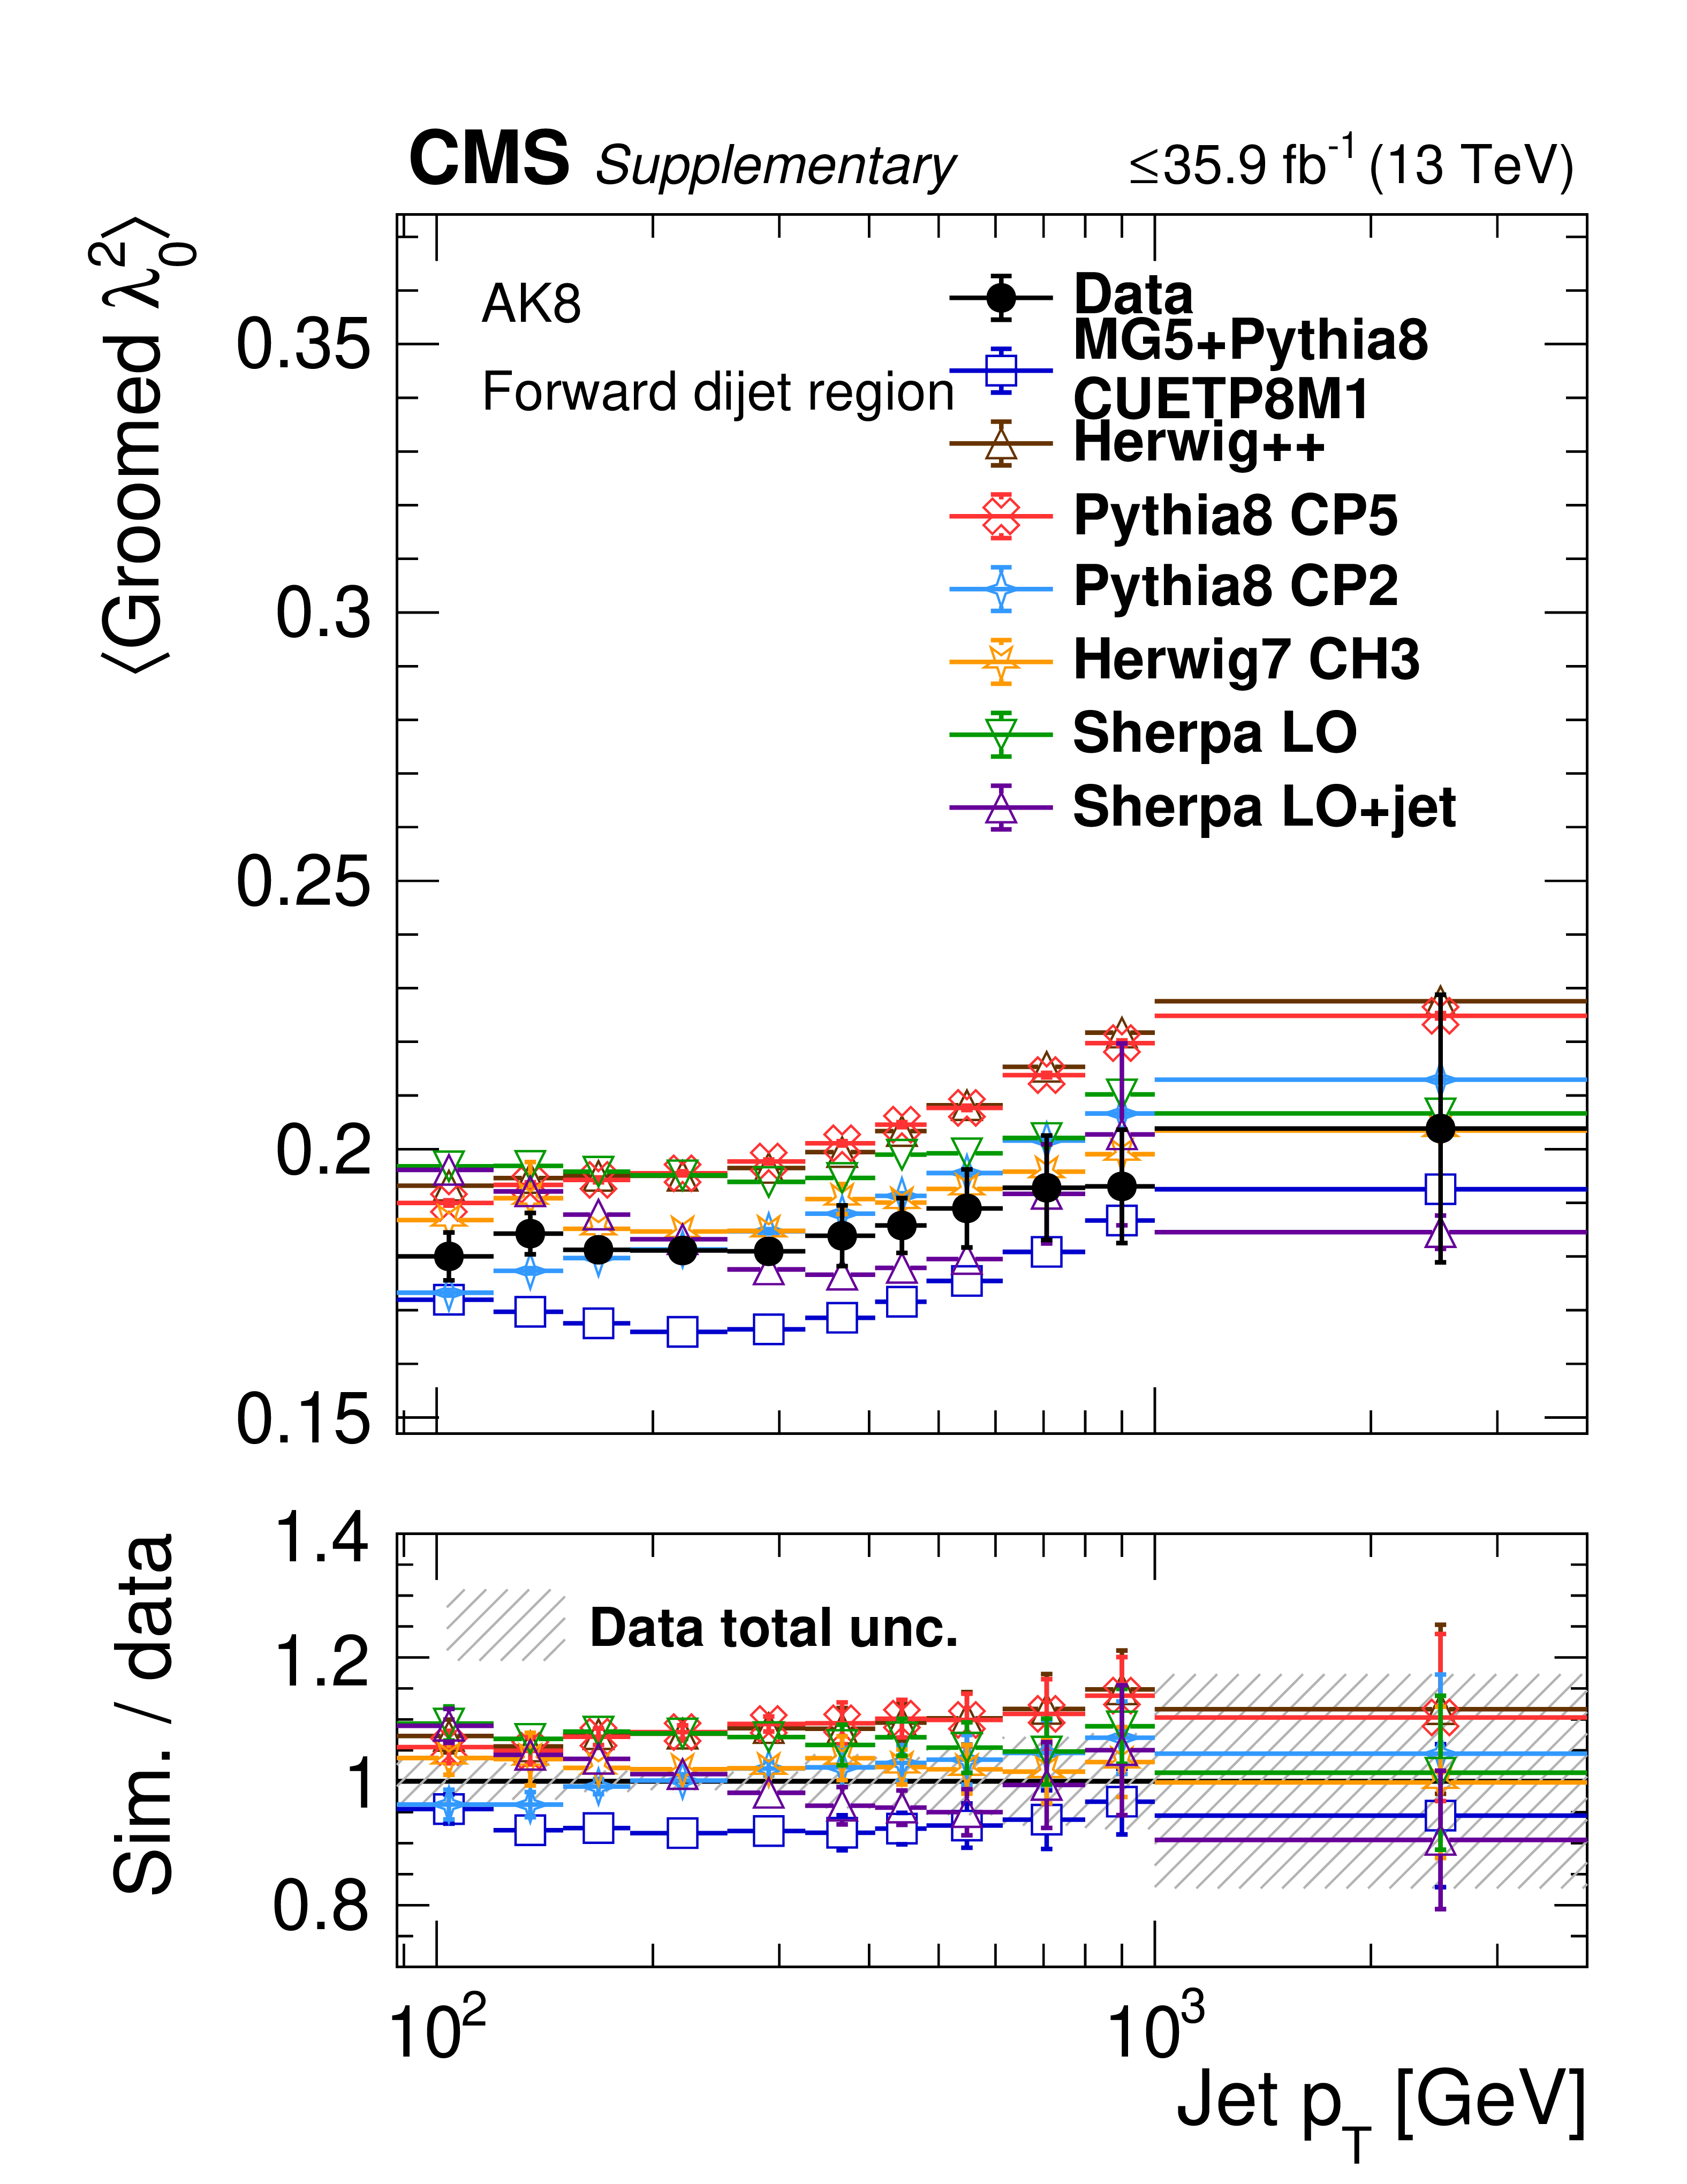
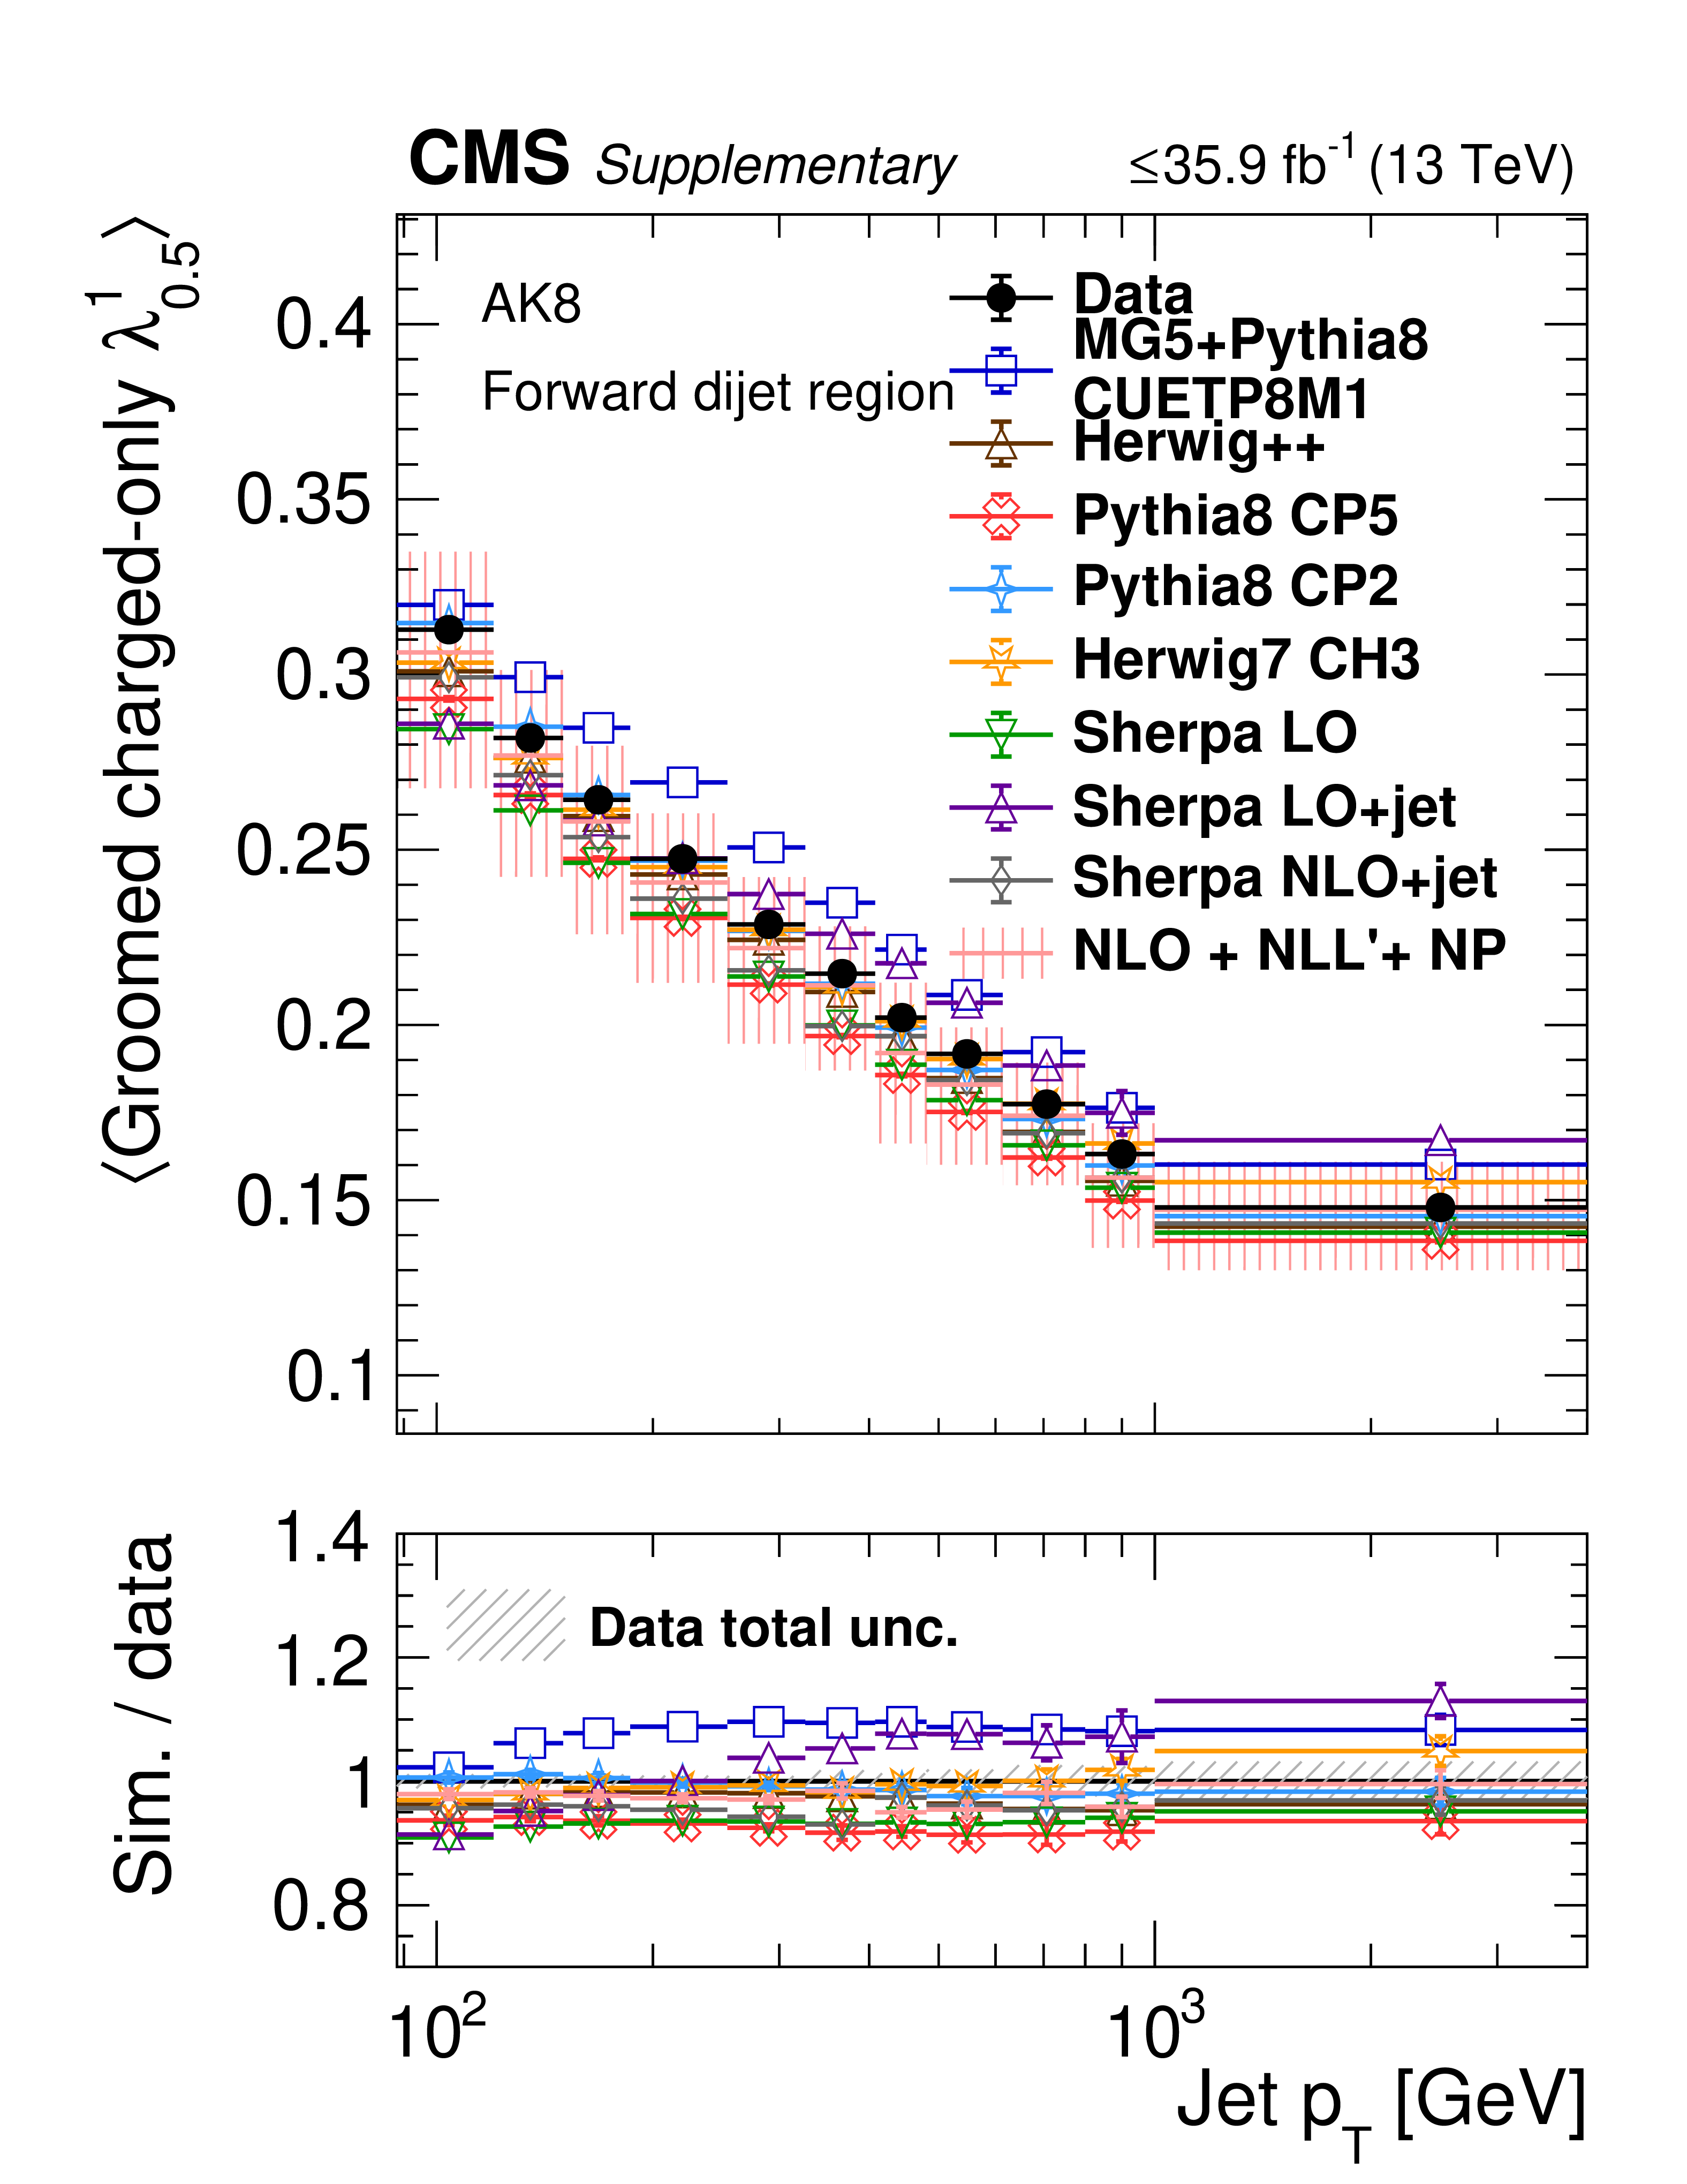
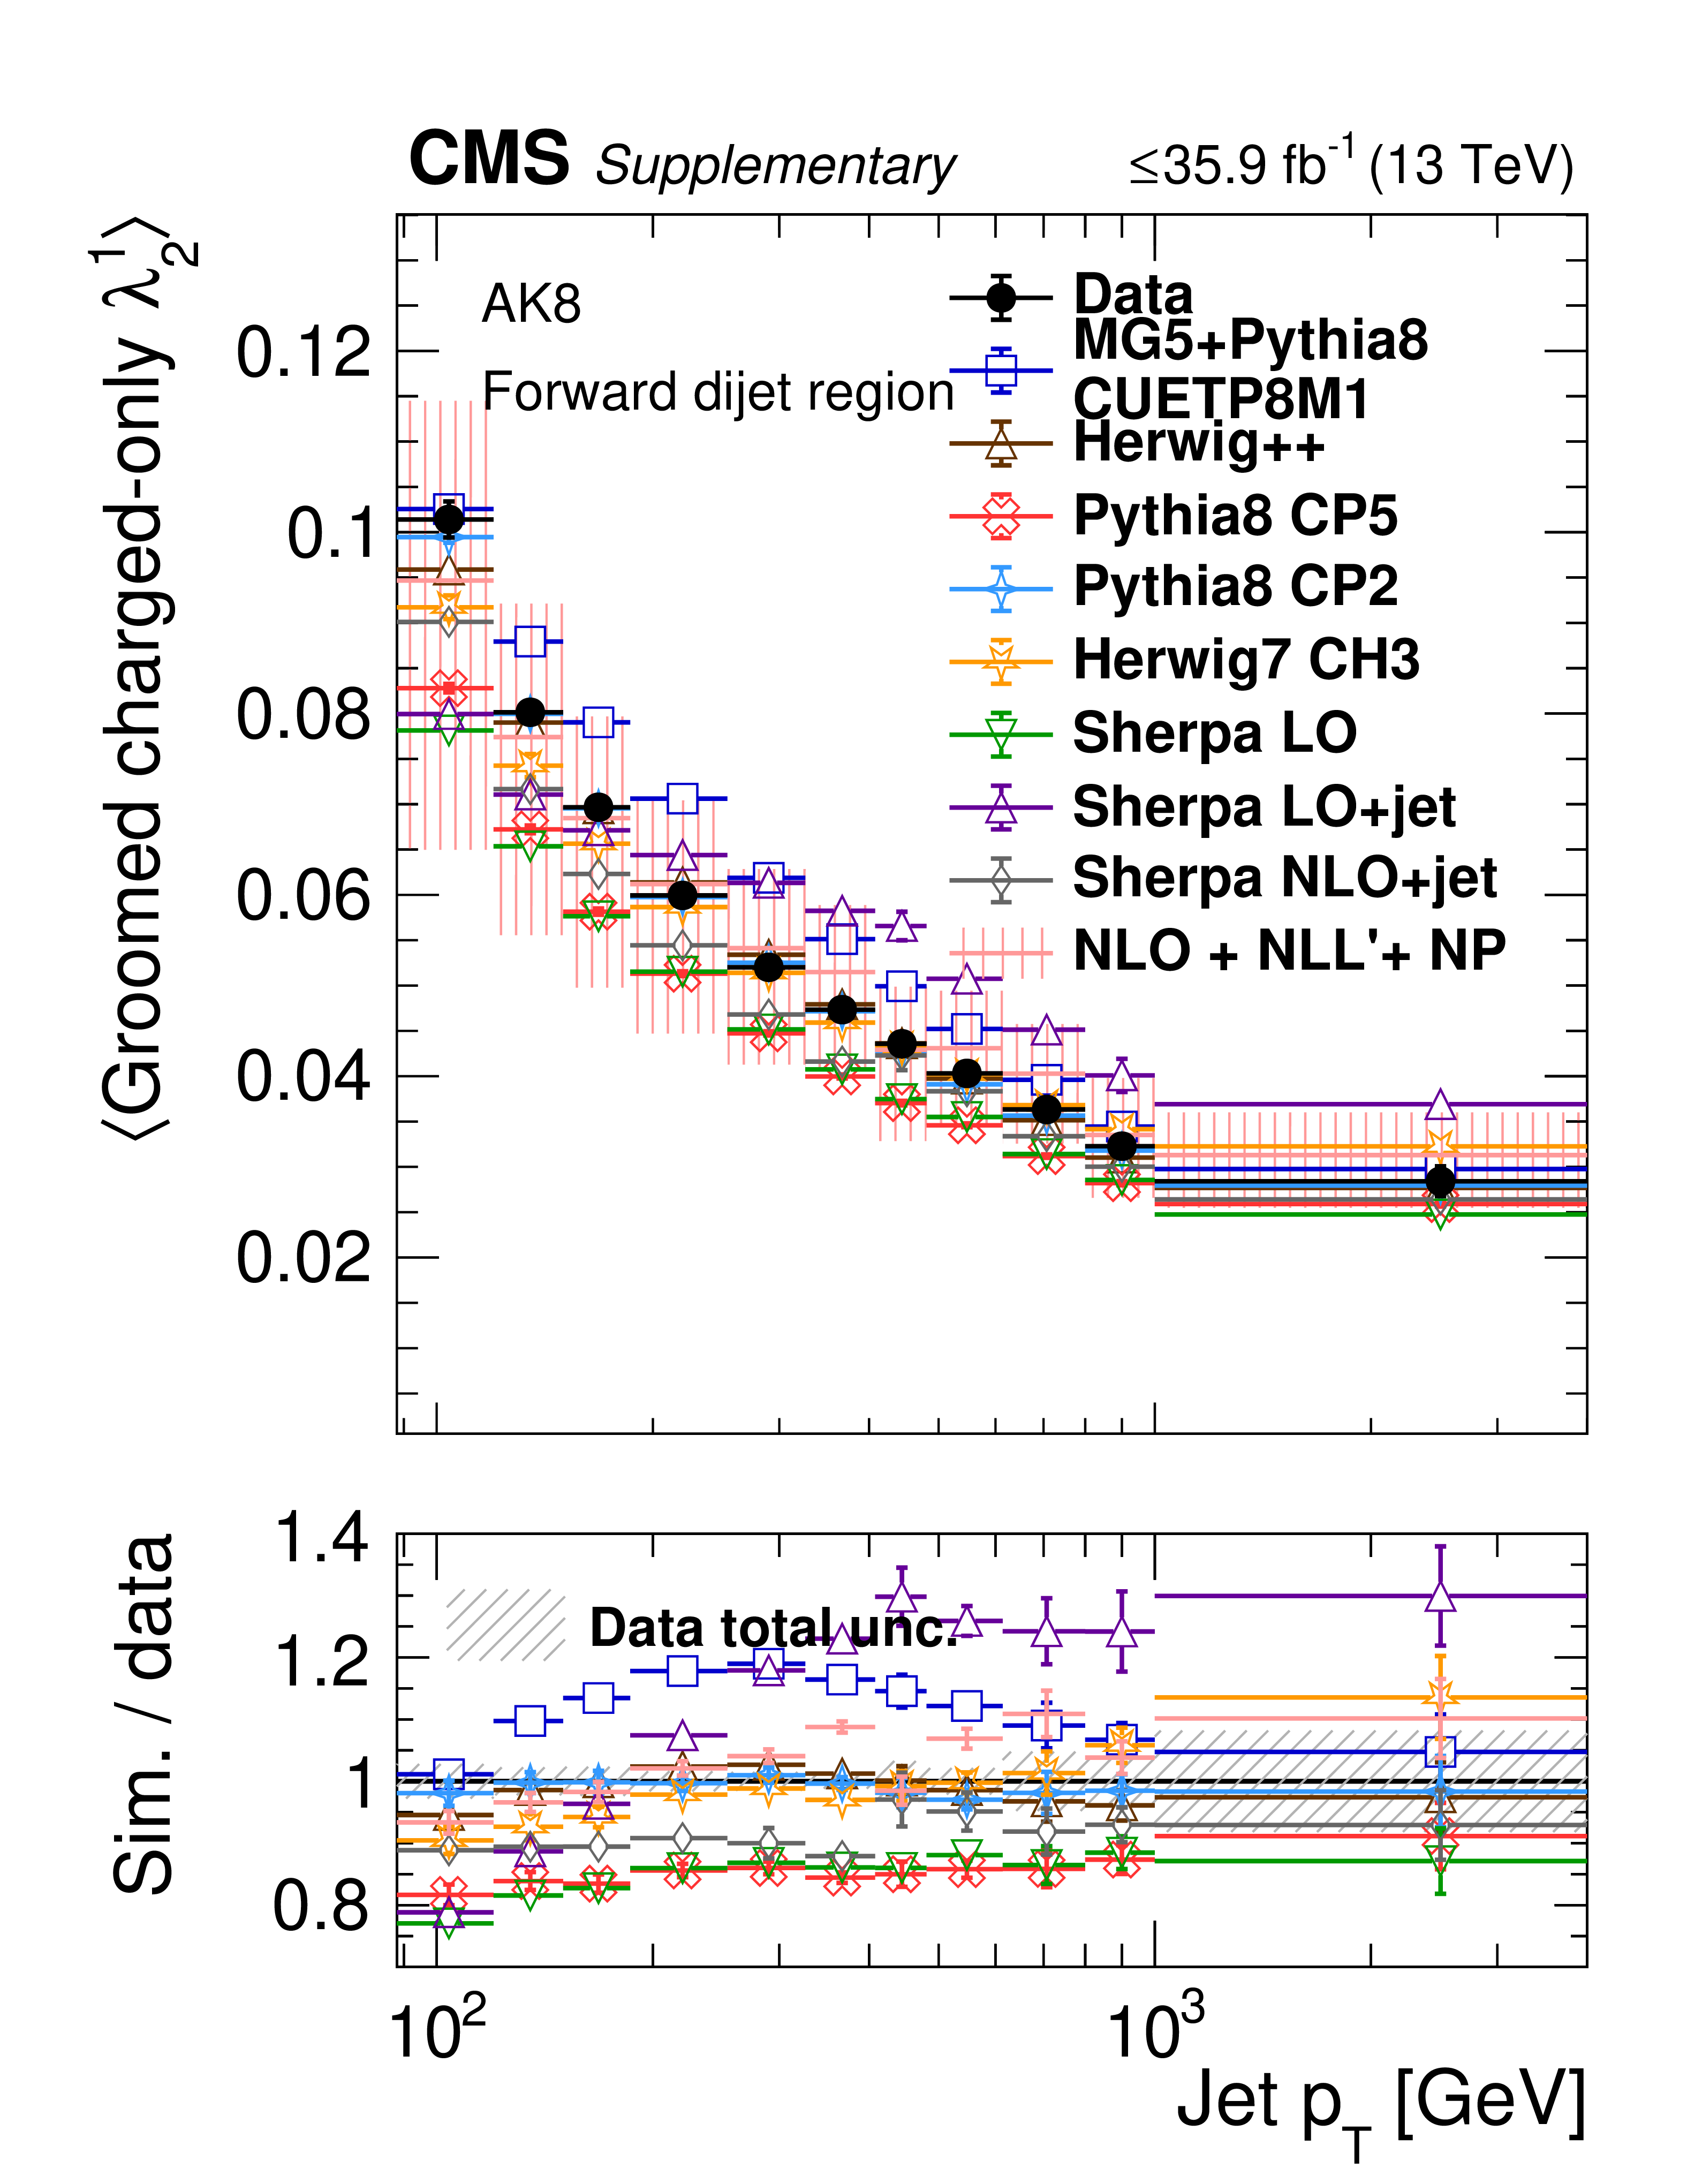
Plots of distribution mean for ungroomed AK4 jets in the forward dijet region, comparing unfolded data to MC. Upper row is charged+neutral variables, lower row is charged-only variables. |

png pdf |
Additional Figure 19-a:
Plots of distribution mean for ungroomed AK4 jets in the forward dijet region, comparing unfolded data to MC. Upper row is charged+neutral variables, lower row is charged-only variables. |

png pdf |
Additional Figure 19-b:
Plots of distribution mean for ungroomed AK4 jets in the forward dijet region, comparing unfolded data to MC. Upper row is charged+neutral variables, lower row is charged-only variables. |
png pdf |
Additional Figure 19-c:
Plots of distribution mean for ungroomed AK4 jets in the forward dijet region, comparing unfolded data to MC. Upper row is charged+neutral variables, lower row is charged-only variables. |
png pdf |
Additional Figure 19-d:
Plots of distribution mean for ungroomed AK4 jets in the forward dijet region, comparing unfolded data to MC. Upper row is charged+neutral variables, lower row is charged-only variables. |
png pdf |
Additional Figure 19-e:
Plots of distribution mean for ungroomed AK4 jets in the forward dijet region, comparing unfolded data to MC. Upper row is charged+neutral variables, lower row is charged-only variables. |

png pdf |
Additional Figure 19-f:
Plots of distribution mean for ungroomed AK4 jets in the forward dijet region, comparing unfolded data to MC. Upper row is charged+neutral variables, lower row is charged-only variables. |
png pdf |
Additional Figure 19-g:
Plots of distribution mean for ungroomed AK4 jets in the forward dijet region, comparing unfolded data to MC. Upper row is charged+neutral variables, lower row is charged-only variables. |
png pdf |
Additional Figure 19-h:
Plots of distribution mean for ungroomed AK4 jets in the forward dijet region, comparing unfolded data to MC. Upper row is charged+neutral variables, lower row is charged-only variables. |
png pdf |
Additional Figure 19-i:
Plots of distribution mean for ungroomed AK4 jets in the forward dijet region, comparing unfolded data to MC. Upper row is charged+neutral variables, lower row is charged-only variables. |

png pdf |
Additional Figure 19-j:
Plots of distribution mean for ungroomed AK4 jets in the forward dijet region, comparing unfolded data to MC. Upper row is charged+neutral variables, lower row is charged-only variables. |

png pdf |
Additional Figure 20:
Plots of distribution mean for groomed AK4 jets in the Z+jet region, comparing unfolded data to MC. Upper row is charged+neutral variables, lower row is charged-only variables. |
png pdf |
Additional Figure 20-a:
Plots of distribution mean for groomed AK4 jets in the Z+jet region, comparing unfolded data to MC. Upper row is charged+neutral variables, lower row is charged-only variables. |
png pdf |
Additional Figure 20-b:
Plots of distribution mean for groomed AK4 jets in the Z+jet region, comparing unfolded data to MC. Upper row is charged+neutral variables, lower row is charged-only variables. |

png pdf |
Additional Figure 20-c:
Plots of distribution mean for groomed AK4 jets in the Z+jet region, comparing unfolded data to MC. Upper row is charged+neutral variables, lower row is charged-only variables. |
png pdf |
Additional Figure 20-d:
Plots of distribution mean for groomed AK4 jets in the Z+jet region, comparing unfolded data to MC. Upper row is charged+neutral variables, lower row is charged-only variables. |

png pdf |
Additional Figure 20-e:
Plots of distribution mean for groomed AK4 jets in the Z+jet region, comparing unfolded data to MC. Upper row is charged+neutral variables, lower row is charged-only variables. |
png pdf |
Additional Figure 20-f:
Plots of distribution mean for groomed AK4 jets in the Z+jet region, comparing unfolded data to MC. Upper row is charged+neutral variables, lower row is charged-only variables. |
png pdf |
Additional Figure 20-g:
Plots of distribution mean for groomed AK4 jets in the Z+jet region, comparing unfolded data to MC. Upper row is charged+neutral variables, lower row is charged-only variables. |
png pdf |
Additional Figure 20-h:
Plots of distribution mean for groomed AK4 jets in the Z+jet region, comparing unfolded data to MC. Upper row is charged+neutral variables, lower row is charged-only variables. |

png pdf |
Additional Figure 20-i:
Plots of distribution mean for groomed AK4 jets in the Z+jet region, comparing unfolded data to MC. Upper row is charged+neutral variables, lower row is charged-only variables. |
png pdf |
Additional Figure 20-j:
Plots of distribution mean for groomed AK4 jets in the Z+jet region, comparing unfolded data to MC. Upper row is charged+neutral variables, lower row is charged-only variables. |

png pdf |
Additional Figure 21:
Plots of distribution mean for groomed AK4 jets in the central dijet region, comparing unfolded data to MC. Upper row is charged+neutral variables, lower row is charged-only variables. |

png pdf |
Additional Figure 21-a:
Plots of distribution mean for groomed AK4 jets in the central dijet region, comparing unfolded data to MC. Upper row is charged+neutral variables, lower row is charged-only variables. |
png pdf |
Additional Figure 21-b:
Plots of distribution mean for groomed AK4 jets in the central dijet region, comparing unfolded data to MC. Upper row is charged+neutral variables, lower row is charged-only variables. |
png pdf |
Additional Figure 21-c:
Plots of distribution mean for groomed AK4 jets in the central dijet region, comparing unfolded data to MC. Upper row is charged+neutral variables, lower row is charged-only variables. |

png pdf |
Additional Figure 21-d:
Plots of distribution mean for groomed AK4 jets in the central dijet region, comparing unfolded data to MC. Upper row is charged+neutral variables, lower row is charged-only variables. |
png pdf |
Additional Figure 21-e:
Plots of distribution mean for groomed AK4 jets in the central dijet region, comparing unfolded data to MC. Upper row is charged+neutral variables, lower row is charged-only variables. |

png pdf |
Additional Figure 21-f:
Plots of distribution mean for groomed AK4 jets in the central dijet region, comparing unfolded data to MC. Upper row is charged+neutral variables, lower row is charged-only variables. |

png pdf |
Additional Figure 21-g:
Plots of distribution mean for groomed AK4 jets in the central dijet region, comparing unfolded data to MC. Upper row is charged+neutral variables, lower row is charged-only variables. |

png pdf |
Additional Figure 21-h:
Plots of distribution mean for groomed AK4 jets in the central dijet region, comparing unfolded data to MC. Upper row is charged+neutral variables, lower row is charged-only variables. |
png pdf |
Additional Figure 21-i:
Plots of distribution mean for groomed AK4 jets in the central dijet region, comparing unfolded data to MC. Upper row is charged+neutral variables, lower row is charged-only variables. |
png pdf |
Additional Figure 21-j:
Plots of distribution mean for groomed AK4 jets in the central dijet region, comparing unfolded data to MC. Upper row is charged+neutral variables, lower row is charged-only variables. |
png pdf |
Additional Figure 22:
Plots of distribution mean for groomed AK4 jets in the forward dijet region, comparing unfolded data to MC. Upper row is charged+neutral variables, lower row is charged-only variables. |

png pdf |
Additional Figure 22-a:
Plots of distribution mean for groomed AK4 jets in the forward dijet region, comparing unfolded data to MC. Upper row is charged+neutral variables, lower row is charged-only variables. |

png pdf |
Additional Figure 22-b:
Plots of distribution mean for groomed AK4 jets in the forward dijet region, comparing unfolded data to MC. Upper row is charged+neutral variables, lower row is charged-only variables. |

png pdf |
Additional Figure 22-c:
Plots of distribution mean for groomed AK4 jets in the forward dijet region, comparing unfolded data to MC. Upper row is charged+neutral variables, lower row is charged-only variables. |
png pdf |
Additional Figure 22-d:
Plots of distribution mean for groomed AK4 jets in the forward dijet region, comparing unfolded data to MC. Upper row is charged+neutral variables, lower row is charged-only variables. |

png pdf |
Additional Figure 22-e:
Plots of distribution mean for groomed AK4 jets in the forward dijet region, comparing unfolded data to MC. Upper row is charged+neutral variables, lower row is charged-only variables. |

png pdf |
Additional Figure 22-f:
Plots of distribution mean for groomed AK4 jets in the forward dijet region, comparing unfolded data to MC. Upper row is charged+neutral variables, lower row is charged-only variables. |
png pdf |
Additional Figure 22-g:
Plots of distribution mean for groomed AK4 jets in the forward dijet region, comparing unfolded data to MC. Upper row is charged+neutral variables, lower row is charged-only variables. |

png pdf |
Additional Figure 22-h:
Plots of distribution mean for groomed AK4 jets in the forward dijet region, comparing unfolded data to MC. Upper row is charged+neutral variables, lower row is charged-only variables. |
png pdf |
Additional Figure 22-i:
Plots of distribution mean for groomed AK4 jets in the forward dijet region, comparing unfolded data to MC. Upper row is charged+neutral variables, lower row is charged-only variables. |

png pdf |
Additional Figure 22-j:
Plots of distribution mean for groomed AK4 jets in the forward dijet region, comparing unfolded data to MC. Upper row is charged+neutral variables, lower row is charged-only variables. |

png pdf |
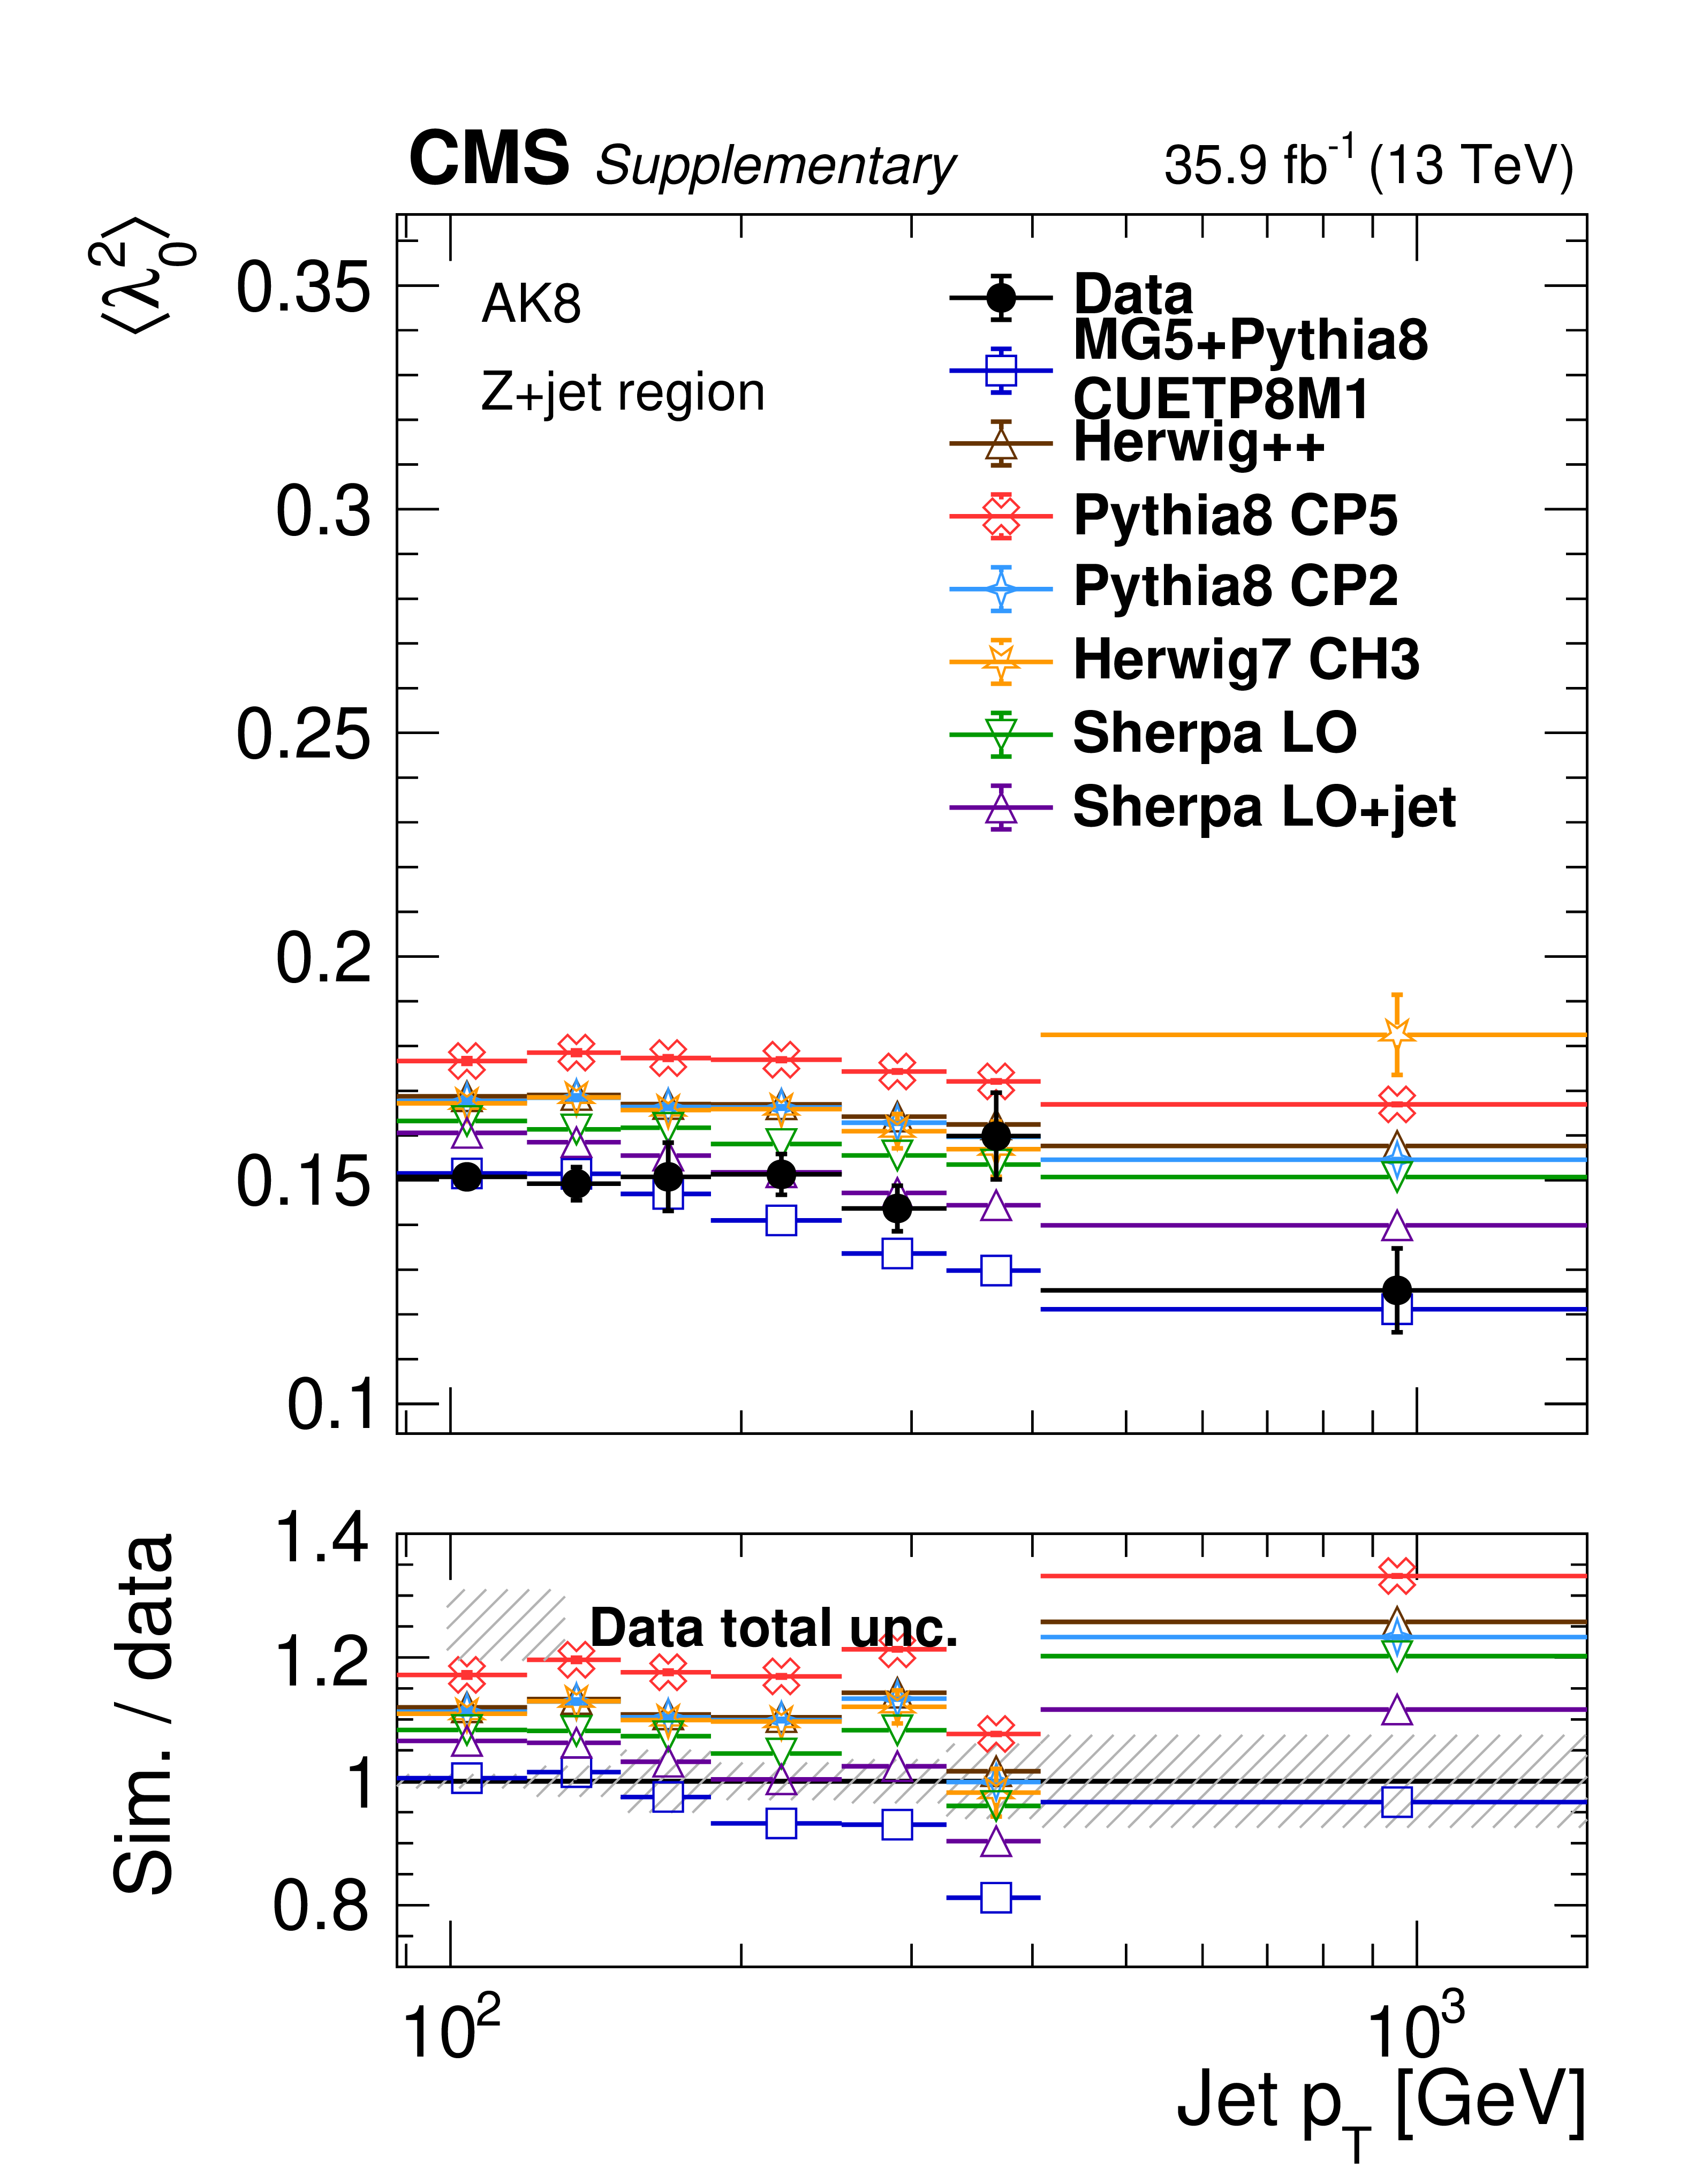
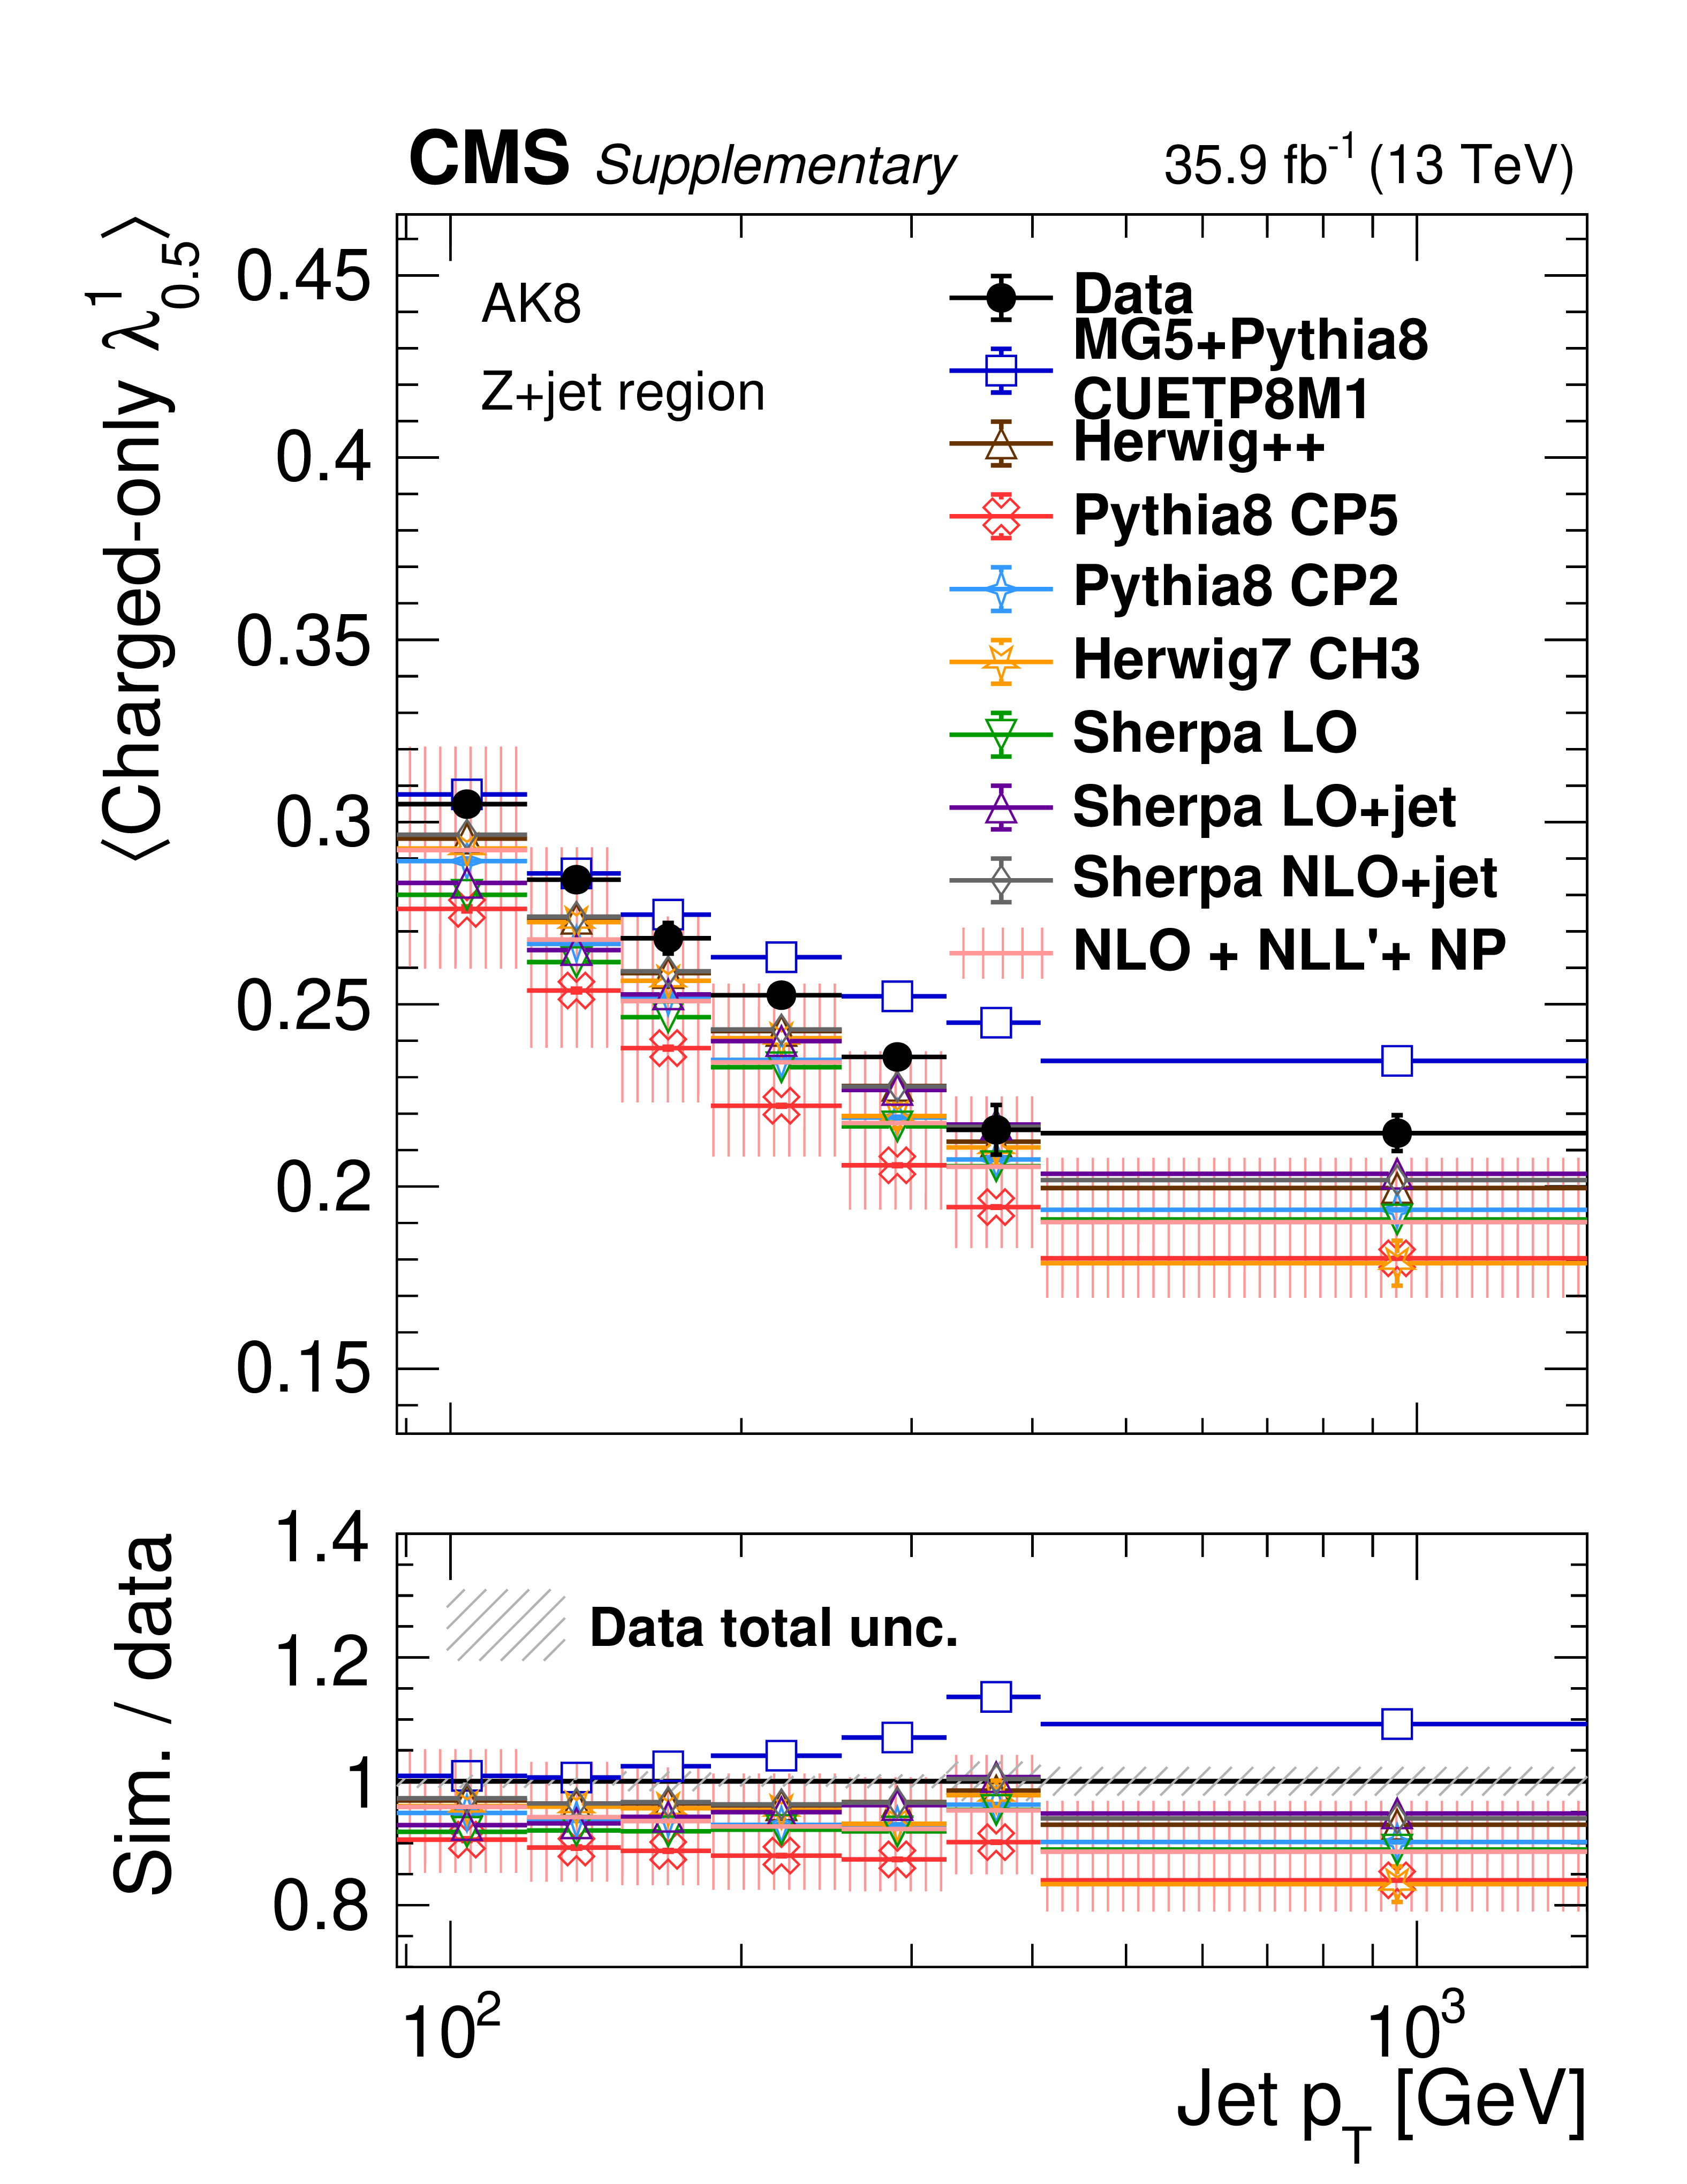
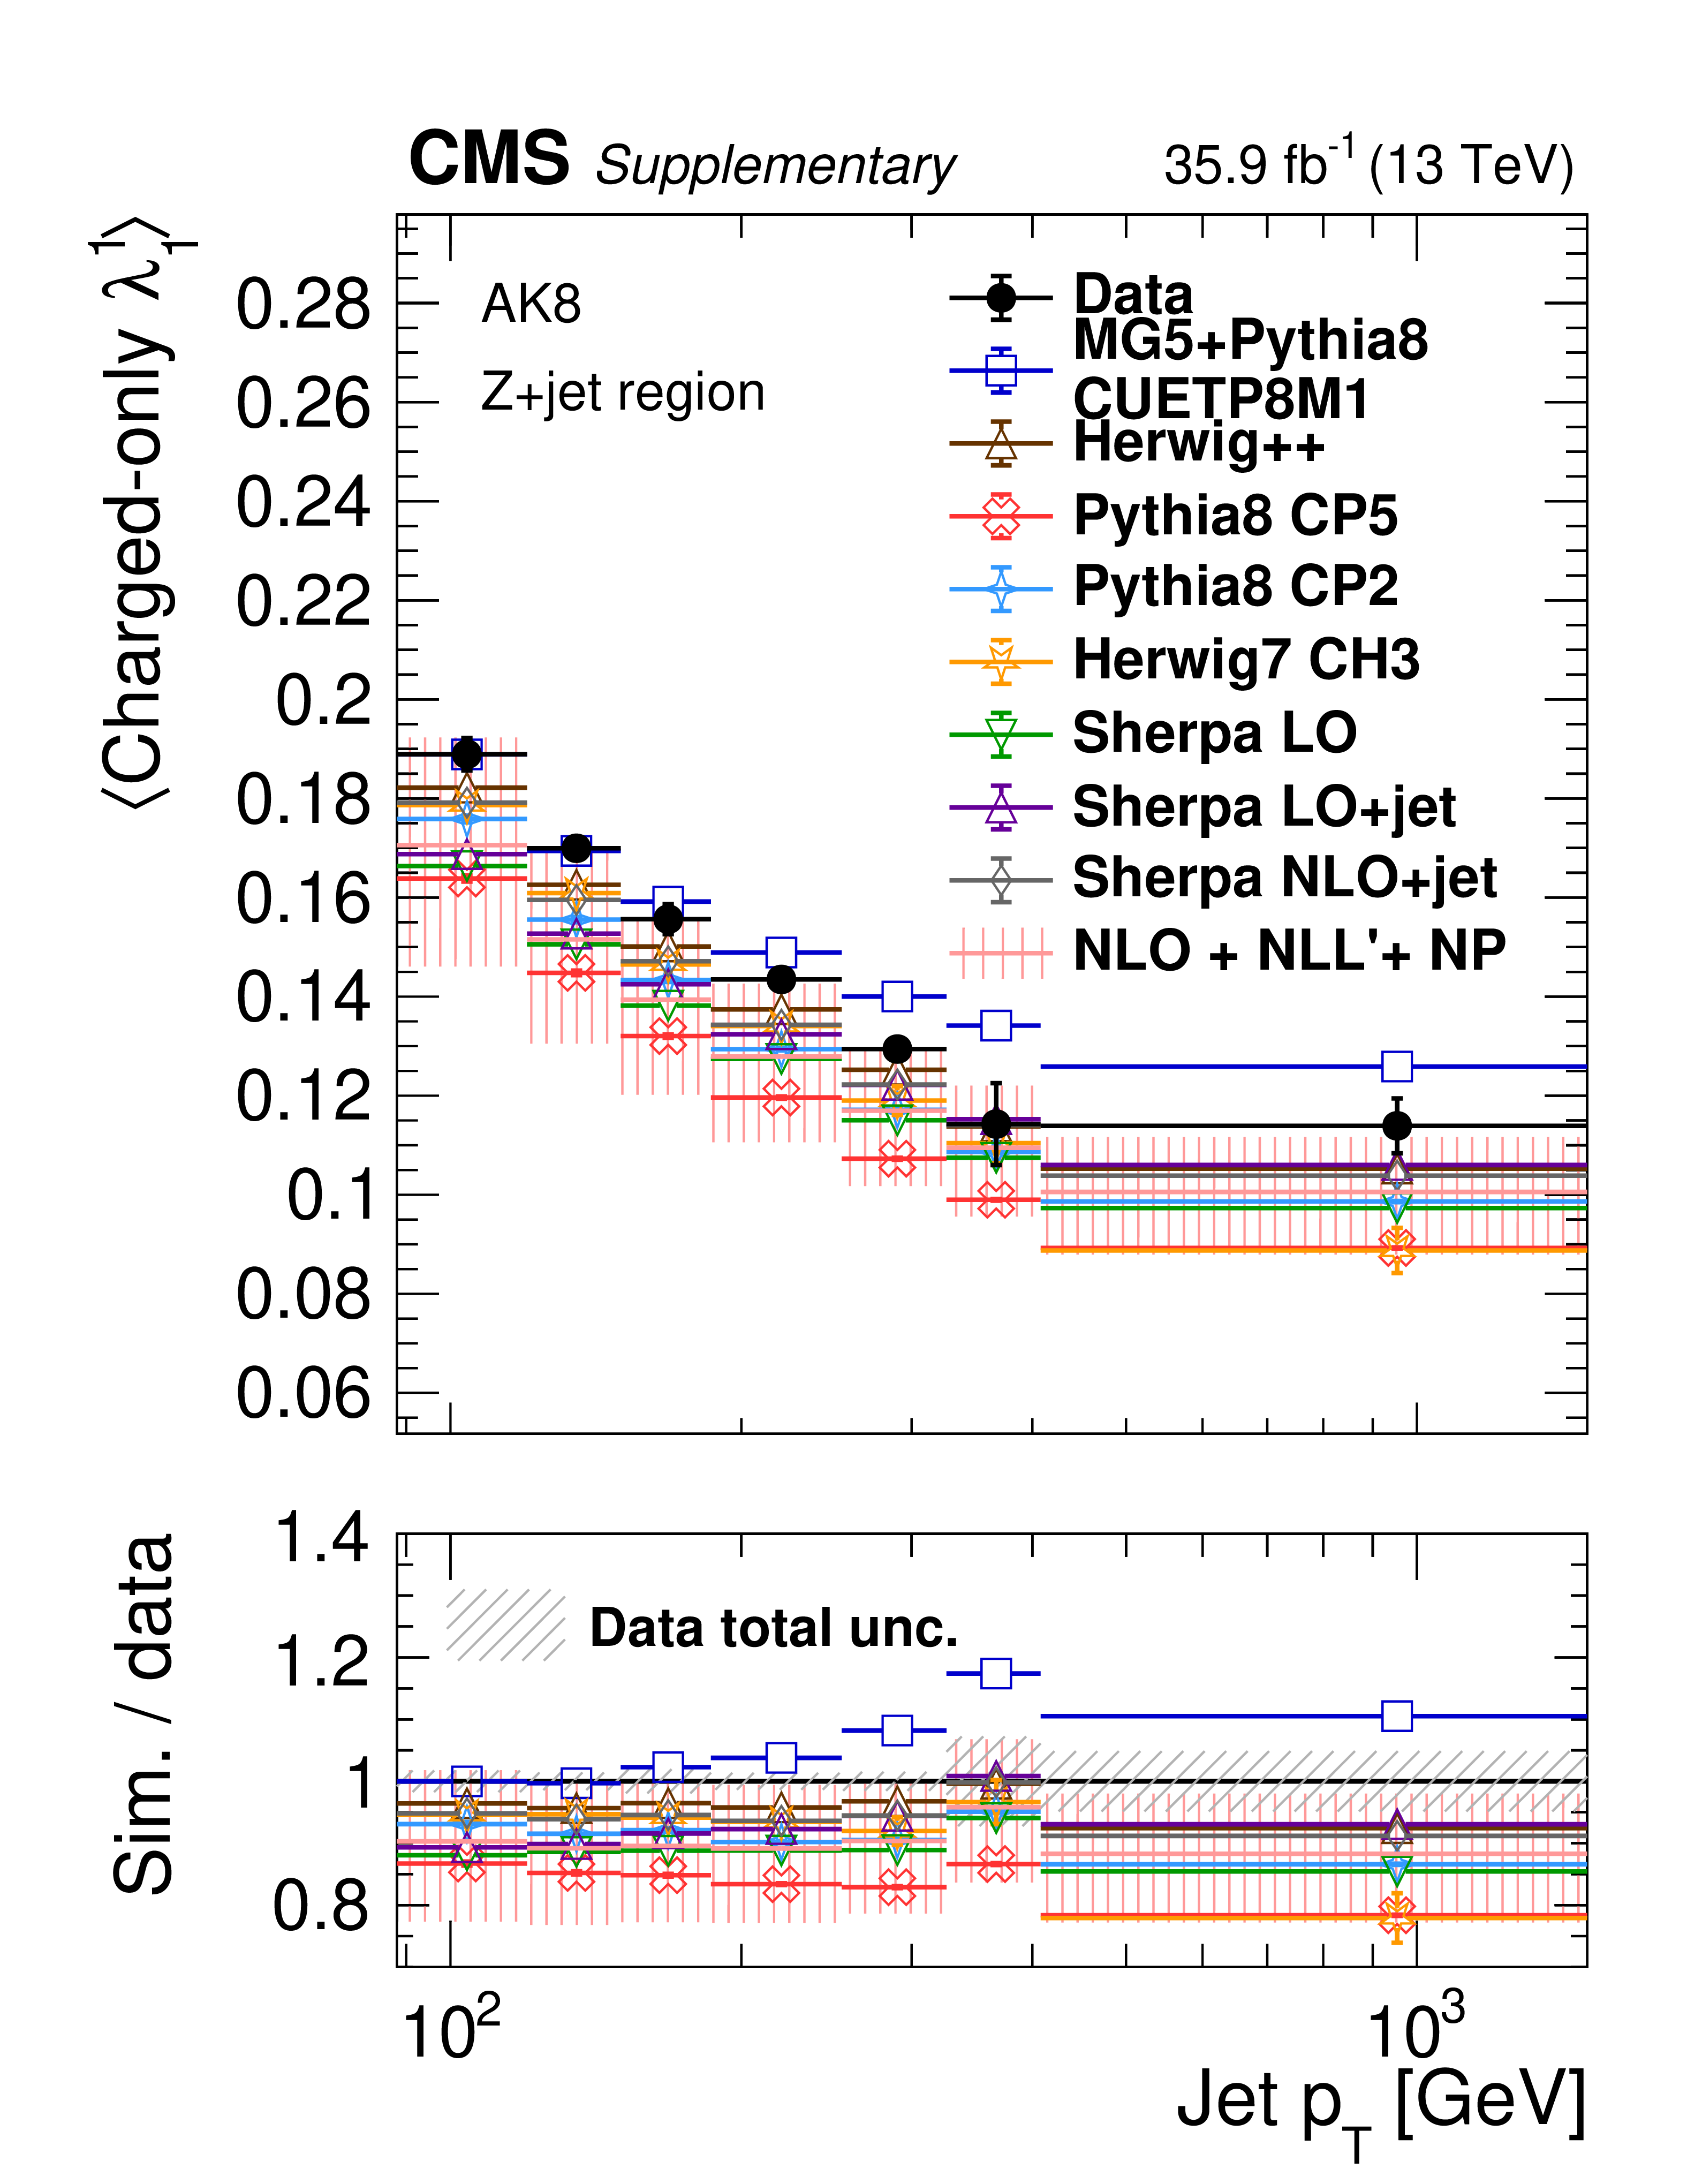
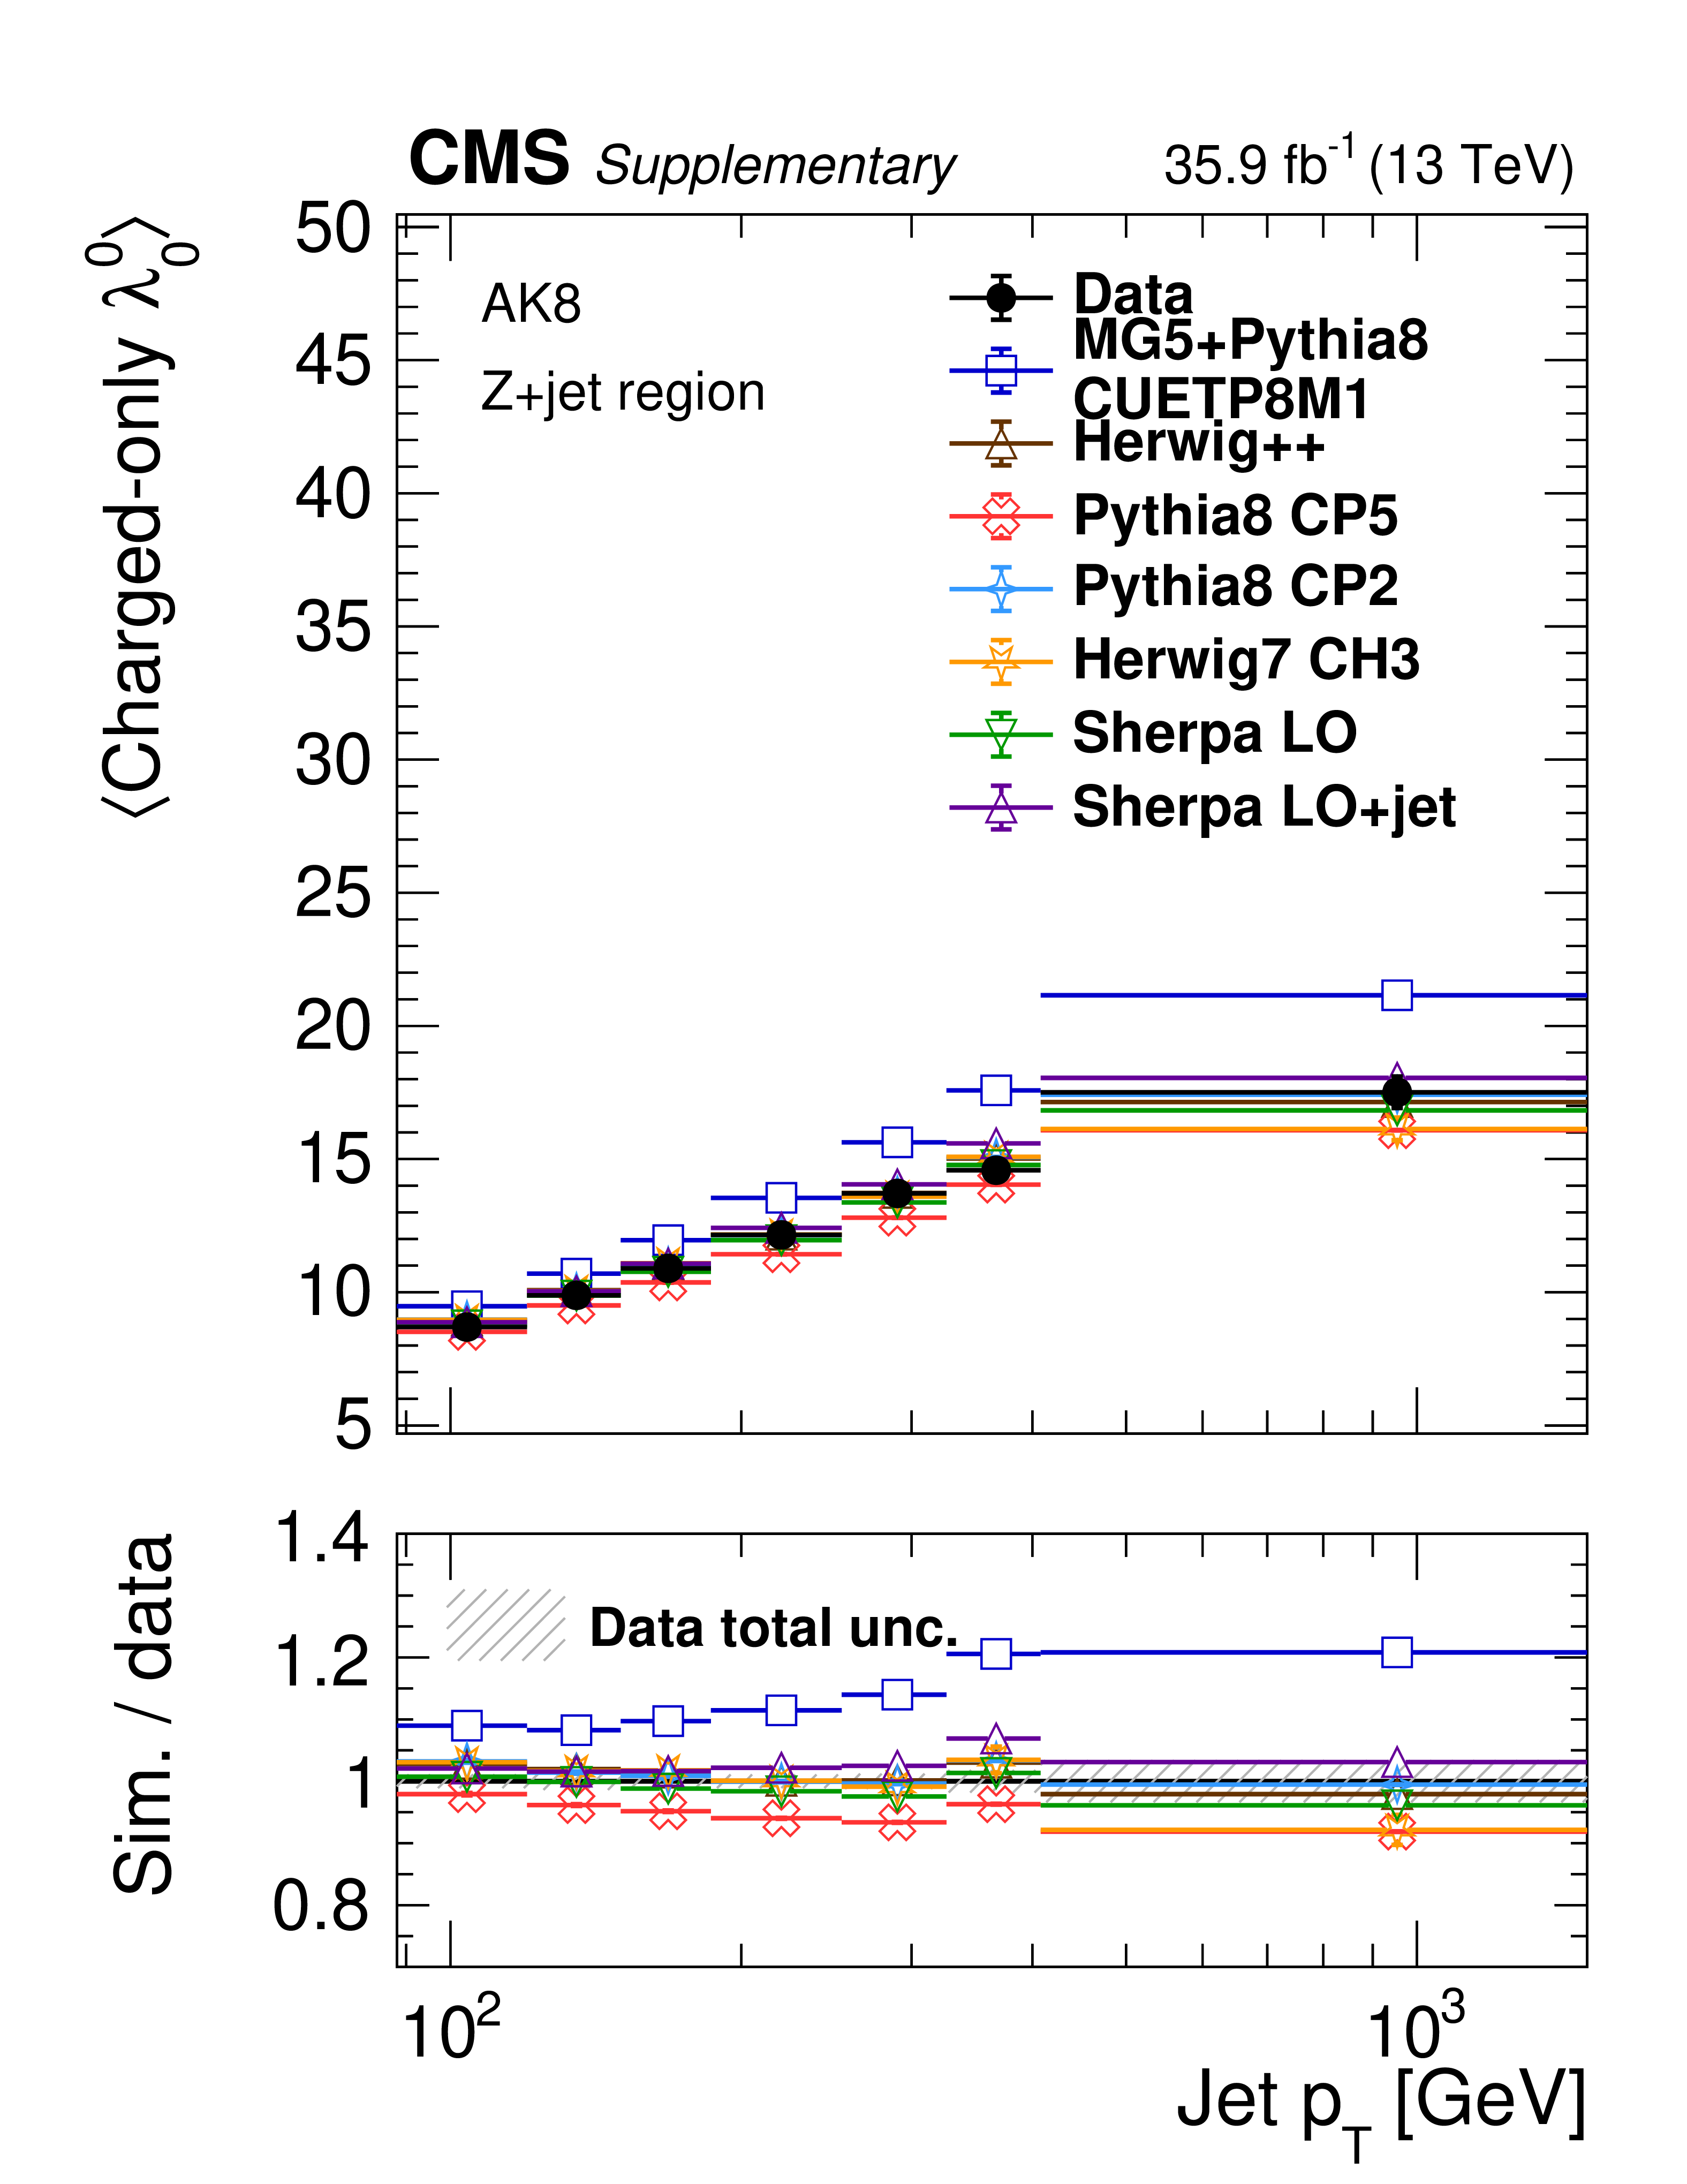
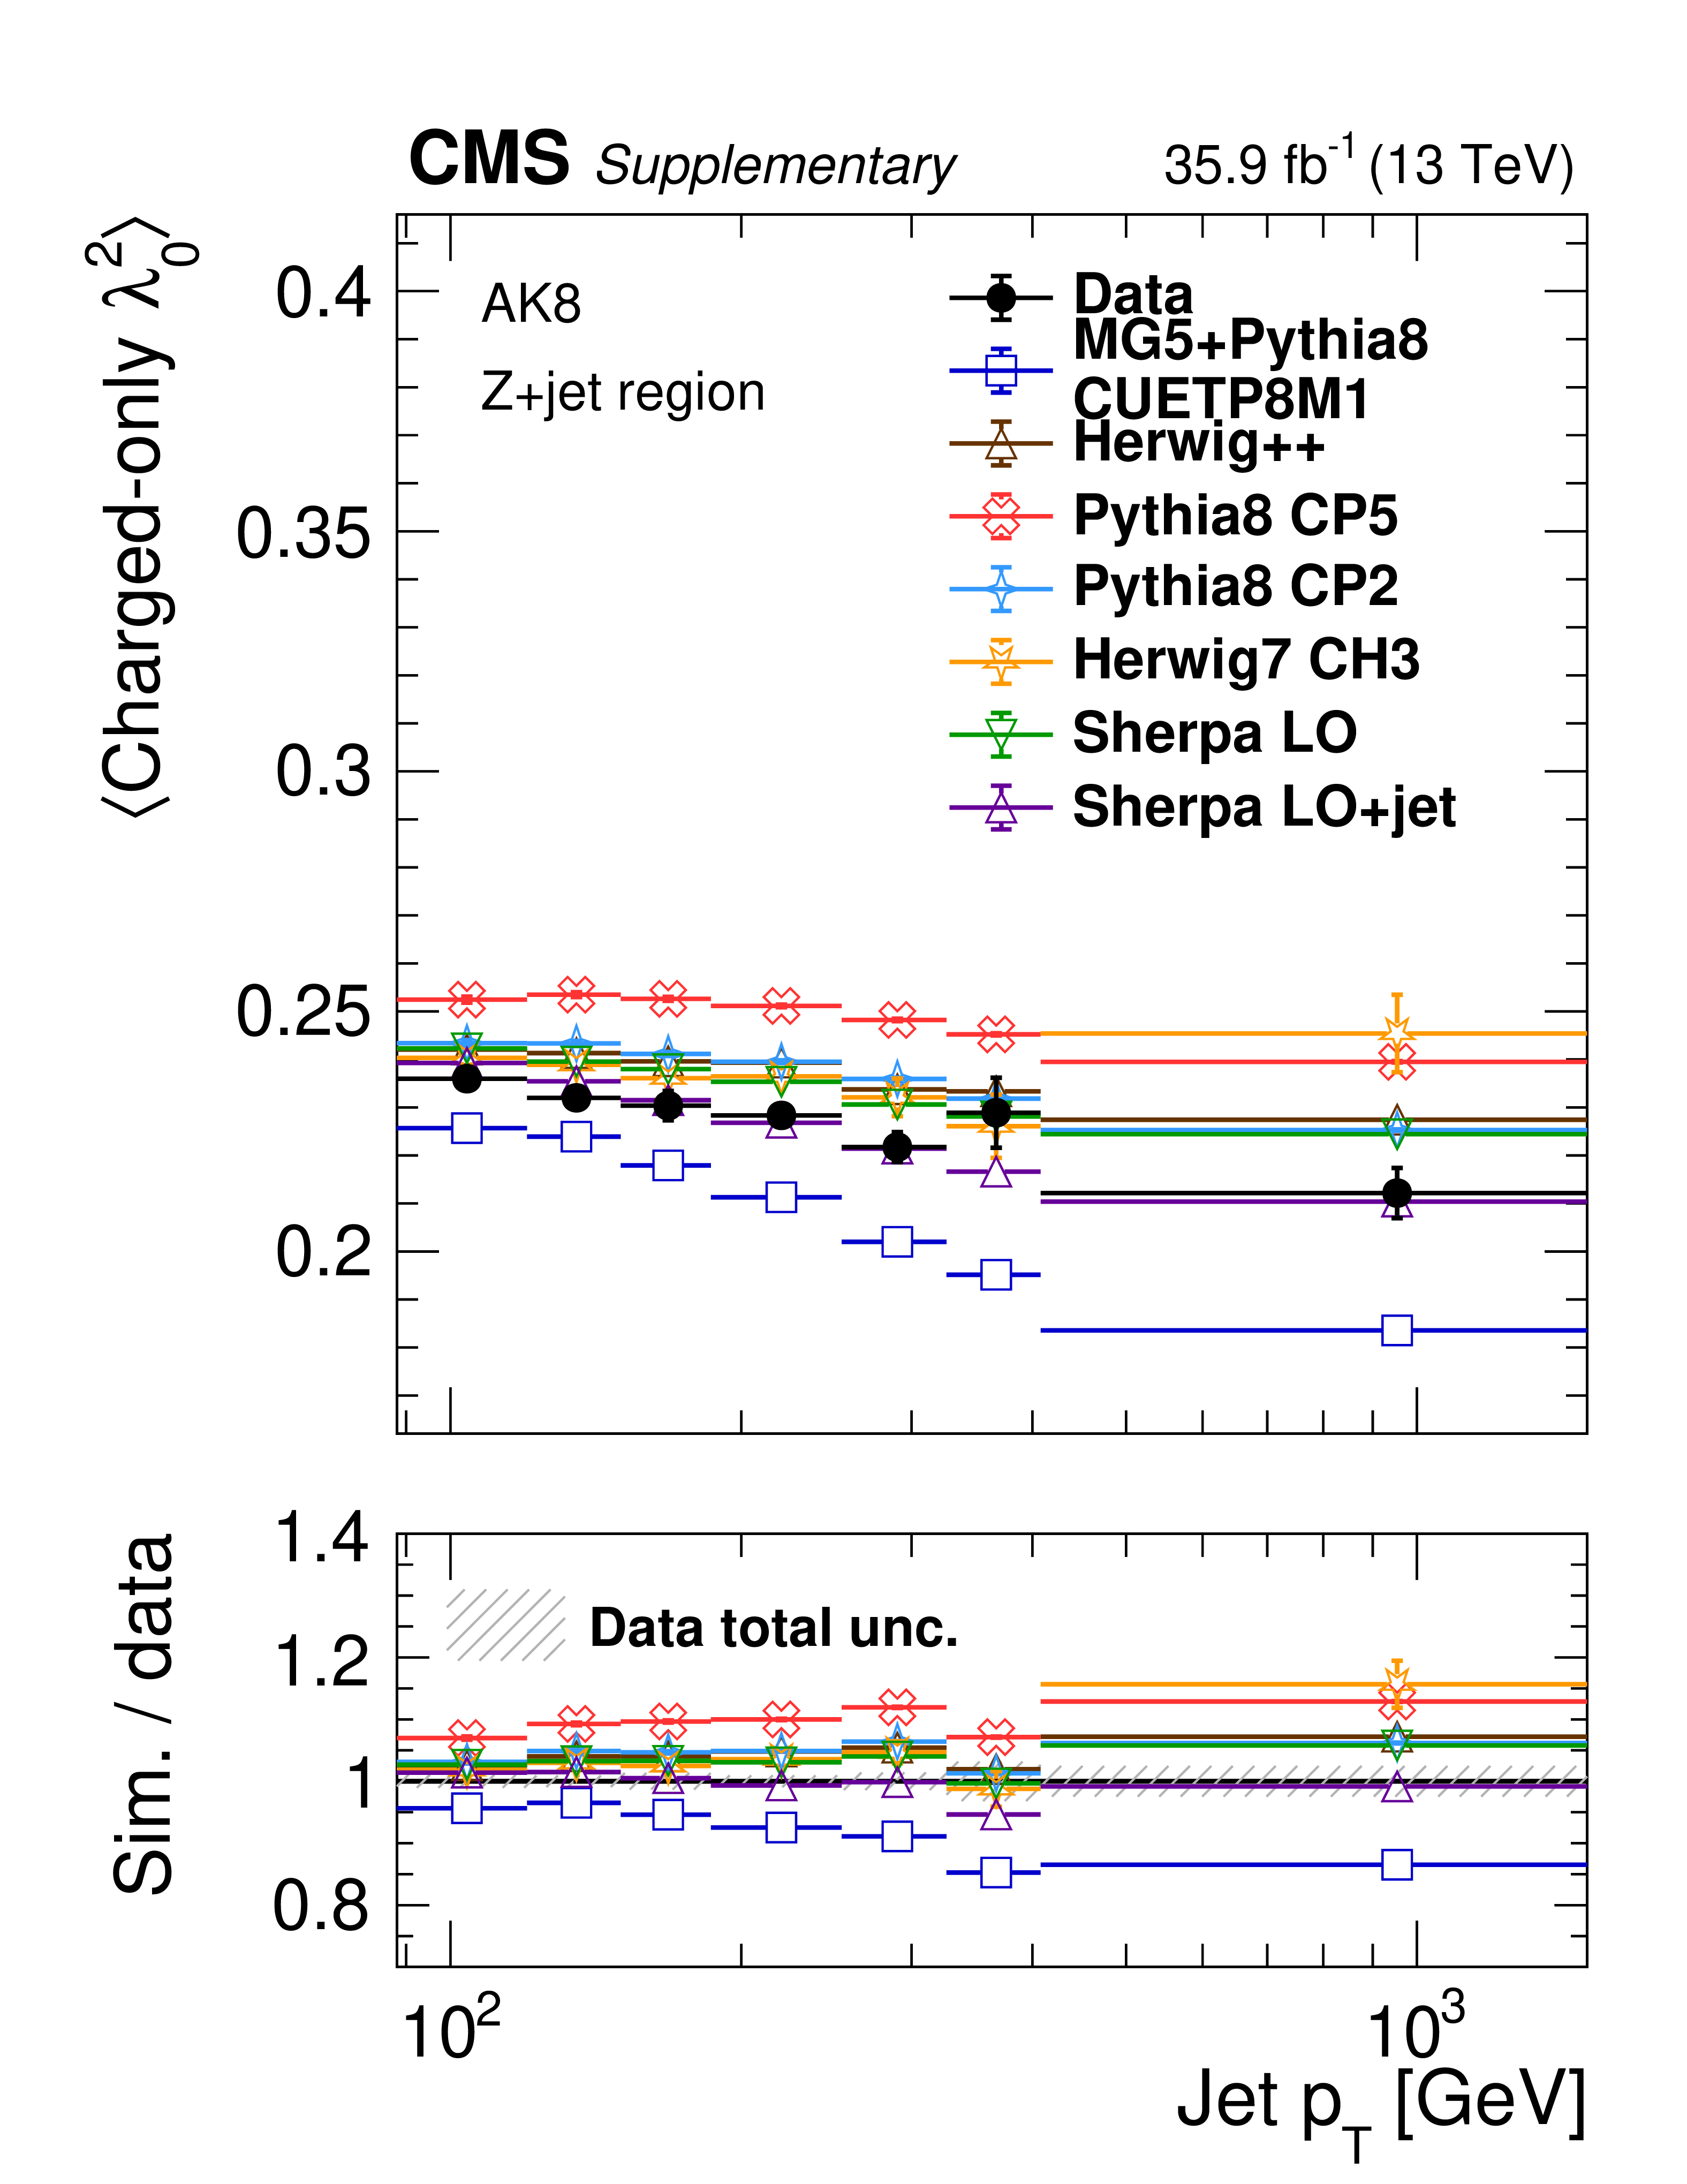
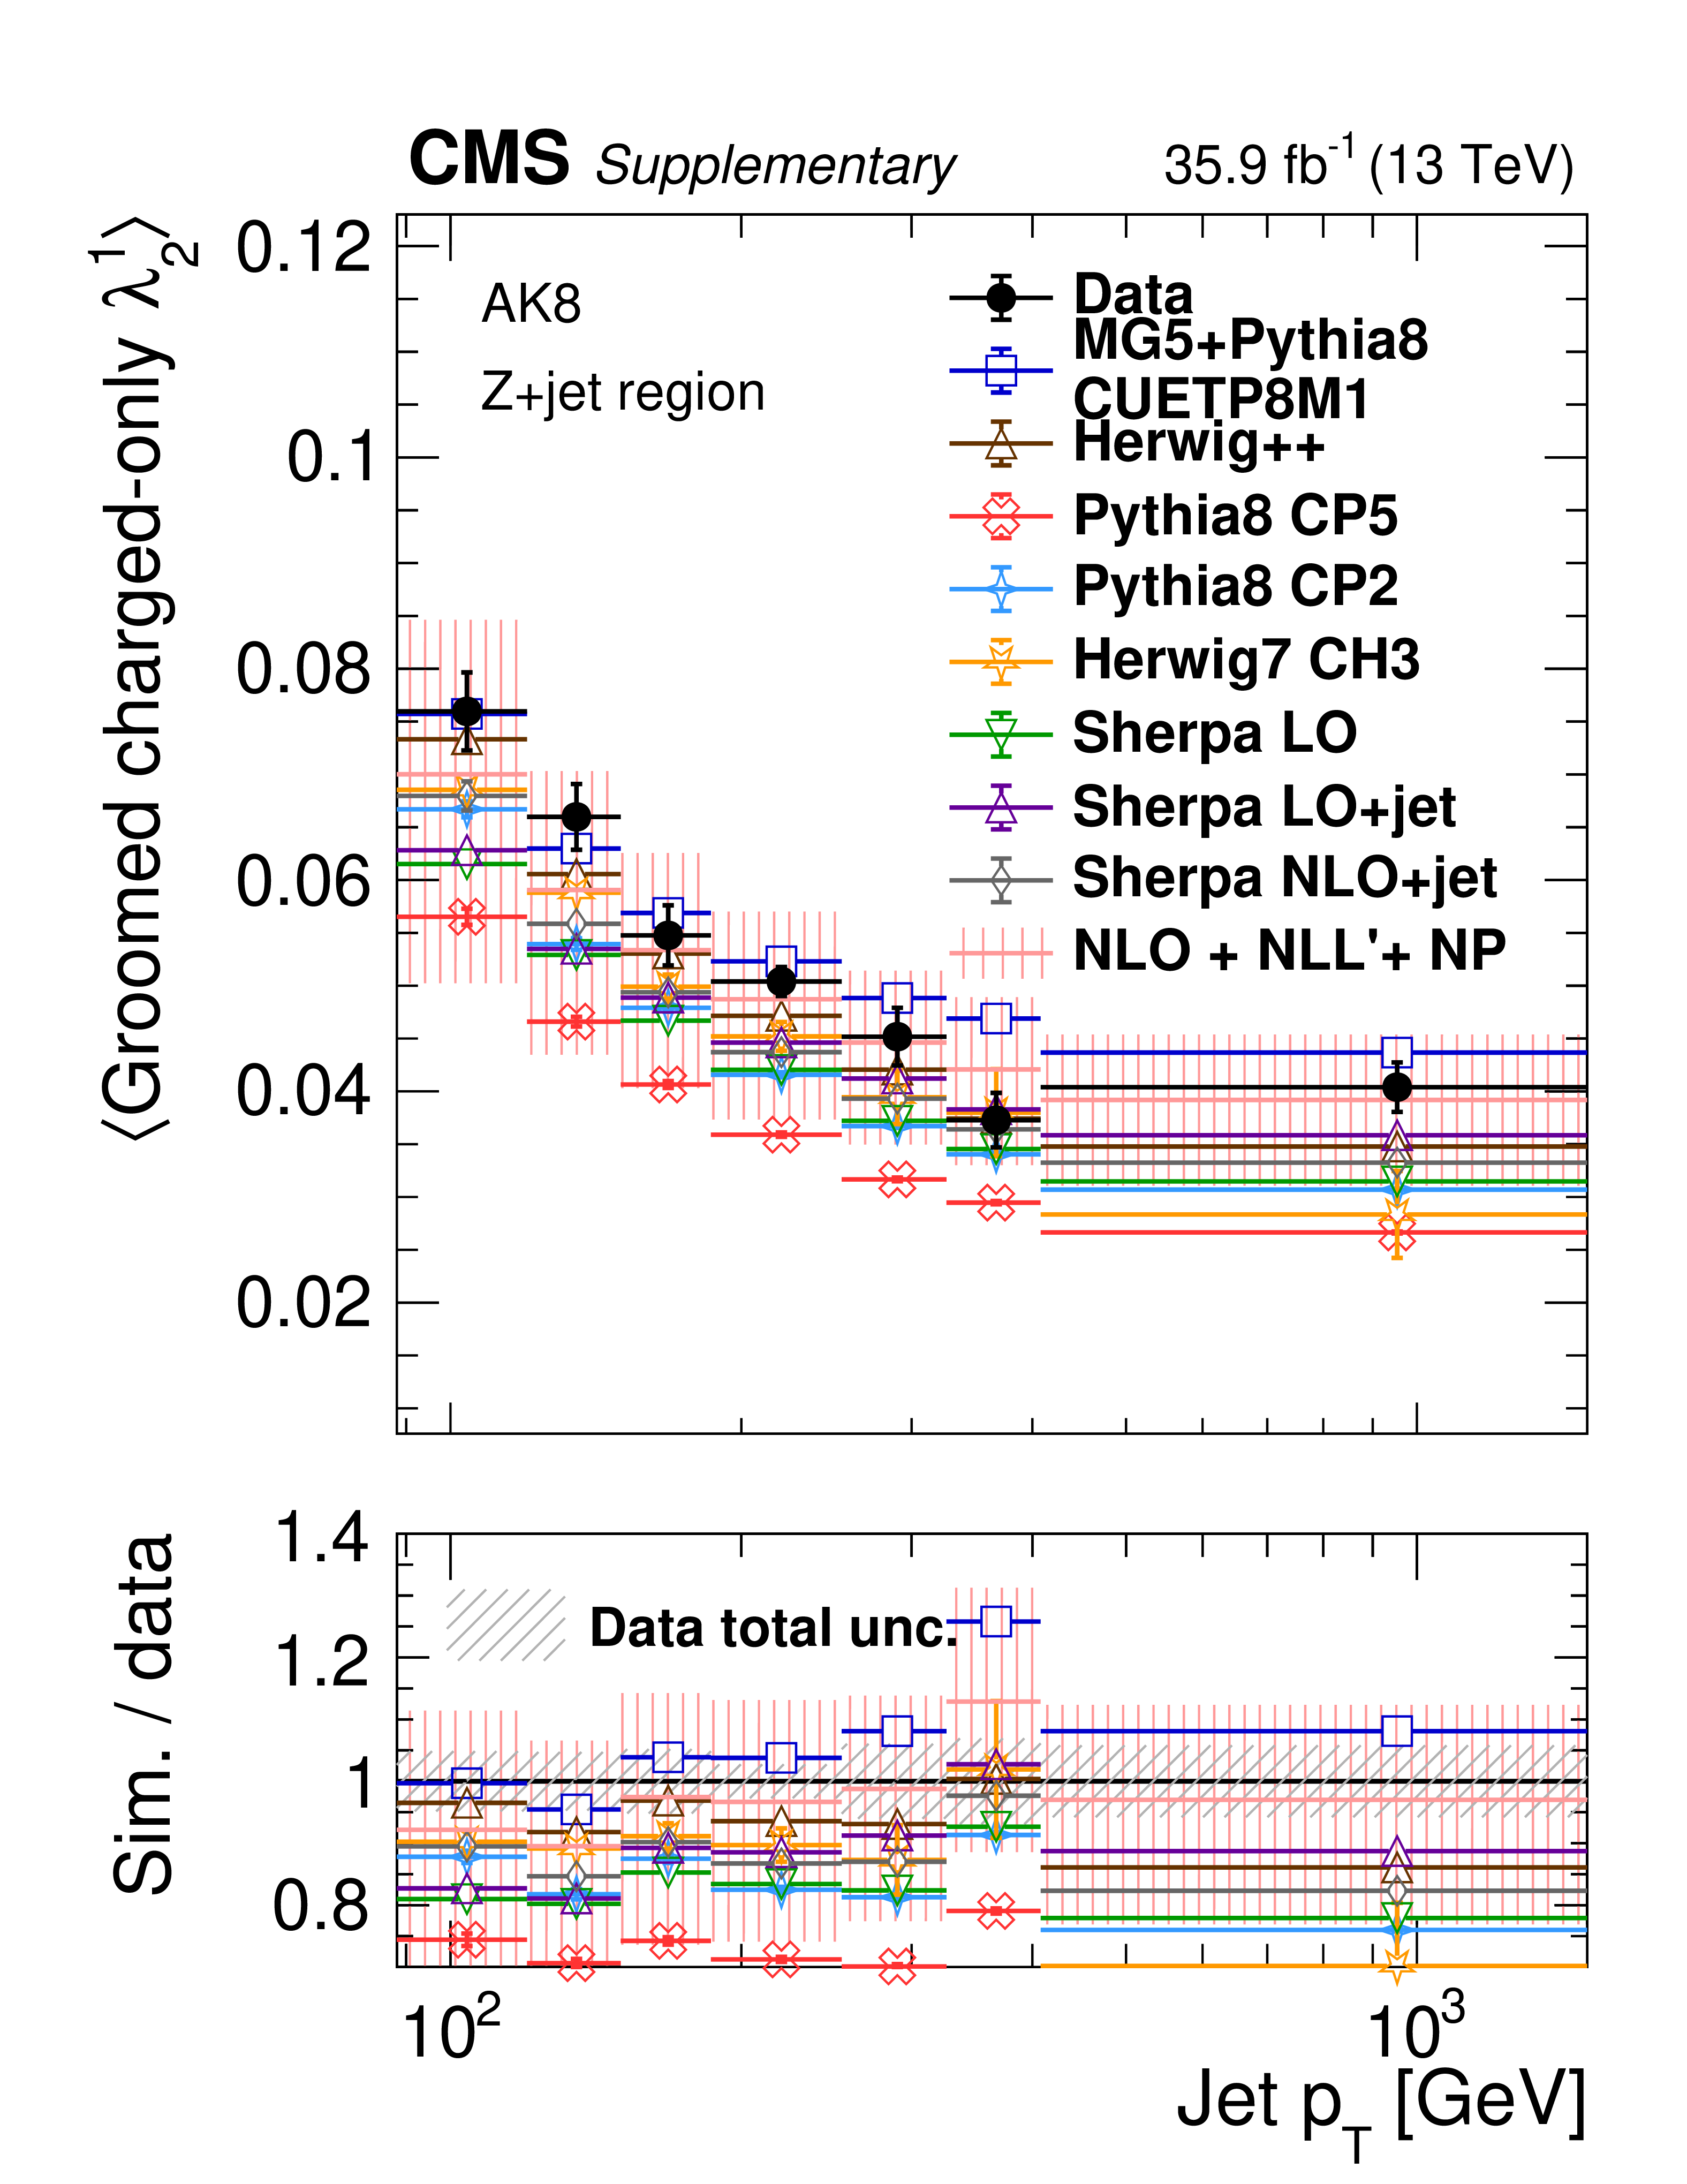
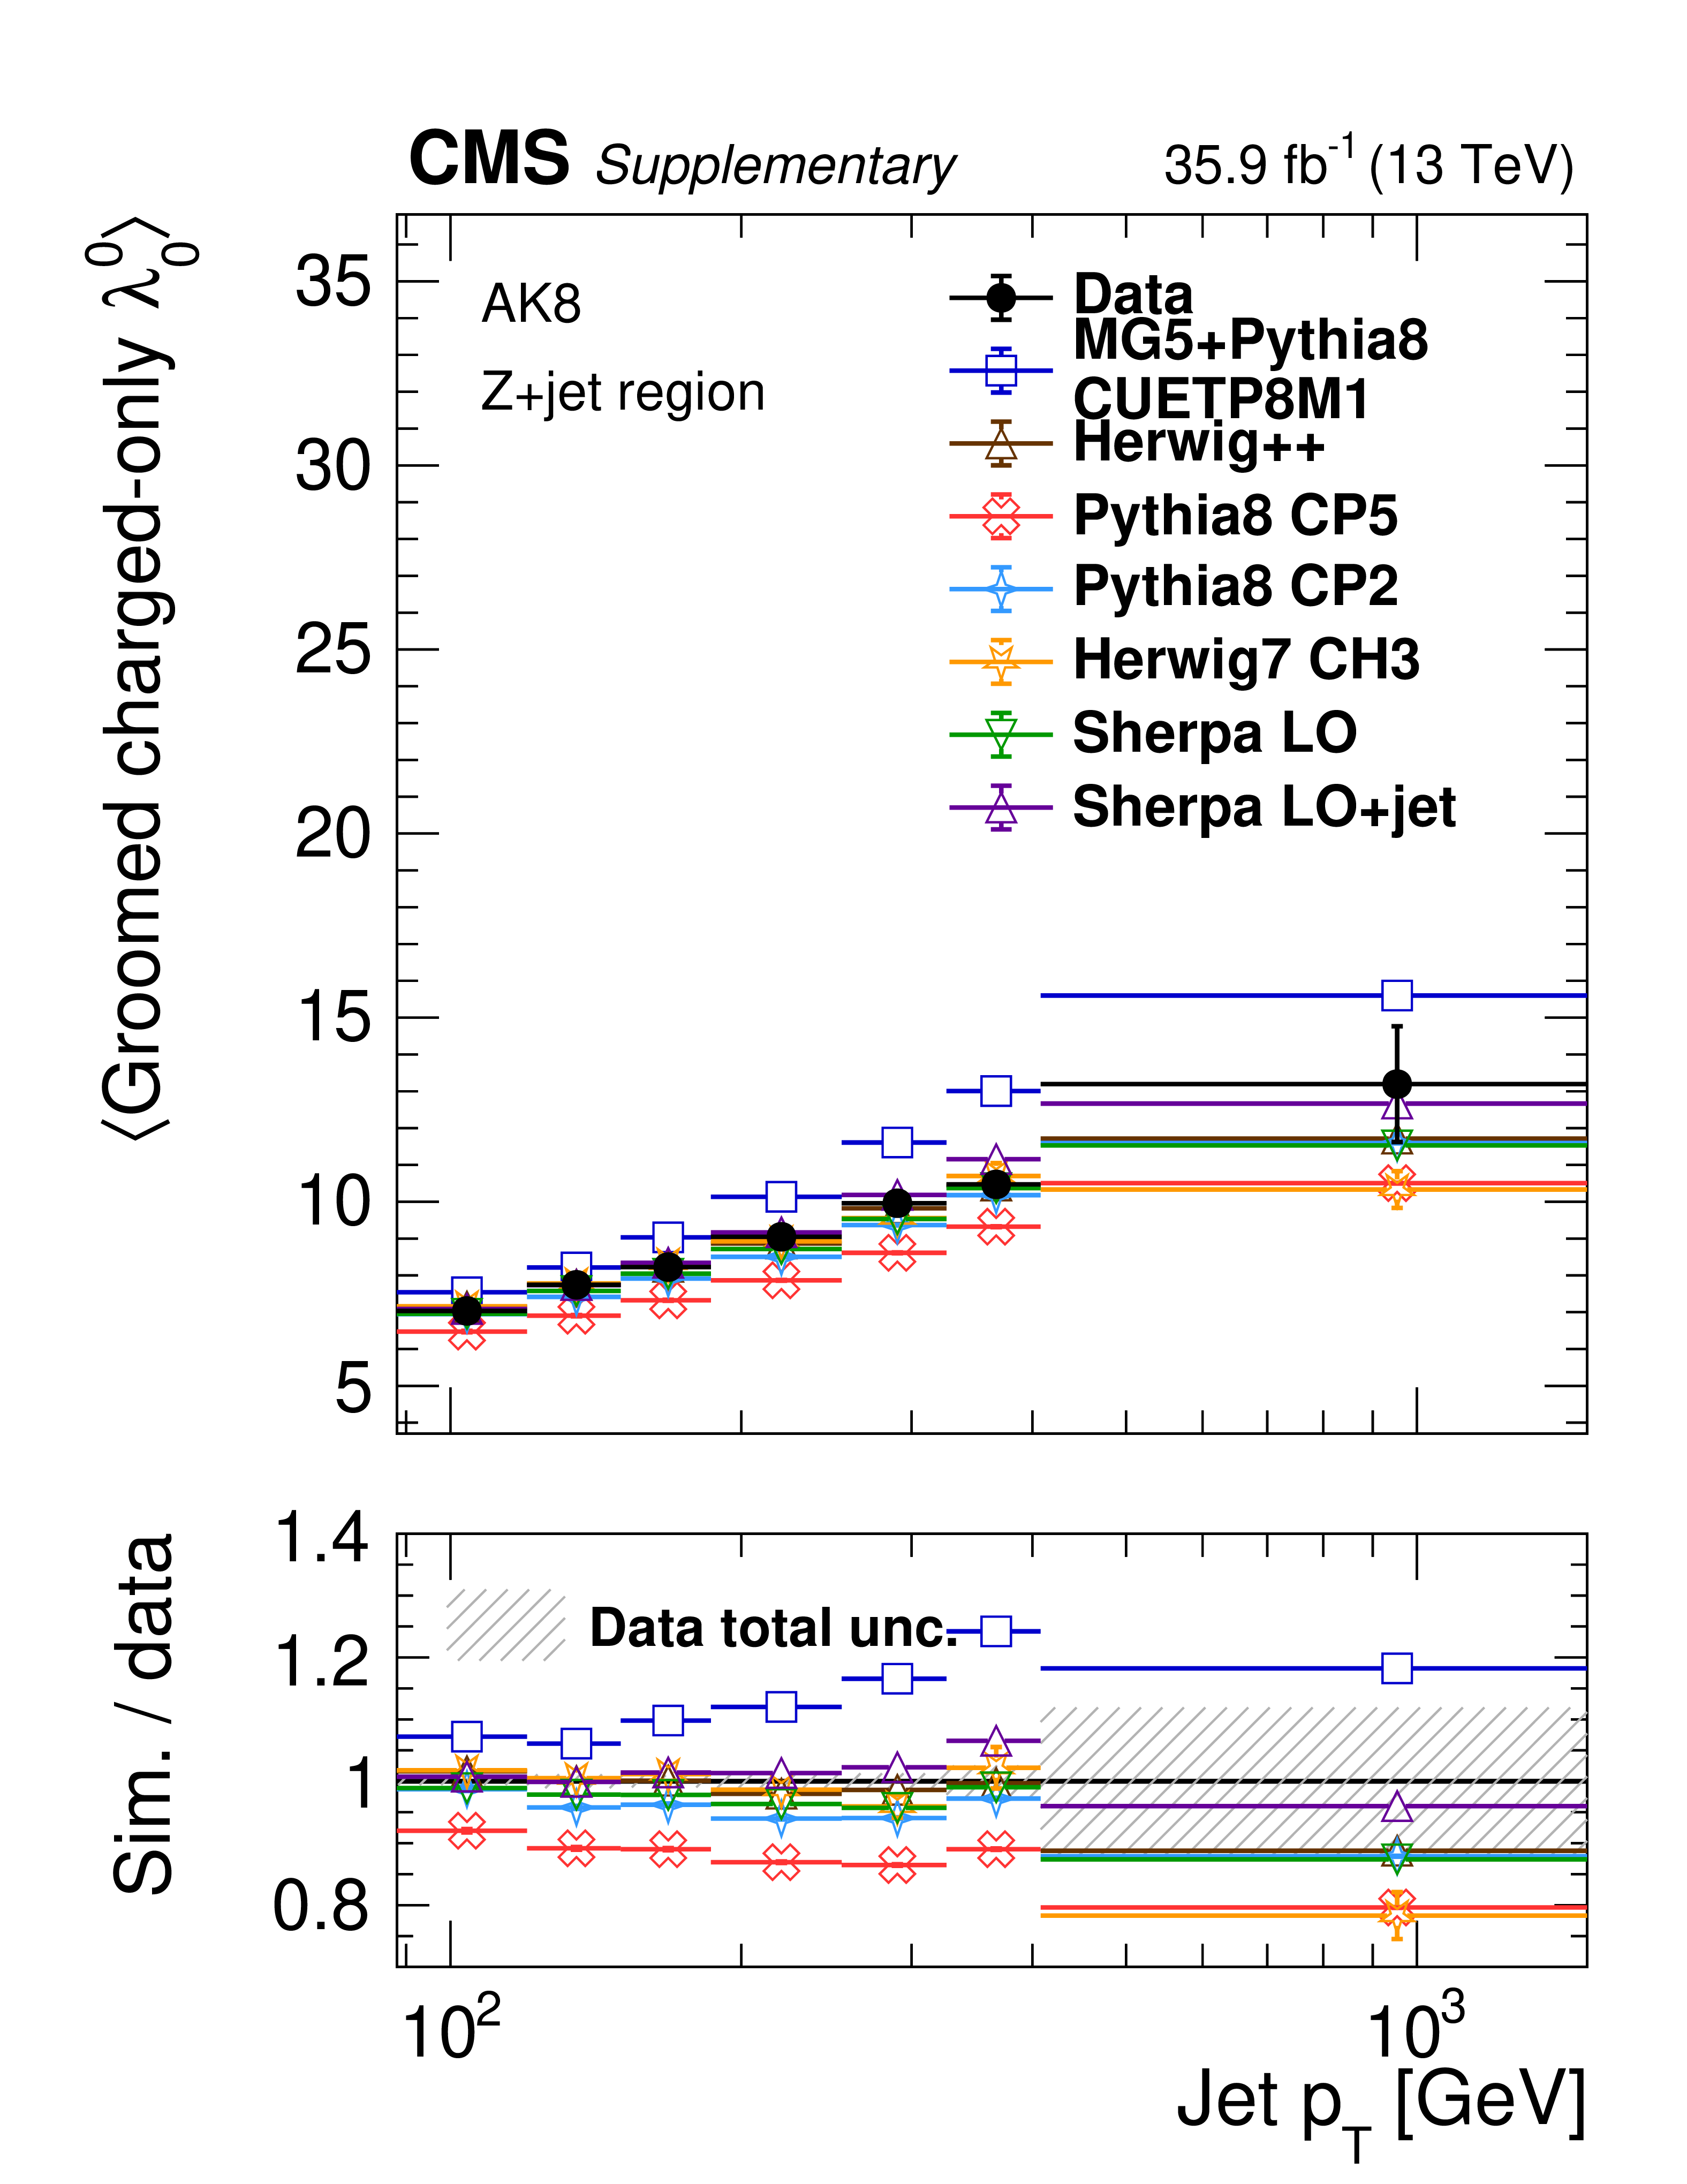
Additional Figure 23:
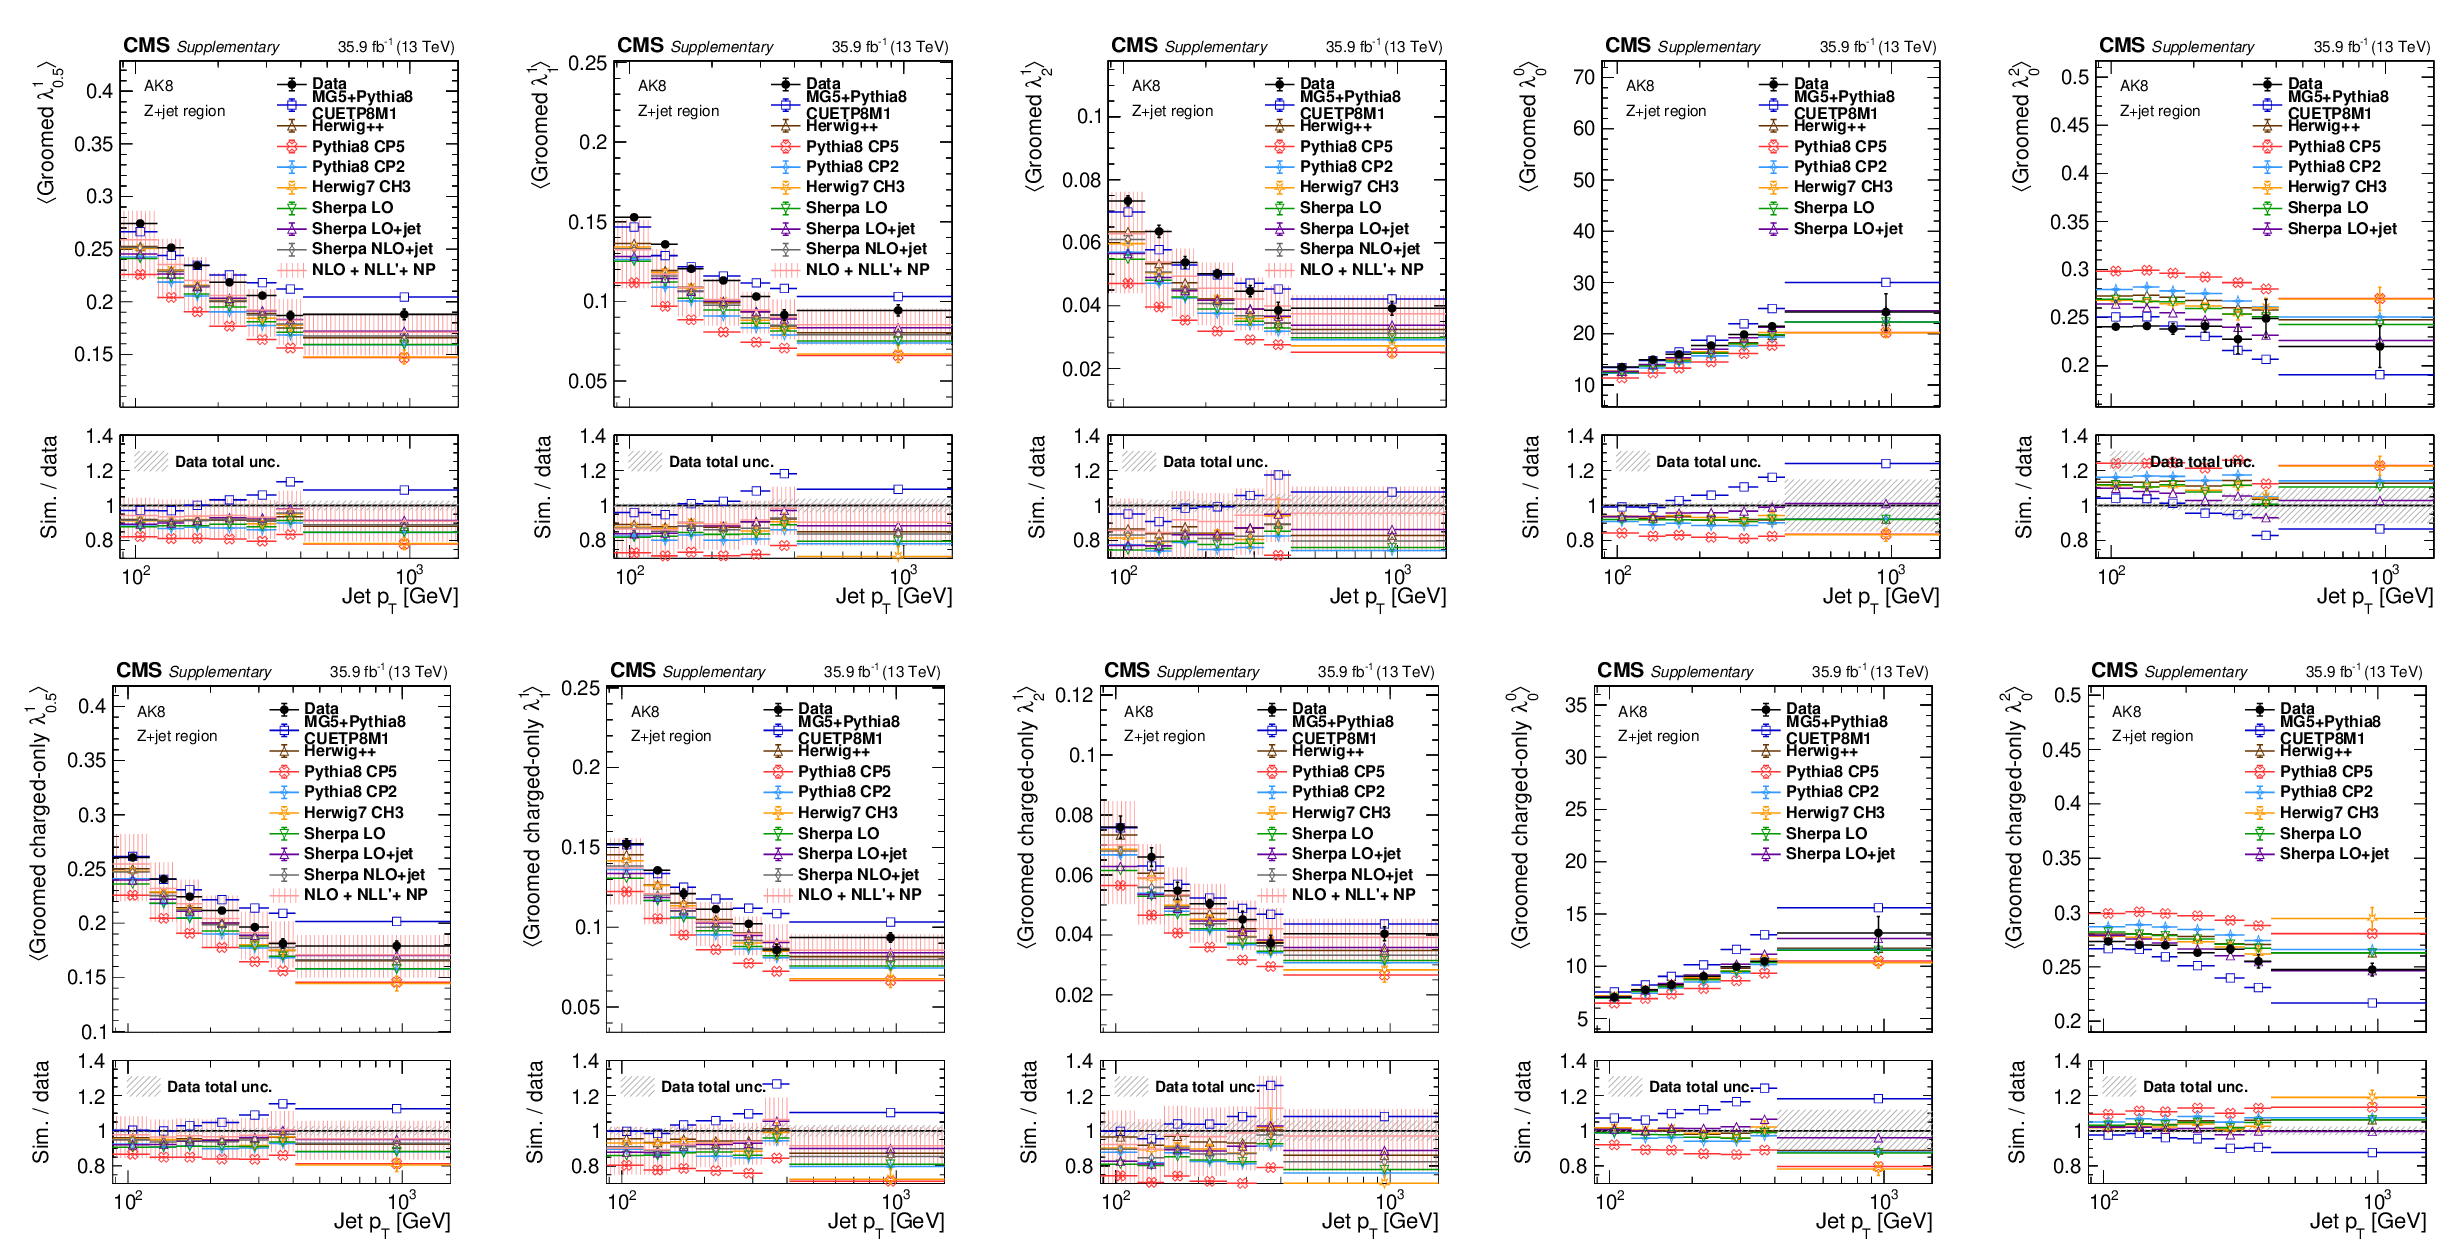
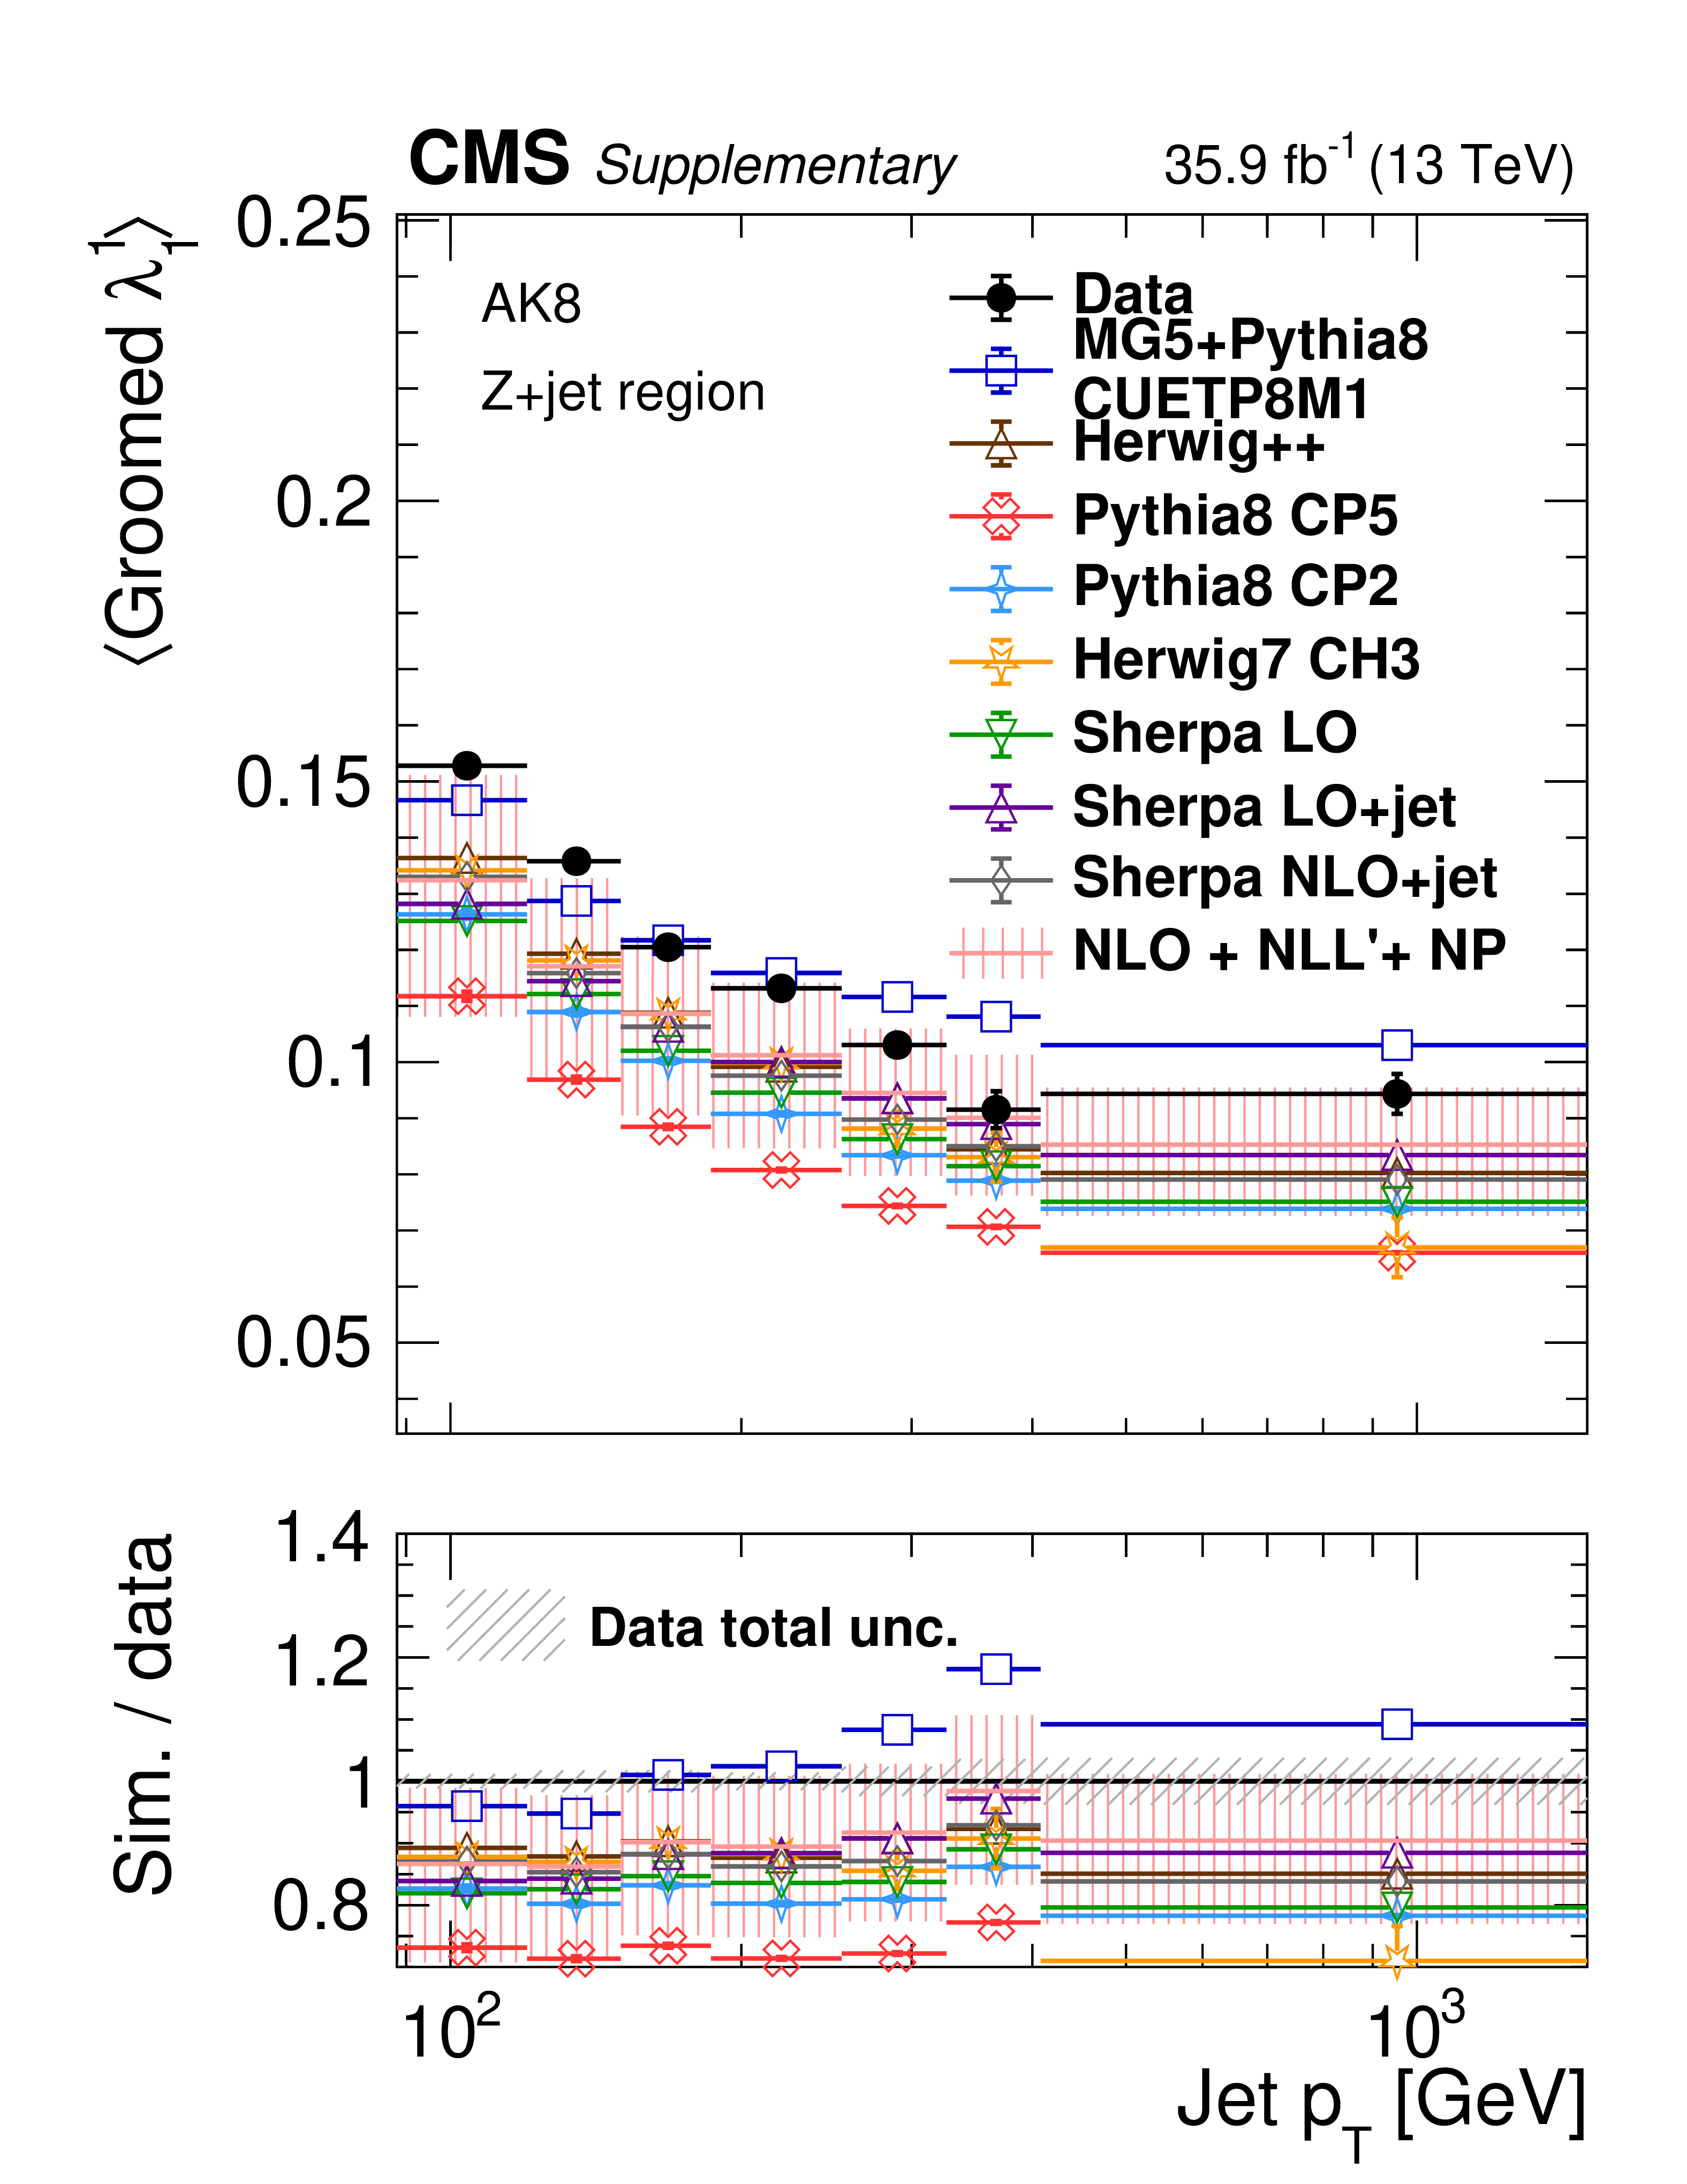
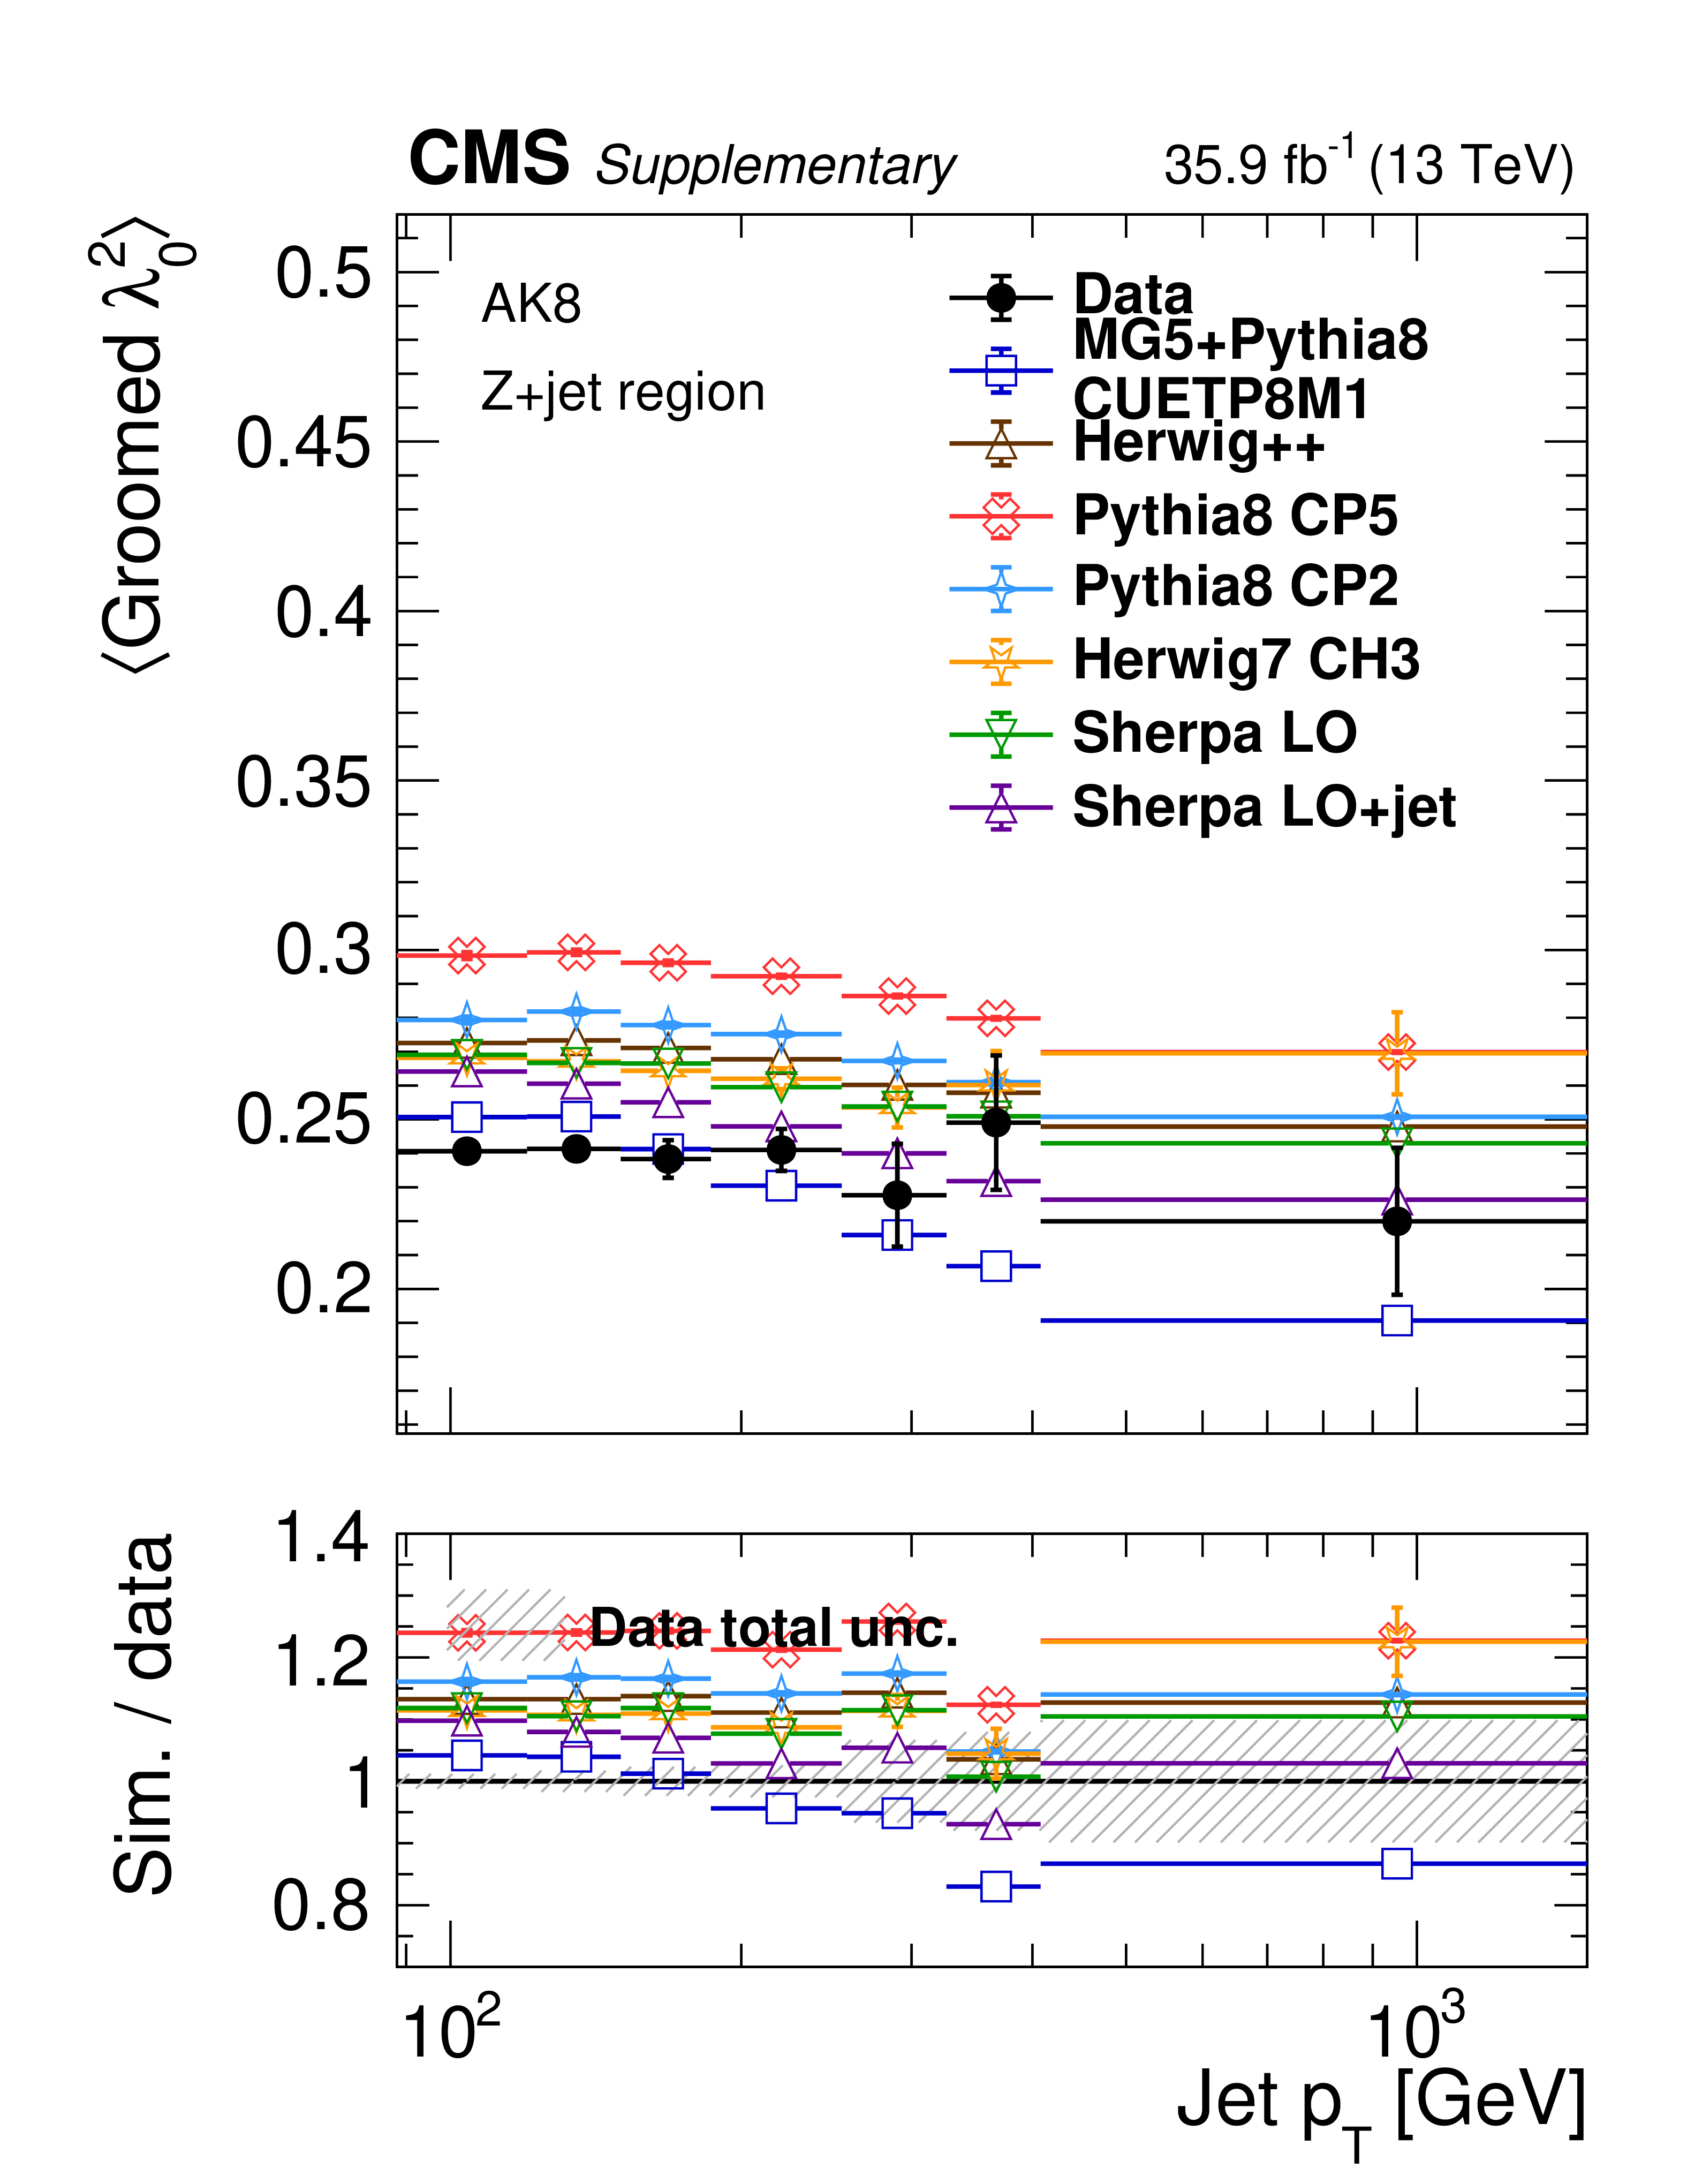
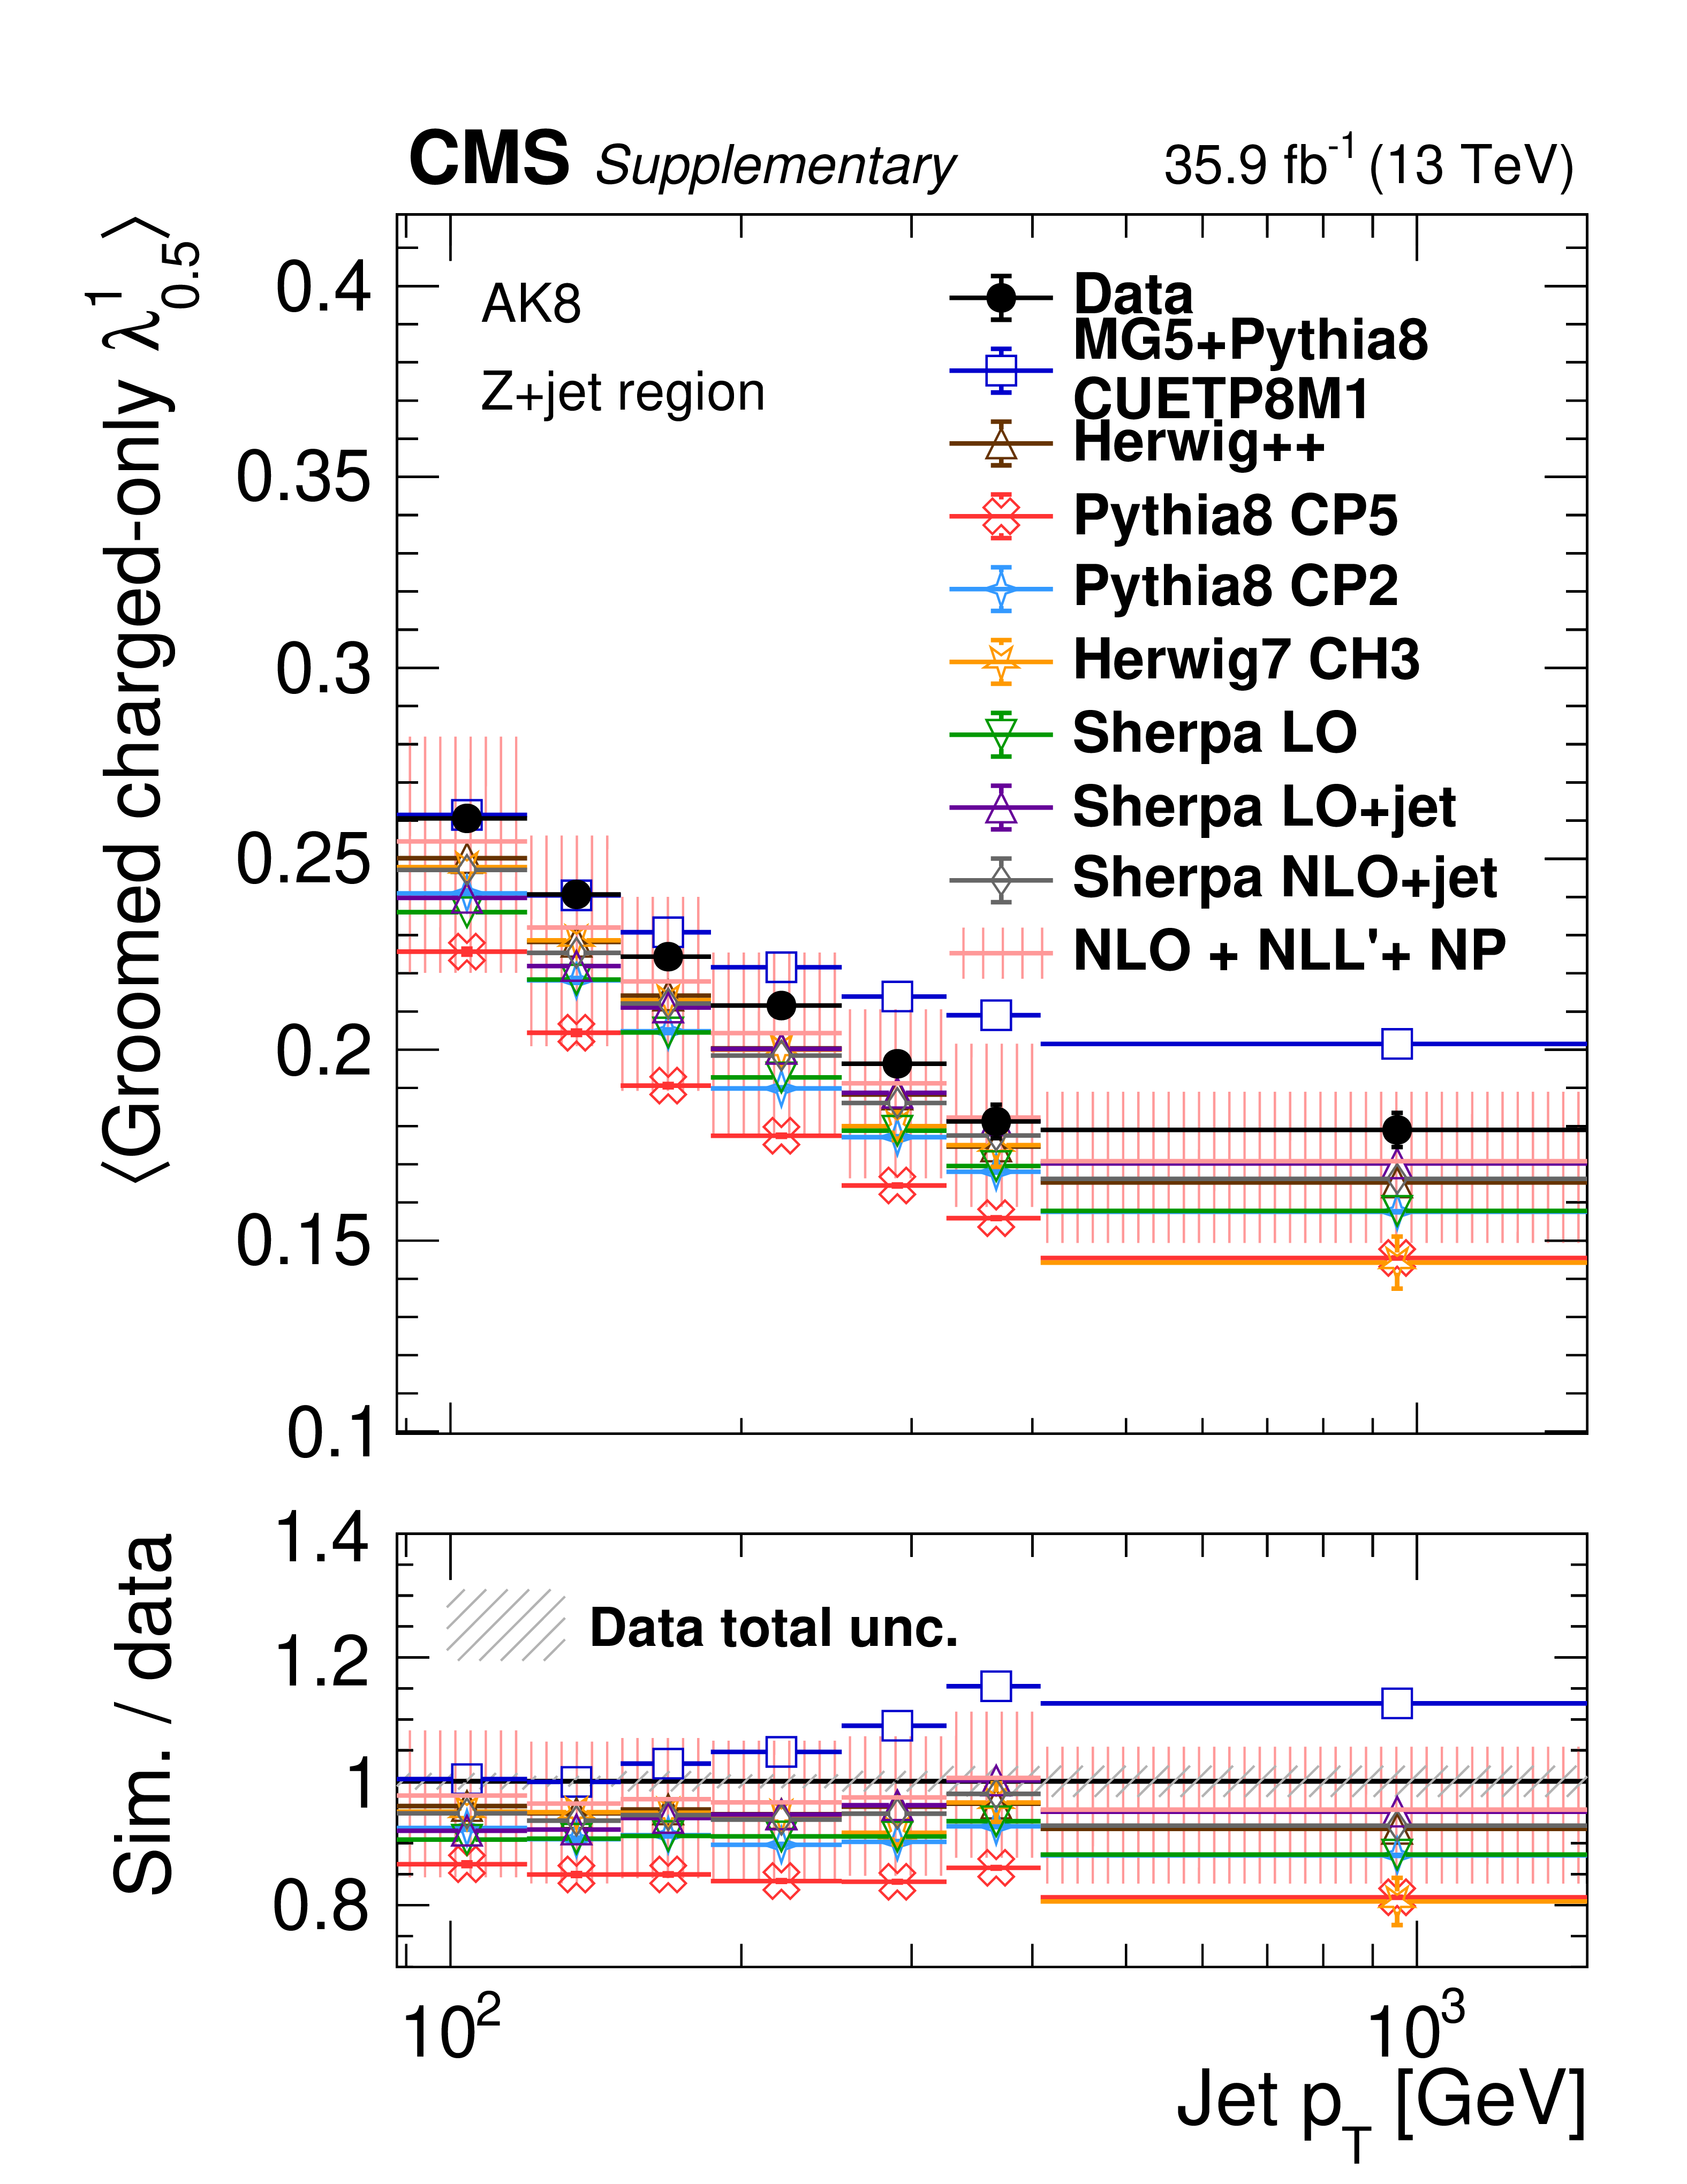
Plots of distribution mean for ungroomed AK8 jets in the Z+jet region, comparing unfolded data to MC. Upper row is charged+neutral variables, lower row is charged-only variables. |

png pdf |
Additional Figure 23-a:
Plots of distribution mean for ungroomed AK8 jets in the Z+jet region, comparing unfolded data to MC. Upper row is charged+neutral variables, lower row is charged-only variables. |

png pdf |
Additional Figure 23-b:
Plots of distribution mean for ungroomed AK8 jets in the Z+jet region, comparing unfolded data to MC. Upper row is charged+neutral variables, lower row is charged-only variables. |

png pdf |
Additional Figure 23-c:
Plots of distribution mean for ungroomed AK8 jets in the Z+jet region, comparing unfolded data to MC. Upper row is charged+neutral variables, lower row is charged-only variables. |

png pdf |
Additional Figure 23-d:
Plots of distribution mean for ungroomed AK8 jets in the Z+jet region, comparing unfolded data to MC. Upper row is charged+neutral variables, lower row is charged-only variables. |
png pdf |
Additional Figure 23-e:
Plots of distribution mean for ungroomed AK8 jets in the Z+jet region, comparing unfolded data to MC. Upper row is charged+neutral variables, lower row is charged-only variables. |
png pdf |
Additional Figure 23-f:
Plots of distribution mean for ungroomed AK8 jets in the Z+jet region, comparing unfolded data to MC. Upper row is charged+neutral variables, lower row is charged-only variables. |
png pdf |
Additional Figure 23-g:
Plots of distribution mean for ungroomed AK8 jets in the Z+jet region, comparing unfolded data to MC. Upper row is charged+neutral variables, lower row is charged-only variables. |

png pdf |
Additional Figure 23-h:
Plots of distribution mean for ungroomed AK8 jets in the Z+jet region, comparing unfolded data to MC. Upper row is charged+neutral variables, lower row is charged-only variables. |
png pdf |
Additional Figure 23-i:
Plots of distribution mean for ungroomed AK8 jets in the Z+jet region, comparing unfolded data to MC. Upper row is charged+neutral variables, lower row is charged-only variables. |
png pdf |
Additional Figure 23-j:
Plots of distribution mean for ungroomed AK8 jets in the Z+jet region, comparing unfolded data to MC. Upper row is charged+neutral variables, lower row is charged-only variables. |

png pdf |
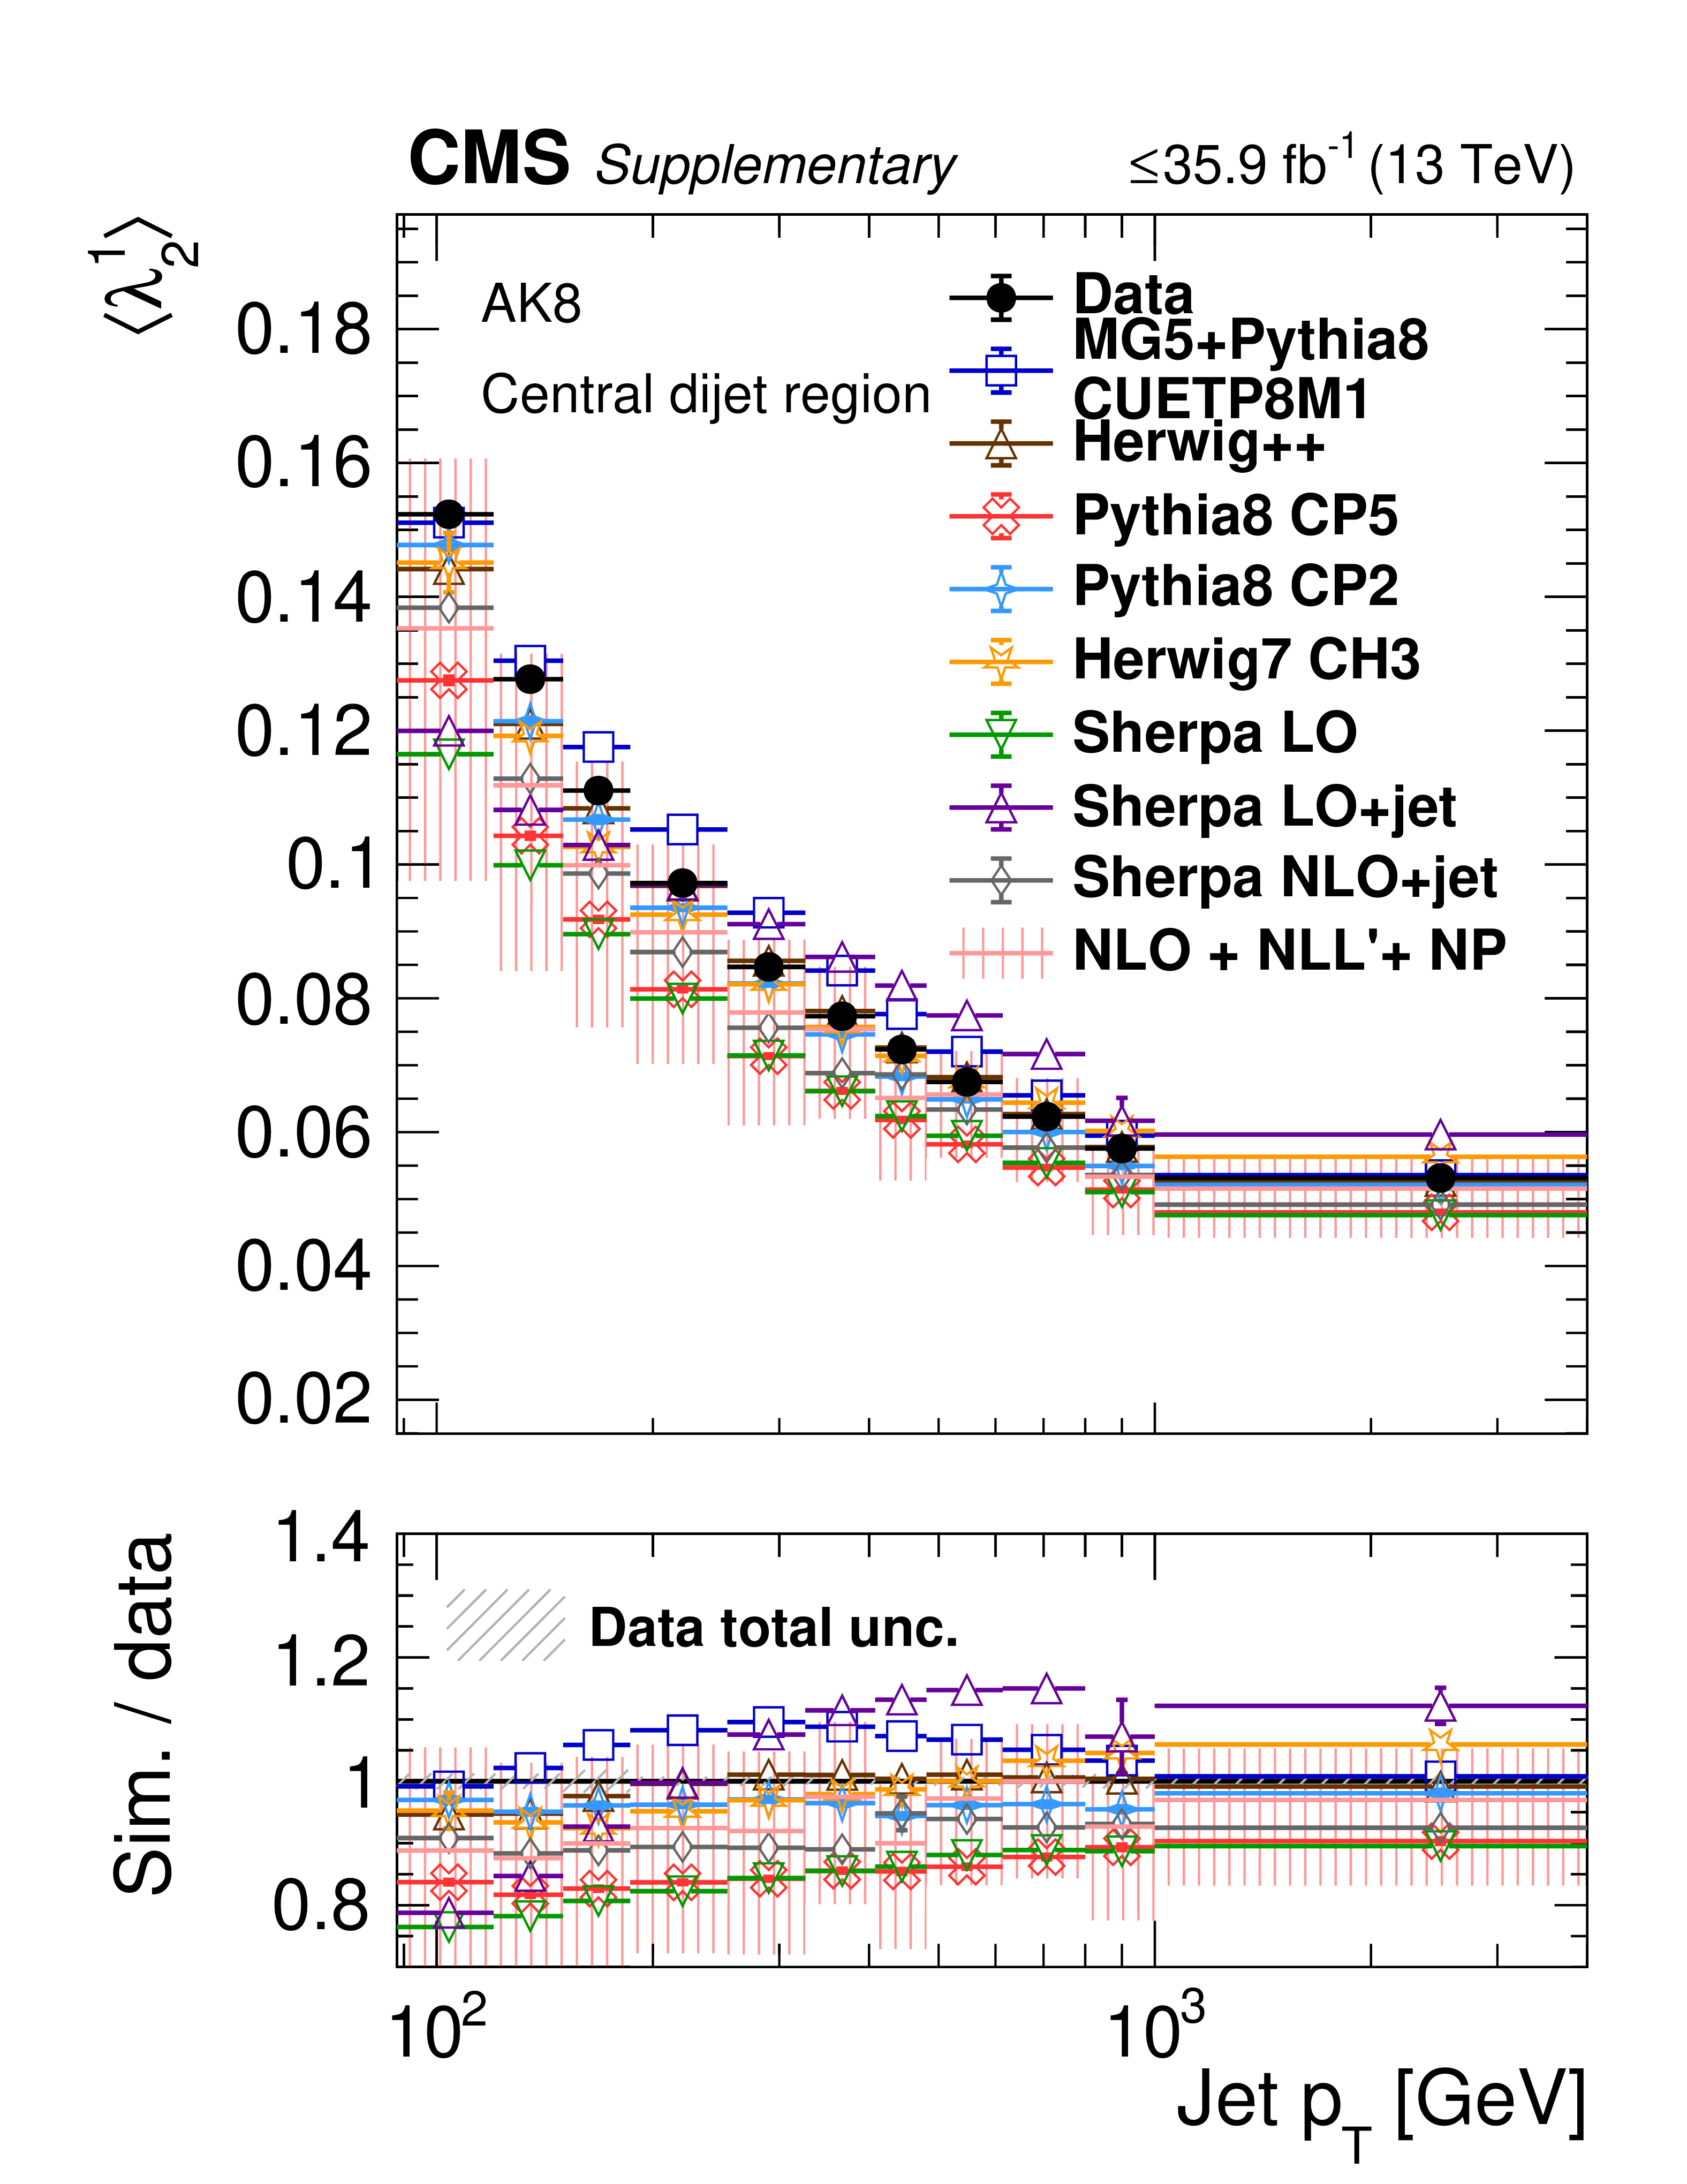
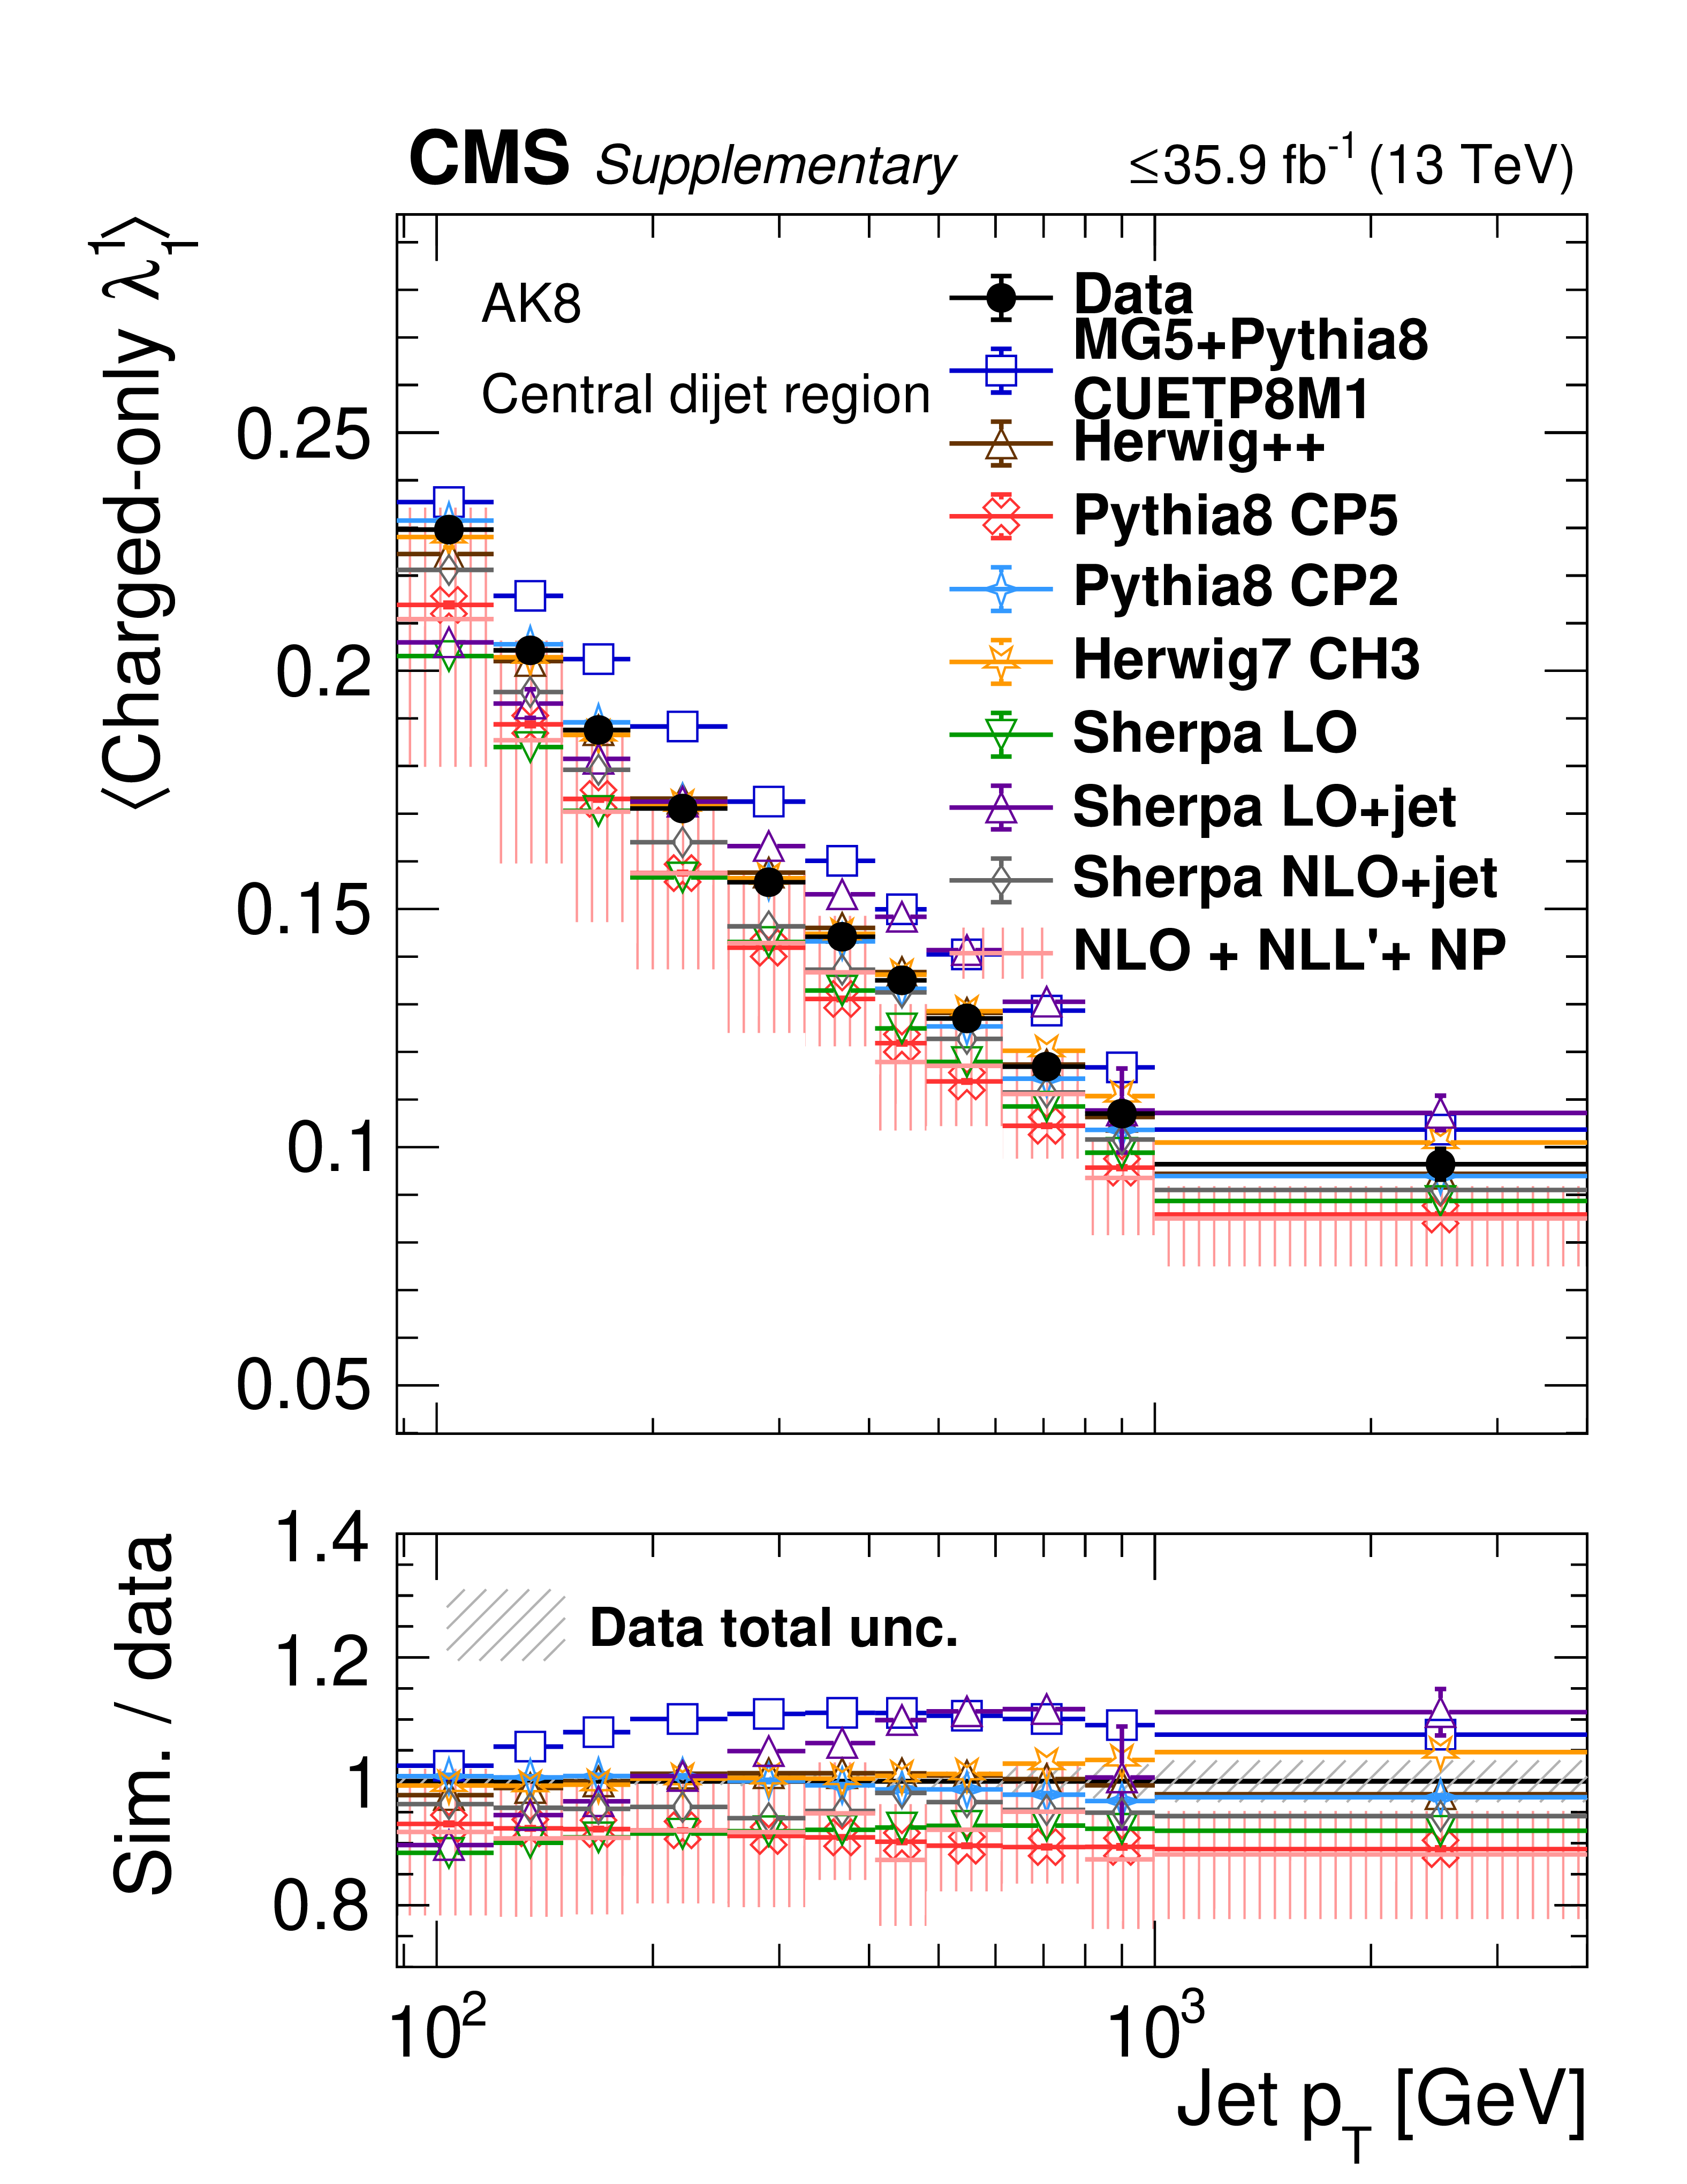
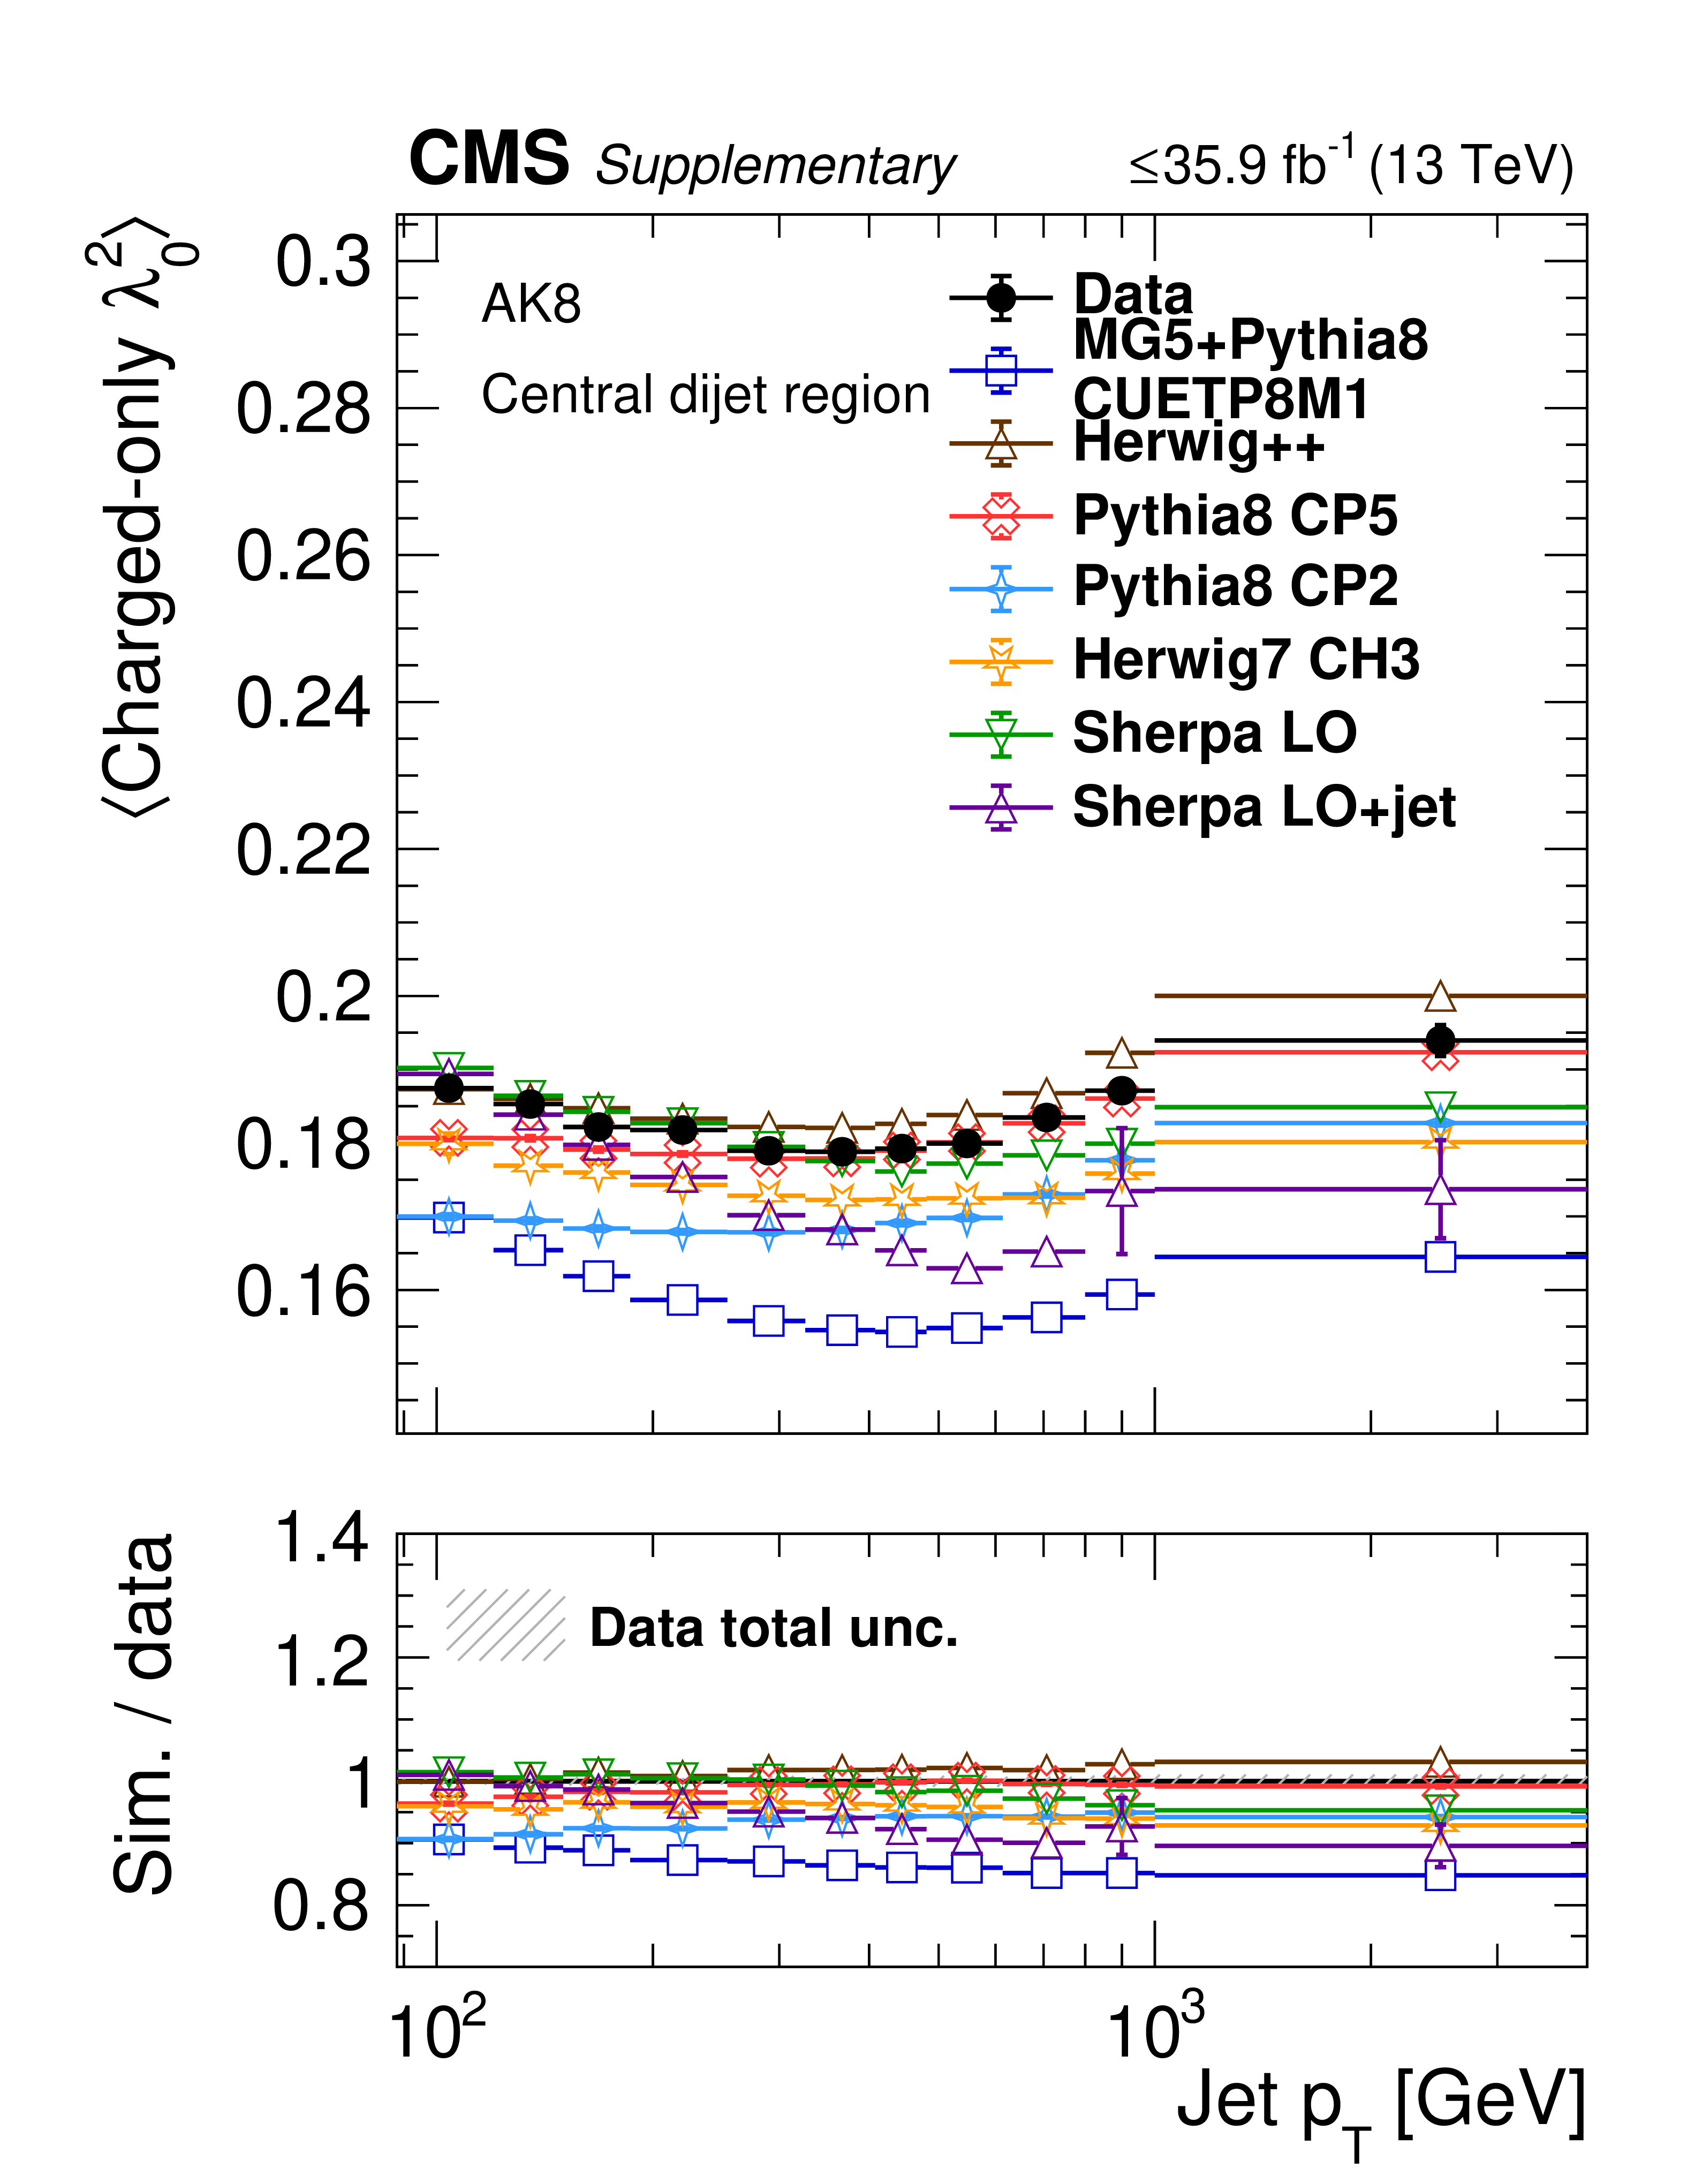
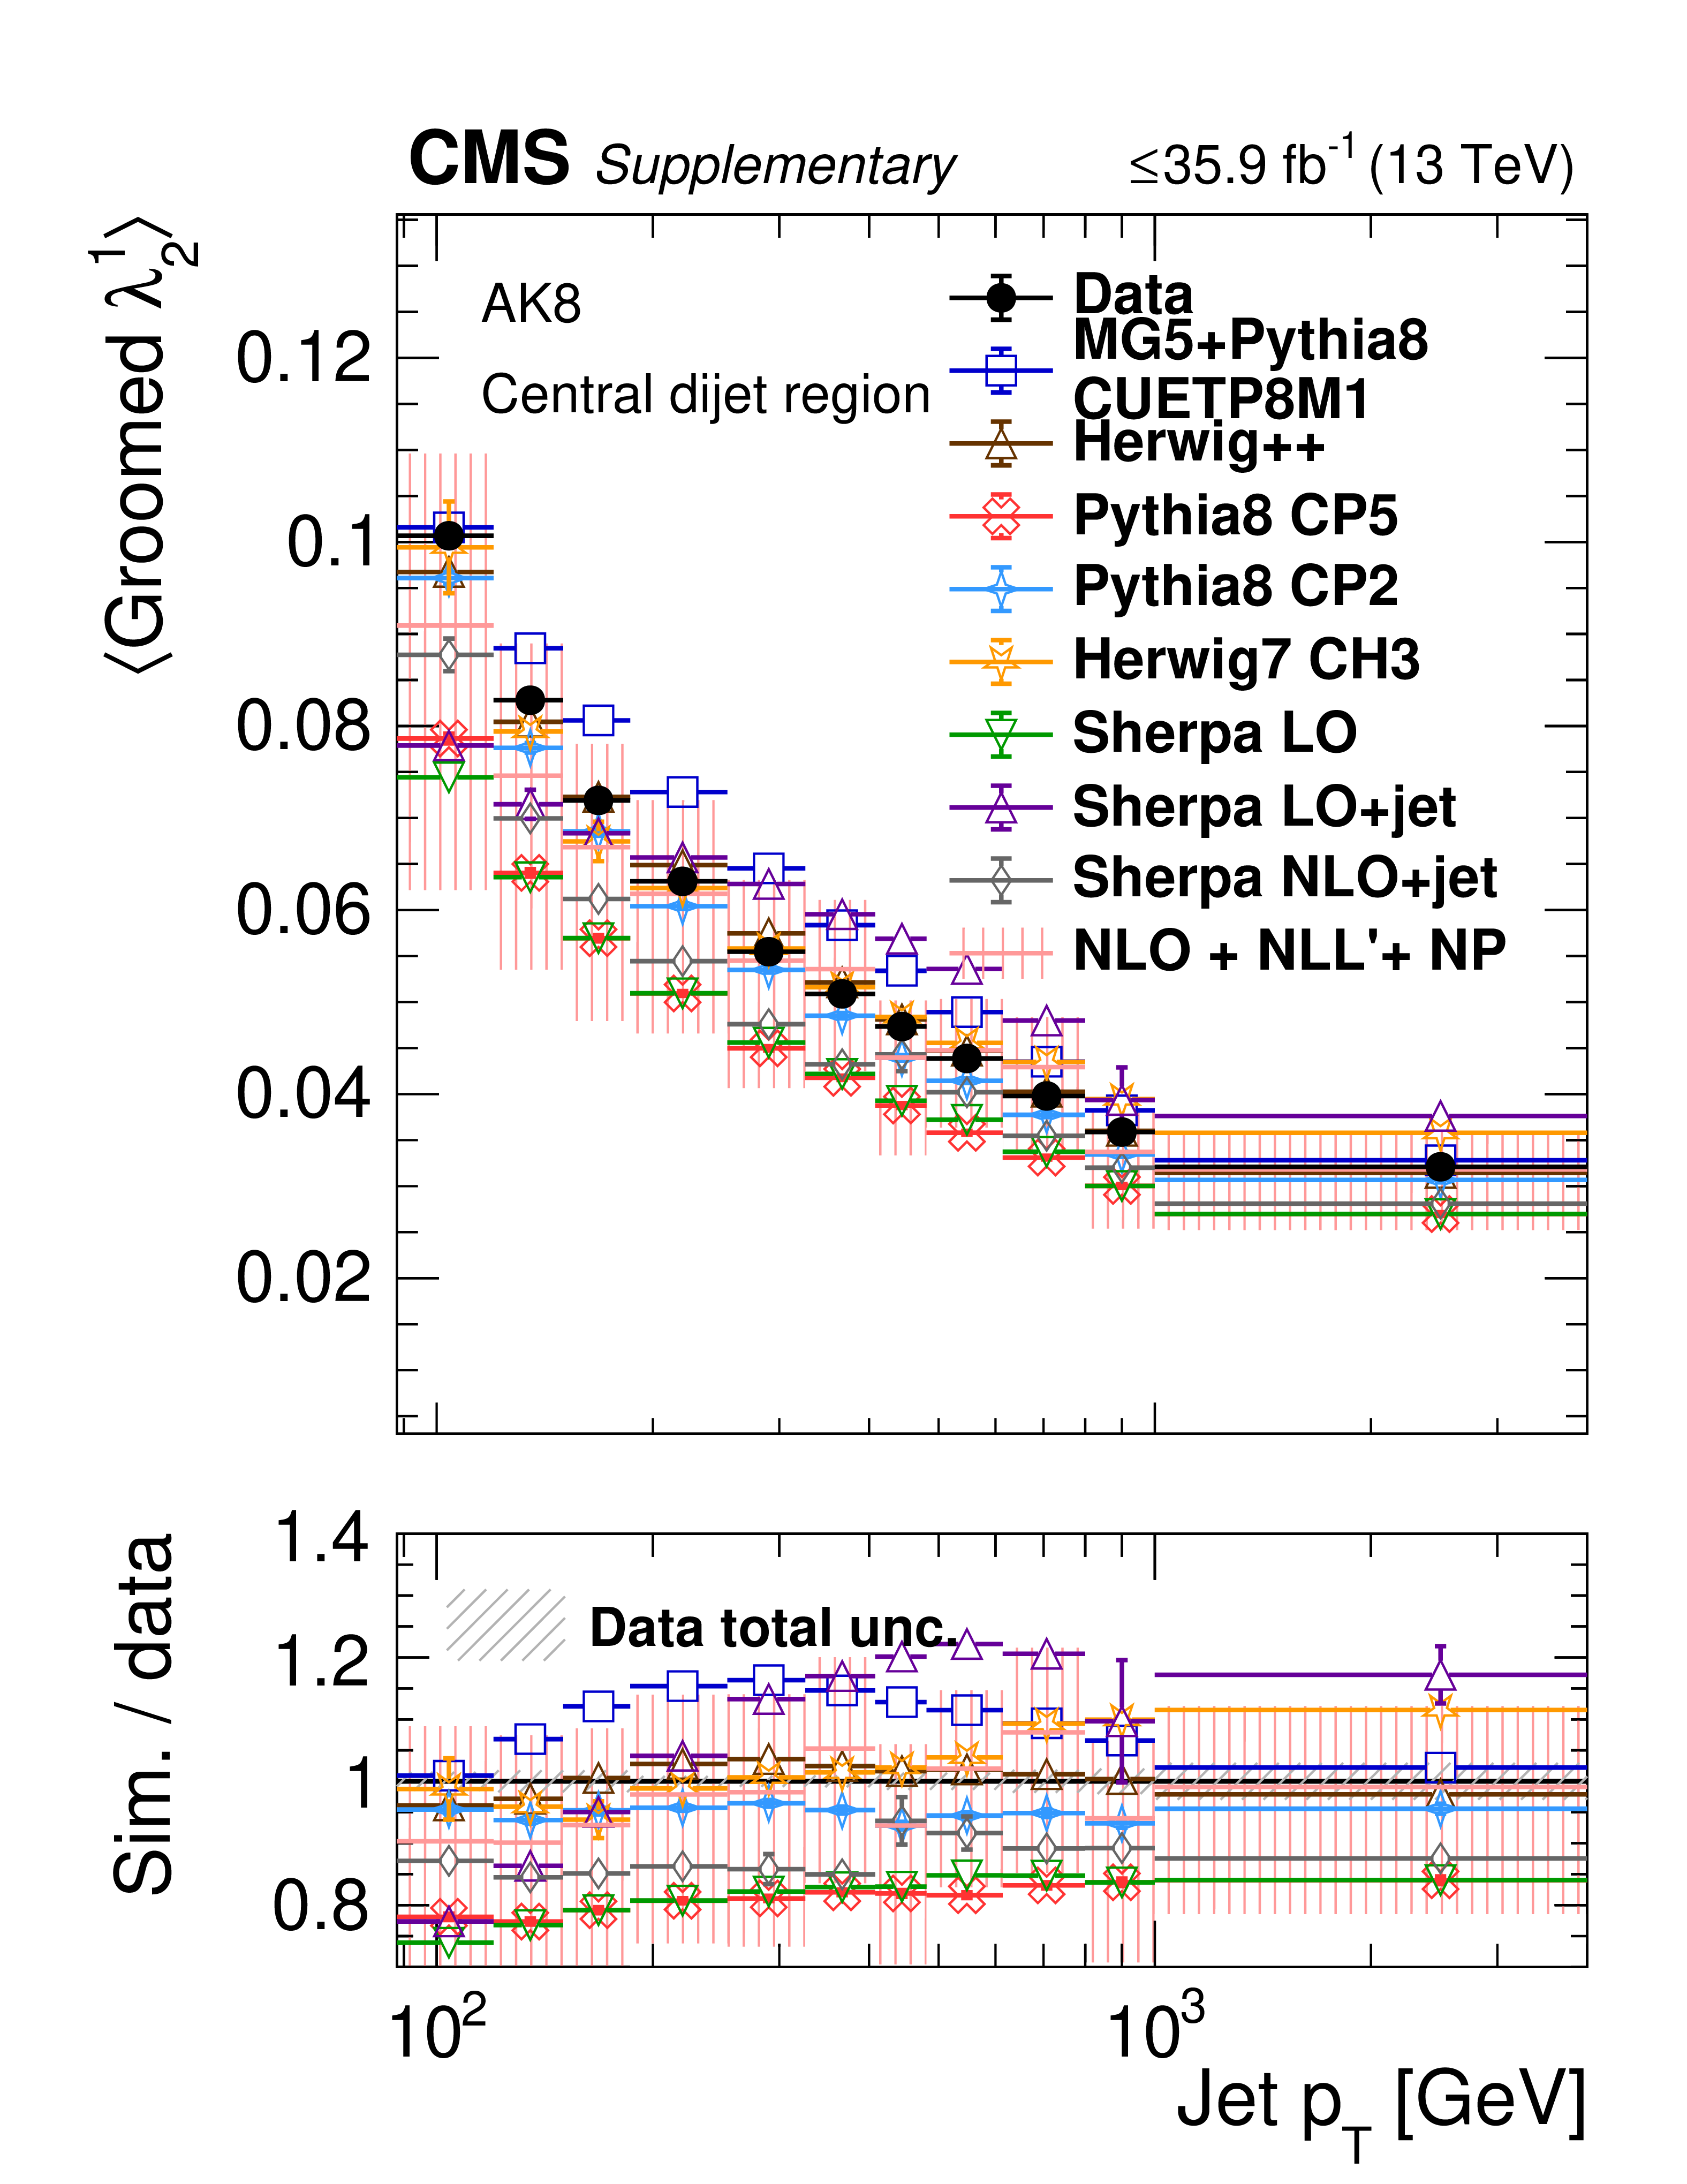
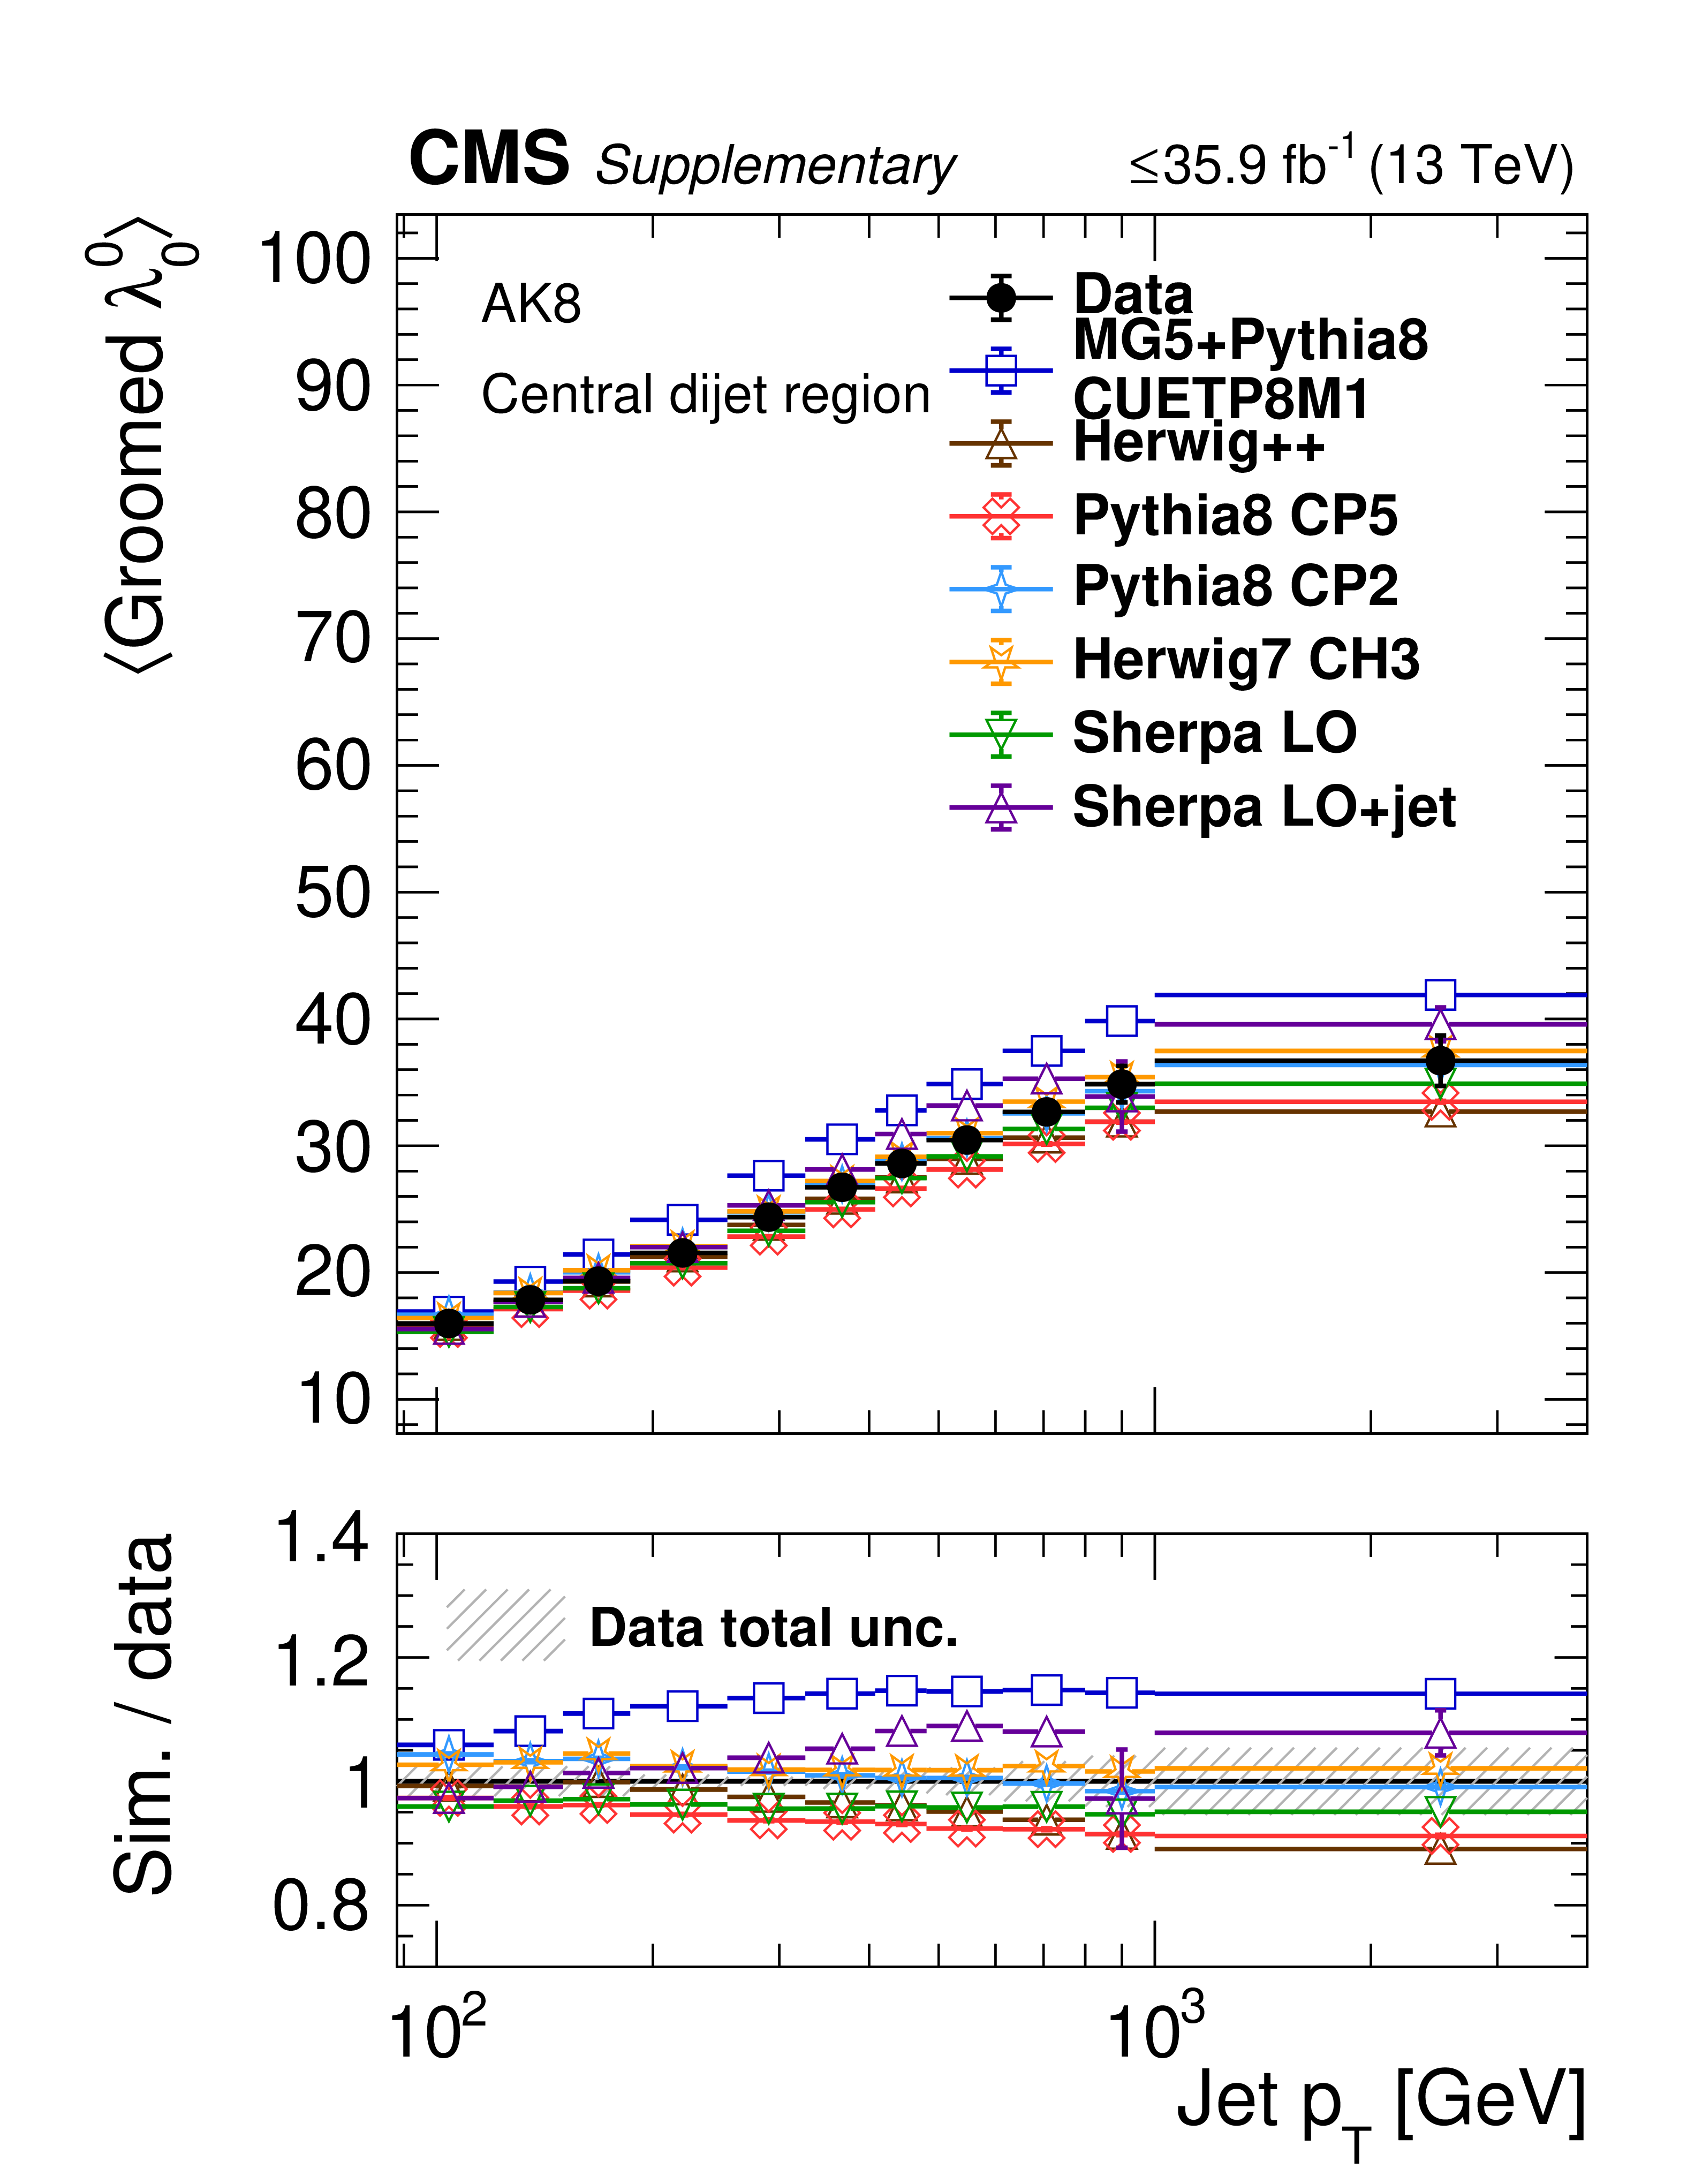
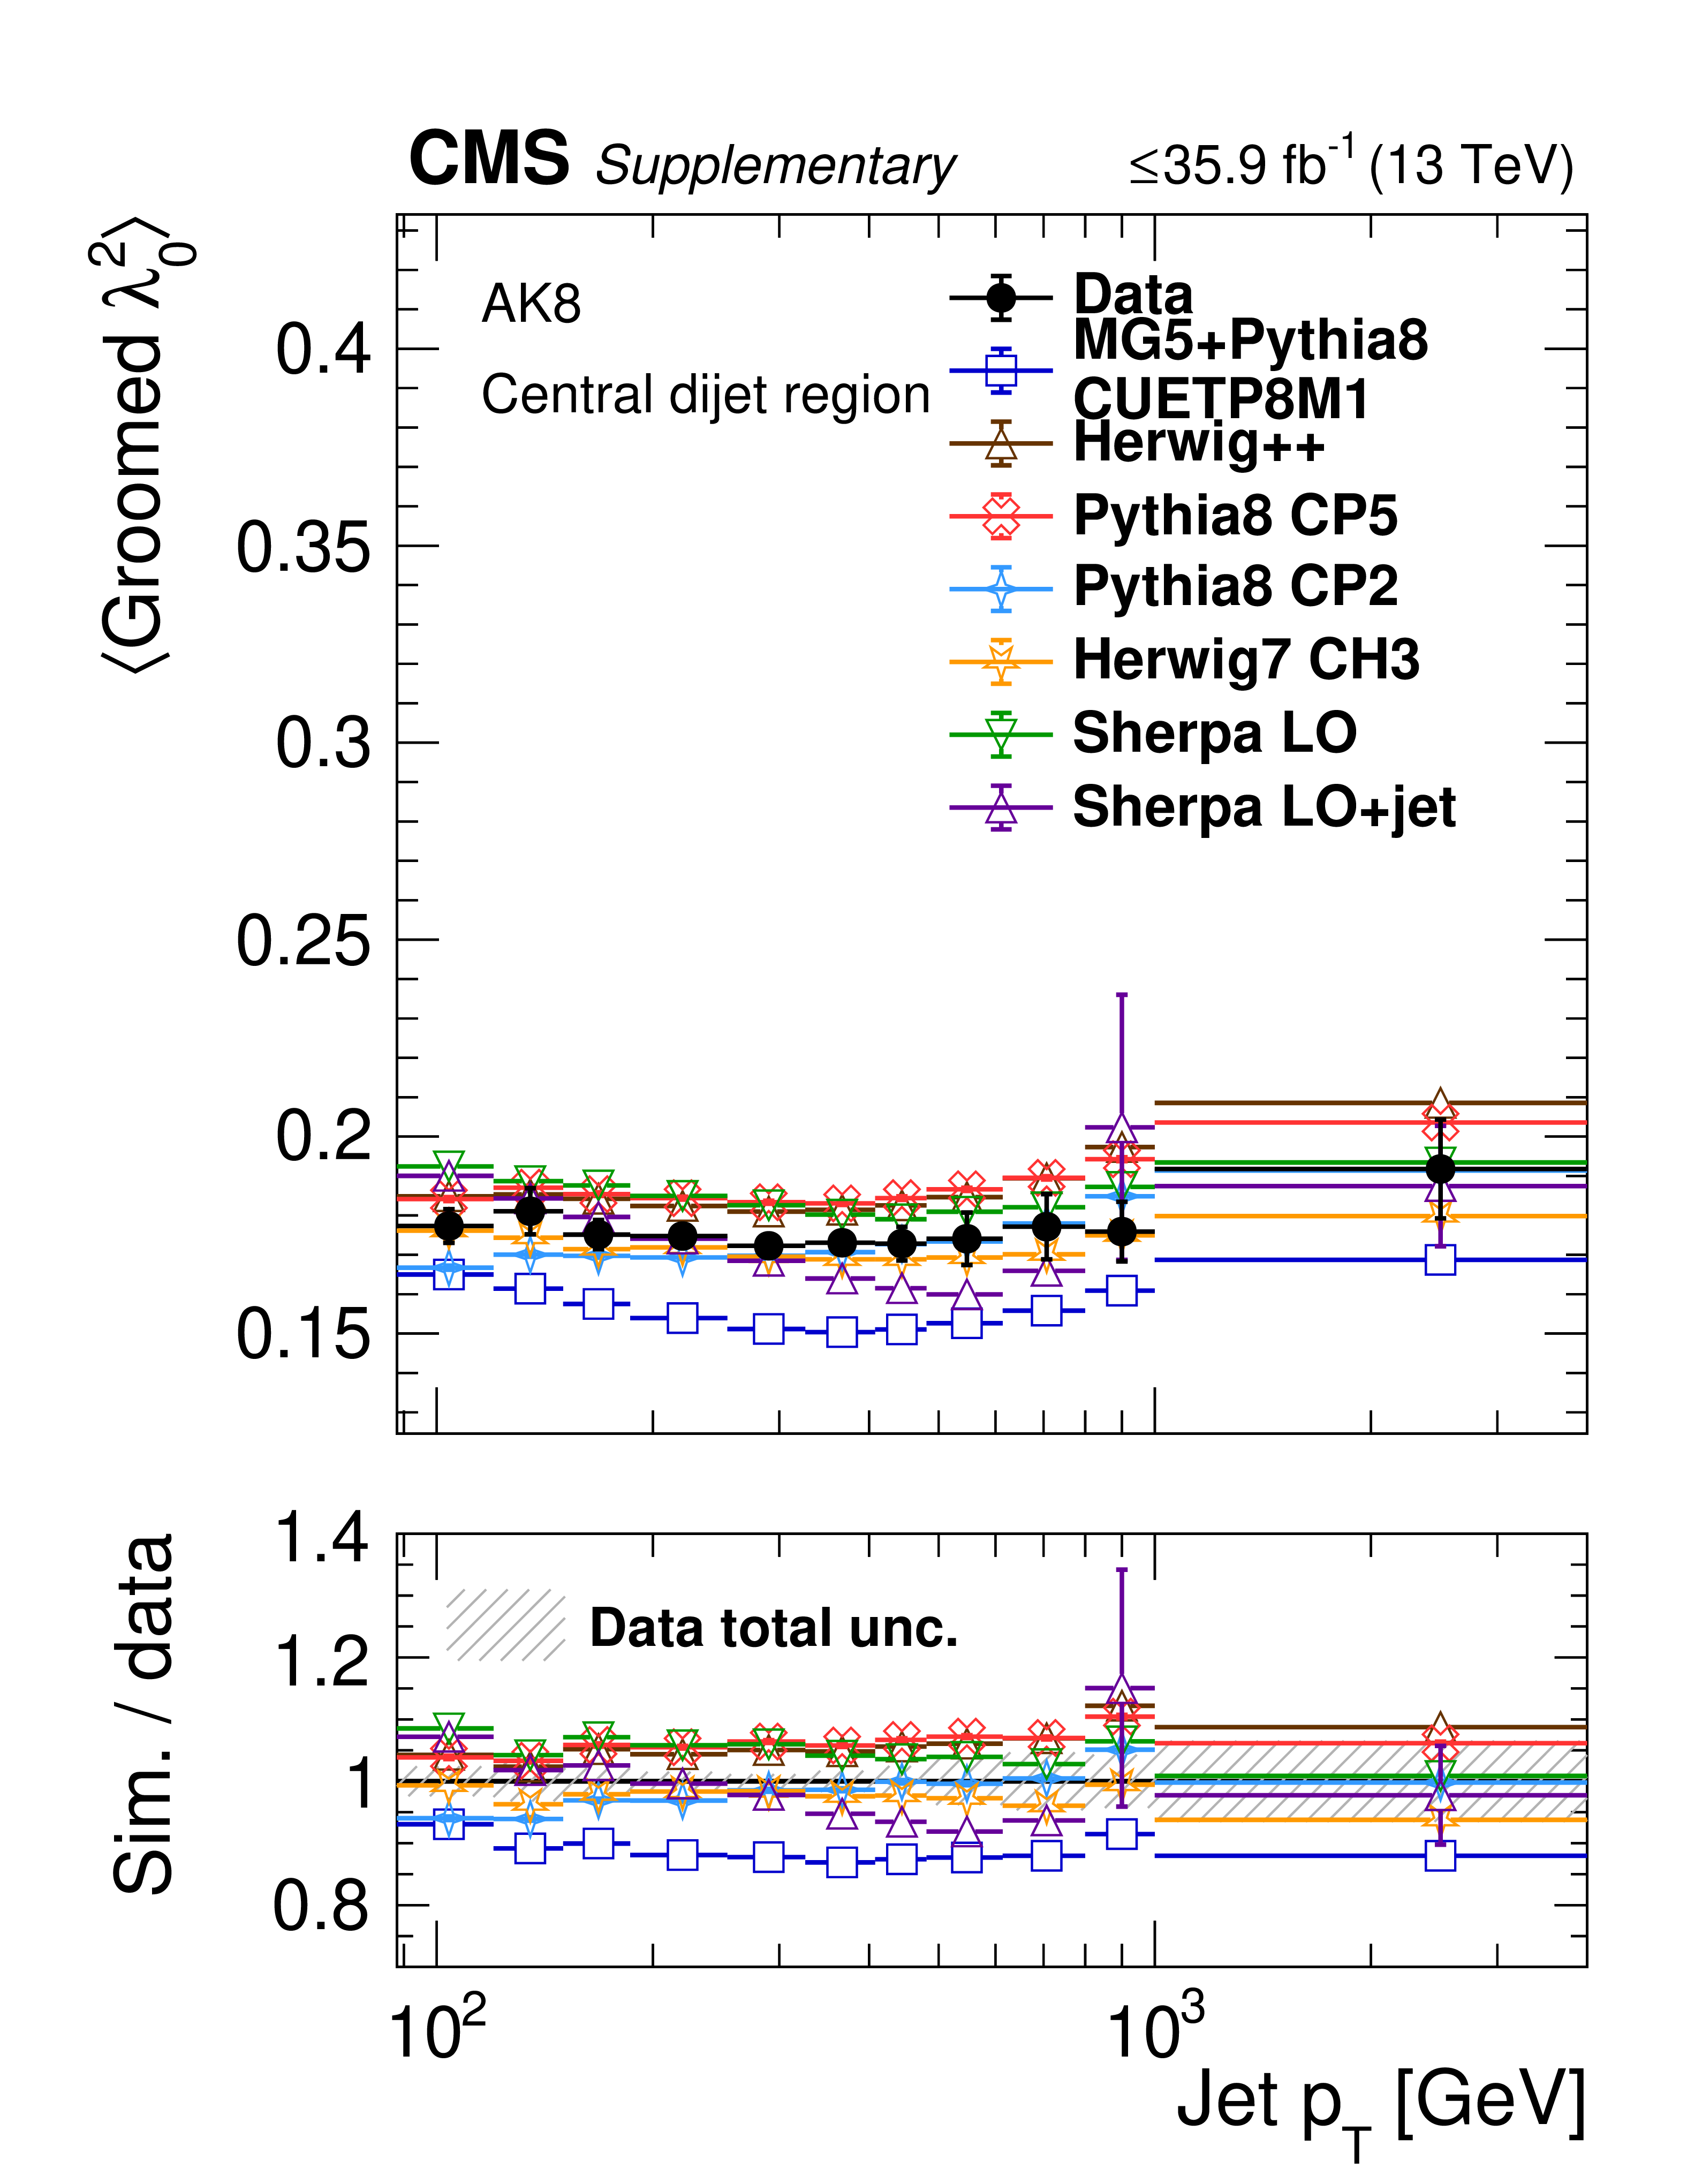
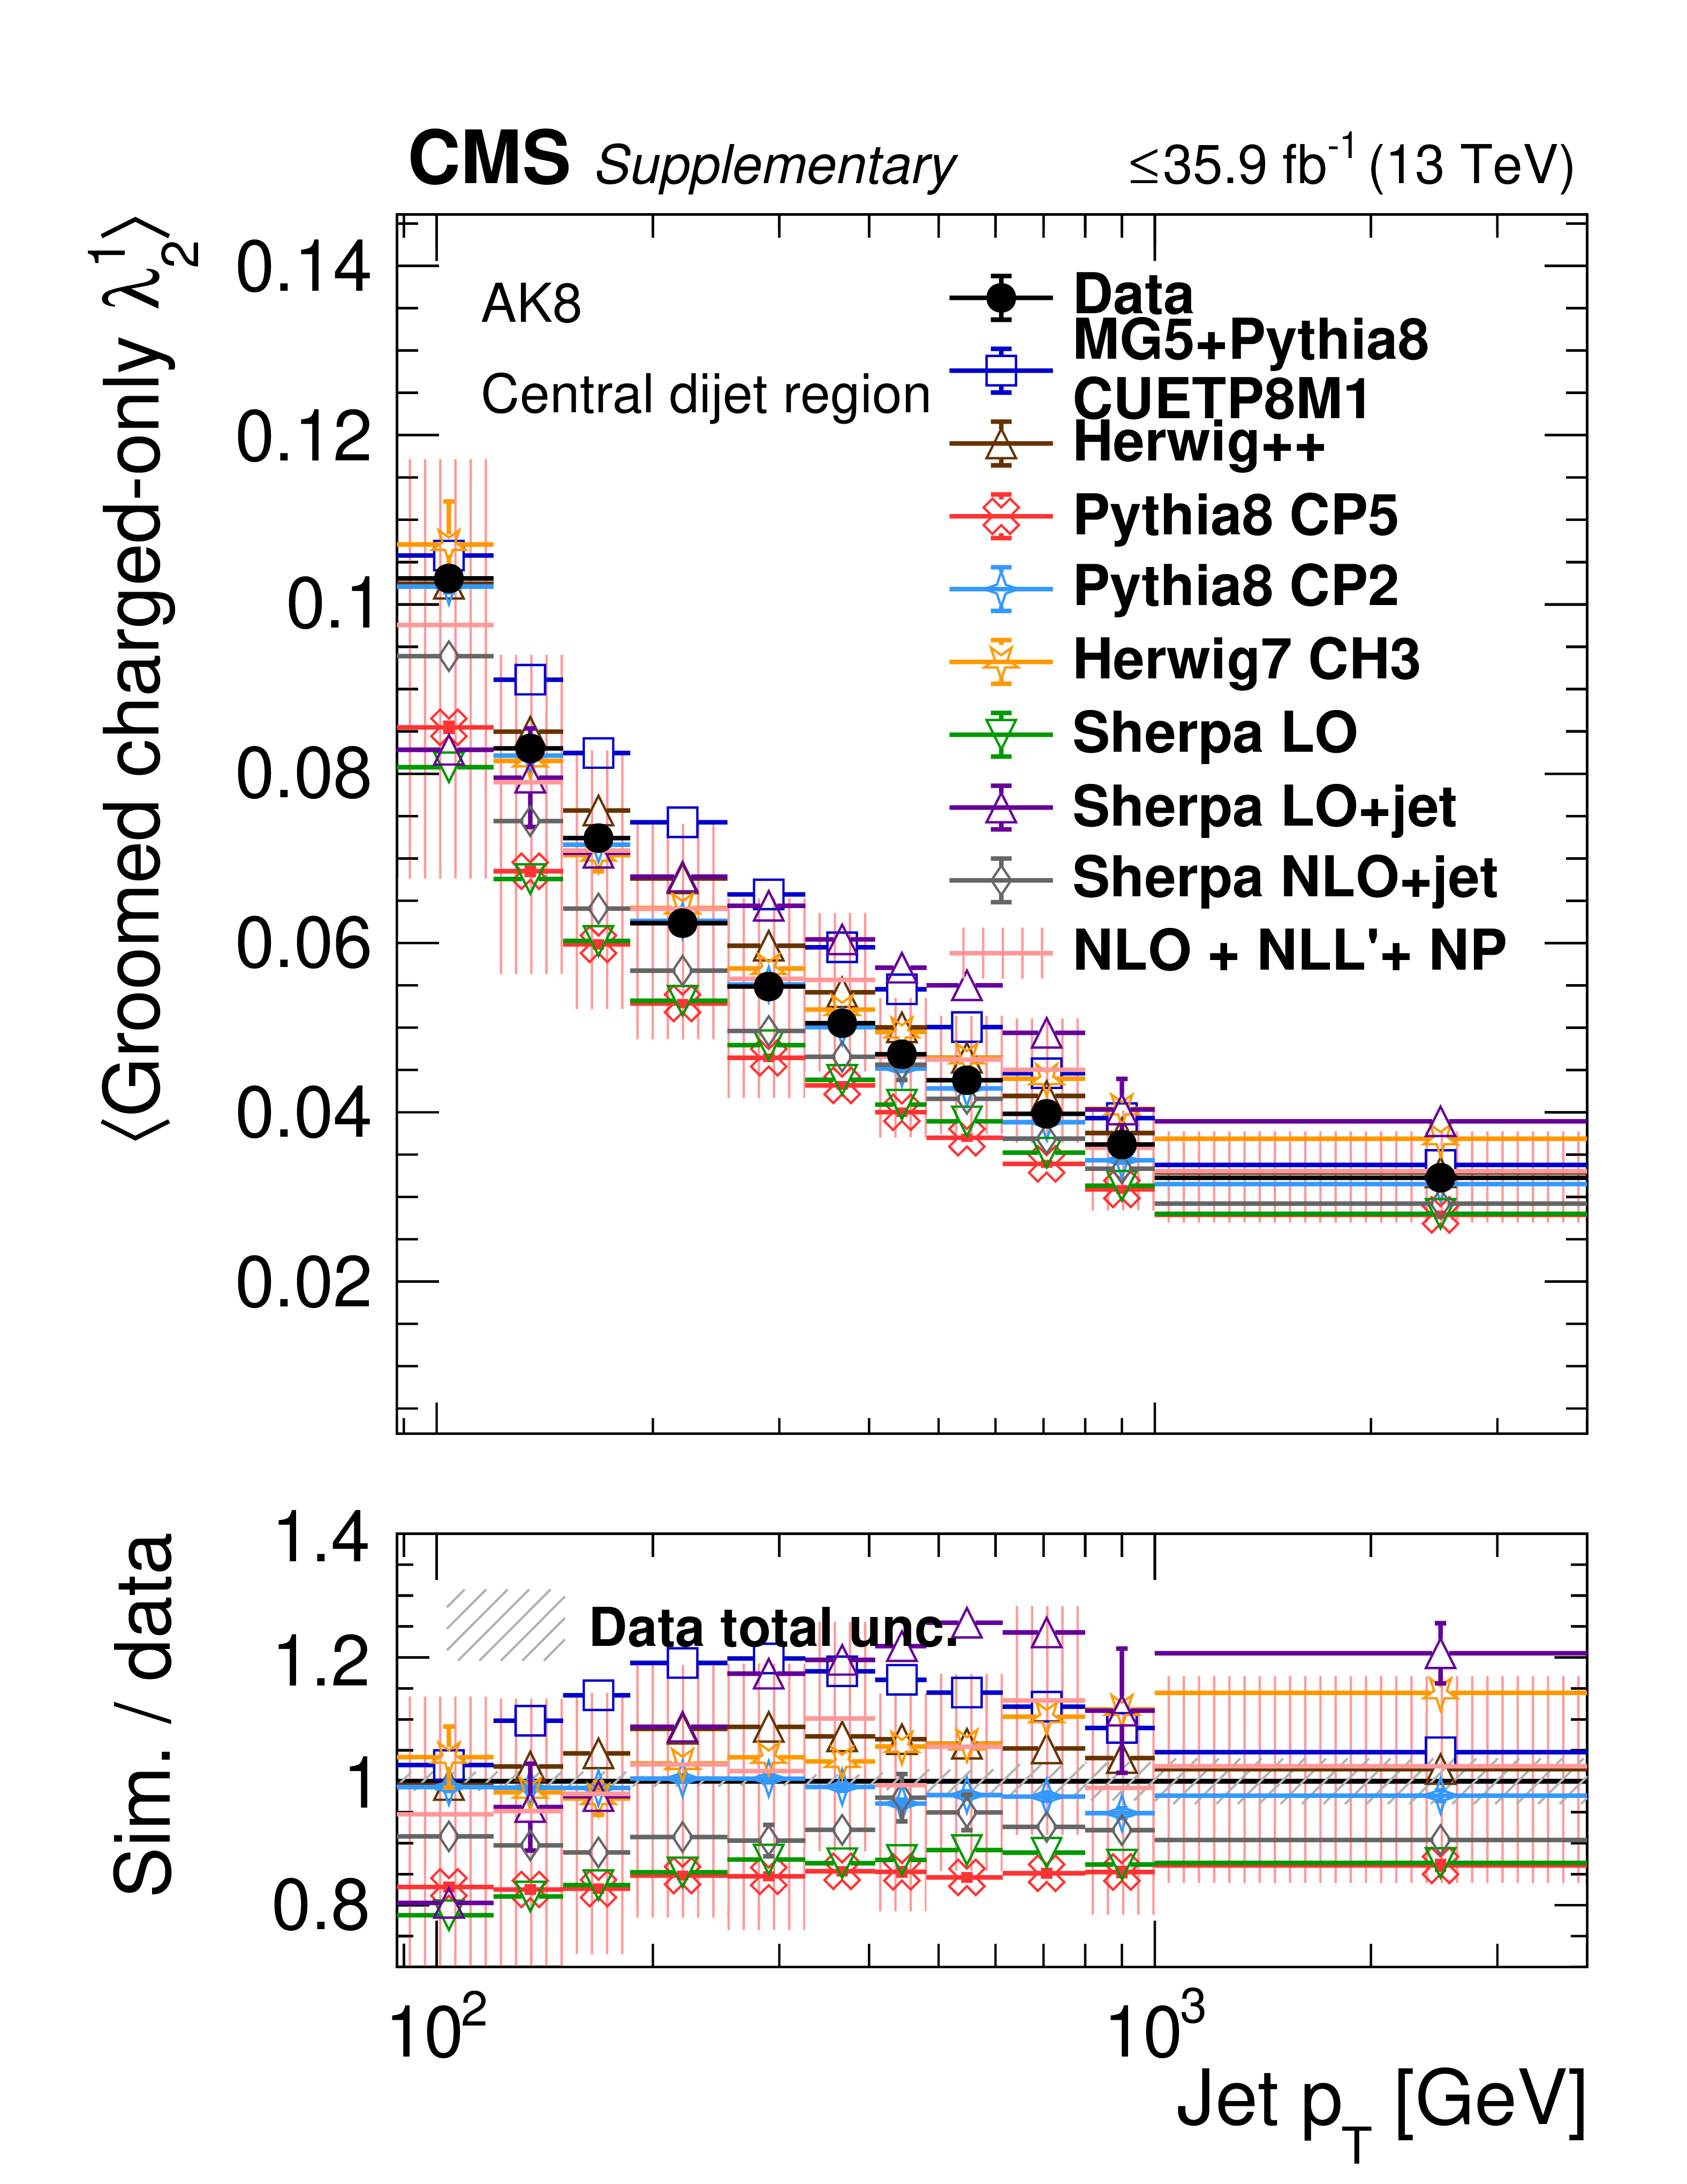
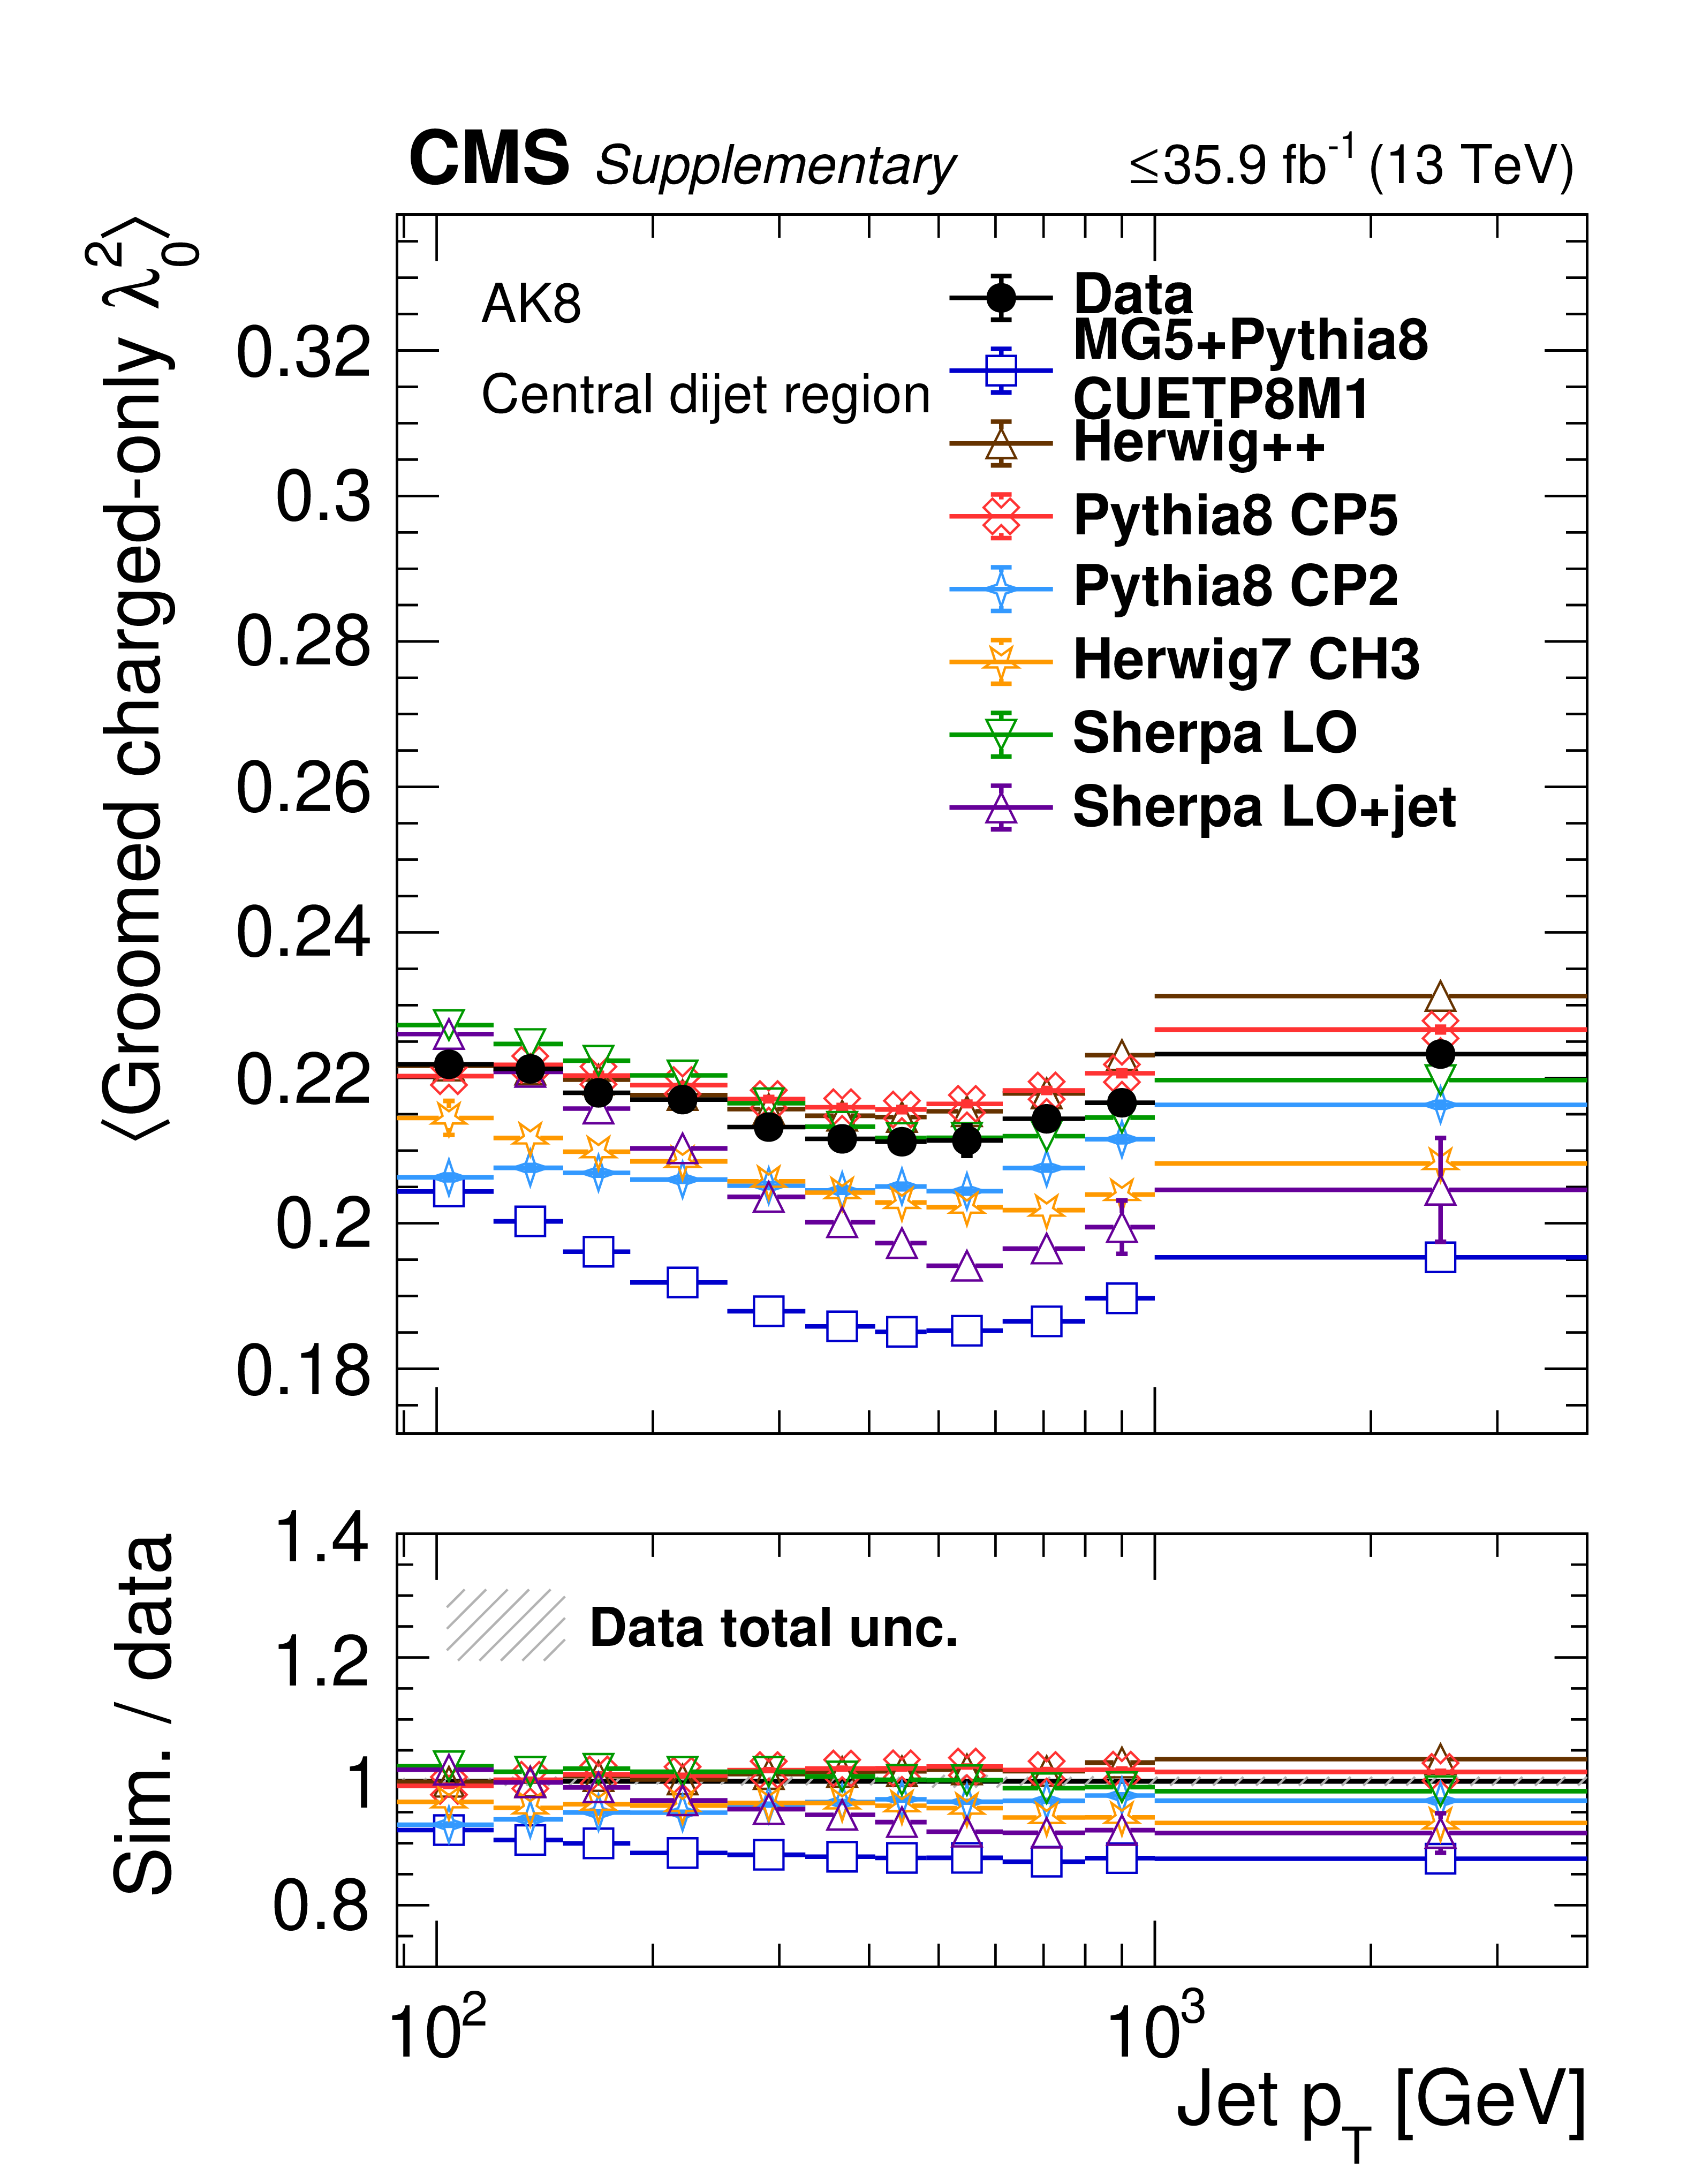
Additional Figure 24:
Plots of distribution mean for ungroomed AK8 jets in the central dijet region, comparing unfolded data to MC. Upper row is charged+neutral variables, lower row is charged-only variables. |

png pdf |
Additional Figure 24-a:
Plots of distribution mean for ungroomed AK8 jets in the central dijet region, comparing unfolded data to MC. Upper row is charged+neutral variables, lower row is charged-only variables. |

png pdf |
Additional Figure 24-b:
Plots of distribution mean for ungroomed AK8 jets in the central dijet region, comparing unfolded data to MC. Upper row is charged+neutral variables, lower row is charged-only variables. |
png pdf |
Additional Figure 24-c:
Plots of distribution mean for ungroomed AK8 jets in the central dijet region, comparing unfolded data to MC. Upper row is charged+neutral variables, lower row is charged-only variables. |

png pdf |
Additional Figure 24-d:
Plots of distribution mean for ungroomed AK8 jets in the central dijet region, comparing unfolded data to MC. Upper row is charged+neutral variables, lower row is charged-only variables. |

png pdf |
Additional Figure 24-e:
Plots of distribution mean for ungroomed AK8 jets in the central dijet region, comparing unfolded data to MC. Upper row is charged+neutral variables, lower row is charged-only variables. |

png pdf |
Additional Figure 24-f:
Plots of distribution mean for ungroomed AK8 jets in the central dijet region, comparing unfolded data to MC. Upper row is charged+neutral variables, lower row is charged-only variables. |
png pdf |
Additional Figure 24-g:
Plots of distribution mean for ungroomed AK8 jets in the central dijet region, comparing unfolded data to MC. Upper row is charged+neutral variables, lower row is charged-only variables. |

png pdf |
Additional Figure 24-h:
Plots of distribution mean for ungroomed AK8 jets in the central dijet region, comparing unfolded data to MC. Upper row is charged+neutral variables, lower row is charged-only variables. |

png pdf |
Additional Figure 24-i:
Plots of distribution mean for ungroomed AK8 jets in the central dijet region, comparing unfolded data to MC. Upper row is charged+neutral variables, lower row is charged-only variables. |
png pdf |
Additional Figure 24-j:
Plots of distribution mean for ungroomed AK8 jets in the central dijet region, comparing unfolded data to MC. Upper row is charged+neutral variables, lower row is charged-only variables. |
png pdf |
Additional Figure 25:
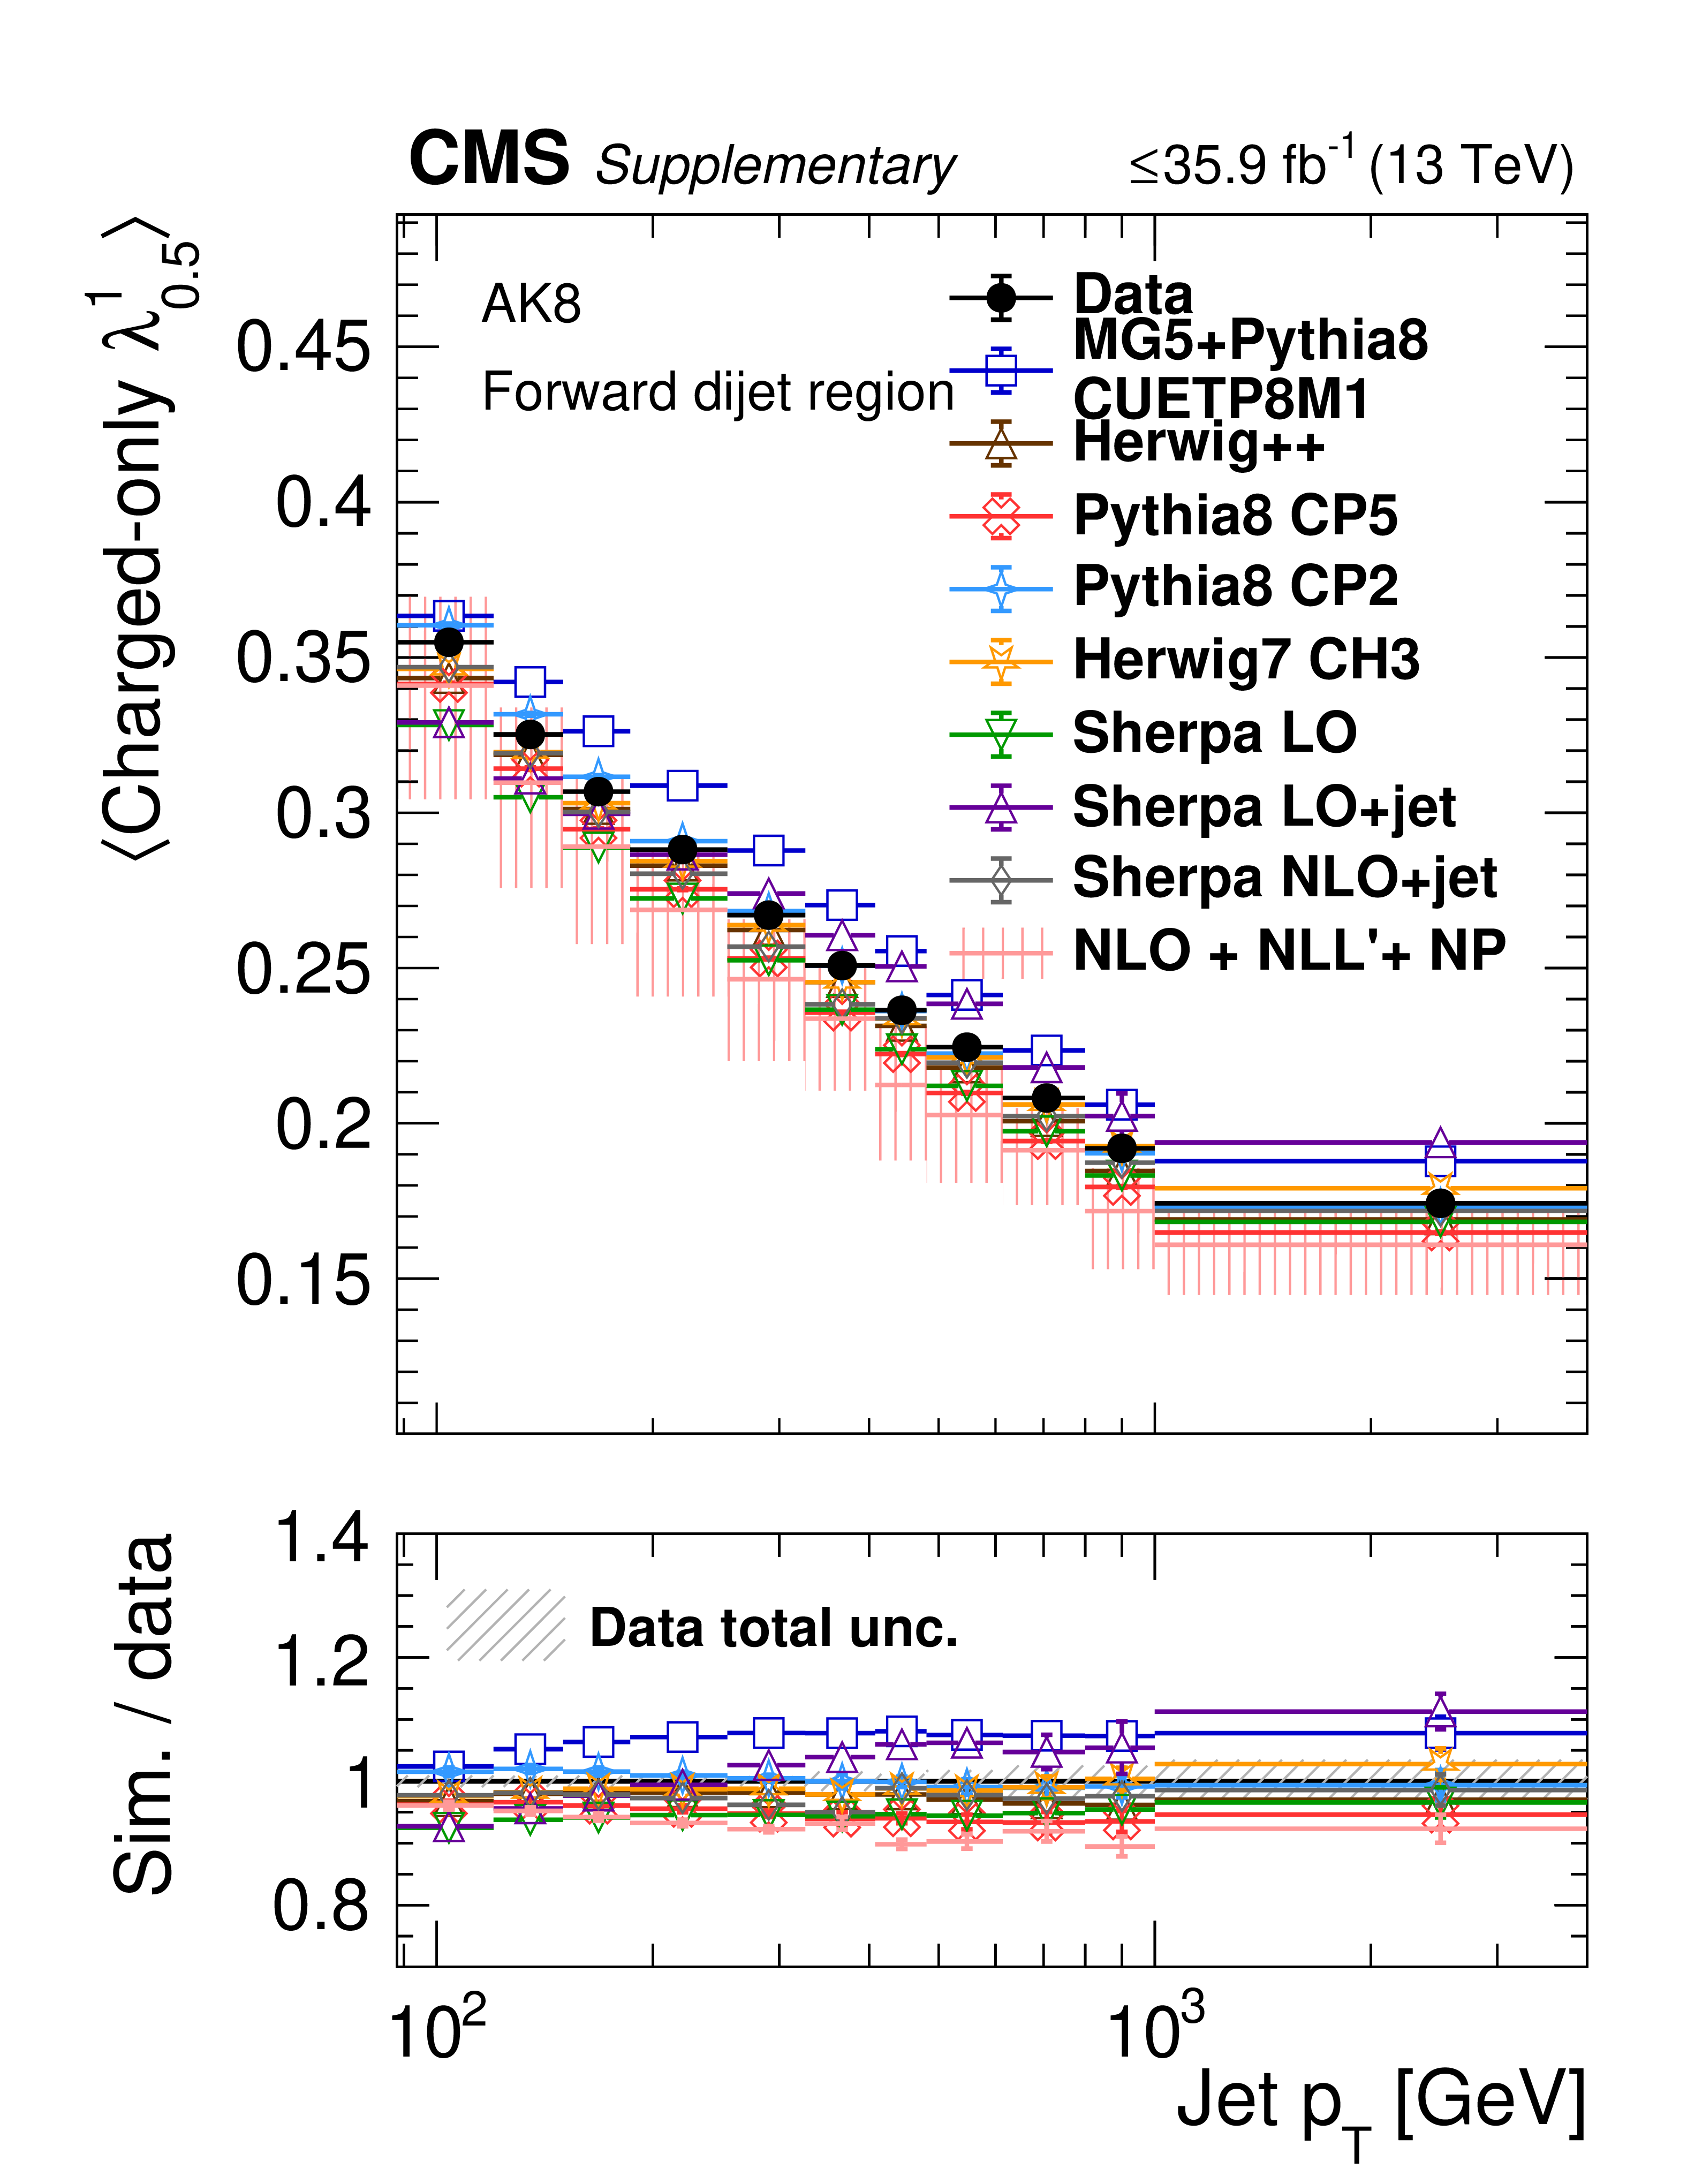
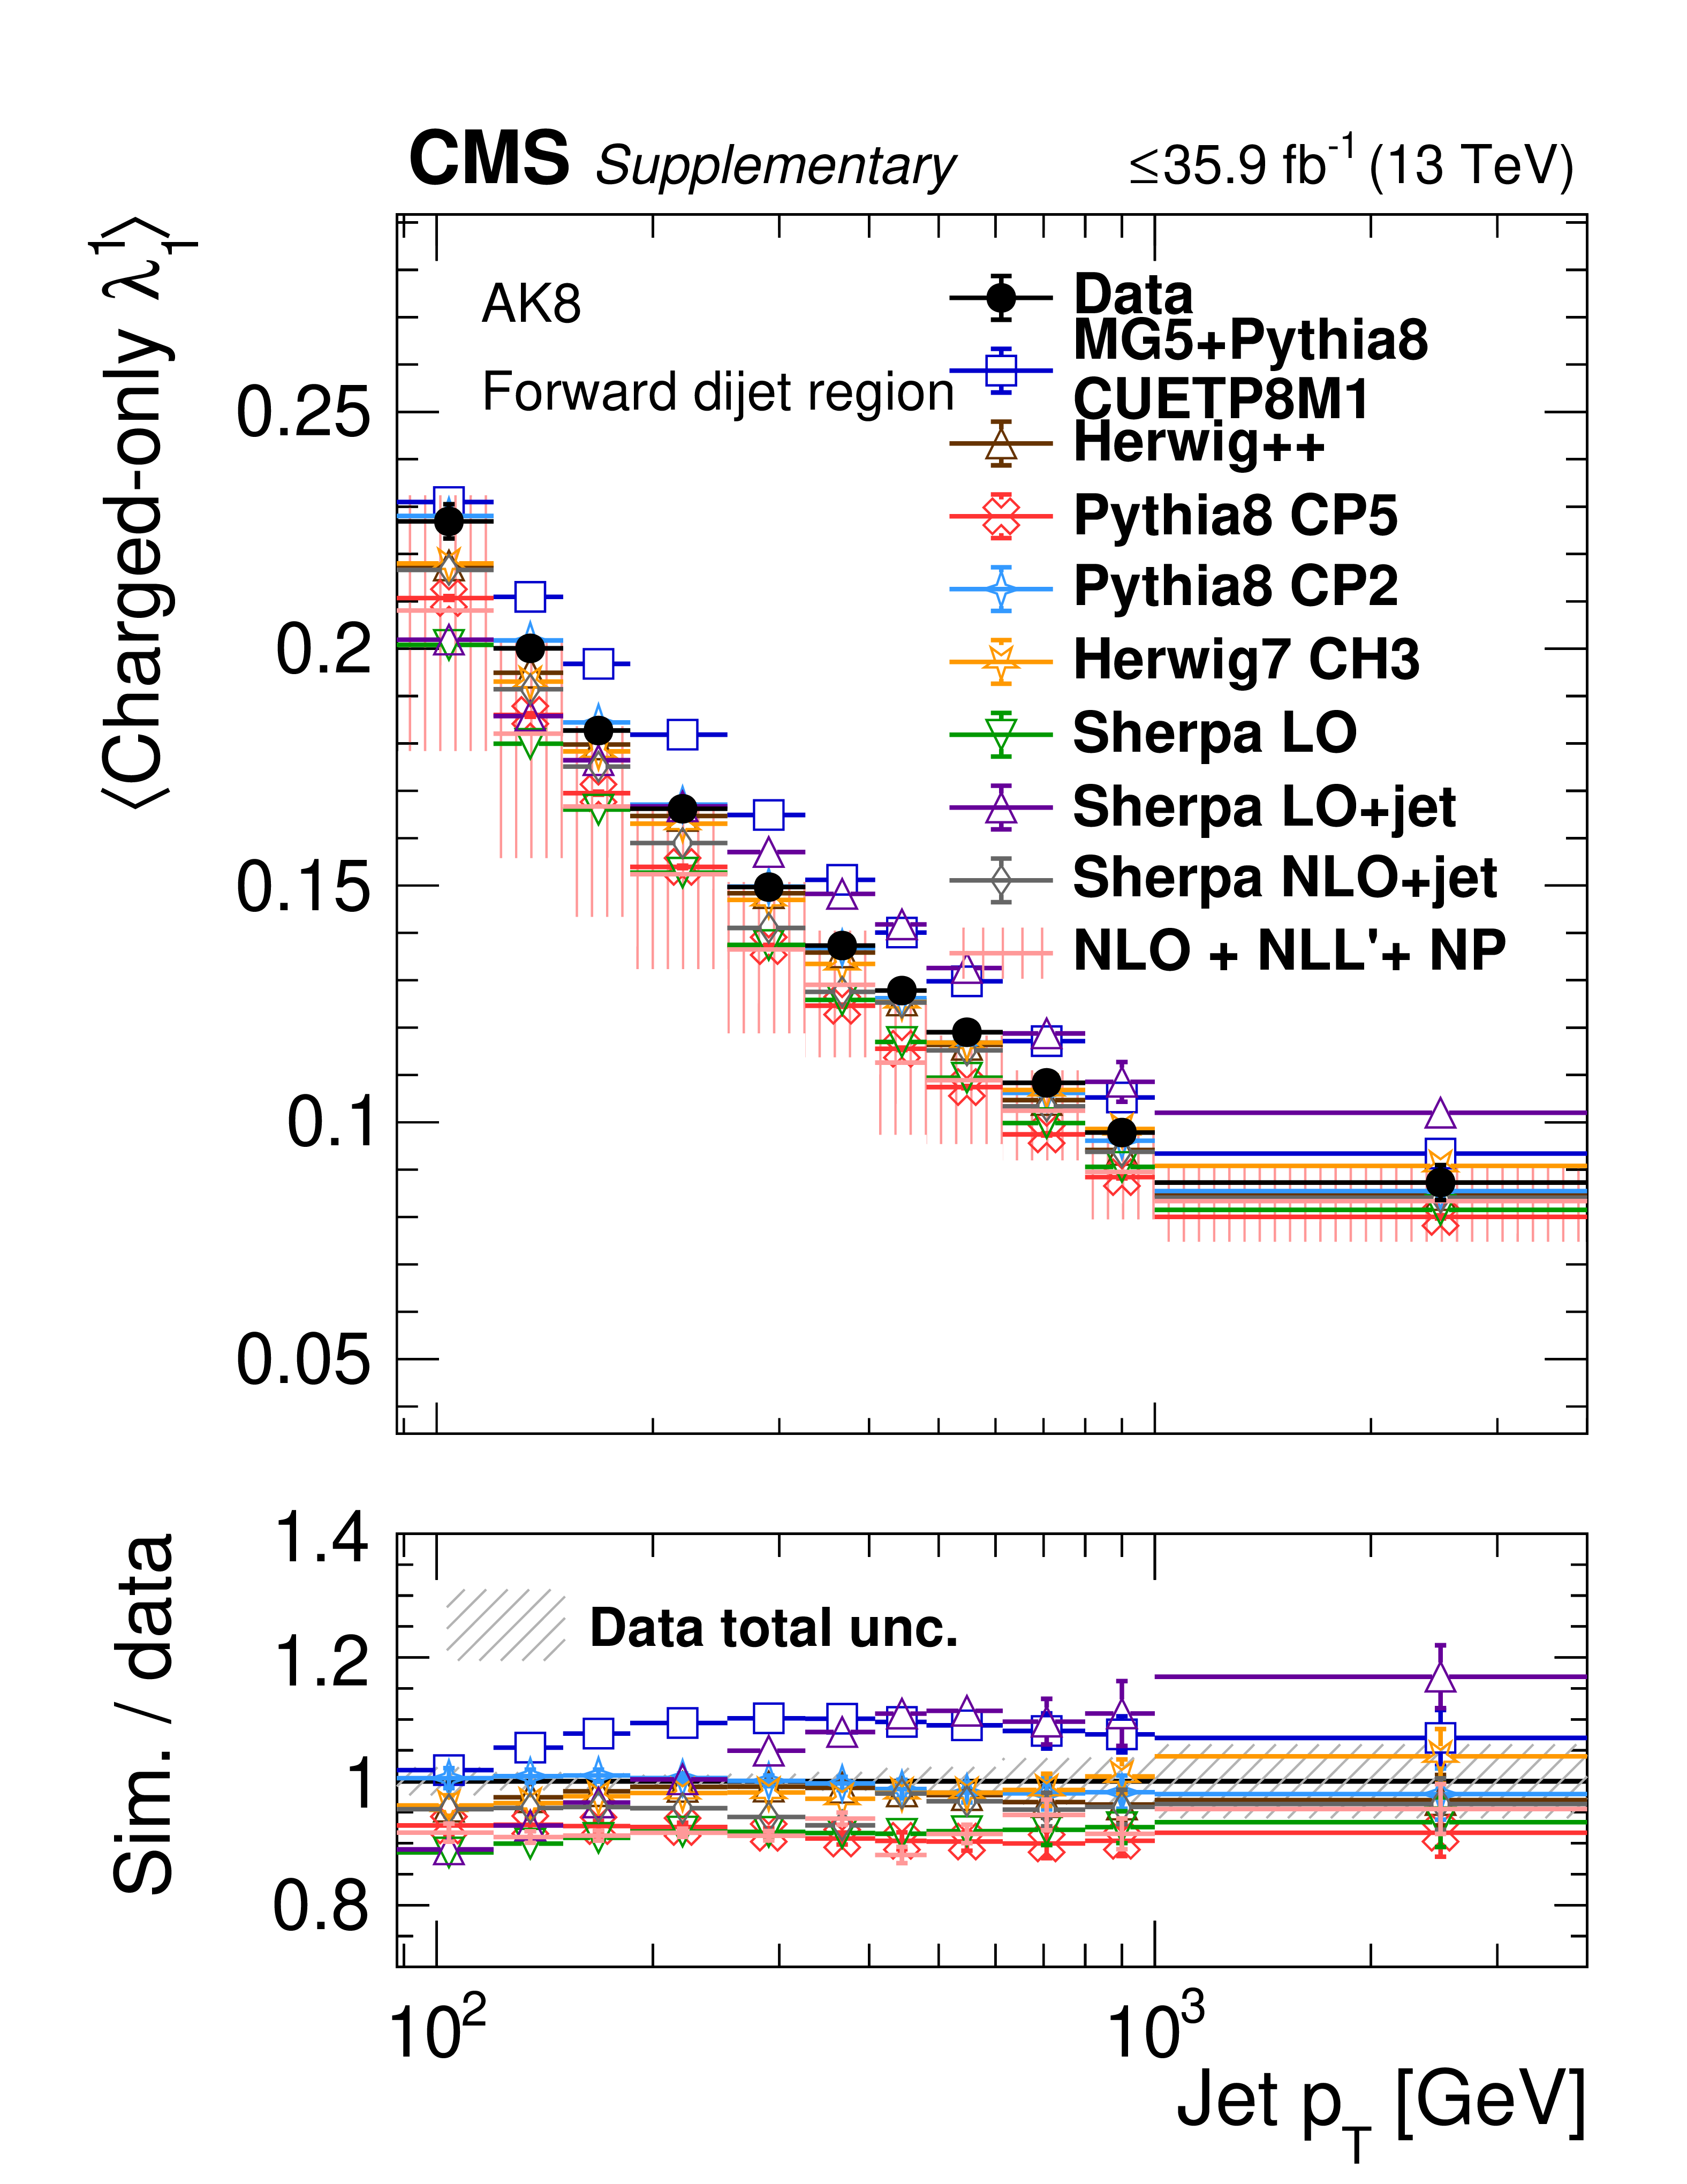
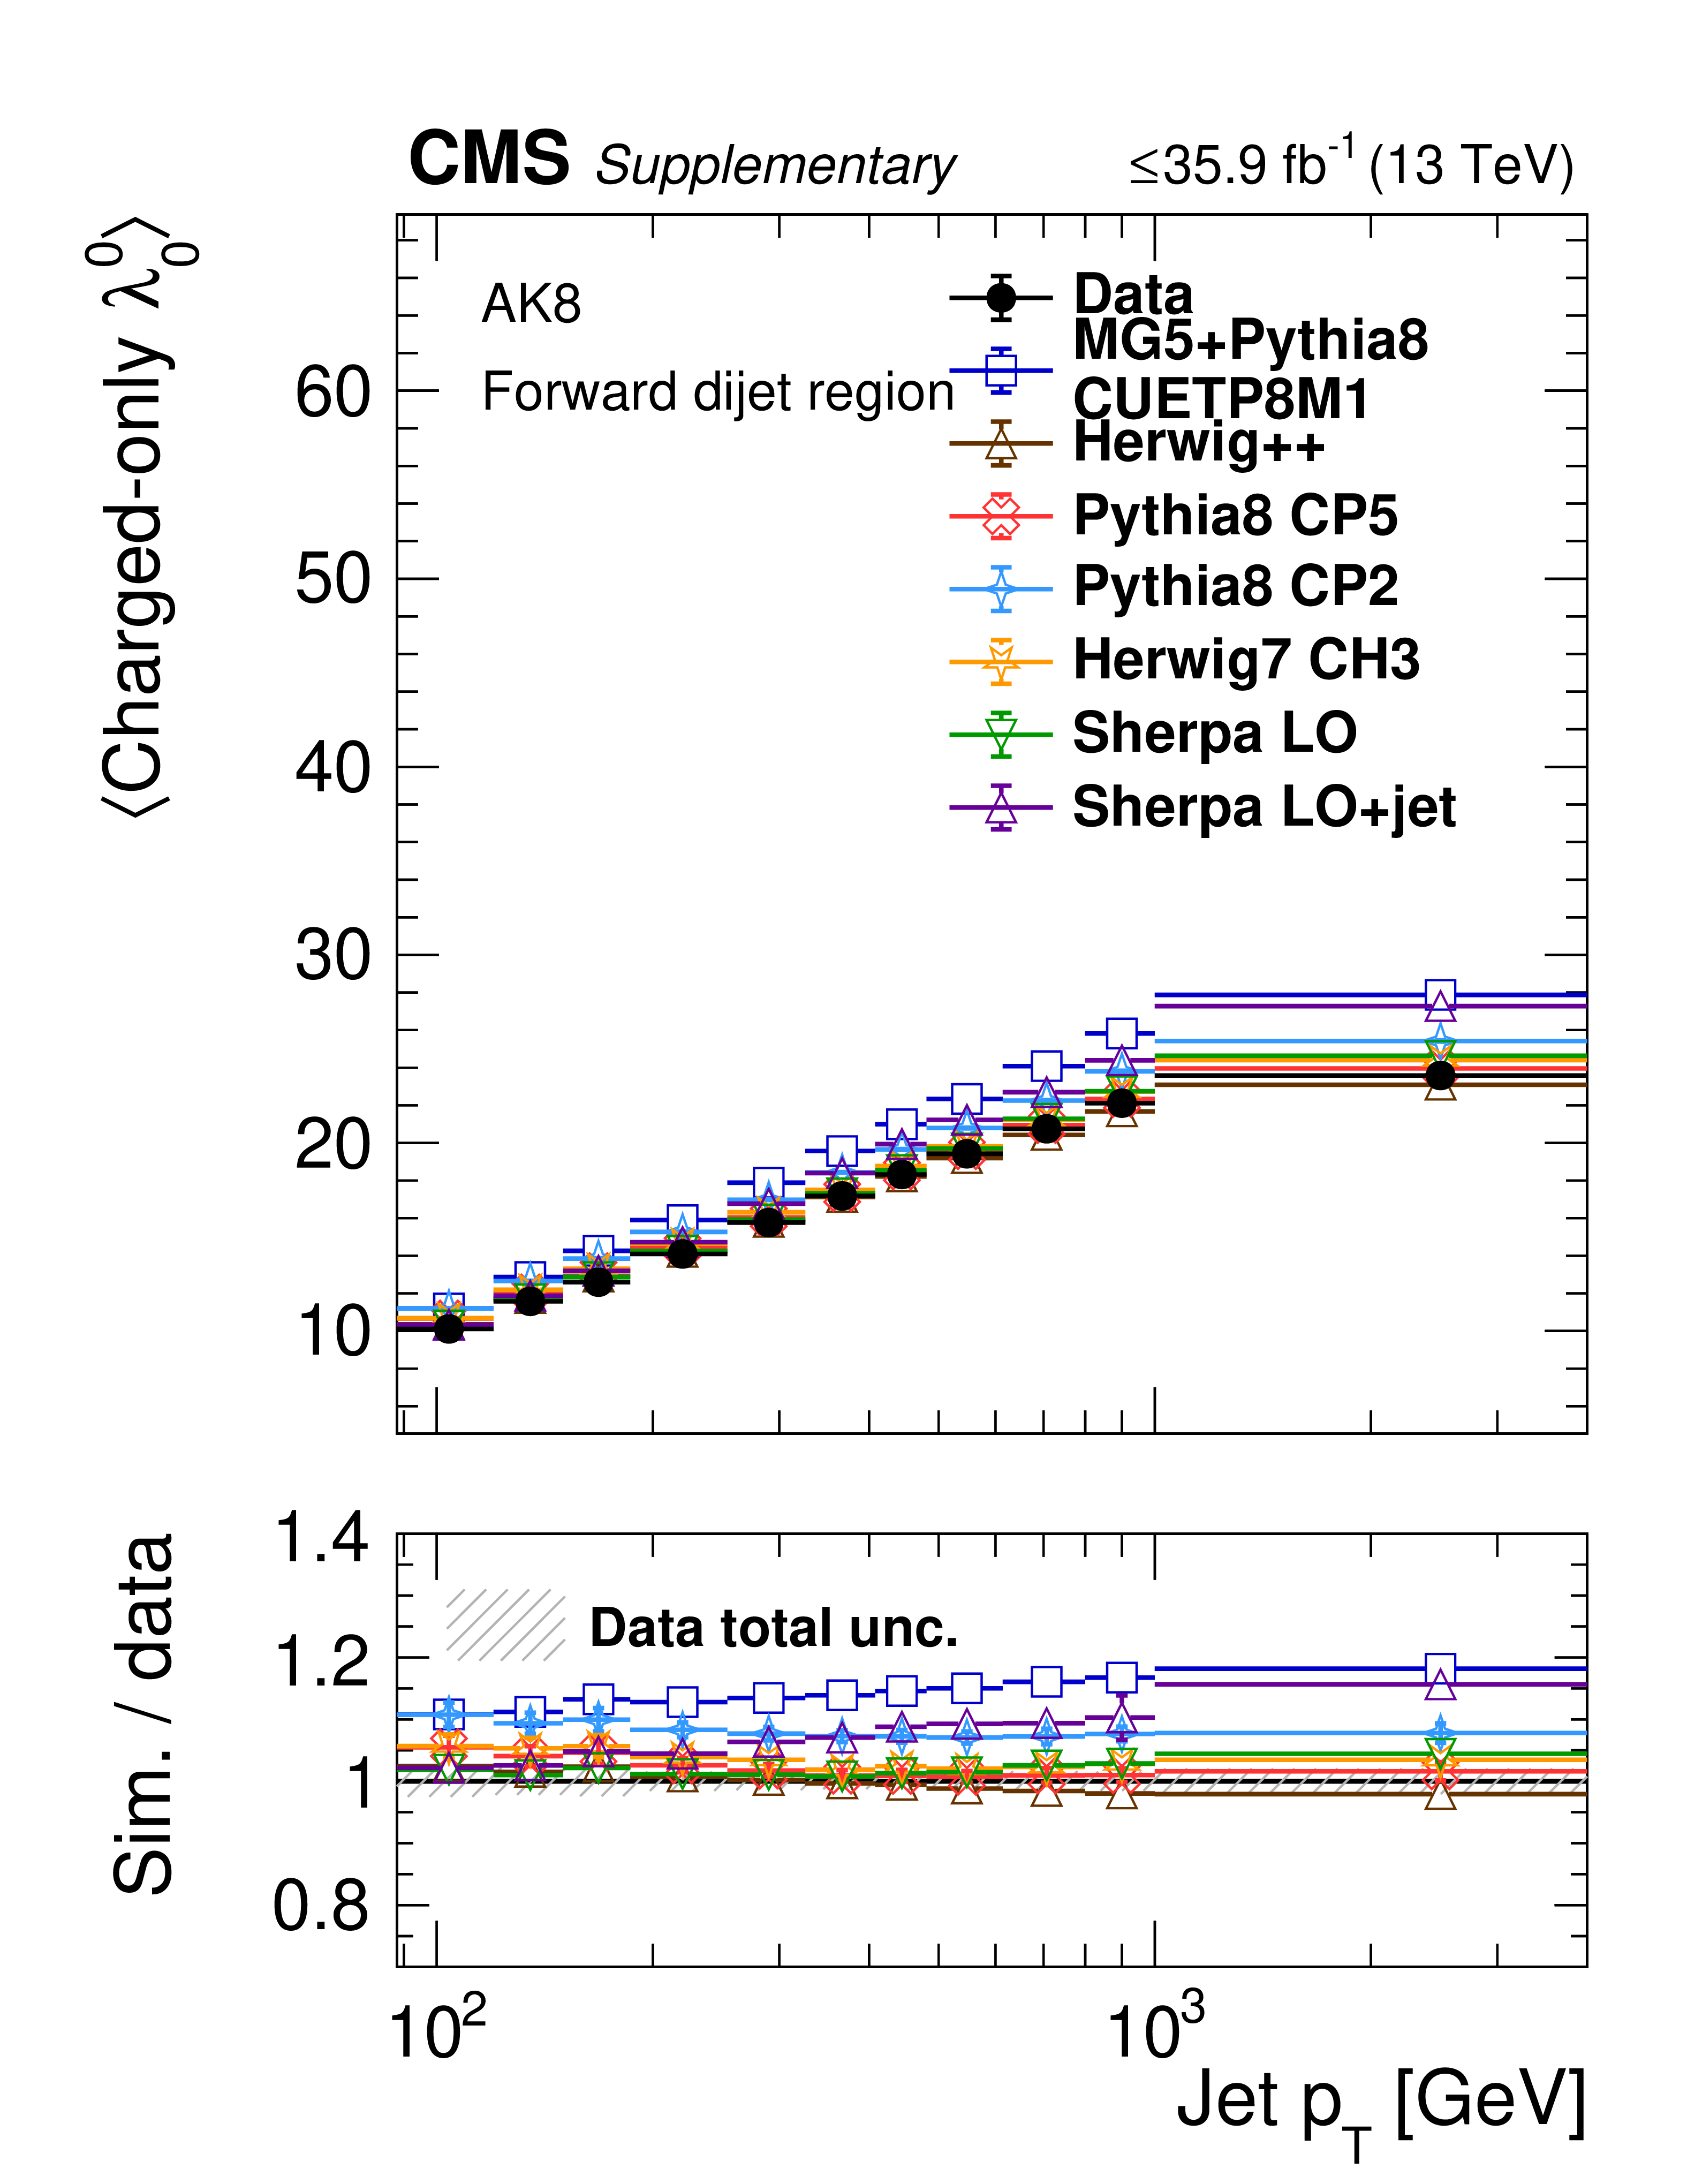
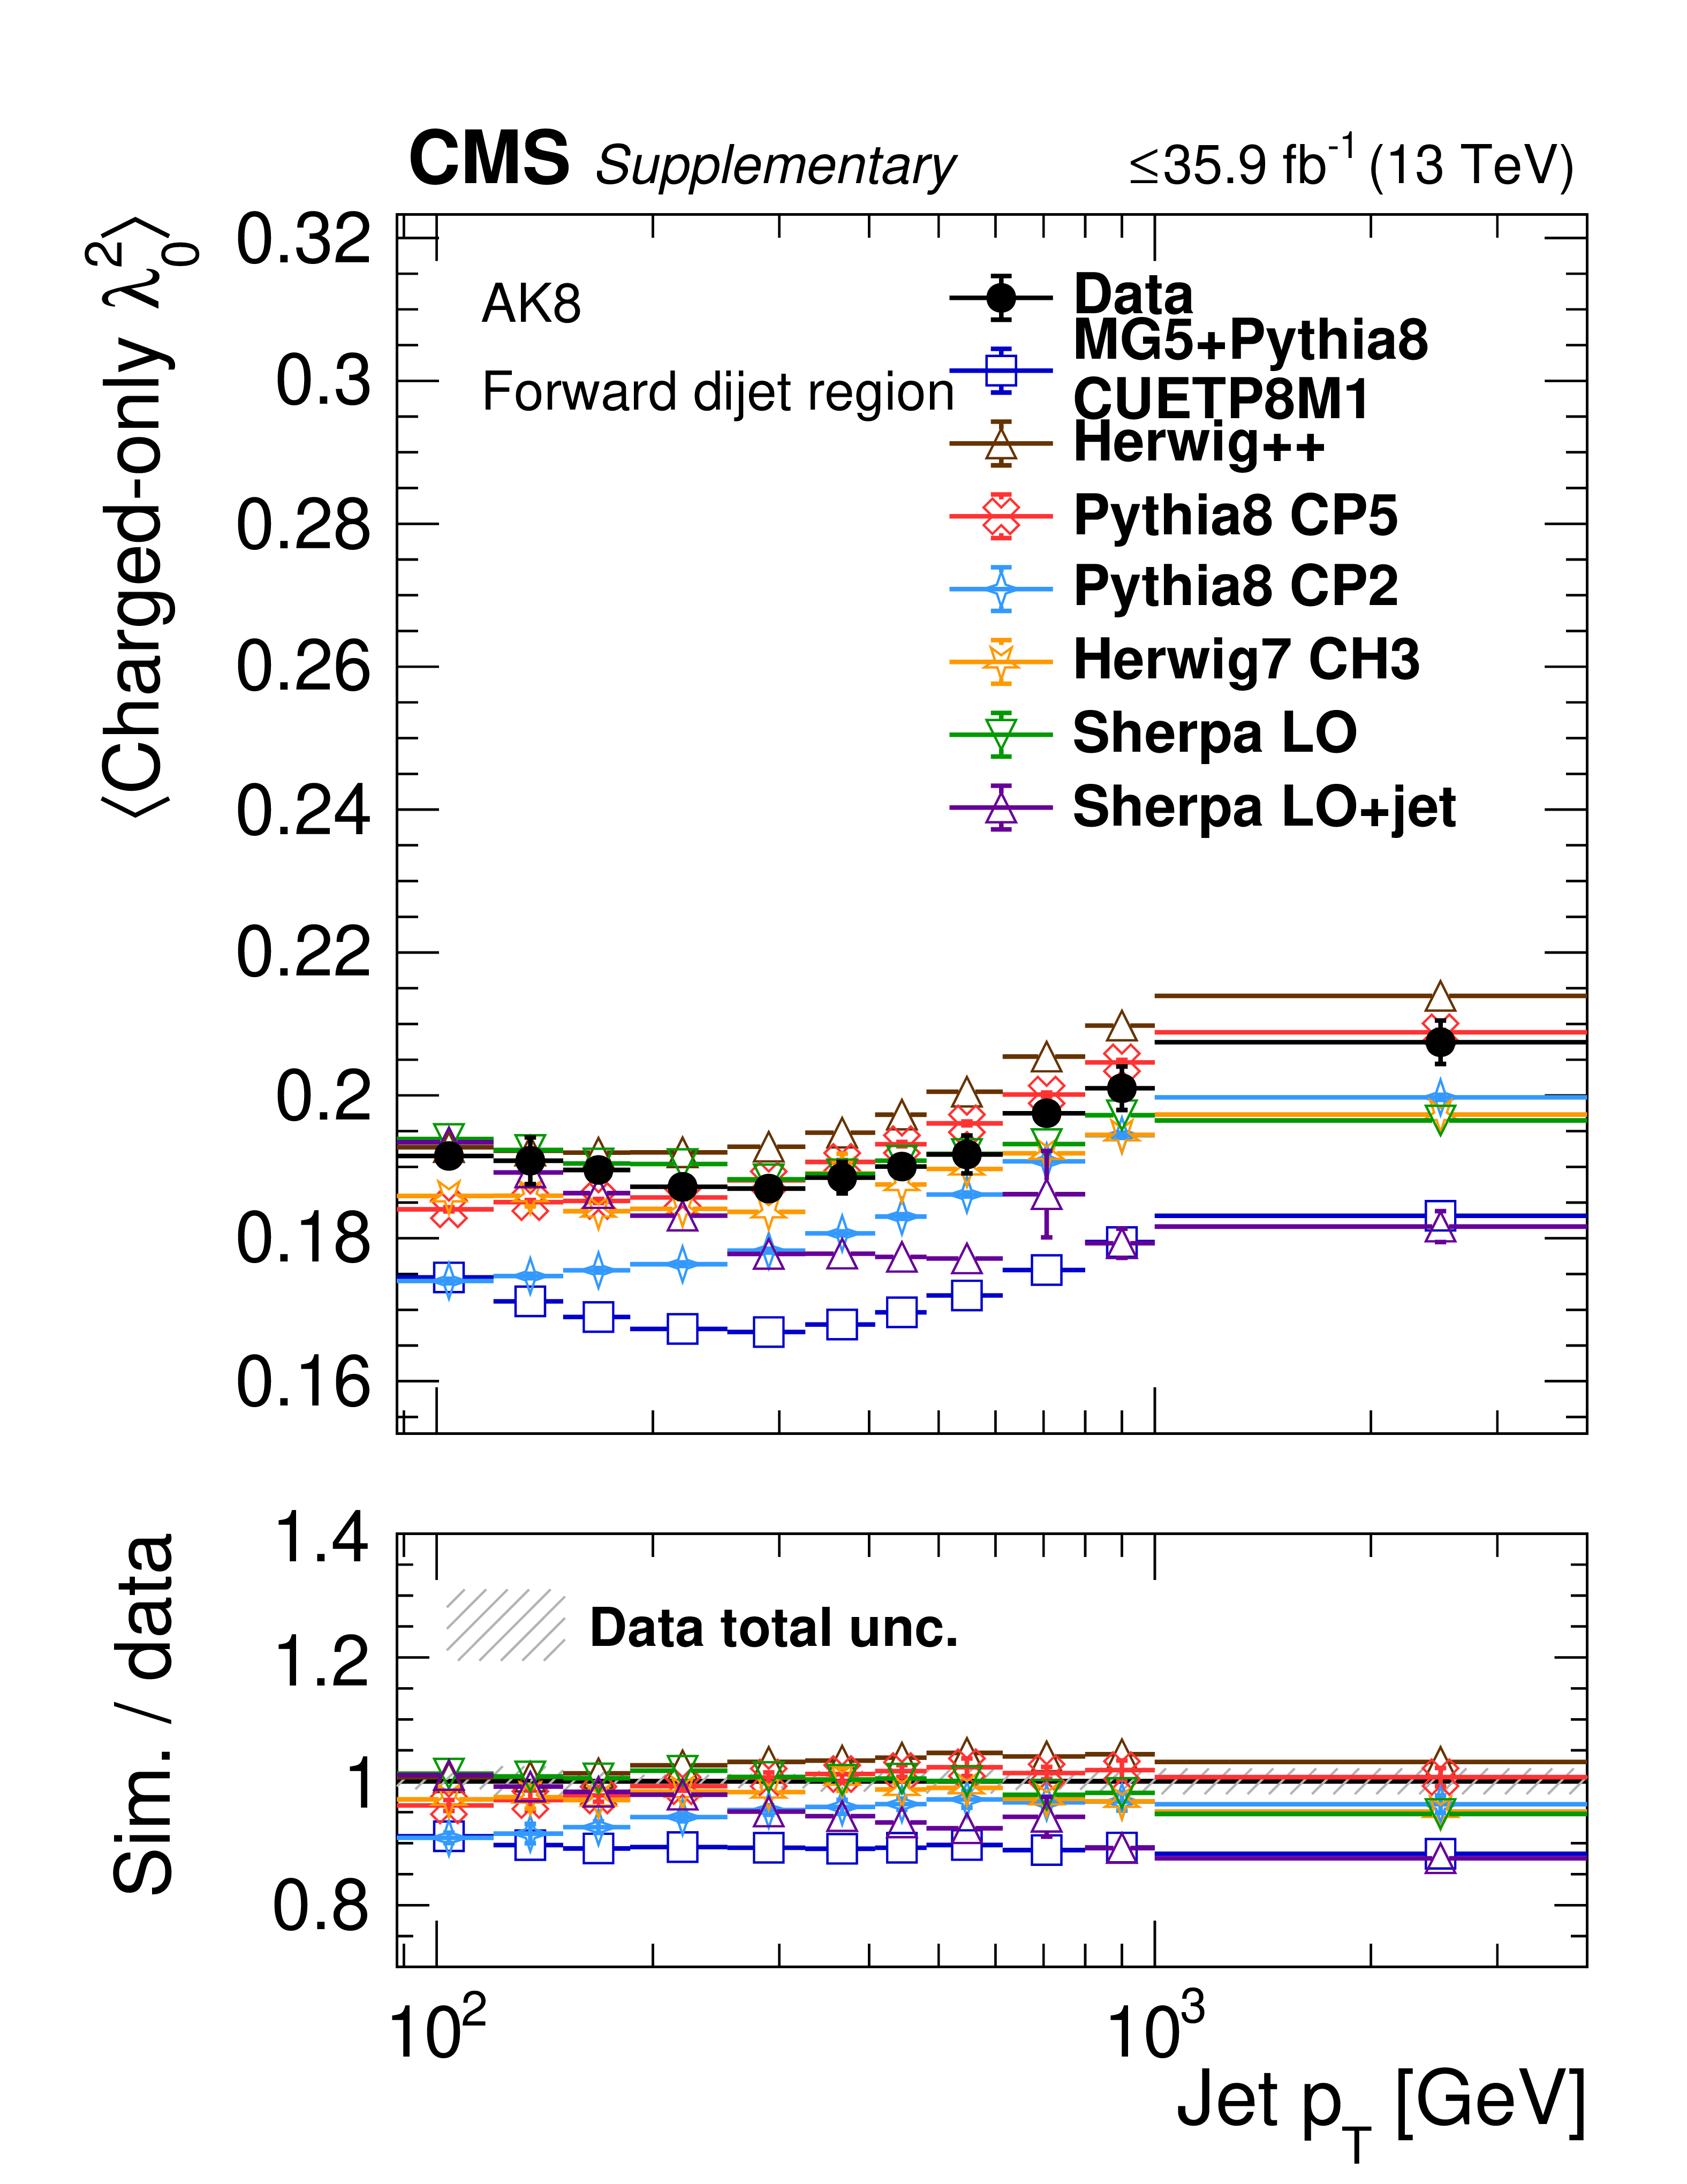
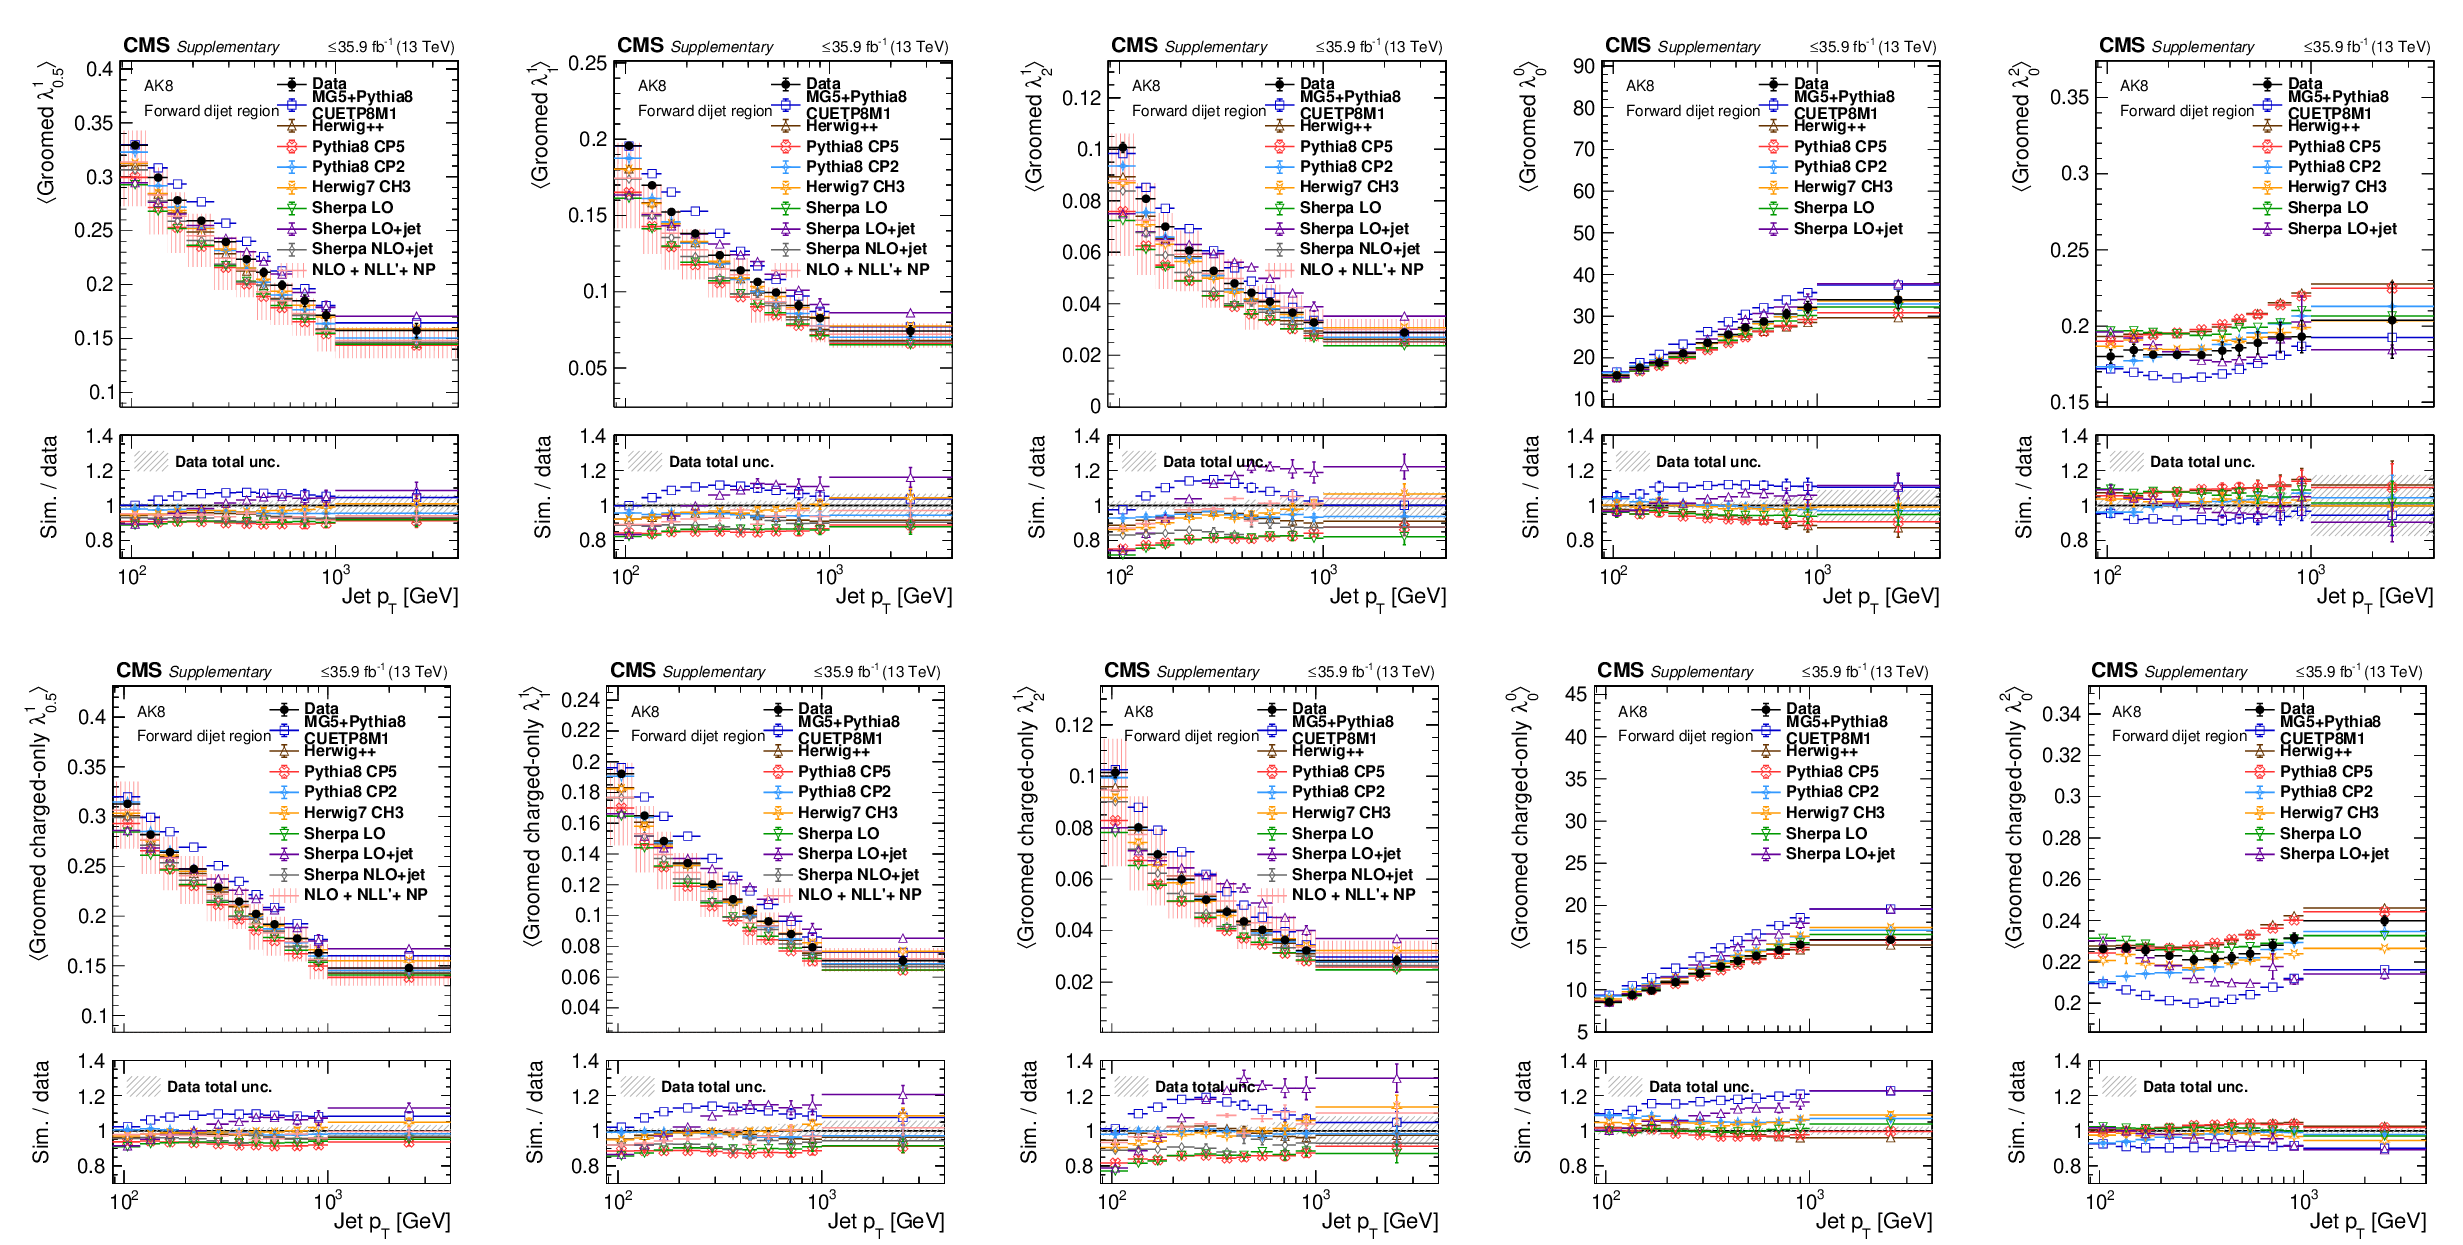
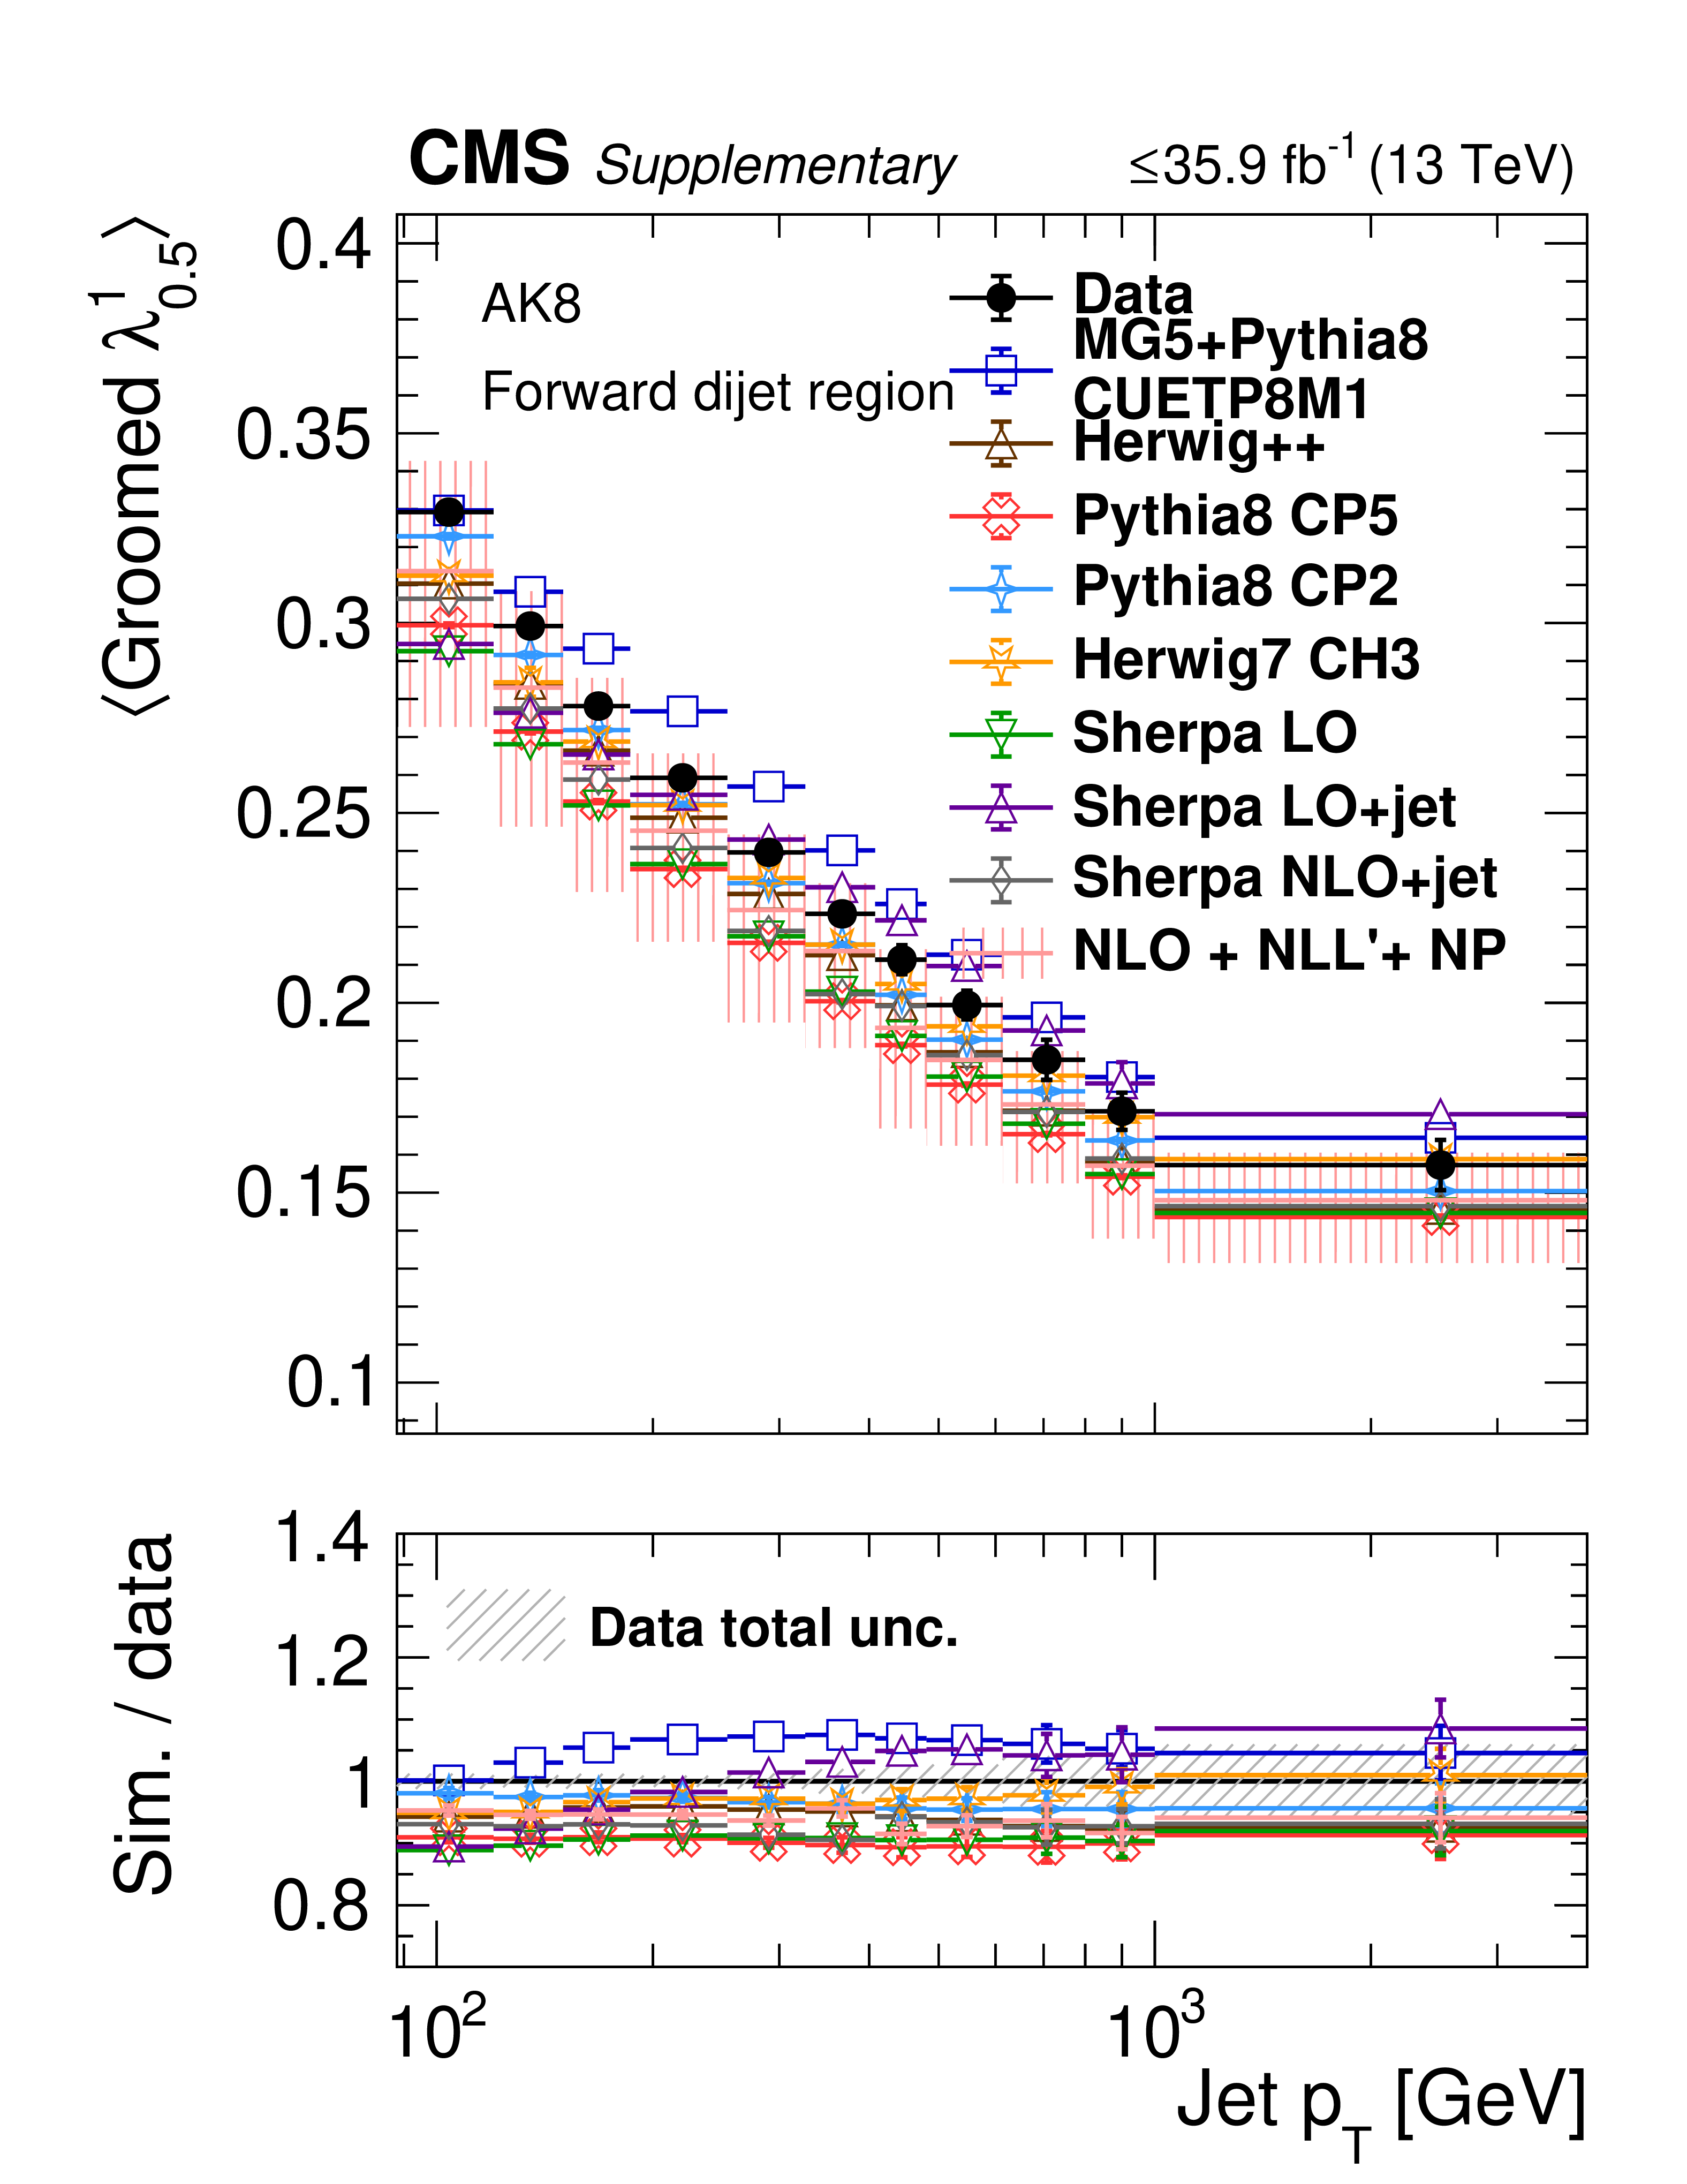
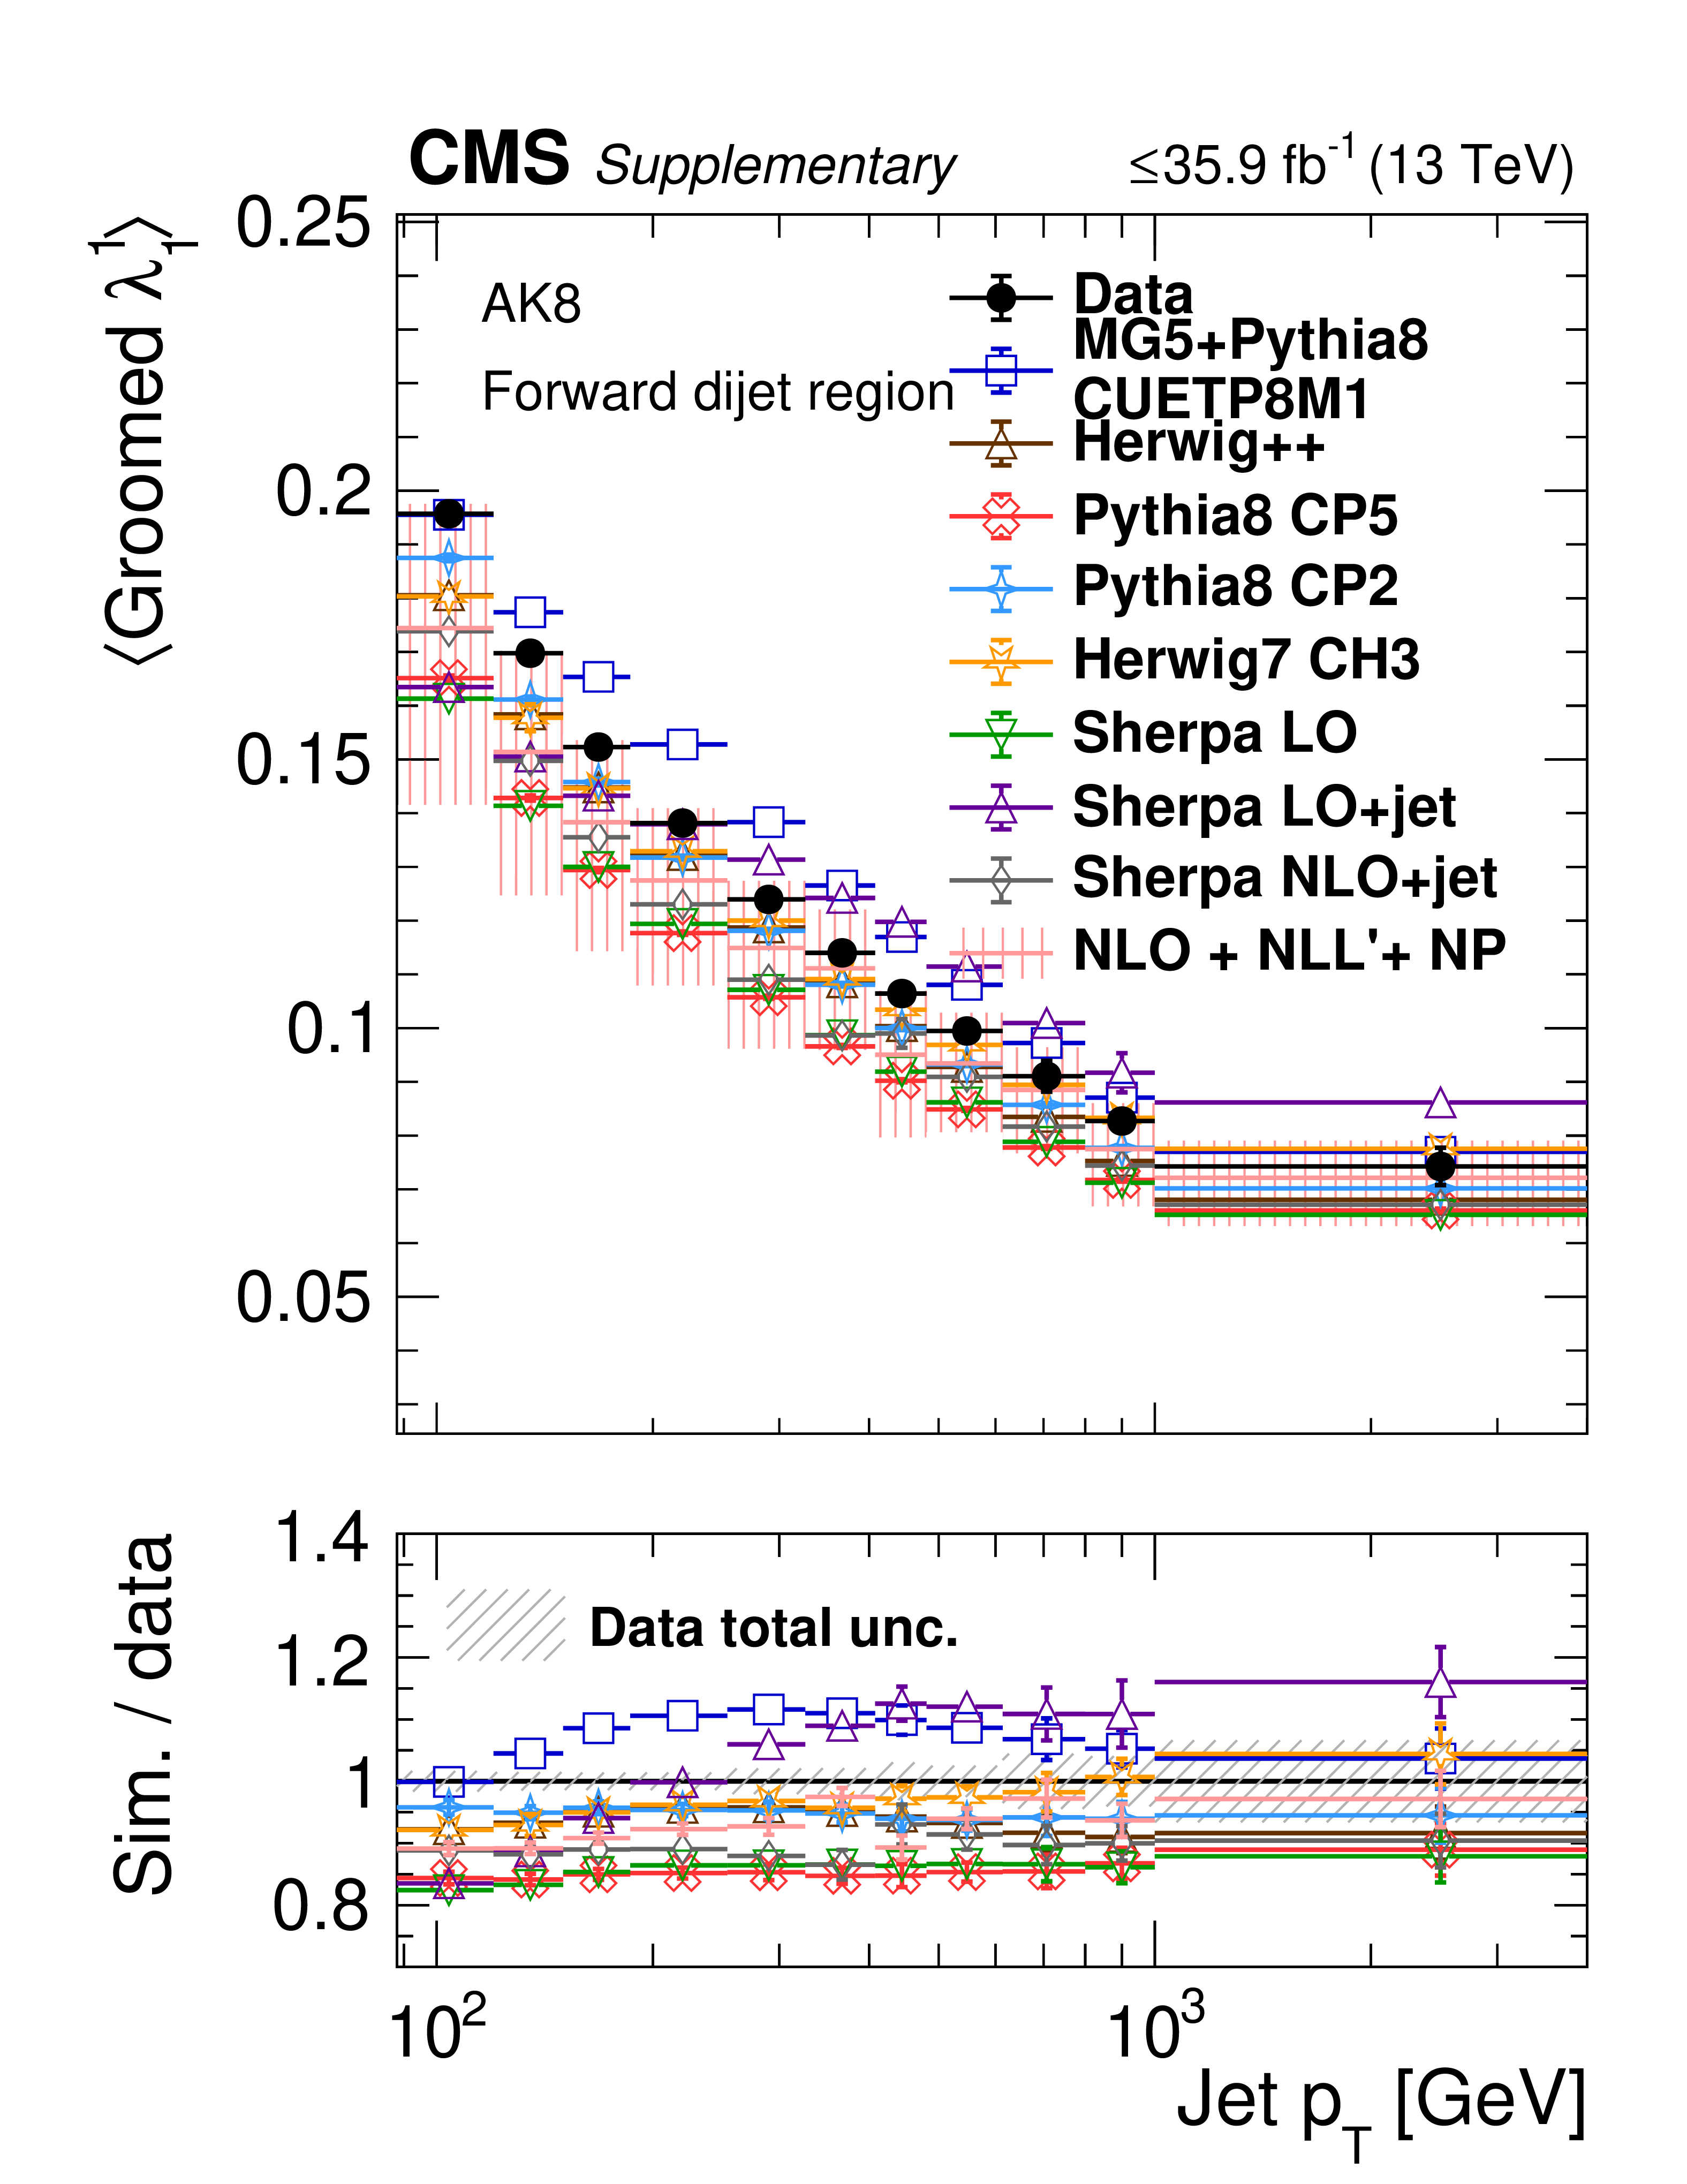
Plots of distribution mean for ungroomed AK8 jets in the forward dijet region, comparing unfolded data to MC. Upper row is charged+neutral variables, lower row is charged-only variables. |

png pdf |
Additional Figure 25-a:
Plots of distribution mean for ungroomed AK8 jets in the forward dijet region, comparing unfolded data to MC. Upper row is charged+neutral variables, lower row is charged-only variables. |
png pdf |
Additional Figure 25-b:
Plots of distribution mean for ungroomed AK8 jets in the forward dijet region, comparing unfolded data to MC. Upper row is charged+neutral variables, lower row is charged-only variables. |
png pdf |
Additional Figure 25-c:
Plots of distribution mean for ungroomed AK8 jets in the forward dijet region, comparing unfolded data to MC. Upper row is charged+neutral variables, lower row is charged-only variables. |
png pdf |
Additional Figure 25-d:
Plots of distribution mean for ungroomed AK8 jets in the forward dijet region, comparing unfolded data to MC. Upper row is charged+neutral variables, lower row is charged-only variables. |

png pdf |
Additional Figure 25-e:
Plots of distribution mean for ungroomed AK8 jets in the forward dijet region, comparing unfolded data to MC. Upper row is charged+neutral variables, lower row is charged-only variables. |
png pdf |
Additional Figure 25-f:
Plots of distribution mean for ungroomed AK8 jets in the forward dijet region, comparing unfolded data to MC. Upper row is charged+neutral variables, lower row is charged-only variables. |
png pdf |
Additional Figure 25-g:
Plots of distribution mean for ungroomed AK8 jets in the forward dijet region, comparing unfolded data to MC. Upper row is charged+neutral variables, lower row is charged-only variables. |

png pdf |
Additional Figure 25-h:
Plots of distribution mean for ungroomed AK8 jets in the forward dijet region, comparing unfolded data to MC. Upper row is charged+neutral variables, lower row is charged-only variables. |
png pdf |
Additional Figure 25-i:
Plots of distribution mean for ungroomed AK8 jets in the forward dijet region, comparing unfolded data to MC. Upper row is charged+neutral variables, lower row is charged-only variables. |
png pdf |
Additional Figure 25-j:
Plots of distribution mean for ungroomed AK8 jets in the forward dijet region, comparing unfolded data to MC. Upper row is charged+neutral variables, lower row is charged-only variables. |
png pdf |
Additional Figure 26:
Plots of distribution mean for groomed AK8 jets in the Z+jet region, comparing unfolded data to MC. Upper row is charged+neutral variables, lower row is charged-only variables. |

png pdf |
Additional Figure 26-a:
Plots of distribution mean for groomed AK8 jets in the Z+jet region, comparing unfolded data to MC. Upper row is charged+neutral variables, lower row is charged-only variables. |
png pdf |
Additional Figure 26-b:
Plots of distribution mean for groomed AK8 jets in the Z+jet region, comparing unfolded data to MC. Upper row is charged+neutral variables, lower row is charged-only variables. |

png pdf |
Additional Figure 26-c:
Plots of distribution mean for groomed AK8 jets in the Z+jet region, comparing unfolded data to MC. Upper row is charged+neutral variables, lower row is charged-only variables. |

png pdf |
Additional Figure 26-d:
Plots of distribution mean for groomed AK8 jets in the Z+jet region, comparing unfolded data to MC. Upper row is charged+neutral variables, lower row is charged-only variables. |
png pdf |
Additional Figure 26-e:
Plots of distribution mean for groomed AK8 jets in the Z+jet region, comparing unfolded data to MC. Upper row is charged+neutral variables, lower row is charged-only variables. |
png pdf |
Additional Figure 26-f:
Plots of distribution mean for groomed AK8 jets in the Z+jet region, comparing unfolded data to MC. Upper row is charged+neutral variables, lower row is charged-only variables. |

png pdf |
Additional Figure 26-g:
Plots of distribution mean for groomed AK8 jets in the Z+jet region, comparing unfolded data to MC. Upper row is charged+neutral variables, lower row is charged-only variables. |
png pdf |
Additional Figure 26-h:
Plots of distribution mean for groomed AK8 jets in the Z+jet region, comparing unfolded data to MC. Upper row is charged+neutral variables, lower row is charged-only variables. |
png pdf |
Additional Figure 26-i:
Plots of distribution mean for groomed AK8 jets in the Z+jet region, comparing unfolded data to MC. Upper row is charged+neutral variables, lower row is charged-only variables. |

png pdf |
Additional Figure 26-j:
Plots of distribution mean for groomed AK8 jets in the Z+jet region, comparing unfolded data to MC. Upper row is charged+neutral variables, lower row is charged-only variables. |
png pdf |
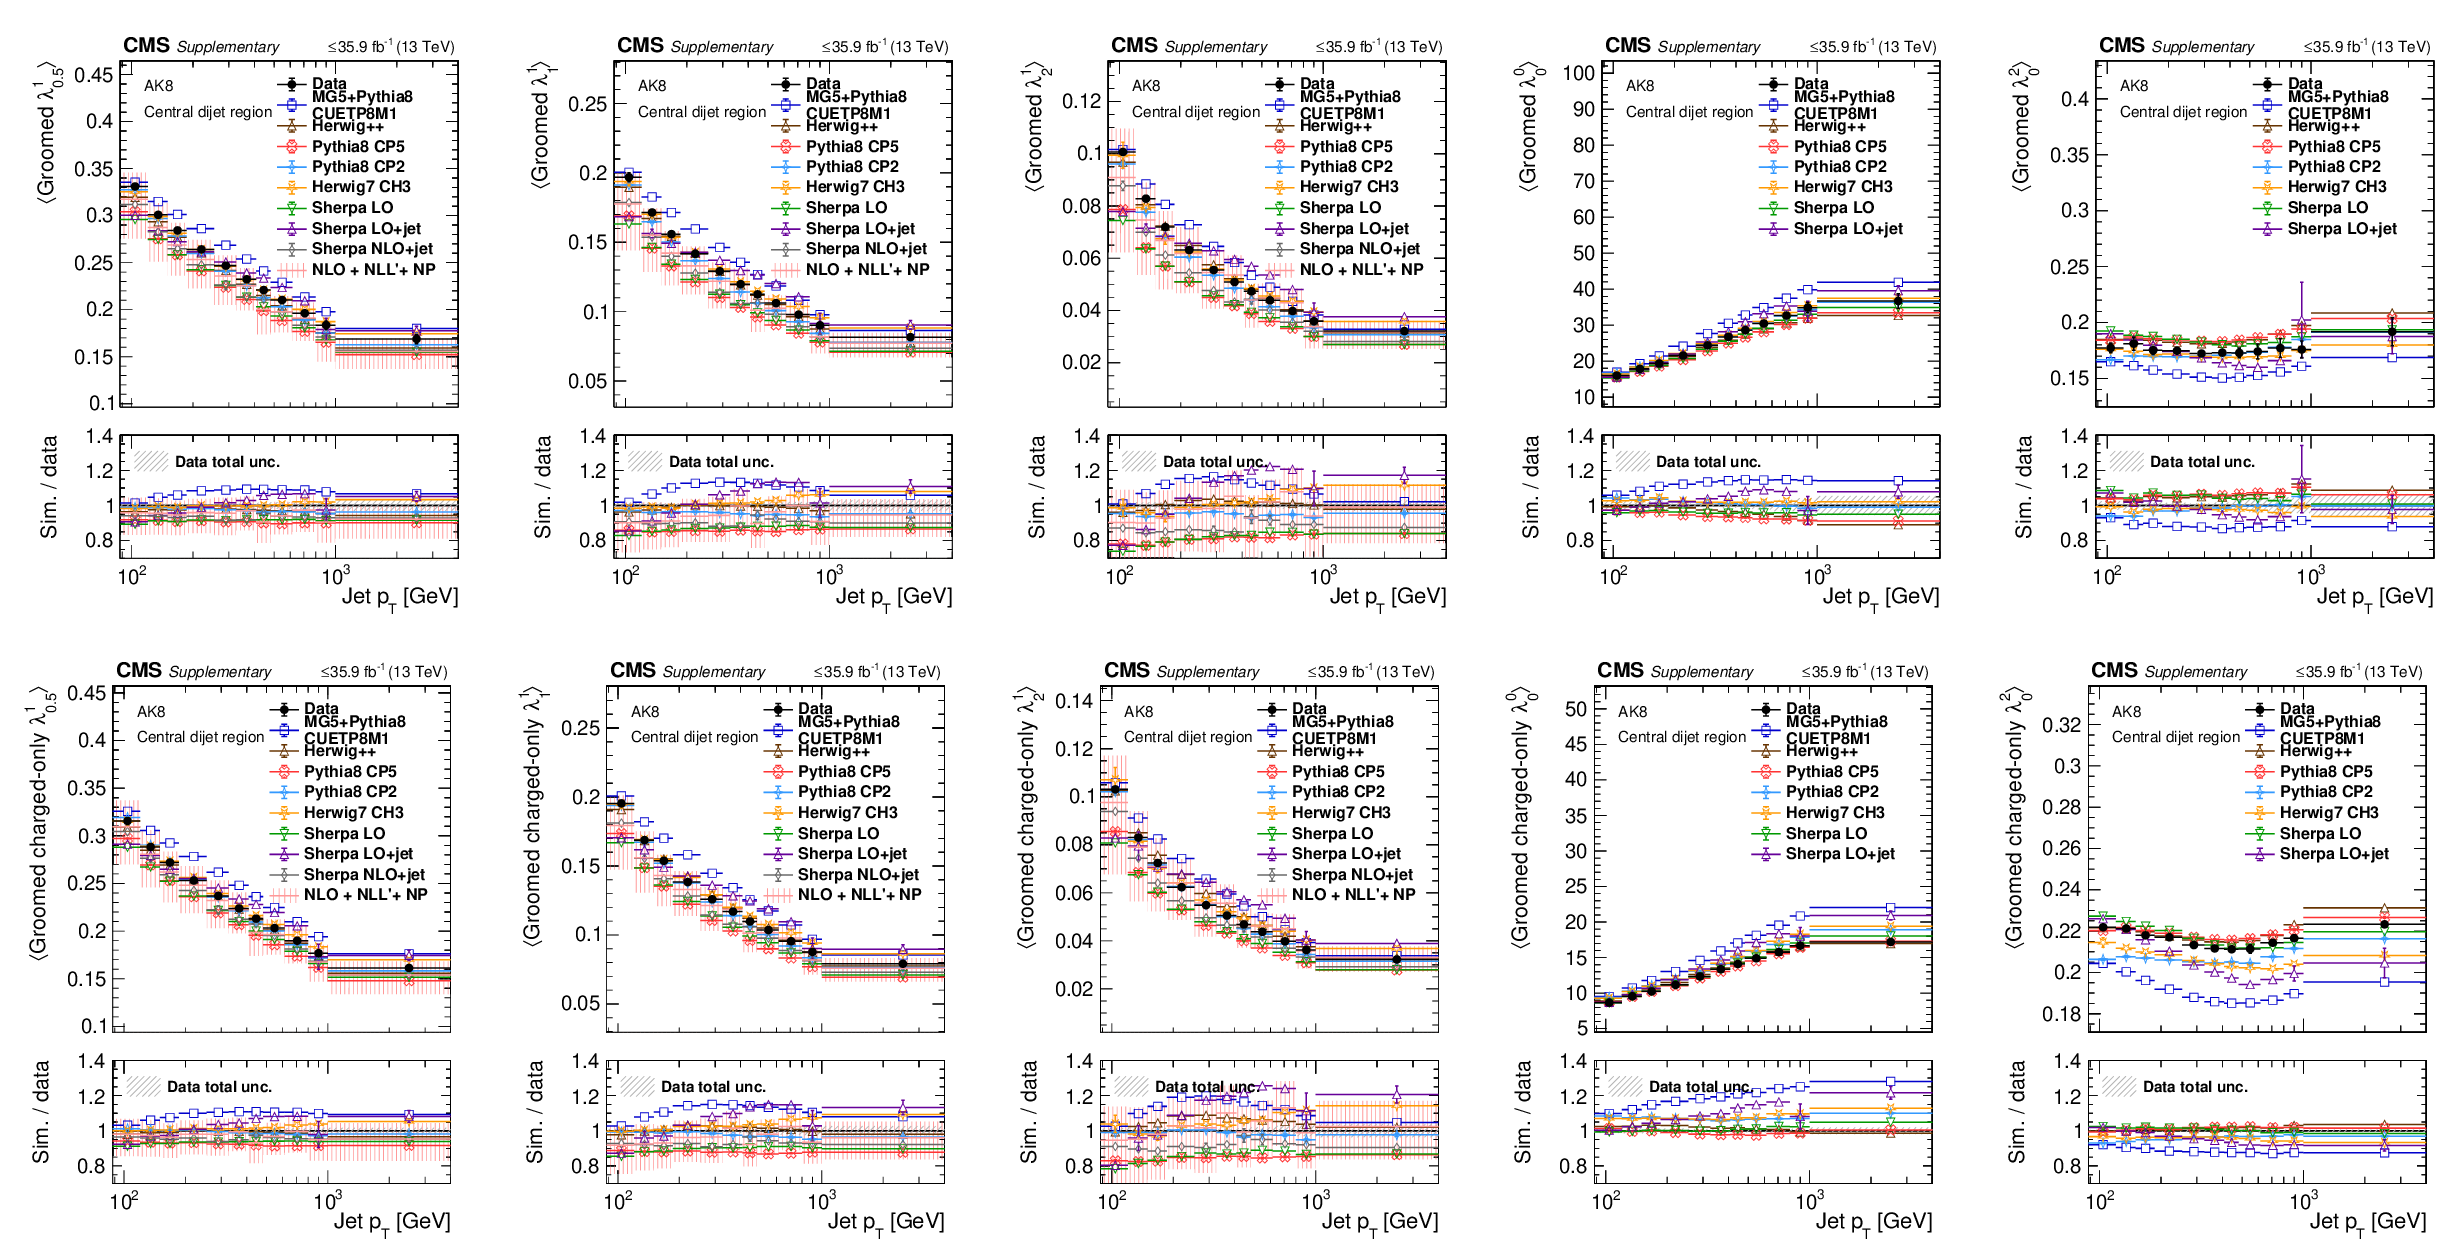
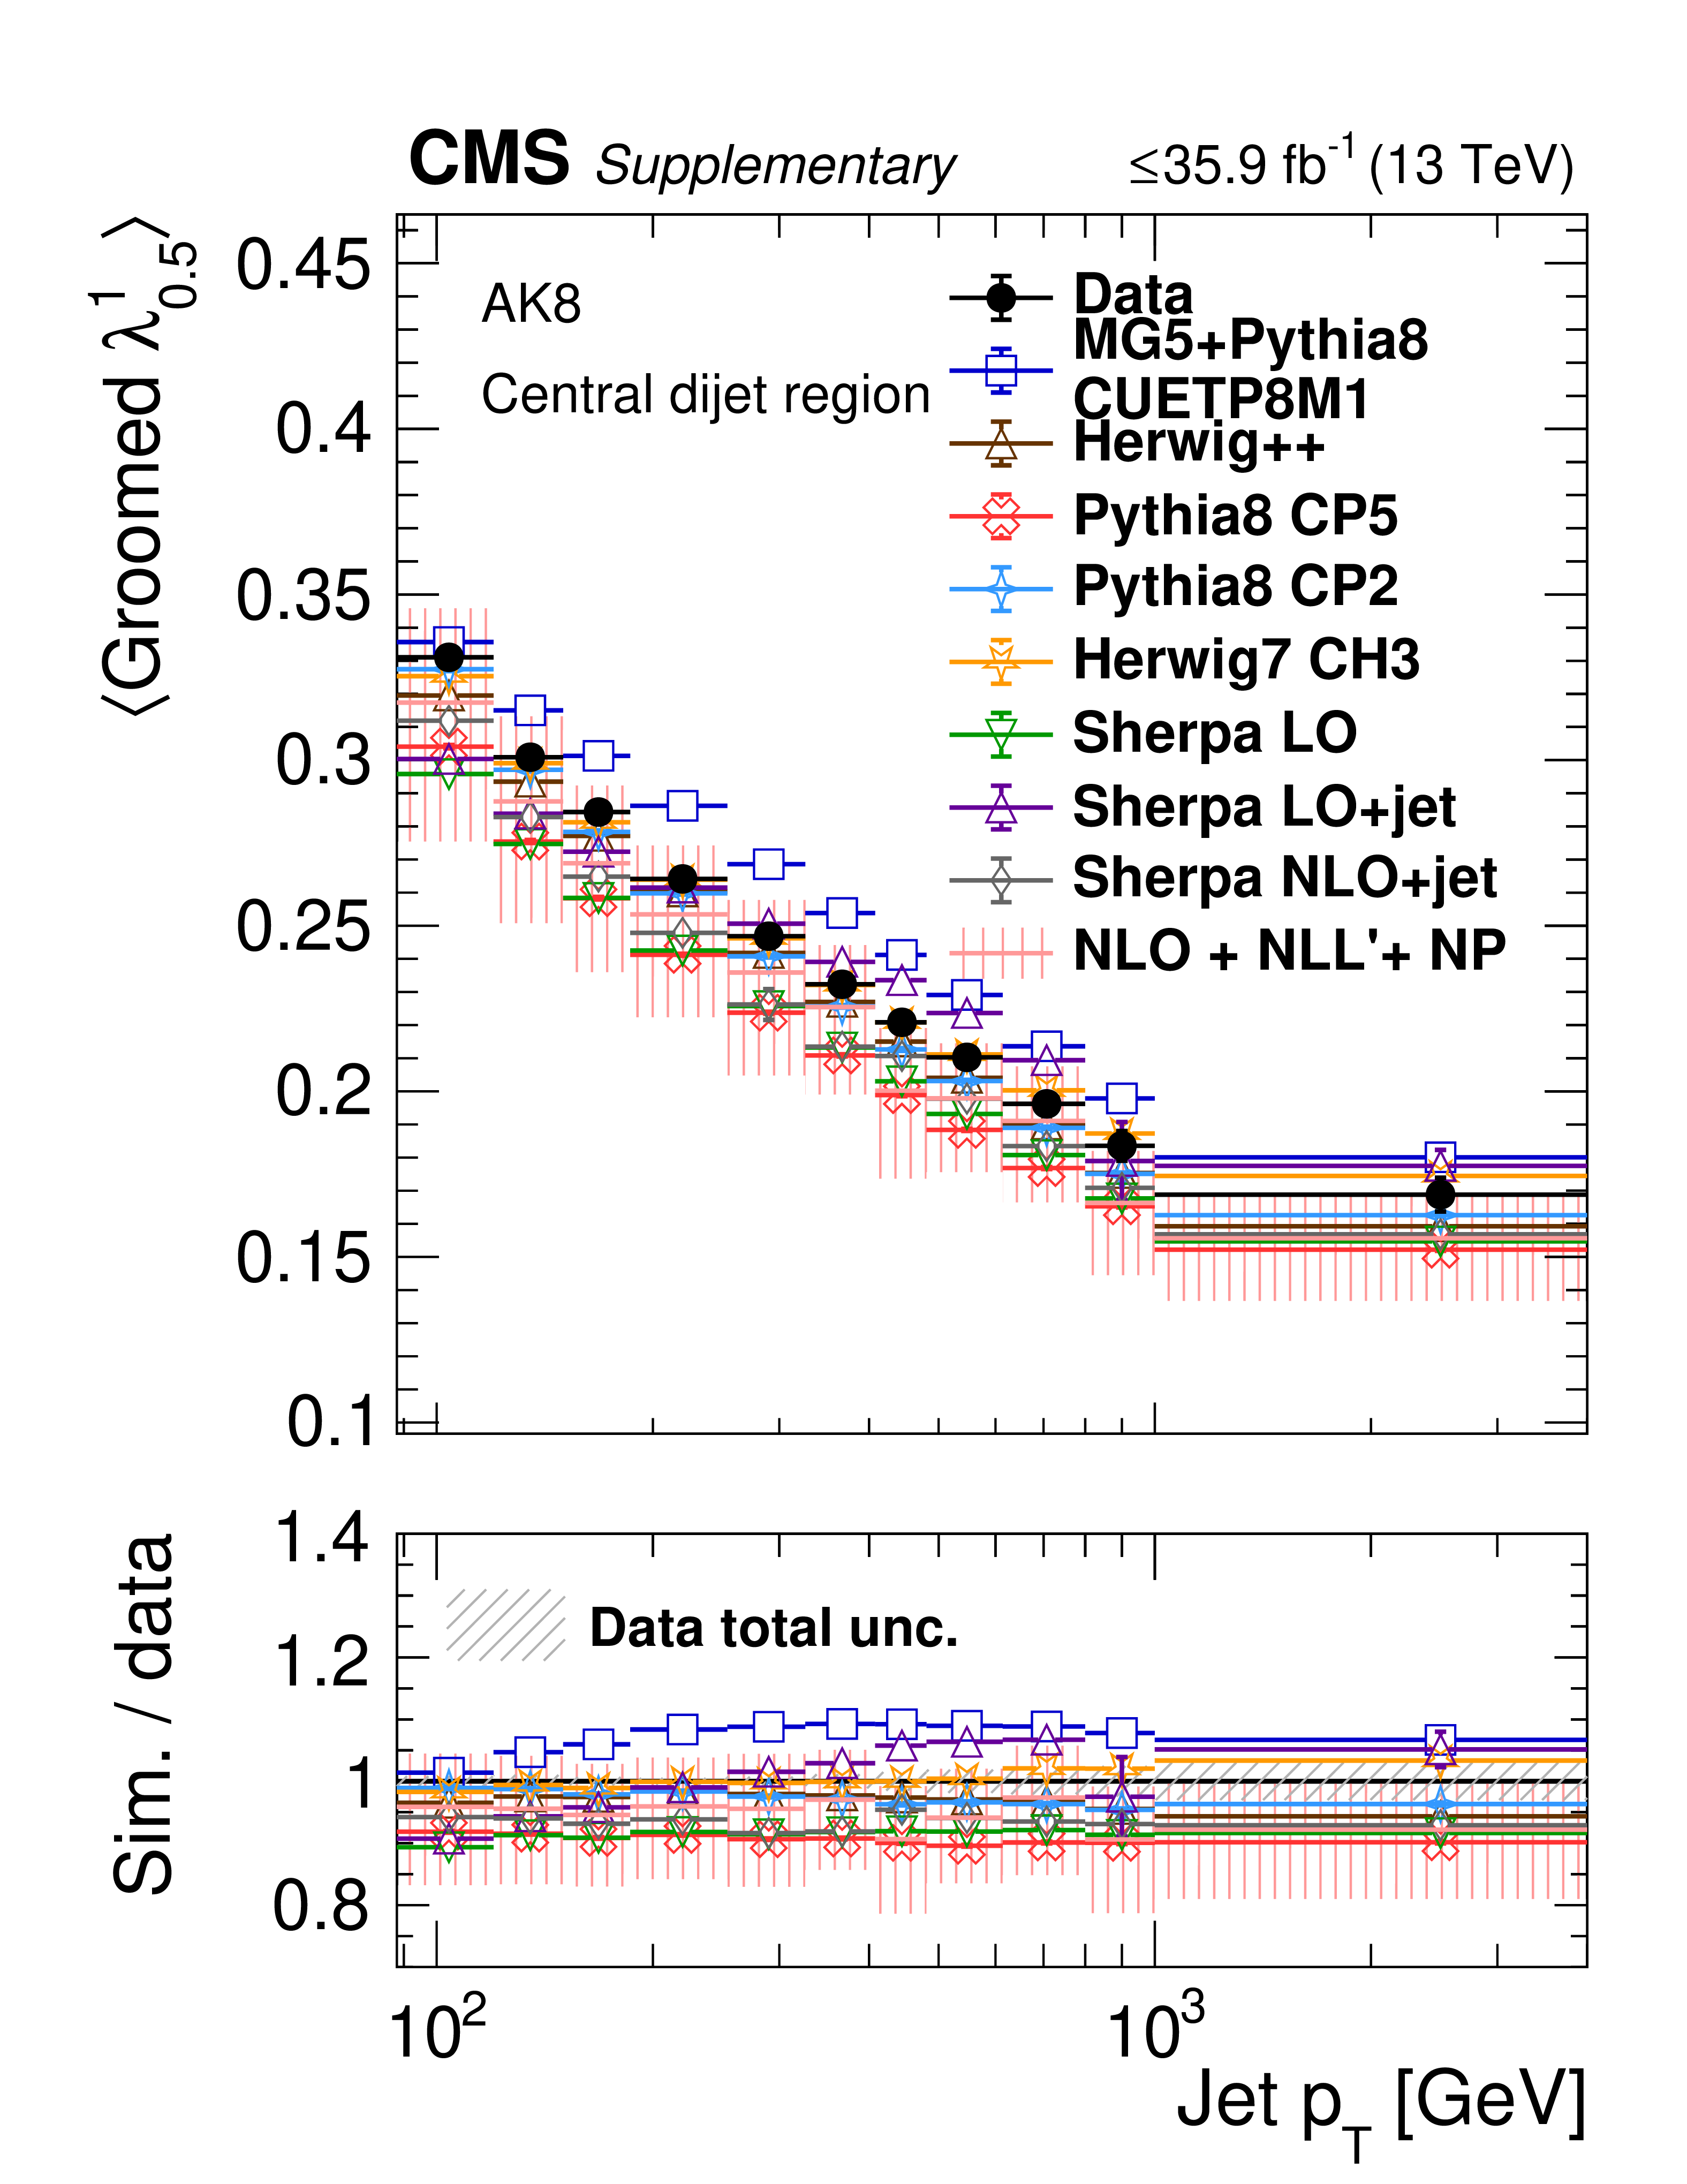
Additional Figure 27:
Plots of distribution mean for groomed AK8 jets in the central dijet region, comparing unfolded data to MC. Upper row is charged+neutral variables, lower row is charged-only variables. |
png pdf |
Additional Figure 27-a:
Plots of distribution mean for groomed AK8 jets in the central dijet region, comparing unfolded data to MC. Upper row is charged+neutral variables, lower row is charged-only variables. |

png pdf |
Additional Figure 27-b:
Plots of distribution mean for groomed AK8 jets in the central dijet region, comparing unfolded data to MC. Upper row is charged+neutral variables, lower row is charged-only variables. |
png pdf |
Additional Figure 27-c:
Plots of distribution mean for groomed AK8 jets in the central dijet region, comparing unfolded data to MC. Upper row is charged+neutral variables, lower row is charged-only variables. |
png pdf |
Additional Figure 27-d:
Plots of distribution mean for groomed AK8 jets in the central dijet region, comparing unfolded data to MC. Upper row is charged+neutral variables, lower row is charged-only variables. |
png pdf |
Additional Figure 27-e:
Plots of distribution mean for groomed AK8 jets in the central dijet region, comparing unfolded data to MC. Upper row is charged+neutral variables, lower row is charged-only variables. |

png pdf |
Additional Figure 27-f:
Plots of distribution mean for groomed AK8 jets in the central dijet region, comparing unfolded data to MC. Upper row is charged+neutral variables, lower row is charged-only variables. |

png pdf |
Additional Figure 27-g:
Plots of distribution mean for groomed AK8 jets in the central dijet region, comparing unfolded data to MC. Upper row is charged+neutral variables, lower row is charged-only variables. |
png pdf |
Additional Figure 27-h:
Plots of distribution mean for groomed AK8 jets in the central dijet region, comparing unfolded data to MC. Upper row is charged+neutral variables, lower row is charged-only variables. |

png pdf |
Additional Figure 27-i:
Plots of distribution mean for groomed AK8 jets in the central dijet region, comparing unfolded data to MC. Upper row is charged+neutral variables, lower row is charged-only variables. |
png pdf |
Additional Figure 27-j:
Plots of distribution mean for groomed AK8 jets in the central dijet region, comparing unfolded data to MC. Upper row is charged+neutral variables, lower row is charged-only variables. |
png pdf |
Additional Figure 28:
Plots of distribution mean for groomed AK8 jets in the forward dijet region, comparing unfolded data to MC. Upper row is charged+neutral variables, lower row is charged-only variables. |
png pdf |
Additional Figure 28-a:
Plots of distribution mean for groomed AK8 jets in the forward dijet region, comparing unfolded data to MC. Upper row is charged+neutral variables, lower row is charged-only variables. |
png pdf |
Additional Figure 28-b:
Plots of distribution mean for groomed AK8 jets in the forward dijet region, comparing unfolded data to MC. Upper row is charged+neutral variables, lower row is charged-only variables. |
png pdf |
Additional Figure 28-c:
Plots of distribution mean for groomed AK8 jets in the forward dijet region, comparing unfolded data to MC. Upper row is charged+neutral variables, lower row is charged-only variables. |

png pdf |
Additional Figure 28-d:
Plots of distribution mean for groomed AK8 jets in the forward dijet region, comparing unfolded data to MC. Upper row is charged+neutral variables, lower row is charged-only variables. |
png pdf |
Additional Figure 28-e:
Plots of distribution mean for groomed AK8 jets in the forward dijet region, comparing unfolded data to MC. Upper row is charged+neutral variables, lower row is charged-only variables. |
png pdf |
Additional Figure 28-f:
Plots of distribution mean for groomed AK8 jets in the forward dijet region, comparing unfolded data to MC. Upper row is charged+neutral variables, lower row is charged-only variables. |

png pdf |
Additional Figure 28-g:
Plots of distribution mean for groomed AK8 jets in the forward dijet region, comparing unfolded data to MC. Upper row is charged+neutral variables, lower row is charged-only variables. |
png pdf |
Additional Figure 28-h:
Plots of distribution mean for groomed AK8 jets in the forward dijet region, comparing unfolded data to MC. Upper row is charged+neutral variables, lower row is charged-only variables. |

png pdf |
Additional Figure 28-i:
Plots of distribution mean for groomed AK8 jets in the forward dijet region, comparing unfolded data to MC. Upper row is charged+neutral variables, lower row is charged-only variables. |

png pdf |
Additional Figure 28-j:
Plots of distribution mean for groomed AK8 jets in the forward dijet region, comparing unfolded data to MC. Upper row is charged+neutral variables, lower row is charged-only variables. |

png pdf |
Additional Figure 29:
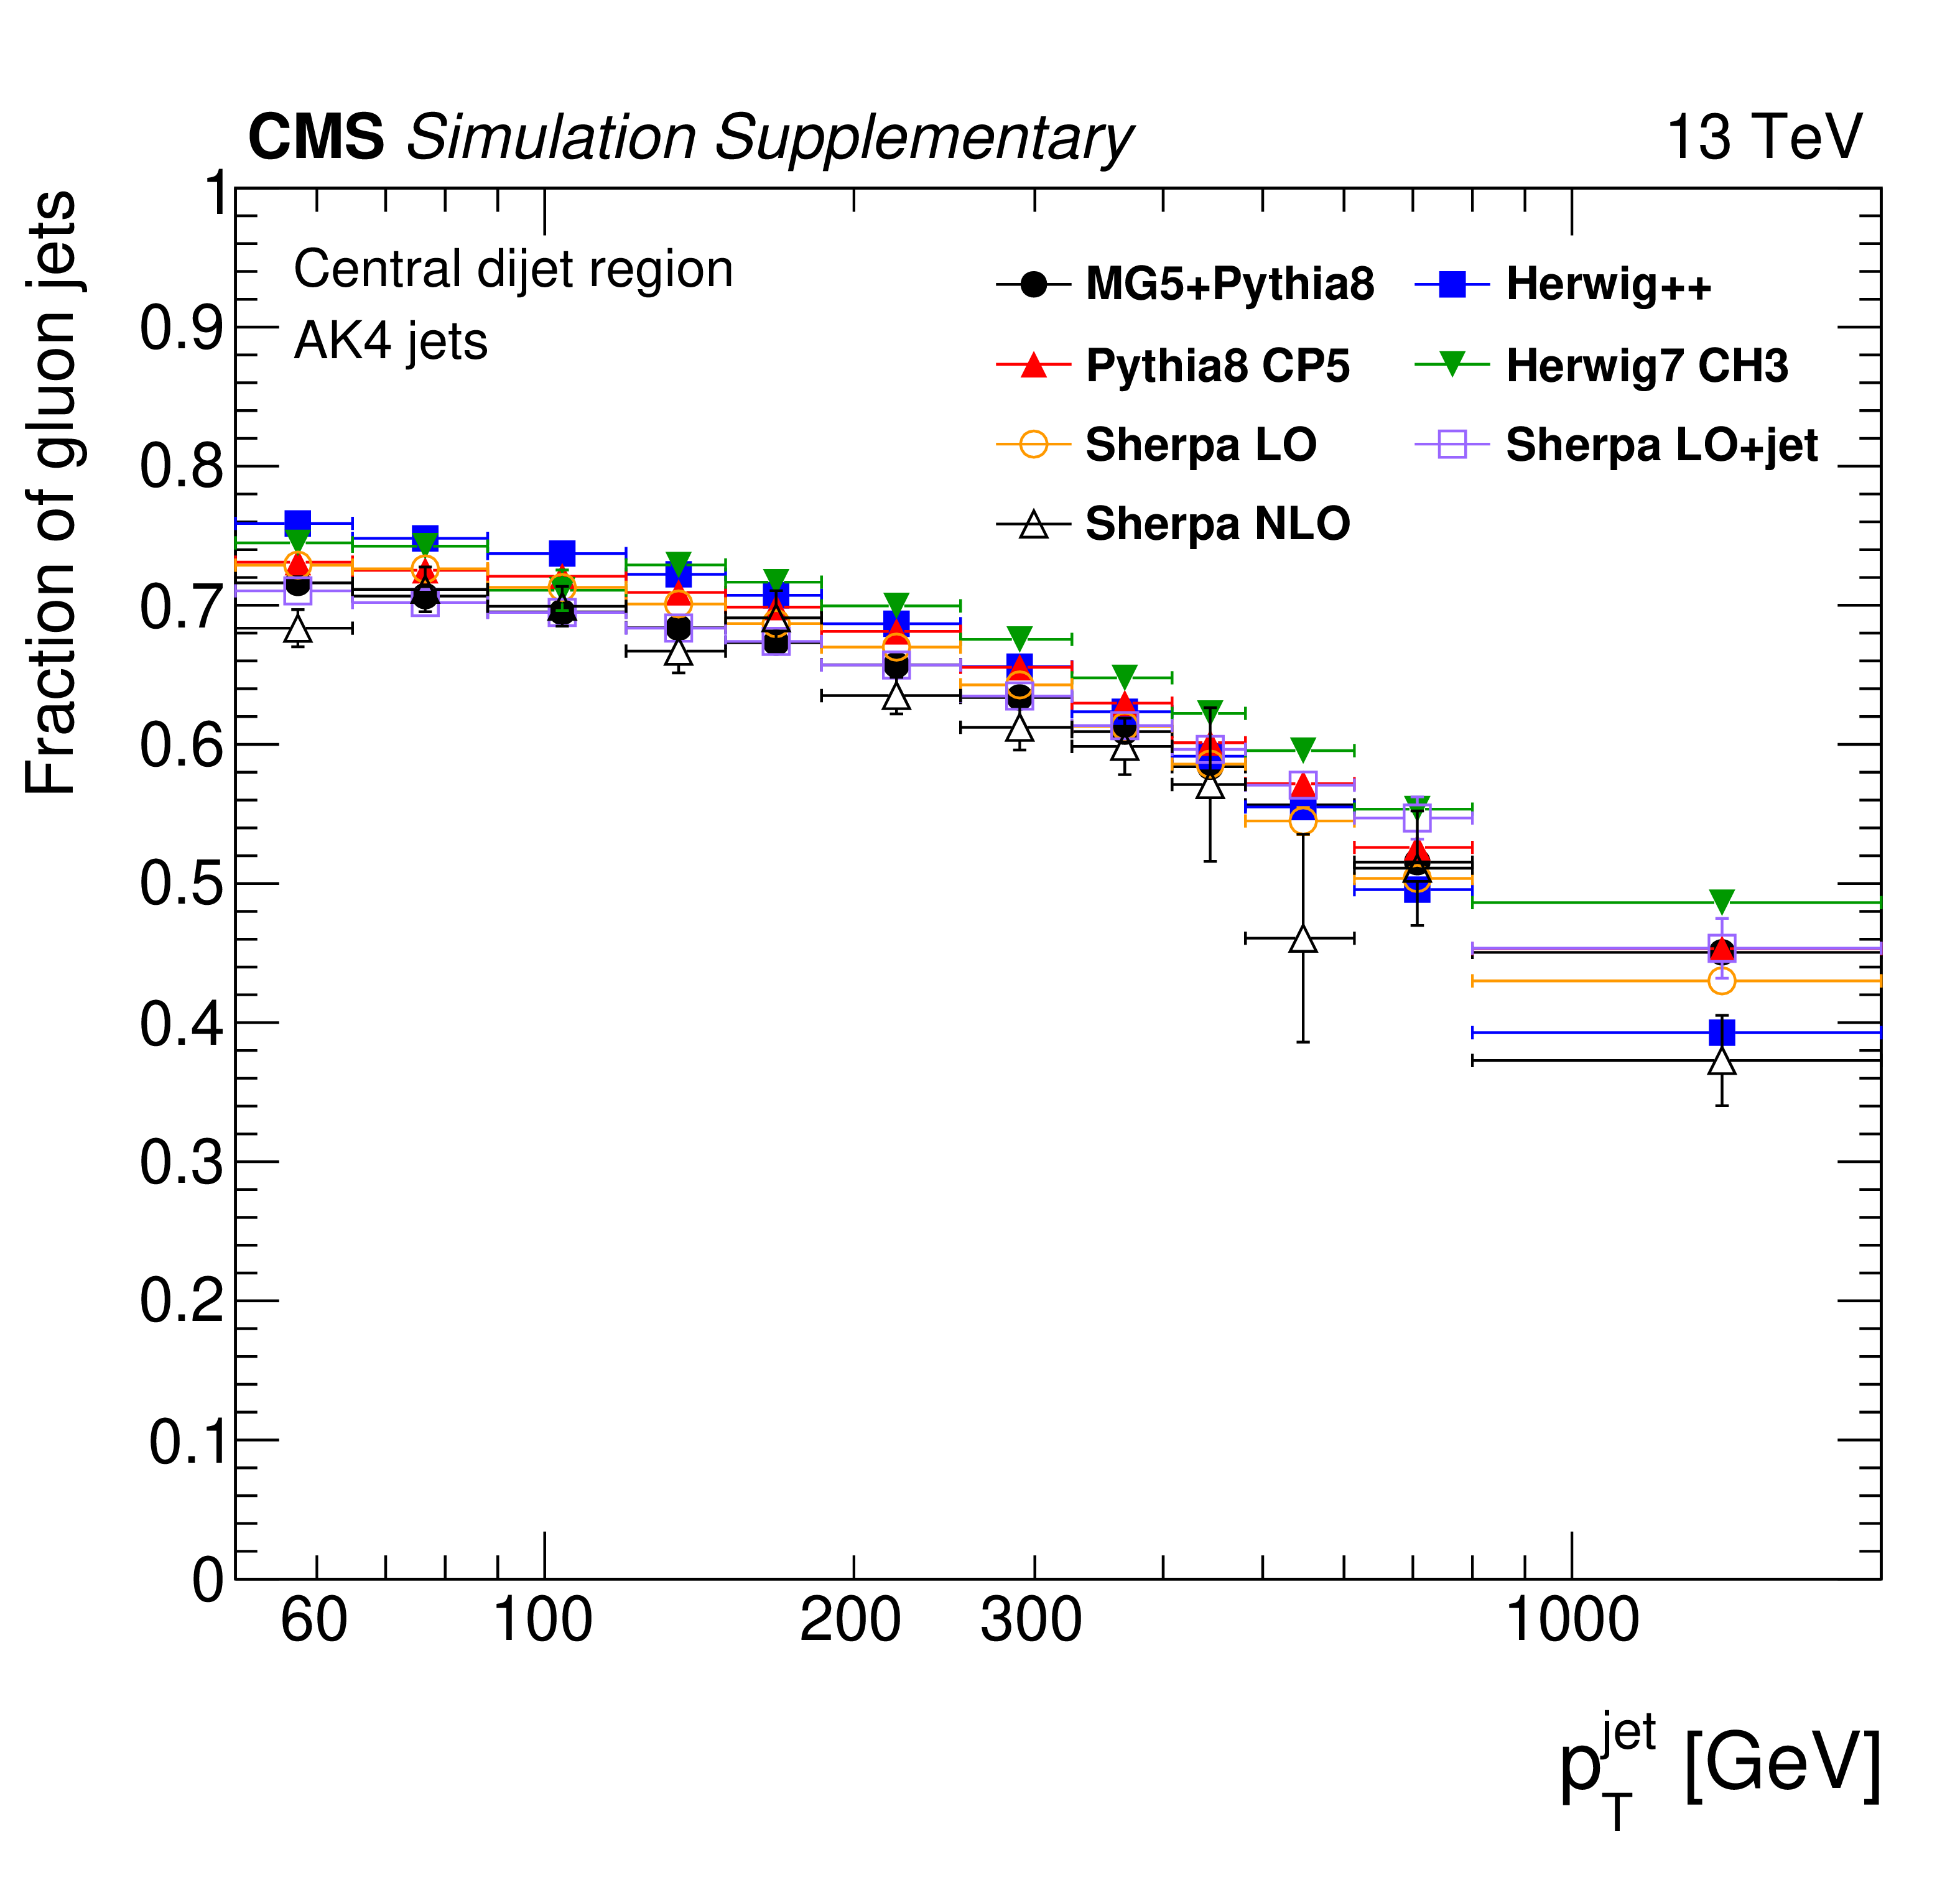
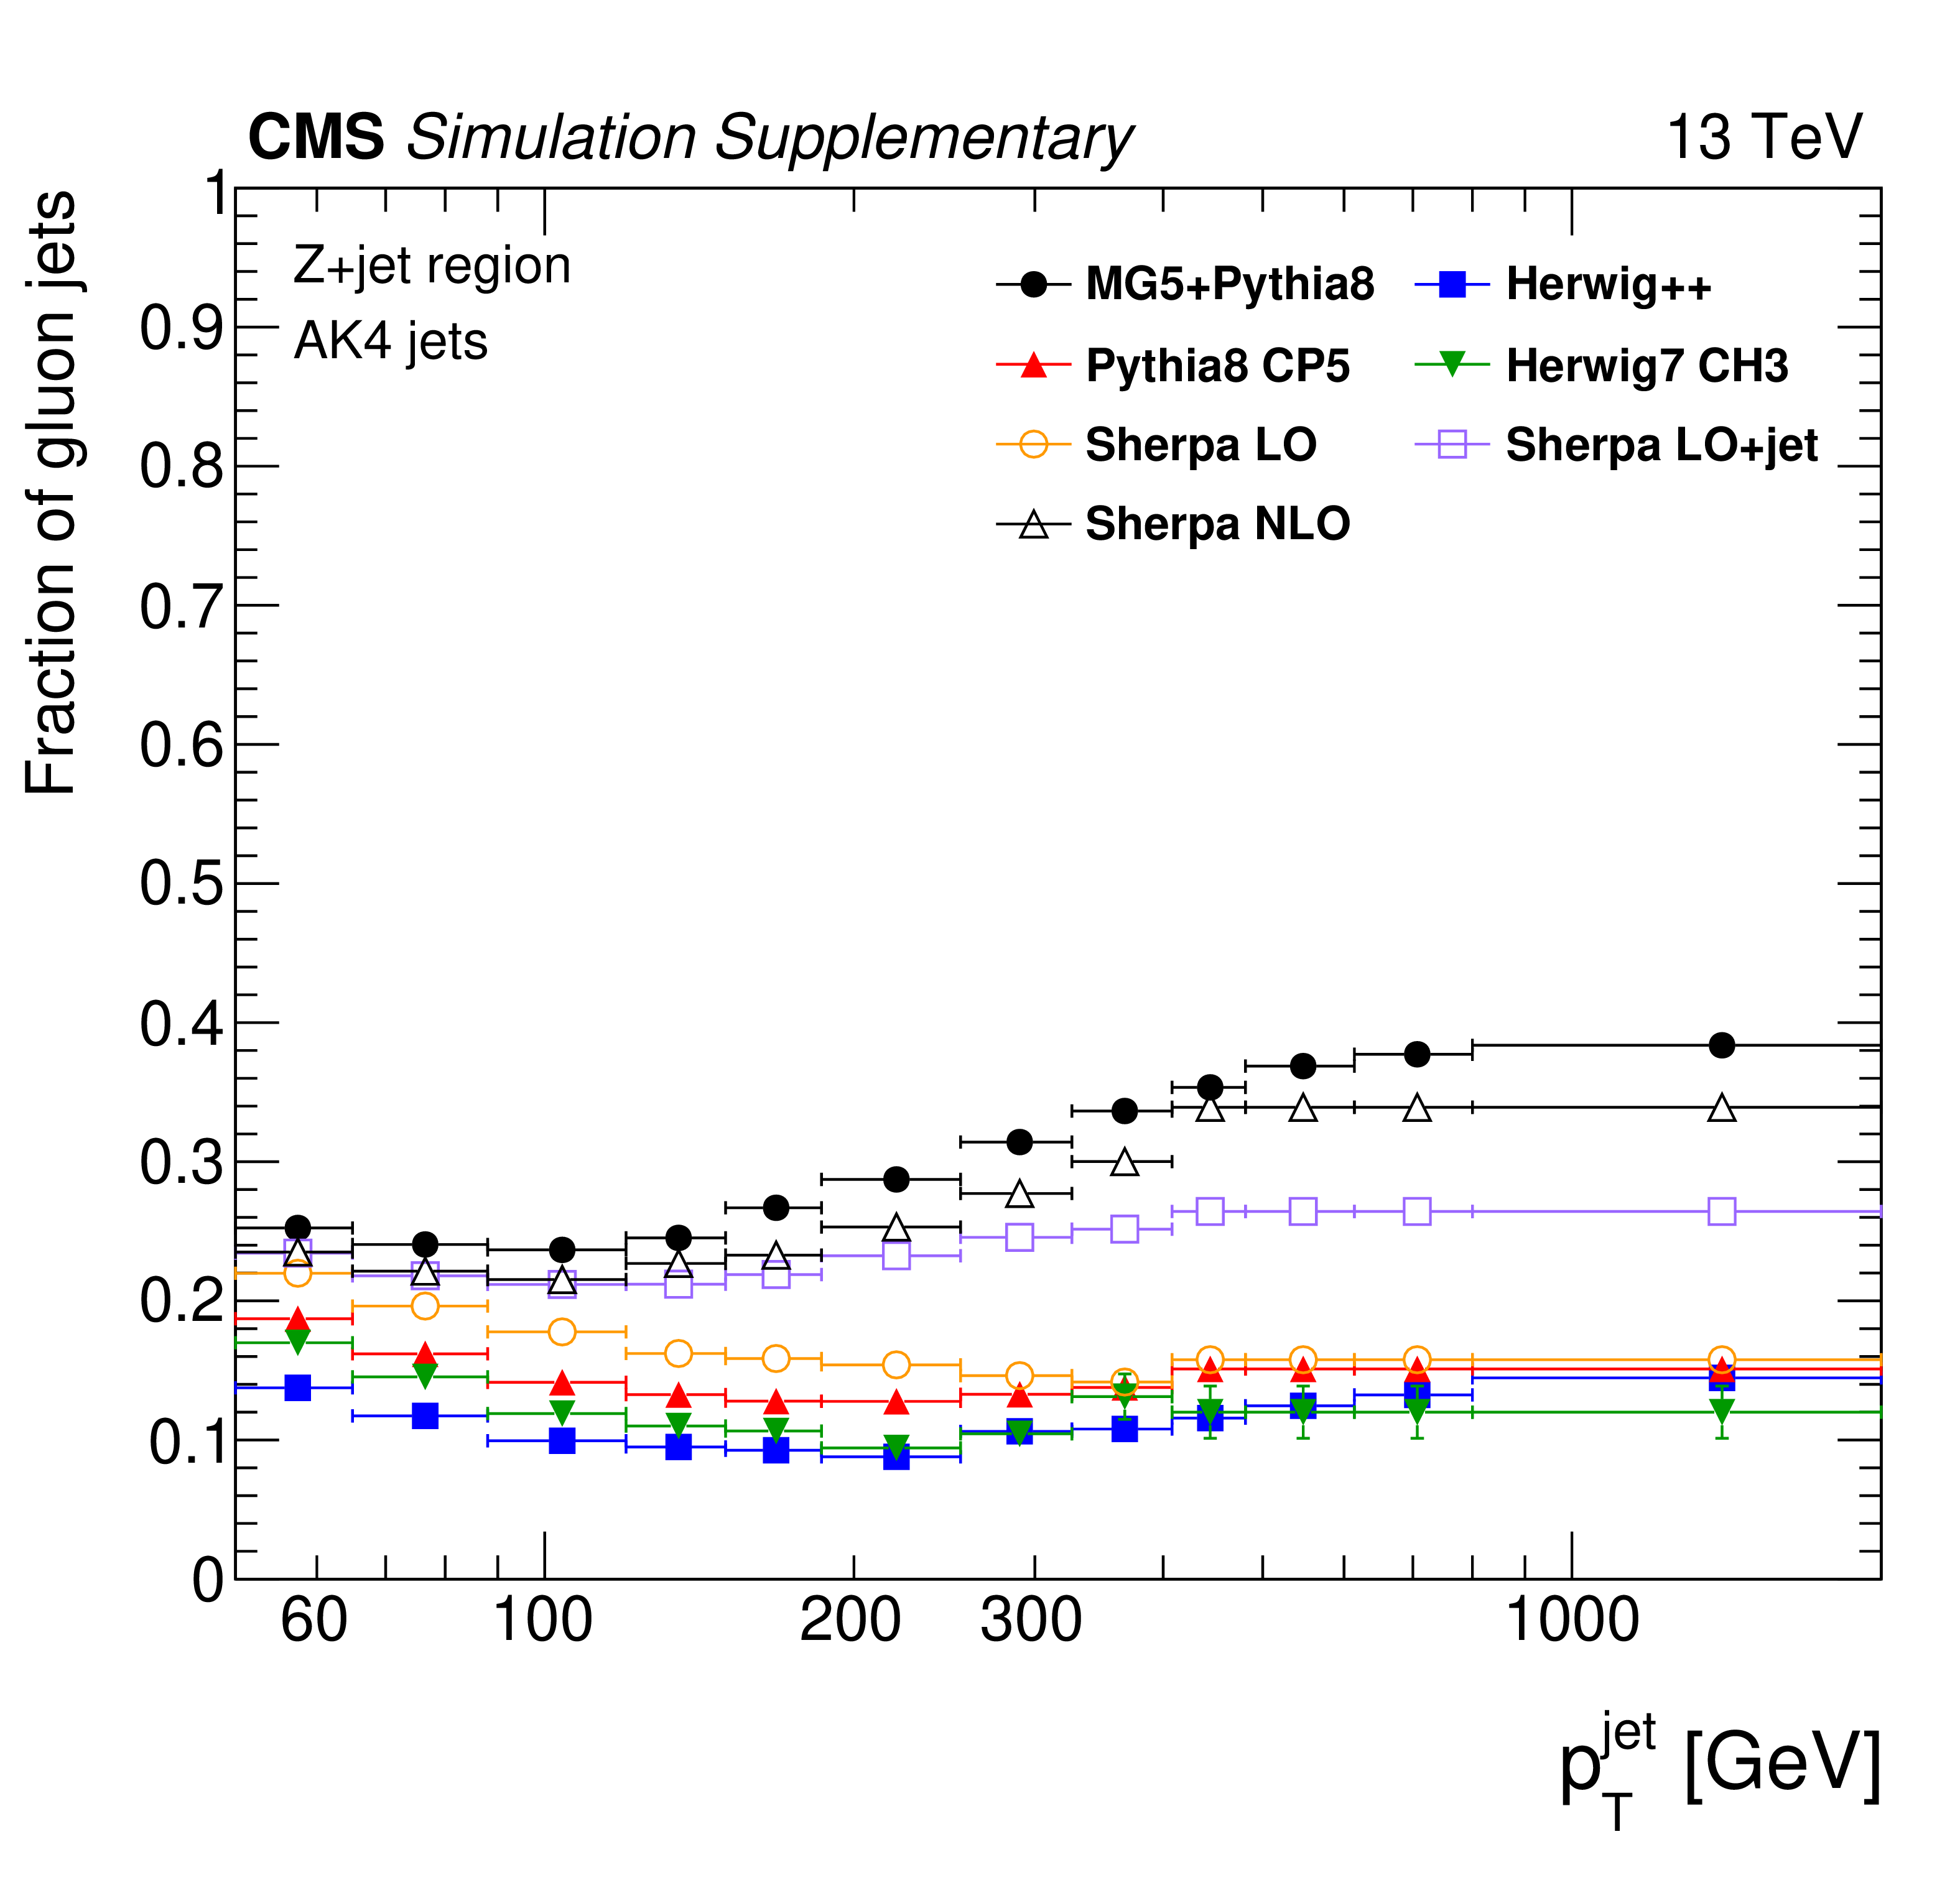
Upper left: gluon jet flavour fraction as a function of jet ${p_{\mathrm {T}}}$ in central dijet region for AK4 jets. Upper right: gluon jet flavour fraction as a function of jet ${p_{\mathrm {T}}}$ in Z+jet region for AK4 jets. Lower: ratio of gluon jet fraction in central dijet region to Z+jet region as a function of jet ${p_{\mathrm {T}}}$ for AK4 jets. {sherpa} LO+jet is {sherpa} LO with CKKW matching for up to 2 (1) additional outgoing partons for the dijet (Z+jet) processes. |
png pdf |
Additional Figure 29-a:
Upper left: gluon jet flavour fraction as a function of jet ${p_{\mathrm {T}}}$ in central dijet region for AK4 jets. Upper right: gluon jet flavour fraction as a function of jet ${p_{\mathrm {T}}}$ in Z+jet region for AK4 jets. Lower: ratio of gluon jet fraction in central dijet region to Z+jet region as a function of jet ${p_{\mathrm {T}}}$ for AK4 jets. {sherpa} LO+jet is {sherpa} LO with CKKW matching for up to 2 (1) additional outgoing partons for the dijet (Z+jet) processes. |
png pdf |
Additional Figure 29-b:
Upper left: gluon jet flavour fraction as a function of jet ${p_{\mathrm {T}}}$ in central dijet region for AK4 jets. Upper right: gluon jet flavour fraction as a function of jet ${p_{\mathrm {T}}}$ in Z+jet region for AK4 jets. Lower: ratio of gluon jet fraction in central dijet region to Z+jet region as a function of jet ${p_{\mathrm {T}}}$ for AK4 jets. {sherpa} LO+jet is {sherpa} LO with CKKW matching for up to 2 (1) additional outgoing partons for the dijet (Z+jet) processes. |
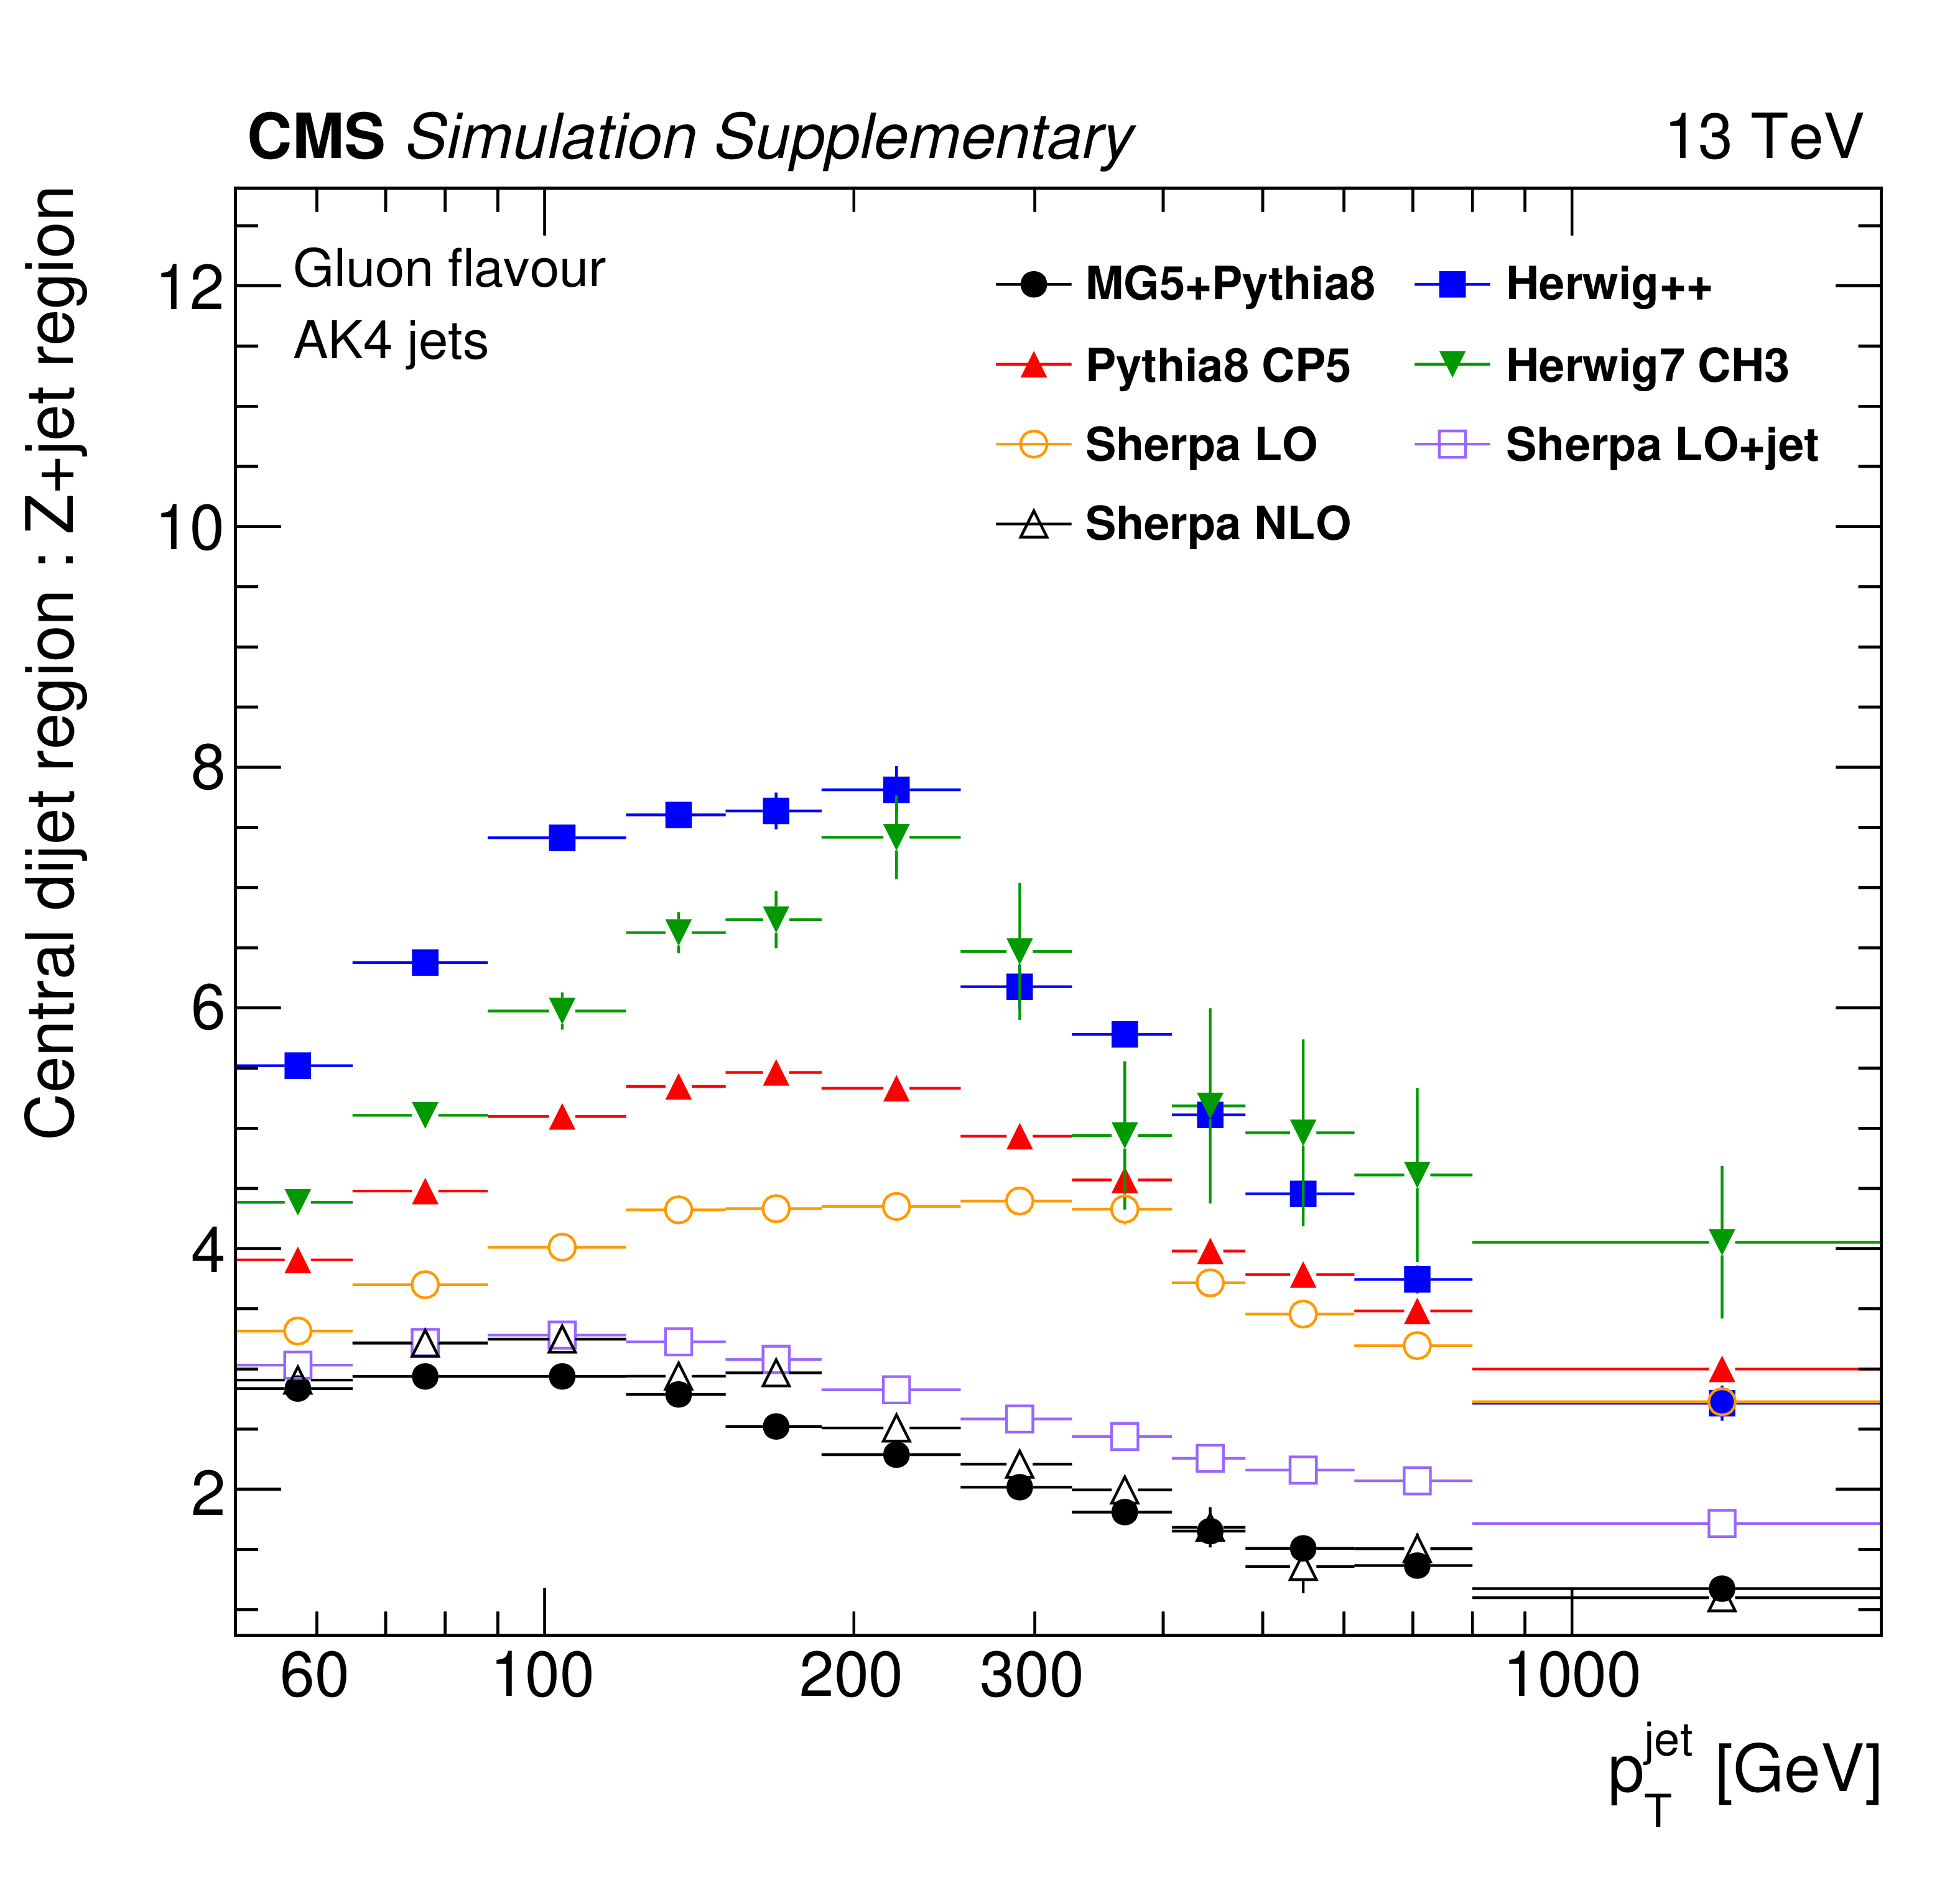
png pdf |
Additional Figure 29-c:
Upper left: gluon jet flavour fraction as a function of jet ${p_{\mathrm {T}}}$ in central dijet region for AK4 jets. Upper right: gluon jet flavour fraction as a function of jet ${p_{\mathrm {T}}}$ in Z+jet region for AK4 jets. Lower: ratio of gluon jet fraction in central dijet region to Z+jet region as a function of jet ${p_{\mathrm {T}}}$ for AK4 jets. {sherpa} LO+jet is {sherpa} LO with CKKW matching for up to 2 (1) additional outgoing partons for the dijet (Z+jet) processes. |
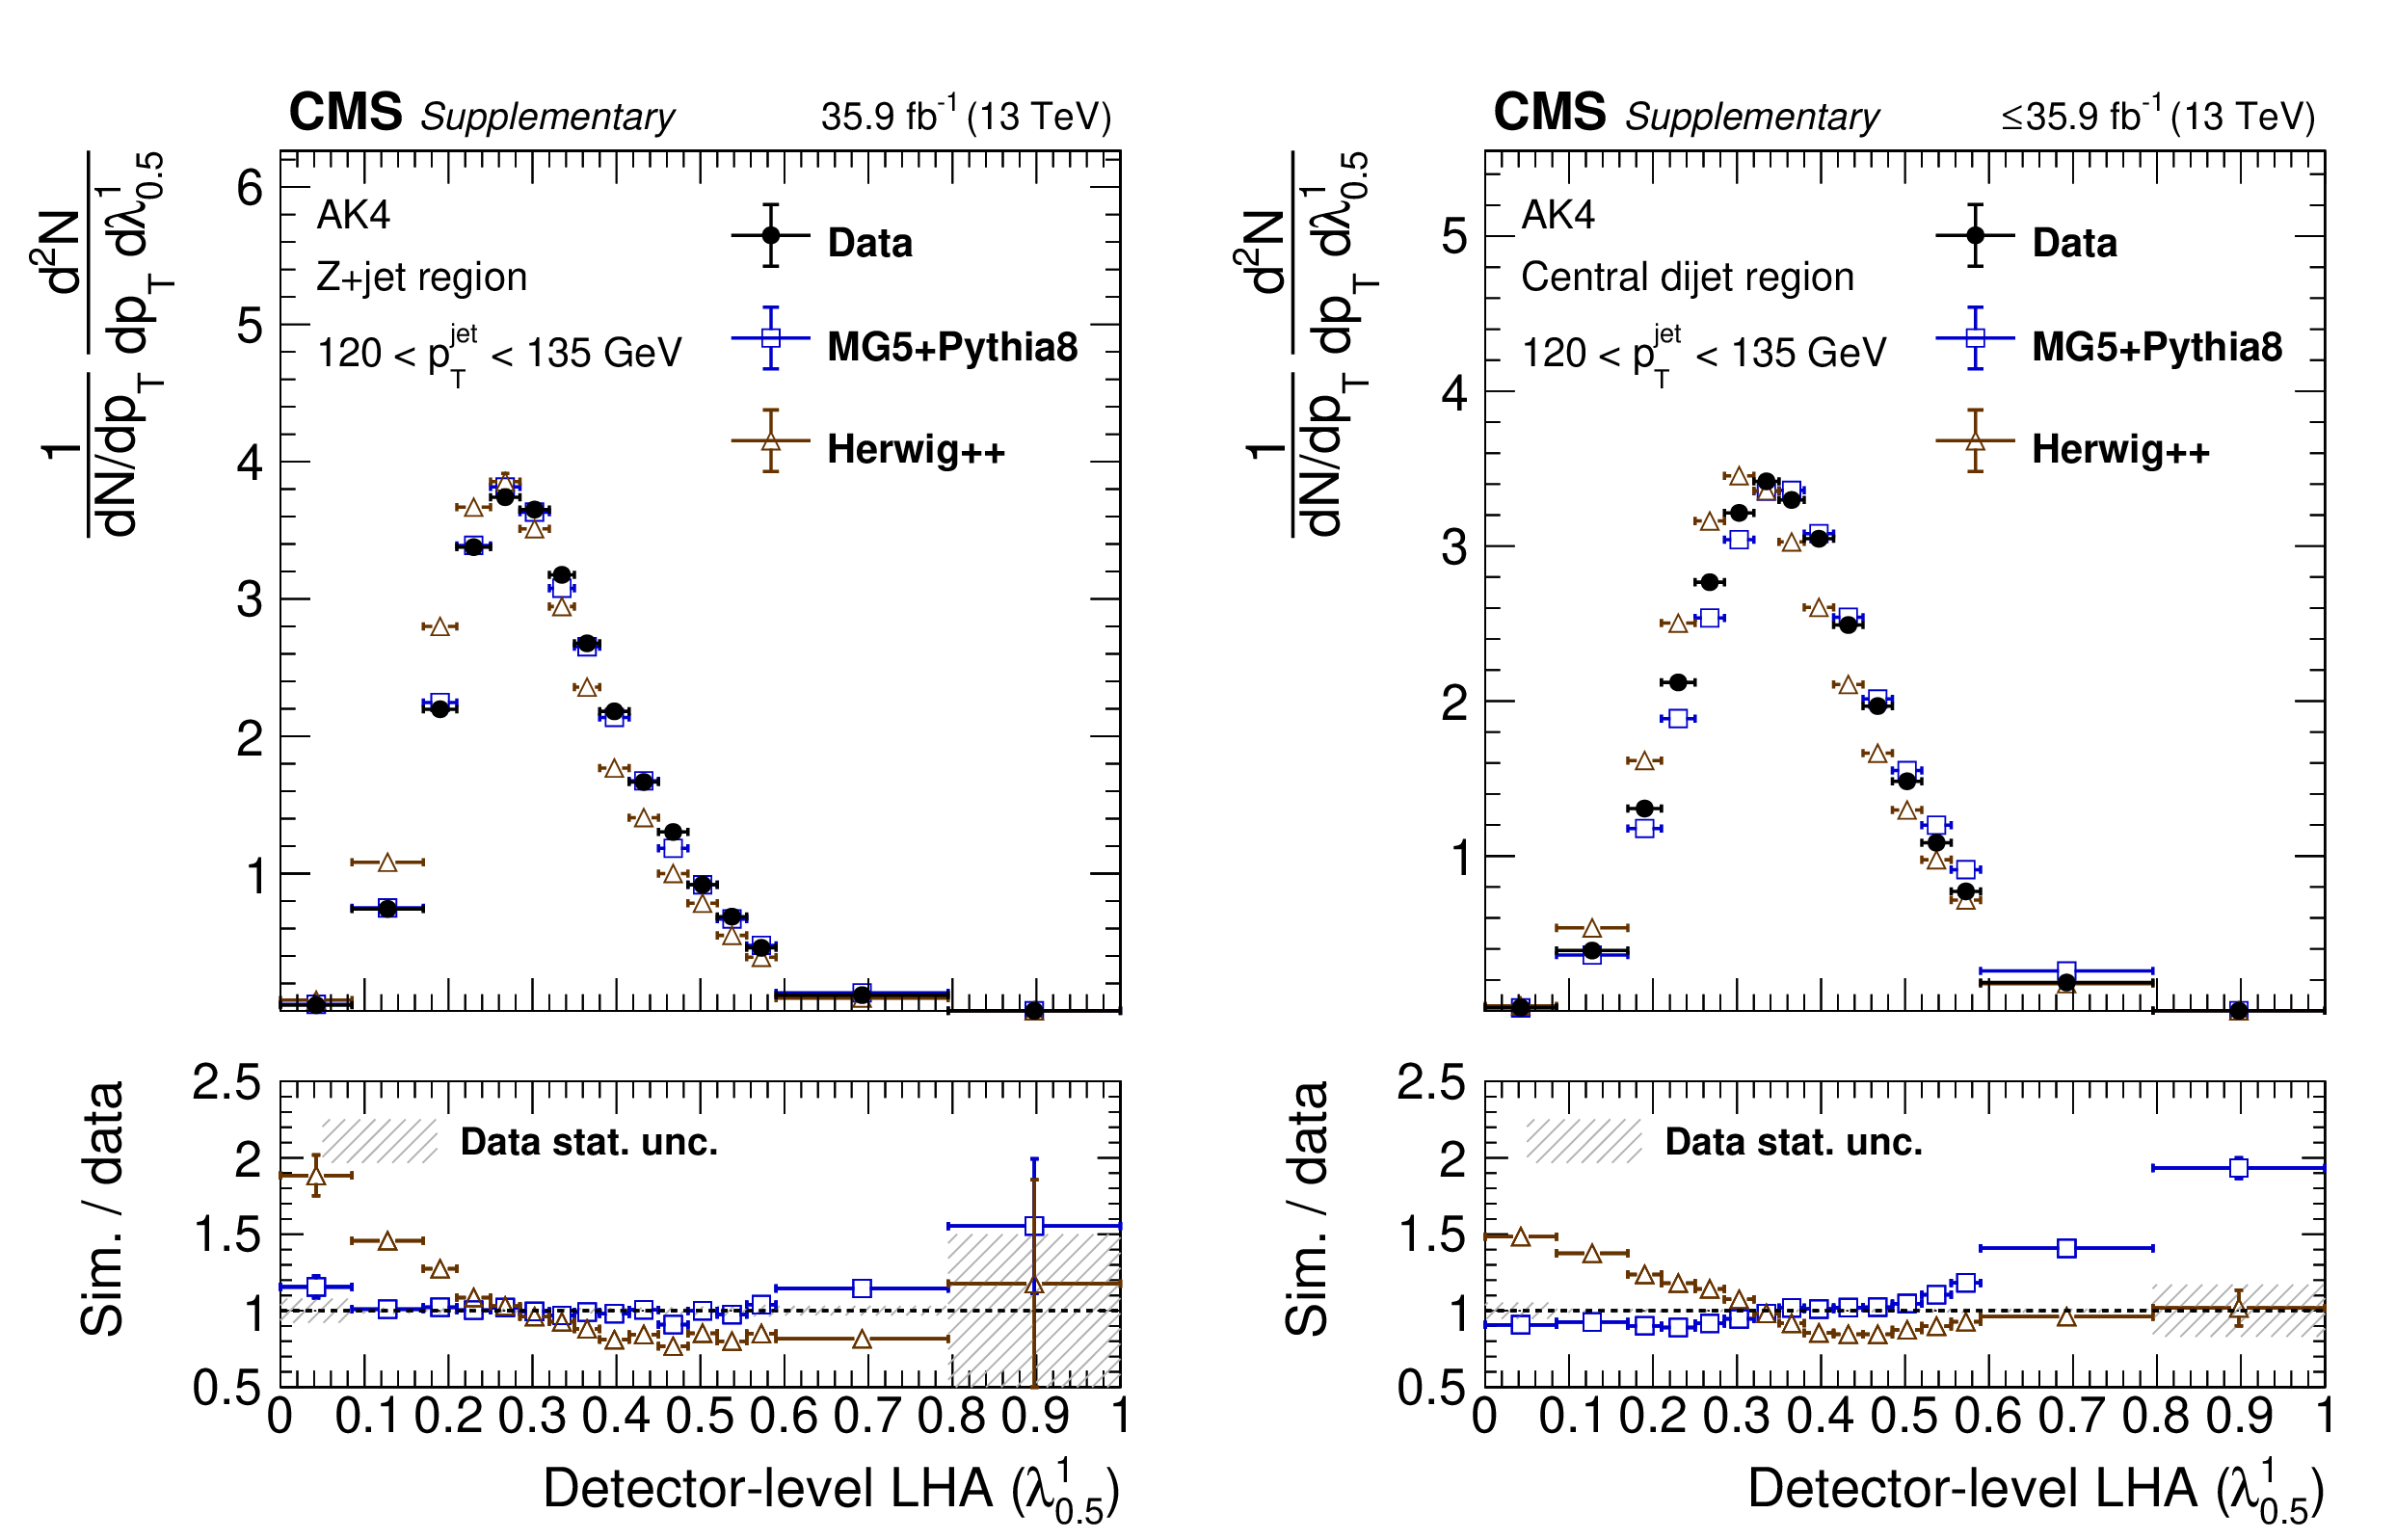
png pdf |
Additional Figure 30:
Data to simulation comparisons for substructure observables in 120 $ < {p_{\mathrm {T}}} < $ 150 GeV in the Z+jet (left) and central dijet regions (right): LHA (${\lambda ^{1}_{0.5}}$) |

png pdf |
Additional Figure 30-a:
Data to simulation comparisons for substructure observables in 120 $ < {p_{\mathrm {T}}} < $ 150 GeV in the Z+jet (left) and central dijet regions (right): LHA (${\lambda ^{1}_{0.5}}$) |

png pdf |
Additional Figure 30-b:
Data to simulation comparisons for substructure observables in 120 $ < {p_{\mathrm {T}}} < $ 150 GeV in the Z+jet (left) and central dijet regions (right): LHA (${\lambda ^{1}_{0.5}}$) |
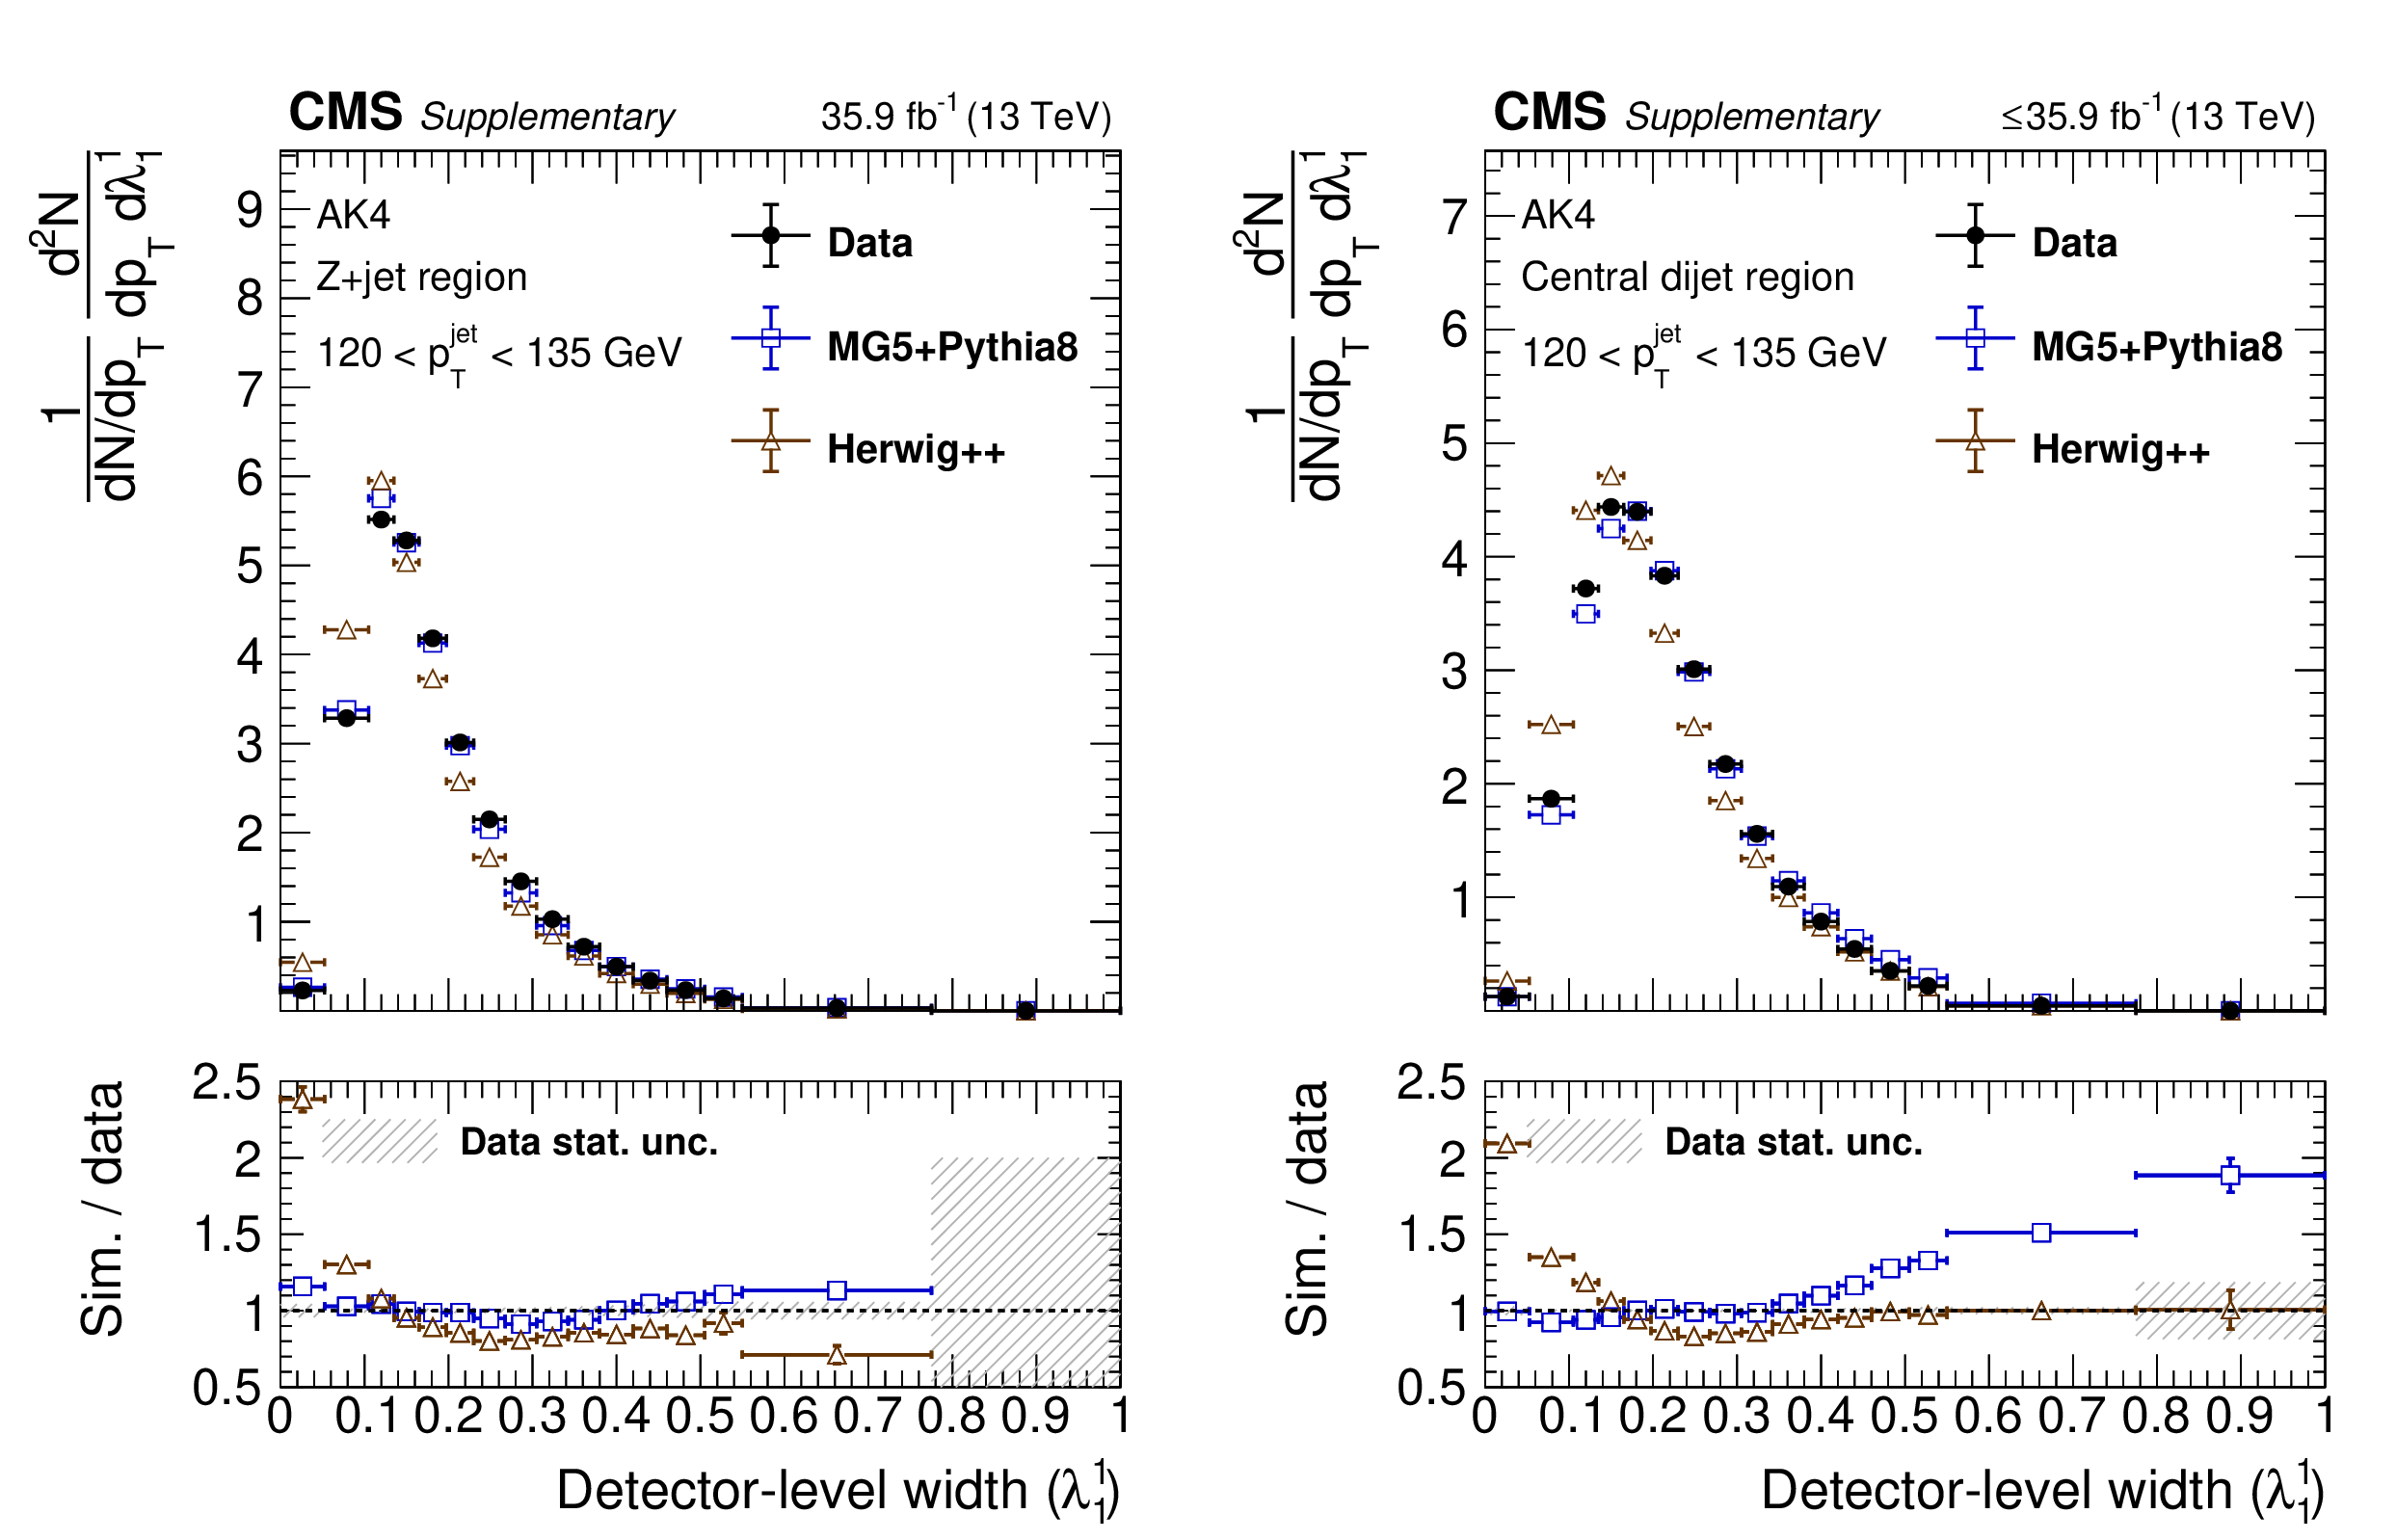
png pdf |
Additional Figure 31:
Data to simulation comparisons for substructure observables in 120 $ < {p_{\mathrm {T}}} < $ 150 GeV in the Z+jet (left) and central dijet regions (right): width (${\lambda ^{1}_{1}}$). |

png pdf |
Additional Figure 31-a:
Data to simulation comparisons for substructure observables in 120 $ < {p_{\mathrm {T}}} < $ 150 GeV in the Z+jet (left) and central dijet regions (right): width (${\lambda ^{1}_{1}}$). |
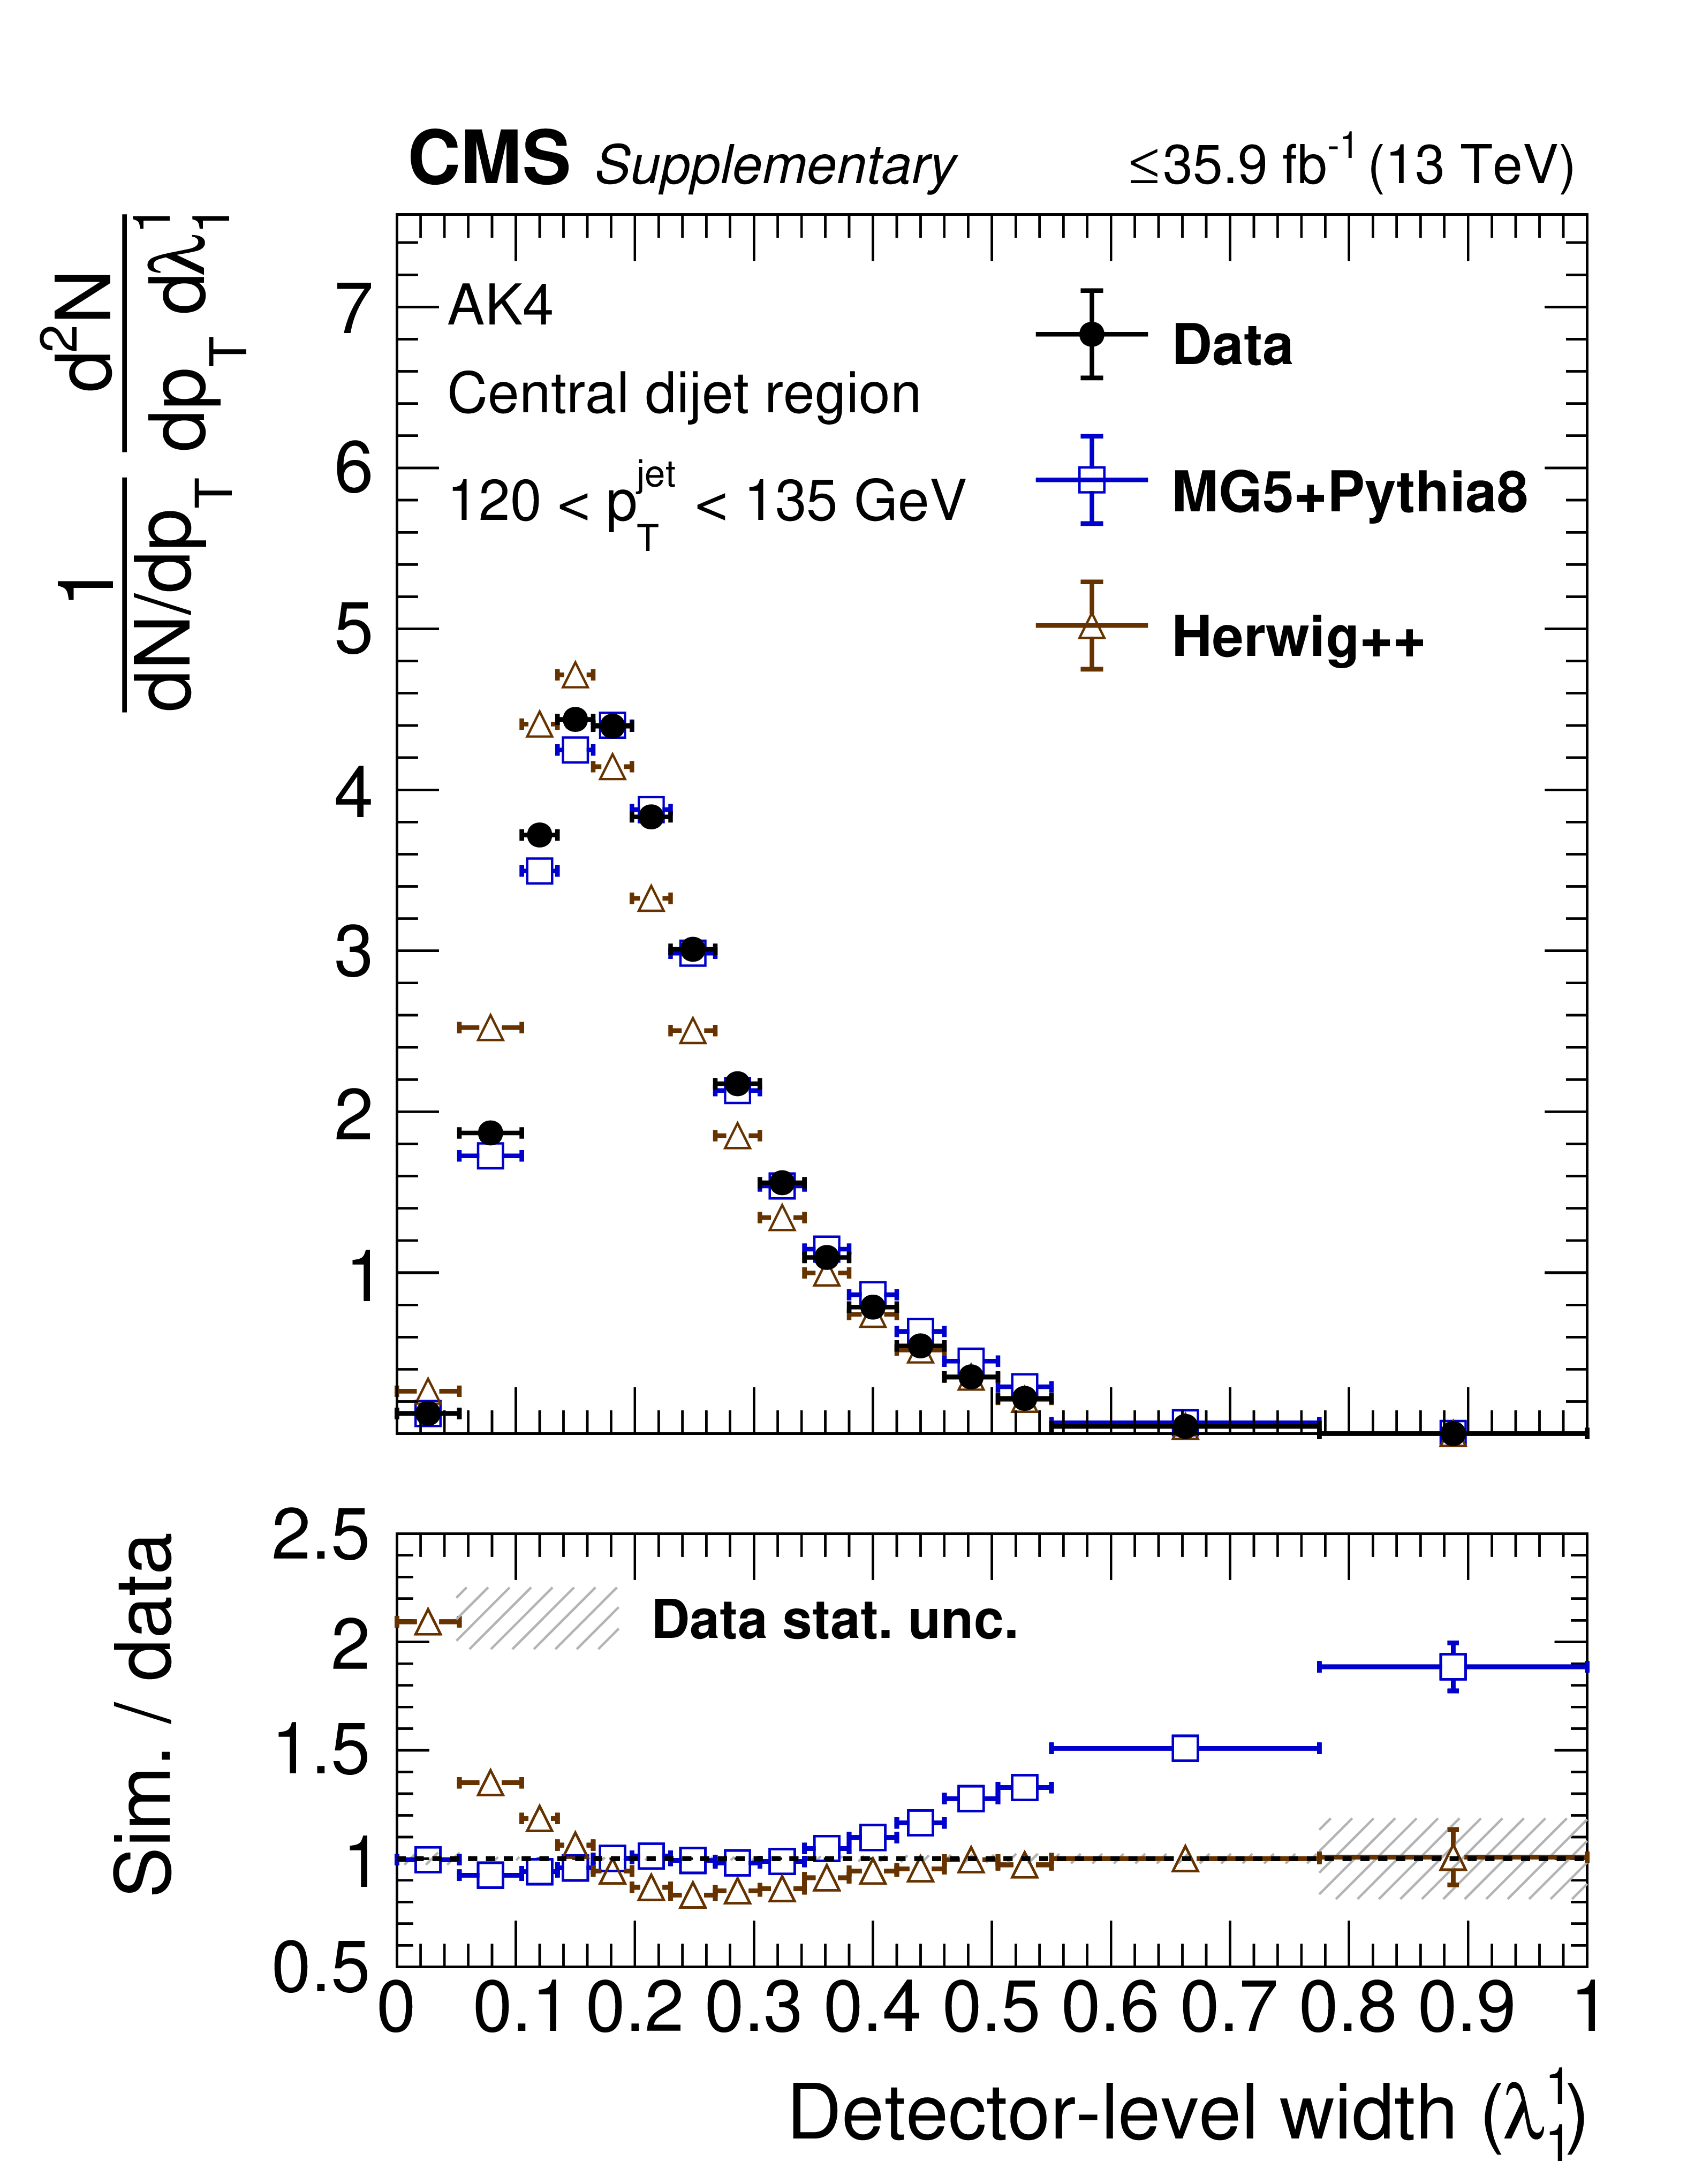
png pdf |
Additional Figure 31-b:
Data to simulation comparisons for substructure observables in 120 $ < {p_{\mathrm {T}}} < $ 150 GeV in the Z+jet (left) and central dijet regions (right): width (${\lambda ^{1}_{1}}$). |

png pdf |
Additional Figure 32:
Data to simulation comparisons for substructure observables in 120 $ < {p_{\mathrm {T}}} < $ 150 GeV in the Z+jet (left) and central dijet regions (right): thrust (${\lambda ^{1}_{2}}$). |
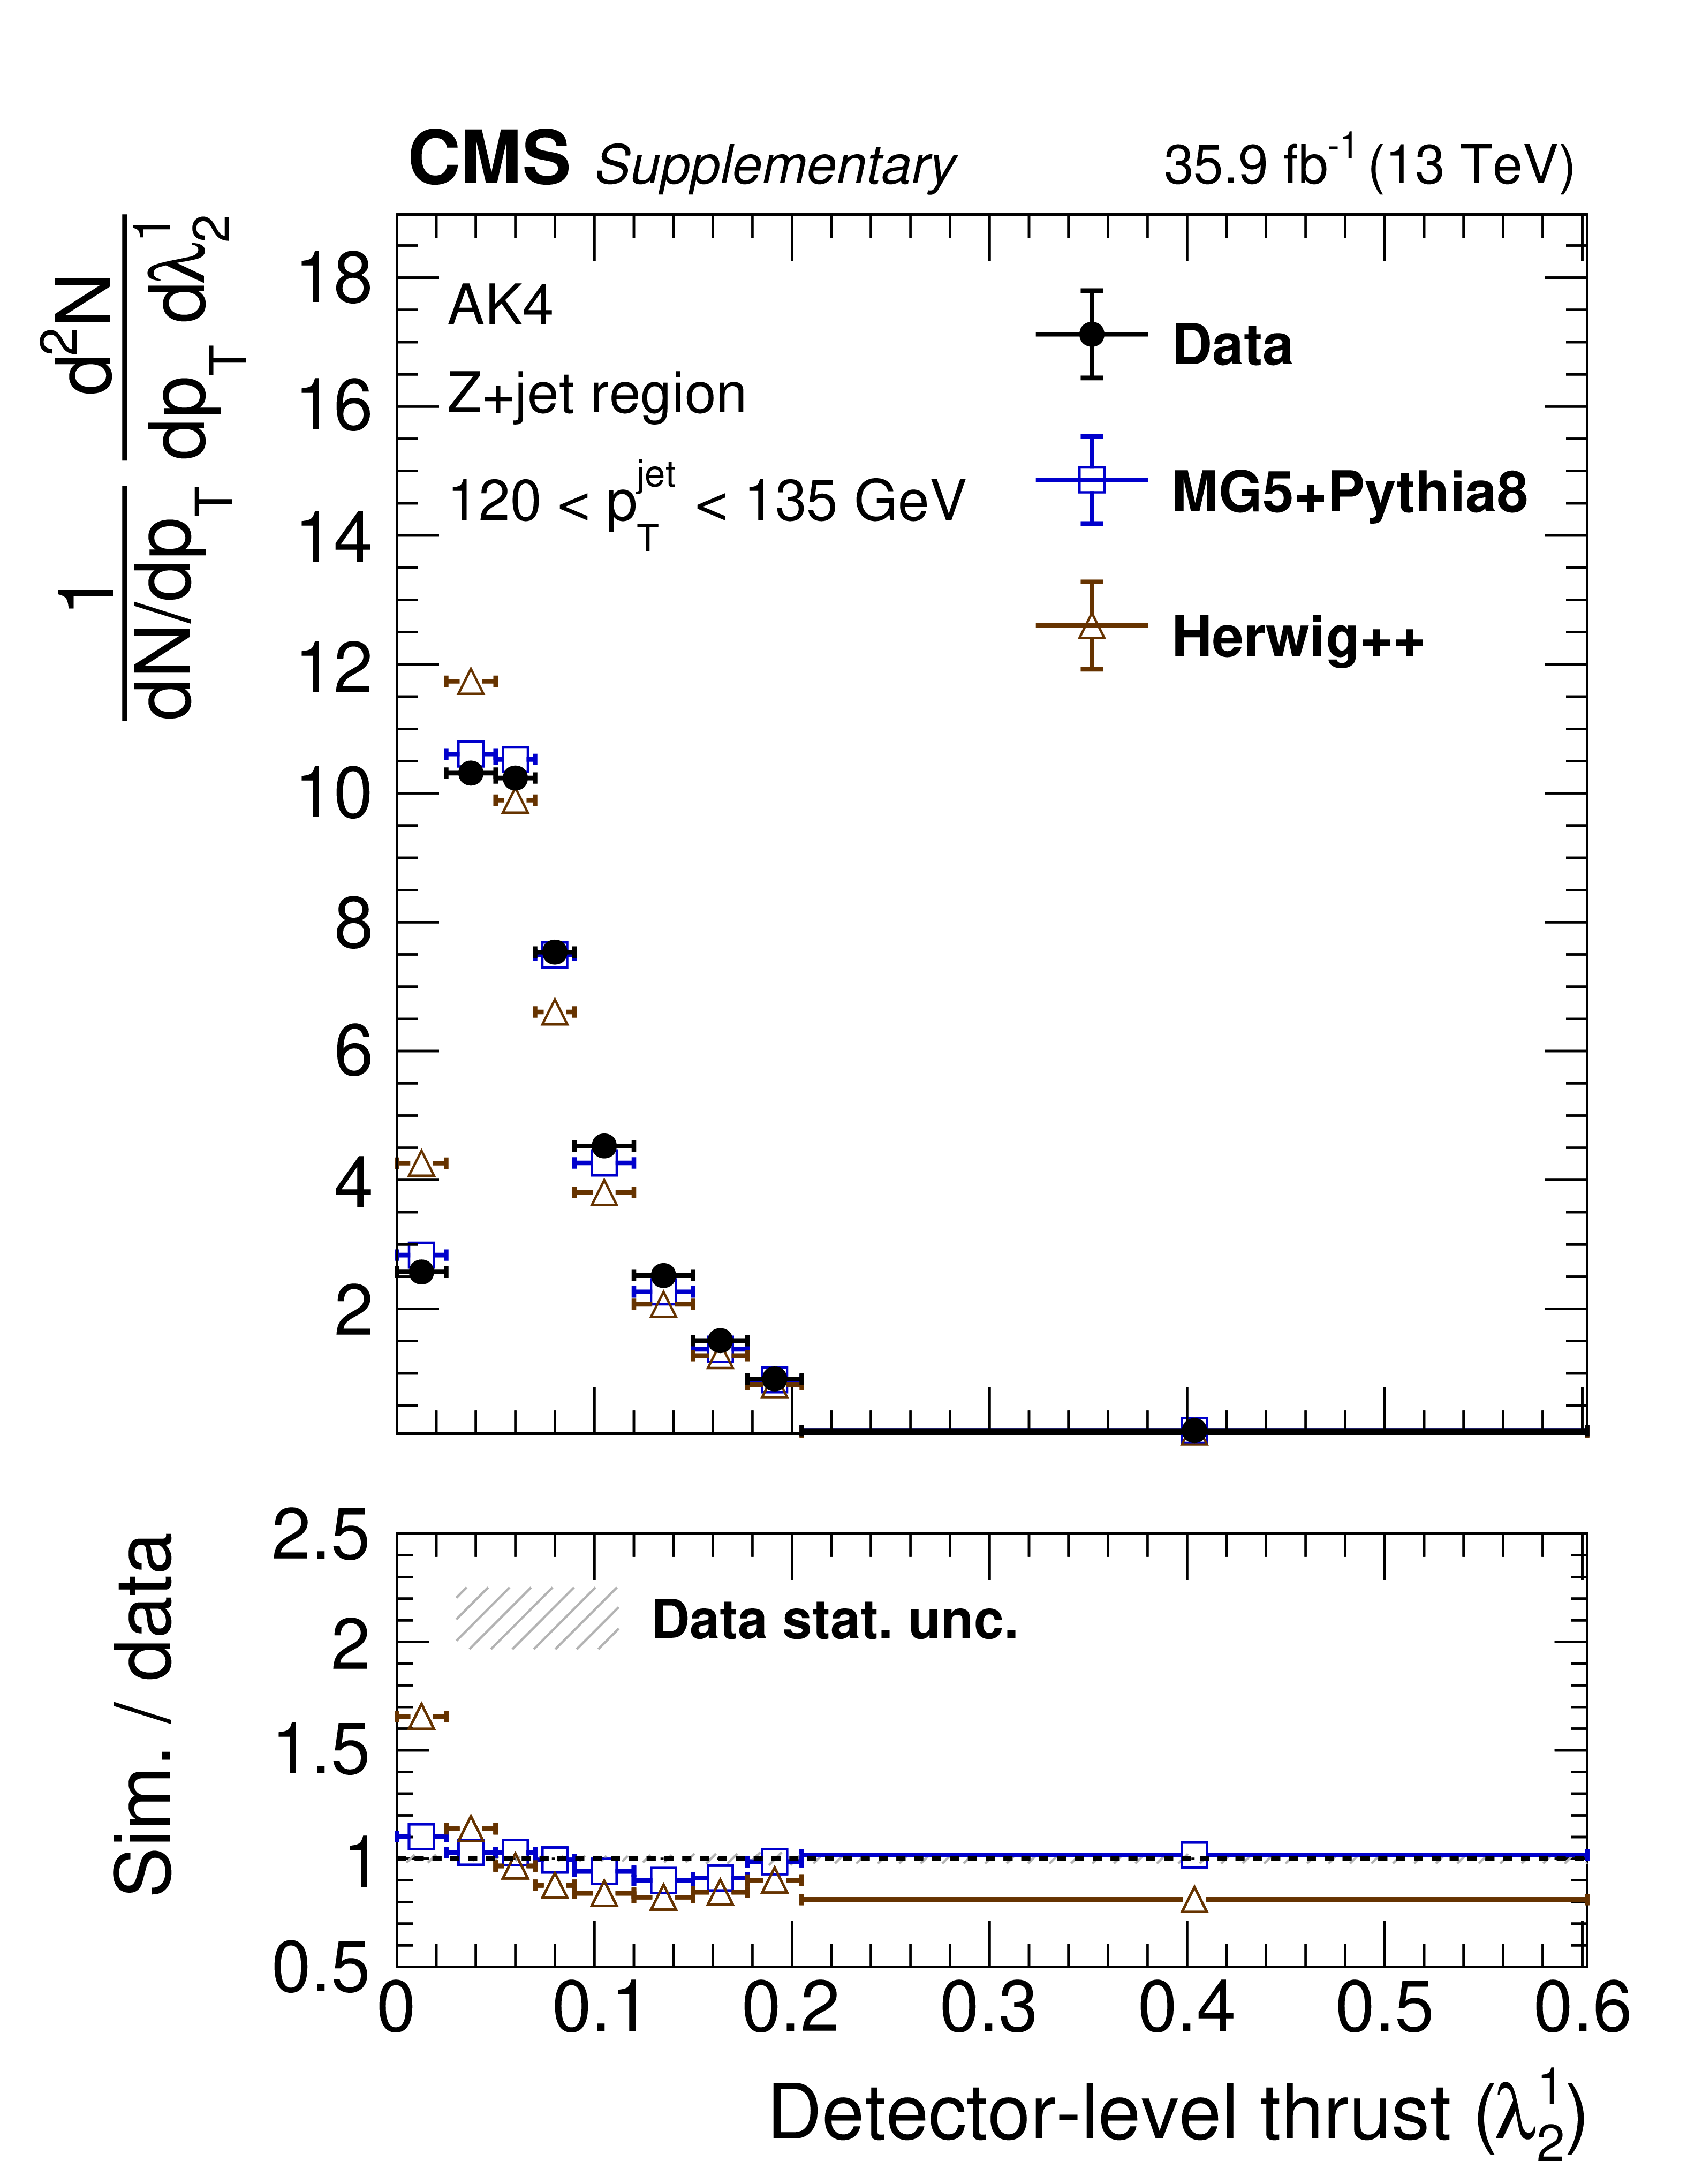
png pdf |
Additional Figure 32-a:
Data to simulation comparisons for substructure observables in 120 $ < {p_{\mathrm {T}}} < $ 150 GeV in the Z+jet (left) and central dijet regions (right): thrust (${\lambda ^{1}_{2}}$). |
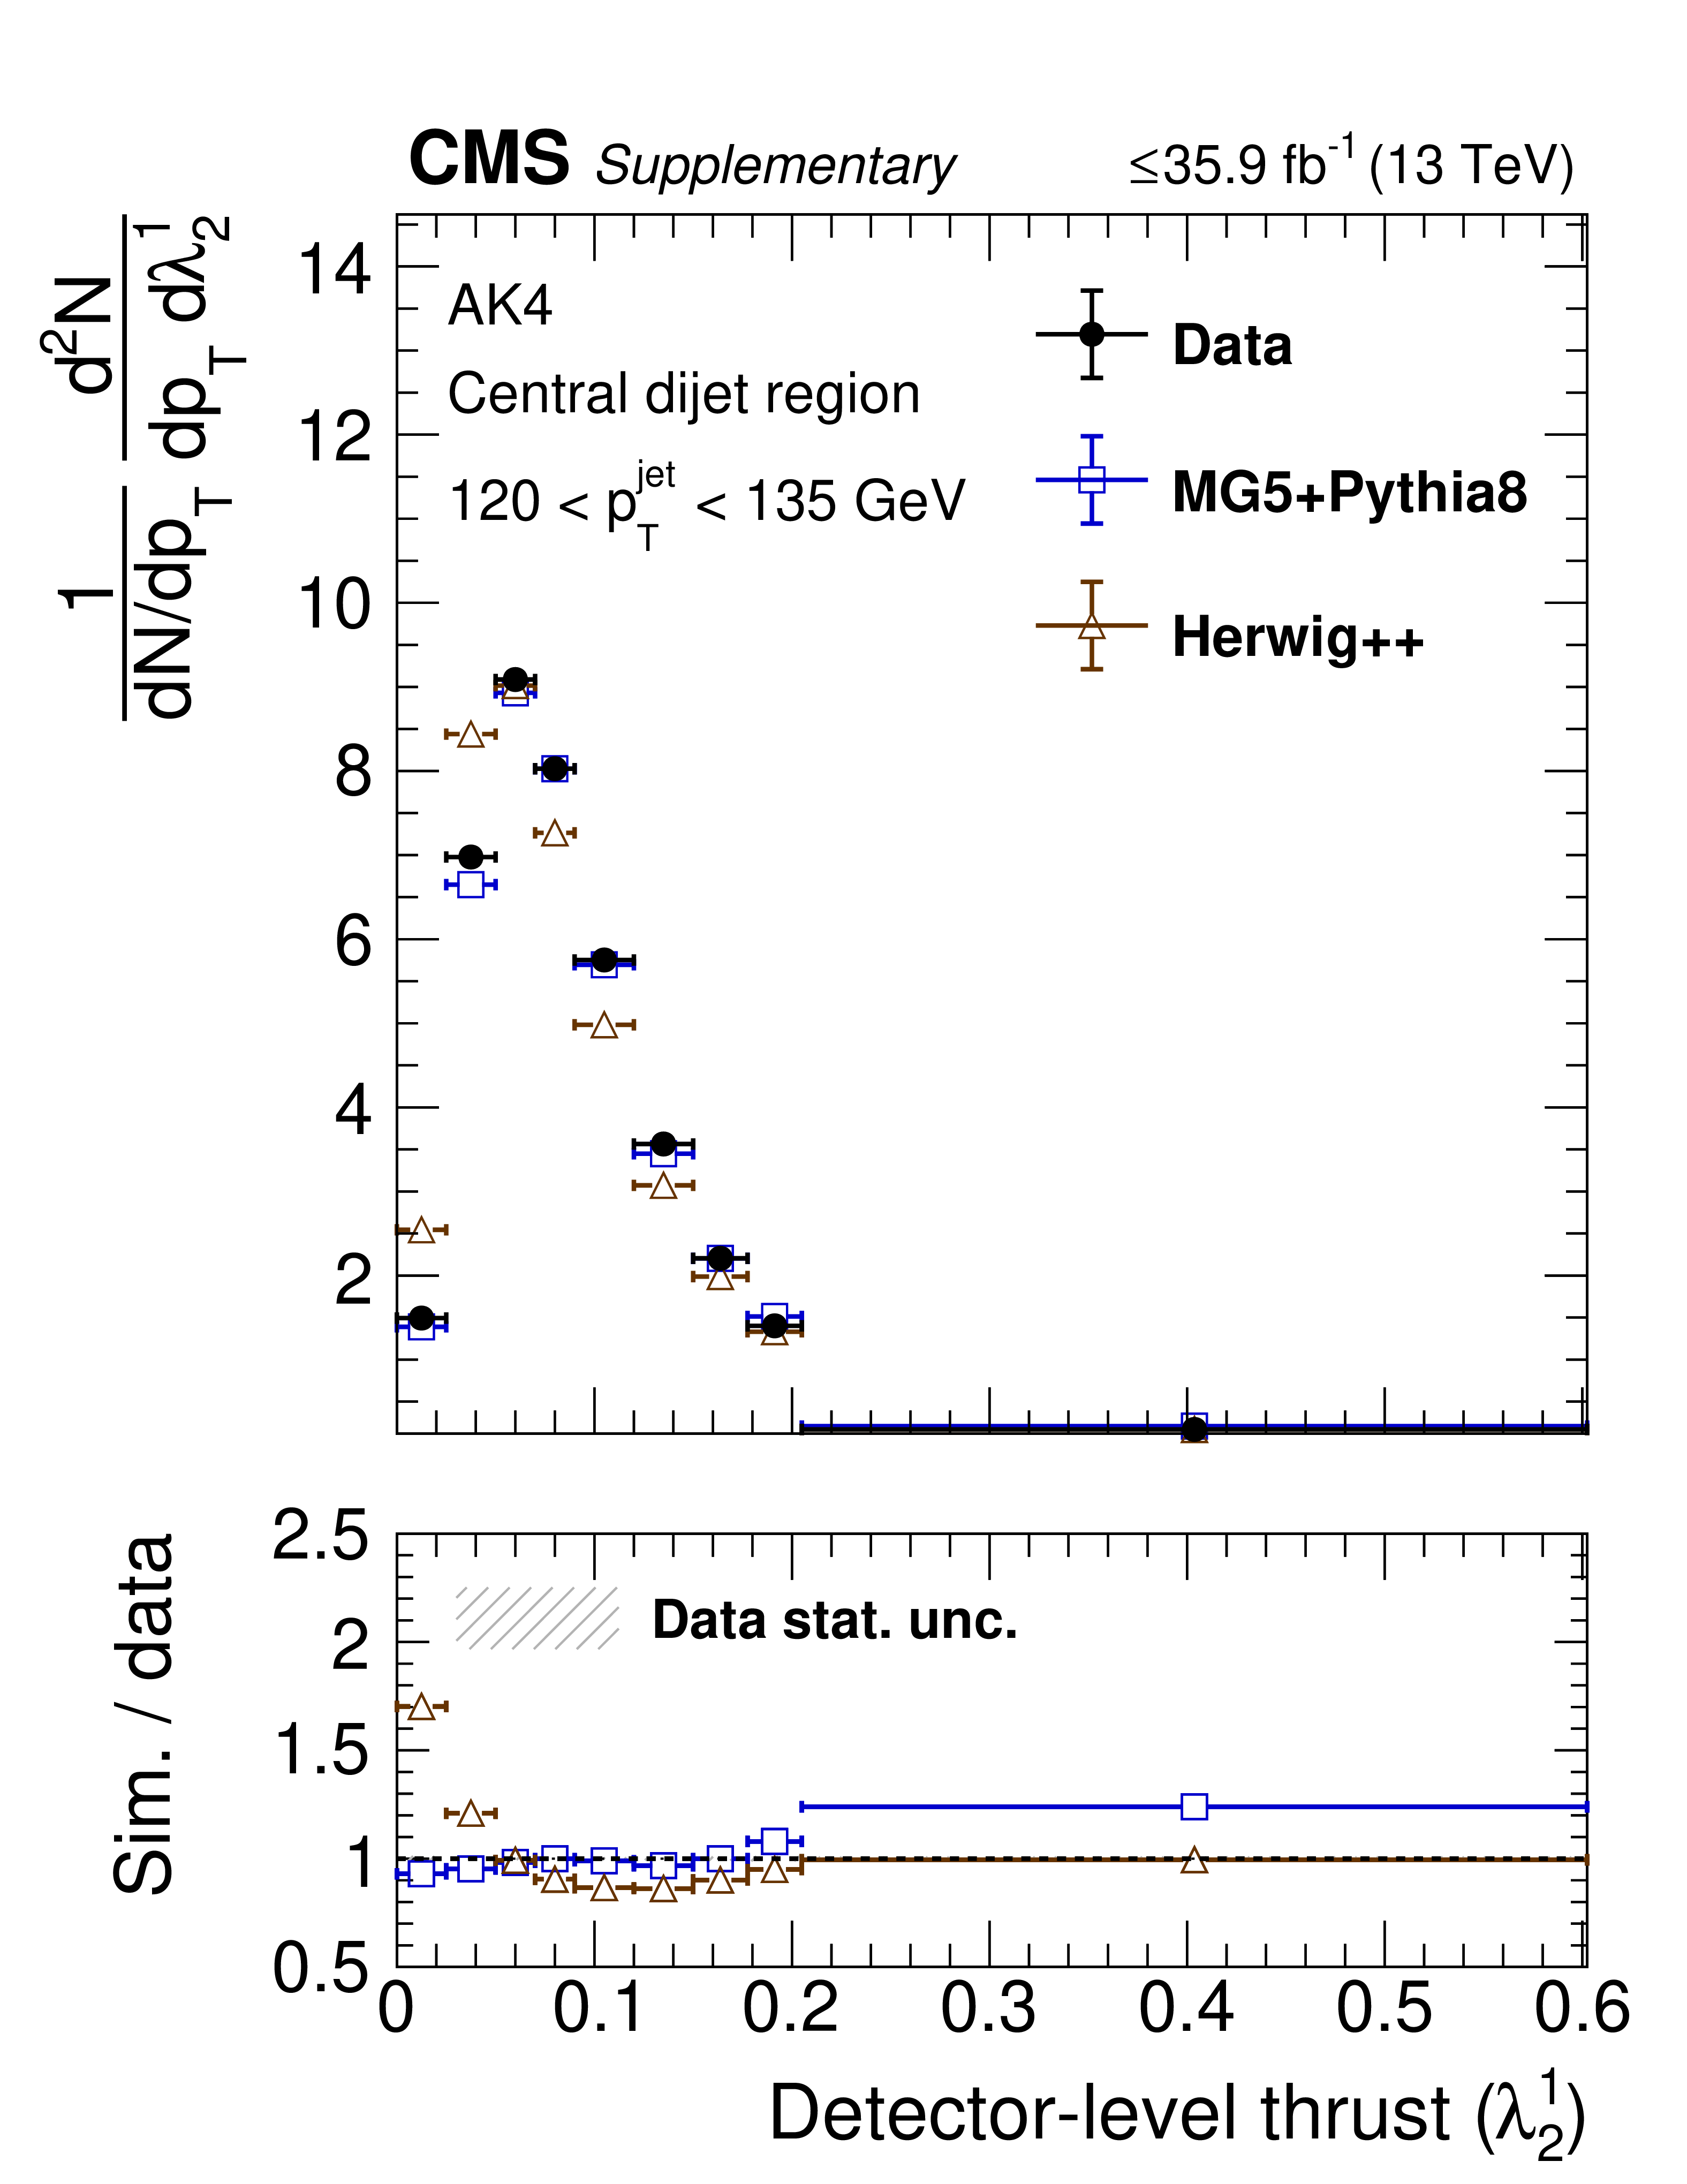
png pdf |
Additional Figure 32-b:
Data to simulation comparisons for substructure observables in 120 $ < {p_{\mathrm {T}}} < $ 150 GeV in the Z+jet (left) and central dijet regions (right): thrust (${\lambda ^{1}_{2}}$). |
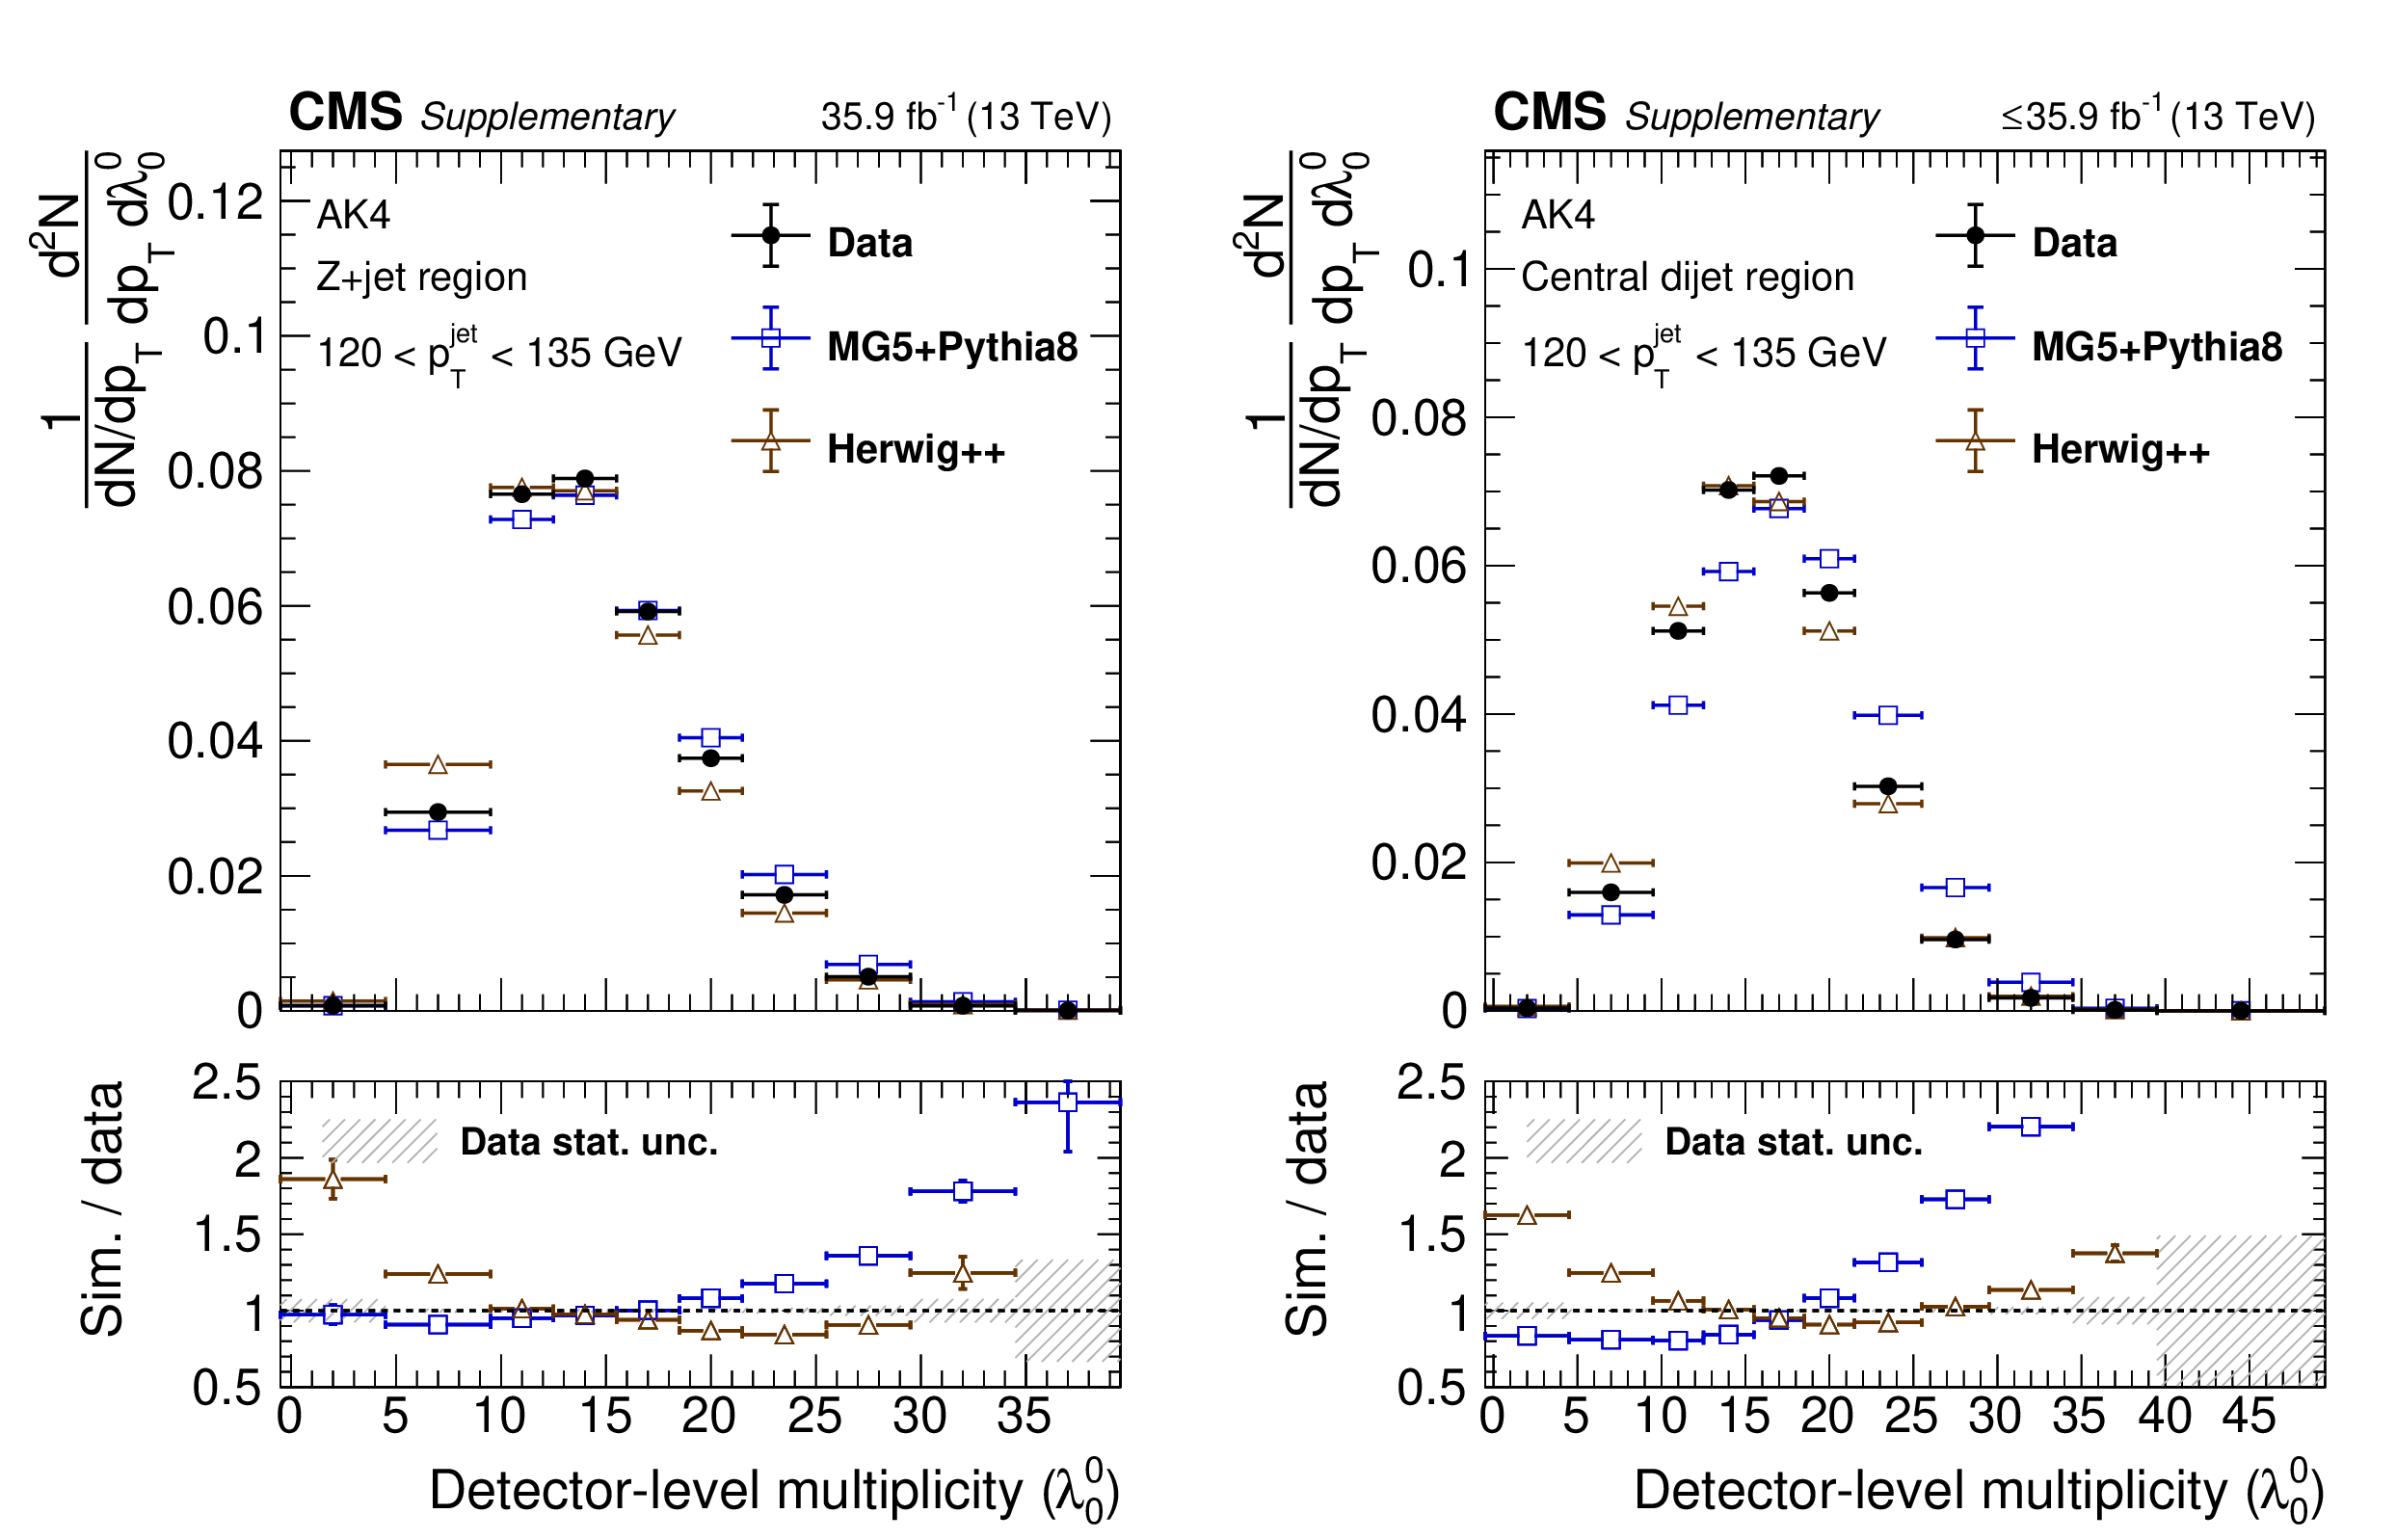
png pdf |
Additional Figure 33:
Data to simulation comparisons for substructure observables in 120 $ < {p_{\mathrm {T}}} < $ 150 GeV in the Z+jet (left) and central dijet regions (right): multiplicity. |
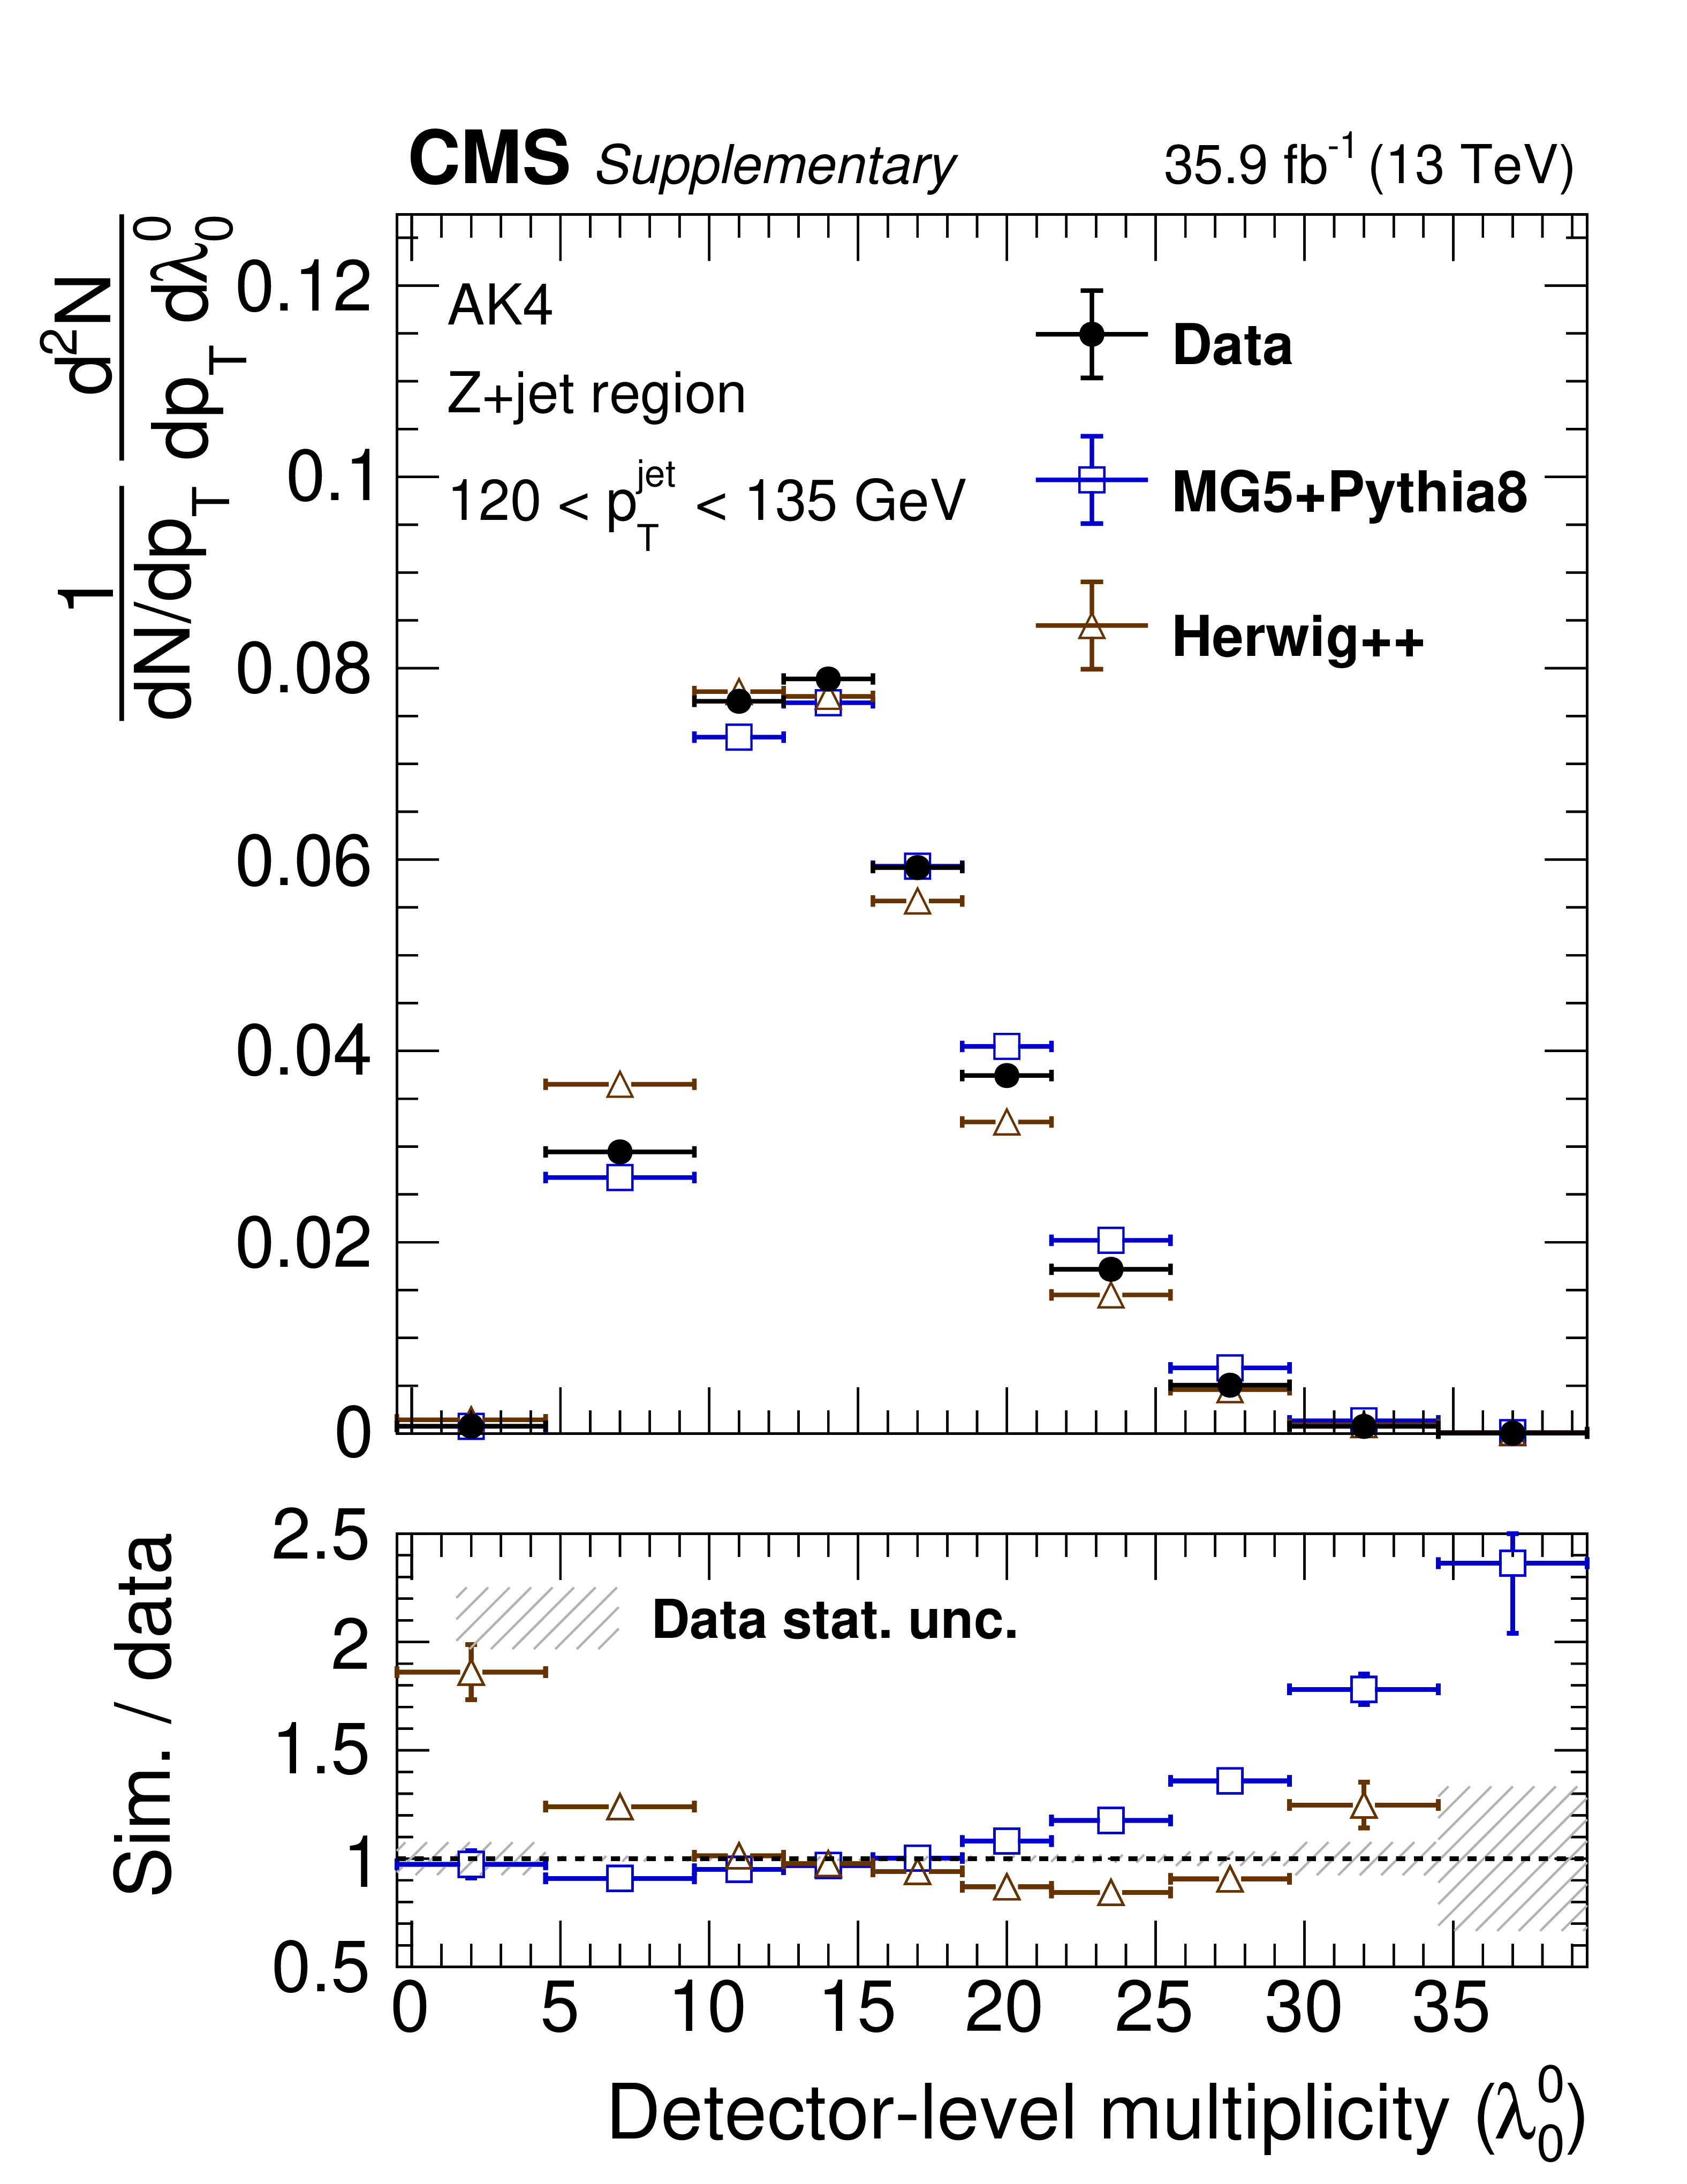
png pdf |
Additional Figure 33-a:
Data to simulation comparisons for substructure observables in 120 $ < {p_{\mathrm {T}}} < $ 150 GeV in the Z+jet (left) and central dijet regions (right): multiplicity. |
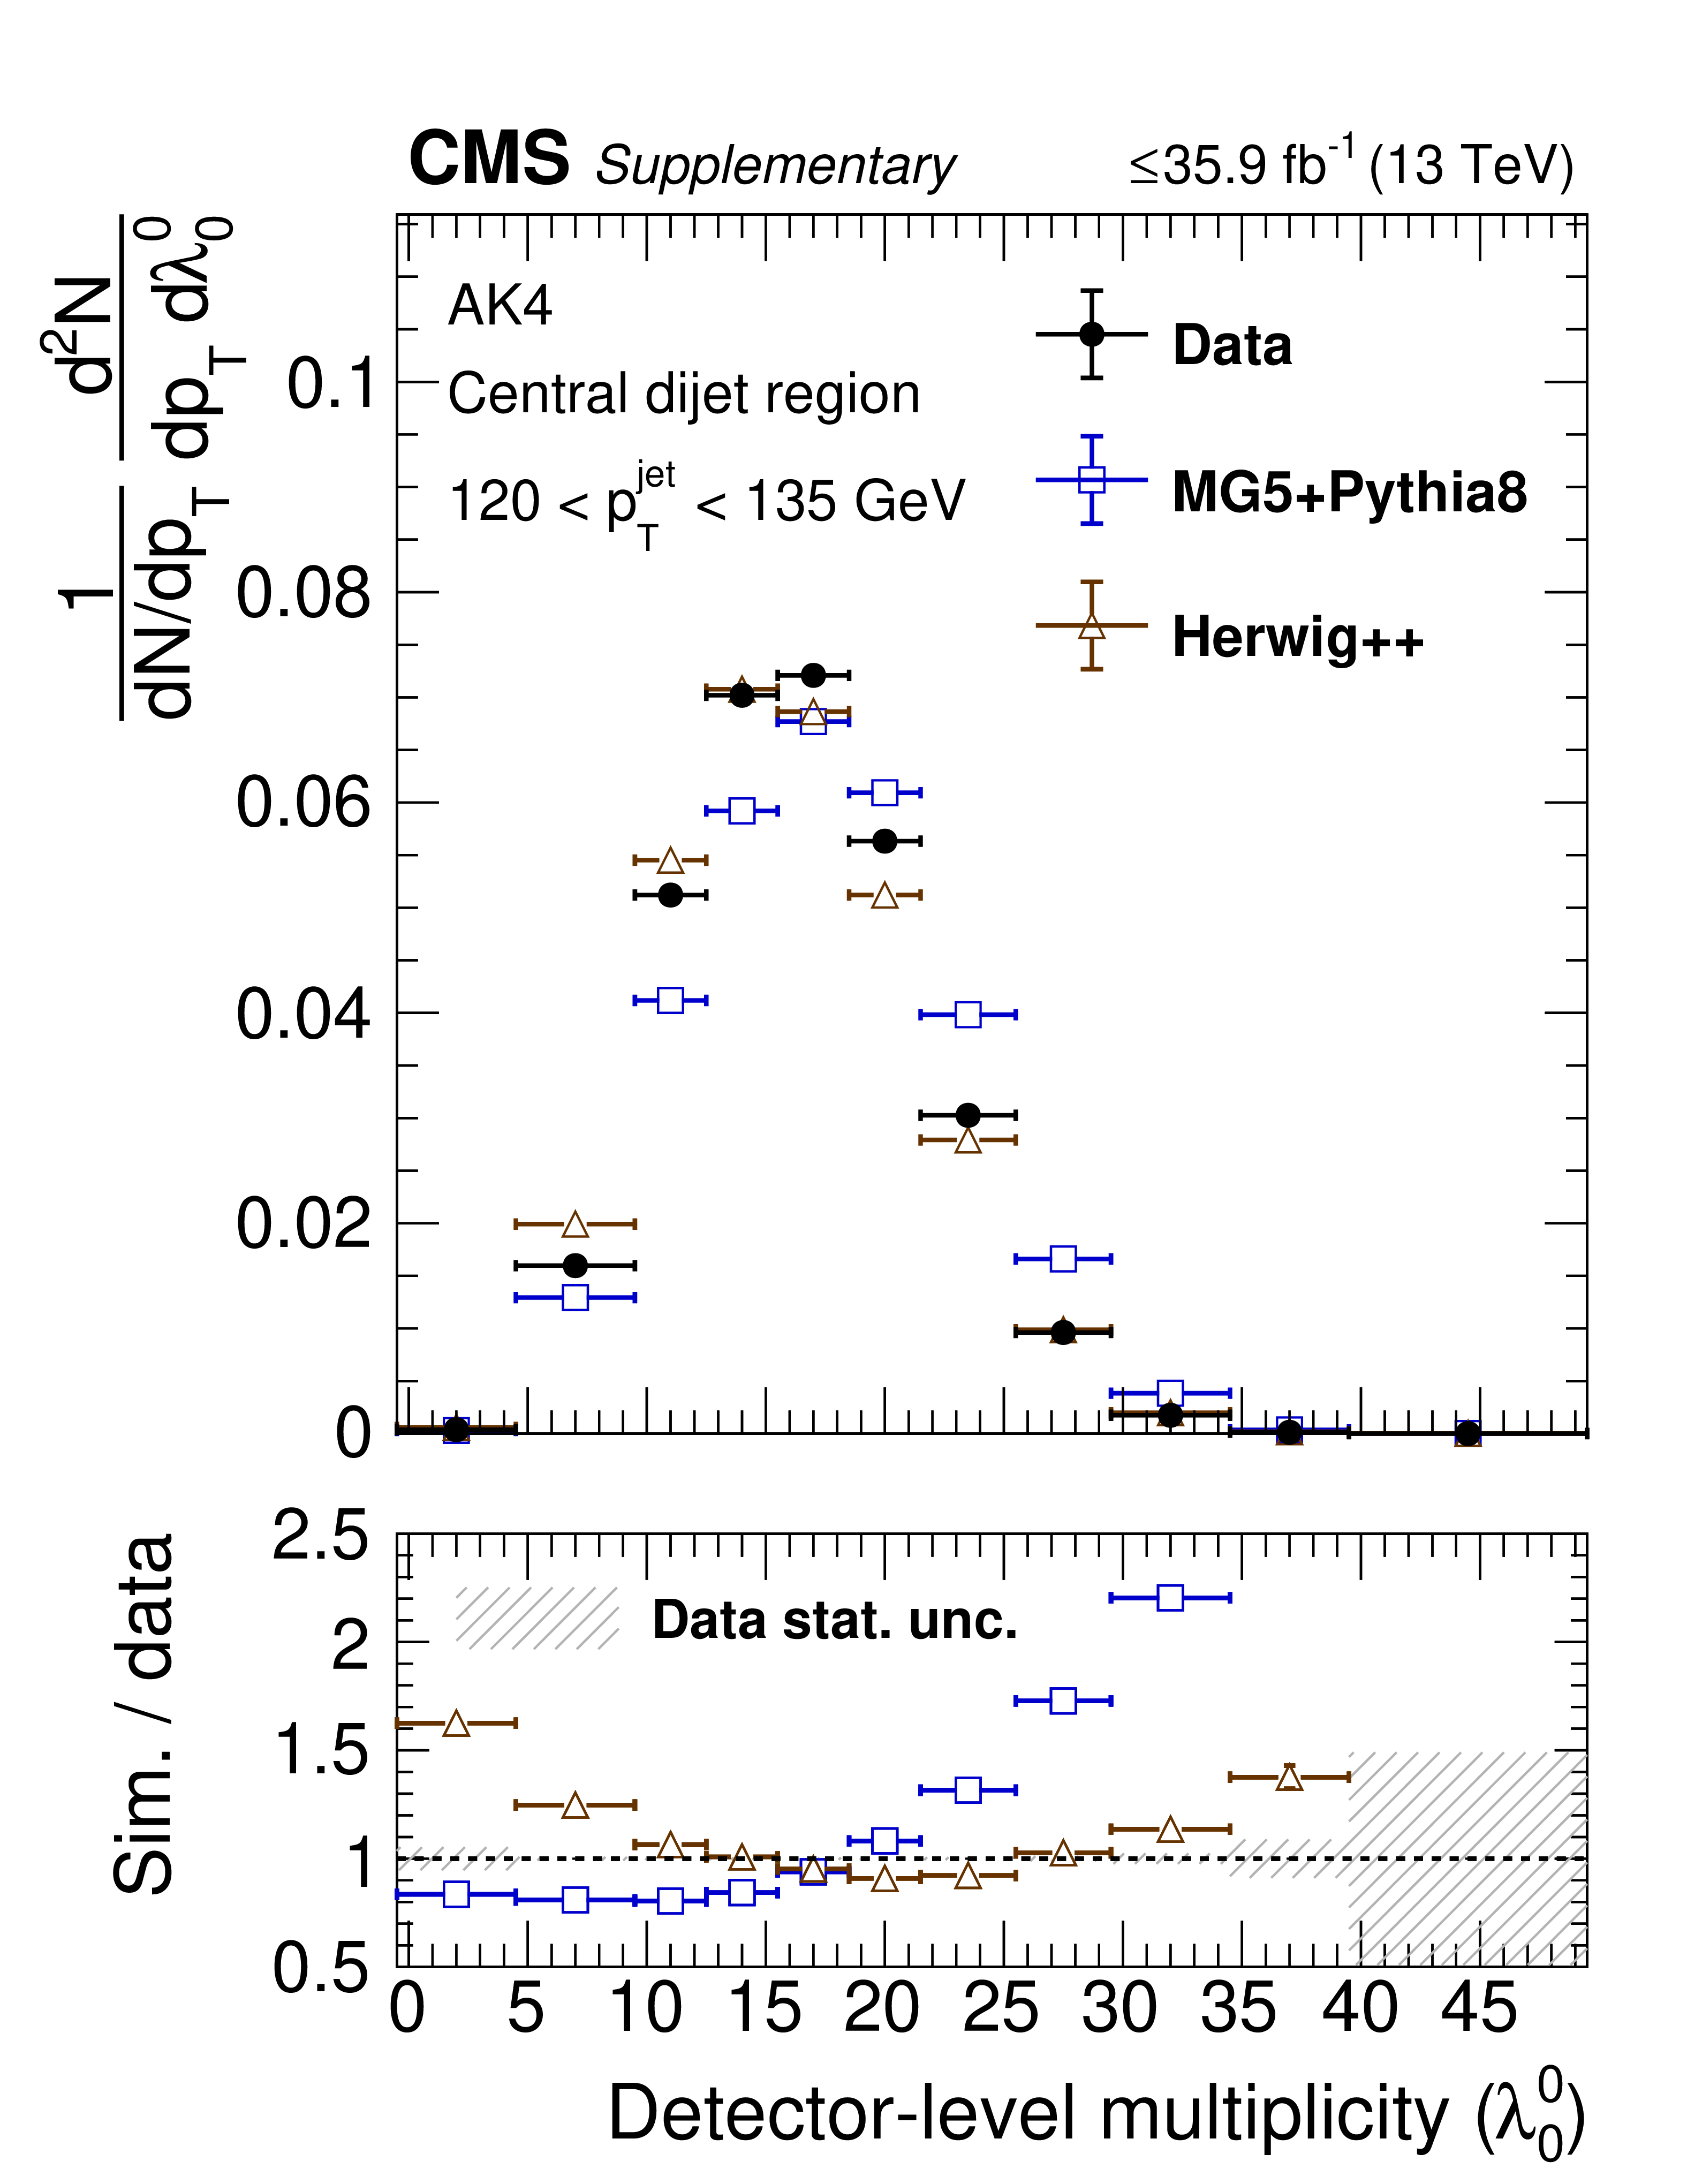
png pdf |
Additional Figure 33-b:
Data to simulation comparisons for substructure observables in 120 $ < {p_{\mathrm {T}}} < $ 150 GeV in the Z+jet (left) and central dijet regions (right): multiplicity. |

png pdf |
Additional Figure 34:
Data to simulation comparisons for substructure observables in 120 $ < {p_{\mathrm {T}}} < $ 150 GeV in the Z+jet (left) and central dijet regions (right): ${(p_{\mathrm {T}}^{\mathrm {D}})^2}$ (${\lambda ^{2}_{0}}$). |
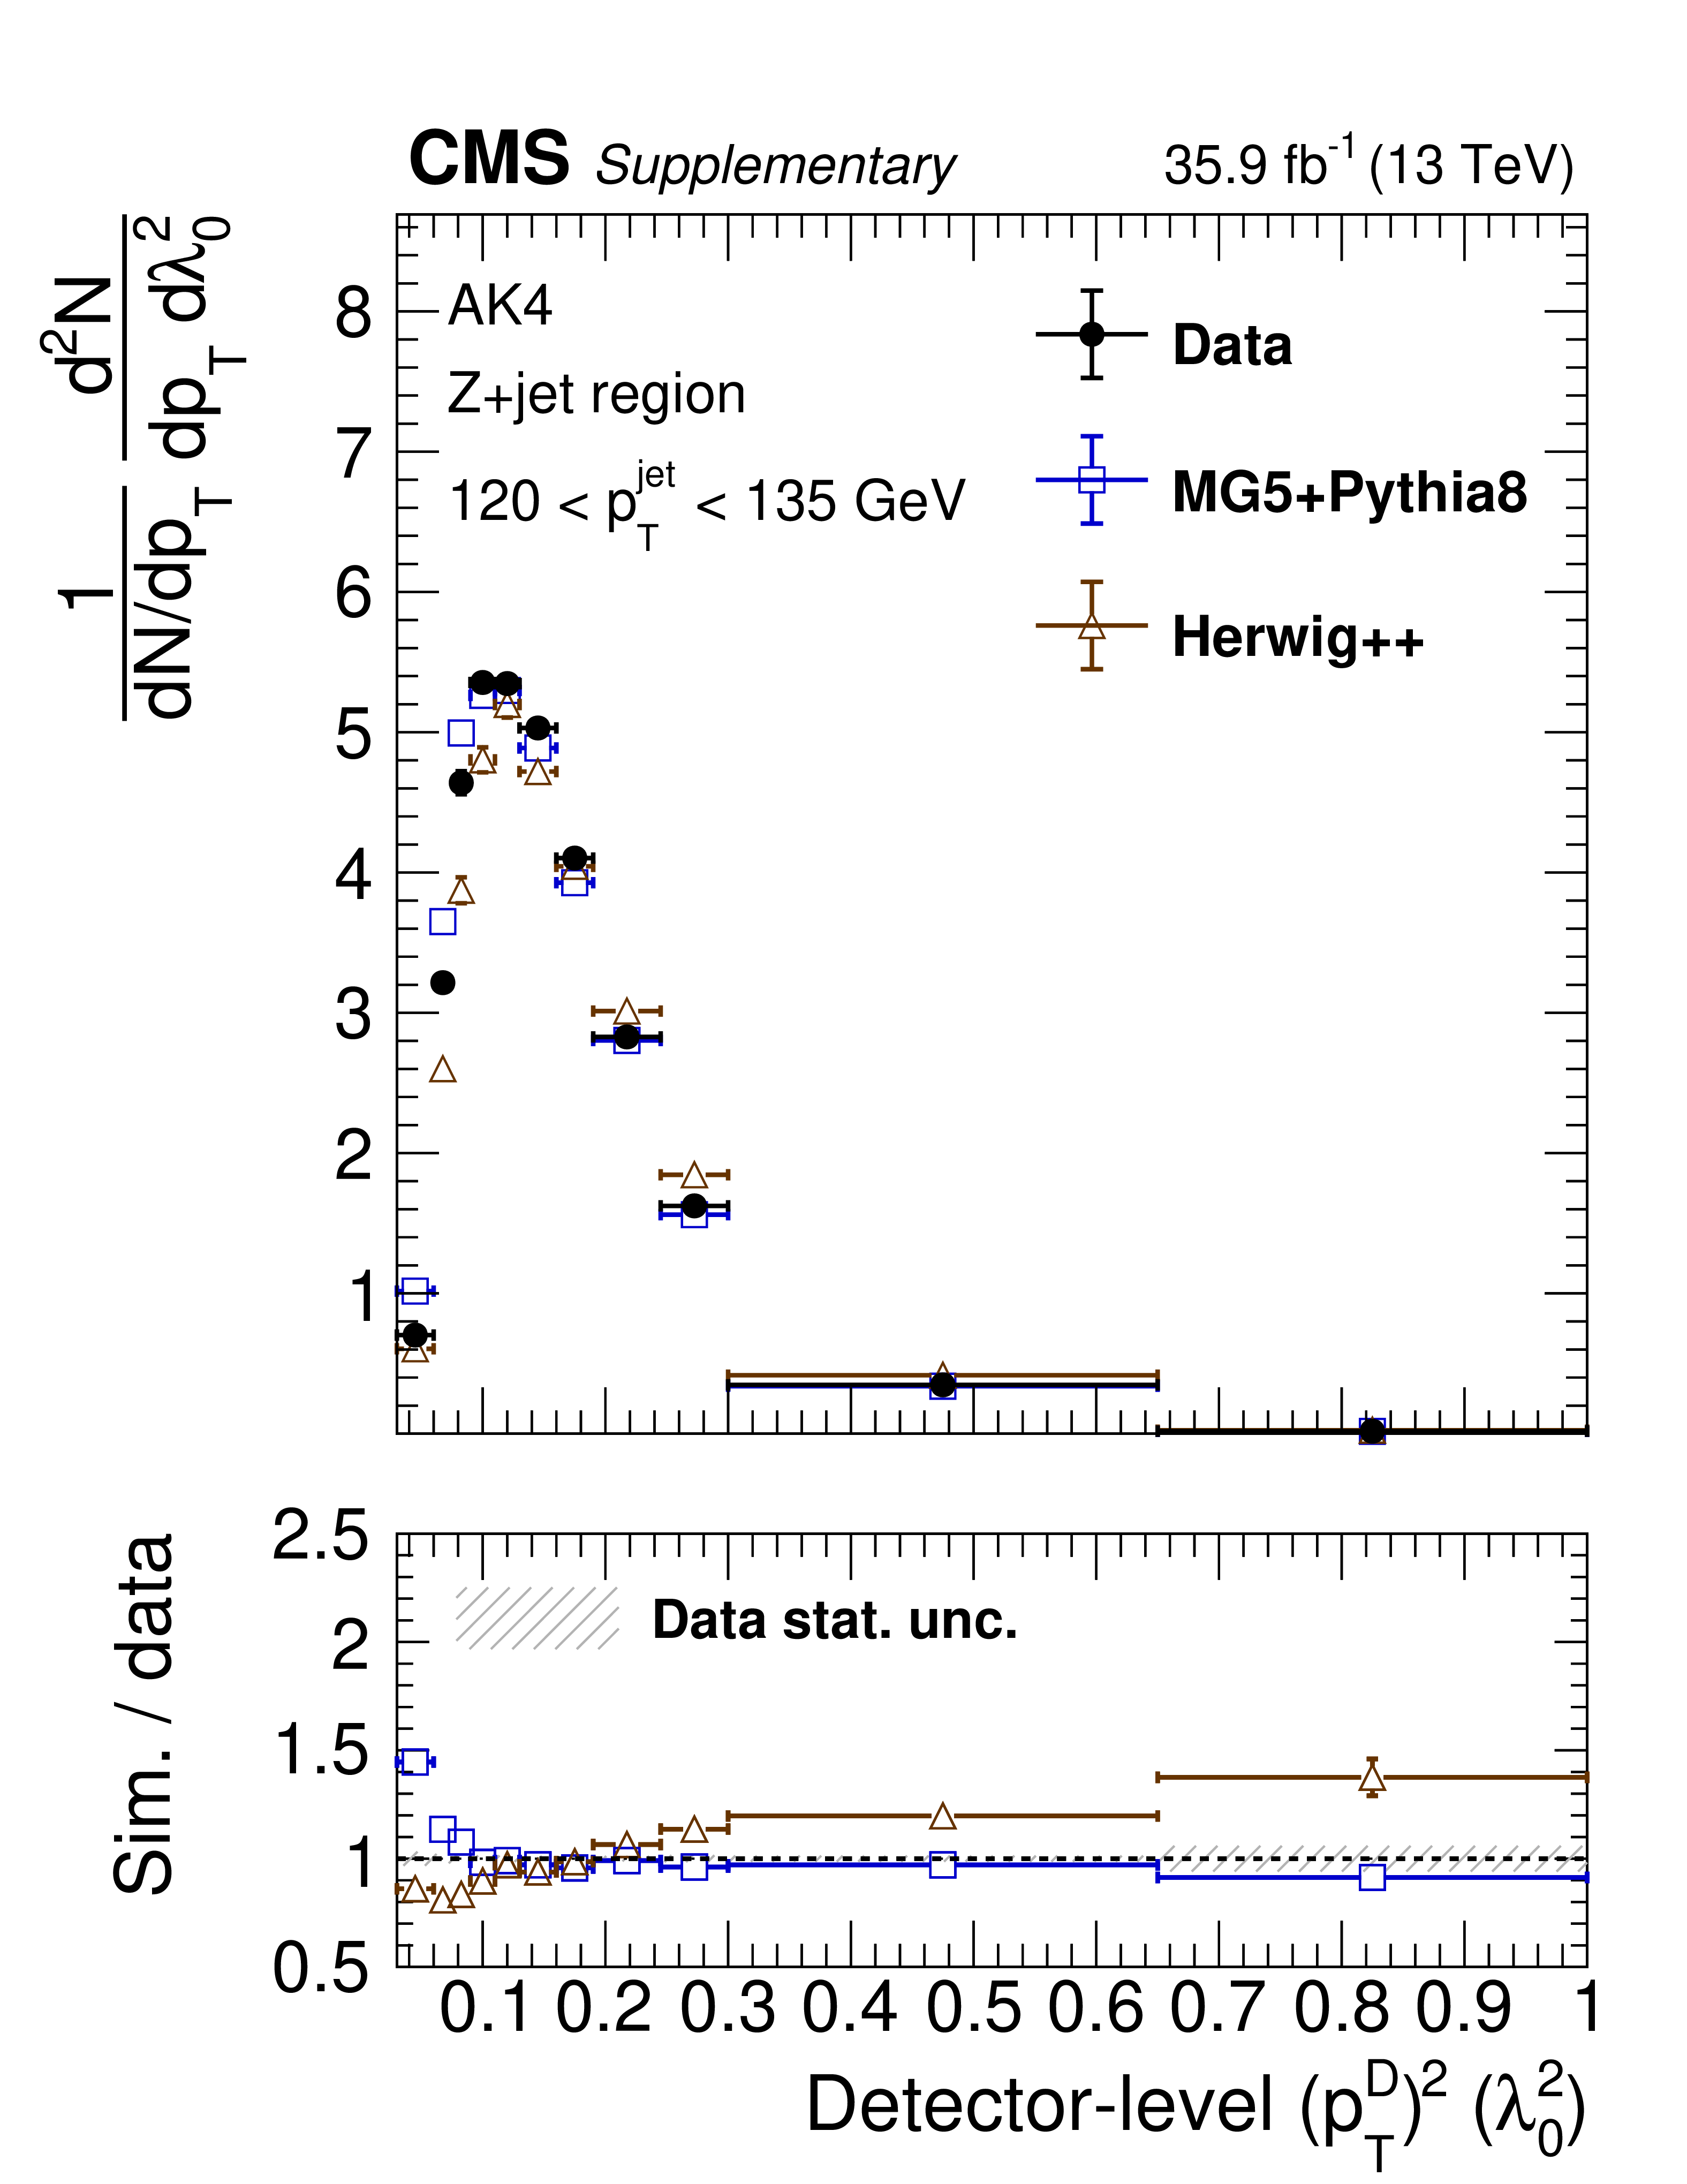
png pdf |
Additional Figure 34-a:
Data to simulation comparisons for substructure observables in 120 $ < {p_{\mathrm {T}}} < $ 150 GeV in the Z+jet (left) and central dijet regions (right): ${(p_{\mathrm {T}}^{\mathrm {D}})^2}$ (${\lambda ^{2}_{0}}$). |

png pdf |
Additional Figure 34-b:
Data to simulation comparisons for substructure observables in 120 $ < {p_{\mathrm {T}}} < $ 150 GeV in the Z+jet (left) and central dijet regions (right): ${(p_{\mathrm {T}}^{\mathrm {D}})^2}$ (${\lambda ^{2}_{0}}$). |
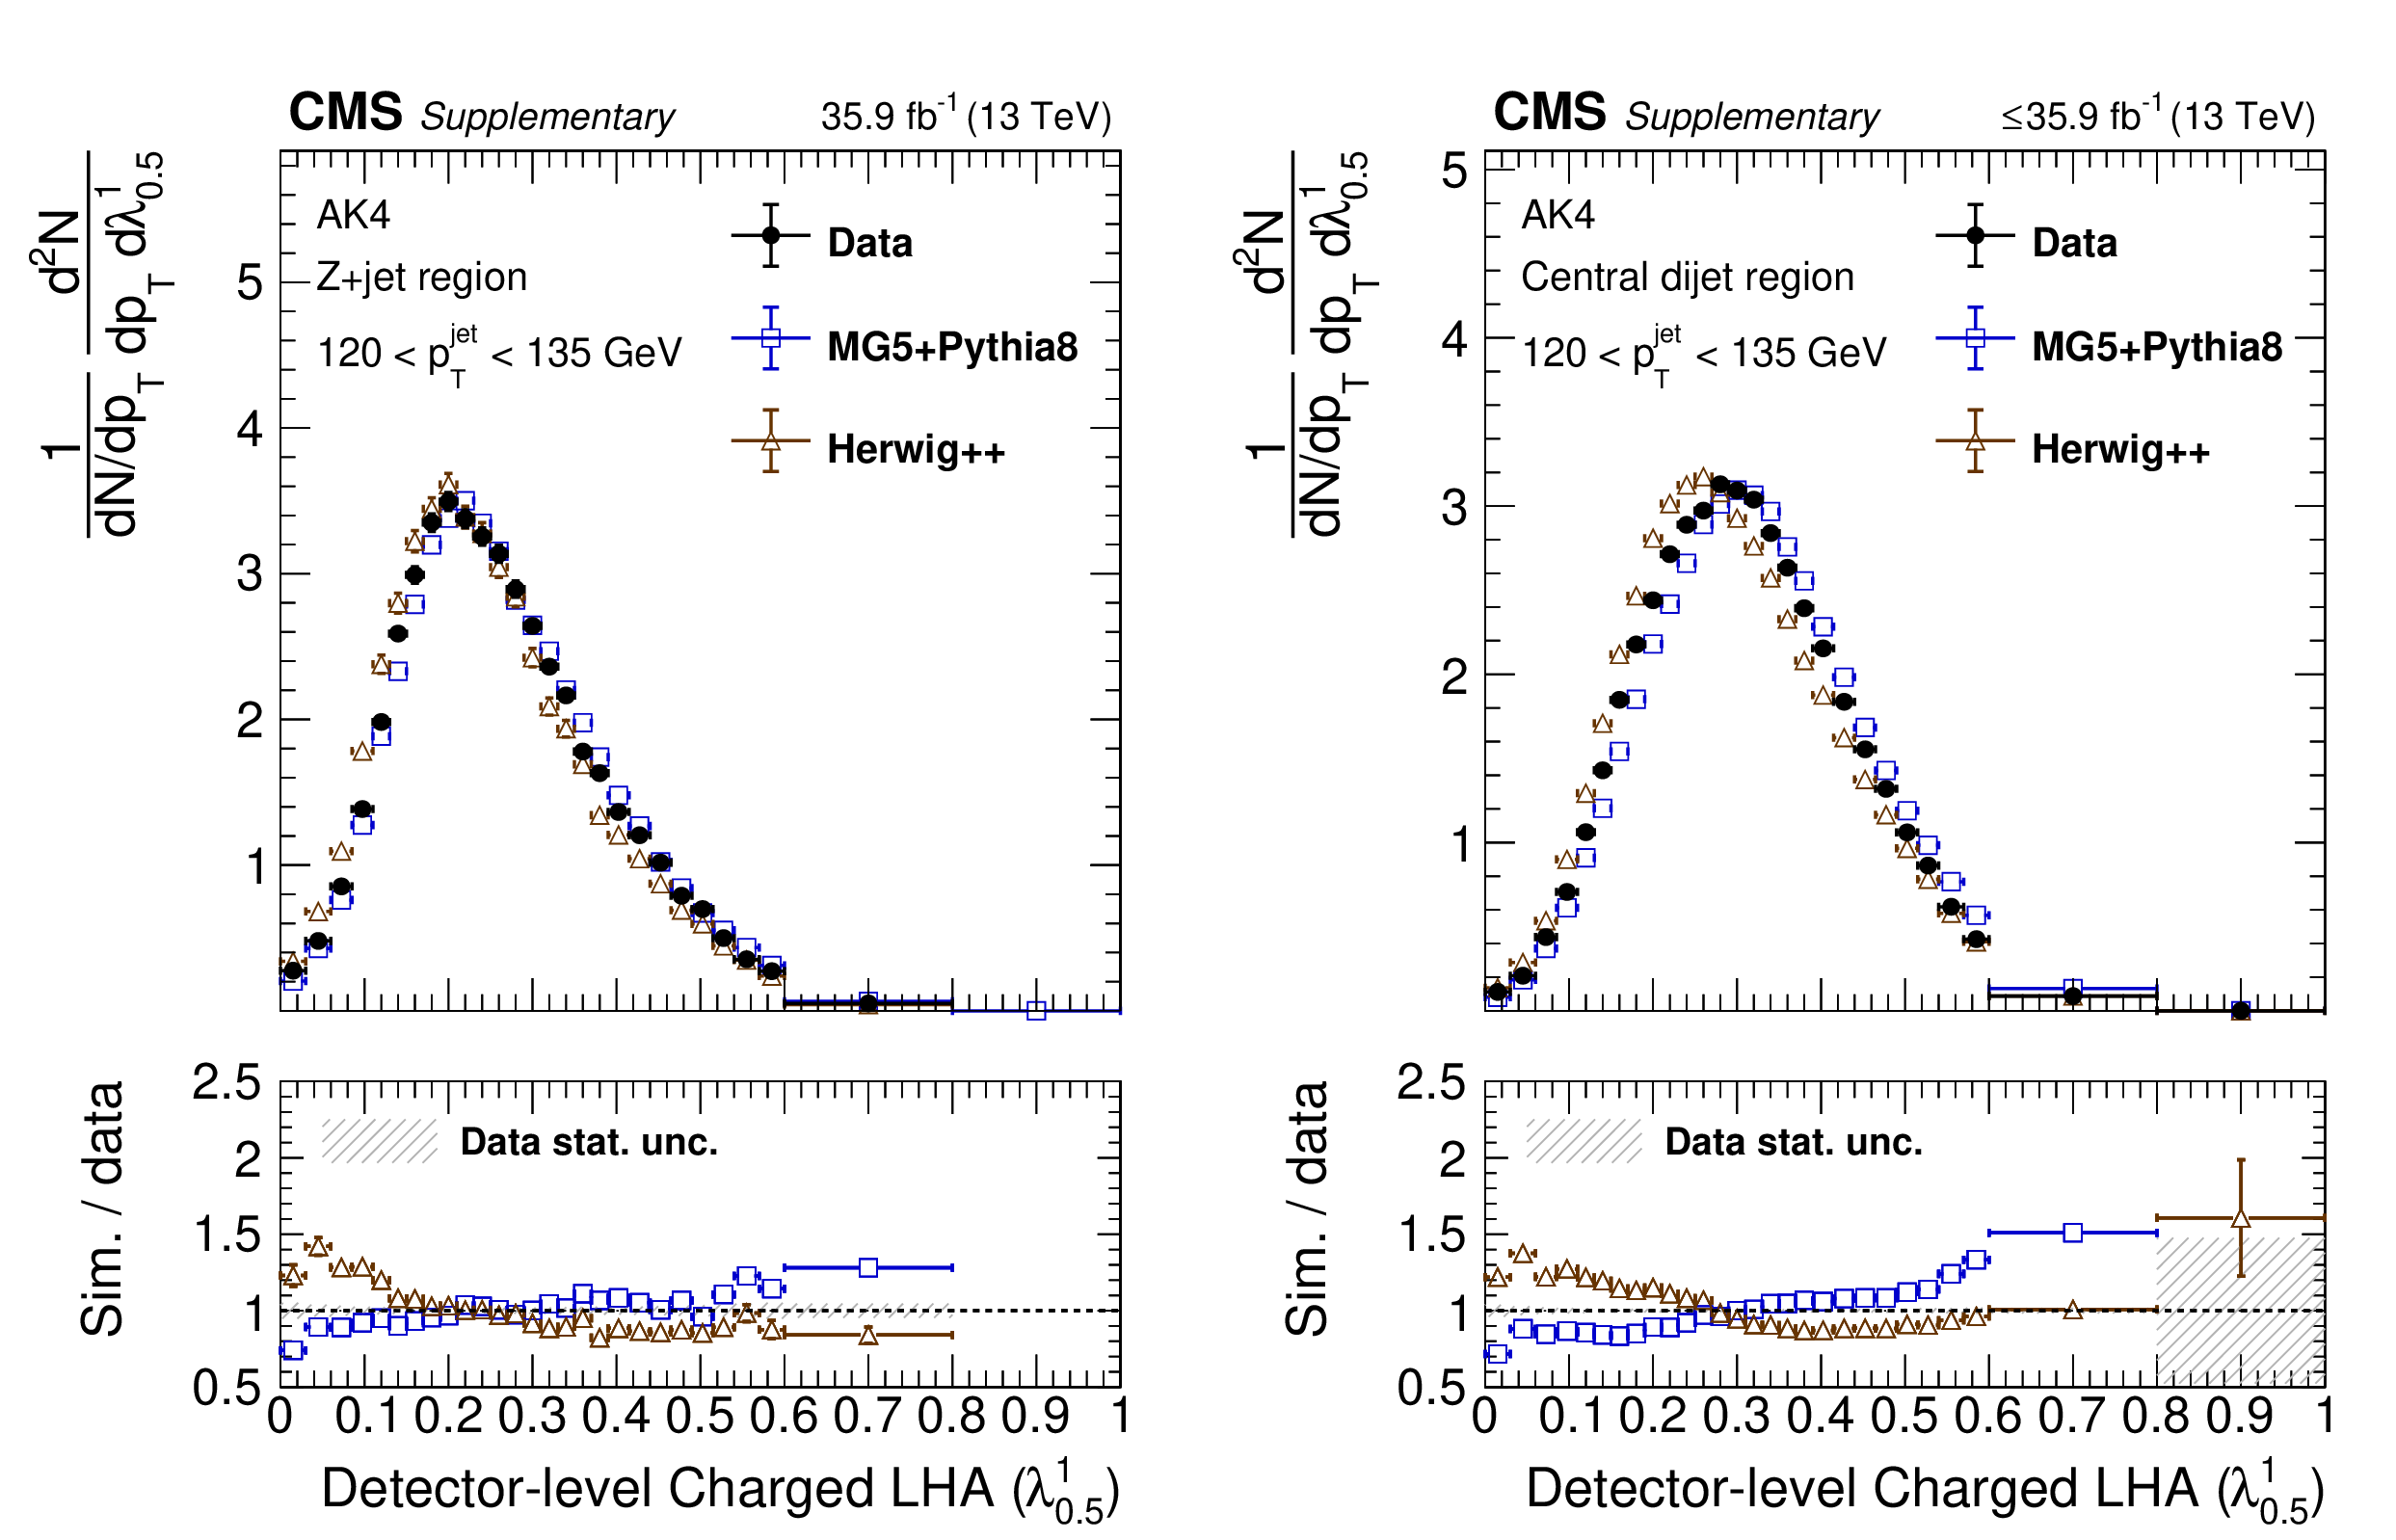
png pdf |
Additional Figure 35:
Data to simulation comparisons for variants of LHA (${\lambda ^{1}_{0.5}}$) in the Z+jet (left) and central dijet region (right): ungroomed AK4 1000 $ < {p_{\mathrm {T}}} < $ 1500 GeV, |

png pdf |
Additional Figure 35-a:
Data to simulation comparisons for variants of LHA (${\lambda ^{1}_{0.5}}$) in the Z+jet (left) and central dijet region (right): ungroomed AK4 1000 $ < {p_{\mathrm {T}}} < $ 1500 GeV, |
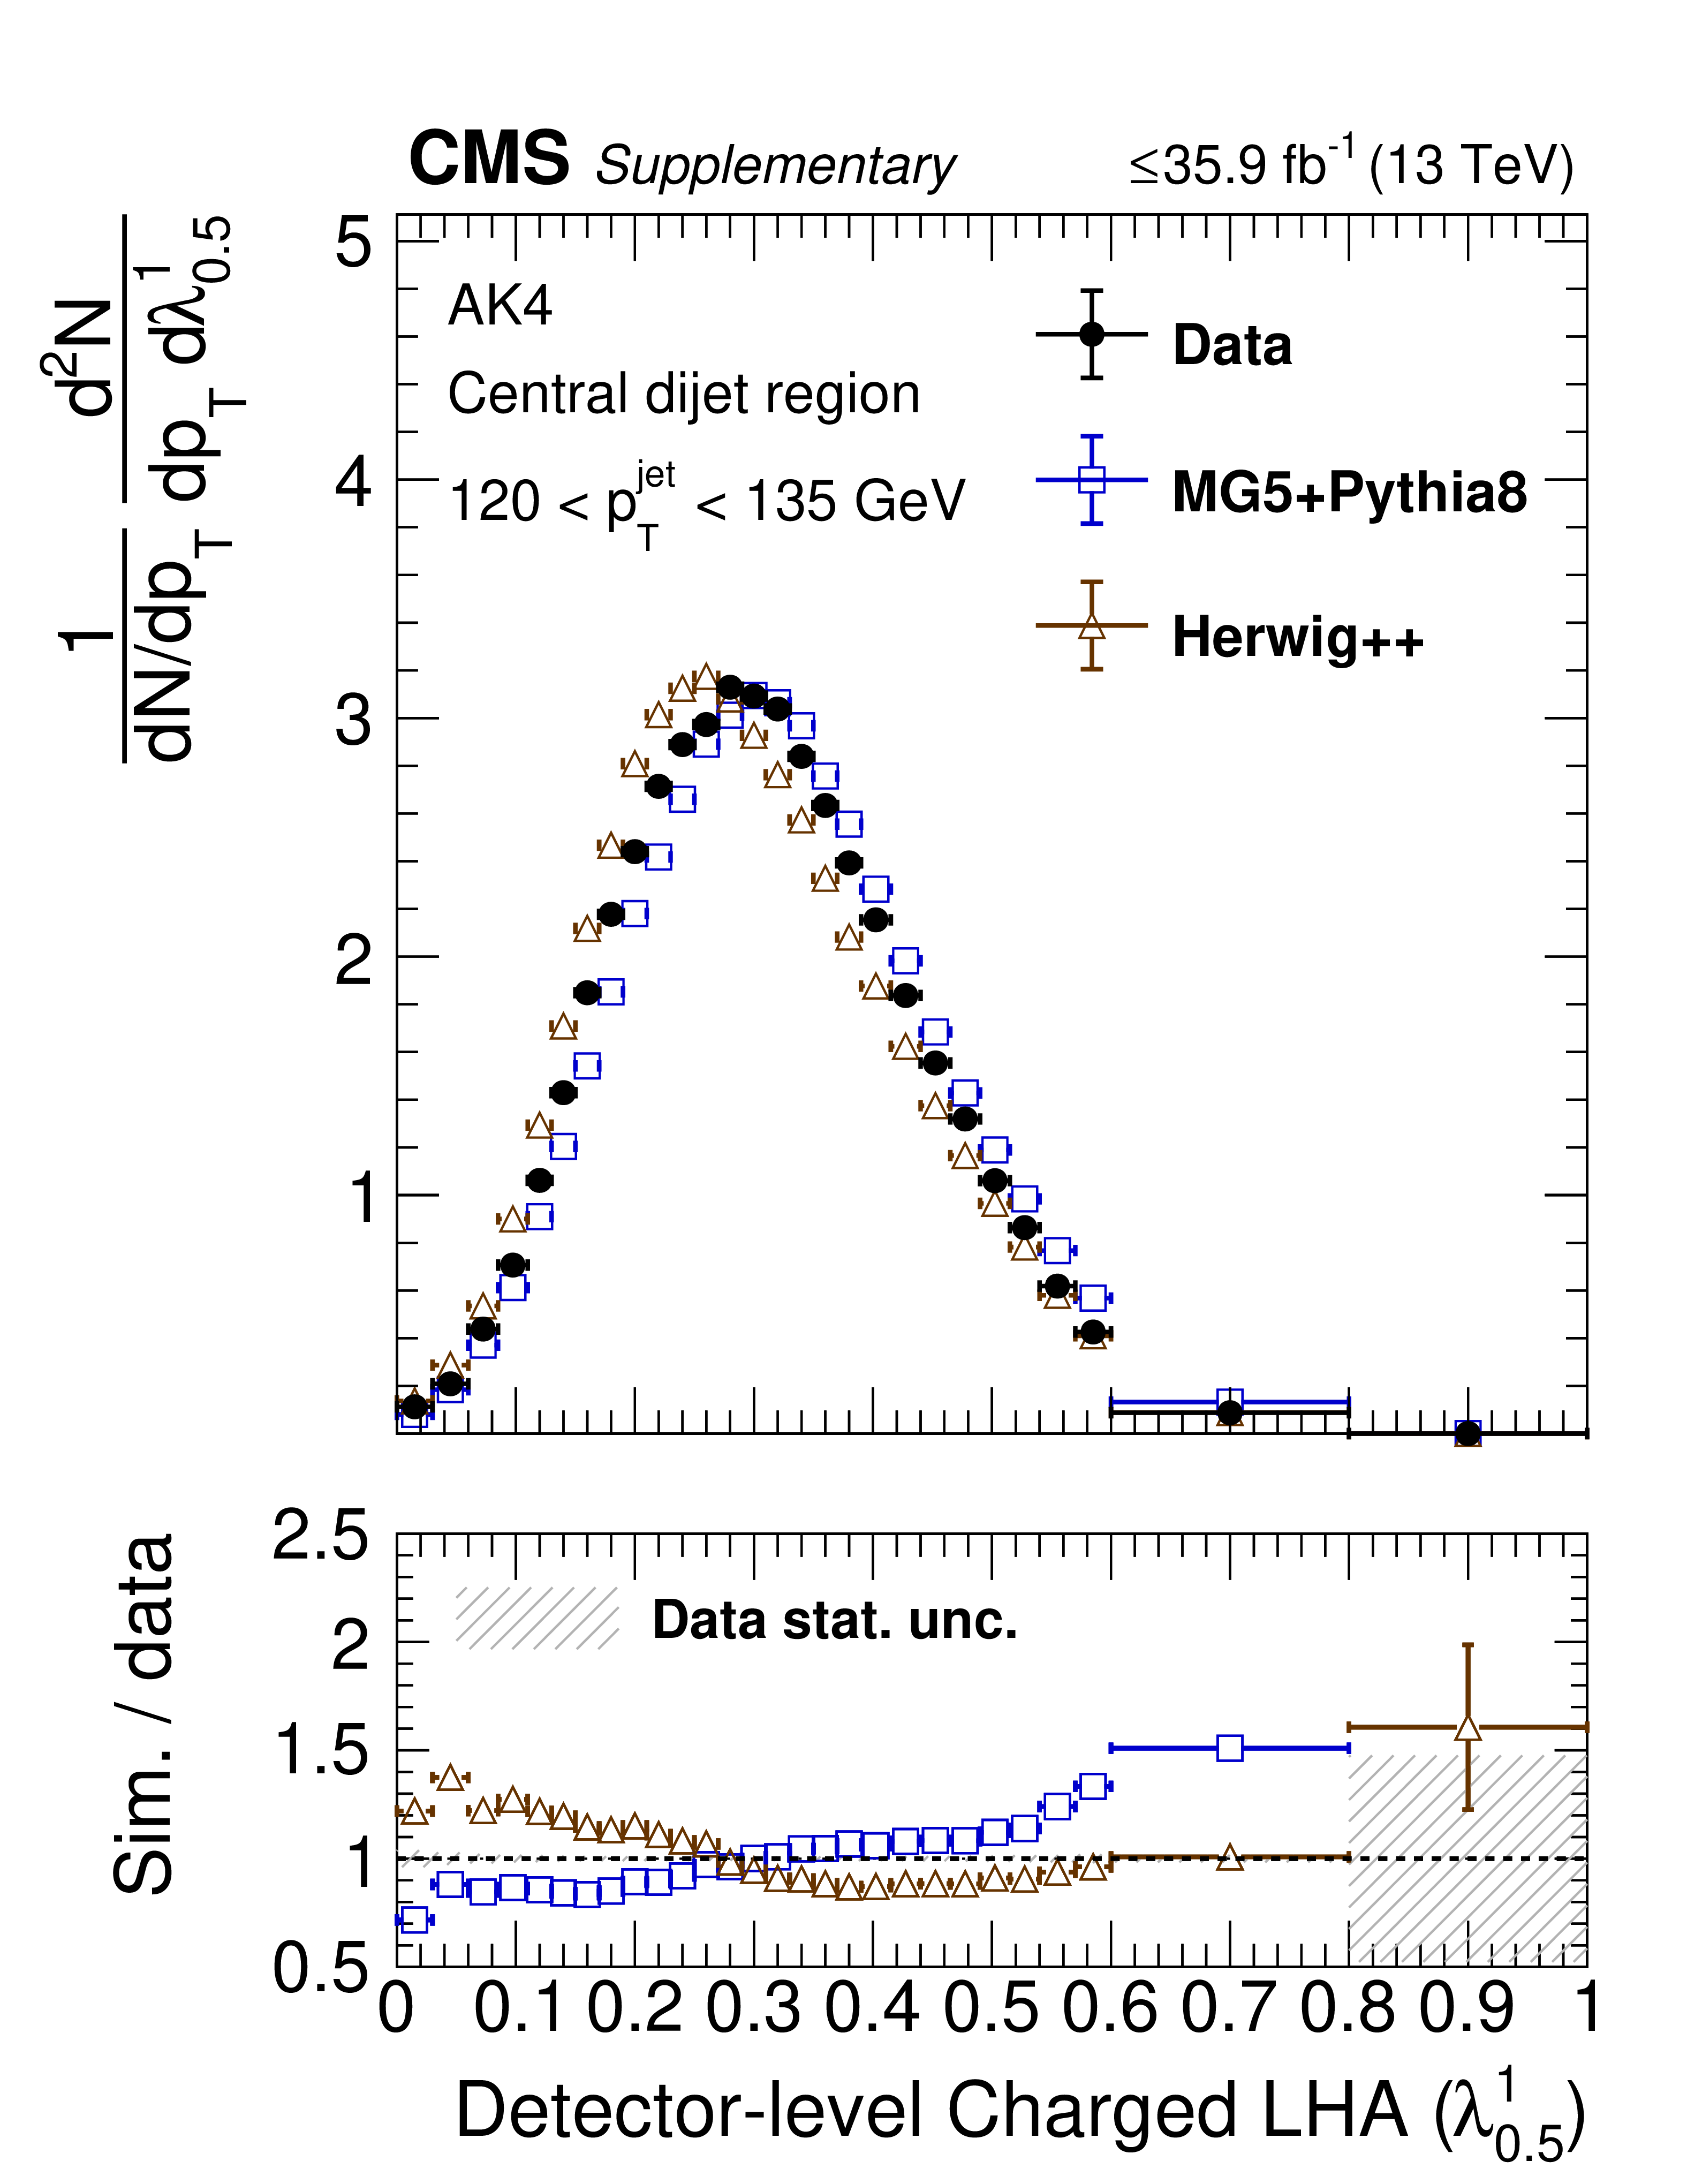
png pdf |
Additional Figure 35-b:
Data to simulation comparisons for variants of LHA (${\lambda ^{1}_{0.5}}$) in the Z+jet (left) and central dijet region (right): ungroomed AK4 1000 $ < {p_{\mathrm {T}}} < $ 1500 GeV, |

png pdf |
Additional Figure 36:
Data to simulation comparisons for variants of LHA (${\lambda ^{1}_{0.5}}$) in the Z+jet (left) and central dijet region (right): ungroomed AK8 120 $ < {p_{\mathrm {T}}} < $ 150 GeV. |
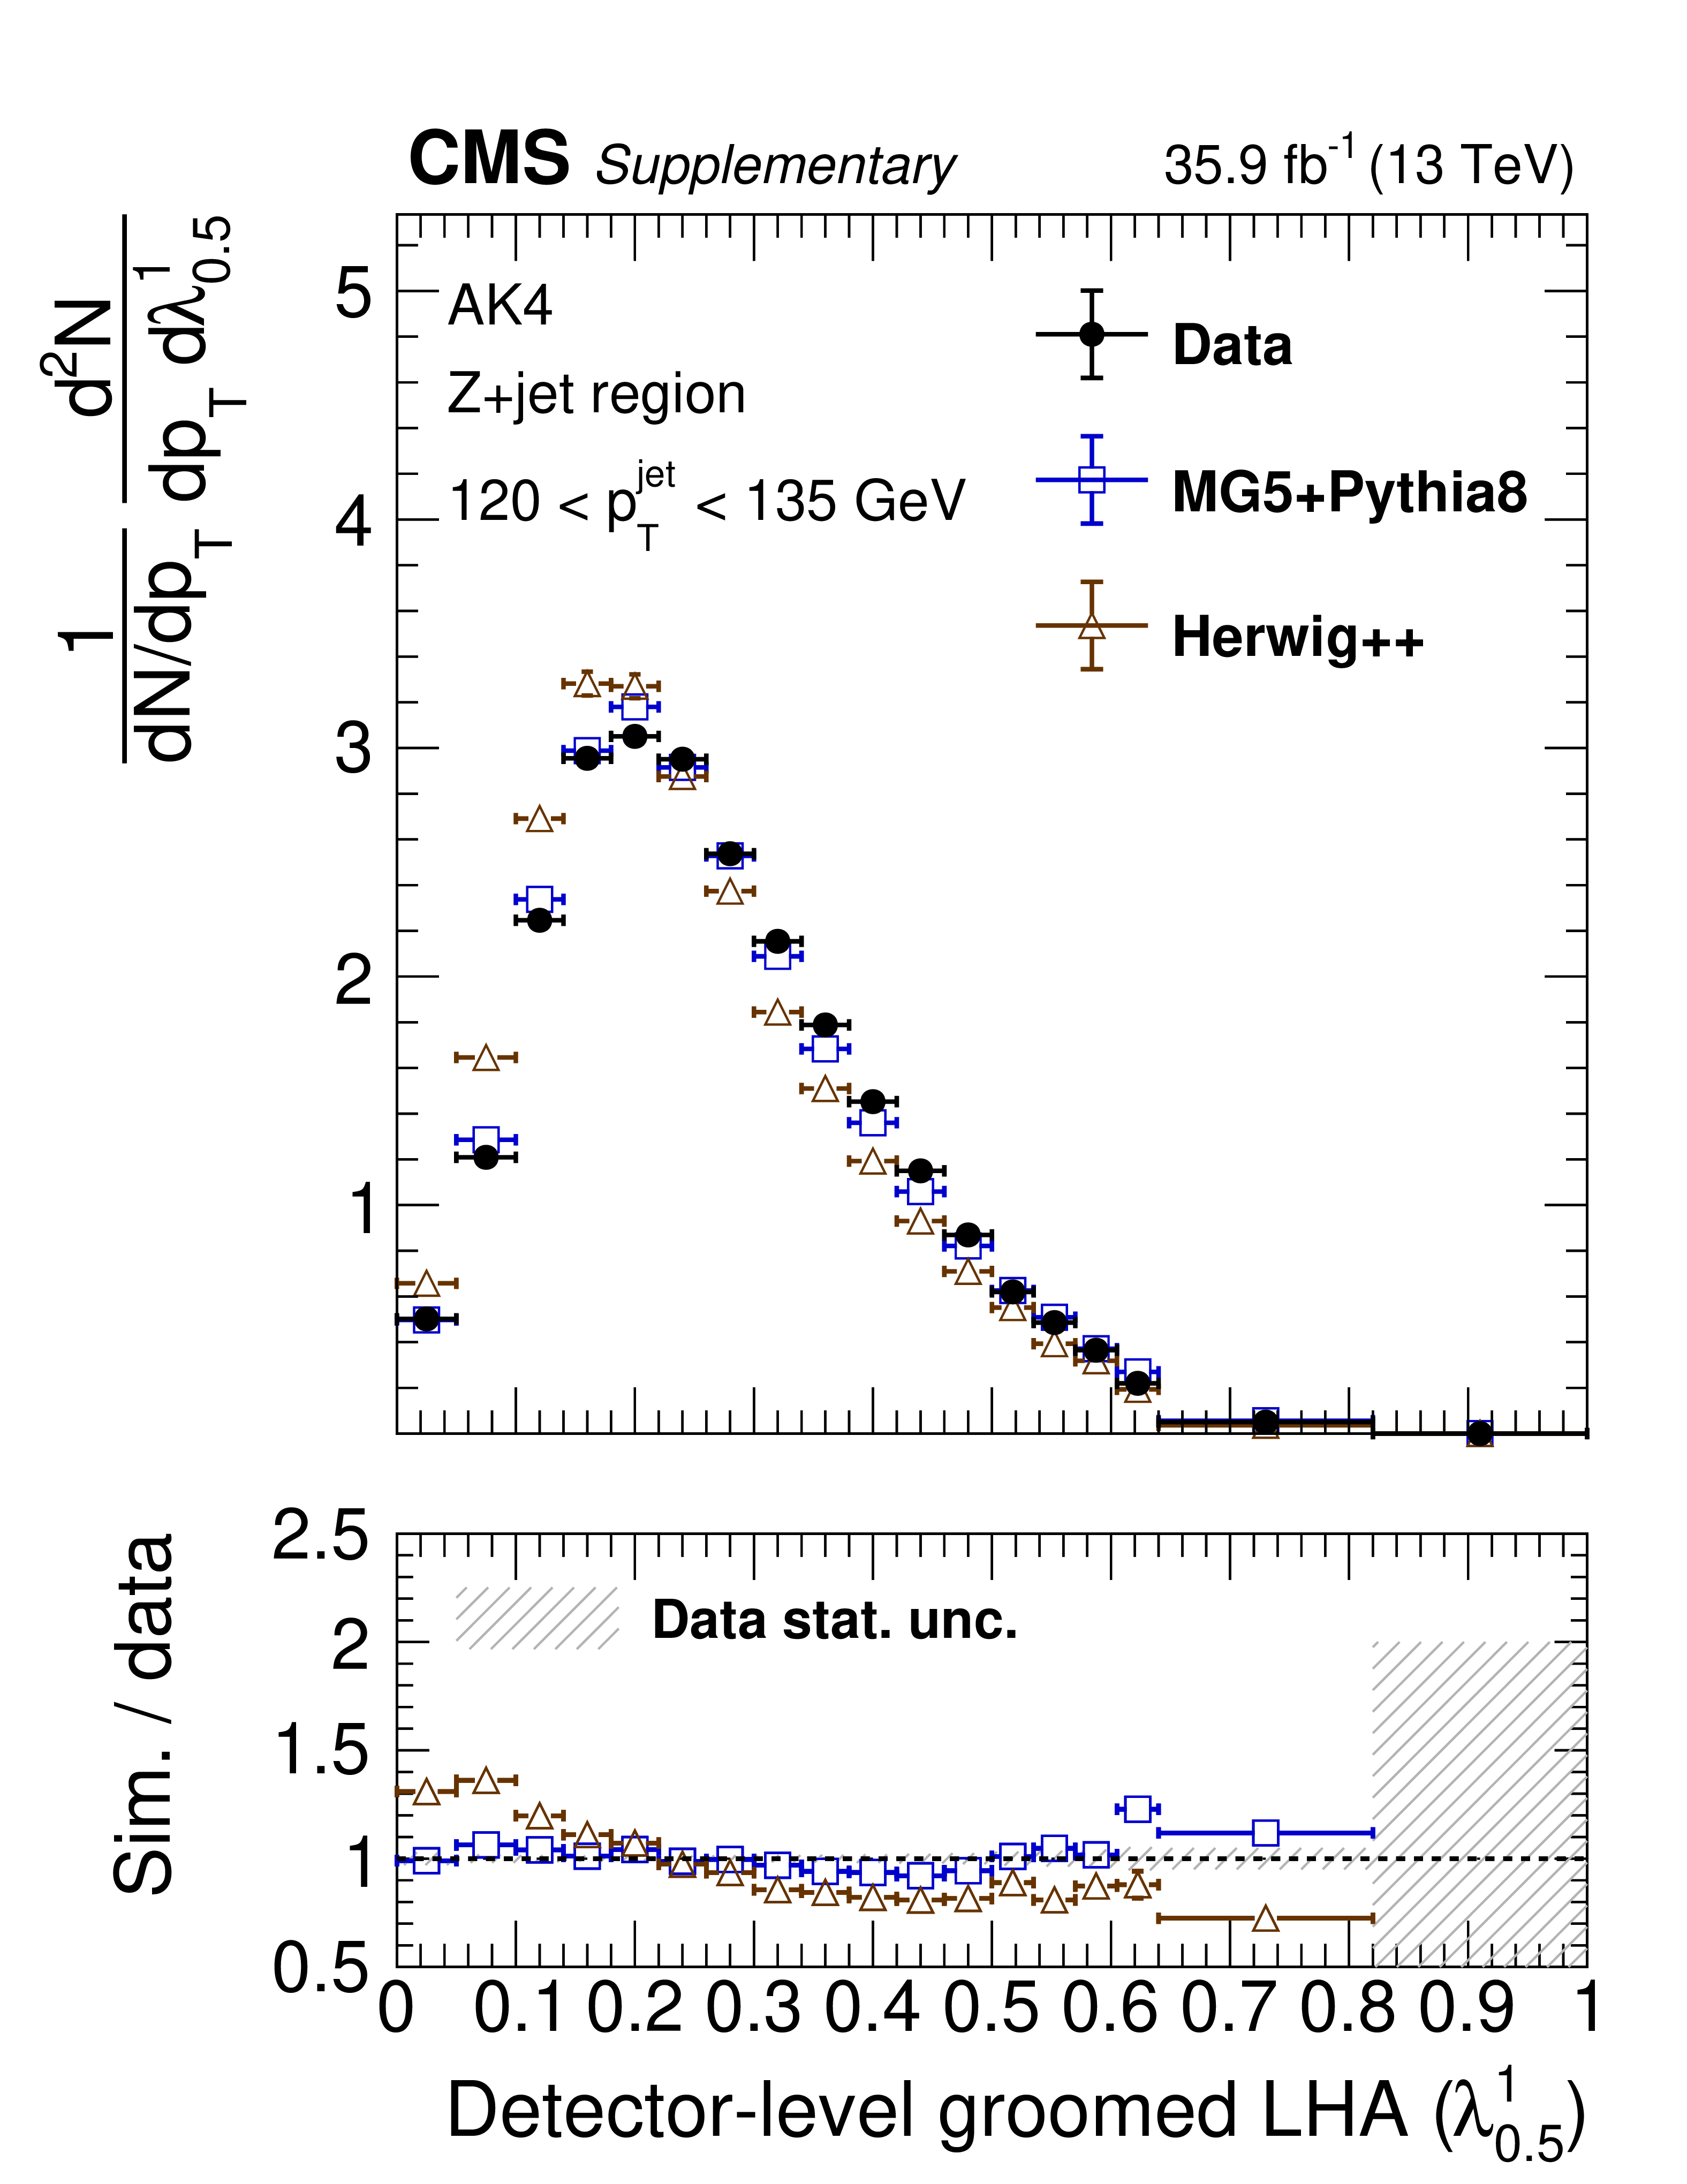
png pdf |
Additional Figure 36-a:
Data to simulation comparisons for variants of LHA (${\lambda ^{1}_{0.5}}$) in the Z+jet (left) and central dijet region (right): ungroomed AK8 120 $ < {p_{\mathrm {T}}} < $ 150 GeV. |

png pdf |
Additional Figure 36-b:
Data to simulation comparisons for variants of LHA (${\lambda ^{1}_{0.5}}$) in the Z+jet (left) and central dijet region (right): ungroomed AK8 120 $ < {p_{\mathrm {T}}} < $ 150 GeV. |

png pdf |
Additional Figure 37:
Data to simulation comparisons for variants of LHA (${\lambda ^{1}_{0.5}}$) in the Z+jet (left) and central dijet region (right): ungroomed charged-only AK4 120 $ < {p_{\mathrm {T}}} < $ 150 GeV. |

png pdf |
Additional Figure 37-a:
Data to simulation comparisons for variants of LHA (${\lambda ^{1}_{0.5}}$) in the Z+jet (left) and central dijet region (right): ungroomed charged-only AK4 120 $ < {p_{\mathrm {T}}} < $ 150 GeV. |
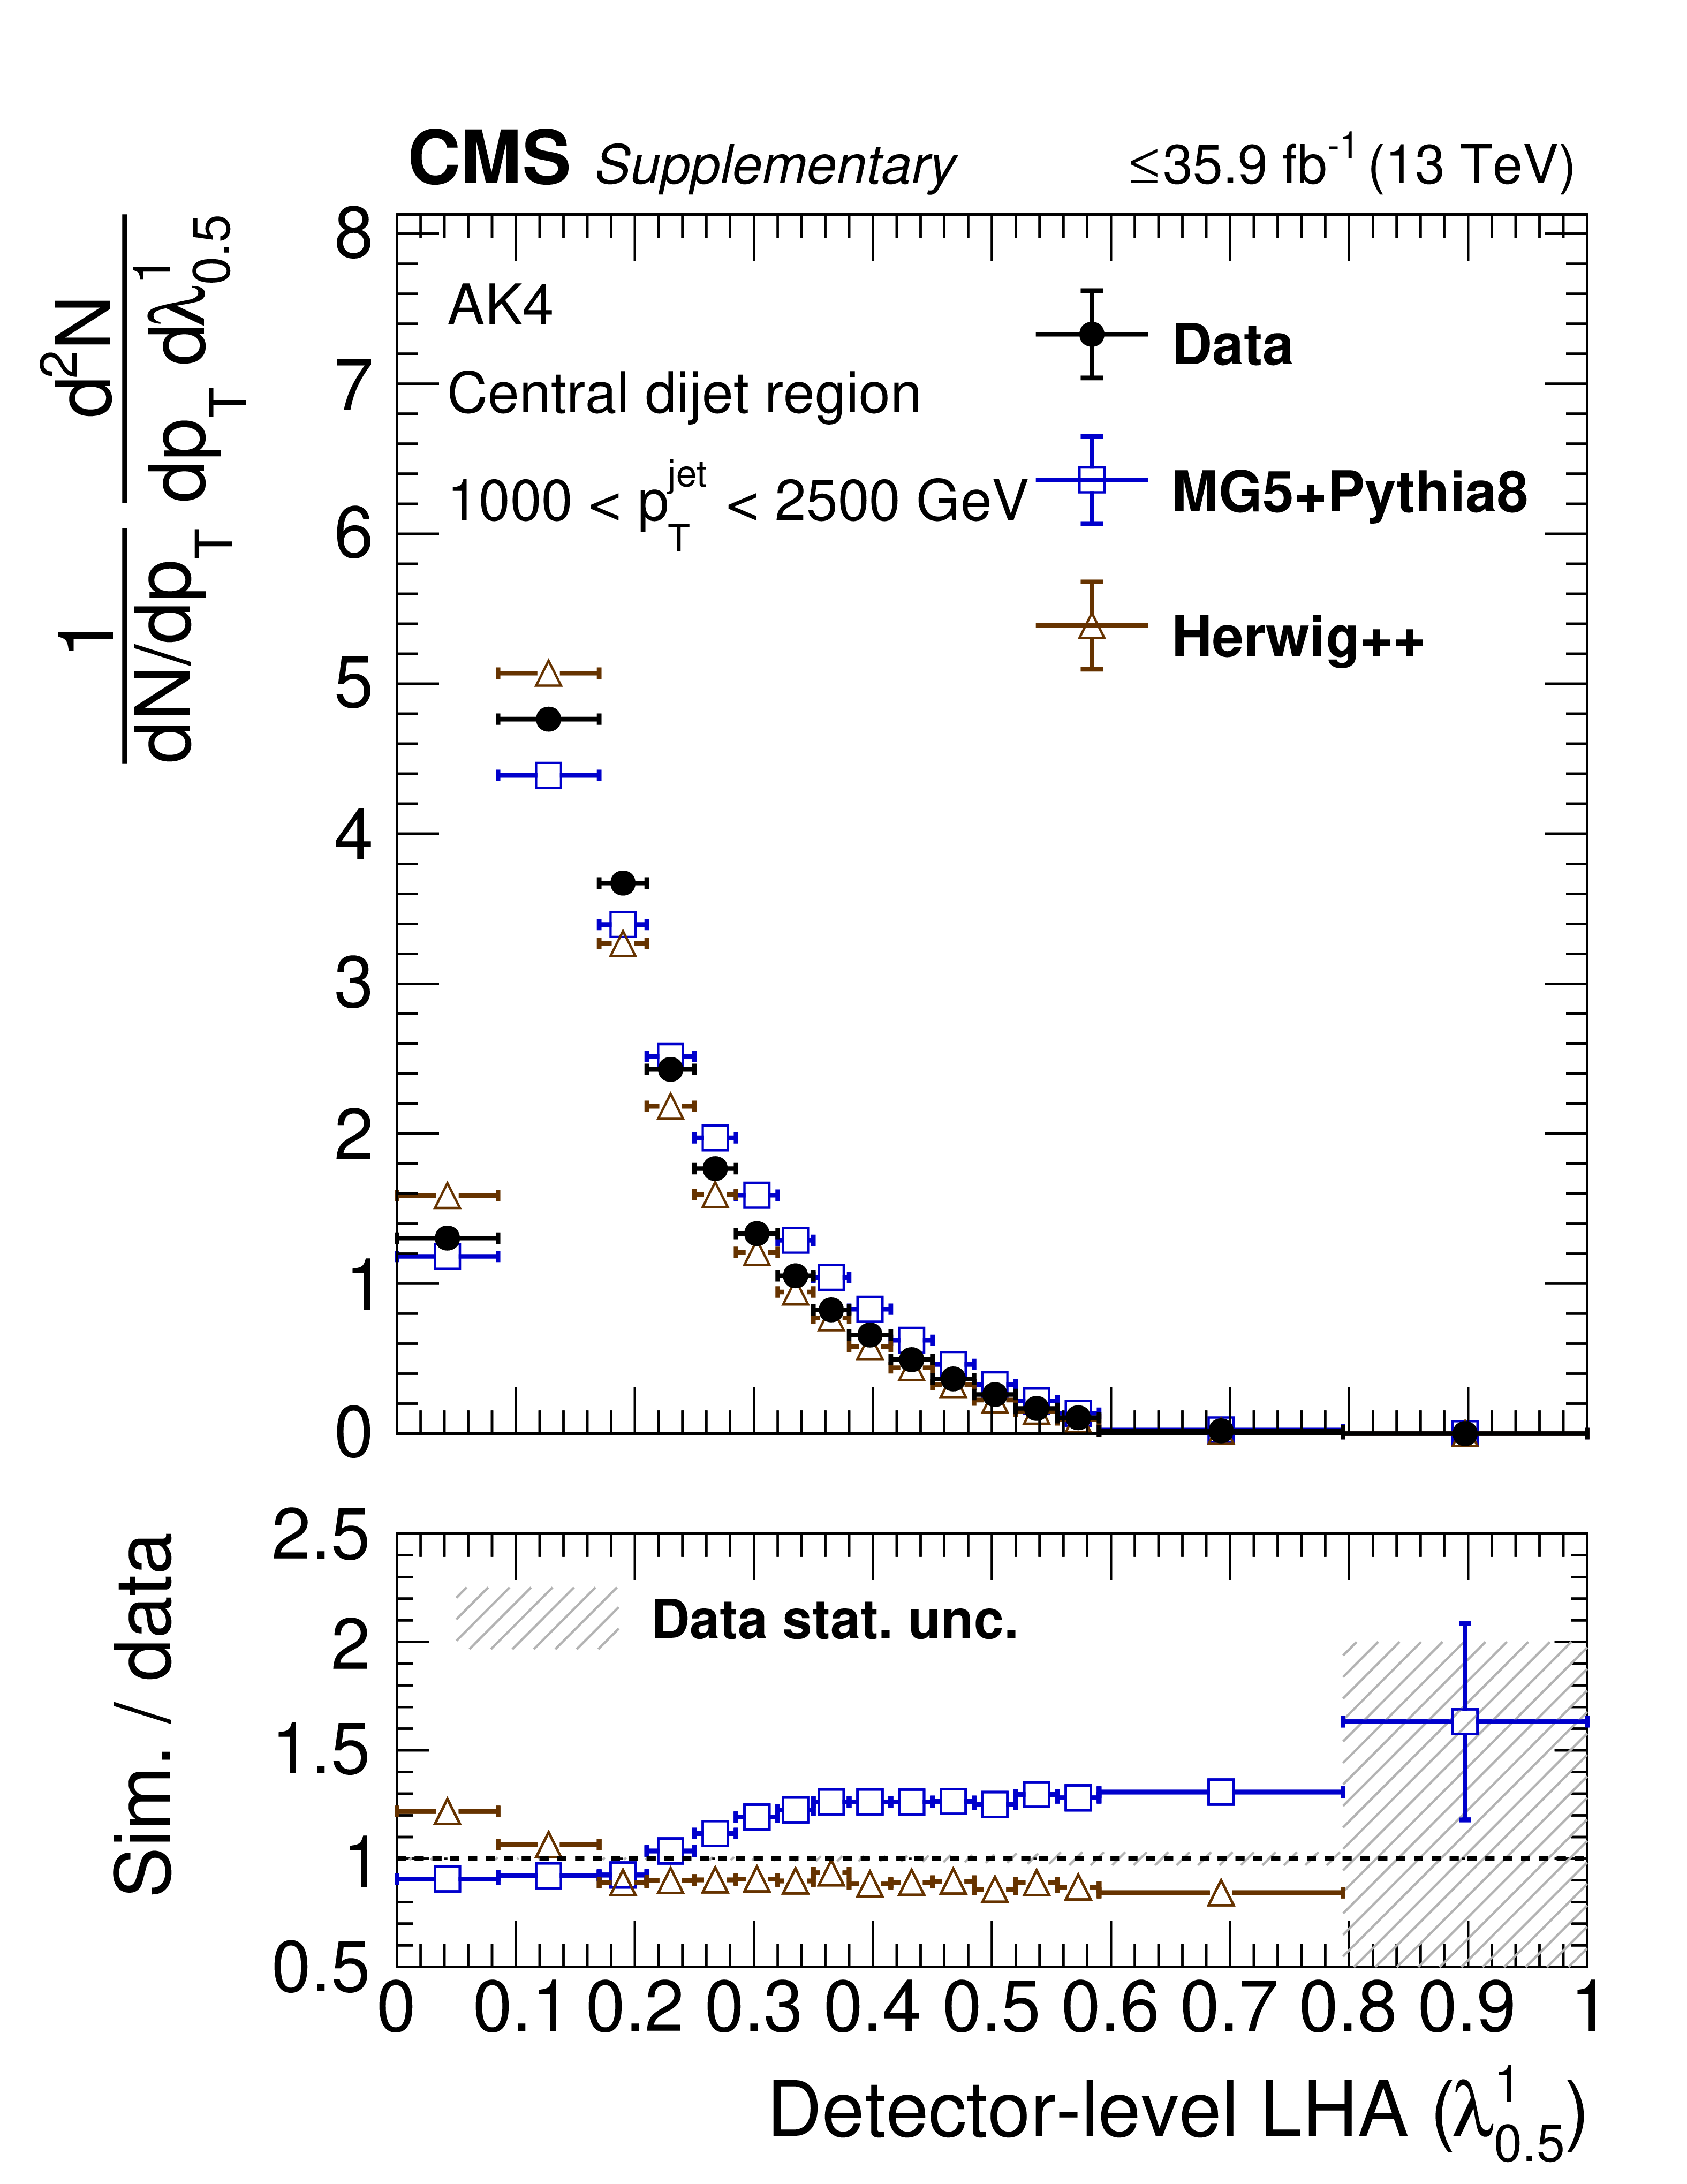
png pdf |
Additional Figure 37-b:
Data to simulation comparisons for variants of LHA (${\lambda ^{1}_{0.5}}$) in the Z+jet (left) and central dijet region (right): ungroomed charged-only AK4 120 $ < {p_{\mathrm {T}}} < $ 150 GeV. |
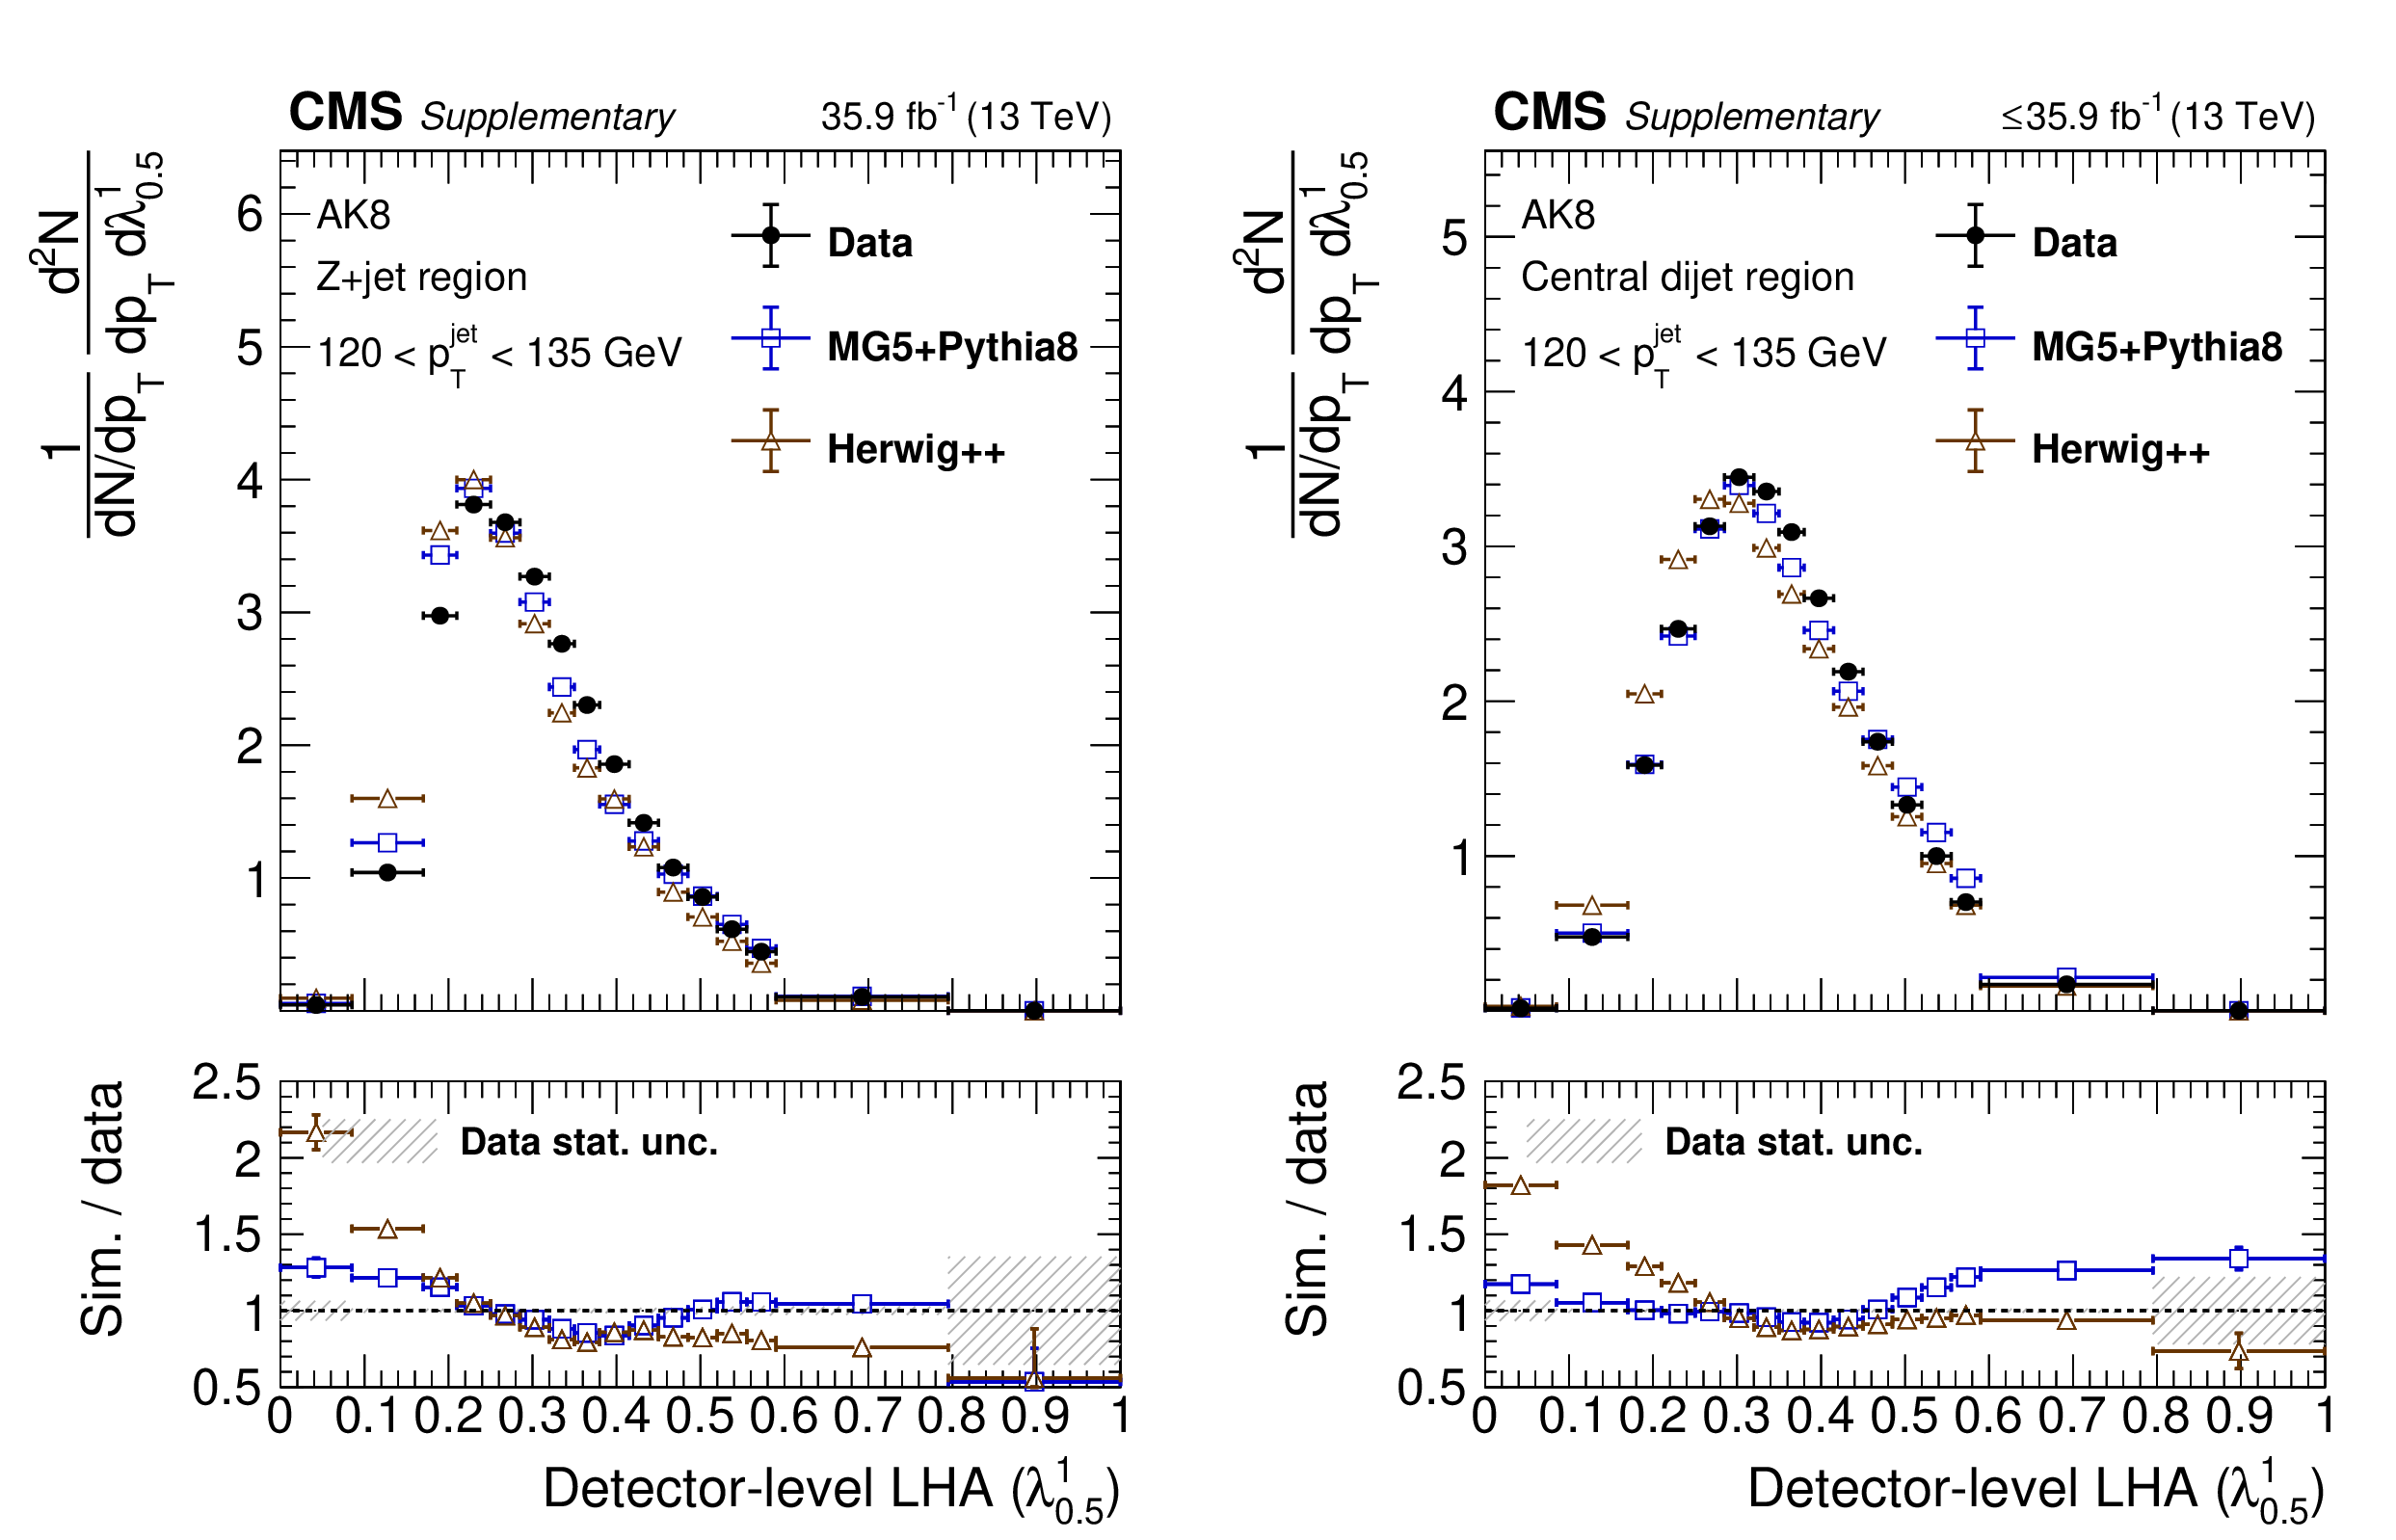
png pdf |
Additional Figure 38:
Data to simulation comparisons for variants of LHA (${\lambda ^{1}_{0.5}}$) in the Z+jet (left) and central dijet region (right): groomed AK4 120 $ < {p_{\mathrm {T}}} < $ 150 GeV. |

png pdf |
Additional Figure 38-a:
Data to simulation comparisons for variants of LHA (${\lambda ^{1}_{0.5}}$) in the Z+jet (left) and central dijet region (right): groomed AK4 120 $ < {p_{\mathrm {T}}} < $ 150 GeV. |
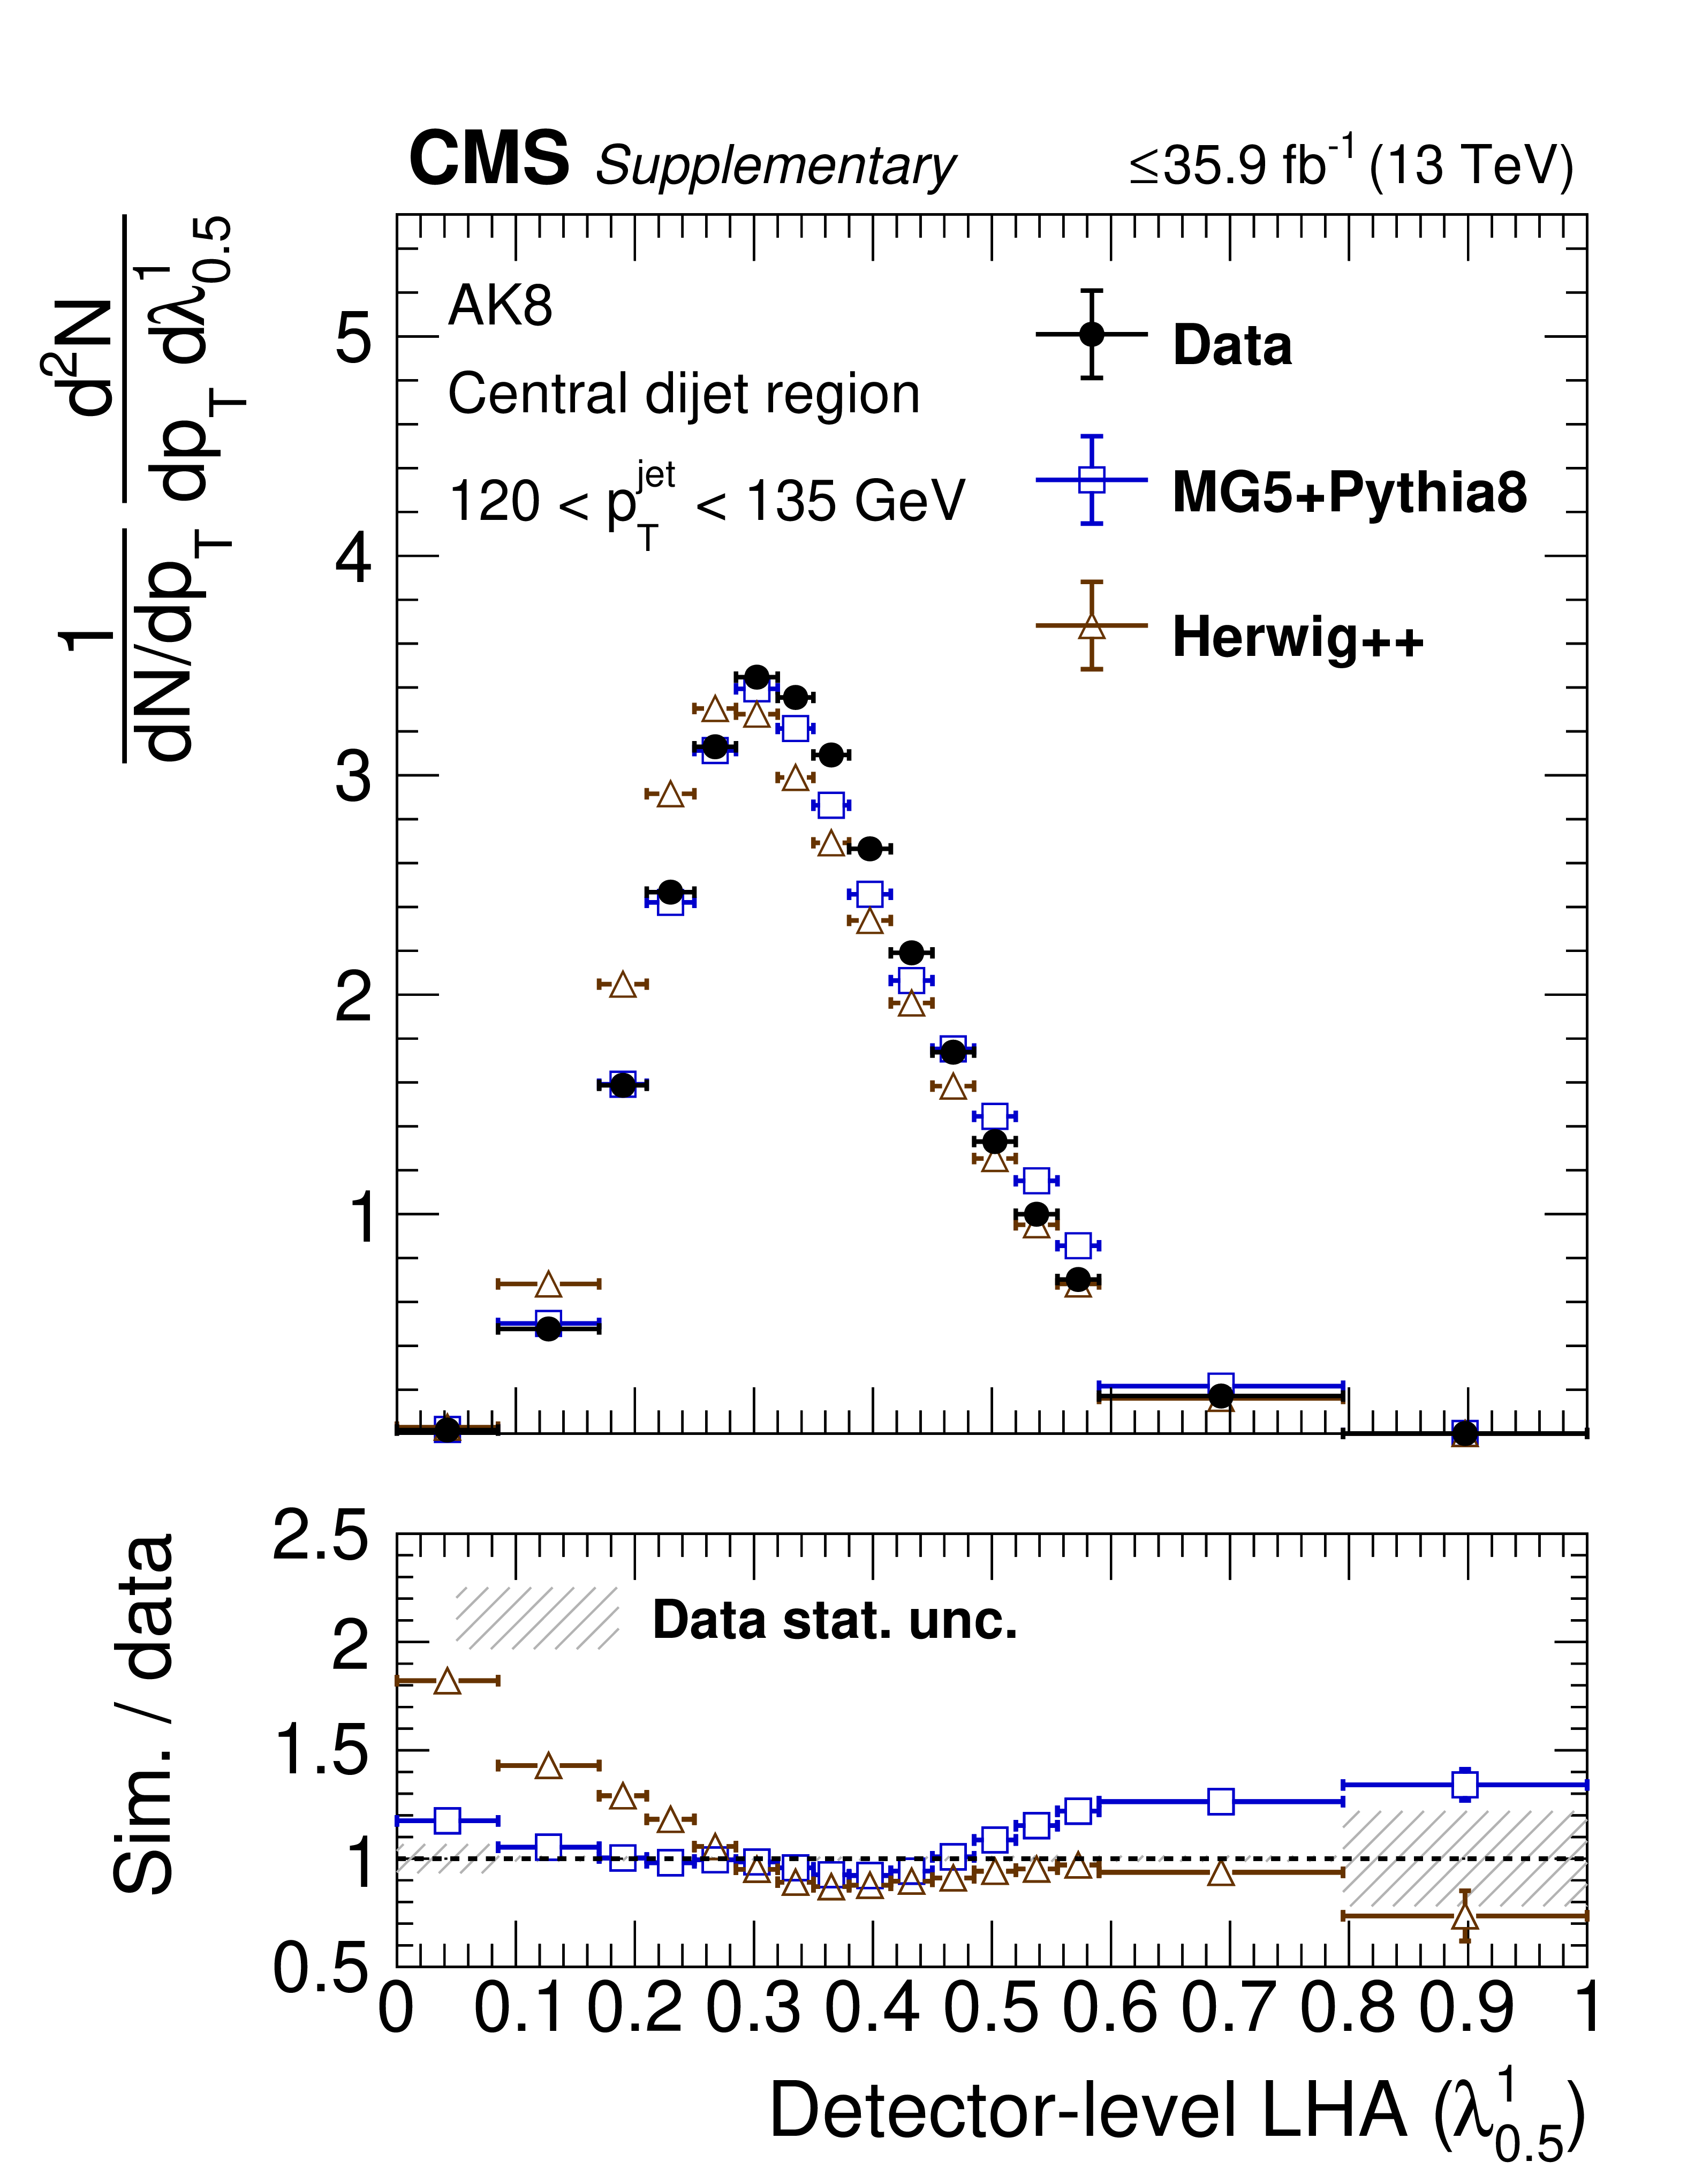
png pdf |
Additional Figure 38-b:
Data to simulation comparisons for variants of LHA (${\lambda ^{1}_{0.5}}$) in the Z+jet (left) and central dijet region (right): groomed AK4 120 $ < {p_{\mathrm {T}}} < $ 150 GeV. |
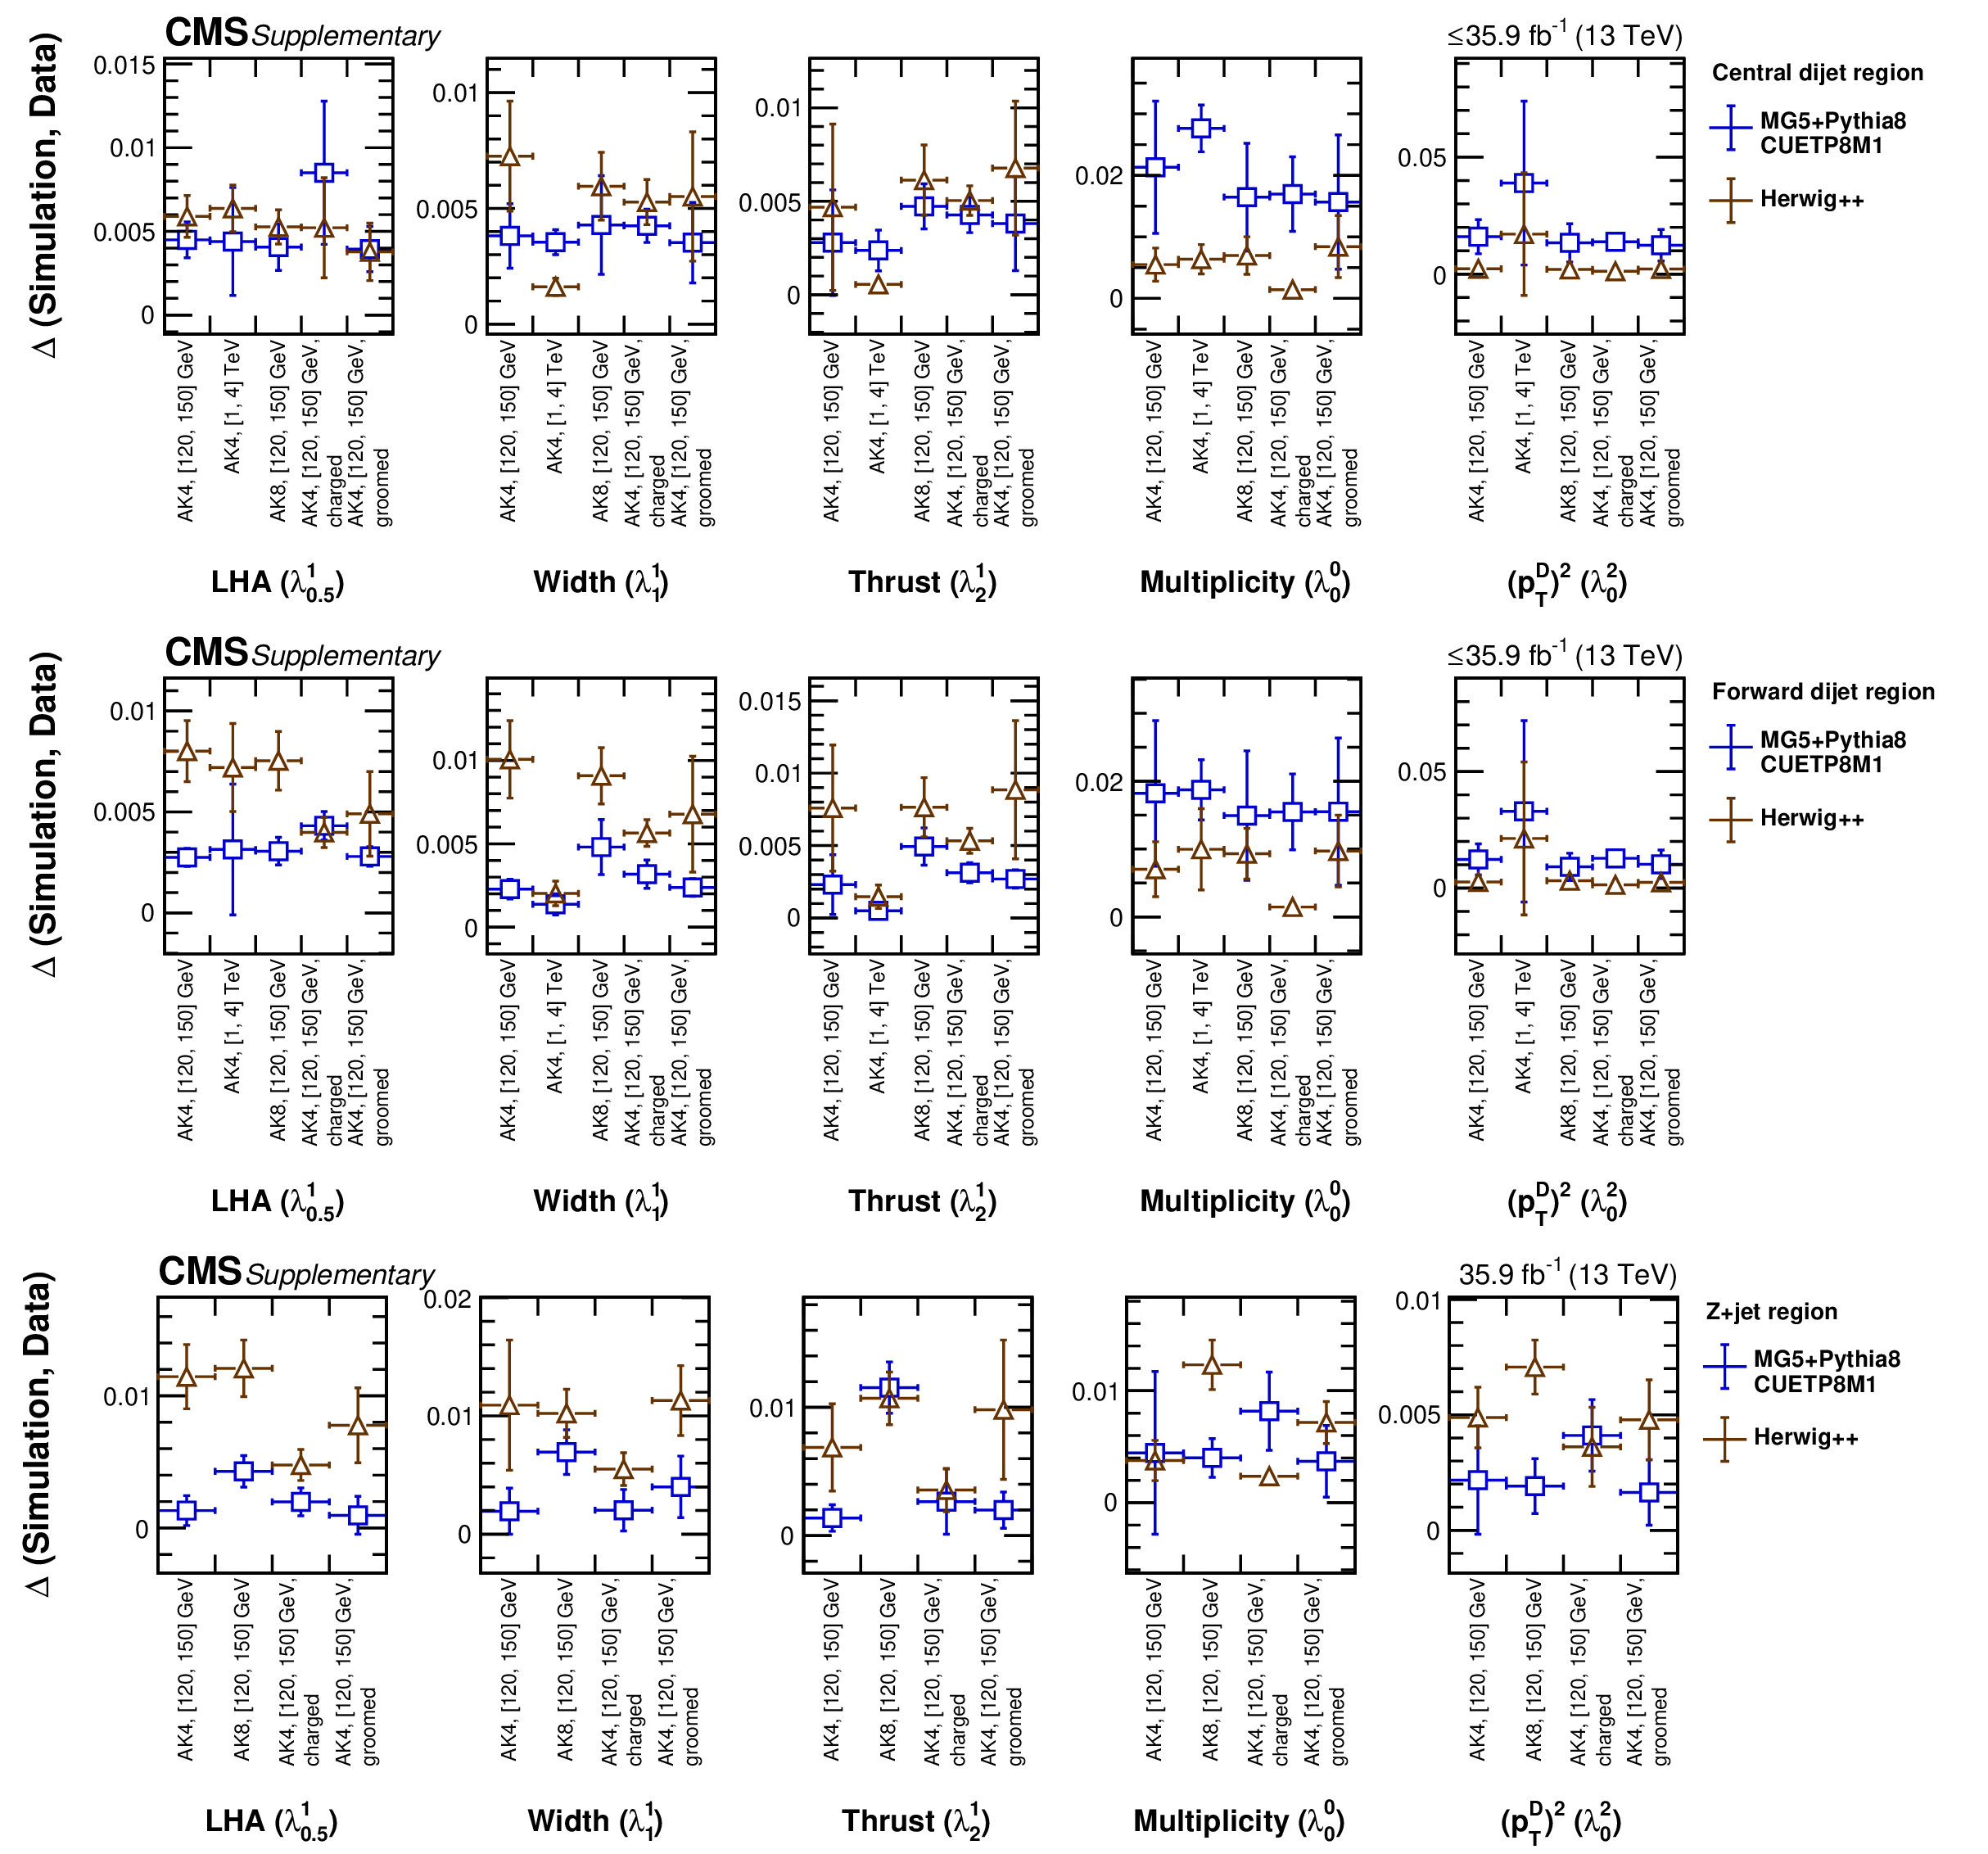
png pdf |
Additional Figure 39:
$\Delta $ of substructure observables in the central dijet (upper), forward dijet (middle) and Z+jet (lower) regions with the following entries on x-axis: ungroomed AK4 120 $ < {p_{\mathrm {T}}} < $ 150 GeV, ungroomed AK4 1000 $ < {p_{\mathrm {T}}} < $ 1500 GeV, ungroomed AK8 120 $ < {p_{\mathrm {T}}} < $ 150 GeV, ungroomed charged-only AK4 120 $ < {p_{\mathrm {T}}} < $ 150 GeV, groomed AK4 120 $ < {p_{\mathrm {T}}} < $ 150 GeV for the observables multiplicity, LHA (${\lambda ^{1}_{0.5}}$), ${(p_{\mathrm {T}}^{\mathrm {D}})^2}$ (${\lambda ^{2}_{0}}$), width (${\lambda ^{1}_{1}}$) and thrust (${\lambda ^{1}_{2}}$). |
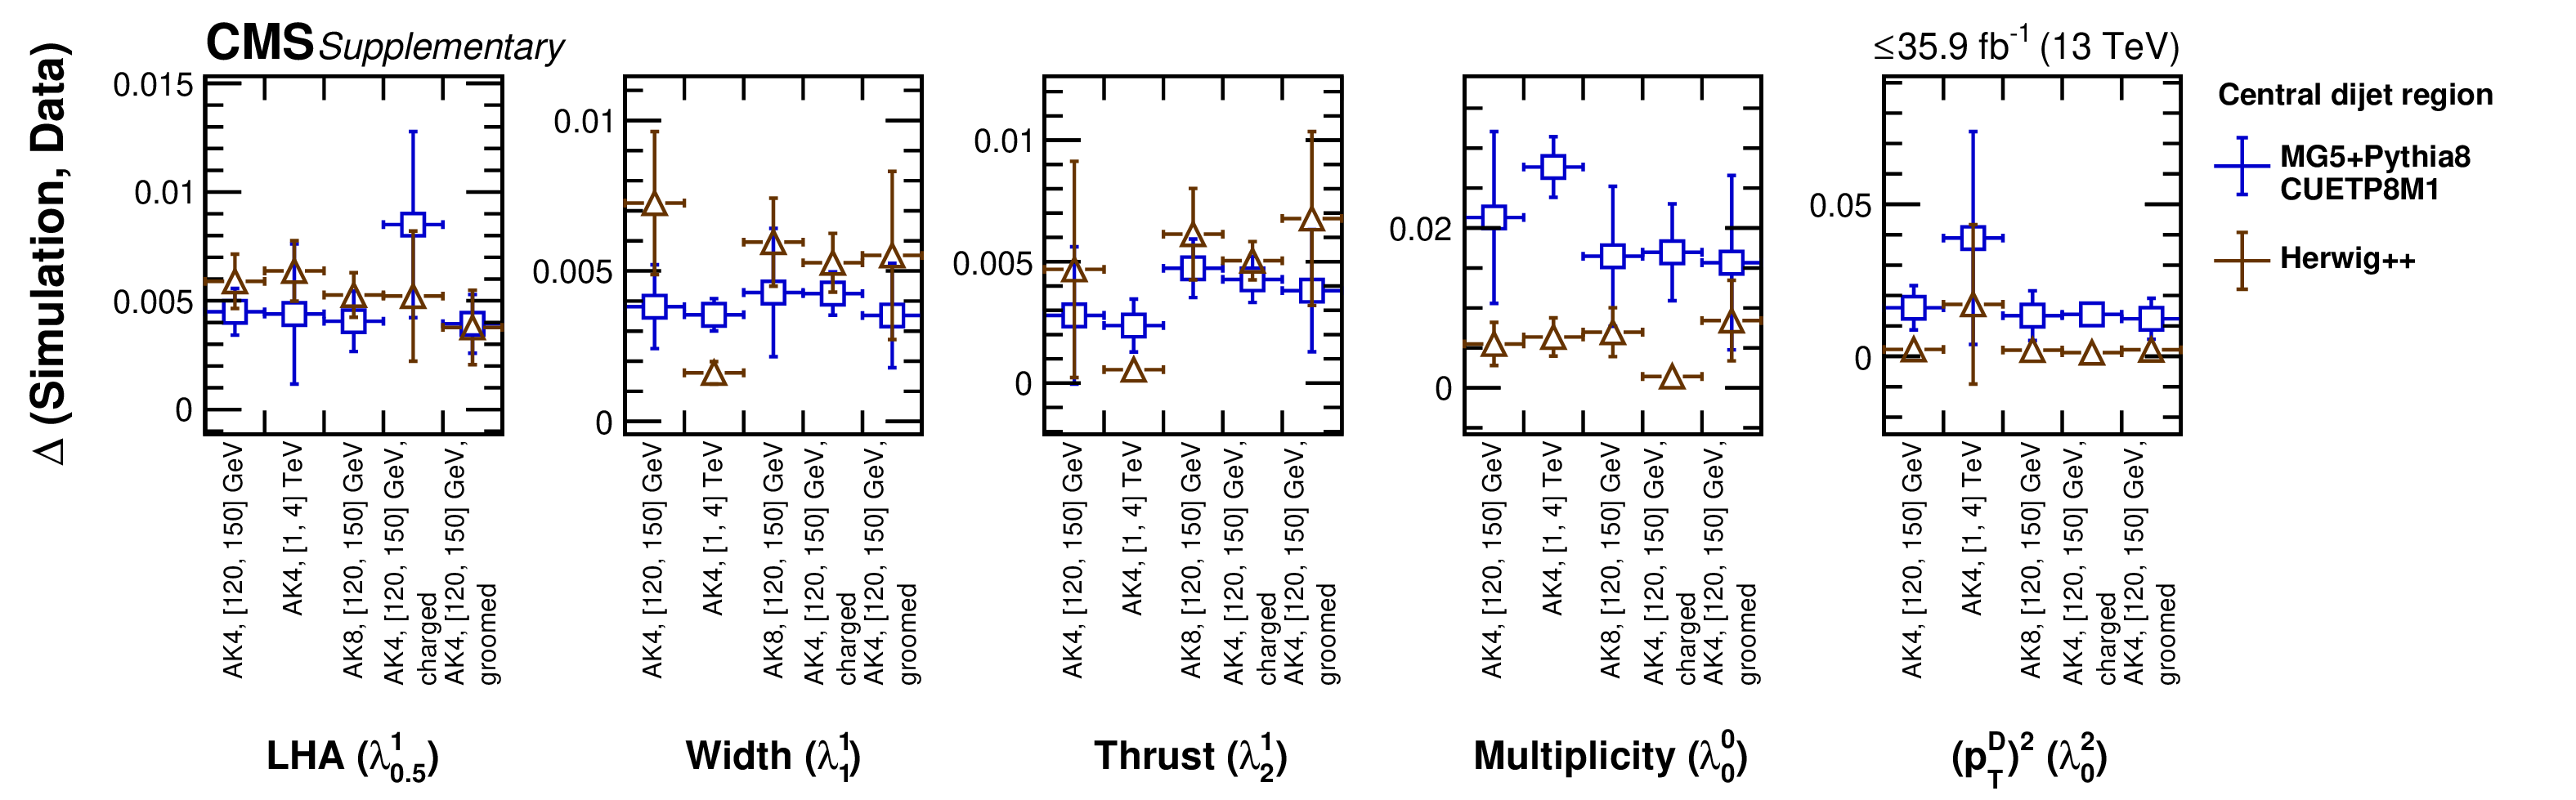
png pdf |
Additional Figure 39-a:
$\Delta $ of substructure observables in the central dijet (upper), forward dijet (middle) and Z+jet (lower) regions with the following entries on x-axis: ungroomed AK4 120 $ < {p_{\mathrm {T}}} < $ 150 GeV, ungroomed AK4 1000 $ < {p_{\mathrm {T}}} < $ 1500 GeV, ungroomed AK8 120 $ < {p_{\mathrm {T}}} < $ 150 GeV, ungroomed charged-only AK4 120 $ < {p_{\mathrm {T}}} < $ 150 GeV, groomed AK4 120 $ < {p_{\mathrm {T}}} < $ 150 GeV for the observables multiplicity, LHA (${\lambda ^{1}_{0.5}}$), ${(p_{\mathrm {T}}^{\mathrm {D}})^2}$ (${\lambda ^{2}_{0}}$), width (${\lambda ^{1}_{1}}$) and thrust (${\lambda ^{1}_{2}}$). |
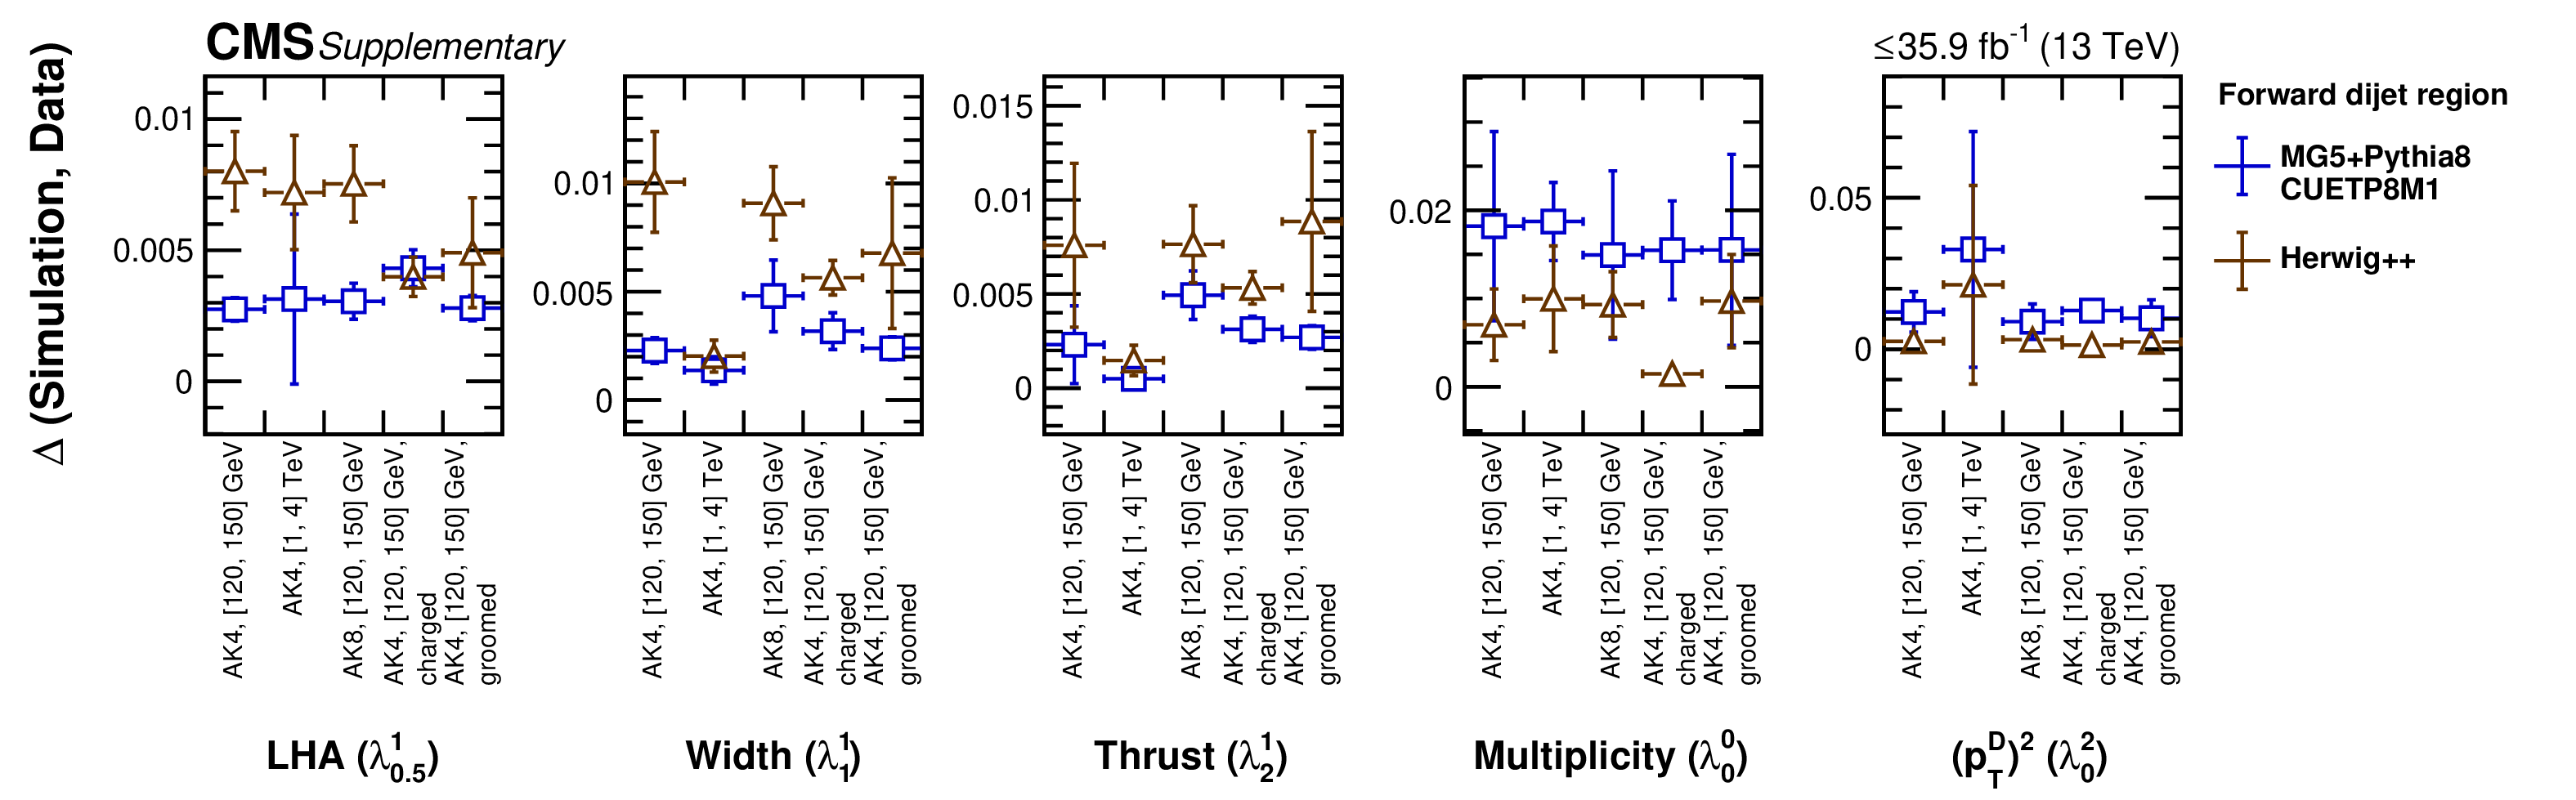
png pdf |
Additional Figure 39-b:
$\Delta $ of substructure observables in the central dijet (upper), forward dijet (middle) and Z+jet (lower) regions with the following entries on x-axis: ungroomed AK4 120 $ < {p_{\mathrm {T}}} < $ 150 GeV, ungroomed AK4 1000 $ < {p_{\mathrm {T}}} < $ 1500 GeV, ungroomed AK8 120 $ < {p_{\mathrm {T}}} < $ 150 GeV, ungroomed charged-only AK4 120 $ < {p_{\mathrm {T}}} < $ 150 GeV, groomed AK4 120 $ < {p_{\mathrm {T}}} < $ 150 GeV for the observables multiplicity, LHA (${\lambda ^{1}_{0.5}}$), ${(p_{\mathrm {T}}^{\mathrm {D}})^2}$ (${\lambda ^{2}_{0}}$), width (${\lambda ^{1}_{1}}$) and thrust (${\lambda ^{1}_{2}}$). |

png pdf |
Additional Figure 39-c:
$\Delta $ of substructure observables in the central dijet (upper), forward dijet (middle) and Z+jet (lower) regions with the following entries on x-axis: ungroomed AK4 120 $ < {p_{\mathrm {T}}} < $ 150 GeV, ungroomed AK4 1000 $ < {p_{\mathrm {T}}} < $ 1500 GeV, ungroomed AK8 120 $ < {p_{\mathrm {T}}} < $ 150 GeV, ungroomed charged-only AK4 120 $ < {p_{\mathrm {T}}} < $ 150 GeV, groomed AK4 120 $ < {p_{\mathrm {T}}} < $ 150 GeV for the observables multiplicity, LHA (${\lambda ^{1}_{0.5}}$), ${(p_{\mathrm {T}}^{\mathrm {D}})^2}$ (${\lambda ^{2}_{0}}$), width (${\lambda ^{1}_{1}}$) and thrust (${\lambda ^{1}_{2}}$). |

png pdf |
Additional Figure 40:
Particle-level distributions of ungroomed AK4 LHA (${\lambda ^{1}_{0.5}}$) in 120 $ < {p_{\mathrm {T}}} < $ 150 in the Z+jet region (left) and in 120 $ < {p_{\mathrm {T}}} < $ 150 in the central dijet region (right). The NLO+NLL'+NP predictions are taken from arXiv:2112.09545. |
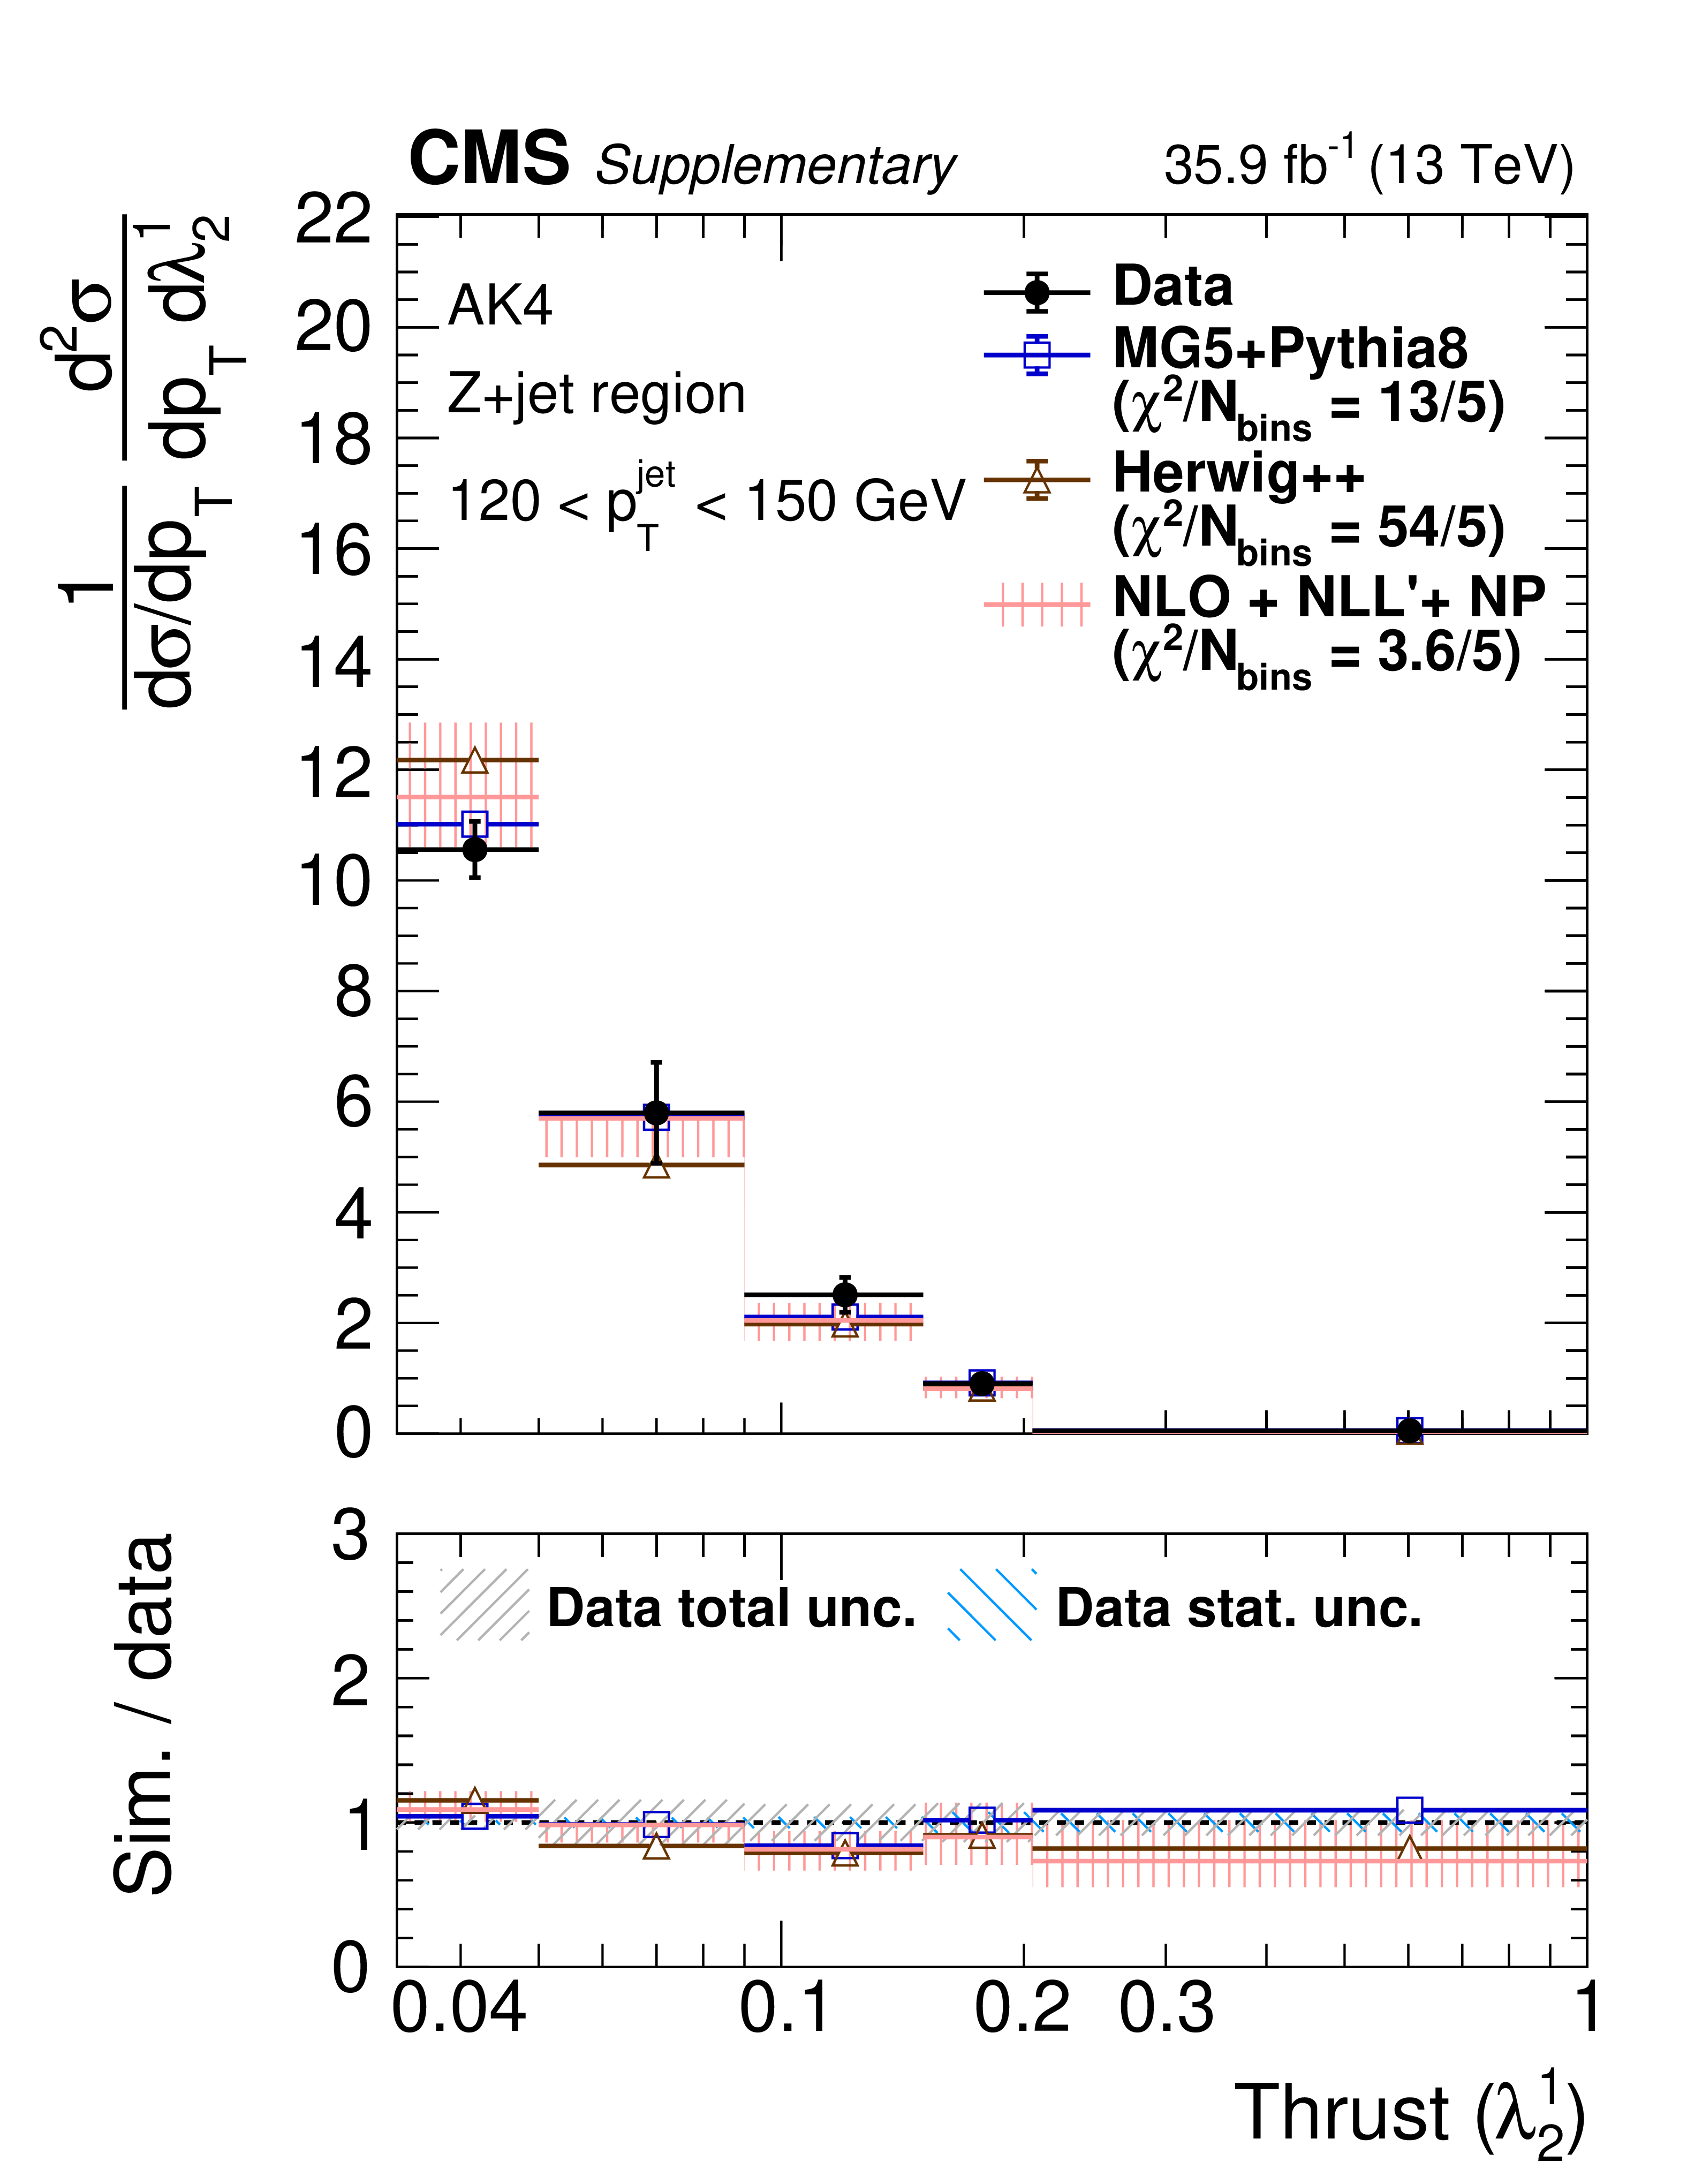
png pdf |
Additional Figure 40-a:
Particle-level distributions of ungroomed AK4 LHA (${\lambda ^{1}_{0.5}}$) in 120 $ < {p_{\mathrm {T}}} < $ 150 in the Z+jet region (left) and in 120 $ < {p_{\mathrm {T}}} < $ 150 in the central dijet region (right). The NLO+NLL'+NP predictions are taken from arXiv:2112.09545. |

png pdf |
Additional Figure 40-b:
Particle-level distributions of ungroomed AK4 LHA (${\lambda ^{1}_{0.5}}$) in 120 $ < {p_{\mathrm {T}}} < $ 150 in the Z+jet region (left) and in 120 $ < {p_{\mathrm {T}}} < $ 150 in the central dijet region (right). The NLO+NLL'+NP predictions are taken from arXiv:2112.09545. |

png pdf |
Additional Figure 41:
Particle-level distributions of ungroomed AK4 LHA (${\lambda ^{1}_{0.5}}$) in 408 $ < {p_{\mathrm {T}}} < $ 4000 GeV in the Z+jet region (left) and in 1000 $ < {p_{\mathrm {T}}} < $ 4000 GeV in the central dijet region (right). The NLO+NLL'+NP predictions are taken from arXiv:2112.09545. |

png pdf |
Additional Figure 41-a:
Particle-level distributions of ungroomed AK4 LHA (${\lambda ^{1}_{0.5}}$) in 408 $ < {p_{\mathrm {T}}} < $ 4000 GeV in the Z+jet region (left) and in 1000 $ < {p_{\mathrm {T}}} < $ 4000 GeV in the central dijet region (right). The NLO+NLL'+NP predictions are taken from arXiv:2112.09545. |
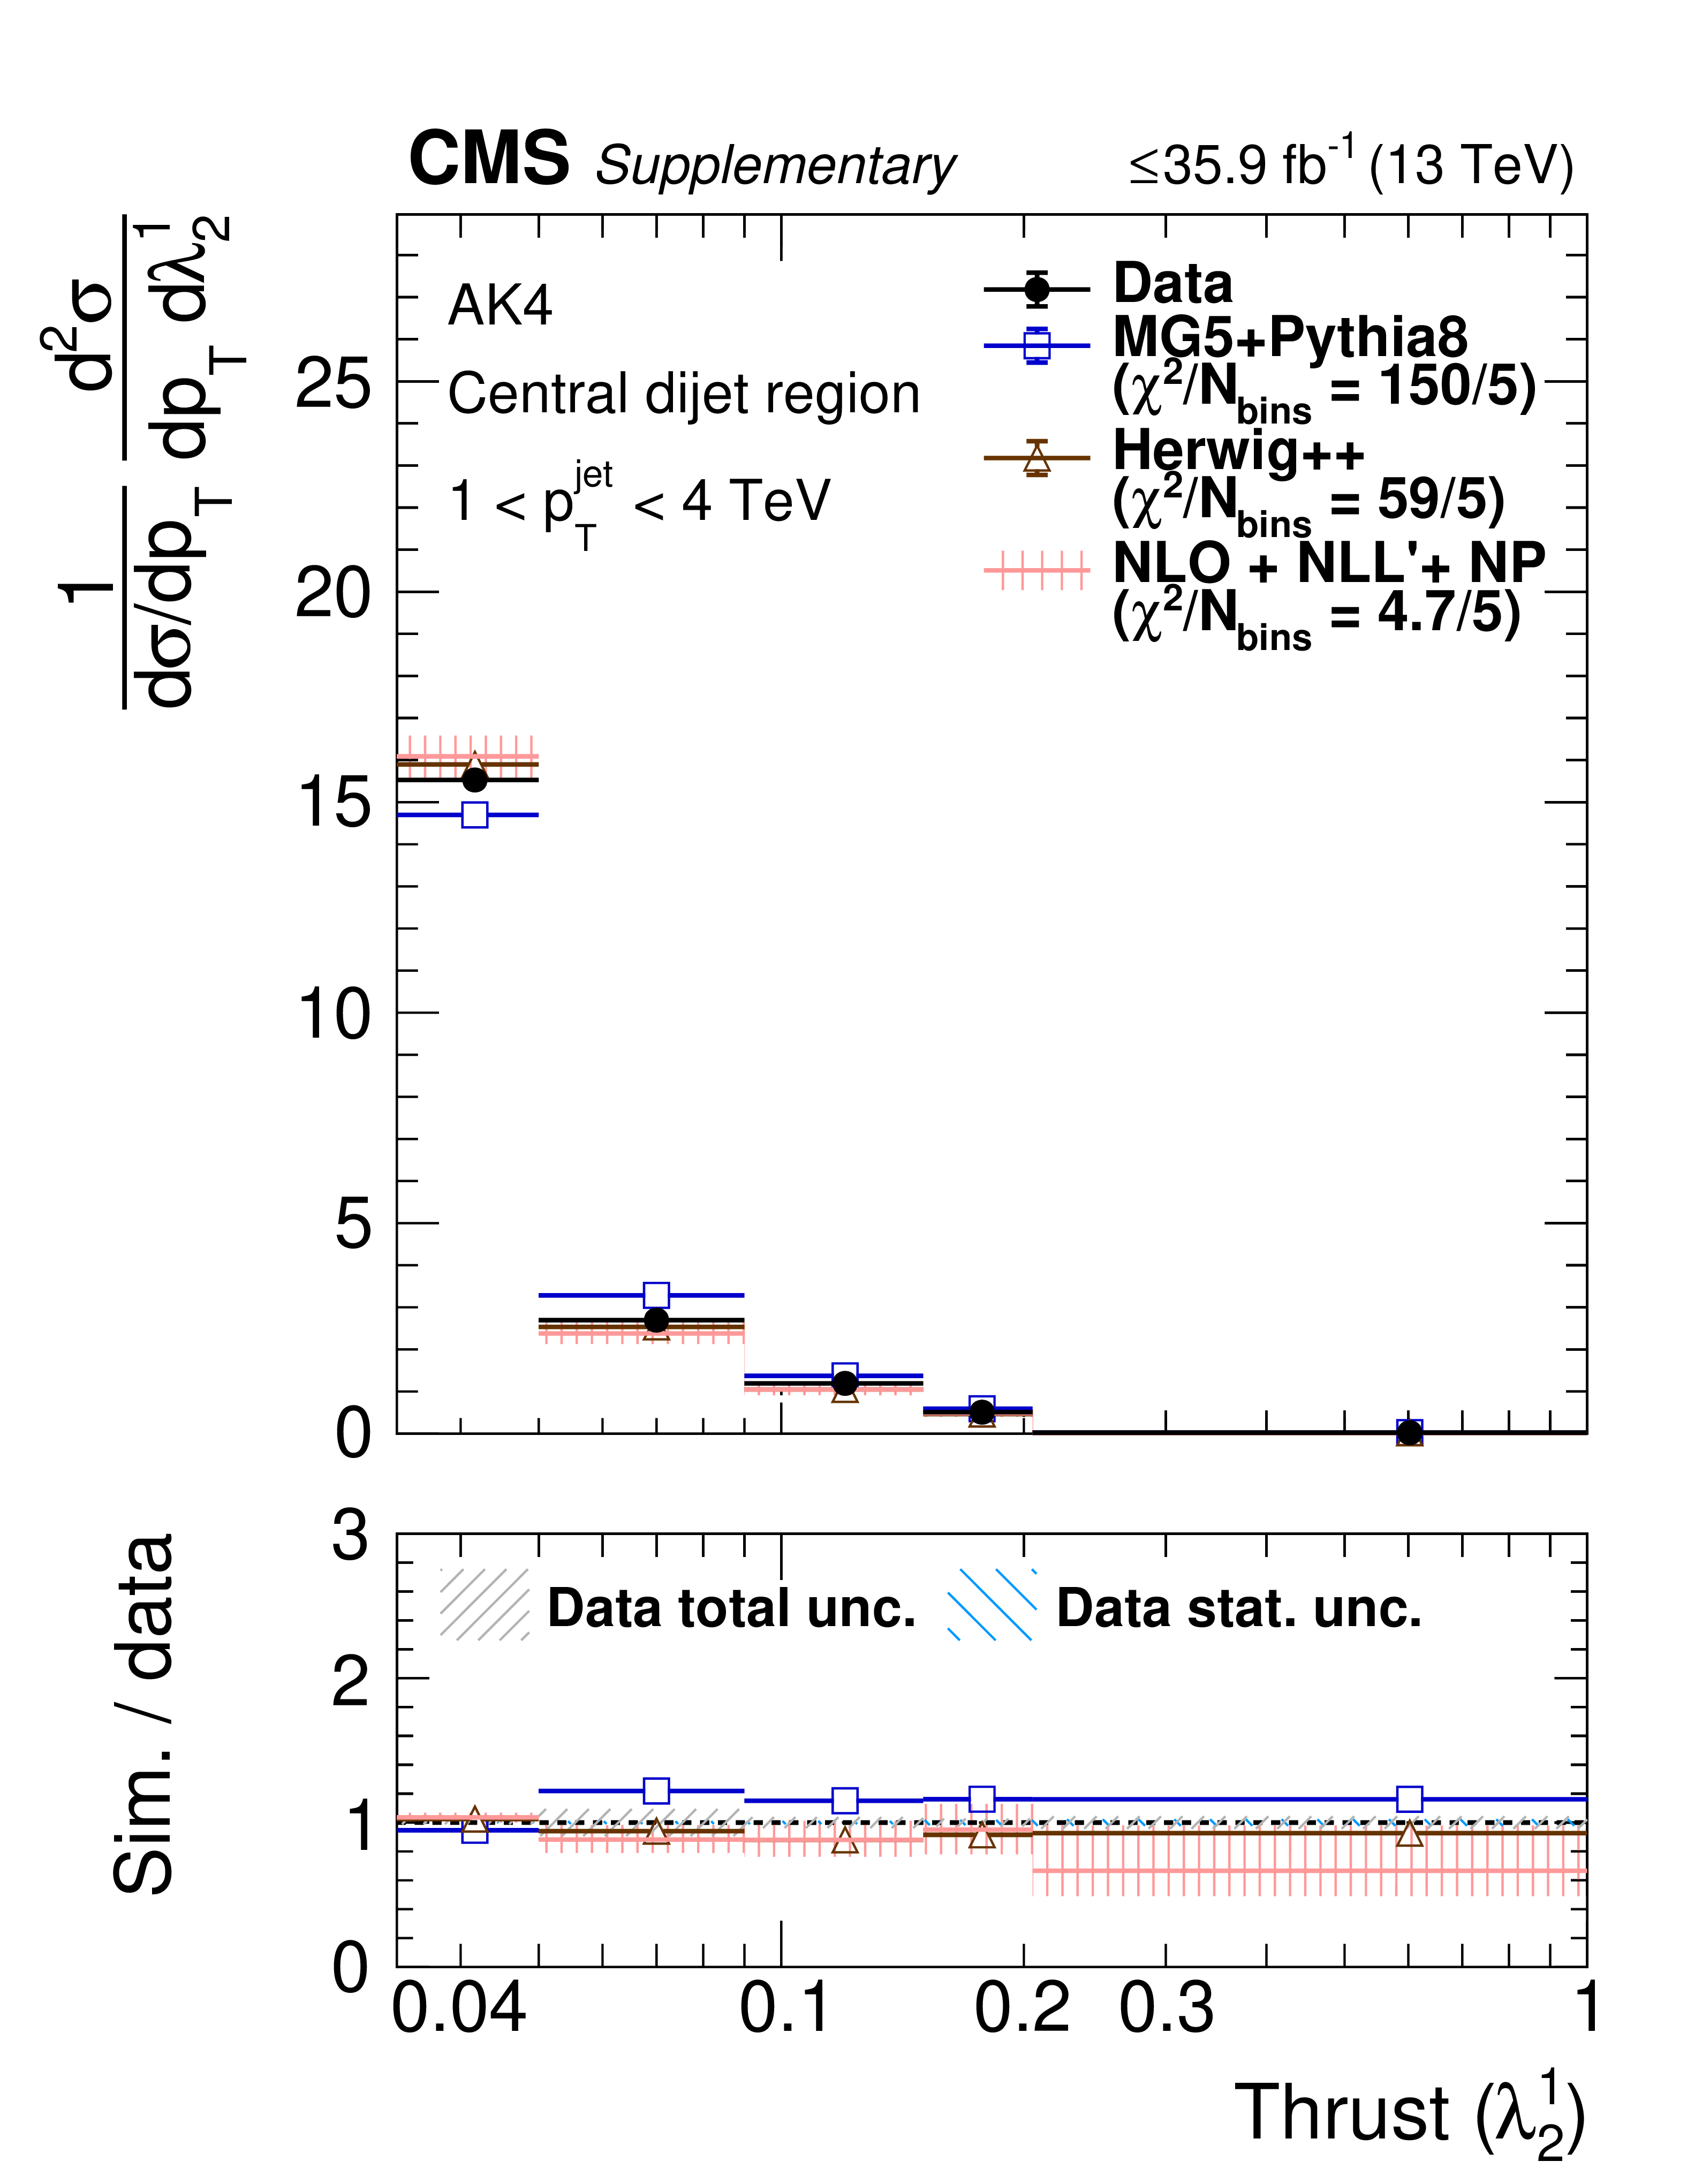
png pdf |
Additional Figure 41-b:
Particle-level distributions of ungroomed AK4 LHA (${\lambda ^{1}_{0.5}}$) in 408 $ < {p_{\mathrm {T}}} < $ 4000 GeV in the Z+jet region (left) and in 1000 $ < {p_{\mathrm {T}}} < $ 4000 GeV in the central dijet region (right). The NLO+NLL'+NP predictions are taken from arXiv:2112.09545. |

png pdf |
Additional Figure 42:
Particle-level distributions of ungroomed AK8 LHA (${\lambda ^{1}_{0.5}}$) in AK8 120 $ < {p_{\mathrm {T}}} < $ 150 GeV in the Z+jet region (left) and central dijet region (right). The NLO+NLL'+NP predictions are taken from arXiv:2112.09545. |

png pdf |
Additional Figure 42-a:
Particle-level distributions of ungroomed AK8 LHA (${\lambda ^{1}_{0.5}}$) in AK8 120 $ < {p_{\mathrm {T}}} < $ 150 GeV in the Z+jet region (left) and central dijet region (right). The NLO+NLL'+NP predictions are taken from arXiv:2112.09545. |

png pdf |
Additional Figure 42-b:
Particle-level distributions of ungroomed AK8 LHA (${\lambda ^{1}_{0.5}}$) in AK8 120 $ < {p_{\mathrm {T}}} < $ 150 GeV in the Z+jet region (left) and central dijet region (right). The NLO+NLL'+NP predictions are taken from arXiv:2112.09545. |
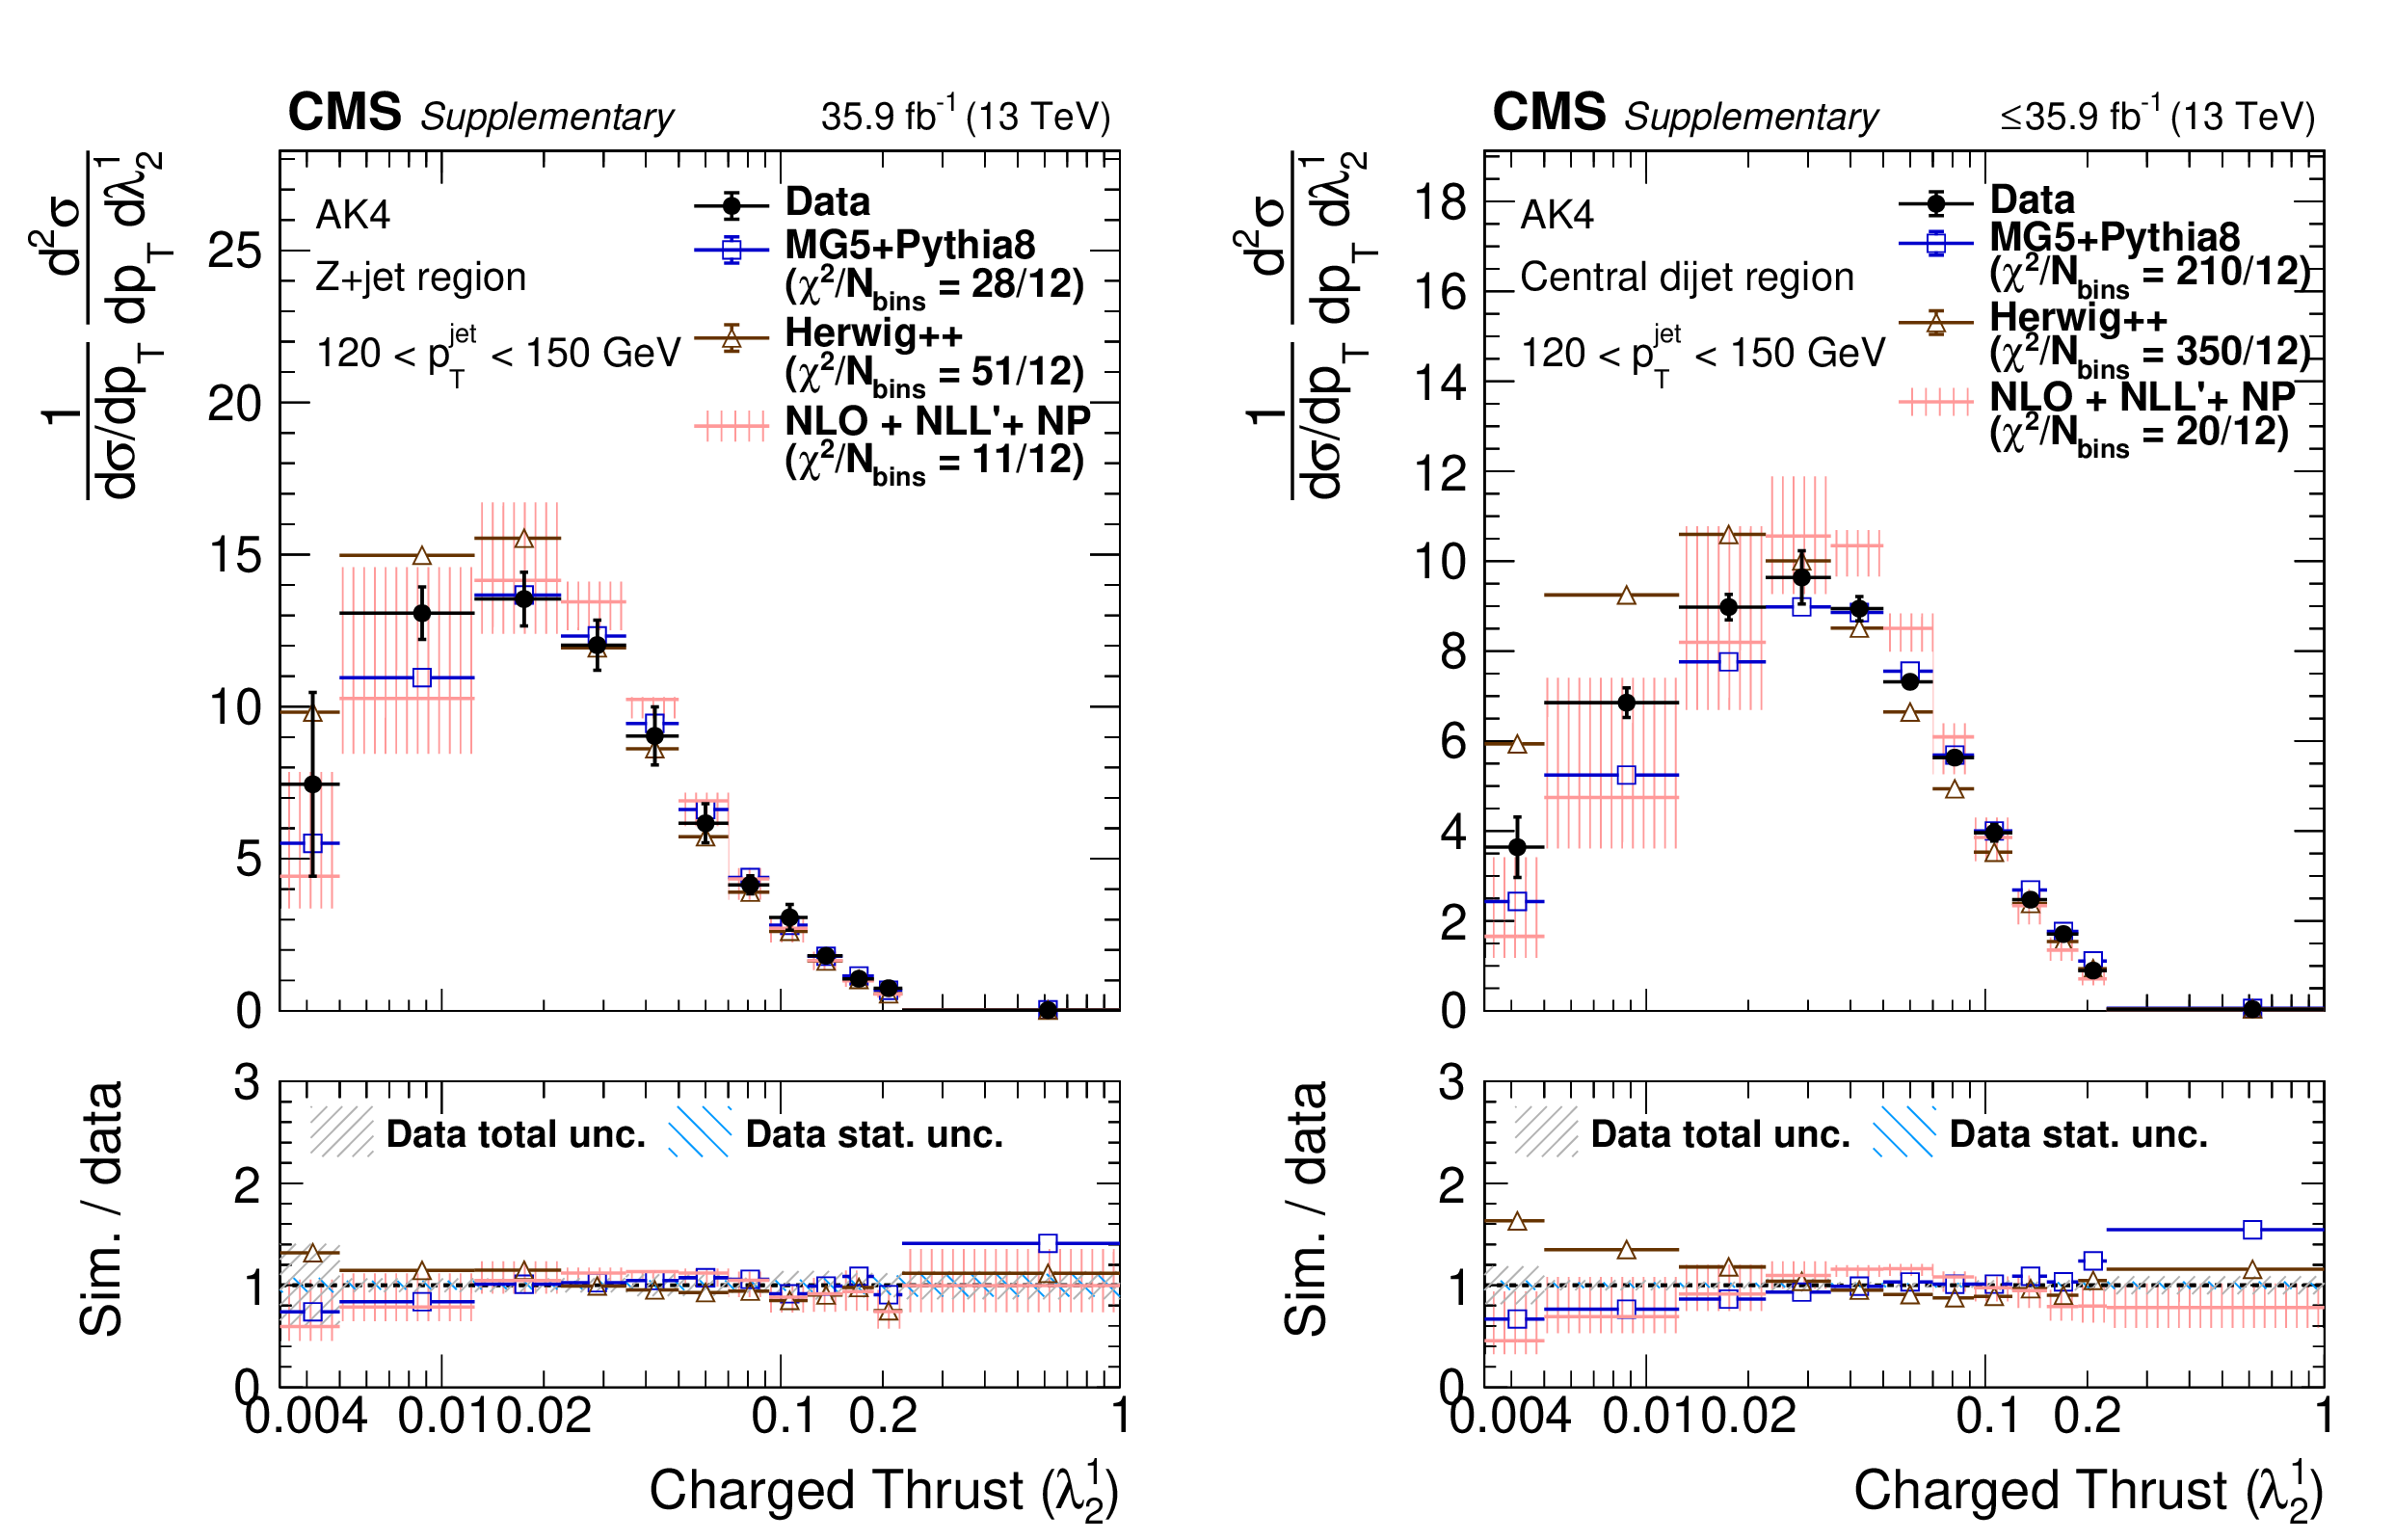
png pdf |
Additional Figure 43:
Particle-level distributions of ungroomed charged-only AK4 LHA (${\lambda ^{1}_{0.5}}$) 120 $ < {p_{\mathrm {T}}} < $ 150 GeV in the Z+jet region (left) and central dijet region (right). The NLO+NLL'+NP predictions are taken from arXiv:2112.09545. |
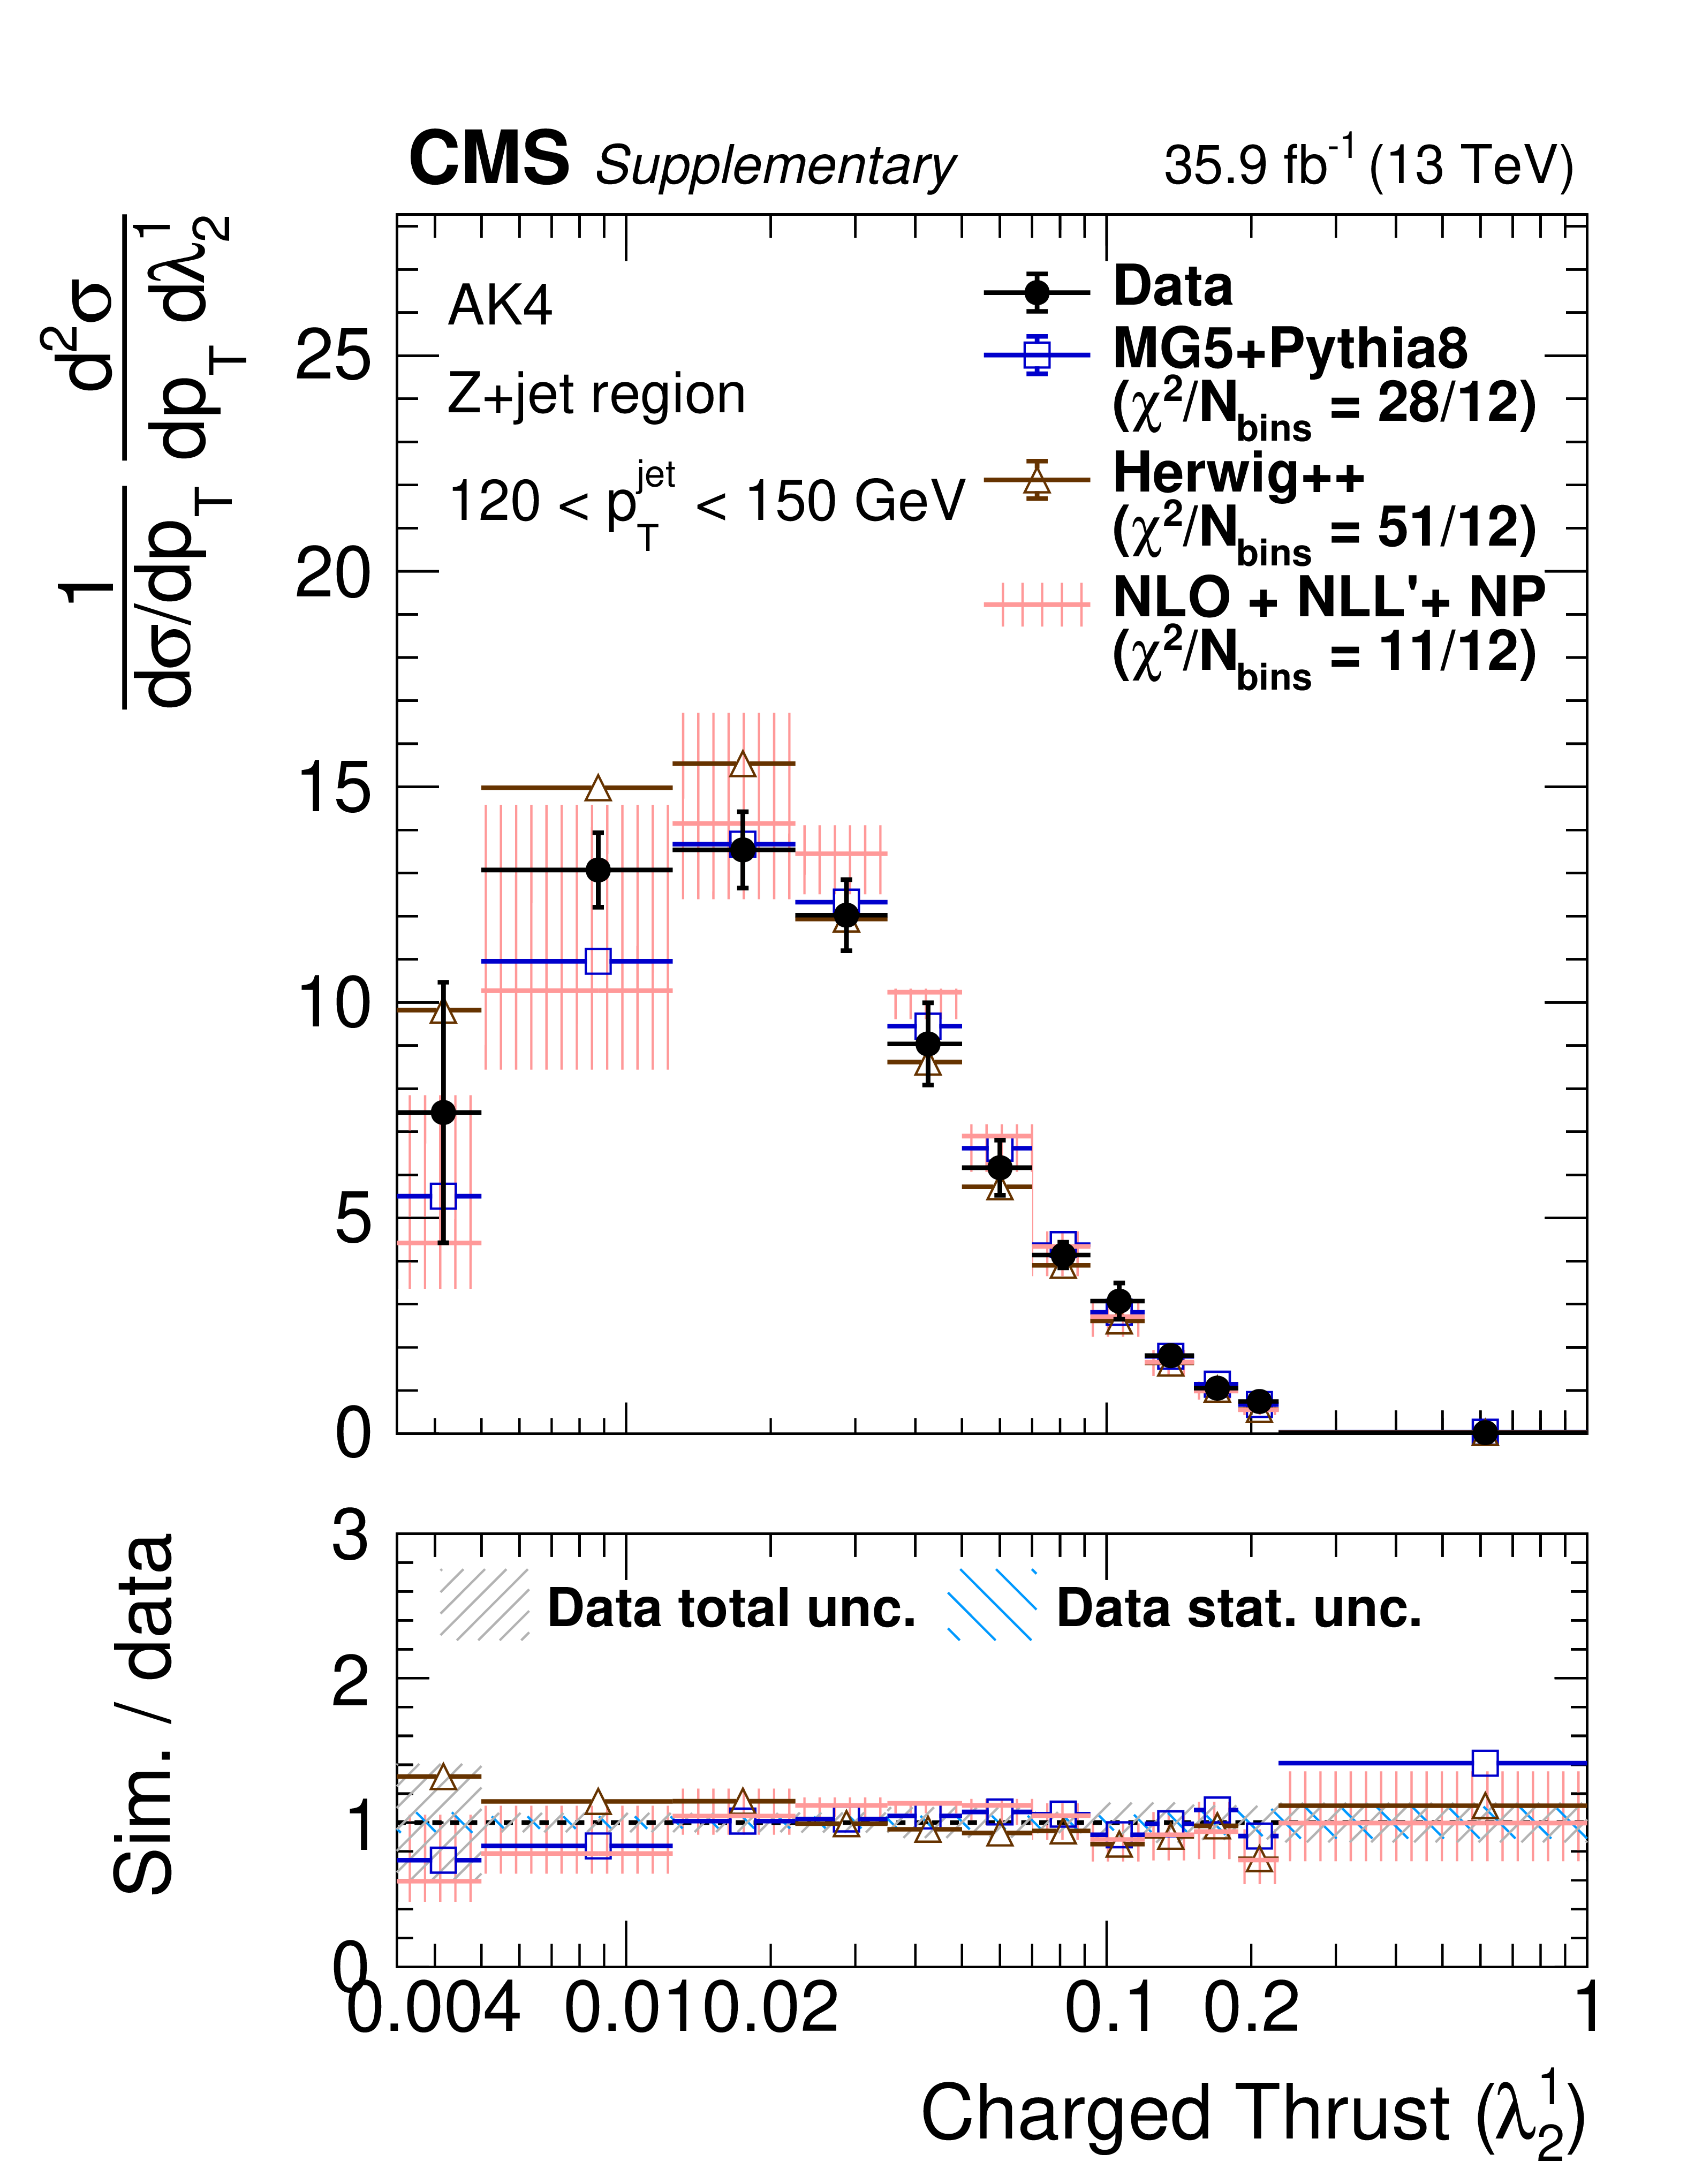
png pdf |
Additional Figure 43-a:
Particle-level distributions of ungroomed charged-only AK4 LHA (${\lambda ^{1}_{0.5}}$) 120 $ < {p_{\mathrm {T}}} < $ 150 GeV in the Z+jet region (left) and central dijet region (right). The NLO+NLL'+NP predictions are taken from arXiv:2112.09545. |

png pdf |
Additional Figure 43-b:
Particle-level distributions of ungroomed charged-only AK4 LHA (${\lambda ^{1}_{0.5}}$) 120 $ < {p_{\mathrm {T}}} < $ 150 GeV in the Z+jet region (left) and central dijet region (right). The NLO+NLL'+NP predictions are taken from arXiv:2112.09545. |
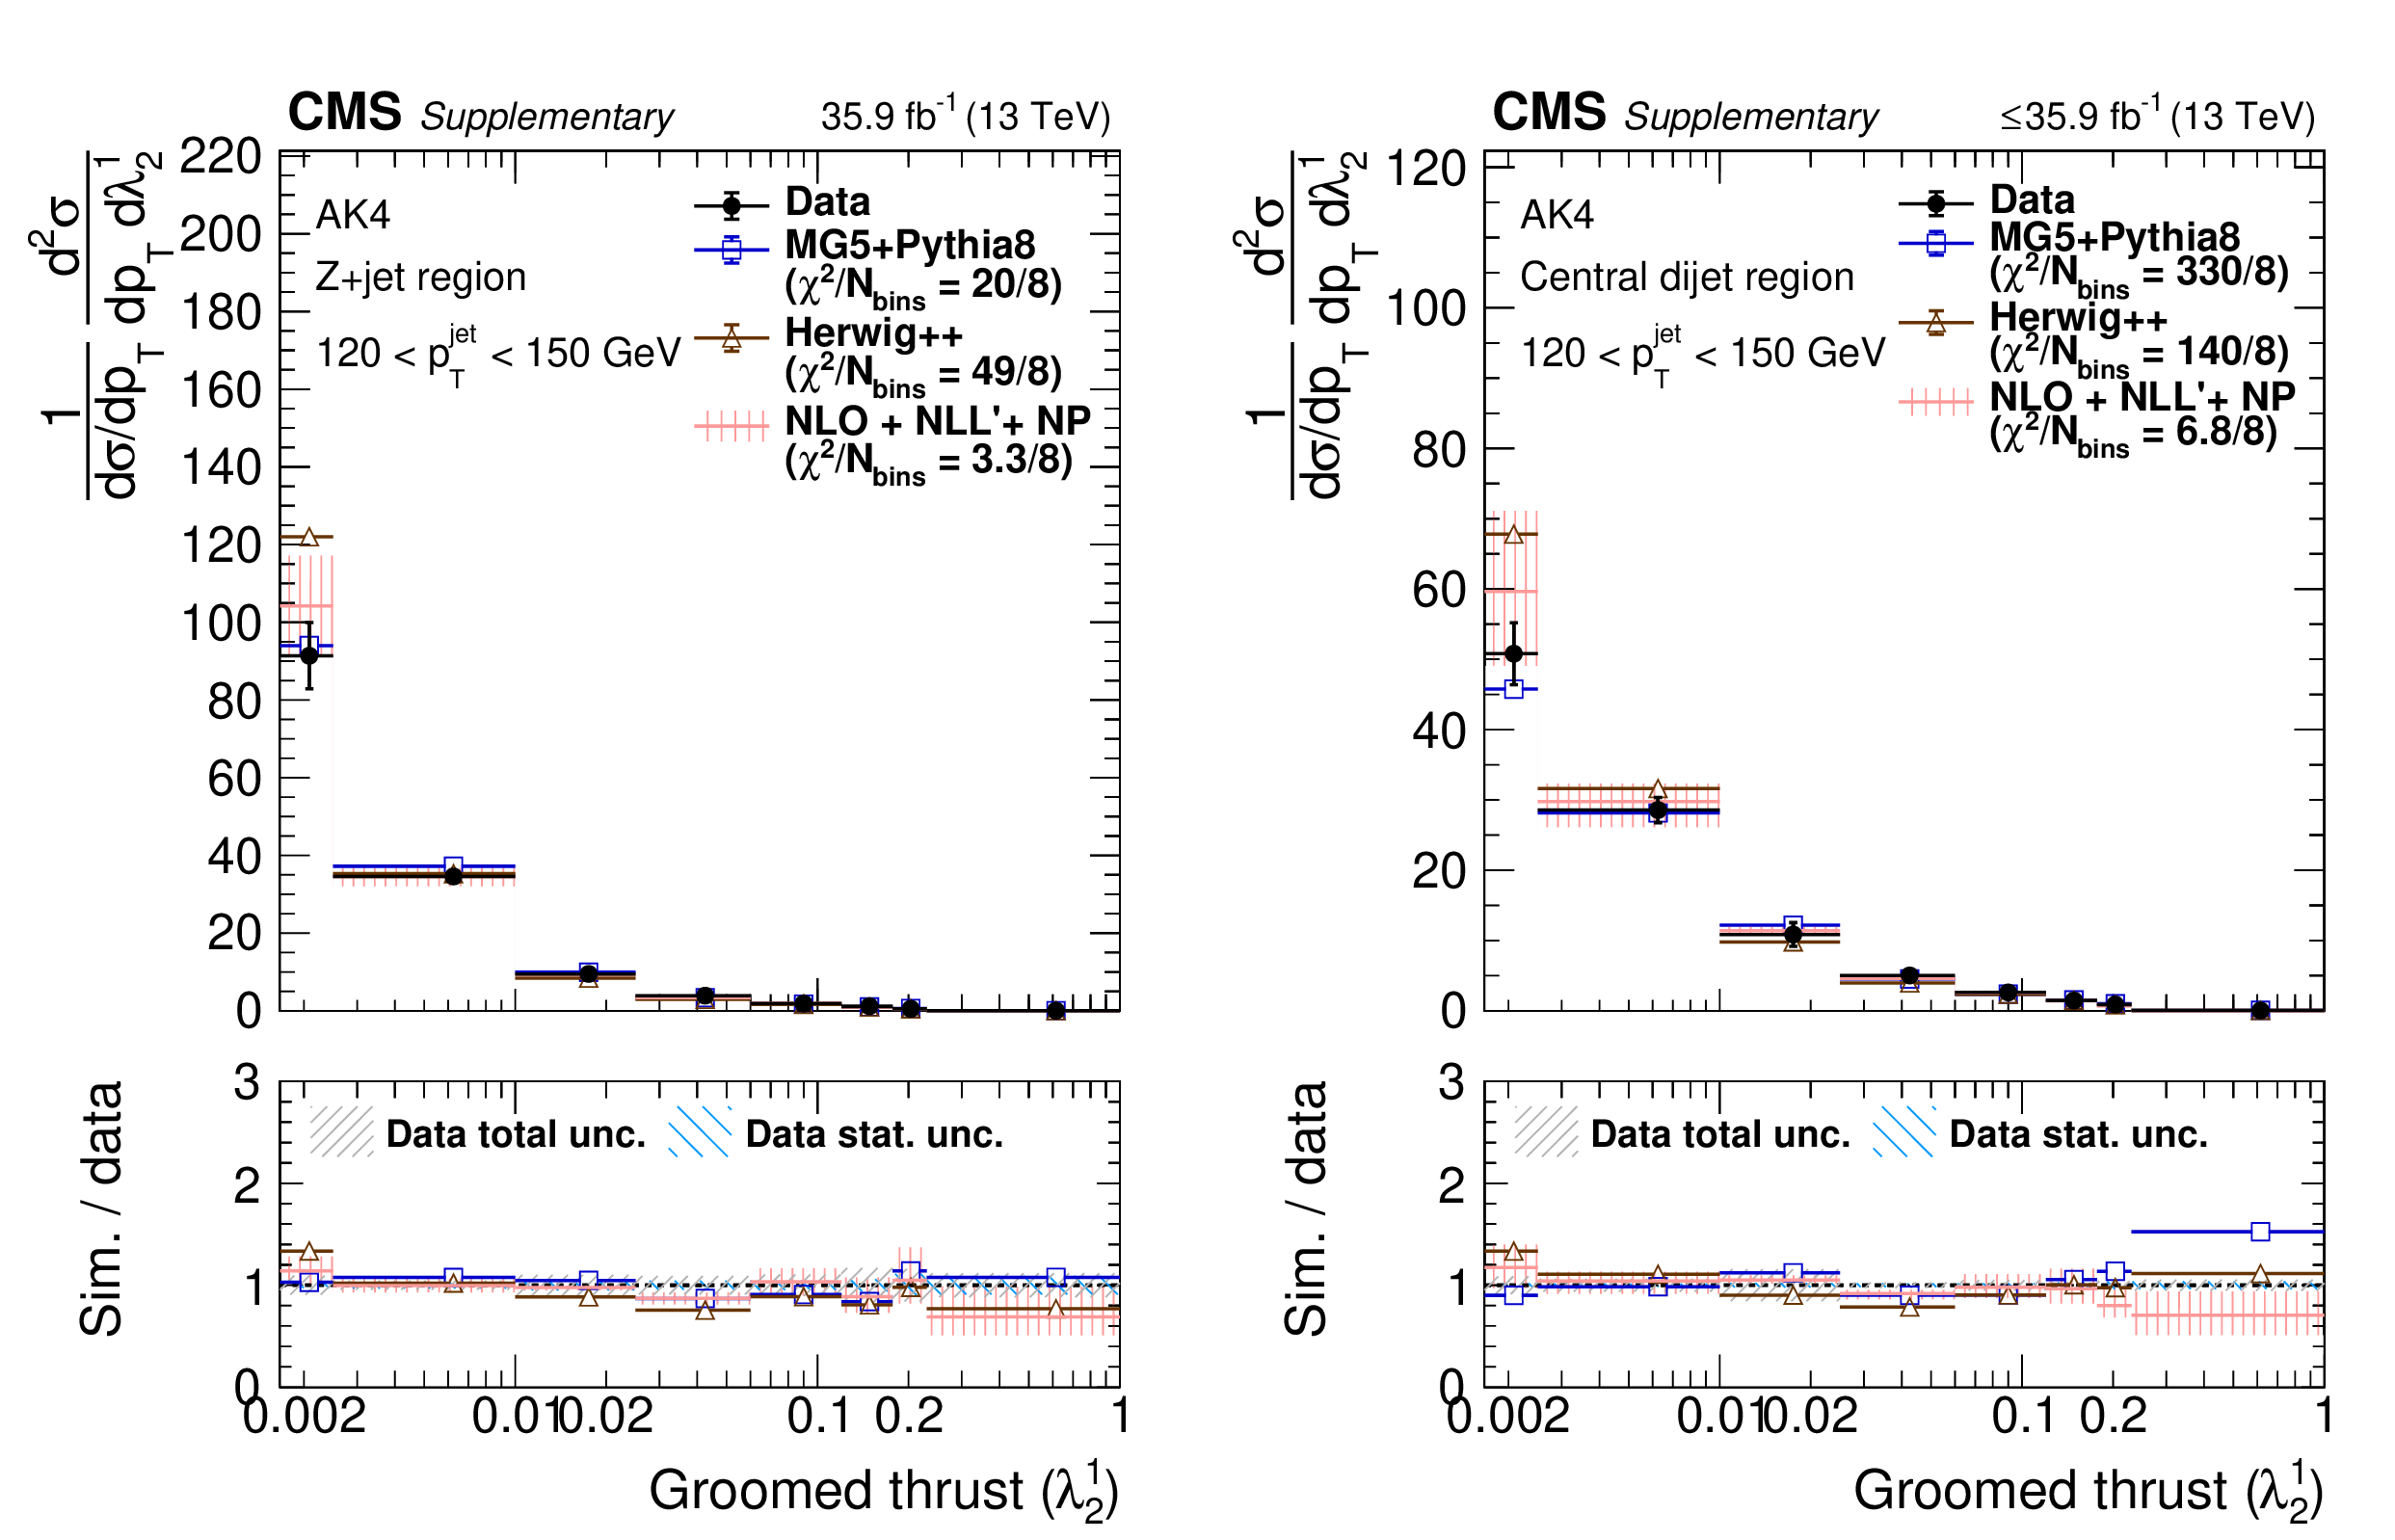
png pdf |
Additional Figure 44:
Particle-level distributions of groomed AK4 LHA (${\lambda ^{1}_{0.5}}$) 120 $ < {p_{\mathrm {T}}} < $ 150 GeV in the Z+jet region (left) and central dijet region (right). The NLO+NLL'+NP predictions are taken from arXiv:2112.09545. |

png pdf |
Additional Figure 44-a:
Particle-level distributions of groomed AK4 LHA (${\lambda ^{1}_{0.5}}$) 120 $ < {p_{\mathrm {T}}} < $ 150 GeV in the Z+jet region (left) and central dijet region (right). The NLO+NLL'+NP predictions are taken from arXiv:2112.09545. |

png pdf |
Additional Figure 44-b:
Particle-level distributions of groomed AK4 LHA (${\lambda ^{1}_{0.5}}$) 120 $ < {p_{\mathrm {T}}} < $ 150 GeV in the Z+jet region (left) and central dijet region (right). The NLO+NLL'+NP predictions are taken from arXiv:2112.09545. |

png pdf |
Additional Figure 45:
Particle-level distributions of ungroomed AK4 width (${\lambda ^{1}_{1}}$) in 120 $ < {p_{\mathrm {T}}} < $ 150 in the Z+jet region (left) and in 120 $ < {p_{\mathrm {T}}} < $ 150 in the central dijet region (right). The NLO+NLL'+NP predictions are taken from arXiv:2112.09545. |
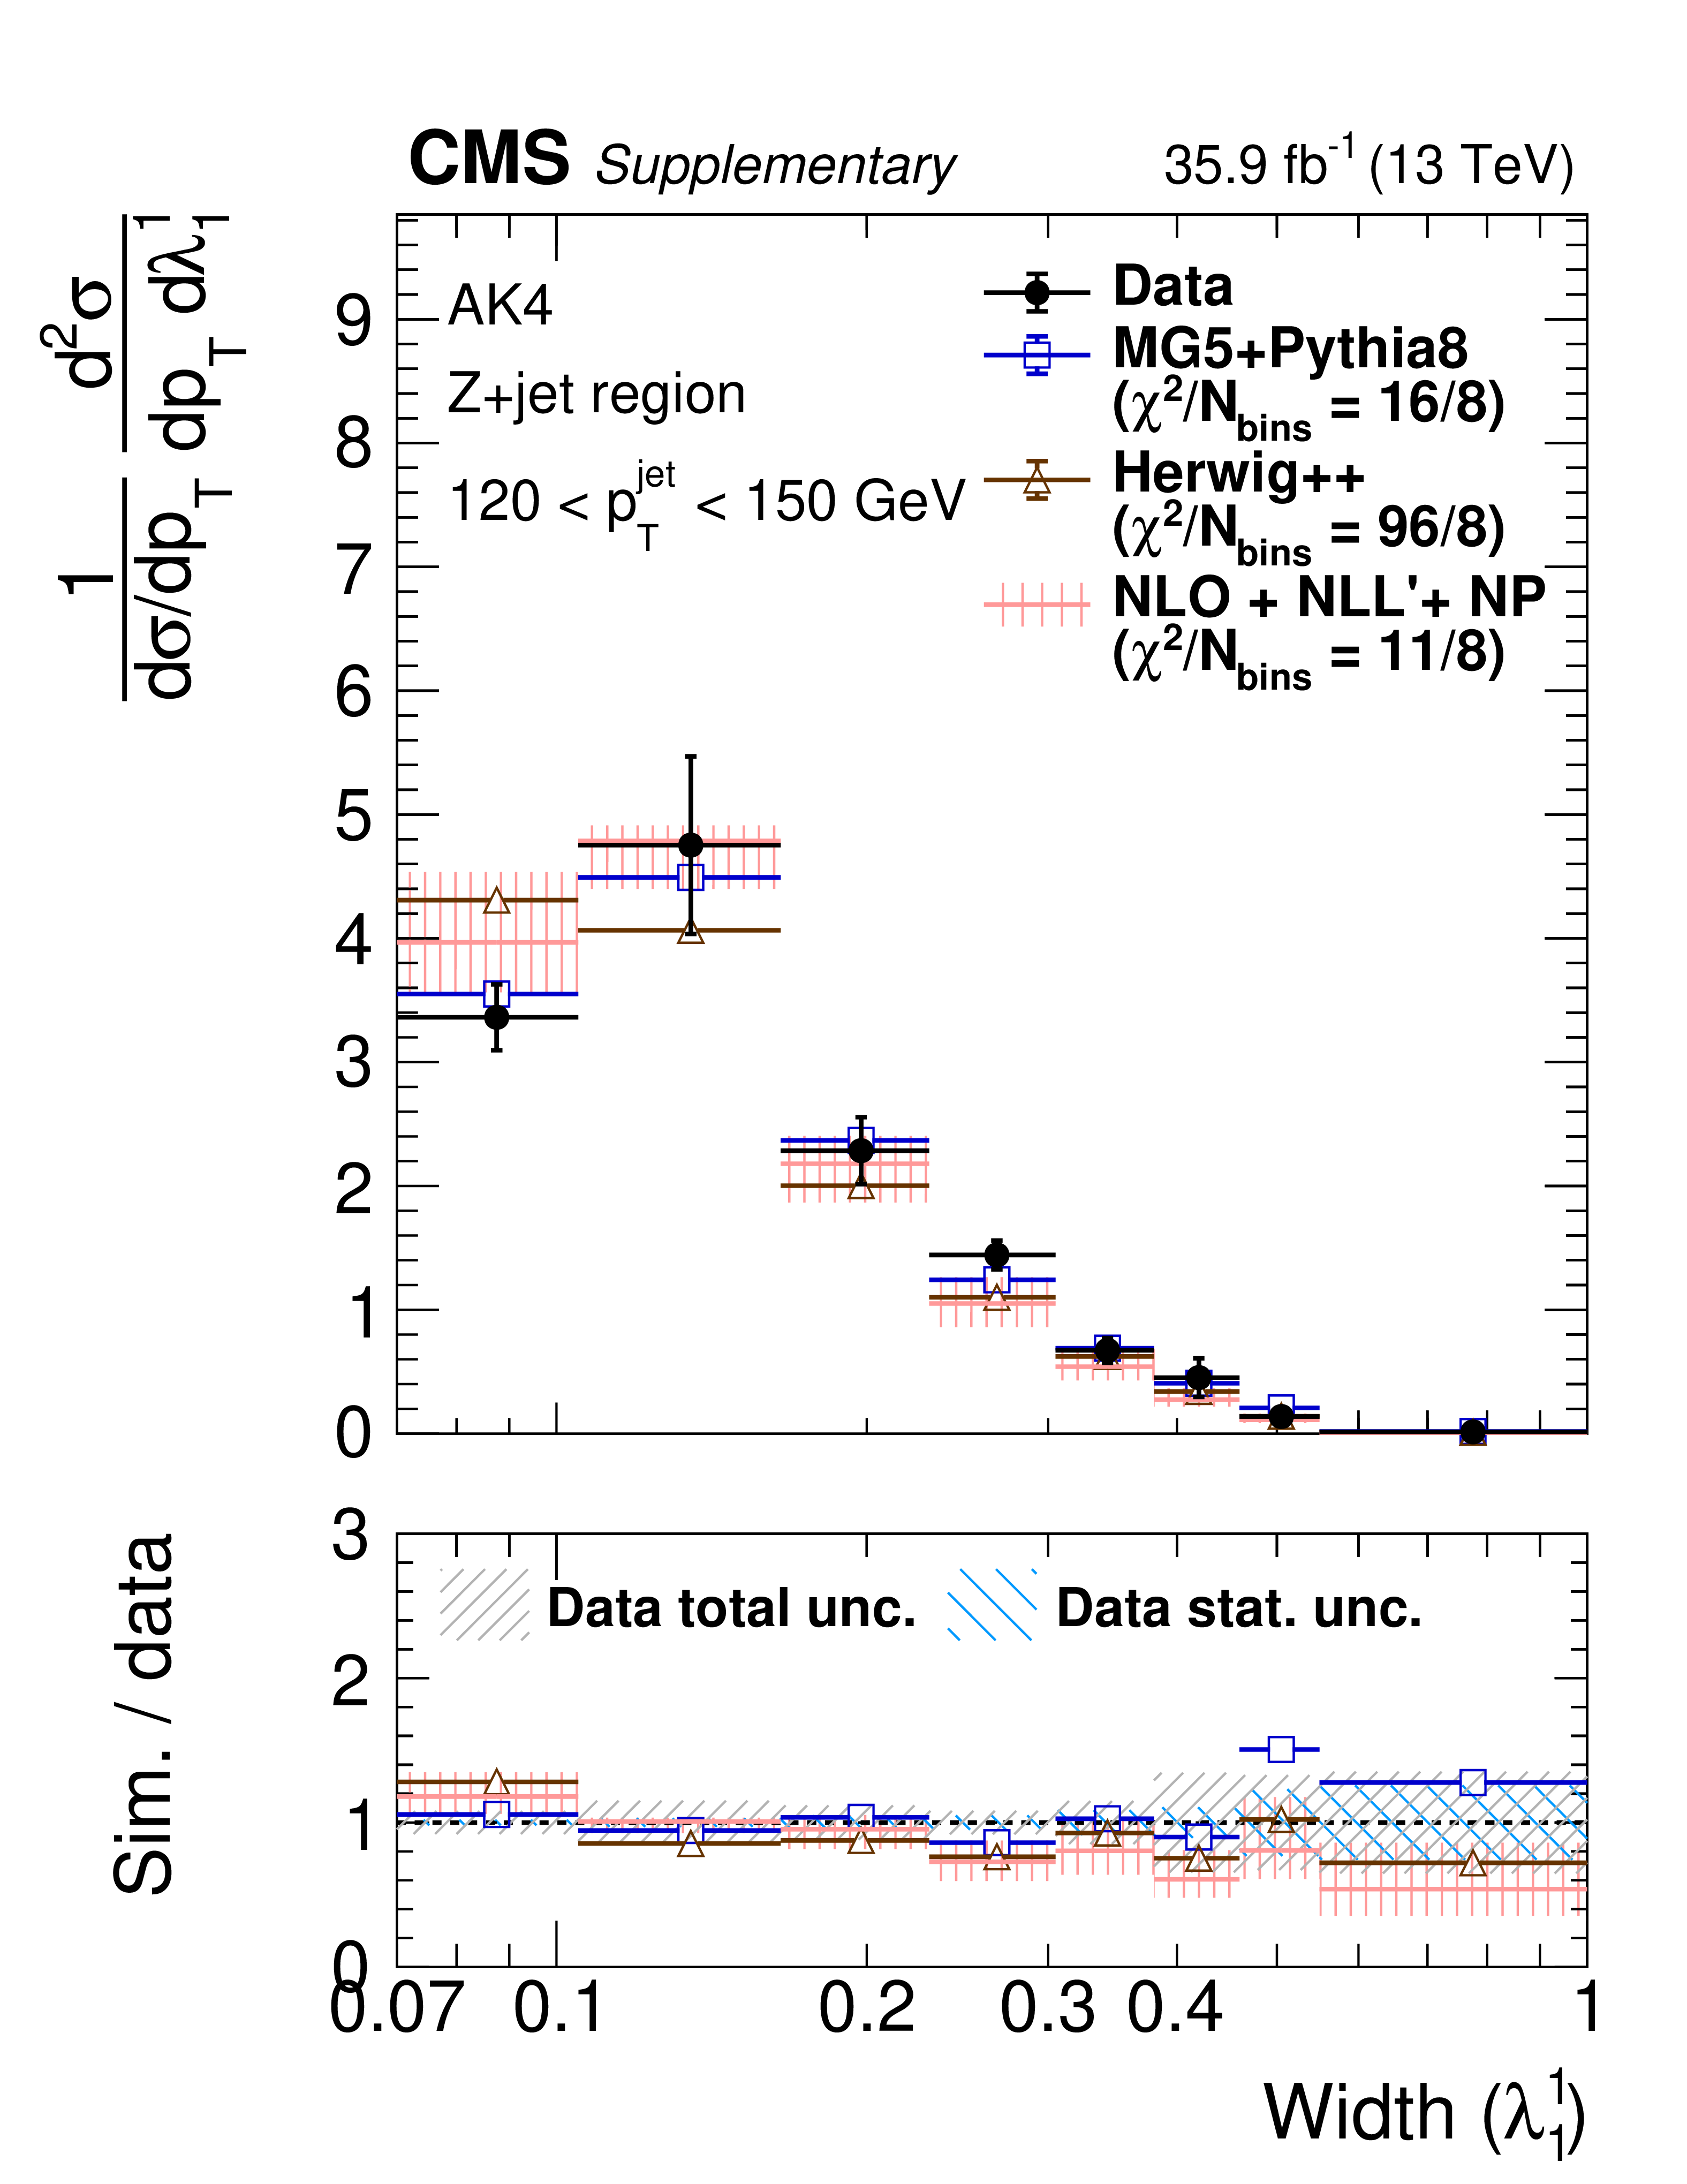
png pdf |
Additional Figure 45-a:
Particle-level distributions of ungroomed AK4 width (${\lambda ^{1}_{1}}$) in 120 $ < {p_{\mathrm {T}}} < $ 150 in the Z+jet region (left) and in 120 $ < {p_{\mathrm {T}}} < $ 150 in the central dijet region (right). The NLO+NLL'+NP predictions are taken from arXiv:2112.09545. |
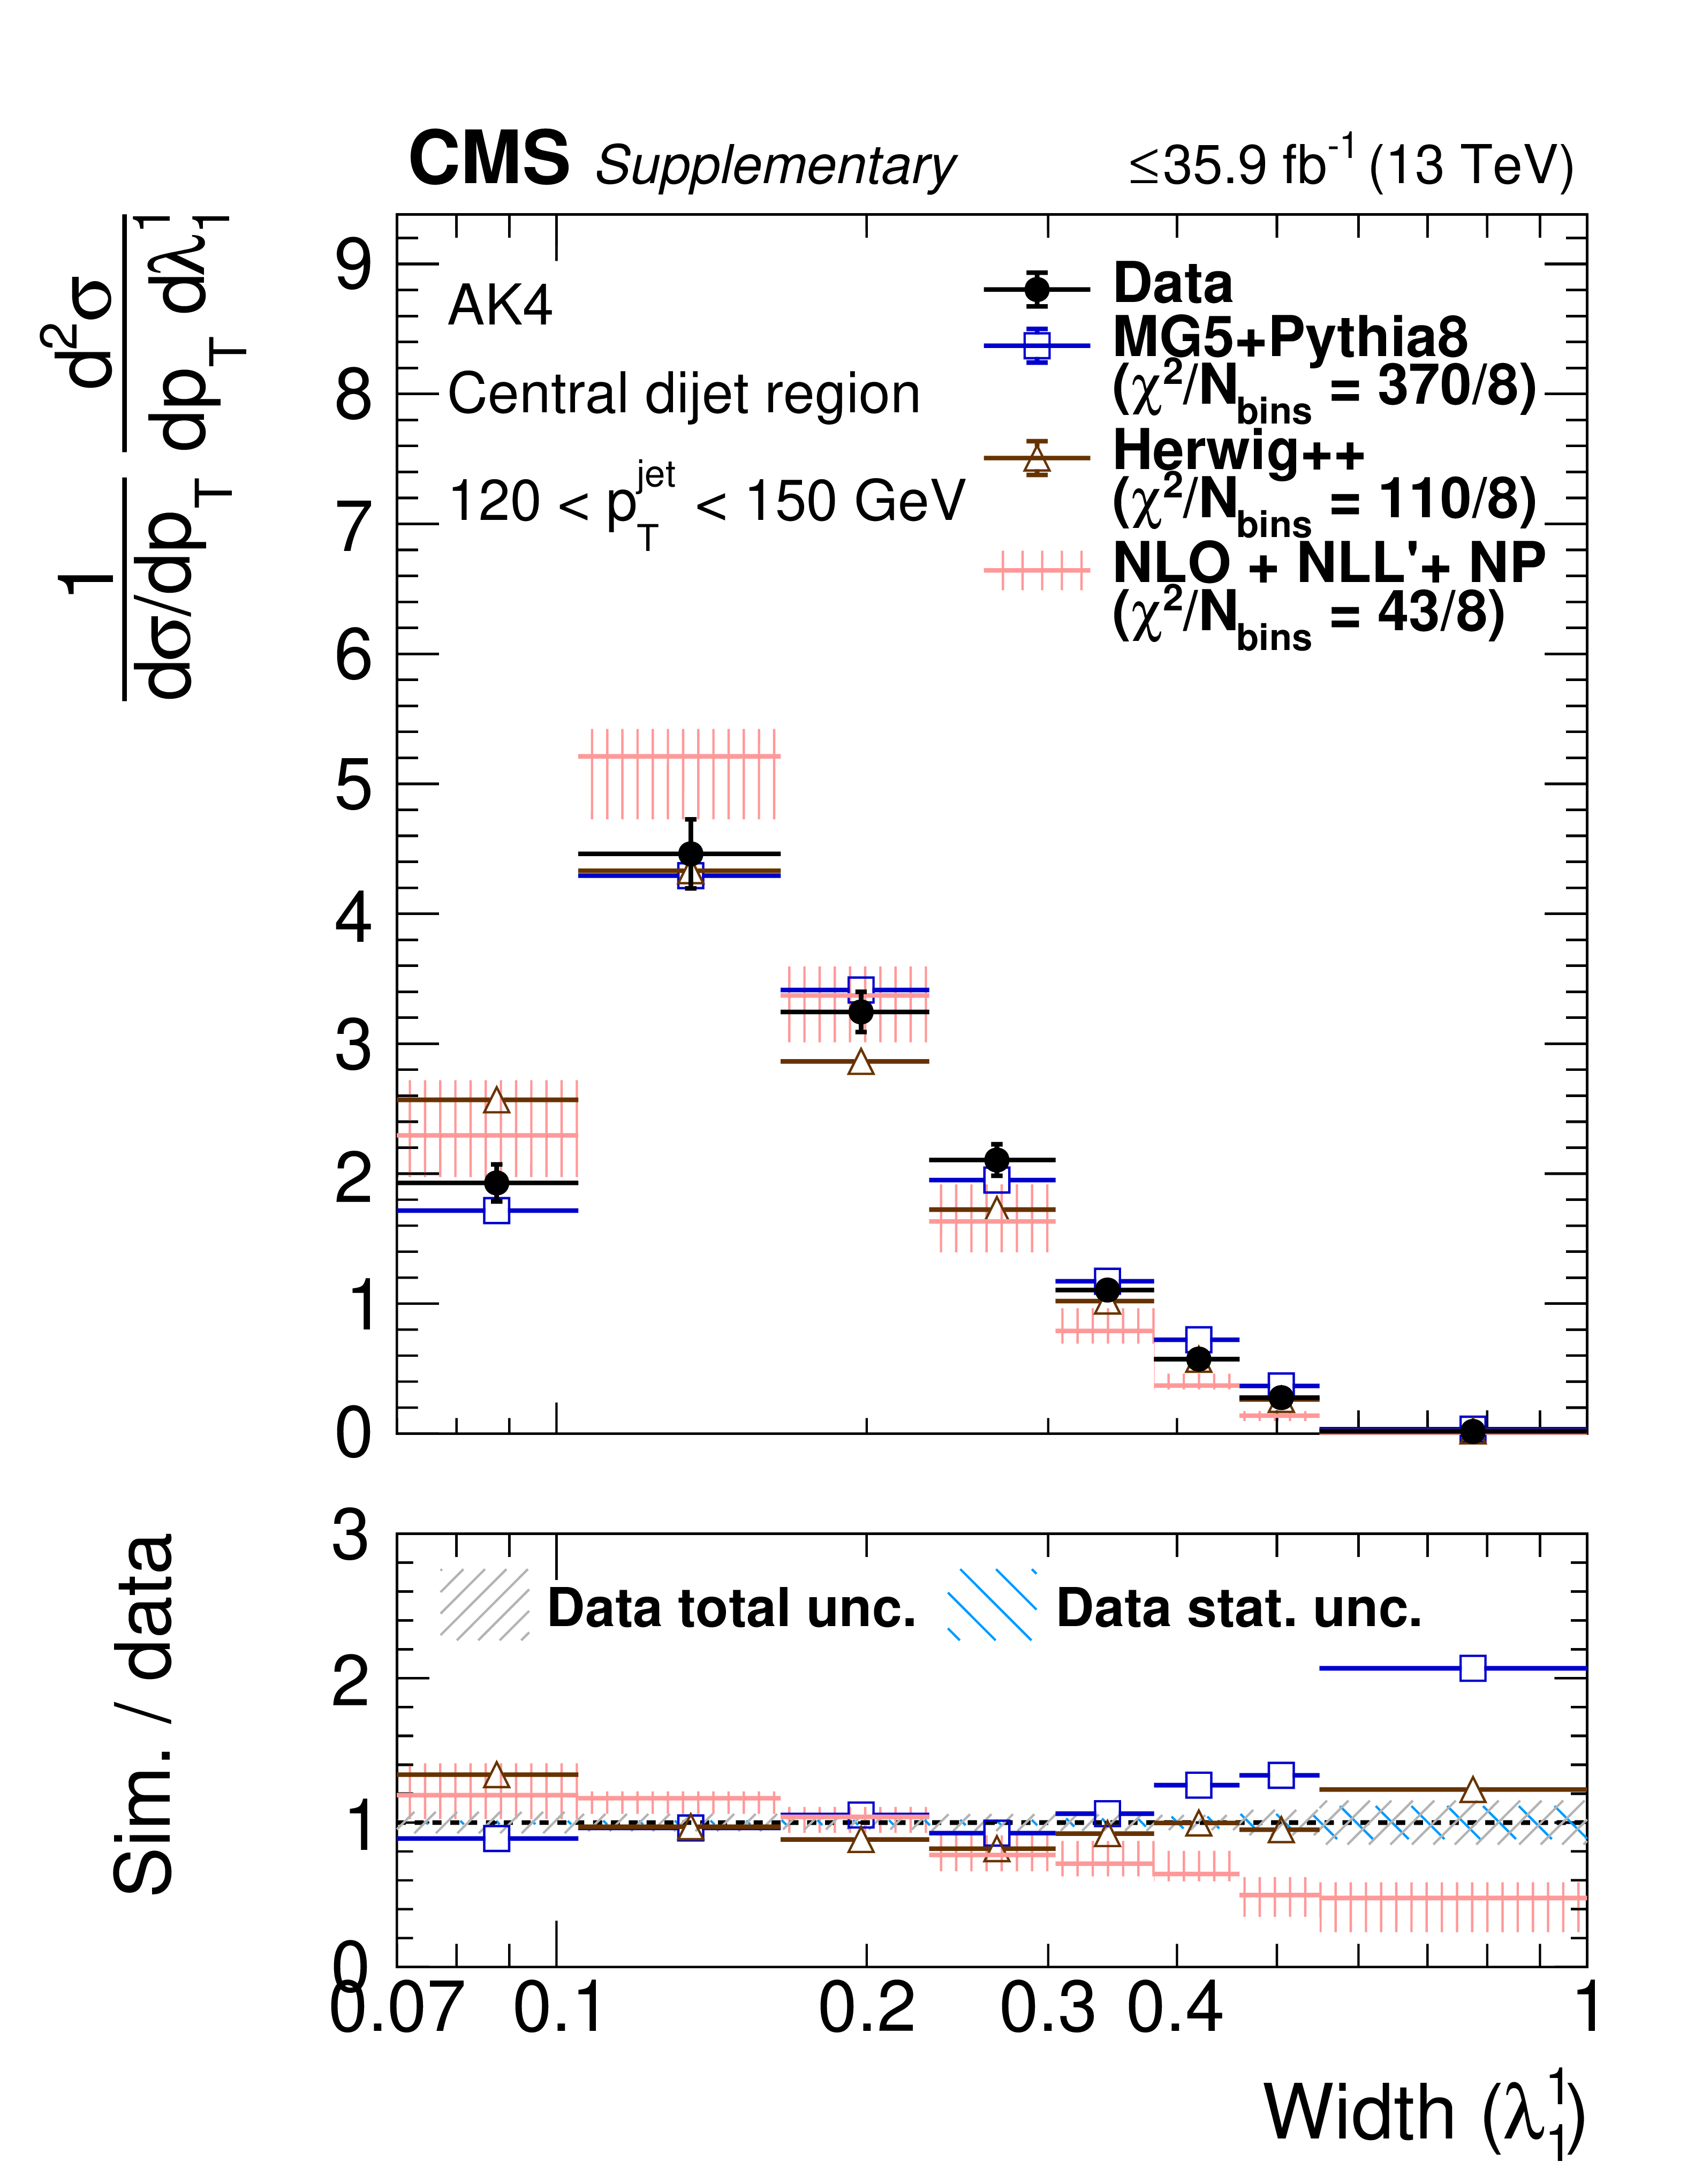
png pdf |
Additional Figure 45-b:
Particle-level distributions of ungroomed AK4 width (${\lambda ^{1}_{1}}$) in 120 $ < {p_{\mathrm {T}}} < $ 150 in the Z+jet region (left) and in 120 $ < {p_{\mathrm {T}}} < $ 150 in the central dijet region (right). The NLO+NLL'+NP predictions are taken from arXiv:2112.09545. |
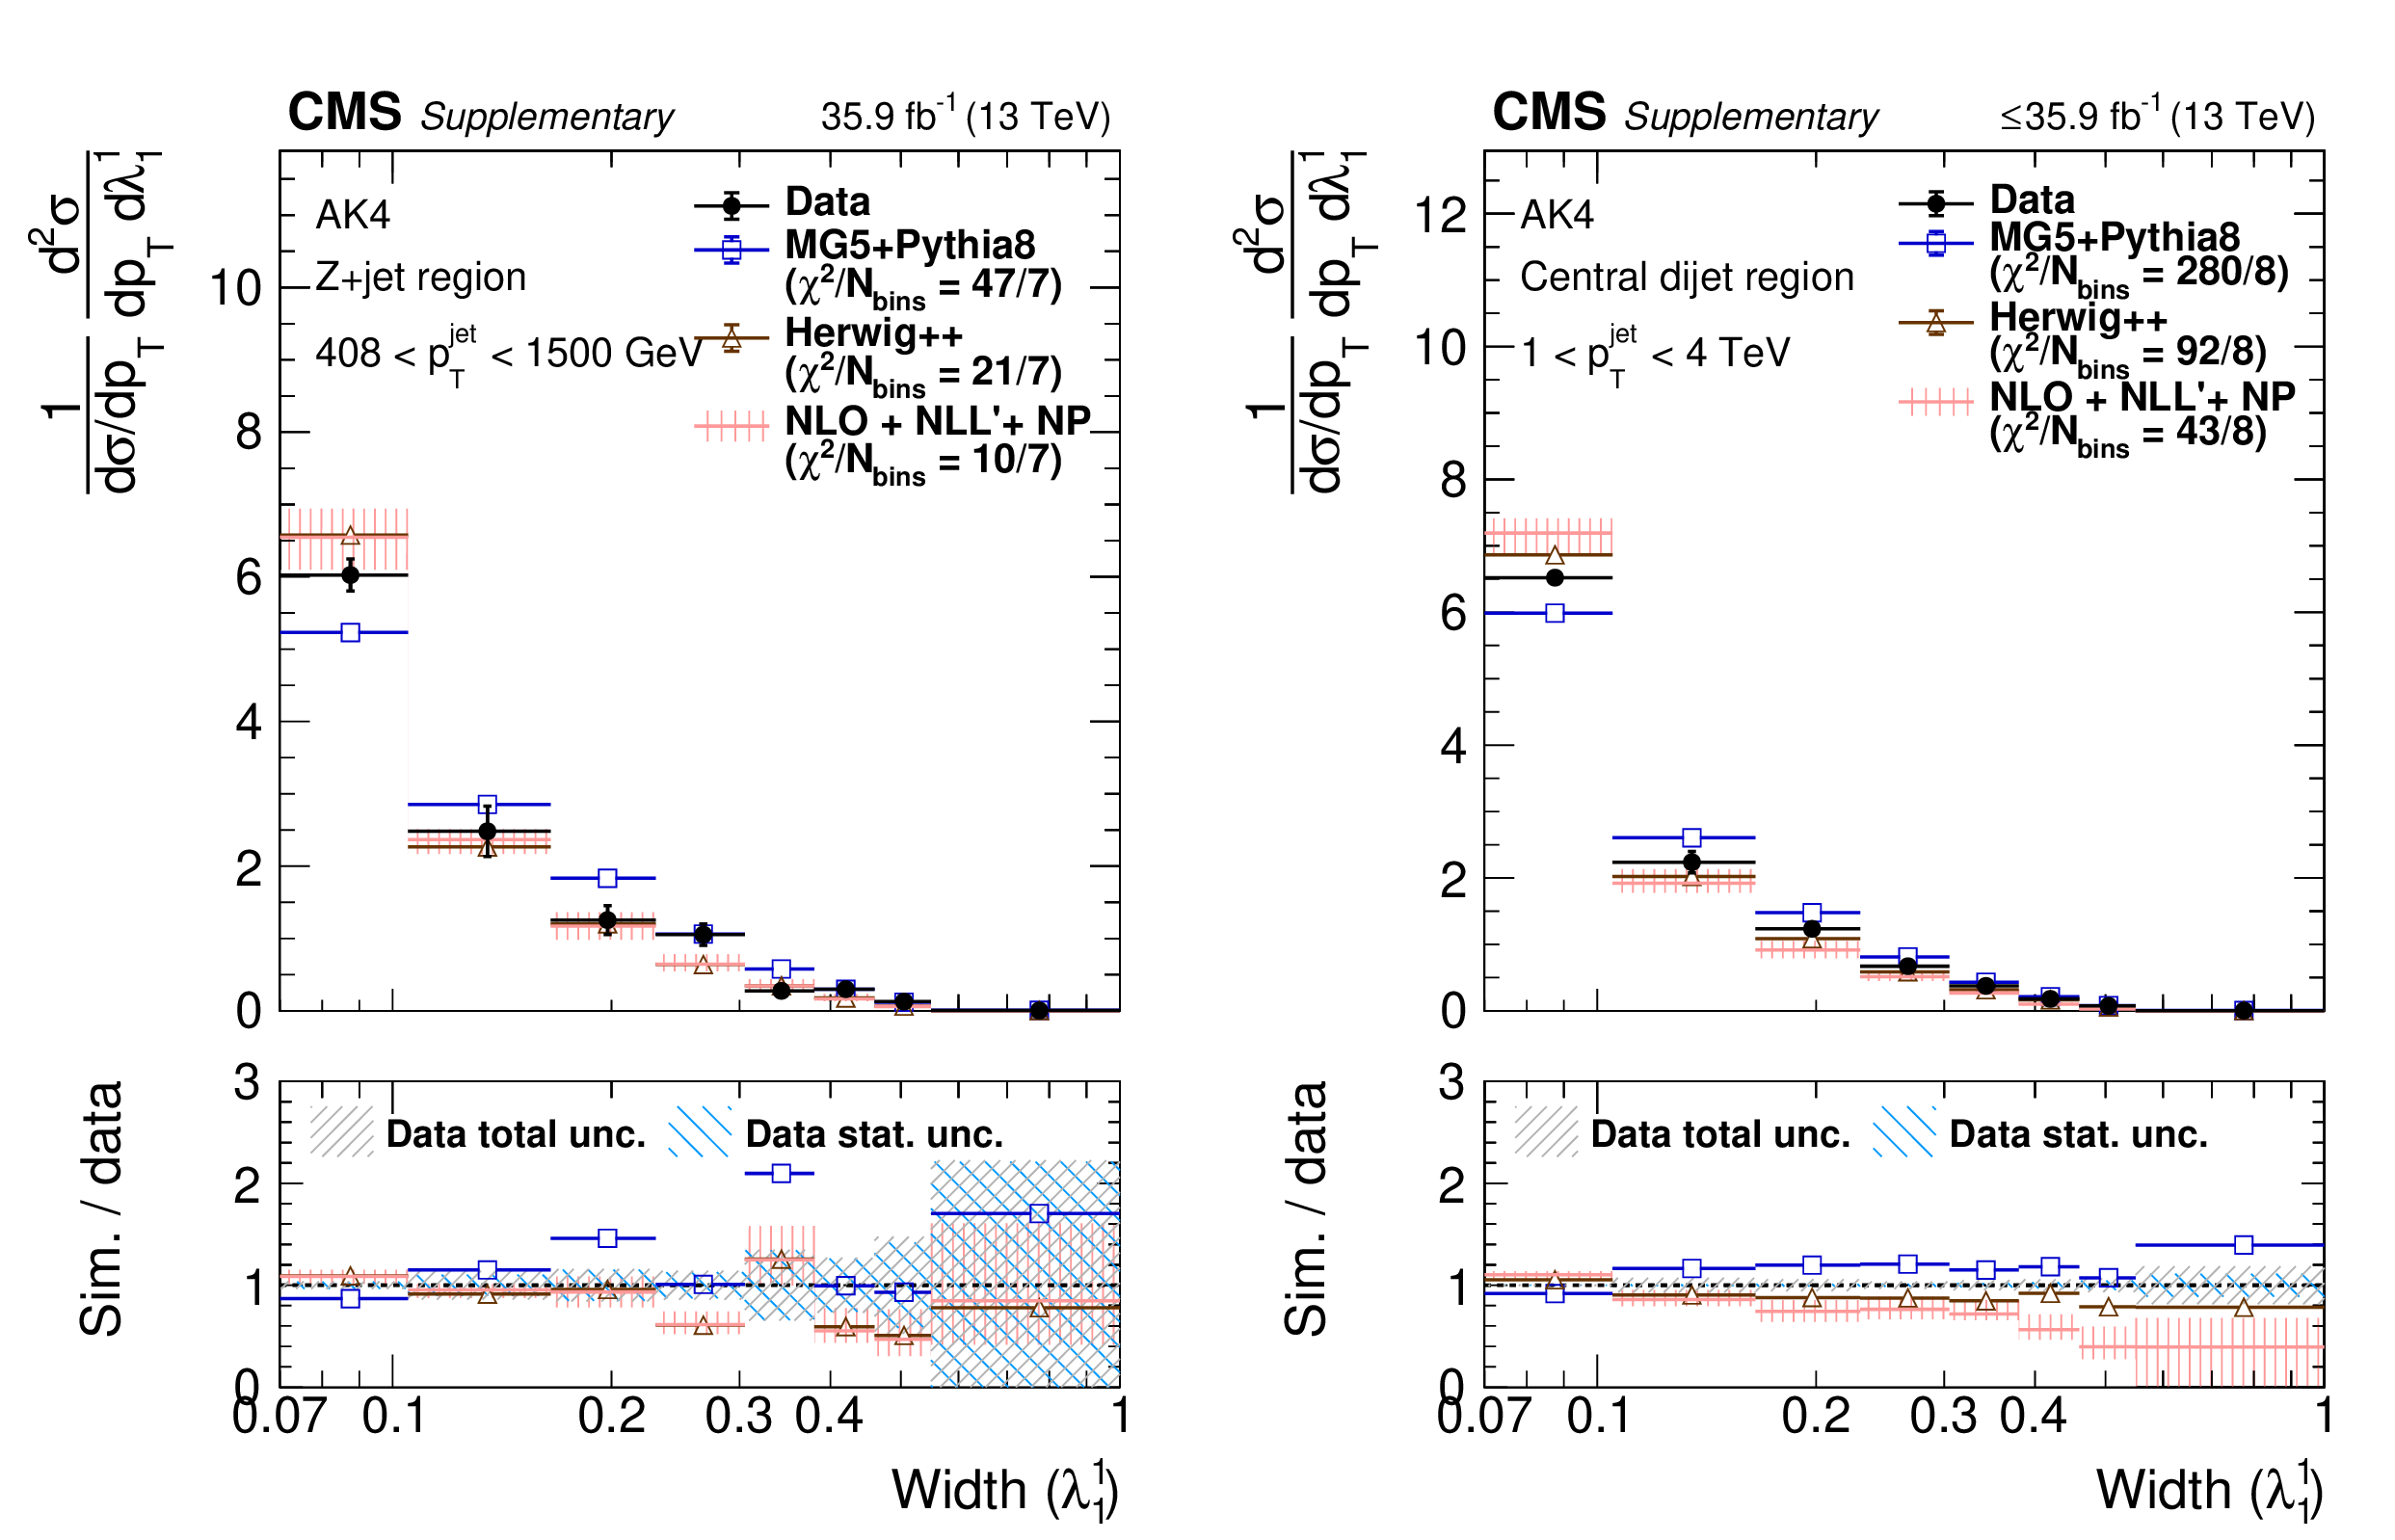
png pdf |
Additional Figure 46:
Particle-level distributions of ungroomed AK4 width (${\lambda ^{1}_{1}}$) in 408 $ < {p_{\mathrm {T}}} < $ 4000 GeV in the Z+jet region (left) and in 1000 $ < {p_{\mathrm {T}}} < $ 4000 GeV in the central dijet region (right). The NLO+NLL'+NP predictions are taken from arXiv:2112.09545. |

png pdf |
Additional Figure 46-a:
Particle-level distributions of ungroomed AK4 width (${\lambda ^{1}_{1}}$) in 408 $ < {p_{\mathrm {T}}} < $ 4000 GeV in the Z+jet region (left) and in 1000 $ < {p_{\mathrm {T}}} < $ 4000 GeV in the central dijet region (right). The NLO+NLL'+NP predictions are taken from arXiv:2112.09545. |
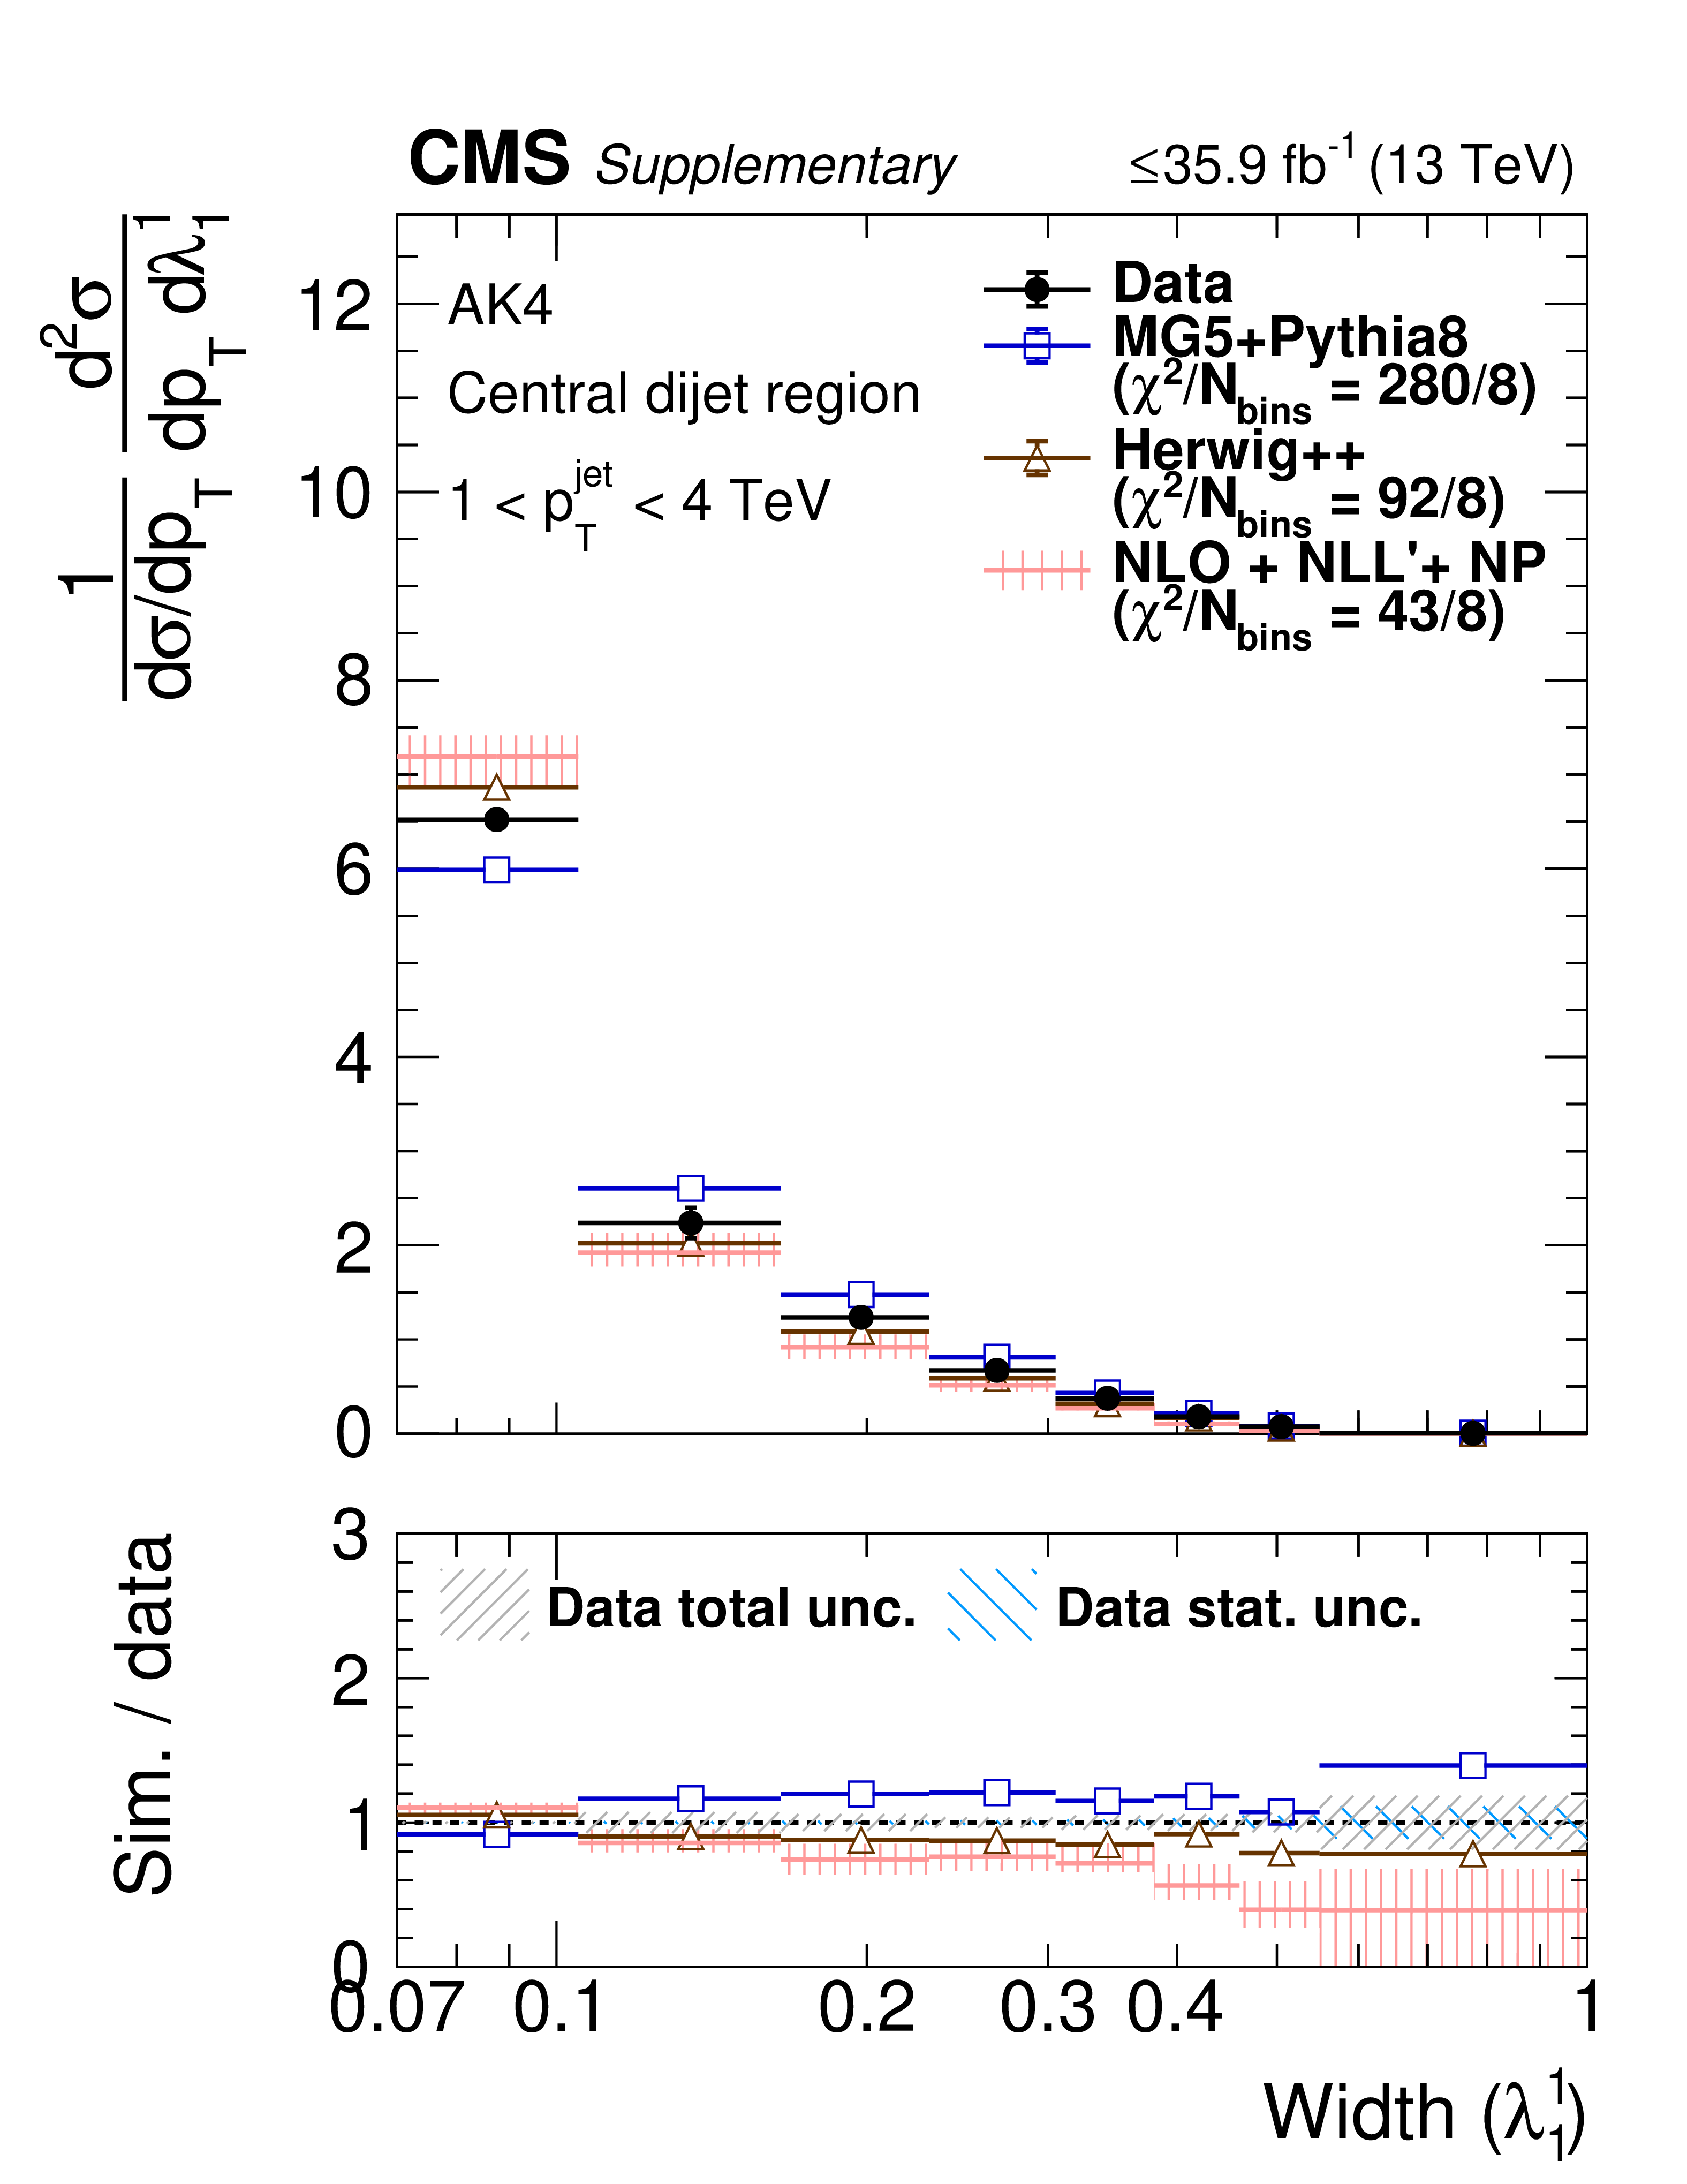
png pdf |
Additional Figure 46-b:
Particle-level distributions of ungroomed AK4 width (${\lambda ^{1}_{1}}$) in 408 $ < {p_{\mathrm {T}}} < $ 4000 GeV in the Z+jet region (left) and in 1000 $ < {p_{\mathrm {T}}} < $ 4000 GeV in the central dijet region (right). The NLO+NLL'+NP predictions are taken from arXiv:2112.09545. |

png pdf |
Additional Figure 47:
Particle-level distributions of ungroomed AK8 width (${\lambda ^{1}_{1}}$) in AK8 120 $ < {p_{\mathrm {T}}} < $ 150 GeV in the Z+jet region (left) and central dijet region (right). The NLO+NLL'+NP predictions are taken from arXiv:2112.09545. |
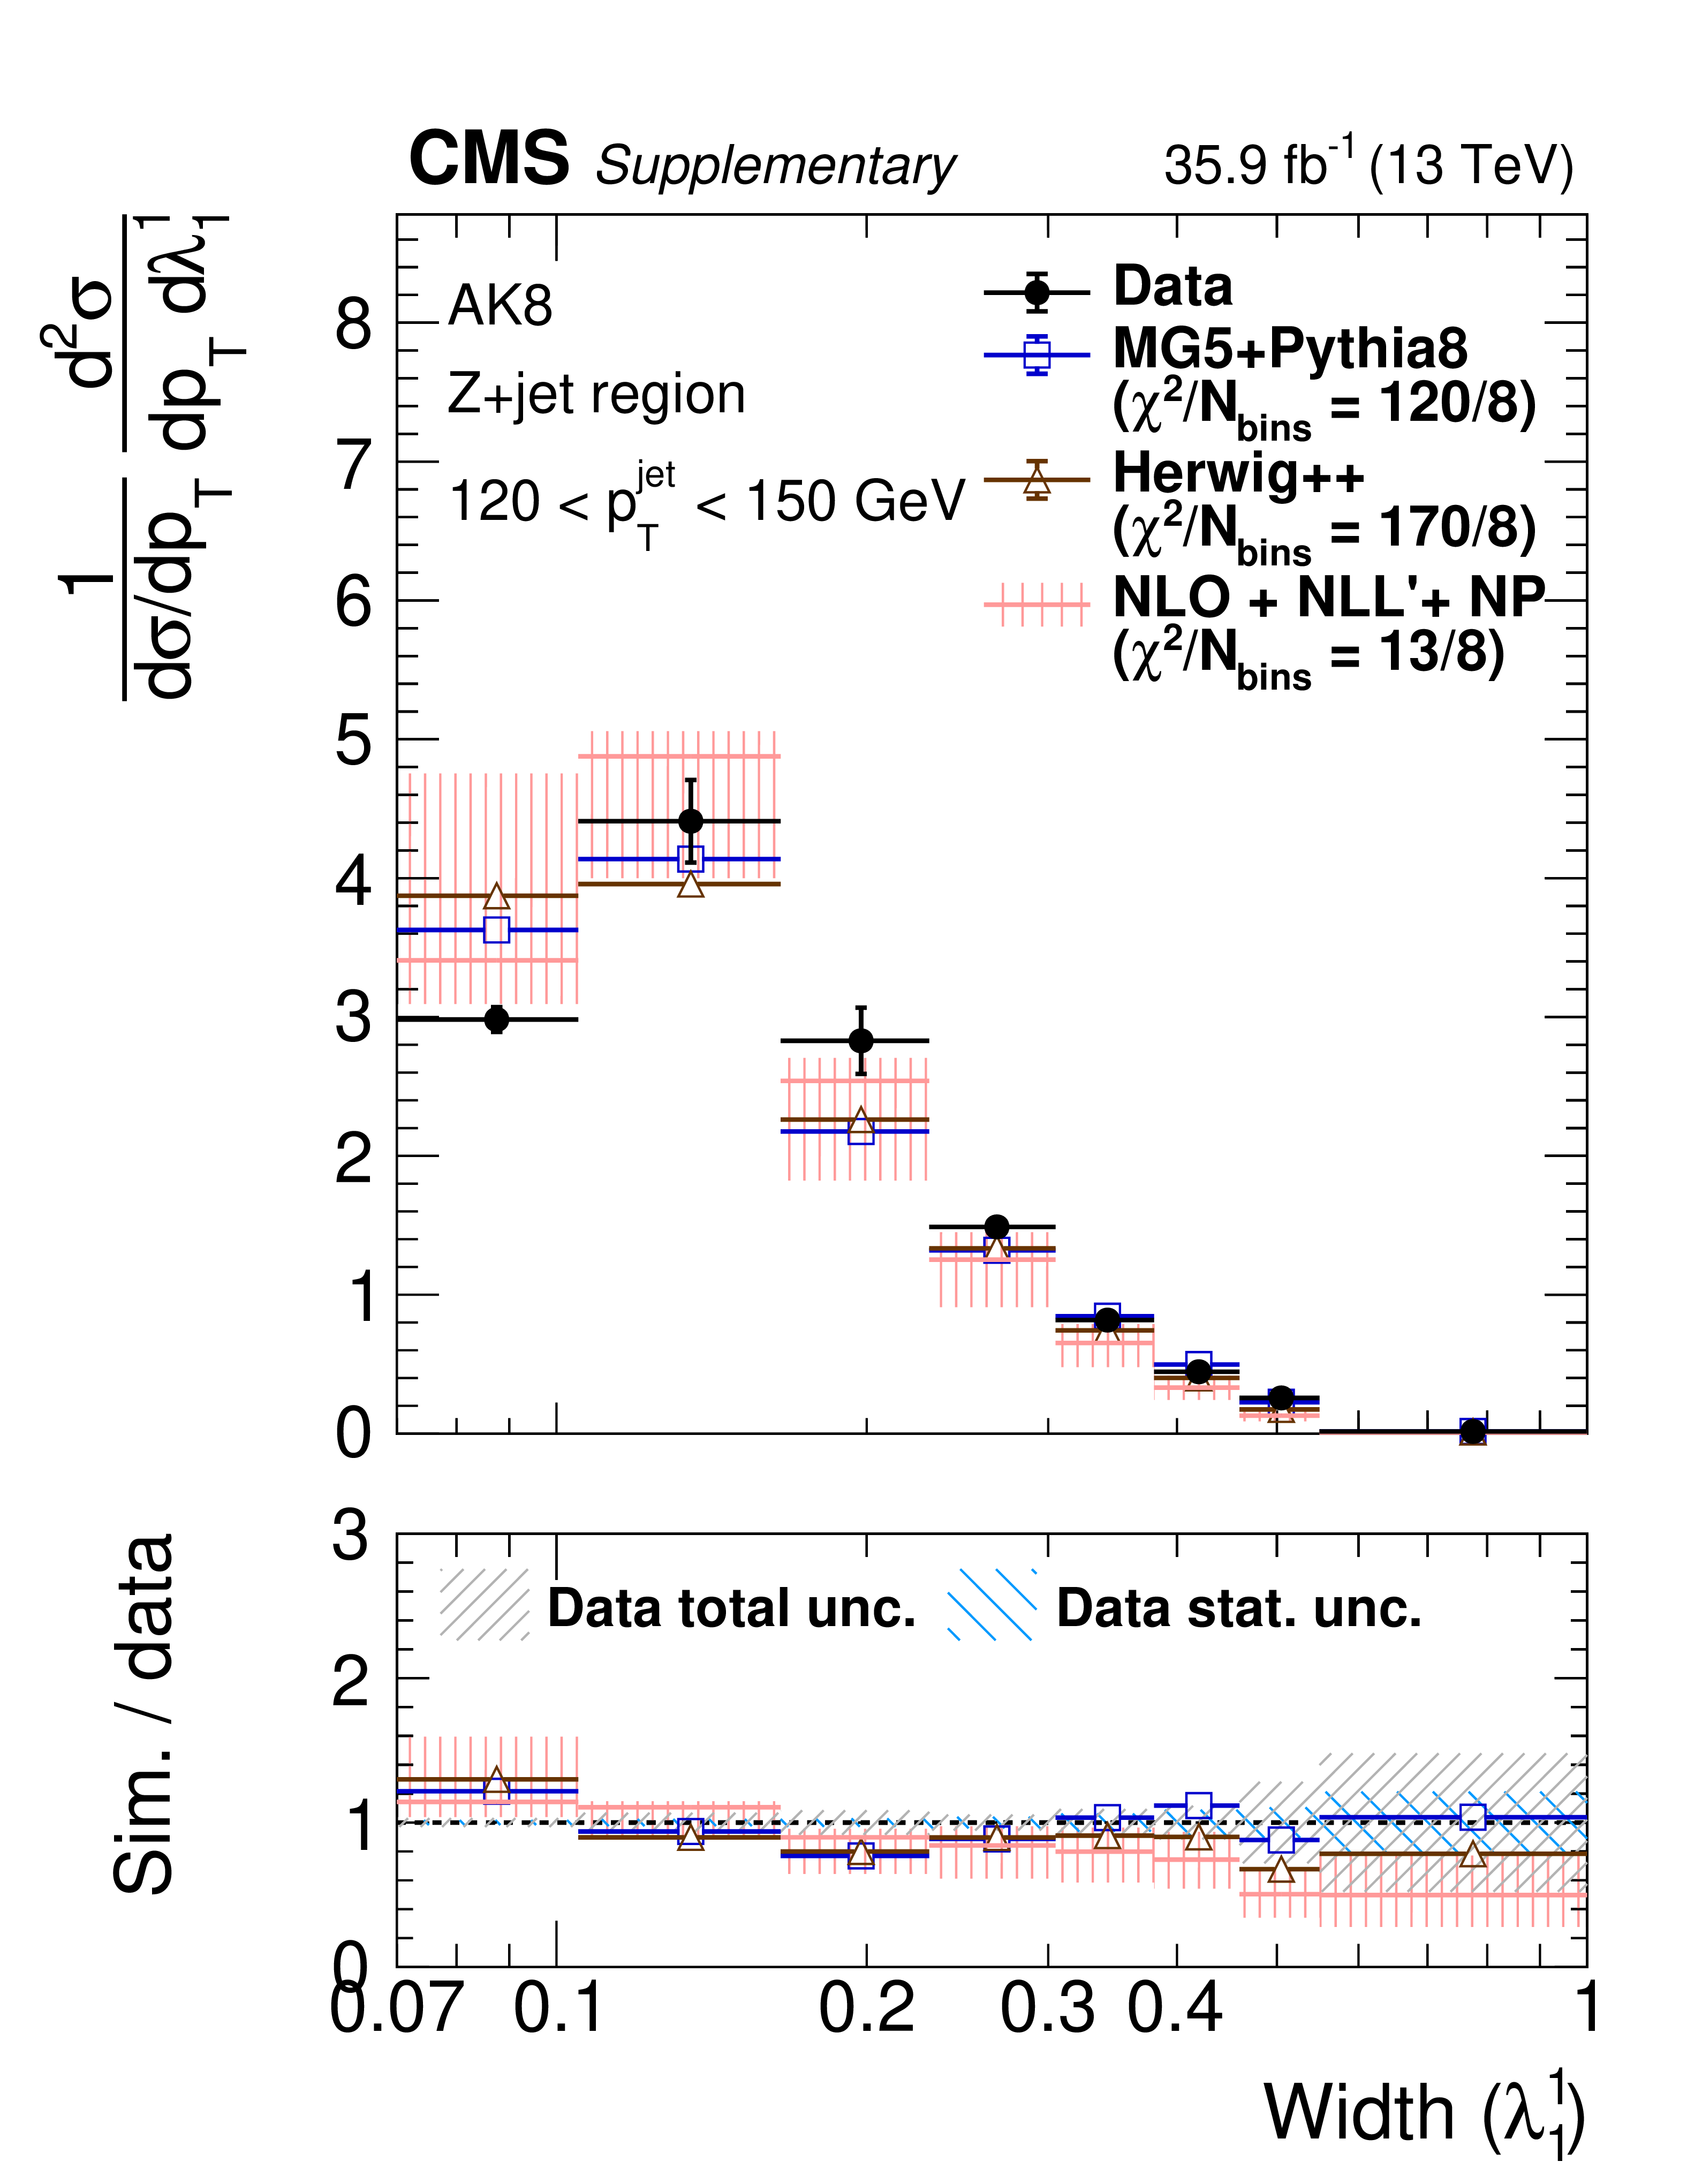
png pdf |
Additional Figure 47-a:
Particle-level distributions of ungroomed AK8 width (${\lambda ^{1}_{1}}$) in AK8 120 $ < {p_{\mathrm {T}}} < $ 150 GeV in the Z+jet region (left) and central dijet region (right). The NLO+NLL'+NP predictions are taken from arXiv:2112.09545. |
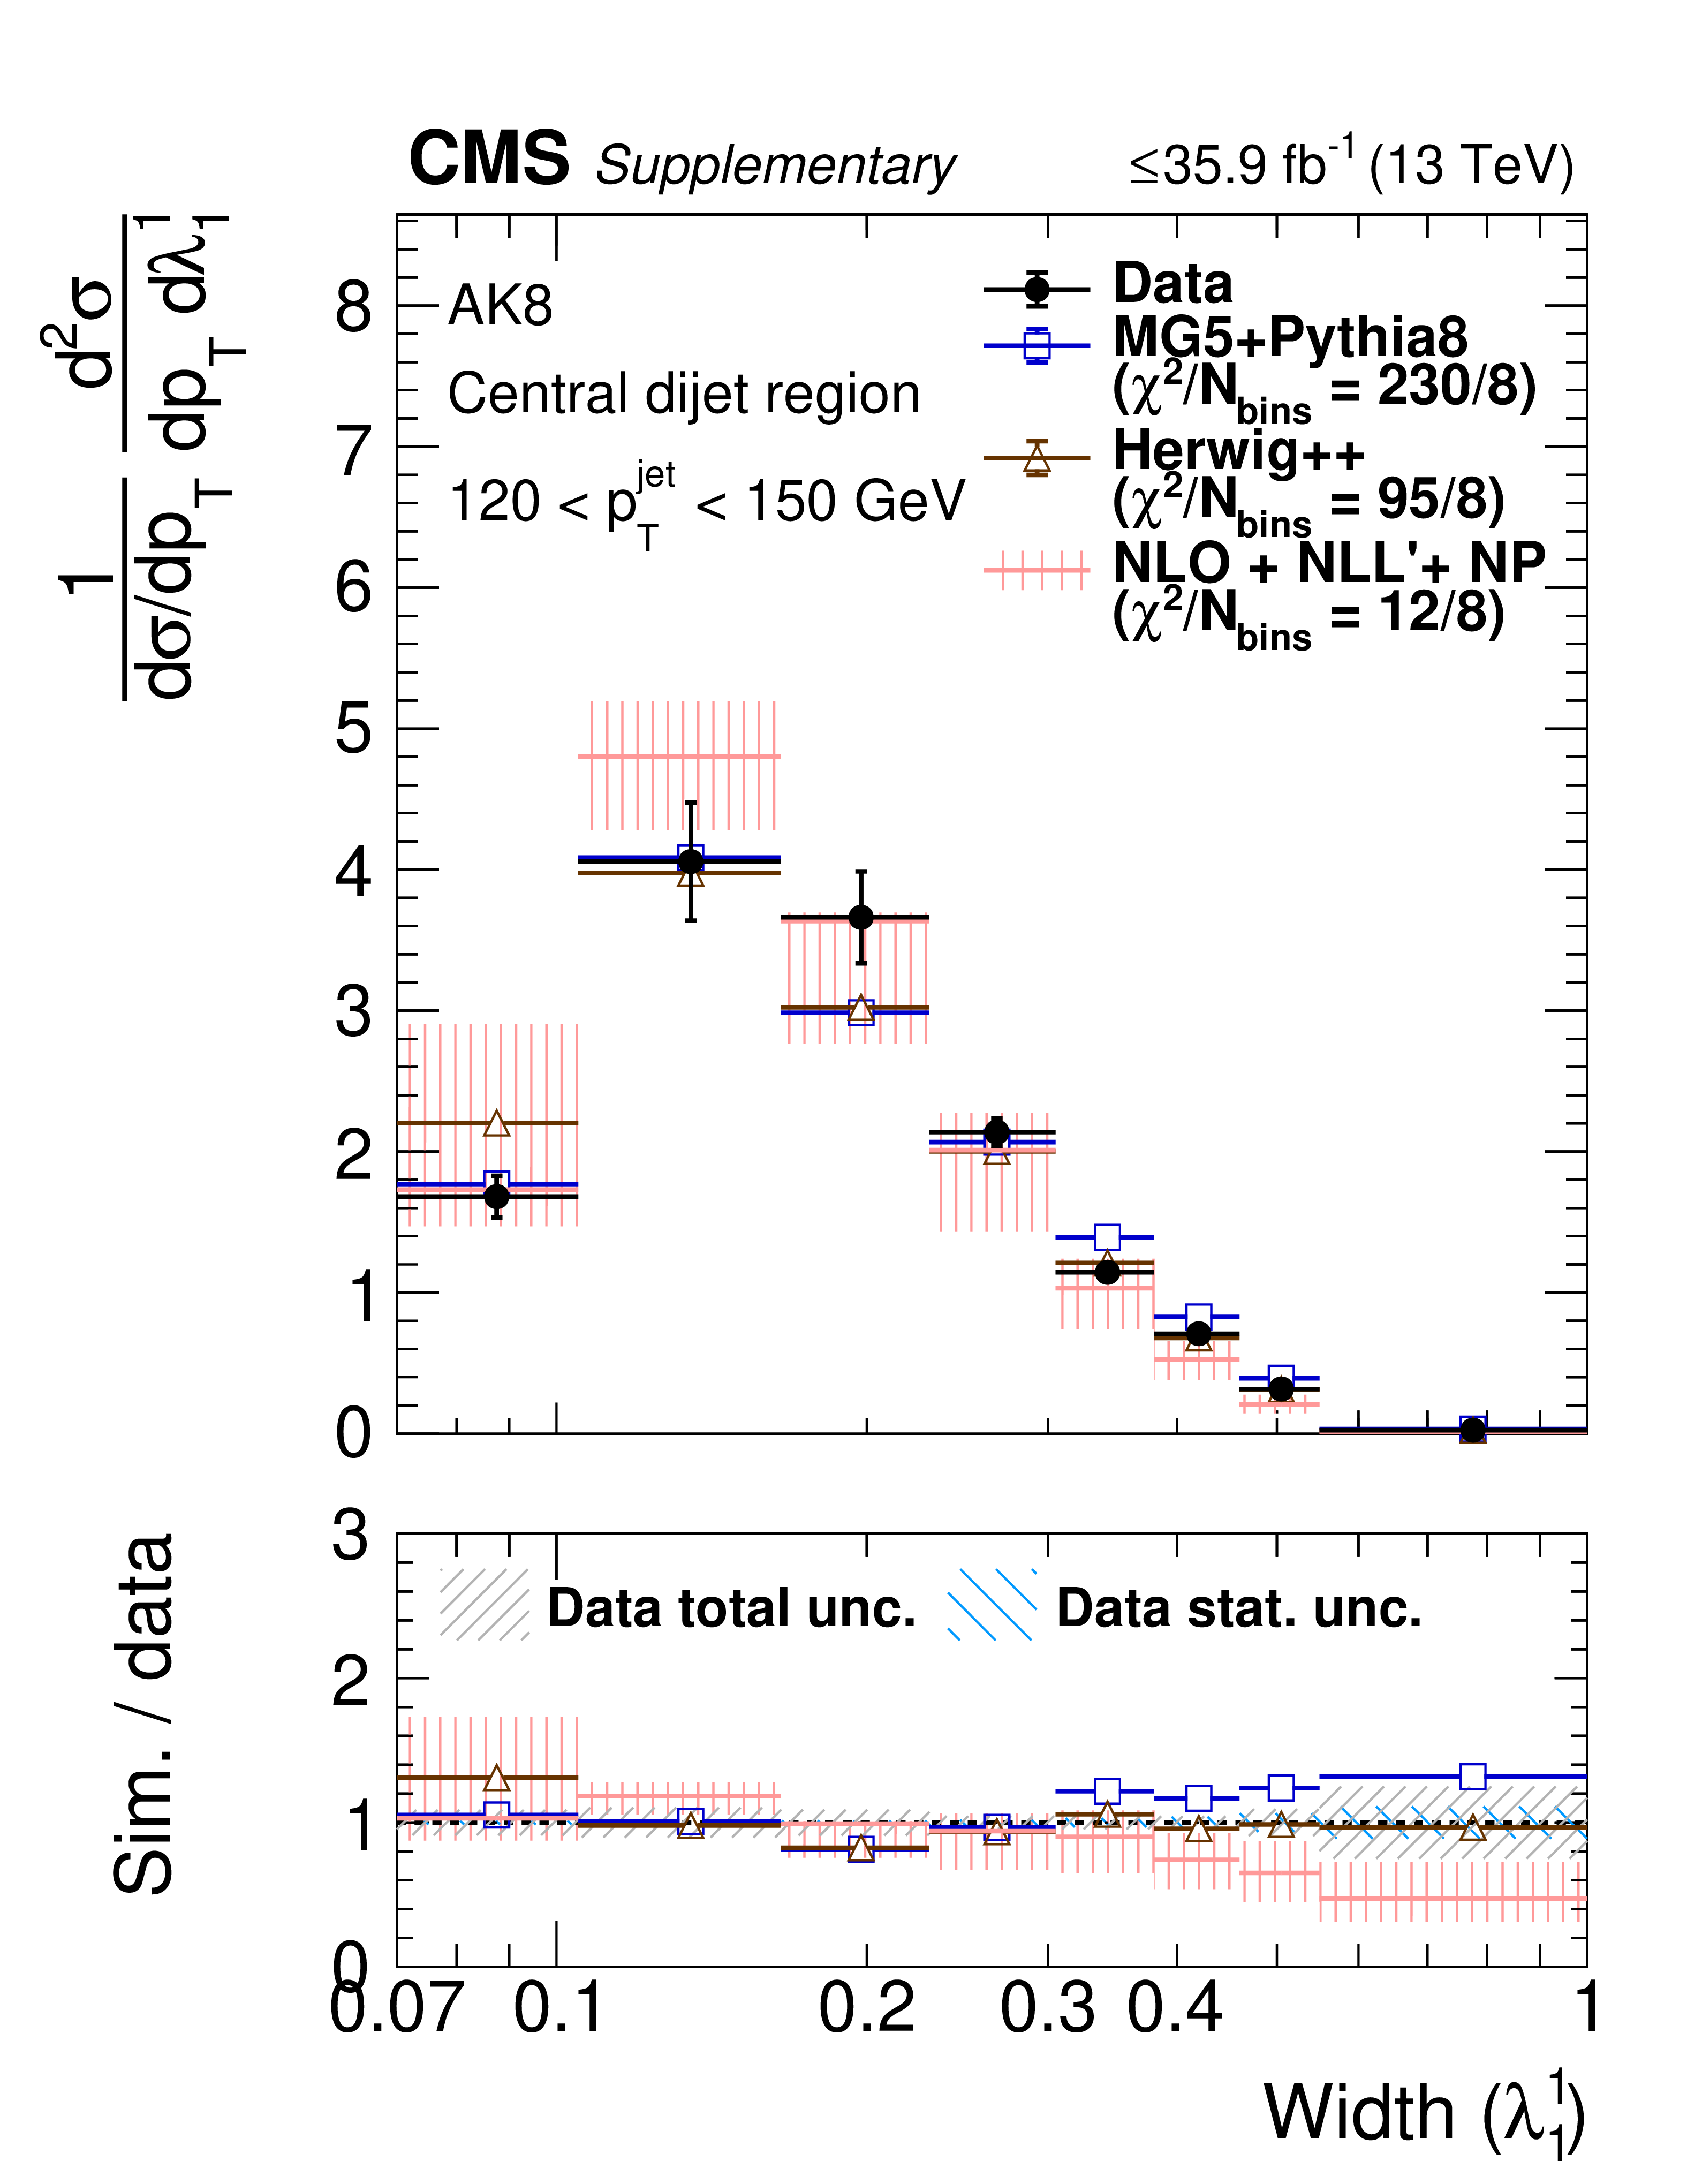
png pdf |
Additional Figure 47-b:
Particle-level distributions of ungroomed AK8 width (${\lambda ^{1}_{1}}$) in AK8 120 $ < {p_{\mathrm {T}}} < $ 150 GeV in the Z+jet region (left) and central dijet region (right). The NLO+NLL'+NP predictions are taken from arXiv:2112.09545. |

png pdf |
Additional Figure 48:
Particle-level distributions of ungroomed charged-only AK4 width (${\lambda ^{1}_{1}}$) 120 $ < {p_{\mathrm {T}}} < $ 150 GeV in the Z+jet region (left) and central dijet region (right). The NLO+NLL'+NP predictions are taken from arXiv:2112.09545. |

png pdf |
Additional Figure 48-a:
Particle-level distributions of ungroomed charged-only AK4 width (${\lambda ^{1}_{1}}$) 120 $ < {p_{\mathrm {T}}} < $ 150 GeV in the Z+jet region (left) and central dijet region (right). The NLO+NLL'+NP predictions are taken from arXiv:2112.09545. |
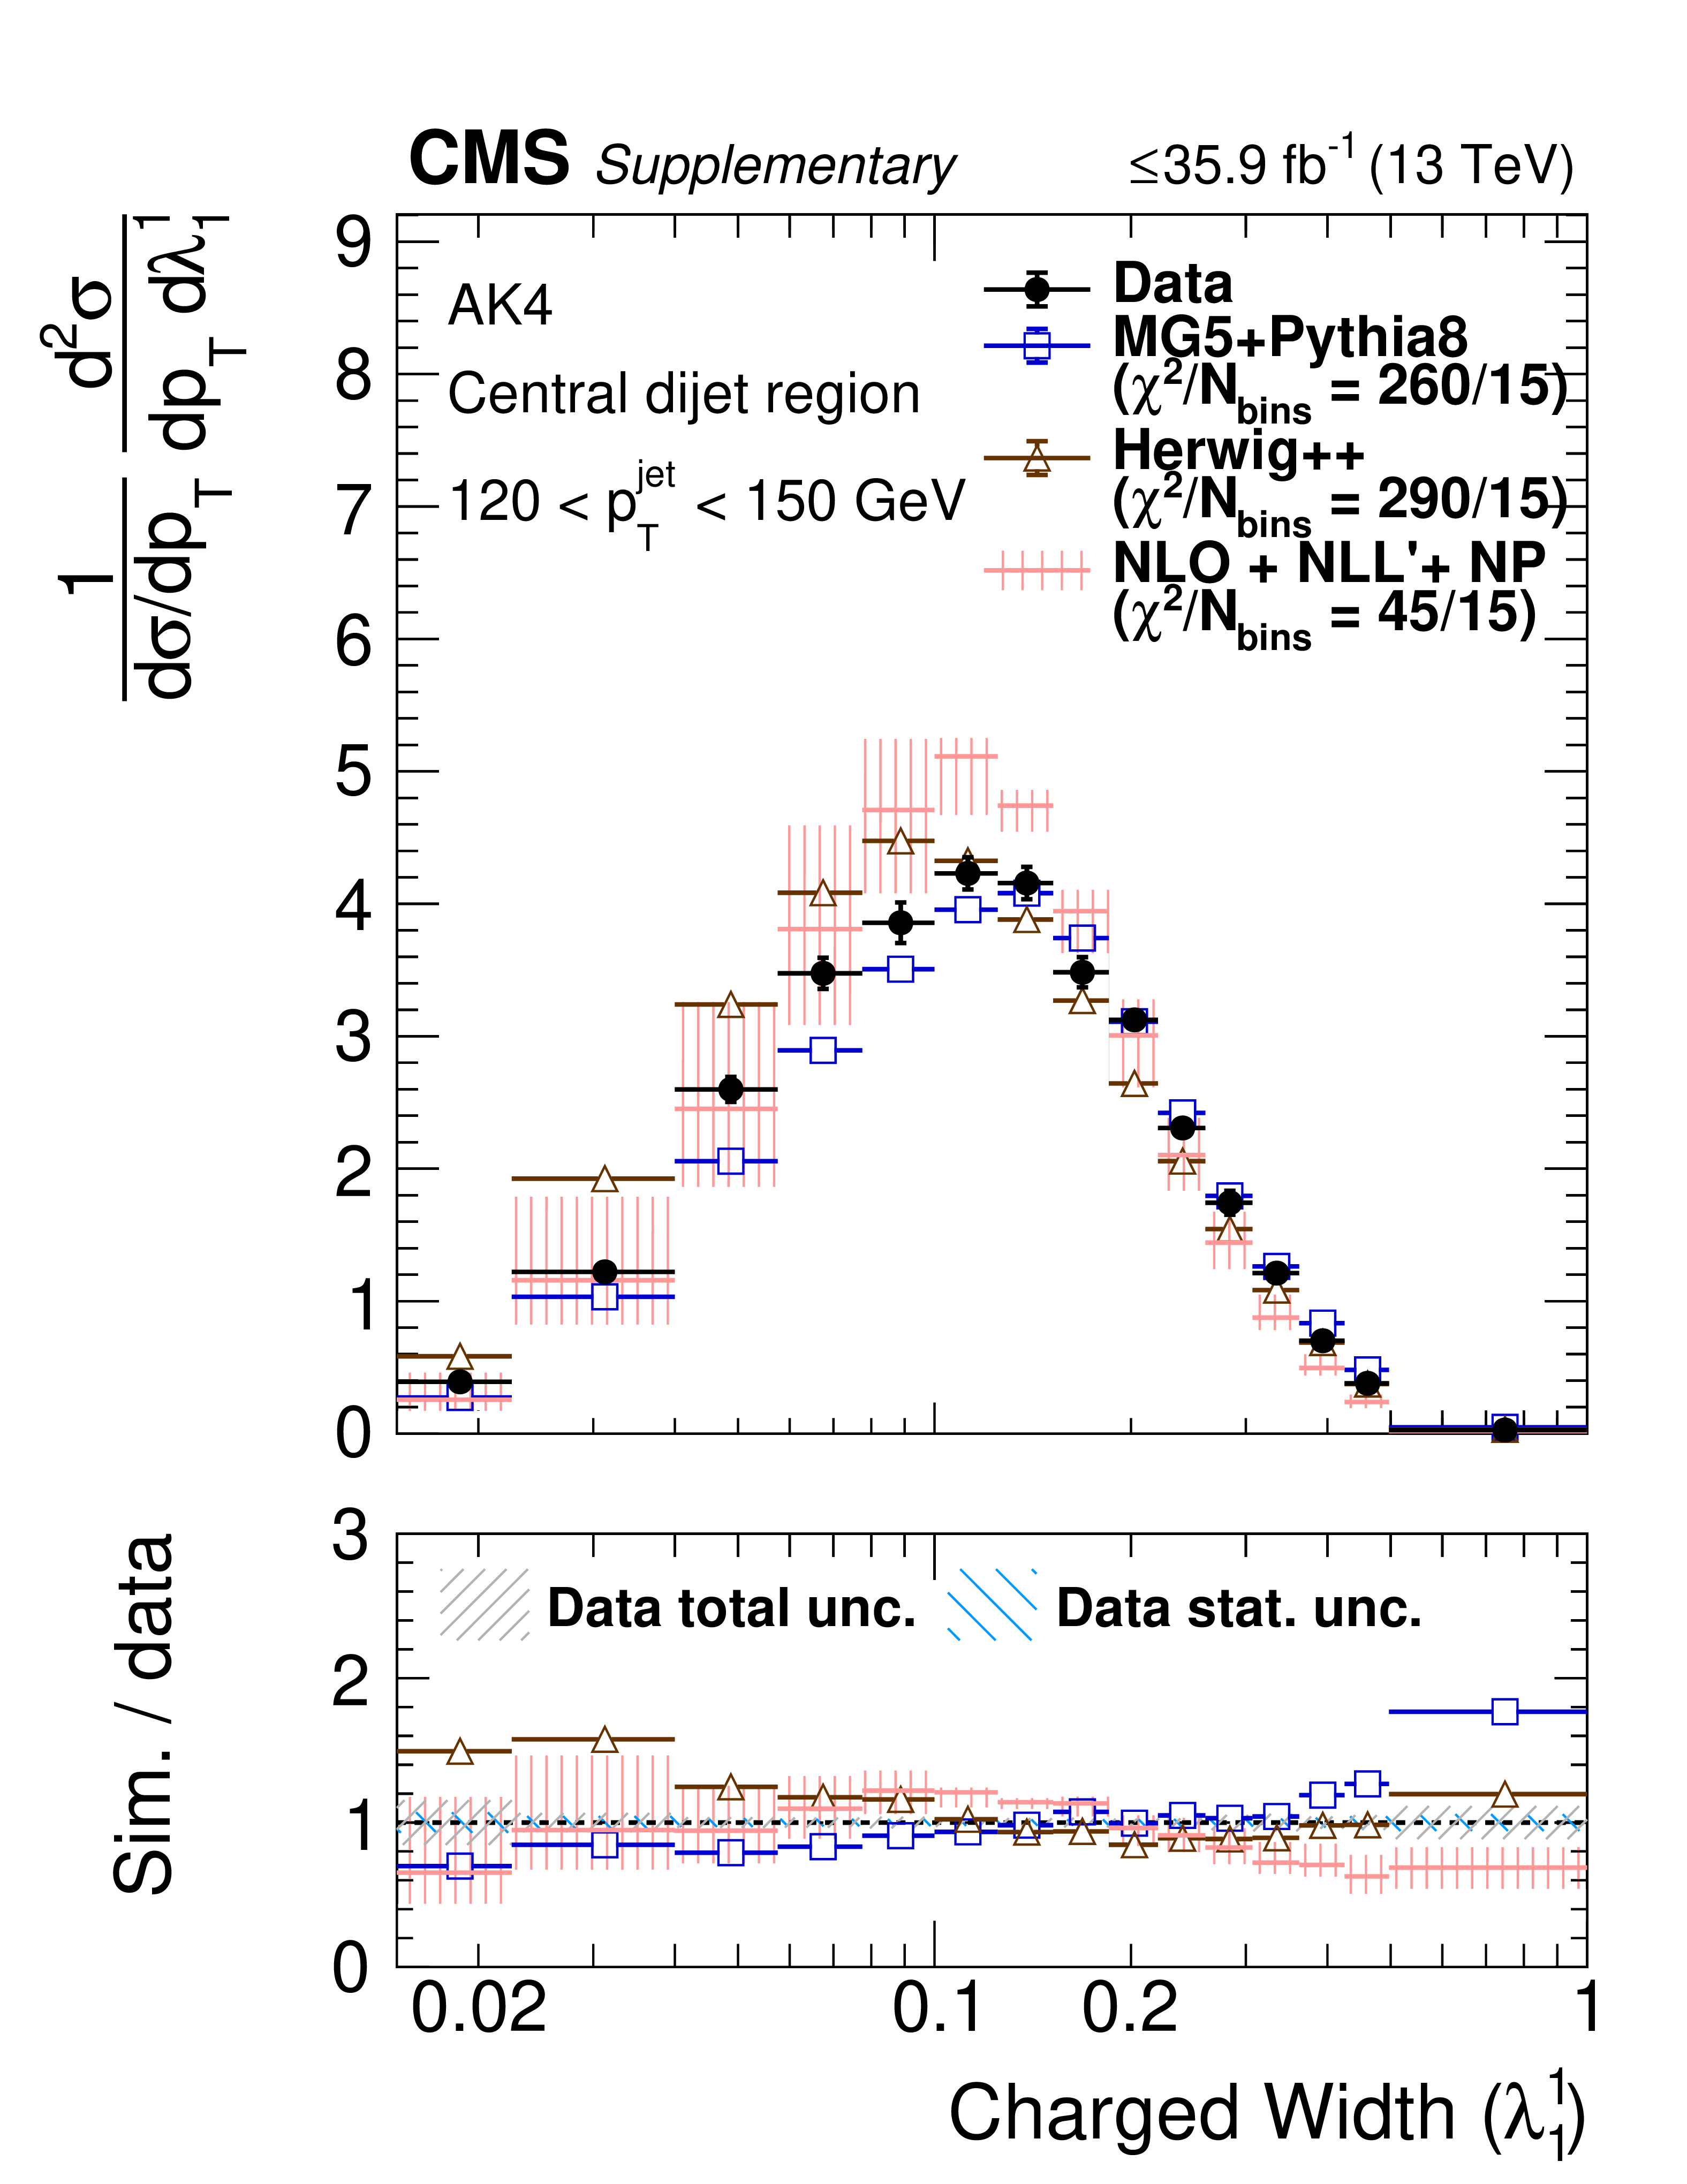
png pdf |
Additional Figure 48-b:
Particle-level distributions of ungroomed charged-only AK4 width (${\lambda ^{1}_{1}}$) 120 $ < {p_{\mathrm {T}}} < $ 150 GeV in the Z+jet region (left) and central dijet region (right). The NLO+NLL'+NP predictions are taken from arXiv:2112.09545. |

png pdf |
Additional Figure 49:
Particle-level distributions of groomed AK4 width (${\lambda ^{1}_{1}}$) 120 $ < {p_{\mathrm {T}}} < $ 150 GeV in the Z+jet region (left) and central dijet region (right). The NLO+NLL'+NP predictions are taken from arXiv:2112.09545. |

png pdf |
Additional Figure 49-a:
Particle-level distributions of groomed AK4 width (${\lambda ^{1}_{1}}$) 120 $ < {p_{\mathrm {T}}} < $ 150 GeV in the Z+jet region (left) and central dijet region (right). The NLO+NLL'+NP predictions are taken from arXiv:2112.09545. |
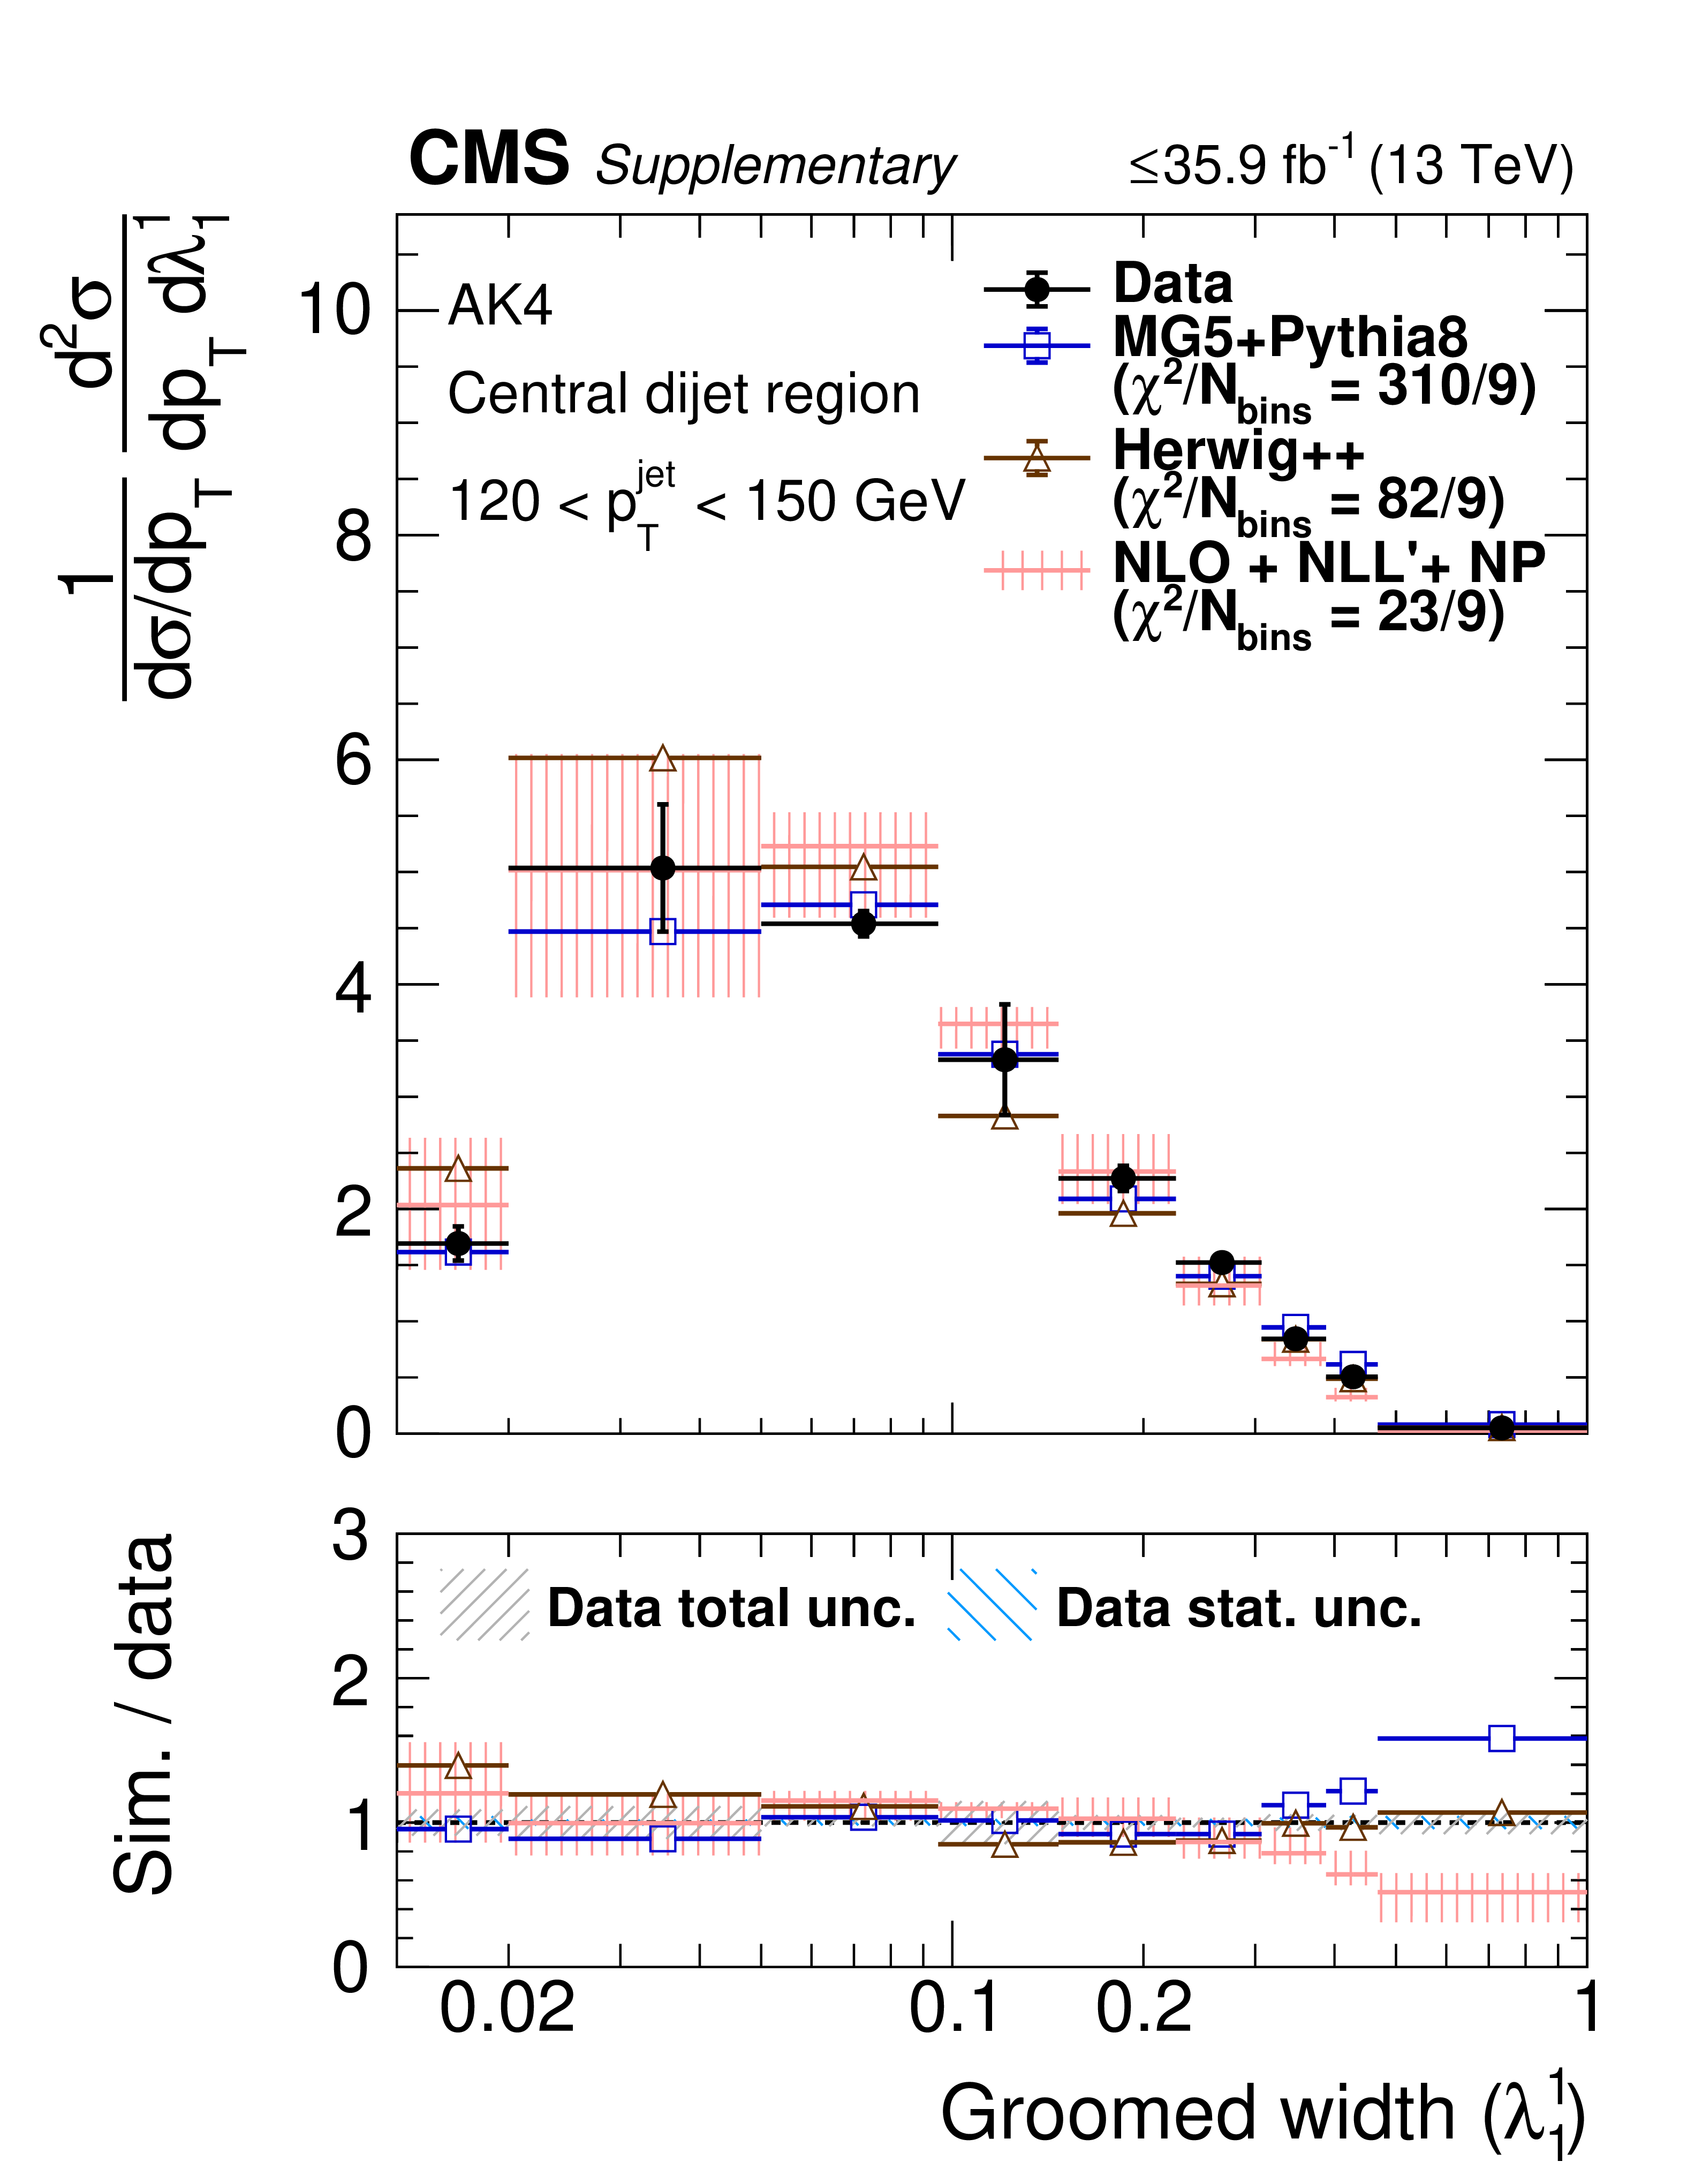
png pdf |
Additional Figure 49-b:
Particle-level distributions of groomed AK4 width (${\lambda ^{1}_{1}}$) 120 $ < {p_{\mathrm {T}}} < $ 150 GeV in the Z+jet region (left) and central dijet region (right). The NLO+NLL'+NP predictions are taken from arXiv:2112.09545. |
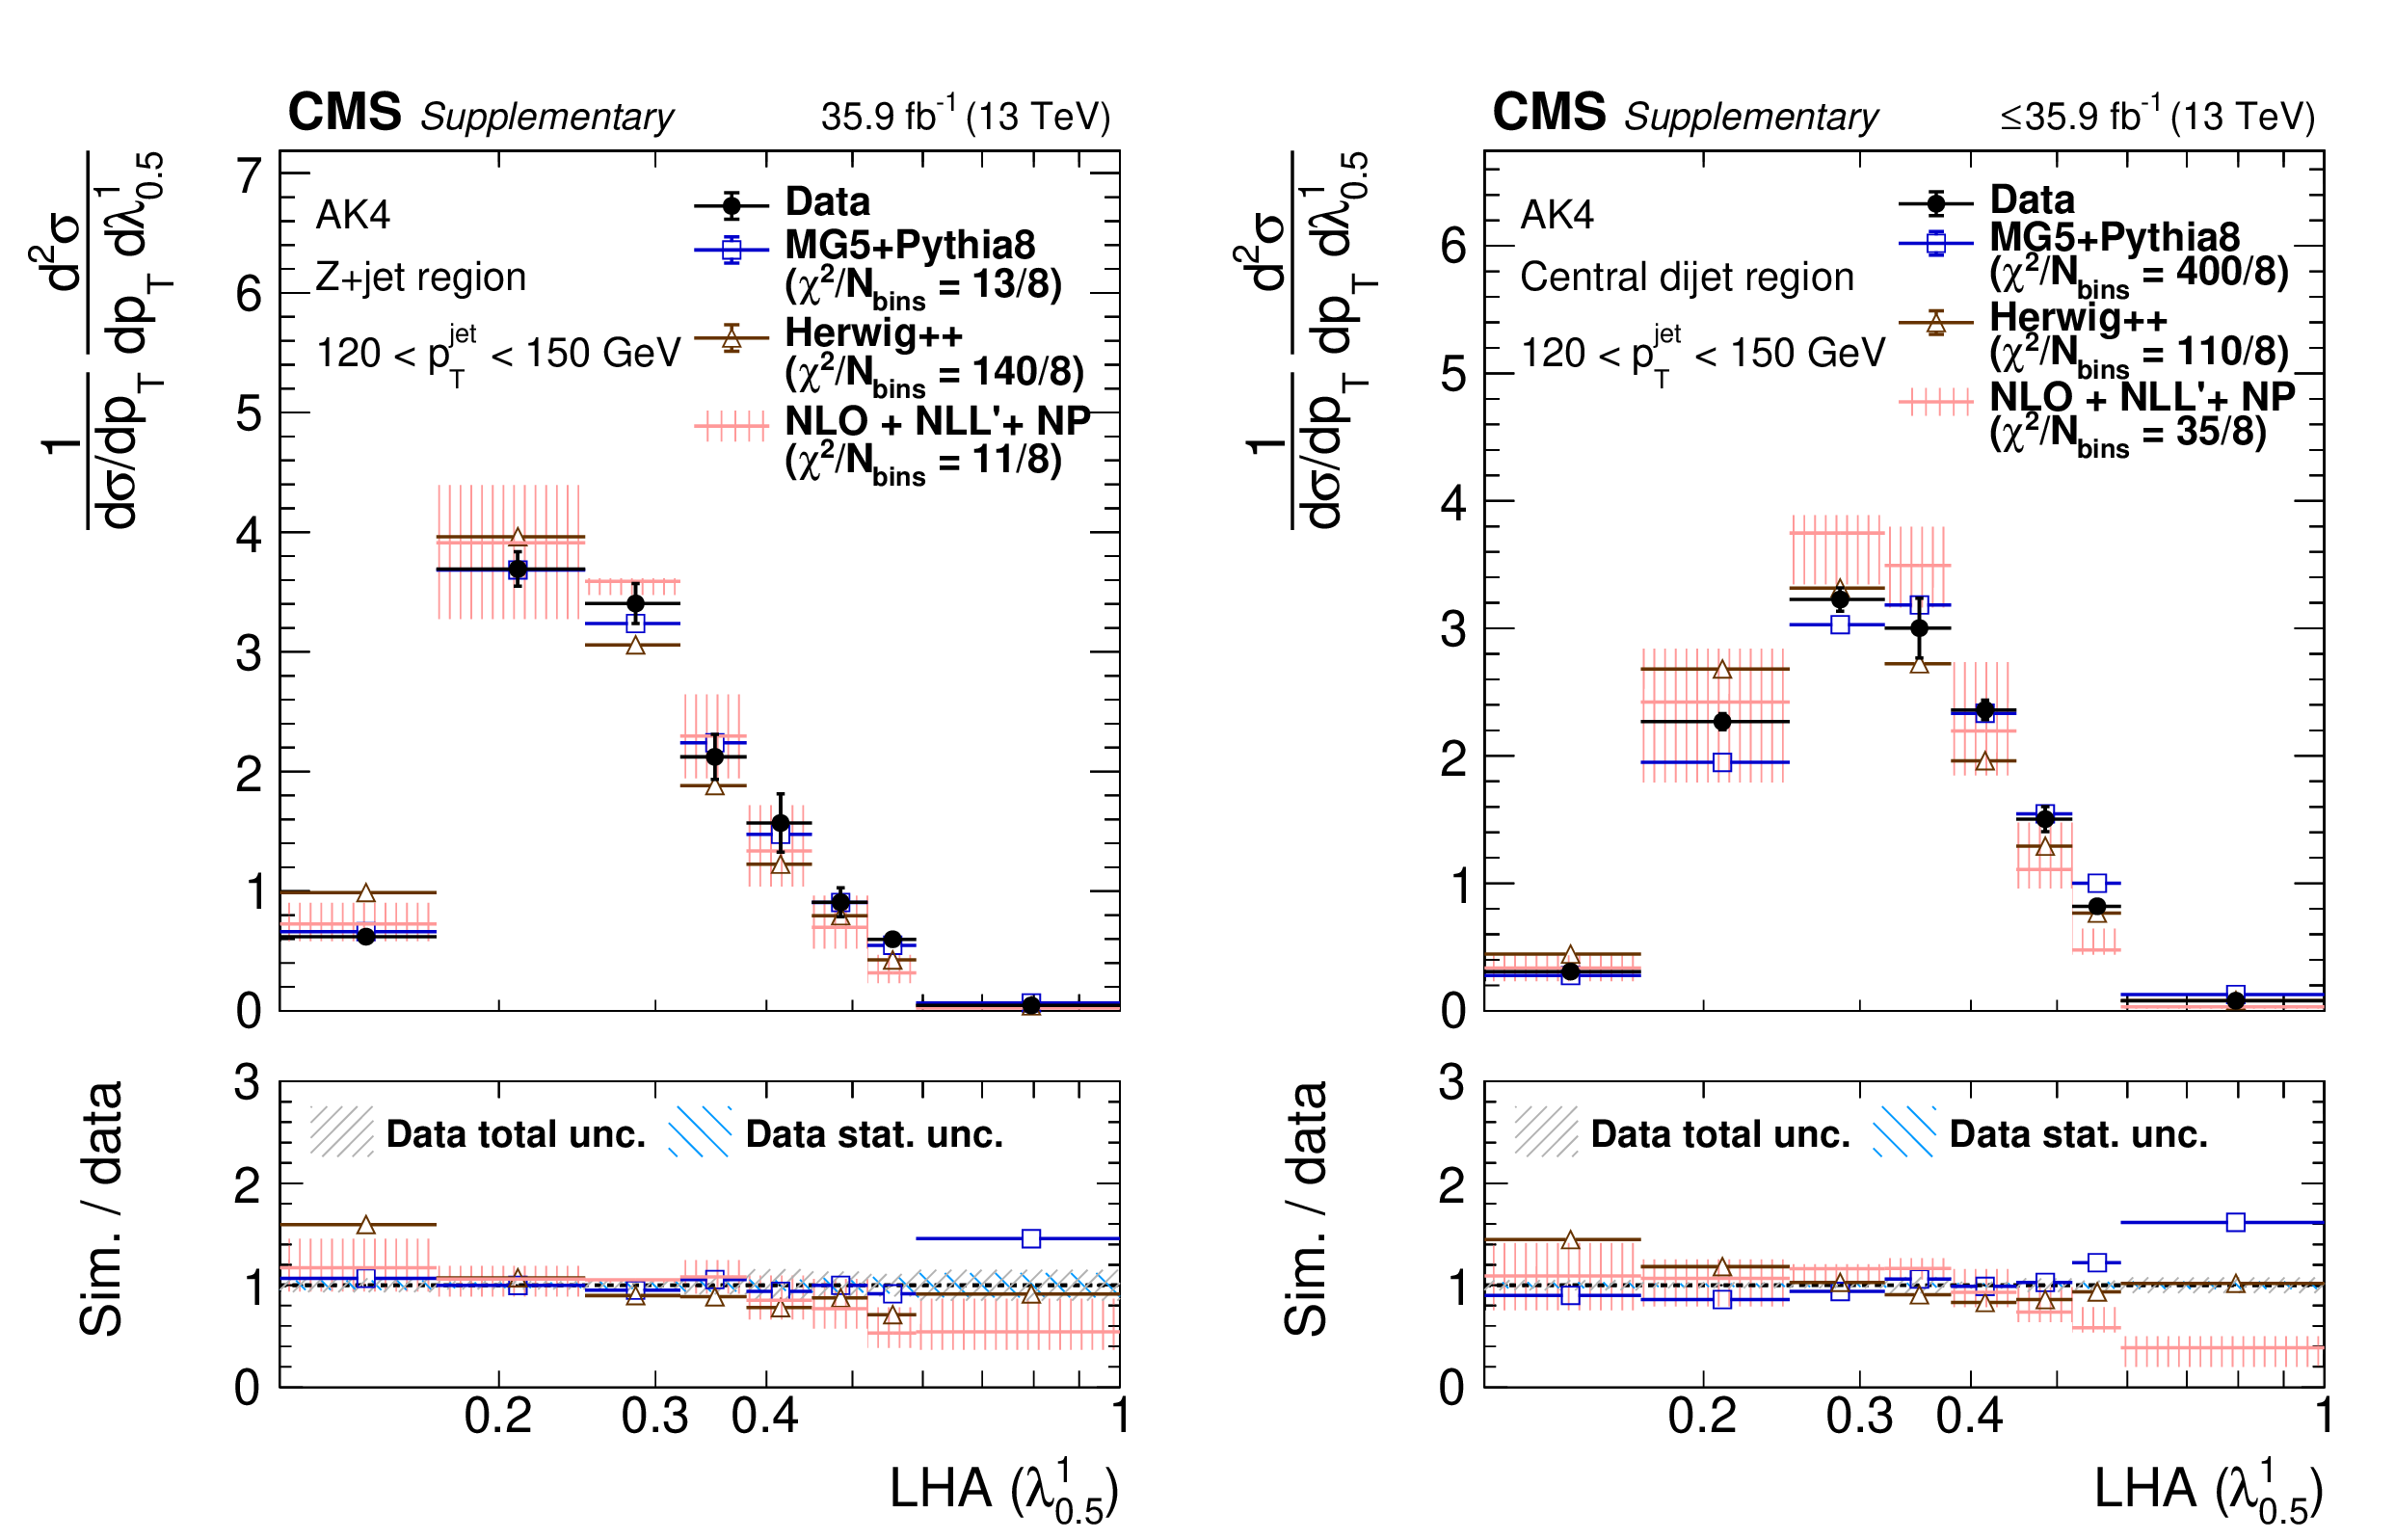
png pdf |
Additional Figure 50:
Particle-level distributions of ungroomed AK4 thrust (${\lambda ^{1}_{2}}$) in 120 $ < {p_{\mathrm {T}}} < $ 150 in the Z+jet region (left) and in 120 $ < {p_{\mathrm {T}}} < $ 150 in the central dijet region (right). The NLO+NLL'+NP predictions are taken from arXiv:2112.09545. |
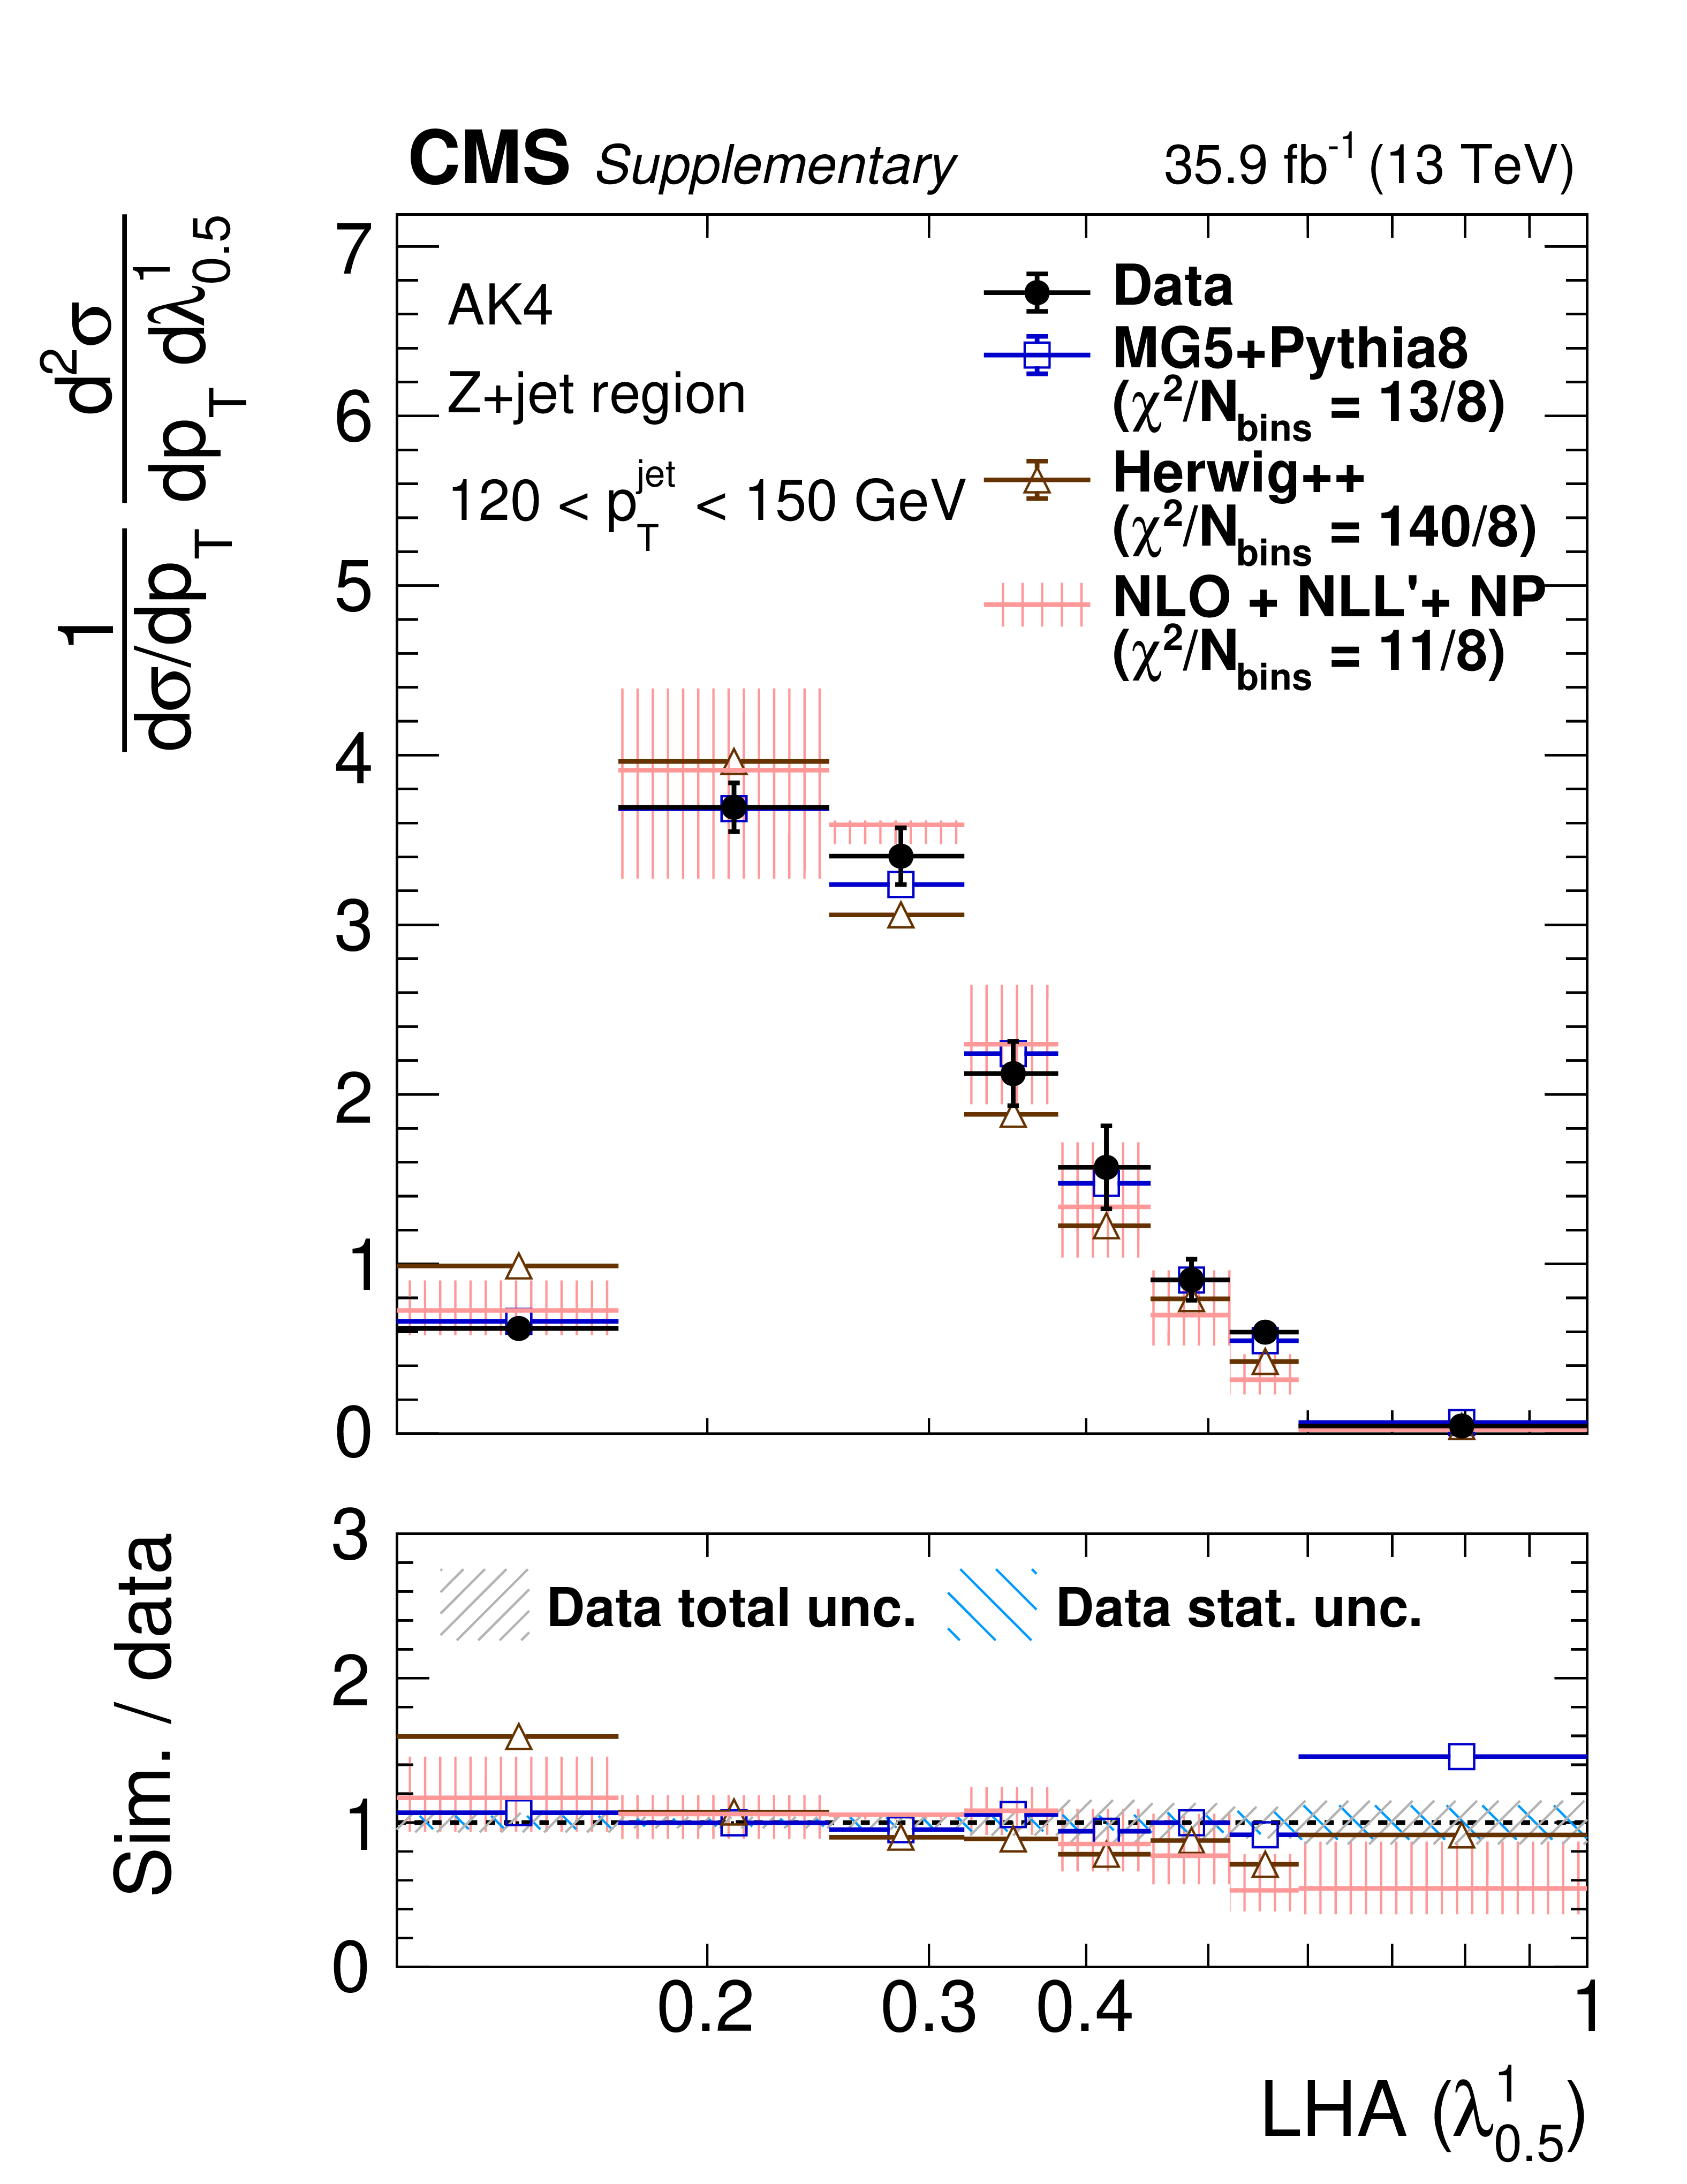
png pdf |
Additional Figure 50-a:
Particle-level distributions of ungroomed AK4 thrust (${\lambda ^{1}_{2}}$) in 120 $ < {p_{\mathrm {T}}} < $ 150 in the Z+jet region (left) and in 120 $ < {p_{\mathrm {T}}} < $ 150 in the central dijet region (right). The NLO+NLL'+NP predictions are taken from arXiv:2112.09545. |
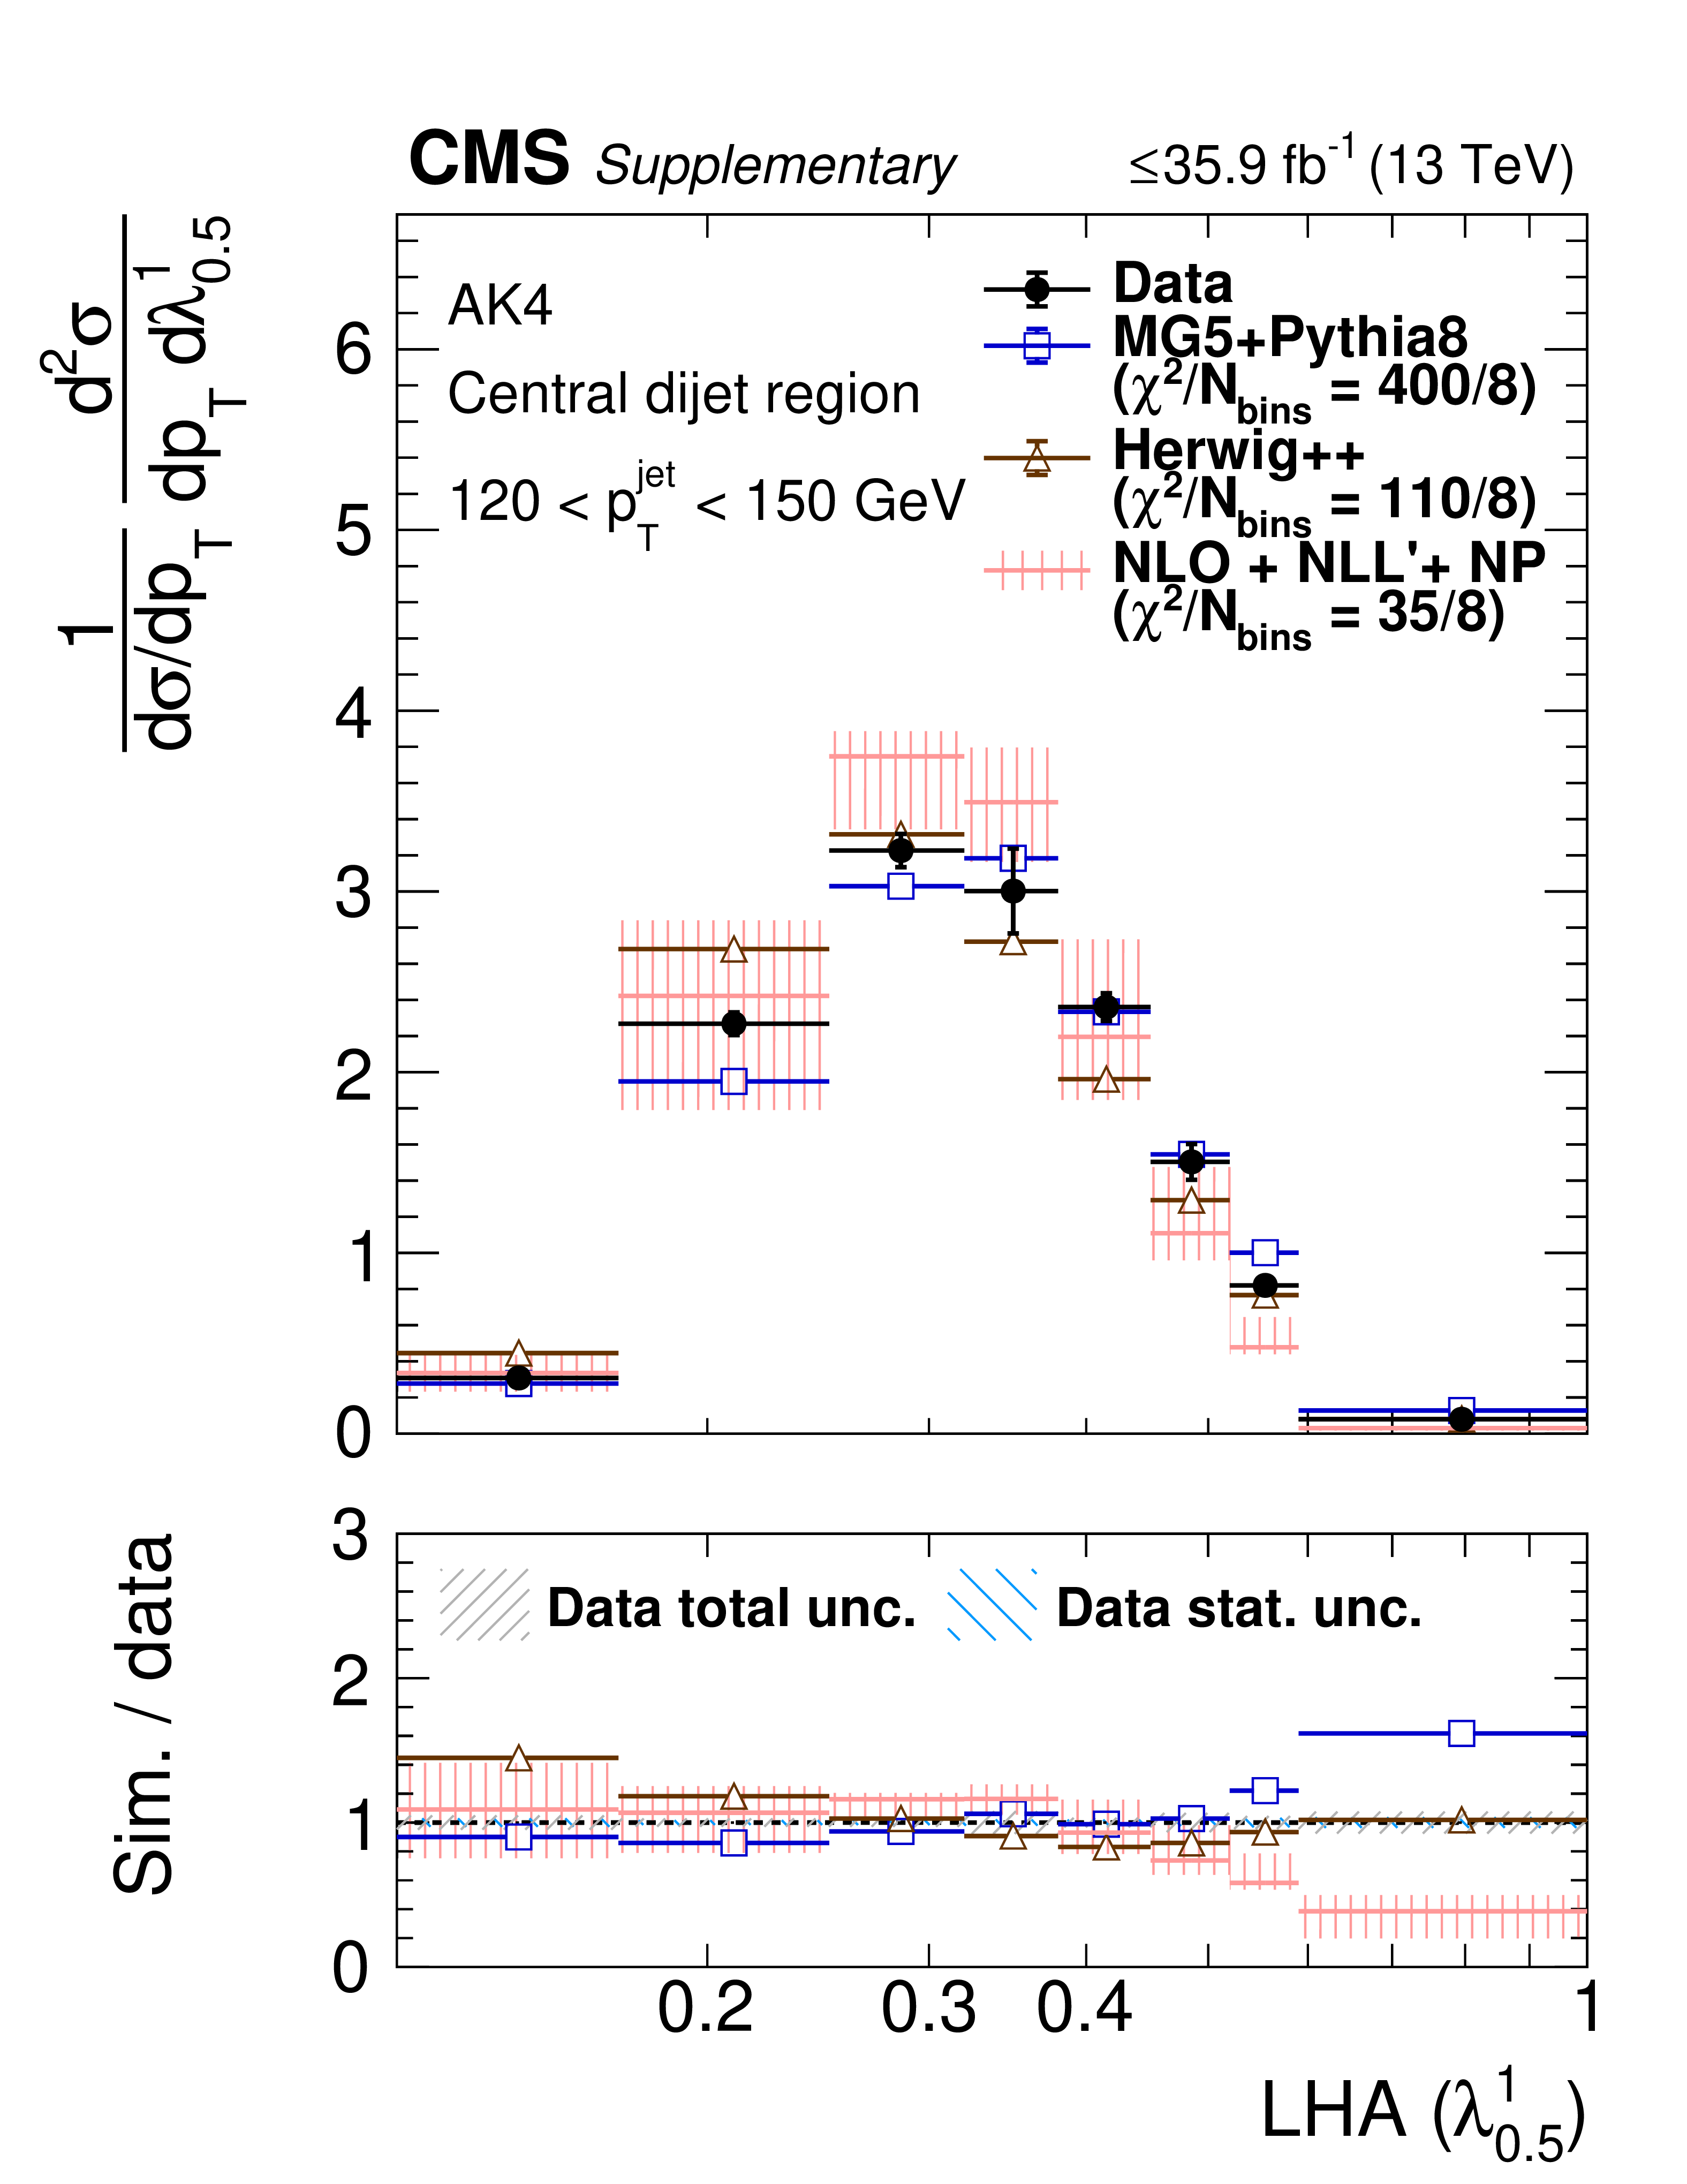
png pdf |
Additional Figure 50-b:
Particle-level distributions of ungroomed AK4 thrust (${\lambda ^{1}_{2}}$) in 120 $ < {p_{\mathrm {T}}} < $ 150 in the Z+jet region (left) and in 120 $ < {p_{\mathrm {T}}} < $ 150 in the central dijet region (right). The NLO+NLL'+NP predictions are taken from arXiv:2112.09545. |
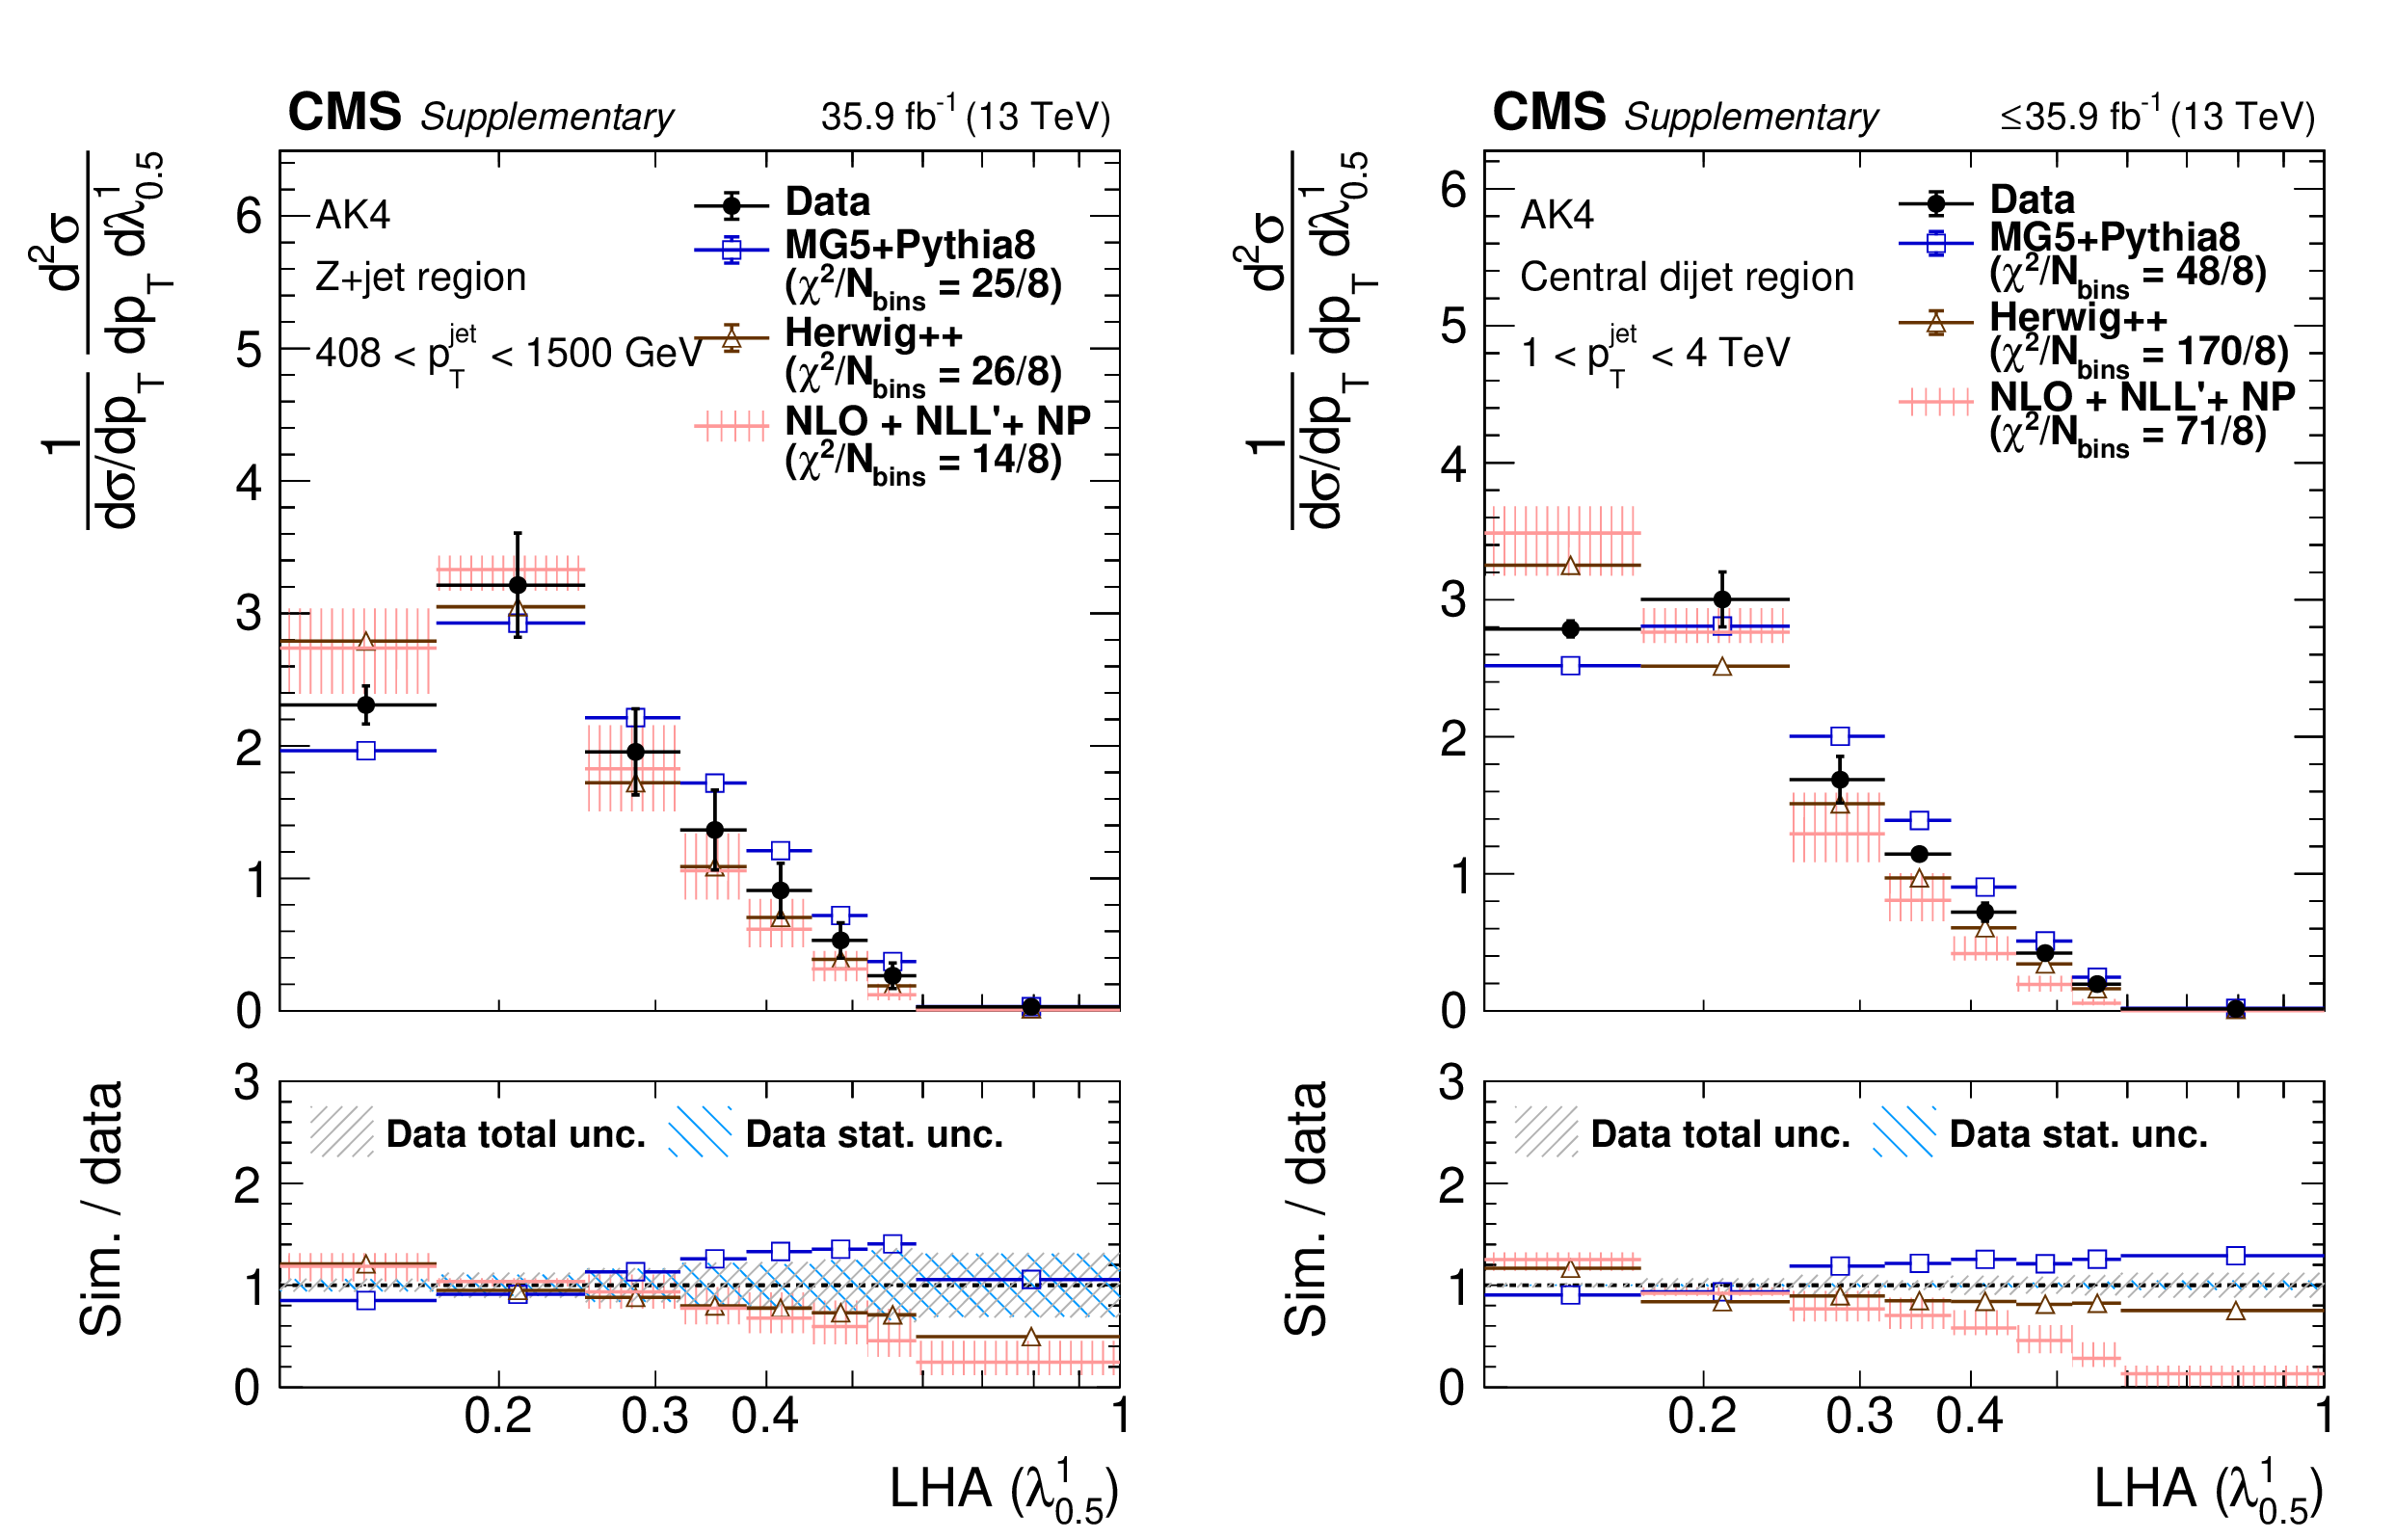
png pdf |
Additional Figure 51:
Particle-level distributions of ungroomed AK4 thrust (${\lambda ^{1}_{2}}$) in 408 $ < {p_{\mathrm {T}}} < $ 4000 GeV in the Z+jet region (left) and in 1000 $ < {p_{\mathrm {T}}} < $ 4000 GeV in the central dijet region (right). The NLO+NLL'+NP predictions are taken from arXiv:2112.09545. |
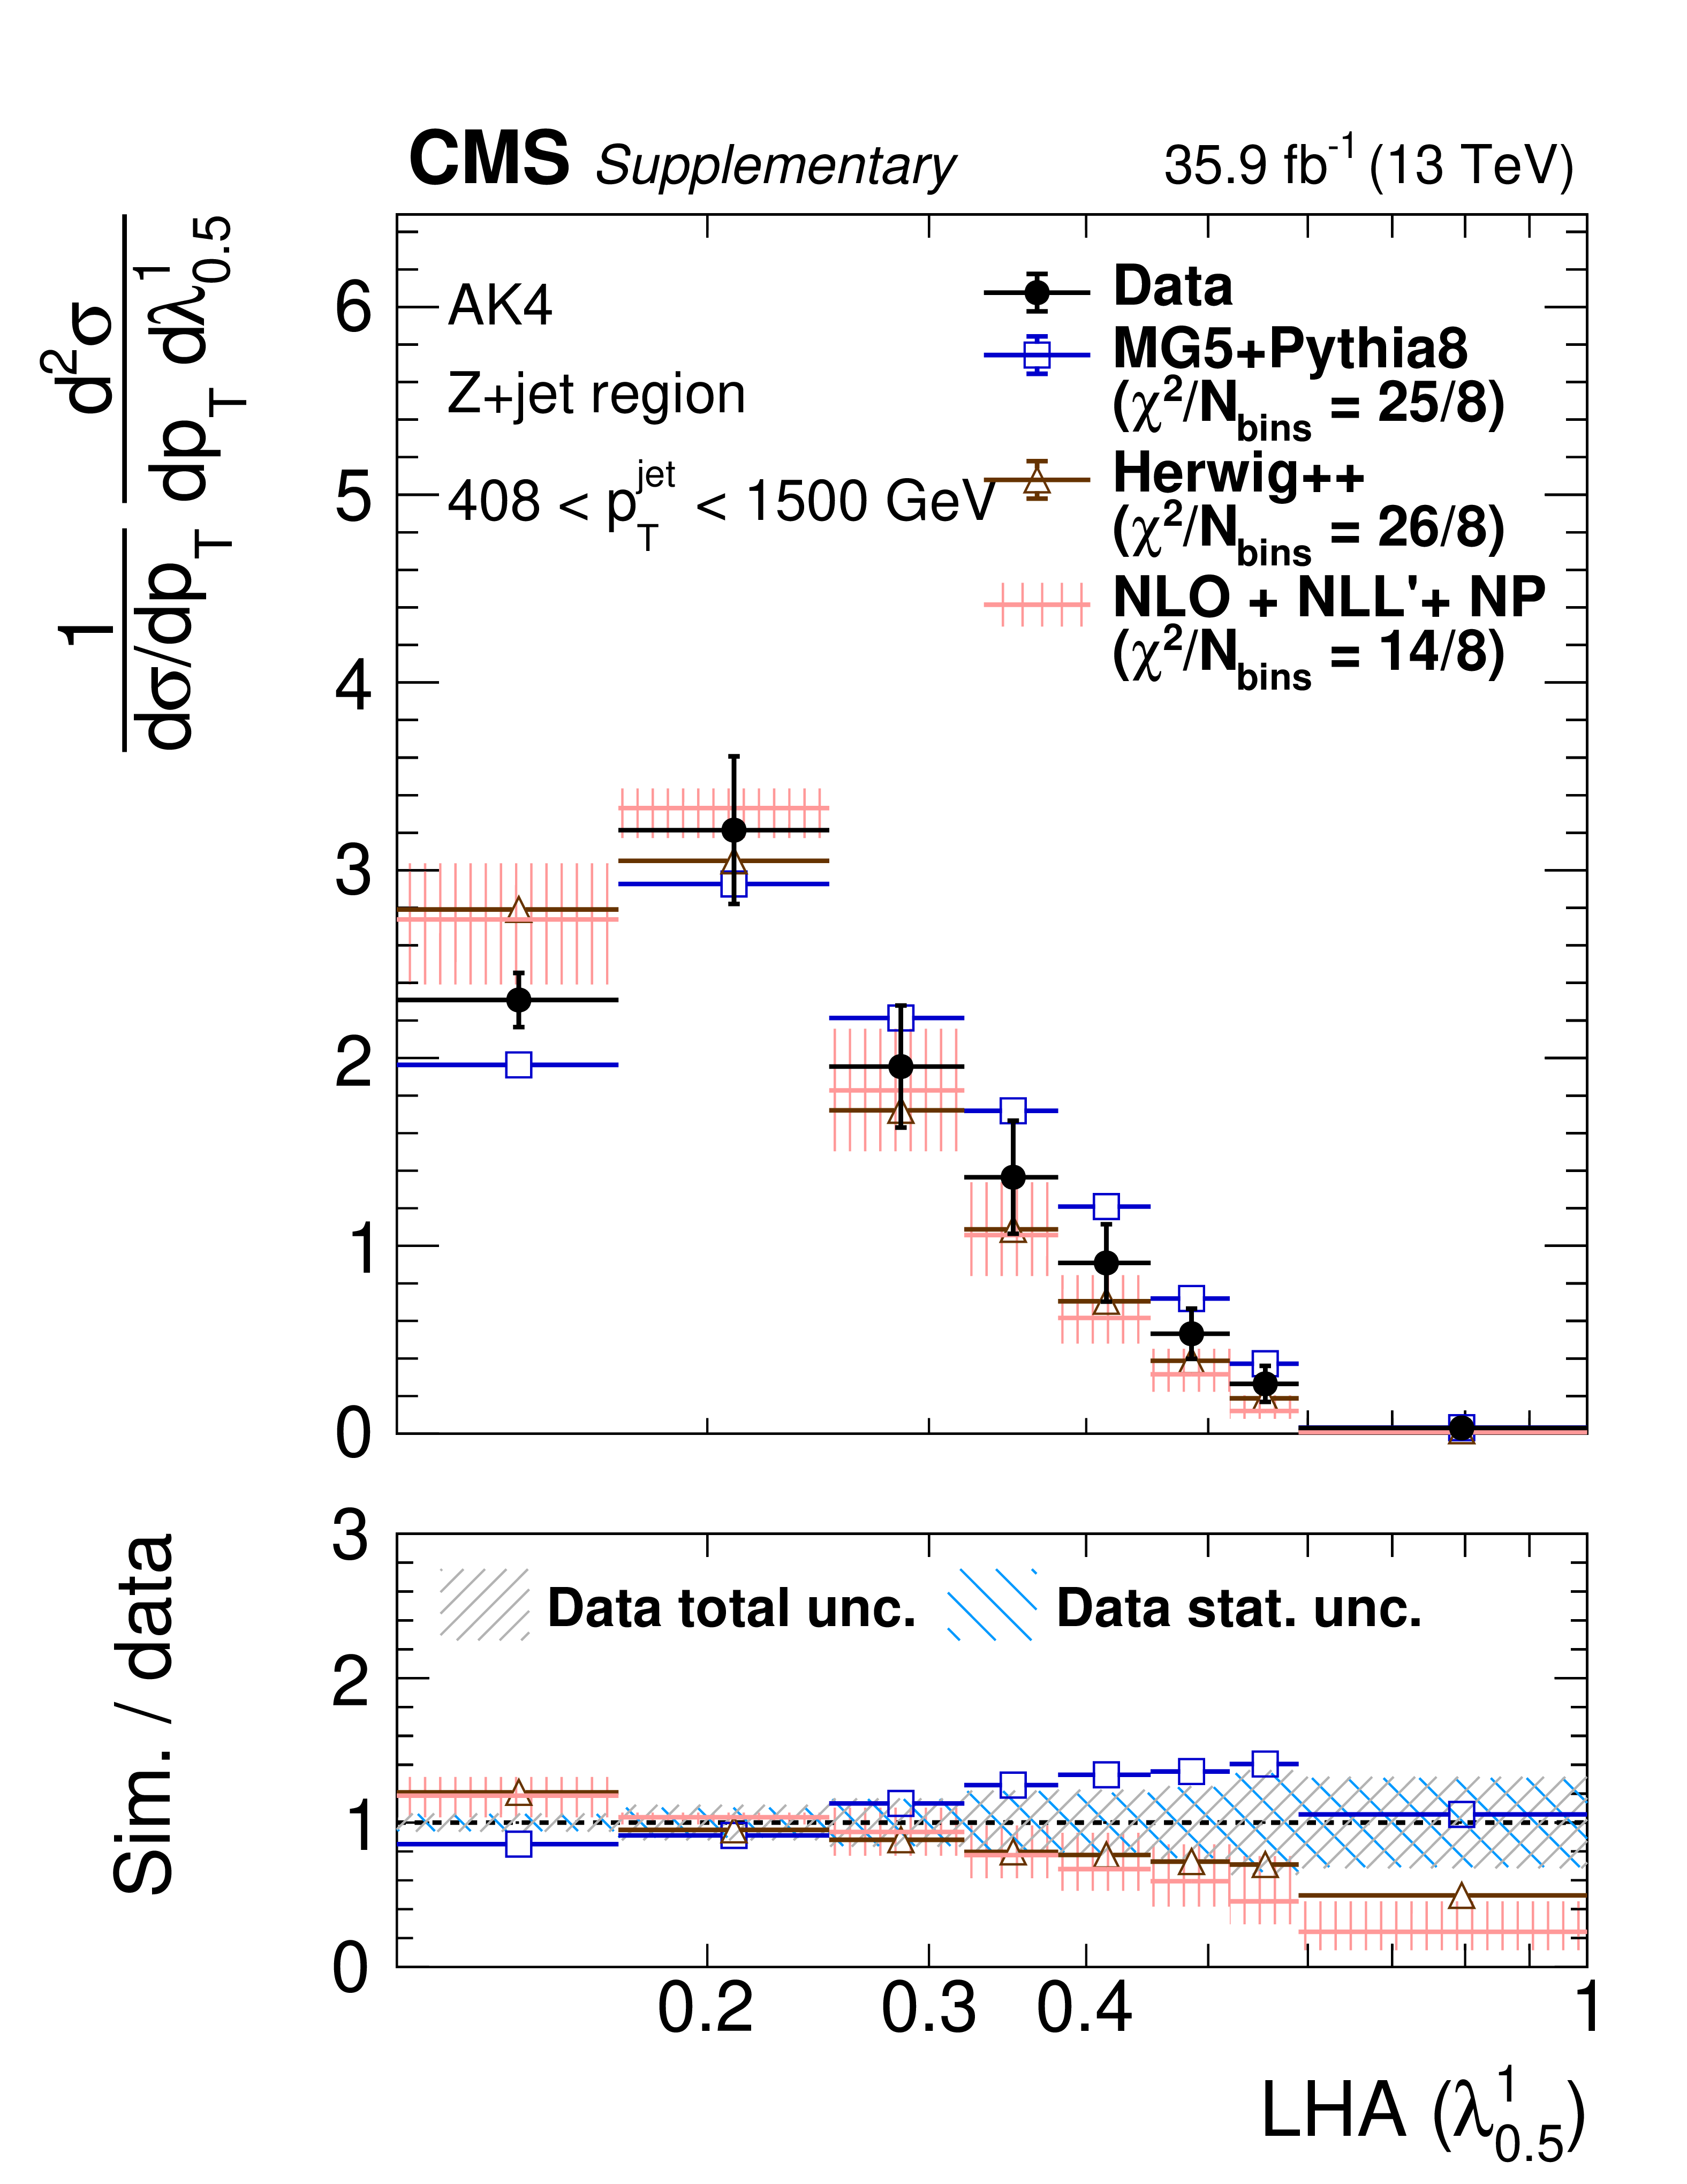
png pdf |
Additional Figure 51-a:
Particle-level distributions of ungroomed AK4 thrust (${\lambda ^{1}_{2}}$) in 408 $ < {p_{\mathrm {T}}} < $ 4000 GeV in the Z+jet region (left) and in 1000 $ < {p_{\mathrm {T}}} < $ 4000 GeV in the central dijet region (right). The NLO+NLL'+NP predictions are taken from arXiv:2112.09545. |
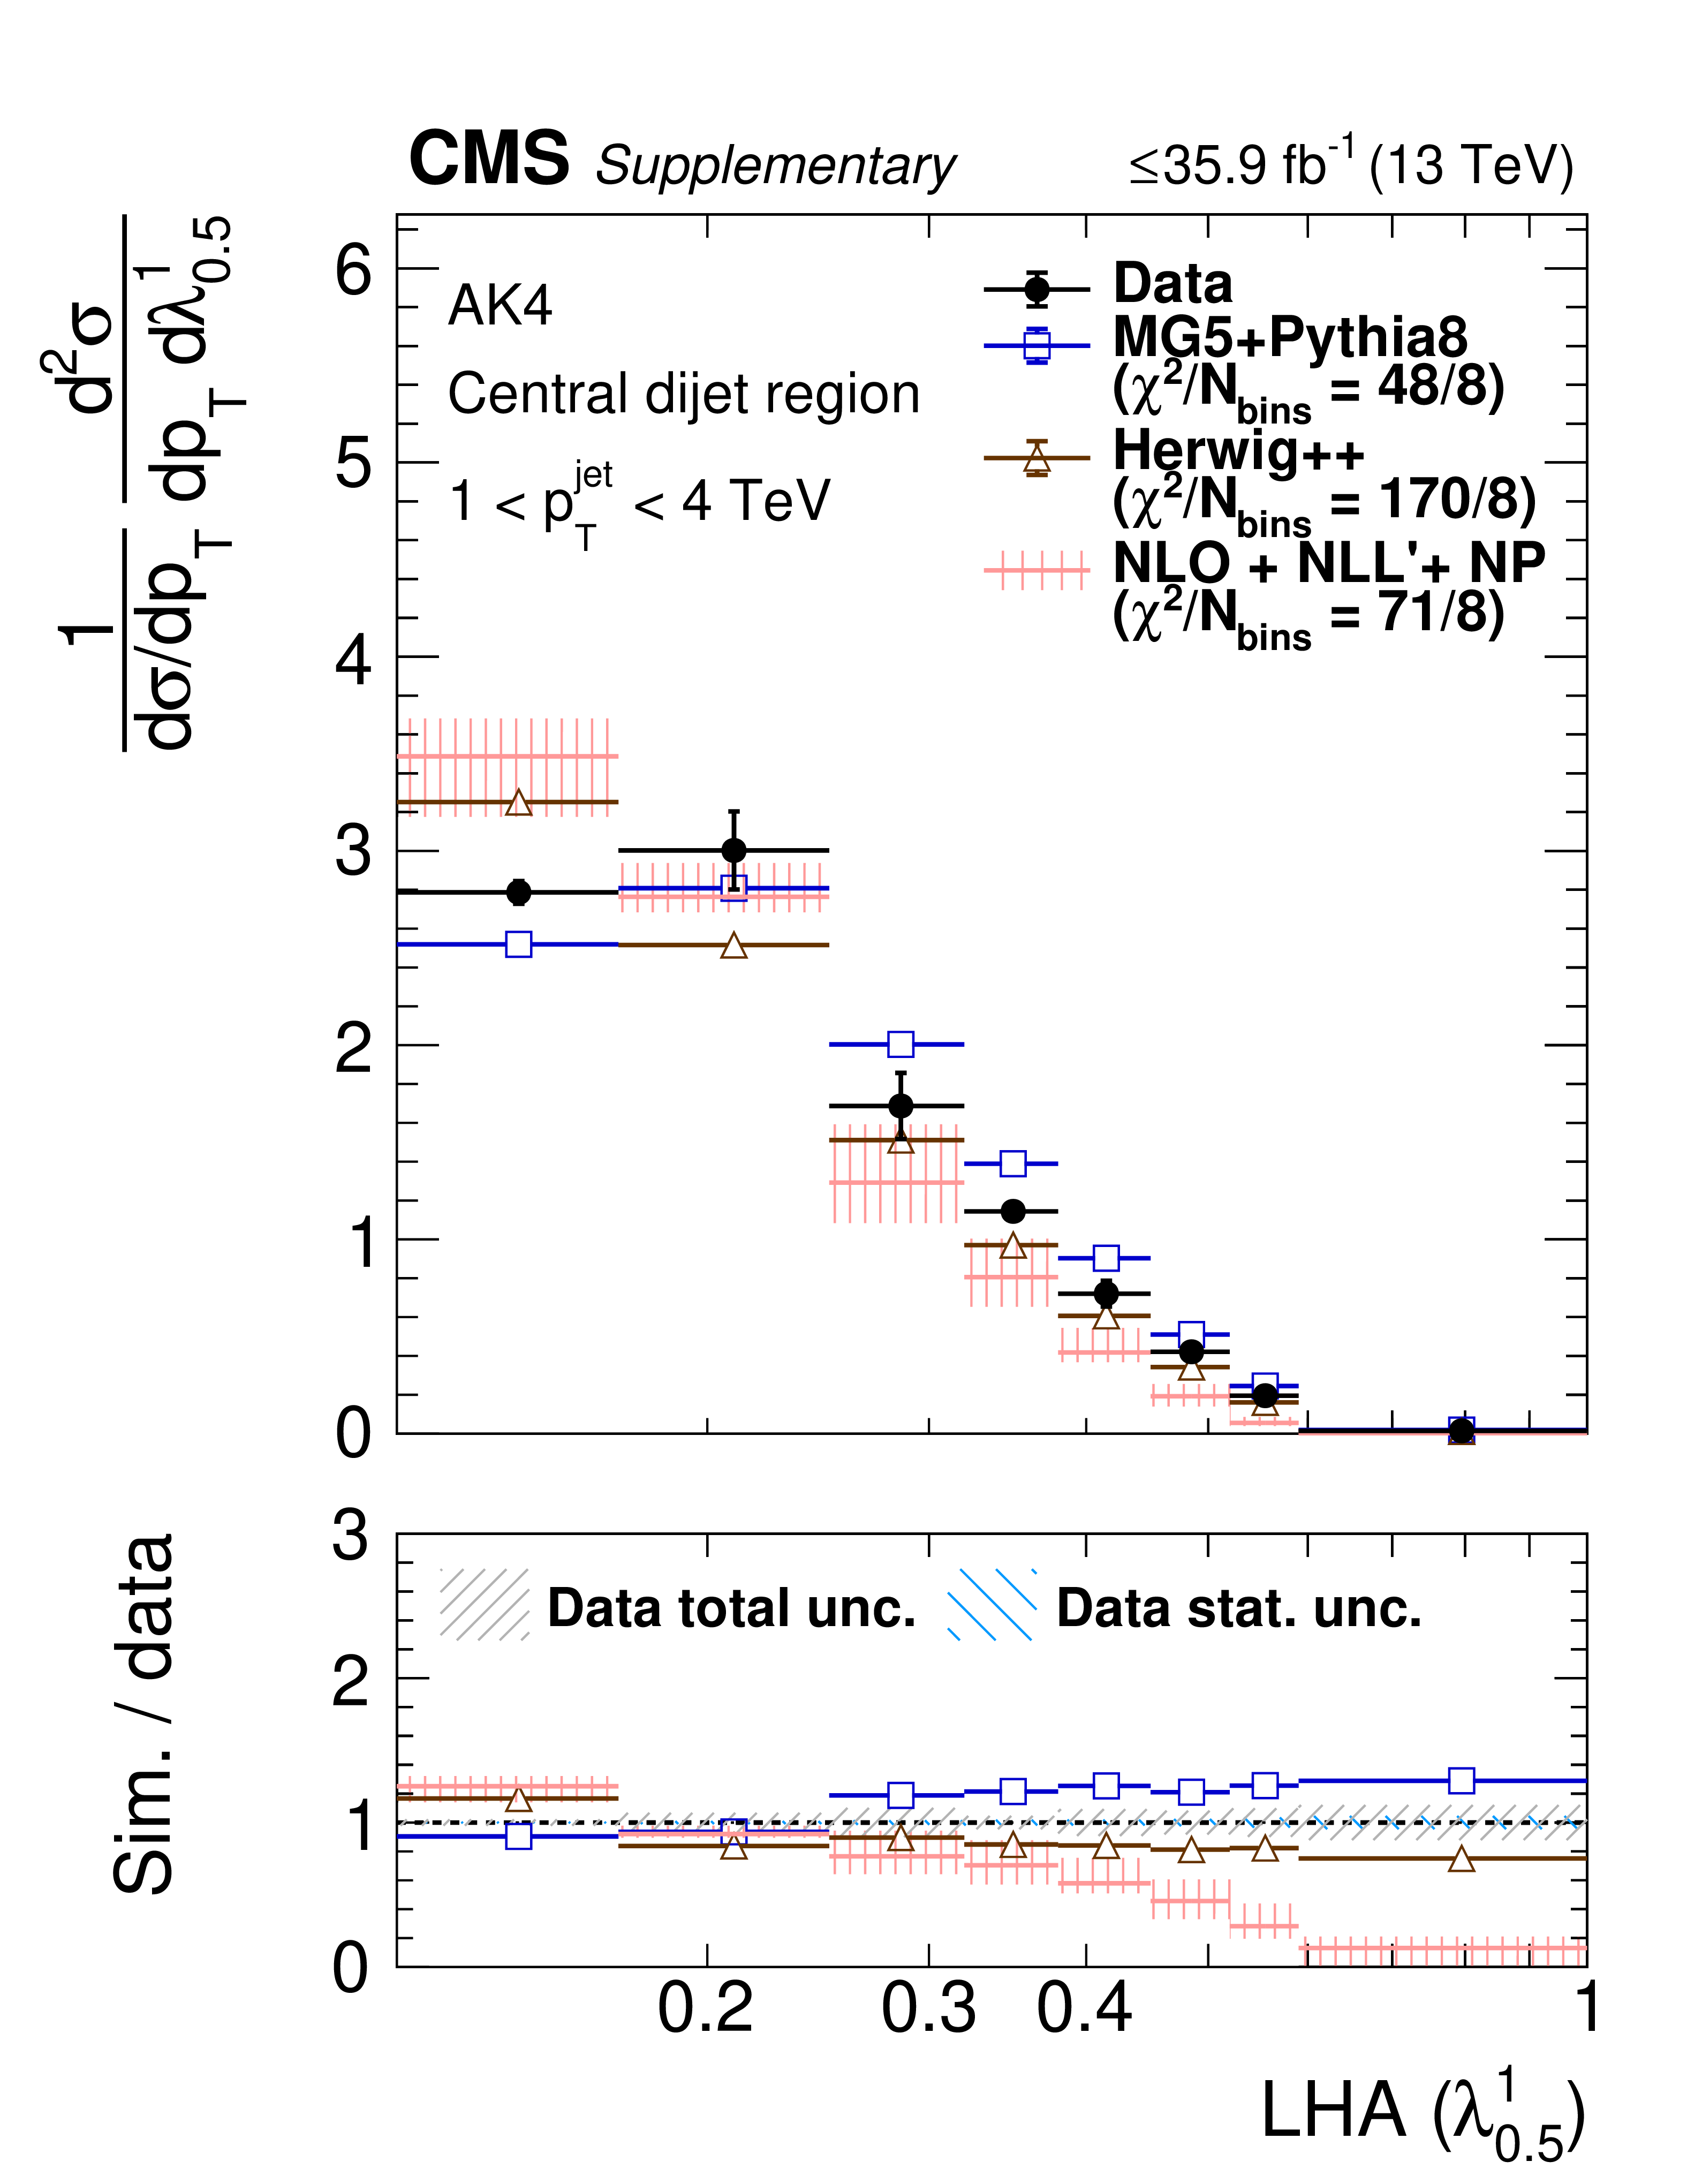
png pdf |
Additional Figure 51-b:
Particle-level distributions of ungroomed AK4 thrust (${\lambda ^{1}_{2}}$) in 408 $ < {p_{\mathrm {T}}} < $ 4000 GeV in the Z+jet region (left) and in 1000 $ < {p_{\mathrm {T}}} < $ 4000 GeV in the central dijet region (right). The NLO+NLL'+NP predictions are taken from arXiv:2112.09545. |
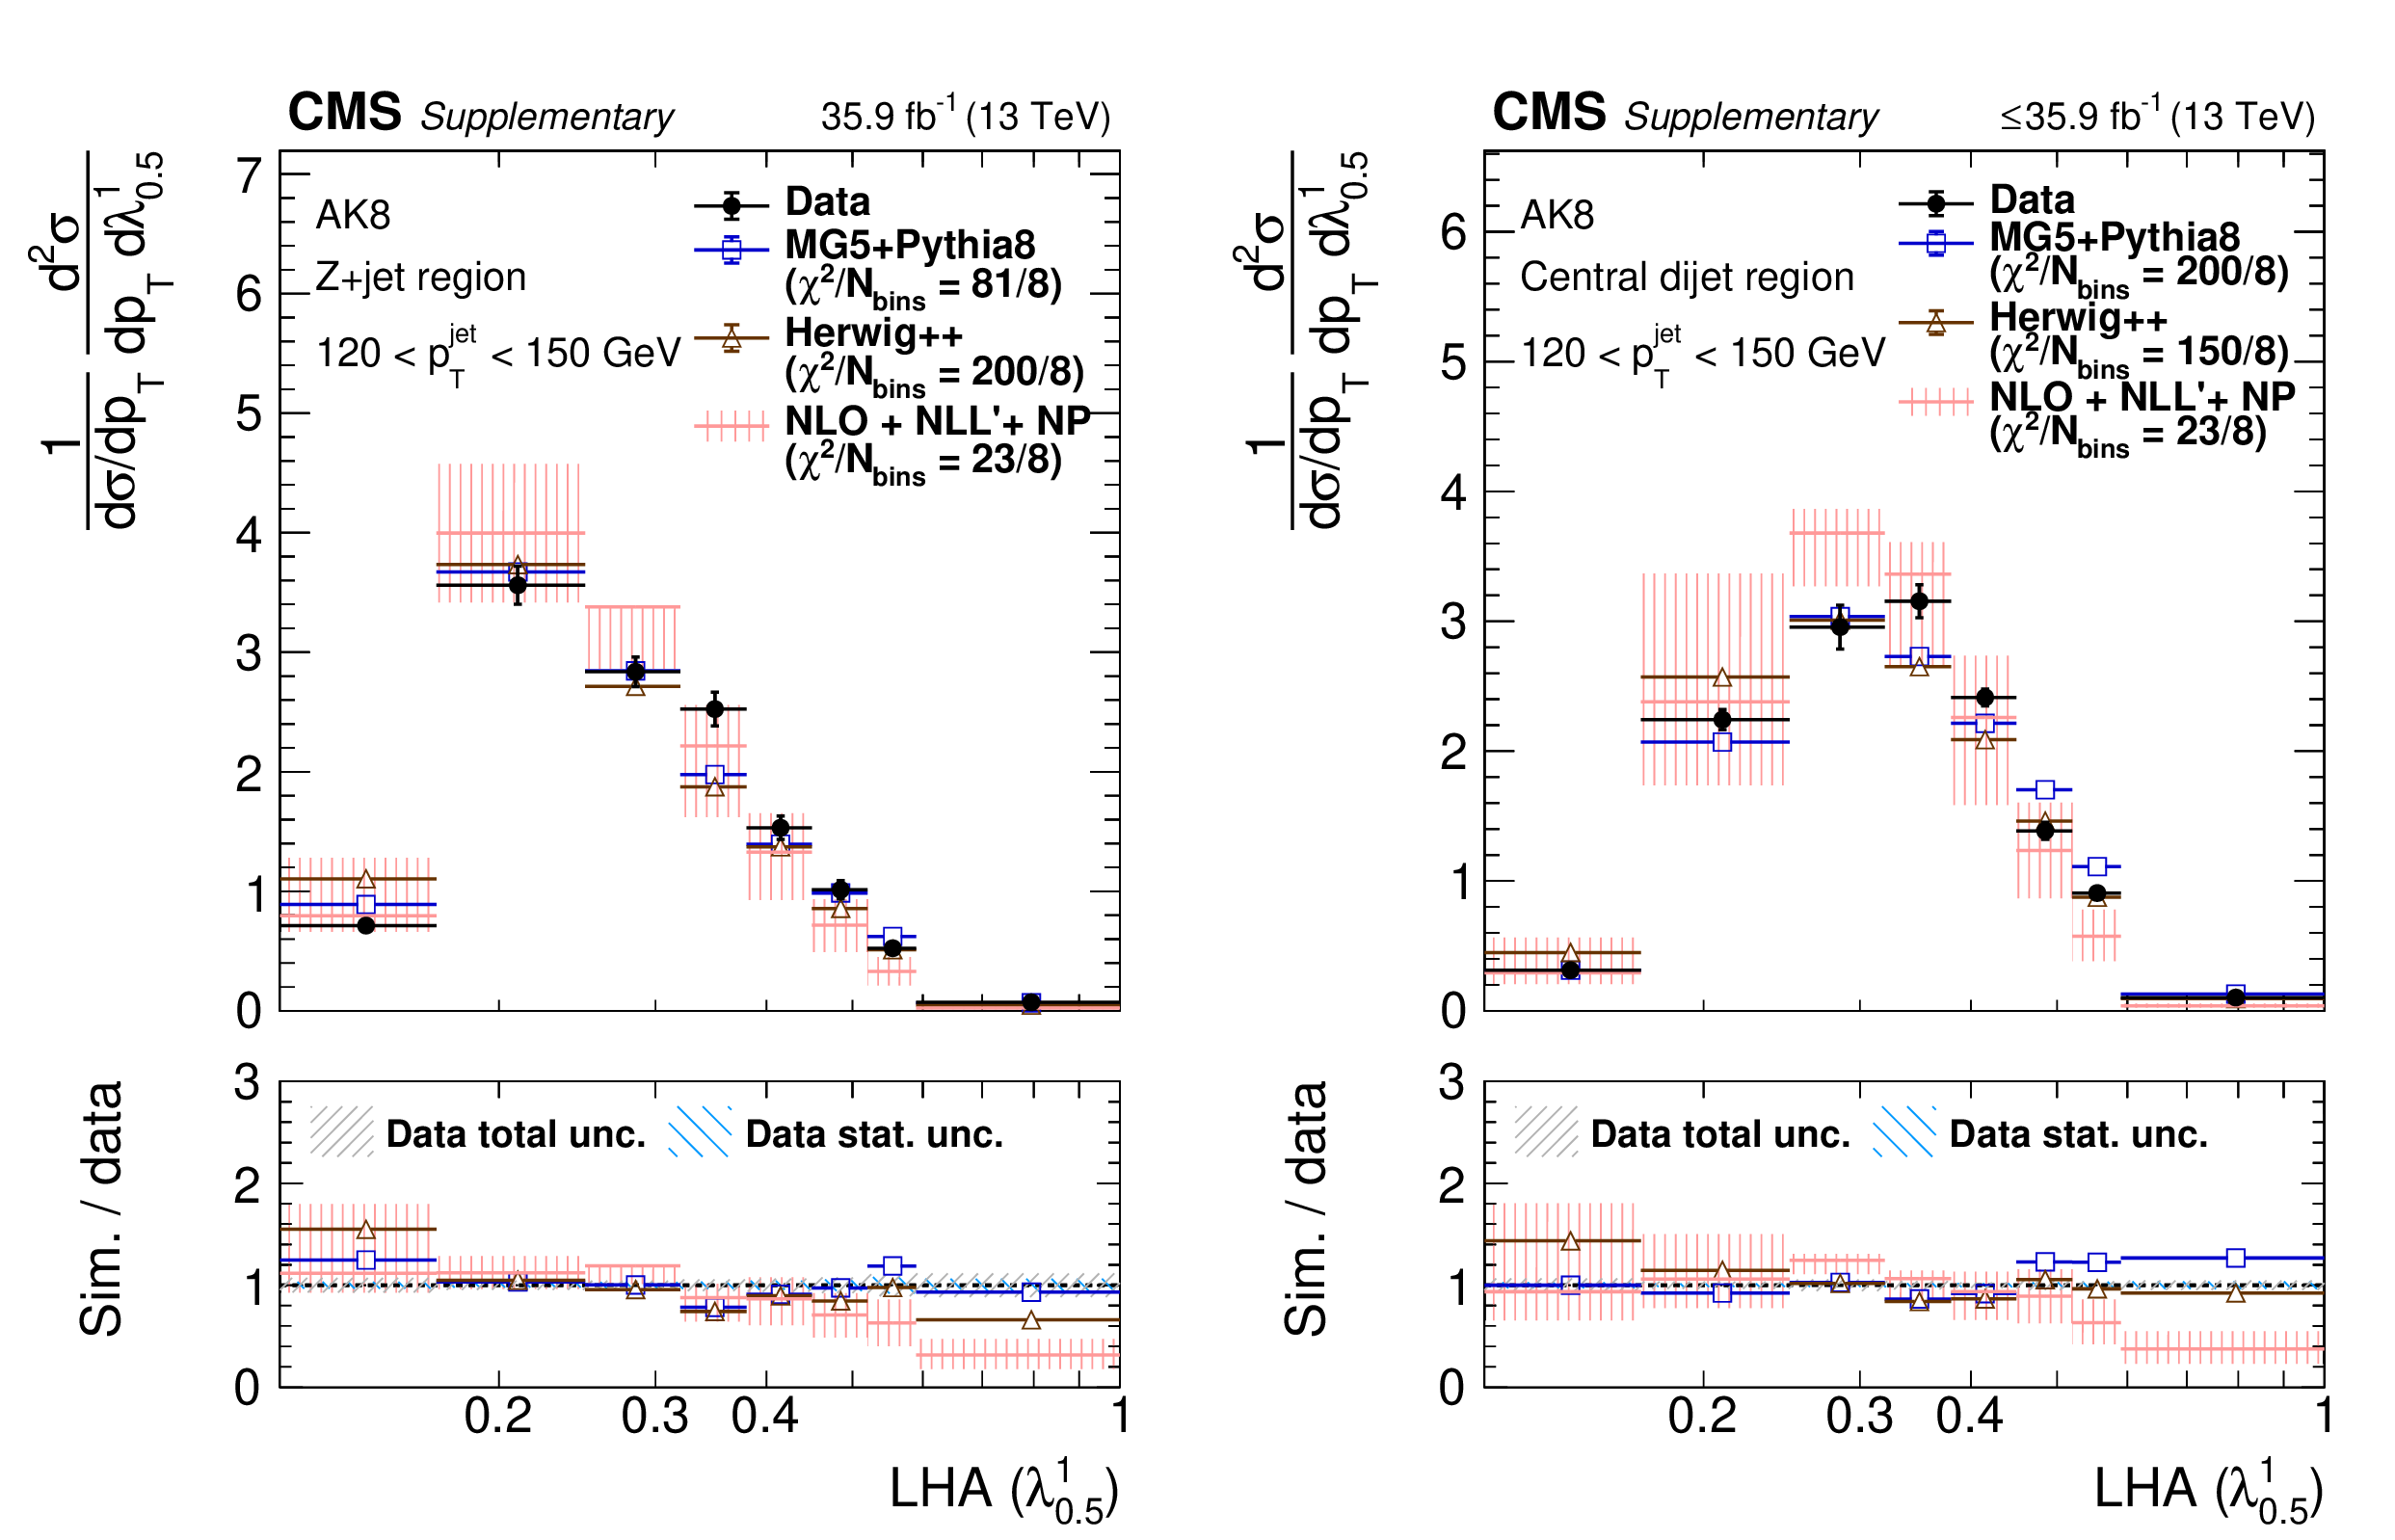
png pdf |
Additional Figure 52:
Particle-level distributions of ungroomed AK8 thrust (${\lambda ^{1}_{2}}$) in AK8 120 $ < {p_{\mathrm {T}}} < $ 150 GeV in the Z+jet region (left) and central dijet region (right). The NLO+NLL'+NP predictions are taken from arXiv:2112.09545. |

png pdf |
Additional Figure 52-a:
Particle-level distributions of ungroomed AK8 thrust (${\lambda ^{1}_{2}}$) in AK8 120 $ < {p_{\mathrm {T}}} < $ 150 GeV in the Z+jet region (left) and central dijet region (right). The NLO+NLL'+NP predictions are taken from arXiv:2112.09545. |
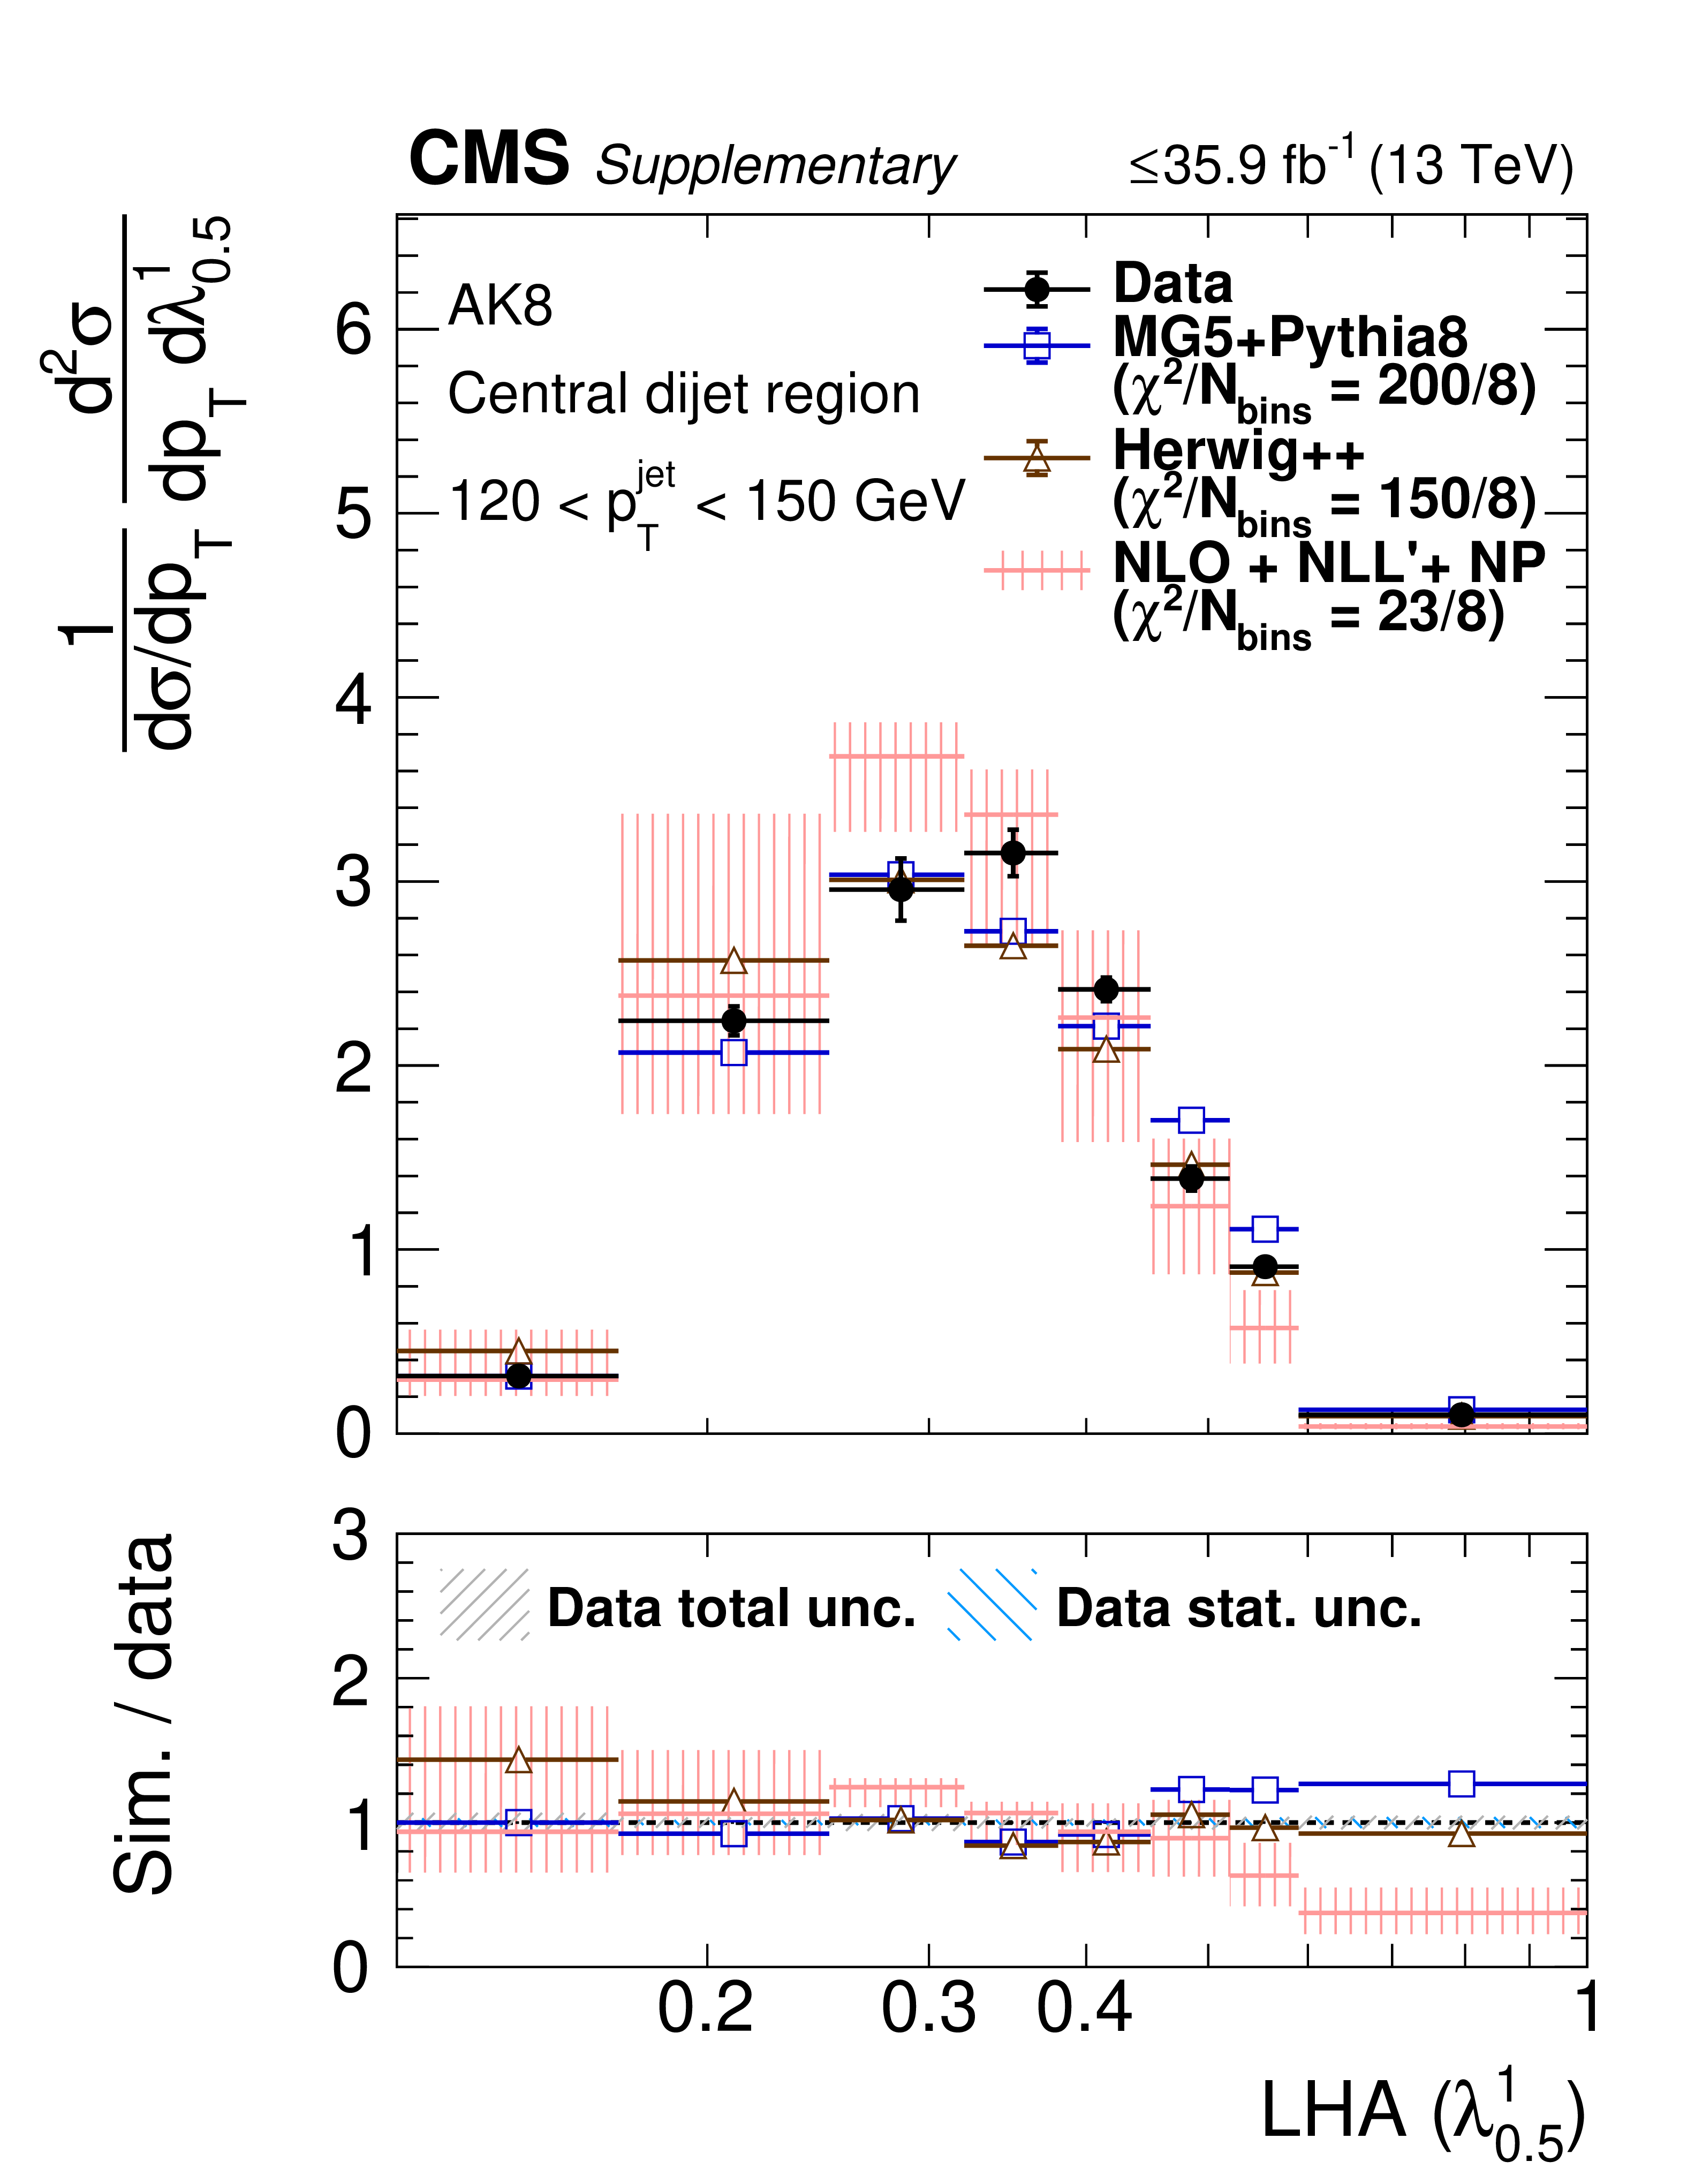
png pdf |
Additional Figure 52-b:
Particle-level distributions of ungroomed AK8 thrust (${\lambda ^{1}_{2}}$) in AK8 120 $ < {p_{\mathrm {T}}} < $ 150 GeV in the Z+jet region (left) and central dijet region (right). The NLO+NLL'+NP predictions are taken from arXiv:2112.09545. |
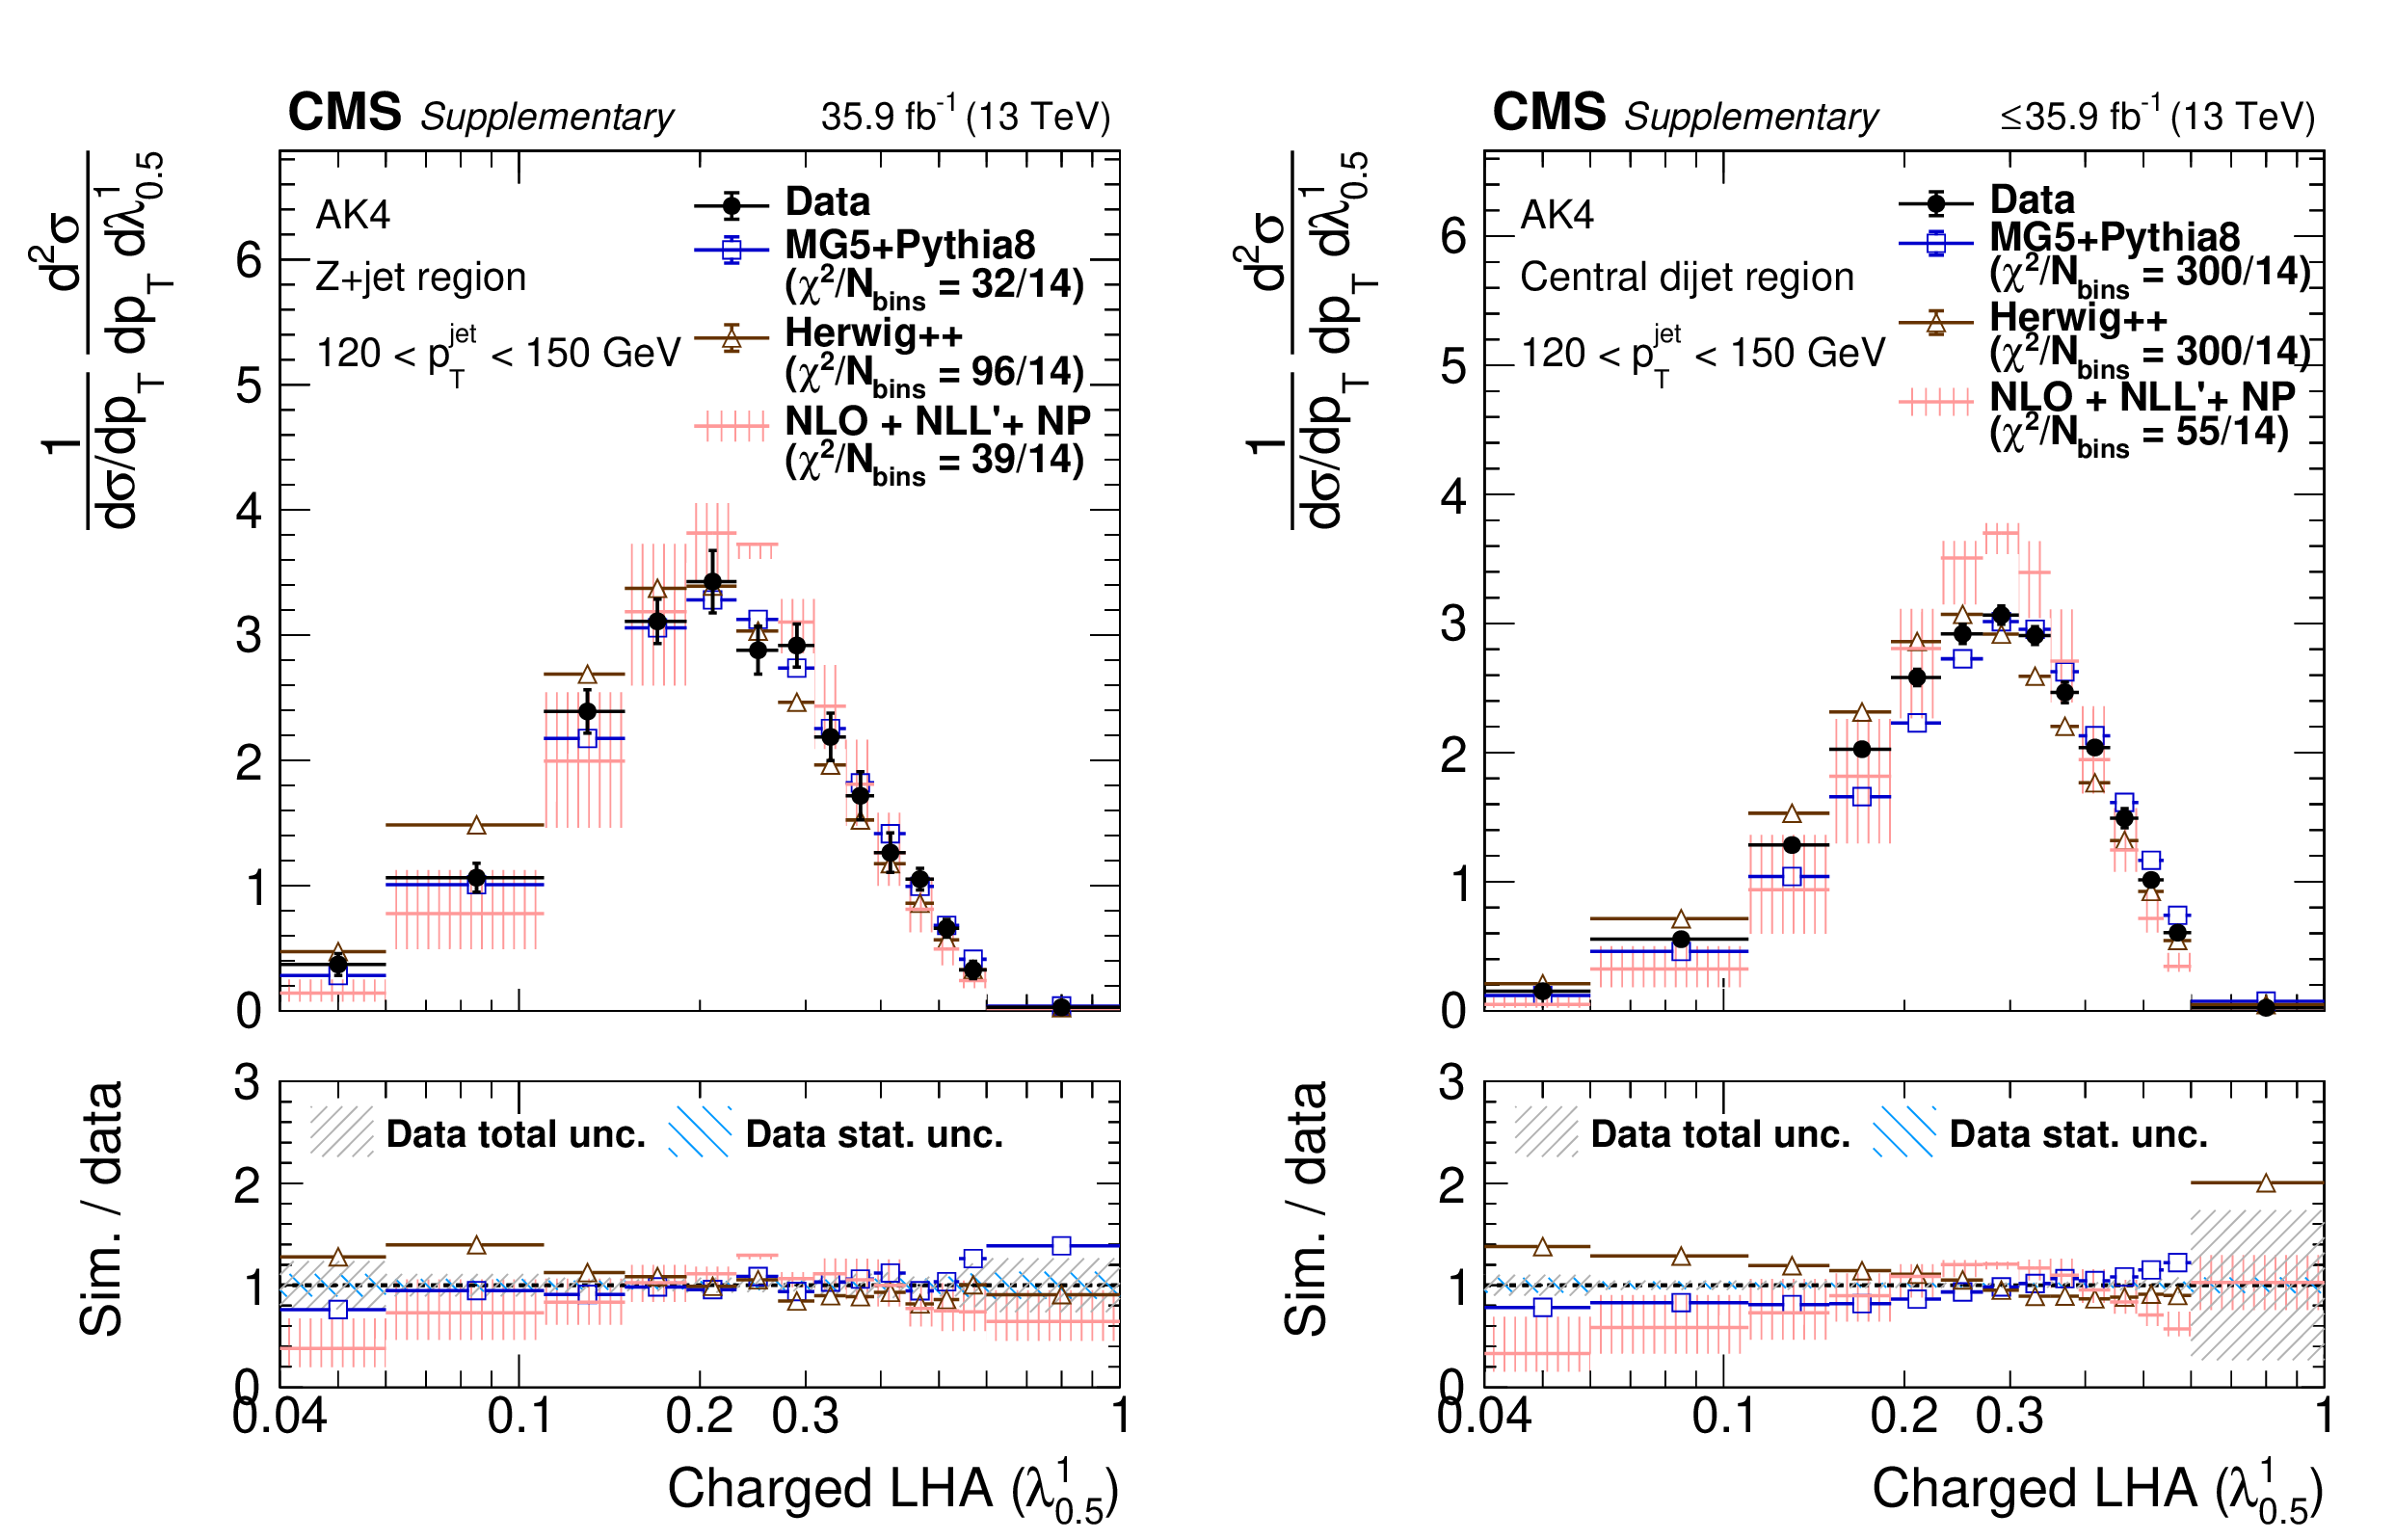
png pdf |
Additional Figure 53:
Particle-level distributions of ungroomed charged-only AK4 thrust (${\lambda ^{1}_{2}}$) 120 $ < {p_{\mathrm {T}}} < $ 150 GeV in the Z+jet region (left) and central dijet region (right). The NLO+NLL'+NP predictions are taken from arXiv:2112.09545. |
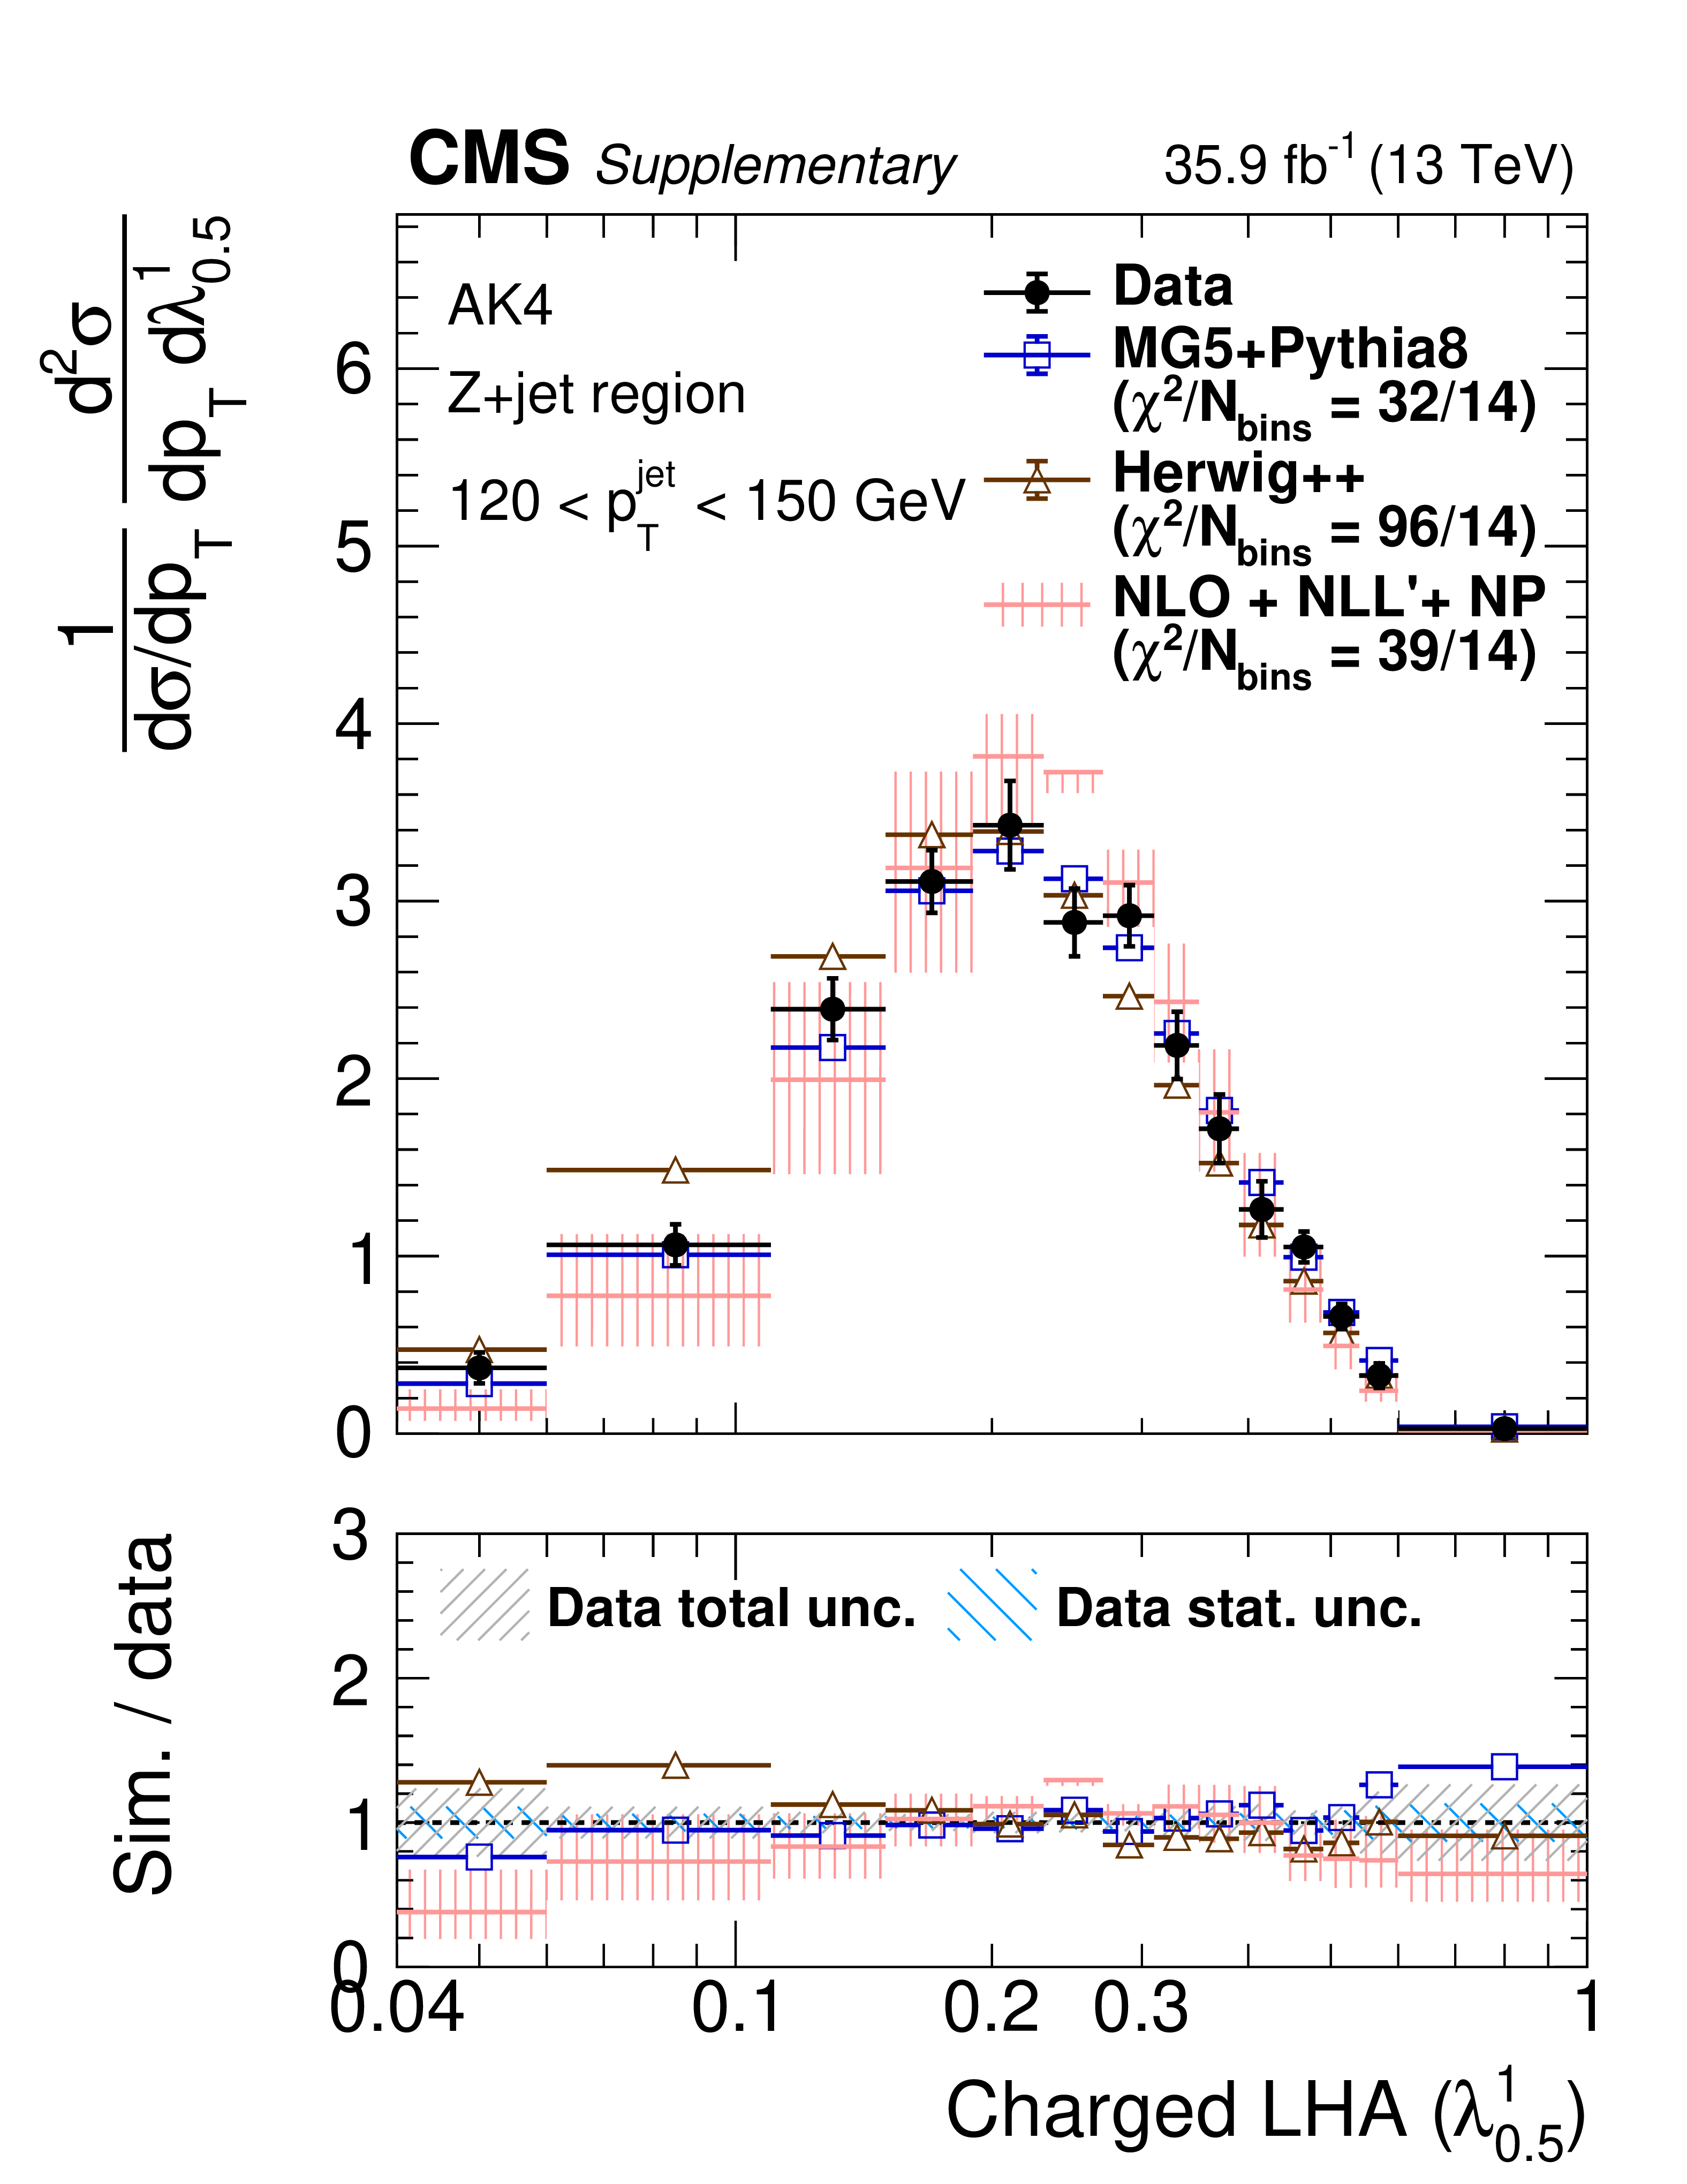
png pdf |
Additional Figure 53-a:
Particle-level distributions of ungroomed charged-only AK4 thrust (${\lambda ^{1}_{2}}$) 120 $ < {p_{\mathrm {T}}} < $ 150 GeV in the Z+jet region (left) and central dijet region (right). The NLO+NLL'+NP predictions are taken from arXiv:2112.09545. |
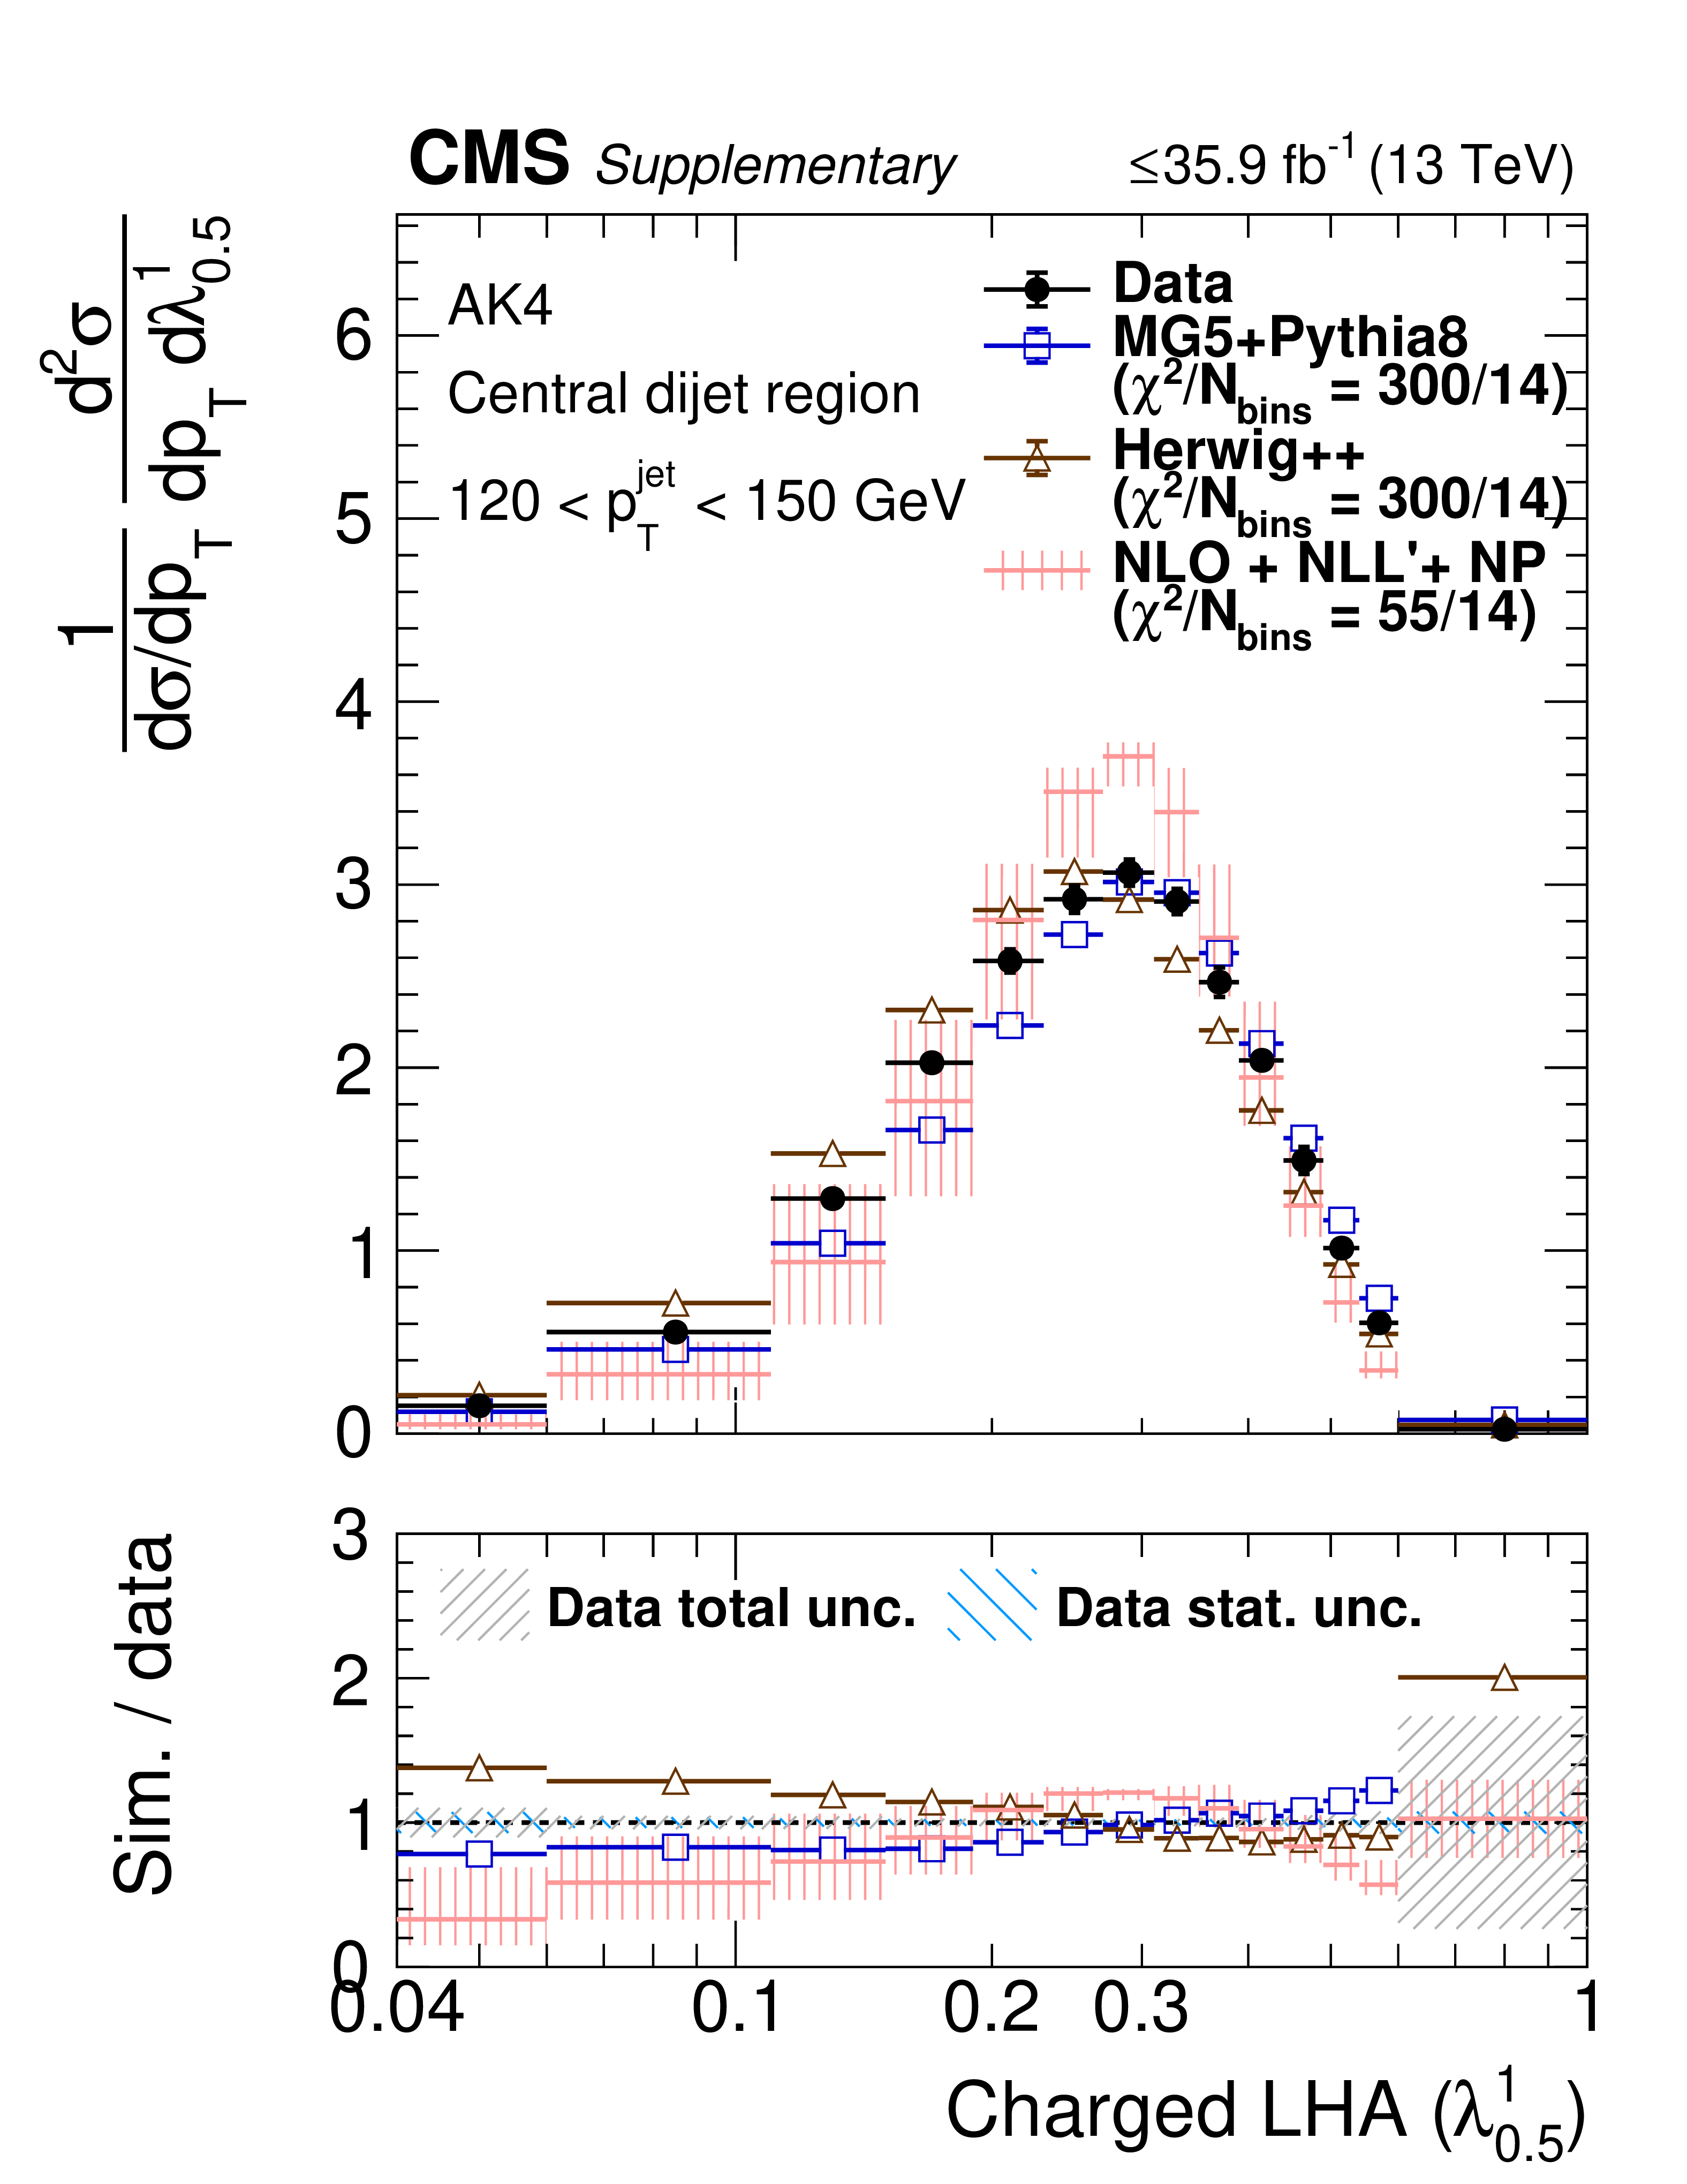
png pdf |
Additional Figure 53-b:
Particle-level distributions of ungroomed charged-only AK4 thrust (${\lambda ^{1}_{2}}$) 120 $ < {p_{\mathrm {T}}} < $ 150 GeV in the Z+jet region (left) and central dijet region (right). The NLO+NLL'+NP predictions are taken from arXiv:2112.09545. |
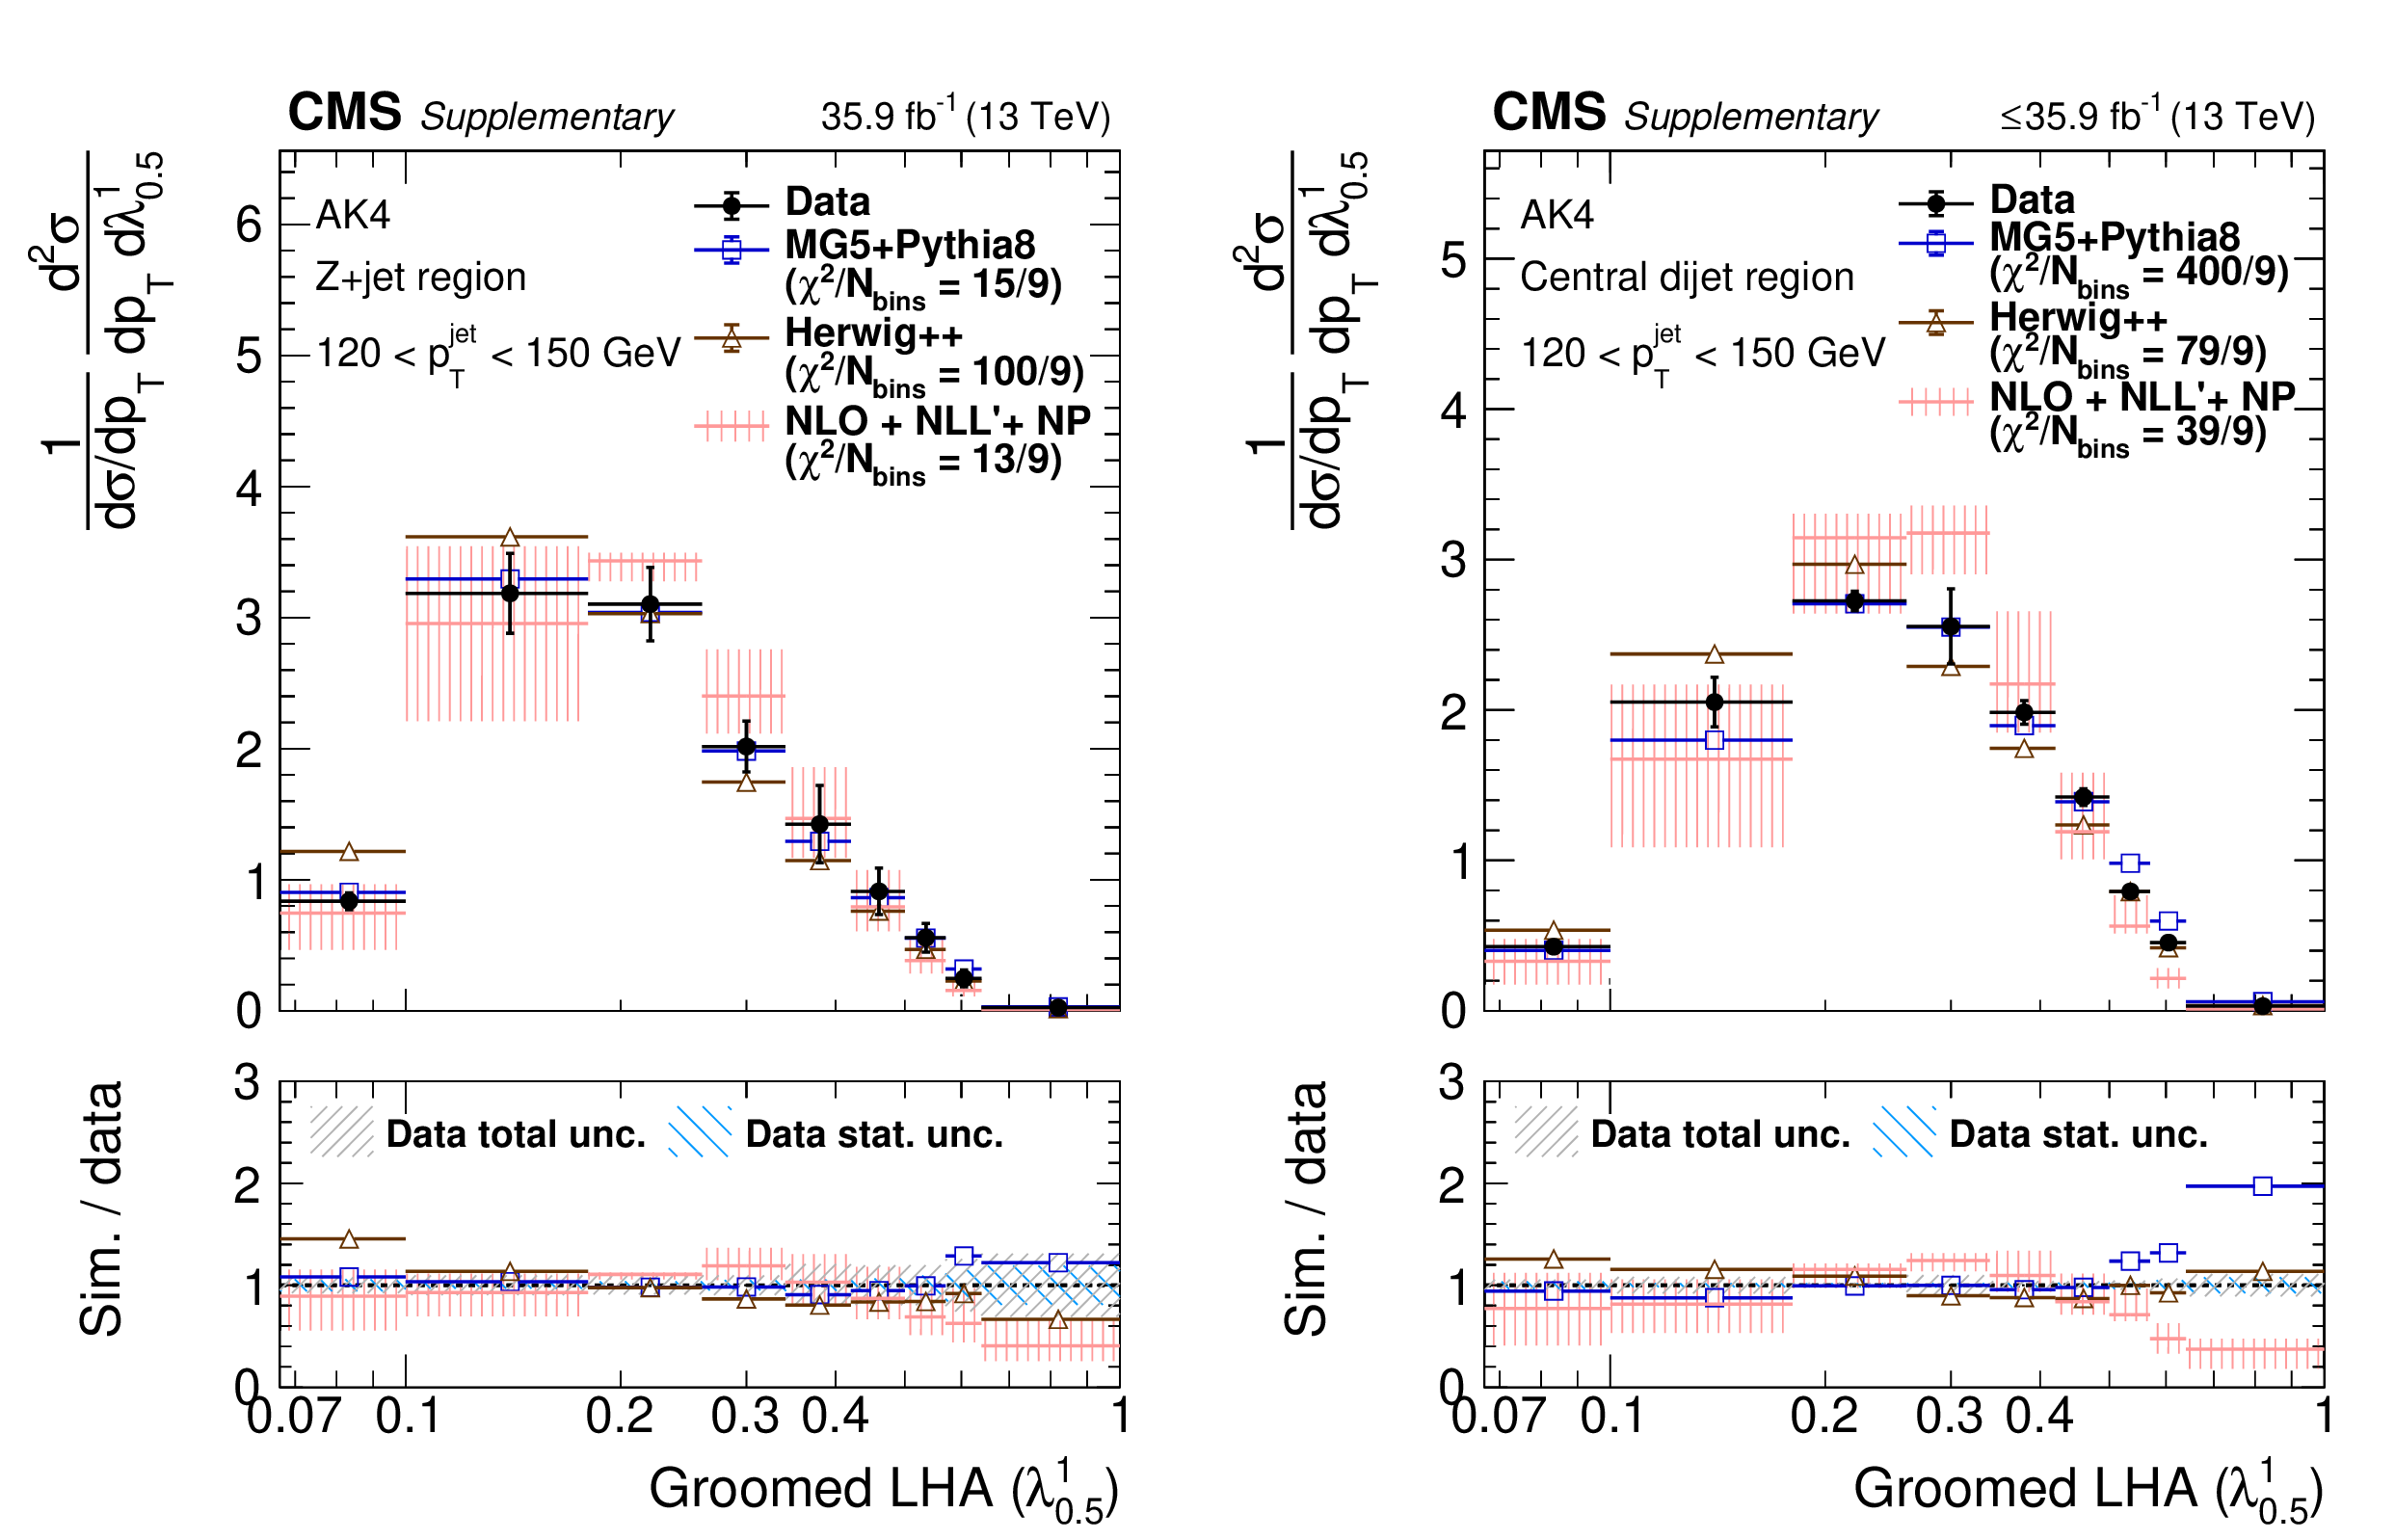
png pdf |
Additional Figure 54:
Particle-level distributions of groomed AK4 thrust (${\lambda ^{1}_{2}}$) 120 $ < {p_{\mathrm {T}}} < $ 150 GeV in the Z+jet region (left) and central dijet region (right). The NLO+NLL'+NP predictions are taken from arXiv:2112.09545. |
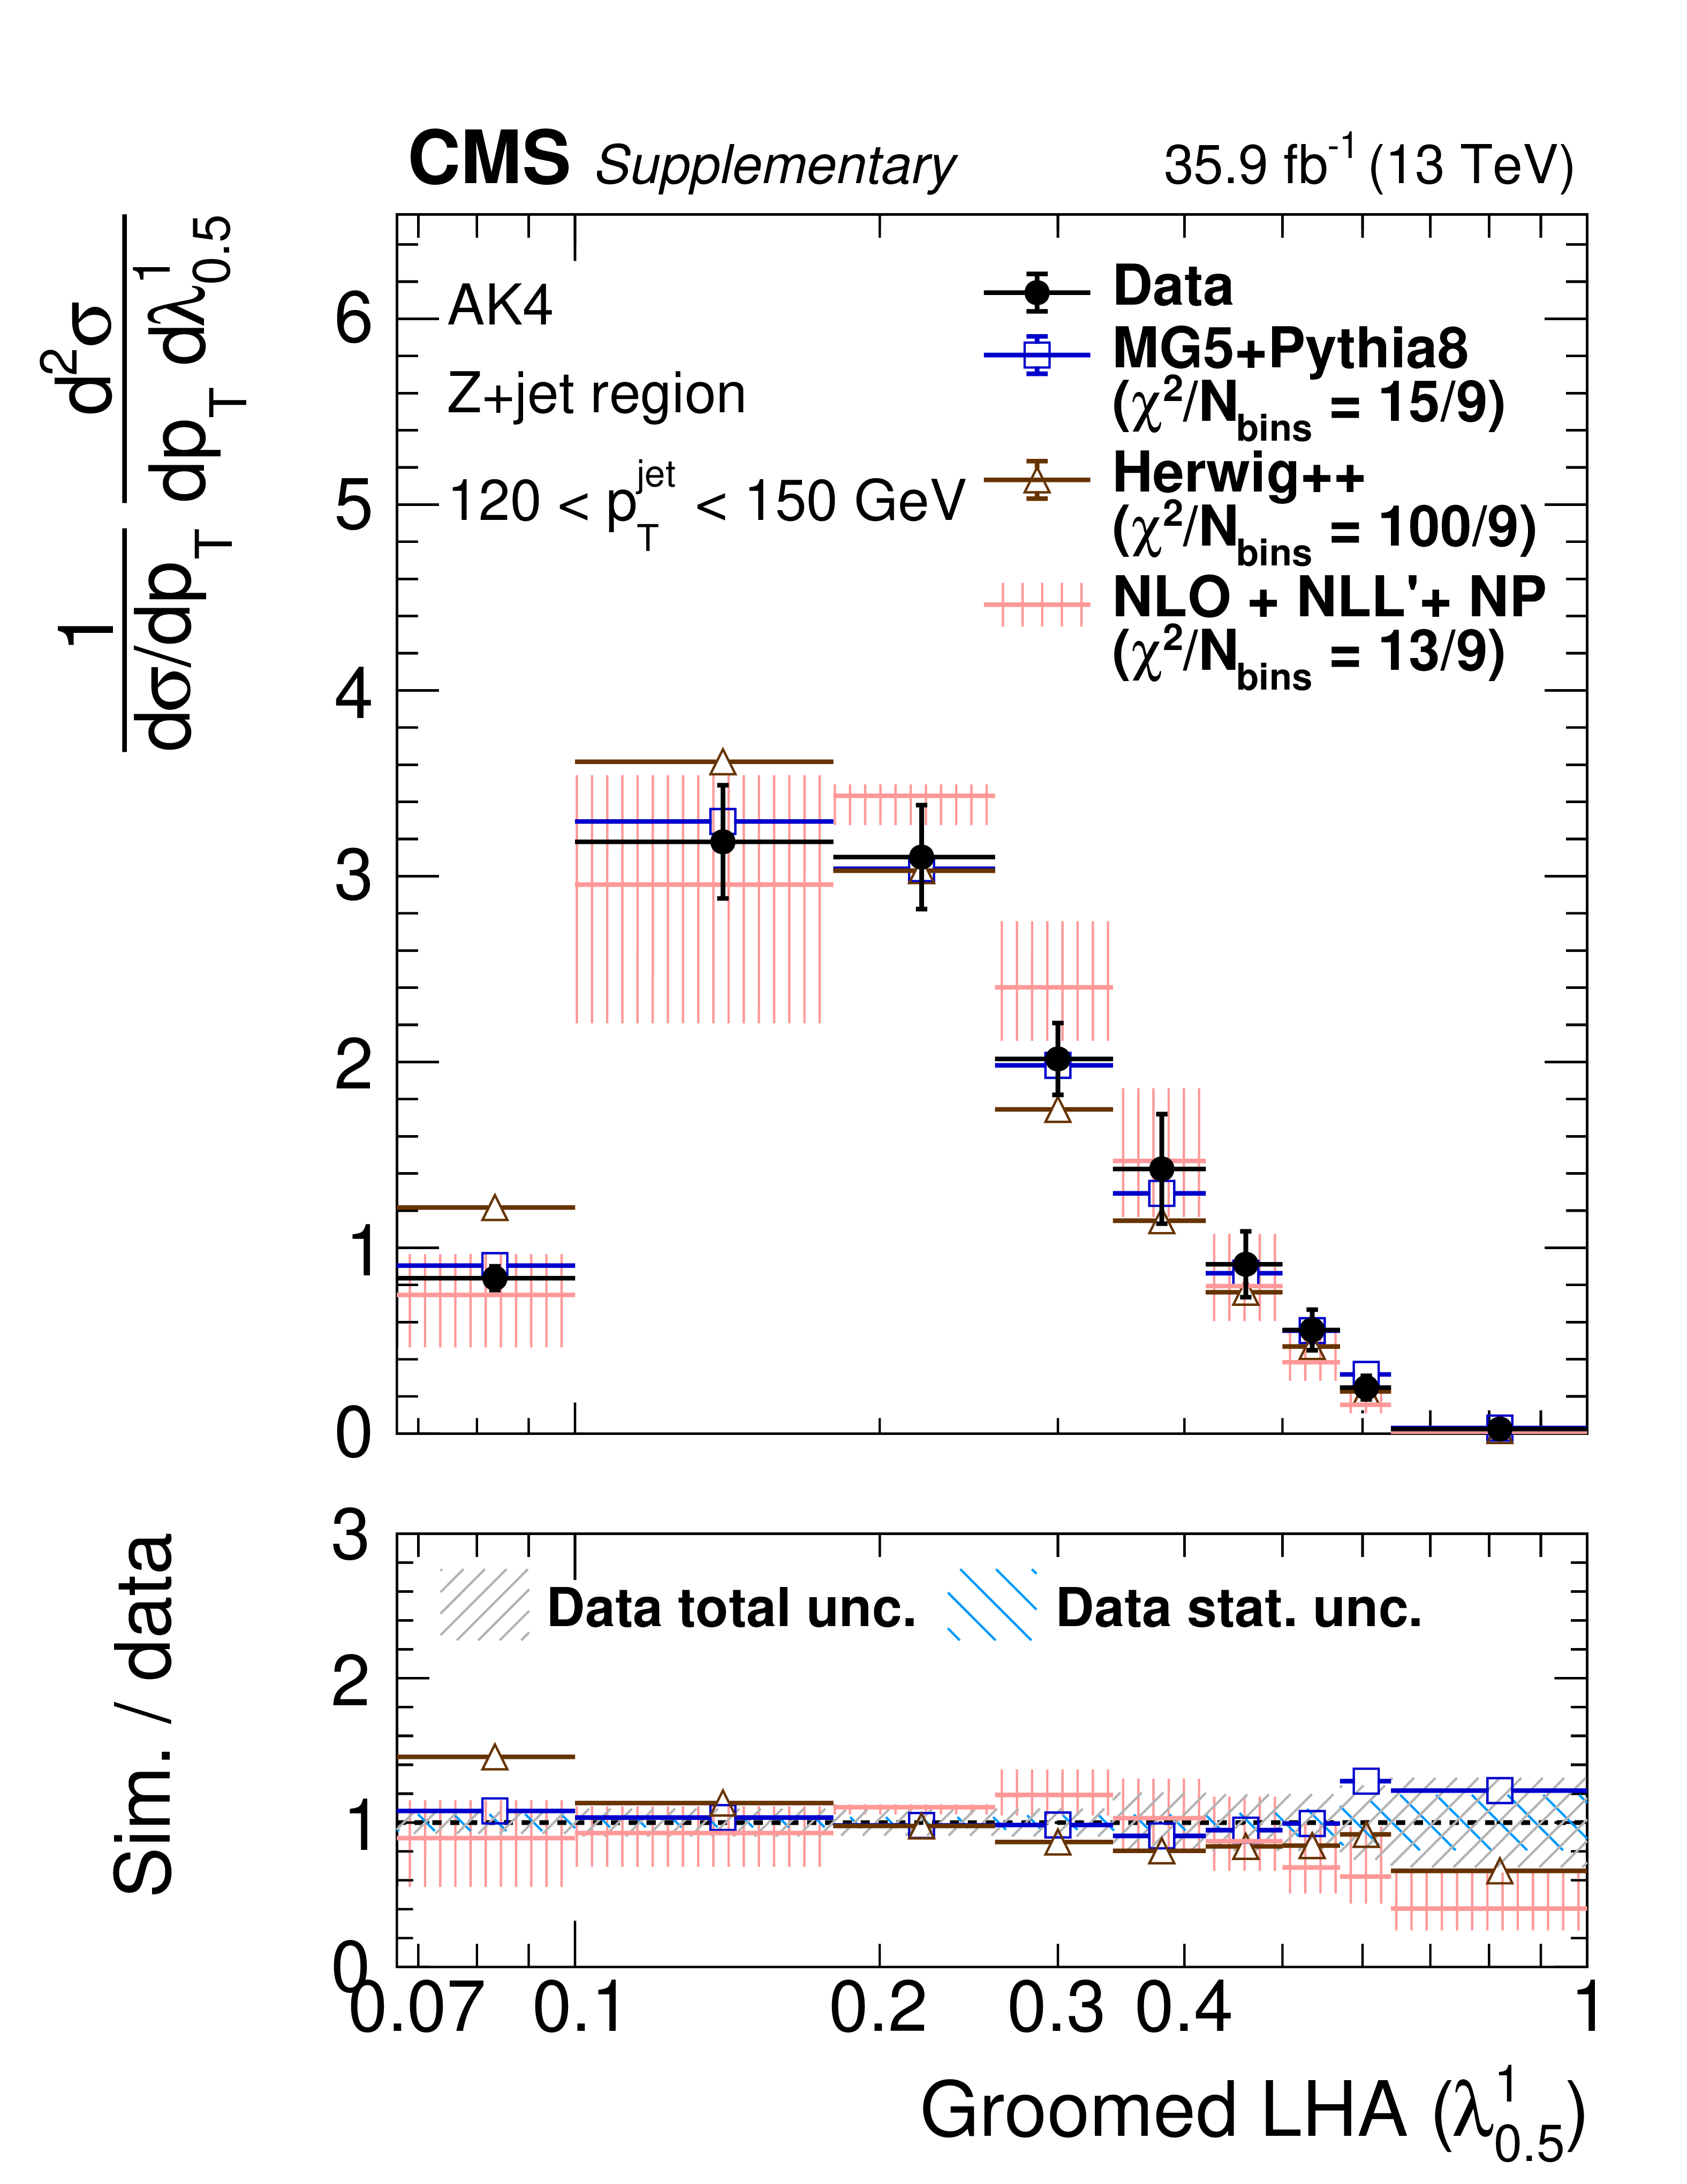
png pdf |
Additional Figure 54-a:
Particle-level distributions of groomed AK4 thrust (${\lambda ^{1}_{2}}$) 120 $ < {p_{\mathrm {T}}} < $ 150 GeV in the Z+jet region (left) and central dijet region (right). The NLO+NLL'+NP predictions are taken from arXiv:2112.09545. |
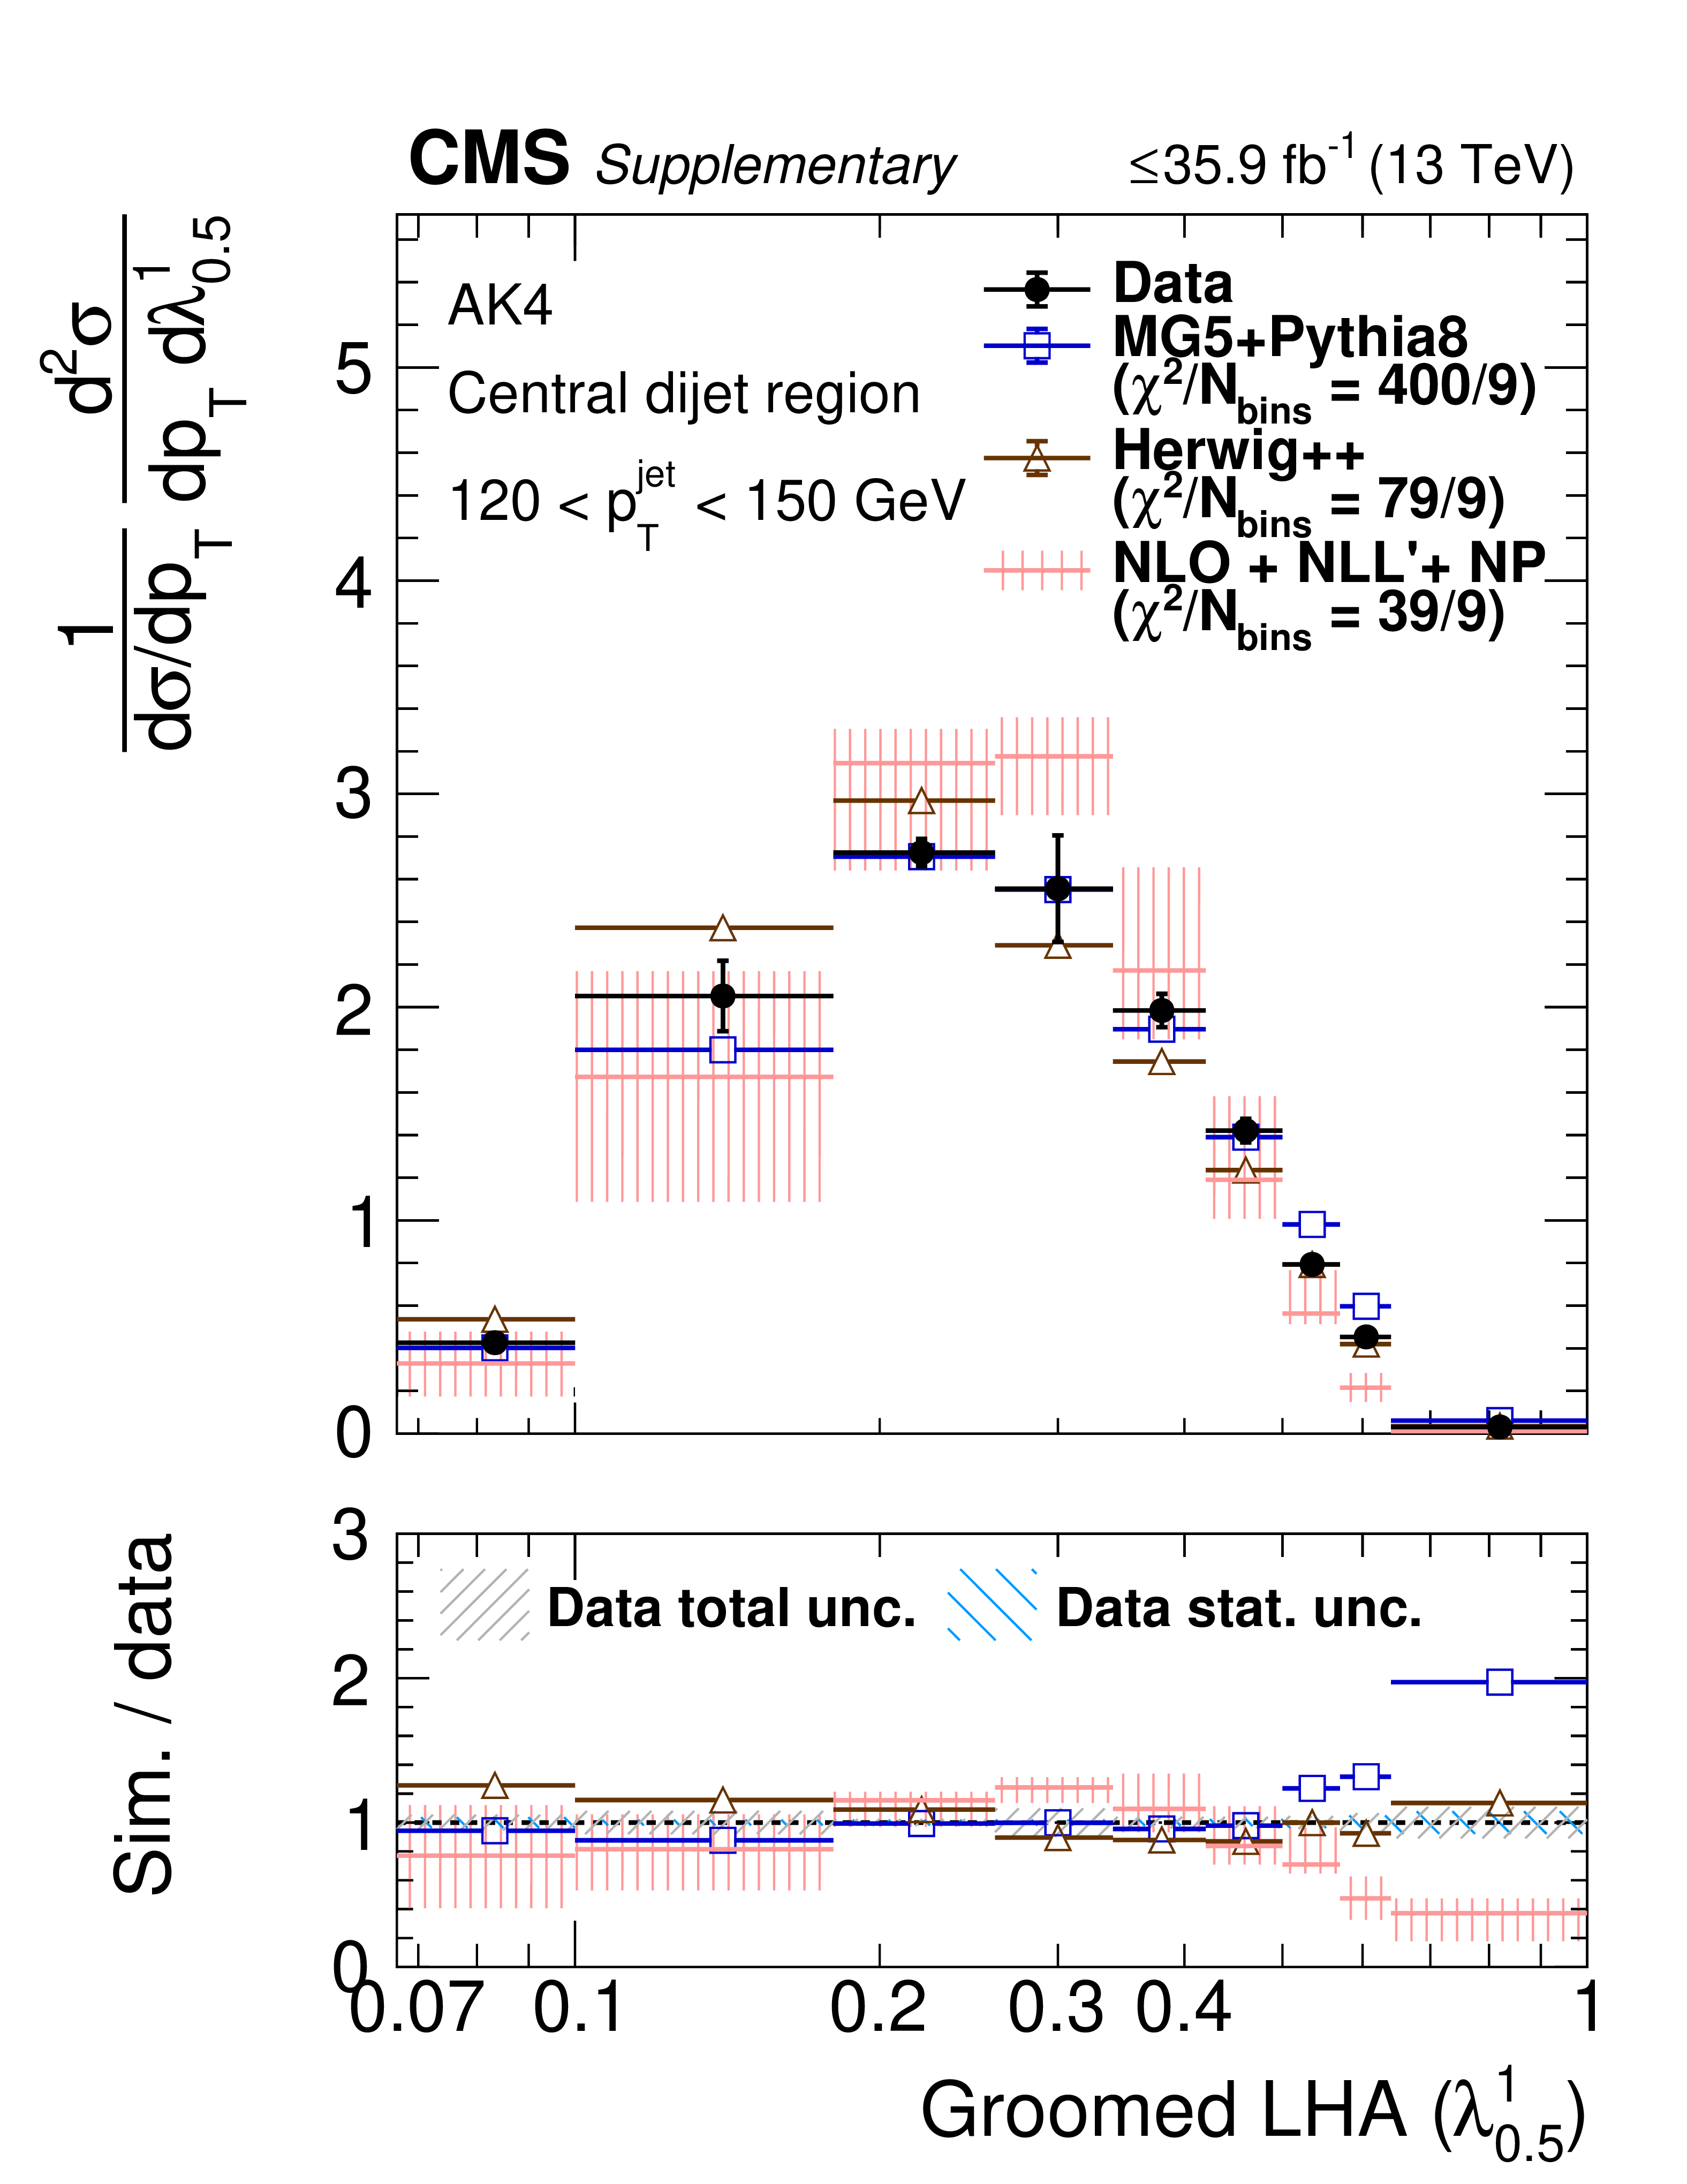
png pdf |
Additional Figure 54-b:
Particle-level distributions of groomed AK4 thrust (${\lambda ^{1}_{2}}$) 120 $ < {p_{\mathrm {T}}} < $ 150 GeV in the Z+jet region (left) and central dijet region (right). The NLO+NLL'+NP predictions are taken from arXiv:2112.09545. |

png pdf |
Additional Figure 55:
Mean value of substructure observables in regions with gluon-enriched and quark-enriched jets, for the following configurations: (1) ungroomed AK4 120 $ < {p_{\mathrm {T}}} < $ 150 GeV, (2) ungroomed AK4 1 $ < {p_{\mathrm {T}}} < $ 4 TeV, (3) ungroomed AK8 120 $ < {p_{\mathrm {T}}} < $ 150 GeV, (4) ungroomed charged AK4 120 $ < {p_{\mathrm {T}}} < $ 150 GeV, and (5) groomed AK4 120 $ < {p_{\mathrm {T}}} < $ 150 GeV; shown for each of the observables LHA (${\lambda ^{1}_{0.5}}$), width (${\lambda ^{1}_{1}}$), thrust (${\lambda ^{1}_{2}}$), multiplicity (${\lambda ^{0}_{0}}$), and ${(p_{\mathrm {T}}^{\mathrm {D}})^2}$ (${\lambda ^{2}_{0}}$). The central jet in the dijet region is used for the gluon-enriched sample, whereas for the quark-enriched sample the jet in the Z+jet region is used for 120 $ < {p_{\mathrm {T}}} < $ 150 GeV, and the forward jet in the dijet region is used for 1 $ < {p_{\mathrm {T}}} < $ 4 TeV. The upper and lower plots show the same data distribution compared with different generator predictions. The error bars on the data correspond to the total uncertainties. The error bars on the simulation correspond to the statistical uncertainties. The Sherpa NLO+jet and NLO+NLL'+NP predictions are taken from arXiv:2112.09545. |

png pdf |
Additional Figure 56:
Ratio of the mean of substructure observables in regions with gluon- and quark-enriched jets, for the following configurations: (1) ungroomed AK4 120 $ < {p_{\mathrm {T}}} < $ 150 GeV, (2) ungroomed AK4 1 $ < {p_{\mathrm {T}}} < $ 4 TeV, (3) ungroomed AK8 120 $ < {p_{\mathrm {T}}} < $ 150 GeV, (4) ungroomed charged AK4 120 $ < {p_{\mathrm {T}}} < $ 150 GeV, and (5) groomed AK4 120 $ < {p_{\mathrm {T}}} < $ 150 GeV; for the observables LHA (${\lambda ^{1}_{0.5}}$), width (${\lambda ^{1}_{1}}$), thrust (${\lambda ^{1}_{2}}$), multiplicity (${\lambda ^{0}_{0}}$), and ${(p_{\mathrm {T}}^{\mathrm {D}})^2}$ (${\lambda ^{2}_{0}}$). The central jet in the dijet region is used for the gluon-enriched sample, whereas for the quark-enriched sample the jet in the Z+jet region is used for 120 $ < {p_{\mathrm {T}}} < $ 150 GeV, whereas the forward jet in the dijet region is used for 1 $ < {p_{\mathrm {T}}} < $ 4 TeV. The upper and lower plots show the same data distribution compared with different generator predictions. The error bars on the data correspond to the total uncertainties. The error bars on the simulation correspond to the statistical uncertainties. The Sherpa NLO+jet and NLO+NLL'+NP predictions are taken from arXiv:2112.09545. |
| References | ||||
| 1 | G. P. Salam | Towards jetography | EPJC 67 (2010) 637 | 0906.1833 |
| 2 | R. Kogler et al. | Jet substructure at the Large Hadron Collider: experimental review | Rev. Mod. Phys. 91 (2019) 045003 | 1803.06991 |
| 3 | A. J. Larkoski, I. Moult, and B. Nachman | Jet substructure at the Large Hadron Collider: a review of recent advances in theory and machine learning | PR 841 (2020) 1 | 1709.04464 |
| 4 | S. Marzani, G. Soyez, and M. Spannowsky | Looking inside jets: an introduction to jet substructure and boosted-object phenomenology | Lect. Notes Phys. 958 (2019) 1 | 1901.10342 |
| 5 | K. Konishi, A. Ukawa, and G. Veneziano | Jet calculus: A simple algorithm for resolving QCD jets | NPB 157 (1979) 45 | |
| 6 | OPAL Collaboration | A study of differences between quark and gluon jets using vertex tagging of quark jets | Z. Phys. C 58 (1993) 387 | |
| 7 | OPAL Collaboration | A model independent measurement of quark and gluon jet properties and differences | Z. Phys. C 68 (1995) 179 | |
| 8 | DELPHI Collaboration | Energy dependence of the differences between the quark and gluon jet fragmentation | Z. Phys. C 70 (1996) 179 | |
| 9 | ALEPH Collaboration | Measurements of the structure of quark and gluon jets in hadronic Z decays | EPJC 17 (2000) 1 | |
| 10 | ALEPH Collaboration | Quark and gluon jet properties in symmetric three jet events | PLB 384 (1996) 353 | |
| 11 | ALEPH Collaboration | Studies of quantum chromodynamics with the ALEPH detector | PR 294 (1998) 1 | |
| 12 | P. Gras et al. | Systematics of quark/gluon tagging | JHEP 07 (2017) 091 | 1704.03878 |
| 13 | ATLAS Collaboration | Properties of jet fragmentation using charged particles measured with the ATLAS detector in pp collisions at $ \sqrt{s}= $ 13 TeV | PRD 100 (2019) 052011 | 1906.09254 |
| 14 | ATLAS Collaboration | Properties of $ \mathrm{g}\rightarrow \mathrm{b}\overline{\mathrm{b}} $ at small opening angles in $ \mathrm{pp} $ collisions with the ATLAS detector at $ \sqrt{s}= $ 13 TeV | PRD 99 (2019) 052004 | 1812.09283 |
| 15 | ATLAS Collaboration | Measurement of jet fragmentation in 5.02 TeV proton-lead and proton-proton collisions with the ATLAS detector | NP A 978 (2018) 65 | 1706.02859 |
| 16 | ATLAS Collaboration | Measurement of jet fragmentation in Pb+Pb and pp collisions at $ \sqrt{{s_\mathrm{NN}}} = $ 2.76 TeV with the ATLAS detector at the LHC | EPJC 77 (2017) 379 | 1702.00674 |
| 17 | ATLAS Collaboration | Measurement of the charged-particle multiplicity inside jets from $ \sqrt{s}= $ 8 TeV pp collisions with the ATLAS detector | EPJC 76 (2016) 322 | 1602.00988 |
| 18 | ATLAS Collaboration | Measurement of the jet fragmentation function and transverse profile in proton-proton collisions at a center-of-mass energy of 7 TeV with the ATLAS detector | EPJC 71 (2011) 1795 | 1109.5816 |
| 19 | ATLAS Collaboration | Properties of jets measured from tracks in proton-proton collisions at center-of-mass energy $ \sqrt{s}= $ 7 TeV with the ATLAS detector | PRD 84 (2011) 054001 | 1107.3311 |
| 20 | CMS Collaboration | Jet shapes of isolated photon-tagged jets in Pb-Pb and pp collisions at $ \sqrt{s_\mathrm{NN}} = $ 5.02 TeV | PRL 122 (2019) 152001 | CMS-HIN-18-006 1809.08602 |
| 21 | CMS Collaboration | Measurement of the splitting function in pp and Pb-Pb collisions at $ \sqrt{s_{\mathrm{NN}}} = $ 5.02 TeV | PRL 120 (2018) 142302 | CMS-HIN-16-006 1708.09429 |
| 22 | CMS Collaboration | Measurement of jet fragmentation in PbPb and pp collisions at $ \sqrt{s_{\mathrm{NN}}} = $ 2.76 TeV | PRC 90 (2014) 024908 | CMS-HIN-12-013 1406.0932 |
| 23 | CMS Collaboration | Shape, transverse size, and charged hadron multiplicity of jets in pp collisions at 7 TeV | JHEP 06 (2012) 160 | CMS-QCD-10-029 1204.3170 |
| 24 | CMS Collaboration | Measurement of jet fragmentation into charged particles in pp and PbPb collisions at $ \sqrt{s_{\mathrm{NN}}}= $ 2.76 TeV | JHEP 10 (2012) 087 | CMS-HIN-11-004 1205.5872 |
| 25 | ALICE Collaboration | Exploration of jet substructure using iterative declustering in pp and Pb-Pb collisions at LHC energies | PLB 802 (2020) 135227 | 1905.02512 |
| 26 | ALICE Collaboration | Measurement of the production of charm jets tagged with D$ ^{0} $ mesons in pp collisions at $ \sqrt{\mathrm{s}}= $ 7 TeV | JHEP 08 (2019) 133 | 1905.02510 |
| 27 | ALICE Collaboration | Jet fragmentation transverse momentum measurements from di-hadron correlations in $ \sqrt{s} = $ 7 TeV pp and $ \sqrt{s_{\rm{NN}}} = $ 5.02 TeV p-Pb collisions | JHEP 03 (2019) 169 | 1811.09742 |
| 28 | ALICE Collaboration | Charged jet cross section and fragmentation in proton-proton collisions at $ \sqrt{s} = $ 7 TeV | PRD 99 (2019) 012016 | 1809.03232 |
| 29 | LHCb Collaboration | Measurement of charged hadron production in Z-tagged jets in proton-proton collisions at $ \sqrt{s}= $ 8 TeV | PRL 123 (2019) 232001 | 1904.08878 |
| 30 | ATLAS Collaboration | Measurement of the Lund jet plane using charged particles in 13 TeV proton-proton collisions with the ATLAS detector | PRL 124 (2020) 222002 | 2004.03540 |
| 31 | ATLAS Collaboration | Measurement of soft-drop jet observables in pp collisions with the ATLAS detector at $ \sqrt {s} = $ 13 TeV | PRD 101 (2020) 052007 | 1912.09837 |
| 32 | ATLAS Collaboration | Measurement of jet-substructure observables in top quark, W boson and light jet production in proton-proton collisions at $ \sqrt{s}= $ 13 TeV with the ATLAS detector | JHEP 08 (2019) 033 | 1903.02942 |
| 33 | ATLAS Collaboration | Measurement of the jet mass in high transverse momentum $ \mathrm{Z}(\rightarrow \mathrm{b}\overline{\mathrm{b}})\gamma $ production at $ \sqrt{s}= $ 13 TeV using the ATLAS detector | PLB 812 (2021) 135991 | 1907.07093 |
| 34 | ATLAS Collaboration | Measurement of colour flow using jet-pull observables in $ \mathrm{t}\overline{\mathrm{t}} $ events with the ATLAS experiment at $ \sqrt{s} = $ 13 TeV | EPJC 78 (2018) 847 | 1805.02935 |
| 35 | ATLAS Collaboration | Measurement of the soft-drop jet mass in pp collisions at $ \sqrt{s} = $ 13 TeV with the ATLAS detector | PRL 121 (2018) 092001 | 1711.08341 |
| 36 | ATLAS Collaboration | Measurement of colour flow with the jet pull angle in $ \mathrm{t}\overline{\mathrm{t}} $ events using the ATLAS detector at $ \sqrt{s}= $ 8 TeV | PLB 750 (2015) 475 | 1506.05629 |
| 37 | ATLAS Collaboration | Measurement of jet charge in dijet events from $ \sqrt{s} = $ 8 TeV pp collisions with the ATLAS detector | PRD 93 (2016) 052003 | 1509.05190 |
| 38 | ATLAS Collaboration | Measurement of jet shapes in top-quark pair events at $ \sqrt{s} = $ 7 TeV using the ATLAS detector | EPJC 73 (2013) 2676 | 1307.5749 |
| 39 | ATLAS Collaboration | ATLAS measurements of the properties of jets for boosted particle searches | PRD 86 (2012) 072006 | 1206.5369 |
| 40 | ATLAS Collaboration | Jet mass and substructure of inclusive jets in $ \sqrt{s}= $ 7 TeV pp collisions with the ATLAS experiment | JHEP 05 (2012) 128 | 1203.4606 |
| 41 | CMS Collaboration | Measurement of jet substructure observables in $ \mathrm{t\overline{t}} $ events from proton-proton collisions at $ \sqrt{s}= $ 13 TeV | PRD 98 (2018) 092014 | CMS-TOP-17-013 1808.07340 |
| 42 | CMS Collaboration | Measurements of the differential jet cross section as a function of the jet mass in dijet events from proton-proton collisions at $ \sqrt{s}= $ 13 TeV | JHEP 11 (2018) 113 | CMS-SMP-16-010 1807.05974 |
| 43 | CMS Collaboration | Measurement of the jet mass in highly boosted $ {\mathrm{t}}\overline{\mathrm{t}} $ events from pp collisions at $ \sqrt{s}= $ 8 TeV | EPJC 77 (2017) 467 | CMS-TOP-15-015 1703.06330 |
| 44 | CMS Collaboration | Measurements of jet charge with dijet events in pp collisions at $ \sqrt{s}= $ 8 TeV | JHEP 10 (2017) 131 | CMS-SMP-15-003 1706.05868 |
| 45 | CMS Collaboration | Studies of jet mass in dijet and W/Z + jet events | JHEP 05 (2013) 090 | CMS-SMP-12-019 1303.4811 |
| 46 | A. J. Larkoski, J. Thaler, and W. J. Waalewijn | Gaining (mutual) information about quark/gluon discrimination | JHEP 11 (2014) 129 | 1408.3122 |
| 47 | J. R. Andersen et al. | Les Houches 2015: Physics at TeV colliders Standard Model working group report | in 9th Les Houches Workshop on Physics at TeV Colliders (PhysTeV 2015) Les Houches, France 2015 | 1605.04692 |
| 48 | E. Farhi | Quantum chromodynamics test for jets | PRL 39 (1977) 1587 | |
| 49 | CMS Collaboration | Performance of quark/gluon discrimination in 8 TeV pp data | CMS-PAS-JME-13-002 | CMS-PAS-JME-13-002 |
| 50 | CMS Collaboration | Jet algorithms performance in 13 TeV data | CMS-PAS-JME-16-003 | CMS-PAS-JME-16-003 |
| 51 | ATLAS Collaboration | Light-quark and gluon jet discrimination in pp collisions at $ \sqrt{s}=$ 7 TeV with the ATLAS detector | EPJC 74 (2014) 3023 | 1405.6583 |
| 52 | A. J. Larkoski, S. Marzani, G. Soyez, and J. Thaler | Soft drop | JHEP 05 (2014) 146 | 1402.2657 |
| 53 | S. Caletti et al. | Jet angularities in Z+jet production at the LHC | JHEP 07 (2021) 076 | 2104.06920 |
| 54 | CMS Collaboration | The CMS experiment at the CERN LHC | JINST 3 (2008) S08004 | CMS-00-001 |
| 55 | CMS Collaboration | Description and performance of track and primary-vertex reconstruction with the CMS tracker | JINST 9 (2014) P10009 | CMS-TRK-11-001 1405.6569 |
| 56 | M. Cacciari, G. P. Salam, and G. Soyez | The anti-$ {k_{\mathrm{T}}} $ jet clustering algorithm | JHEP 04 (2008) 063 | 0802.1189 |
| 57 | M. Cacciari, G. P. Salam, and G. Soyez | FastJet user manual | EPJC 72 (2012) 1896 | 1111.6097 |
| 58 | CMS Collaboration | Performance of the CMS muon detector and muon reconstruction with proton-proton collisions at $ \sqrt{s} = $ 13 TeV | JINST 13 (2018) P06015 | CMS-MUO-16-001 1804.04528 |
| 59 | CMS Collaboration | Particle-flow reconstruction and global event description with the CMS detector | JINST 12 (2017) P10003 | CMS-PRF-14-001 1706.04965 |
| 60 | D. Bertolini, P. Harris, M. Low, and N. Tran | Pileup per particle identification | JHEP 10 (2014) 059 | 1407.6013 |
| 61 | CMS Collaboration | Pileup mitigation at CMS in 13 TeV data | JINST 15 (2020) P09018 | CMS-JME-18-001 2003.00503 |
| 62 | CMS Collaboration | Jet energy scale and resolution in the CMS experiment in pp collisions at 8 TeV | JINST 12 (2017) P02014 | CMS-JME-13-004 1607.03663 |
| 63 | CMS Collaboration | The CMS trigger system | JINST 12 (2017) P01020 | CMS-TRG-12-001 1609.02366 |
| 64 | CMS Collaboration | Performance of the CMS level-1 trigger in proton-proton collisions at $ \sqrt{s} = $ 13 TeV | JINST 15 (2020) P10017 | CMS-TRG-17-001 2006.10165 |
| 65 | CMS Collaboration | Performance of the CMS muon trigger system in proton-proton collisions at $ \sqrt{s} = $ 13 TeV | JINST 16 (2021) P07001 | CMS-MUO-19-001 2102.04790 |
| 66 | J. Alwall et al. | The automated computation of tree-level and next-to-leading order differential cross sections, and their matching to parton shower simulations | JHEP 07 (2014) 079 | 1405.0301 |
| 67 | T. Sjostrand et al. | An introduction to PYTHIA 8.2 | CPC 191 (2015) 159 | 1410.3012 |
| 68 | B. Andersson, G. Gustafson, G. Ingelman, and T. Sjostrand | Parton fragmentation and string dynamics | PR 97 (1983) 31 | |
| 69 | T. Sjostrand | The merging of jets | PLB 142 (1984) 420 | |
| 70 | J. Alwall et al. | Comparative study of various algorithms for the merging of parton showers and matrix elements in hadronic collisions | EPJC 53 (2008) 473 | 0706.2569 |
| 71 | P. Skands, S. Carrazza, and J. Rojo | Tuning PYTHIA 8.1: the Monash 2013 tune | EPJC 74 (2014) 3024 | 1404.5630 |
| 72 | CMS Collaboration | Event generator tunes obtained from underlying event and multiparton scattering measurements | EPJC 76 (2016) 155 | CMS-GEN-14-001 1512.00815 |
| 73 | M. Bahr et al. | Herwig++ physics and manual | EPJC 58 (2008) 639 | 0803.0883 |
| 74 | J. Bellm et al. | Herwig++ 2.7 release note | 1310.6877 | |
| 75 | M. H. Seymour and A. Siodmok | Constraining MPI models using $ \sigma_{\mathrm{eff}} $ and recent Tevatron and LHC underlying event data | JHEP 10 (2013) 113 | 1307.5015 |
| 76 | S. Gieseke, P. Stephens, and B. Webber | New formalism for QCD parton showers | JHEP 12 (2003) 045 | hep-ph/0310083 |
| 77 | B. R. Webber | A QCD model for jet fragmentation including soft gluon interference | NPB 238 (1984) 492 | |
| 78 | J. M. Lindert et al. | Precise predictions for V+jets dark matter backgrounds | EPJC 77 (2017) 829 | 1705.04664 |
| 79 | NNPDF Collaboration | Parton distributions for the LHC Run II | JHEP 04 (2015) 040 | 1410.8849 |
| 80 | GEANT4 Collaboration | GEANT4--a simulation toolkit | NIMA 506 (2003) 250 | |
| 81 | CMS Collaboration | Extraction and validation of a new set of CMS PYTHIA8 tunes from underlying-event measurements | EPJC 80 (2020) 4 | CMS-GEN-17-001 1903.12179 |
| 82 | J. Bellm et al. | Herwig 7.0/Herwig++ 3.0 release note | EPJC 76 (2016) 196 | 1512.01178 |
| 83 | CMS Collaboration | Development and validation of HERWIG 7 tunes from CMS underlying-event measurements | EPJC 81 (2021) 312 | CMS-GEN-19-001 2011.03422 |
| 84 | Sherpa Collaboration | Event generation with Sherpa 2.2 | SciPost Phys. 7 (2019) 034 | 1905.09127 |
| 85 | F. Krauss, R. Kuhn, and G. Soff | AMEGIC++ 1.0: a matrix element generator in C++ | JHEP 02 (2002) 044 | hep-ph/0109036 |
| 86 | T. Gleisberg and S. Hoeche | Comix, a new matrix element generator | JHEP 12 (2008) 039 | 0808.3674 |
| 87 | S. Catani, F. Krauss, R. Kuhn, and B. R. Webber | QCD matrix elements+parton showers | JHEP 11 (2001) 063 | hep-ph/0109231 |
| 88 | F. Krauss | Matrix elements and parton showers in hadronic interactions | JHEP 08 (2002) 015 | hep-ph/0205283 |
| 89 | A. Schalicke and F. Krauss | Implementing the ME+PS merging algorithm | JHEP 07 (2005) 018 | hep-ph/0503281 |
| 90 | S. Schumann and F. Krauss | A parton shower algorithm based on Catani-Seymour dipole factorisation | JHEP 03 (2008) 038 | 0709.1027 |
| 91 | J.-C. Winter, F. Krauss, and G. Soff | A modified cluster hadronization model | EPJC 36 (2004) 381 | hep-ph/0311085 |
| 92 | D. Reichelt, P. Richardson, and A. Siodmok | Improving the simulation of quark and gluon jets with Herwig 7 | EPJC 77 (2017) 876 | 1708.01491 |
| 93 | M. Rubin, G. P. Salam, and S. Sapeta | Giant QCD k-factors beyond NLO | JHEP 09 (2010) 084 | 1006.2144 |
| 94 | A. J. Larkoski, D. Neill, and J. Thaler | Jet shapes with the broadening axis | JHEP 04 (2014) 017 | 1401.2158 |
| 95 | Y. L. Dokshitzer, G. D. Leder, S. Moretti, and B. R. Webber | Better jet clustering algorithms | JHEP 08 (1997) 001 | hep-ph/9707323 |
| 96 | M. Dasgupta, A. Fregoso, S. Marzani, and G. P. Salam | Towards an understanding of jet substructure | JHEP 09 (2013) 029 | 1307.0007 |
| 97 | J. M. Butterworth, A. R. Davison, M. Rubin, and G. P. Salam | Jet substructure as a new Higgs search channel at the LHC | PRL 100 (2008) 242001 | 0802.2470 |
| 98 | CMS Collaboration | HEPData record for this analysis | HEPData record for this analysis | |
| 99 | S. Schmitt | TUnfold: an algorithm for correcting migration effects in high energy physics | JINST 7 (2012) T10003 | 1205.6201 |
| 100 | CMS Collaboration | Measurement of the inelastic proton-proton cross section at $ \sqrt{s}= $ 13 TeV | JHEP 07 (2018) 161 | CMS-FSQ-15-005 1802.02613 |
| 101 | M. Cacciari et al. | The $ \mathrm{t\bar{t}} $ cross-section at 1.8 TeV and 1.96 TeV: a study of the systematics due to parton densities and scale dependence | JHEP 04 (2004) 068 | hep-ph/0303085 |
| 102 | S. Catani, D. de Florian, M. Grazzini, and P. Nason | Soft gluon resummation for Higgs boson production at hadron colliders | JHEP 07 (2003) 028 | hep-ph/0306211 |
|
|
Compact Muon Solenoid LHC, CERN |
|

|

|

|

|

|