

Compact Muon Solenoid
LHC, CERN
| CMS-B2G-17-017 ; CERN-EP-2018-254 | ||
| Search for resonant $\mathrm{t\bar{t}}$ production in proton-proton collisions at $\sqrt{s} = $ 13 TeV | ||
| CMS Collaboration | ||
| 14 October 2018 | ||
| JHEP 04 (2019) 031 | ||
| Abstract: A search for a heavy resonance decaying into a top quark and antiquark ($\mathrm{t\bar{t}}$) pair is performed using proton-proton collisions at $\sqrt{s} = $ 13 TeV. The search uses the data set collected with the CMS detector in 2016, which corresponds to an integrated luminosity of 35.9 fb$^{-1}$. The analysis considers three exclusive final states and uses reconstruction techniques that are optimized for top quarks with high Lorentz boosts, which requires the use of nonisolated leptons and jet substructure techniques. No significant excess of events relative to the expected yield from standard model processes is observed. Upper limits on the production cross section of heavy resonances decaying to a $\mathrm{t\bar{t}}$ pair are calculated. Limits are derived for a leptophobic topcolor Z' resonance with widths of 1, 10, and 30%, relative to the mass of the resonance, and exclude masses up to 3.80, 5.25, and 6.65 TeV, respectively. Kaluza-Klein excitations of the gluon in the Randall-Sundrum model are excluded up to 4.55 TeV. To date, these are the most stringent limits on $\mathrm{t\bar{t}}$ resonances. | ||
| Links: e-print arXiv:1810.05905 [hep-ex] (PDF) ; CDS record ; inSPIRE record ; HepData record ; CADI line (restricted) ; | ||
| Figures | |
png pdf |
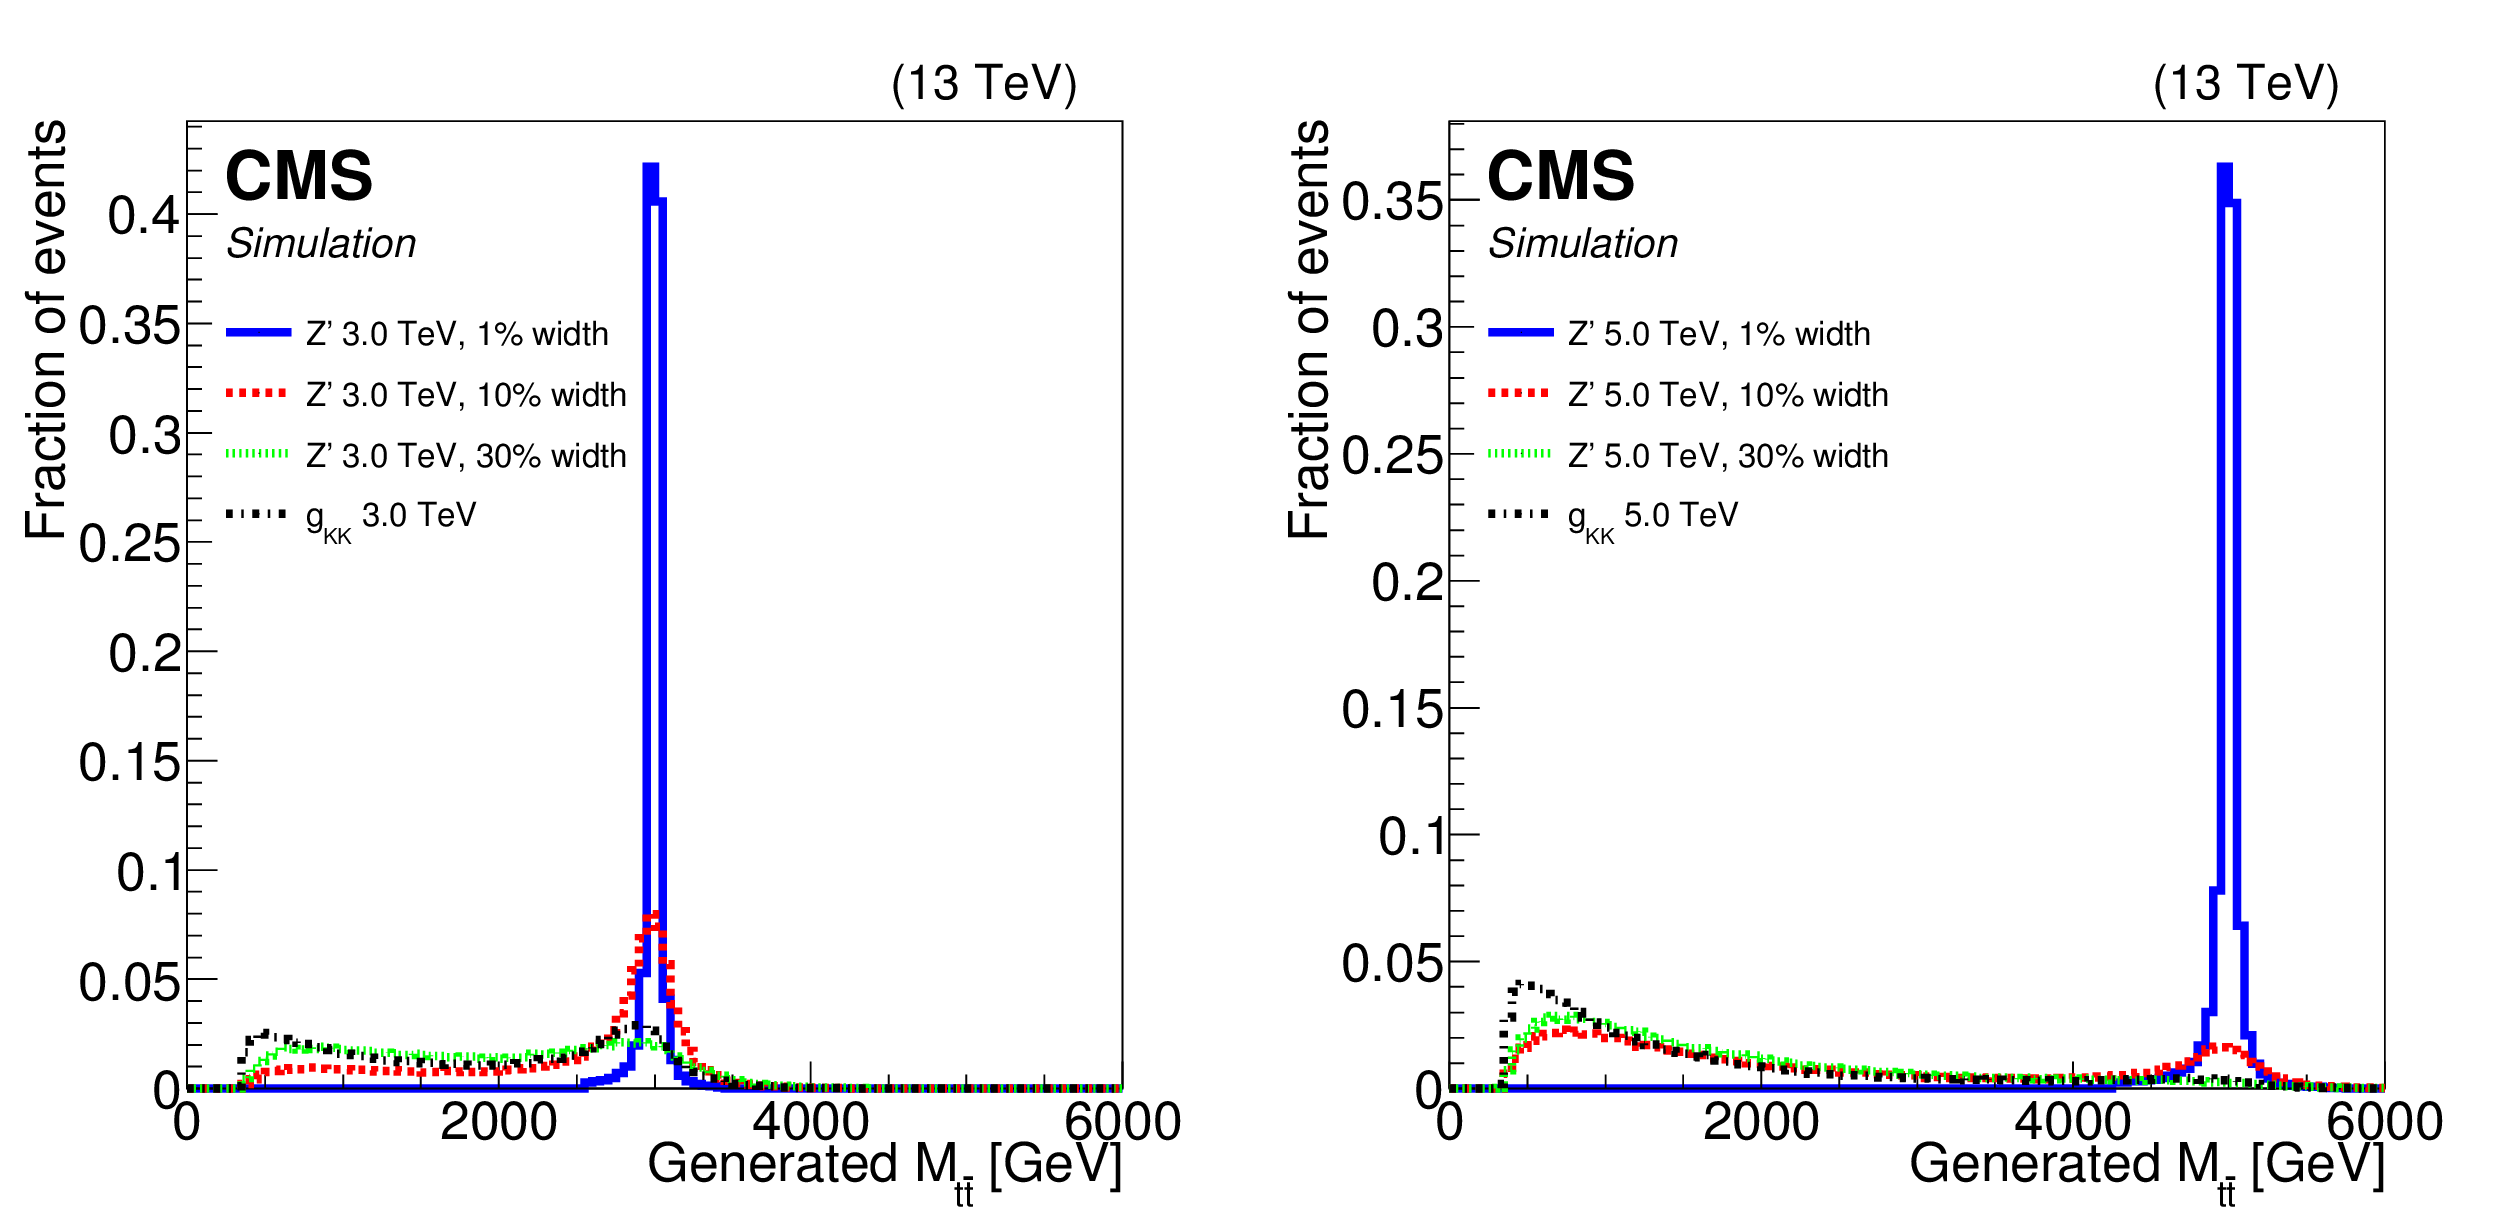
Figure 1:
The $ {{\mathrm {t}\overline {\mathrm {t}}}} $ invariant mass distributions for four signal models with resonance masses of 3 TeV (left) and 5 TeV (right). |
png pdf |
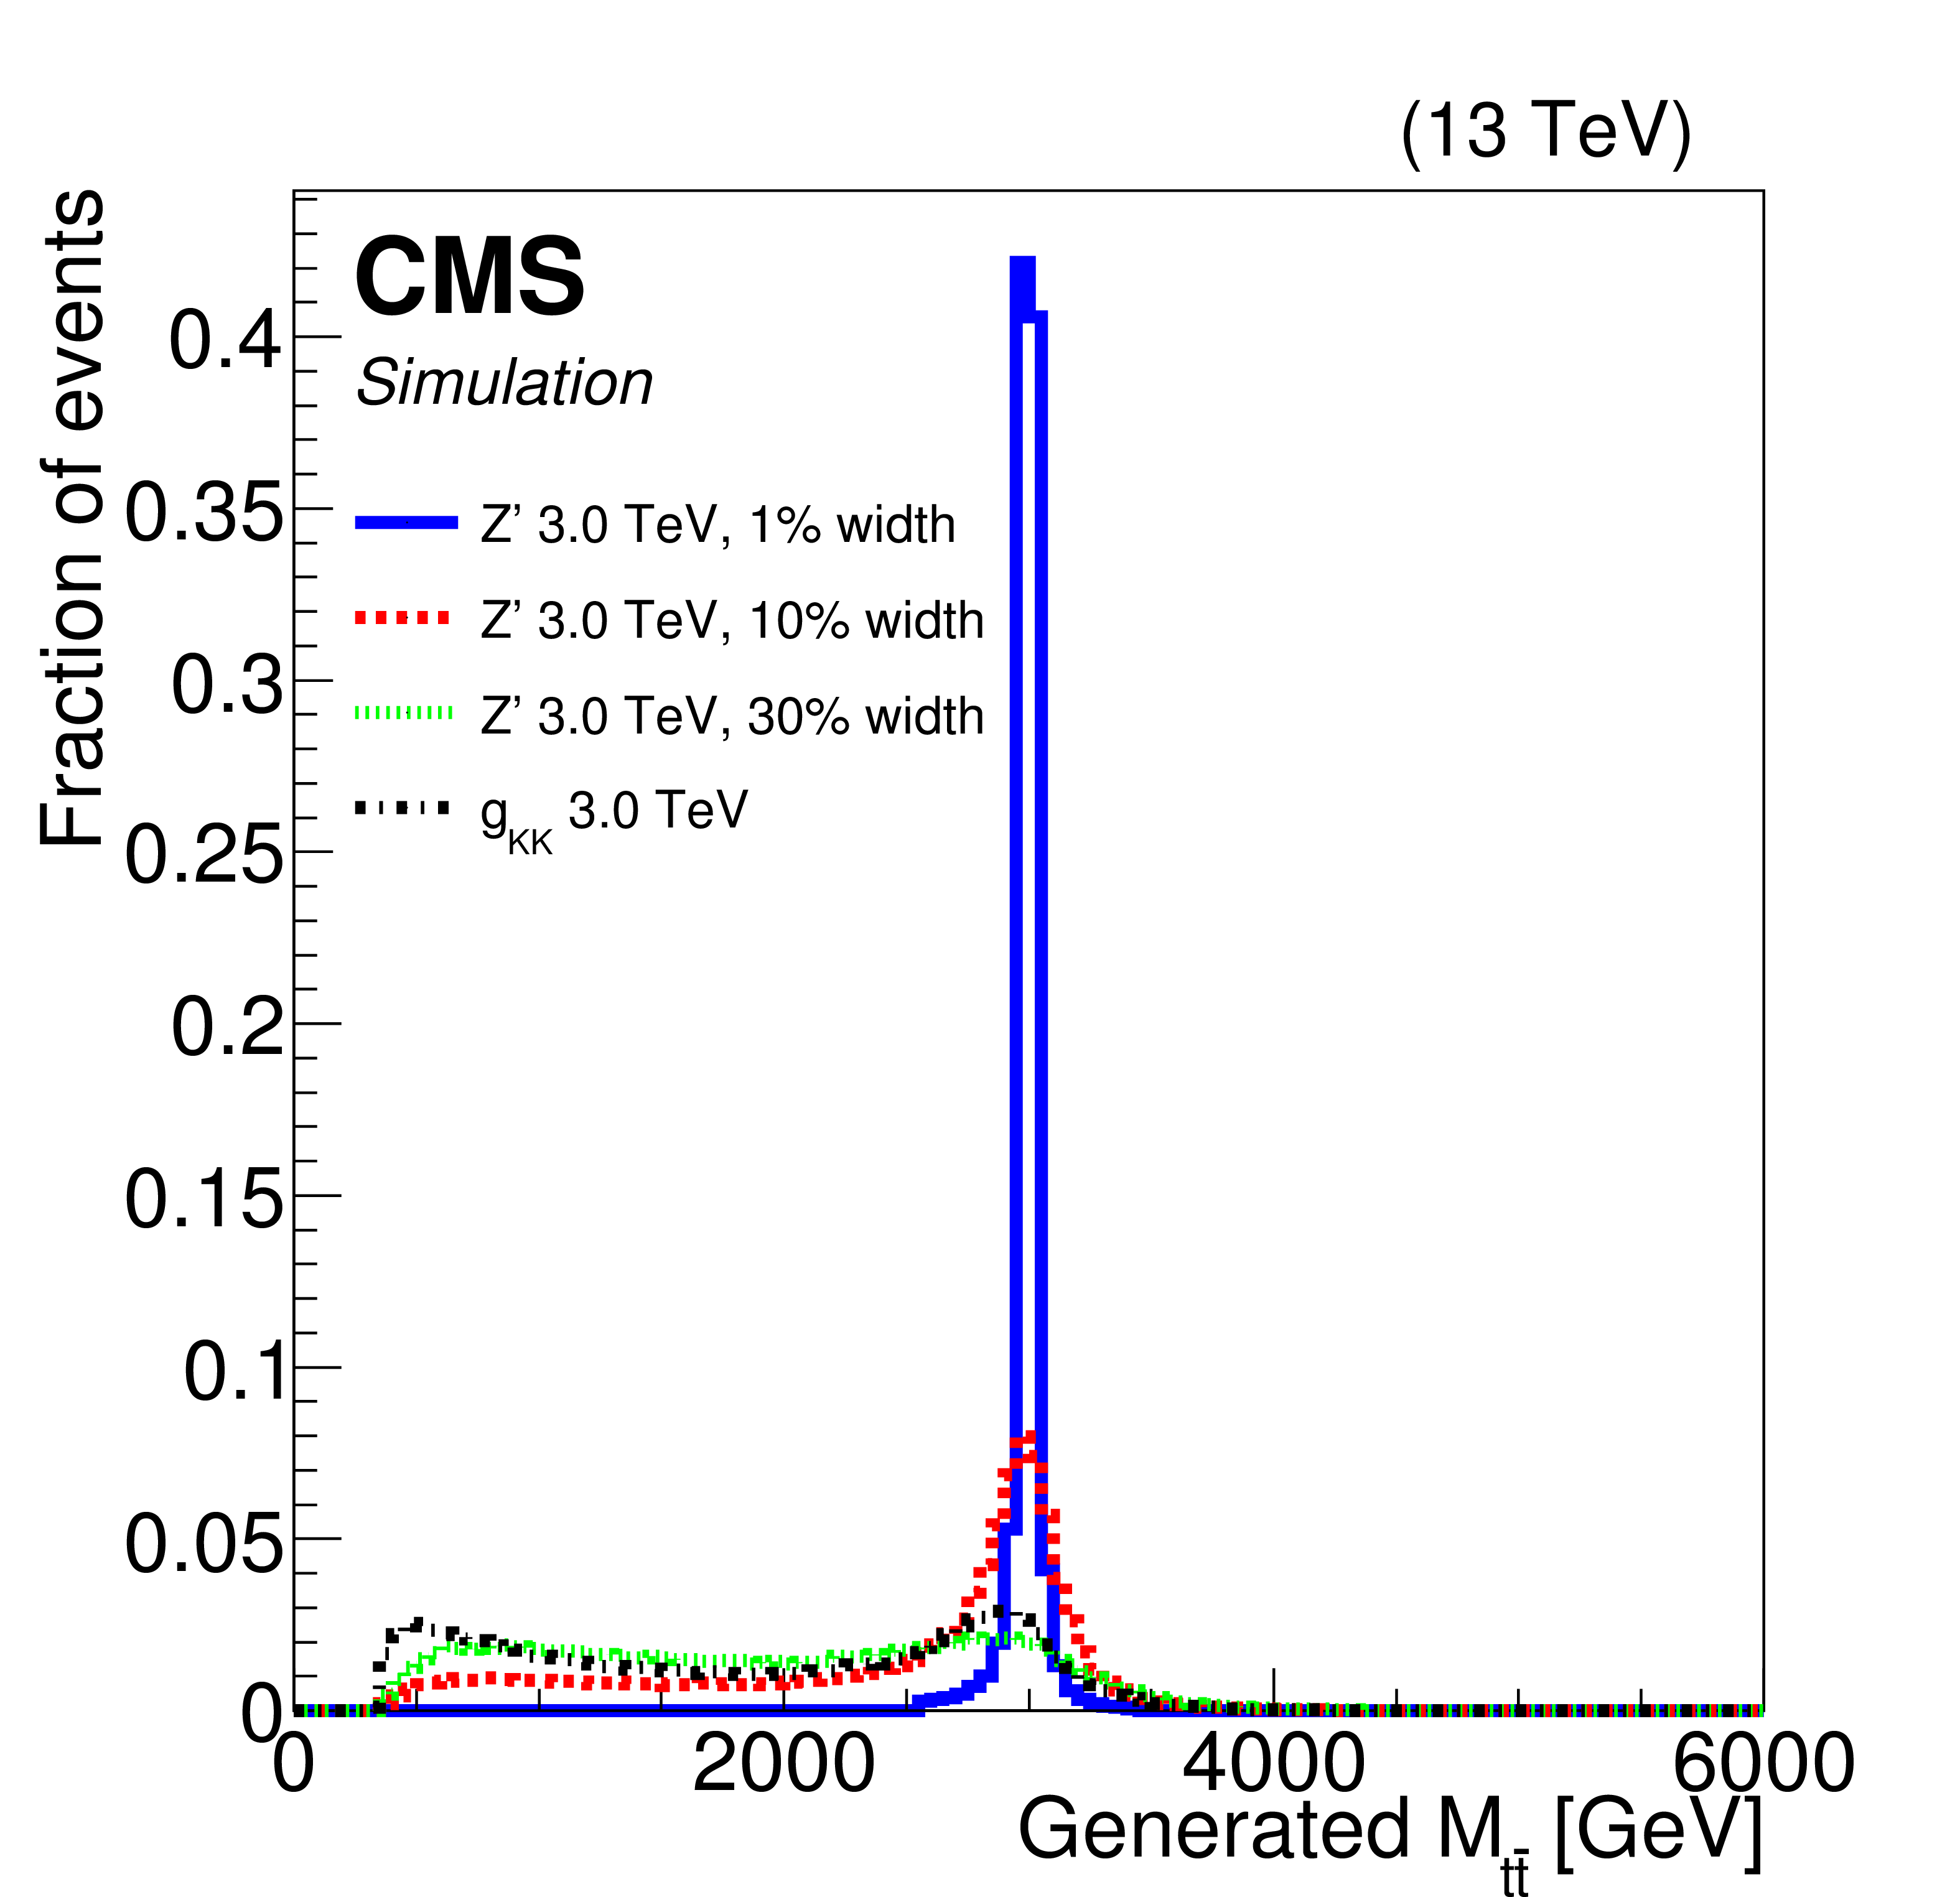
Figure 1-a:
The $ {{\mathrm {t}\overline {\mathrm {t}}}} $ invariant mass distributions for four signal models with resonance masses of 3 TeV. |
png pdf |
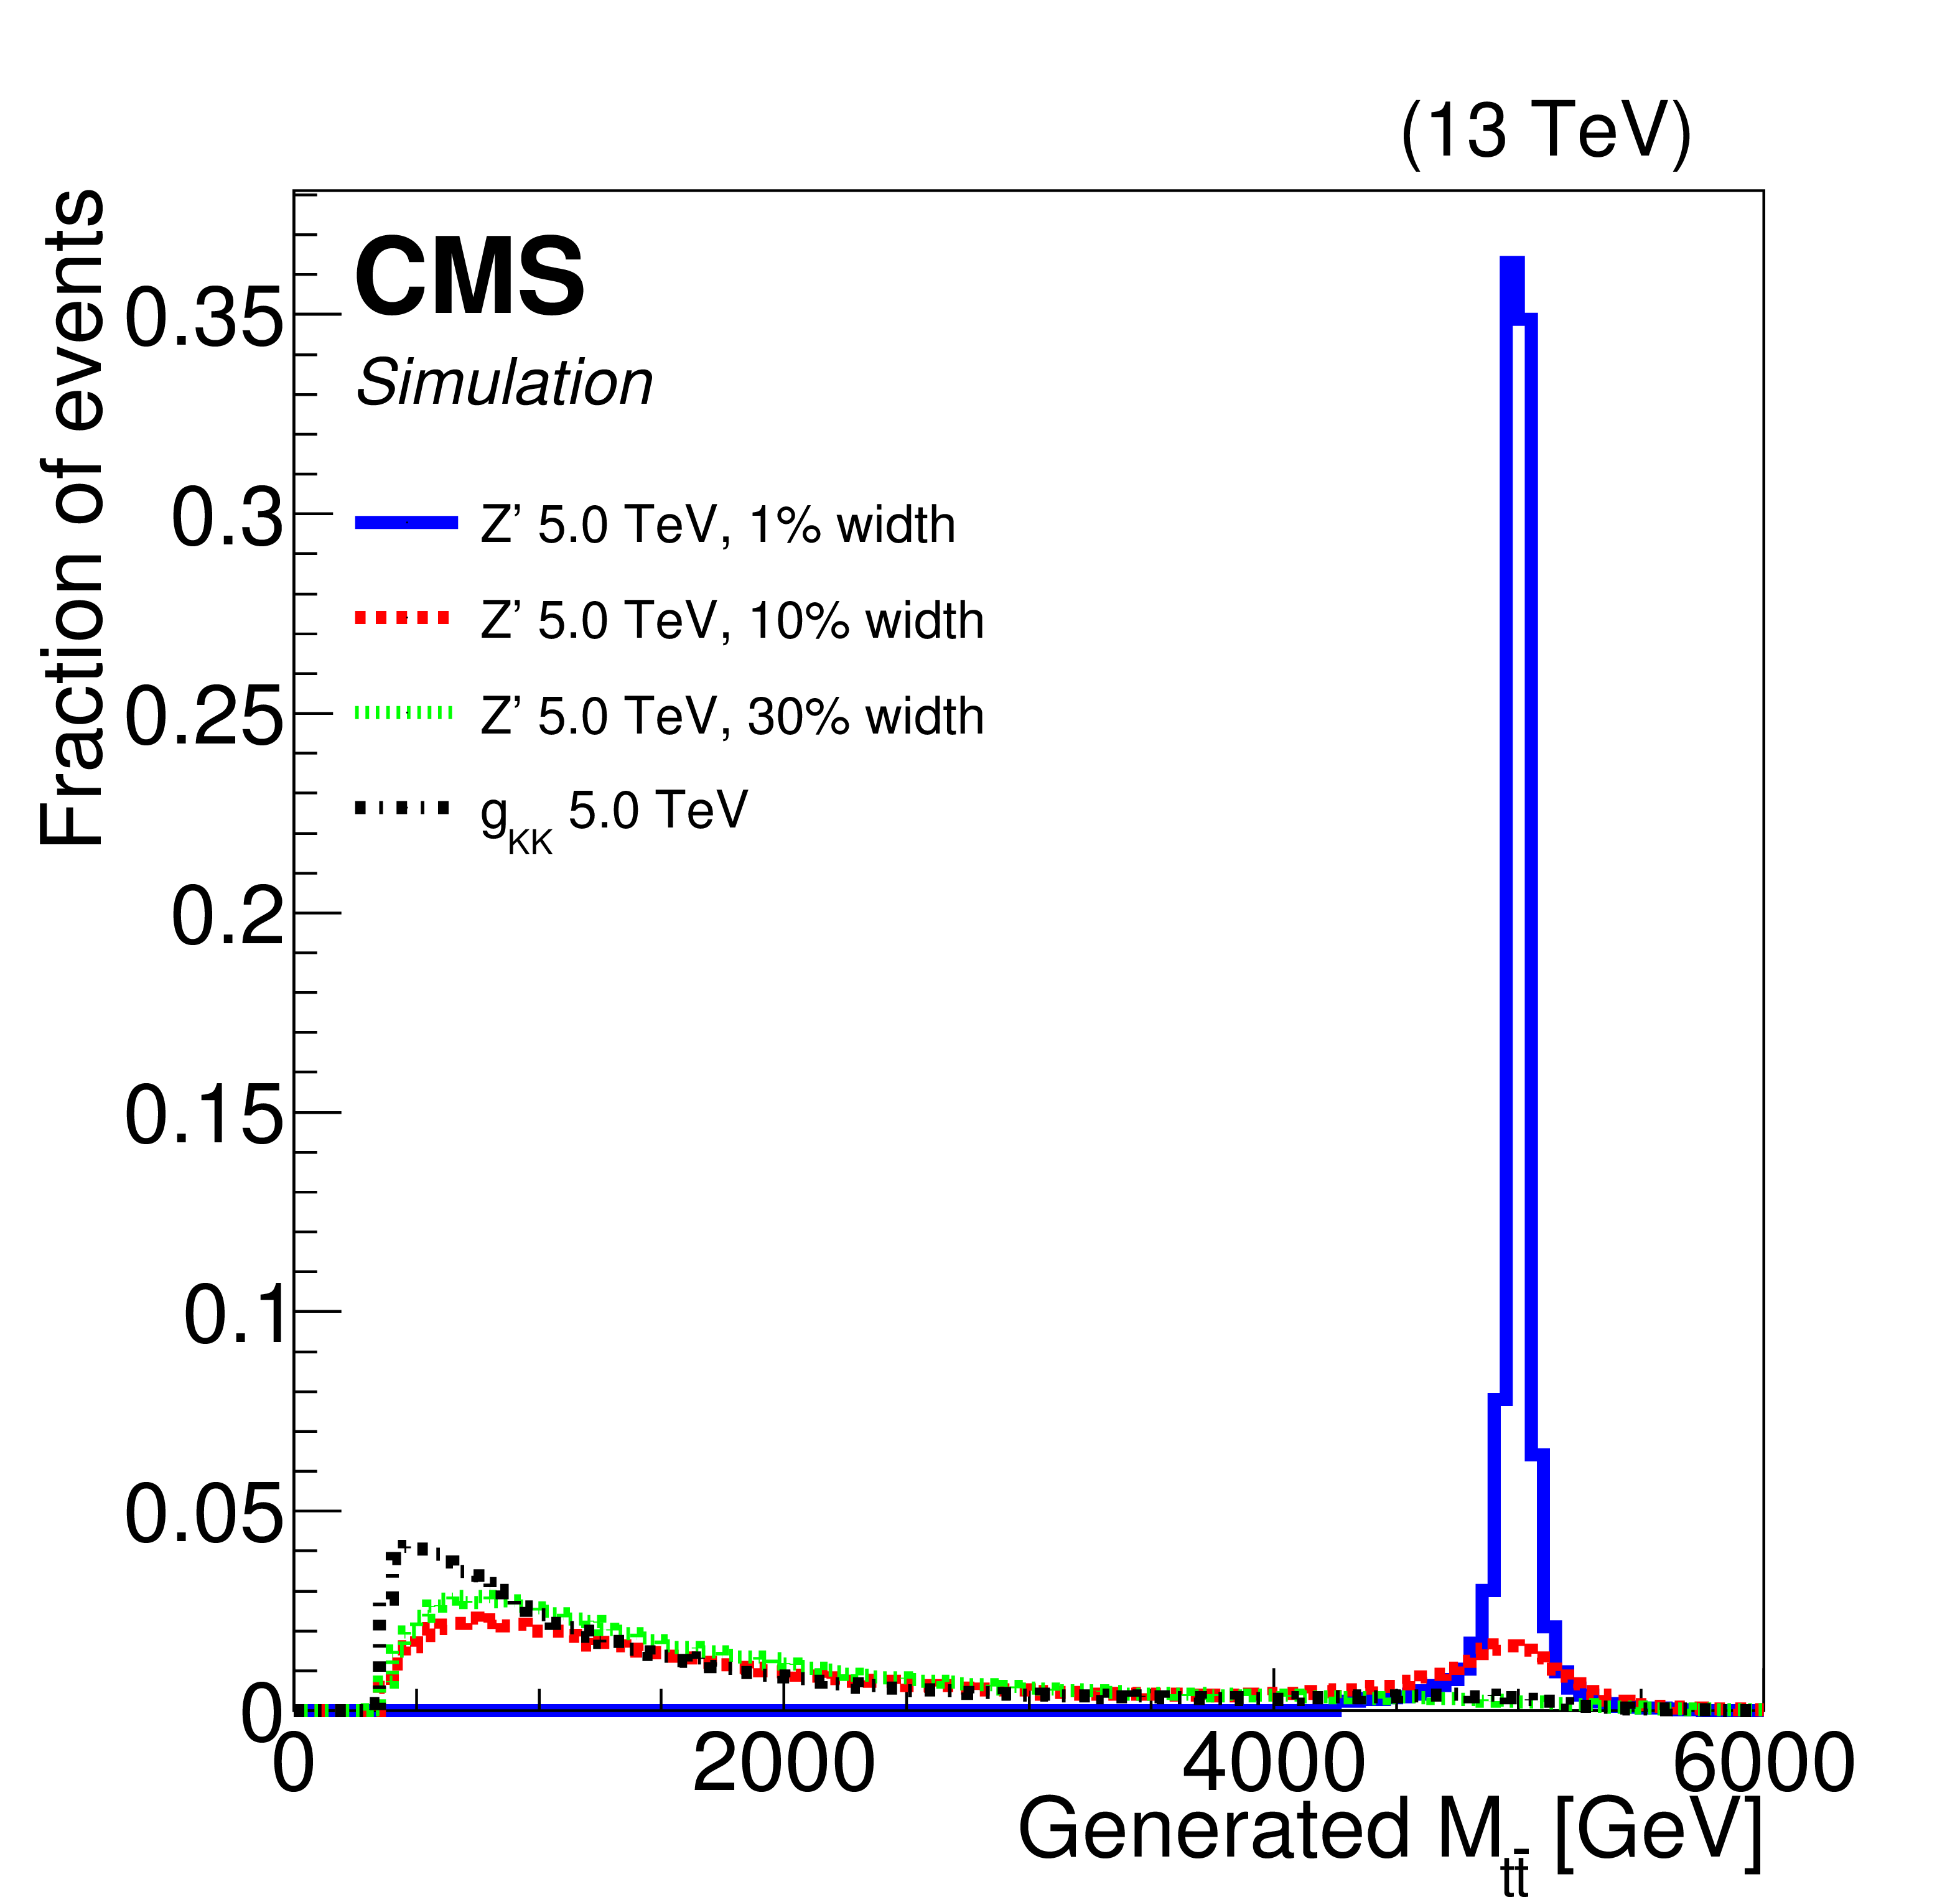
Figure 1-b:
The $ {{\mathrm {t}\overline {\mathrm {t}}}} $ invariant mass distributions for four signal models with resonance masses of 5 TeV. |
png pdf |
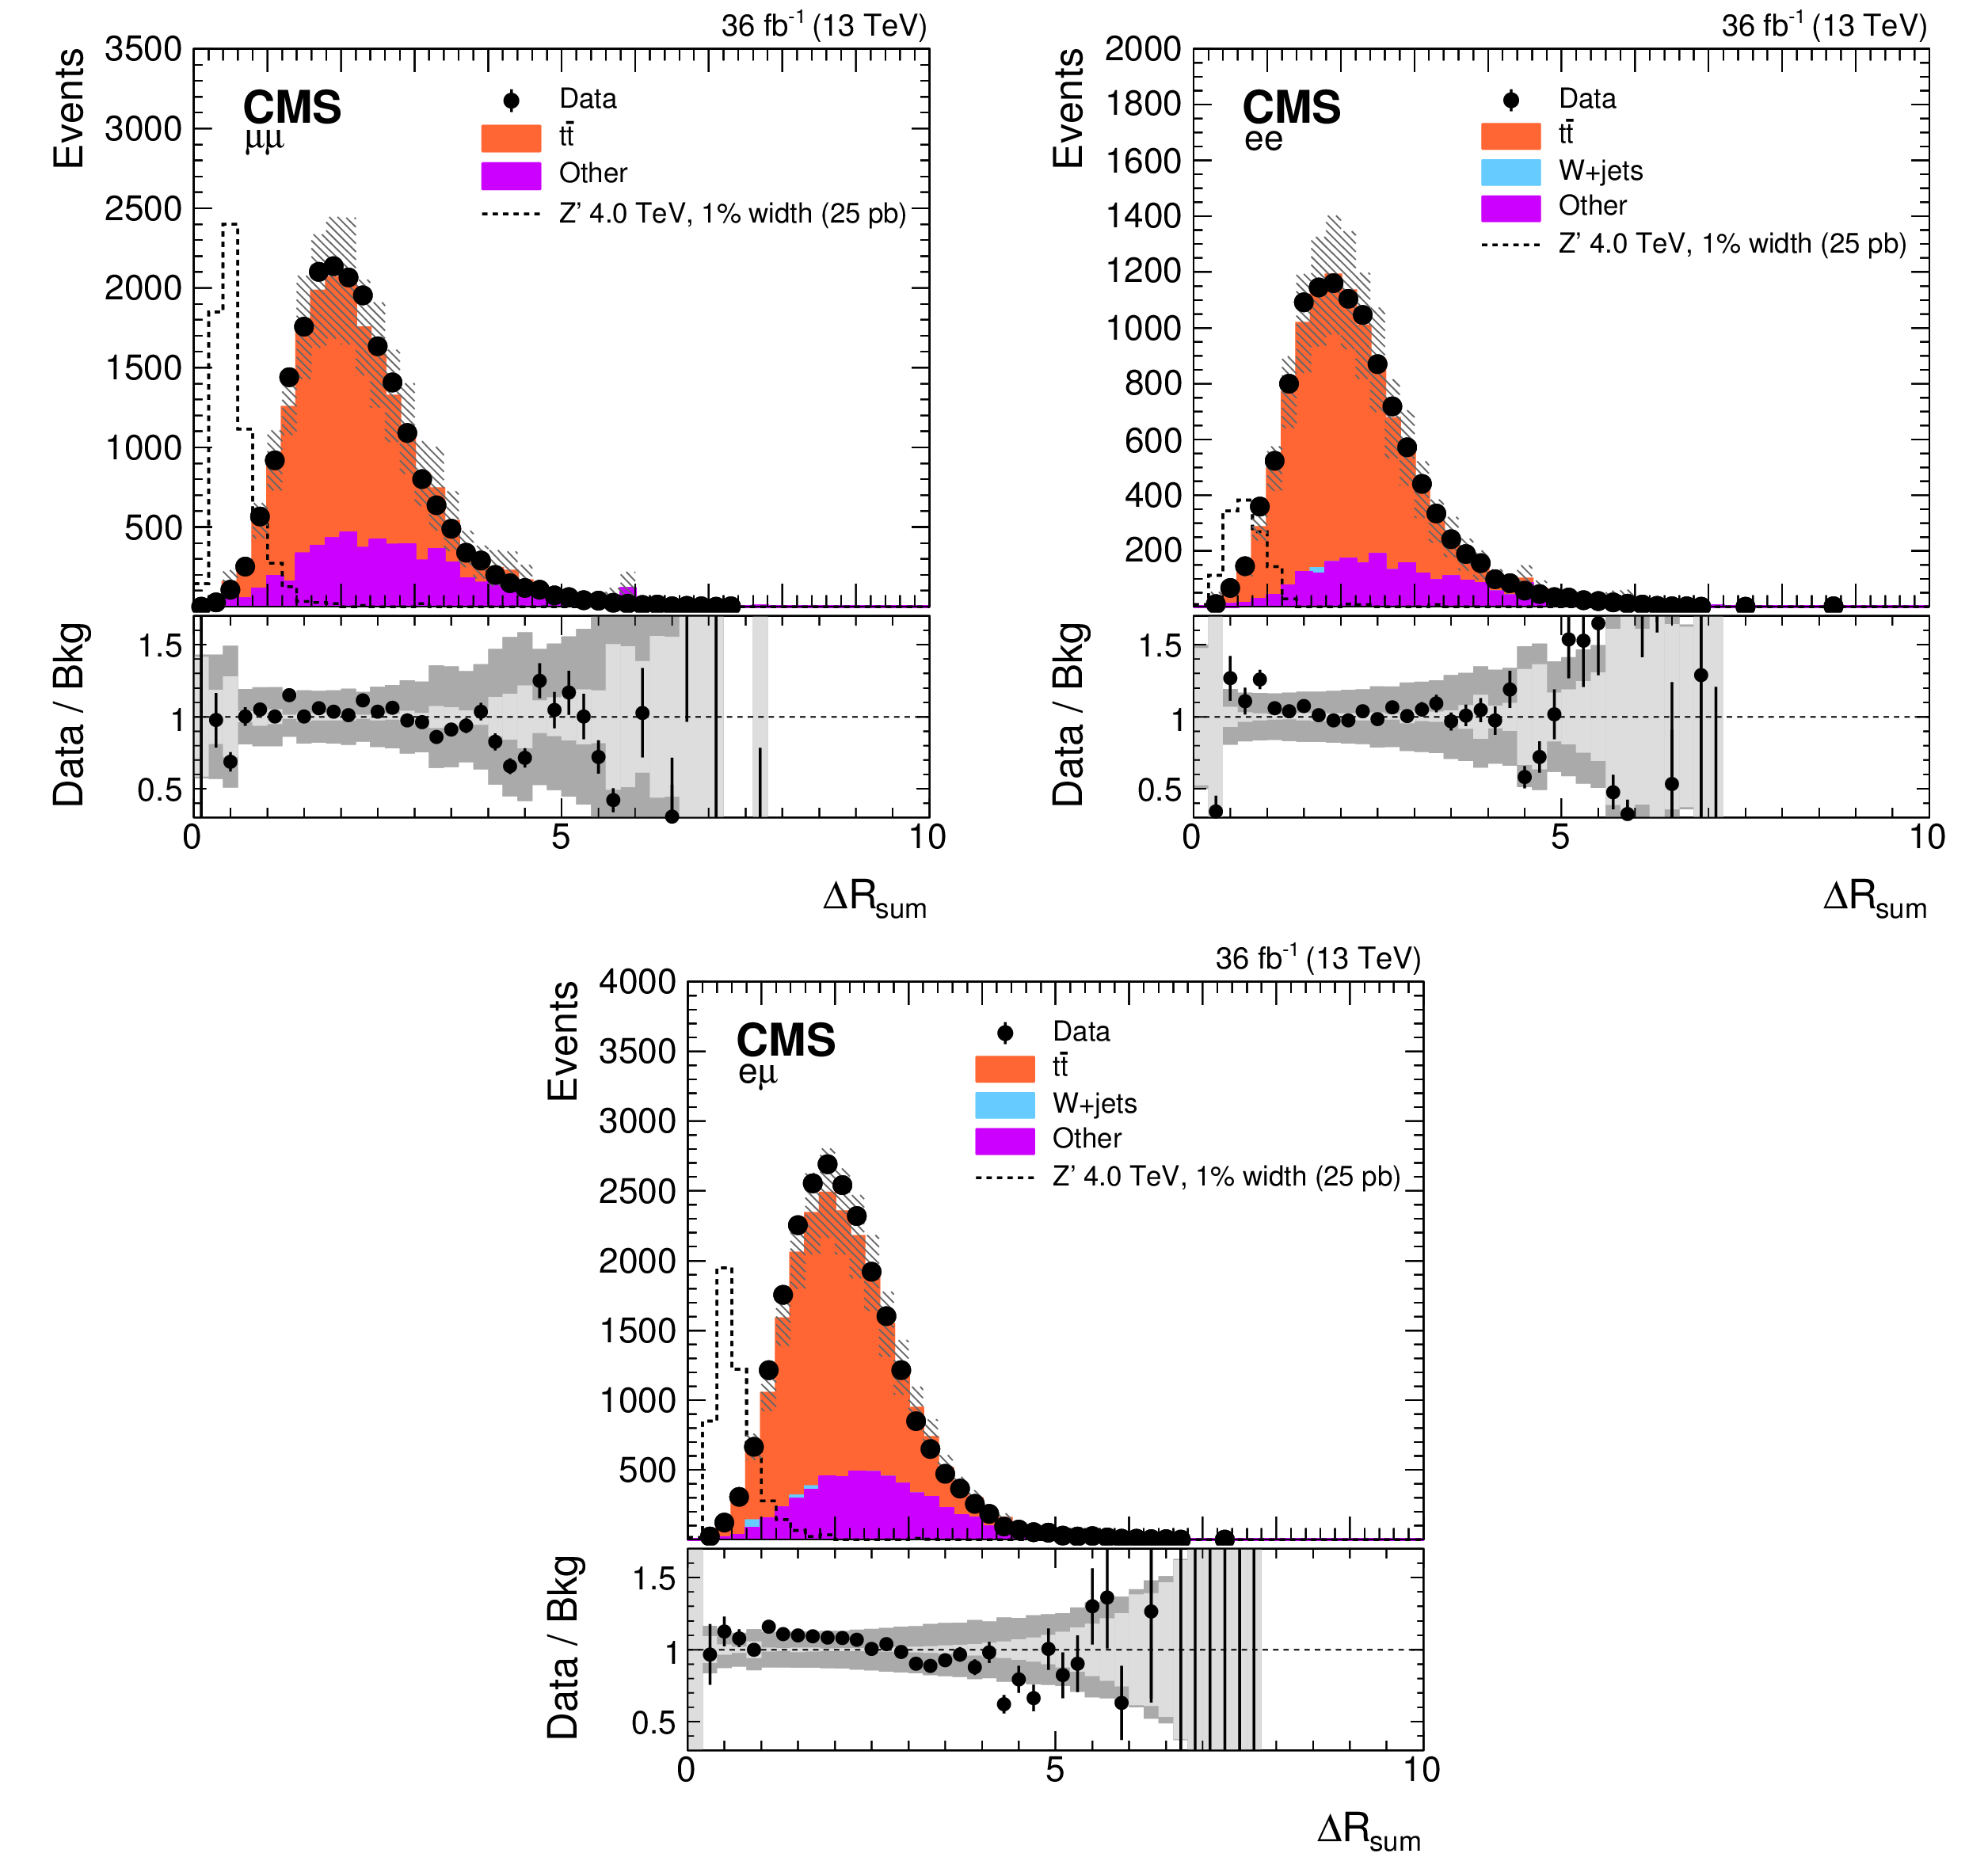
Figure 2:
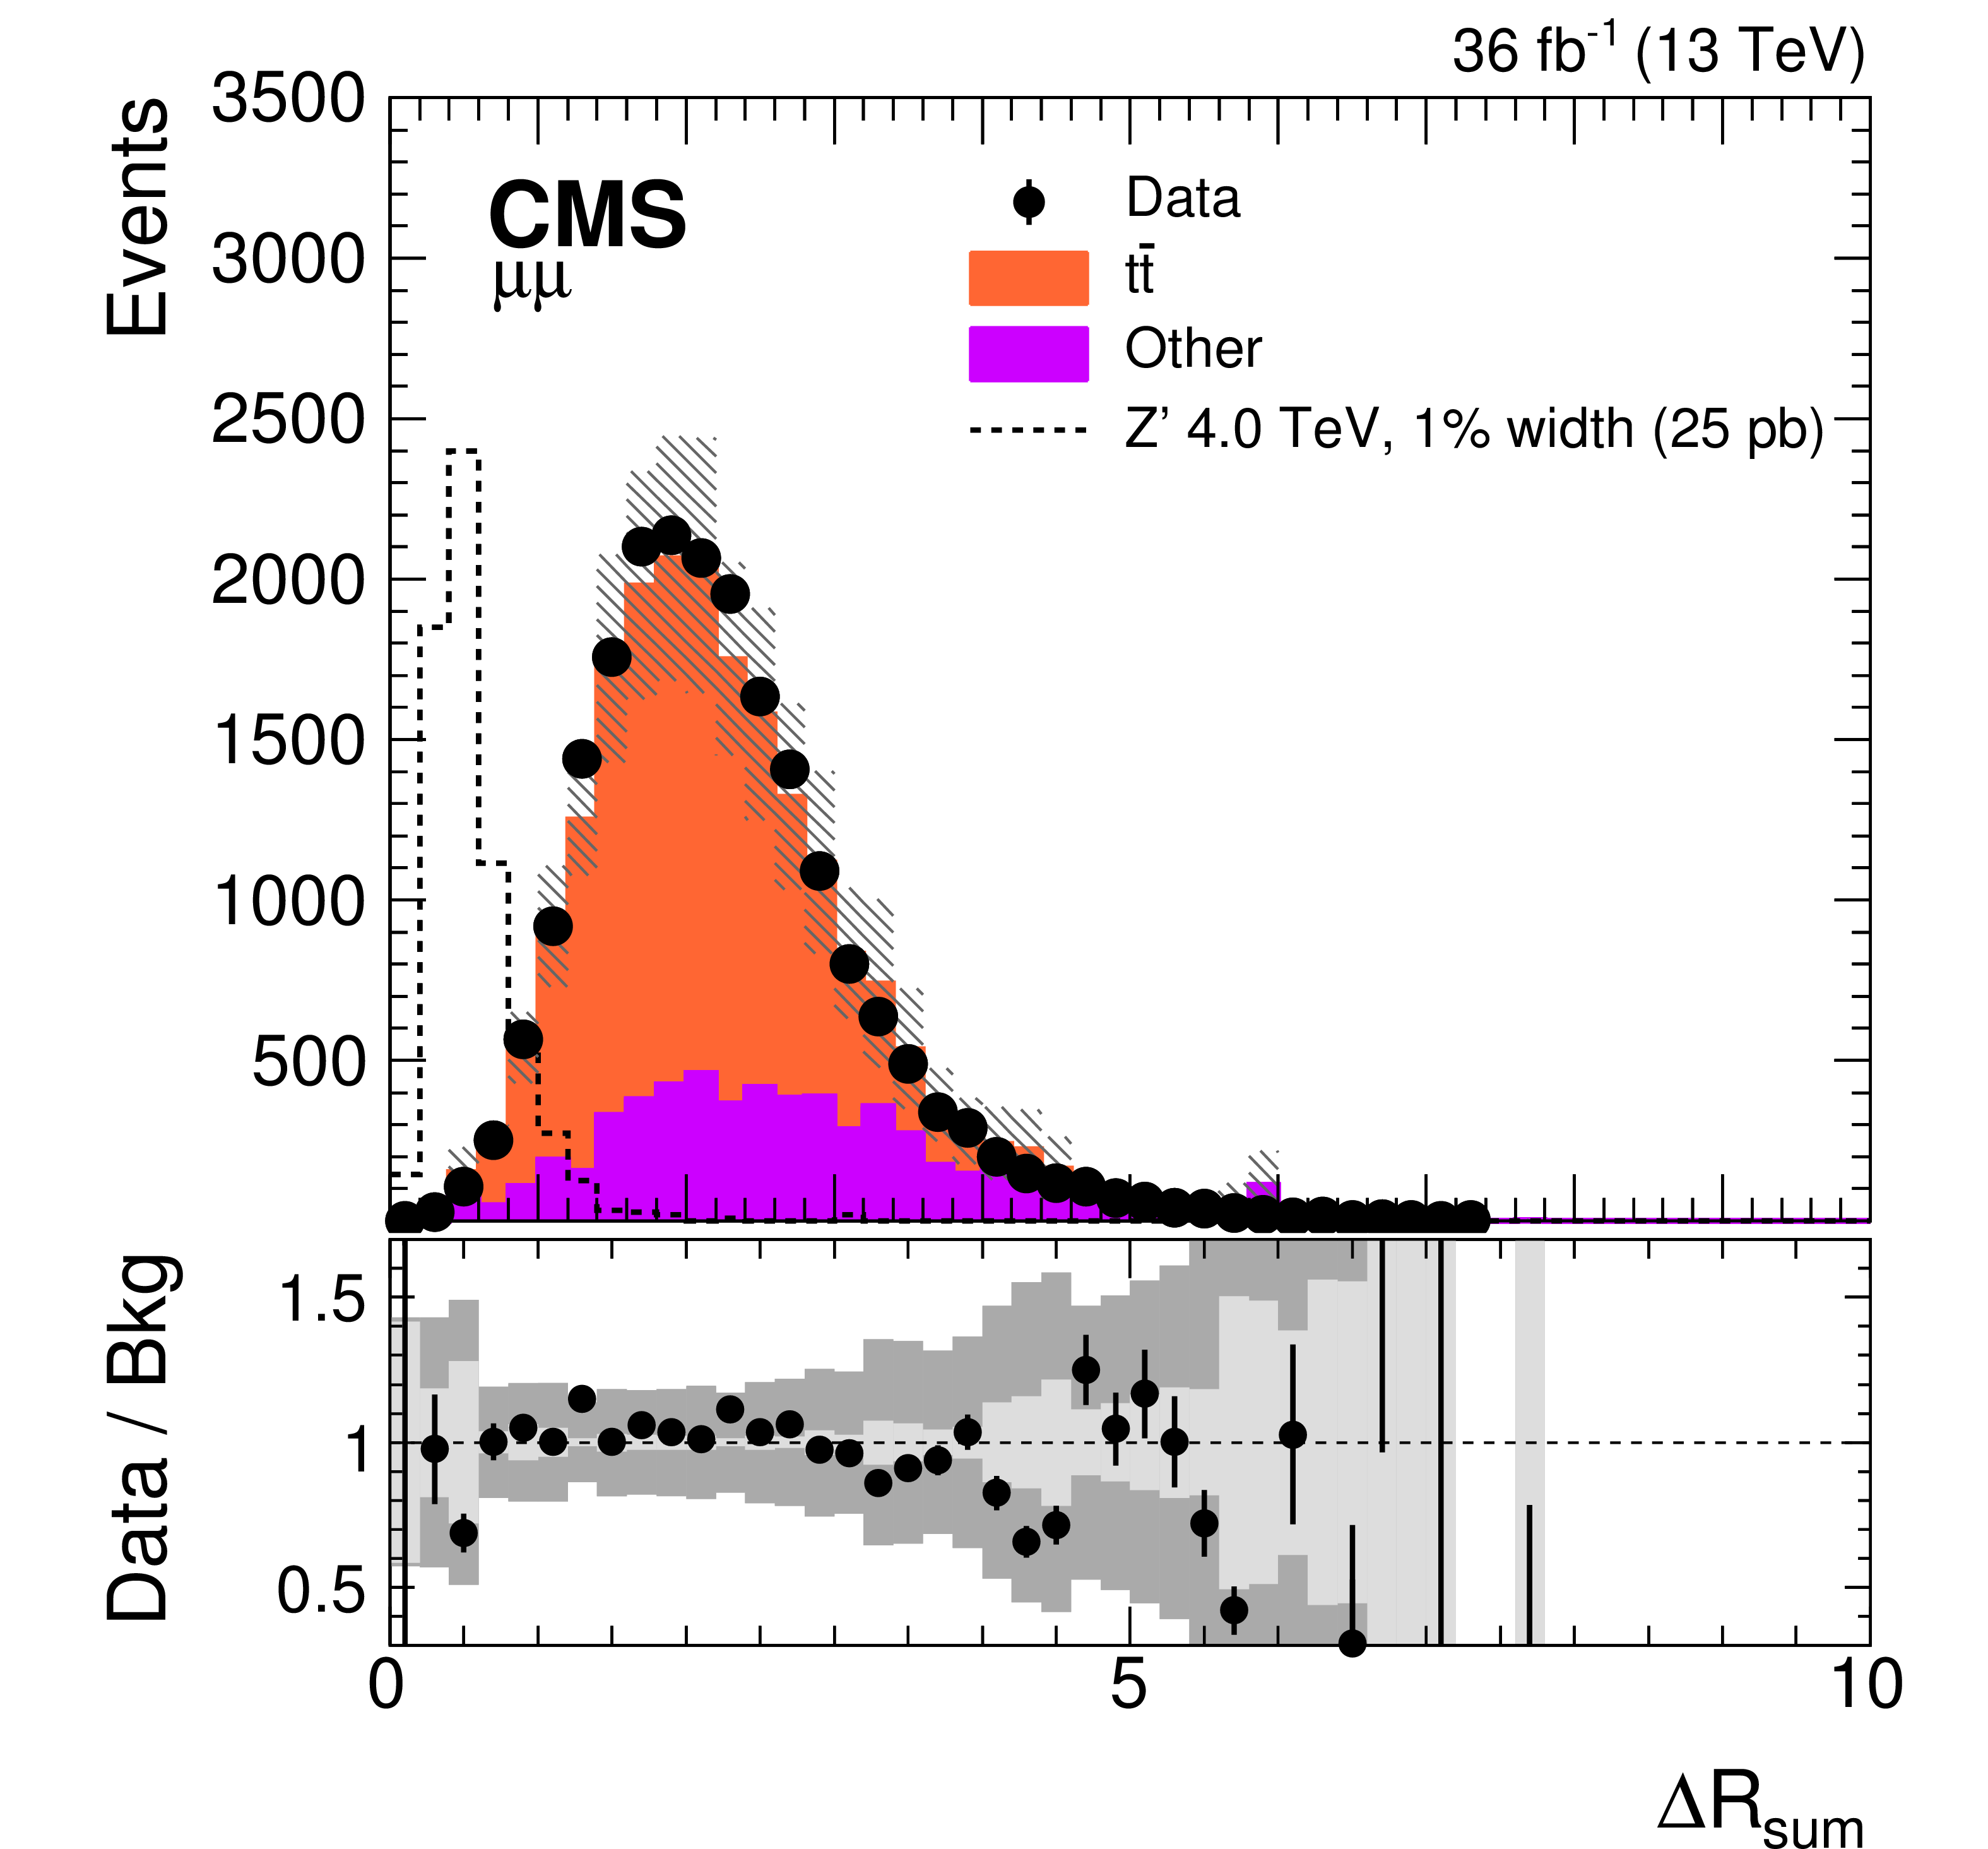
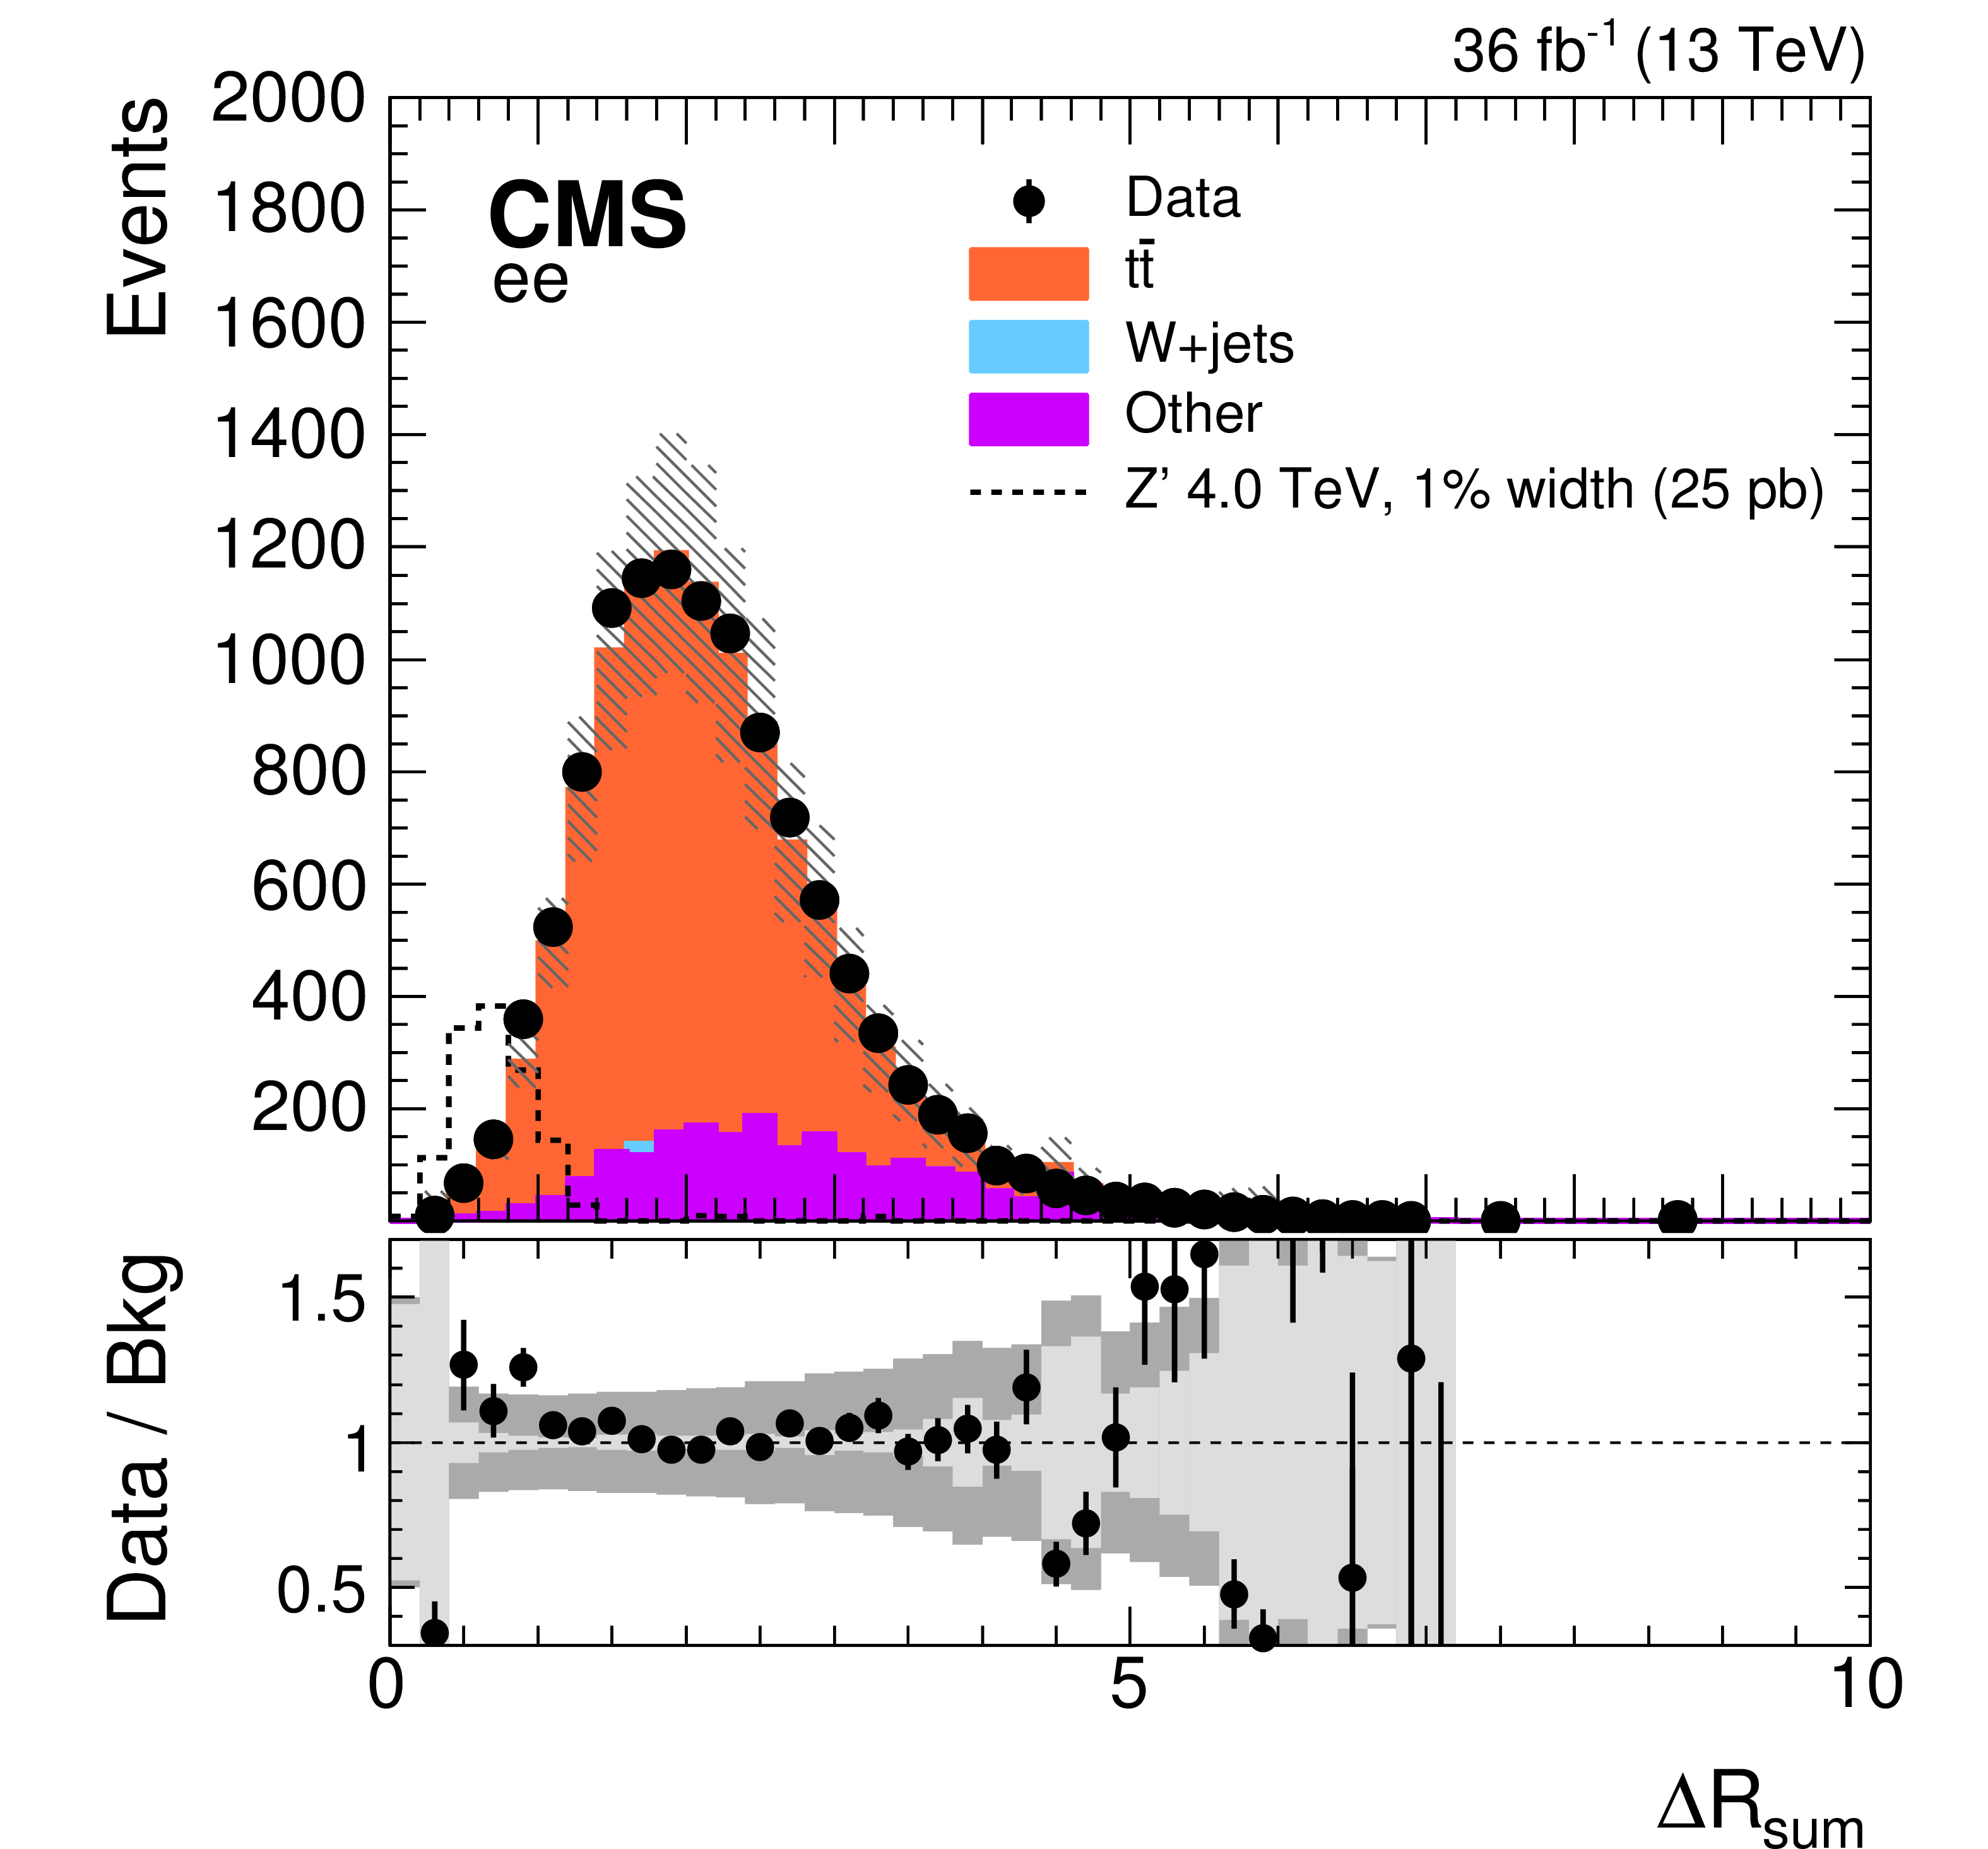
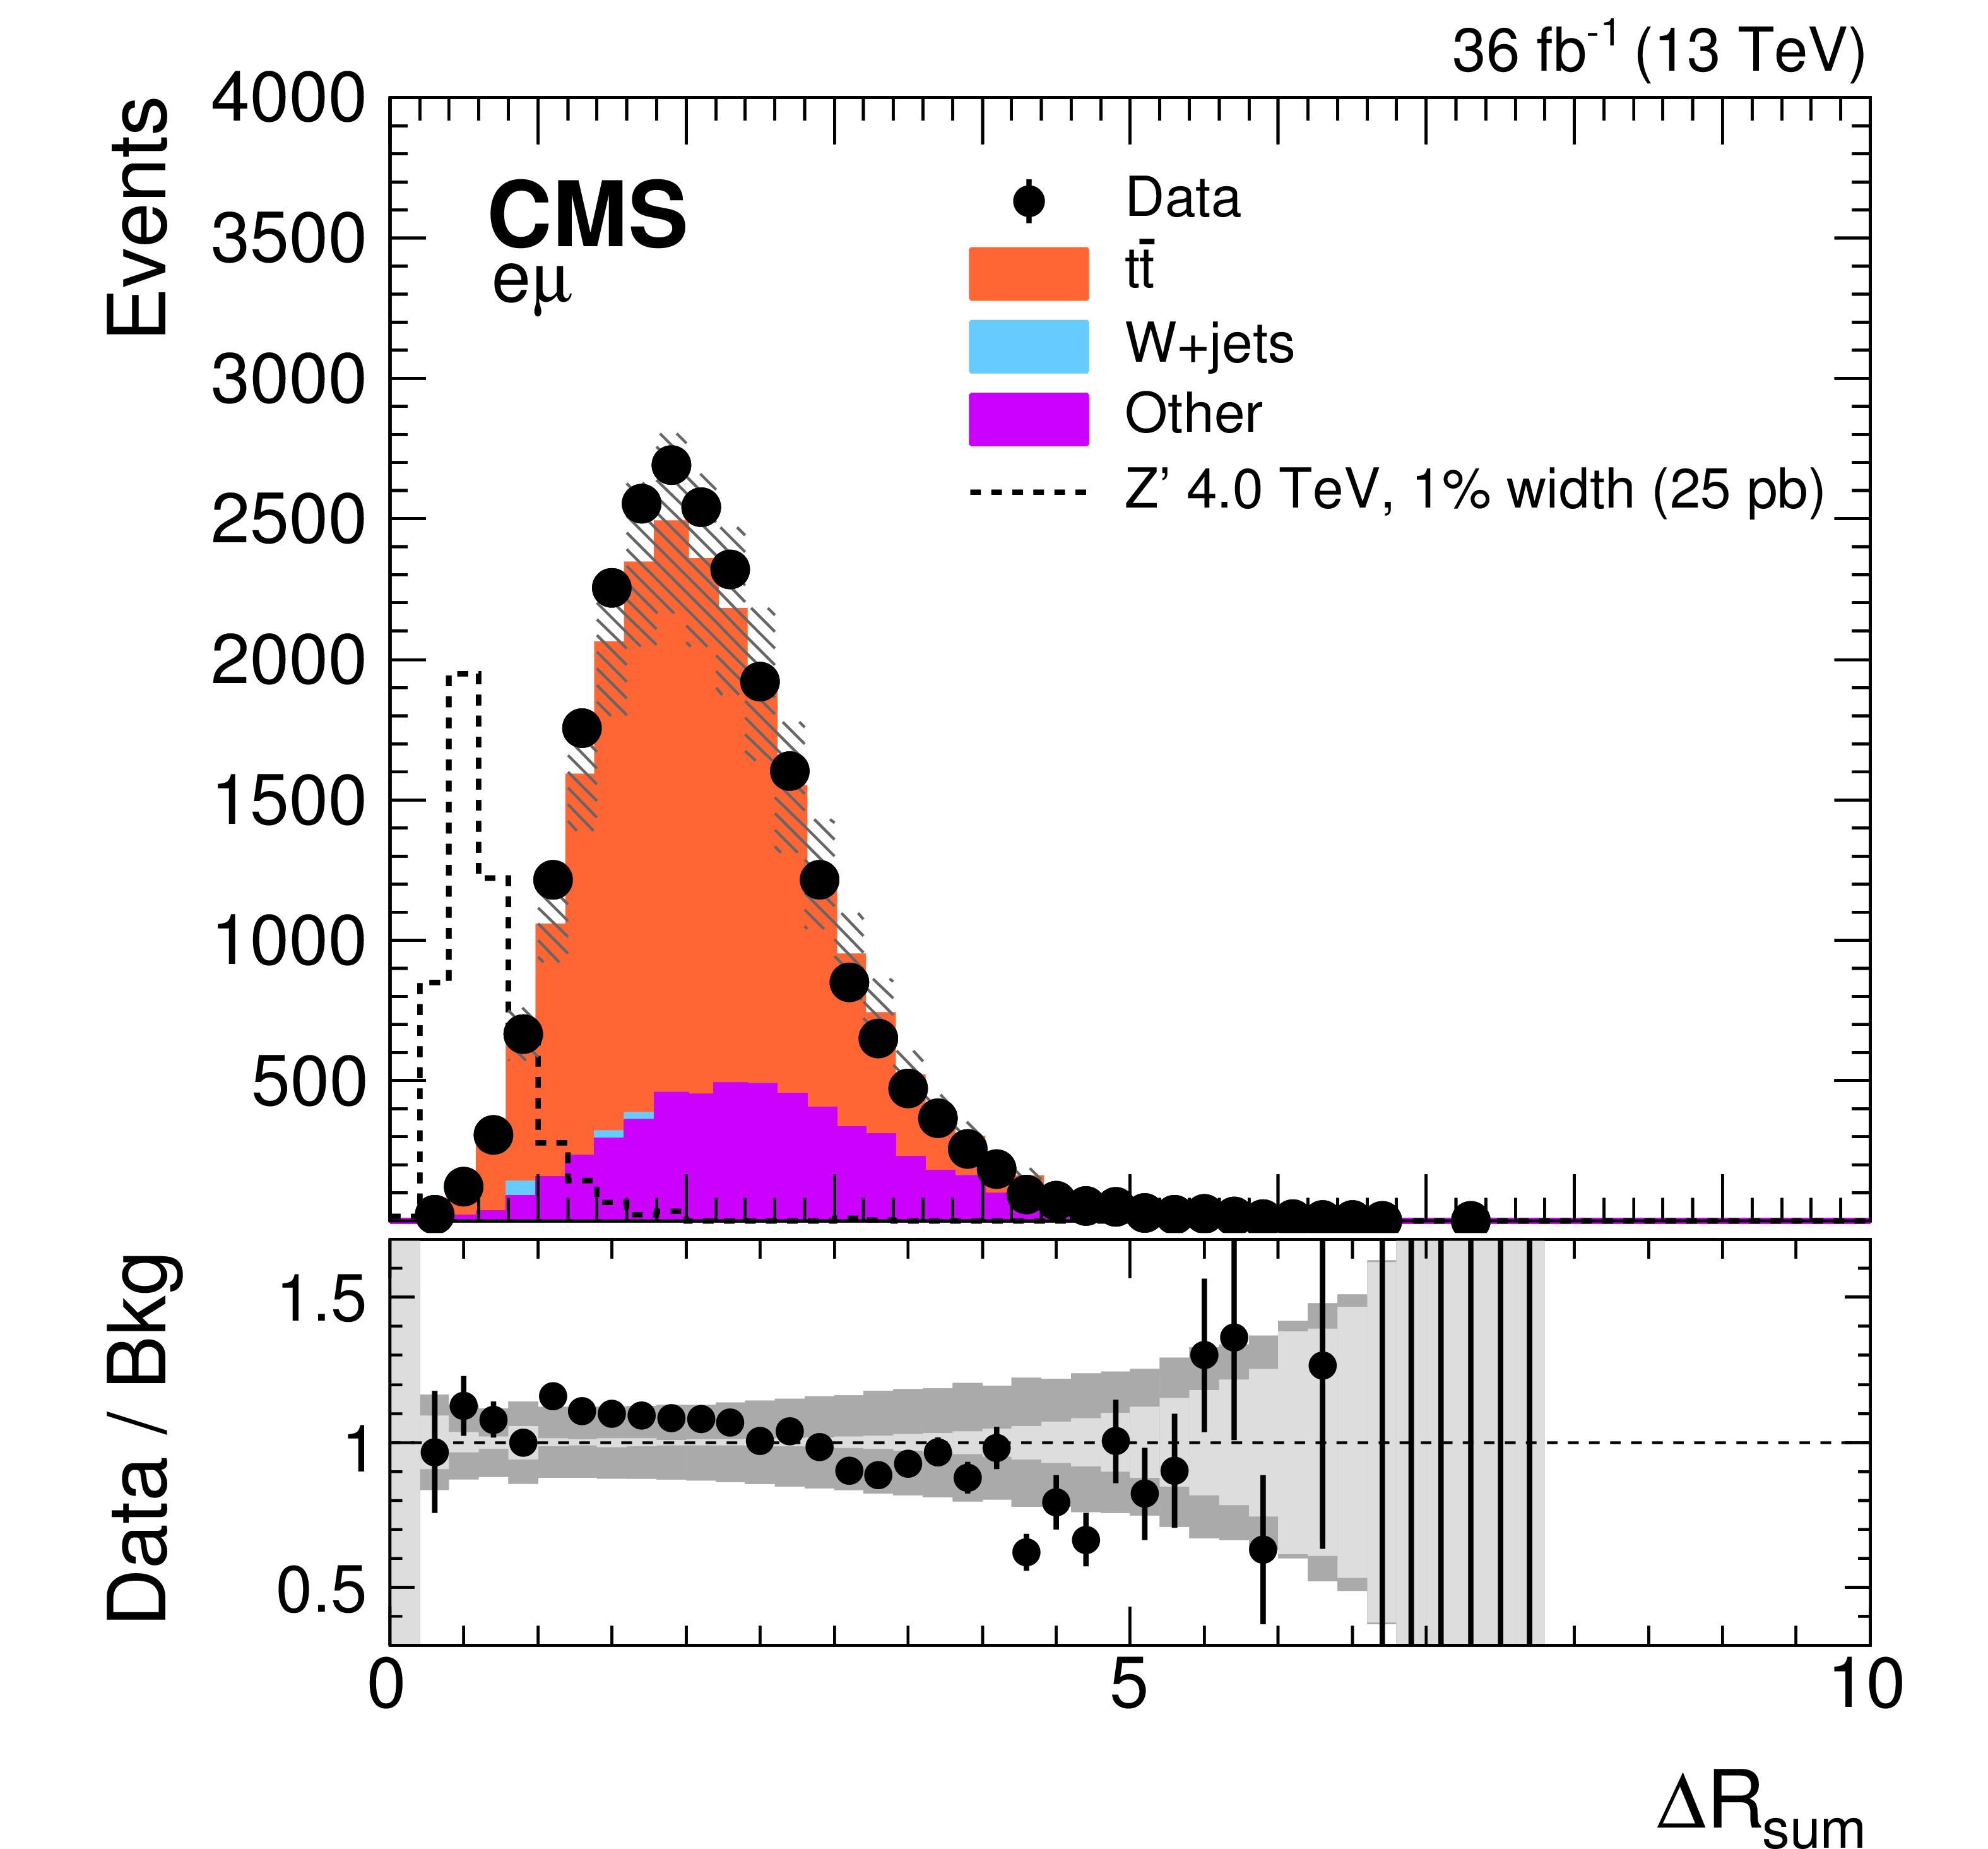
Distributions of $\Delta R_{\text {sum}}$ in $\mu \mu $ (upper left), $ \mathrm{ee} $ (upper right), and $ {\mathrm {e}}\mu $ (lower) events. The contribution expected from a 4 TeV Z' boson, with a relative width of 1%, is shown normalized to a cross section of 25 pb. The hatched band on the simulated distribution represents the statistical and systematic uncertainties. The lower panels in each plot show the ratio of data to the SM background prediction and the light (dark) gray band represents statistical (systematic) uncertainty. The error bars on the data points indicate the Poisson statistical uncertainties. |
png pdf |
Figure 2-a:
Distribution of $\Delta R_{\text {sum}}$ in $\mu \mu $ events. The contribution expected from a 4 TeV Z' boson, with a relative width of 1%, is shown normalized to a cross section of 25 pb. The hatched band on the simulated distribution represents the statistical and systematic uncertainties. The lower panel shows the ratio of data to the SM background prediction and the light (dark) gray band represents statistical (systematic) uncertainty. The error bars on the data points indicate the Poisson statistical uncertainties. |
png pdf |
Figure 2-b:
Distribution of $\Delta R_{\text {sum}}$ in $ \mathrm{ee} $ events. The contribution expected from a 4 TeV Z' boson, with a relative width of 1%, is shown normalized to a cross section of 25 pb. The hatched band on the simulated distribution represents the statistical and systematic uncertainties. The lower panel shows the ratio of data to the SM background prediction and the light (dark) gray band represents statistical (systematic) uncertainty. The error bars on the data points indicate the Poisson statistical uncertainties. |
png pdf |
Figure 2-c:
Distribution of $\Delta R_{\text {sum}}$ in $ {\mathrm {e}}\mu $ events. The contribution expected from a 4 TeV Z' boson, with a relative width of 1%, is shown normalized to a cross section of 25 pb. The hatched band on the simulated distribution represents the statistical and systematic uncertainties. The lower panel shows the ratio of data to the SM background prediction and the light (dark) gray band represents statistical (systematic) uncertainty. The error bars on the data points indicate the Poisson statistical uncertainties. |
png pdf |
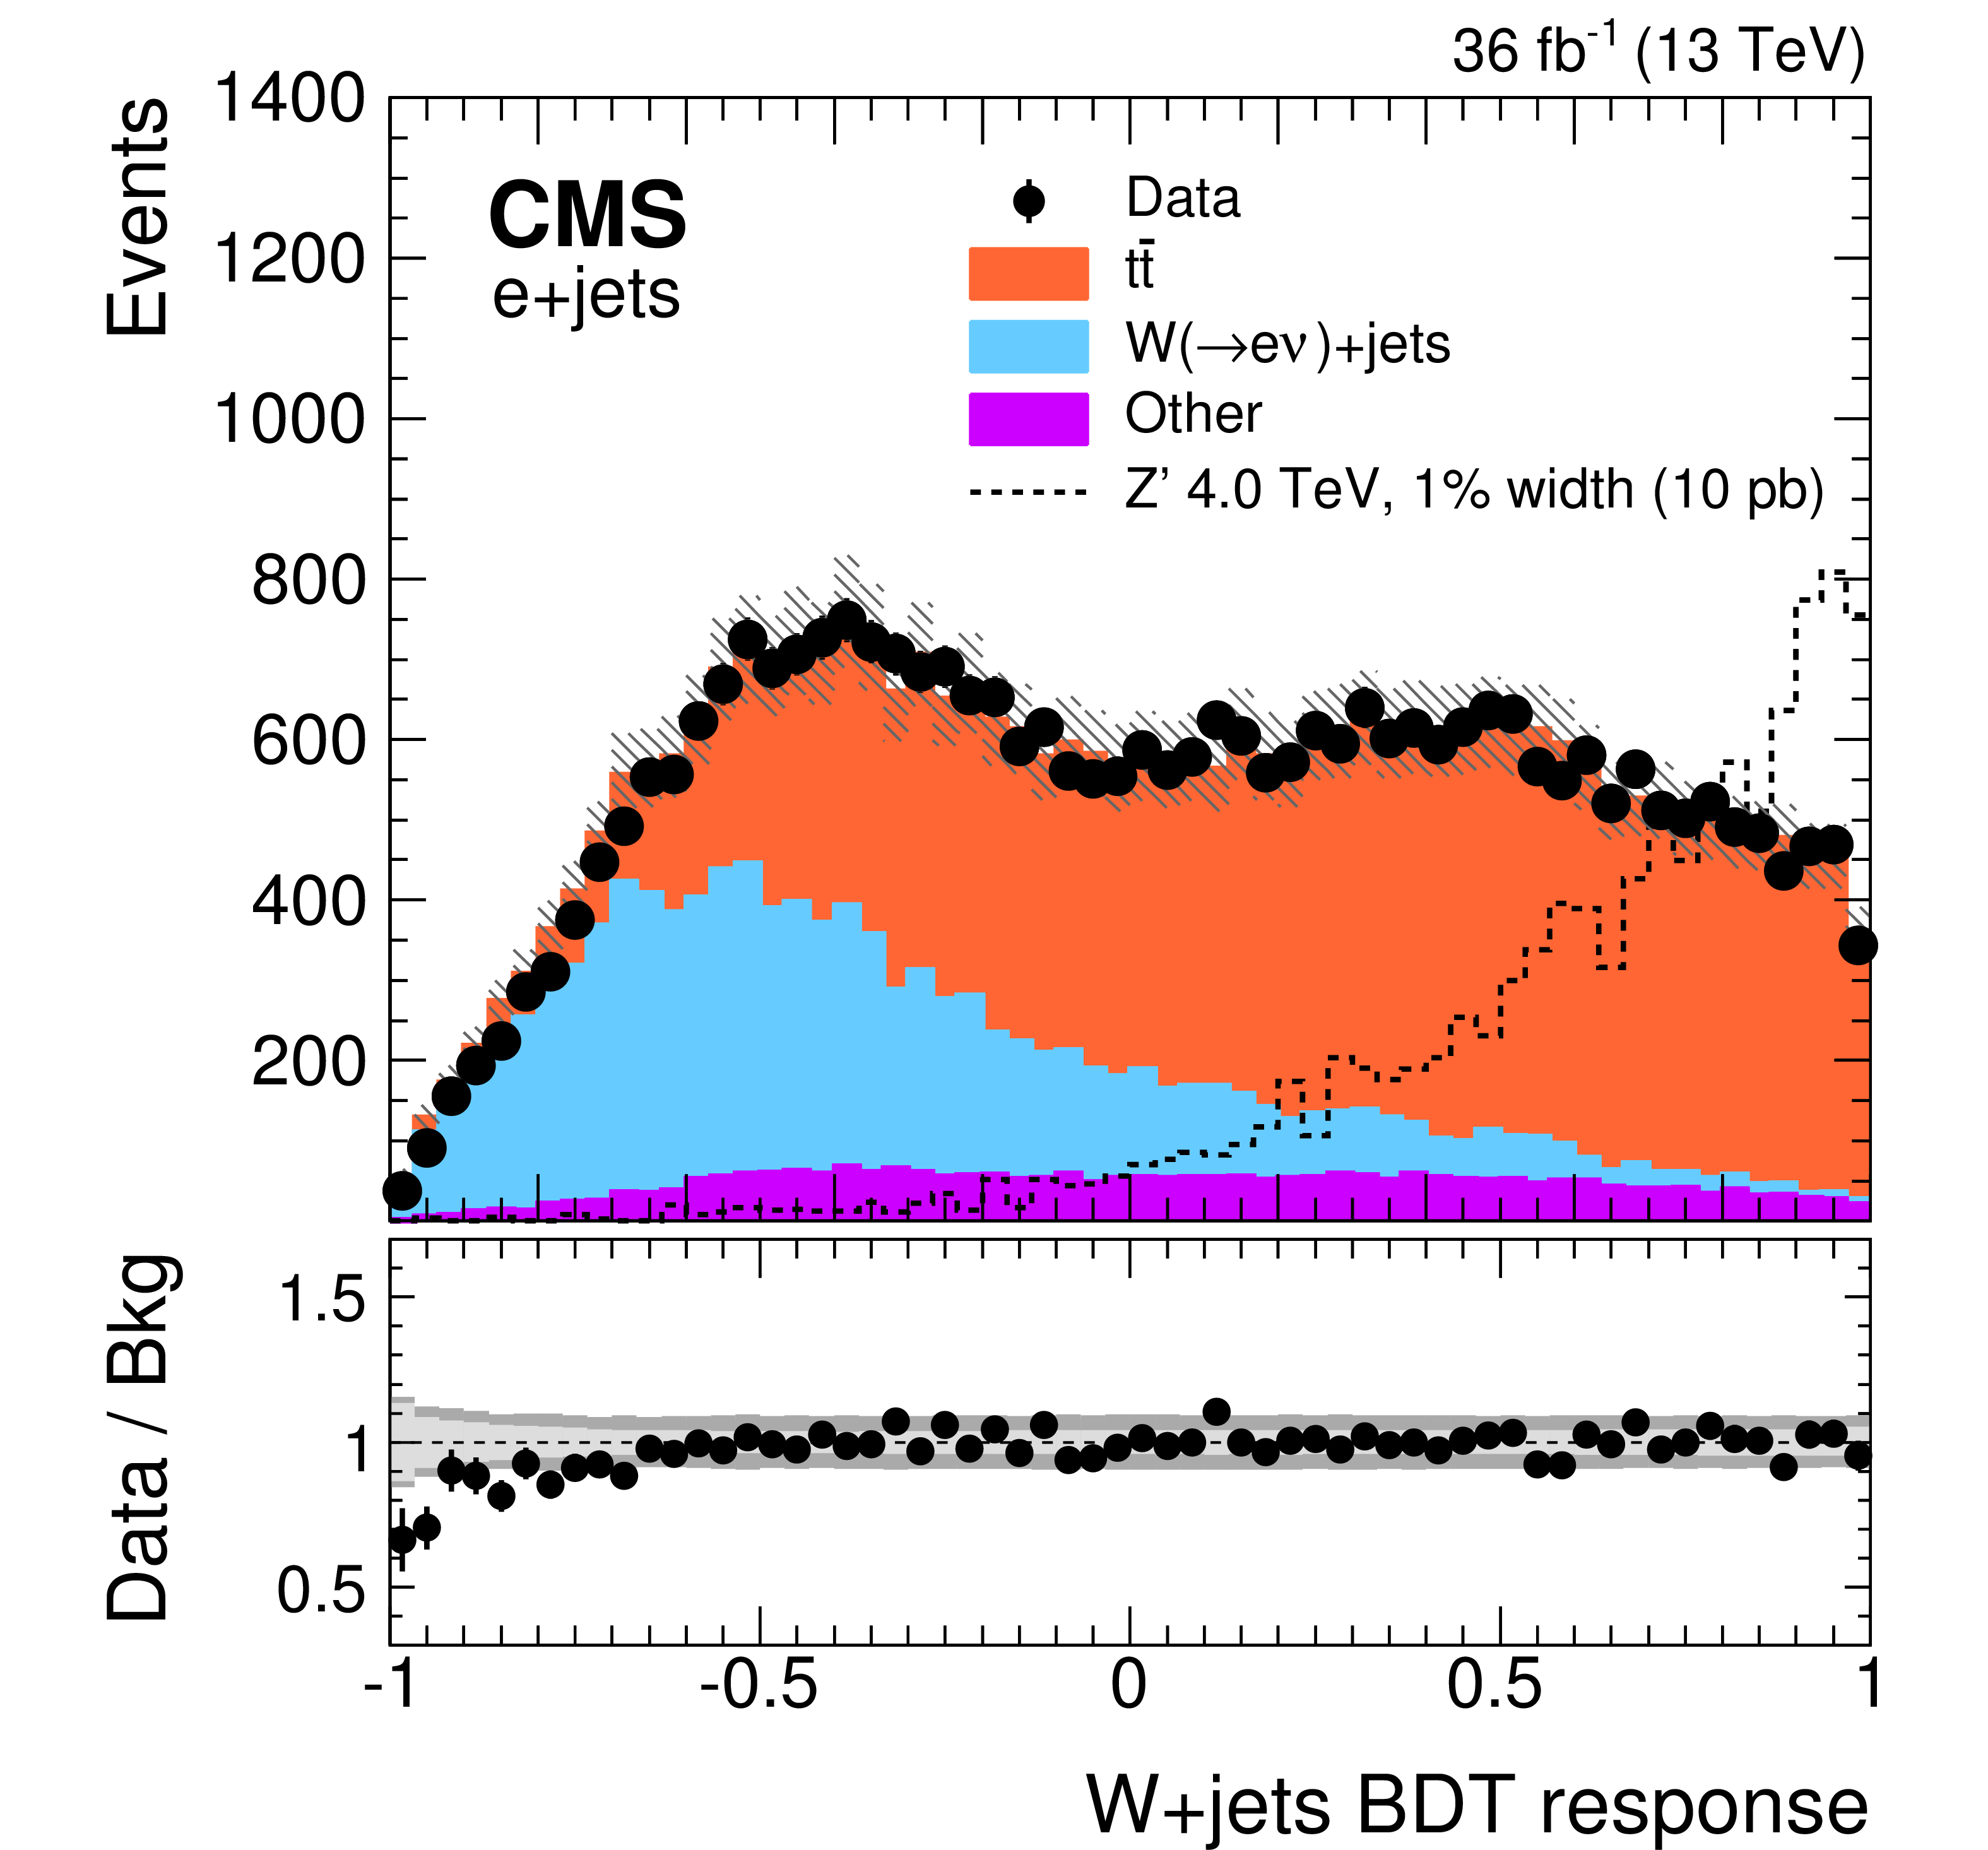
Figure 3:
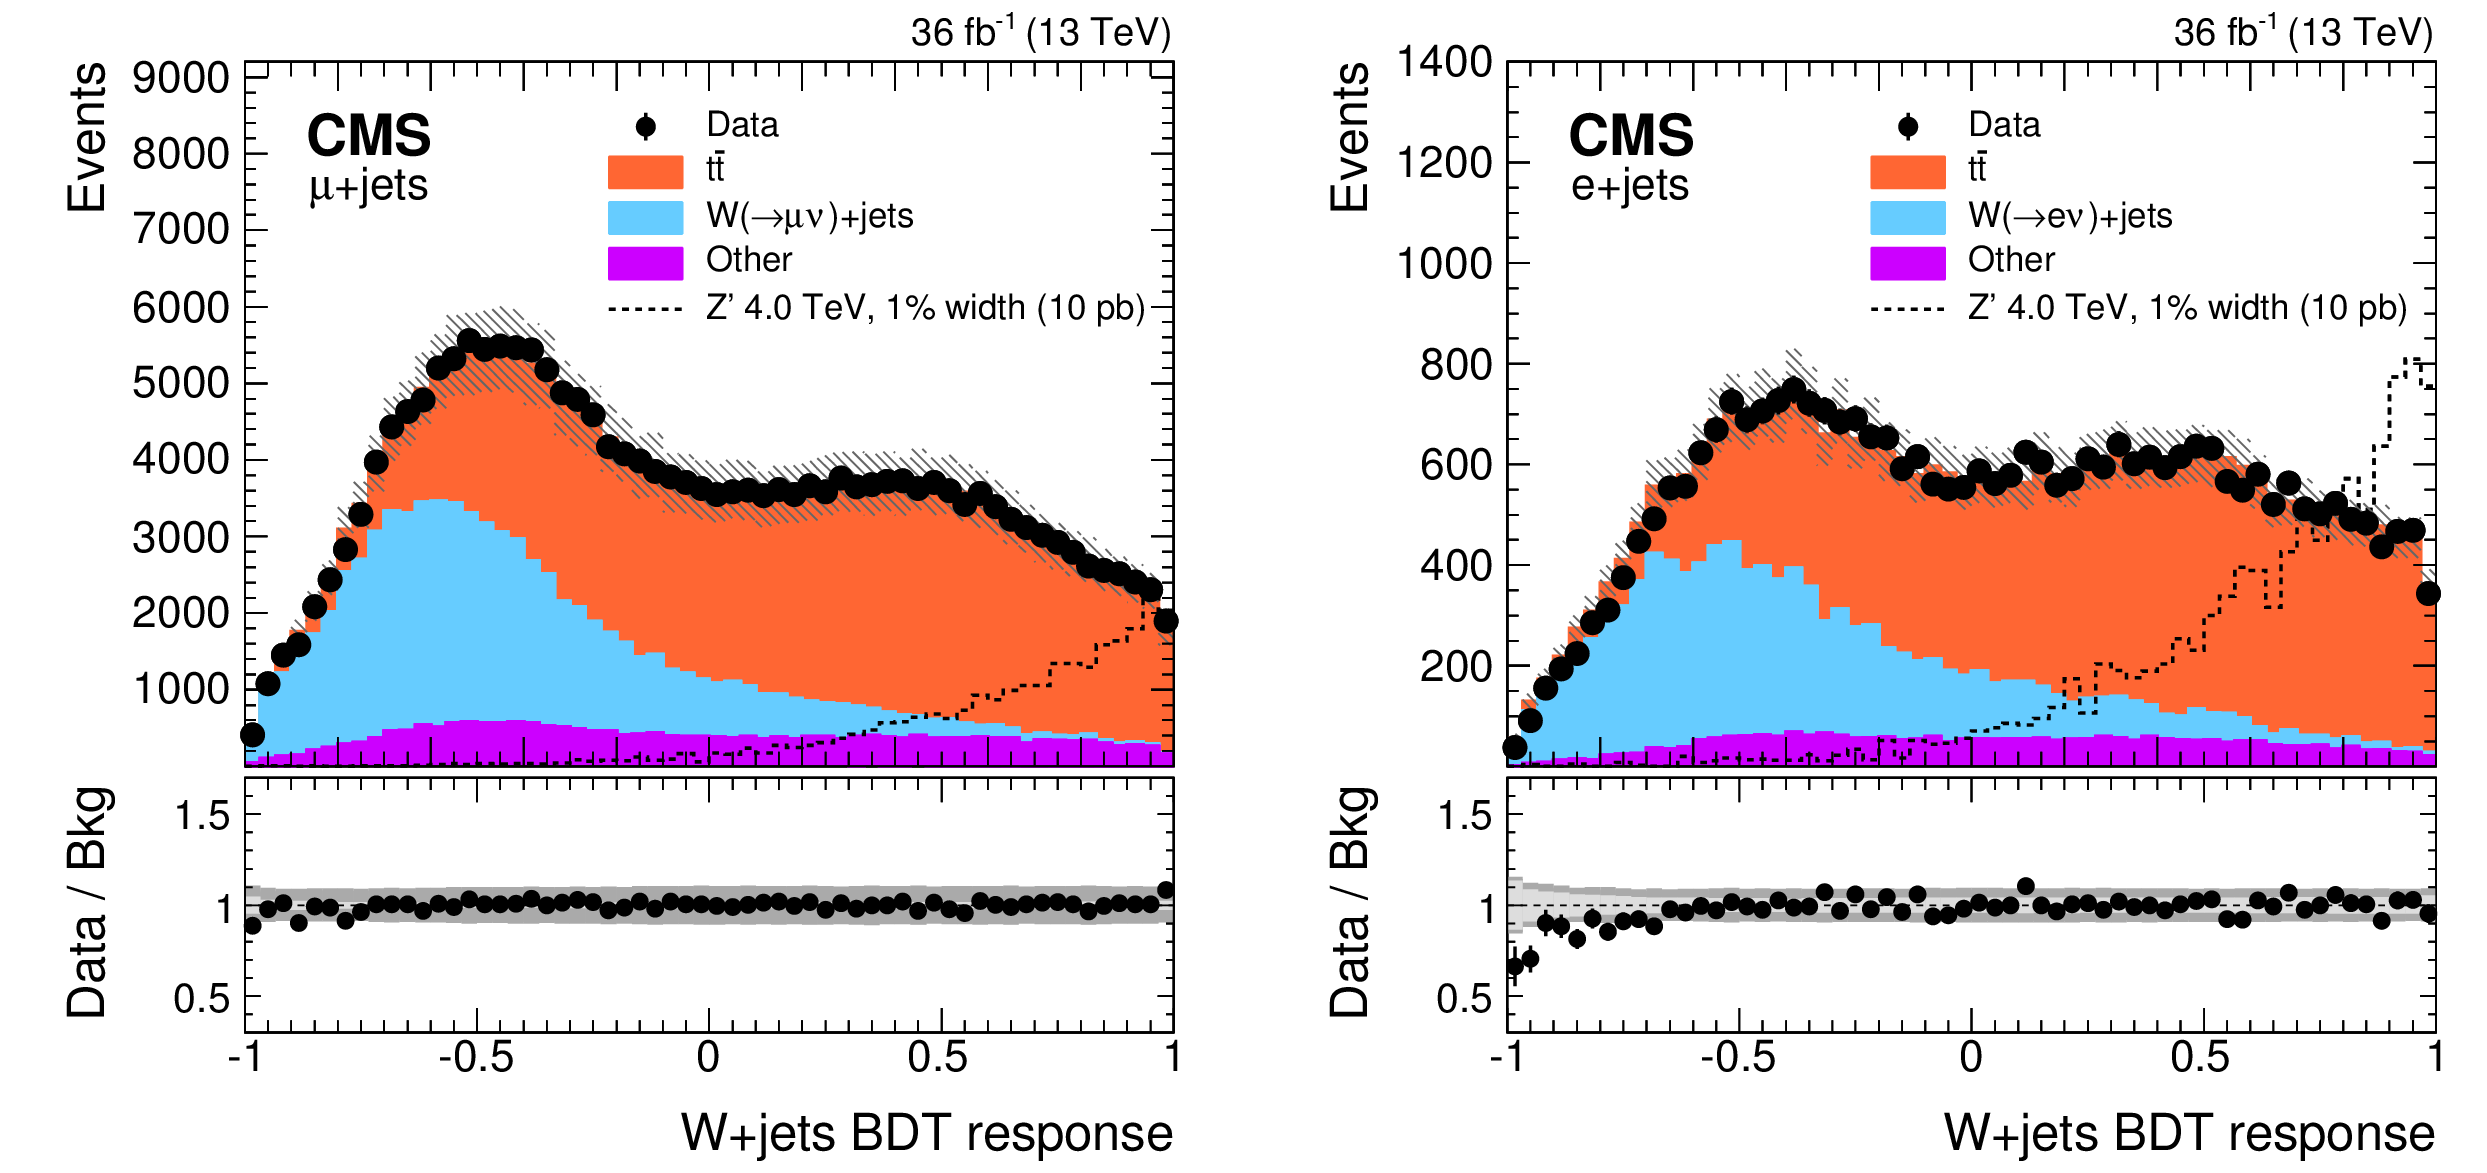
W+jets BDT distributions in the muon (left) and electron (right) single-lepton channel. The SR is defined as events with W+jets BDT $\ge$ 0.5. The contribution expected from a 4 TeV Z' boson, with a relative width of 1%, is shown normalized to a cross section of 10 pb. The hatched band on the simulation represents the statistical and systematic uncertainties. The lower panels in each plot show the ratio of data to the SM background prediction and the light (dark) gray band represents statistical (systematic) uncertainty. The error bars on the data points indicate Poisson statistical uncertainty. |

png pdf |
Figure 3-a:
W+jets BDT distribution in the muon single-lepton channel. The SR is defined as events with W+jets BDT $\ge$ 0.5. The contribution expected from a 4 TeV Z' boson, with a relative width of 1%, is shown normalized to a cross section of 10 pb. The hatched band on the simulation represents the statistical and systematic uncertainties. The lower panel shows the ratio of data to the SM background prediction and the light (dark) gray band represents statistical (systematic) uncertainty. The error bars on the data points indicate Poisson statistical uncertainty. |
png pdf |
Figure 3-b:
W+jets BDT distribution in the electron single-lepton channel. The SR is defined as events with W+jets BDT $\ge$ 0.5. The contribution expected from a 4 TeV Z' boson, with a relative width of 1%, is shown normalized to a cross section of 10 pb. The hatched band on the simulation represents the statistical and systematic uncertainties. The lower panel shows the ratio of data to the SM background prediction and the light (dark) gray band represents statistical (systematic) uncertainty. The error bars on the data points indicate Poisson statistical uncertainty. |

png pdf |
Figure 4:
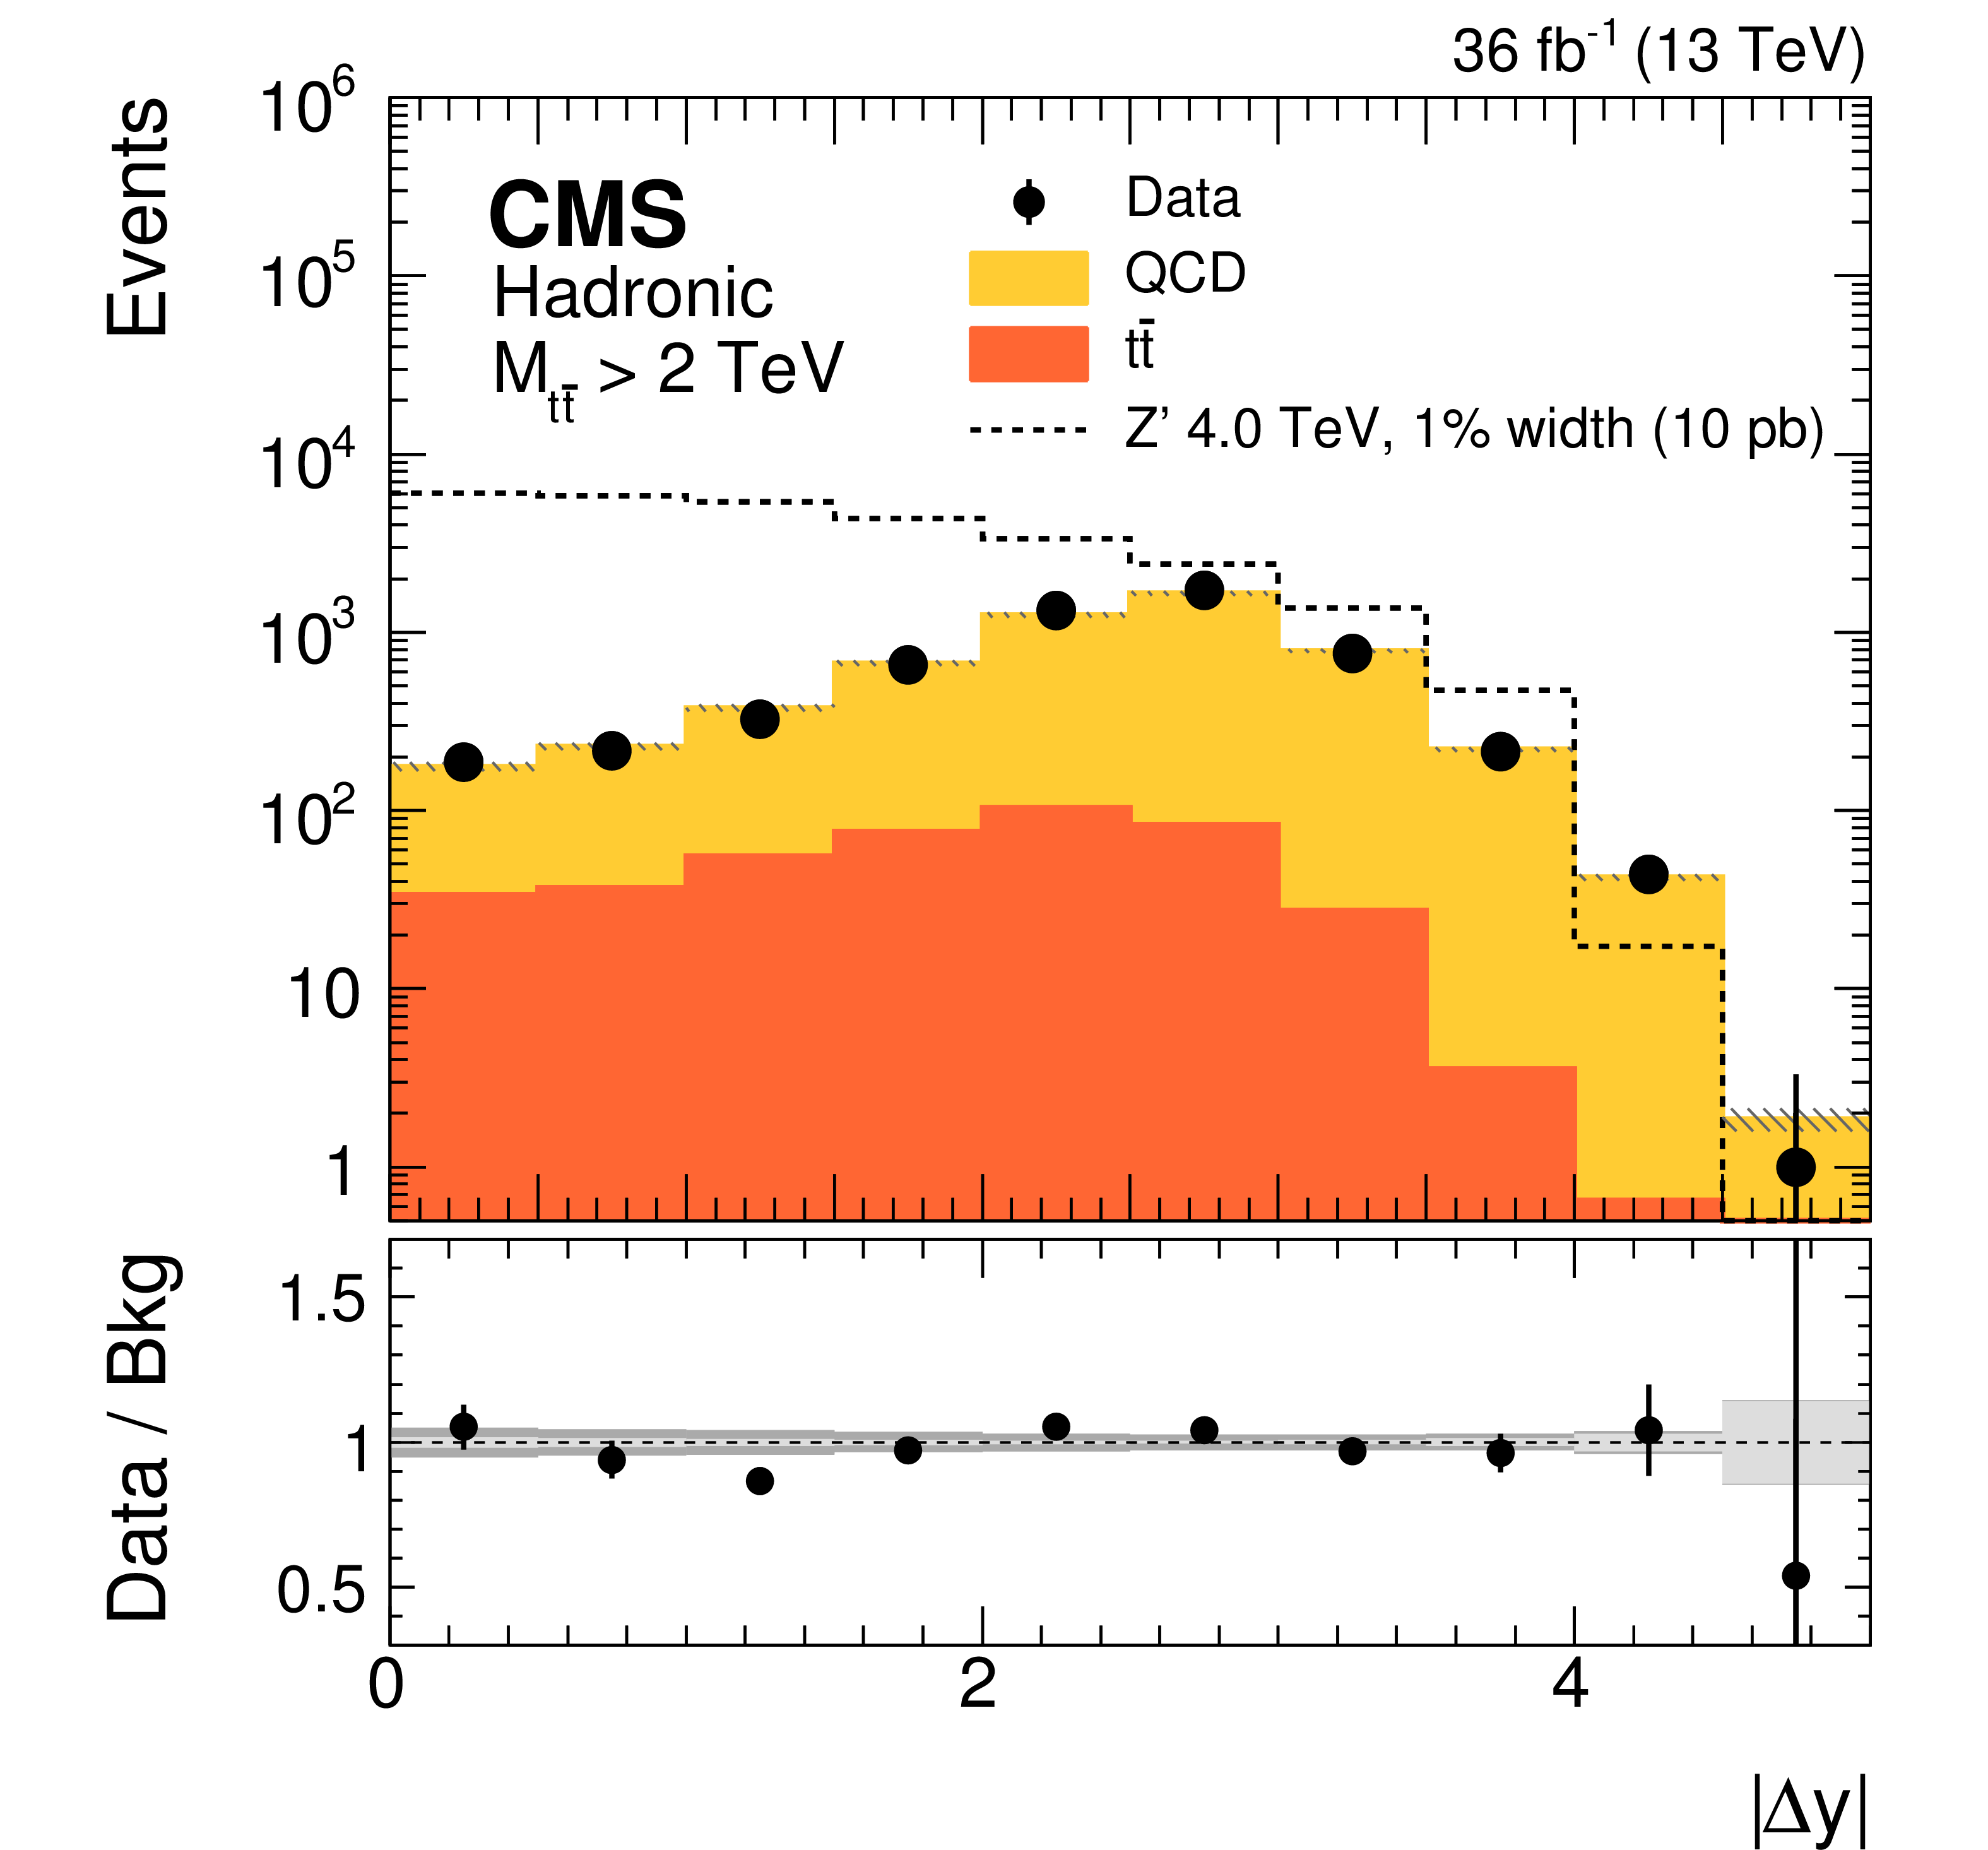
Dijet rapidity difference $(\Delta y)$ for events passing the fully hadronic event selection for all $ {m_{{{\mathrm {t}\overline {\mathrm {t}}}}}} $ (left) and for events with an $ {m_{{{\mathrm {t}\overline {\mathrm {t}}}}}} > $ 2 TeV (right). The contribution expected from a 4 TeV Z' boson, with a relative width of 1%, is shown normalized to a cross section of 10 pb. The hatched band around the simulated distribution represents the statistical and systematic uncertainties. The lower panels in each plot show the ratio of data to the SM background prediction and the light (dark) gray band represents statistical (systematic) uncertainty. |

png pdf |
Figure 4-a:
Dijet rapidity difference $(\Delta y)$ for events passing the fully hadronic event selection for all $ {m_{{{\mathrm {t}\overline {\mathrm {t}}}}}} $. The contribution expected from a 4 TeV Z' boson, with a relative width of 1%, is shown normalized to a cross section of 10 pb. The hatched band around the simulated distribution represents the statistical and systematic uncertainties. The lower panel shows the ratio of data to the SM background prediction and the light (dark) gray band represents statistical (systematic) uncertainty. |
png pdf |
Figure 4-b:
Dijet rapidity difference $(\Delta y)$ for events with an $ {m_{{{\mathrm {t}\overline {\mathrm {t}}}}}} > $ 2 TeV. The contribution expected from a 4 TeV Z' boson, with a relative width of 1%, is shown normalized to a cross section of 10 pb. The hatched band around the simulated distribution represents the statistical and systematic uncertainties. The lower panel shows the ratio of data to the SM background prediction and the light (dark) gray band represents statistical (systematic) uncertainty. |
png pdf |
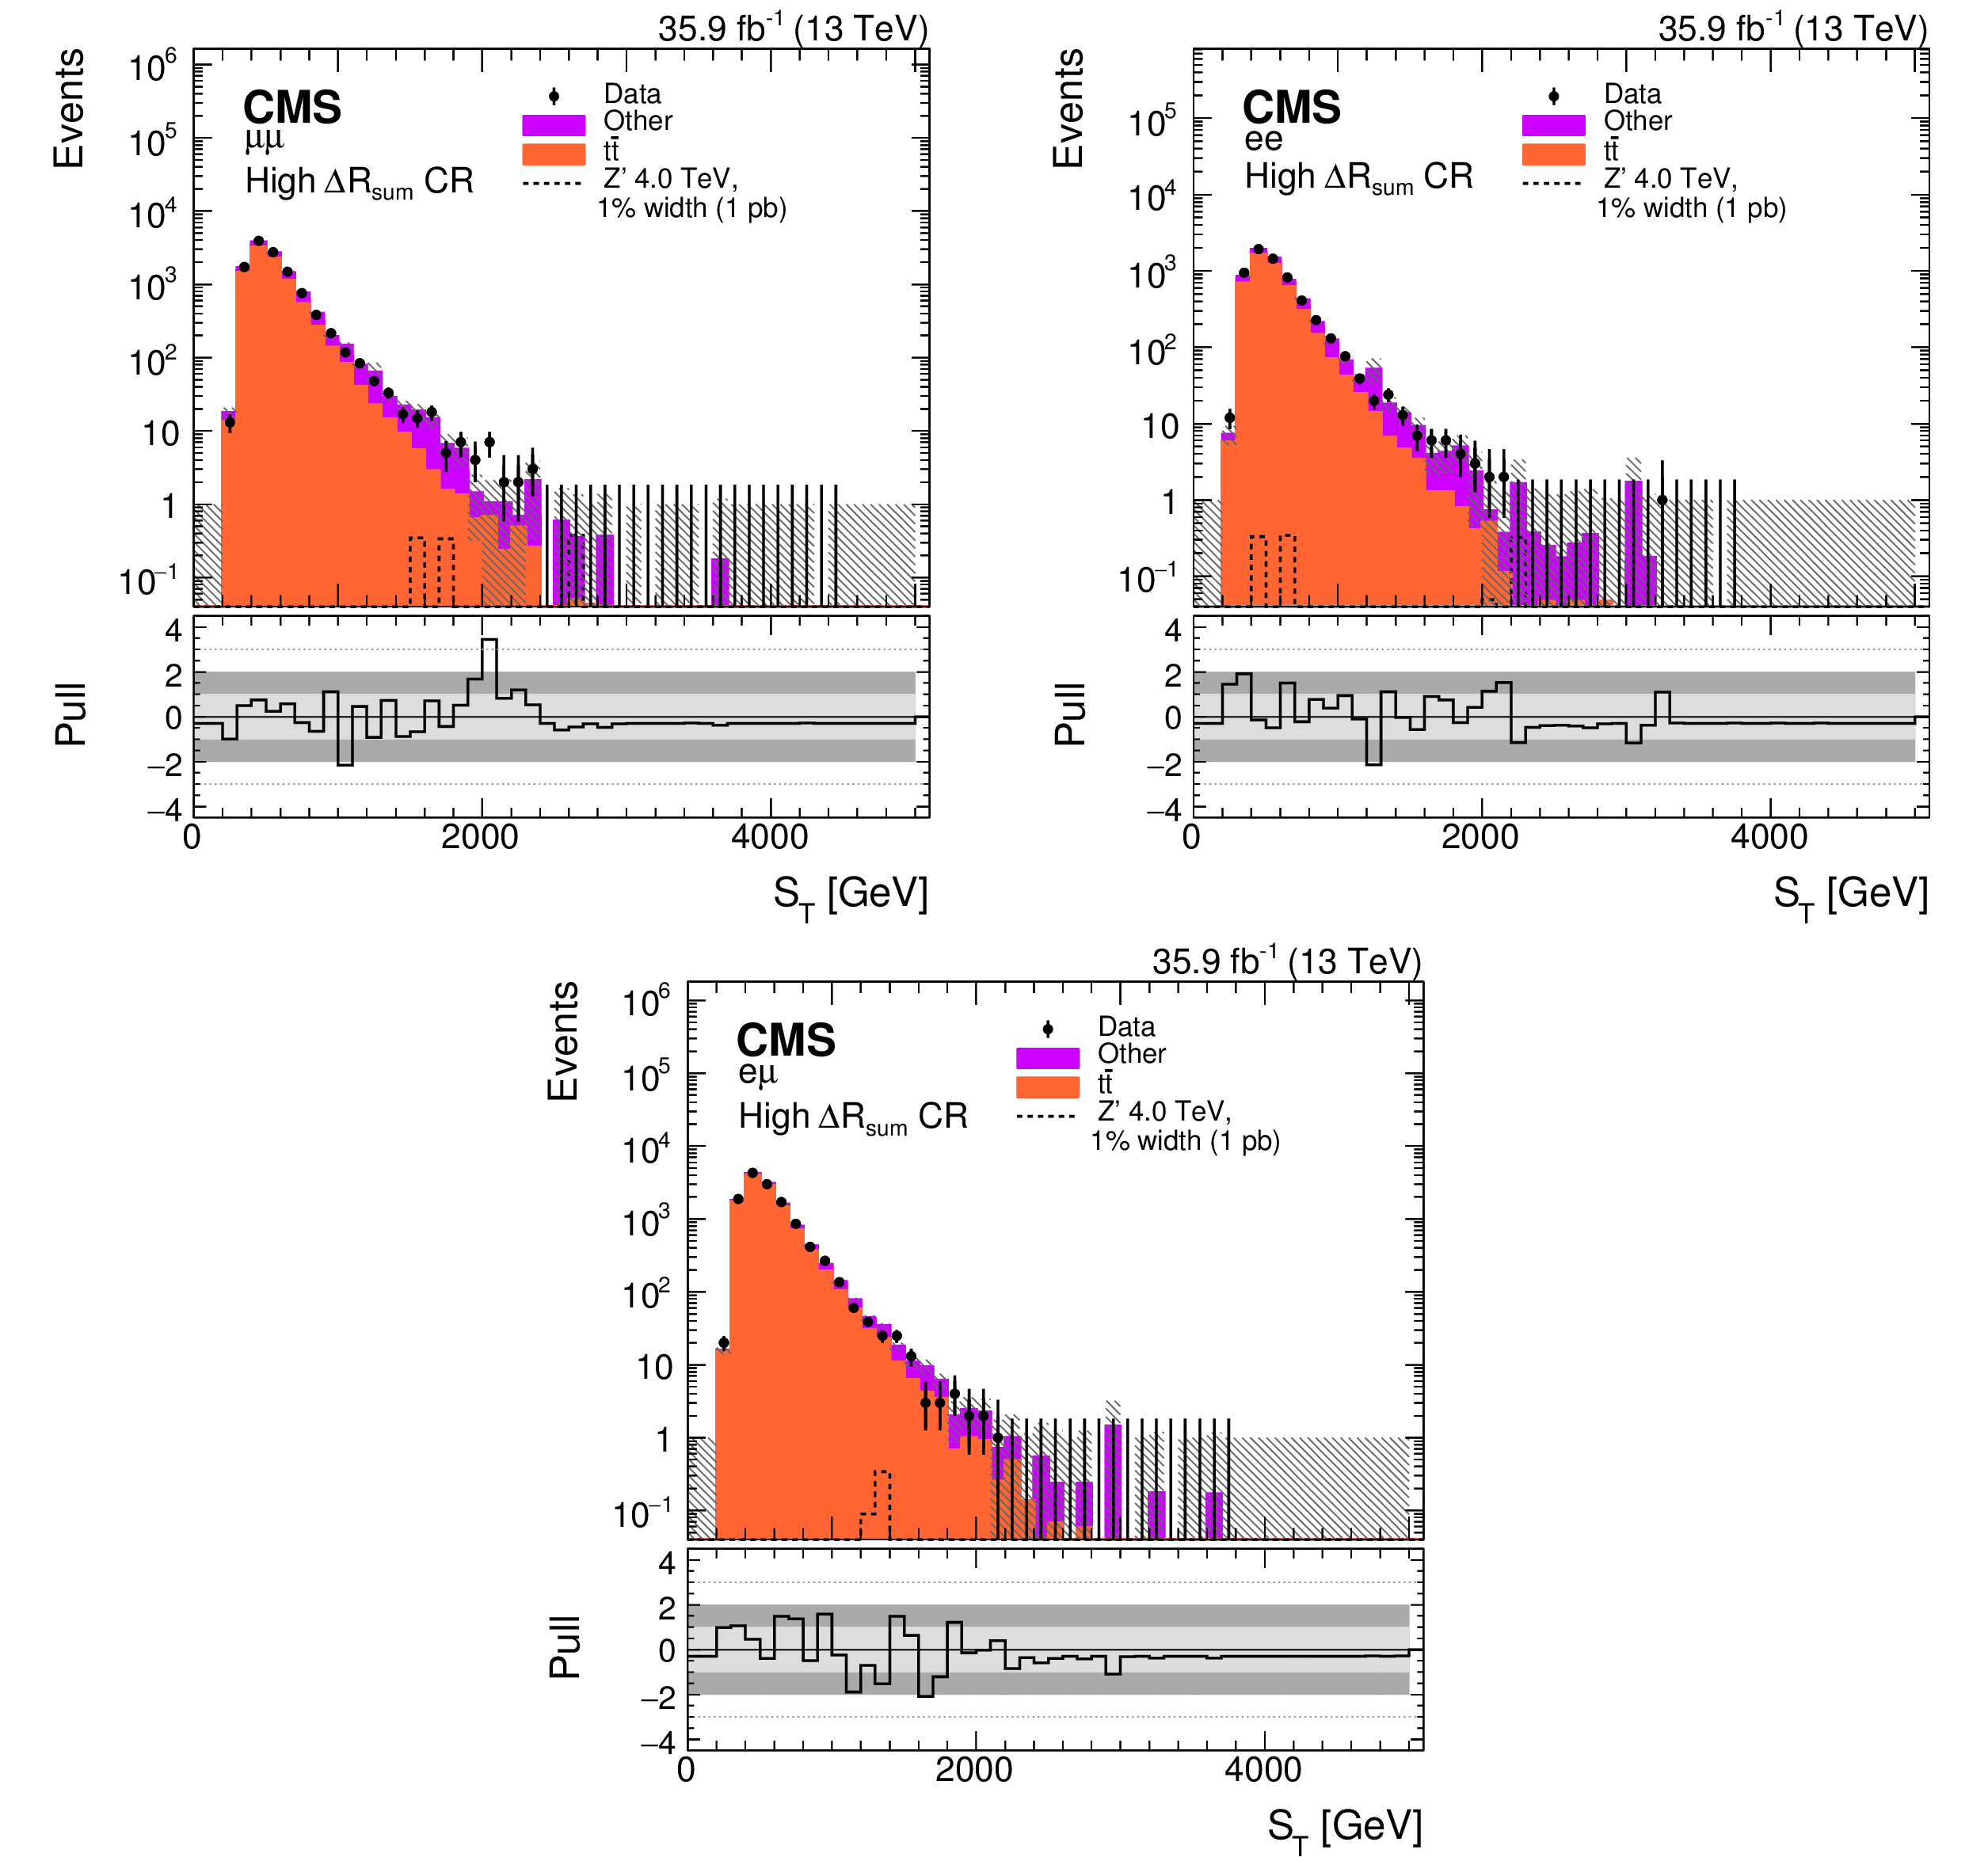
Figure 5:
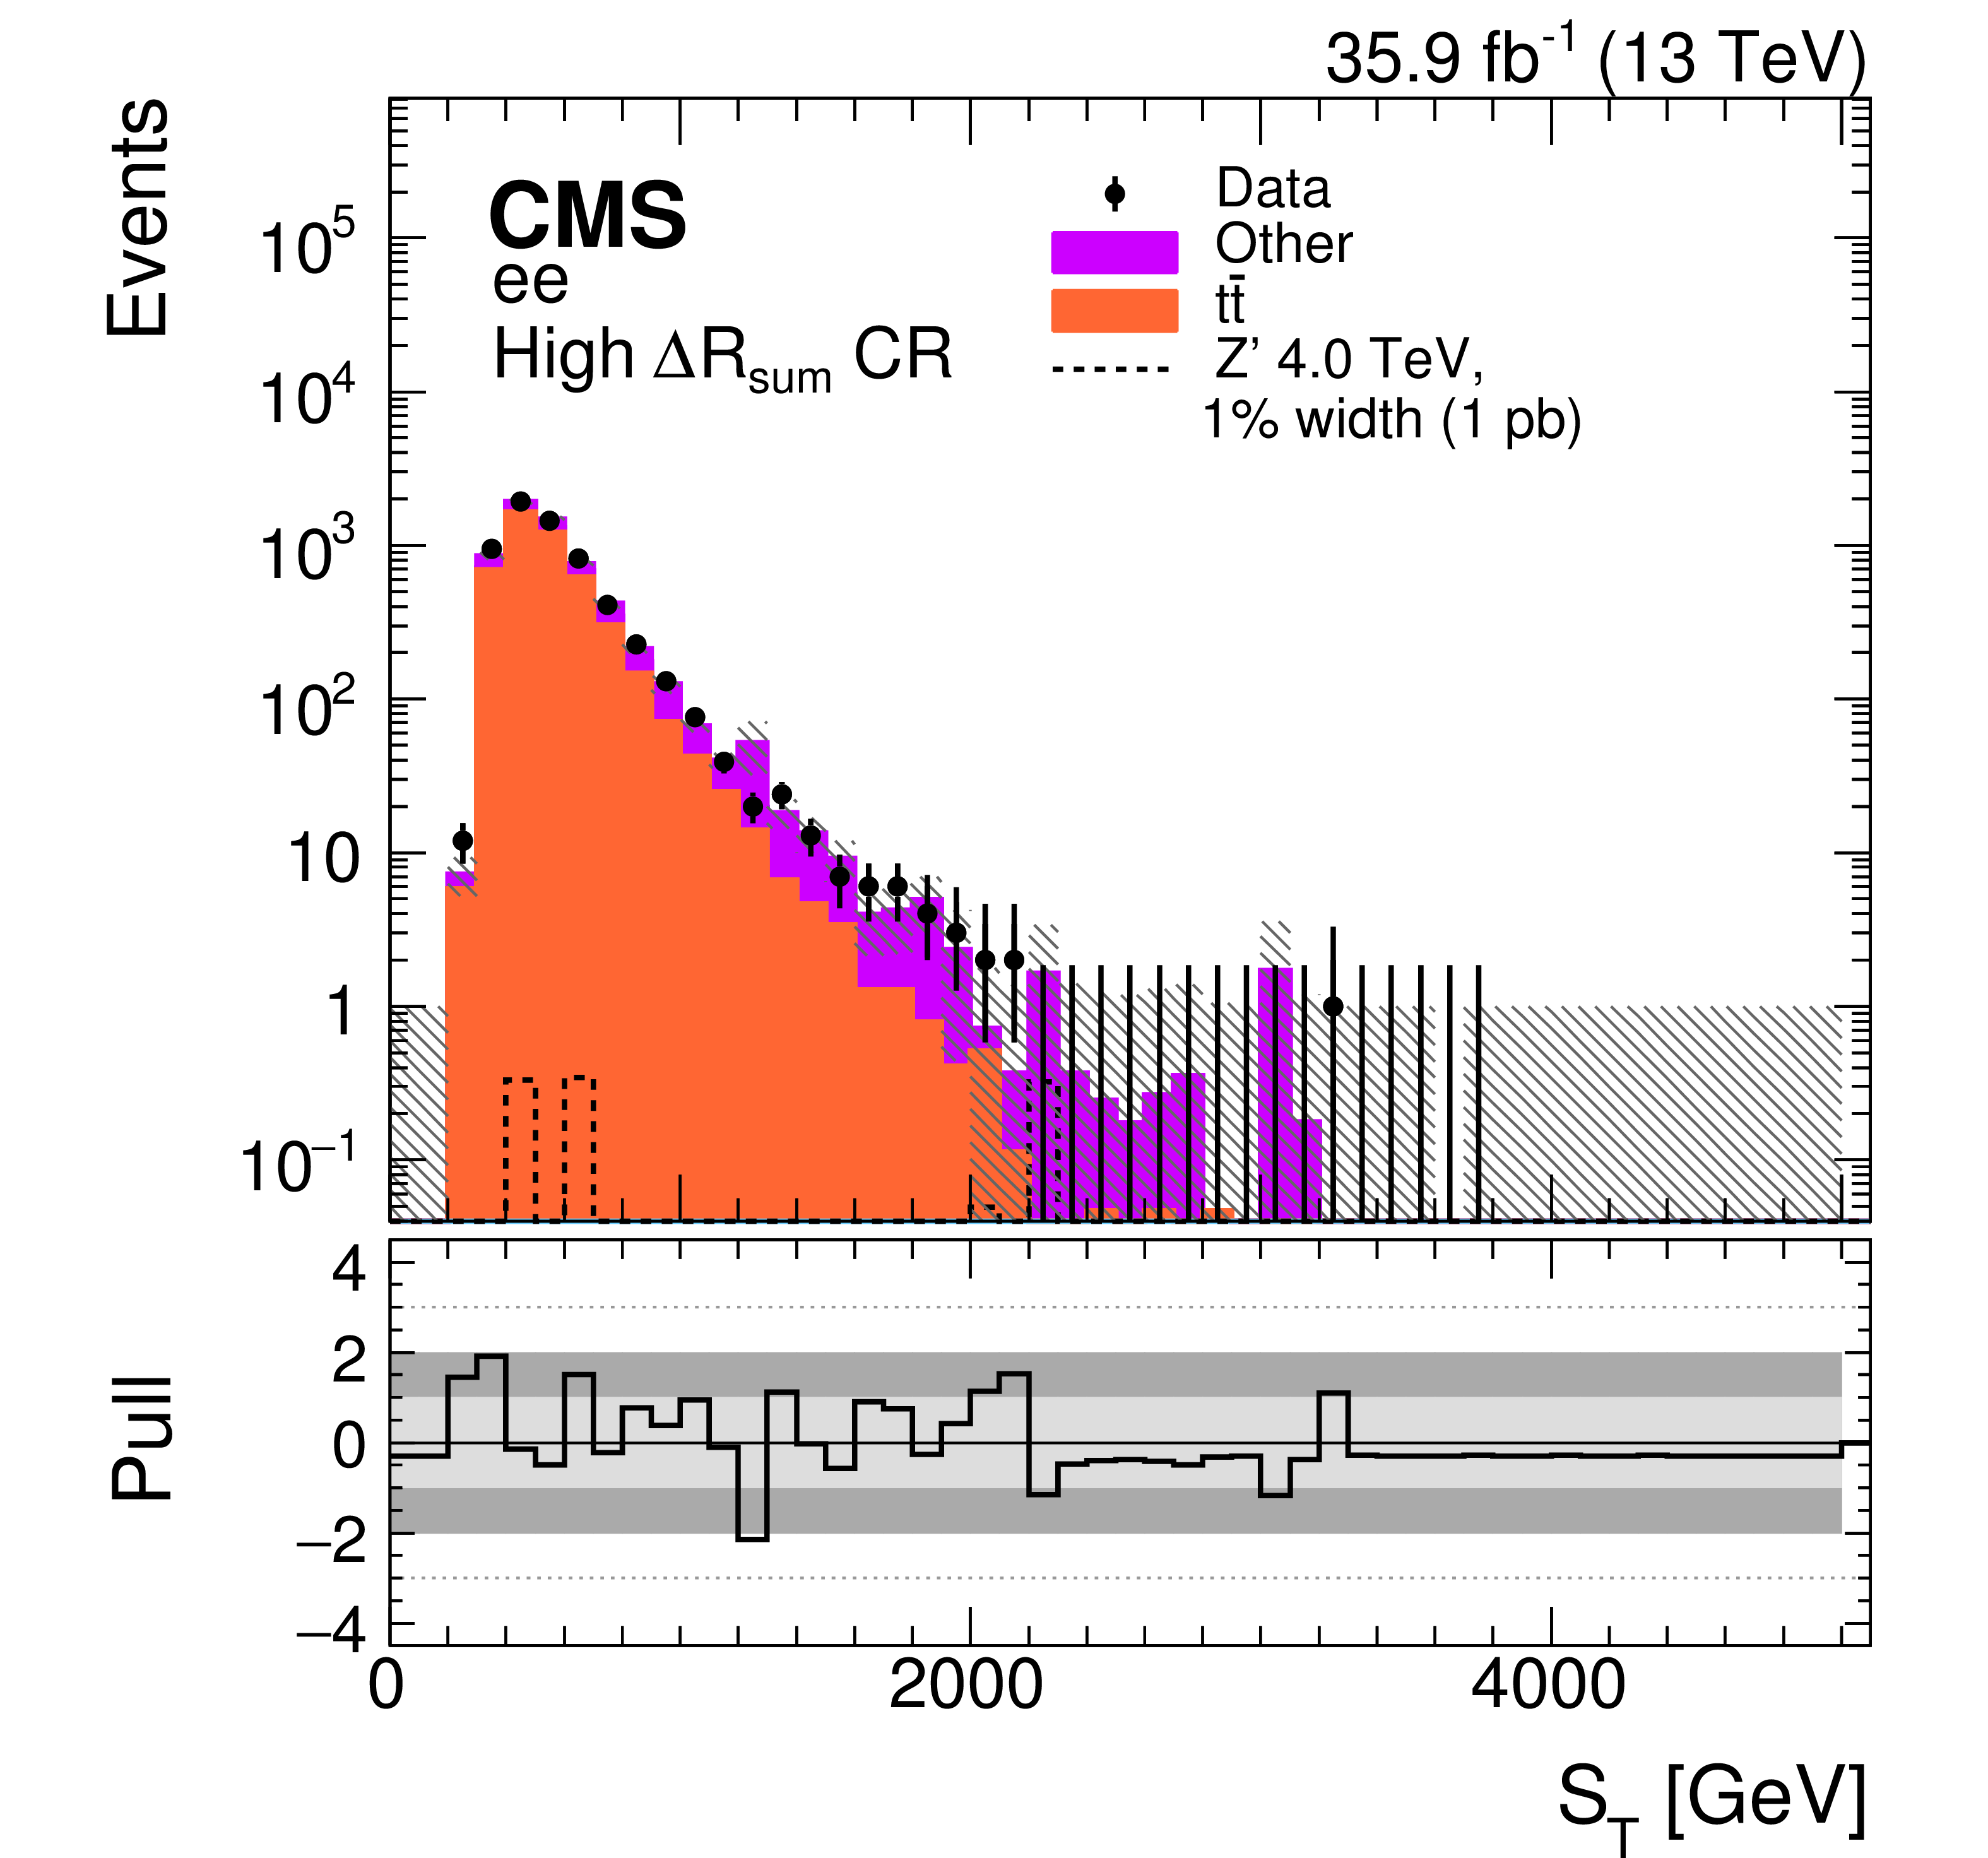
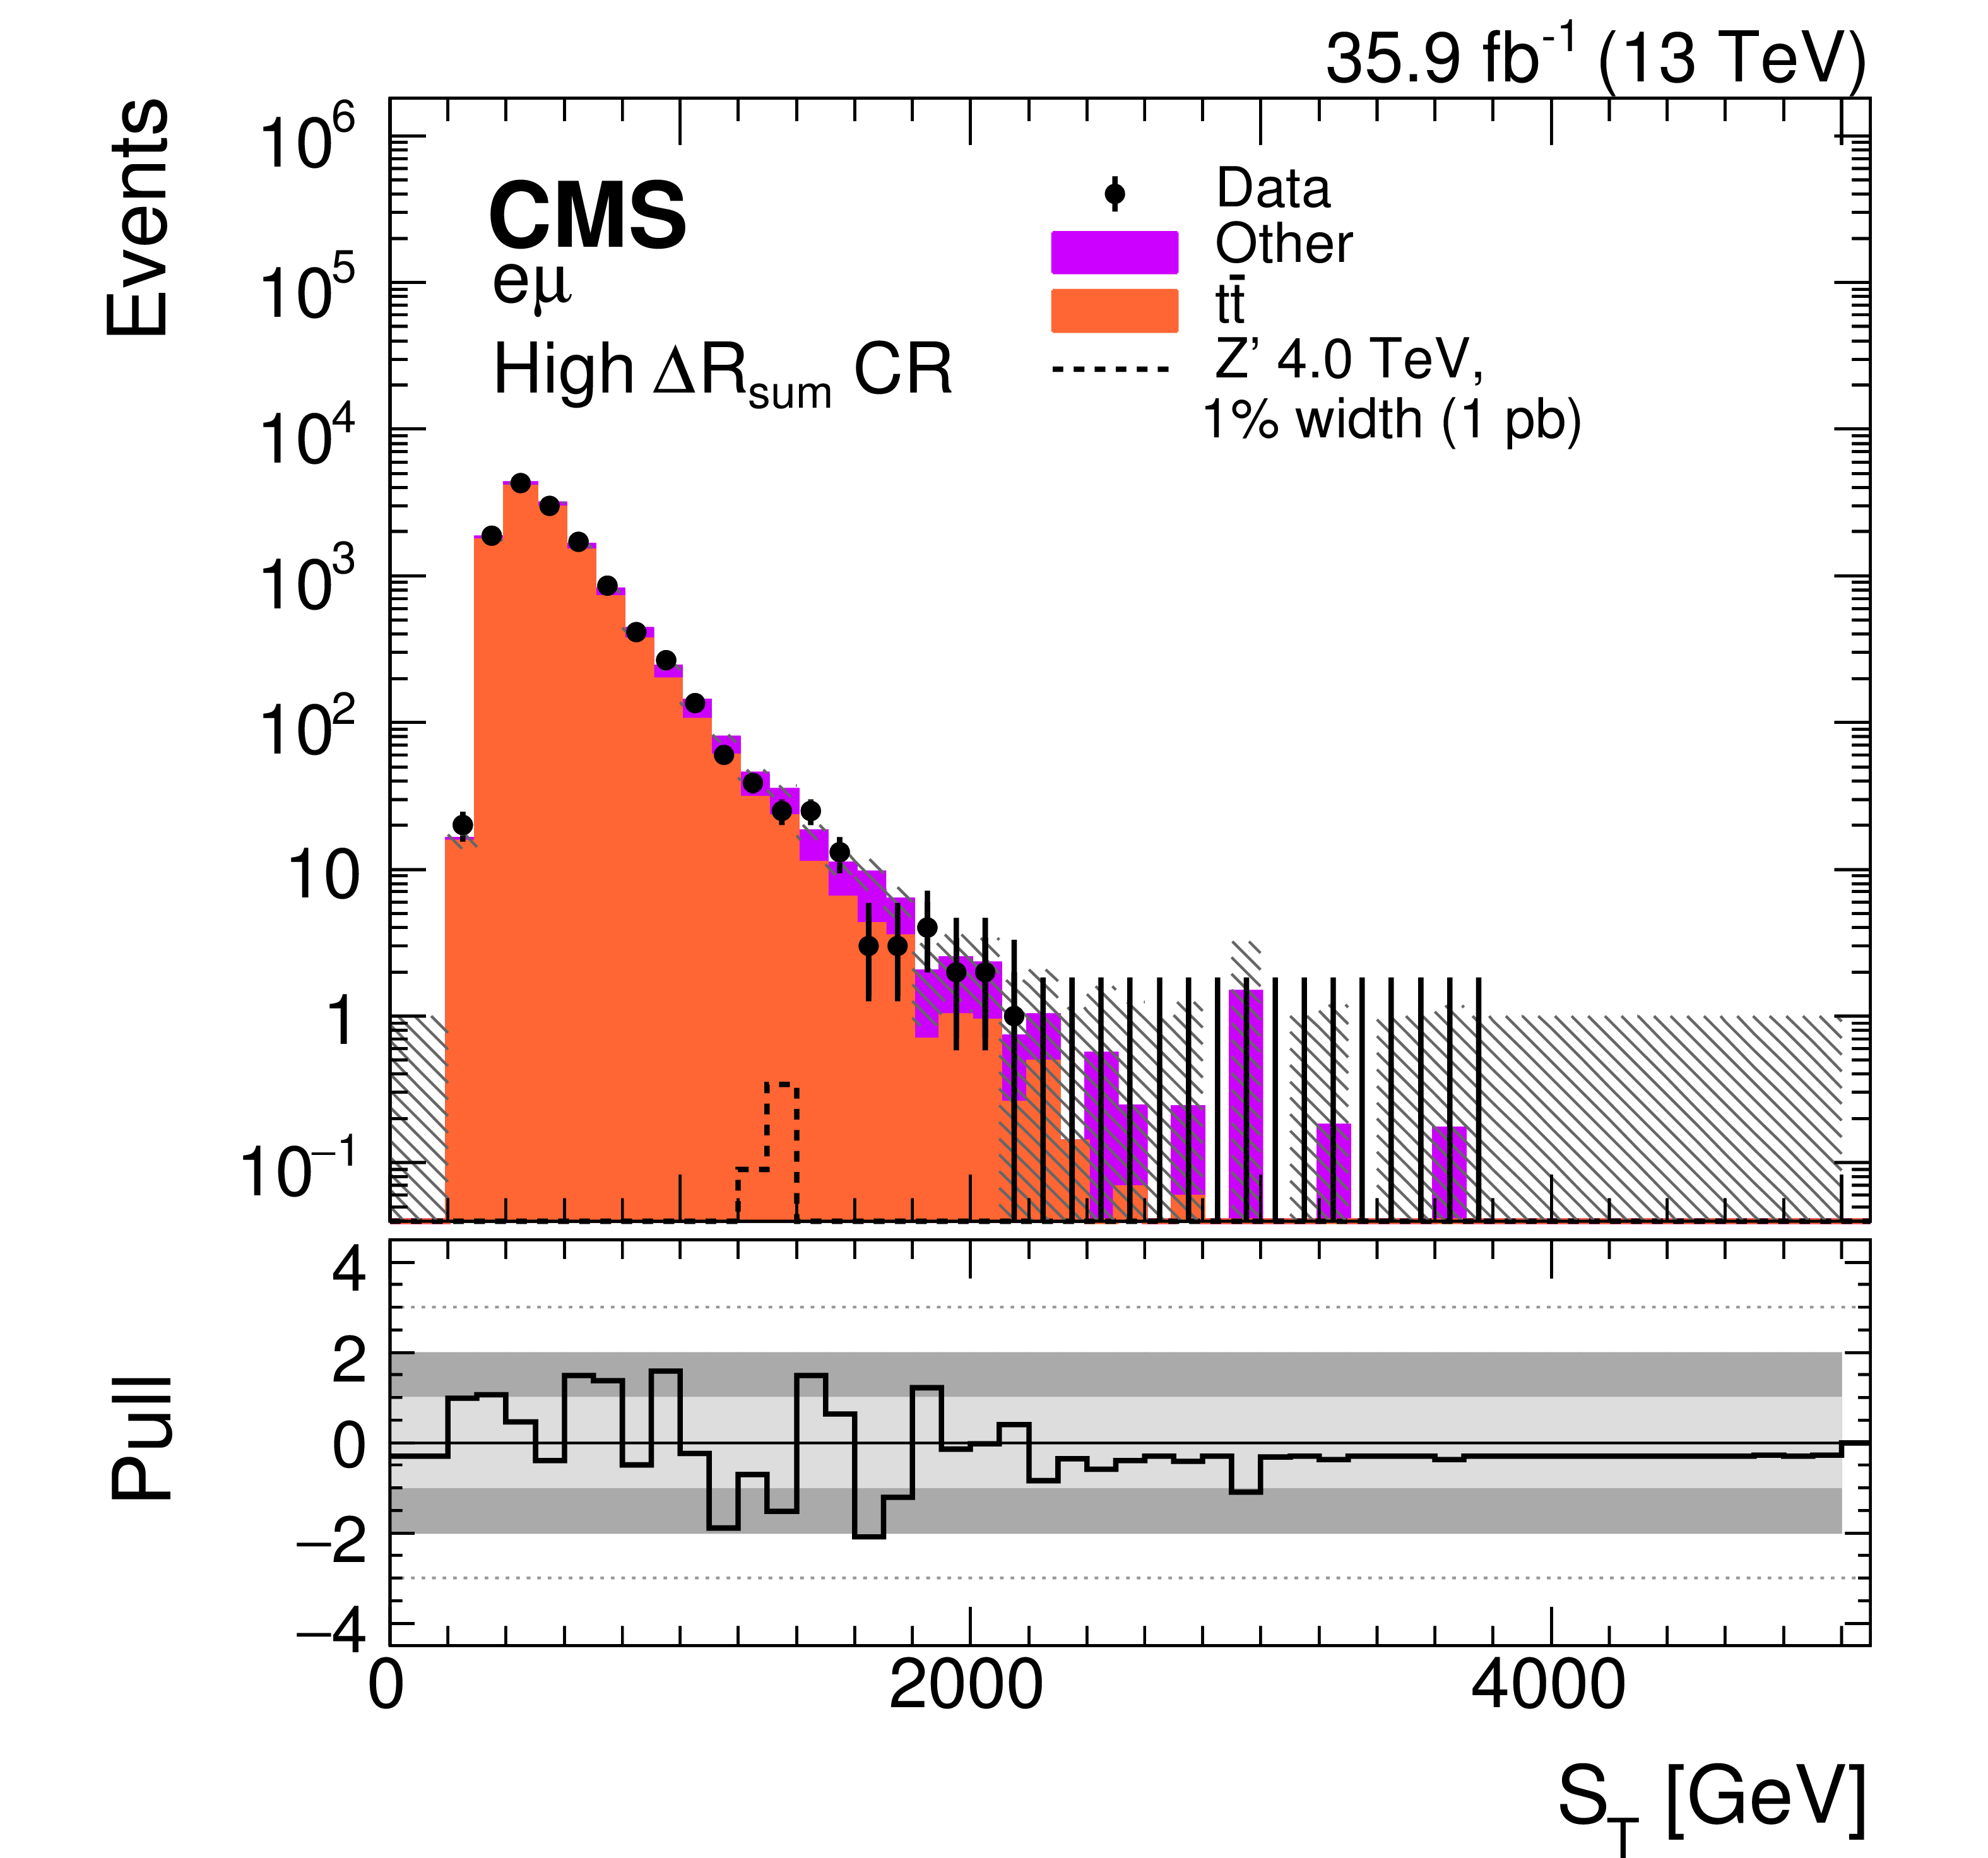
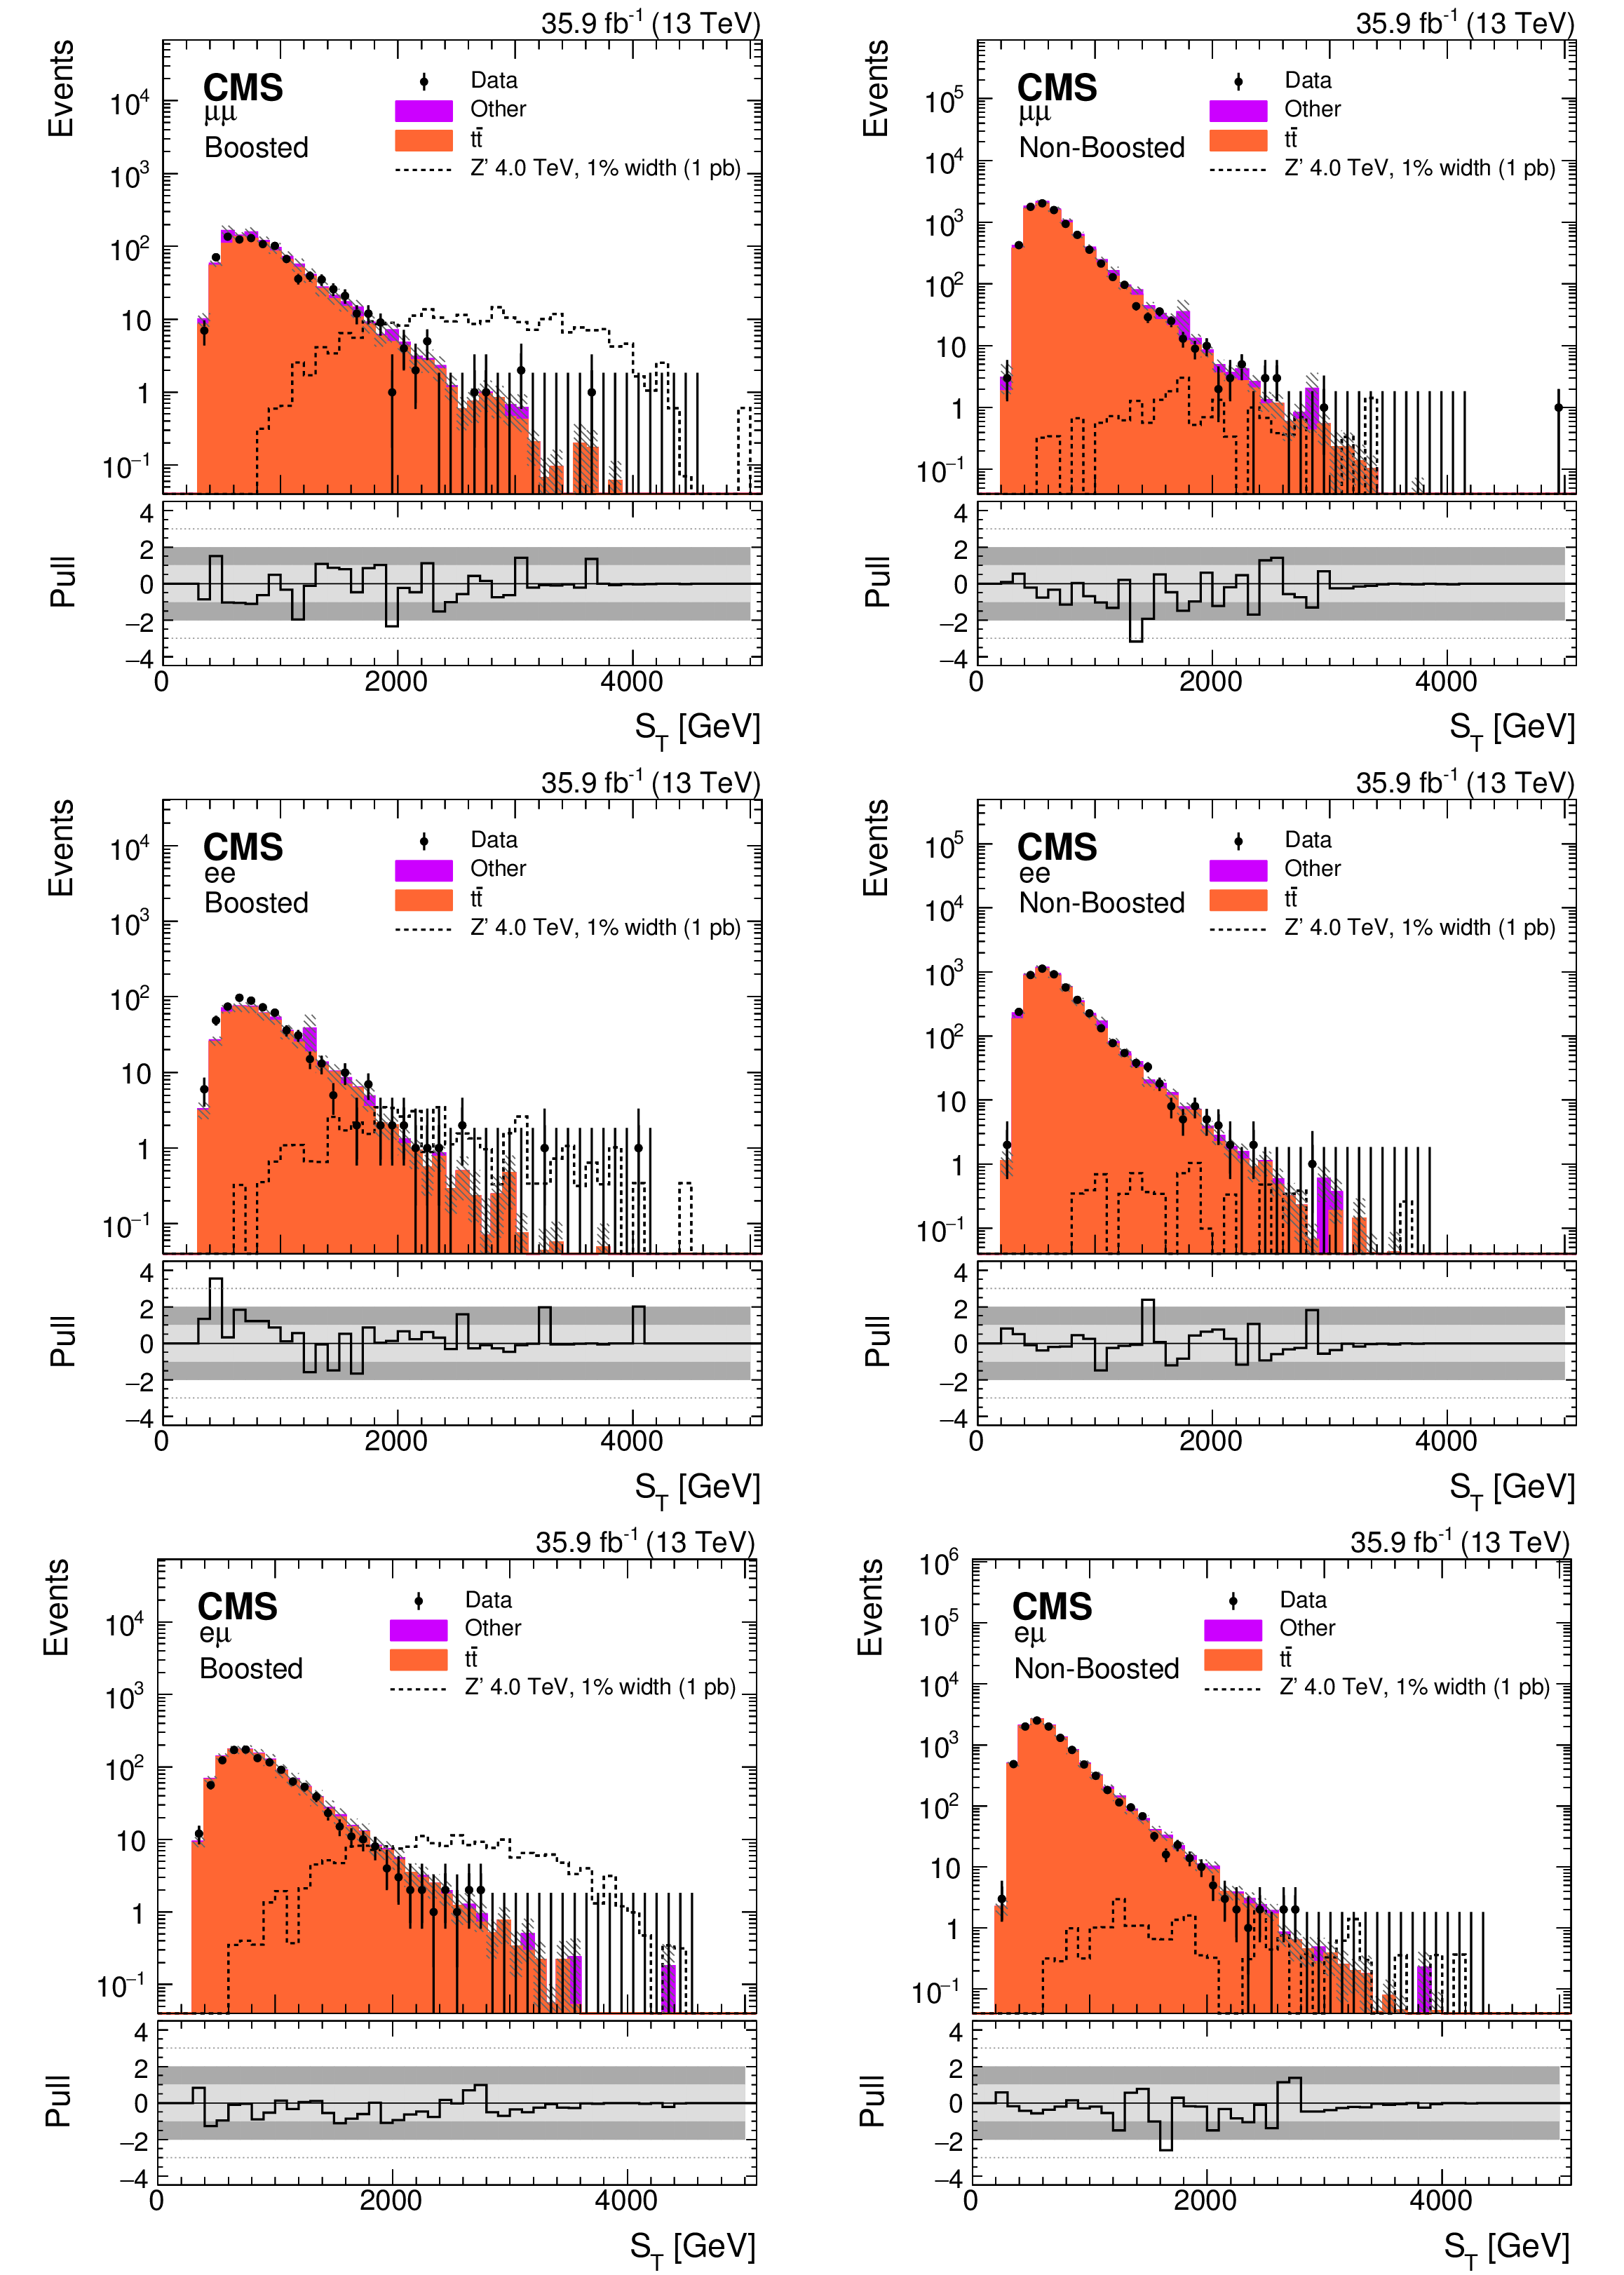
Distributions of $ {S_{\text {T}}} $ in the background-enriched CR for $\mu \mu $ (upper left), $ \mathrm{ee} $ (upper right), and $ {\mathrm {e}}\mu $ (lower) subchannels. The contribution expected from a 4 TeV Z' boson, with a relative width of 1%, is shown normalized to a cross section of 1 pb. The hatched band on the simulation represents the uncertainty in the background prediction. The lower panel shows the pull of each histogram bin from the SM prediction. The light (dark) gray band represents a pull of one (two) standard deviations (s.d.) from the predicted value. |
png pdf |
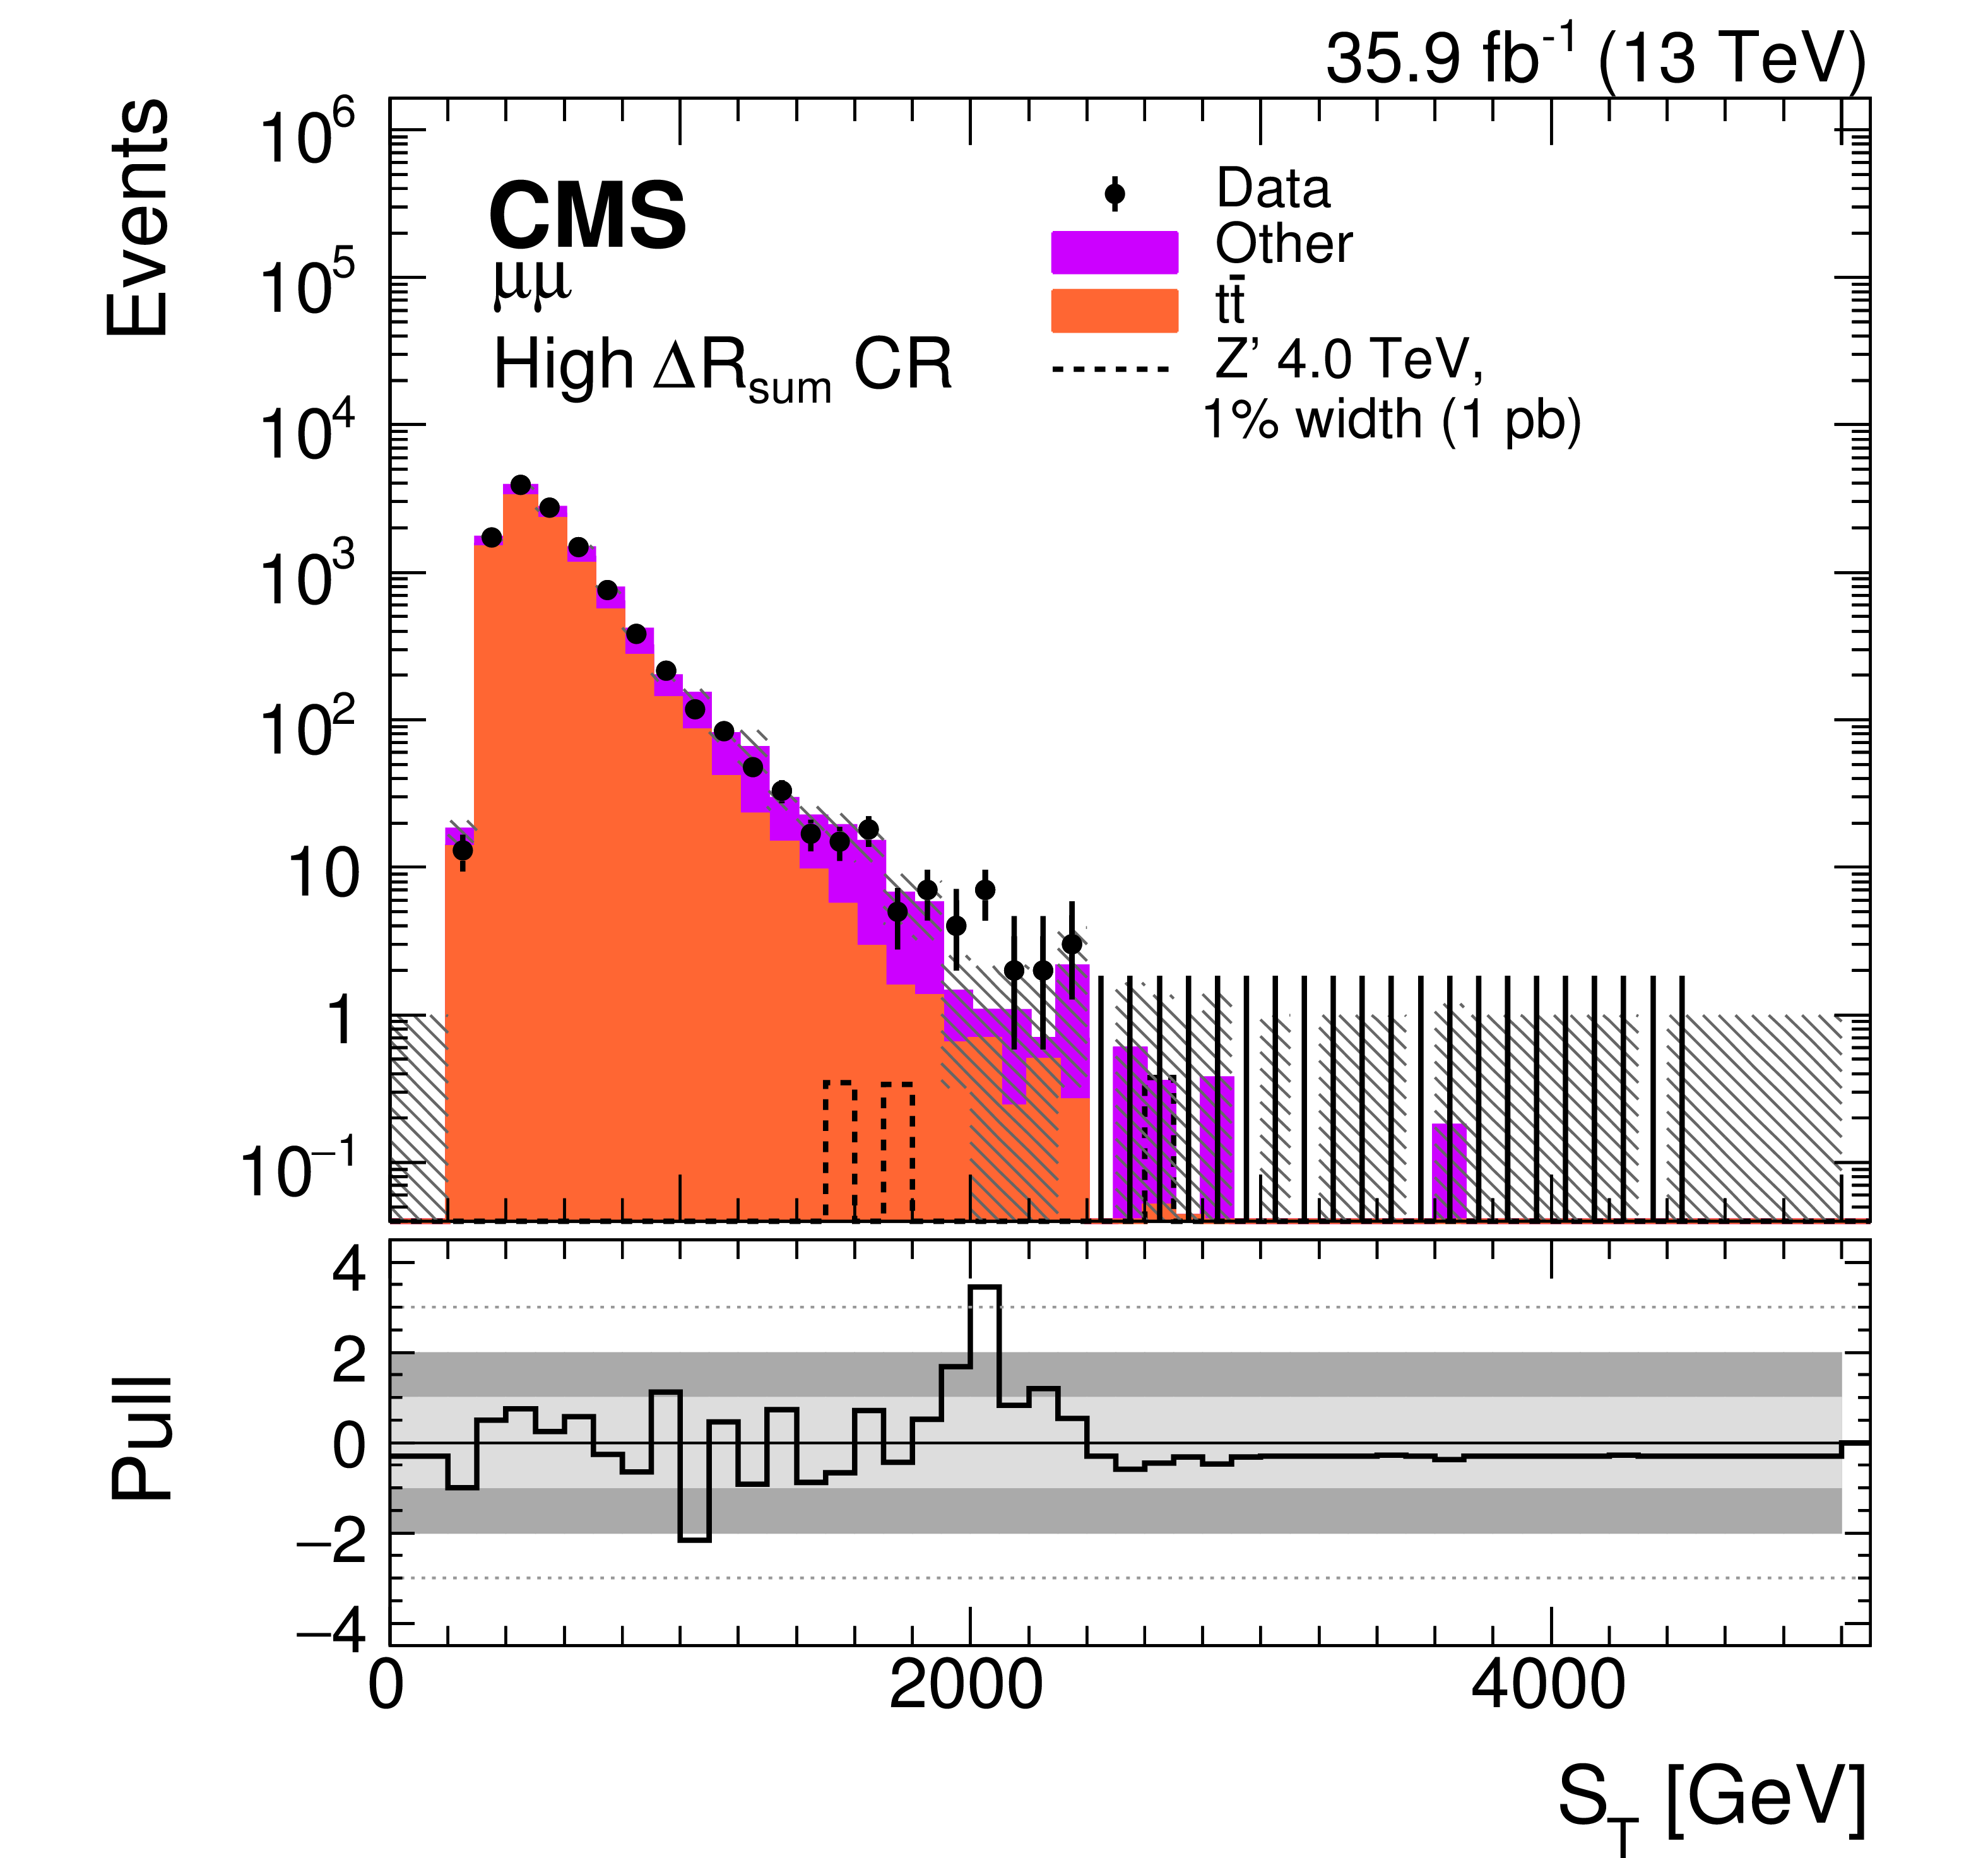
Figure 5-a:
Distribution of $ {S_{\text {T}}} $ in the background-enriched CR for the $\mu \mu $ subchannel. The contribution expected from a 4 TeV Z' boson, with a relative width of 1%, is shown normalized to a cross section of 1 pb. The hatched band on the simulation represents the uncertainty in the background prediction. The lower panel shows the pull of each histogram bin from the SM prediction. The light (dark) gray band represents a pull of one (two) standard deviations (s.d.) from the predicted value. |
png pdf |
Figure 5-b:
Distribution of $ {S_{\text {T}}} $ in the background-enriched CR for the $ \mathrm{ee} $ subchannel. The contribution expected from a 4 TeV Z' boson, with a relative width of 1%, is shown normalized to a cross section of 1 pb. The hatched band on the simulation represents the uncertainty in the background prediction. The lower panel shows the pull of each histogram bin from the SM prediction. The light (dark) gray band represents a pull of one (two) standard deviations (s.d.) from the predicted value. |
png pdf |
Figure 5-c:
Distribution of $ {S_{\text {T}}} $ in the background-enriched CR for the $ {\mathrm {e}}\mu $ subchannel. The contribution expected from a 4 TeV Z' boson, with a relative width of 1%, is shown normalized to a cross section of 1 pb. The hatched band on the simulation represents the uncertainty in the background prediction. The lower panel shows the pull of each histogram bin from the SM prediction. The light (dark) gray band represents a pull of one (two) standard deviations (s.d.) from the predicted value. |
png pdf |
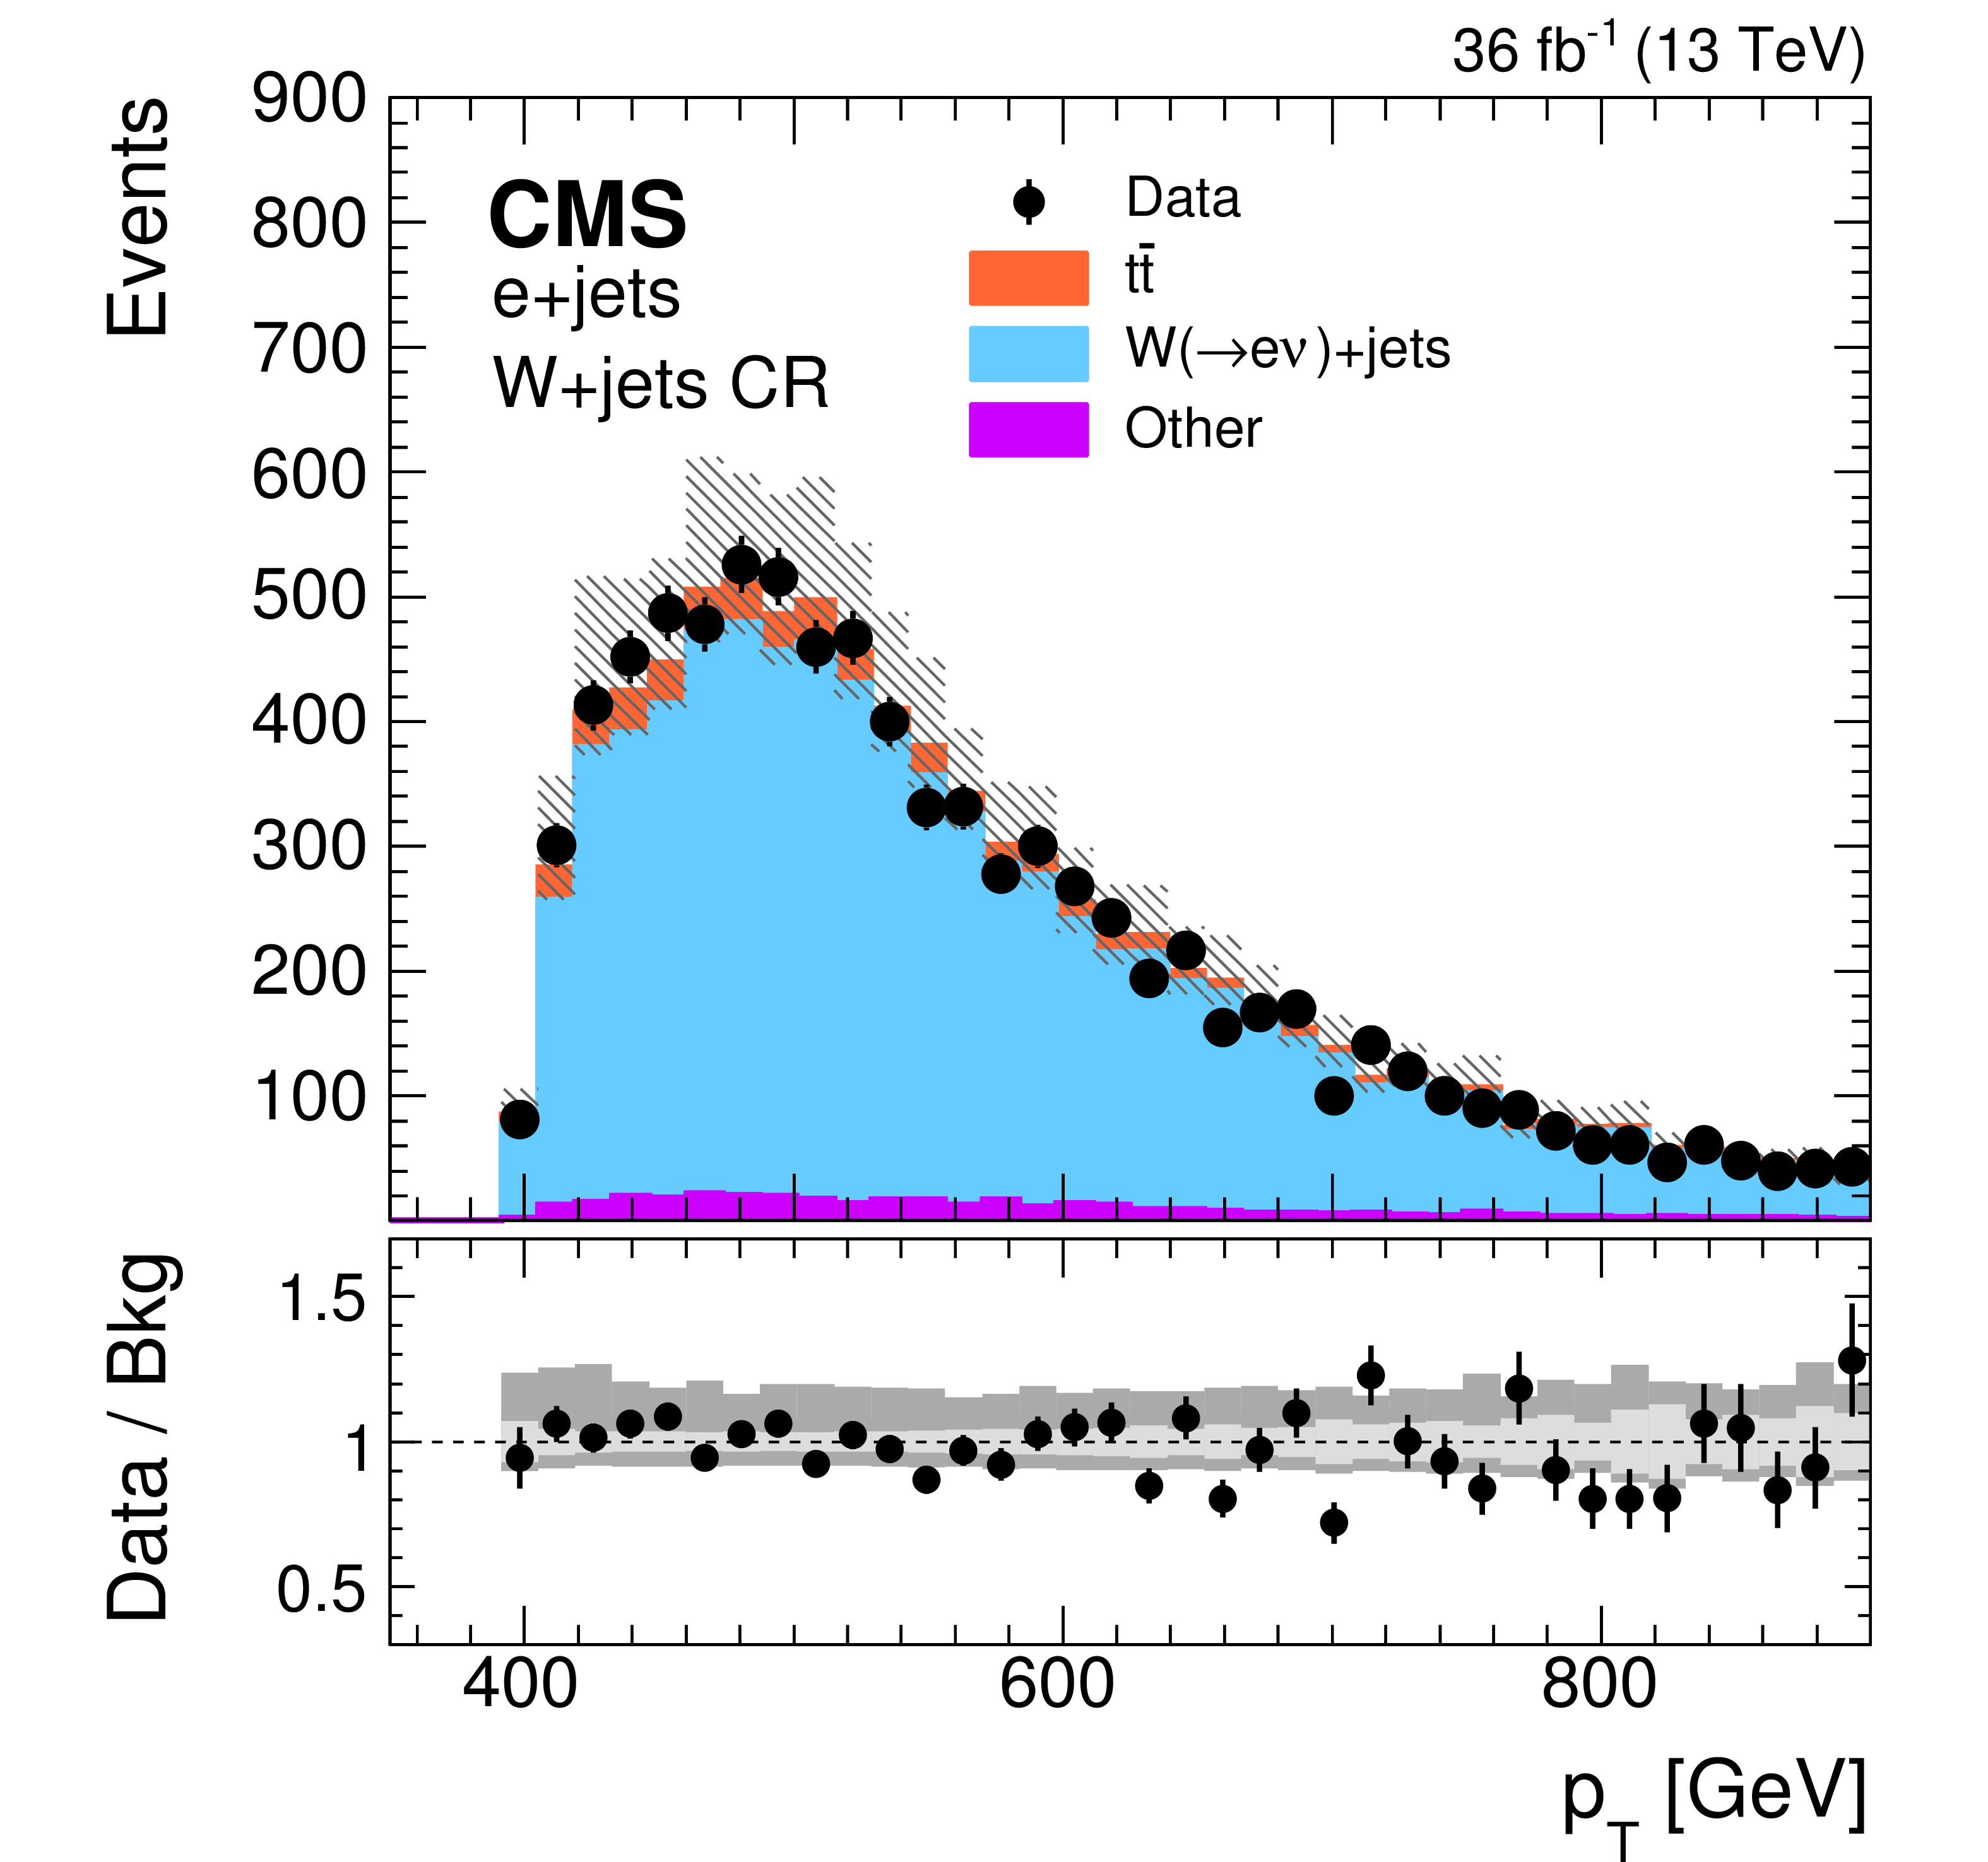
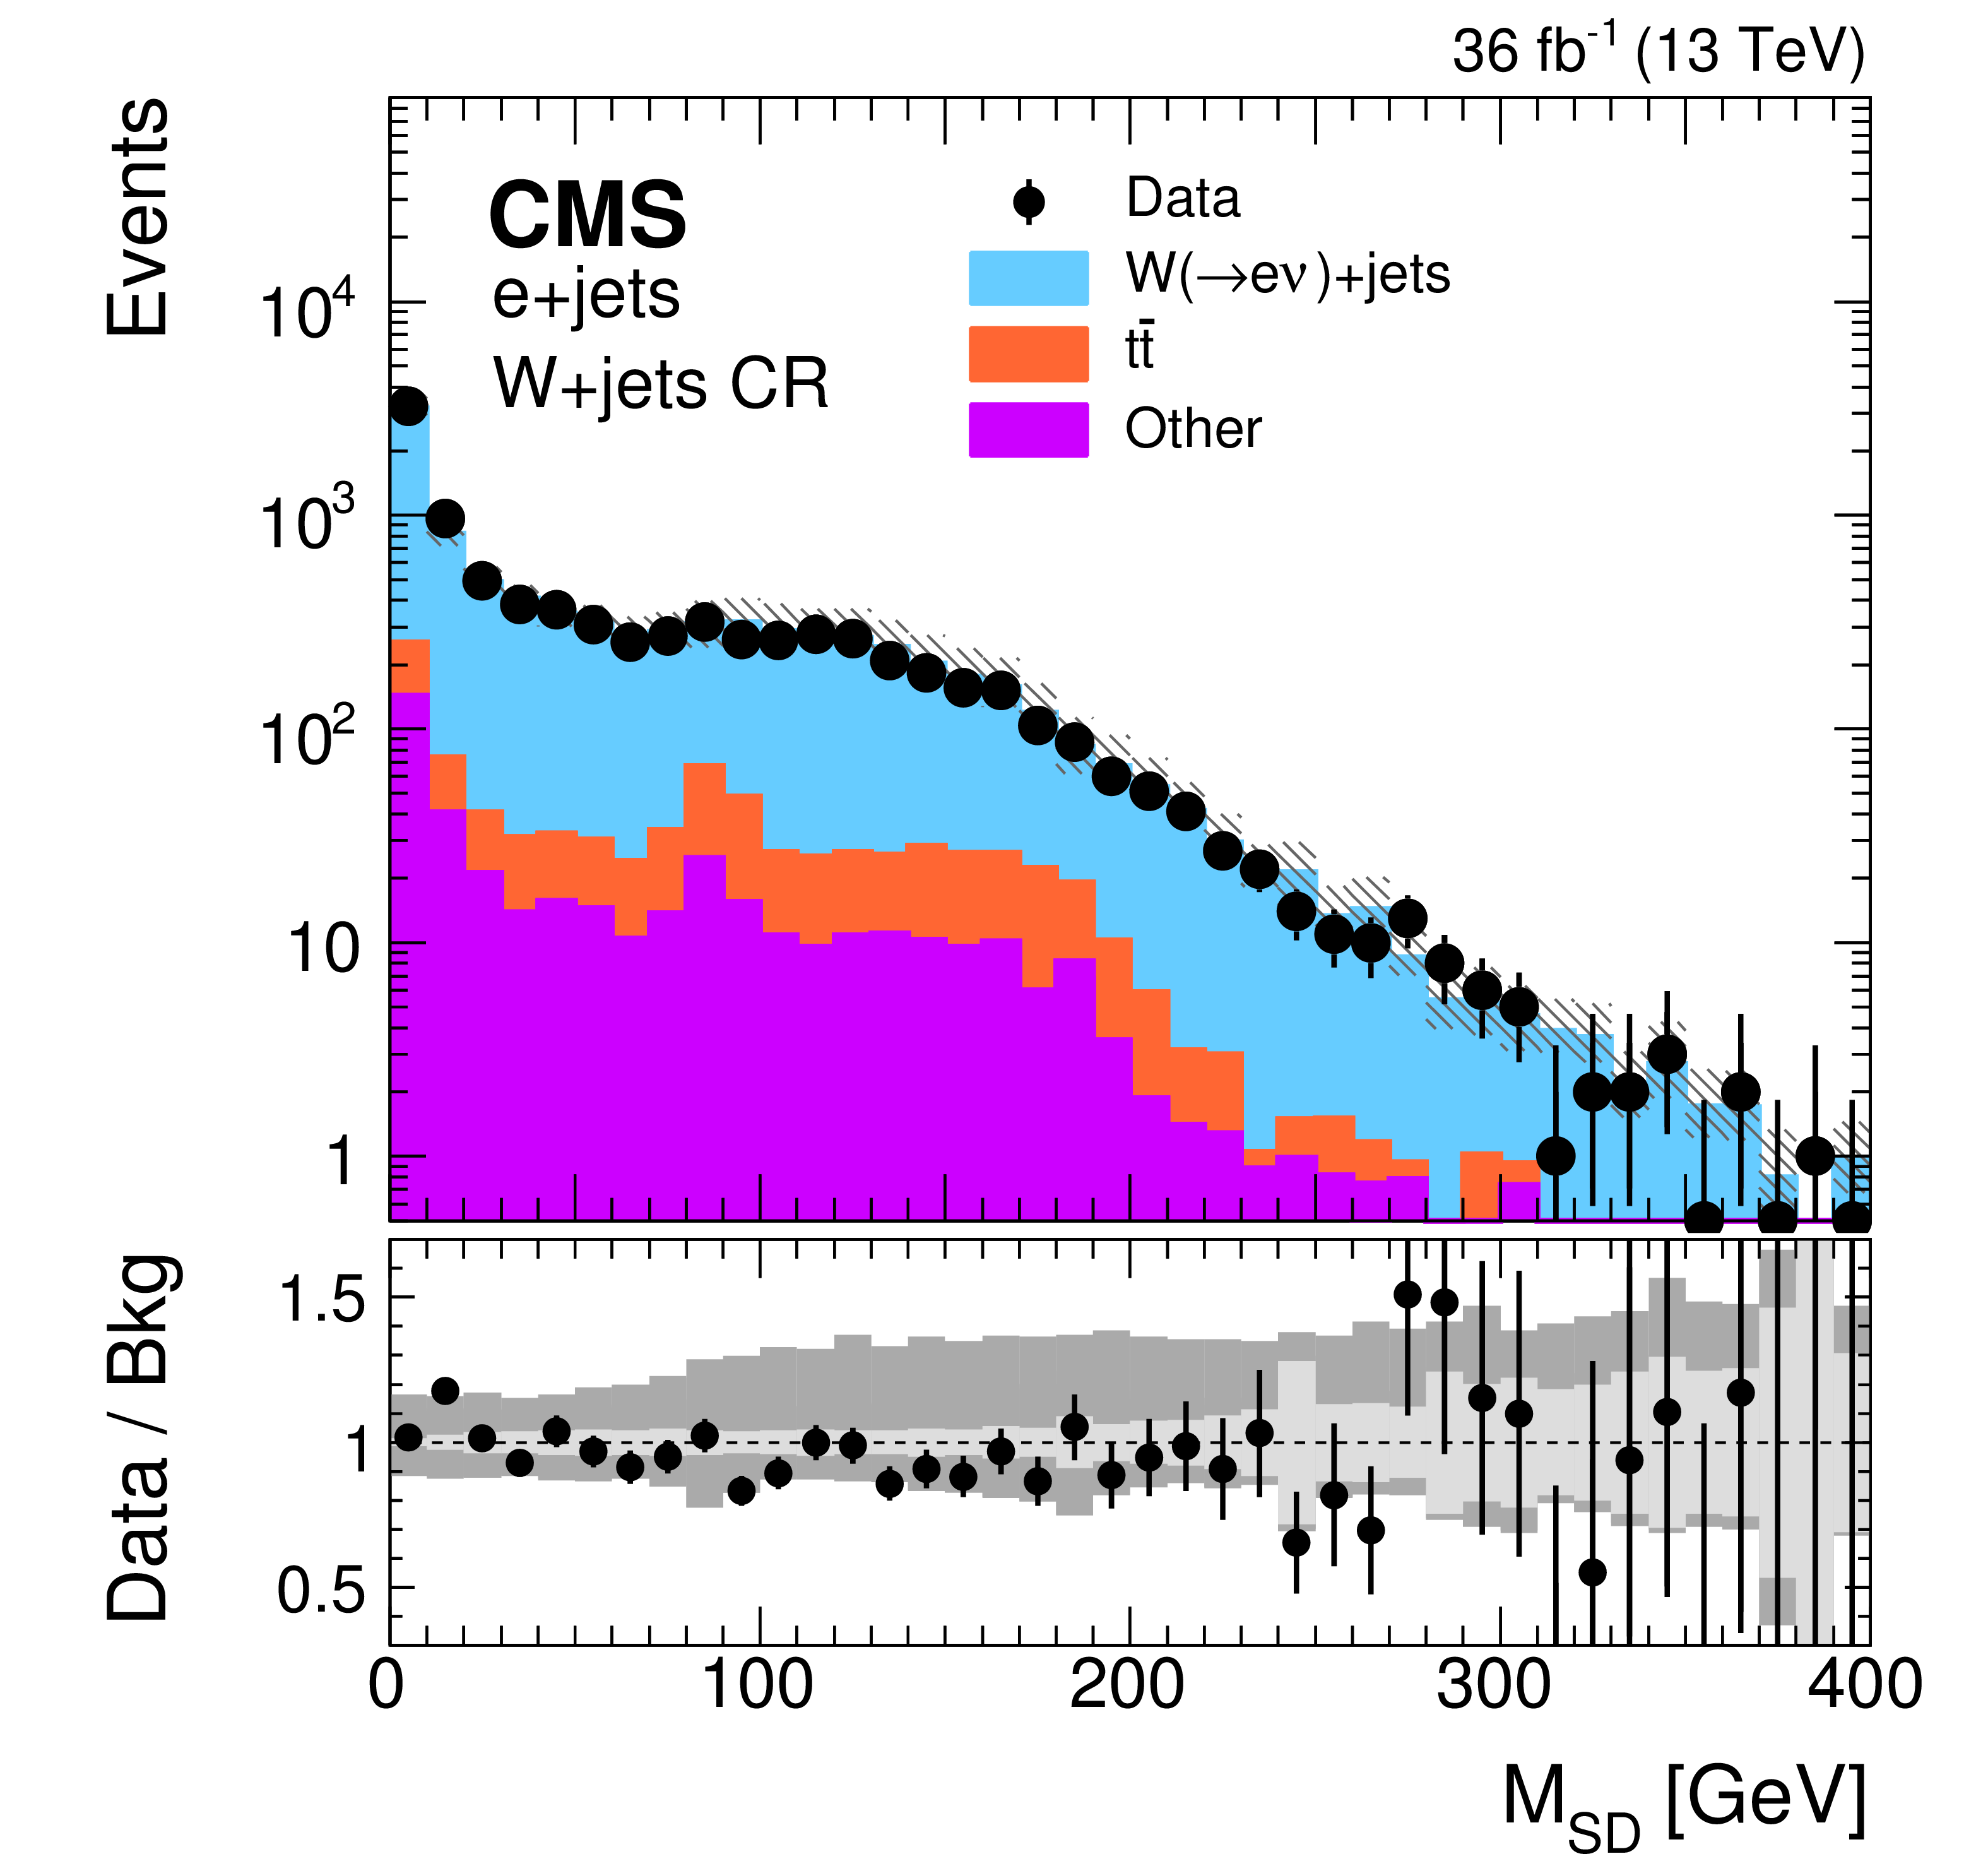
Figure 6:
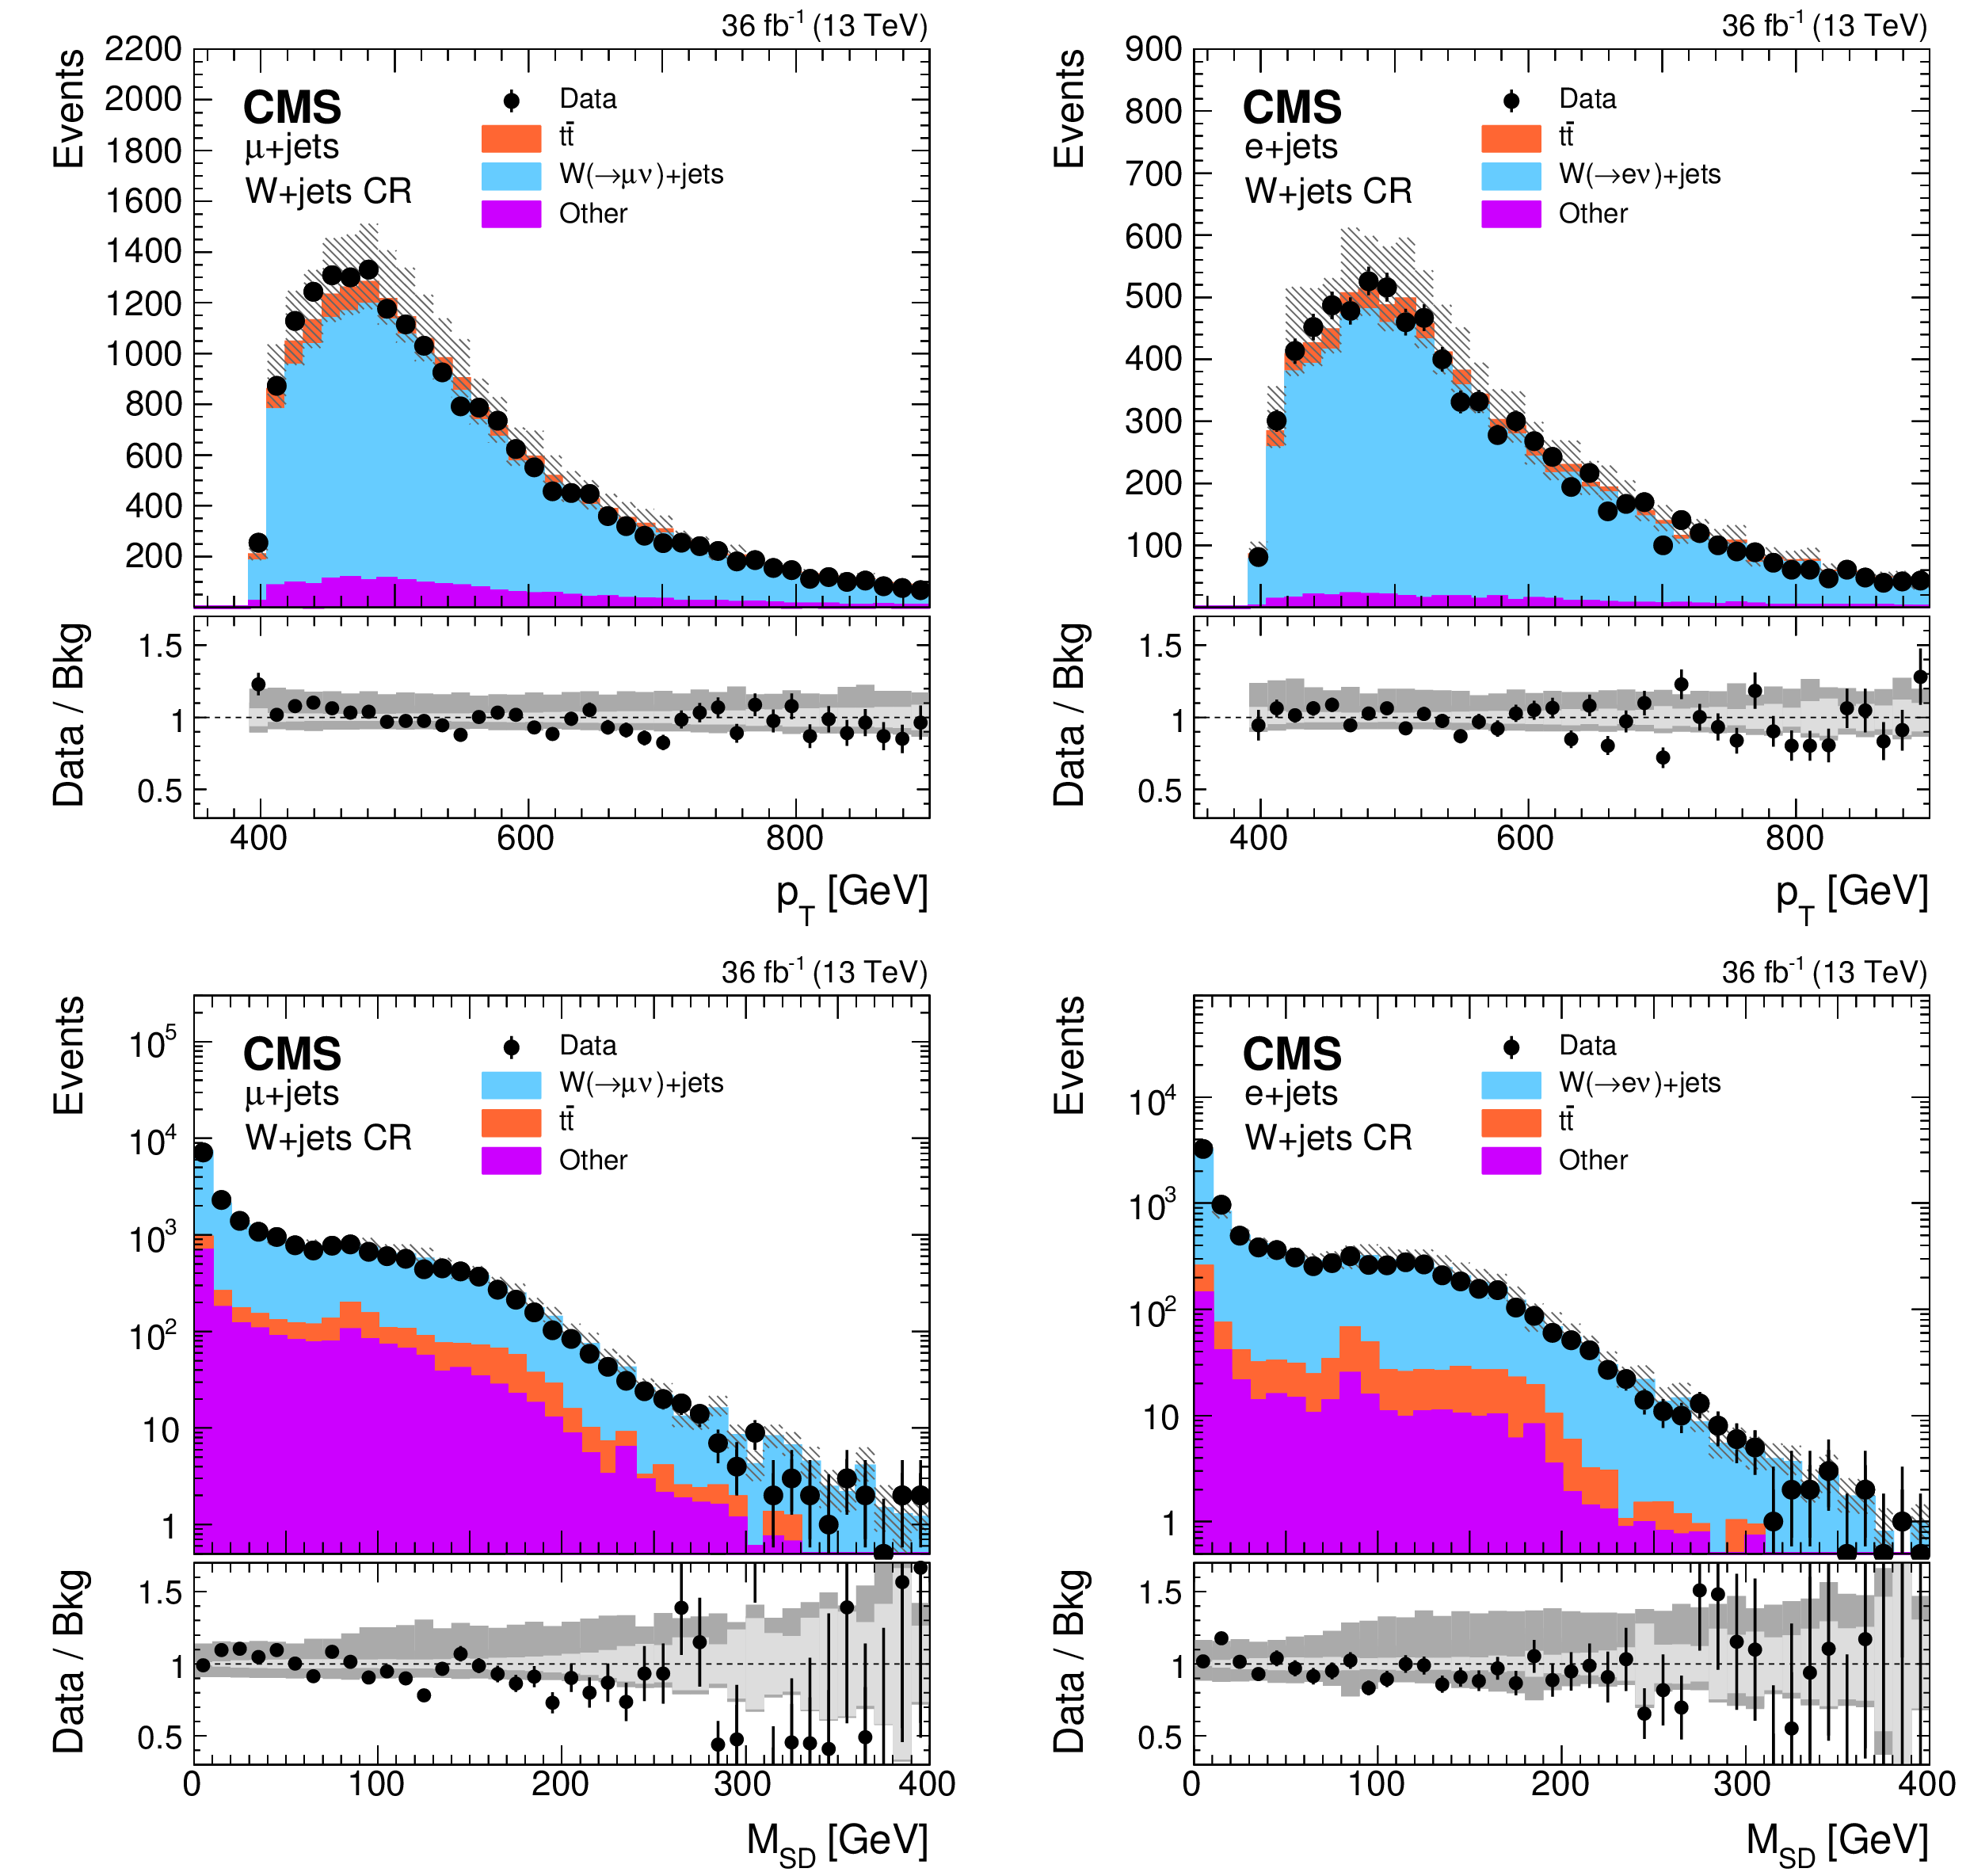
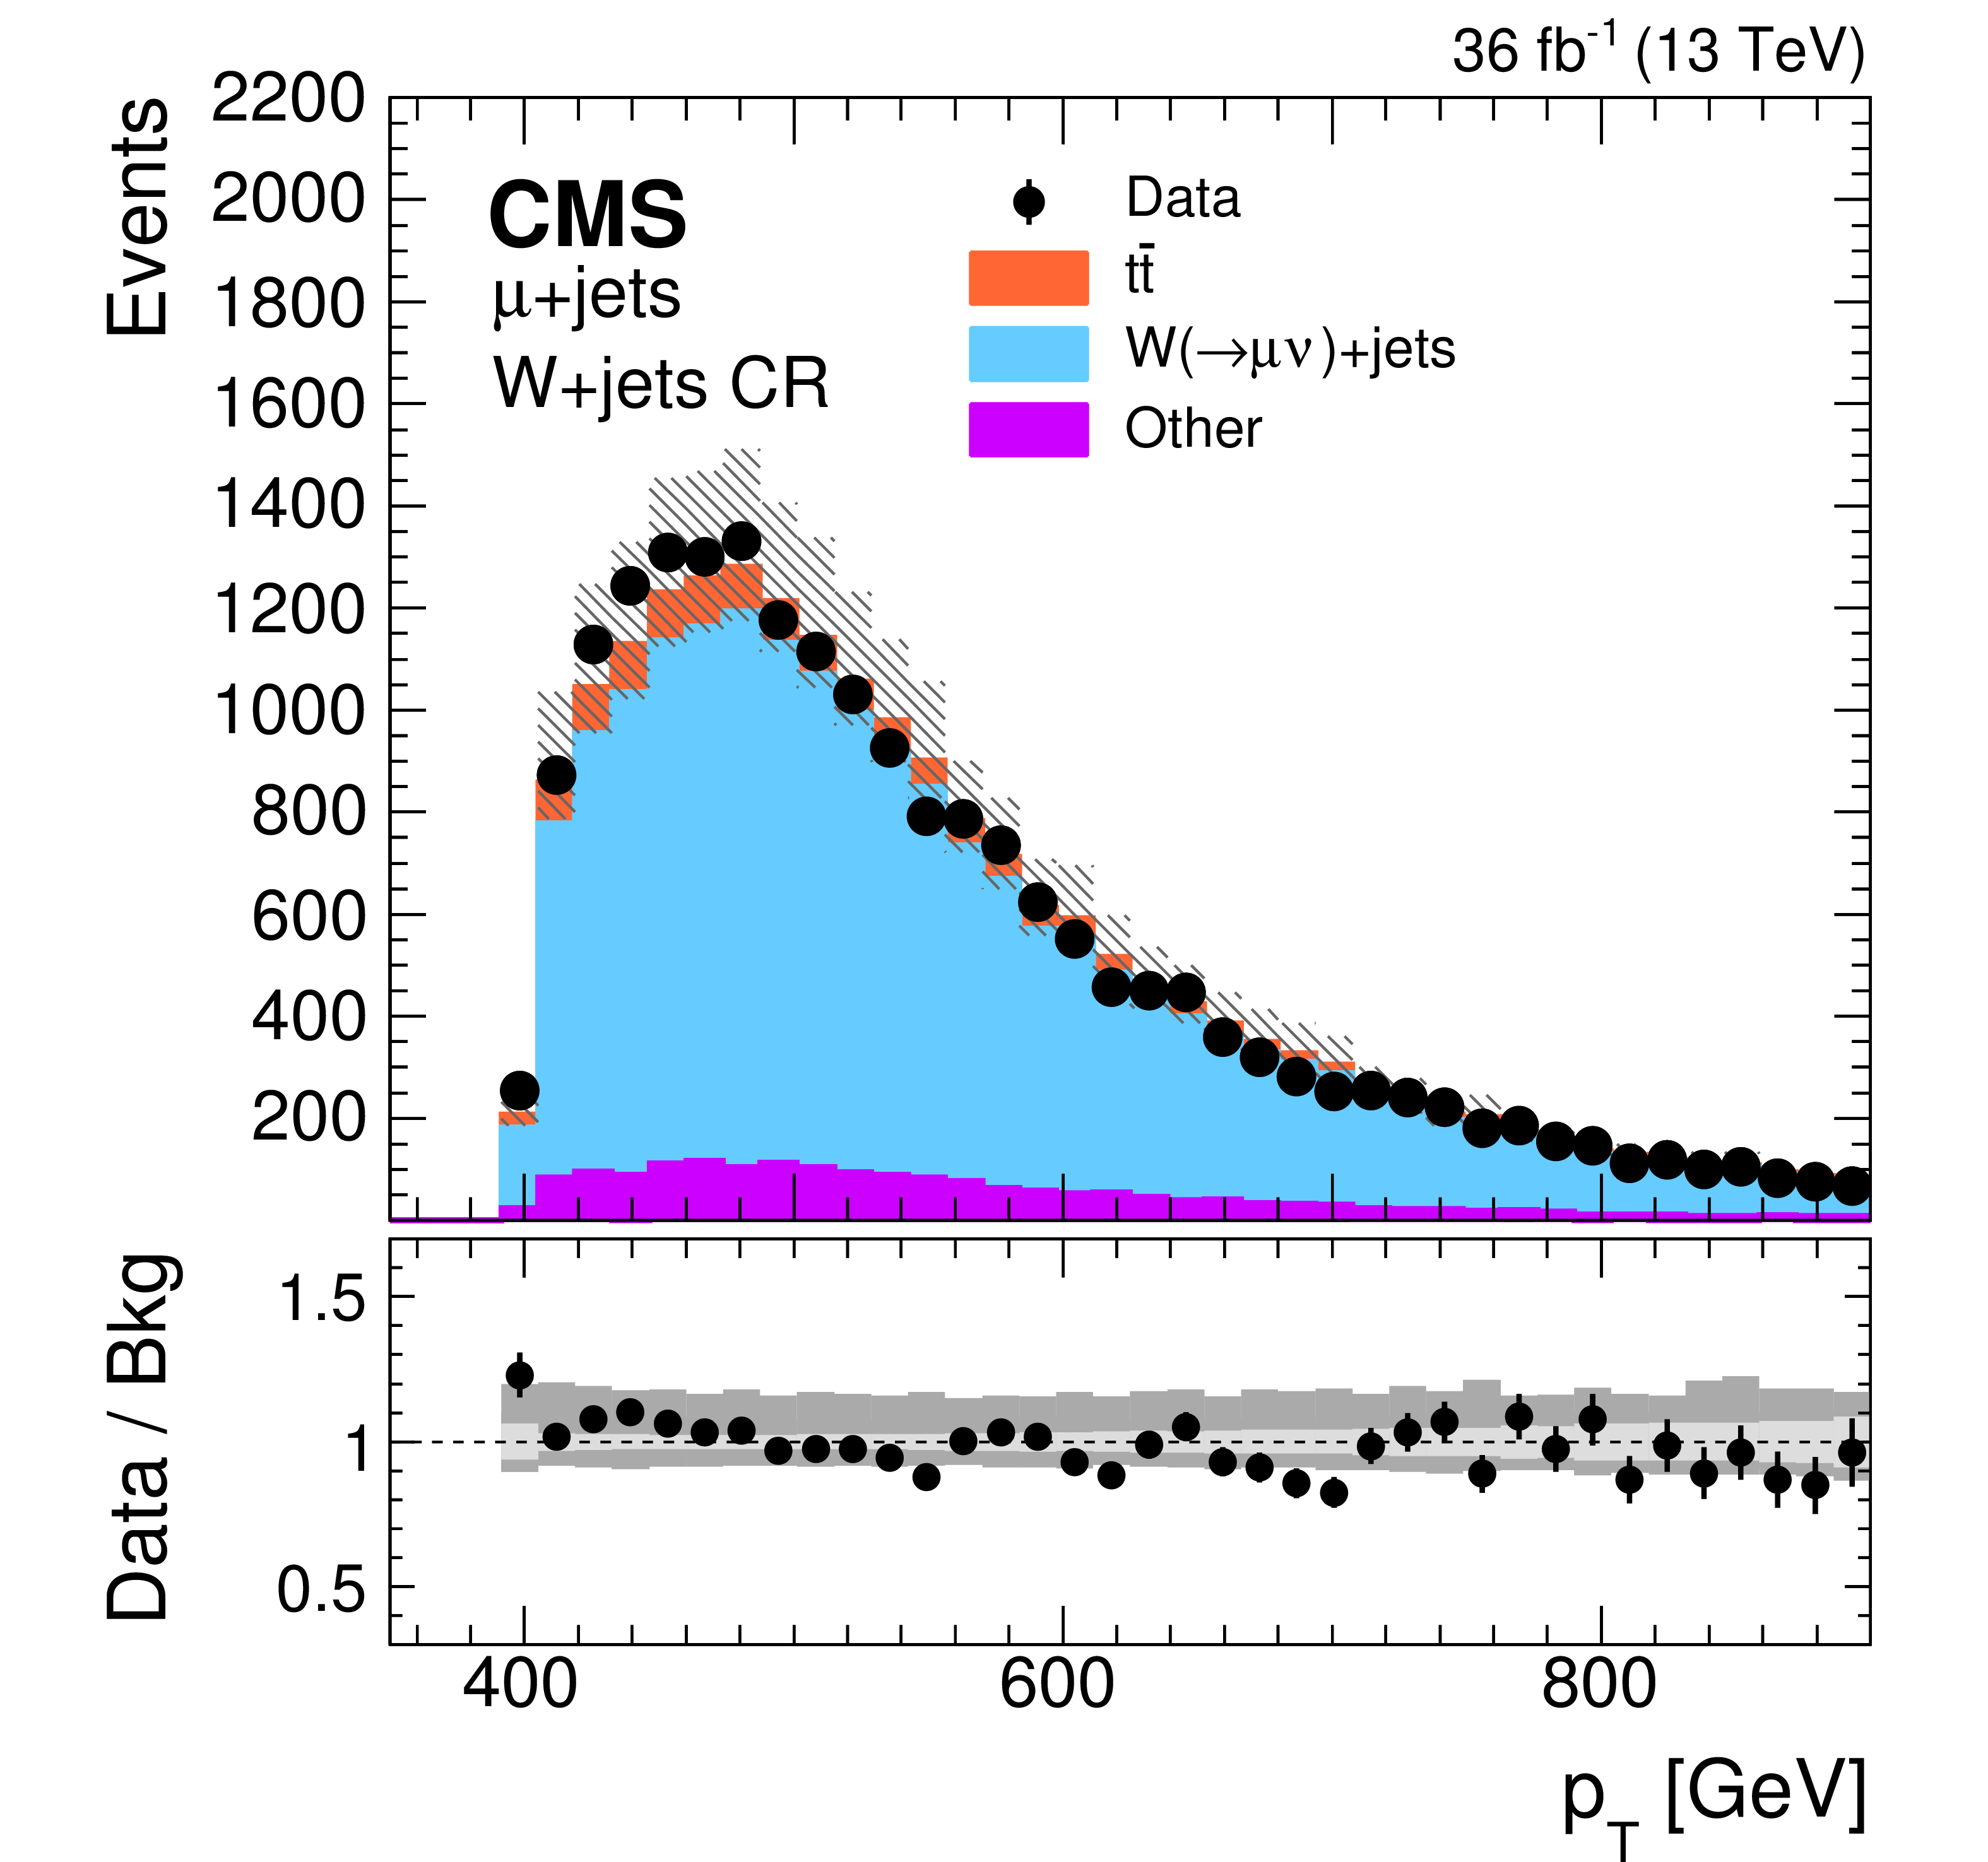
Distributions of $ {p_{\mathrm {T}}} $ (upper) and $ {m_{\text {SD}}} $ (lower) for the W+jets background in the muon (left) and electron (right) channels using the W+jets mistag CR. The jet $ {p_{\mathrm {T}}} $ information is taken from the CHS jets, while the $ {m_{\text {SD}}} $ is take from the PUPPI jets. The hatched band on the simulation represents the uncertainty in the background prediction. The lower panels in each plot show the ratio of data to the SM background prediction and the light (dark) gray band represents statistical (systematic) uncertainty. |
png pdf |
Figure 6-a:
Distribution of $ {p_{\mathrm {T}}} $ for the W+jets background in the muon channel using the W+jets mistag CR. The jet $ {p_{\mathrm {T}}} $ information is taken from the CHS jets, while the $ {m_{\text {SD}}} $ is take from the PUPPI jets. The hatched band on the simulation represents the uncertainty in the background prediction. The lower panel shows the ratio of data to the SM background prediction and the light (dark) gray band represents statistical (systematic) uncertainty. |
png pdf |
Figure 6-b:
Distribution of $ {p_{\mathrm {T}}} $ for the W+jets background in the electron channel using the W+jets mistag CR. The jet $ {p_{\mathrm {T}}} $ information is taken from the CHS jets, while the $ {m_{\text {SD}}} $ is take from the PUPPI jets. The hatched band on the simulation represents the uncertainty in the background prediction. The lower panel shows the ratio of data to the SM background prediction and the light (dark) gray band represents statistical (systematic) uncertainty. |

png pdf |
Figure 6-c:
Distribution of $ {m_{\text {SD}}} $ for the W+jets background in the muon channel using the W+jets mistag CR. The jet $ {p_{\mathrm {T}}} $ information is taken from the CHS jets, while the $ {m_{\text {SD}}} $ is take from the PUPPI jets. The hatched band on the simulation represents the uncertainty in the background prediction. The lower panel shows the ratio of data to the SM background prediction and the light (dark) gray band represents statistical (systematic) uncertainty. |
png pdf |
Figure 6-d:
Distribution of $ {m_{\text {SD}}} $ for the W+jets background in the electron channel using the W+jets mistag CR. The jet $ {p_{\mathrm {T}}} $ information is taken from the CHS jets, while the $ {m_{\text {SD}}} $ is take from the PUPPI jets. The hatched band on the simulation represents the uncertainty in the background prediction. The lower panel shows the ratio of data to the SM background prediction and the light (dark) gray band represents statistical (systematic) uncertainty. |
png pdf |
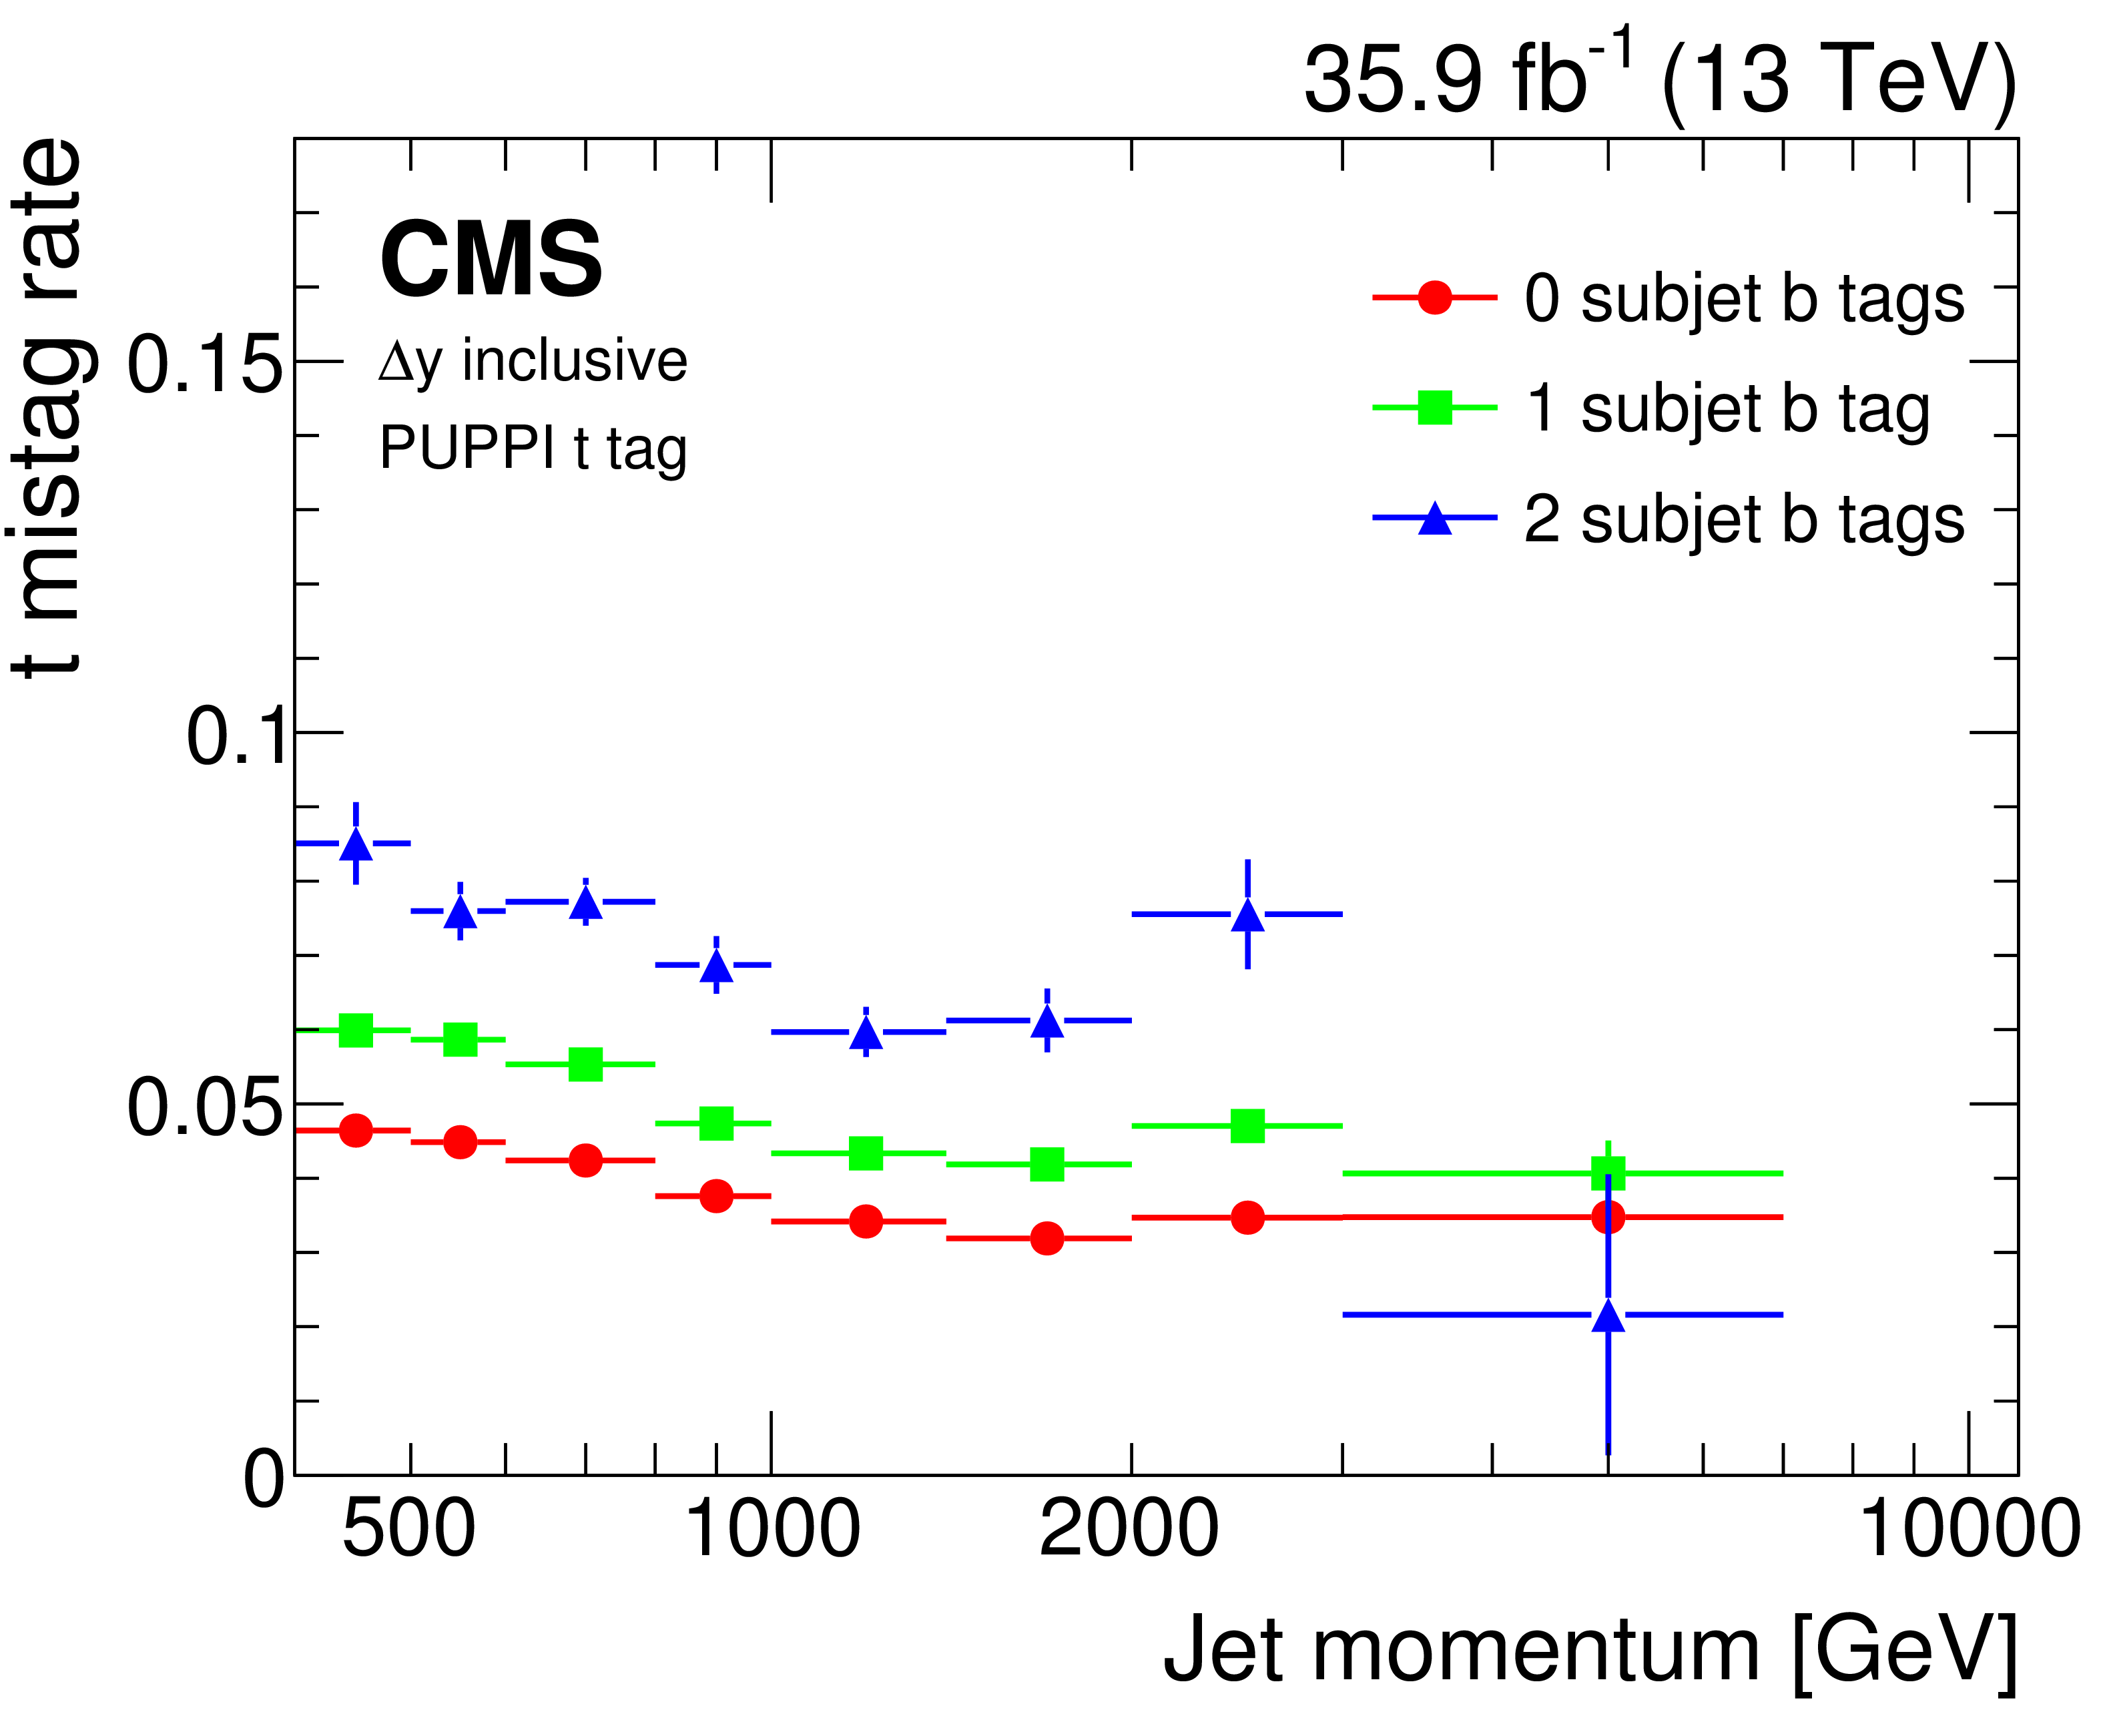
Figure 7:
The t-mistag rate as measured with an anti-tag and probe procedure separately for each b-tag category. |
png pdf |
Figure 8:
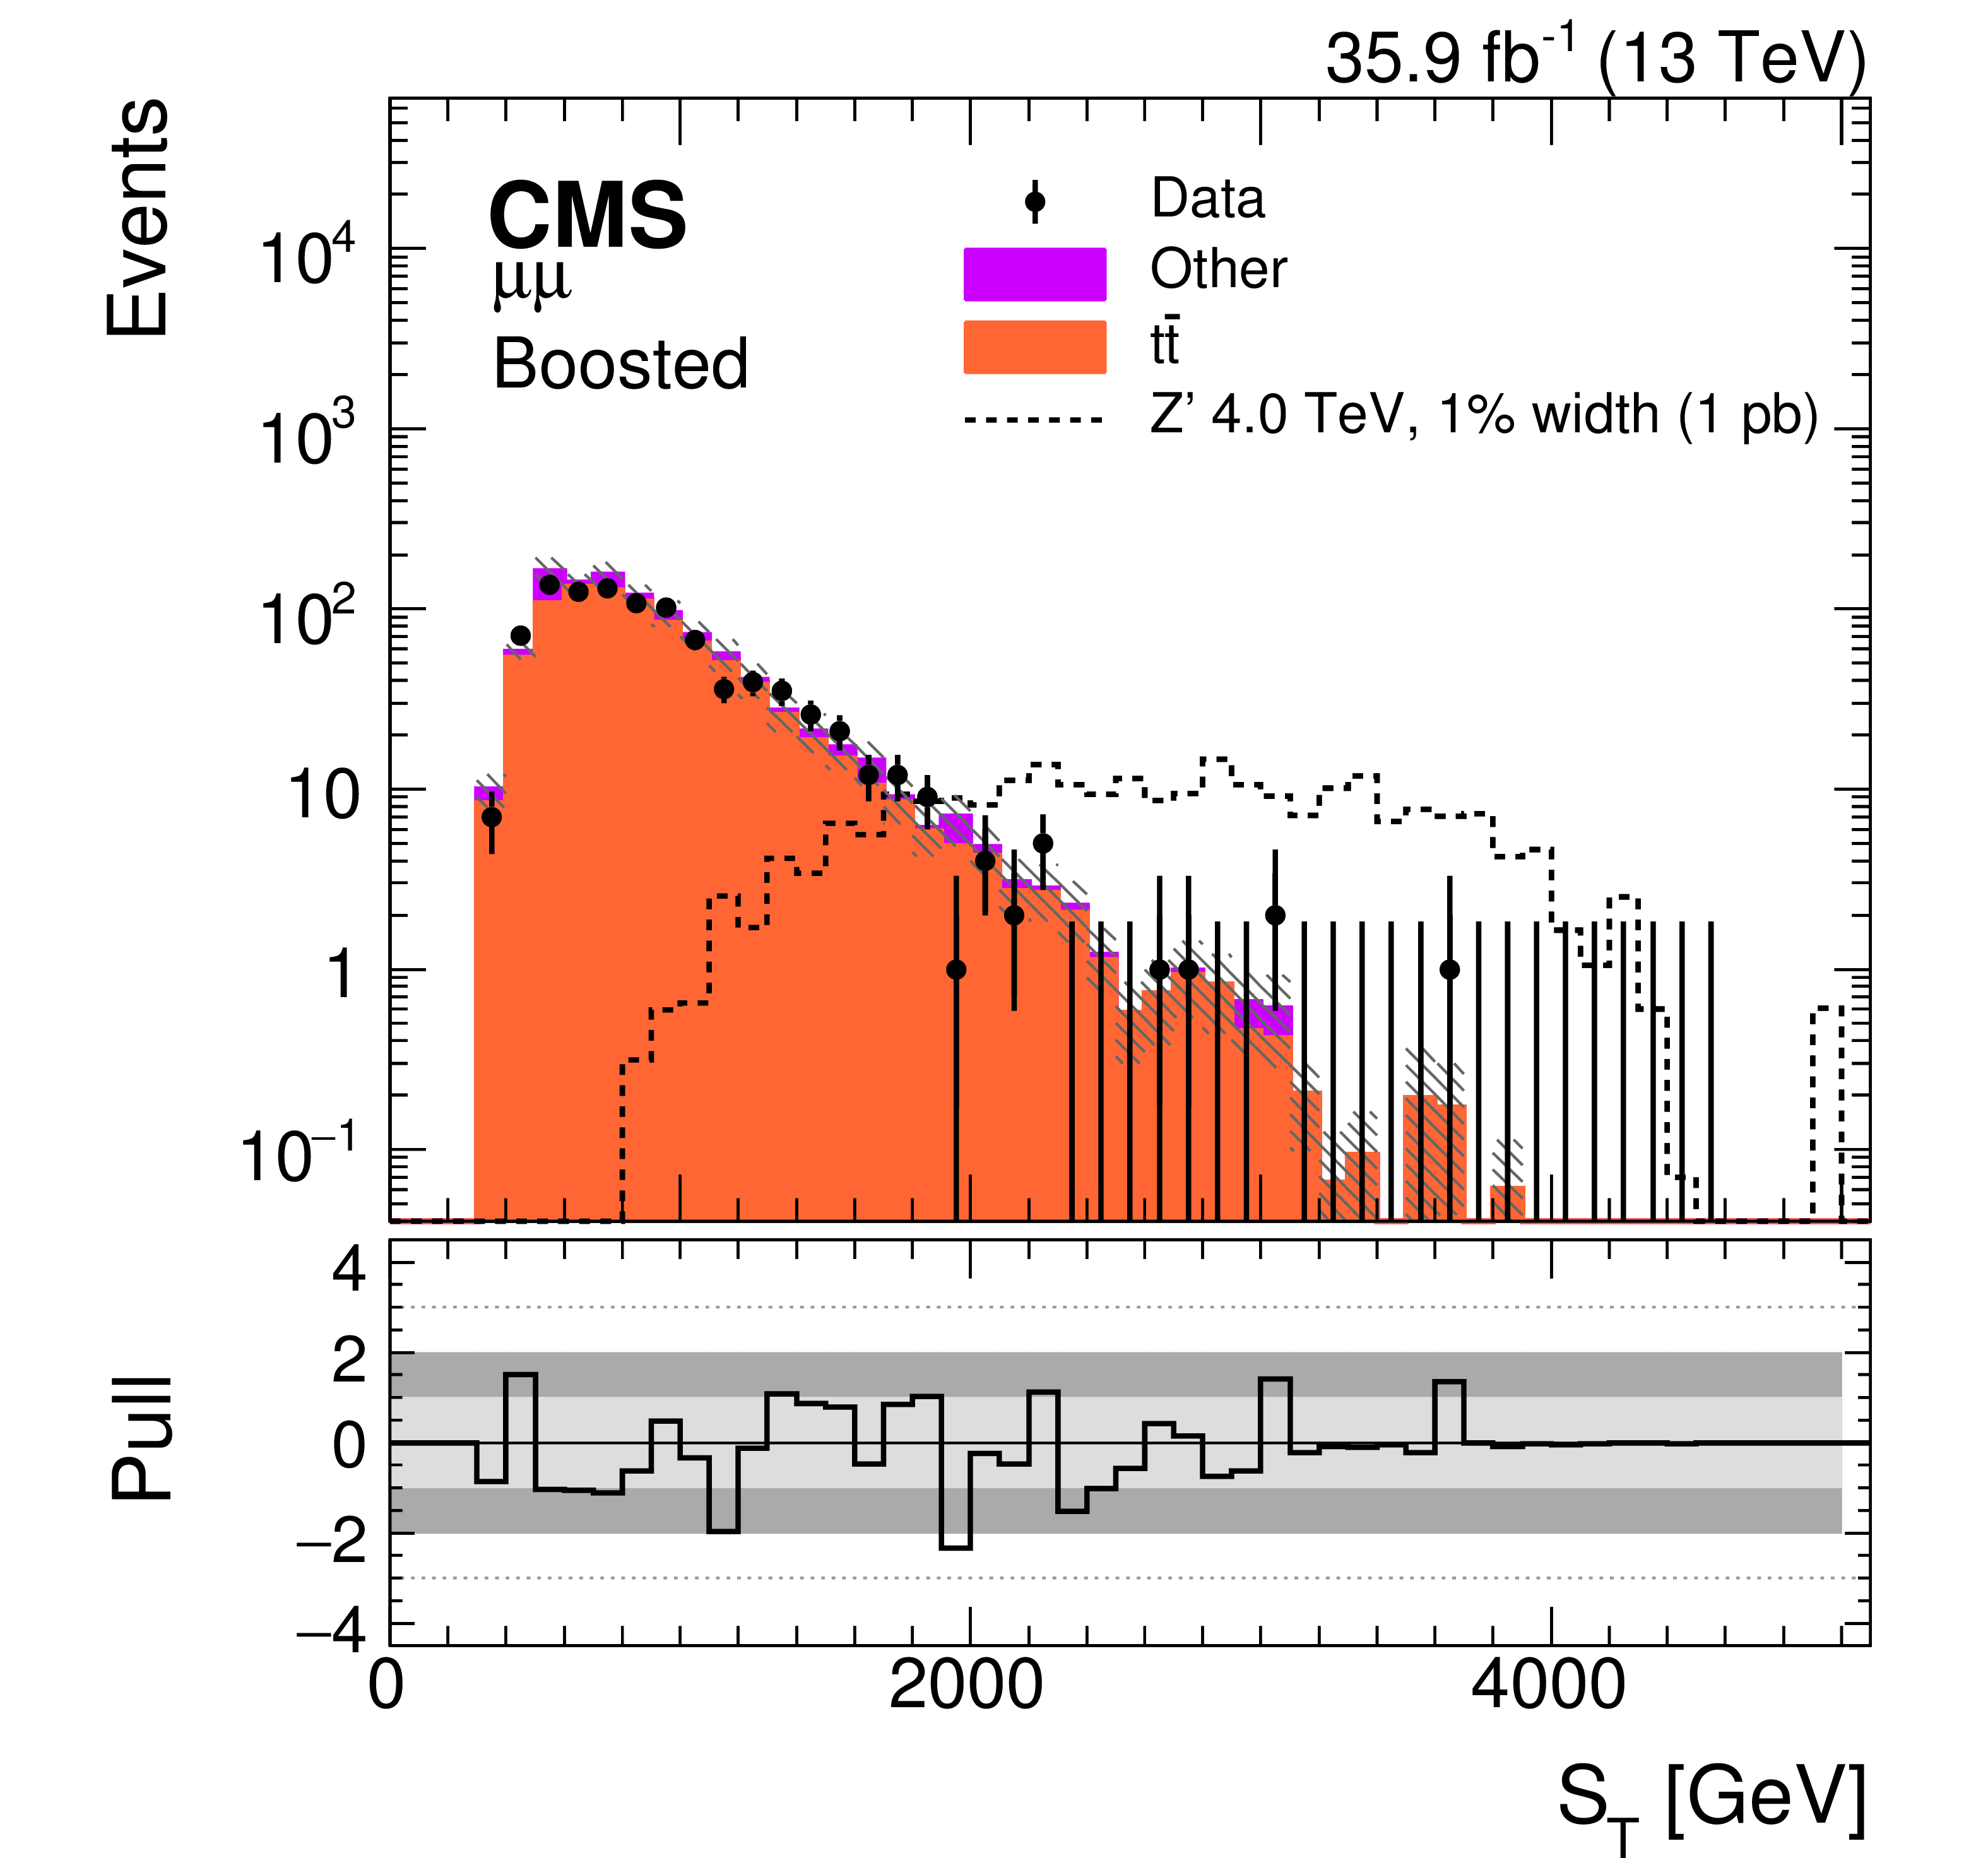
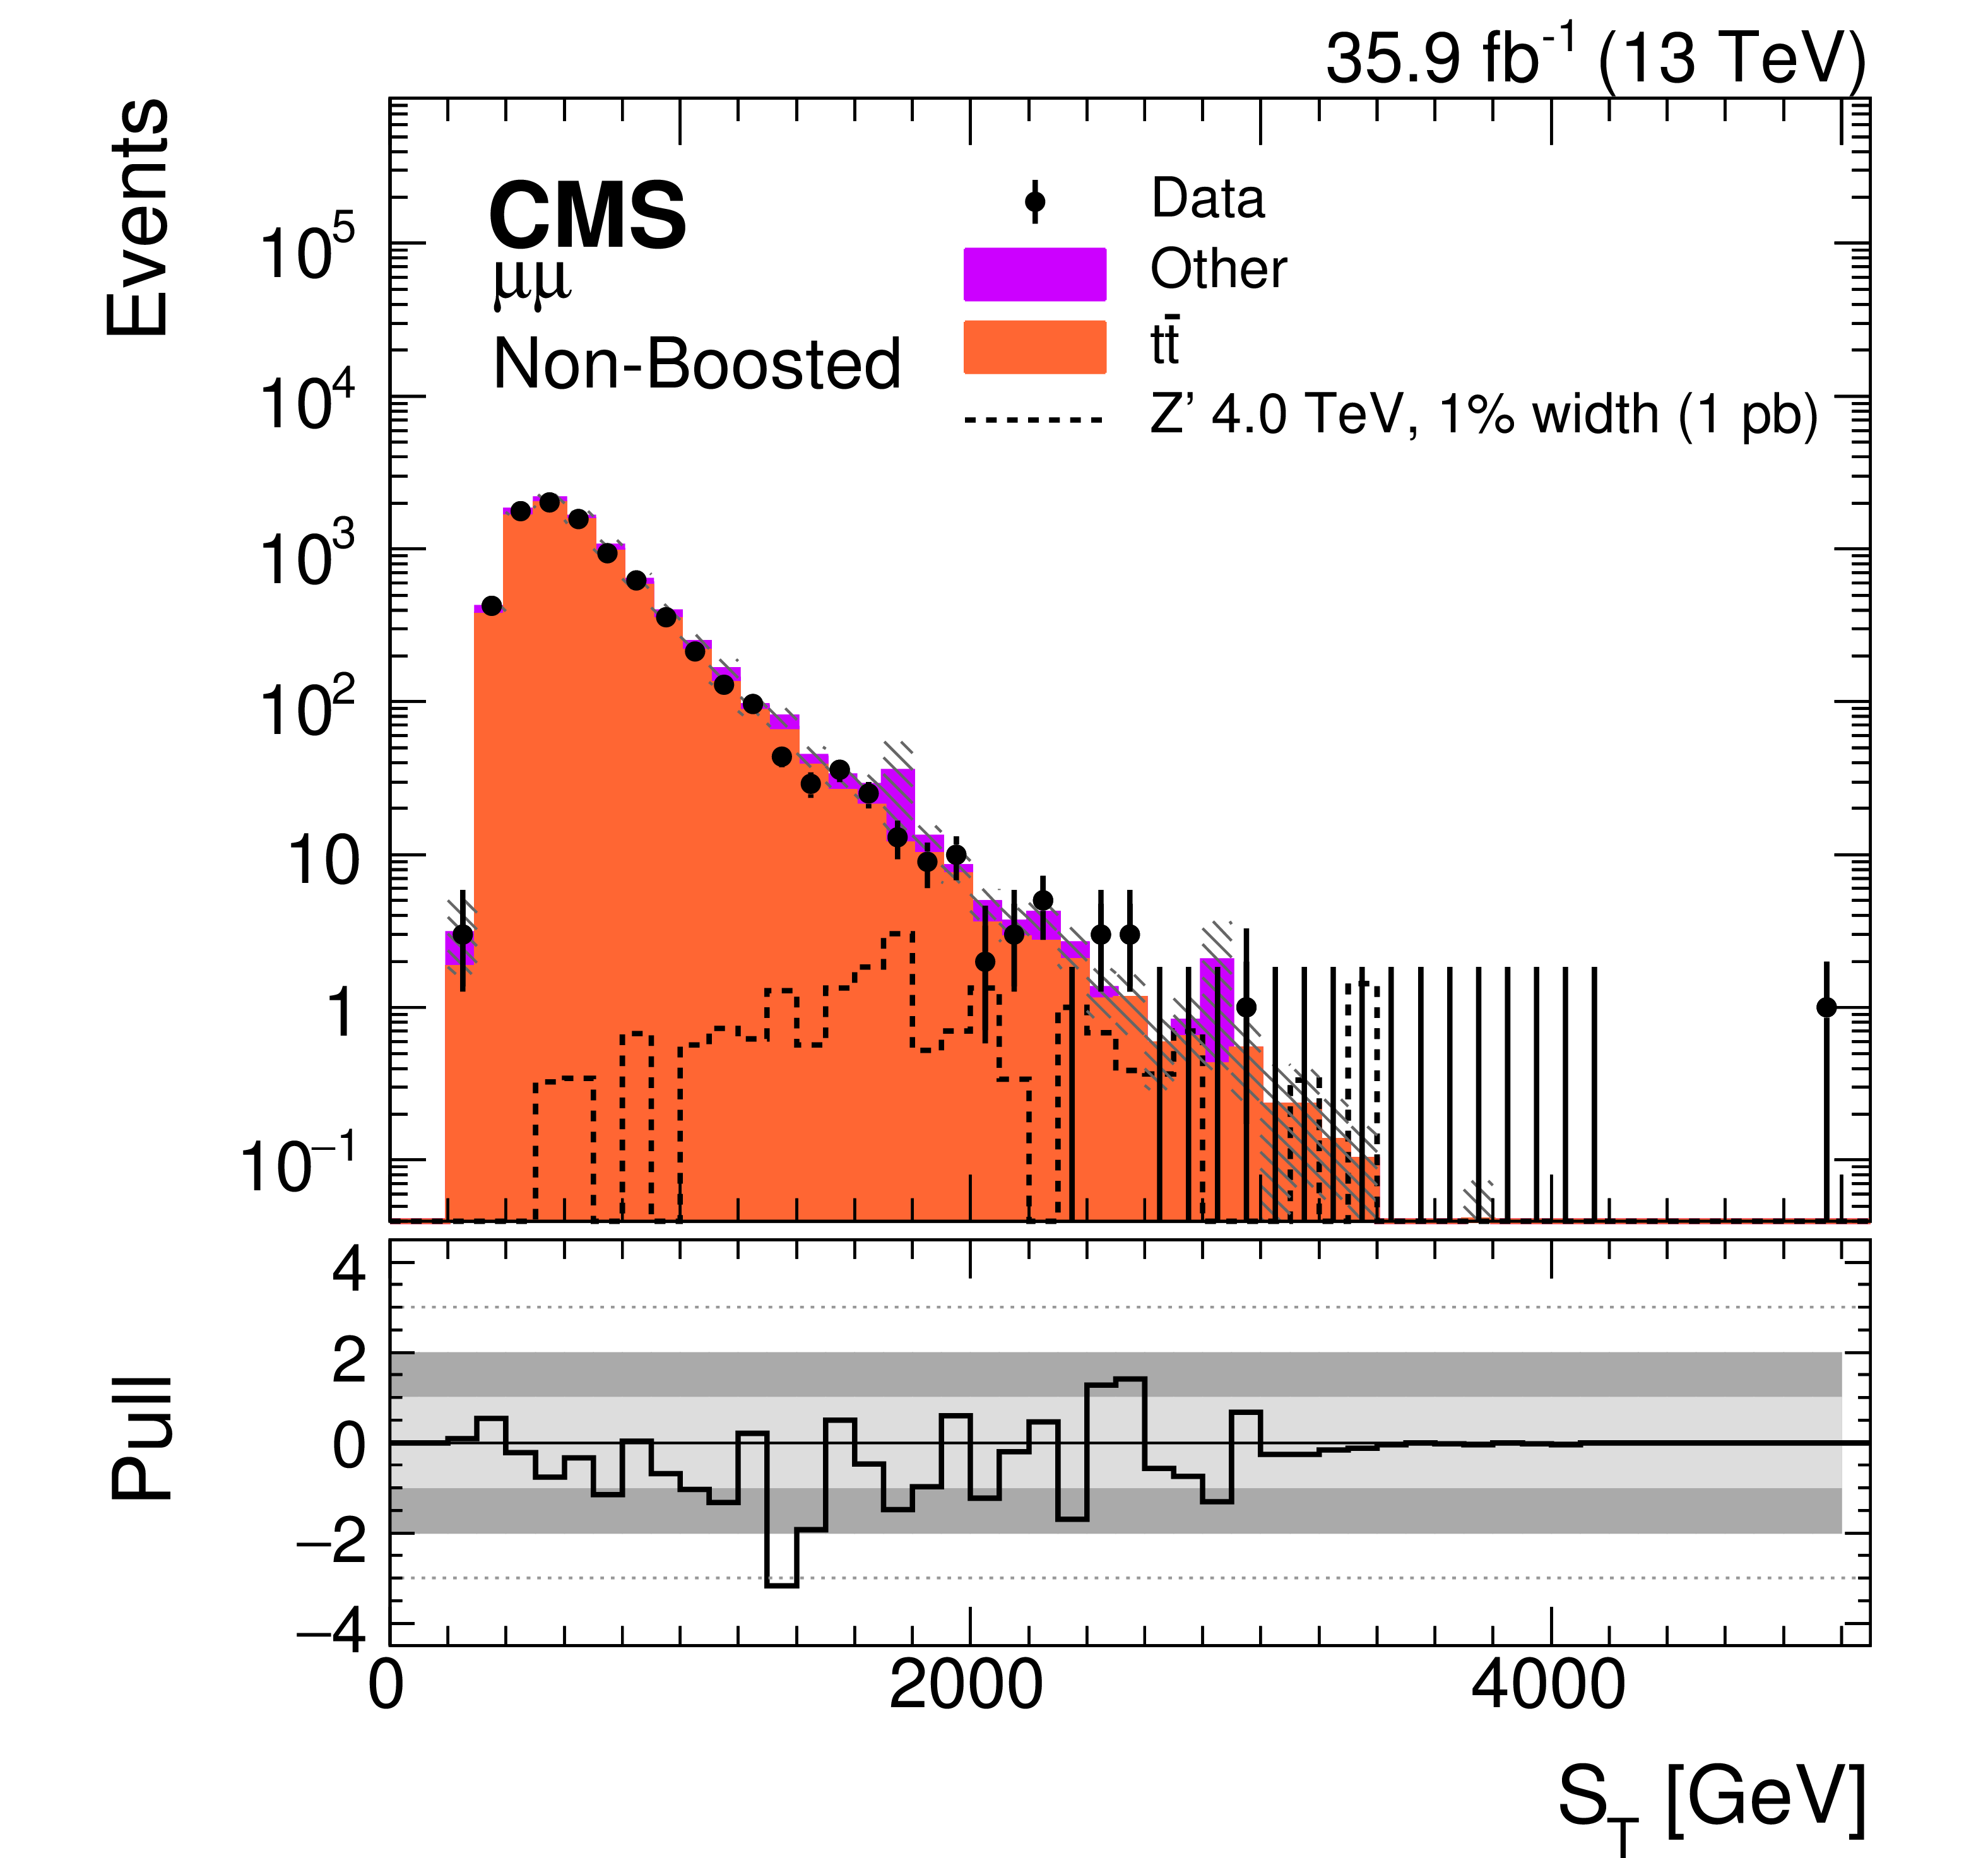
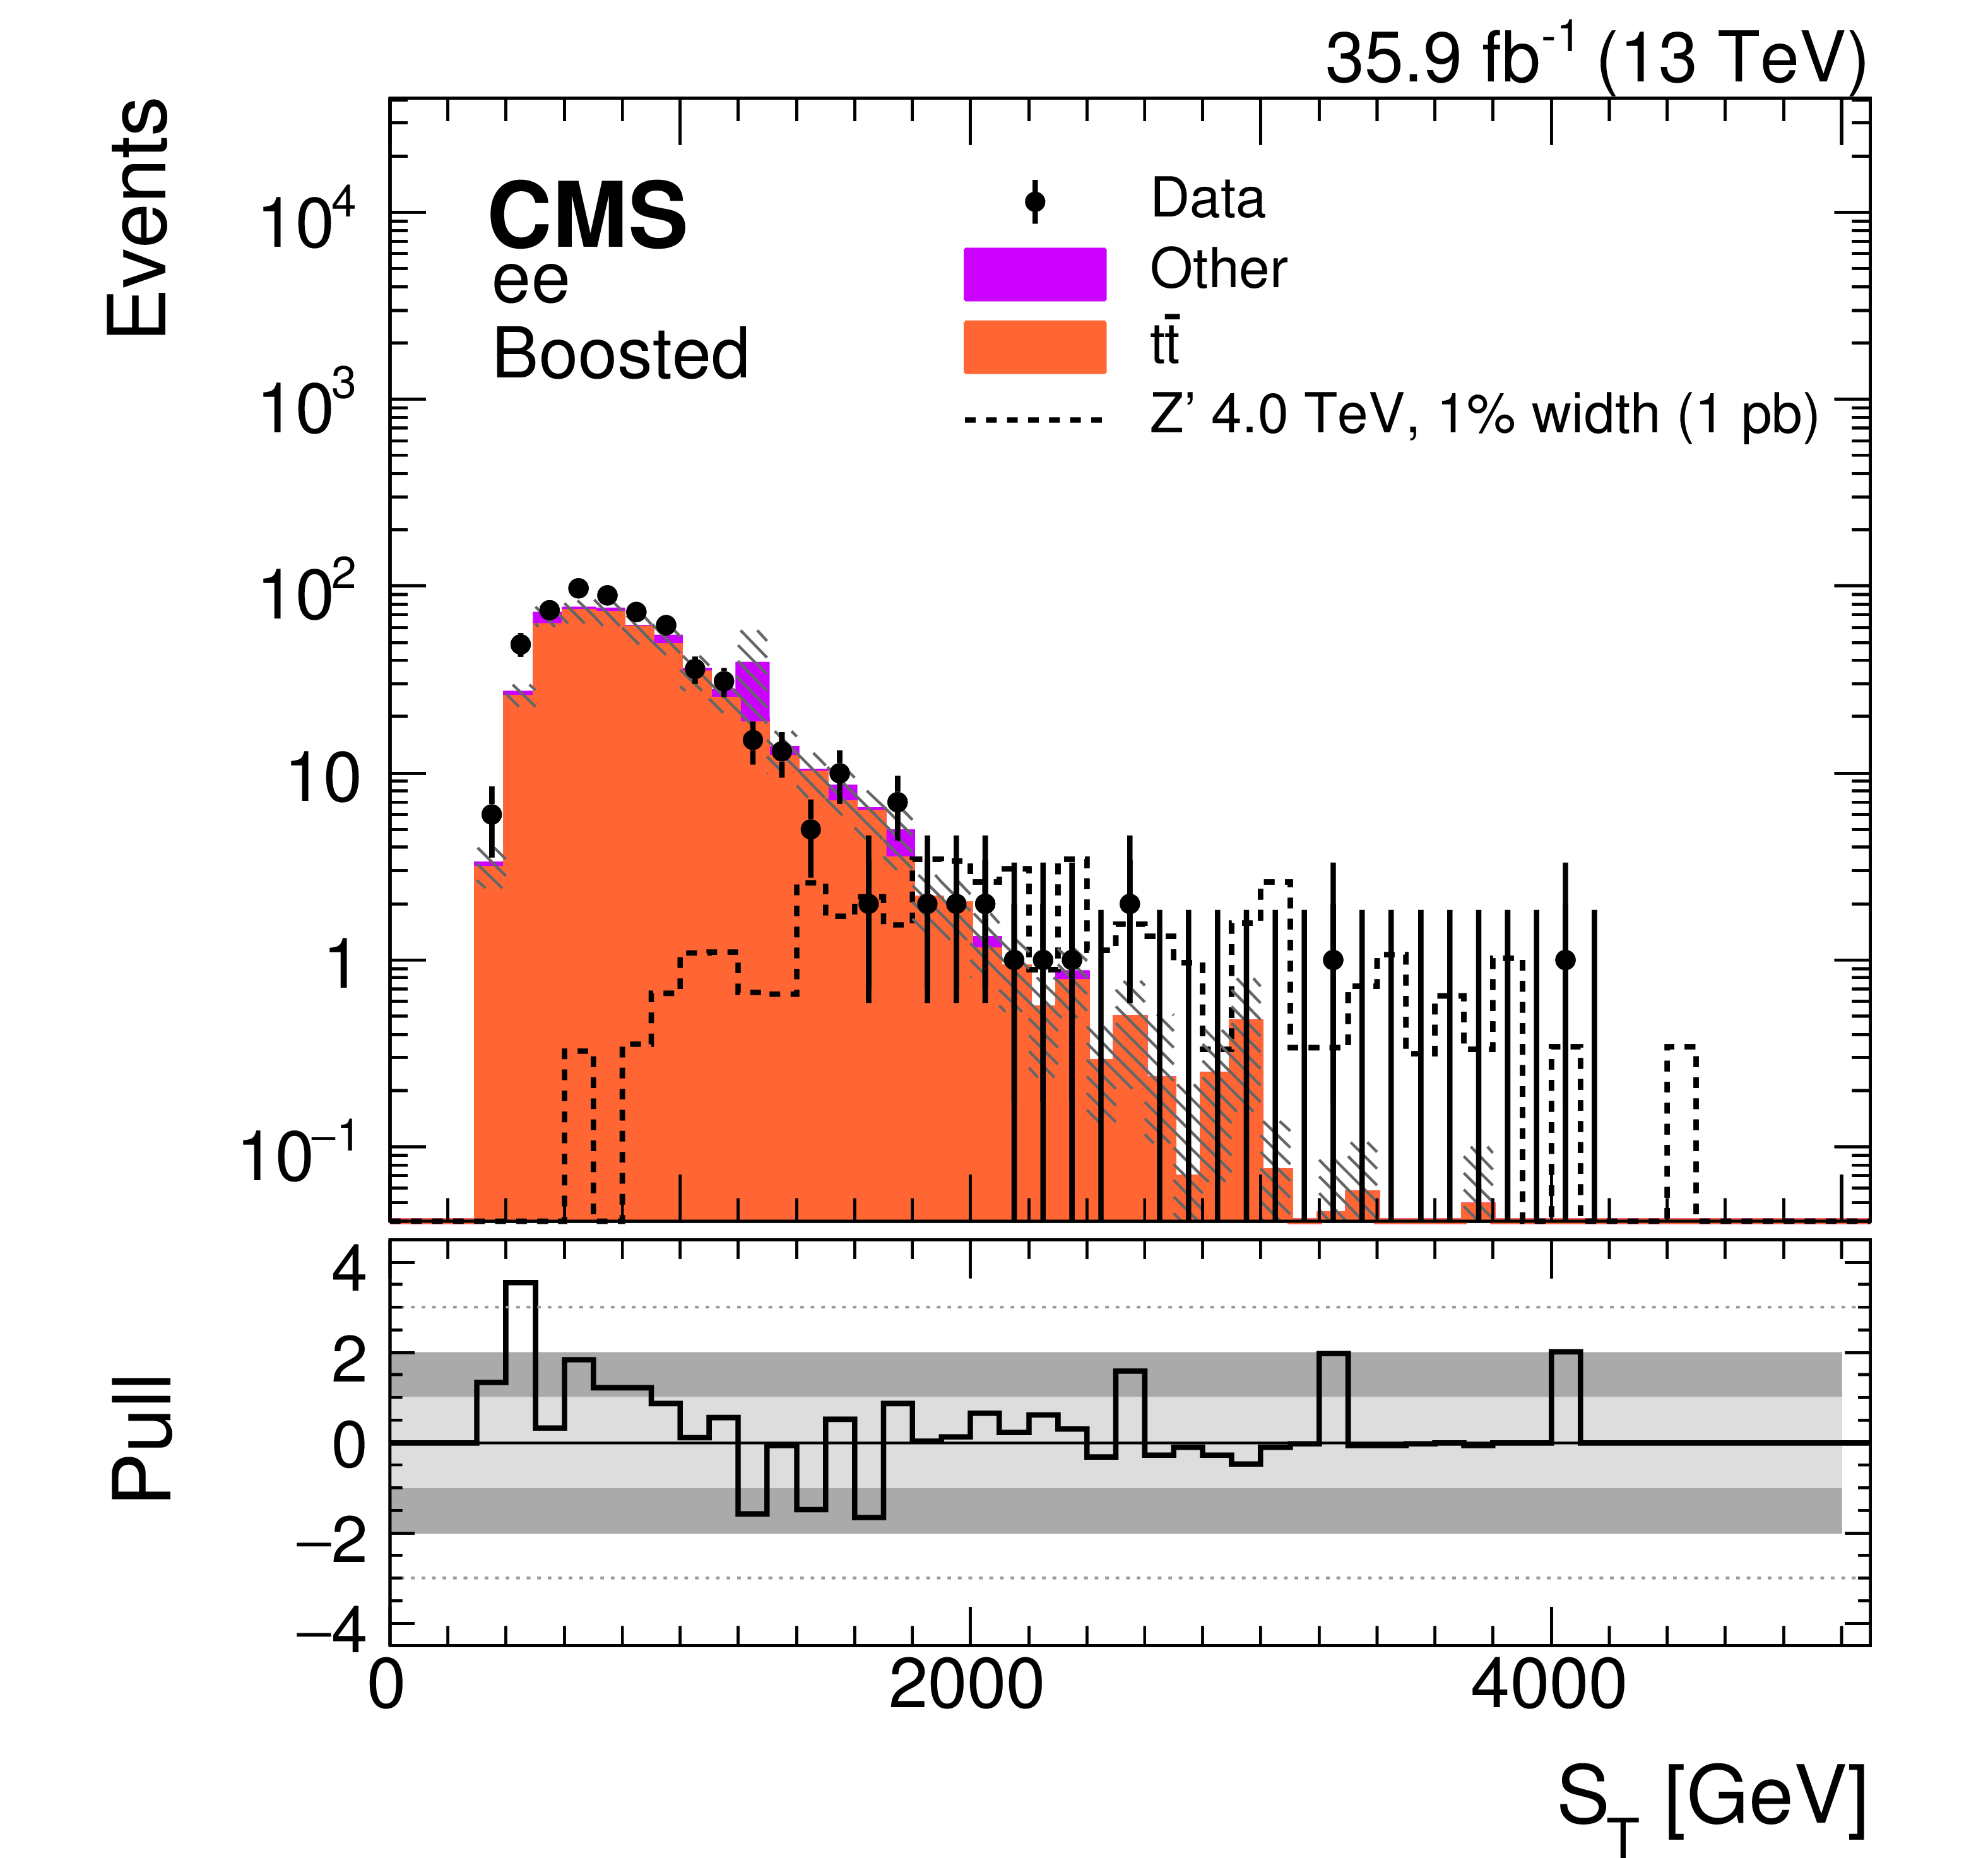
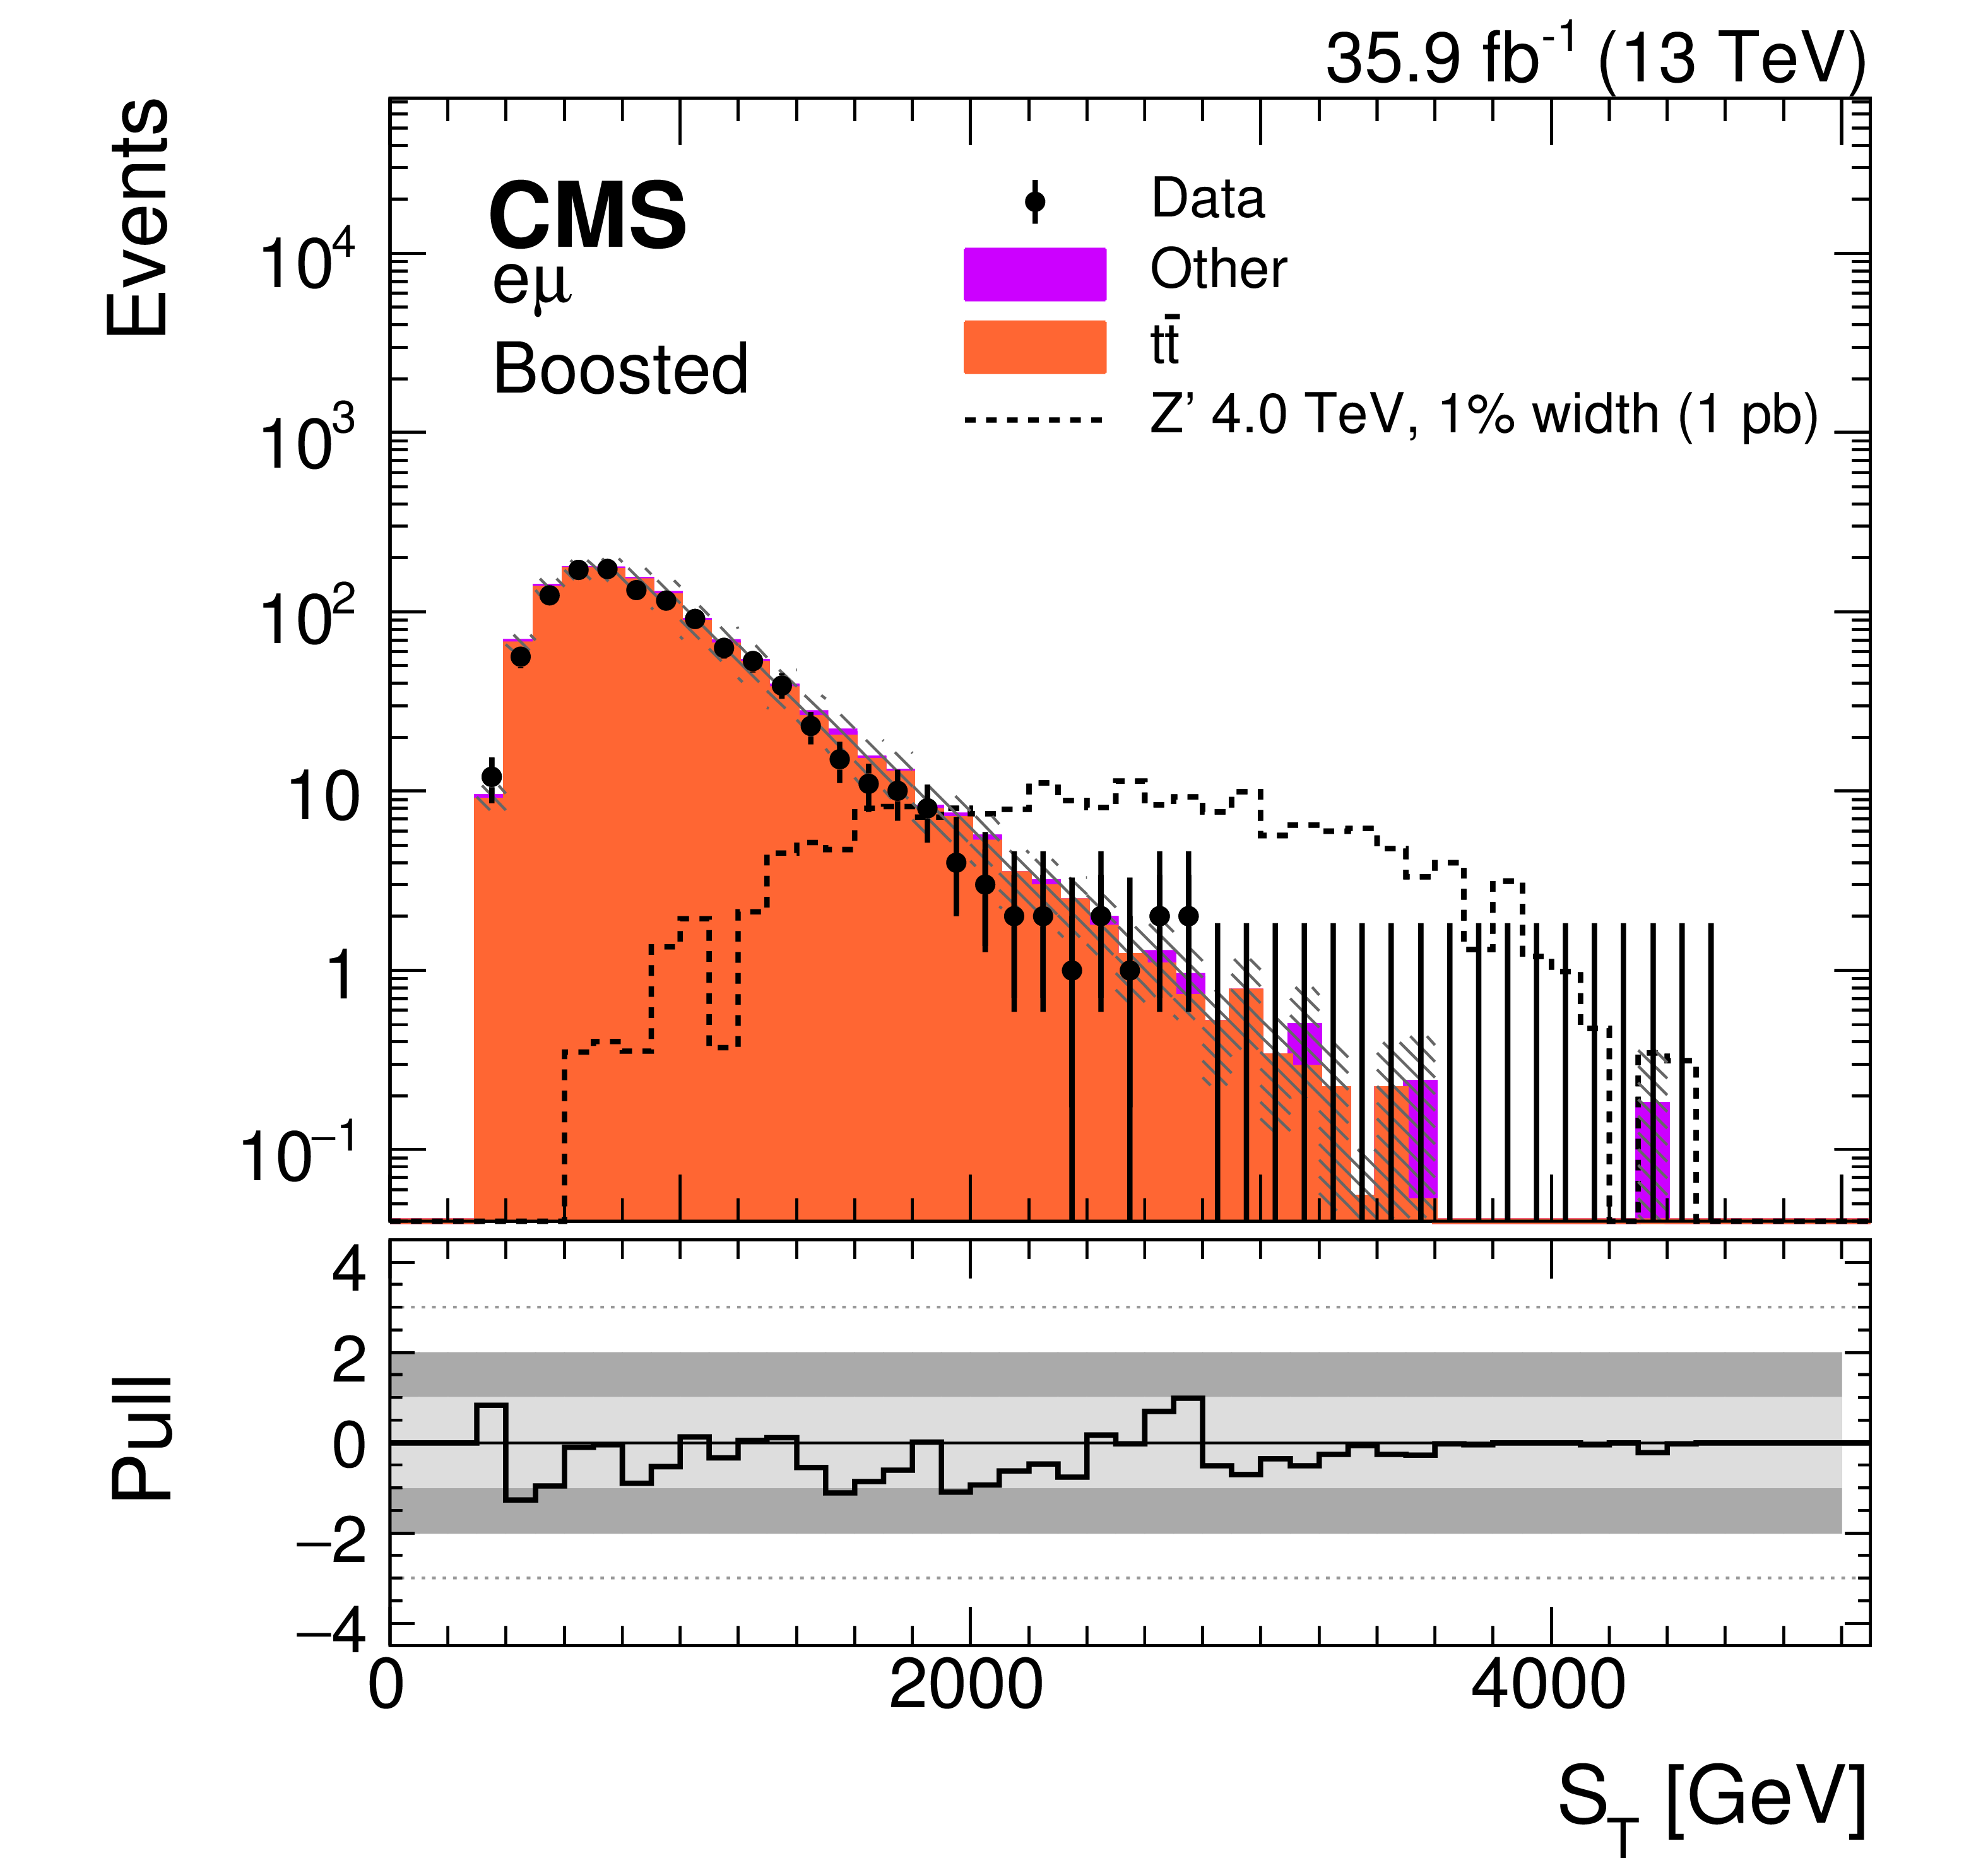
Distributions of $ {S_{\text {T}}} $ for the $\mu \mu $ (upper), $ \mathrm{ee} $ (middle), and $ {\mathrm {e}}\mu $ (lower) SRs in the boosted (left) and non-boosted (right) regions, as defined in Section 6.1. The contribution expected from a 4 TeV Z' boson, with a relative width of 1%, is shown normalized to a cross section of 1 pb. The hatched band on the simulation represents the uncertainty in the background prediction. The lower panel in each plot shows the pull of each histogram bin from the SM prediction. The light (dark) gray band represents a pull of one (two) s.d. from the predicted value. |
png pdf |
Figure 8-a:
Distribution of $ {S_{\text {T}}} $ for the $\mu \mu $ SR in the boosted region, as defined in Section 6.1. The contribution expected from a 4 TeV Z' boson, with a relative width of 1%, is shown normalized to a cross section of 1 pb. The hatched band on the simulation represents the uncertainty in the background prediction. The lower panel shows the pull of each histogram bin from the SM prediction. The light (dark) gray band represents a pull of one (two) s.d. from the predicted value. |
png pdf |
Figure 8-b:
Distribution of $ {S_{\text {T}}} $ for the $\mu \mu $ SR in the non-boosted region, as defined in Section 6.1. The contribution expected from a 4 TeV Z' boson, with a relative width of 1%, is shown normalized to a cross section of 1 pb. The hatched band on the simulation represents the uncertainty in the background prediction. The lower panel shows the pull of each histogram bin from the SM prediction. The light (dark) gray band represents a pull of one (two) s.d. from the predicted value. |
png pdf |
Figure 8-c:
Distribution of $ {S_{\text {T}}} $ for the $ \mathrm{ee} $ SR in the boosted region, as defined in Section 6.1. The contribution expected from a 4 TeV Z' boson, with a relative width of 1%, is shown normalized to a cross section of 1 pb. The hatched band on the simulation represents the uncertainty in the background prediction. The lower panel shows the pull of each histogram bin from the SM prediction. The light (dark) gray band represents a pull of one (two) s.d. from the predicted value. |

png pdf |
Figure 8-d:
Distribution of $ {S_{\text {T}}} $ for the $ \mathrm{ee} $ SR in the non-boosted region, as defined in Section 6.1. The contribution expected from a 4 TeV Z' boson, with a relative width of 1%, is shown normalized to a cross section of 1 pb. The hatched band on the simulation represents the uncertainty in the background prediction. The lower panel shows the pull of each histogram bin from the SM prediction. The light (dark) gray band represents a pull of one (two) s.d. from the predicted value. |
png pdf |
Figure 8-e:
Distribution of $ {S_{\text {T}}} $ for the $ {\mathrm {e}}\mu $ SR in the boosted region, as defined in Section 6.1. The contribution expected from a 4 TeV Z' boson, with a relative width of 1%, is shown normalized to a cross section of 1 pb. The hatched band on the simulation represents the uncertainty in the background prediction. The lower panel shows the pull of each histogram bin from the SM prediction. The light (dark) gray band represents a pull of one (two) s.d. from the predicted value. |
png pdf |
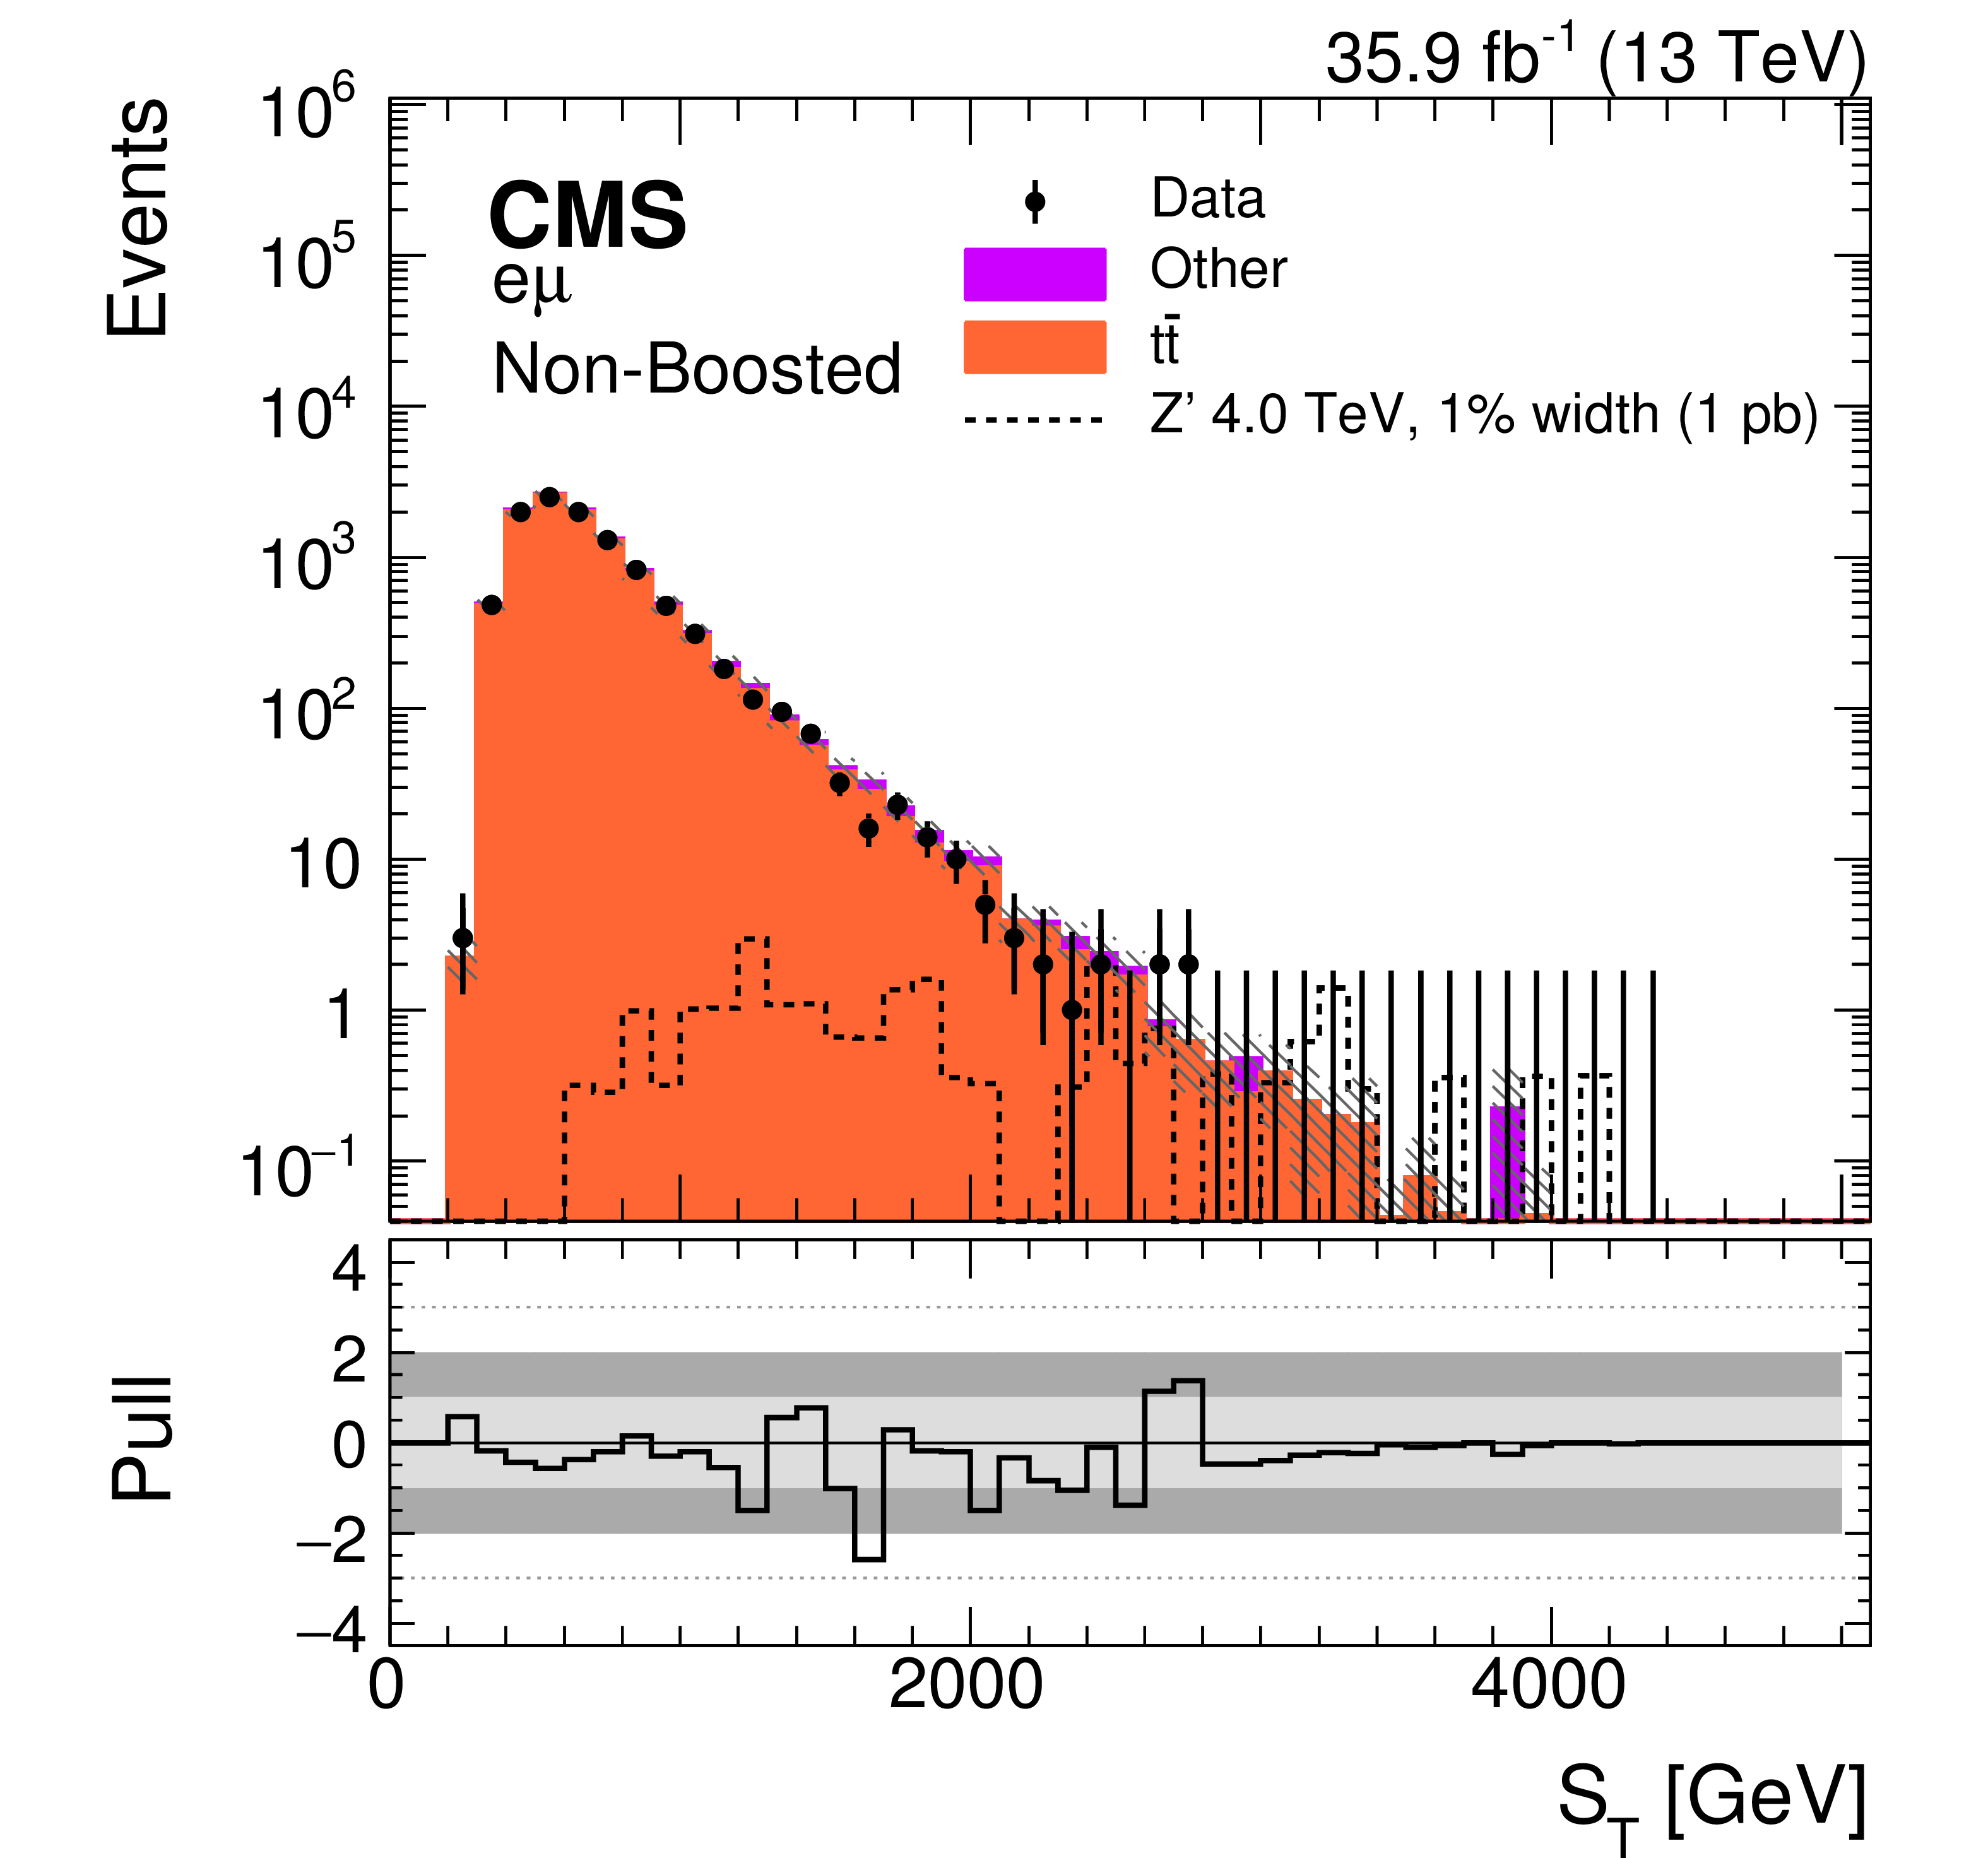
Figure 8-f:
Distribution of $ {S_{\text {T}}} $ for the $ {\mathrm {e}}\mu $ SR in the non-boosted region, as defined in Section 6.1. The contribution expected from a 4 TeV Z' boson, with a relative width of 1%, is shown normalized to a cross section of 1 pb. The hatched band on the simulation represents the uncertainty in the background prediction. The lower panel shows the pull of each histogram bin from the SM prediction. The light (dark) gray band represents a pull of one (two) s.d. from the predicted value. |
png pdf |
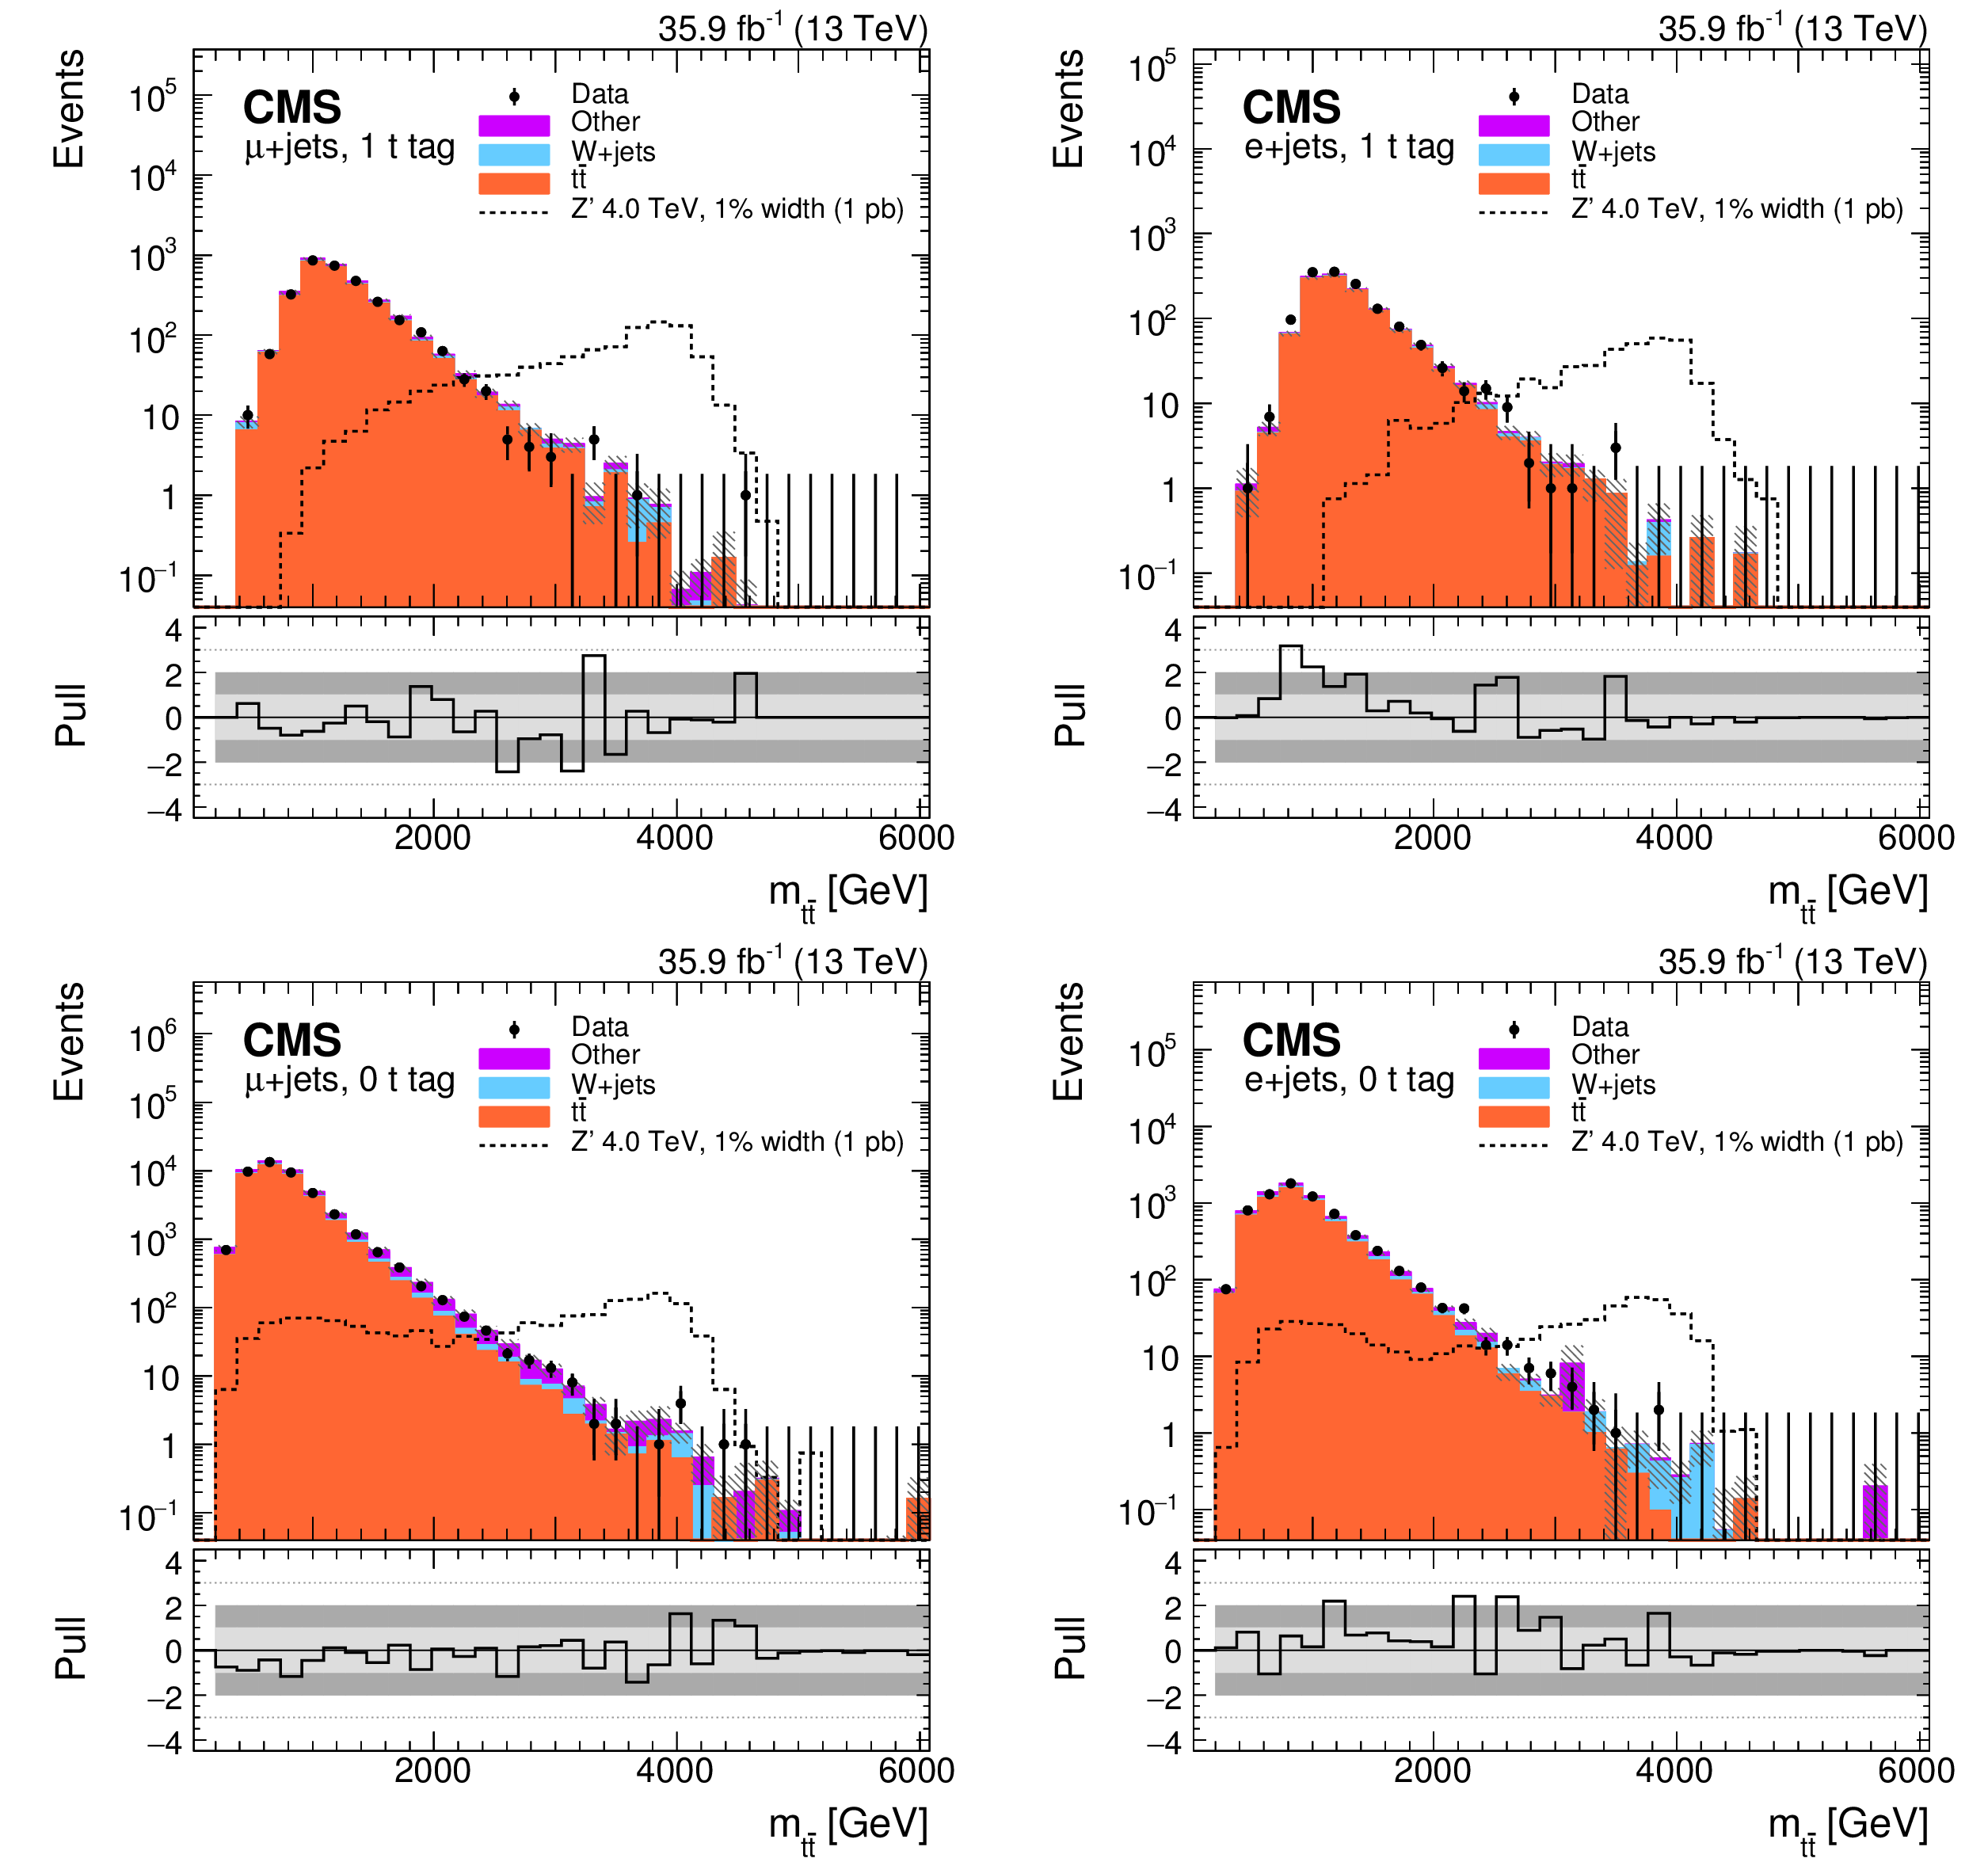
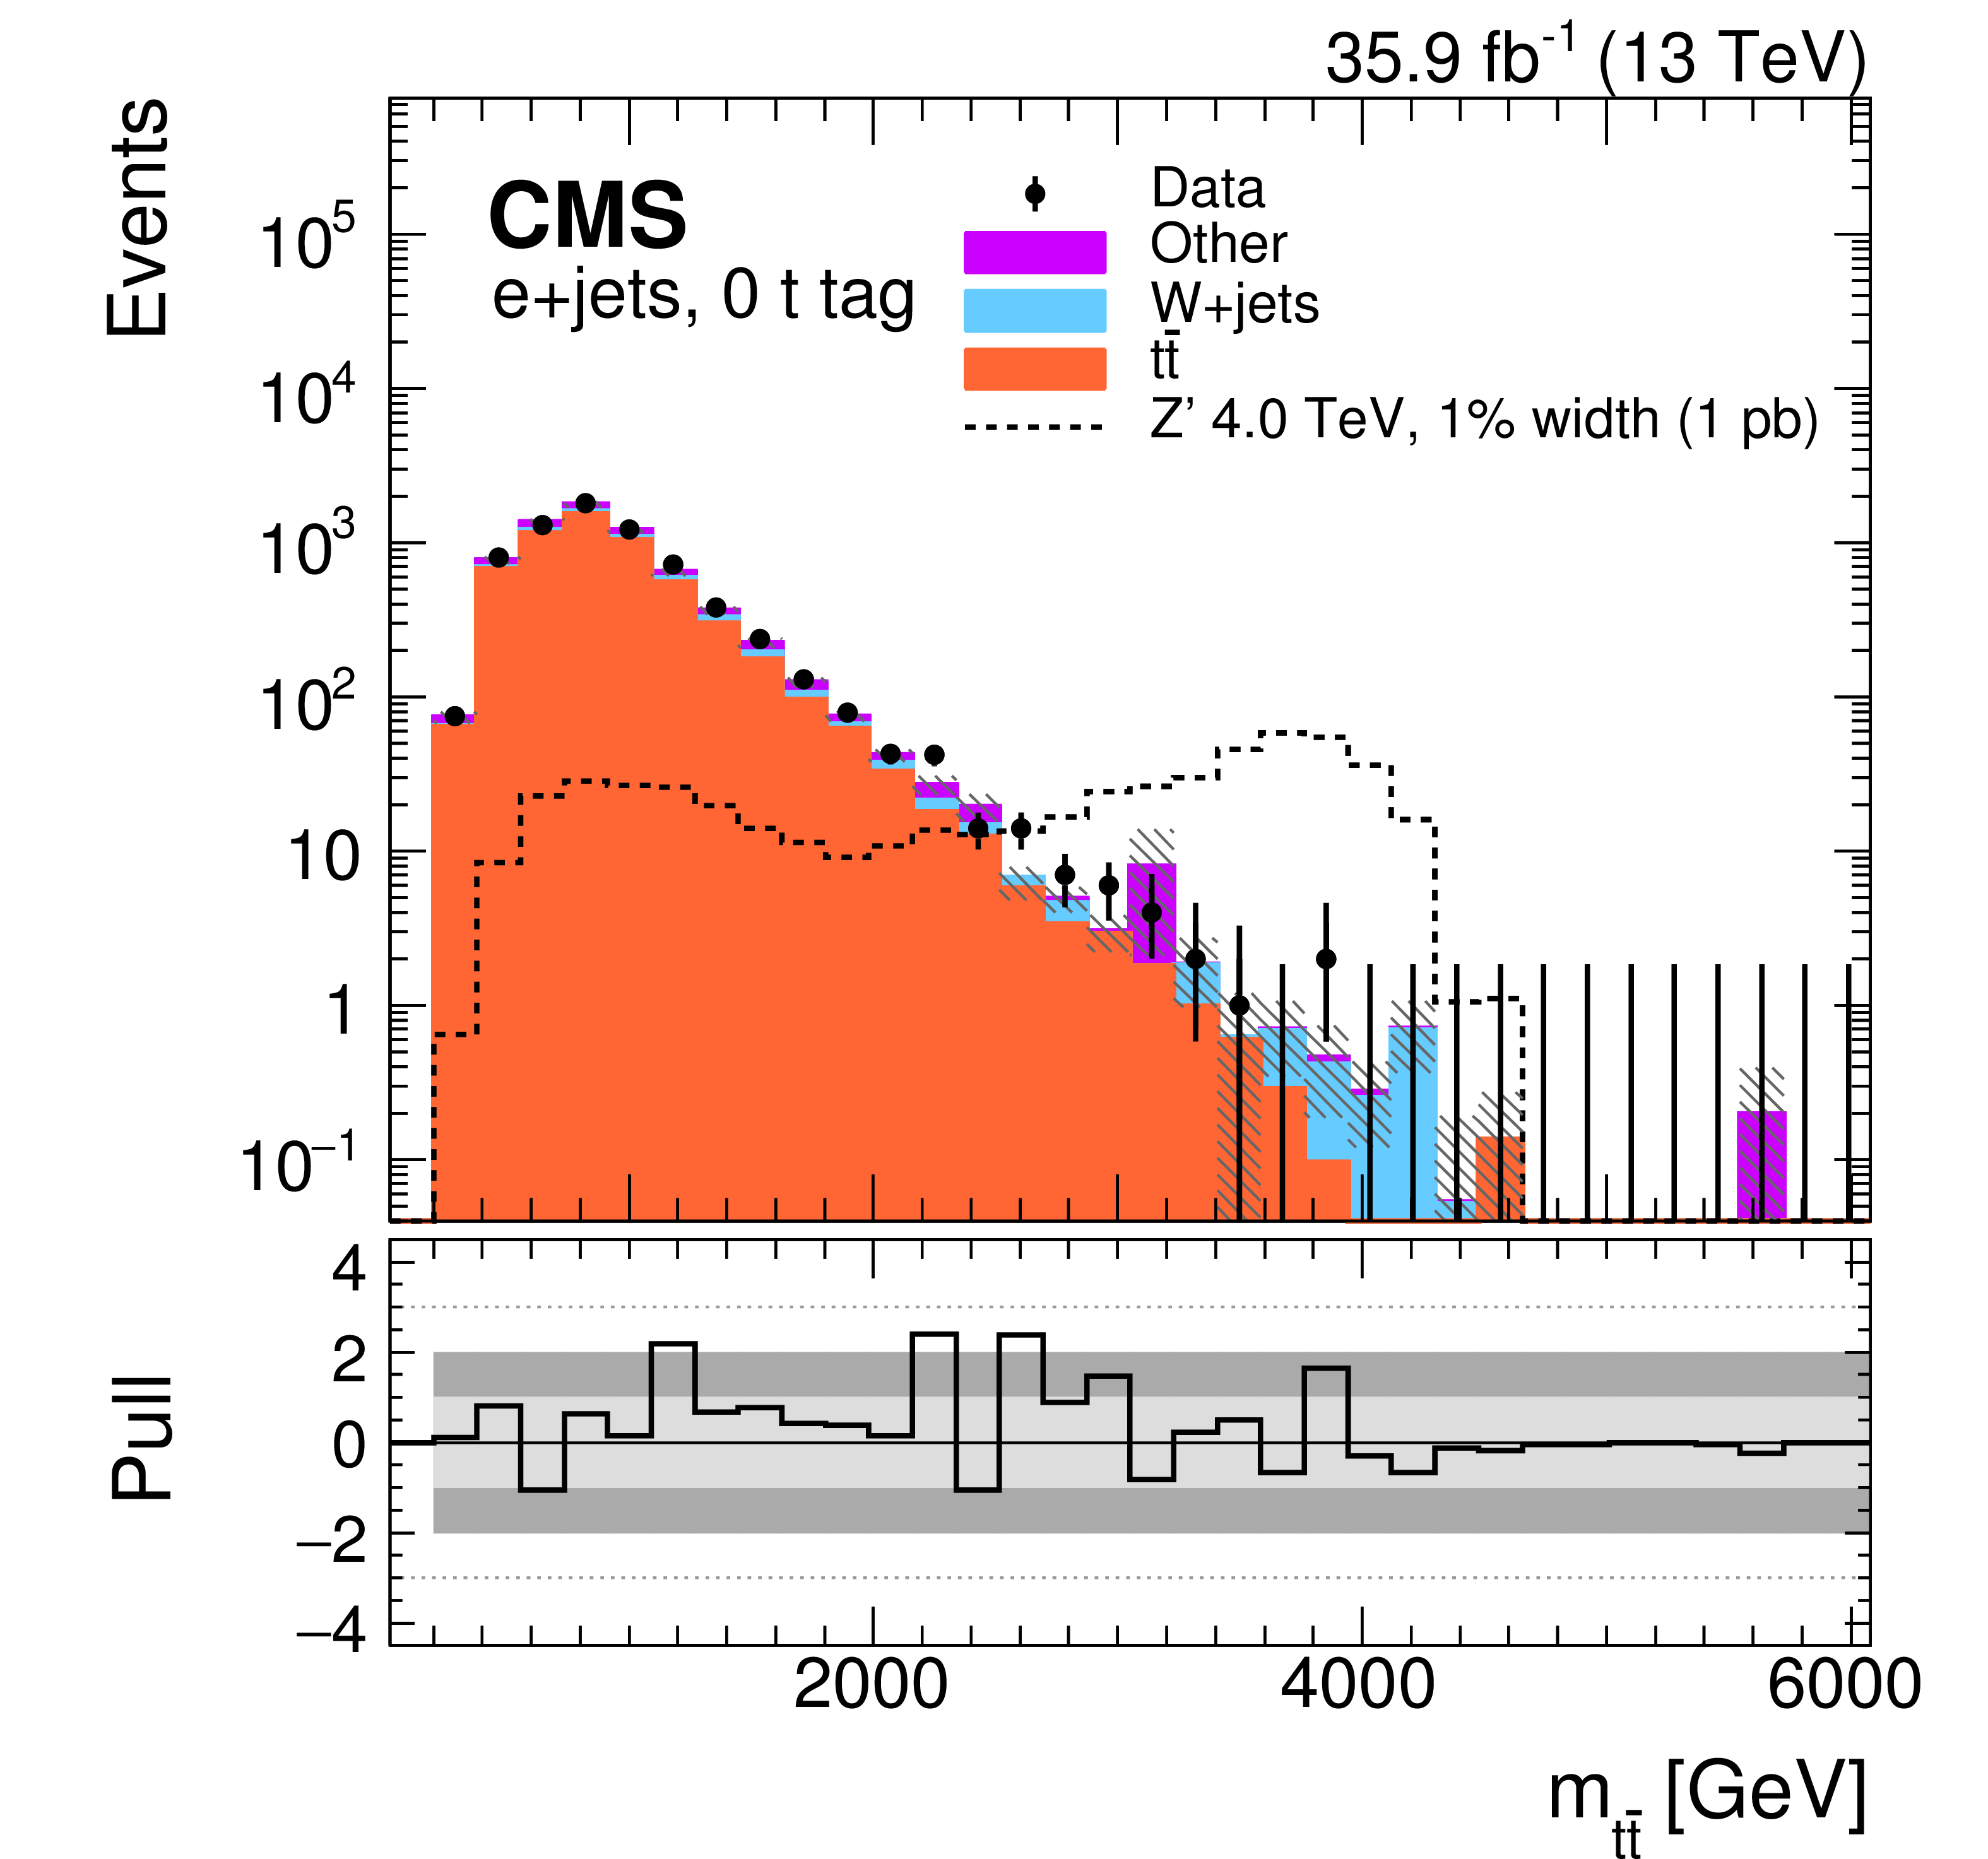
Figure 9:
Distributions of $ {m_{{{\mathrm {t}\overline {\mathrm {t}}}}}} $ for the single-lepton channel SRs for the muon (left) and electron (right) categories with (upper) and without (lower) t-tagging. The contribution expected from a 4 TeV Z' boson, with a relative width of 1%, is shown normalized to a cross section of 1 pb. The hatched band on the simulation represents the uncertainty in the background prediction. The lower panel in each plot shows the pull of each histogram bin from the SM prediction. The light (dark) gray band represents a pull of one (two) s.d. from the predicted value. |
png pdf |
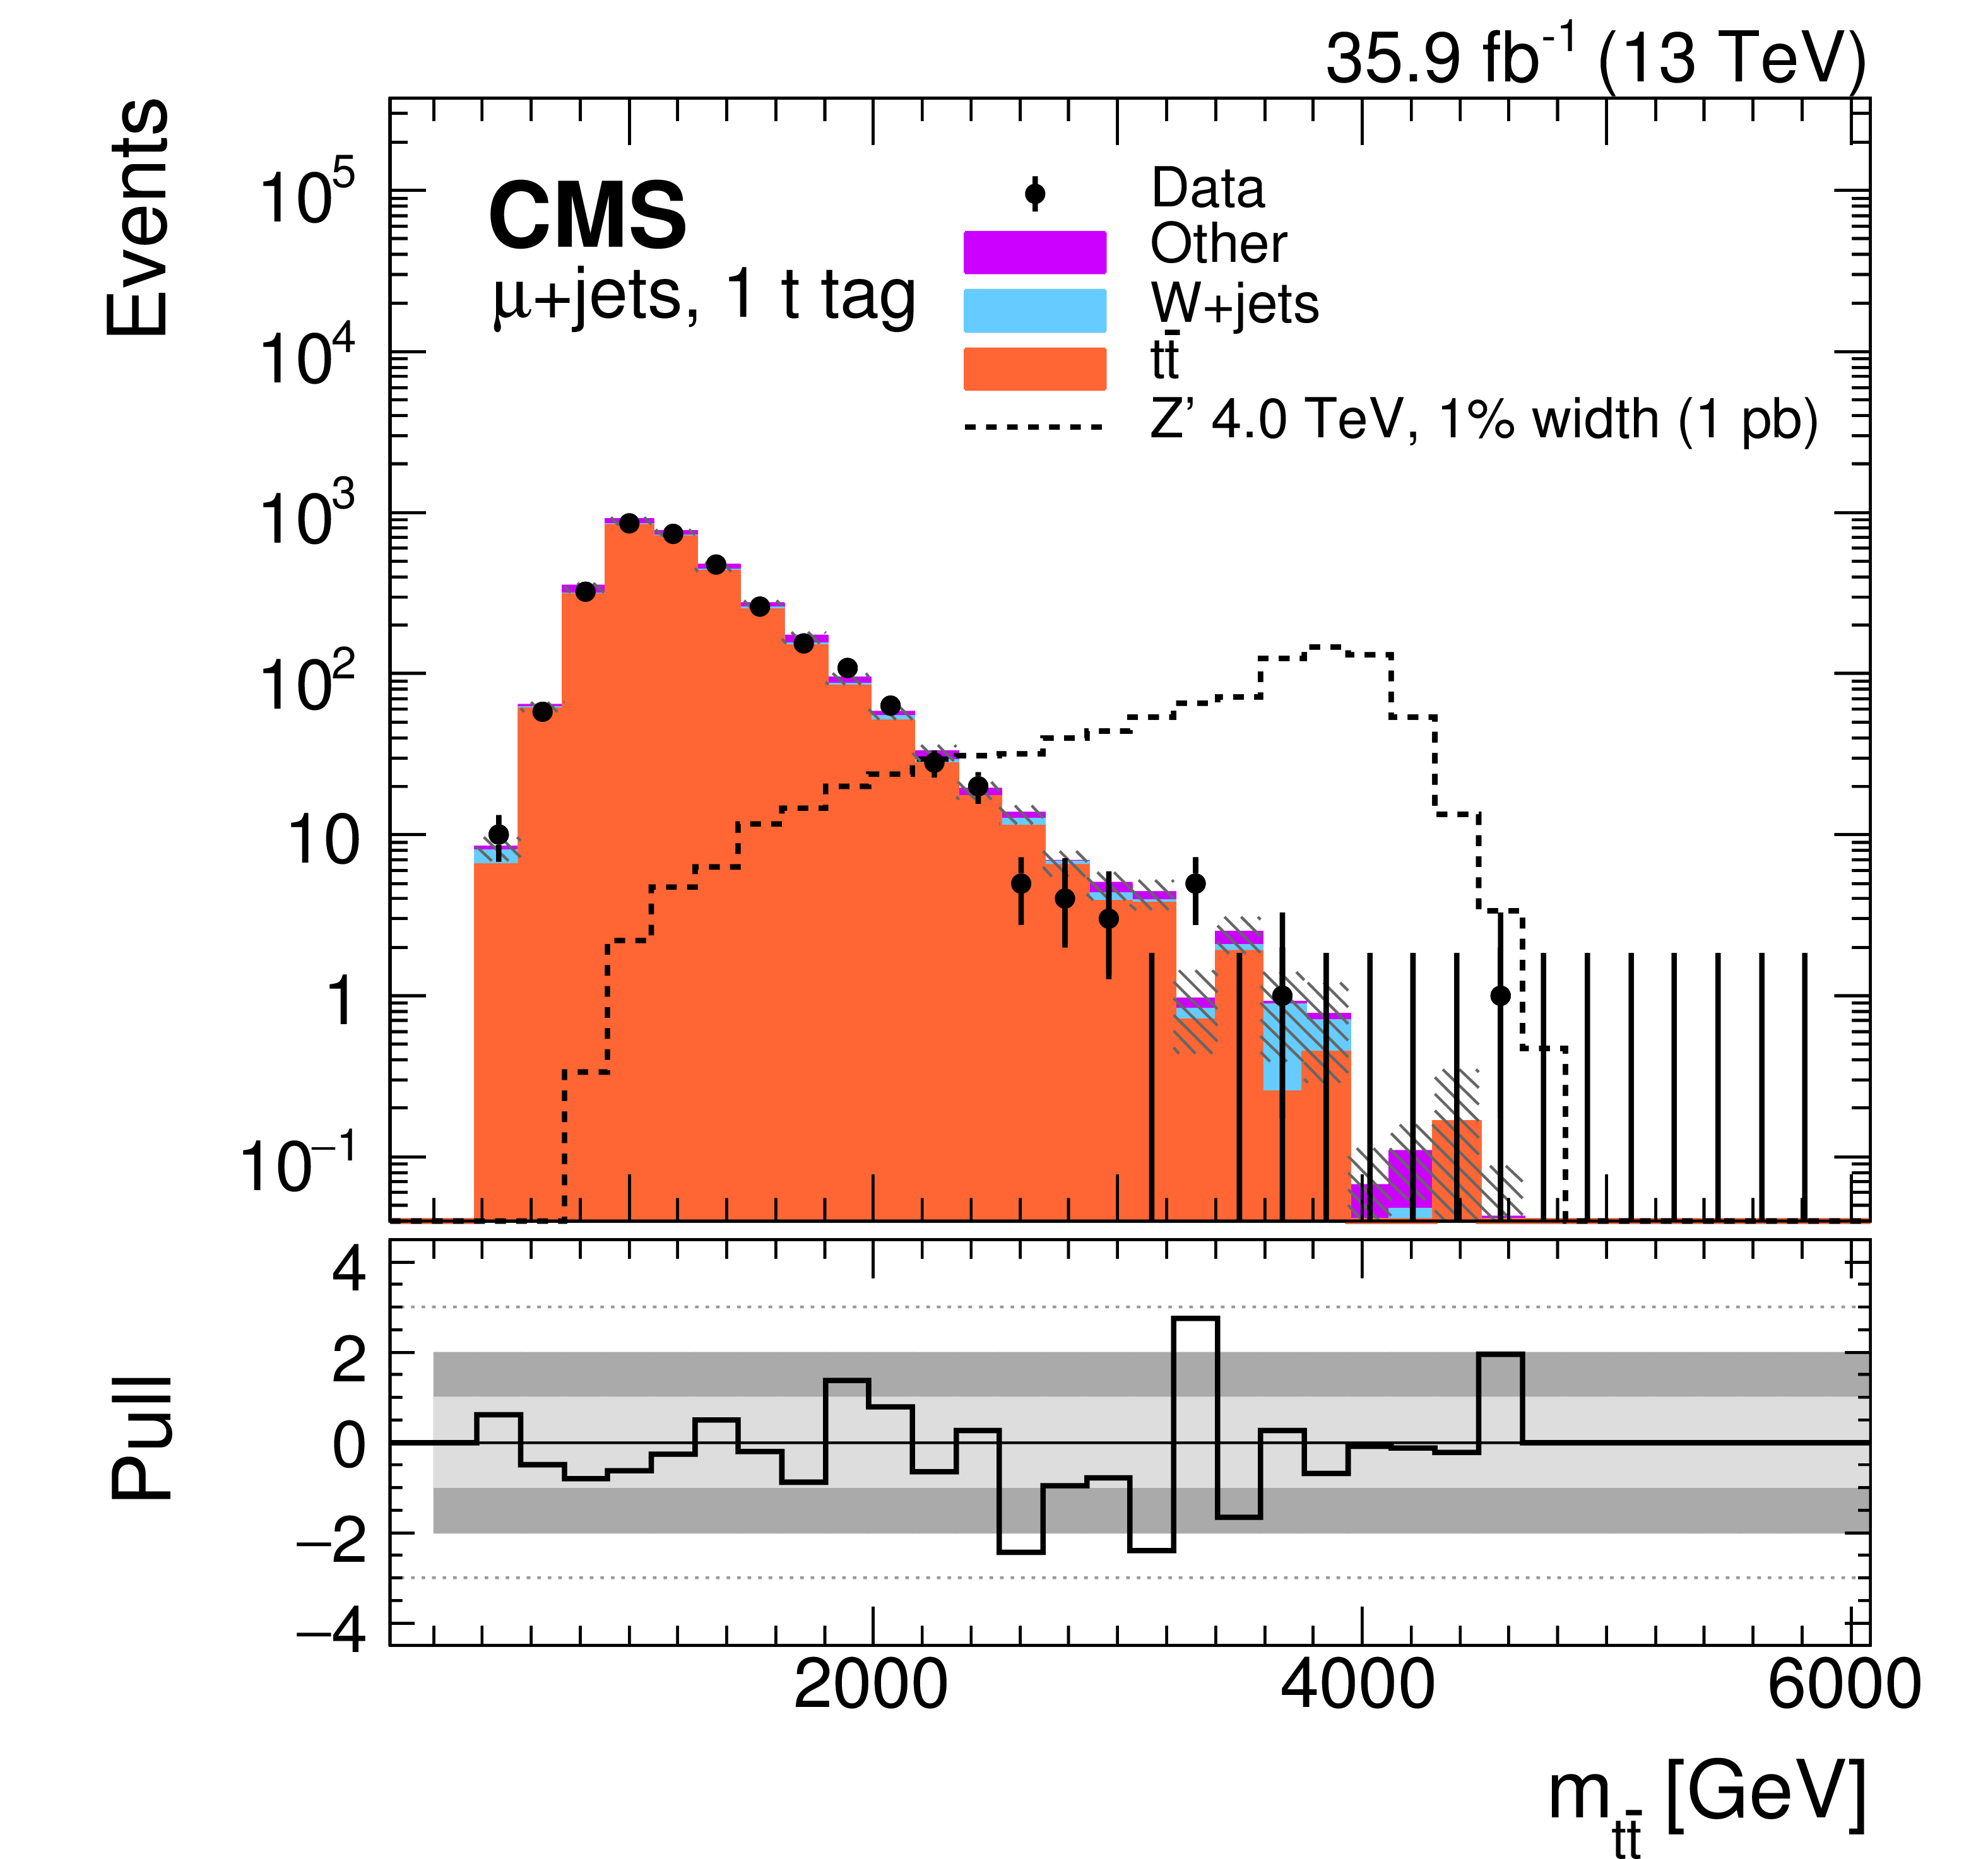
Figure 9-a:
Distribution of $ {m_{{{\mathrm {t}\overline {\mathrm {t}}}}}} $ for the single-lepton channel SR for the muon category with t-tagging. The contribution expected from a 4 TeV Z' boson, with a relative width of 1%, is shown normalized to a cross section of 1 pb. The hatched band on the simulation represents the uncertainty in the background prediction. The lower panel shows the pull of each histogram bin from the SM prediction. The light (dark) gray band represents a pull of one (two) s.d. from the predicted value. |

png pdf |
Figure 9-b:
Distribution of $ {m_{{{\mathrm {t}\overline {\mathrm {t}}}}}} $ for the single-lepton channel SR for the electron category with t-tagging. The contribution expected from a 4 TeV Z' boson, with a relative width of 1%, is shown normalized to a cross section of 1 pb. The hatched band on the simulation represents the uncertainty in the background prediction. The lower panel shows the pull of each histogram bin from the SM prediction. The light (dark) gray band represents a pull of one (two) s.d. from the predicted value. |
png pdf |
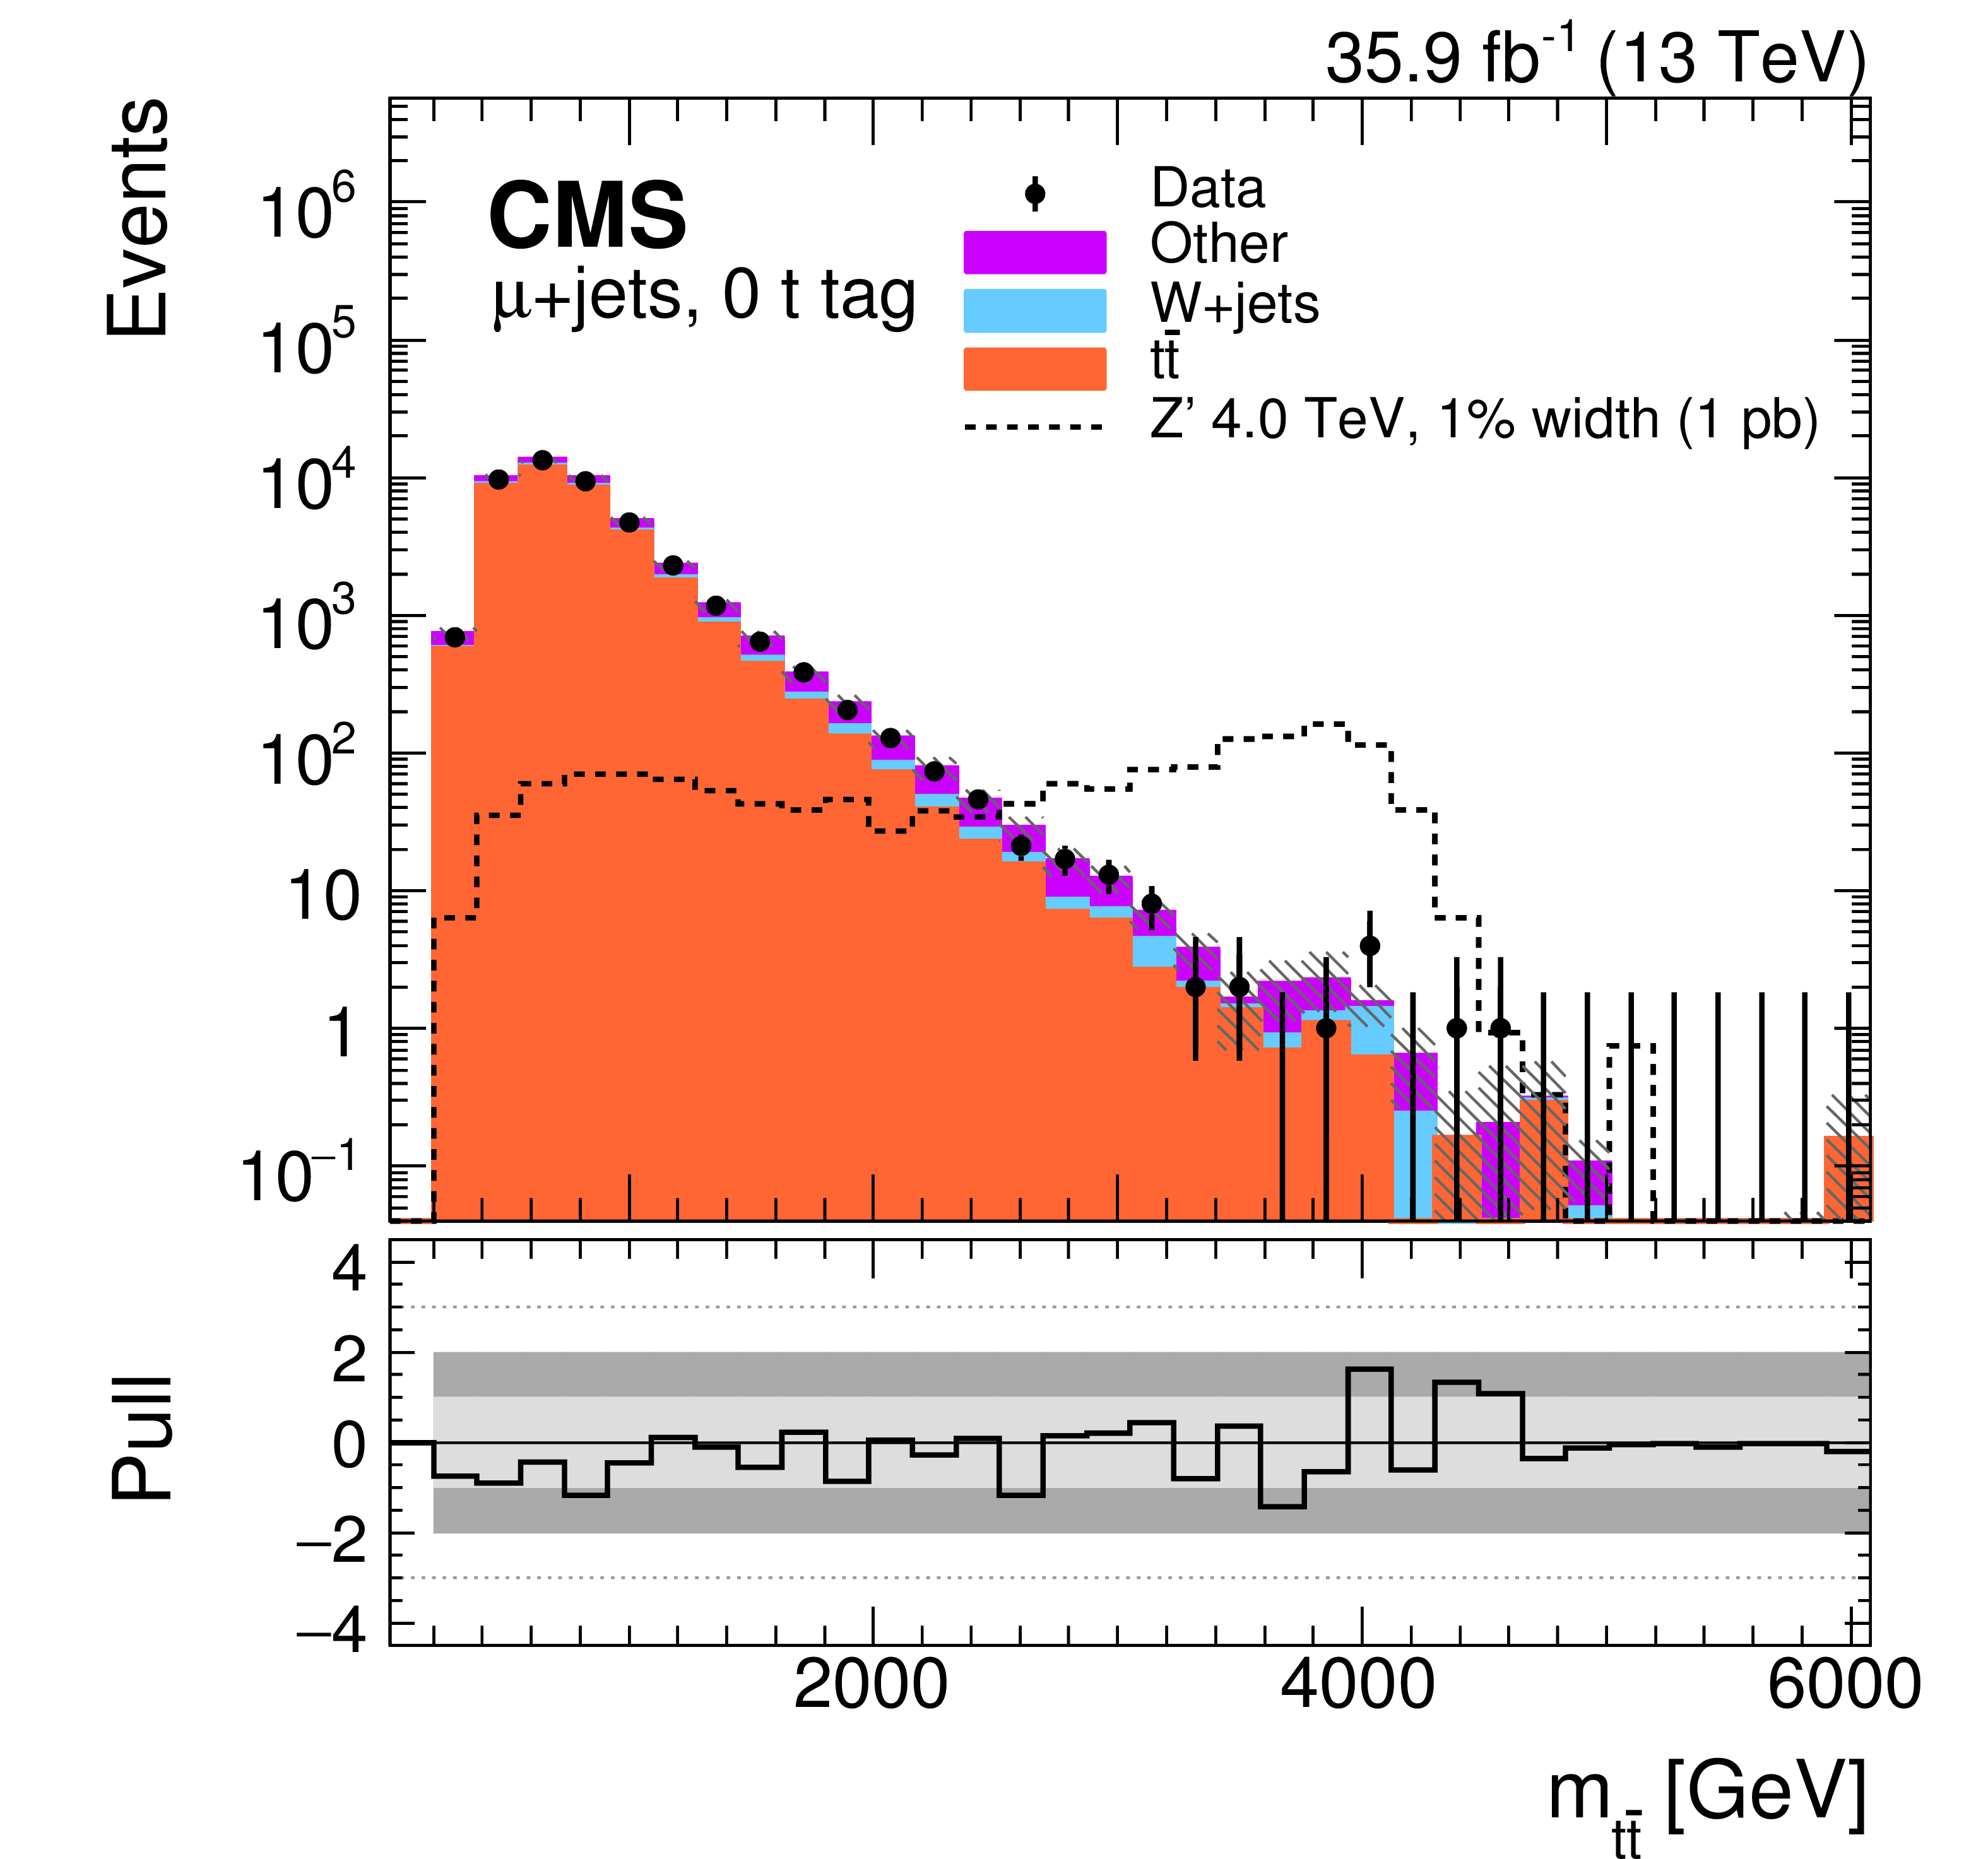
Figure 9-c:
Distribution of $ {m_{{{\mathrm {t}\overline {\mathrm {t}}}}}} $ for the single-lepton channel SR for the muon category without t-tagging. The contribution expected from a 4 TeV Z' boson, with a relative width of 1%, is shown normalized to a cross section of 1 pb. The hatched band on the simulation represents the uncertainty in the background prediction. The lower panel shows the pull of each histogram bin from the SM prediction. The light (dark) gray band represents a pull of one (two) s.d. from the predicted value. |
png pdf |
Figure 9-d:
Distribution of $ {m_{{{\mathrm {t}\overline {\mathrm {t}}}}}} $ for the single-lepton channel SR for the electron category without t-tagging. The contribution expected from a 4 TeV Z' boson, with a relative width of 1%, is shown normalized to a cross section of 1 pb. The hatched band on the simulation represents the uncertainty in the background prediction. The lower panel shows the pull of each histogram bin from the SM prediction. The light (dark) gray band represents a pull of one (two) s.d. from the predicted value. |
png pdf |
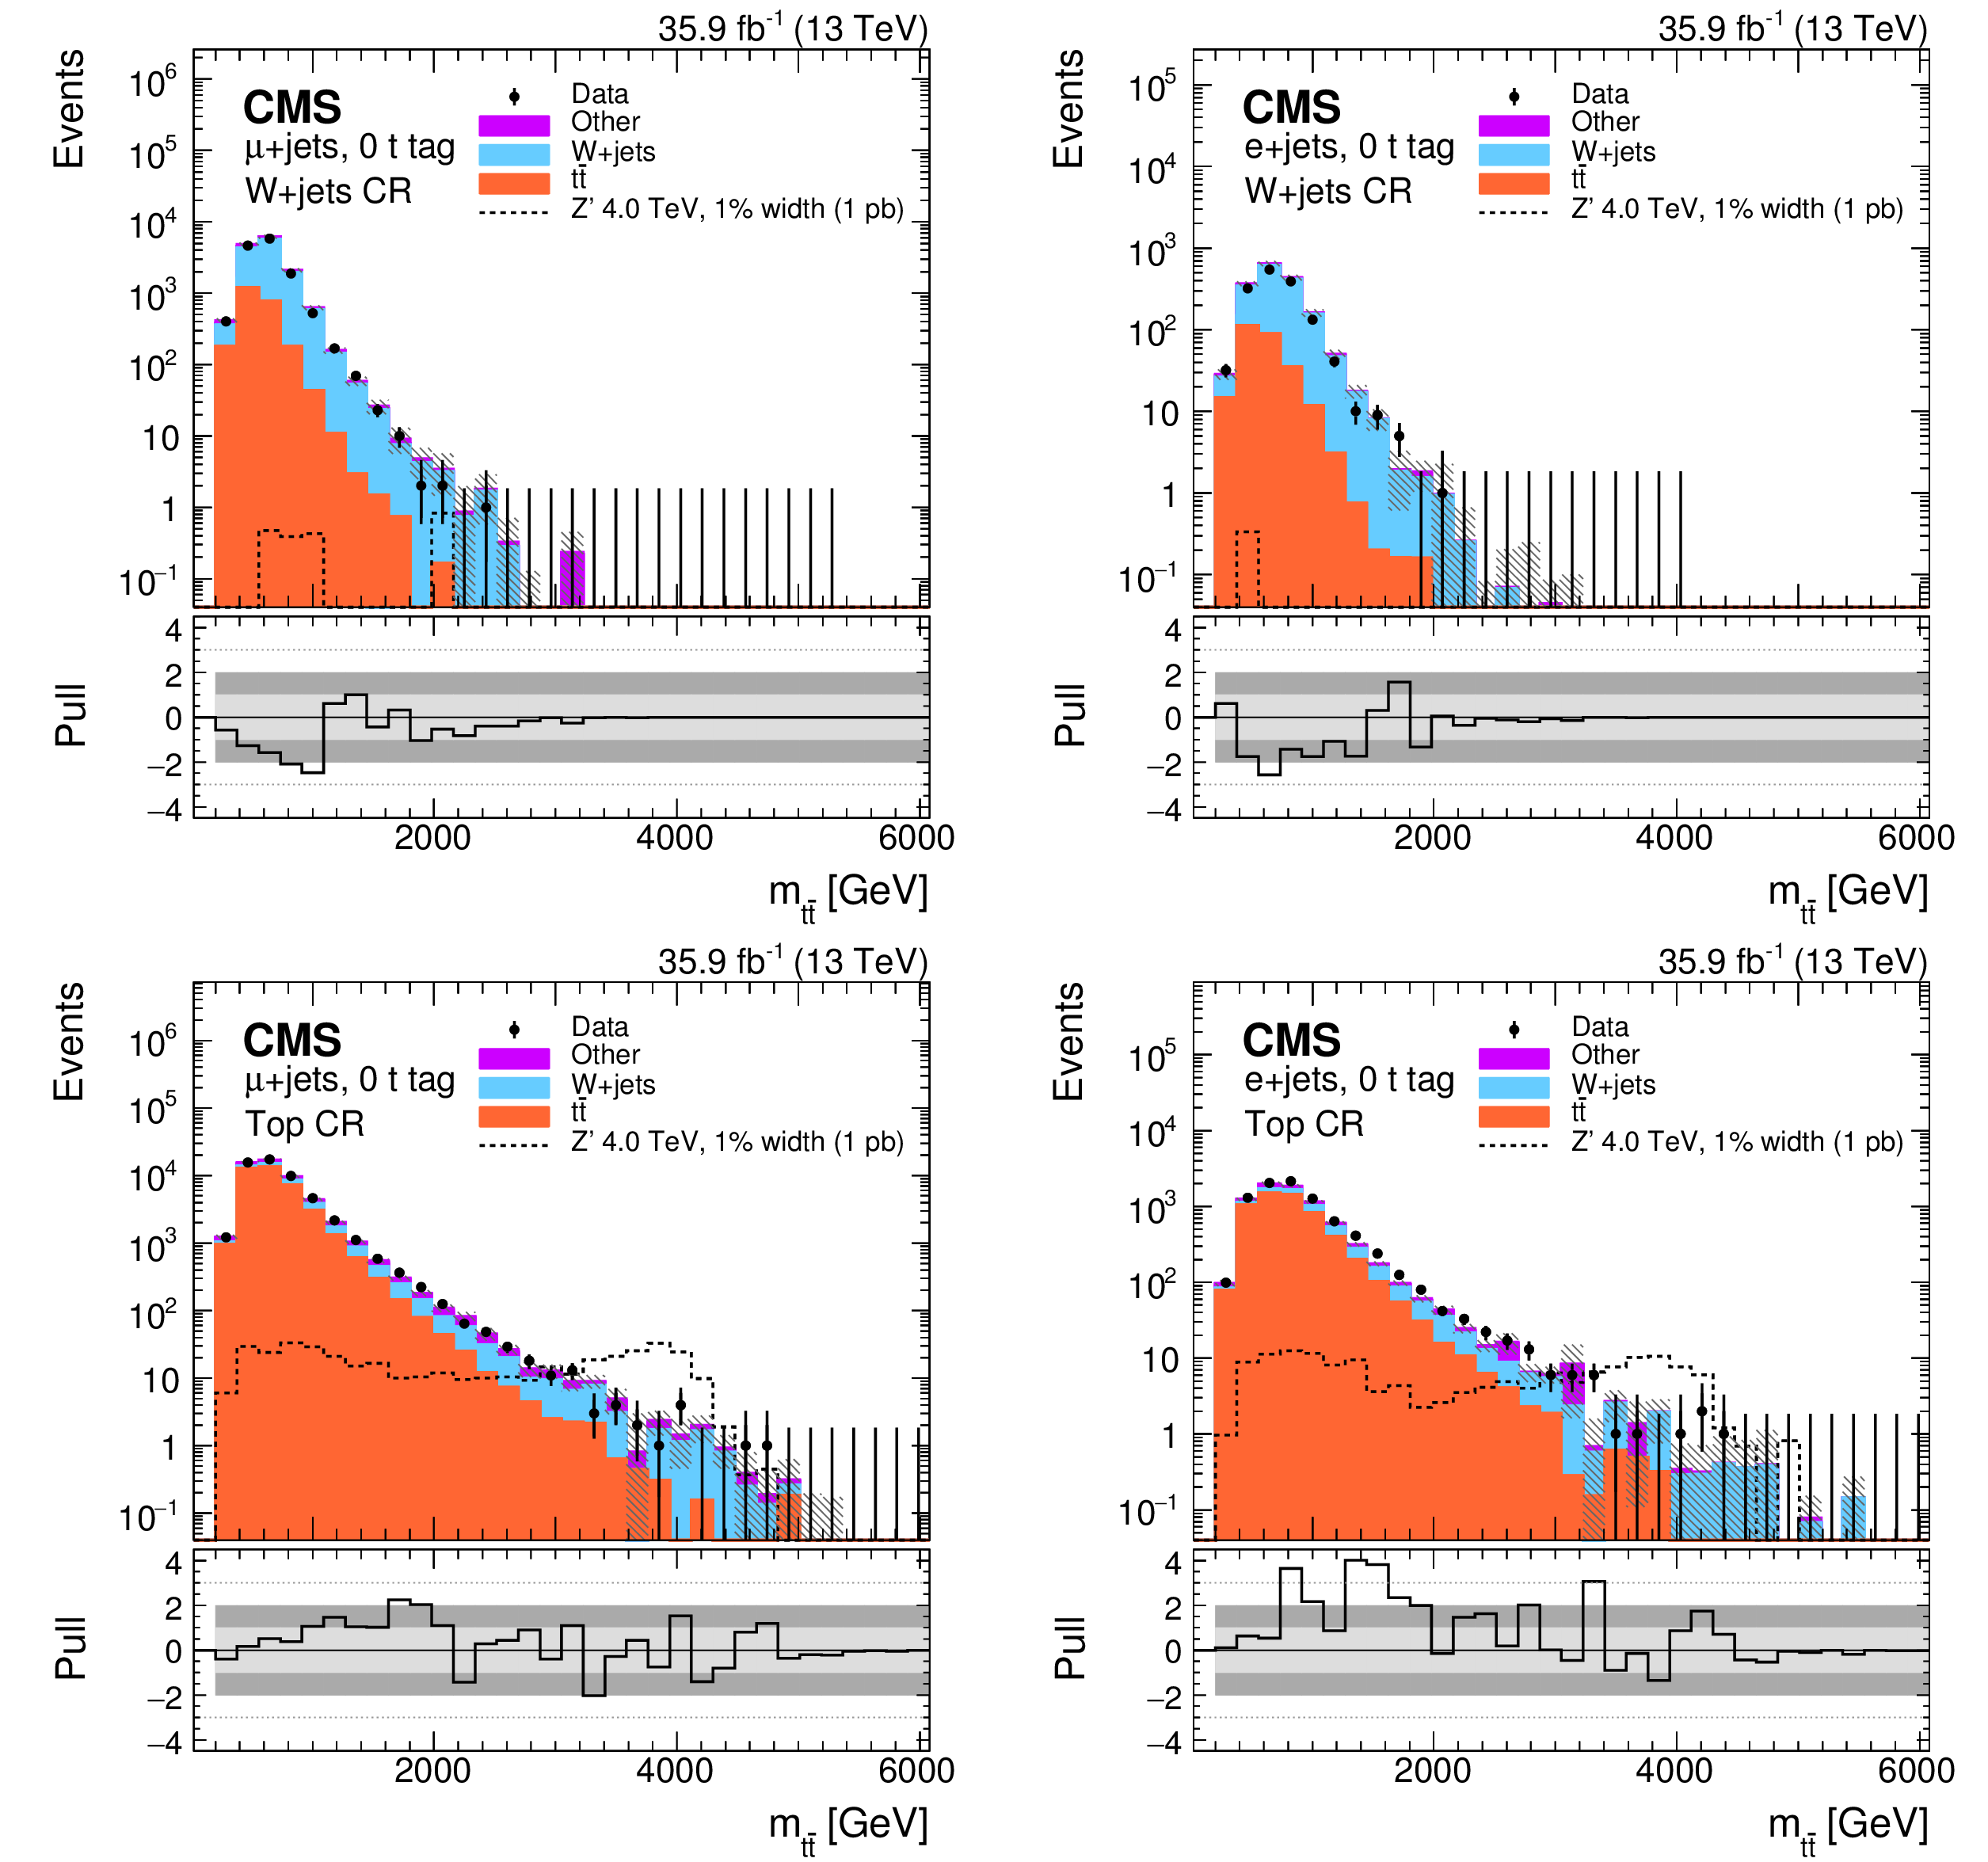
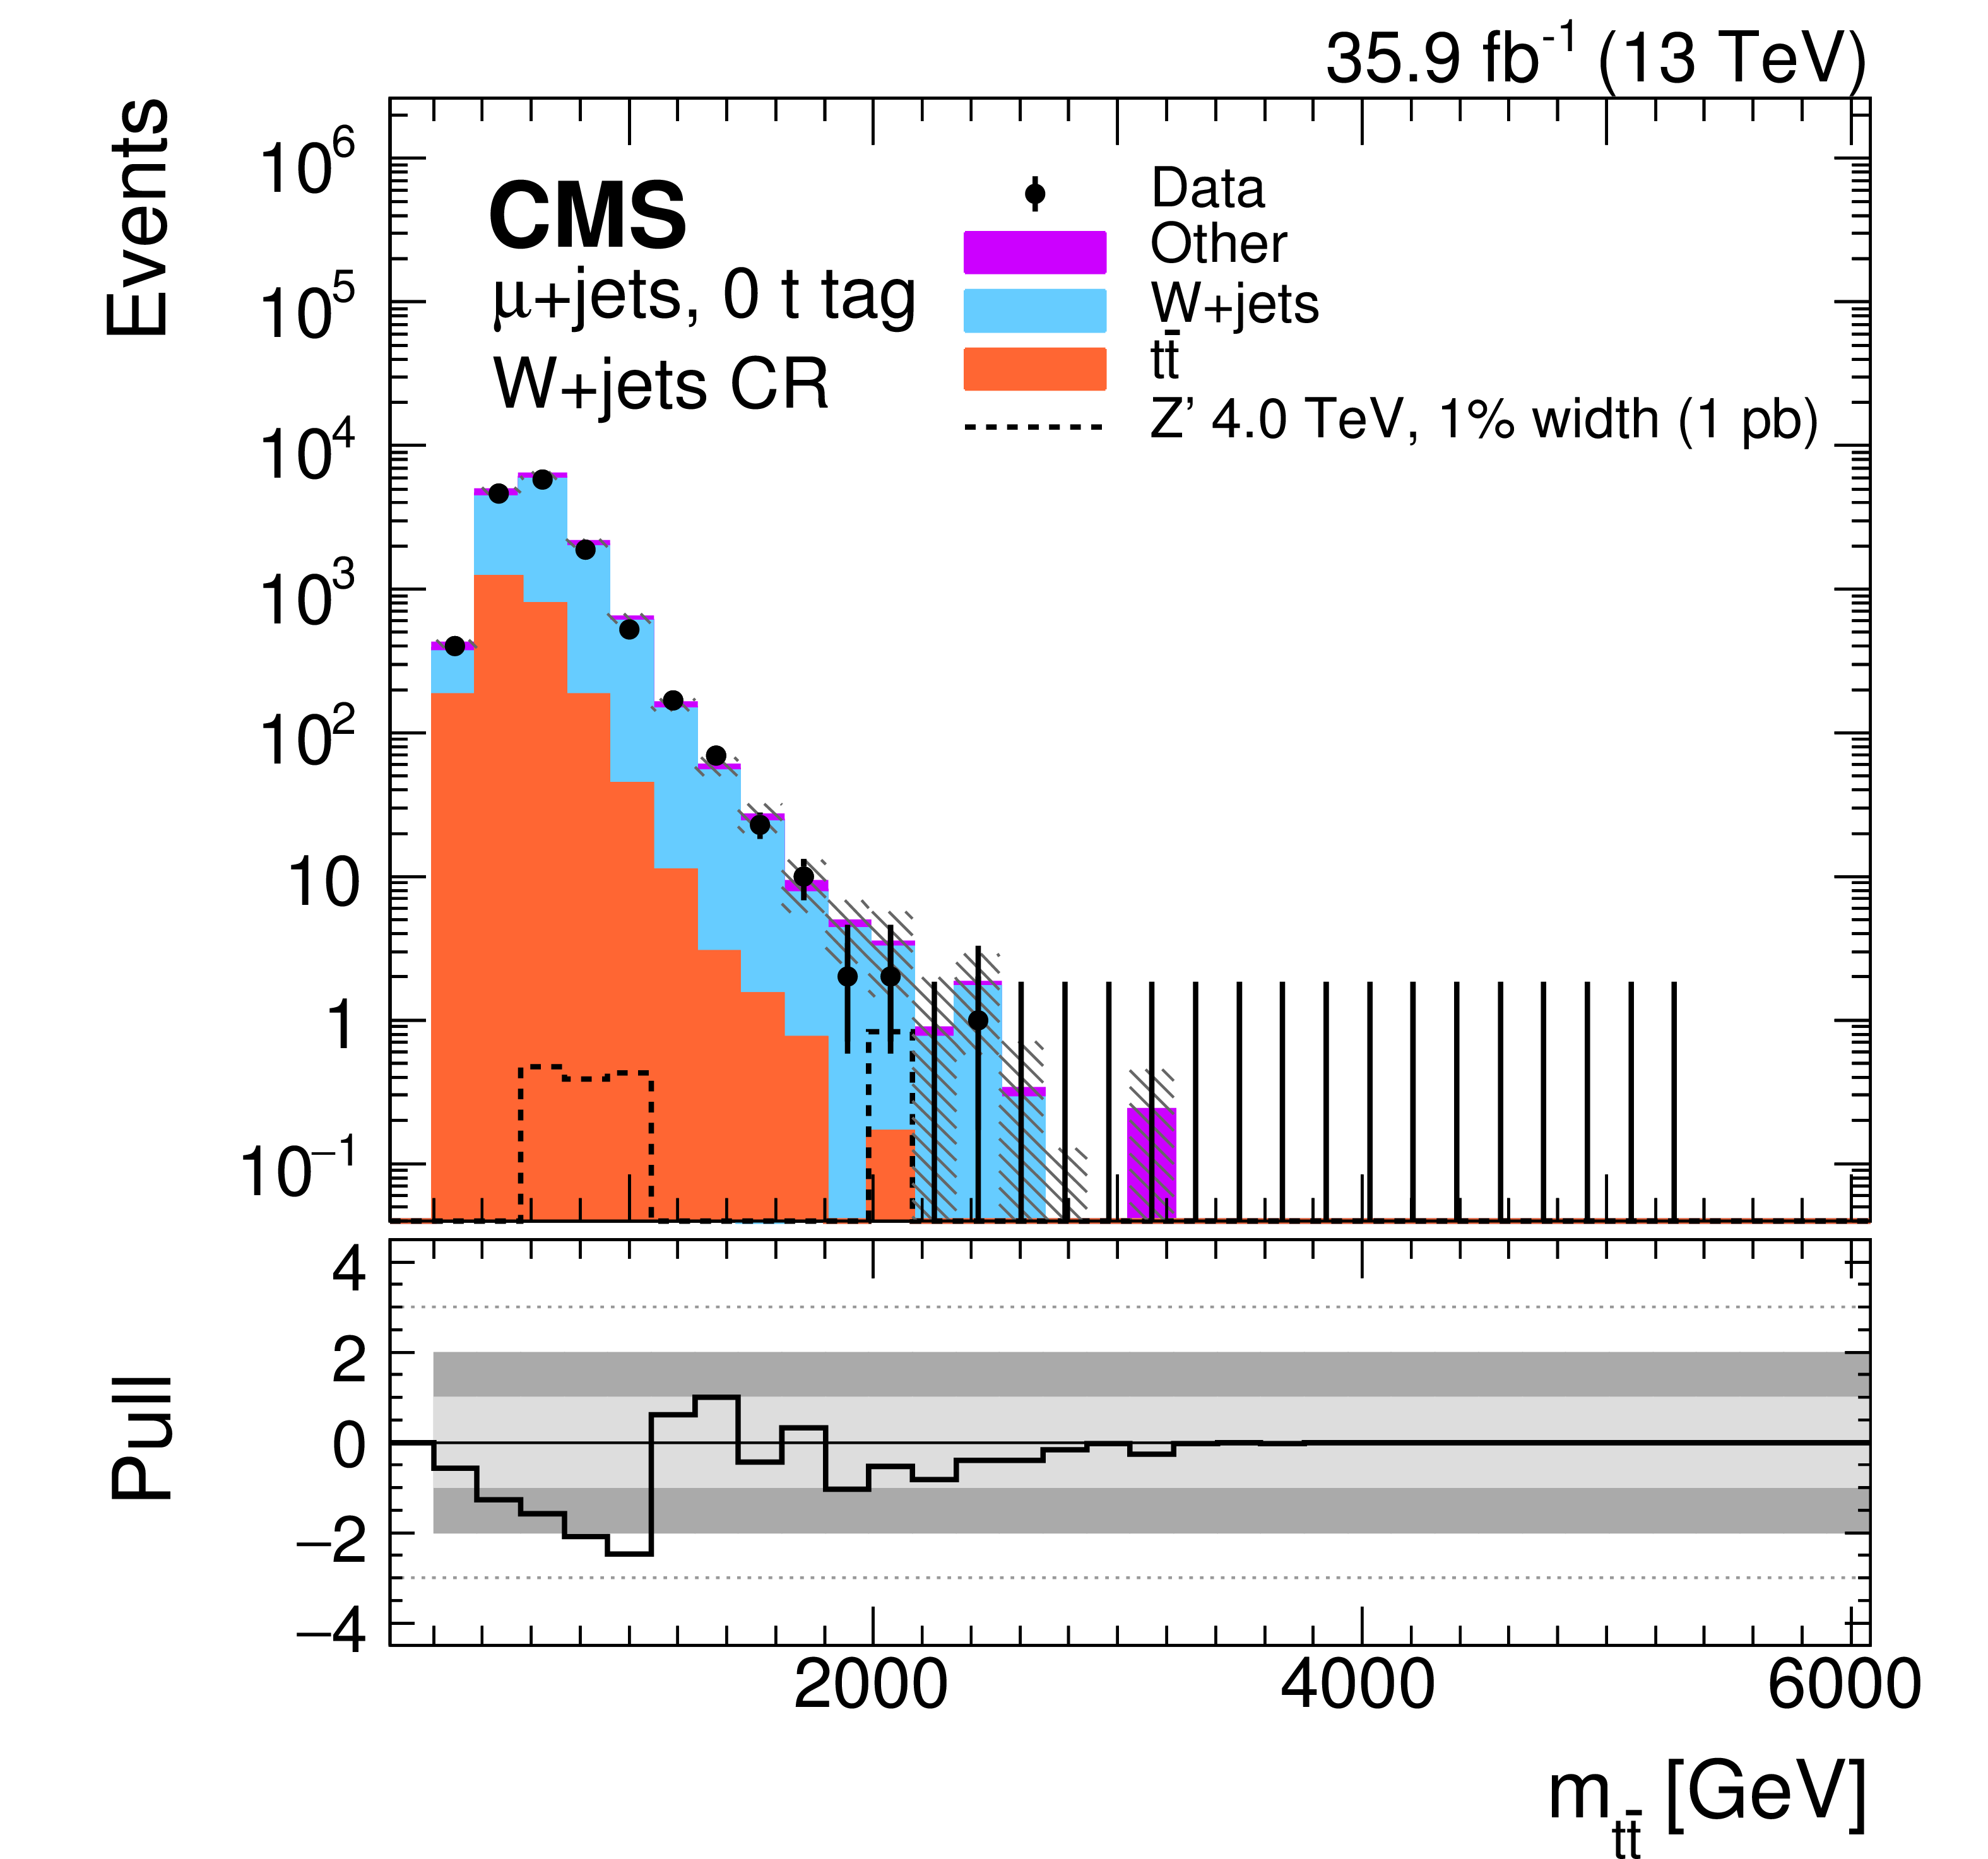
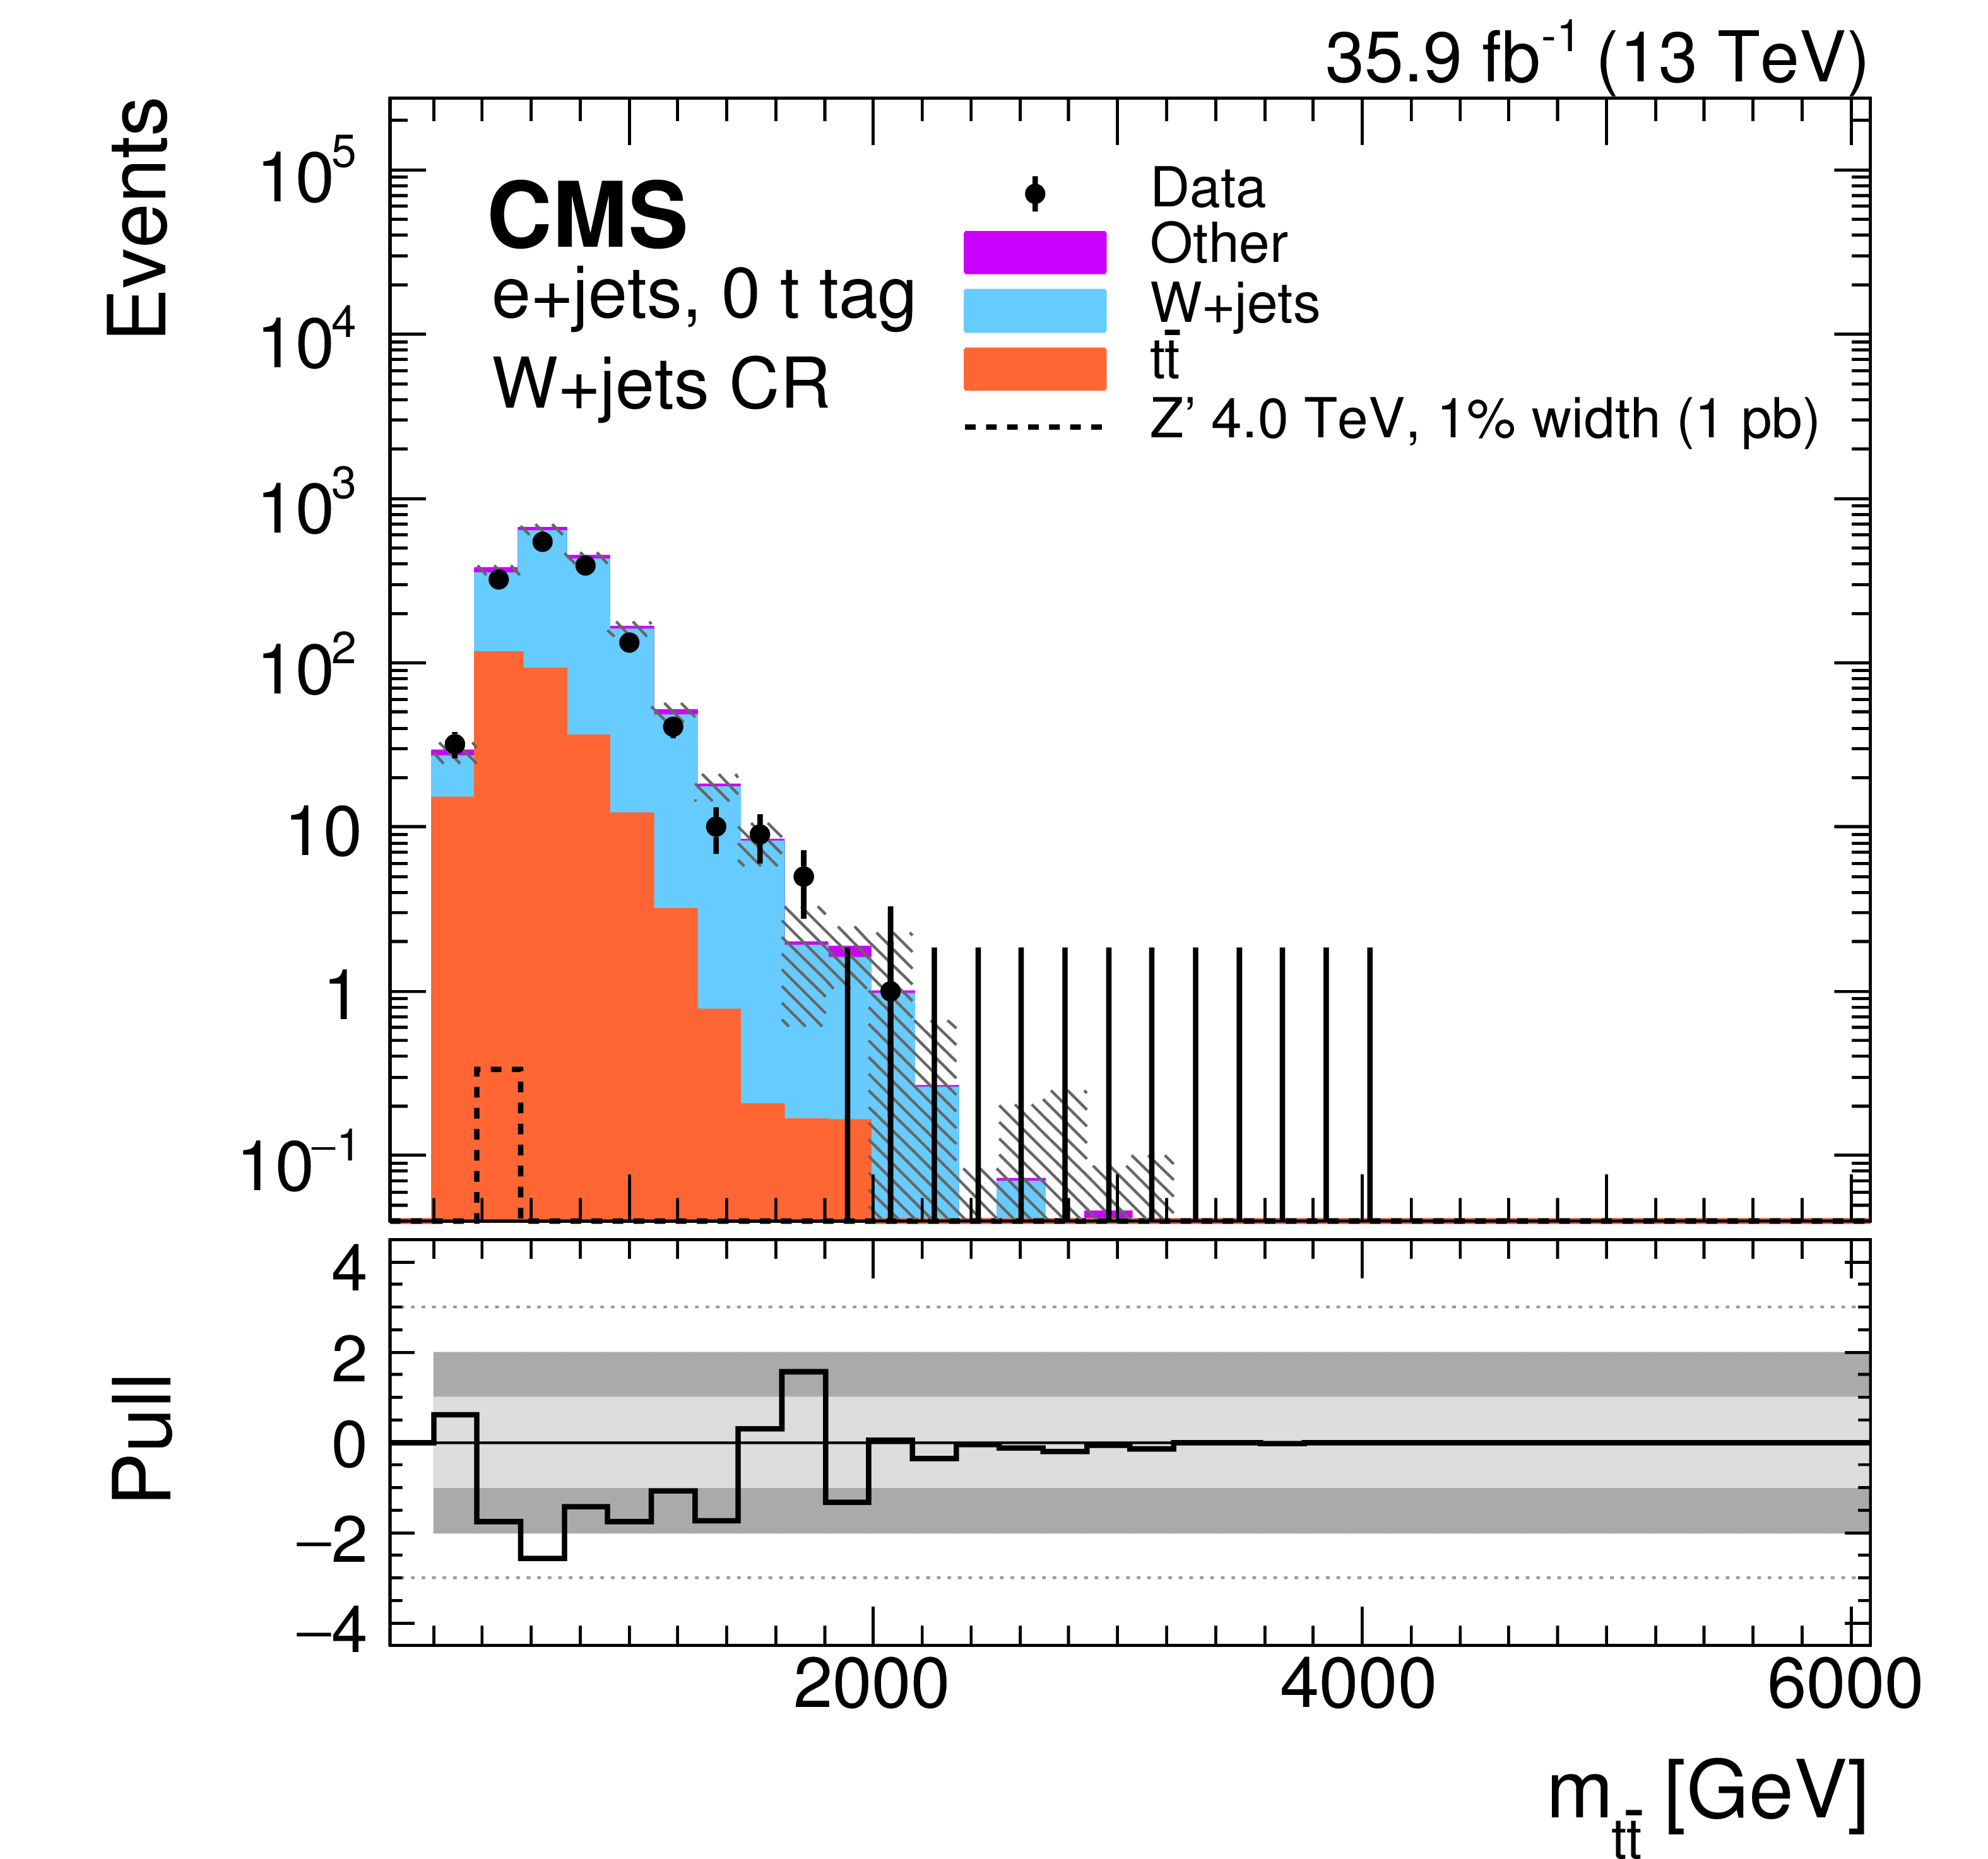
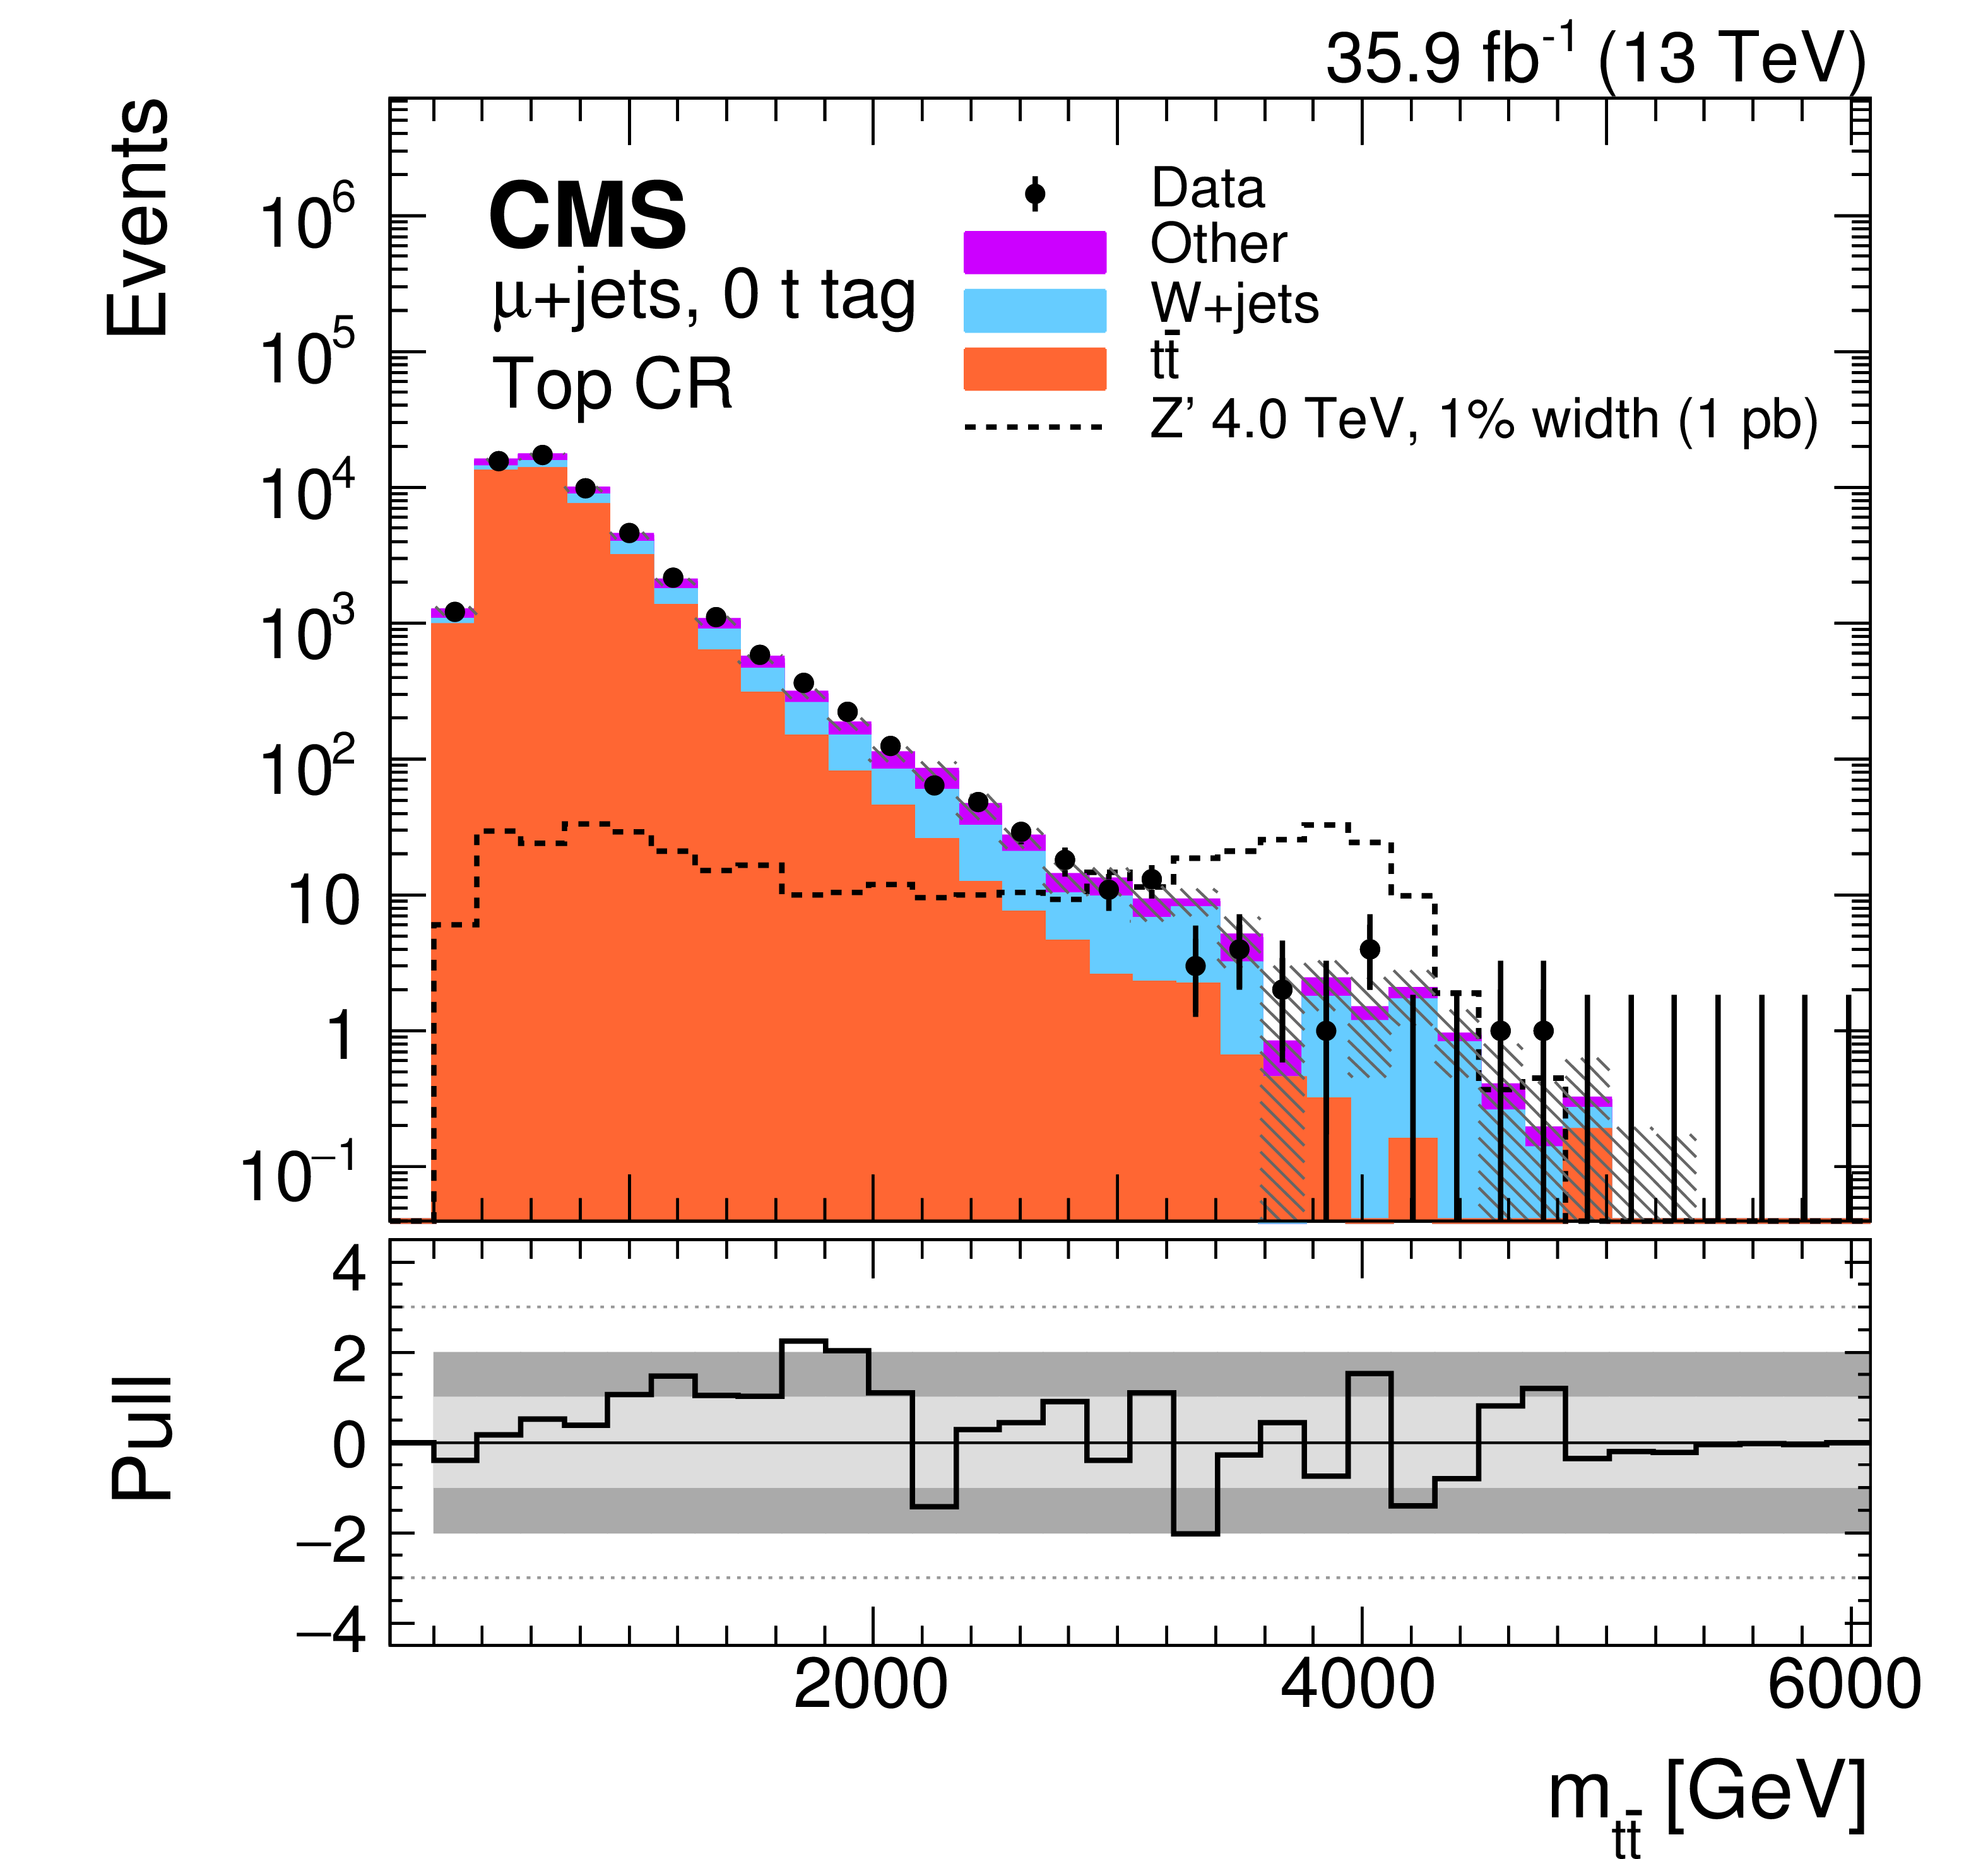
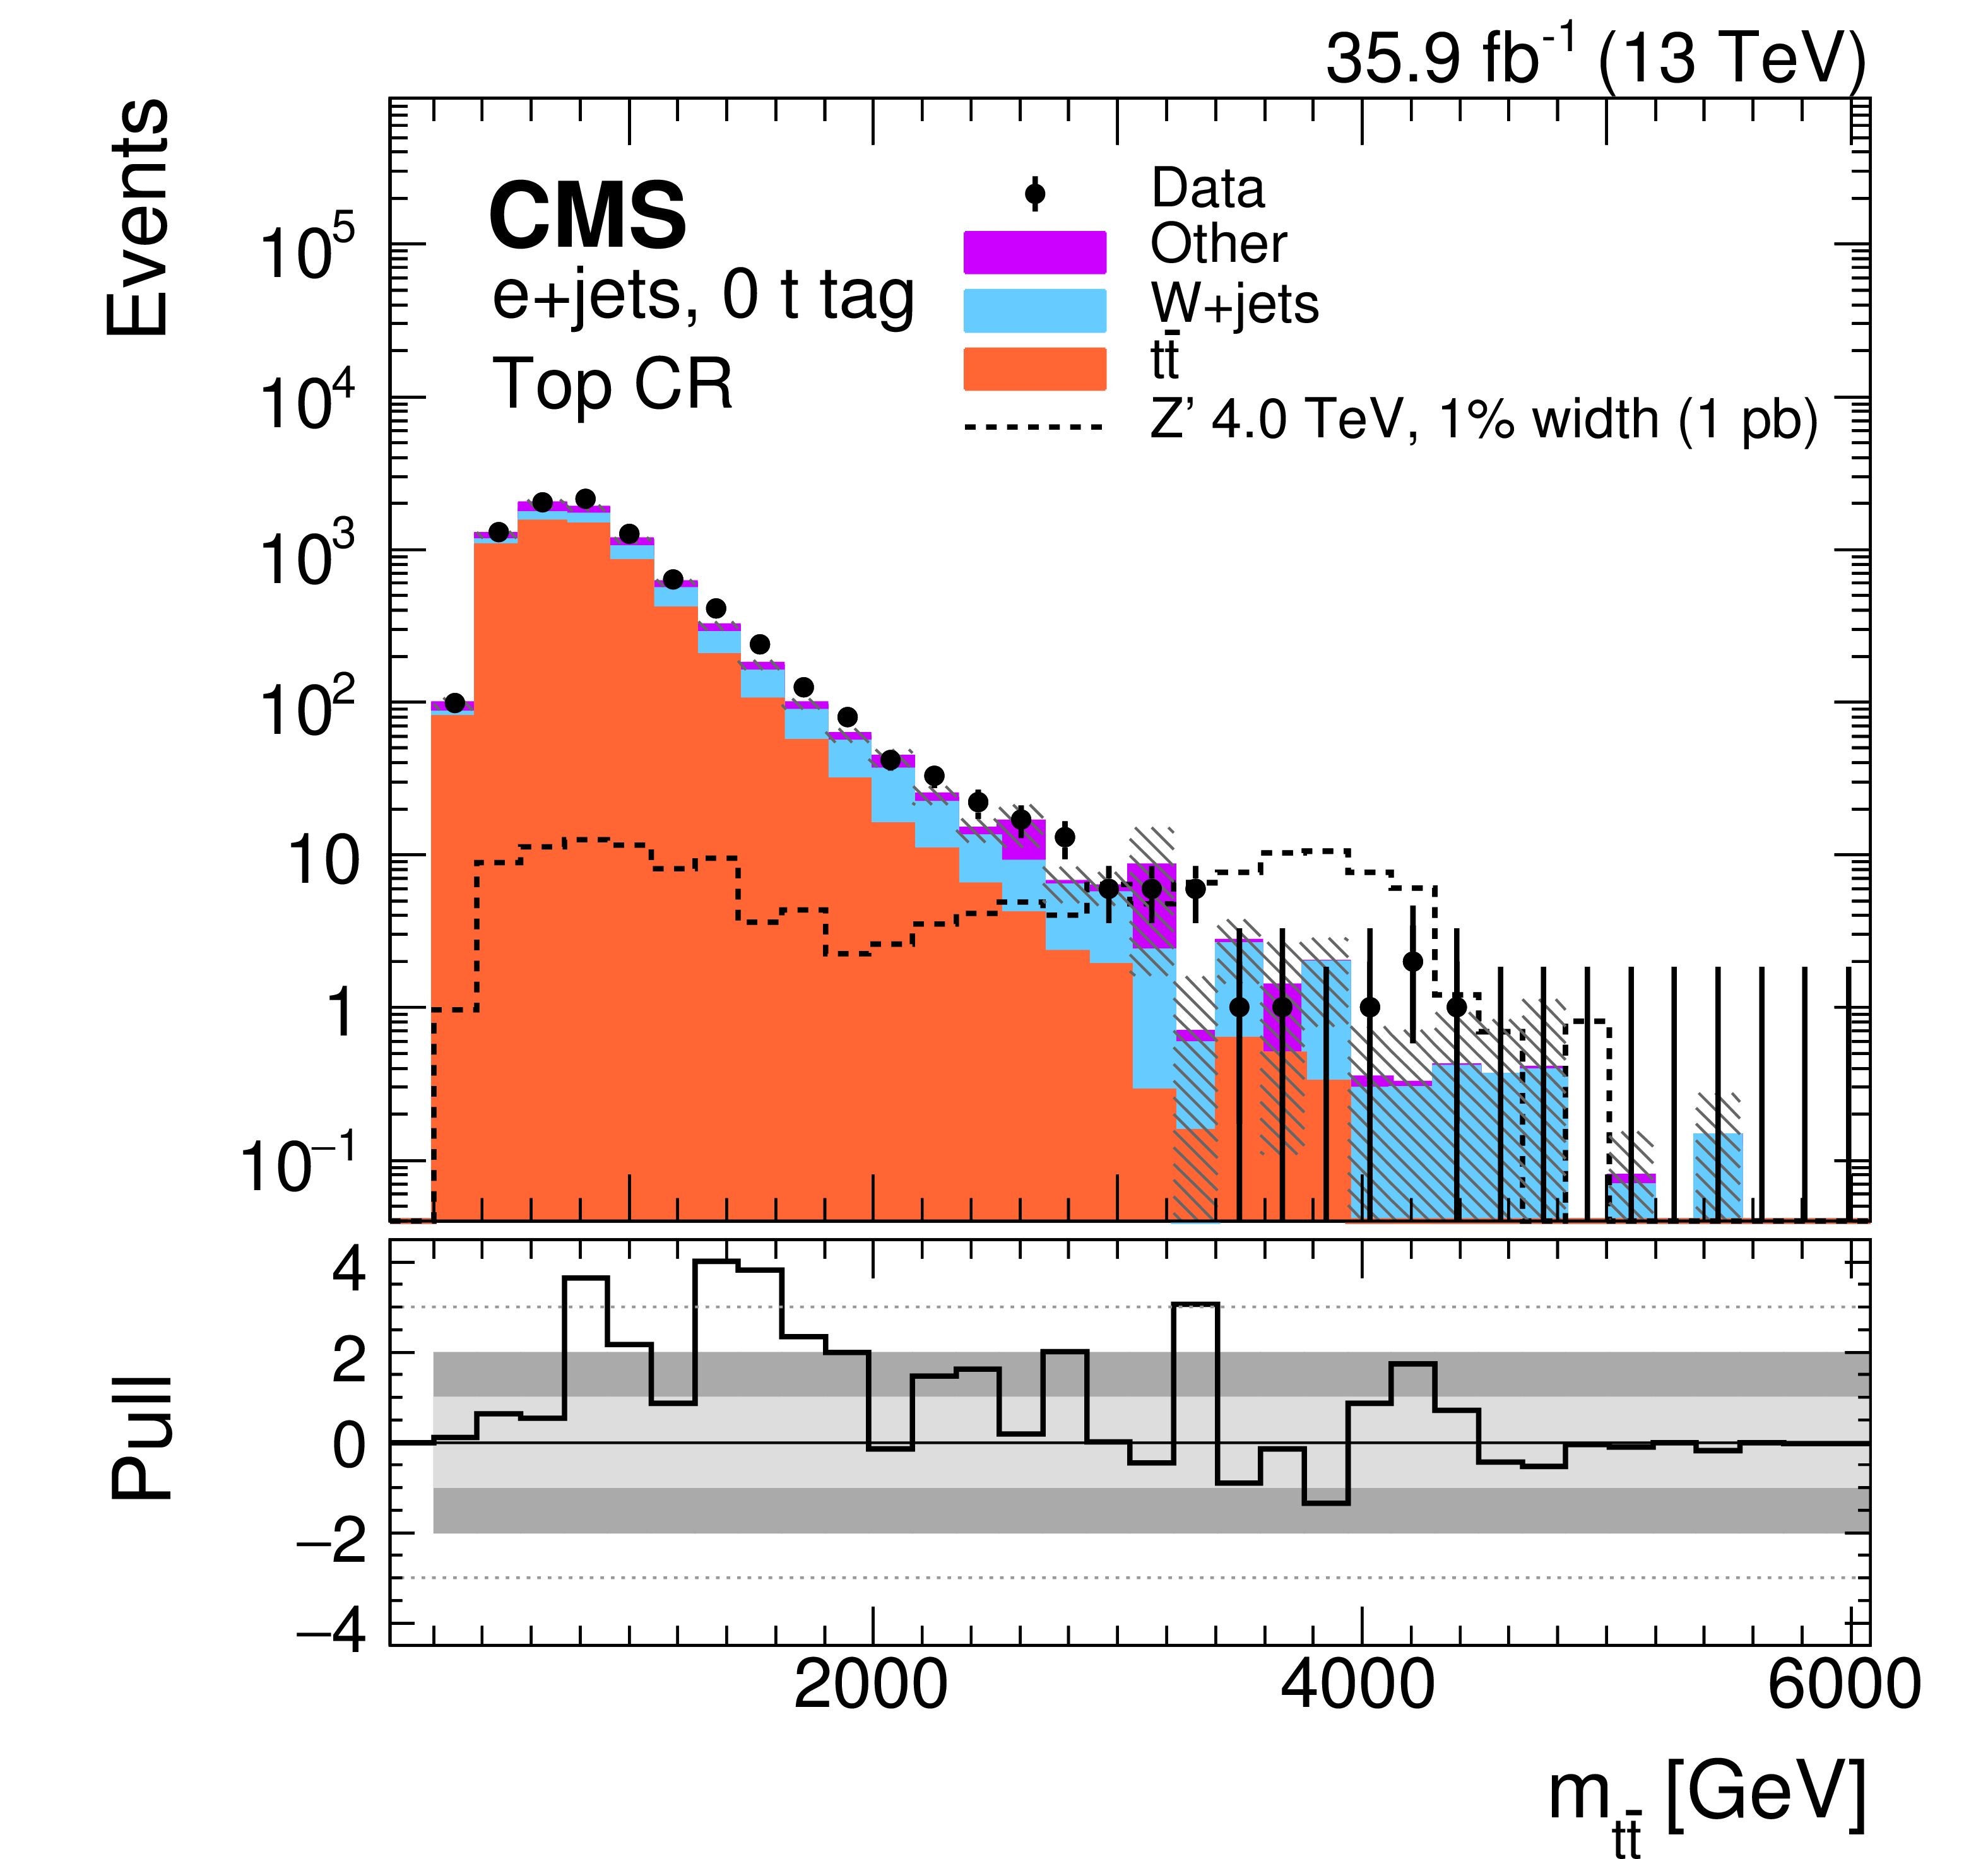
Figure 10:
Distributions of $ {m_{{{\mathrm {t}\overline {\mathrm {t}}}}}} $ for the single-lepton channel CR1 (upper) and CR2 (lower) for the muon (left) and electron (right) categories. The contribution expected from a 4 TeV Z' boson, with a relative width of 1%, is shown normalized to a cross section of 1 pb. The hatched band on the simulation represents the uncertainty in the background prediction. The lower panel in each plot shows the pull of each histogram bin from the SM prediction. The light (dark) gray band represents a pull of one (two) s.d. from the predicted value. |
png pdf |
Figure 10-a:
Distribution of $ {m_{{{\mathrm {t}\overline {\mathrm {t}}}}}} $ for the single-lepton channel CR1 for the muon category. The contribution expected from a 4 TeV Z' boson, with a relative width of 1%, is shown normalized to a cross section of 1 pb. The hatched band on the simulation represents the uncertainty in the background prediction. The lower panel in each plot shows the pull of each histogram bin from the SM prediction. The light (dark) gray band represents a pull of one (two) s.d. from the predicted value. |
png pdf |
Figure 10-b:
Distribution of $ {m_{{{\mathrm {t}\overline {\mathrm {t}}}}}} $ for the single-lepton channel CR1 for the electron category. The contribution expected from a 4 TeV Z' boson, with a relative width of 1%, is shown normalized to a cross section of 1 pb. The hatched band on the simulation represents the uncertainty in the background prediction. The lower panel in each plot shows the pull of each histogram bin from the SM prediction. The light (dark) gray band represents a pull of one (two) s.d. from the predicted value. |
png pdf |
Figure 10-c:
Distribution of $ {m_{{{\mathrm {t}\overline {\mathrm {t}}}}}} $ for the single-lepton channel CR2 for the muon category. The contribution expected from a 4 TeV Z' boson, with a relative width of 1%, is shown normalized to a cross section of 1 pb. The hatched band on the simulation represents the uncertainty in the background prediction. The lower panel in each plot shows the pull of each histogram bin from the SM prediction. The light (dark) gray band represents a pull of one (two) s.d. from the predicted value. |
png pdf |
Figure 10-d:
Distribution of $ {m_{{{\mathrm {t}\overline {\mathrm {t}}}}}} $ for the single-lepton channel CR2 for the electron category. The contribution expected from a 4 TeV Z' boson, with a relative width of 1%, is shown normalized to a cross section of 1 pb. The hatched band on the simulation represents the uncertainty in the background prediction. The lower panel in each plot shows the pull of each histogram bin from the SM prediction. The light (dark) gray band represents a pull of one (two) s.d. from the predicted value. |
png pdf |
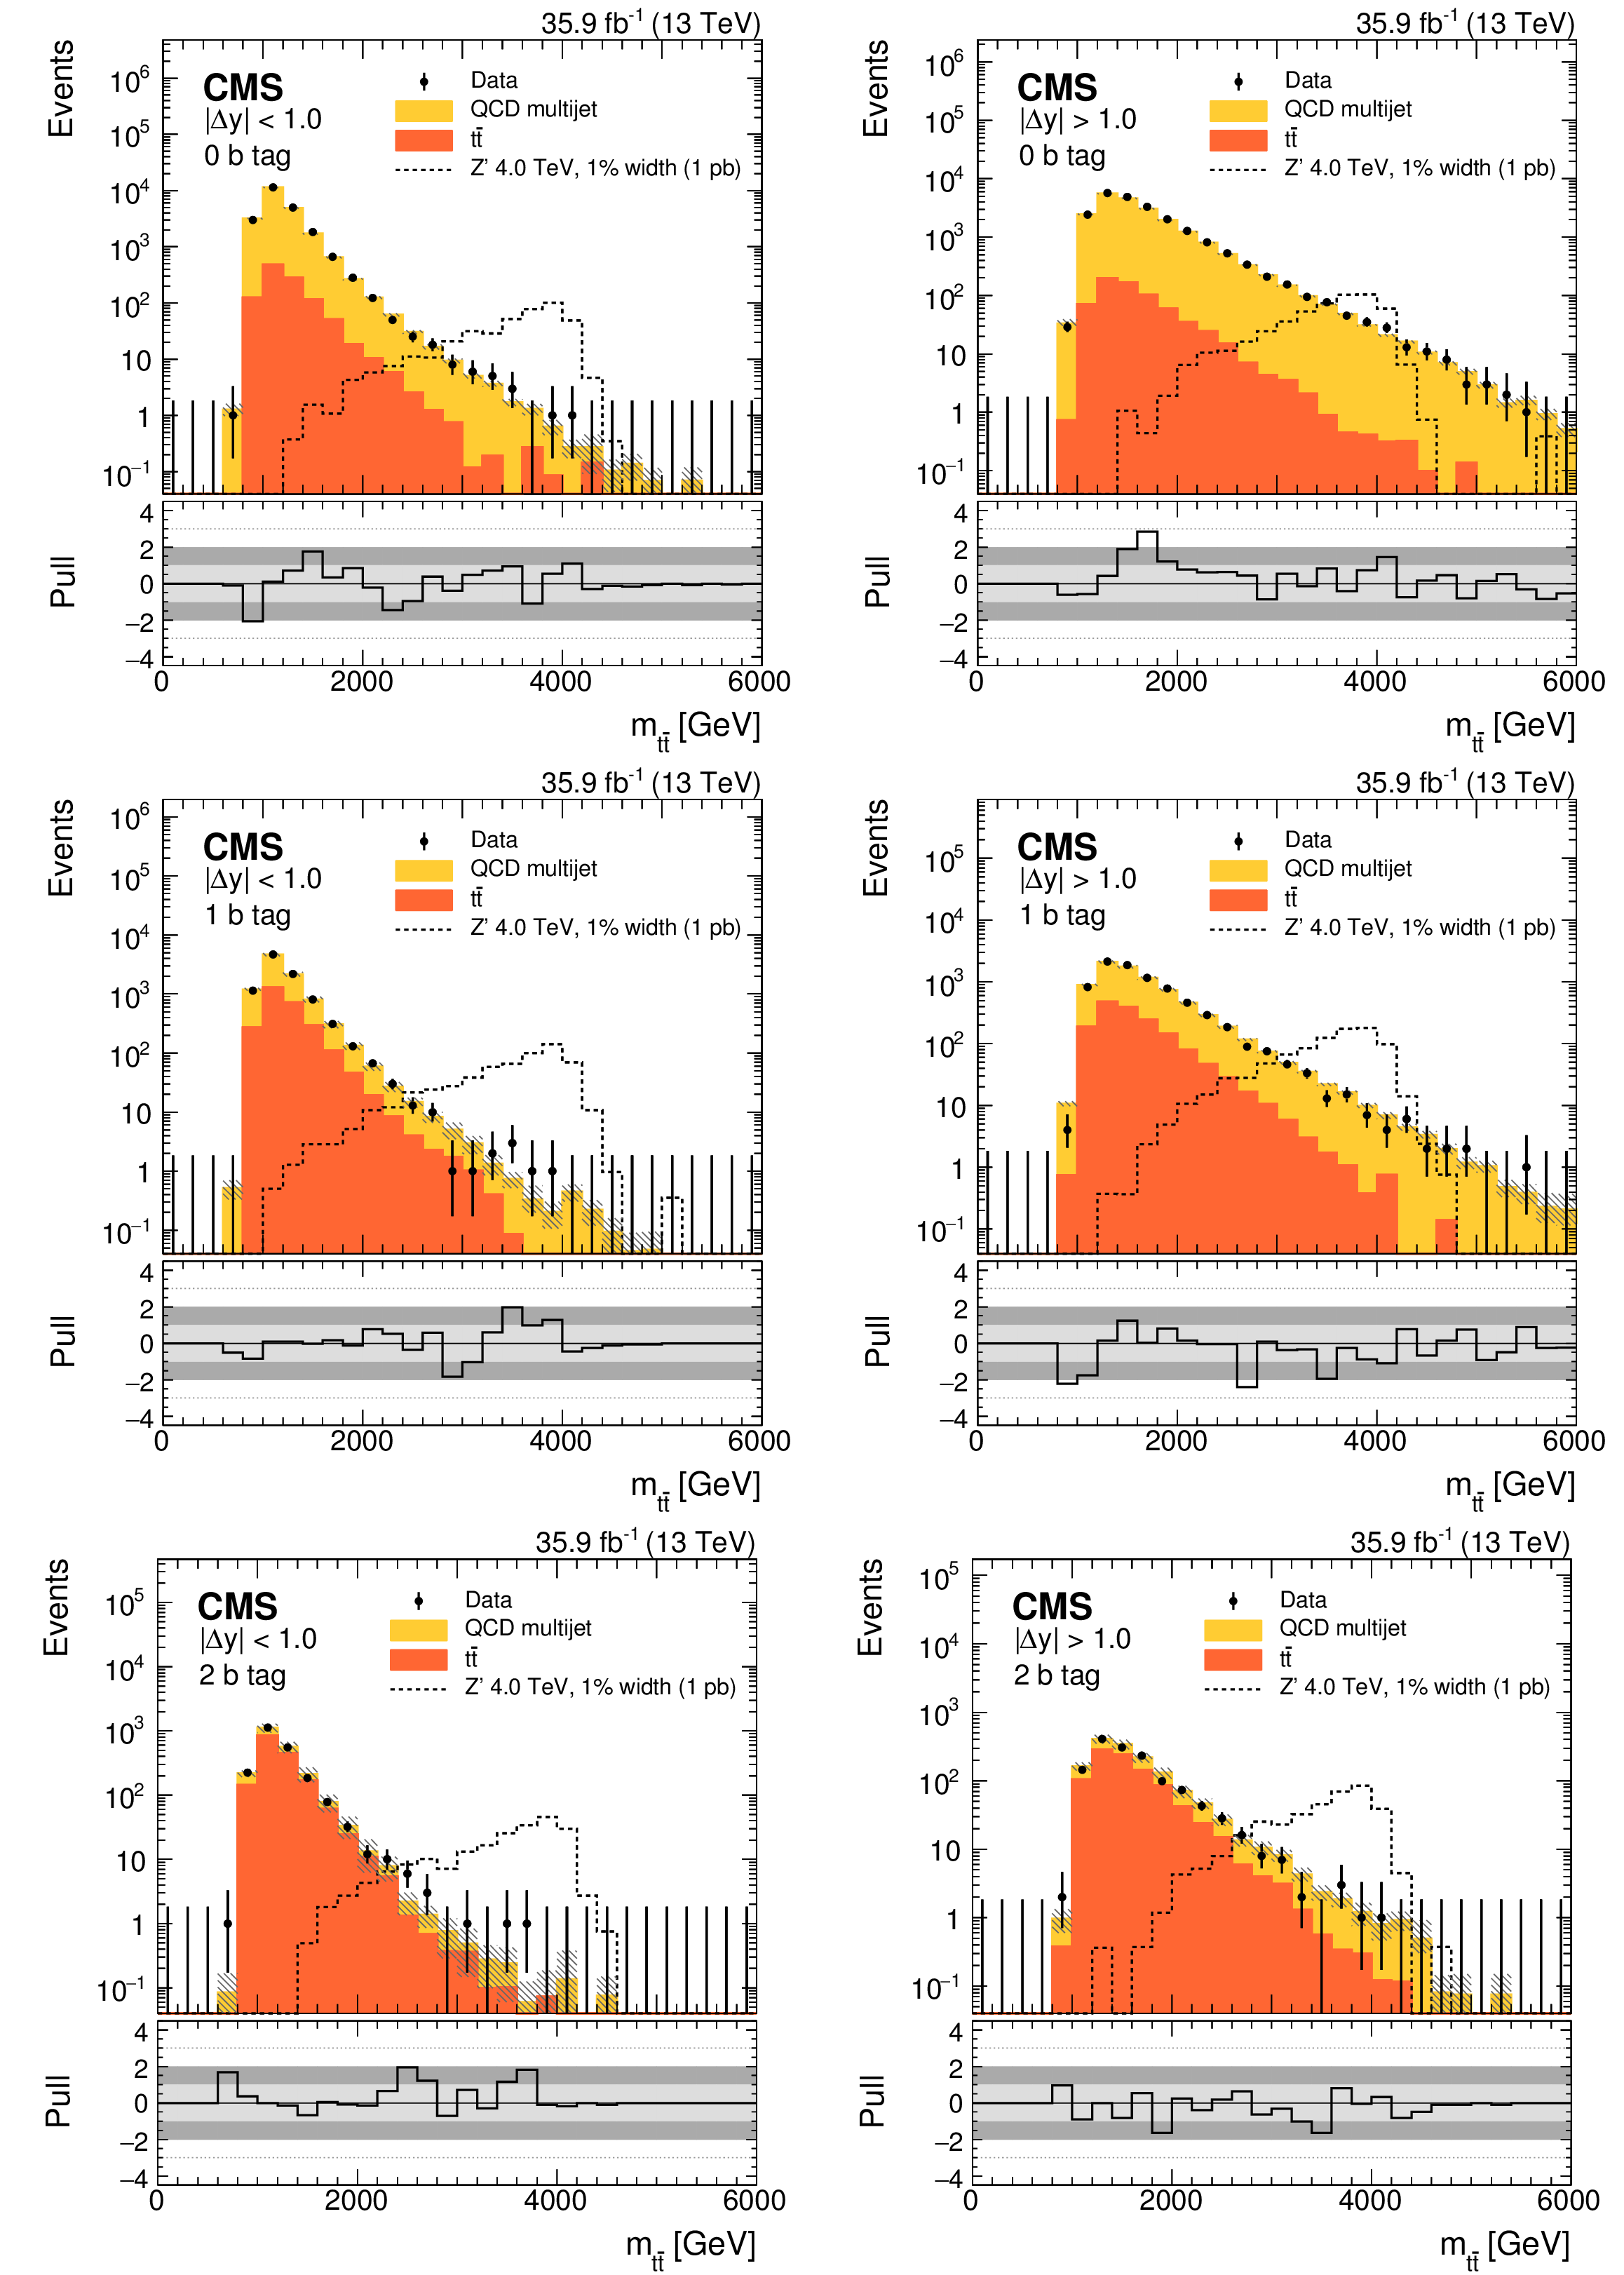
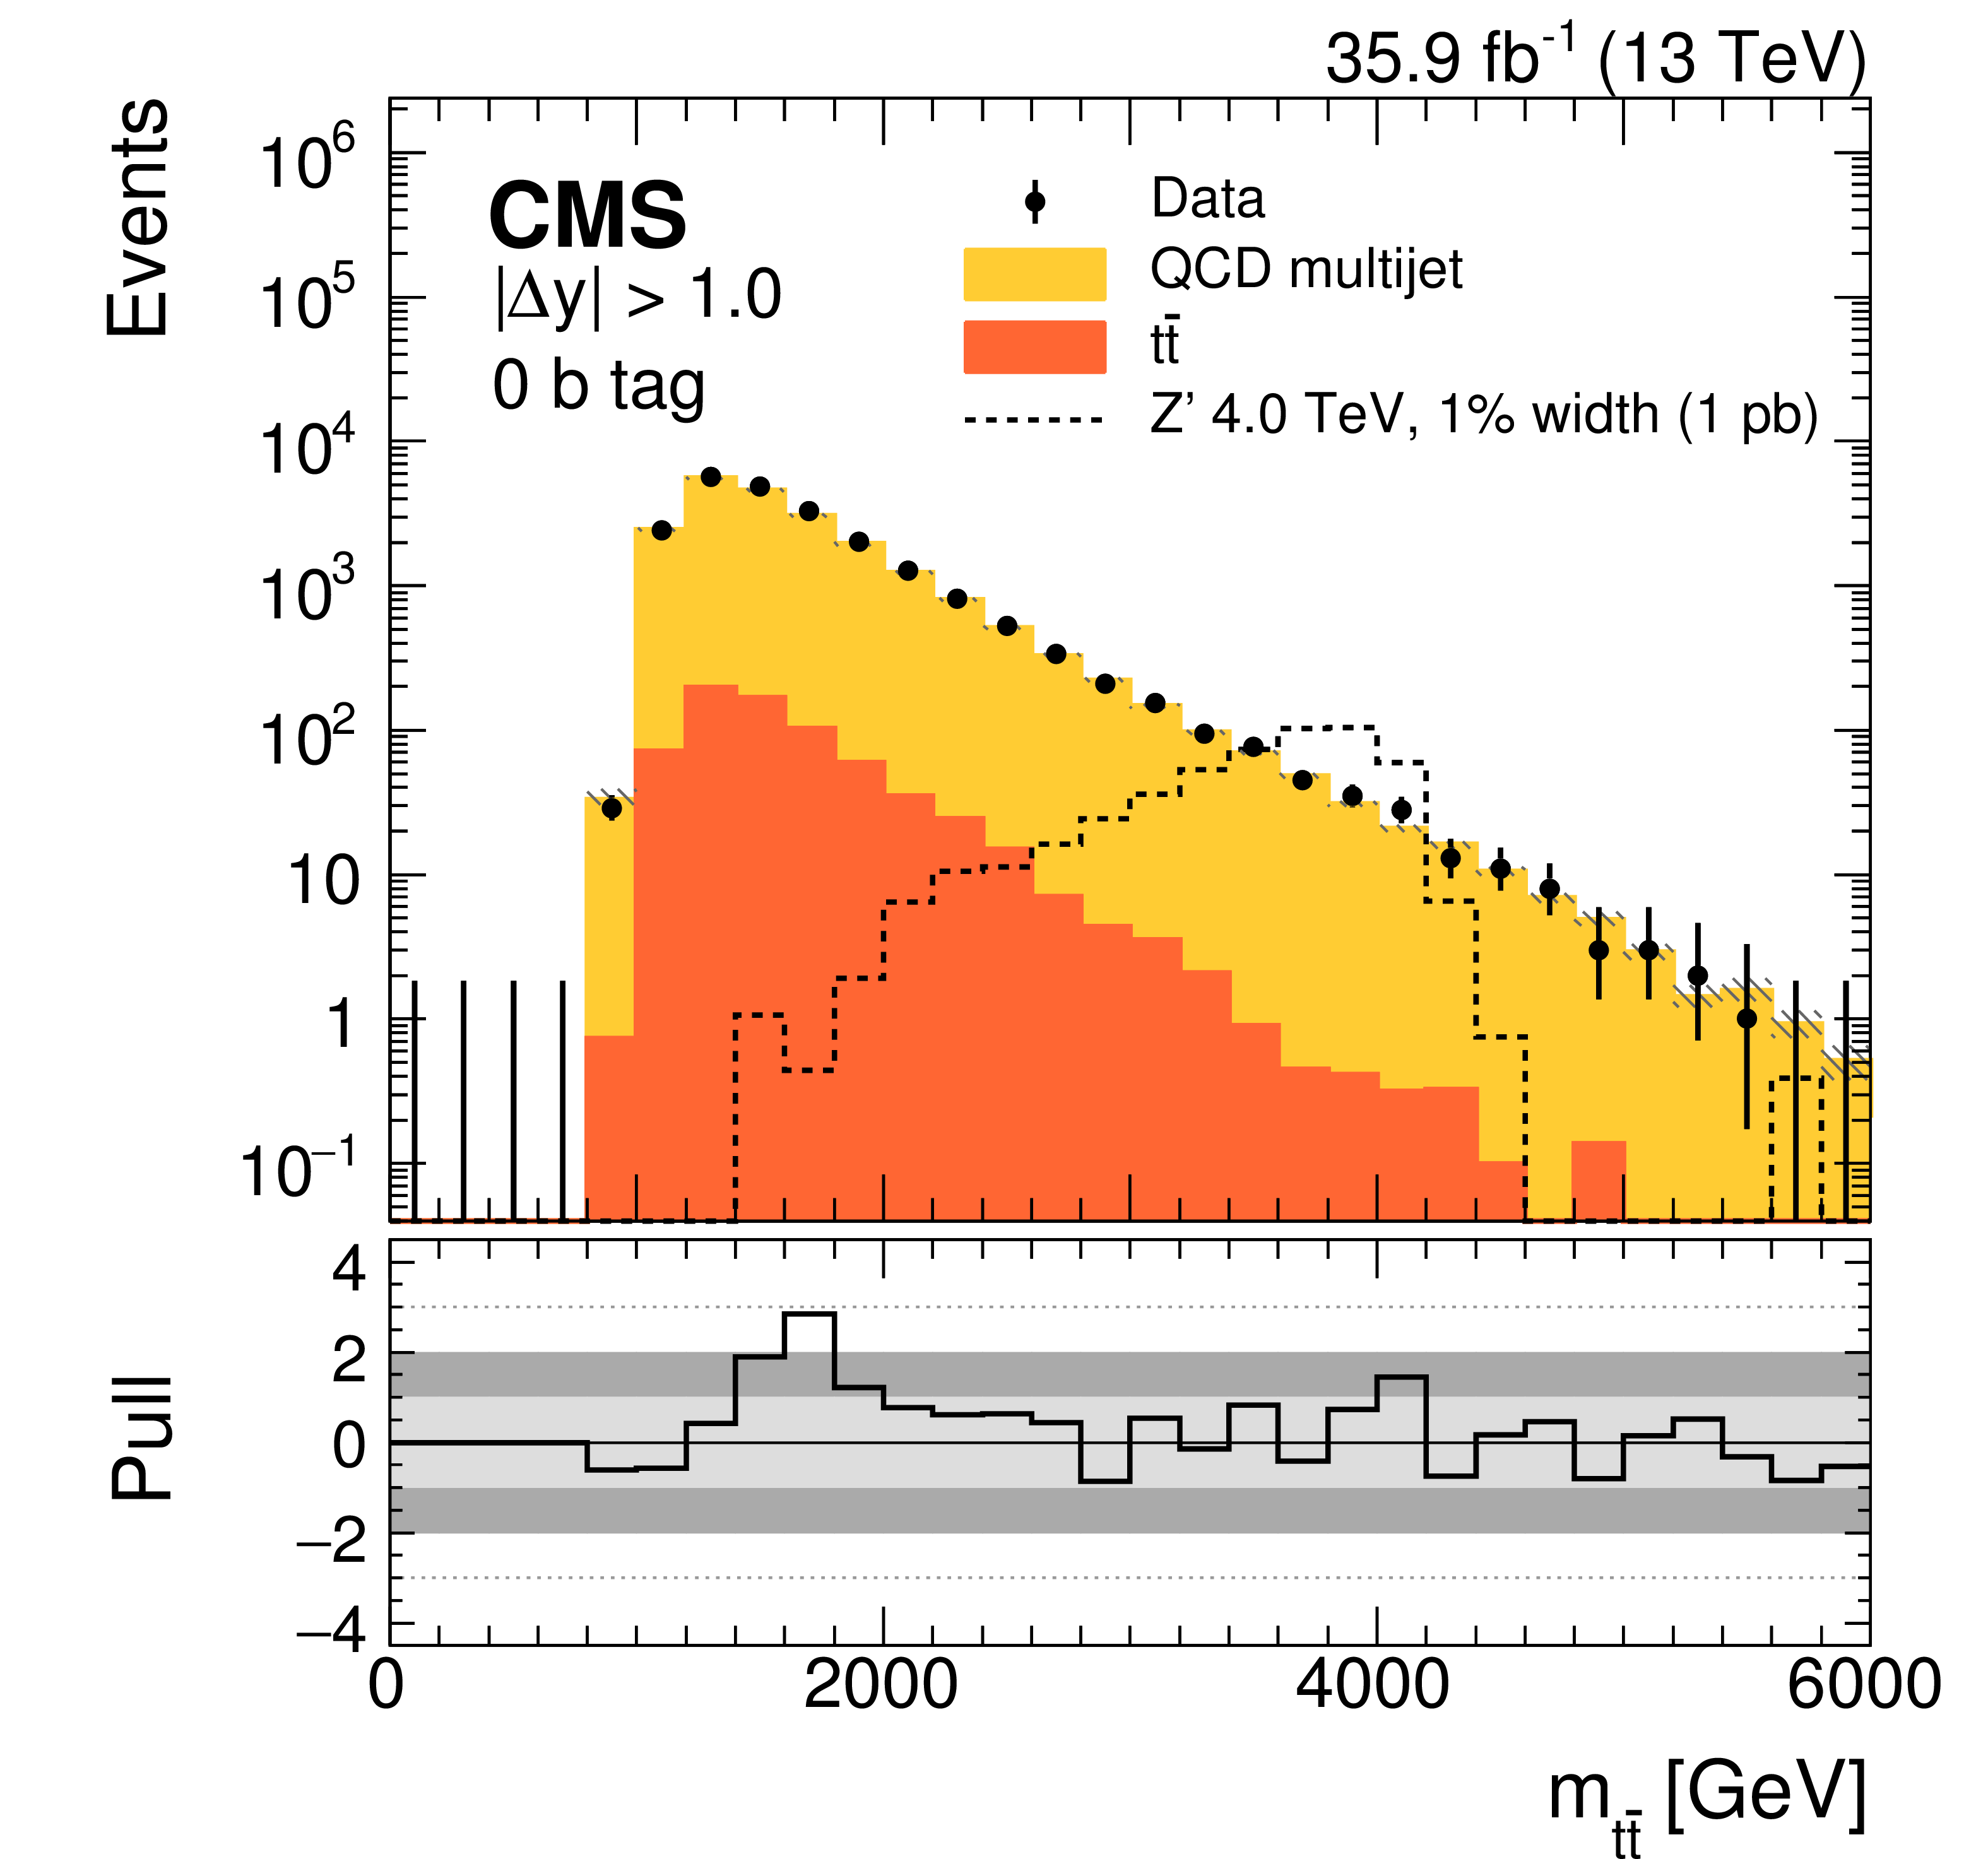
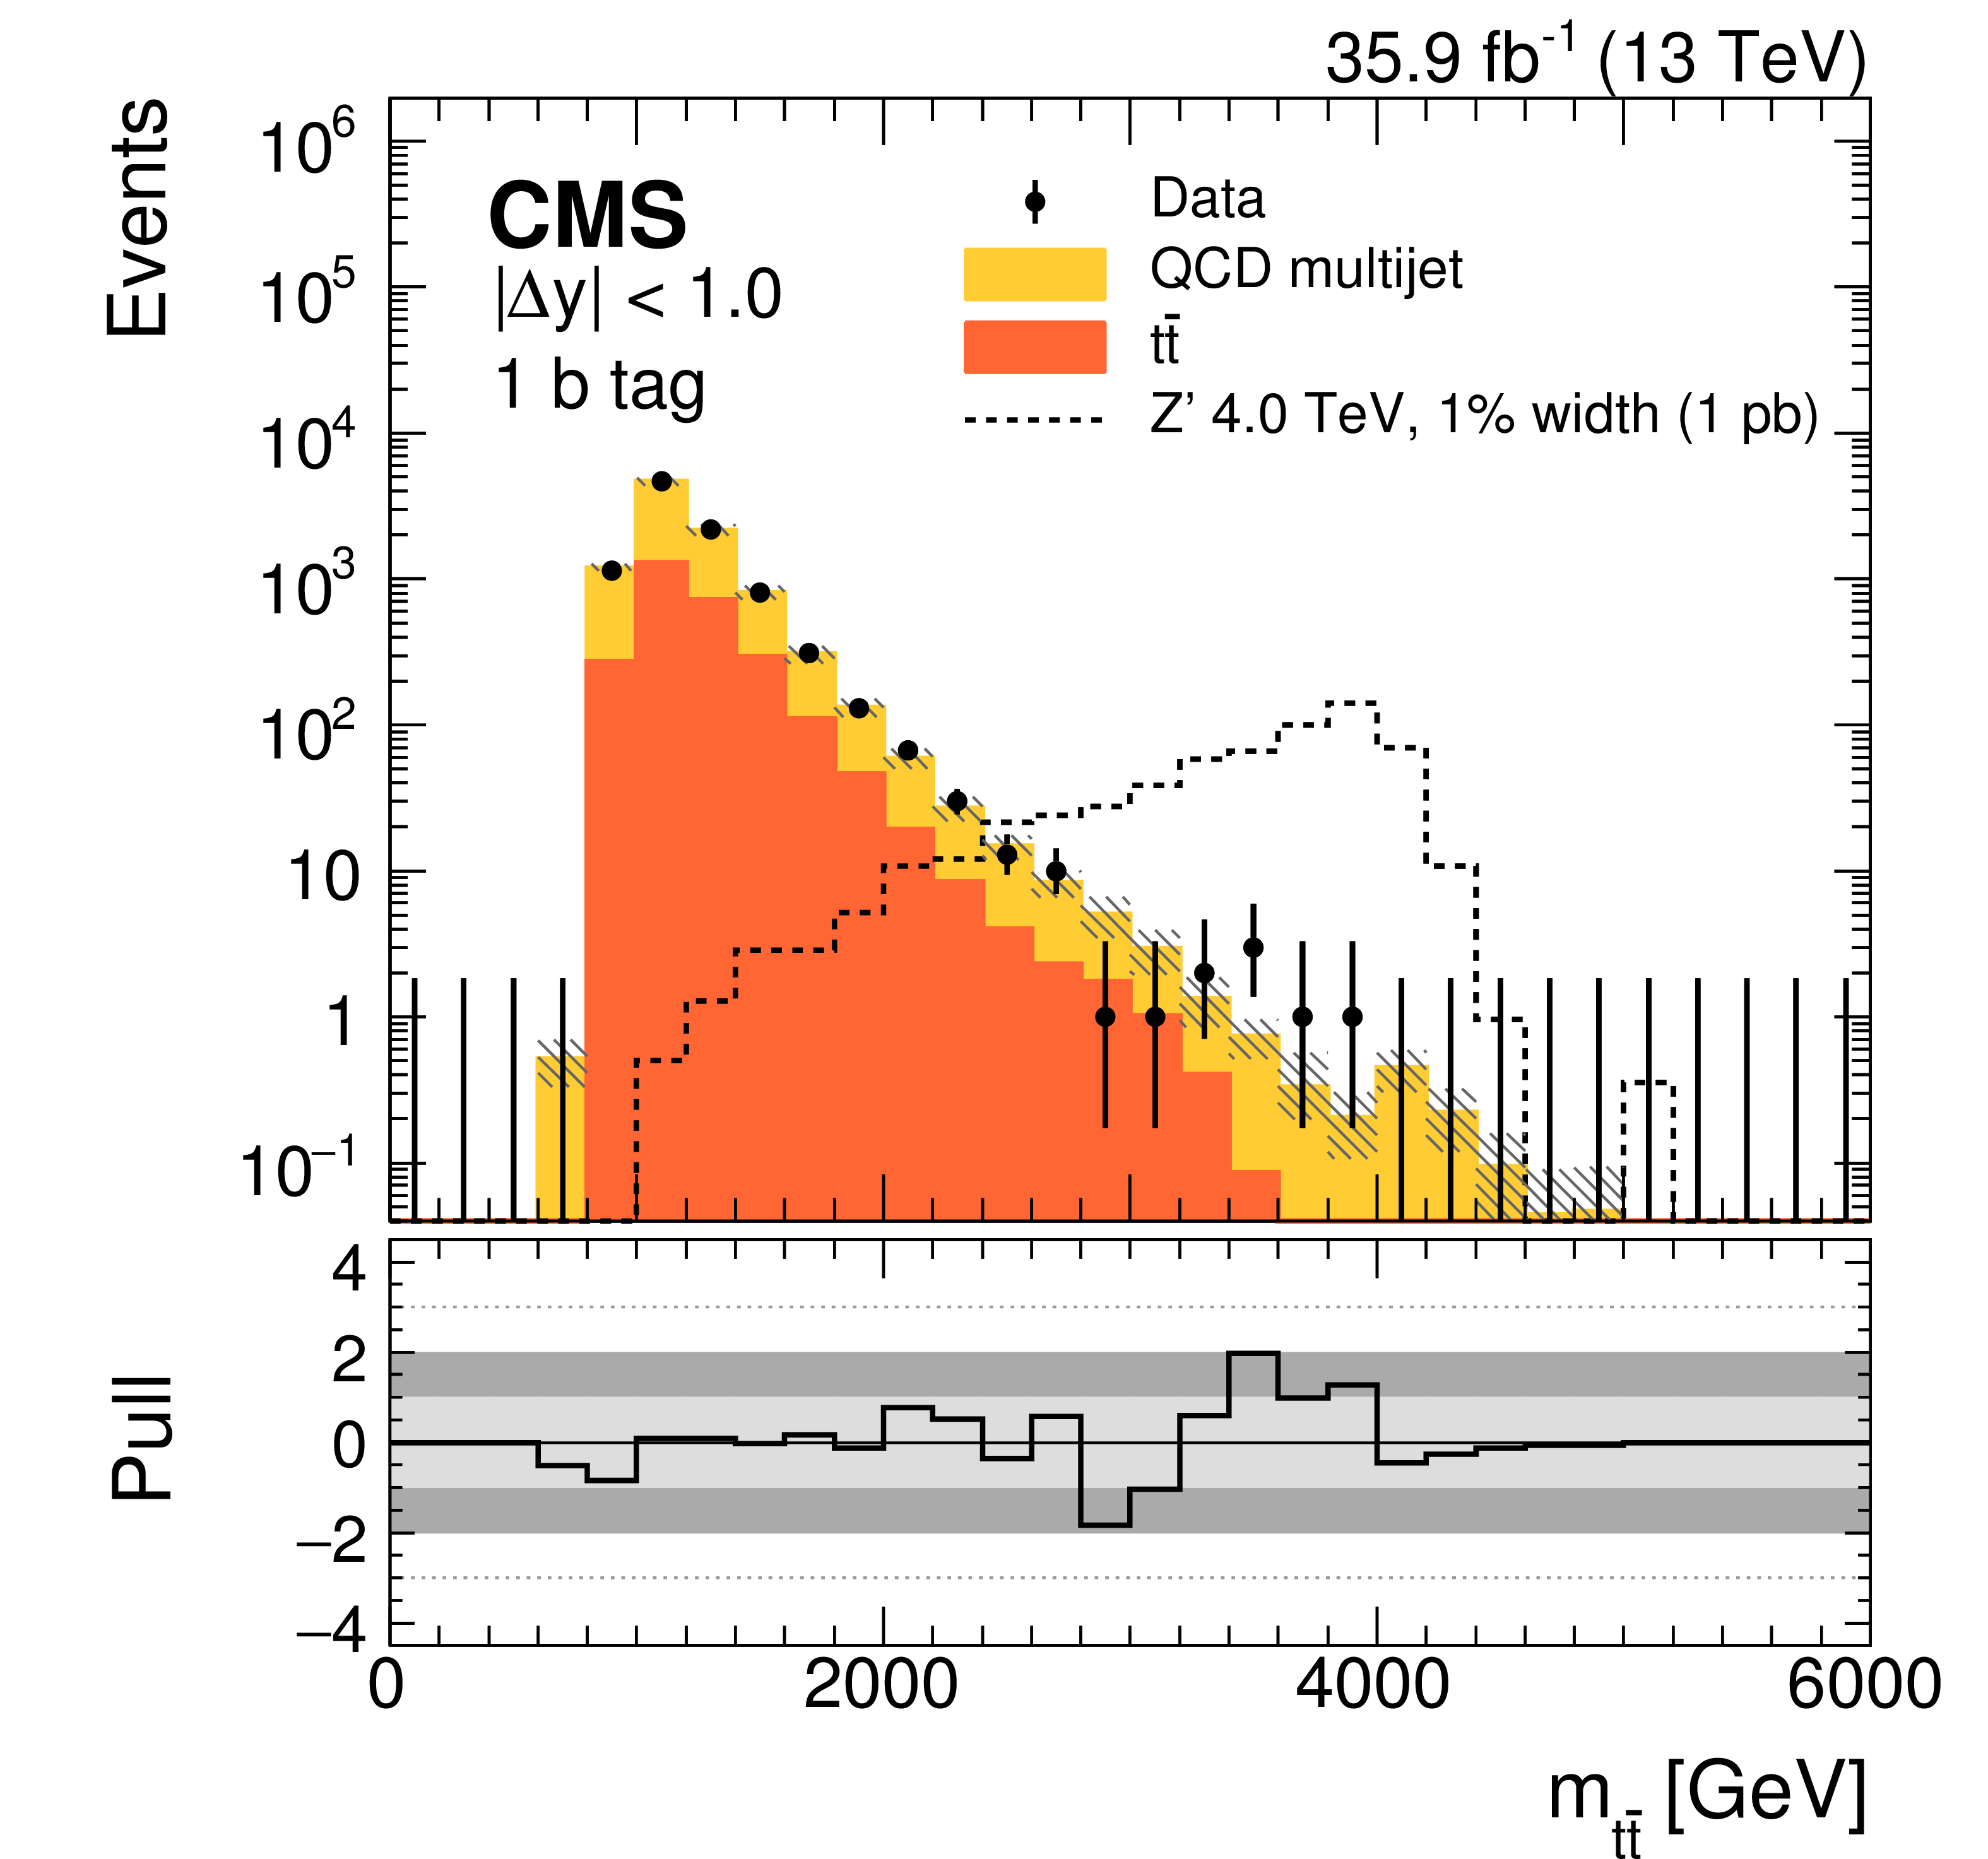
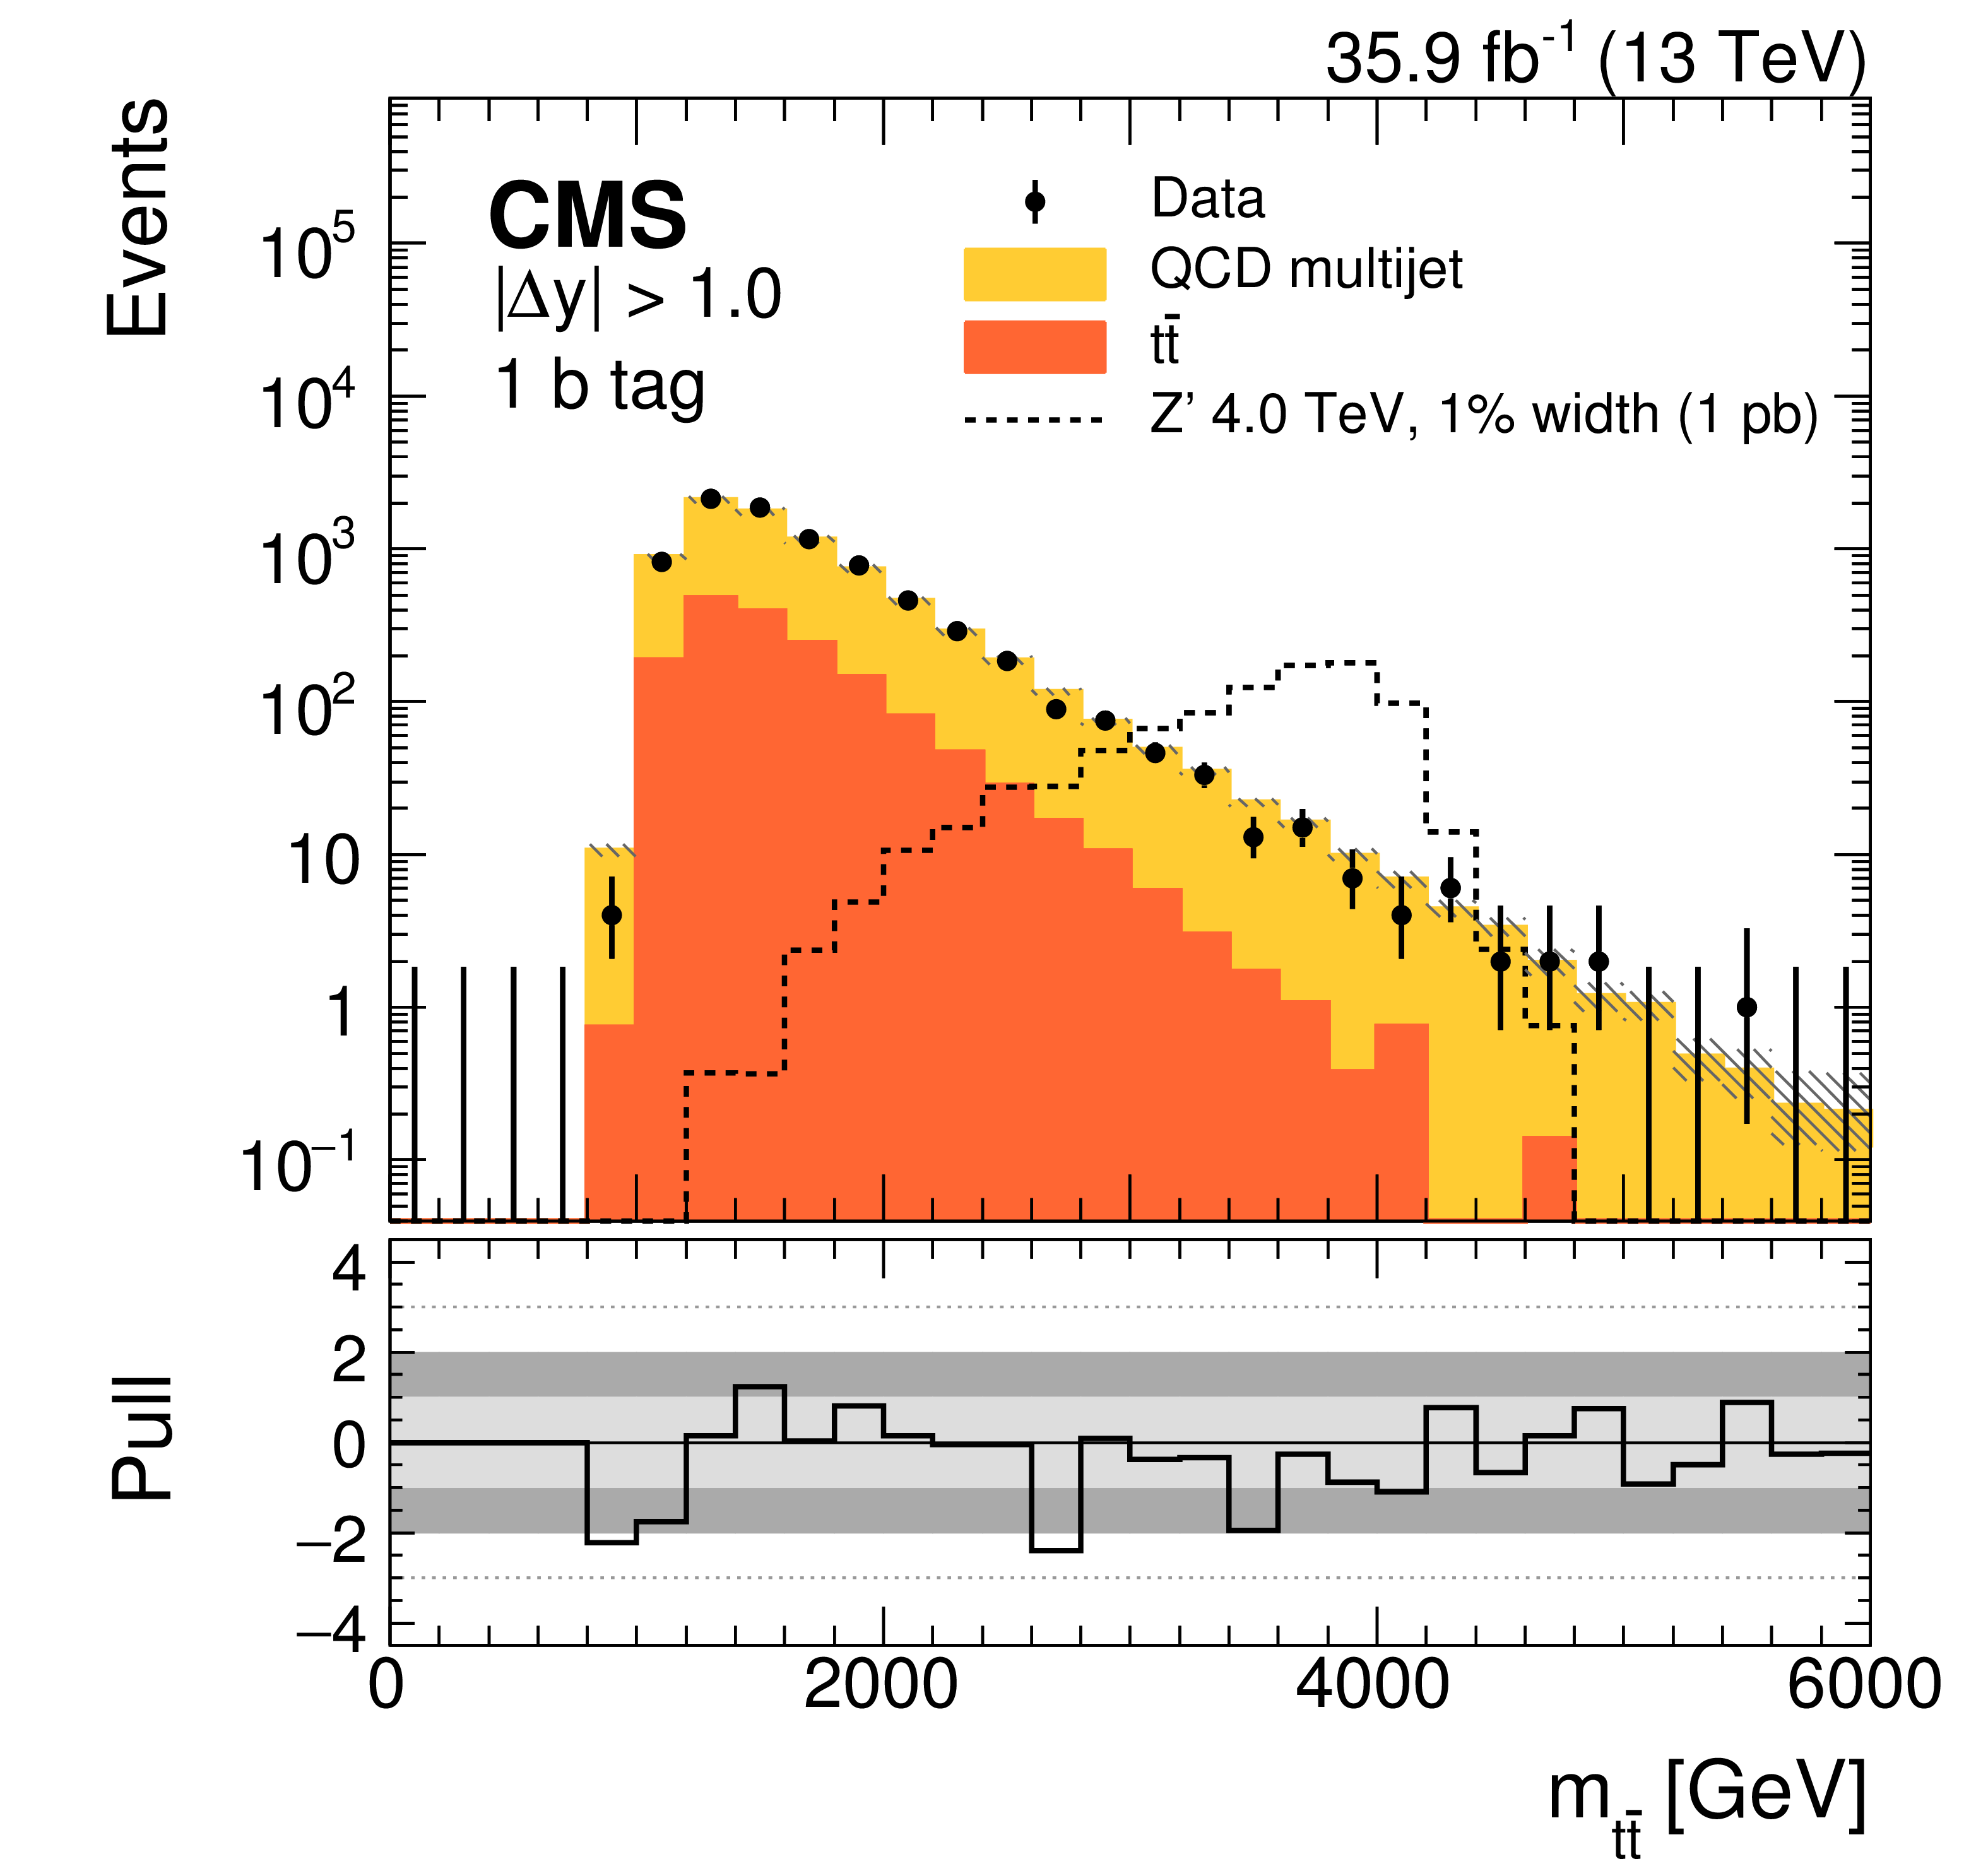
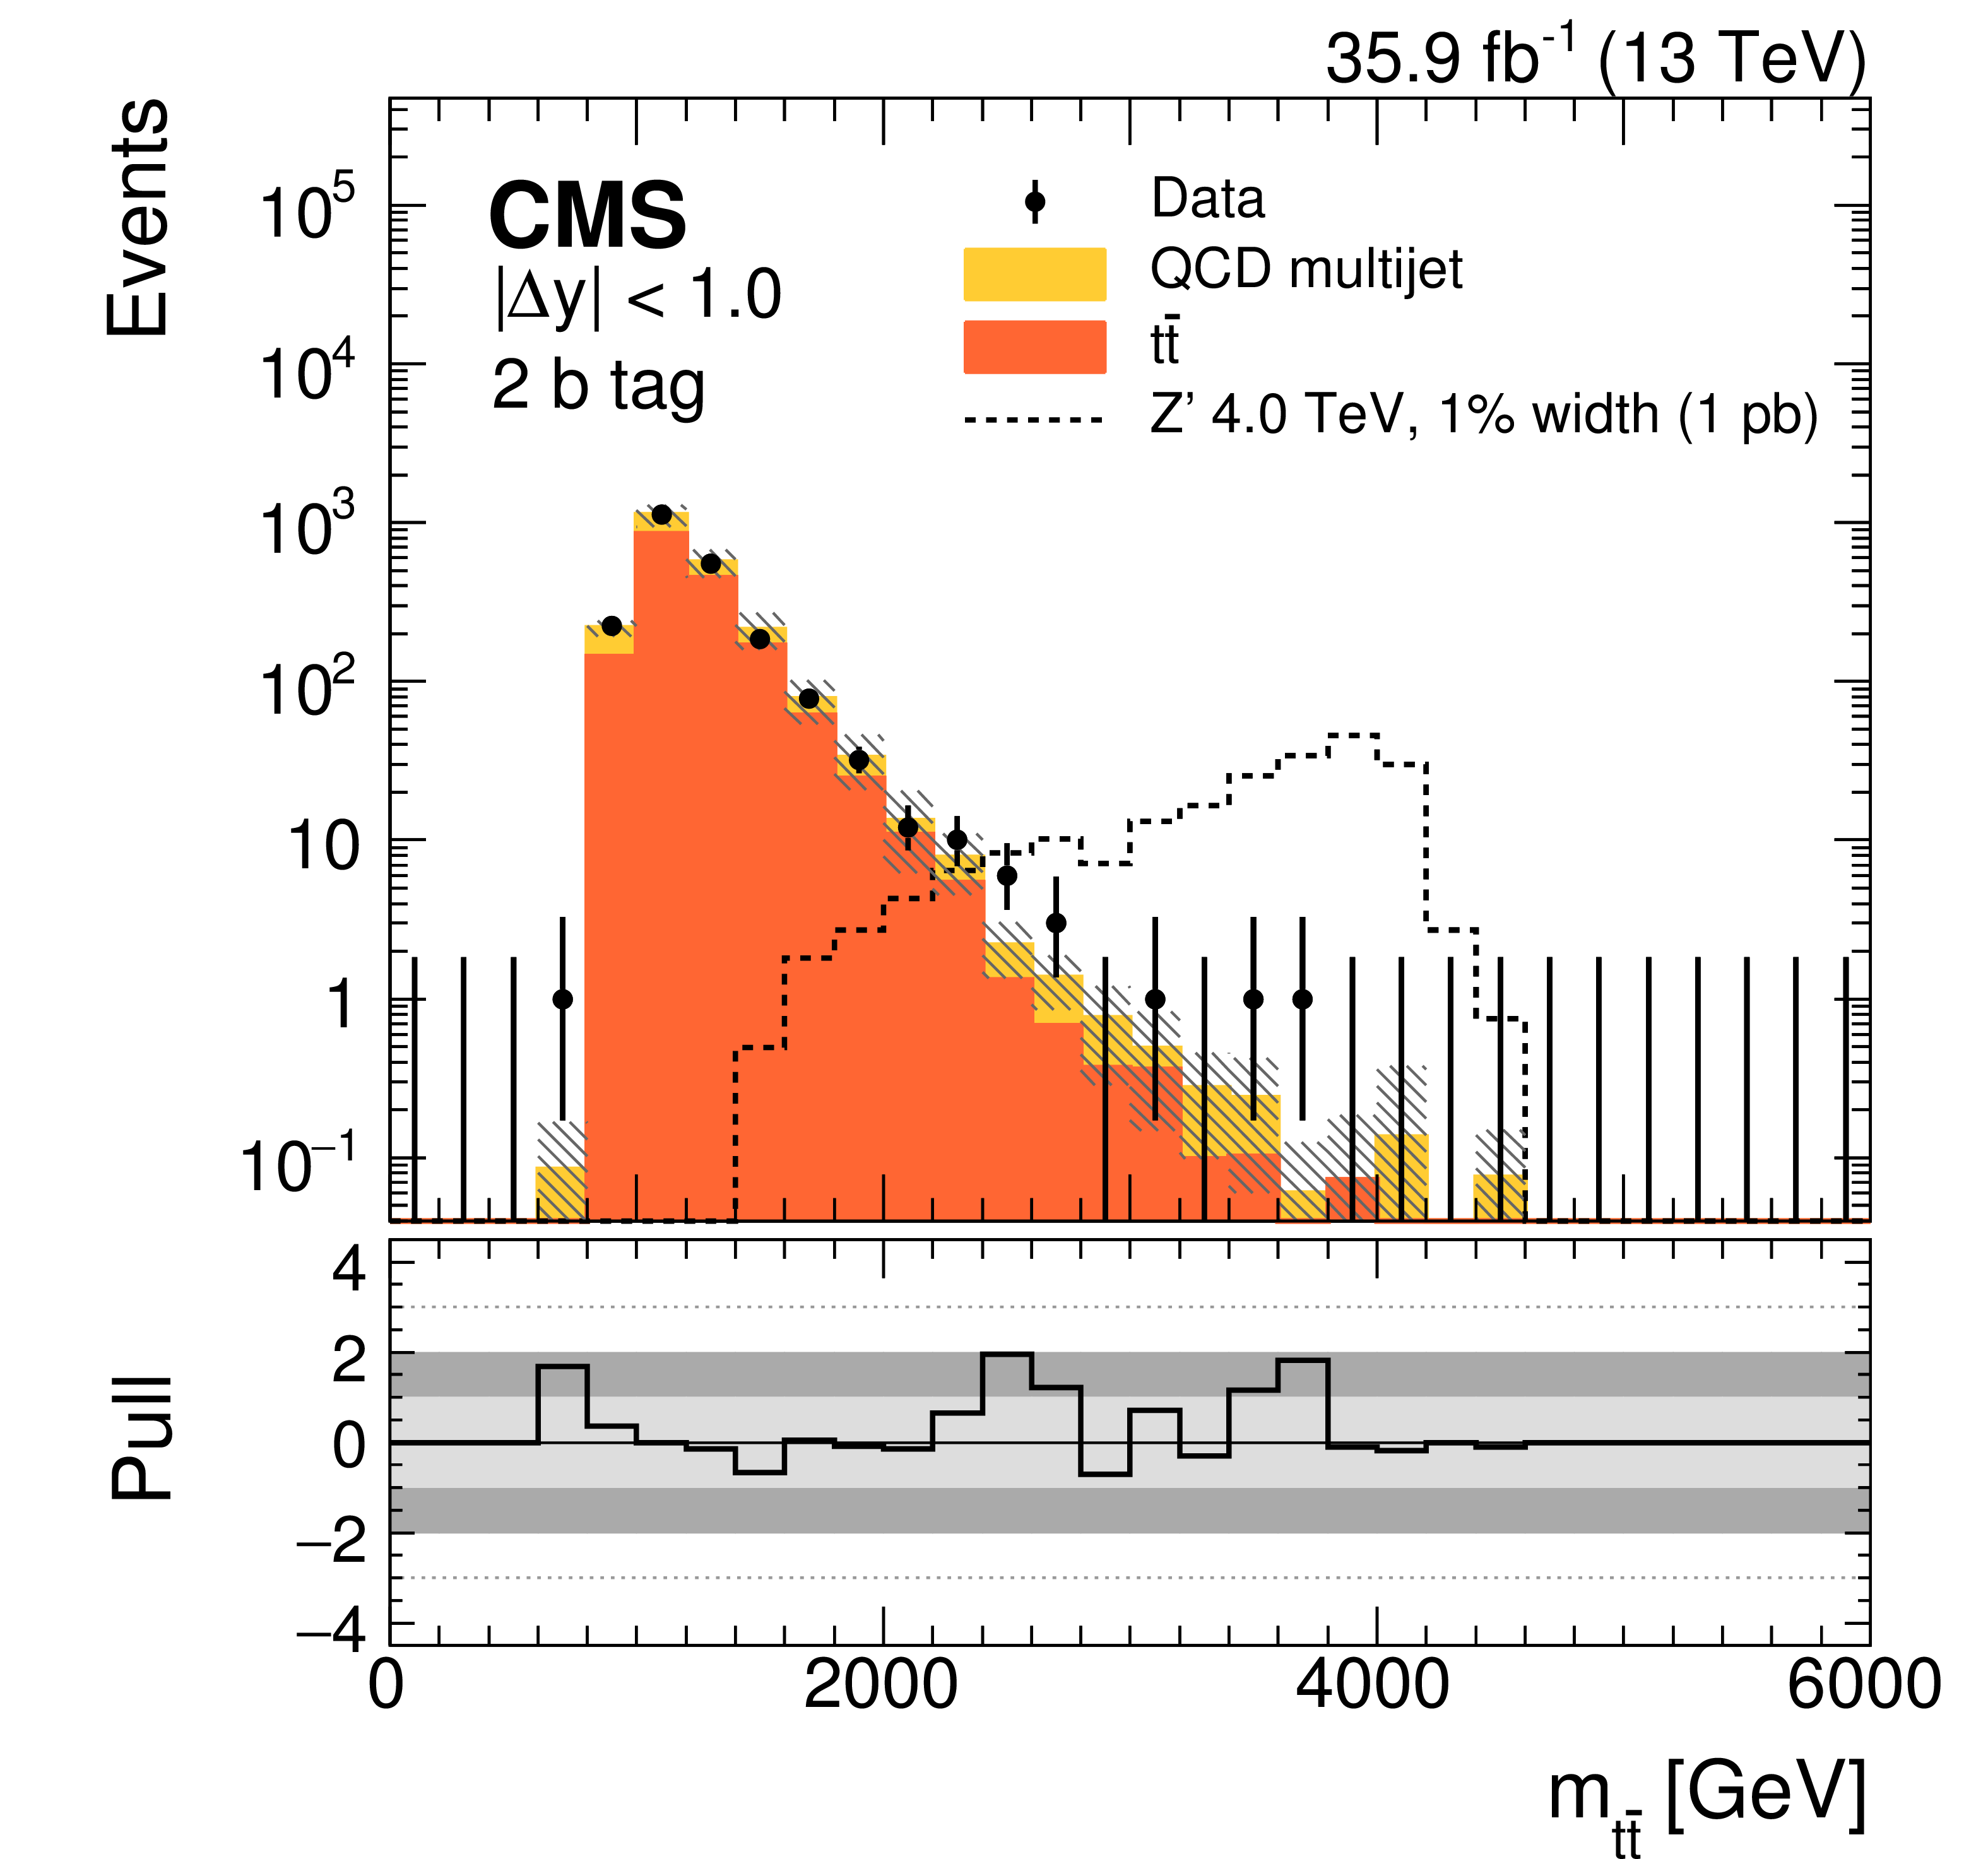
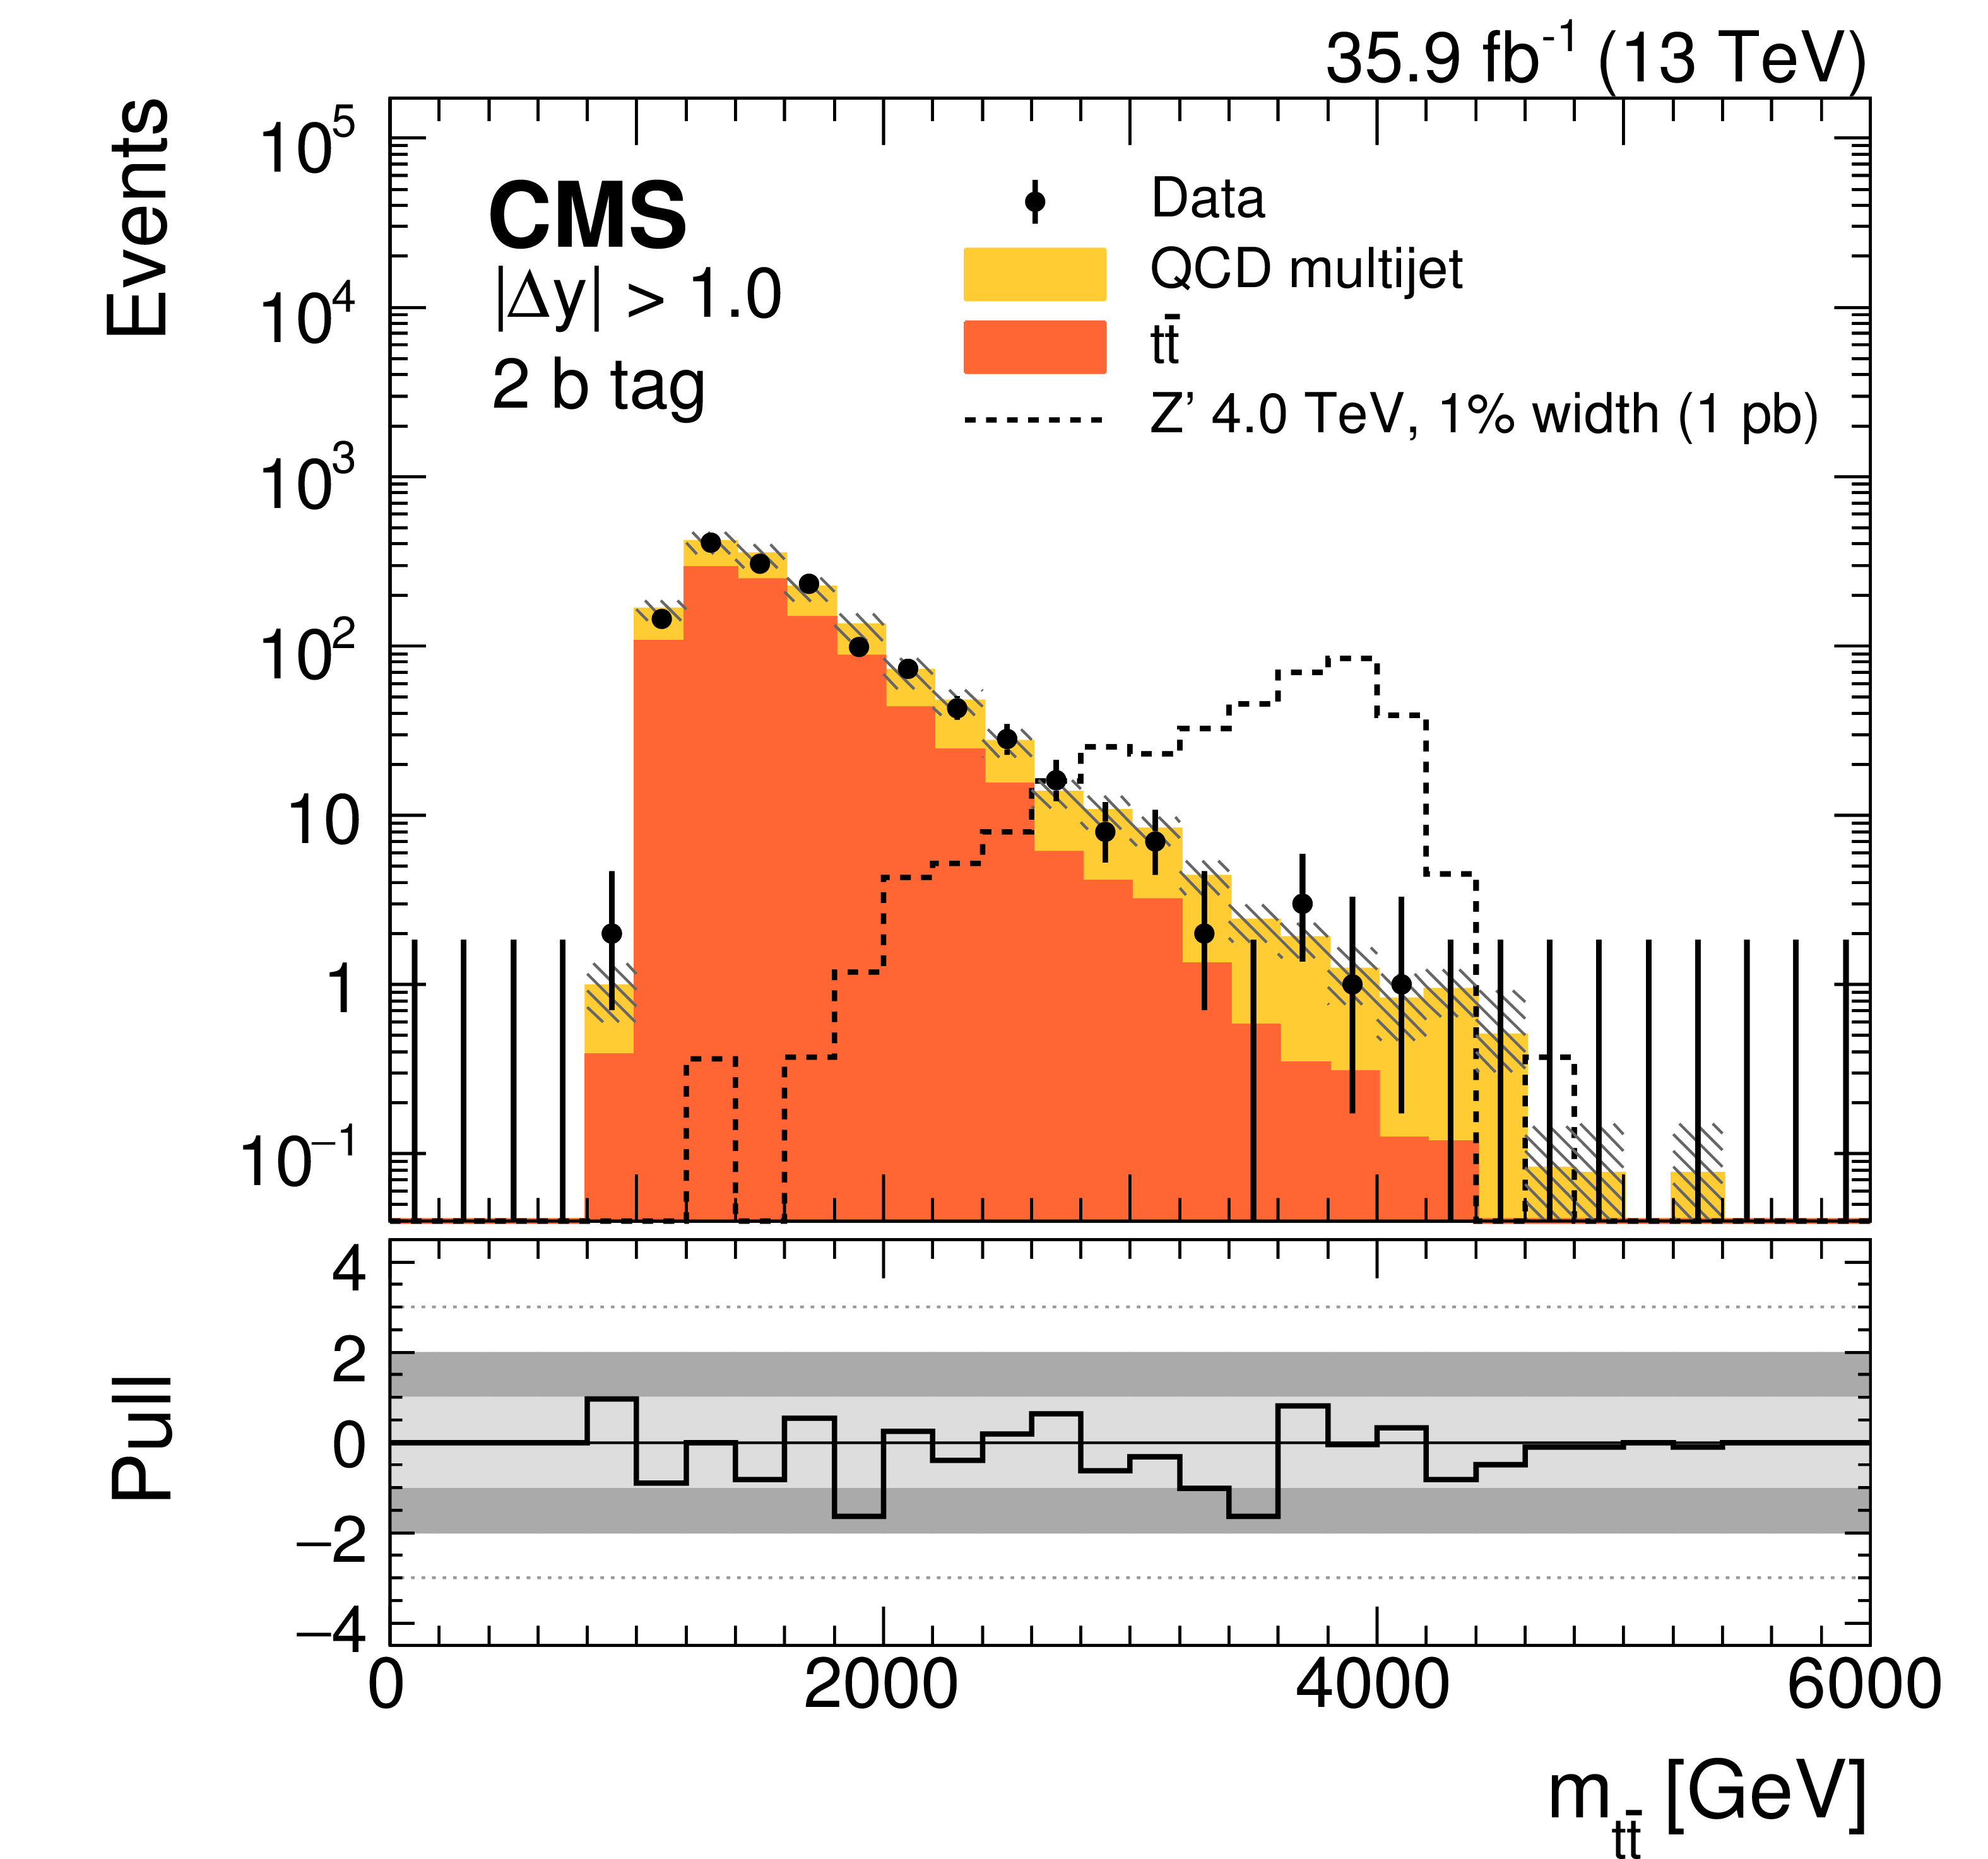
Figure 11:
Distributions of $ {m_{{{\mathrm {t}\overline {\mathrm {t}}}}}} $ for the fully hadronic channel SR categories, used to extract the final results. The contribution expected from a 4 TeV Z' boson, with a relative width of 1%, is shown normalized to a cross section of 1 pb. The hatched band on the simulation represents the uncertainty in the background prediction. The lower panel in each plot shows the pull of each histogram bin from the SM prediction. The light (dark) gray band represents a pull of one (two) s.d. from the predicted value. |

png pdf |
Figure 11-a:
Distribution of $ {m_{{{\mathrm {t}\overline {\mathrm {t}}}}}} $ for the fully hadronic channel SR category with $| \Delta y | < $ 1.0 and 0 b-tag. The contribution expected from a 4 TeV Z' boson, with a relative width of 1%, is shown normalized to a cross section of 1 pb. The hatched band on the simulation represents the uncertainty in the background prediction. The lower panel shows the pull of each histogram bin from the SM prediction. The light (dark) gray band represents a pull of one (two) s.d. from the predicted value. |
png pdf |
Figure 11-b:
Distribution of $ {m_{{{\mathrm {t}\overline {\mathrm {t}}}}}} $ for the fully hadronic channel SR category with $| \Delta y | > $ 1.0 and 0 b-tag. The contribution expected from a 4 TeV Z' boson, with a relative width of 1%, is shown normalized to a cross section of 1 pb. The hatched band on the simulation represents the uncertainty in the background prediction. The lower panel shows the pull of each histogram bin from the SM prediction. The light (dark) gray band represents a pull of one (two) s.d. from the predicted value. |
png pdf |
Figure 11-c:
Distribution of $ {m_{{{\mathrm {t}\overline {\mathrm {t}}}}}} $ for the fully hadronic channel SR category with $| \Delta y | < $ 1.0 and 1 b-tag. The contribution expected from a 4 TeV Z' boson, with a relative width of 1%, is shown normalized to a cross section of 1 pb. The hatched band on the simulation represents the uncertainty in the background prediction. The lower panel shows the pull of each histogram bin from the SM prediction. The light (dark) gray band represents a pull of one (two) s.d. from the predicted value. |
png pdf |
Figure 11-d:
Distribution of $ {m_{{{\mathrm {t}\overline {\mathrm {t}}}}}} $ for the fully hadronic channel SR category with $| \Delta y | > $ 1.0 and 1 b-tag. The contribution expected from a 4 TeV Z' boson, with a relative width of 1%, is shown normalized to a cross section of 1 pb. The hatched band on the simulation represents the uncertainty in the background prediction. The lower panel shows the pull of each histogram bin from the SM prediction. The light (dark) gray band represents a pull of one (two) s.d. from the predicted value. |
png pdf |
Figure 11-e:
Distribution of $ {m_{{{\mathrm {t}\overline {\mathrm {t}}}}}} $ for the fully hadronic channel SR category with $| \Delta y | < $ 1.0 and 2 b-tags. The contribution expected from a 4 TeV Z' boson, with a relative width of 1%, is shown normalized to a cross section of 1 pb. The hatched band on the simulation represents the uncertainty in the background prediction. The lower panel shows the pull of each histogram bin from the SM prediction. The light (dark) gray band represents a pull of one (two) s.d. from the predicted value. |
png pdf |
Figure 11-f:
Distribution of $ {m_{{{\mathrm {t}\overline {\mathrm {t}}}}}} $ for the fully hadronic channel SR category with $| \Delta y | > $ 1.0 and 2 b-tags. The contribution expected from a 4 TeV Z' boson, with a relative width of 1%, is shown normalized to a cross section of 1 pb. The hatched band on the simulation represents the uncertainty in the background prediction. The lower panel shows the pull of each histogram bin from the SM prediction. The light (dark) gray band represents a pull of one (two) s.d. from the predicted value. |

png pdf |
Figure 12:
Comparison of the sensitivities for each analysis channel contributing to the combination. The expected limits at 95% CL are shown for each channel with the narrow colored lines, while the combination result is shown with thick the black line. These results are shown specifically for the ${{\mathrm {g}} _{\text {KK}}}$ signal hypothesis, as this model has characteristics that are common to many $ {{\mathrm {t}\overline {\mathrm {t}}}} $ resonance searches. The multiplicative factor of 1.3 for the ${{\mathrm {g}} _{\text {KK}}}$ is the NLO $K$ factor. |
png pdf |
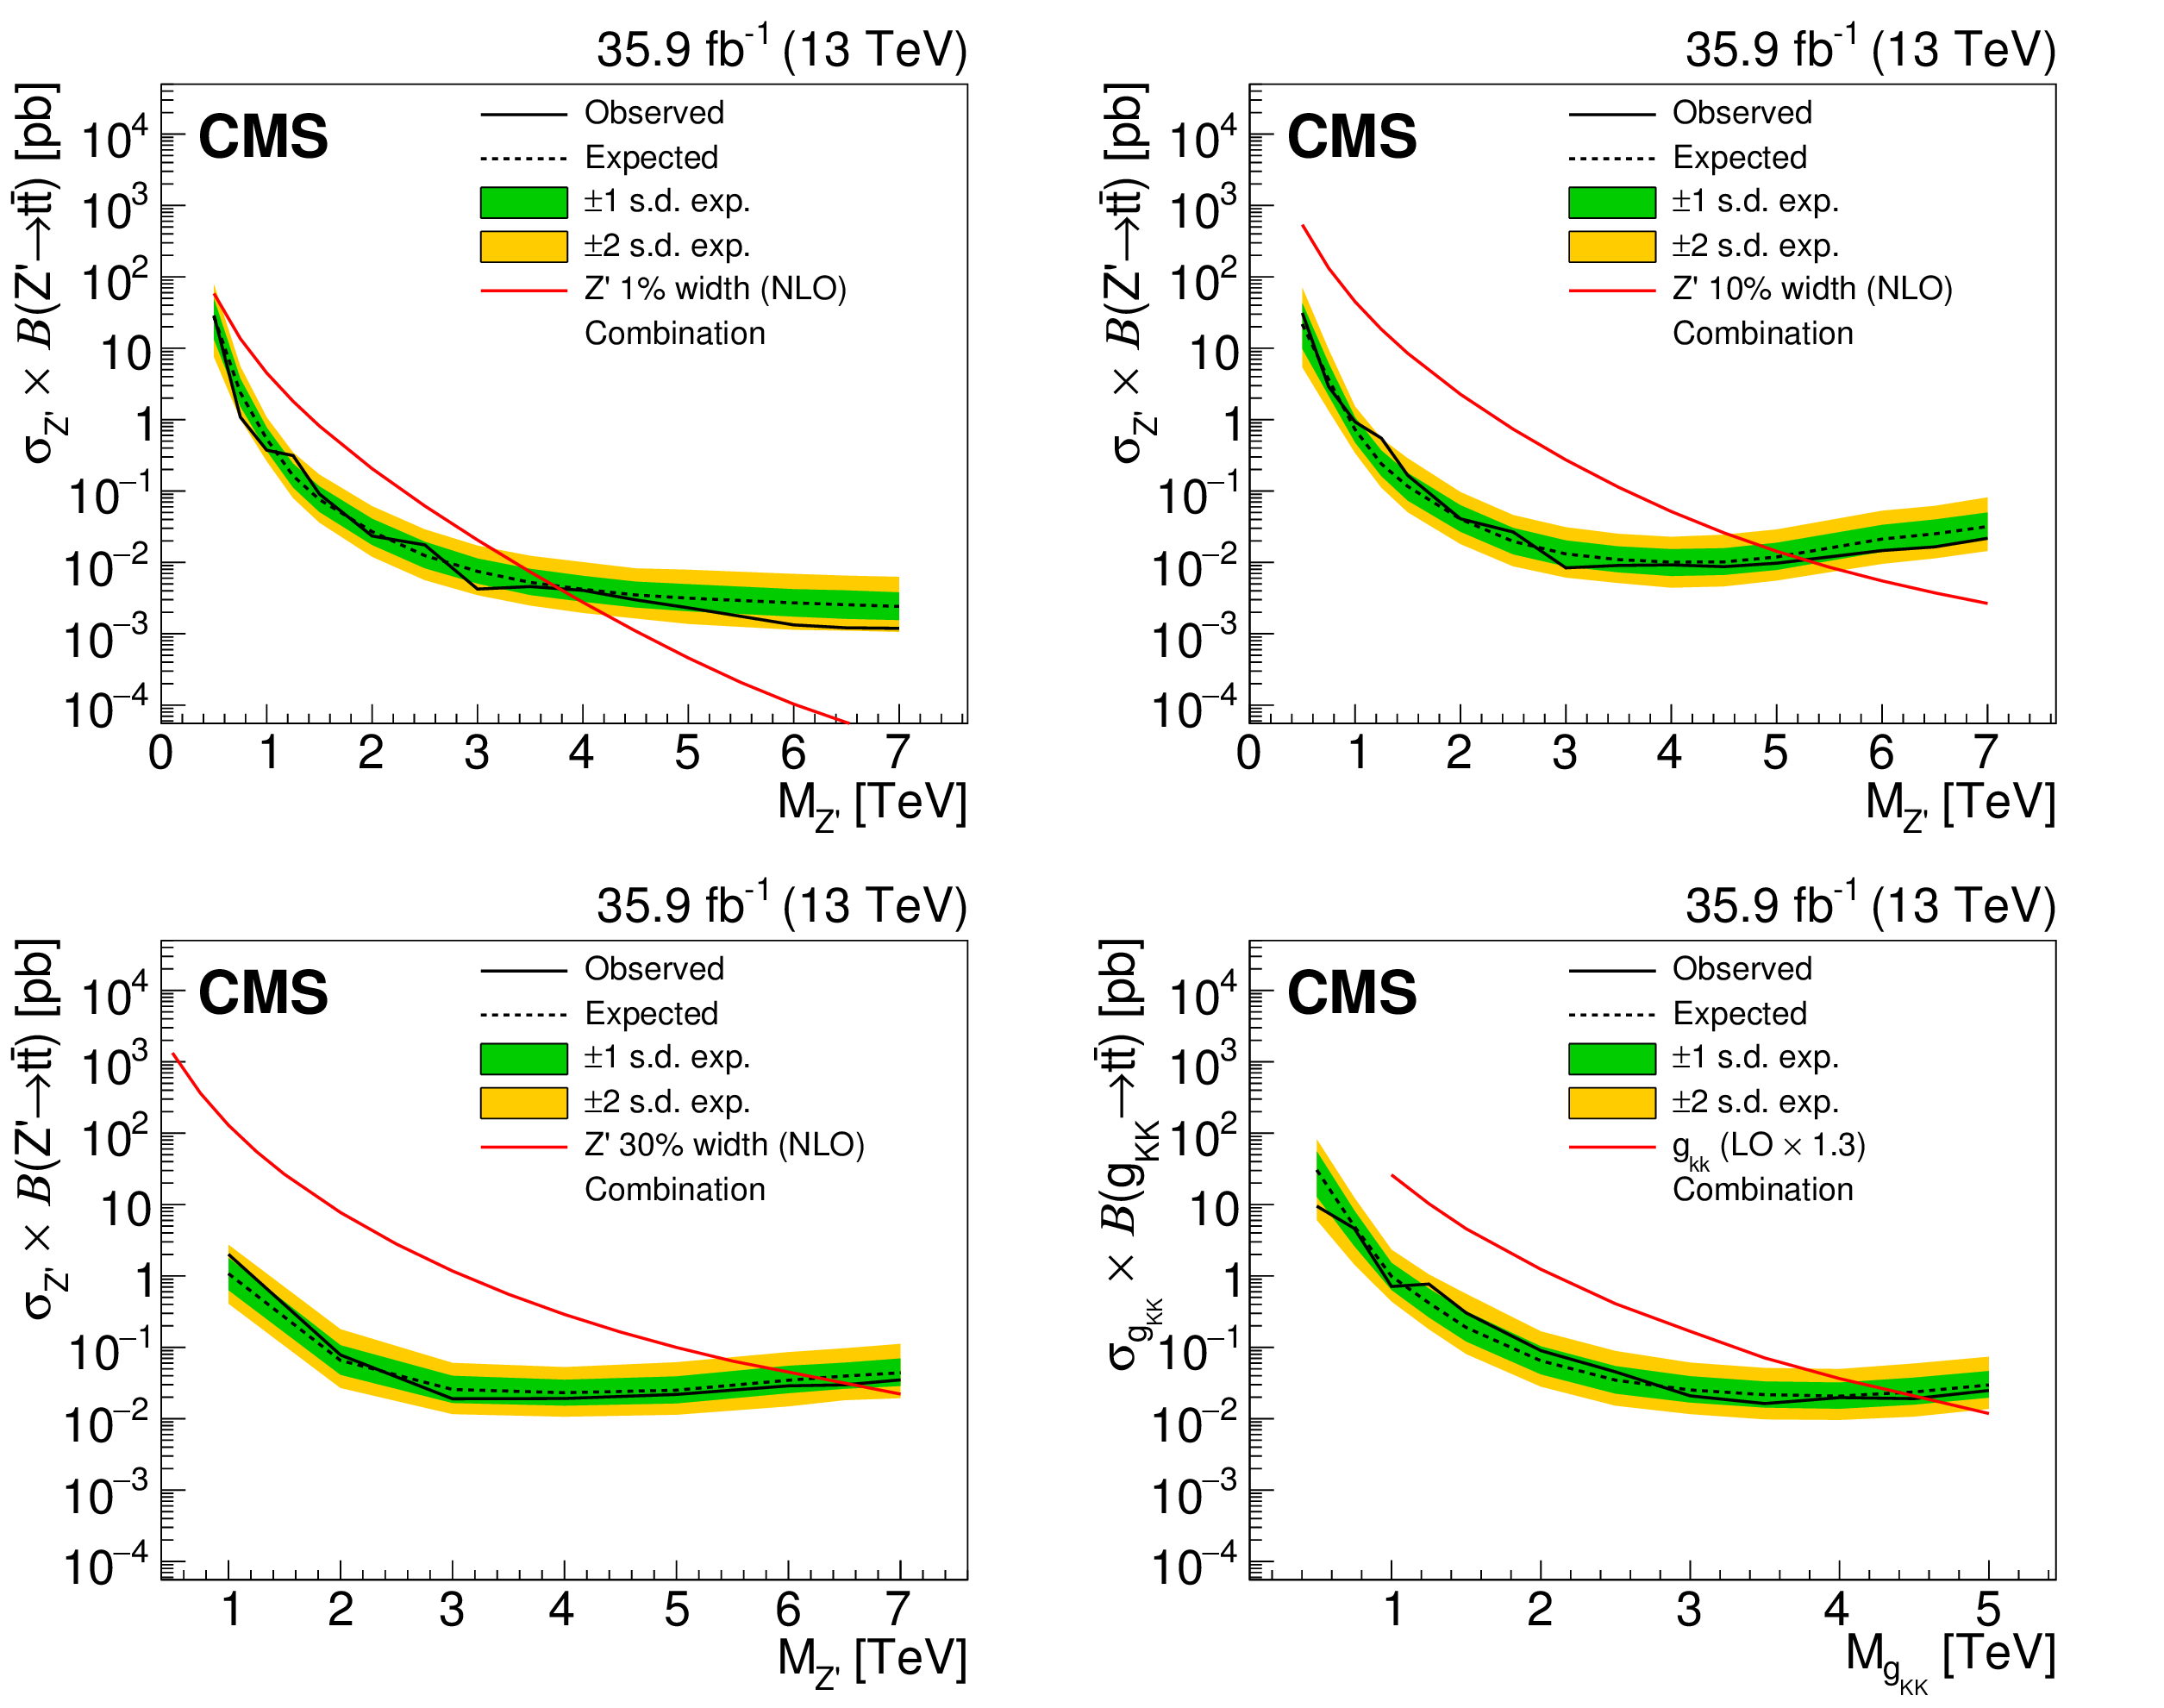
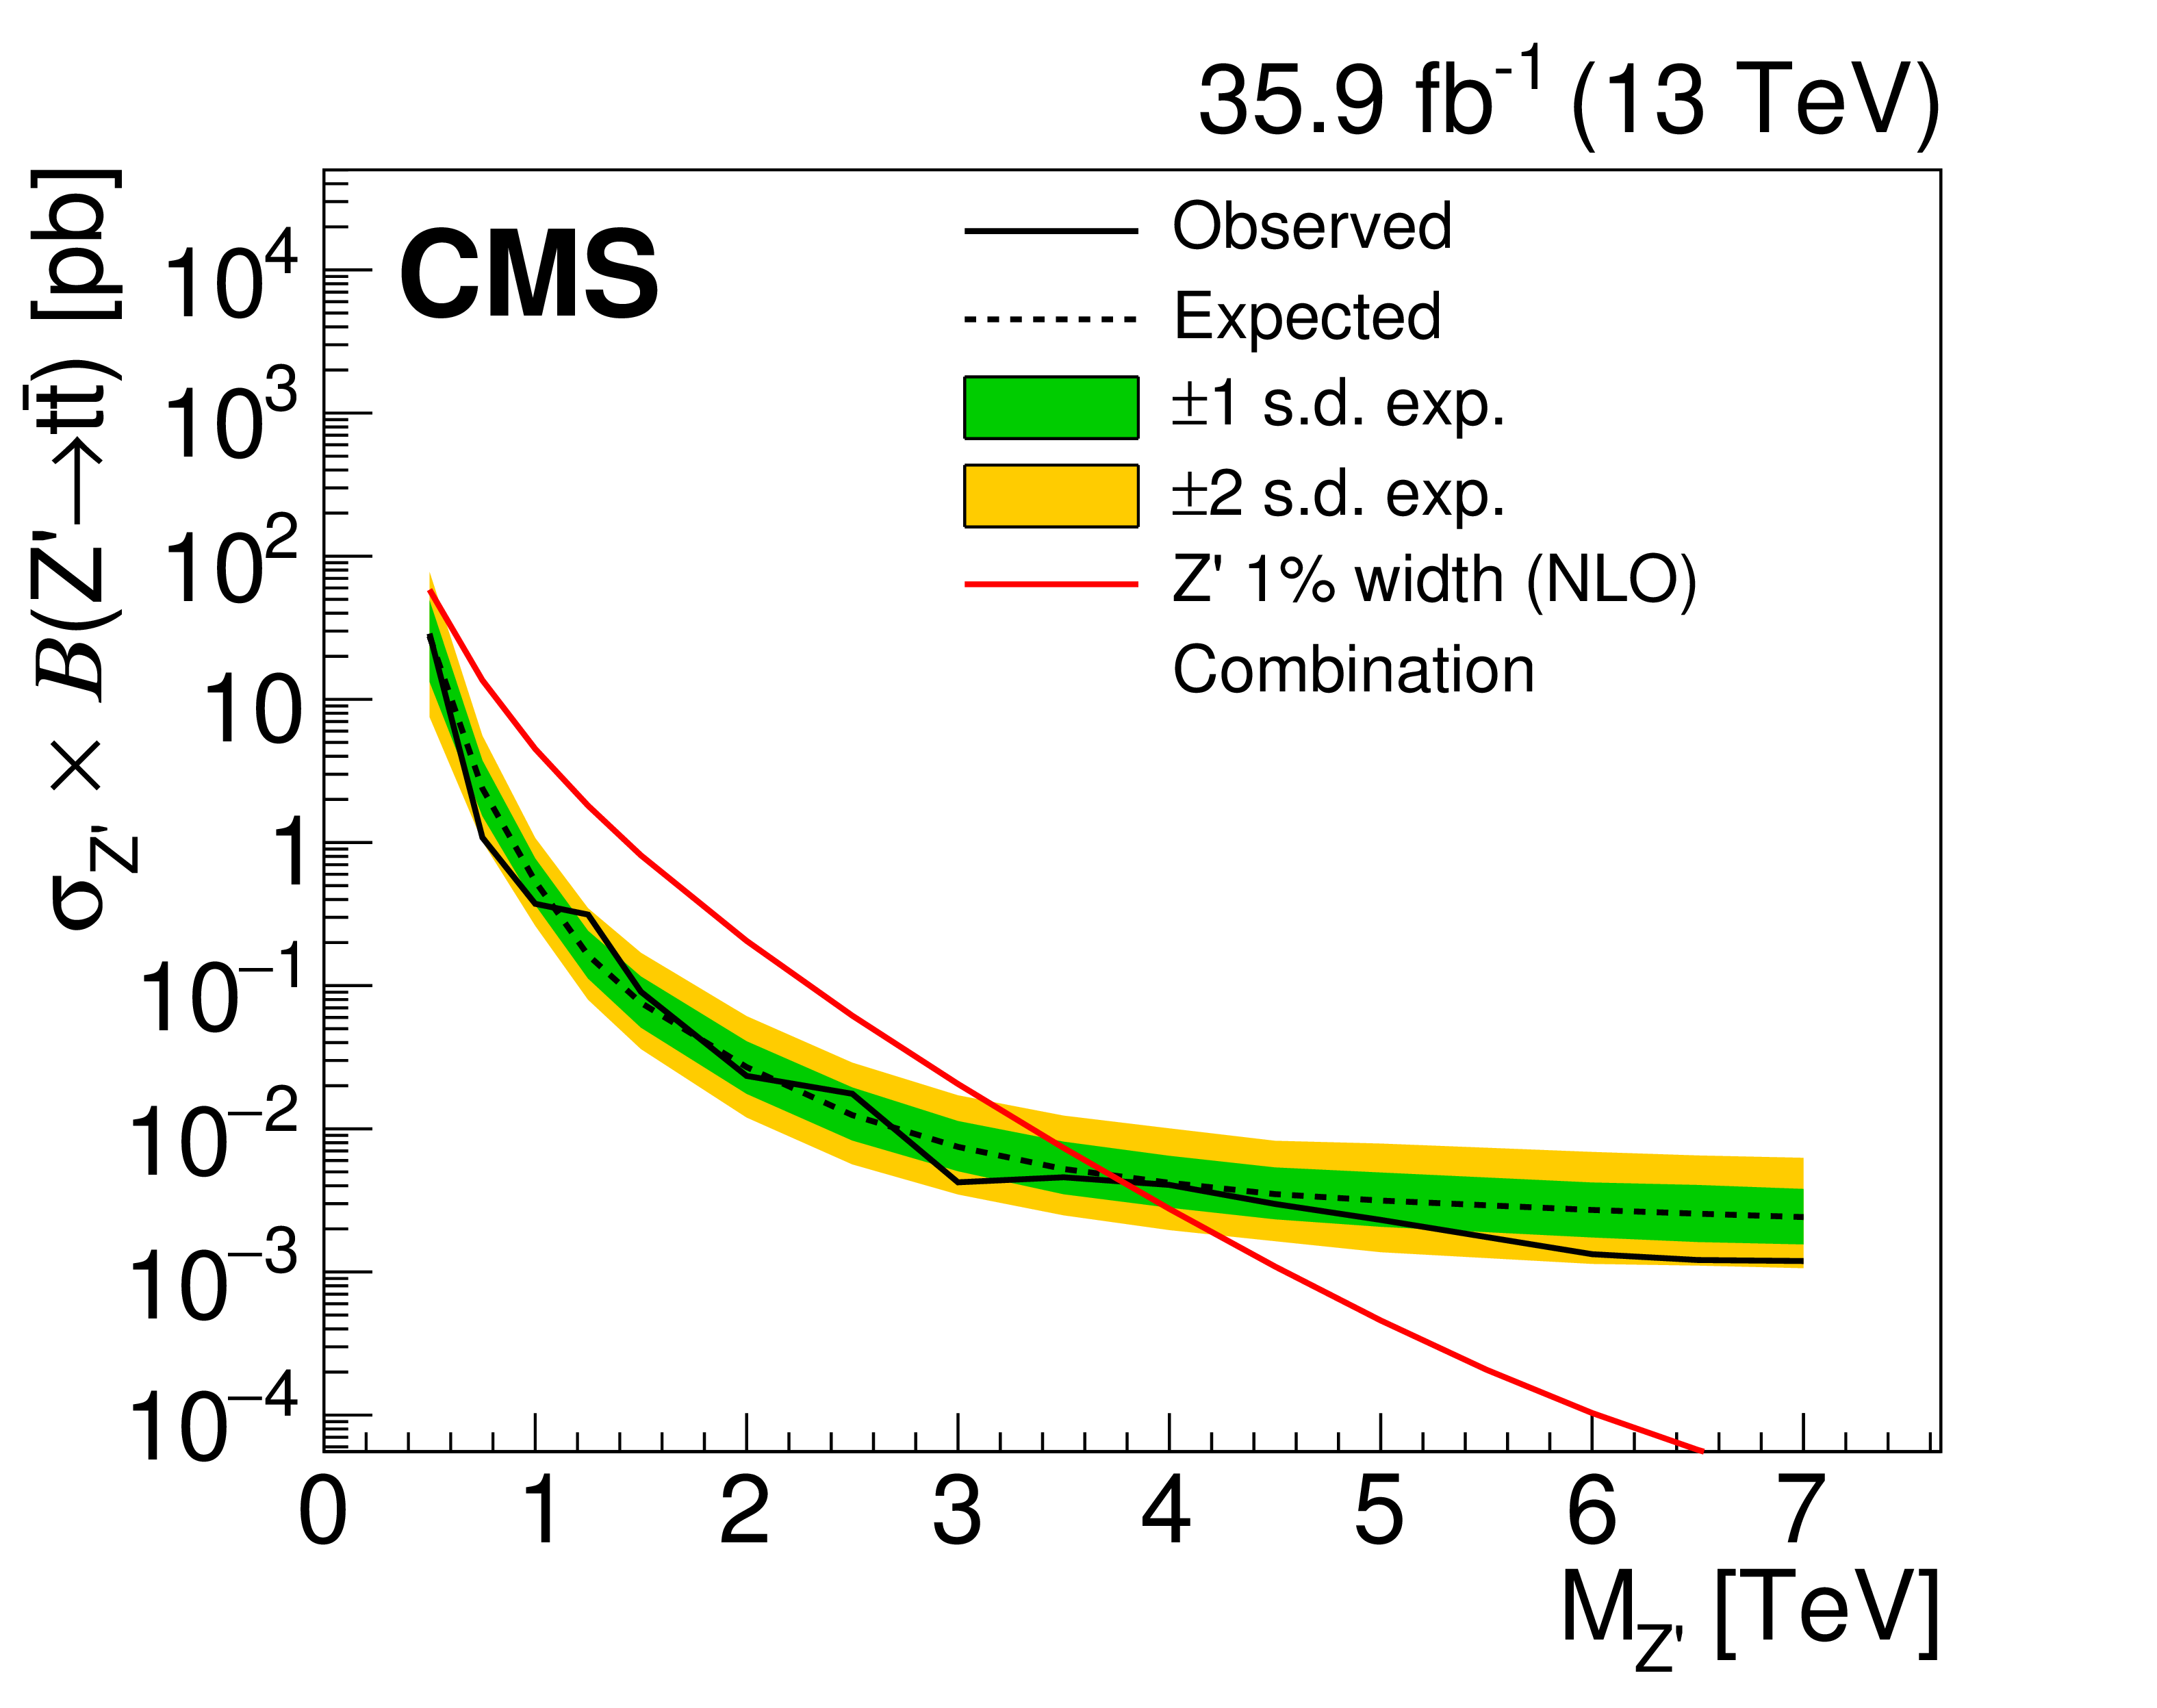
Figure 13:
Observed and expected limits at 95% CL for each of the four signal hypotheses considered in this analysis. |
png pdf |
Figure 13-a:
Observed and expected limits at 95% CL for the ${{\mathrm {g}} _{\text {KK}}}$ hypothesis. |
png pdf |
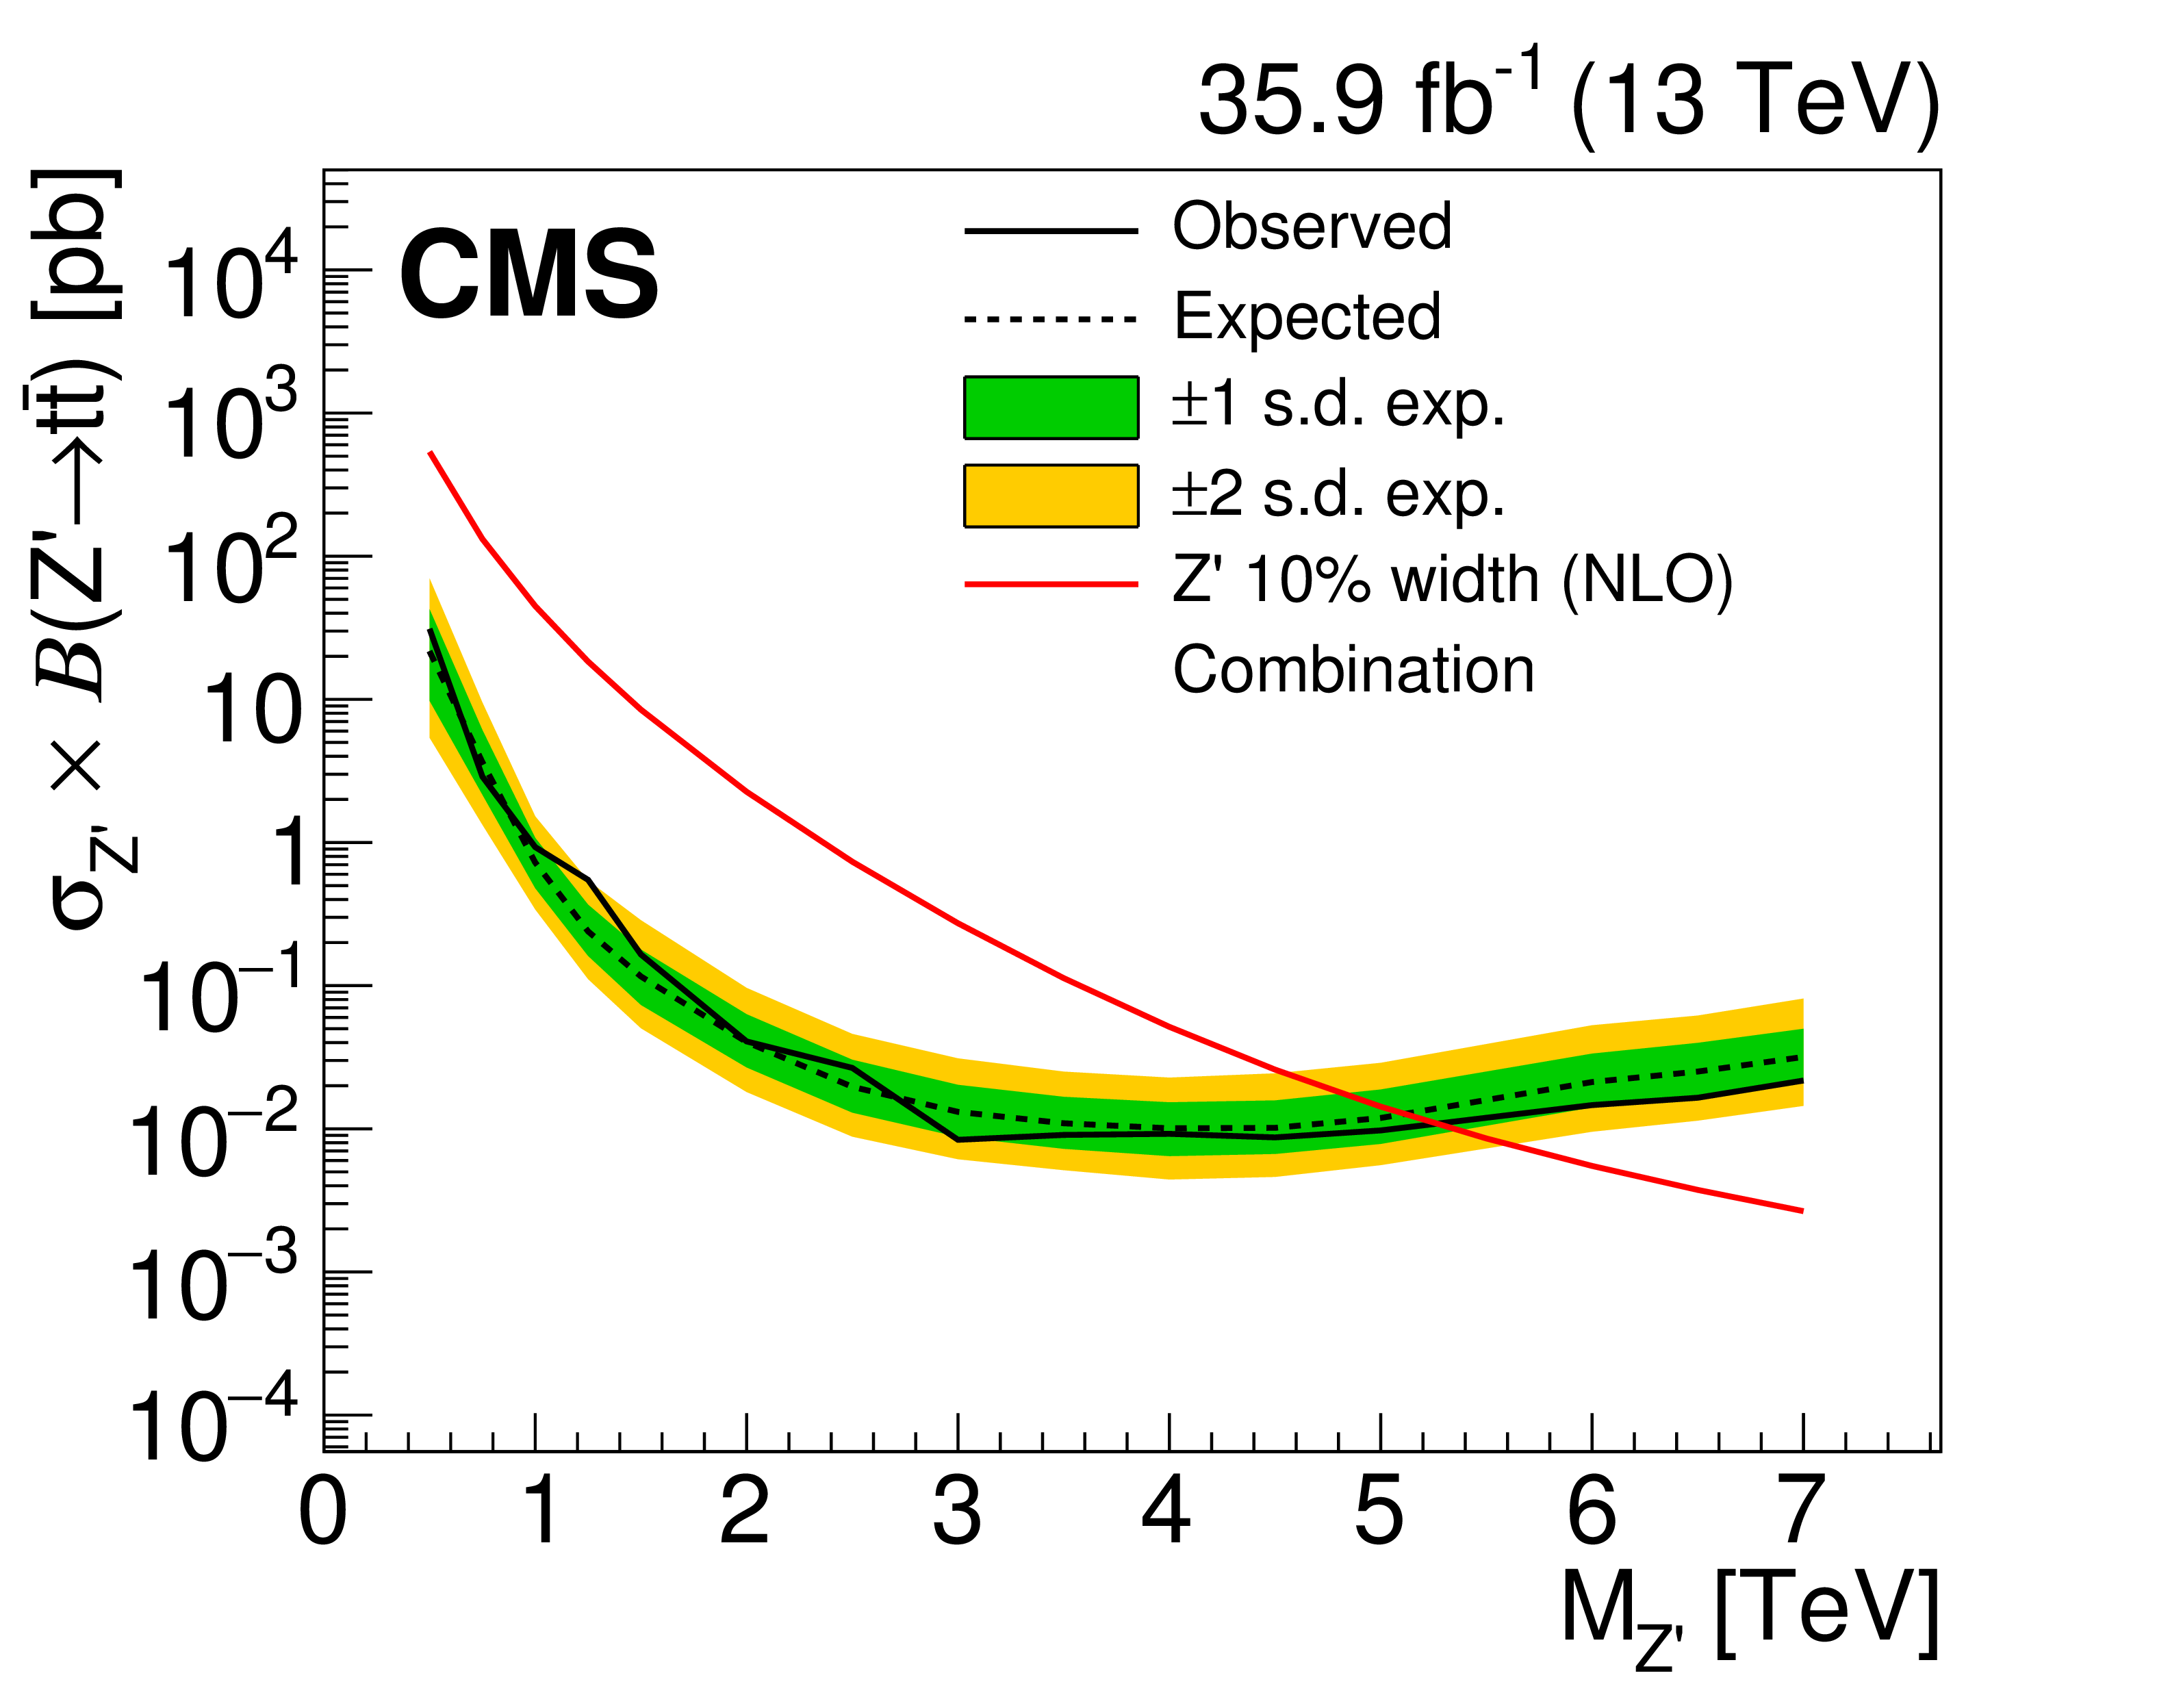
Figure 13-b:
Observed and expected limits at 95% CL for the wide ($\Gamma /m = $ 10%) Z' boson resonance hypothesis. |

png pdf |
Figure 13-c:
Observed and expected limits at 95% CL for the extra-wide ($\Gamma /m = $ 30%) Z' boson resonance hypothesis. |

png pdf |
Figure 13-d:
Observed and expected limits at 95% CL for each of the four signal hypotheses considered in this analysis. |
| Tables | |
png pdf |
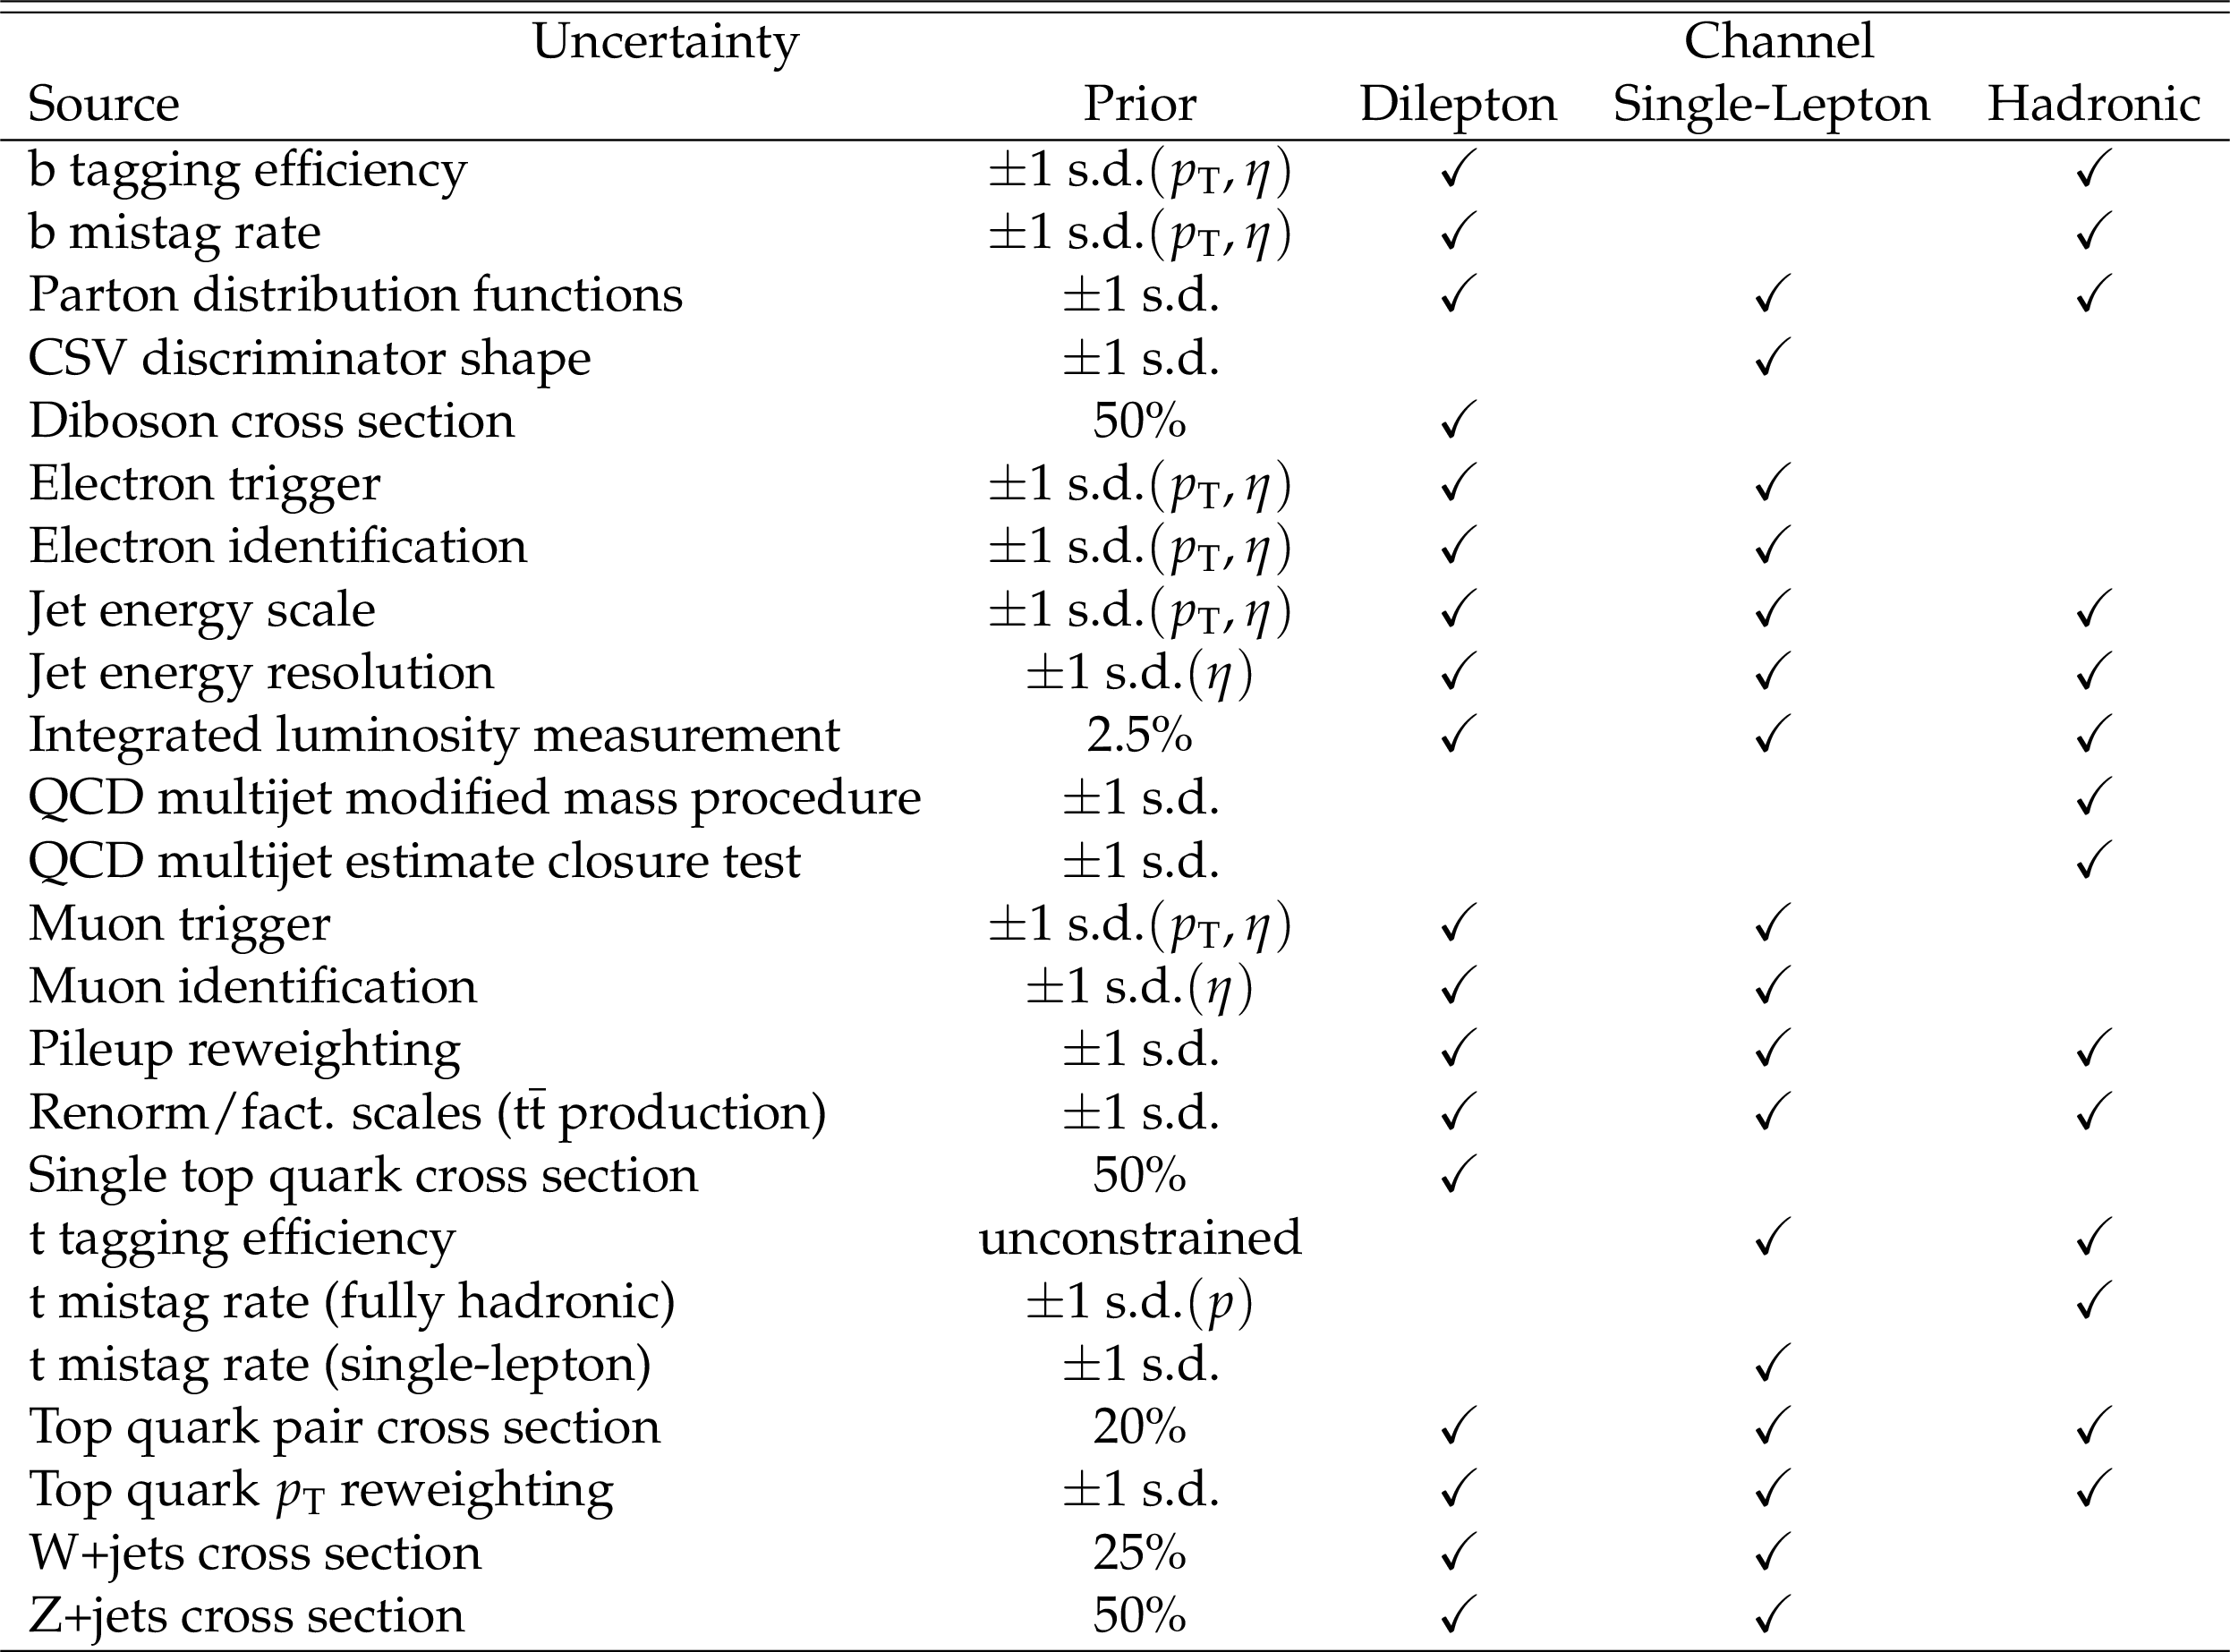
Table 1:
Sources of systematic uncertainty that affect the $ {m_{{{\mathrm {t}\overline {\mathrm {t}}}}}} $ and $ {S_{\text {T}}} $ distributions in each analysis channel. For uncertainty sources that apply to multiple channels, the corresponding nuisance parameter is fully correlated across these channels if the symbol v appears in the same row. For normalization uncertainties, the size of the effect on the prior distribution is indicated. Shape uncertainties have priors of $ \pm $1 s.d., and the dependence on the kinematic quantities is shown. |
png pdf |
Table 2:
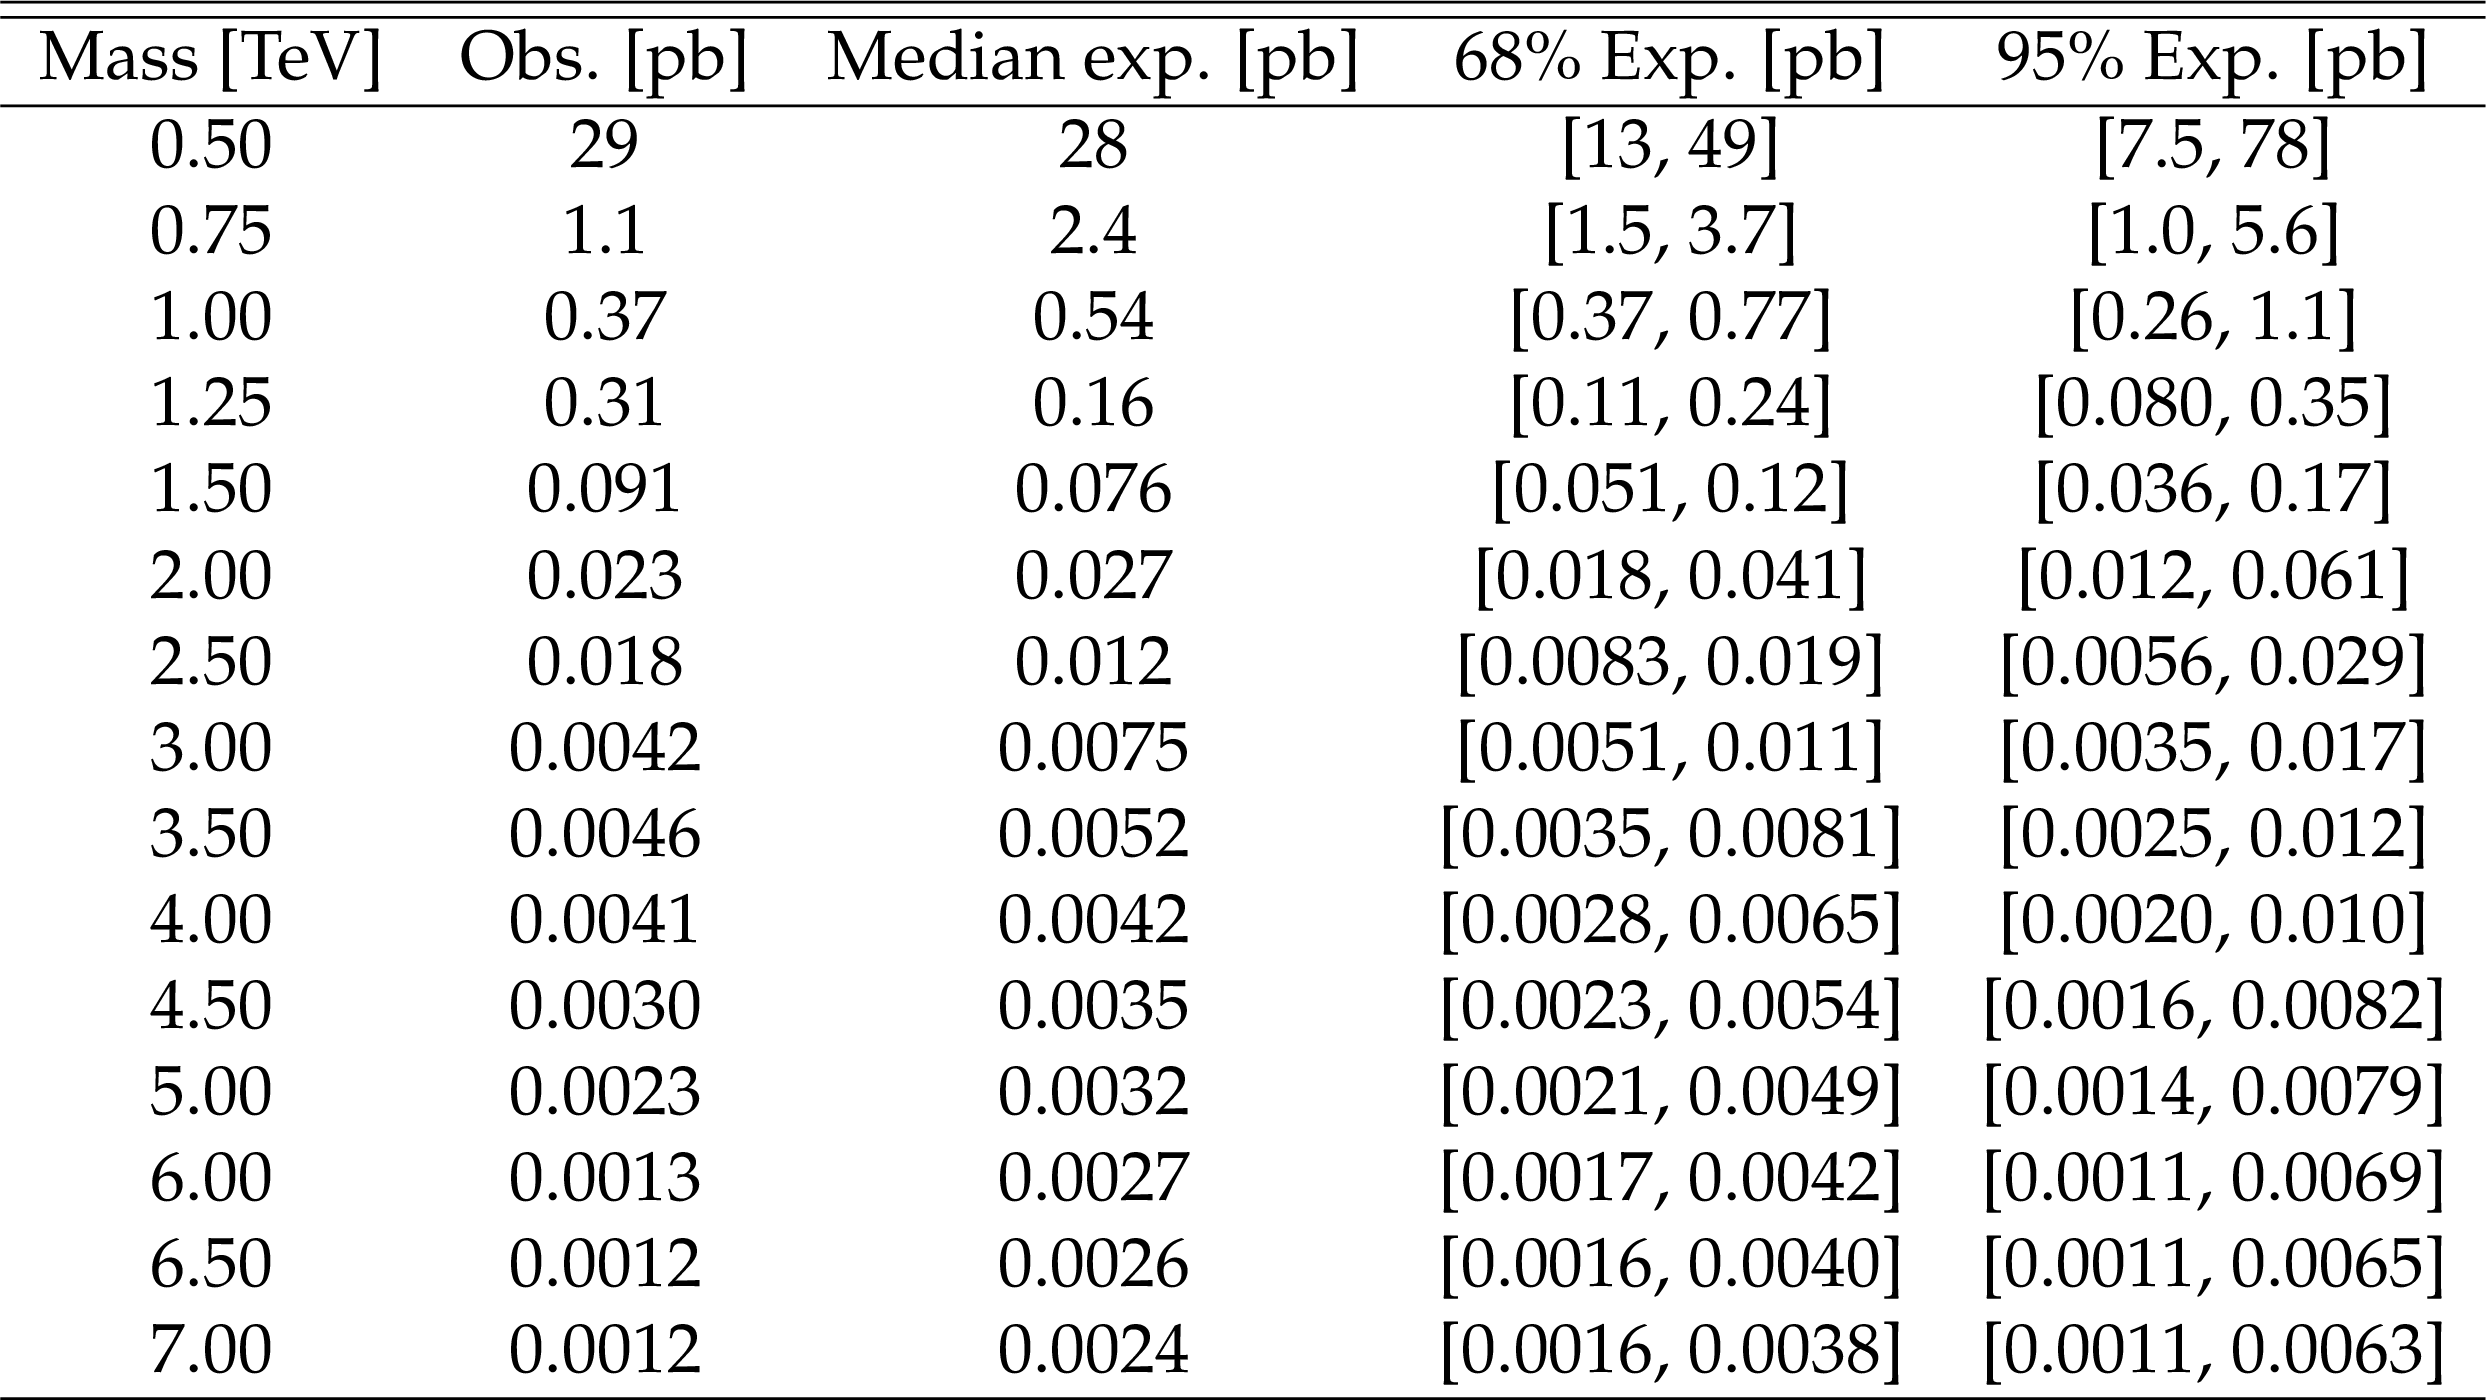
Limits at 95% CL on the product of the resonance production cross section and branching fraction for the narrow ($\Gamma /m = $ 1%) Z' boson resonance hypothesis. |

png pdf |
Table 3:
Limits at 95% CL on the product of the resonance production cross section and branching fraction for the wide ($\Gamma /m = $ 10%) Z' boson resonance hypothesis. |

png pdf |
Table 4:
Limits at 95% CL on the product of the resonance production cross section and branching fraction for the extra-wide ($\Gamma /m = $ 30%) Z' boson resonance hypothesis. |

png pdf |
Table 5:
Limits at 95% CL on the product of the resonance production cross section and branching fraction for the ${{\mathrm {g}} _{\text {KK}}}$ gluon resonance hypothesis. |
| Summary |
|
A search for a generic massive top quark and antiquark ($\mathrm{t\bar{t}}$) resonance has been presented. The analysis was performed using data collected by the CMS experiment in 2016 at the LHC at $\sqrt{s} = $ 13 TeV, corresponding to an integrated luminosity of 35.9 fb$^{-1}$. The analysis is focused on searching for a $\mathrm{t\bar{t}}$ resonance above 2 TeV, where the decay products of the top quark become collimated because of its large Lorentz boost. The analysis performed a simultaneous measurement of the backgrounds and the t-tagging efficiency from data. The data are consistent with the background-only hypothesis, and no evidence for a massive $\mathrm{t\bar{t}}$ resonance has been found. Limits at 95% confidence level are calculated for the production cross section for a spin-1 resonance decaying to $\mathrm{t\bar{t}}$ pairs with a variety of decay widths. Limits were calculated for two benchmark signal processes that decay to $\mathrm{t\bar{t}}$ pairs. A topcolor Z' boson with relative widths of 1, 10, or 30% is excluded in the mass ranges 0.50-3.80, 0.50-5.25, and 0.50-6.65 TeV, respectively. The first Kaluza-Klein excitation of the gluon in the Randall-Sundrum scenario (${\mathrm{g}_{\text{KK}}} $) is excluded in the range 0.50-4.55 TeV. This is the first search by any experiment at $\sqrt{s} = $ 13 TeV for $\mathrm{t\bar{t}}$ resonances that combines all three decay topologies of the $\mathrm{t\bar{t}}$ system: dilepton, single-lepton, and fully hadronic. The sensitivity of the analysis exceeds previous searches at $\sqrt{s} = $ 8 and 13 TeV, particularly at high $\mathrm{t\bar{t}}$ invariant mass. Previous measurements have excluded a topcolor Z' up to 3.0, 3.9, and 4.0 TeV, for relative widths of 1, 10, and 30%, and ${\mathrm{g}_{\text{KK}}}$ from 3.3 to 3.8 TeV, depending on model [32,31]. The presented analysis improves upon those limits, extending the Z' exclusions to 3.80, 5.25, and 6.65 TeV and the ${\mathrm{g}_{\text{KK}}}$ exclusion to 4.55 TeV. These are the most stringent limits on the topcolor Z' and ${\mathrm{g}_{\text{KK}}}$ models to date. |
| References | ||||
| 1 | CDF Collaboration | Observation of top quark production in $ {\mathrm{p}}\overline{{\mathrm{p}}} $ collisions | PRL 74 (1995) 2626 | hep-ex/9503002 |
| 2 | D0 Collaboration | Observation of the top quark | PRL 74 (1995) 2632 | hep-ex/9503003 |
| 3 | J. L. Rosner | Prominent decay modes of a leptophobic Z' | PLB 387 (1996) 113 | hep-ph/9607207 |
| 4 | K. R. Lynch, S. Mrenna, M. Narain, and E. H. Simmons | Finding Z' bosons coupled preferentially to the third family at CERN LEP and the Fermilab Tevatron | PRD 63 (2001) 035006 | hep-ph/0007286 |
| 5 | M. Carena, A. Daleo, B. A. Dobrescu, and T. M. P. Tait | Z' gauge bosons at the Fermilab Tevatron | PRD 70 (2004) 093009 | hep-ph/0408098 |
| 6 | D. Dicus, A. Stange, and S. Willenbrock | Higgs decay to top quarks at hadron colliders | PLB 333 (1994) 126 | hep-ph/9404359 |
| 7 | P. H. Frampton and S. L. Glashow | Chiral color: an alternative to the standard model | PLB 190 (1987) 157 | |
| 8 | D. Choudhurya, R. M. Godbole, R. K. Singh, and K. Wagh | Top production at the Tevatron/LHC and nonstandard, strongly interacting spin one particles | PLB 657 (2007) 69 | 0810.3635 |
| 9 | R. M. Godbole and D. Choudhury | Nonstandard, strongly interacting spin one $ \mathrm{t\bar{t}} $ resonances | in Proceedings, 34th international conference on high energy physics (ICHEP 2008): Philadelphia, Pennsylvania, July 30-August 5 | 0810.3635 |
| 10 | C. T. Hill | Topcolor: top quark condensation in a gauge extension of the standard model | PLB 266 (1991) 419 | |
| 11 | C. T. Hill and S. J. Parke | Top production: sensitivity to new physics | PRD 49 (1994) 4454 | hep-ph/9312324 |
| 12 | C. T. Hill | Topcolor assisted technicolor | PLB 345 (1995) 483 | hep-ph/9911288 |
| 13 | R. M. Harris, C. T. Hill, and S. J. Parke | Cross section for topcolor $ \mathrm{Z'}_{\text{t}} $ decaying to $ \mathrm{t\bar{t}} $ | hep-ph/9911288 | |
| 14 | R. M. Harris and S. Jain | Cross sections for leptophobic topcolor Z' decaying to top-antitop | EPJC 72 (2012) 2072 | 1112.4928 |
| 15 | L. Randall and R. Sundrum | A large mass hierarchy from a small extra dimension | PRL 83 (1999) 3370 | hep-ph/9905221 |
| 16 | L. Randall and R. Sundrum | An alternative to compactification | PRL 83 (1999) 4690 | hep-th/9906064 |
| 17 | K. Agashe et al. | LHC signals from warped extra dimensions | PRD 77 (2008) 015003 | hep-ph/0612015 |
| 18 | H. Davoudiasl, J. L. Hewett, and T. G. Rizzo | Phenomenology of the Randall-Sundrum gauge hierarchy model | PRL 84 (2000) 2080 | hep-ph/9909255 |
| 19 | CDF Collaboration | Limits on the production of narrow $ \mathrm{t\bar{t}} $ resonances in $ {\mathrm{p}}\overline{{\mathrm{p}}} $ collisions at $ \sqrt{s} = $ 1.96 TeV | PRD 77 (2008) 051102 | 0710.5335 |
| 20 | CDF Collaboration | Search for resonant $ \mathrm{t\bar{t}} $ production in $ {\mathrm{p}}\overline{{\mathrm{p}}} $ collisions at $ \sqrt{s} = $ 1.96 TeV | PRL 100 (2008) 231801 | 0709.0705 |
| 21 | CDF Collaboration | A search for resonant production of $ \mathrm{t\bar{t}} $ pairs in 4.8$ fb$^{-1} of integrated luminosity of $ {\mathrm{p}}\overline{{\mathrm{p}}} $ collisions at $ \sqrt{s} = $ 1.96 TeV | PRD 84 (2011) 072004 | 1107.5063 |
| 22 | D0 Collaboration | Search for a narrow $ \mathrm{t\bar{t}} $ resonance in $ {\mathrm{p}}\overline{{\mathrm{p}}} $ collisions at $ \sqrt{s} = $ 1.96 TeV | PRD 85 (2012) 051101 | 1111.1271 |
| 23 | CDF Collaboration | Search for resonant production of $ \mathrm{t\bar{t}} $ decaying to jets in $ {\mathrm{p}}\overline{{\mathrm{p}}} $ collisions at $ \sqrt{s} = $ 1.96 TeV | PRD 84 (2011) 072003 | 1108.4755 |
| 24 | D0 Collaboration | Search for $ \mathrm{t\bar{t}} $ resonances in the lepton plus jets final state in $ {\mathrm{p}}\overline{{\mathrm{p}}} $ collisions at $ \sqrt{s} = $ 1.96 TeV | PLB 668 (2008) 98 | 0804.3664 |
| 25 | CMS Collaboration | Search for anomalous $ \mathrm{t\bar{t}} $ production in the highly-boosted all-hadronic final state | JHEP 09 (2012) 029 | CMS-EXO-11-006 1204.2488 |
| 26 | ATLAS Collaboration | A search for $ \mathrm{t\bar{t}} $ resonances in lepton+jets events with highly boosted top quarks collected in $ {\mathrm{p}}{\mathrm{p}} $ collisions at $ \sqrt{s} = $ 7 TeV with the ATLAS detector | JHEP 09 (2012) 041 | 1207.2409 |
| 27 | ATLAS Collaboration | Search for $ \mathrm{t\bar{t}} $ resonances in the lepton plus jets final state with ATLAS using 4.7$ fb$^{-1} of $ {\mathrm{p}}{\mathrm{p}} $ collisions at $ \sqrt{s} = $ 7 TeV | PRD 88 (2013) 012004 | 1305.2756 |
| 28 | CMS Collaboration | Search for resonant $ \mathrm{t\bar{t}} $ production in lepton+jets events in $ {\mathrm{p}}{\mathrm{p}} $ collisions at $ \sqrt{s} = $ 7 TeV | JHEP 12 (2012) 015 | CMS-TOP-12-017 1209.4397 |
| 29 | CMS Collaboration | Search for Z' resonances decaying to $ \mathrm{t\bar{t}} $ in dilepton+jets final states in $ {\mathrm{p}}{\mathrm{p}} $ collisions at $ \sqrt{s} = $ 7 TeV | PRD 87 (2013) 072002 | CMS-TOP-11-010 1211.3338 |
| 30 | CMS Collaboration | Searches for new physics using the $ \mathrm{t\bar{t}} $ invariant mass distribution in $ {\mathrm{p}}{\mathrm{p}} $ collisions at $ \sqrt{s} = $ 8 TeV | PRL 111 (2013) 211804 | CMS-B2G-13-001 1309.2030 |
| 31 | CMS Collaboration | Search for $ \mathrm{t\bar{t}} $ resonances in highly boosted lepton+jets and fully hadronic final states in proton-proton collisions at $ \sqrt{s} = $ 13 TeV | JHEP 07 (2017) 001 | CMS-B2G-16-015 1704.03366 |
| 32 | ATLAS Collaboration | Search for heavy particles decaying into top-quark pairs using lepton-plus-jets events in proton-proton collisions at $ \sqrt{s} = $ 13 TeV with the ATLAS detector | EPJC 78 (2018) 565 | 1804.10823 |
| 33 | CMS Collaboration | Identification of heavy-flavour jets with the CMS detector in $ {\mathrm{p}}{\mathrm{p}} $ collisions at 13 TeV | JINST 13 (2018) P05011 | CMS-BTV-16-002 1712.07158 |
| 34 | CMS Collaboration | The CMS trigger system | JINST 12 (2017) P01020 | CMS-TRG-12-001 1609.02366 |
| 35 | CMS Collaboration | The CMS experiment at the CERN LHC | JINST 3 (2008) S08004 | CMS-00-001 |
| 36 | CMS Collaboration | Particle-flow reconstruction and global event description with the CMS detector | JINST 12 (2017) P10003 | CMS-PRF-14-001 1706.04965 |
| 37 | CMS Collaboration | Description and performance of track and primary-vertex reconstruction with the CMS tracker | JINST 9 (2014) P10009 | CMS-TRK-11-001 1405.6569 |
| 38 | M. Cacciari, G. P. Salam, and G. Soyez | The anti-$ {k_{\mathrm{T}}} $ jet clustering algorithm | JHEP 04 (2008) 063 | 0802.1189 |
| 39 | M. Cacciari, G. P. Salam, and G. Soyez | FastJet user manual | EPJC 72 (2012) 1896 | 1111.6097 |
| 40 | CMS Collaboration | Determination of jet energy calibration and transverse momentum resolution in CMS | JINST 6 (2011) P11002 | CMS-JME-10-011 1107.4277 |
| 41 | CMS Collaboration | Performance of electron reconstruction and selection with the CMS detector in proton-proton collisions at $ \sqrt{s} = $ 8 TeV | JINST 10 (2015) P06005 | CMS-EGM-13-001 1502.02701 |
| 42 | CMS Collaboration | Energy calibration and resolution of the CMS electromagnetic calorimeter in $ {\mathrm{p}}{\mathrm{p}} $ collisions at $ \sqrt{s} = $ 7 TeV | JINST 8 (2013) P09009 | CMS-EGM-11-001 1306.2016 |
| 43 | M. Cacciari, G. P. Salam, and G. Soyez | The catchment area of jets | JHEP 04 (2008) 005 | 0802.1188 |
| 44 | CMS Collaboration | Top tagging with new approaches | CMS-PAS-JME-15-002 | CMS-PAS-JME-15-002 |
| 45 | CMS Collaboration | Jet performance in $ {\mathrm{p}}{\mathrm{p}} $ collisions at 7 TeV | CMS-PAS-JME-10-003 | |
| 46 | CMS Collaboration | Missing transverse energy performance of the CMS detector | JINST 6 (2011) P09001 | CMS-JME-10-009 1106.5048 |
| 47 | CMS Collaboration | A Cambridge-Aachen (C-A) based jet algorithm for boosted top-jet tagging | CDS | |
| 48 | CMS Collaboration | Boosted top-jet tagging at CMS | CMS-PAS-JME-13-007 | CMS-PAS-JME-13-007 |
| 49 | D. E. Kaplan, K. Rehermann, M. D. Schwartz, and B. Tweedie | Top tagging: a method for identifying boosted hadronically decaying top quarks | PRL 101 (2008) 142001 | 0806.0848 |
| 50 | D. Bertolini, P. Harris, M. Low, and N. Tran | Pileup per particle identification | JHEP 10 (2014) 059 | 1407.6013 |
| 51 | M. Dasgupta, A. Fregoso, S. Marzani, and G. P. Salam | Towards an understanding of jet substructure | JHEP 09 (2013) 029 | 1307.0007 |
| 52 | A. J. Larkoski, S. Marzani, G. Soyez, and J. Thaler | Soft drop | JHEP 05 (2014) 146 | 1402.2657 |
| 53 | J. Thaler and K. Van Tilburg | Identifying boosted objects with $ n $-subjettiness | JHEP 03 (2011) 015 | 1011.2268 |
| 54 | J. Thaler and K. Van Tilburg | Maximizing boosted top identification by minimizing $ n $-subjettiness | JHEP 02 (2012) 093 | 1108.2701 |
| 55 | J. Alwall et al. | The automated computation of tree-level and next-to-leading order differential cross sections, and their matching to parton shower simulations | JHEP 07 (2014) 079 | 1405.0301 |
| 56 | J. Alwall et al. | Comparative study of various algorithms for the merging of parton showers and matrix elements in hadronic collisions | EPJC 53 (2008) 473 | 0706.2569 |
| 57 | T. Sjostrand et al. | An introduction to PYTHIA 8.2 | CPC 191 (2015) 159 | 1410.3012 |
| 58 | S. Ask et al. | Identifying the colour of TeV-scale resonances | JHEP 01 (2012) 018 | 1108.2396 |
| 59 | P. Nason | A new method for combining NLO QCD with shower Monte Carlo algorithms | JHEP 11 (2004) 040 | hep-ph/0409146 |
| 60 | S. Frixione, P. Nason, and G. Ridolfi | A positive-weight next-to-leading-order Monte Carlo for heavy flavour hadroproduction | JHEP 09 (2007) 126 | 0707.3088 |
| 61 | S. Frixione, P. Nason, and C. Oleari | Matching NLO QCD computations with parton shower simulations: the POWHEG method | JHEP 11 (2007) 070 | 0709.2092 |
| 62 | S. Alioli, P. Nason, C. Oleari, and E. Re | A general framework for implementing NLO calculations in shower Monte Carlo programs: the POWHEG BOX | JHEP 06 (2010) 043 | 1002.2581 |
| 63 | S. Alioli, P. Nason, C. Oleari, and E. Re | NLO single-top production matched with shower in POWHEG: $ s $- and $ t $-channel contributions | JHEP 09 (2009) 111 | 0907.4076 |
| 64 | E. Re | Single-top Wt-channel production matched with parton showers using the POWHEG method | EPJC 71 (2011) 1547 | 1009.2450 |
| 65 | R. Frederix and S. Frixione | Merging meets matching in MC@NLO | JHEP 12 (2012) 061 | 1209.6215 |
| 66 | CMS Collaboration | Event generator tunes obtained from underlying event and multiparton scattering measurements | EPJC 76 (2016) 155 | CMS-GEN-14-001 1512.00815 |
| 67 | NNPDF Collaboration | Parton distributions for the LHC run II | JHEP 04 (2015) 040 | 1410.8849 |
| 68 | M. Czakon and A. Mitov | Top++: a program for the calculation of the top-pair cross-section at hadron colliders | CPC 185 (2014) 2930 | 1112.5675 |
| 69 | Y. Li and F. Petriello | Combining QCD and electroweak corrections to dilepton production in FEWZ | PRD 86 (2012) 094034 | 1208.5967 |
| 70 | P. Kant et al. | HatHor for single top-quark production: updated predictions and uncertainty estimates for single top-quark production in hadronic collisions | CPC 191 (2015) 74 | 1406.4403 |
| 71 | N. Kidonakis | NNLL threshold resummation for top-pair and single-top production | Phys. Part. Nucl. 45 (2014) 714 | 1210.7813 |
| 72 | GEANT4 Collaboration | GEANT4 --- a simulation toolkit | NIMA 506 (2003) 250 | |
| 73 | M. Hildreth, V. N. Ivanchenko, D. J. Lange, and M. J. Kortelainen | CMS full simulation for run-2 | J. Phys. Conf. Ser. 664 (2015) 072022 | |
| 74 | B. P. Roe et al. | Boosted decision trees, an alternative to artificial neural networks | NIMA 543 (2005) 577 | physics/0408124 |
| 75 | H. Voss, A. Hocker, J. Stelzer, and F. Tegenfeldt | TMVA, the toolkit for multivariate data analysis with ROOT | in XIth International Workshop on Advanced Computing and Analysis Techniques in Physics Research (ACAT), p. 40 2007 | physics/0703039 |
| 76 | J. D. Bjorken and S. J. Brodsky | Statistical model for electron-positron annihilation into hadrons | PRD 1 (1970) 1416 | |
| 77 | CMS Collaboration | CMS luminosity measurement for the 2016 data taking period | CDS | |
| 78 | CMS Collaboration | Measurement of the inelastic proton-proton cross section at $ \sqrt{s} = $ 13 TeV | CMS-FSQ-15-005 1802.02613 |
|
| 79 | ATLAS Collaboration | Measurement of the inelastic proton-proton cross section at $ \sqrt{s} = $ 13 TeV with the ATLAS detector at the LHC | PRL 117 (2016) 182002 | 1606.02625 |
| 80 | J. Butterworth et al. | PDF4LHC recommendations for LHC run II | JPG 43 (2016) 023001 | 1510.03865 |
| 81 | CMS Collaboration | Measurement of differential cross sections for top quark pair production using the lepton+jets final state in proton-proton collisions at 13 TeV | PRD 95 (2017) 092001 | CMS-TOP-16-008 1610.04191 |
| 82 | J. Ott | Theta --- A framework for template-based modeling and inference | 2010 \url http://www-ekp.physik.uni-karlsruhe.de/\ ott/theta/theta-auto | |
| 83 | G. Cowan, ``Statistics'', Ch. 39 in Particle Data Group | Statistics'', Ch. 39 in Particle Data Group, ``Review of particle physics | CPC 40 (2016) 100001 | |
| 84 | ATLAS and CMS Collaborations, The LHC Higgs Combination Group | Procedure for the LHC Higgs boson search combination in summer 2011 | CMS-NOTE-2011-005 | |
| 85 | R. J. Barlow and C. Beeston | Fitting using finite Monte Carlo samples | CPC 77 (1993) 219 | |
|
|
Compact Muon Solenoid LHC, CERN |
|

|

|

|

|

|