

Compact Muon Solenoid
LHC, CERN
| CMS-B2G-20-012 ; CERN-EP-2023-213 | ||
| Search for W' bosons decaying to a top and a bottom quark in leptonic final states in proton-proton collisions at $ \sqrt{s} = $ 13 TeV | ||
| CMS Collaboration | ||
| 30 October 2023 | ||
| Accepted for publication in JHEP | ||
| Abstract: A search for W' bosons decaying to a top and a bottom quark in final states including an electron or a muon is performed with the CMS detector at the LHC. The analyzed data correspond to an integrated luminosity of 138 fb$ ^{-1} $ of proton-proton collisions at a center-of-mass energy of 13 TeV. Good agreement with the standard model expectation is observed and no evidence for the existence of the W' boson is found over the mass range examined. The largest observed deviation from the standard model expectation is found for a W' boson mass ($ m_{\mathrm{W^{'}}} $) hypothesis of 3.8 TeV with a relative decay width of 1%, with a local (global) significance of 2.6 (2.0) standard deviations. Upper limits on the production cross sections of W' bosons decaying to a top and a bottom quark are set. Left- and right-handed W' bosons with $ m_{\mathrm{W^{'}}} $ below 3.9 and 4.3 TeV, respectively, are excluded at the 95% confidence level, under the assumption that the new particle has a narrow decay width. Limits are also set for relative decay widths up to 30%. These are the most stringent limits to date on this W' boson decay channel. | ||
| Links: e-print arXiv:2310.19893 [hep-ex] (PDF) ; CDS record ; inSPIRE record ; HepData record ; Physics Briefing ; CADI line (restricted) ; | ||
| Figures | |
png pdf |
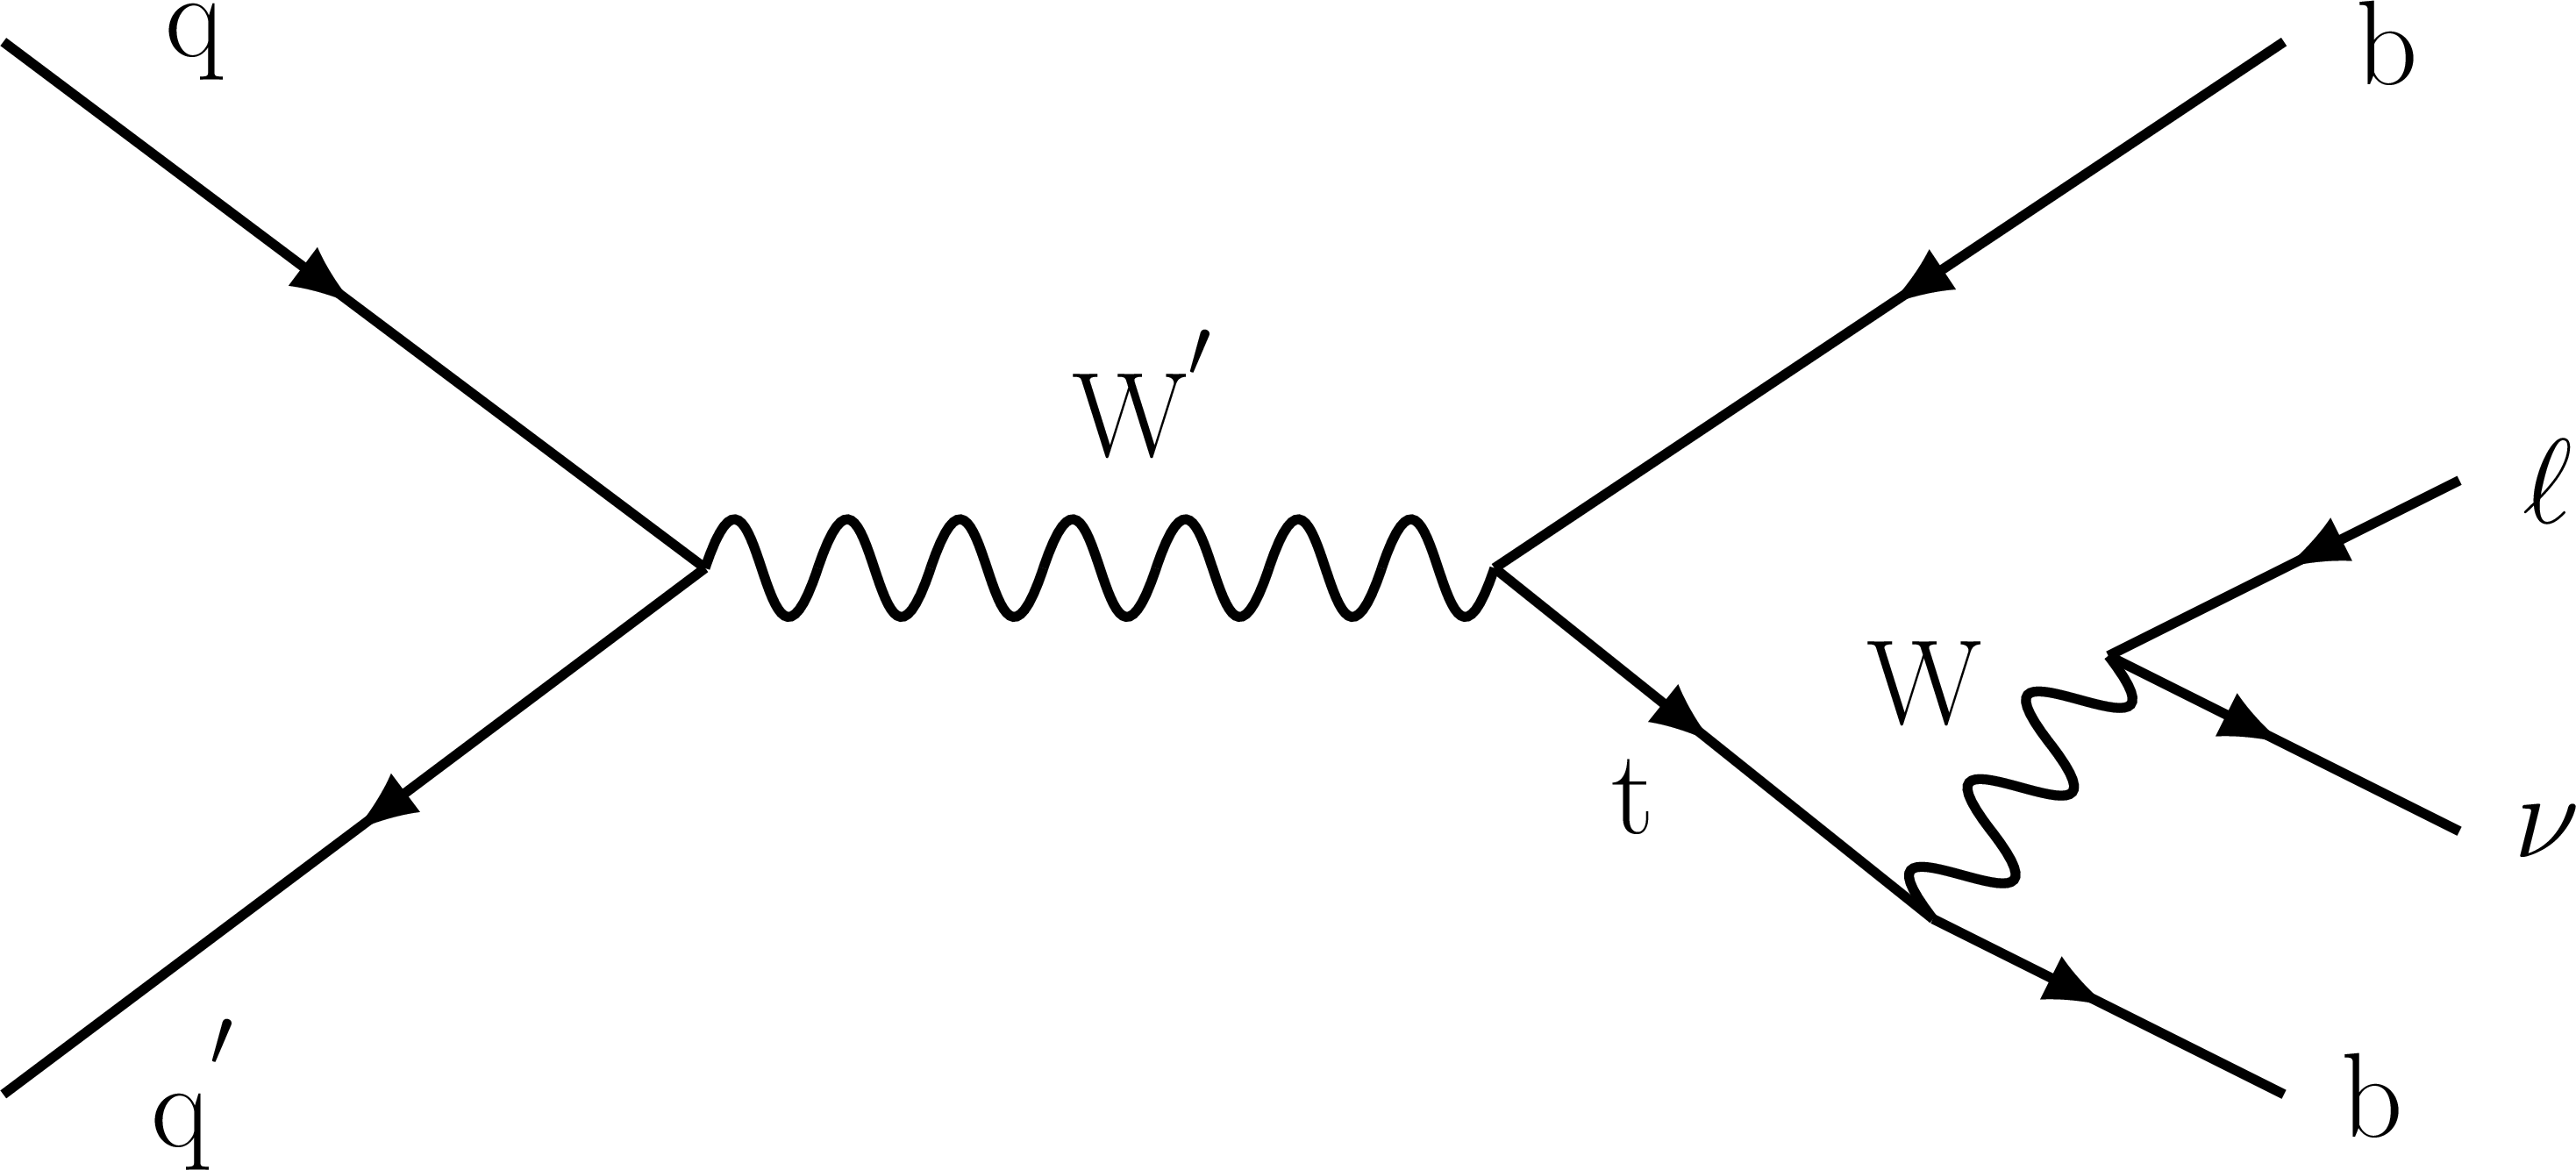
Figure 1:
Representative LO Feynman diagram for a W' boson produced in the $ s $-channel and decaying to a top and a bottom quark, with a lepton in the final state. |
png pdf |
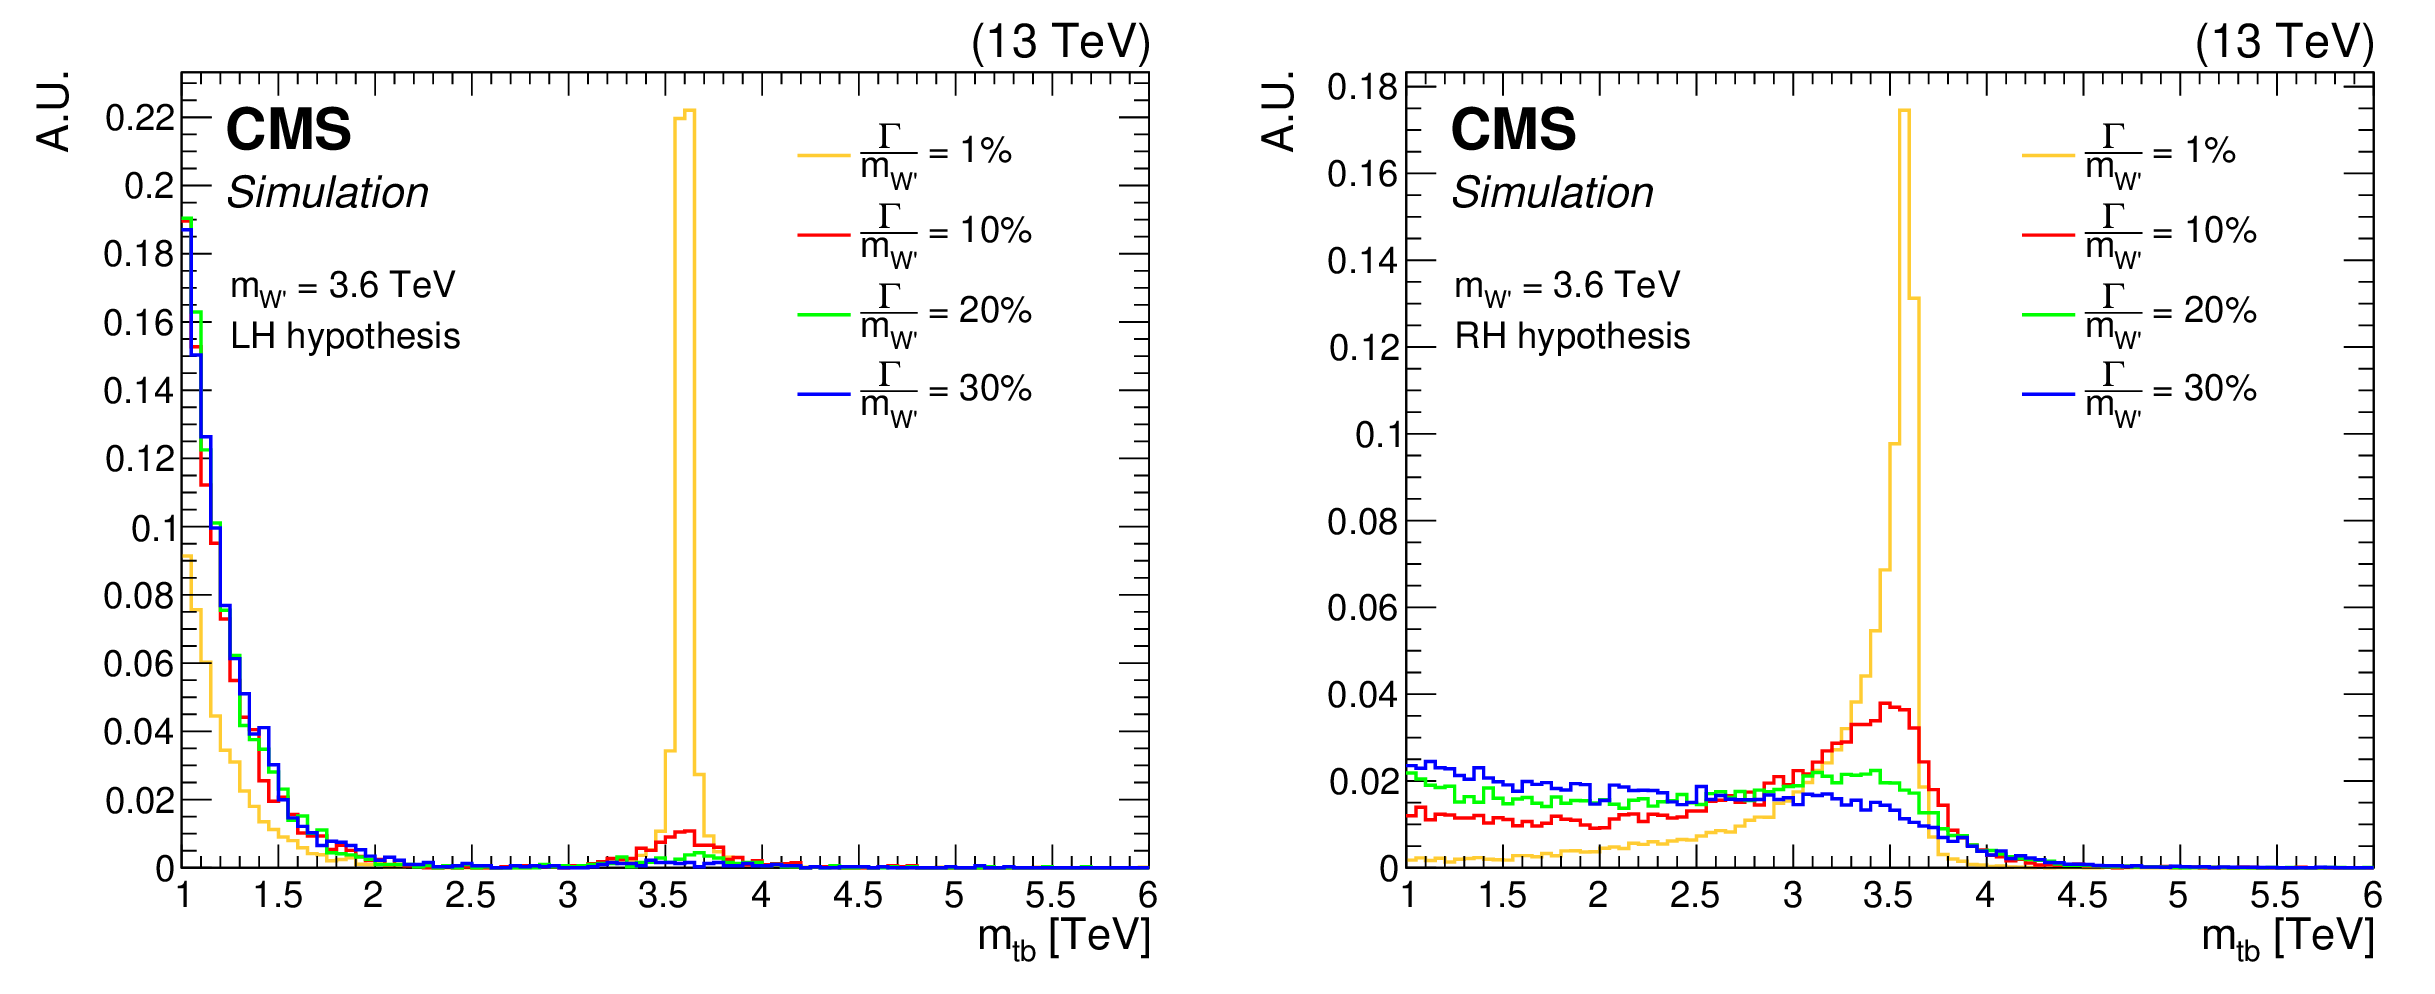
Figure 2:
Representative distributions of the invariant mass of the top-bottom quark pair, $ m_{\mathrm{t}\mathrm{b}} $, as originating from the W' boson for left- (left) and right-handed (right) W' bosons, with relative widths $ \Gamma/m_{\mathrm{W^{'}}} $ of 1, 10, 20, and 30% for a W' boson mass of 3.6 TeV. For the LH, the signal is simulated including the SM production of single top quarks in the $ s $-channel to correctly take into account the relative interference with the production of the W' boson. |
png pdf |
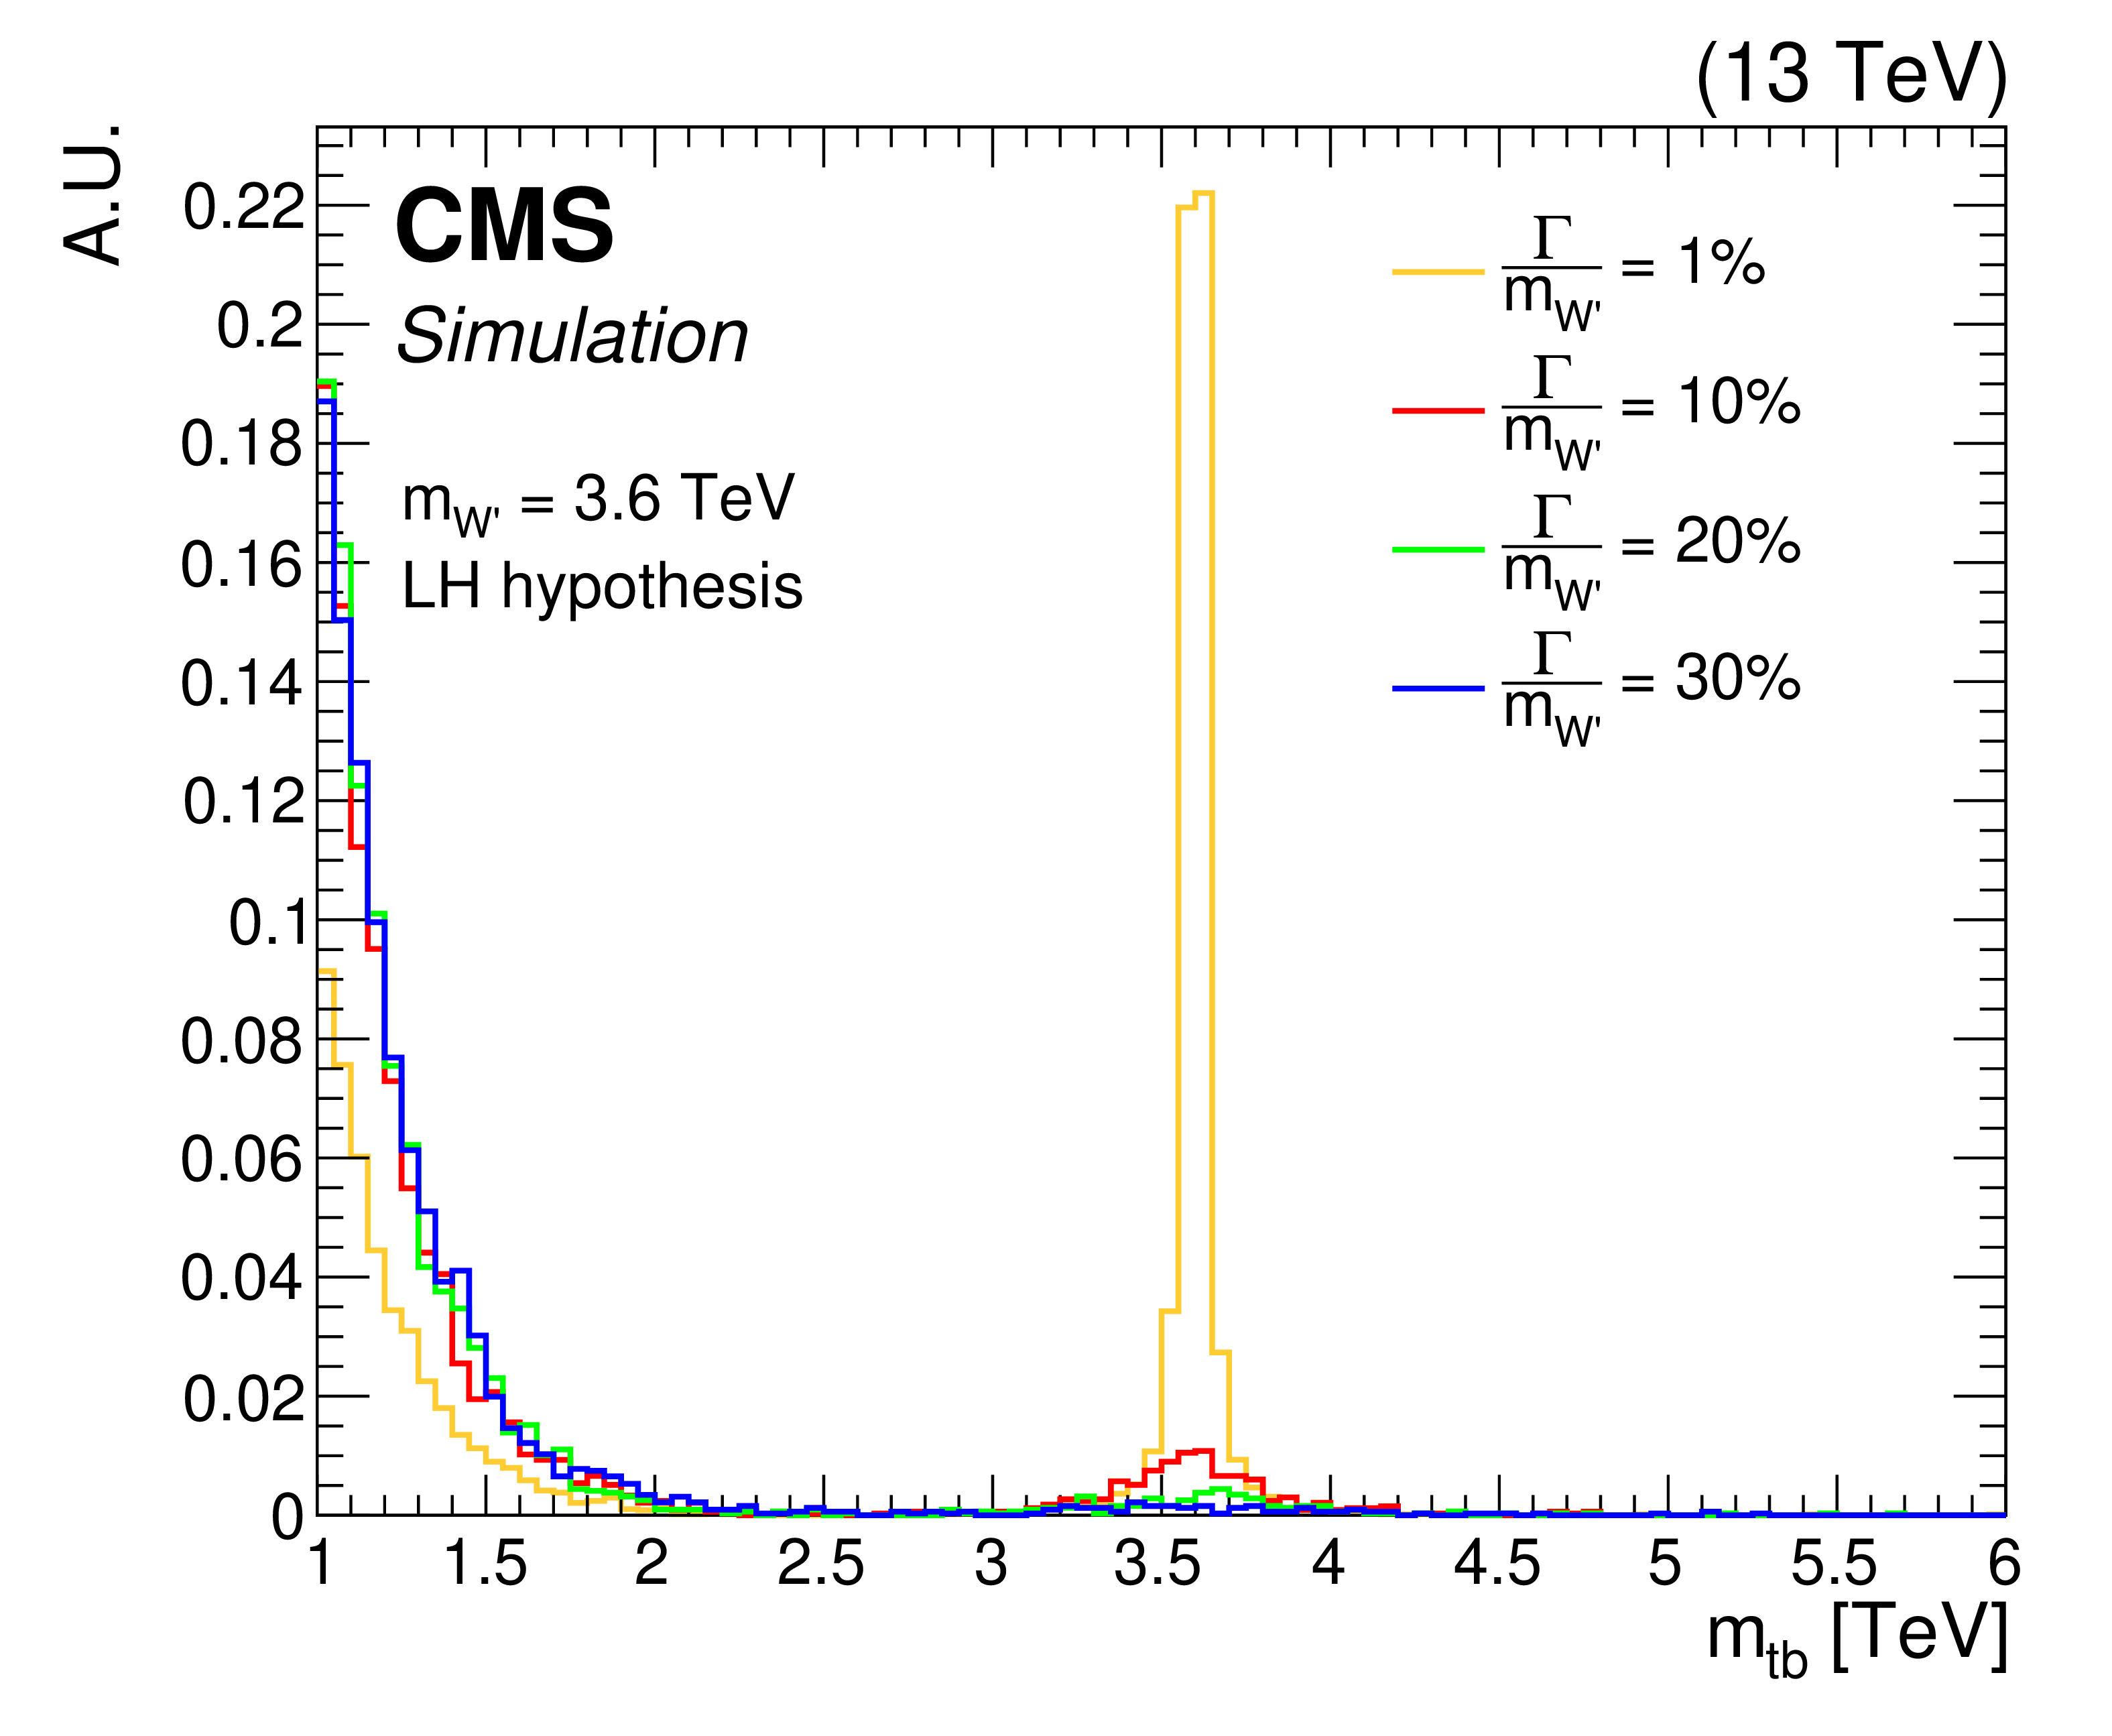
Figure 2-a:
Representative distributions of the invariant mass of the top-bottom quark pair, $ m_{\mathrm{t}\mathrm{b}} $, as originating from left-handed W' bosons, with relative widths $ \Gamma/m_{\mathrm{W^{'}}} $ of 1, 10, 20, and 30% for a W' boson mass of 3.6 TeV. For the LH, the signal is simulated including the SM production of single top quarks in the $ s $-channel to correctly take into account the relative interference with the production of the W' boson. |
png pdf |
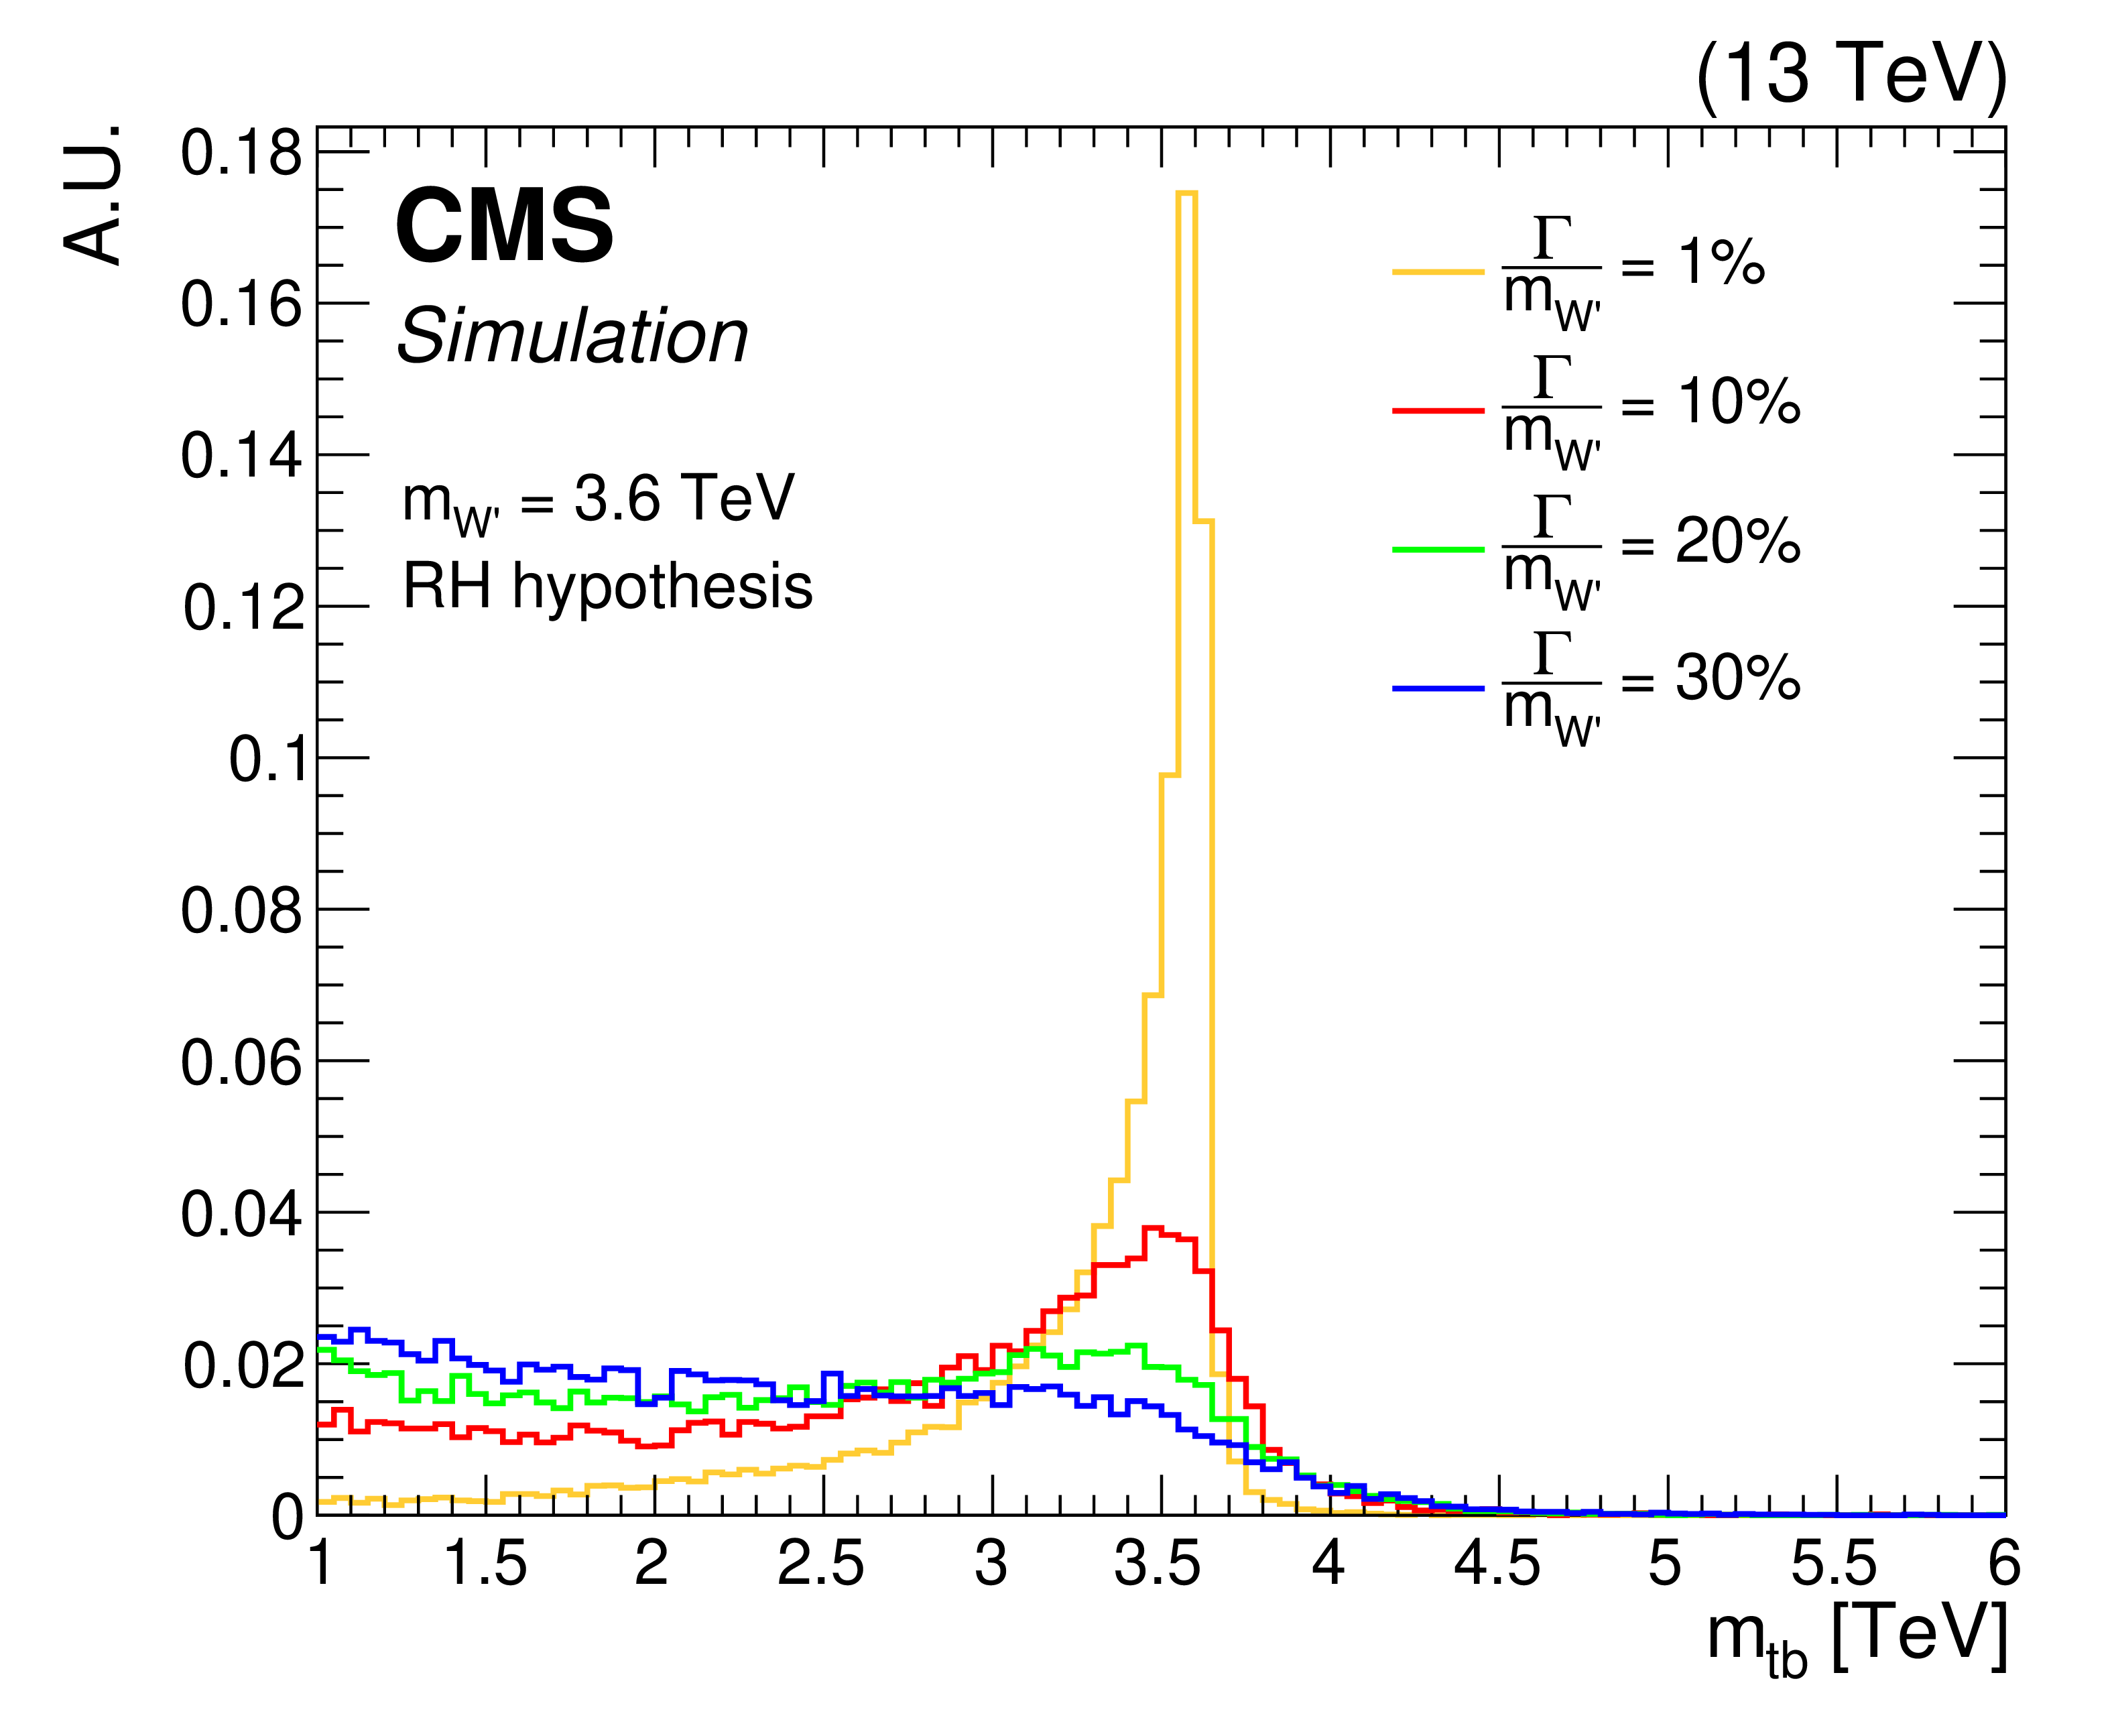
Figure 2-b:
Representative distributions of the invariant mass of the top-bottom quark pair, $ m_{\mathrm{t}\mathrm{b}} $, as originating from right-handed W' bosons, with relative widths $ \Gamma/m_{\mathrm{W^{'}}} $ of 1, 10, 20, and 30% for a W' boson mass of 3.6 TeV. For the LH, the signal is simulated including the SM production of single top quarks in the $ s $-channel to correctly take into account the relative interference with the production of the W' boson. |
png pdf |
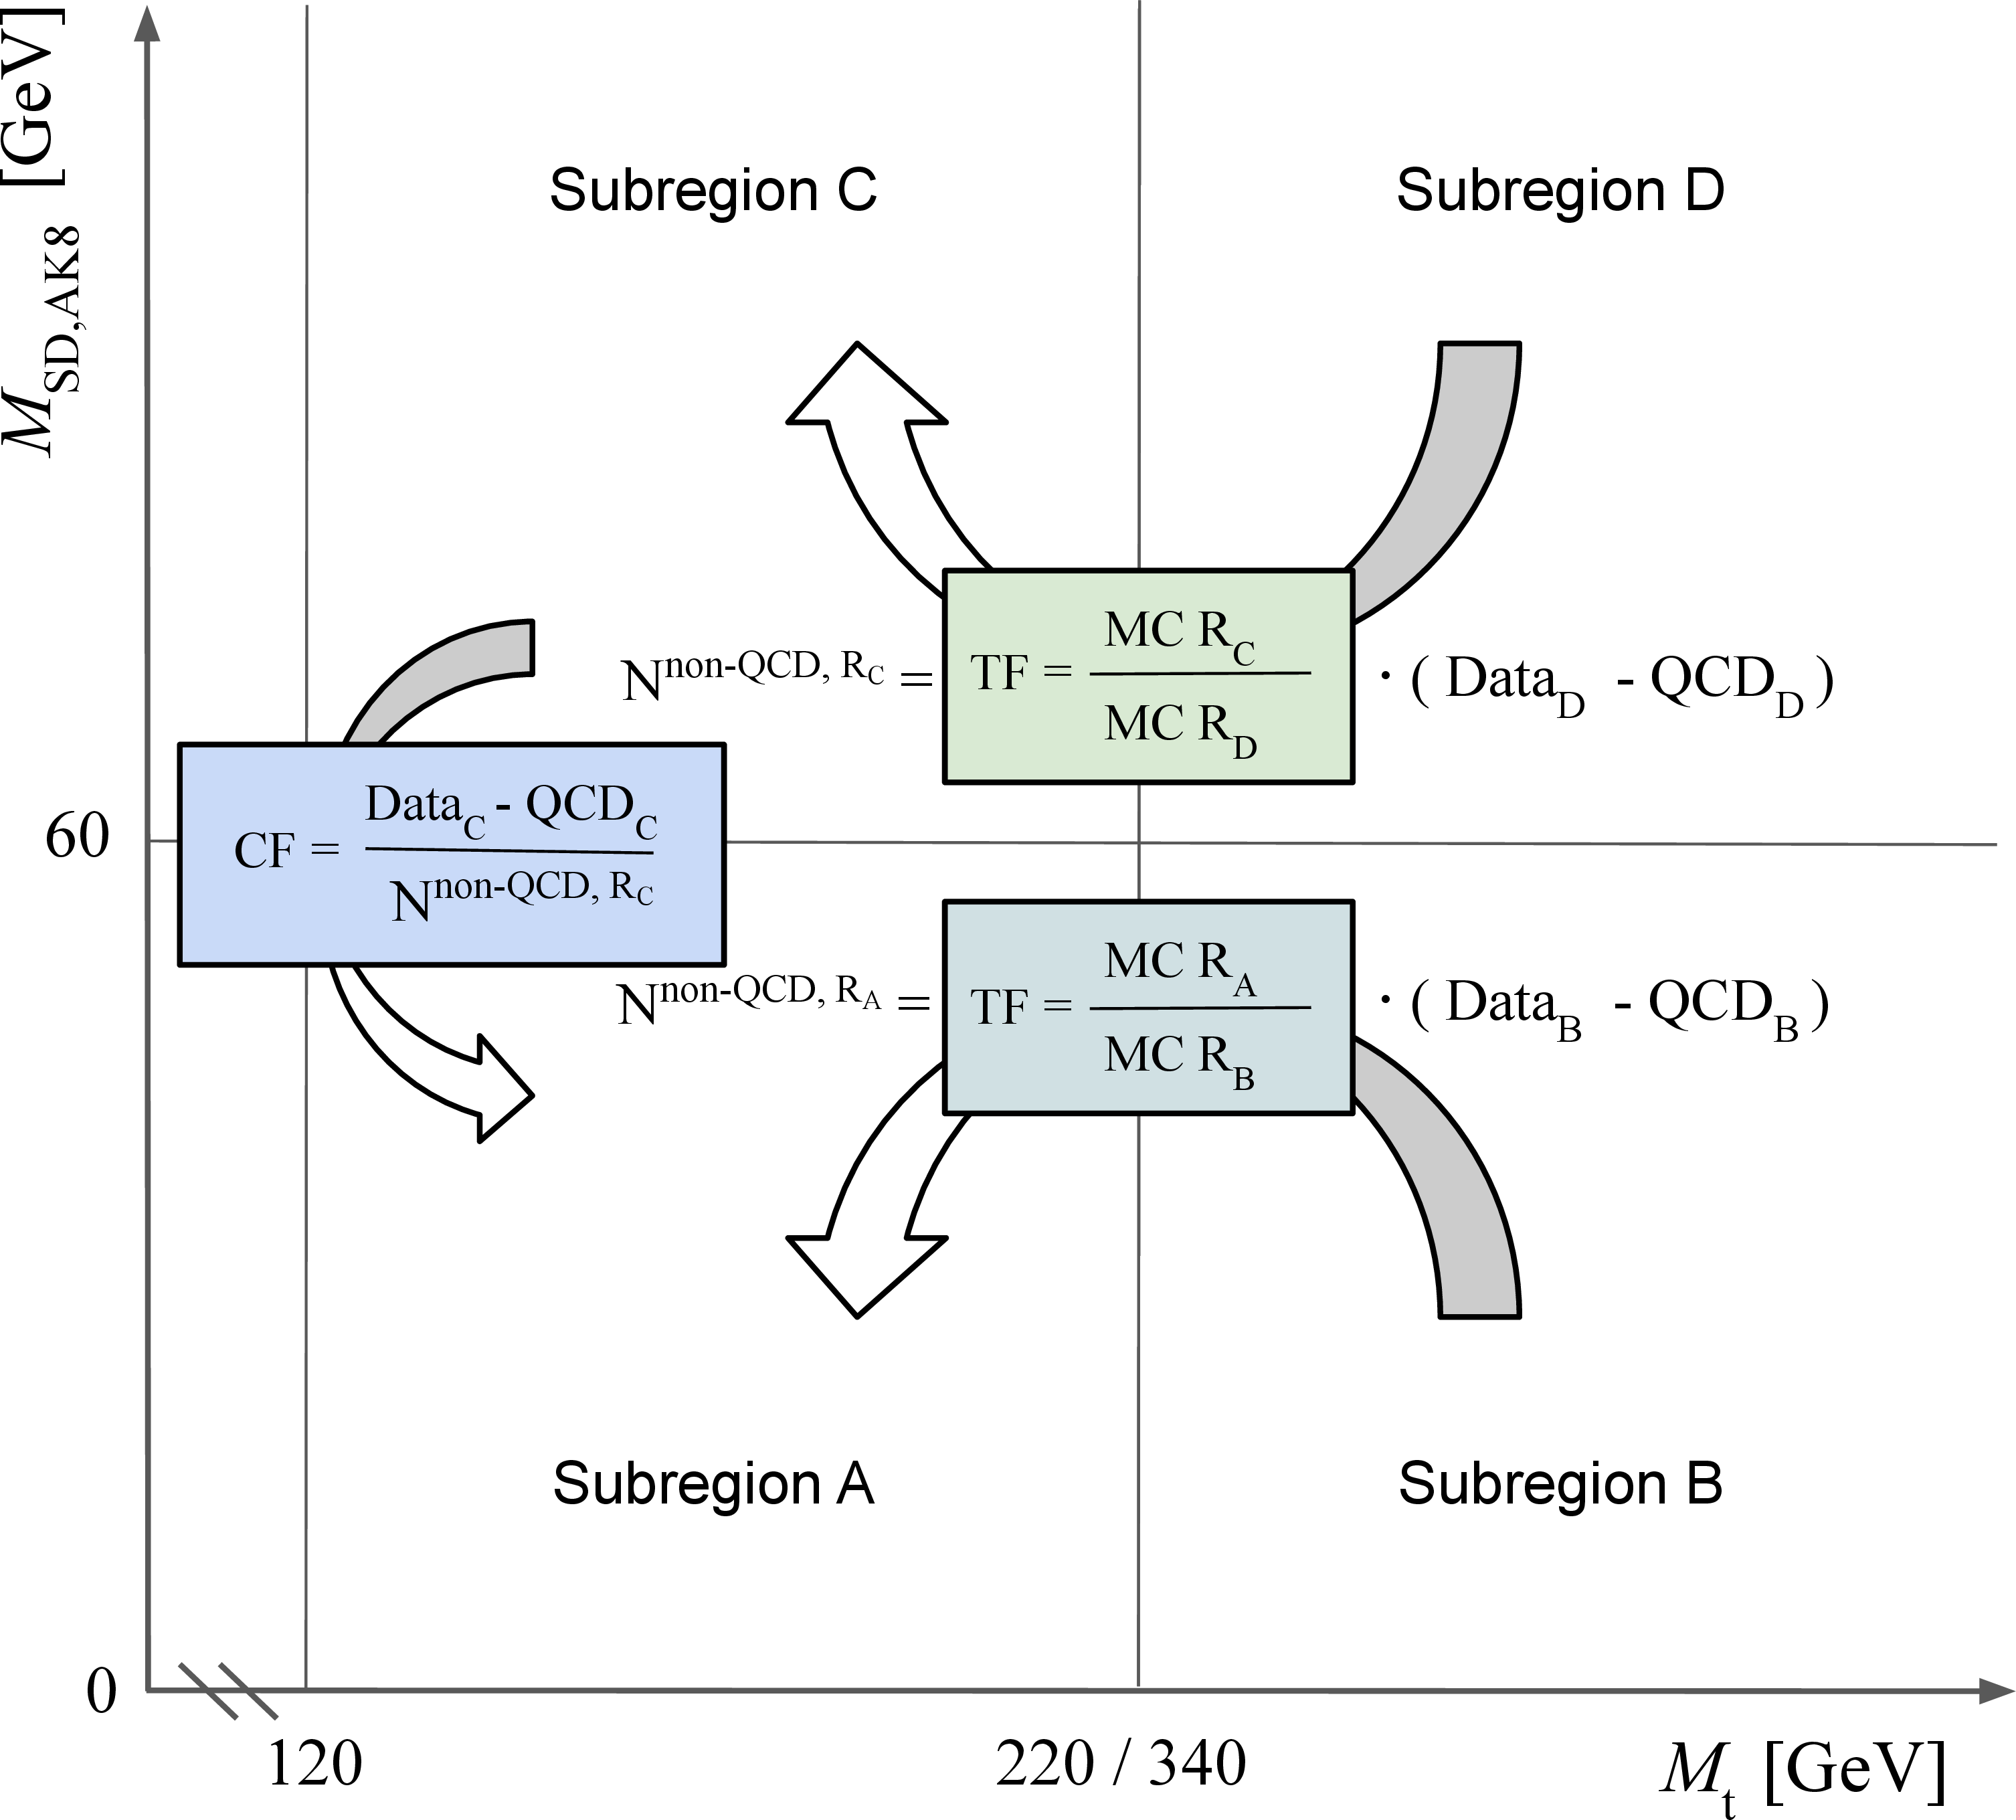
Figure 3:
A visual representation of the subregions and their usage in the background extraction procedure. The $ x $ axis reports the requirements applied on $ M_{\mathrm{t}} $ in order to define the subregions while the $ y $ axis represents the soft-drop mass of the AK8 jet associated to the AK4 jet used to reconstruct the W' boson ($ M_{\mathrm{SD,AK8}} $). |
png pdf |
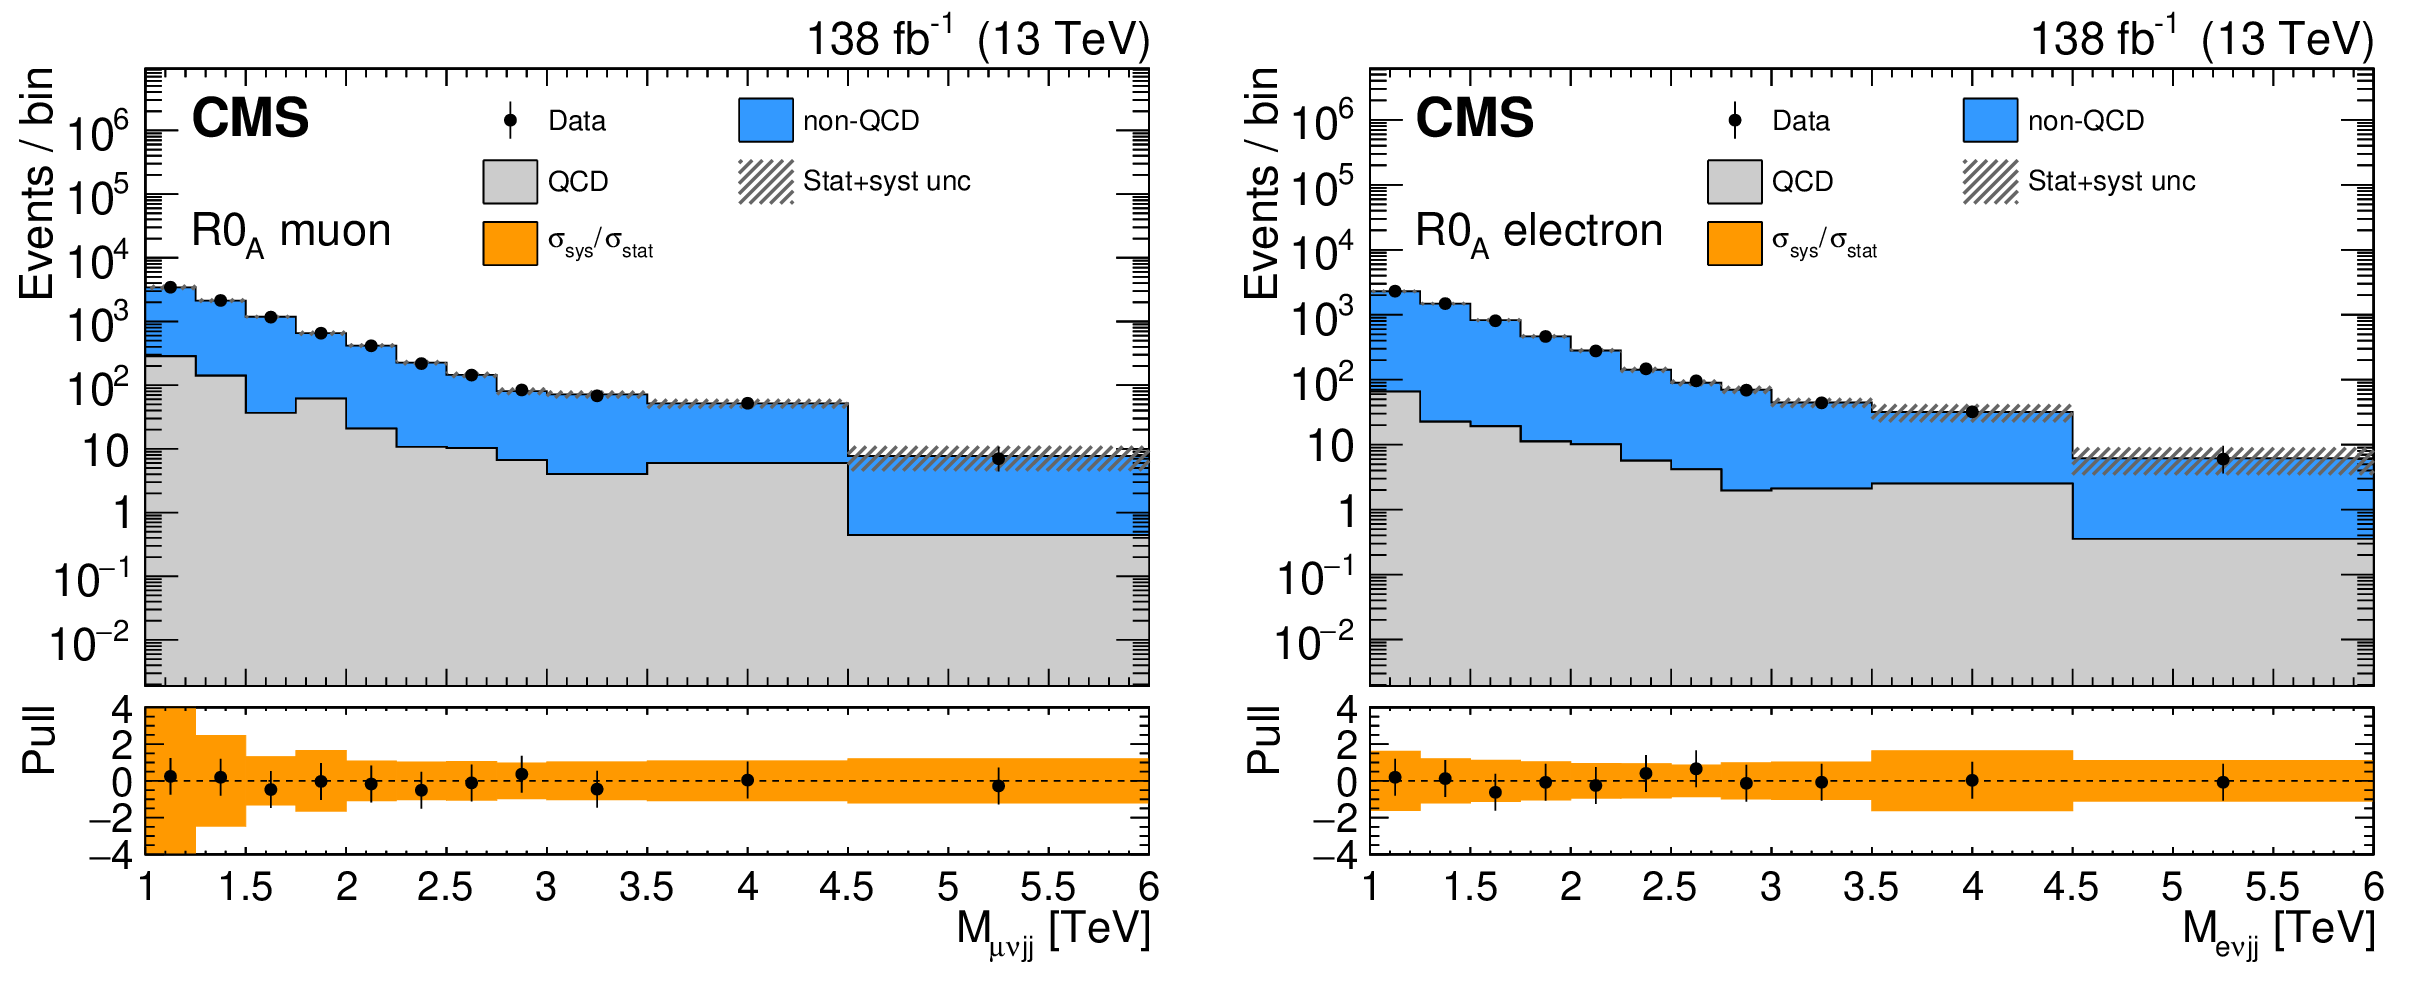
Figure 4:
Post-fit distributions of $ M_{\mathrm{\ell \nu jj}} $ in the $ \mathrm{\mathrm{R0}_A} $ control subregion for muons (left) or electrons (right). The lower panel reports the data minus the expected number of events normalized to the statistical uncertainty of the data. The orange band represents the systematic uncertainties, also normalized to the statistical uncertainty of the data. |
png pdf |
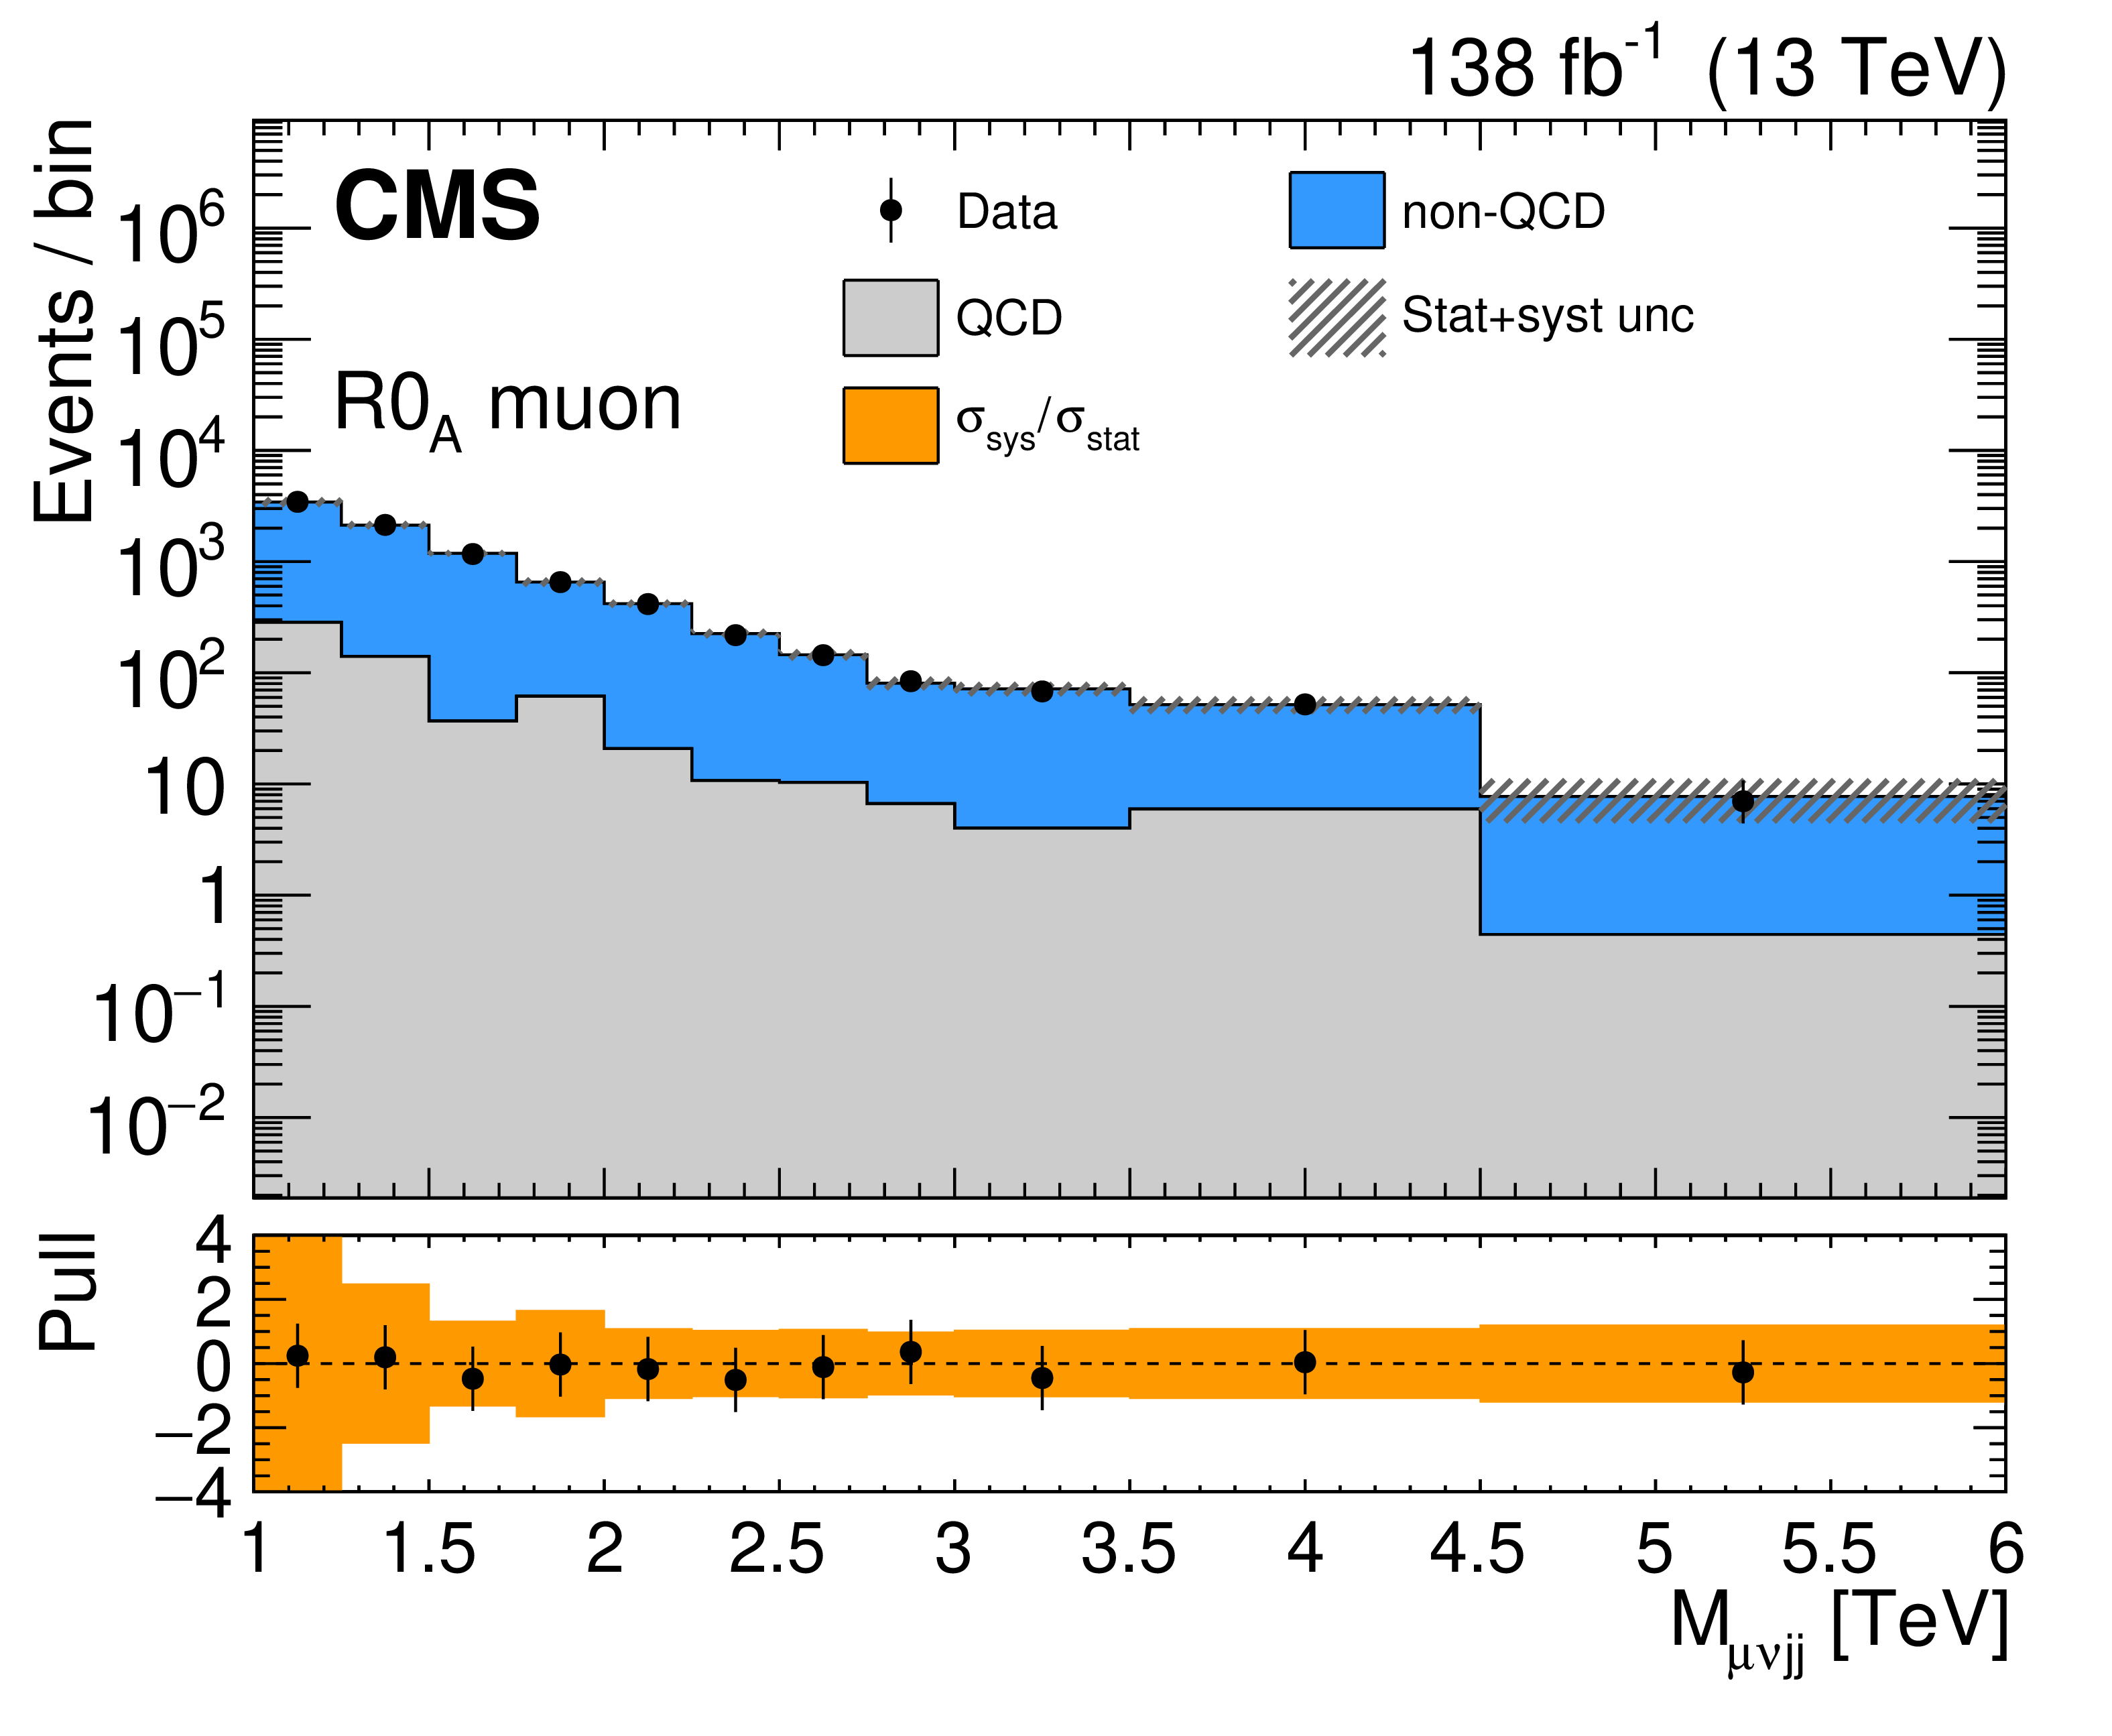
Figure 4-a:
Post-fit distributions of $ M_{\mathrm{\ell \nu jj}} $ in the $ \mathrm{\mathrm{R0}_A} $ control subregion for muons. The lower panel reports the data minus the expected number of events normalized to the statistical uncertainty of the data. The orange band represents the systematic uncertainties, also normalized to the statistical uncertainty of the data. |
png pdf |
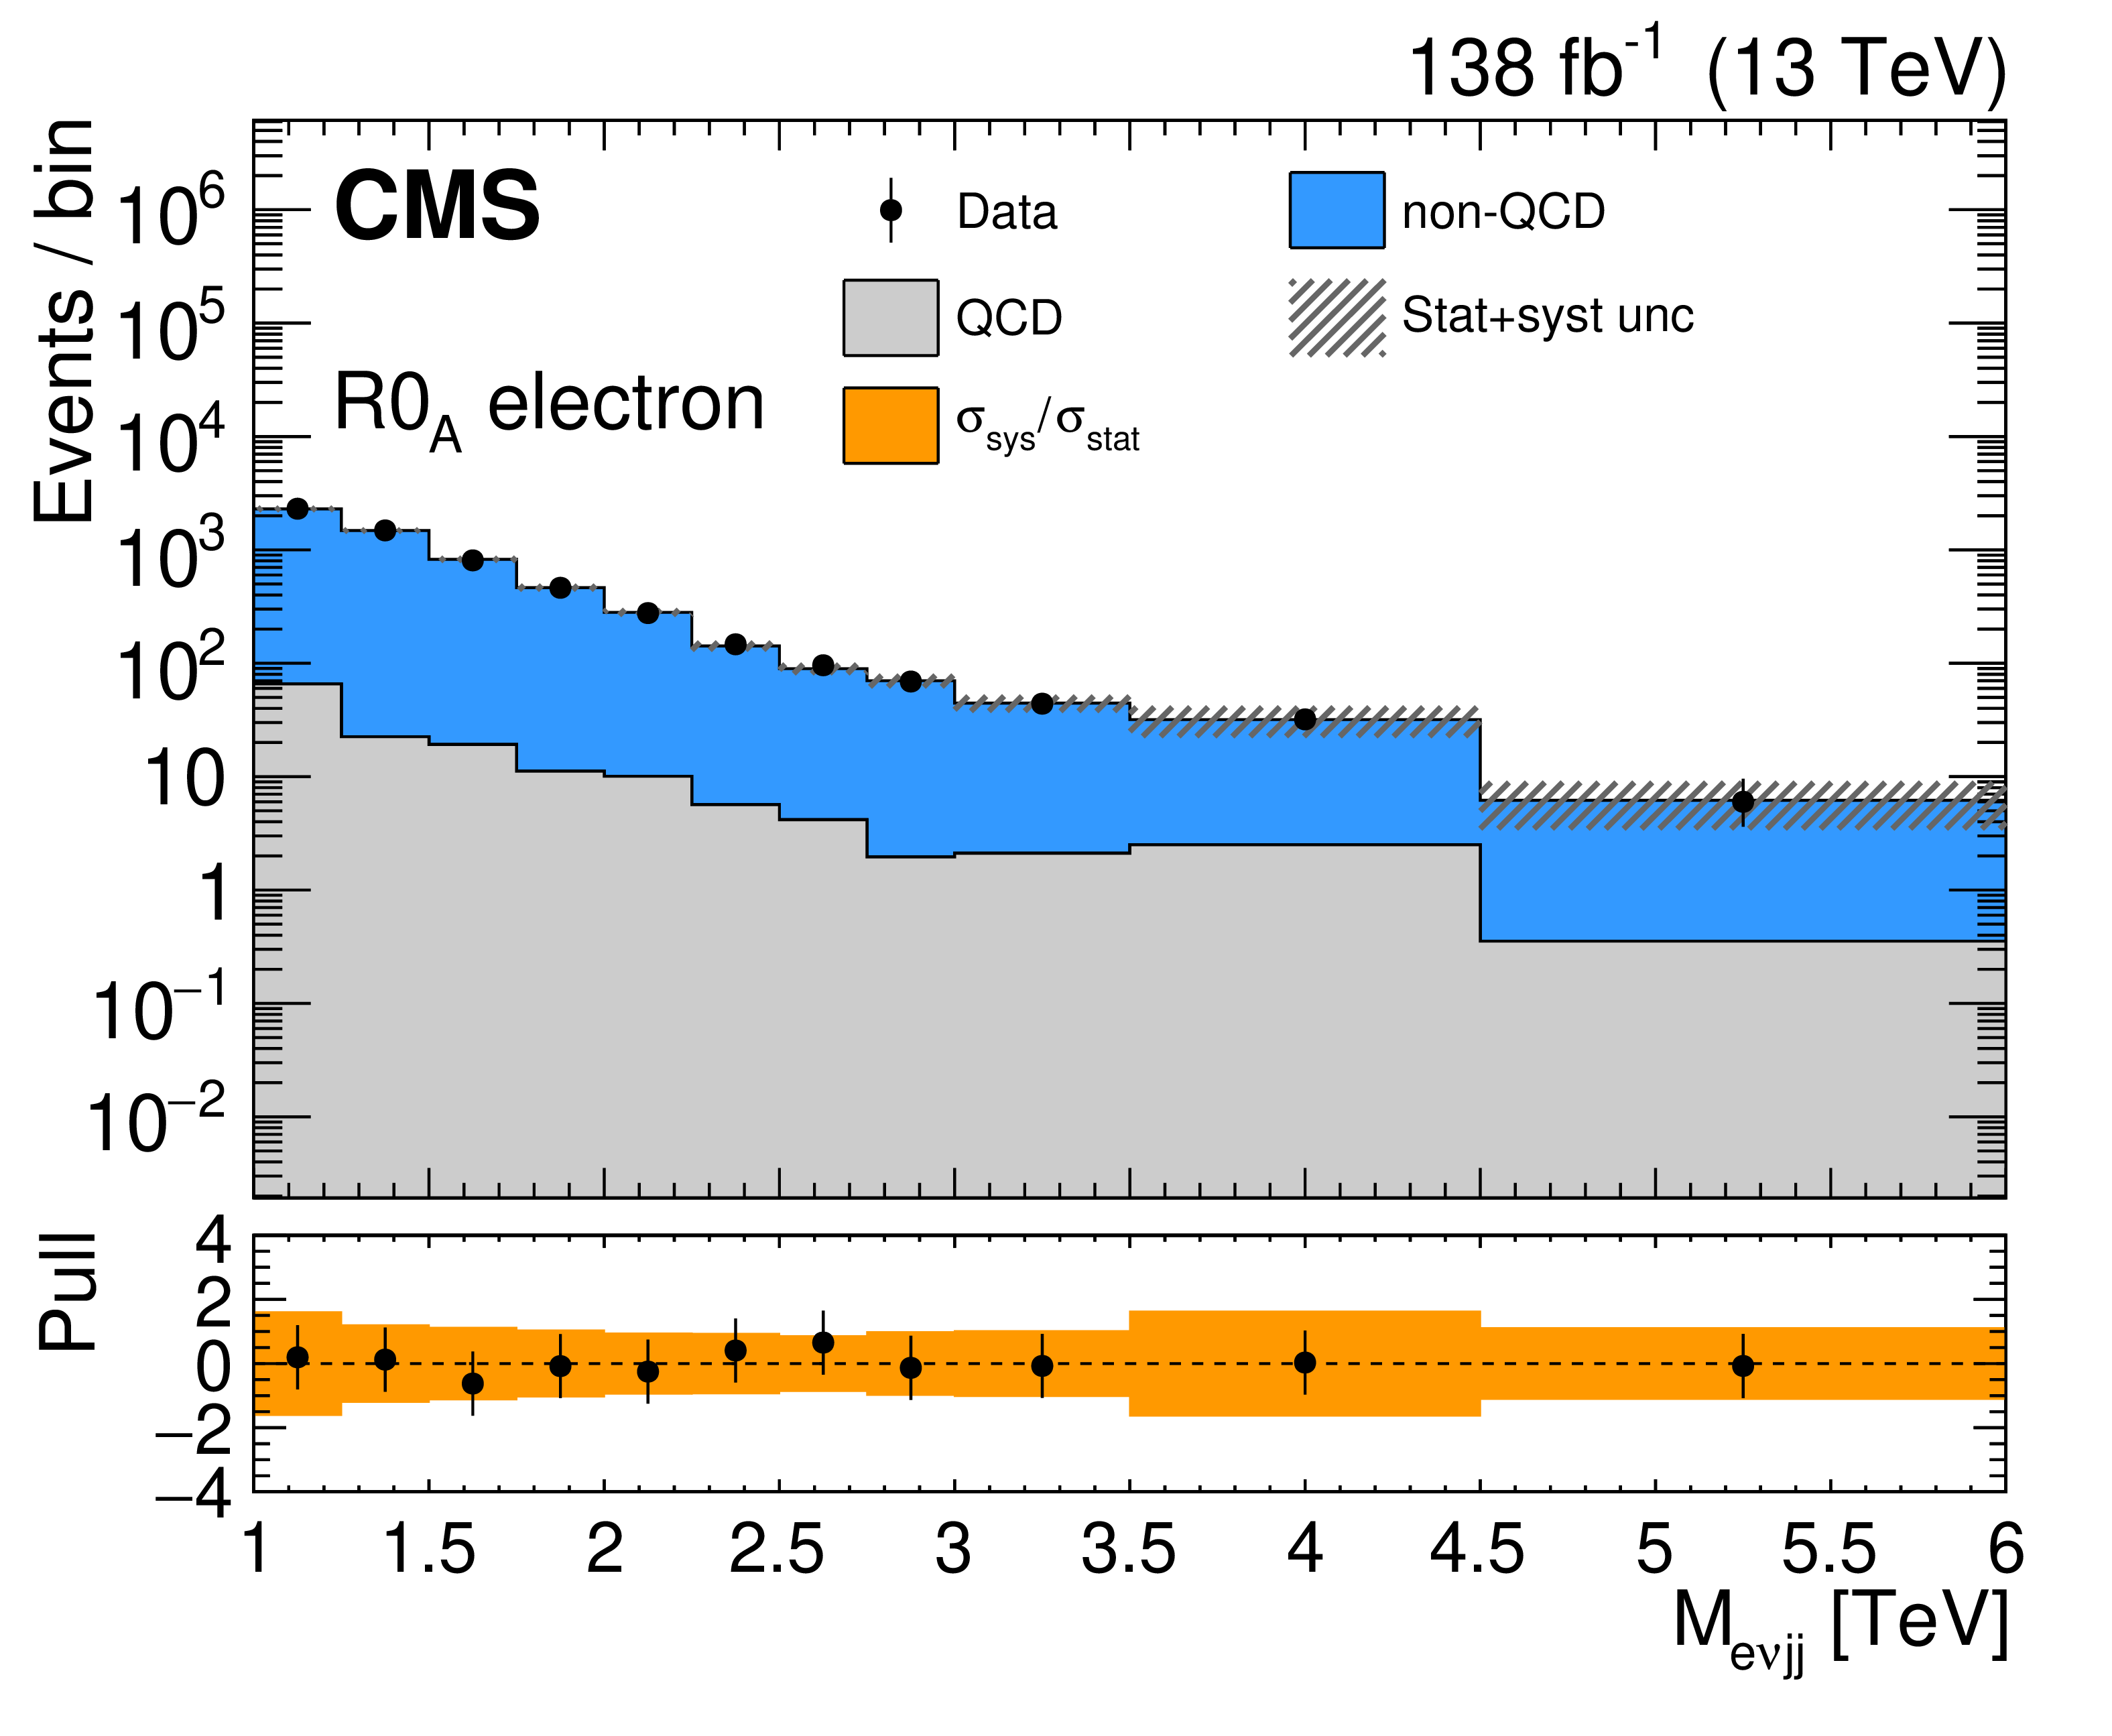
Figure 4-b:
Post-fit distributions of $ M_{\mathrm{\ell \nu jj}} $ in the $ \mathrm{\mathrm{R0}_A} $ control subregion for electrons. The lower panel reports the data minus the expected number of events normalized to the statistical uncertainty of the data. The orange band represents the systematic uncertainties, also normalized to the statistical uncertainty of the data. |
png pdf |
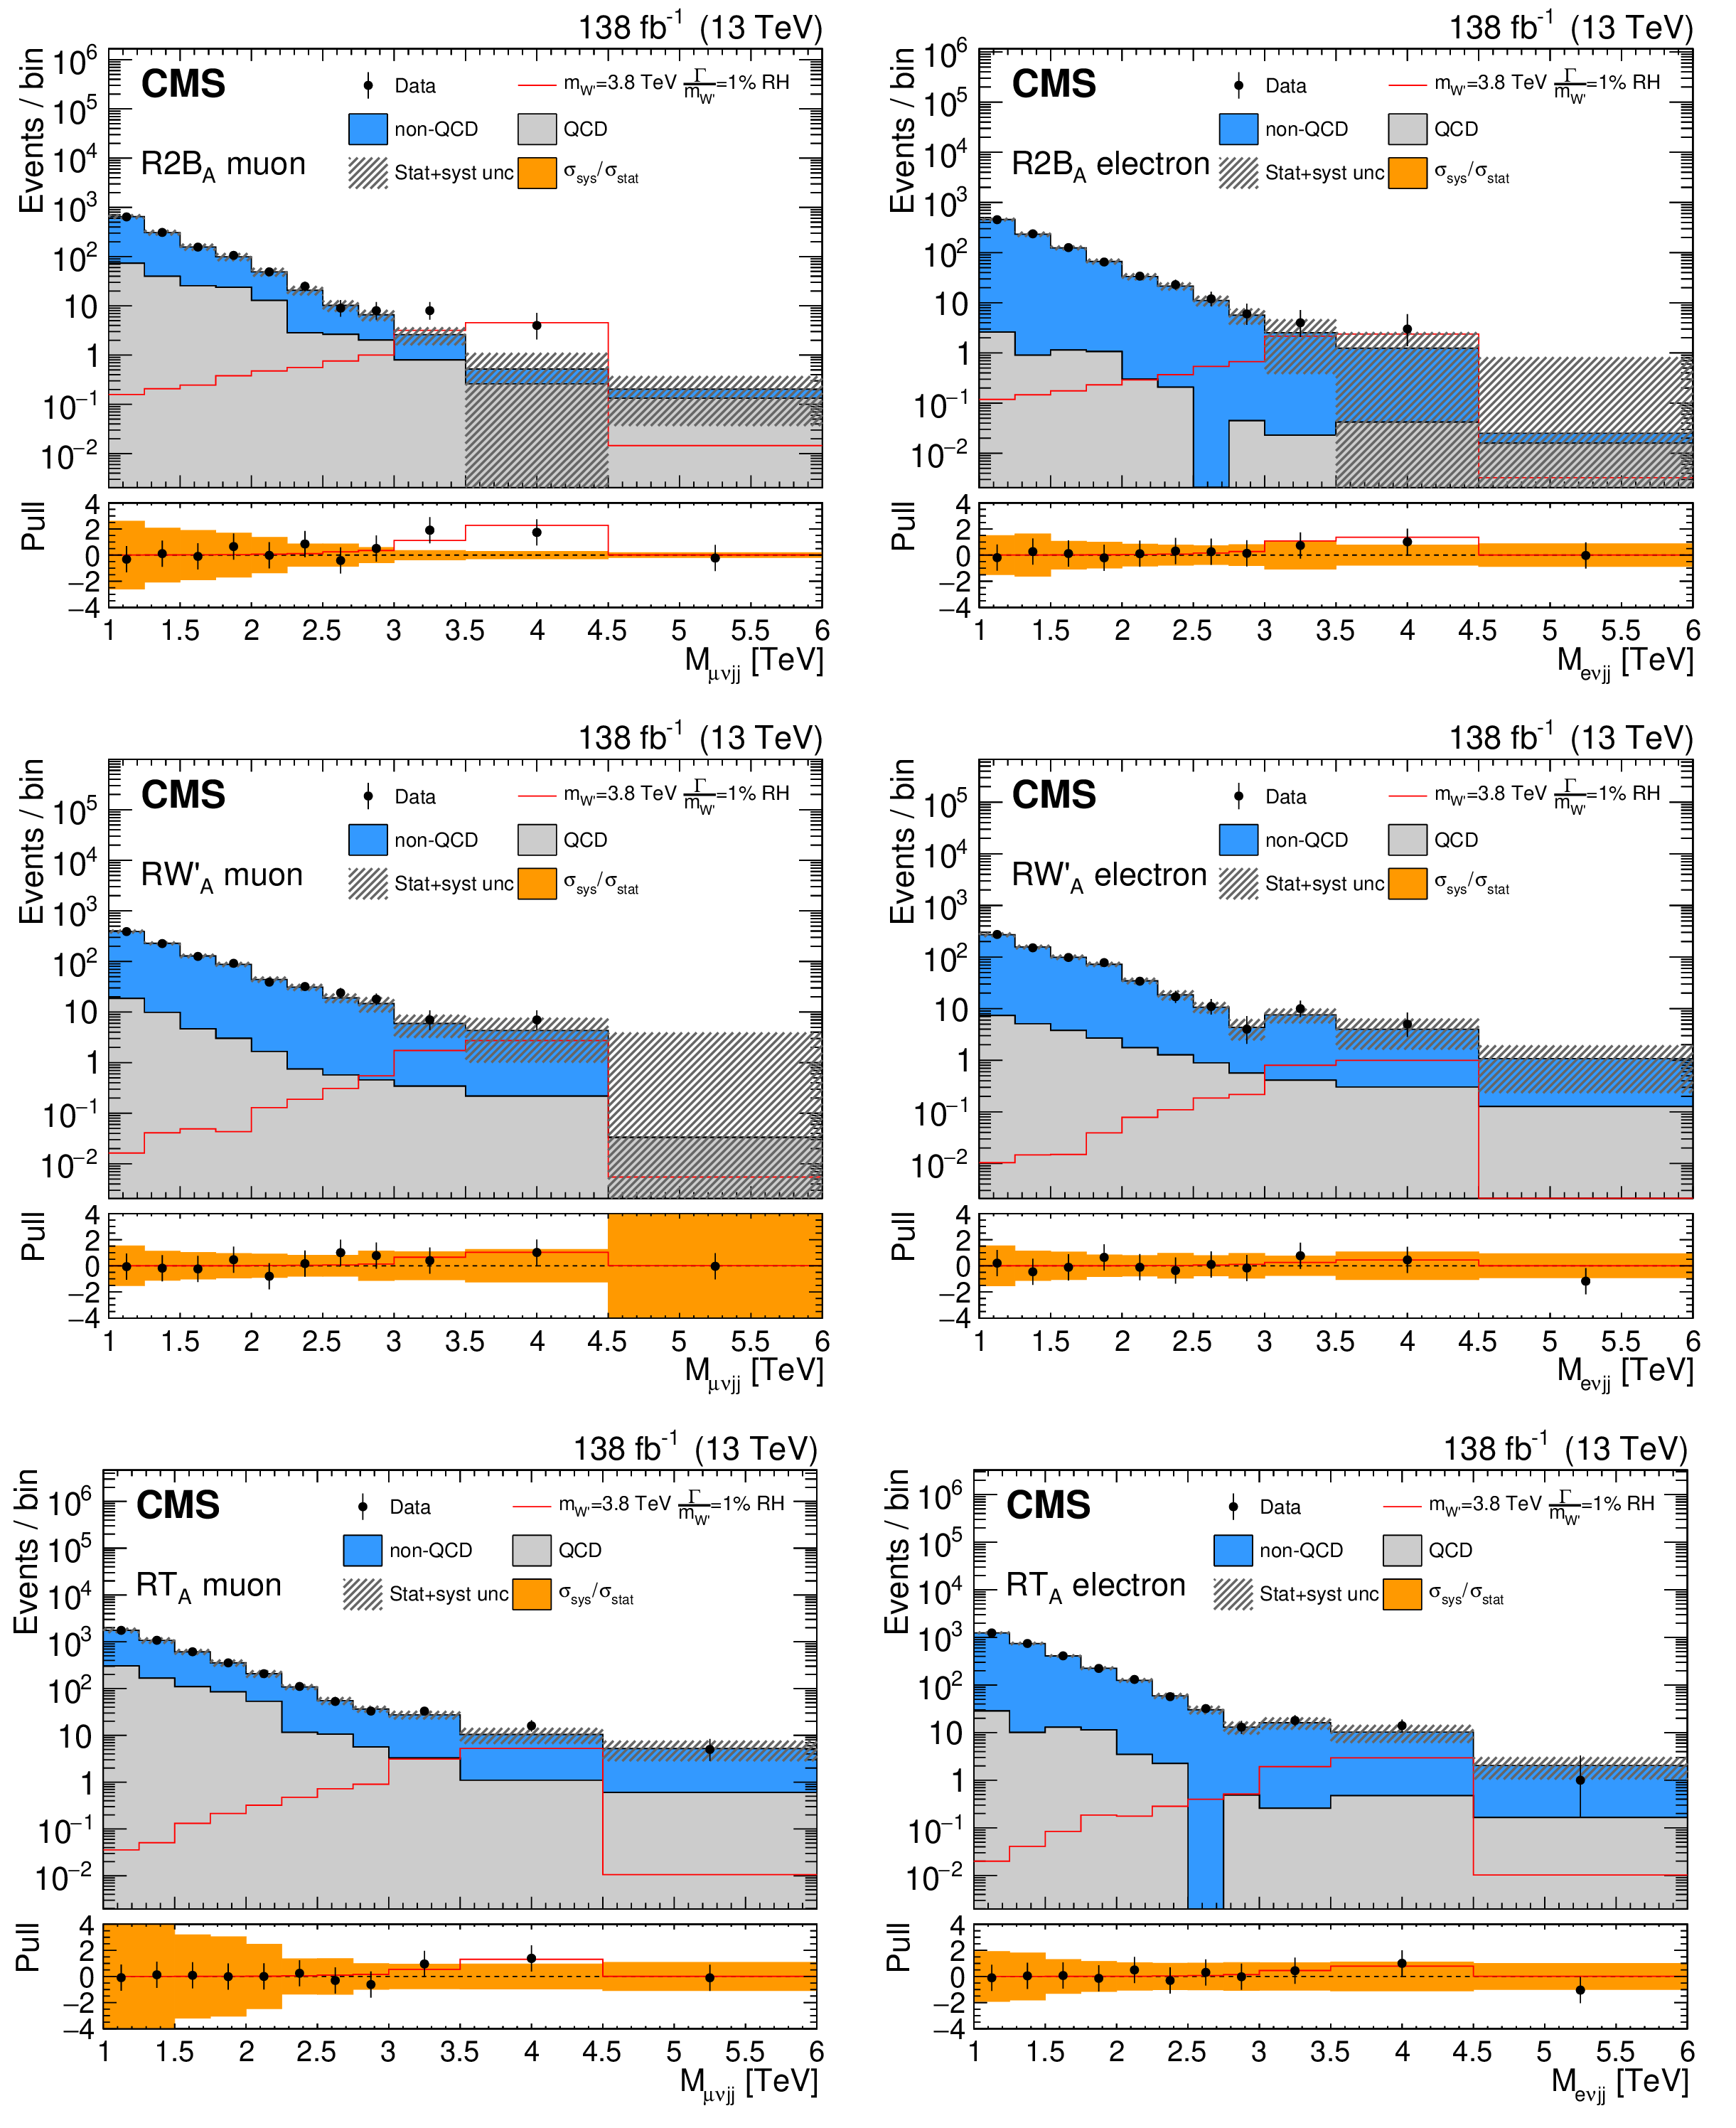
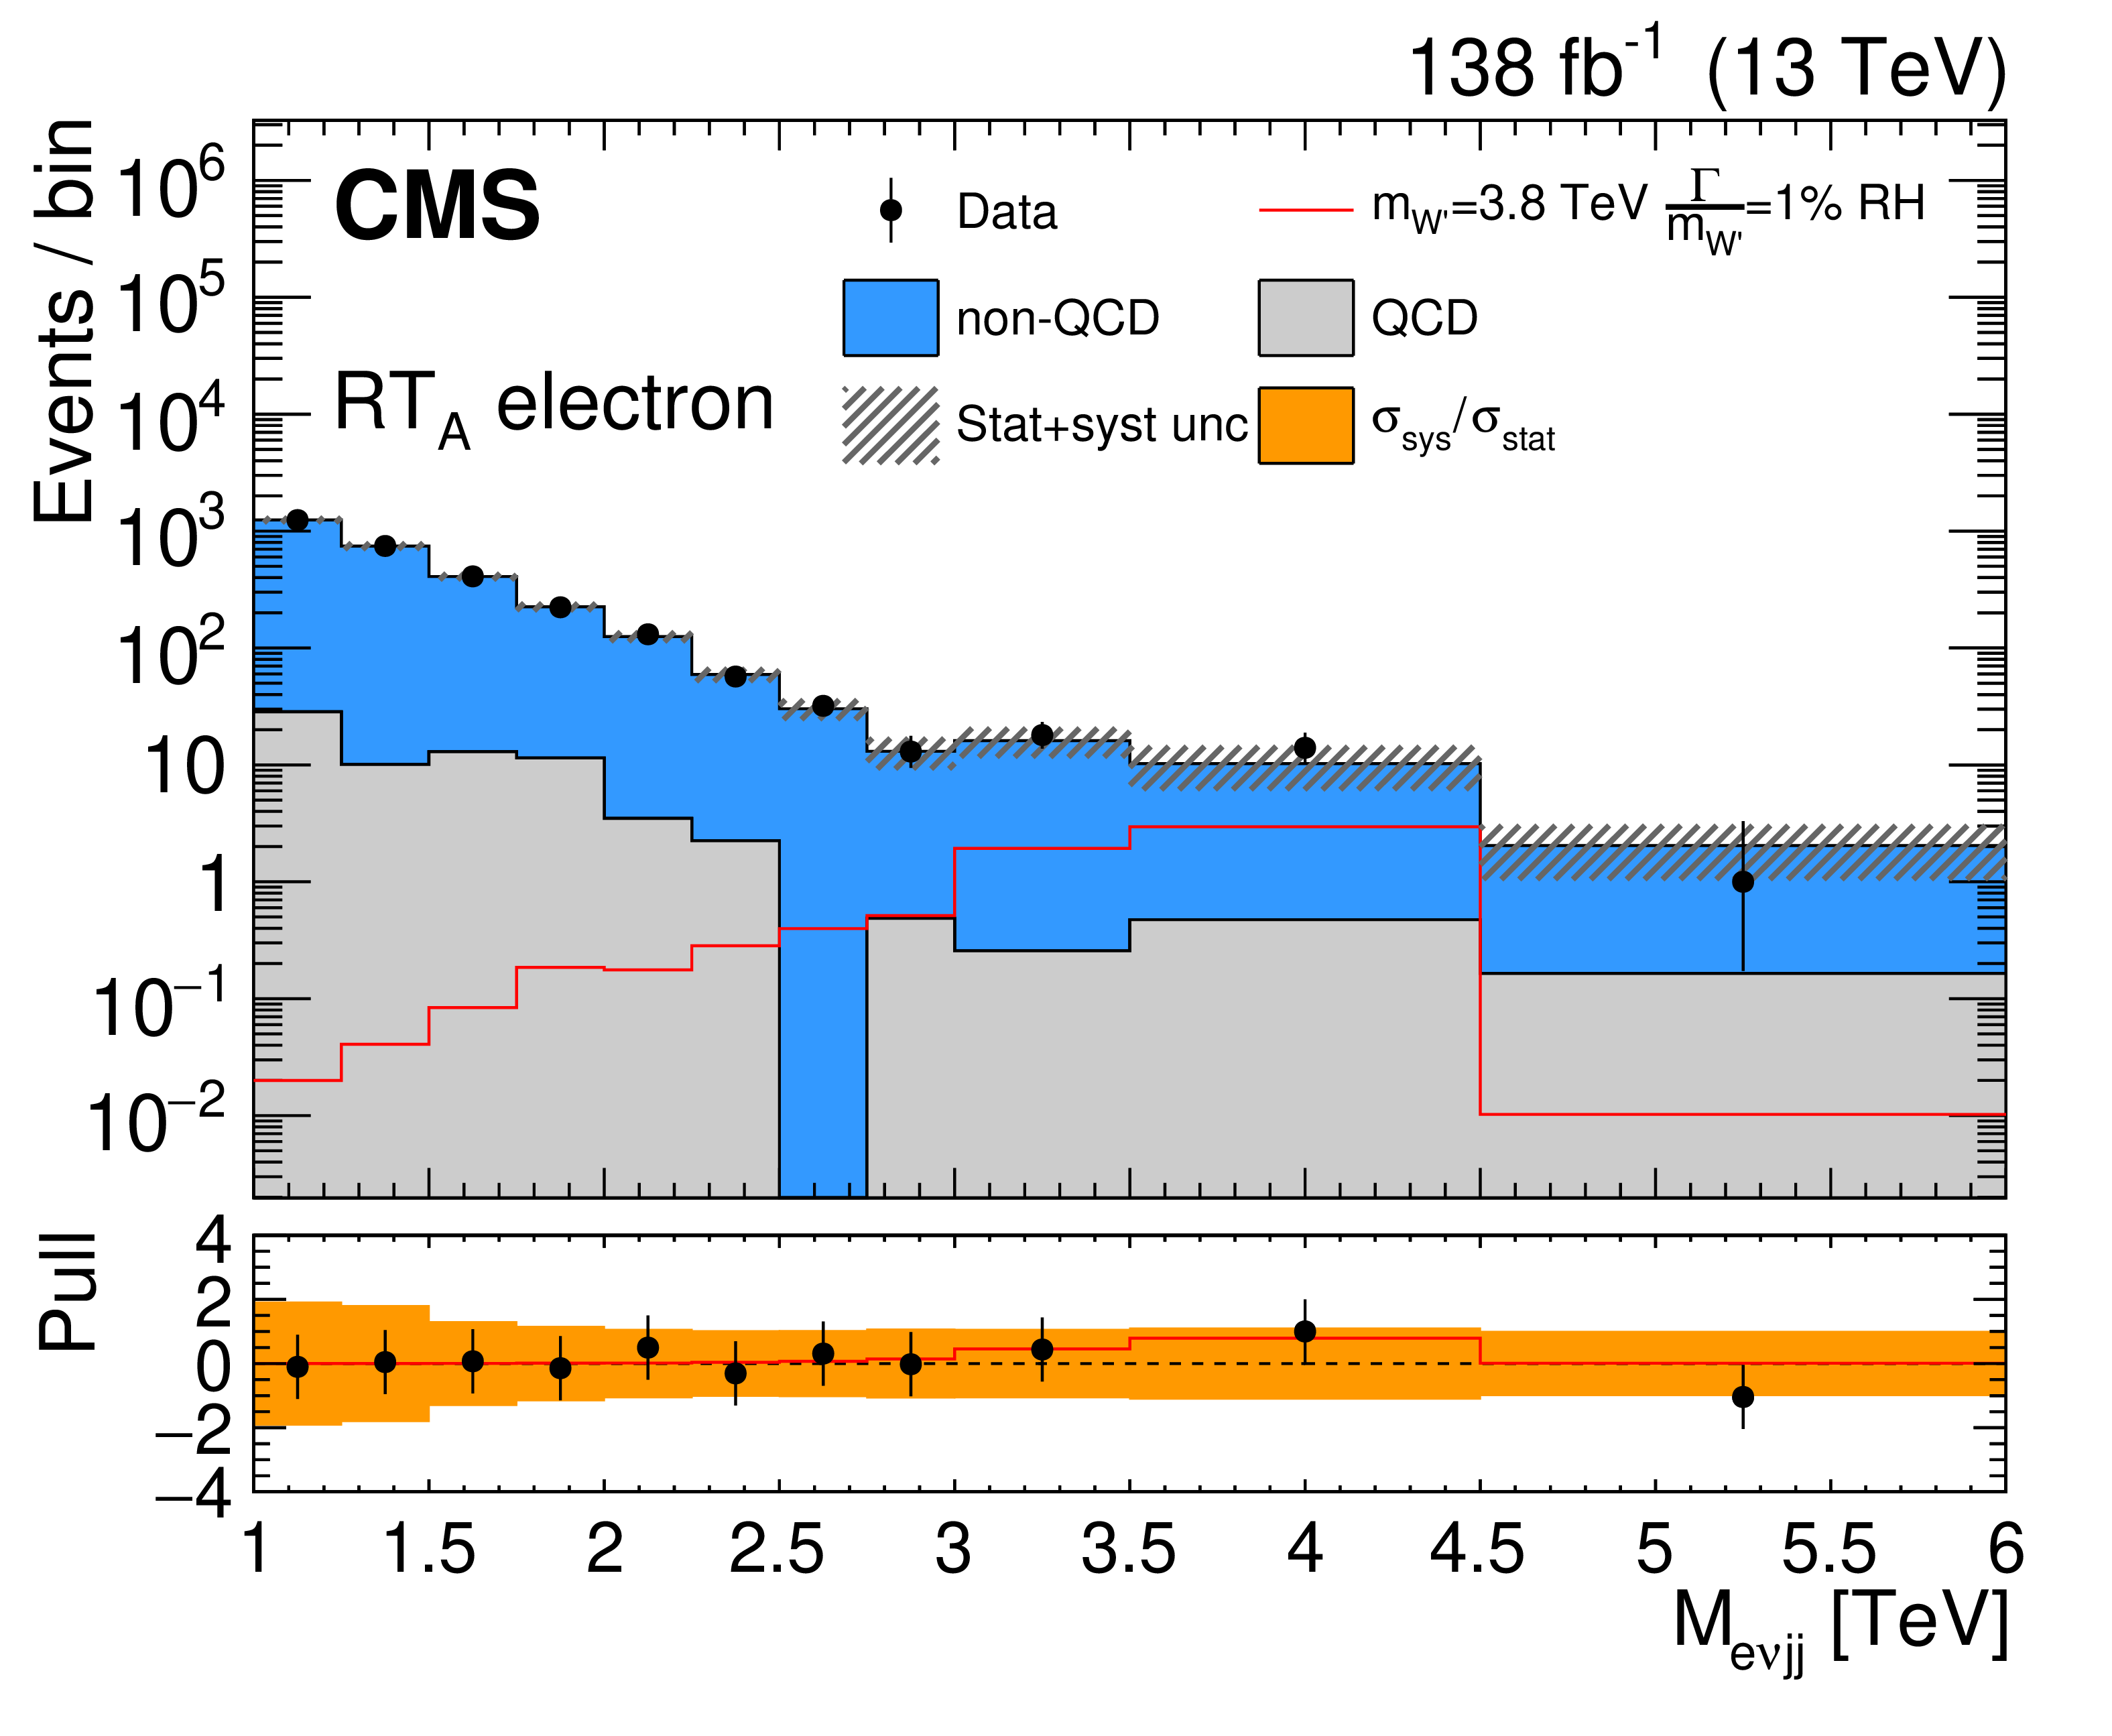
Figure 5:
Post-fit distributions of $ M_{\mathrm{\ell \nu jj}} $ in the $ \mathrm{\mathrm{R2B}_A} $ (upper), $ \mathrm{\mathrm{R\mathrm{W^{'}}}_A} $ (middle), and $ \mathrm{\mathrm{RT}_A} $ (lower) subregions for muons (left column) and electrons (right column). All process yields and nuisance parameters are set to the values obtained from the background plus signal fit. The signal considered for the fit corresponds to the purely right-handed production of a W' with $ m_{\mathrm{W^{'}}} $ of 3.6 TeV and a relative width of 1% of the $ m_{\mathrm{W^{'}}} $, and is represented by the solid red line. The lower panels show the data minus the expected number of events, normalized to the statistical uncertainty of the data. The orange band represents the systematic uncertainties, also normalized to the statistical uncertainty of the data. |
png pdf |
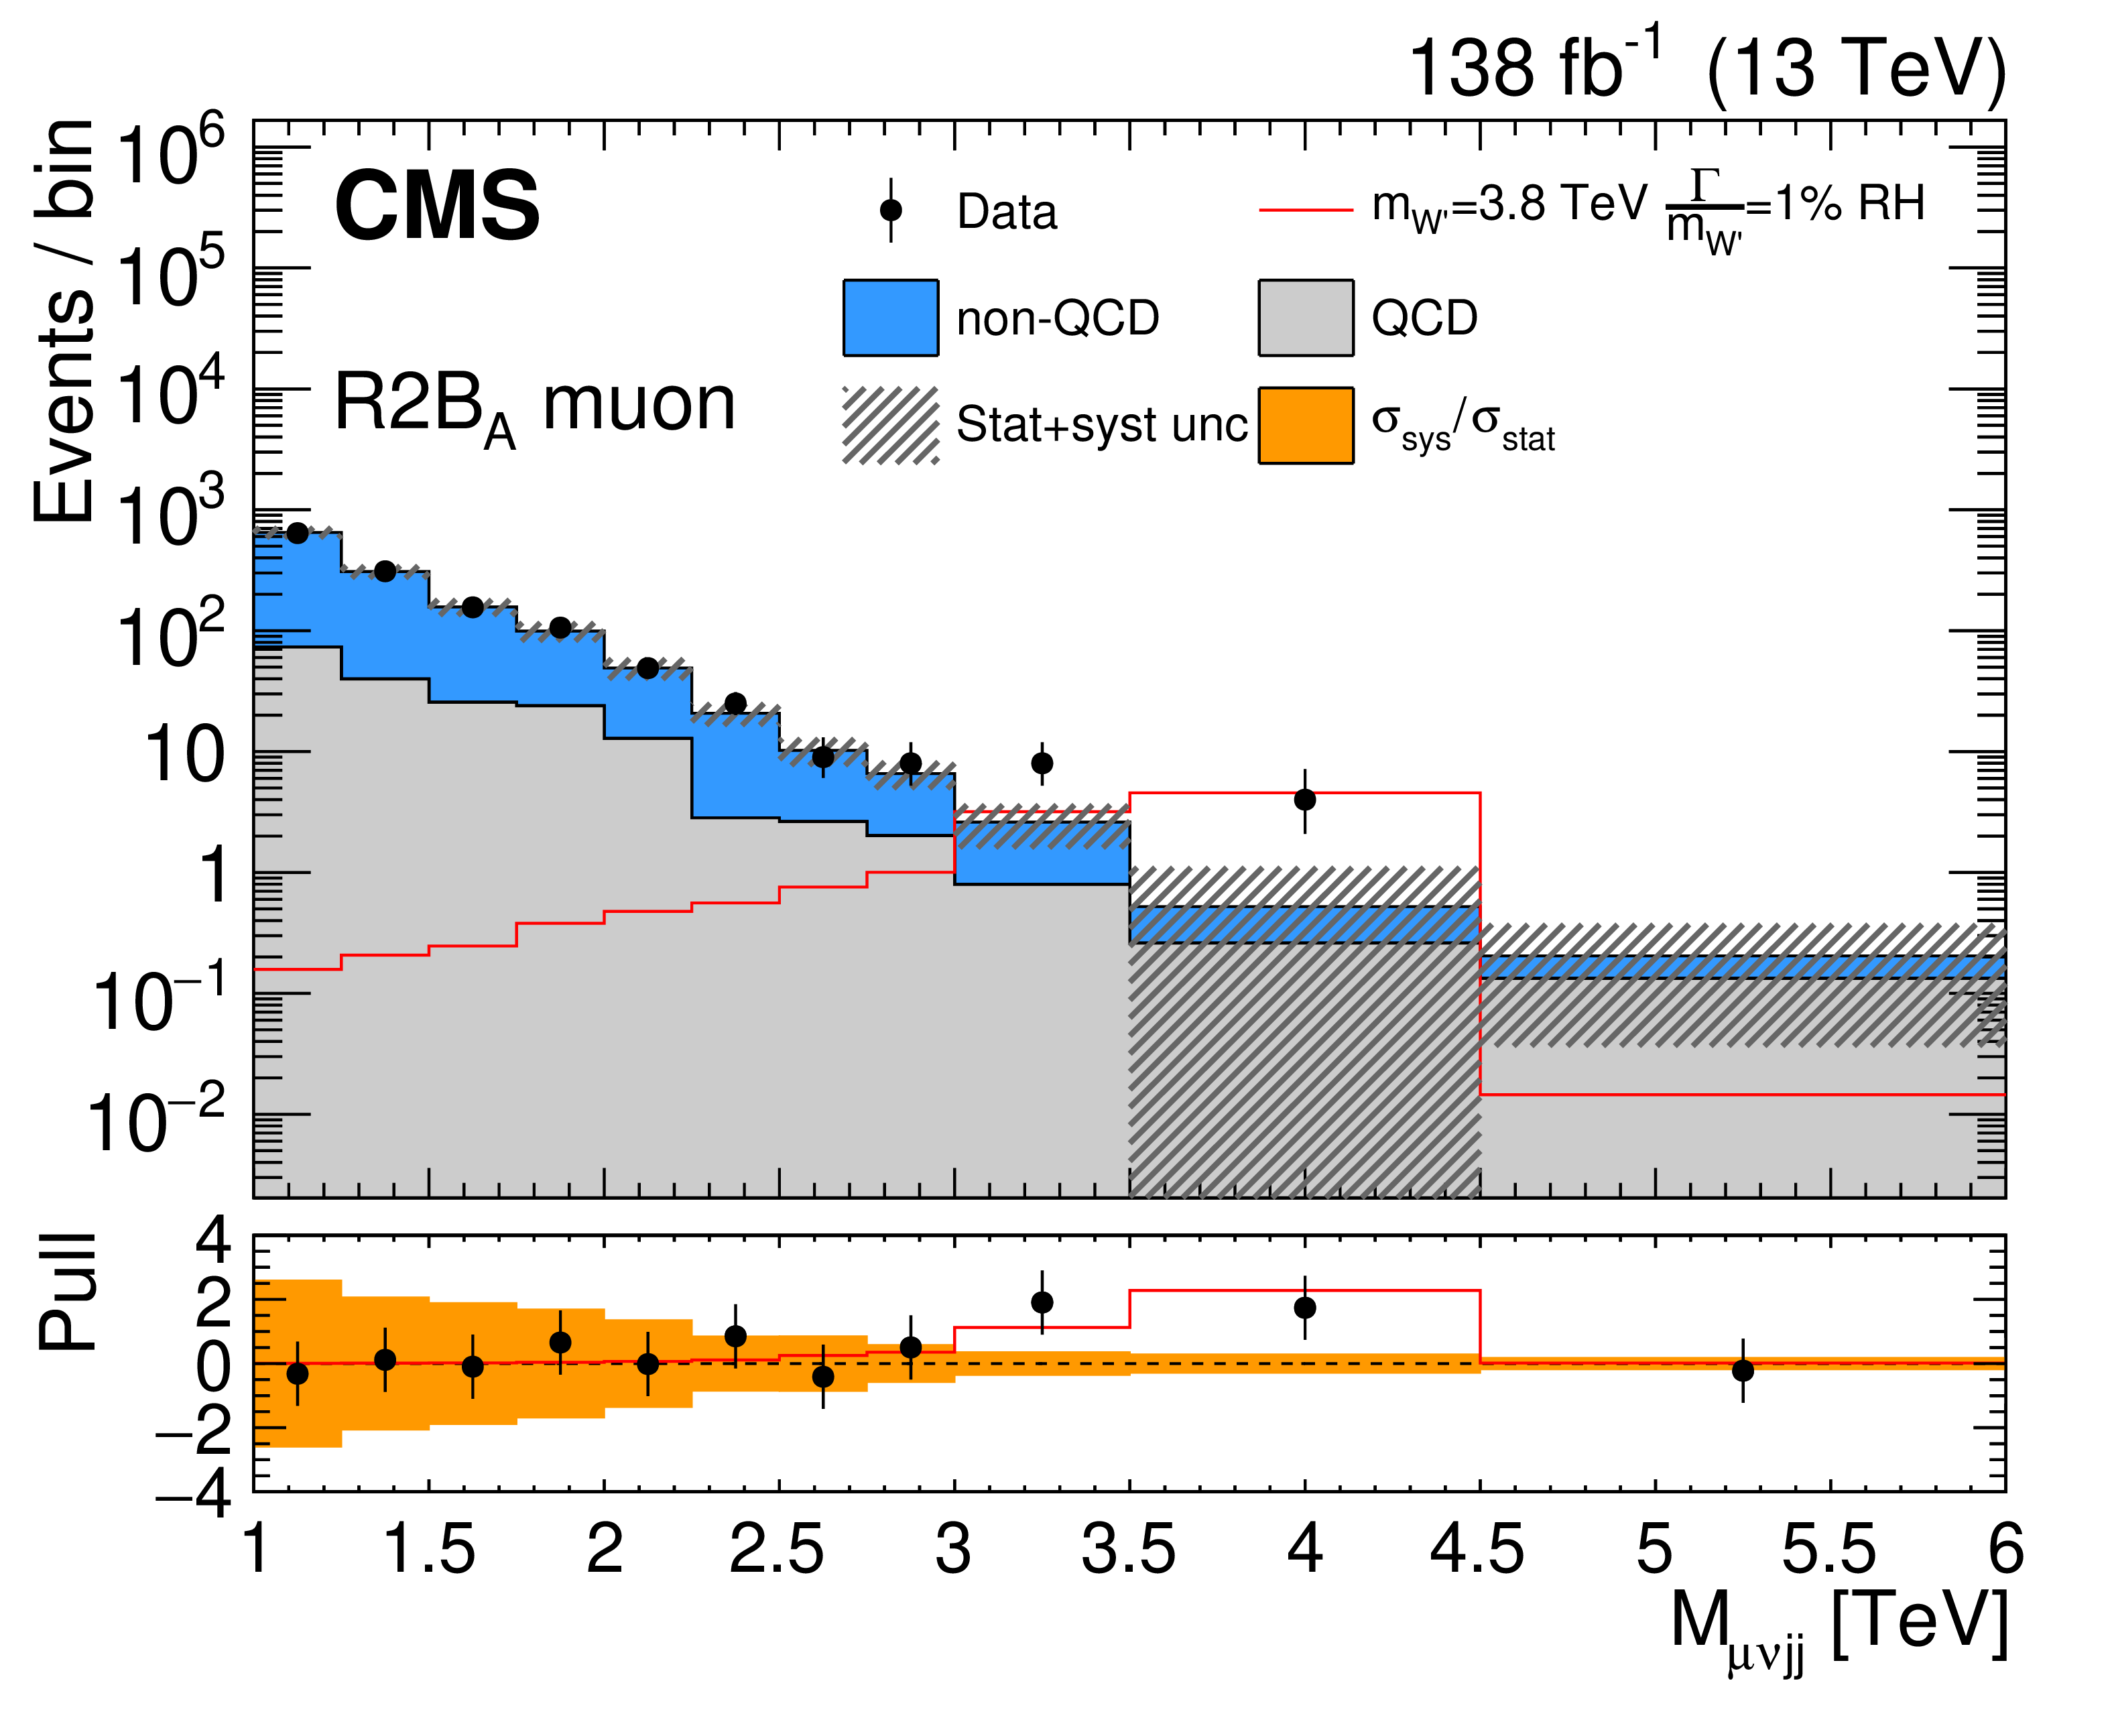
Figure 5-a:
Post-fit distribution of $ M_{\mathrm{\ell \nu jj}} $ in the $ \mathrm{\mathrm{R2B}_A} $ subregion for muons. All process yields and nuisance parameters are set to the values obtained from the background plus signal fit. The signal considered for the fit corresponds to the purely right-handed production of a W' with $ m_{\mathrm{W^{'}}} $ of 3.6 TeV and a relative width of 1% of the $ m_{\mathrm{W^{'}}} $, and is represented by the solid red line. The lower panel shows the data minus the expected number of events, normalized to the statistical uncertainty of the data. The orange band represents the systematic uncertainties, also normalized to the statistical uncertainty of the data. |
png pdf |
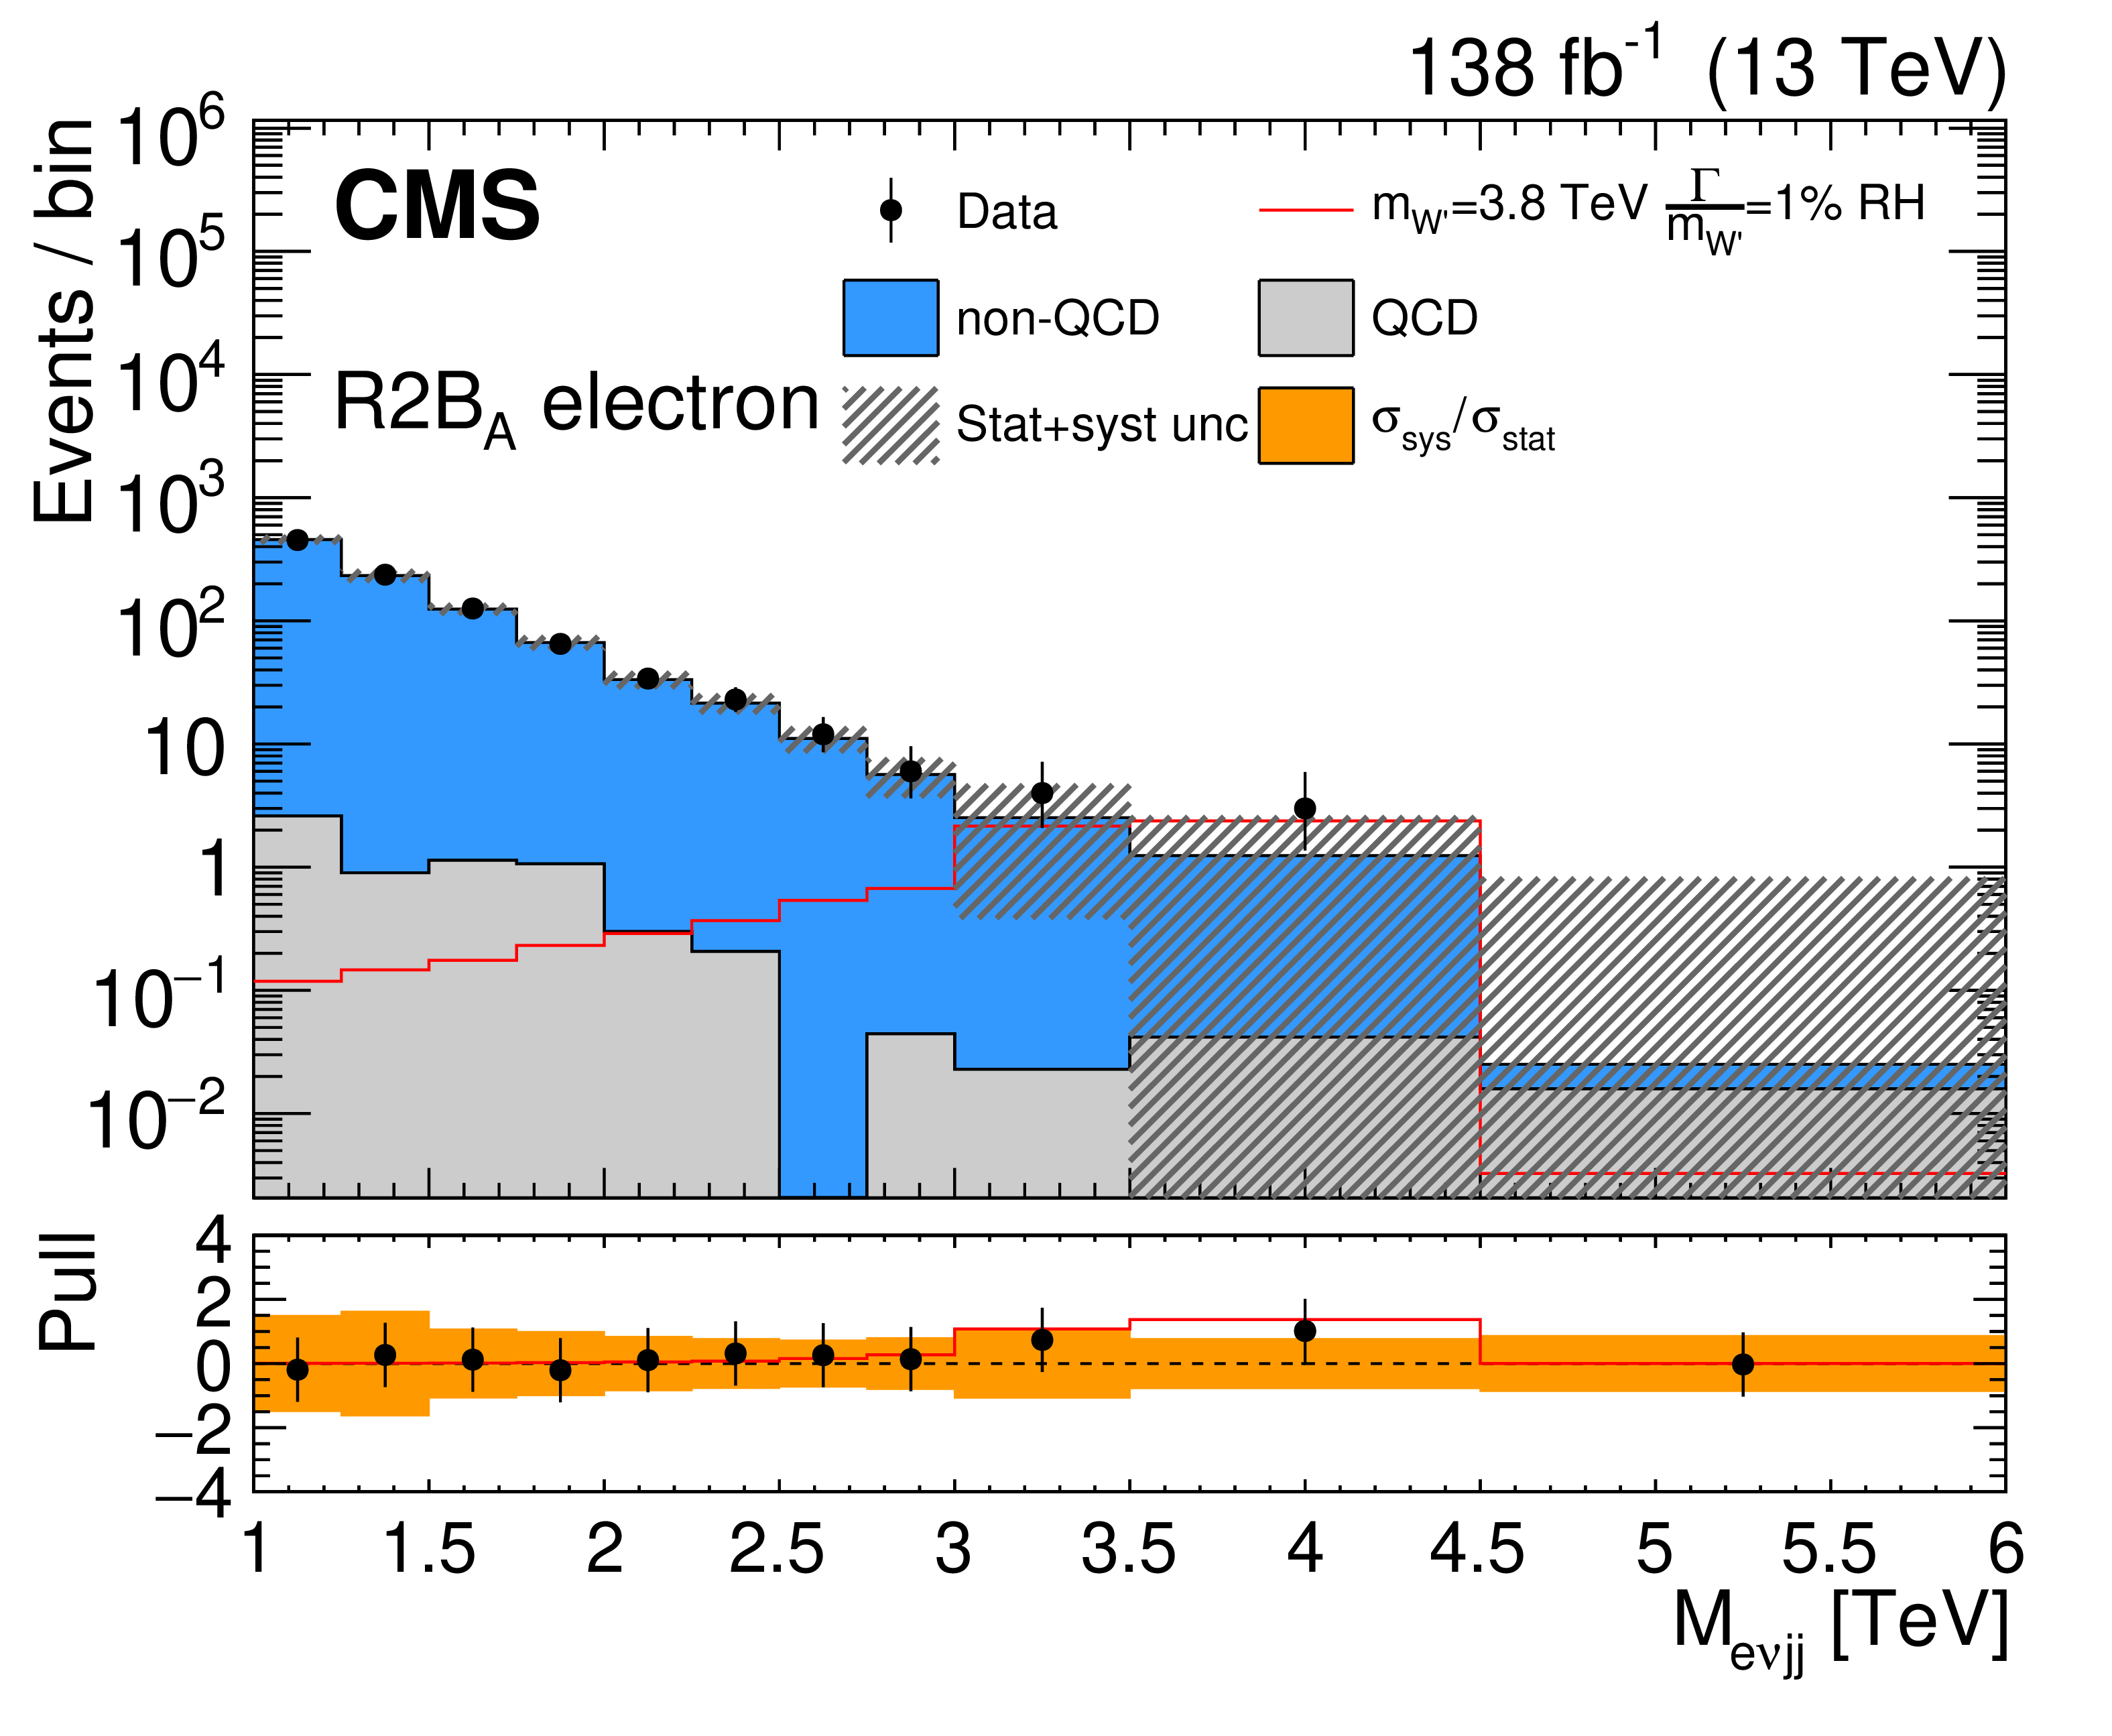
Figure 5-b:
Post-fit distribution of $ M_{\mathrm{\ell \nu jj}} $ in the $ \mathrm{\mathrm{R2B}_A} $ subregion electrons. All process yields and nuisance parameters are set to the values obtained from the background plus signal fit. The signal considered for the fit corresponds to the purely right-handed production of a W' with $ m_{\mathrm{W^{'}}} $ of 3.6 TeV and a relative width of 1% of the $ m_{\mathrm{W^{'}}} $, and is represented by the solid red line. The lower panel shows the data minus the expected number of events, normalized to the statistical uncertainty of the data. The orange band represents the systematic uncertainties, also normalized to the statistical uncertainty of the data. |

png pdf |
Figure 5-c:
Post-fit distribution of $ \mathrm{\mathrm{R\mathrm{W^{'}}}_A} $ subregion for muons. All process yields and nuisance parameters are set to the values obtained from the background plus signal fit. The signal considered for the fit corresponds to the purely right-handed production of a W' with $ m_{\mathrm{W^{'}}} $ of 3.6 TeV and a relative width of 1% of the $ m_{\mathrm{W^{'}}} $, and is represented by the solid red line. The lower panel shows the data minus the expected number of events, normalized to the statistical uncertainty of the data. The orange band represents the systematic uncertainties, also normalized to the statistical uncertainty of the data. |
png pdf |
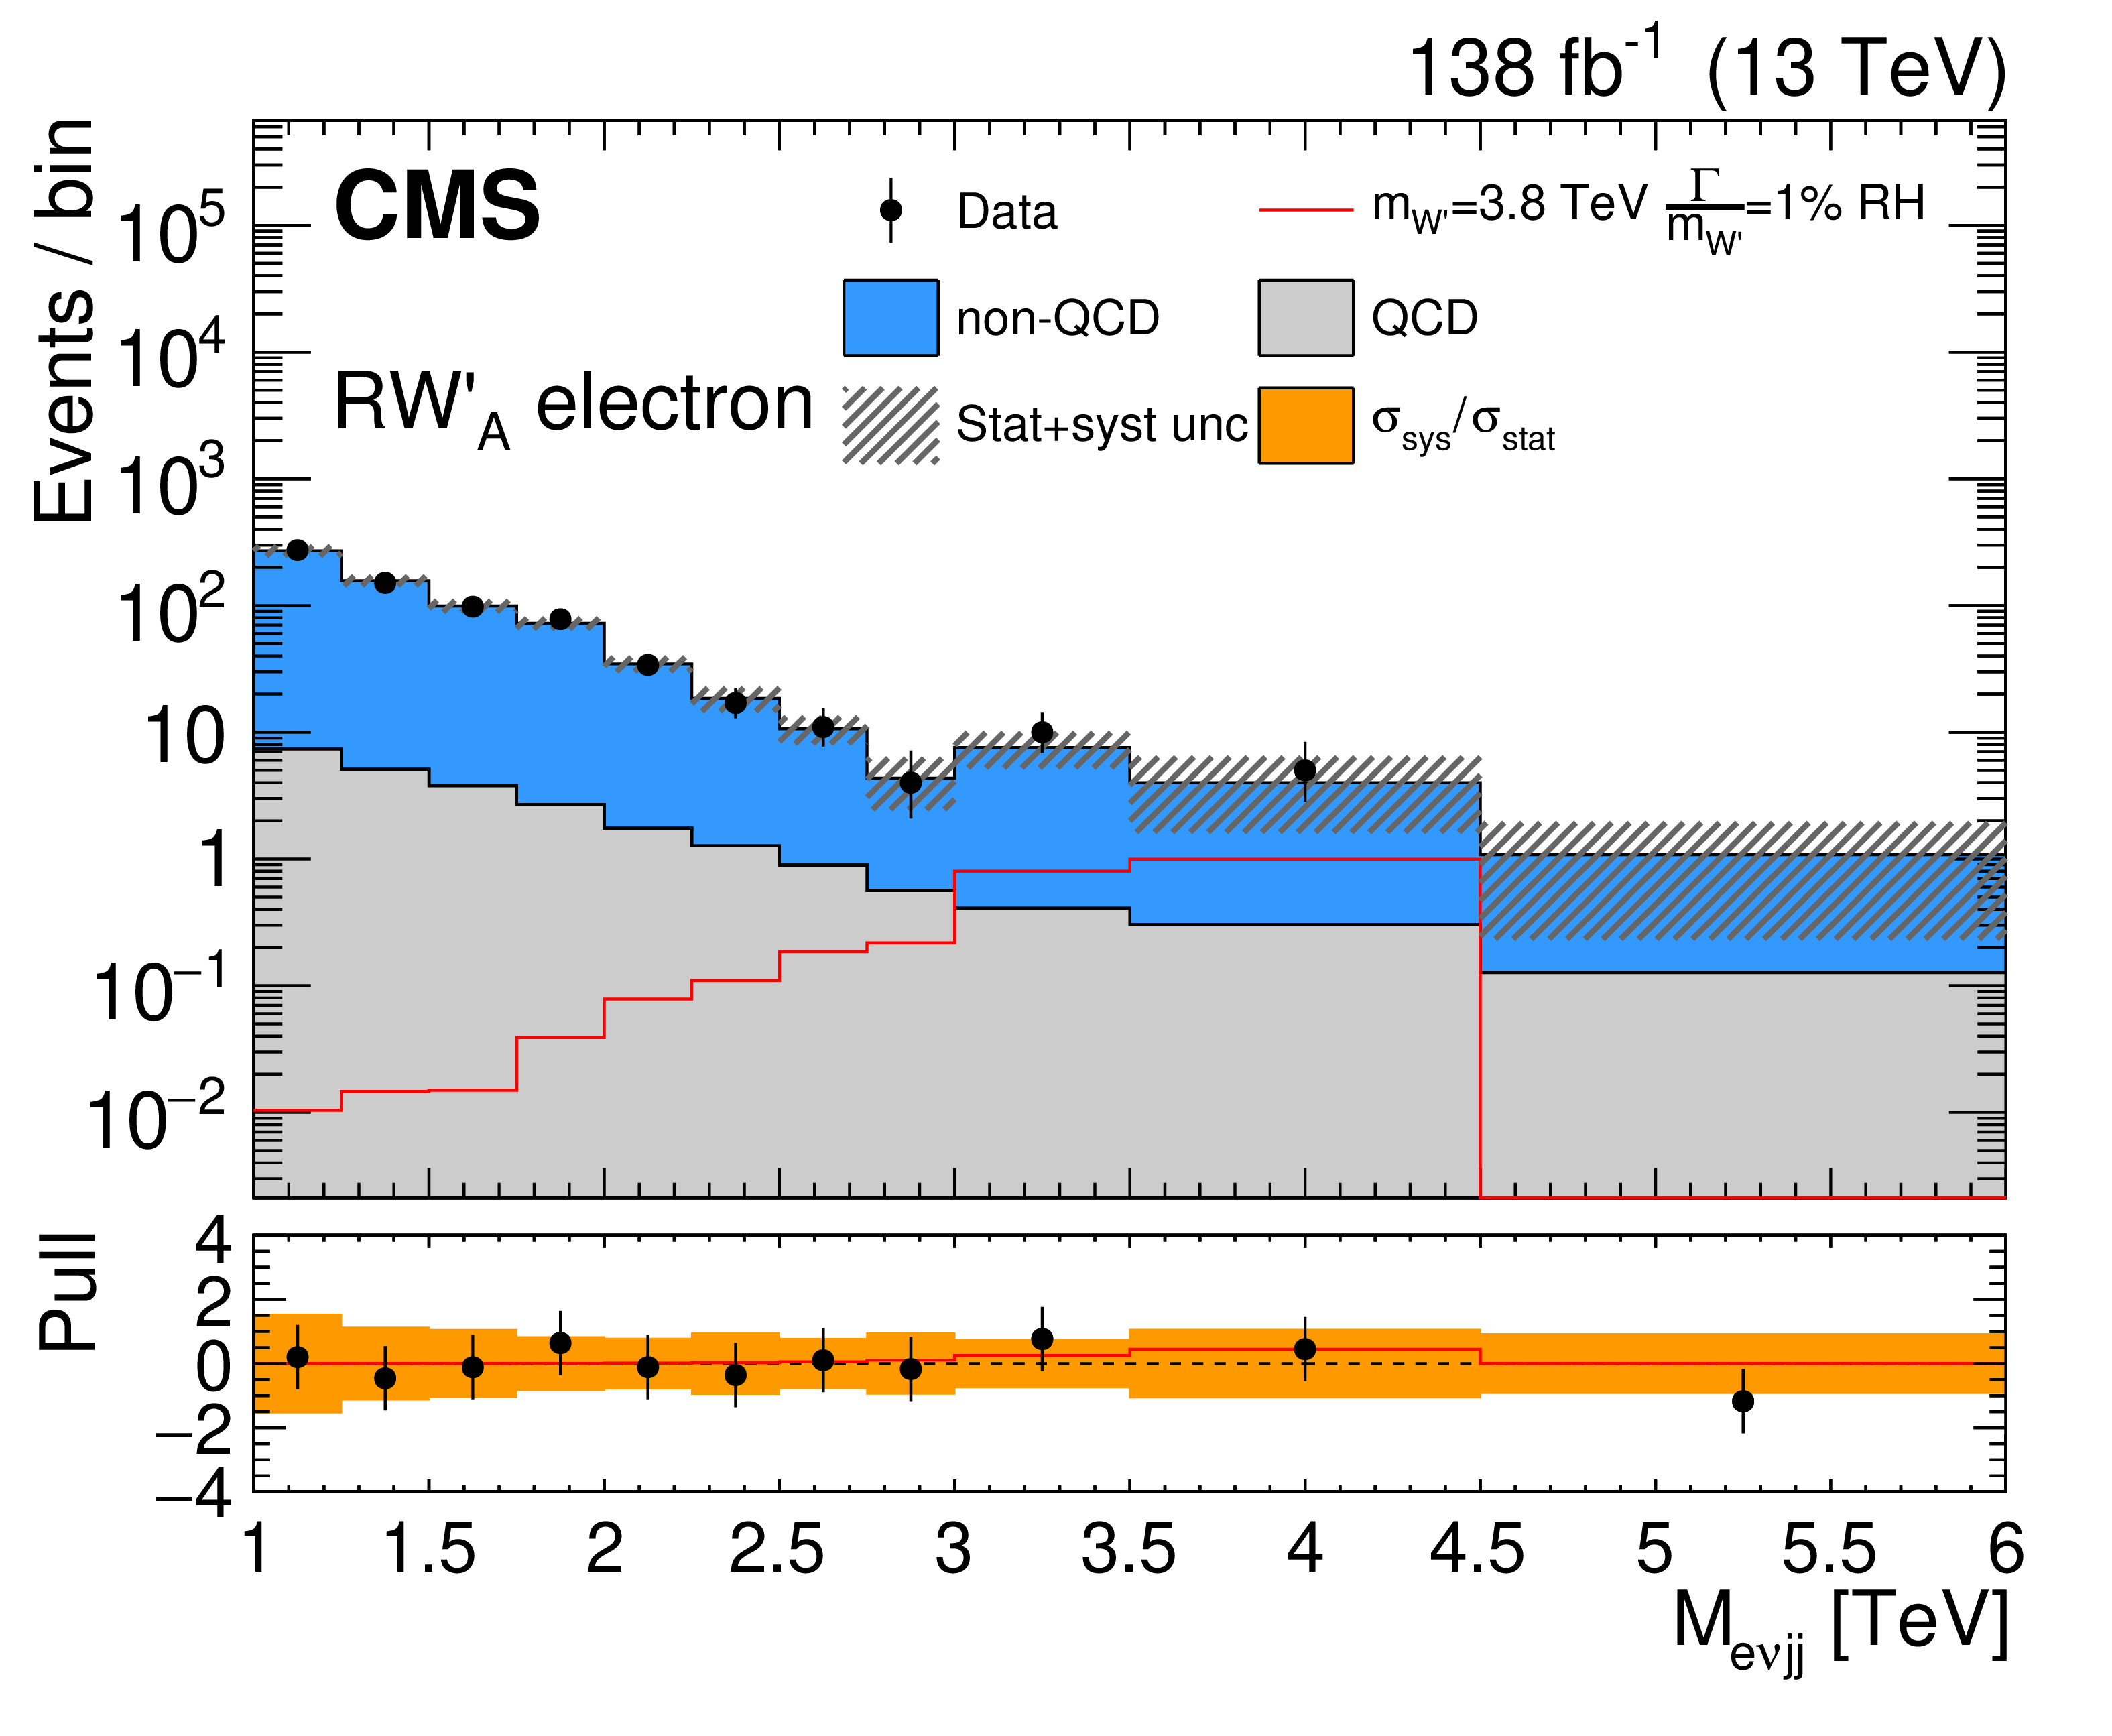
Figure 5-d:
Post-fit distribution of $ \mathrm{\mathrm{R\mathrm{W^{'}}}_A} $ subregion electrons. All process yields and nuisance parameters are set to the values obtained from the background plus signal fit. The signal considered for the fit corresponds to the purely right-handed production of a W' with $ m_{\mathrm{W^{'}}} $ of 3.6 TeV and a relative width of 1% of the $ m_{\mathrm{W^{'}}} $, and is represented by the solid red line. The lower panel shows the data minus the expected number of events, normalized to the statistical uncertainty of the data. The orange band represents the systematic uncertainties, also normalized to the statistical uncertainty of the data. |

png pdf |
Figure 5-e:
Post-fit distribution of $ \mathrm{\mathrm{RT}_A} $ subregion for muons. All process yields and nuisance parameters are set to the values obtained from the background plus signal fit. The signal considered for the fit corresponds to the purely right-handed production of a W' with $ m_{\mathrm{W^{'}}} $ of 3.6 TeV and a relative width of 1% of the $ m_{\mathrm{W^{'}}} $, and is represented by the solid red line. The lower panel shows the data minus the expected number of events, normalized to the statistical uncertainty of the data. The orange band represents the systematic uncertainties, also normalized to the statistical uncertainty of the data. |
png pdf |
Figure 5-f:
Post-fit distribution of $ \mathrm{\mathrm{RT}_A} $ subregion electrons. All process yields and nuisance parameters are set to the values obtained from the background plus signal fit. The signal considered for the fit corresponds to the purely right-handed production of a W' with $ m_{\mathrm{W^{'}}} $ of 3.6 TeV and a relative width of 1% of the $ m_{\mathrm{W^{'}}} $, and is represented by the solid red line. The lower panel shows the data minus the expected number of events, normalized to the statistical uncertainty of the data. The orange band represents the systematic uncertainties, also normalized to the statistical uncertainty of the data. |
png pdf |
Figure 6:
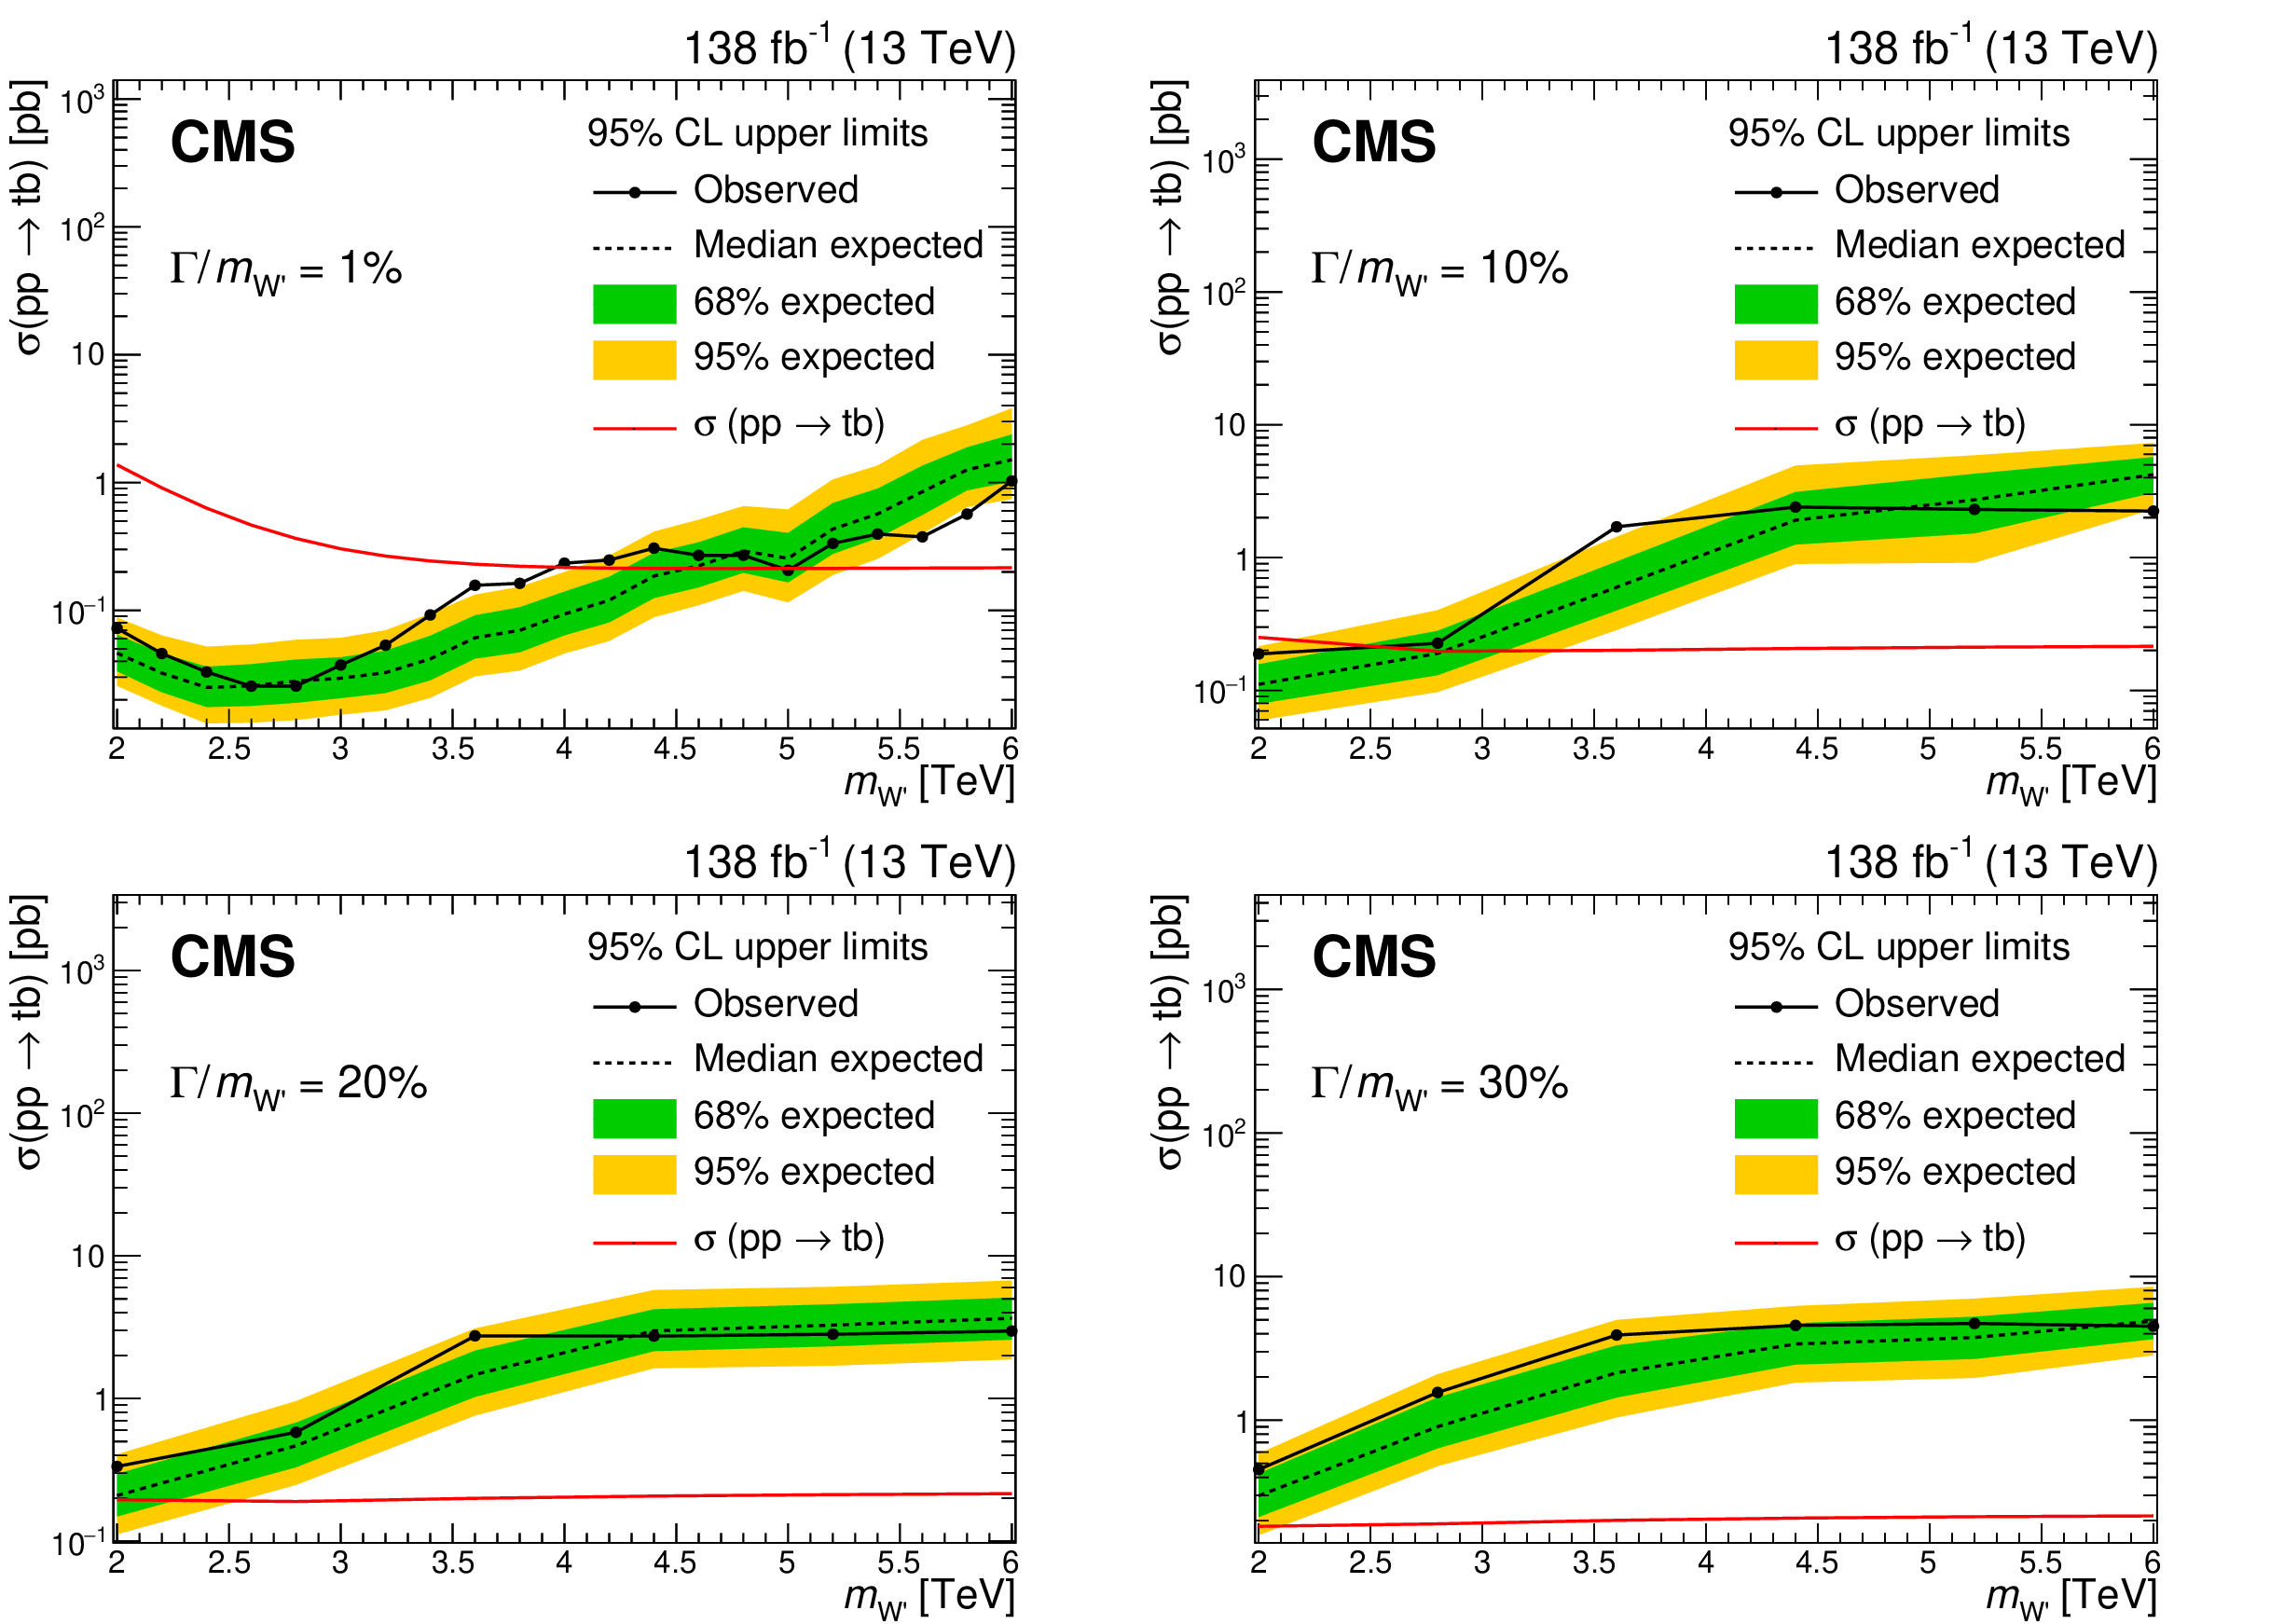
Observed and expected 95% CL upper limits on the product of the production cross section for production of a $ \mathrm{t}\mathrm{b} $ quark pair in the $ s $-channel, mediated by either a W or a left-handed W' boson, and including interference terms, given as functions of $ m_{\mathrm{W^{'}}} $ for a relative width of 1% (upper left), 10% (upper right), 20% (lower left), and 30% (lower right). The inner (green) band and the outer (yellow) band indicate the regions containing 68 and 95%, respectively, of the distribution of limits expected under the background-only hypothesis. The solid red curves show the theoretical expectation at LO. |
png pdf |
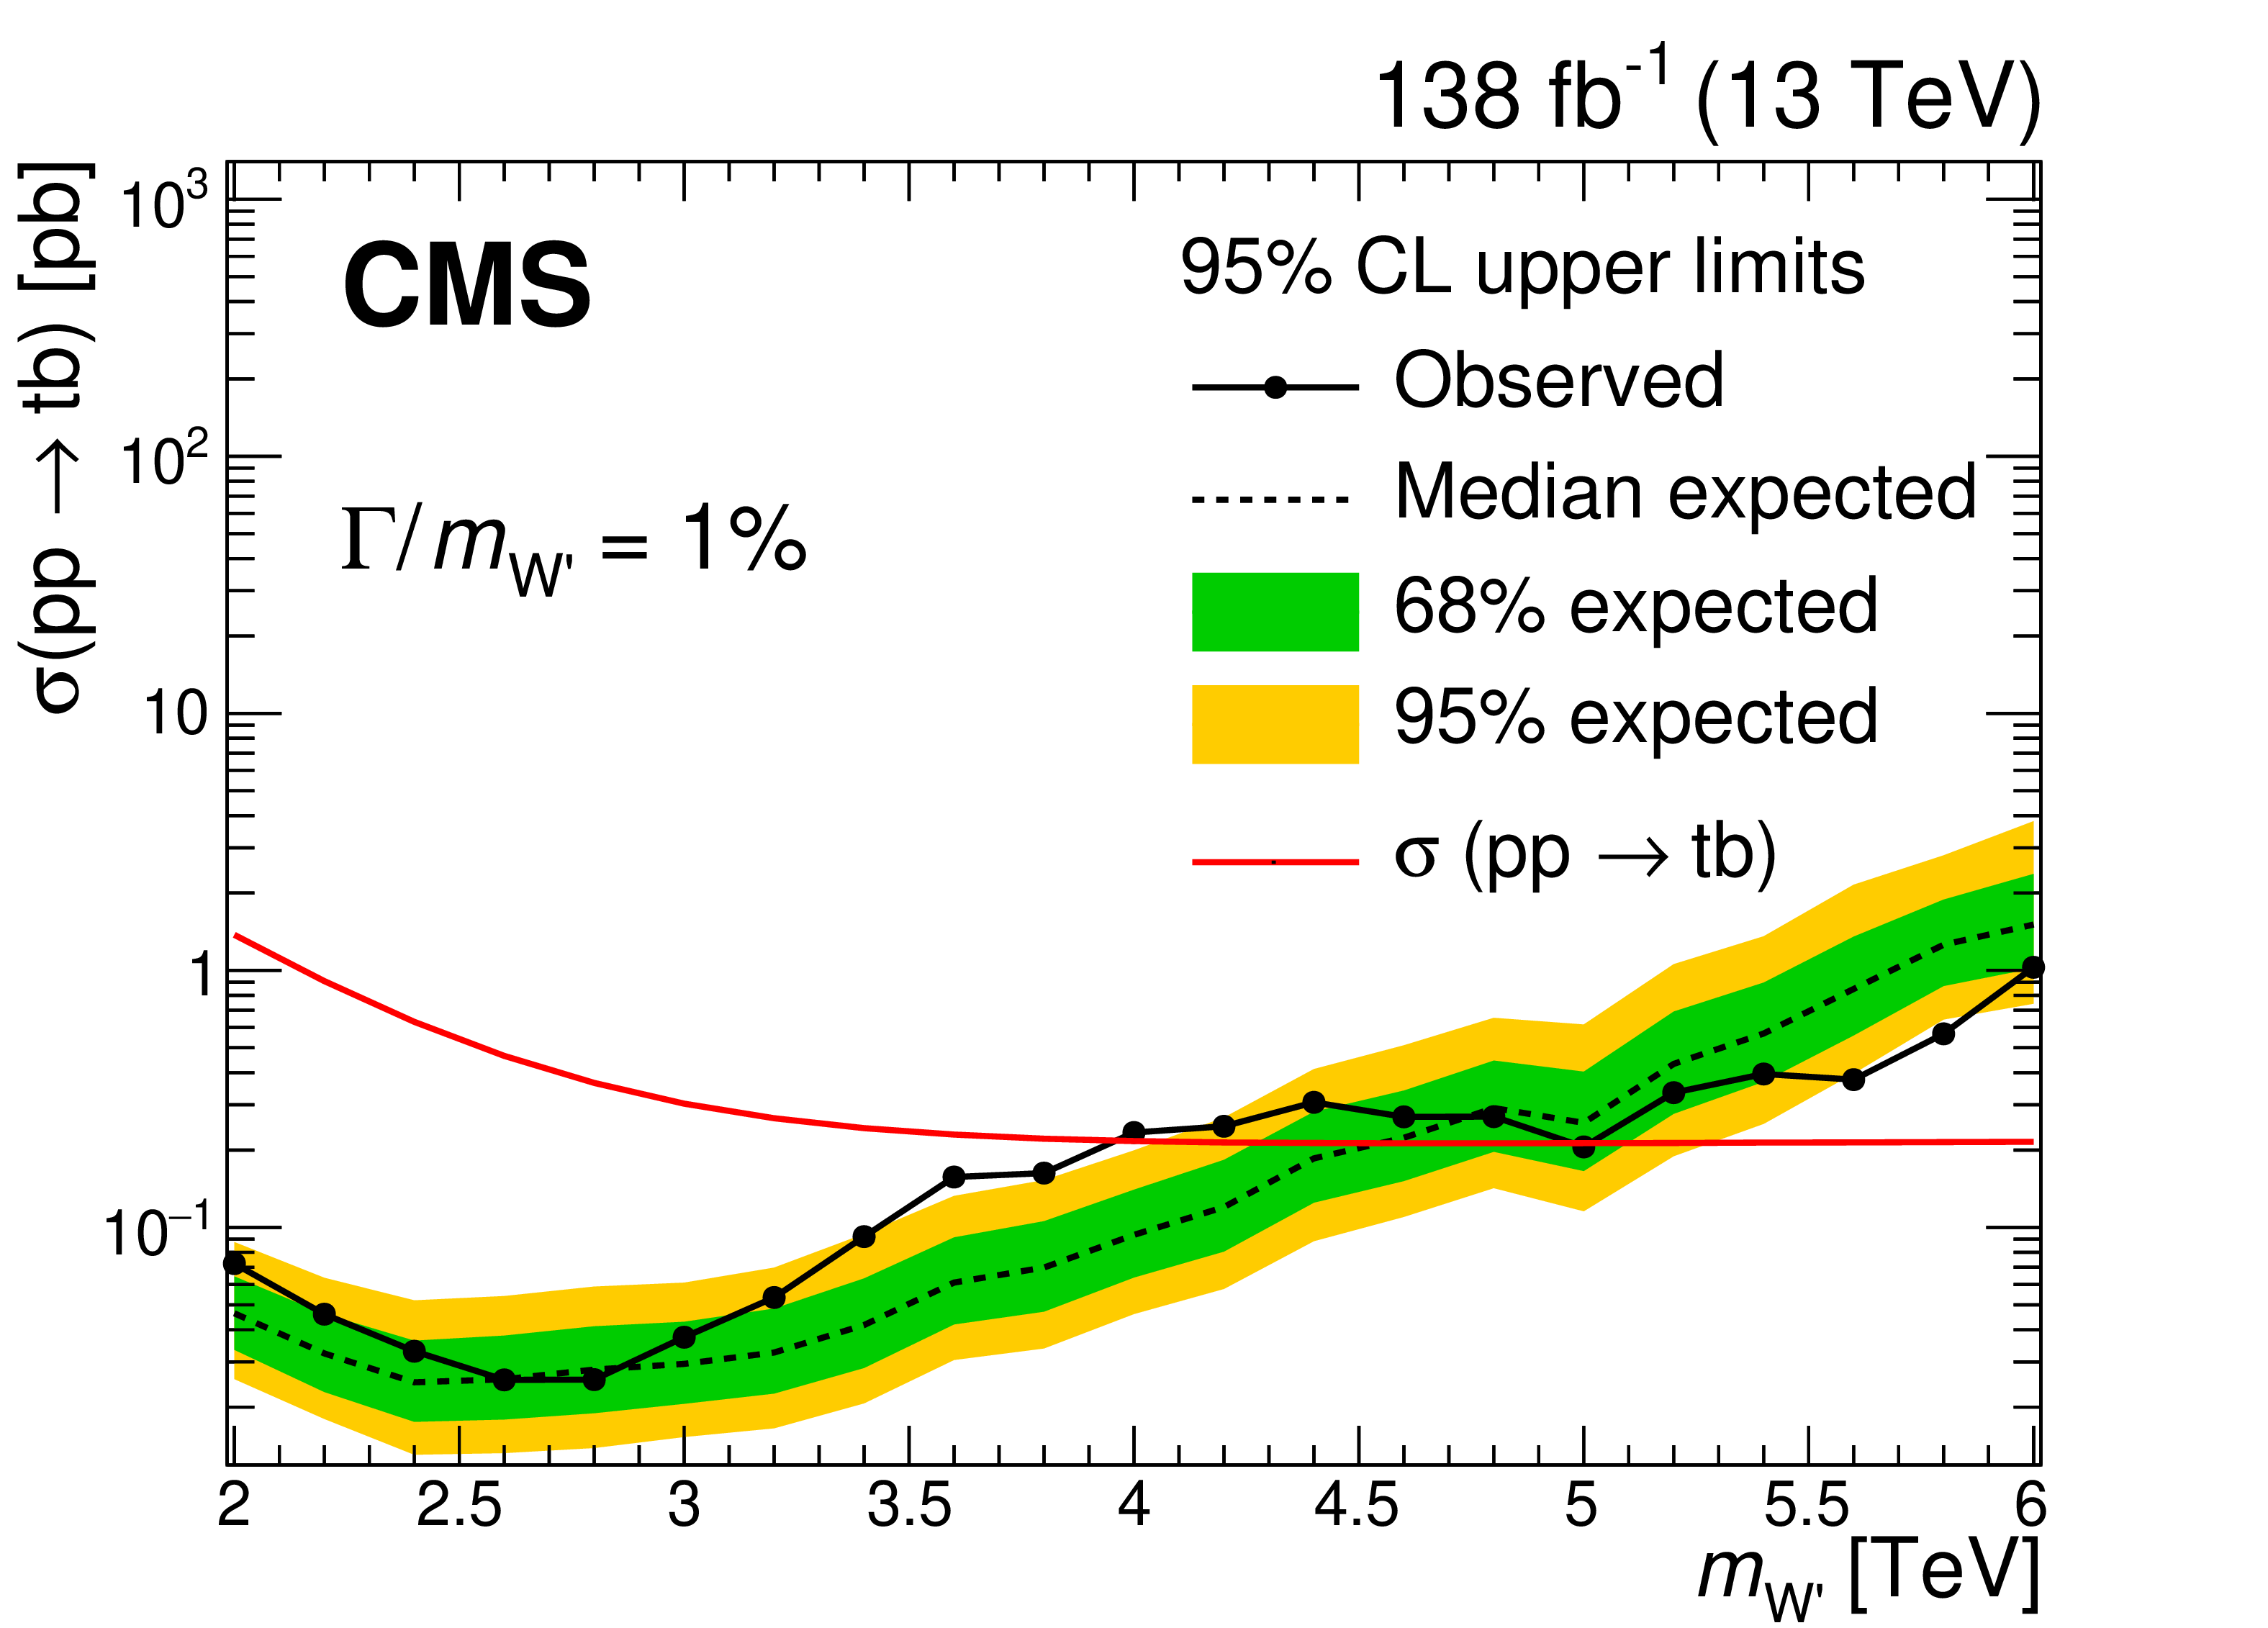
Figure 6-a:
Observed and expected 95% CL upper limits on the product of the production cross section for production of a $ \mathrm{t}\mathrm{b} $ quark pair in the $ s $-channel, mediated by either a W or a left-handed W' boson, and including interference terms, given as functions of $ m_{\mathrm{W^{'}}} $ for a relative width of 1%. The inner (green) band and the outer (yellow) band indicate the regions containing 68 and 95%, respectively, of the distribution of limits expected under the background-only hypothesis. The solid red curves show the theoretical expectation at LO. |
png pdf |
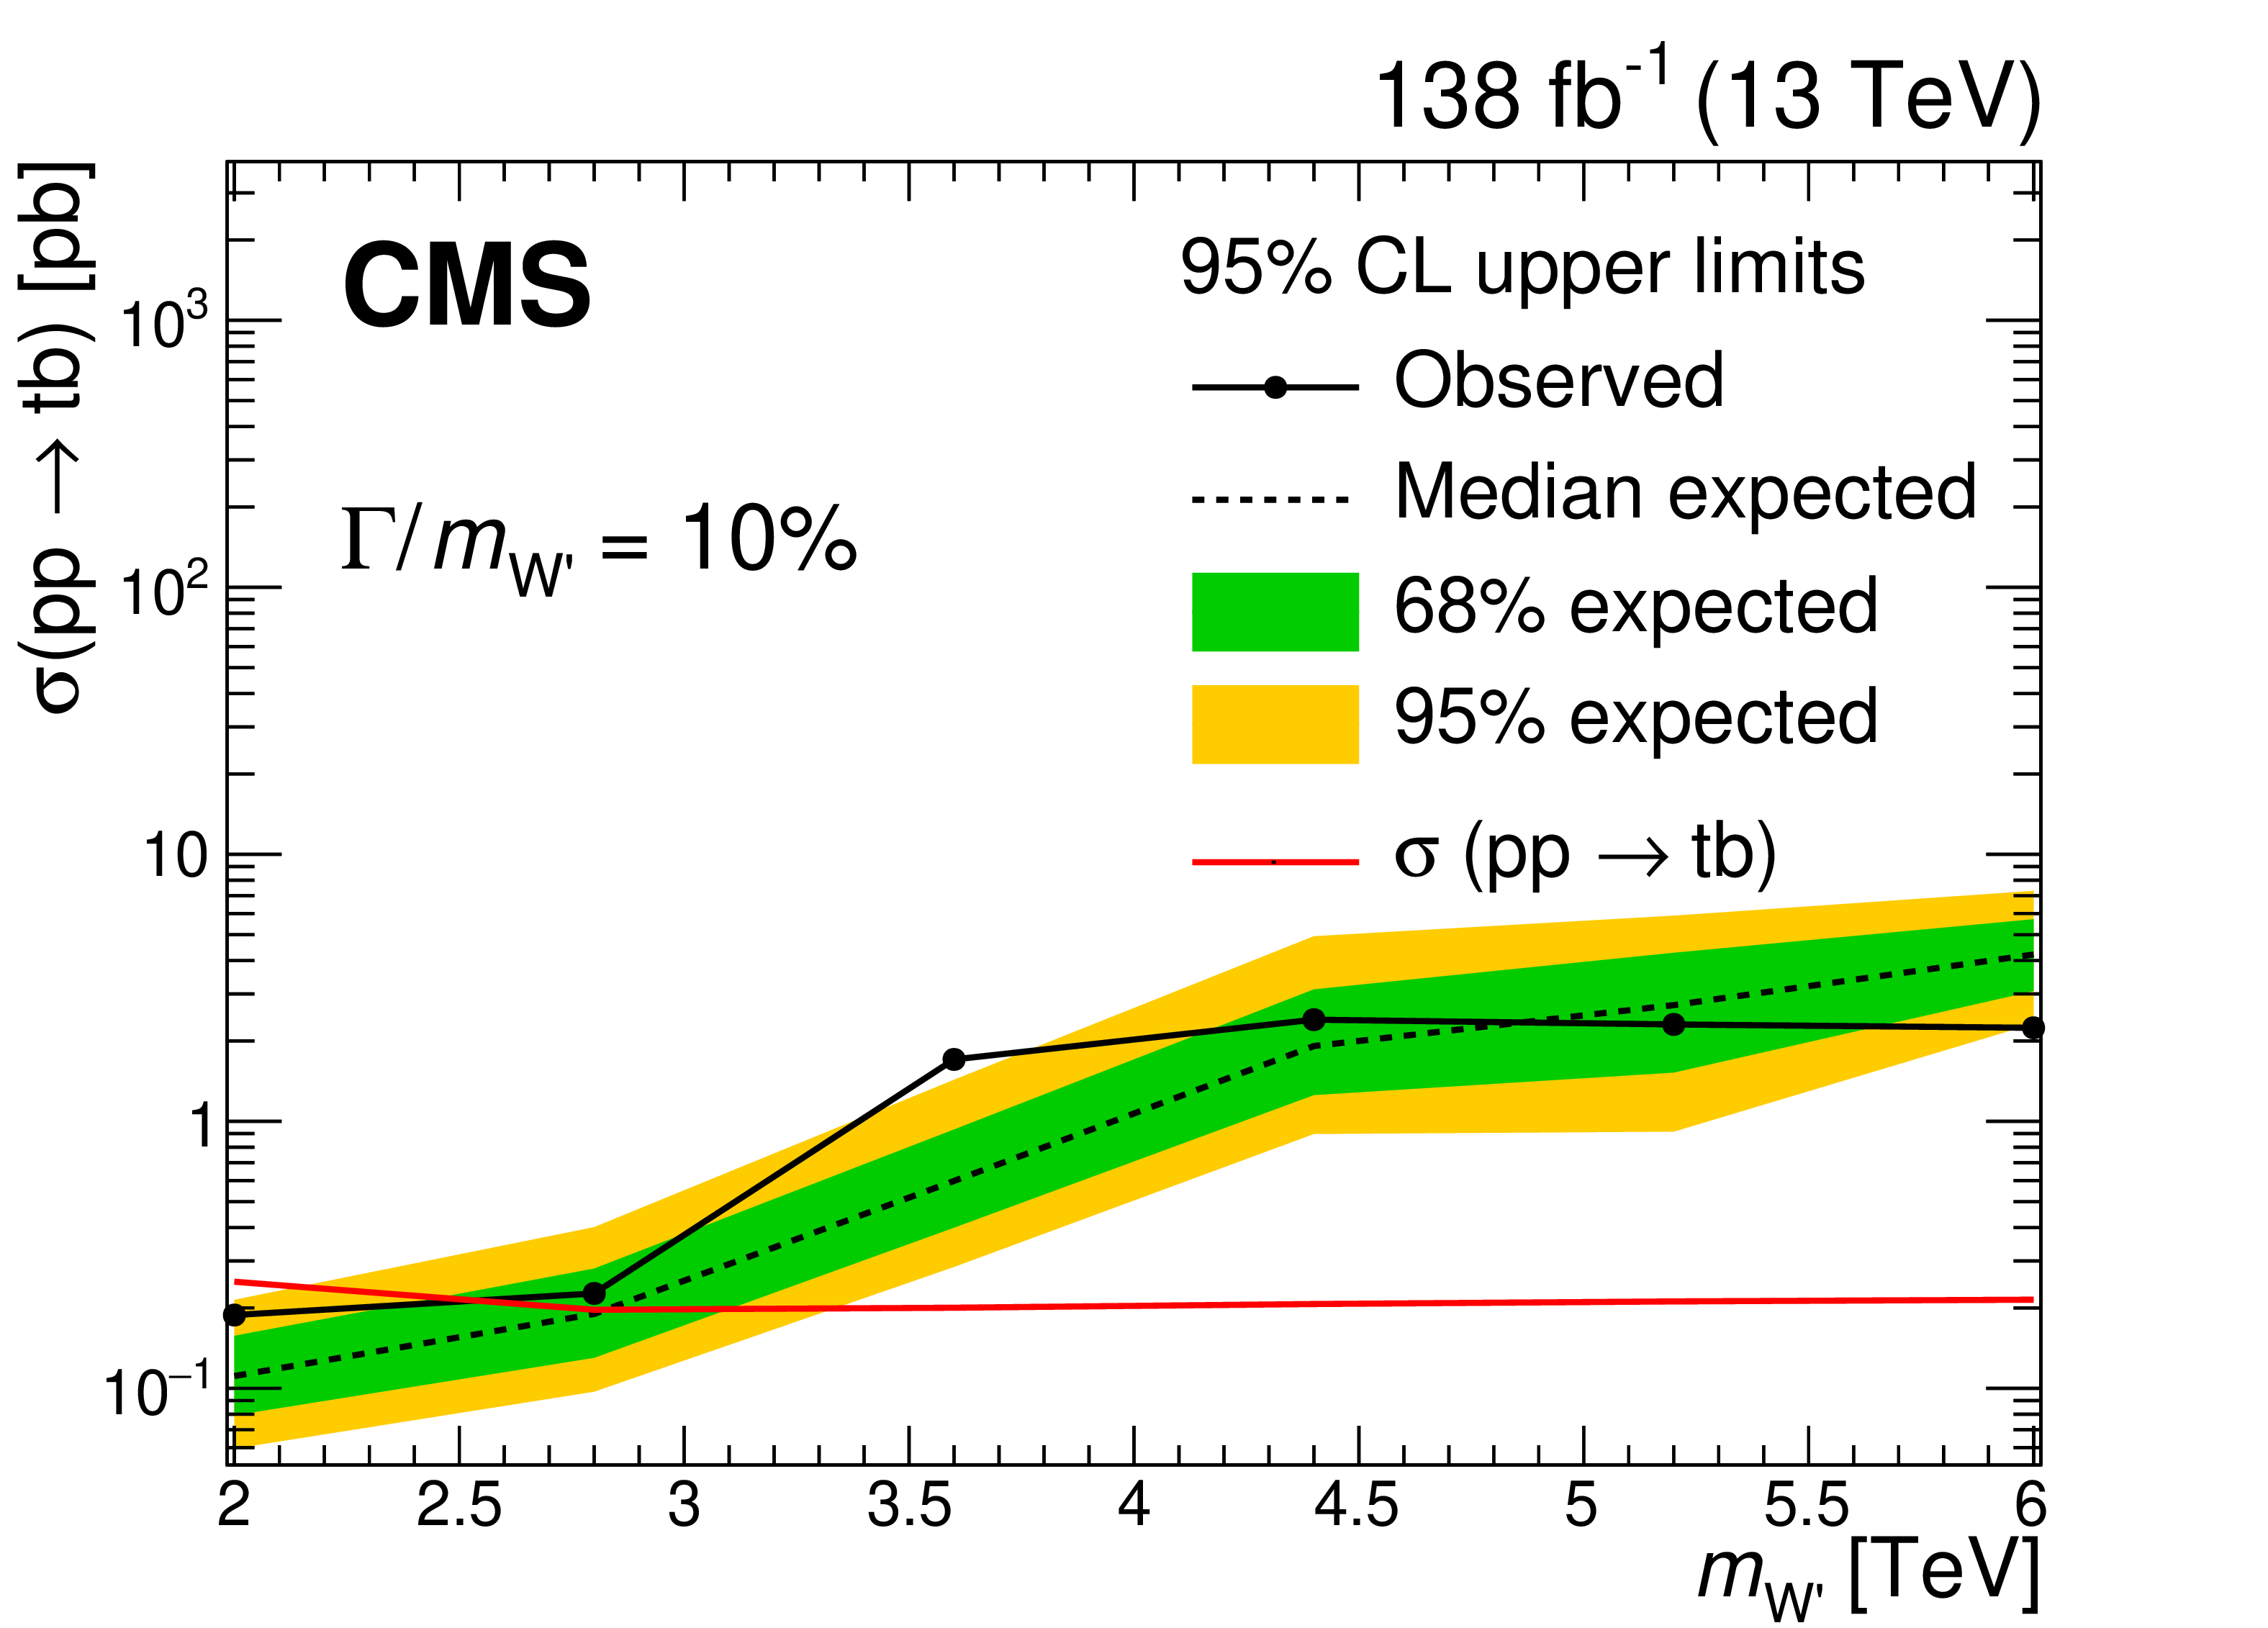
Figure 6-b:
Observed and expected 95% CL upper limits on the product of the production cross section for production of a $ \mathrm{t}\mathrm{b} $ quark pair in the $ s $-channel, mediated by either a W or a left-handed W' boson, and including interference terms, given as functions of $ m_{\mathrm{W^{'}}} $ for a relative width of 10%. The inner (green) band and the outer (yellow) band indicate the regions containing 68 and 95%, respectively, of the distribution of limits expected under the background-only hypothesis. The solid red curves show the theoretical expectation at LO. |
png pdf |
Figure 6-c:
Observed and expected 95% CL upper limits on the product of the production cross section for production of a $ \mathrm{t}\mathrm{b} $ quark pair in the $ s $-channel, mediated by either a W or a left-handed W' boson, and including interference terms, given as functions of $ m_{\mathrm{W^{'}}} $ for a relative width of 20%. The inner (green) band and the outer (yellow) band indicate the regions containing 68 and 95%, respectively, of the distribution of limits expected under the background-only hypothesis. The solid red curves show the theoretical expectation at LO. |
png pdf |
Figure 6-d:
Observed and expected 95% CL upper limits on the product of the production cross section for production of a $ \mathrm{t}\mathrm{b} $ quark pair in the $ s $-channel, mediated by either a W or a left-handed W' boson, and including interference terms, given as functions of $ m_{\mathrm{W^{'}}} $ for a relative width of 30%. The inner (green) band and the outer (yellow) band indicate the regions containing 68 and 95%, respectively, of the distribution of limits expected under the background-only hypothesis. The solid red curves show the theoretical expectation at LO. |
png pdf |
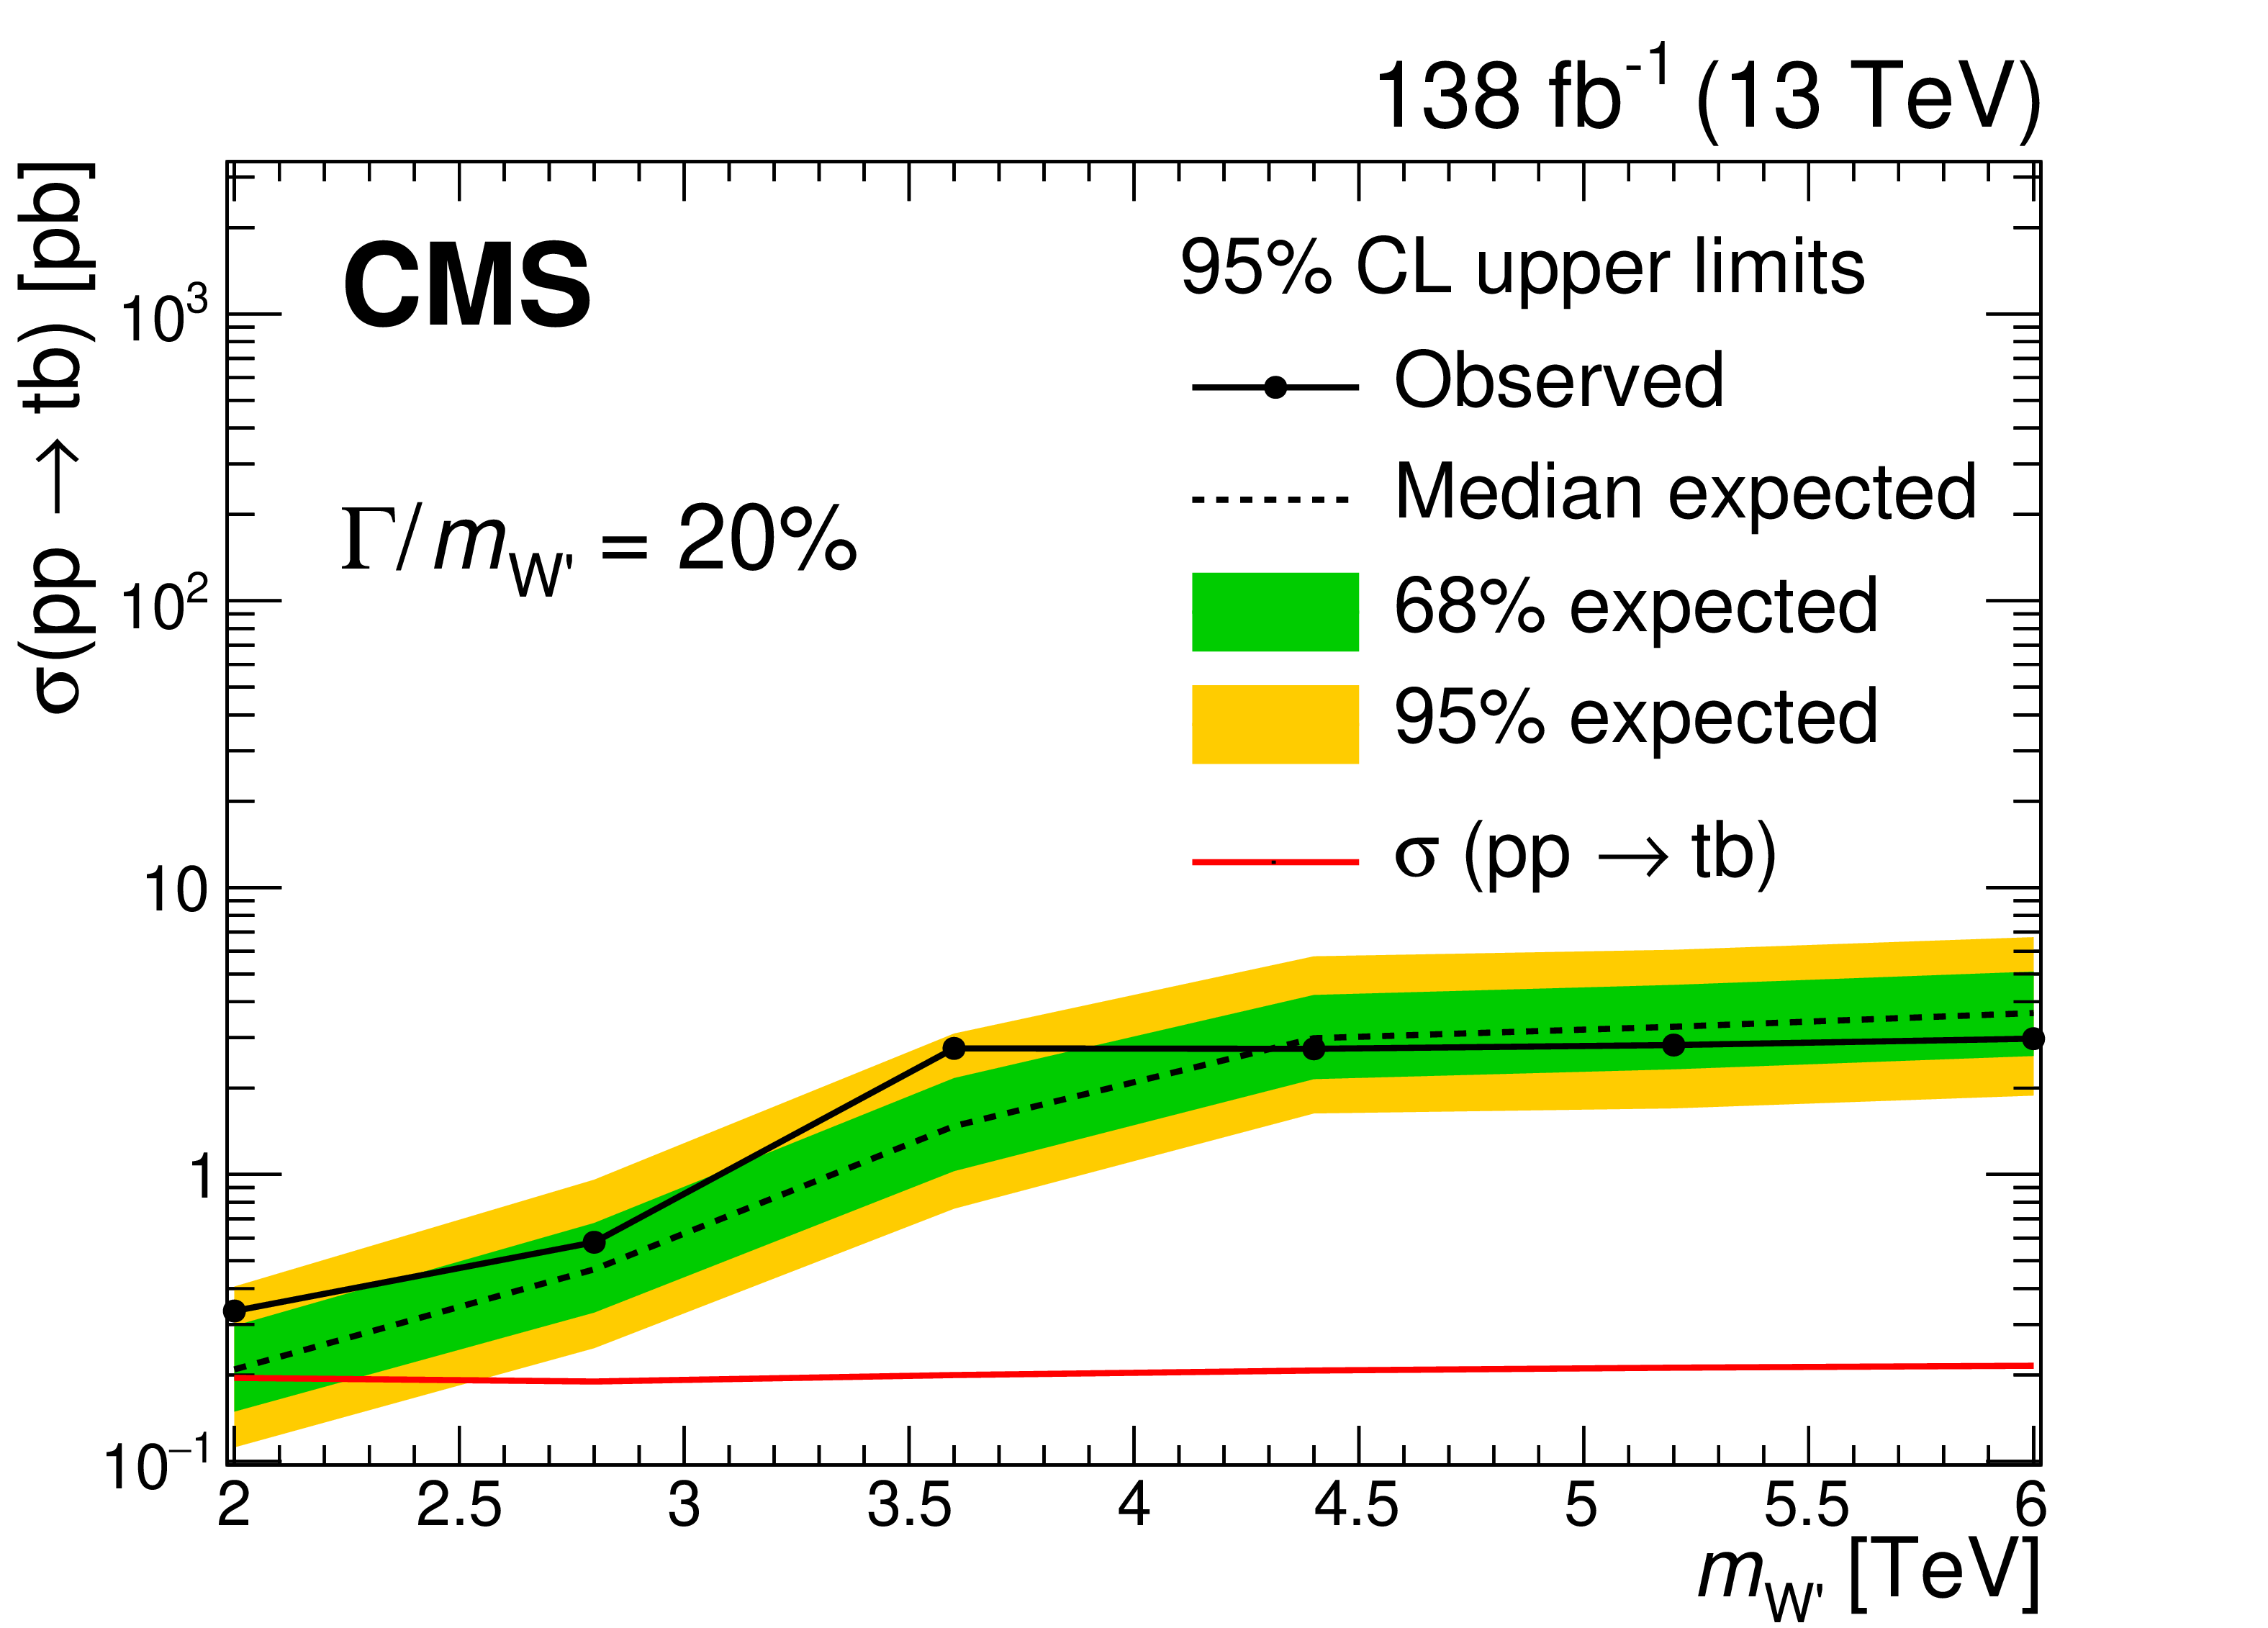
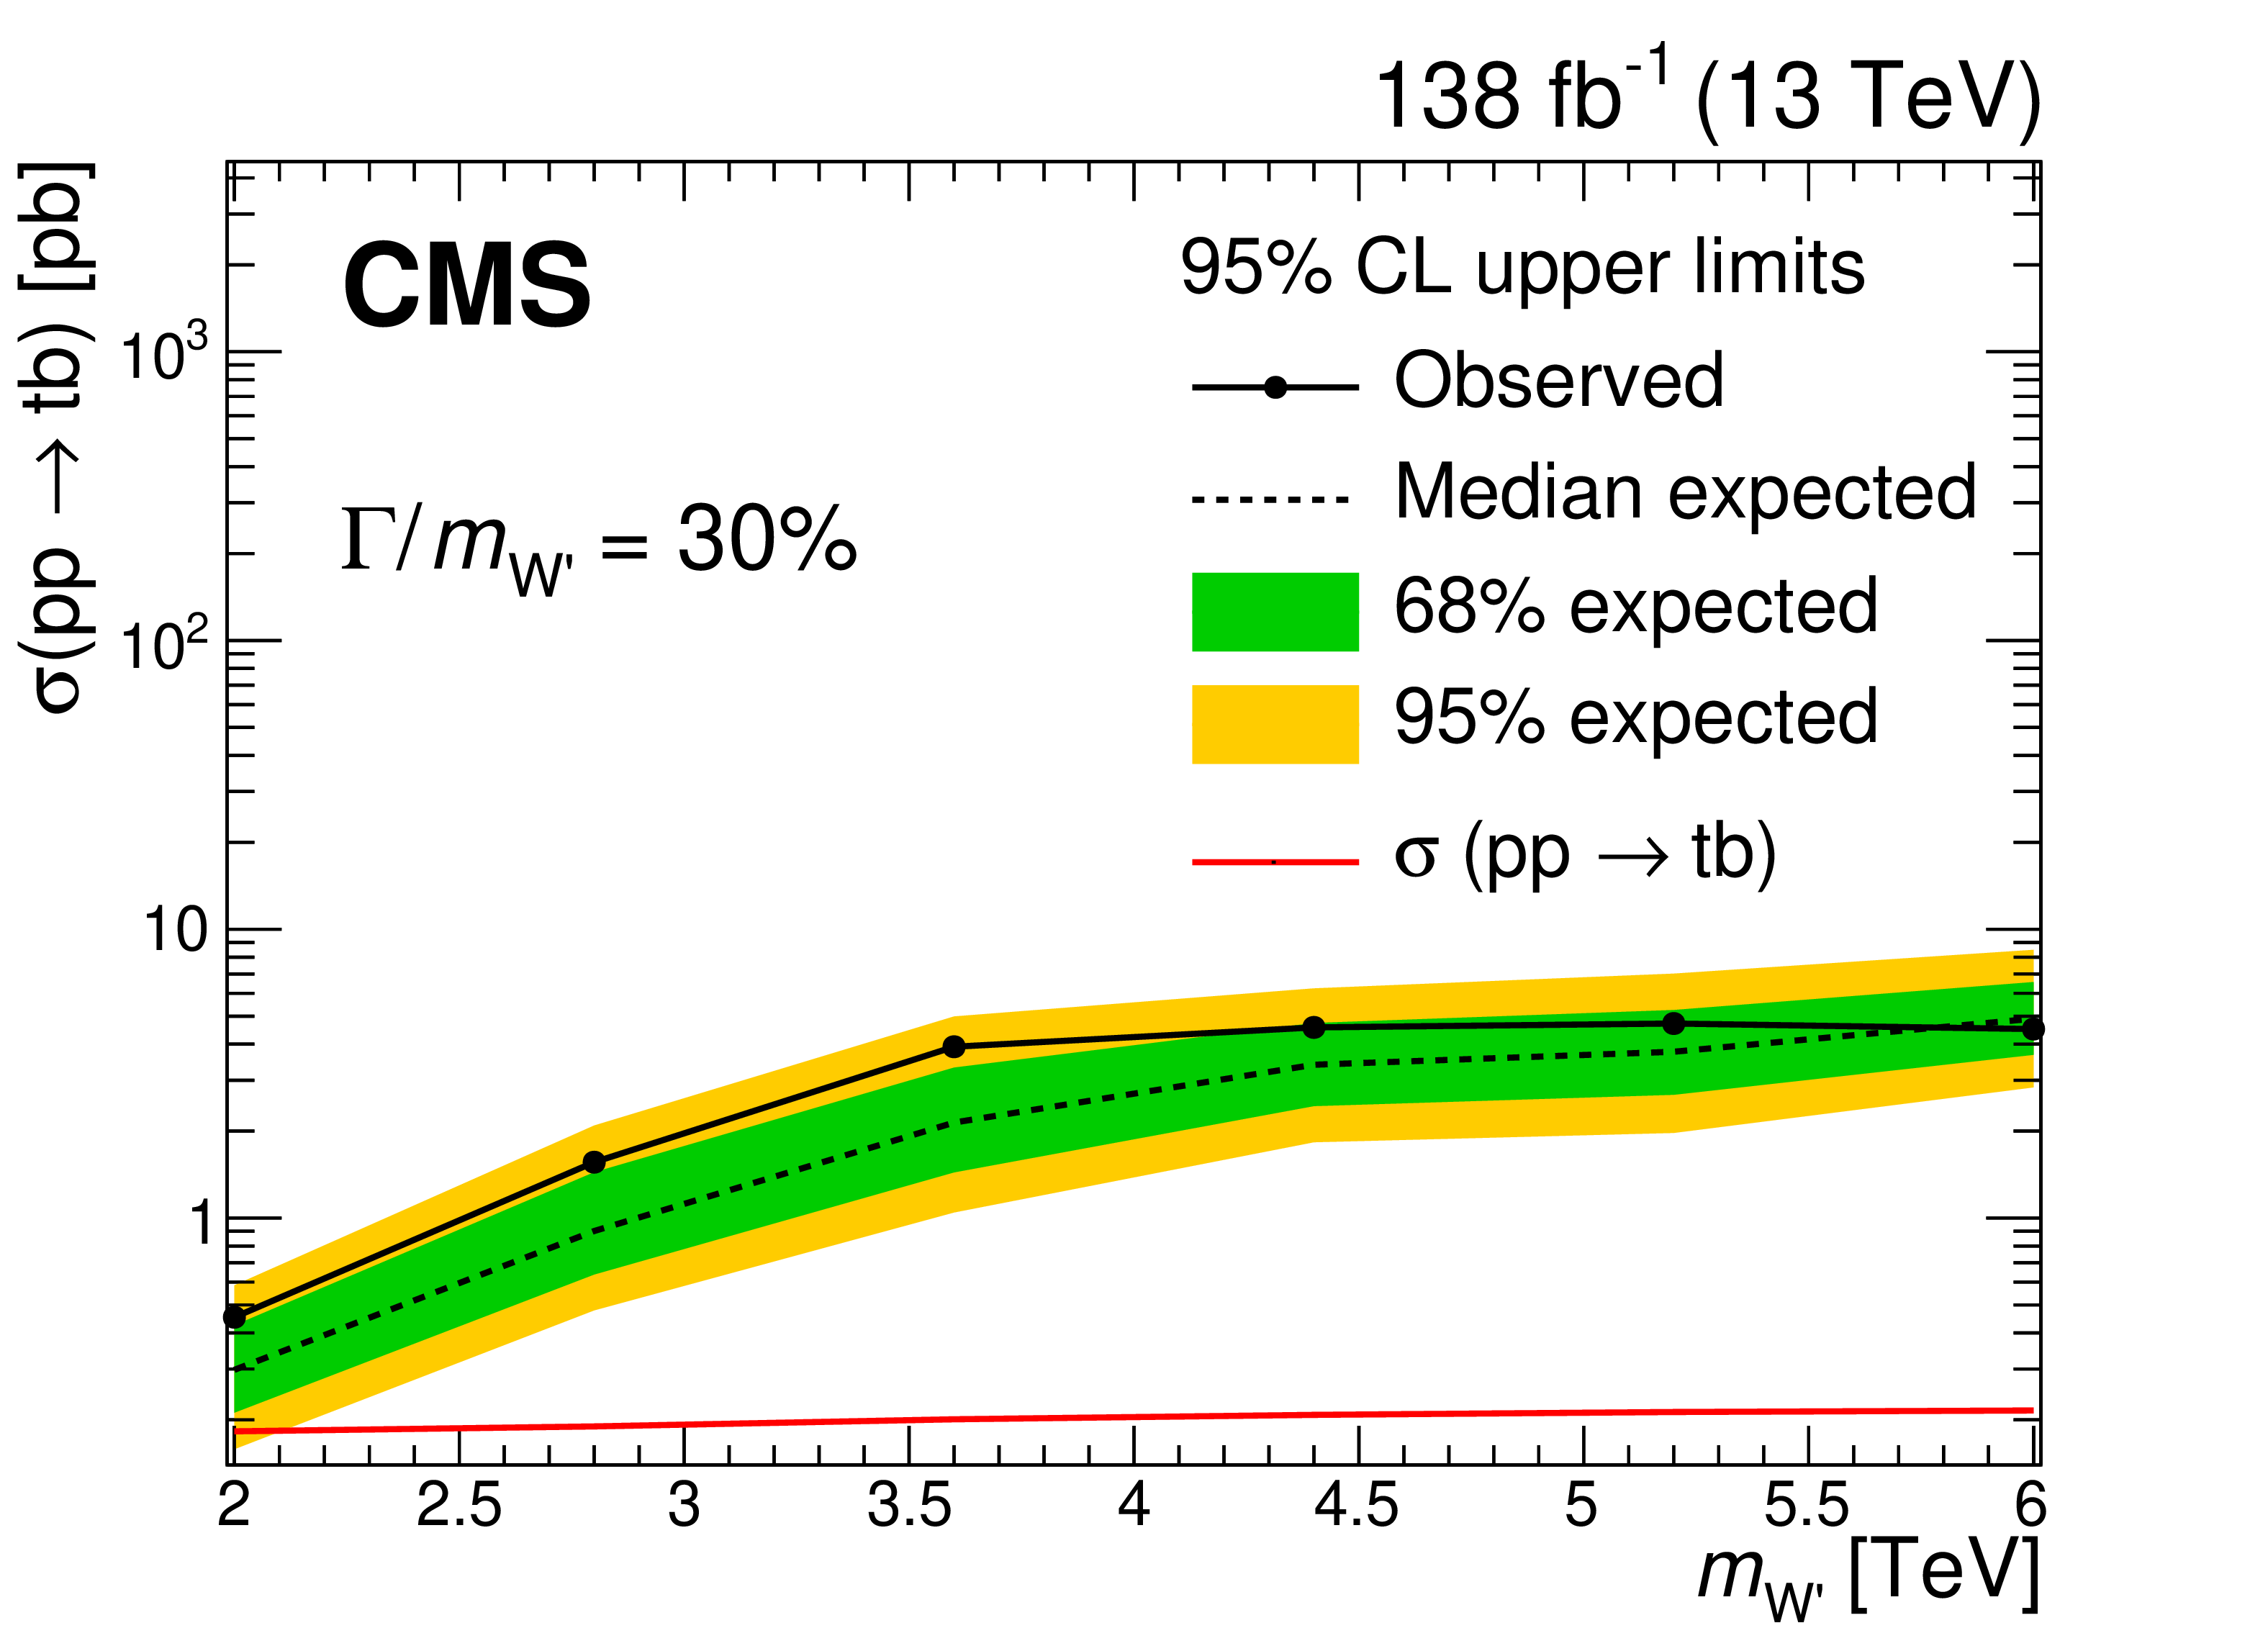
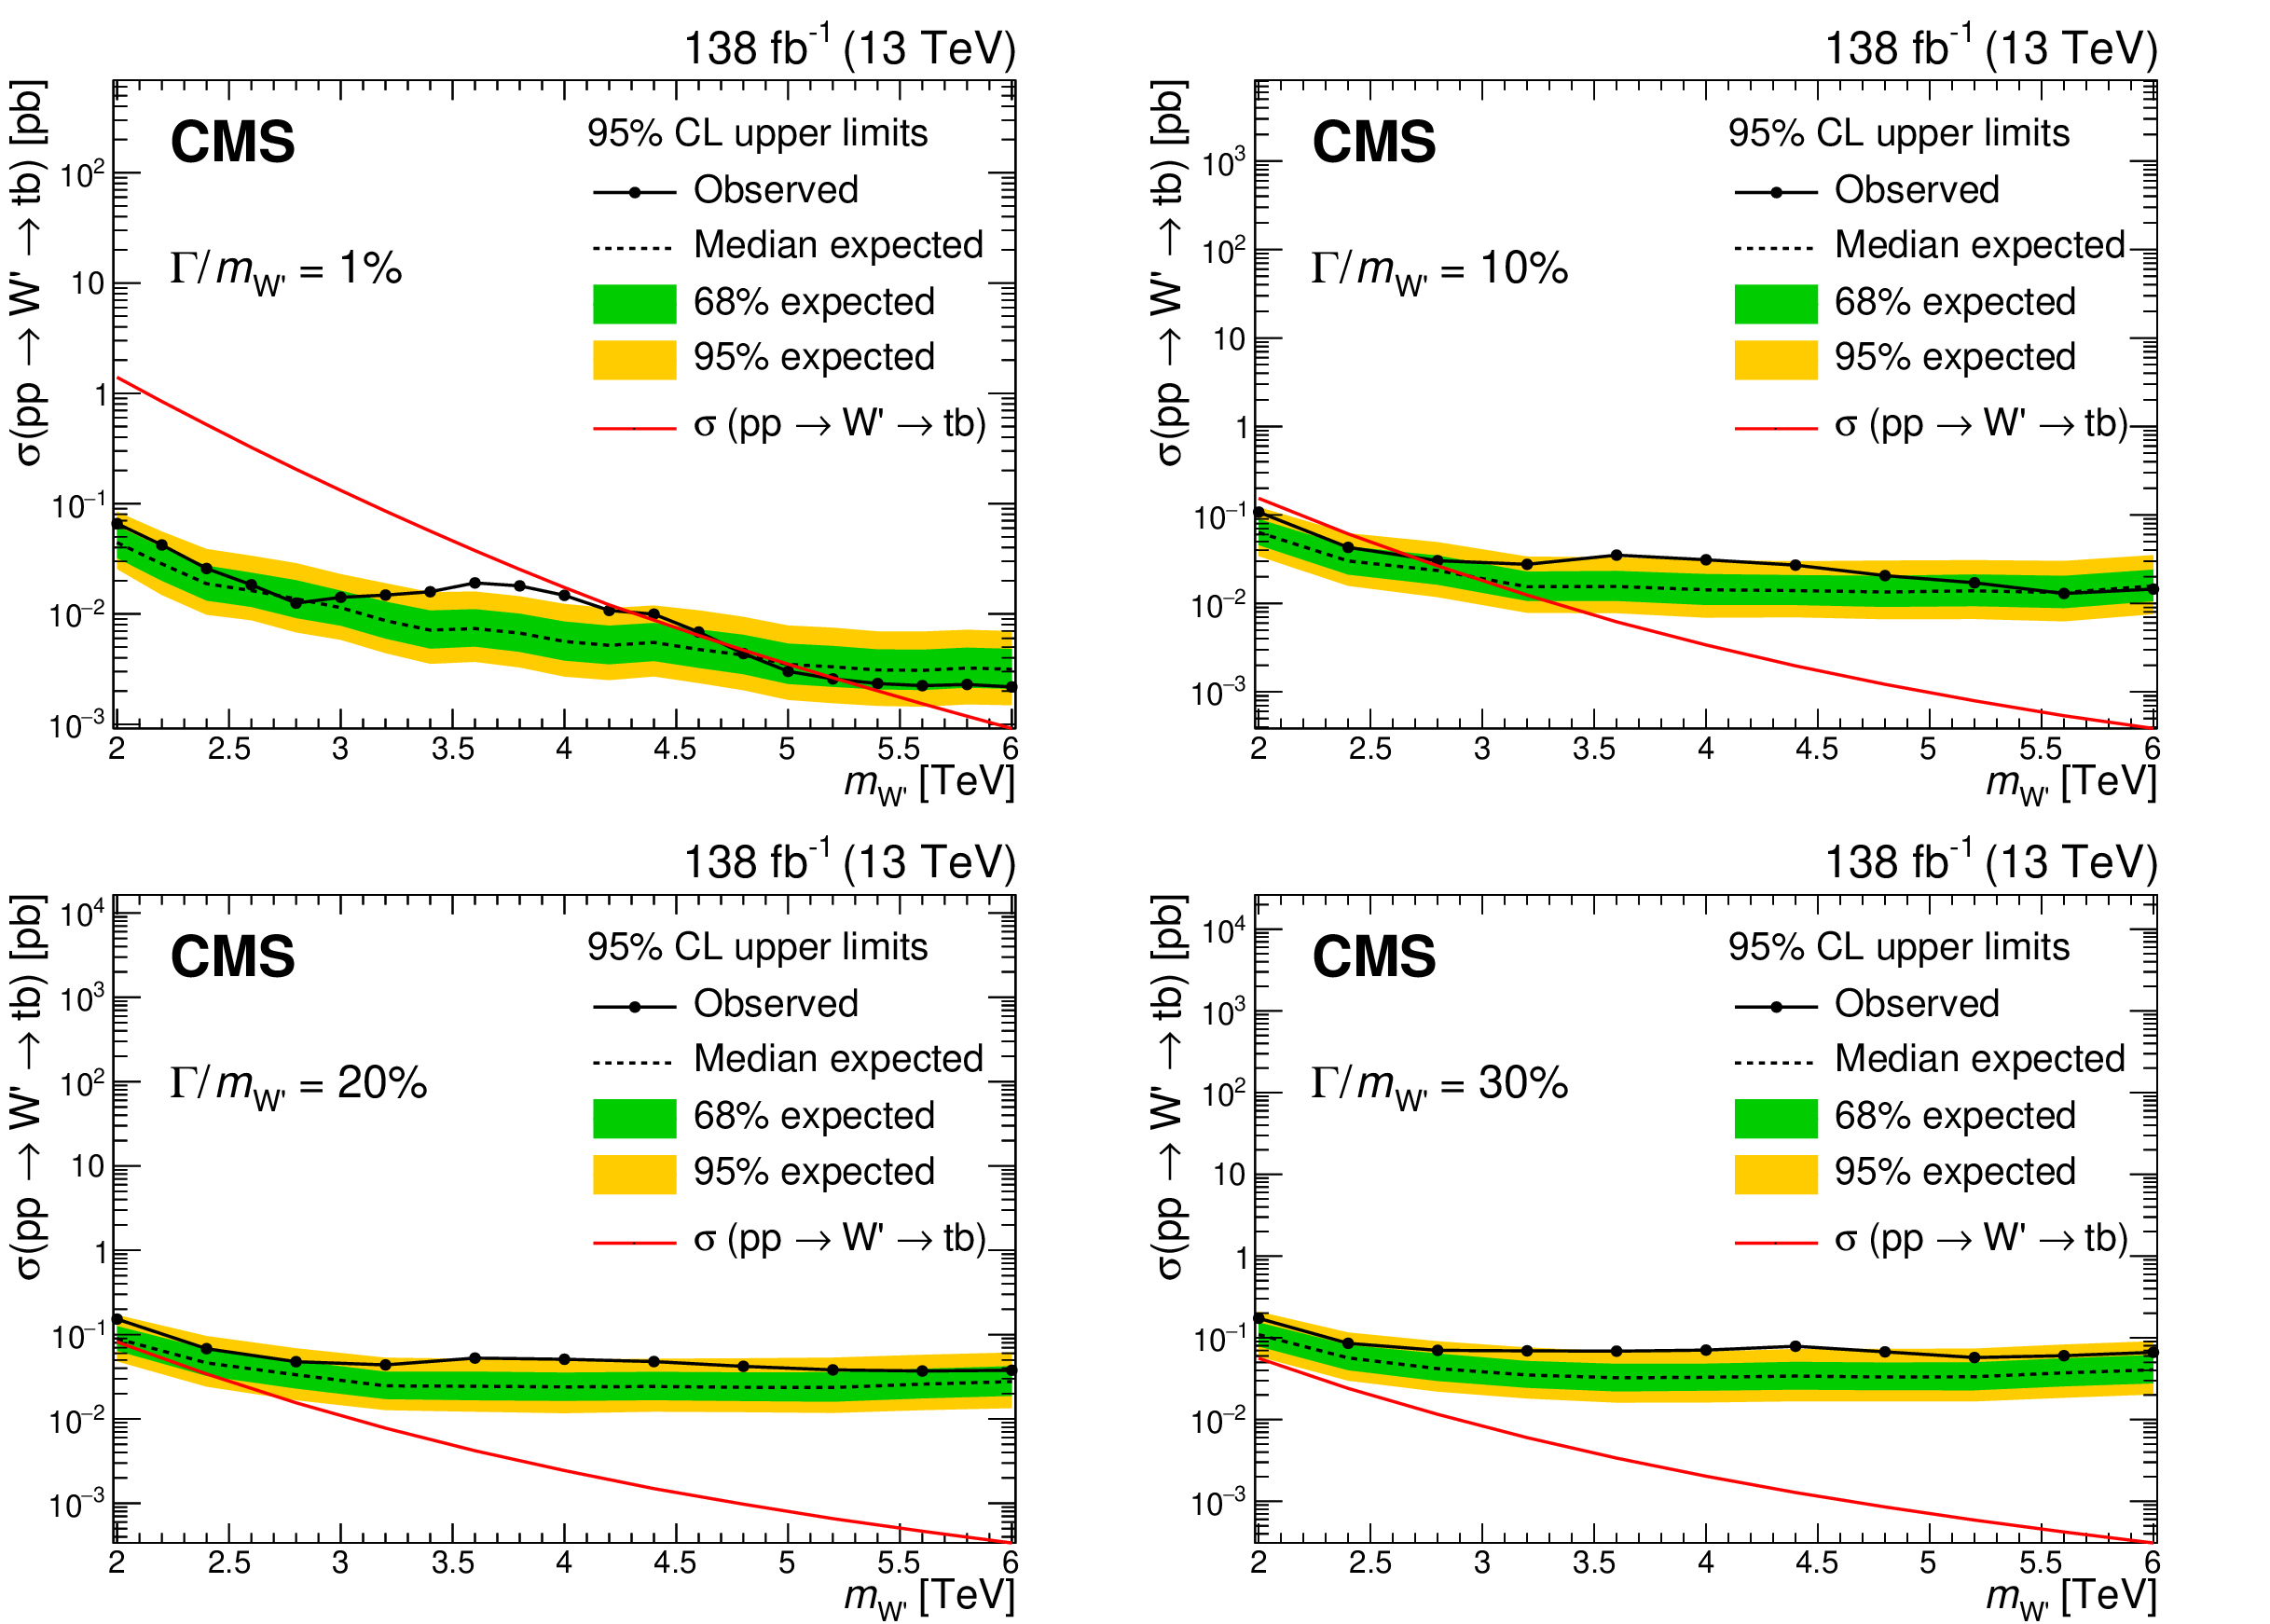
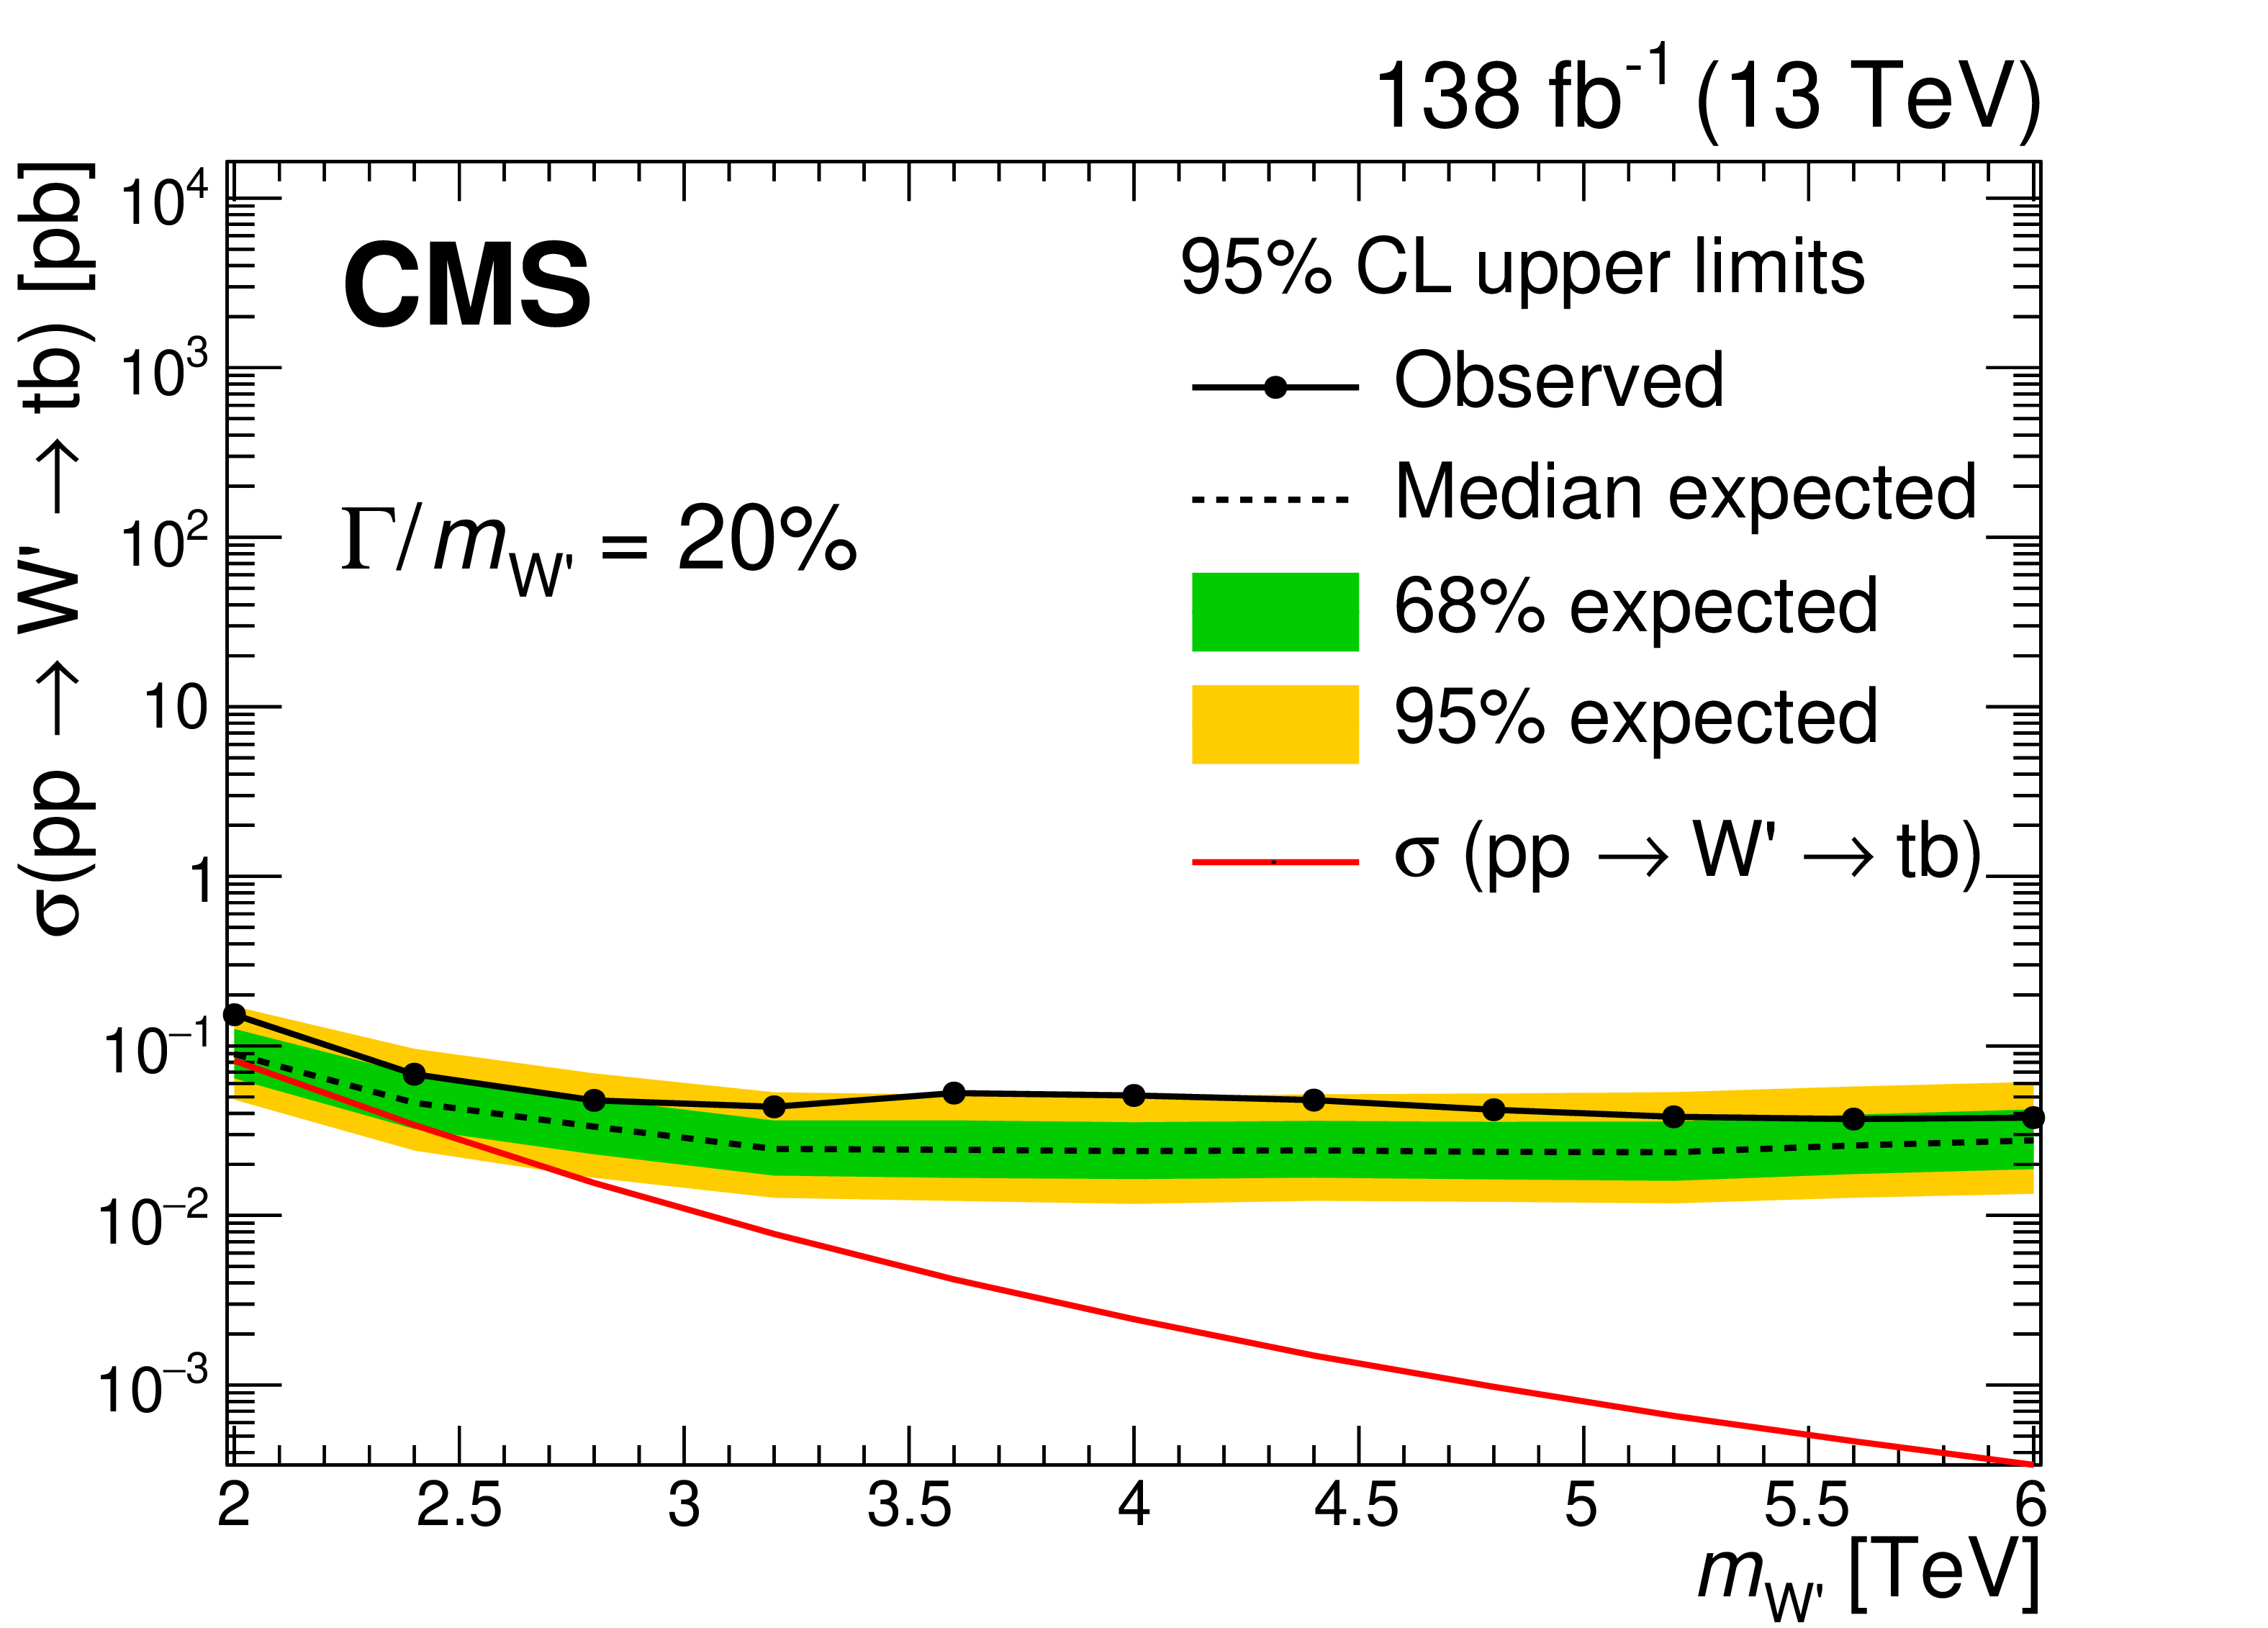
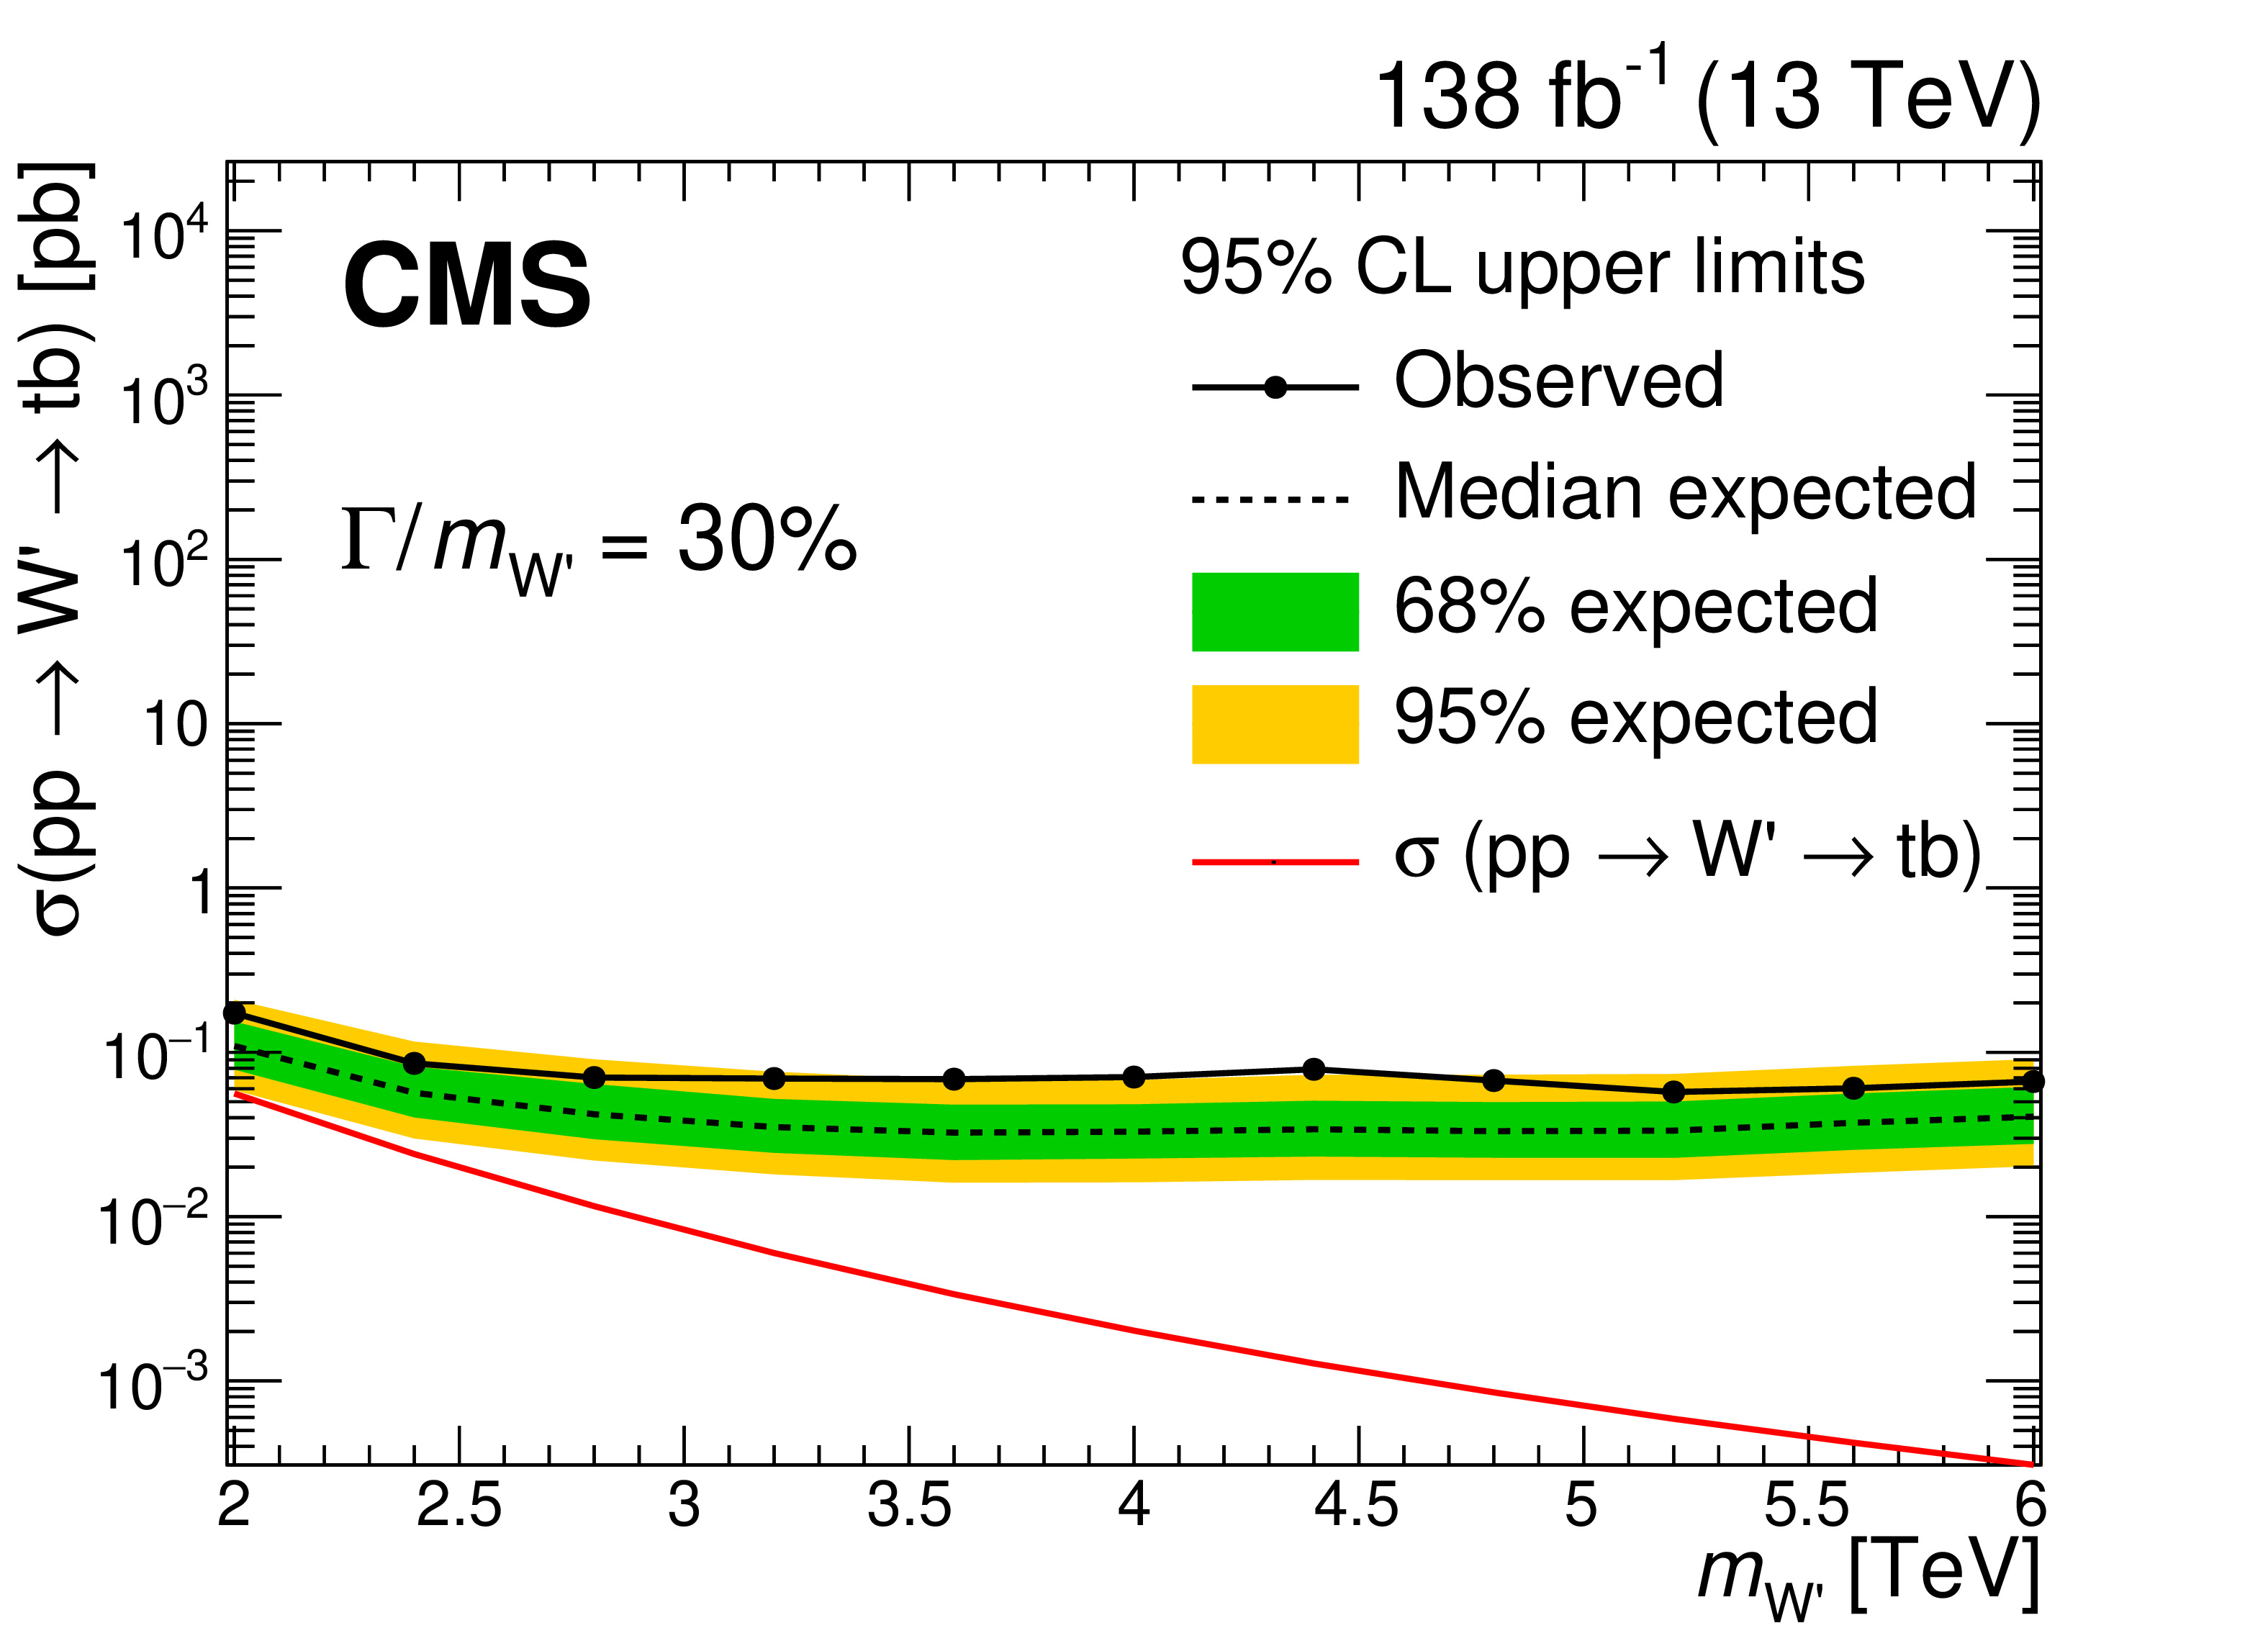
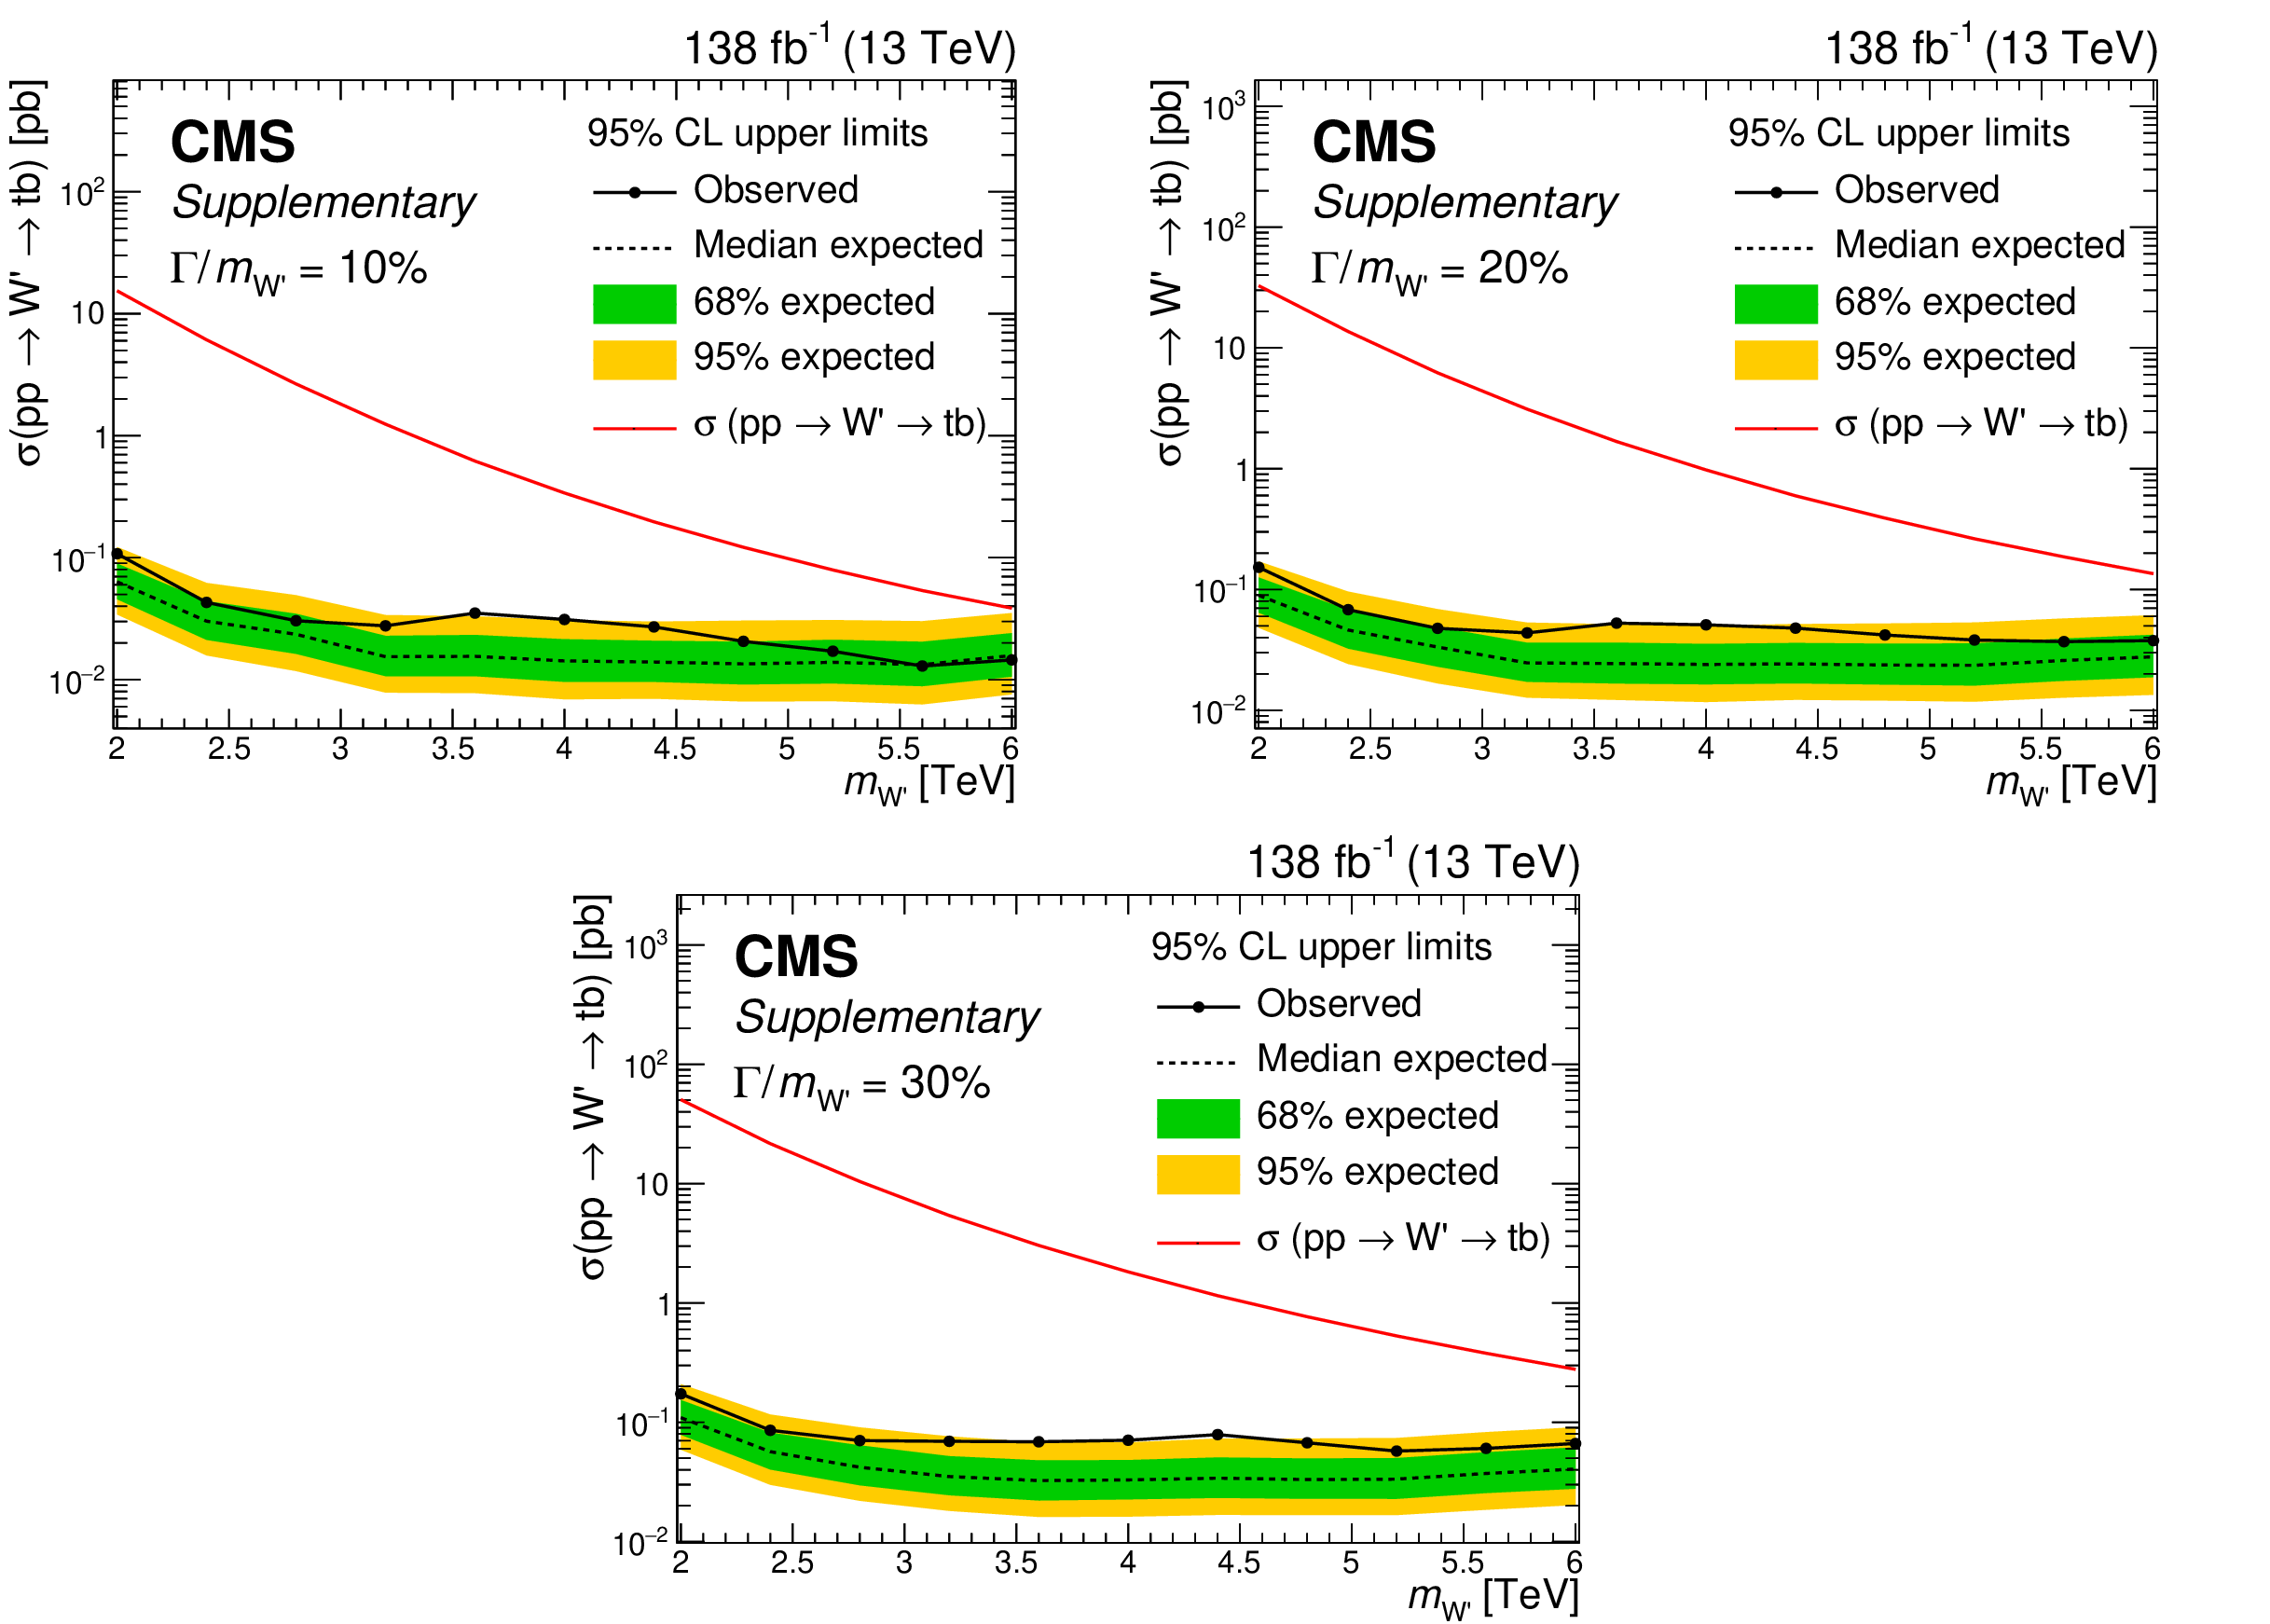
Figure 7:
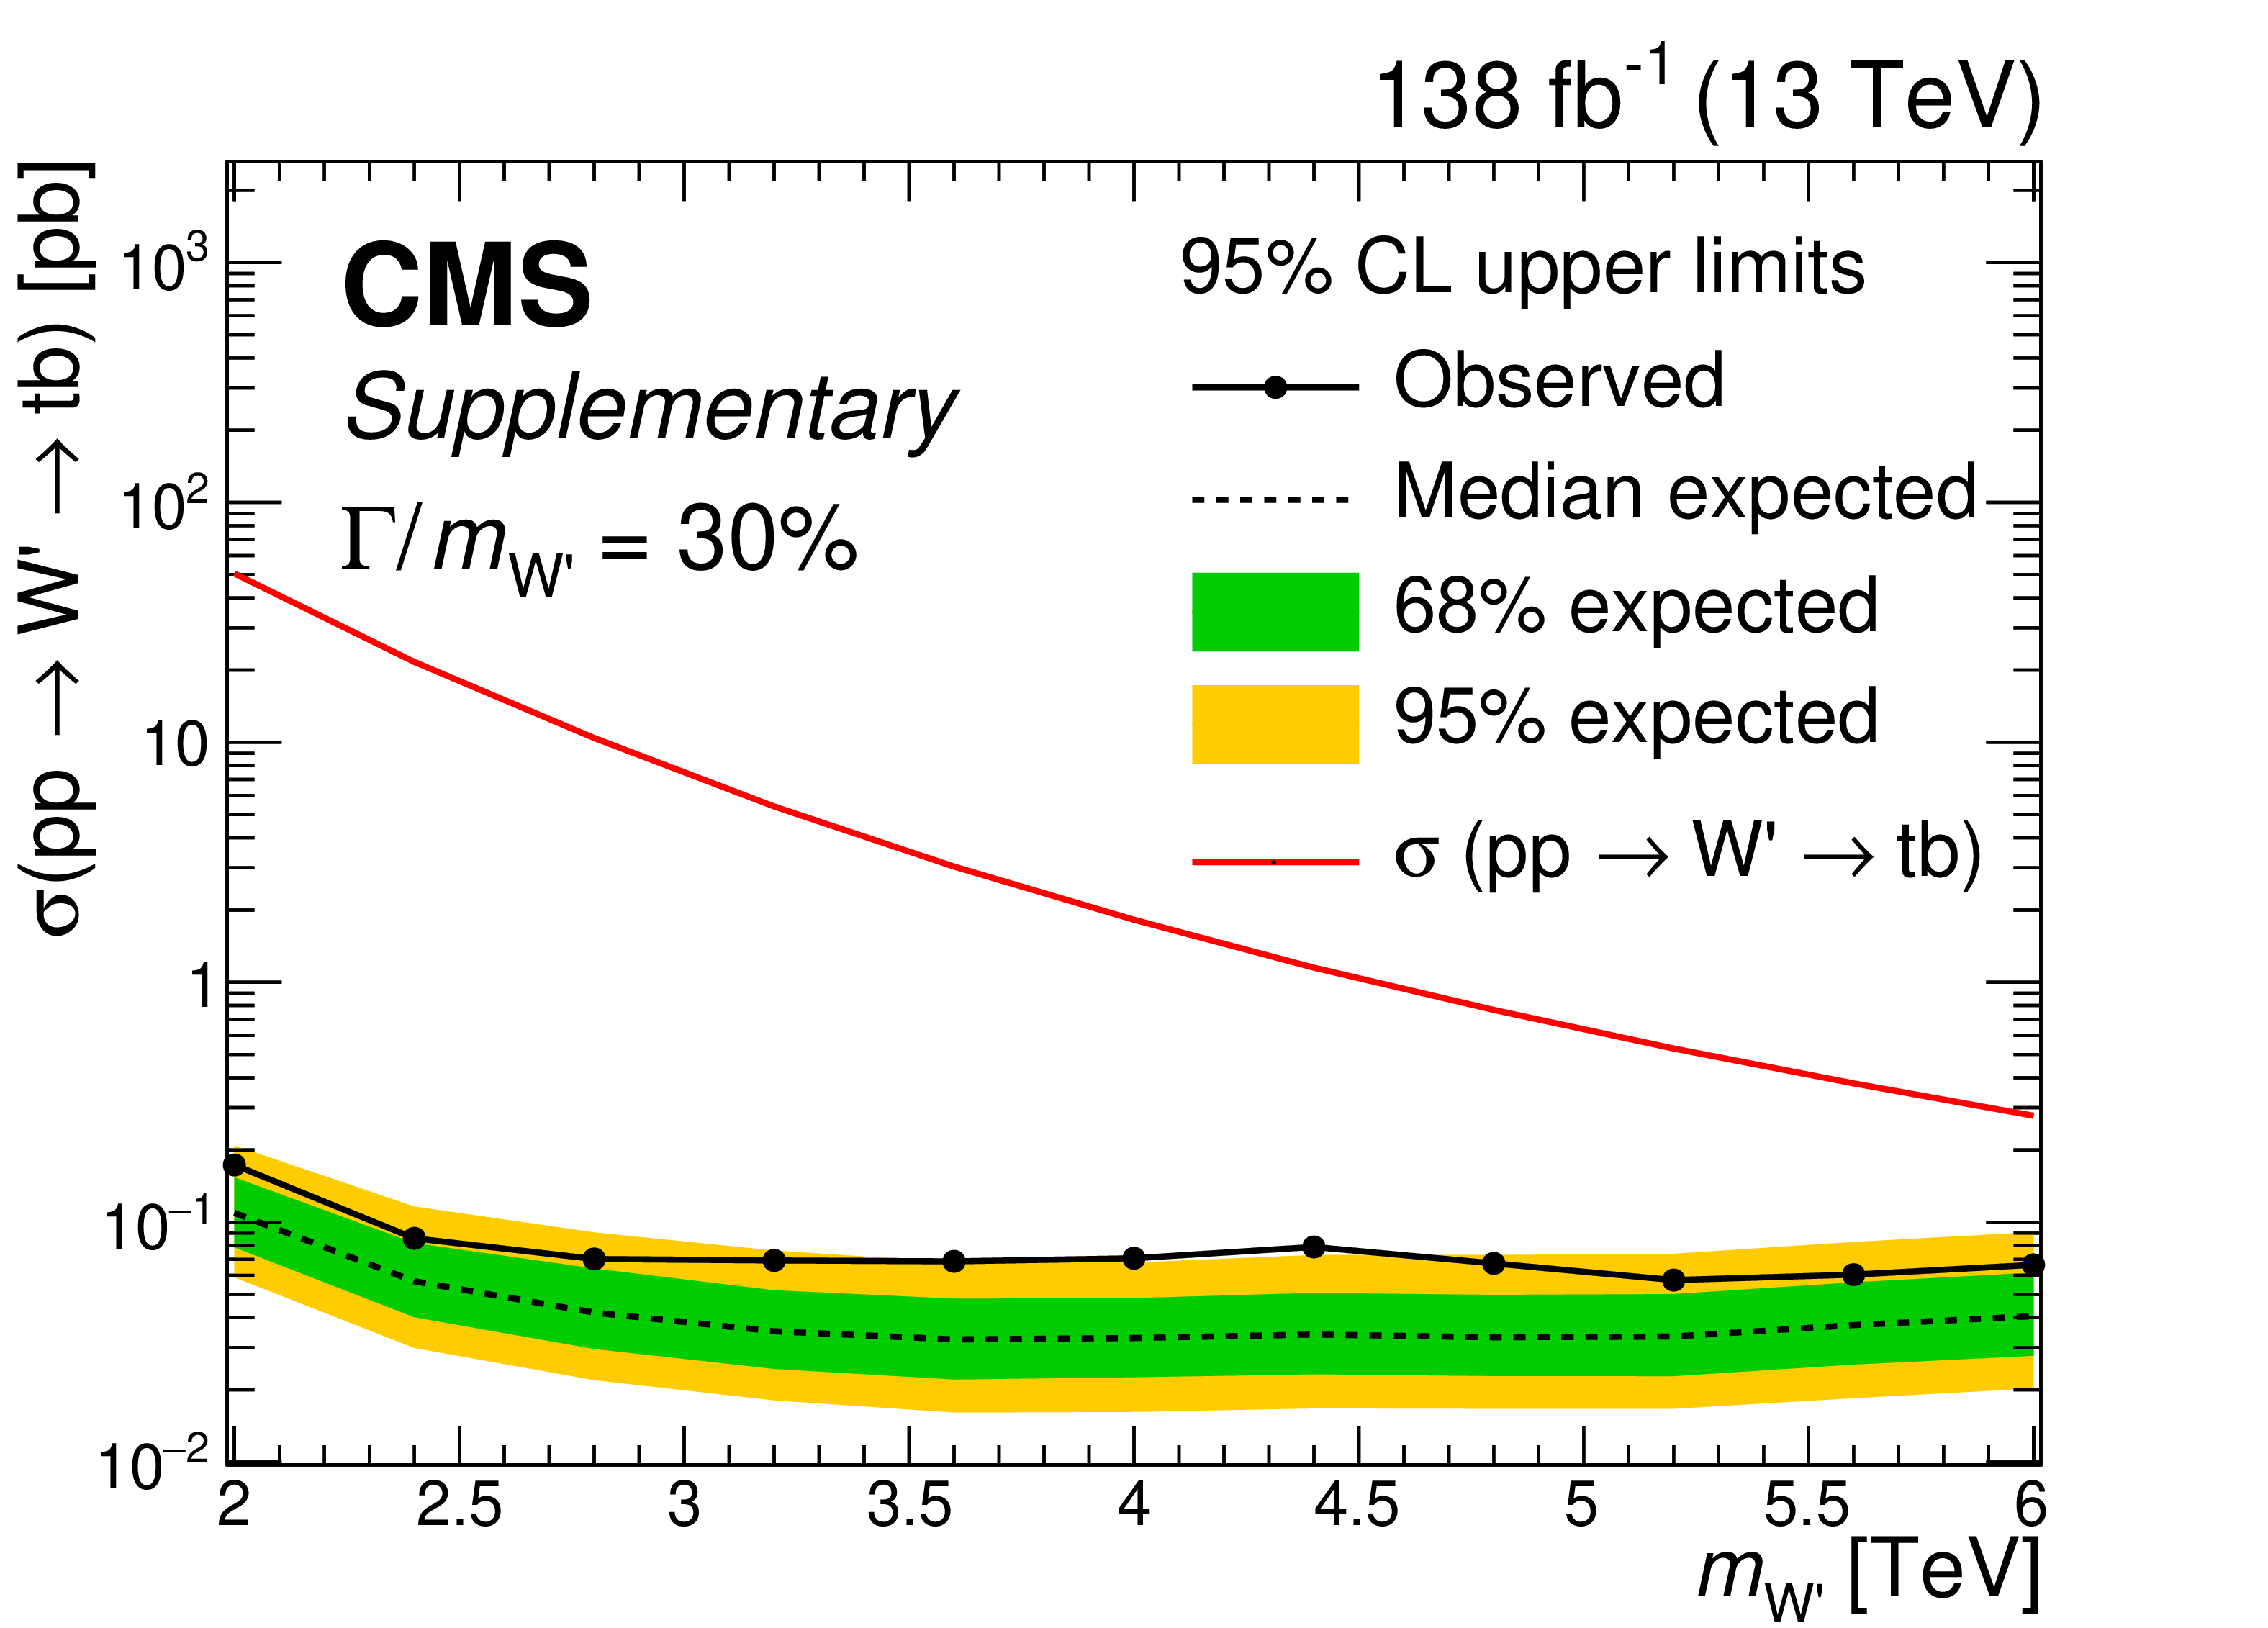
Observed and expected 95% CL upper limits on the product of the production cross section for a right-handed W' boson and the W' $ \to \mathrm{t}\mathrm{b} $ branching fraction, as functions of $ m_{\mathrm{W^{'}}} $ for a relative width of 1% (upper left), 10% (upper right), 20% (lower left), and 30% (lower right). The inner (green) band and the outer (yellow) band indicate the regions containing 68 and 95%, respectively, of the distribution of limits expected under the background-only hypothesis. The solid red curves show the theoretical expectation at LO. |
png pdf |
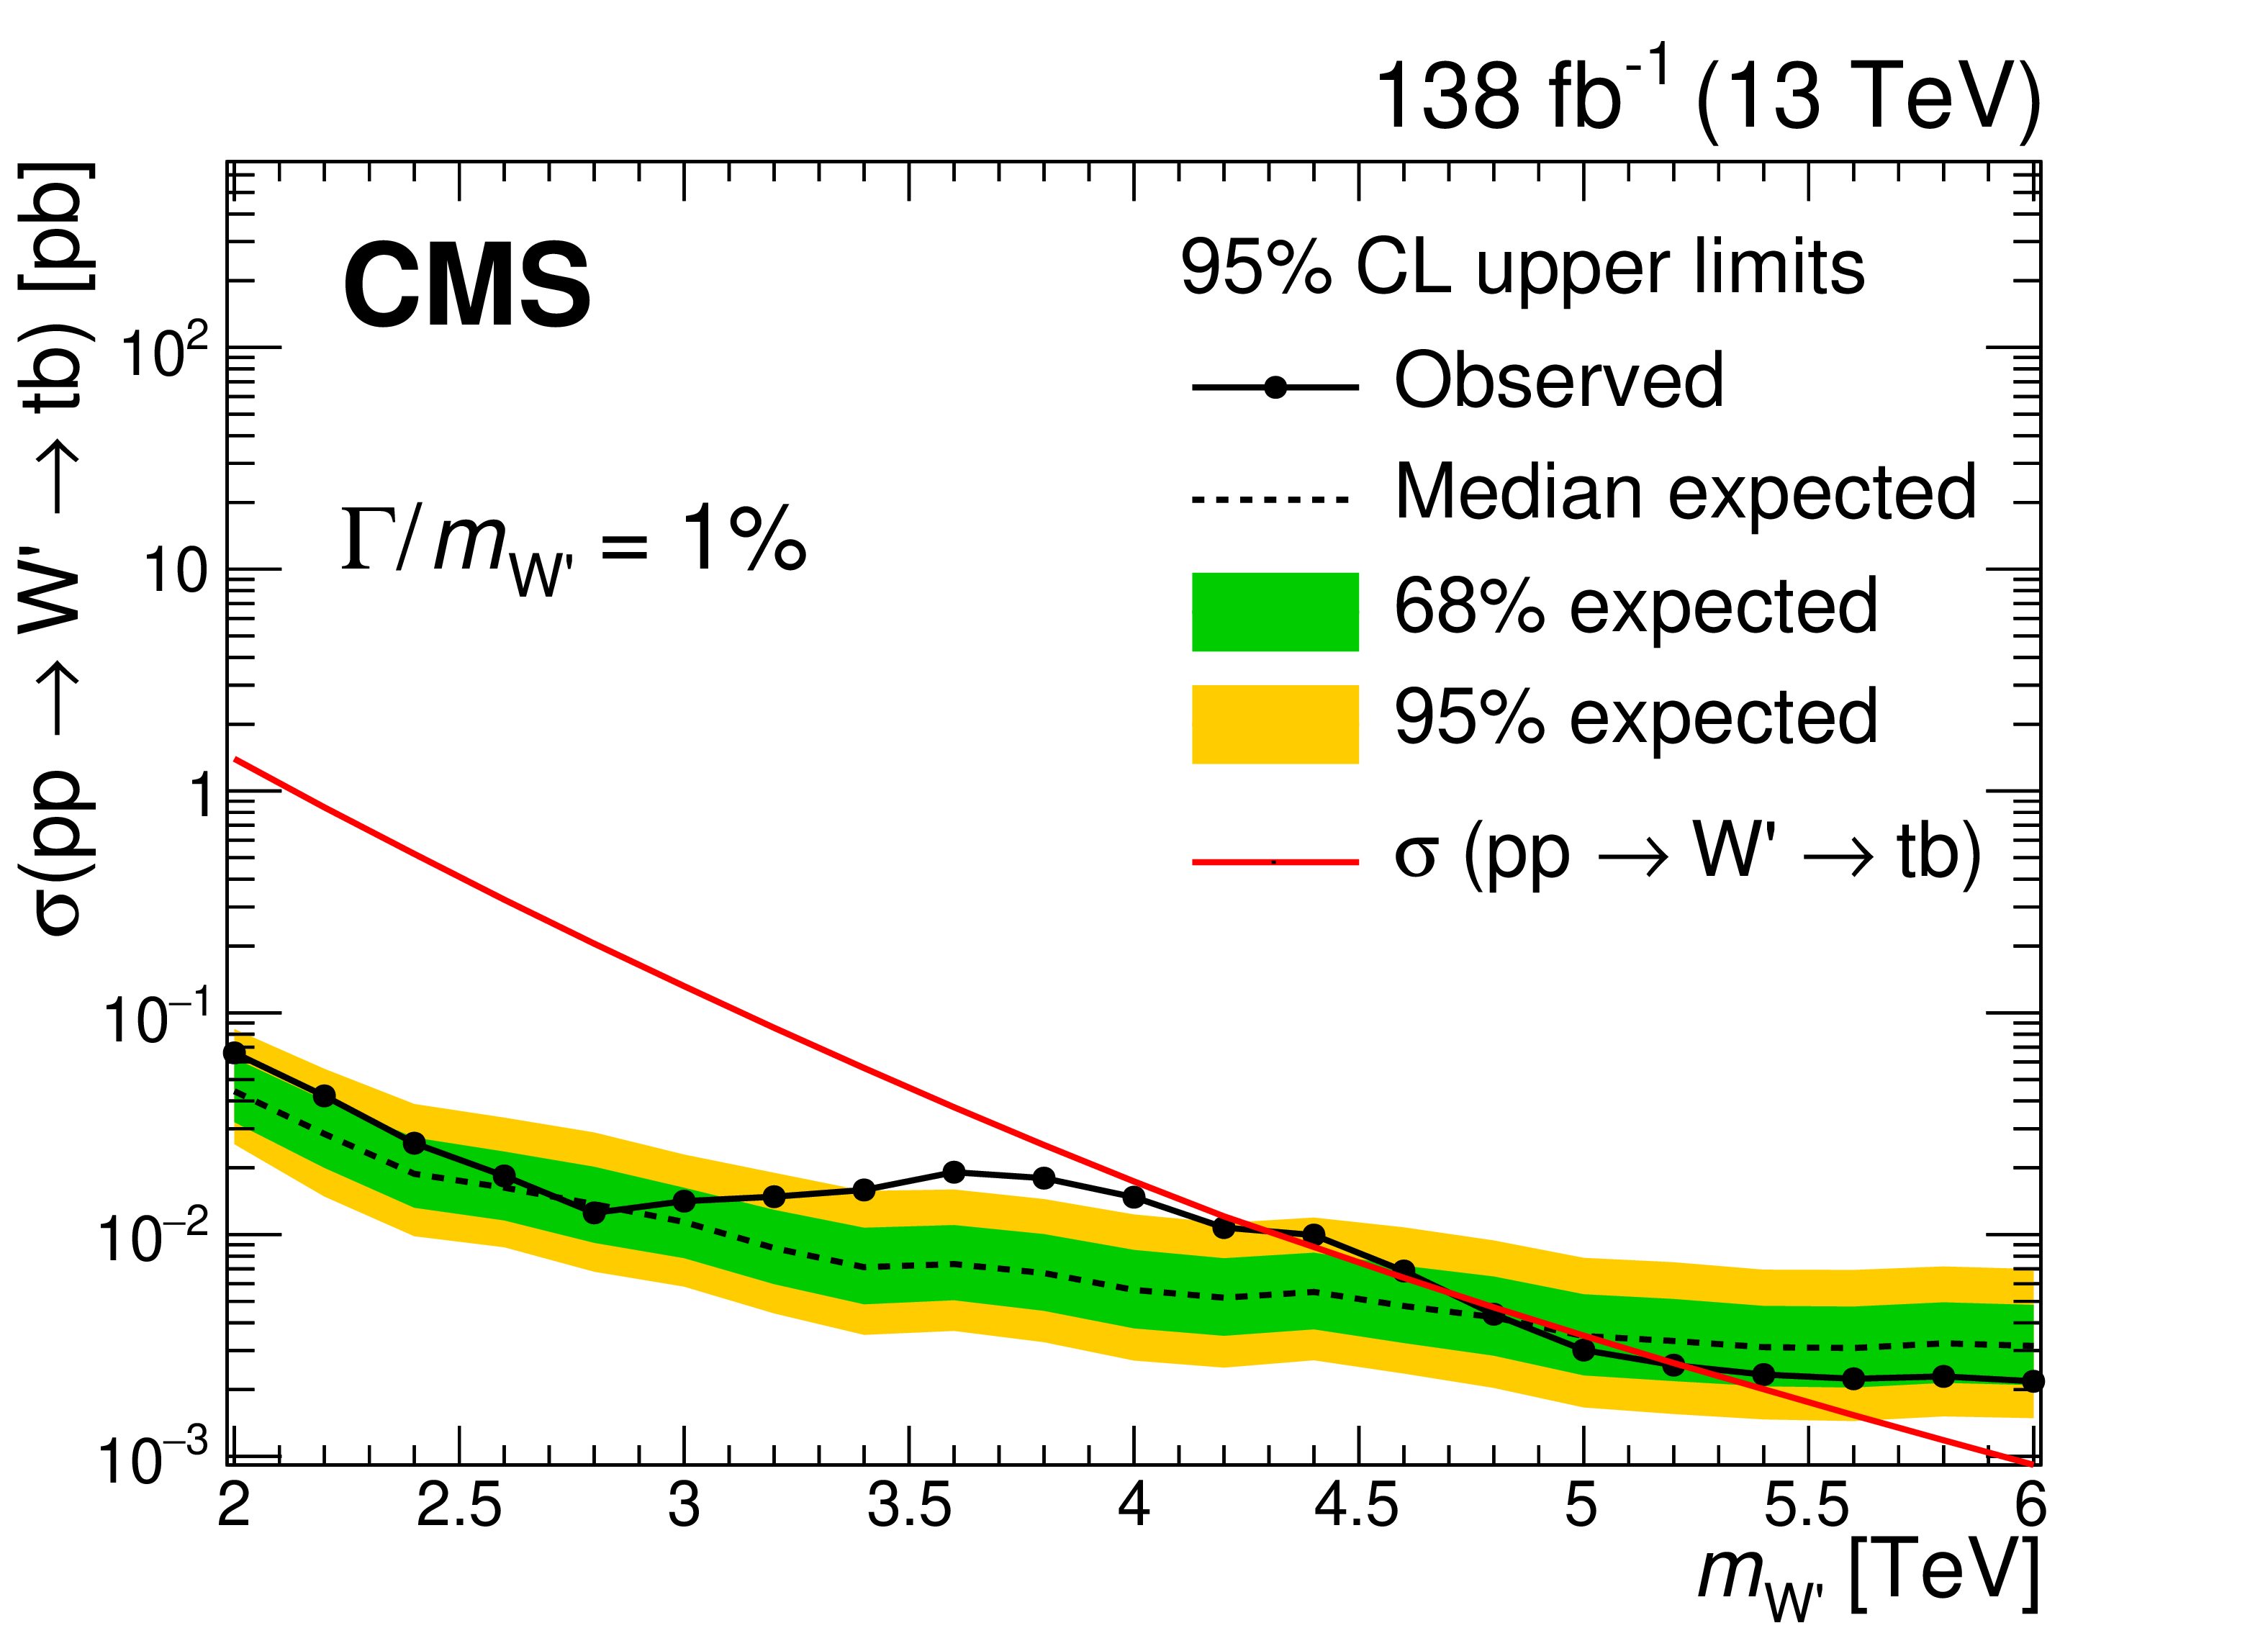
Figure 7-a:
Observed and expected 95% CL upper limits on the product of the production cross section for a right-handed W' boson and the W' $ \to \mathrm{t}\mathrm{b} $ branching fraction, as functions of $ m_{\mathrm{W^{'}}} $ for a relative width of 1%. The inner (green) band and the outer (yellow) band indicate the regions containing 68 and 95%, respectively, of the distribution of limits expected under the background-only hypothesis. The solid red curves show the theoretical expectation at LO. |

png pdf |
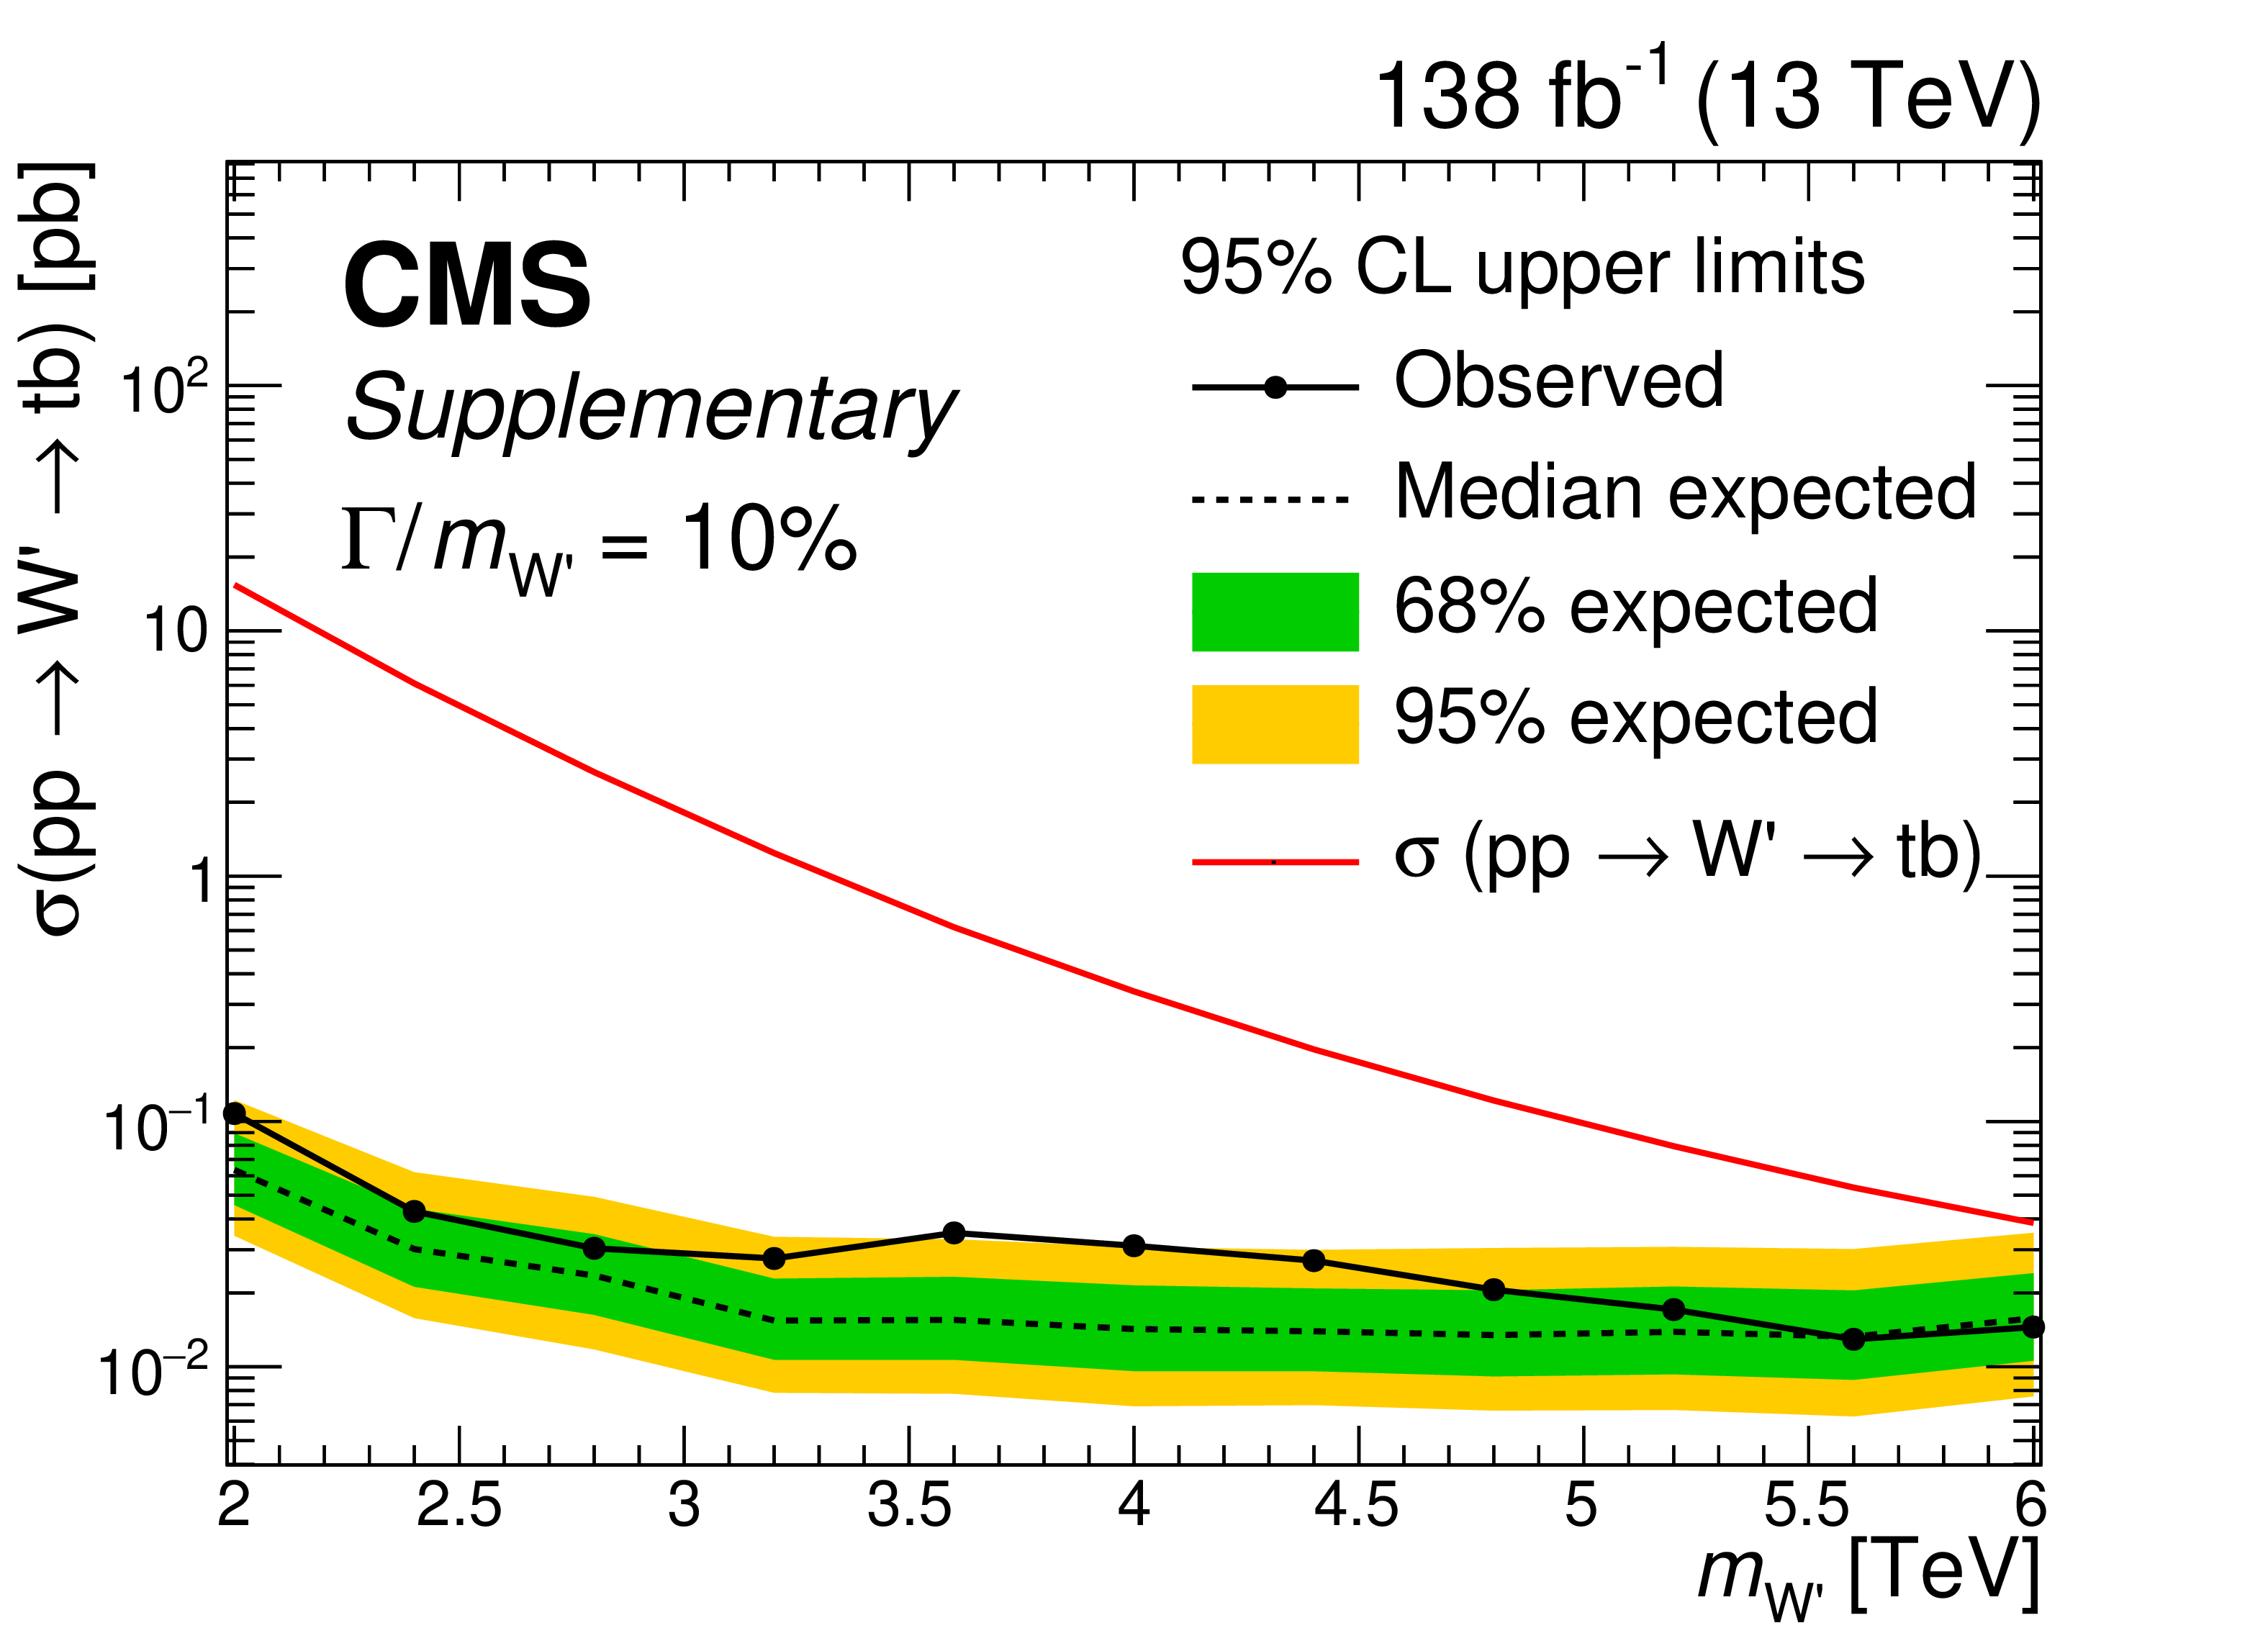
Figure 7-b:
Observed and expected 95% CL upper limits on the product of the production cross section for a right-handed W' boson and the W' $ \to \mathrm{t}\mathrm{b} $ branching fraction, as functions of $ m_{\mathrm{W^{'}}} $ for a relative width of 10%. The inner (green) band and the outer (yellow) band indicate the regions containing 68 and 95%, respectively, of the distribution of limits expected under the background-only hypothesis. The solid red curves show the theoretical expectation at LO. |
png pdf |
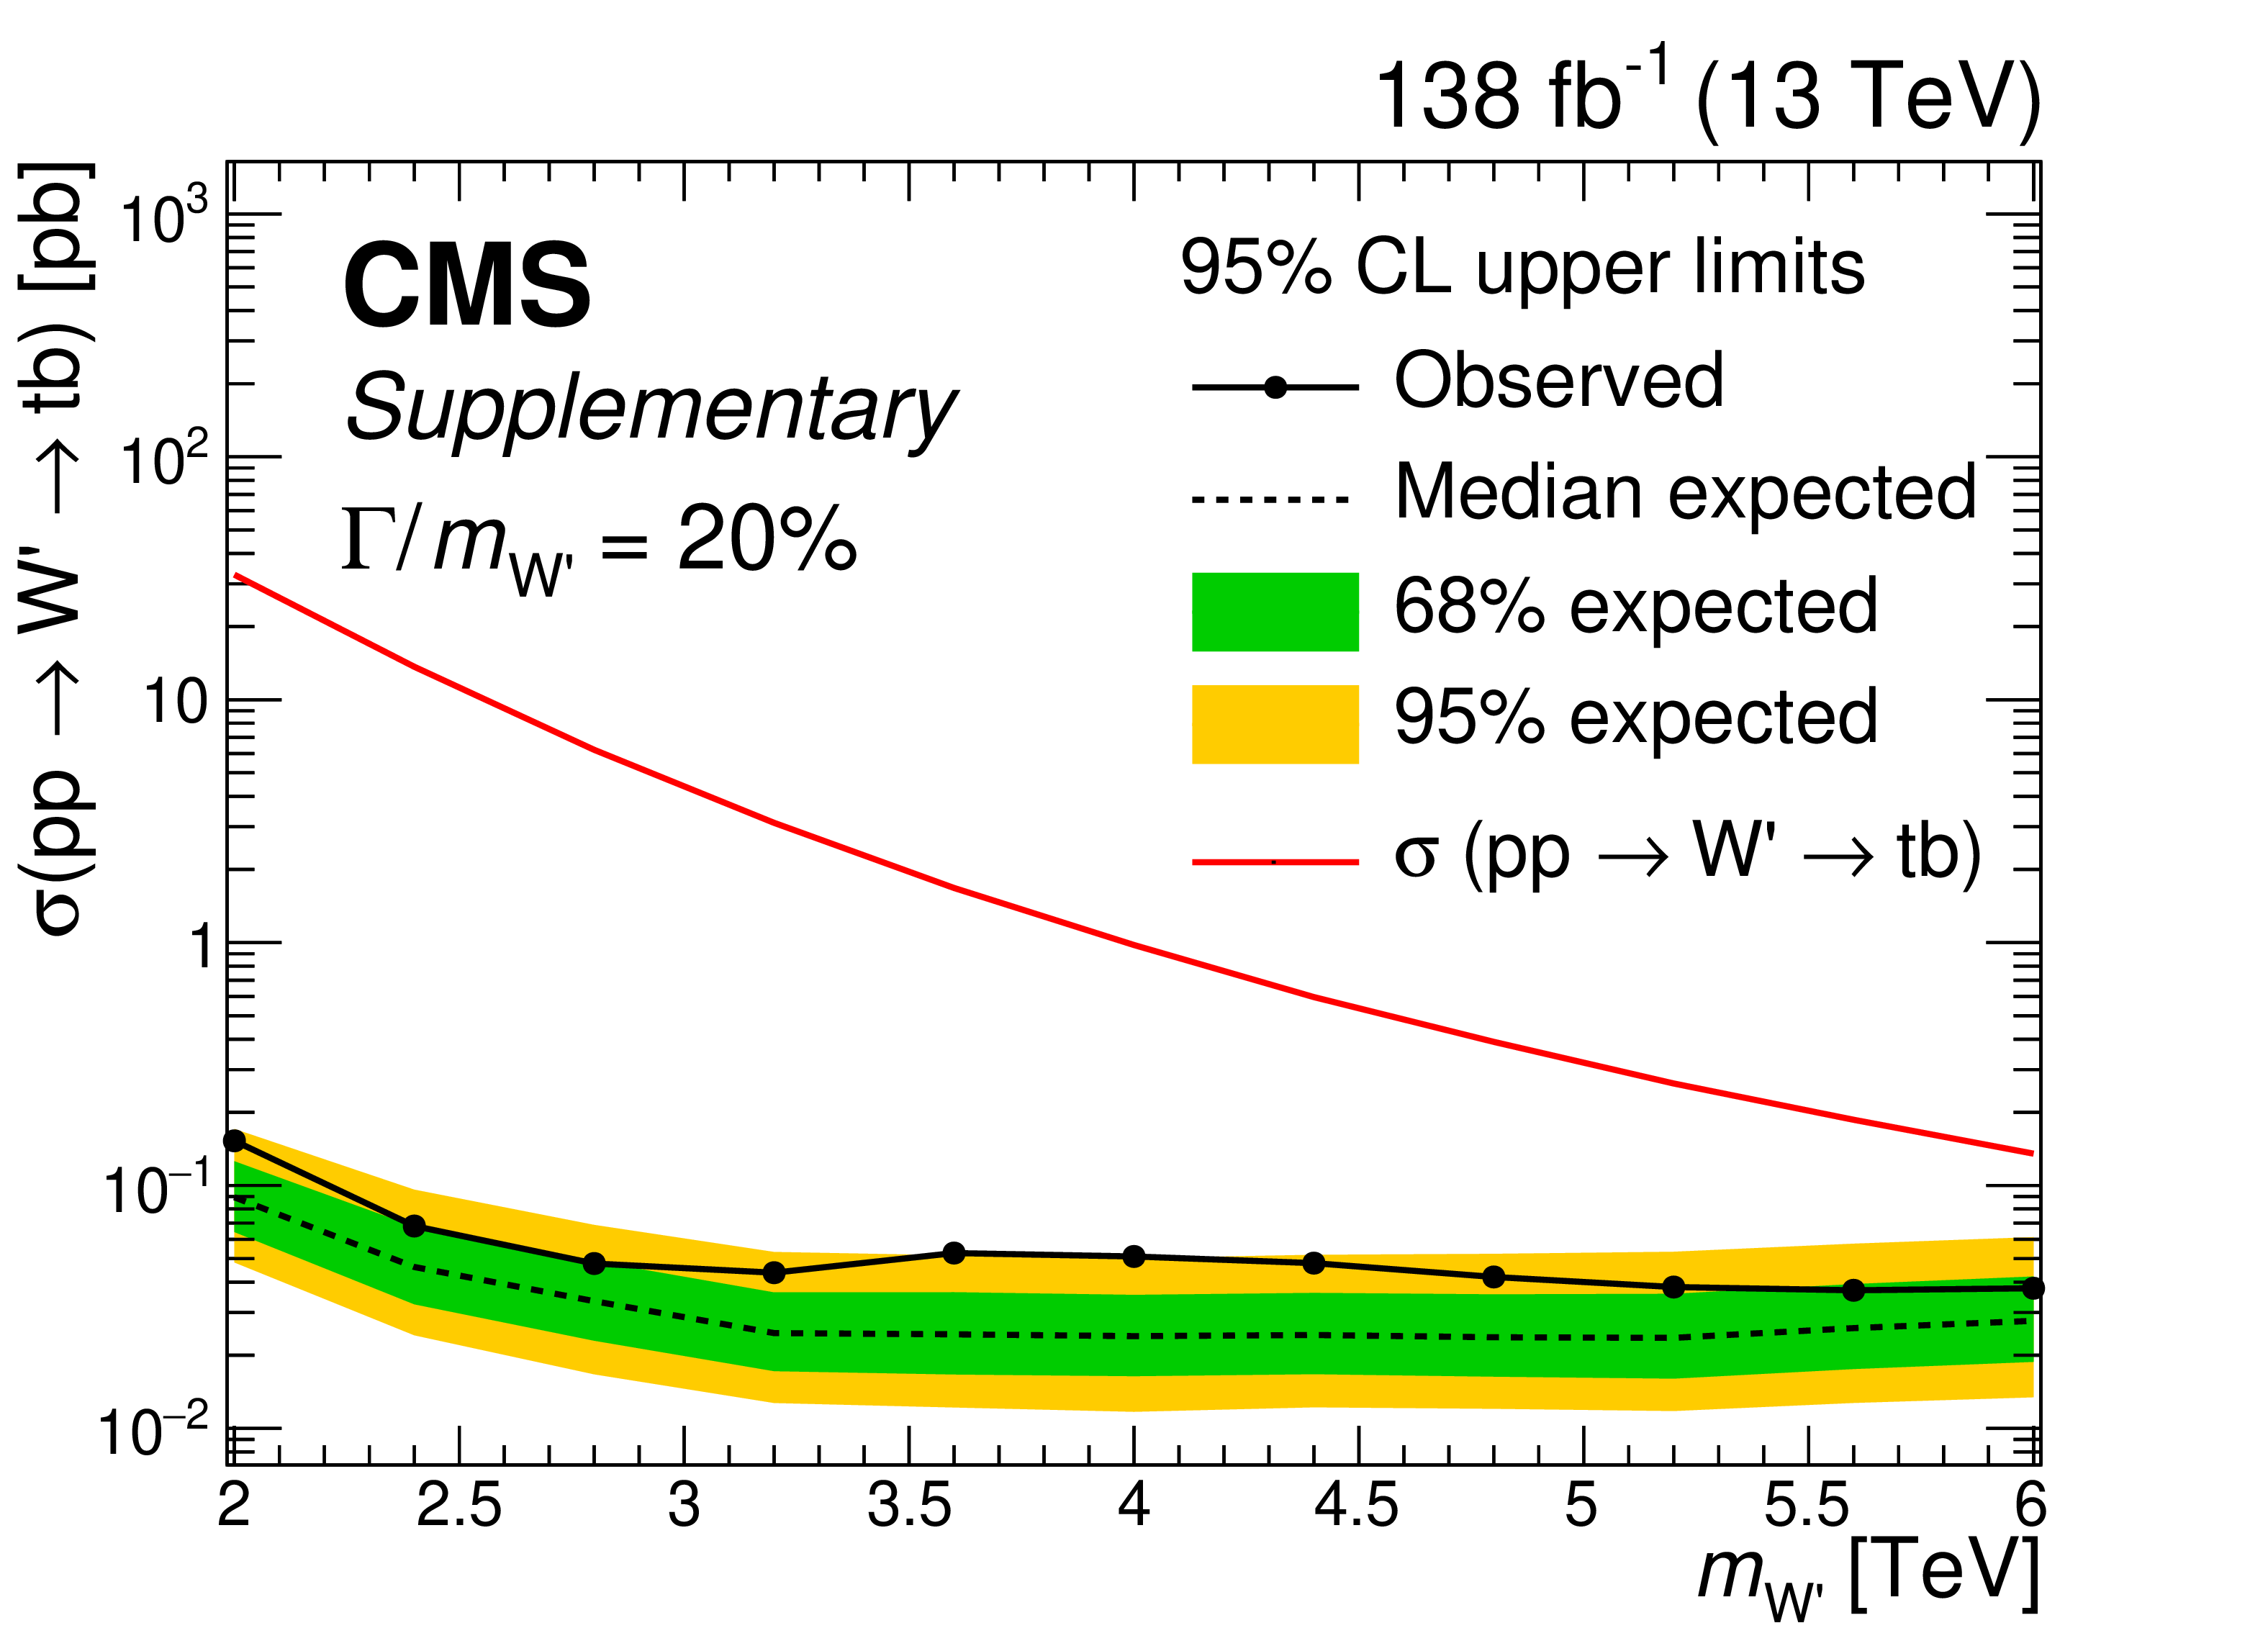
Figure 7-c:
Observed and expected 95% CL upper limits on the product of the production cross section for a right-handed W' boson and the W' $ \to \mathrm{t}\mathrm{b} $ branching fraction, as functions of $ m_{\mathrm{W^{'}}} $ for a relative width of 20%. The inner (green) band and the outer (yellow) band indicate the regions containing 68 and 95%, respectively, of the distribution of limits expected under the background-only hypothesis. The solid red curves show the theoretical expectation at LO. |
png pdf |
Figure 7-d:
Observed and expected 95% CL upper limits on the product of the production cross section for a right-handed W' boson and the W' $ \to \mathrm{t}\mathrm{b} $ branching fraction, as functions of $ m_{\mathrm{W^{'}}} $ for a relative width of 30%. The inner (green) band and the outer (yellow) band indicate the regions containing 68 and 95%, respectively, of the distribution of limits expected under the background-only hypothesis. The solid red curves show the theoretical expectation at LO. |
png pdf |
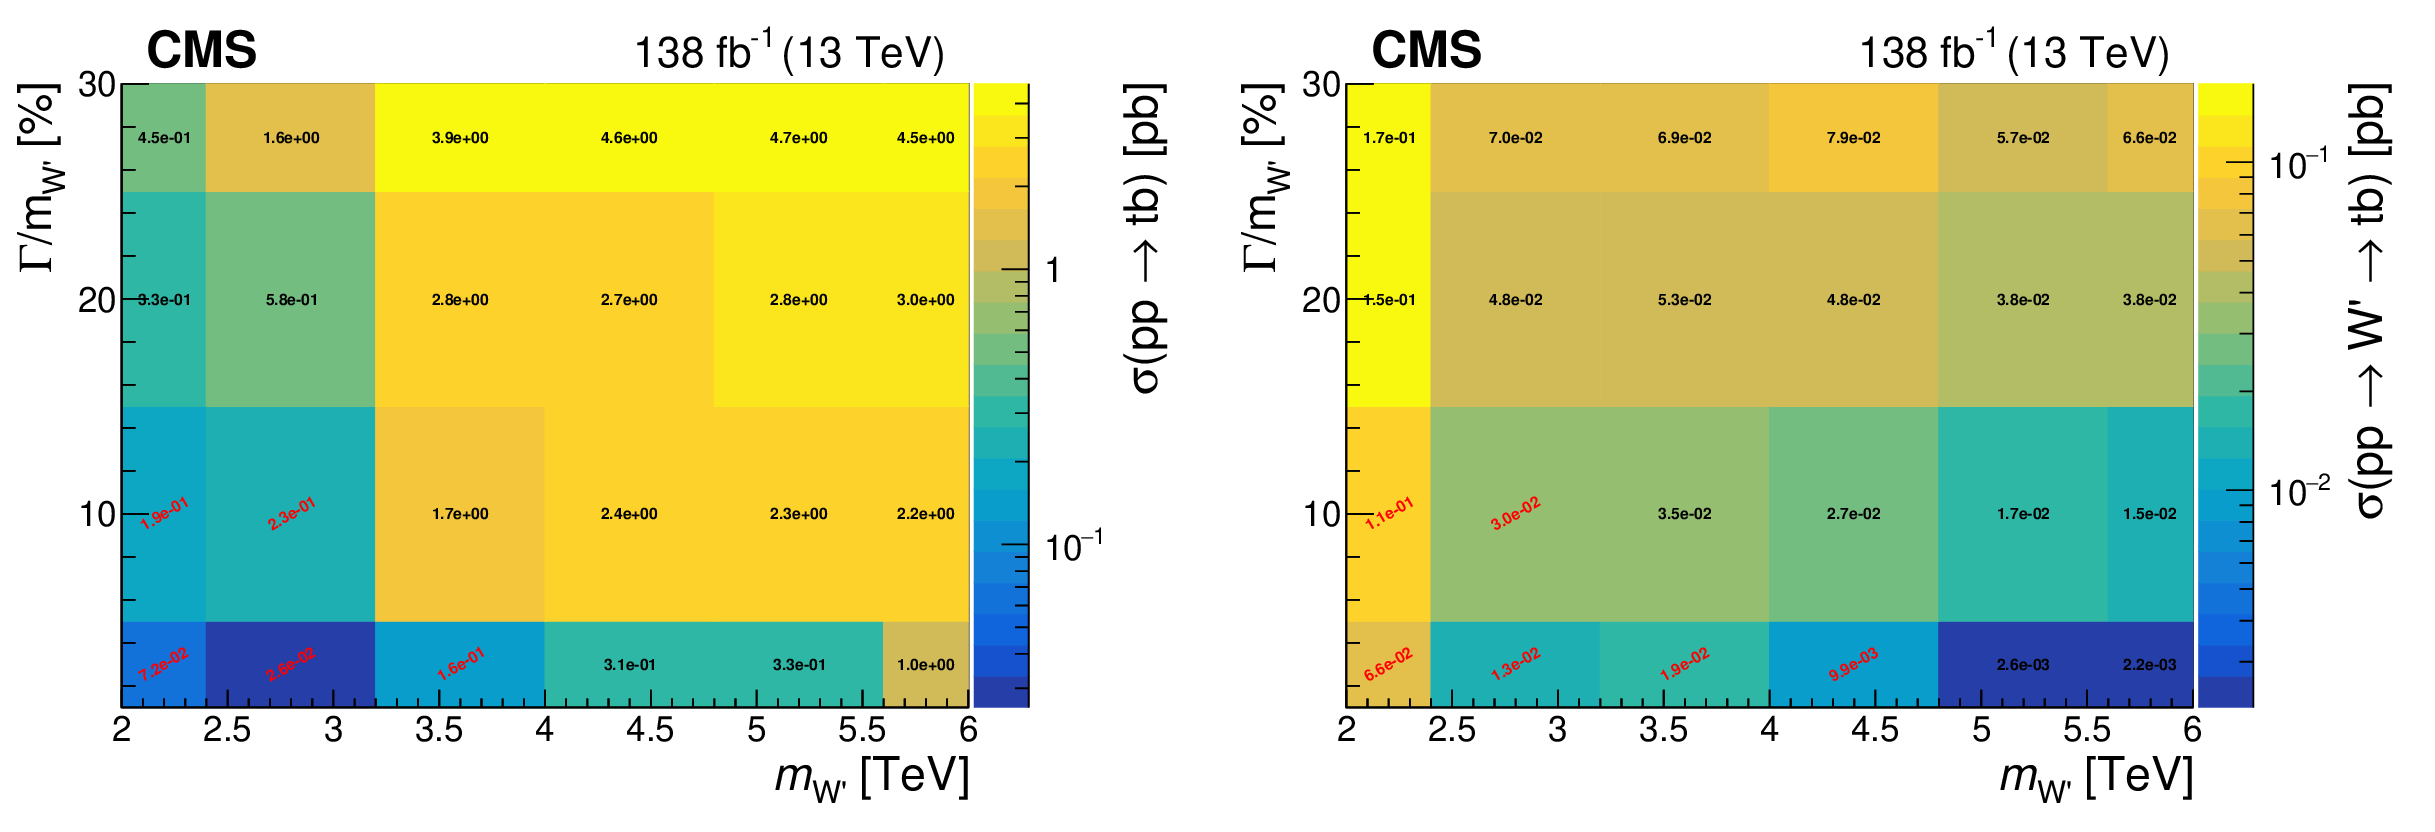
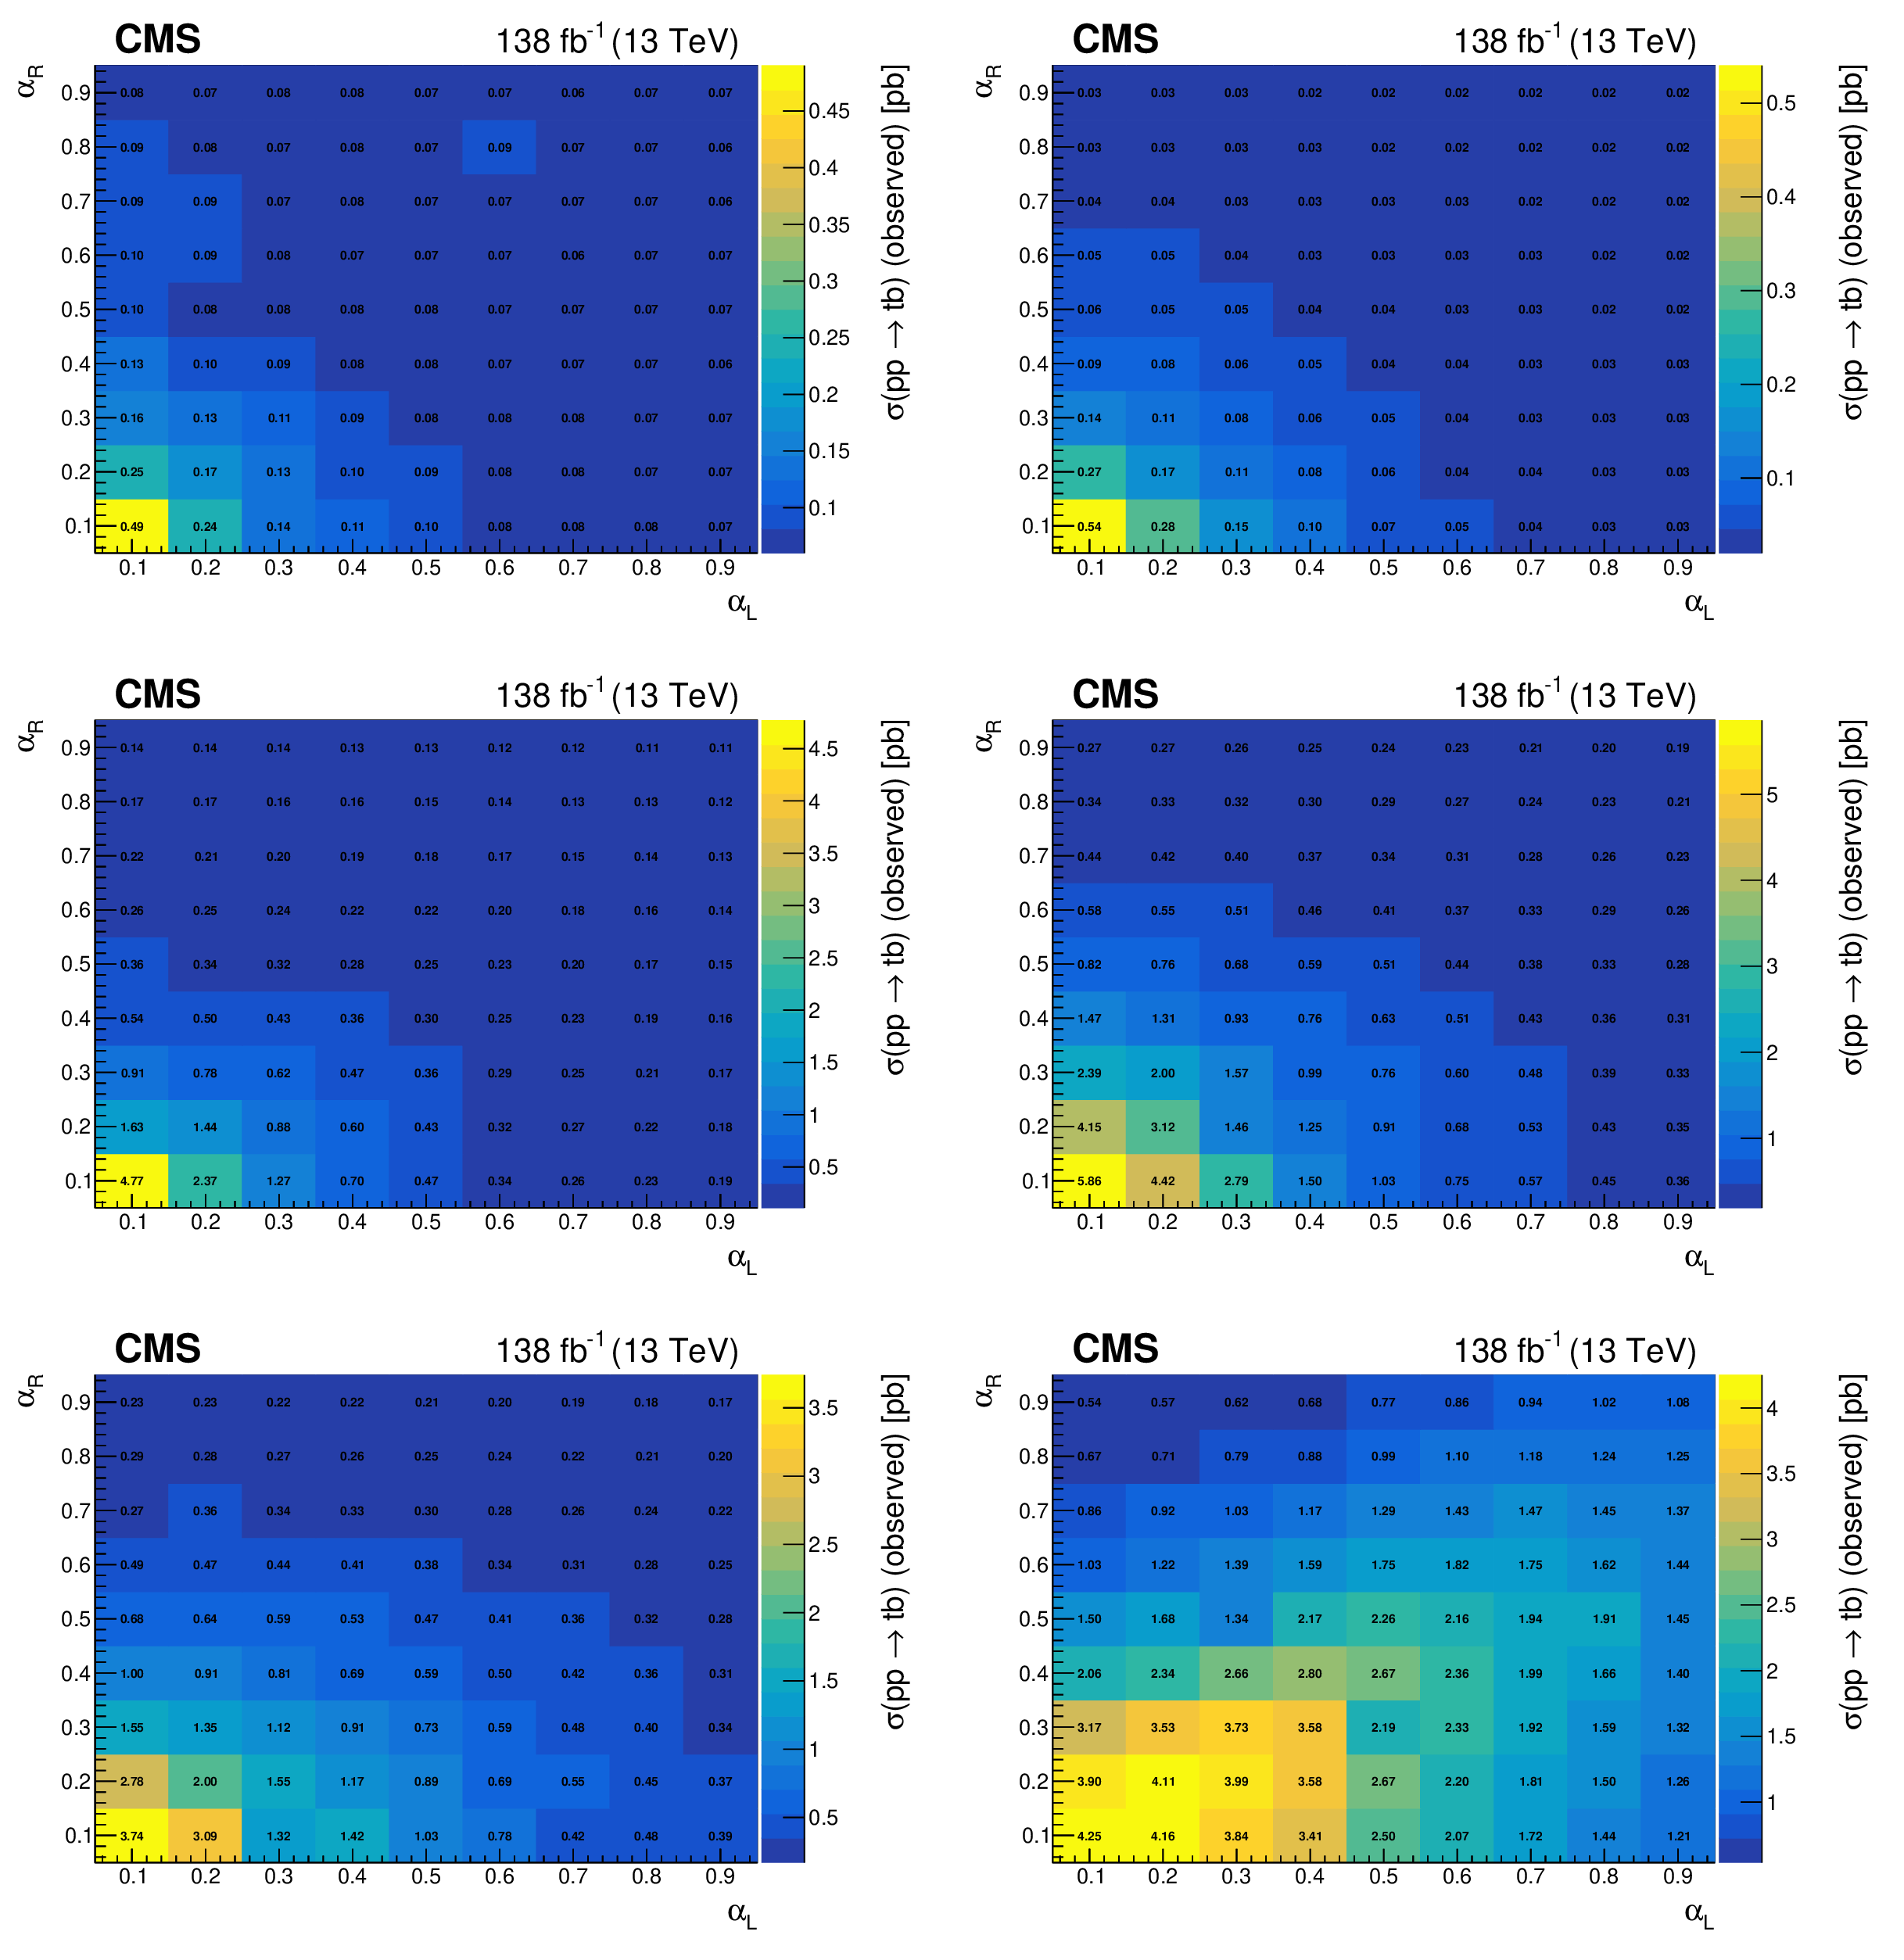
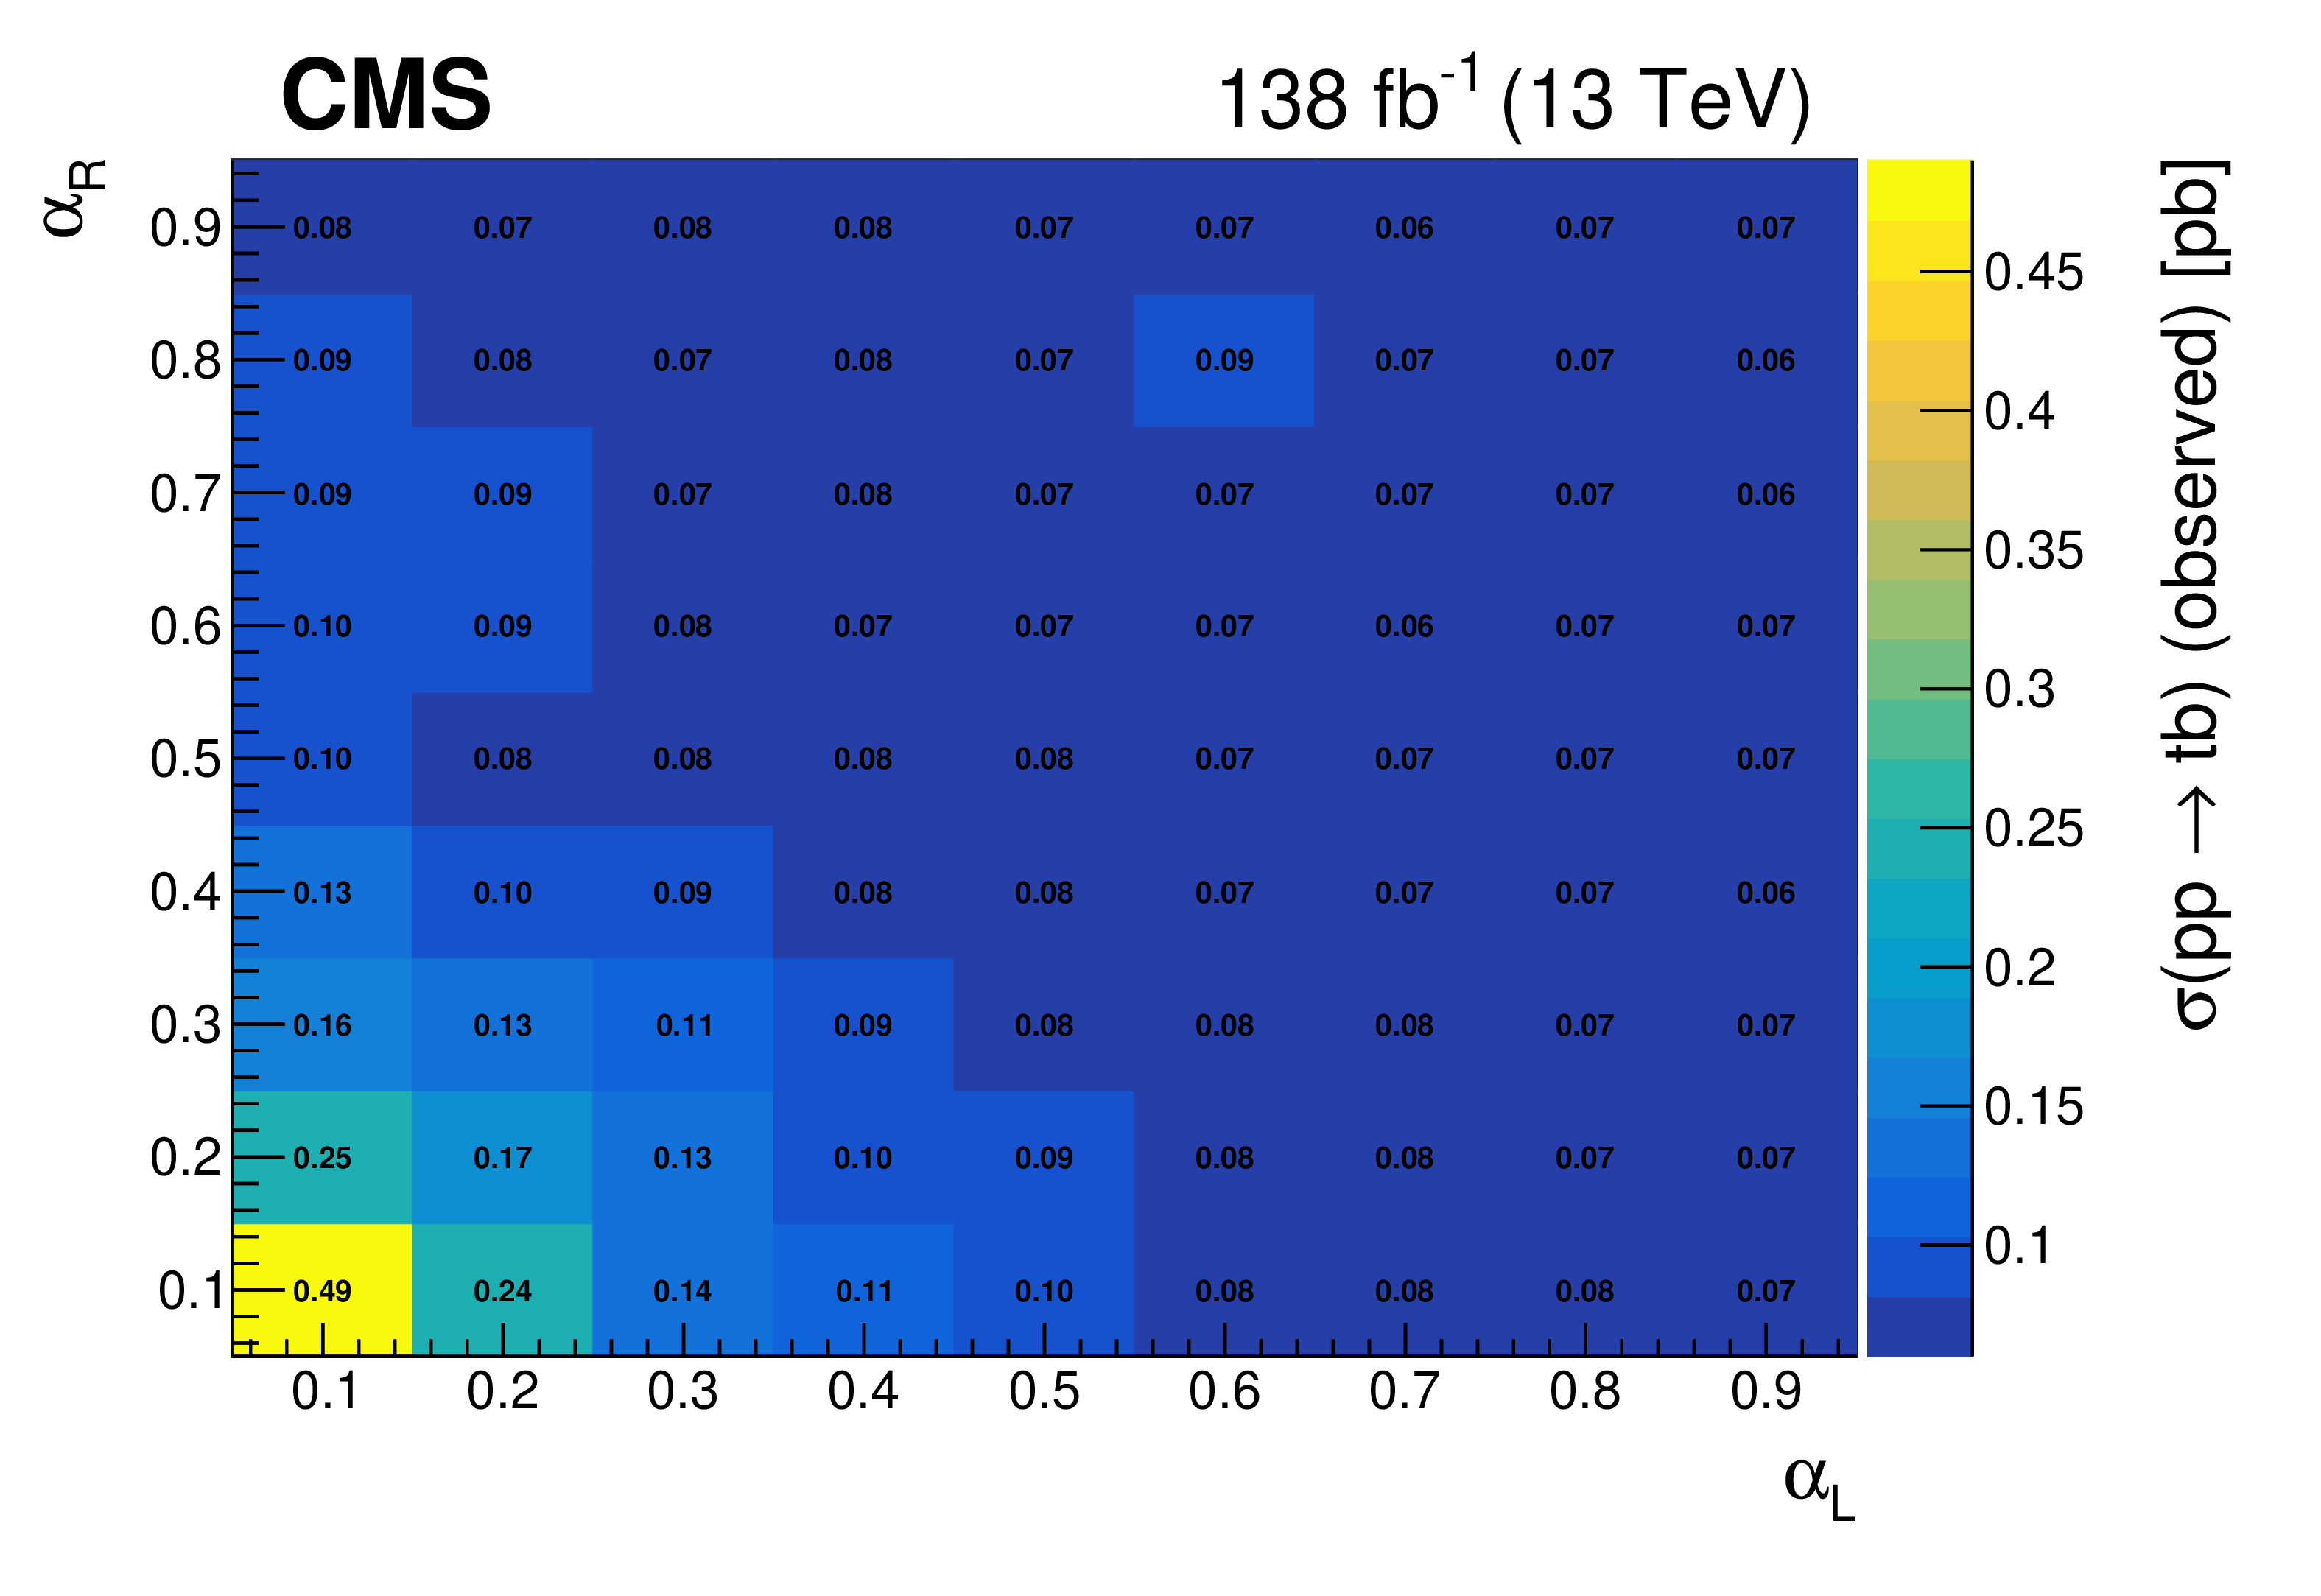
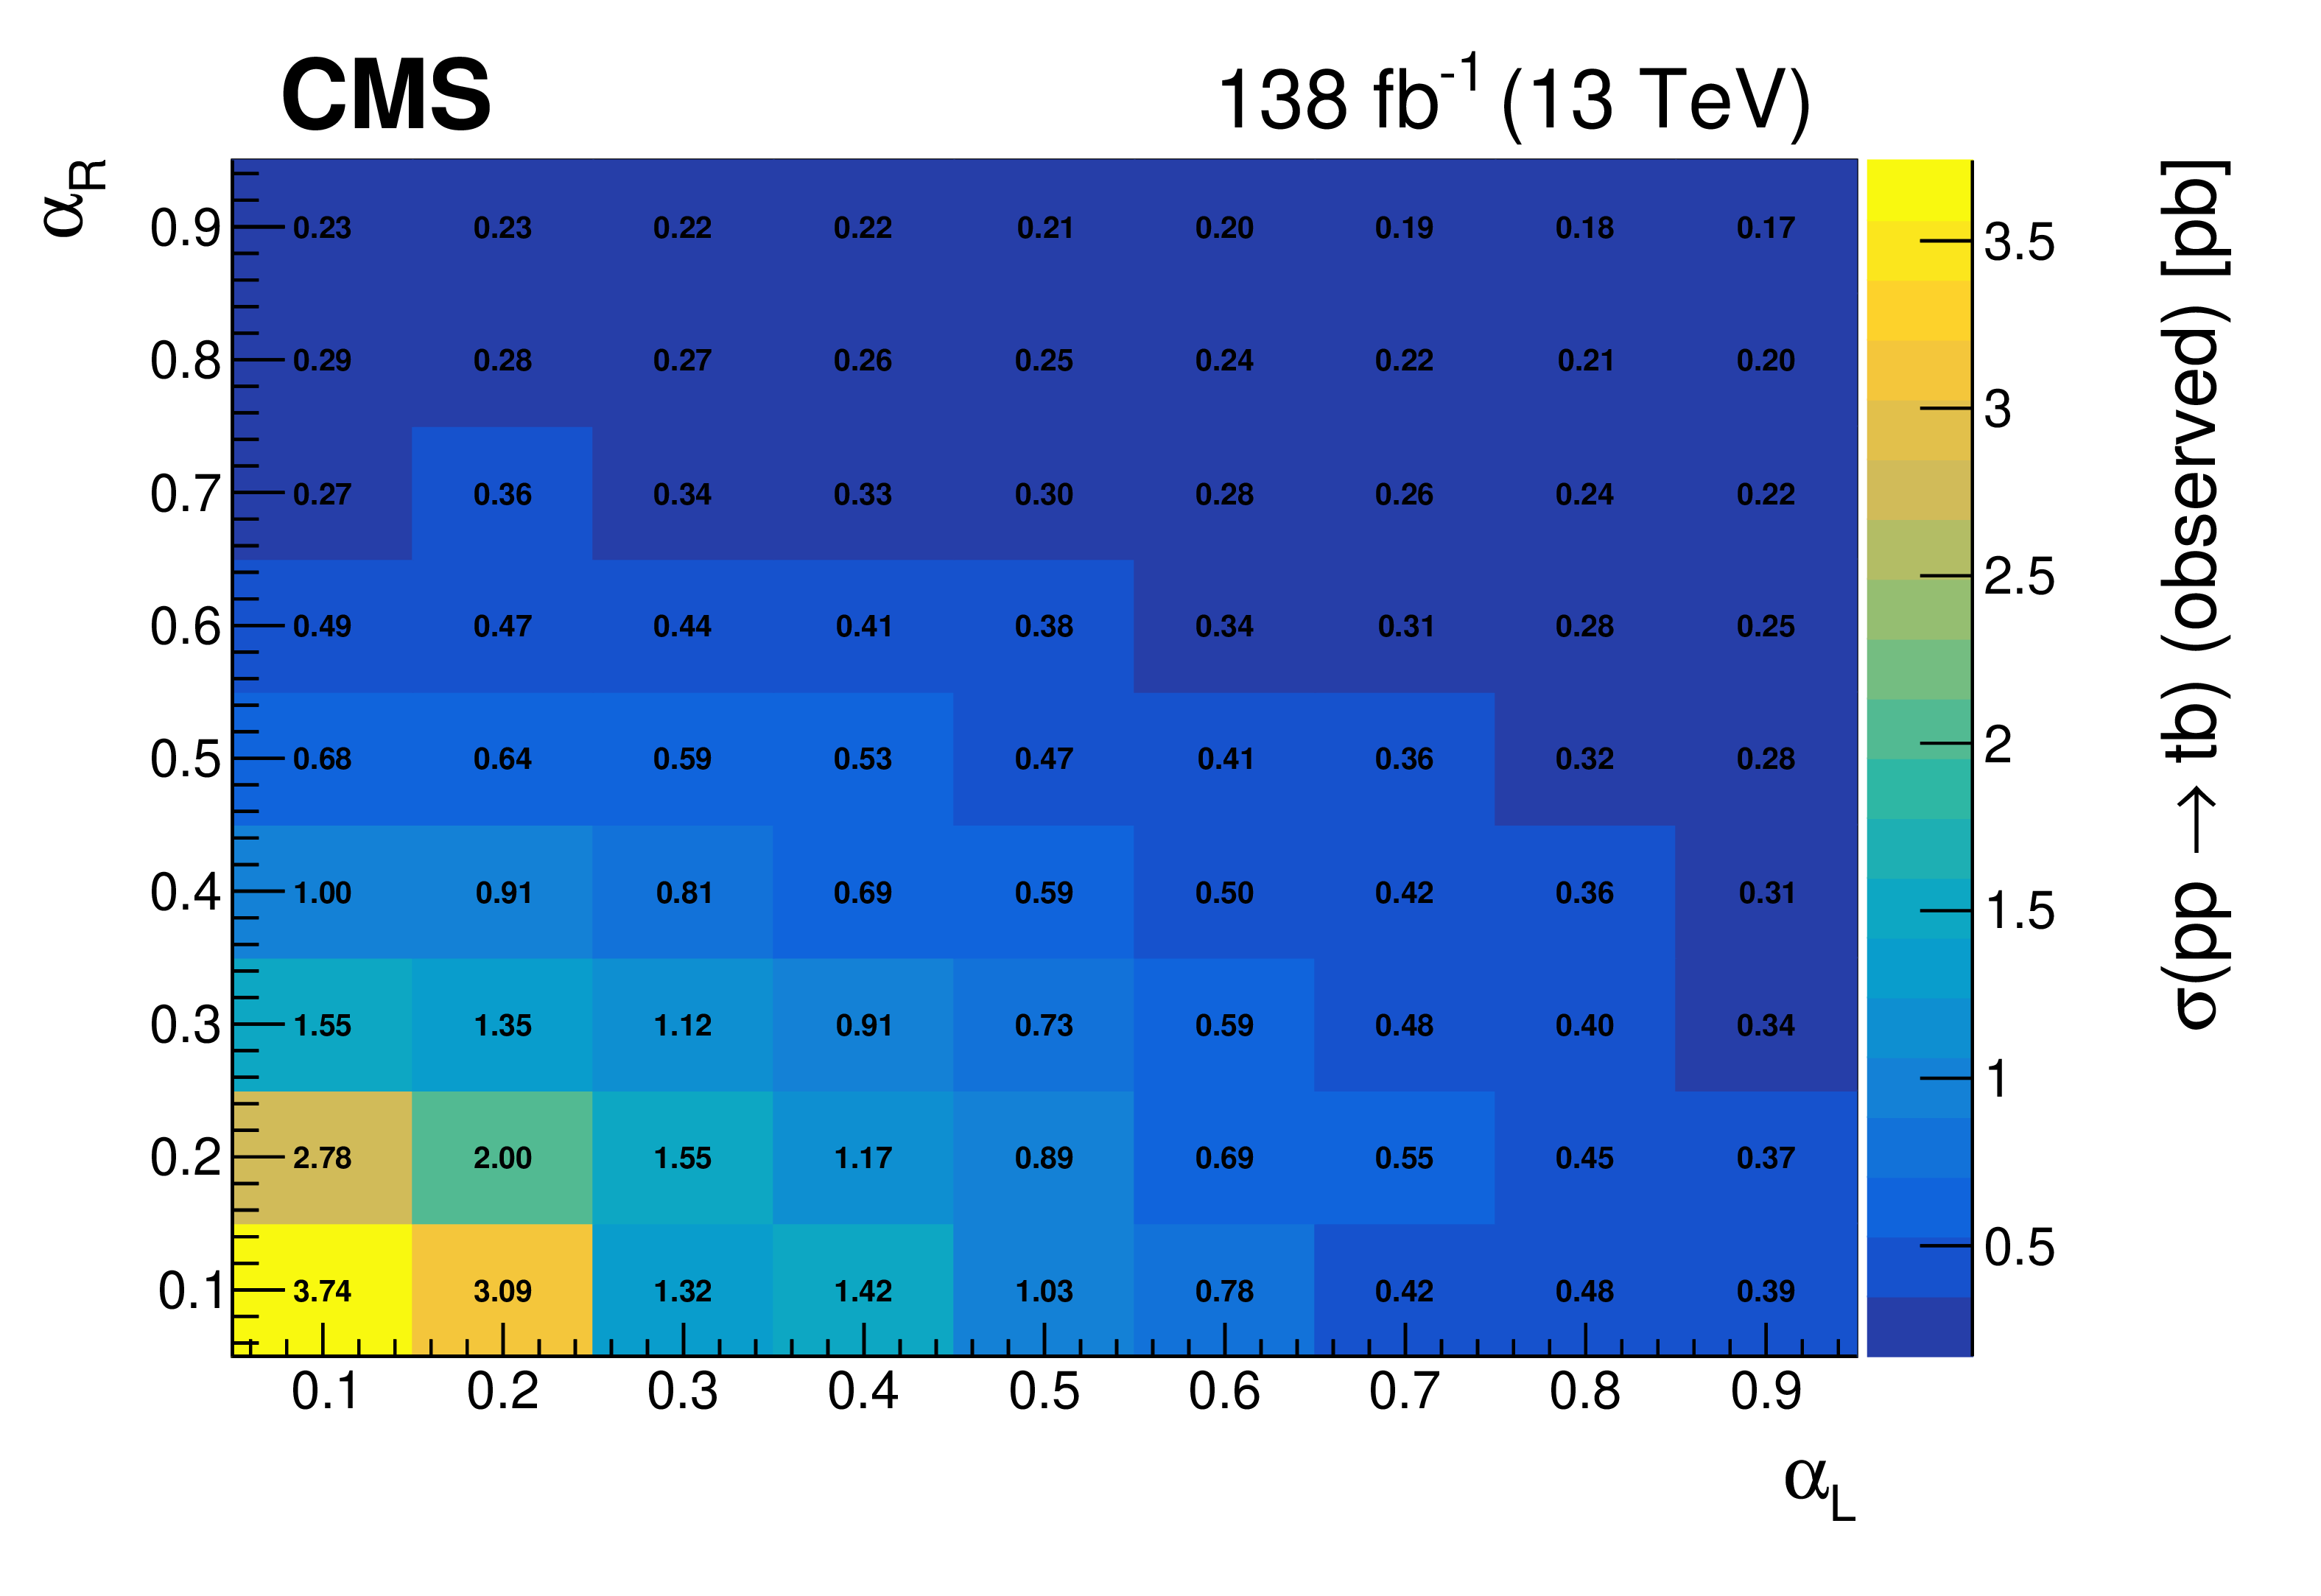
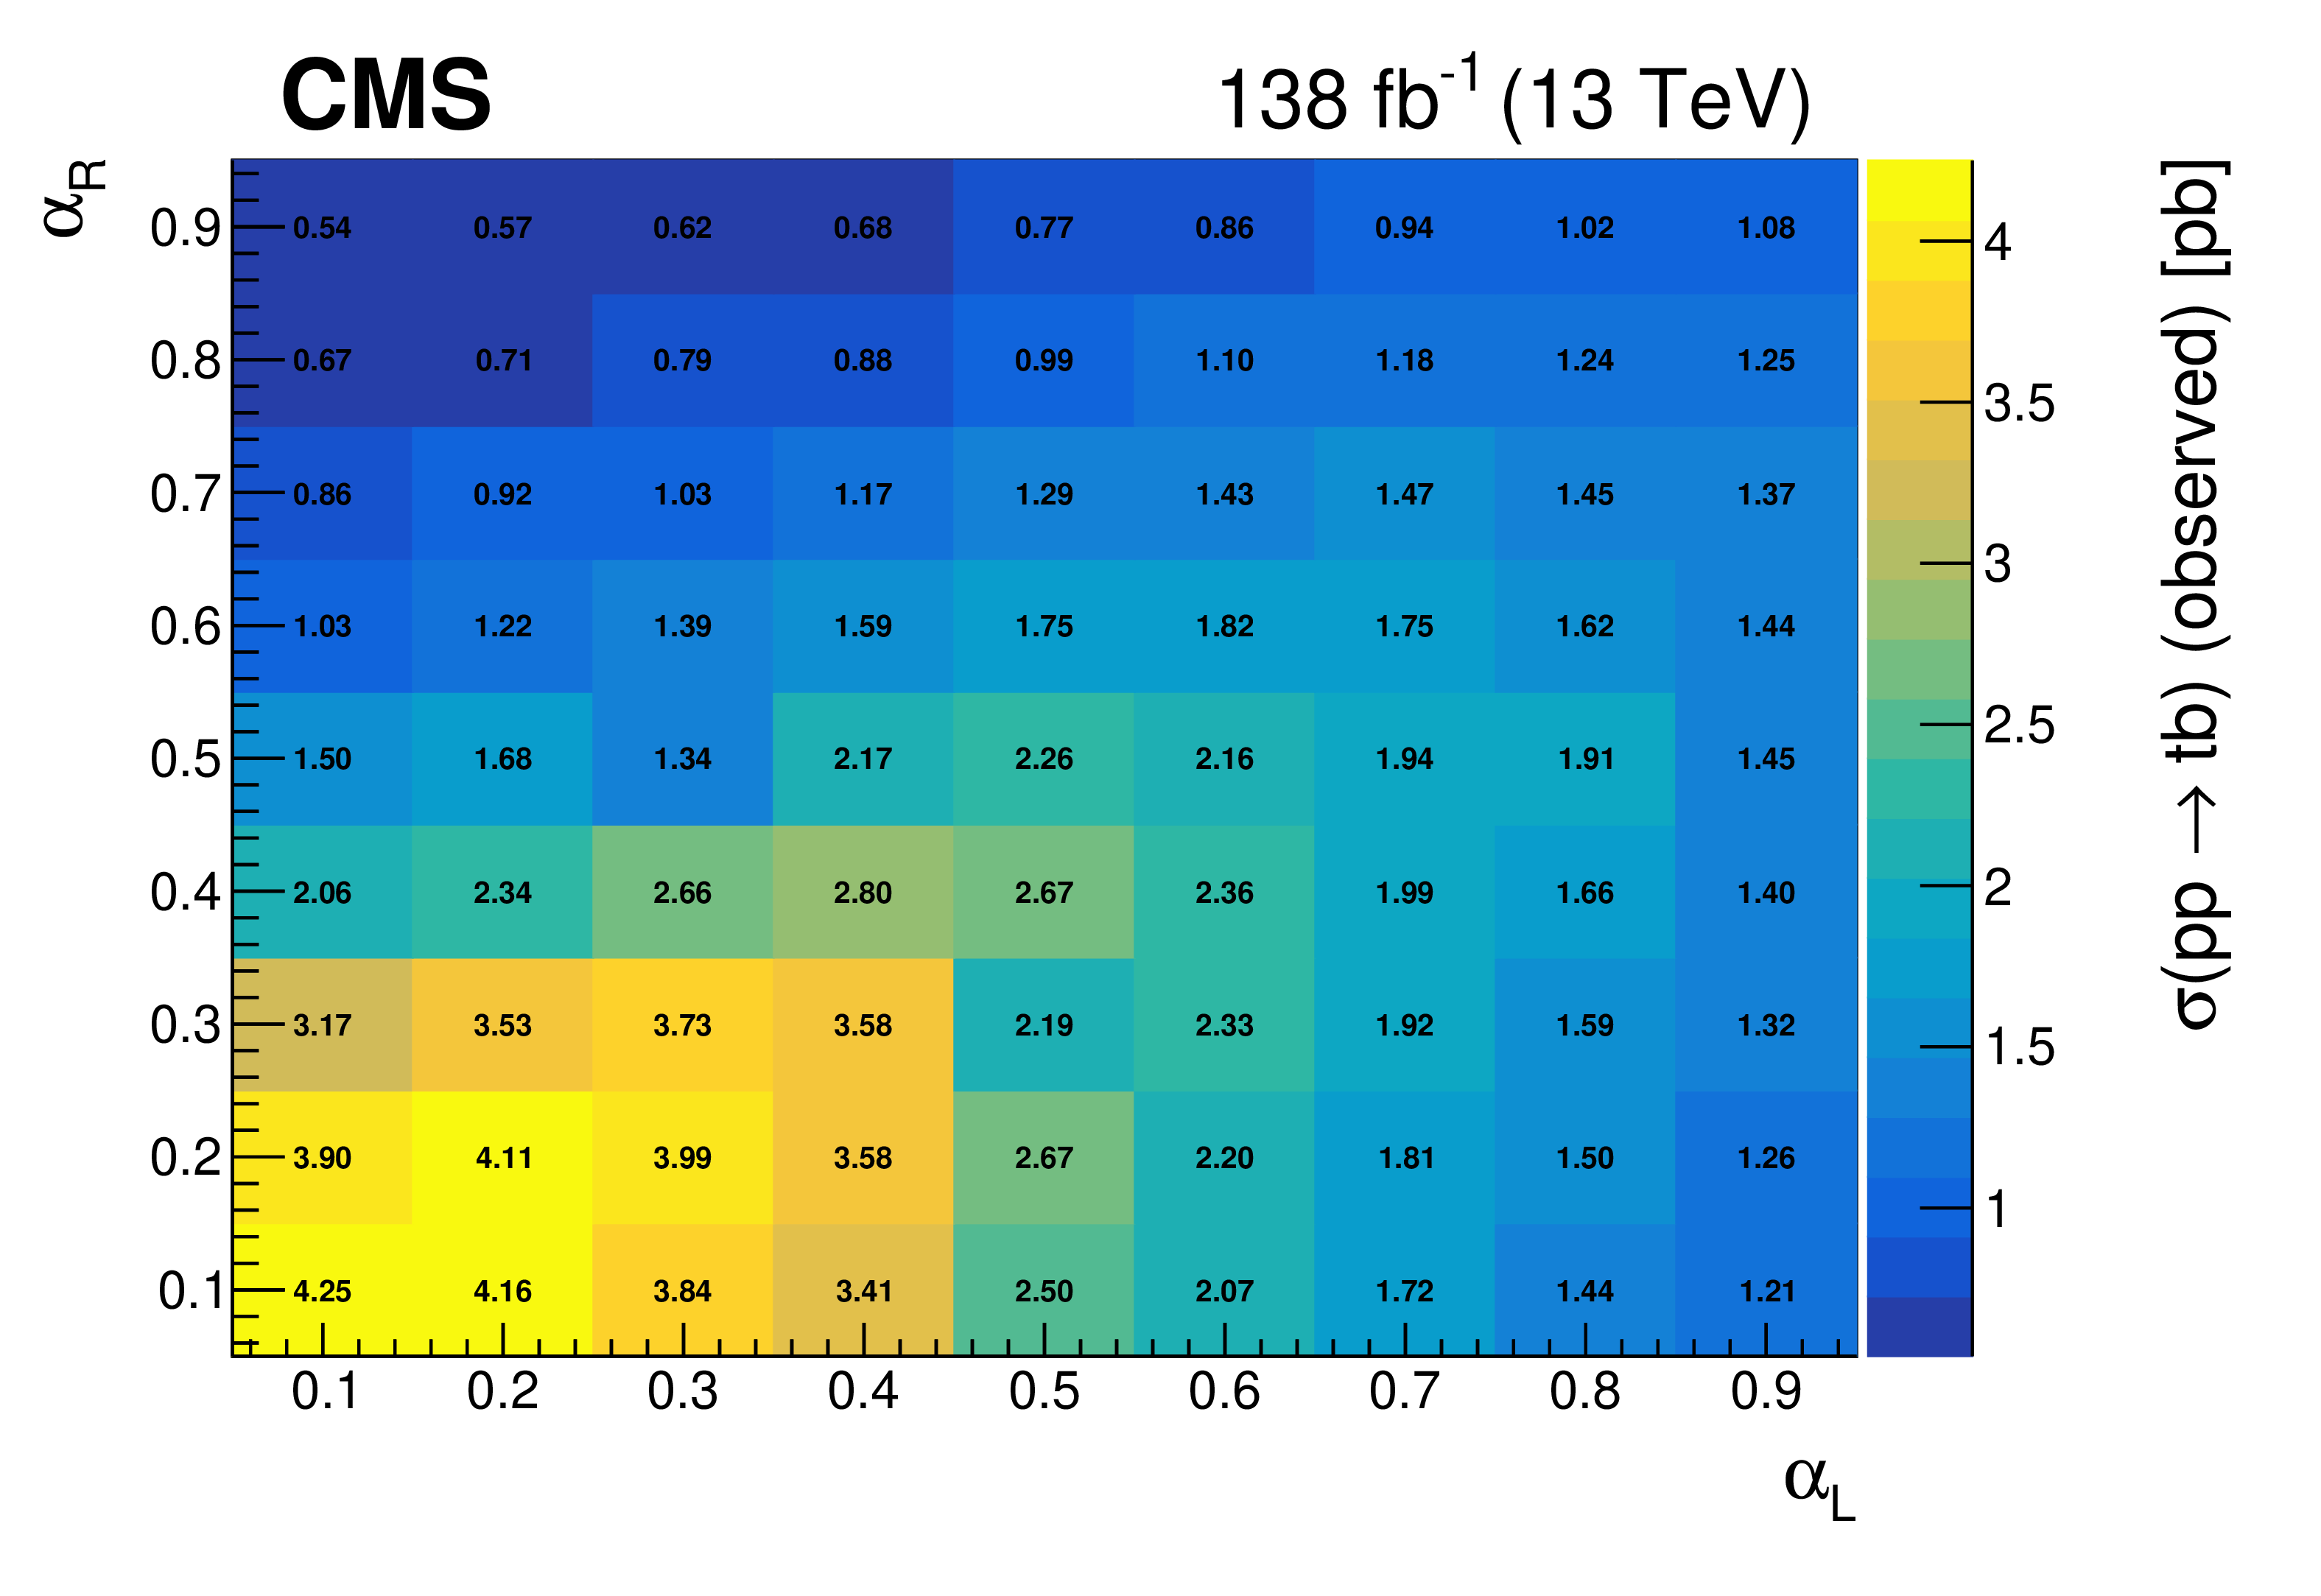
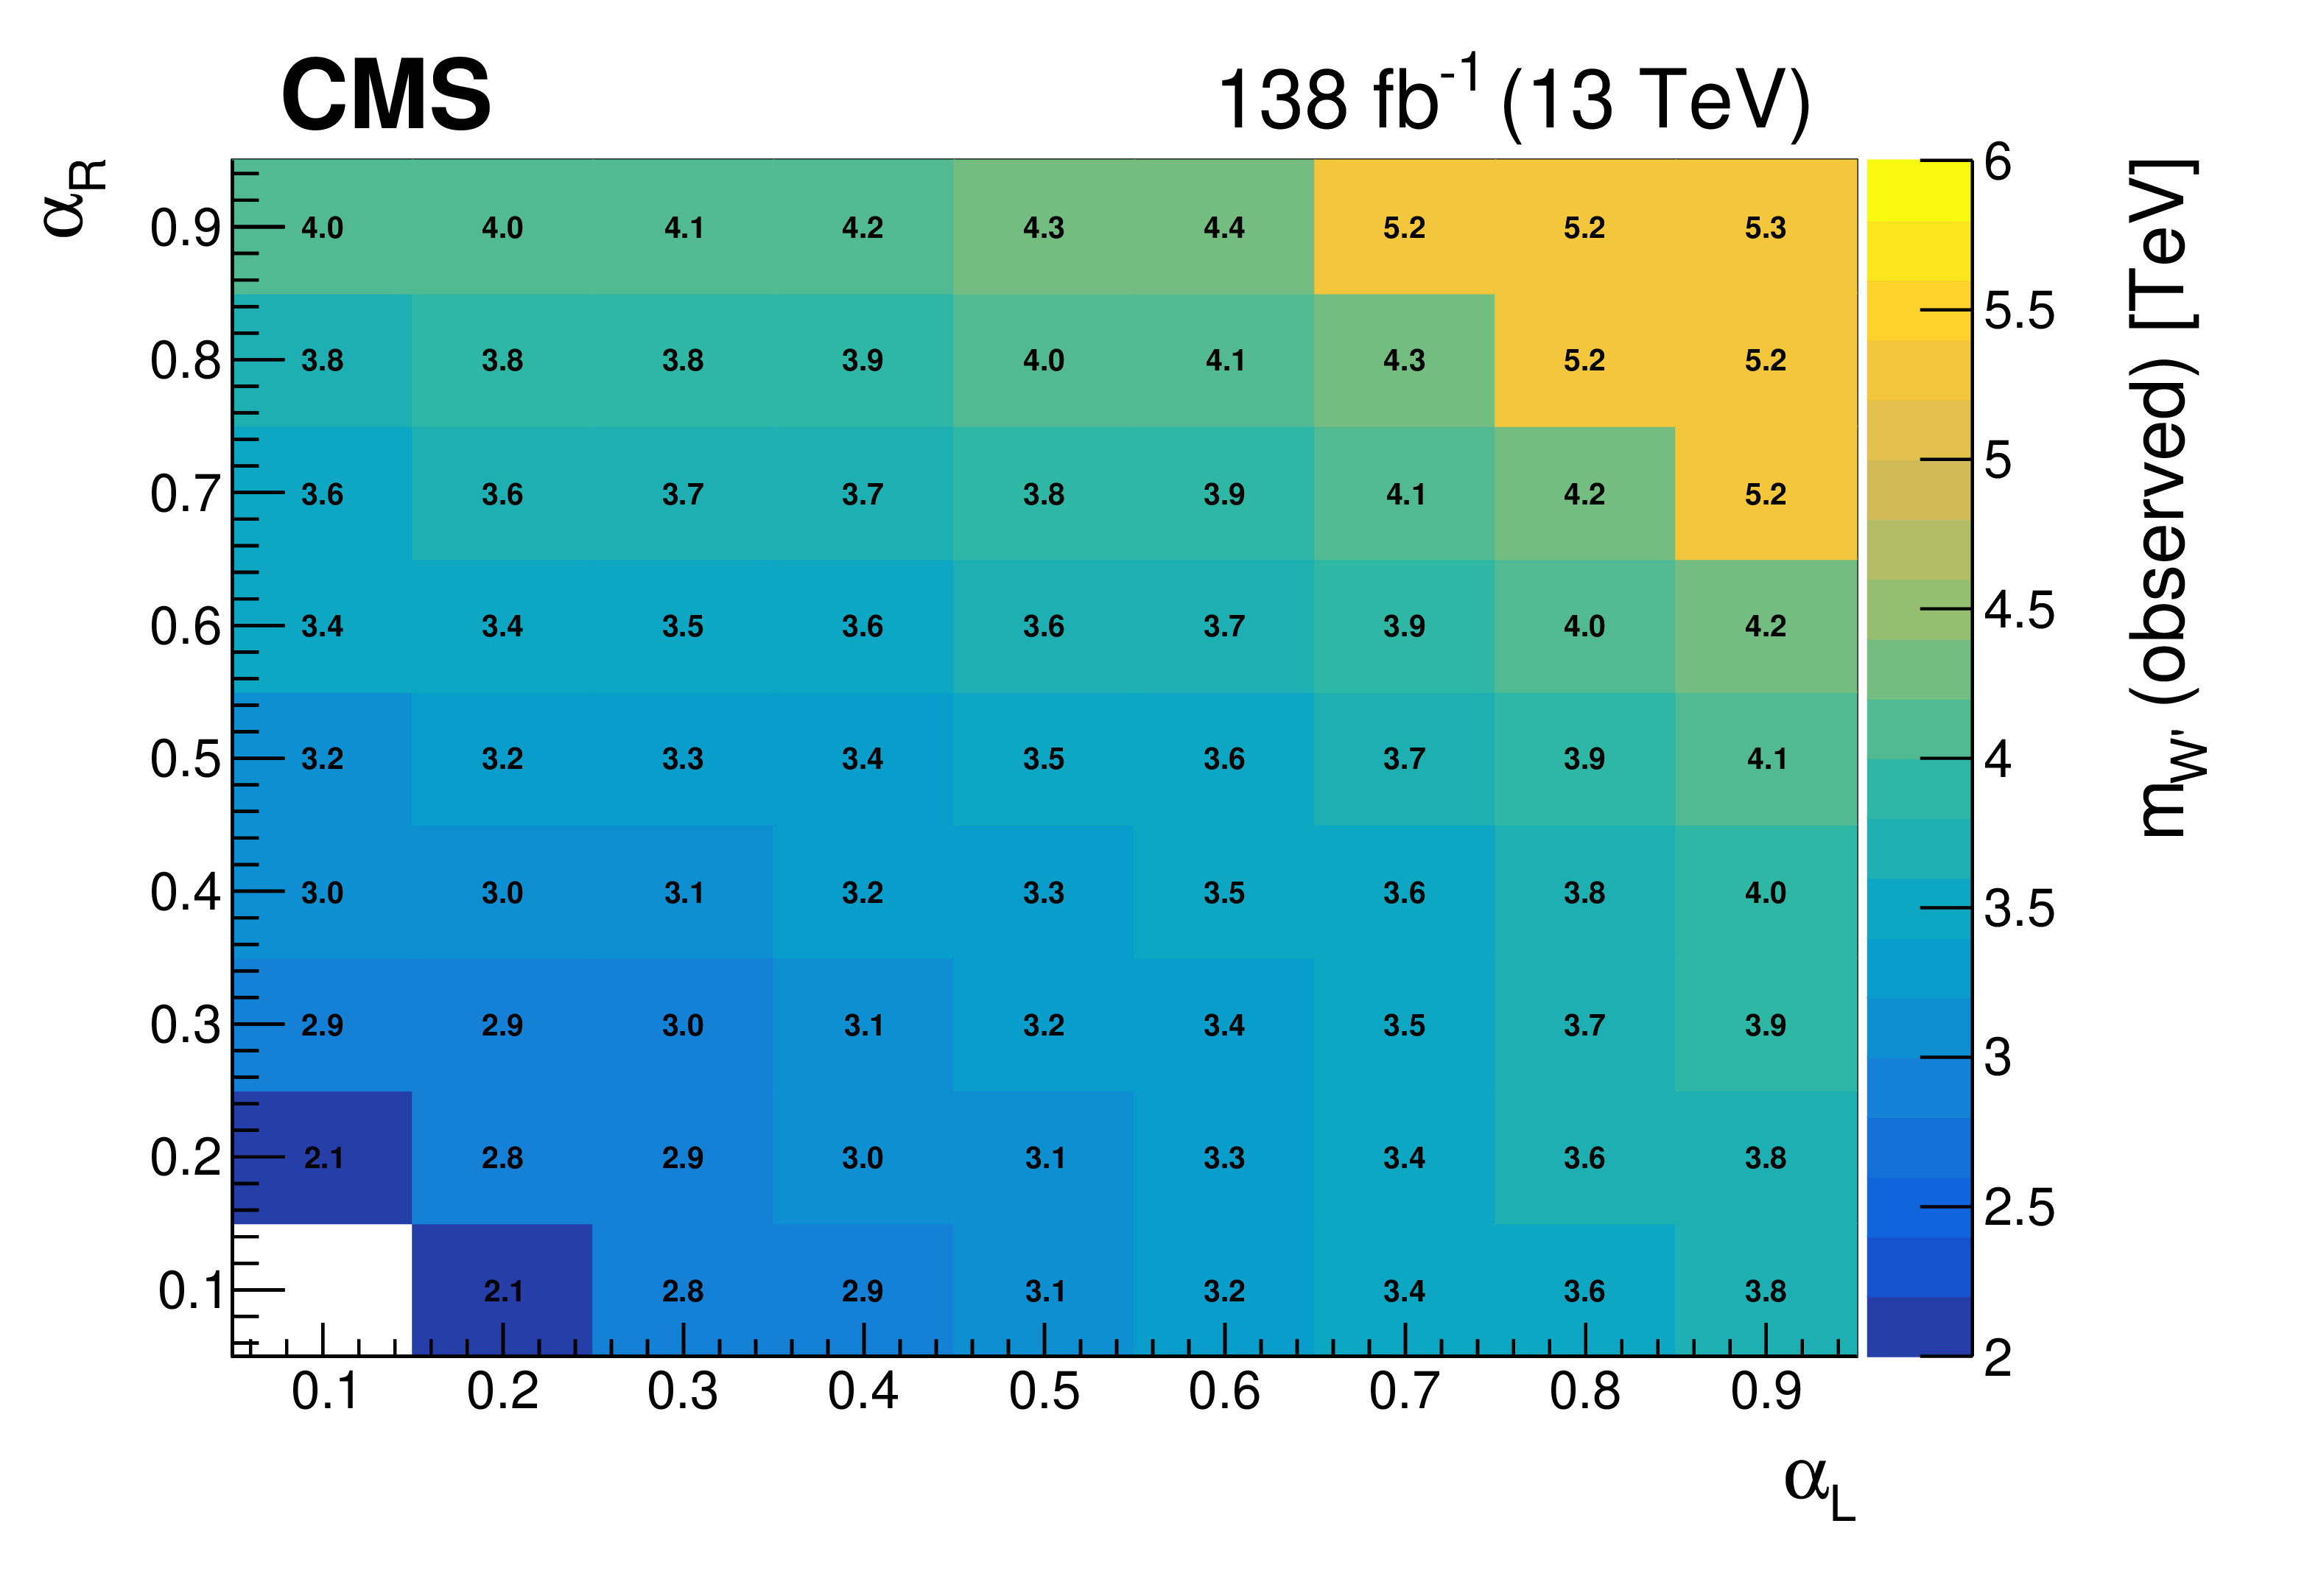
Figure 8:
Observed 95% CL upper limit on the production cross section for a left- (on the left) and right-handed (on the right) W' boson in the $ \mathrm{t}\mathrm{b} $ final state, as functions of $ m_{\mathrm{W^{'}}} $ and relative width $ \Gamma/m_{\mathrm{W^{'}}} $. Numbers in red, written diagonally, represent values of the excluded cross sections that are lower than the theoretical ones for the analyzed model. |

png pdf |
Figure 8-a:
Observed 95% CL upper limit on the production cross section for a left-handed W' boson in the $ \mathrm{t}\mathrm{b} $ final state, as functions of $ m_{\mathrm{W^{'}}} $ and relative width $ \Gamma/m_{\mathrm{W^{'}}} $. Numbers in red, written diagonally, represent values of the excluded cross sections that are lower than the theoretical ones for the analyzed model. |
png pdf |
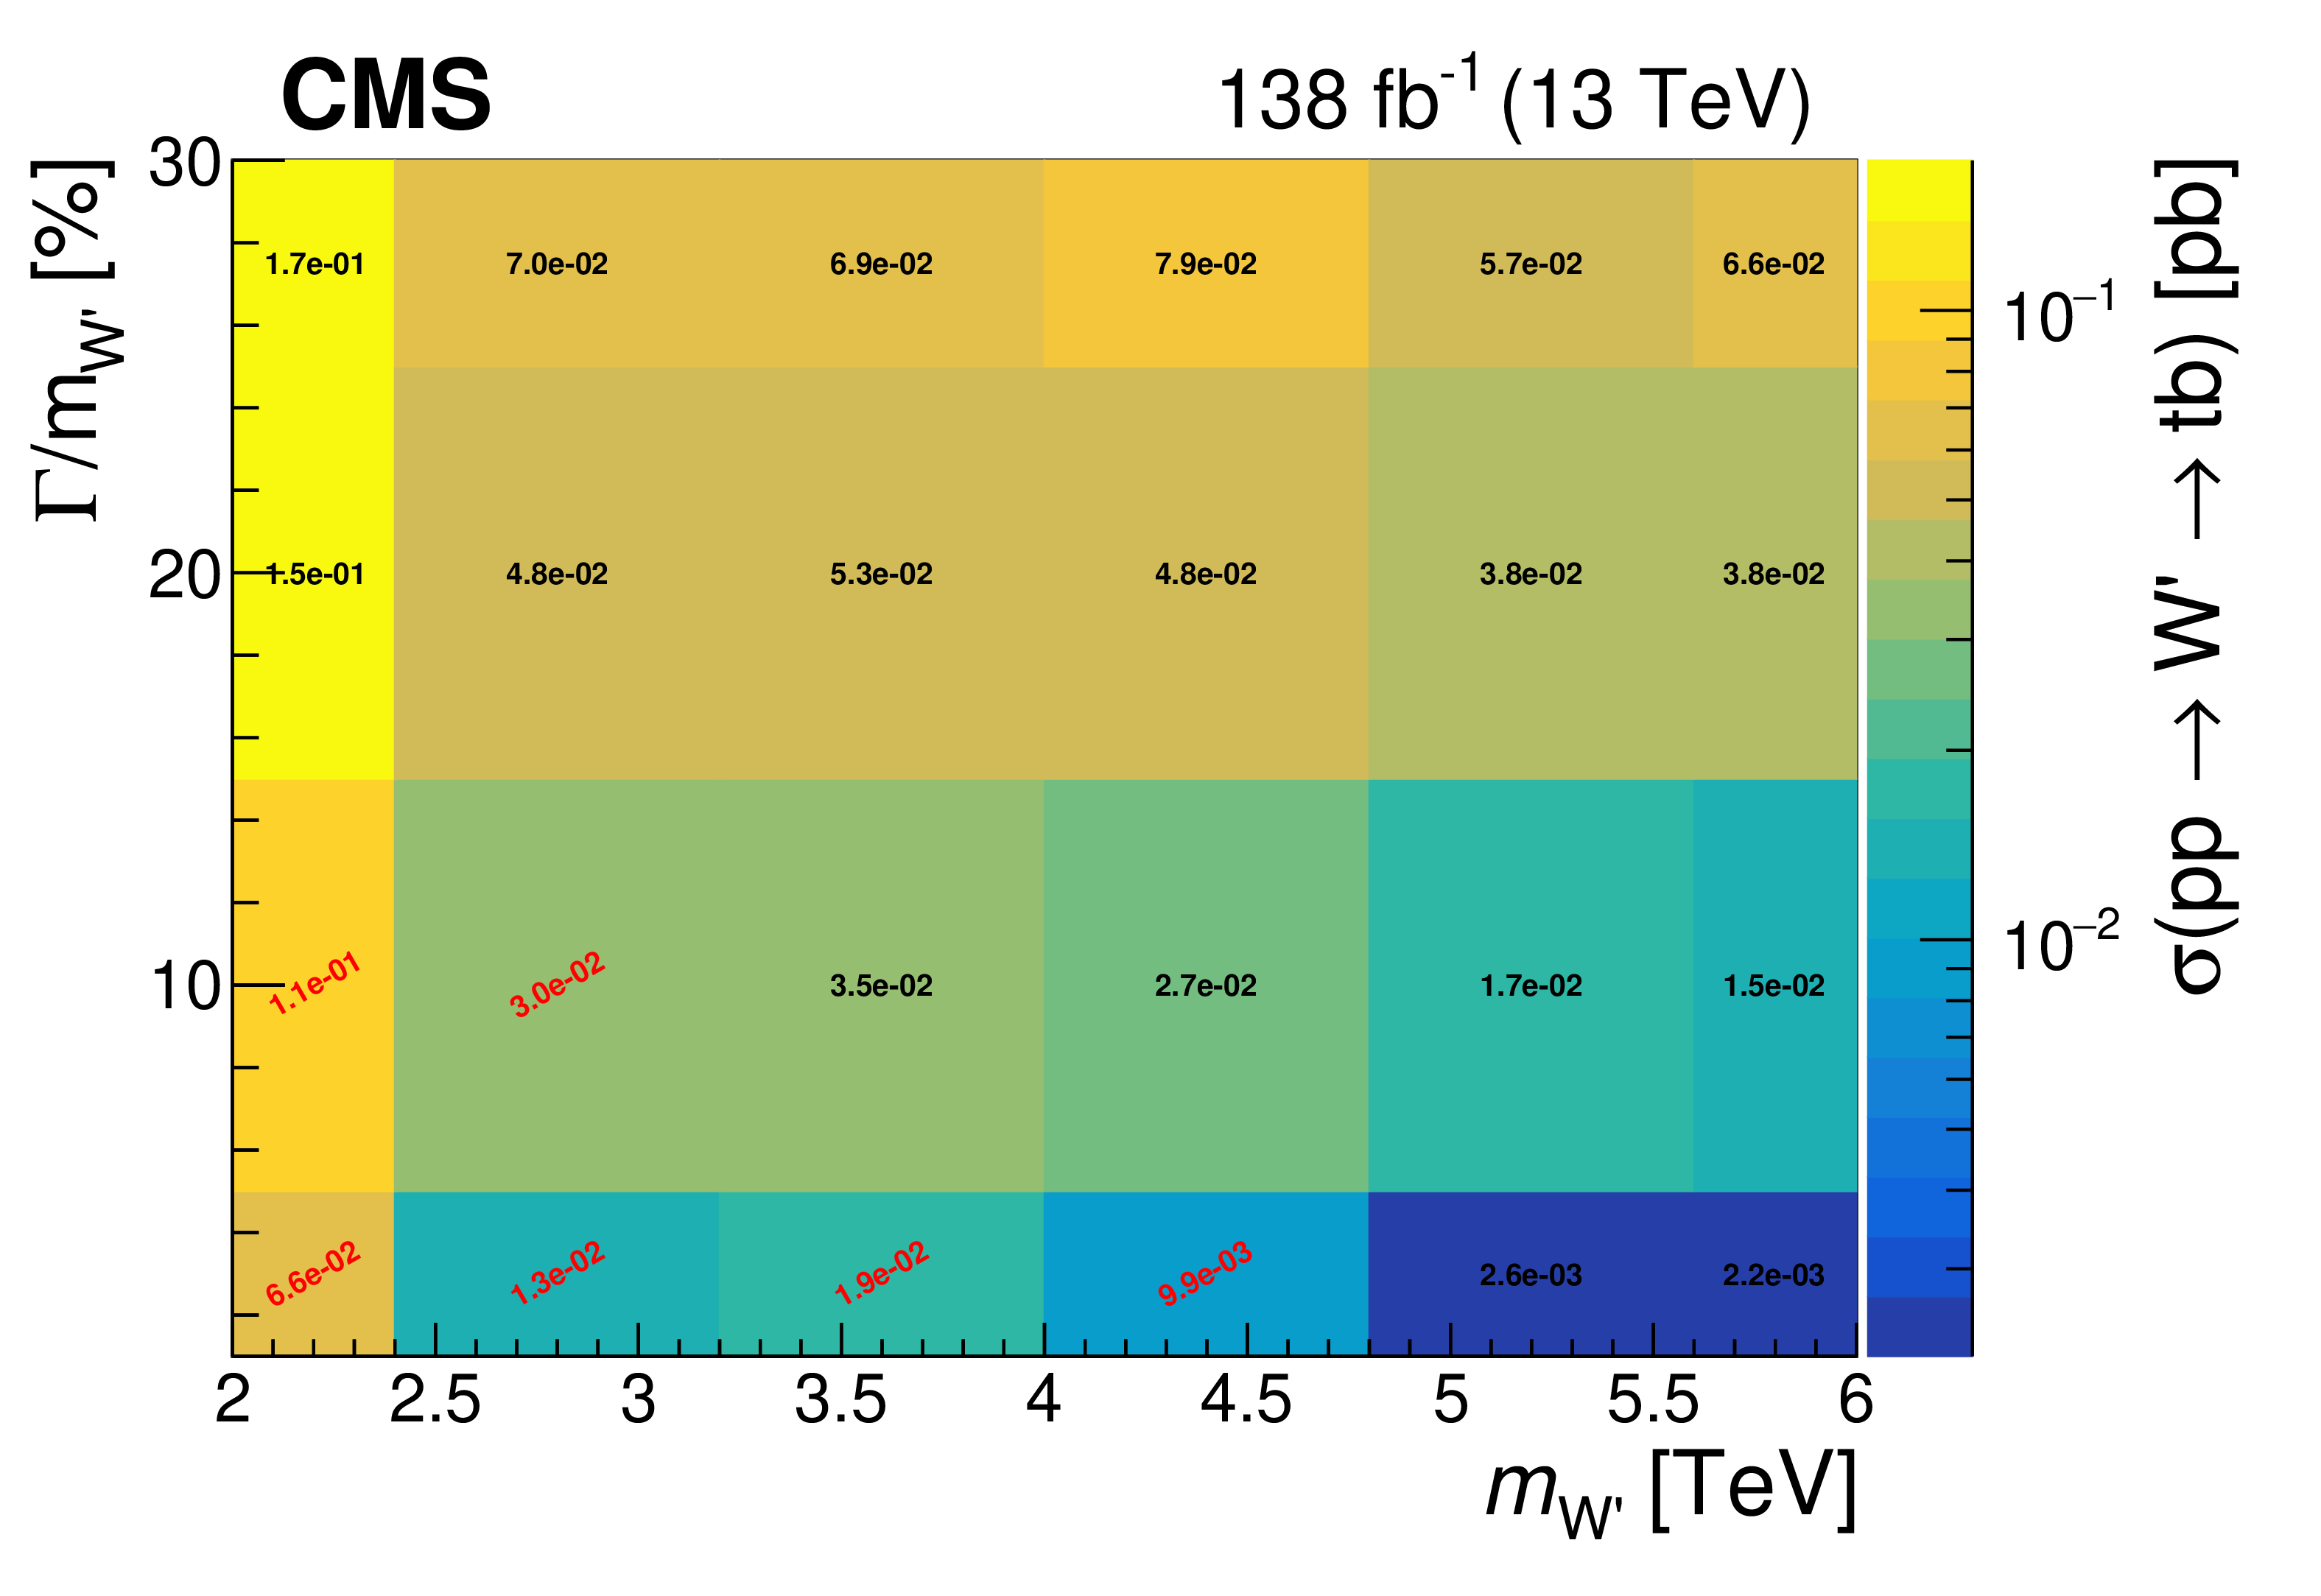
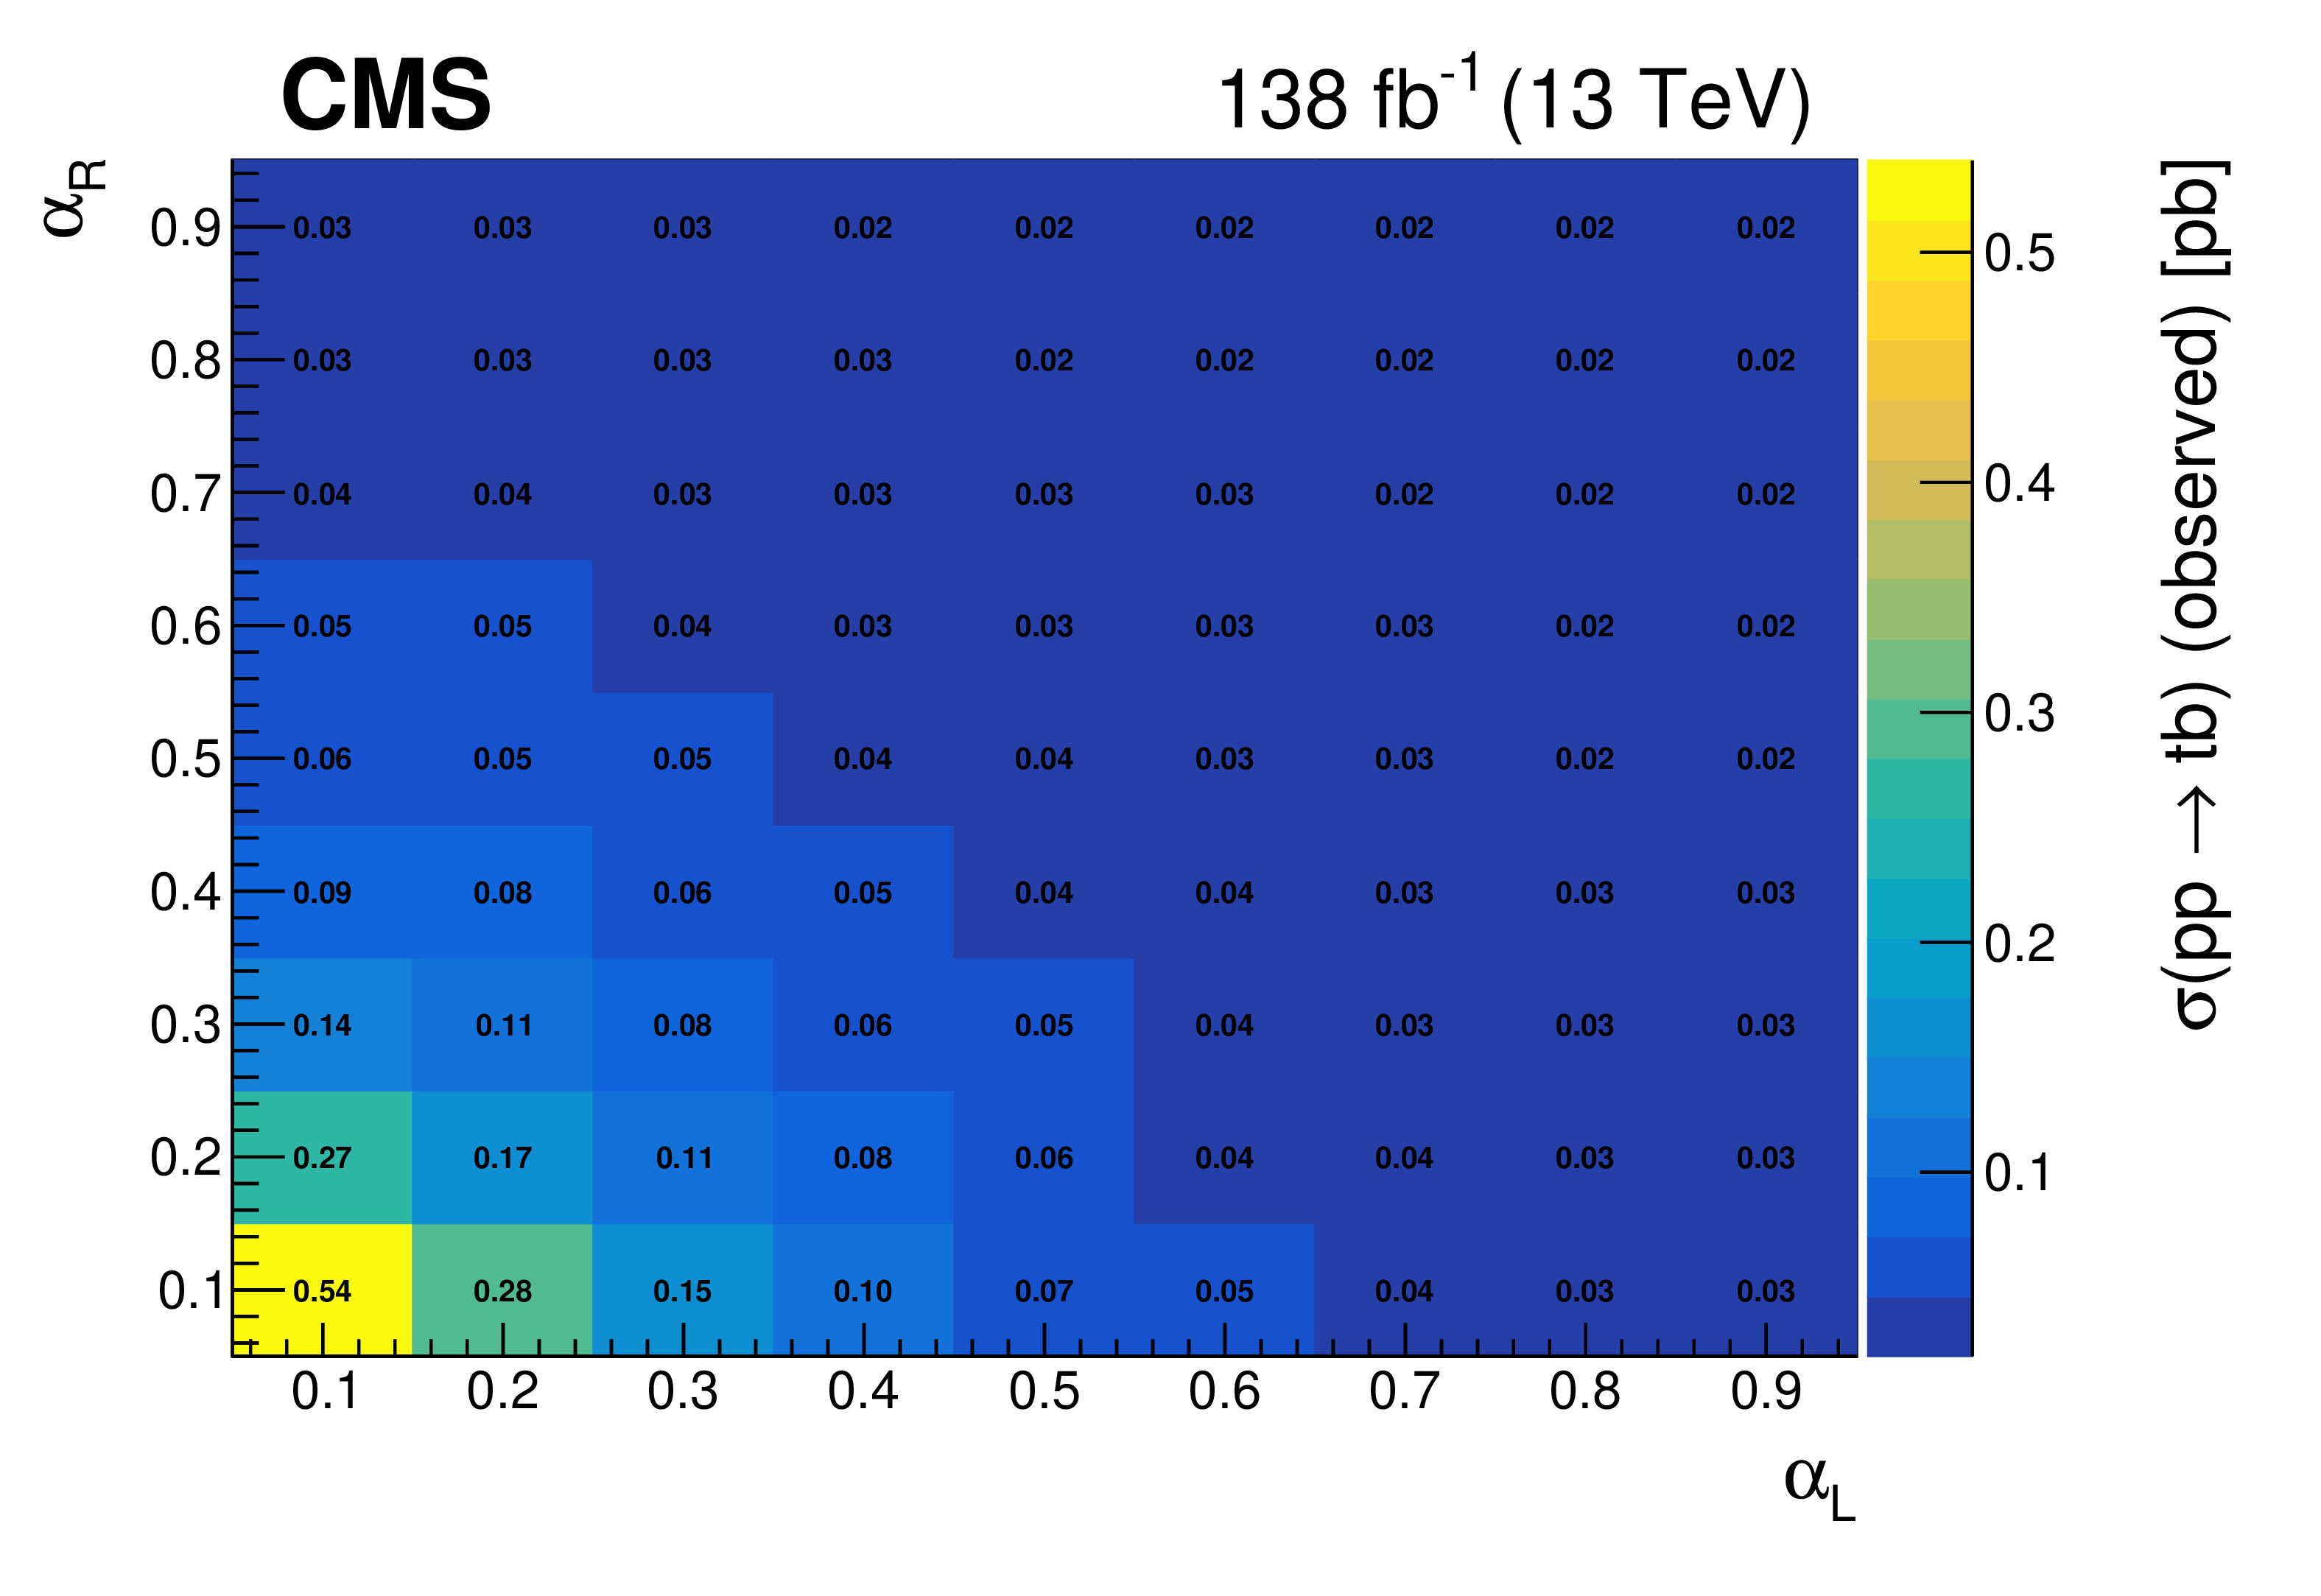
Figure 8-b:
Observed 95% CL upper limit on the production cross section for a right-handed W' boson in the $ \mathrm{t}\mathrm{b} $ final state, as functions of $ m_{\mathrm{W^{'}}} $ and relative width $ \Gamma/m_{\mathrm{W^{'}}} $. Numbers in red, written diagonally, represent values of the excluded cross sections that are lower than the theoretical ones for the analyzed model. |
png pdf |
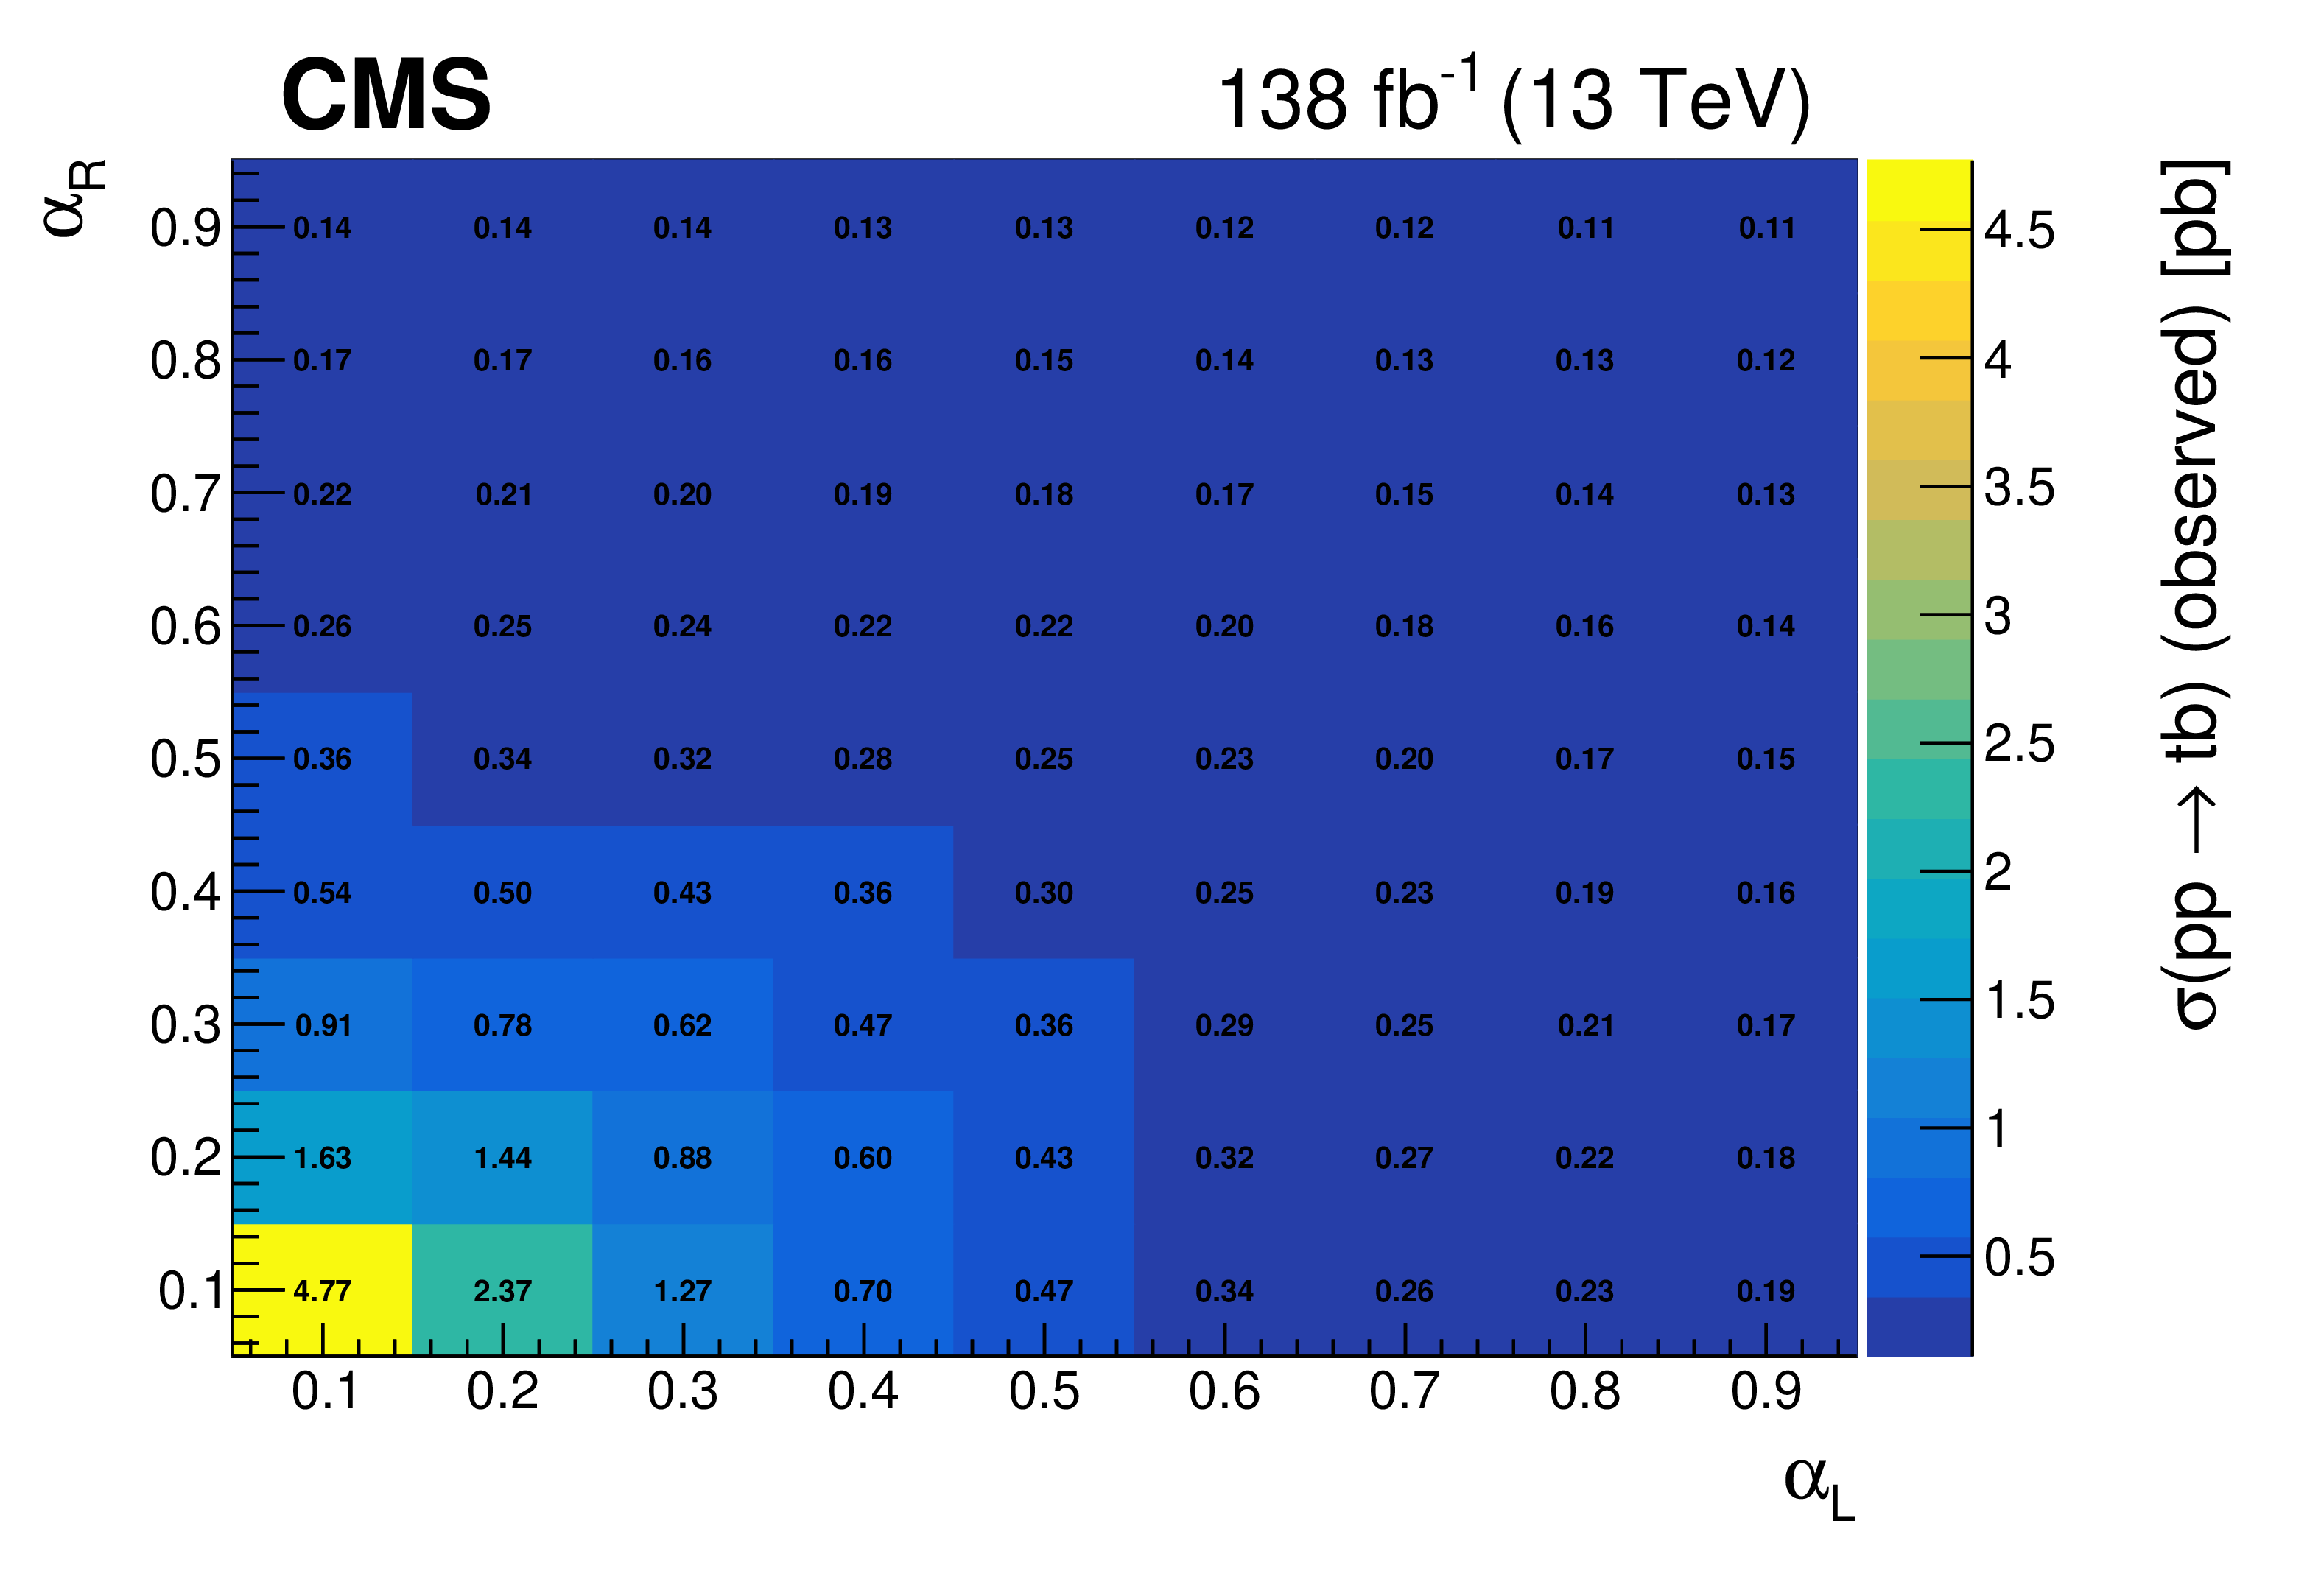
Figure 9:
Observed 95% CL upper limit on the production cross section for a generalized left-right coupling of the W' boson to a t and a b quark for a mass of the W' boson of 2 TeV (upper left), 2.8 TeV (upper right), 3.6 TeV (middle left), 4.4 TeV (middle right), 5.2 TeV (lower left), and of 6 TeV (lower right). |
png pdf |
Figure 9-a:
Observed 95% CL upper limit on the production cross section for a generalized left-right coupling of the W' boson to a t and a b quark for a mass of the W' boson of 2 TeV. |
png pdf |
Figure 9-b:
Observed 95% CL upper limit on the production cross section for a generalized left-right coupling of the W' boson to a t and a b quark for a mass of the W' boson of 2.8 TeV. |
png pdf |
Figure 9-c:
Observed 95% CL upper limit on the production cross section for a generalized left-right coupling of the W' boson to a t and a b quark for a mass of the W' boson of 3.6 TeV. |

png pdf |
Figure 9-d:
Observed 95% CL upper limit on the production cross section for a generalized left-right coupling of the W' boson to a t and a b quark for a mass of the W' boson of 4.4 TeV. |
png pdf |
Figure 9-e:
Observed 95% CL upper limit on the production cross section for a generalized left-right coupling of the W' boson to a t and a b quark for a mass of the W' boson of 5.2 TeV. |
png pdf |
Figure 9-f:
Observed 95% CL upper limit on the production cross section for a generalized left-right coupling of the W' boson to a t and a b quark for a mass of the W' boson of 6 TeV. |
png pdf |
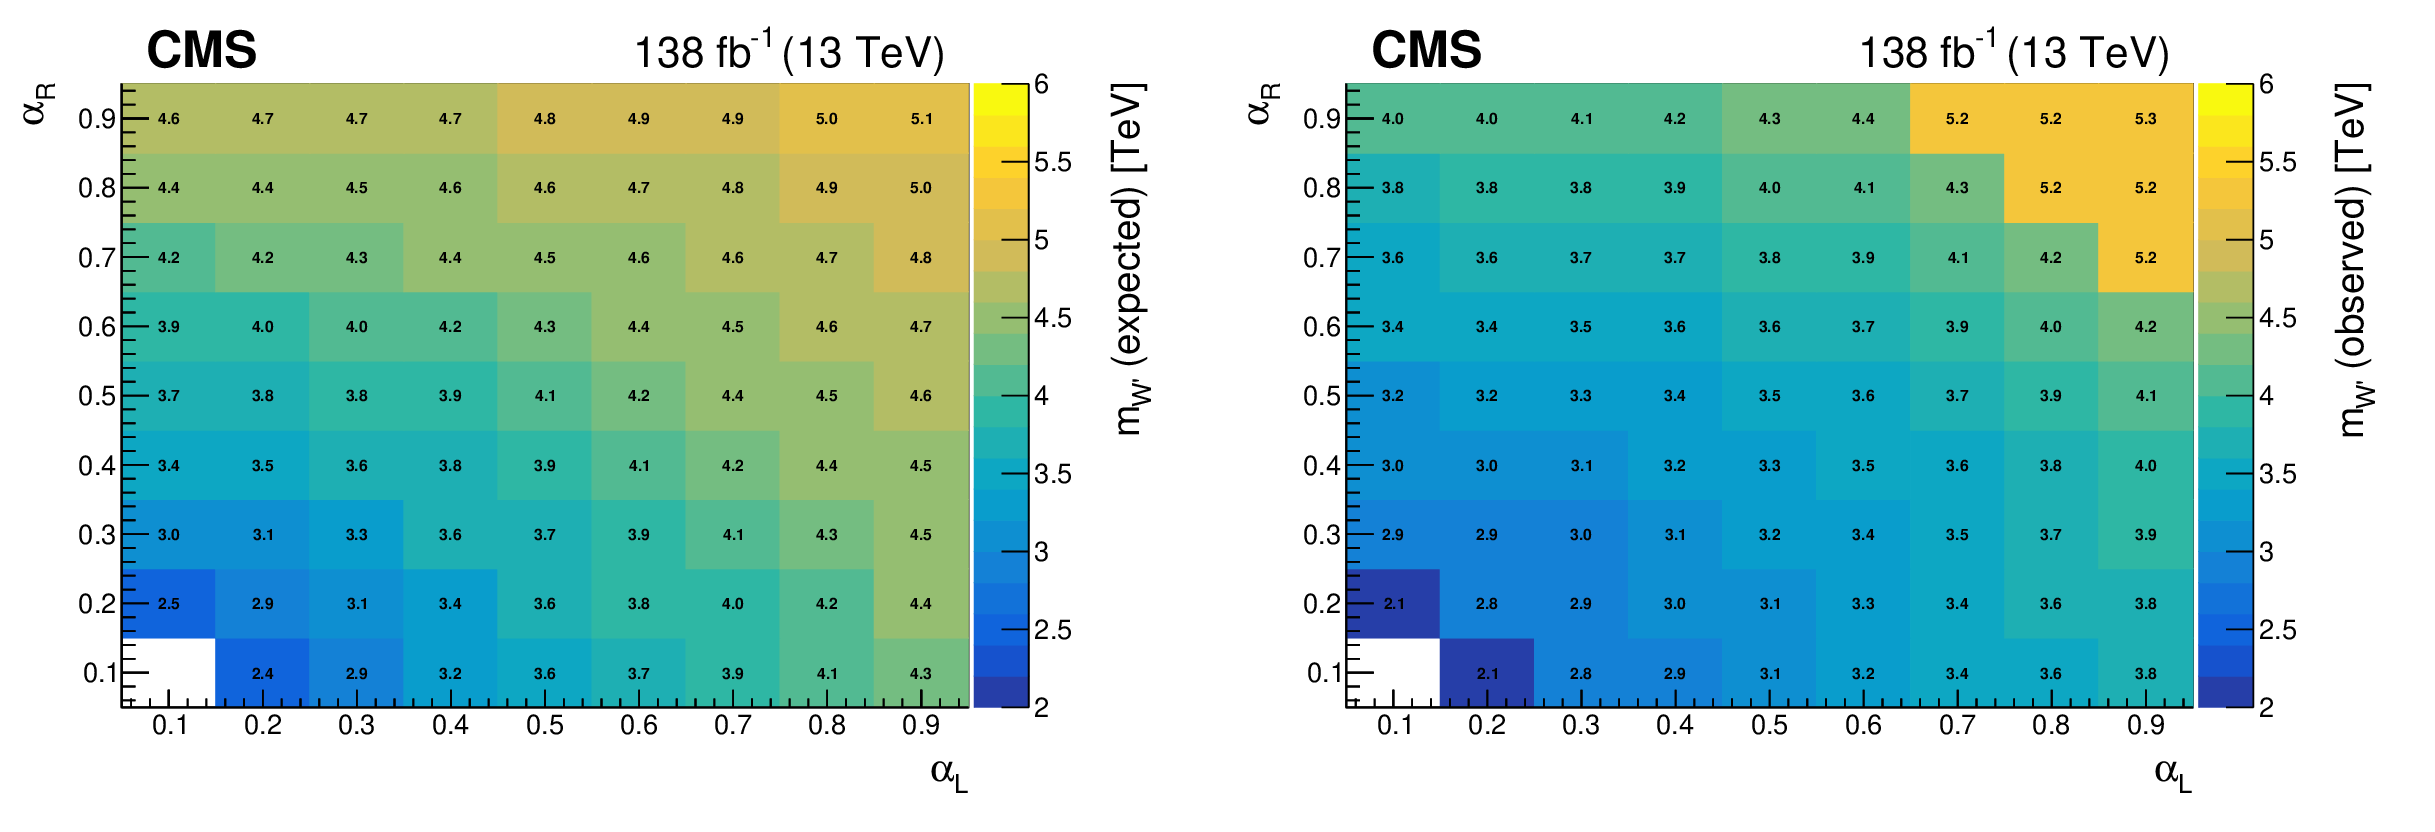
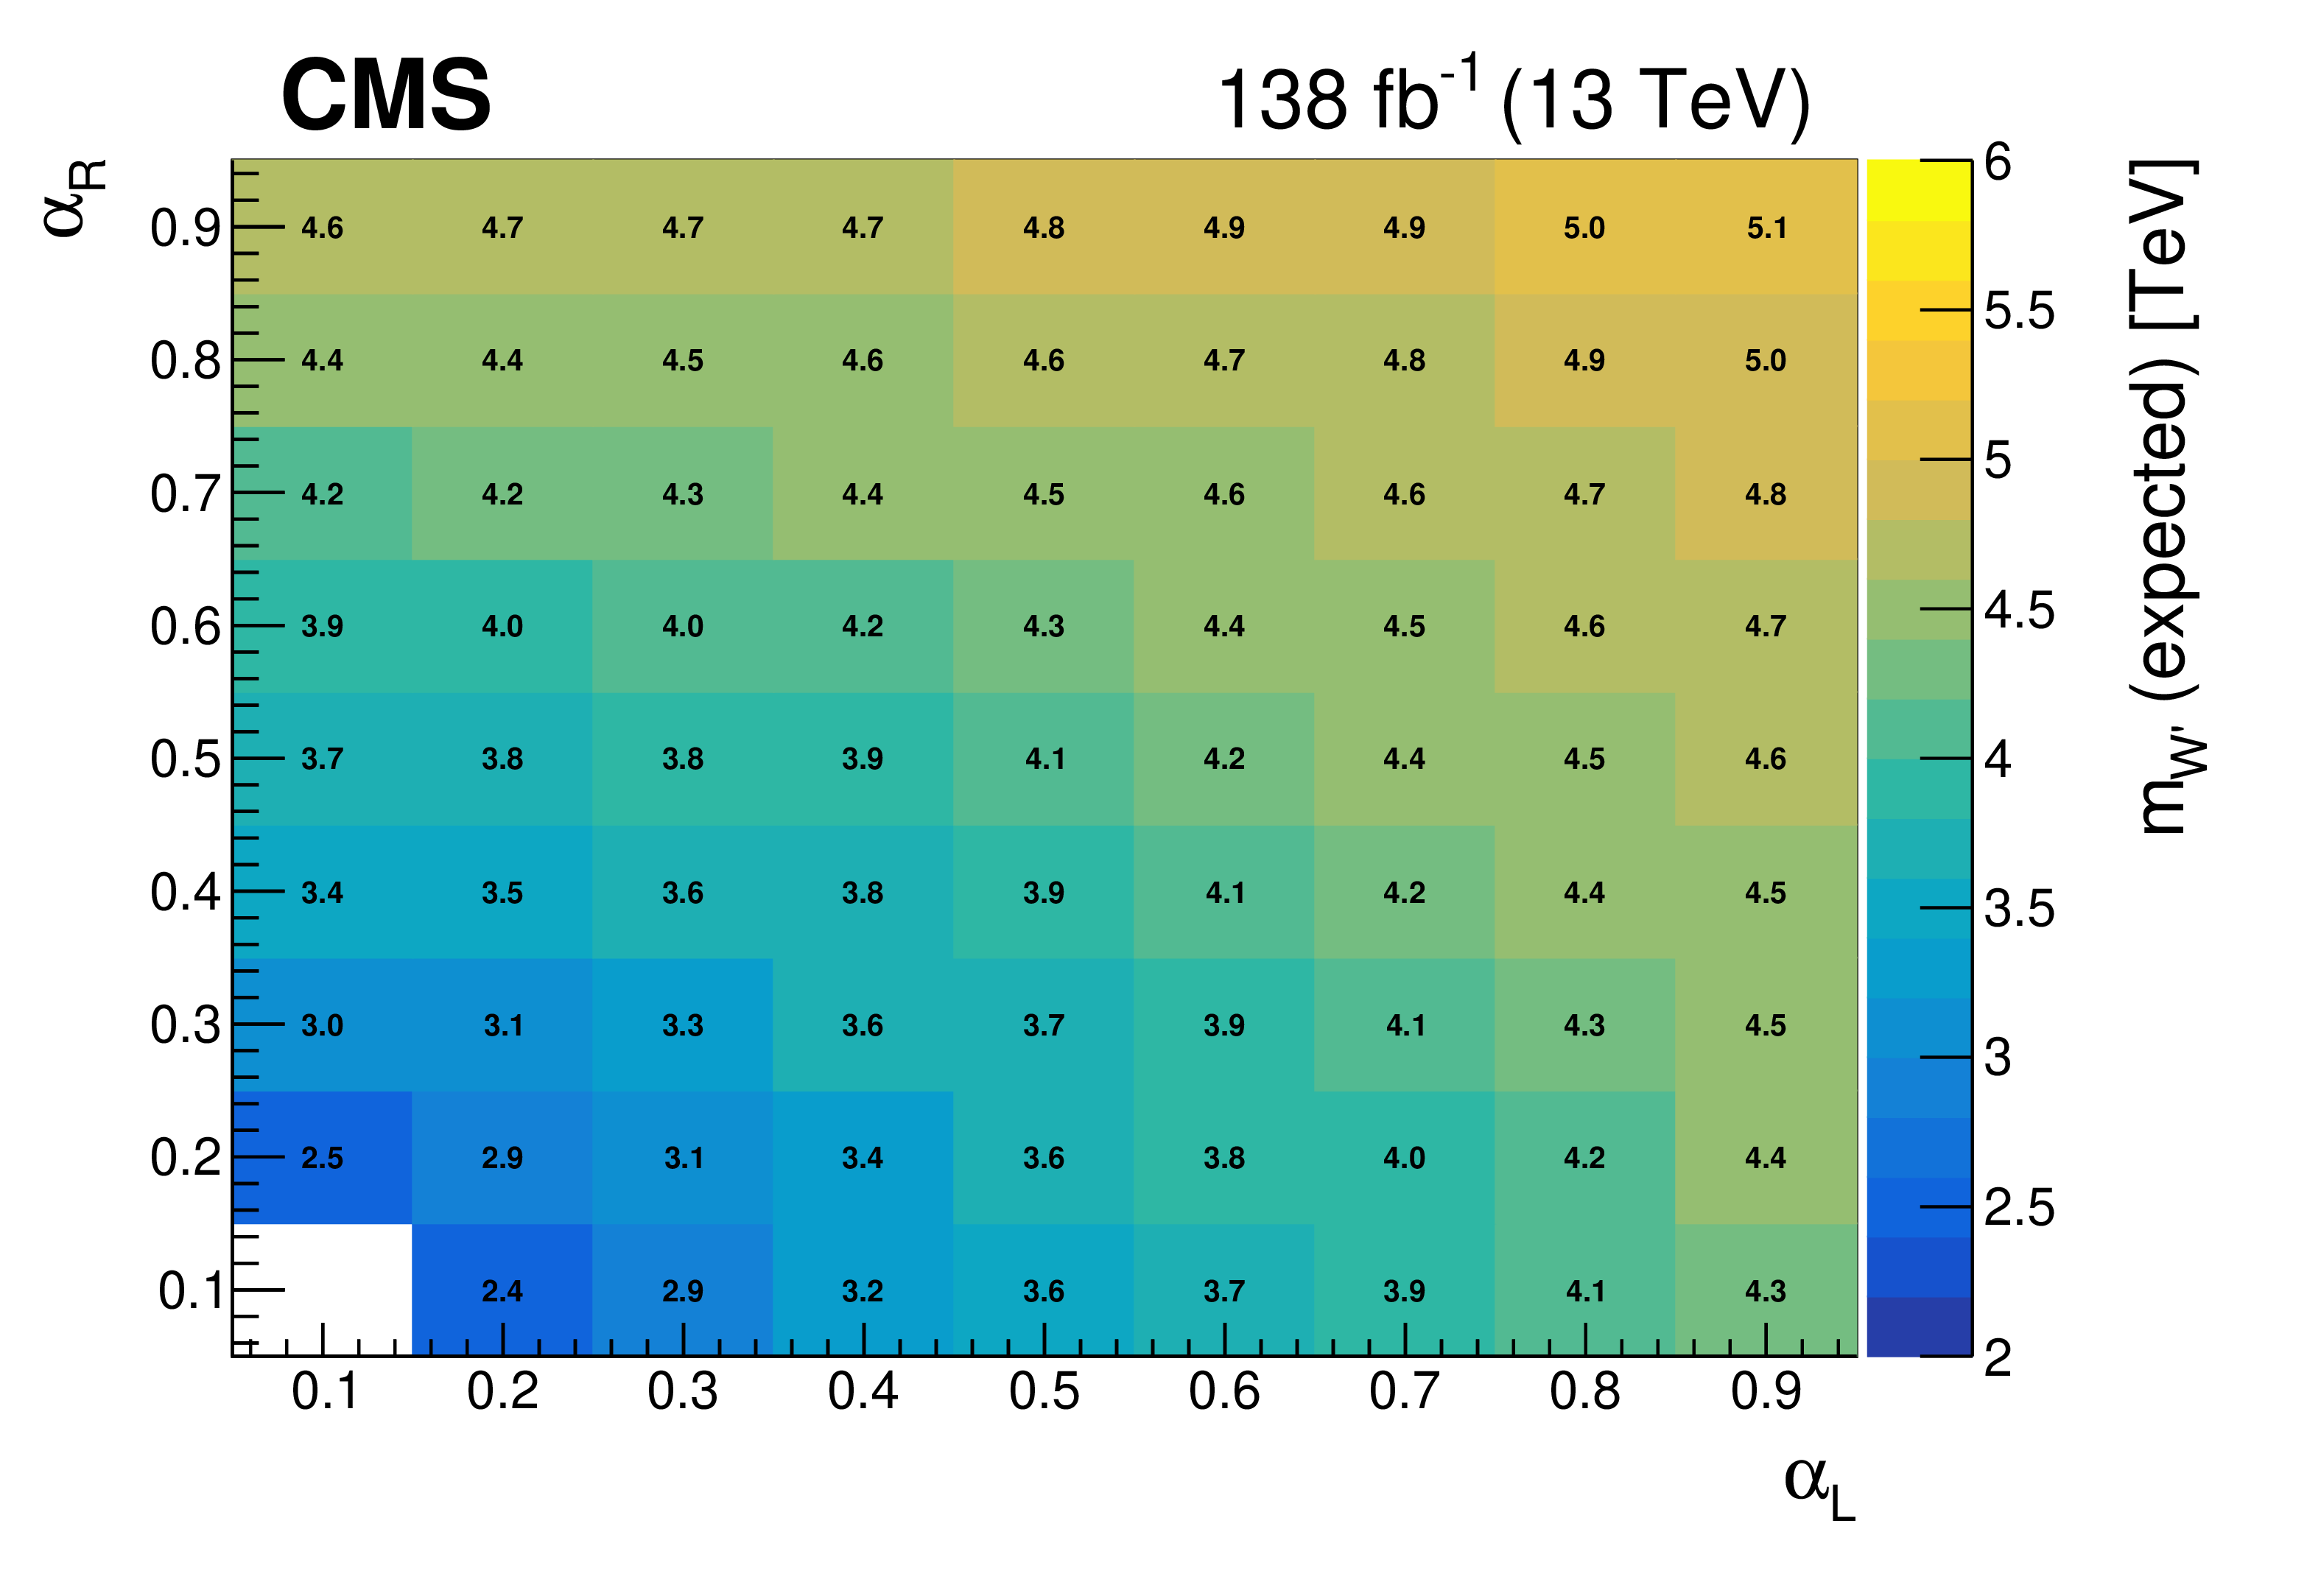
Figure 10:
Expected (left) and observed (right) 95% CL lower limit on $ m_{\mathrm{W^{'}}} $ for a generalized left-right coupling of the W' boson to a t and a b quark. |
png pdf |
Figure 10-a:
Expected 95% CL lower limit on $ m_{\mathrm{W^{'}}} $ for a generalized left-right coupling of the W' boson to a t and a b quark. |
png pdf |
Figure 10-b:
Observed 95% CL lower limit on $ m_{\mathrm{W^{'}}} $ for a generalized left-right coupling of the W' boson to a t and a b quark. |
png pdf |
Figure A1:
Observed and expected 95% CL upper limits on the product of the production cross section for a right-handed W' boson and the W' $ \to \mathrm{t}\mathrm{b} $ branching fraction, as functions of the $ m_{\mathrm{W^{'}}} $ for a relative width of 10% (upper left), 20% (upper right), and 30% (lower). The inner (green) band and the outer (yellow) band indicate the regions containing 68 and 95%, respectively, of the distribution of limits expected under the background-only hypothesis. The solid curves show the theoretical expectation at LO in the case that the couplings, and thus the partial widths, are varied together with the total width. In this interpretation the branching fraction of the W' $ \to \mathrm{t}\mathrm{b} $ decays is the same for each value of the width of the W' boson. |
png pdf |
Figure A1-a:
Observed and expected 95% CL upper limits on the product of the production cross section for a right-handed W' boson and the W' $ \to \mathrm{t}\mathrm{b} $ branching fraction, as functions of the $ m_{\mathrm{W^{'}}} $ for a relative width of 10%. The inner (green) band and the outer (yellow) band indicate the regions containing 68 and 95%, respectively, of the distribution of limits expected under the background-only hypothesis. The solid curves show the theoretical expectation at LO in the case that the couplings, and thus the partial widths, are varied together with the total width. In this interpretation the branching fraction of the W' $ \to \mathrm{t}\mathrm{b} $ decays is the same for each value of the width of the W' boson. |
png pdf |
Figure A1-b:
Observed and expected 95% CL upper limits on the product of the production cross section for a right-handed W' boson and the W' $ \to \mathrm{t}\mathrm{b} $ branching fraction, as functions of the $ m_{\mathrm{W^{'}}} $ for a relative width of 20%. The inner (green) band and the outer (yellow) band indicate the regions containing 68 and 95%, respectively, of the distribution of limits expected under the background-only hypothesis. The solid curves show the theoretical expectation at LO in the case that the couplings, and thus the partial widths, are varied together with the total width. In this interpretation the branching fraction of the W' $ \to \mathrm{t}\mathrm{b} $ decays is the same for each value of the width of the W' boson. |
png pdf |
Figure A1-c:
Observed and expected 95% CL upper limits on the product of the production cross section for a right-handed W' boson and the W' $ \to \mathrm{t}\mathrm{b} $ branching fraction, as functions of the $ m_{\mathrm{W^{'}}} $ for a relative width of 30%. The inner (green) band and the outer (yellow) band indicate the regions containing 68 and 95%, respectively, of the distribution of limits expected under the background-only hypothesis. The solid curves show the theoretical expectation at LO in the case that the couplings, and thus the partial widths, are varied together with the total width. In this interpretation the branching fraction of the W' $ \to \mathrm{t}\mathrm{b} $ decays is the same for each value of the width of the W' boson. |
| Tables | |

png pdf |
Table 1:
The regions defined in the analysis depending on the number of b-tagged jets and of the $ \mathrm{j_{\mathrm{t}}} $ and $ \mathrm{j_{\mathrm{W^{'}}}} $ assignment. |
| Summary |
| A search is presented for W' bosons decaying to a top and a bottom quark in leptonic final states, making use of 138 fb$ ^{-1} $ of proton-proton collision data collected with the CMS detector at the LHC. Good agreement between data and the standard model expectation is observed. Upper limits at 95% confidence level are set on the product of the W' production cross section and the branching fraction of W' $ \to \mathrm{t}\mathrm{b} $. Multiple hypotheses are considered for the new particle mass, width, and chirality. For a 1% relative width hypothesis, purely right-handed W' bosons are excluded with masses lower than 4.3 TeV. Production cross sections above 66 to 2 fb are excluded for masses between 2 and 6 TeV. Purely left-handed W' bosons with a 1% relative decay width are excluded for masses lower than 3.9 TeV. The largest excess, with a local (global) significance of 2.6 (2.0) standard deviations, is observed for a hypothesized right-handed W' boson with a mass of 3.8 TeV and a relative width of 1%. For a 10% relative width hypothesis, purely right-handed W' bosons are excluded with masses lower than 2.7 TeV. Purely left-handed W' bosons are excluded with masses lower than 2.5 TeV for a relative width of 10% of the W' boson mass. For the first time, limits on the production cross section of a W' boson with relative widths of 20% and 30% are set for purely left- and right-handed couplings. Scenarios with the presence of both left- and right-handed couplings are also tested and limits on their production cross sections are set. For these scenarios, exclusion limits on the W' boson mass are provided for the considered model. These results constitute the most stringent constraints to date on a W' boson decaying to a top and a bottom quark. |
| References | ||||
| 1 | R. N. Mohapatra and J. C. Pati | `Natural' left-right symmetry | PRD 11 (1975) 2558 | |
| 2 | G. Senjanovic and R. N. Mohapatra | Exact left-right symmetry and spontaneous violation of parity | PRD 12 (1975) 1502 | |
| 3 | P. Minkowski | $ \mu \to e\gamma $ at a rate of one out of 10$^{9} $ muon decays? | PLB 67 (1977) 421 | |
| 4 | R. N. Mohapatra and G. Senjanovic | Neutrino mass and spontaneous parity nonconservation | PRL 44 (1980) 912 | |
| 5 | J. C. Pati, A. Salam, and J. A. Strathdee | A preon model with hidden electric and magnetic type charges | NPB 185 (1981) 416 | |
| 6 | R. N. Mohapatra | Unification and Supersymmetry: The Frontiers of Quark-Lepton Physics | Springer, Berlin, 1986 ISBN 978-1-4757-1930-7, 978-1-4757-1928-4 |
|
| 7 | K. S. Babu, X.-G. He, and E. Ma | New supersymmetric left-right gauge model: Higgs-boson structure and neutral-current analysis | PRD 36 (1987) 878 | |
| 8 | F. Pisano and V. Pleitez | SU(3)$\otimes$U(1) model for electroweak interactions | PRD 46 (1992) 410 | hep-ph/9206242 |
| 9 | G. Burdman, B. A. Dobrescu, and E. Pontón | Resonances from two universal extra dimensions | PRD 74 (2006) 075008 | hep-ph/0601186 |
| 10 | Z. Chacko, H.-S. Goh, and R. Harnik | A Twin Higgs model from left-right symmetry | JHEP 01 (2006) 108 | hep-ph/0512088 |
| 11 | H.-S. Goh and C. A. Krenke | Little Twin Higgs model | PRD 76 (2007) 115018 | 0707.3650 |
| 12 | A. Belyaev et al. | Technicolor Walks at the LHC | PRD 79 (2009) 035006 | 0809.0793 |
| 13 | J. M. Cabarcas, D. Gomez Dumm, and R. Martinez | Flavor changing neutral currents in 331 models | JPG 37 (2010) 045001 | 0910.5700 |
| 14 | A. J. Buras, F. De Fazio, J. Girrbach, and M. V. Carlucci | The anatomy of quark flavour observables in 331 models in the flavour precision era | JHEP 02 (2013) 023 | 1211.1237 |
| 15 | A. Ahmed | Heavy Higgs of the Twin Higgs models | JHEP 02 (2018) 048 | 1711.03107 |
| 16 | BABAR Collaboration | Evidence for an excess of $ \bar{B} \to {D^{(*)}} \tau^-\bar{\nu}_\tau $ decays | PRL 109 (2012) 101802 | 1205.5442 |
| 17 | Belle Collaboration | Measurement of the $ \tau $ lepton polarization and $ {R(D^*)} $ in the decay $ \bar{B} \to {D^*} \tau^- \bar{\nu}_\tau $ | PRL 118 (2017) 211801 | 1612.00529 |
| 18 | M. Abdullah et al. | Probing a simplified W$ ^\prime $ model of $ {R}({D}^{*}) $ anomalies using b tags, $ \tau $ leptons, and missing energy | PRD 98 (2018) 055016 | 1805.01869 |
| 19 | D. J. Muller and S. Nandi | Top flavor: A separate SU(2) for the third family | PLB 383 (1996) 345 | hep-ph/9602390 |
| 20 | R. Calabrese et al. | Top-flavor scheme in the context of W$ ^\prime $ searches at LHC | PRD 104 (2021) 055006 | 2104.06720 |
| 21 | CMS Collaboration | Search for heavy resonances decaying to a top quark and a bottom quark in the lepton+jets final state in proton-proton collisions at 13 TeV | PLB 777 (2018) 39 | 1708.08539 |
| 22 | ATLAS Collaboration | Search for high-mass resonances decaying to $ \tau\nu $ in pp collisions at $ \sqrt{s}= $ 13 TeV with the ATLAS detector | PRL 120 (2018) 161802 | 1801.06992 |
| 23 | ATLAS Collaboration | Search for vector-boson resonances decaying to a top quark and bottom quark in the lepton plus jets final state in pp collisions at $ \sqrt{s} = $ 13 TeV with the ATLAS detector | PLB 788 (2019) 347 | 1807.10473 |
| 24 | CMS Collaboration | Search for a W$ ^\prime $ boson decaying to a $ \tau $ lepton and a neutrino in proton-proton collisions at $ \sqrt{s} = $ 13 TeV | PLB 792 (2019) 107 | CMS-EXO-17-008 1807.11421 |
| 25 | CMS Collaboration | Search for W$ ^\prime $ bosons decaying to a top and a bottom quark at $ \sqrt{s}= $ 13 TeV in the hadronic final state | PLB 820 (2021) 136535 | 2104.04831 |
| 26 | N. Vignaroli | New W$ ^\prime $ signals at the LHC | PRD 89 (2014) 095027 | 1404.5558 |
| 27 | D. Barducci and C. Delaunay | Bounding wide composite vector resonances at the LHC | JHEP 02 (2016) 055 | 1511.01101 |
| 28 | CMS Collaboration | HEPData record for this analysis | link | |
| 29 | CMS Collaboration | The CMS experiment at the CERN LHC | JINST 3 (2008) S08004 | |
| 30 | CMS Collaboration | The CMS trigger system | JINST 12 (2017) P01020 | CMS-TRG-12-001 1609.02366 |
| 31 | J. Alwall et al. | The automated computation of tree-level and next-to-leading order differential cross sections, and their matching to parton shower simulations | JHEP 07 (2014) 079 | 1405.0301 |
| 32 | P. Nason | A new method for combining NLO QCD with shower Monte Carlo algorithms | JHEP 11 (2004) 040 | hep-ph/0409146 |
| 33 | S. Frixione, P. Nason, and C. Oleari | Matching NLO QCD computations with parton shower simulations: the POWHEG method | JHEP 11 (2007) 070 | 0709.2092 |
| 34 | S. Alioli, P. Nason, C. Oleari, and E. Re | A general framework for implementing NLO calculations in shower Monte Carlo programs: the POWHEG BOX | JHEP 06 (2010) 043 | 1002.2581 |
| 35 | S. Frixione, P. Nason, and G. Ridolfi | A positive-weight next-to-leading-order Monte Carlo for heavy flavour hadroproduction | JHEP 09 (2007) 126 | 0707.3088 |
| 36 | R. Frederix, E. Re, and P. Torrielli | Single-top $ t $-channel hadroproduction in the four-flavour scheme with POWHEG and aMC@NLO | JHEP 09 (2012) 130 | 1207.5391 |
| 37 | CMS Collaboration | Event generator tunes obtained from underlying event and multiparton scattering measurements | EPJC 76 (2016) 155 | CMS-GEN-14-001 1512.00815 |
| 38 | CMS Collaboration | Extraction and validation of a new set of CMS PYTHIA8 tunes from underlying-event measurements | EPJC 80 (2020) 4 | CMS-GEN-17-001 1903.12179 |
| 39 | CMS Collaboration | Investigations of the impact of the parton shower tuning in PYTHIA 8 in the modelling of $ \mathrm{t} \overline{\mathrm{t}} $ at $ \sqrt{s}= $ 8 and 13 TeV | CMS Physics Analysis Summary, 2016 CMS-PAS-TOP-16-021 |
CMS-PAS-TOP-16-021 |
| 40 | M. Czakon and A. Mitov | Top++: a program for the calculation of the top-pair cross-section at hadron colliders | Comput. Phys. Commun. 185 (2014) 2930 | 1112.5675 |
| 41 | M. Aliev et al. | HATHOR --- HAdronic Top and Heavy quarks crOss section calculatoR | Comput. Phys. Commun. 182 (2011) 1034 | 1007.1327 |
| 42 | J. M. Lindert et al. | Precise predictions for V+jets dark matter backgrounds | EPJC 77 (2017) 829 | 1705.04664 |
| 43 | CMS Collaboration | Search for a W' boson decaying to a bottom quark and a top quark in pp collisions at $ \sqrt{s}= $ 7 TeV | PLB 718 (2013) 1229 | CMS-EXO-12-001 1208.0956 |
| 44 | NNPDF Collaboration | Parton distributions for the LHC Run II | JHEP 04 (2015) 040 | 1410.8849 |
| 45 | NNPDF Collaboration | Parton distributions from high-precision collider data | EPJC 77 (2017) 663 | 1706.00428 |
| 46 | GEANT4 Collaboration | GEANT 4---a simulation toolkit | NIM A 506 (2003) 250 | |
| 47 | CMS Collaboration | Particle-flow reconstruction and global event description with the CMS detector | JINST 12 (2017) P10003 | CMS-PRF-14-001 1706.04965 |
| 48 | CMS Collaboration | Technical proposal for the Phase-II upgrade of the Compact Muon Solenoid | CMS Technical Proposal CERN-LHCC-2015-010, CMS-TDR-15-02, 2015 CDS |
|
| 49 | M. Cacciari, G. P. Salam, and G. Soyez | The anti-$ k_{\mathrm{T}} $ jet clustering algorithm | JHEP 04 (2008) 063 | 0802.1189 |
| 50 | M. Cacciari, G. P. Salam, and G. Soyez | FastJet user manual | EPJC 72 (2012) 1896 | 1111.6097 |
| 51 | K. Rehermann and B. Tweedie | Efficient identification of boosted semileptonic top quarks at the LHC | JHEP 03 (2011) 059 | 1007.2221 |
| 52 | J. M. Butterworth, A. R. Davison, M. Rubin, and G. P. Salam | Jet substructure as a new Higgs search channel at the LHC | PRL 100 (2008) 242001 | 0802.2470 |
| 53 | M. Dasgupta, A. Fregoso, S. Marzani, and G. P. Salam | Towards an understanding of jet substructure | JHEP 09 (2013) 029 | 1307.0007 |
| 54 | A. J. Larkoski, S. Marzani, G. Soyez, and J. Thaler | Soft drop | JHEP 05 (2014) 146 | 1402.2657 |
| 55 | M. Cacciari and G. P. Salam | Pileup subtraction using jet areas | PLB 659 (2008) 119 | 0707.1378 |
| 56 | D. Bertolini, P. Harris, M. Low, and N. Tran | Pileup per particle identification | JHEP 10 (2014) 059 | 1407.6013 |
| 57 | CMS Collaboration | Jet energy scale and resolution in the CMS experiment in pp collisions at 8 TeV | JINST 12 (2017) P02014 | CMS-JME-13-004 1607.03663 |
| 58 | CMS Collaboration | Jet algorithms performance in 13 TeV data | technical report, CERN, Geneva, 2017 CDS |
|
| 59 | CMS Collaboration | Identification of heavy-flavour jets with the CMS detector in pp collisions at 13 TeV | JINST 13 (2018) P05011 | CMS-BTV-16-002 1712.07158 |
| 60 | CMS Collaboration | Performance of the DeepJet b tagging algorithm using 41.9/fb of data from proton-proton collisions at 13 TeV with Phase 1 CMS detector | CMS Detector Performance Note CMS-DP-2018-058, 2018 CDS |
|
| 61 | E. Bols et al. | Jet flavour classification using DeepJet | JINST 15 (2020) P12012 | 2008.10519 |
| 62 | CMS Collaboration | Measurement of the single top quark and antiquark production cross sections in the $ t $ channel and their ratio in proton-proton collisions at $ \sqrt{s}= $ 13 TeV | PLB 800 (2019) 135042 | CMS-TOP-17-011 1812.10514 |
| 63 | Particle Data Group Collaboration | Review of particle physics | Prog. Theor. Exp. Phys. 2022 (2022) 083C01 | |
| 64 | CMS Collaboration | Precision luminosity measurement in proton-proton collisions at $ \sqrt{s} = $ 13 TeV in 2015 and 2016 at CMS | EPJC 81 (2021) 800 | CMS-LUM-17-003 2104.01927 |
| 65 | CMS Collaboration | CMS luminosity measurement for the 2017 data-taking period at $ \sqrt{s} = $ 13 TeV | CMS Physics Analysis Summary, 2018 CMS-PAS-LUM-17-004 |
CMS-PAS-LUM-17-004 |
| 66 | CMS Collaboration | CMS luminosity measurement for the 2018 data-taking period at $ \sqrt{s} = $ 13 TeV | CMS Physics Analysis Summary, 2019 CMS-PAS-LUM-18-002 |
CMS-PAS-LUM-18-002 |
| 67 | J. Butterworth et al. | PDF4LHC recommendations for LHC Run II | JPG 43 (2016) 023001 | 1510.03865 |
| 68 | CMS Collaboration | Measurement of the inelastic proton-proton cross section at $ \sqrt{s}= $ 13 TeV | JHEP 07 (2018) 161 | CMS-FSQ-15-005 1802.02613 |
| 69 | R. Barlow and C. Beeston | Fitting using finite Monte Carlo samples | Comput. Phys. Commun. 77 (1993) 219 | |
| 70 | J. S. Conway | Nuisance parameters in likelihoods for multisource spectra | in Proceedings of orkshop on Statistical Issues Related to Discovery Claims in Search Experiments and Unfolding, H.~Prosper and L.~Lyons, eds., number CERN-2011-006, . CERN, 2011 PHYSTAT 2011 (2011) 115 |
|
| 71 | E. Gross and O. Vitells | Trial factors for the look elsewhere effect in high energy physics | EPJC 70 (2010) 525 | 1005.1891 |
| 72 | T. Junk | Confidence level computation for combining searches with small statistics | NIM A 434 (1999) 435 | hep-ex/9902006 |
| 73 | A. L. Read | Presentation of search results: the CL$_{\text{s}} $ technique | JPG 28 (2002) 2693 | |
| 74 | G. Cowan, K. Cranmer, E. Gross, and O. Vitells | Asymptotic formulae for likelihood-based tests of new physics | EPJC 71 (2011) 1554 | 1007.1727 |
| 75 | E. Boos, V. Bunichev, L. Dudko, and M. Perfilov | Interference between W' and W in single-top quark production processes | PLB 655 (2007) 245 | hep-ph/0610080 |
|
|
Compact Muon Solenoid LHC, CERN |
|

|

|

|

|

|