

Compact Muon Solenoid
LHC, CERN
| CMS-EXO-17-011 ; CERN-EP-2018-028 | ||
| Search for a heavy right-handed W boson and a heavy neutrino in events with two same-flavor leptons and two jets at $\sqrt{s} = $ 13 TeV | ||
| CMS Collaboration | ||
| 29 March 2018 | ||
| JHEP 05 (2018) 148 | ||
| Abstract: A search for a heavy right-handed W boson ($ \mathrm{ W_R } $) decaying to a heavy right-handed neutrino and a charged lepton in events with two same-flavor leptons (e or $ \mu $) and two jets, is presented. The analysis is based on proton-proton collision data, collected by the CMS Collaboration at the LHC in 2016 and corresponding to an integrated luminosity of 35.9 fb$^{-1}$. No significant excess above the standard model expectation is seen in the invariant mass distribution of the dilepton plus dijet system. Assuming that couplings are identical to those of the standard model, and that only one heavy neutrino flavor ${\mathrm {N_R}}$ contributes significantly to the $ \mathrm{ W_R } $ decay width, the region in the two-dimensional ($ {m_{ \mathrm{ W_R } }} $, $ {m_{{\mathrm {N_R}} }} $) mass plane excluded at 95% confidence level extends to approximately ${m_{ \mathrm{ W_R } }} = $ 4.4 TeV and covers a large range of right-handed neutrino masses below the $ \mathrm{ W_R } $ boson mass. This analysis provides the most stringent limits on the $ \mathrm{ W_R } $ mass to date. | ||
| Links: e-print arXiv:1803.11116 [hep-ex] (PDF) ; CDS record ; inSPIRE record ; CADI line (restricted) ; | ||
| Figures | |
png pdf |
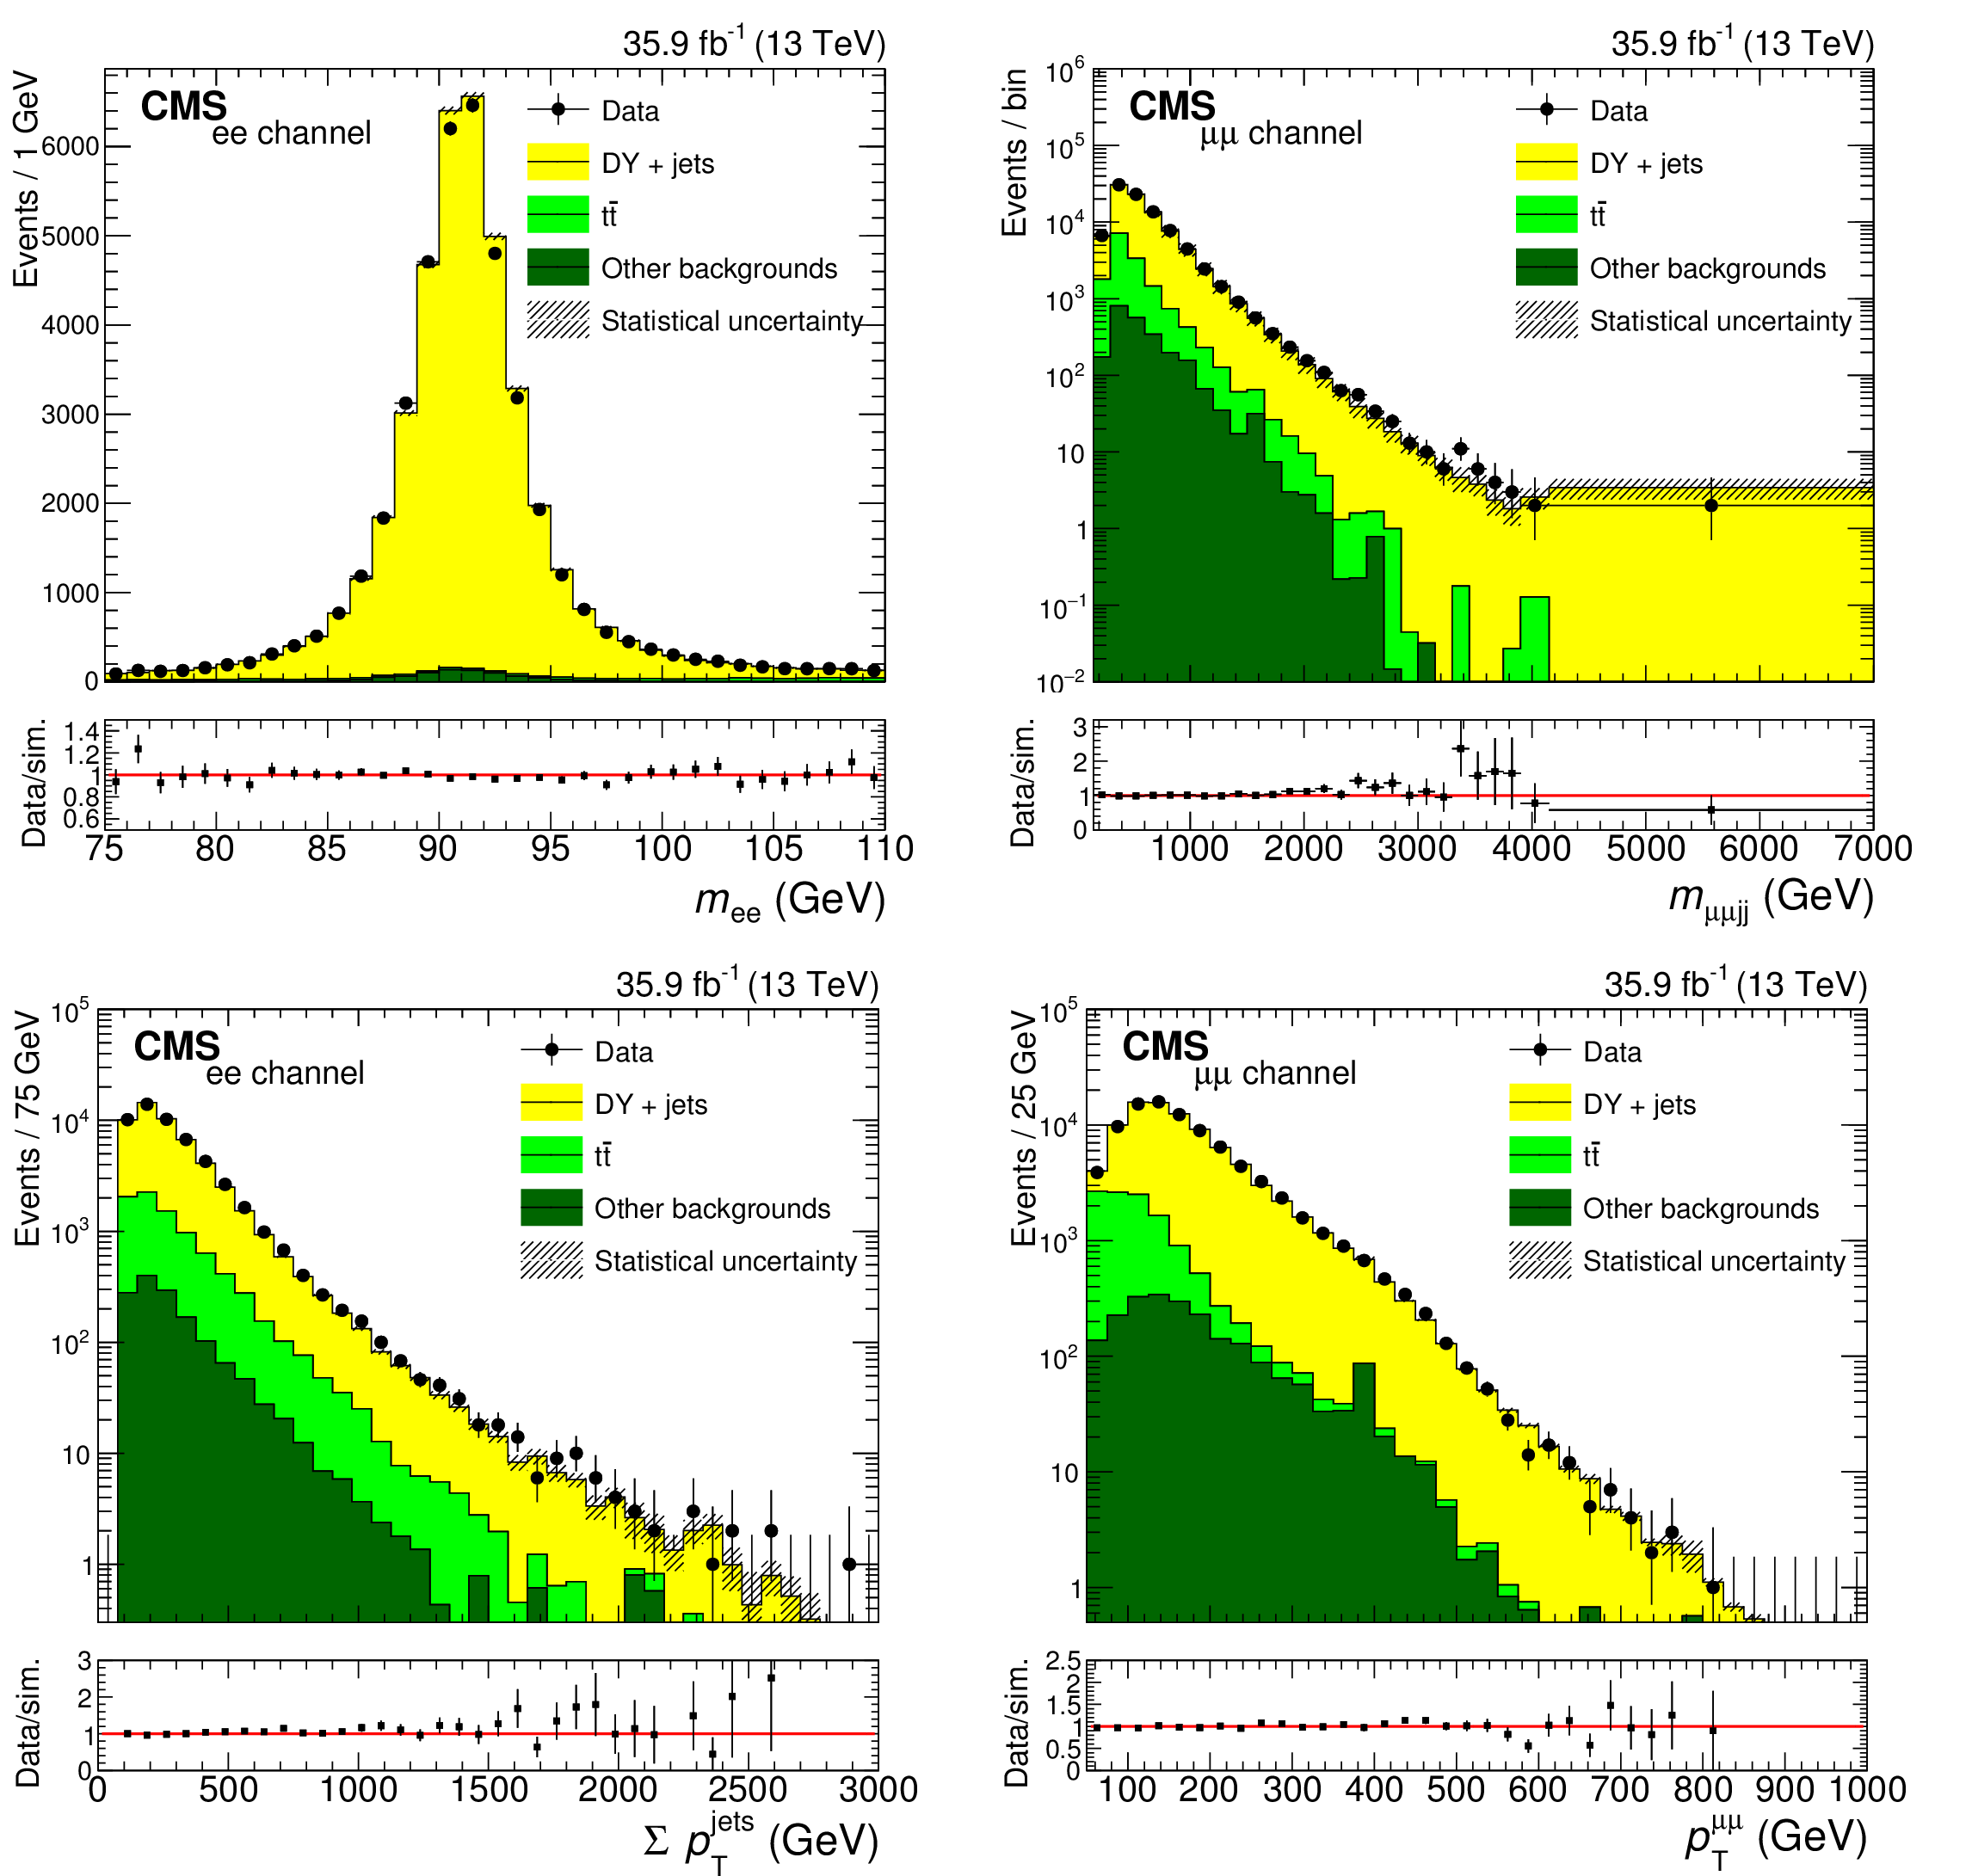
Figure 1:
Kinematic distributions for events in the low dilepton mass control region with the DY SF applied. The dilepton mass (upper) and the scalar sum of all jet transverse momenta (lower) for the ee DY plus two jets selection are shown on the left. The $ {m_{\ell \ell \text {jj}}} $ (upper) and the dilepton transverse momentum (lower) for the $ {\mu} {\mu} $ DY plus two jets selection are shown on the right. The uncertainty bands on the simulated background histograms include only statistical uncertainties. The uncertainty bars in the ratio plots represent combined statistical uncertainties of data and simulation. |
png pdf |
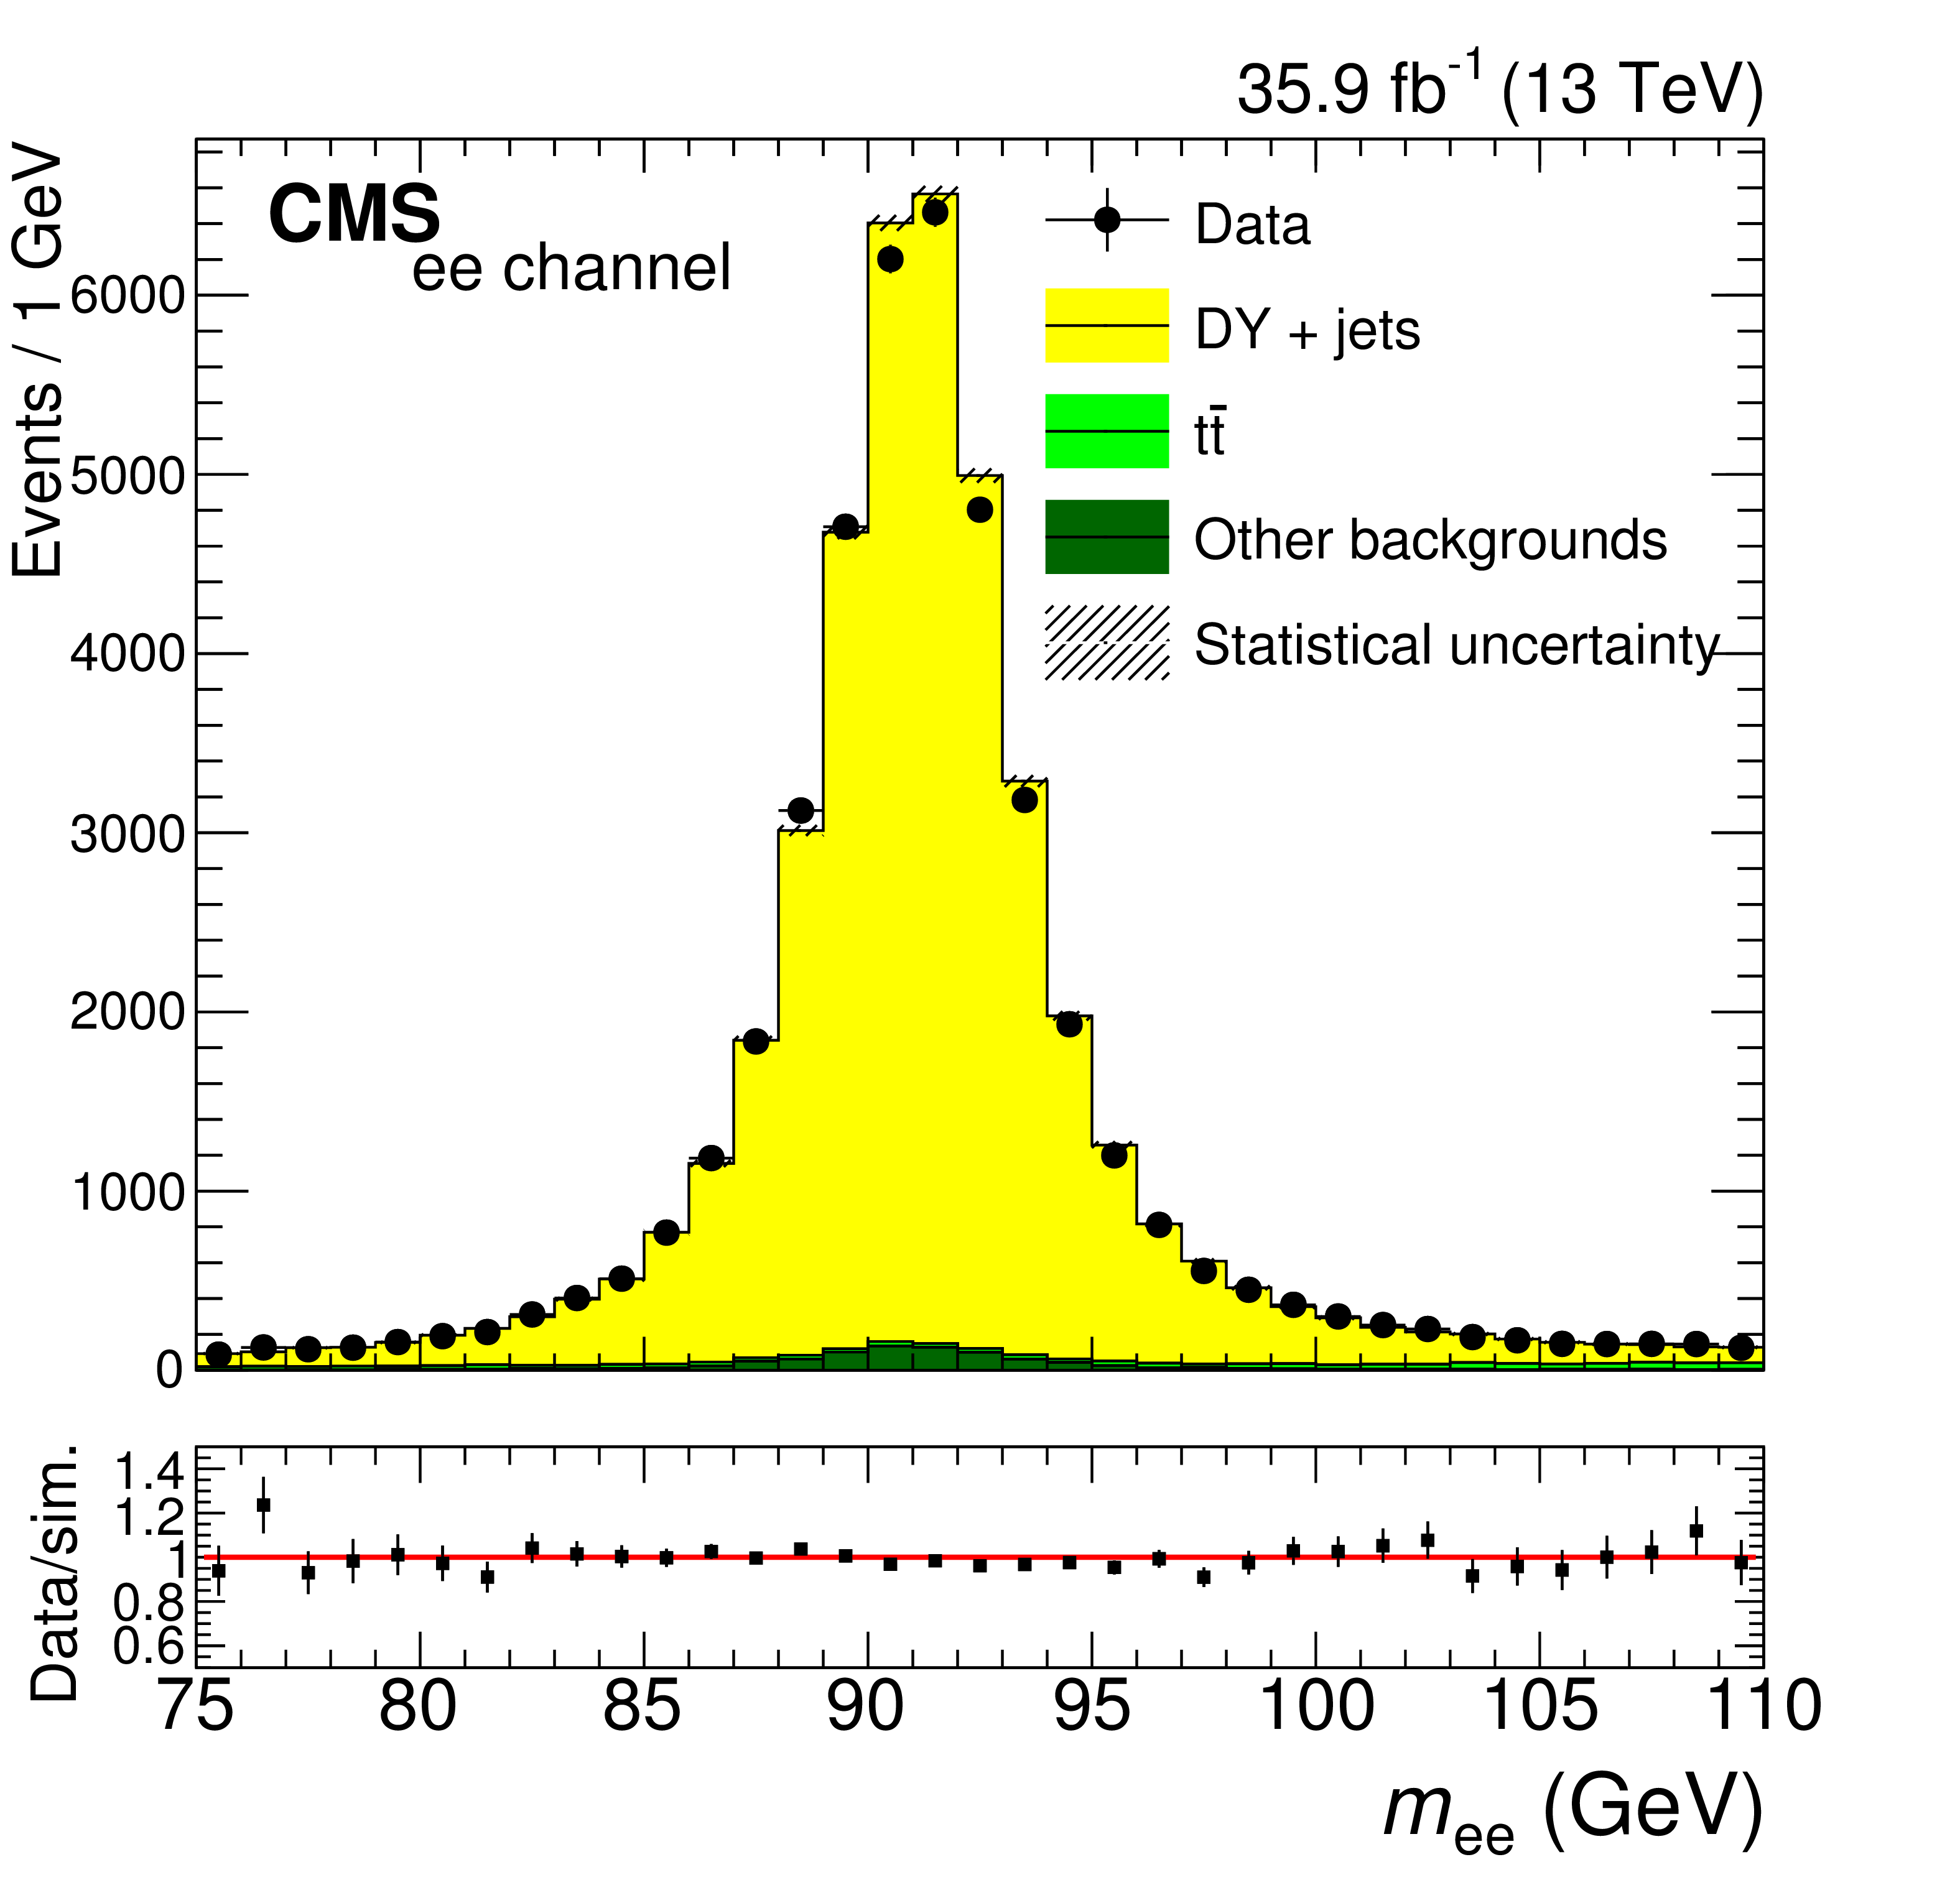
Figure 1-a:
Dilepton mass distribution for events in the low dilepton mass control region with the DY SF applied, for the ee DY plus two jets selection. The uncertainty bands on the simulated background histograms include only statistical uncertainties. The uncertainty bars in the ratio plot represent combined statistical uncertainties of data and simulation. |

png pdf |
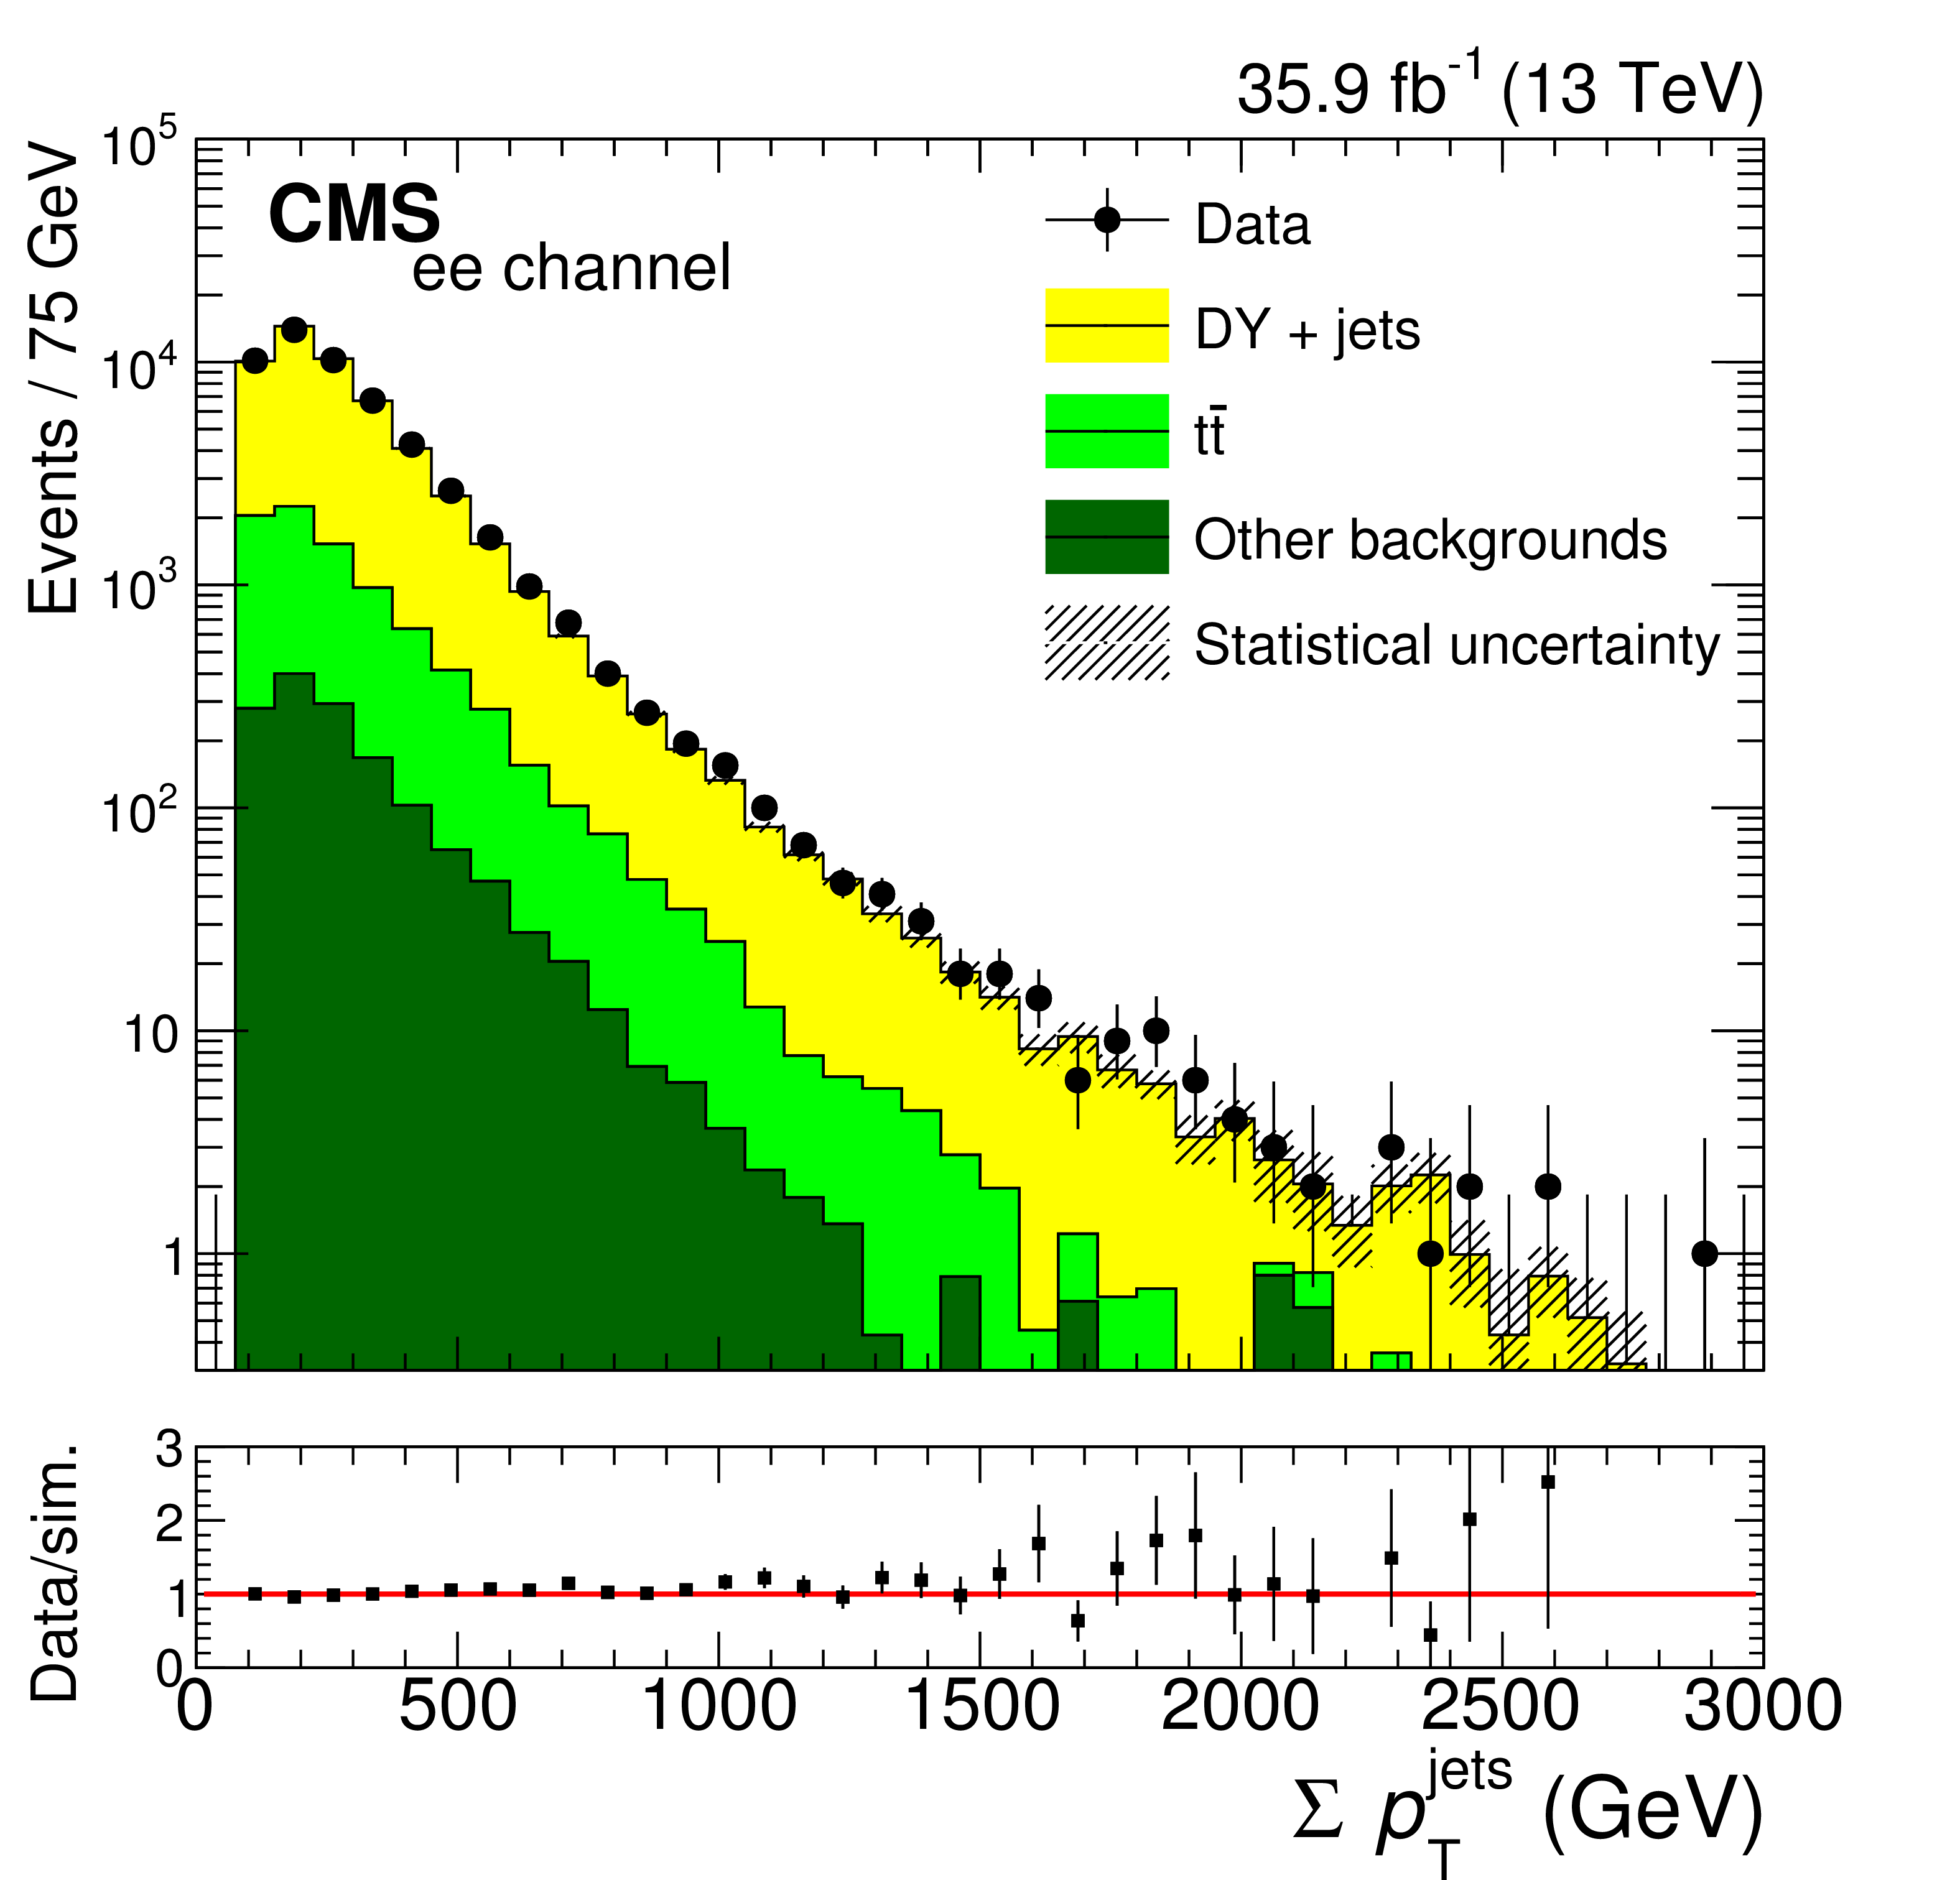
Figure 1-b:
Dilepton mass Scalar sum of all jet transverse momenta $ {m_{\ell \ell \text {jj}}} $ Dilepton transverse momentum distribution for events in the low dilepton mass control region with the DY SF applied, for the ee DY plus two jets selection. for the $ {\mu} {\mu} $ DY plus two jets selection. The uncertainty bands on the simulated background histograms include only statistical uncertainties. The uncertainty bars in the ratio plot represent combined statistical uncertainties of data and simulation. |
png pdf |
Figure 1-c:
Dilepton mass Scalar sum of all jet transverse momenta $ {m_{\ell \ell \text {jj}}} $ Dilepton transverse momentum distribution for events in the low dilepton mass control region with the DY SF applied, for the ee DY plus two jets selection. for the $ {\mu} {\mu} $ DY plus two jets selection. The uncertainty bands on the simulated background histograms include only statistical uncertainties. The uncertainty bars in the ratio plot represent combined statistical uncertainties of data and simulation. |
png pdf |
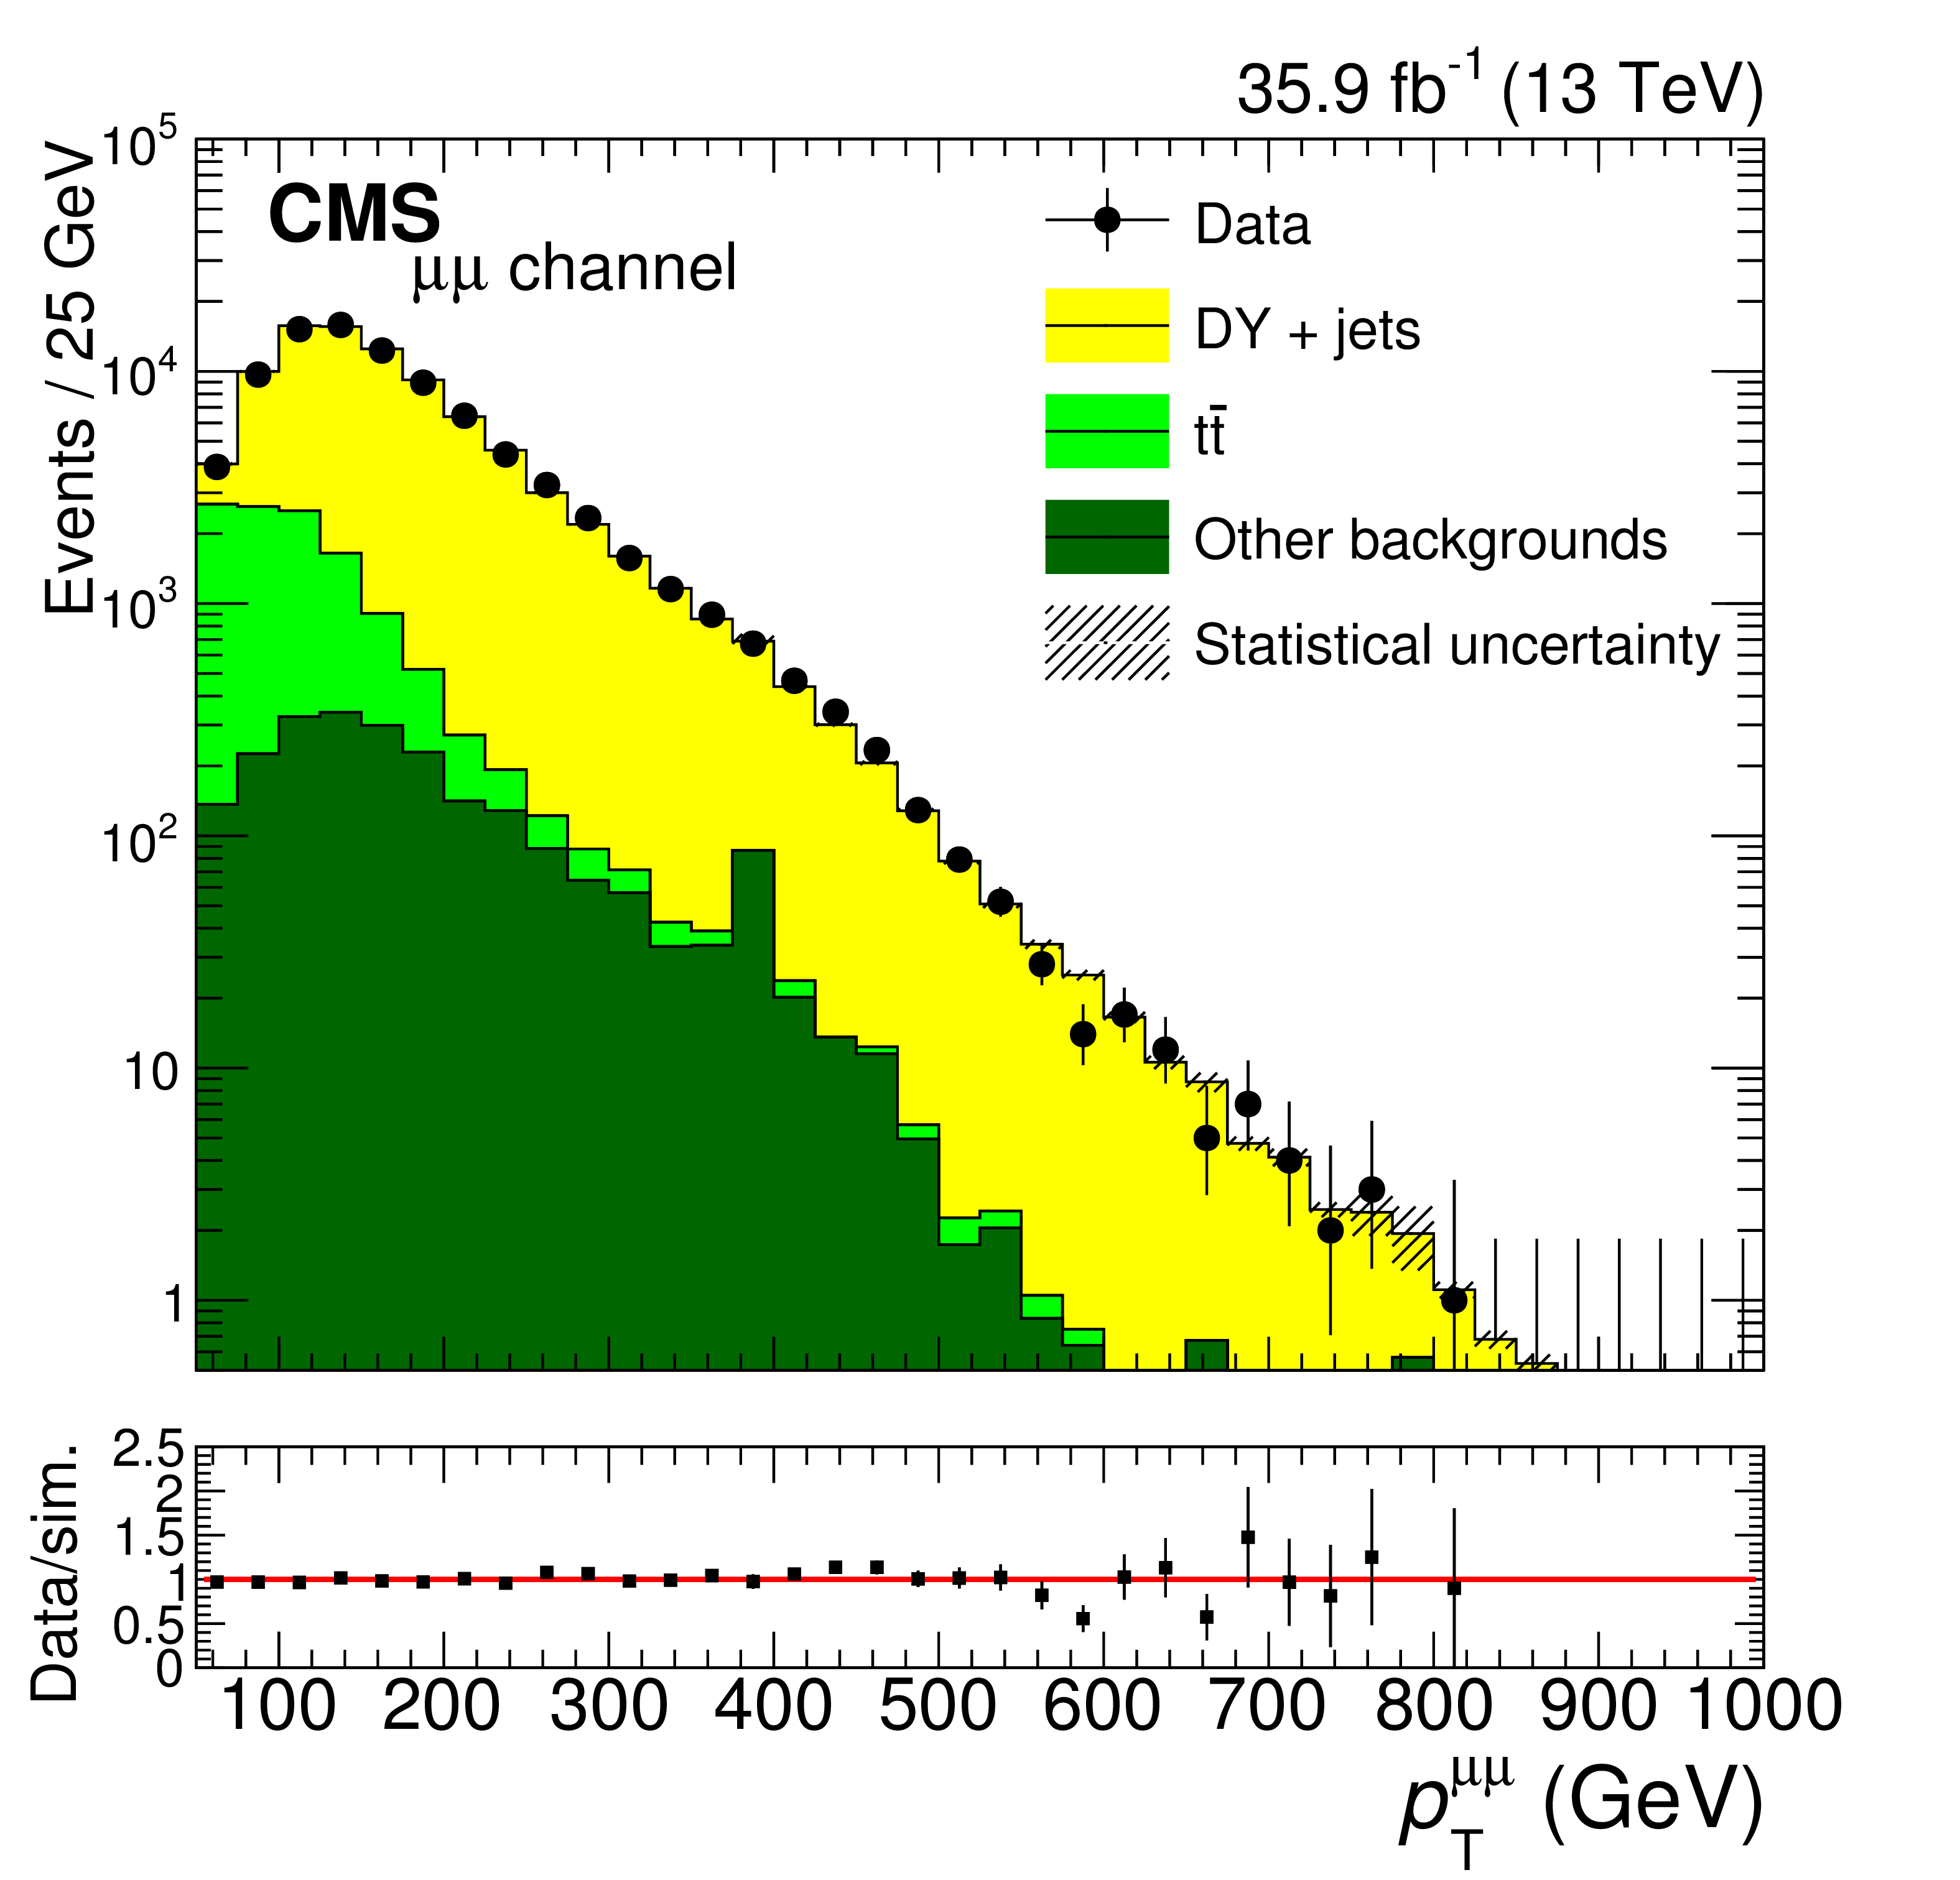
Figure 1-d:
Dilepton mass Scalar sum of all jet transverse momenta $ {m_{\ell \ell \text {jj}}} $ Dilepton transverse momentum distribution for events in the low dilepton mass control region with the DY SF applied, for the ee DY plus two jets selection. for the $ {\mu} {\mu} $ DY plus two jets selection. The uncertainty bands on the simulated background histograms include only statistical uncertainties. The uncertainty bars in the ratio plot represent combined statistical uncertainties of data and simulation. |
png pdf |
Figure 2:
The $ {m_{\ell \ell \text {jj}}} $ distribution in the low $ {m_{\ell \ell \text {jj}}} $ control region with the DY SF applied for the electron (left) and muon (right) channel. The uncertainty bands on the simulated background histograms include only statistical uncertainties. The uncertainty bars in the ratio plots represent combined statistical uncertainties of data and simulation. |
png pdf |
Figure 2-a:
The $ {m_{\ell \ell \text {jj}}} $ distribution in the low $ {m_{\ell \ell \text {jj}}} $ control region with the DY SF applied for the electron channel. The uncertainty bands on the simulated background histograms include only statistical uncertainties. The uncertainty bars in the ratio plot represent combined statistical uncertainties of data and simulation. |

png pdf |
Figure 2-b:
The $ {m_{\ell \ell \text {jj}}} $ distribution in the low $ {m_{\ell \ell \text {jj}}} $ control region with the DY SF applied for the muon channel. The uncertainty bands on the simulated background histograms include only statistical uncertainties. The uncertainty bars in the ratio plot represent combined statistical uncertainties of data and simulation. |

png pdf |
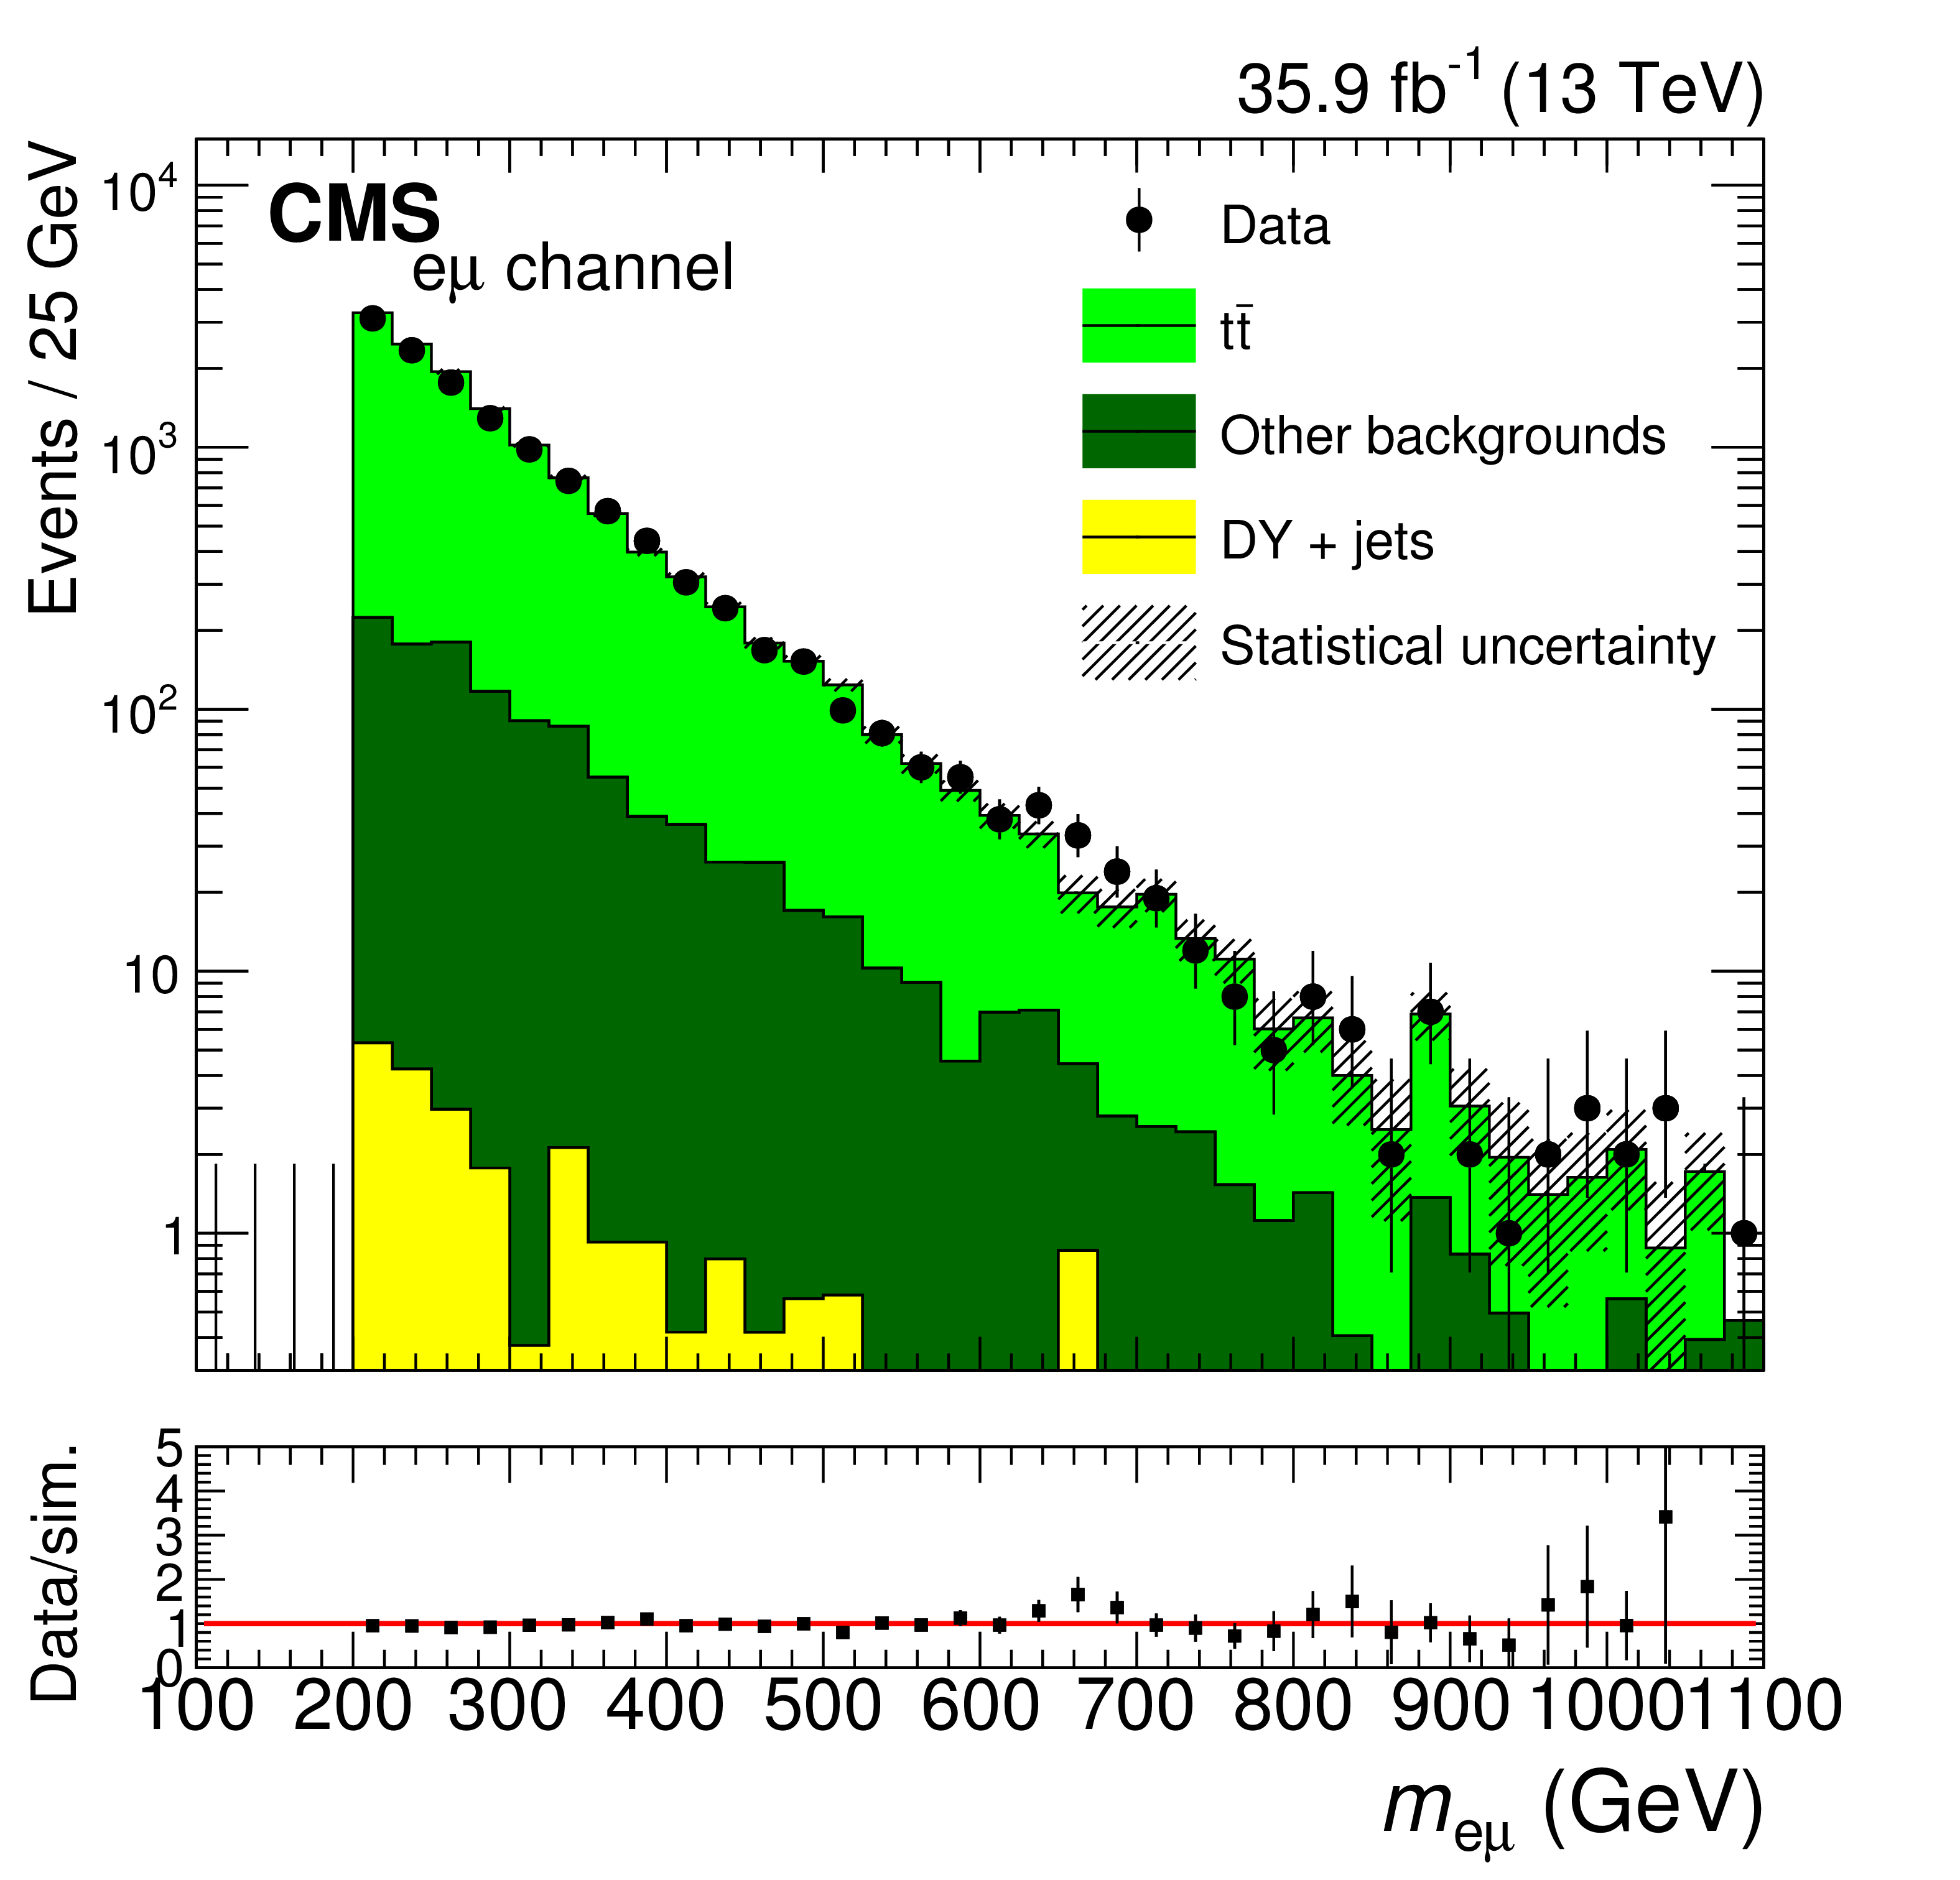
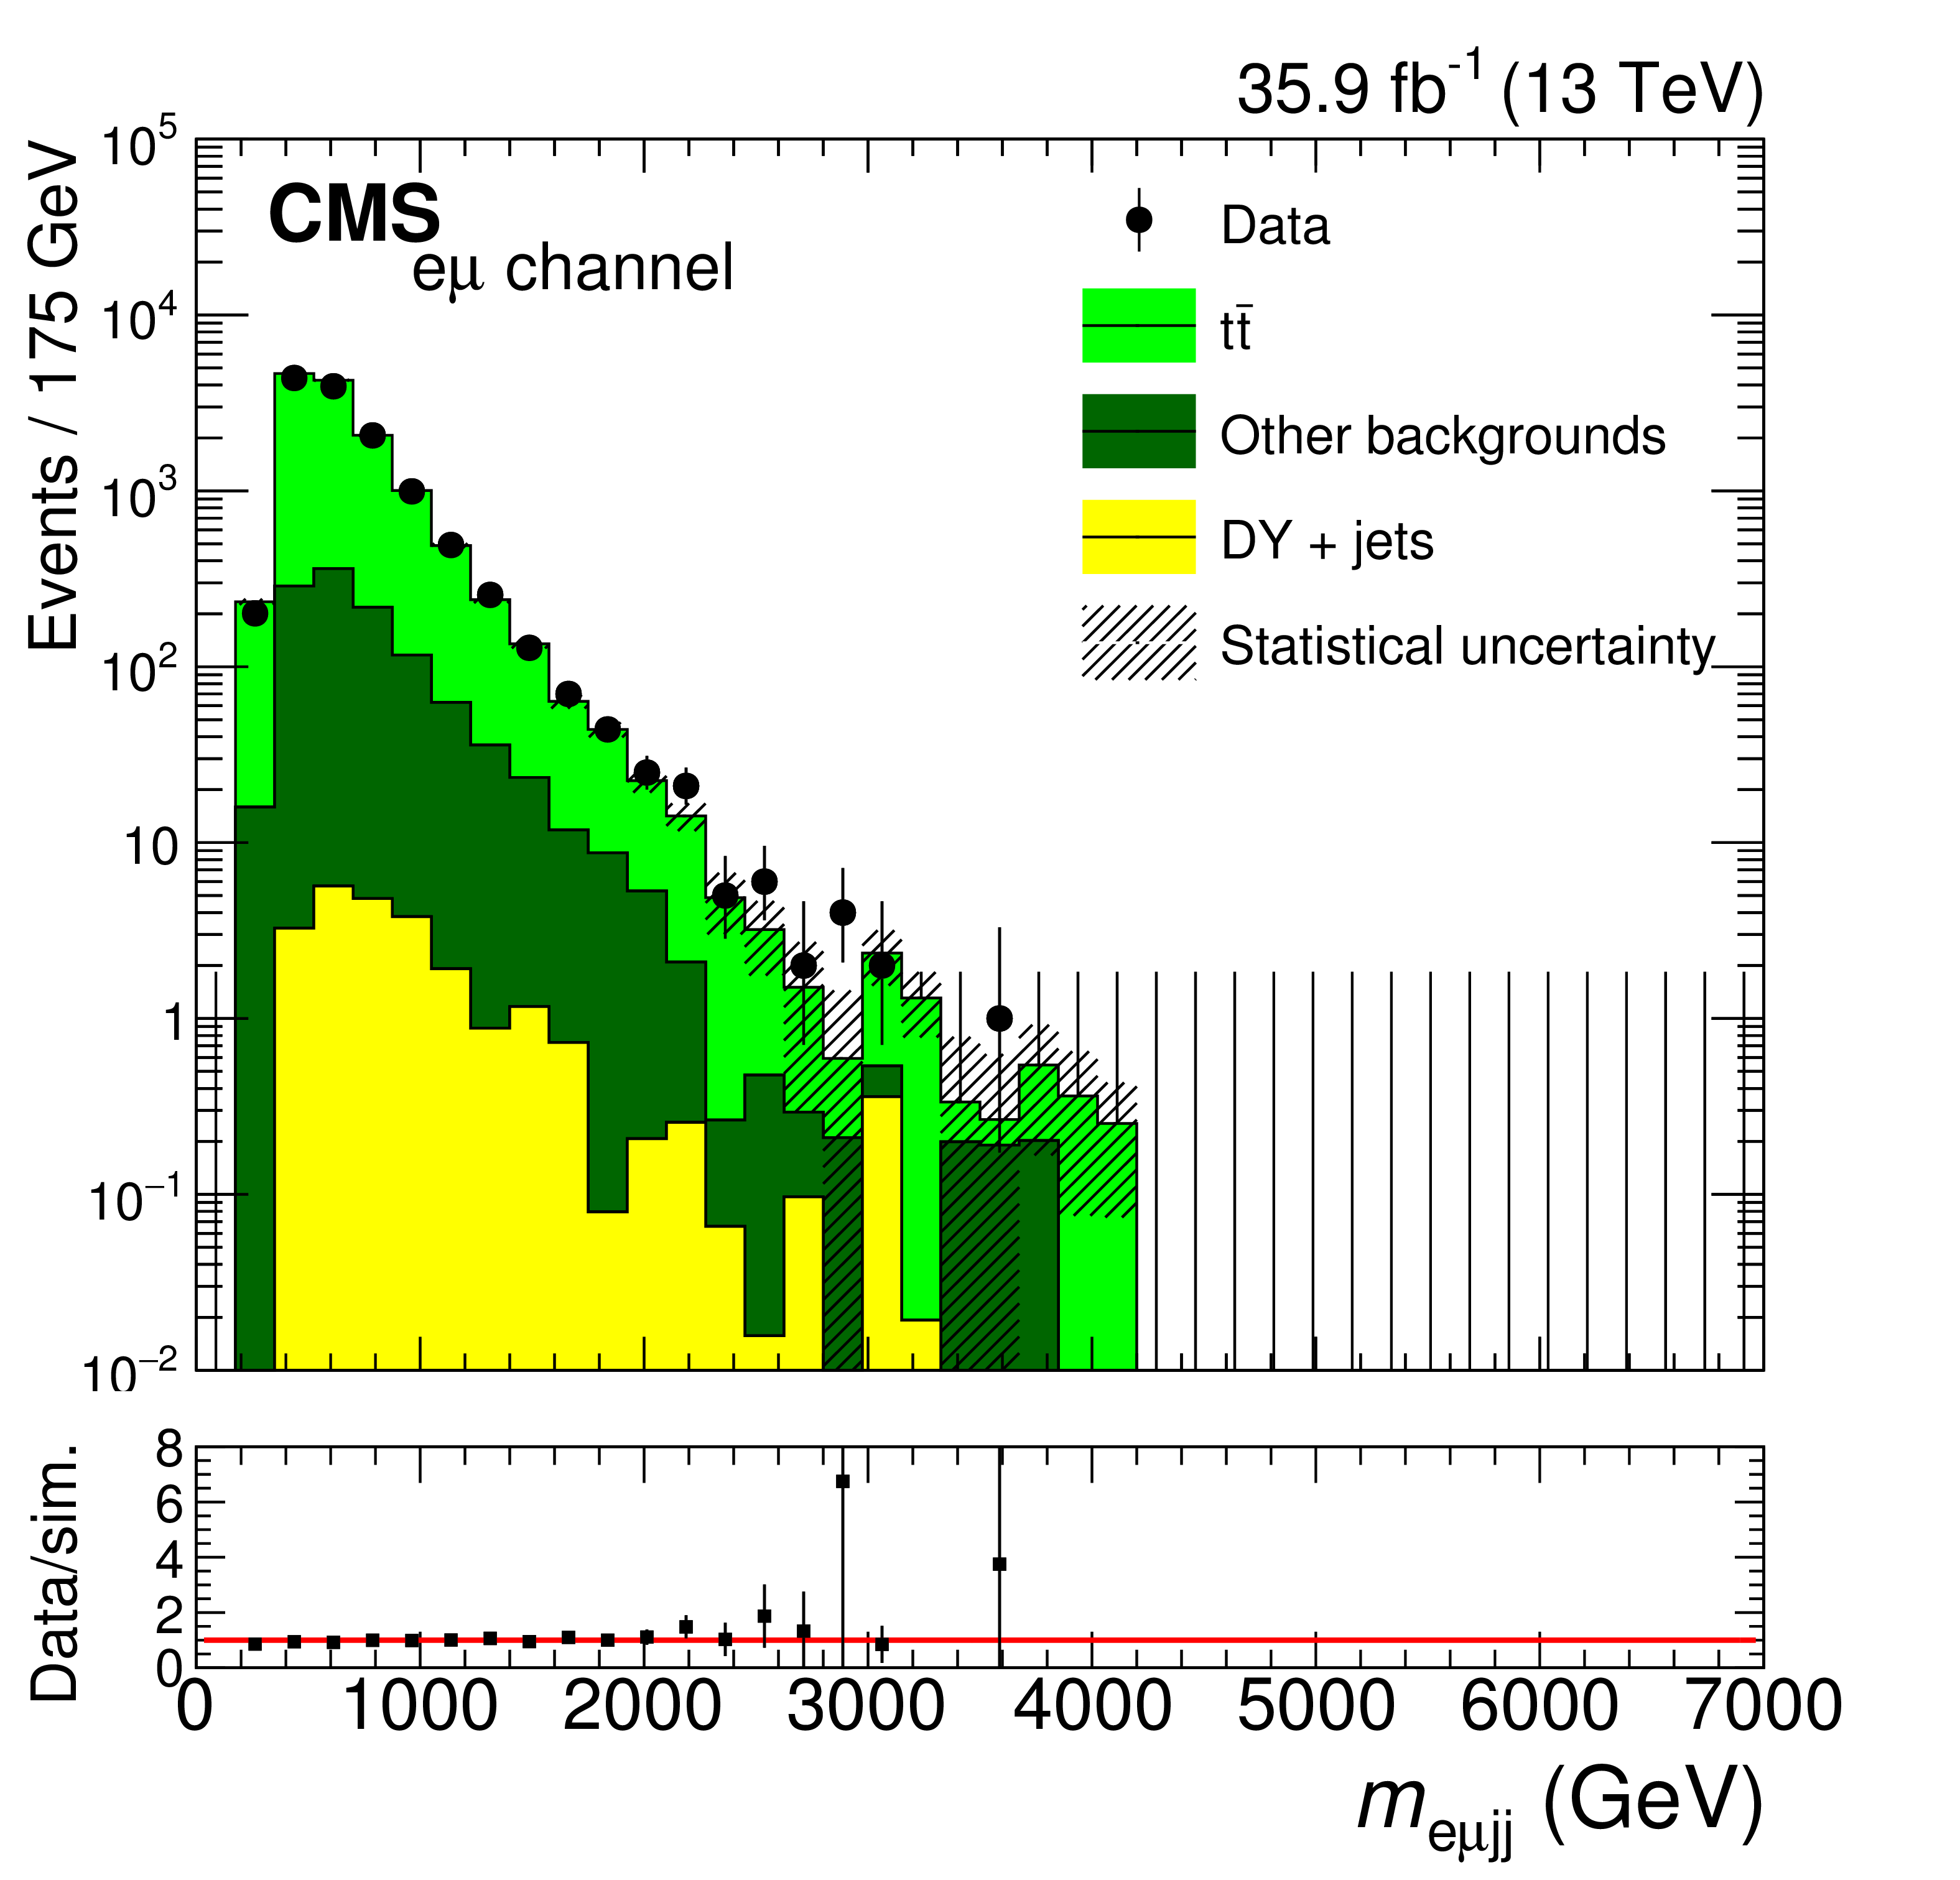
Figure 3:
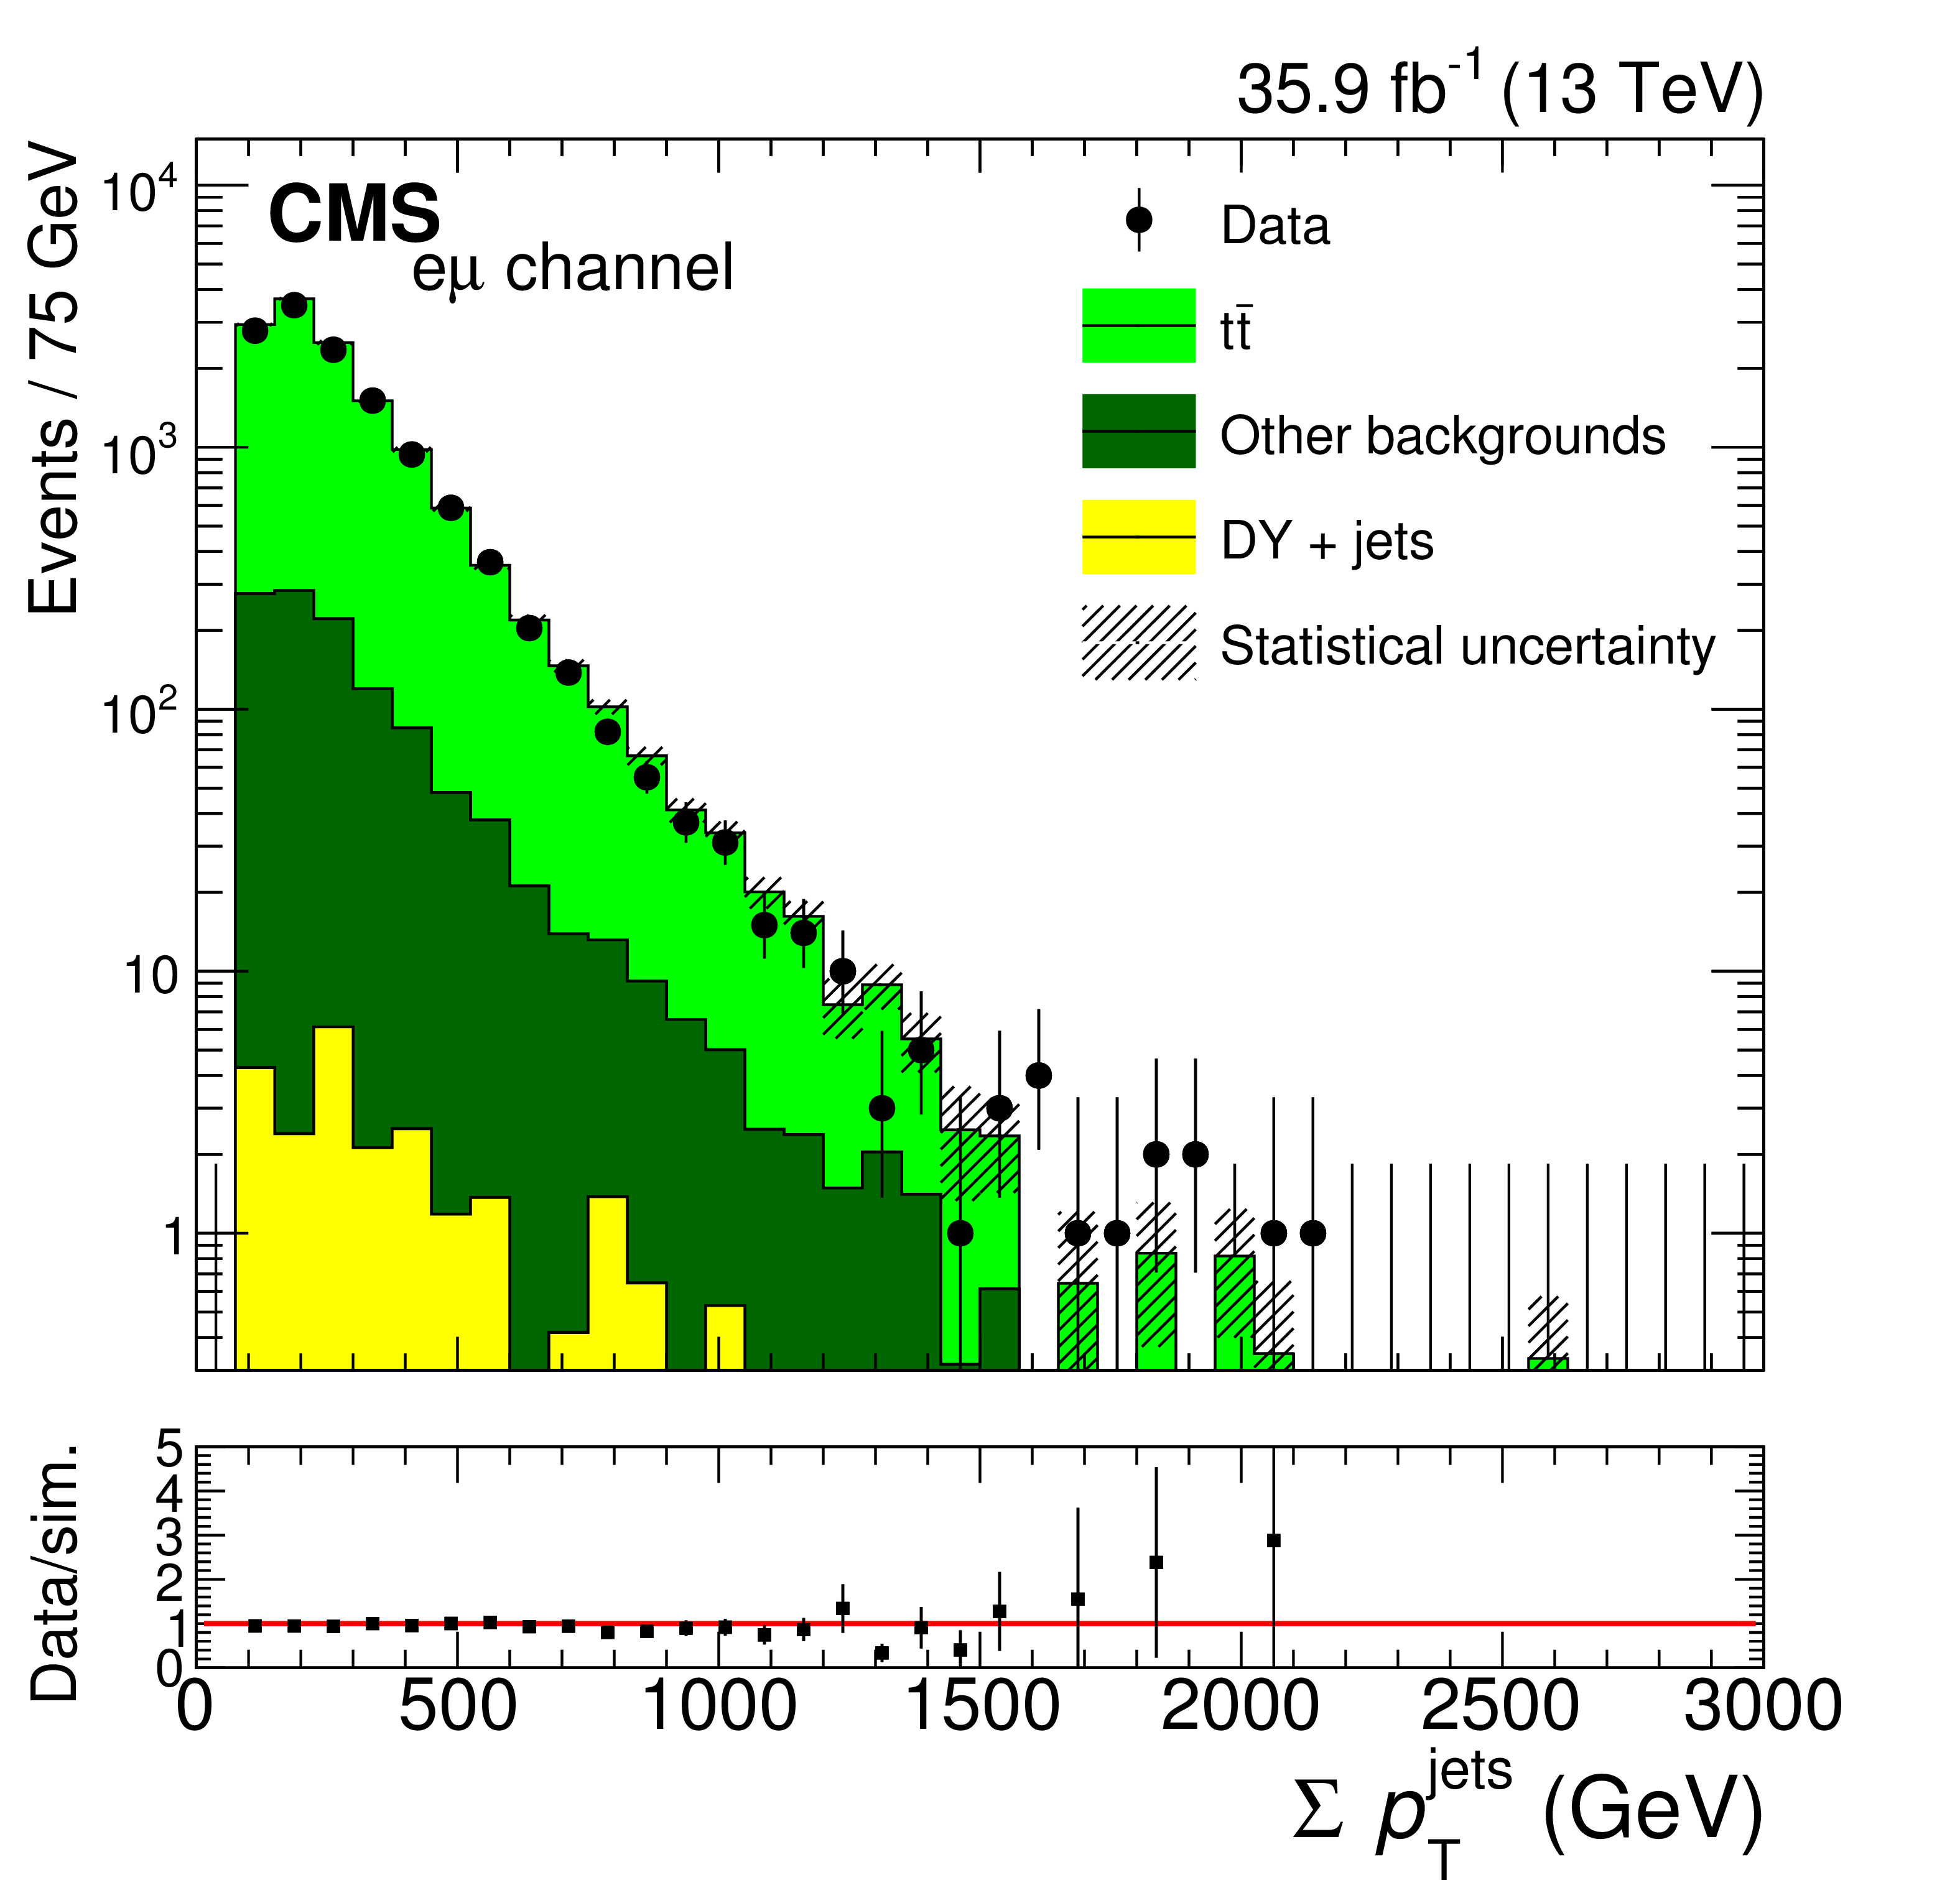
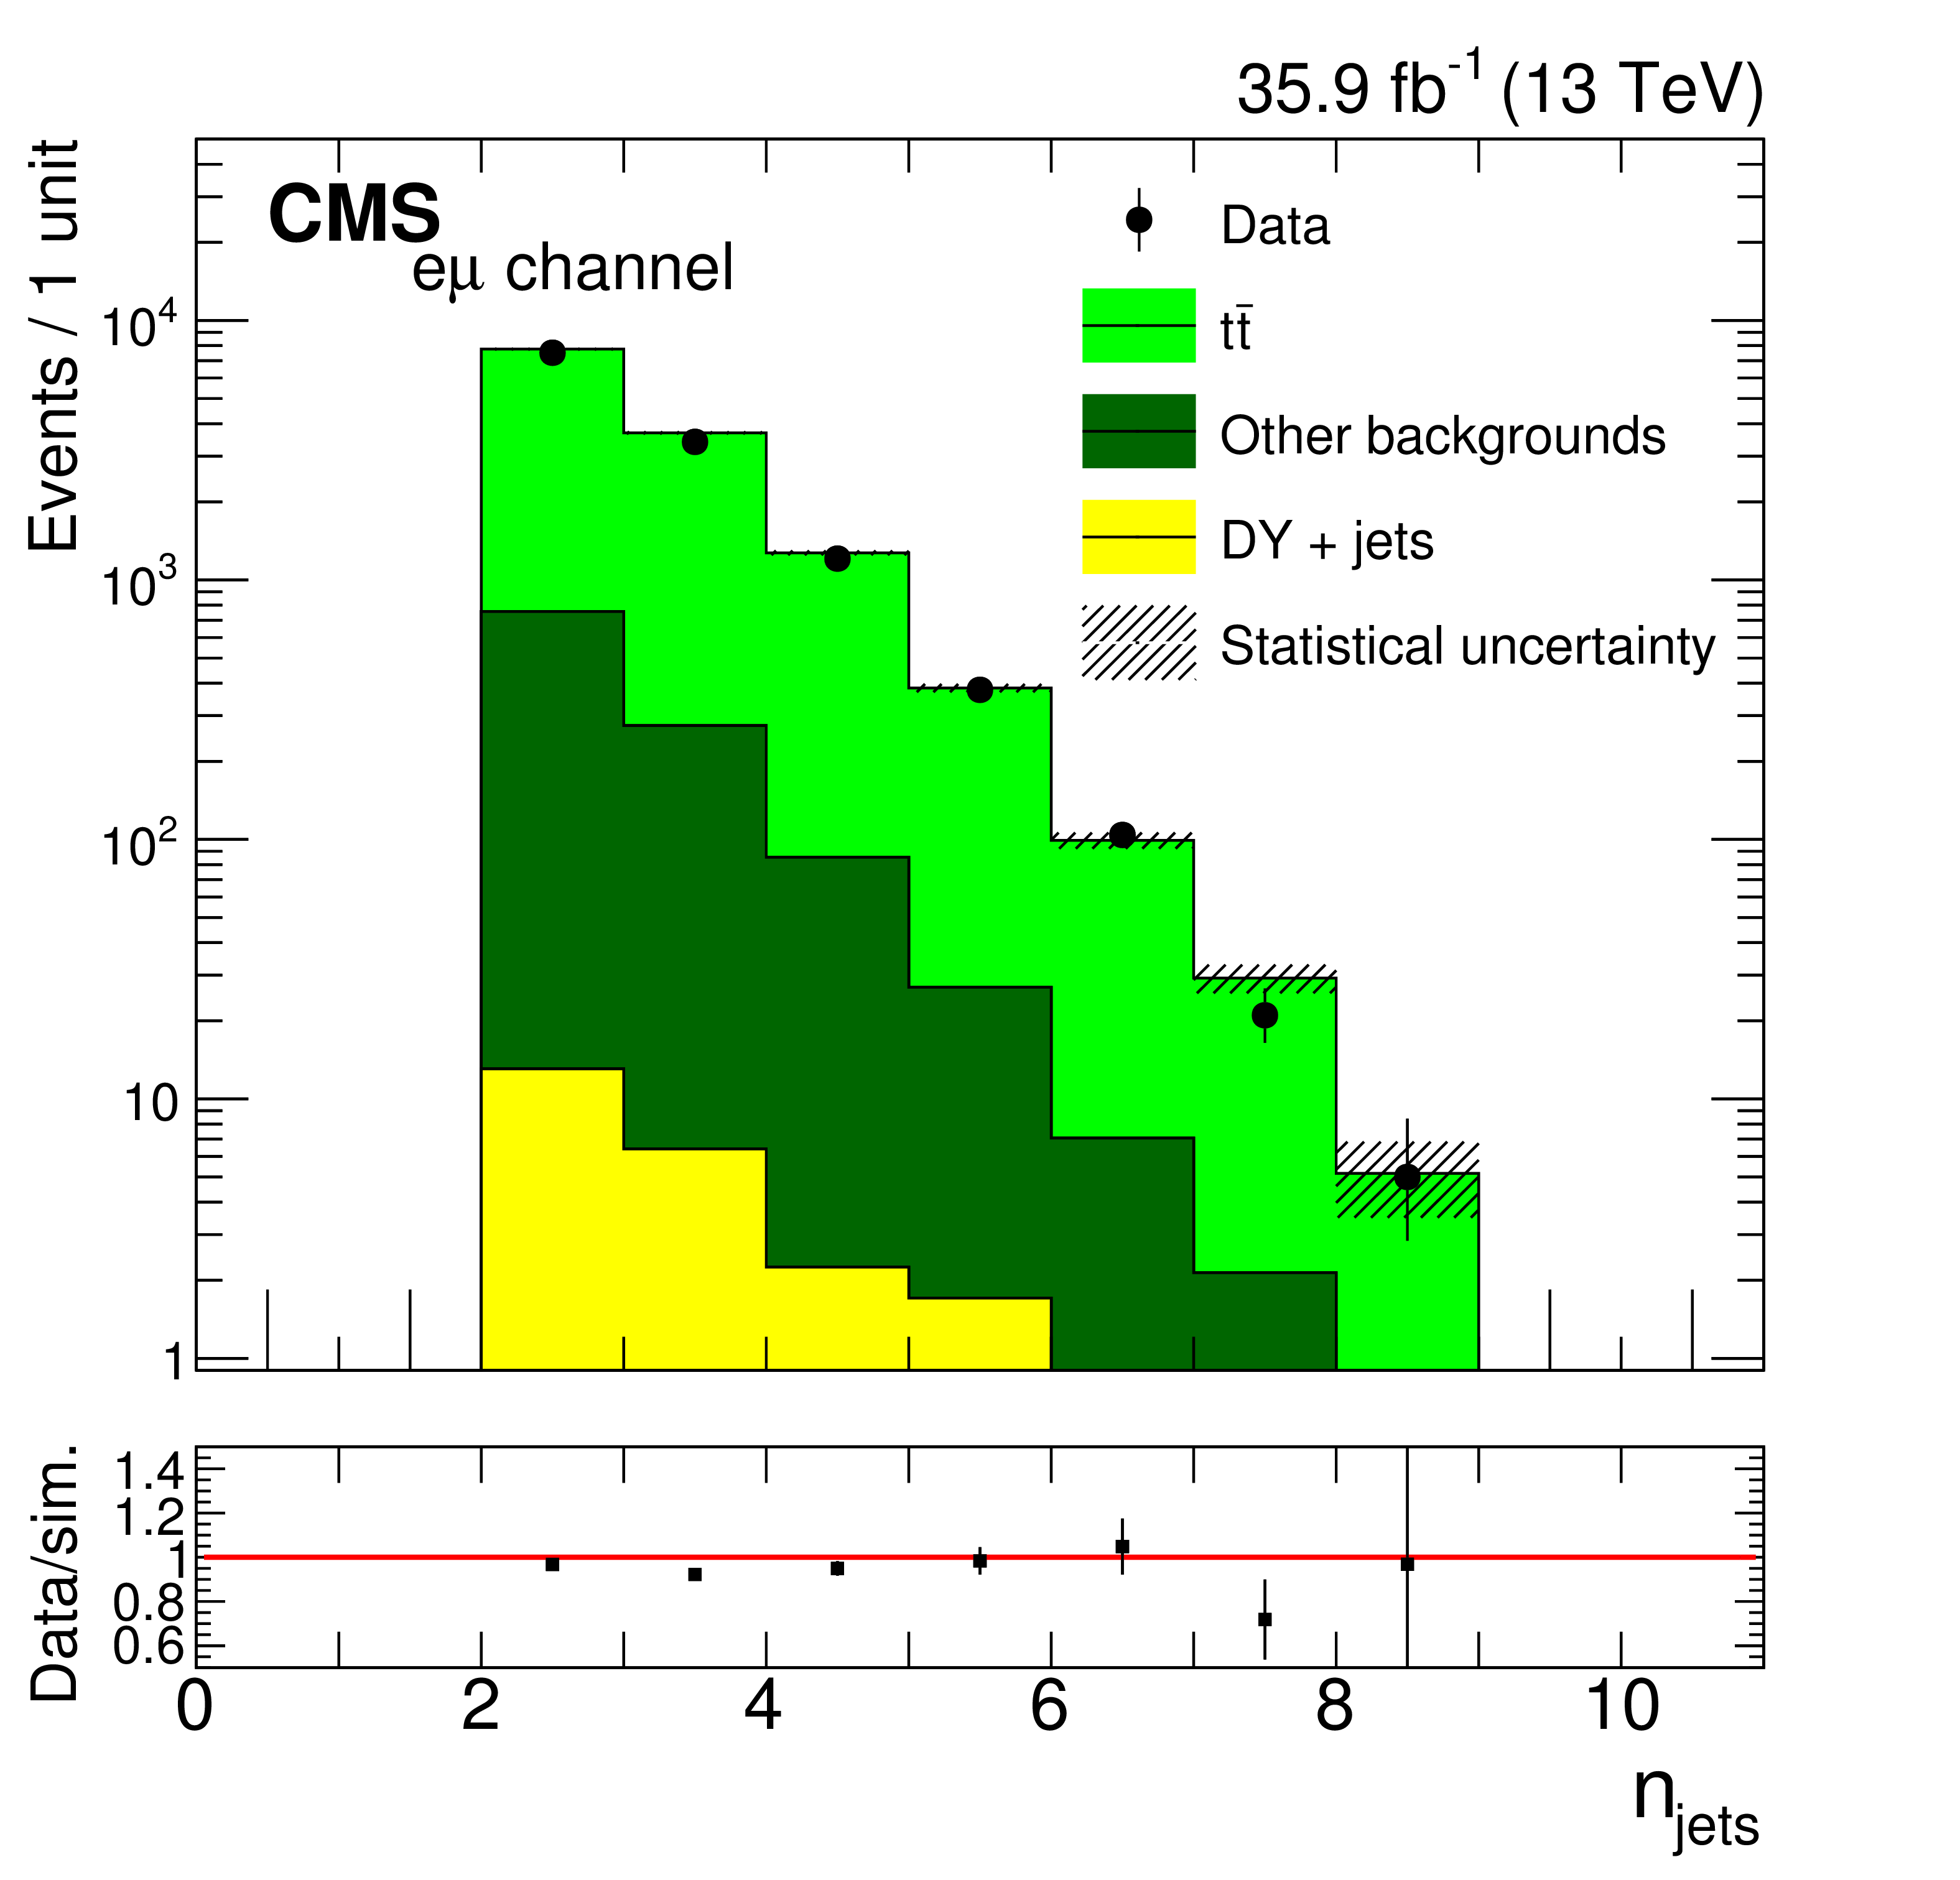
Kinematic distributions for events in the flavor control region with the DY SF applied. The dilepton mass (upper left), the $ {m_{\ell \ell \text {jj}}} $ (upper right), the scalar sum of all jet transverse momenta (lower left), and the number of jets (lower right) are shown. The uncertainty bands on the simulated background histograms include only statistical uncertainties. The uncertainty bars in the ratio plots represent combined statistical uncertainties of data and simulation. |
png pdf |
Figure 3-a:
The dilepton mass distribution for events in the flavor control region with the DY SF applied. The uncertainty bands on the simulated background histograms include only statistical uncertainties. The uncertainty bars in the ratio plot represent combined statistical uncertainties of data and simulation. |
png pdf |
Figure 3-b:
The $ {m_{\ell \ell \text {jj}}} $ sdistribution for events in the flavor control region with the DY SF applied. The uncertainty bands on the simulated background histograms include only statistical uncertainties. The uncertainty bars in the ratio plot represent combined statistical uncertainties of data and simulation. |
png pdf |
Figure 3-c:
The scalar sum of all jet transverse momenta distribution for events in the flavor control region with the DY SF applied. The uncertainty bands on the simulated background histograms include only statistical uncertainties. The uncertainty bars in the ratio plot represent combined statistical uncertainties of data and simulation. |
png pdf |
Figure 3-d:
The number of jets distribution for events in the flavor control region with the DY SF applied. The uncertainty bands on the simulated background histograms include only statistical uncertainties. The uncertainty bars in the ratio plot represent combined statistical uncertainties of data and simulation. |
png pdf |
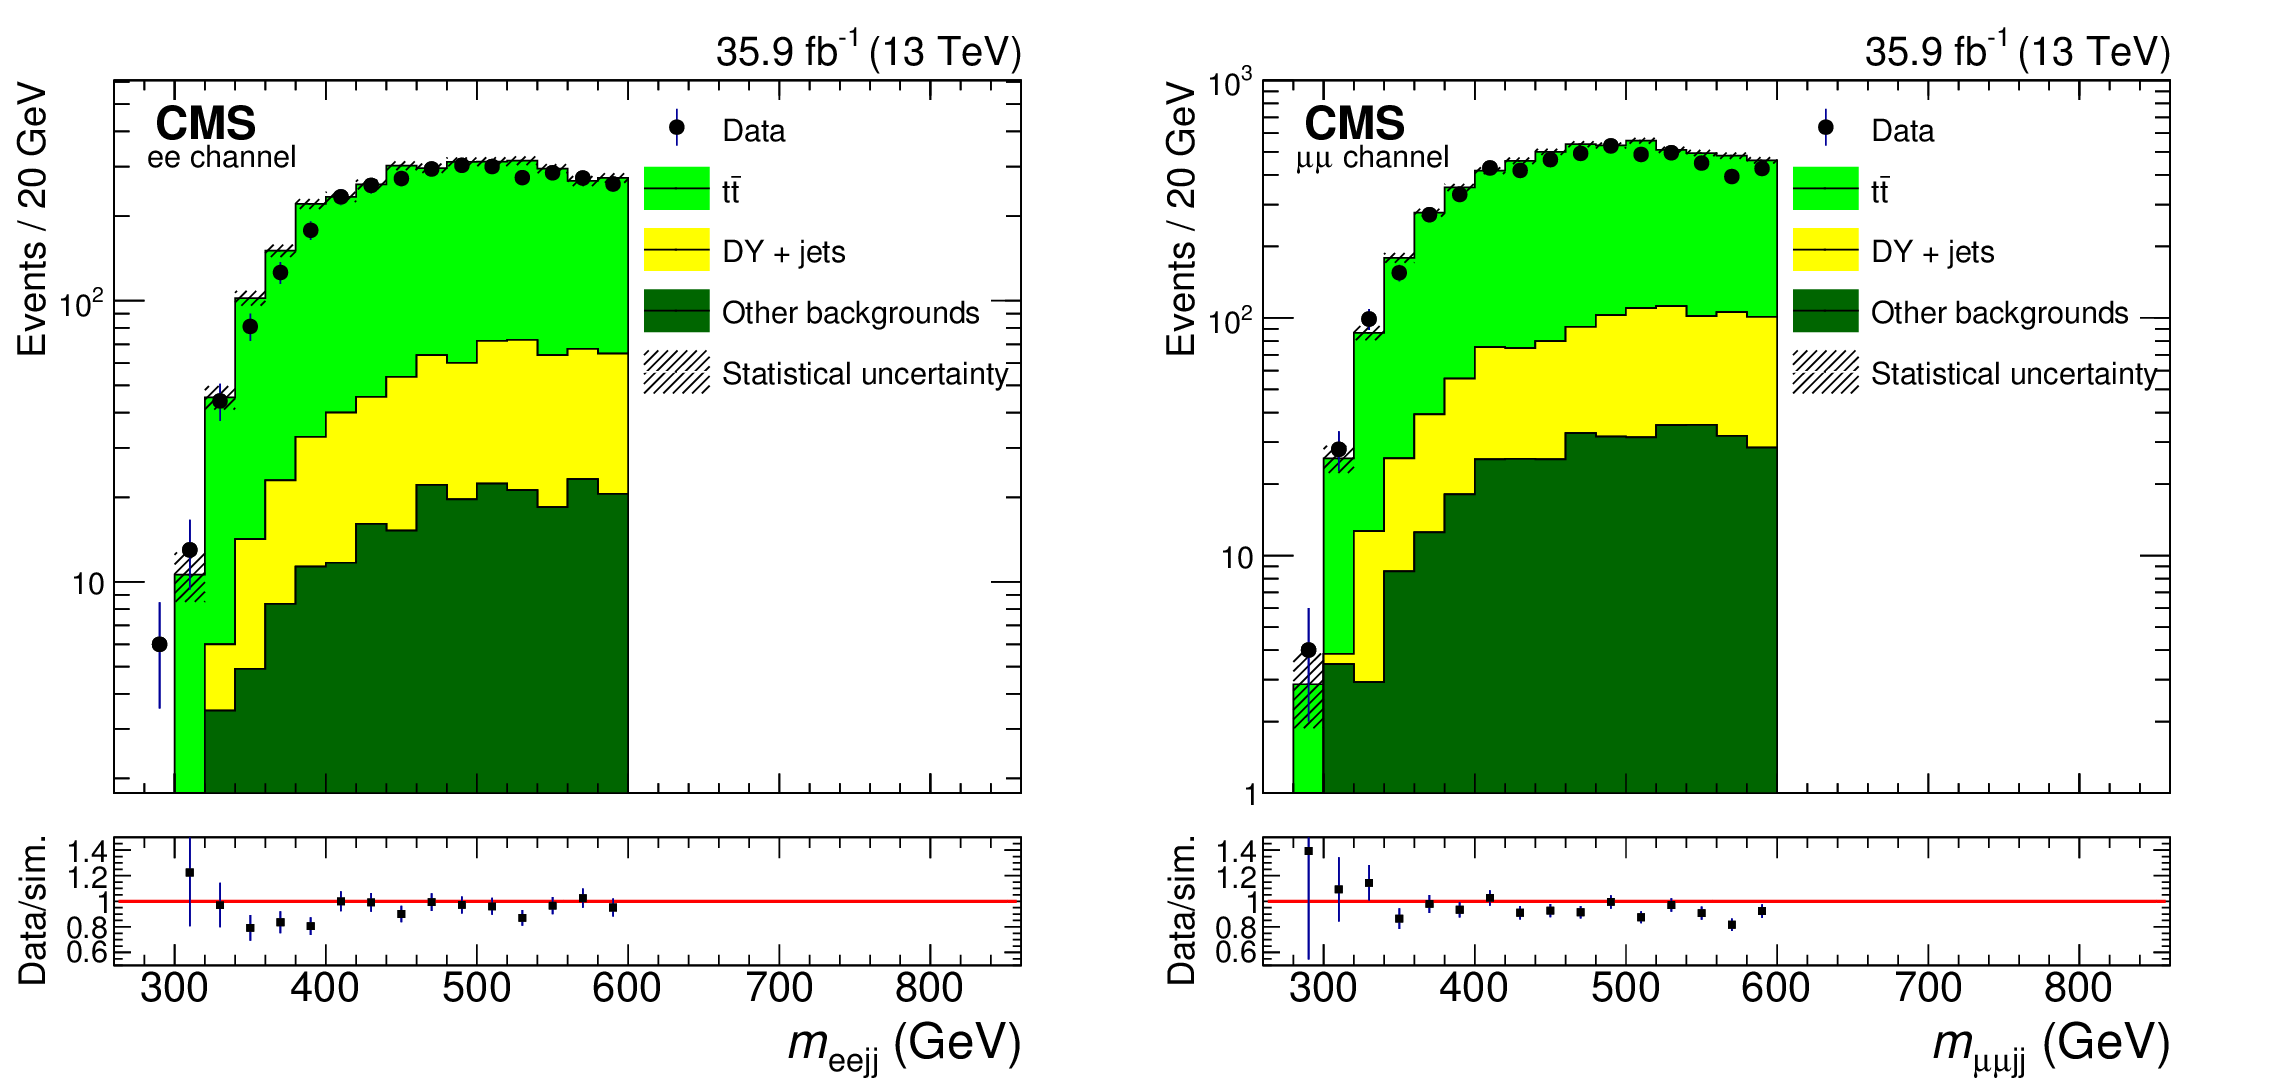
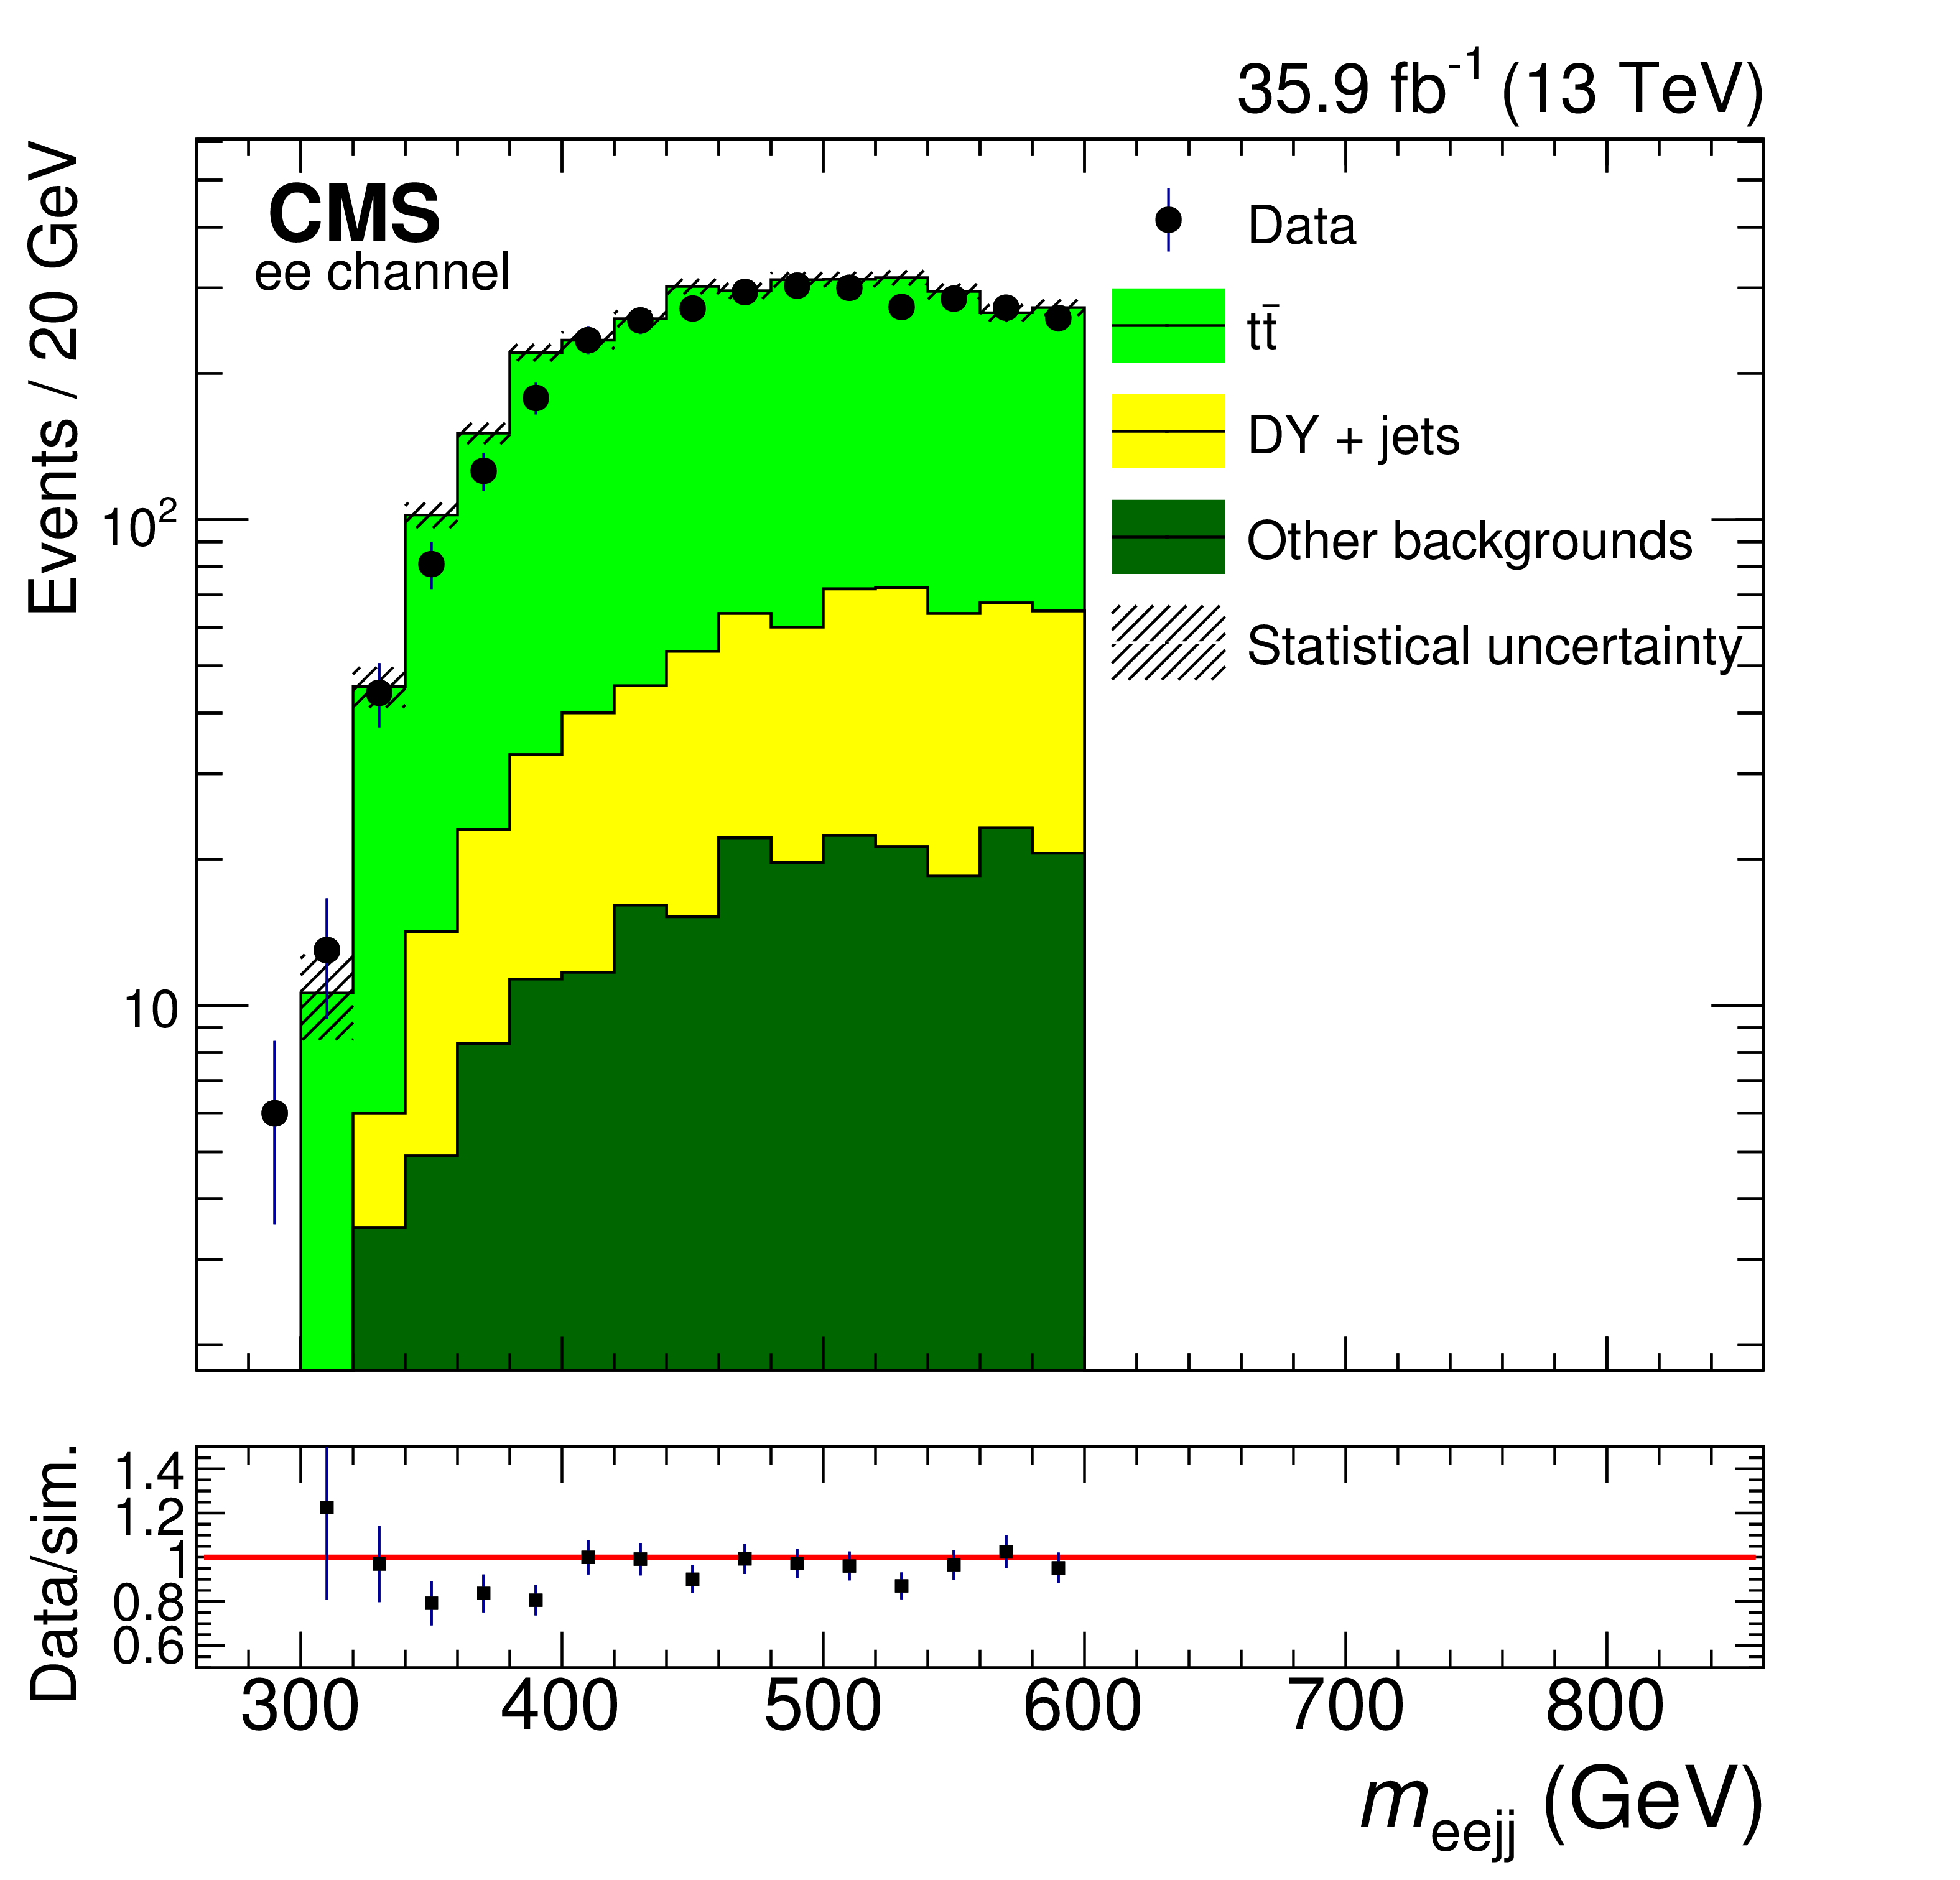
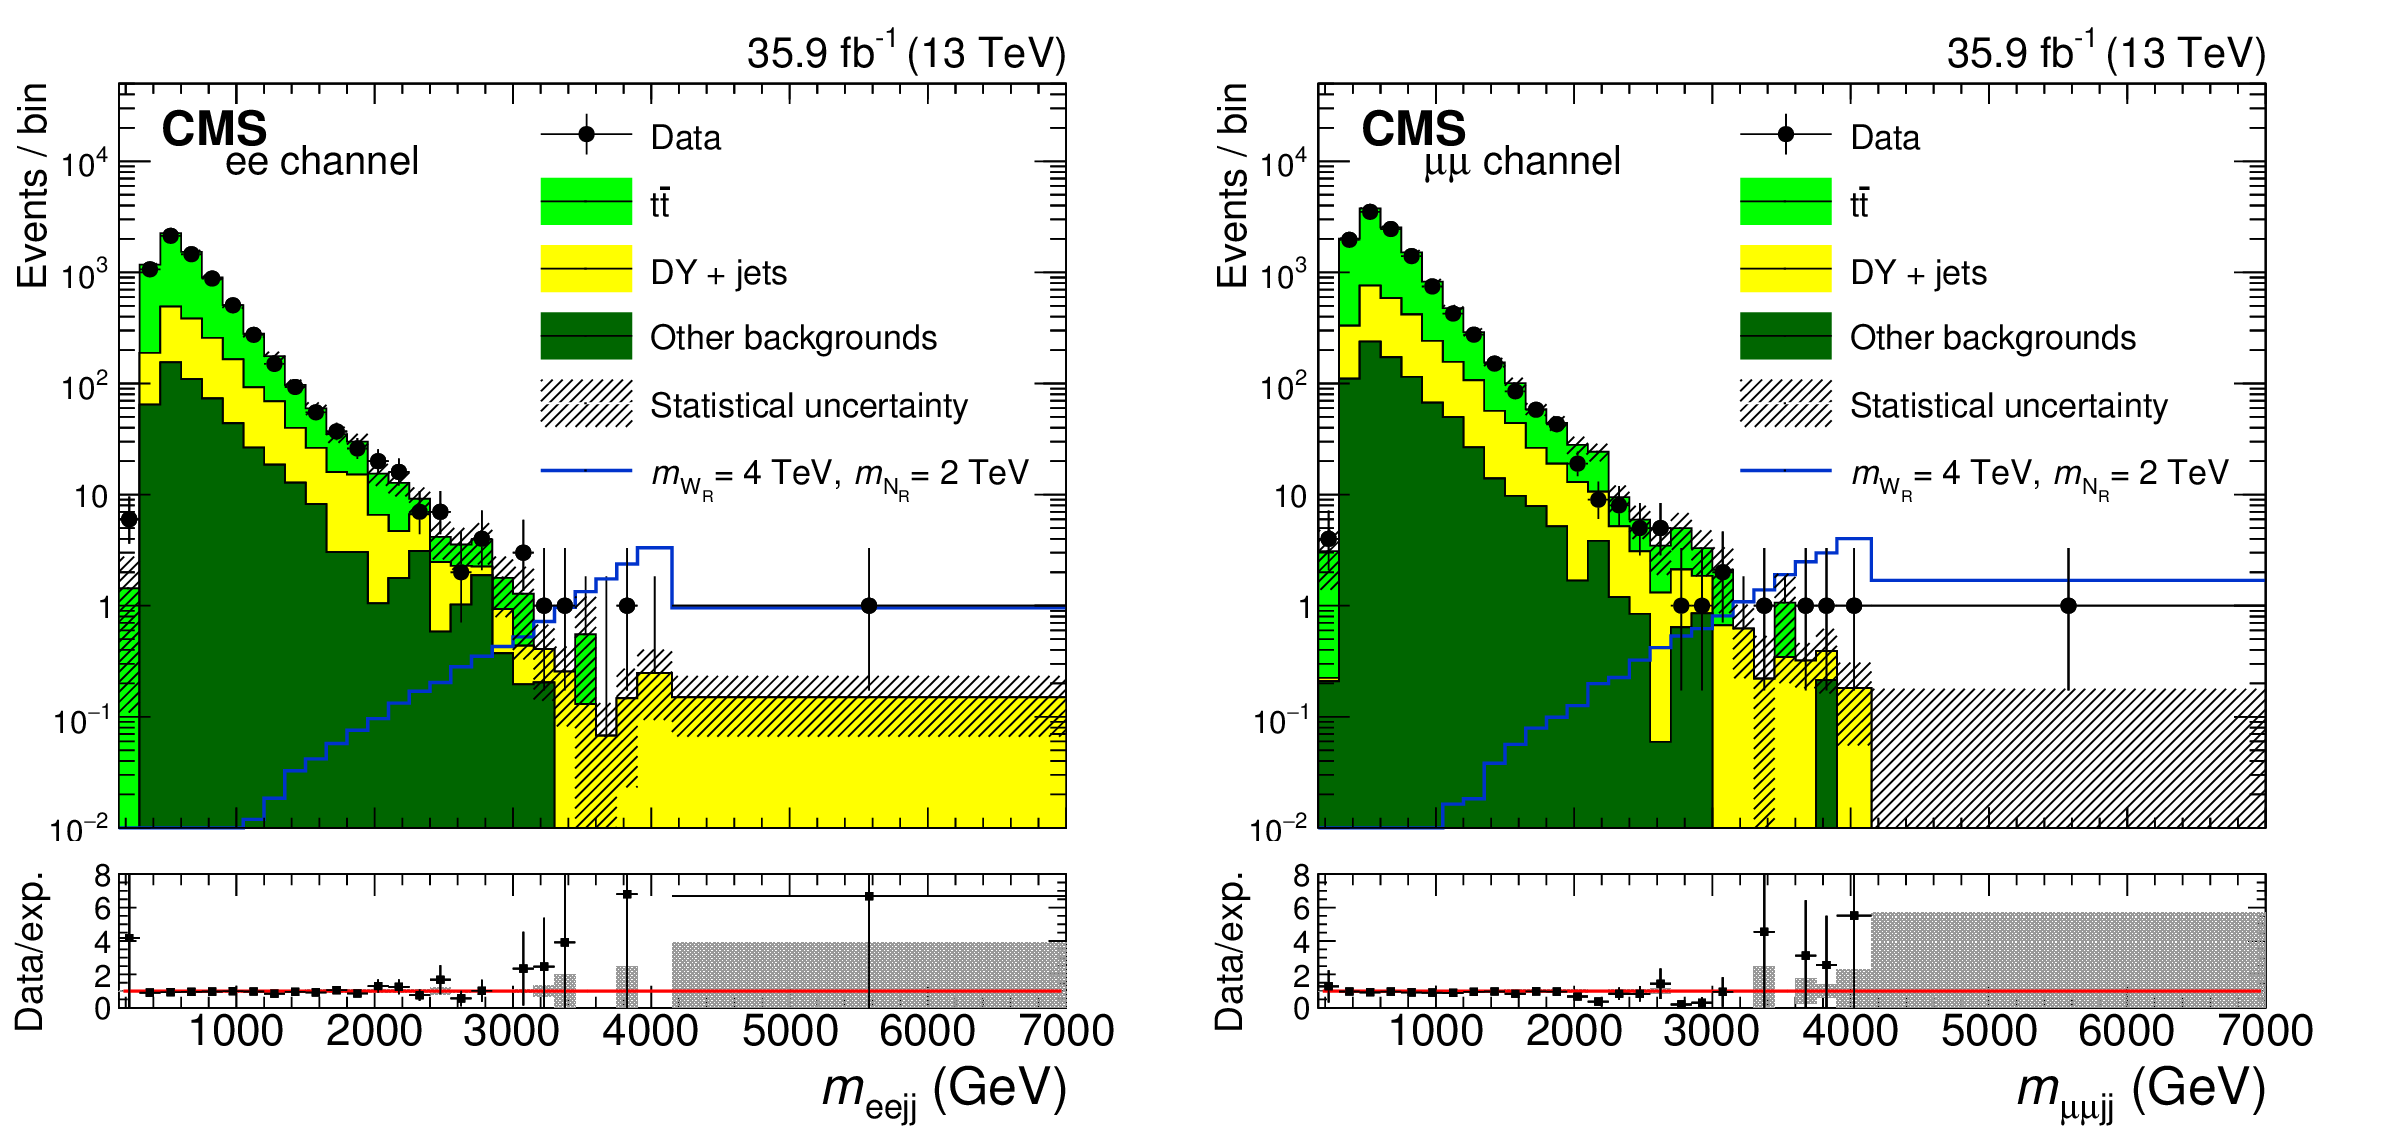
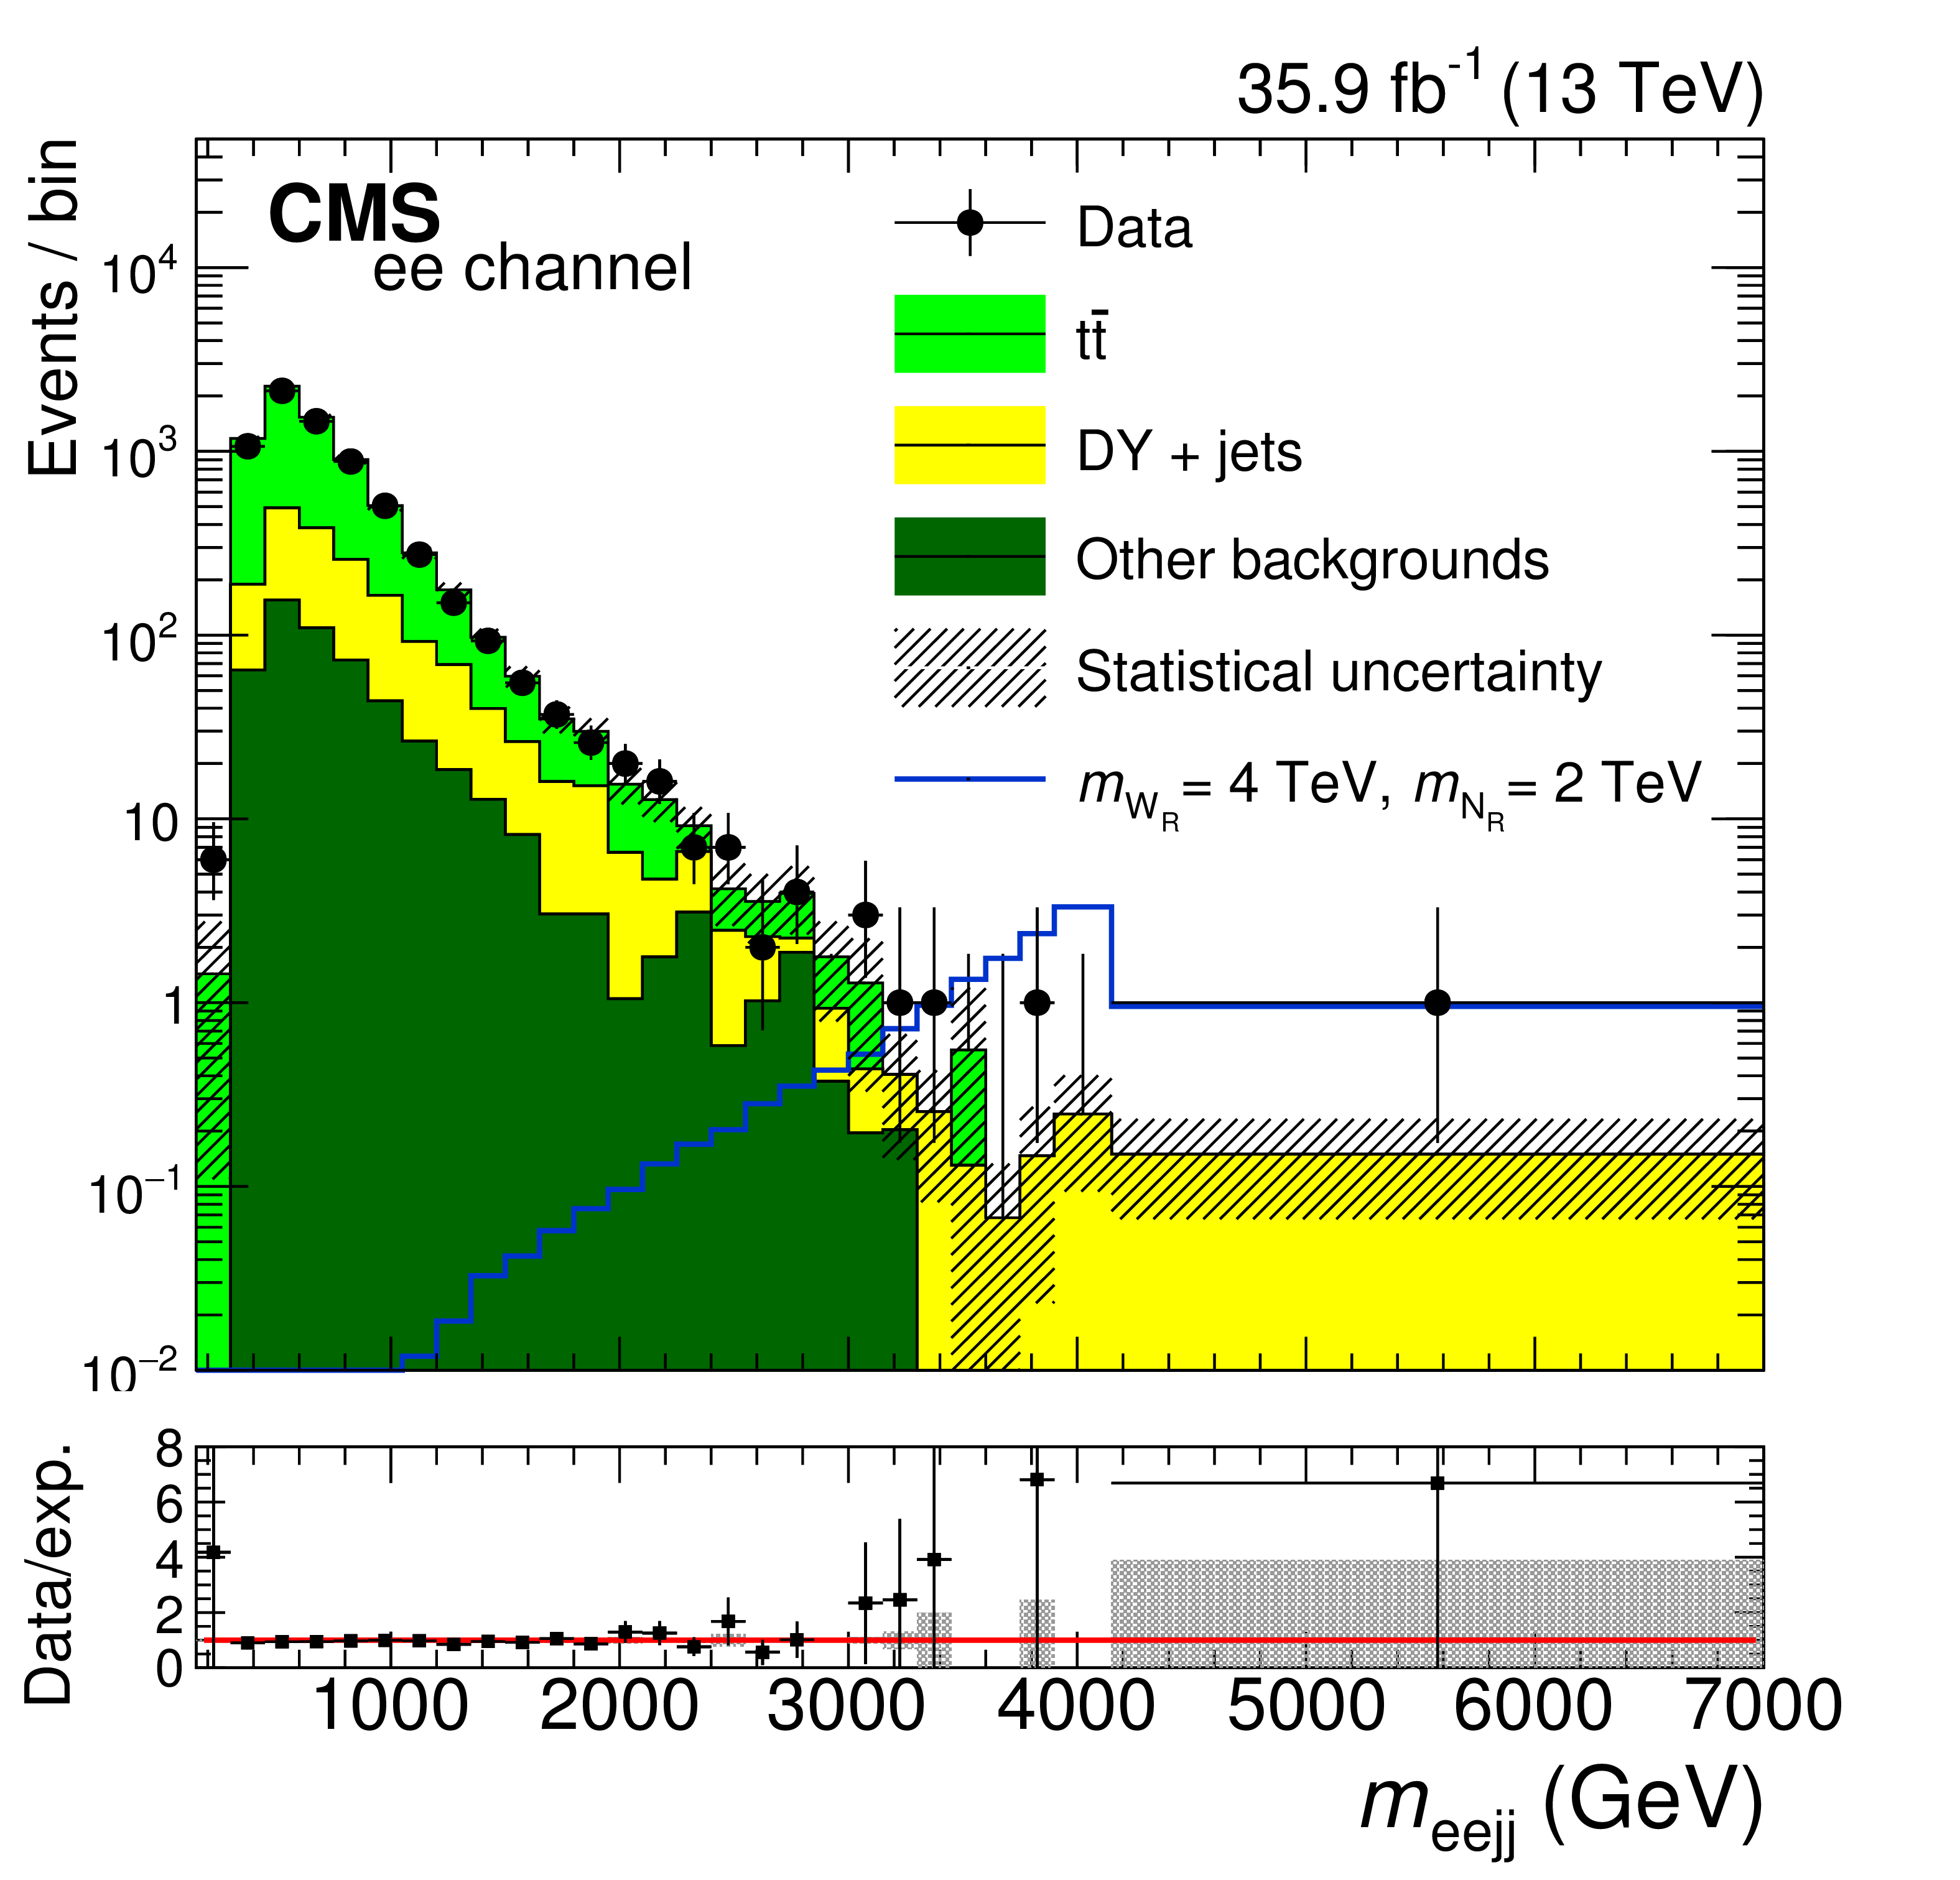
Figure 4:
The $ {m_{\ell \ell \text {jj}}} $ distribution in the signal region for the electron (left) and muon (right) channel. The uncertainty bands on the simulated background histograms include only statistical uncertainties. The uncertainty bars in the ratio plots represent combined statistical uncertainties of data and simulation. The gray error band around unity represents the systematic uncertainty on the simulation. |
png pdf |
Figure 4-a:
The $ {m_{\ell \ell \text {jj}}} $ distribution in the signal region for the electron channel. The uncertainty bands on the simulated background histograms include only statistical uncertainties. The uncertainty bars in the ratio plot represent combined statistical uncertainties of data and simulation. The gray error band around unity represents the systematic uncertainty on the simulation. |

png pdf |
Figure 4-b:
The $ {m_{\ell \ell \text {jj}}} $ distribution in the signal region for the muon channel. The uncertainty bands on the simulated background histograms include only statistical uncertainties. The uncertainty bars in the ratio plot represent combined statistical uncertainties of data and simulation. The gray error band around unity represents the systematic uncertainty on the simulation. |

png pdf |
Figure 5:
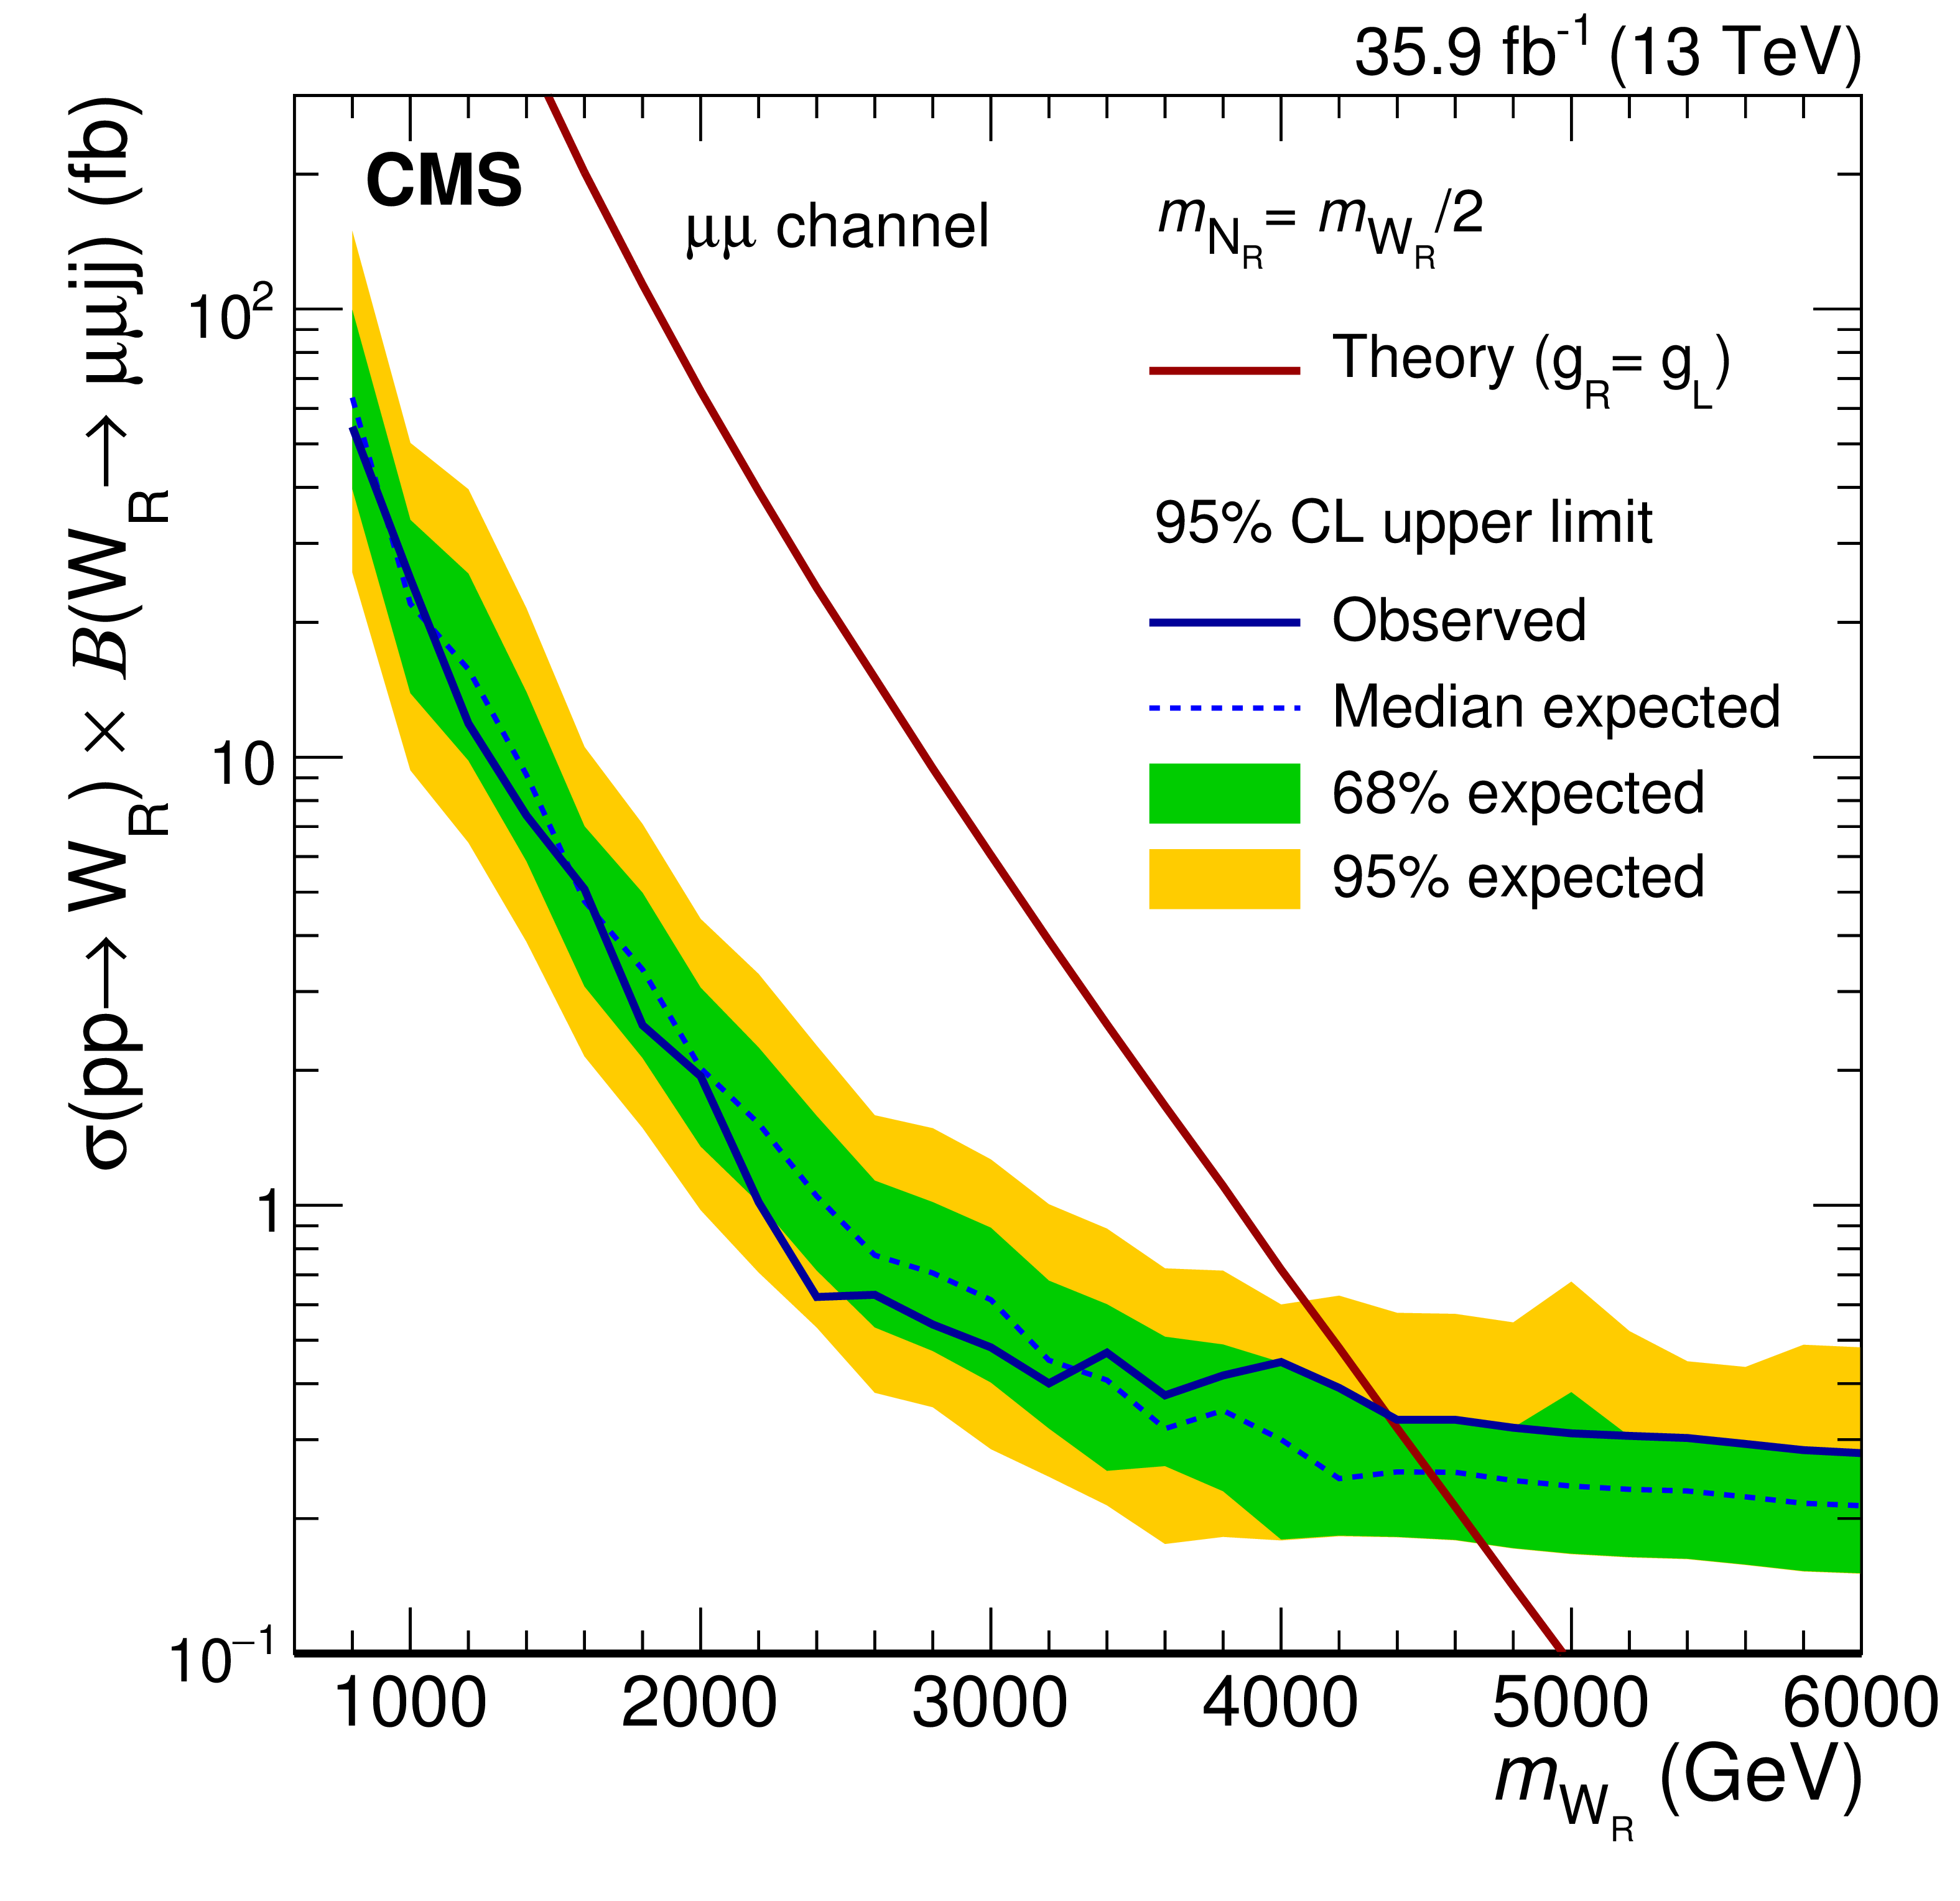
Expected and observed 95% CL upper limits on the product of $\sigma ({\mathrm {p}} {\mathrm {p}}\to {\mathrm {W_R}})$ and branching fraction $B({\mathrm {W_R}} \to \ell \ell \text {jj})$ for the electron channel on the left and for the muon channel on the right. The inner (green) band and the outer (yellow) band indicate the expected 68% and 95% CL exclusion regions. |

png pdf |
Figure 5-a:
Expected and observed 95% CL upper limits on the product of $\sigma ({\mathrm {p}} {\mathrm {p}}\to {\mathrm {W_R}})$ and branching fraction $B({\mathrm {W_R}} \to \ell \ell \text {jj})$ for the electron channel. The inner (green) band and the outer (yellow) band indicate the expected 68% and 95% CL exclusion regions. |
png pdf |
Figure 5-b:
Expected and observed 95% CL upper limits on the product of $\sigma ({\mathrm {p}} {\mathrm {p}}\to {\mathrm {W_R}})$ and branching fraction $B({\mathrm {W_R}} \to \ell \ell \text {jj})$ for the muon channel. The inner (green) band and the outer (yellow) band indicate the expected 68% and 95% CL exclusion regions. |
png pdf |
Figure 6:
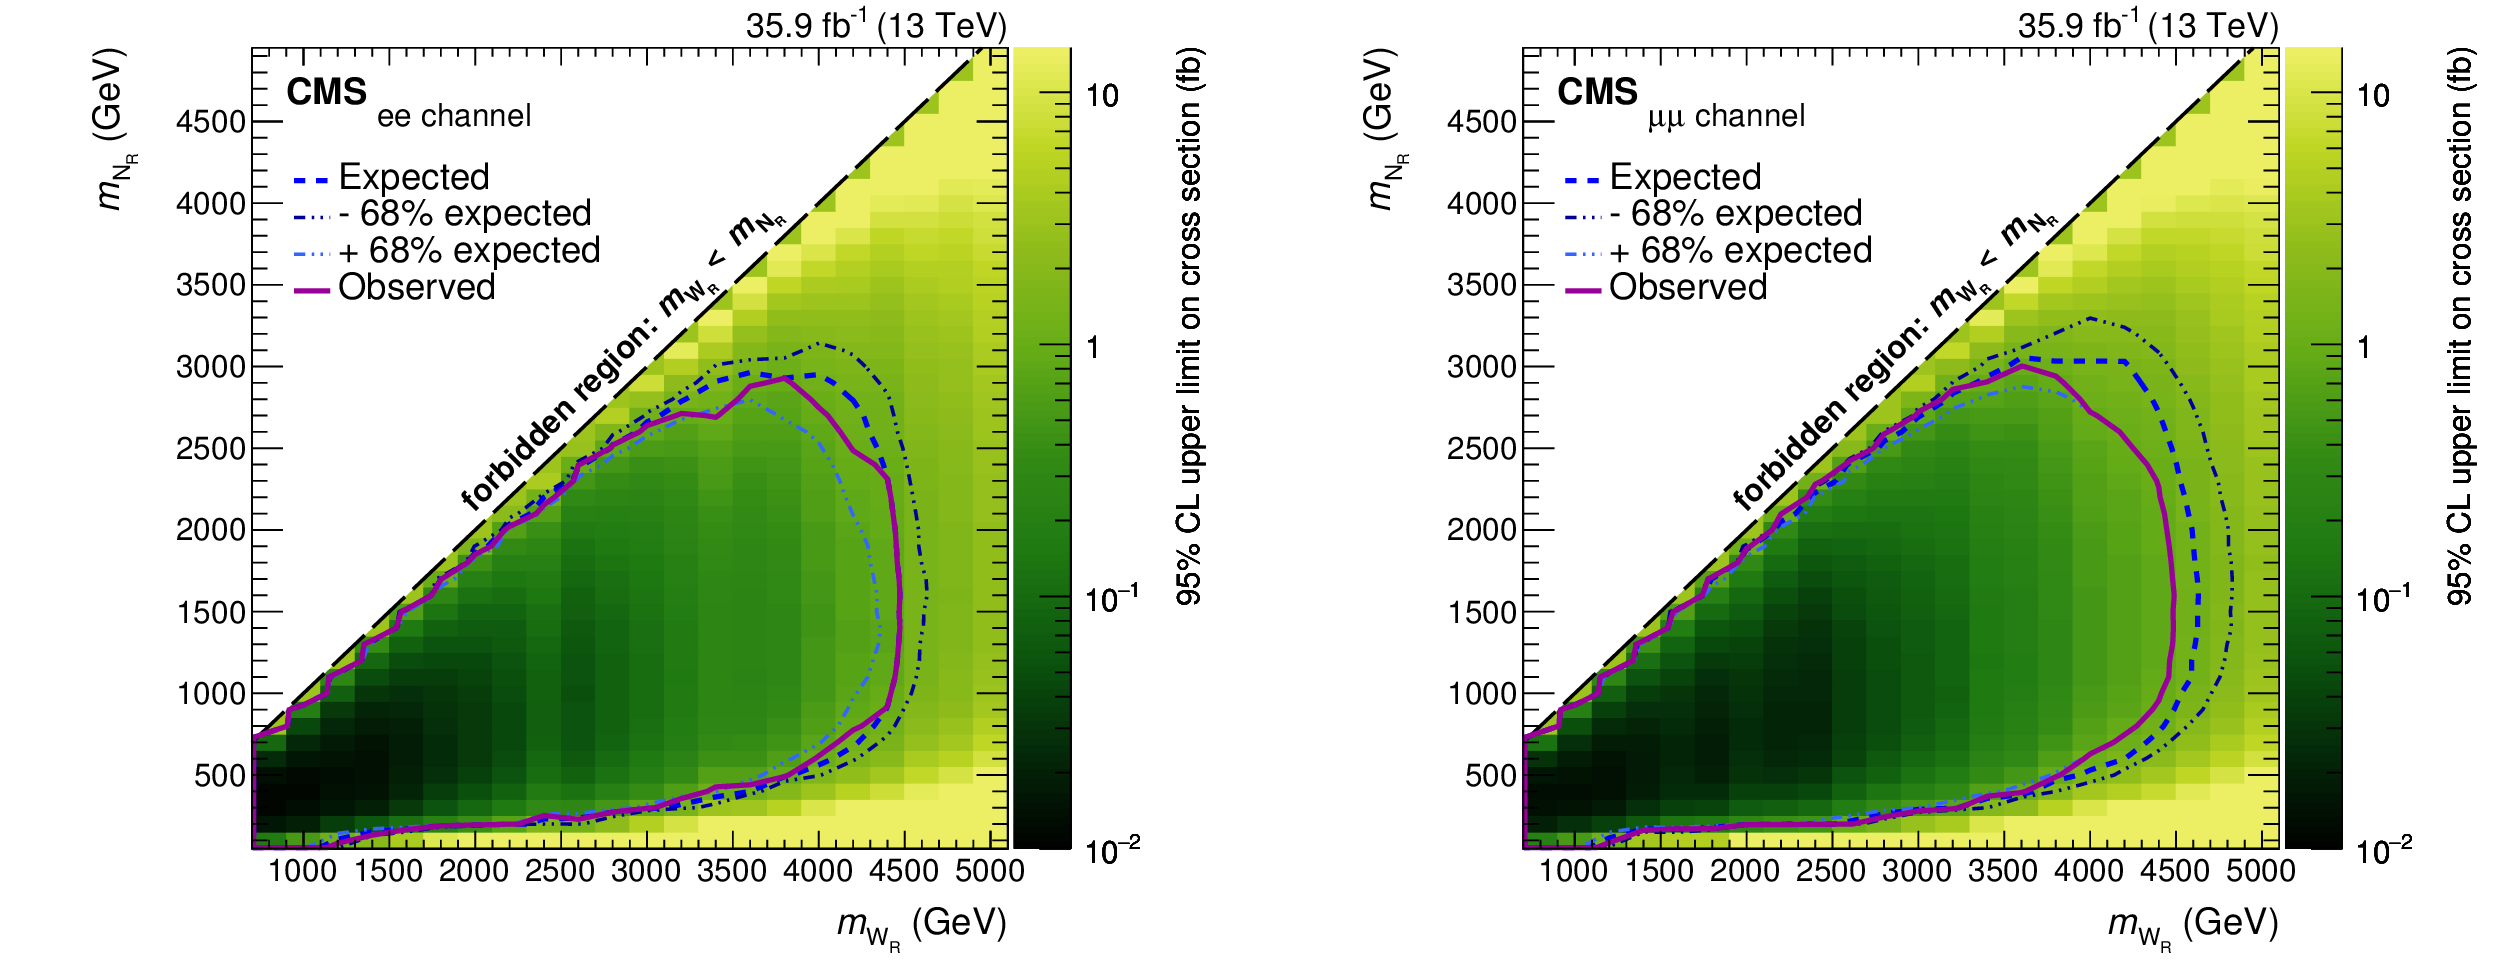
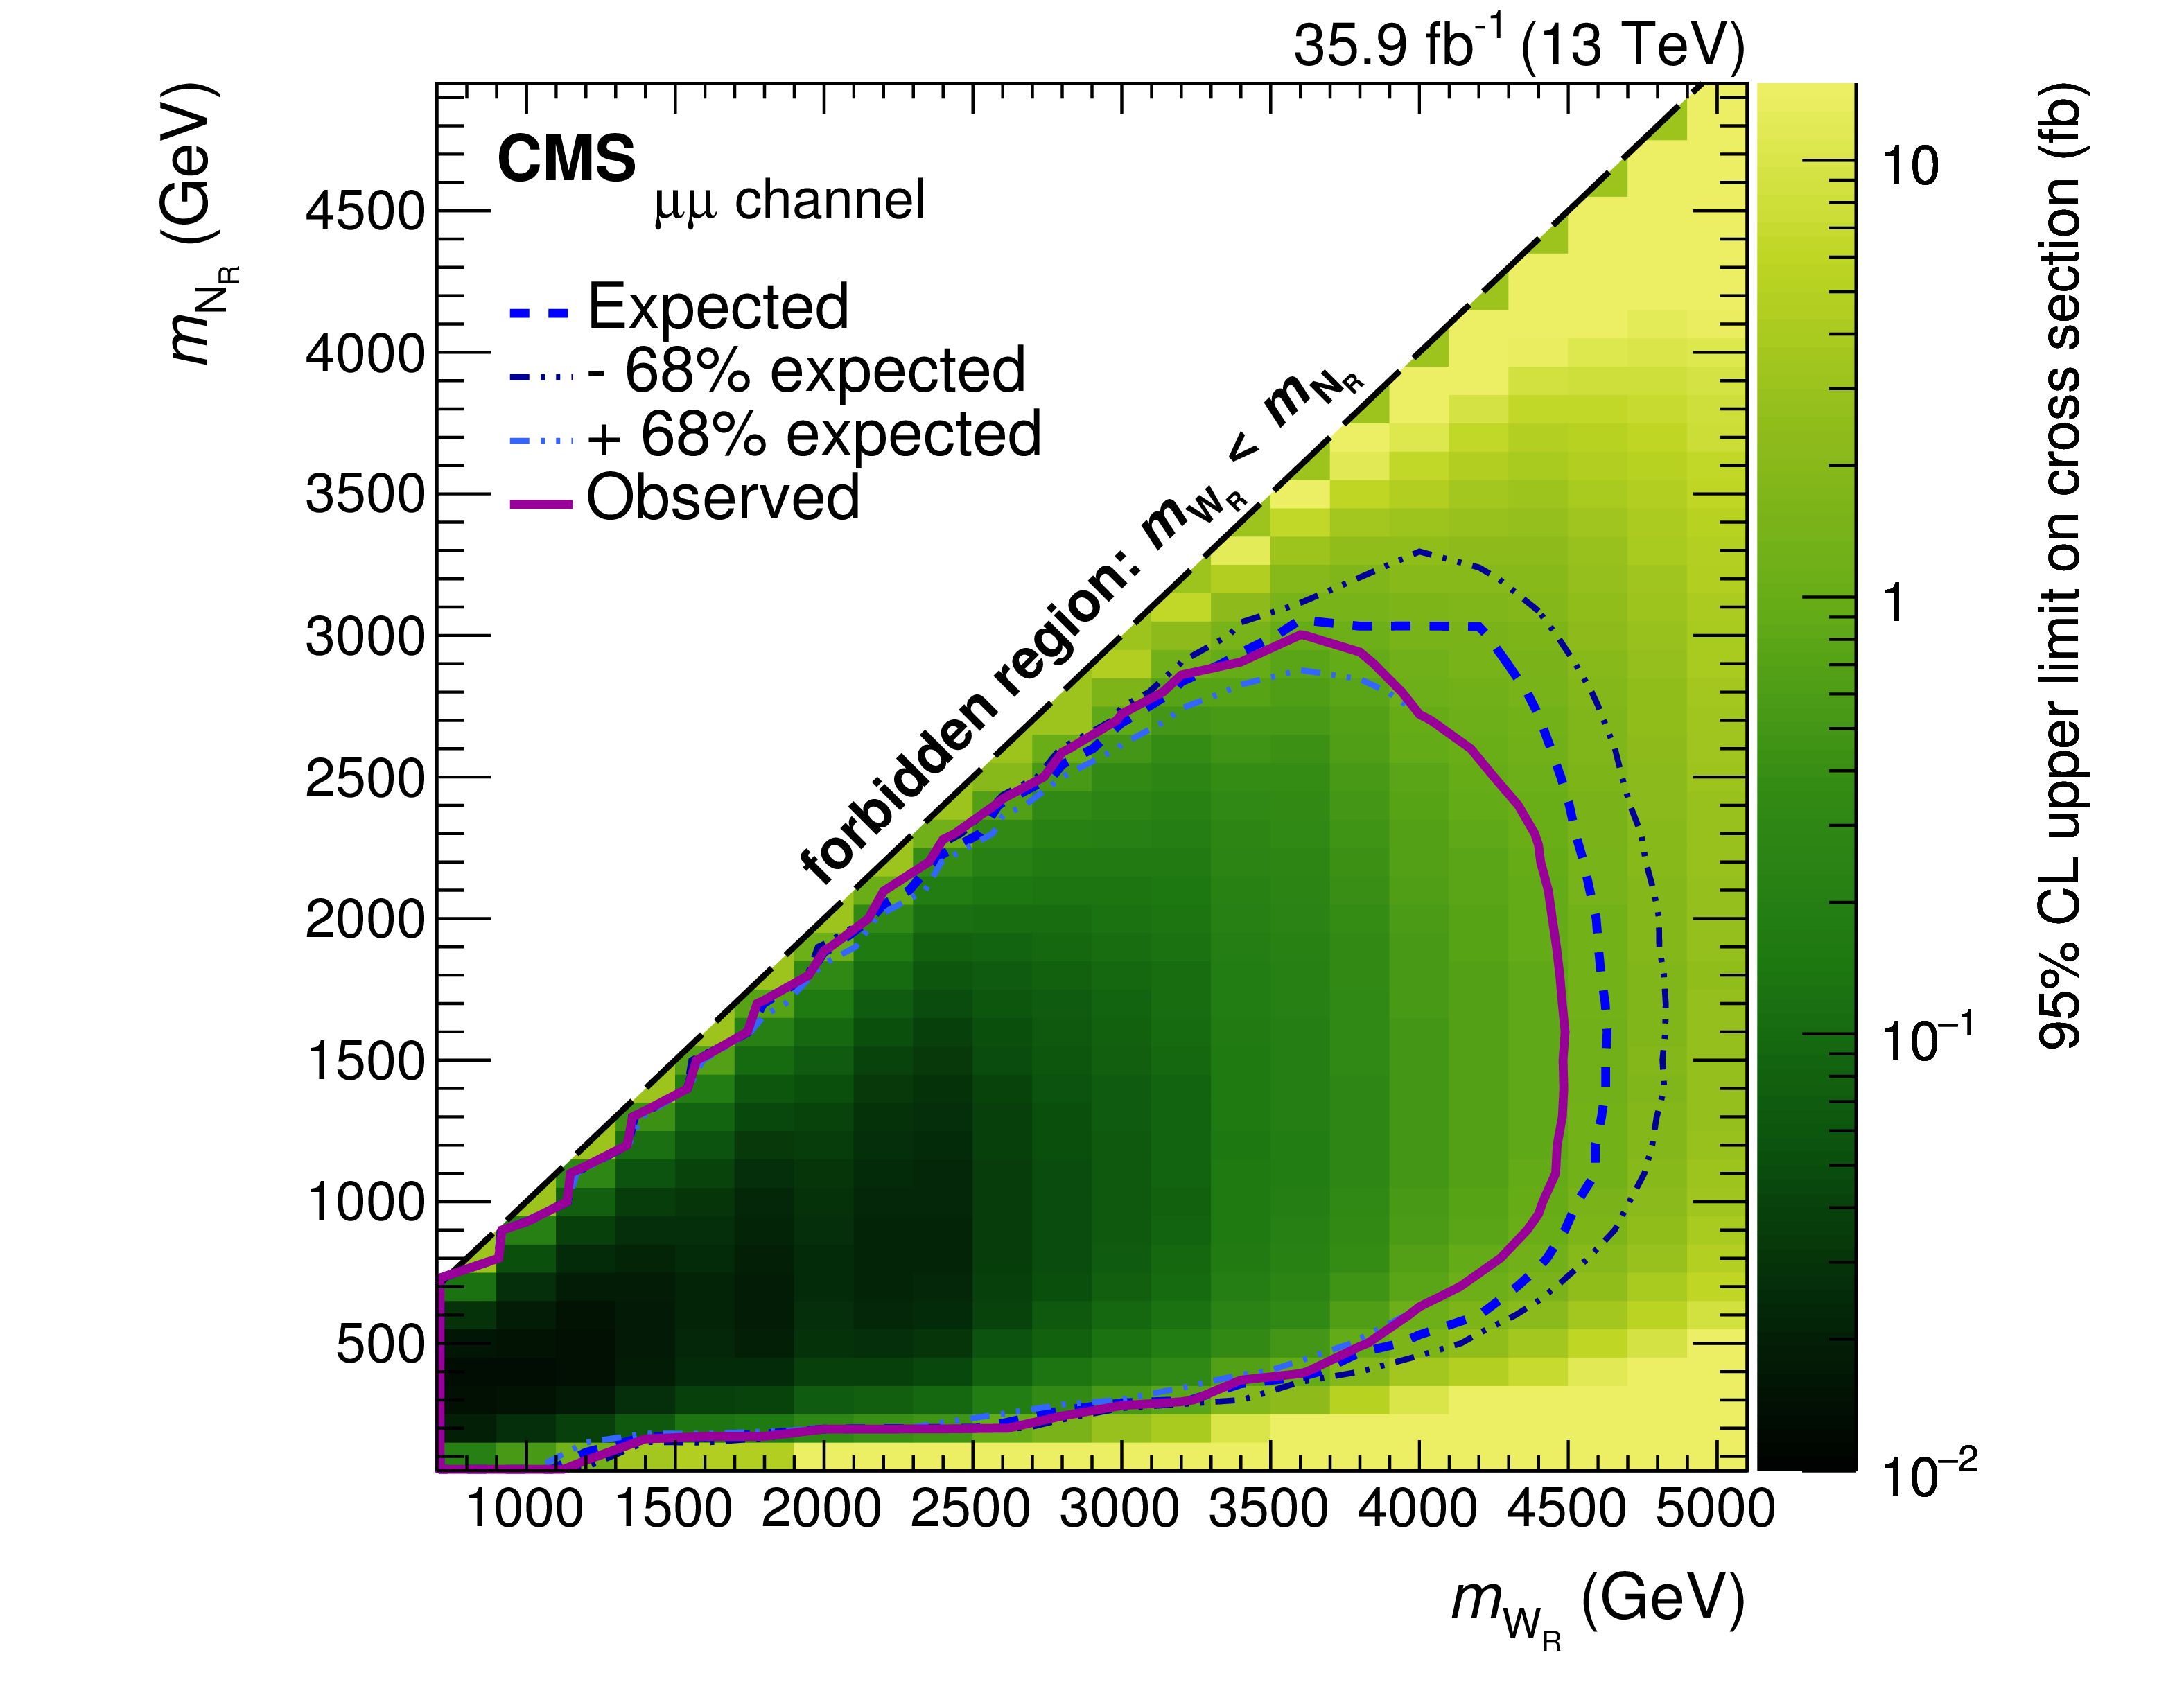
Upper limit on the cross section for different $ {\mathrm {W_R}} $ and ${\mathrm {N_R}}$ mass hypotheses, for the electron channel on the left and for the muon channel on the right. The expected and observed exclusions are shown as the dotted (blue) curve and the solid (red) curve, respectively. The thin-dotted (blue) curves indicate the region in ($ {m_{{\mathrm {W_R}}}} $, ${m_{{\mathrm {N_R}}}})$ parameter space that is expected to be excluded at 68% CL in the case that no signal is present in the data. |

png pdf |
Figure 6-a:
Upper limit on the cross section for different $ {\mathrm {W_R}} $ and ${\mathrm {N_R}}$ mass hypotheses, for the electron channel. The expected and observed exclusions are shown as the dotted (blue) curve and the solid (red) curve, respectively. The thin-dotted (blue) curves indicate the region in ($ {m_{{\mathrm {W_R}}}} $, ${m_{{\mathrm {N_R}}}})$ parameter space that is expected to be excluded at 68% CL in the case that no signal is present in the data. |
png pdf |
Figure 6-b:
Upper limit on the cross section for different $ {\mathrm {W_R}} $ and ${\mathrm {N_R}}$ mass hypotheses, for the muon channel. The expected and observed exclusions are shown as the dotted (blue) curve and the solid (red) curve, respectively. The thin-dotted (blue) curves indicate the region in ($ {m_{{\mathrm {W_R}}}} $, ${m_{{\mathrm {N_R}}}})$ parameter space that is expected to be excluded at 68% CL in the case that no signal is present in the data. |
| Tables | |
png pdf |
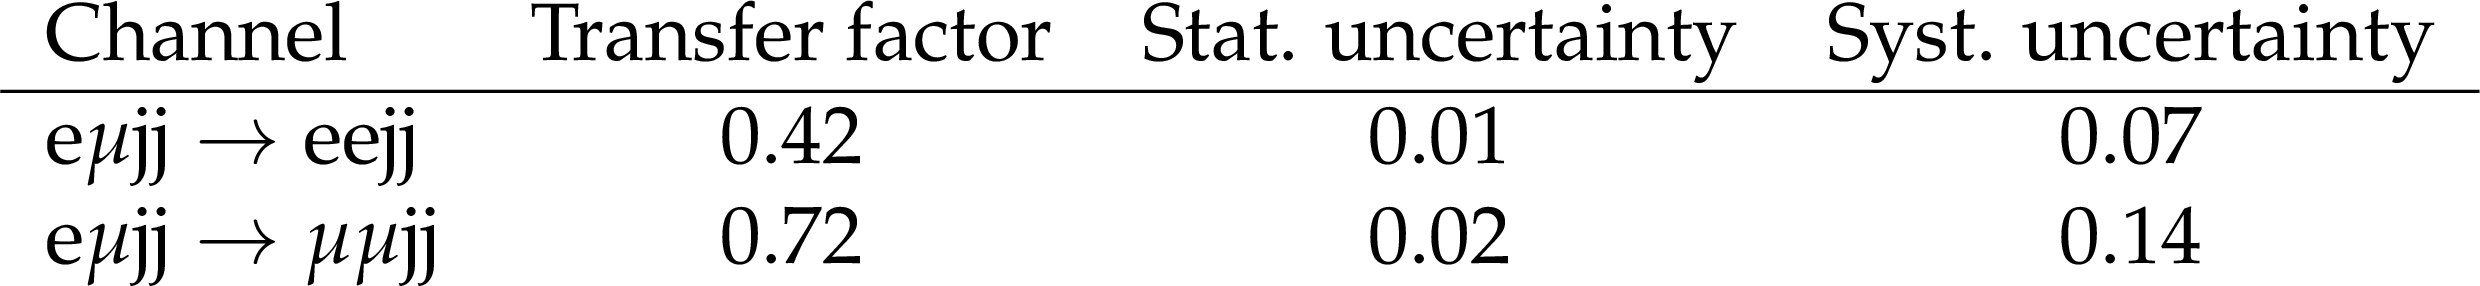
Table 1:
Transfer factors applied to the number of events in the flavor control region to estimate the number of $ {{\mathrm {t}\overline {\mathrm {t}}}} $ events in the $ {{\mathrm {e}} {\mathrm {e}}\text {jj}} $ and $ {{\mu} {\mu} \text {jj}}$ signal regions. |
png pdf |
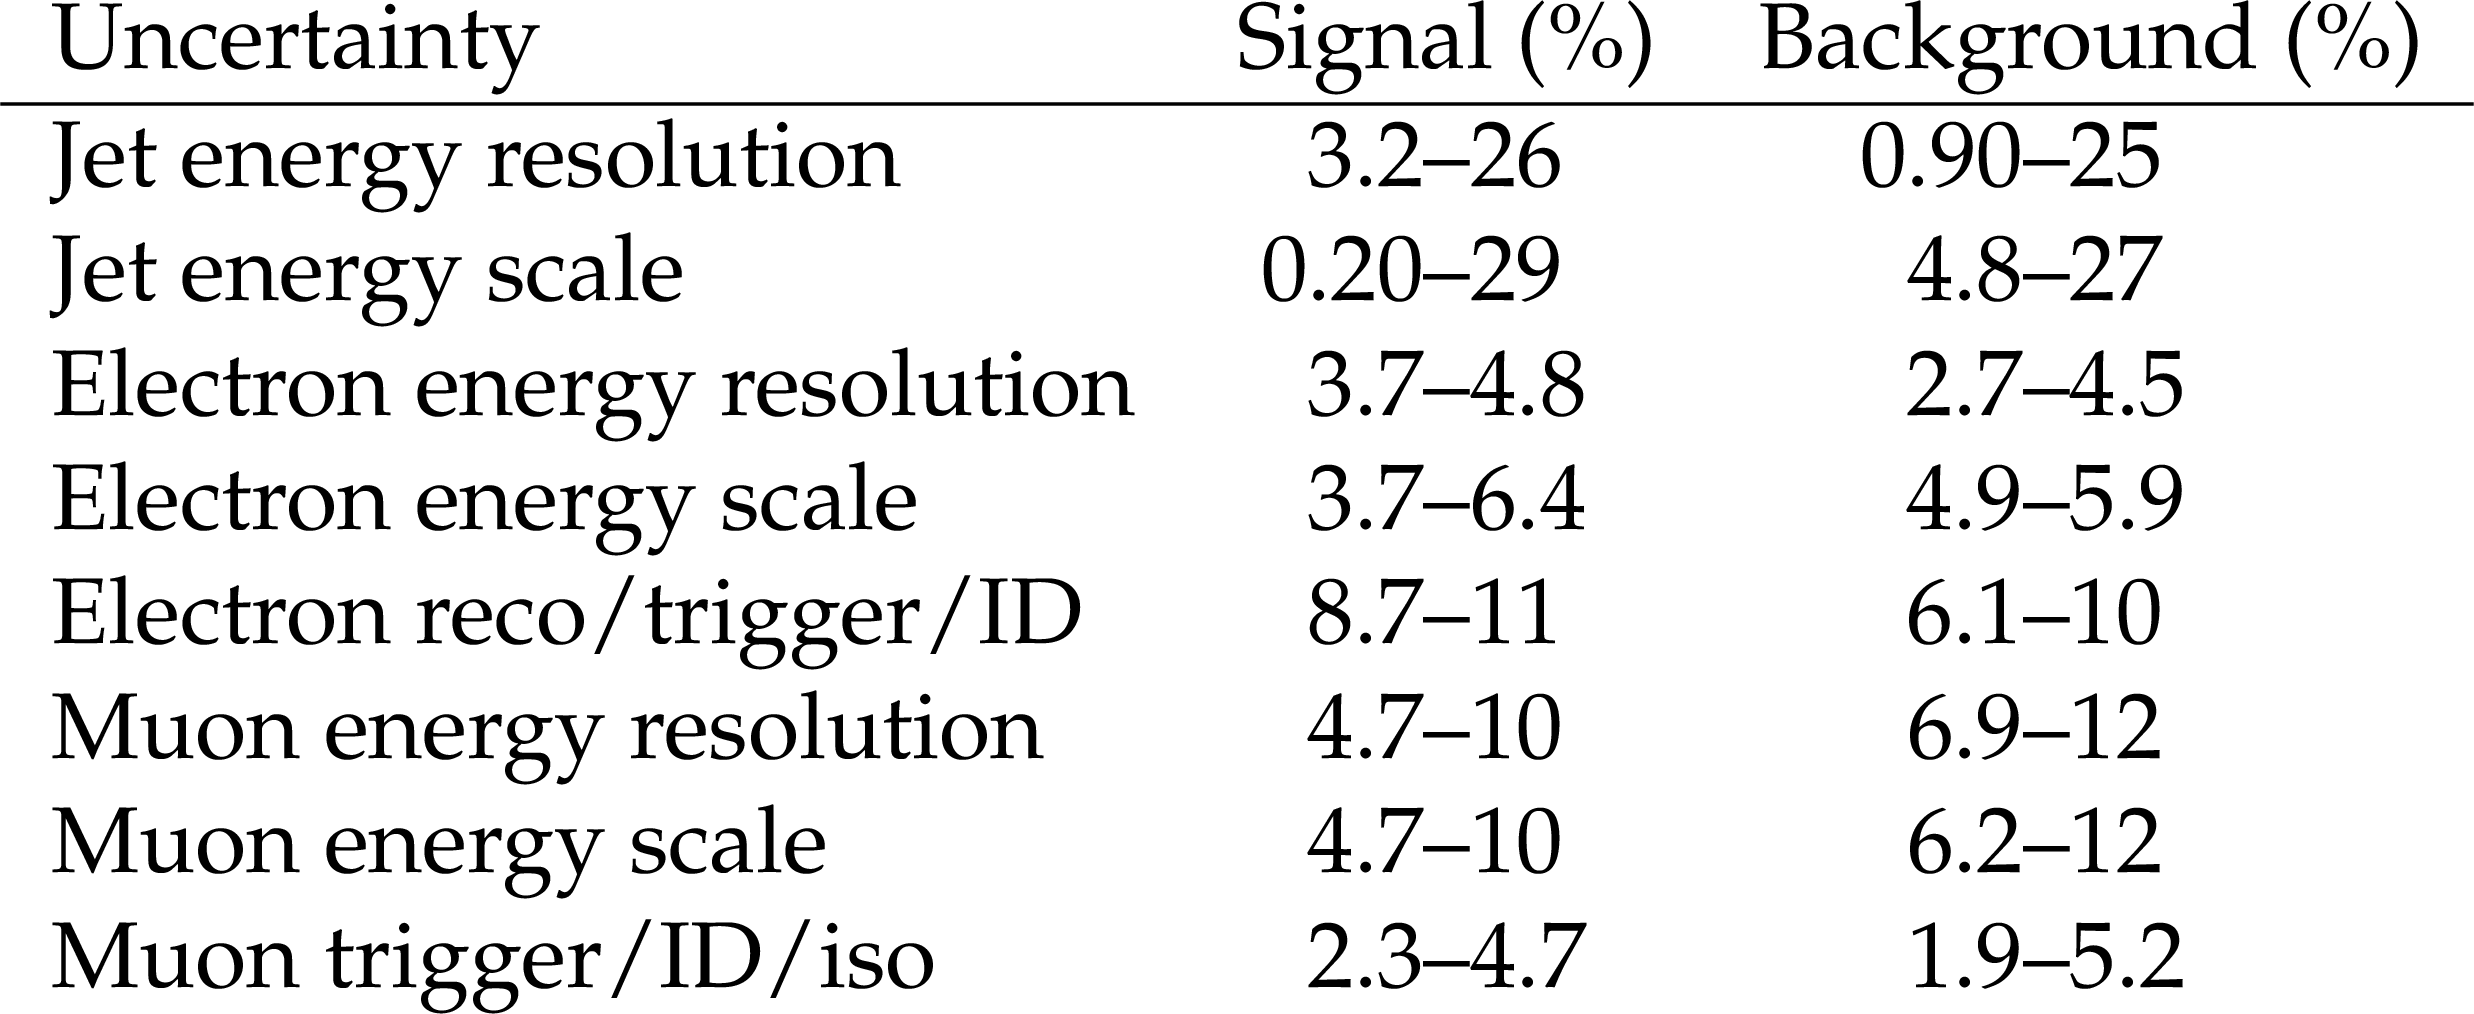
Table 2:
Effect of systematic uncertainties in candidate reconstruction efficiencies, energy scale and resolutions on the signal and background yields. The Signal column shows the range of uncertainties computed at each of the $ {\mathrm {W_R}} $ mass points. The Background column indicates the range of the uncertainties for the different backgrounds. |
png pdf |
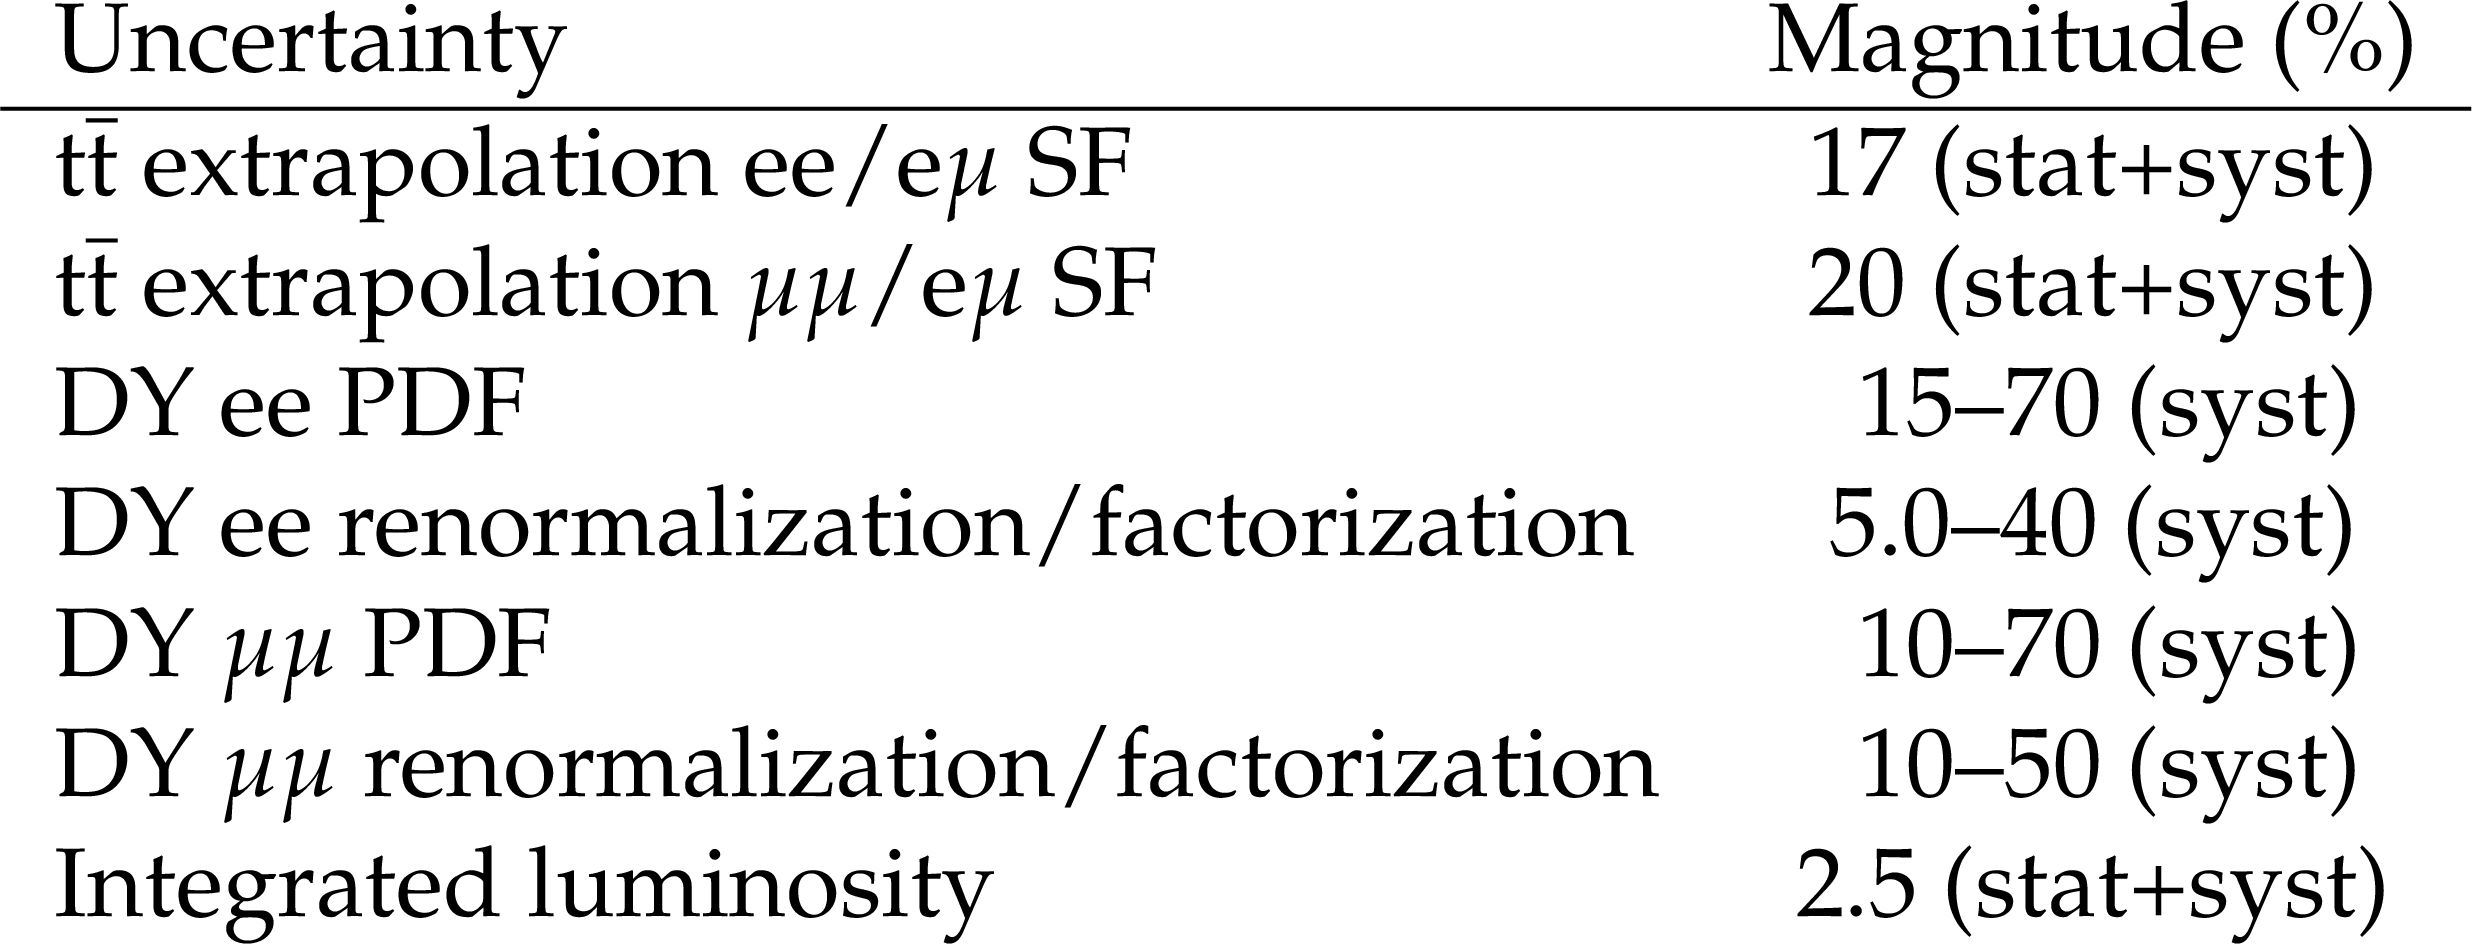
Table 3:
Uncertainties affecting the $ {m_{\ell \ell \text {jj}}} $ distribution shape and normalization. The uncertainties in the $ {{\mathrm {t}\overline {\mathrm {t}}}} $ SFs affect the $ {{\mathrm {t}\overline {\mathrm {t}}}} $ background, the uncertainties in the DY PDF and the DY factorization and renormalization scales affect the DY+jets background, and the uncertainty in the integrated luminosity affects both signal and backgrounds. |

png pdf |
Table 4:
Number of expected events for signal, DY+jets, $ {{\mathrm {t}\overline {\mathrm {t}}}} $, Other, and All backgrounds, as well as the observed number of events in different $ {\mathrm {W_R}} $ mass windows. All uncertainties are included in the expected number of events. In each table cell, the entry is of the form (mean $\pm $ stat $\pm $ syst). |
| Summary |
| A search for a right-handed analogue of the standard model W boson in the decay channel of two leptons and two jets has been presented. The analysis is based on proton-proton collision data collected at $\sqrt{s} = $ 13 TeV by the CMS experiment at the LHC in 2016, corresponding to an integrated luminosity of 35.9 fb$^{-1}$. No significant excess over the standard model background expectations is observed in the invariant mass distribution of the dilepton plus dijet system. Thus the 2.8$\sigma$ excess previously observed in data recorded by CMS at 8 TeV is not confirmed. Assuming that couplings are identical to those of the standard model, a region in the two-dimensional plane ($ {m_{ \mathrm{ W_R } }} $, $ {m_{{\mathrm {N_R}} }} $) covering a large range of right-handed neutrino masses is excluded at 95% confidence level. A $ \mathrm{ W_R } $ boson decaying into a right-handed heavy neutrino with a mass ${m_{{\mathrm {N_R}} }}=1/2 {m_{\mathrm{ W_R }}}$ is excluded at 95% confidence level up to a mass of 4.4 TeV, providing the most stringent limit to date. |
| References | ||||
| 1 | J. C. Pati and A. Salam | Lepton number as the fourth color | PRD 10 (1974) 275, .[Erratum: \it Phys. Rev. D\/ \bf 11 (1975) 703, \DOI10.1103/PhysRevD.11.703.2] | |
| 2 | R. N. Mohapatra and J. C. Pati | A natural left-right symmetry | PRD 11 (1975) 2558 | |
| 3 | G. Senjanovic and R. N. Mohapatra | Exact left-right symmetry and spontaneous violation of parity | PRD 12 (1975) 1502 | |
| 4 | W.-Y. Keung and G. Senjanovic | Majorana neutrinos and the production of the right-handed charged gauge boson | PRL 50 (1983) 1427 | |
| 5 | P. Adhya, D. R. Chaudhuri, and A. Raychaudhuri | Decay and decoupling of heavy right-handed Majorana neutrinos in the L-R model | EPJC 19 (2001) 183 | hep-ph/0006260 |
| 6 | P. S. B. Dev, R. N. Mohapatra, and Y. Zhang | Heavy right-handed neutrino dark matter in left-right models | MPLA 32 (2017) 1740007 | 1610.05738 |
| 7 | R. N. Mohapatra and G. Senjanovic | Neutrino mass and spontaneous parity violation | PRL 44 (1980) 912 | |
| 8 | M. Gell-Mann, P. Ramond, and R. Slansky | Complex spinors and unified theories | in Supergravity, P. V. Nieuwenhuizen and D. Z. Freedman, eds., p. 315 Elsevier, 1979 Conference number C79-09-27 | 1306.4669 |
| 9 | CMS Collaboration | Search for heavy neutrinos and $ \mathrm {W} $ bosons with right-handed couplings in proton-proton collisions at $ \sqrt{s} = $ 8 TeV | EPJC 74 (2014) 3149 | CMS-EXO-13-008 1407.3683 |
| 10 | CMS Collaboration | Search for heavy neutrinos or third-generation leptoquarks in final states with two hadronically decaying $ \tau $ leptons and two jets in proton-proton collisions at $ \sqrt{s}= $ 13 TeV | JHEP 03 (2017) 077 | CMS-EXO-16-016 1612.01190 |
| 11 | CMS Collaboration | Search for the third-generation scalar leptoquarks and heavy right-handed neutrinos in final states with two tau leptons and two jets in proton-proton collisions at $ \sqrt{s} = $ 13 TeV | JHEP 07 (2017) 121 | CMS-EXO-16-023 1703.03995 |
| 12 | CMS Collaboration | Search for a heavy composite Majorana neutrino in the final state with two leptons and two quarks at $ \sqrt{s} = $ 13 TeV | CMS-EXO-16-026 1706.08578 |
|
| 13 | ATLAS Collaboration | Search for heavy neutrinos and right-handed $ \mathrm {W} $ bosons in events with two leptons and jets in pp collisions at $ \sqrt{s}= $ 7 TeV with the ATLAS detector | EPJC 72 (2012) 2056 | 1203.5420 |
| 14 | ATLAS Collaboration | Search for third generation scalar leptoquarks in pp collisions at $ \sqrt{s} = $ 7 TeV with the ATLAS detector | JHEP 06 (2013) 033 | 1303.0526 |
| 15 | ATLAS Collaboration | Search for heavy Majorana neutrinos with the ATLAS detector in pp collisions at $ \sqrt{s}= $ 8 TeV | JHEP 07 (2015) 162 | 1506.06020 |
| 16 | CMS Collaboration | The CMS experiment at the CERN LHC | JINST 3 (2008) S08004 | CMS-00-001 |
| 17 | CMS Collaboration | The CMS trigger system | JINST 12 (2017) P01020 | CMS-TRG-12-001 1609.02366 |
| 18 | CMS Collaboration | Particle-flow reconstruction and global event description with the CMS detector | JINST 12 (2017) P10003 | CMS-PRF-14-001 1706.04965 |
| 19 | CMS Collaboration | Performance of electron reconstruction and selection with the CMS detector in proton-proton collisions at $ \sqrt{s} = $ 8 TeV | JINST 10 (2015) P06005 | CMS-EGM-13-001 1502.02701 |
| 20 | CMS Collaboration | Performance of CMS muon reconstruction in pp collision events at $ \sqrt{s} = $ 7 TeV | JINST 7 (2012) P10002 | CMS-MUO-10-004 1206.4071 |
| 21 | M. Cacciari, G. P. Salam, and G. Soyez | The anti-$ {k_{\mathrm{T}}} $ jet clustering algorithm | JHEP 04 (2008) 063 | 0802.1189 |
| 22 | M. Cacciari, G. P. Salam, and G. Soyez | FastJet user manual | EPJC 72 (2012) 1896 | 1111.6097 |
| 23 | M. Cacciari and G. P. Salam | Pileup subtraction using jet areas | PLB 659 (2008) 119 | 0707.1378 |
| 24 | CMS Collaboration | Jet energy scale and resolution in the CMS experiment in pp collisions at 8 TeV | JINST 12 (2017) P02014 | CMS-JME-13-004 1607.03663 |
| 25 | S. Agostinelli et al. | GEANT4--a simulation toolkit | NIMA 506 (2003) 250 | |
| 26 | T. Sjostrand et al. | An introduction to PYTHIA 8.2 | CPC 191 (2015) 159 | 1410.3012 |
| 27 | R. D. Ball et al. | Parton distributions with LHC data | NPB 867 (2013) 244 | 1207.1303 |
| 28 | J. Alwall et al. | The automated computation of tree-level and next-to-leading order differential cross sections, and their matching to parton shower simulations | JHEP 07 (2014) 079 | 1405.0301 |
| 29 | NNPDF Collaboration | Parton distributions for the LHC run II | JHEP 04 (2015) 040 | 1410.8849 |
| 30 | P. Nason | A new method for combining NLO QCD with shower Monte Carlo algorithms | JHEP 11 (2004) 040 | hep-ph/0409146 |
| 31 | S. Frixione, P. Nason, and C. Oleari | Matching NLO QCD computations with parton shower simulations: the POWHEG method | JHEP 11 (2007) 070 | 0709.2092 |
| 32 | S. Alioli, P. Nason, C. Oleari, and E. Re | A general framework for implementing NLO calculations in shower Monte Carlo programs: the POWHEG BOX | JHEP 06 (2010) 043 | 1002.2581 |
| 33 | E. Re | Single-top Wt-channel production matched with parton showers using the POWHEG method | EPJC 71 (2011) 1547 | 1009.2450 |
| 34 | CMS Collaboration | Event generator tunes obtained from underlying event and multiparton scattering measurements | EPJC 76 (2016) 155 | CMS-GEN-14-001 1512.00815 |
| 35 | J. Alwall et al. | Comparative study of various algorithms for the merging of parton showers and matrix elements in hadronic collisions | EPJC 53 (2008) 473 | 0706.2569 |
| 36 | R. Frederix and S. Frixione | Merging meets matching in MC@NLO | JHEP 12 (2012) 061 | 1209.6215 |
| 37 | CMS Collaboration | CMS luminosity measurements for the 2016 data taking period | CMS-PAS-LUM-17-001 | CMS-PAS-LUM-17-001 |
| 38 | J. Butterworth et al. | PDF4LHC recommendations for LHC Run II | JPG 43 (2016) 023001 | 1510.03865 |
| 39 | ATLAS and CMS Collaborations | Procedure for the LHC Higgs boson search combination in summer 2011 | CMS-NOTE-2011-005 | |
|
|
Compact Muon Solenoid LHC, CERN |
|

|

|

|

|

|