

Compact Muon Solenoid
LHC, CERN
| CMS-EXO-18-001 ; CERN-EP-2018-255 | ||
| Search for new particles decaying to a jet and an emerging jet | ||
| CMS Collaboration | ||
| 23 October 2018 | ||
| JHEP 02 (2019) 179 | ||
| Abstract: A search is performed for events consistent with the pair production of a new heavy particle that acts as a mediator between a dark sector and normal matter, and that decays to a light quark and a new fermion called a dark quark. The search is based on data corresponding to an integrated luminosity of 16.1 fb$^{-1}$ from proton-proton collisions at $\sqrt{s} = $ 13 TeV collected by the CMS experiment at the LHC in 2016. The dark quark is charged only under a new quantum-chromodynamics-like force, and forms an "emerging jet'' via a parton shower, containing long-lived dark hadrons that give rise to displaced vertices when decaying to standard model hadrons. The data are consistent with the expectation from standard model processes. Limits are set at 95% confidence level excluding dark pion decay lengths between 5 and 225 mm for dark mediators with masses between 400 and 1250 GeV. Decay lengths smaller than 5 and greater than 225 mm are also excluded in the lower part of this mass range. The dependence of the limit on the dark pion mass is weak for masses between 1 and 10 GeV. This analysis is the first dedicated search for the pair production of a new particle that decays to a jet and an emerging jet. | ||
| Links: e-print arXiv:1810.10069 [hep-ex] (PDF) ; CDS record ; inSPIRE record ; HepData record ; CADI line (restricted) ; | ||
| Figures | |
png pdf |
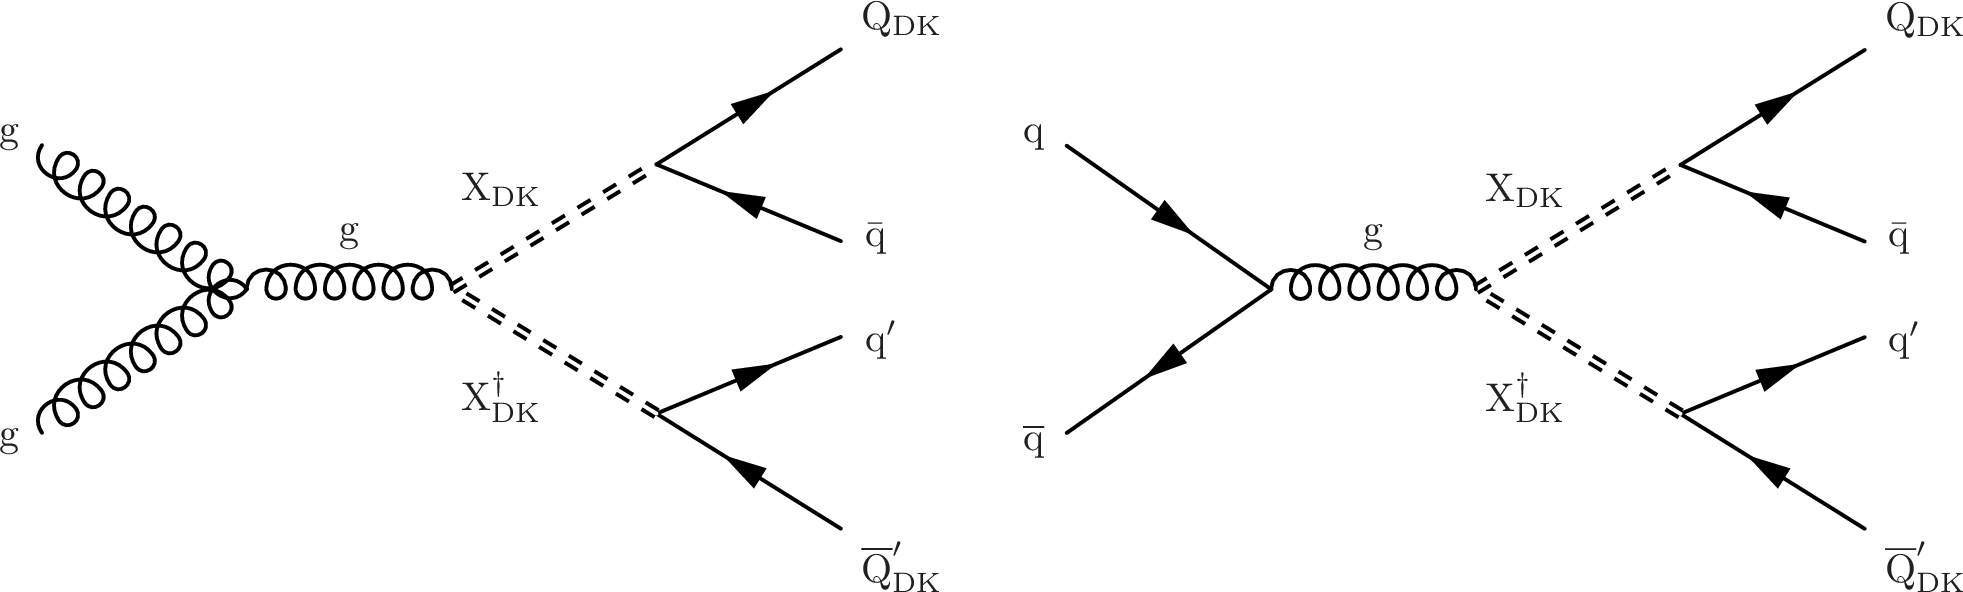
Figure 1:
Feynman diagrams in the BSSW model for the pair production of mediator particles, with each mediator decaying to a quark and a dark quark $ {\mathrm {Q}_{\mathrm {DK}}} $, via gluon-gluon fusion (left) and quark-antiquark annihilation (right). |

png pdf |
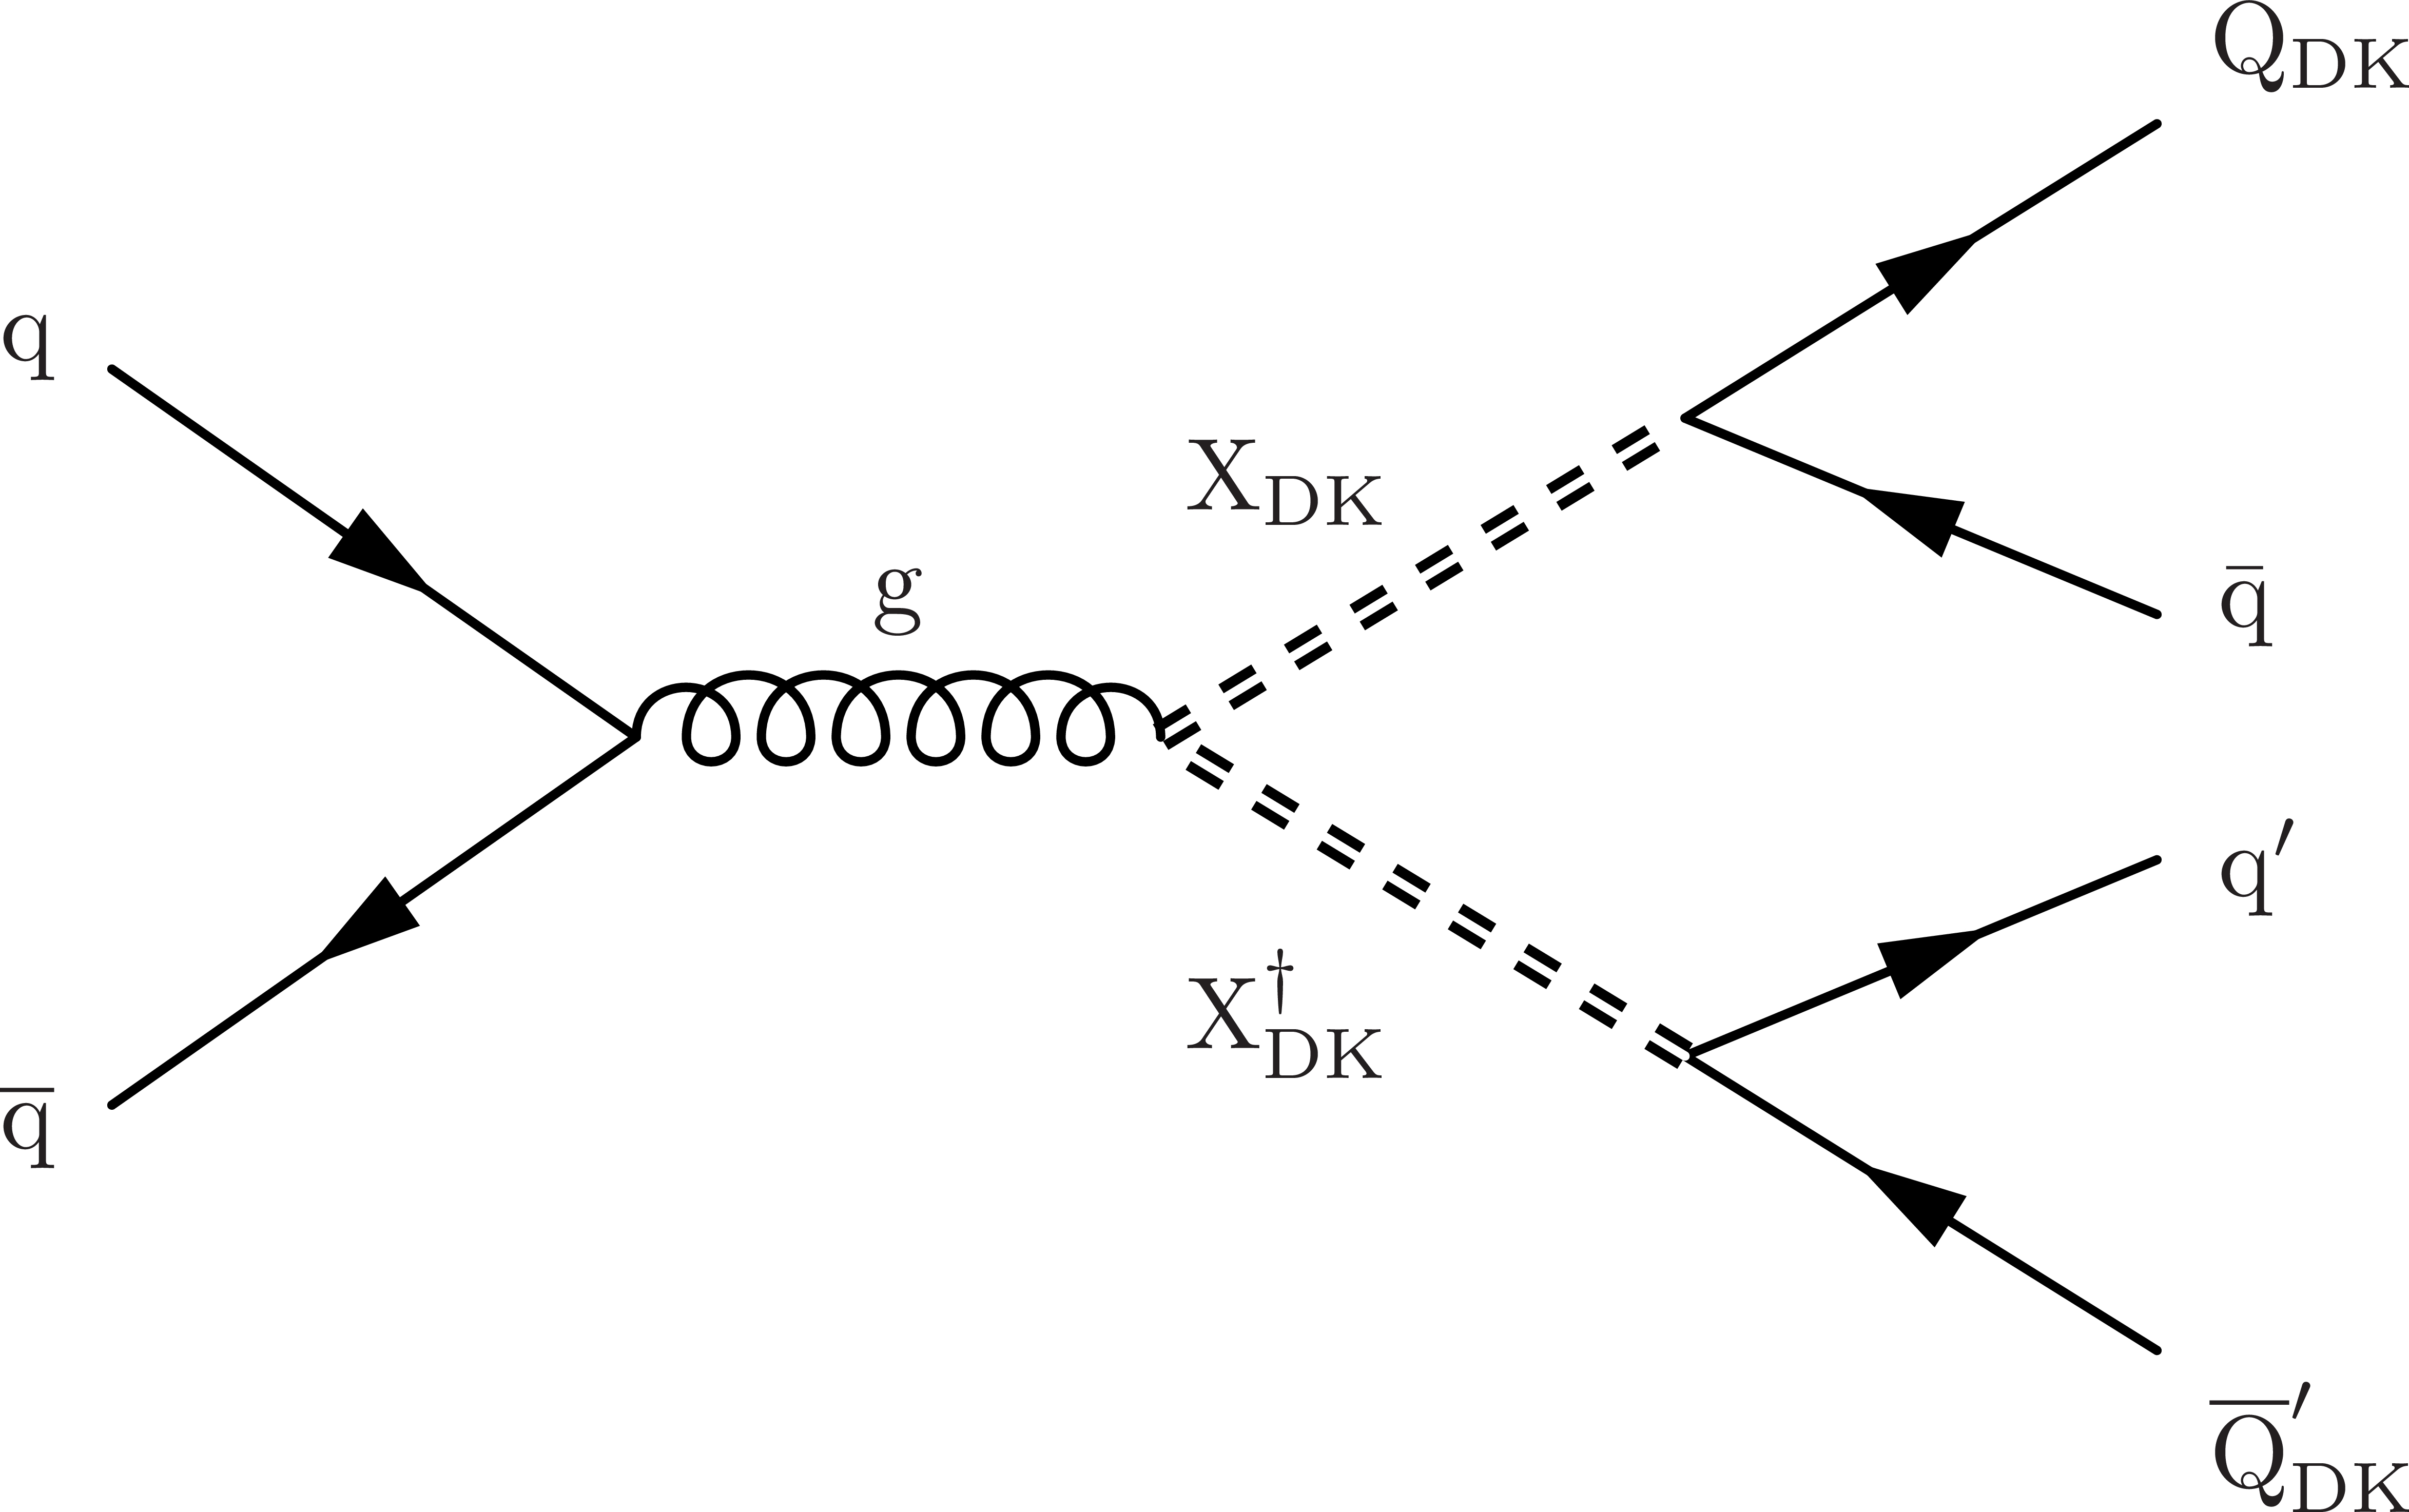
Figure 1-a:
Feynman diagram in the BSSW model for the pair production of mediator particles, with each mediator decaying to a quark and a dark quark $ {\mathrm {Q}_{\mathrm {DK}}} $, via gluon-gluon fusion. |
png pdf |
Figure 1-b:
Feynman diagram in the BSSW model for the pair production of mediator particles, with each mediator decaying to a quark and a dark quark $ {\mathrm {Q}_{\mathrm {DK}}} $, via quark-antiquark annihilation. |

png pdf |
Figure 2:
Distributions of ${< IP_{\mathrm {2D}}>}$ for background (black) and for signals with a mediator mass of 1 TeV and a dark pion proper decay length of 25 mm, for various dark pion masses. |
png pdf |
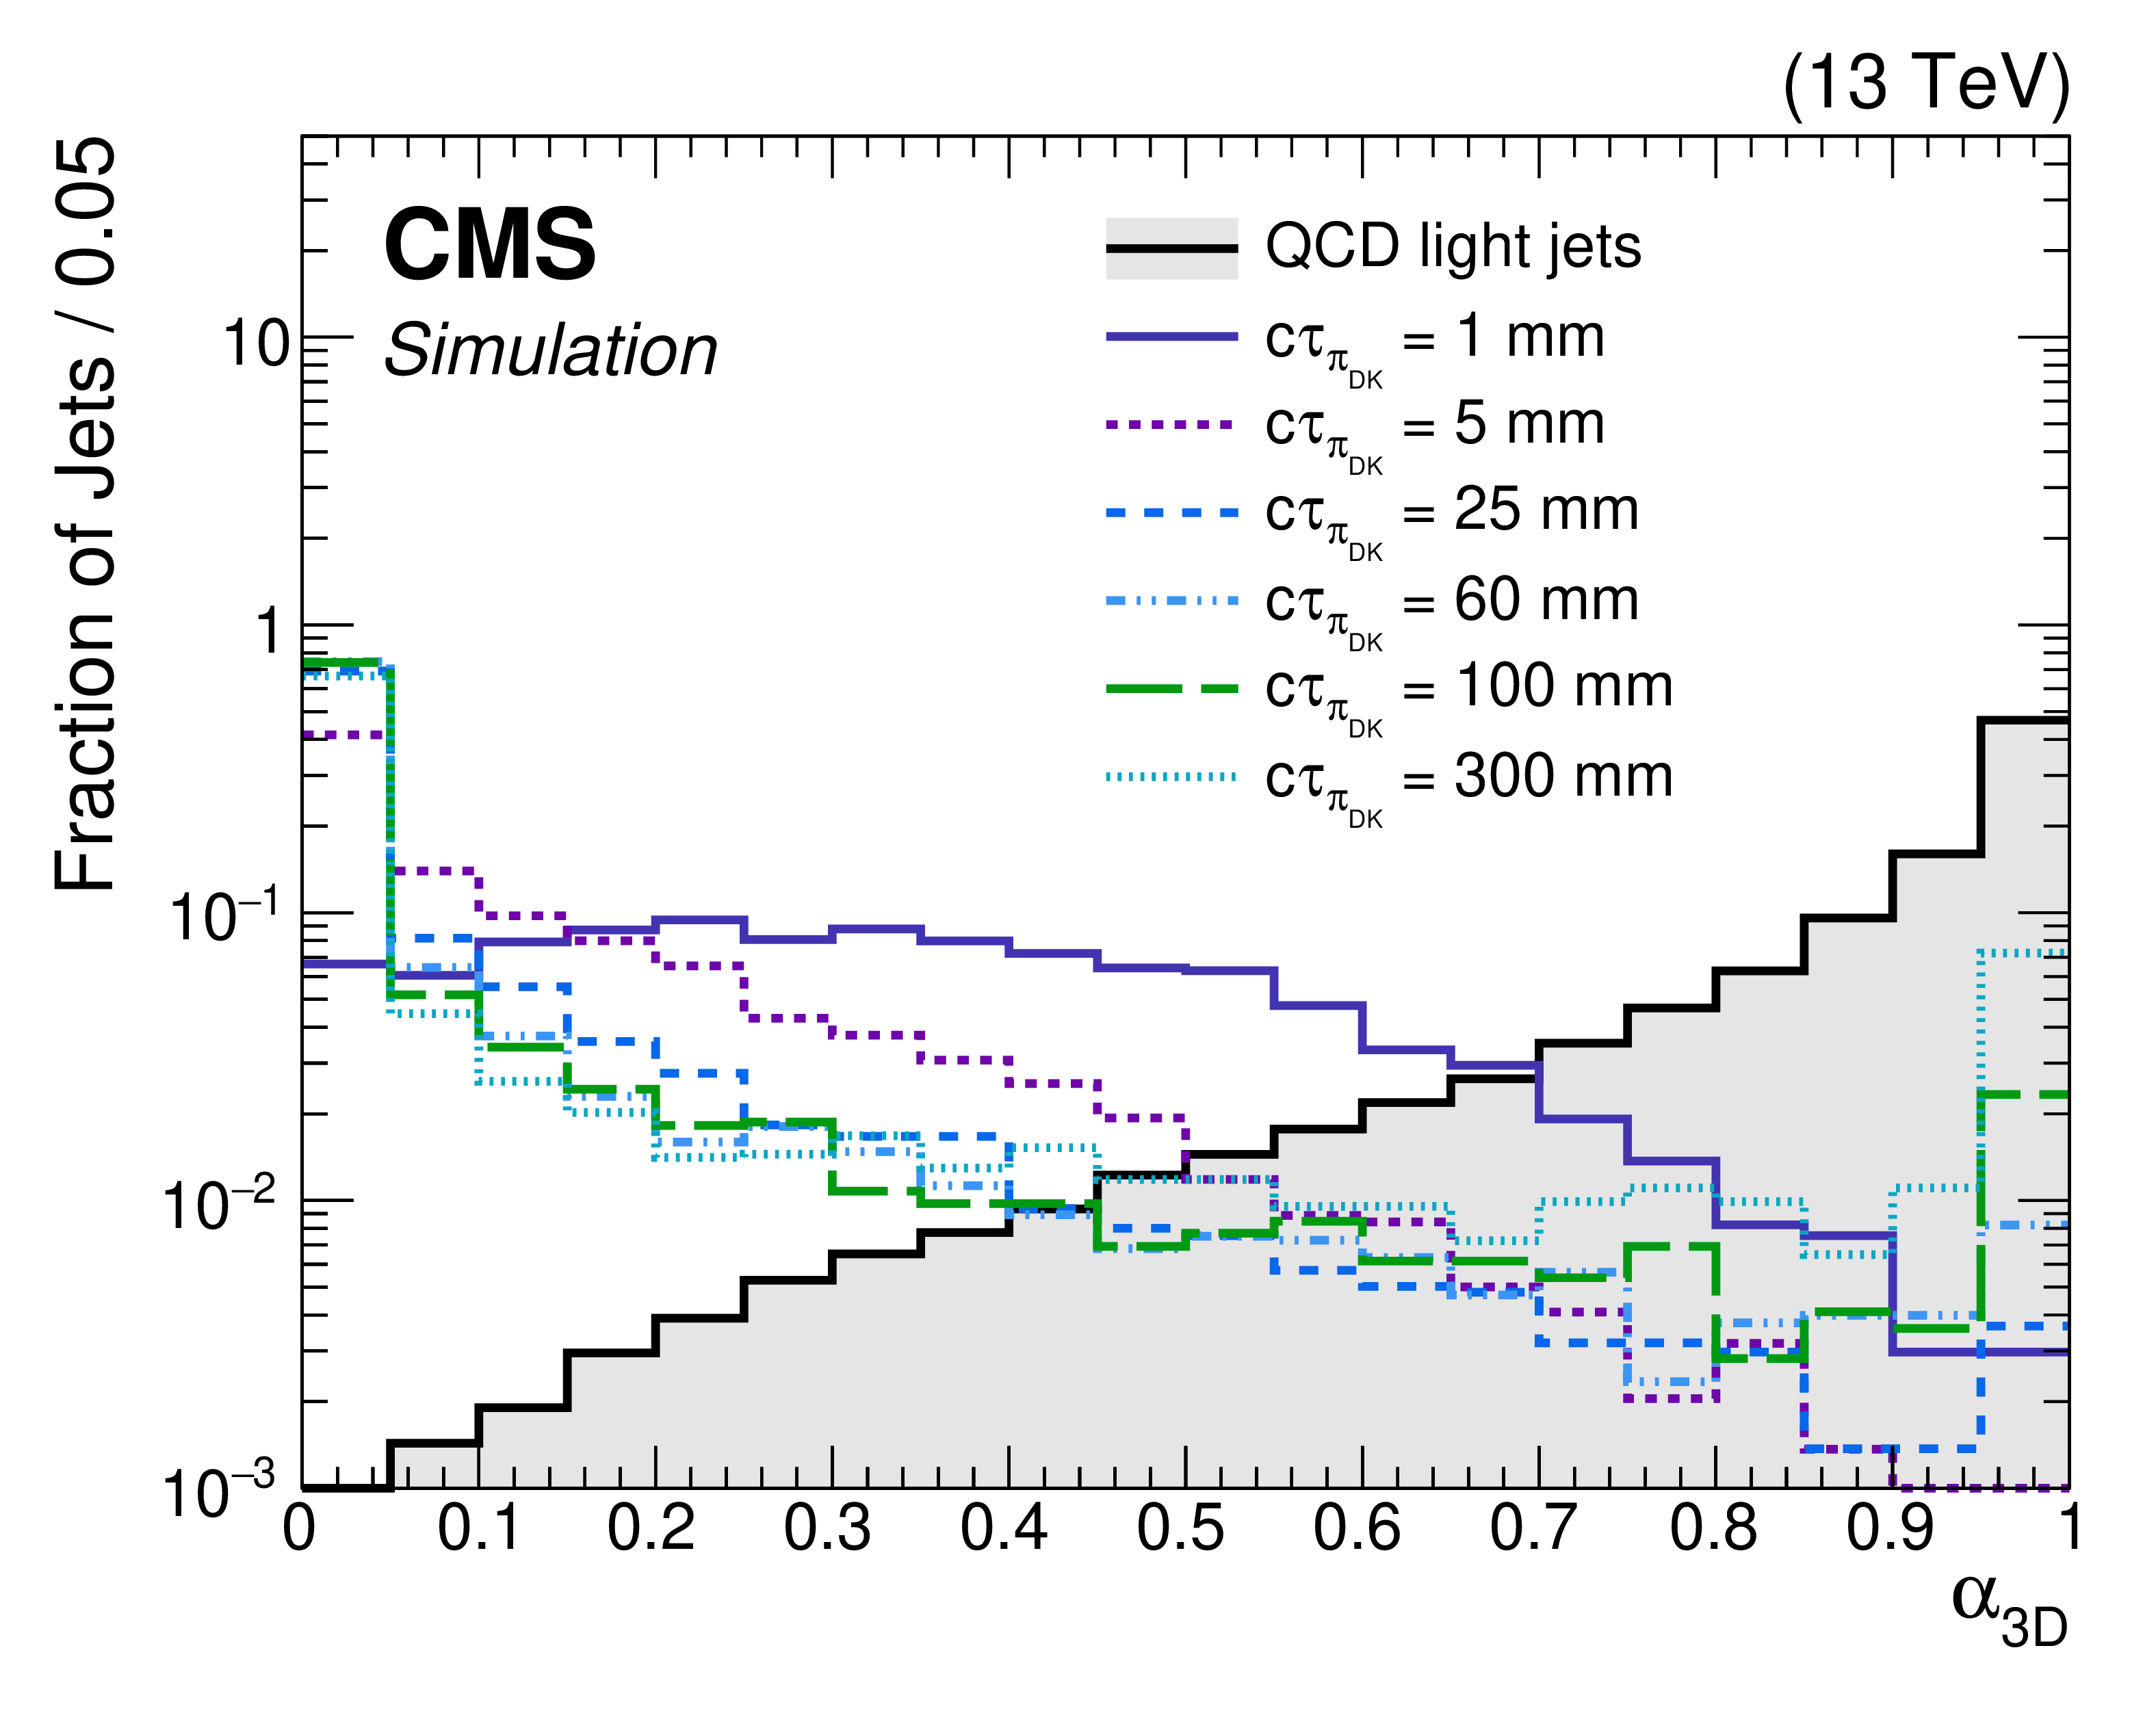
Figure 3:
Distributions of ${\alpha _{\mathrm {3D}}}$ for background (black) and for signals with a mediator mass of 1 TeV and a dark pion mass of 5 GeV for dark pion proper decay lengths ranging from 1 to 300 mm. |
png pdf |
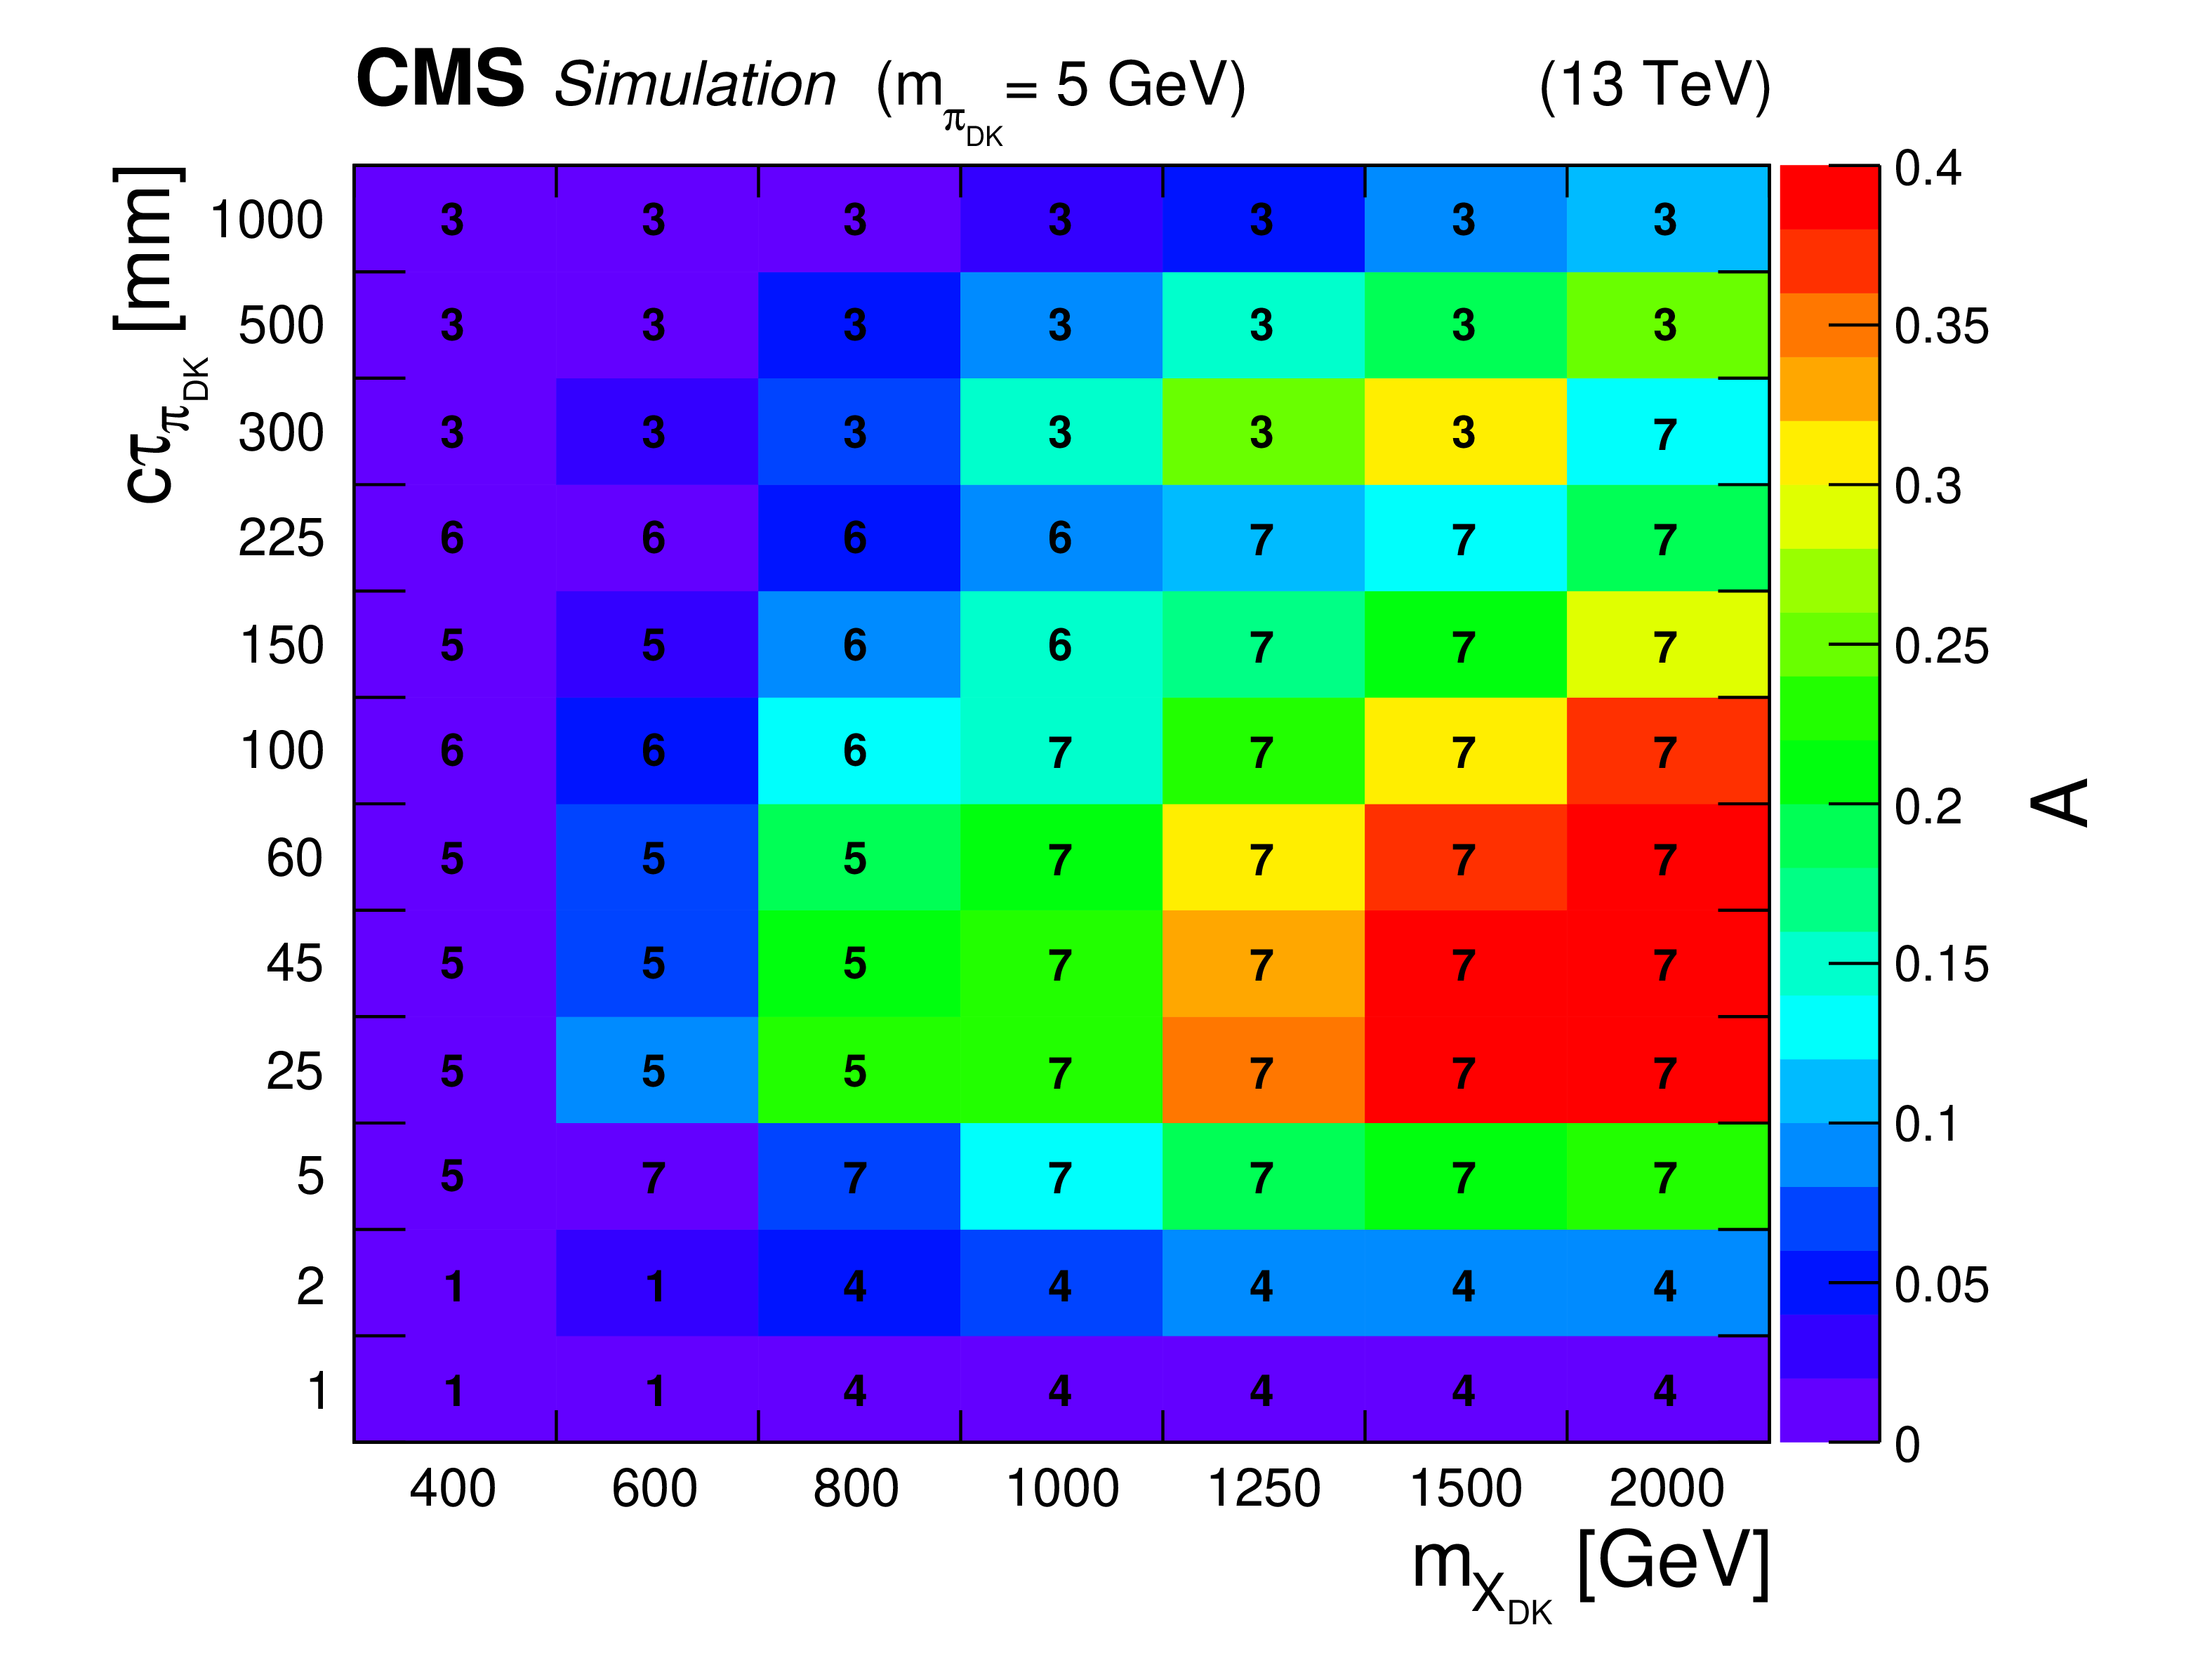
Figure 4:
The signal acceptance A, defined as the fraction of simulated signal events passing the selection criteria, for models with a dark pion mass ${m_{\pi _\mathrm {DK}}}$ of 5 GeV as a function of the mediator mass ${m_{\mathrm {X_{DK}}}}$ and the dark pion proper decay length ${c\tau _{\pi _\mathrm {DK}}}$. The corresponding selection set number for each model is indicated as text on the plot. |

png pdf |
Figure 5:
Measured misidentification probability distribution as a function of track multiplicity for the EMJ-1 criteria group defined in Table 2. The red up-pointing triangles are for b jets while the blue down-pointing triangles are for light-flavor jets. The horizontal lines on the data points indicate the variable bin width. The uncertainty bars represent the statistical uncertainties of $ {\epsilon _{\mathrm {f1}}} $ , $ {\epsilon _{\mathrm {f2}}} $, $ {f_{\mathrm {b1}}} $, and ${f_{\mathrm {b2}}}$ in Eq. (7), where the uncertainties in $ {\epsilon _{\mathrm {f1}}} $ and $ {\epsilon _{\mathrm {f2}}} $ correspond to Clopper-Pearson intervals [38]. |
png pdf |
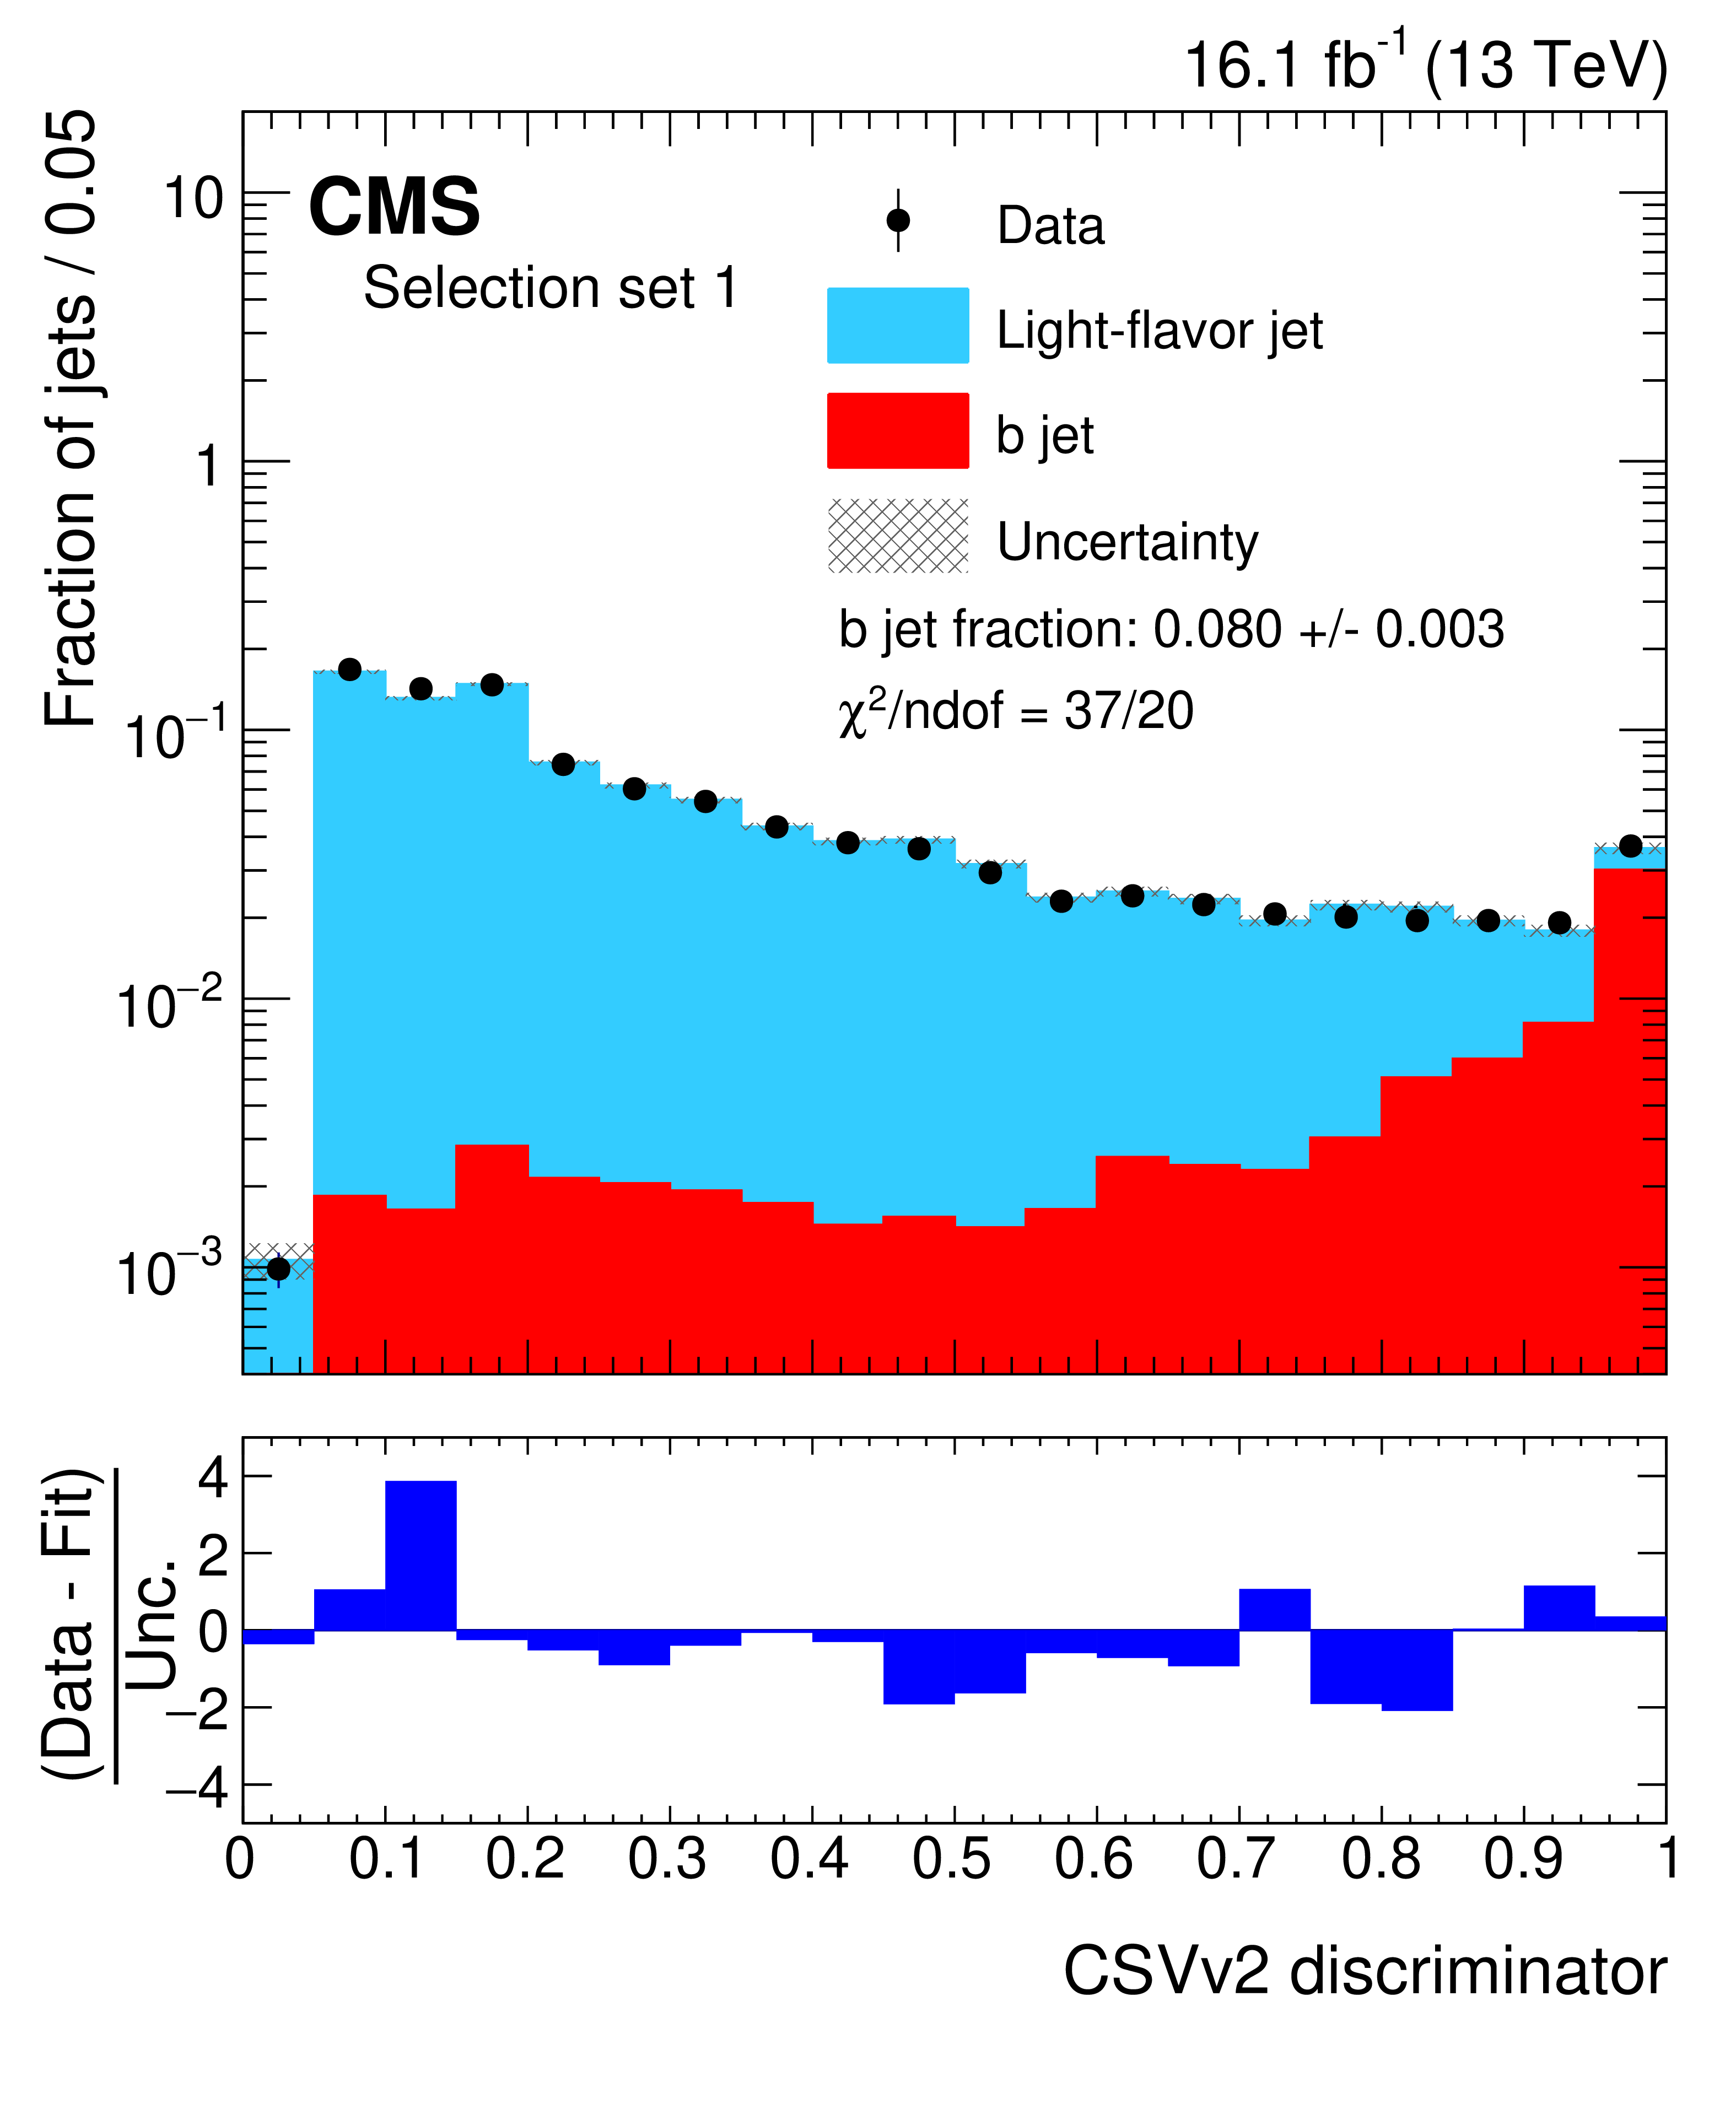
Figure 6:
Determination of the b jet fraction by fitting the CSVv2 discriminator distribution. The red and blue distributions are the CSVv2 discriminator templates of b jets and light-flavor jets, respectively. The black points with uncertainty bars show the data distribution. The uncertainties in the upper panel include statistical uncertainties of the b jet and light-flavor jet templates, and the fit uncertainties, summed in quadrature. The goodness of fit is given by the $\chi ^2$ divided by the number of degrees of freedom (ndof). The bottom panel shows the difference between data and the fit result, divided by the combination of the statistical uncertainty of data and the uncertainty from the upper panel. The distributions are derived from kinematic samples resulting from selection set 1 in Table 3. |

png pdf |
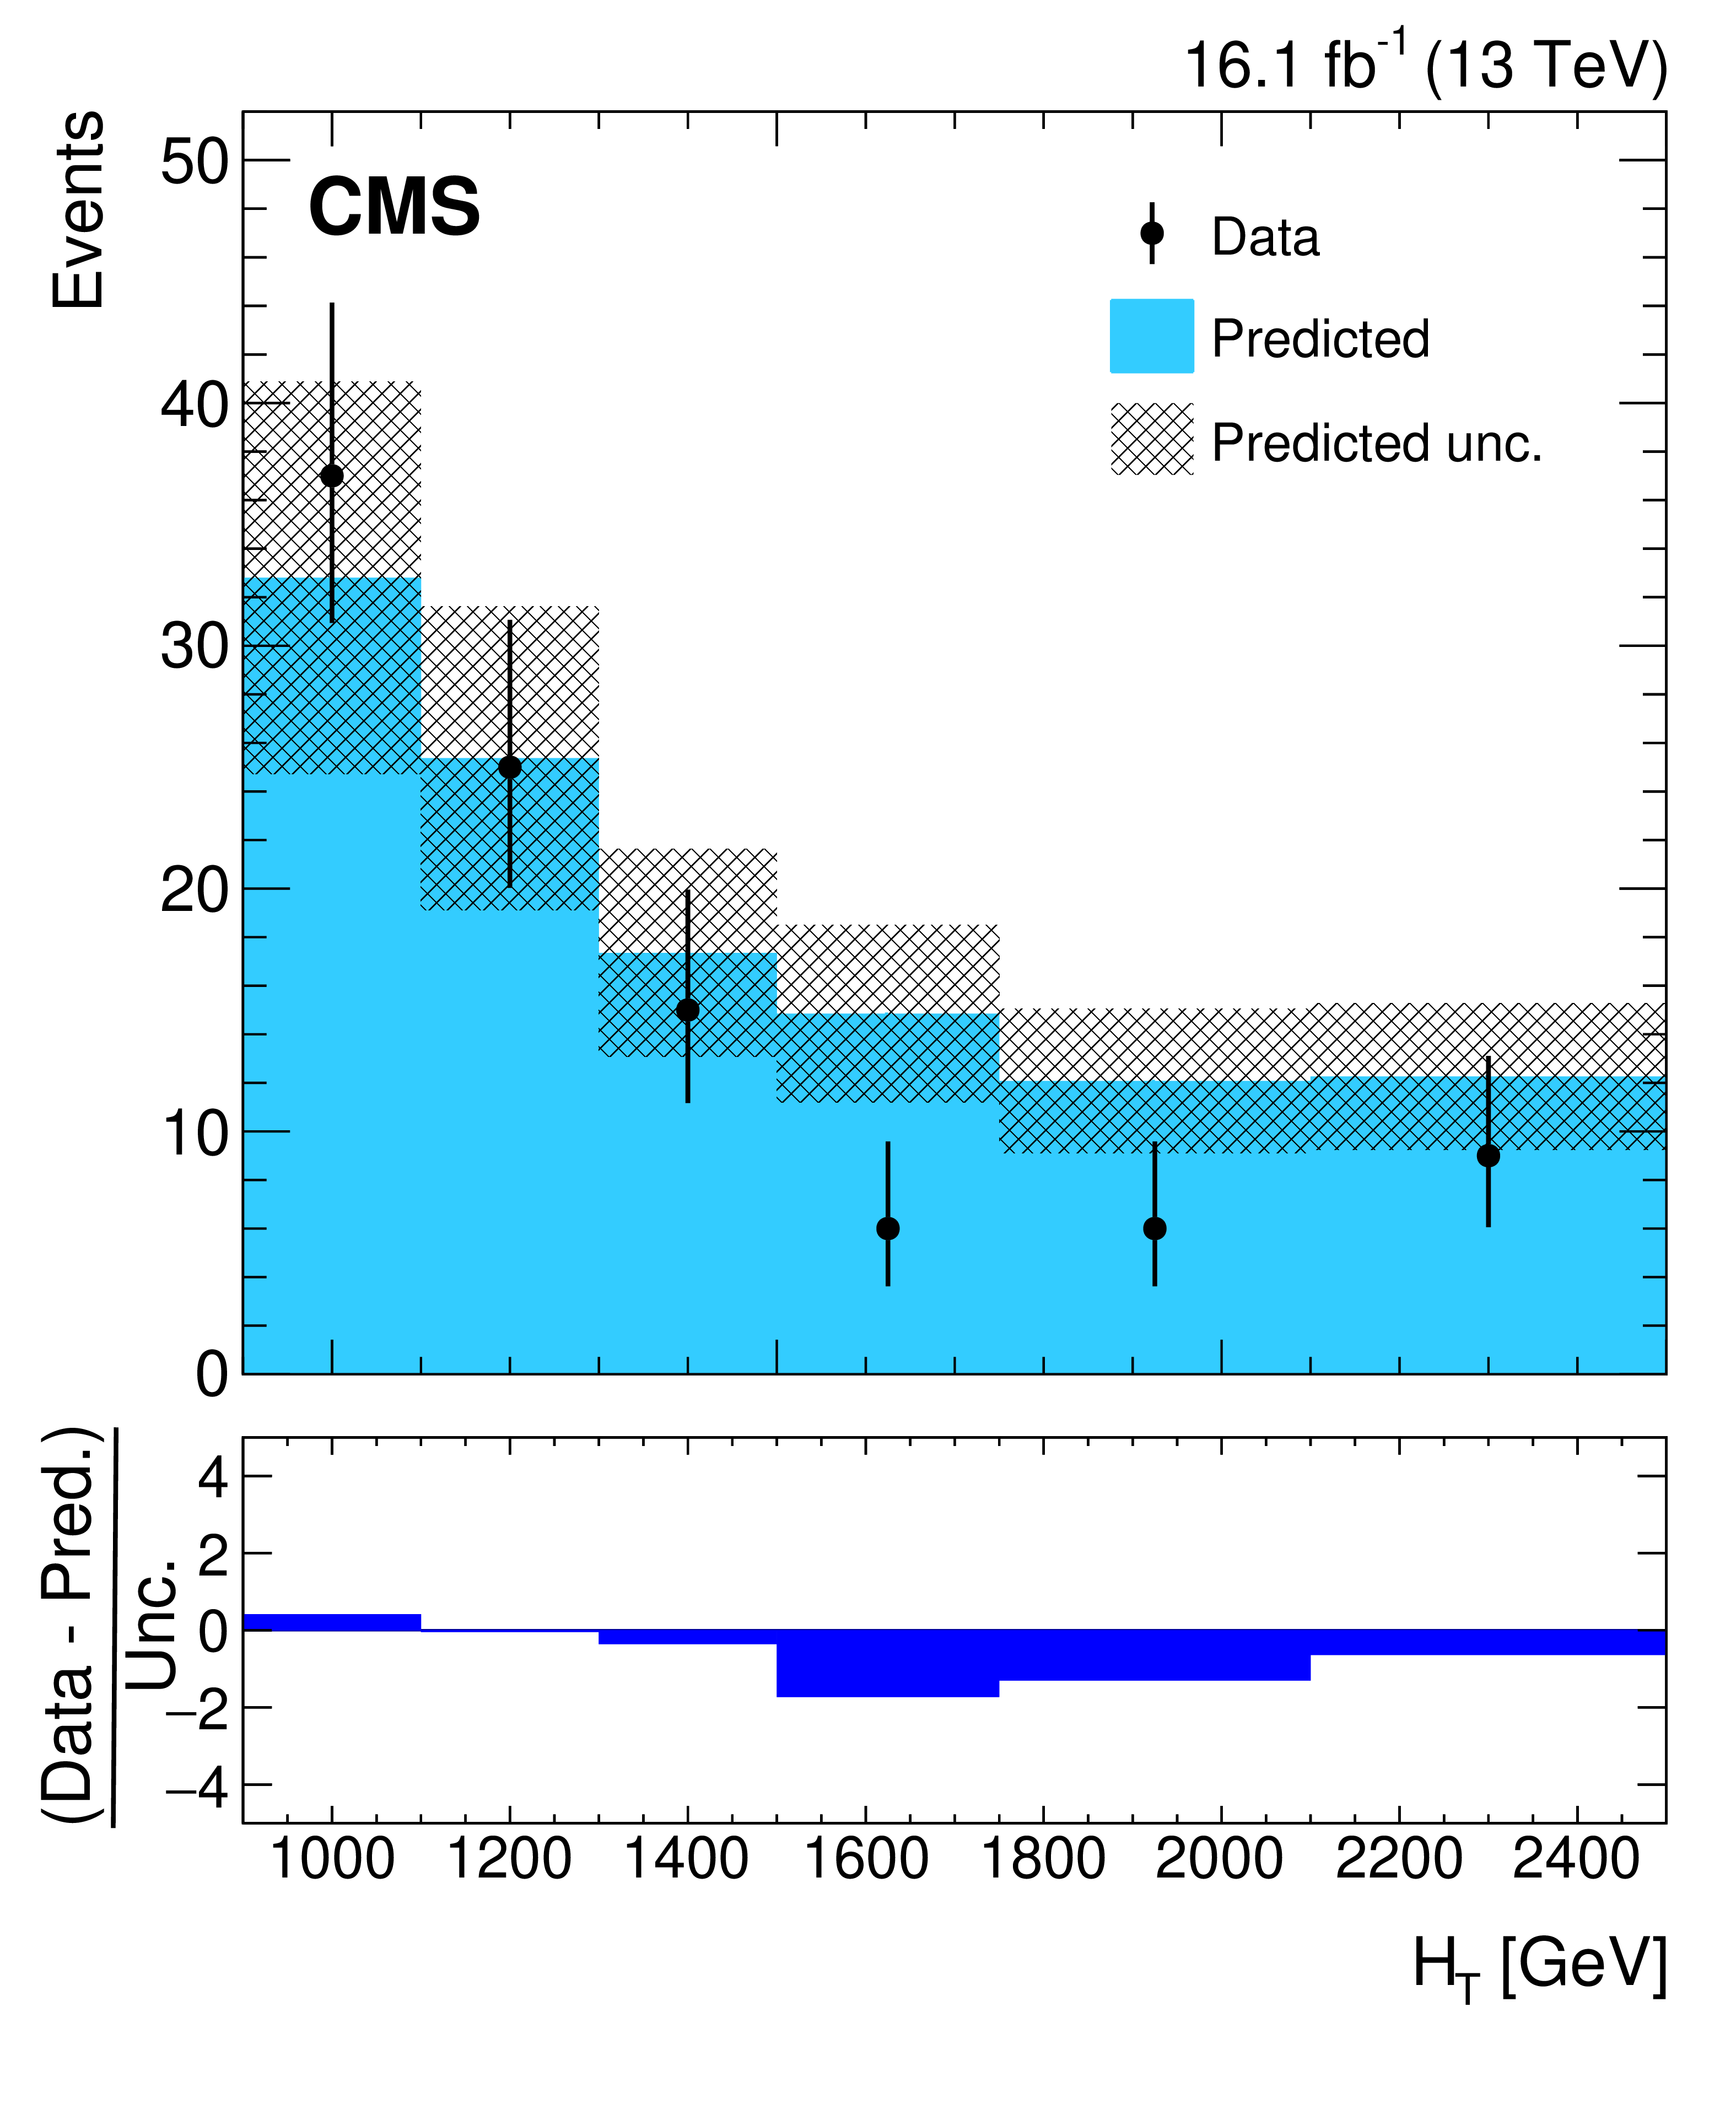
Figure 7:
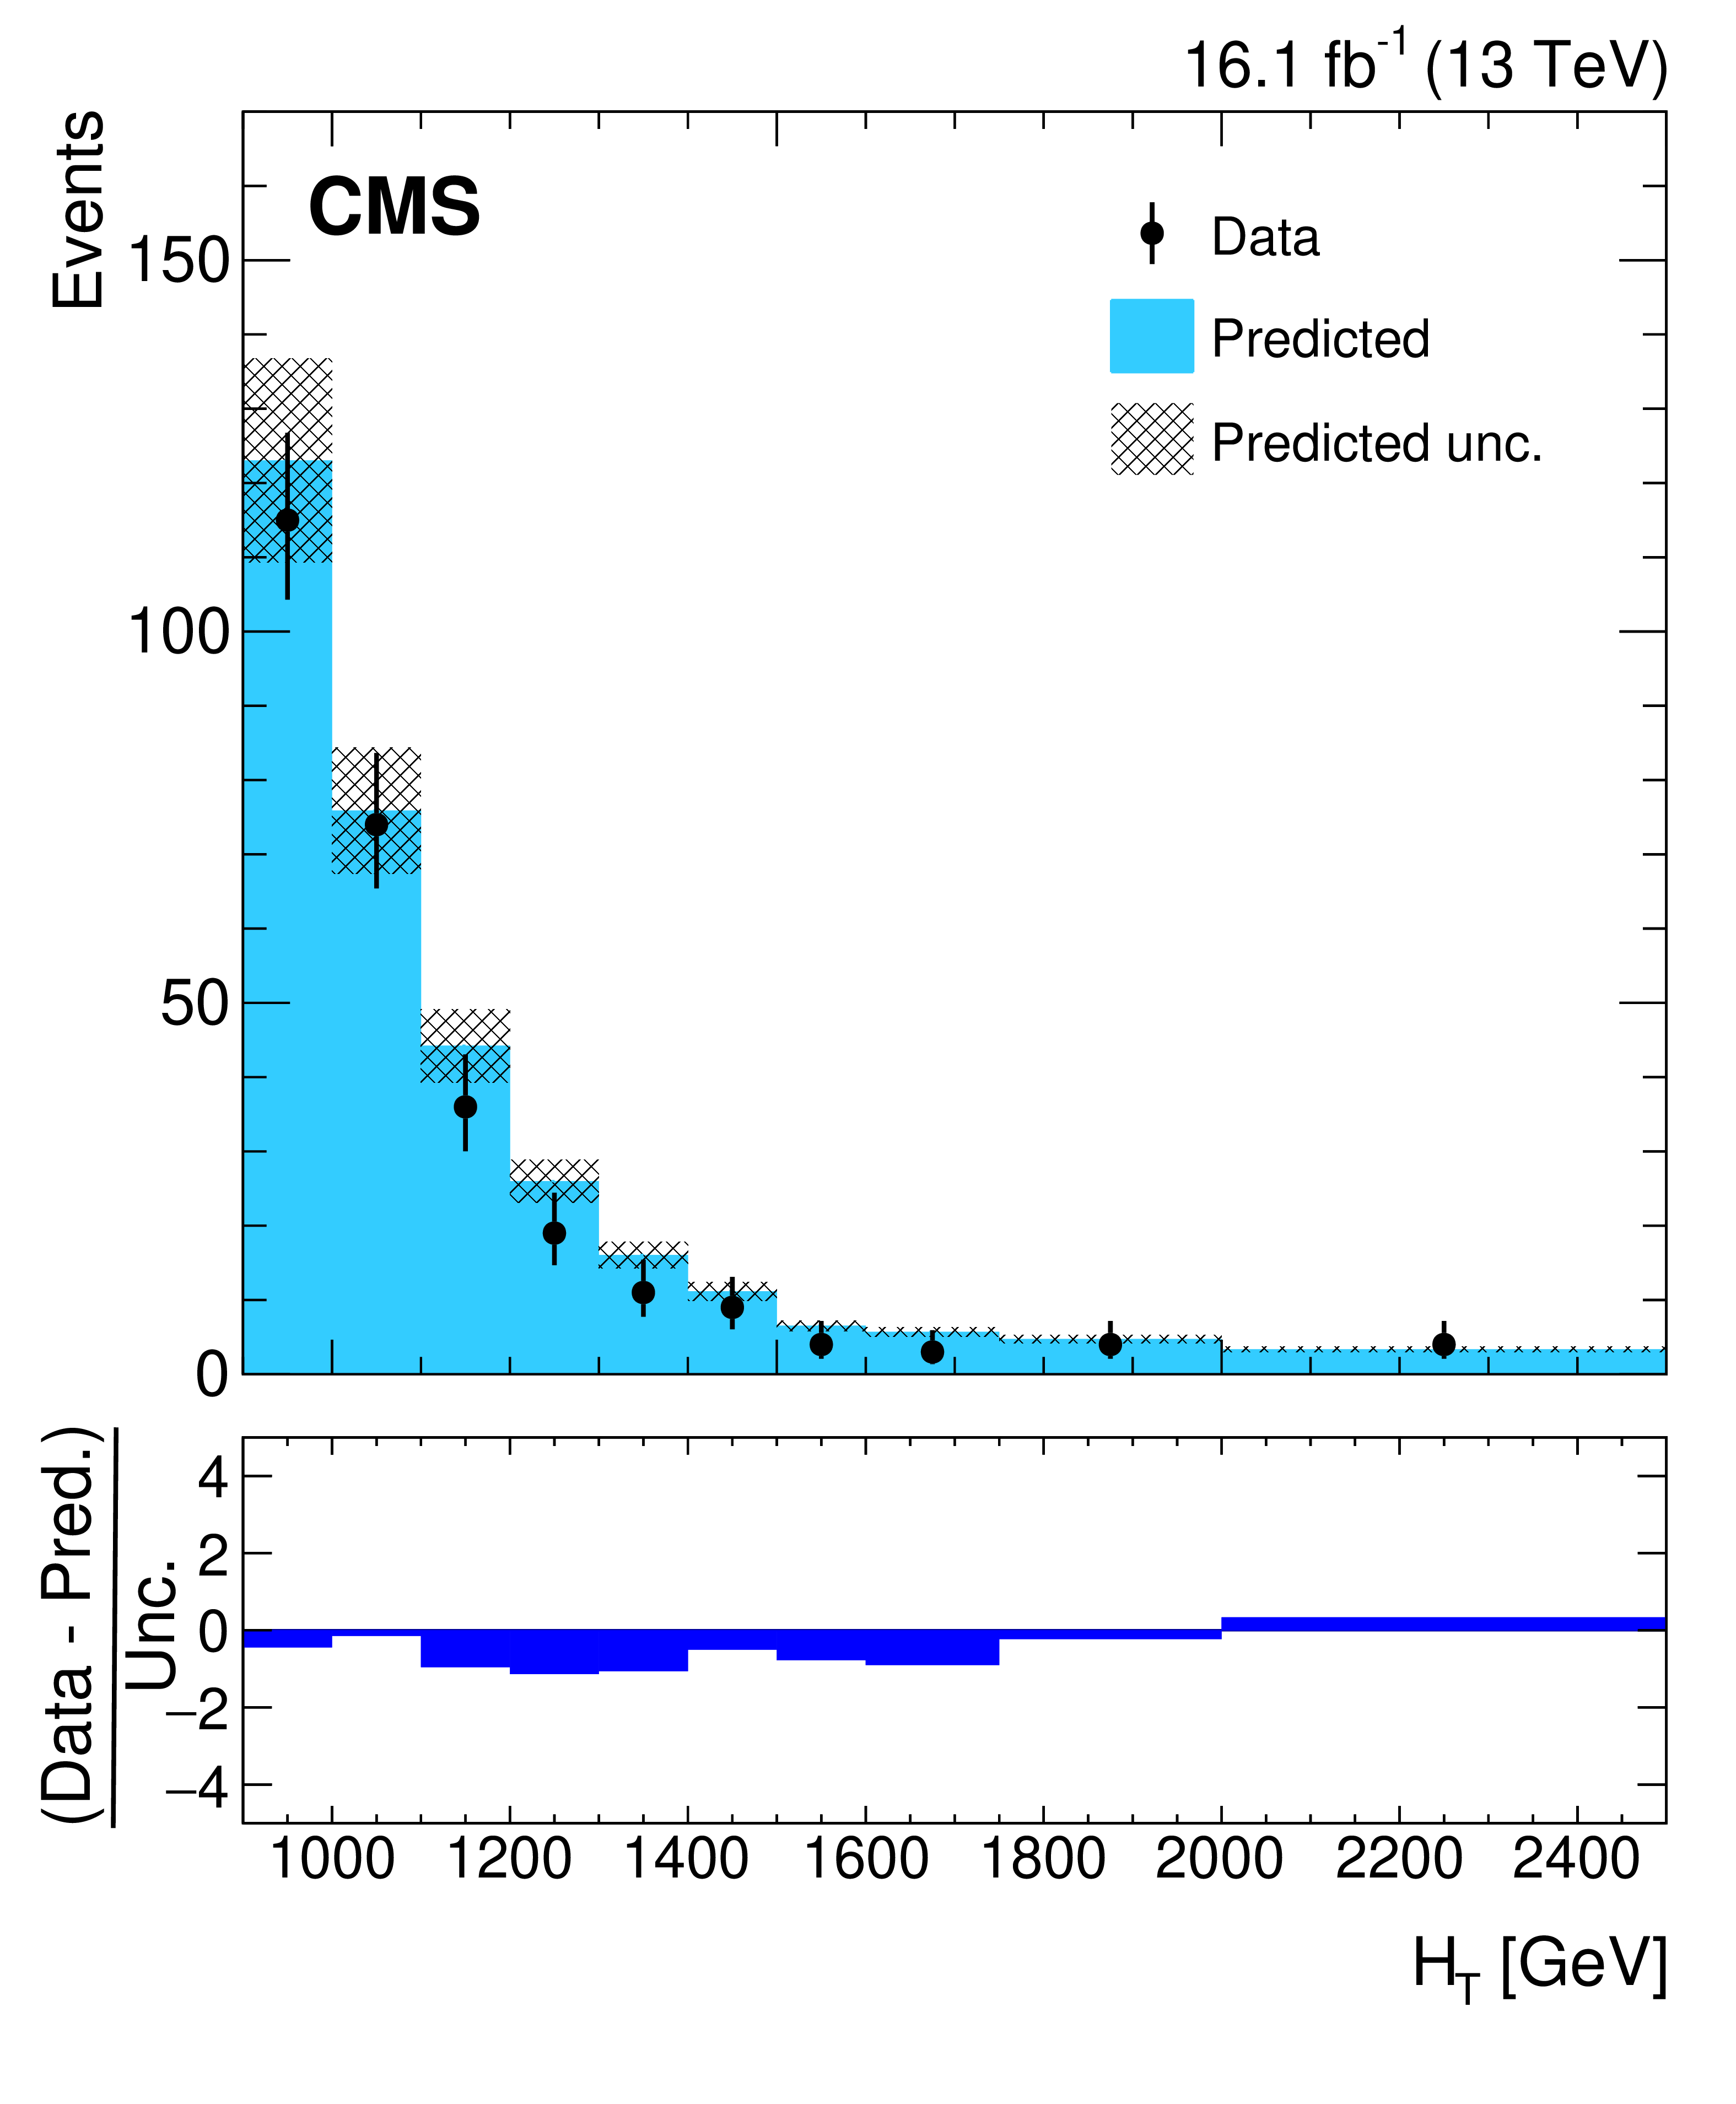
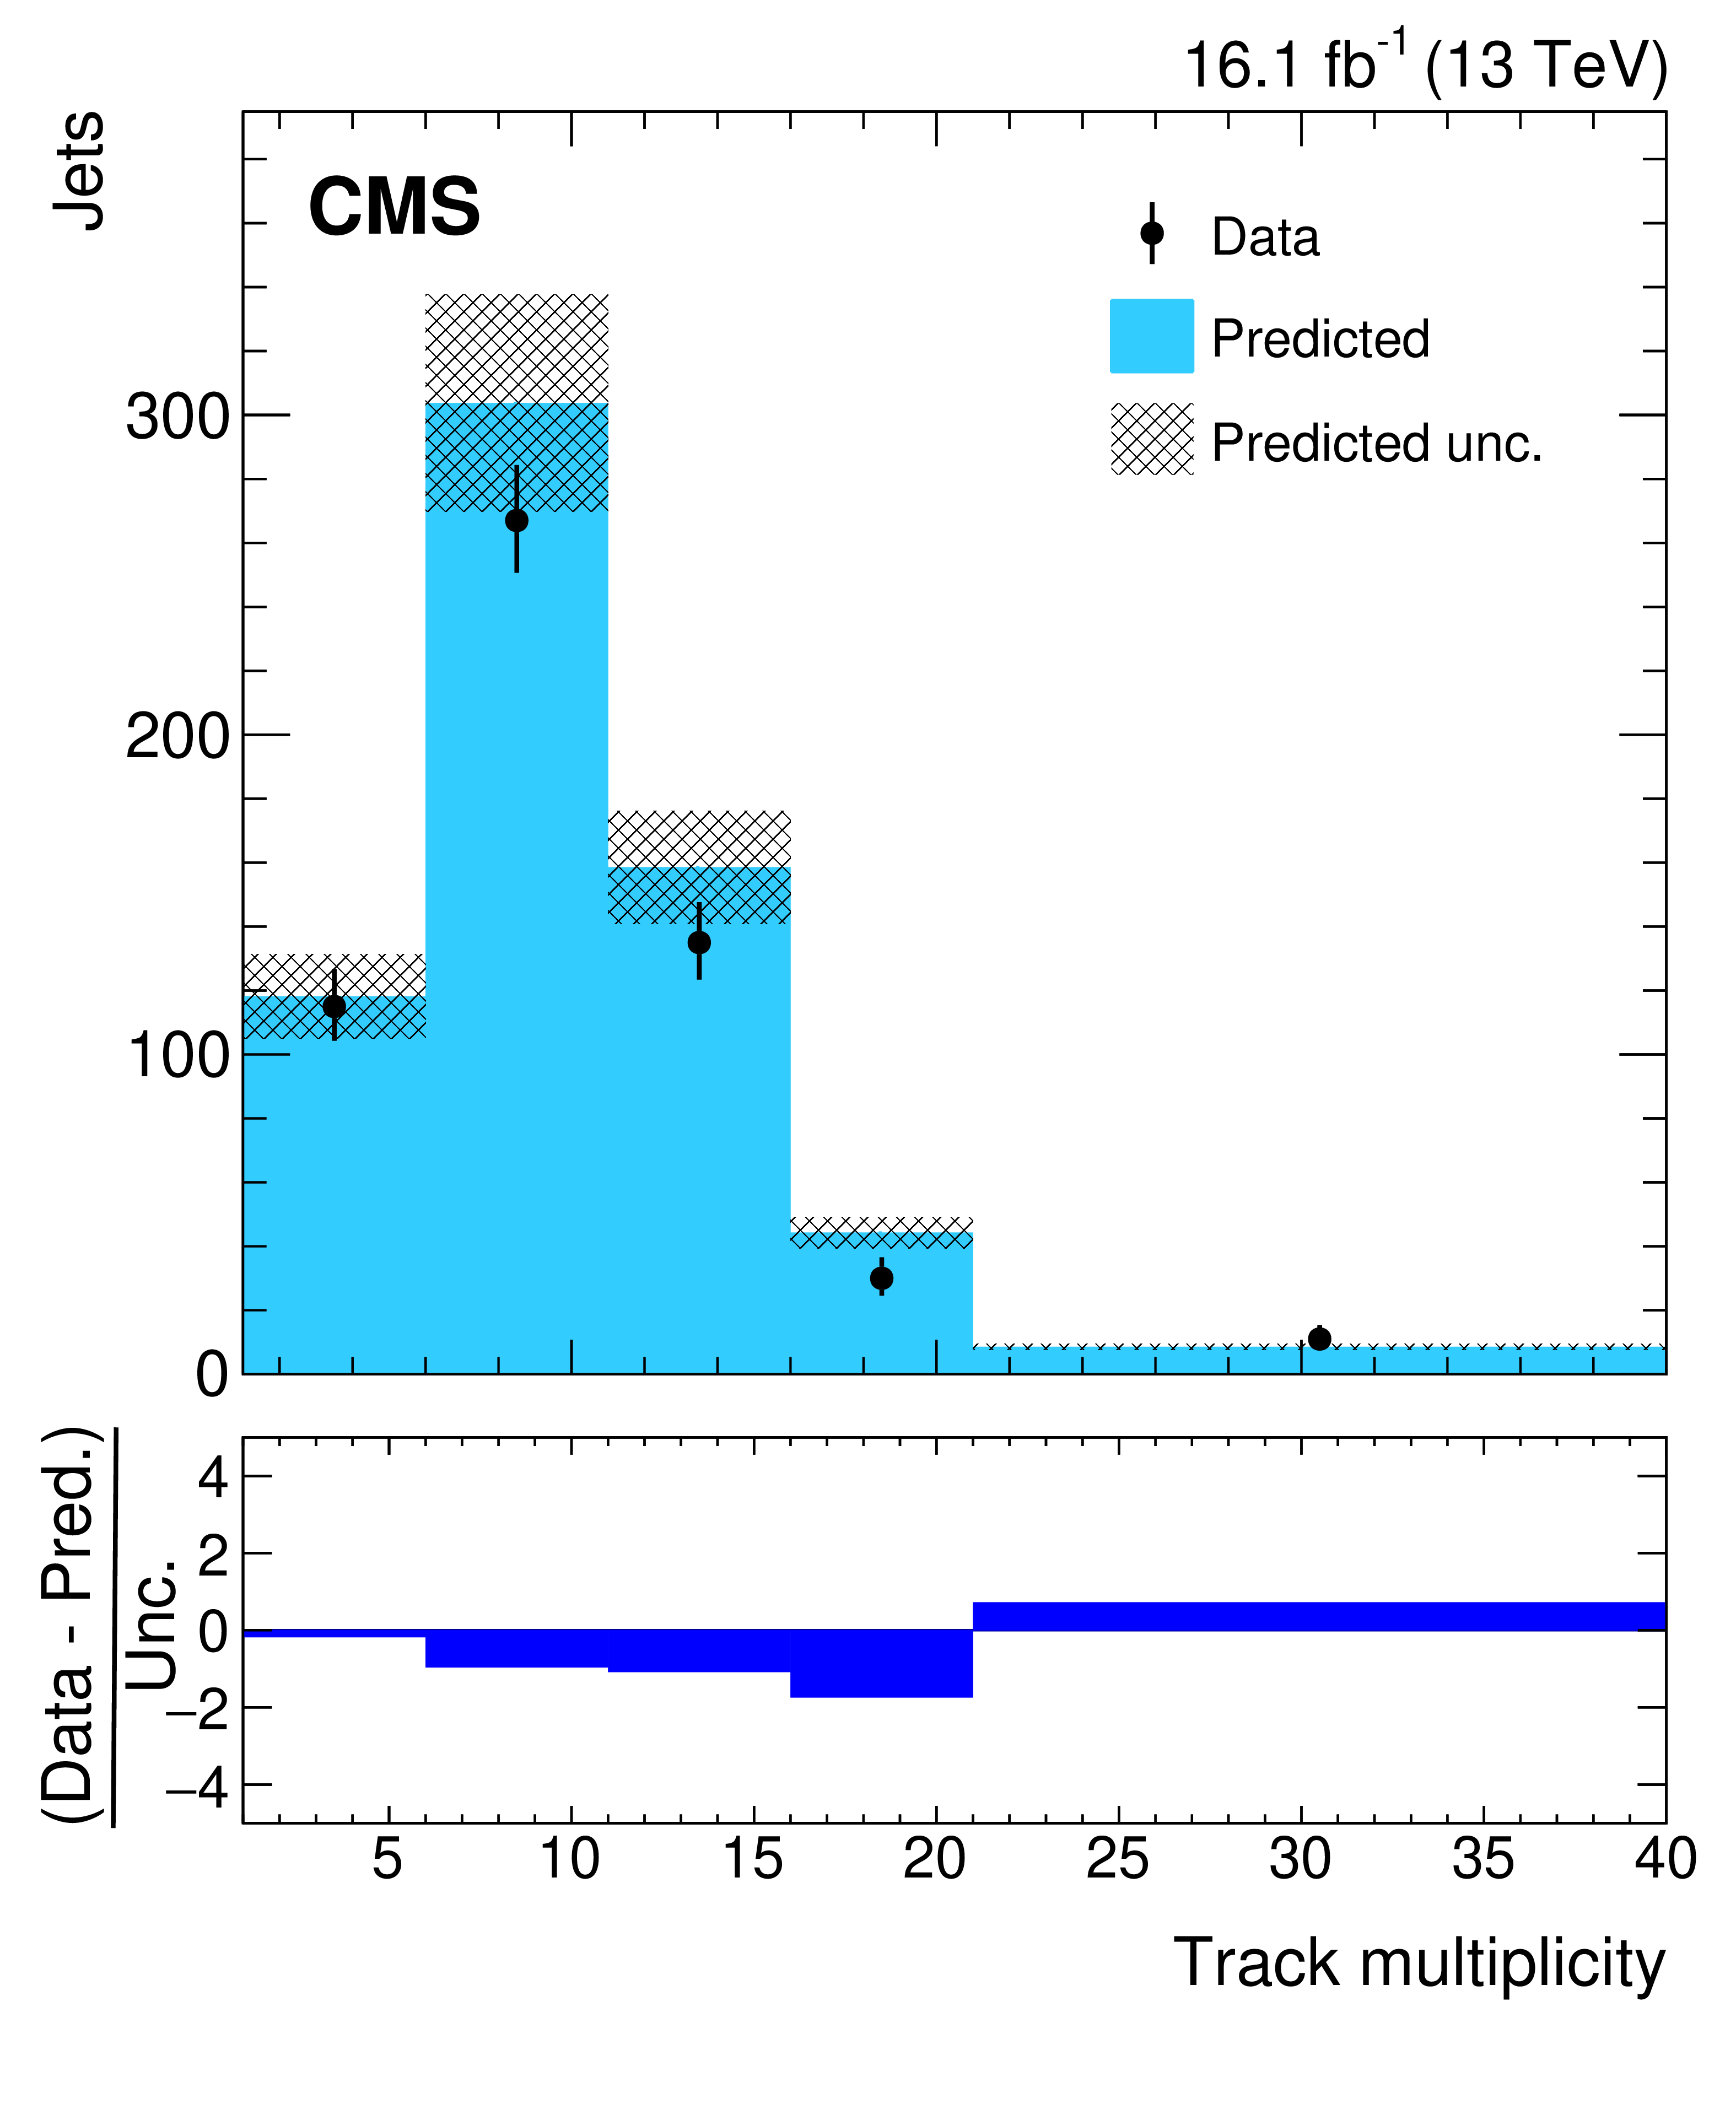
The $ {H_{\mathrm {T}}} $ (left) and number of associated tracks (right) distributions for the observed data events (black points) and the predicted background estimation (blue) for selection set 8 (SM QCD-enhanced), requiring at least two jets tagged by loose emerging jet criteria. The bottom panel shows the difference between observed data and predicted background, divided by the sum in quadrature of the statistical uncertainty in data and the predicted uncertainties from misidentification probability estimation. |
png pdf |
Figure 7-a:
The $ {H_{\mathrm {T}}} $ distribution for the observed data events (black points) and the predicted background estimation (blue) for selection set 8 (SM QCD-enhanced), requiring at least two jets tagged by loose emerging jet criteria. The bottom panel shows the difference between observed data and predicted background, divided by the sum in quadrature of the statistical uncertainty in data and the predicted uncertainties from misidentification probability estimation. |
png pdf |
Figure 7-b:
The number of associated tracks distribution for the observed data events (black points) and the predicted background estimation (blue) for selection set 8 (SM QCD-enhanced), requiring at least two jets tagged by loose emerging jet criteria. The bottom panel shows the difference between observed data and predicted background, divided by the sum in quadrature of the statistical uncertainty in data and the predicted uncertainties from misidentification probability estimation. |
png pdf |
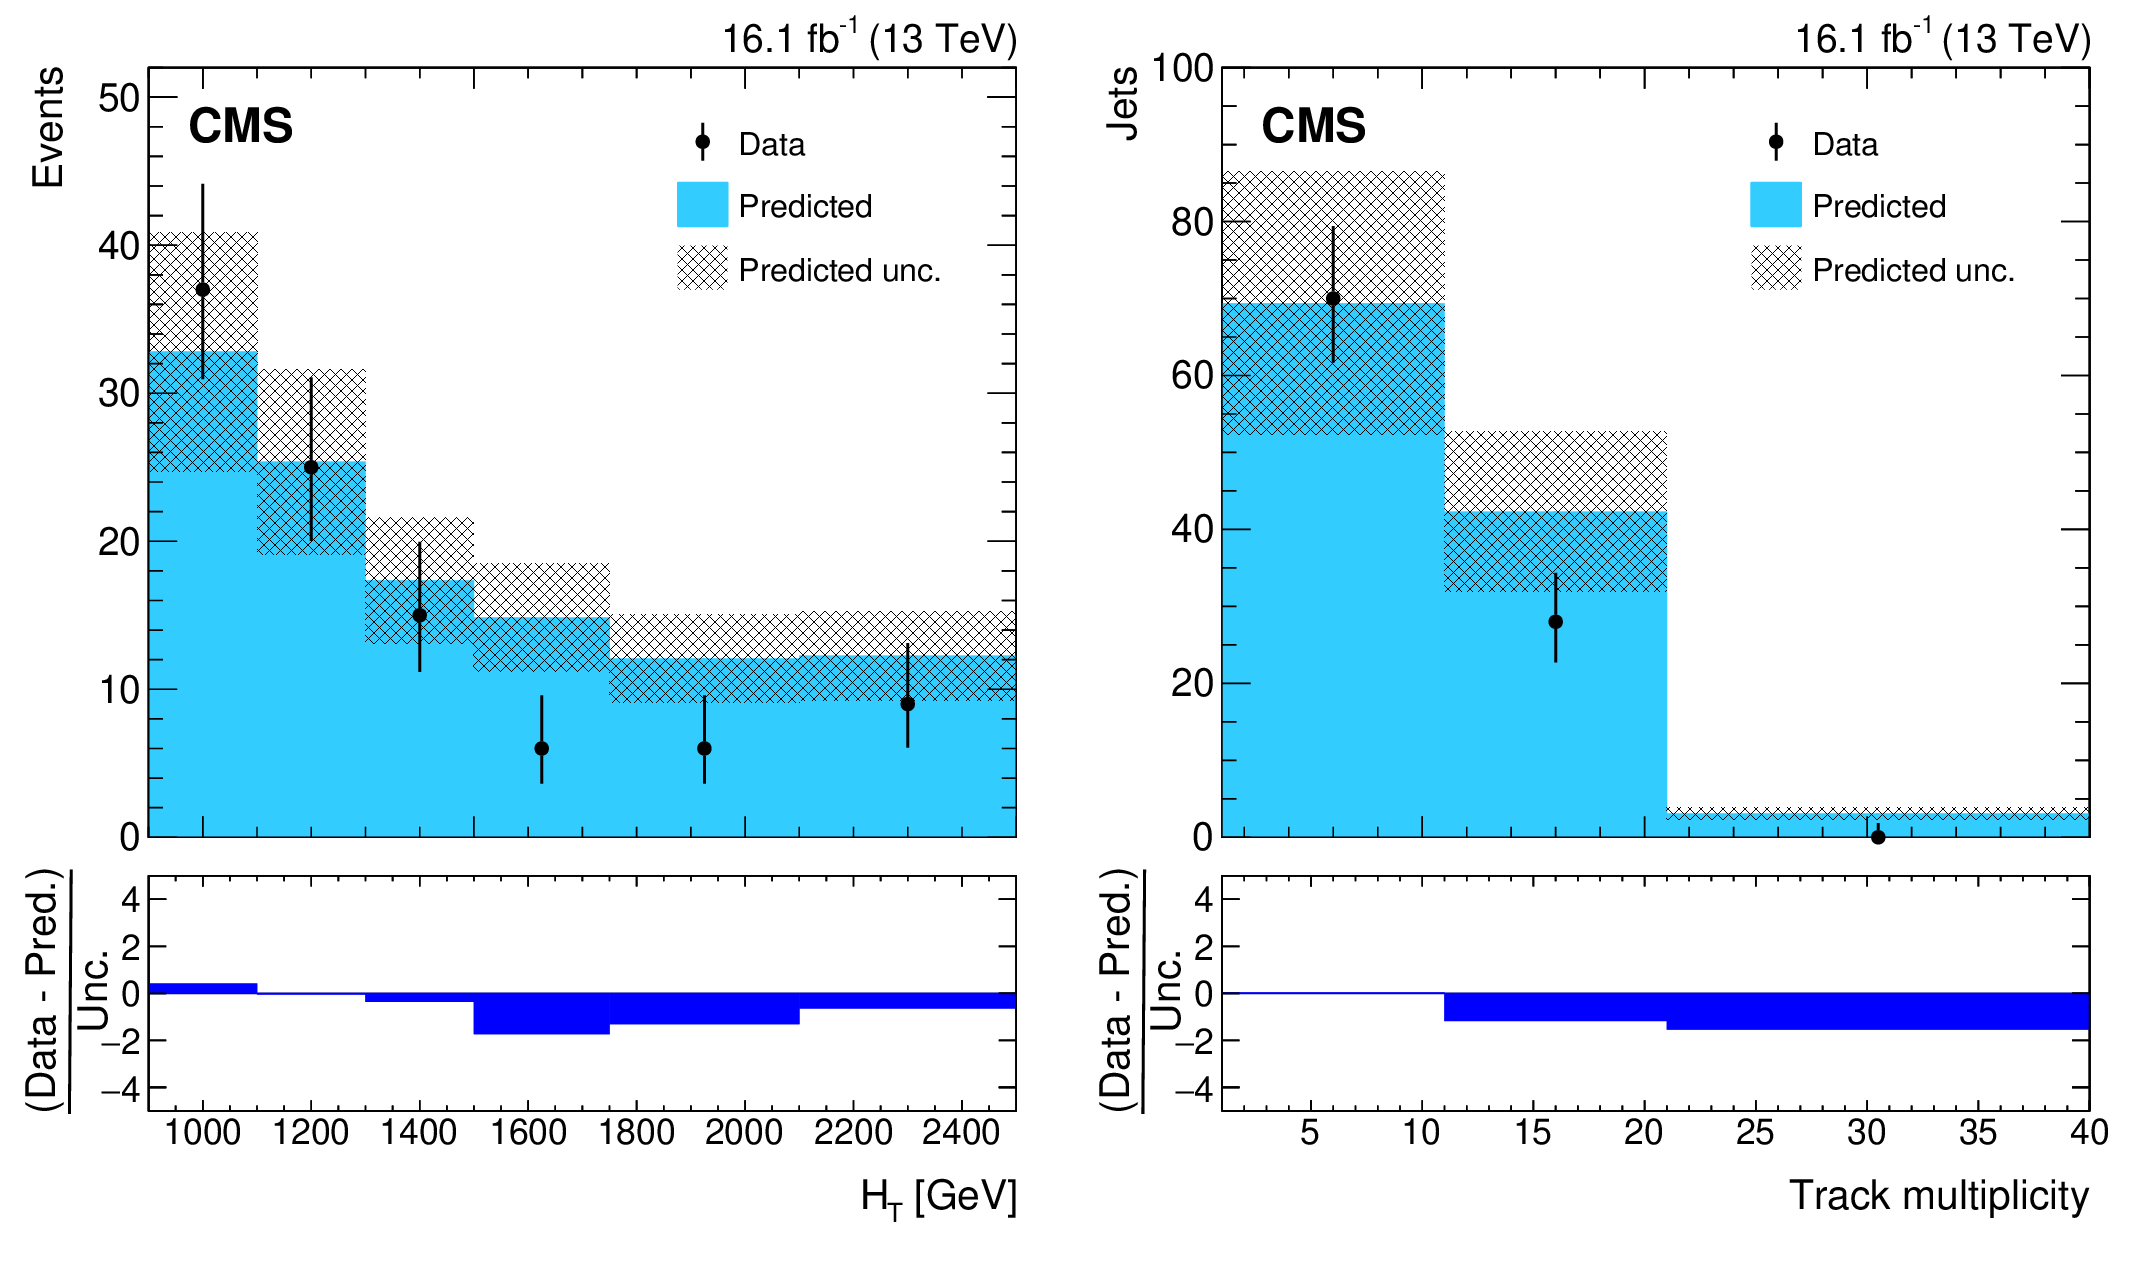
Figure 8:
The $ {H_{\mathrm {T}}} $ (left) and number of associated tracks (right) distributions of the observed data events (black points) and the predicted background estimation (blue) for selection set 9 (SM QCD-enhanced), requiring at least one jet tagged by loose emerging jet criteria and large $ {{p_{\mathrm {T}}} ^\text {miss}} $. The bottom panel shows the difference between observed data and predicted background, divided by the sum in quadrature of the statistical uncertainty in data and the predicted uncertainties from misidentification probability estimation. |
png pdf |
Figure 8-a:
The $ {H_{\mathrm {T}}} $ distribution of the observed data events (black points) and the predicted background estimation (blue) for selection set 9 (SM QCD-enhanced), requiring at least one jet tagged by loose emerging jet criteria and large $ {{p_{\mathrm {T}}} ^\text {miss}} $. The bottom panel shows the difference between observed data and predicted background, divided by the sum in quadrature of the statistical uncertainty in data and the predicted uncertainties from misidentification probability estimation. |

png pdf |
Figure 8-b:
The number of associated tracks distribution of the observed data events (black points) and the predicted background estimation (blue) for selection set 9 (SM QCD-enhanced), requiring at least one jet tagged by loose emerging jet criteria and large $ {{p_{\mathrm {T}}} ^\text {miss}} $. The bottom panel shows the difference between observed data and predicted background, divided by the sum in quadrature of the statistical uncertainty in data and the predicted uncertainties from misidentification probability estimation. |
png pdf |
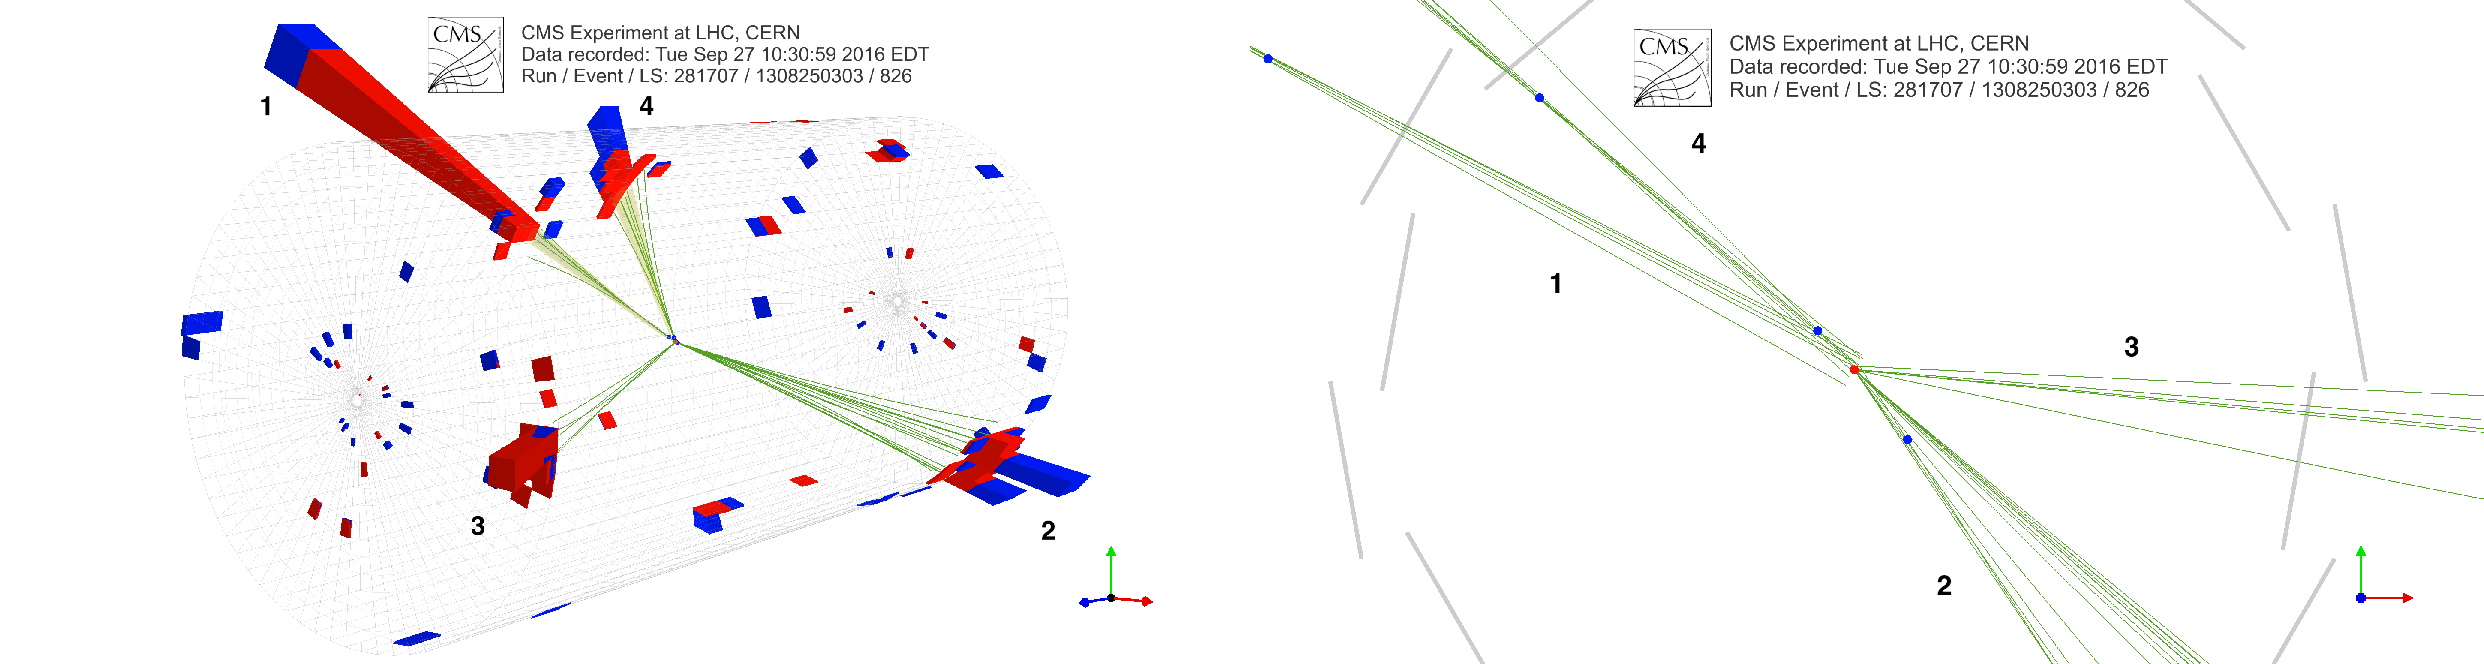
Figure 9:
Event display of an event passing both selection set 1 and selection set 5. The event contains four jets (jets 1 and 4 pass the emerging jet criteria), consistent with the decay of two massive mediator particles, each decaying to an SM quark and a dark QCD quark. In such a scenario, the dark mesons produced in the fragmentation of the dark quark would decay back to SM particles via the mediator, resulting in displaced vertices with decay distances on the mm scale. (Left) 3D display: the green lines represent reconstructed tracks, the red (blue) truncated pyramids represent energy in the ECAL (HCAL) detectors, respectively. (Right) Reconstructed tracks in $\rho $-$\phi $ view. The filled blue circles represent reconstructed secondary vertices, while the filled red circle is the PV. The solid grey lines represent the innermost layer of the silicon pixel detector. |

png |
Figure 9-a:
Event display of an event passing both selection set 1 and selection set 5. The event contains four jets (jets 1 and 4 pass the emerging jet criteria), consistent with the decay of two massive mediator particles, each decaying to an SM quark and a dark QCD quark. In such a scenario, the dark mesons produced in the fragmentation of the dark quark would decay back to SM particles via the mediator, resulting in displaced vertices with decay distances on the mm scale. 3D display: the green lines represent reconstructed tracks, the red (blue) truncated pyramids represent energy in the ECAL (HCAL) detectors, respectively. |
png |
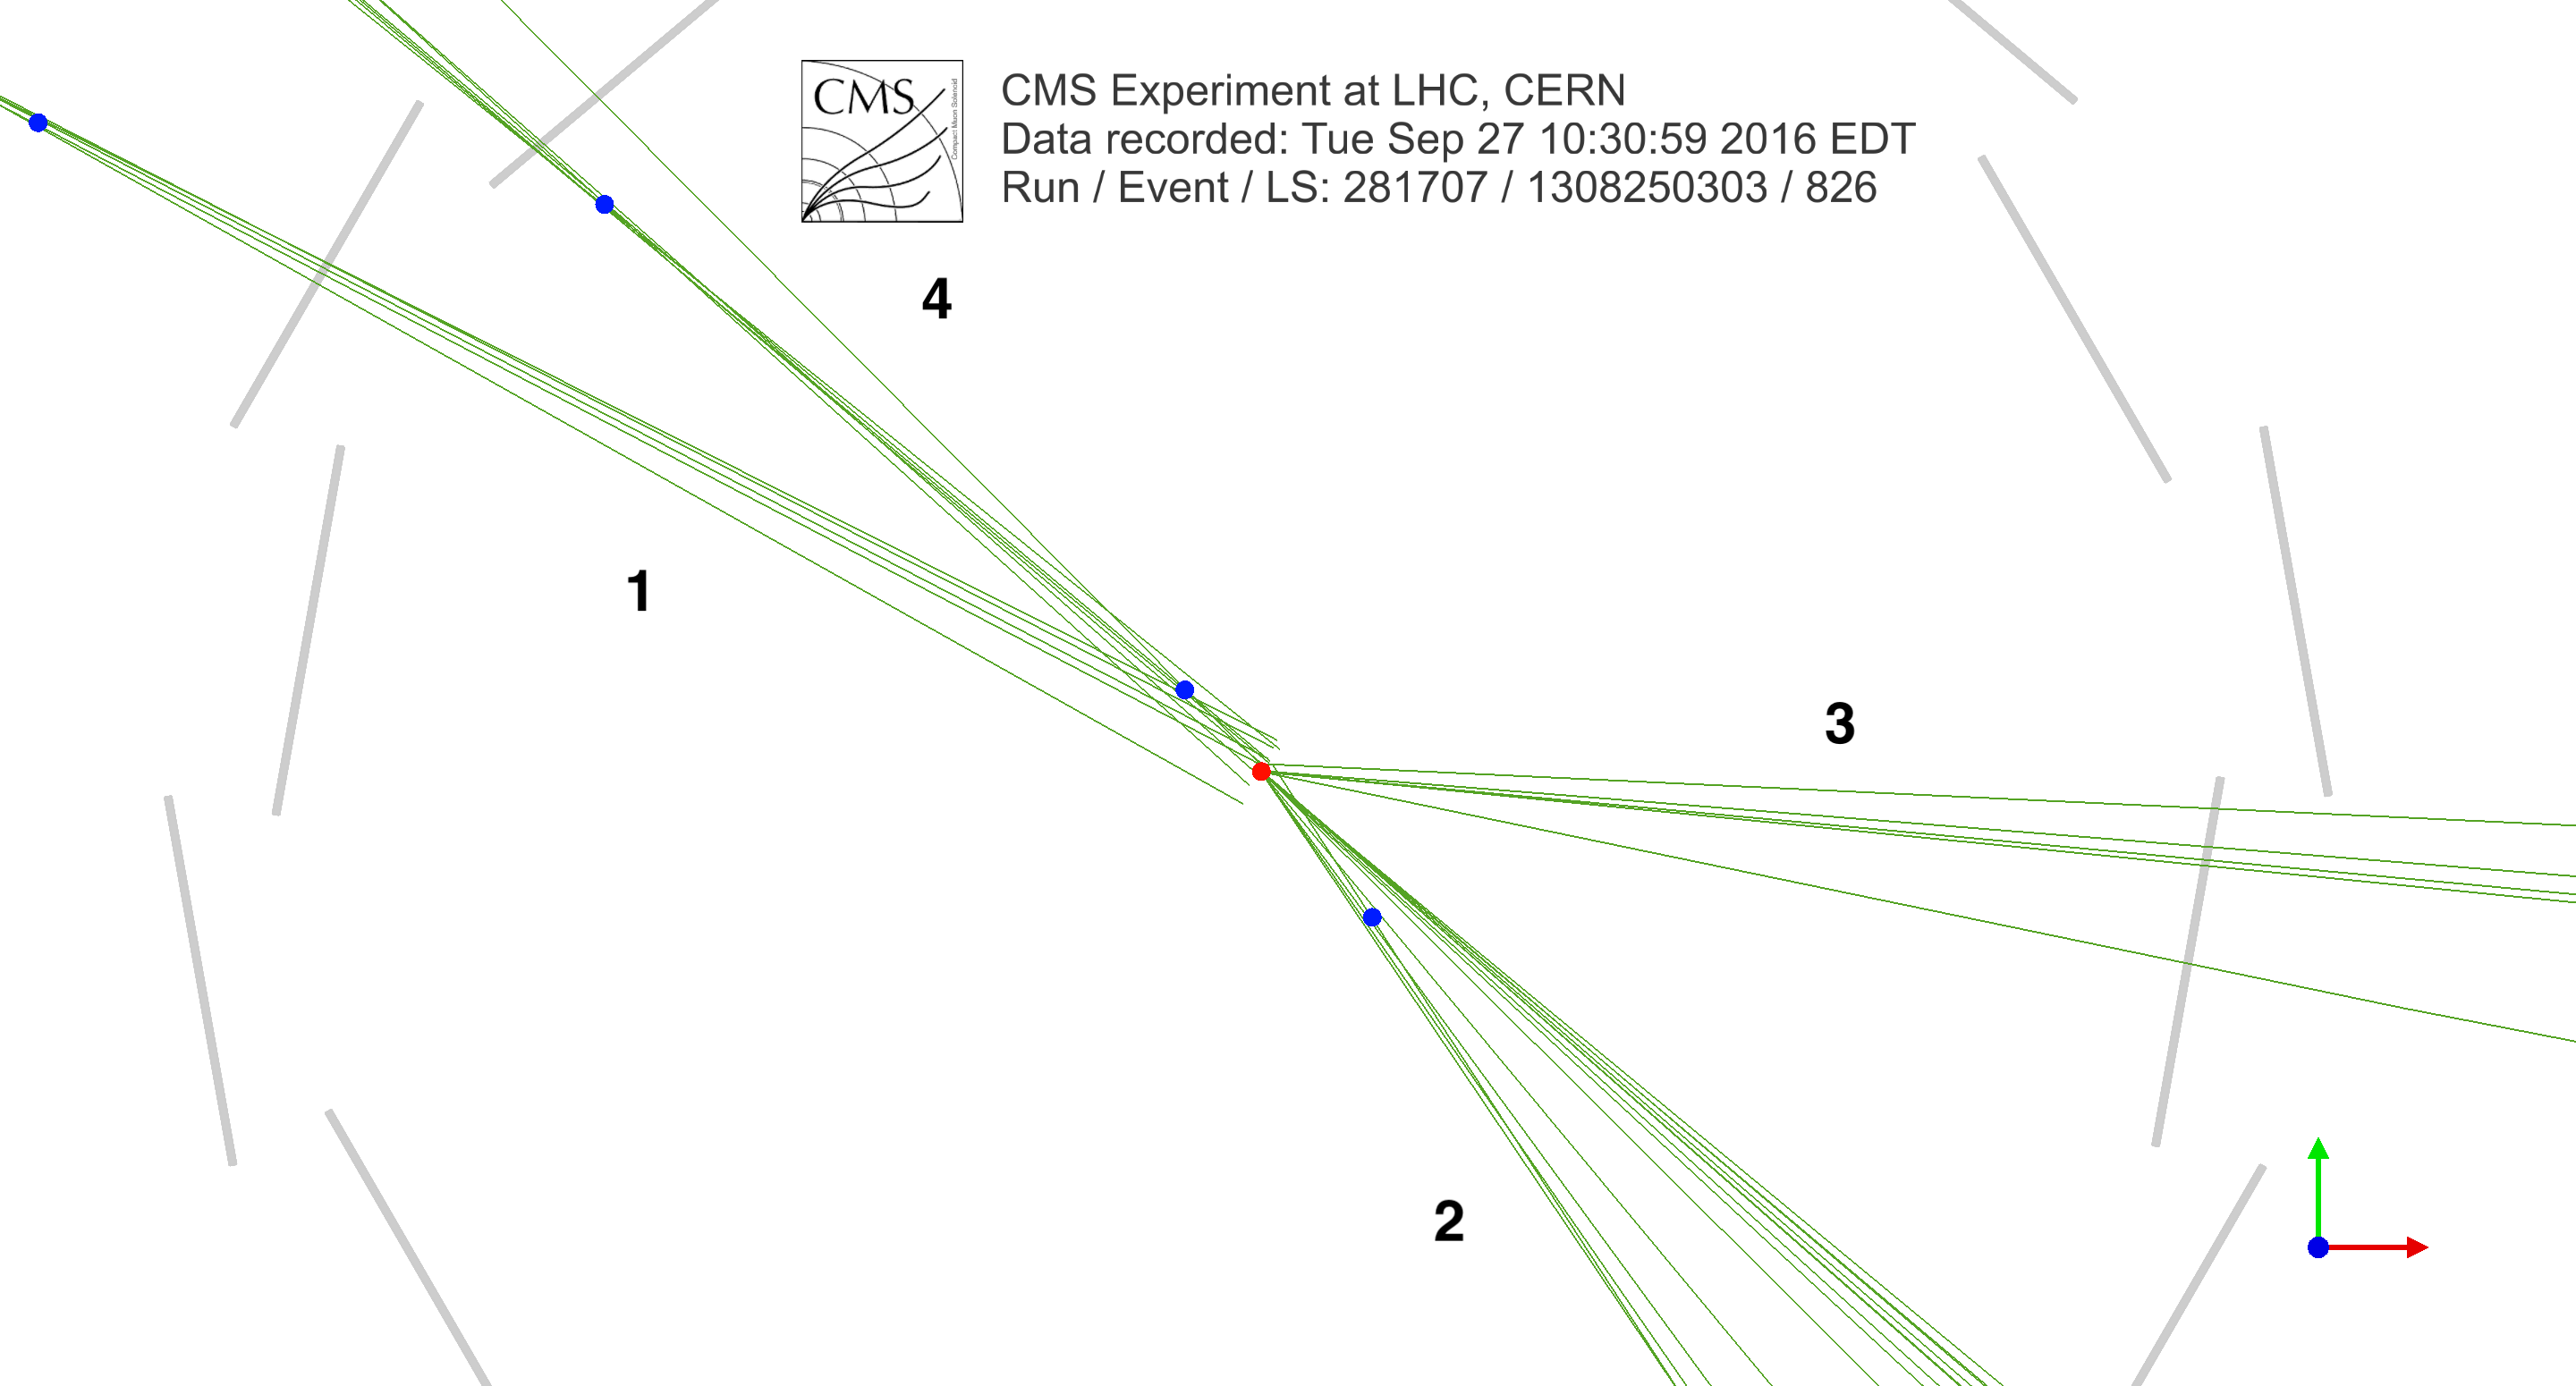
Figure 9-b:
Event display of an event passing both selection set 1 and selection set 5. The event contains four jets (jets 1 and 4 pass the emerging jet criteria), consistent with the decay of two massive mediator particles, each decaying to an SM quark and a dark QCD quark. In such a scenario, the dark mesons produced in the fragmentation of the dark quark would decay back to SM particles via the mediator, resulting in displaced vertices with decay distances on the mm scale. Reconstructed tracks in $\rho $-$\phi $ view. The filled blue circles represent reconstructed secondary vertices, while the filled red circle is the PV. The solid grey lines represent the innermost layer of the silicon pixel detector. |
png pdf |
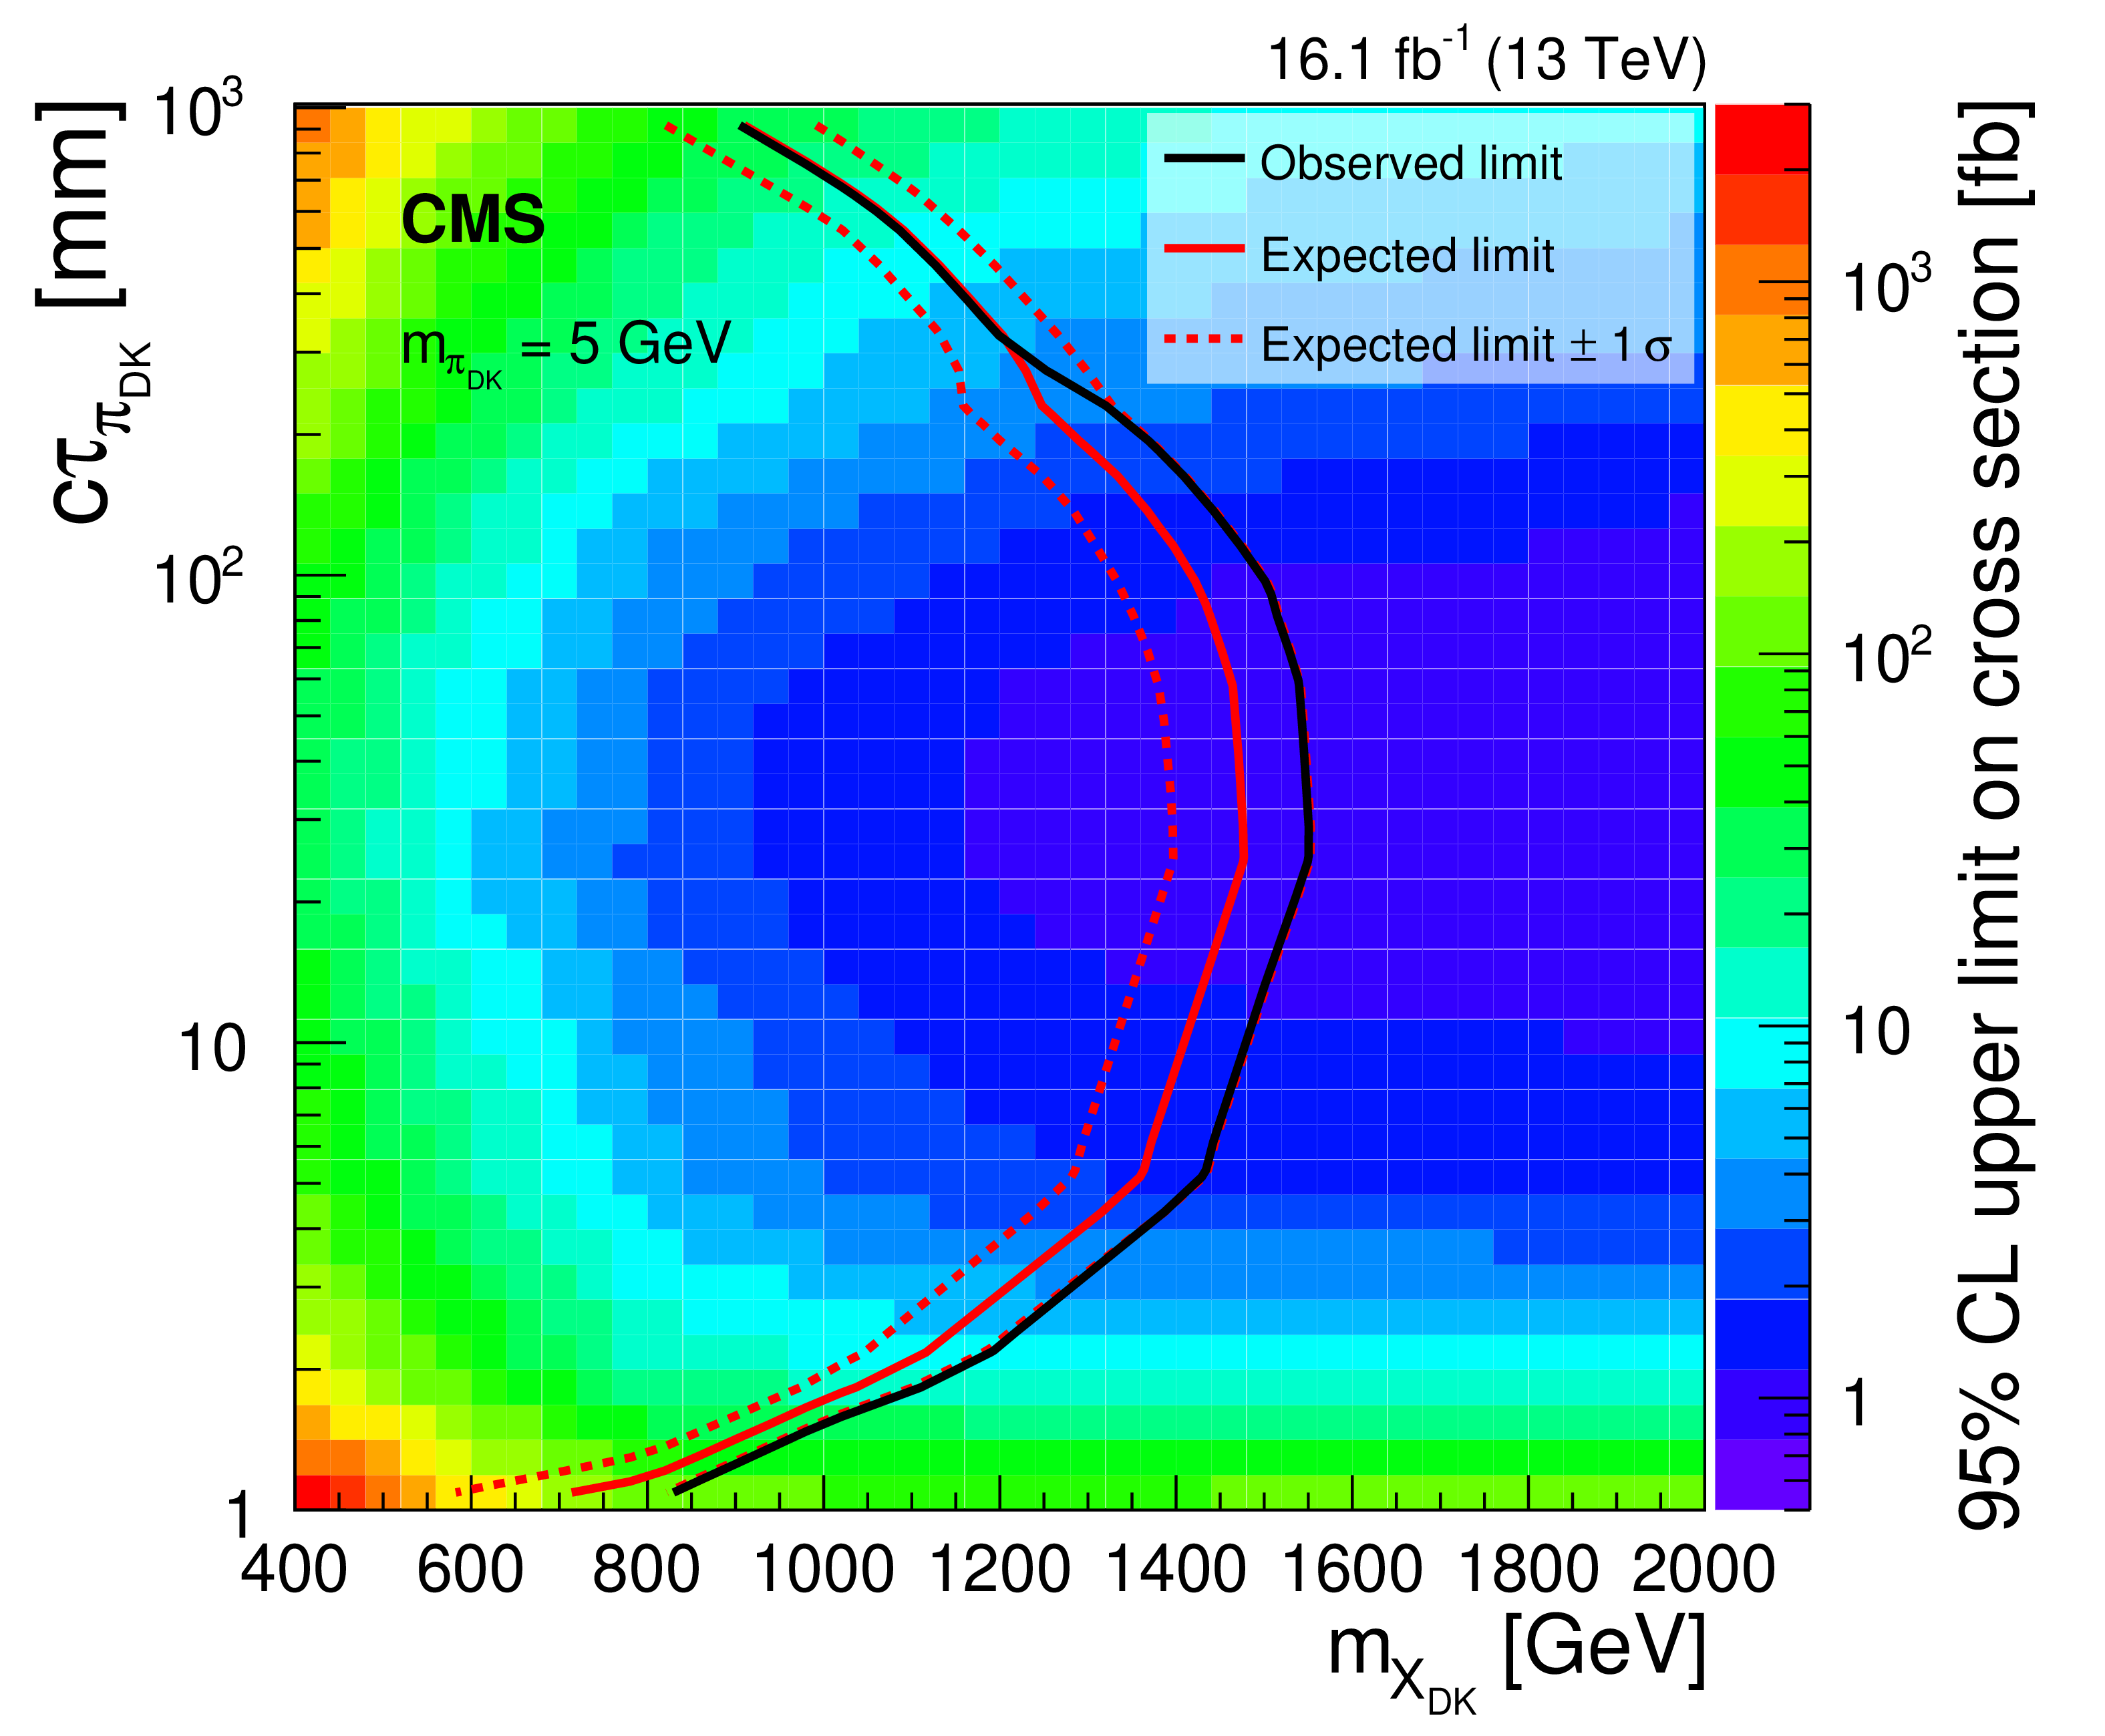
Figure 10:
Upper limits at 95% CL on the signal cross section and signal exclusion contours derived from theoretical cross sections for models with dark pion mass $ {m_{\pi _\mathrm {DK}}} $ of 5 GeV in the $ {m_{\mathrm {X_{DK}}}} $-$ {c\tau _{\pi _\mathrm {DK}}} $ plane. The solid red contour is the expected upper limit, with its one standard-deviation region enclosed in red dashed lines. The solid black contour is the observed upper limit. The region to the left of the observed contour is excluded. |
| Tables | |
png pdf |
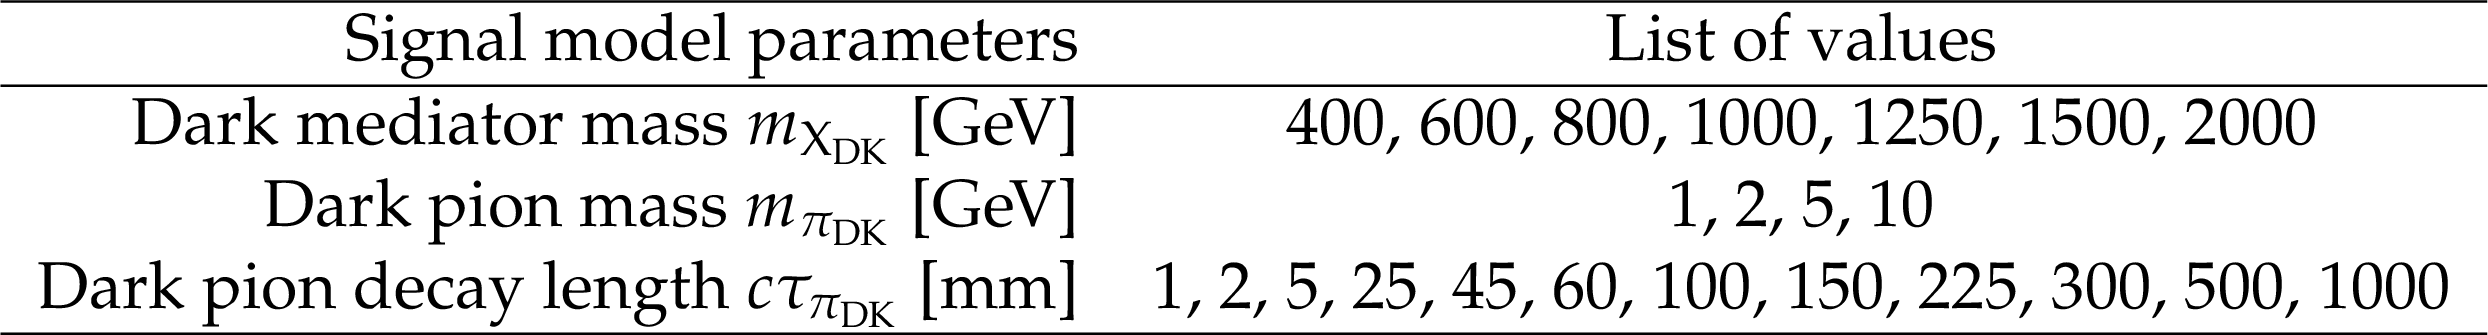
Table 1:
Parameters used in generating the 336 simulated signal event samples. A sample corresponding to a single model was created for each possible set of parameter values. |
png pdf |
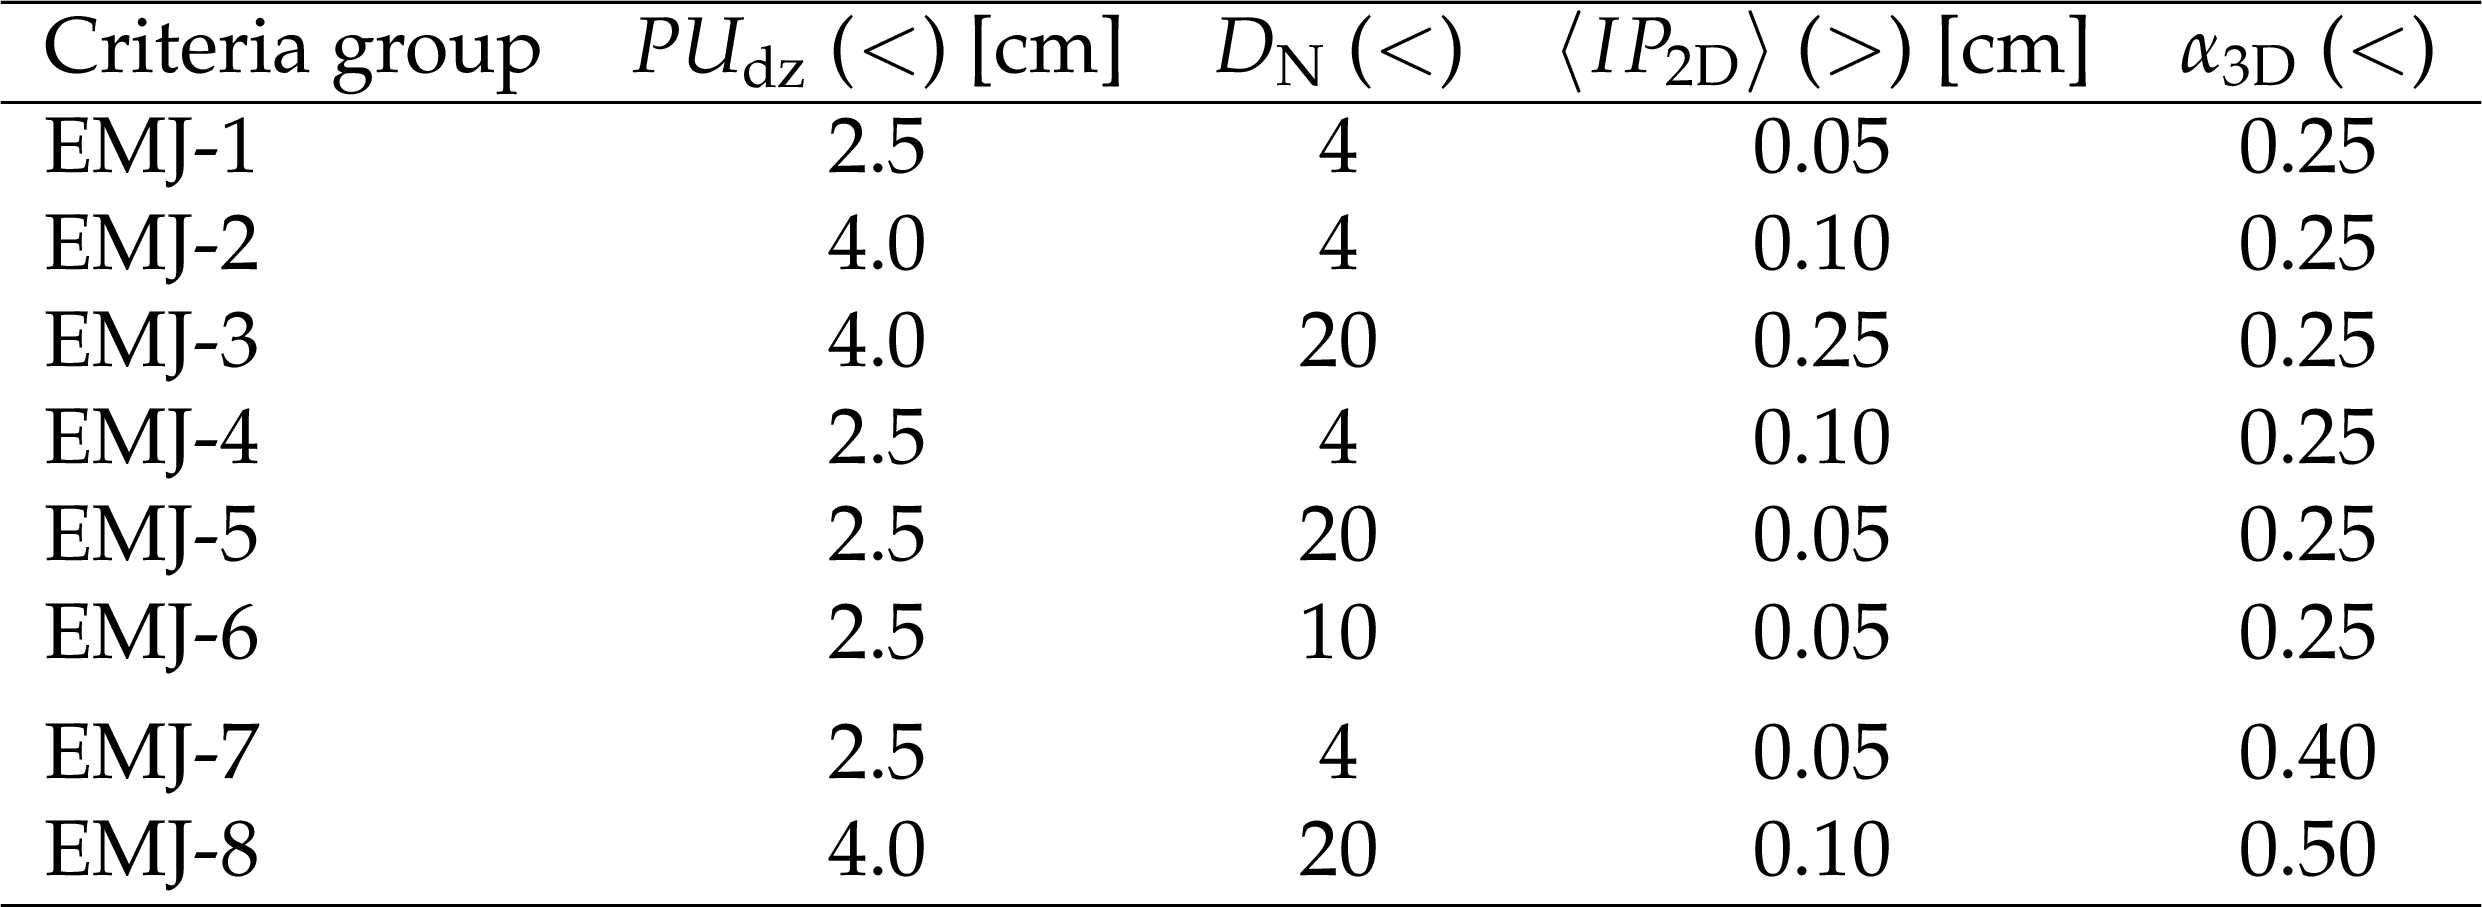
Table 2:
Groups of requirements (associated operator indicated in parentheses) on the variables used in the identification of emerging jets. The groups EMJ-1 to -6 are used for the selection sets that define the signal regions, while the groups EMJ-7 and -8 are used to define SM QCD-enhanced samples for the tests of the background estimation methods. |
png pdf |
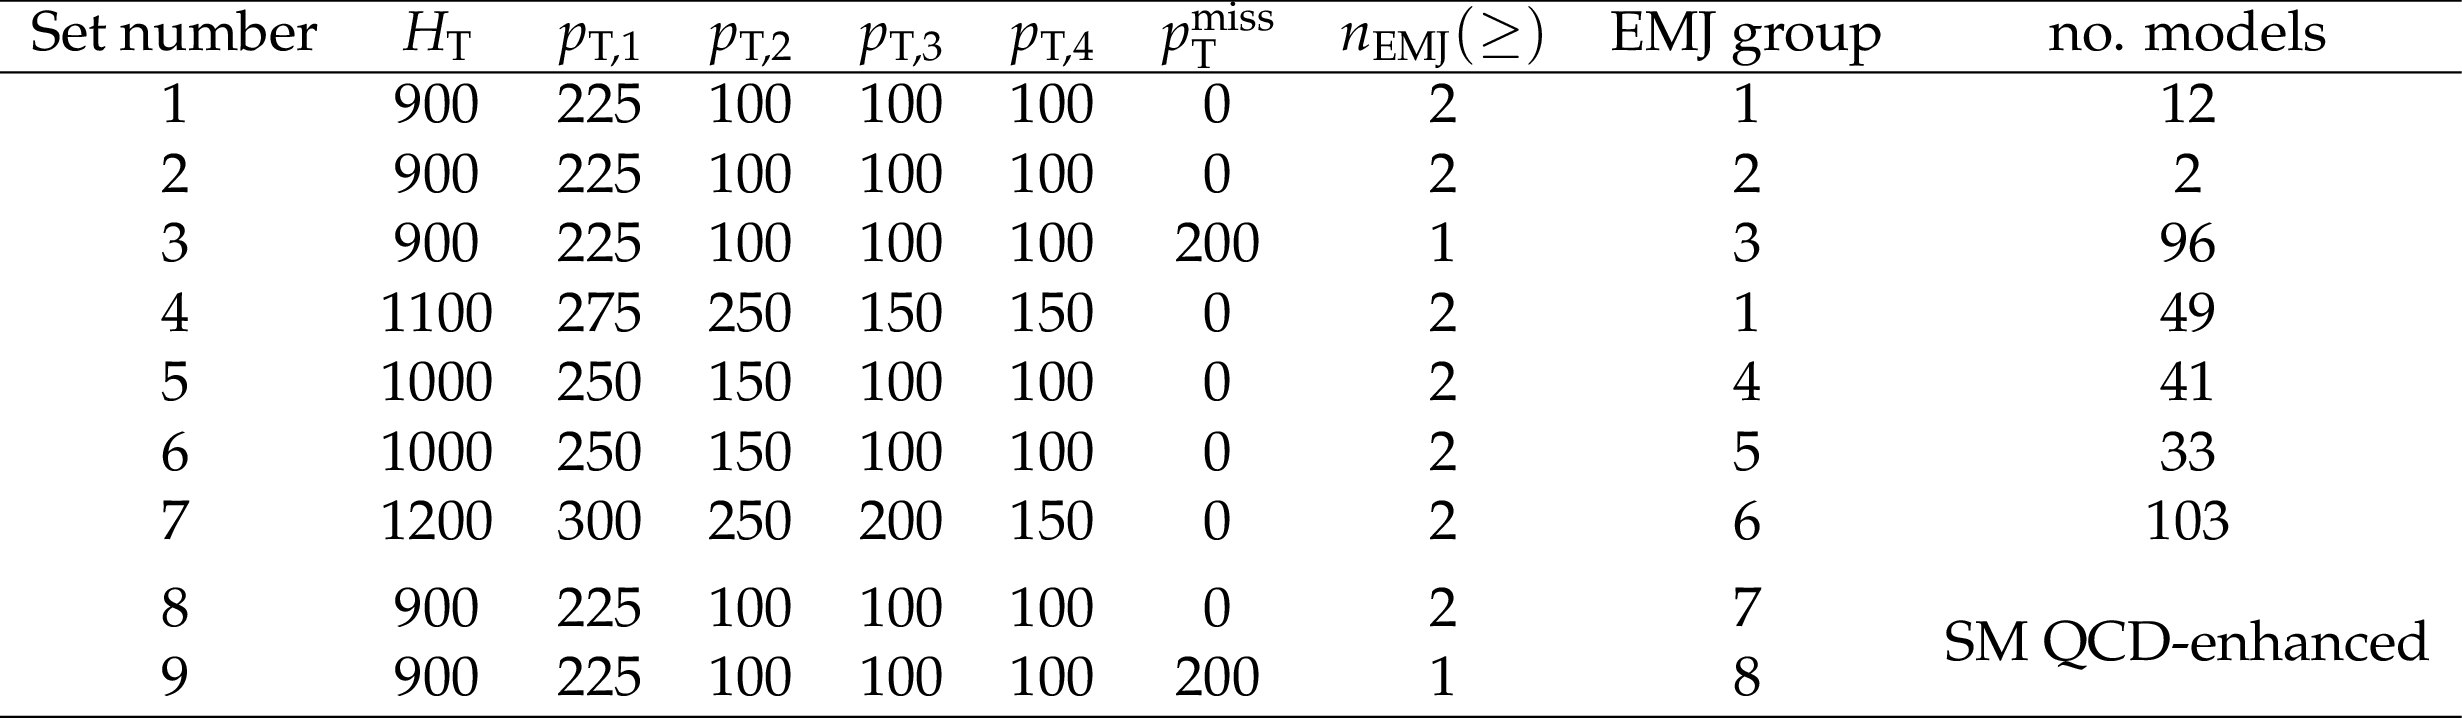
Table 3:
The seven optimized selection sets used for this search, and the two SM QCD-enhanced selections (sets 8 and 9) used in tests of the background estimation methods. The headers of the columns are: the scalar $ {p_{\mathrm {T}}} $ sum of the four leading jets ($ {H_{\mathrm {T}}} $) [GeV], the requirements on the $ {p_{\mathrm {T}}} $ of the jets ($p_\mathrm {T,i}$) [GeV], the requirement on $ {{p_{\mathrm {T}}} ^\text {miss}} $ [GeV], the minimum number of the four leading jets that pass the emerging jet selection ($ {n_\mathrm {EMJ}} $), and the EMJ criteria group described in Table 2. The last column is the total number of models defined in Table 1 for which the associated selection set gives the best expected sensitivity. |
png pdf |
Table 4:
Systematic uncertainties affecting the background estimate from control samples in data. For the definition of the selection sets, see Table 3. |

png pdf |
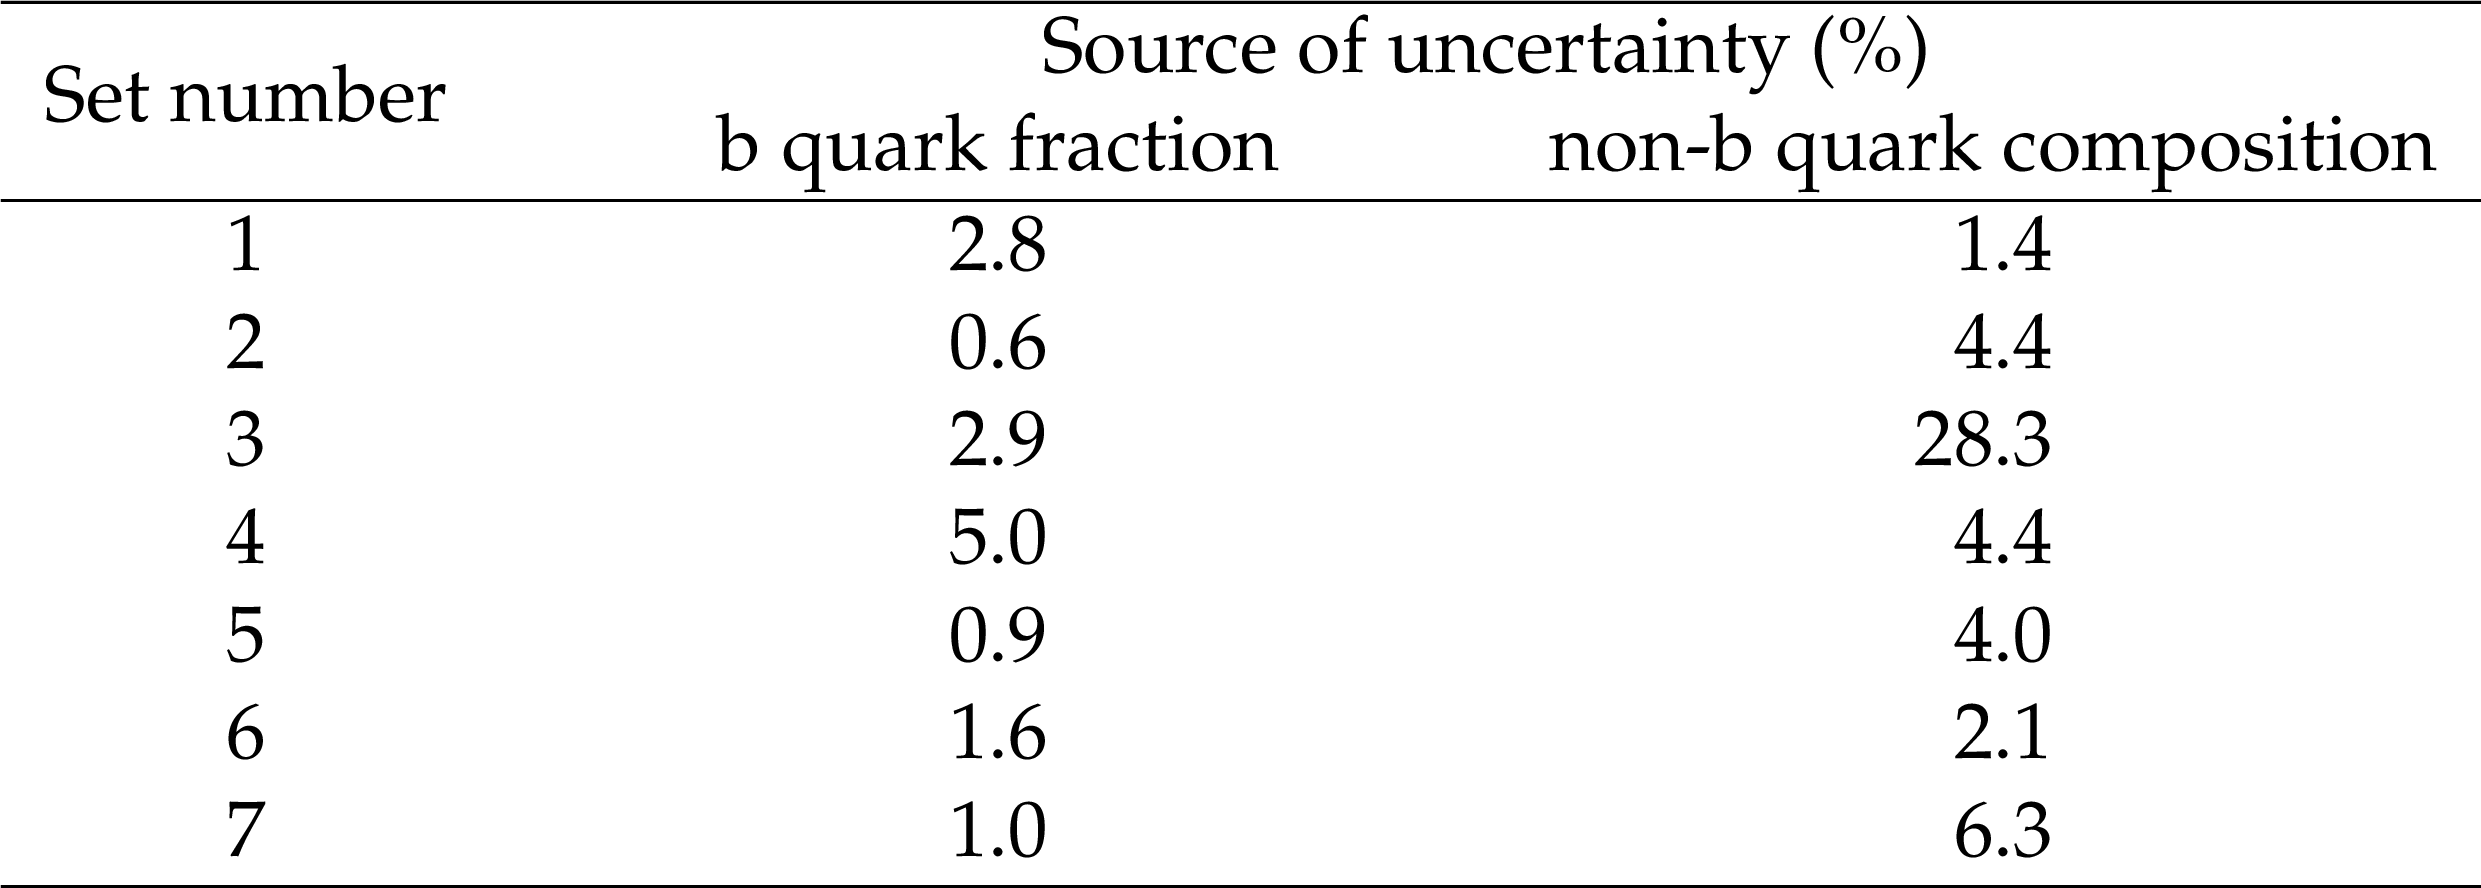
Table 5:
Ranges of systematic uncertainties over all models given in Table 1 for which a 95% CL exclusion is expected, for the uncertainties from different sources. |
png pdf |
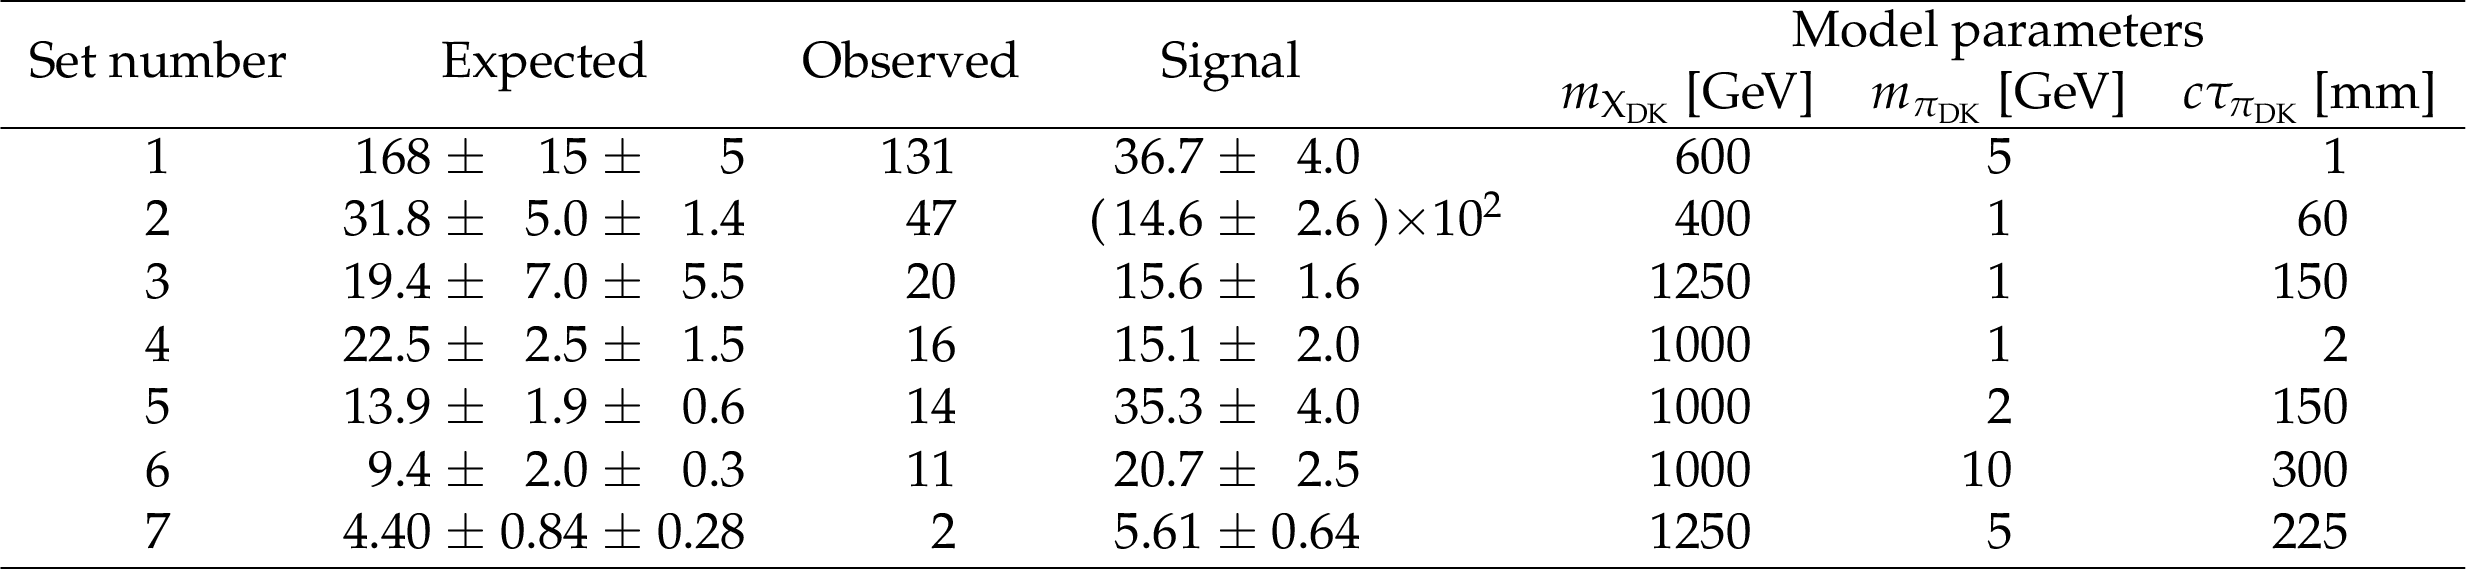
Table 6:
Expected (mean $\pm$ syst$_1$ $\pm$ syst$_2$) and observed event yields for each selection set. Uncertainties due to the limited number of events in the control sample and statistical uncertainties in the misidentification probabilities are denoted by "syst$_1$'', while "syst$_2$'' combines the systematic uncertainty sources discussed in Table 4. The "Signal'' column shows the expected event yield for the heaviest mediator mass that can be excluded for each set, with the systematic uncertainties from sources discussed in Table 5 summed in quadrature. The associated model parameters are specified in the last three columns. |
| Summary |
| A search is presented for events consistent with the pair production of a heavy mediator particle that decays to a light quark and a new fermion called a dark quark, using data from proton-proton collisions at $\sqrt{s} = $ 13 TeV corresponding to an integrated luminosity of 16.1 fb$^{-1}$. The dark quark is assumed to be charged only under a new quantum-chromodynamics-like dark force, and to form an emerging jet via a parton shower, containing long-lived dark hadrons that give rise to displaced vertices when decaying to standard model hadrons. The data are consistent with the expected contributions from standard model processes. Limits are set at 95% confidence level excluding dark pion decay lengths between 5 and 225 mm for dark mediators with masses between 400 and 1250 GeV. Decay lengths smaller than 5 and greater than 225 mm are also excluded in the lower part of this mass range. The dependence of the limit on the dark pion mass is weak for masses between 1 and 10 GeV. This analysis is the first dedicated search for the pair production of a new particle that decays to a jet and an emerging jet. |
| References | ||||
| 1 | B.-L. Young | A survey of dark matter and related topics in cosmology | Front. Phys. (2016) 121201 | |
| 2 | K. Petraki and R. Volkas | Review of asymmetric dark matter | Int. J. Mod. Phys. A 28 (2013) 1330028 | 1305.4939 |
| 3 | K. Zurek | Asymmetric dark matter: theories, signatures, and constraints | Phys. Rep. 537 (2014) 91 | 1308.0338 |
| 4 | G. Bertone, D. Hooper, and J. Silk | Particle dark matter: evidence, candidates and constraints | J. Phys. Rep. 405 (2005) 279 | hep-ph/0404175 |
| 5 | Planck Collaboration | Planck 2015 results - XIII. cosmological parameters | A\&A 594 (2016) A13 | 1502.01589 |
| 6 | Y. Bai and P. Schwaller | Scale of dark QCD | PRD 89 (2014) 063522 | 1306.4676 |
| 7 | P. Schwaller, D. Stolarski, and A. Weiler | Emerging jets | JHEP 05 (2015) 59 | 1502.05409 |
| 8 | J. Brod et al. | Stealth QCD-like strong interactions and the $ t\overline{t} $ asymmetry | PRD 91 (2015) 095009 | 1407.8188 |
| 9 | P. Agrawal, M. Blanke, and K. Gemmler | Flavored dark matter beyond minimal flavor violation | JHEP 10 (2014) 72 | 1405.6709 |
| 10 | L. Calibbi, A. Crivellin, and B. Zald\'\ivar | Flavor portal to dark matter | PRD 92 (2015) 016004 | 1501.07268 |
| 11 | S. Renner and P. Schwaller | A flavoured dark sector | JHEP 08 (2018) 52 | 1803.08080 |
| 12 | CMS Collaboration | Description and performance of track and primary-vertex reconstruction with the CMS tracker | JINST 9 (2014) P10009 | CMS-TRK-11-001 1405.6569 |
| 13 | CMS Collaboration | The CMS trigger system | JINST 12 (2017) P01020 | CMS-TRG-12-001 1609.02366 |
| 14 | CMS Collaboration | The CMS experiment at the CERN LHC | JINST 3 (2008) S08004 | CMS-00-001 |
| 15 | K. Rose | Deterministic annealing for clustering, compression, classification, regression, and related optimization problems | in Proceedings of the IEEE 86, p. 2210 1998 | |
| 16 | R. Fruhwirth, W. Waltenberger, and P. Vanlaer | Adaptive vertex fitting | JPG 34 (2007) N343 | |
| 17 | M. Cacciari, G. P. Salam, and G. Soyez | The anti-$ {k_{\mathrm{T}}} $ jet clustering algorithm | JHEP 04 (2008) 063 | 0802.1189 |
| 18 | M. Cacciari, G. P. Salam, and G. Soyez | FastJet user manual | EPJC 72 (2012) 1896 | 1111.6097 |
| 19 | CMS Collaboration | Particle-flow reconstruction and global event description with the CMS detector | JINST 12 (2017) P10003 | CMS-PRF-14-001 1706.04965 |
| 20 | CMS Collaboration | Determination of jet energy calibration and transverse momentum resolution in CMS | JINST 06 (2011) 11002 | CMS-JME-10-011 1107.4277 |
| 21 | M. Cacciari and G. P. Salam | Pileup subtraction using jet areas | PLB 659 (2008) 119 | |
| 22 | CMS Collaboration | Pileup Removal Algorithms | CMS-PAS-JME-14-001 | CMS-PAS-JME-14-001 |
| 23 | CMS Collaboration | Jet energy scale and resolution in the CMS experiment in pp collisions at 8 TeV | JINST 12 (2017) P02014 | CMS-JME-13-004 1607.03663 |
| 24 | CMS Collaboration | Identification of heavy-flavour jets with the CMS detector in pp collisions at 13 TeV | JINST 13 (2018) P05011 | CMS-BTV-16-002 1712.07158 |
| 25 | J. Alwall et al. | The automated computation of tree-level and next-to-leading order differential cross sections, and their matching to parton shower simulations | JHEP 07 (2014) 079 | 1405.0301 |
| 26 | T. Sjostrand et al. | An introduction to PYTHIA 8.2 | CPC 191 (2015) 159 | 1410.3012 |
| 27 | NNPDF Collaboration | Parton distributions for the LHC Run II | JHEP 04 (2015) 040 | 1410.8849 |
| 28 | CMS Collaboration | Event generator tunes obtained from underlying event and multiparton scattering measurements | EPJC 76 (2016) 155 | CMS-GEN-14-001 1512.00815 |
| 29 | N. Arkani-Hamed et al. | MARMOSET: The Path from LHC Data to the New Standard Model via On-Shell Effective Theories | hep-ph/0703088 | |
| 30 | J. Alwall, P. C. Schuster, and N. Toro | Simplified models for a first characterization of new physics at t$ \ $ he LHC | PRD 79 (2009) 075020 | 0810.3921 |
| 31 | J. Alwall, M.-P. Le, M. Lisanti, and J. G. Wacker | Model-Independent Jets plus Missing Energy Searches | PRD 79 (2009) 015005 | 0809.3264 |
| 32 | D. S. M. Alves, E. Izaguirre, and J. G. Wacker | Where the sidewalk ends: jets and missing energy search strategies for the 7 TeV LHC | JHEP 10 (2011) 012 | 1102.5338 |
| 33 | LHC New Physics Working Group, D. Alves et al. | Simplified models for LHC new physics searches | JPG 39 (2012) 105005 | 1105.2838 |
| 34 | C. Borschensky et al. | Squark and gluino production cross sections in pp collisions at $ \sqrt{s} = $ 13 , 14, 33 and 100 TeV | EPJC 74 (2014) 3174 | 1407.5066 |
| 35 | GEANT4 Collaboration | GEANT4--a simulation toolkit | NIMA 506 (2003) 250 | |
| 36 | GEANT4 Collaboration | Geant4 developments and applications | IEEE Trans. Nucl. Sci 53 (2006) 270 | |
| 37 | CMS Collaboration | Search for new long-lived particles at $ \sqrt{s}= $ 13 TeV | PLB 780 (2018) 432 | CMS-EXO-16-003 1711.09120 |
| 38 | C. J. Clopper and E. S. Pearson | The use of confidence or fiducial limits illustrated in the case of the binomial | Biometrika 26 (1934) 404 | |
| 39 | CMS Collaboration | CMS luminosity measurements for the 2016 data taking period | CMS-PAS-LUM-17-001 | CMS-PAS-LUM-17-001 |
| 40 | CMS Collaboration | Measurement of the inelastic proton-proton cross section at $ \sqrt{s}= $ 13 TeV | JHEP 07 (2018) 161 | CMS-FSQ-15-005 1802.02613 |
| 41 | J. Butterworth et al. | PDF4LHC recommendations for LHC run II | JPG 43 (2016) 023001 | 1510.03865 |
| 42 | T. Junk | Confidence level computation for combining searches with small statistics | NIMA 434 (1999) 435 | hep-ex/9902006 |
| 43 | A. L. Read | Presentation of search results: The CLs technique | JPG 28 (2002) 2693 | |
| 44 | The ATLAS Collaboration, The CMS Collaboration, The LHC Higgs Combination Group | Procedure for the LHC Higgs boson search combination in Summer 2011 | CMS-NOTE-2011-005 | |
| 45 | G. Cowan, K. Cranmer, E. Gross, and O. Vitells | Asymptotic formulae for likelihood-based tests of new physics | EPJC 71 (2011) 1554 | 1007.1727 |
|
|
Compact Muon Solenoid LHC, CERN |
|

|

|

|

|

|