

Compact Muon Solenoid
LHC, CERN
| CMS-EXO-19-001 ; CERN-EP-2019-113 | ||
| Search for long-lived particles using nonprompt jets and missing transverse momentum with proton-proton collisions at $\sqrt{s} = $ 13 TeV | ||
| CMS Collaboration | ||
| 17 June 2019 | ||
| Phys. Lett. B 797 (2019) 134876 | ||
| Abstract: A search for long-lived particles decaying to displaced, nonprompt jets and missing transverse momentum is presented. The data sample corresponds to an integrated luminosity of 137 fb$^{-1}$ of proton-proton collisions at a center-of-mass energy of 13 TeV collected by the CMS experiment at the CERN LHC in 2016-2018. Candidate signal events containing nonprompt jets are identified using the timing capabilities of the CMS electromagnetic calorimeter. The results of the search are consistent with the background prediction and are interpreted using a gauge-mediated supersymmetry breaking reference model with a gluino next-to-lightest supersymmetric particle. In this model, gluino masses up to 2100, 2500, and 1900 GeV are excluded at 95% confidence level for proper decay lengths of 0.3, 1, and 100 m, respectively. These are the best limits to date for such massive gluinos with proper decay lengths greater than $\sim$ 0.5 m. | ||
| Links: e-print arXiv:1906.06441 [hep-ex] (PDF) ; CDS record ; inSPIRE record ; HepData record ; CADI line (restricted) ; | ||
| Figures & Tables | Summary | Additional Figures & Tables | References | CMS Publications |
|---|
| Figures | |
png pdf |
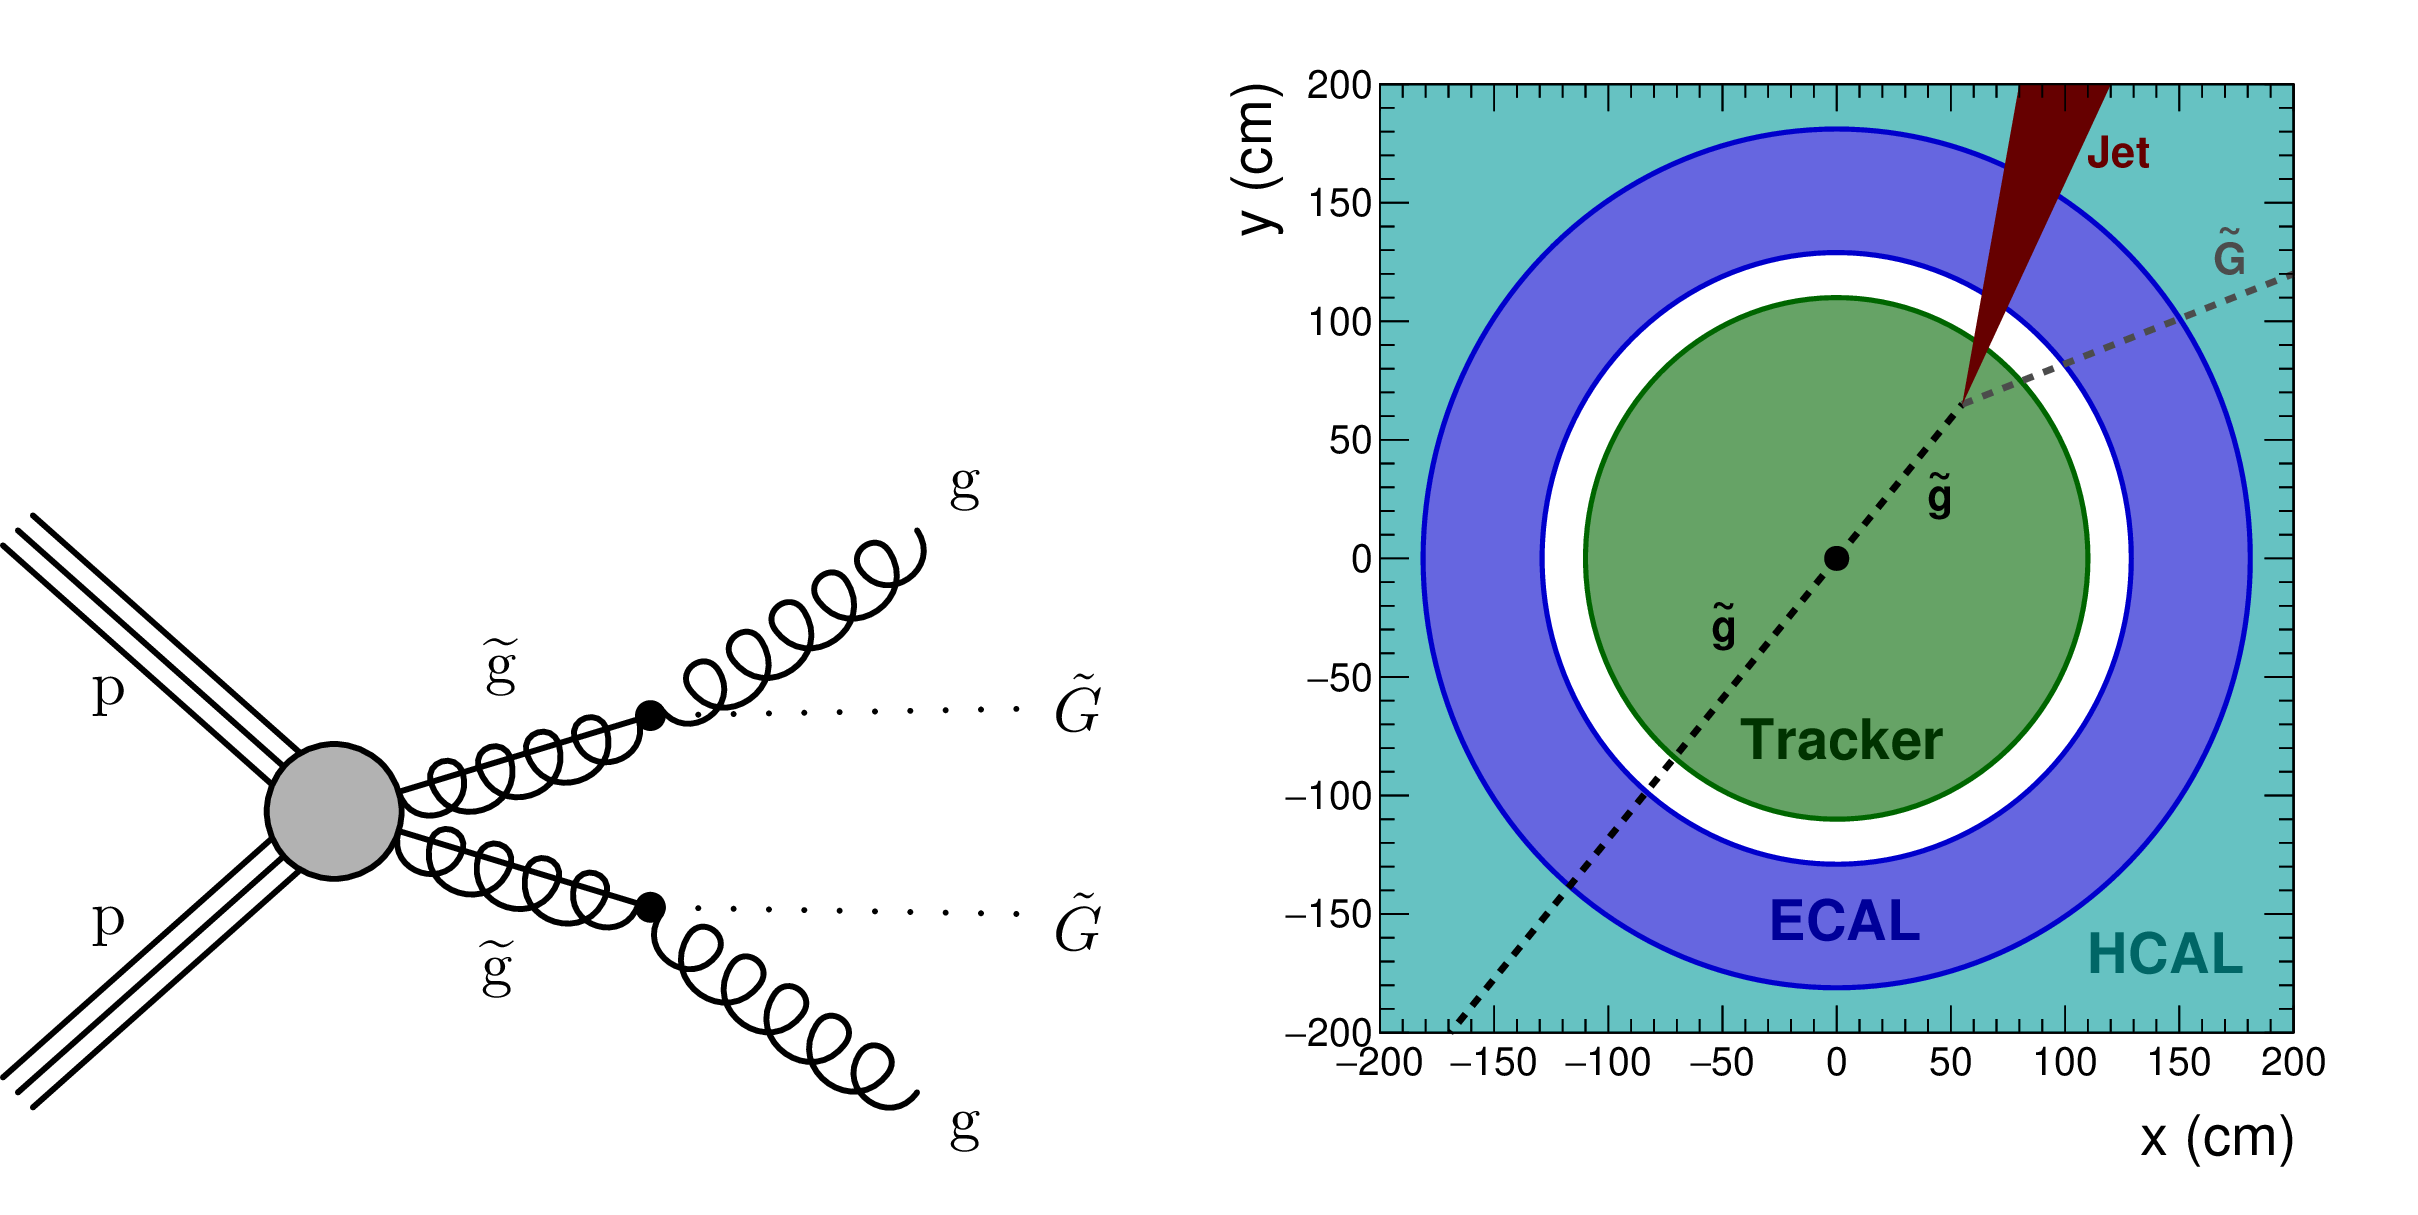
Figure 1:
Diagram showing the GMSB signal model (left figure), and diagram of a typical event (right figure), expected to pass the signal region selection. The event has delayed energy depositions in the calorimeters but no tracks from a primary vertex. |
png pdf |
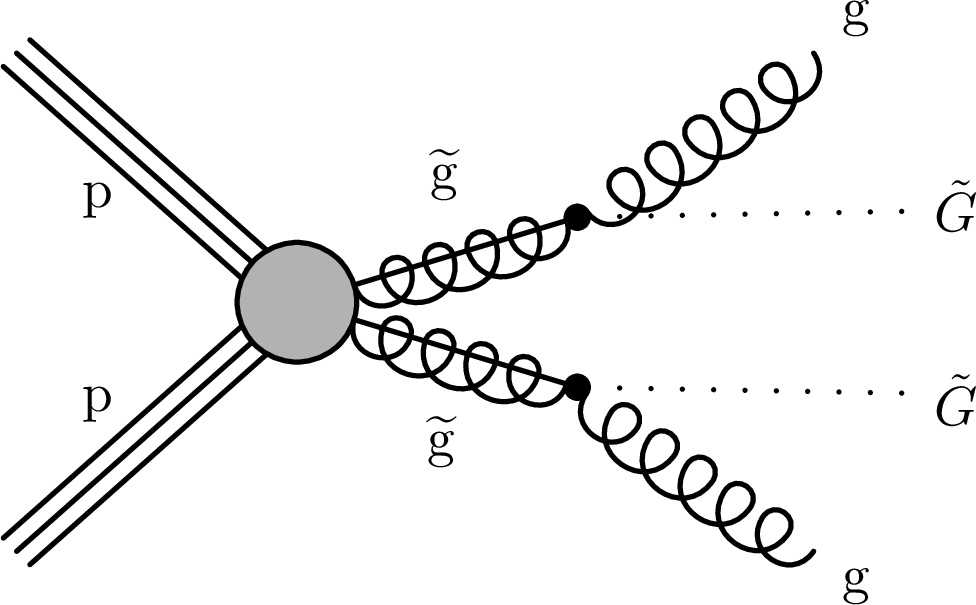
Figure 1-a:
Diagram showing the GMSB signal model |
png pdf |
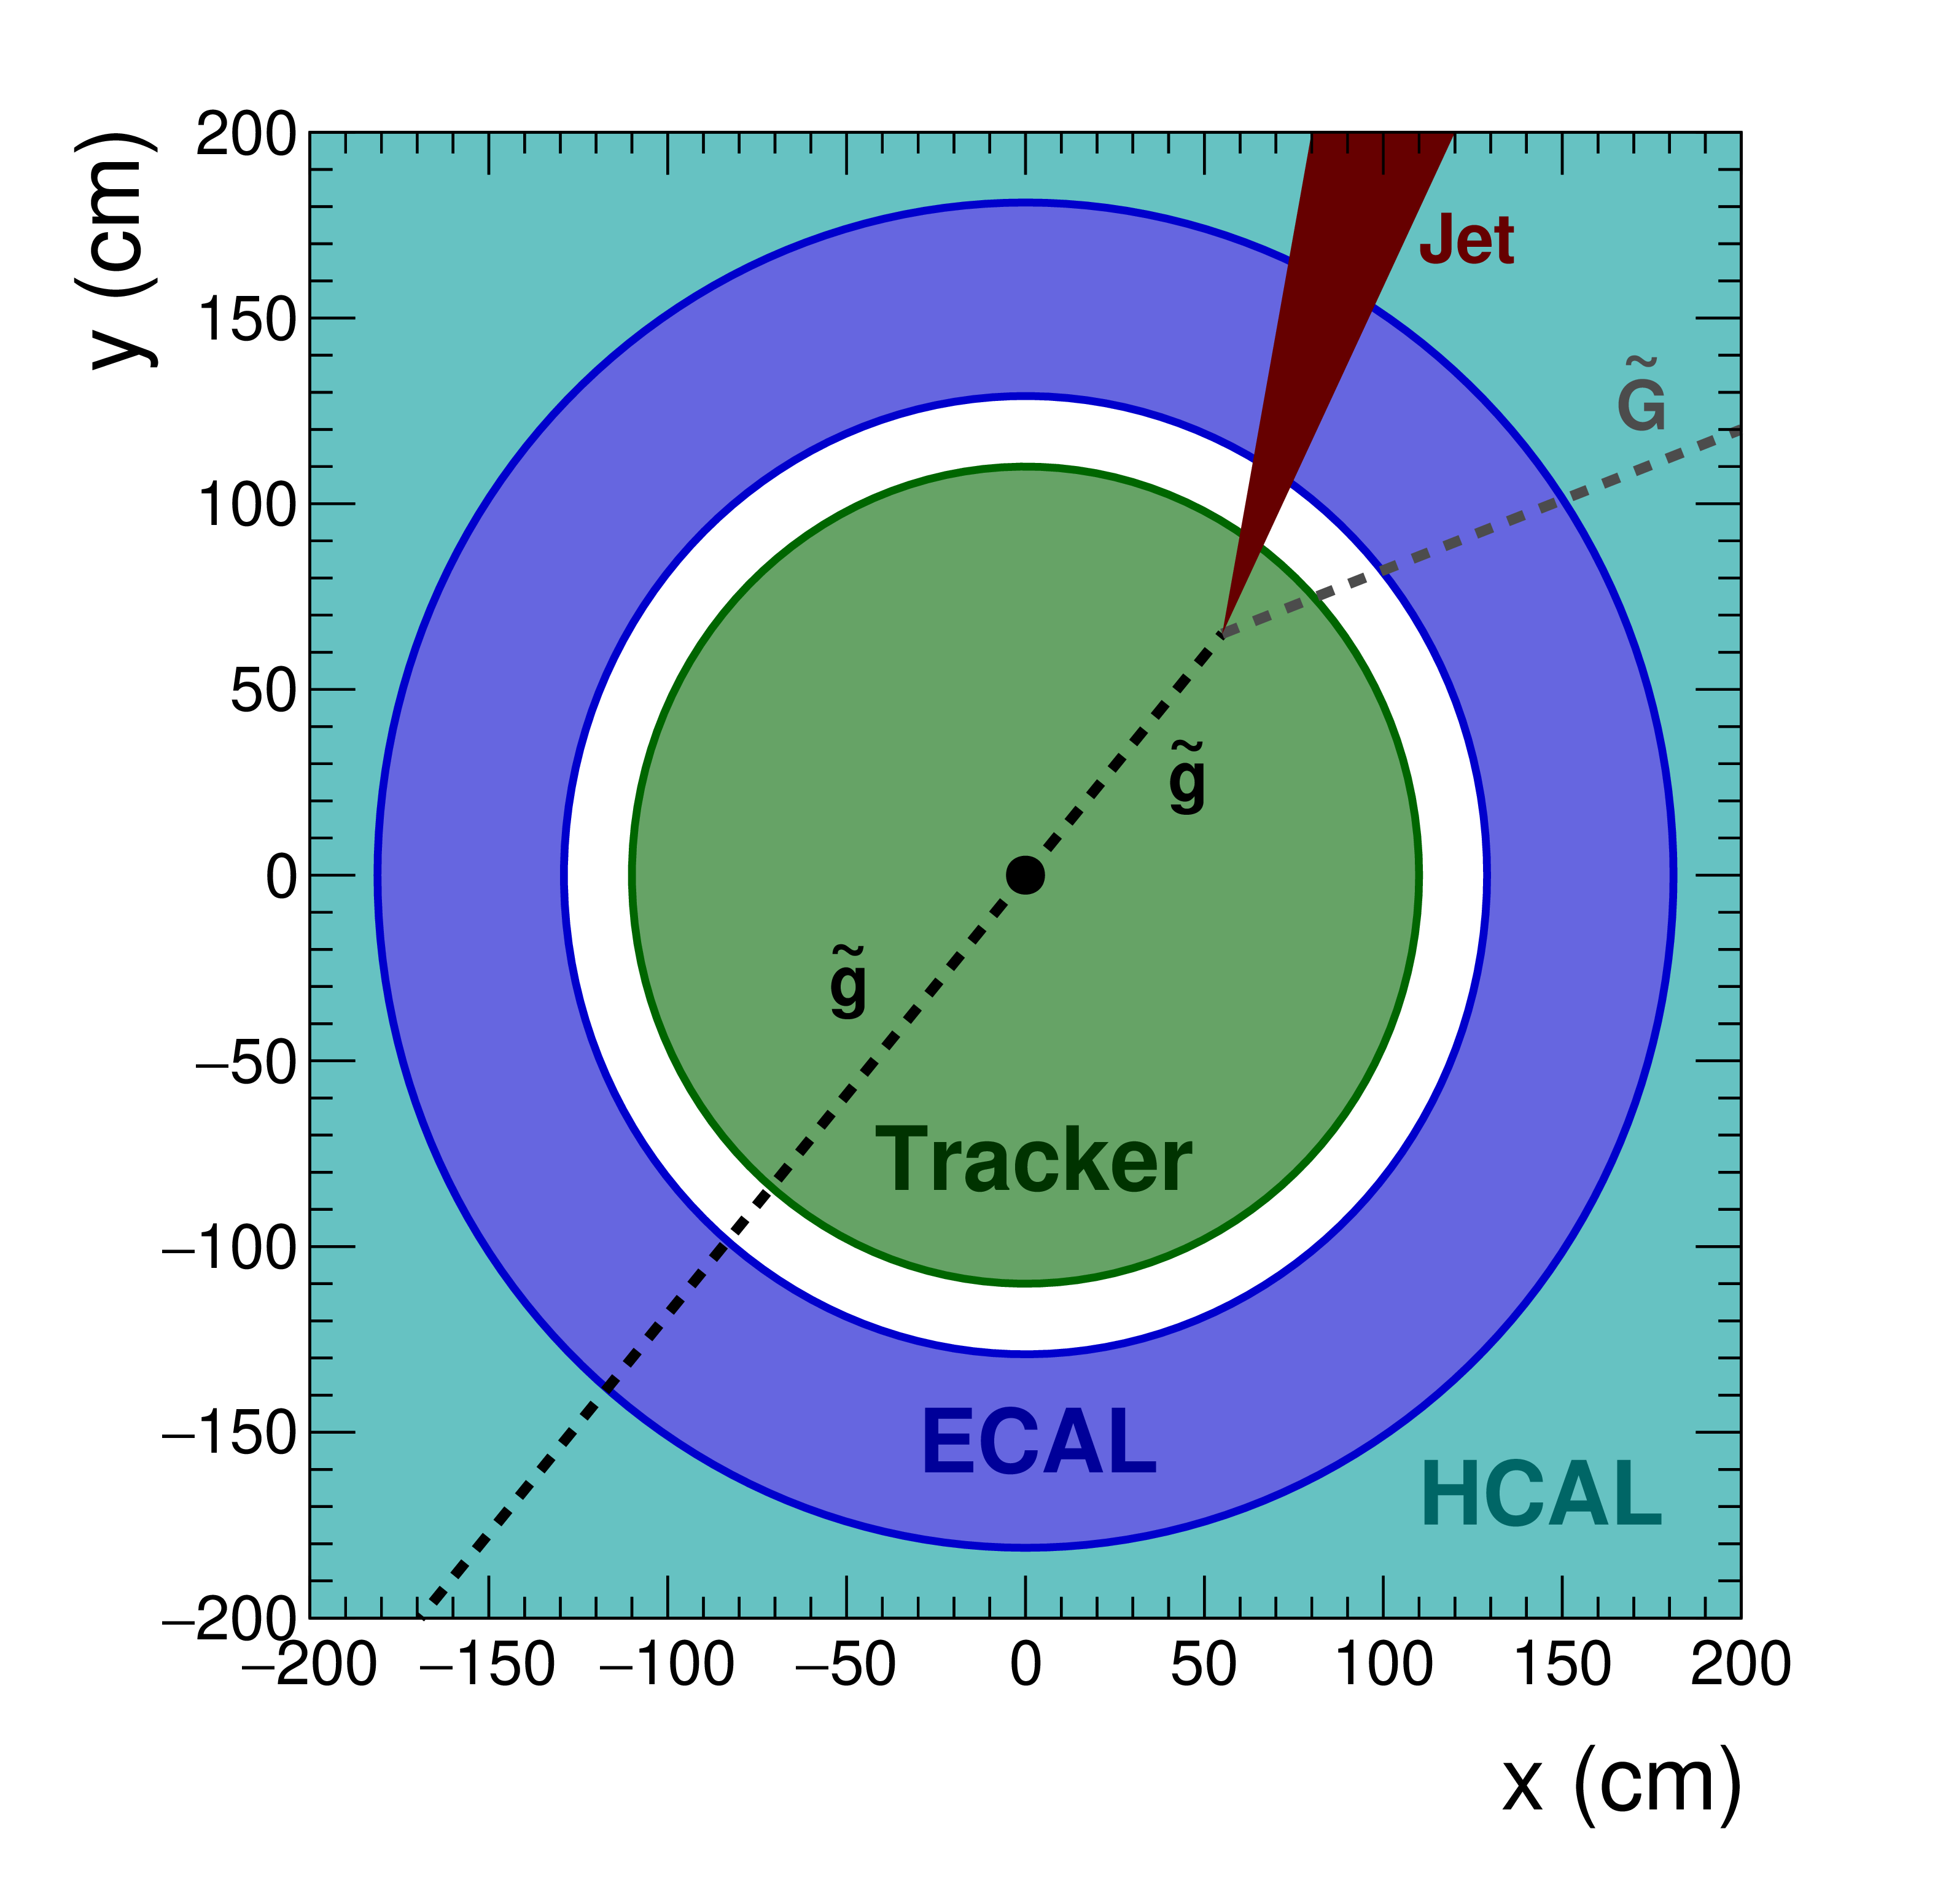
Figure 1-b:
Diagram of a typical event (right figure), expected to pass the signal region selection. The event has delayed energy depositions in the calorimeters but no tracks from a primary vertex. |
png pdf |
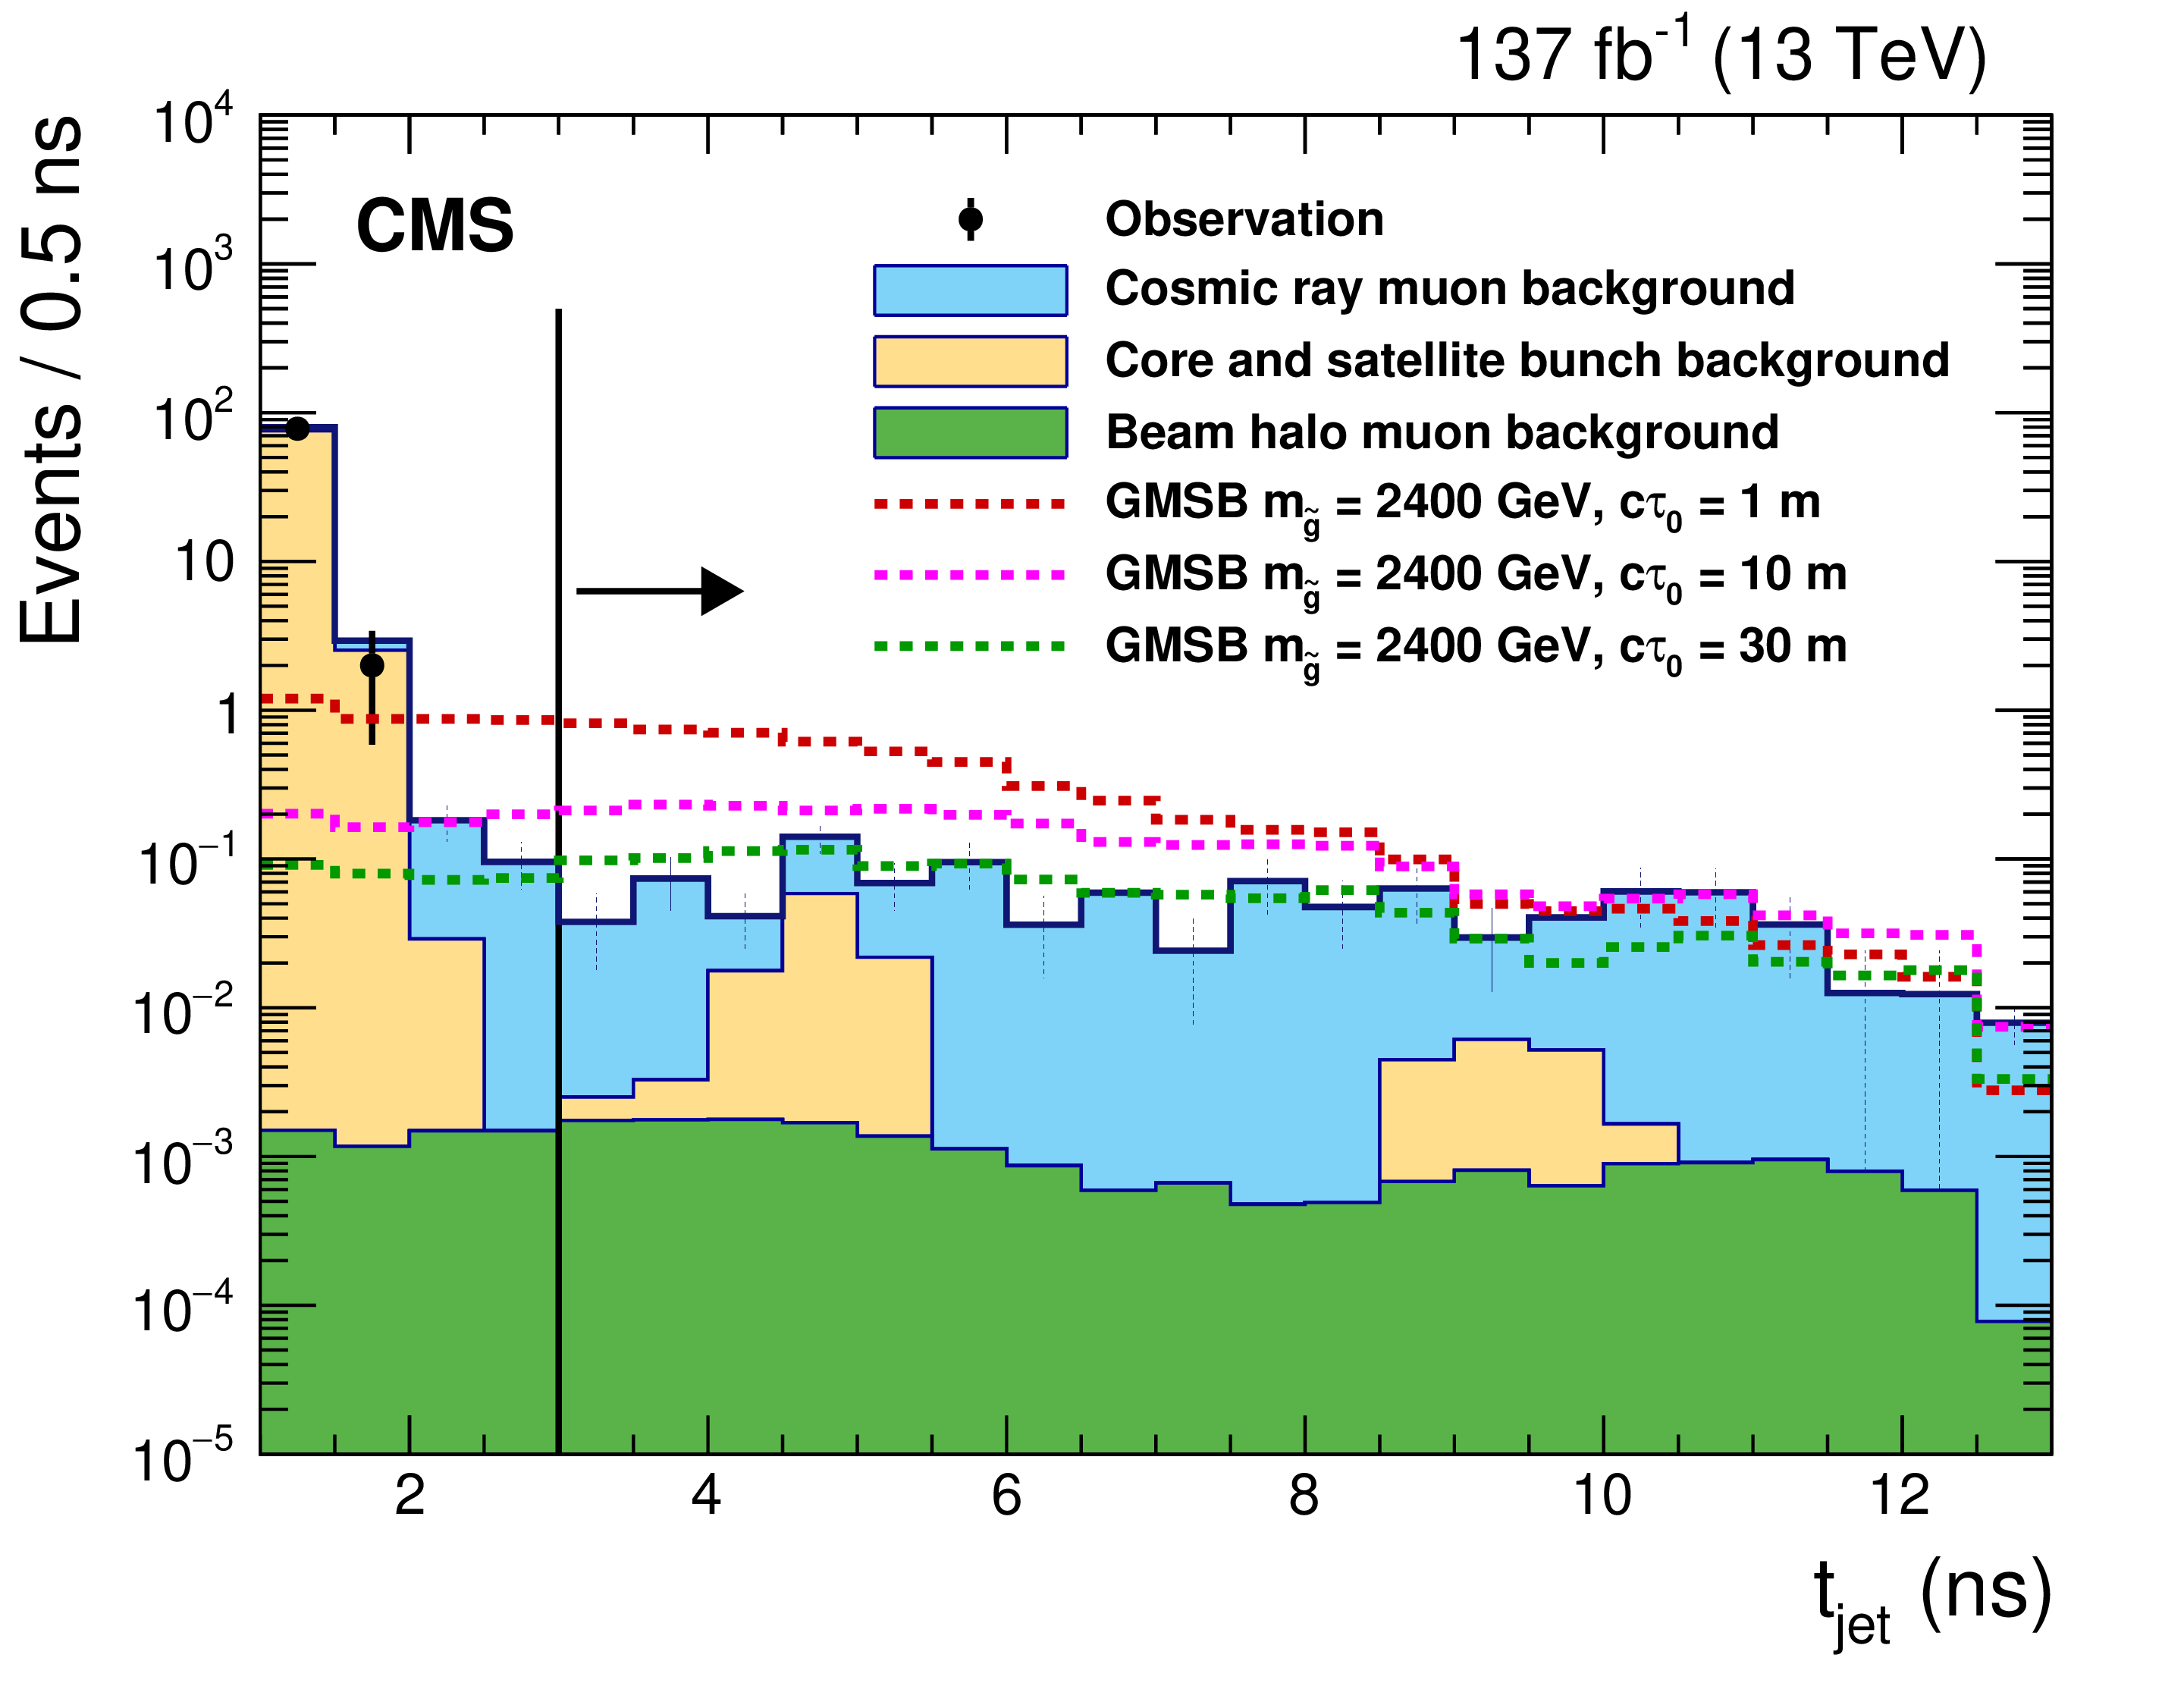
Figure 2:
The timing distribution of the background sources predicted to contribute to the signal region, compared to those for a representative signal model. The time is defined by the jet in the event with the largest ${t_{\textrm {jet}}}$ passing the relevant selection. The distributions for the major background sources are taken from control regions and normalized to the predictions detailed in Section 6. The observed data is shown by the black points. No events are observed in data for $ {t_{\textrm {jet}}} > $ 3 ns (indicated with a vertical black line). |
png pdf |
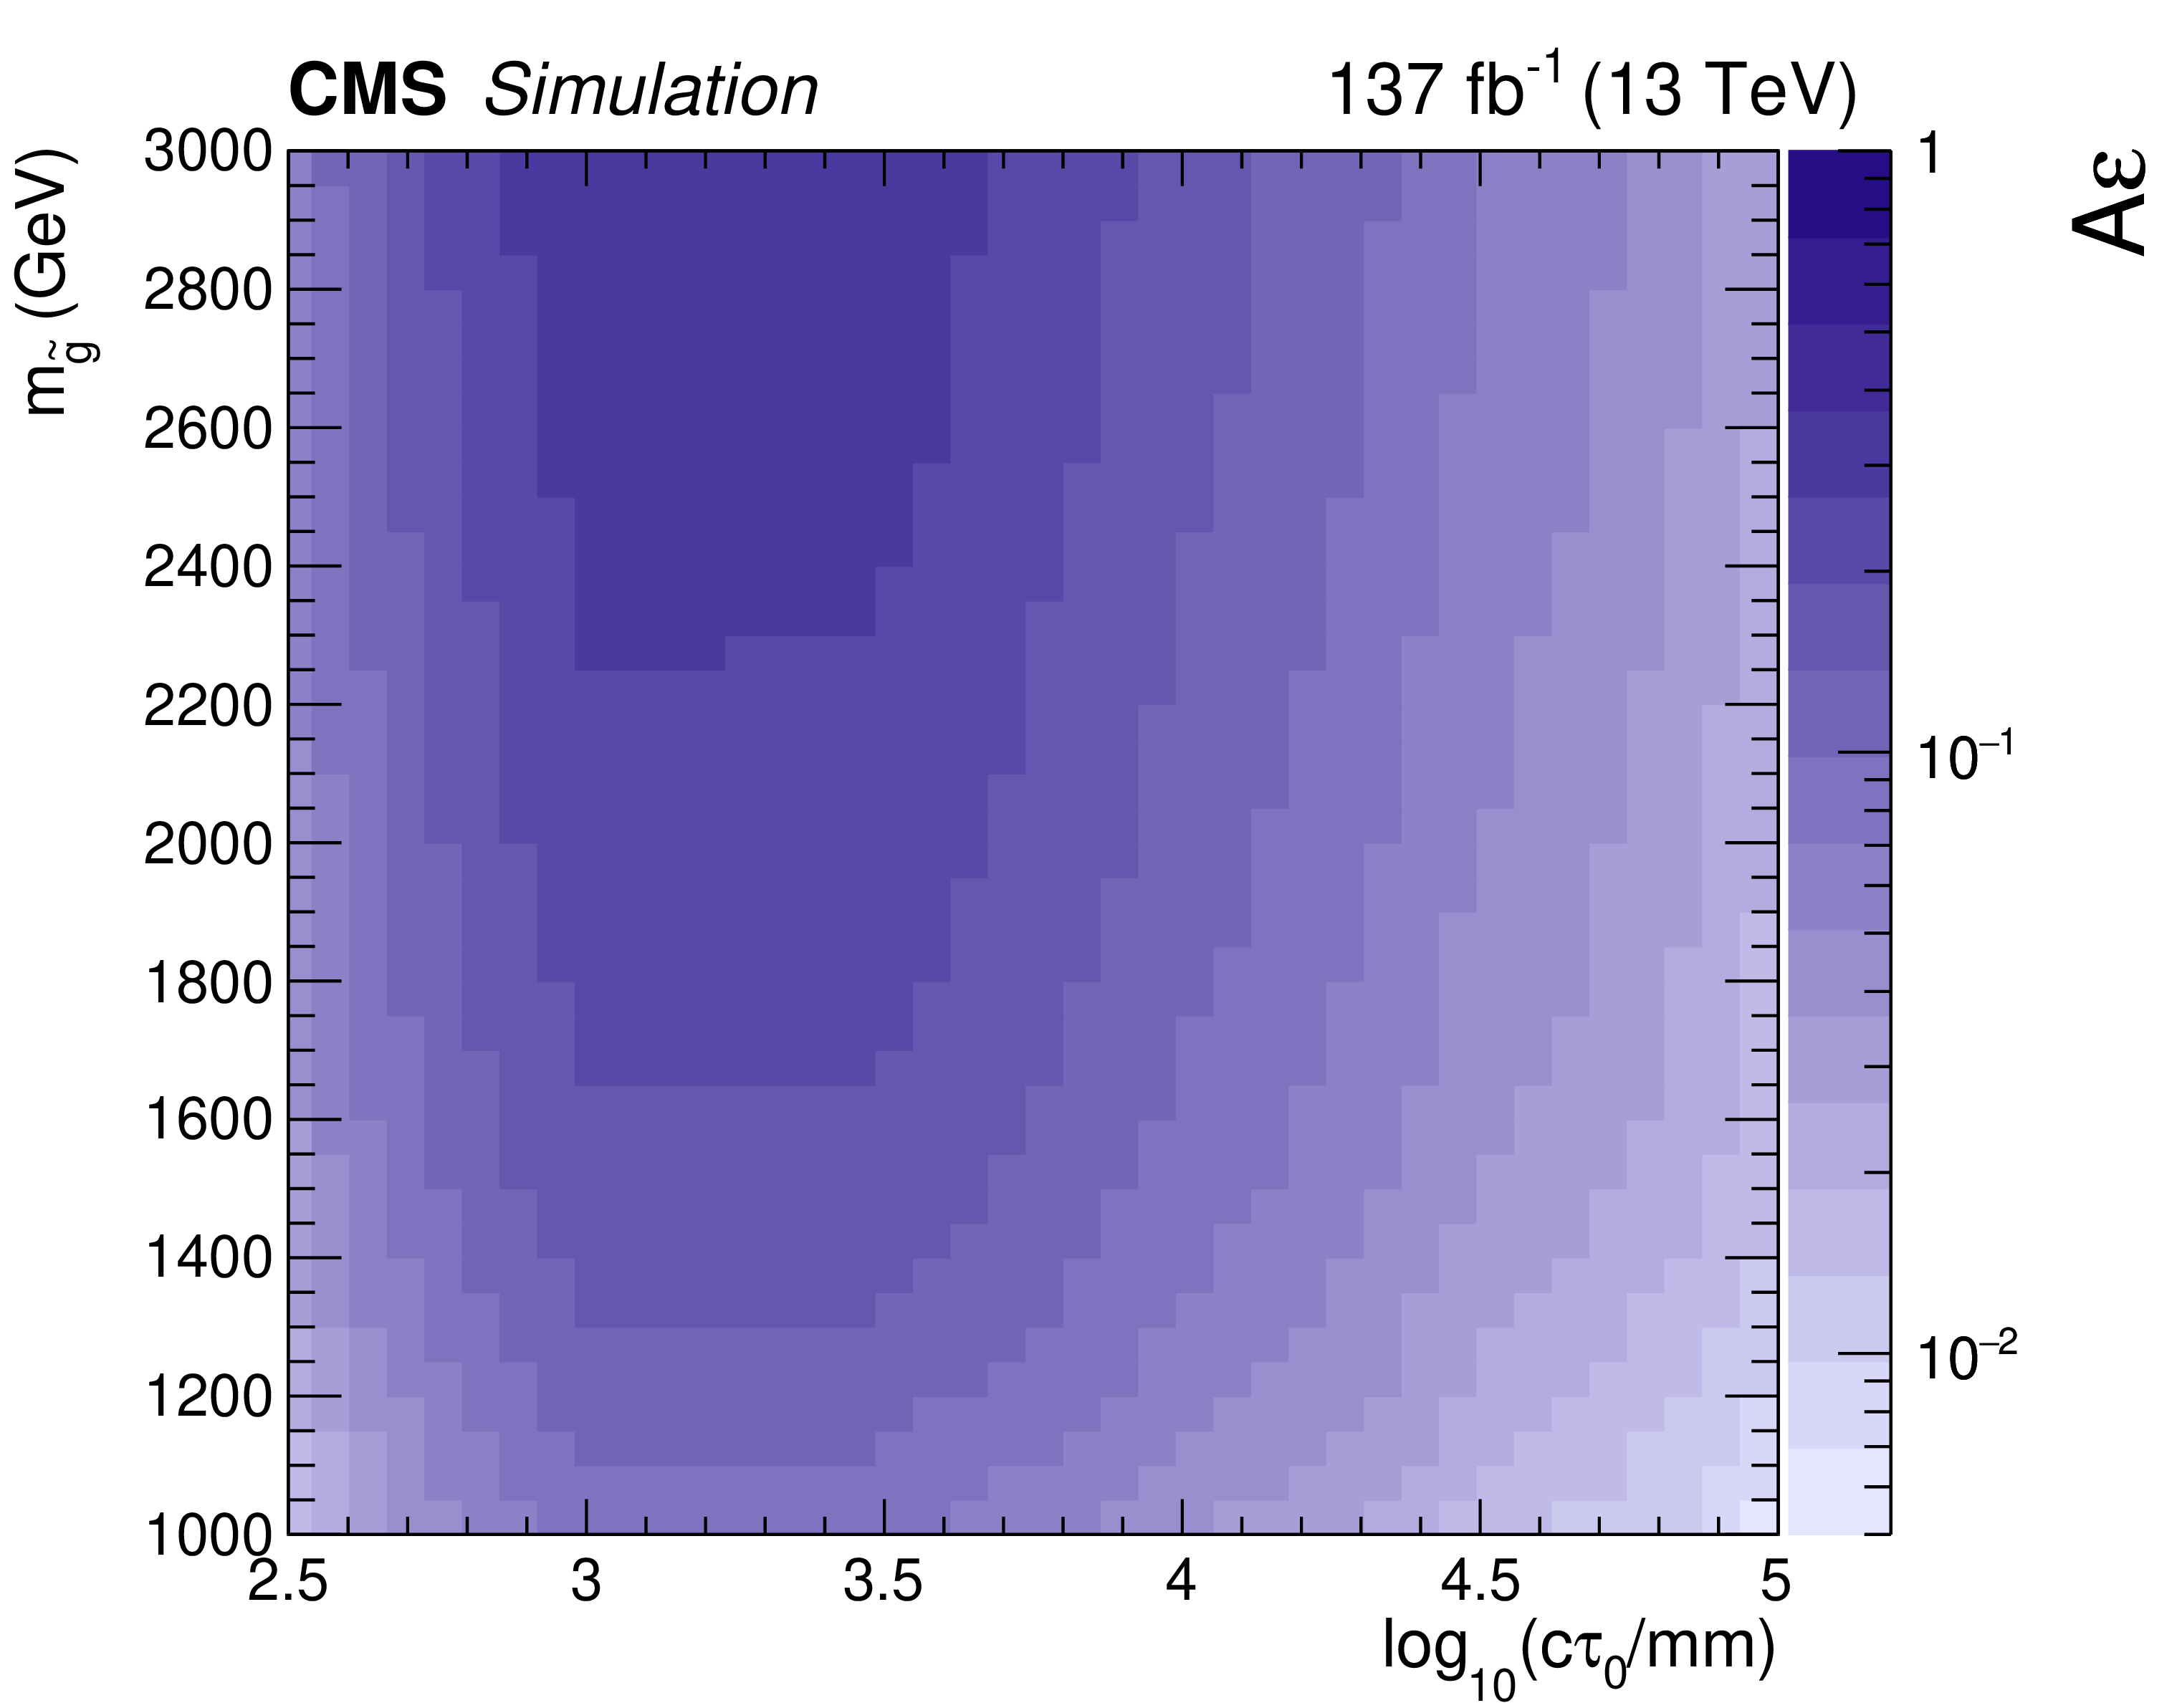
Figure 3:
The product, ${\mathcal {A}\varepsilon}$, of the acceptance and efficiency in the ${c\tau _{0}}$ vs. ${m_{{\mathrm{\tilde{g}}}}}$ plane for the GMSB model, after all requirements. |
png pdf |
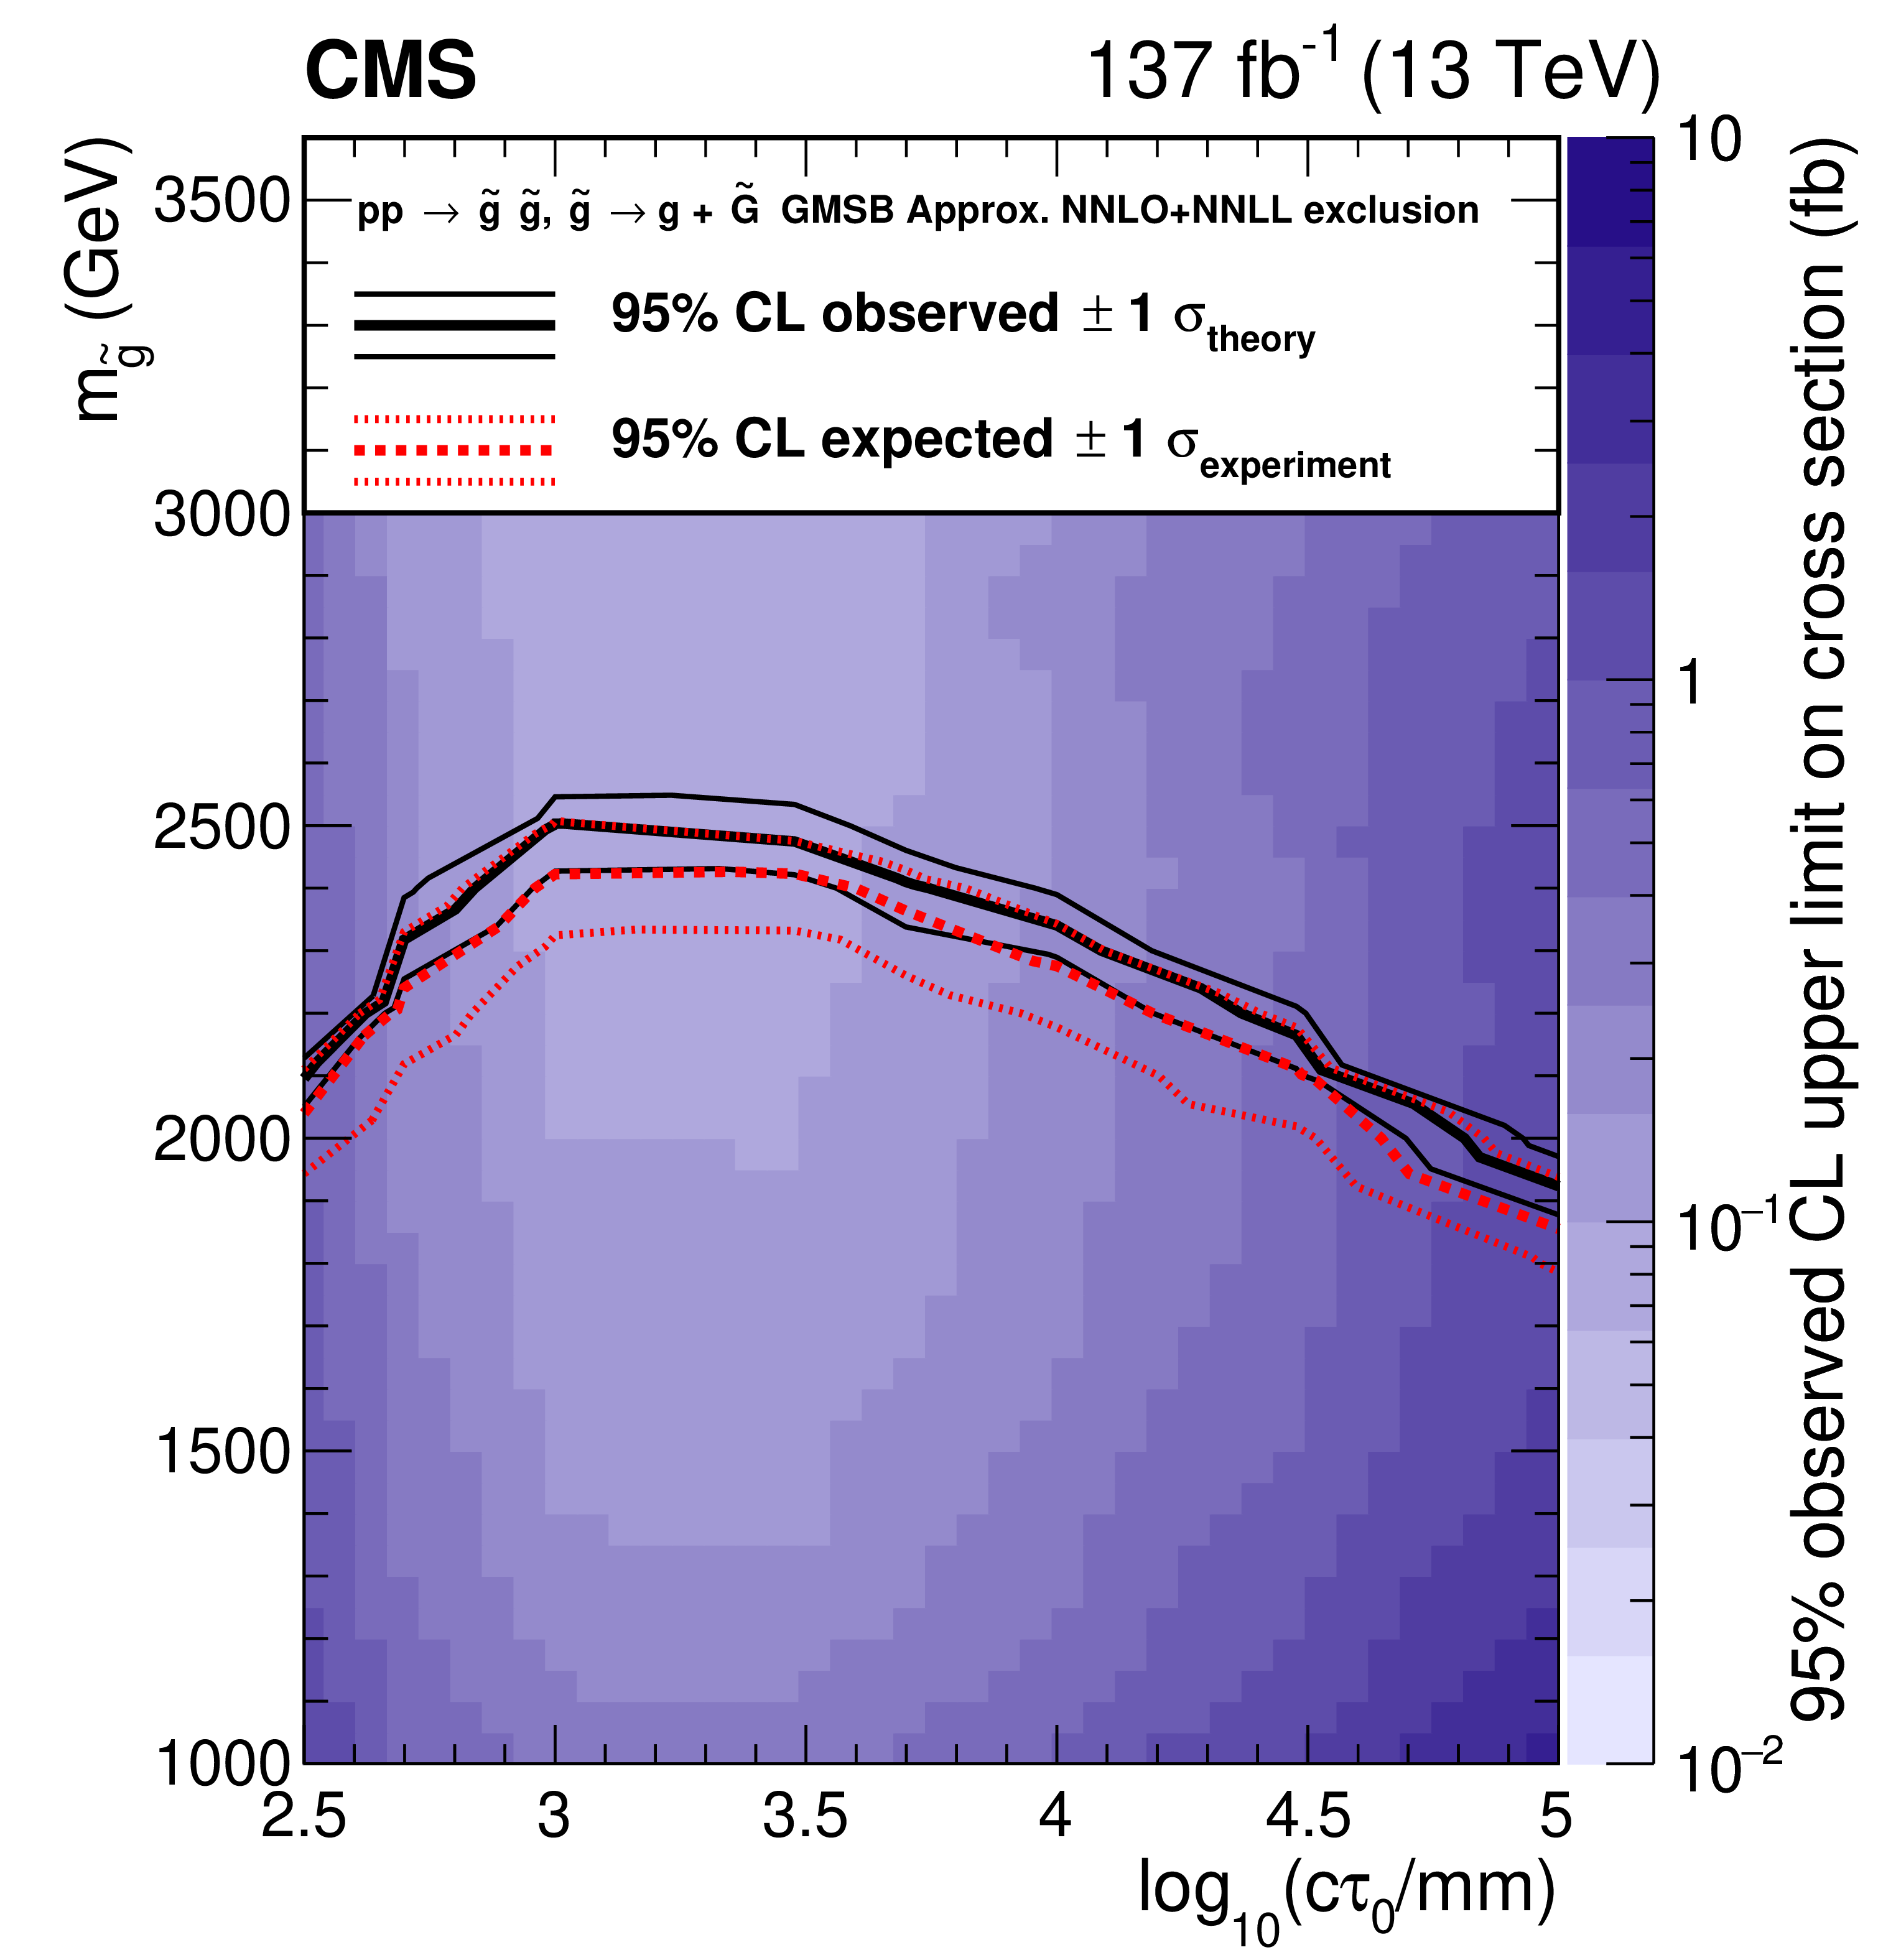
Figure 4:
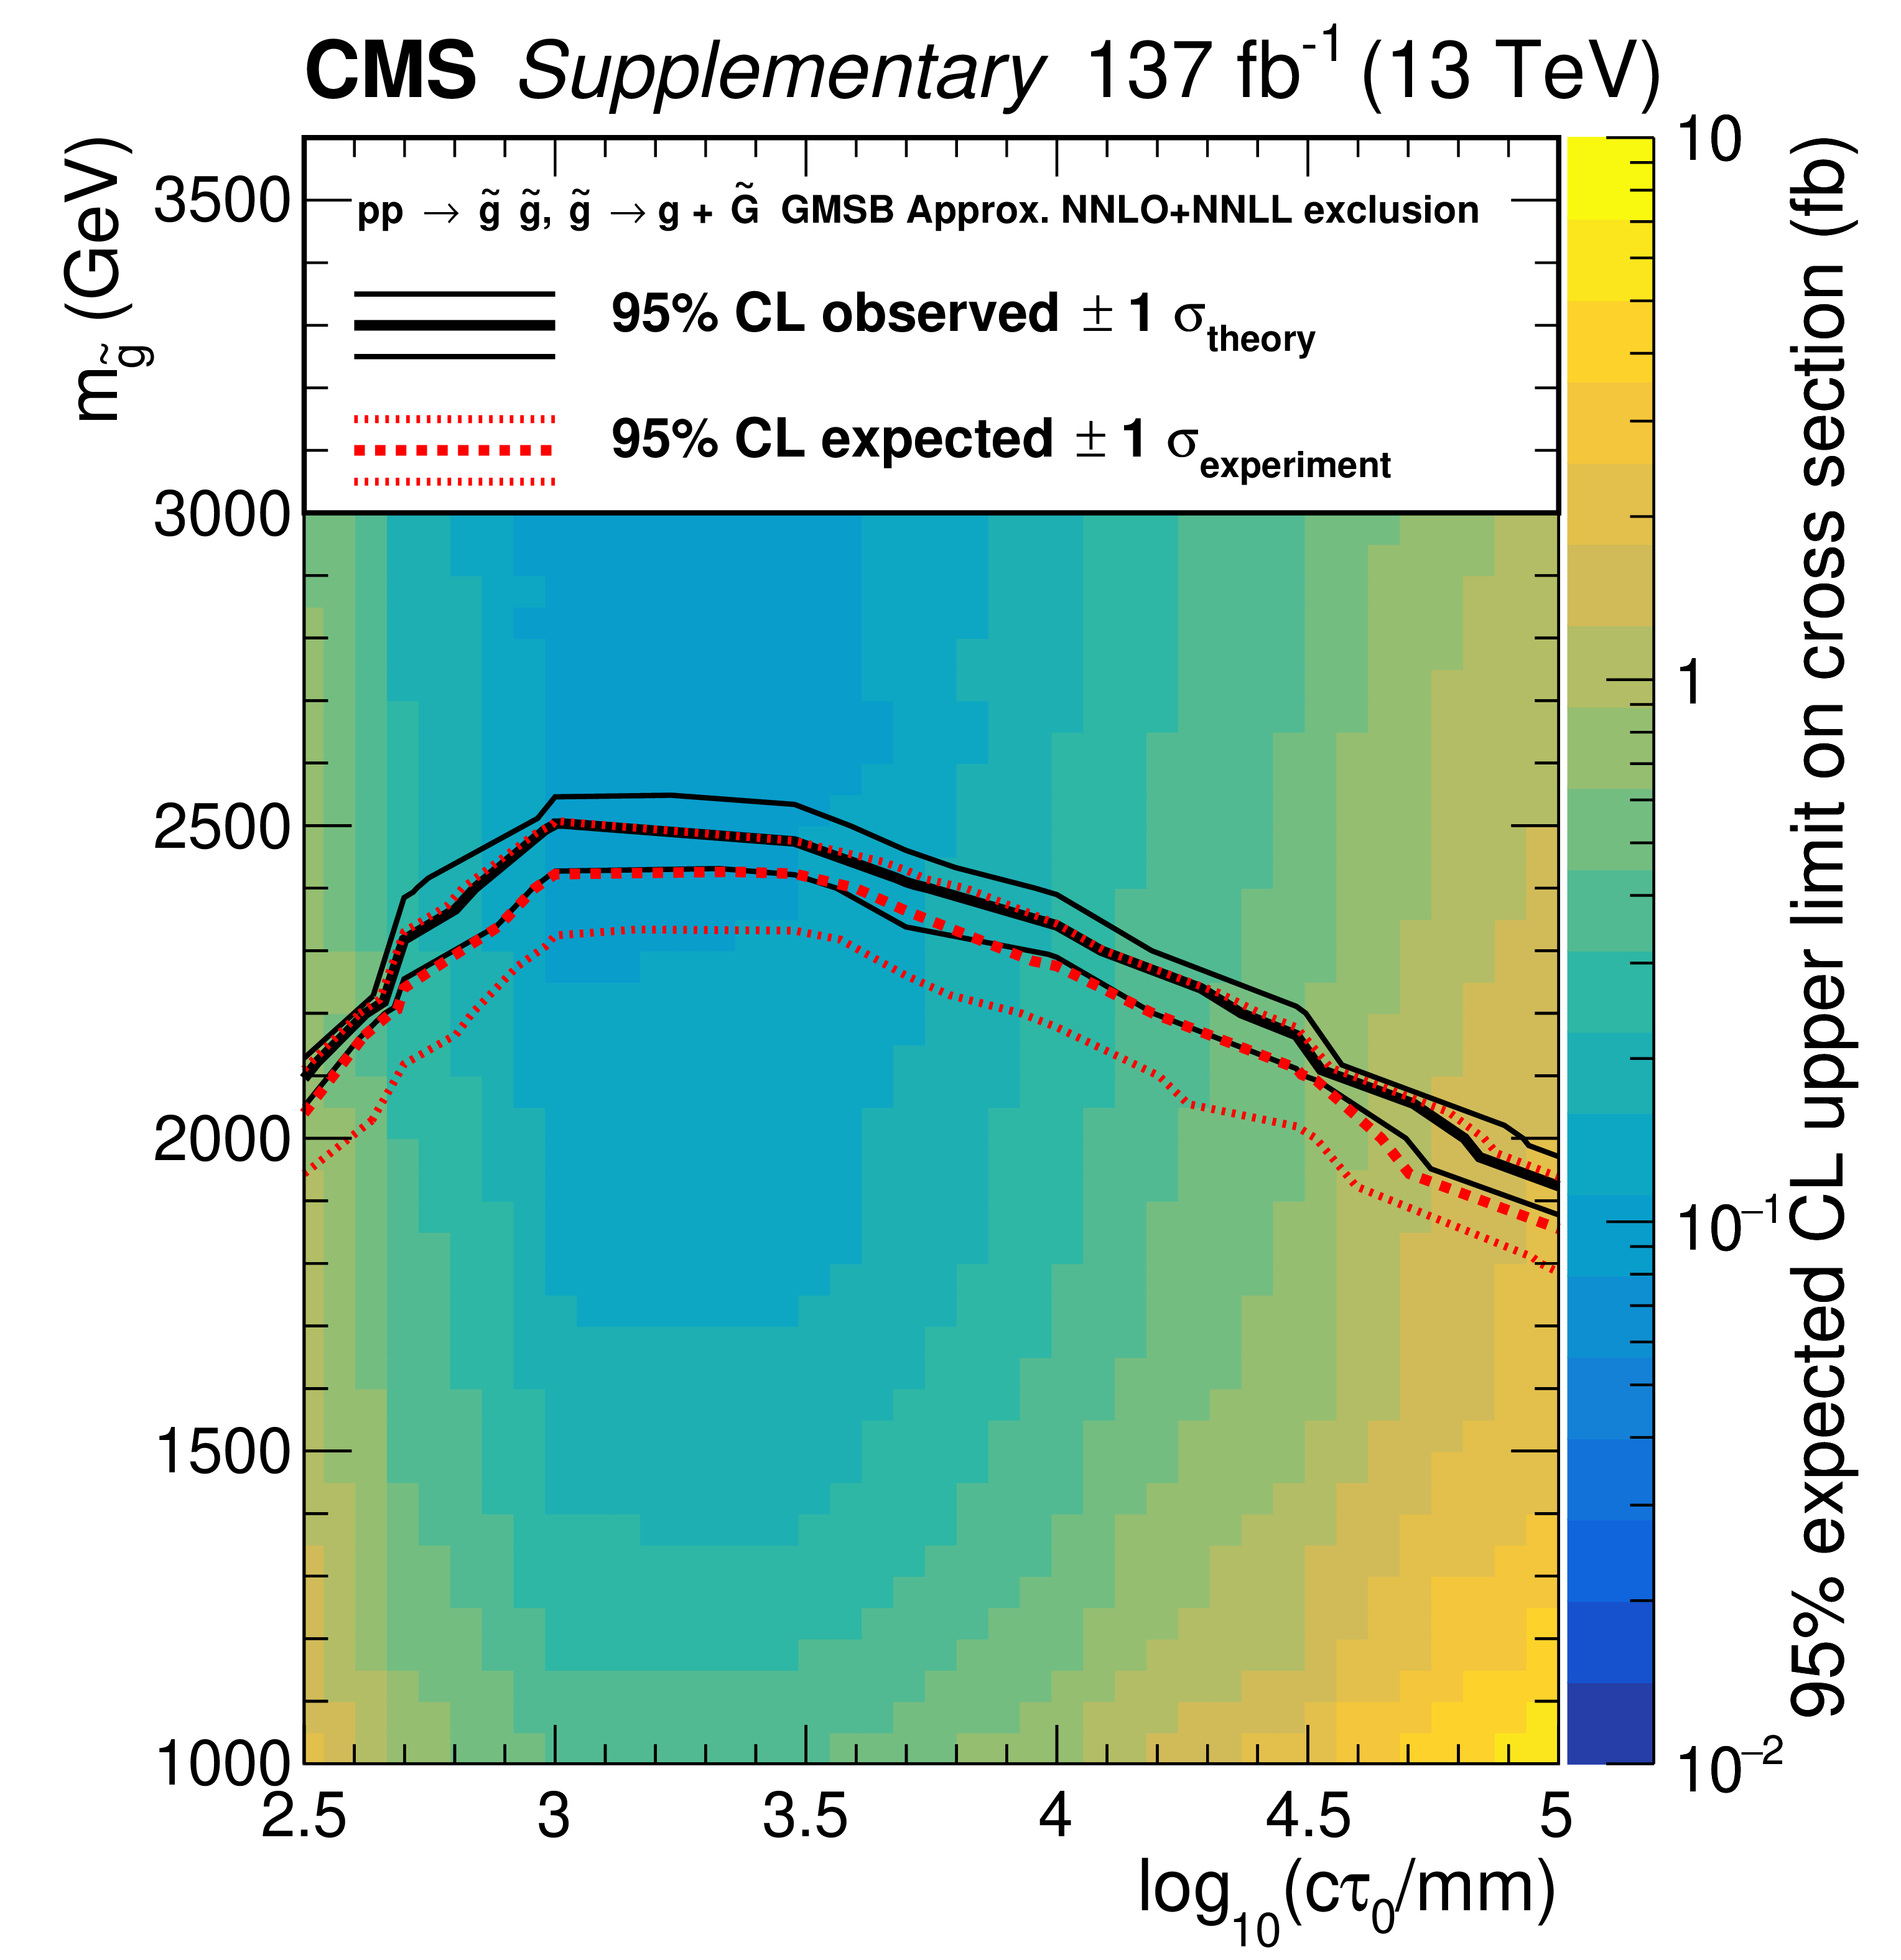
The observed upper limits at 95% CL for the gluino pair production cross section in the GMSB model, shown in the plane of ${m_{{\mathrm{\tilde{g}}}}}$ and ${c\tau _{0}}$. A branching fraction of 100% for the gluino decay to a gluon and a gravitino is assumed. The area below the thick black curve represents the observed exclusion region, while the dashed red lines indicate the expected limits and their $ \pm $1 standard deviation ranges. The thin black lines show the effect of the theoretical uncertainties on the signal cross section. |

png pdf |
Figure 5:
The observed and expected upper limits at 95% CL on the gluino pair production cross section for a gluino GMSB model with $ {m_{{\mathrm{\tilde{g}}}}} = $ 2400 GeV. The one (two) standard deviation variation in the expected limit is shown in the inner green (outer yellow) band. The blue solid line shows the observed limit obtained by the CMS displaced jet search [24]. |
| Tables | |
png pdf |
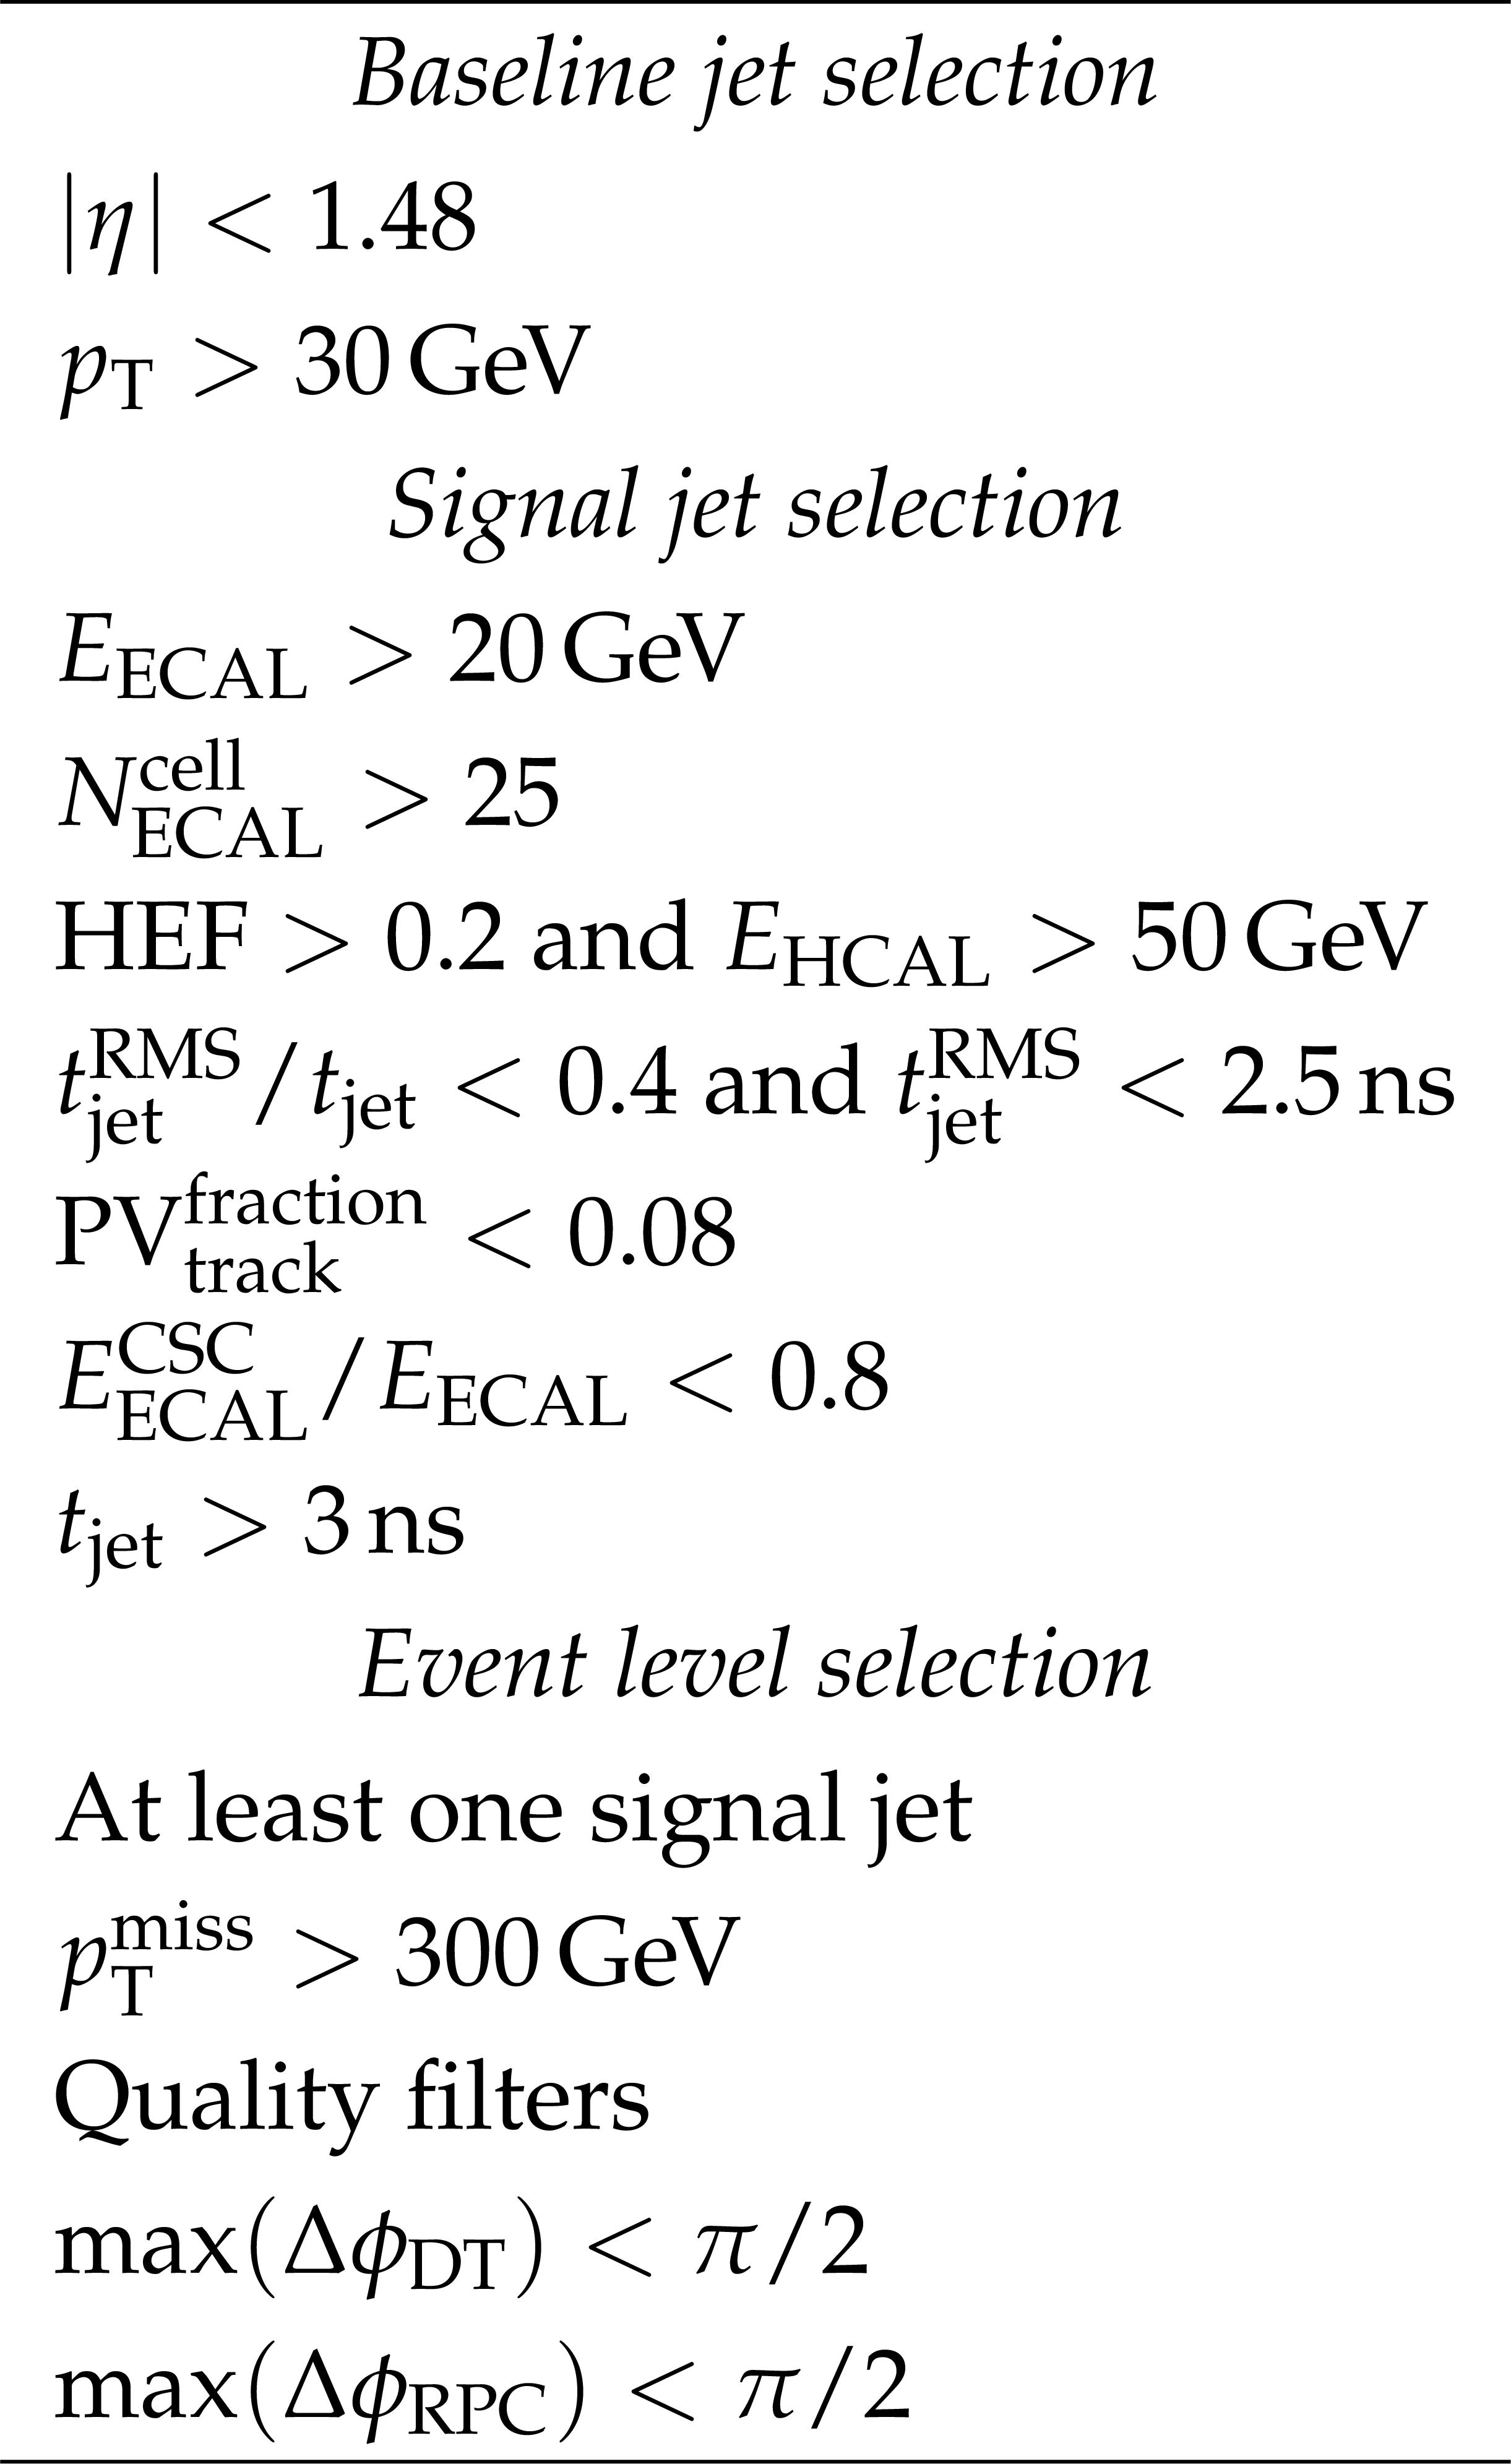
Table 1:
Summary of the requirements used to define the signal region. |
png pdf |
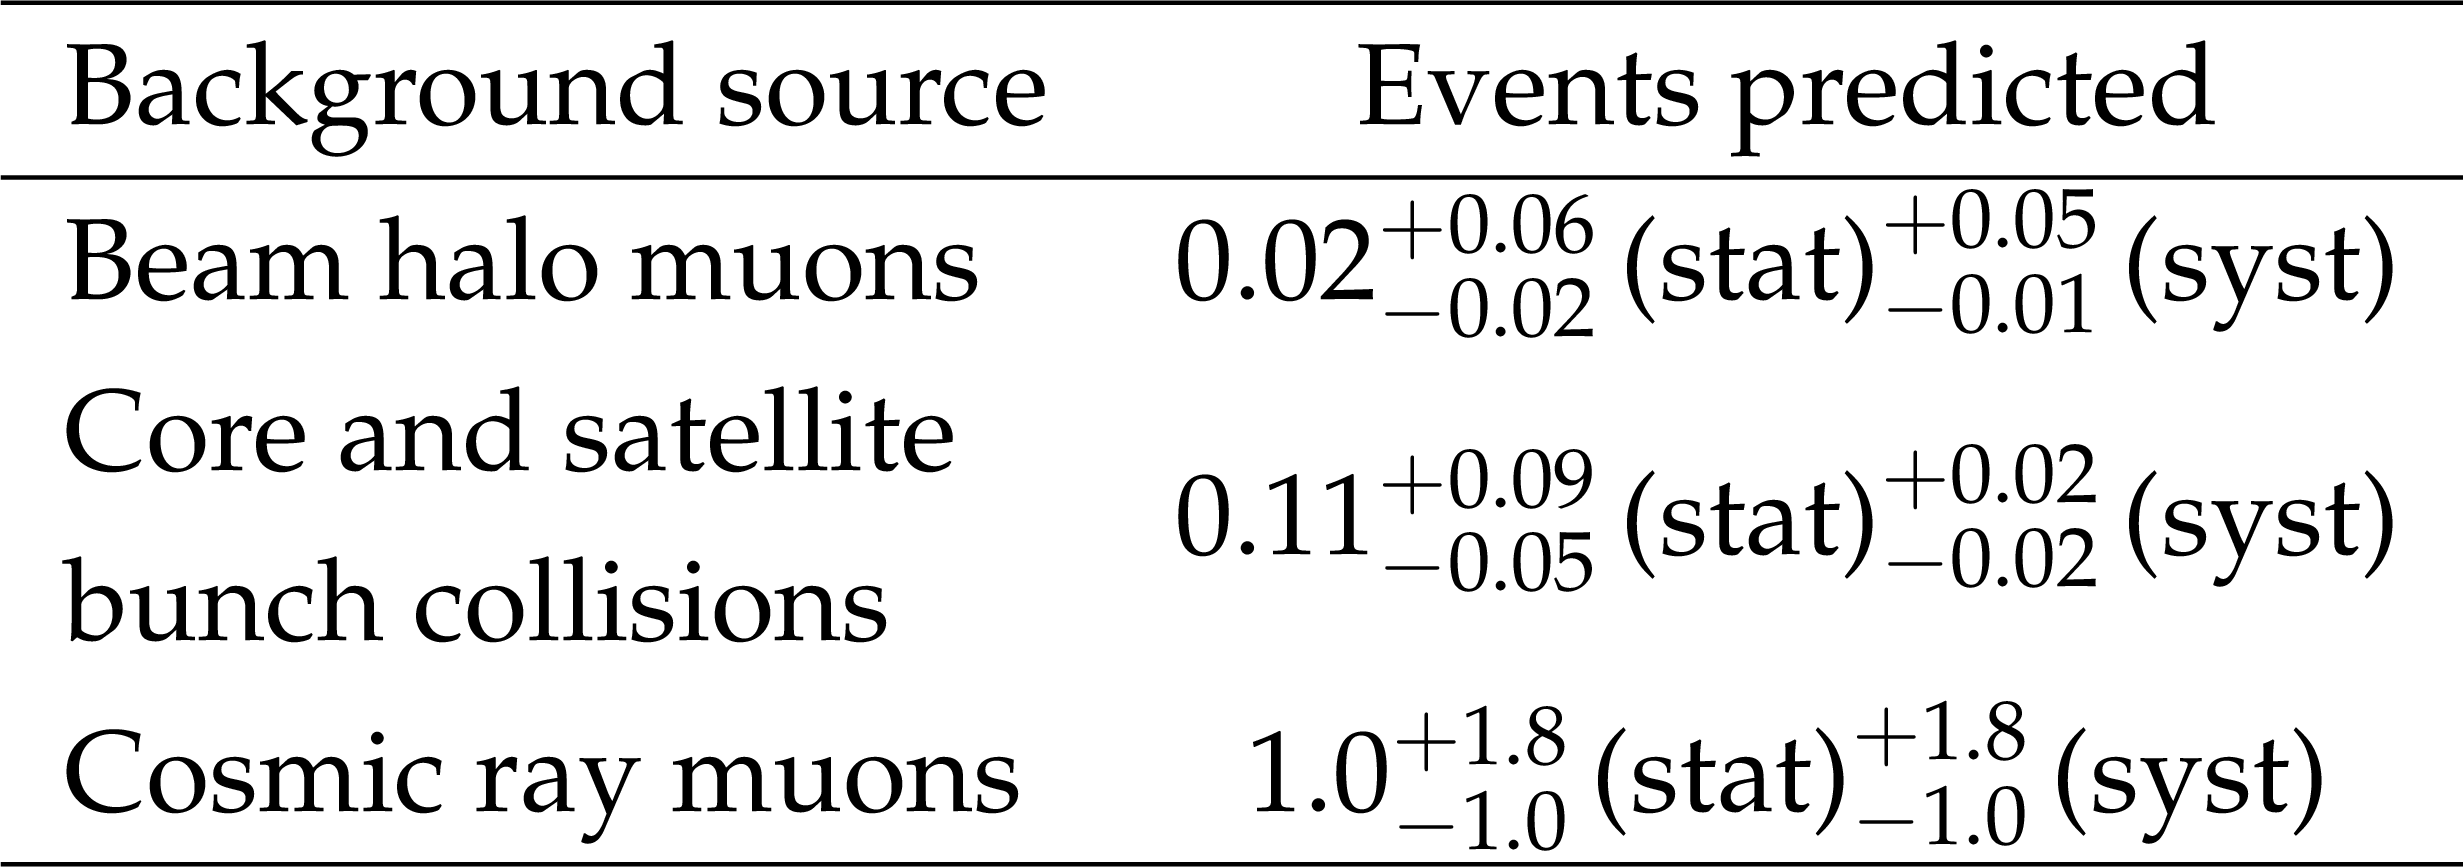
Table 2:
Summary of the estimated number of background events. |

png pdf |
Table 3:
The derived uncertainty in the product, ${\mathcal {A}\varepsilon}$, of the acceptance and efficiency from the modeling of the variables discussed in Section 5.1.2, for a representative model with $ {m_{{\mathrm{\tilde{g}}}}} = $ 2400 GeV. |
| Summary |
| An inclusive search for long-lived particles has been presented, based on a data sample of proton-proton collisions collected at $\sqrt{s} = $ 13 TeV by the CMS experiment, corresponding to an integrated luminosity of 137 fb$^{-1}$. The search uses the timing of energy deposits in the electromagnetic calorimeter to select delayed jets from the decays of heavy long-lived particles, with residual background contributions estimated using measurements in control regions in the data. The results are interpreted using the gluino gauge-mediated supersymmetry breaking signal model and gluino masses up to 2100, 2500, and 1900 GeV are excluded at 95% confidence level for proper decay lengths of 0.3, 1, and 100 m, respectively. The reach for models that predict significant missing transverse momentum in the final state is significantly extended beyond all previous searches, for proper decay lengths greater than $\sim$0.5 m. |
| Additional Figures | |
png pdf |
Additional Figure 1:
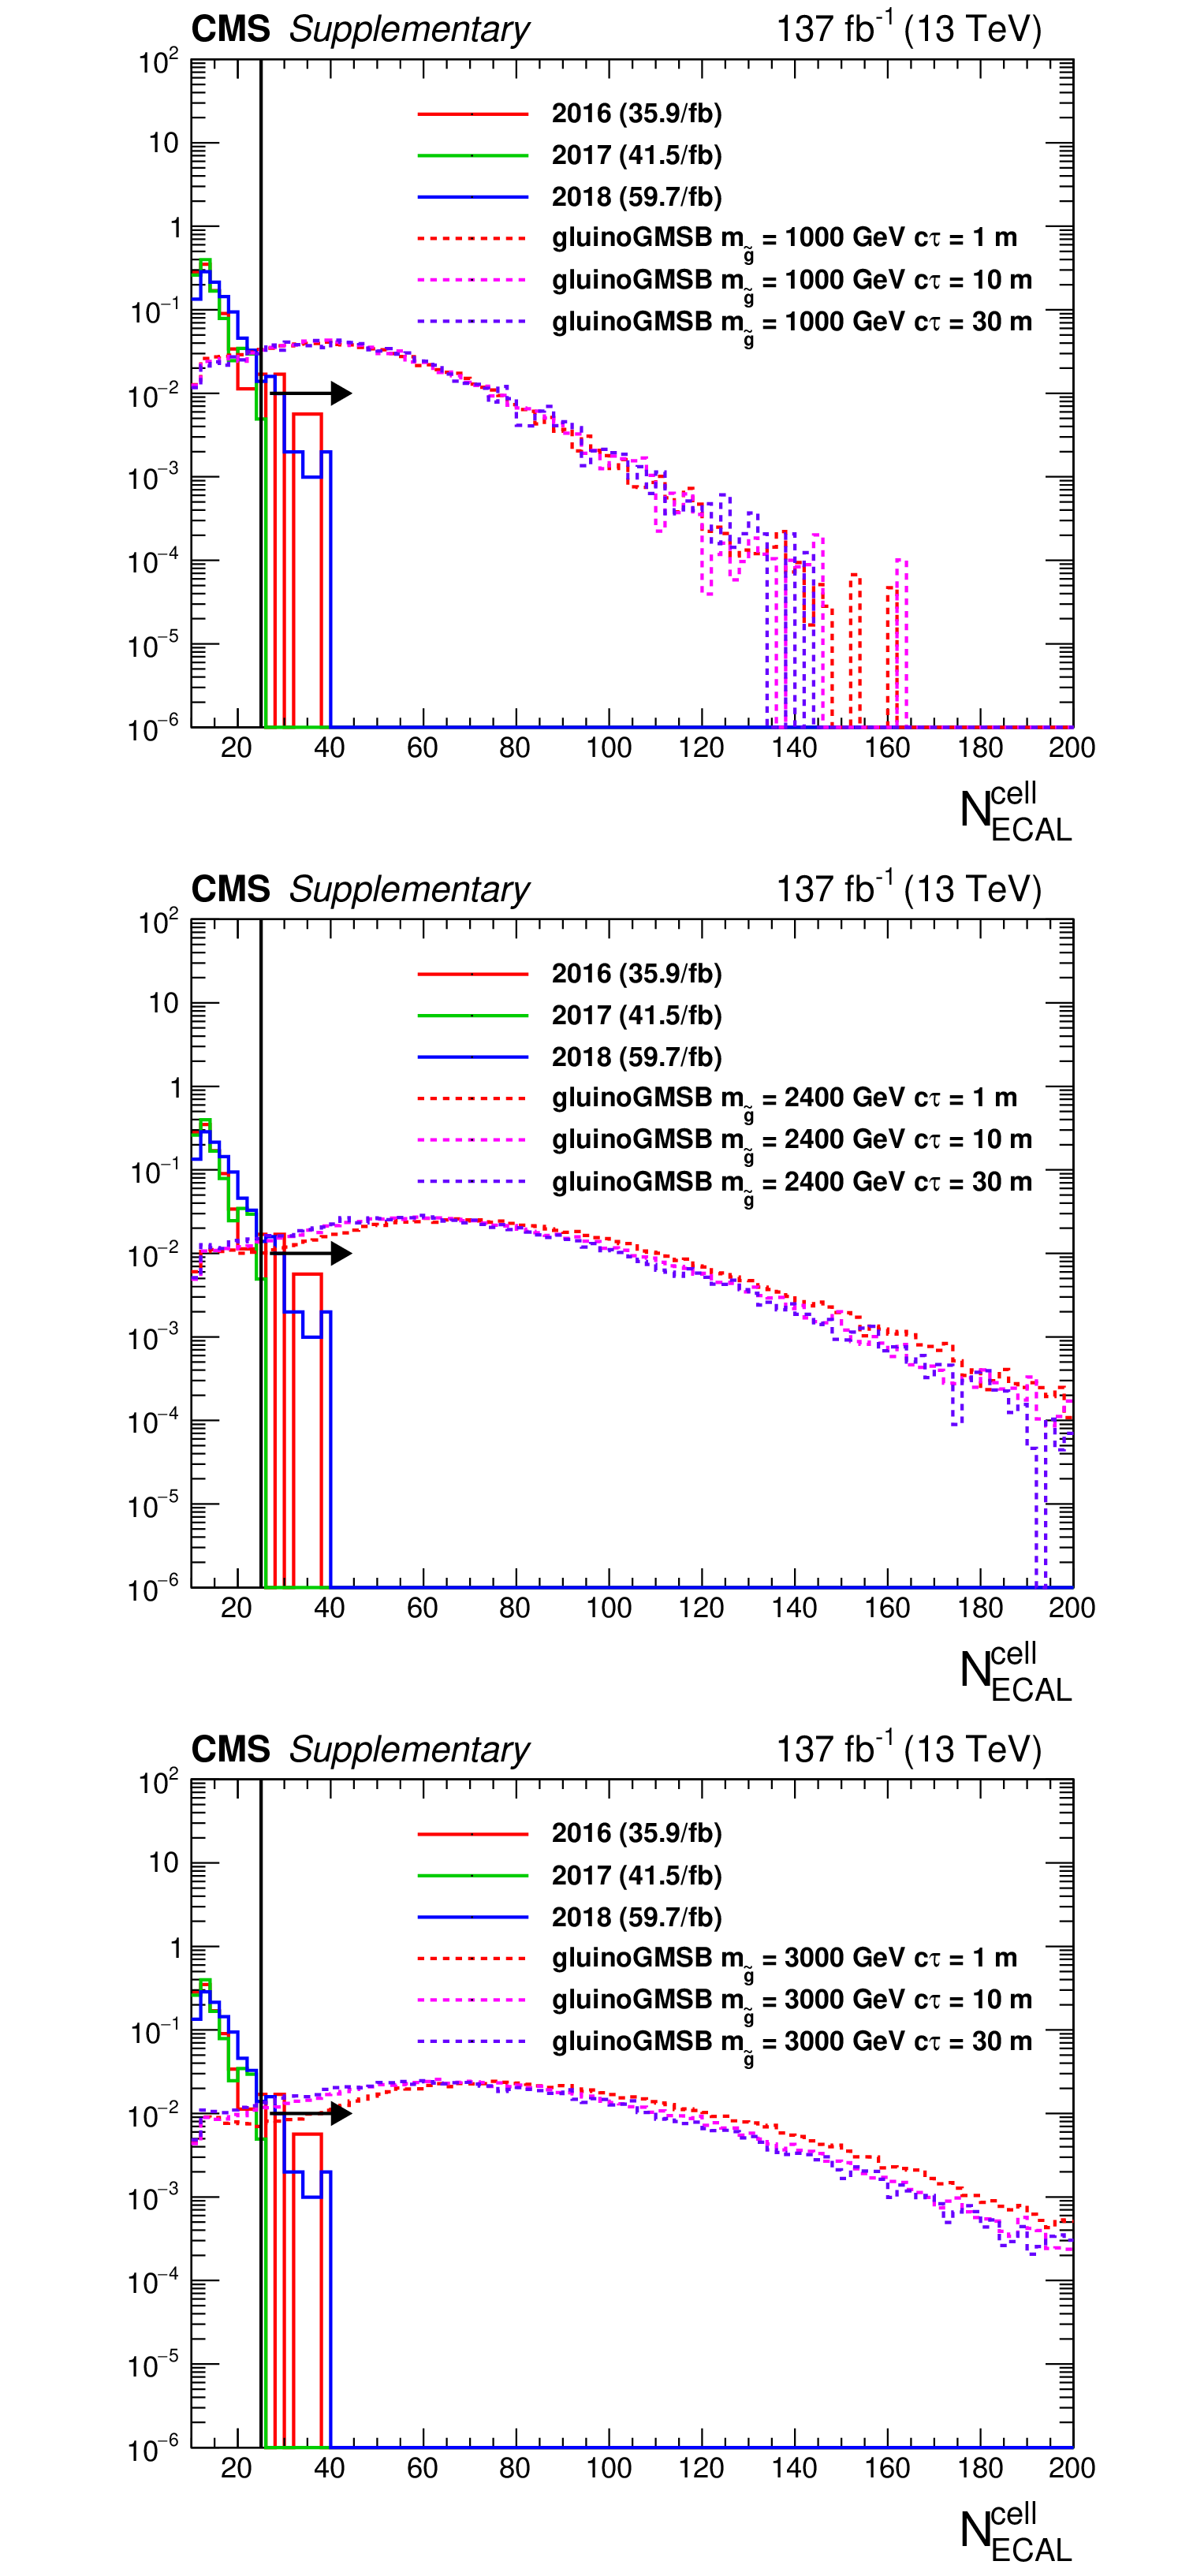
The distribution (normalized to unity) of number of ECAL cells hit in the jet for jets in a background enriched data sample (satisfying $|\eta | < $ 1.48, $ {PV_{\rm track}^{\rm fraction}} > $ 1/12, $ {\textrm {HEF}} > $ 0.2, $ {t_{\textrm {jet}}} < -$3 ns and $ {E^{\textrm {CSC}}_\textrm {ECAL}/E_{\textrm {ECAL}}} < $ 0.8) and for signal jets satisfying signal region requirements (except those on ${E_{\textrm {ECAL}}}$ and ${N^{\textrm {cell}}_{\textrm {ECAL}}}$). |
png pdf |
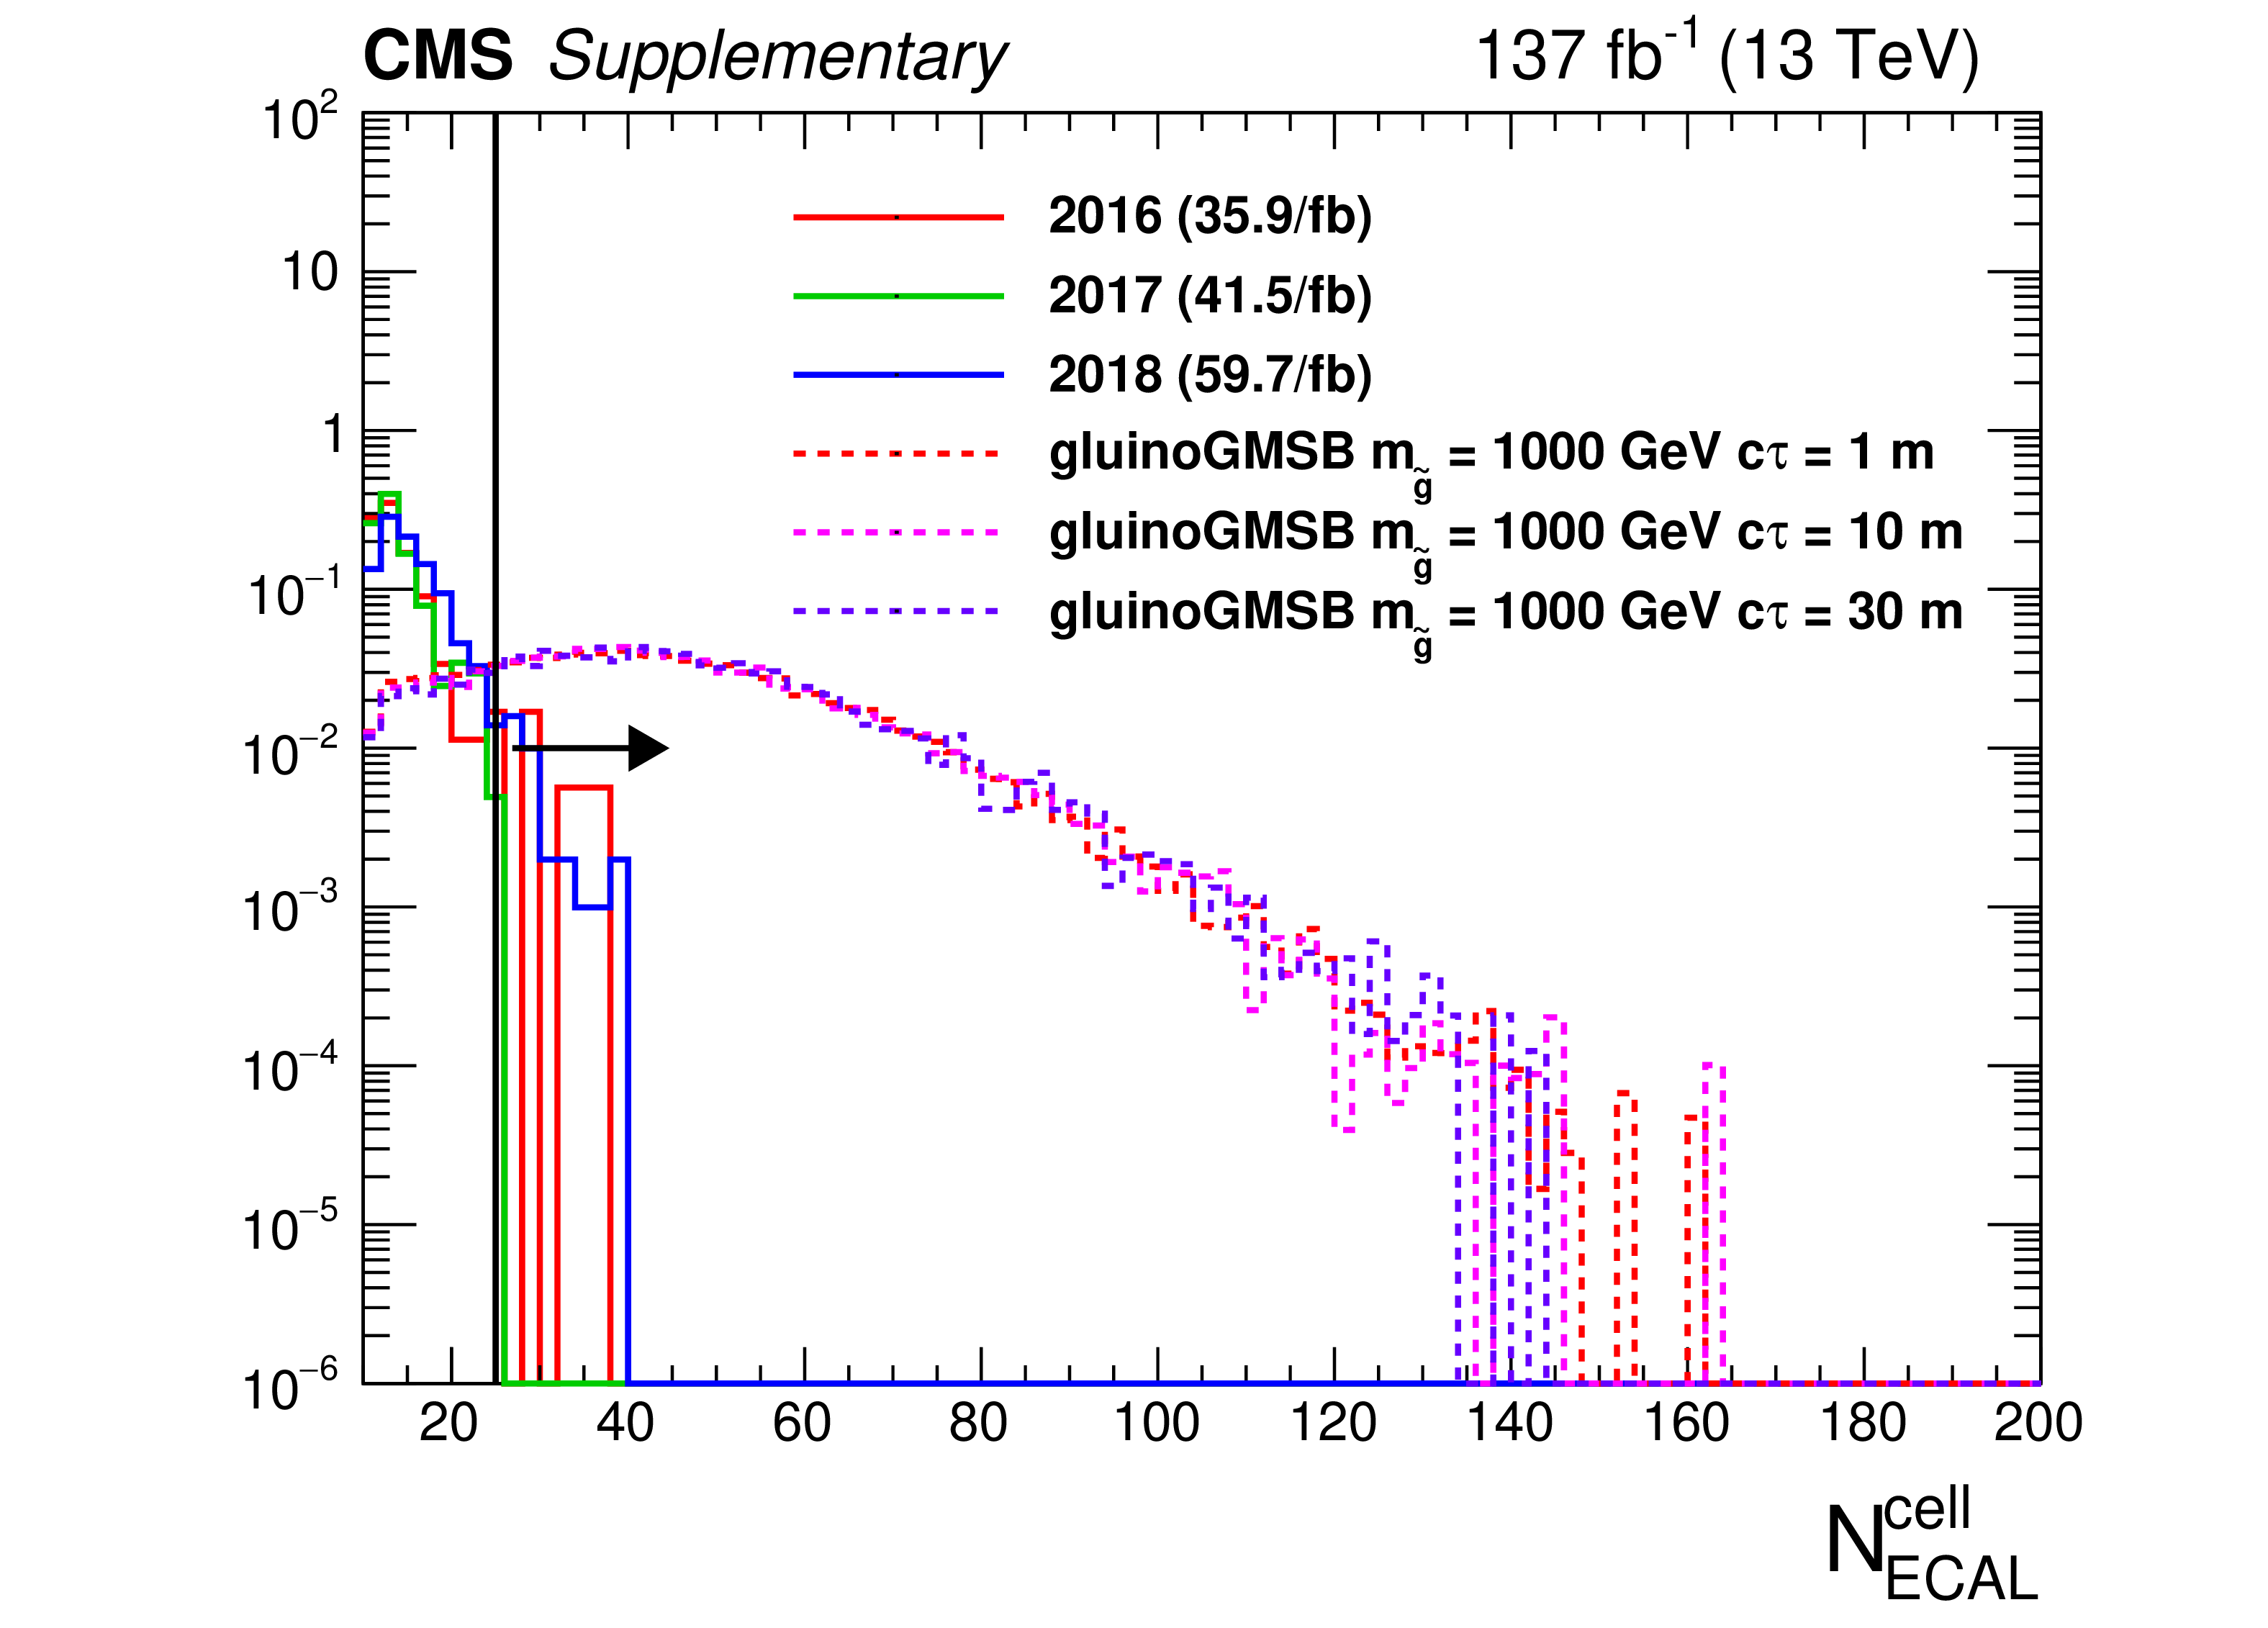
Additional Figure 1-a:
The distribution (normalized to unity) of number of ECAL cells hit in the jet for jets in a background enriched data sample (satisfying $|\eta | < $ 1.48, $ {PV_{\rm track}^{\rm fraction}} > $ 1/12, $ {\textrm {HEF}} > $ 0.2, $ {t_{\textrm {jet}}} < -$3 ns and $ {E^{\textrm {CSC}}_\textrm {ECAL}/E_{\textrm {ECAL}}} < $ 0.8) and for signal jets satisfying signal region requirements (except those on ${E_{\textrm {ECAL}}}$ and ${N^{\textrm {cell}}_{\textrm {ECAL}}}$). |

png pdf |
Additional Figure 1-b:
The distribution (normalized to unity) of number of ECAL cells hit in the jet for jets in a background enriched data sample (satisfying $|\eta | < $ 1.48, $ {PV_{\rm track}^{\rm fraction}} > $ 1/12, $ {\textrm {HEF}} > $ 0.2, $ {t_{\textrm {jet}}} < -$3 ns and $ {E^{\textrm {CSC}}_\textrm {ECAL}/E_{\textrm {ECAL}}} < $ 0.8) and for signal jets satisfying signal region requirements (except those on ${E_{\textrm {ECAL}}}$ and ${N^{\textrm {cell}}_{\textrm {ECAL}}}$). |
png pdf |
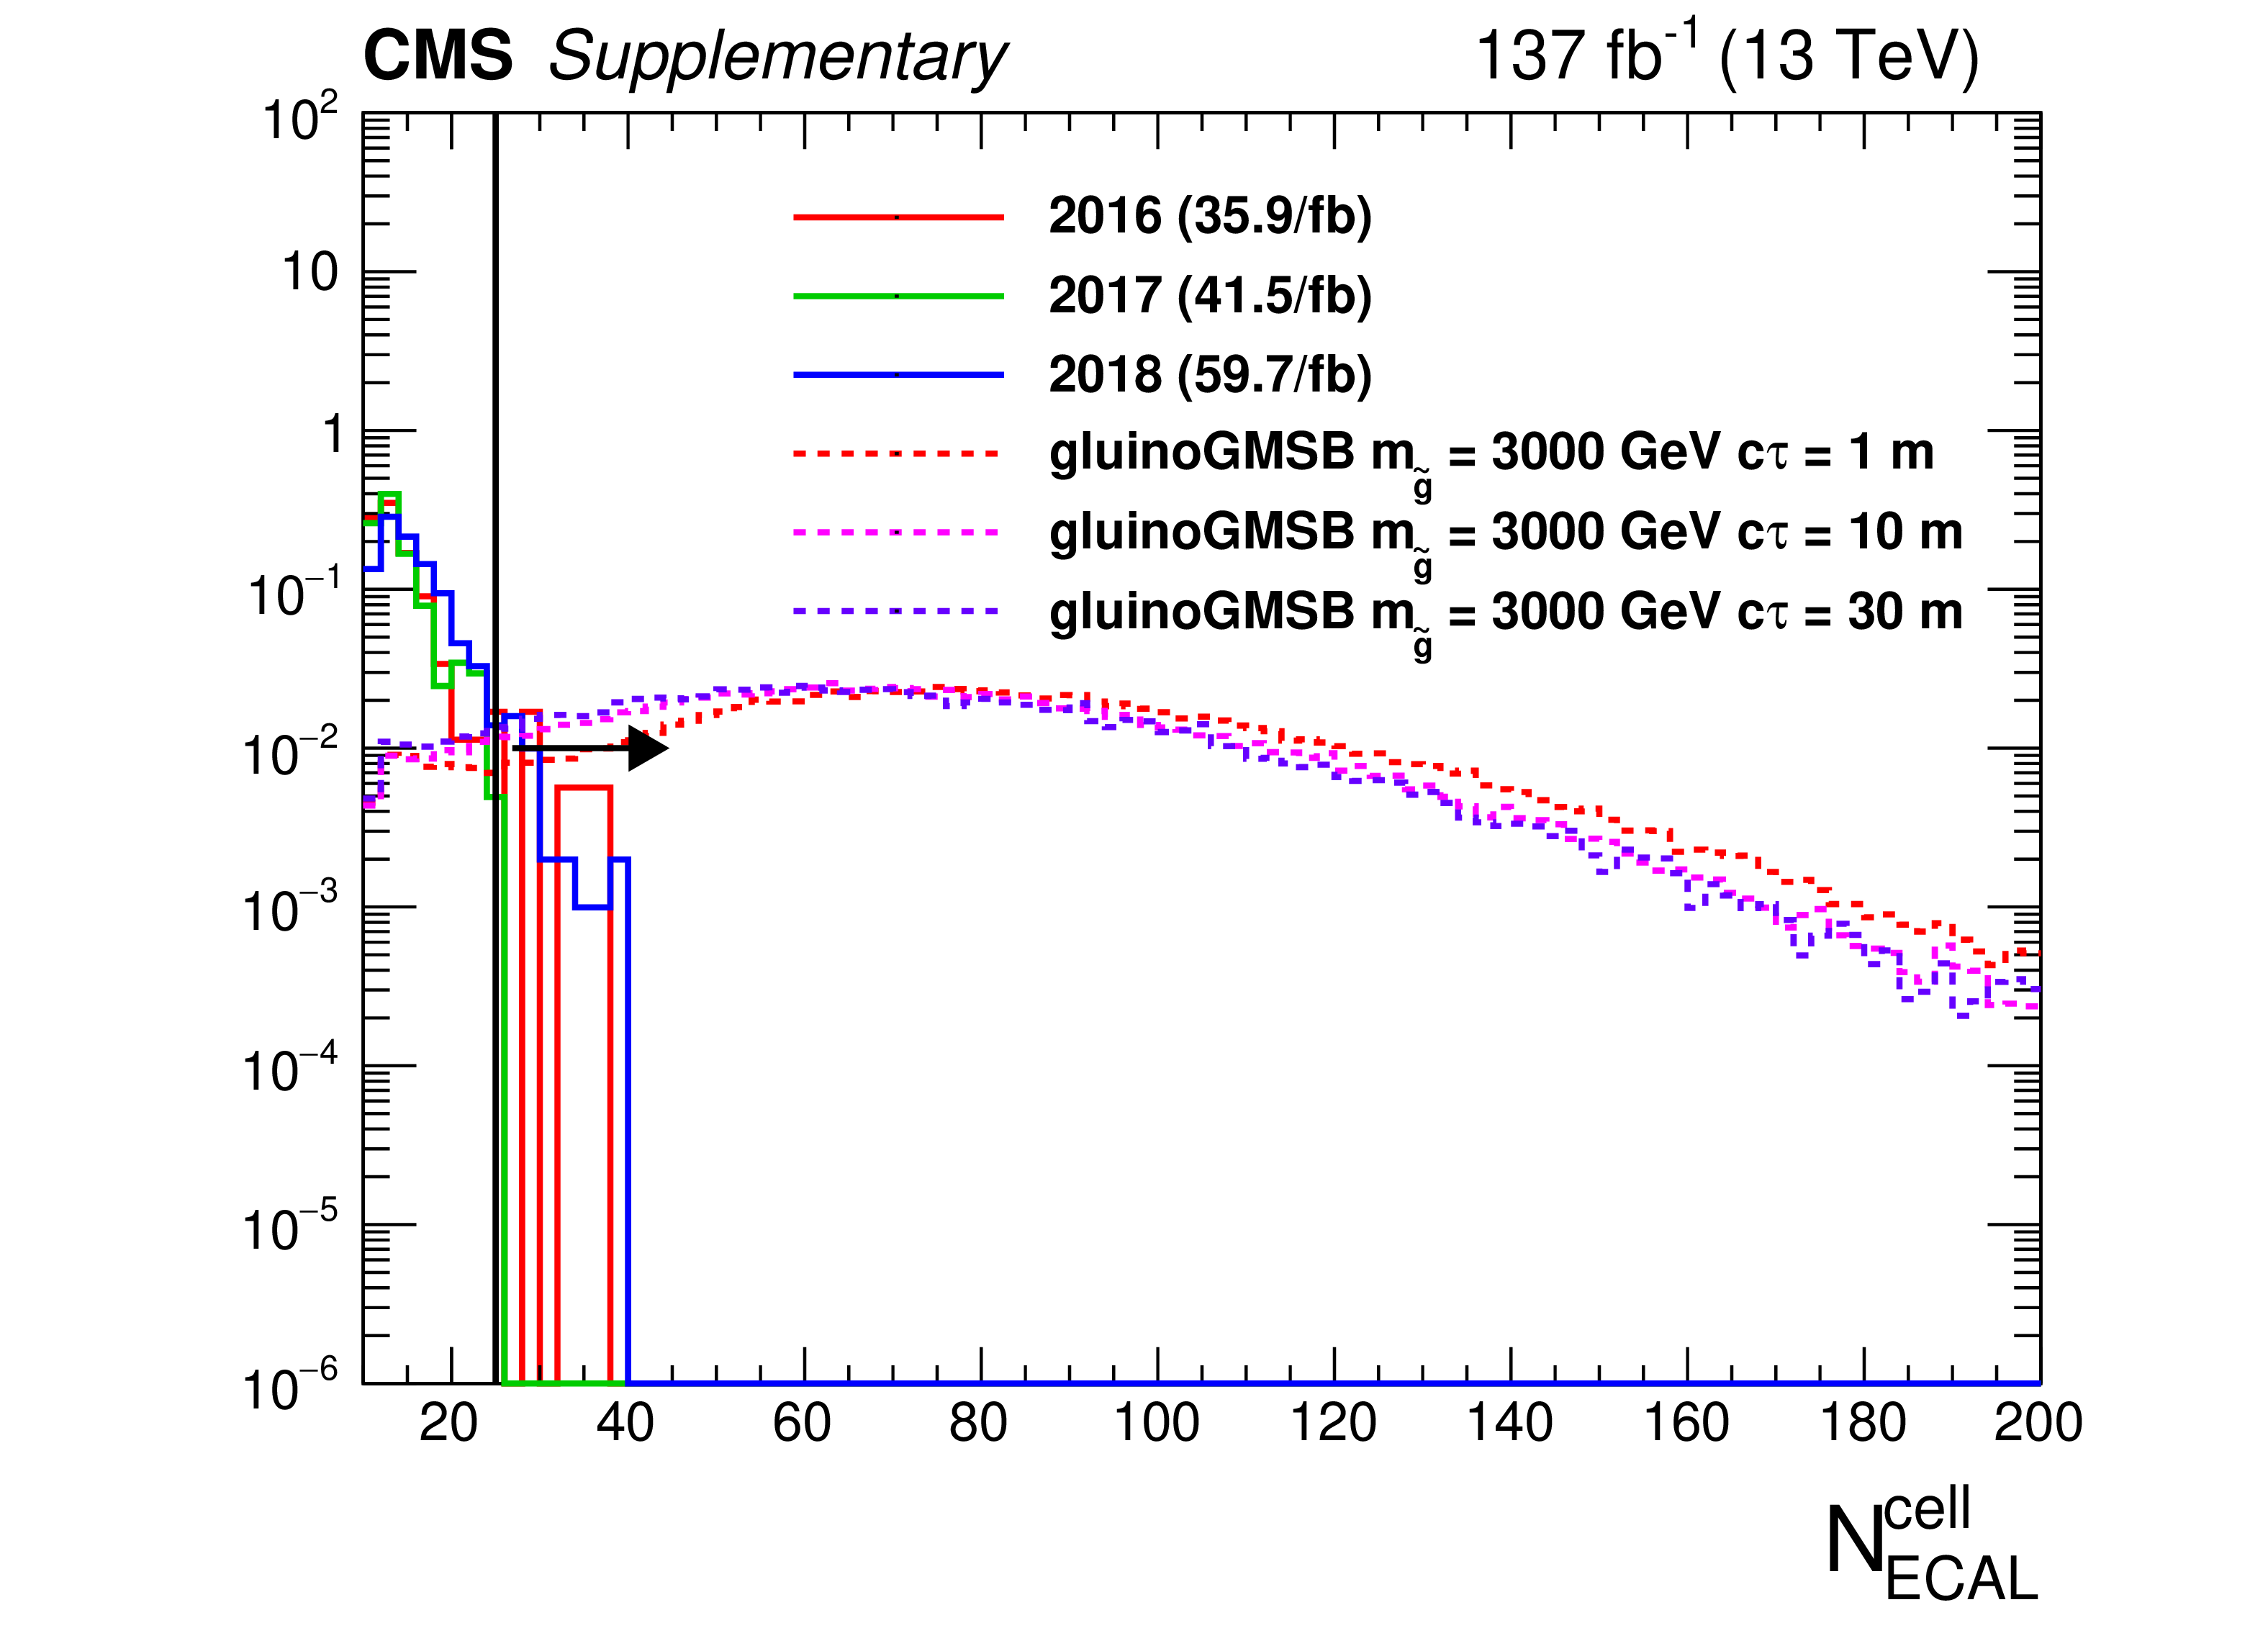
Additional Figure 1-c:
The distribution (normalized to unity) of number of ECAL cells hit in the jet for jets in a background enriched data sample (satisfying $|\eta | < $ 1.48, $ {PV_{\rm track}^{\rm fraction}} > $ 1/12, $ {\textrm {HEF}} > $ 0.2, $ {t_{\textrm {jet}}} < -$3 ns and $ {E^{\textrm {CSC}}_\textrm {ECAL}/E_{\textrm {ECAL}}} < $ 0.8) and for signal jets satisfying signal region requirements (except those on ${E_{\textrm {ECAL}}}$ and ${N^{\textrm {cell}}_{\textrm {ECAL}}}$). |
png pdf |
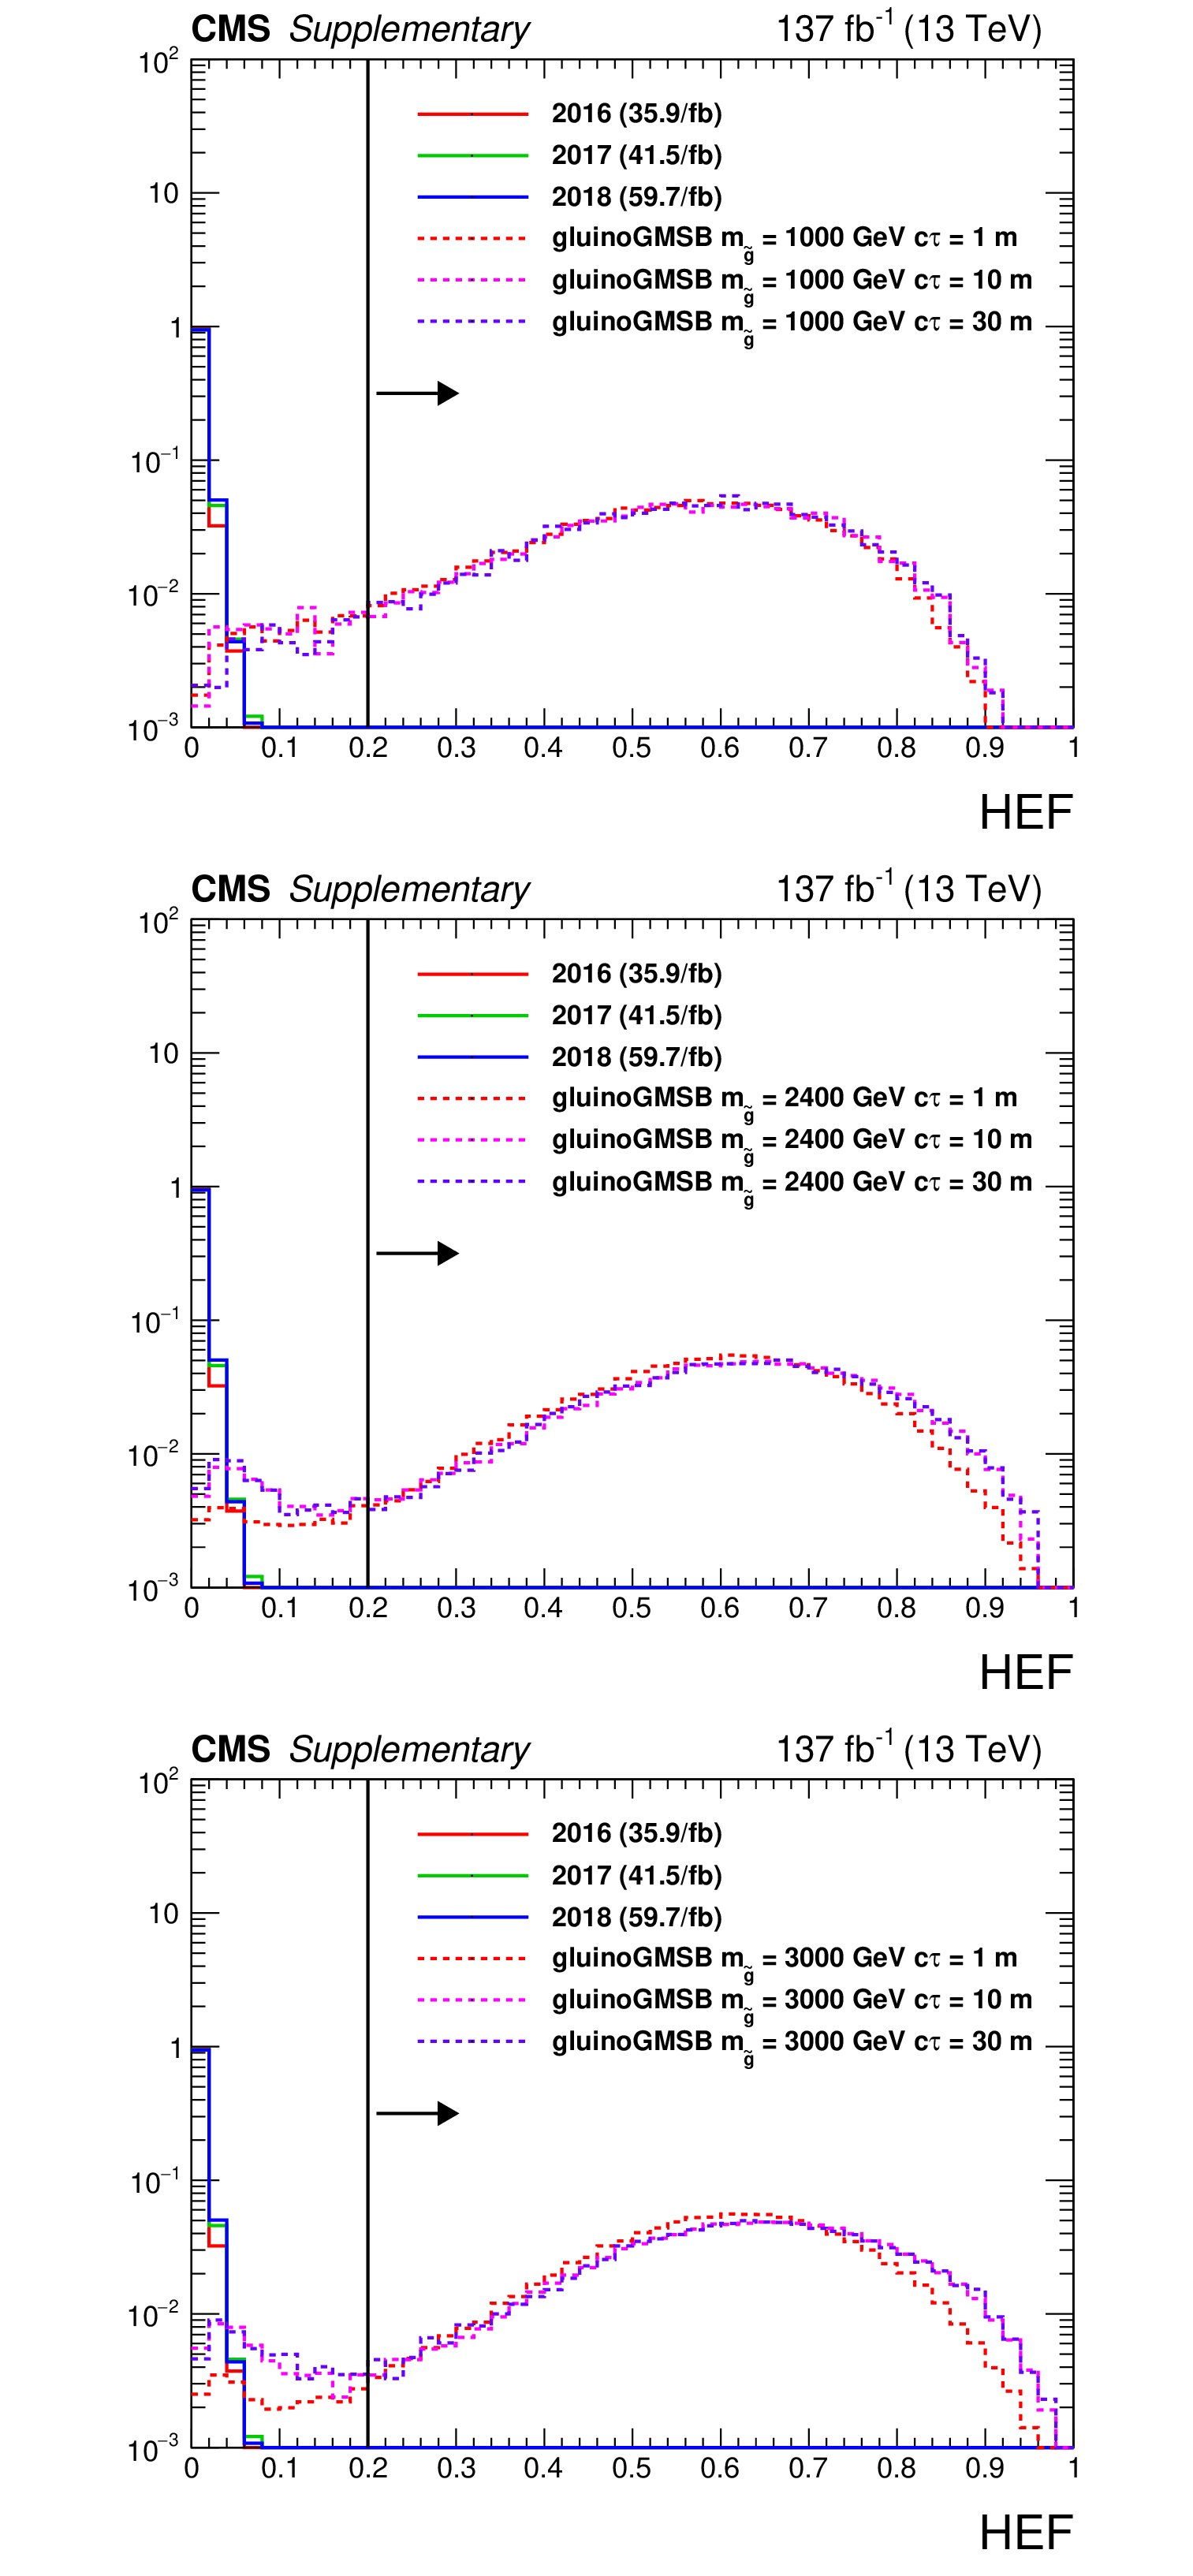
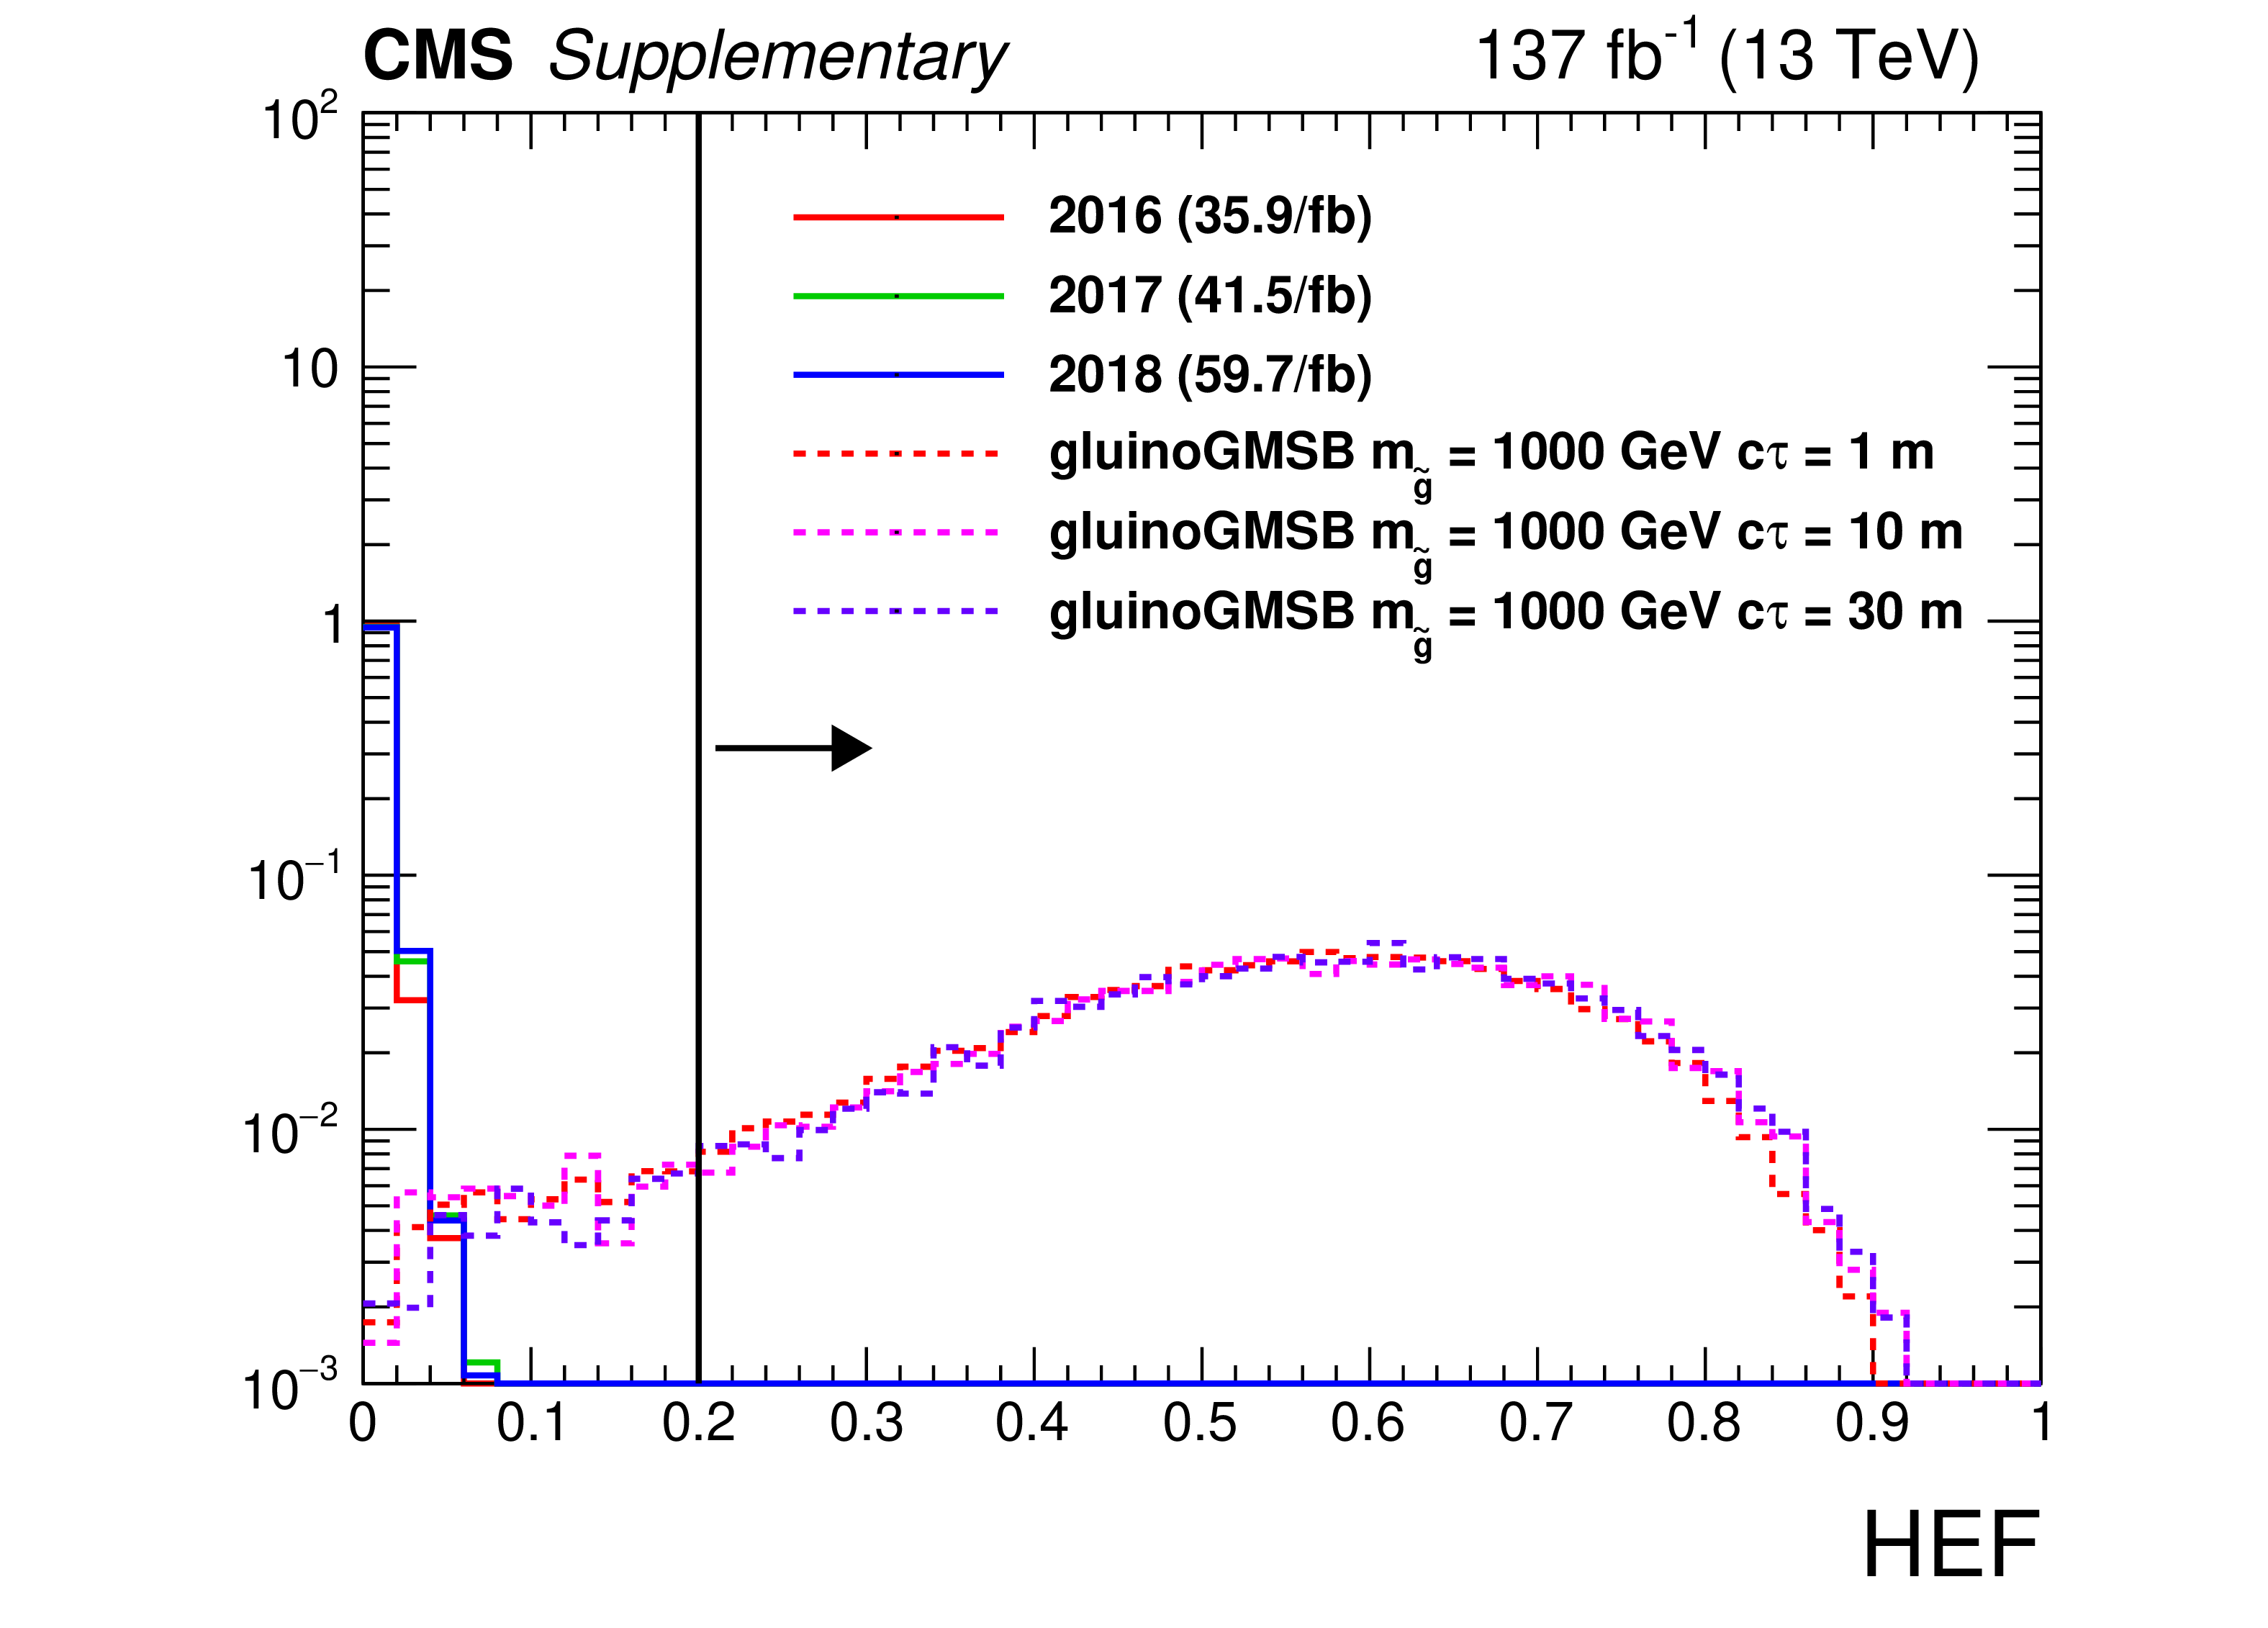
Additional Figure 2:
The distribution (normalized to unity) of $ {\textrm {HEF}} $ for a data sample enriched in beam halo and noise jets (satisfying $|\eta | < $ 1.48, $ {p_{\mathrm {T}}} > $ 30 GeV, $ {PV_{\rm track}^{\rm fraction}} < $ 1/12, $ {t_{\textrm {jet}}} < -$3 ns, $ {E_{\textrm {ECAL}}} > $ 20 GeV and $ {{t^{\textrm {RMS}}_\textrm {jet}} / {t_{\textrm {jet}}}} < $ 0.4) and for signal jets passing signal region selections (except on $ {\textrm {HEF}} $). |
png pdf |
Additional Figure 2-a:
The distribution (normalized to unity) of $ {\textrm {HEF}} $ for a data sample enriched in beam halo and noise jets (satisfying $|\eta | < $ 1.48, $ {p_{\mathrm {T}}} > $ 30 GeV, $ {PV_{\rm track}^{\rm fraction}} < $ 1/12, $ {t_{\textrm {jet}}} < -$3 ns, $ {E_{\textrm {ECAL}}} > $ 20 GeV and $ {{t^{\textrm {RMS}}_\textrm {jet}} / {t_{\textrm {jet}}}} < $ 0.4) and for signal jets passing signal region selections (except on $ {\textrm {HEF}} $). |
png pdf |
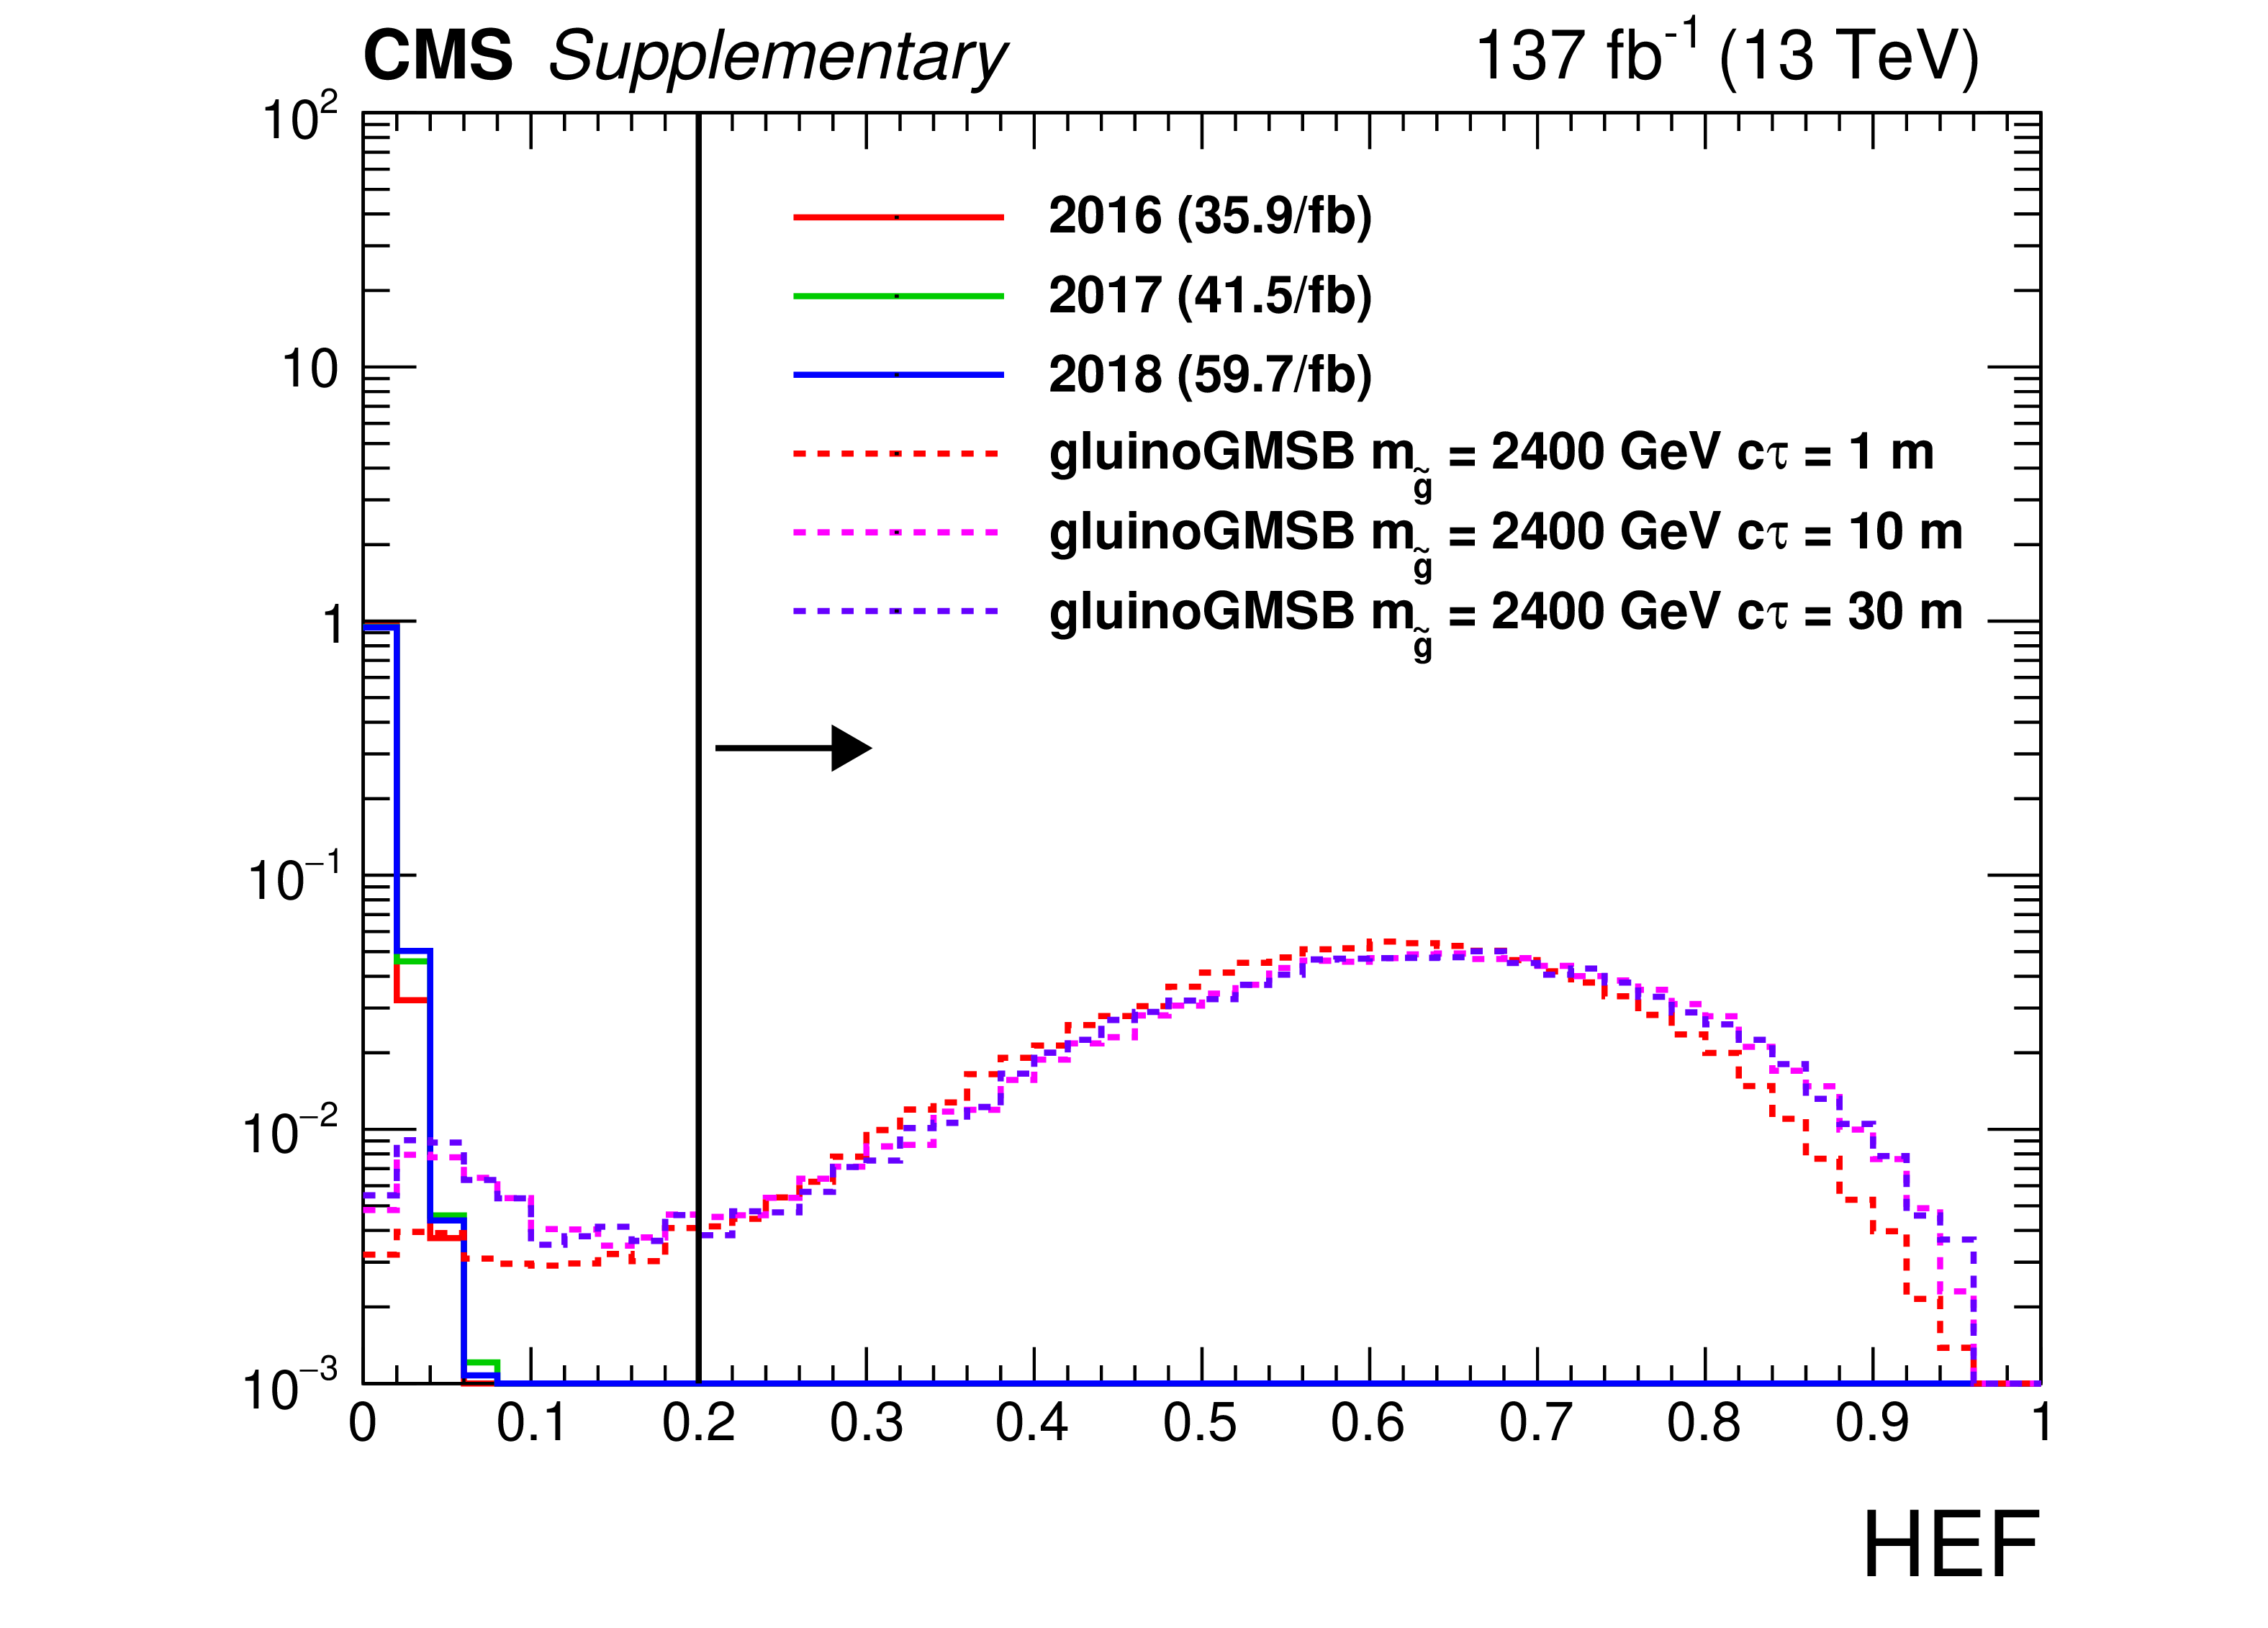
Additional Figure 2-b:
The distribution (normalized to unity) of $ {\textrm {HEF}} $ for a data sample enriched in beam halo and noise jets (satisfying $|\eta | < $ 1.48, $ {p_{\mathrm {T}}} > $ 30 GeV, $ {PV_{\rm track}^{\rm fraction}} < $ 1/12, $ {t_{\textrm {jet}}} < -$3 ns, $ {E_{\textrm {ECAL}}} > $ 20 GeV and $ {{t^{\textrm {RMS}}_\textrm {jet}} / {t_{\textrm {jet}}}} < $ 0.4) and for signal jets passing signal region selections (except on $ {\textrm {HEF}} $). |
png pdf |
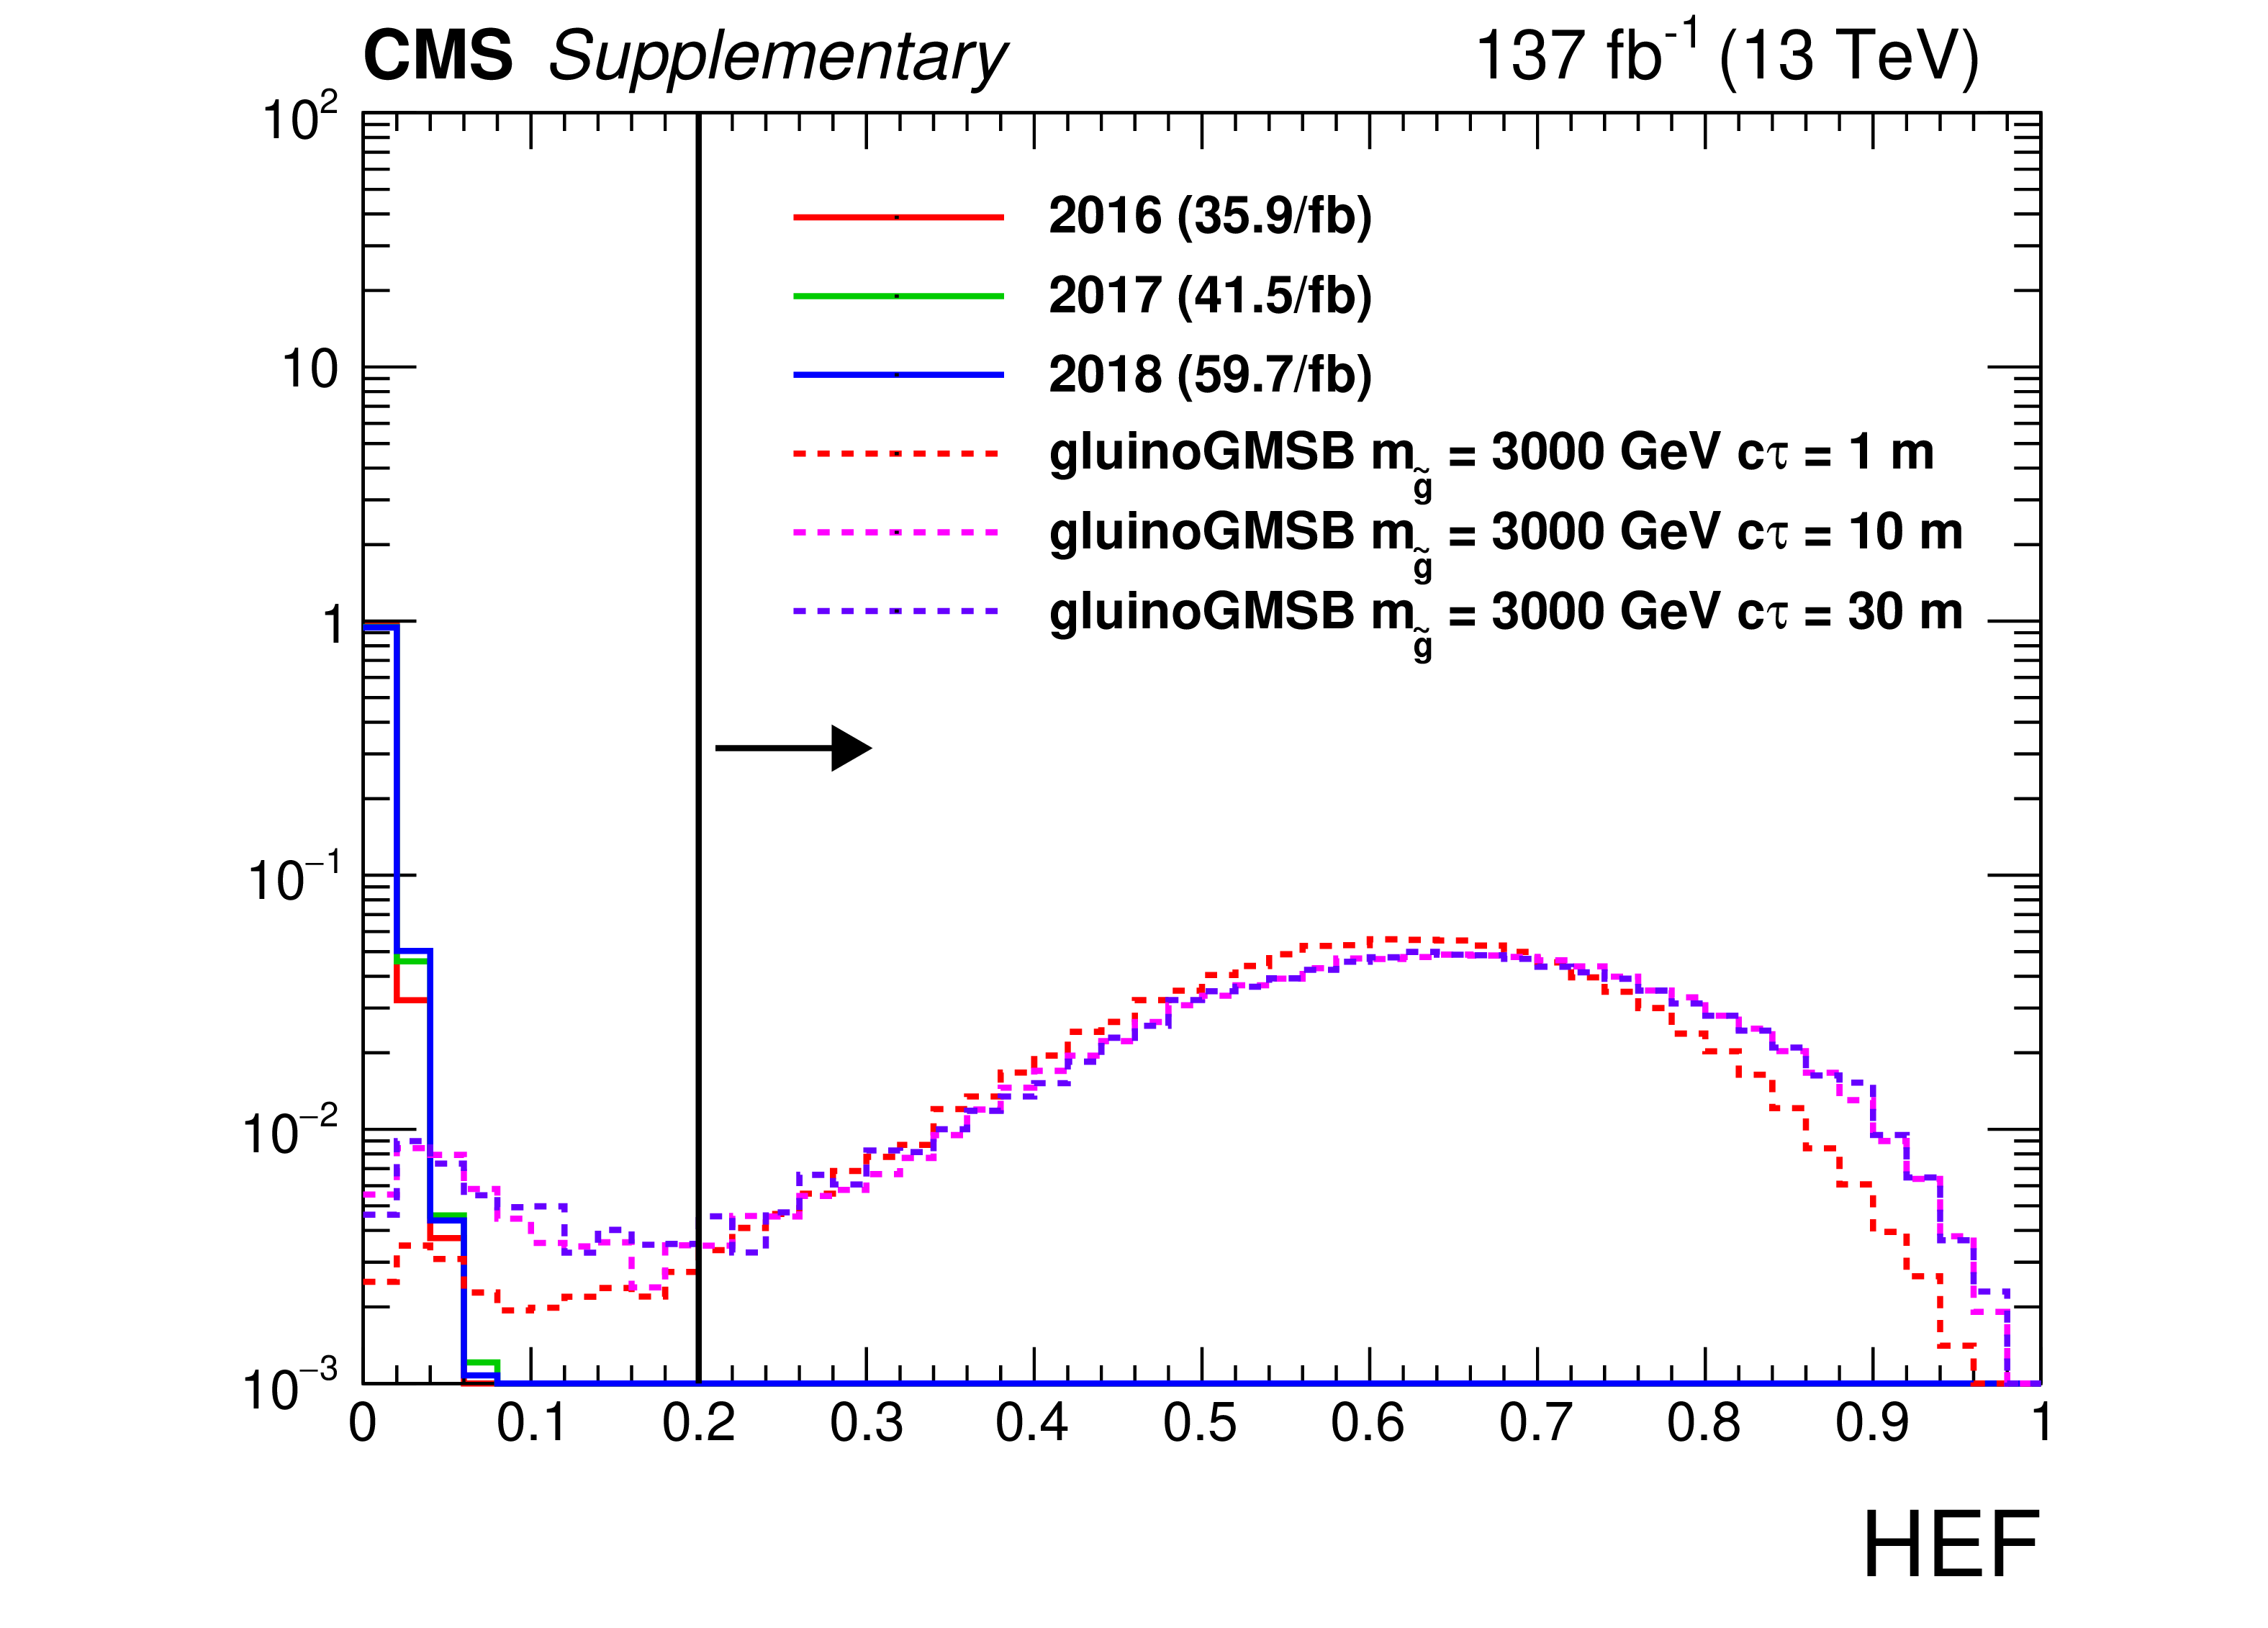
Additional Figure 2-c:
The distribution (normalized to unity) of $ {\textrm {HEF}} $ for a data sample enriched in beam halo and noise jets (satisfying $|\eta | < $ 1.48, $ {p_{\mathrm {T}}} > $ 30 GeV, $ {PV_{\rm track}^{\rm fraction}} < $ 1/12, $ {t_{\textrm {jet}}} < -$3 ns, $ {E_{\textrm {ECAL}}} > $ 20 GeV and $ {{t^{\textrm {RMS}}_\textrm {jet}} / {t_{\textrm {jet}}}} < $ 0.4) and for signal jets passing signal region selections (except on $ {\textrm {HEF}} $). |
png pdf |
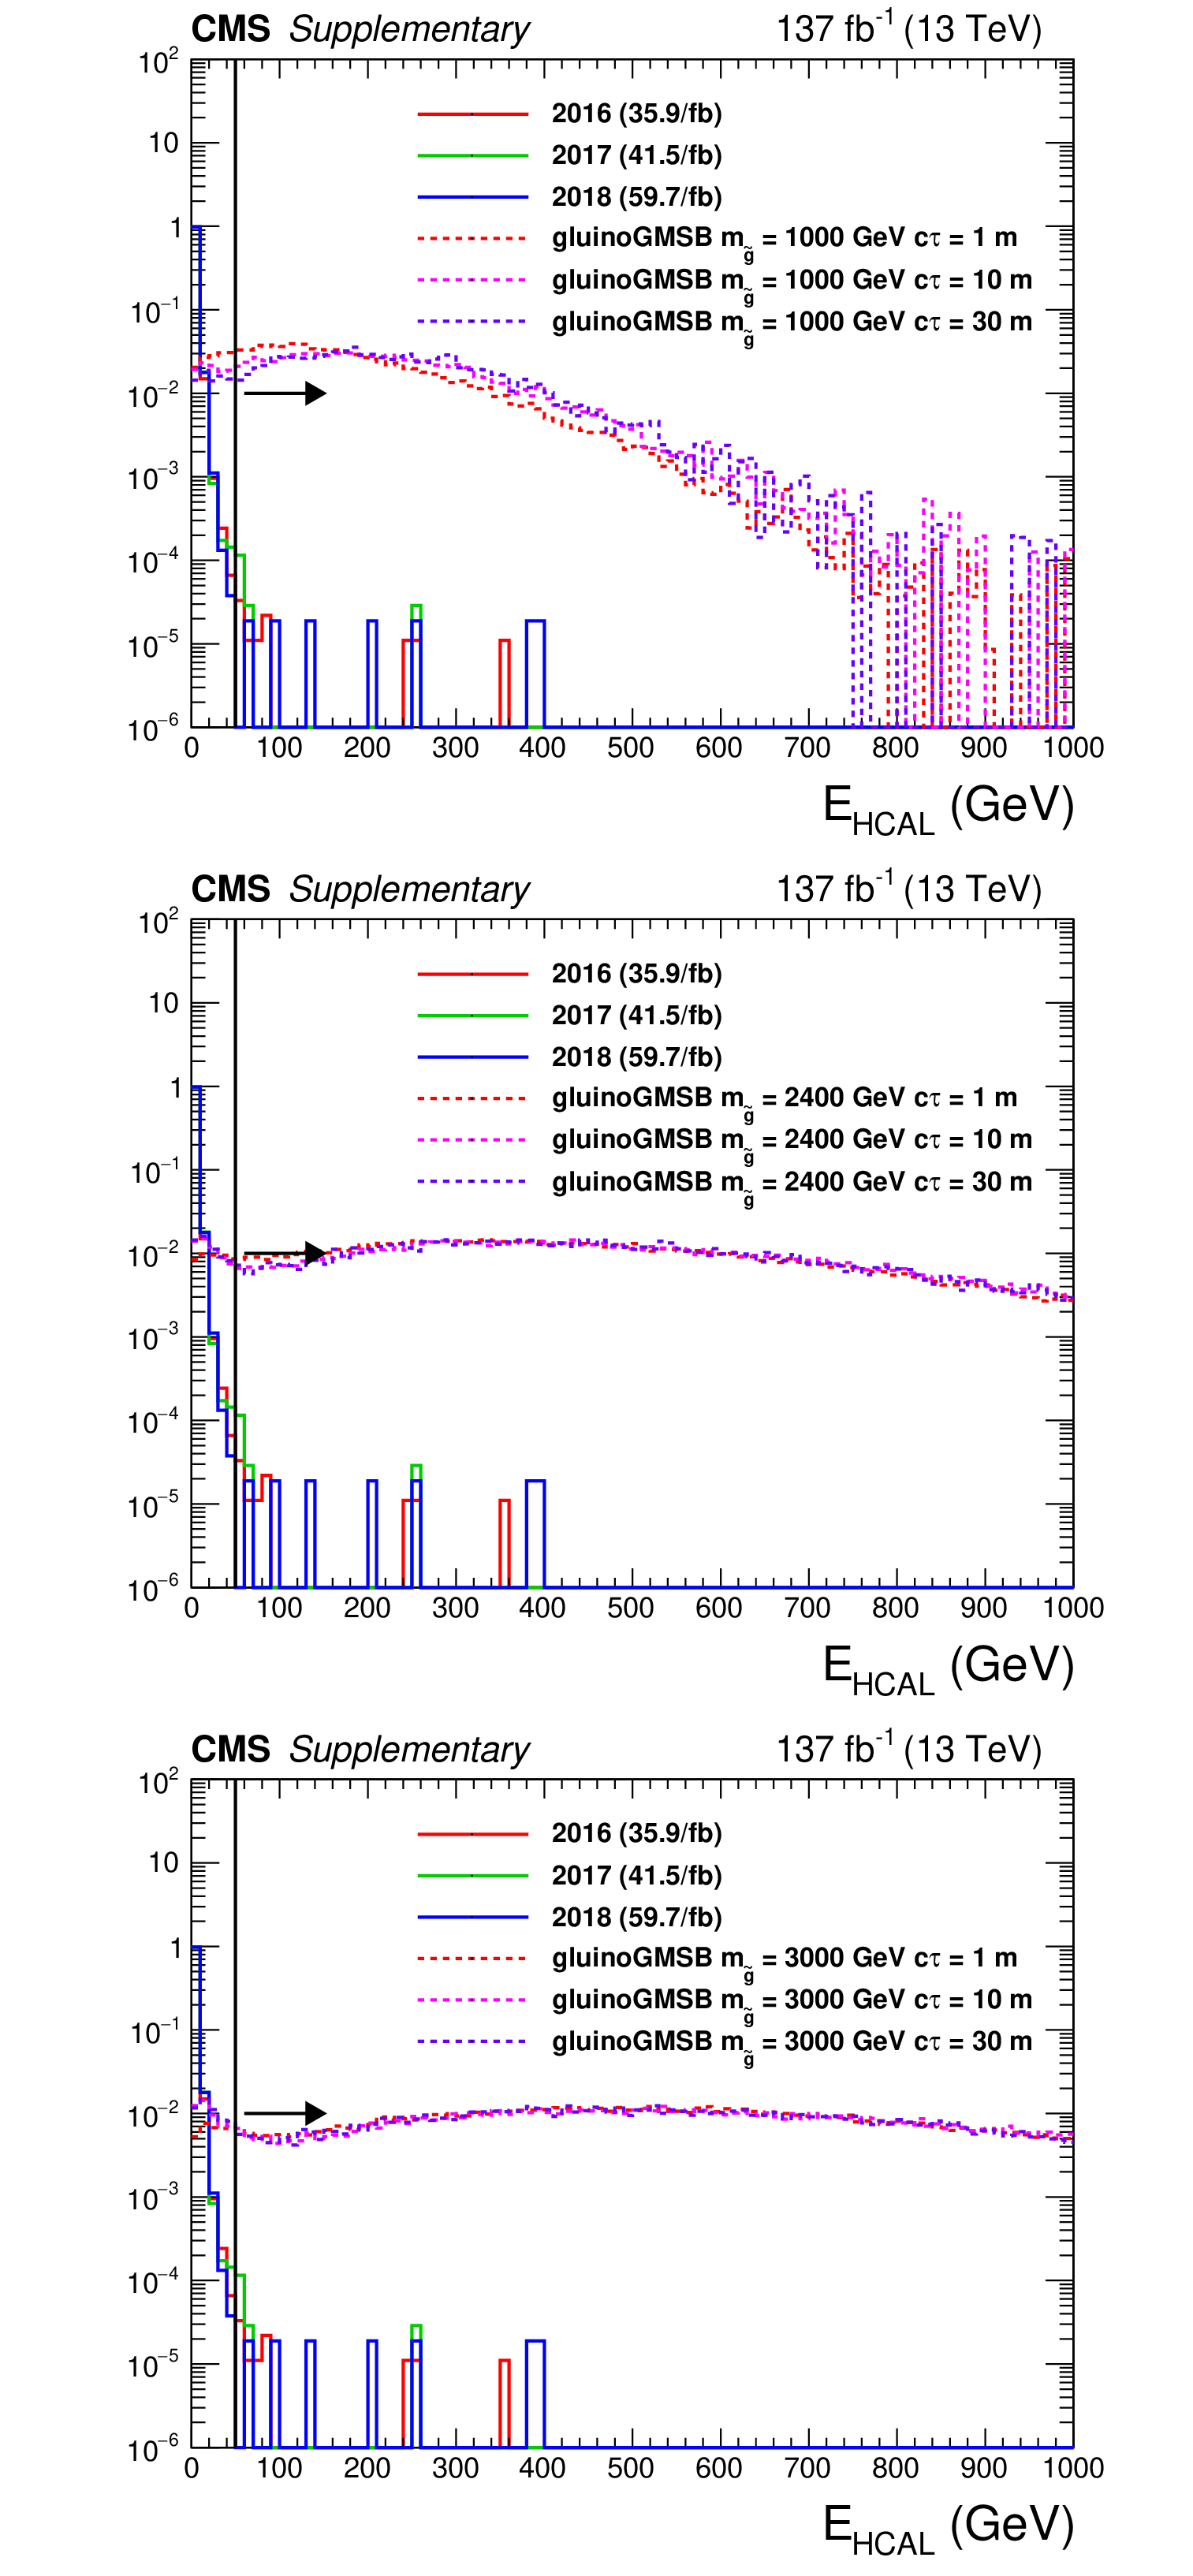
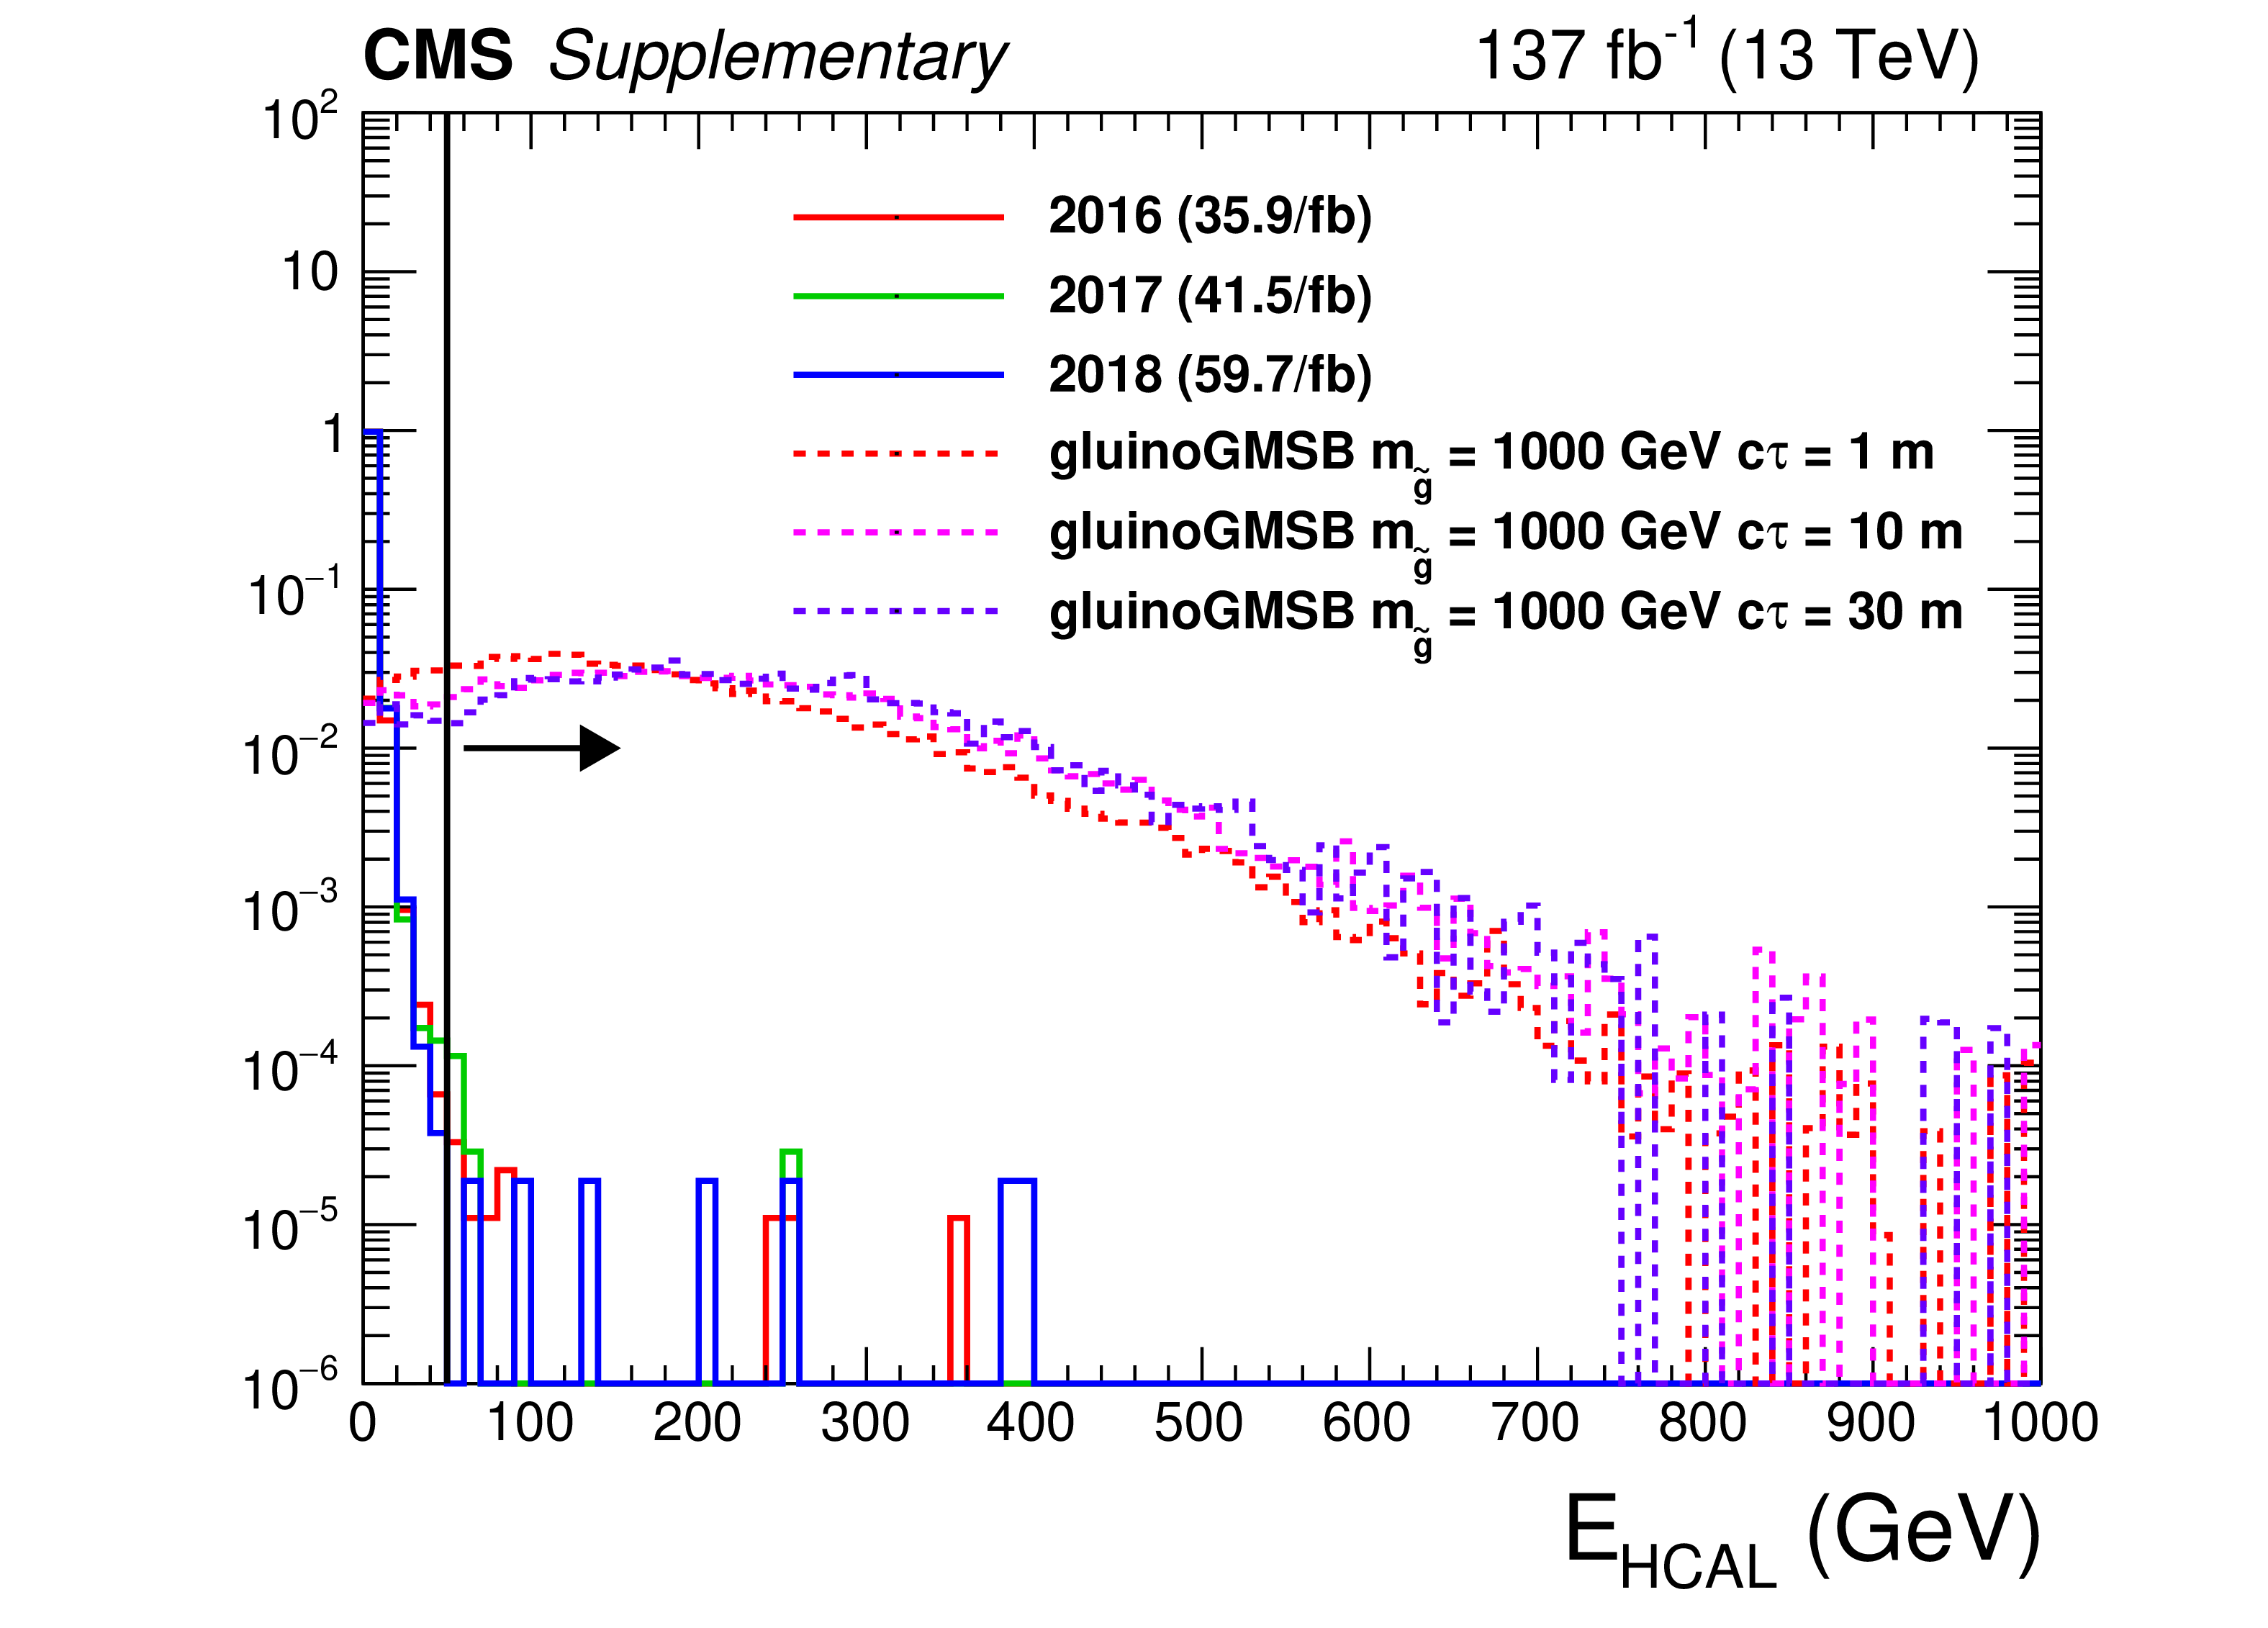
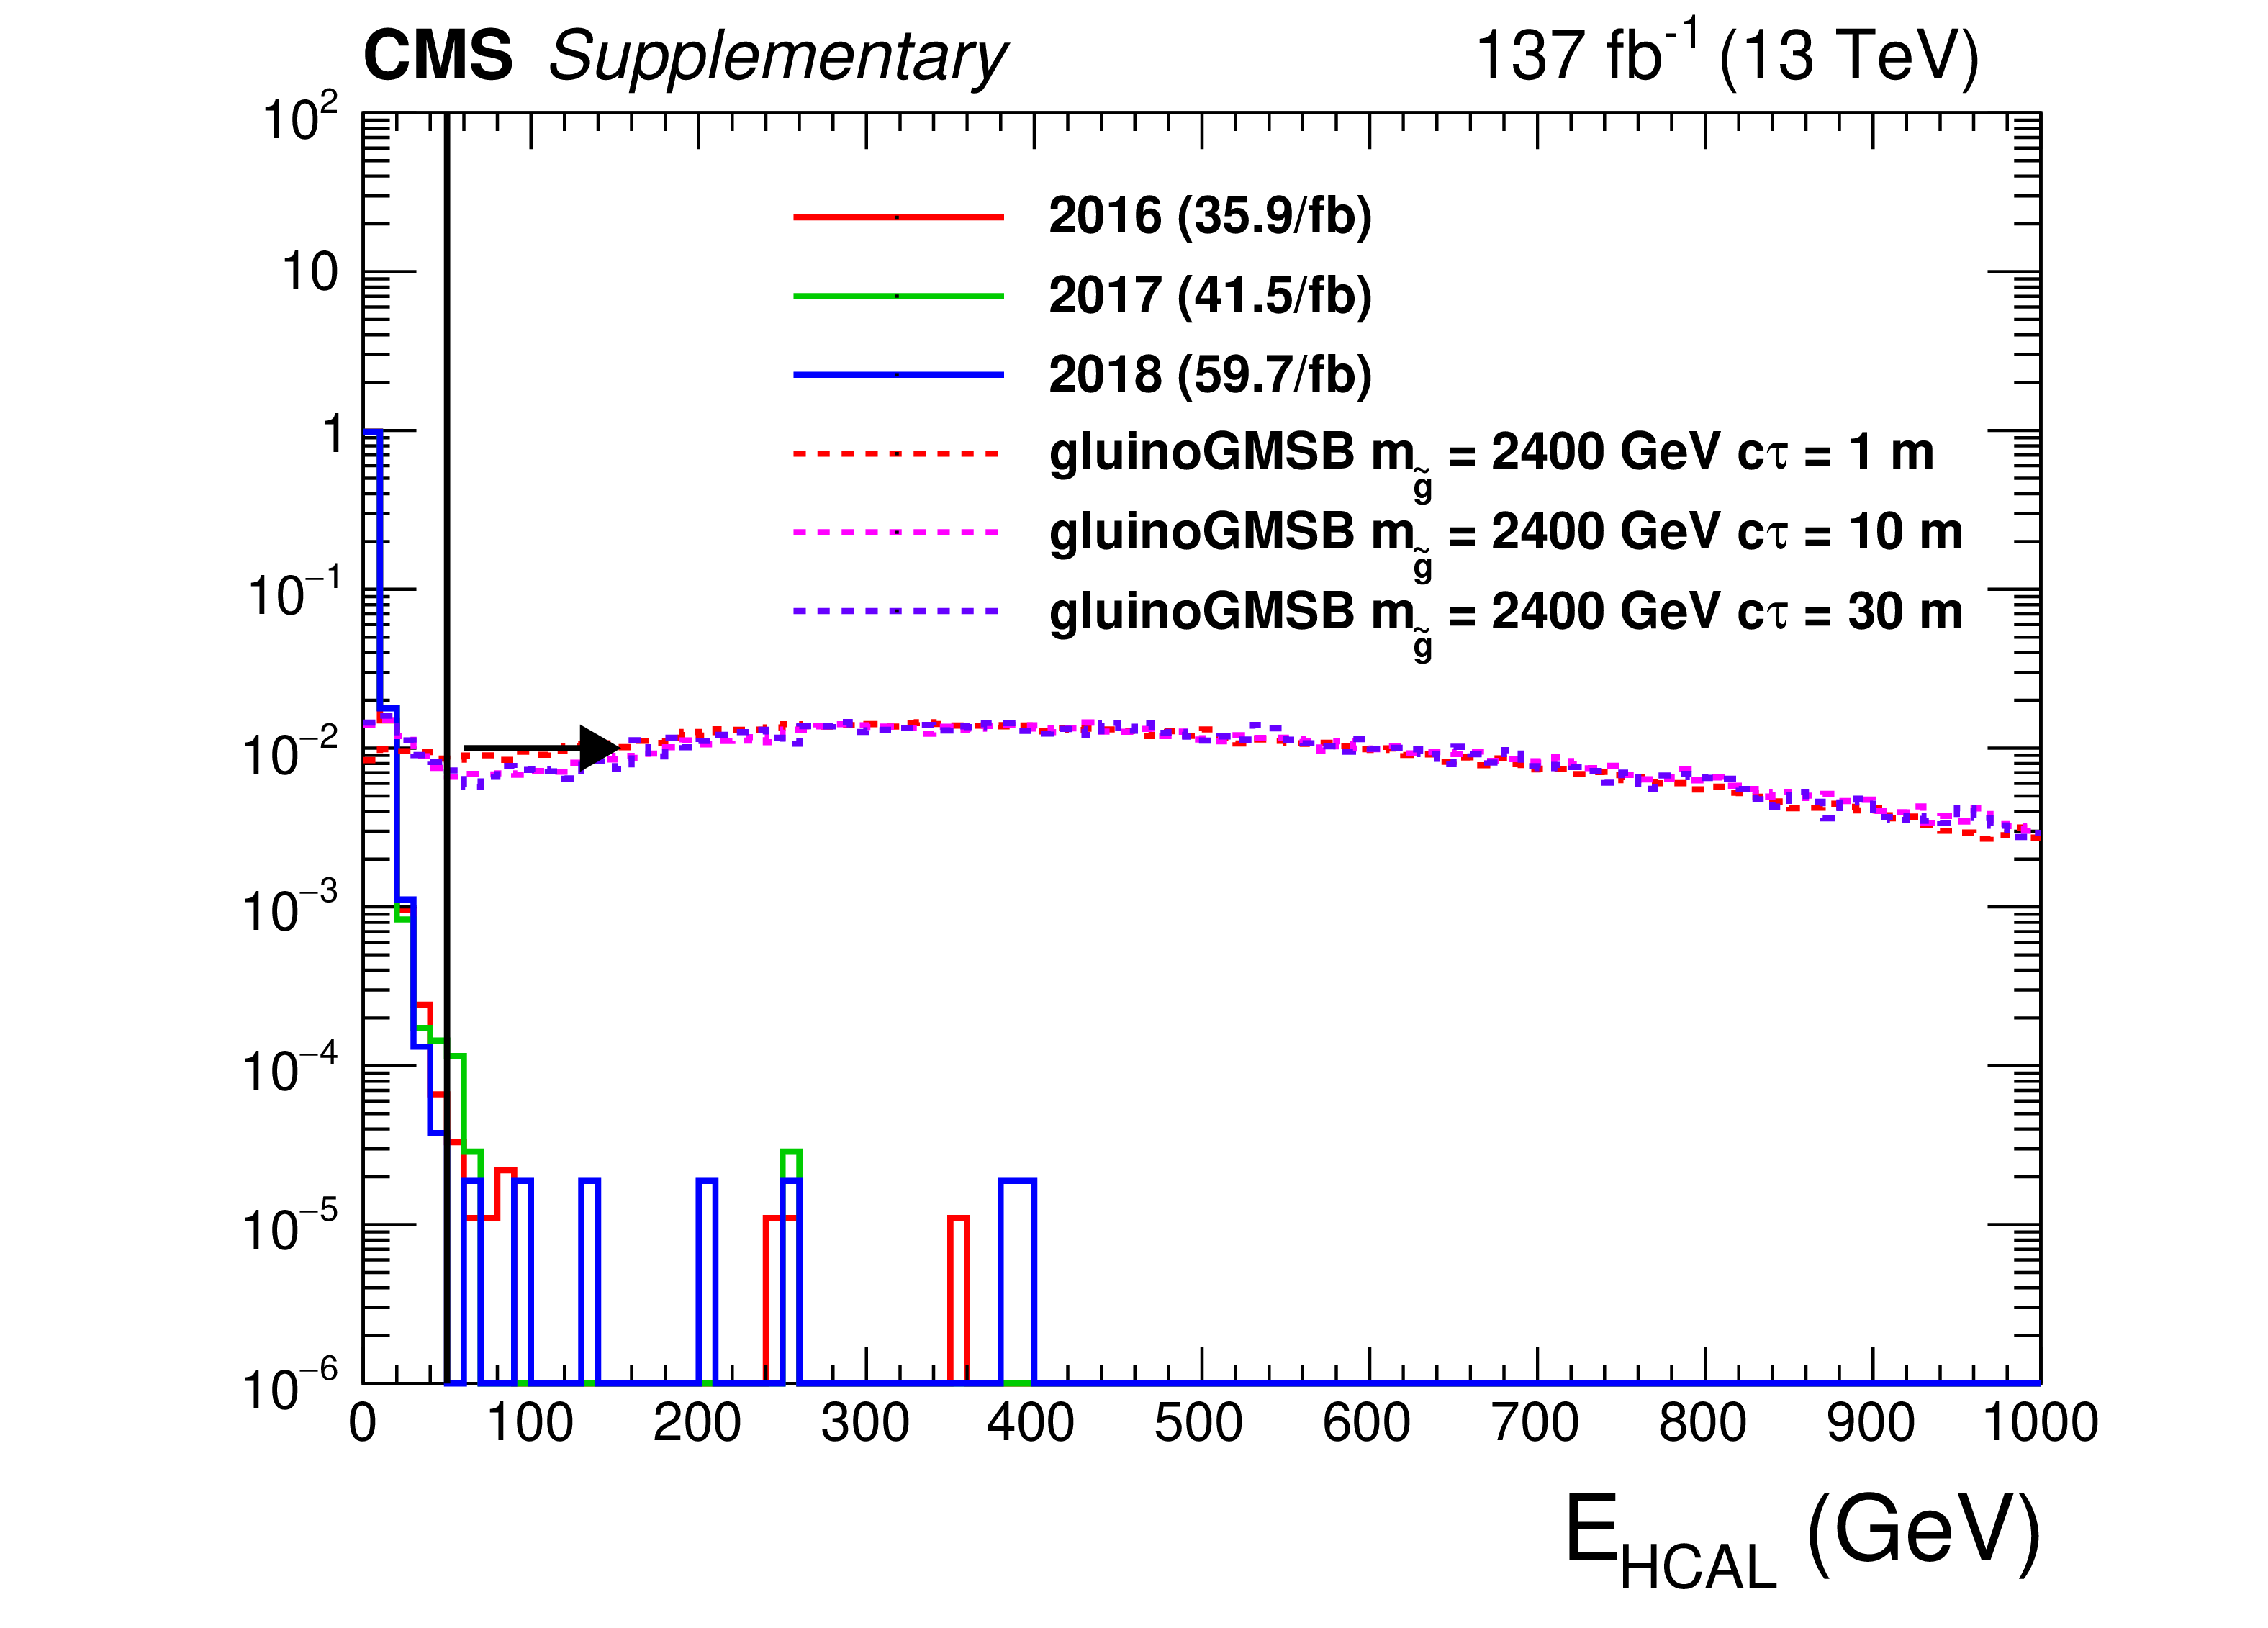
Additional Figure 3:
The distribution (normalized to unity) of $ {E_{\textrm {HCAL}}} $ for a data sample enriched in beam halo and noise jets (satisfying $|\eta | < $ 1.48, $ {p_{\mathrm {T}}} > $ 30 GeV, $ {PV_{\rm track}^{\rm fraction}} < $ 1/12, $ {t_{\textrm {jet}}} < -$3 ns, $ {E_{\textrm {ECAL}}} > $ 20 GeV and $ {{t^{\textrm {RMS}}_\textrm {jet}} / {t_{\textrm {jet}}}} < $ 0.4) and for signal jets passing signal region selections (except on $ {E_{\textrm {HCAL}}} $). |
png pdf |
Additional Figure 3-a:
The distribution (normalized to unity) of $ {E_{\textrm {HCAL}}} $ for a data sample enriched in beam halo and noise jets (satisfying $|\eta | < $ 1.48, $ {p_{\mathrm {T}}} > $ 30 GeV, $ {PV_{\rm track}^{\rm fraction}} < $ 1/12, $ {t_{\textrm {jet}}} < -$3 ns, $ {E_{\textrm {ECAL}}} > $ 20 GeV and $ {{t^{\textrm {RMS}}_\textrm {jet}} / {t_{\textrm {jet}}}} < $ 0.4) and for signal jets passing signal region selections (except on $ {E_{\textrm {HCAL}}} $). |
png pdf |
Additional Figure 3-b:
The distribution (normalized to unity) of $ {E_{\textrm {HCAL}}} $ for a data sample enriched in beam halo and noise jets (satisfying $|\eta | < $ 1.48, $ {p_{\mathrm {T}}} > $ 30 GeV, $ {PV_{\rm track}^{\rm fraction}} < $ 1/12, $ {t_{\textrm {jet}}} < -$3 ns, $ {E_{\textrm {ECAL}}} > $ 20 GeV and $ {{t^{\textrm {RMS}}_\textrm {jet}} / {t_{\textrm {jet}}}} < $ 0.4) and for signal jets passing signal region selections (except on $ {E_{\textrm {HCAL}}} $). |

png pdf |
Additional Figure 3-c:
The distribution (normalized to unity) of $ {E_{\textrm {HCAL}}} $ for a data sample enriched in beam halo and noise jets (satisfying $|\eta | < $ 1.48, $ {p_{\mathrm {T}}} > $ 30 GeV, $ {PV_{\rm track}^{\rm fraction}} < $ 1/12, $ {t_{\textrm {jet}}} < -$3 ns, $ {E_{\textrm {ECAL}}} > $ 20 GeV and $ {{t^{\textrm {RMS}}_\textrm {jet}} / {t_{\textrm {jet}}}} < $ 0.4) and for signal jets passing signal region selections (except on $ {E_{\textrm {HCAL}}} $). |
png pdf |
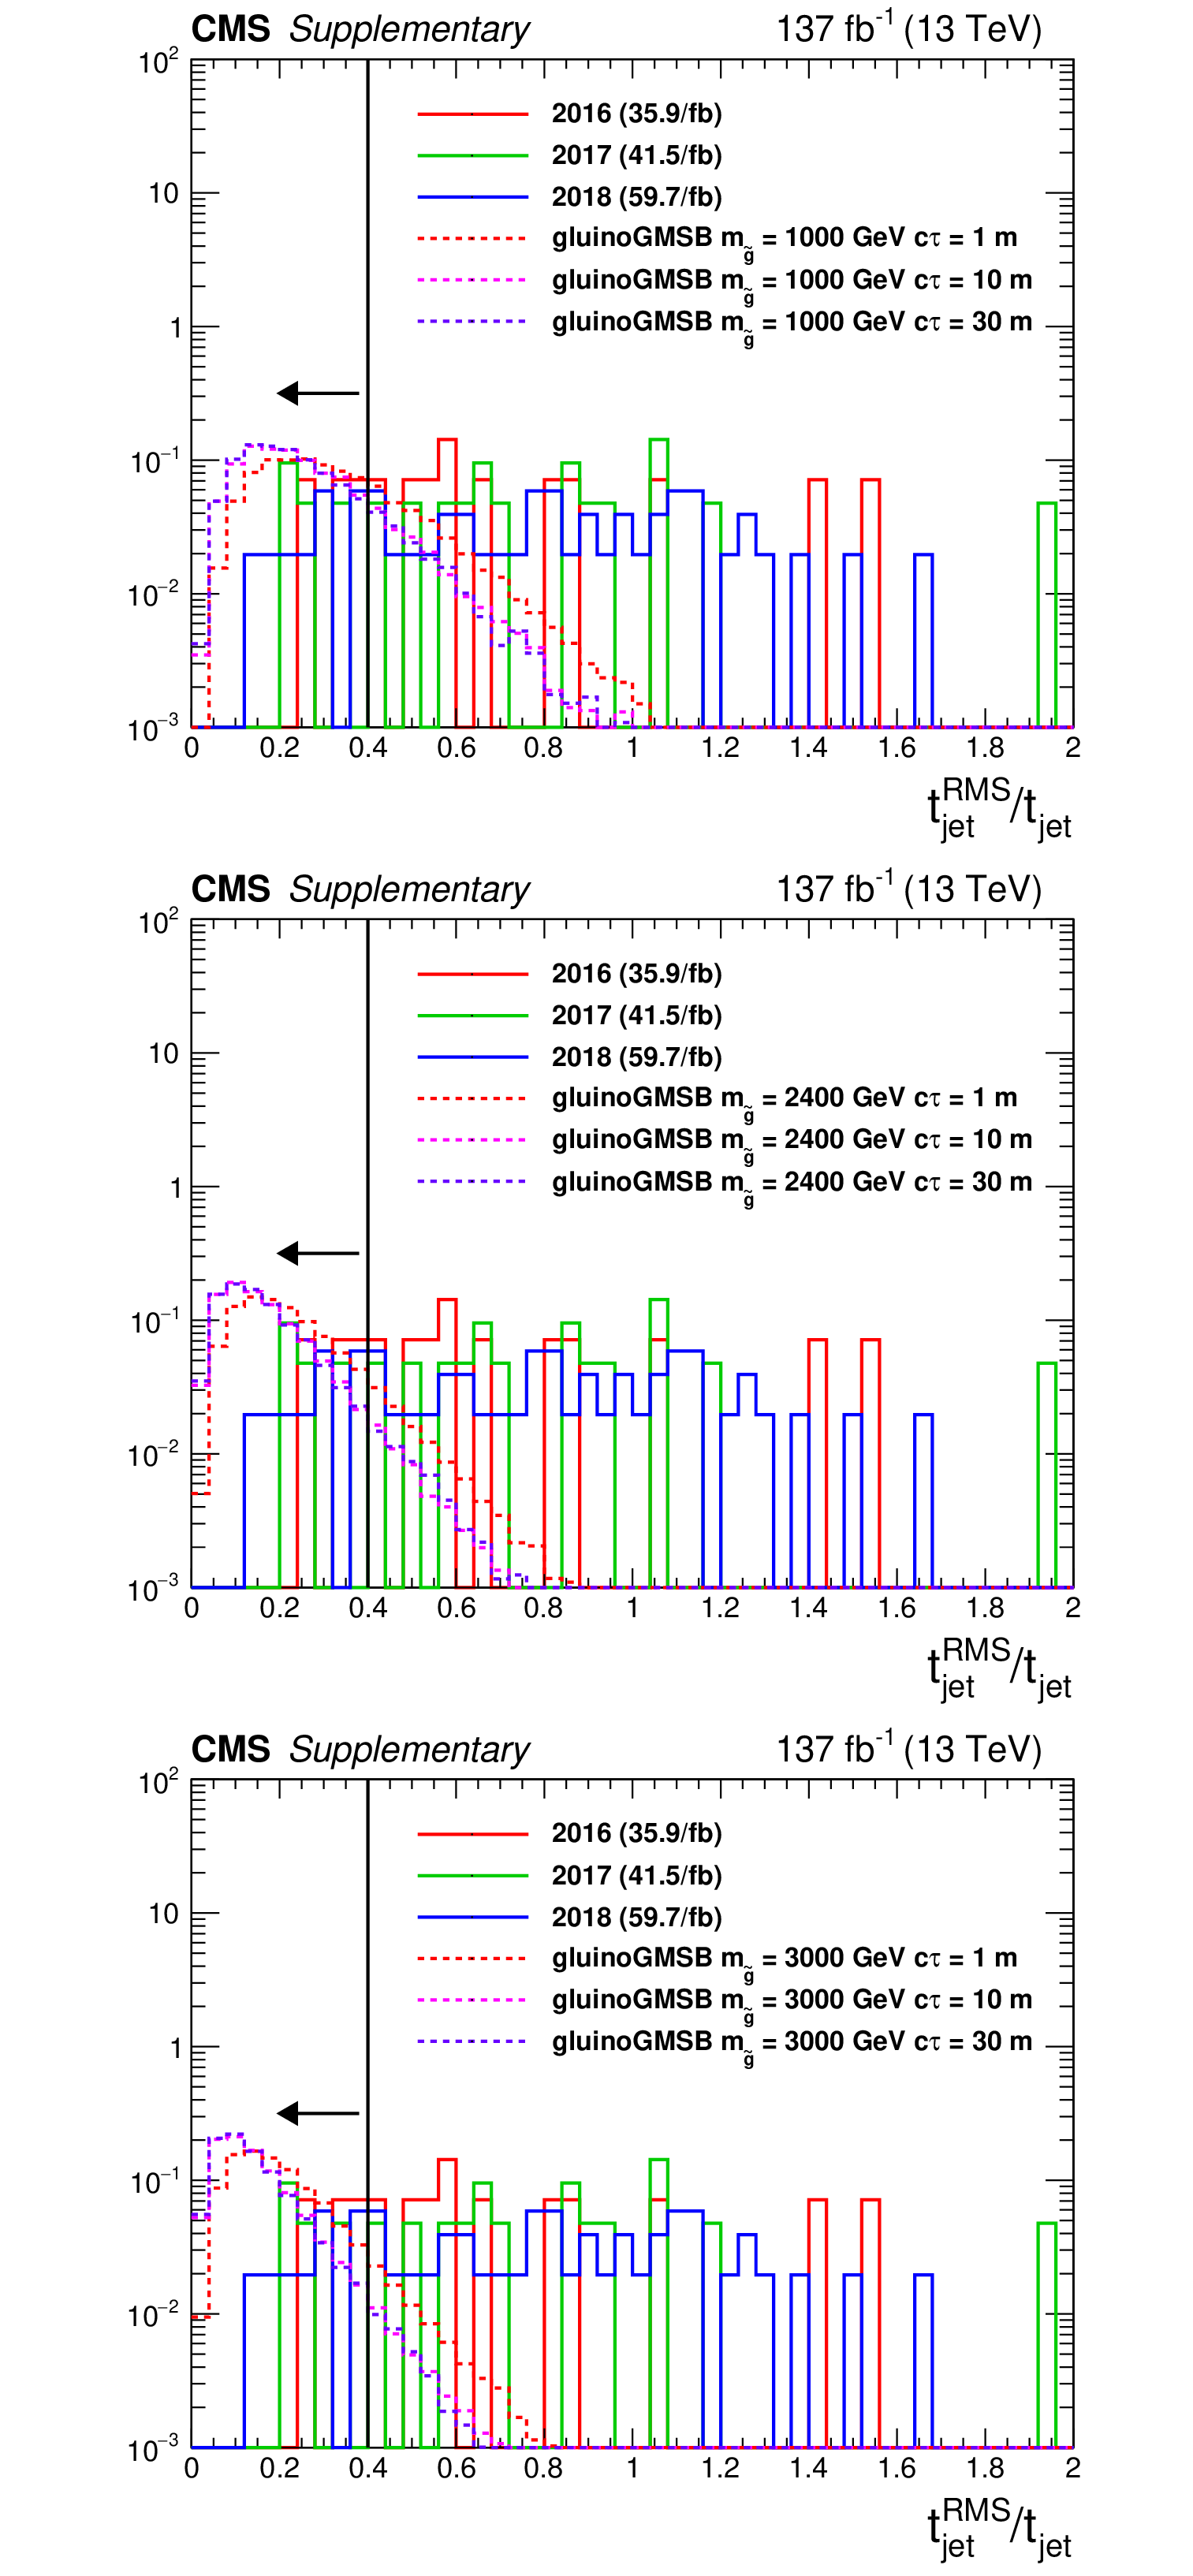
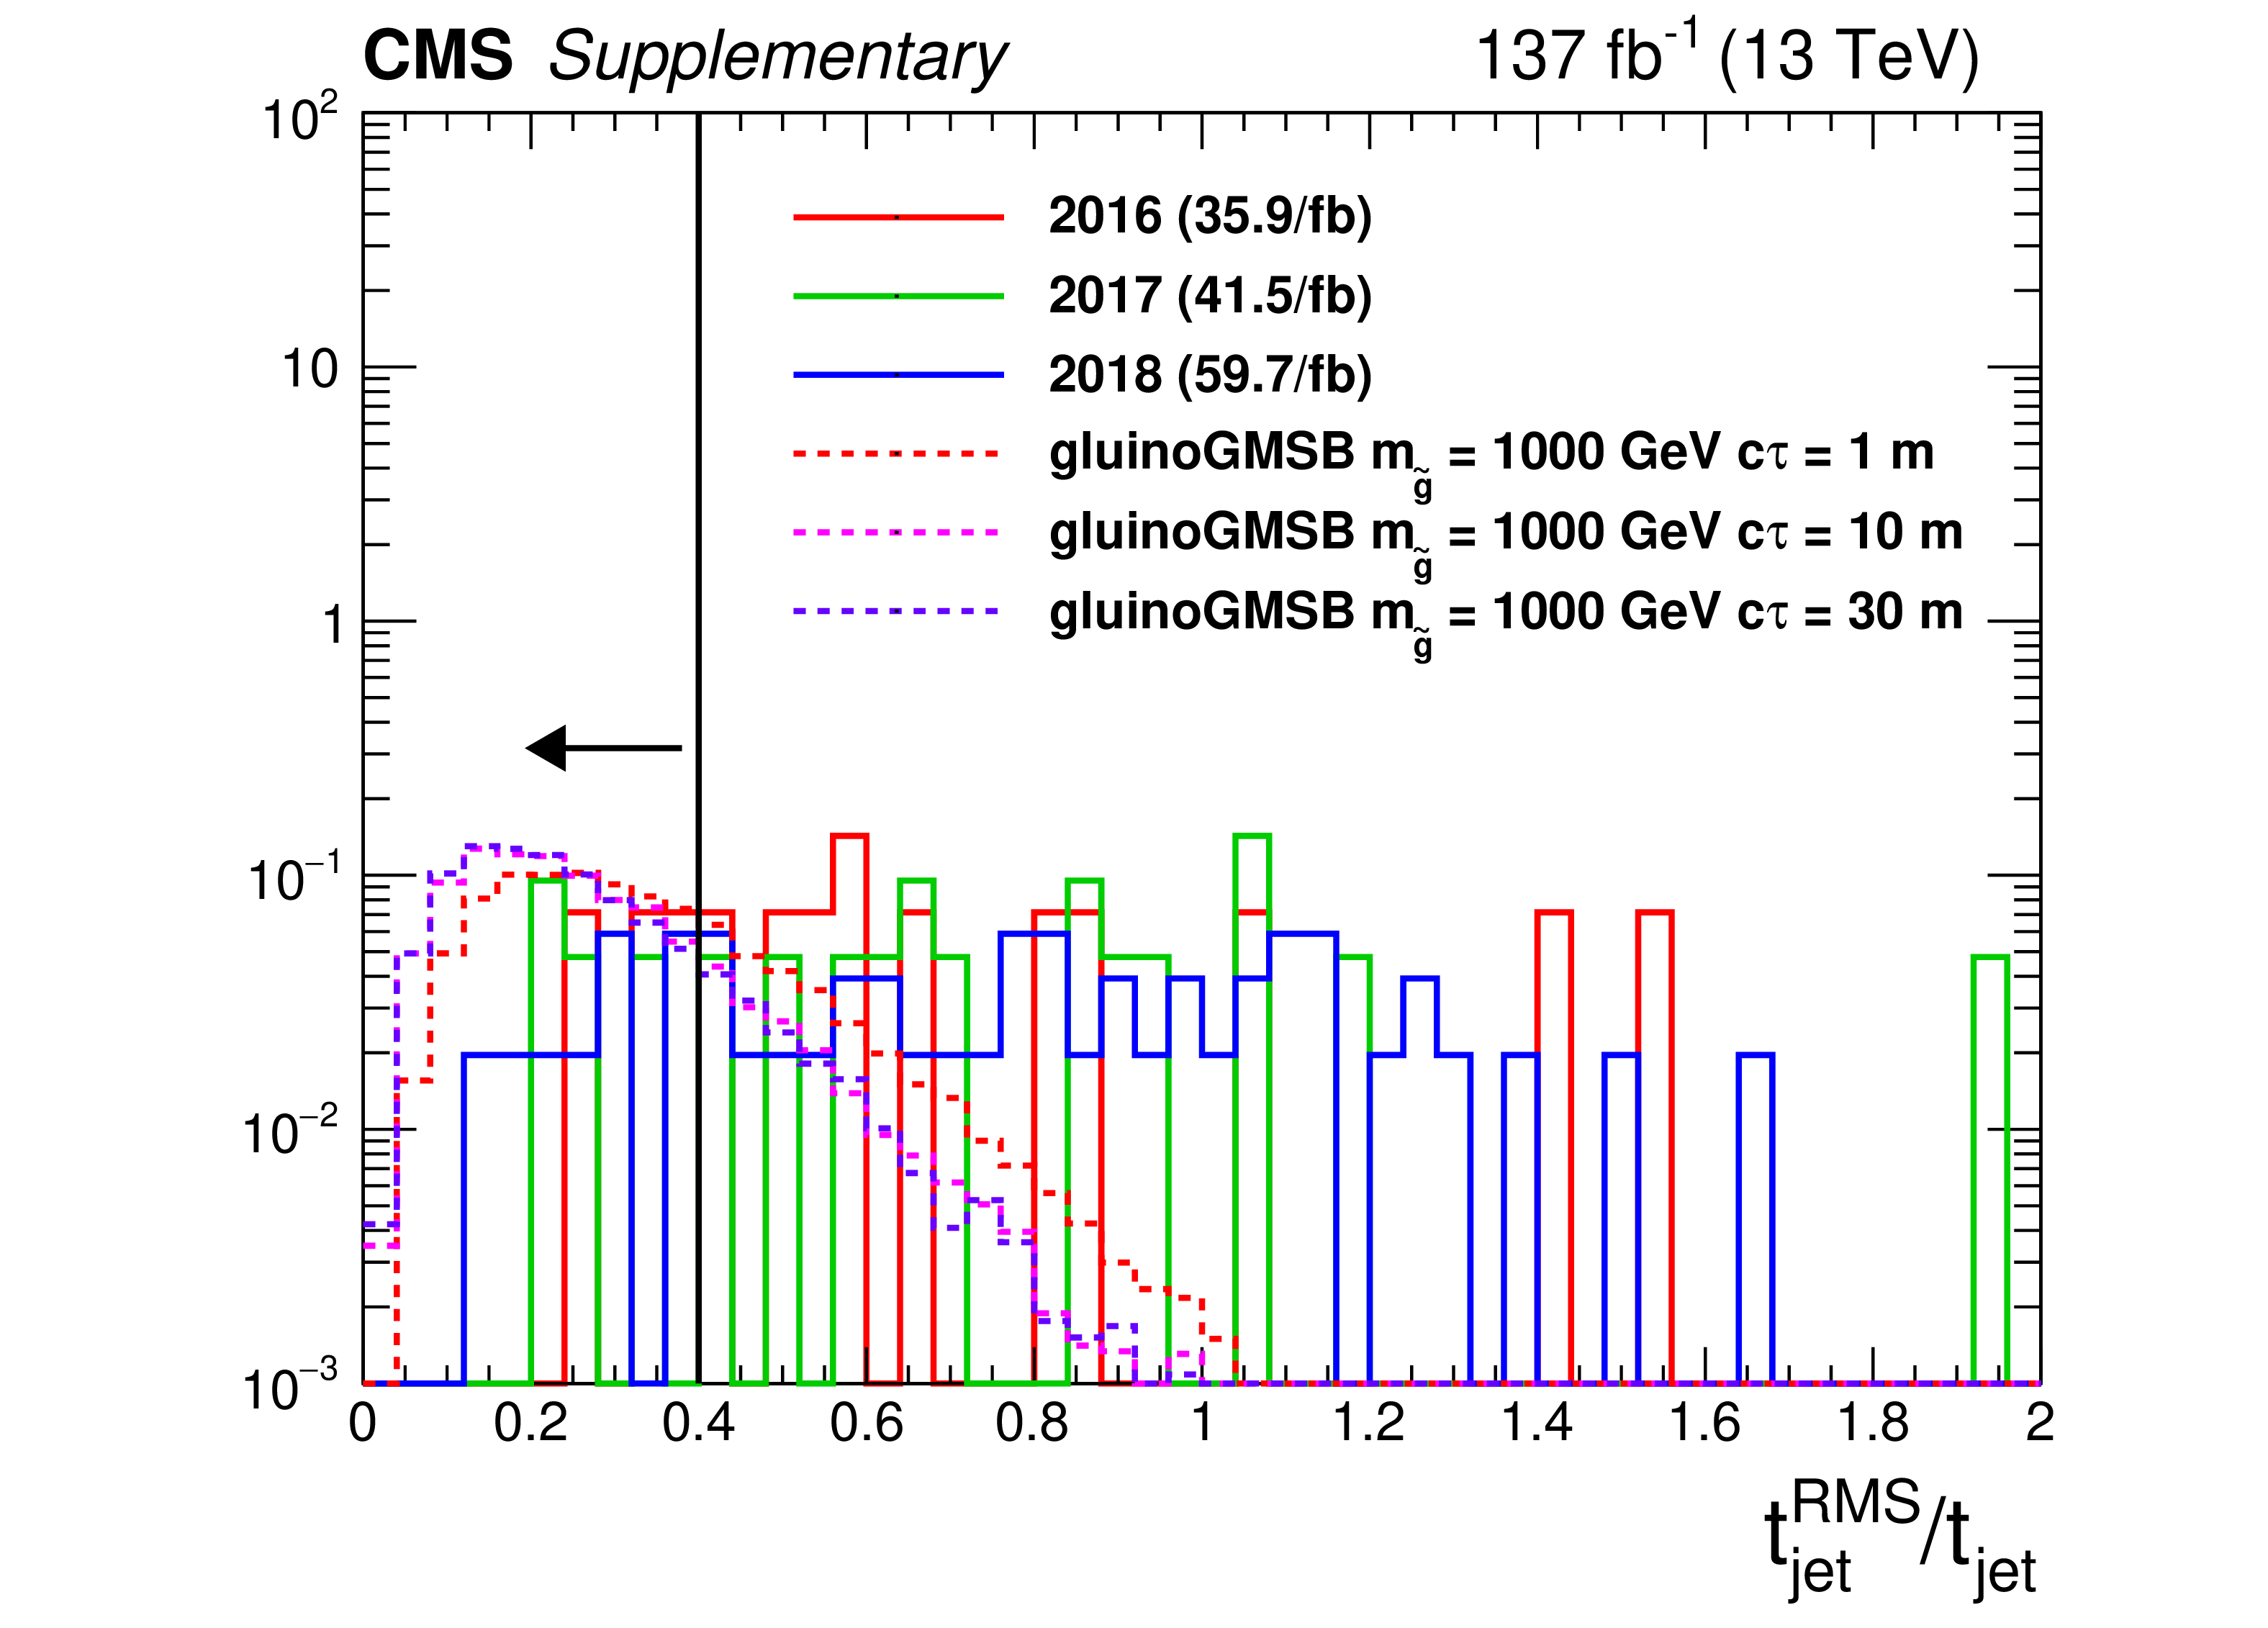
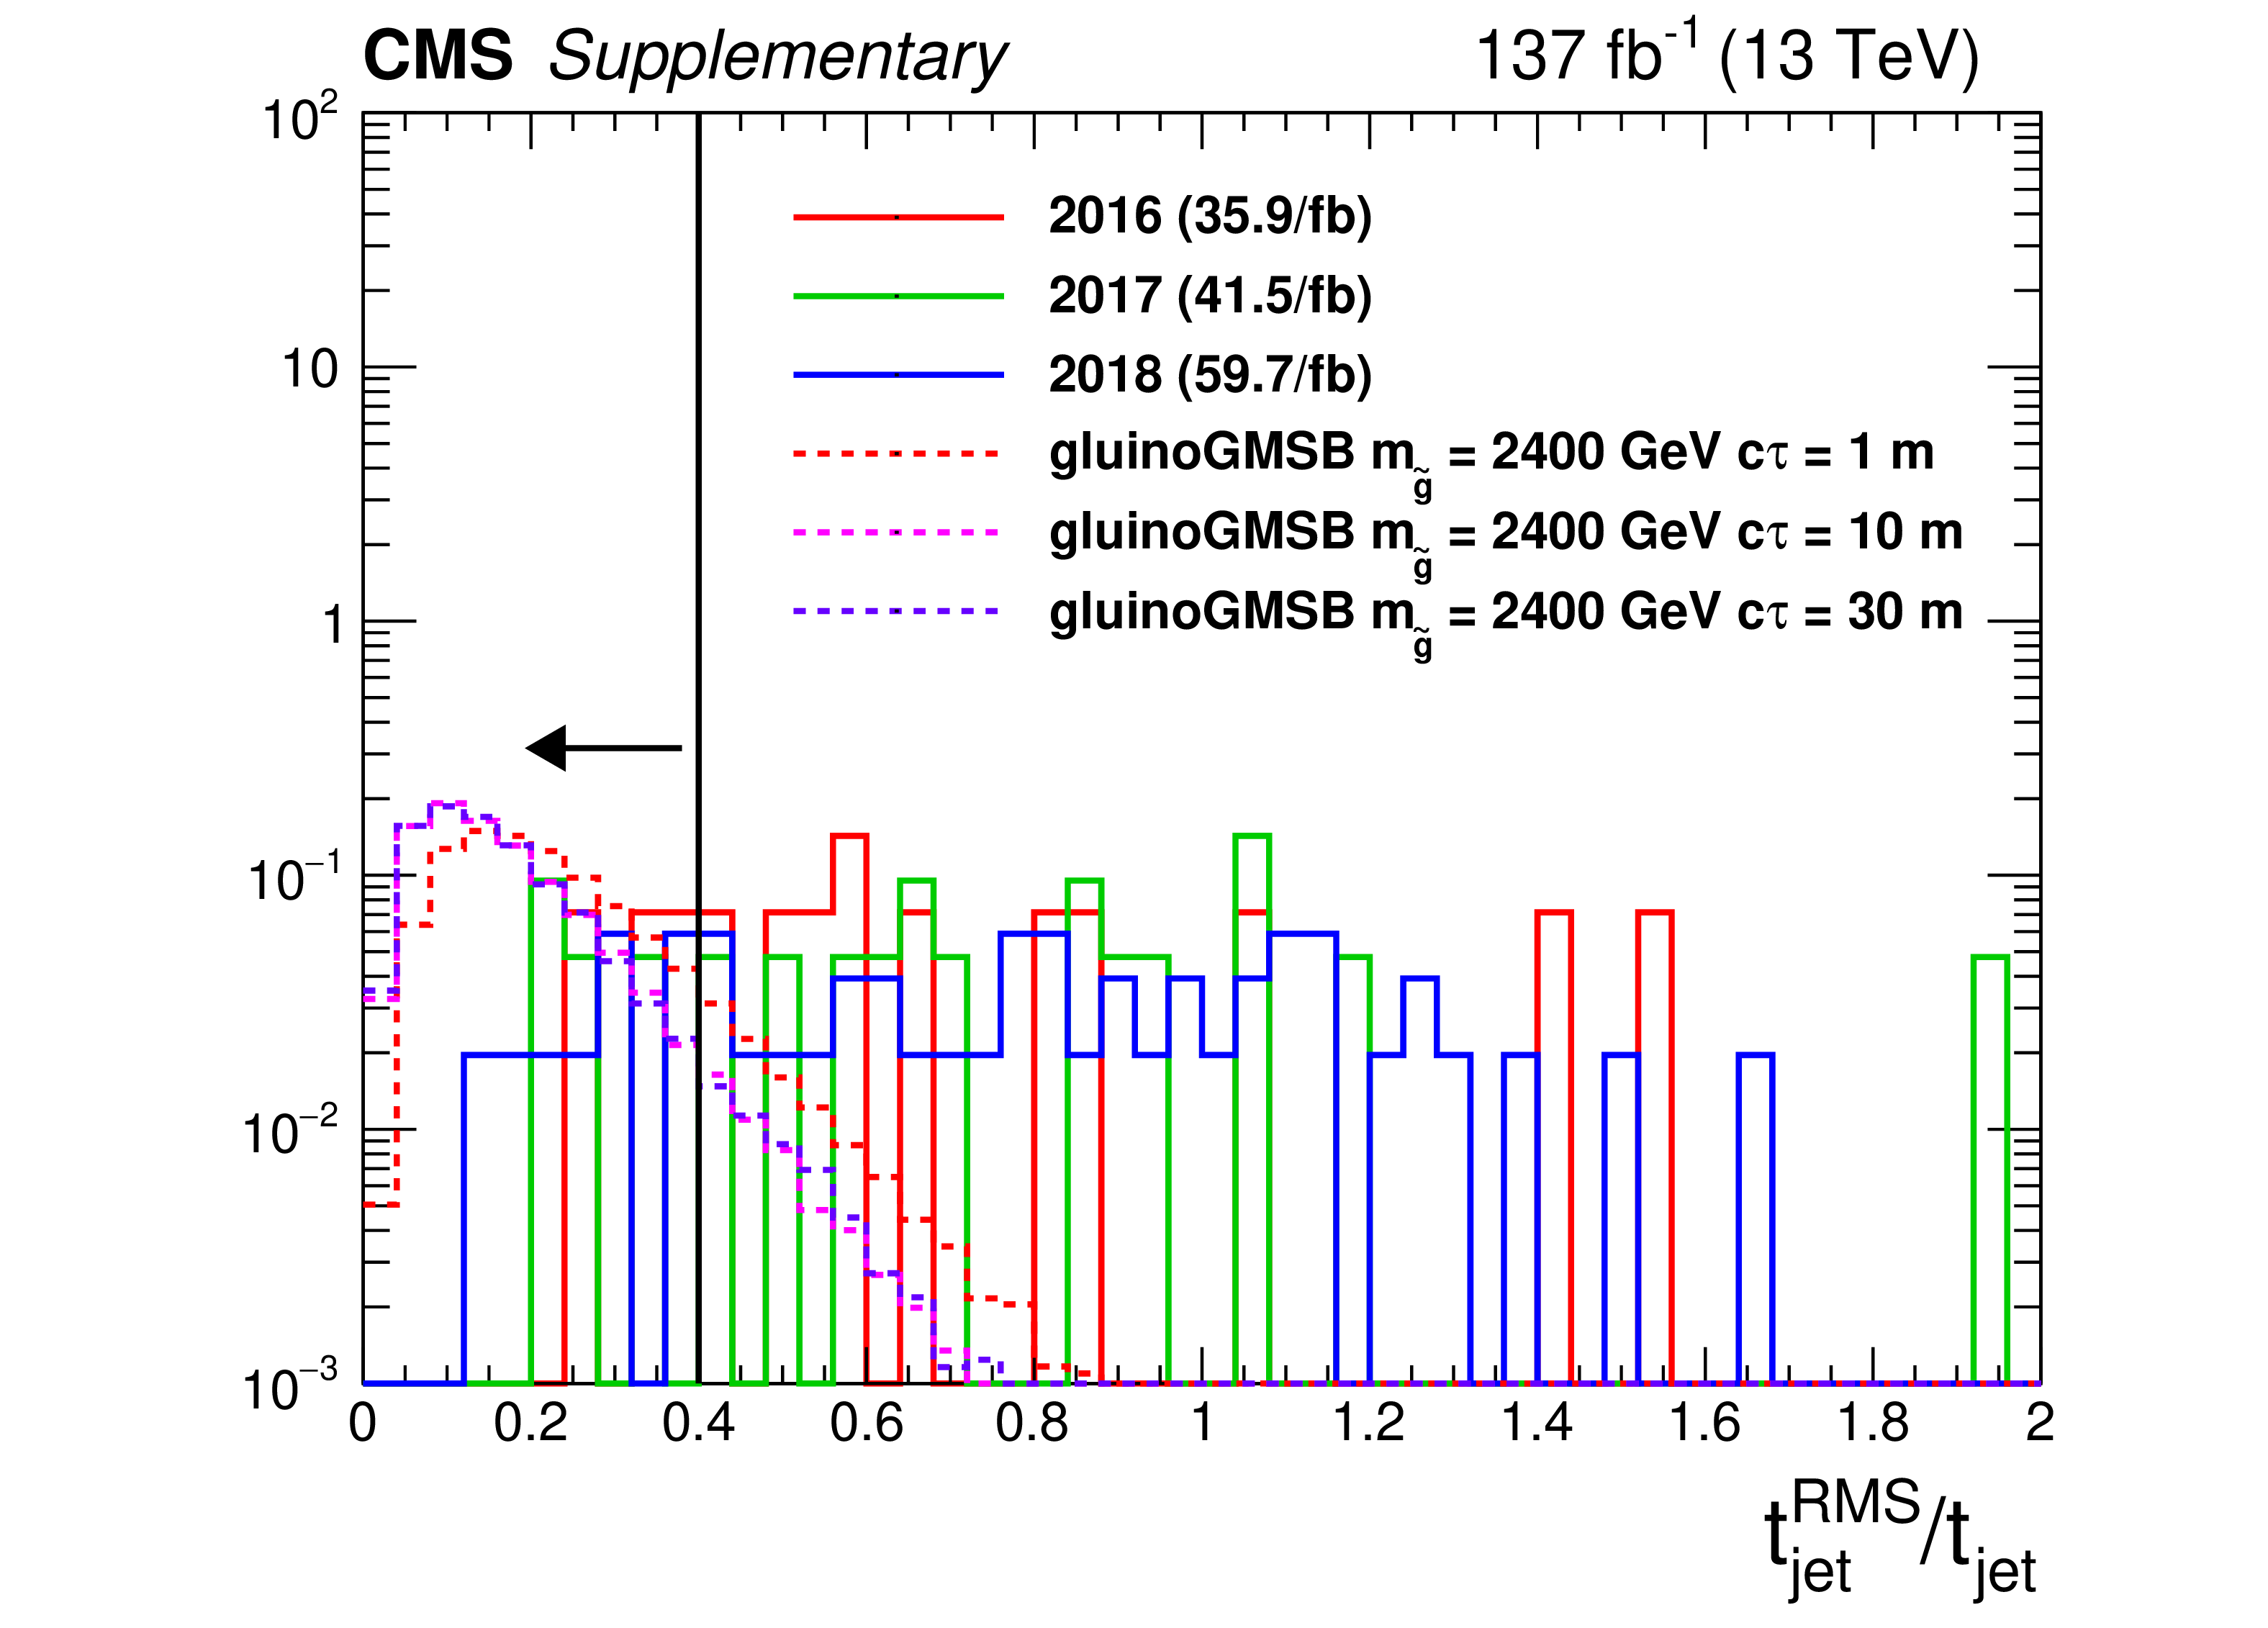
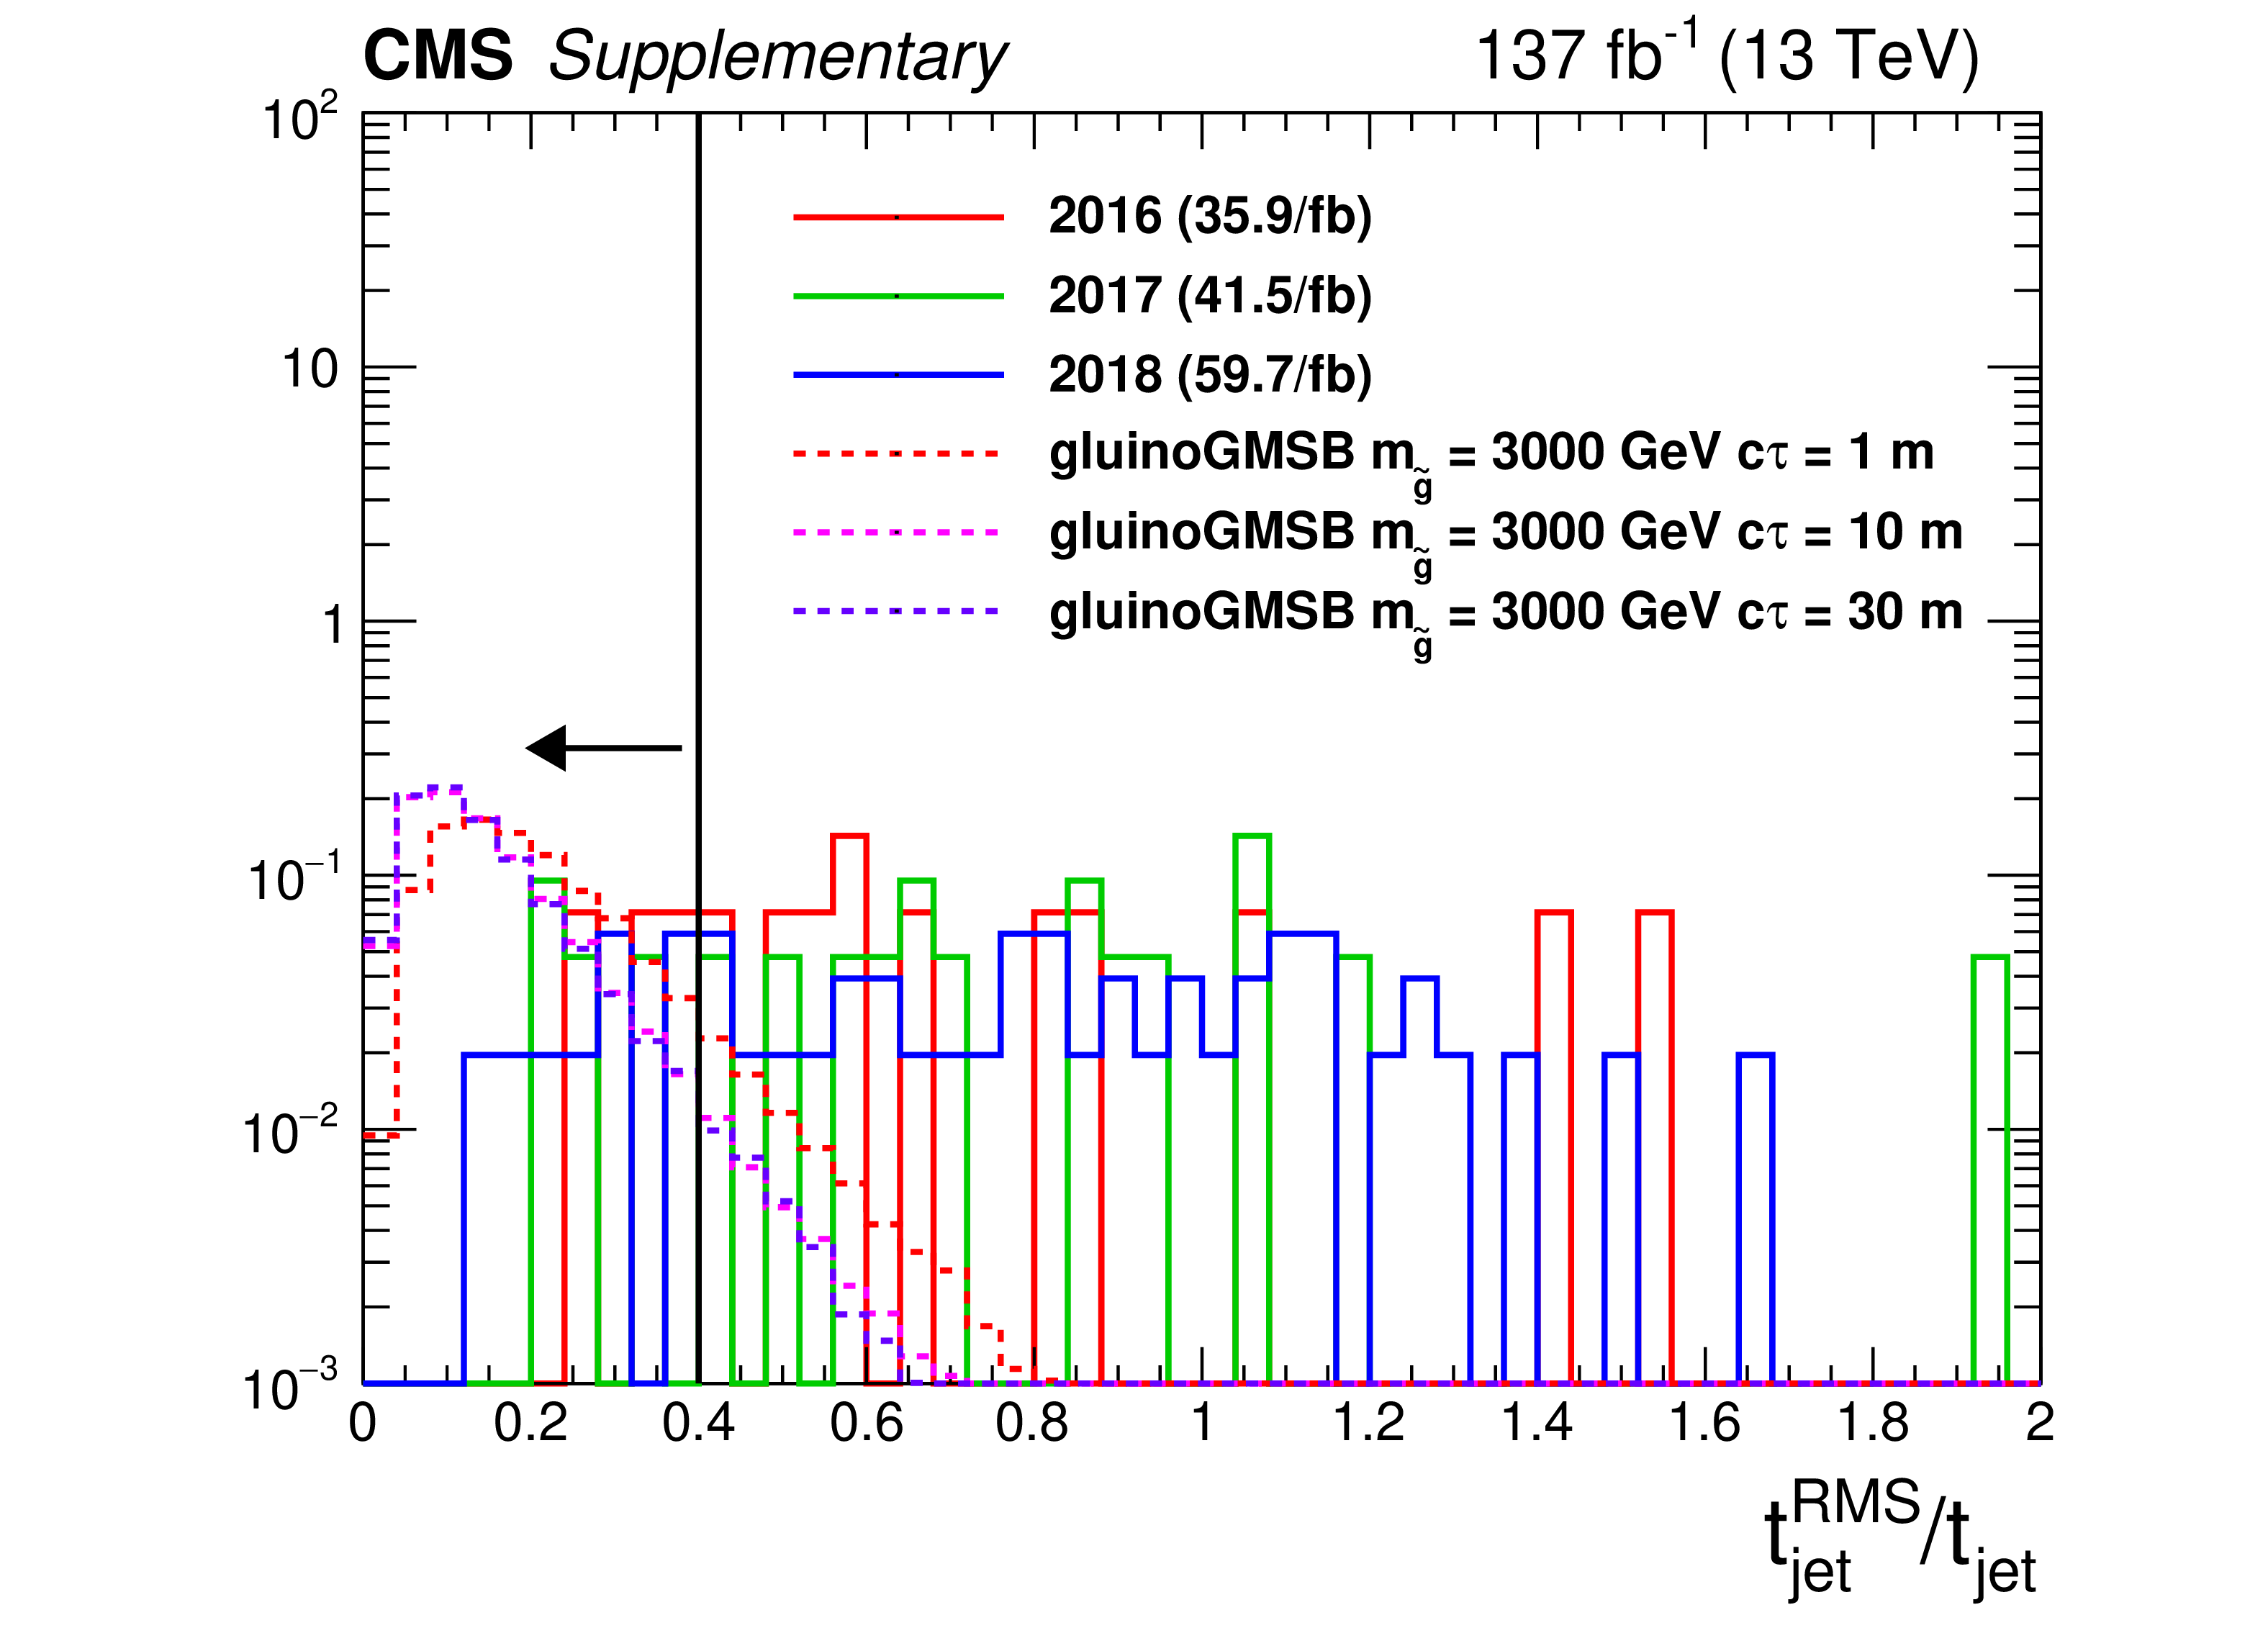
Additional Figure 4:
The distribution (normalized to unity) of ${{t^{\textrm {RMS}}_\textrm {jet}} / {t_{\textrm {jet}}}}$ for data sample enriched in jets from noise (satisfying $|\eta | < $ 1.48, $ {p_{\mathrm {T}}} > $ 30 GeV, $ {PV_{\rm track}^{\rm fraction}} > $ 1/12, $ {\textrm {HEF}} > $ 0.2, $ {t_{\textrm {jet}}} < -$3 ns, $ {E_{\textrm {ECAL}}} > $ 20 GeV and $ {E^{\textrm {CSC}}_\textrm {ECAL}/E_{\textrm {ECAL}}} < $ 0.8) and for signal jets passing signal region selections (except on ${{t^{\textrm {RMS}}_\textrm {jet}} / {t_{\textrm {jet}}}}$ and ${t^{\textrm {RMS}}_\textrm {jet}}$). |
png pdf |
Additional Figure 4-a:
The distribution (normalized to unity) of ${{t^{\textrm {RMS}}_\textrm {jet}} / {t_{\textrm {jet}}}}$ for data sample enriched in jets from noise (satisfying $|\eta | < $ 1.48, $ {p_{\mathrm {T}}} > $ 30 GeV, $ {PV_{\rm track}^{\rm fraction}} > $ 1/12, $ {\textrm {HEF}} > $ 0.2, $ {t_{\textrm {jet}}} < -$3 ns, $ {E_{\textrm {ECAL}}} > $ 20 GeV and $ {E^{\textrm {CSC}}_\textrm {ECAL}/E_{\textrm {ECAL}}} < $ 0.8) and for signal jets passing signal region selections (except on ${{t^{\textrm {RMS}}_\textrm {jet}} / {t_{\textrm {jet}}}}$ and ${t^{\textrm {RMS}}_\textrm {jet}}$). |
png pdf |
Additional Figure 4-b:
The distribution (normalized to unity) of ${{t^{\textrm {RMS}}_\textrm {jet}} / {t_{\textrm {jet}}}}$ for data sample enriched in jets from noise (satisfying $|\eta | < $ 1.48, $ {p_{\mathrm {T}}} > $ 30 GeV, $ {PV_{\rm track}^{\rm fraction}} > $ 1/12, $ {\textrm {HEF}} > $ 0.2, $ {t_{\textrm {jet}}} < -$3 ns, $ {E_{\textrm {ECAL}}} > $ 20 GeV and $ {E^{\textrm {CSC}}_\textrm {ECAL}/E_{\textrm {ECAL}}} < $ 0.8) and for signal jets passing signal region selections (except on ${{t^{\textrm {RMS}}_\textrm {jet}} / {t_{\textrm {jet}}}}$ and ${t^{\textrm {RMS}}_\textrm {jet}}$). |
png pdf |
Additional Figure 4-c:
The distribution (normalized to unity) of ${{t^{\textrm {RMS}}_\textrm {jet}} / {t_{\textrm {jet}}}}$ for data sample enriched in jets from noise (satisfying $|\eta | < $ 1.48, $ {p_{\mathrm {T}}} > $ 30 GeV, $ {PV_{\rm track}^{\rm fraction}} > $ 1/12, $ {\textrm {HEF}} > $ 0.2, $ {t_{\textrm {jet}}} < -$3 ns, $ {E_{\textrm {ECAL}}} > $ 20 GeV and $ {E^{\textrm {CSC}}_\textrm {ECAL}/E_{\textrm {ECAL}}} < $ 0.8) and for signal jets passing signal region selections (except on ${{t^{\textrm {RMS}}_\textrm {jet}} / {t_{\textrm {jet}}}}$ and ${t^{\textrm {RMS}}_\textrm {jet}}$). |
png pdf |
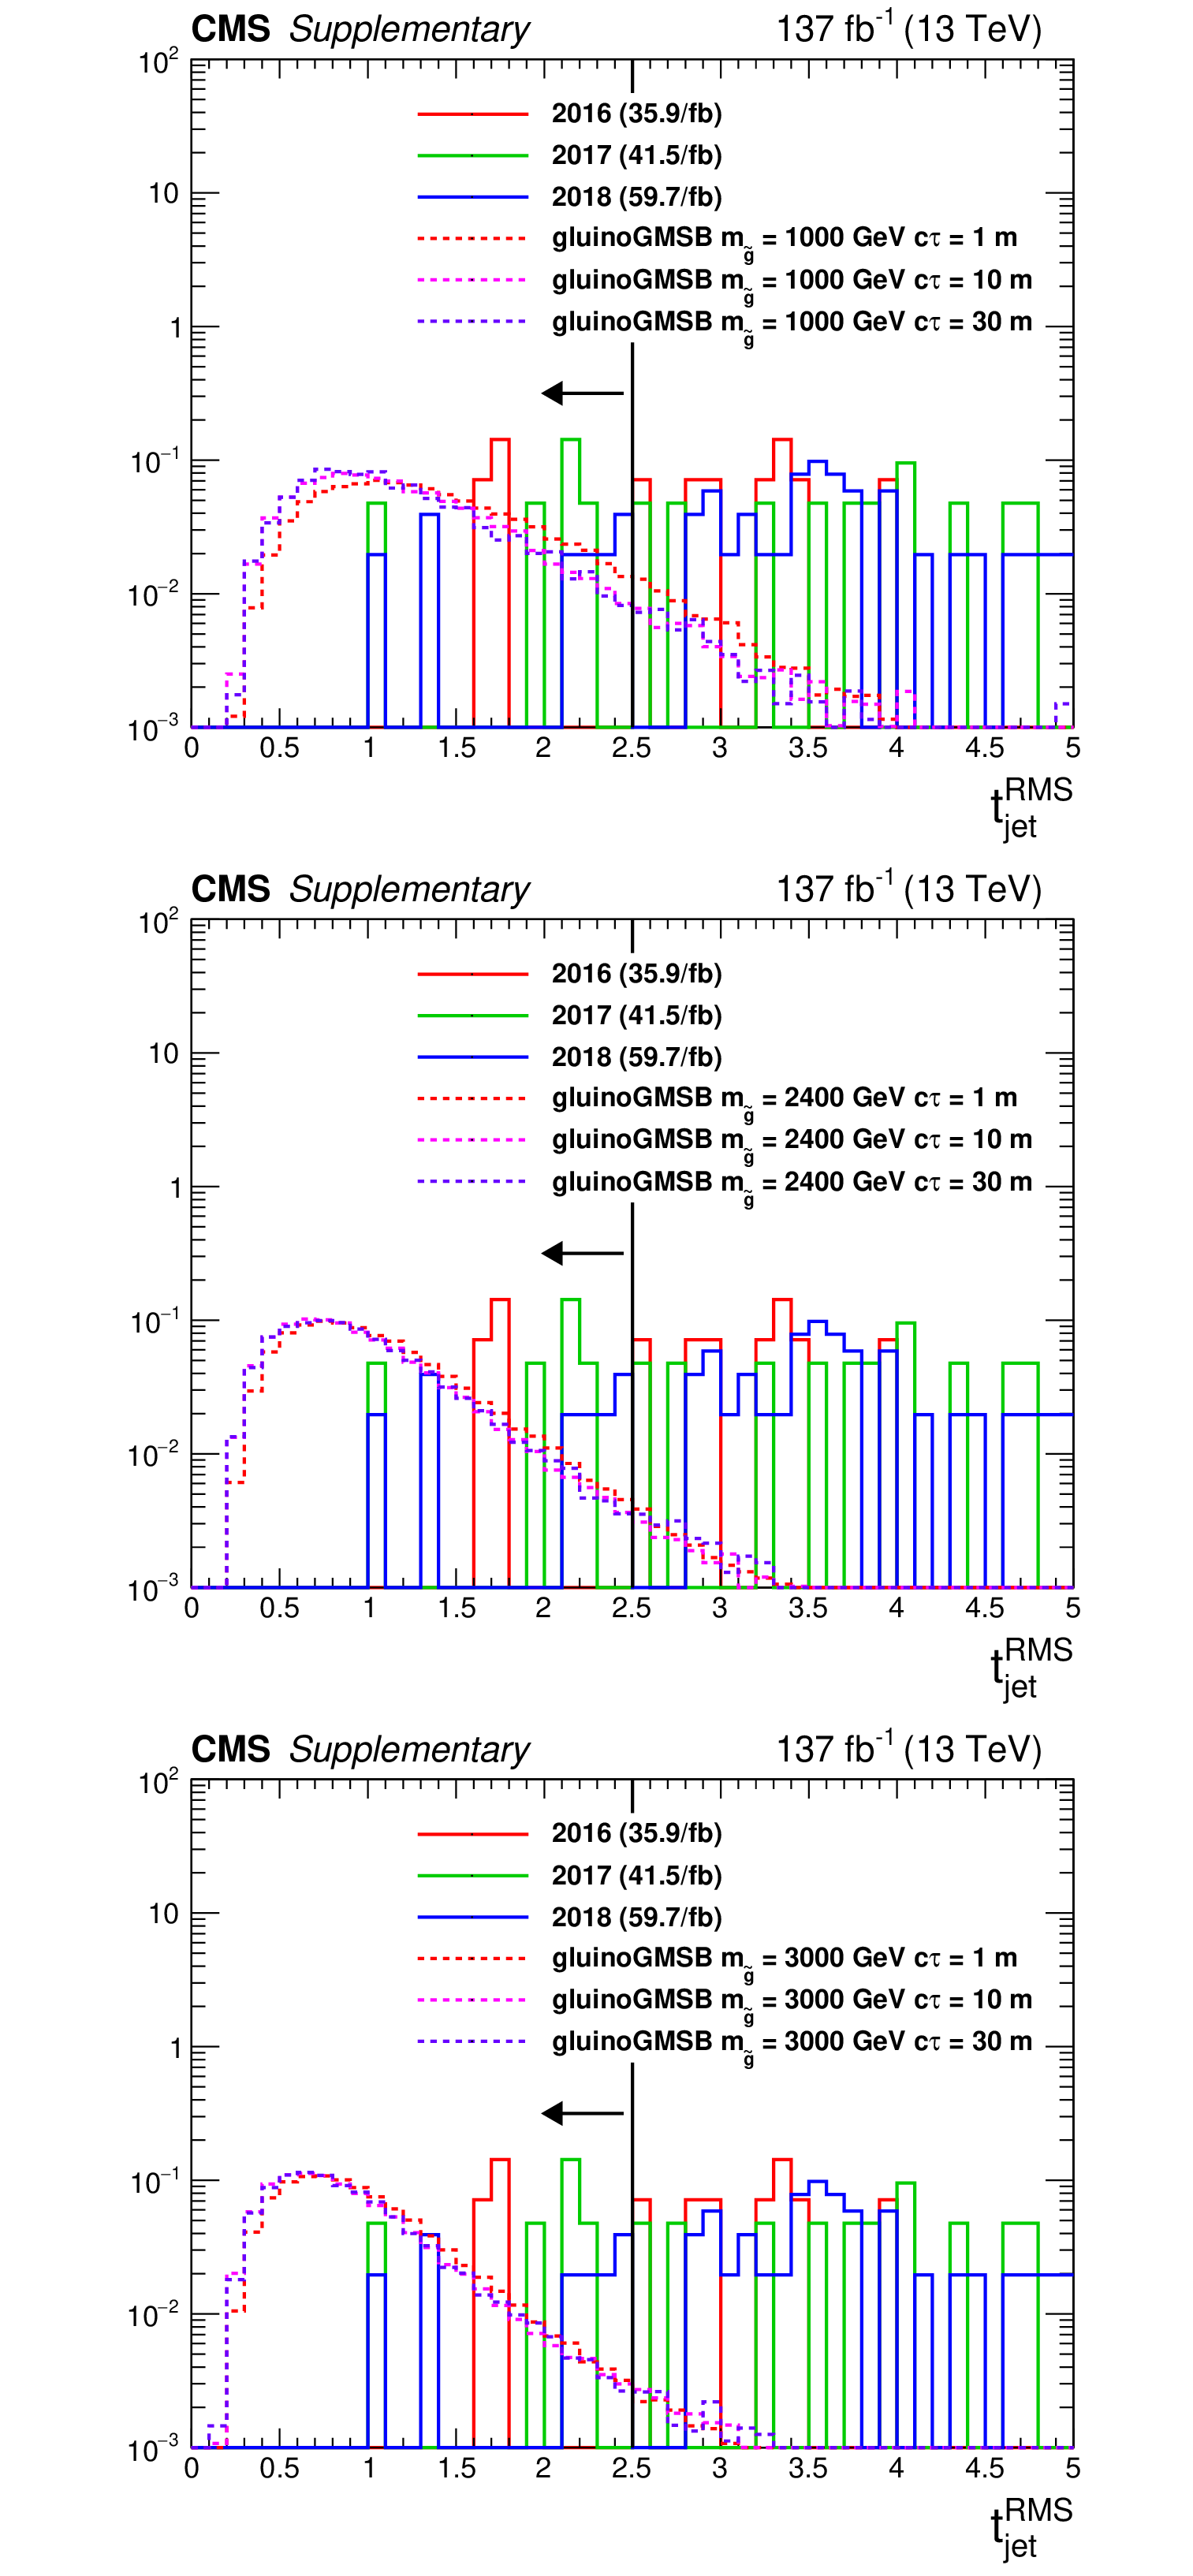
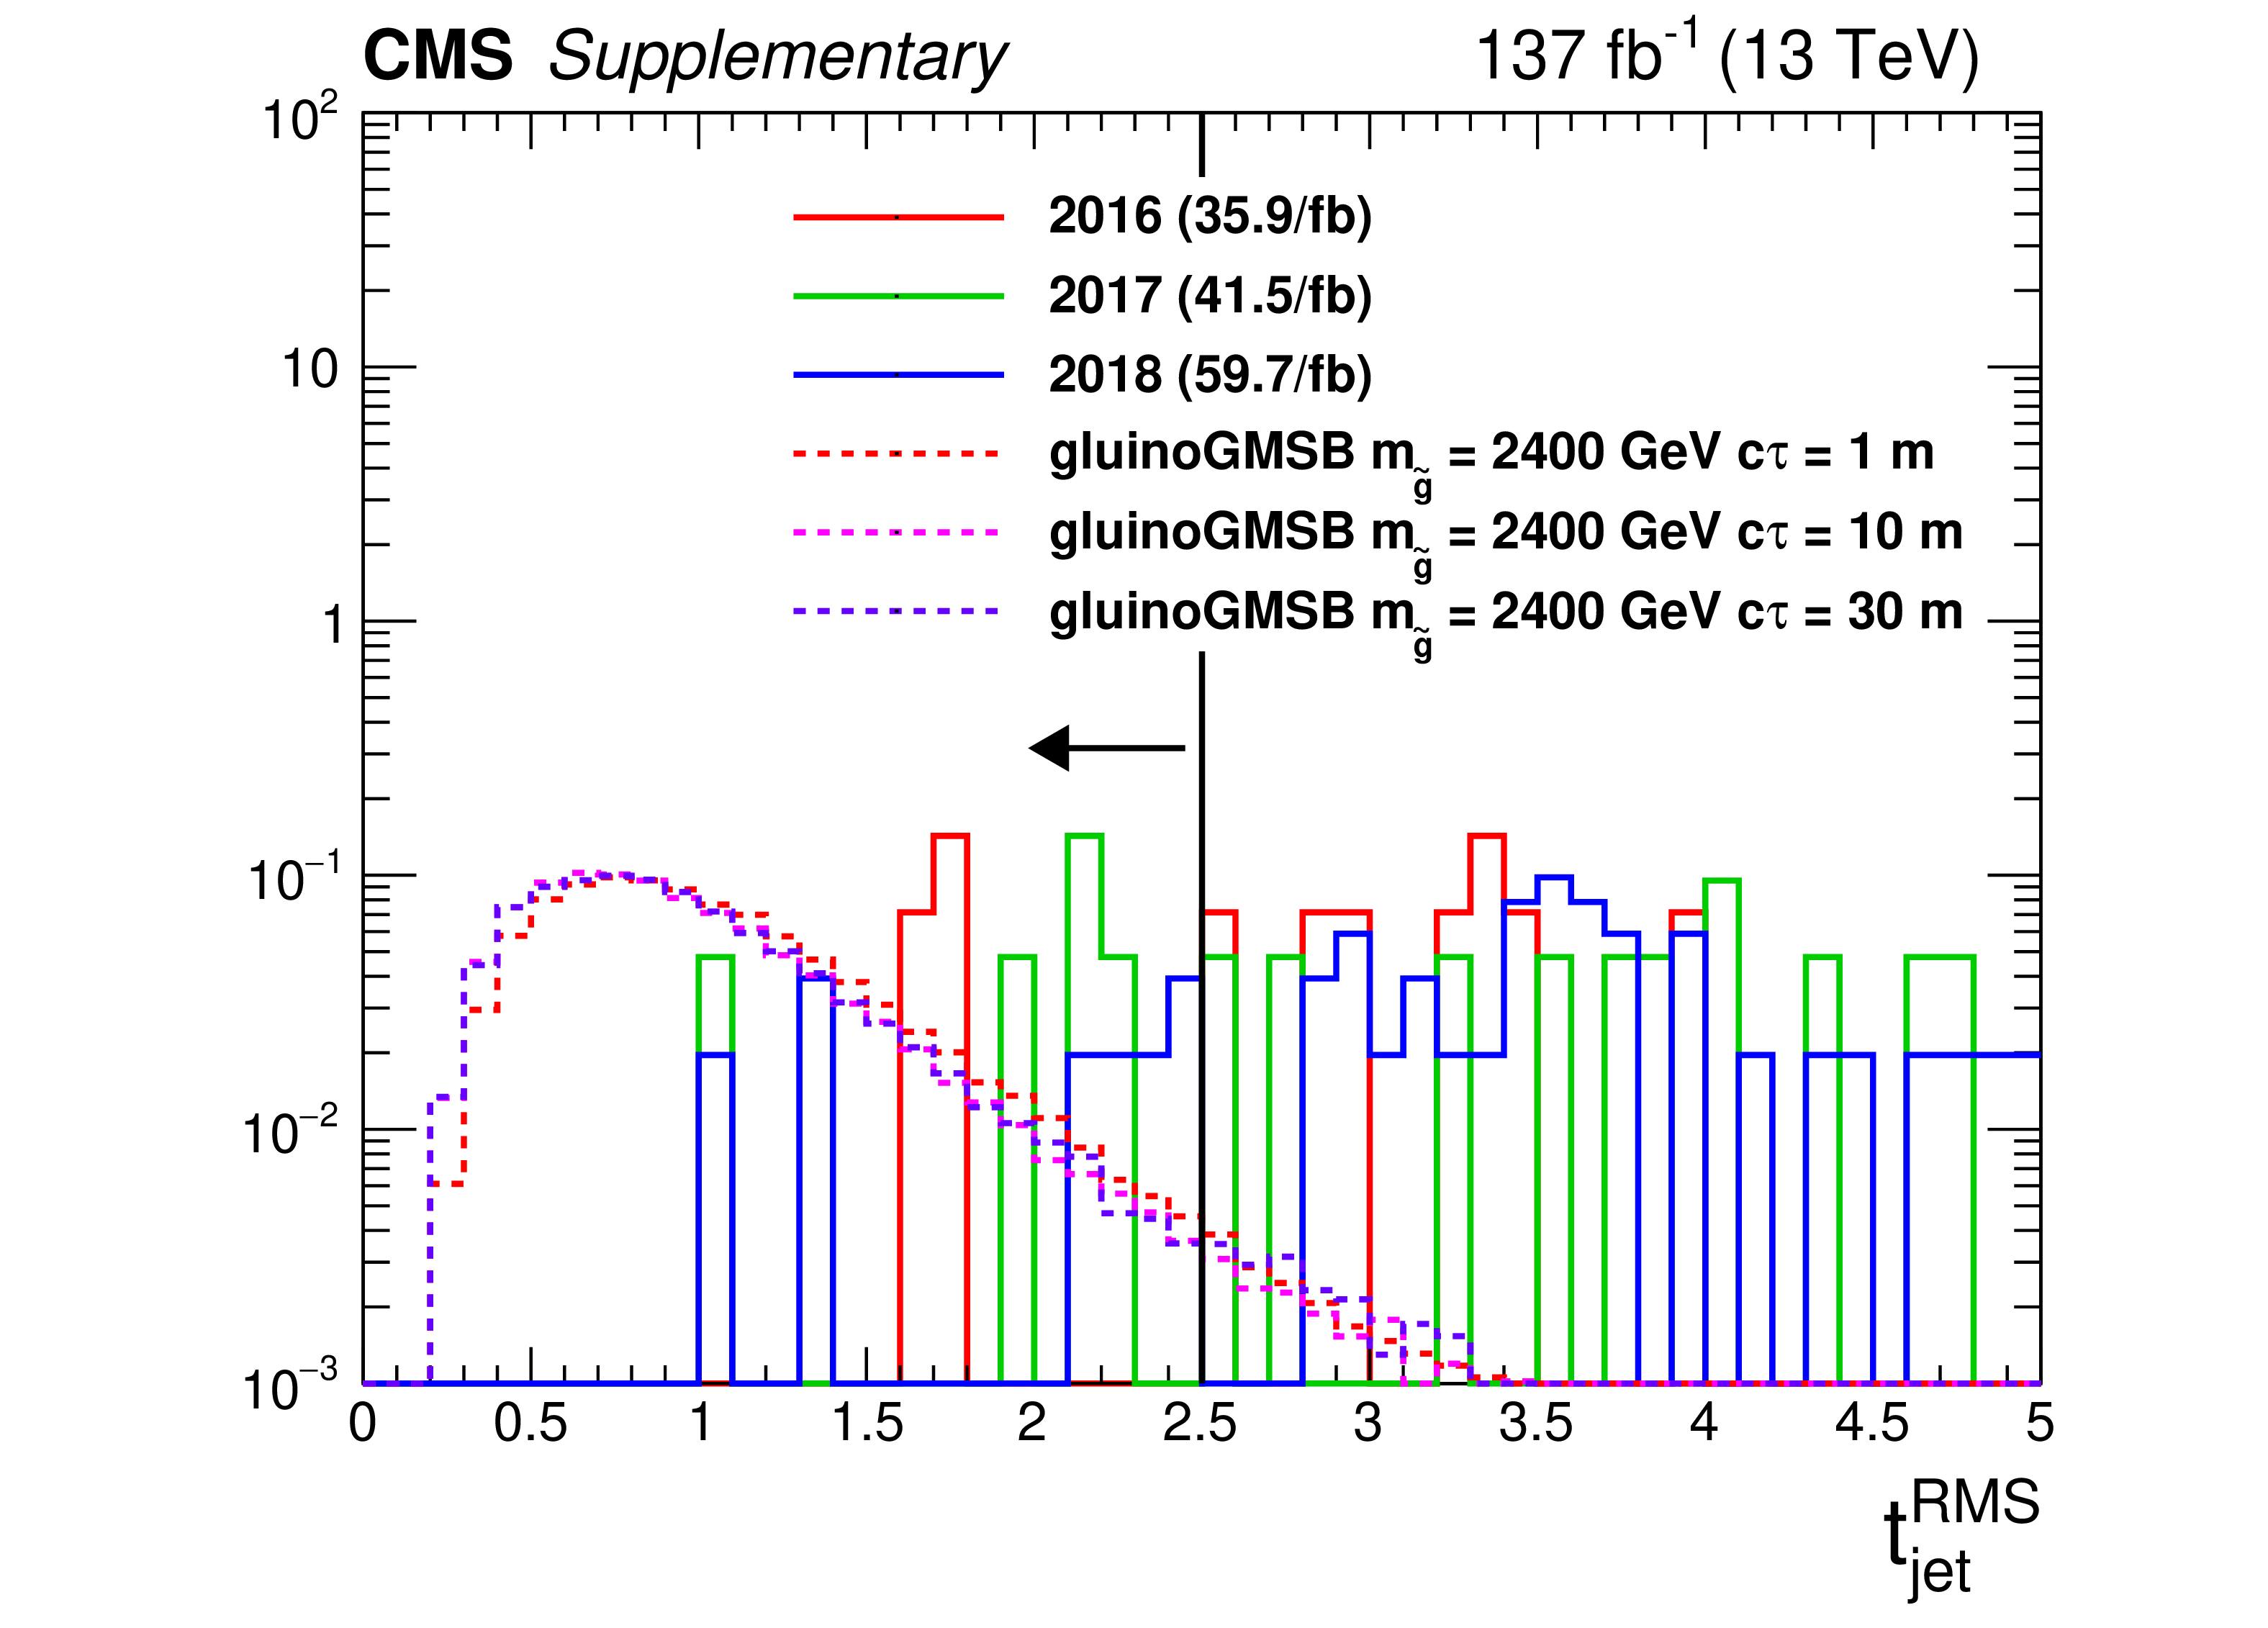
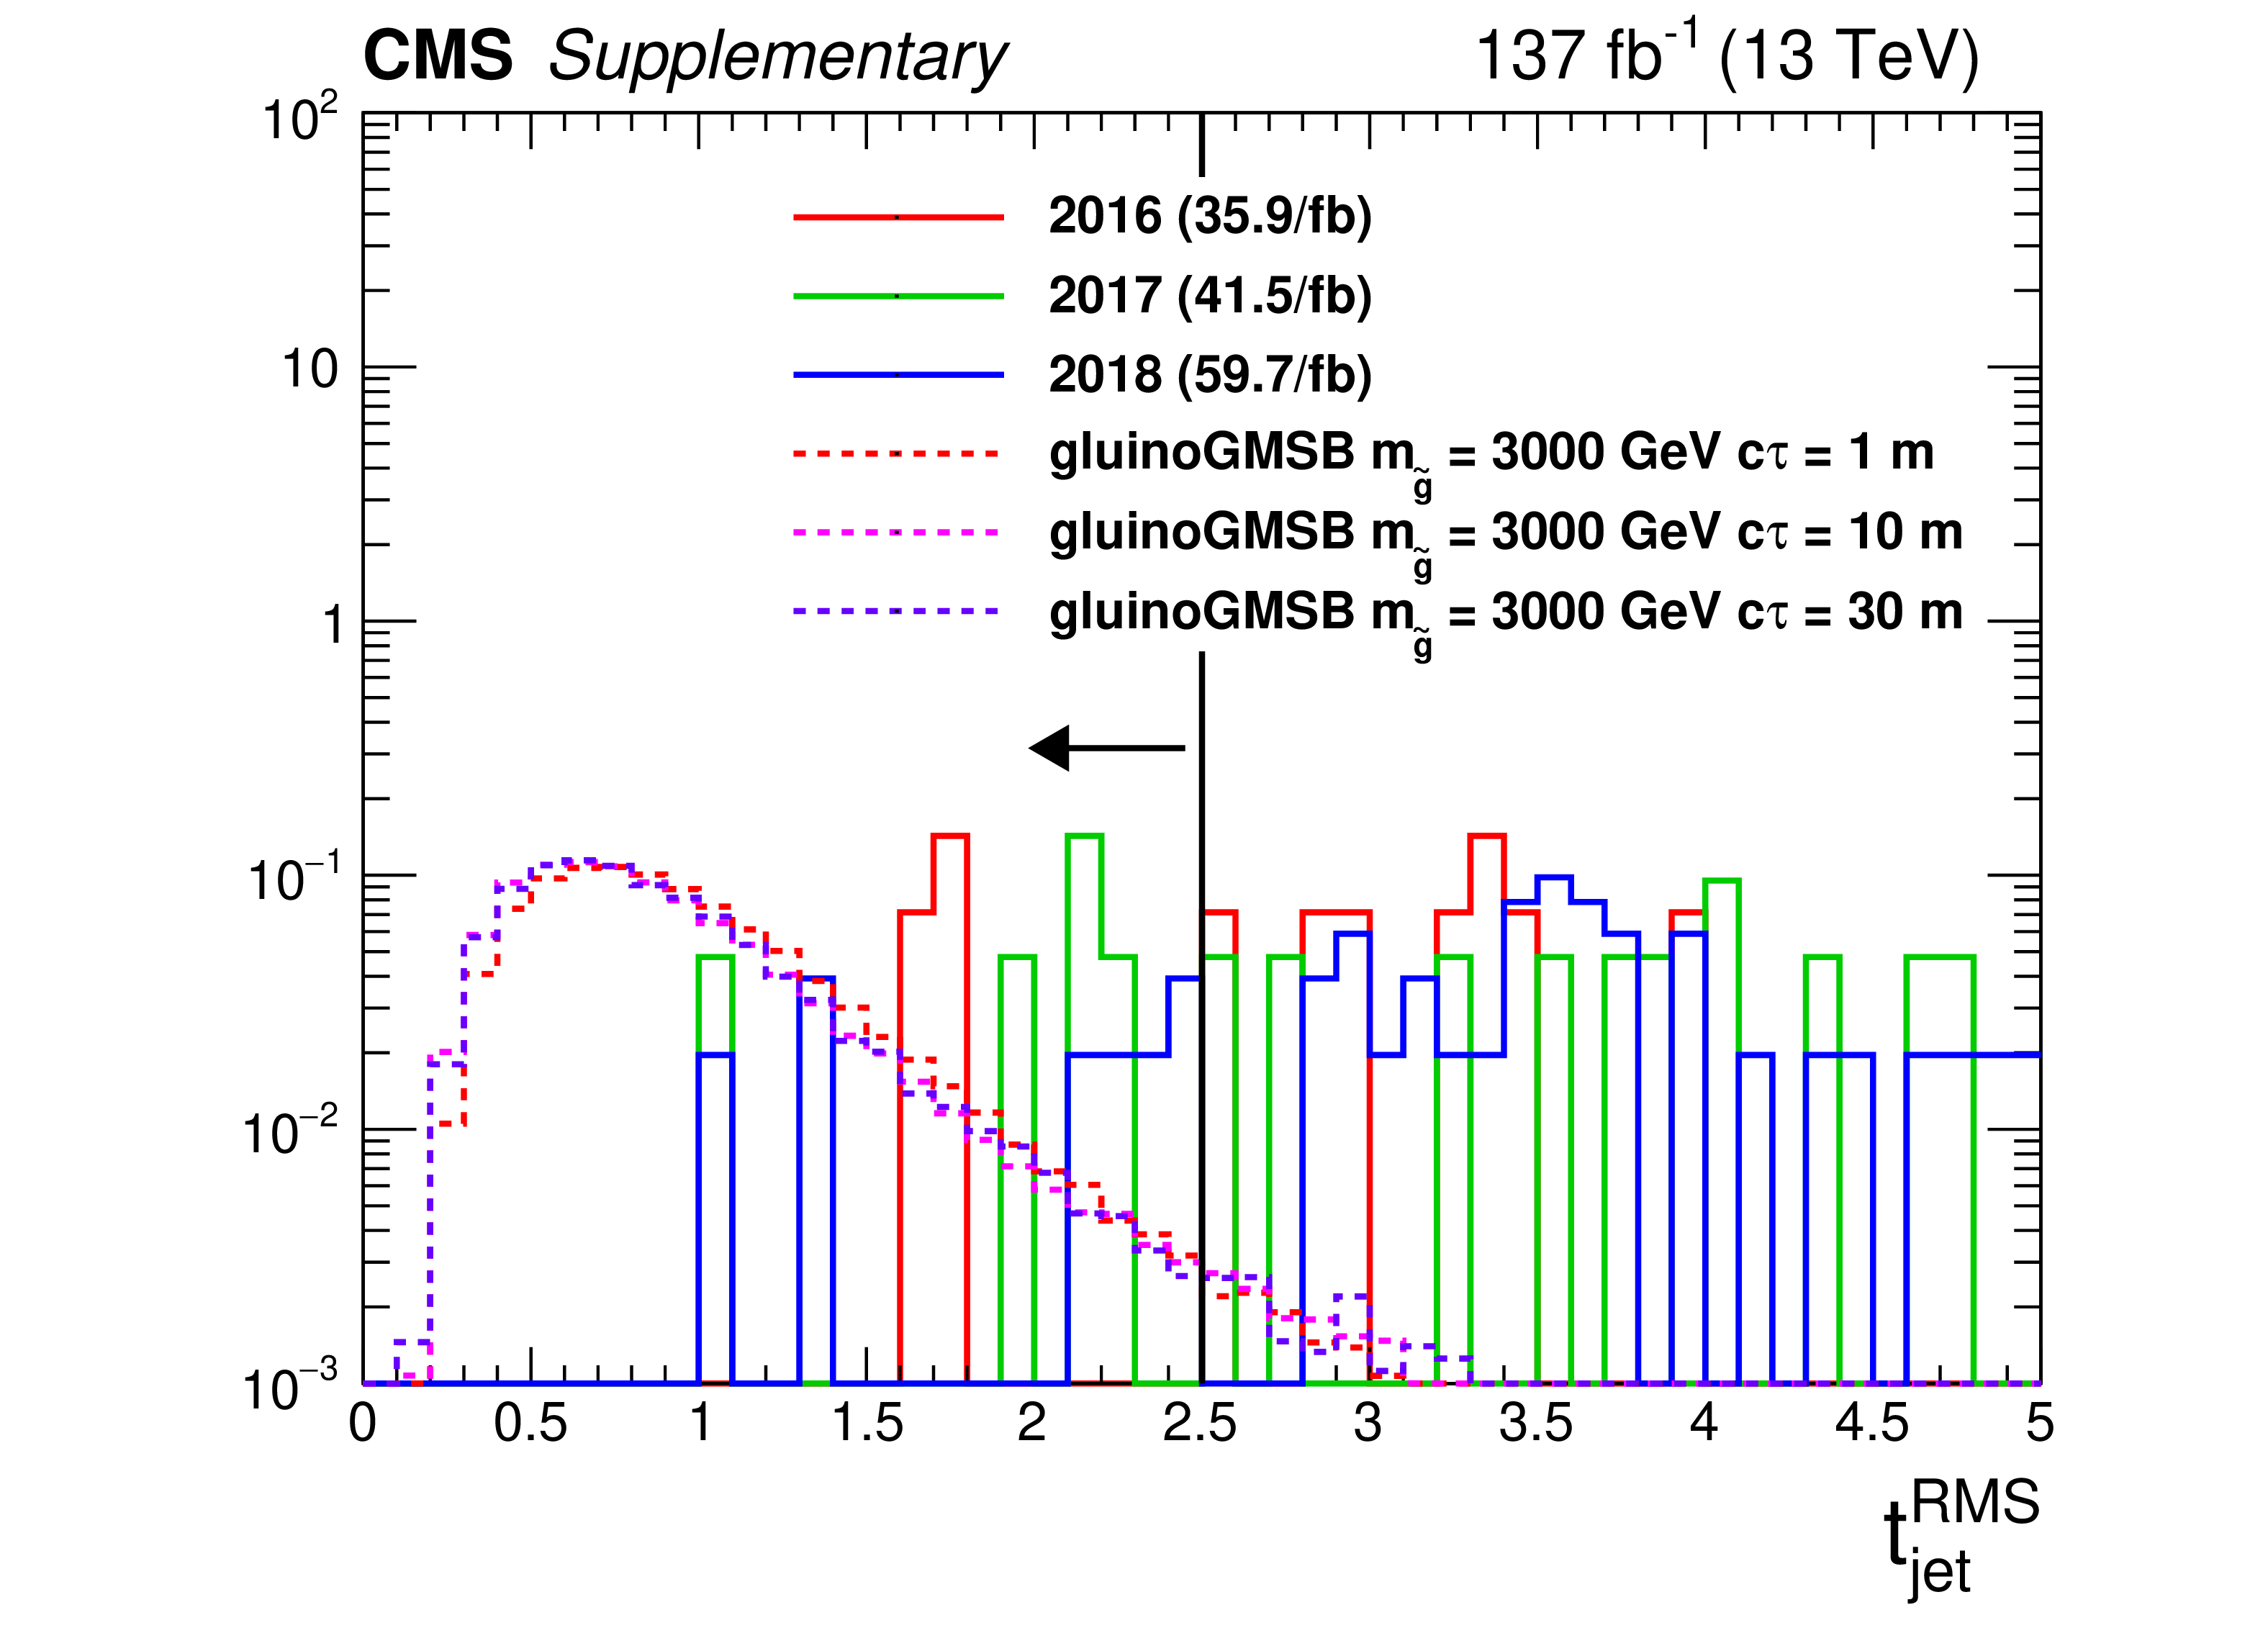
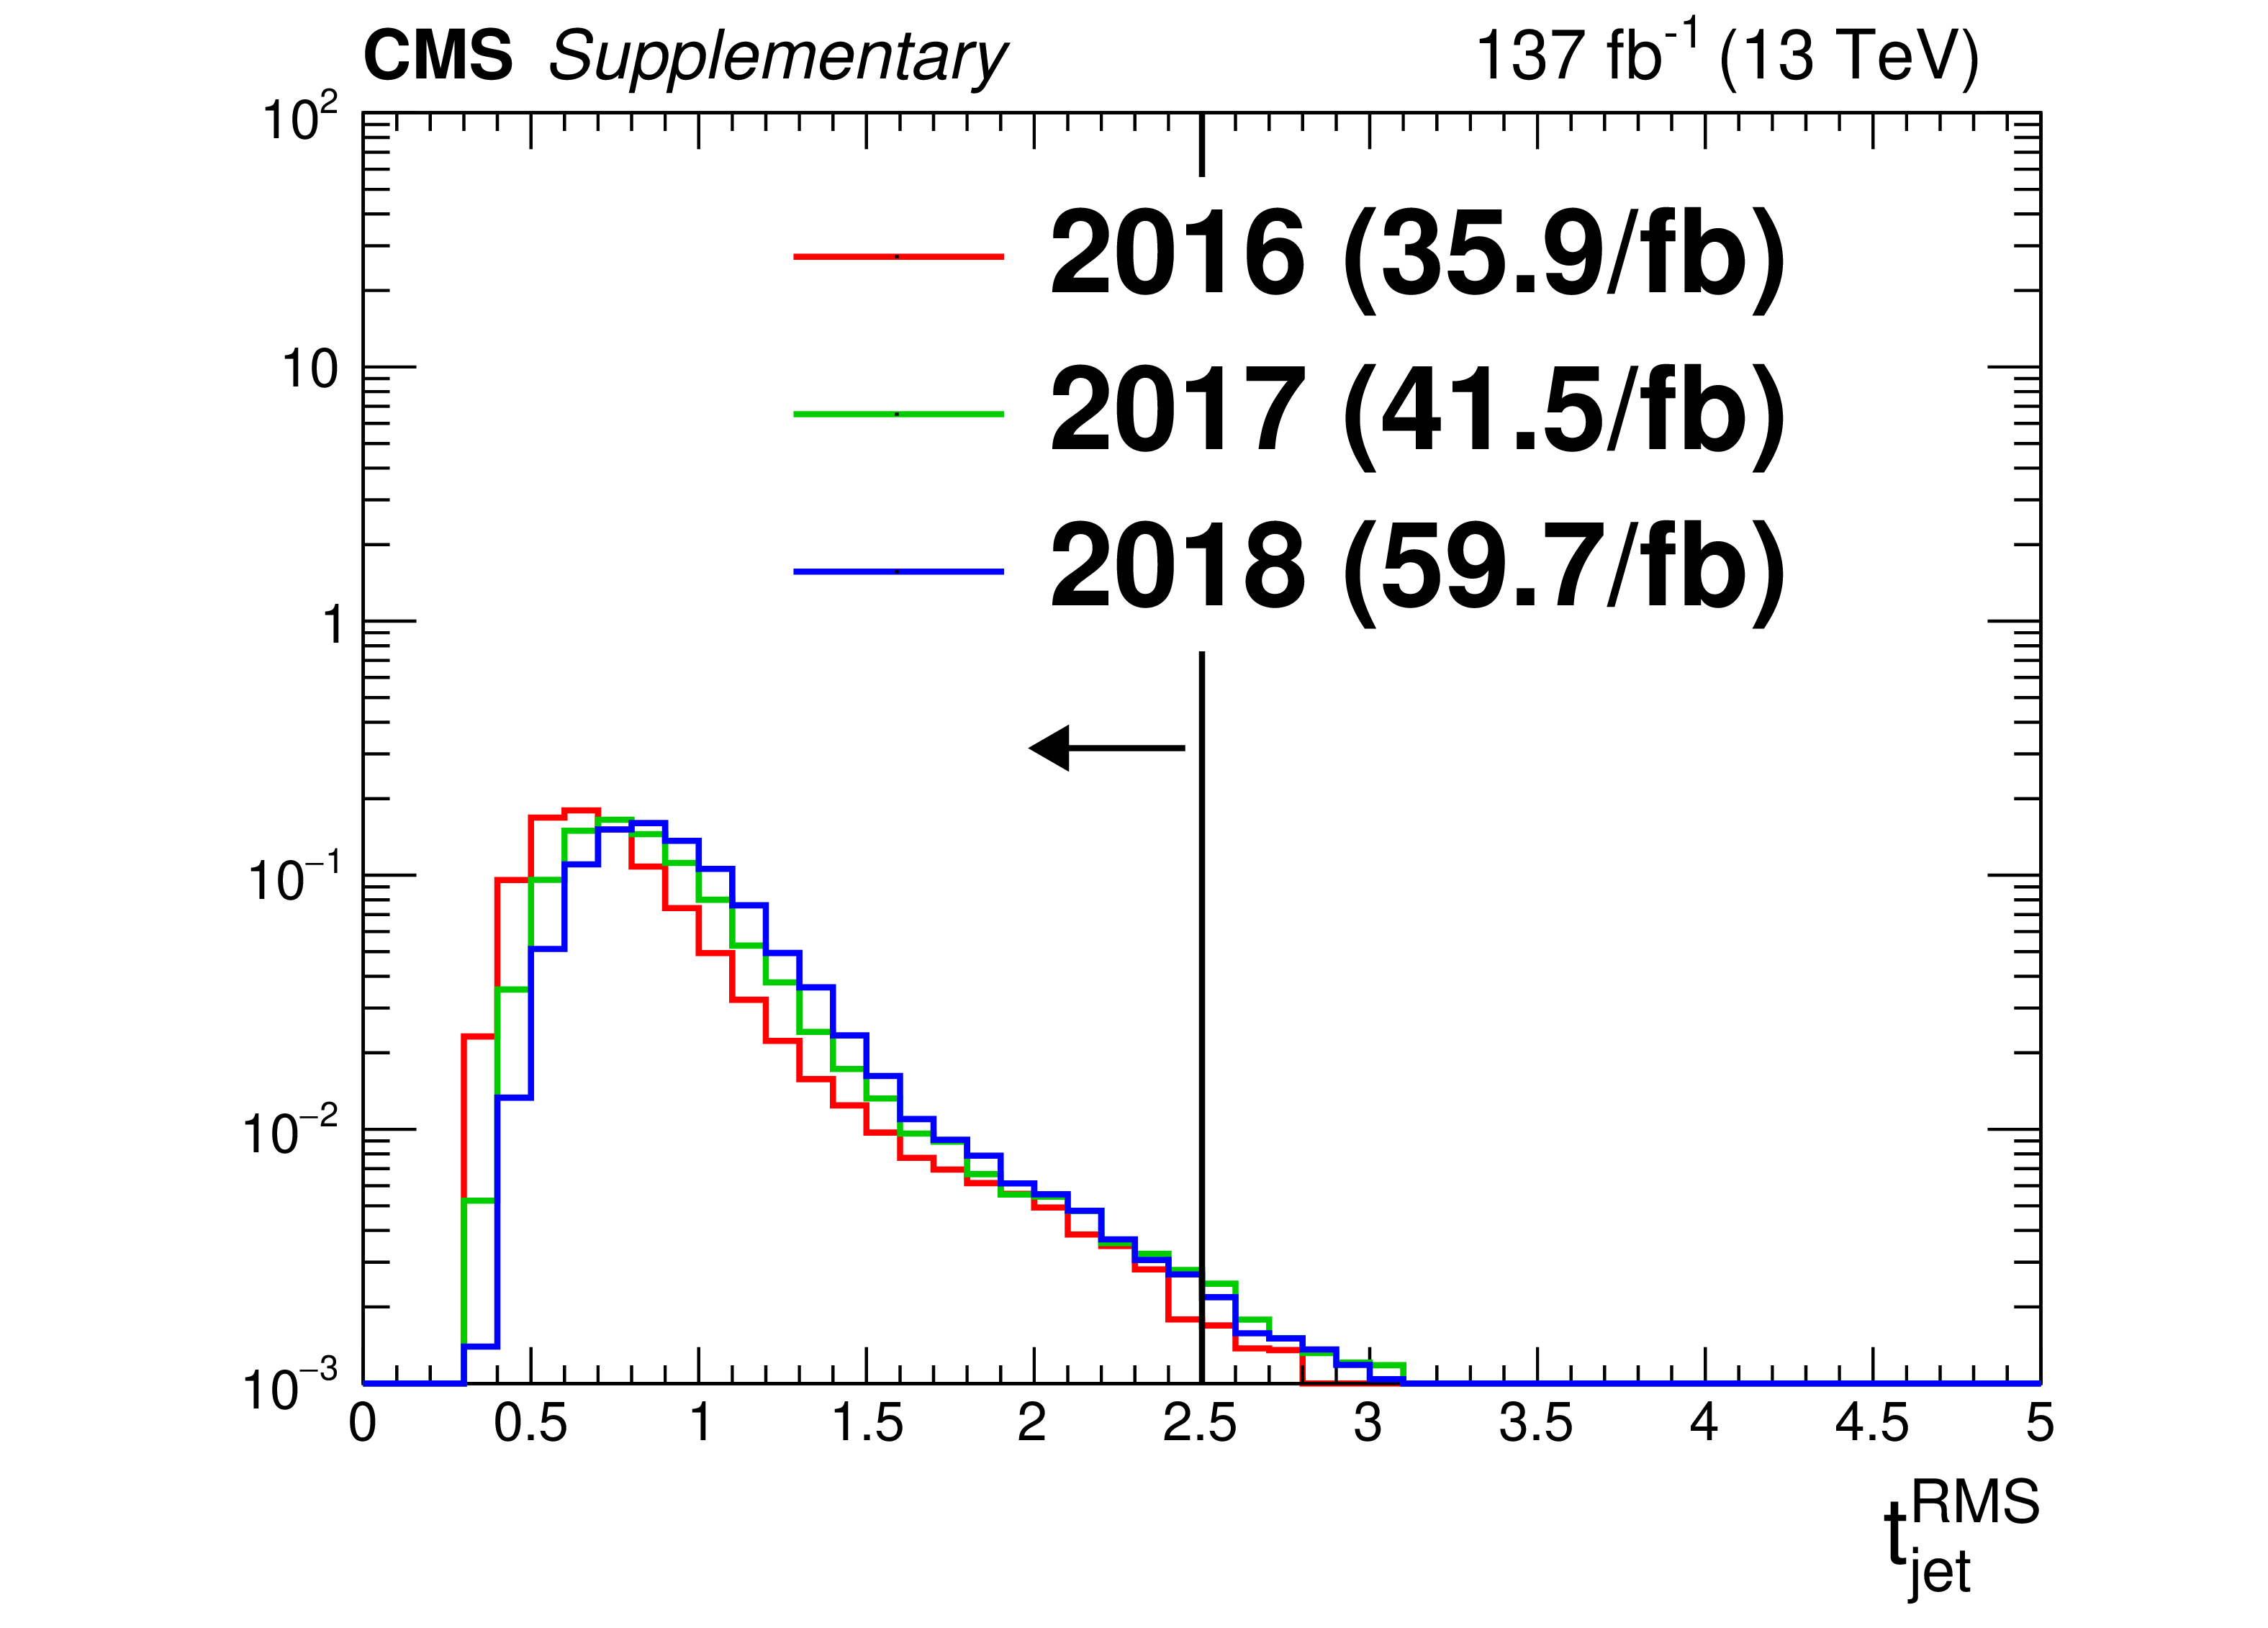
Additional Figure 5:
The distribution (normalized to unity) of ${t^{\textrm {RMS}}_\textrm {jet}}$ for data sample enriched in jets from noise (satisfying $|\eta | < $ 1.48, $ {p_{\mathrm {T}}} > $ 30 GeV, $ {PV_{\rm track}^{\rm fraction}} > $ 1/12, $ {\textrm {HEF}} > $ 0.2, $ {t_{\textrm {jet}}} < -$3 ns, $ {E_{\textrm {ECAL}}} > $ 20 GeV and $ {E^{\textrm {CSC}}_\textrm {ECAL}/E_{\textrm {ECAL}}} < $ 0.8) and for signal jets passing signal region selections (except on ${{t^{\textrm {RMS}}_\textrm {jet}} / {t_{\textrm {jet}}}}$ and ${t^{\textrm {RMS}}_\textrm {jet}}$). |

png pdf |
Additional Figure 5-a:
The distribution (normalized to unity) of ${t^{\textrm {RMS}}_\textrm {jet}}$ for data sample enriched in jets from noise (satisfying $|\eta | < $ 1.48, $ {p_{\mathrm {T}}} > $ 30 GeV, $ {PV_{\rm track}^{\rm fraction}} > $ 1/12, $ {\textrm {HEF}} > $ 0.2, $ {t_{\textrm {jet}}} < -$3 ns, $ {E_{\textrm {ECAL}}} > $ 20 GeV and $ {E^{\textrm {CSC}}_\textrm {ECAL}/E_{\textrm {ECAL}}} < $ 0.8) and for signal jets passing signal region selections (except on ${{t^{\textrm {RMS}}_\textrm {jet}} / {t_{\textrm {jet}}}}$ and ${t^{\textrm {RMS}}_\textrm {jet}}$). |
png pdf |
Additional Figure 5-b:
The distribution (normalized to unity) of ${t^{\textrm {RMS}}_\textrm {jet}}$ for data sample enriched in jets from noise (satisfying $|\eta | < $ 1.48, $ {p_{\mathrm {T}}} > $ 30 GeV, $ {PV_{\rm track}^{\rm fraction}} > $ 1/12, $ {\textrm {HEF}} > $ 0.2, $ {t_{\textrm {jet}}} < -$3 ns, $ {E_{\textrm {ECAL}}} > $ 20 GeV and $ {E^{\textrm {CSC}}_\textrm {ECAL}/E_{\textrm {ECAL}}} < $ 0.8) and for signal jets passing signal region selections (except on ${{t^{\textrm {RMS}}_\textrm {jet}} / {t_{\textrm {jet}}}}$ and ${t^{\textrm {RMS}}_\textrm {jet}}$). |
png pdf |
Additional Figure 5-c:
The distribution (normalized to unity) of ${t^{\textrm {RMS}}_\textrm {jet}}$ for data sample enriched in jets from noise (satisfying $|\eta | < $ 1.48, $ {p_{\mathrm {T}}} > $ 30 GeV, $ {PV_{\rm track}^{\rm fraction}} > $ 1/12, $ {\textrm {HEF}} > $ 0.2, $ {t_{\textrm {jet}}} < -$3 ns, $ {E_{\textrm {ECAL}}} > $ 20 GeV and $ {E^{\textrm {CSC}}_\textrm {ECAL}/E_{\textrm {ECAL}}} < $ 0.8) and for signal jets passing signal region selections (except on ${{t^{\textrm {RMS}}_\textrm {jet}} / {t_{\textrm {jet}}}}$ and ${t^{\textrm {RMS}}_\textrm {jet}}$). |
png pdf |
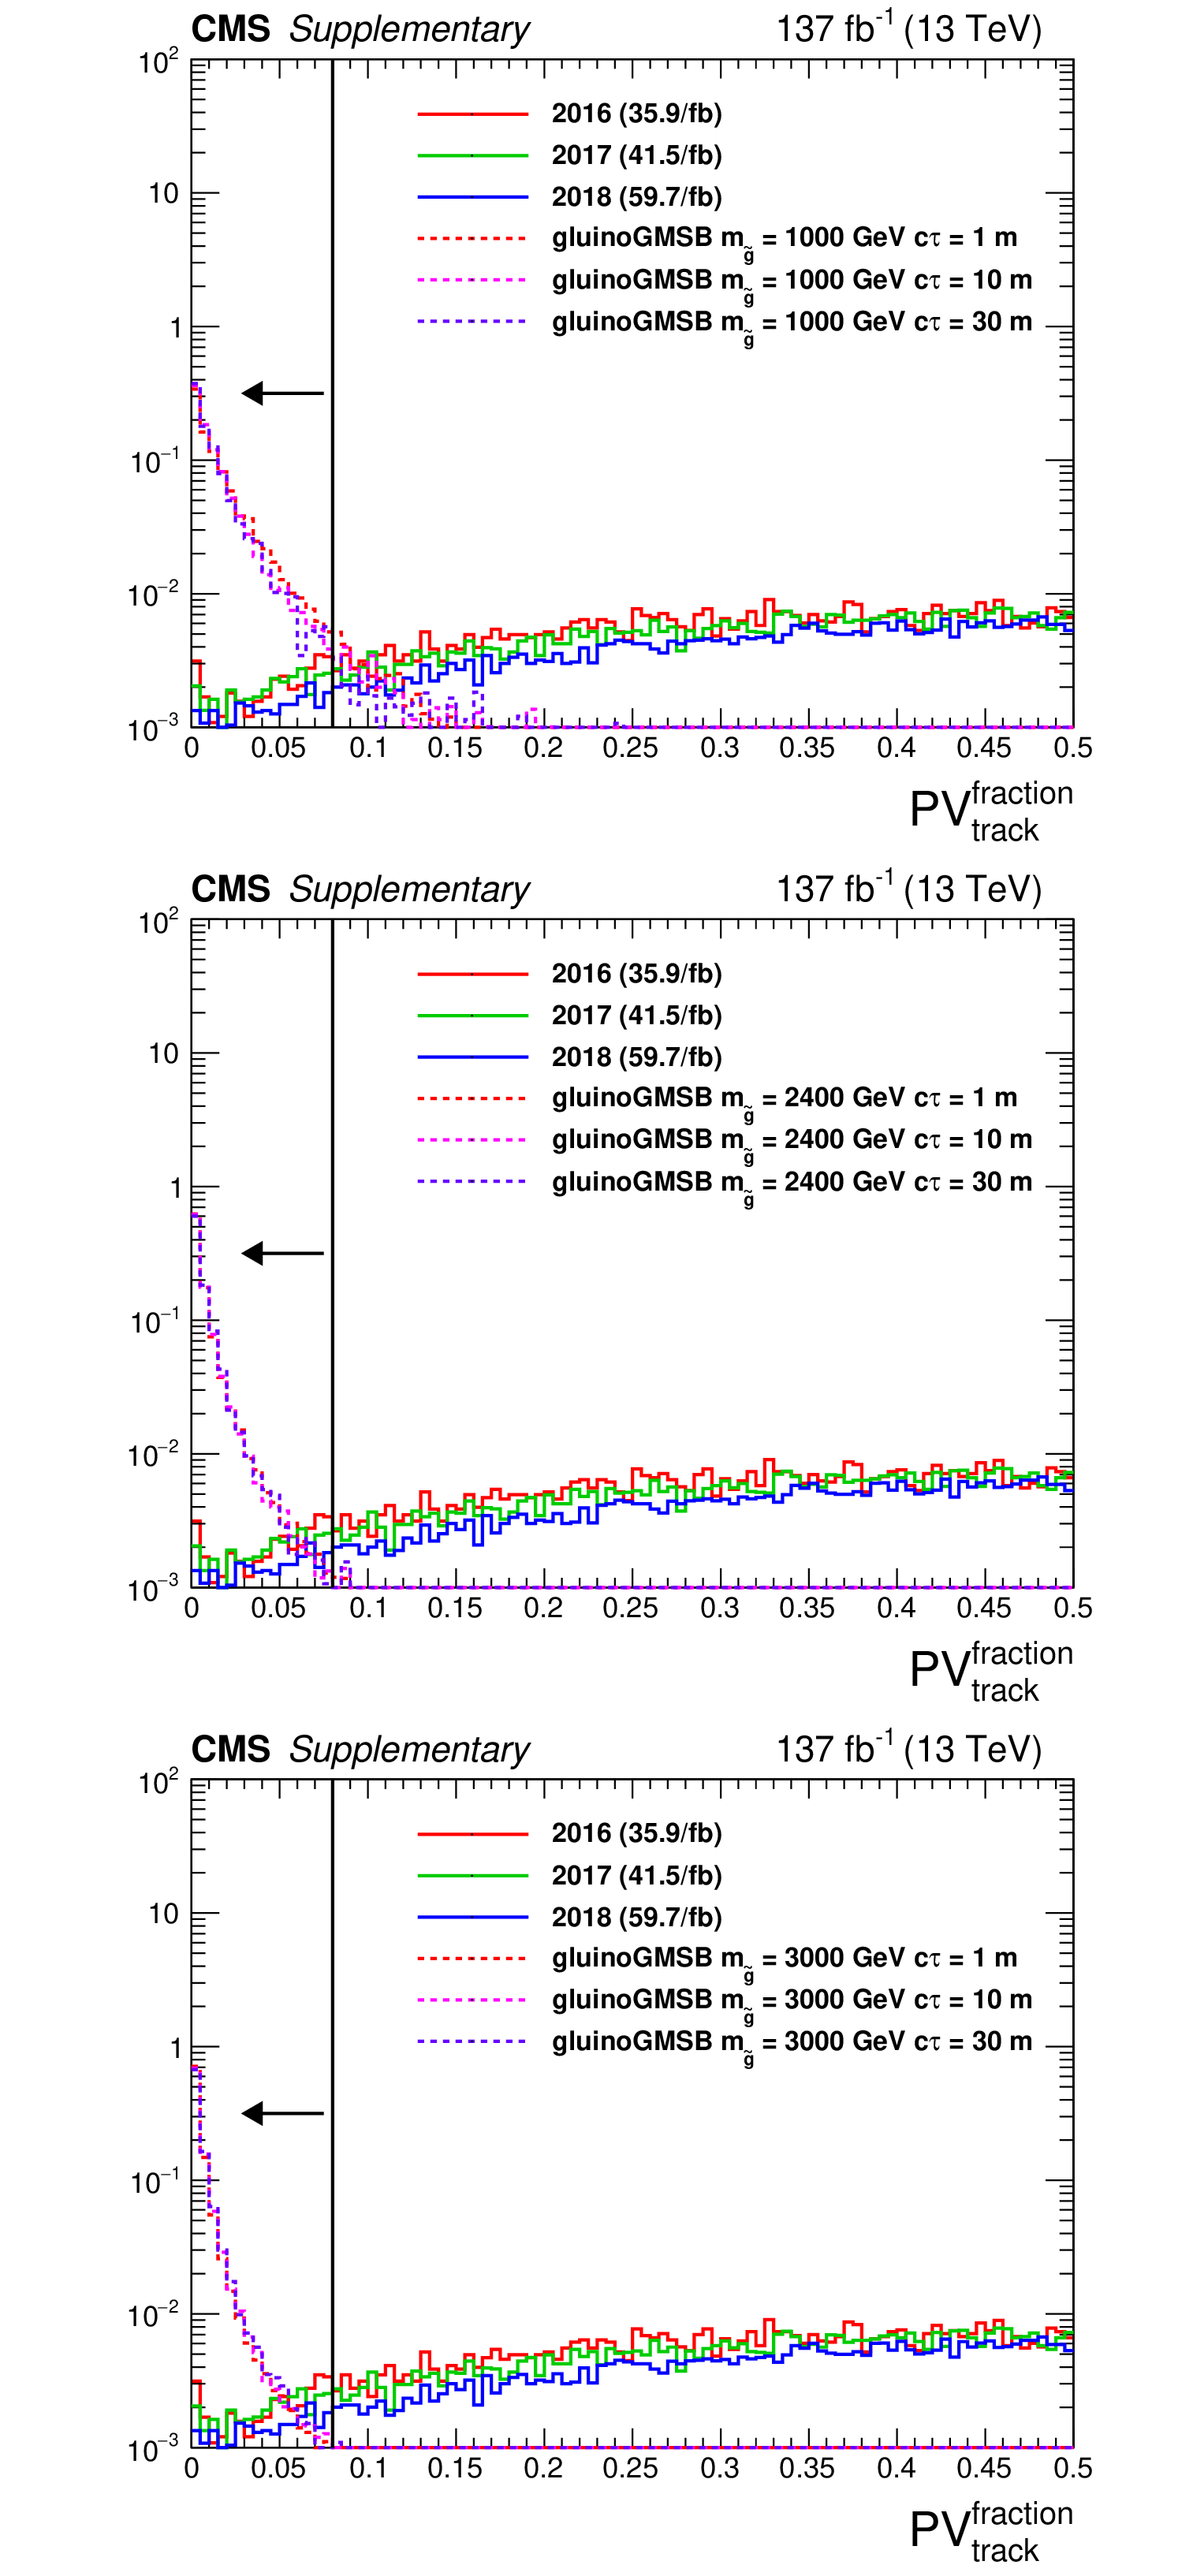
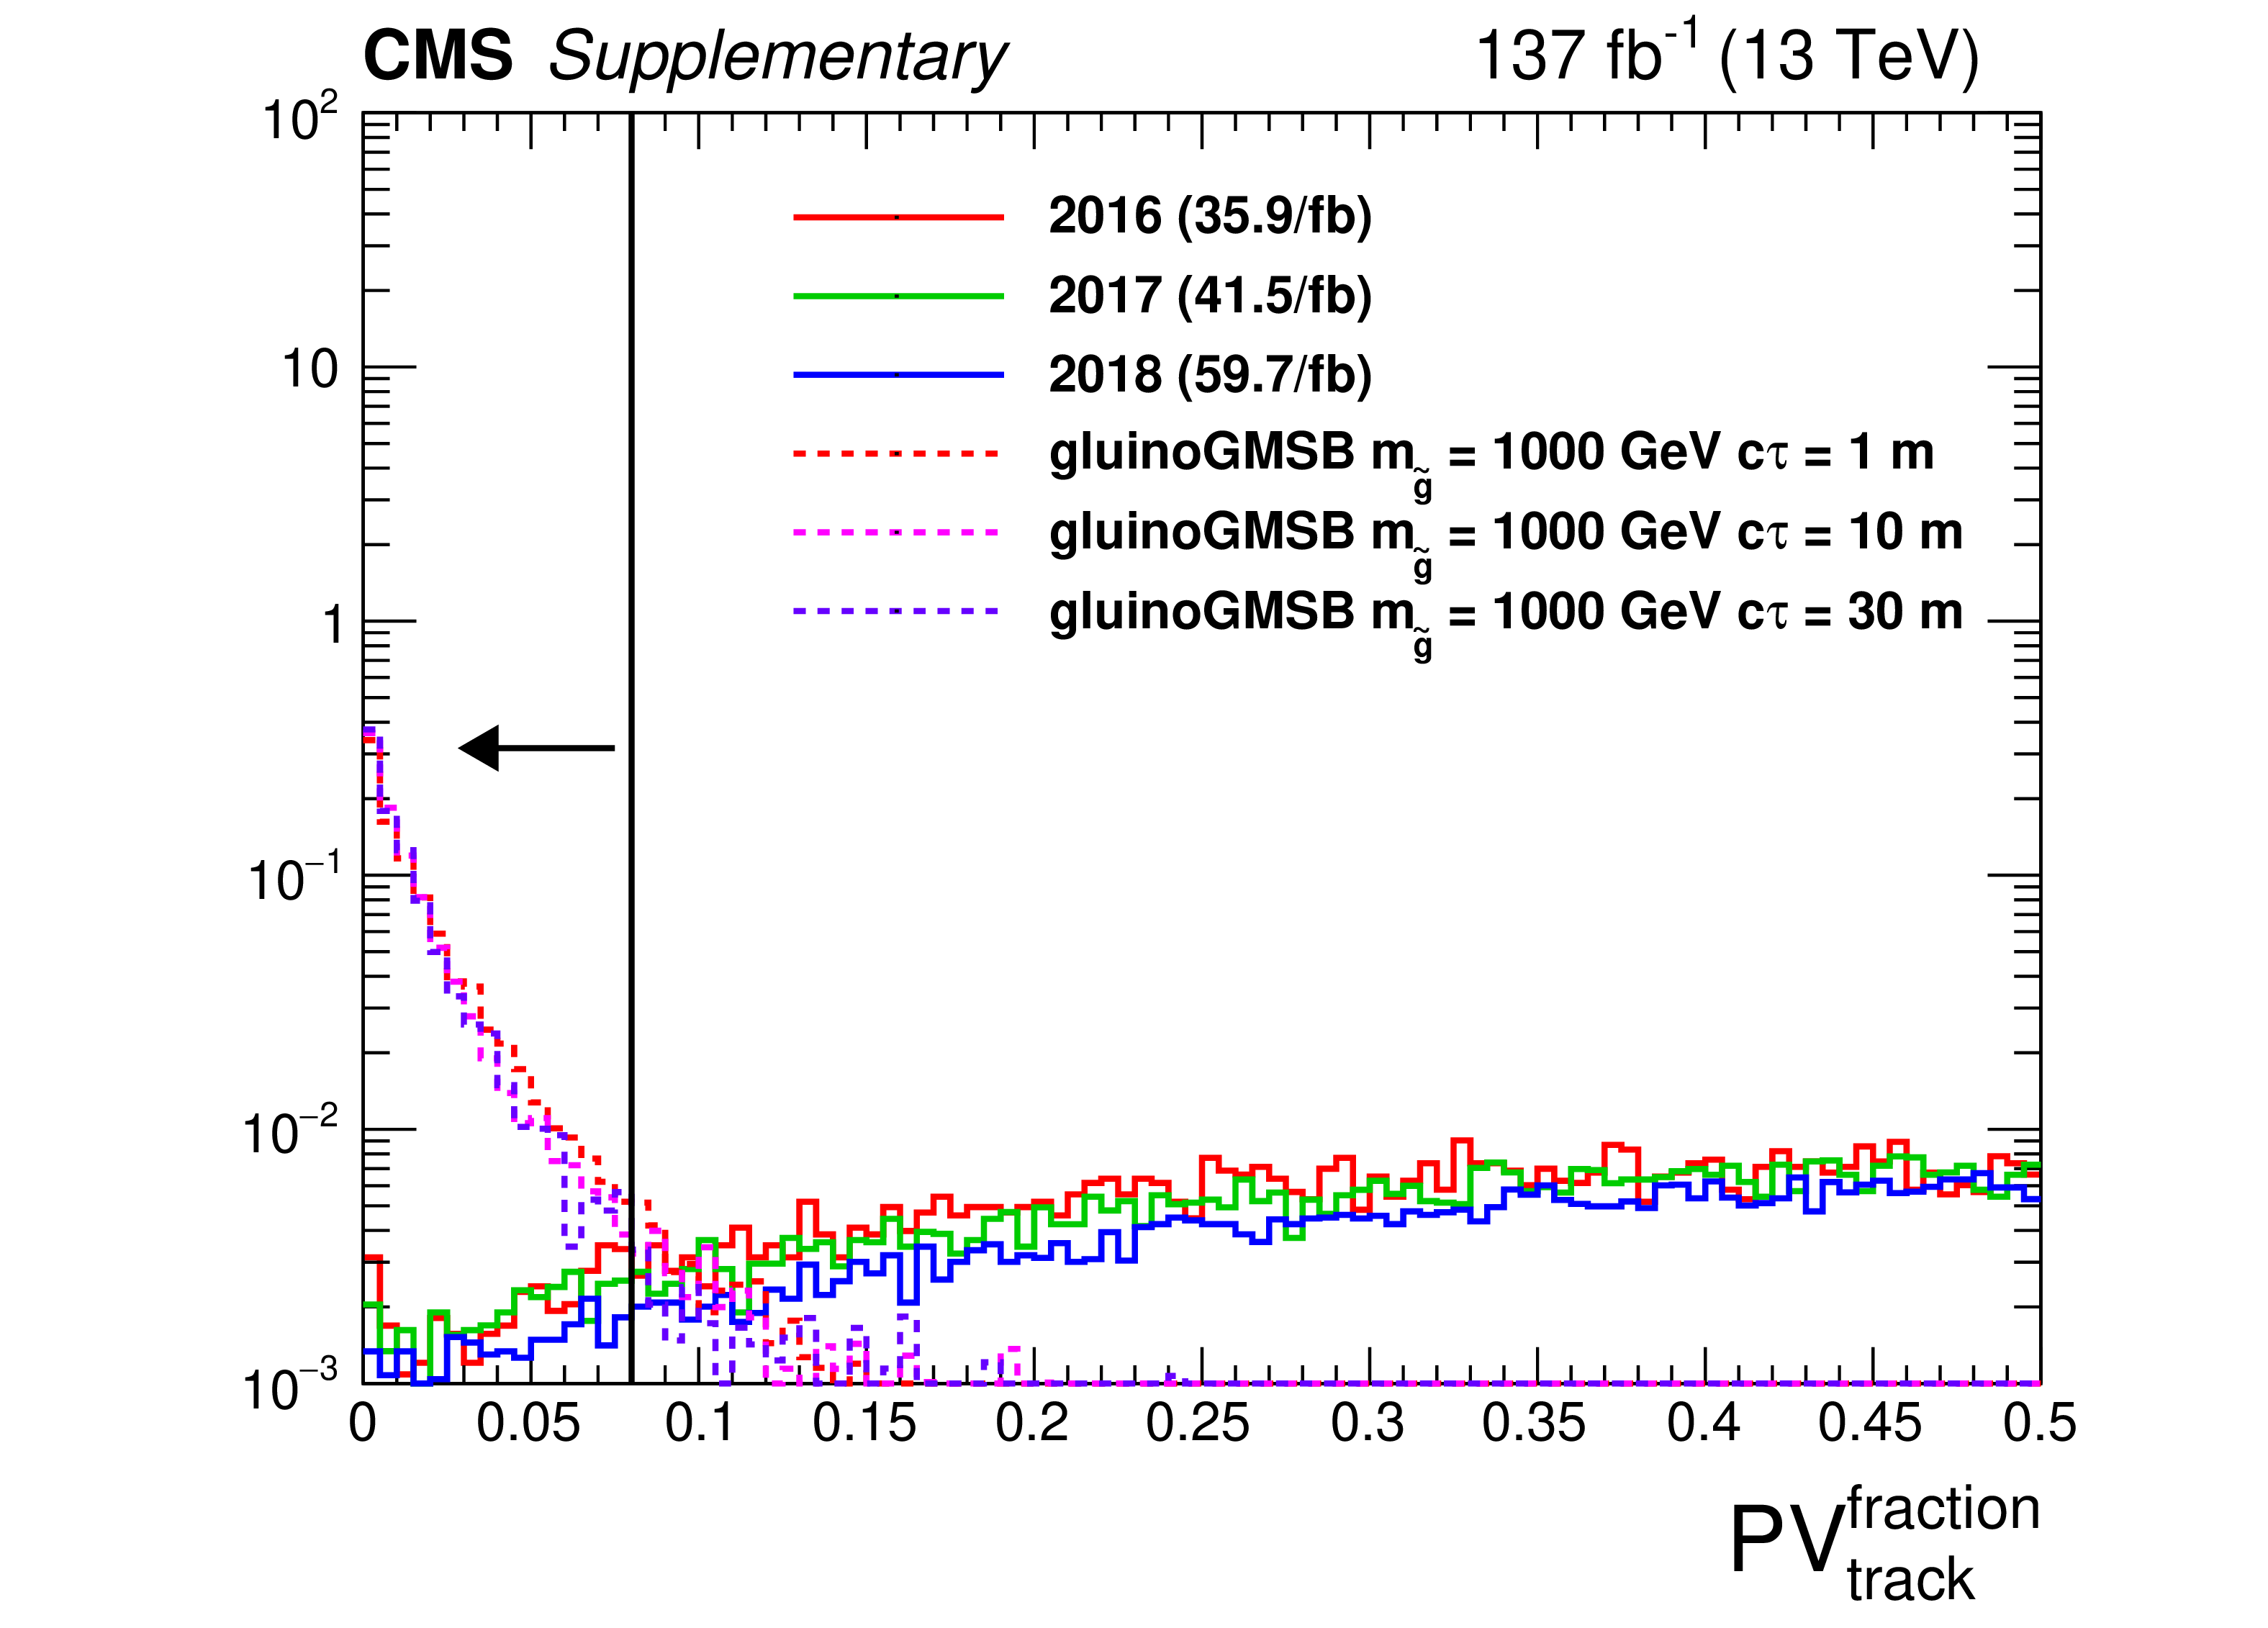
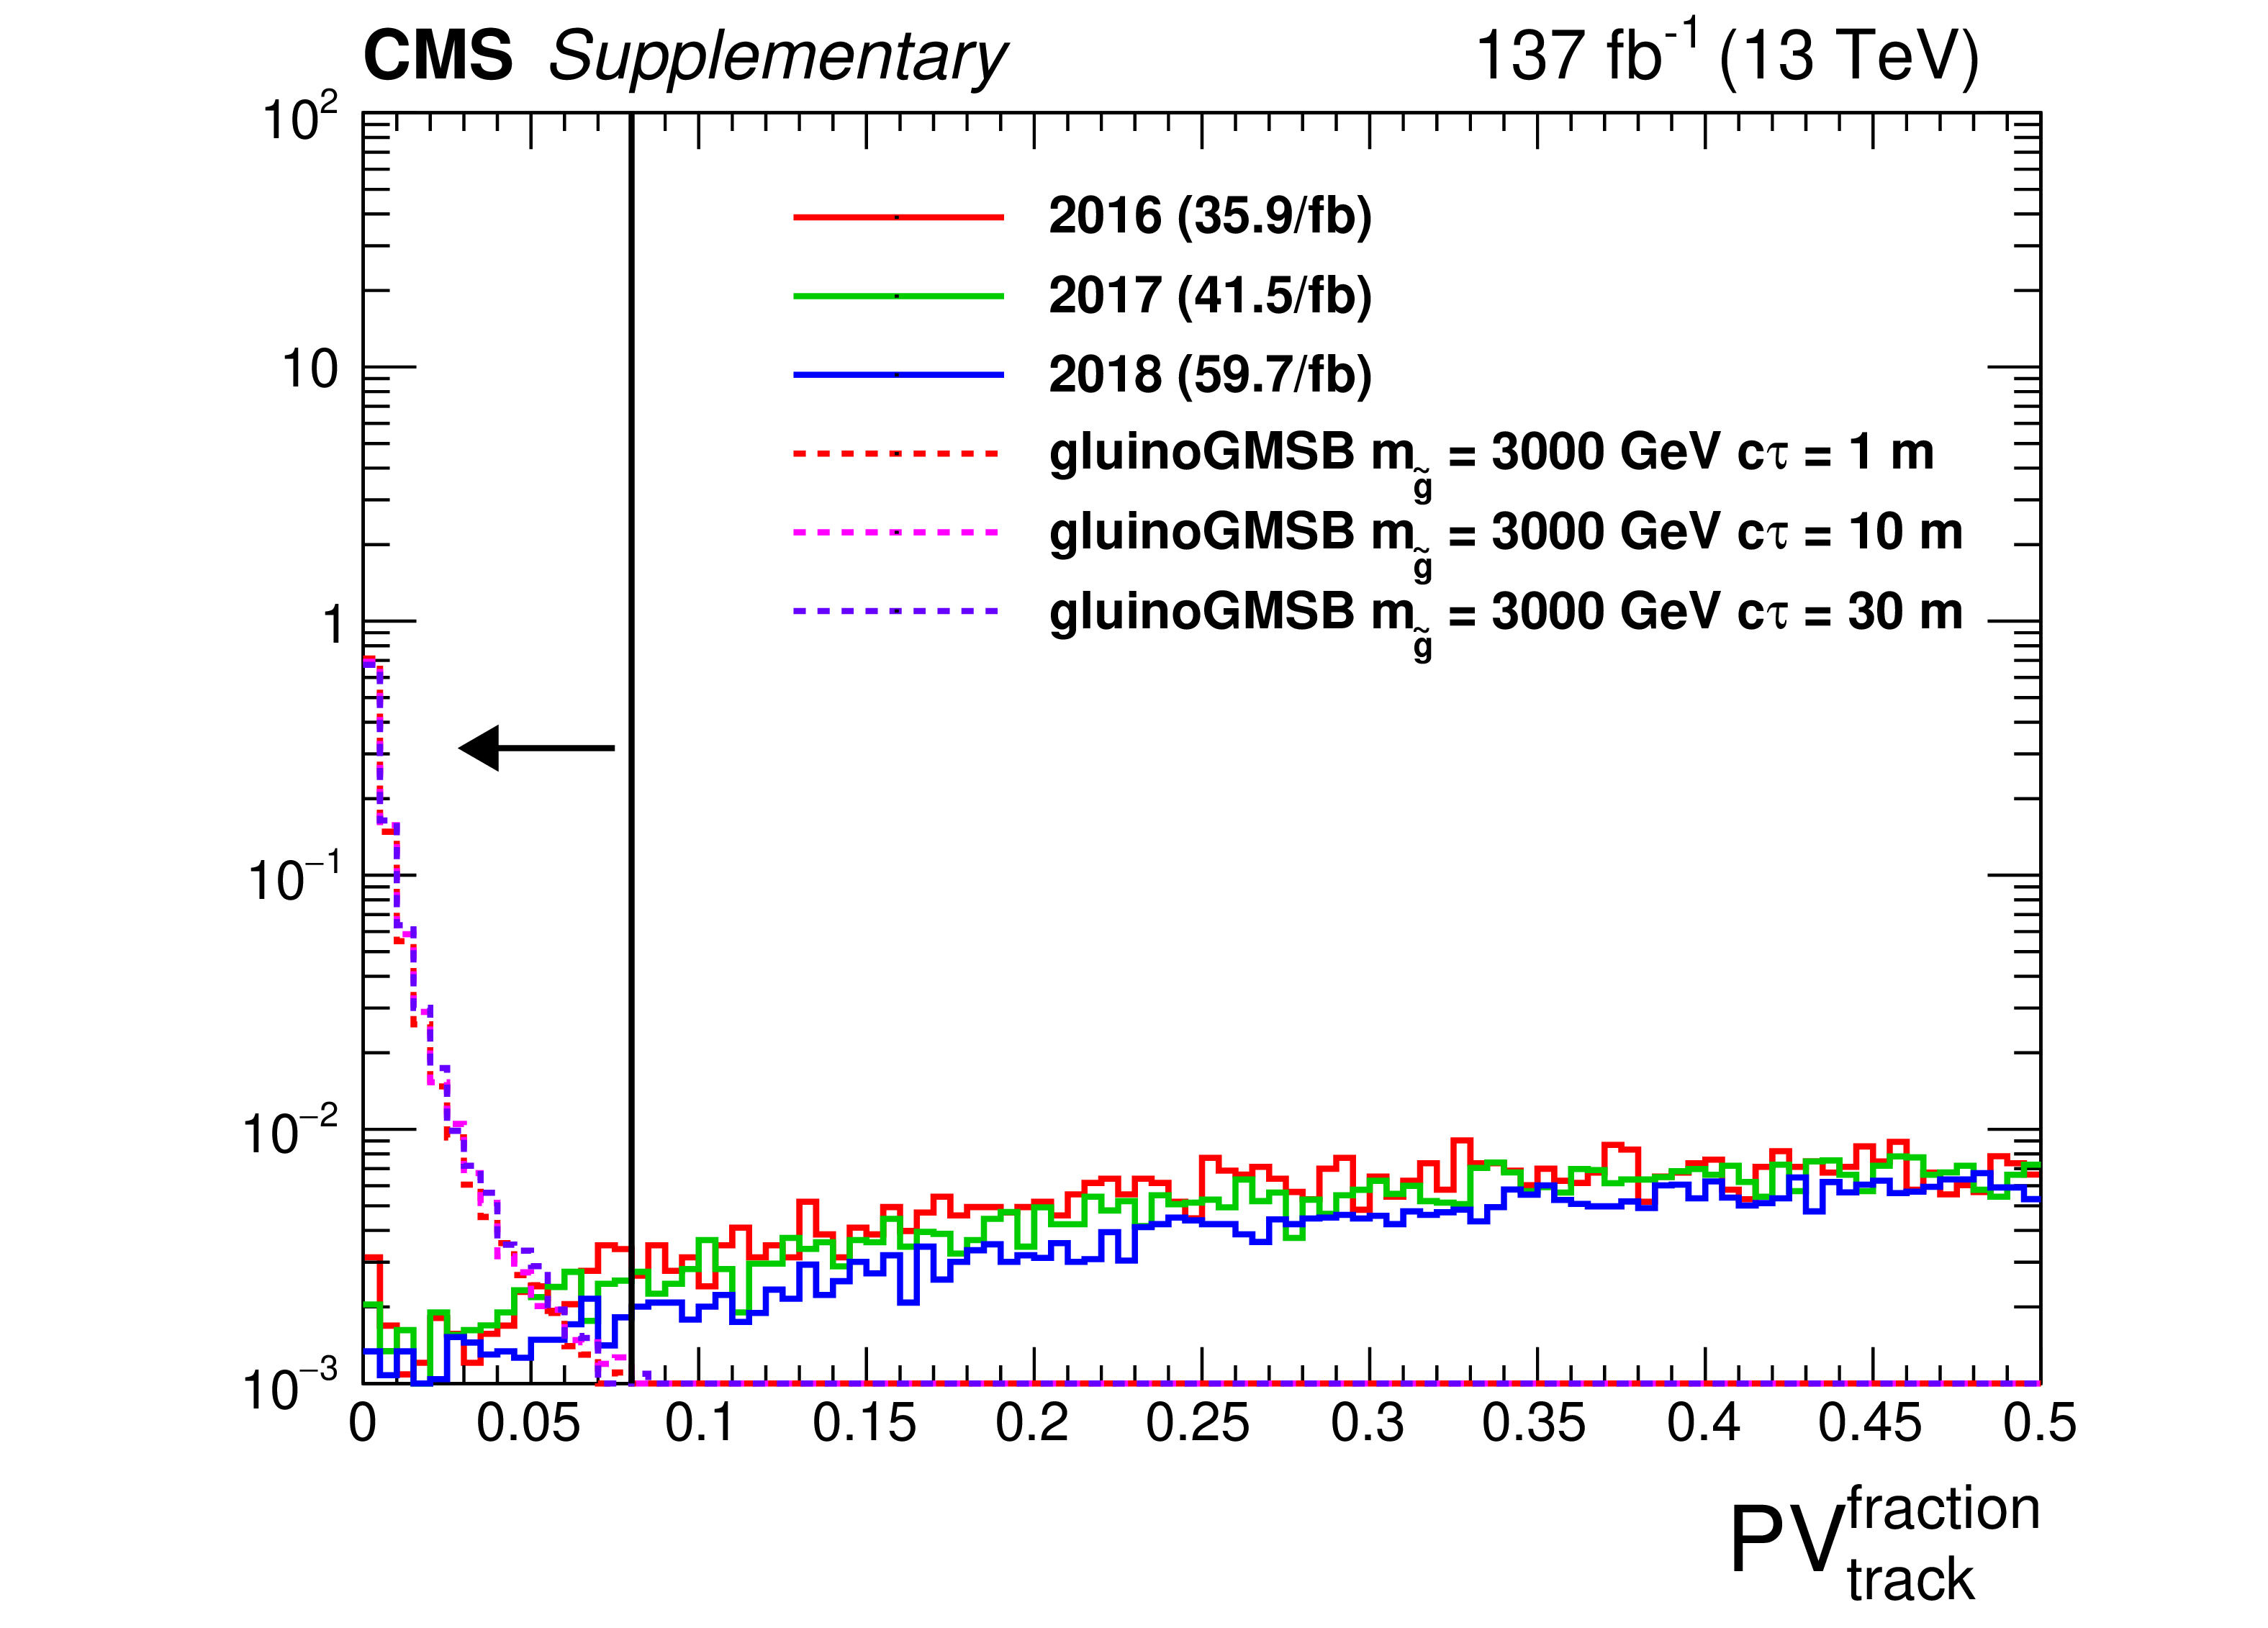
Additional Figure 6:
The distribution (normalized to unity) of ${PV_{\rm track}^{\rm fraction}}$ for a data sample enriched in main bunch backgrounds (satisfying $ {p_{\mathrm {T}}} > $ 30 GeV, $|\eta | < $ 1.48, $ {E^{\textrm {CSC}}_\textrm {ECAL}/E_{\textrm {ECAL}}} < $ 0.8, $| {t_{\textrm {jet}}} | < $ 3 ns and $ {E_{\textrm {ECAL}}} > $ 20 GeV) and for signal jets passing signal selections (except on ${PV_{\rm track}^{\rm fraction}}$). |
png pdf |
Additional Figure 6-a:
The distribution (normalized to unity) of ${PV_{\rm track}^{\rm fraction}}$ for a data sample enriched in main bunch backgrounds (satisfying $ {p_{\mathrm {T}}} > $ 30 GeV, $|\eta | < $ 1.48, $ {E^{\textrm {CSC}}_\textrm {ECAL}/E_{\textrm {ECAL}}} < $ 0.8, $| {t_{\textrm {jet}}} | < $ 3 ns and $ {E_{\textrm {ECAL}}} > $ 20 GeV) and for signal jets passing signal selections (except on ${PV_{\rm track}^{\rm fraction}}$). |
png pdf |
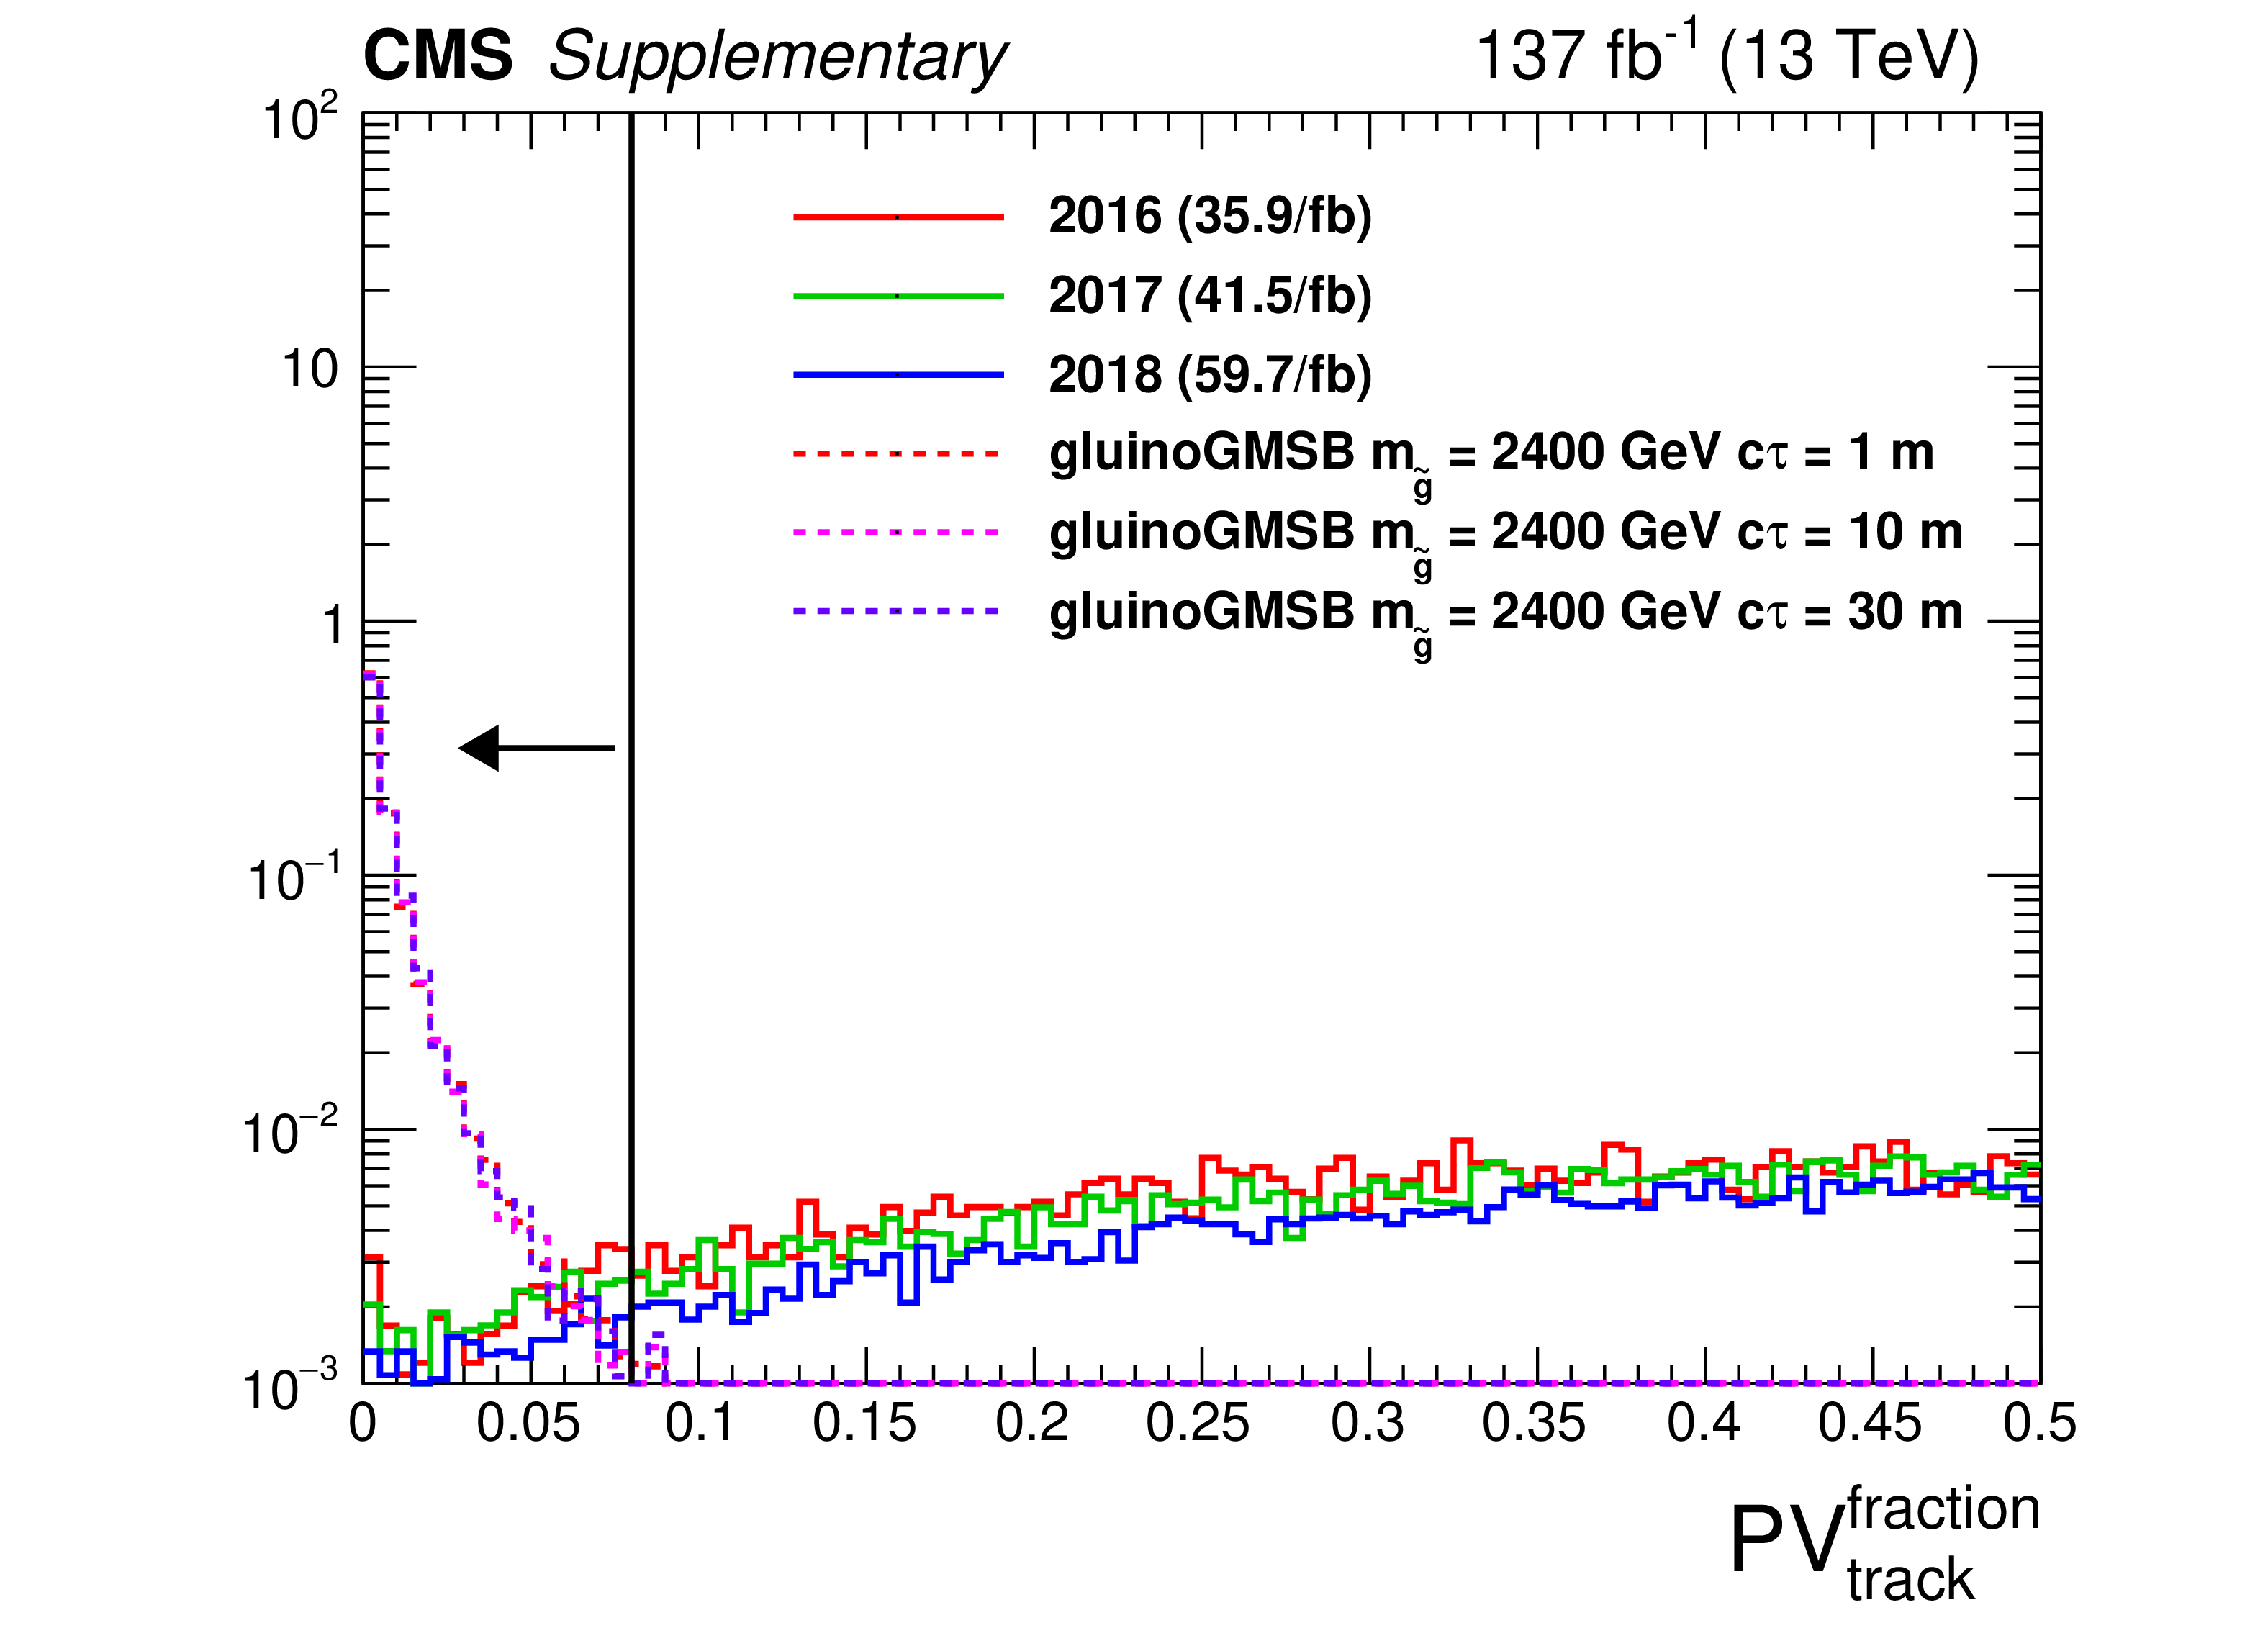
Additional Figure 6-b:
The distribution (normalized to unity) of ${PV_{\rm track}^{\rm fraction}}$ for a data sample enriched in main bunch backgrounds (satisfying $ {p_{\mathrm {T}}} > $ 30 GeV, $|\eta | < $ 1.48, $ {E^{\textrm {CSC}}_\textrm {ECAL}/E_{\textrm {ECAL}}} < $ 0.8, $| {t_{\textrm {jet}}} | < $ 3 ns and $ {E_{\textrm {ECAL}}} > $ 20 GeV) and for signal jets passing signal selections (except on ${PV_{\rm track}^{\rm fraction}}$). |
png pdf |
Additional Figure 6-c:
The distribution (normalized to unity) of ${PV_{\rm track}^{\rm fraction}}$ for a data sample enriched in main bunch backgrounds (satisfying $ {p_{\mathrm {T}}} > $ 30 GeV, $|\eta | < $ 1.48, $ {E^{\textrm {CSC}}_\textrm {ECAL}/E_{\textrm {ECAL}}} < $ 0.8, $| {t_{\textrm {jet}}} | < $ 3 ns and $ {E_{\textrm {ECAL}}} > $ 20 GeV) and for signal jets passing signal selections (except on ${PV_{\rm track}^{\rm fraction}}$). |

png pdf |
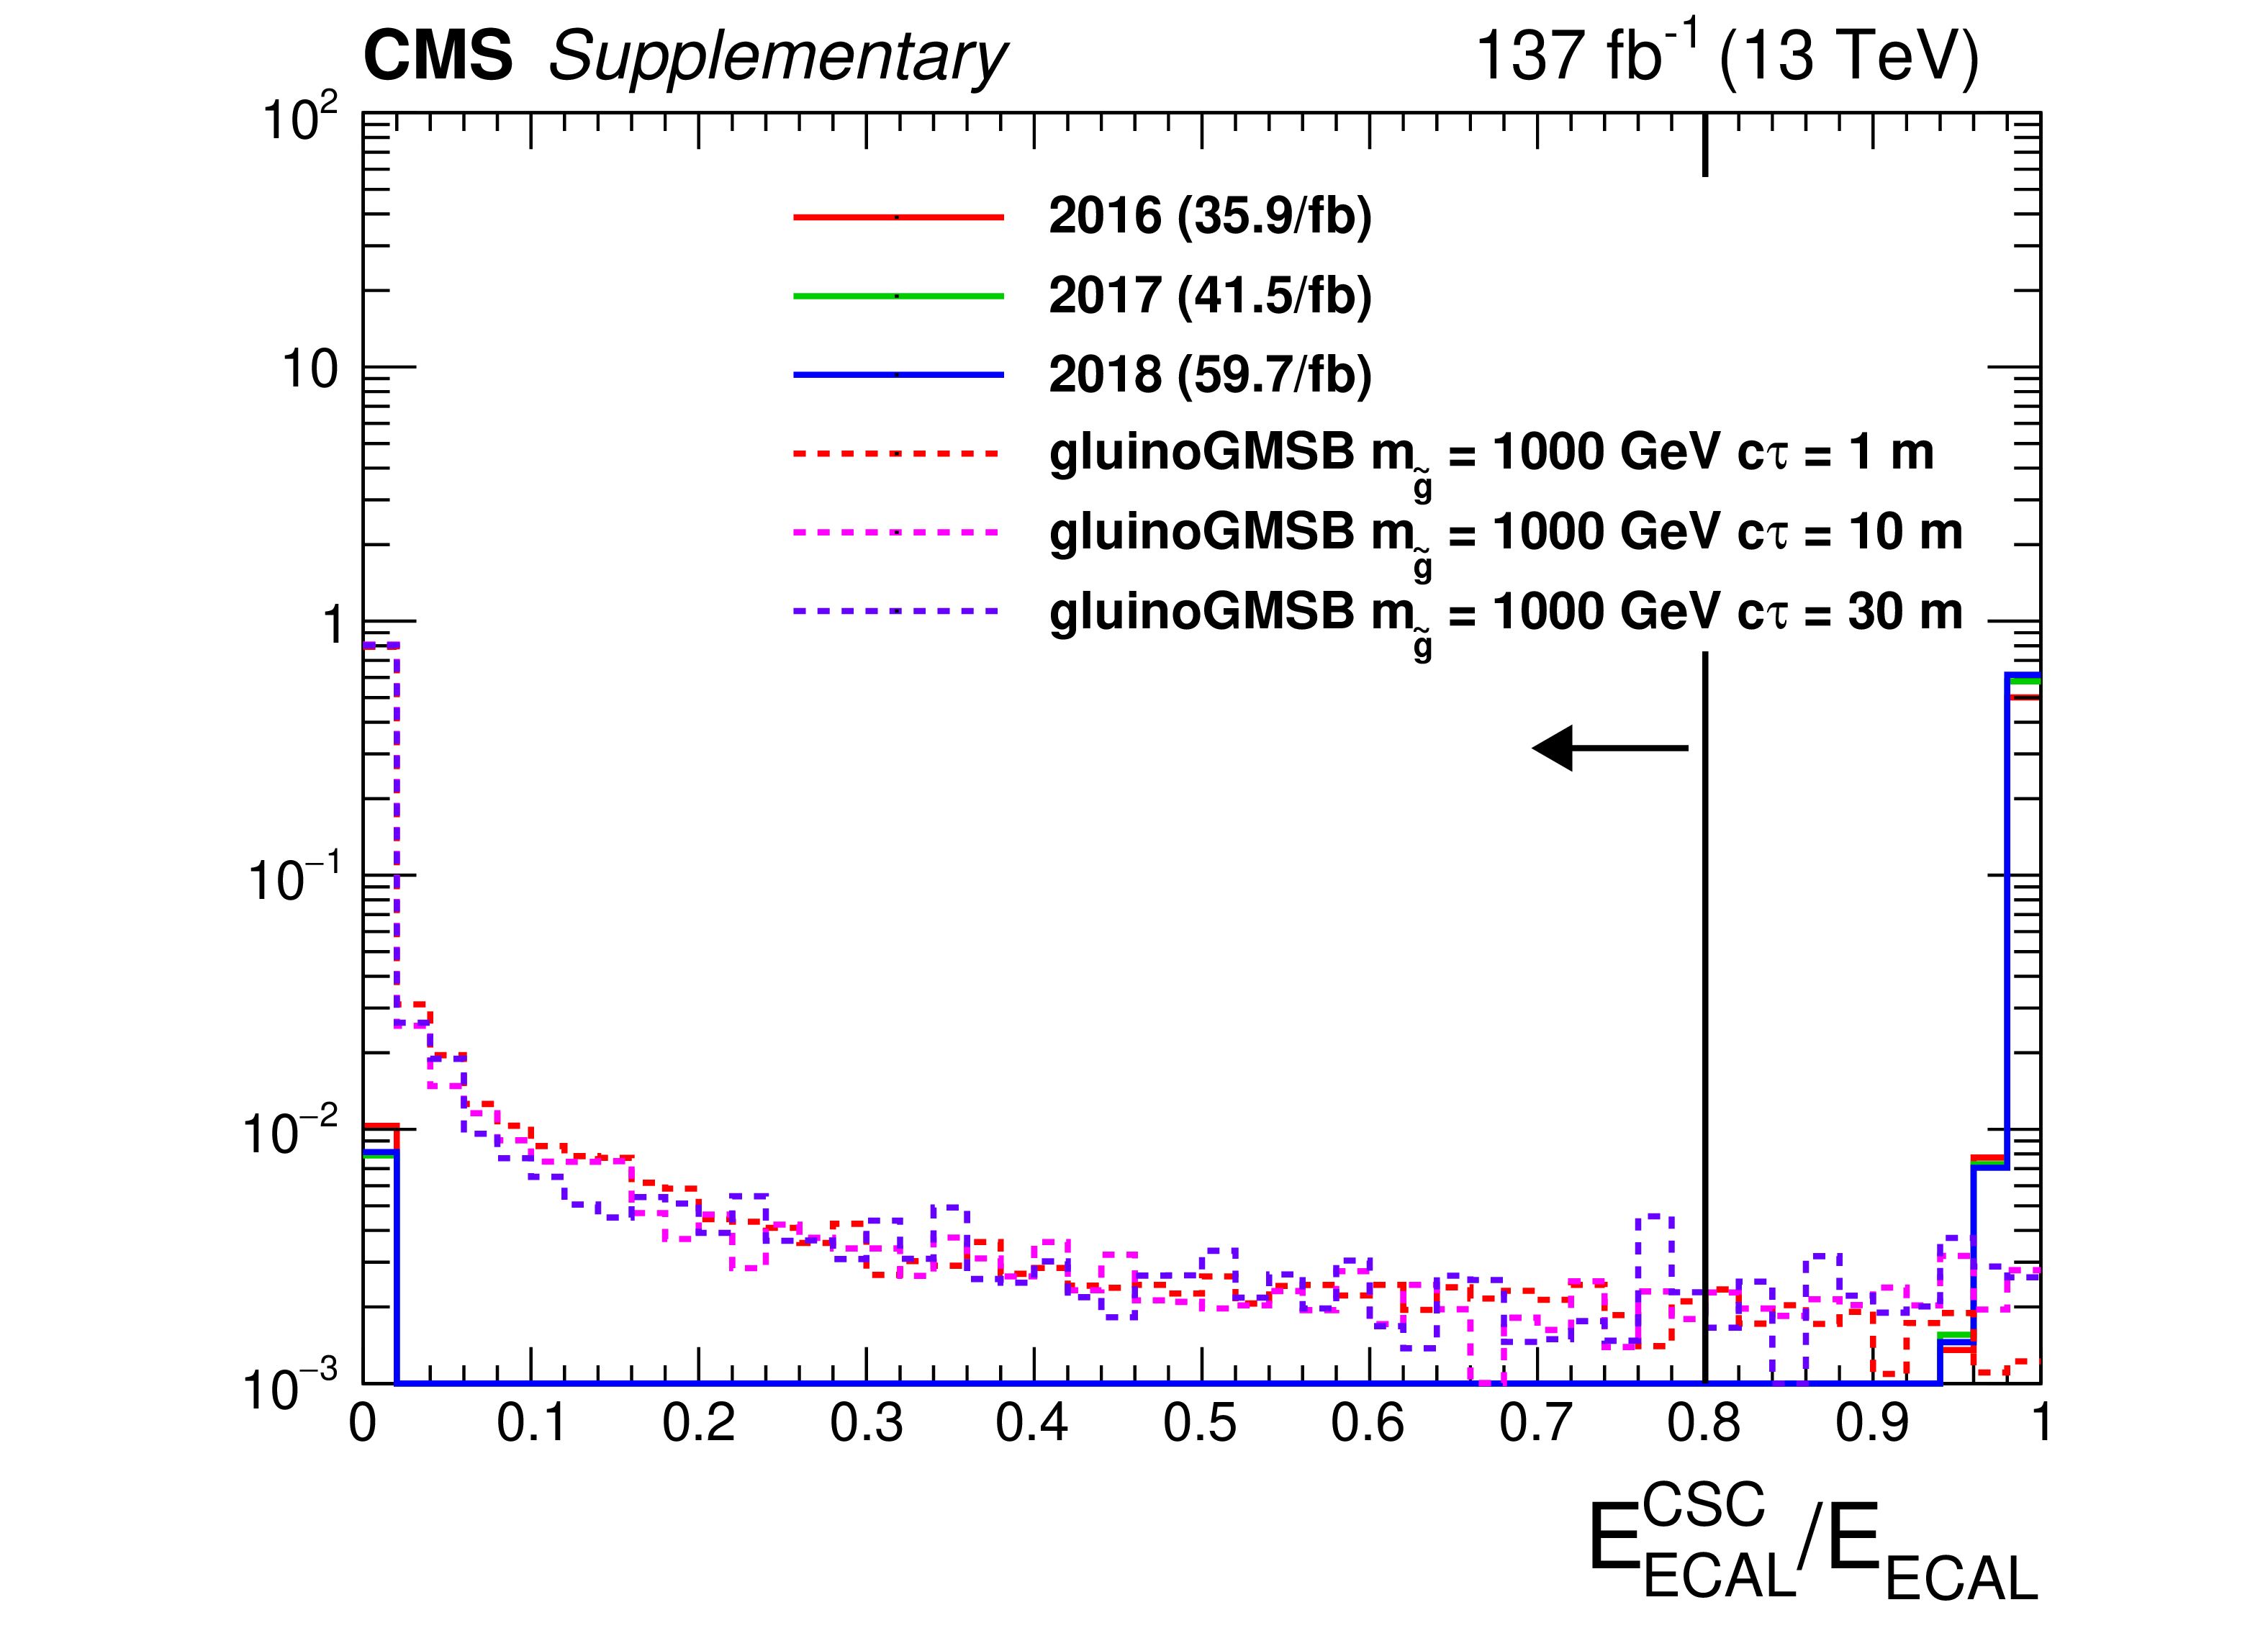
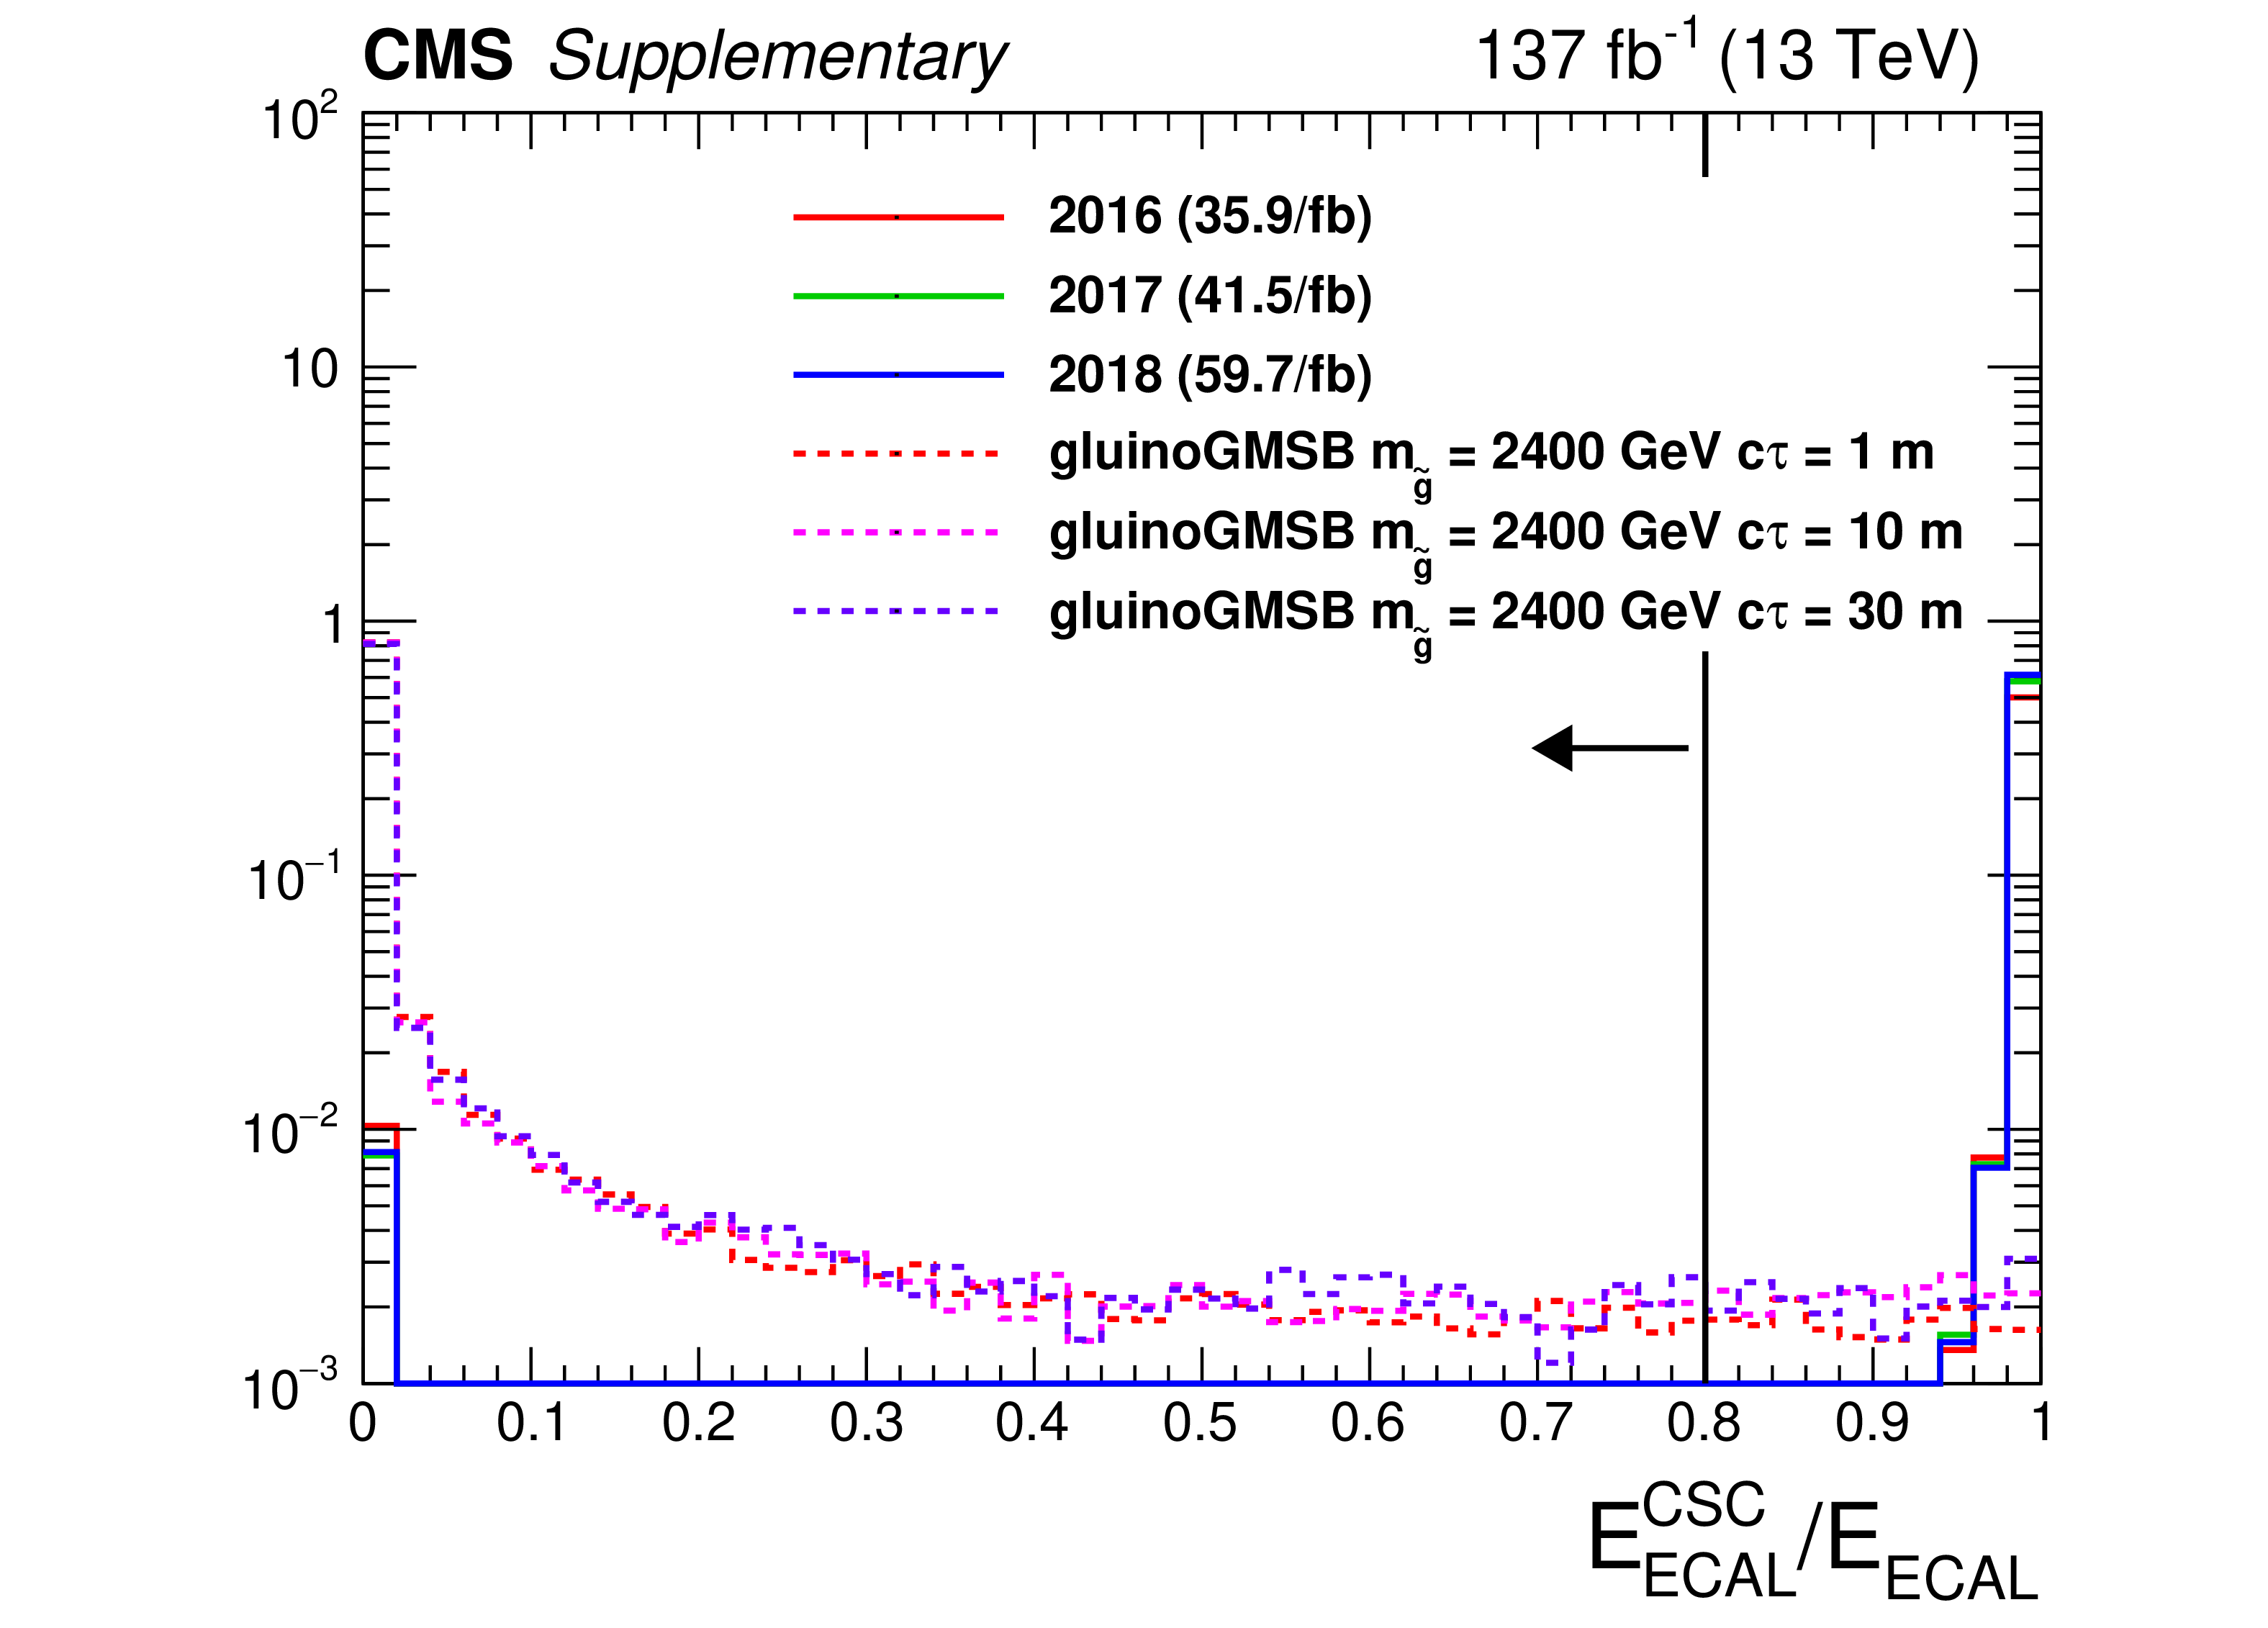
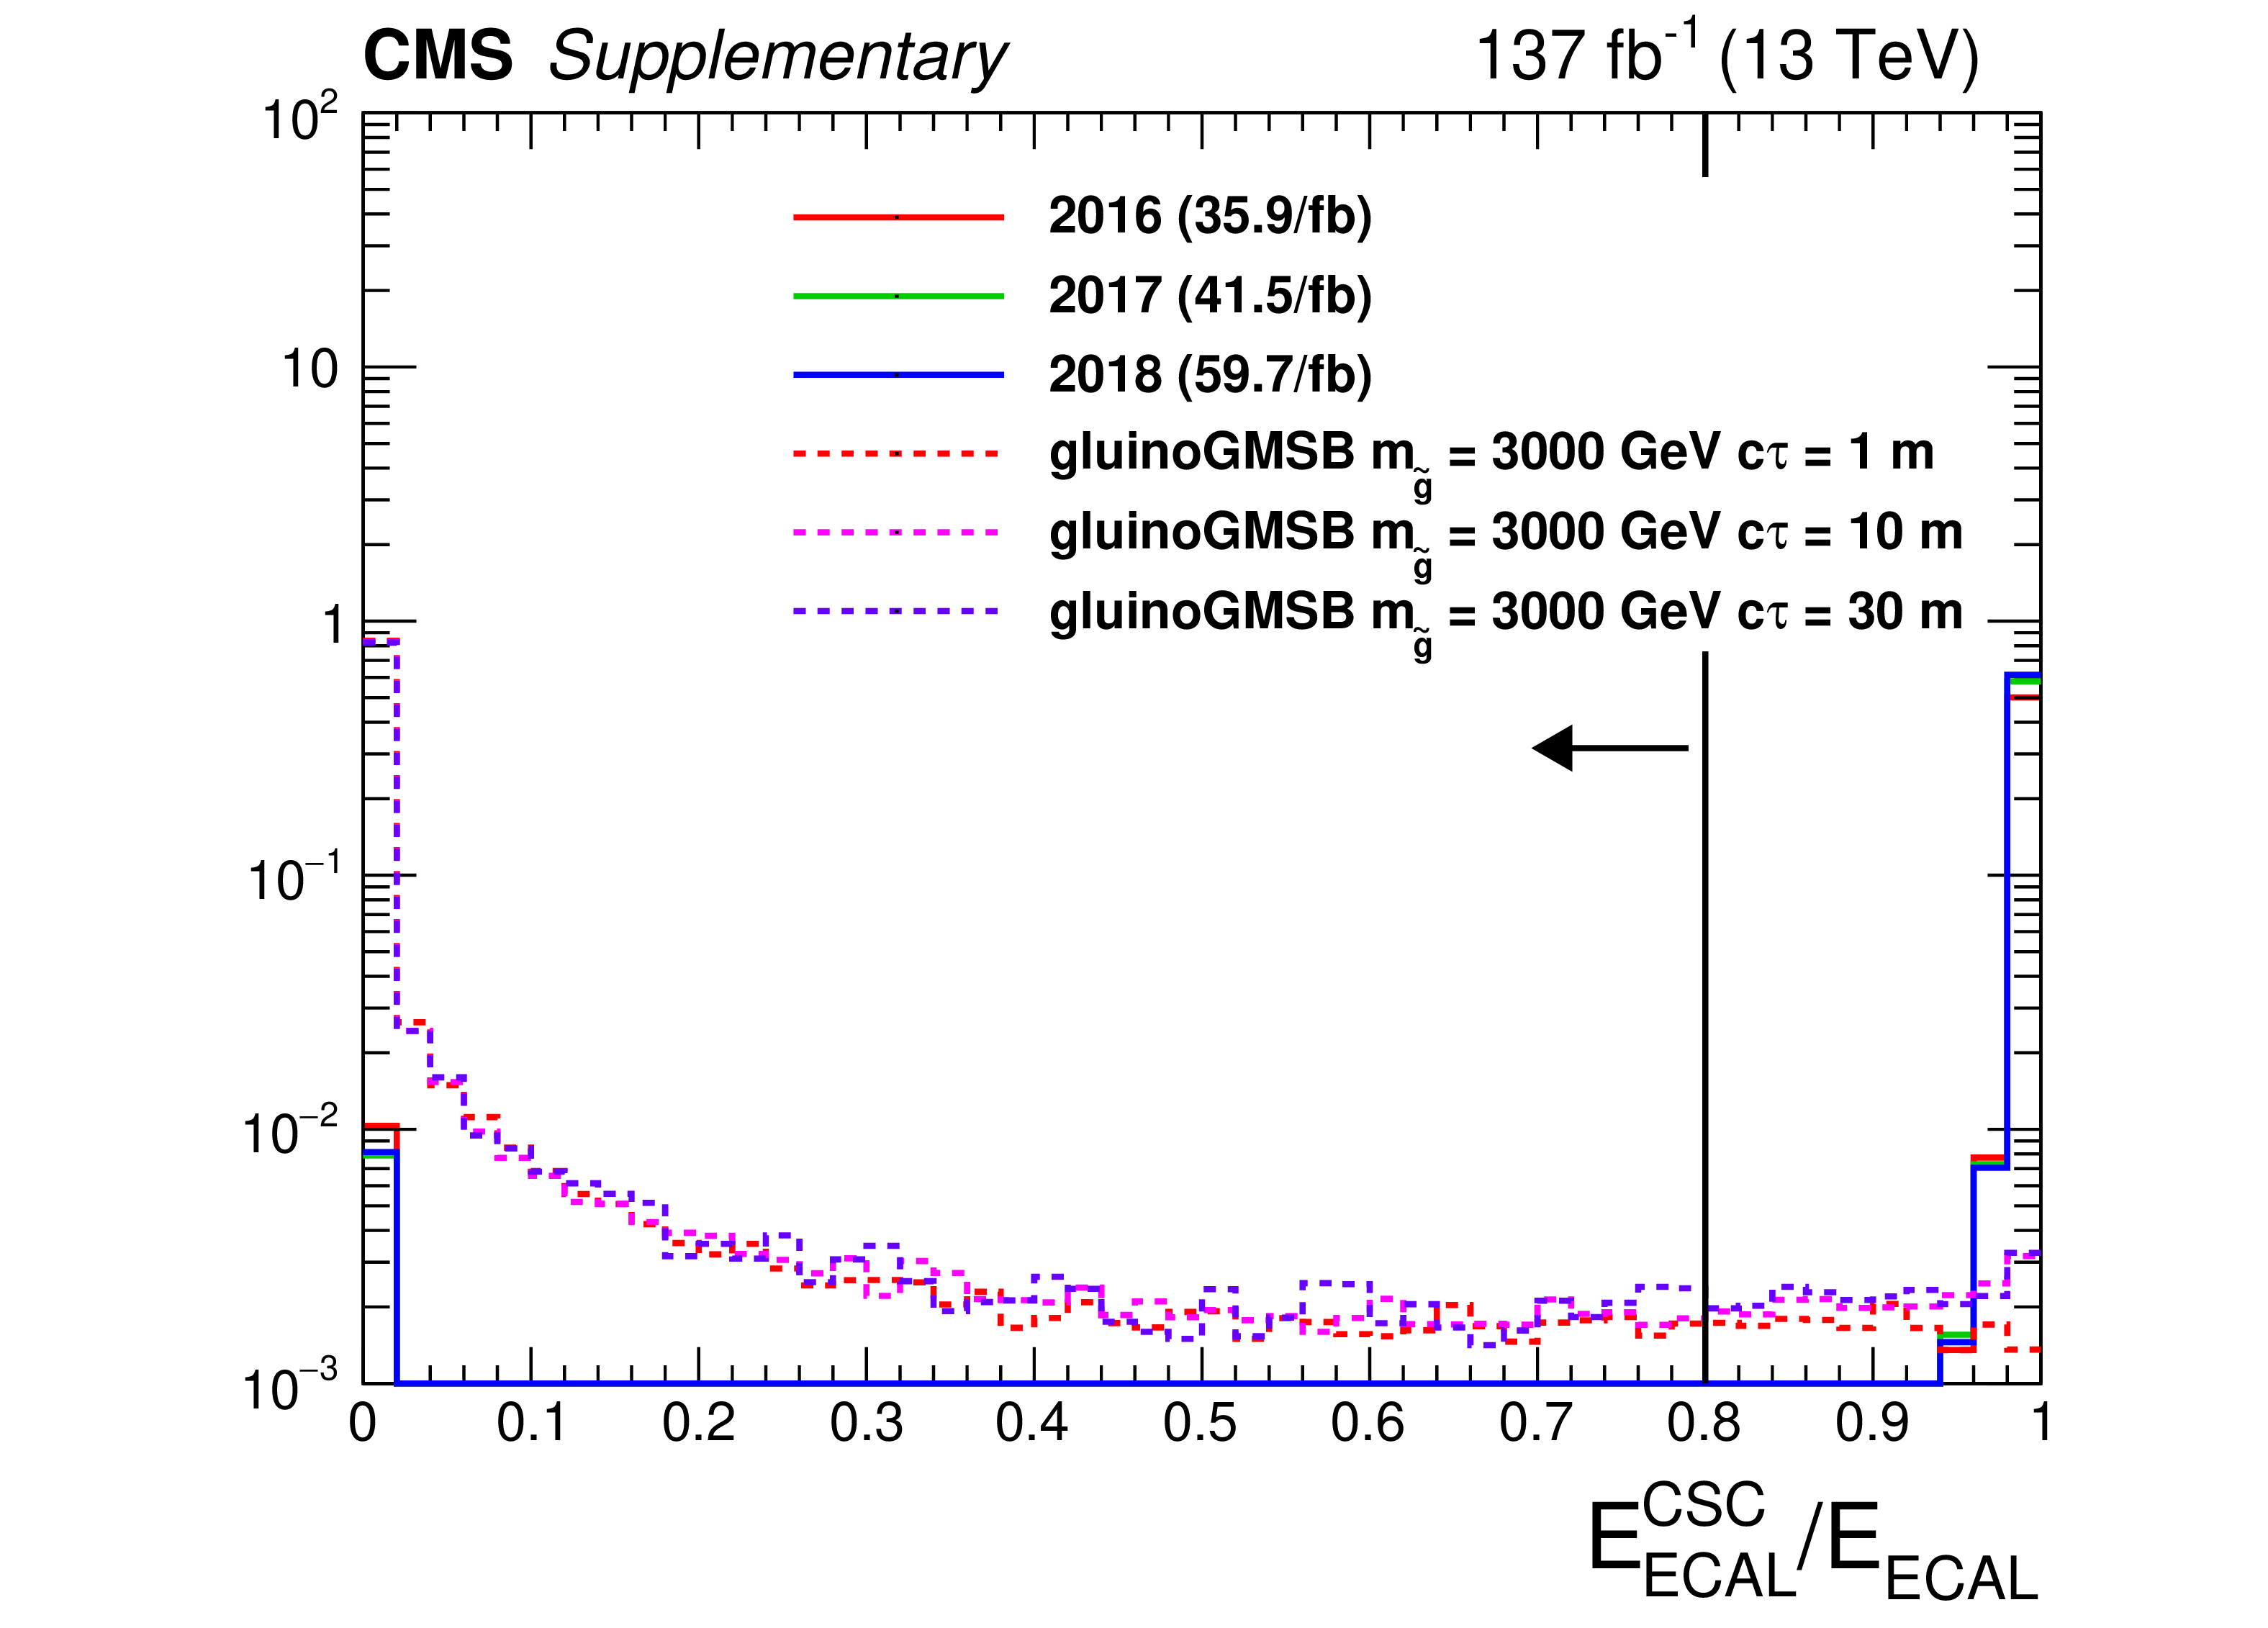
Additional Figure 7:
The distribution (normalized to unity) of ${E^{\textrm {CSC}}_\textrm {ECAL}/E_{\textrm {ECAL}}}$ for a data sample enriched in beam halo (satisfying $ {p_{\mathrm {T}}} > $ 30 GeV, $|\eta | < $ 1.48, $ {PV_{\rm track}^{\rm fraction}} < $ 1/12, $ {\textrm {HEF}} < $ 0.2, $ {{t^{\textrm {RMS}}_\textrm {jet}} / {t_{\textrm {jet}}}} < $ 0.4, $ {t_{\textrm {jet}}} < -$3 ns and $ {E_{\textrm {ECAL}}} > $ 20 GeV) and for signal jets passing signal selections (except on ${E^{\textrm {CSC}}_\textrm {ECAL}/E_{\textrm {ECAL}}}$). |
png pdf |
Additional Figure 7-a:
The distribution (normalized to unity) of ${E^{\textrm {CSC}}_\textrm {ECAL}/E_{\textrm {ECAL}}}$ for a data sample enriched in beam halo (satisfying $ {p_{\mathrm {T}}} > $ 30 GeV, $|\eta | < $ 1.48, $ {PV_{\rm track}^{\rm fraction}} < $ 1/12, $ {\textrm {HEF}} < $ 0.2, $ {{t^{\textrm {RMS}}_\textrm {jet}} / {t_{\textrm {jet}}}} < $ 0.4, $ {t_{\textrm {jet}}} < -$3 ns and $ {E_{\textrm {ECAL}}} > $ 20 GeV) and for signal jets passing signal selections (except on ${E^{\textrm {CSC}}_\textrm {ECAL}/E_{\textrm {ECAL}}}$). |
png pdf |
Additional Figure 7-b:
The distribution (normalized to unity) of ${E^{\textrm {CSC}}_\textrm {ECAL}/E_{\textrm {ECAL}}}$ for a data sample enriched in beam halo (satisfying $ {p_{\mathrm {T}}} > $ 30 GeV, $|\eta | < $ 1.48, $ {PV_{\rm track}^{\rm fraction}} < $ 1/12, $ {\textrm {HEF}} < $ 0.2, $ {{t^{\textrm {RMS}}_\textrm {jet}} / {t_{\textrm {jet}}}} < $ 0.4, $ {t_{\textrm {jet}}} < -$3 ns and $ {E_{\textrm {ECAL}}} > $ 20 GeV) and for signal jets passing signal selections (except on ${E^{\textrm {CSC}}_\textrm {ECAL}/E_{\textrm {ECAL}}}$). |
png pdf |
Additional Figure 7-c:
The distribution (normalized to unity) of ${E^{\textrm {CSC}}_\textrm {ECAL}/E_{\textrm {ECAL}}}$ for a data sample enriched in beam halo (satisfying $ {p_{\mathrm {T}}} > $ 30 GeV, $|\eta | < $ 1.48, $ {PV_{\rm track}^{\rm fraction}} < $ 1/12, $ {\textrm {HEF}} < $ 0.2, $ {{t^{\textrm {RMS}}_\textrm {jet}} / {t_{\textrm {jet}}}} < $ 0.4, $ {t_{\textrm {jet}}} < -$3 ns and $ {E_{\textrm {ECAL}}} > $ 20 GeV) and for signal jets passing signal selections (except on ${E^{\textrm {CSC}}_\textrm {ECAL}/E_{\textrm {ECAL}}}$). |
png pdf |
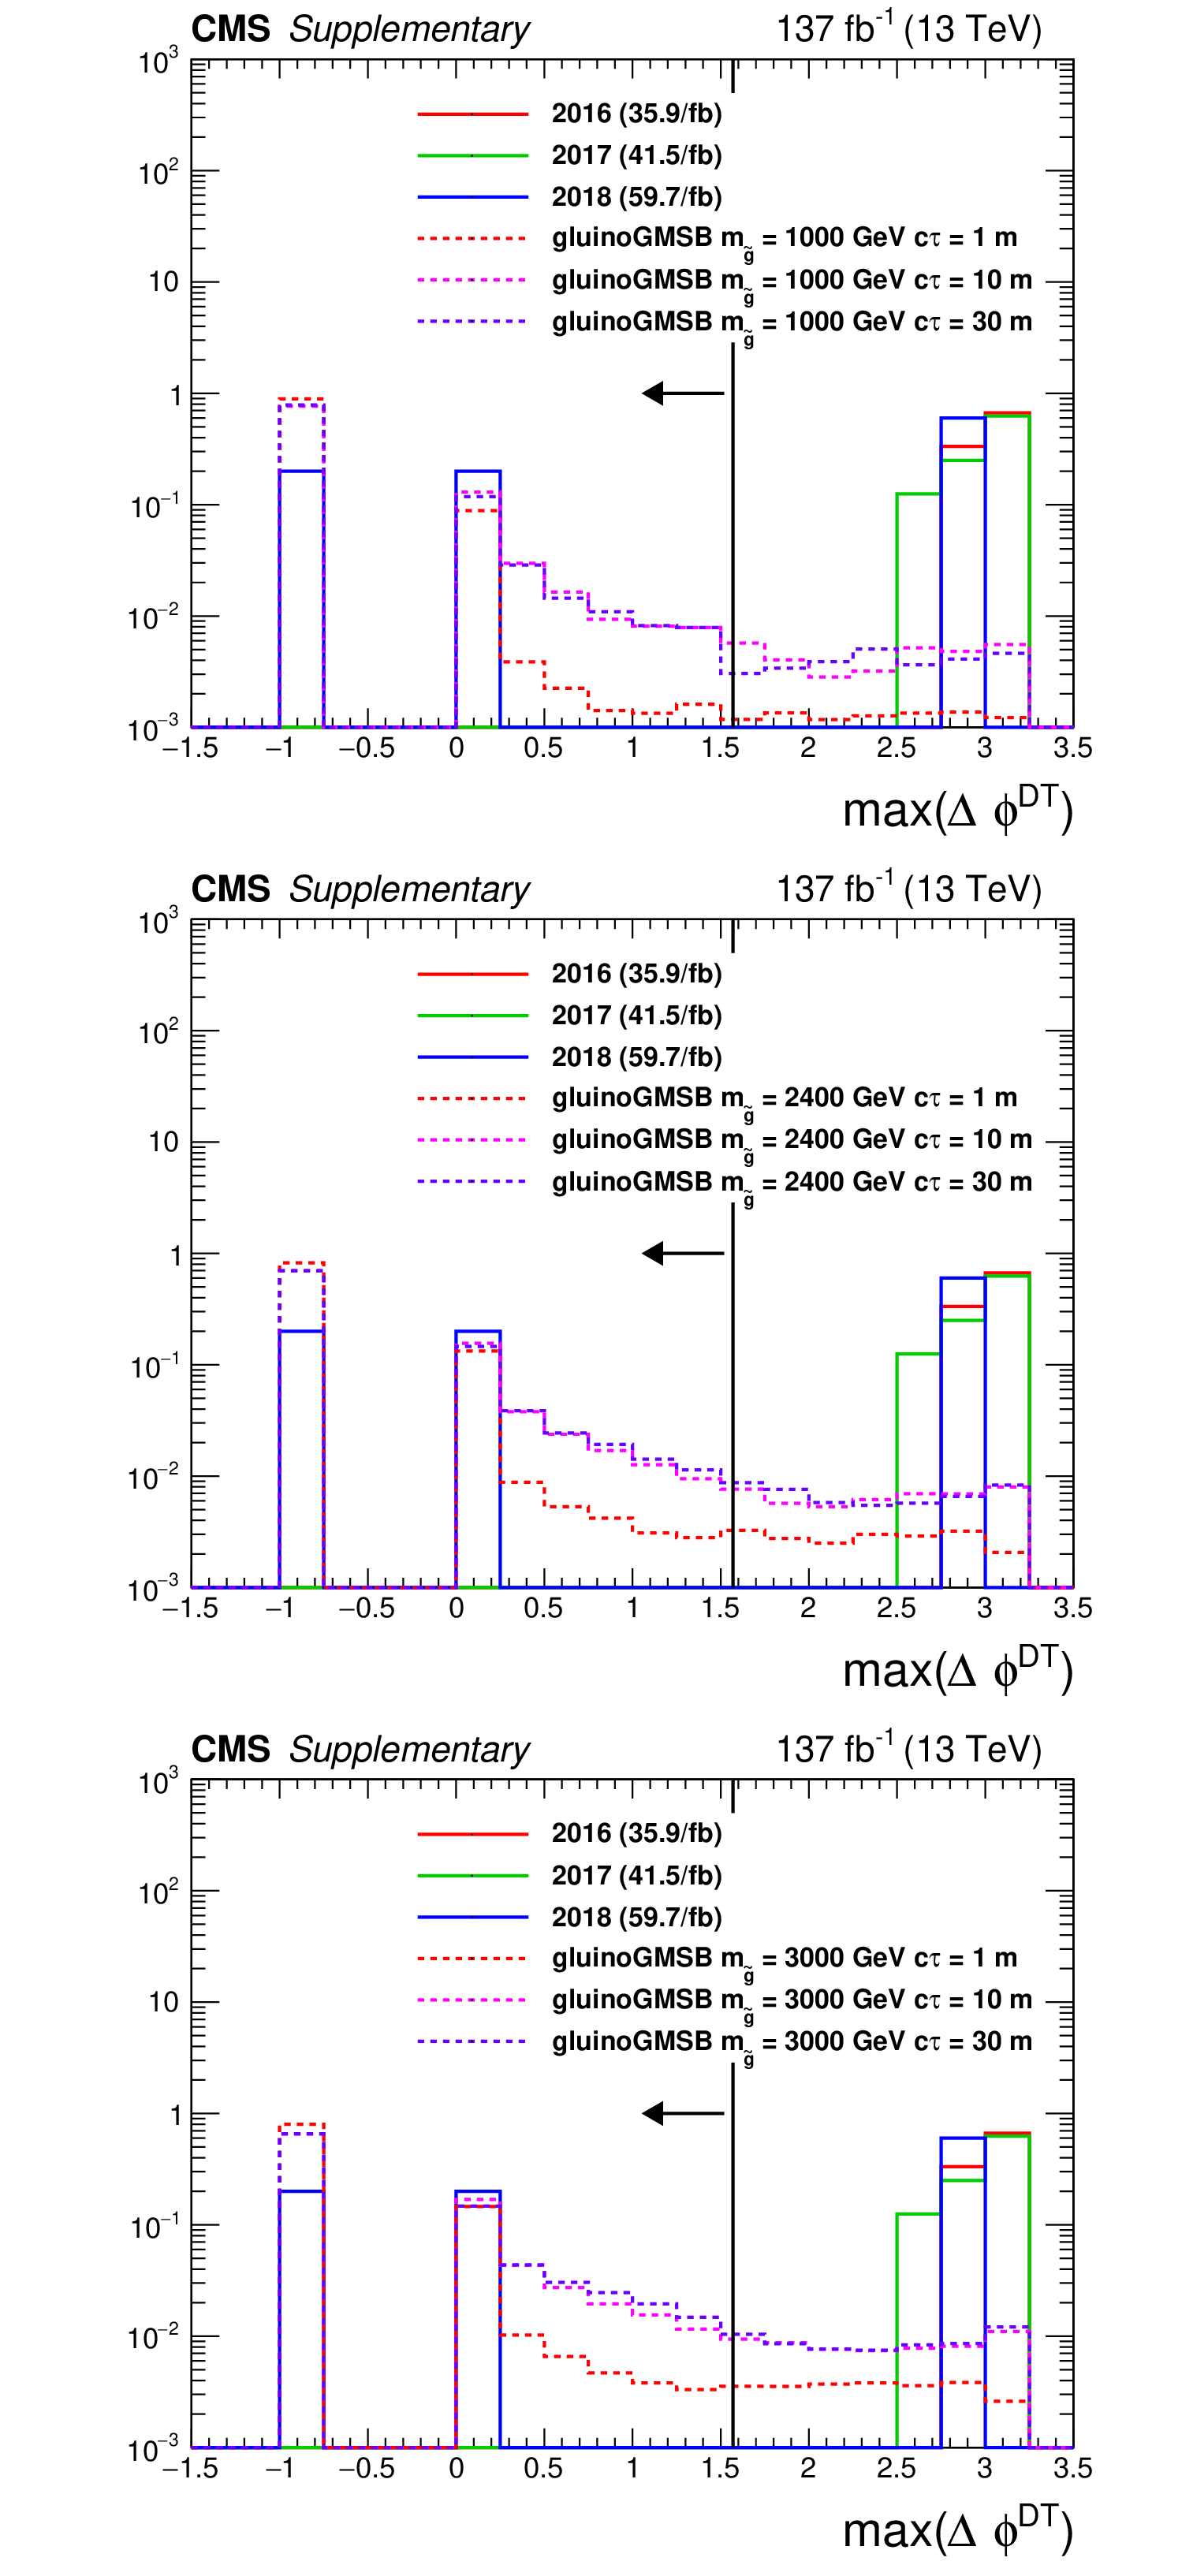
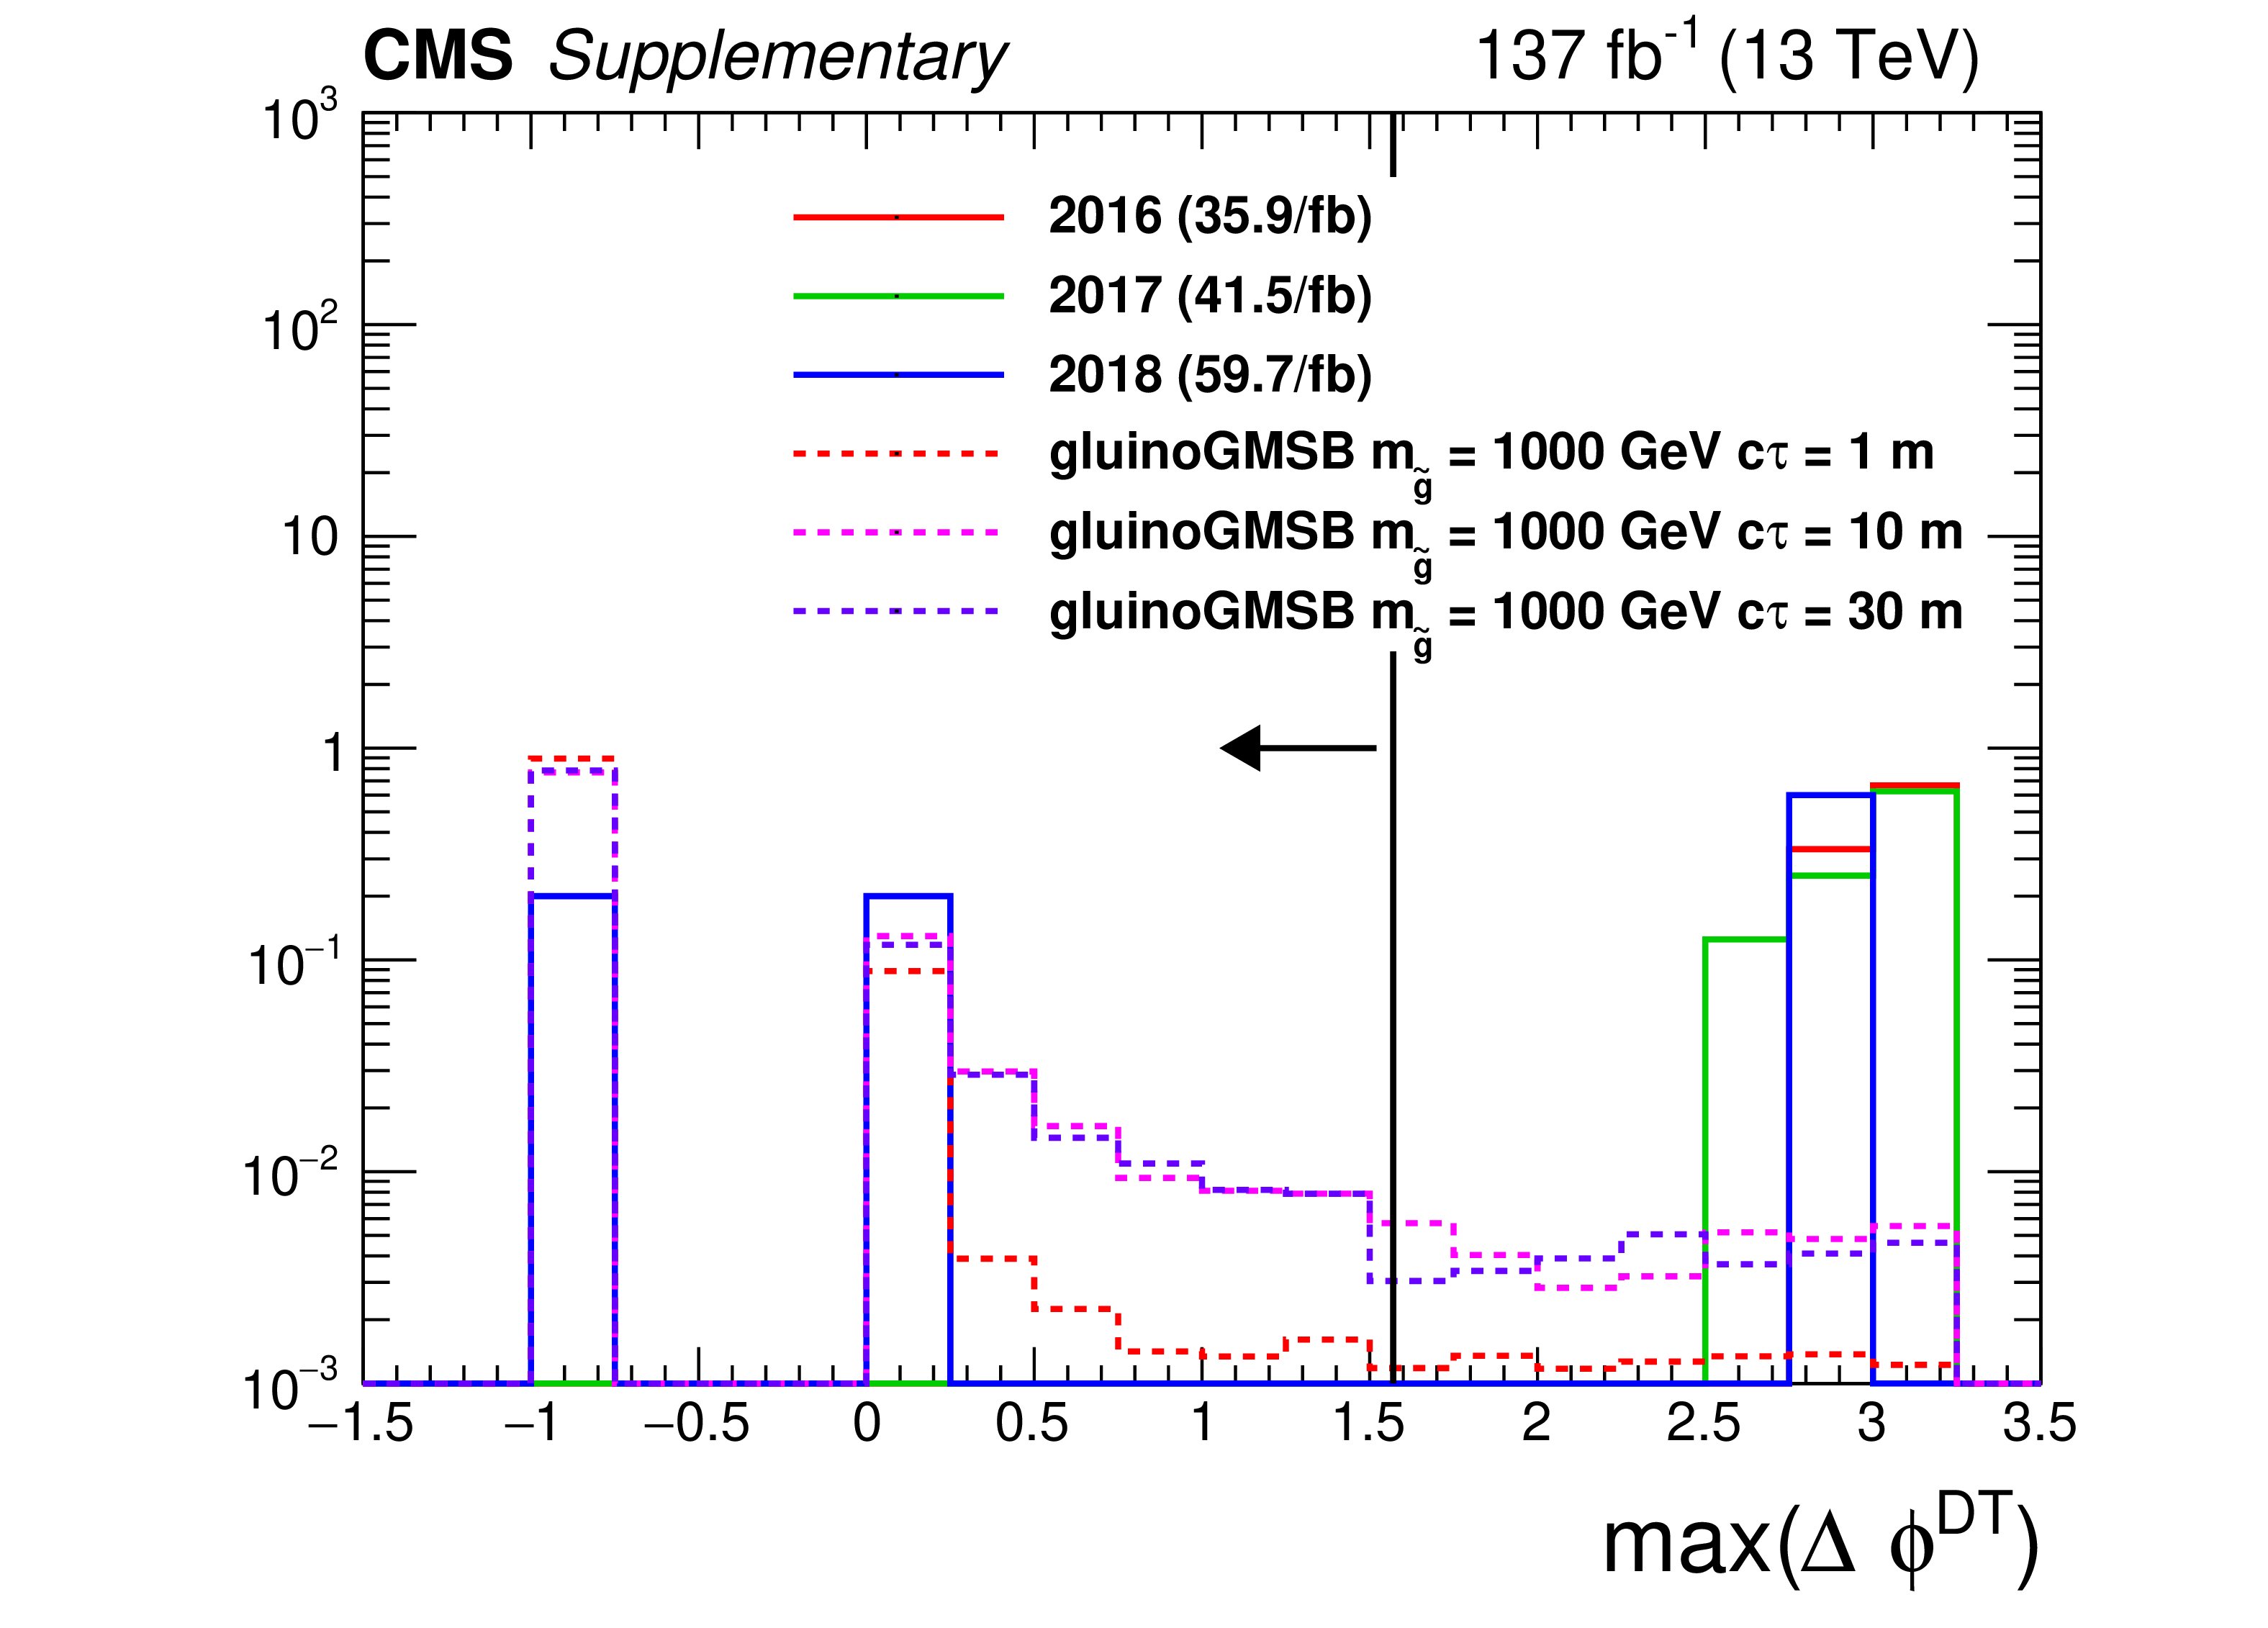
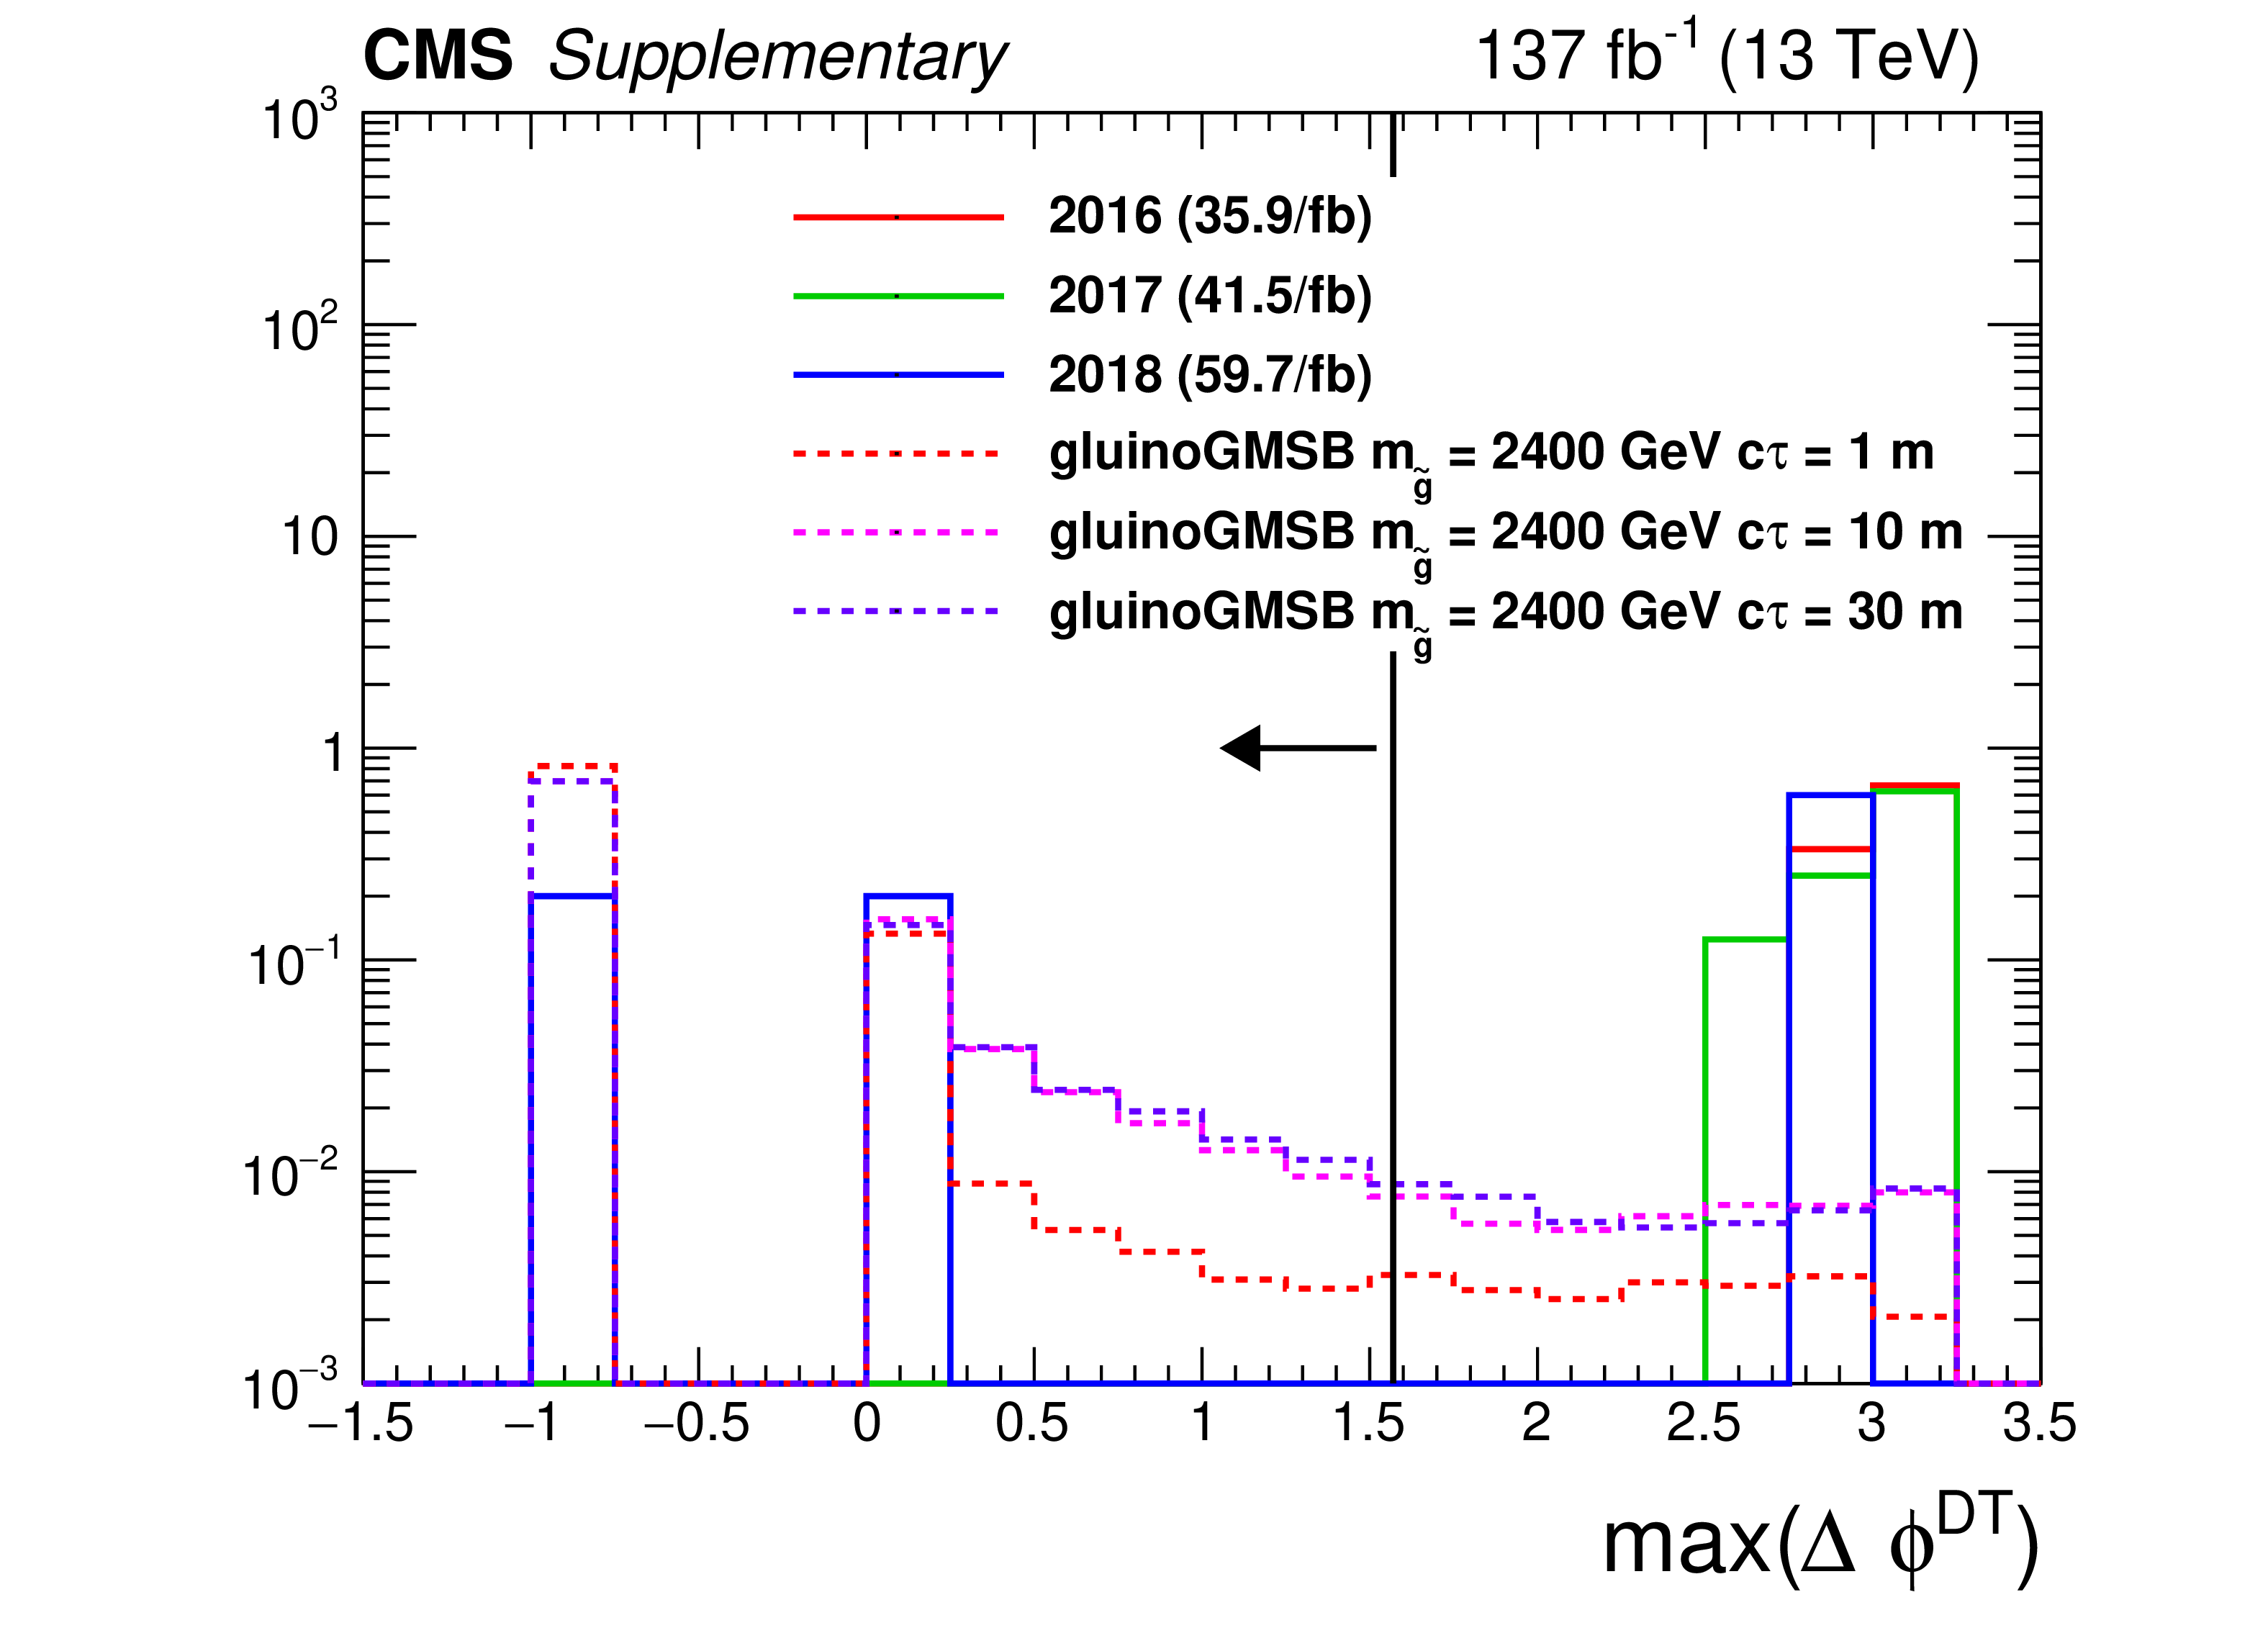
Additional Figure 8:
The distribution (normalized to unity) of ${\textrm {max}(\Delta \phi _{DT})}$ for a data sample enriched in cosmic muons (satisfying $ {E^{\textrm {CSC}}_\textrm {ECAL}/E_{\textrm {ECAL}}} < $ 0.8, $ {p_{\mathrm {T}}} > $ 30 GeV, $|\eta | < $ 1.48, $ {PV_{\rm track}^{\rm fraction}} < $ 1/12, $ {\textrm {HEF}} > $ 0.2, $ {{t^{\textrm {RMS}}_\textrm {jet}} / {t_{\textrm {jet}}}} < $ 0.4, $ {t_{\textrm {jet}}} > $ 3 ns, $ {E_{\textrm {ECAL}}} > $ 20 GeV and failing the HCAL noise rejection quality filters) and for signal jets passing signal selections (except on ${\textrm {max}(\Delta \phi _{DT})}$). |
png pdf |
Additional Figure 8-a:
The distribution (normalized to unity) of ${\textrm {max}(\Delta \phi _{DT})}$ for a data sample enriched in cosmic muons (satisfying $ {E^{\textrm {CSC}}_\textrm {ECAL}/E_{\textrm {ECAL}}} < $ 0.8, $ {p_{\mathrm {T}}} > $ 30 GeV, $|\eta | < $ 1.48, $ {PV_{\rm track}^{\rm fraction}} < $ 1/12, $ {\textrm {HEF}} > $ 0.2, $ {{t^{\textrm {RMS}}_\textrm {jet}} / {t_{\textrm {jet}}}} < $ 0.4, $ {t_{\textrm {jet}}} > $ 3 ns, $ {E_{\textrm {ECAL}}} > $ 20 GeV and failing the HCAL noise rejection quality filters) and for signal jets passing signal selections (except on ${\textrm {max}(\Delta \phi _{DT})}$). |
png pdf |
Additional Figure 8-b:
The distribution (normalized to unity) of ${\textrm {max}(\Delta \phi _{DT})}$ for a data sample enriched in cosmic muons (satisfying $ {E^{\textrm {CSC}}_\textrm {ECAL}/E_{\textrm {ECAL}}} < $ 0.8, $ {p_{\mathrm {T}}} > $ 30 GeV, $|\eta | < $ 1.48, $ {PV_{\rm track}^{\rm fraction}} < $ 1/12, $ {\textrm {HEF}} > $ 0.2, $ {{t^{\textrm {RMS}}_\textrm {jet}} / {t_{\textrm {jet}}}} < $ 0.4, $ {t_{\textrm {jet}}} > $ 3 ns, $ {E_{\textrm {ECAL}}} > $ 20 GeV and failing the HCAL noise rejection quality filters) and for signal jets passing signal selections (except on ${\textrm {max}(\Delta \phi _{DT})}$). |

png pdf |
Additional Figure 8-c:
The distribution (normalized to unity) of ${\textrm {max}(\Delta \phi _{DT})}$ for a data sample enriched in cosmic muons (satisfying $ {E^{\textrm {CSC}}_\textrm {ECAL}/E_{\textrm {ECAL}}} < $ 0.8, $ {p_{\mathrm {T}}} > $ 30 GeV, $|\eta | < $ 1.48, $ {PV_{\rm track}^{\rm fraction}} < $ 1/12, $ {\textrm {HEF}} > $ 0.2, $ {{t^{\textrm {RMS}}_\textrm {jet}} / {t_{\textrm {jet}}}} < $ 0.4, $ {t_{\textrm {jet}}} > $ 3 ns, $ {E_{\textrm {ECAL}}} > $ 20 GeV and failing the HCAL noise rejection quality filters) and for signal jets passing signal selections (except on ${\textrm {max}(\Delta \phi _{DT})}$). |
png pdf |
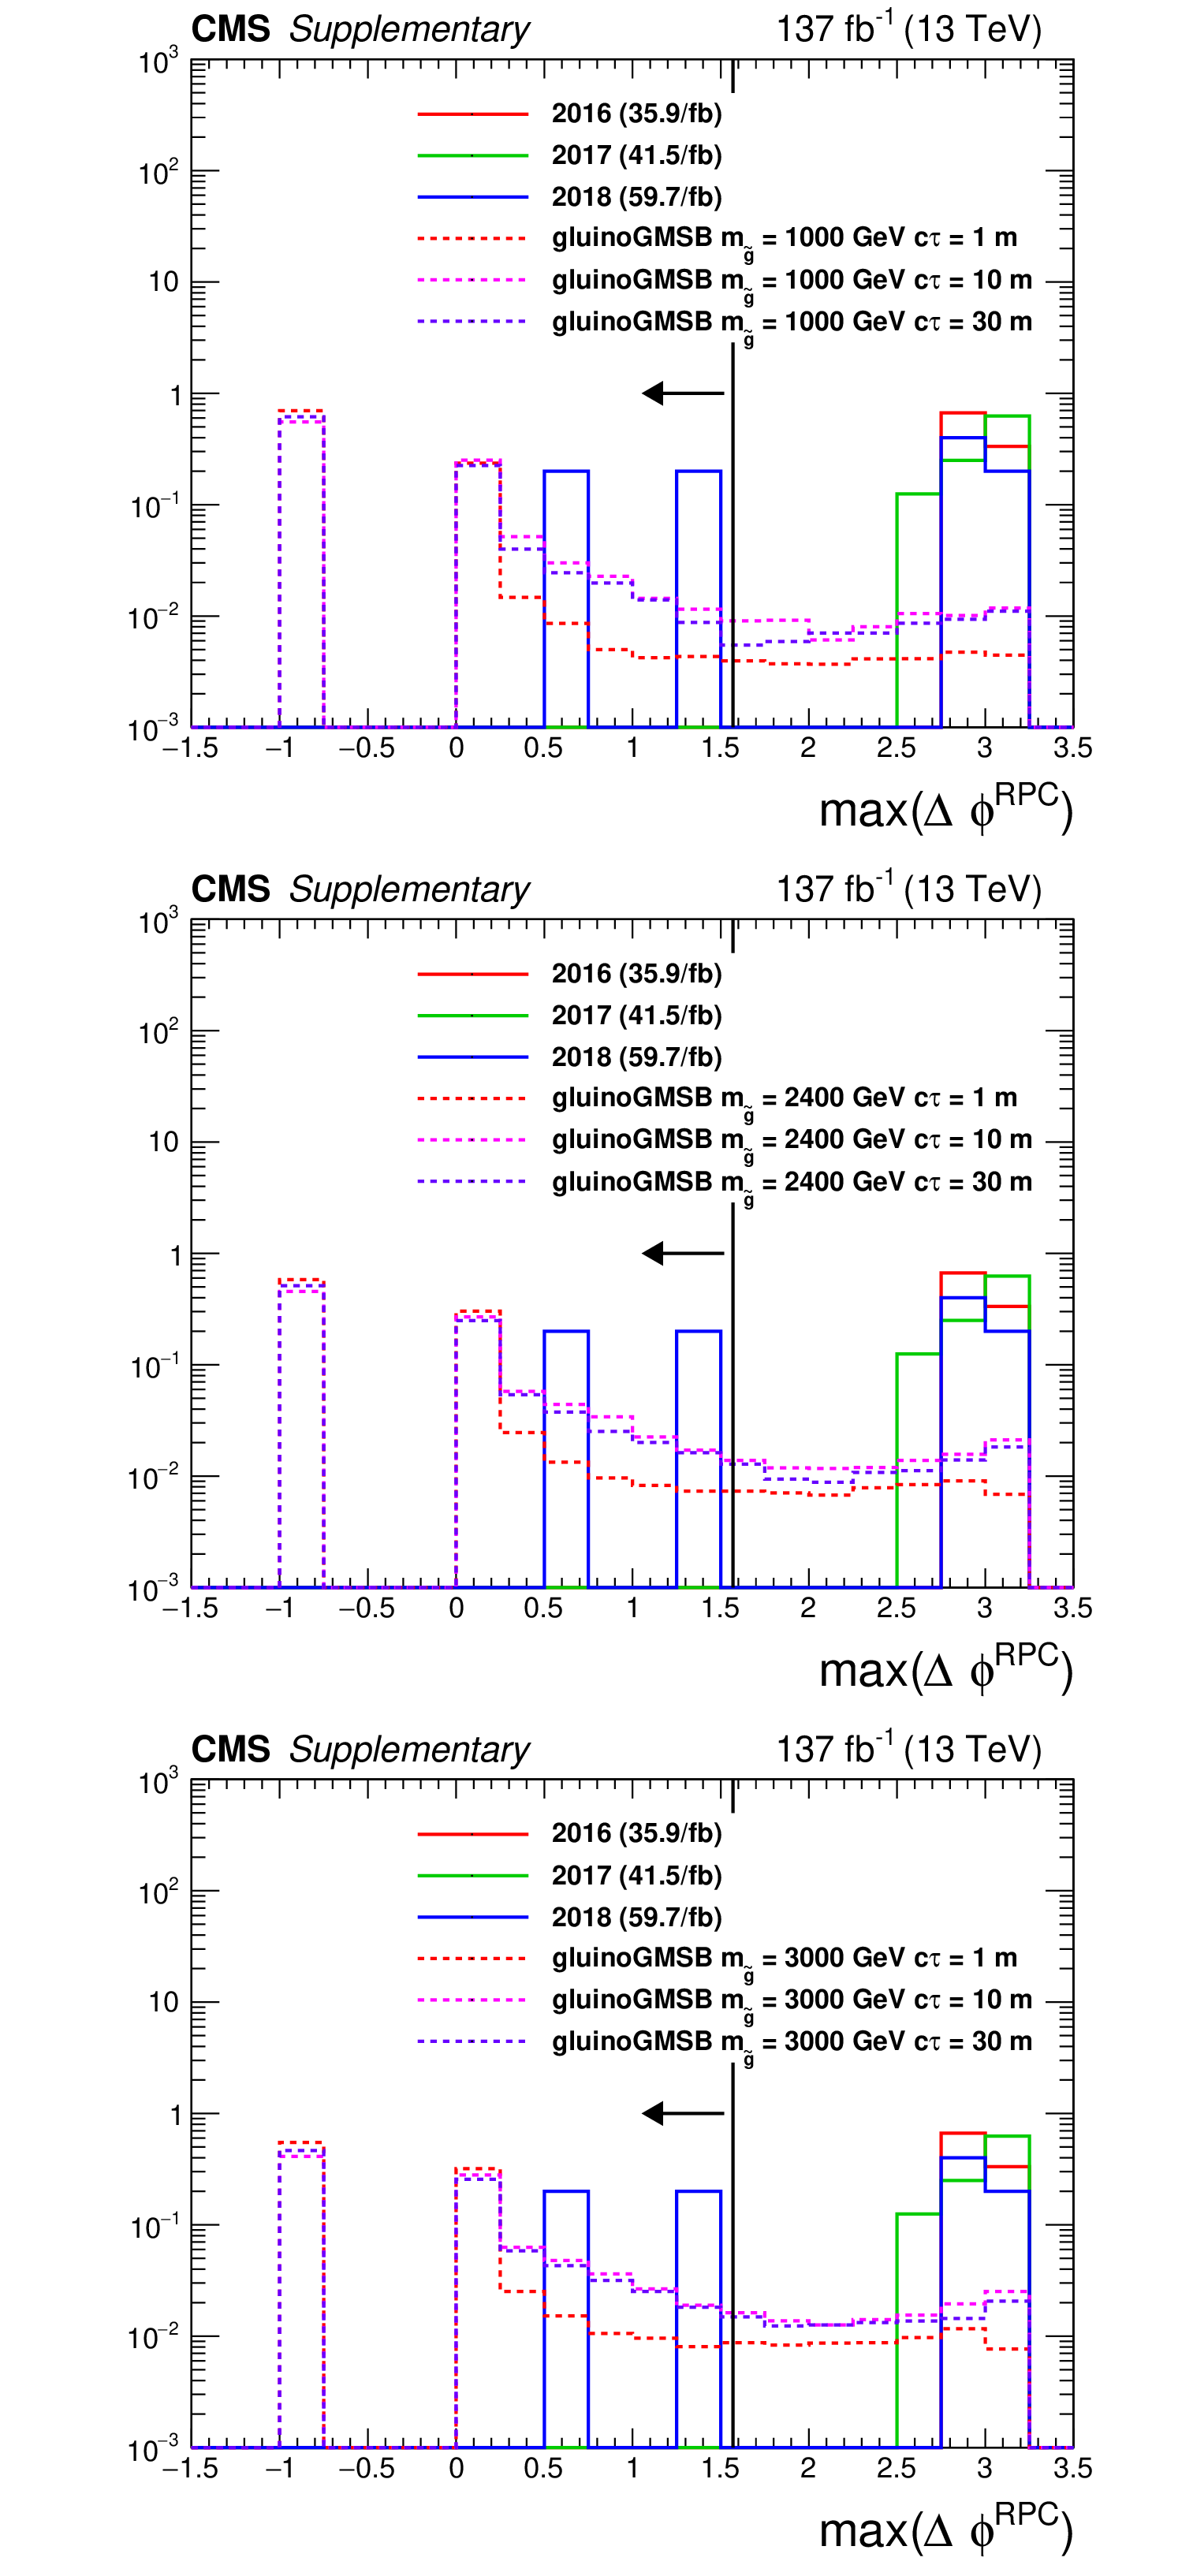
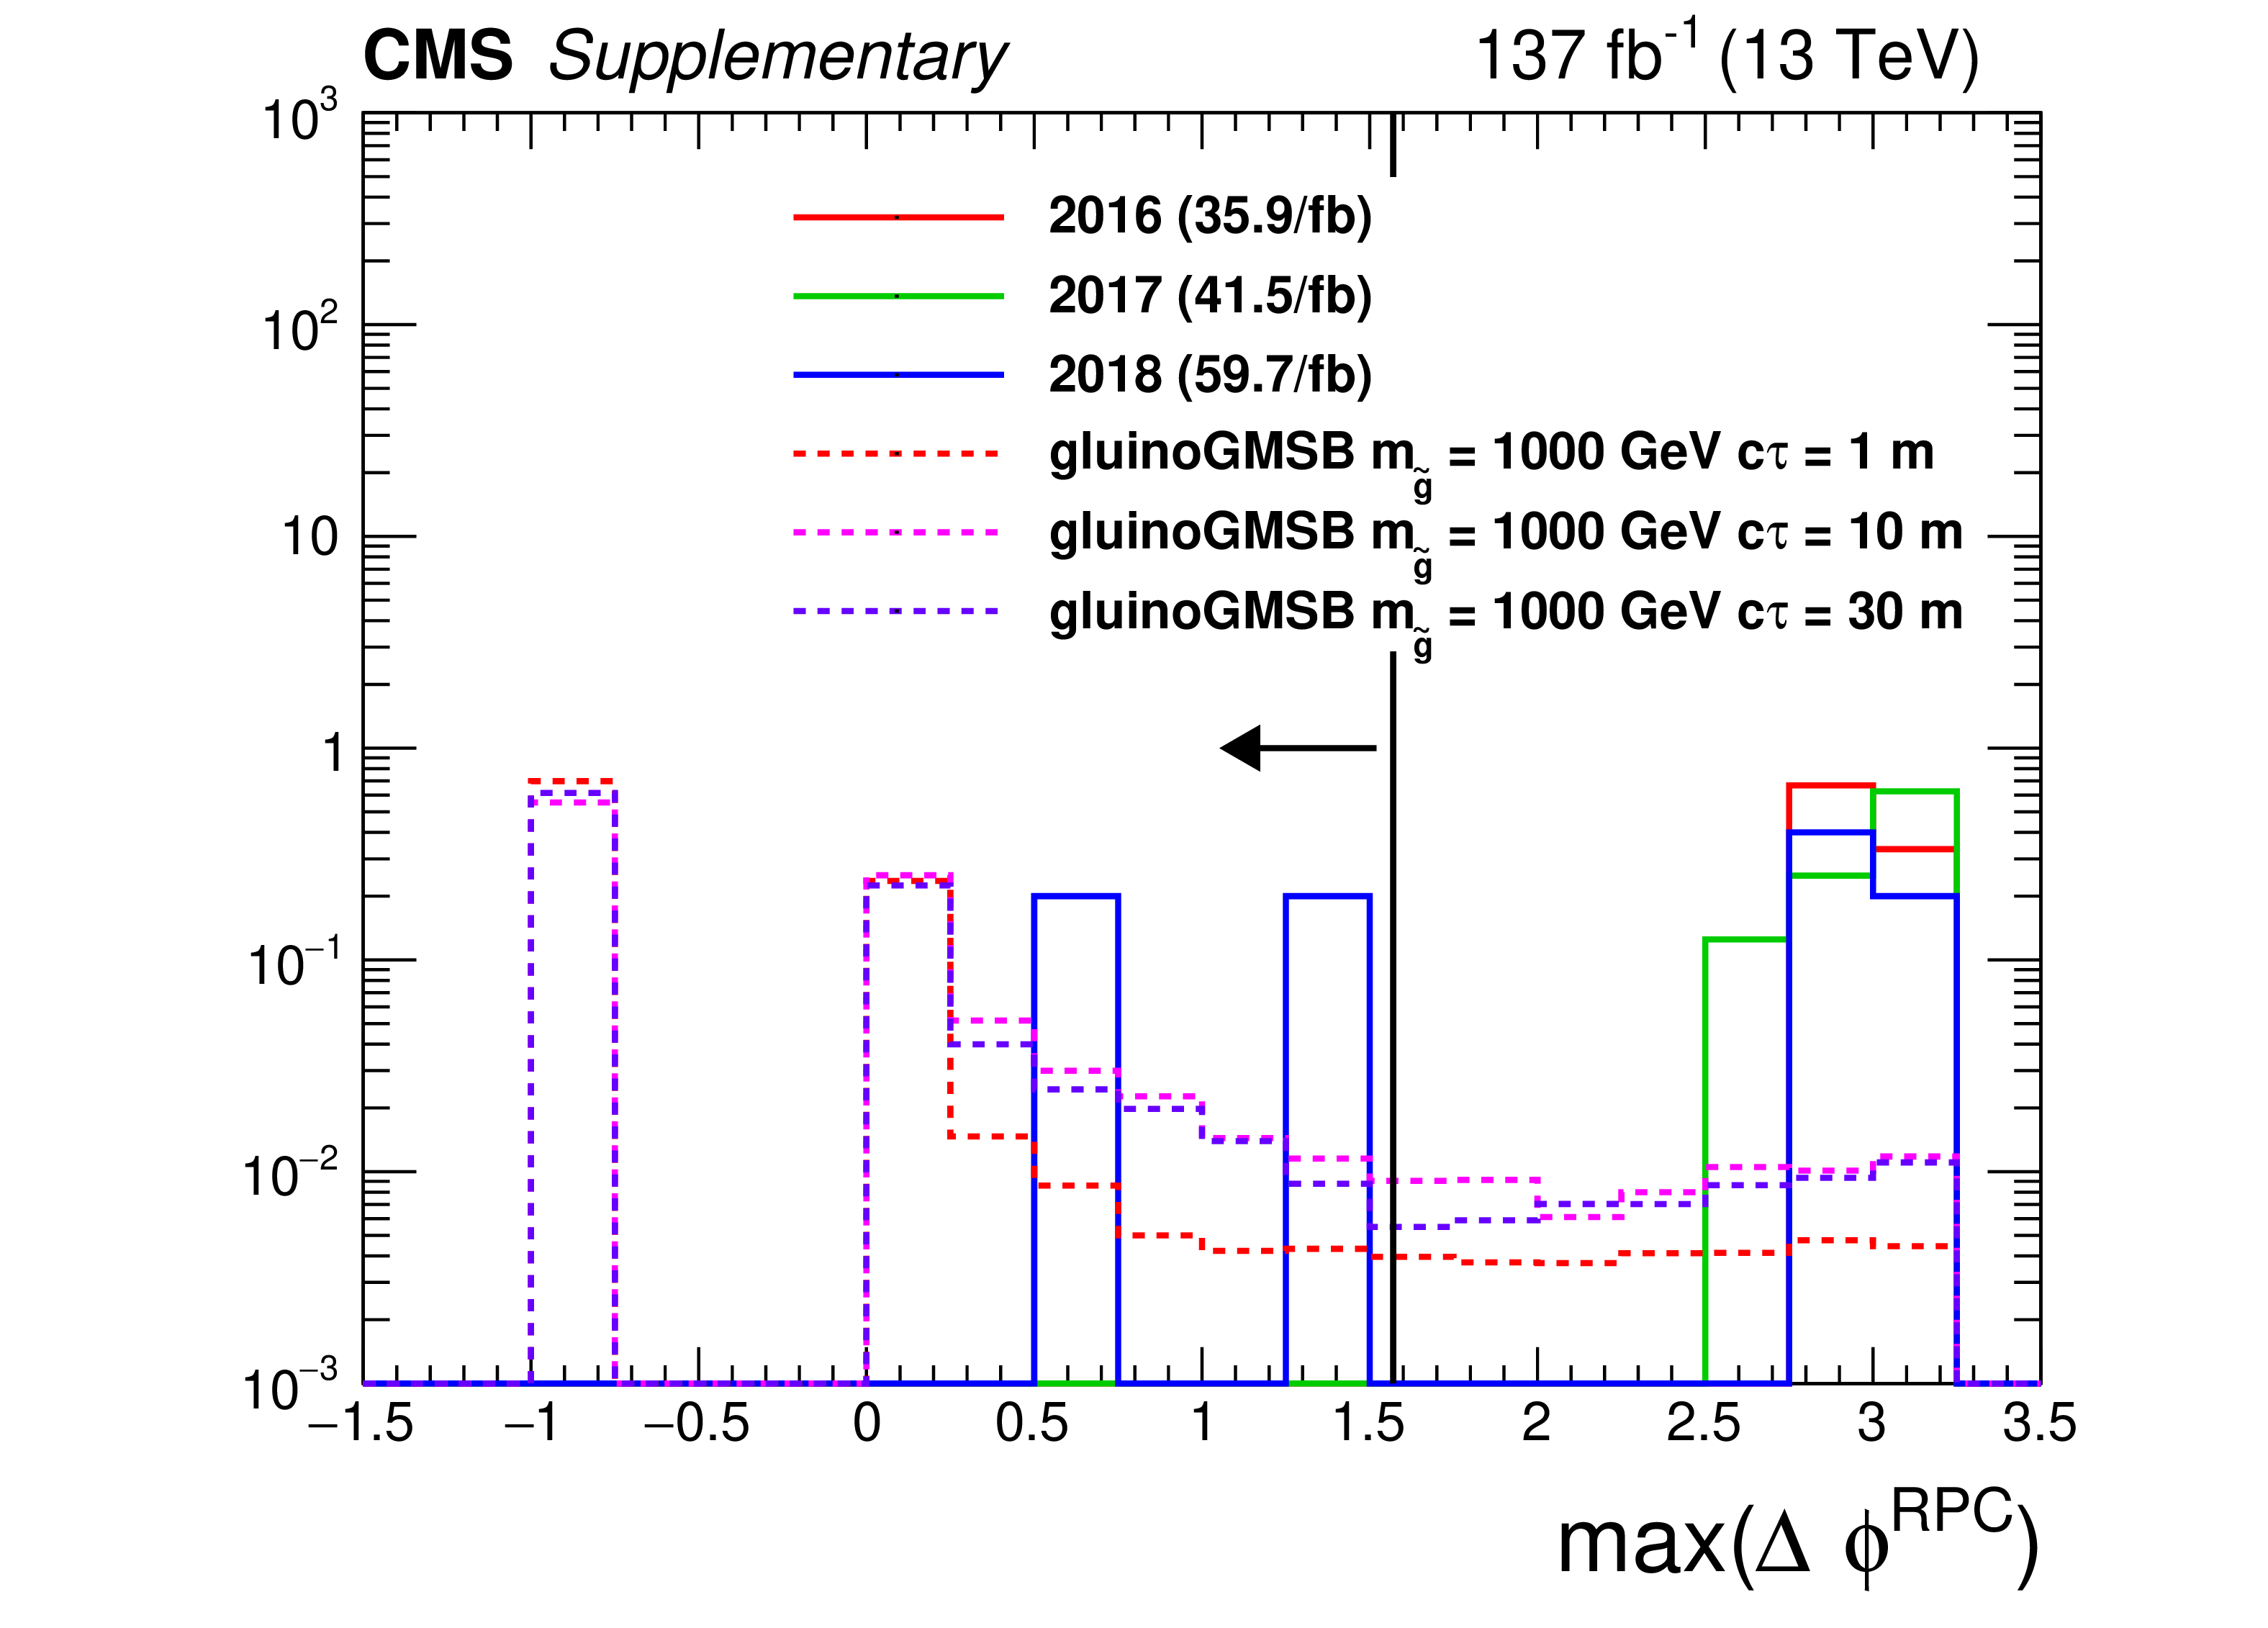
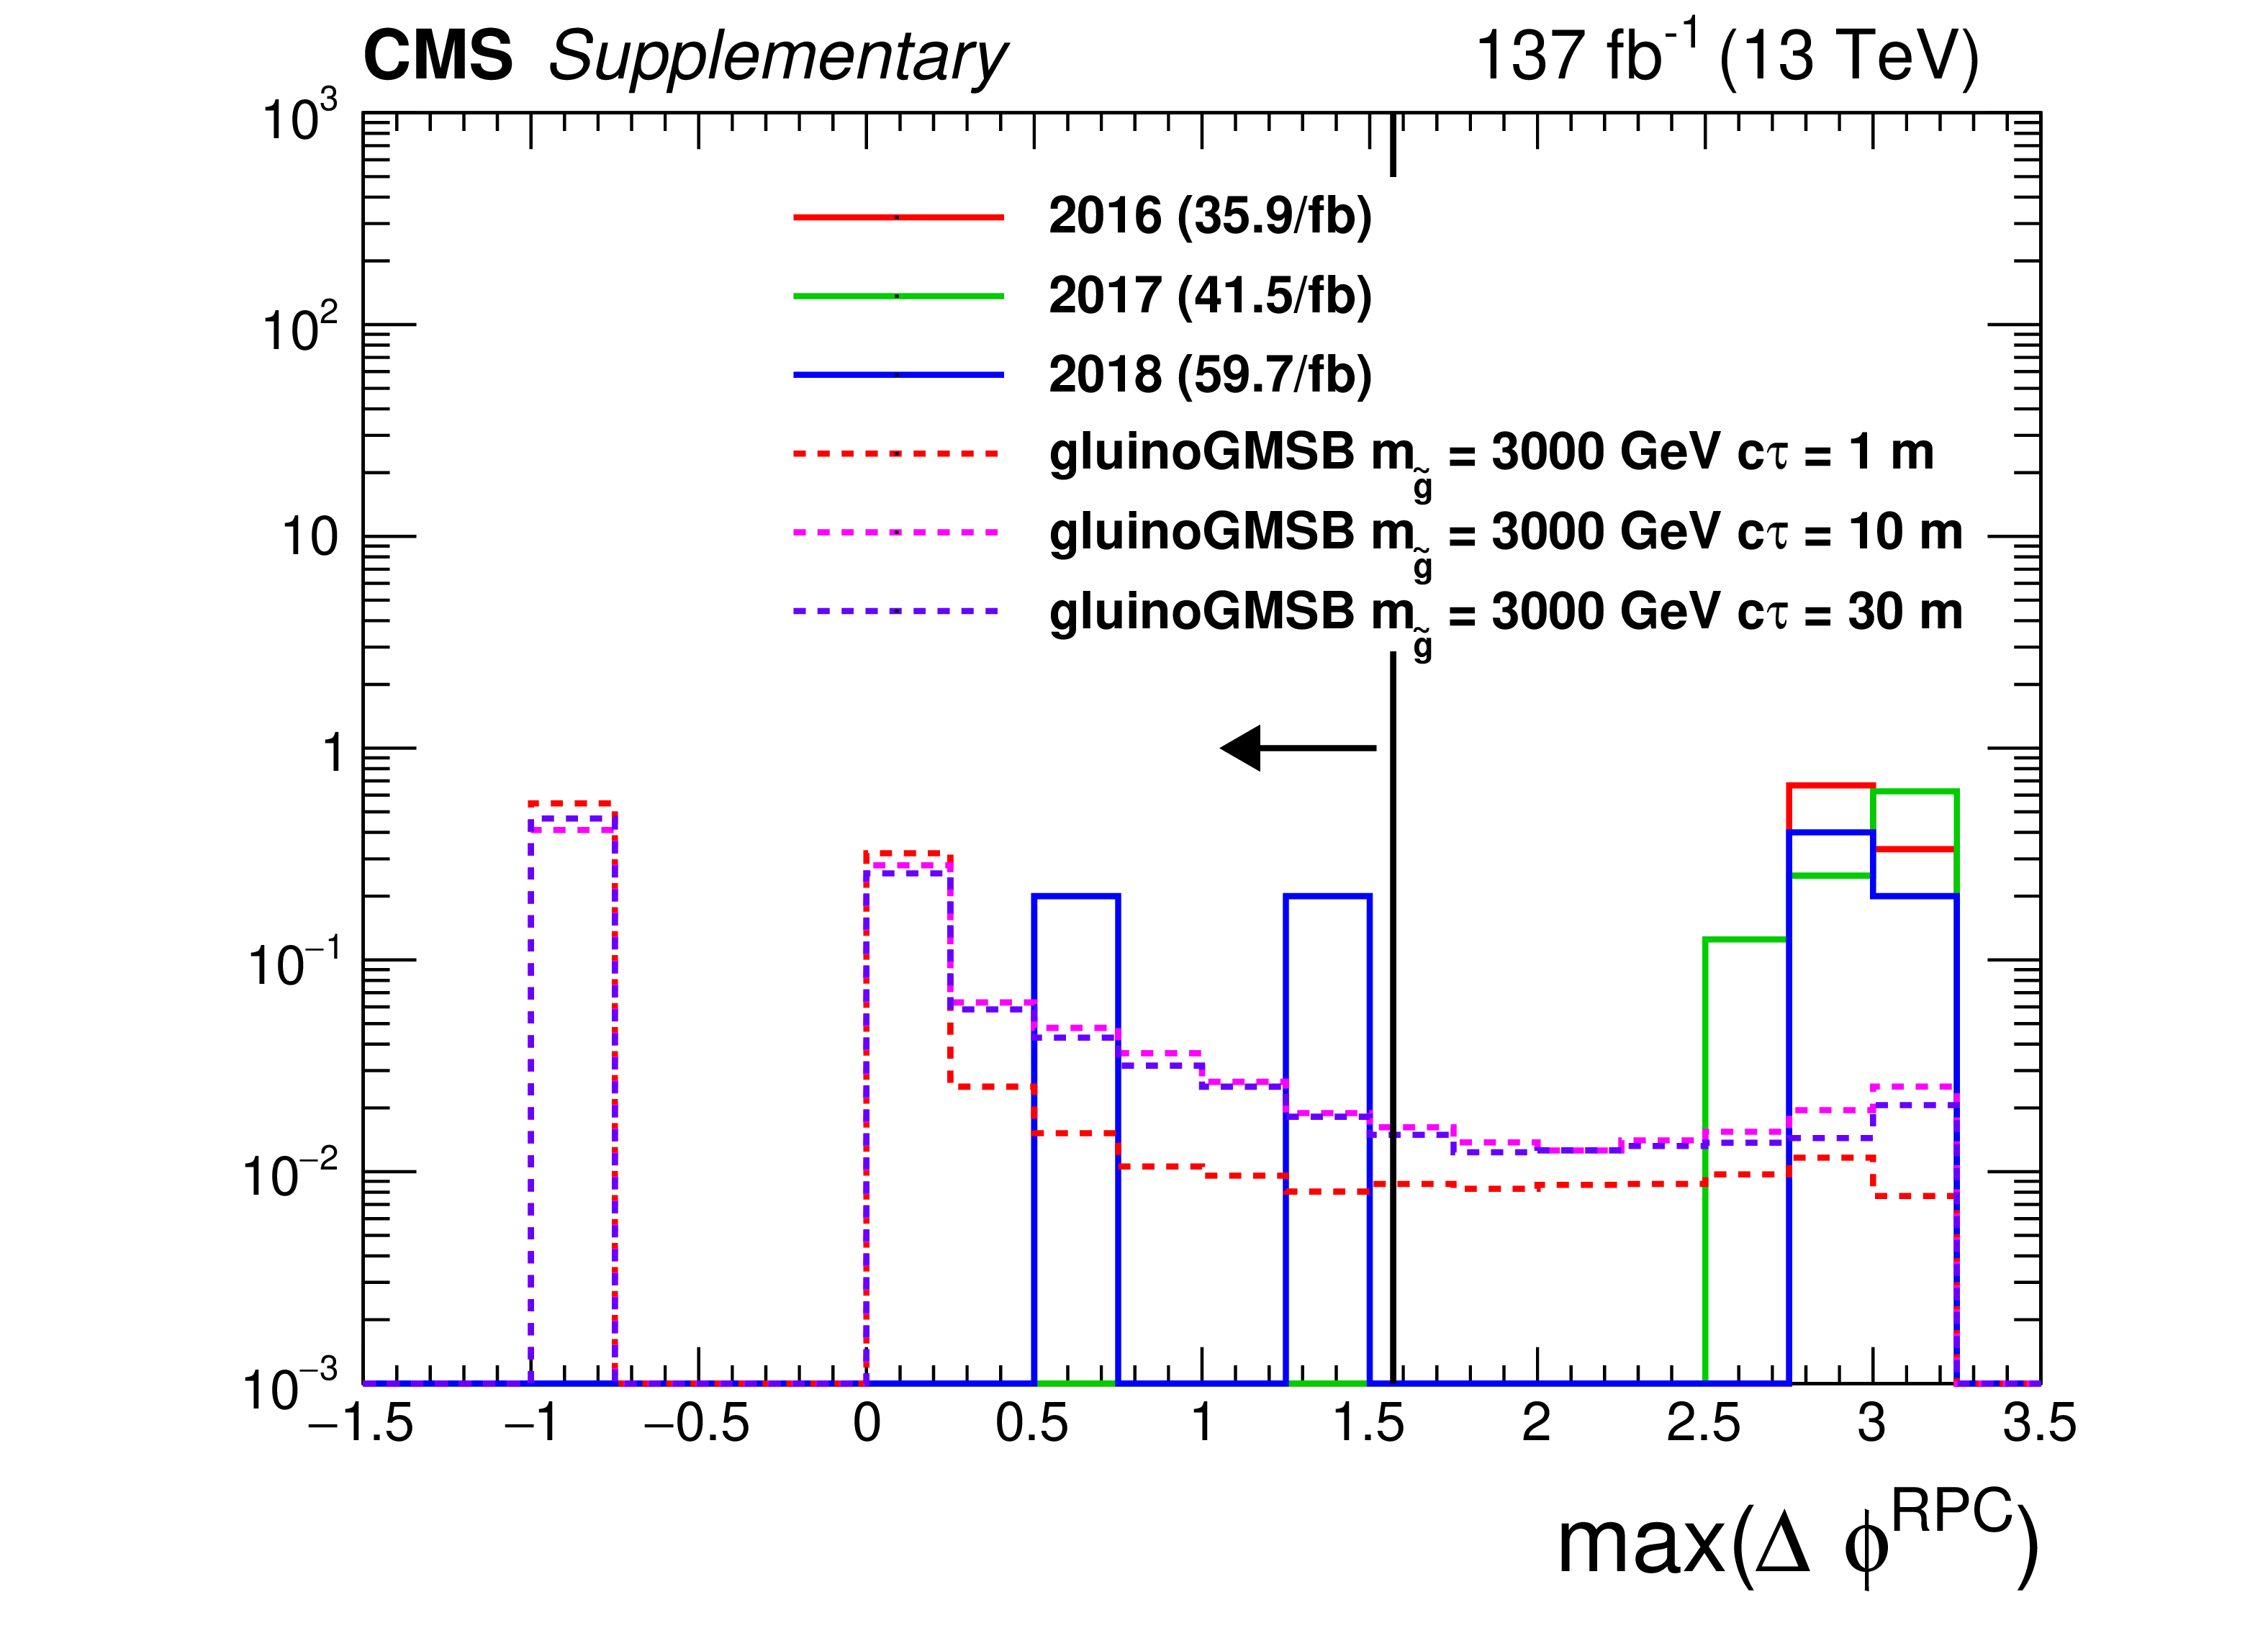
Additional Figure 9:
The distribution (normalized to unity) of ${\textrm {max}(\Delta \phi _{RPC})}$ for a data sample enriched in cosmic muons (satisfying $ {E^{\textrm {CSC}}_\textrm {ECAL}/E_{\textrm {ECAL}}} < $ 0.8, $ {p_{\mathrm {T}}} > $ 30 GeV, $|\eta | < $ 1.48, $ {PV_{\rm track}^{\rm fraction}} < $ 1/12, $ {\textrm {HEF}} > $ 0.2, $ {{t^{\textrm {RMS}}_\textrm {jet}} / {t_{\textrm {jet}}}} < $ 0.4, $ {t_{\textrm {jet}}} > $ 3 ns, $ {E_{\textrm {ECAL}}} > $ 20 GeV and failing the HCAL noise rejection quality filters) and for signal jets passing signal selections (except on ${\textrm {max}(\Delta \phi _{RPC})}$). |
png pdf |
Additional Figure 9-a:
The distribution (normalized to unity) of ${\textrm {max}(\Delta \phi _{RPC})}$ for a data sample enriched in cosmic muons (satisfying $ {E^{\textrm {CSC}}_\textrm {ECAL}/E_{\textrm {ECAL}}} < $ 0.8, $ {p_{\mathrm {T}}} > $ 30 GeV, $|\eta | < $ 1.48, $ {PV_{\rm track}^{\rm fraction}} < $ 1/12, $ {\textrm {HEF}} > $ 0.2, $ {{t^{\textrm {RMS}}_\textrm {jet}} / {t_{\textrm {jet}}}} < $ 0.4, $ {t_{\textrm {jet}}} > $ 3 ns, $ {E_{\textrm {ECAL}}} > $ 20 GeV and failing the HCAL noise rejection quality filters) and for signal jets passing signal selections (except on ${\textrm {max}(\Delta \phi _{RPC})}$). |

png pdf |
Additional Figure 9-b:
The distribution (normalized to unity) of ${\textrm {max}(\Delta \phi _{RPC})}$ for a data sample enriched in cosmic muons (satisfying $ {E^{\textrm {CSC}}_\textrm {ECAL}/E_{\textrm {ECAL}}} < $ 0.8, $ {p_{\mathrm {T}}} > $ 30 GeV, $|\eta | < $ 1.48, $ {PV_{\rm track}^{\rm fraction}} < $ 1/12, $ {\textrm {HEF}} > $ 0.2, $ {{t^{\textrm {RMS}}_\textrm {jet}} / {t_{\textrm {jet}}}} < $ 0.4, $ {t_{\textrm {jet}}} > $ 3 ns, $ {E_{\textrm {ECAL}}} > $ 20 GeV and failing the HCAL noise rejection quality filters) and for signal jets passing signal selections (except on ${\textrm {max}(\Delta \phi _{RPC})}$). |
png pdf |
Additional Figure 9-c:
The distribution (normalized to unity) of ${\textrm {max}(\Delta \phi _{RPC})}$ for a data sample enriched in cosmic muons (satisfying $ {E^{\textrm {CSC}}_\textrm {ECAL}/E_{\textrm {ECAL}}} < $ 0.8, $ {p_{\mathrm {T}}} > $ 30 GeV, $|\eta | < $ 1.48, $ {PV_{\rm track}^{\rm fraction}} < $ 1/12, $ {\textrm {HEF}} > $ 0.2, $ {{t^{\textrm {RMS}}_\textrm {jet}} / {t_{\textrm {jet}}}} < $ 0.4, $ {t_{\textrm {jet}}} > $ 3 ns, $ {E_{\textrm {ECAL}}} > $ 20 GeV and failing the HCAL noise rejection quality filters) and for signal jets passing signal selections (except on ${\textrm {max}(\Delta \phi _{RPC})}$). |
png pdf |
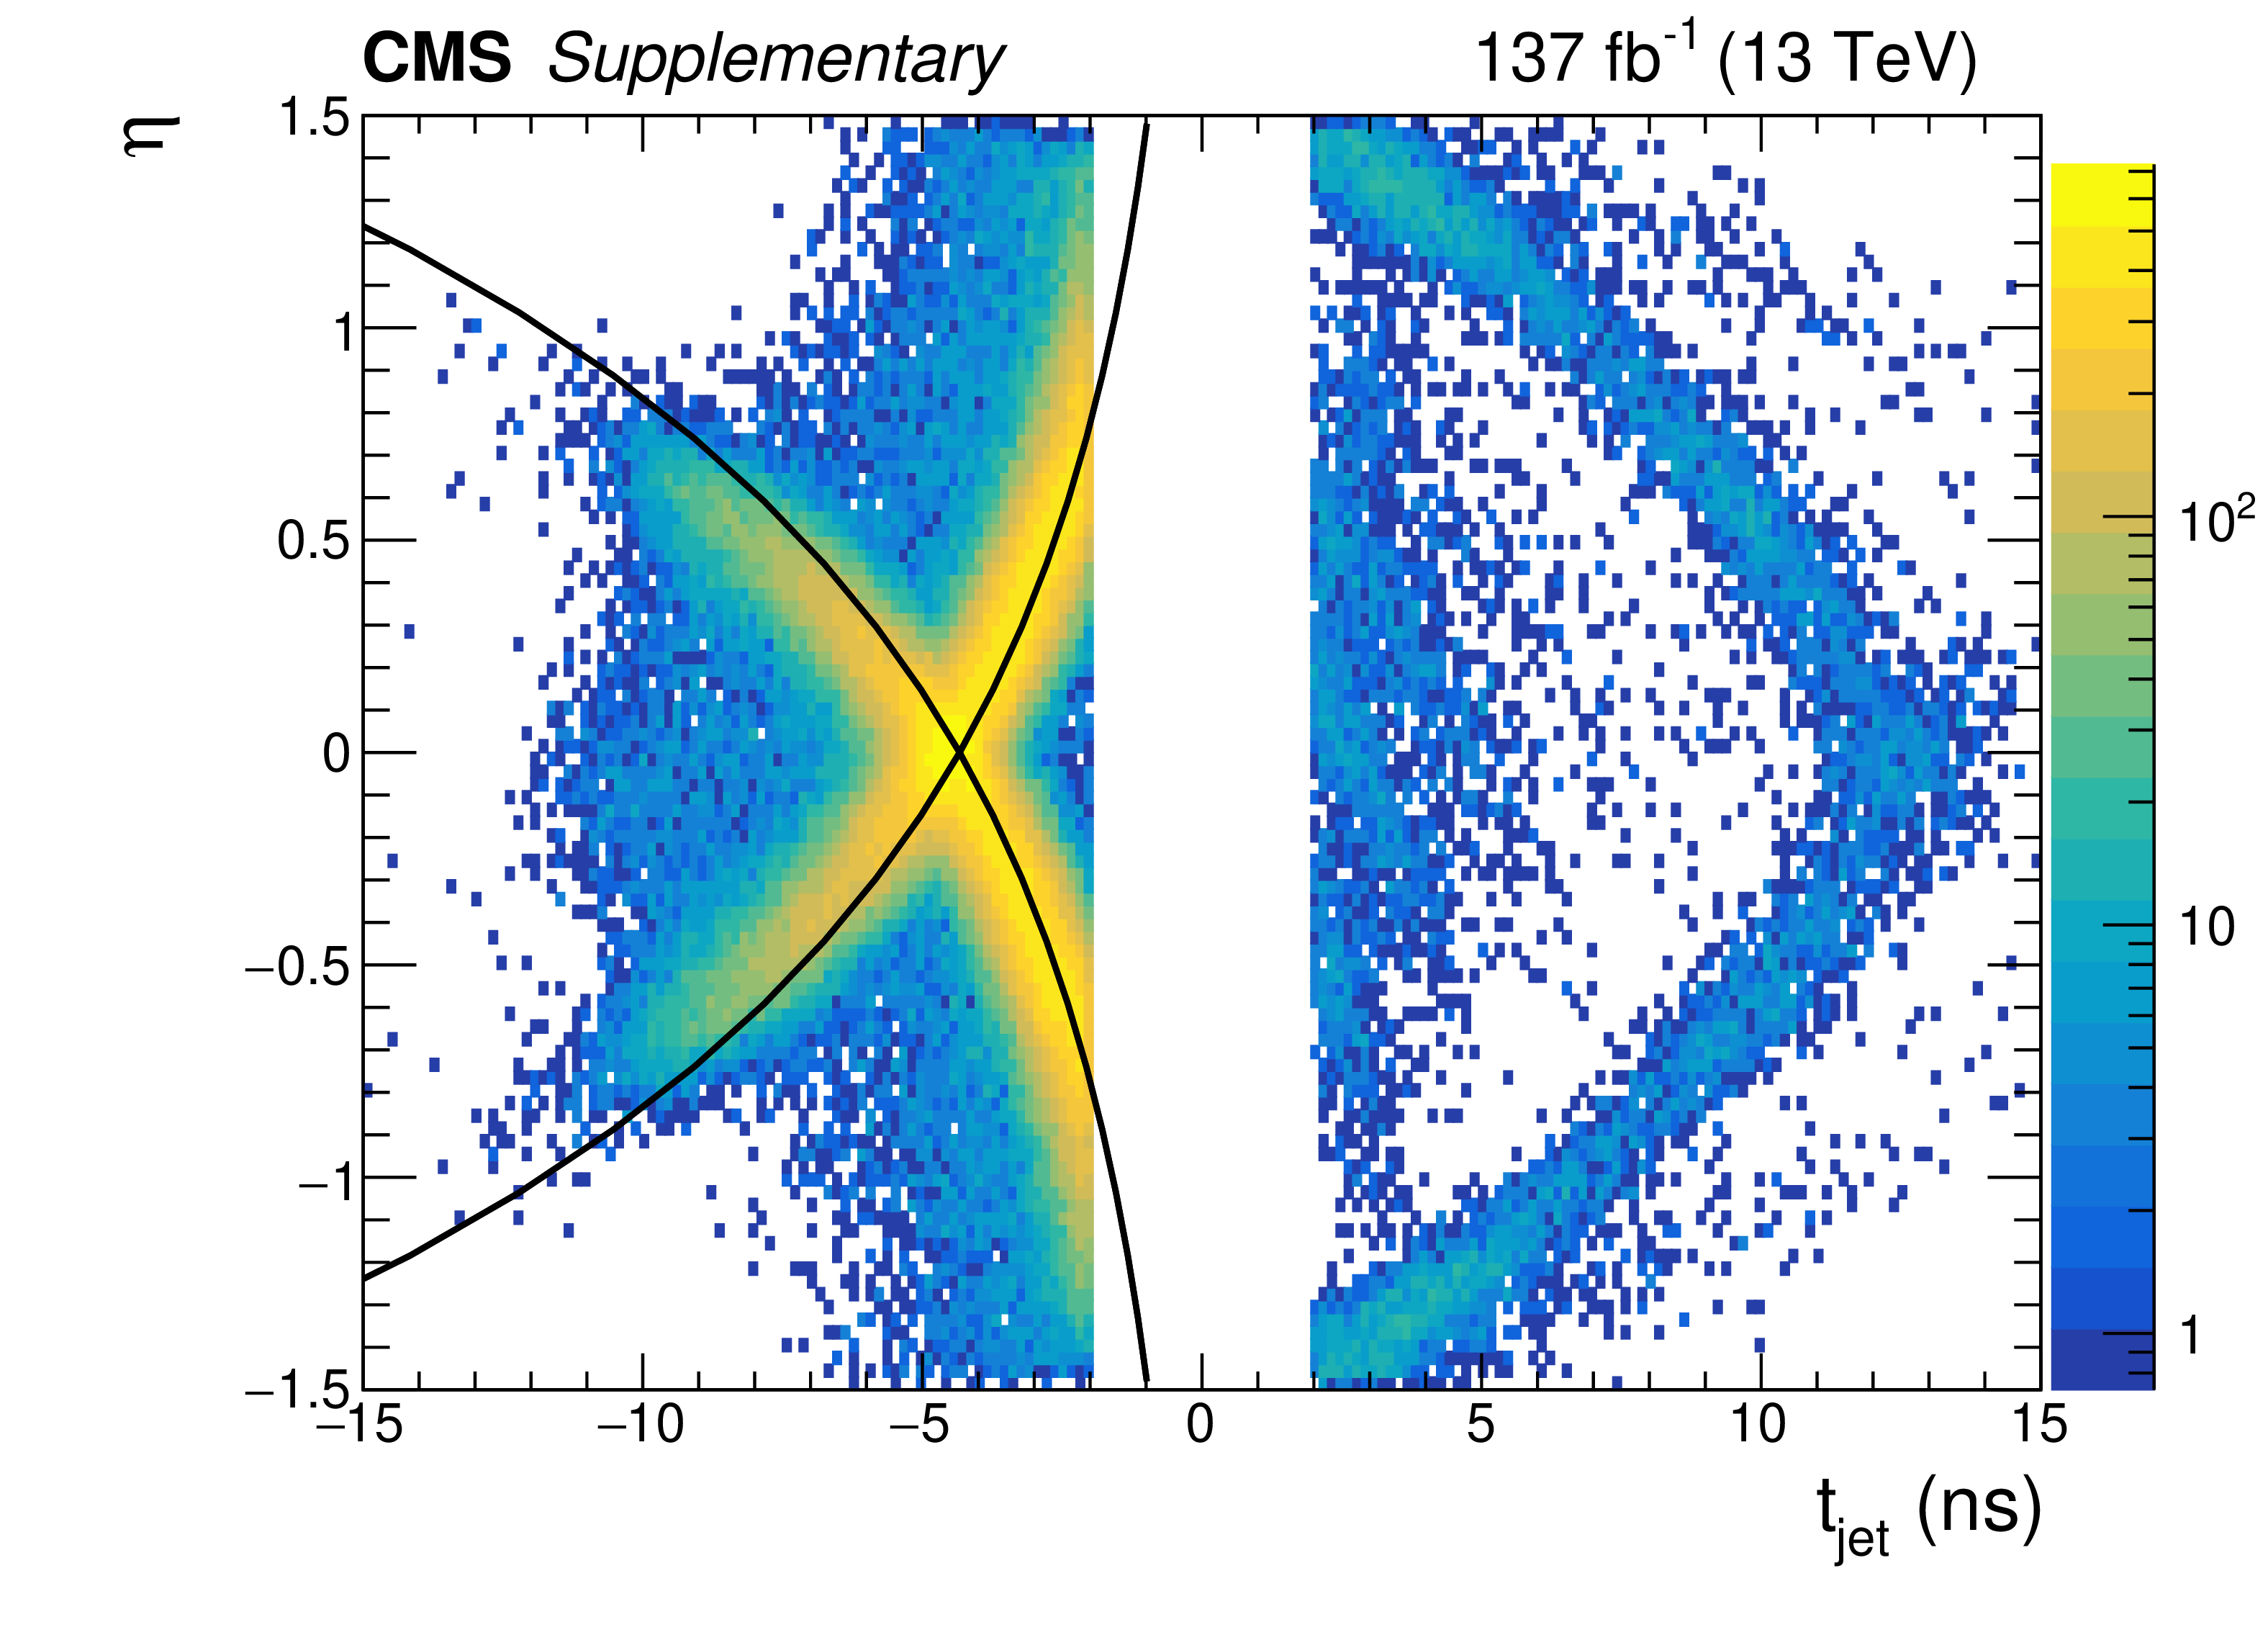
Additional Figure 10:
The $\eta $ dependence of the jet time for jets passing beam halo selection and with $| {t_{\textrm {jet}}} | > $ 2 ns. The black lines show the expected time distribution from the path difference for beam halo from the main bunch. Additional deposits, including those at positive times, come from beam halo associated with satellite and following or previous main bunches. |
png pdf |
Additional Figure 11:
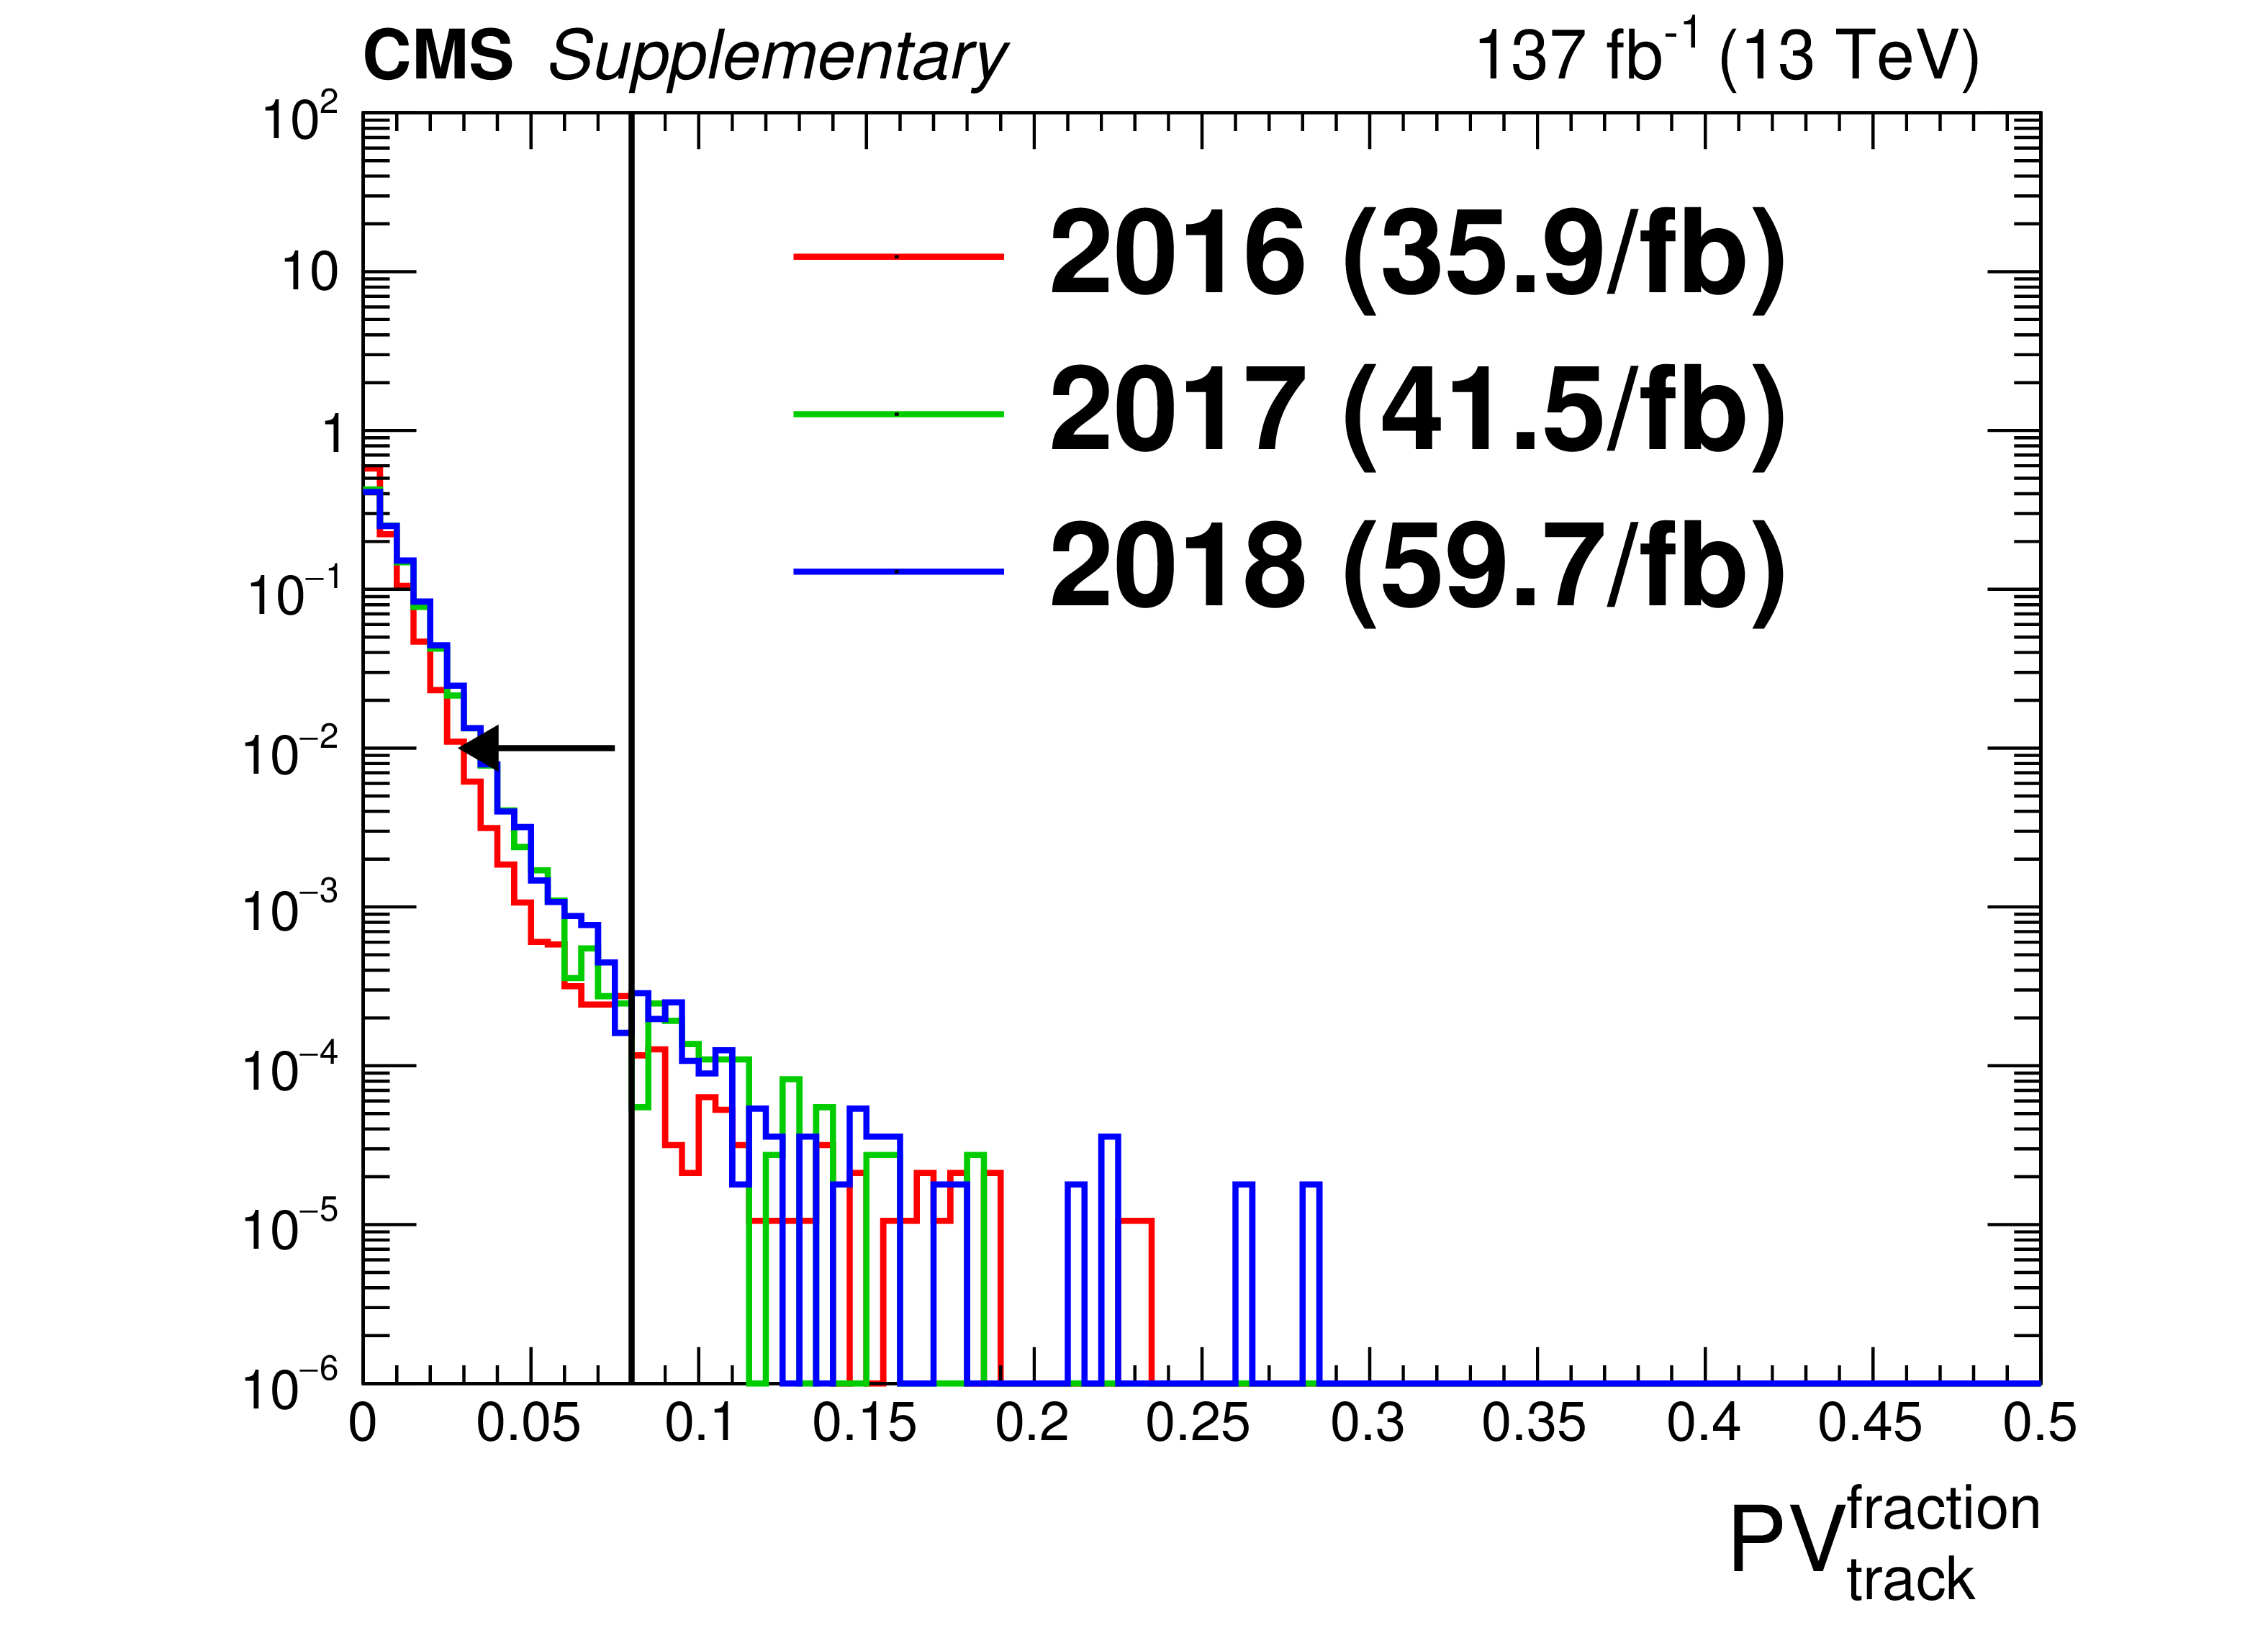
The distribution of ${PV_{\rm track}^{\rm fraction}}$ for a data sample enriched in beam halo (satisfying $ {p_{\mathrm {T}}} > $ 30 GeV, $|\eta | < $ 1.48, $ {\textrm {HEF}} < $ 0.2, $ {{t^{\textrm {RMS}}_\textrm {jet}} / {t_{\textrm {jet}}}} < $ 0.4, $ {t^{\textrm {RMS}}_\textrm {jet}} < $ 2.5 and $ {t_{\textrm {jet}}} < -$3 ns). |
png pdf |
Additional Figure 12:
The distribution of ${t^{\textrm {RMS}}_\textrm {jet}}$ for a data sample enriched in beam halo (satisfying $ {p_{\mathrm {T}}} > $ 30 GeV, $|\eta | < $ 1.48, $ {\textrm {HEF}} < $ 0.2, $ {PV_{\rm track}^{\rm fraction}} < $ 1/12 and $ {t_{\textrm {jet}}} < -$3 ns). |
png pdf |
Additional Figure 13:
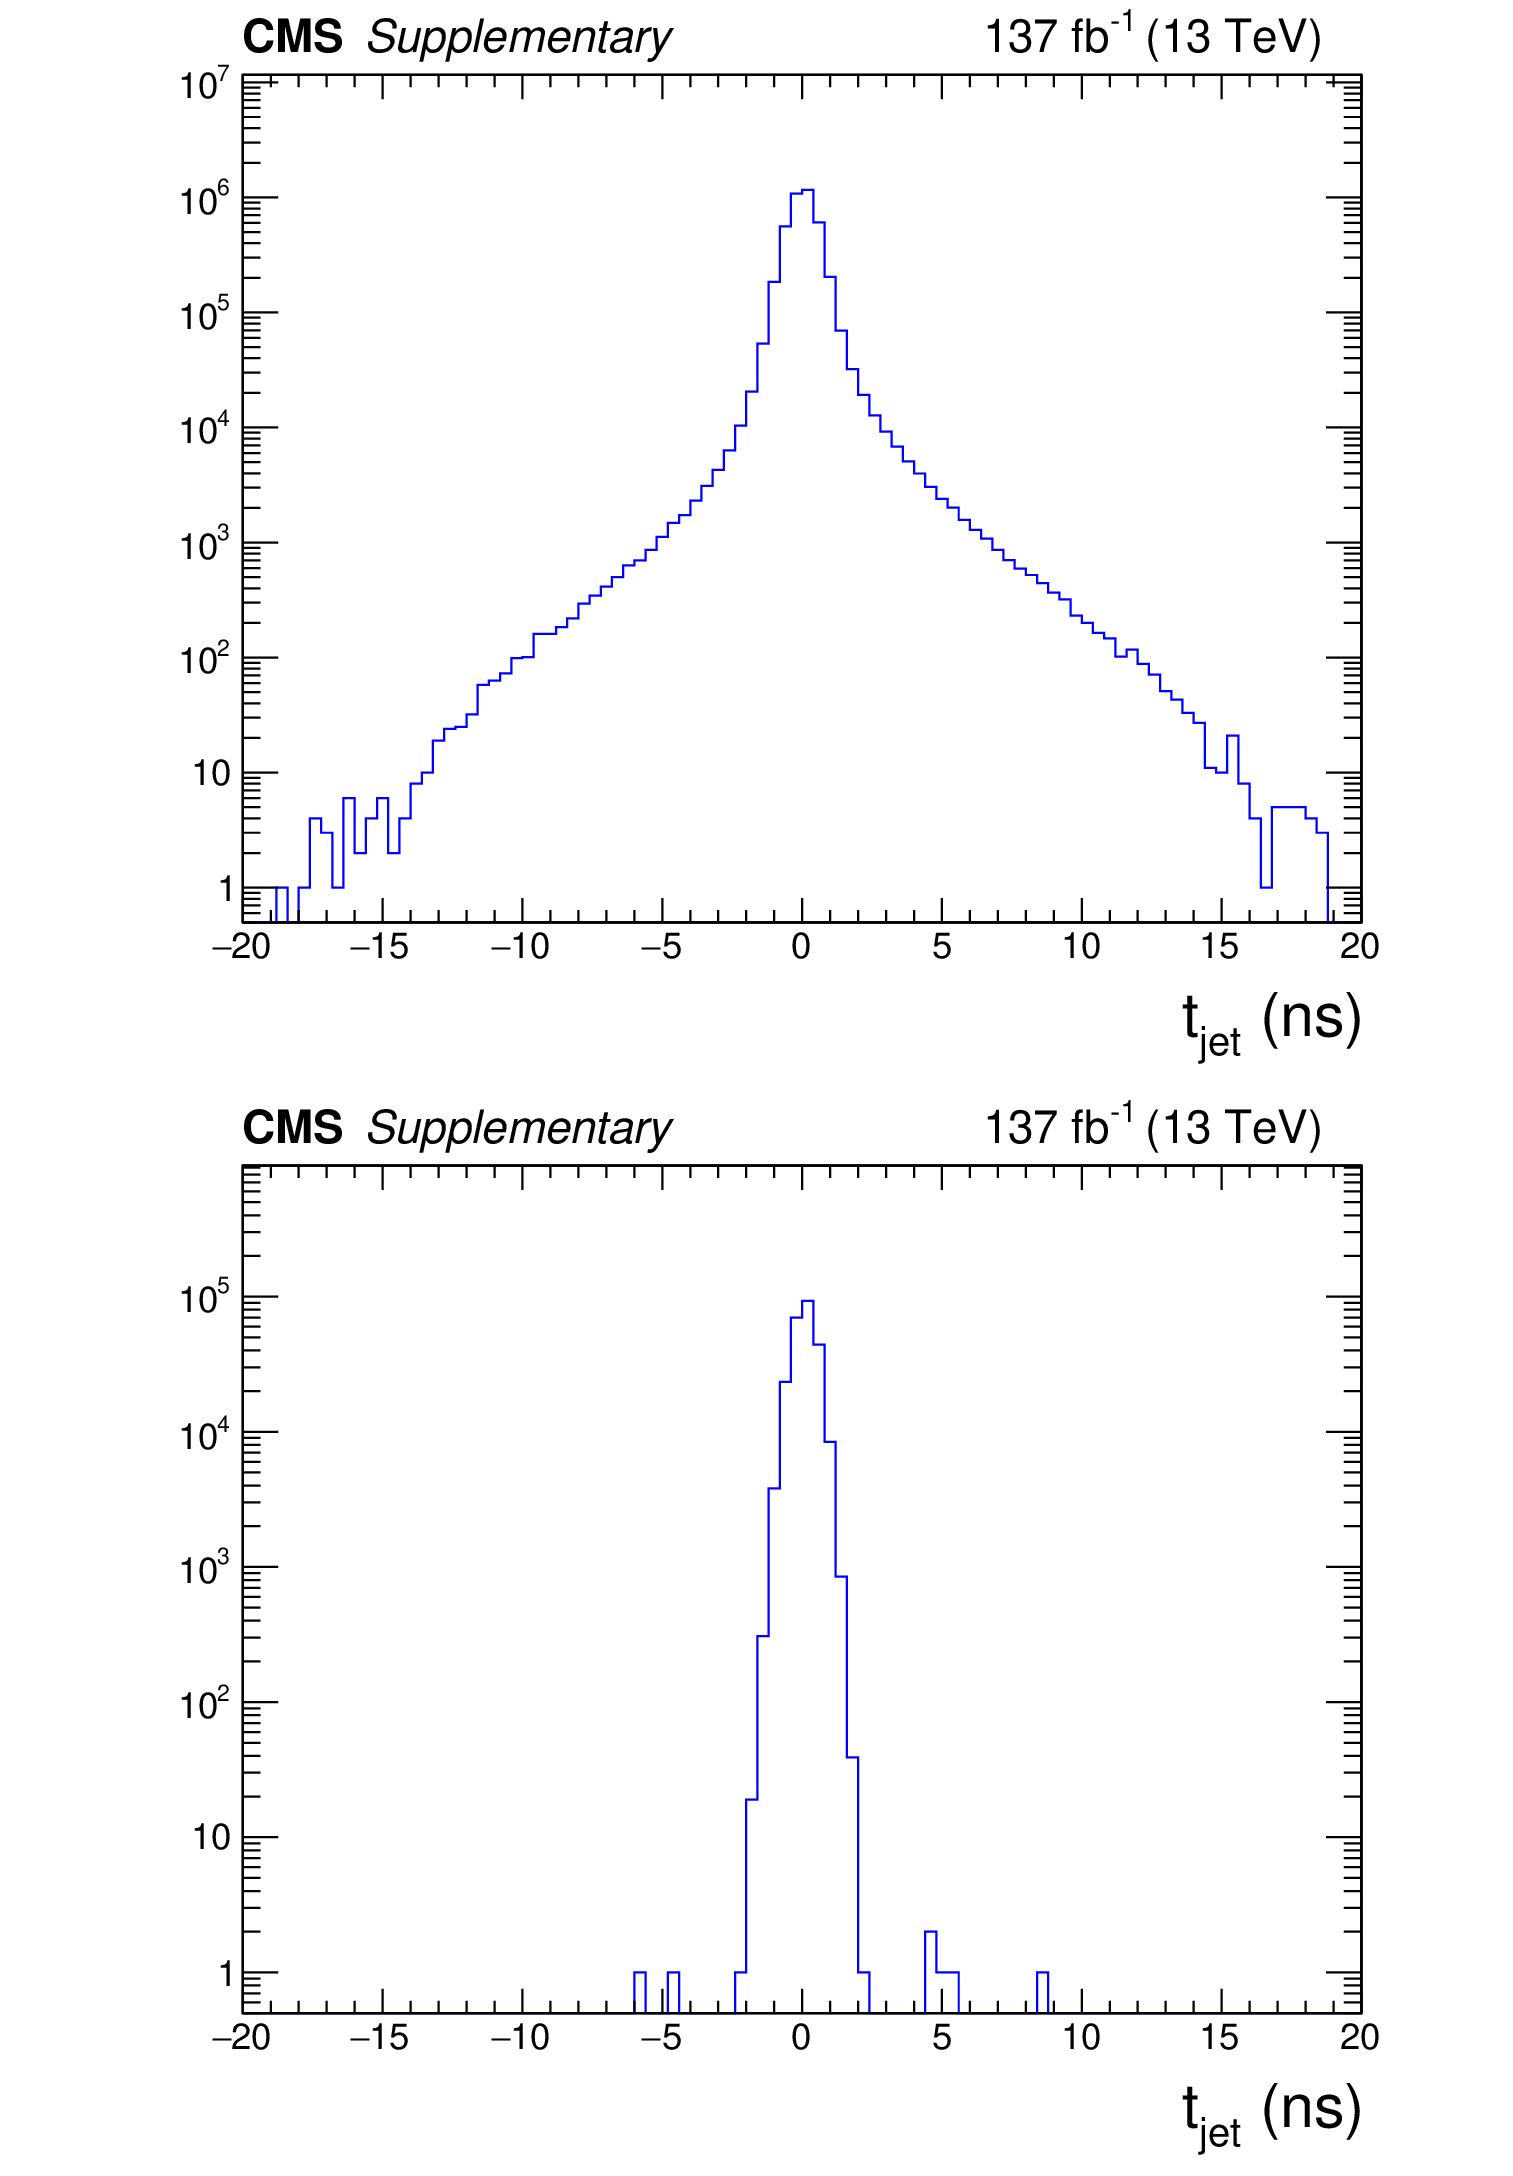
Distribution of ${t_{\textrm {jet}}}$ for jets with the full Run 2 dataset with no cleaning selection applied (a) and after all jet cleaning selections are applied (b) in events satisfying the trigger requirements and satisfying $ {{p_{\mathrm {T}}} ^\text {miss}} > 300$. The jets are required to pass an inverted selection of $ {PV_{\rm track}^{\rm fraction}} > $ 1/12 to enrich the sample in those originating from main and satellite bunch backgrounds. The cleaning selections are shown to reduce the backgrounds by many orders of magnitude. |

png pdf |
Additional Figure 13-a:
Distribution of ${t_{\textrm {jet}}}$ for jets with the full Run 2 dataset with no cleaning selection applied in events satisfying the trigger requirements and satisfying $ {{p_{\mathrm {T}}} ^\text {miss}} > 300$. The jets are required to pass an inverted selection of $ {PV_{\rm track}^{\rm fraction}} > $ 1/12 to enrich the sample in those originating from main and satellite bunch backgrounds. The cleaning selections are shown to reduce the backgrounds by many orders of magnitude. |

png pdf |
Additional Figure 13-b:
Distribution of ${t_{\textrm {jet}}}$ for jets with the full Run 2 dataset after all jet cleaning selections are applied in events satisfying the trigger requirements and satisfying $ {{p_{\mathrm {T}}} ^\text {miss}} > 300$. The jets are required to pass an inverted selection of $ {PV_{\rm track}^{\rm fraction}} > $ 1/12 to enrich the sample in those originating from main and satellite bunch backgrounds. The cleaning selections are shown to reduce the backgrounds by many orders of magnitude. |
png pdf |
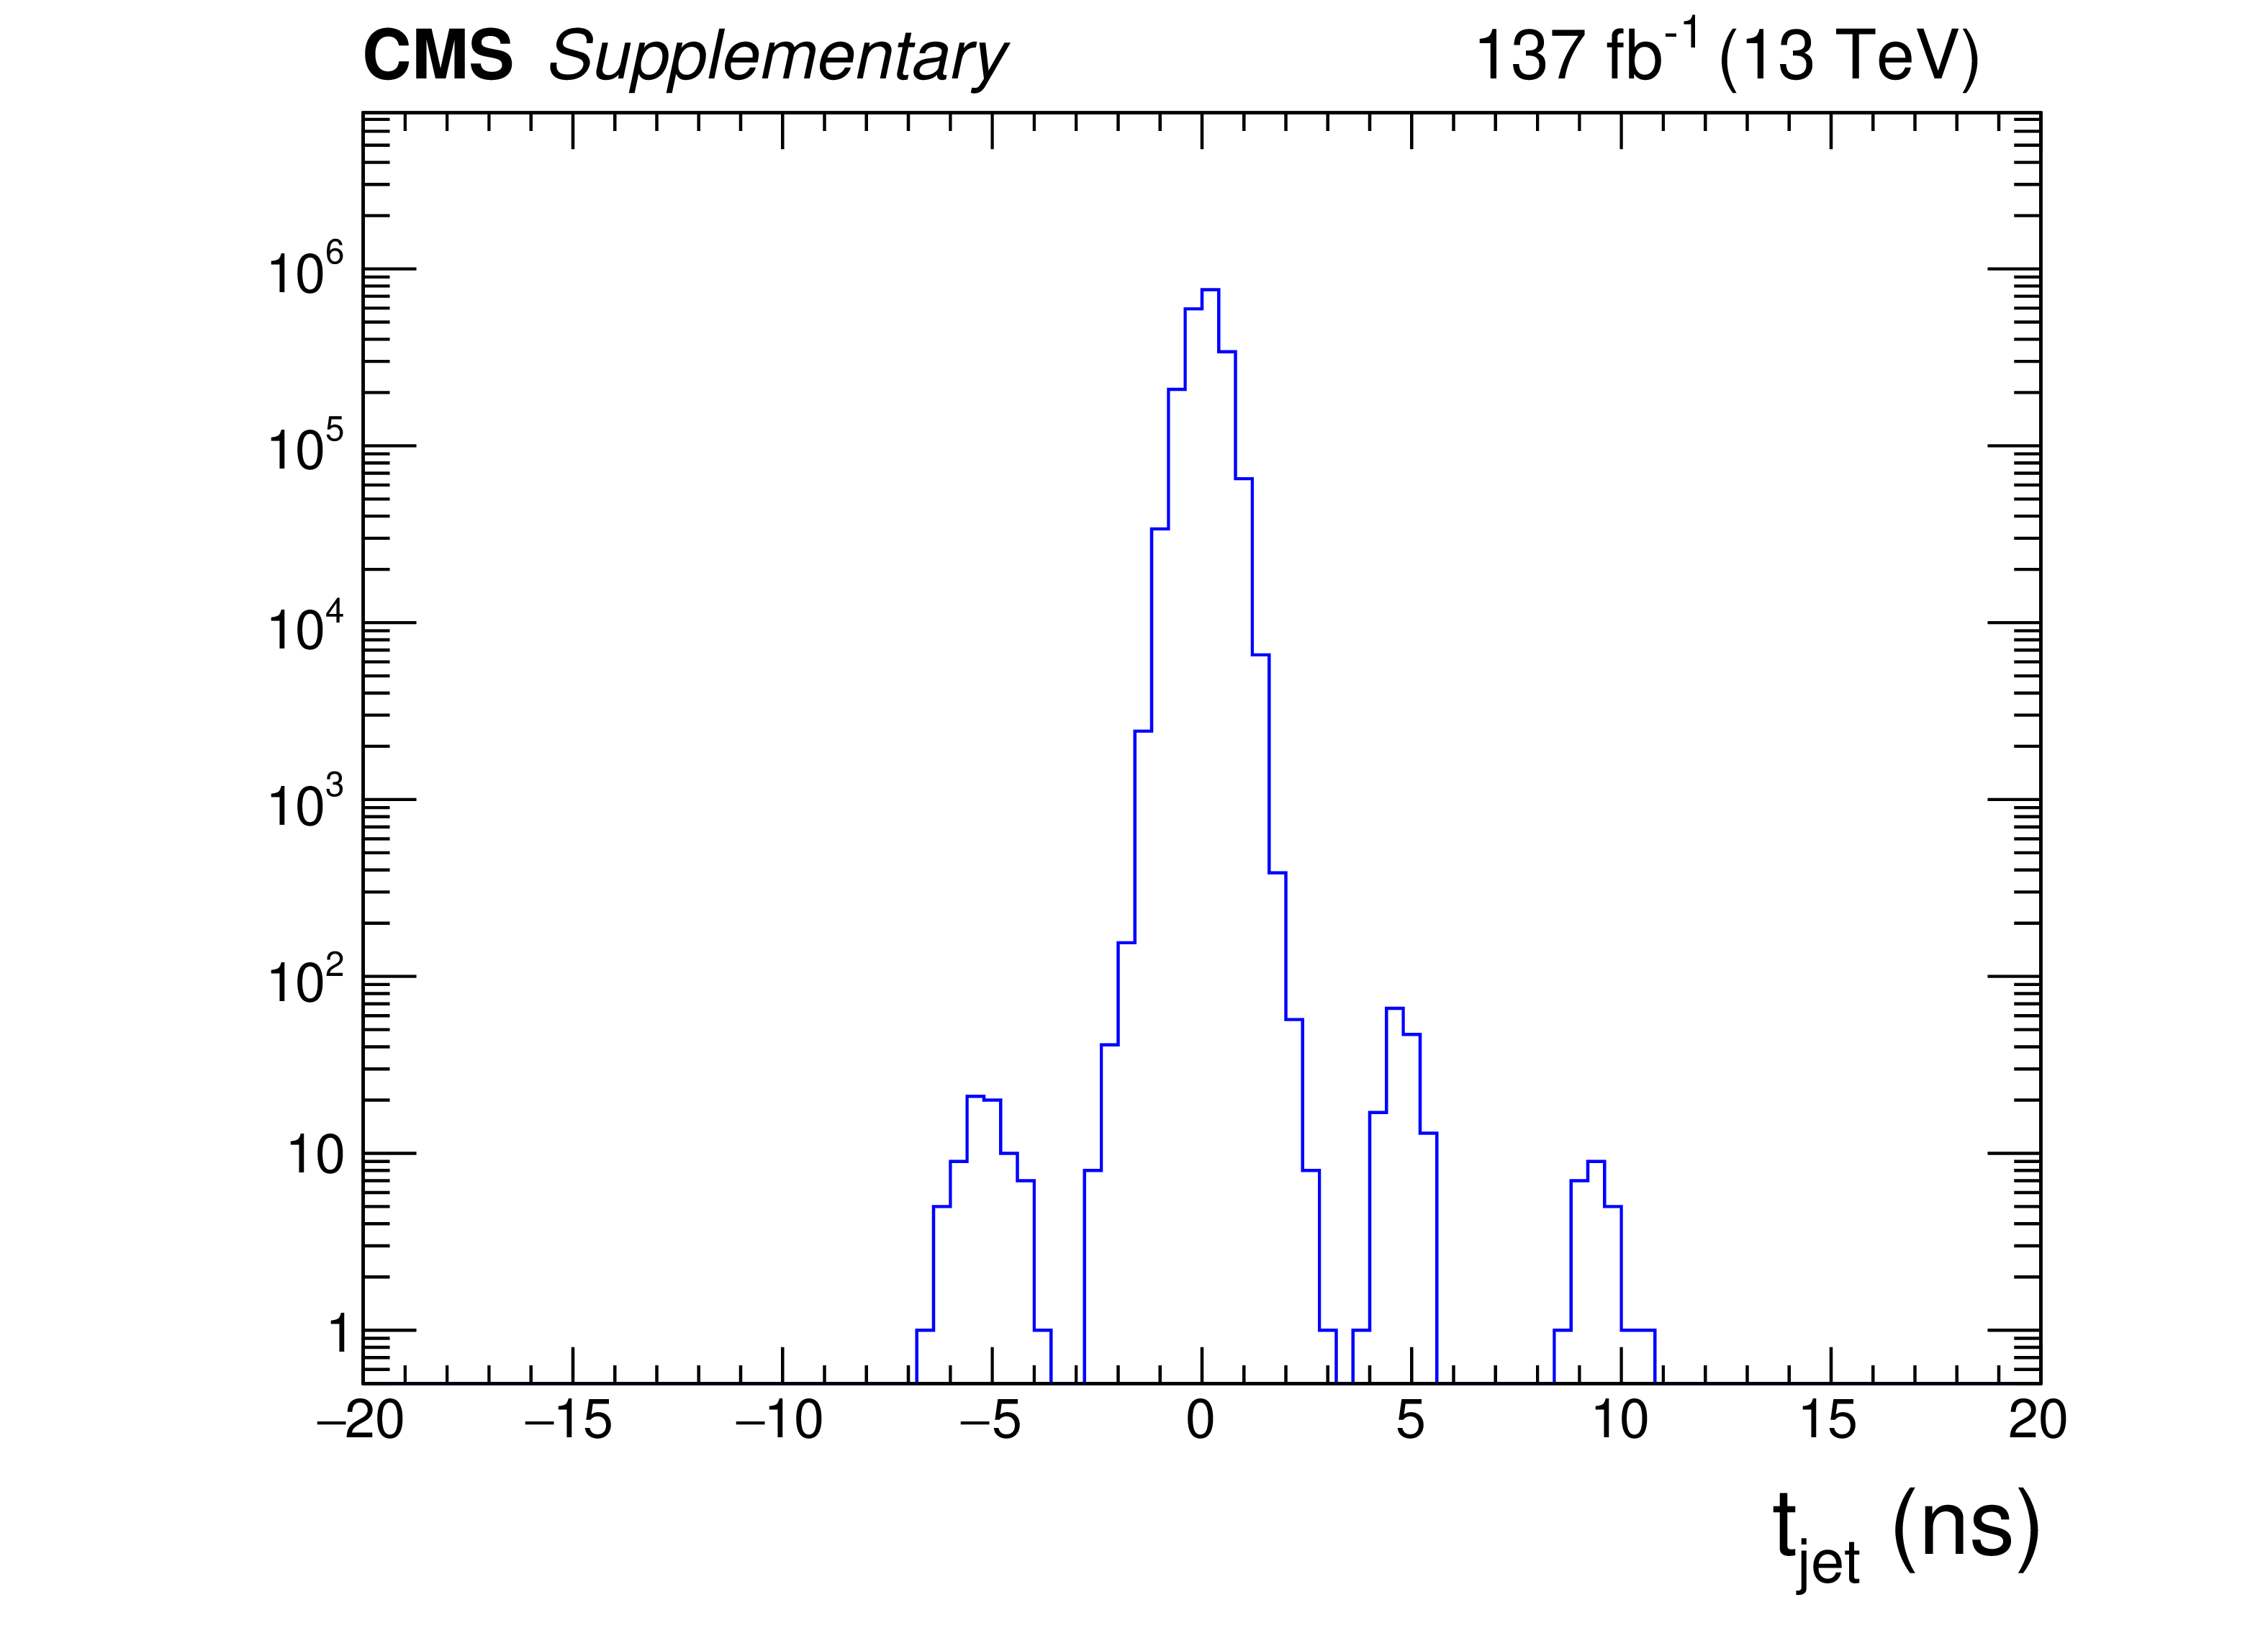
Additional Figure 14:
Distribution of ${t_{\textrm {jet}}}$ for jets with the full Run 2 dataset in events satisfying the trigger requirements and satisfying $ {{p_{\mathrm {T}}} ^\text {miss}} < 300$. The jets are required to pass an inverted selection of $ {PV_{\rm track}^{\rm fraction}} > $ 1/12 to enrich the sample in those originating from main and satellite bunch backgrounds (all other jet cleaning selections are applied). Clear contributions from jets from satellite bunch collisions can be seen peaked around -5, 5 and 10 ns. |
png pdf |
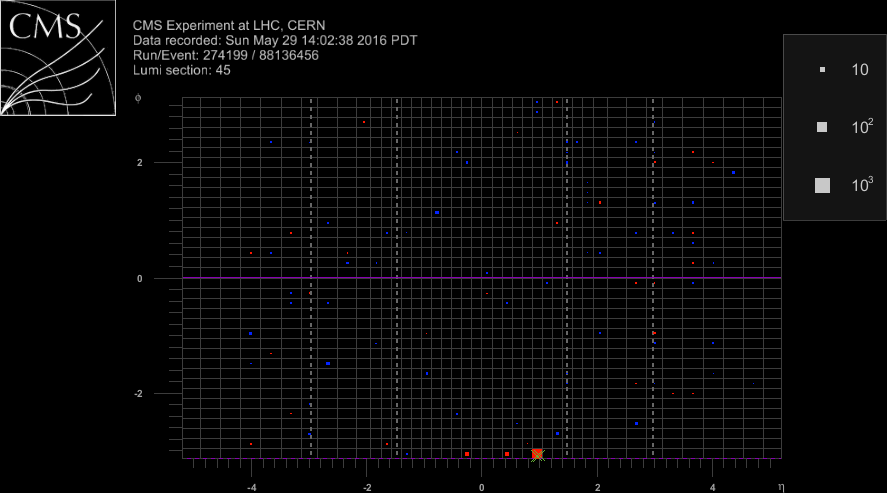
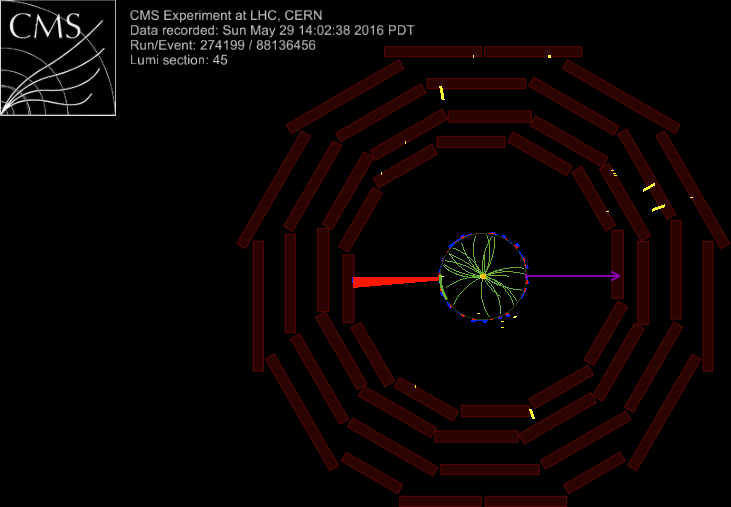
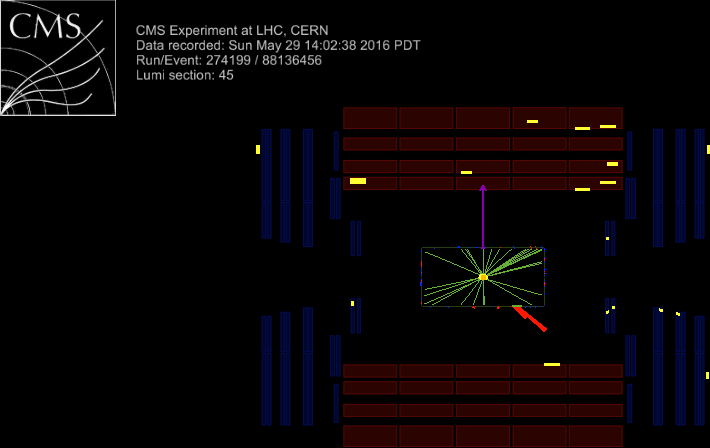
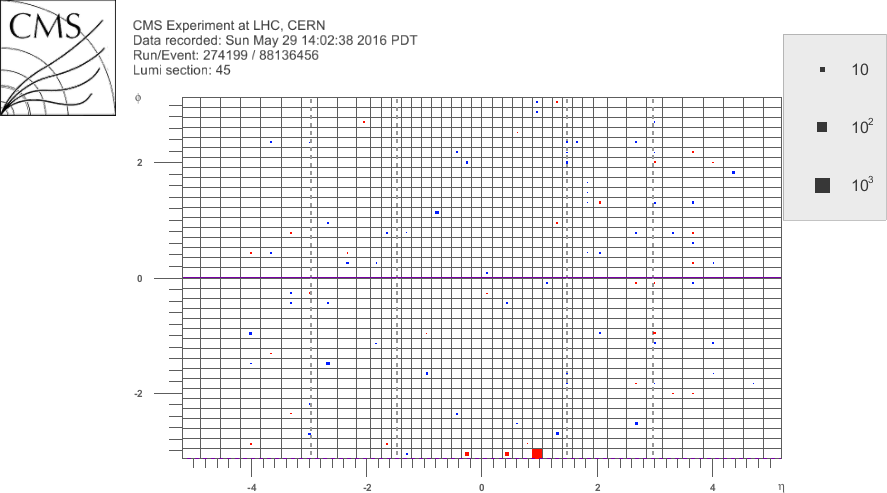
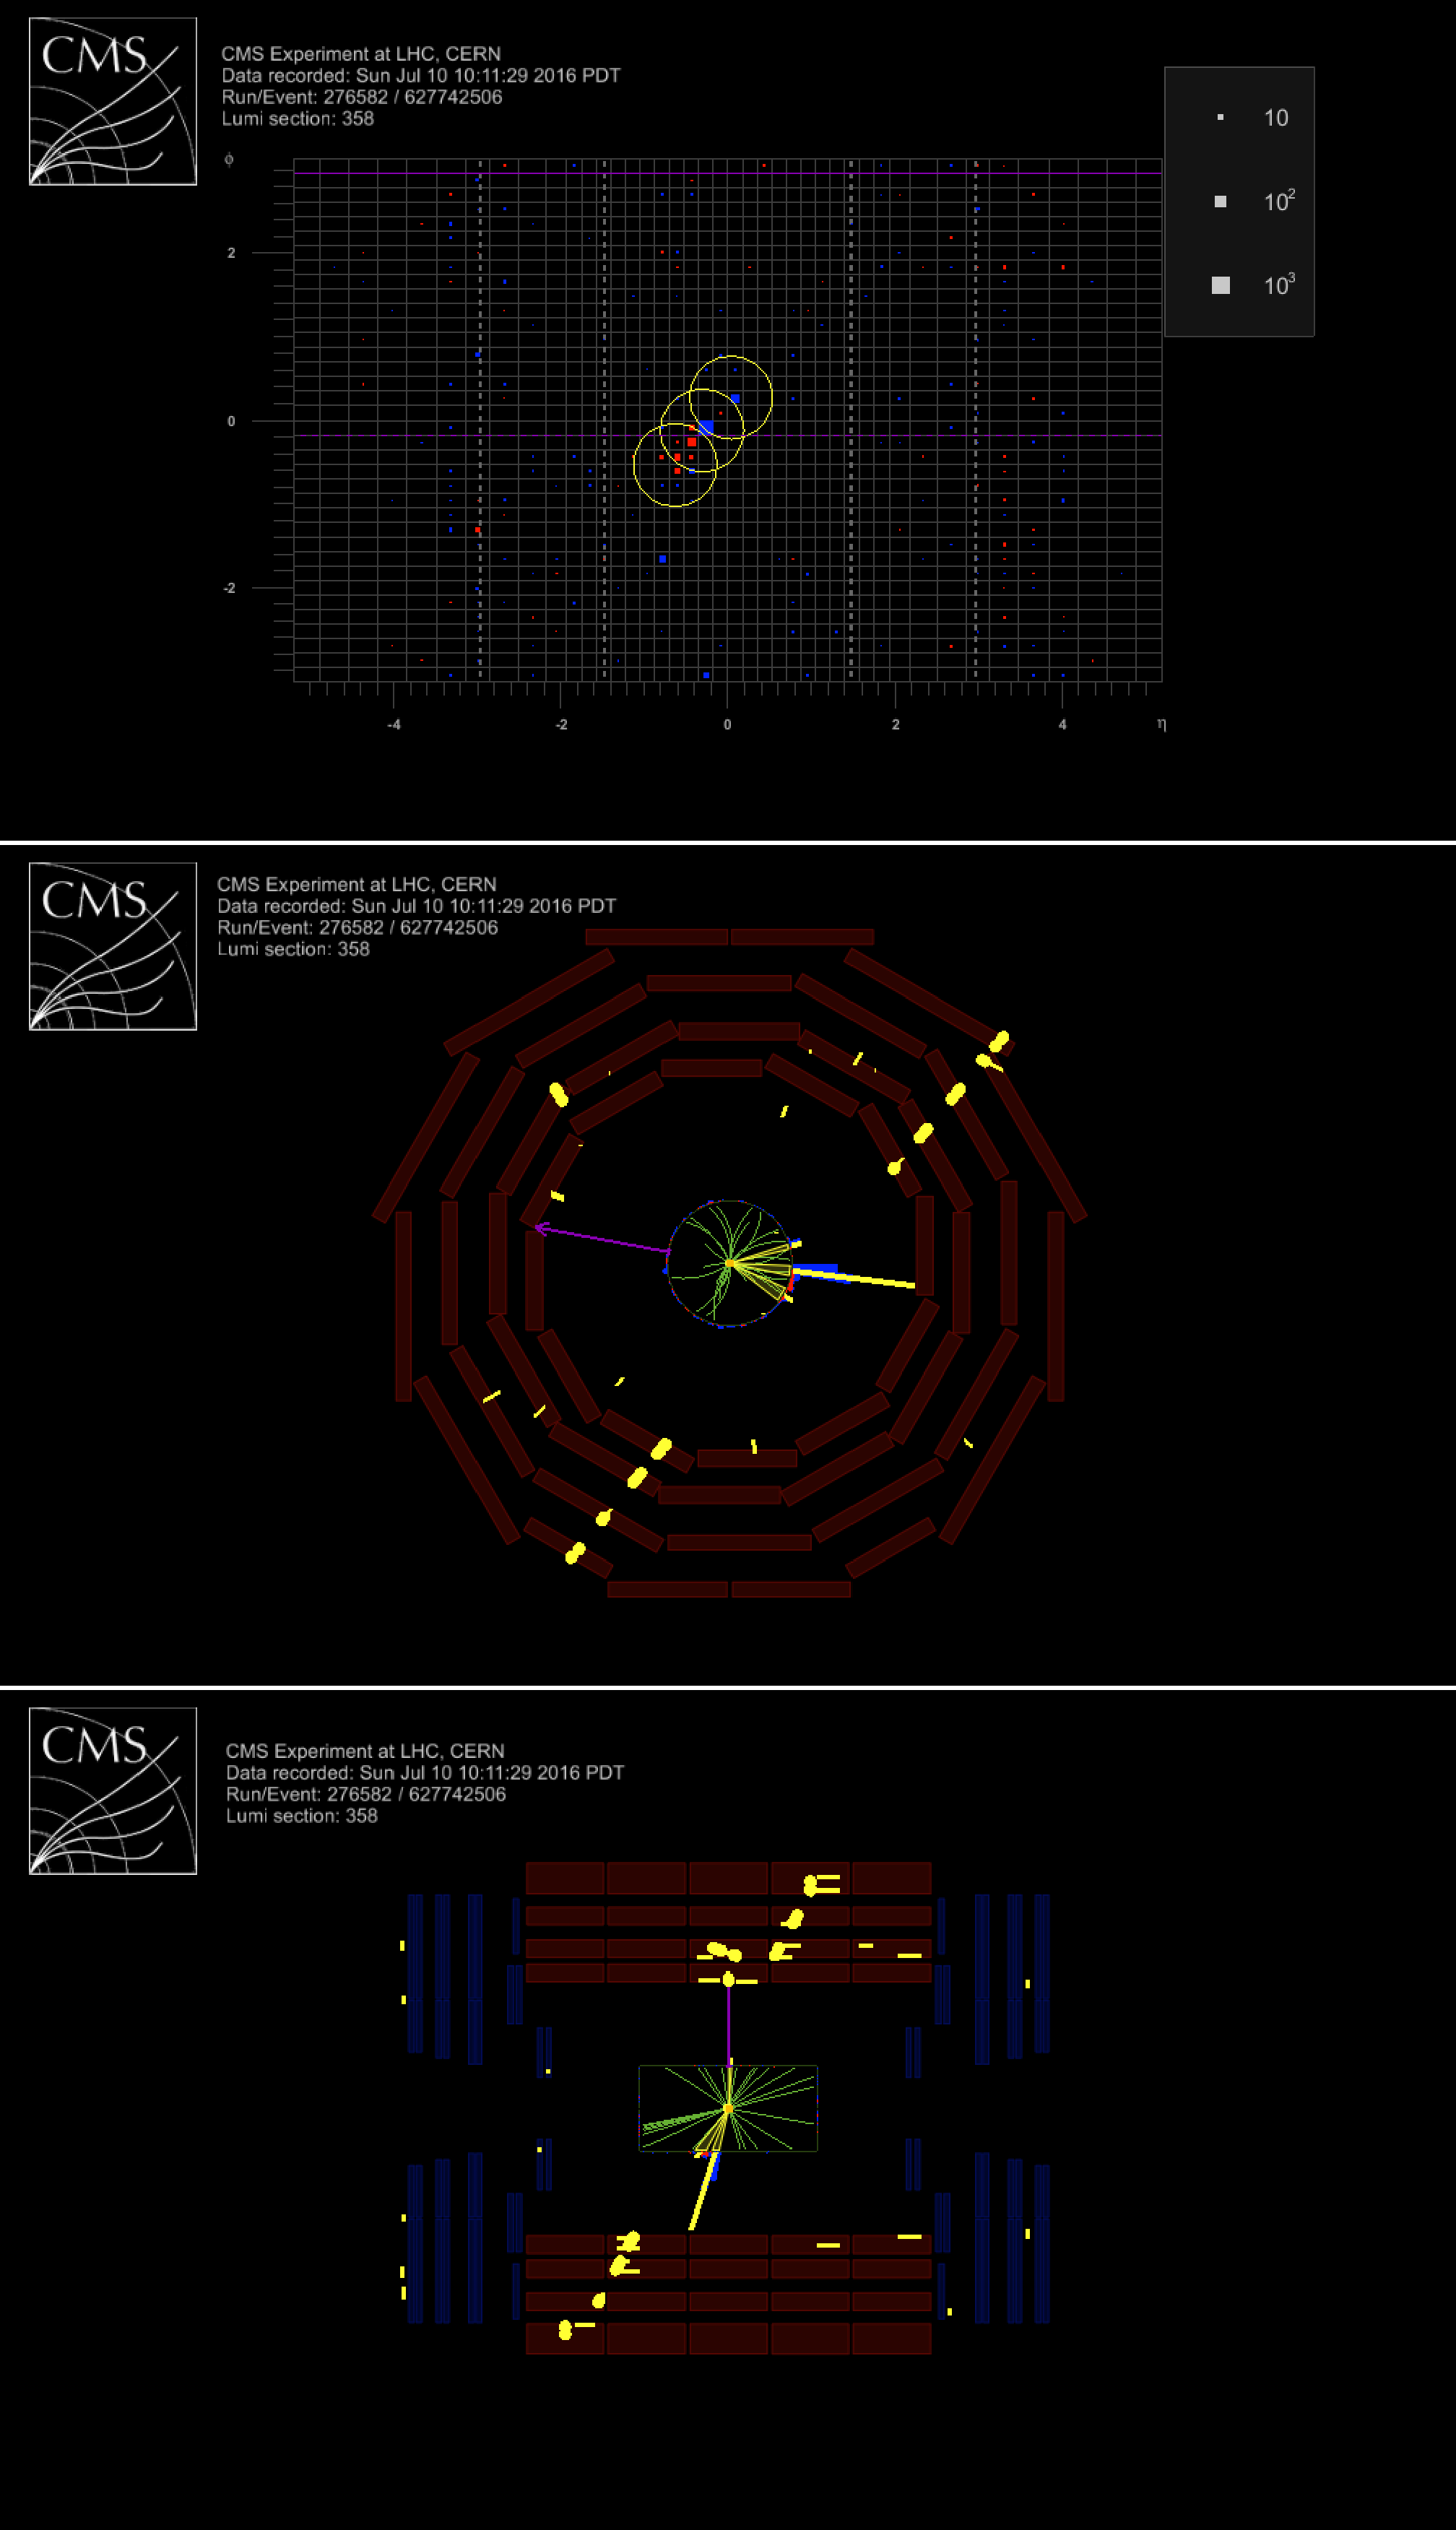
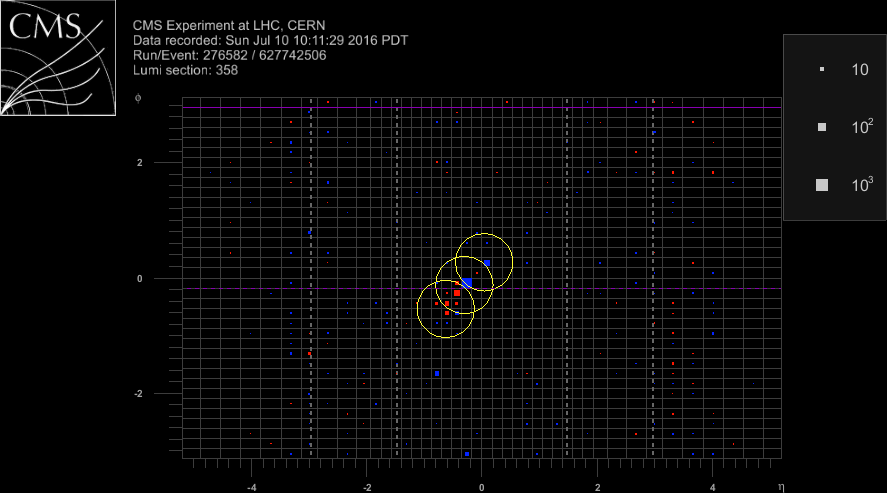
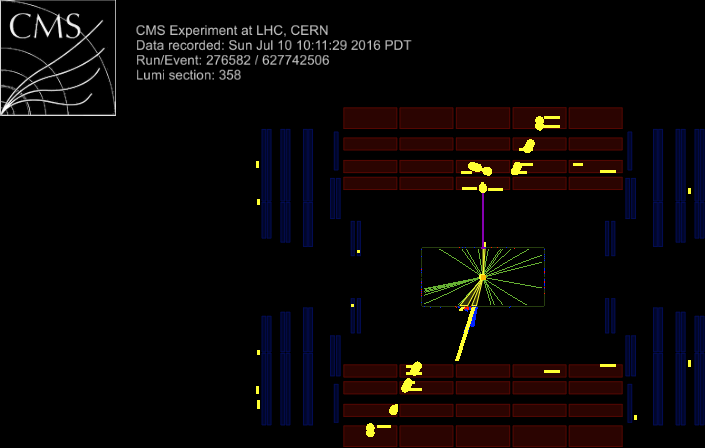
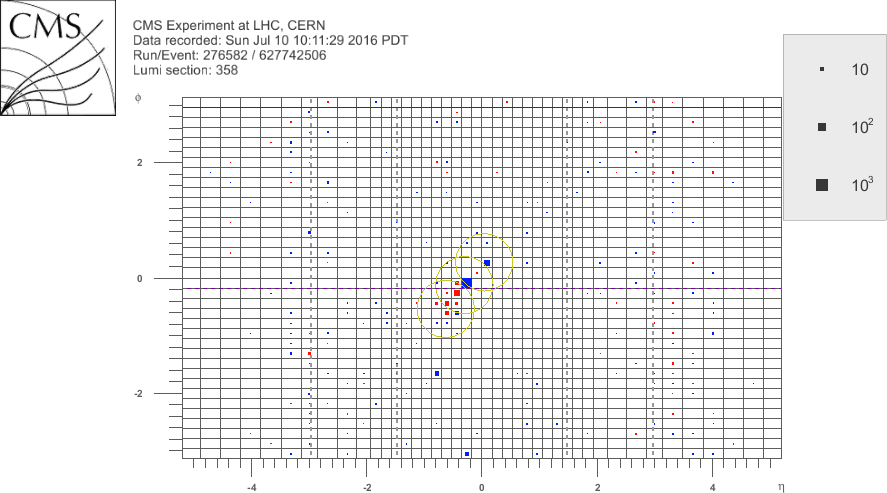
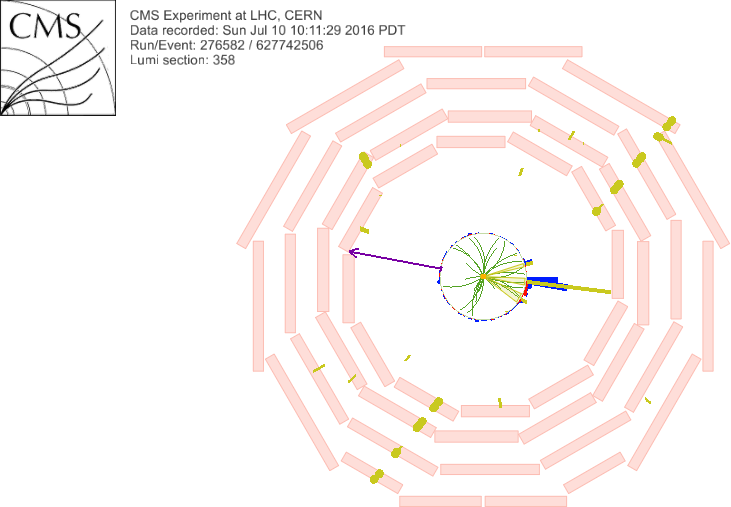
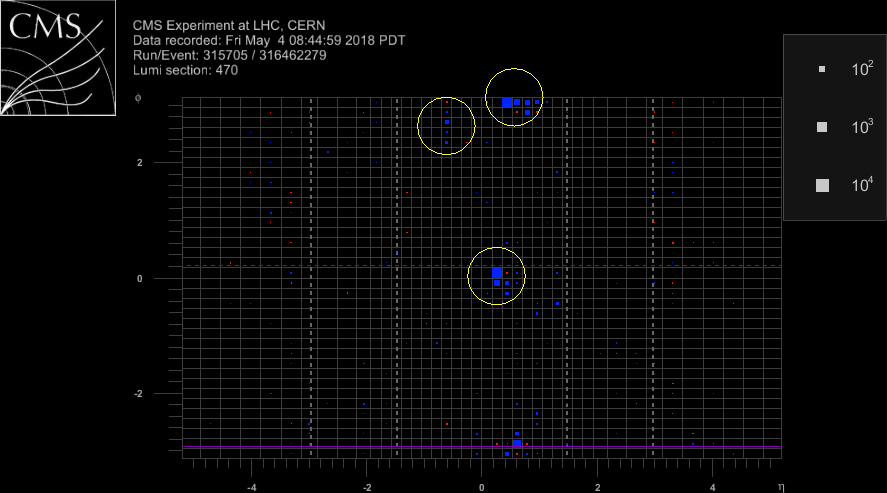
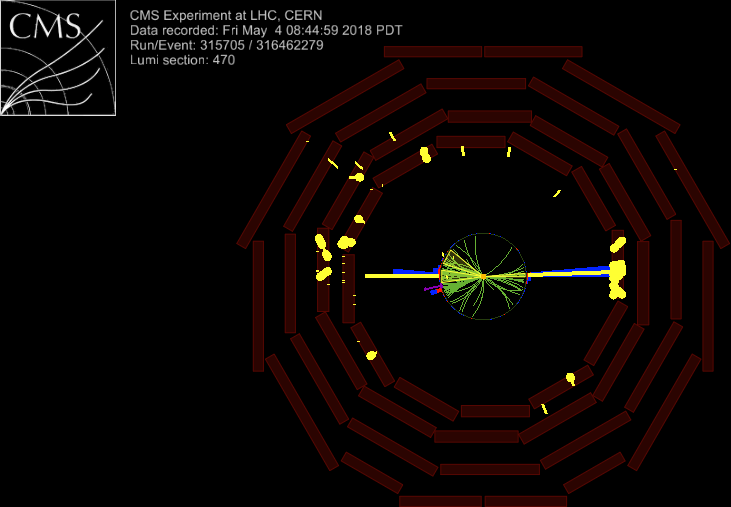
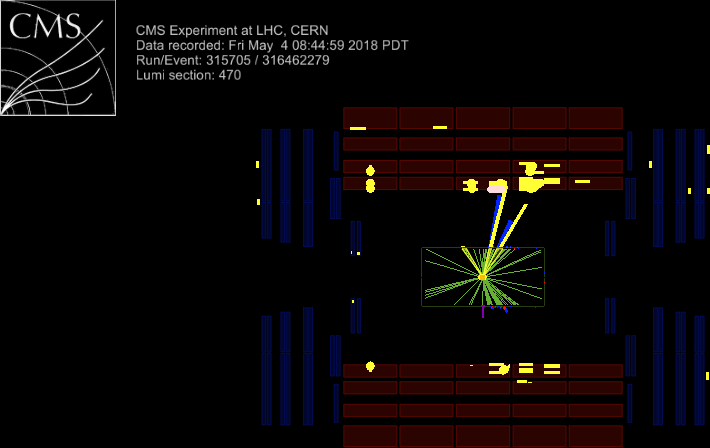
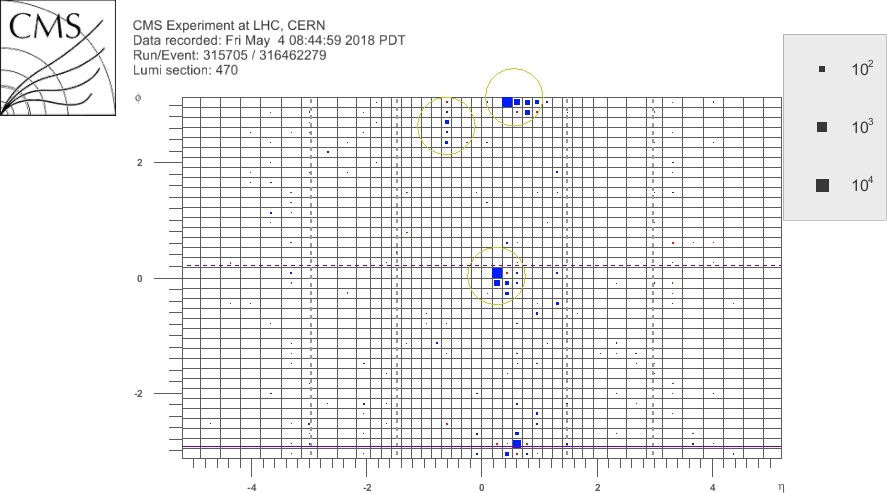
Additional Figure 15:
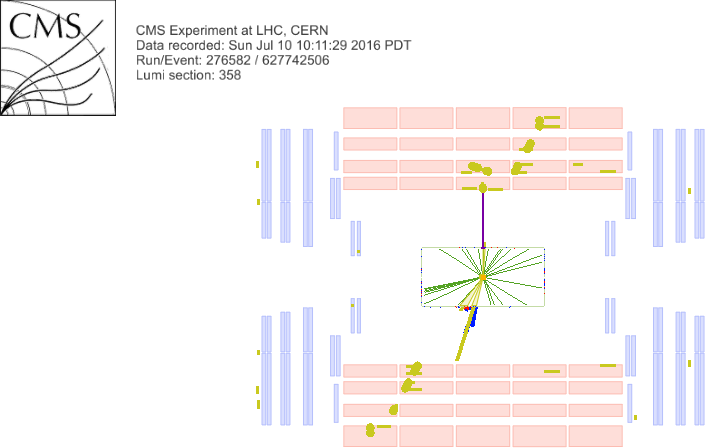
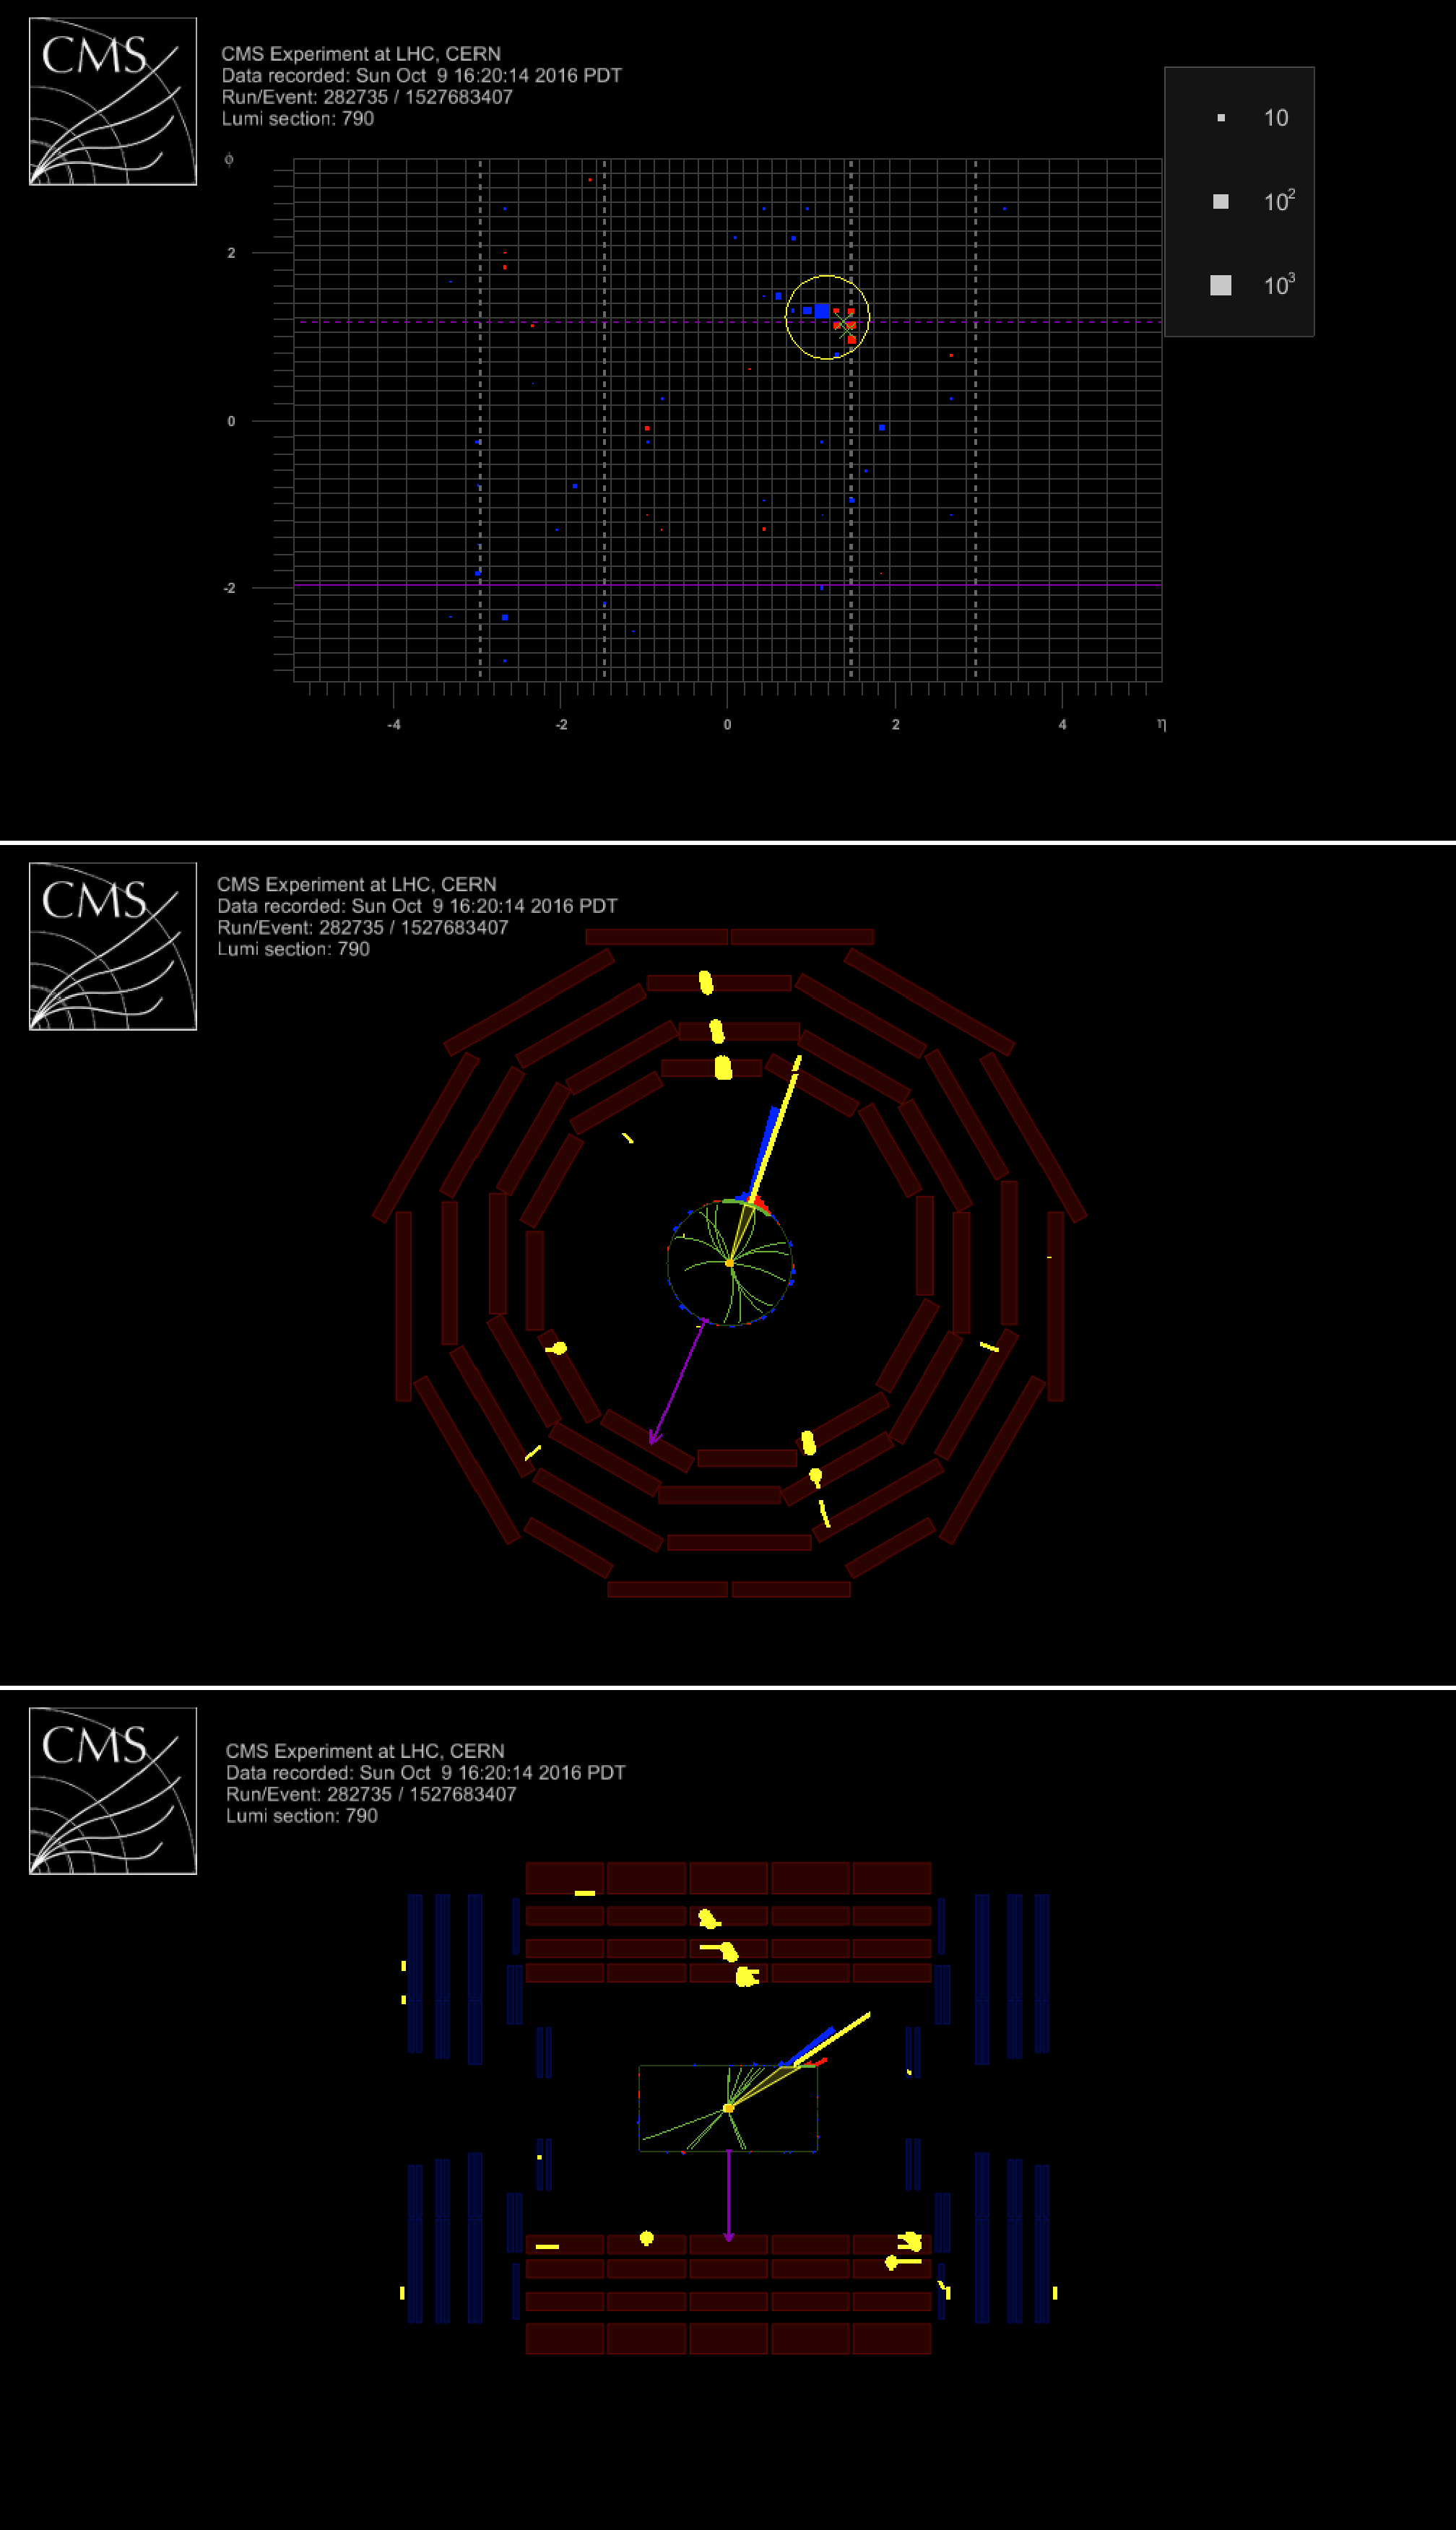
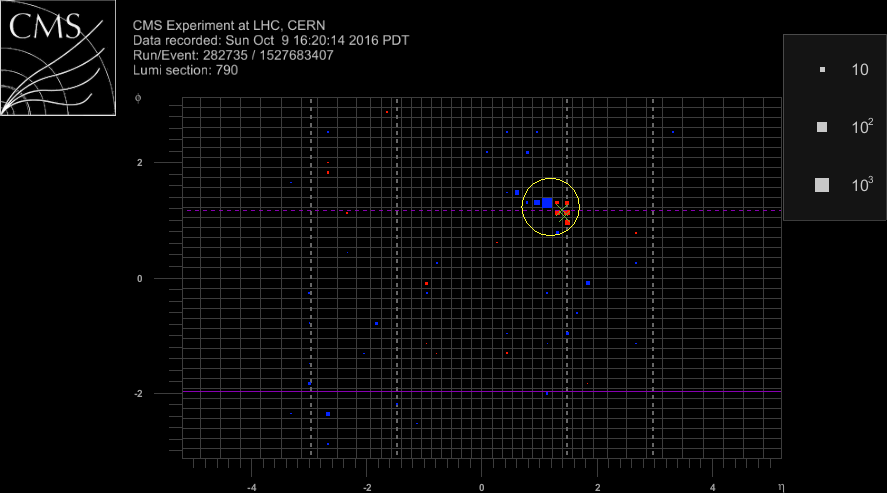
Event display for a beam muon candidate event which satisfies all signal selections except for $ {\textrm {HEF}} $ and $ {E^{\textrm {CSC}}_\textrm {ECAL}/E_{\textrm {ECAL}}} $ (black background). |
png pdf |
Additional Figure 15-a:
Event display for a beam muon candidate event which satisfies all signal selections except for $ {\textrm {HEF}} $ and $ {E^{\textrm {CSC}}_\textrm {ECAL}/E_{\textrm {ECAL}}} $ (black background). |
png pdf |
Additional Figure 15-b:
Event display for a beam muon candidate event which satisfies all signal selections except for $ {\textrm {HEF}} $ and $ {E^{\textrm {CSC}}_\textrm {ECAL}/E_{\textrm {ECAL}}} $ (black background). |
png pdf |
Additional Figure 15-c:
Event display for a beam muon candidate event which satisfies all signal selections except for $ {\textrm {HEF}} $ and $ {E^{\textrm {CSC}}_\textrm {ECAL}/E_{\textrm {ECAL}}} $ (black background). |
png pdf |
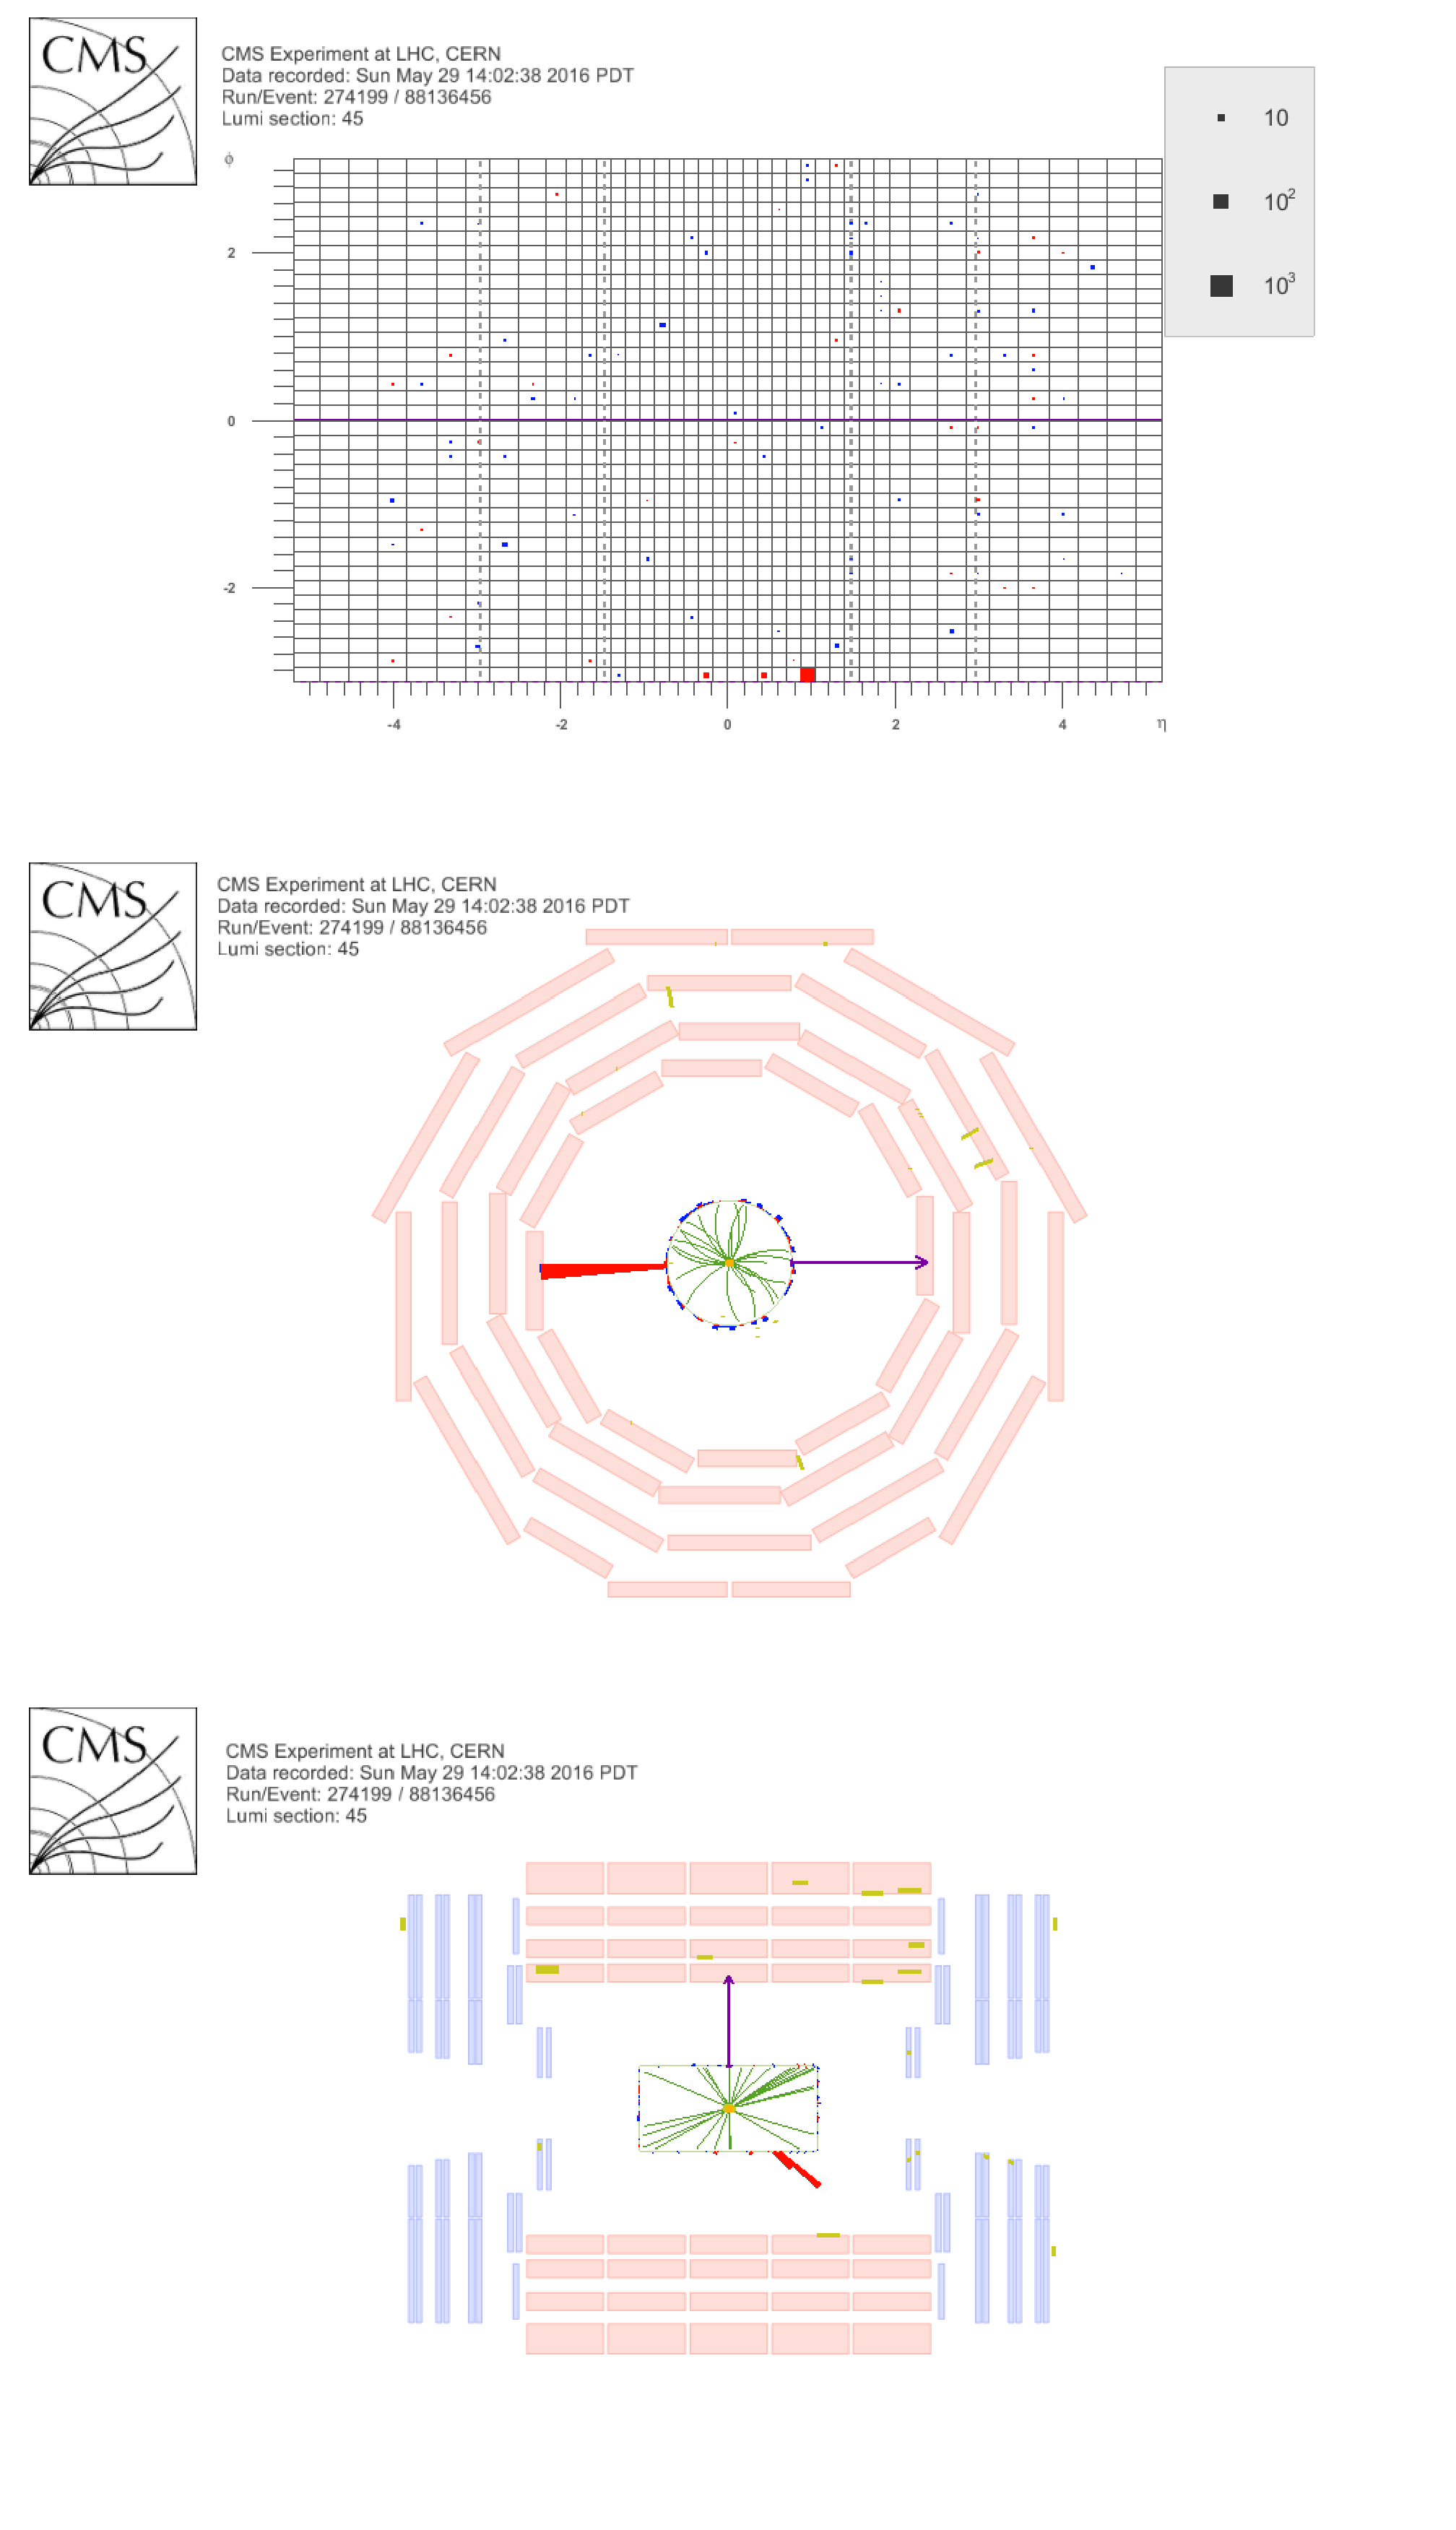
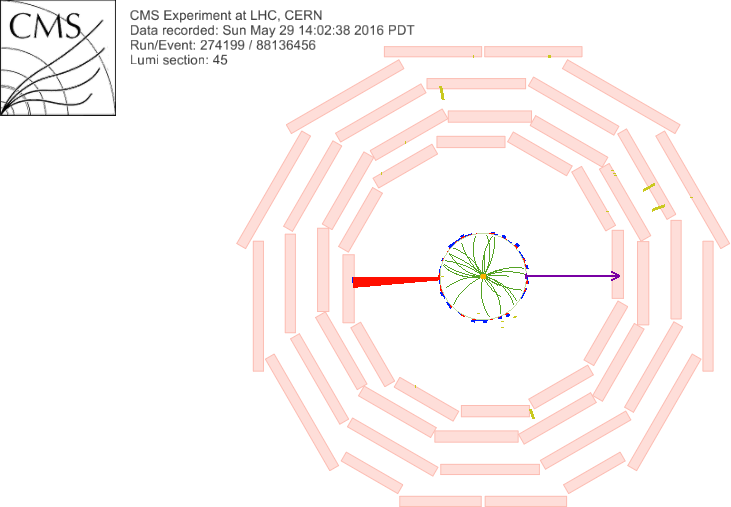
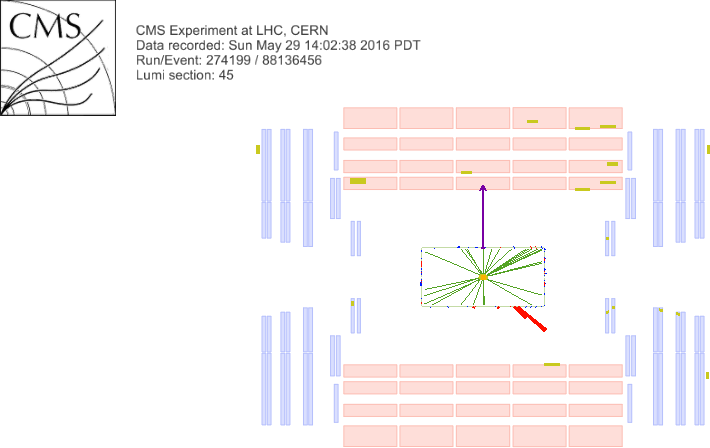
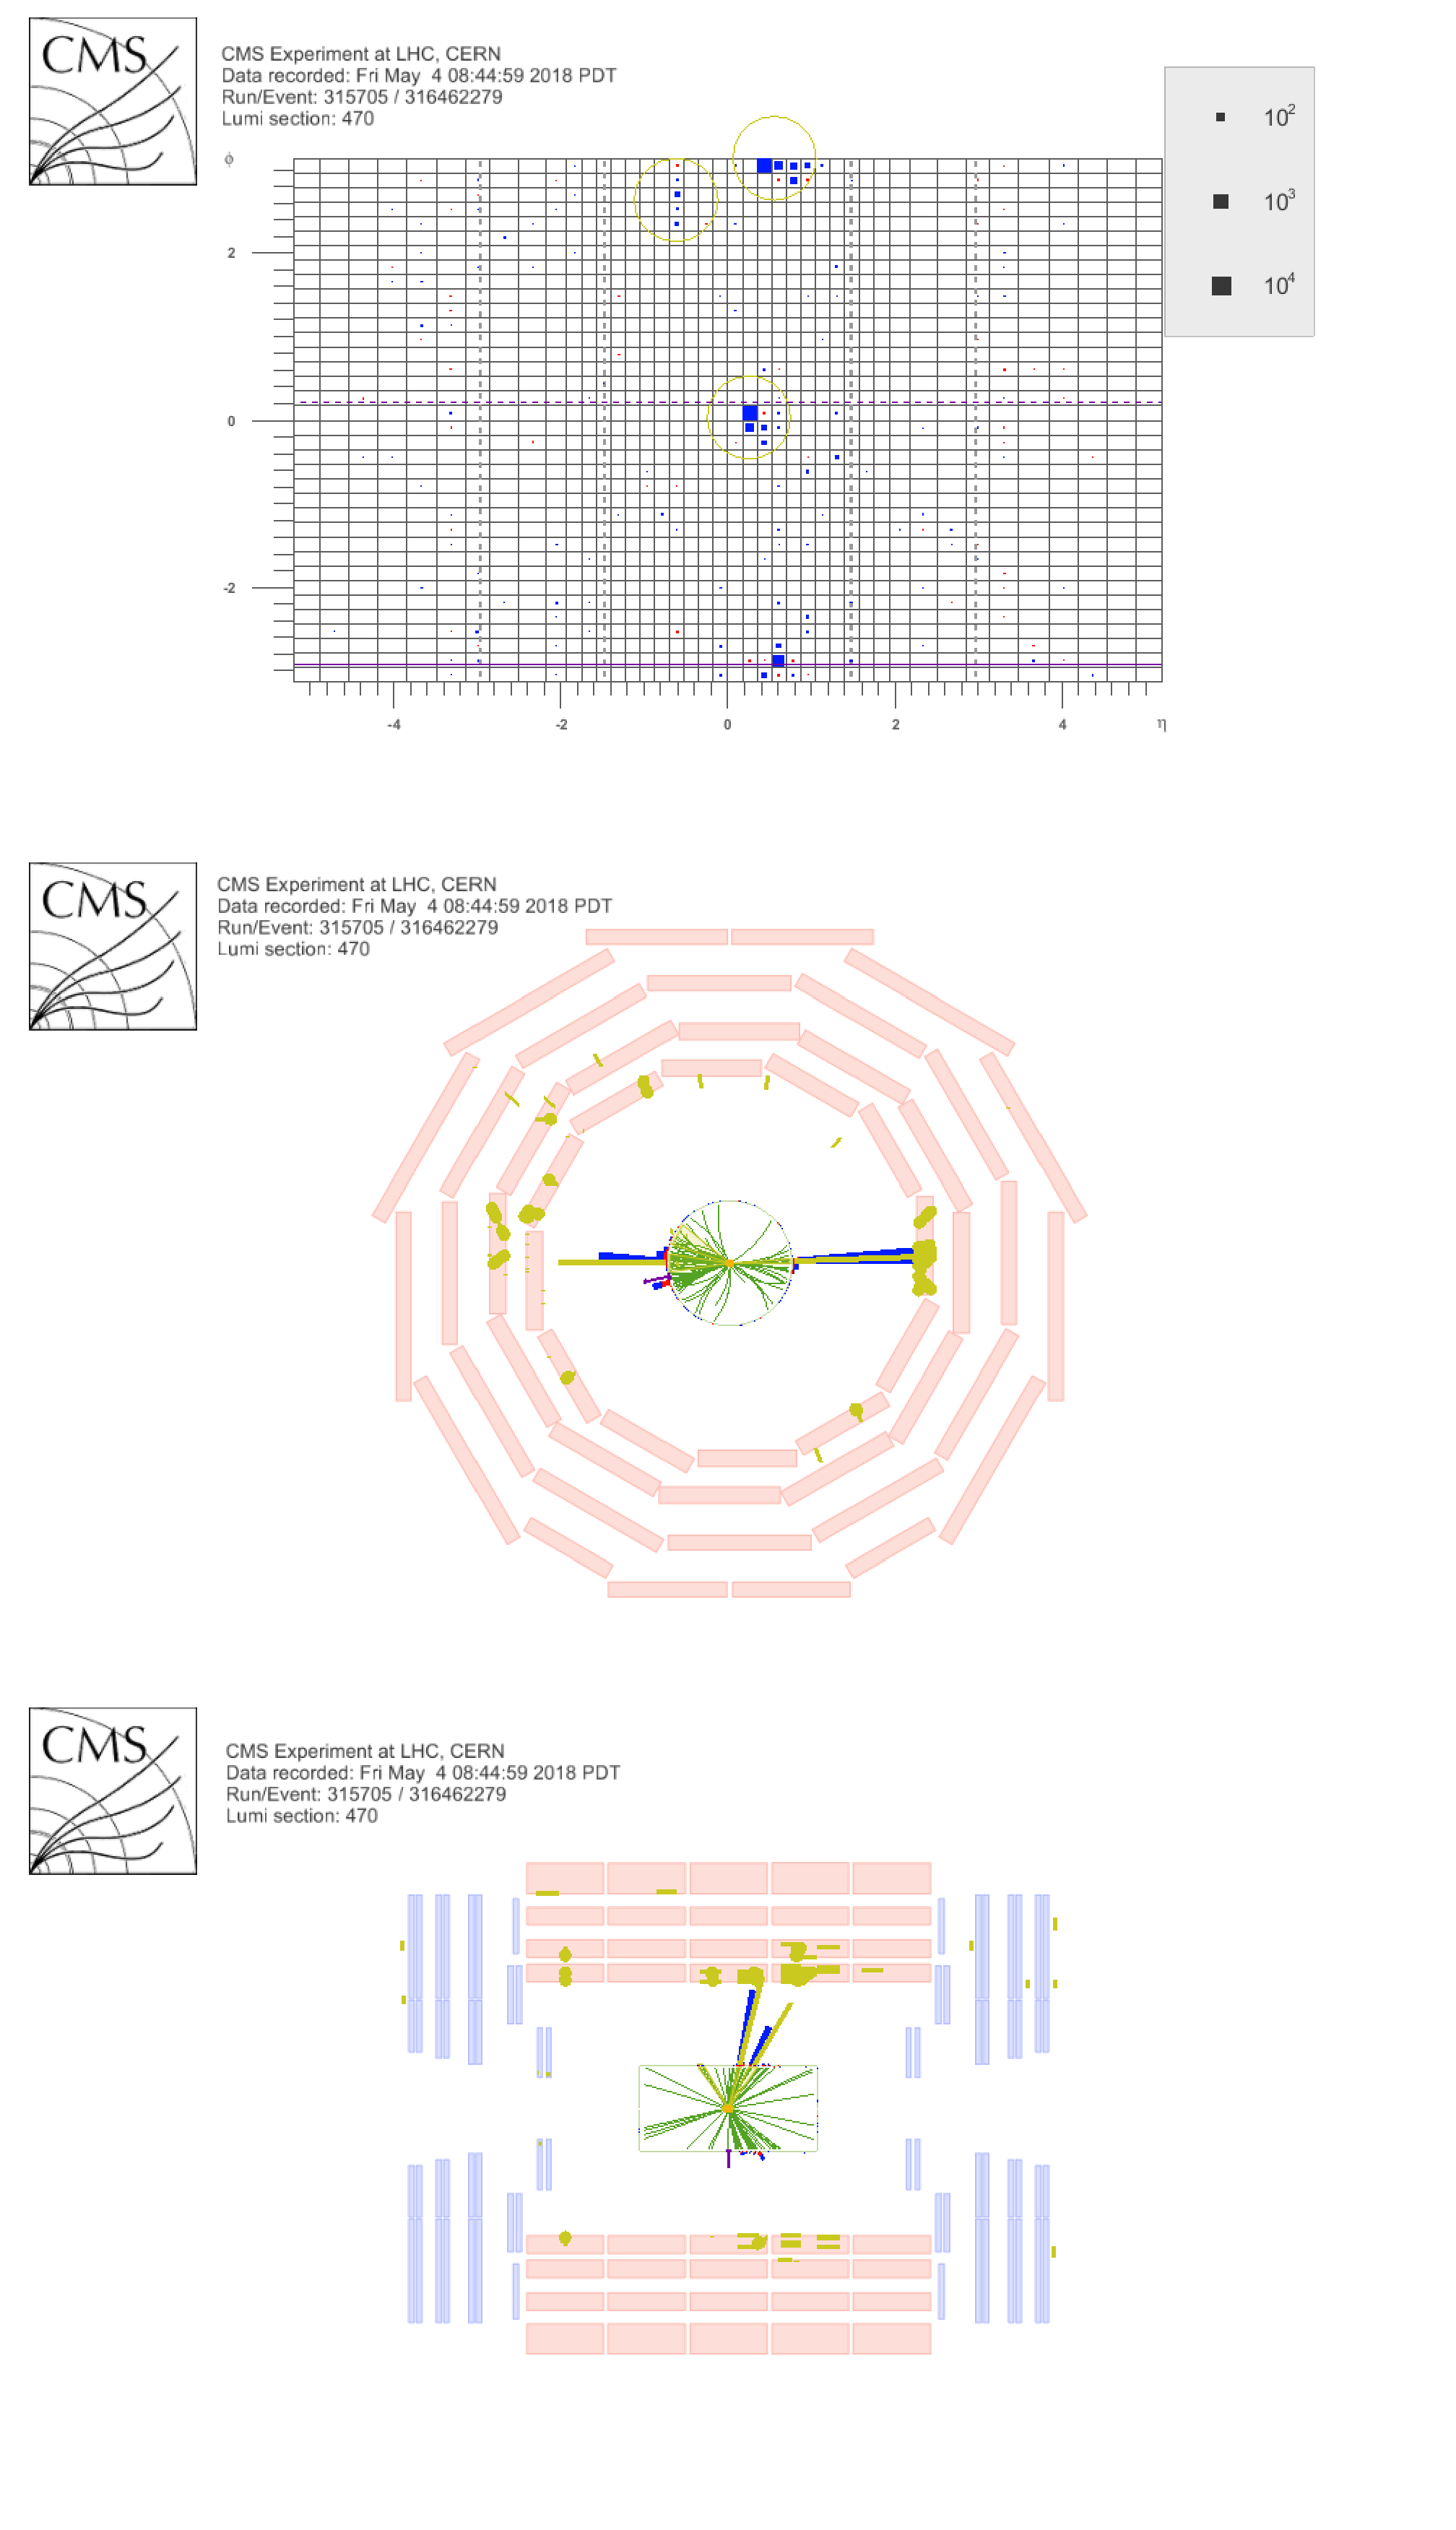
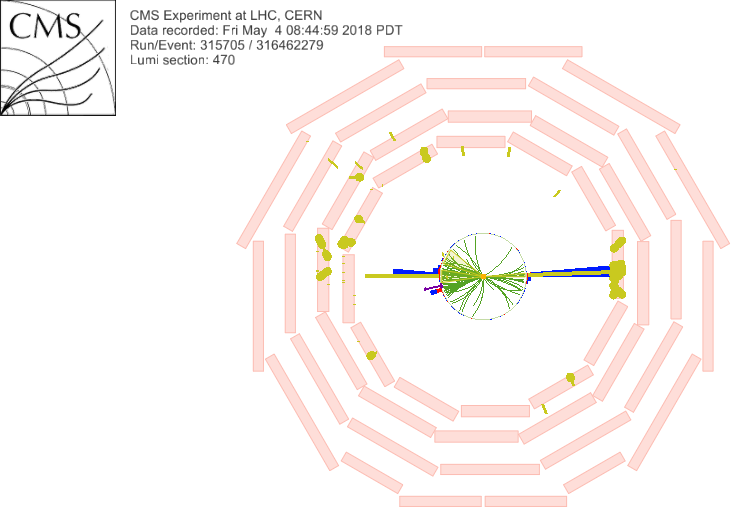
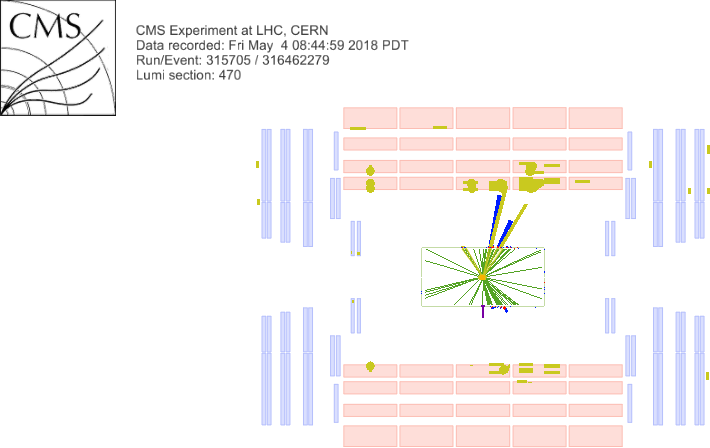
Additional Figure 16:
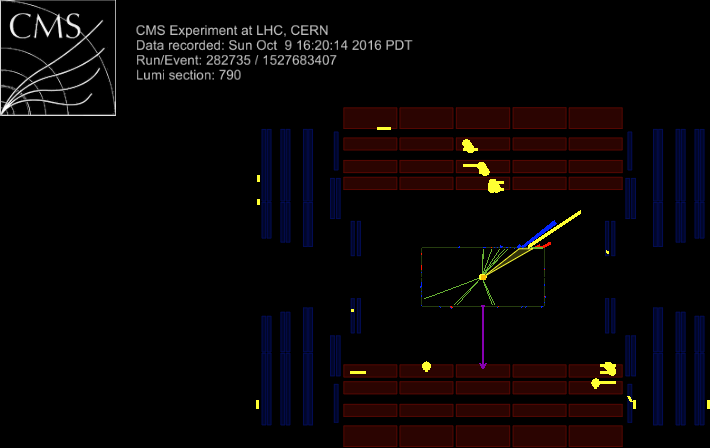
Event display for a beam muon candidate event which satisfies all signal selections except for $ {\textrm {HEF}} $ and $ {E^{\textrm {CSC}}_\textrm {ECAL}/E_{\textrm {ECAL}}} $ (white background). |
png pdf |
Additional Figure 16-a:
Event display for a beam muon candidate event which satisfies all signal selections except for $ {\textrm {HEF}} $ and $ {E^{\textrm {CSC}}_\textrm {ECAL}/E_{\textrm {ECAL}}} $ (white background). |
png pdf |
Additional Figure 16-b:
Event display for a beam muon candidate event which satisfies all signal selections except for $ {\textrm {HEF}} $ and $ {E^{\textrm {CSC}}_\textrm {ECAL}/E_{\textrm {ECAL}}} $ (white background). |
png pdf |
Additional Figure 16-c:
Event display for a beam muon candidate event which satisfies all signal selections except for $ {\textrm {HEF}} $ and $ {E^{\textrm {CSC}}_\textrm {ECAL}/E_{\textrm {ECAL}}} $ (white background). |
png pdf |
Additional Figure 17:
Event display for a cosmic muon candidate which satisfies all signal selections except for $ {\textrm {max}(\Delta \phi _{DT})} $ (black background). |
png pdf |
Additional Figure 17-a:
Event display for a cosmic muon candidate which satisfies all signal selections except for $ {\textrm {max}(\Delta \phi _{DT})} $ (black background). |

png pdf |
Additional Figure 17-b:
Event display for a cosmic muon candidate which satisfies all signal selections except for $ {\textrm {max}(\Delta \phi _{DT})} $ (black background). |
png pdf |
Additional Figure 17-c:
Event display for a cosmic muon candidate which satisfies all signal selections except for $ {\textrm {max}(\Delta \phi _{DT})} $ (black background). |

png pdf |
Additional Figure 18:
Event display for a cosmic muon candidate which satisfies all signal selections except for $ {\textrm {max}(\Delta \phi _{DT})} $ (white background). |
png pdf |
Additional Figure 18-a:
Event display for a cosmic muon candidate which satisfies all signal selections except for $ {\textrm {max}(\Delta \phi _{DT})} $ (white background). |
png pdf |
Additional Figure 18-b:
Event display for a cosmic muon candidate which satisfies all signal selections except for $ {\textrm {max}(\Delta \phi _{DT})} $ (white background). |
png pdf |
Additional Figure 18-c:
Event display for a cosmic muon candidate which satisfies all signal selections except for $ {\textrm {max}(\Delta \phi _{DT})} $ (white background). |
png pdf |
Additional Figure 19:
Event display for a cosmic muon candidate which satisfies all signal selections except for $ {\textrm {max}(\Delta \phi _{RPC})} $ (black background). |
png pdf |
Additional Figure 19-a:
Event display for a cosmic muon candidate which satisfies all signal selections except for $ {\textrm {max}(\Delta \phi _{RPC})} $ (black background). |

png pdf |
Additional Figure 19-b:
Event display for a cosmic muon candidate which satisfies all signal selections except for $ {\textrm {max}(\Delta \phi _{RPC})} $ (black background). |
png pdf |
Additional Figure 19-c:
Event display for a cosmic muon candidate which satisfies all signal selections except for $ {\textrm {max}(\Delta \phi _{RPC})} $ (black background). |
png pdf |
Additional Figure 20:
Event display for a cosmic muon candidate which satisfies all signal selections except for $ {\textrm {max}(\Delta \phi _{RPC})} $ (white background). |

png pdf |
Additional Figure 20-a:
Event display for a cosmic muon candidate which satisfies all signal selections except for $ {\textrm {max}(\Delta \phi _{RPC})} $ (white background). |
png pdf |
Additional Figure 20-b:
Event display for a cosmic muon candidate which satisfies all signal selections except for $ {\textrm {max}(\Delta \phi _{RPC})} $ (white background). |
png pdf |
Additional Figure 20-c:
Event display for a cosmic muon candidate which satisfies all signal selections except for $ {\textrm {max}(\Delta \phi _{RPC})} $ (white background). |
png pdf |
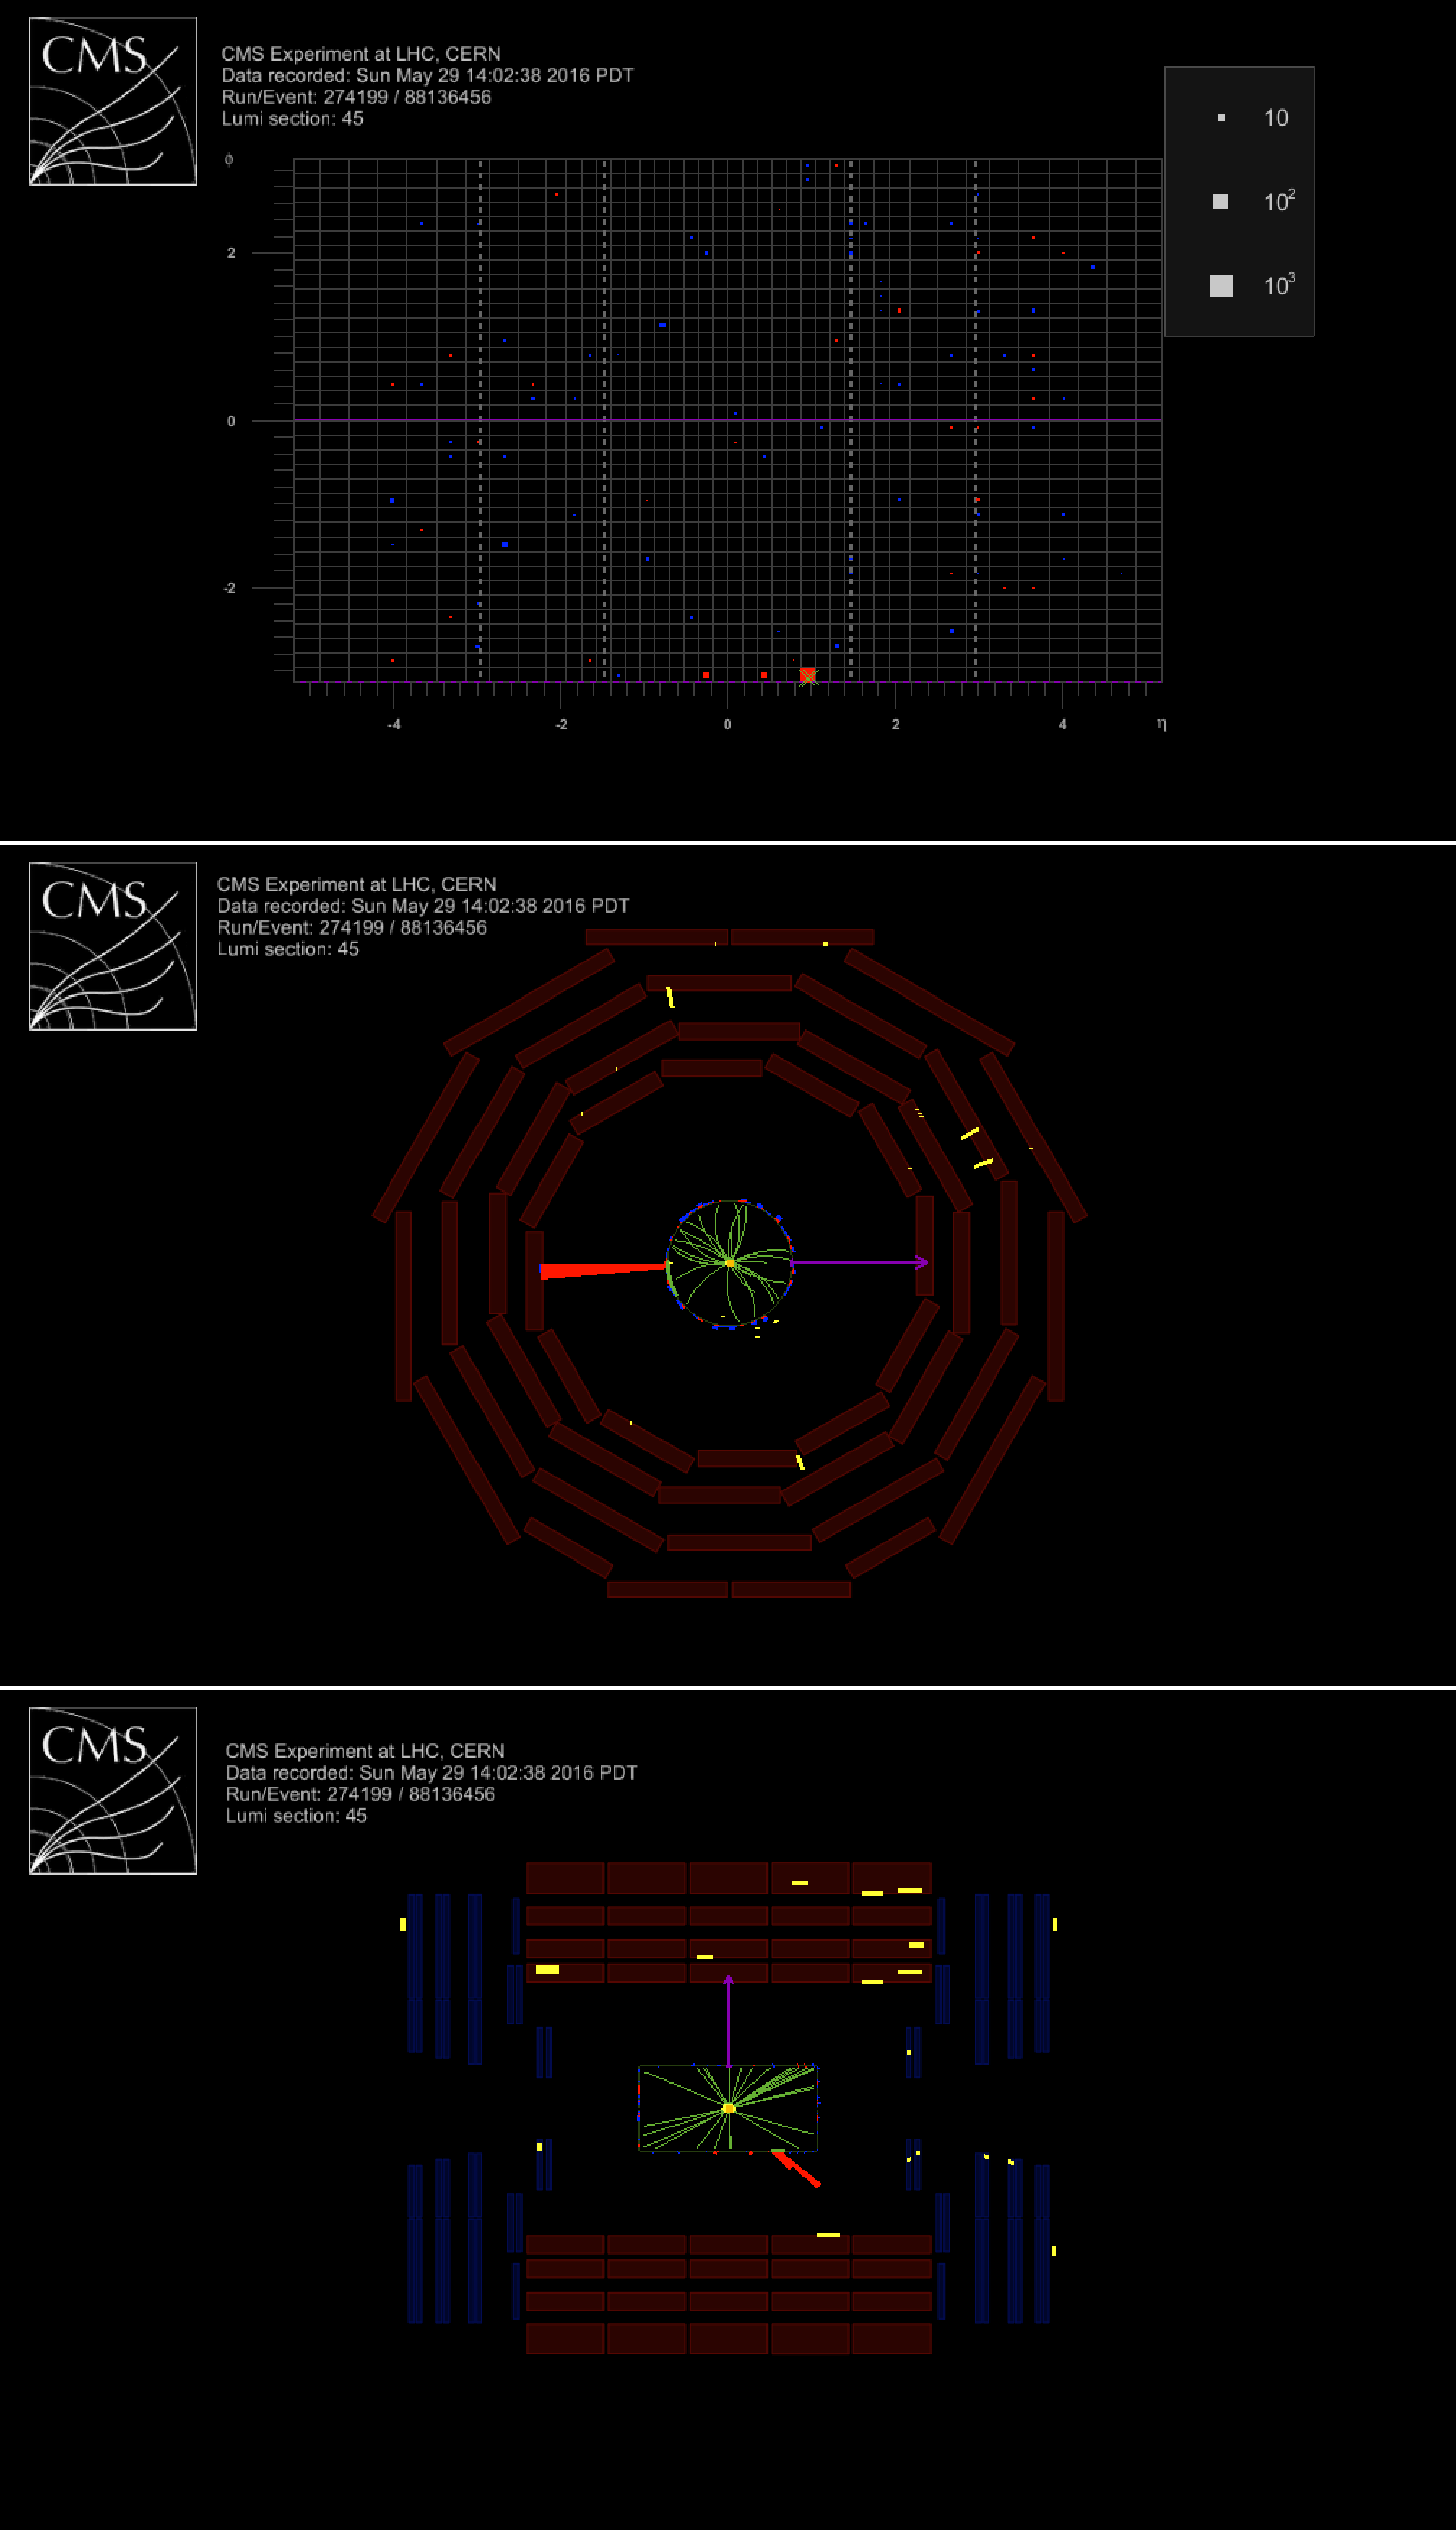
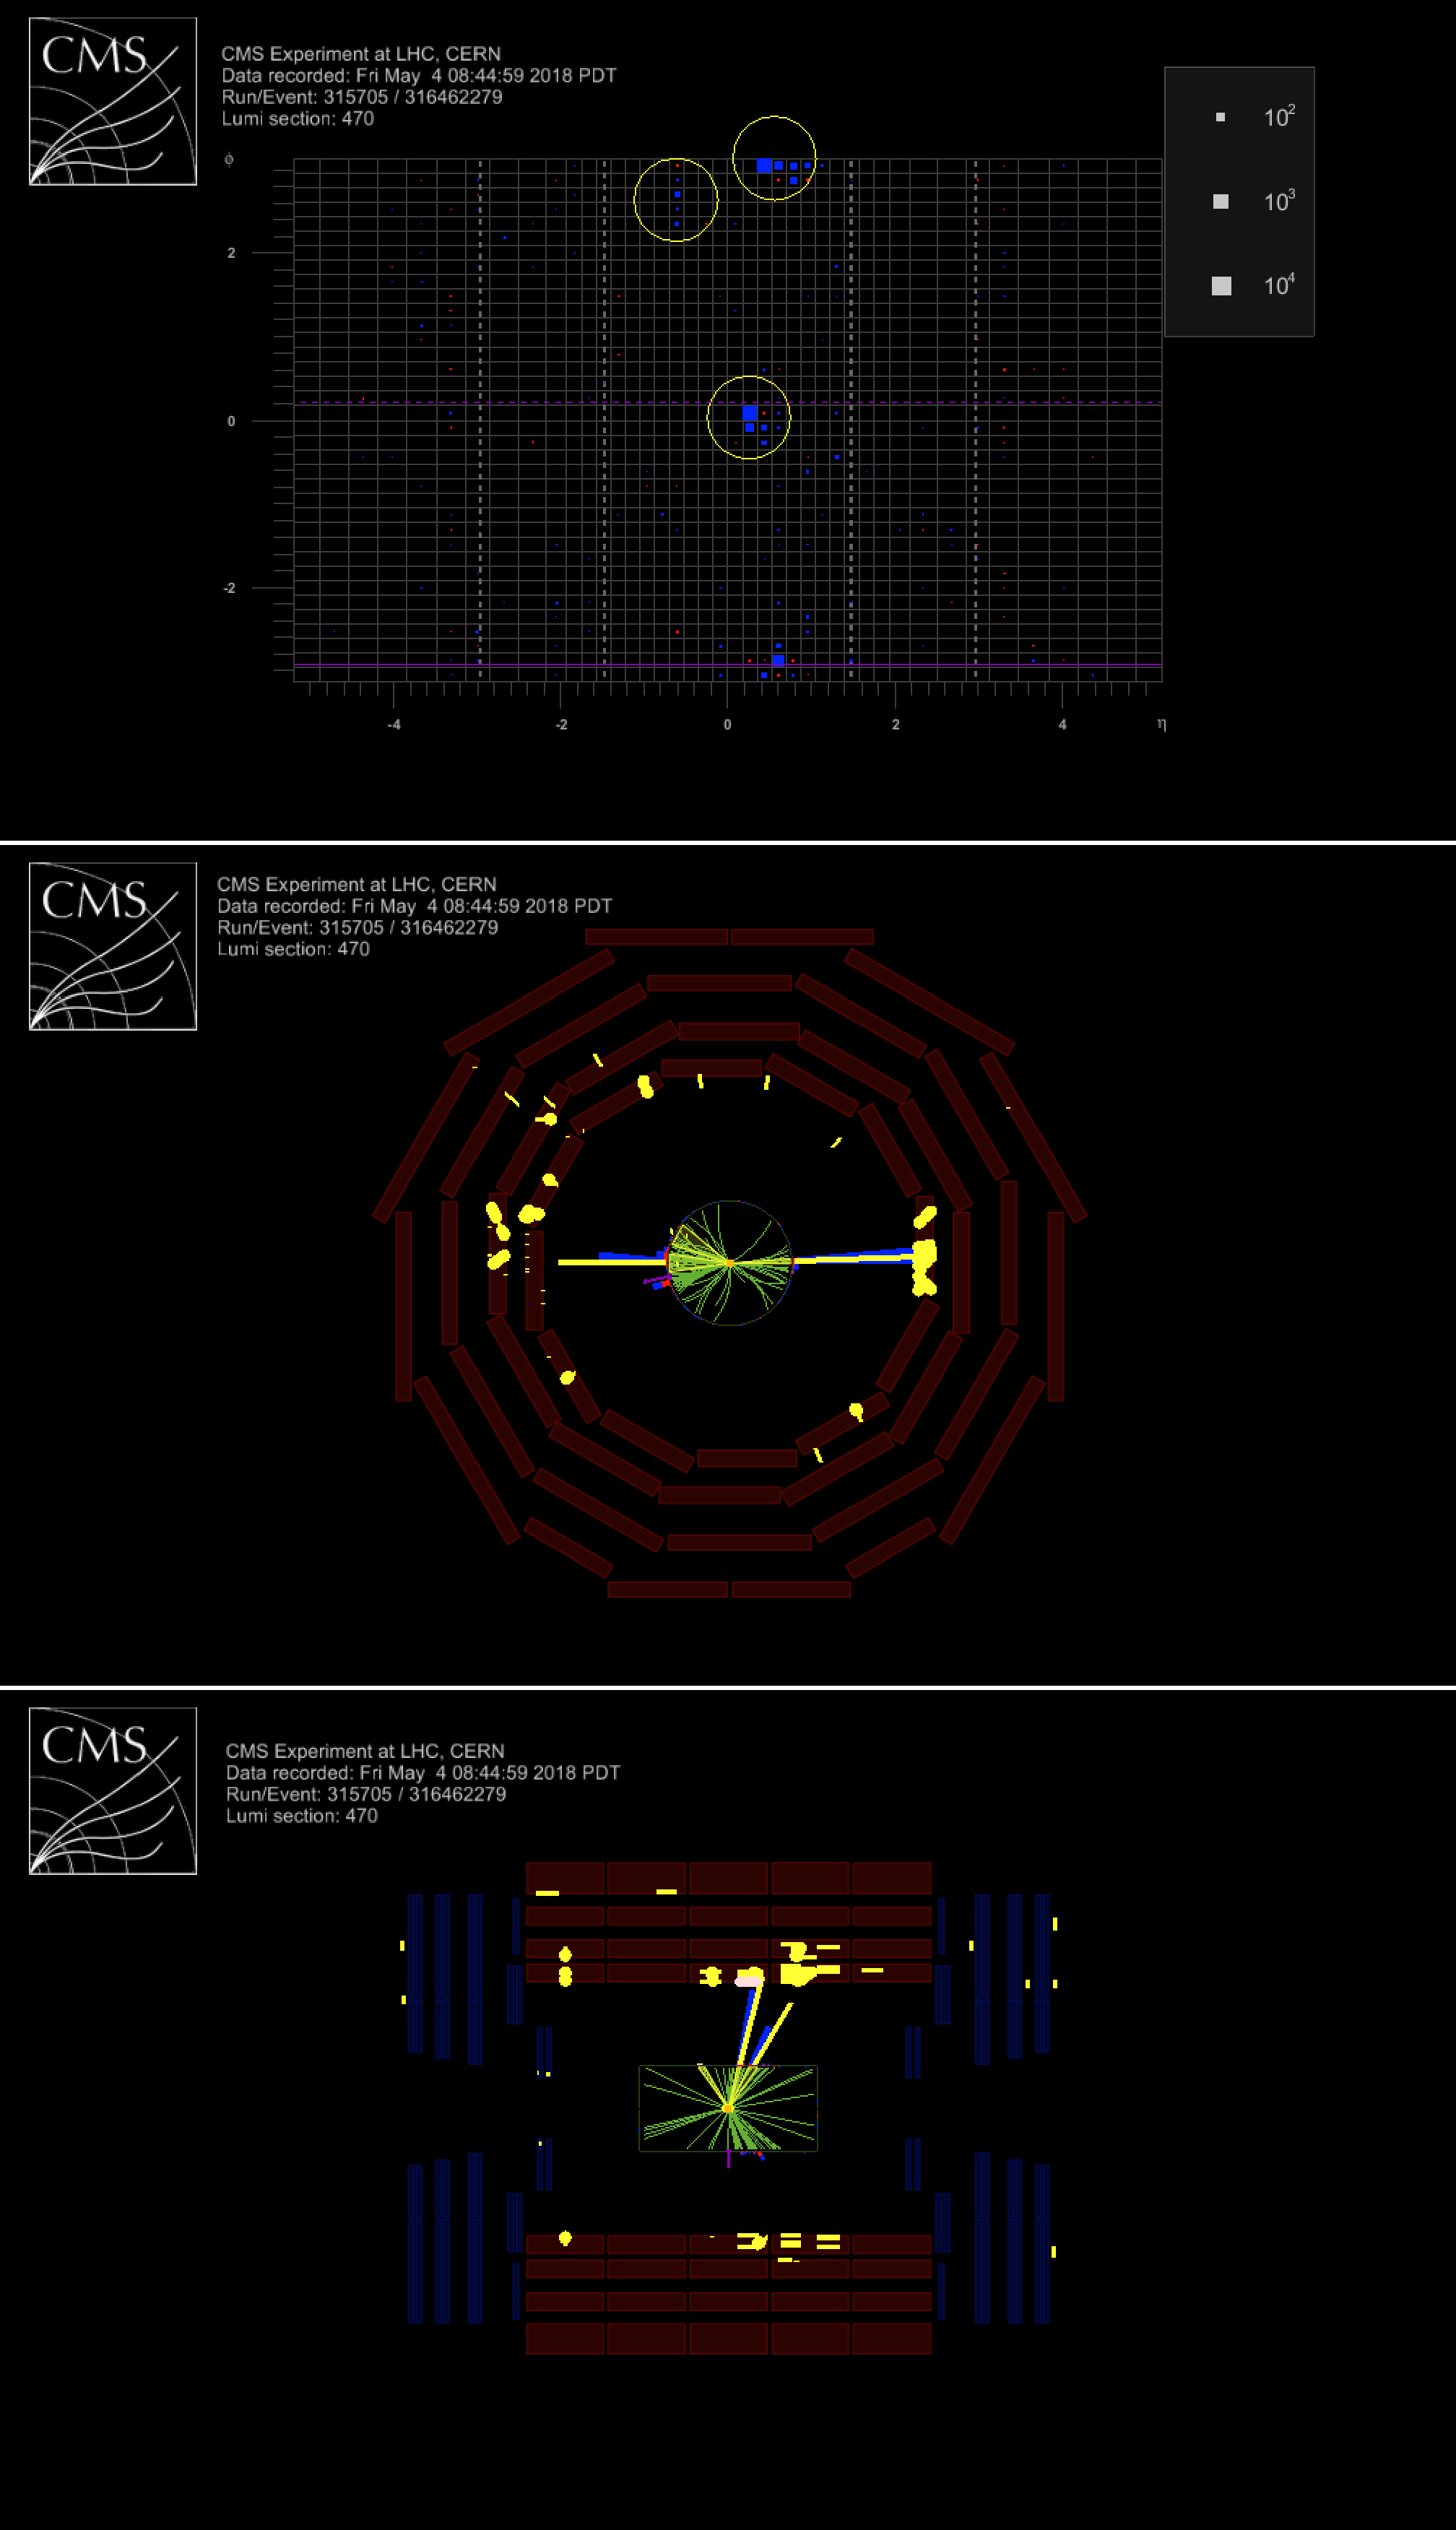
Additional Figure 21:
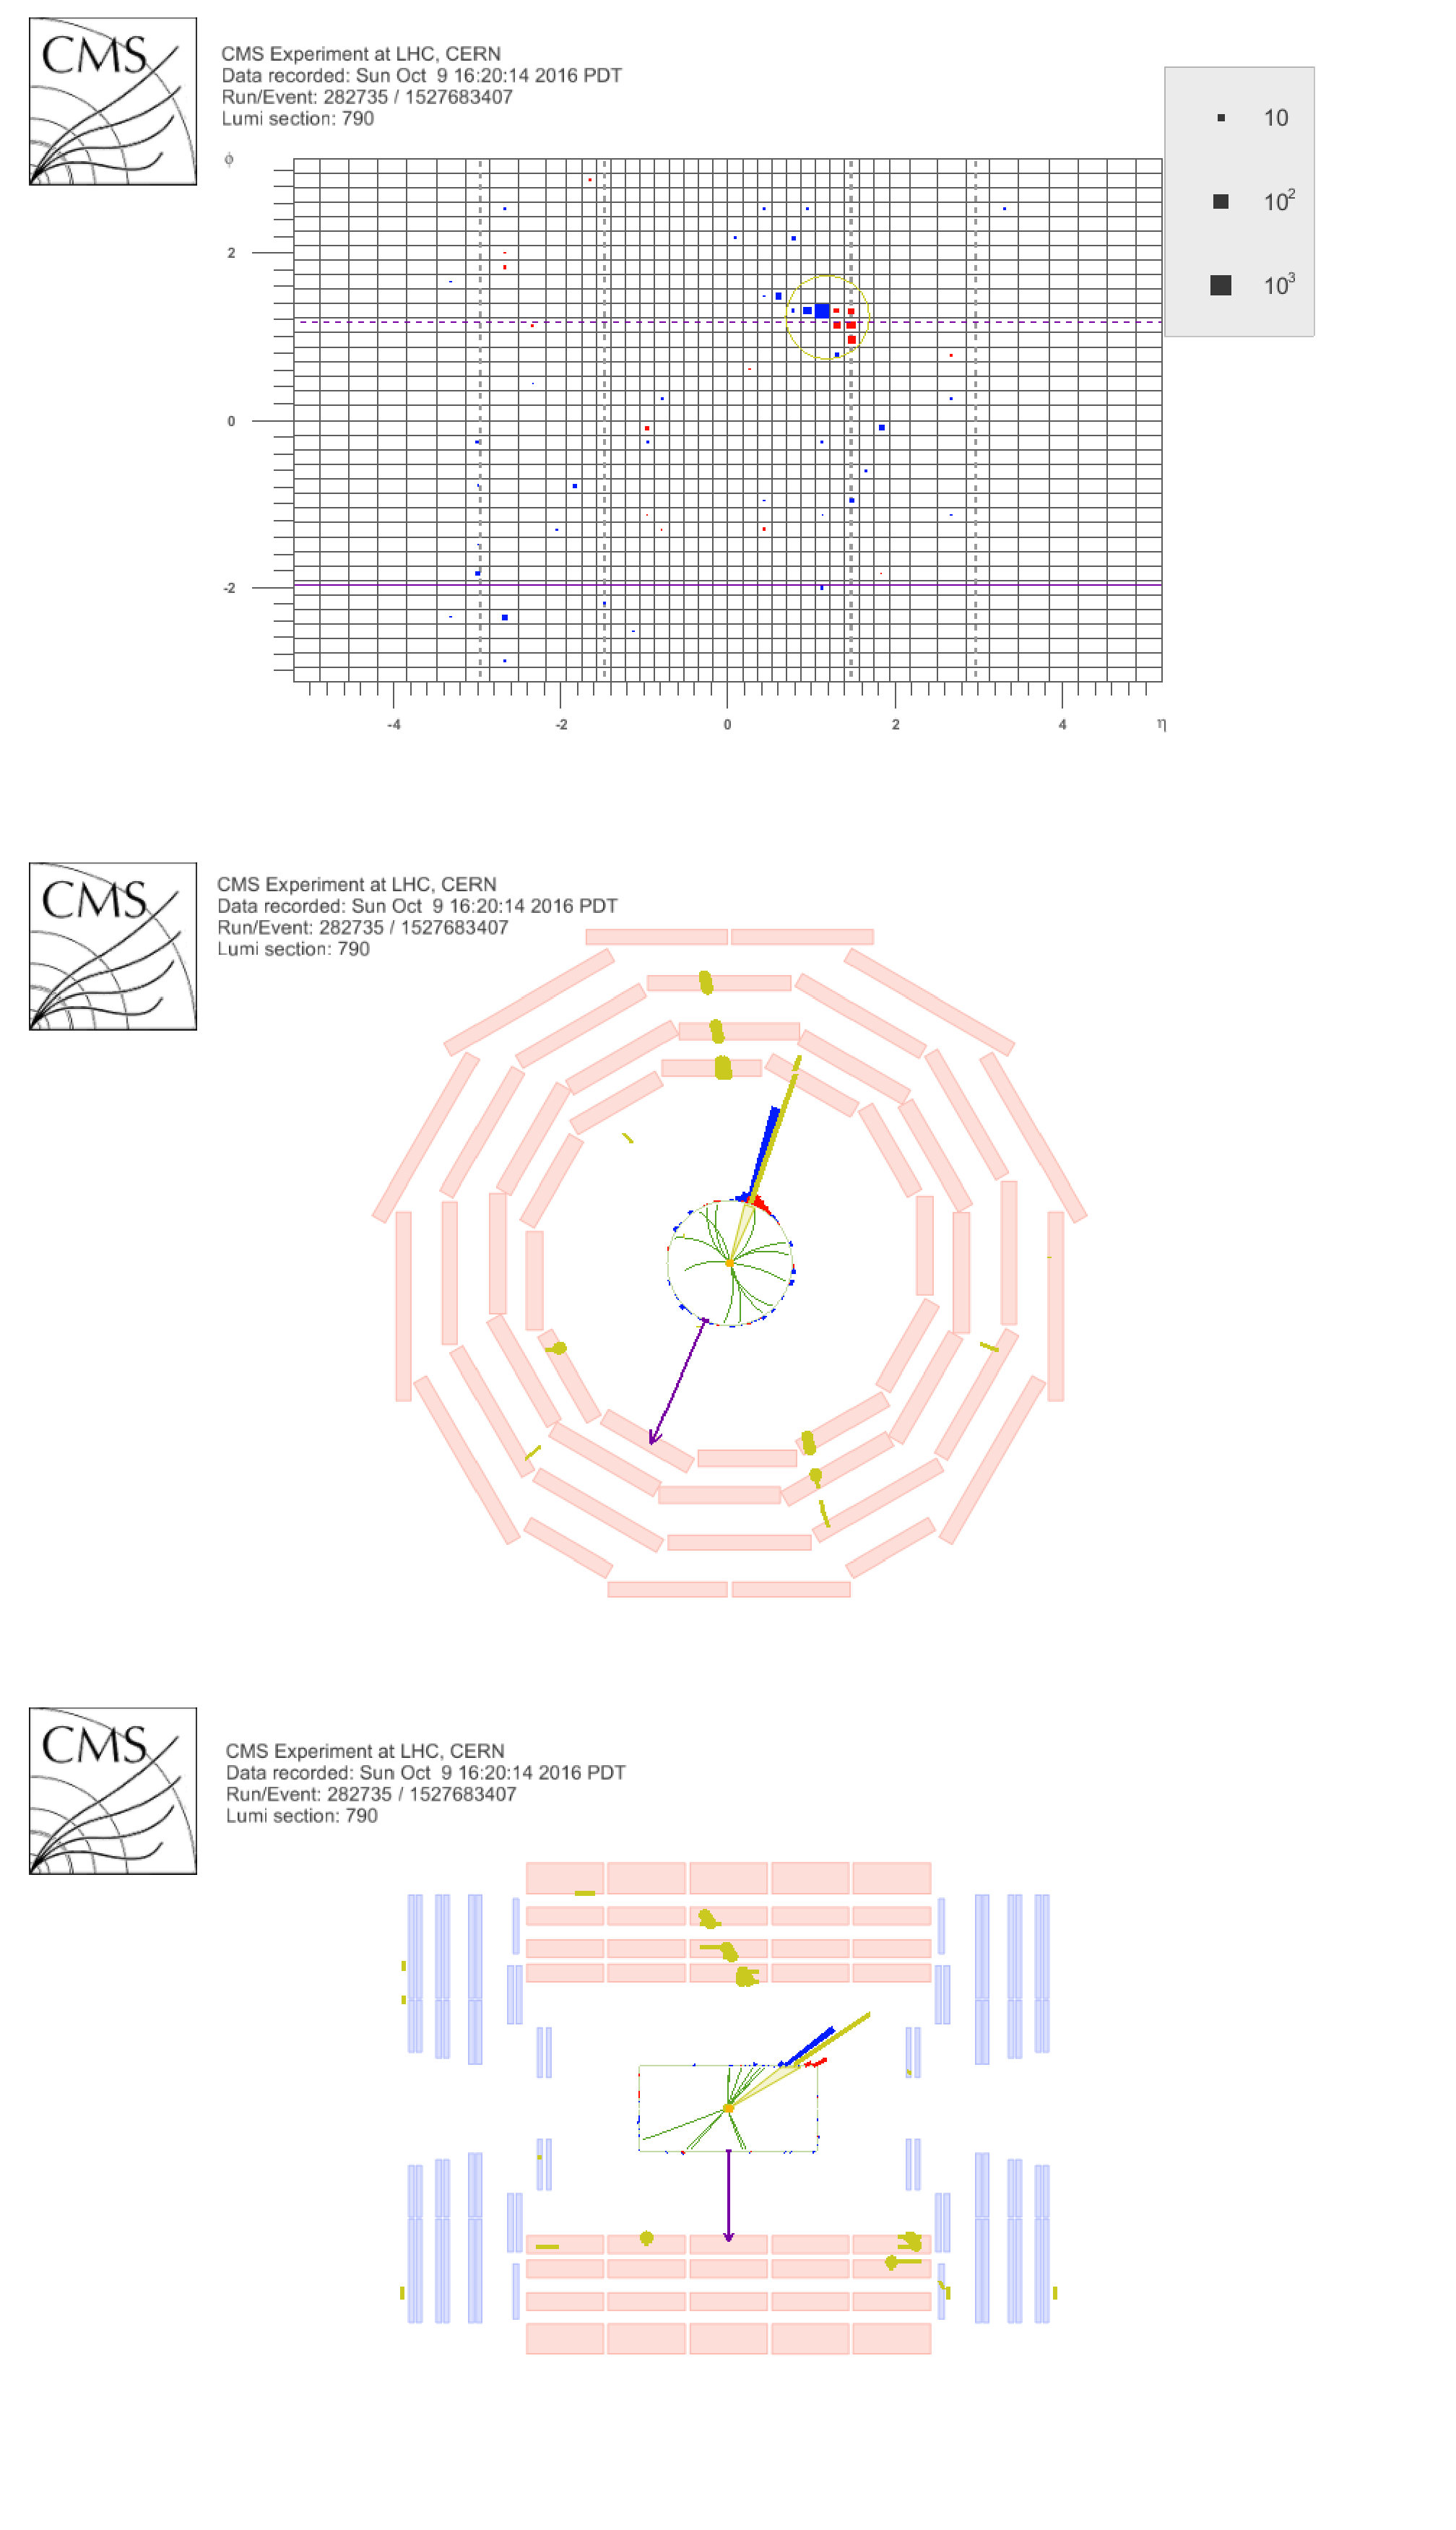
Event display for a satellite bunch candidate which satisfies all signal selections except for $ {PV_{\rm track}^{\rm fraction}} $ (black background). |
png pdf |
Additional Figure 21-a:
Event display for a satellite bunch candidate which satisfies all signal selections except for $ {PV_{\rm track}^{\rm fraction}} $ (black background). |
png pdf |
Additional Figure 21-b:
Event display for a satellite bunch candidate which satisfies all signal selections except for $ {PV_{\rm track}^{\rm fraction}} $ (black background). |
png pdf |
Additional Figure 21-c:
Event display for a satellite bunch candidate which satisfies all signal selections except for $ {PV_{\rm track}^{\rm fraction}} $ (black background). |
png pdf |
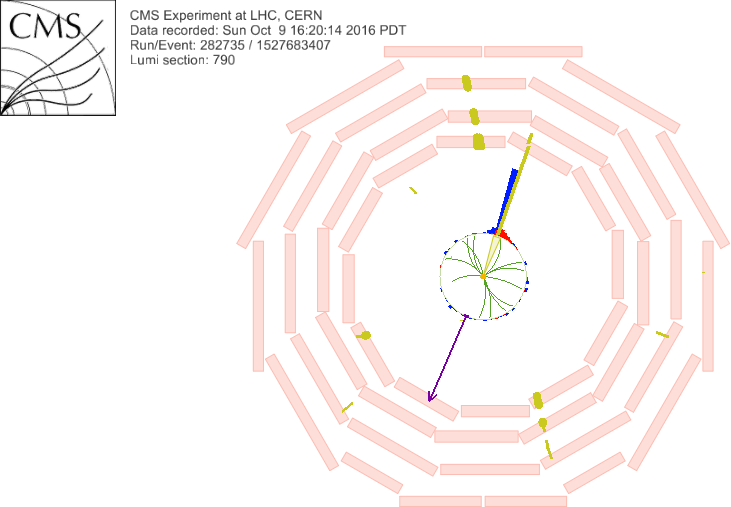
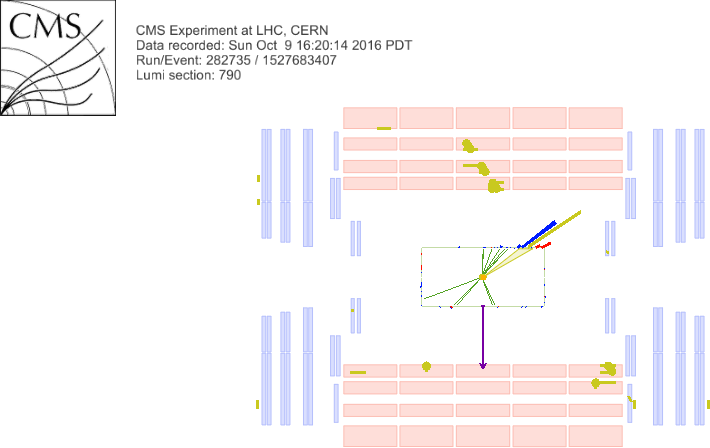
Additional Figure 22:
Event display for a satellite bunch candidate which satisfies all signal selections except for $ {PV_{\rm track}^{\rm fraction}} $ (white background). |
png pdf |
Additional Figure 22-a:
Event display for a satellite bunch candidate which satisfies all signal selections except for $ {PV_{\rm track}^{\rm fraction}} $ (white background). |
png pdf |
Additional Figure 22-b:
Event display for a satellite bunch candidate which satisfies all signal selections except for $ {PV_{\rm track}^{\rm fraction}} $ (white background). |
png pdf |
Additional Figure 22-c:
Event display for a satellite bunch candidate which satisfies all signal selections except for $ {PV_{\rm track}^{\rm fraction}} $ (white background). |

png pdf |
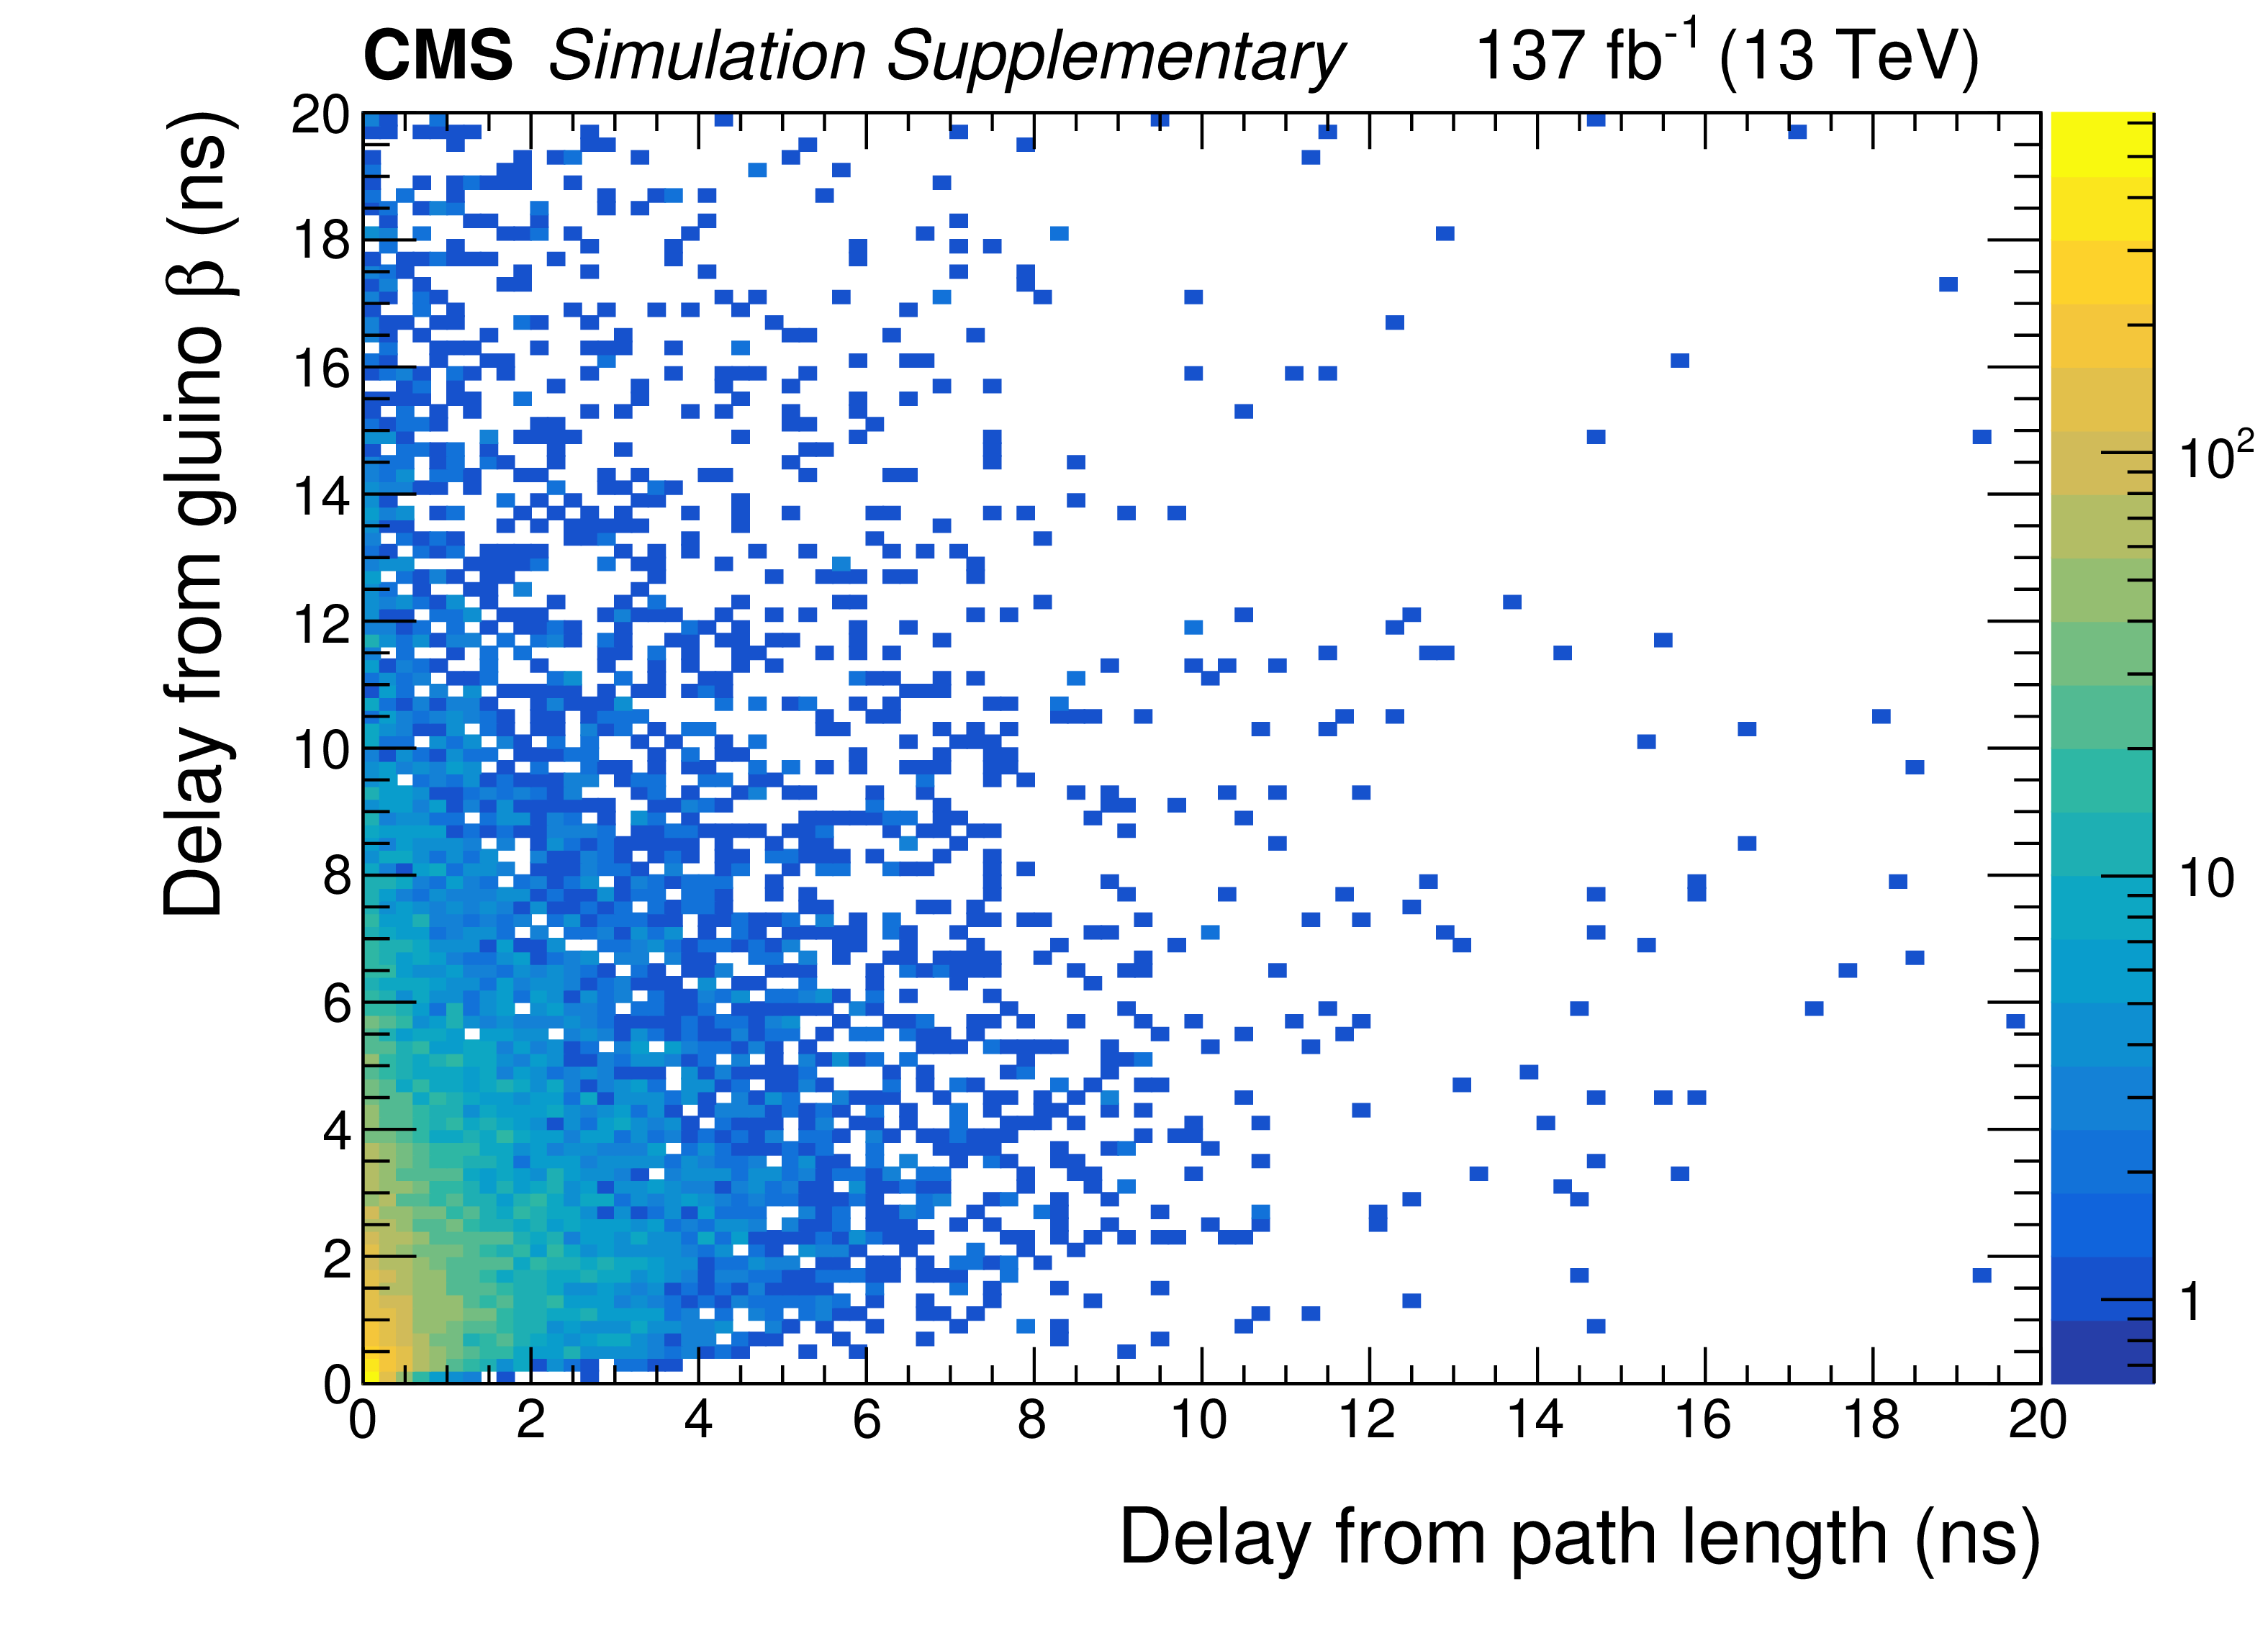
Additional Figure 23:
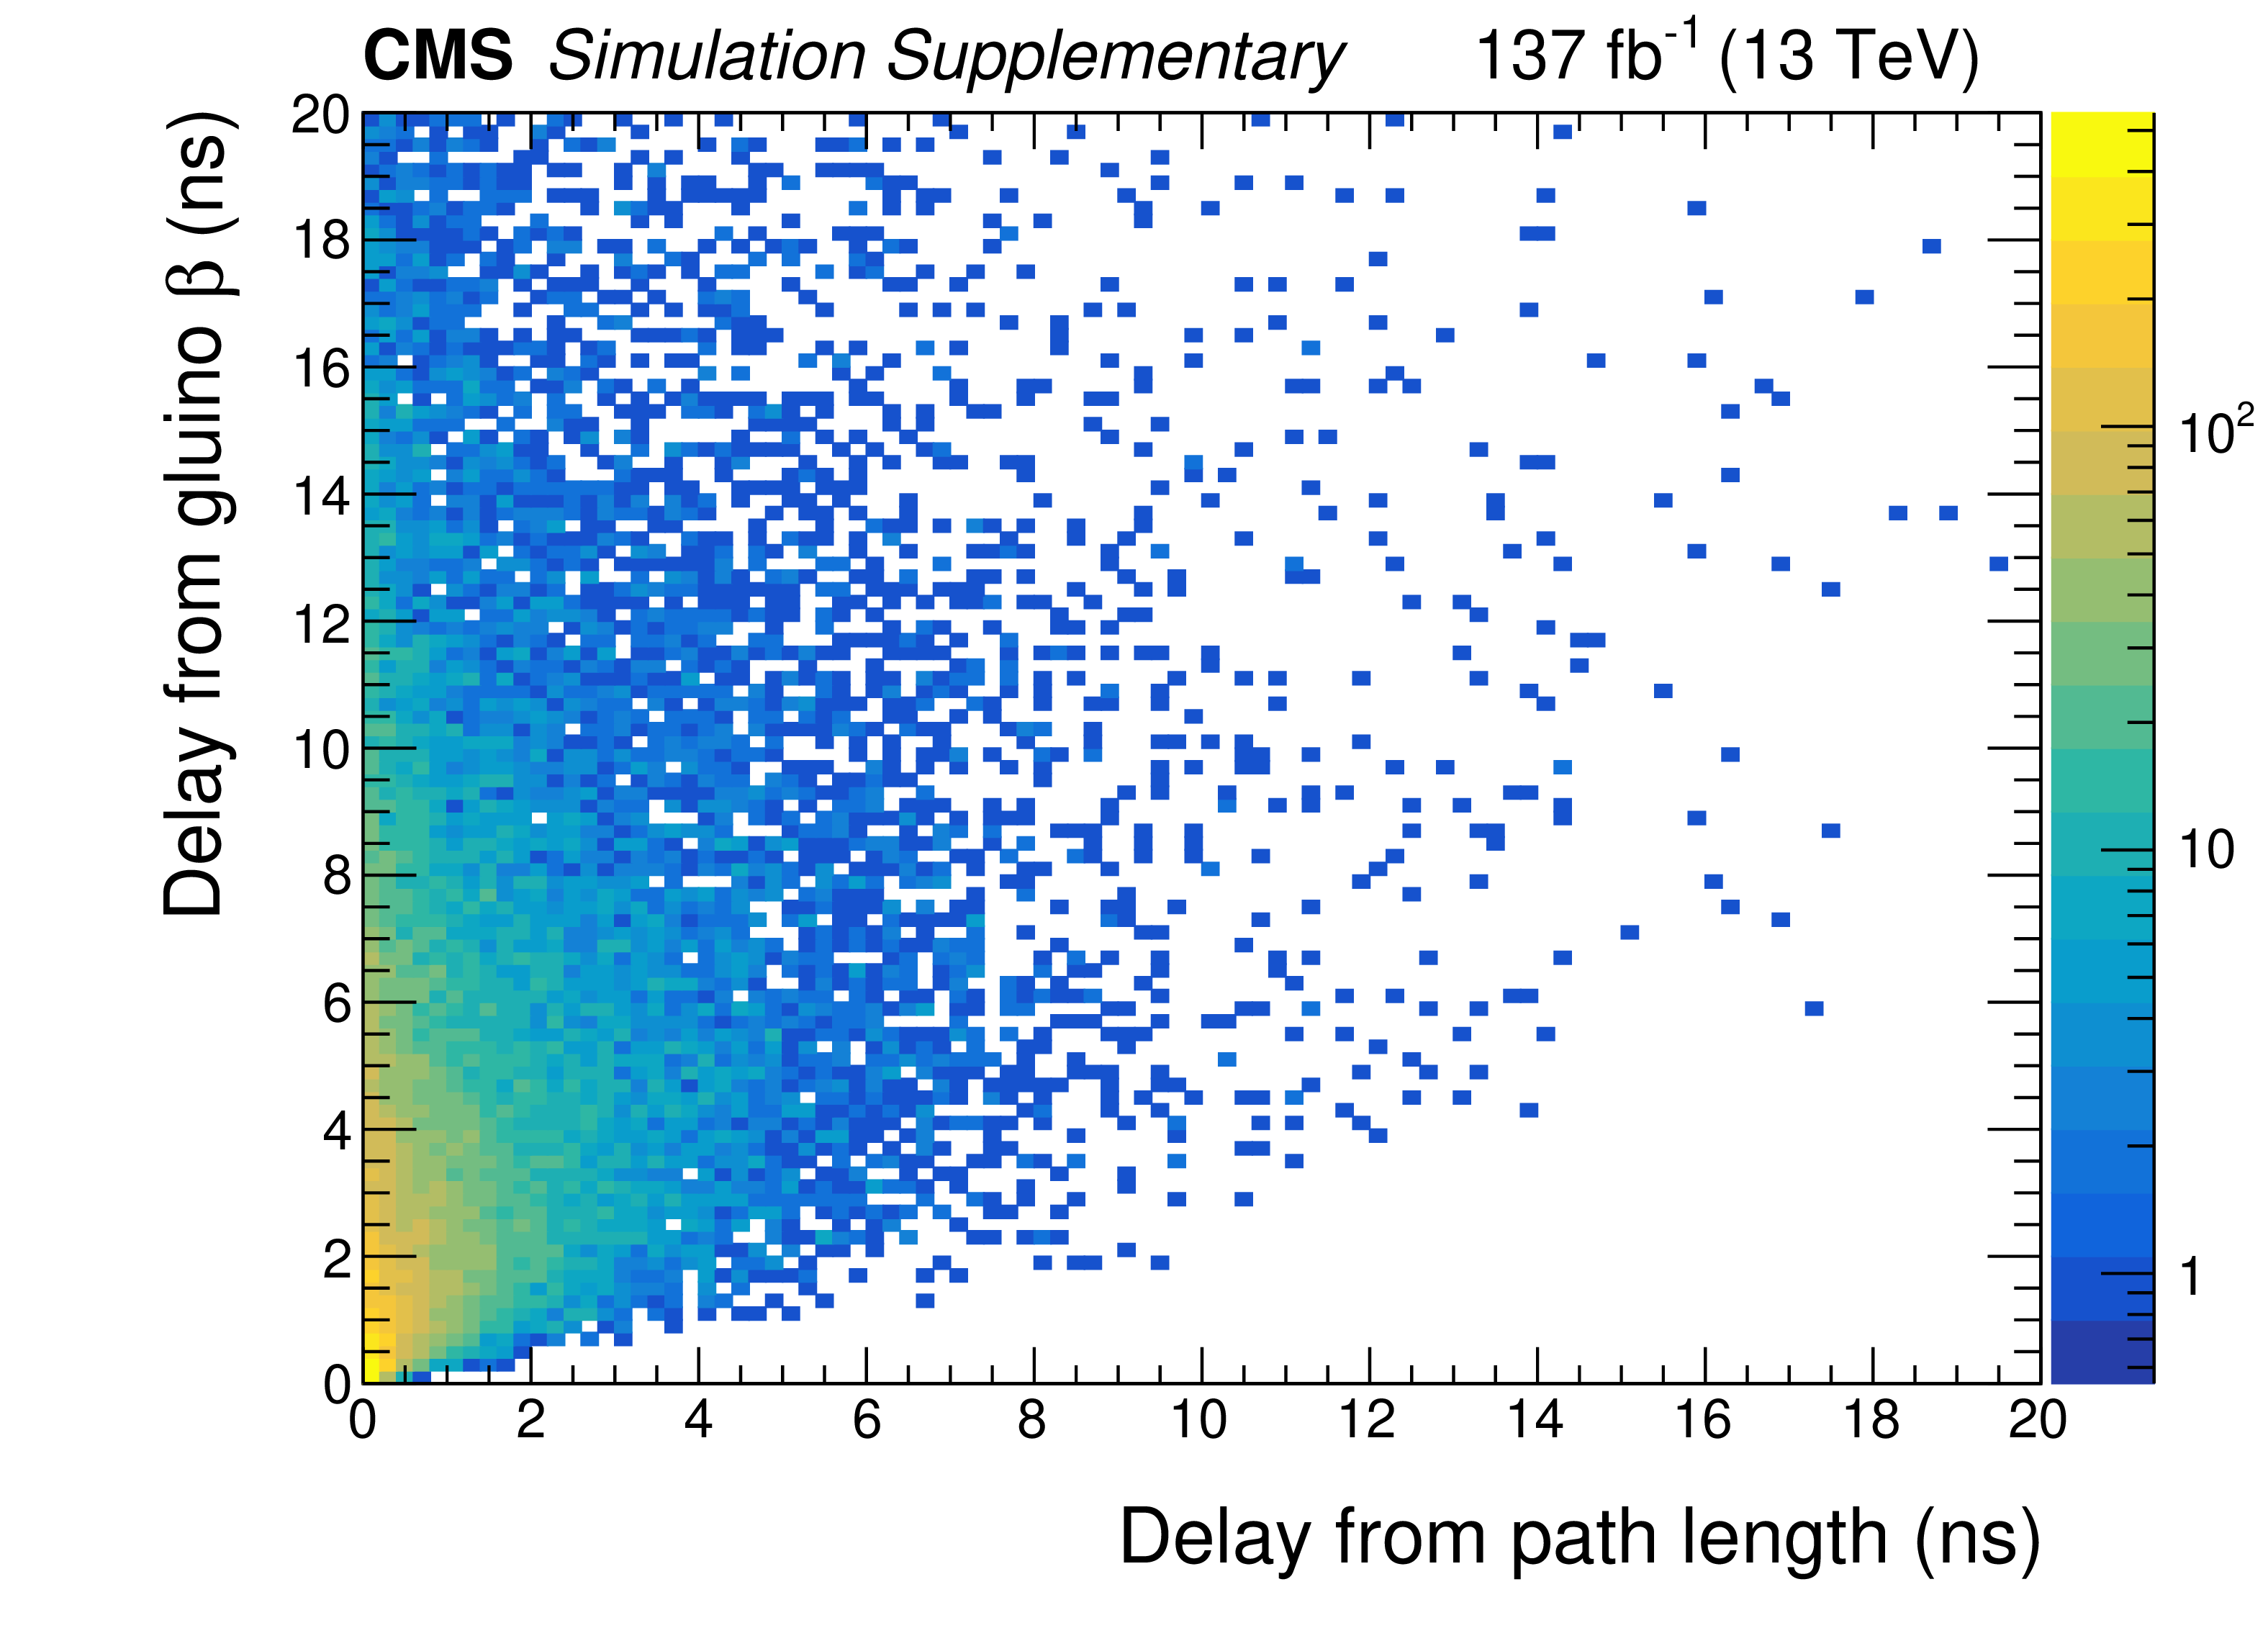
Contribution to the delayed time of jets from the $\beta $ of the gluino is plotted against the delay contribution from the difference (assuming straight line paths) between the path taken by the gluino and the particle forming the jet from the path length for a particle travelling directly to the same position on the ECAL barrel for gluino $ {c\tau _{0}} = $ 10 m and mass of 1000 GeV (a) and 3000 GeV (b). The dominant contribution is shown to be the gluino $\beta $. |
png pdf |
Additional Figure 23-a:
Contribution to the delayed time of jets from the $\beta $ of the gluino is plotted against the delay contribution from the difference (assuming straight line paths) between the path taken by the gluino and the particle forming the jet from the path length for a particle travelling directly to the same position on the ECAL barrel for gluino $ {c\tau _{0}} = $ 10 m and mass of 1000 GeV. The dominant contribution is shown to be the gluino $\beta $. |
png pdf |
Additional Figure 23-b:
Contribution to the delayed time of jets from the $\beta $ of the gluino is plotted against the delay contribution from the difference (assuming straight line paths) between the path taken by the gluino and the particle forming the jet from the path length for a particle travelling directly to the same position on the ECAL barrel for gluino $ {c\tau _{0}} = $ 10 m and mass of 3000 GeV. The dominant contribution is shown to be the gluino $\beta $. |

png pdf |
Additional Figure 24:
The observed upper limits at 95% CL for the gluino pair production cross section relative to the theoretical cross section in the GMSB model, shown in the plane of $m_{\tilde{g}}$ and $c\tau _{0}$. A branching fraction of 100% for the gluino decay to a gluon and a gravitino is assumed. The area below the thick black curve represents the observed exclusion region, while the dashed red lines indicate the expected limits and their $ \pm $1 standard deviation ranges from experimental uncertainties. The thin black lines show the effect of the theoretical uncertainties on the signal cross section. |
png pdf |
Additional Figure 25:
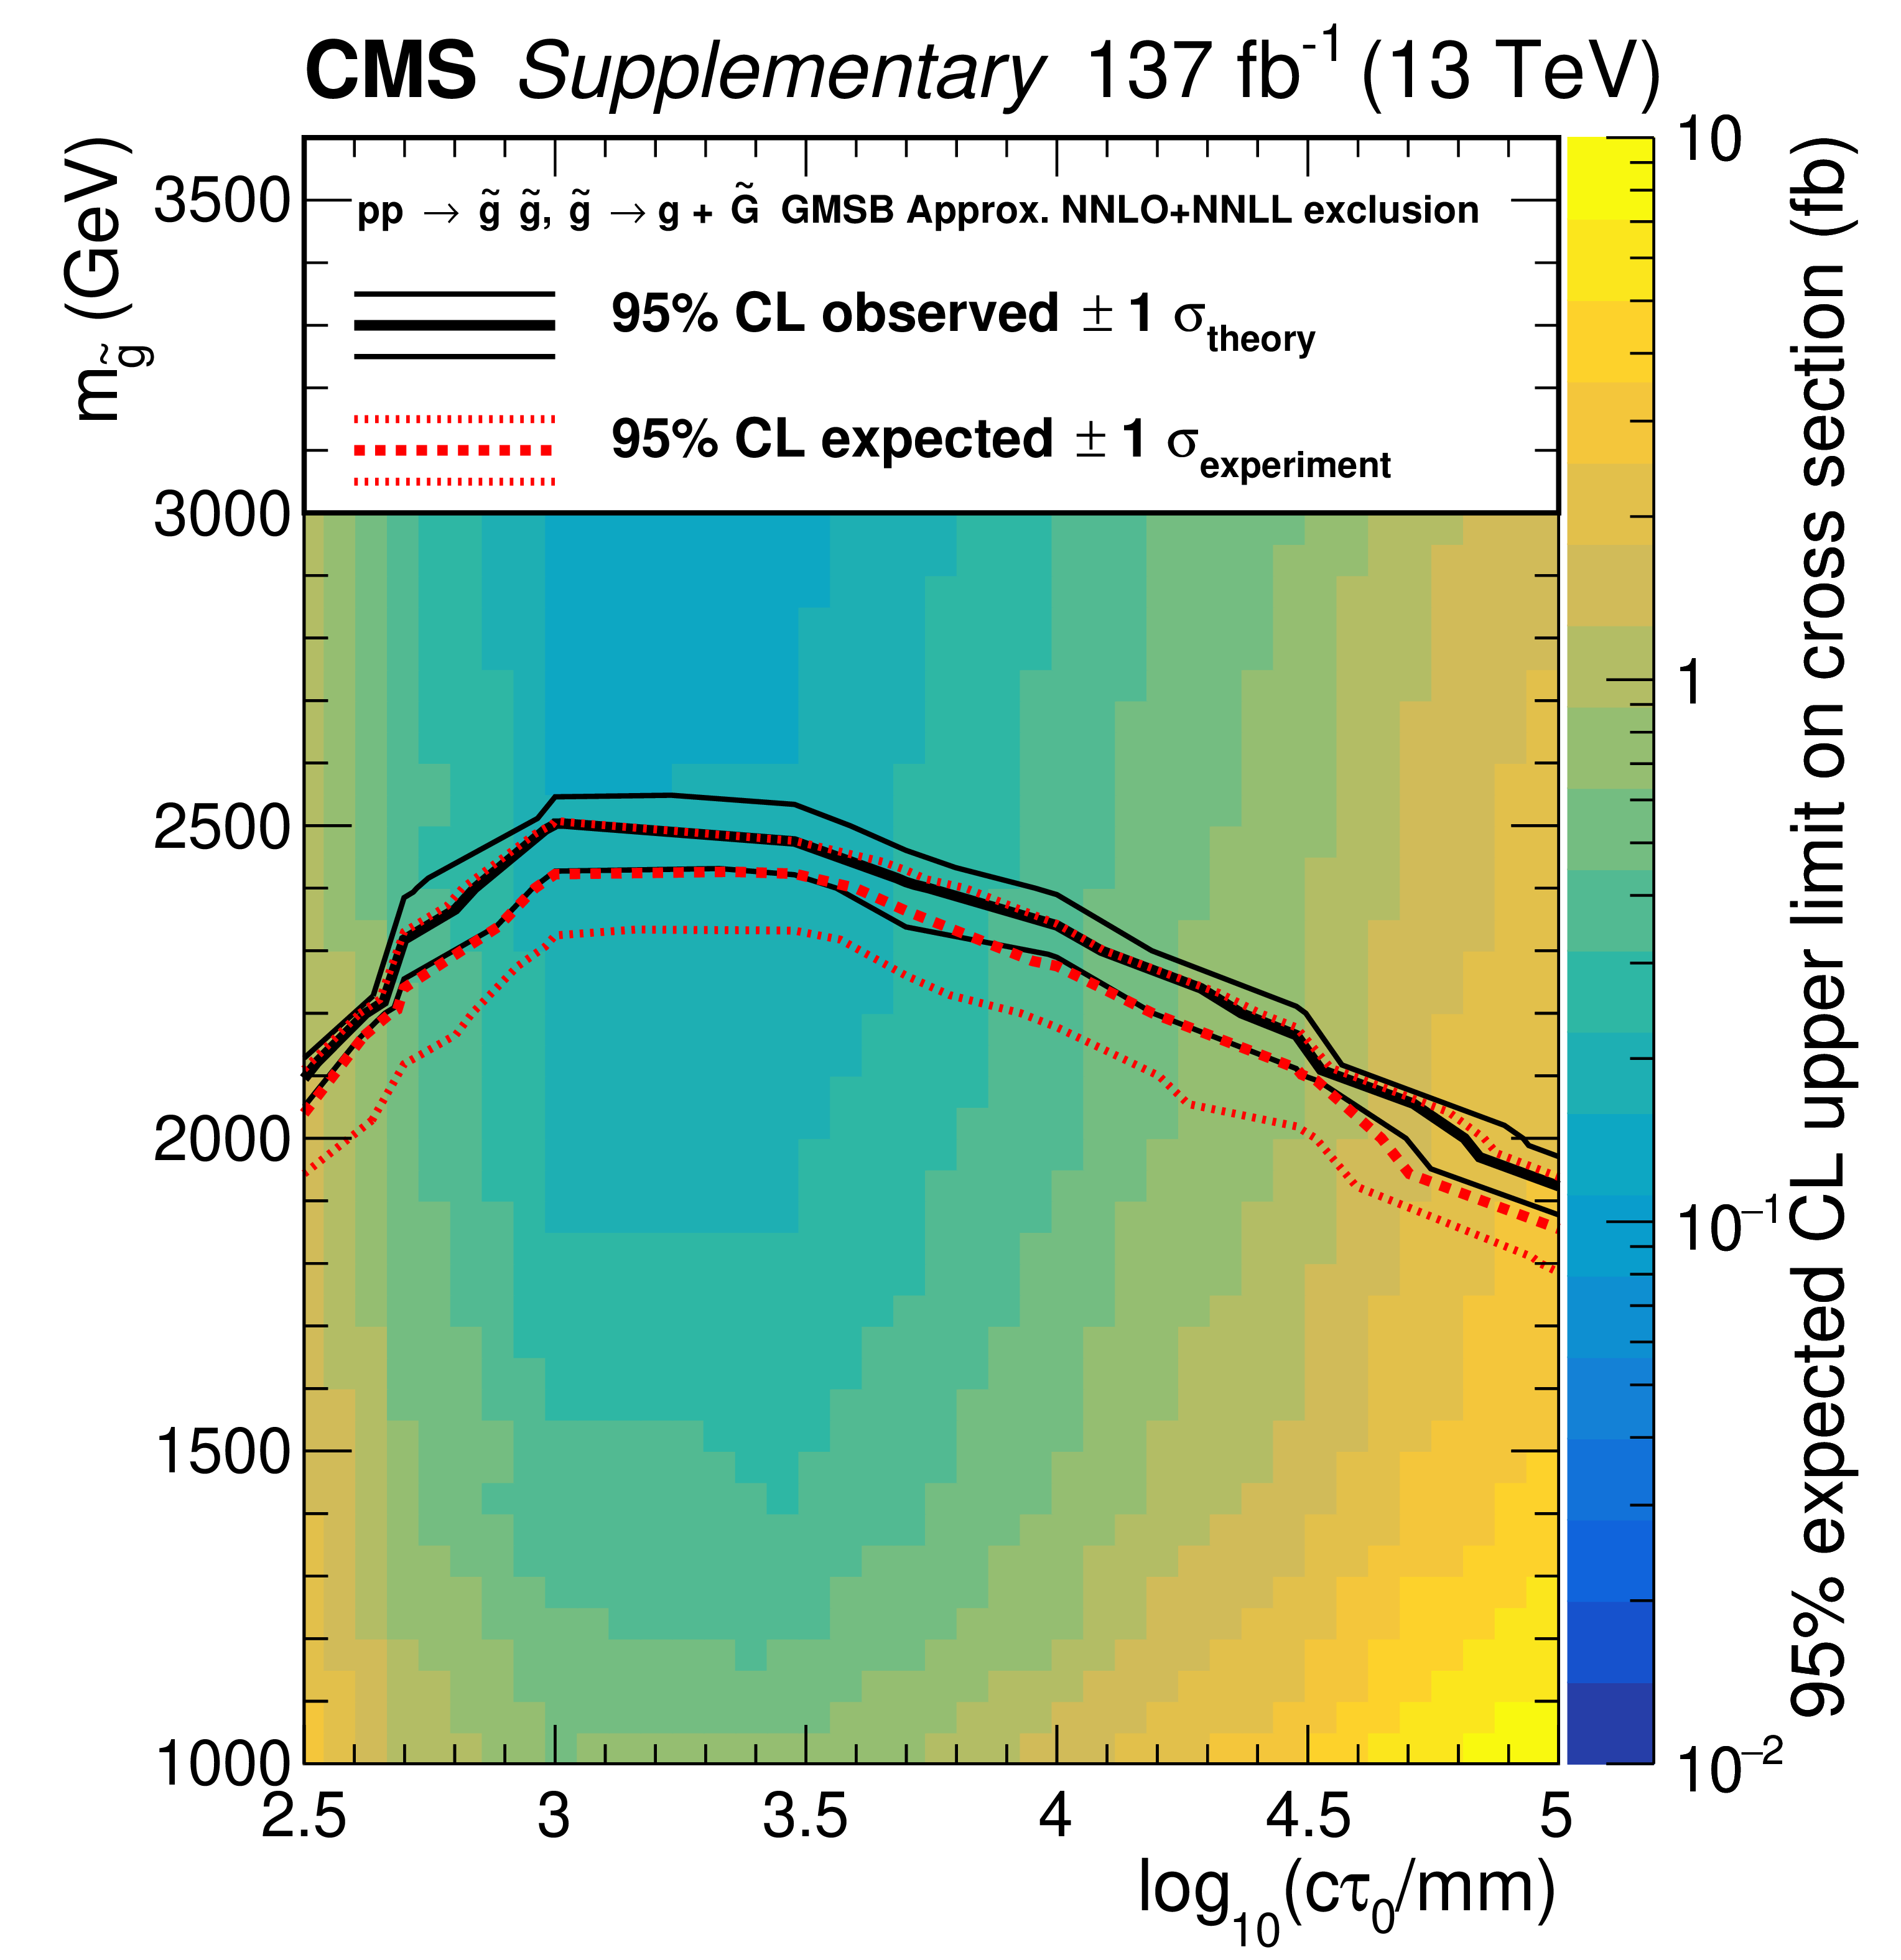
The expected upper limits at 95% CL for the gluino pair production cross section relative to the theoretical cross section in the GMSB model, shown in the plane of $m_{\tilde{g}}$ and $c\tau _{0}$. A branching fraction of 100% for the gluino decay to a gluon and a gravitino is assumed. The area below the thick black curve represents the observed exclusion region, while the dashed red lines indicate the expected limits and their $ \pm $1 standard deviation ranges from experimental uncertainties. The thin black lines show the effect of the theoretical uncertainties on the signal cross section. |
png pdf |
Additional Figure 26:
The expected plus 1 $\sigma _{\mathrm {experiment}}$ upper limits at 95% CL for the gluino pair production cross section relative to the theoretical cross section in the GMSB model, shown in the plane of $m_{\tilde{g}}$ and $c\tau _{0}$. A branching fraction of 100% for the gluino decay to a gluon and a gravitino is assumed. The area below the thick black curve represents the observed exclusion region, while the dashed red lines indicate the expected limits and their $ \pm $1 standard deviation ranges from experimental uncertainties. The thin black lines show the effect of the theoretical uncertainties on the signal cross section. |
png pdf |
Additional Figure 27:
The expected minus 1 $\sigma _{\mathrm {experiment}}$ upper limits at 95% CL for the gluino pair production cross section relative to the theoretical cross section in the GMSB model, shown in the plane of $m_{\tilde{g}}$ and $c\tau _{0}$. A branching fraction of 100% for the gluino decay to a gluon and a gravitino is assumed. The area below the thick black curve represents the observed exclusion region, while the dashed red lines indicate the expected limits and their $ \pm $1 standard deviation ranges from experimental uncertainties. The thin black lines show the effect of the theoretical uncertainties on the signal cross section. |
png pdf |
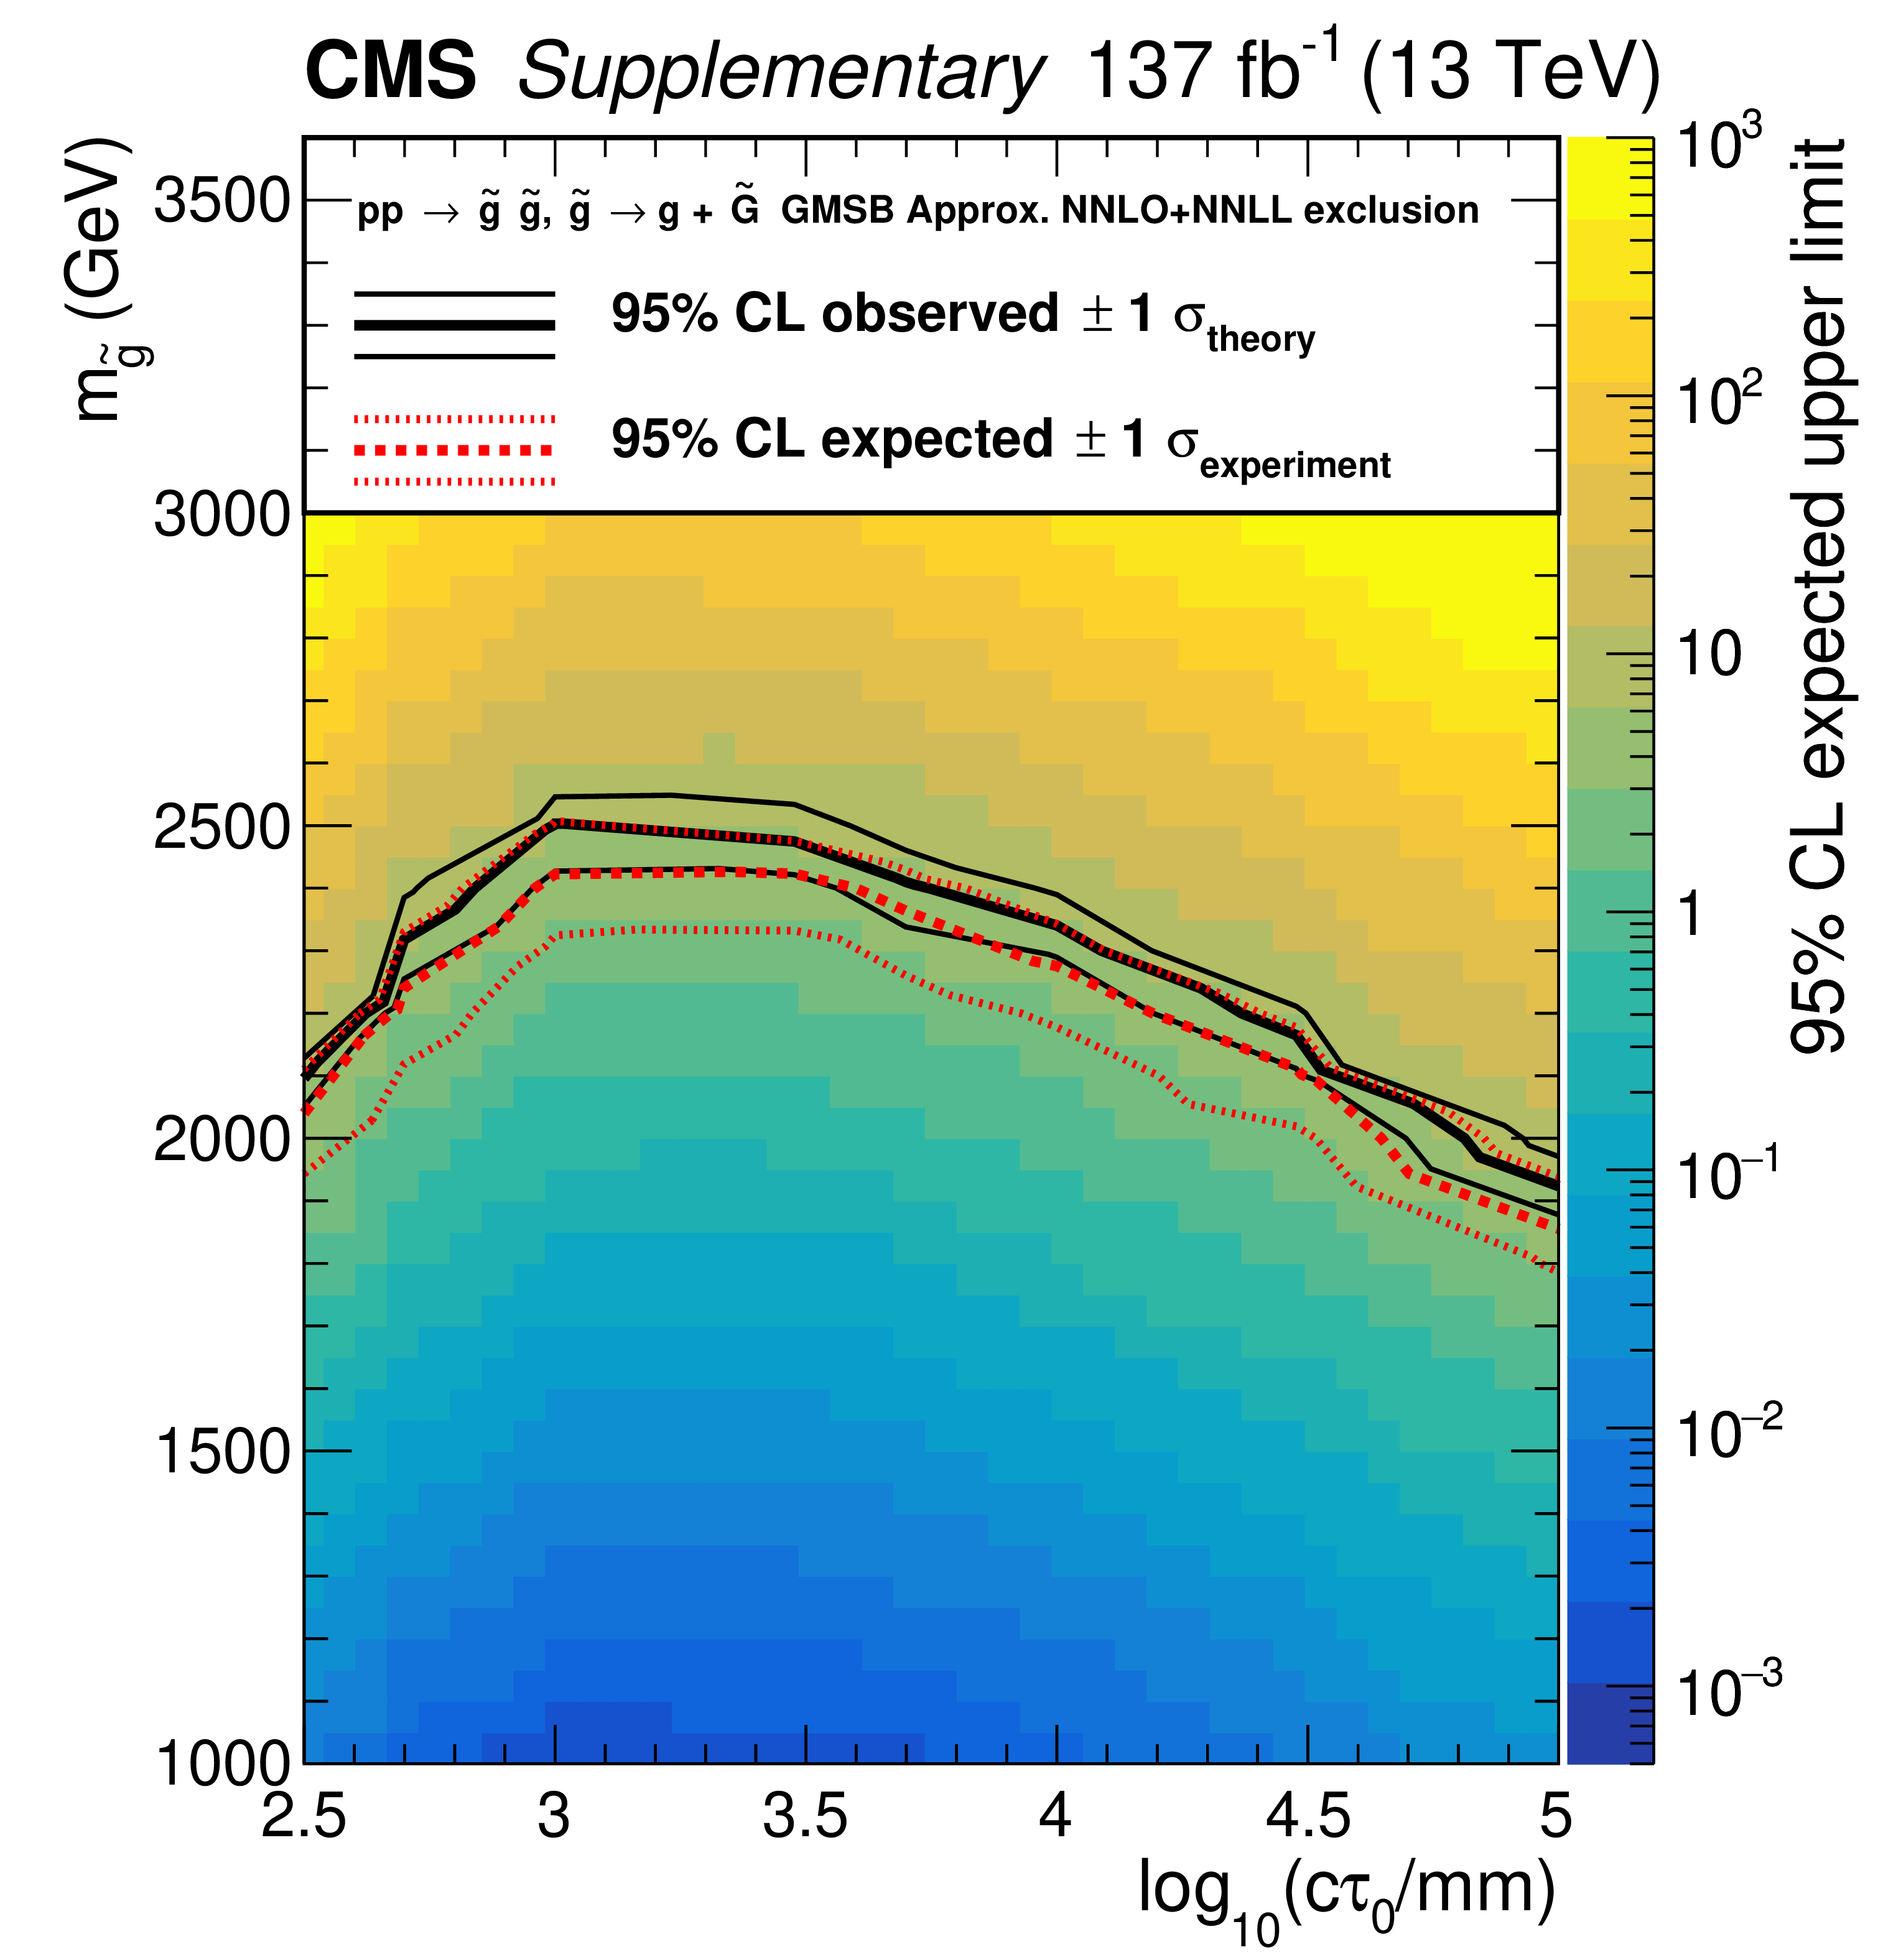
Additional Figure 28:
The expected upper limits at 95% CL for the gluino pair production cross section in the GMSB model, shown in the plane of $m_{\tilde{g}}$ and $c\tau _{0}$. A branching fraction of 100% for the gluino decay to a gluon and a gravitino is assumed. The area below the thick black curve represents the observed exclusion region, while the dashed red lines indicate the expected limits and their $ \pm $1 standard deviation ranges from experimental uncertainties. The thin black lines show the effect of the theoretical uncertainties on the signal cross section. |

png pdf |
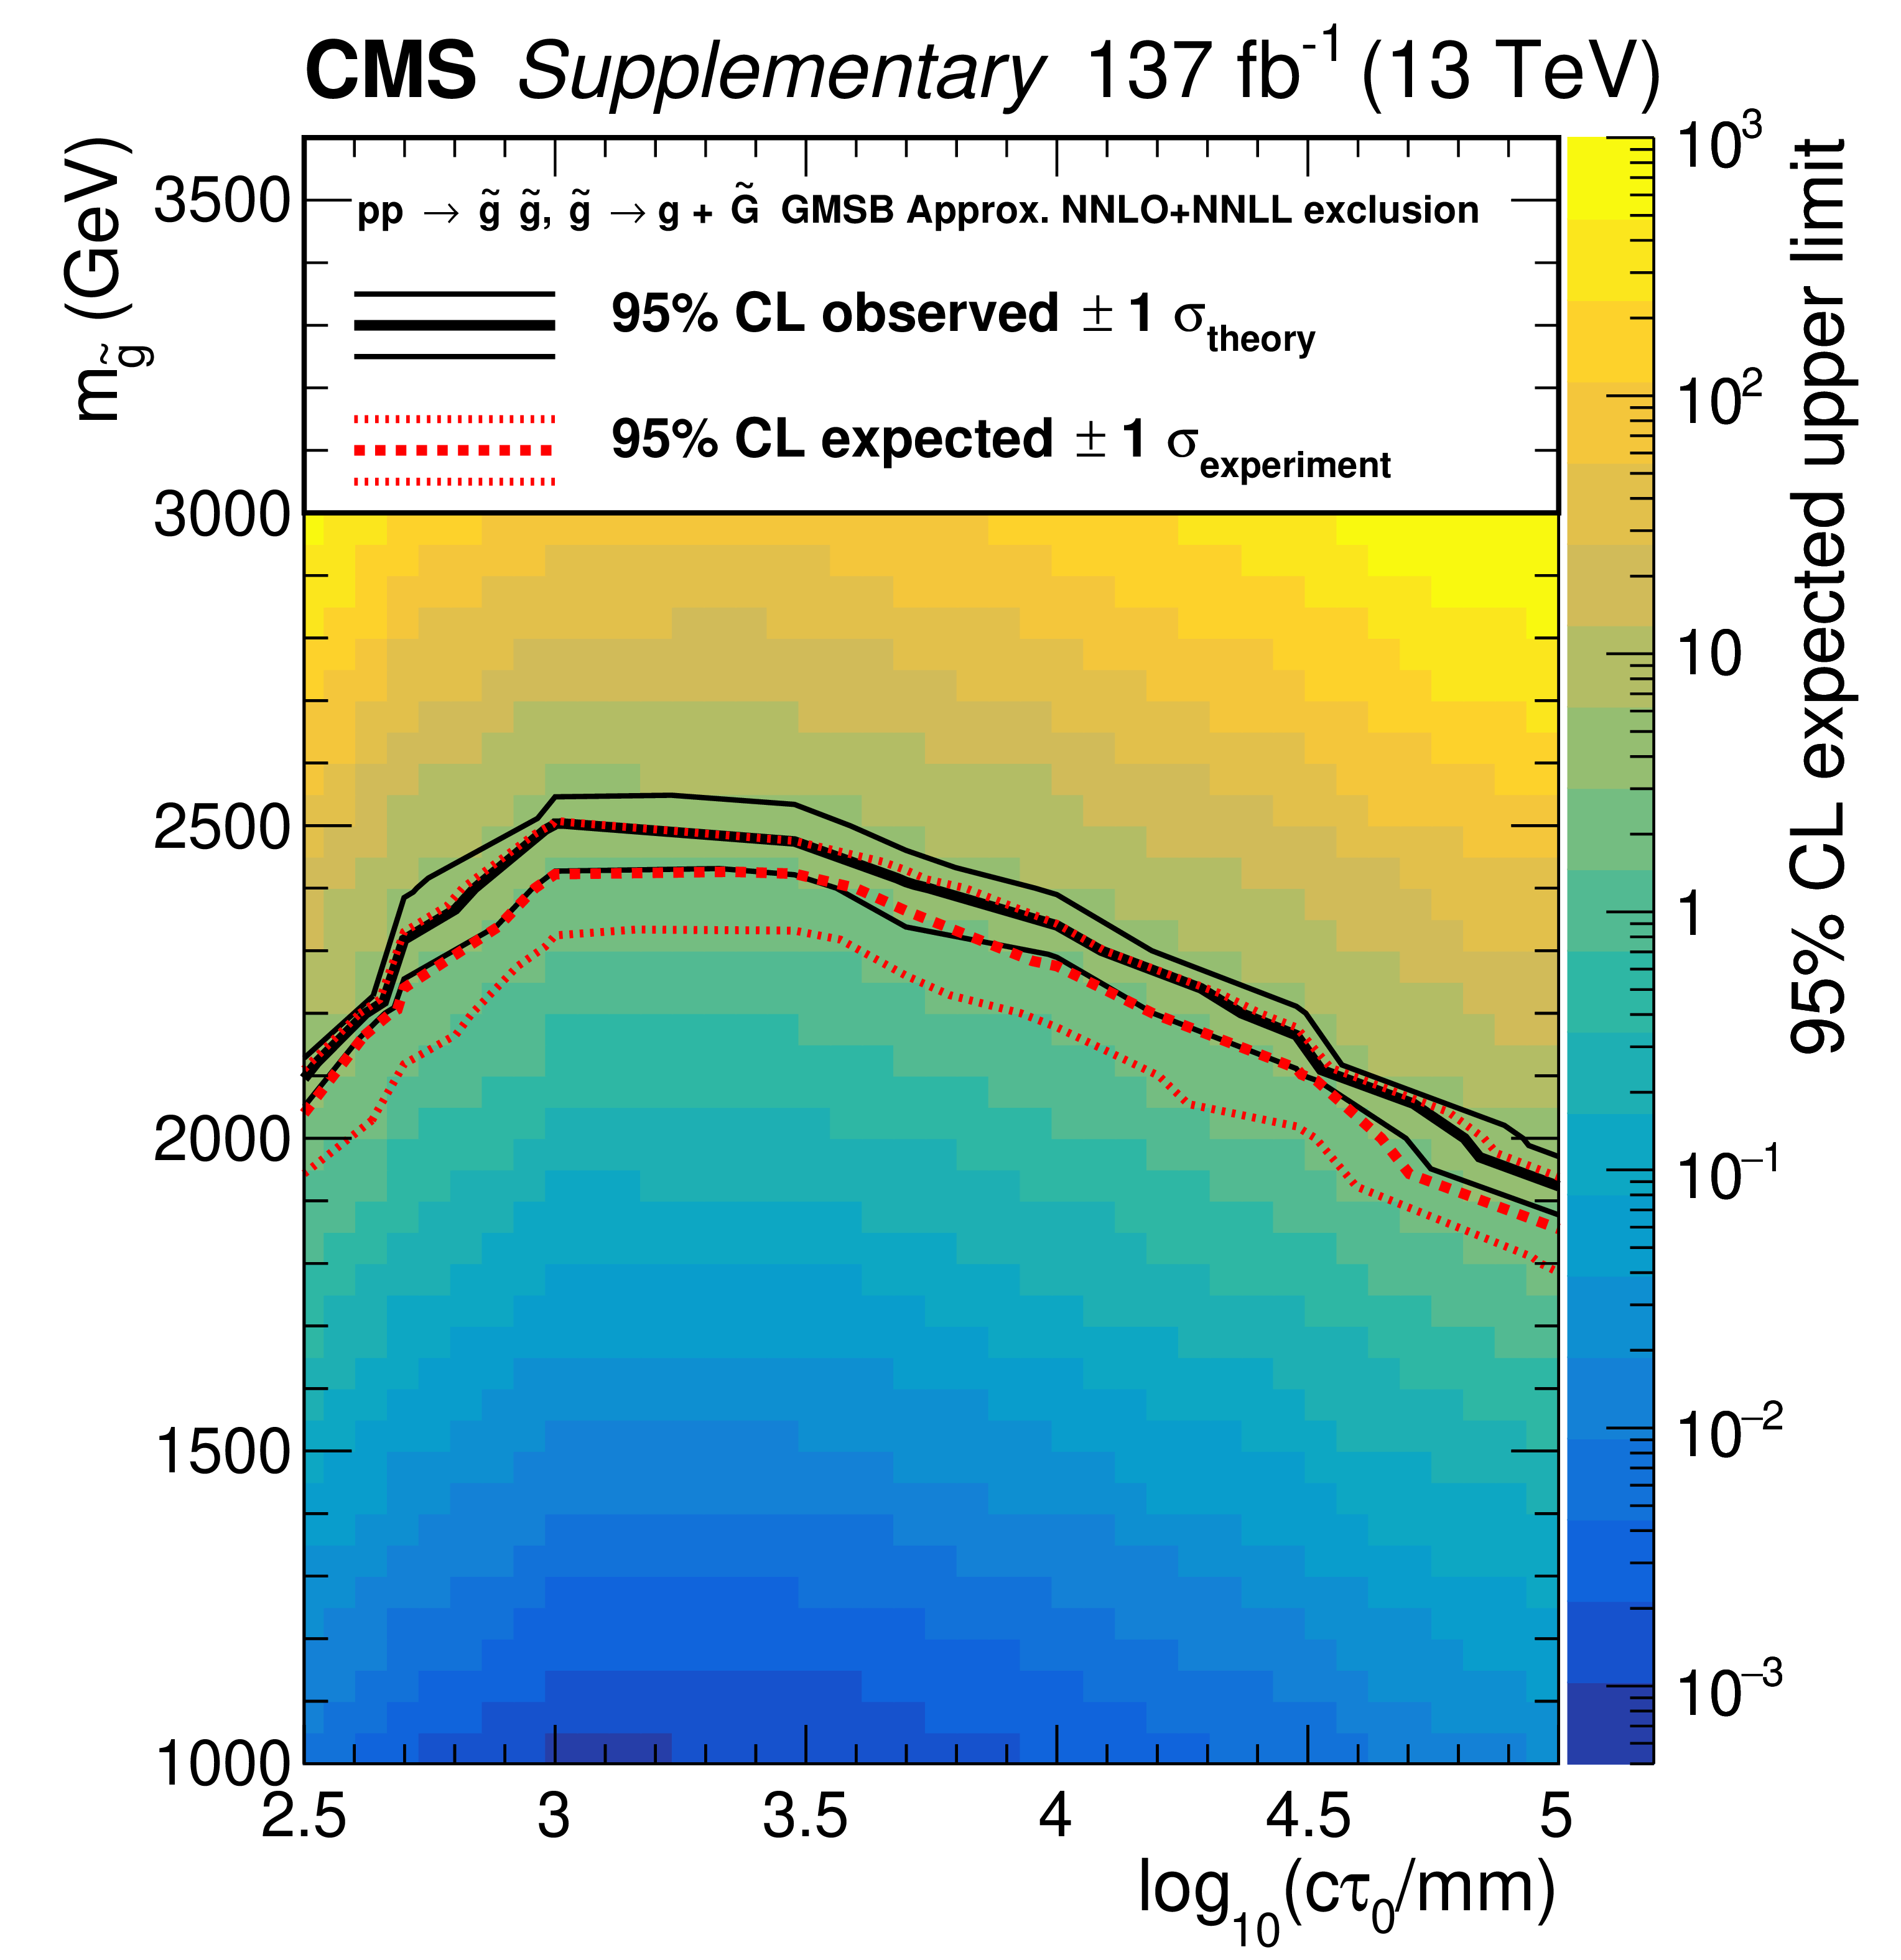
Additional Figure 29:
The expected plus 1 $\sigma _{\mathrm {experiment}}$ upper limits at 95% CL for the gluino pair production cross section relative in the GMSB model, shown in the plane of $m_{\tilde{g}}$ and $c\tau _{0}$. A branching fraction of 100% for the gluino decay to a gluon and a gravitino is assumed. The area below the thick black curve represents the observed exclusion region, while the dashed red lines indicate the expected limits and their $ \pm $1 standard deviation ranges from experimental uncertainties. The thin black lines show the effect of the theoretical uncertainties on the signal cross section. |
png pdf |
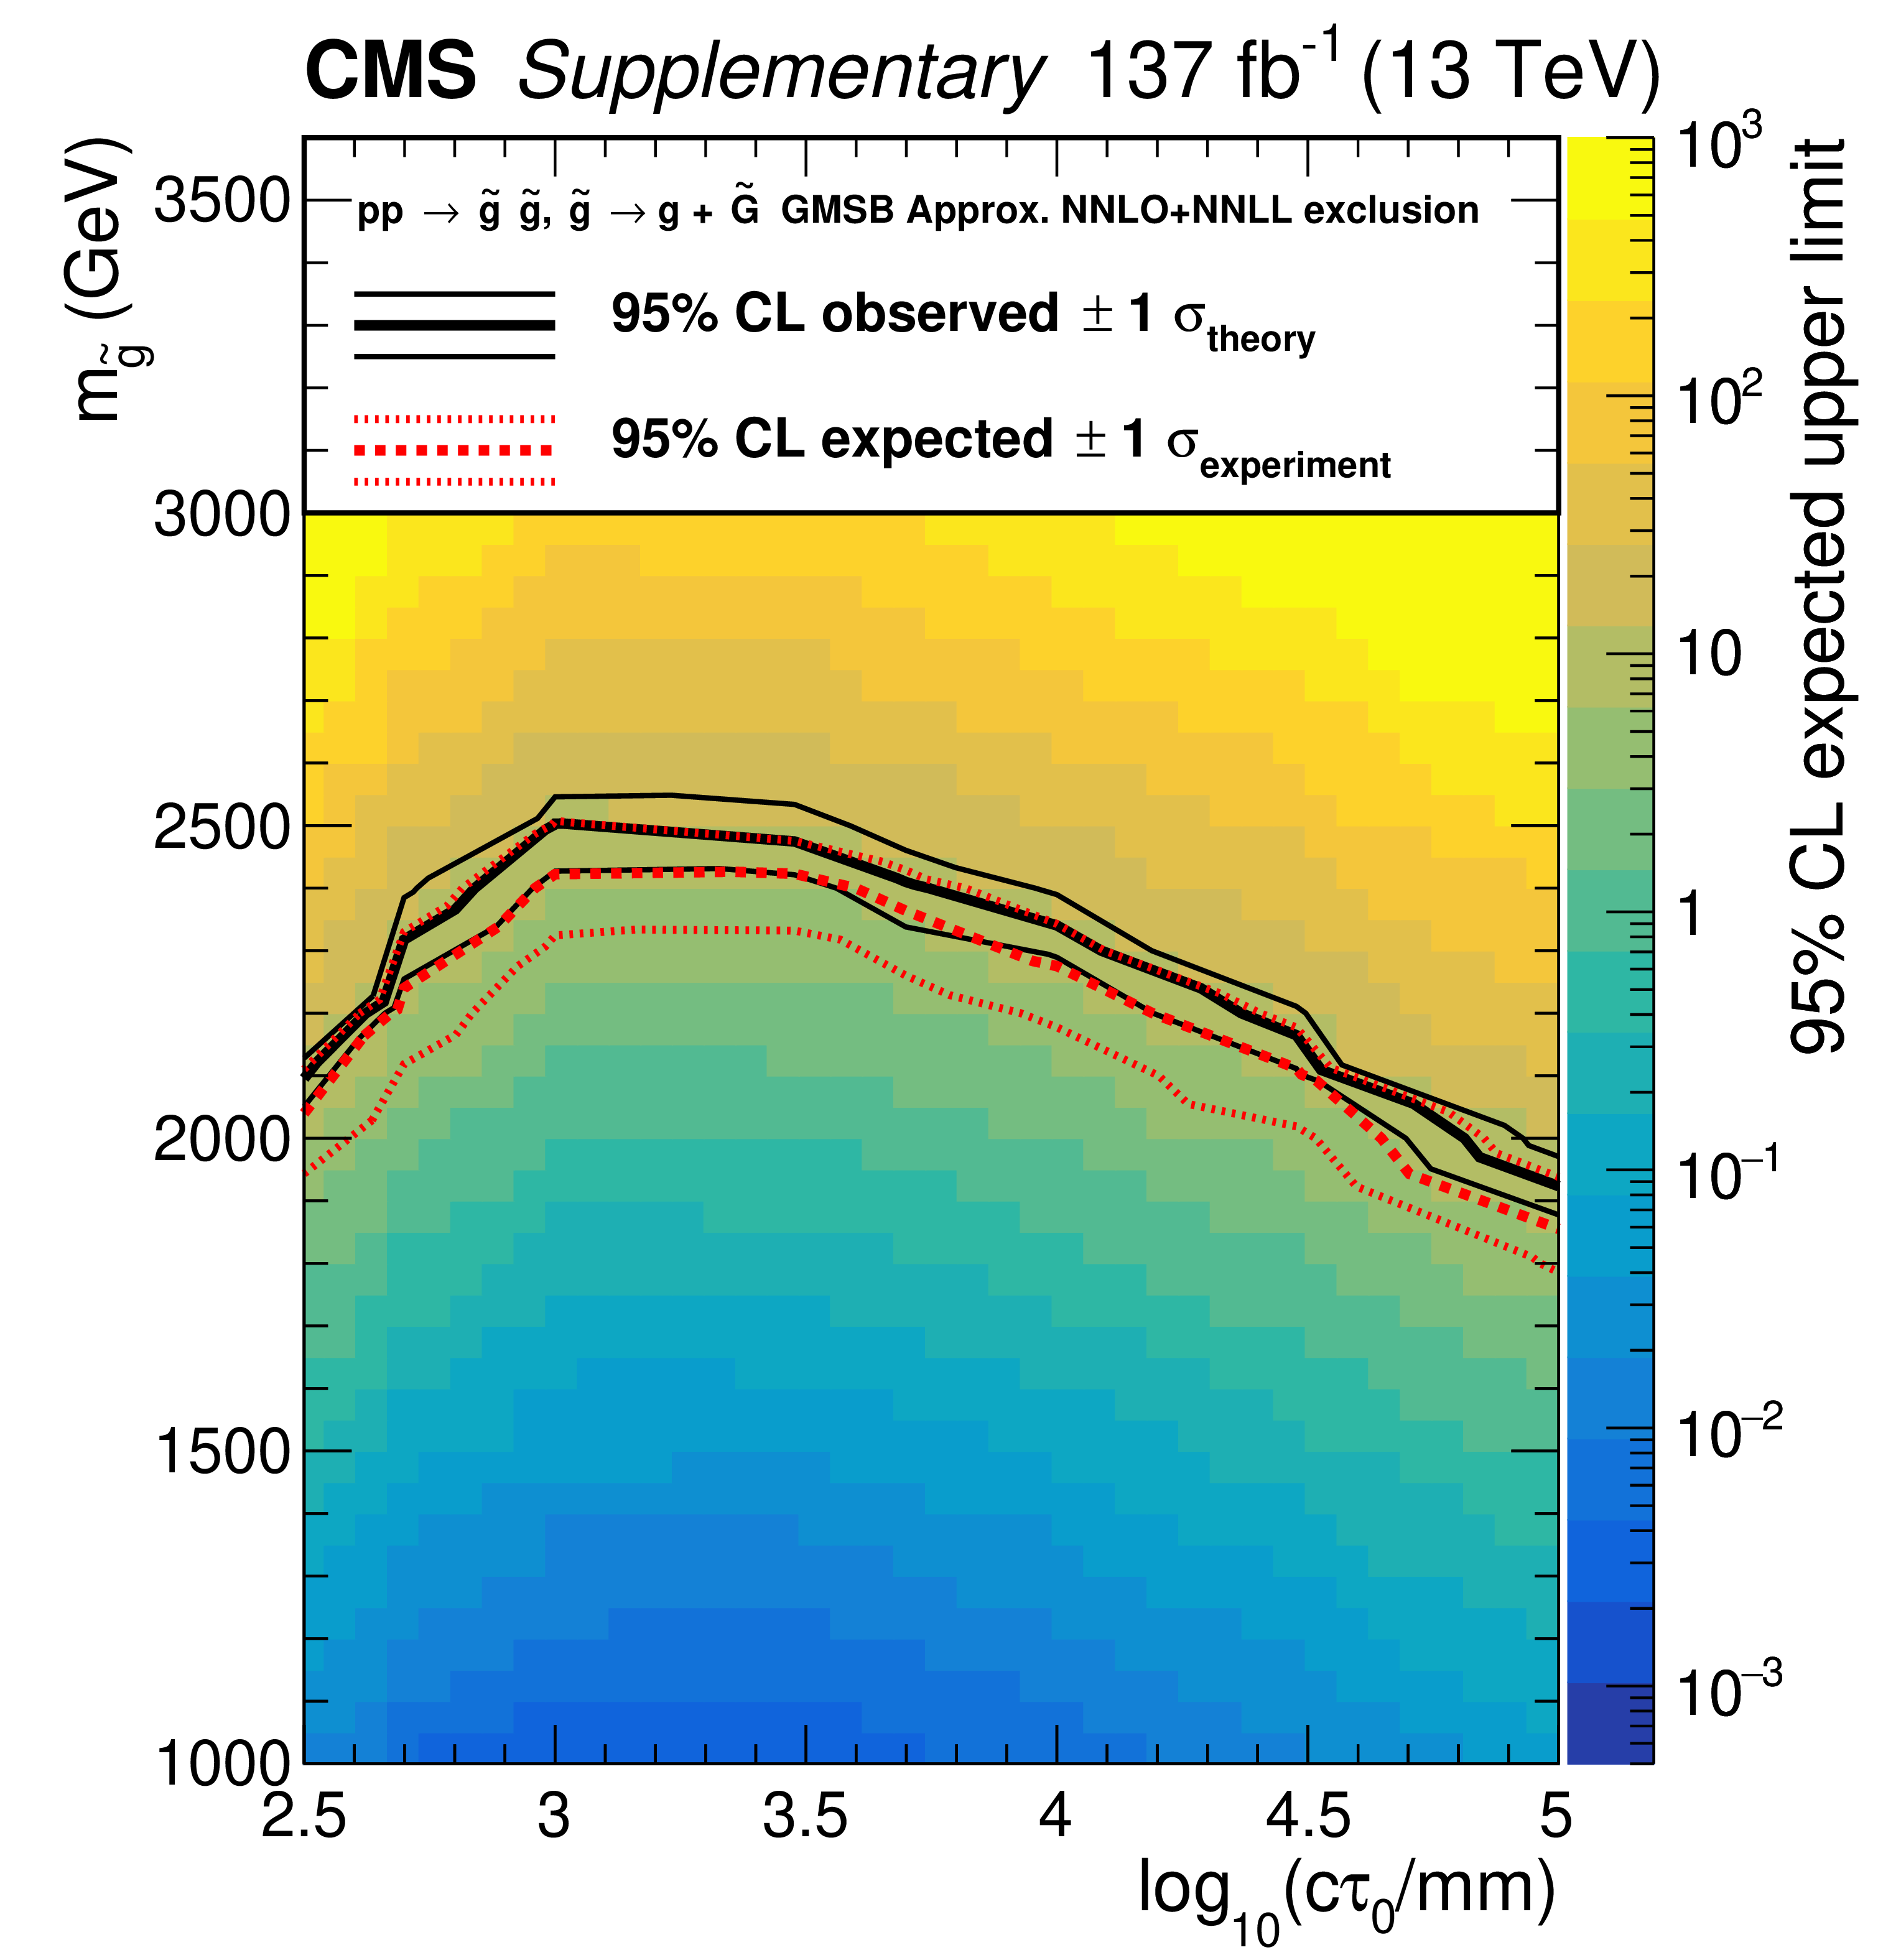
Additional Figure 30:
The expected minus 1 $\sigma _{\mathrm {experiment}}$ upper limits at 95% CL for the gluino pair production cross section relative in the GMSB model, shown in the plane of $m_{\tilde{g}}$ and $c\tau _{0}$. A branching fraction of 100% for the gluino decay to a gluon and a gravitino is assumed. The area below the thick black curve represents the observed exclusion region, while the dashed red lines indicate the expected limits and their $ \pm $1 standard deviation ranges from experimental uncertainties. The thin black lines show the effect of the theoretical uncertainties on the signal cross section. |
| Additional Tables | |

png pdf |
Additional Table 1:
Selection efficiencies for the GMSB model with gluino mass 1000 GeV |
png pdf |
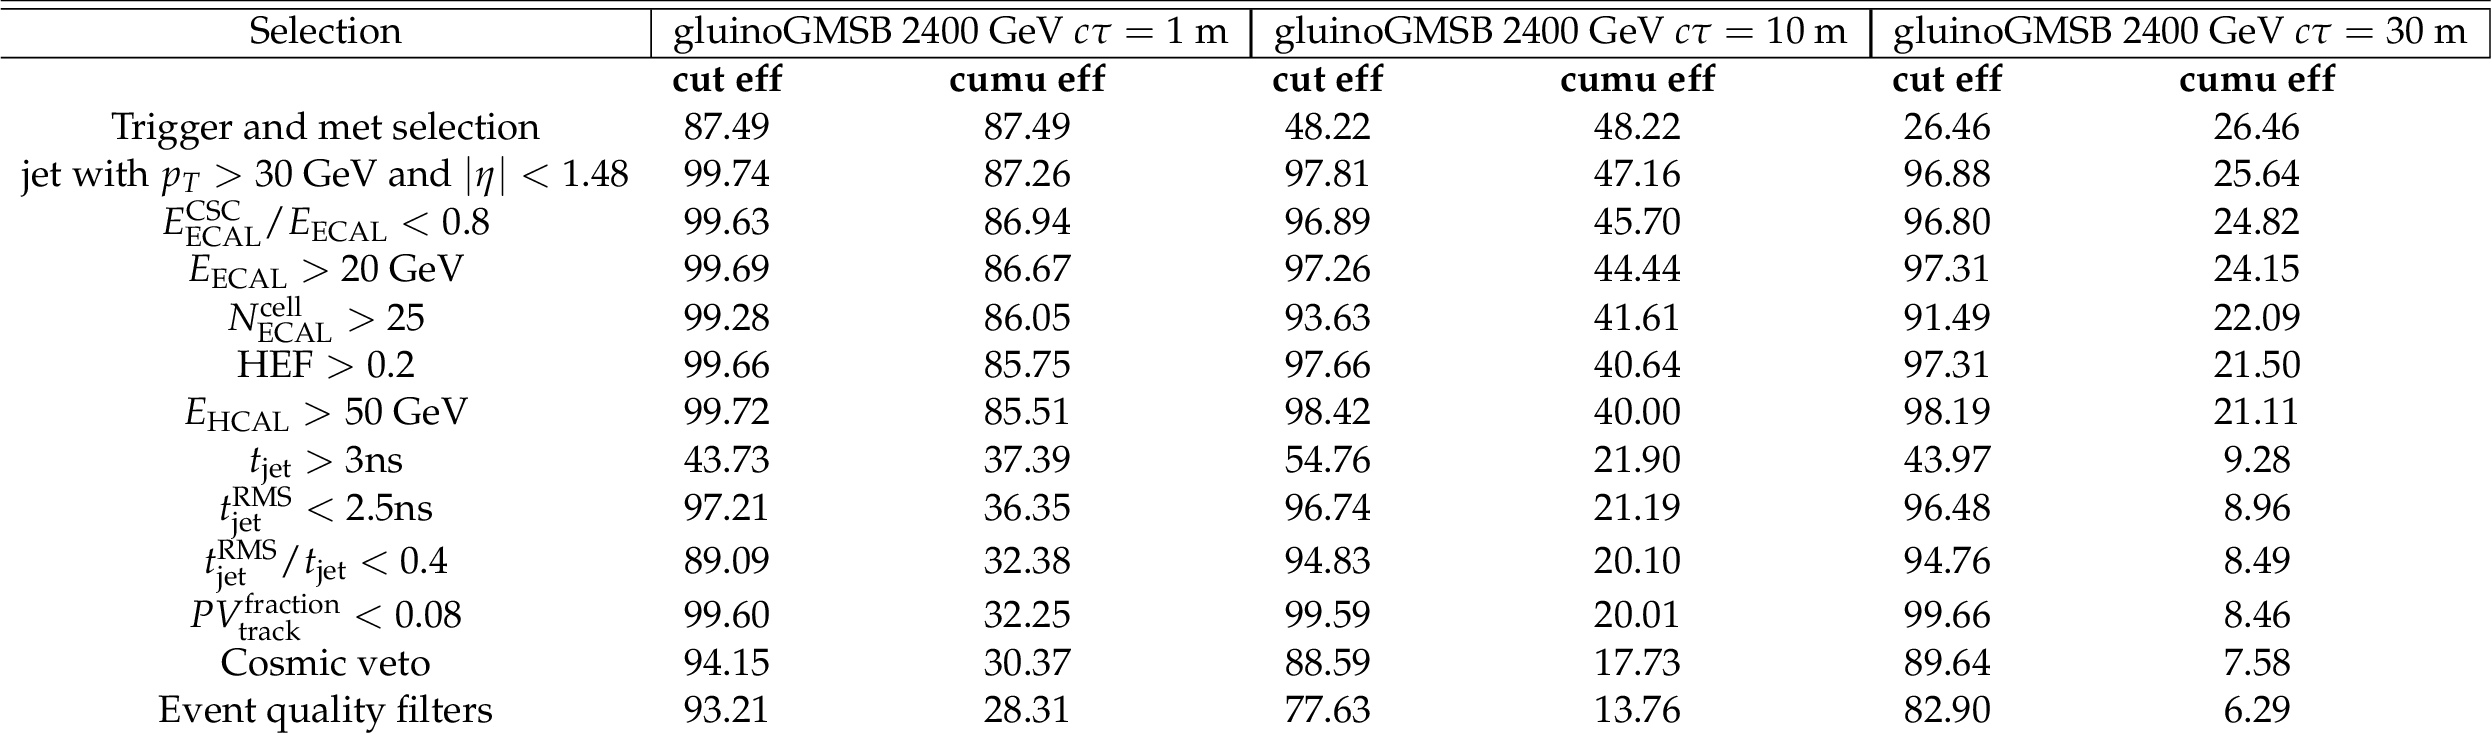
Additional Table 2:
Selection efficiencies for the GMSB model with gluino mass 2400 GeV |
png pdf |
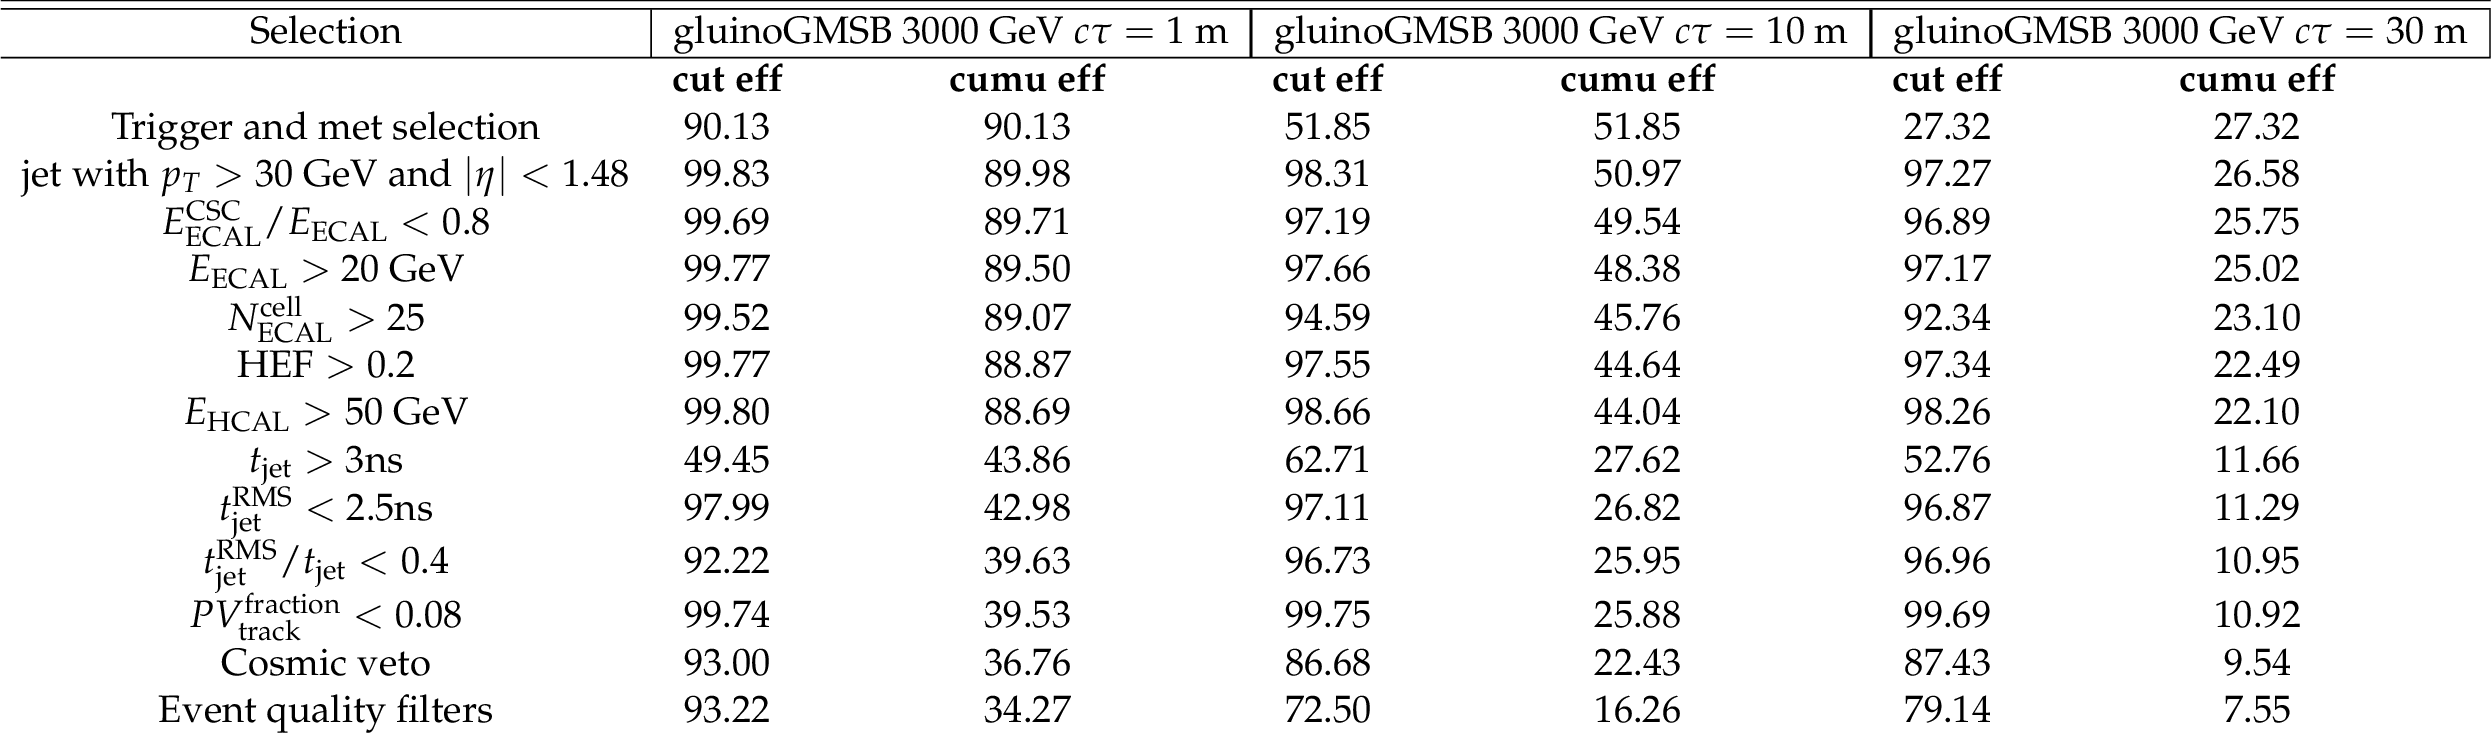
Additional Table 3:
Selection efficiencies for the GMSB model with gluino mass 3000 GeV |
| References | ||||
| 1 | Z. Liu and B. Tweedie | The fate of long-lived superparticles with hadronic decays after LHC run 1 | JHEP 06 (2015) 042 | 1503.05923 |
| 2 | G. F. Giudice and R. Rattazzi | Theories with gauge mediated supersymmetry breaking | PR 322 (1999) 419 | hep-ph/9801271 |
| 3 | N. Arkani-Hamed and S. Dimopoulos | Supersymmetric unification without low energy supersymmetry and signatures for fine-tuning at the LHC | JHEP 06 (2005) 073 | hep-th/0405159 |
| 4 | G. F. Giudice and A. Romanino | Split supersymmetry | NPB 699 (2004) 65 | hep-ph/0406088 |
| 5 | J. Fan, M. Reece, and J. T. Ruderman | Stealth supersymmetry | JHEP 11 (2011) 012 | 1105.5135 |
| 6 | M. J. Strassler and K. M. Zurek | Echoes of a hidden valley at hadron colliders | PLB 651 (2007) 374 | hep-ph/0604261 |
| 7 | CMS Collaboration | The CMS electromagnetic calorimeter project: Technical Design Report | CDS | |
| 8 | ATLAS Collaboration | The ATLAS Experiment at the CERN Large Hadron Collider | JINST 3 (2008) S08003 | |
| 9 | CMS Collaboration | The CMS Experiment at the CERN LHC | JINST 3 (2008) S08004 | CMS-00-001 |
| 10 | LHCb Collaboration | The LHCb Detector at the LHC | JINST 3 (2008) S08005 | |
| 11 | CMS Collaboration | Search for stopped gluinos in pp collisions at $ \sqrt{s} = $ 7 TeV | PRL 106 (2011) 011801 | CMS-EXO-10-003 1011.5861 |
| 12 | ATLAS Collaboration | Search for decays of stopped, long-lived particles from 7 TeV pp collisions with the ATLAS detector | EPJC 72 (2012) 1965 | 1201.5595 |
| 13 | ATLAS Collaboration | Search for long-lived stopped R-hadrons decaying out-of-time with pp collisions using the ATLAS detector | PRD 88 (2013) 112003 | 1310.6584 |
| 14 | CMS Collaboration | Search for decays of stopped long-lived particles produced in proton-proton collisions at $ \sqrt{s} = $ 8 TeV | EPJC 75 (2015) 151 | CMS-EXO-12-036 1501.05603 |
| 15 | ATLAS Collaboration | Search for massive, long-lived particles using multitrack displaced vertices or displaced lepton pairs in pp collisions at $ \sqrt{s} = $ 8 TeV with the ATLAS detector | PRD 92 (2015) 072004 | 1504.05162 |
| 16 | ATLAS Collaboration | Search for metastable heavy charged particles with large ionization energy loss in pp collisions at $ \sqrt{s} = $ 13 TeV using the ATLAS experiment | PRD 93 (2016) 112015 | 1604.04520 |
| 17 | ATLAS Collaboration | Search for long-lived, massive particles in events with displaced vertices and missing transverse momentum in $ \sqrt{s} = $ 13 TeV pp collisions with the ATLAS detector | PRD 97 (2018) 052012 | 1710.04901 |
| 18 | CMS Collaboration | Search for decays of stopped exotic long-lived particles produced in proton-proton collisions at $ \sqrt{s}= $ 13 TeV | JHEP 05 (2018) 127 | CMS-EXO-16-004 1801.00359 |
| 19 | ATLAS Collaboration | Search for long-lived neutral particles in $ pp $ collisions at $ \sqrt{s} = $ 13 TeV that decay into displaced hadronic jets in the ATLAS calorimeter | EPJC 79 (2019) 481 | 1902.03094 |
| 20 | CMS Collaboration | Search for long-lived particles decaying into displaced jets in proton-proton collisions at $ \sqrt{s}= $ 13 TeV | PRD 99 (2019) 032011 | CMS-EXO-18-007 1811.07991 |
| 21 | CMS Collaboration | Search for long-lived particles with displaced vertices in multijet events in proton-proton collisions at $ \sqrt{s} = $ 13 TeV | PRD 98 (2018) 092011 | CMS-EXO-17-018 1808.03078 |
| 22 | LHCb Collaboration | Updated search for long-lived particles decaying to jet pairs | EPJC 77 (2017) 812 | 1705.07332 |
| 23 | ATLAS Collaboration | Search for a light Higgs boson decaying to long-lived weakly-interacting particles in proton-proton collisions at $ \sqrt{s}= $ 7 TeV with the ATLAS detector | PRL 108 (2012) 251801 | 1203.1303 |
| 24 | ATLAS Collaboration | Search for long-lived, weakly interacting particles that decay to displaced hadronic jets in proton-proton collisions at $ \sqrt{s}= $ 8 TeV with the ATLAS detector | PRD 92 (2015), no. 1, 012010 | 1504.03634 |
| 25 | ATLAS Collaboration | Search for long-lived particles produced in $ pp $ collisions at $ \sqrt{s}= $ 13 TeV that decay into displaced hadronic jets in the ATLAS muon spectrometer | PRD 99 (2019), no. 5, 052005 | 1811.07370 |
| 26 | CMS Collaboration | Search for long-lived particles in events with photons and missing energy in proton-proton collisions at $ \sqrt{s}= $ 7 TeV | PLB 722 (2013) 273 | CMS-EXO-11-035 1212.1838 |
| 27 | ATLAS Collaboration | Search for nonpointing and delayed photons in the diphoton and missing transverse momentum final state in 8 TeV pp collisions at the LHC using the ATLAS detector | PRD 90 (2014) 112005 | 1409.5542 |
| 28 | J. Liu, Z. Liu, and L.-T. Wang | Long-lived particles at the LHC: catching them in time | PRL 122 (2019) 131801 | 1805.05957 |
| 29 | CMS Collaboration | Description and performance of track and primary-vertex reconstruction with the CMS tracker | JINST 9 (2014) P10009 | CMS-TRK-11-001 1405.6569 |
| 30 | CMS Collaboration | Calibration of the CMS drift tube chambers and measurement of the drift velocity with cosmic rays | JINST 5 (2010) T03016 | CMS-CFT-09-023 0911.4895 |
| 31 | D. del Re | Timing performance of the CMS ECAL and prospects for the future | Journal of Physics: Conference Series 587 (2015) 012003 | |
| 32 | CMS Collaboration | The CMS trigger system | JINST 12 (2017) P01020 | CMS-TRG-12-001 1609.02366 |
| 33 | M. Cacciari, G. P. Salam, and G. Soyez | The anti-$ {k_{\mathrm{T}}} $ jet clustering algorithm | JHEP 04 (2008) 063 | 0802.1189 |
| 34 | M. Cacciari, G. P. Salam, and G. Soyez | FastJet user manual | EPJC 72 (2012) 1896 | 1111.6097 |
| 35 | CMS Collaboration | Jet energy scale and resolution in the CMS experiment in pp collisions at 8 TeV | JINST 12 (2017) P02014 | CMS-JME-13-004 1607.03663 |
| 36 | CMS Collaboration | Particle-flow reconstruction and global event description with the CMS detector | JINST 12 (2017) P10003 | CMS-PRF-14-001 1706.04965 |
| 37 | CMS Collaboration | CMS luminosity measurement for the 2016 data taking period | CMS-PAS-LUM-17-001 | CMS-PAS-LUM-17-001 |
| 38 | CMS Collaboration | CMS luminosity measurement for the 2017 data-taking period at $ \sqrt{s} = $ 13 TeV | CMS-PAS-LUM-17-004 | CMS-PAS-LUM-17-004 |
| 39 | CMS Collaboration | CMS luminosity measurement for the 2018 data-taking period at $ \sqrt{s} = $ 13 TeV | CMS-PAS-LUM-18-002 | CMS-PAS-LUM-18-002 |
| 40 | CMS Collaboration | Performance of missing transverse momentum reconstruction in proton-proton collisions at $ \sqrt{s} = $ 13 TeV using the CMS detector | JINST 14 (2019) P07004 | CMS-JME-17-001 1903.06078 |
| 41 | W. Beenakker, R. Hopker, M. Spira, and P. M. Zerwas | Squark and gluino production at hadron colliders | NPB 492 (1997) 51 | hep-ph/9610490 |
| 42 | A. Kulesza and L. Motyka | Threshold resummation for squark-antisquark and gluino-pair production at the LHC | PRL 102 (2009) 111802 | 0807.2405 |
| 43 | A. Kulesza and L. Motyka | Soft gluon resummation for the production of gluino-gluino and squark-antisquark pairs at the LHC | PRD 80 (2009) 095004 | 0905.4749 |
| 44 | W. Beenakker et al. | Soft-gluon resummation for squark and gluino hadroproduction | JHEP 12 (2009) 041 | 0909.4418 |
| 45 | W. Beenakker et al. | Squark and gluino hadroproduction | Int. J. Mod. Phys. A 26 (2011) 2637 | 1105.1110 |
| 46 | C. Borschensky et al. | Squark and gluino production cross sections in pp collisions at $ \sqrt{s} = $ 13, 14, 33 and 100 TeV | EPJC 74 (2014) 3174 | 1407.5066 |
| 47 | W. Beenakker et al. | NNLL-fast: predictions for coloured supersymmetric particle production at the LHC with threshold and Coulomb resummation | JHEP 12 (2016) 133 | 1607.07741 |
| 48 | T. Sjostrand, S. Mrenna, and P. Z. Skands | A brief introduction to PYTHIA 8.1 | CPC 178 (2008) 852 | 0710.3820 |
| 49 | NNPDF Collaboration | Parton distributions for the LHC Run II | JHEP 04 (2015) 040 | 1410.8849 |
| 50 | M. Fairbairn et al. | Stable massive particles at colliders | PR 438 (2007) 1 | hep-ph/0611040 |
| 51 | A. C. Kraan | Interactions of heavy stable hadronizing particles | EPJC 37 (2004) 91 | hep-ex/0404001 |
| 52 | G. Farrar and P. Fayet | Phenomenology of the production, decay, and detection of new hadronic states associated with supersymmetry | PLB 76 (1978) 575 | |
| 53 | CMS Collaboration | Extraction and validation of a new set of CMS PYTHIA8 tunes from underlying-event measurements | Submitted to \it EPJC | CMS-GEN-17-001 1903.12179 |
| 54 | J. Alwall et al. | The automated computation of tree-level and next-to-leading order differential cross sections, and their matching to parton shower simulations | JHEP 07 (2014) 079 | 1405.0301 |
| 55 | GEANT4 Collaboration | GEANT4---a simulation toolkit | Nucl. Instr. Meth. A 506 (2003) 250 | |
| 56 | A. Bertarelli et al. | Mechanical design for robustness of the LHC collimators | Proceedings of the 2005 Particle Accelerator Conference (2005) 913 | |
| 57 | R. Mackeprang and A. Rizzi | Interactions of coloured heavy stable particles in matter | EPJC 50 (2007) 353 | hep-ph/0612161 |
| 58 | CMS Collaboration | Measurement of the inelastic proton-proton cross section at $ \sqrt{s}= $ 13 TeV | JHEP 07 (2018) 161 | CMS-FSQ-15-005 1802.02613 |
| 59 | ATLAS and CMS Collaborations | Procedure for the LHC Higgs boson search combination in Summer 2011 | CMS-NOTE-2011-005 | |
| 60 | T. Junk | Confidence level computation for combining searches with small statistics | Nucl. Instr. Meth. A 434 (1999) 435 | hep-ex/9902006 |
| 61 | A. L. Read | Presentation of search results: the CLs technique | JPG 28 (2002) 2693 | |
|
|
Compact Muon Solenoid LHC, CERN |
|

|

|

|

|

|