

Compact Muon Solenoid
LHC, CERN
| CMS-JME-17-001 ; CERN-EP-2018-335 | ||
| Performance of missing transverse momentum reconstruction in proton-proton collisions at $\sqrt{s} = $ 13 TeV using the CMS detector | ||
| CMS Collaboration | ||
| 14 March 2019 | ||
| JINST 14 (2019) P07004 | ||
| Abstract: The performance of missing transverse momentum ($ \vec{p}_{\mathrm{T}}^{\text{miss}} $) reconstruction algorithms for the CMS experiment is presented, using proton-proton collisions at a center-of-mass energy of 13 TeV, collected at the CERN LHC in 2016. The data sample corresponds to an integrated luminosity of 35.9 fb$^{-1}$. The results include measurements of the scale and resolution of $ \vec{p}_{\mathrm{T}}^{\text{miss}} $, and detailed studies of events identified with anomalous $ \vec{p}_{\mathrm{T}}^{\text{miss}} $. The performance is presented of a $ \vec{p}_{\mathrm{T}}^{\text{miss}} $ reconstruction algorithm that mitigates the effects of multiple proton-proton interactions, using the "pileup per particle identification'' method. The performance is shown of an algorithm used to estimate the compatibility of the reconstructed $ \vec{p}_{\mathrm{T}}^{\text{miss}} $ with the hypothesis that it originates from resolution effects. | ||
| Links: e-print arXiv:1903.06078 [hep-ex] (PDF) ; CDS record ; inSPIRE record ; CADI line (restricted) ; | ||
| Figures | |
png pdf |
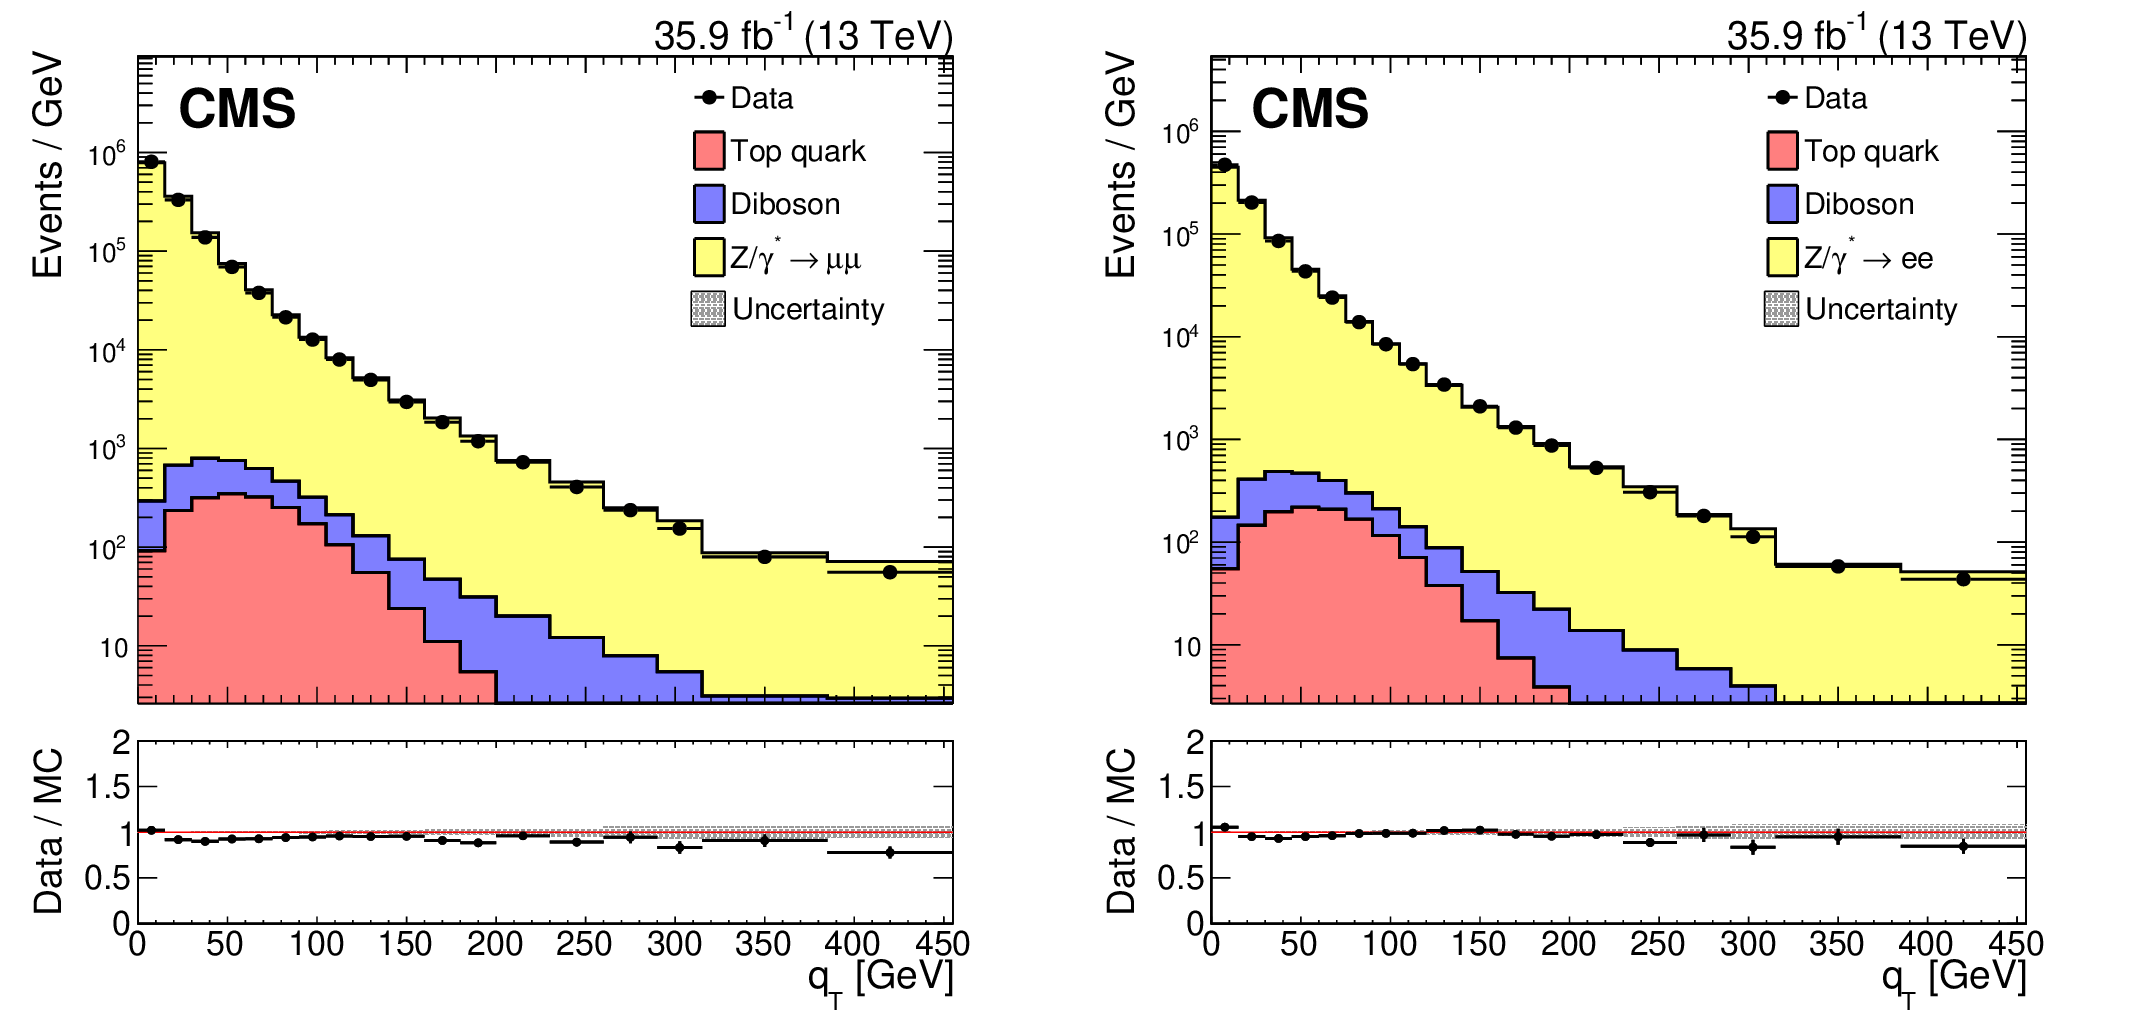
Figure 1:
Upper panels: Distributions of Z boson ${{q}_\mathrm {T}}$ in ${{\mathrm {Z}}\to {\mu} ^+ {\mu ^-}}$ (left) and ${{\mathrm {Z}}\to {\mathrm {e}^+} {\mathrm {e}^-}}$ (right) samples. The diboson contribution corresponds to processes with two electroweak bosons produced in the final state. The top quark contribution corresponds to the top pair and single top production processes. The last bin includes all events with $ {{q}_\mathrm {T}} > $ 385 GeV. Lower panel: Data to simulation ratio. The band corresponds to the statistical uncertainty in simulated samples. |
png pdf |
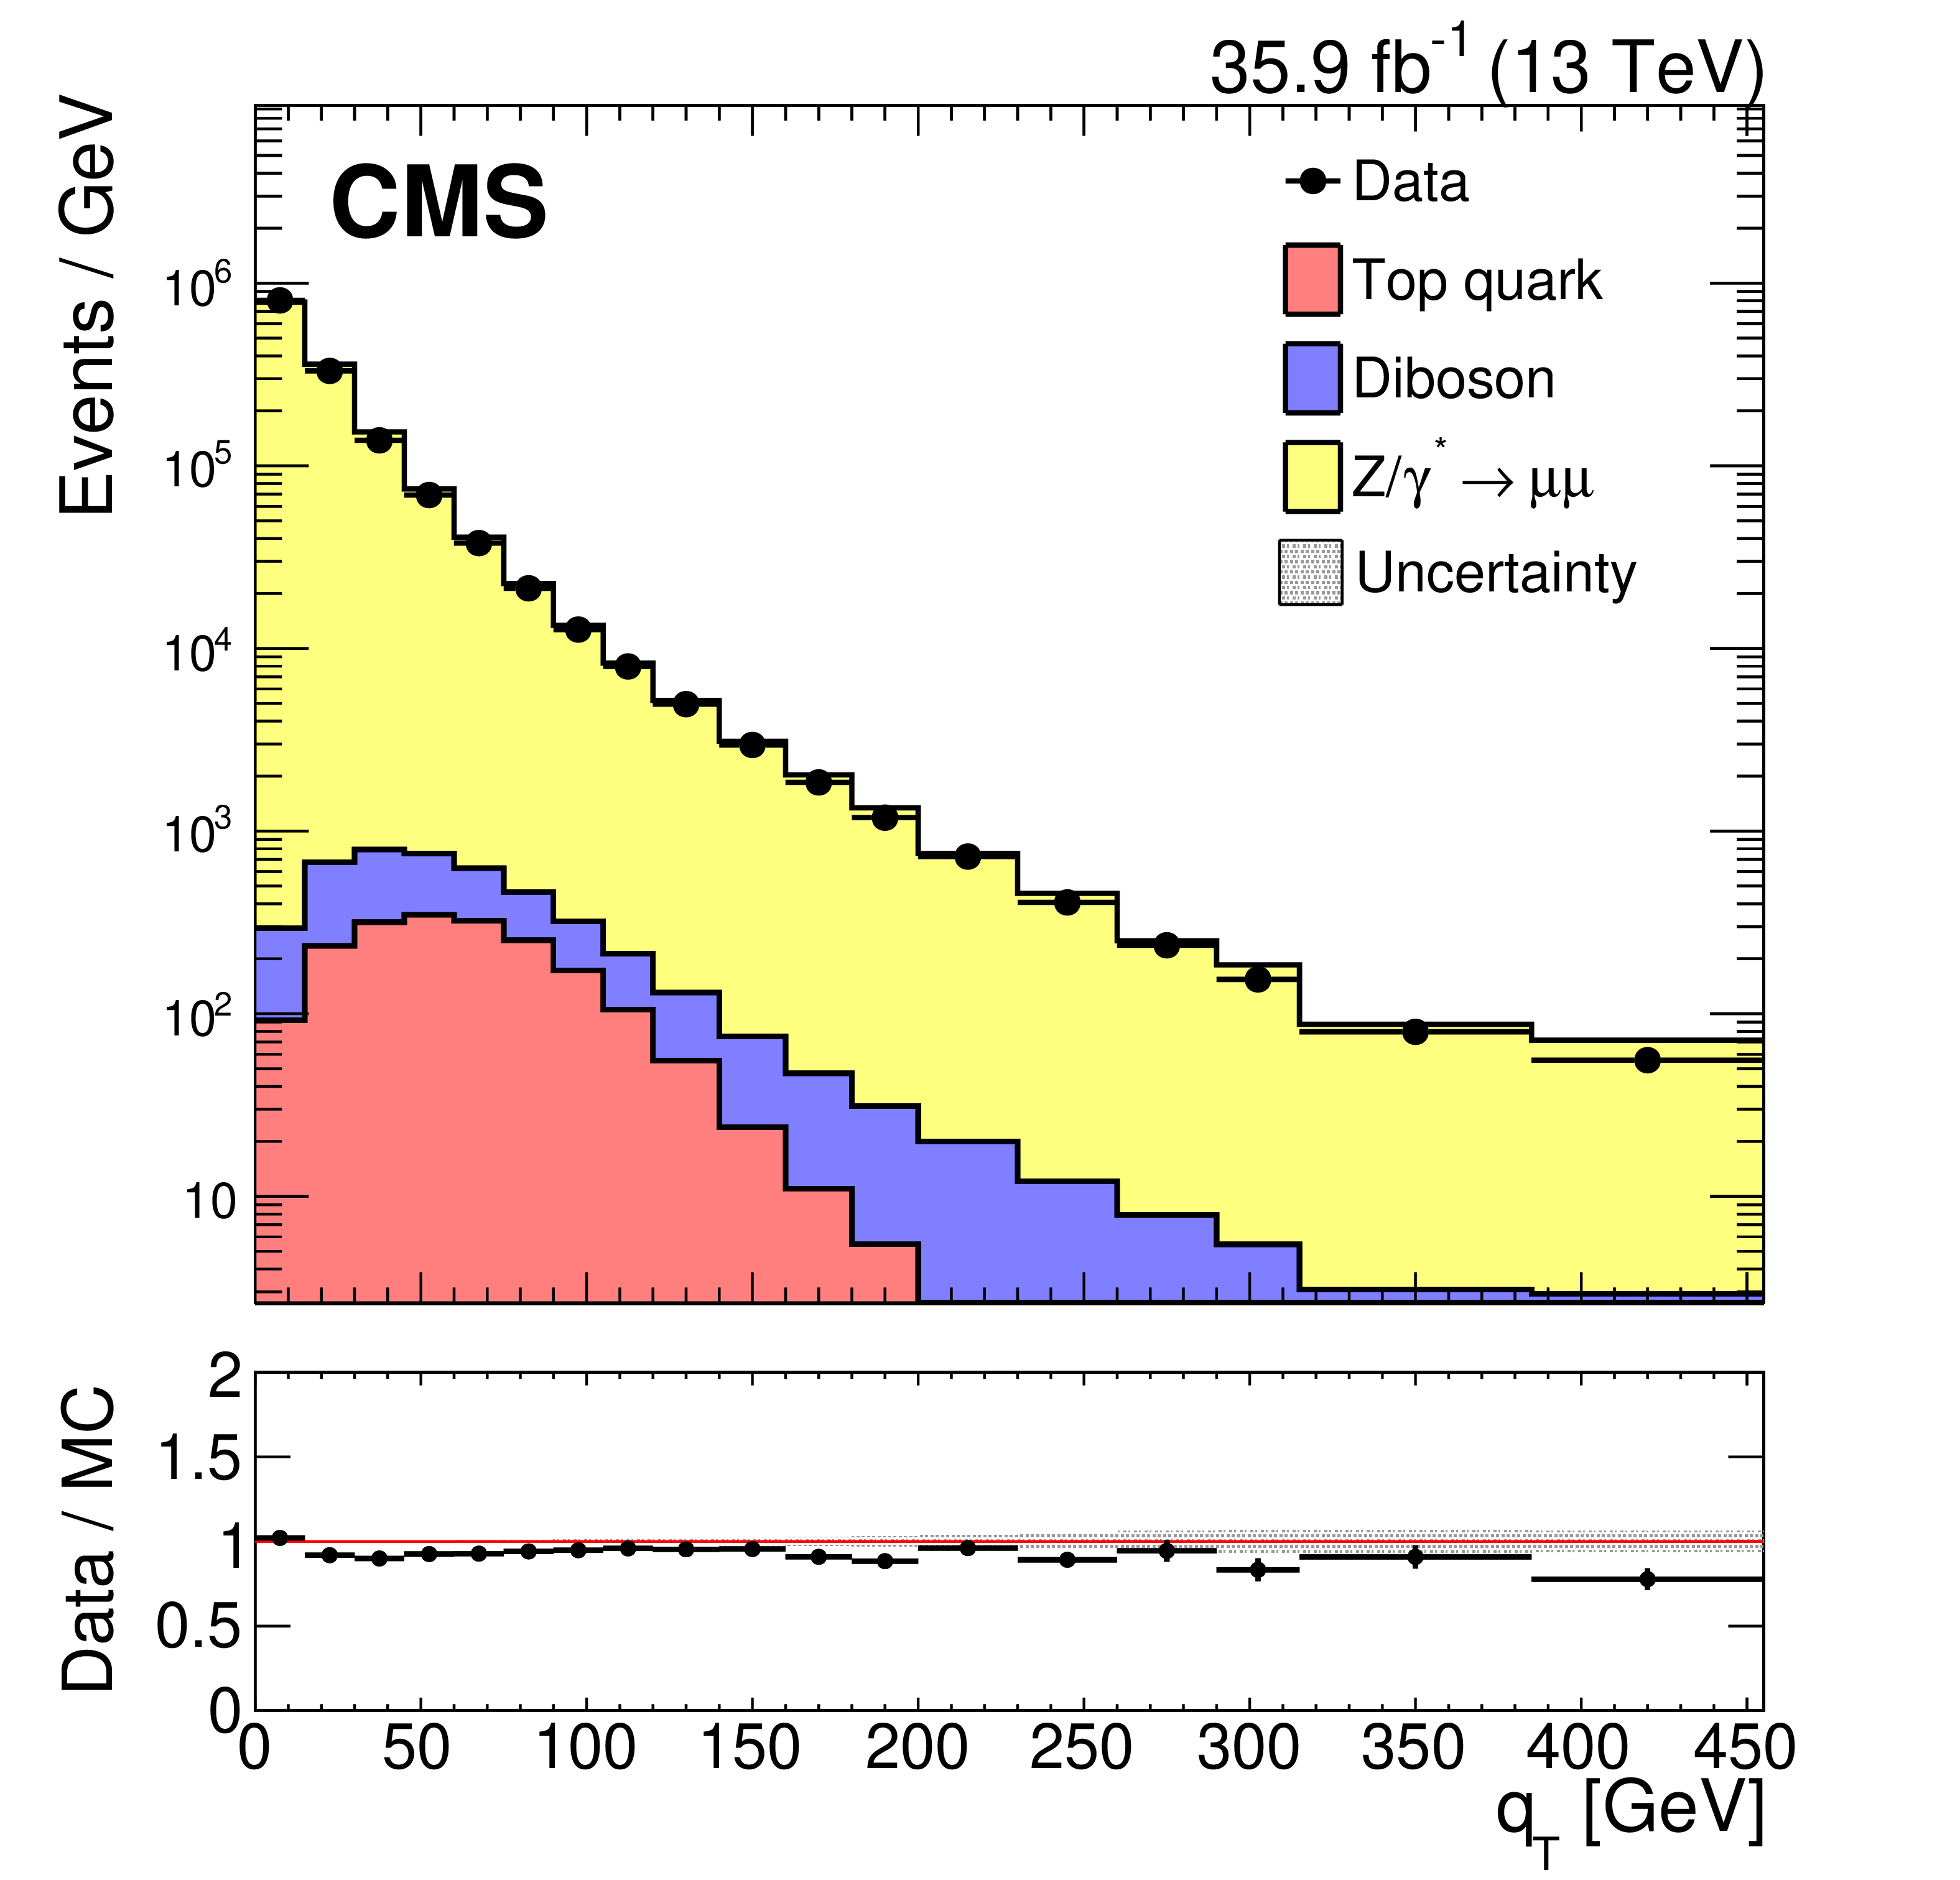
Figure 1-a:
Upper panel: Distribution of Z boson ${{q}_\mathrm {T}}$ in the ${{\mathrm {Z}}\to {\mu} ^+ {\mu ^-}}$ sample. The diboson contribution corresponds to processes with two electroweak bosons produced in the final state. The top quark contribution corresponds to the top pair and single top production processes. The last bin includes all events with $ {{q}_\mathrm {T}} > $ 385 GeV. Lower panel: Data to simulation ratio. The band corresponds to the statistical uncertainty in simulated samples. |
png pdf |
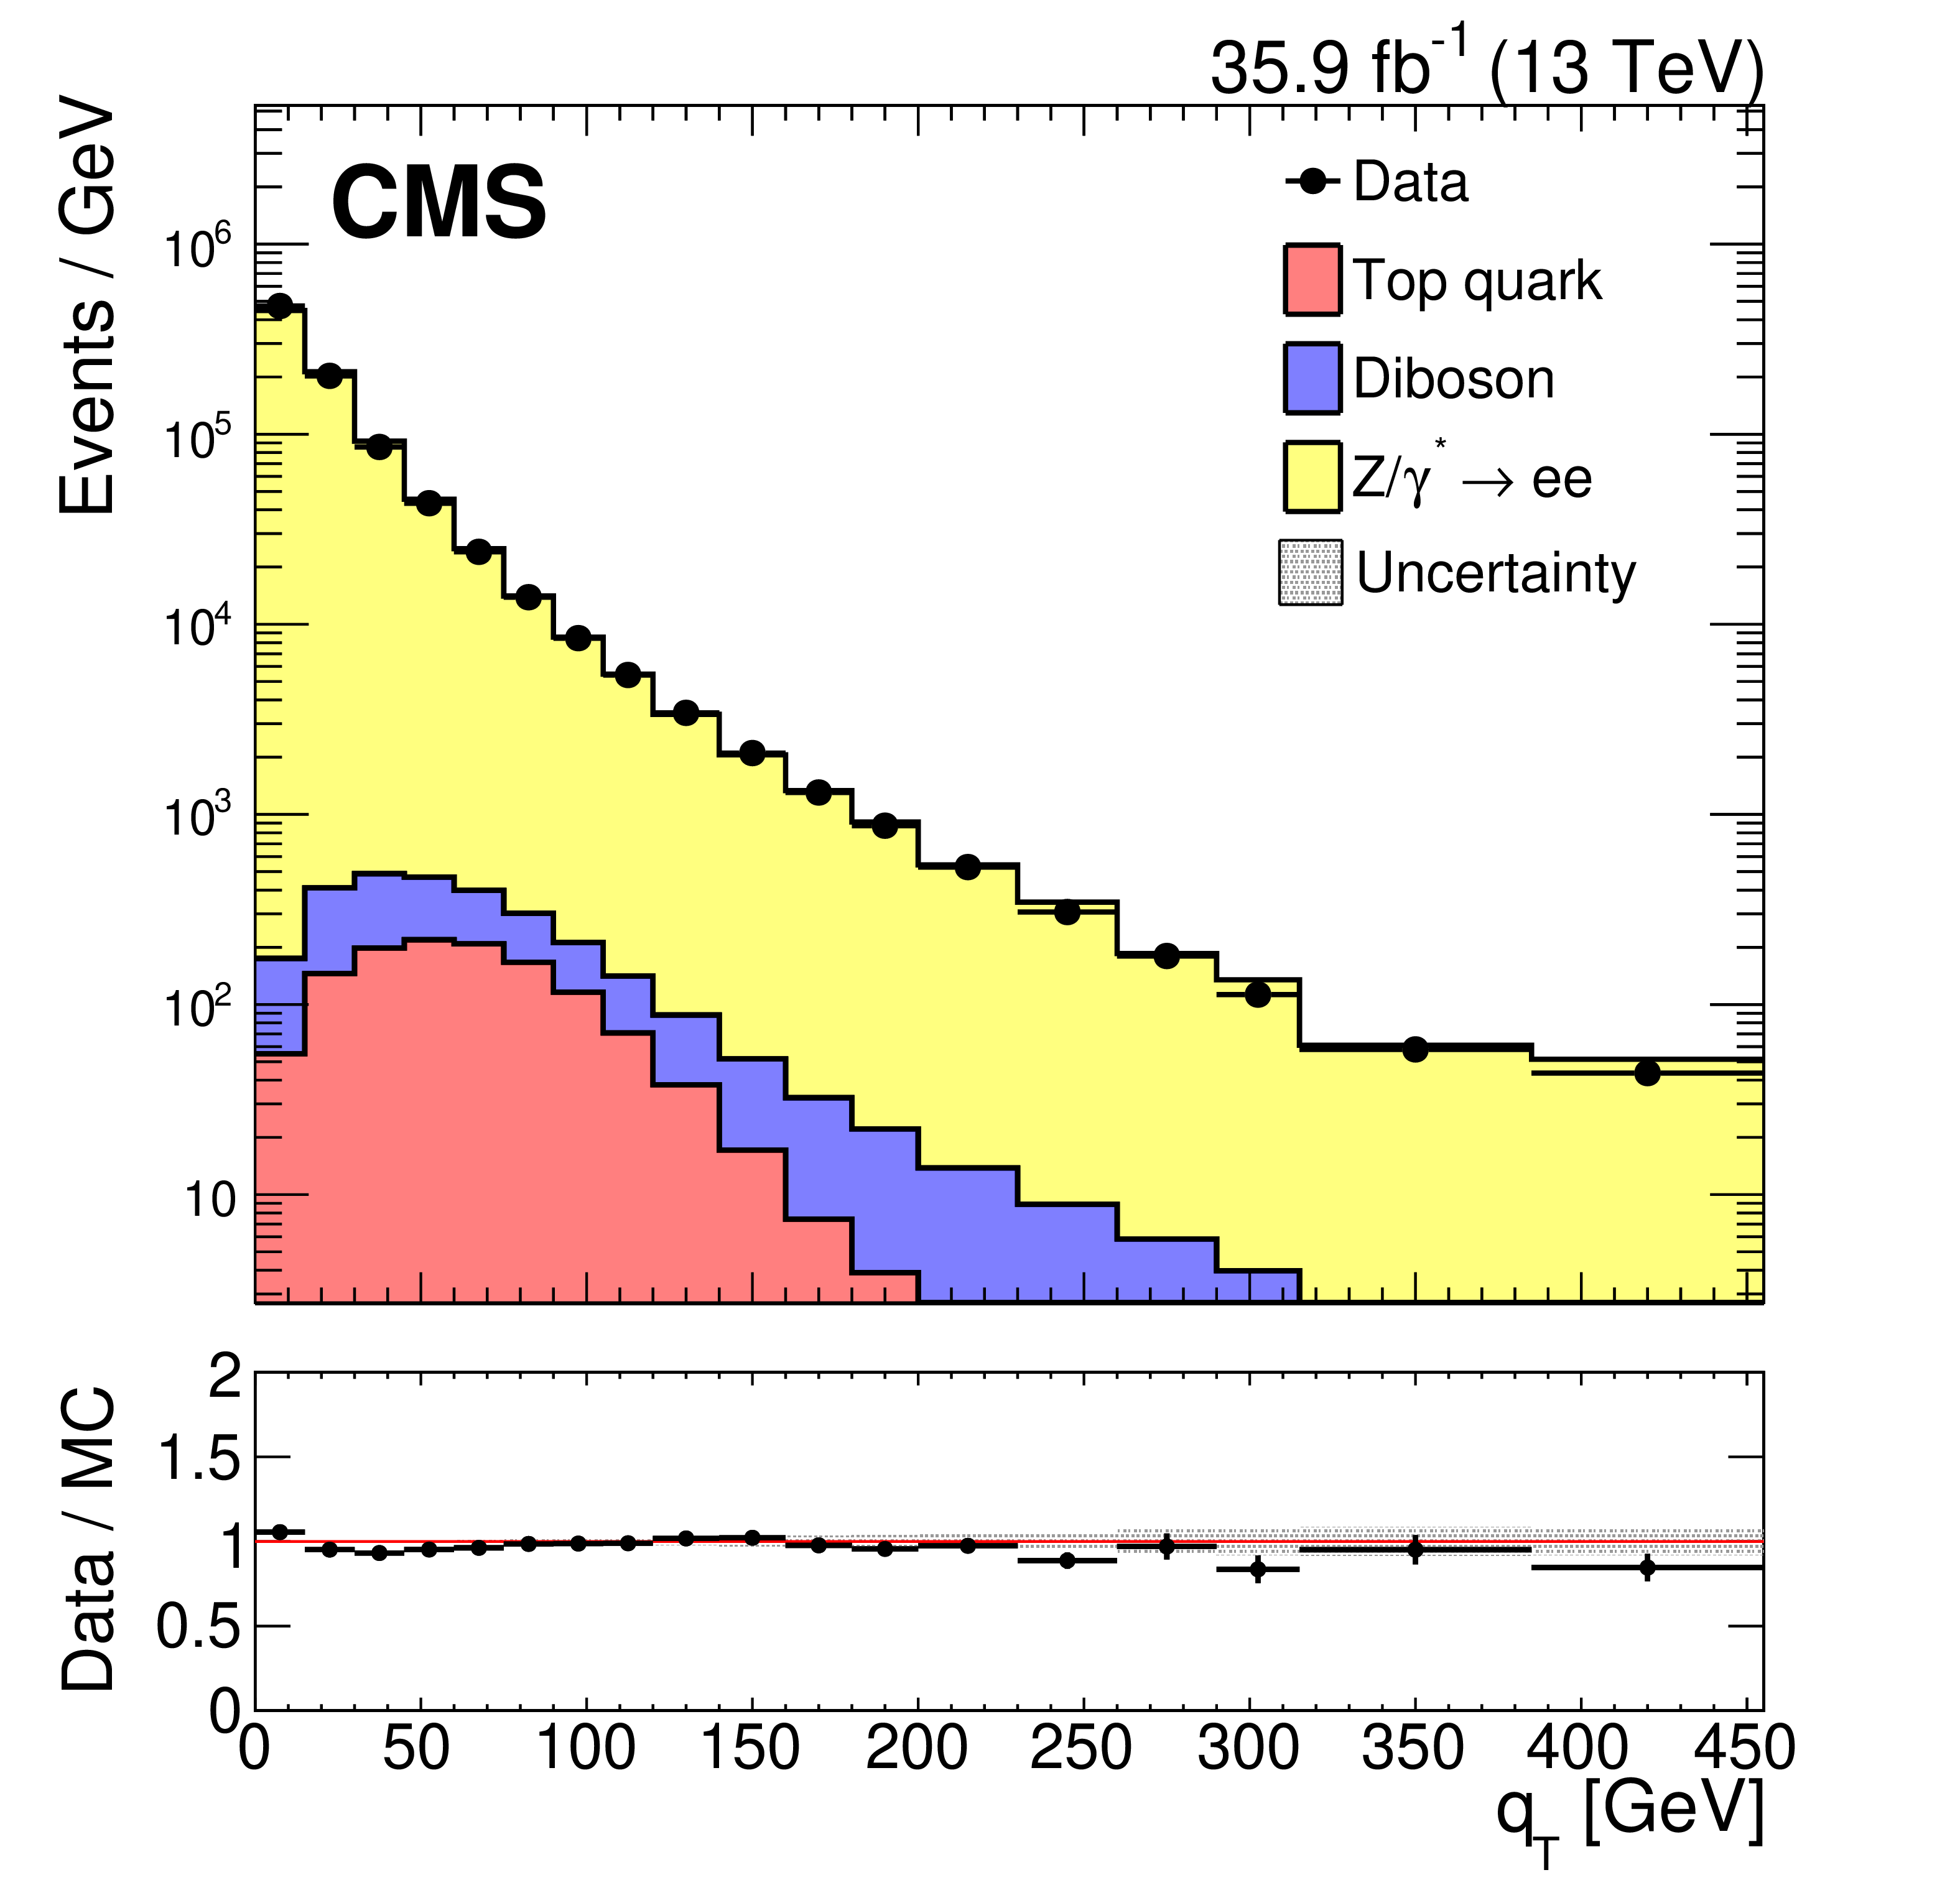
Figure 1-b:
Upper panel: Distribution of Z boson ${{q}_\mathrm {T}}$ in the ${{\mathrm {Z}}\to {\mathrm {e}^+} {\mathrm {e}^-}}$ sample. The diboson contribution corresponds to processes with two electroweak bosons produced in the final state. The top quark contribution corresponds to the top pair and single top production processes. The last bin includes all events with $ {{q}_\mathrm {T}} > $ 385 GeV. Lower panel: Data to simulation ratio. The band corresponds to the statistical uncertainty in simulated samples. |

png pdf |
Figure 2:
Upper panel: Distribution of the photon ${{q}_\mathrm {T}}$ in the single-photon sample. The V$ {\gamma} $, top quark contribution corresponds to the $ {\mathrm {Z}} {\gamma} $, $ {\mathrm {W}} {\gamma} $, top pair and single top production processes. The last bin includes all events with $ {{q}_\mathrm {T}} > $ 385 GeV. Lower panel: Data to simulation ratio. The band corresponds to the statistical uncertainty in the simulated samples. |
png pdf |
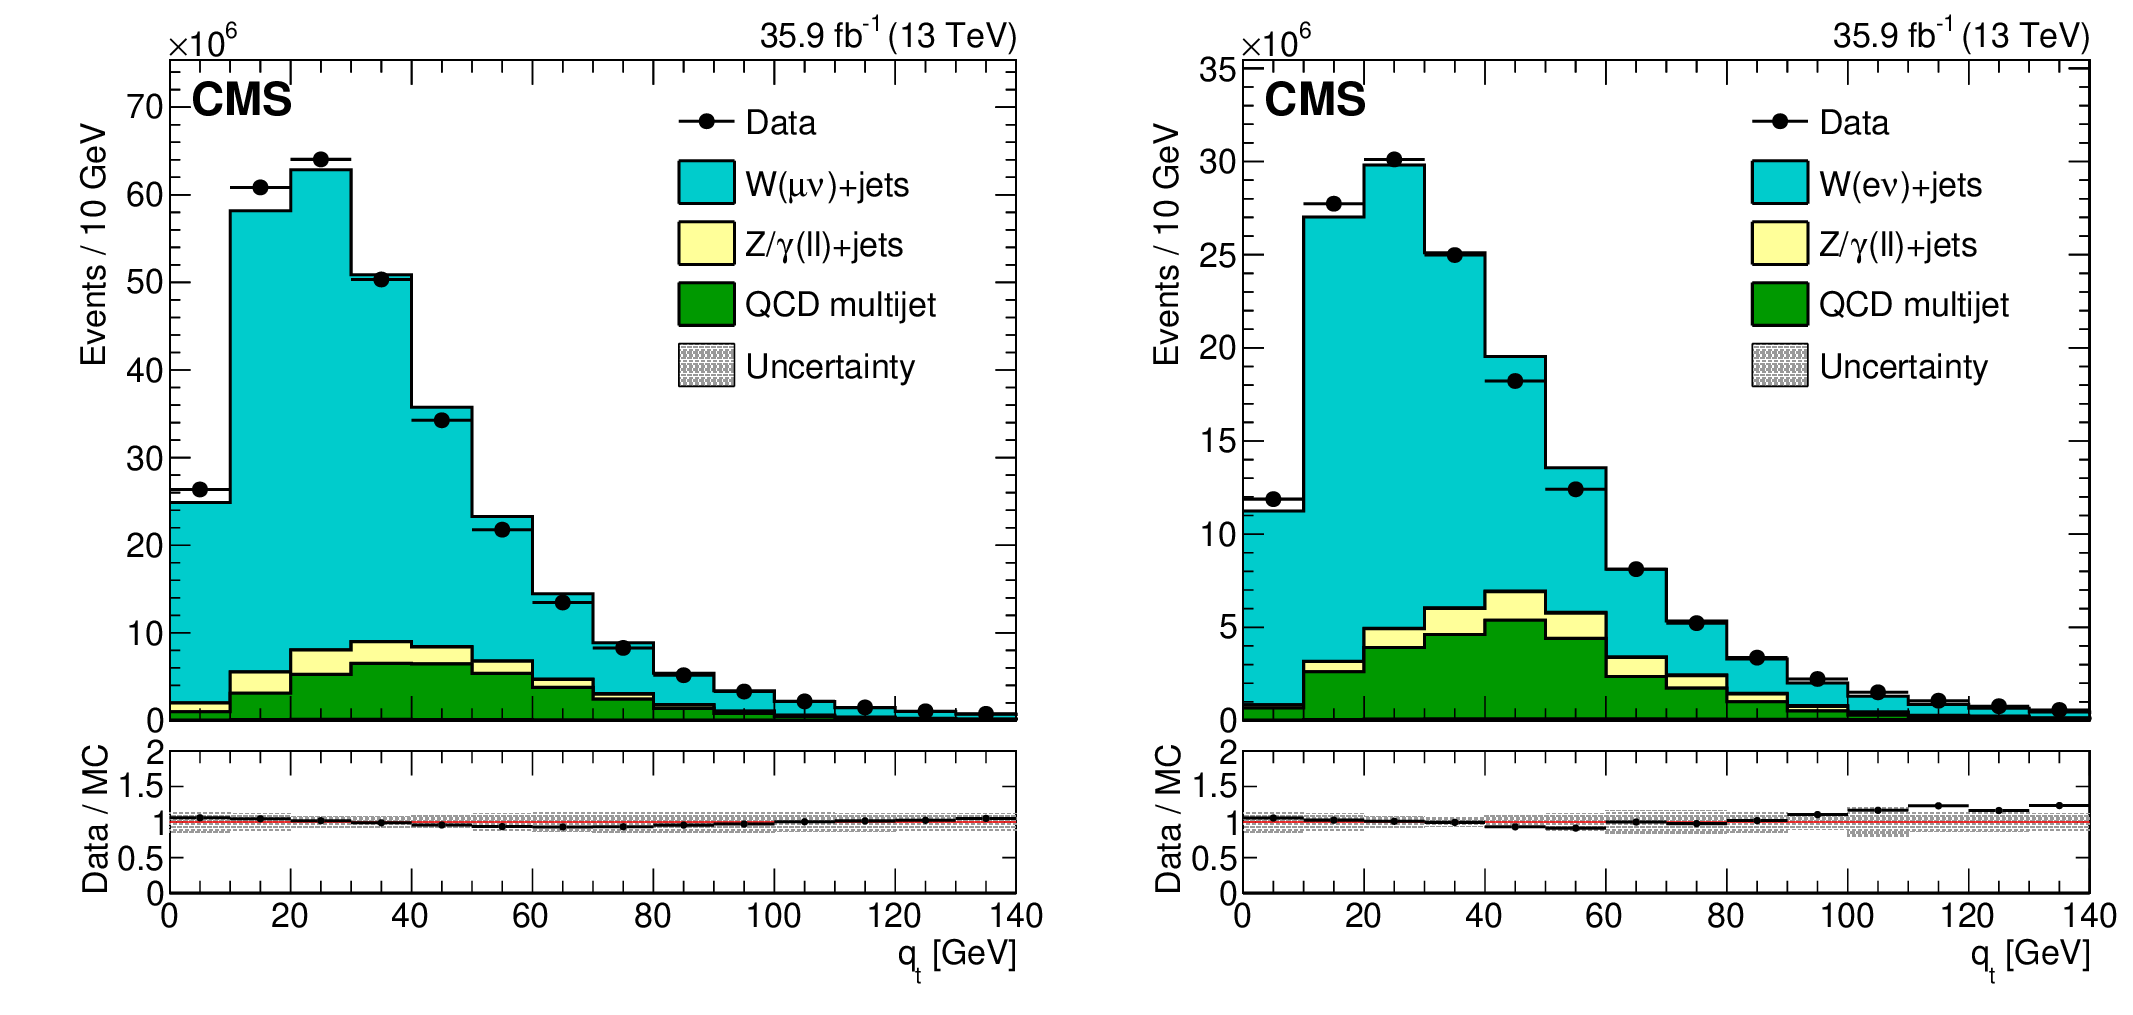
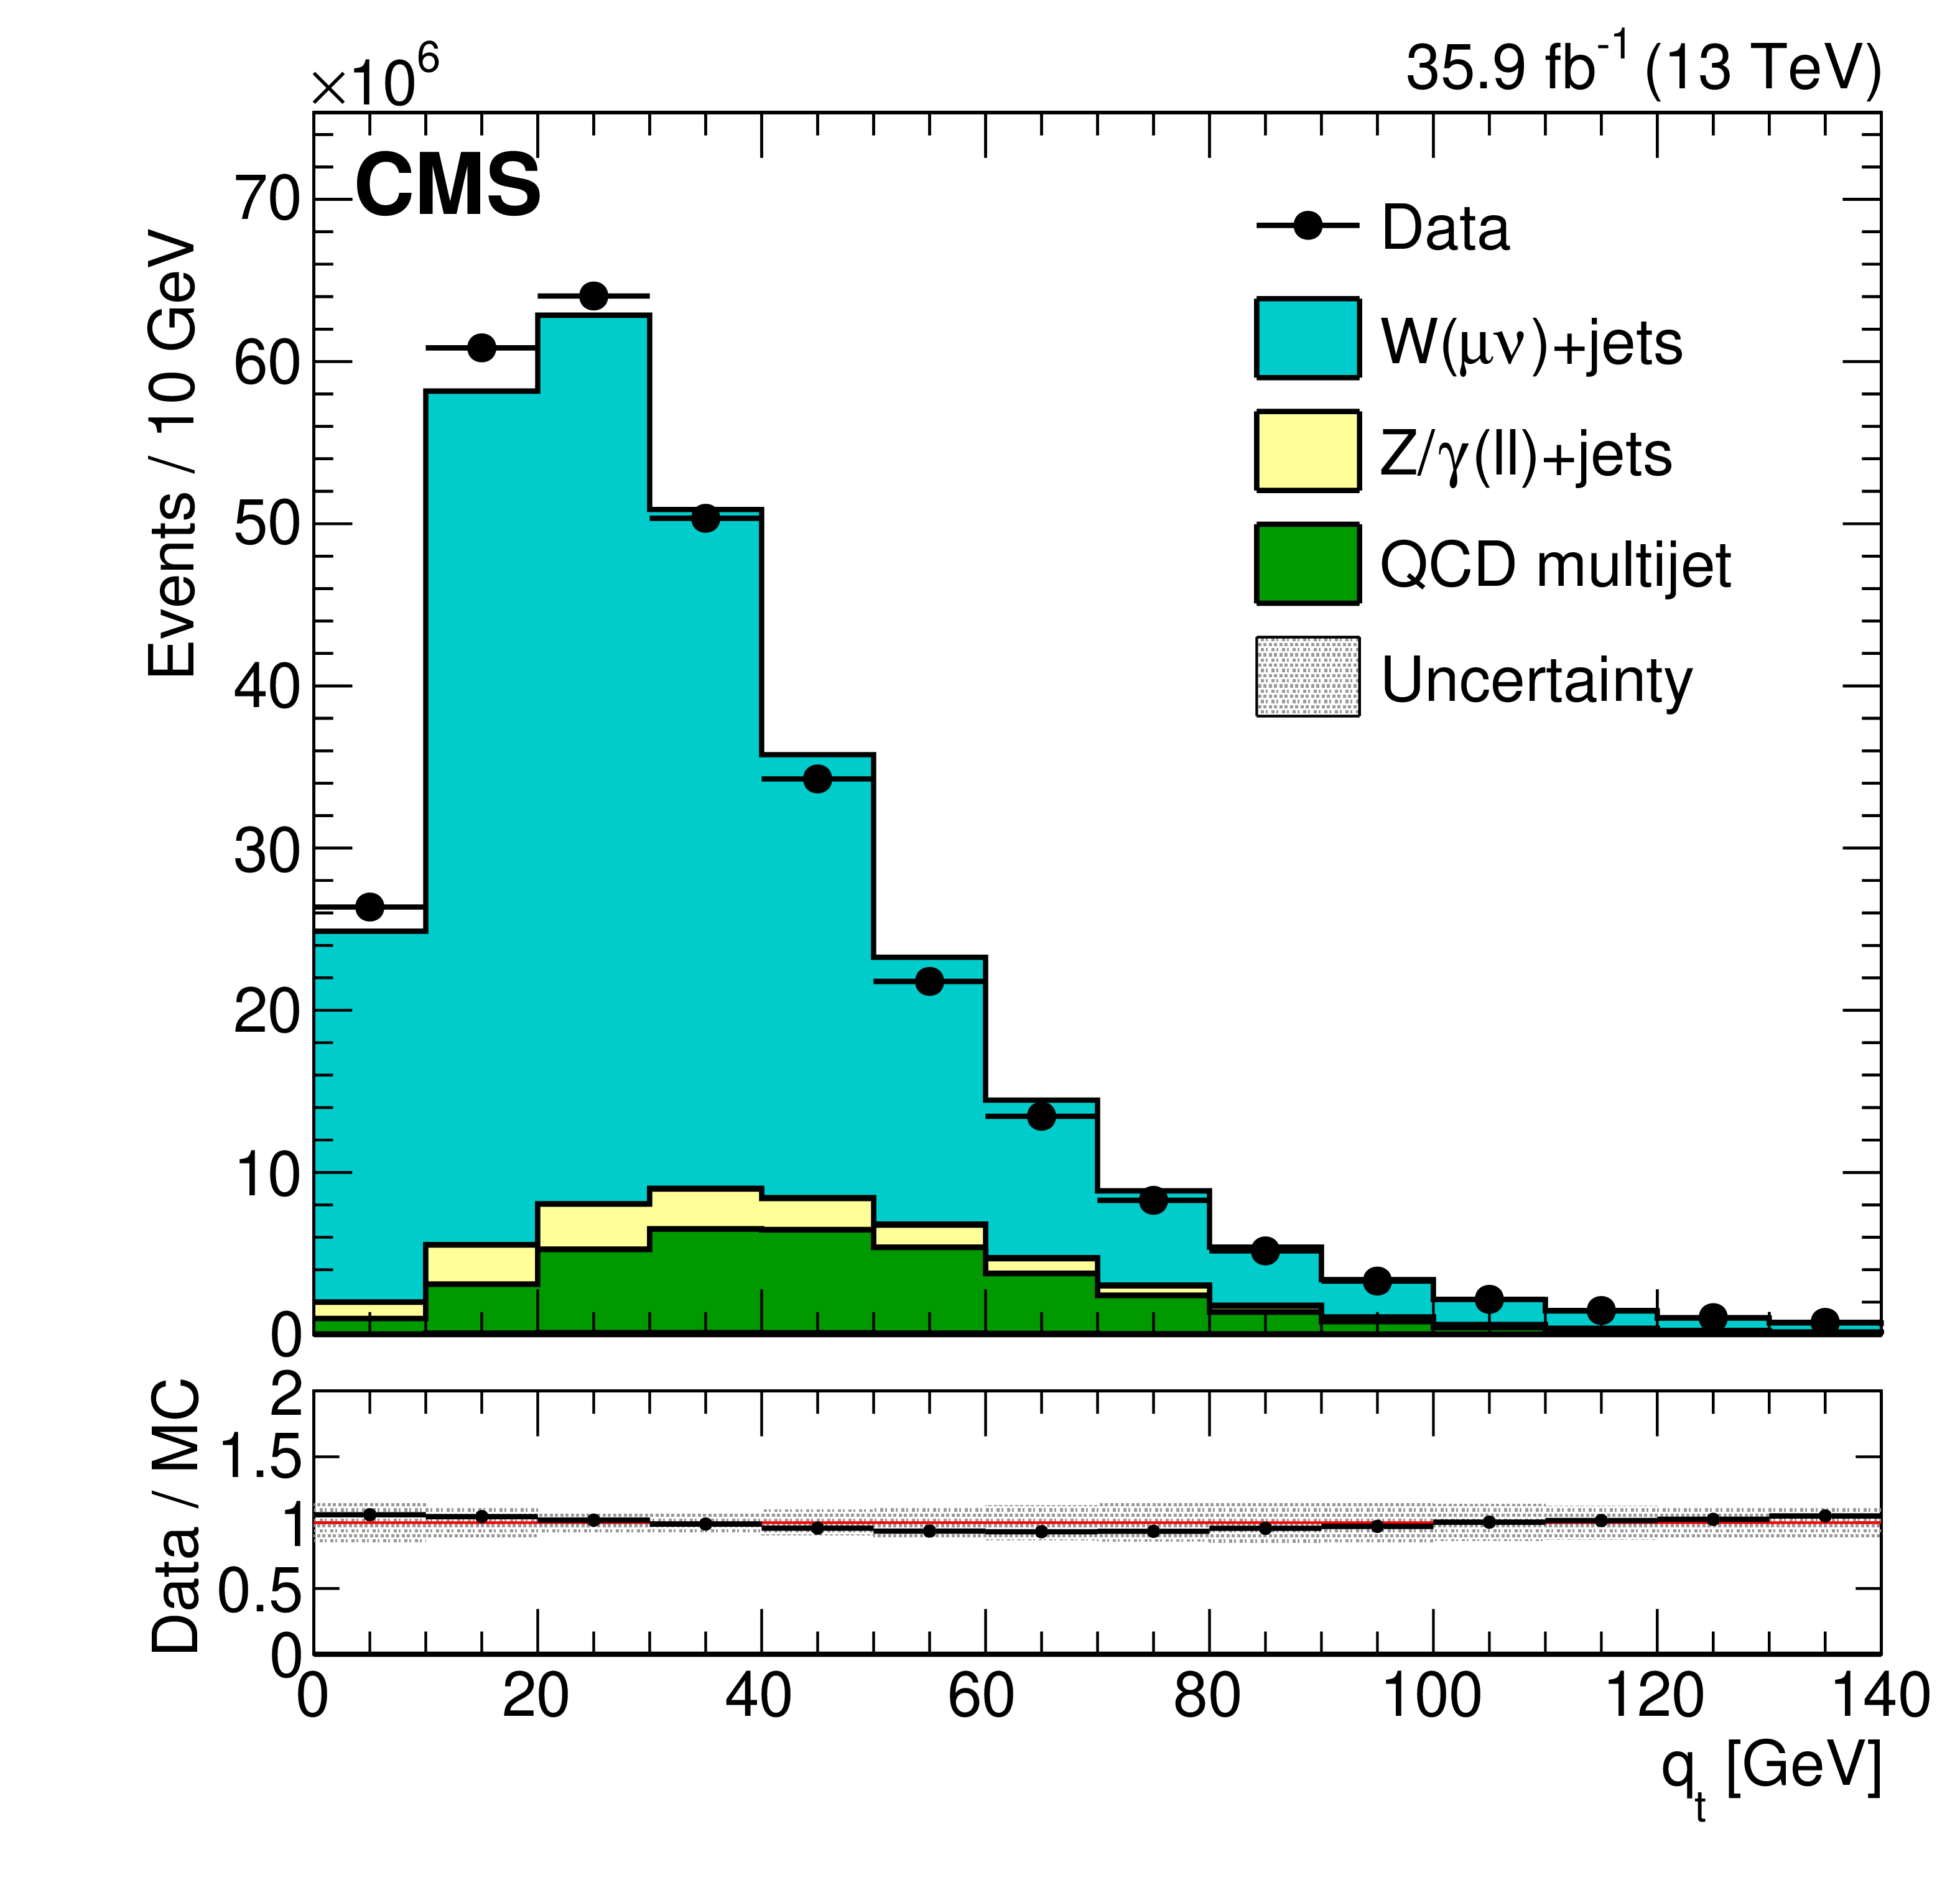
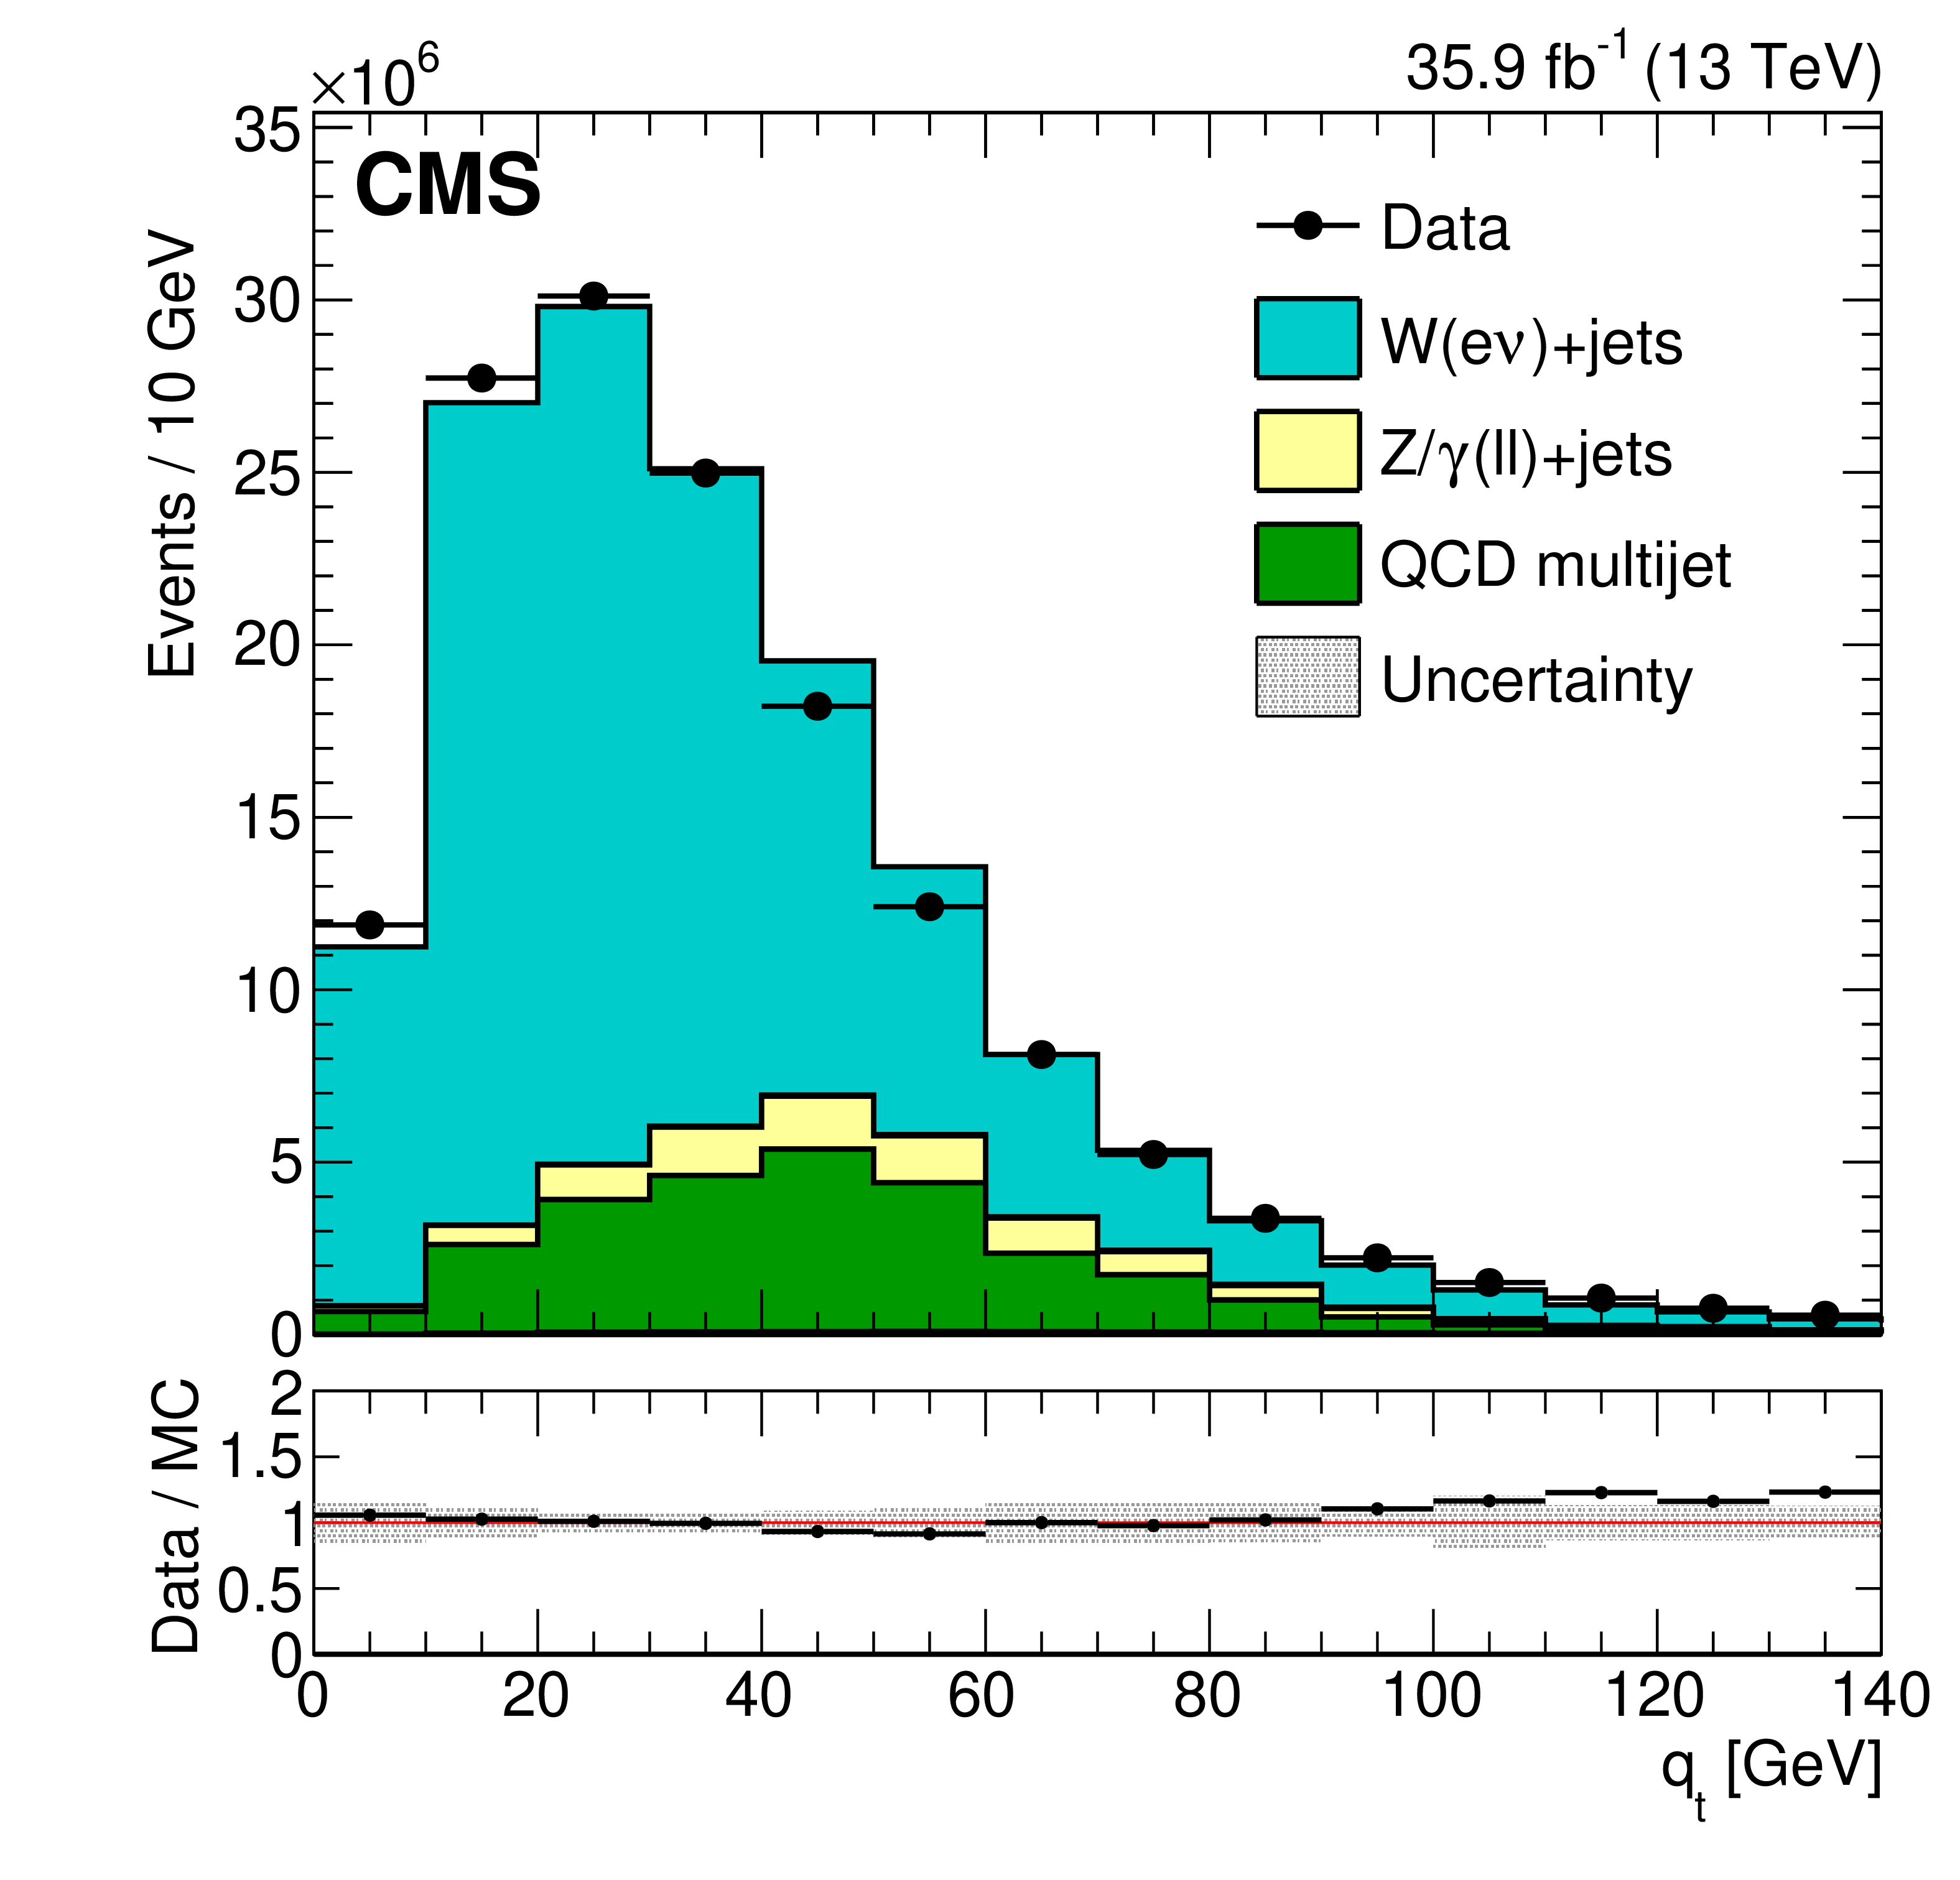
Figure 3:
Upper panels: Distributions of $ {\mathrm {W}}$ boson ${{q}_\mathrm {T}}$ in single-muon (left) and single-electron (right) samples. The last bin includes all events with $ {{q}_\mathrm {T}} > $ 130 GeV. Lower panels: Data to simulation ratio. The systematic uncertainties due to the JES, the JER, and variations in the $E_{U}$ are added in quadrature and displayed with a band. |
png pdf |
Figure 3-a:
Upper panel: Distribution of $ {\mathrm {W}}$ boson ${{q}_\mathrm {T}}$ in the single-muon sample. The last bin includes all events with $ {{q}_\mathrm {T}} > $ 130 GeV. Lower panel: Data to simulation ratio. The systematic uncertainties due to the JES, the JER, and variations in the $E_{U}$ are added in quadrature and displayed with a band. |
png pdf |
Figure 3-b:
Upper panel: Distribution of $ {\mathrm {W}}$ boson ${{q}_\mathrm {T}}$ in the single-electron sample. The last bin includes all events with $ {{q}_\mathrm {T}} > $ 130 GeV. Lower panel: Data to simulation ratio. The systematic uncertainties due to the JES, the JER, and variations in the $E_{U}$ are added in quadrature and displayed with a band. |
png pdf |
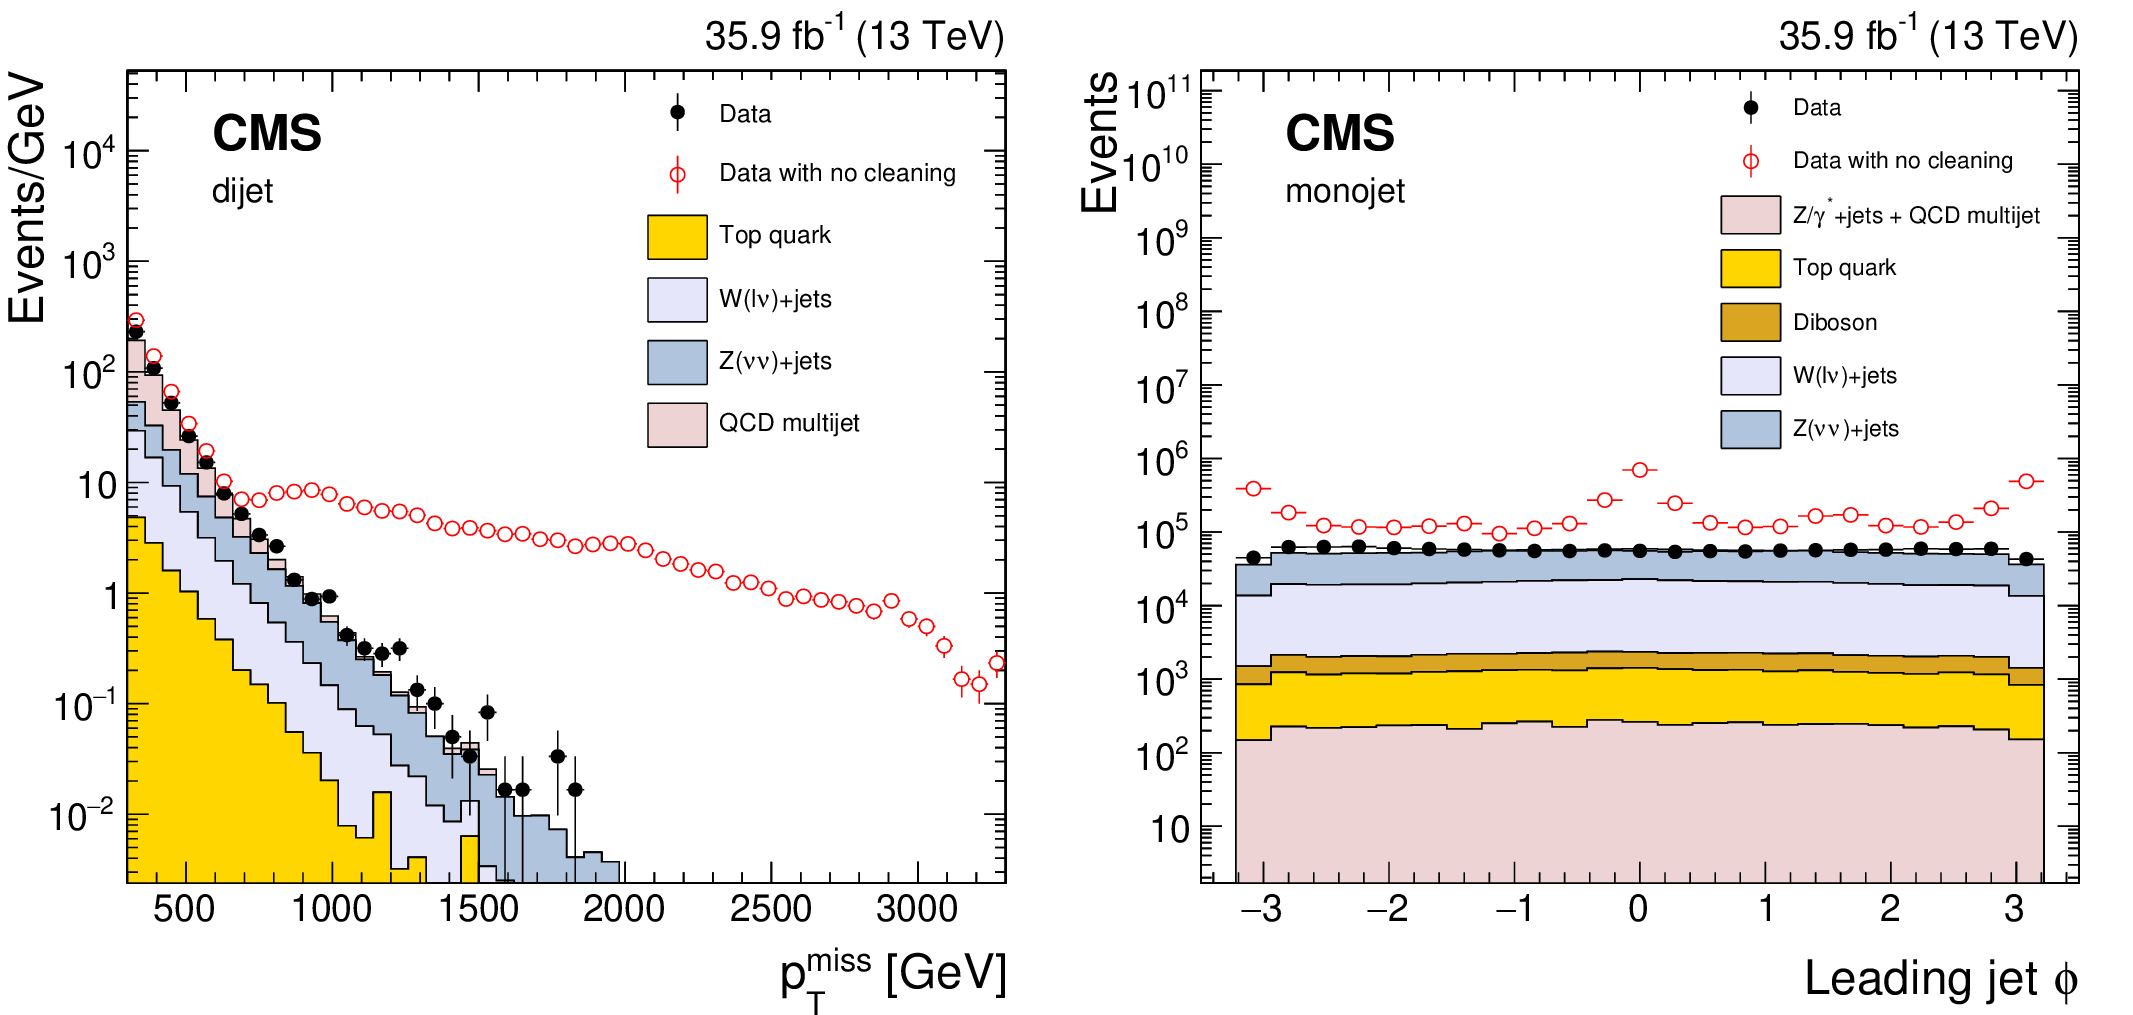
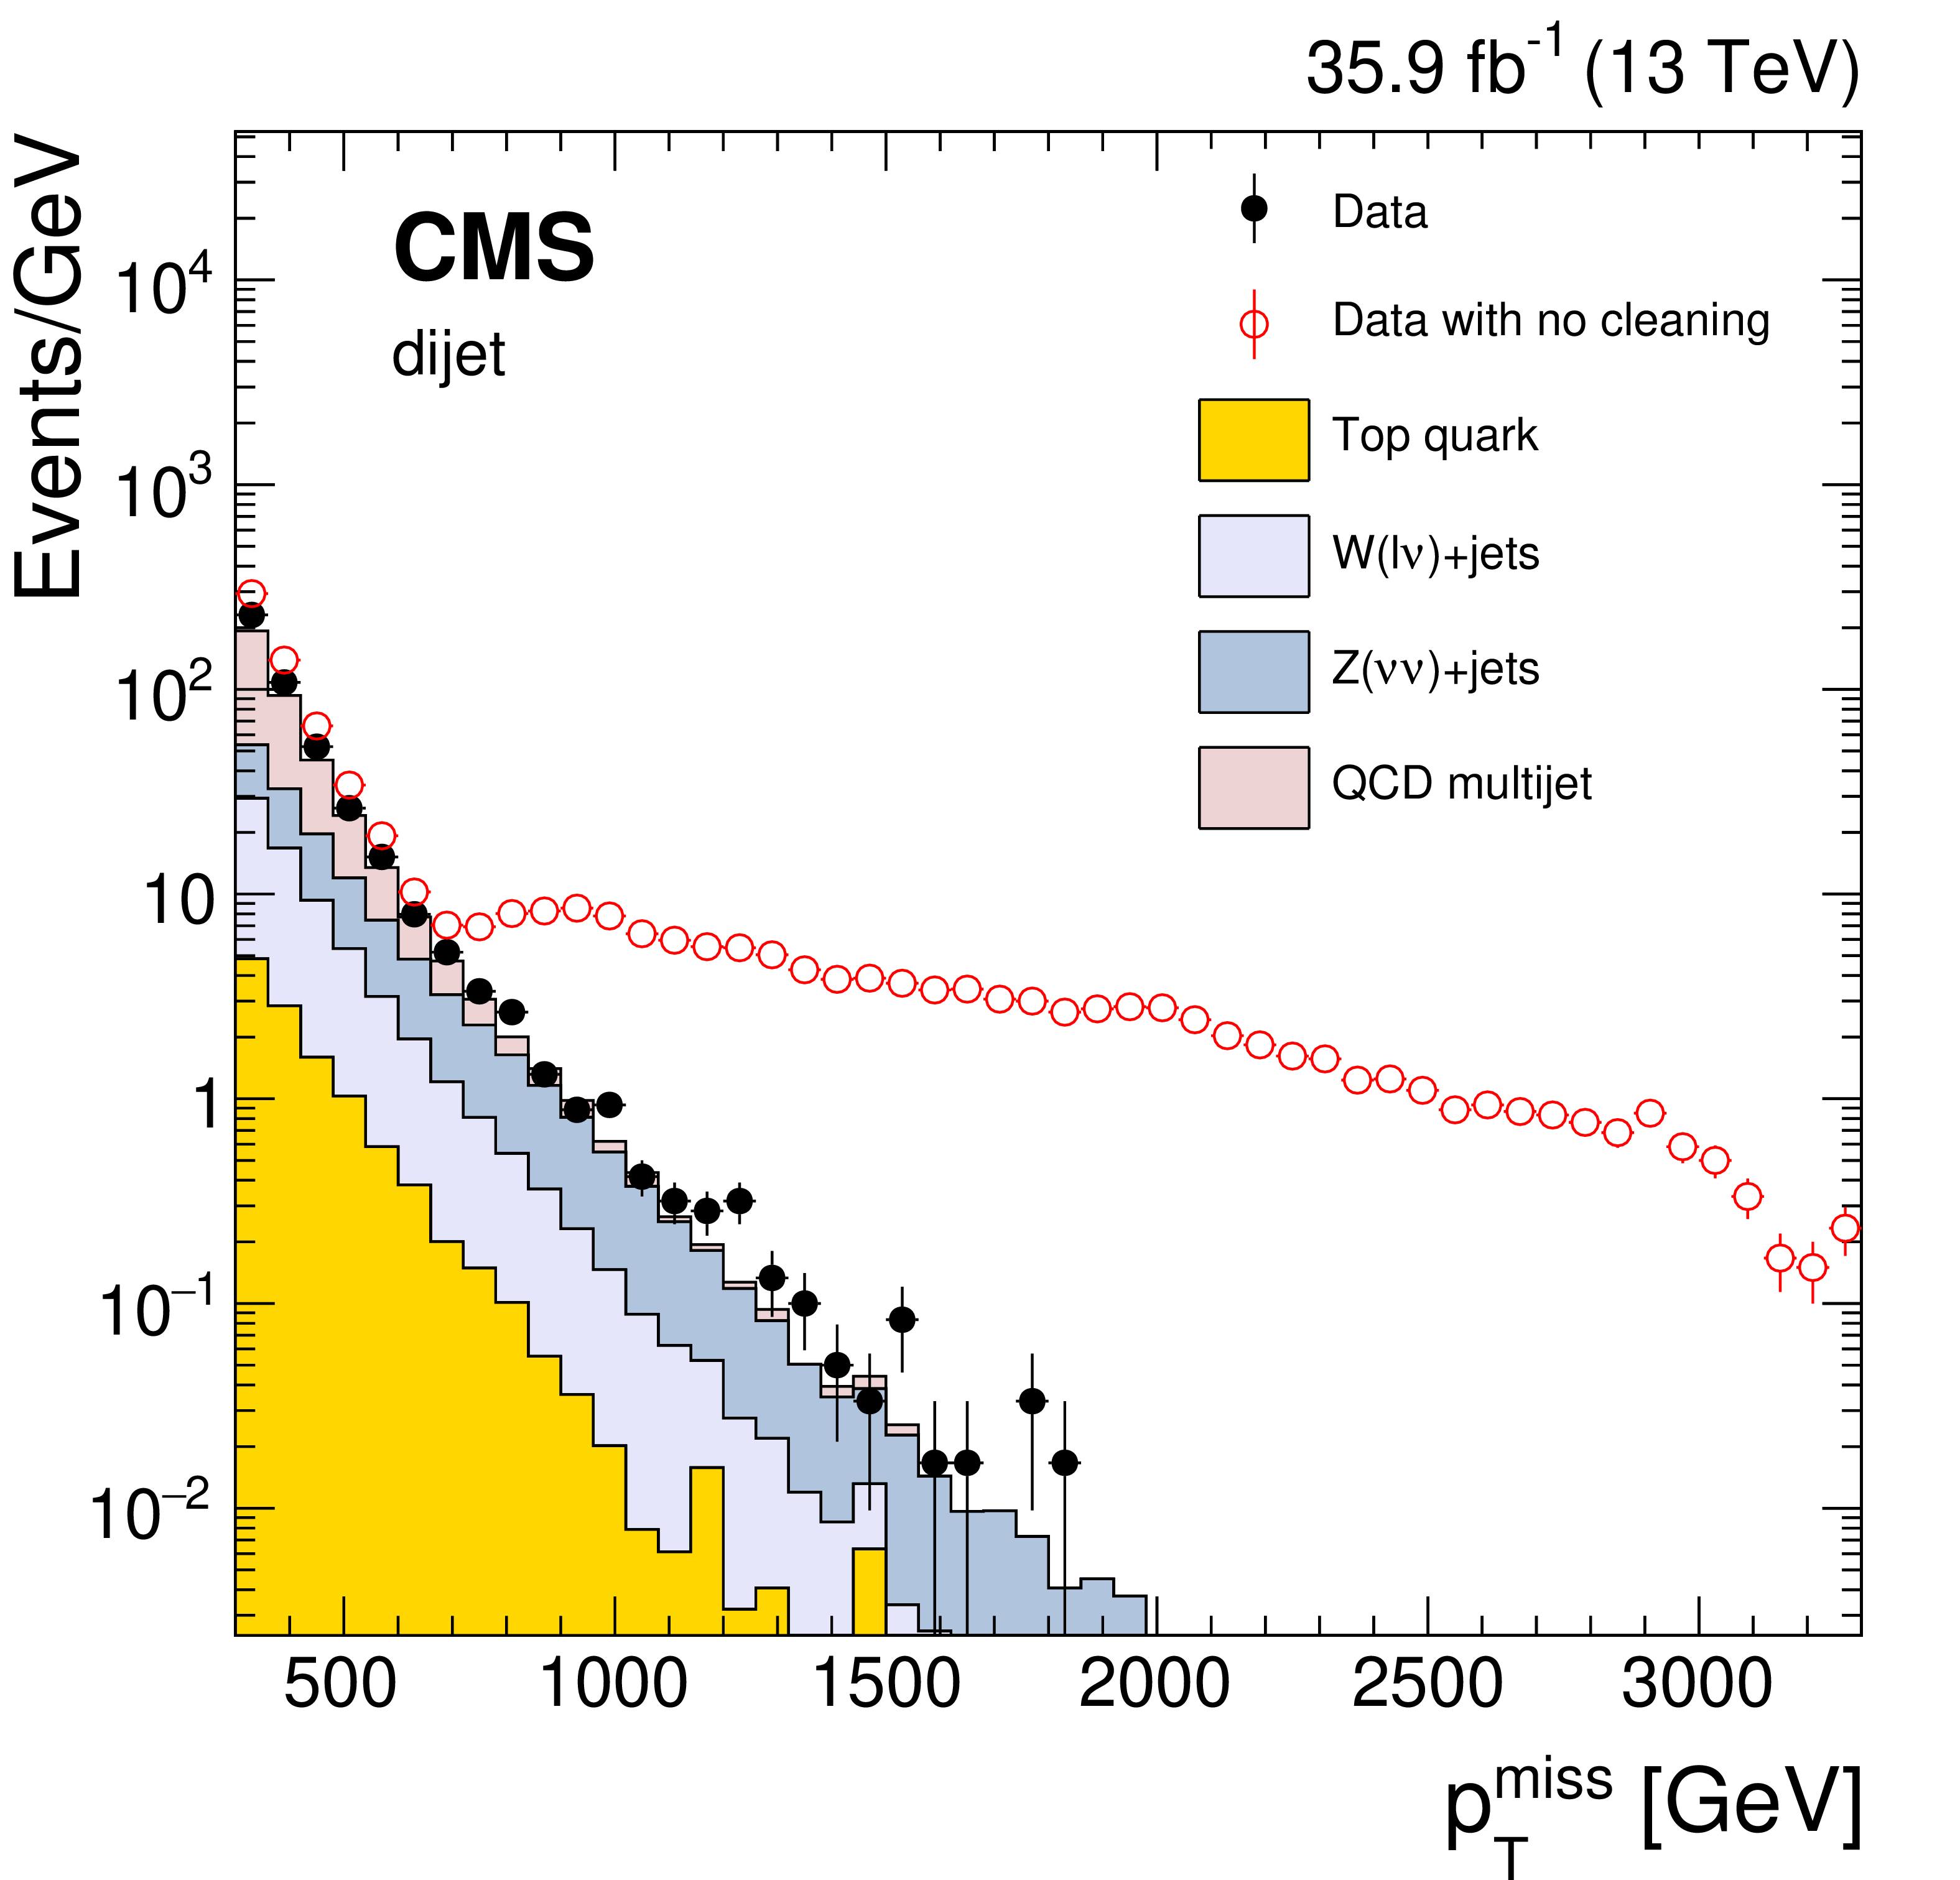
Figure 4:
The ${{p_{\mathrm {T}}} ^\text {miss}}$ (left) and jet $\phi $ (right) distributions for events passing the dijet (left) and monojet (right) selection with the event filtering algorithms applied, including that based on jet identification requirements (filled markers), without the event filtering algorithms applied (open markers), and from simulation (solid histograms). |
png pdf |
Figure 4-a:
The ${{p_{\mathrm {T}}} ^\text {miss}}$ distribution for events passing the dijet selection with the event filtering algorithms applied, including that based on jet identification requirements (filled markers), without the event filtering algorithms applied (open markers), and from simulation (solid histograms). |

png pdf |
Figure 4-b:
The jet $\phi $ distribution for events passing the monojet selection with the event filtering algorithms applied, including that based on jet identification requirements (filled markers), without the event filtering algorithms applied (open markers), and from simulation (solid histograms). |
png pdf |
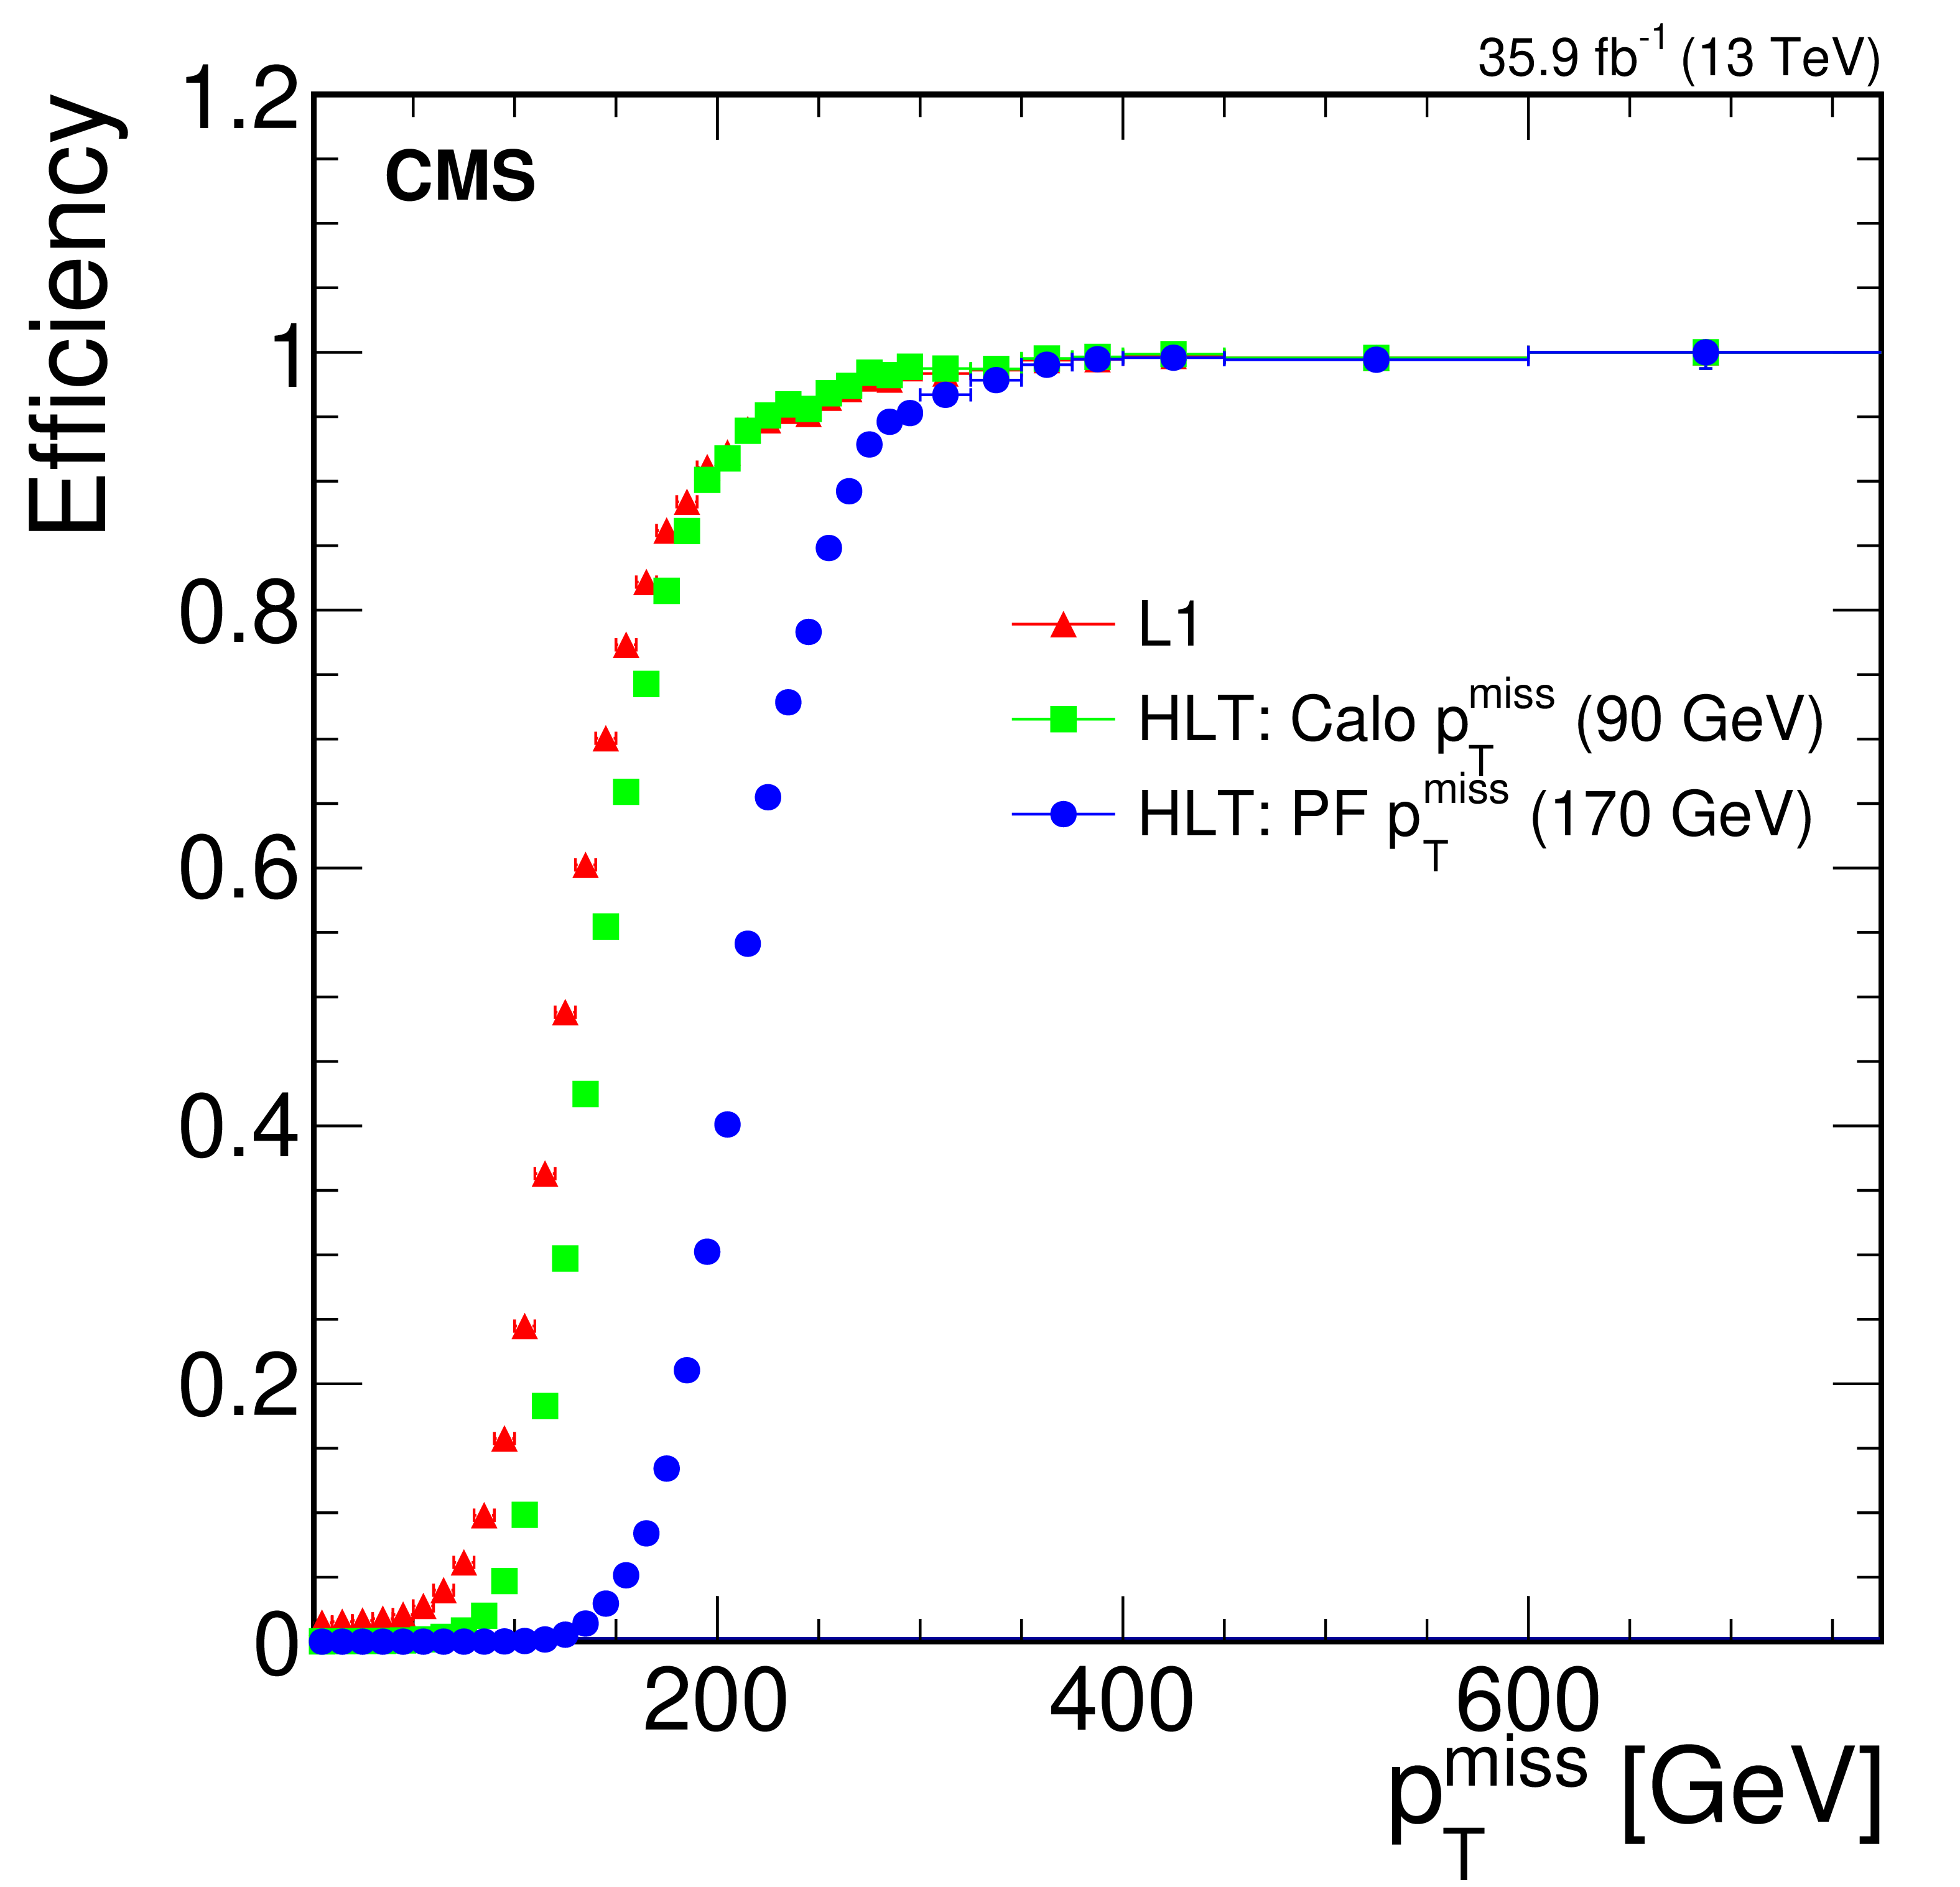
Figure 5:
The ${{p_{\mathrm {T}}} ^\text {miss}}$ trigger efficiency as a function of offline ${{p_{\mathrm {T}}} ^\text {miss}}$, measured using a single-electron sample. The efficiency of each reconstruction algorithm, namely the L1, the calorimeter, and the PF-based ${{p_{\mathrm {T}}} ^\text {miss}}$ algorithms, is shown separately. The numbers in parentheses correspond to the HLT ${{p_{\mathrm {T}}} ^\text {miss}}$ thresholds. The logical OR of the L1 ${{p_{\mathrm {T}}} ^\text {miss}}$ triggers with requirements on ${{p_{\mathrm {T}}} ^\text {miss}}$ greater than 50, 60, 70, 80, 90, 100 and 120 GeV are used. |
png pdf |
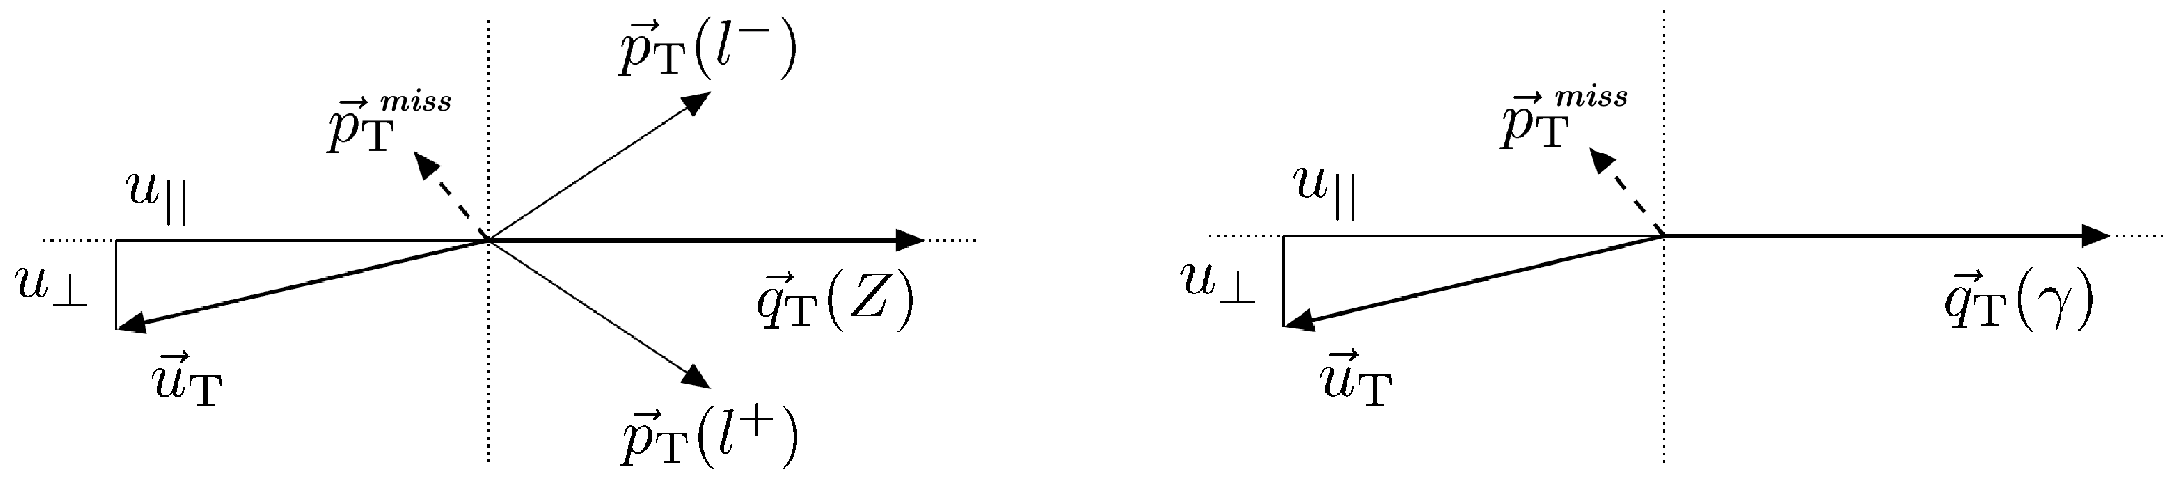
Figure 6:
Illustration of the Z boson (left) and photon (right) event kinematics in the transverse plane. The vector ${\vec{u}_\mathrm {T}}$ denotes the vectorial sum of all particles reconstructed in the event except for the two leptons from the Z decay (left) or the photon (right). |
png pdf |
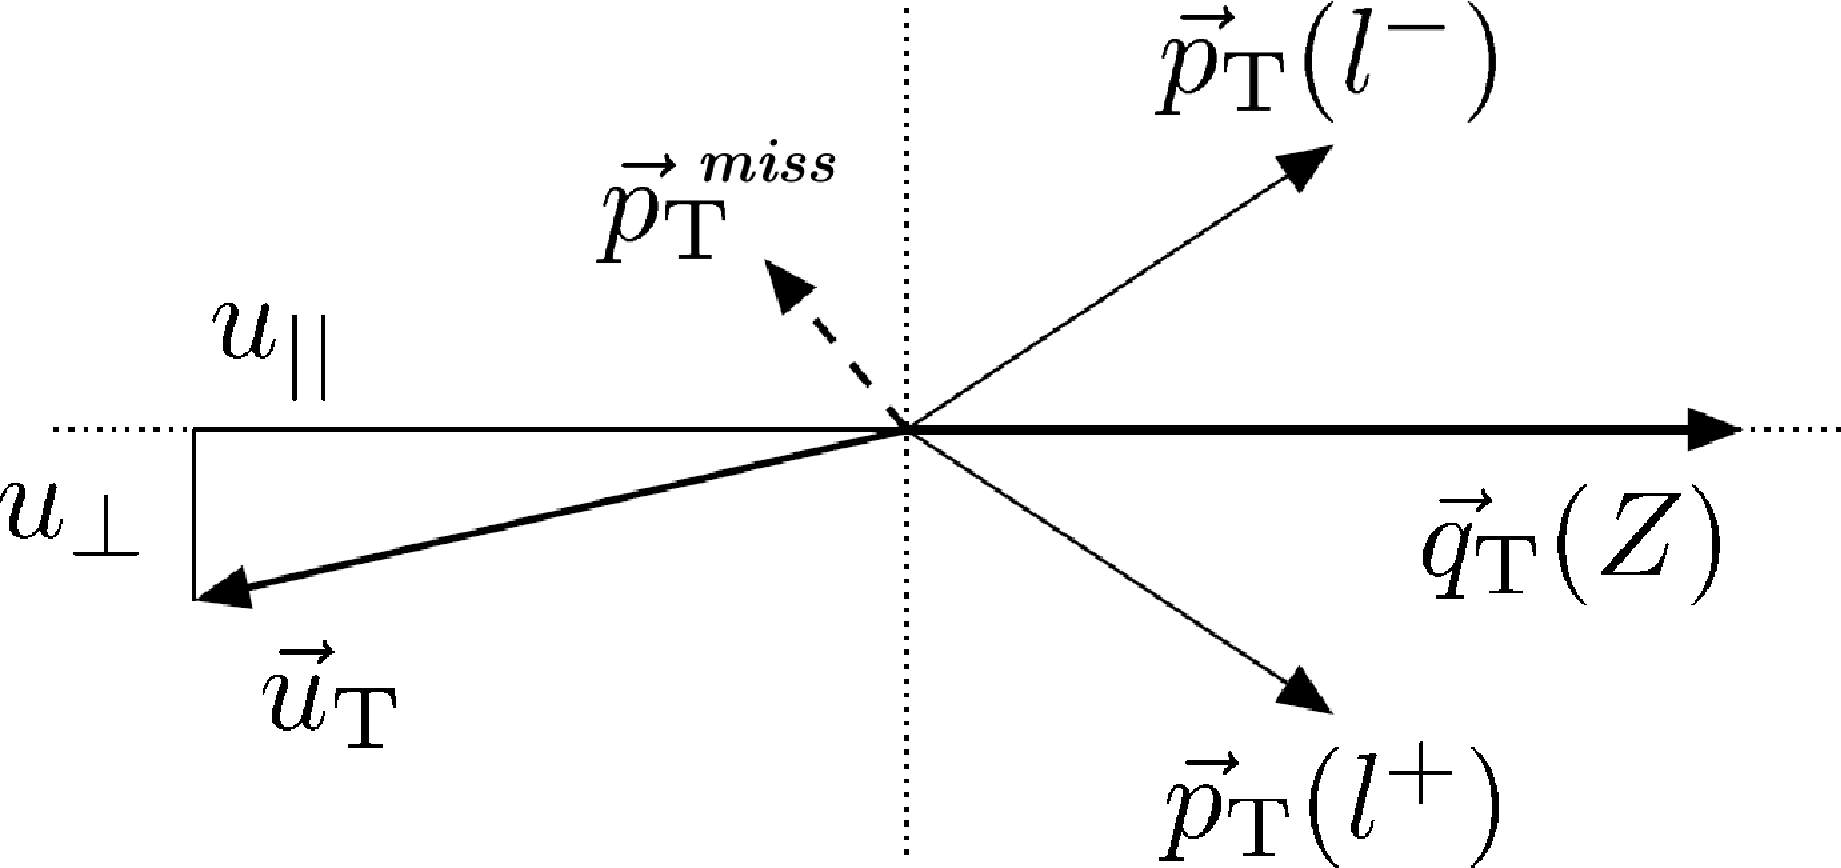
Figure 6-a:
Illustration of the Z boson event kinematics in the transverse plane. The vector ${\vec{u}_\mathrm {T}}$ denotes the vectorial sum of all particles reconstructed in the event except for the two leptons from the Z decay. |
png pdf |
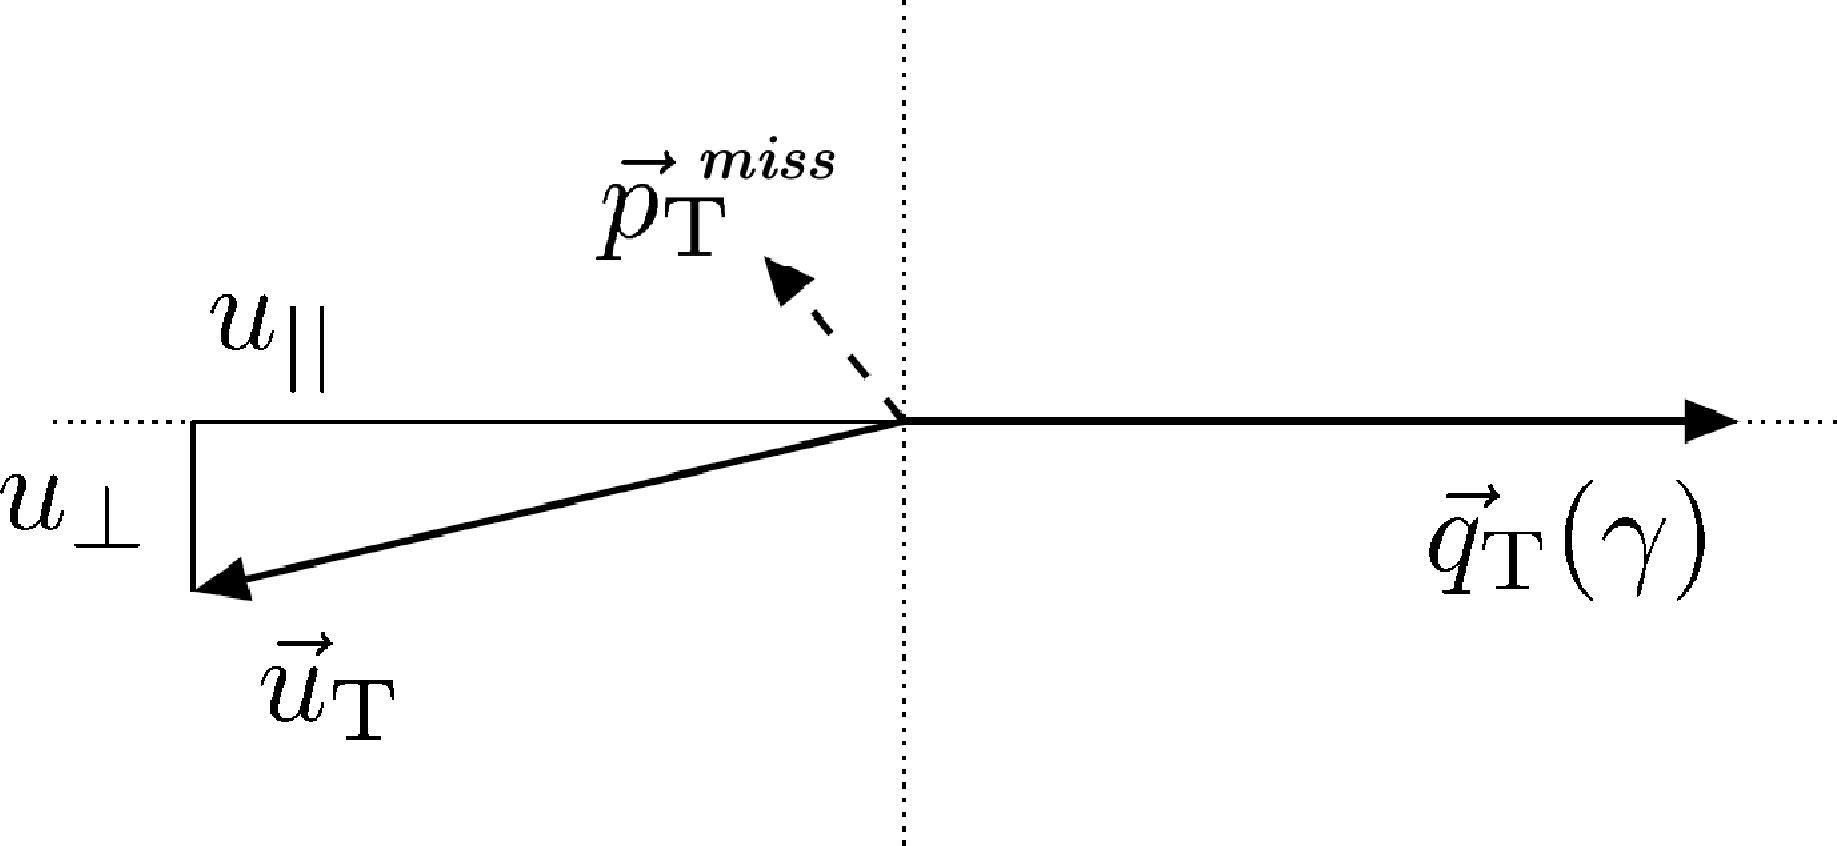
Figure 6-b:
Illustration of the photon event kinematics in the transverse plane. The vector ${\vec{u}_\mathrm {T}}$ denotes the vectorial sum of all particles reconstructed in the event except for the photon. |

png pdf |
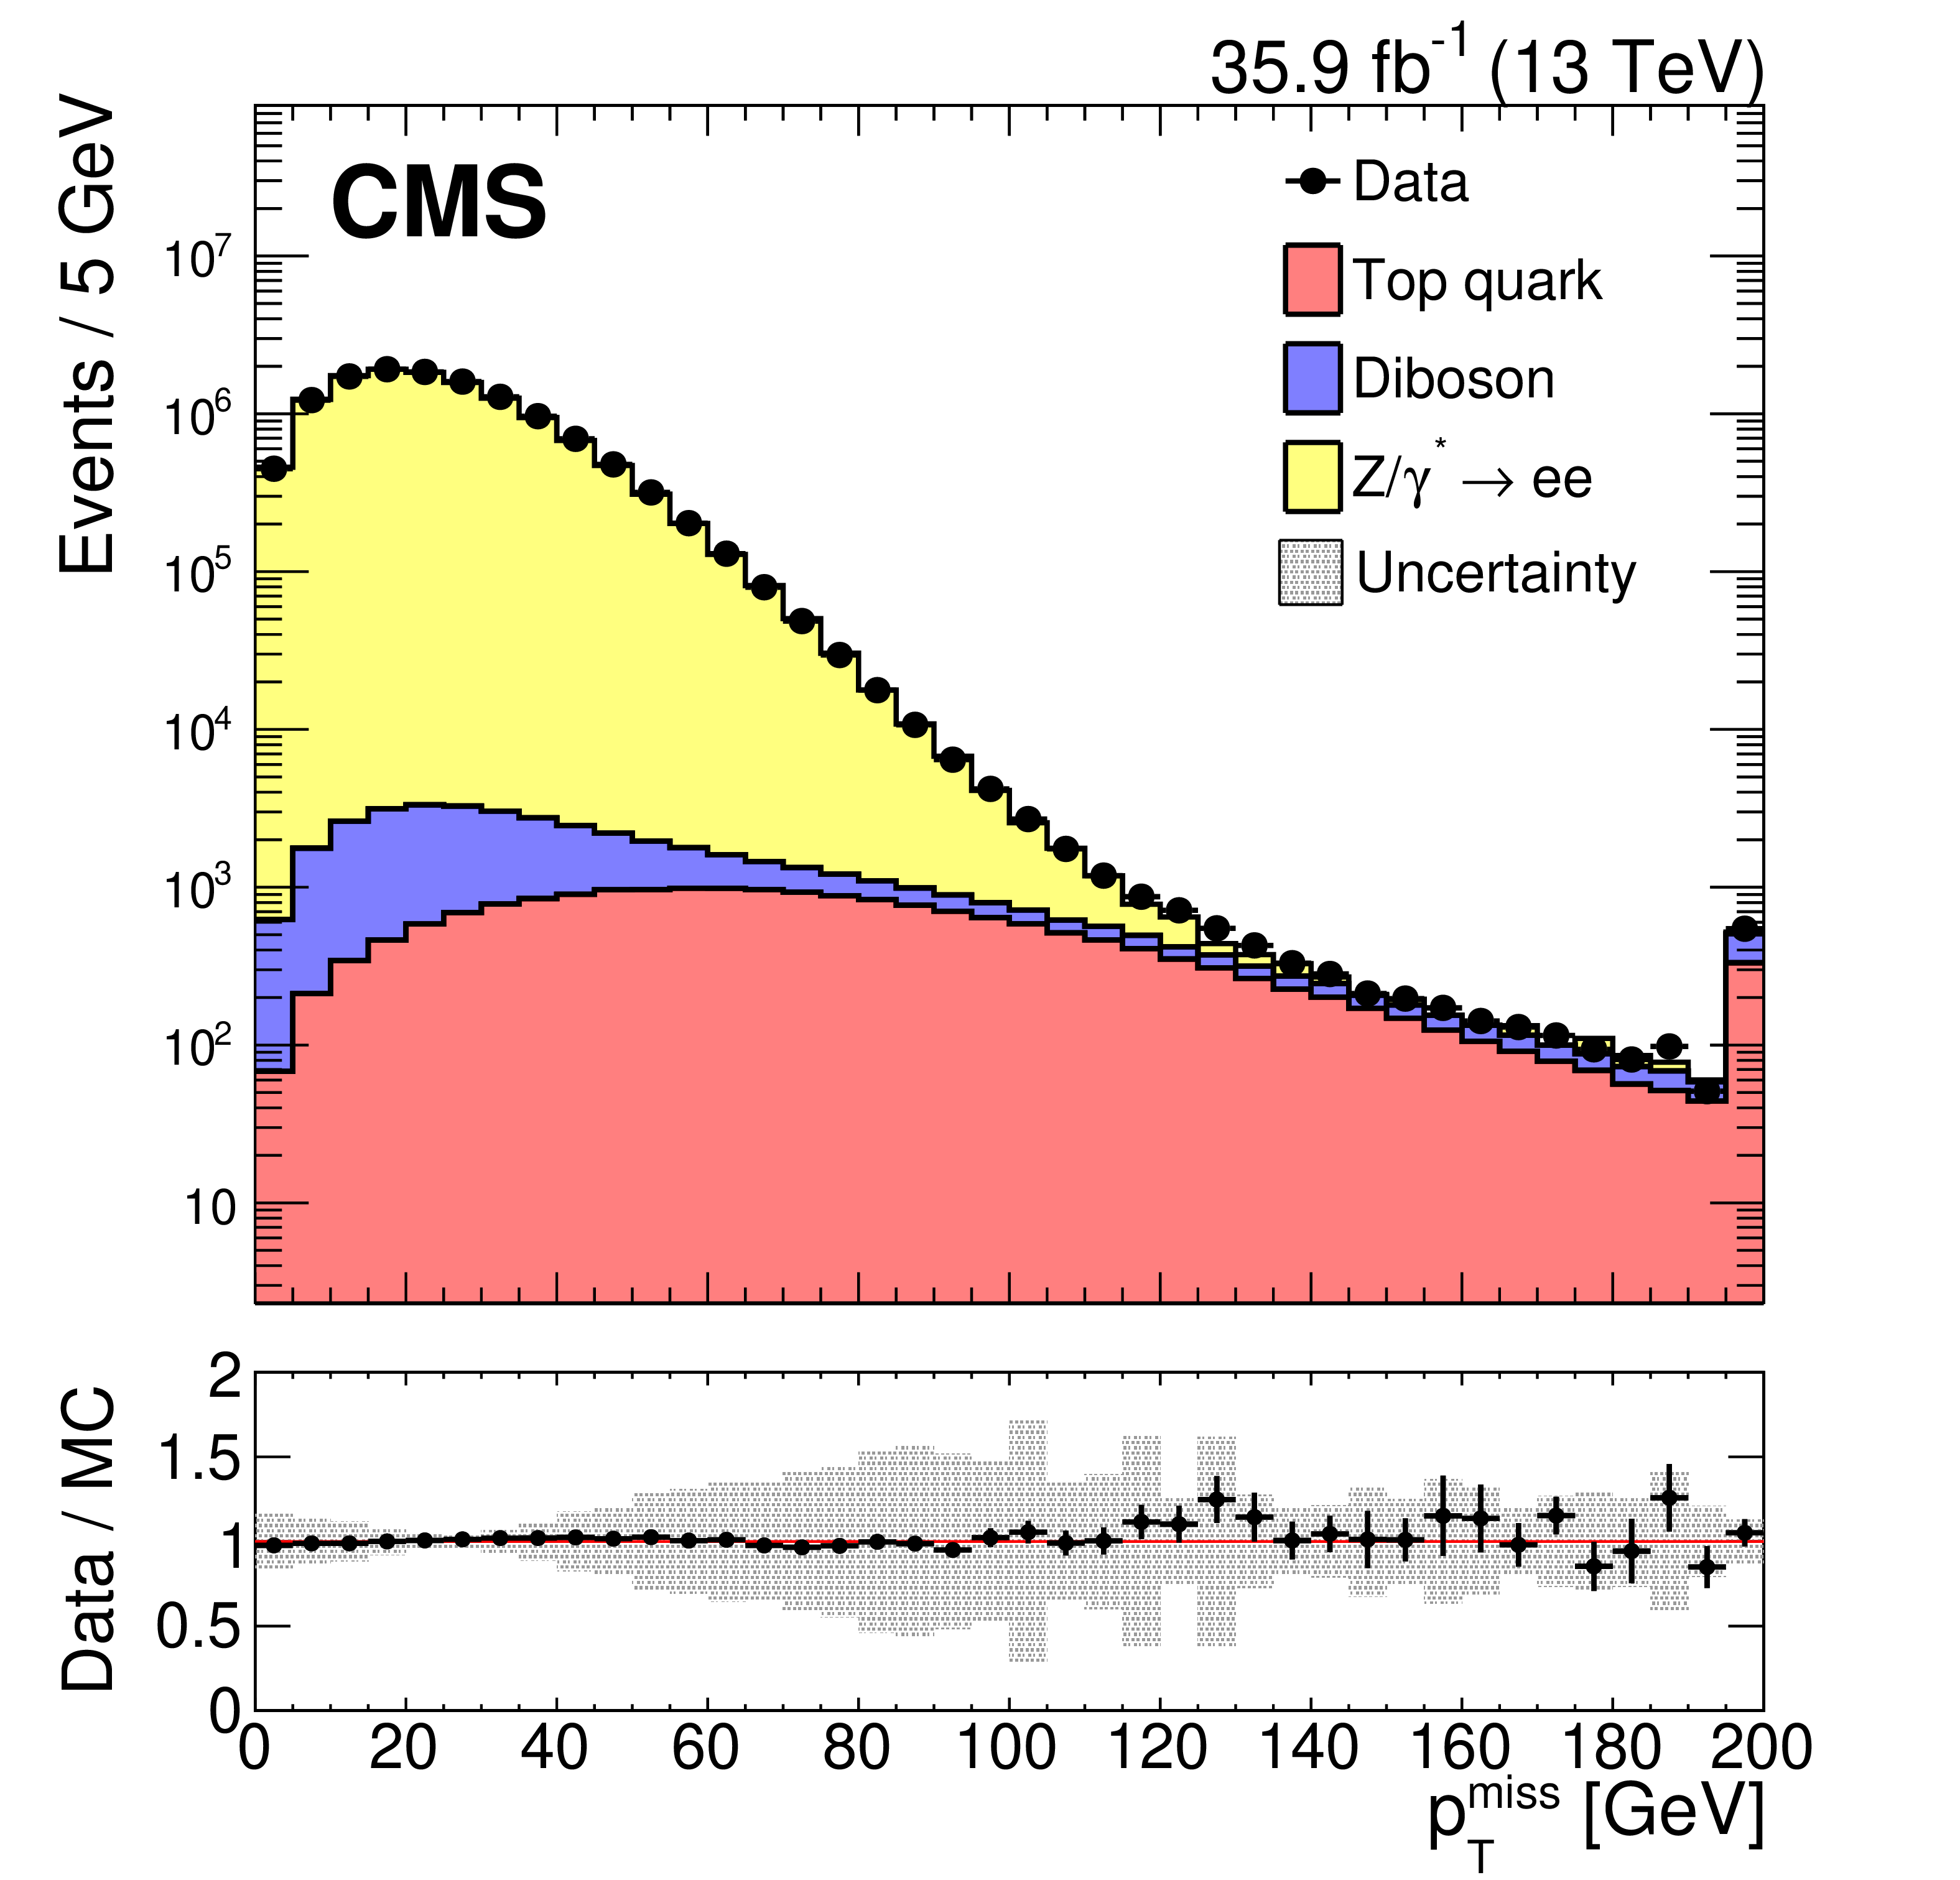
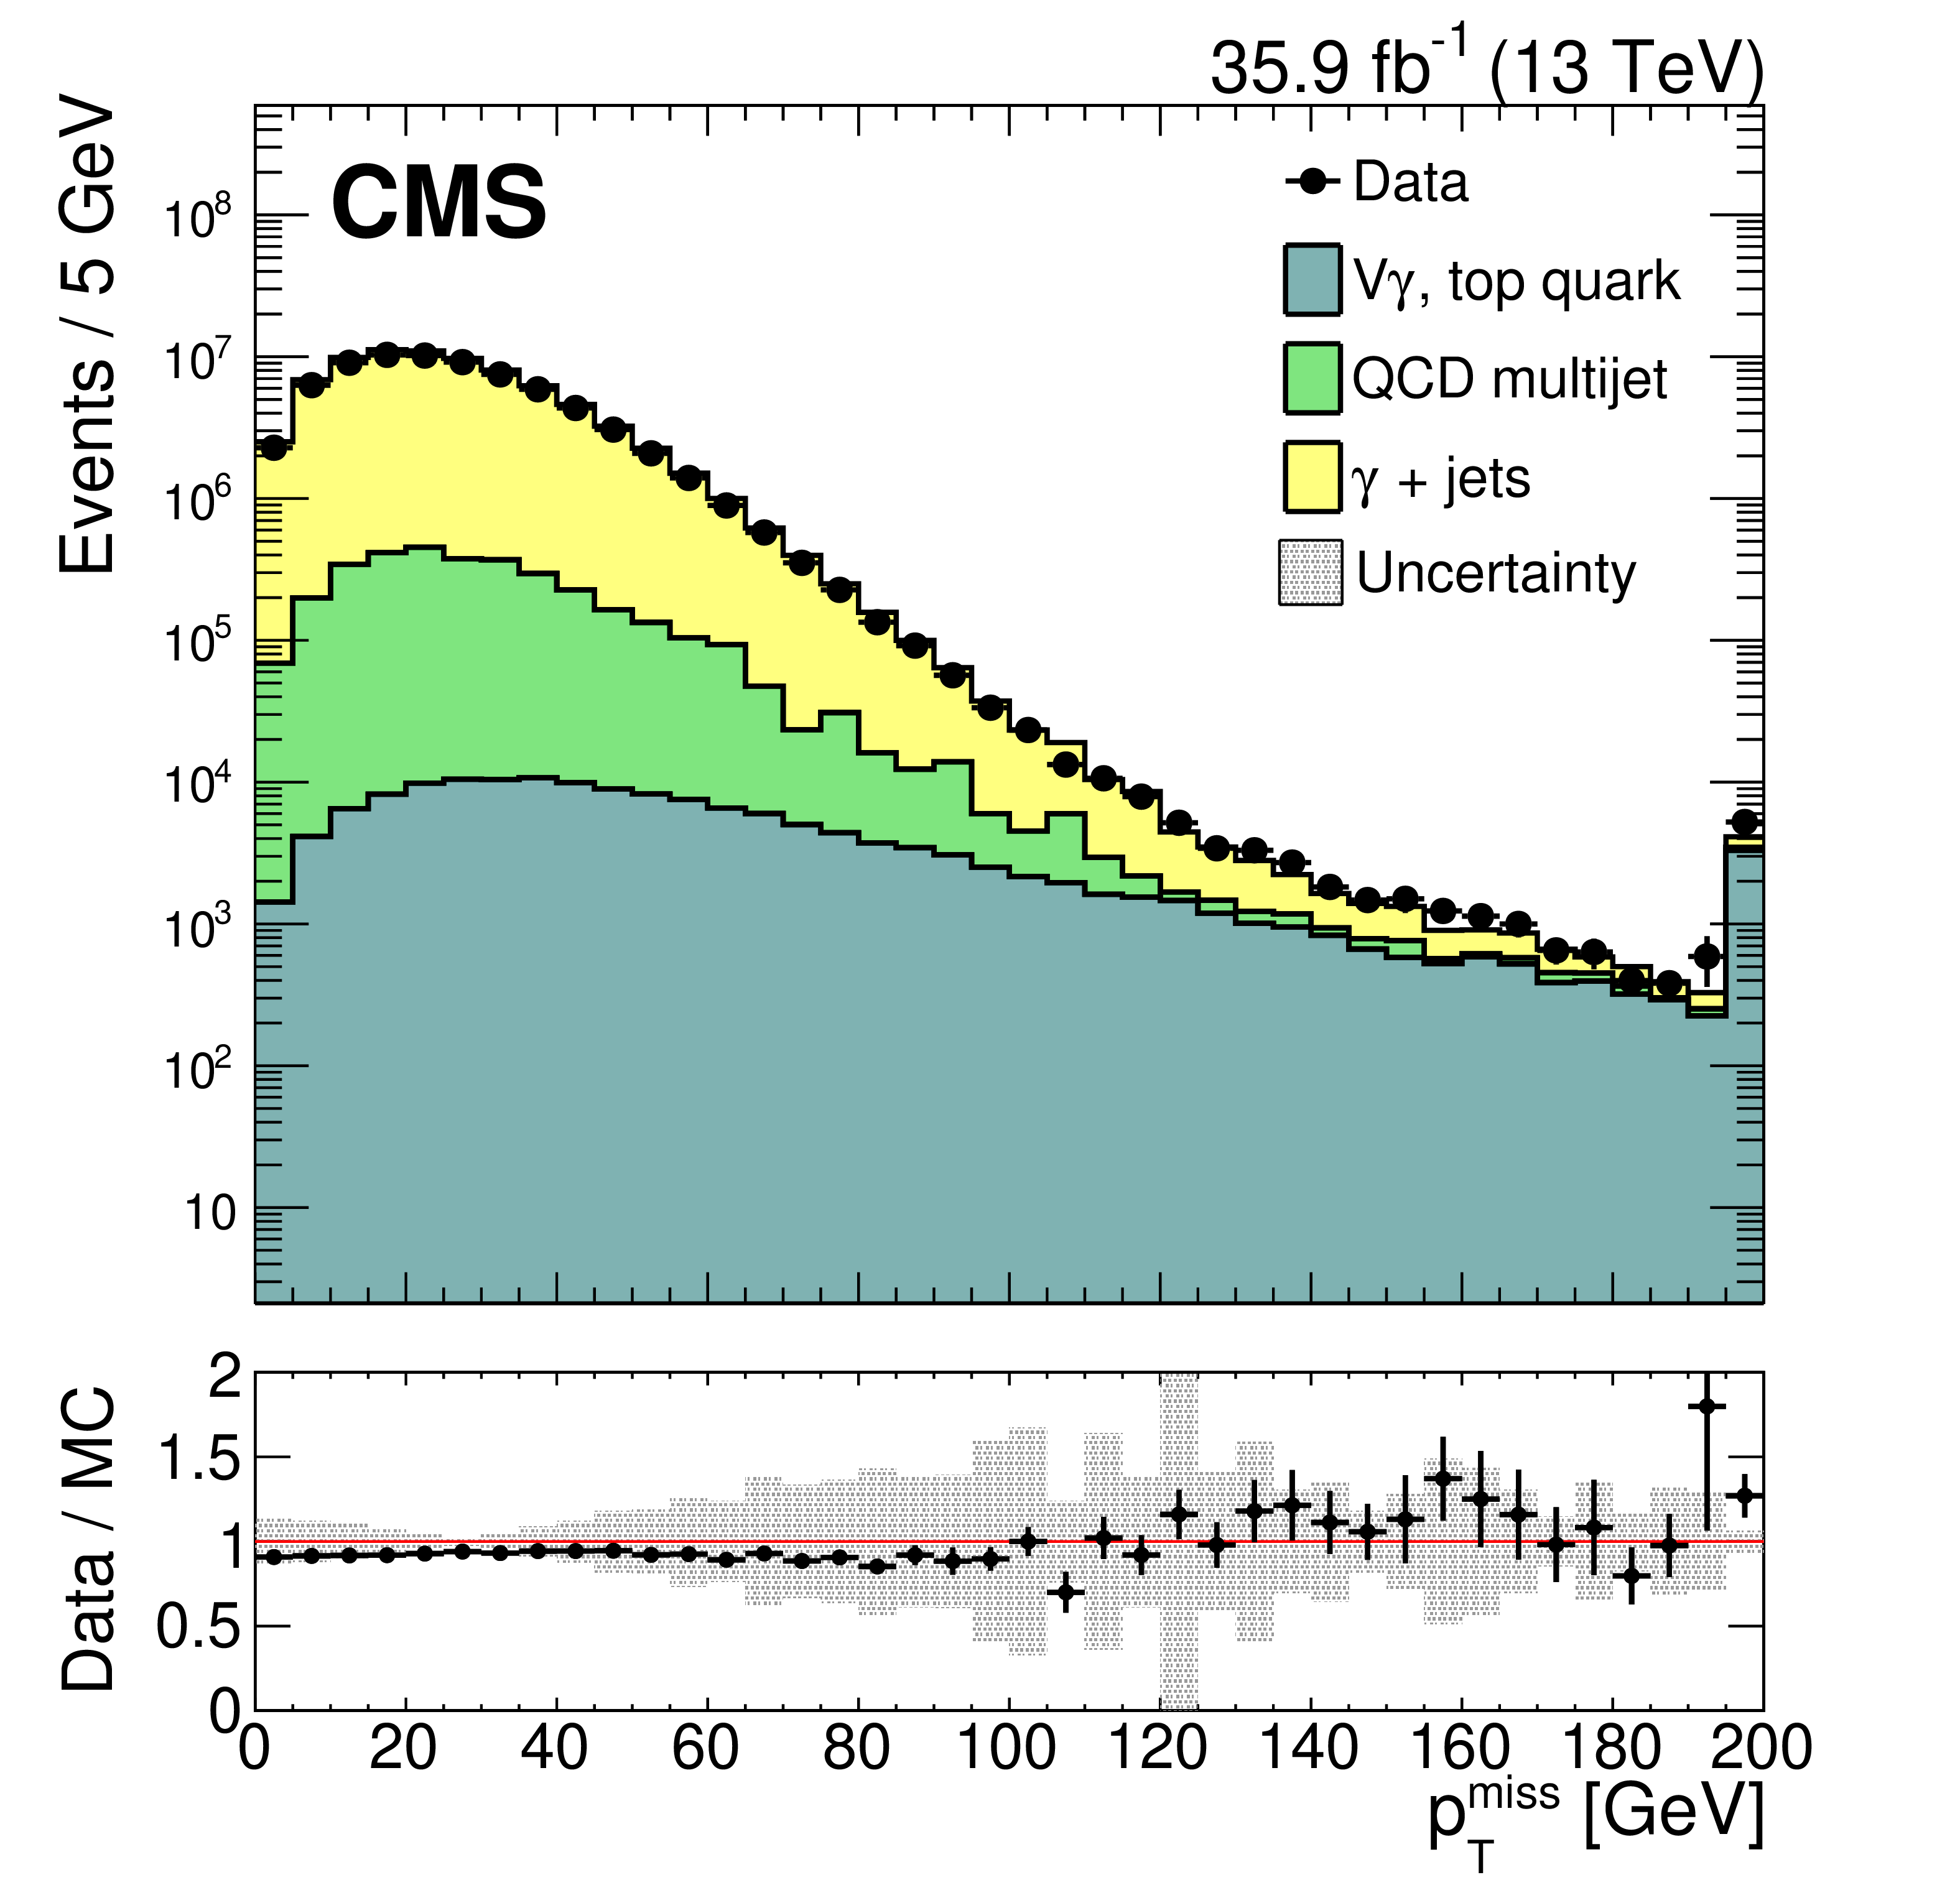
Figure 7:
Upper panel: Distributions of ${{p_{\mathrm {T}}} ^\text {miss}}$ in ${{\mathrm {Z}}\to {\mu} ^+ {\mu ^-}}$ (top left), ${{\mathrm {Z}}\to {\mathrm {e}^+} {\mathrm {e}^-}}$ (top right), and $ {\gamma} $+jets events (lower middle) in data and simulation. The last bin includes all events with $ {{p_{\mathrm {T}}} ^\text {miss}} > $ 195 GeV. Lower panel: Data to simulation ratio. The systematic uncertainties due to the JES, the JER, and variations in the $E_{U}$ are added in quadrature and represented by the shaded band. |

png pdf |
Figure 7-a:
Upper panel: Distribution of ${{p_{\mathrm {T}}} ^\text {miss}}$ in ${{\mathrm {Z}}\to {\mu} ^+ {\mu ^-}}$ events in data and simulation. The last bin includes all events with $ {{p_{\mathrm {T}}} ^\text {miss}} > $ 195 GeV. Lower panel: Data to simulation ratio. The systematic uncertainties due to the JES, the JER, and variations in the $E_{U}$ are added in quadrature and represented by the shaded band. |
png pdf |
Figure 7-b:
Upper panel: Distribution of ${{p_{\mathrm {T}}} ^\text {miss}}$ in ${{\mathrm {Z}}\to {\mathrm {e}^+} {\mathrm {e}^-}}$ events in data and simulation. The last bin includes all events with $ {{p_{\mathrm {T}}} ^\text {miss}} > $ 195 GeV. Lower panel: Data to simulation ratio. The systematic uncertainties due to the JES, the JER, and variations in the $E_{U}$ are added in quadrature and represented by the shaded band. |
png pdf |
Figure 7-c:
Upper panel: Distribution of ${{p_{\mathrm {T}}} ^\text {miss}}$ in $ {\gamma} $+jets events in data and simulation. The last bin includes all events with $ {{p_{\mathrm {T}}} ^\text {miss}} > $ 195 GeV. Lower panel: Data to simulation ratio. The systematic uncertainties due to the JES, the JER, and variations in the $E_{U}$ are added in quadrature and represented by the shaded band. |
png pdf |
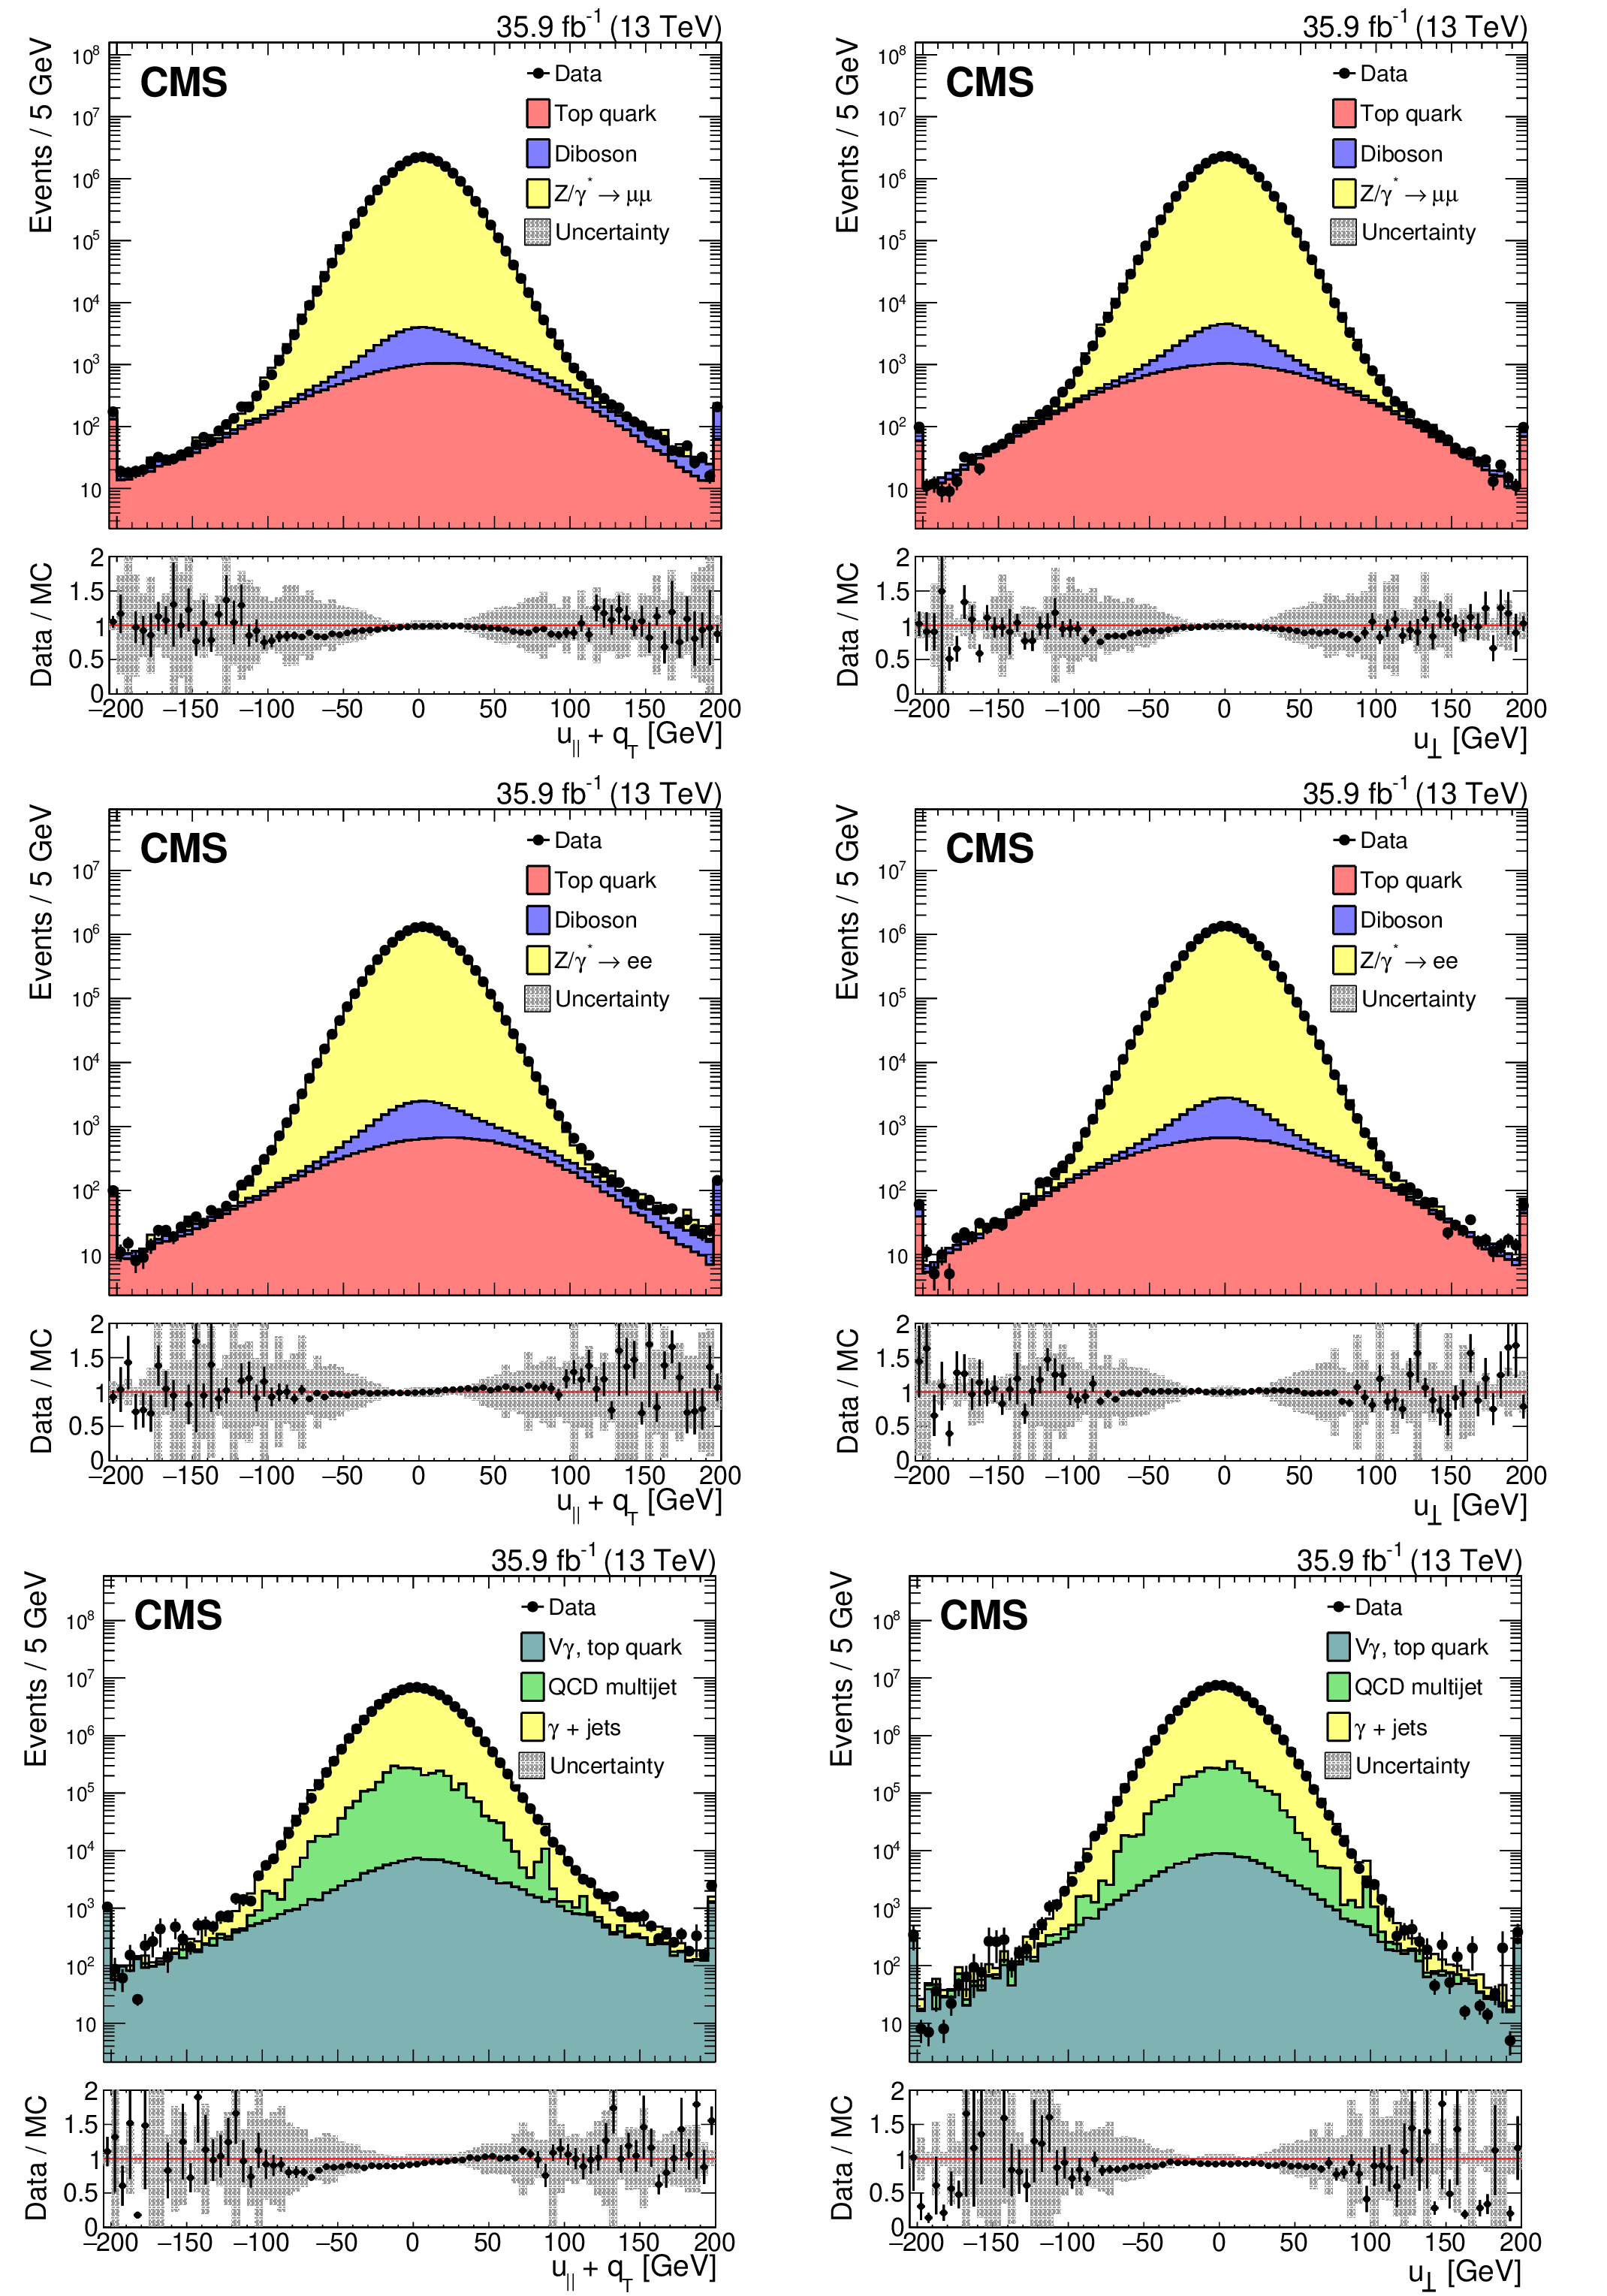
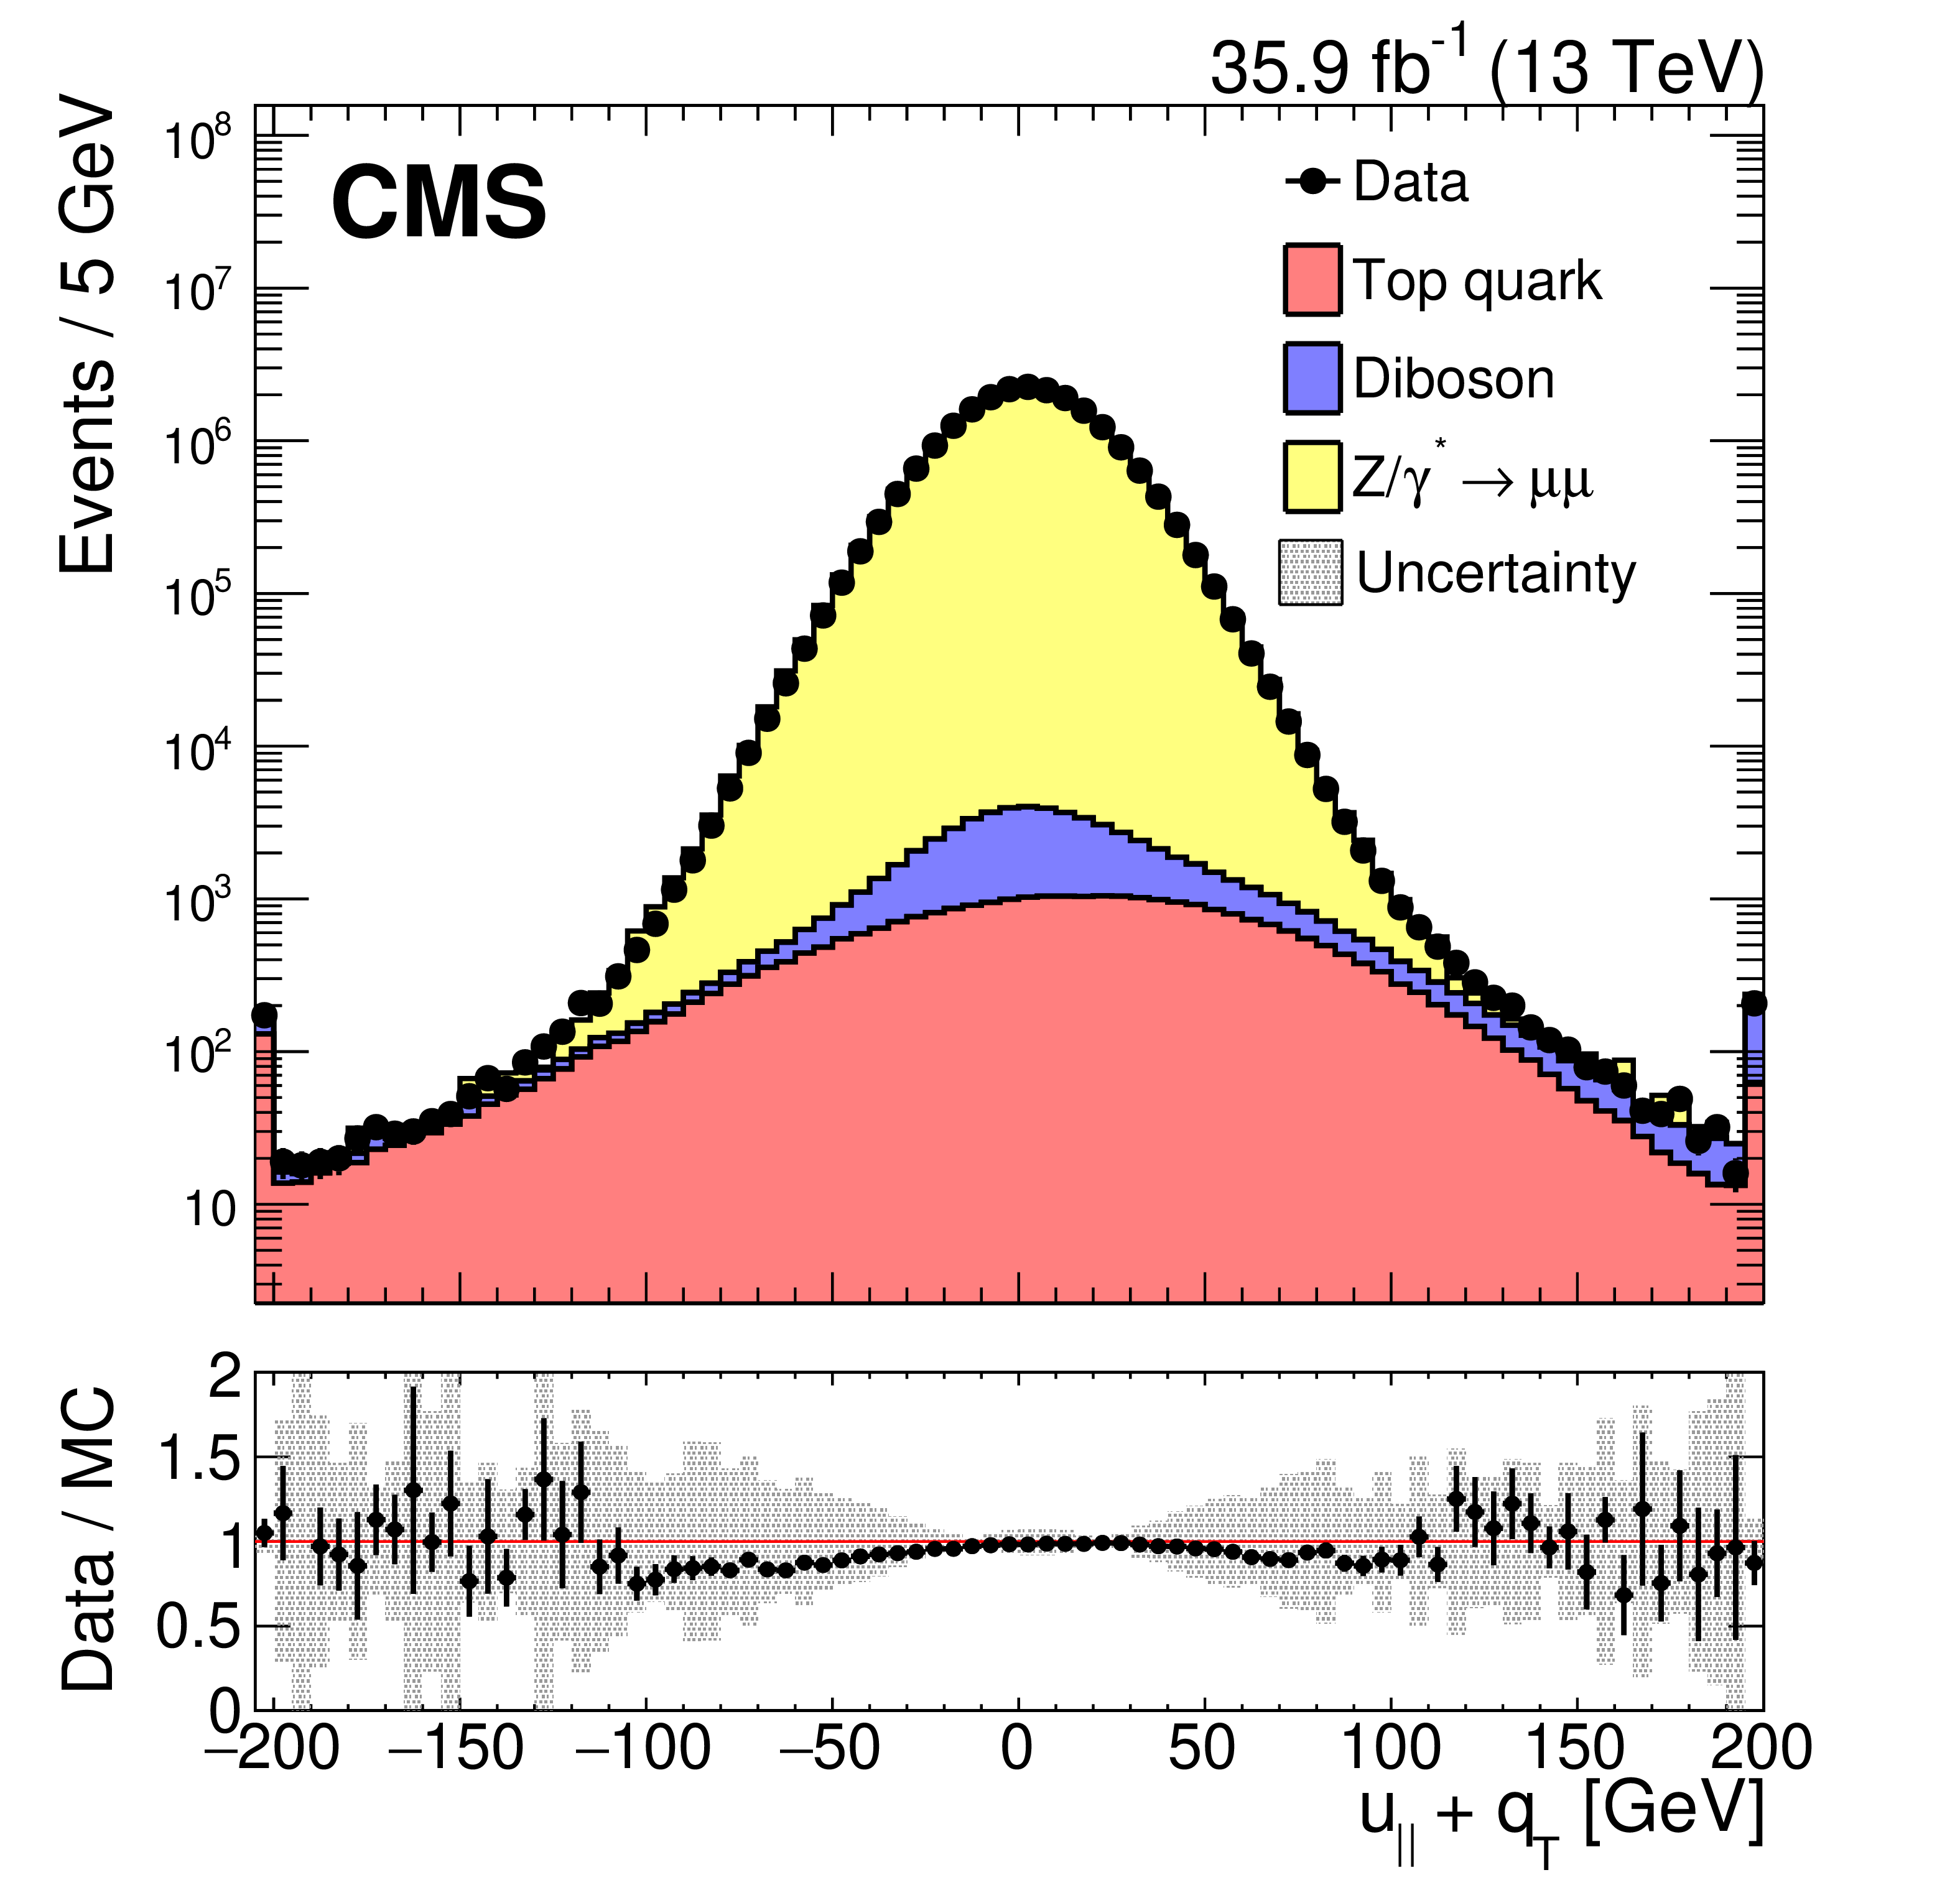
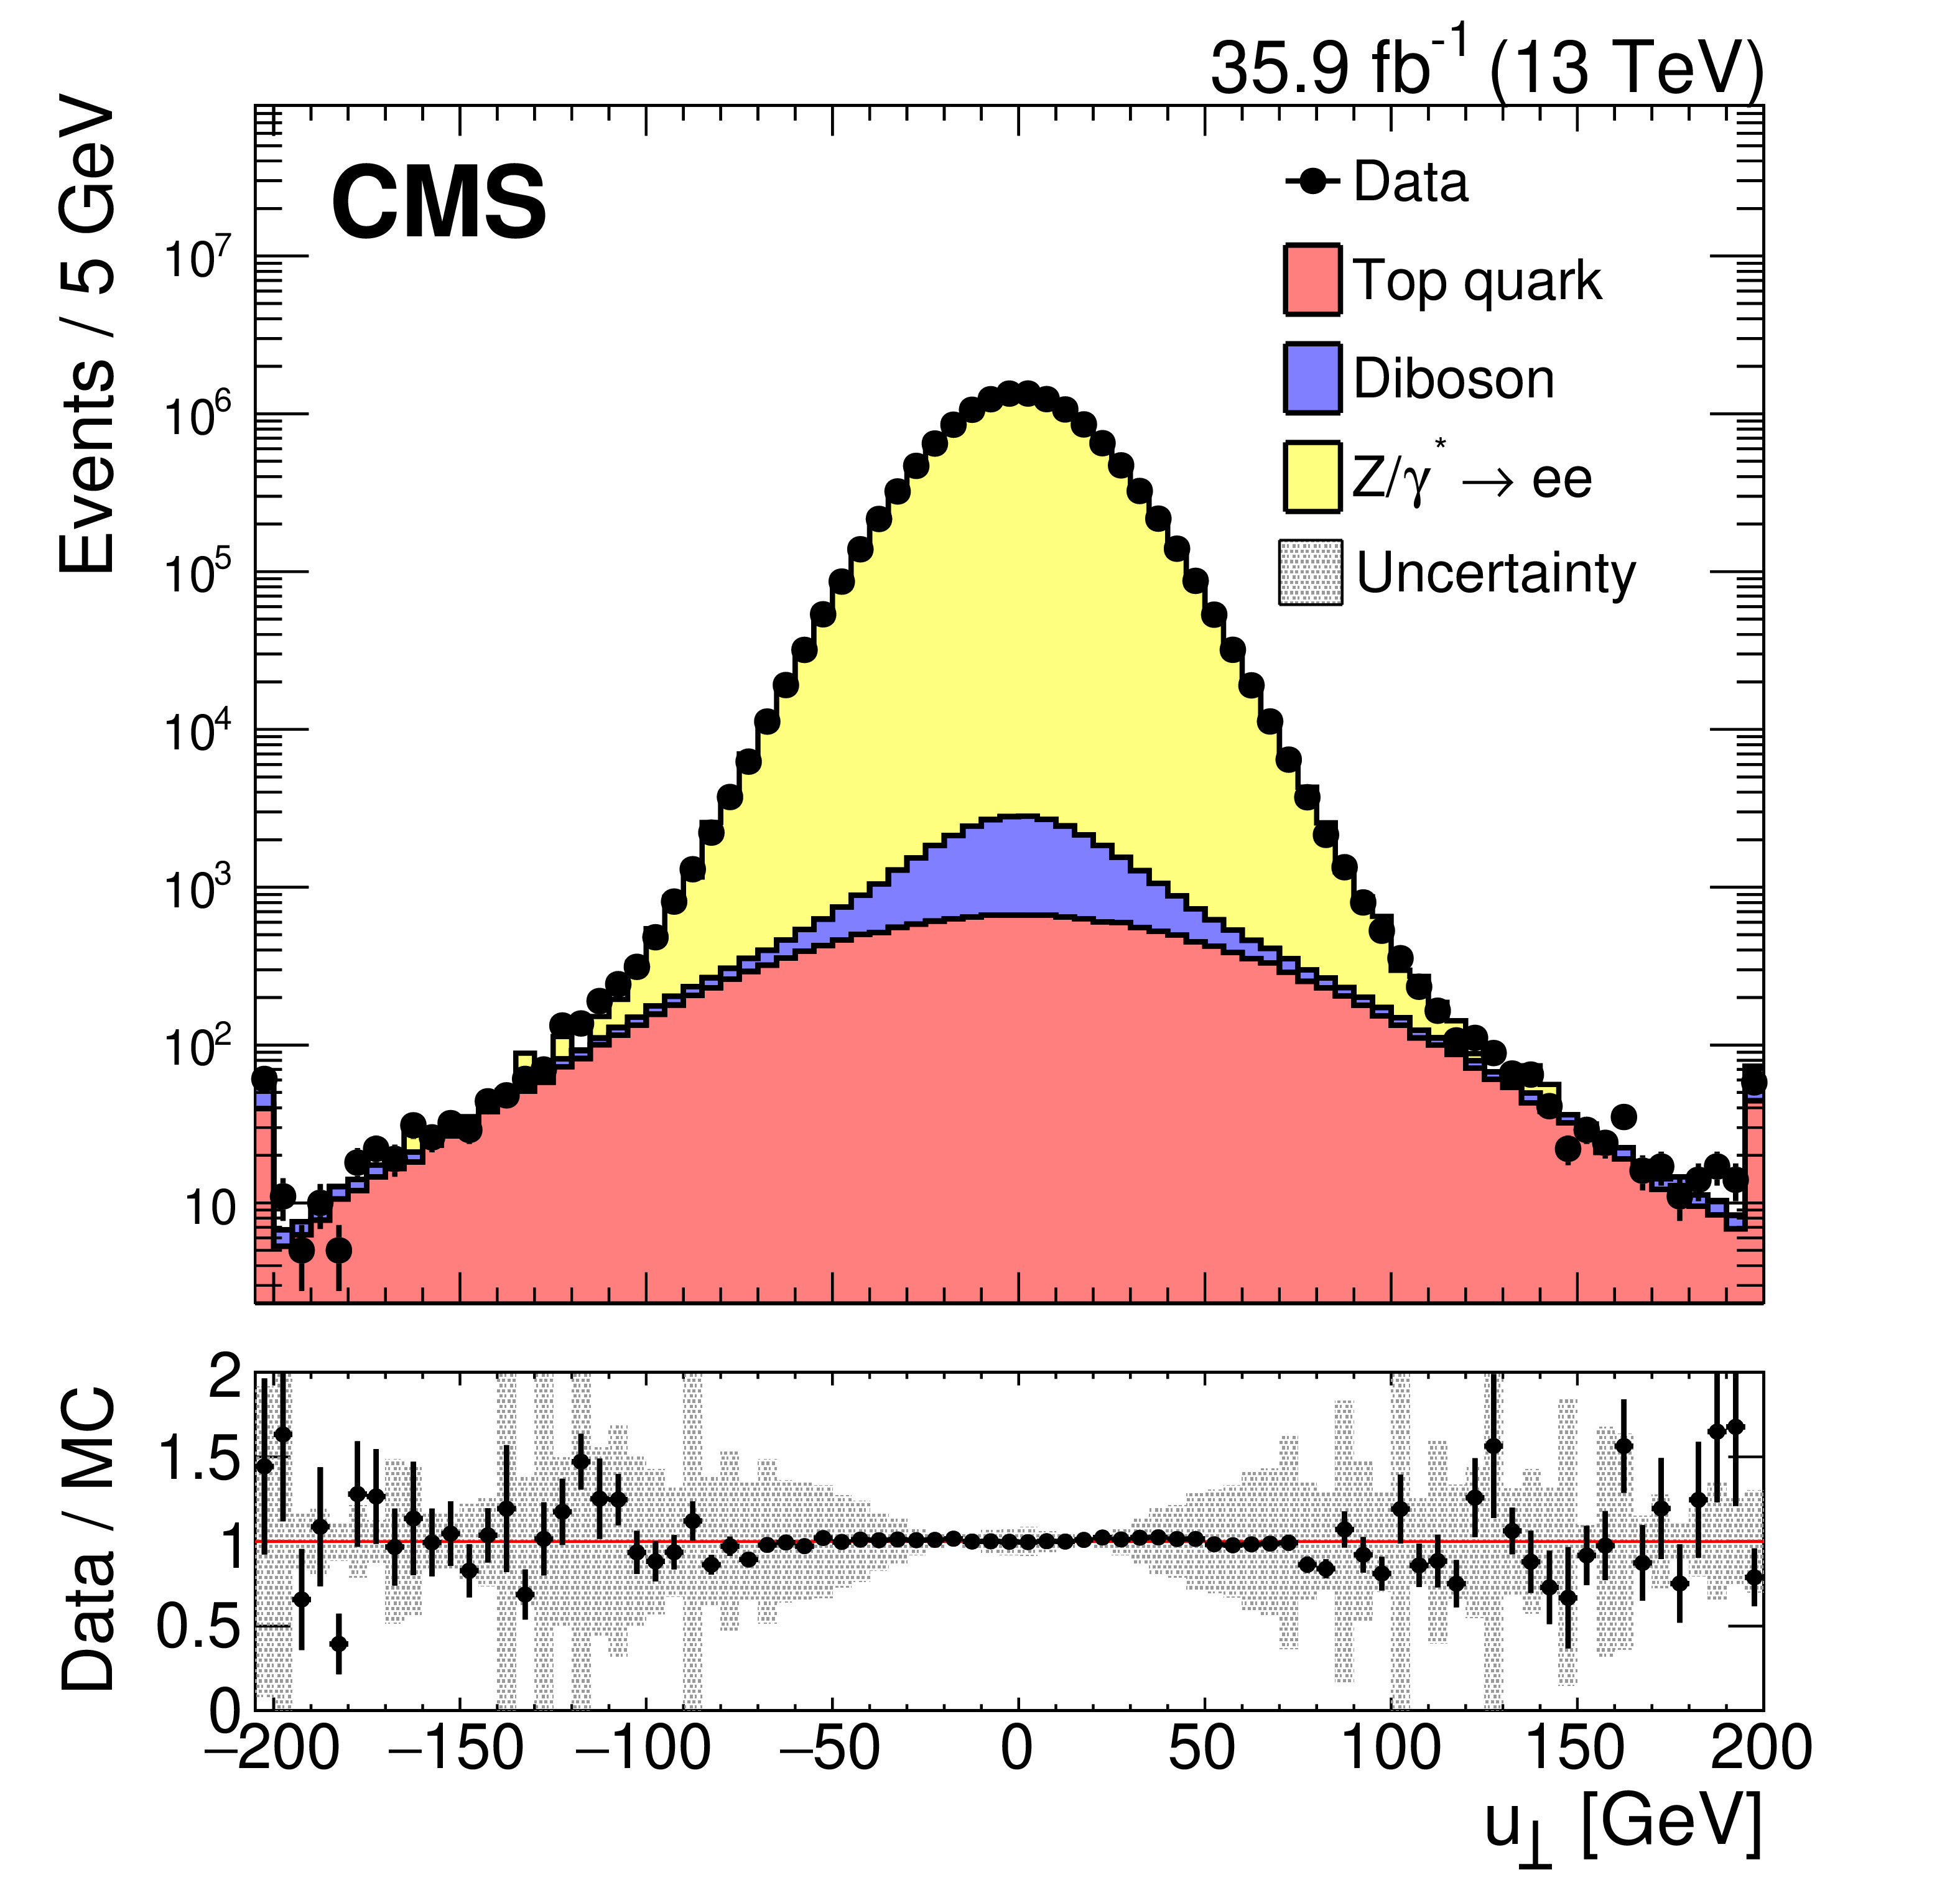
Figure 8:
Distribution of ${u_{\Vert}}$+${{q}_\mathrm {T}}$ and ${u_{\perp}}$ components of the hadronic recoil, in data (filled markers) and simulation (solid histograms), in the ${{\mathrm {Z}}\to {\mu} ^+ {\mu ^-}}$ (upper), ${{\mathrm {Z}}\to {\mathrm {e}^+} {\mathrm {e}^-}}$ (middle), and $ {\gamma} $+jets (lower) samples. The first and the last bins include all events below -195 and above +195, respectively. The points in the lower panel of each plot show the data to simulation ratio. The systematic uncertainties due to the JES, the JER, and variations in the $E_{U}$ are added in quadrature and represented by the shaded band. |
png pdf |
Figure 8-a:
Distribution of the ${u_{\Vert}}$+${{q}_\mathrm {T}}$ components of the hadronic recoil, in data (filled markers) and simulation (solid histograms), in the ${{\mathrm {Z}}\to {\mu} ^+ {\mu ^-}}$ sample. The first and the last bins include all events below -195 and above +195, respectively. The points in the lower panel of each plot show the data to simulation ratio. The systematic uncertainties due to the JES, the JER, and variations in the $E_{U}$ are added in quadrature and represented by the shaded band. |

png pdf |
Figure 8-b:
Distribution of the ${u_{\perp}}$ components of the hadronic recoil, in data (filled markers) and simulation (solid histograms), in the ${{\mathrm {Z}}\to {\mu} ^+ {\mu ^-}}$ sample. The first and the last bins include all events below -195 and above +195, respectively. The points in the lower panel of each plot show the data to simulation ratio. The systematic uncertainties due to the JES, the JER, and variations in the $E_{U}$ are added in quadrature and represented by the shaded band. |

png pdf |
Figure 8-c:
Distribution of the ${u_{\Vert}}$+${{q}_\mathrm {T}}$ components of the hadronic recoil, in data (filled markers) and simulation (solid histograms), in the ${{\mathrm {Z}}\to {\mathrm {e}^+} {\mathrm {e}^-}}$ sample. The first and the last bins include all events below -195 and above +195, respectively. The points in the lower panel of each plot show the data to simulation ratio. The systematic uncertainties due to the JES, the JER, and variations in the $E_{U}$ are added in quadrature and represented by the shaded band. |
png pdf |
Figure 8-d:
Distribution of the ${u_{\perp}}$ components of the hadronic recoil, in data (filled markers) and simulation (solid histograms), in the ${{\mathrm {Z}}\to {\mathrm {e}^+} {\mathrm {e}^-}}$ sample. The first and the last bins include all events below -195 and above +195, respectively. The points in the lower panel of each plot show the data to simulation ratio. The systematic uncertainties due to the JES, the JER, and variations in the $E_{U}$ are added in quadrature and represented by the shaded band. |
png pdf |
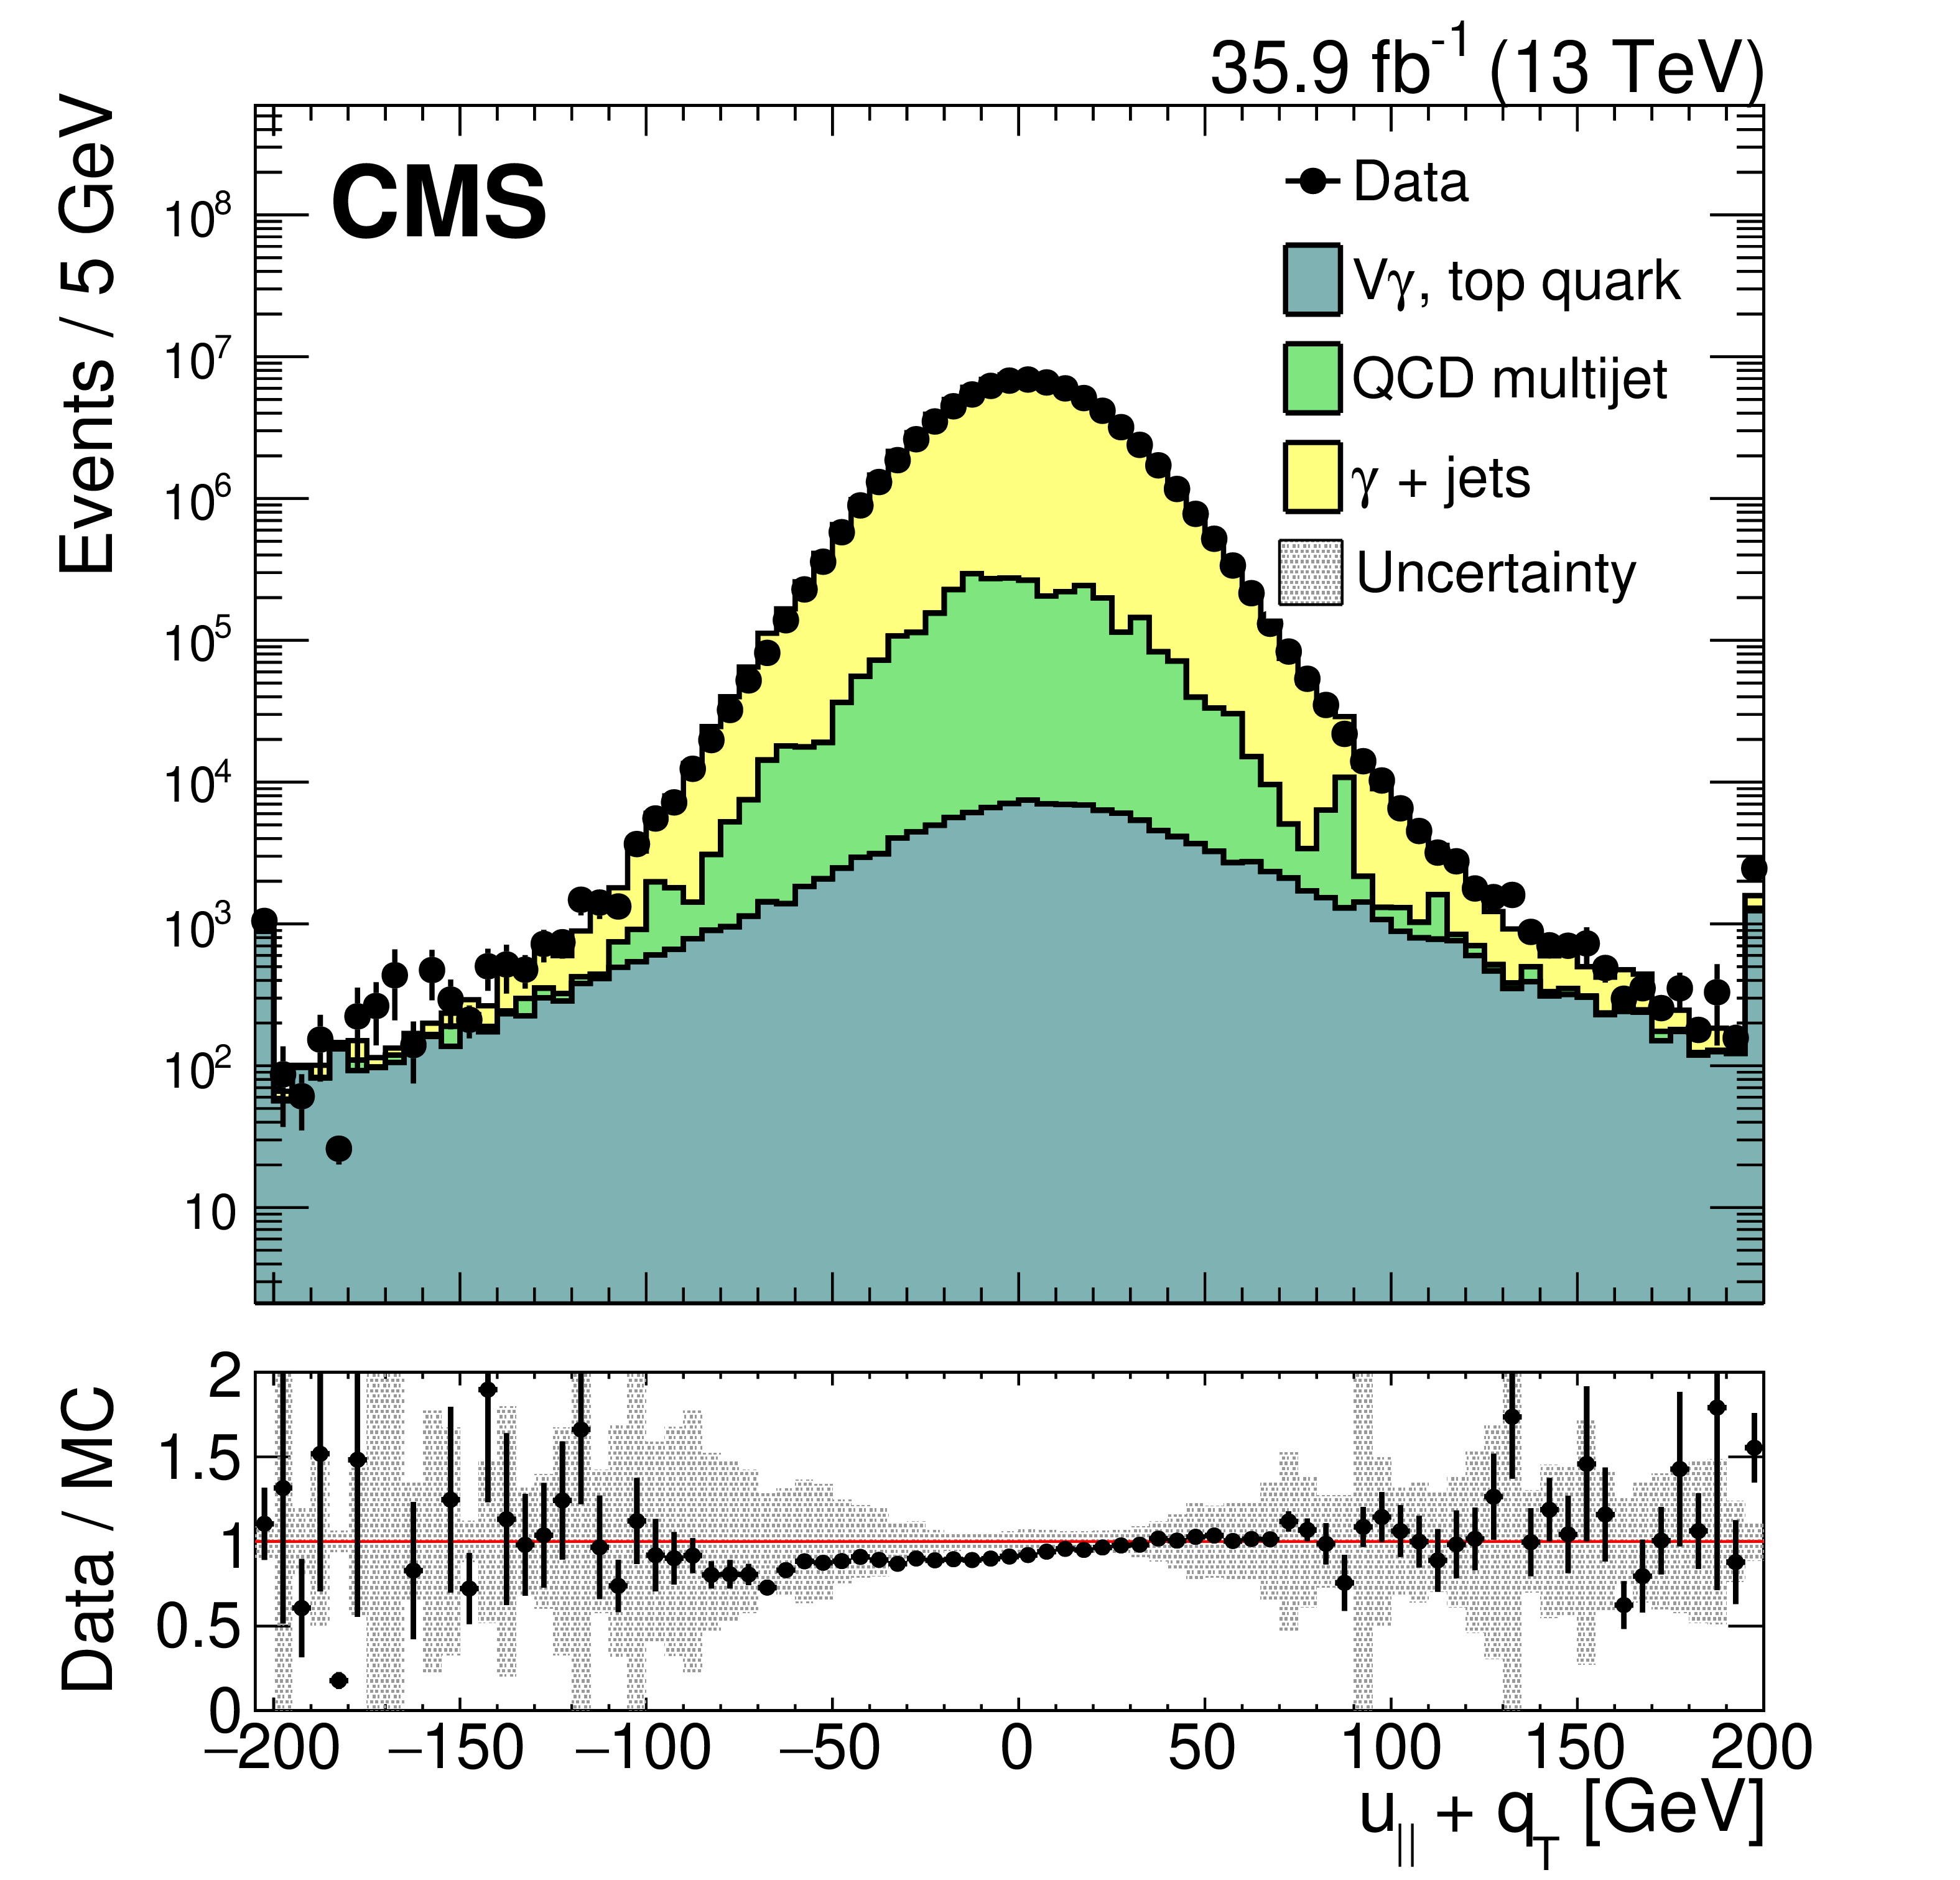
Figure 8-e:
Distribution of the ${u_{\Vert}}$+${{q}_\mathrm {T}}$ components of the hadronic recoil, in data (filled markers) and simulation (solid histograms), in the $ {\gamma} $+jets sample. The first and the last bins include all events below -195 and above +195, respectively. The points in the lower panel of each plot show the data to simulation ratio. The systematic uncertainties due to the JES, the JER, and variations in the $E_{U}$ are added in quadrature and represented by the shaded band. |

png pdf |
Figure 8-f:
Distribution of the ${u_{\perp}}$ components of the hadronic recoil, in data (filled markers) and simulation (solid histograms), in the $ {\gamma} $+jets sample. The first and the last bins include all events below -195 and above +195, respectively. The points in the lower panel of each plot show the data to simulation ratio. The systematic uncertainties due to the JES, the JER, and variations in the $E_{U}$ are added in quadrature and represented by the shaded band. |

png pdf |
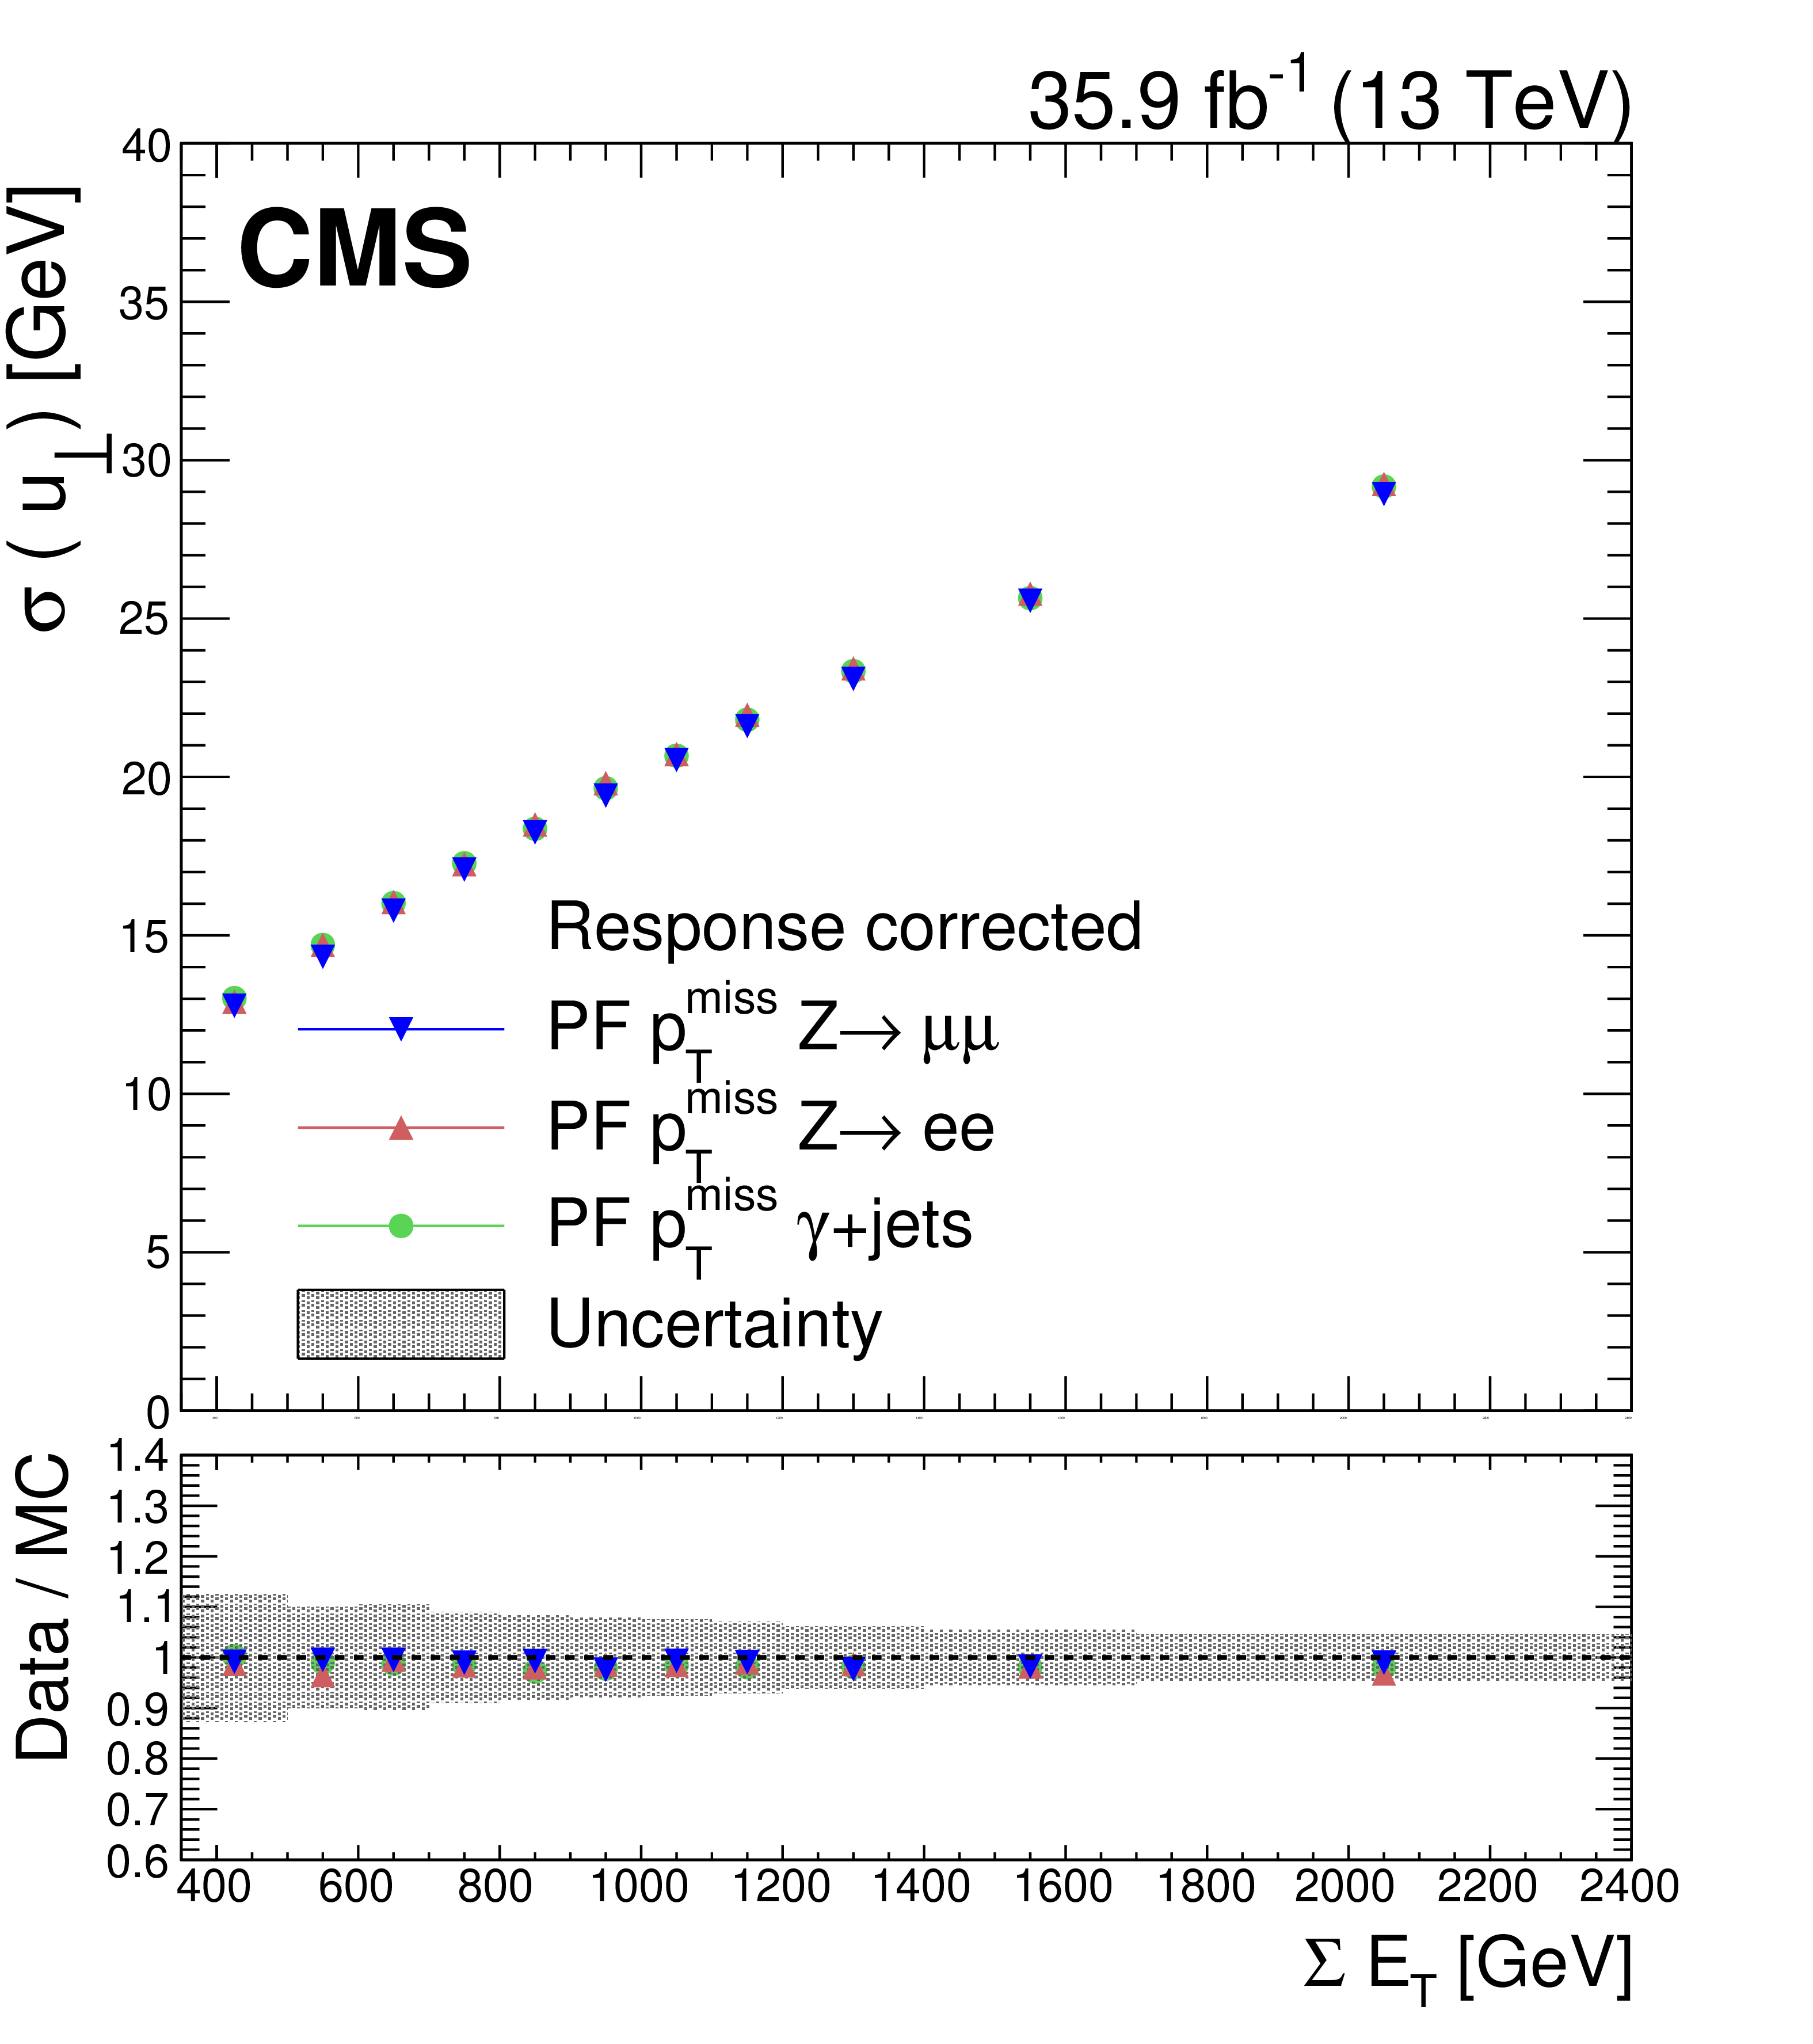
Figure 9:
Upper panel: Response of ${{p_{\mathrm {T}}} ^\text {miss}}$, defined as $-< {u_{\Vert}} > /< {{q}_\mathrm {T}} > $, in data in ${{\mathrm {Z}}\to {\mu} ^+ {\mu ^-}}$ (blue), ${{\mathrm {Z}}\to {\mathrm {e}^+} {\mathrm {e}^-}}$ (red), and $ {\gamma} $+jets (green) events. Lower panel: Ratio of the ${{p_{\mathrm {T}}} ^\text {miss}}$ response in data and simulation. The band corresponds to the systematic uncertainties due to the JES, the JER, and variations in the $E_{U}$ added in quadrature, estimated from the ${{\mathrm {Z}}\to {\mathrm {e}^+} {\mathrm {e}^-}}$ sample. |
png pdf |
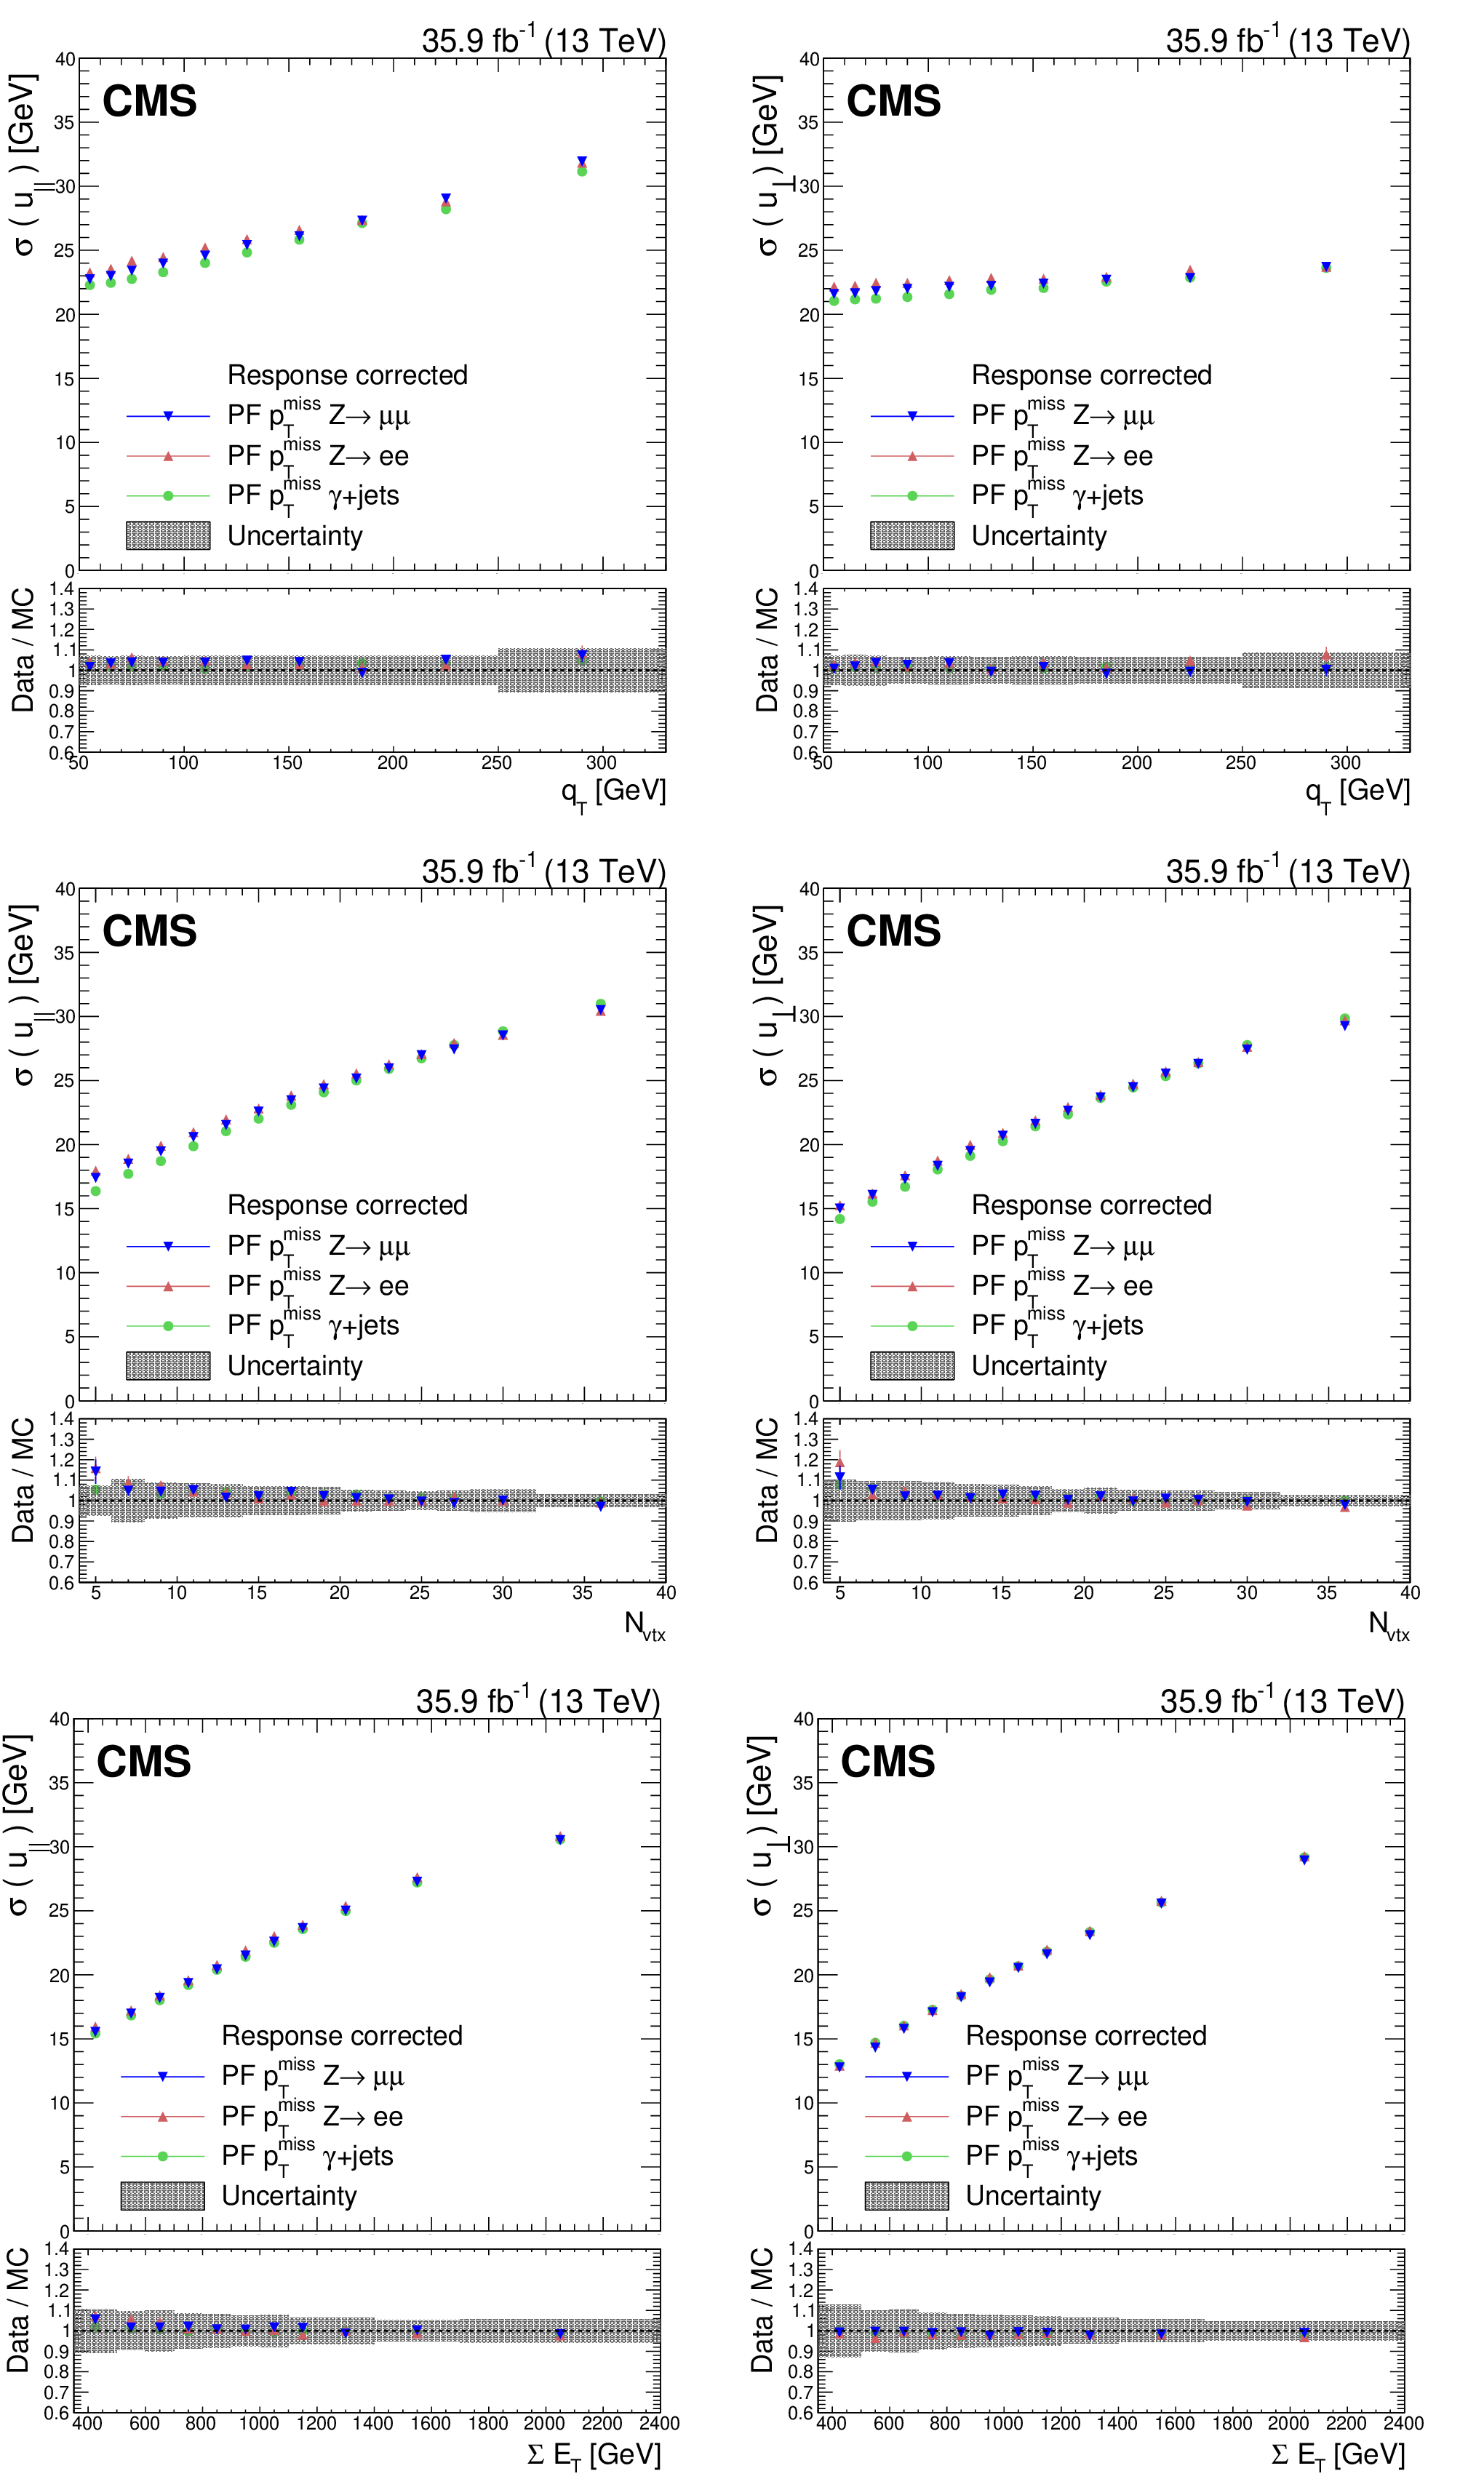
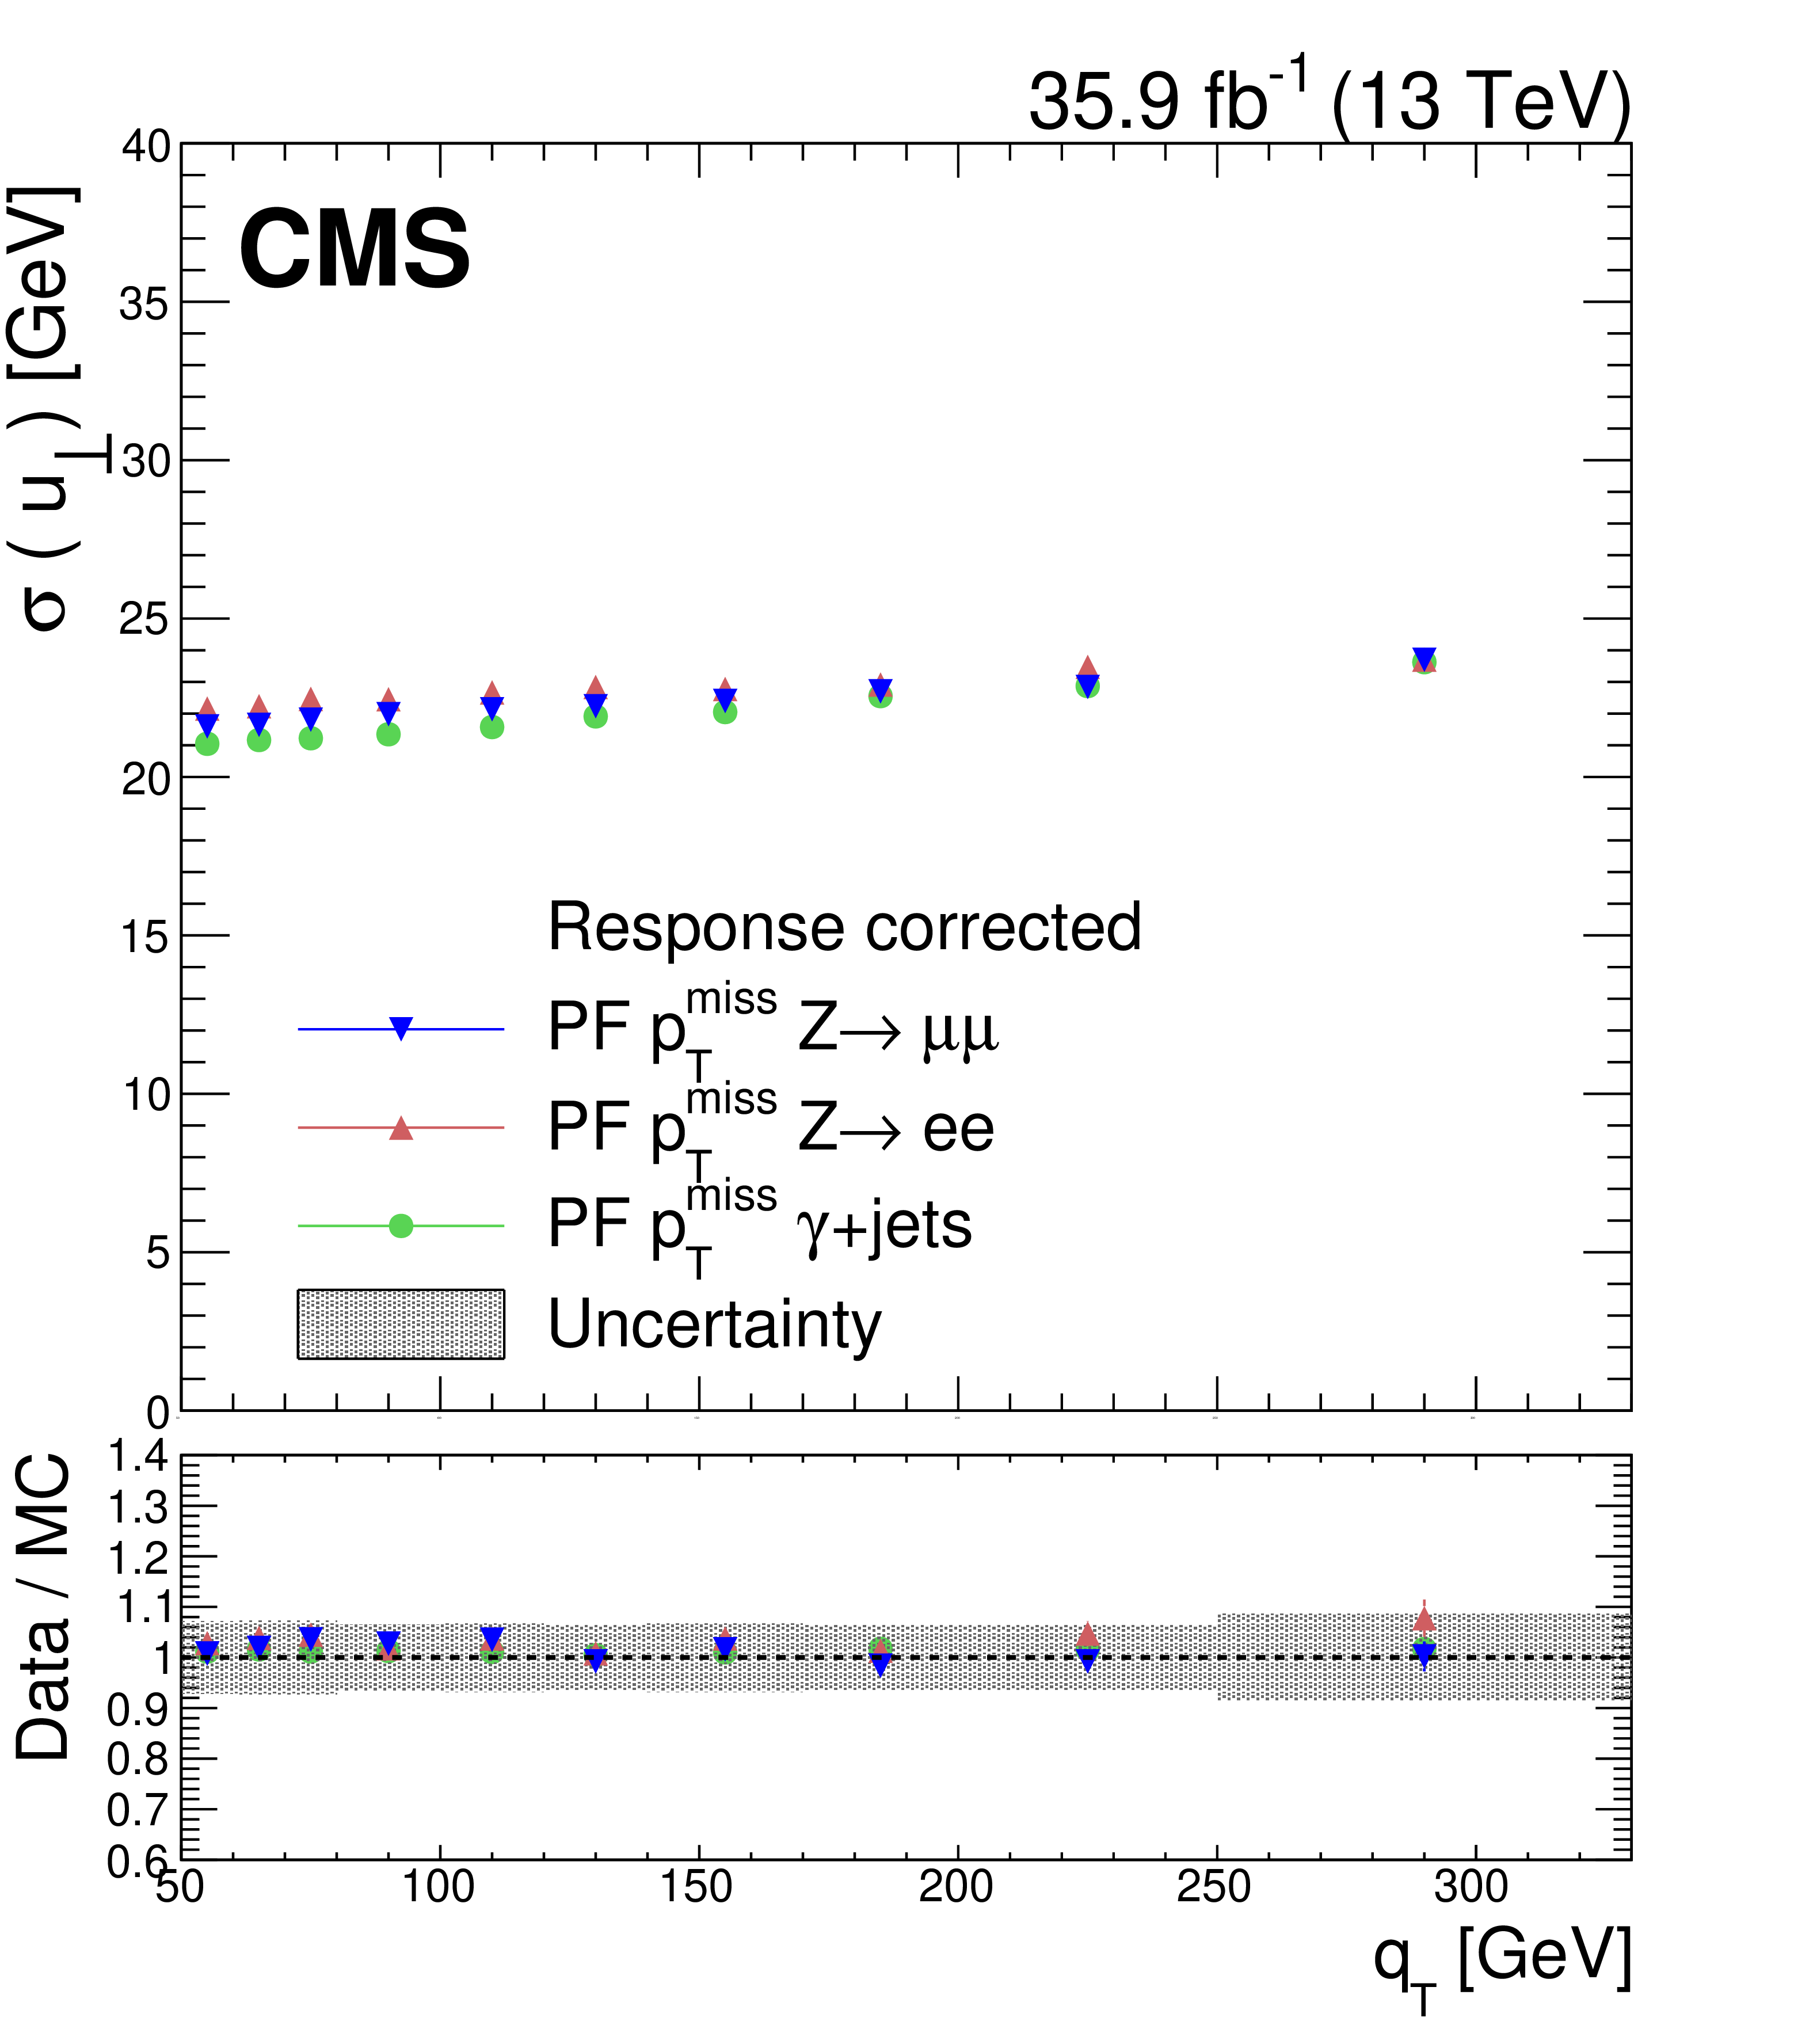
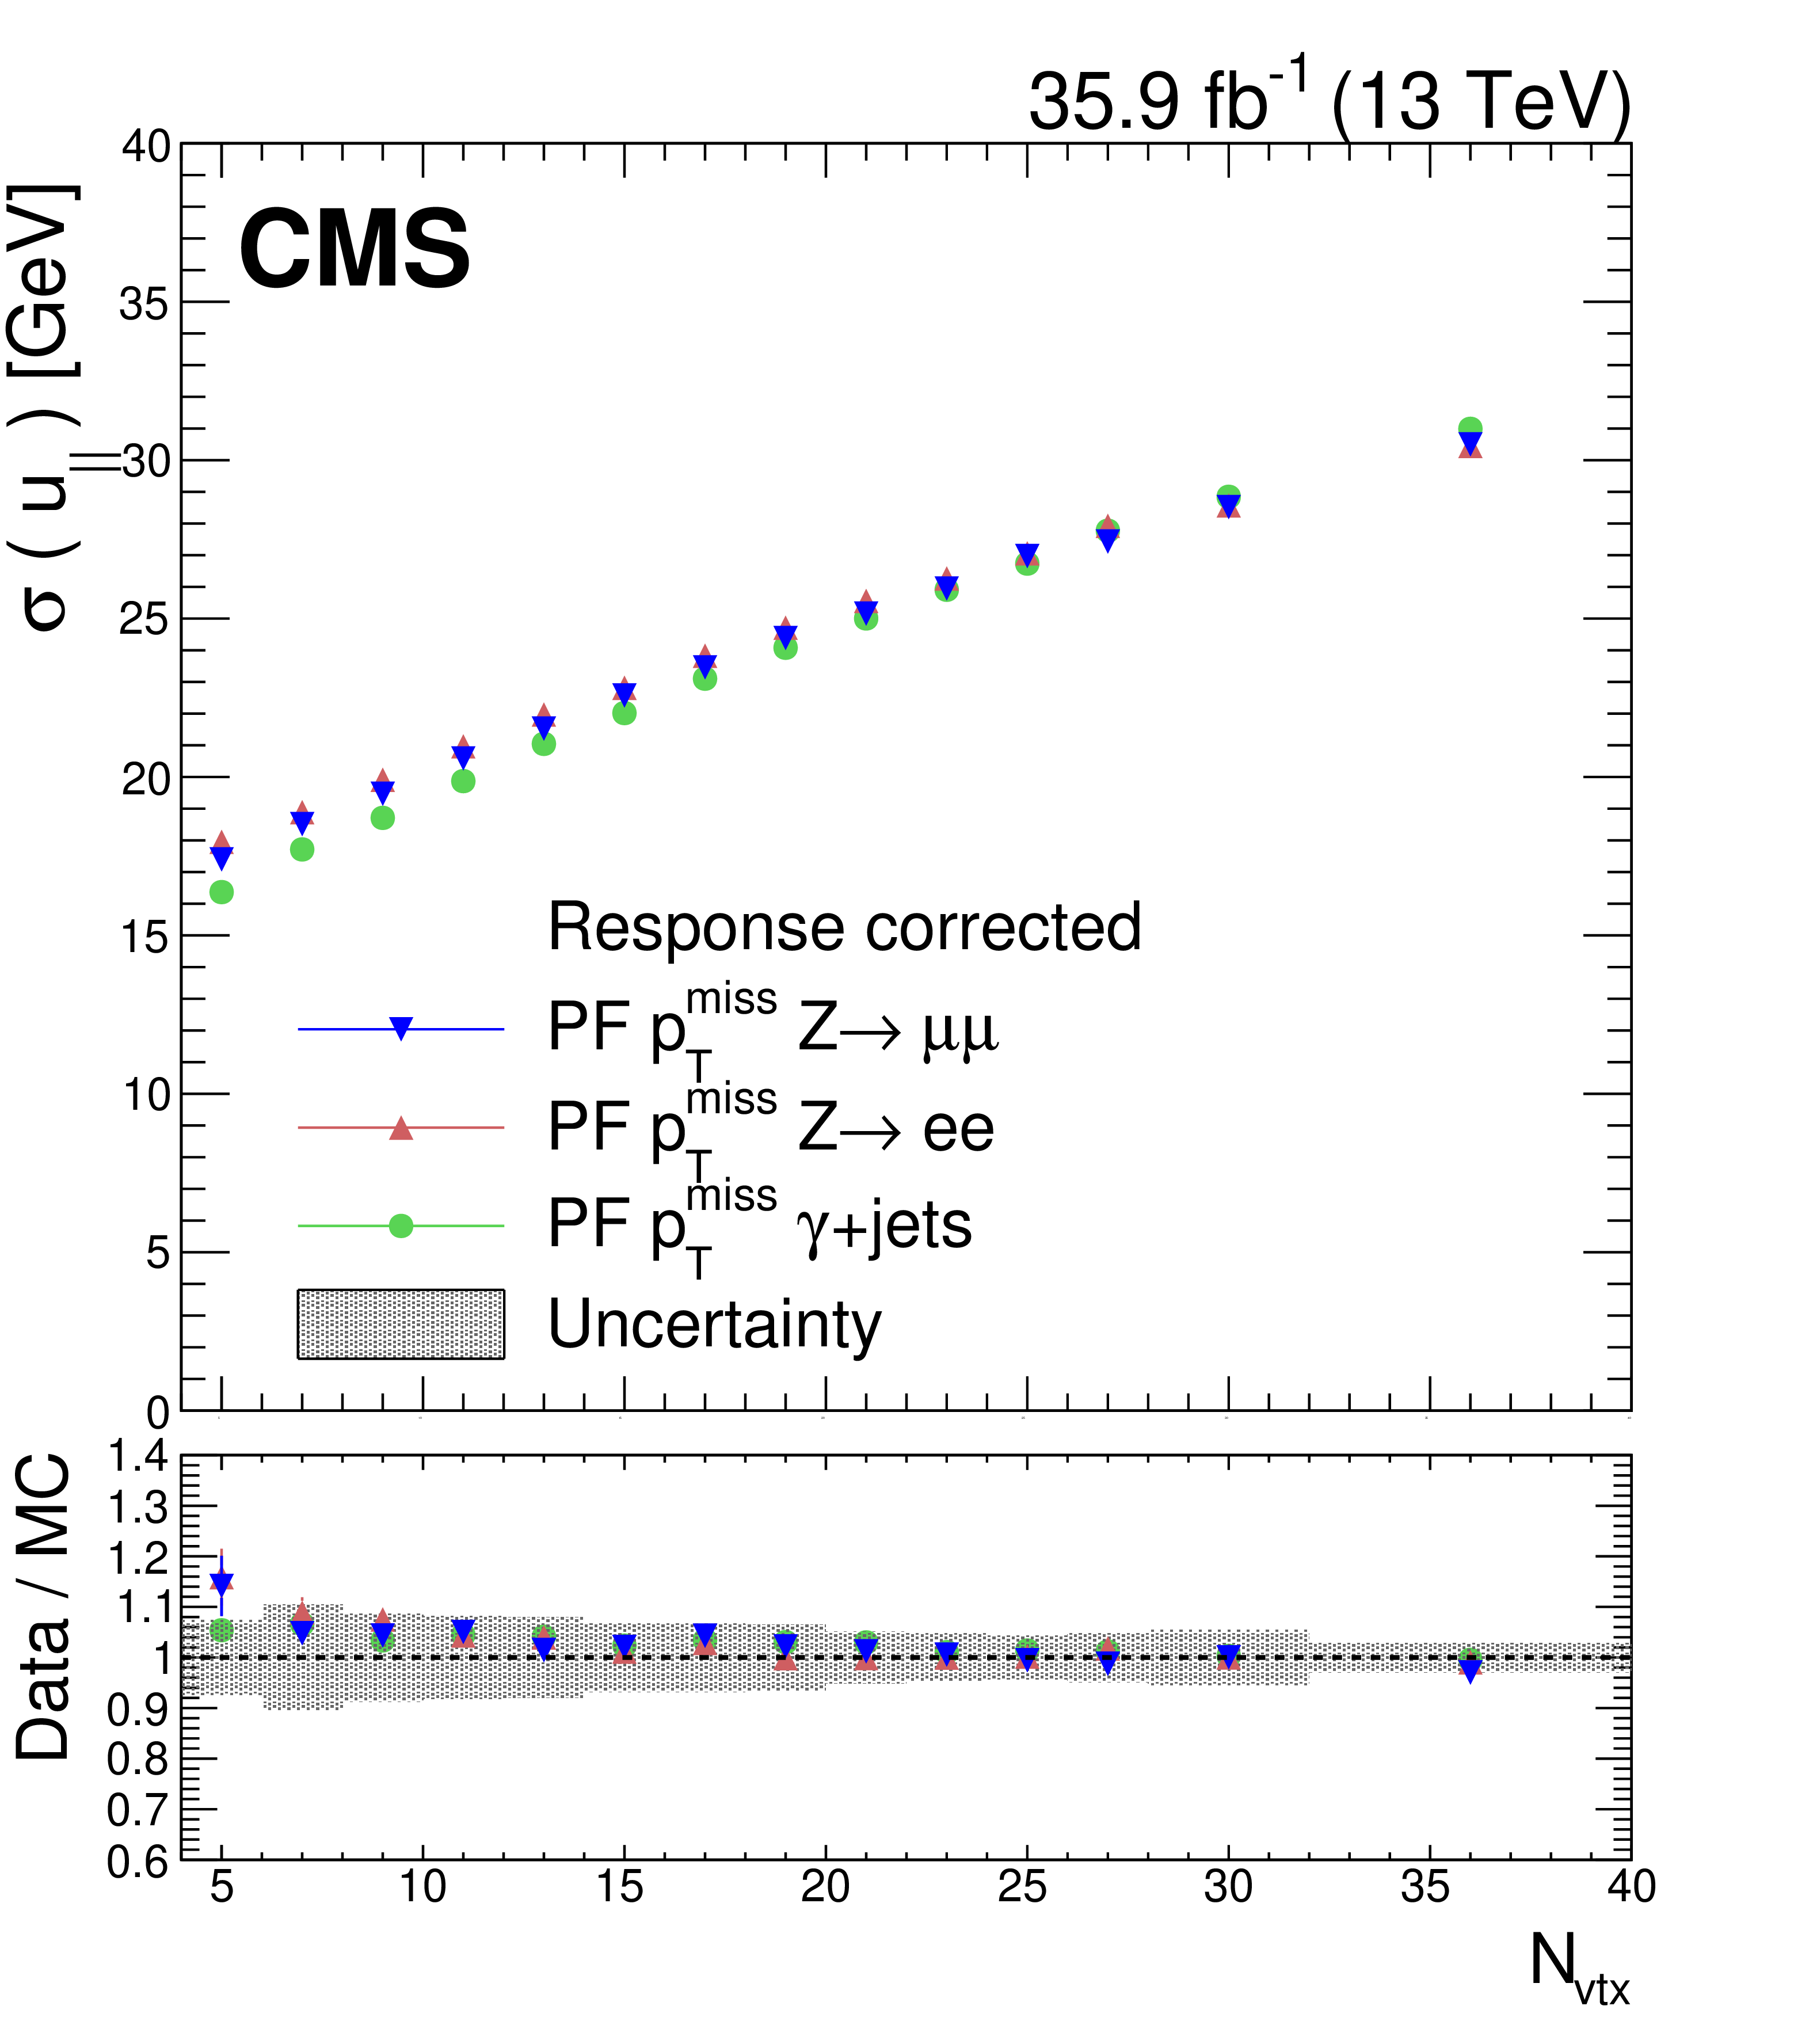
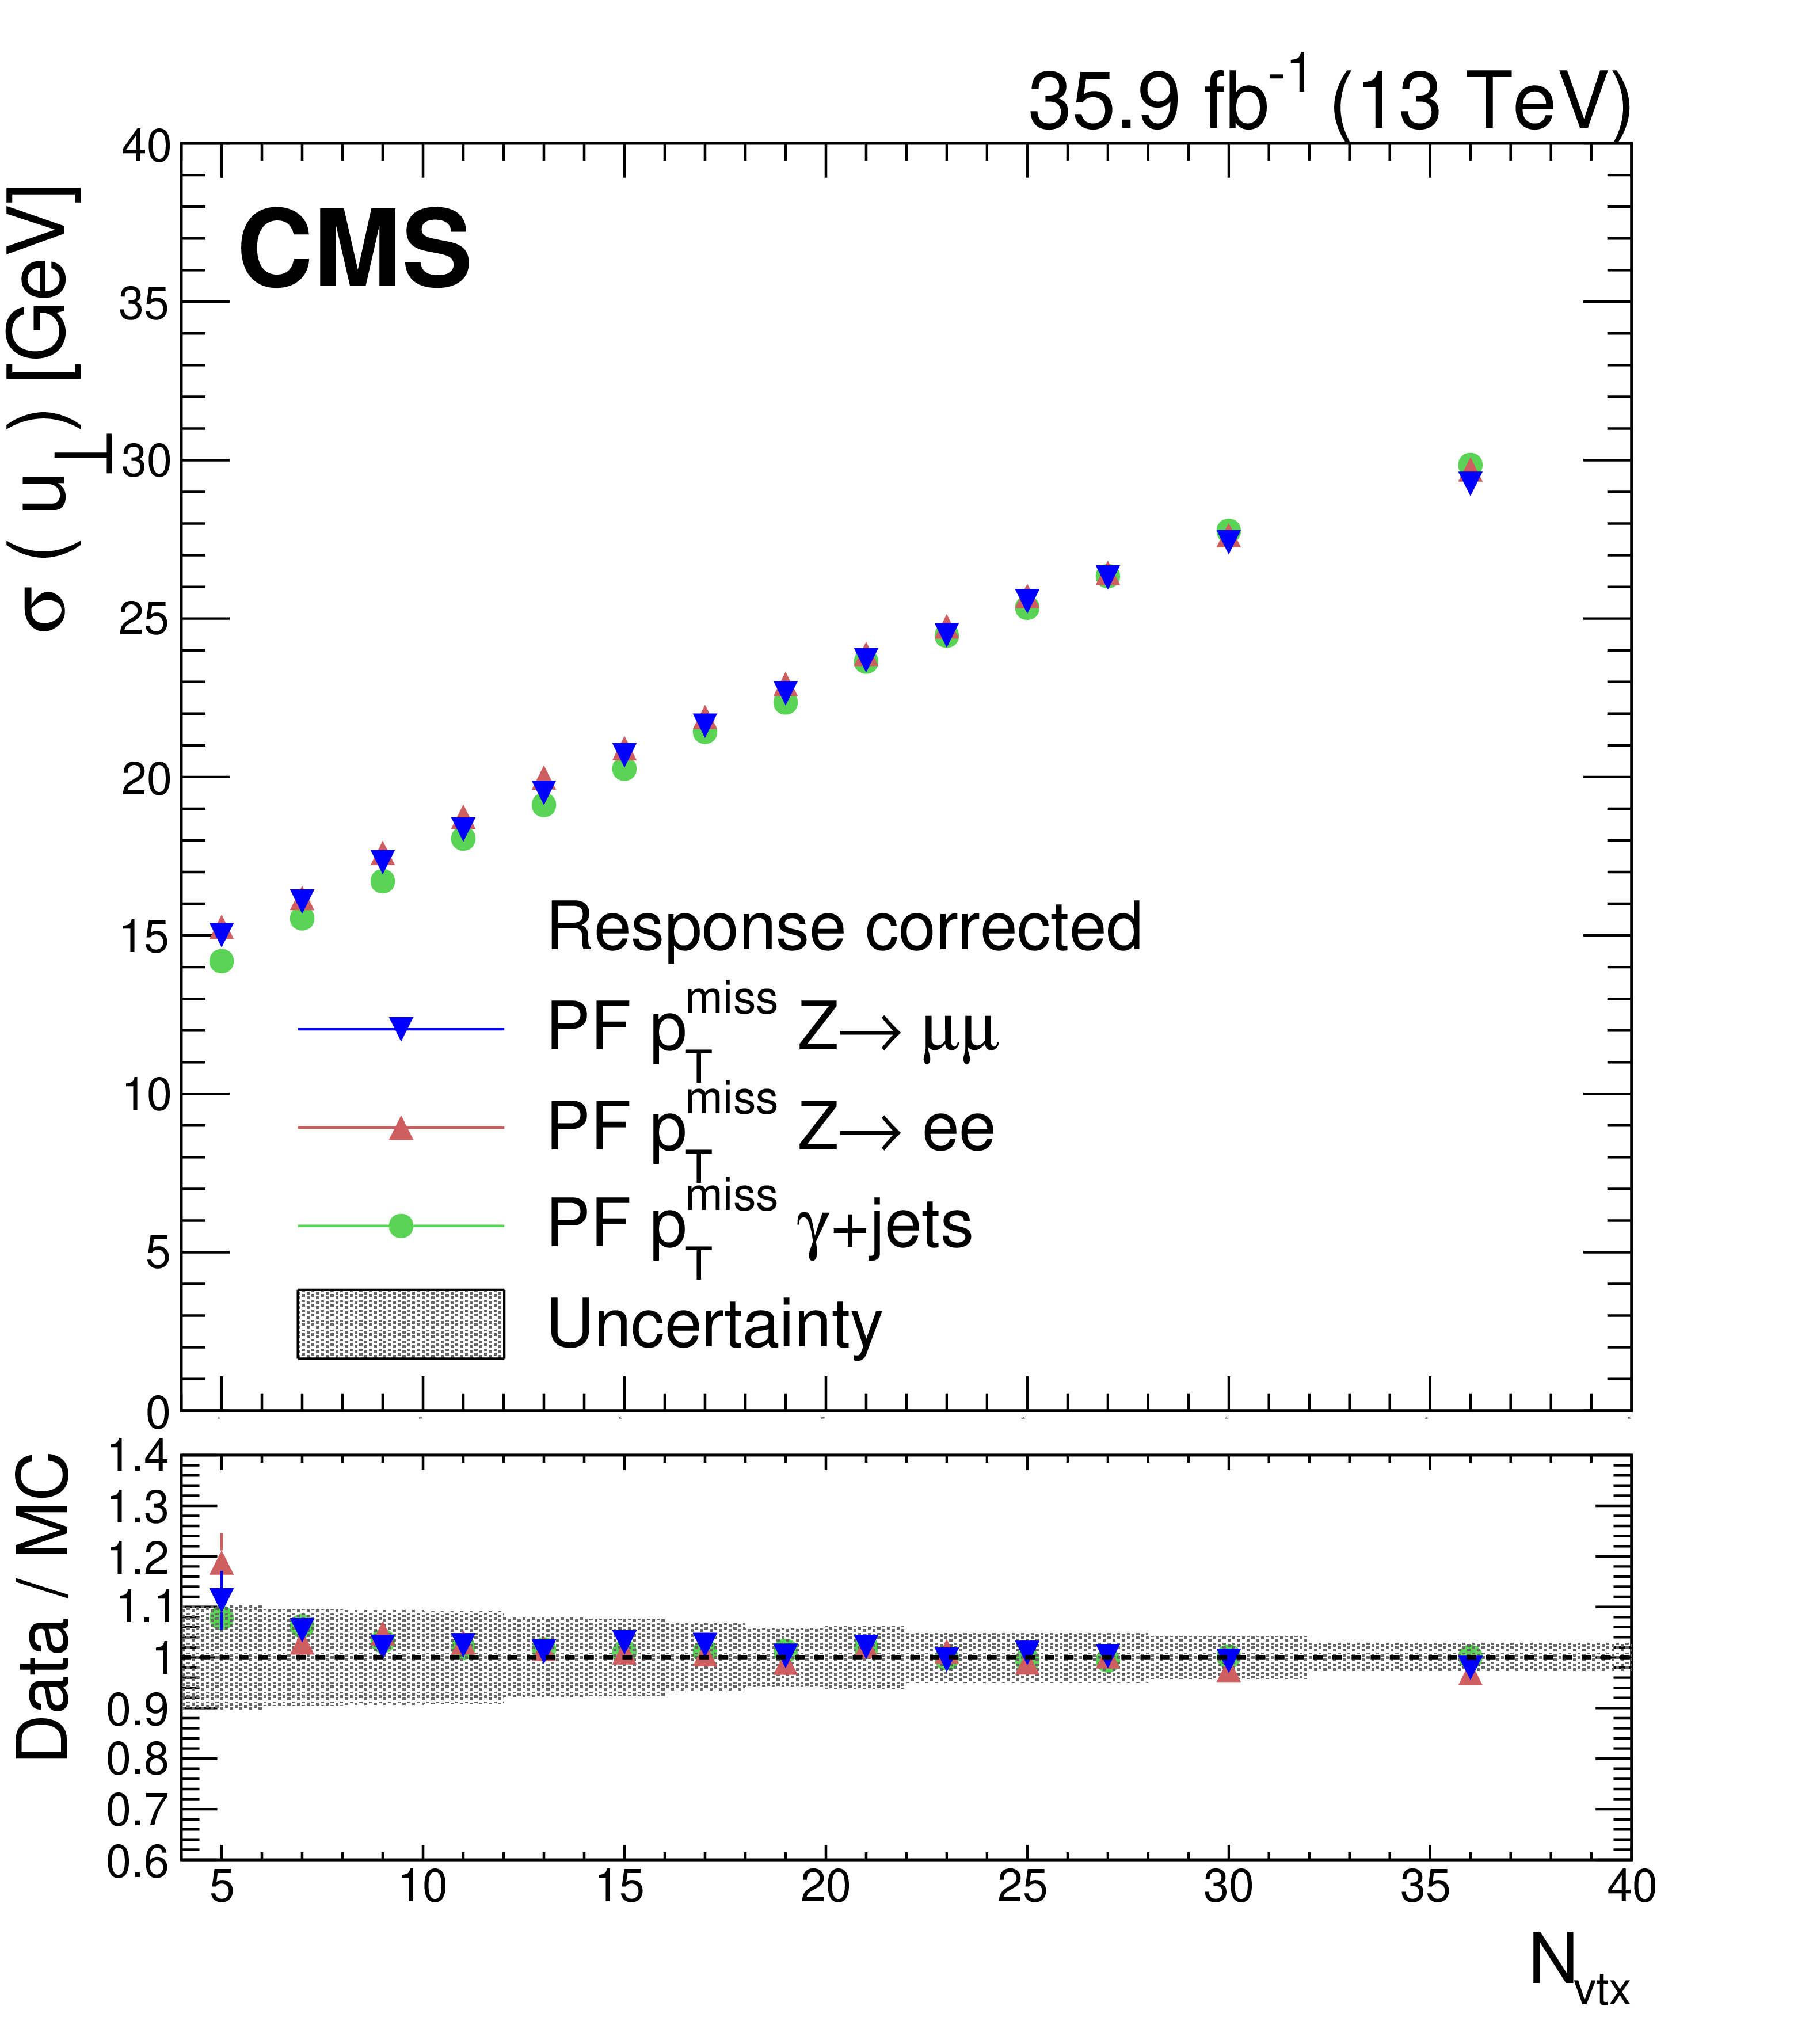
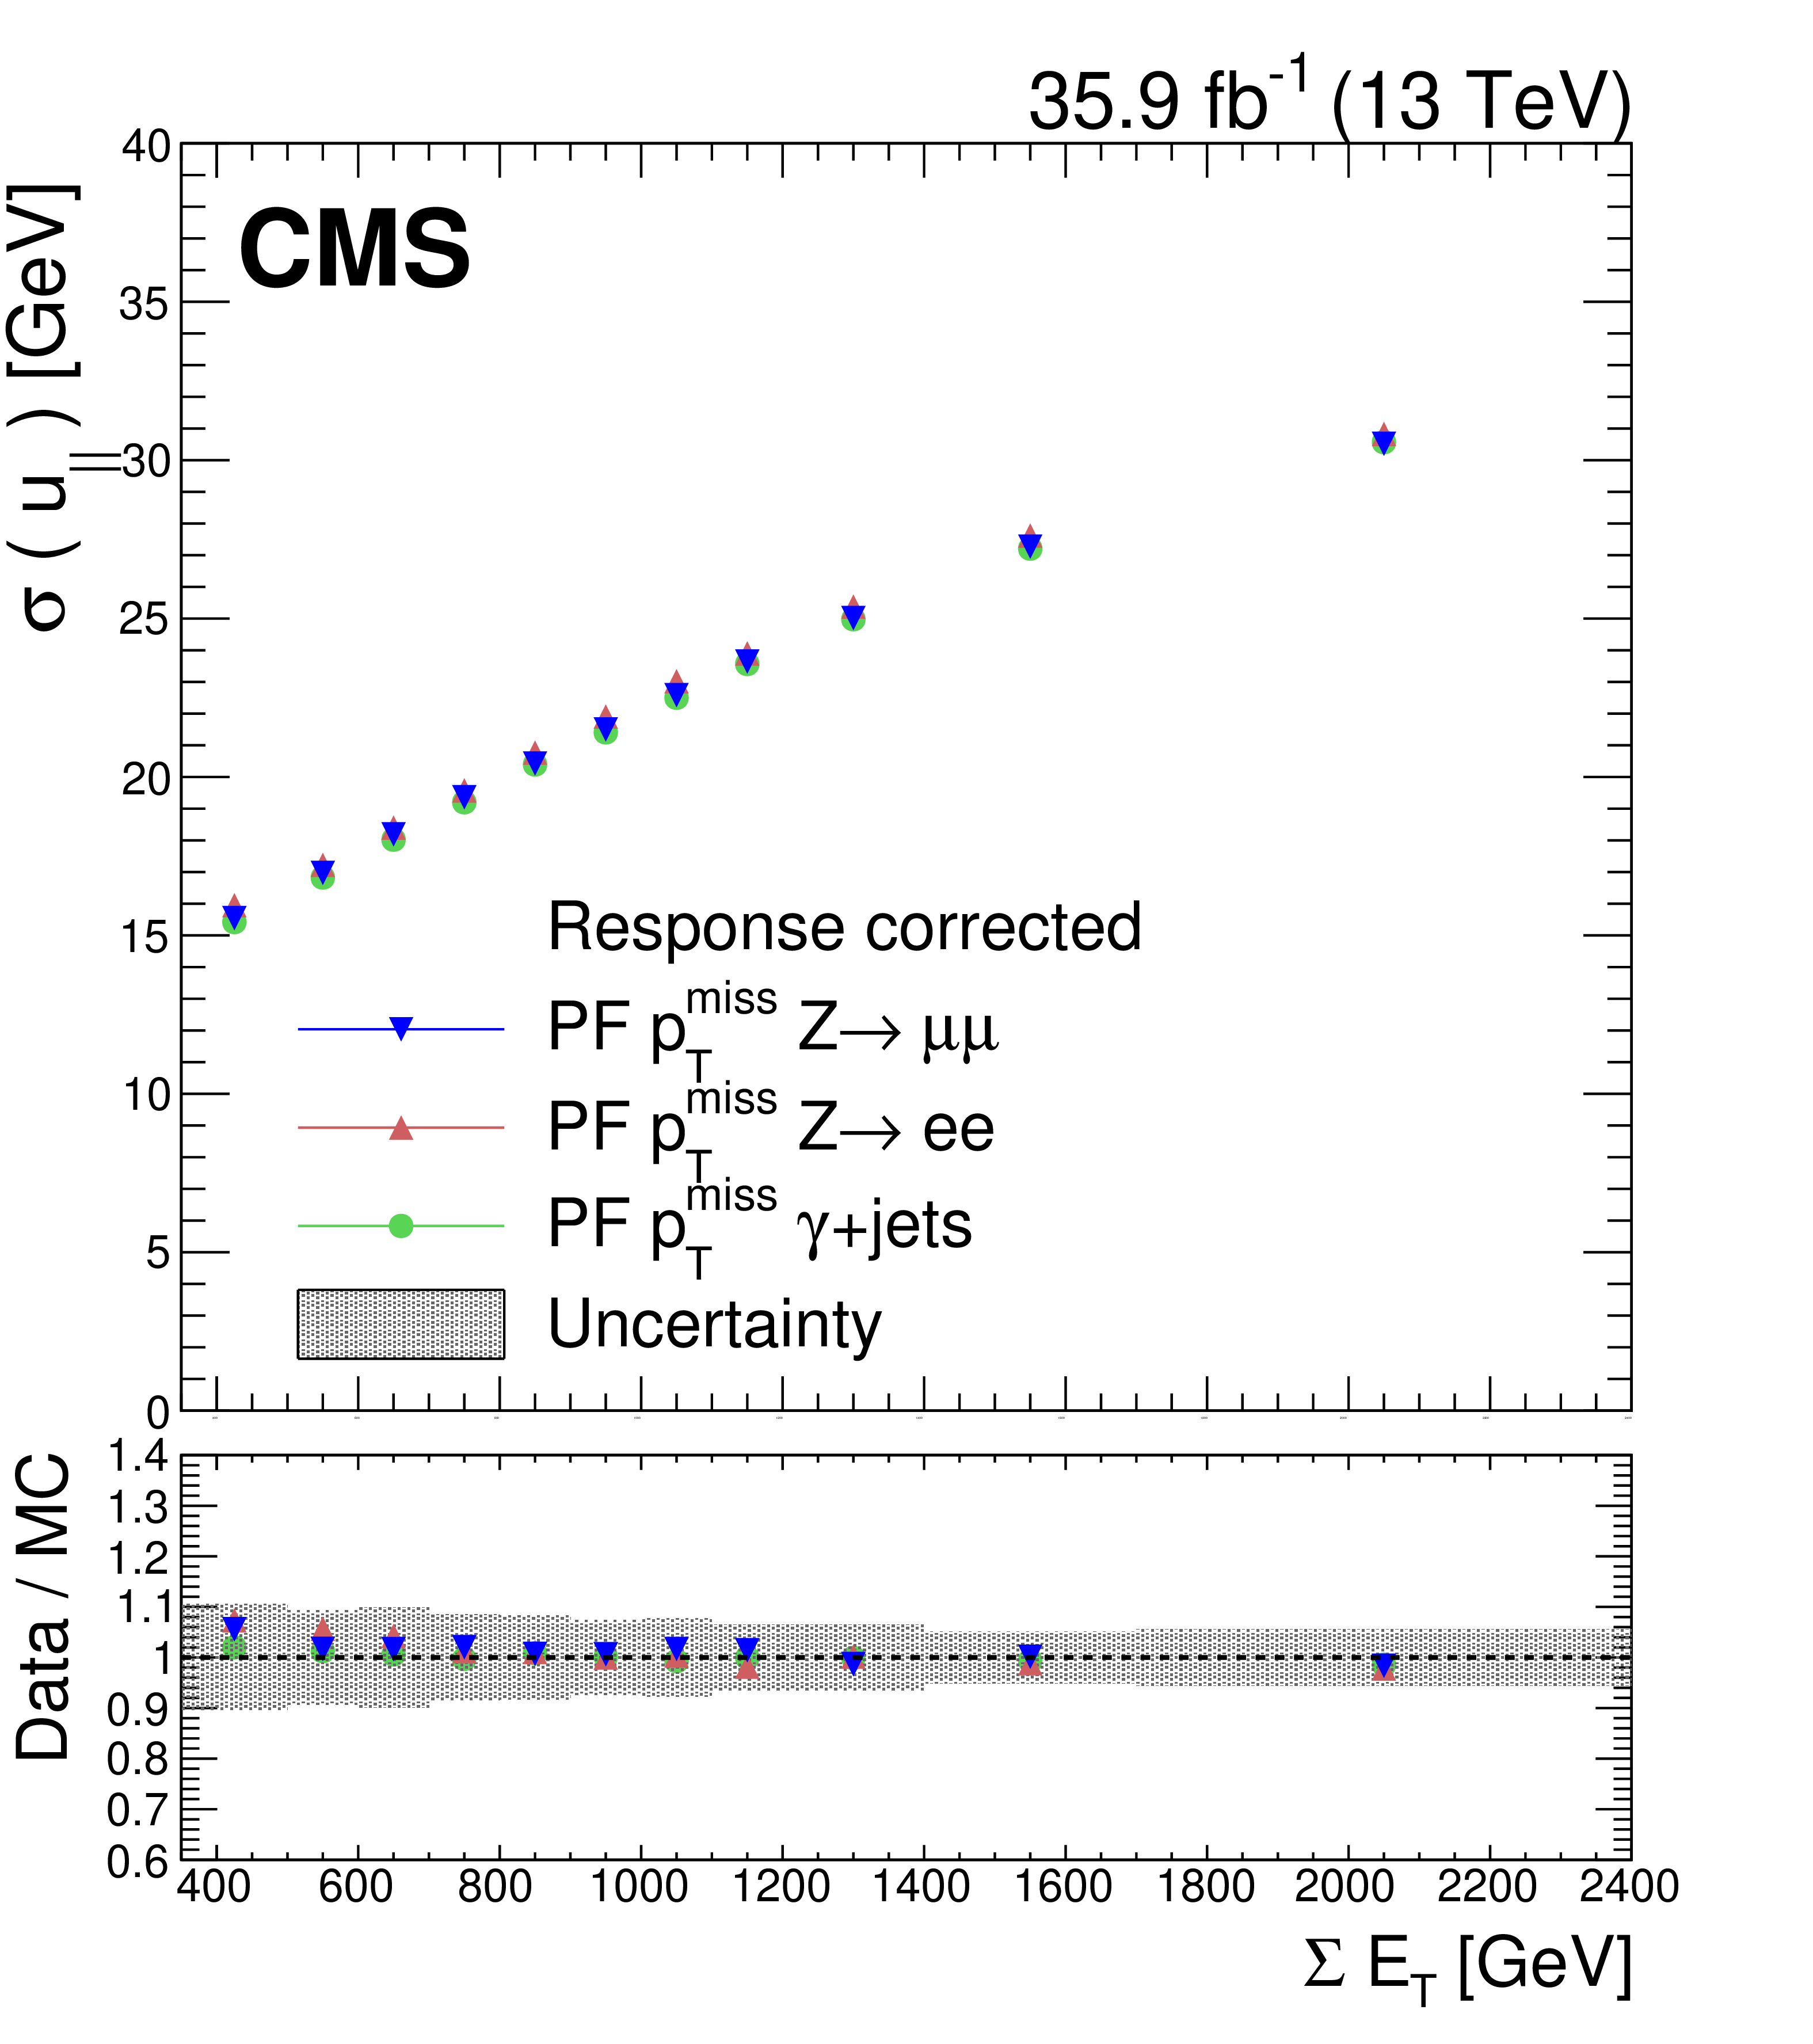
Figure 10:
Resolution of the ${u_{\Vert}}$ and ${u_{\perp}}$ components of the hadronic recoil as a function of ${{q}_\mathrm {T}}$ (upper row), the reconstructed vertices (middle row), and the scalar ${p_{\mathrm {T}}}$ sum of all PF candidates (lower row), in ${{\mathrm {Z}}\to {\mu} ^+ {\mu ^-}}$, ${{\mathrm {Z}}\to {\mathrm {e}^+} {\mathrm {e}^-}}$, and $ {\gamma} $+jets events. In each plot, the upper panel shows the resolution in data, whereas the lower panel shows the ratio of data to simulation. The band corresponds to the systematic uncertainties due to the JES, the JER, and variations in the $E_{U}$ added in quadrature, estimated from the ${{\mathrm {Z}}\to {\mathrm {e}^+} {\mathrm {e}^-}}$ sample. |
png pdf |
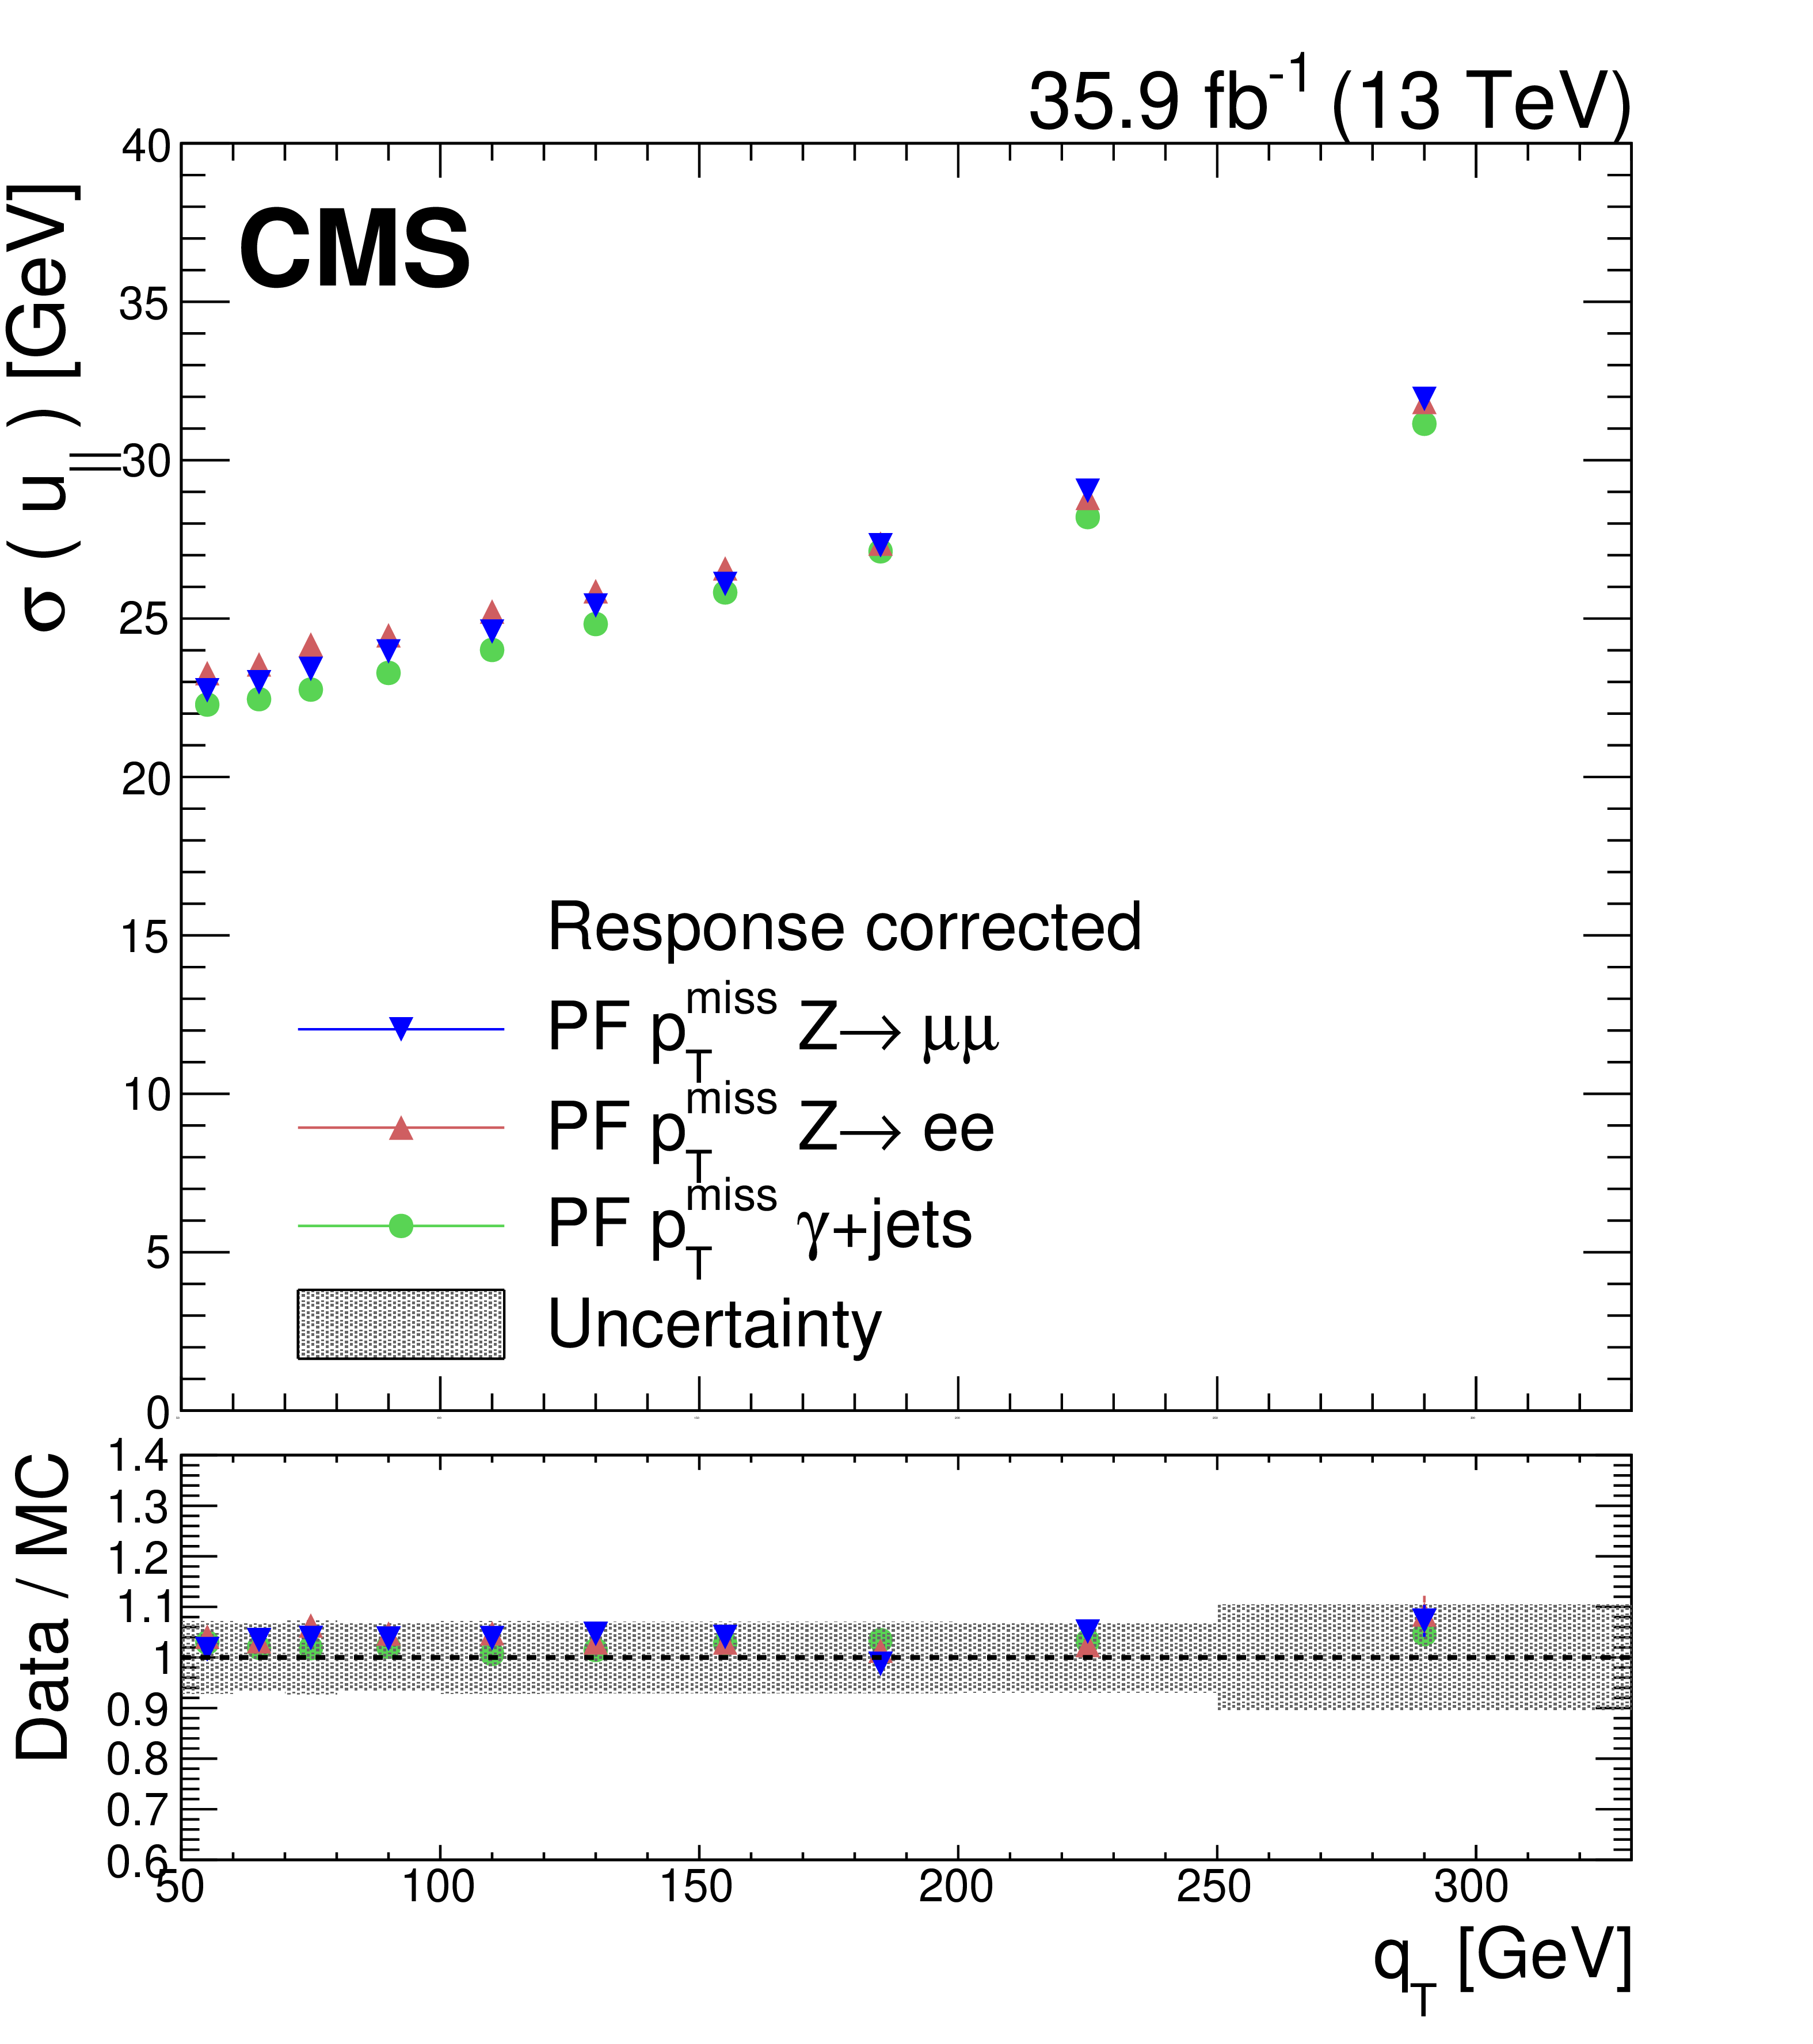
Figure 10-a:
Resolution of the ${u_{\Vert}}$ component of the hadronic recoil as a function of ${{q}_\mathrm {T}}$ in ${{\mathrm {Z}}\to {\mu} ^+ {\mu ^-}}$, ${{\mathrm {Z}}\to {\mathrm {e}^+} {\mathrm {e}^-}}$, and $ {\gamma} $+jets events. The upper panel shows the resolution in data, whereas the lower panel shows the ratio of data to simulation. The band corresponds to the systematic uncertainties due to the JES, the JER, and variations in the $E_{U}$ added in quadrature, estimated from the ${{\mathrm {Z}}\to {\mathrm {e}^+} {\mathrm {e}^-}}$ sample. |
png pdf |
Figure 10-b:
Resolution of the ${u_{\perp}}$ component of the hadronic recoil as a function of ${{q}_\mathrm {T}}$ in ${{\mathrm {Z}}\to {\mu} ^+ {\mu ^-}}$, ${{\mathrm {Z}}\to {\mathrm {e}^+} {\mathrm {e}^-}}$, and $ {\gamma} $+jets events. The upper panel shows the resolution in data, whereas the lower panel shows the ratio of data to simulation. The band corresponds to the systematic uncertainties due to the JES, the JER, and variations in the $E_{U}$ added in quadrature, estimated from the ${{\mathrm {Z}}\to {\mathrm {e}^+} {\mathrm {e}^-}}$ sample. |
png pdf |
Figure 10-c:
Resolution of the ${u_{\Vert}}$ component of the hadronic recoil as a function of the reconstructed vertices in ${{\mathrm {Z}}\to {\mu} ^+ {\mu ^-}}$, ${{\mathrm {Z}}\to {\mathrm {e}^+} {\mathrm {e}^-}}$, and $ {\gamma} $+jets events. The upper panel shows the resolution in data, whereas the lower panel shows the ratio of data to simulation. The band corresponds to the systematic uncertainties due to the JES, the JER, and variations in the $E_{U}$ added in quadrature, estimated from the ${{\mathrm {Z}}\to {\mathrm {e}^+} {\mathrm {e}^-}}$ sample. |
png pdf |
Figure 10-d:
Resolution of the ${u_{\perp}}$ component of the hadronic recoil as a function of the reconstructed vertices in ${{\mathrm {Z}}\to {\mu} ^+ {\mu ^-}}$, ${{\mathrm {Z}}\to {\mathrm {e}^+} {\mathrm {e}^-}}$, and $ {\gamma} $+jets events. The upper panel shows the resolution in data, whereas the lower panel shows the ratio of data to simulation. The band corresponds to the systematic uncertainties due to the JES, the JER, and variations in the $E_{U}$ added in quadrature, estimated from the ${{\mathrm {Z}}\to {\mathrm {e}^+} {\mathrm {e}^-}}$ sample. |
png pdf |
Figure 10-e:
Resolution of the ${u_{\Vert}}$ component of the hadronic recoil as a function of the scalar ${p_{\mathrm {T}}}$ sum of all PF candidates in ${{\mathrm {Z}}\to {\mu} ^+ {\mu ^-}}$, ${{\mathrm {Z}}\to {\mathrm {e}^+} {\mathrm {e}^-}}$, and $ {\gamma} $+jets events. The upper panel shows the resolution in data, whereas the lower panel shows the ratio of data to simulation. The band corresponds to the systematic uncertainties due to the JES, the JER, and variations in the $E_{U}$ added in quadrature, estimated from the ${{\mathrm {Z}}\to {\mathrm {e}^+} {\mathrm {e}^-}}$ sample. |
png pdf |
Figure 10-f:
Resolution of the ${u_{\perp}}$ component of the hadronic recoil as a function of the scalar ${p_{\mathrm {T}}}$ sum of all PF candidates in ${{\mathrm {Z}}\to {\mu} ^+ {\mu ^-}}$, ${{\mathrm {Z}}\to {\mathrm {e}^+} {\mathrm {e}^-}}$, and $ {\gamma} $+jets events. The upper panel shows the resolution in data, whereas the lower panel shows the ratio of data to simulation. The band corresponds to the systematic uncertainties due to the JES, the JER, and variations in the $E_{U}$ added in quadrature, estimated from the ${{\mathrm {Z}}\to {\mathrm {e}^+} {\mathrm {e}^-}}$ sample. |
png pdf |
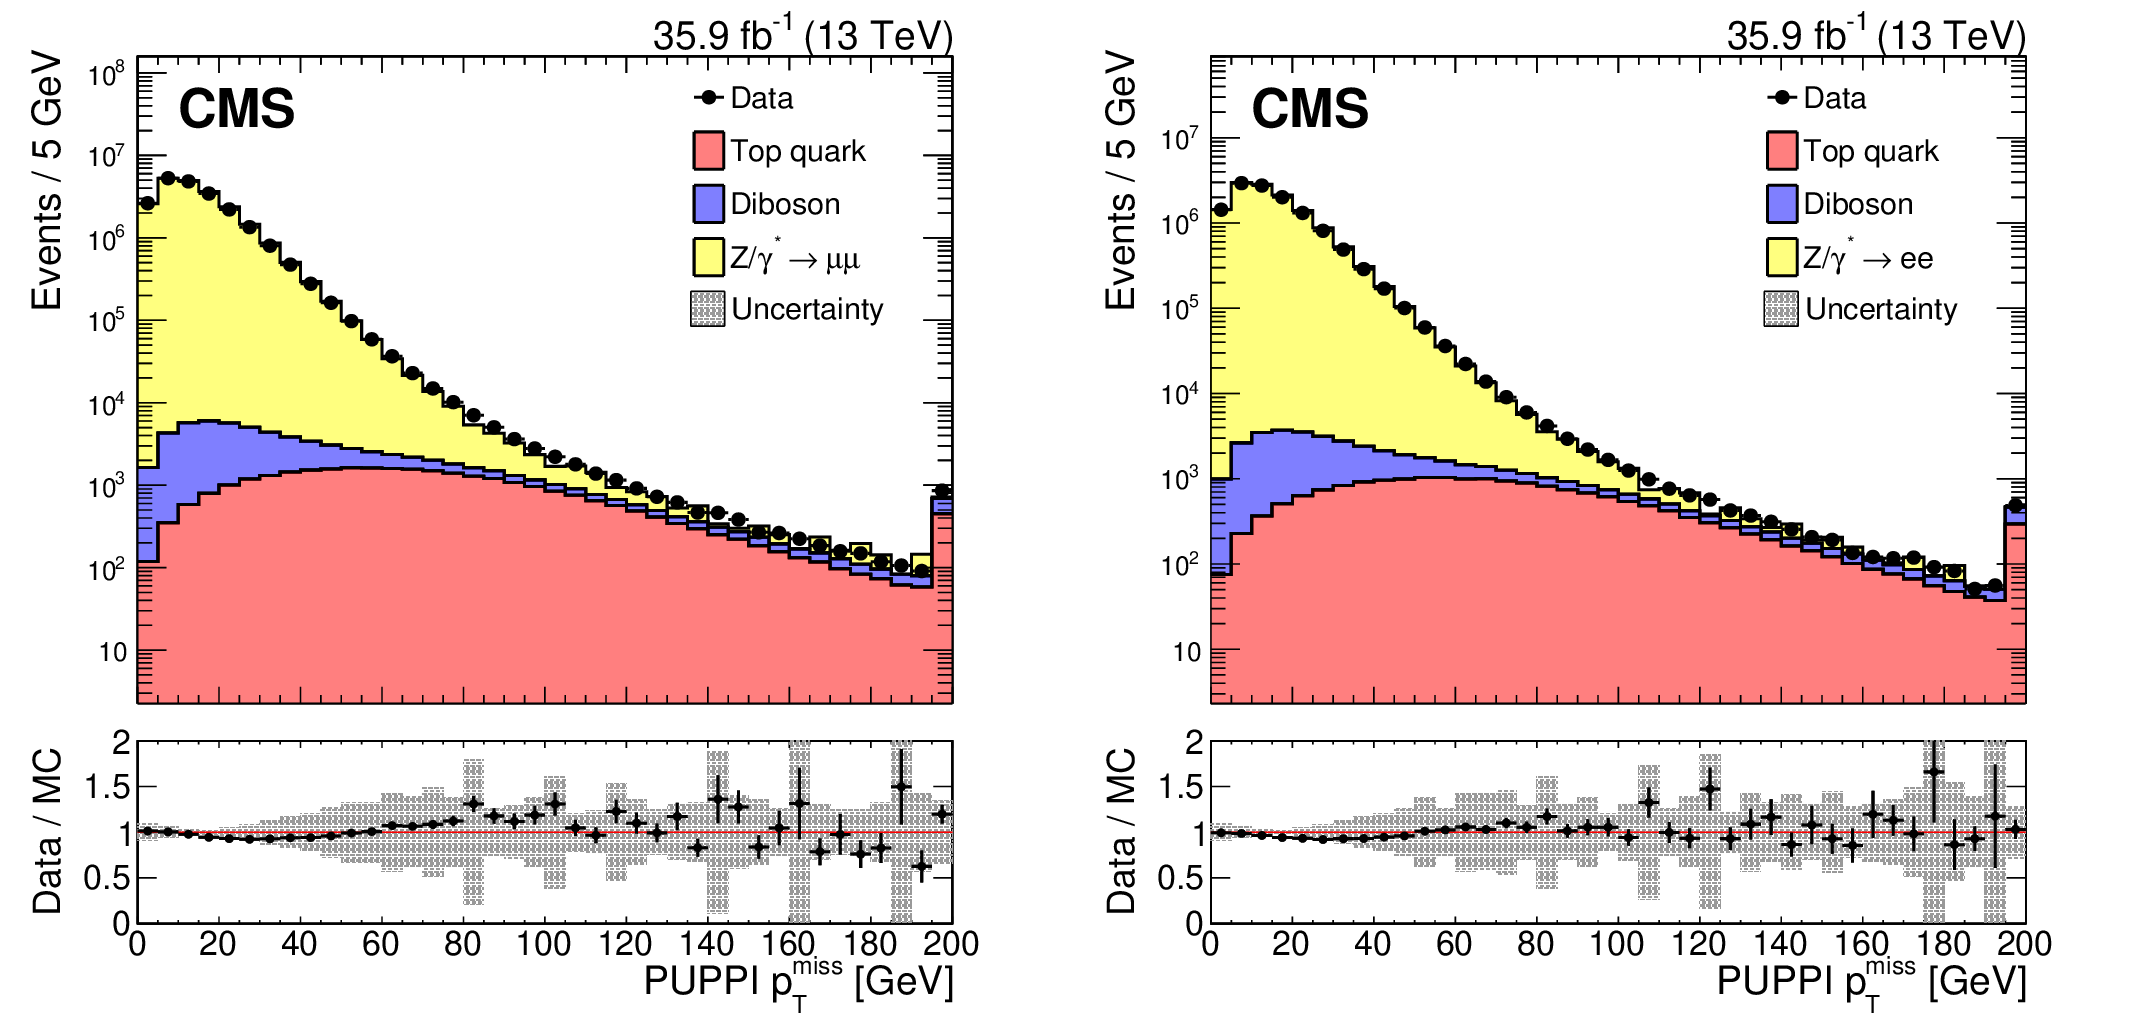
Figure 11:
Upper panels: Distributions of PUPPI ${{p_{\mathrm {T}}} ^\text {miss}}$ in ${{\mathrm {Z}}\to {\mu} ^+ {\mu ^-}}$ (left) and ${{\mathrm {Z}}\to {\mathrm {e}^+} {\mathrm {e}^-}}$ (right) events. The last bin includes all events with $ {{p_{\mathrm {T}}} ^\text {miss}} > $ 195 GeV. Lower panels: Data-to-simulation ratio. The band corresponds to the systematic uncertainties due to the JES, the JER, and variations in the $E_{U}$ added in quadrature, estimated from the ${{\mathrm {Z}}\to {\mathrm {e}^+} {\mathrm {e}^-}}$ sample. |
png pdf |
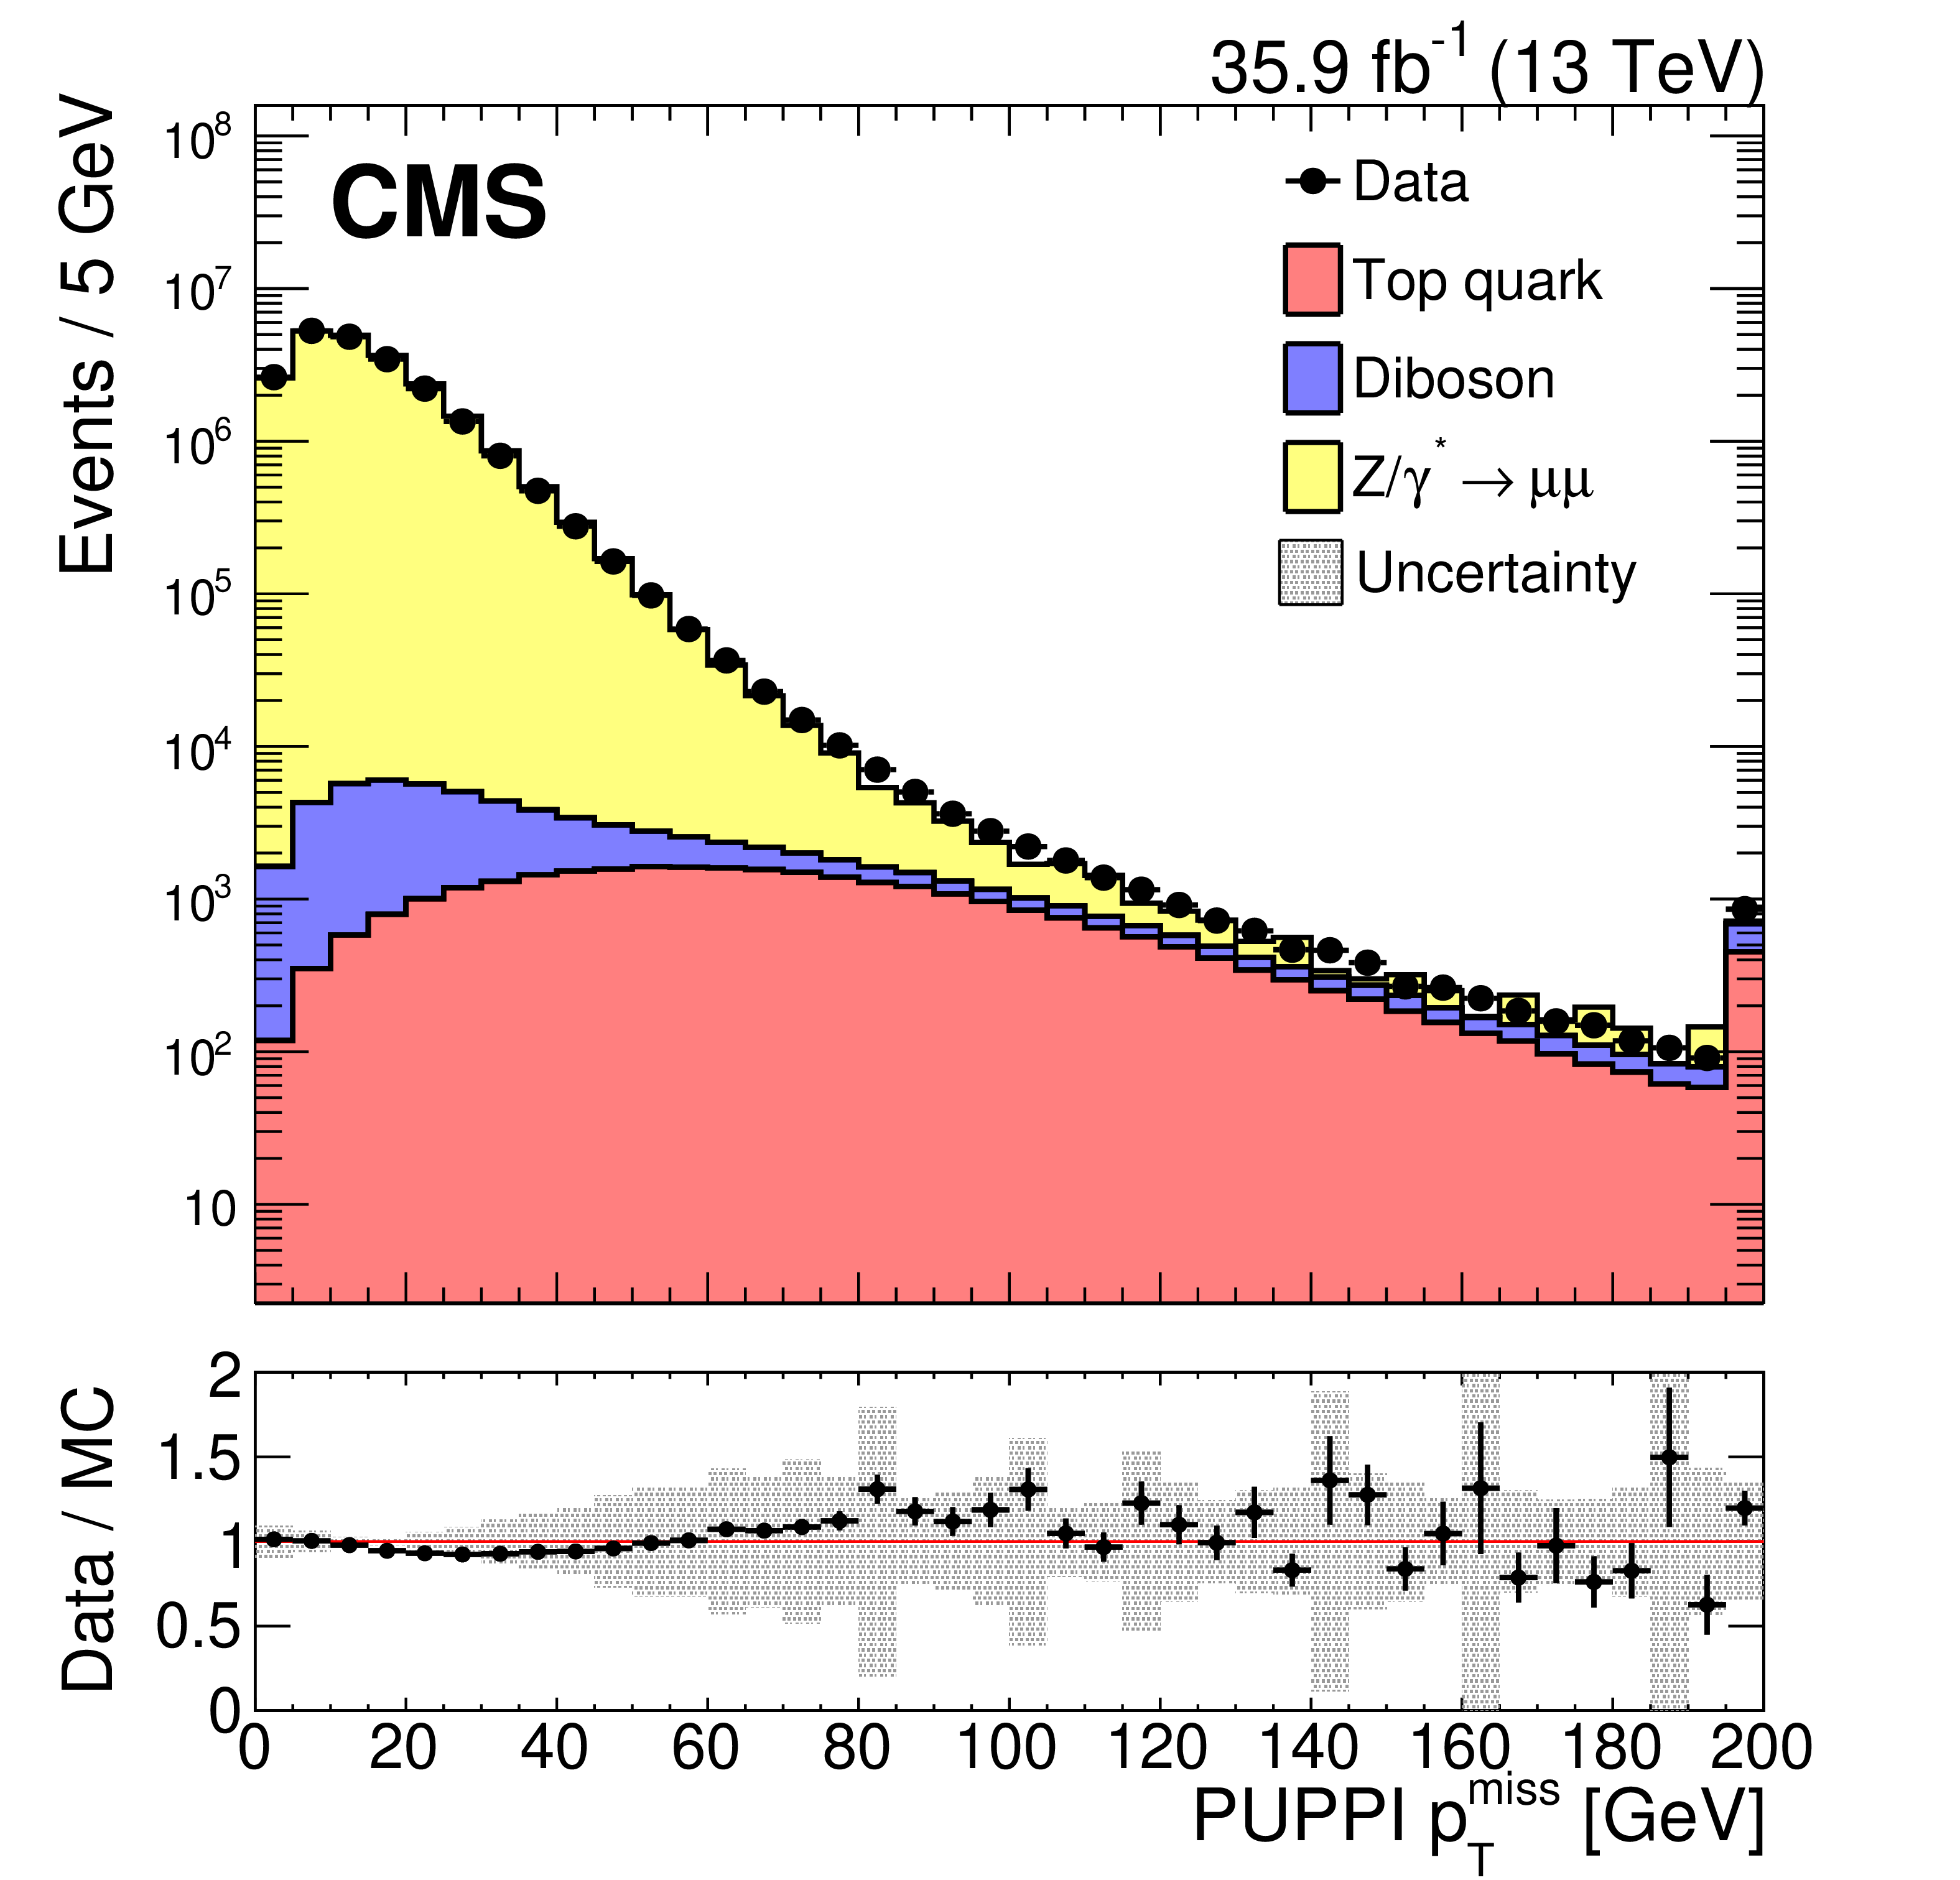
Figure 11-a:
Upper panel: Distribution of PUPPI ${{p_{\mathrm {T}}} ^\text {miss}}$ in ${{\mathrm {Z}}\to {\mu} ^+ {\mu ^-}}$ events. The last bin includes all events with $ {{p_{\mathrm {T}}} ^\text {miss}} > $ 195 GeV. Lower panel: Data-to-simulation ratio. The band corresponds to the systematic uncertainties due to the JES, the JER, and variations in the $E_{U}$ added in quadrature, estimated from the ${{\mathrm {Z}}\to {\mathrm {e}^+} {\mathrm {e}^-}}$ sample. |
png pdf |
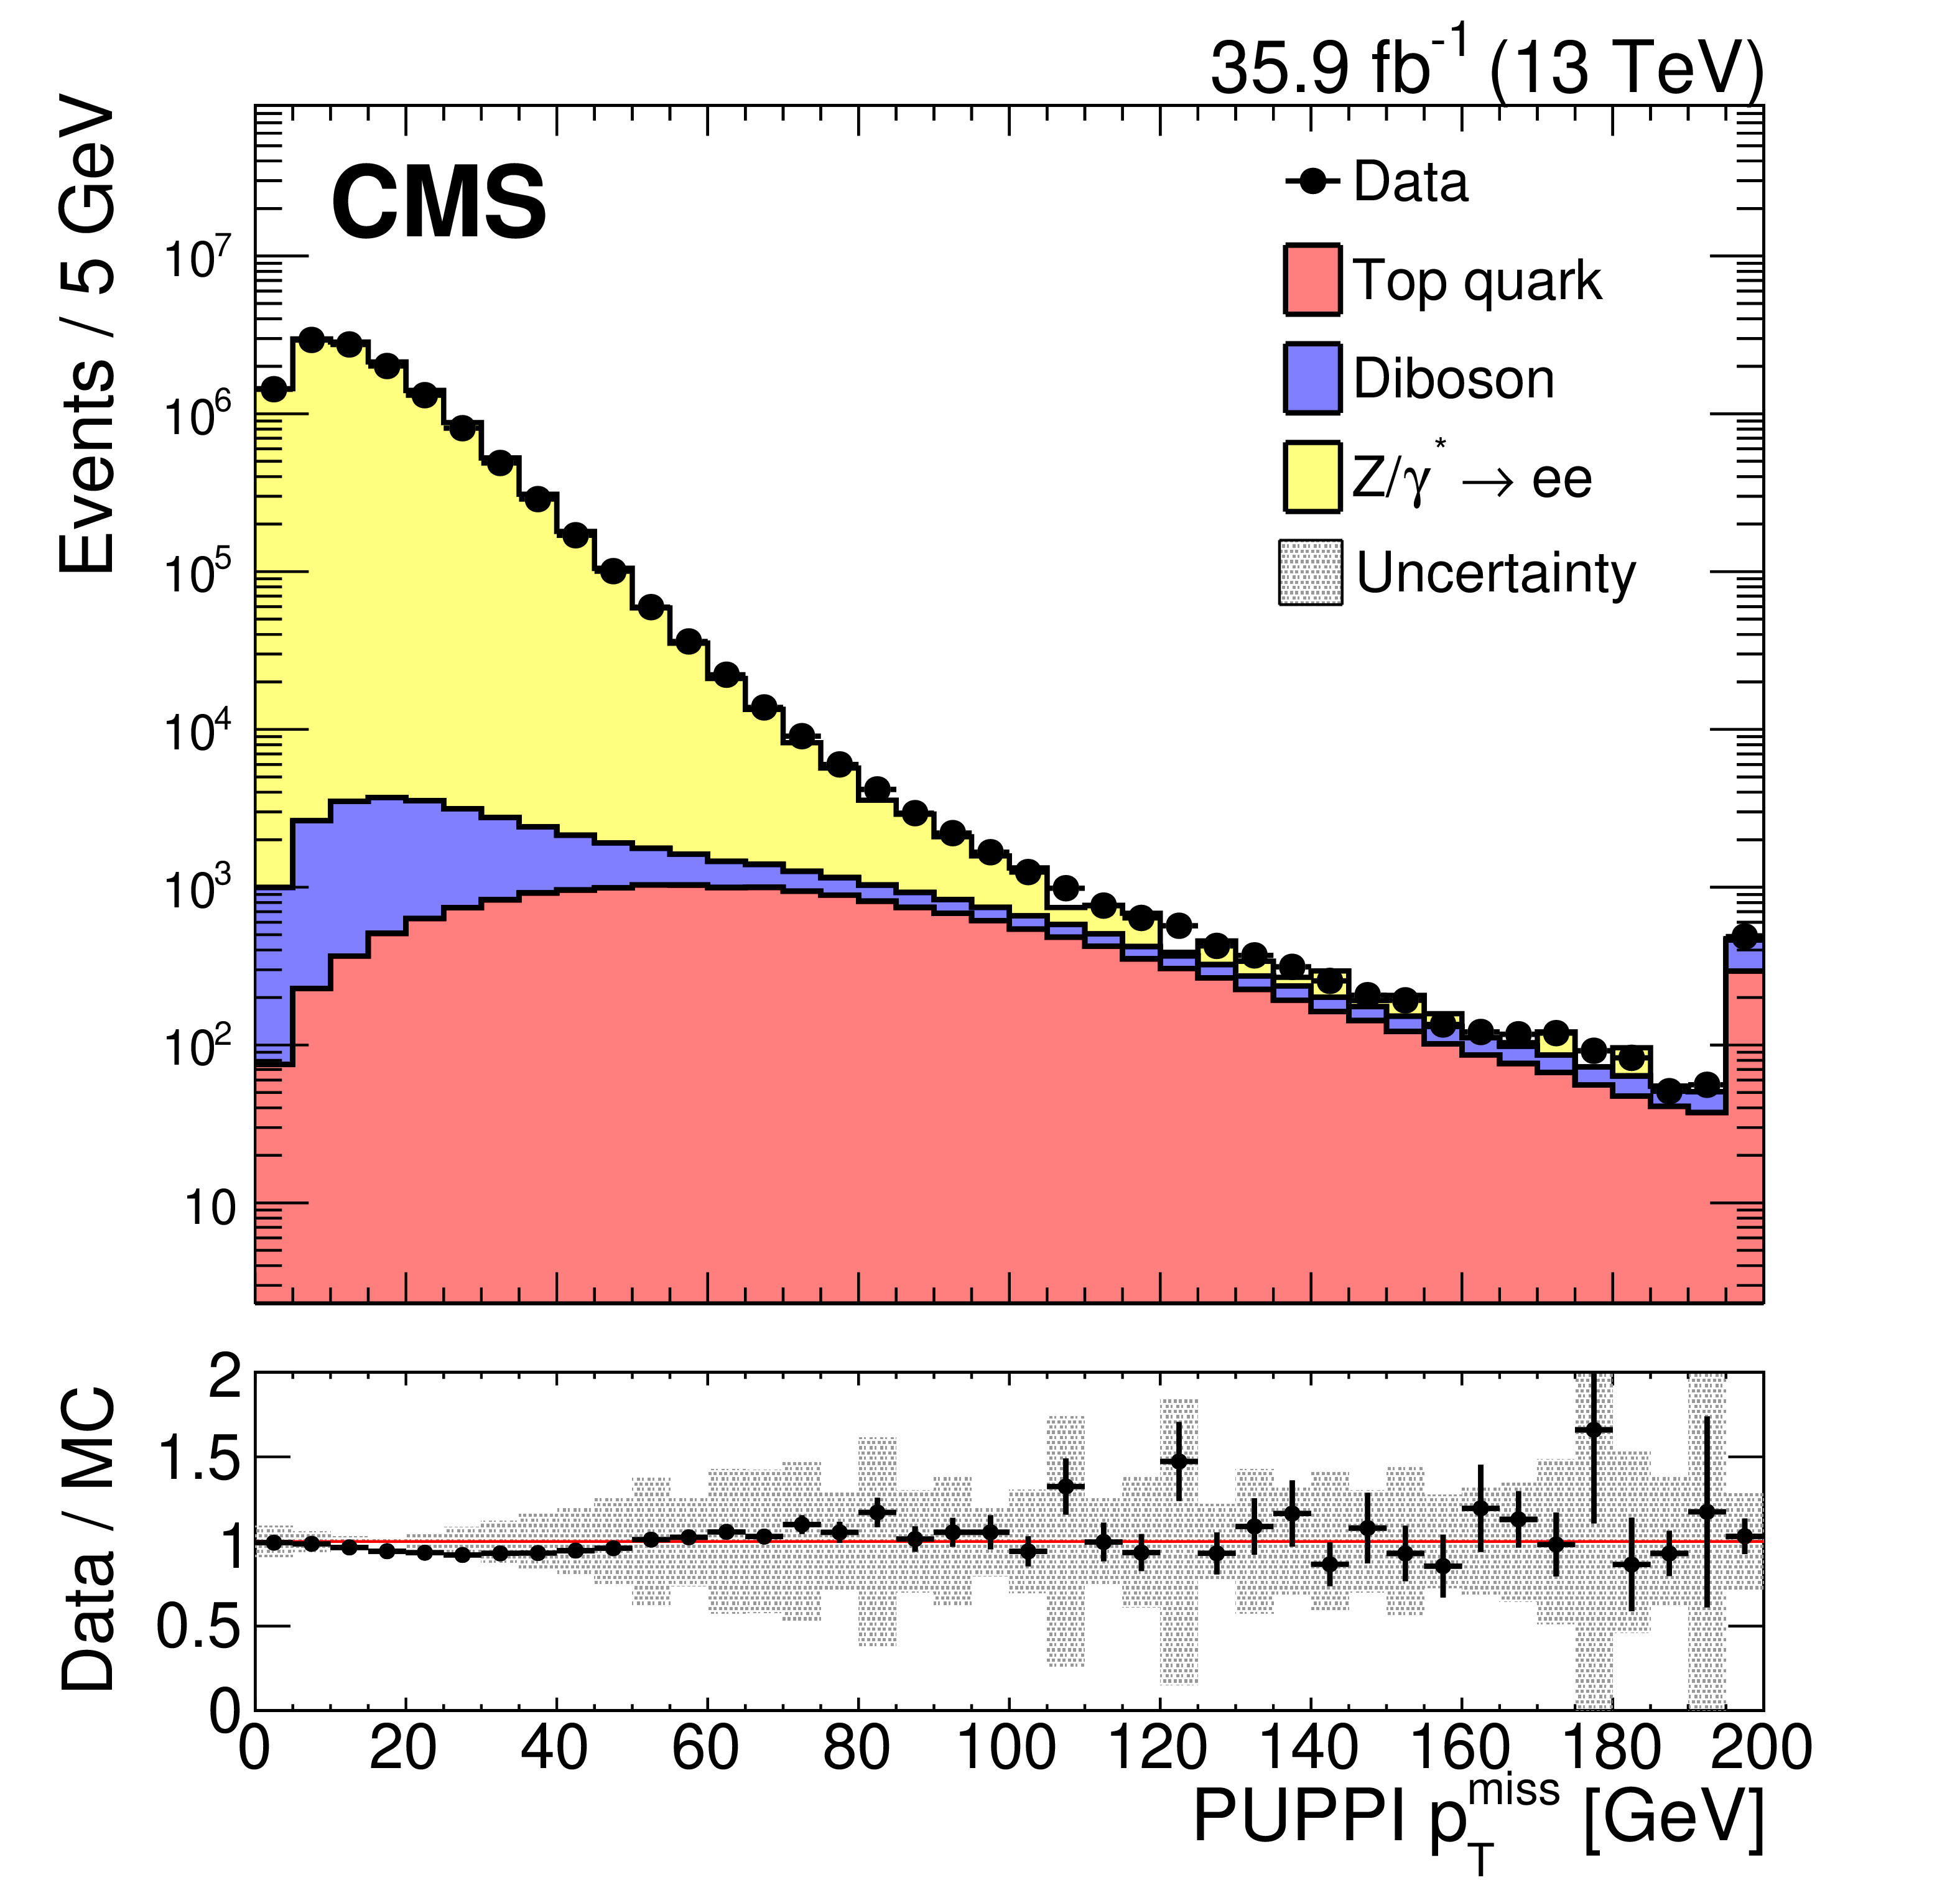
Figure 11-b:
Upper panel: Distribution of PUPPI ${{p_{\mathrm {T}}} ^\text {miss}}$ in ${{\mathrm {Z}}\to {\mathrm {e}^+} {\mathrm {e}^-}}$ events. The last bin includes all events with $ {{p_{\mathrm {T}}} ^\text {miss}} > $ 195 GeV. Lower panel: Data-to-simulation ratio. The band corresponds to the systematic uncertainties due to the JES, the JER, and variations in the $E_{U}$ added in quadrature, estimated from the ${{\mathrm {Z}}\to {\mathrm {e}^+} {\mathrm {e}^-}}$ sample. |
png pdf |
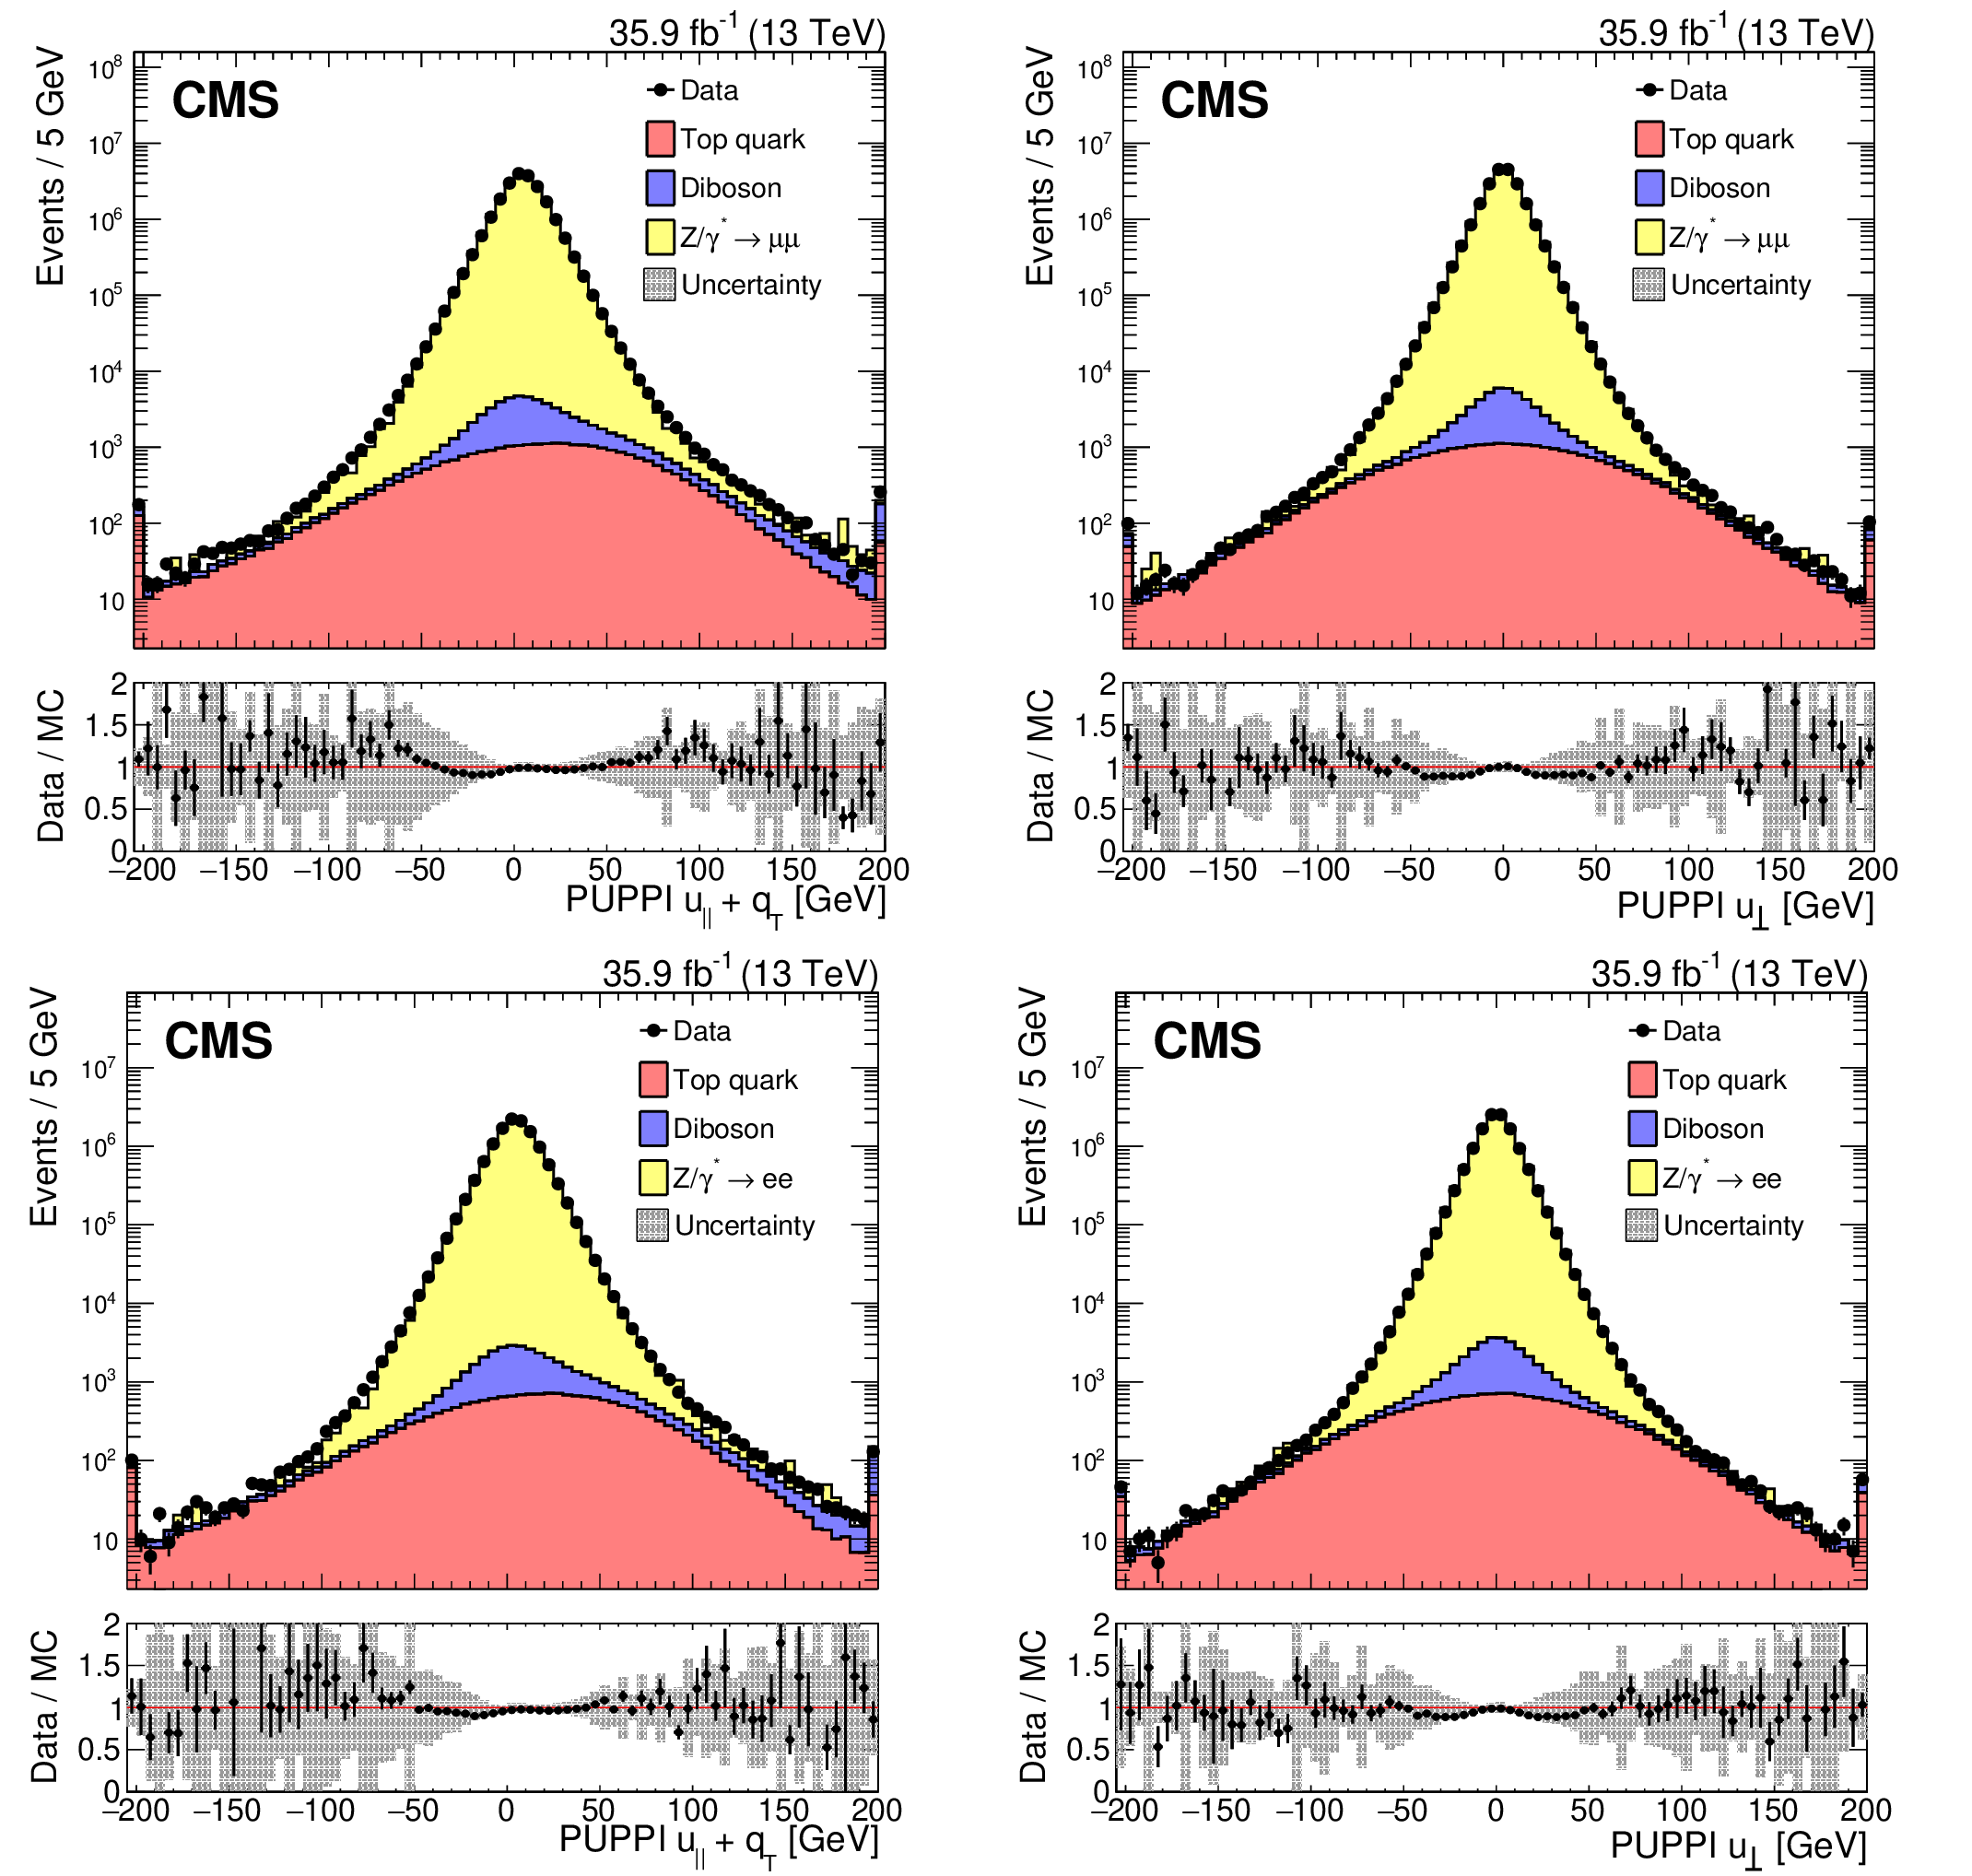
Figure 12:
Upper panels: Distributions of the ${u_{\Vert}}$+${{q}_\mathrm {T}}$ and ${u_{\perp}}$ components of the hadronic recoil, in data (filled markers) and simulation (solid histograms), for the ${{\mathrm {Z}}\to {\mu} ^+ {\mu ^-}}$ (upper) and ${{\mathrm {Z}}\to {\mathrm {e}^+} {\mathrm {e}^-}}$ (lower) events. The first and the last bins include all events below -195 and above +195, respectively. Lower panel: Data-to-simulation ratio. The band corresponds to the systematic uncertainties due to the JES, the JER, and variations in the $E_{U}$ added in quadrature, estimated from the ${{\mathrm {Z}}\to {\mathrm {e}^+} {\mathrm {e}^-}}$ sample. |
png pdf |
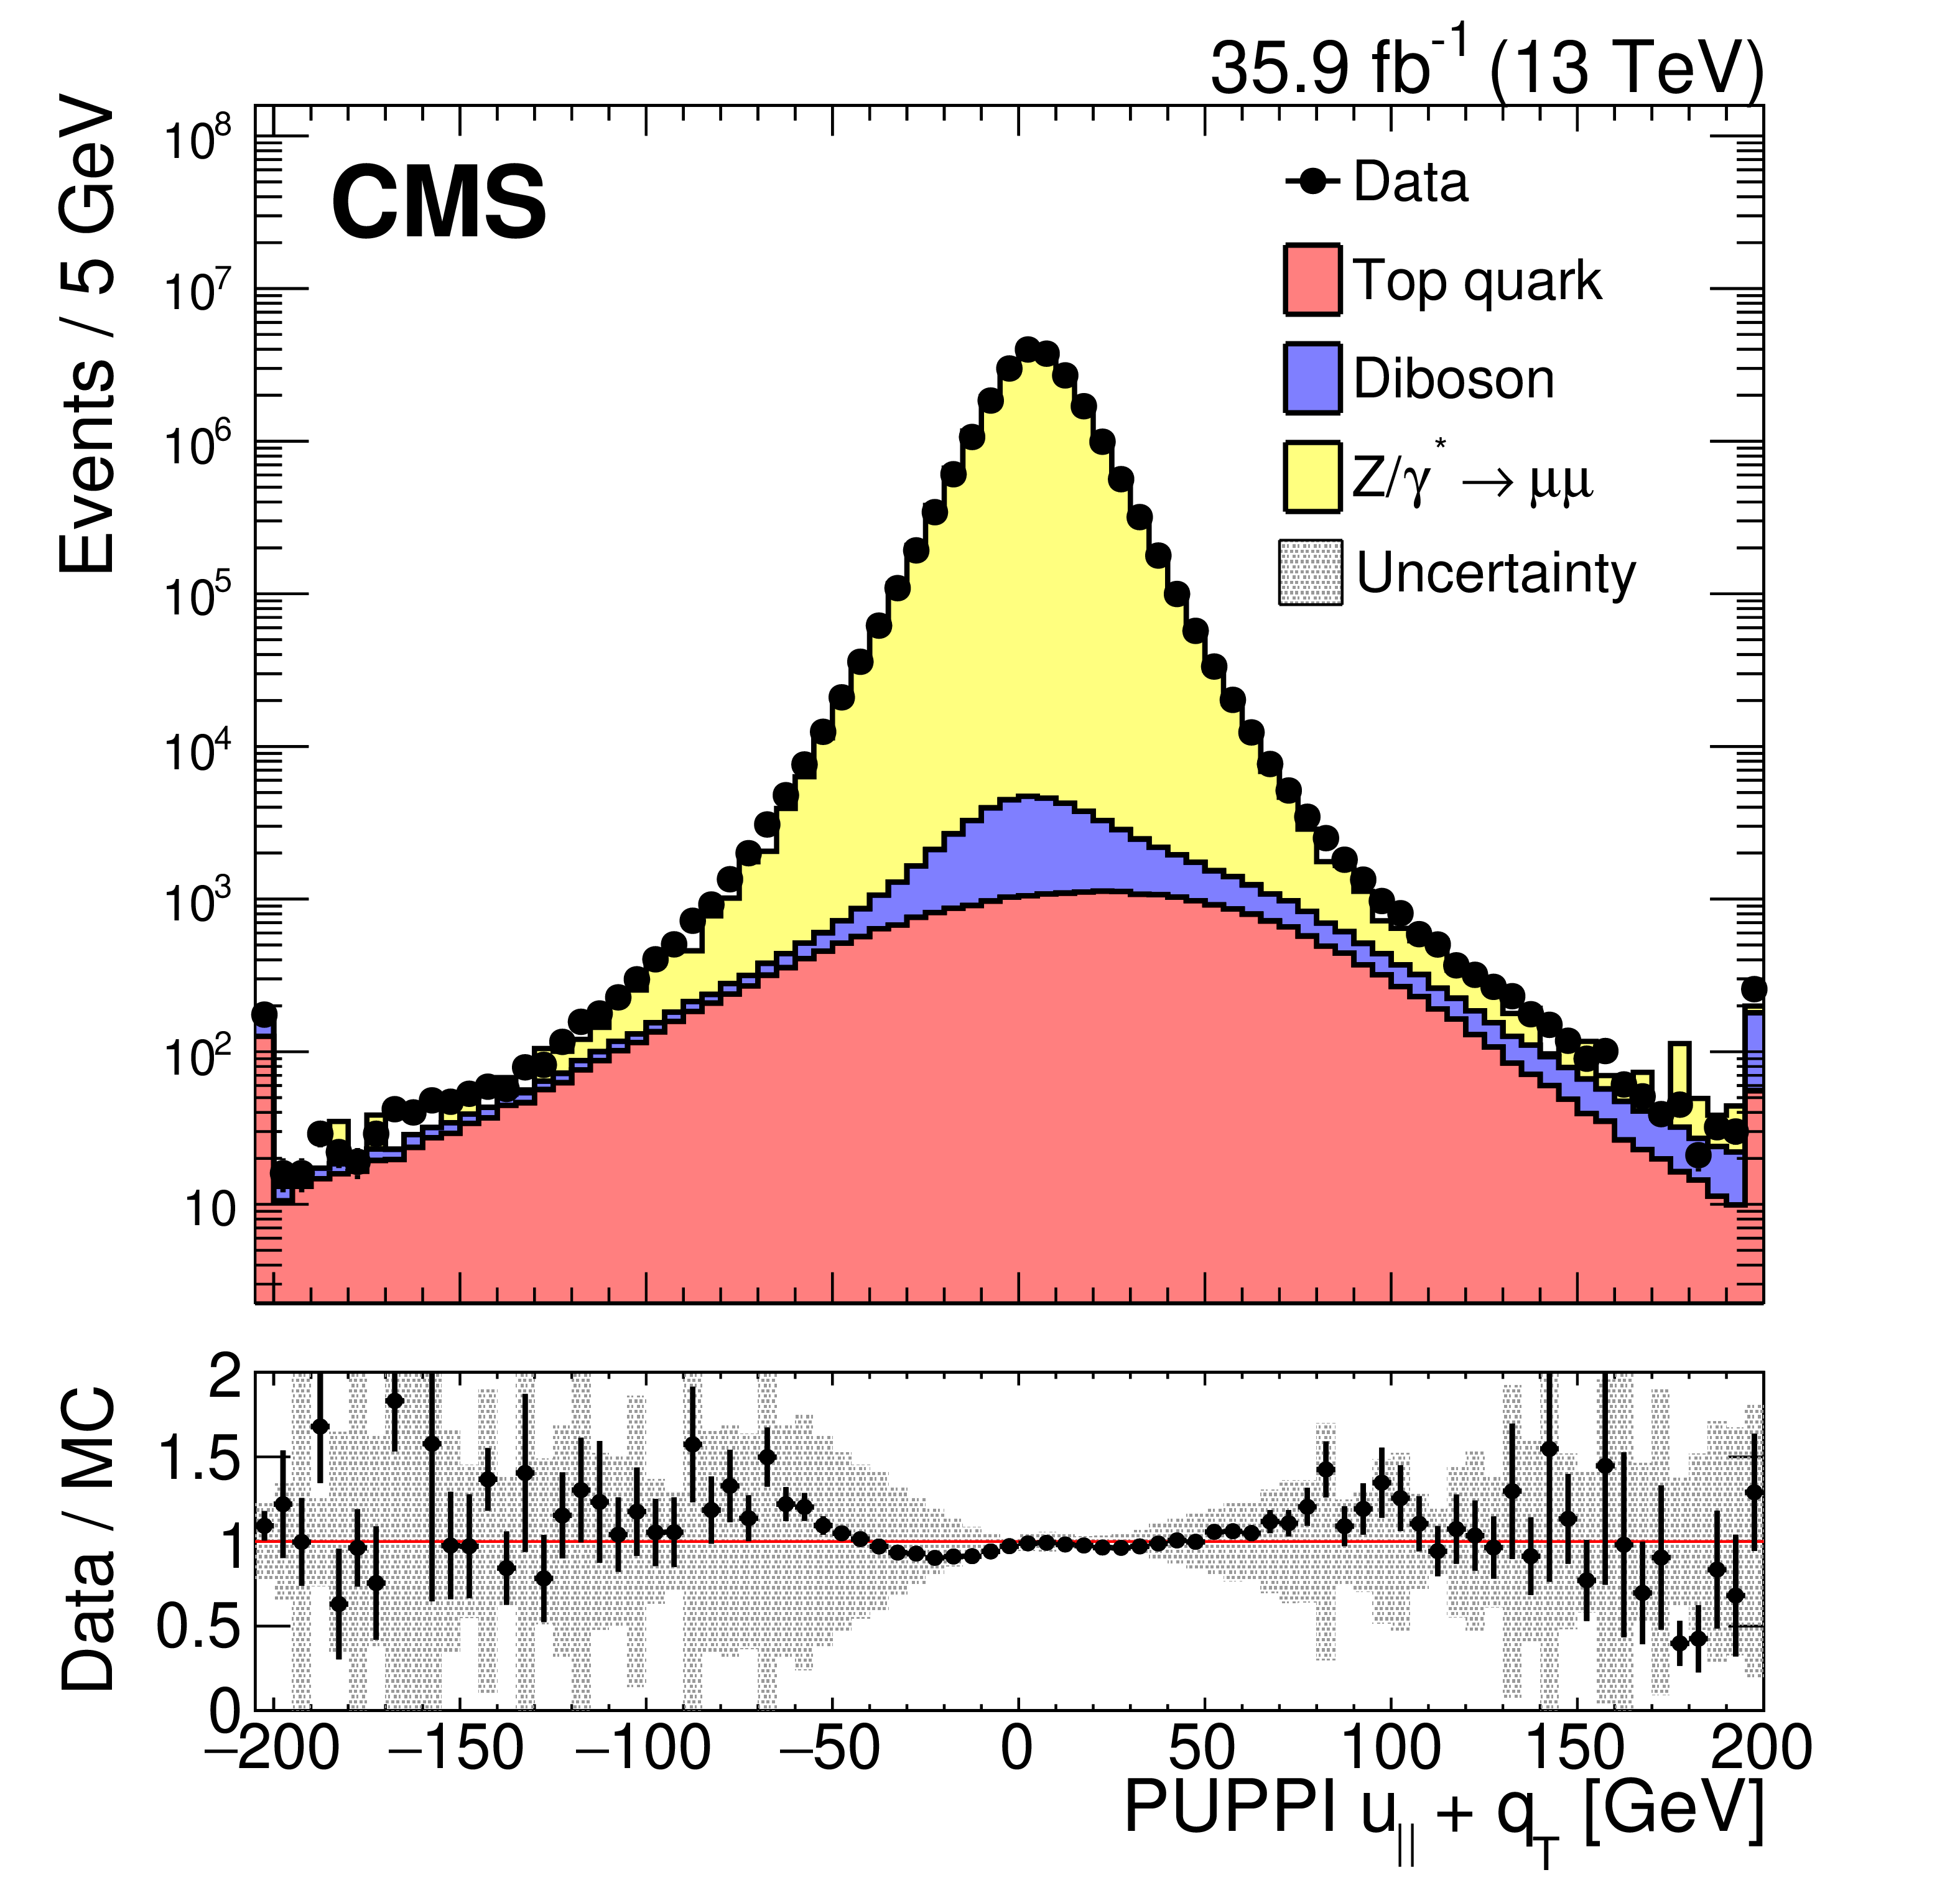
Figure 12-a:
Upper panel: Distribution of the ${u_{\Vert}}$+${{q}_\mathrm {T}}$ component of the hadronic recoil, in data (filled markers) and simulation (solid histograms), for the ${{\mathrm {Z}}\to {\mu} ^+ {\mu ^-}}$ events. The first and the last bins include all events below -195 and above +195, respectively. Lower panel: Data-to-simulation ratio. The band corresponds to the systematic uncertainties due to the JES, the JER, and variations in the $E_{U}$ added in quadrature, estimated from the ${{\mathrm {Z}}\to {\mathrm {e}^+} {\mathrm {e}^-}}$ sample. |

png pdf |
Figure 12-b:
Upper panel: Distribution of the ${u_{\perp}}$ component of the hadronic recoil, in data (filled markers) and simulation (solid histograms), for the ${{\mathrm {Z}}\to {\mu} ^+ {\mu ^-}}$ events. The first and the last bins include all events below -195 and above +195, respectively. Lower panel: Data-to-simulation ratio. The band corresponds to the systematic uncertainties due to the JES, the JER, and variations in the $E_{U}$ added in quadrature, estimated from the ${{\mathrm {Z}}\to {\mathrm {e}^+} {\mathrm {e}^-}}$ sample. |
png pdf |
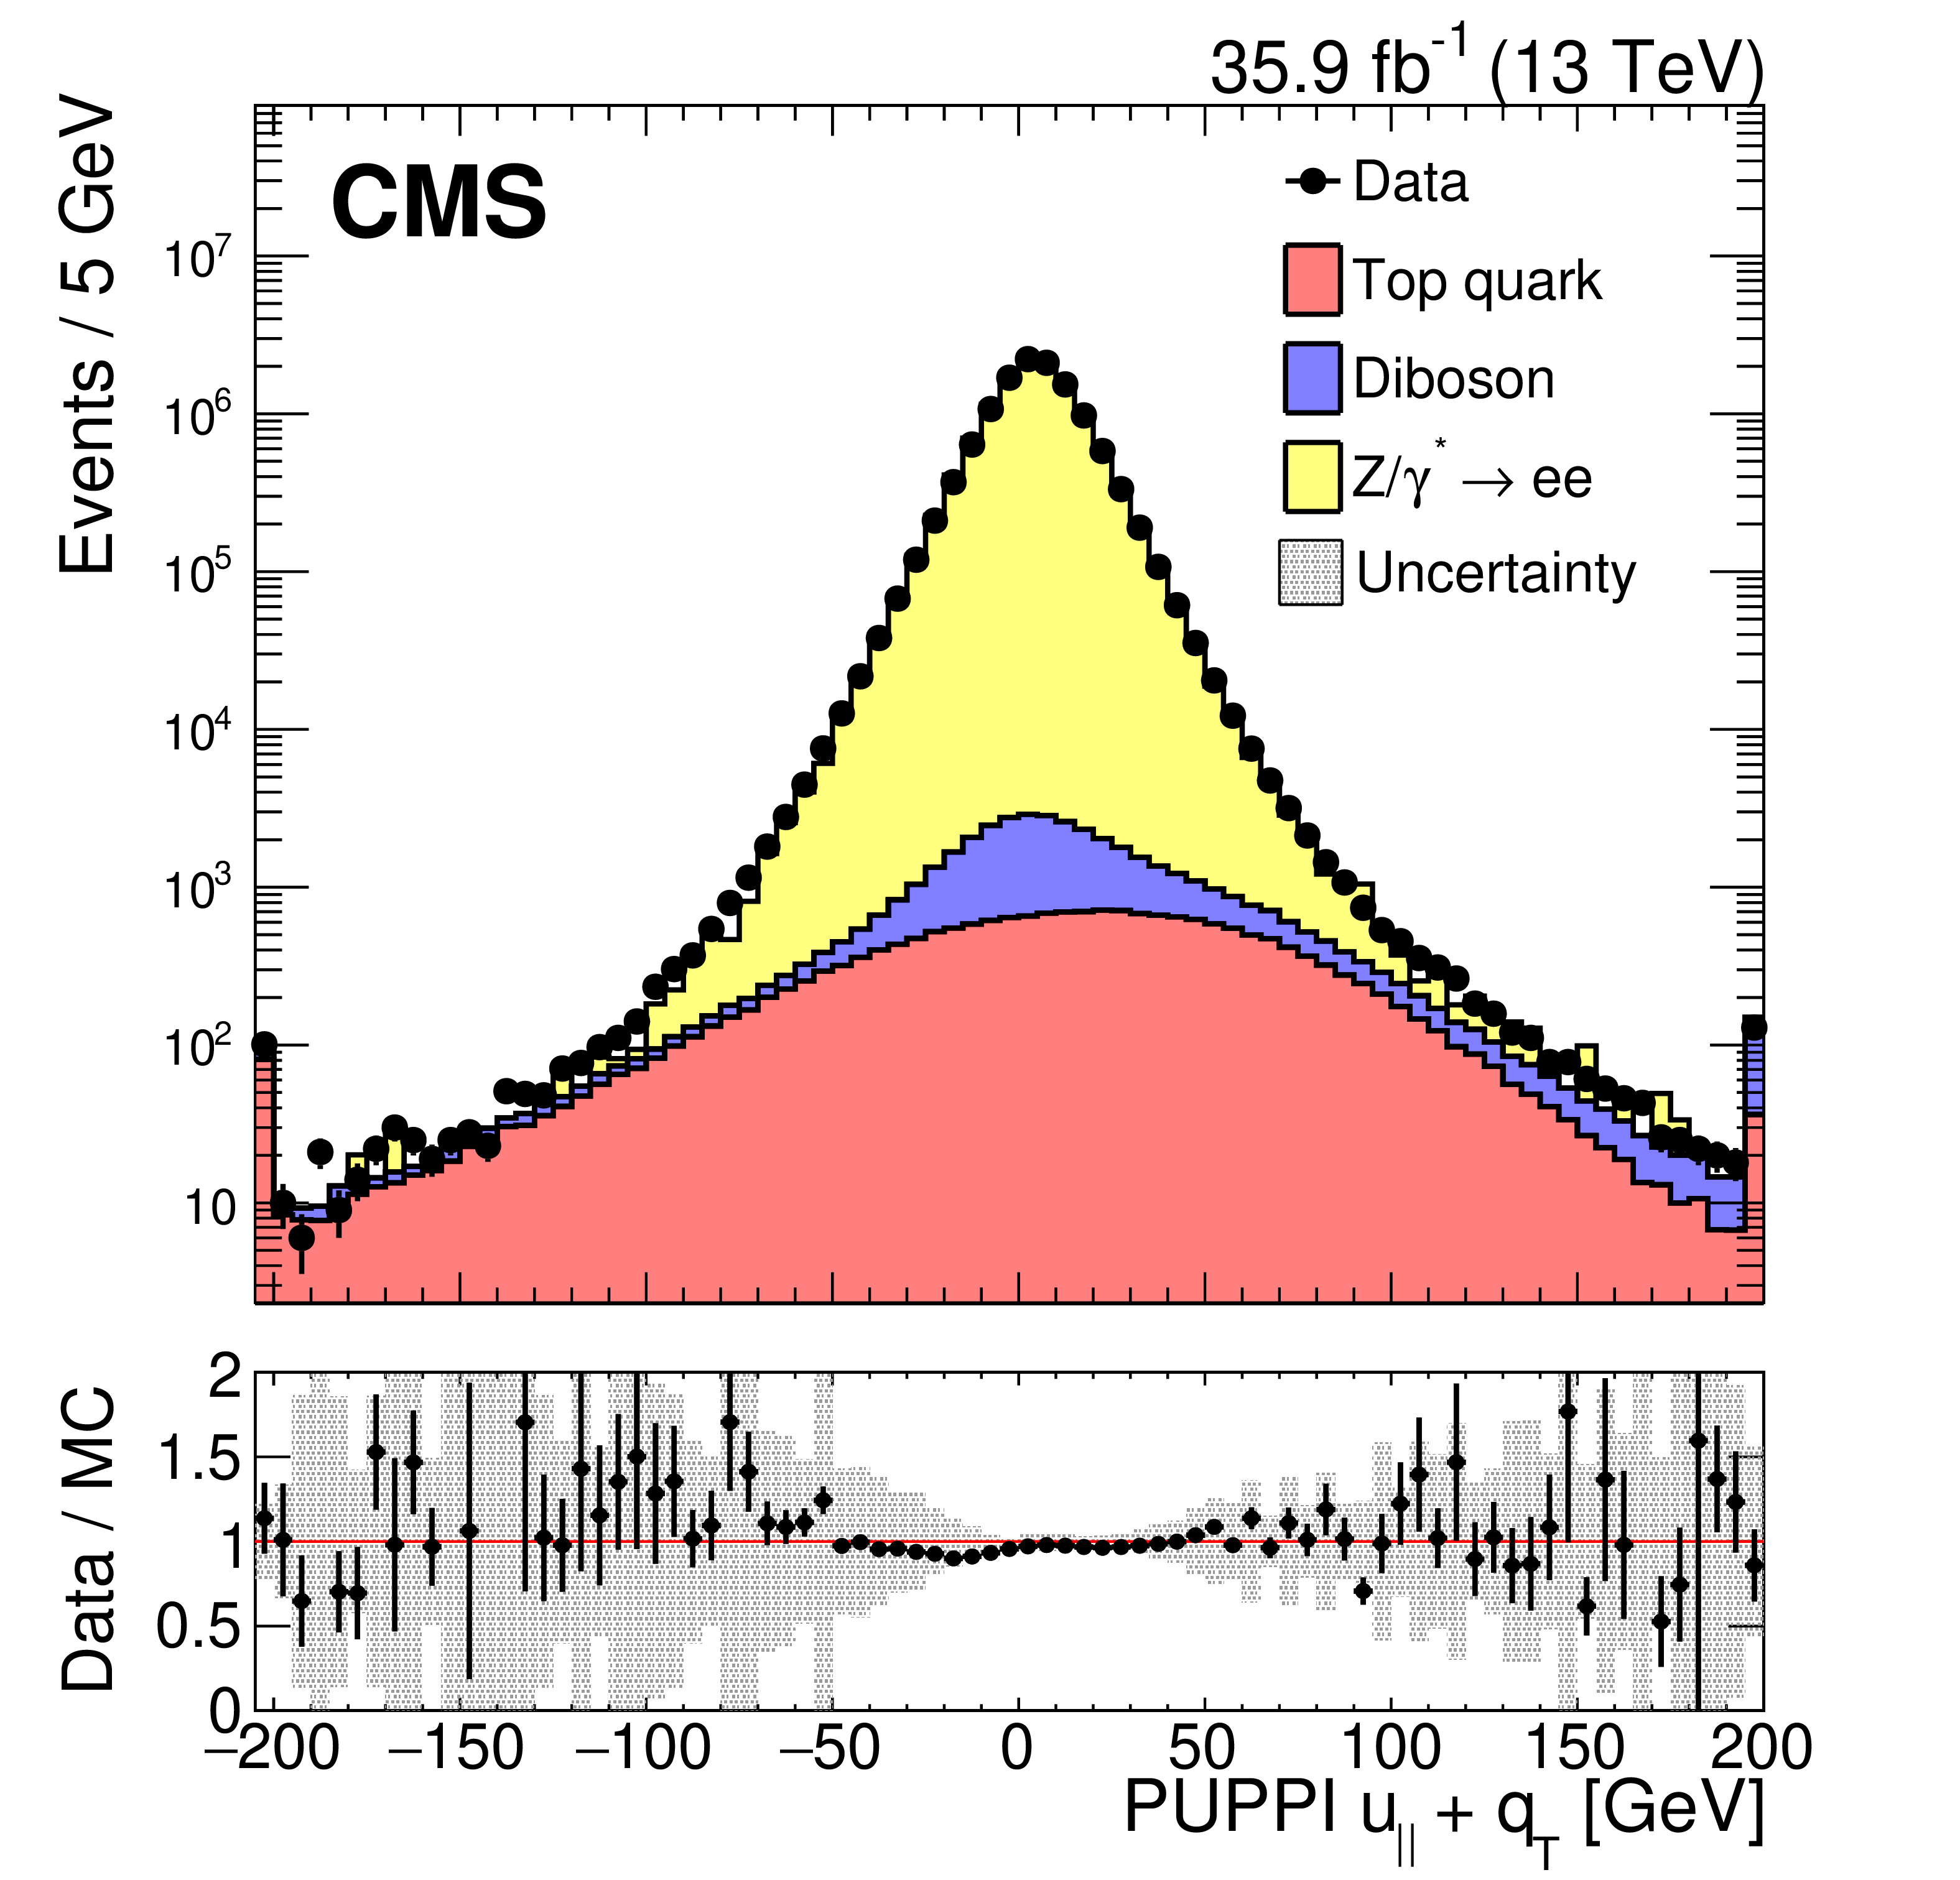
Figure 12-c:
Upper panel: Distribution of the ${u_{\Vert}}$+${{q}_\mathrm {T}}$ component of the hadronic recoil, in data (filled markers) and simulation (solid histograms), for the ${{\mathrm {Z}}\to {\mathrm {e}^+} {\mathrm {e}^-}}$ events. The first and the last bins include all events below -195 and above +195, respectively. Lower panel: Data-to-simulation ratio. The band corresponds to the systematic uncertainties due to the JES, the JER, and variations in the $E_{U}$ added in quadrature, estimated from the ${{\mathrm {Z}}\to {\mathrm {e}^+} {\mathrm {e}^-}}$ sample. |
png pdf |
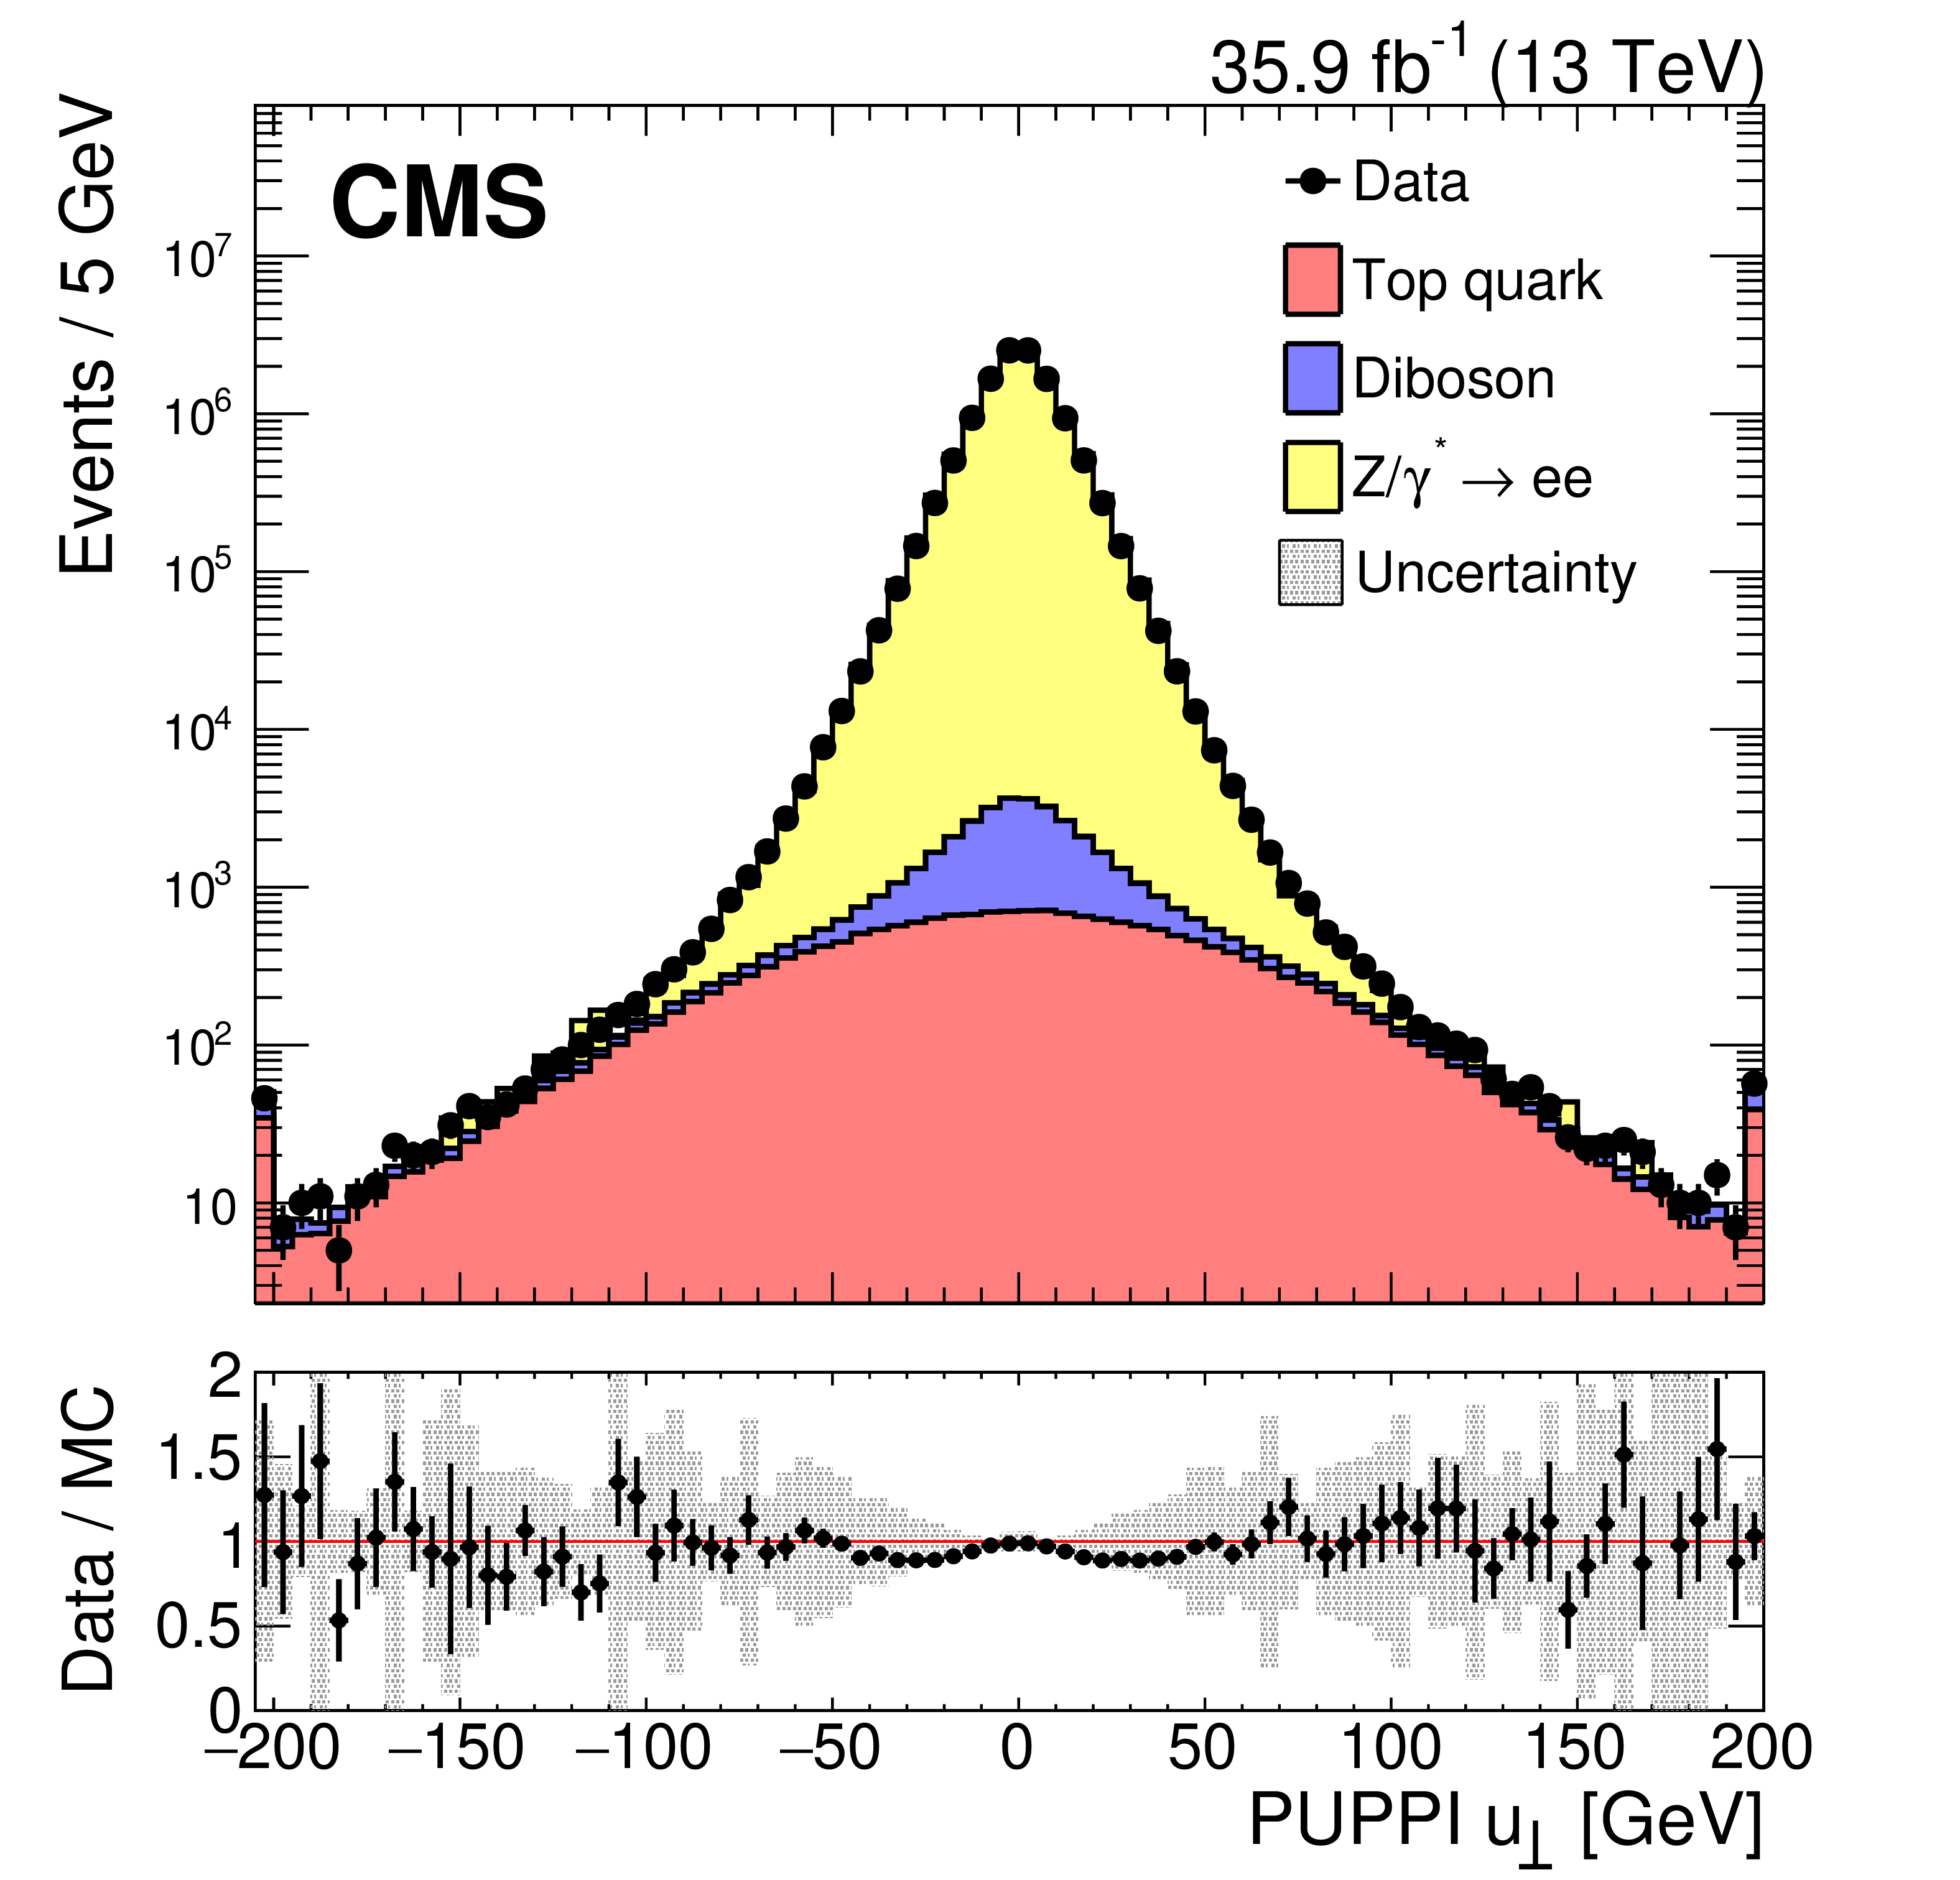
Figure 12-d:
Upper panel: Distribution of the ${u_{\perp}}$ component of the hadronic recoil, in data (filled markers) and simulation (solid histograms), for the ${{\mathrm {Z}}\to {\mathrm {e}^+} {\mathrm {e}^-}}$ events. The first and the last bins include all events below -195 and above +195, respectively. Lower panel: Data-to-simulation ratio. The band corresponds to the systematic uncertainties due to the JES, the JER, and variations in the $E_{U}$ added in quadrature, estimated from the ${{\mathrm {Z}}\to {\mathrm {e}^+} {\mathrm {e}^-}}$ sample. |
png pdf |
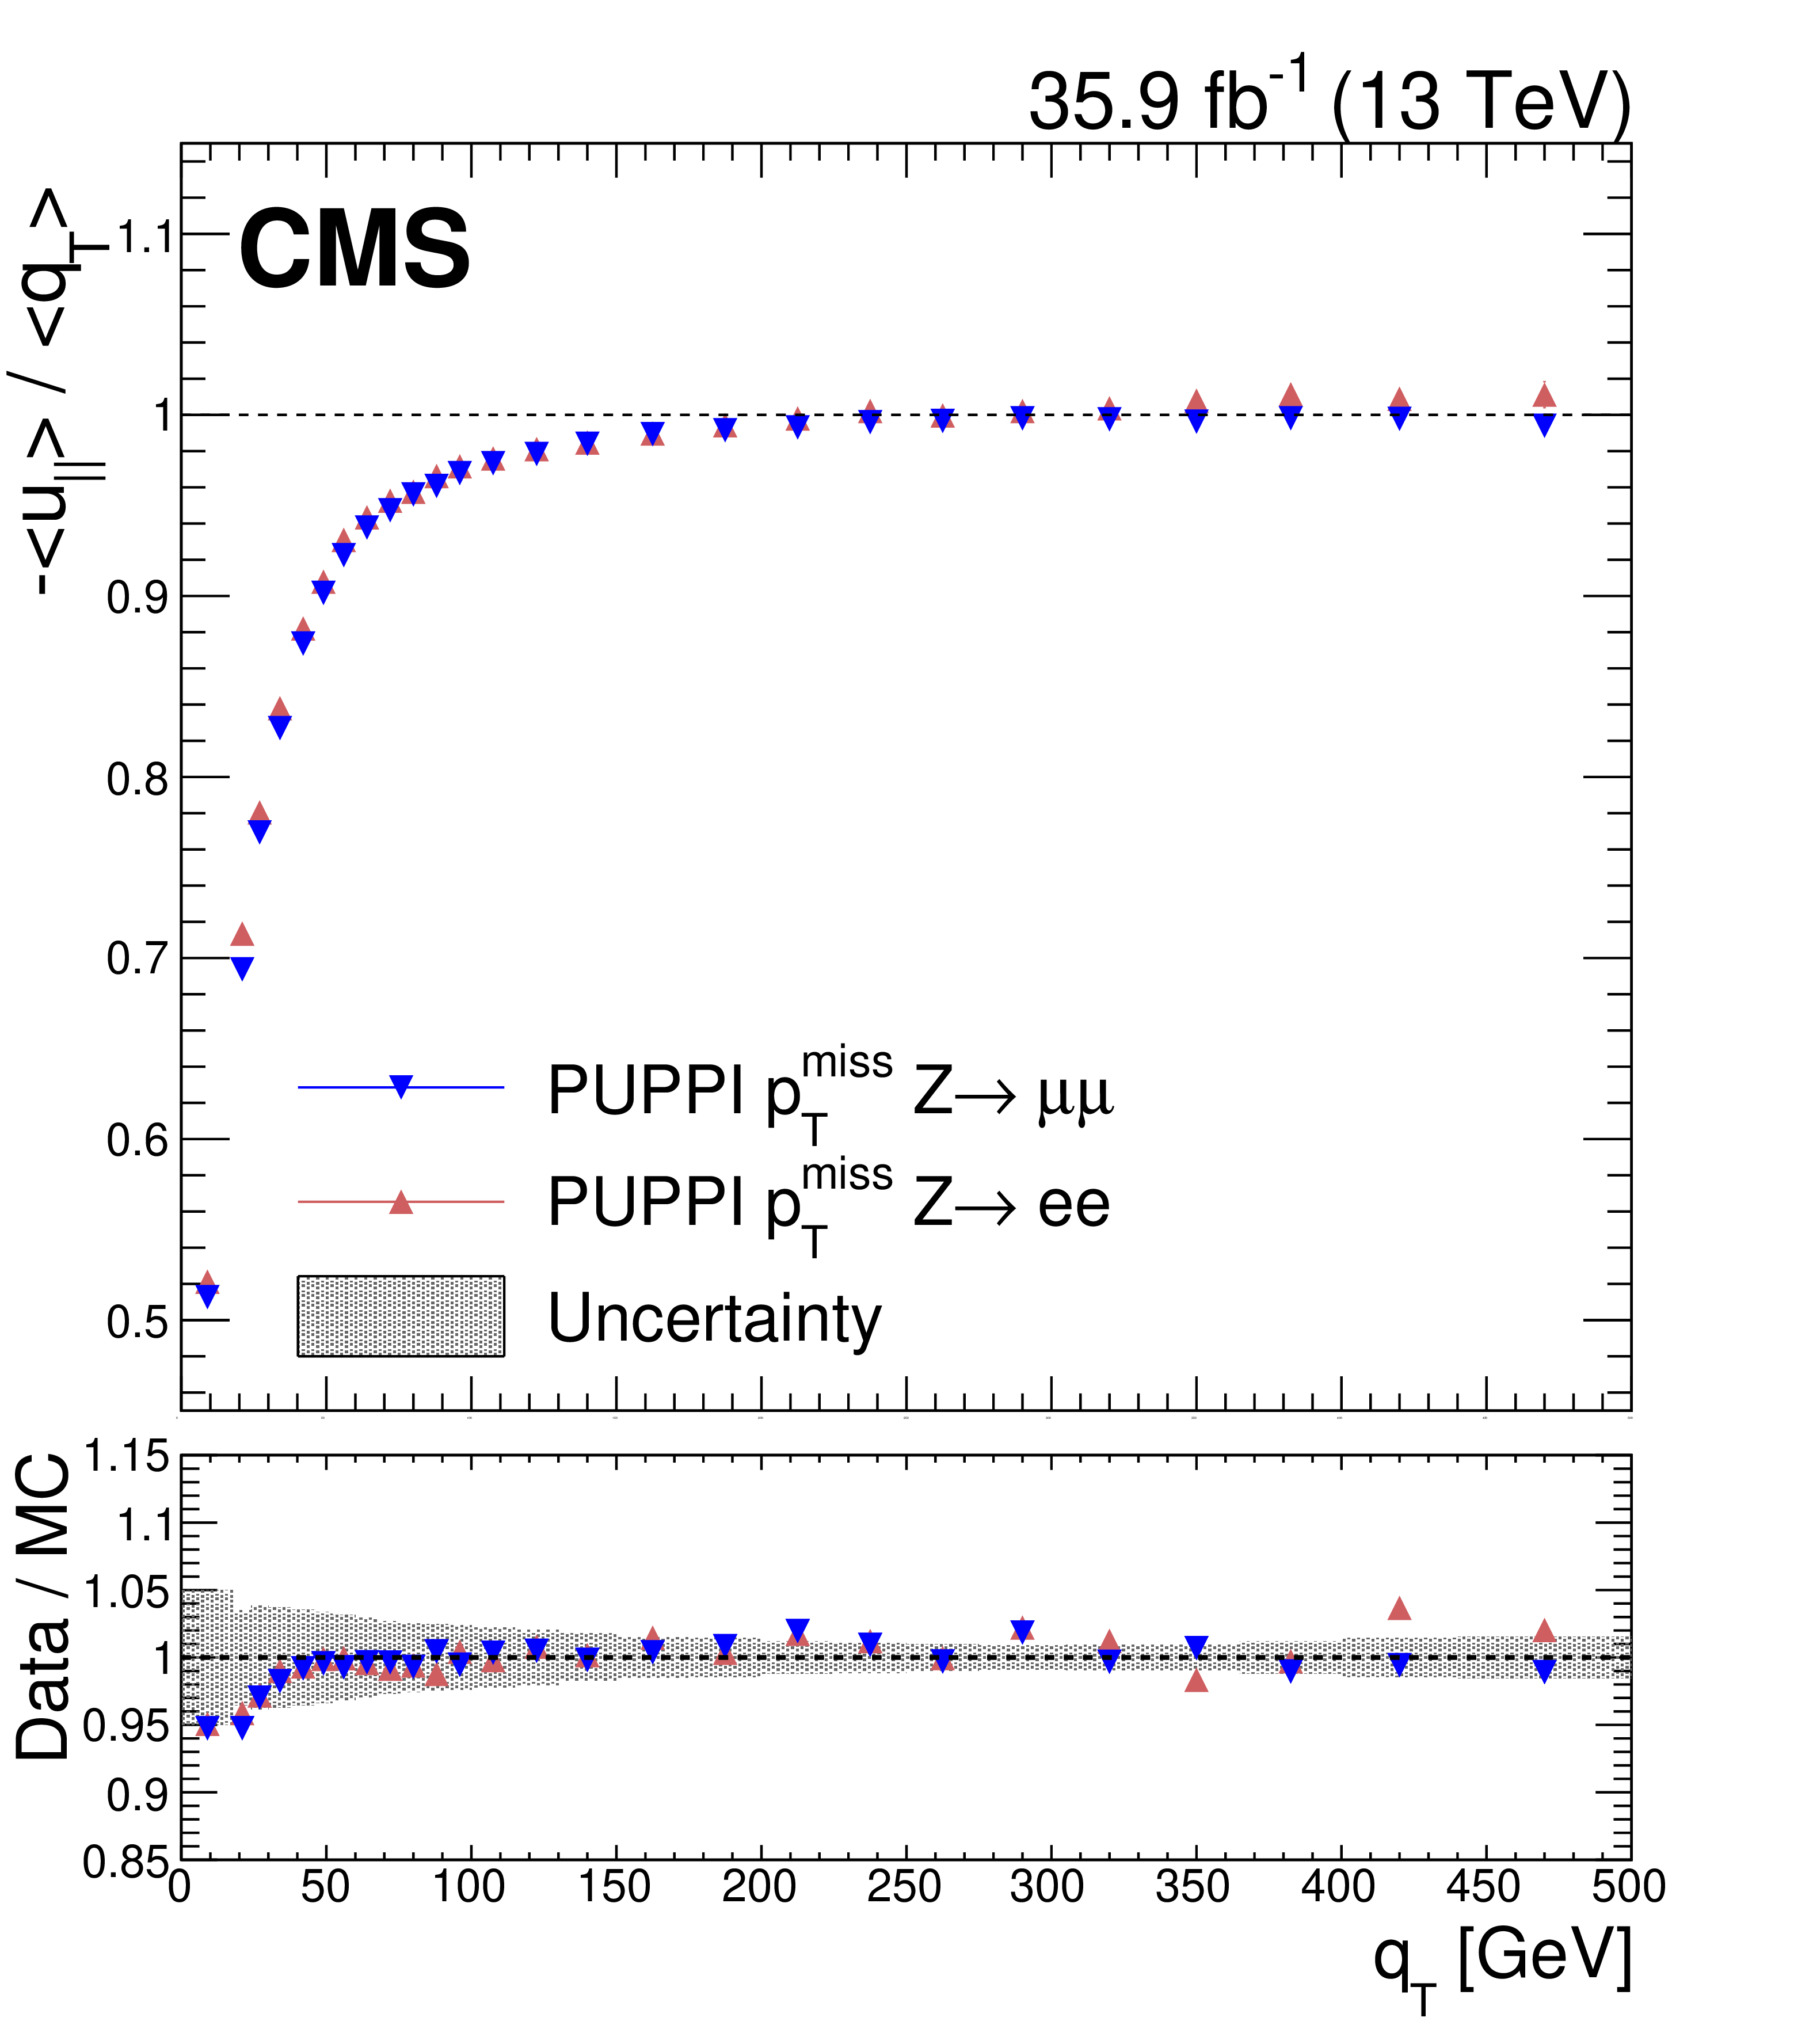
Figure 13:
Upper panel: Response of PUPPI ${{p_{\mathrm {T}}} ^\text {miss}}$, defined as $-< {u_{\Vert}} > /< {{q}_\mathrm {T}} > $, in data in ${{\mathrm {Z}}\to {\mu} ^+ {\mu ^-}}$ and ${{\mathrm {Z}}\to {\mathrm {e}^+} {\mathrm {e}^-}}$ events. Lower panel: ratio of the PUPPI ${{p_{\mathrm {T}}} ^\text {miss}}$ response in data and simulation. The band corresponds to the systematic uncertainties due to the JES, the JER, and variations in the $E_{U}$ added in quadrature, estimated from the ${{\mathrm {Z}}\to {\mathrm {e}^+} {\mathrm {e}^-}}$ sample. |
png pdf |
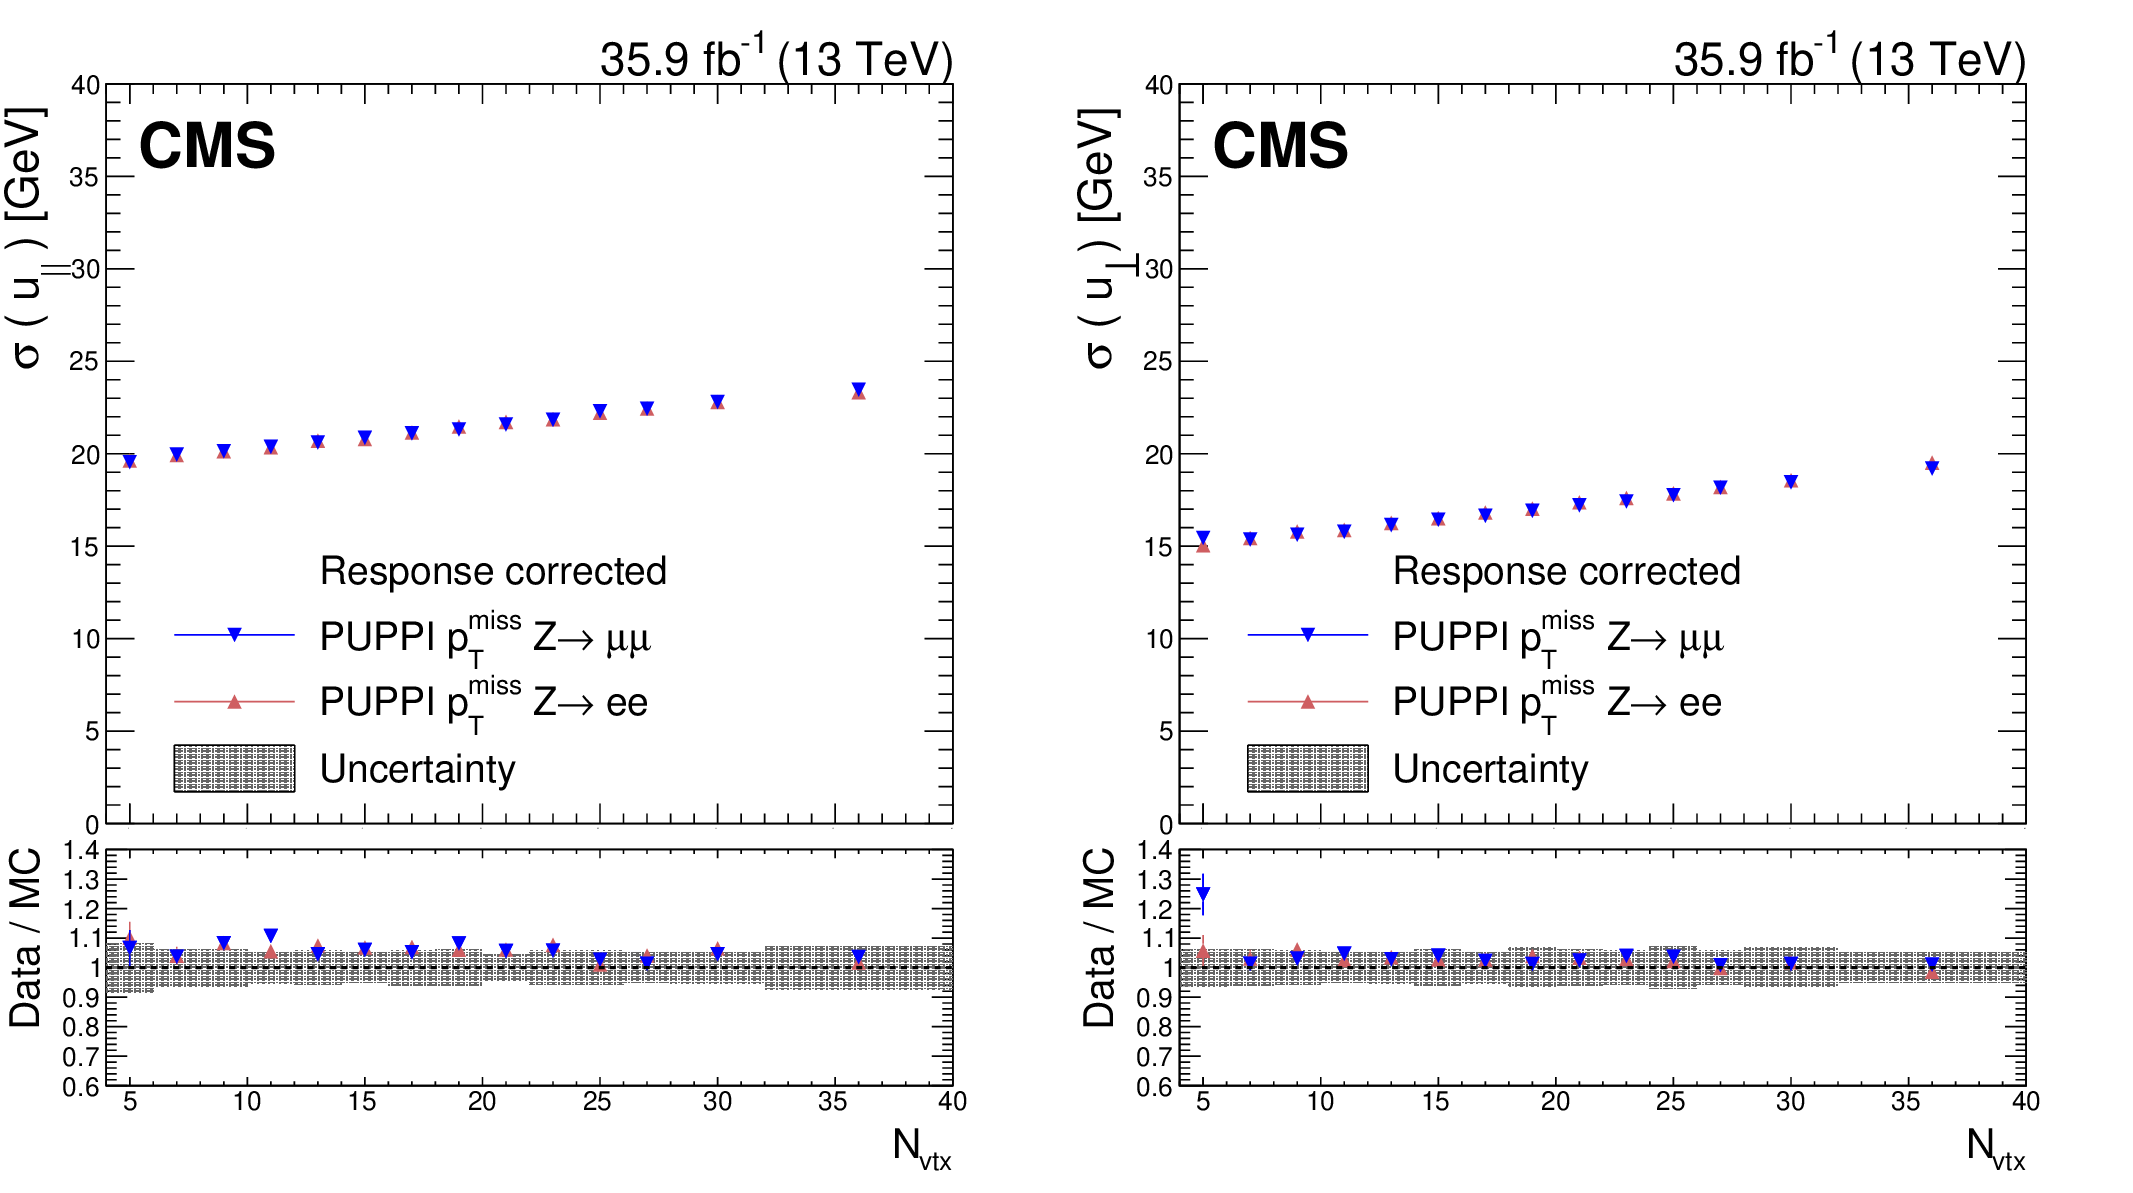
Figure 14:
PUPPI ${{p_{\mathrm {T}}} ^\text {miss}}$ resolution of the ${u_{\Vert}}$ (left) and ${u_{\perp}}$ (right) components of the hadronic recoil as a function of ${\text {N}_{\text {vtx}}}$, in ${{\mathrm {Z}}\to {\mu} ^+ {\mu ^-}}$ and ${{\mathrm {Z}}\to {\mathrm {e}^+} {\mathrm {e}^-}}$ events. In each plot, the upper panel shows the resolution in data, whereas the lower panel shows the ratio of data to simulation. The band corresponds to the systematic uncertainties due to the JES, the JER, and variations in the $E_{U}$ added in quadrature, estimated from the ${{\mathrm {Z}}\to {\mathrm {e}^+} {\mathrm {e}^-}}$ sample. |
png pdf |
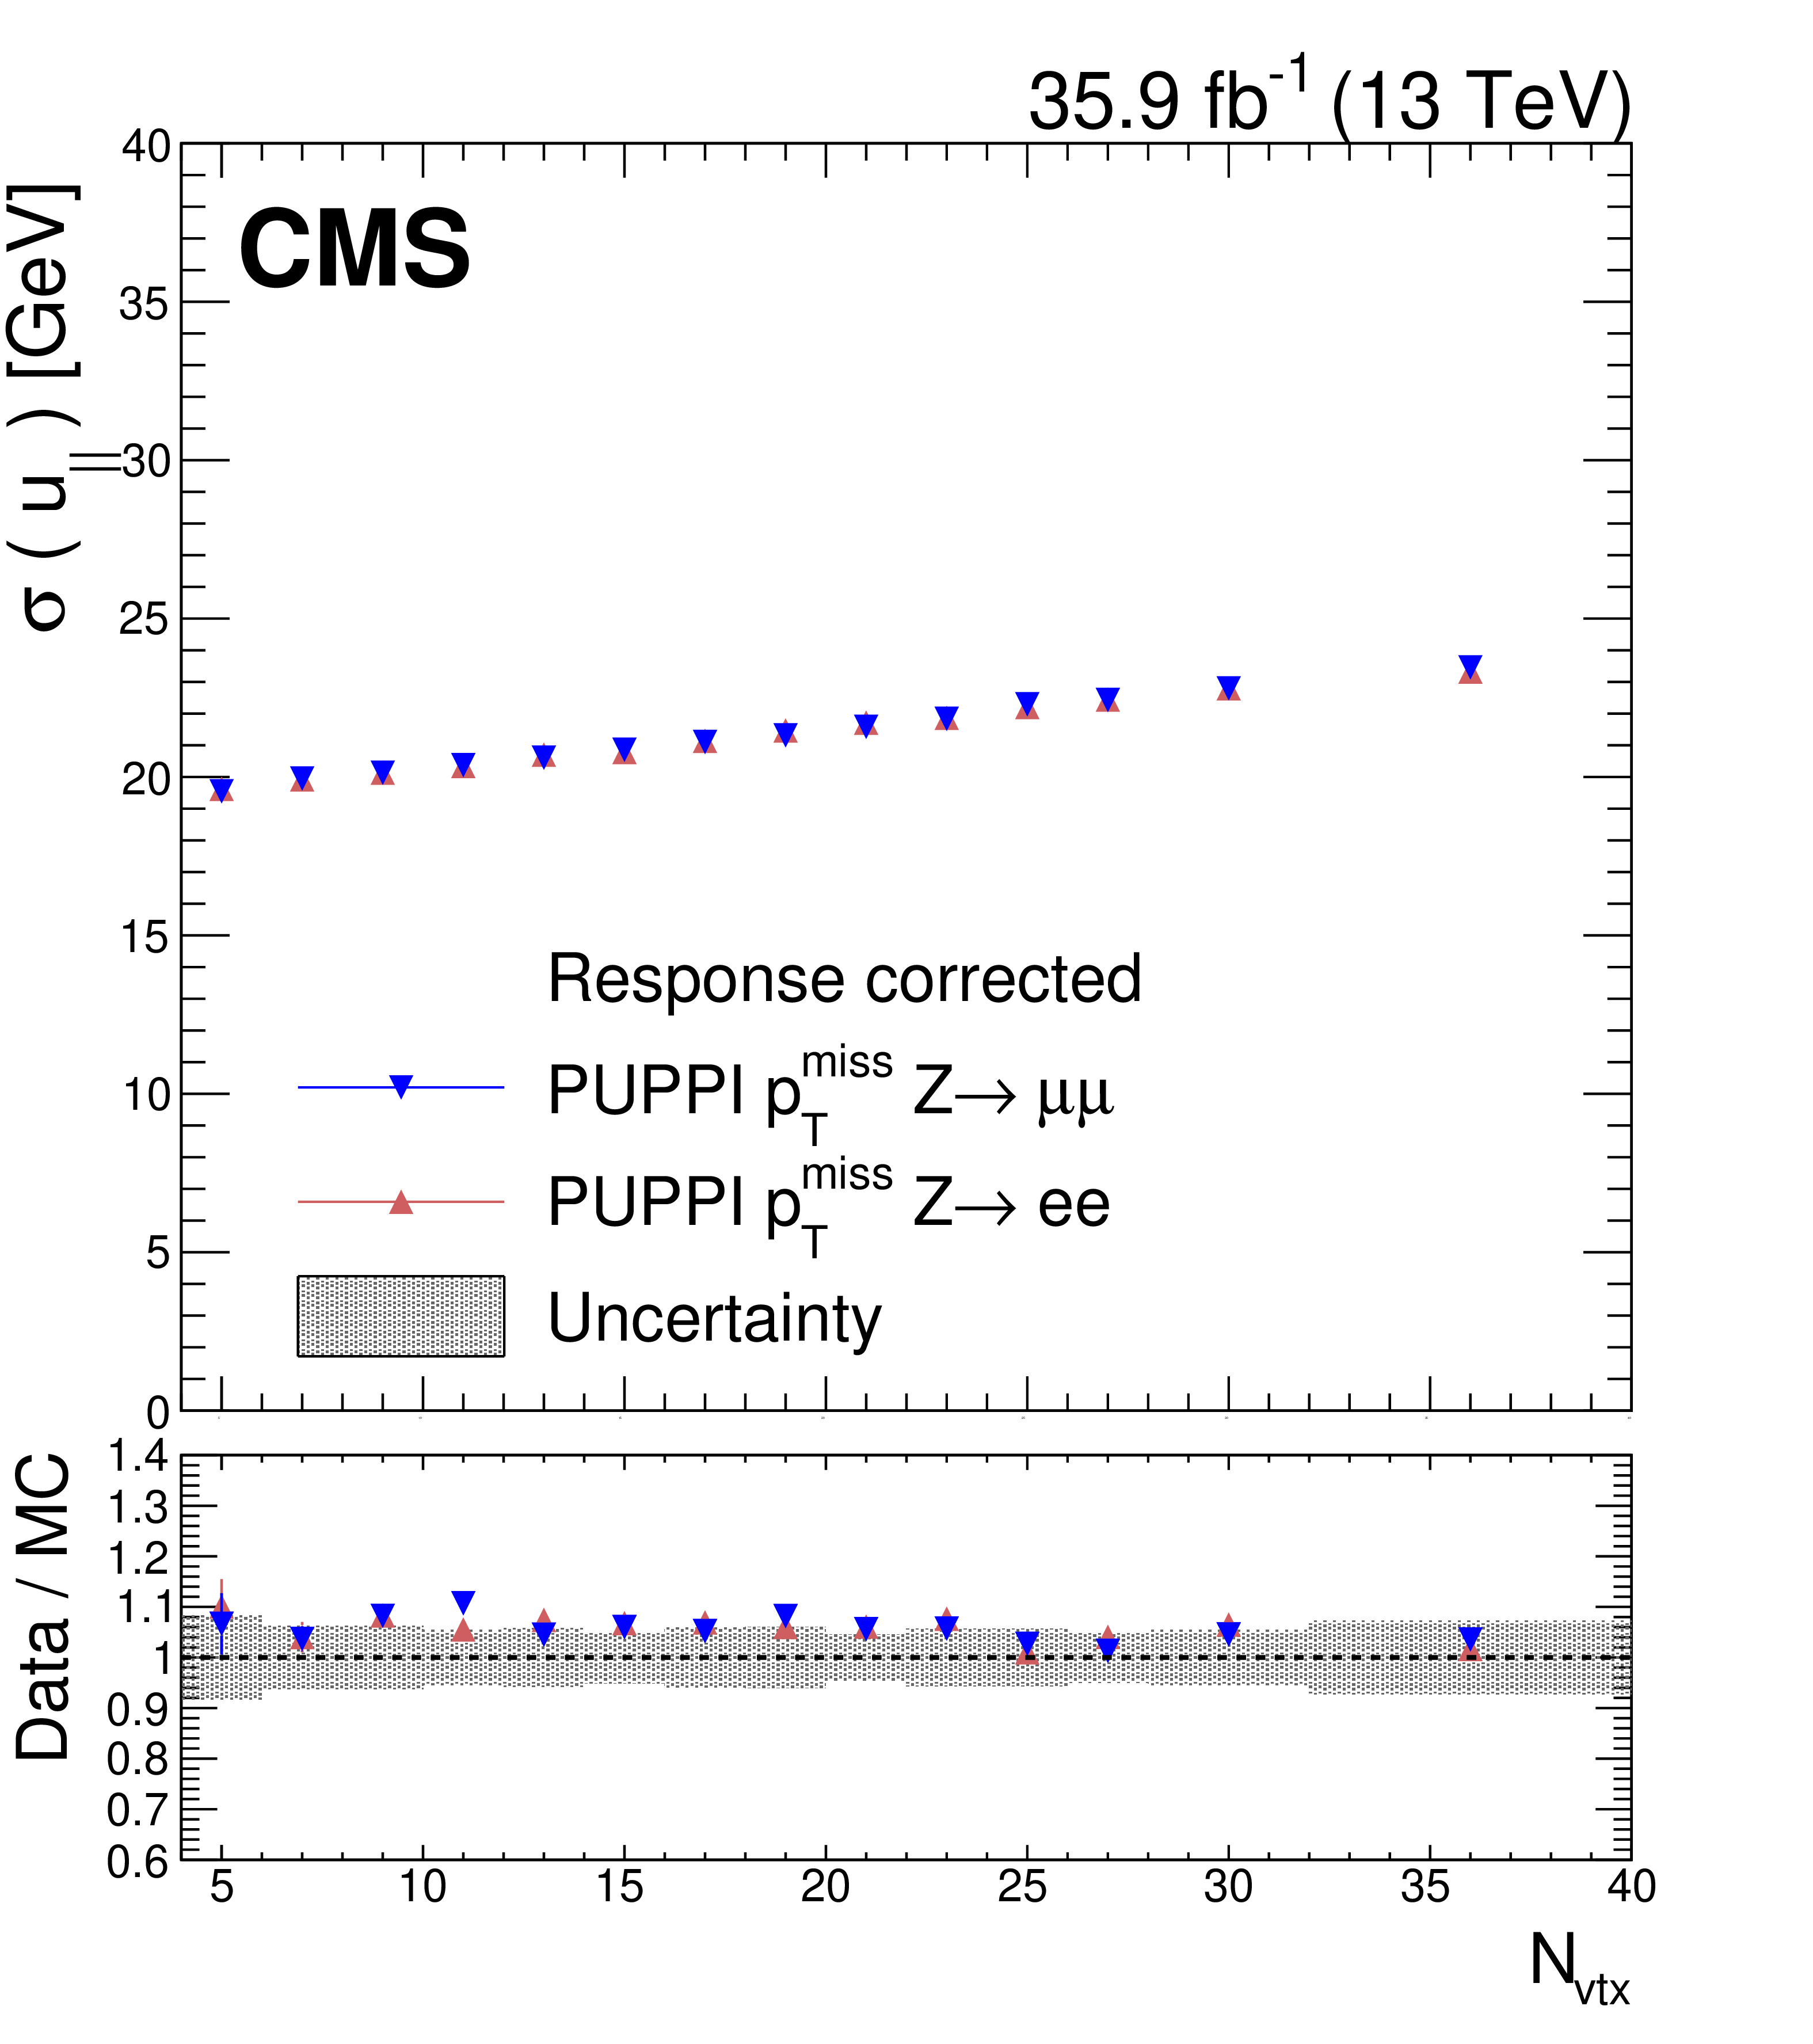
Figure 14-a:
PUPPI ${{p_{\mathrm {T}}} ^\text {miss}}$ resolution of the ${u_{\Vert}}$ component of the hadronic recoil as a function of ${\text {N}_{\text {vtx}}}$, in ${{\mathrm {Z}}\to {\mu} ^+ {\mu ^-}}$ and ${{\mathrm {Z}}\to {\mathrm {e}^+} {\mathrm {e}^-}}$ events. The upper panel shows the resolution in data, whereas the lower panel shows the ratio of data to simulation. The band corresponds to the systematic uncertainties due to the JES, the JER, and variations in the $E_{U}$ added in quadrature, estimated from the ${{\mathrm {Z}}\to {\mathrm {e}^+} {\mathrm {e}^-}}$ sample. |
png pdf |
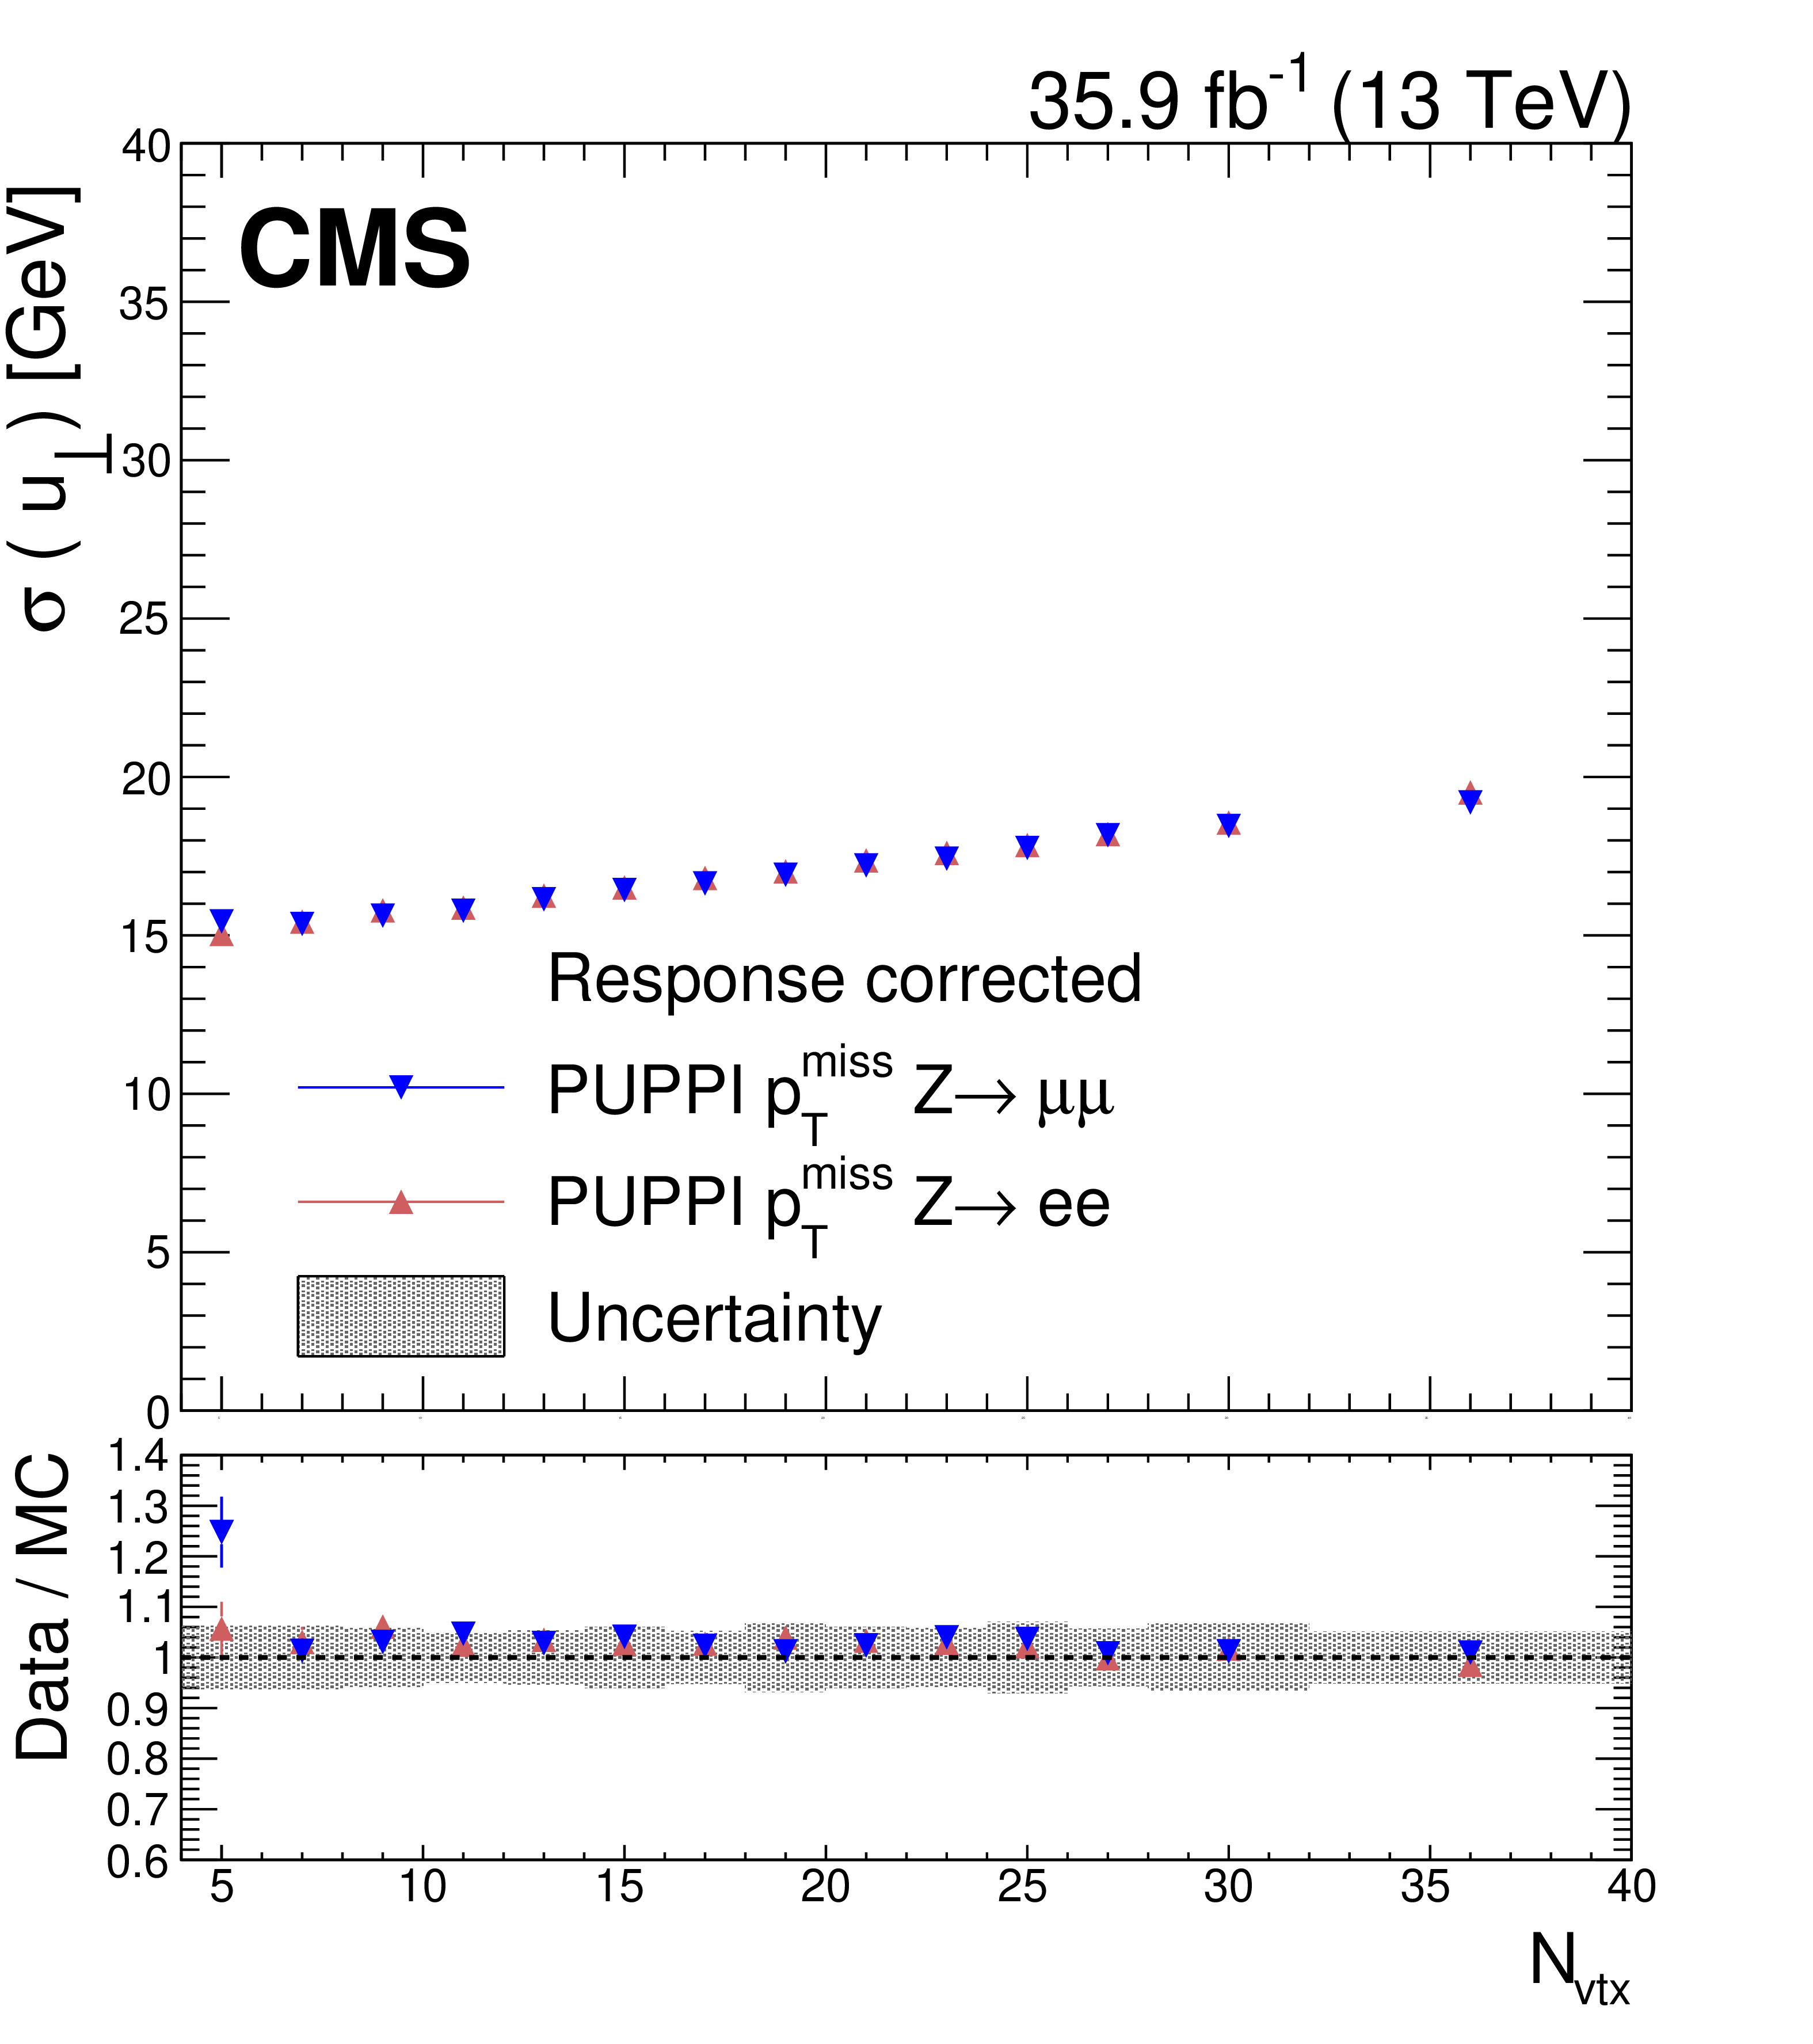
Figure 14-b:
PUPPI ${{p_{\mathrm {T}}} ^\text {miss}}$ resolution of the ${u_{\perp}}$ component of the hadronic recoil as a function of ${\text {N}_{\text {vtx}}}$, in ${{\mathrm {Z}}\to {\mu} ^+ {\mu ^-}}$ and ${{\mathrm {Z}}\to {\mathrm {e}^+} {\mathrm {e}^-}}$ events. The upper panel shows the resolution in data, whereas the lower panel shows the ratio of data to simulation. The band corresponds to the systematic uncertainties due to the JES, the JER, and variations in the $E_{U}$ added in quadrature, estimated from the ${{\mathrm {Z}}\to {\mathrm {e}^+} {\mathrm {e}^-}}$ sample. |
png pdf |
Figure 15:
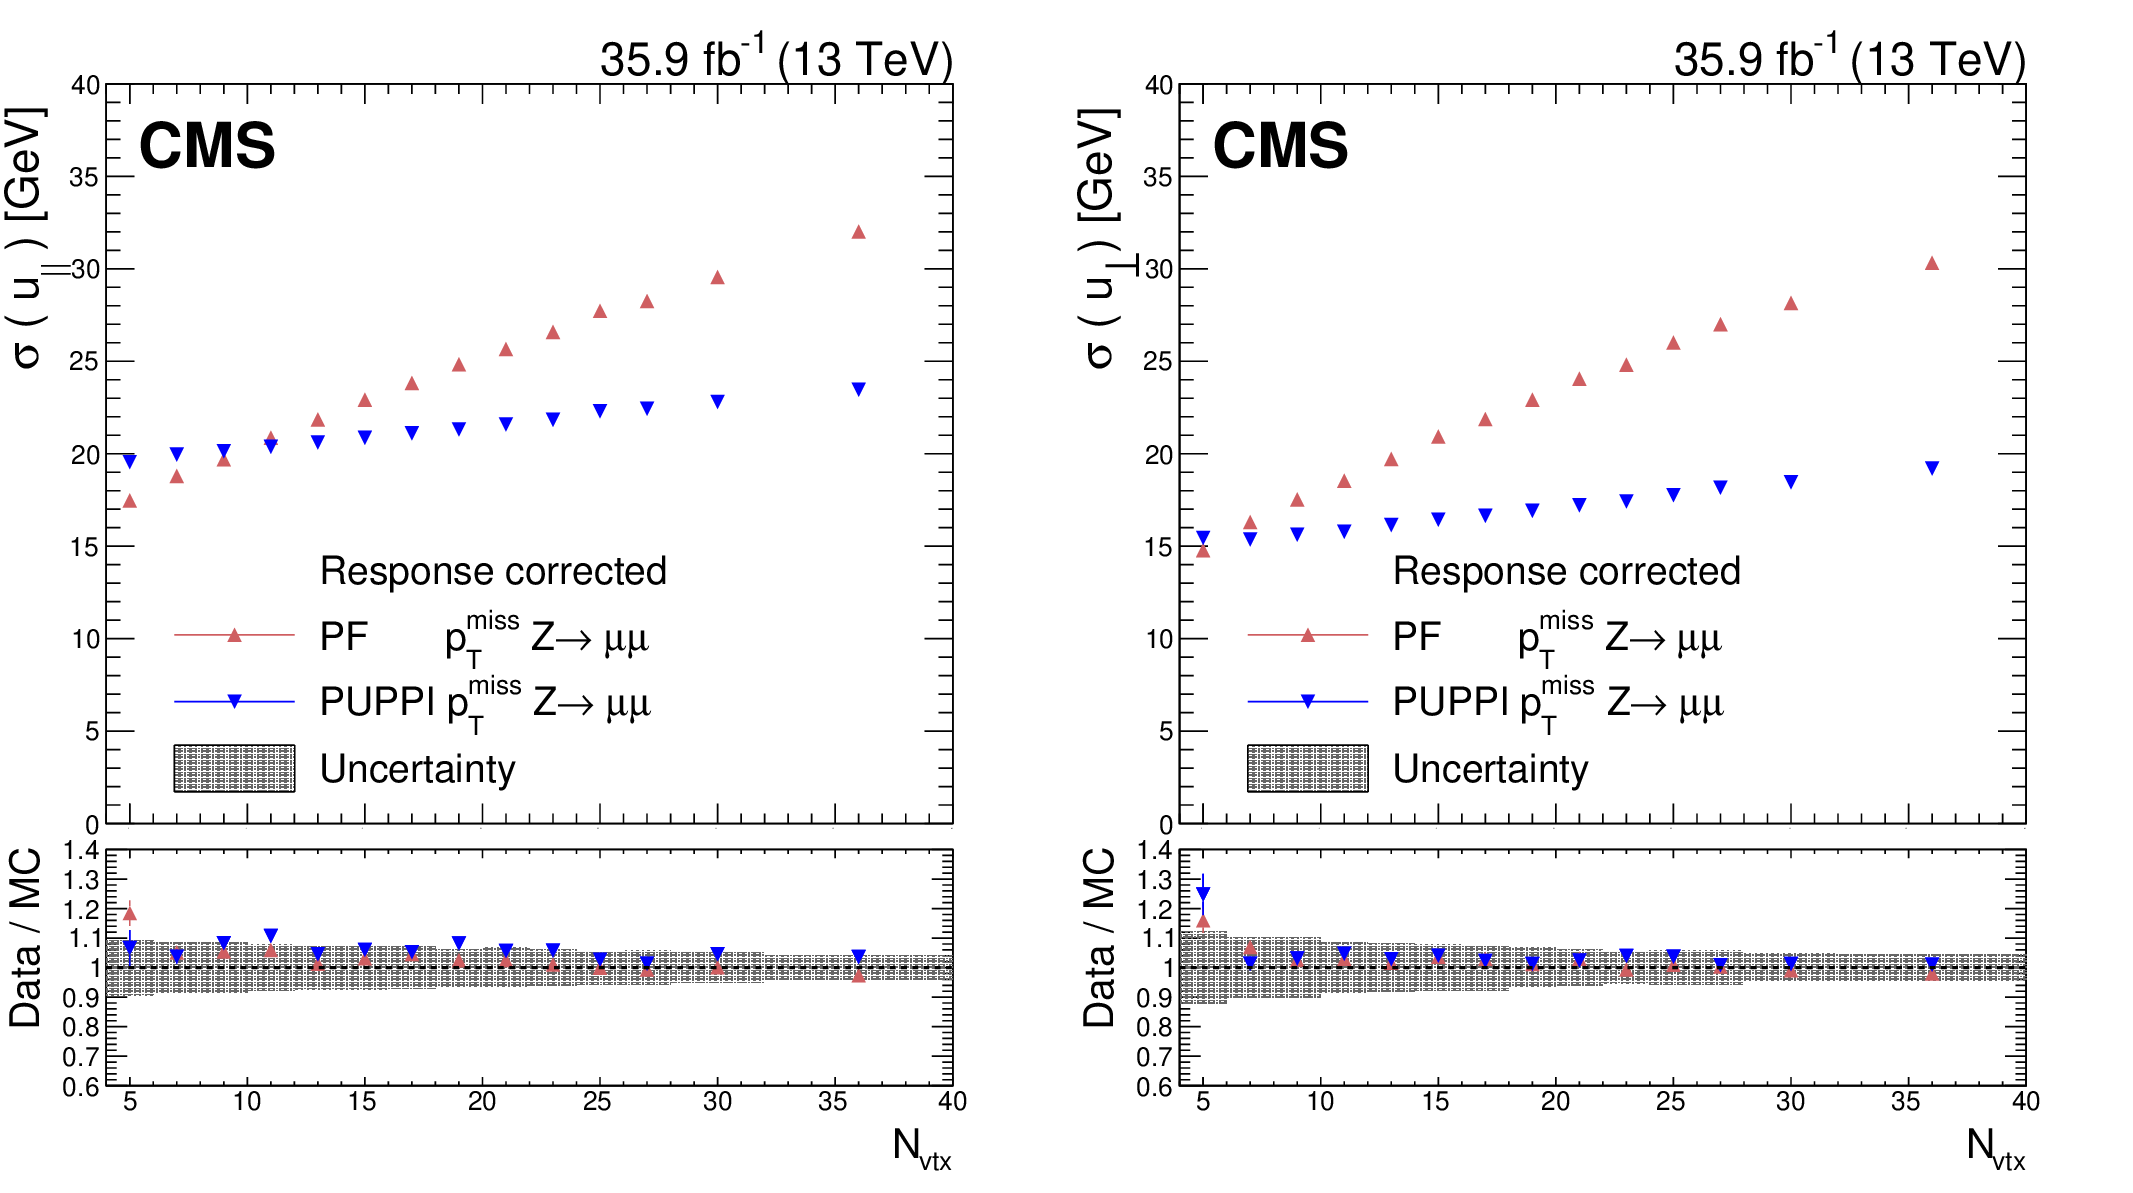
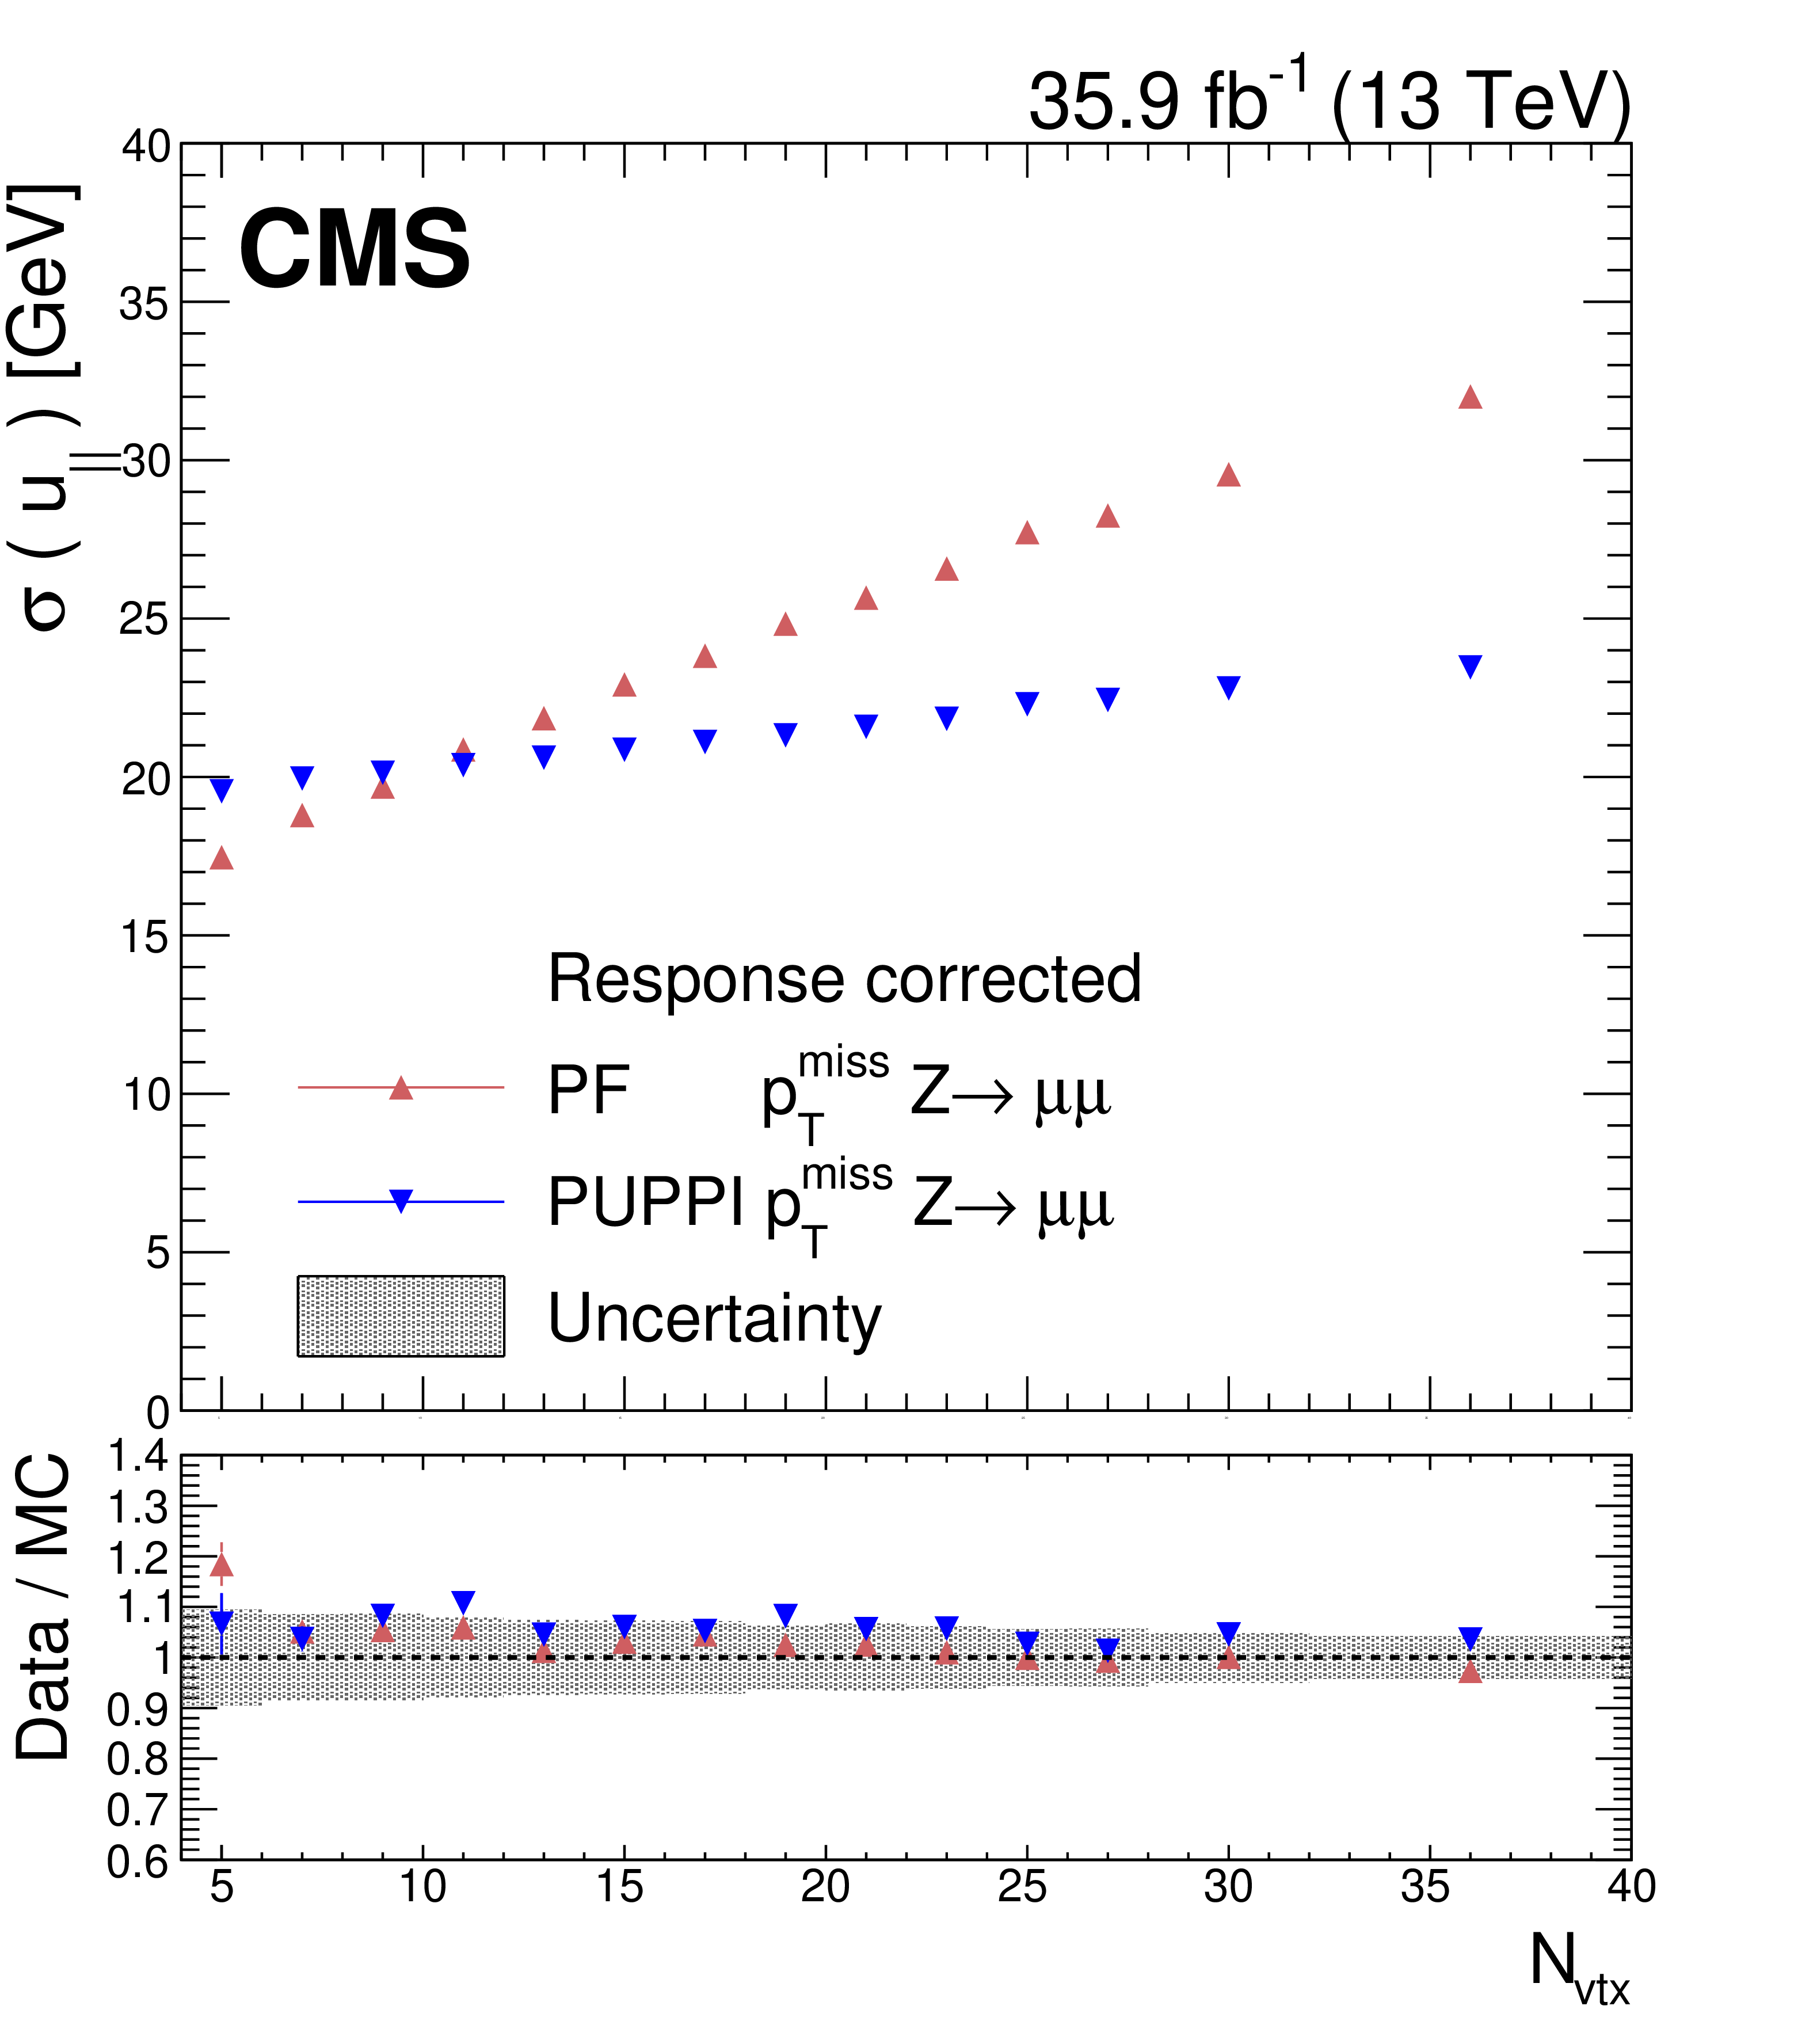
Upper panels: PUPPI and PF ${{p_{\mathrm {T}}} ^\text {miss}}$ resolution of ${u_{\Vert}}$ (left) and ${u_{\perp}}$ (right) components of the hadronic recoil as a function of ${\text {N}_{\text {vtx}}}$, in ${{\mathrm {Z}}\to {\mu} ^+ {\mu ^-}}$ events. Lower panels: Data-to-simulation ratio. The systematic uncertainties due to the JES, the JER, and variations in the $E_{U}$ are added in quadrature and represented by the shaded band. |
png pdf |
Figure 15-a:
Upper panel: PUPPI and PF ${{p_{\mathrm {T}}} ^\text {miss}}$ resolution of the ${u_{\Vert}}$ component of the hadronic recoil as a function of ${\text {N}_{\text {vtx}}}$, in ${{\mathrm {Z}}\to {\mu} ^+ {\mu ^-}}$ events. Lower panel: Data-to-simulation ratio. The systematic uncertainties due to the JES, the JER, and variations in the $E_{U}$ are added in quadrature and represented by the shaded band. |
png pdf |
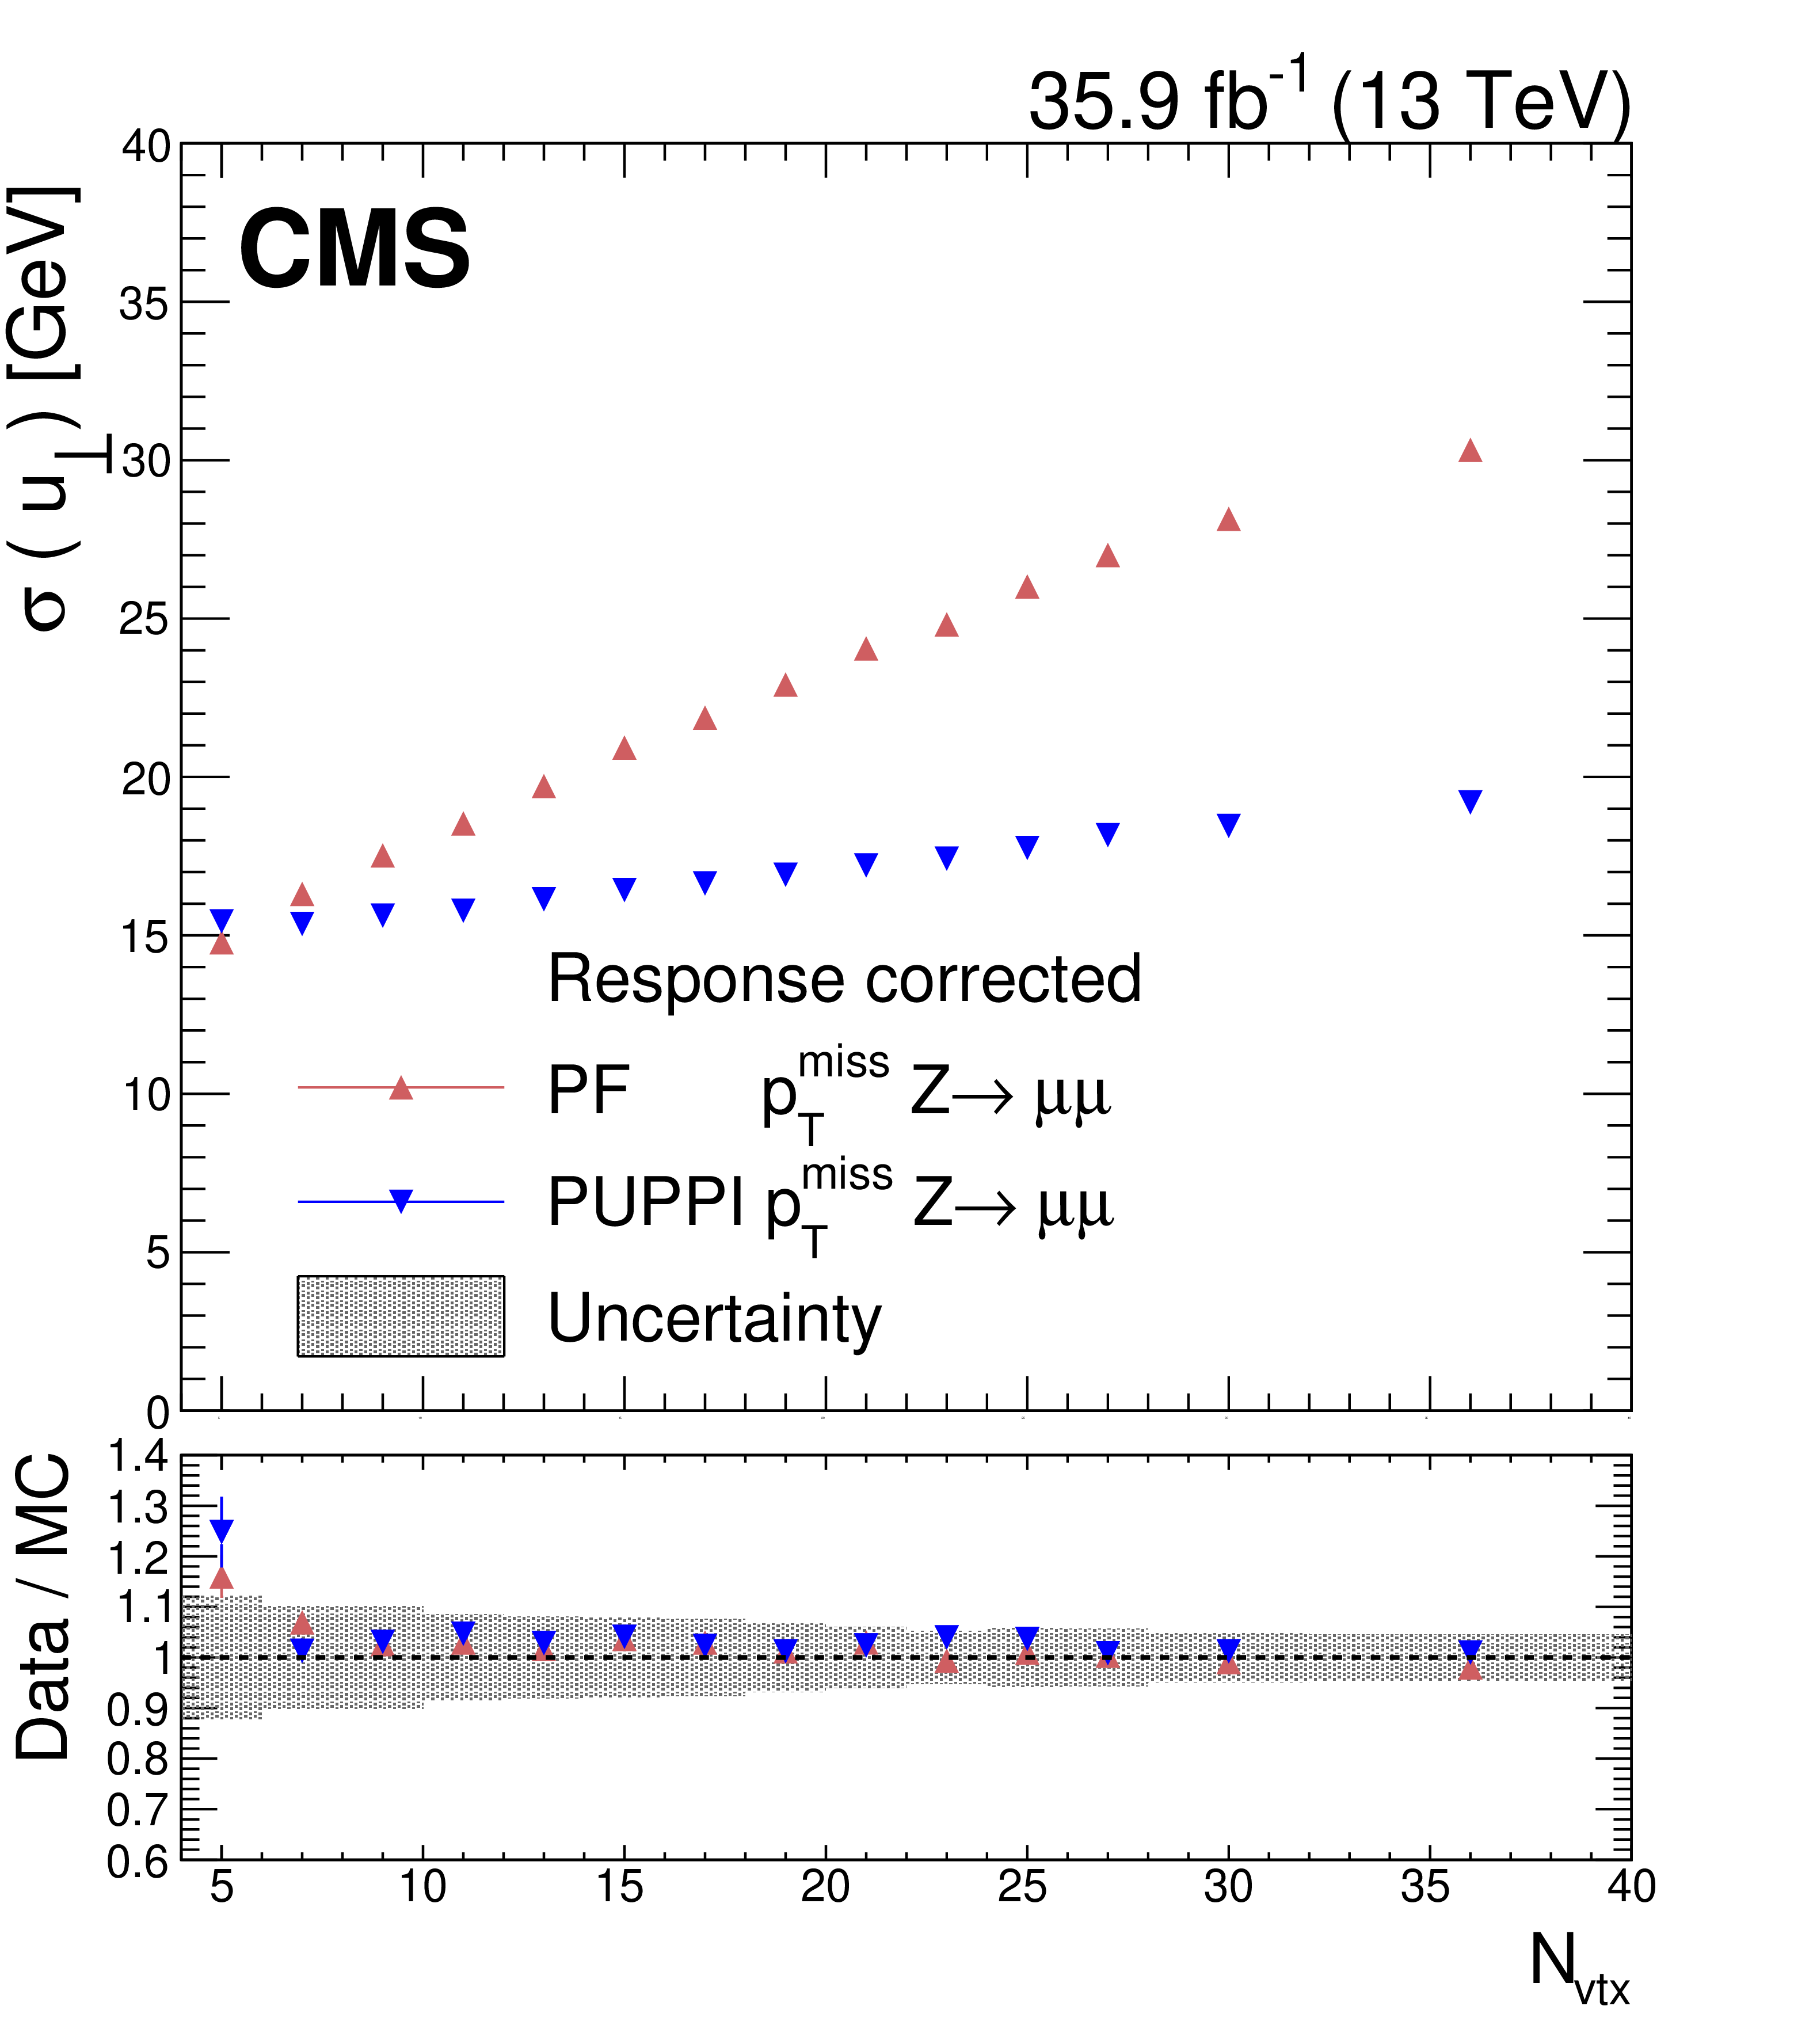
Figure 15-b:
Upper panel: PUPPI and PF ${{p_{\mathrm {T}}} ^\text {miss}}$ resolution of the ${u_{\perp}}$ component of the hadronic recoil as a function of ${\text {N}_{\text {vtx}}}$, in ${{\mathrm {Z}}\to {\mu} ^+ {\mu ^-}}$ events. Lower panel: Data-to-simulation ratio. The systematic uncertainties due to the JES, the JER, and variations in the $E_{U}$ are added in quadrature and represented by the shaded band. |
png pdf |
Figure 16:
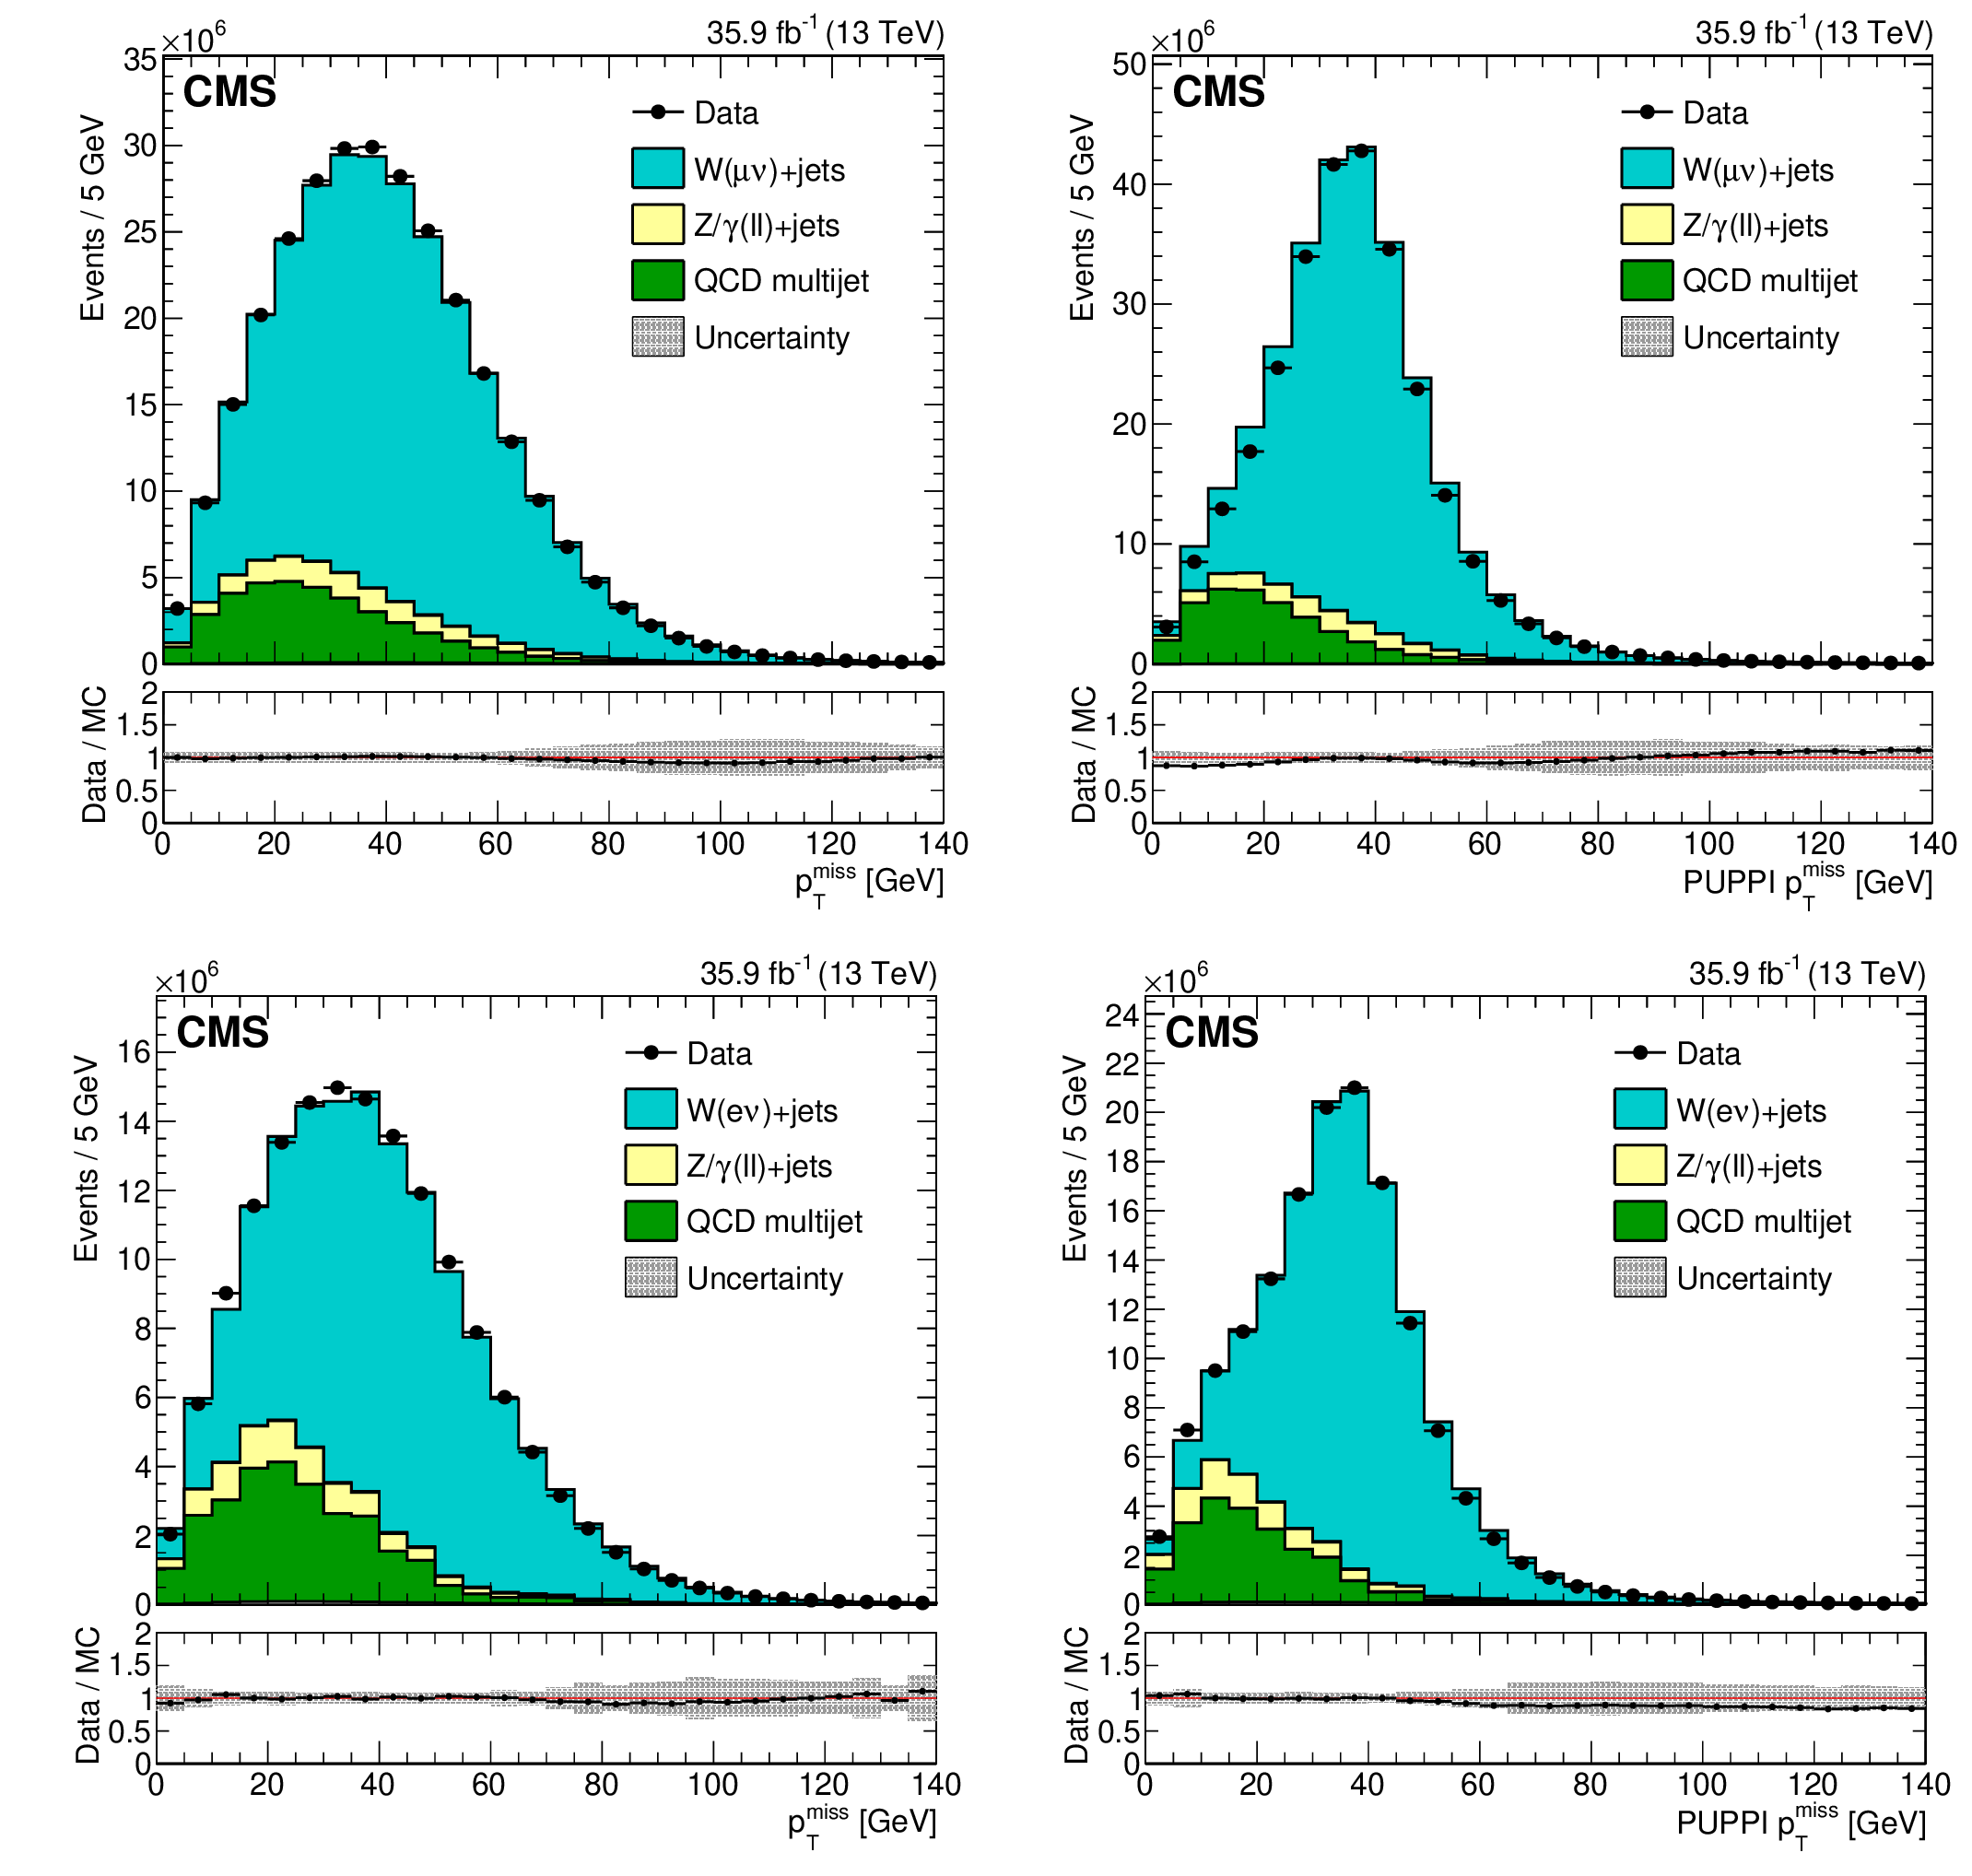
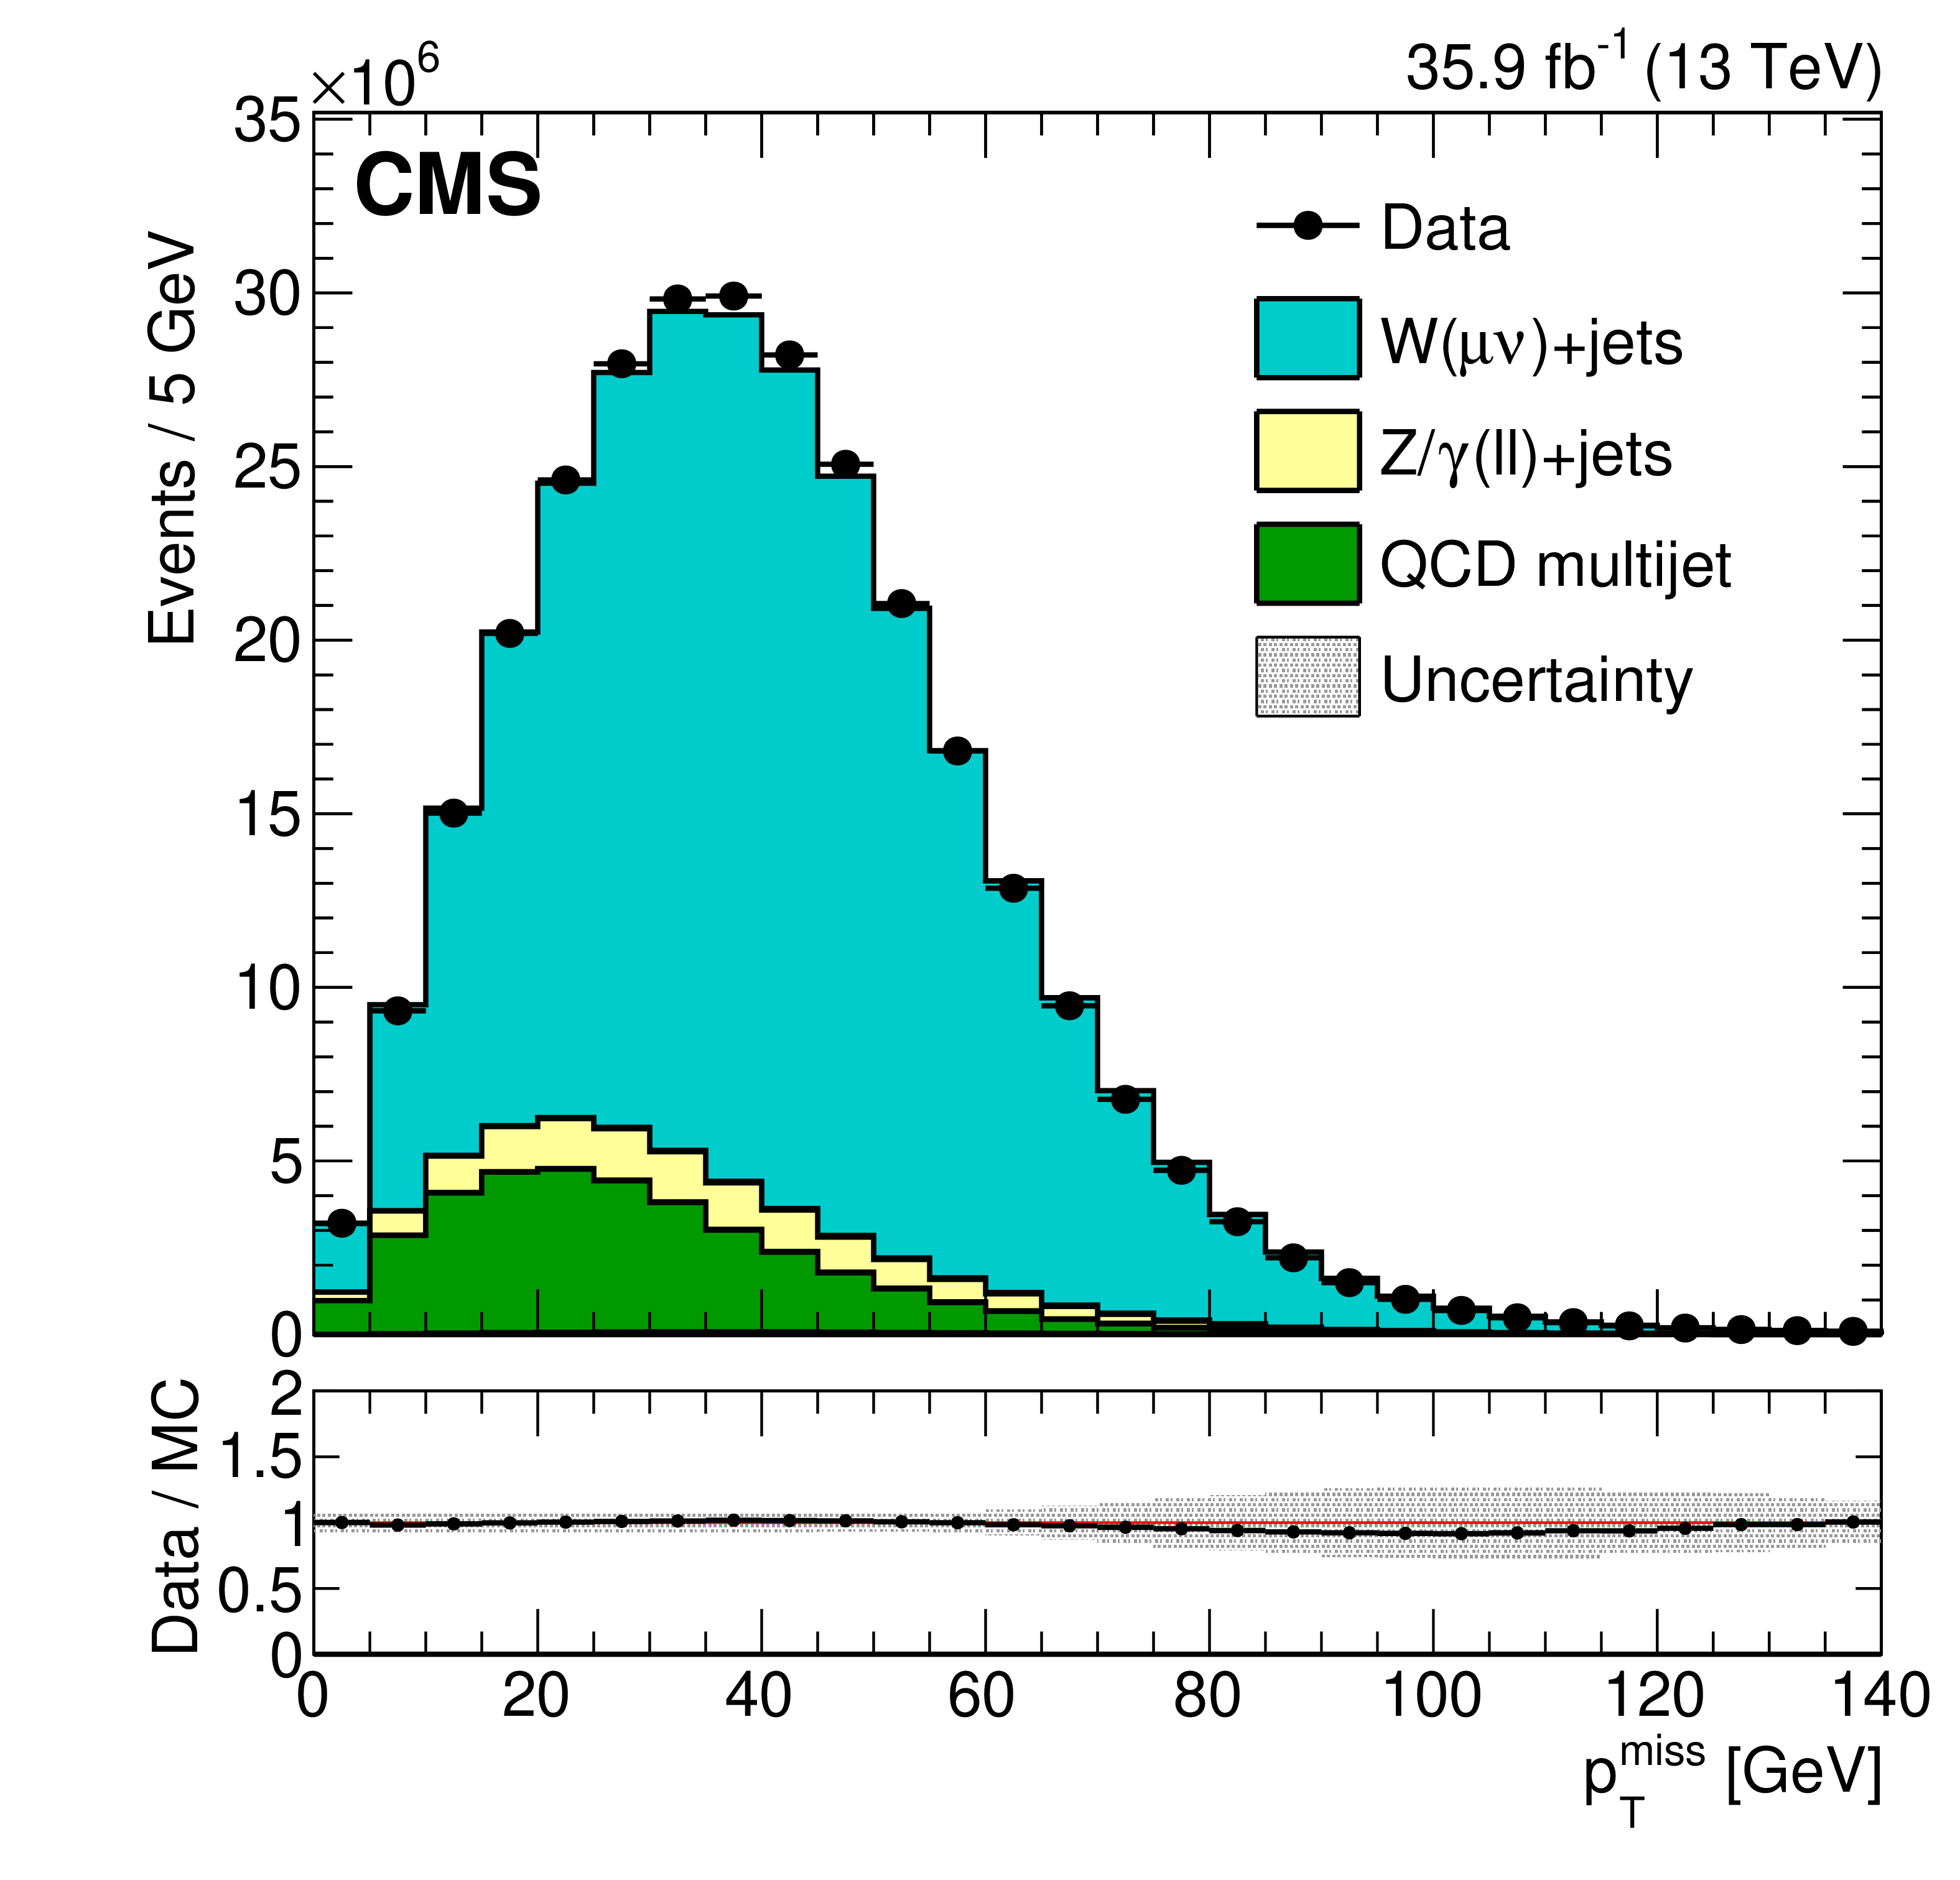
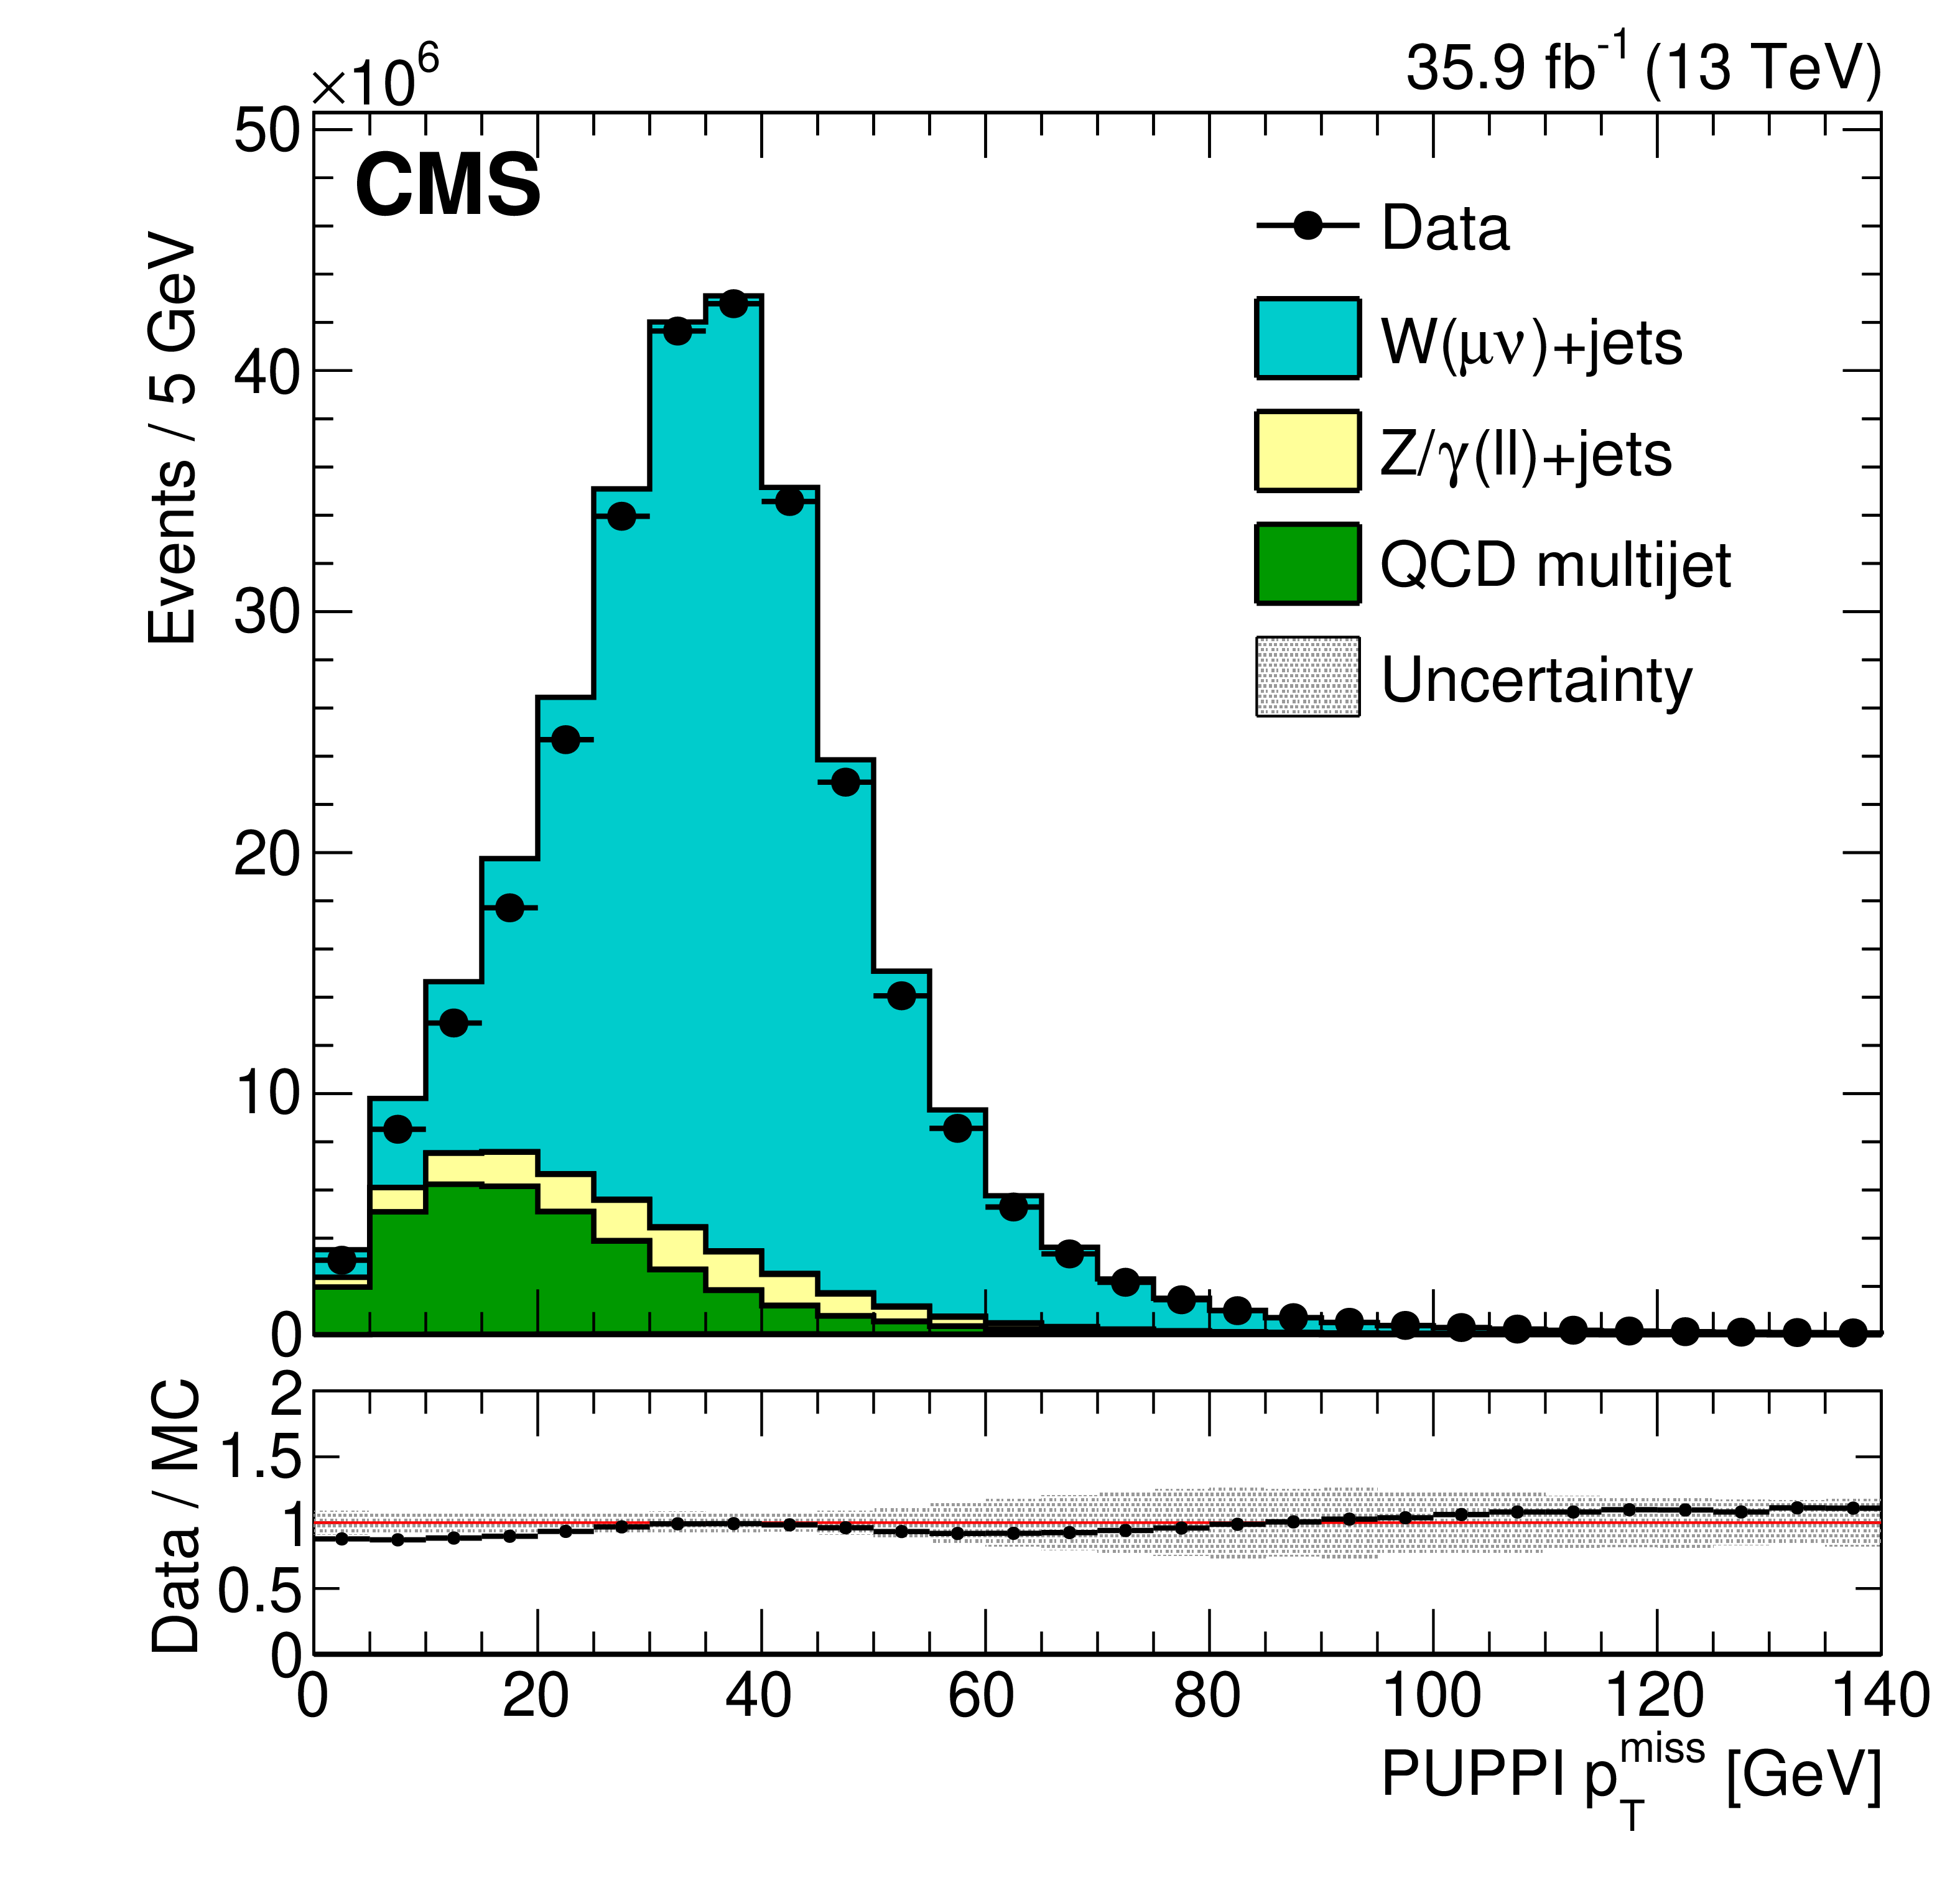
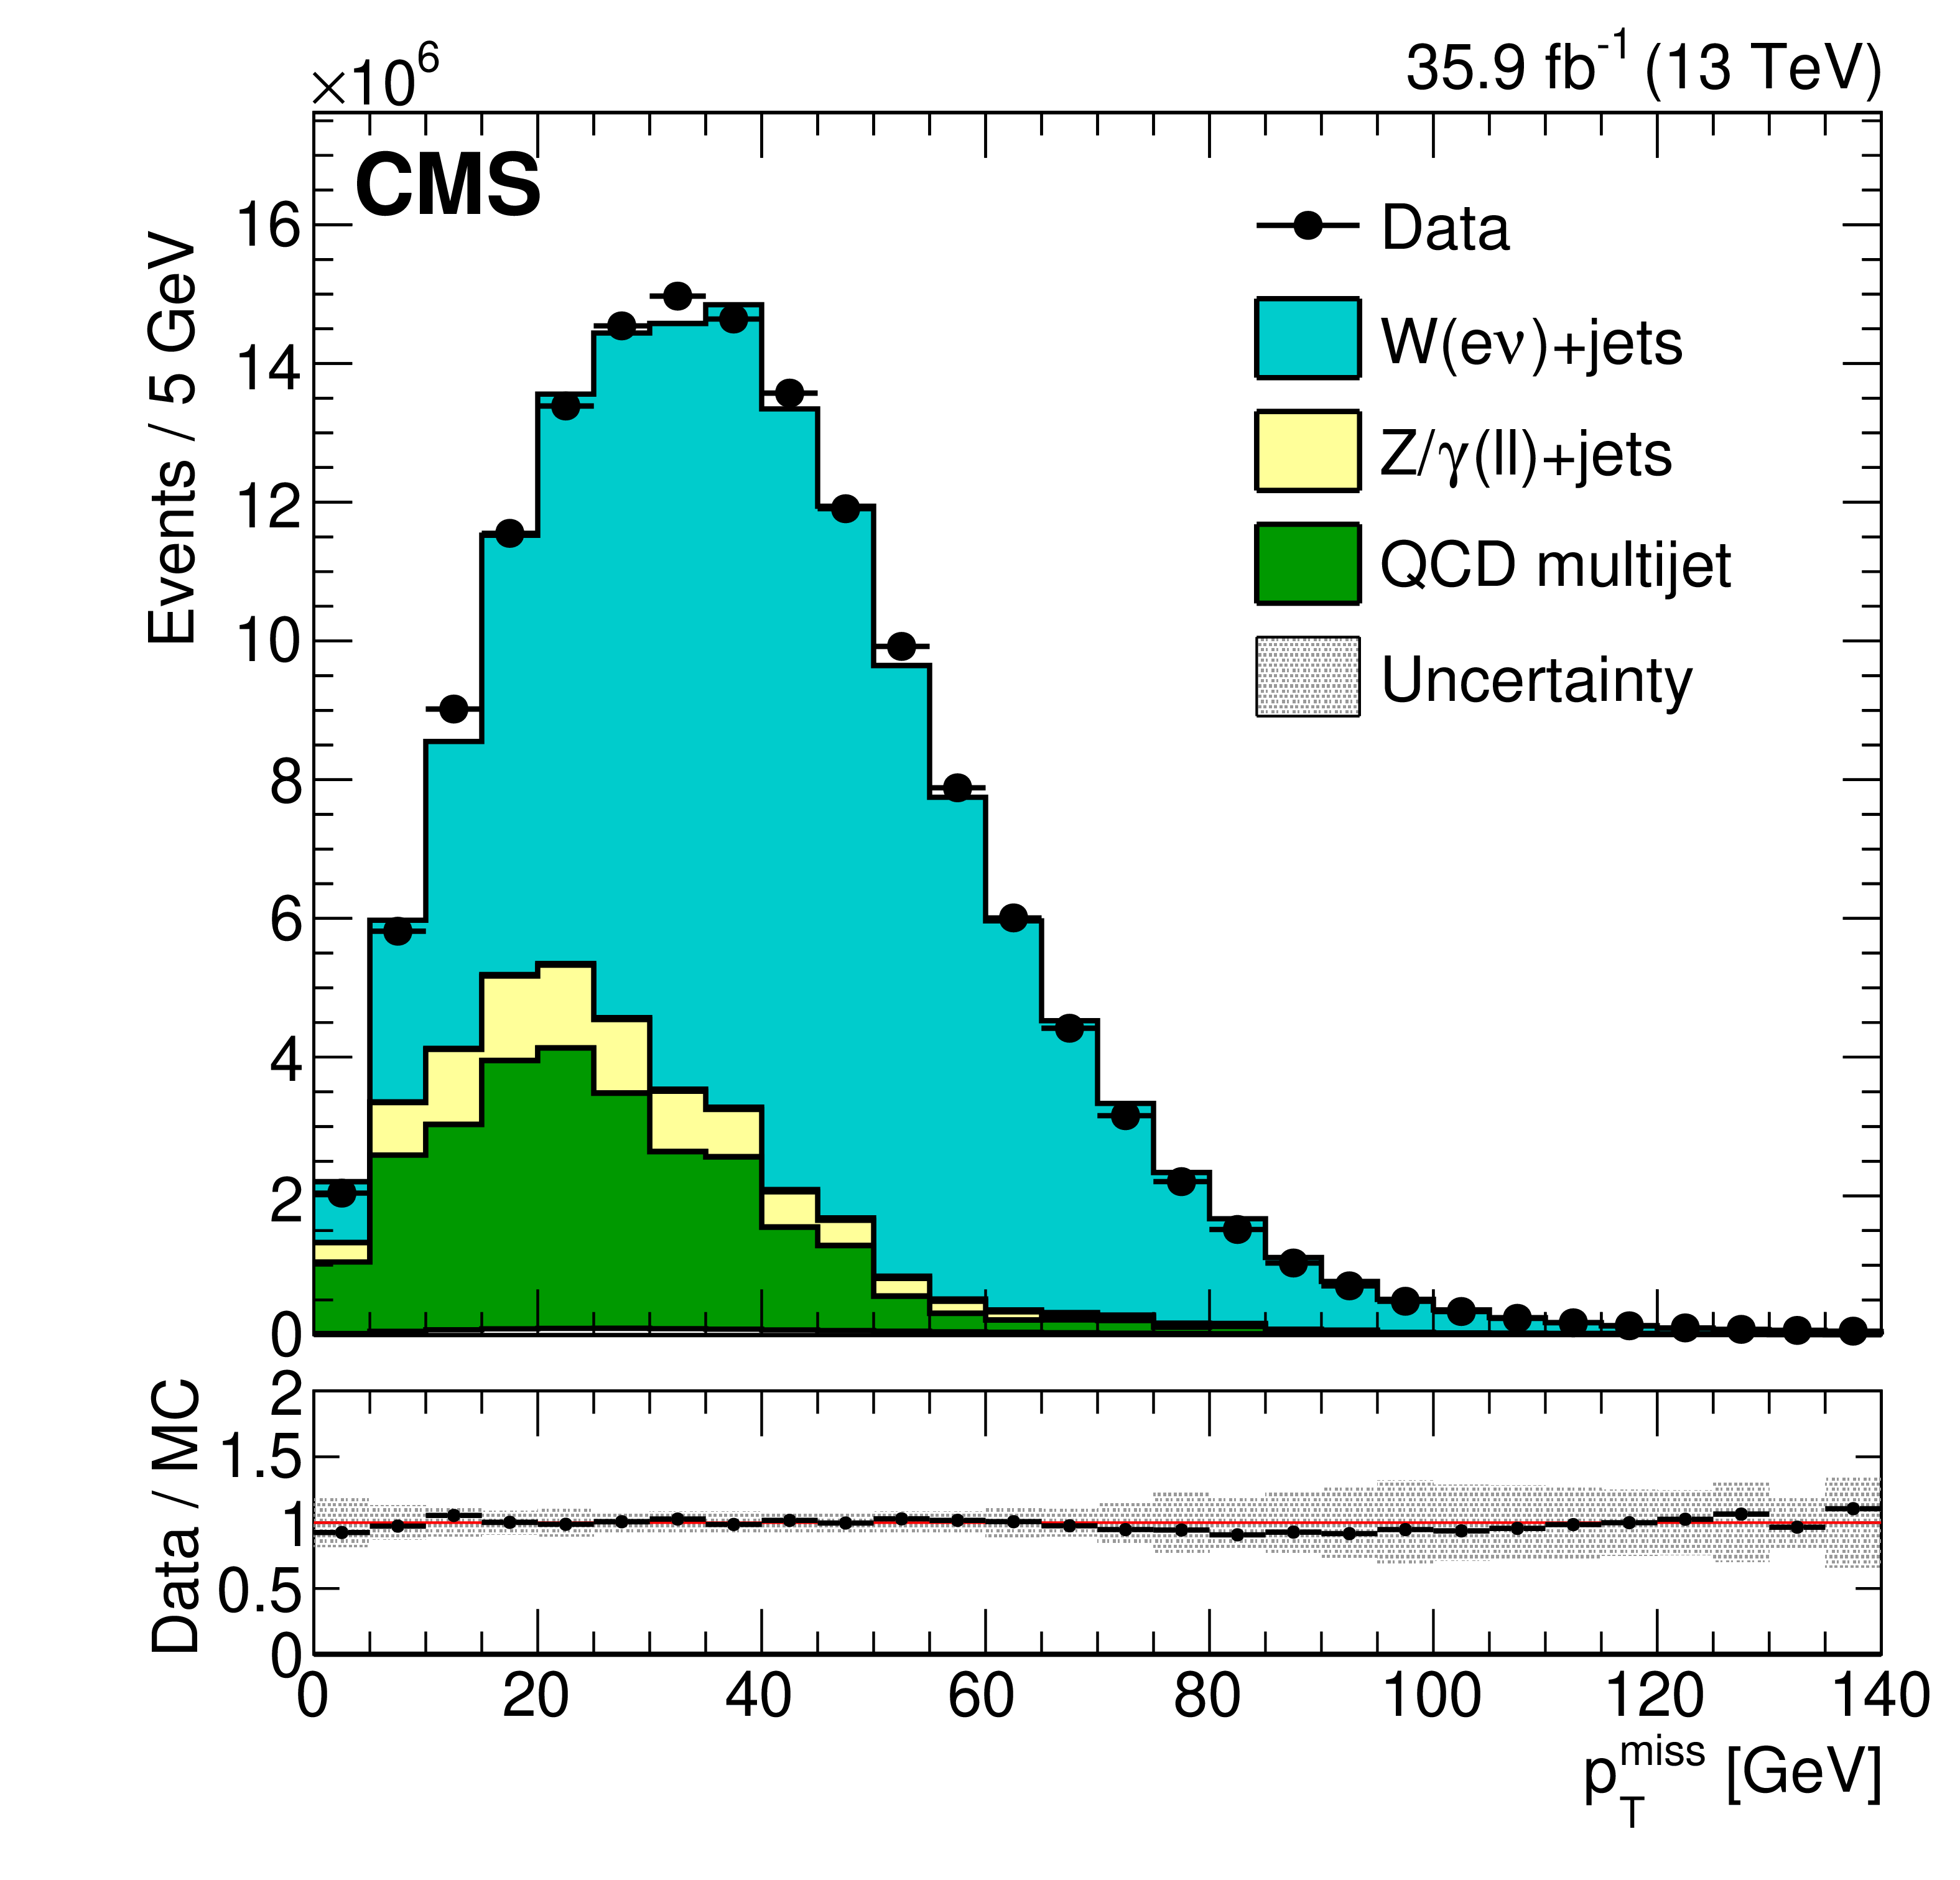
The PF (left) and PUPPI (right) ${{p_{\mathrm {T}}} ^\text {miss}}$ distributions are shown for single-muon (upper) and single-electron (lower) events. The last bin includes all events with $ {{p_{\mathrm {T}}} ^\text {miss}} > $ 135 GeV. In all the distributions, the lower panel shows the ratio of data to simulation. The systematic uncertainties due to the JES, the JER, and variations in the $E_{U}$ are added in quadrature and represented by the shaded band. |
png pdf |
Figure 16-a:
The PF ${{p_{\mathrm {T}}} ^\text {miss}}$ distribution is shown for single-muon events. The last bin includes all events with $ {{p_{\mathrm {T}}} ^\text {miss}} > $ 135 GeV. The lower panel shows the ratio of data to simulation. The systematic uncertainties due to the JES, the JER, and variations in the $E_{U}$ are added in quadrature and represented by the shaded band. |
png pdf |
Figure 16-b:
The PUPPI ${{p_{\mathrm {T}}} ^\text {miss}}$ distribution is shown for single-muon events. The last bin includes all events with $ {{p_{\mathrm {T}}} ^\text {miss}} > $ 135 GeV. The lower panel shows the ratio of data to simulation. The systematic uncertainties due to the JES, the JER, and variations in the $E_{U}$ are added in quadrature and represented by the shaded band. |
png pdf |
Figure 16-c:
The PF ${{p_{\mathrm {T}}} ^\text {miss}}$ distribution is shown for single-electron events. The last bin includes all events with $ {{p_{\mathrm {T}}} ^\text {miss}} > $ 135 GeV. The lower panel shows the ratio of data to simulation. The systematic uncertainties due to the JES, the JER, and variations in the $E_{U}$ are added in quadrature and represented by the shaded band. |

png pdf |
Figure 16-d:
The PUPPI ${{p_{\mathrm {T}}} ^\text {miss}}$ distribution is shown for single-electron events. The last bin includes all events with $ {{p_{\mathrm {T}}} ^\text {miss}} > $ 135 GeV. The lower panel shows the ratio of data to simulation. The systematic uncertainties due to the JES, the JER, and variations in the $E_{U}$ are added in quadrature and represented by the shaded band. |

png pdf |
Figure 17:
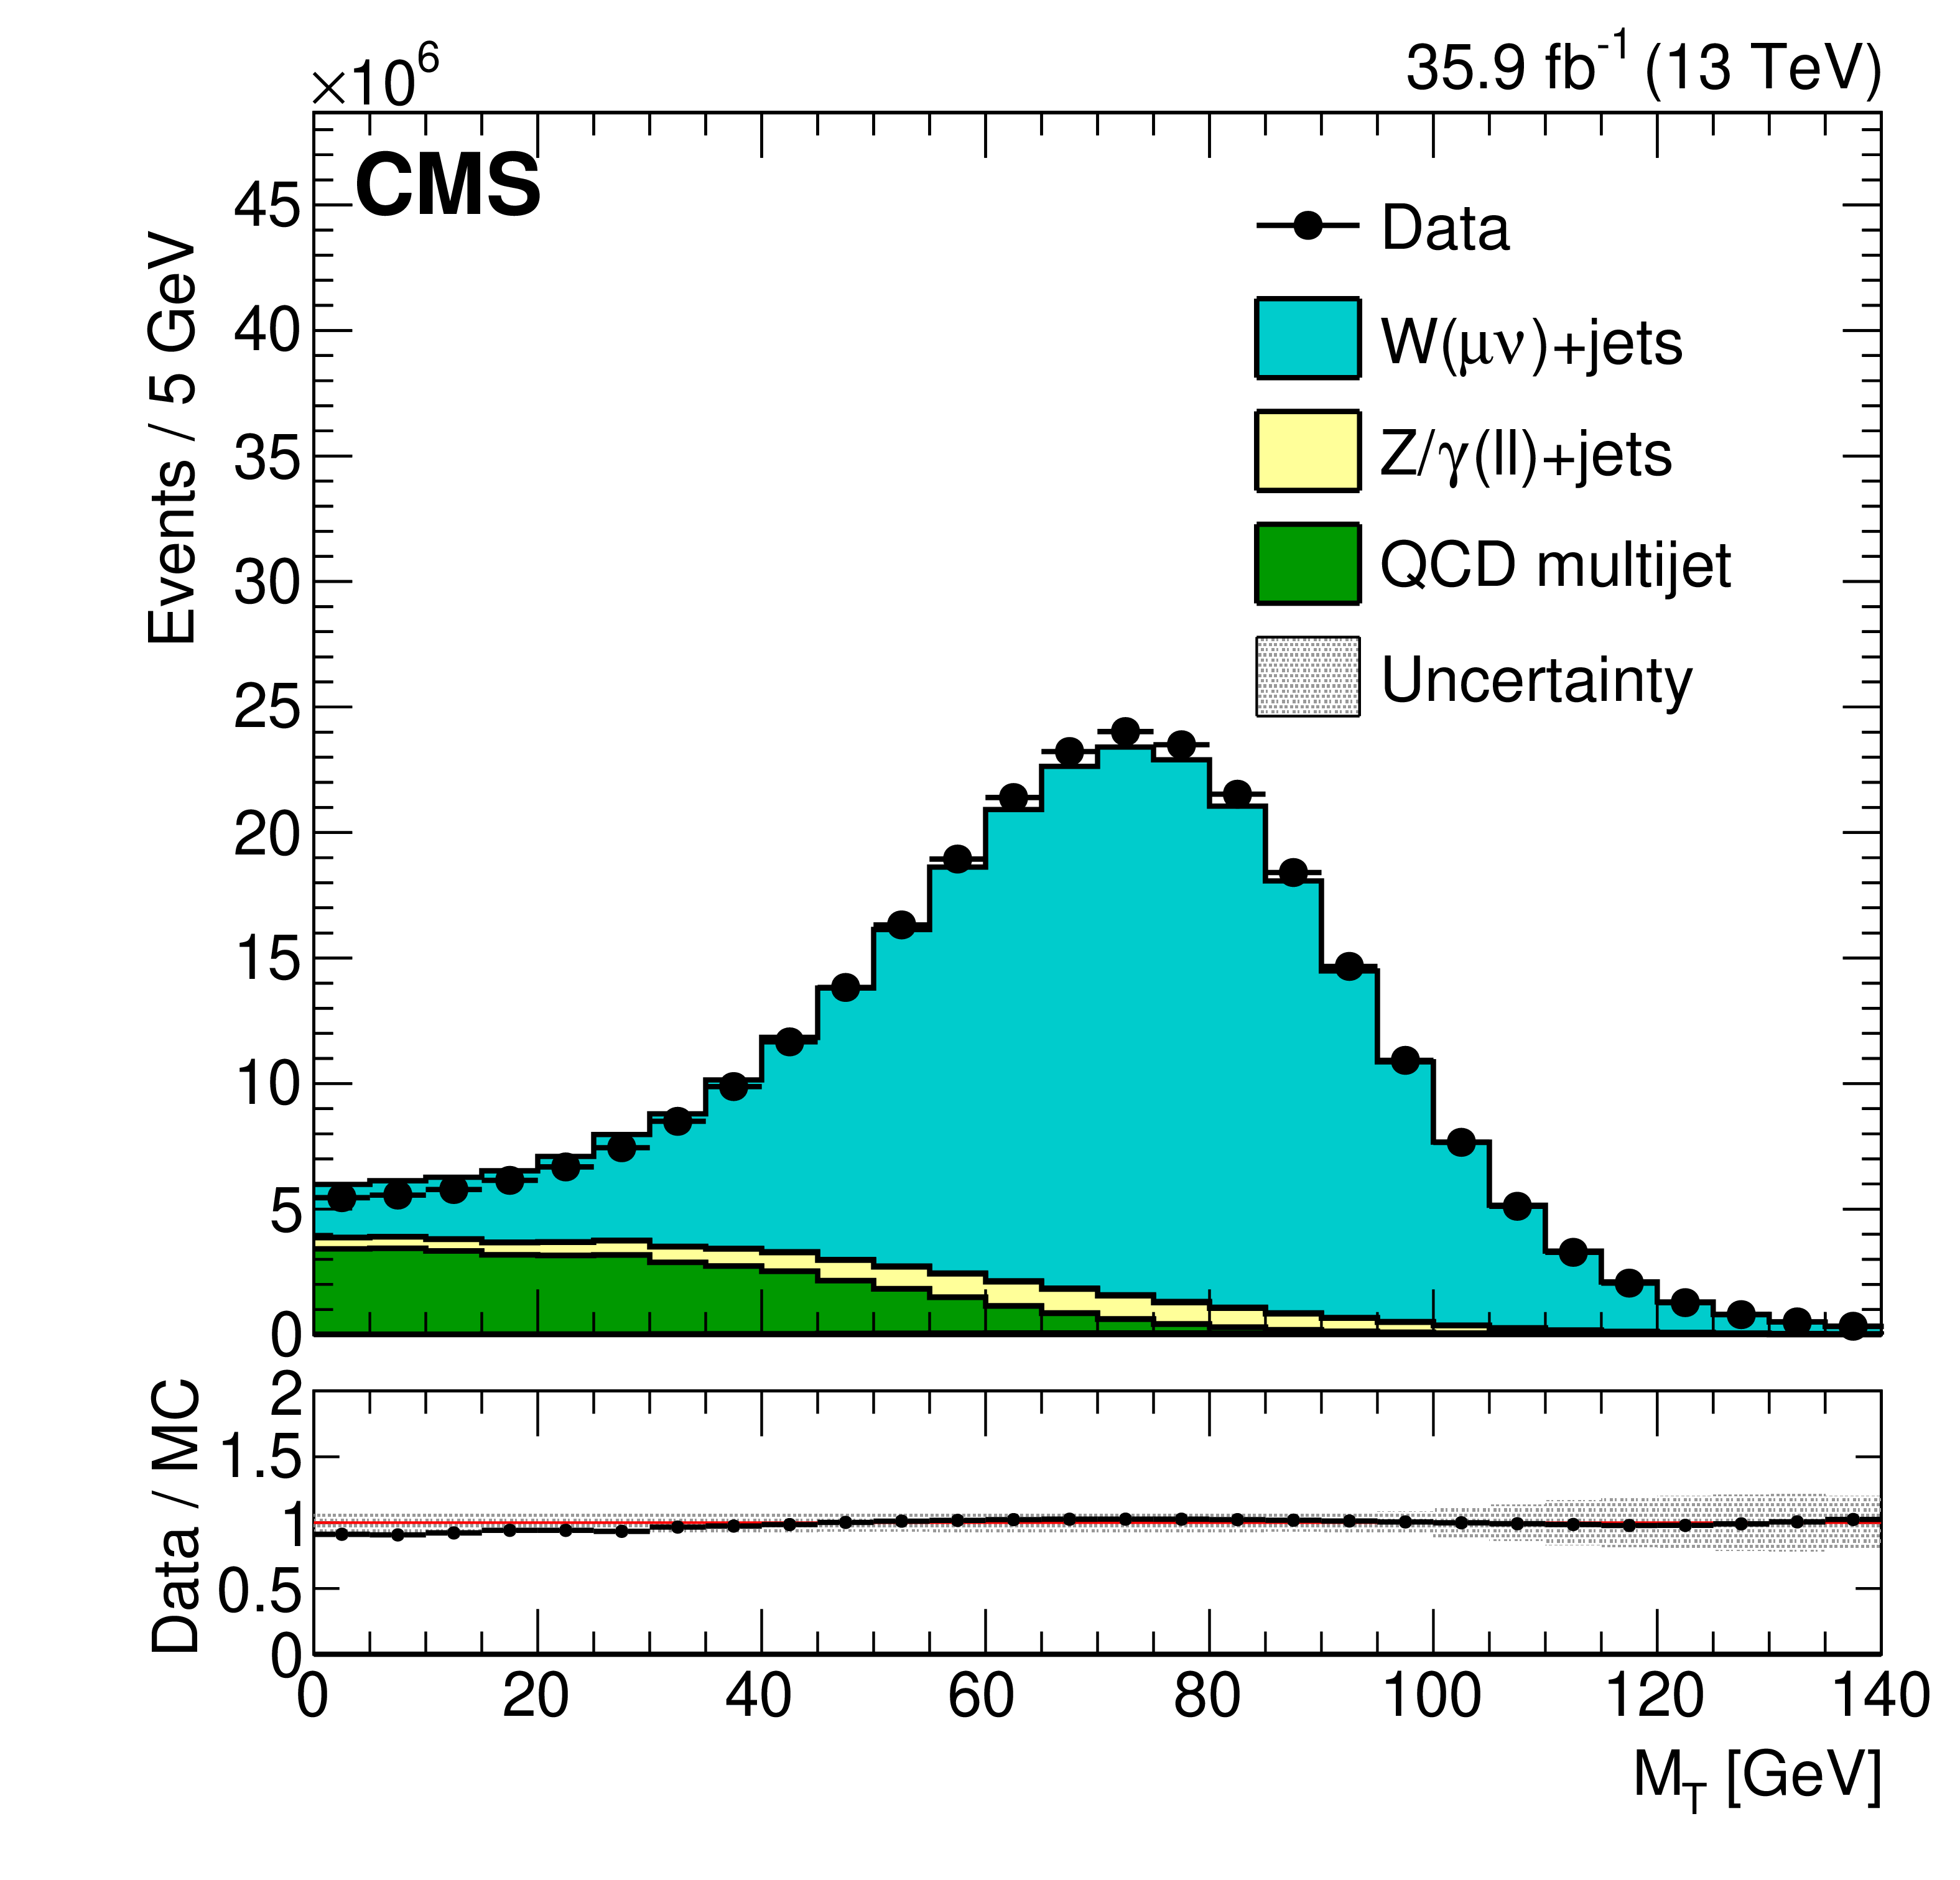
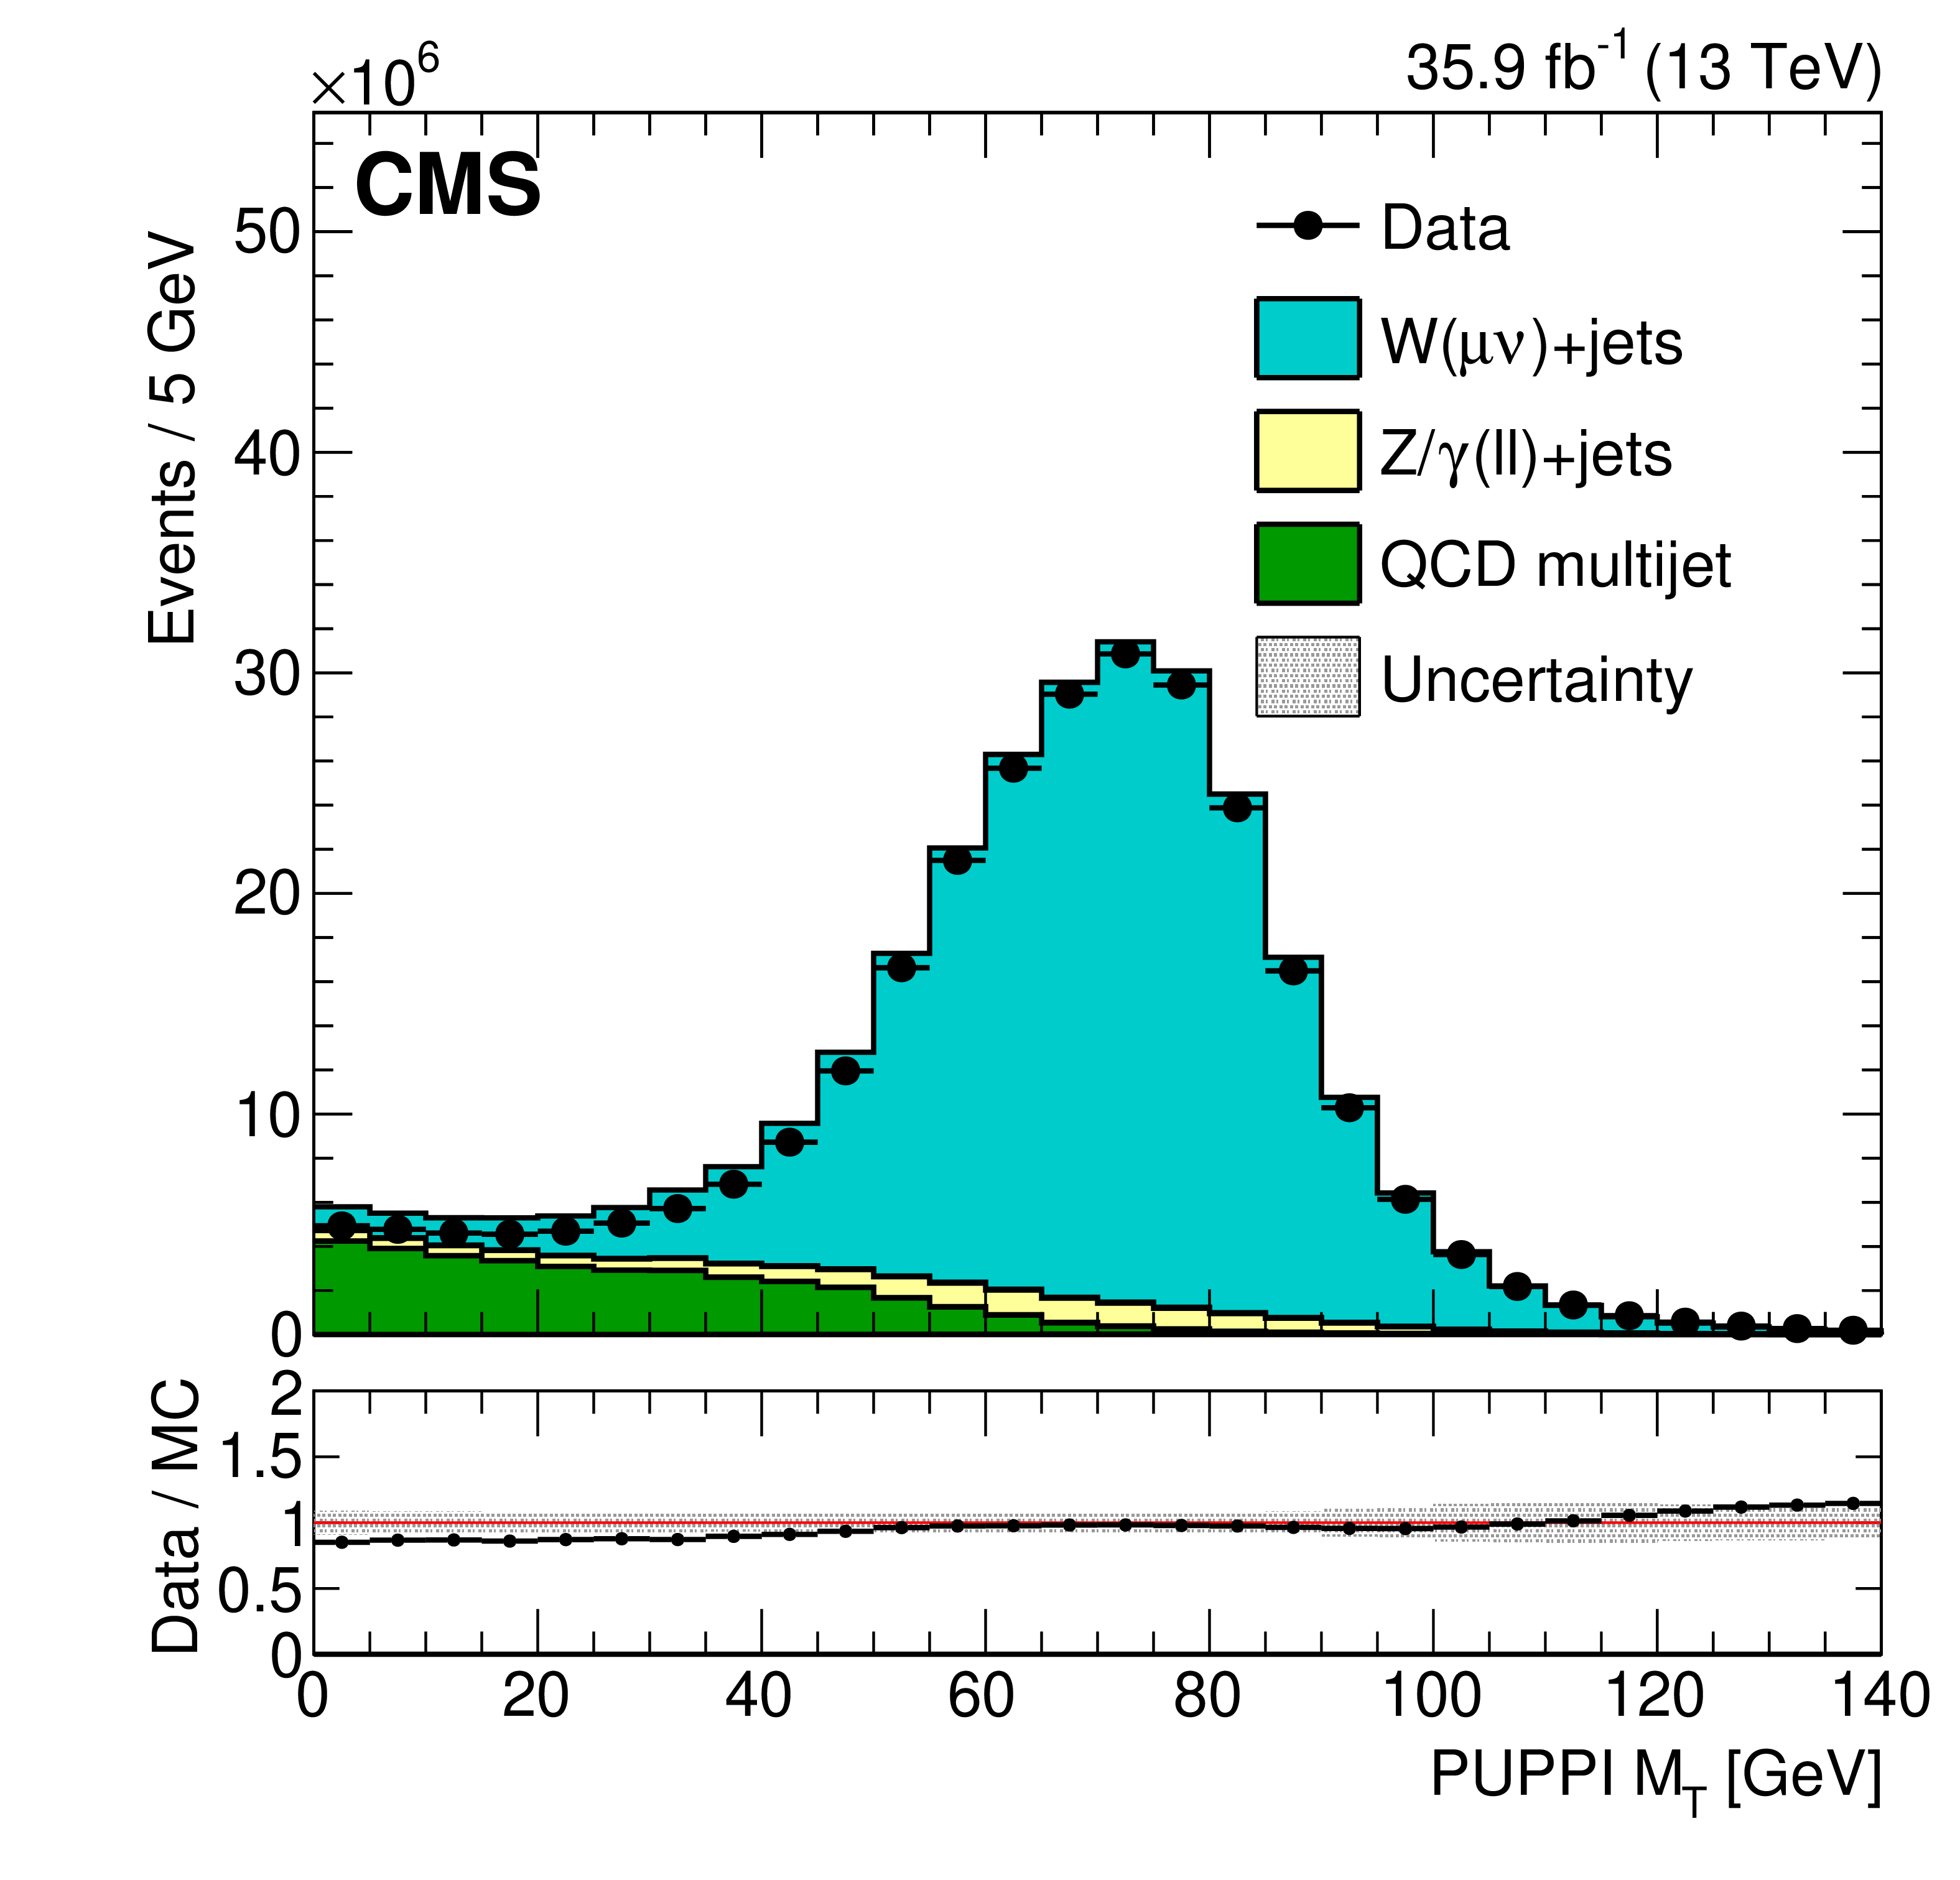
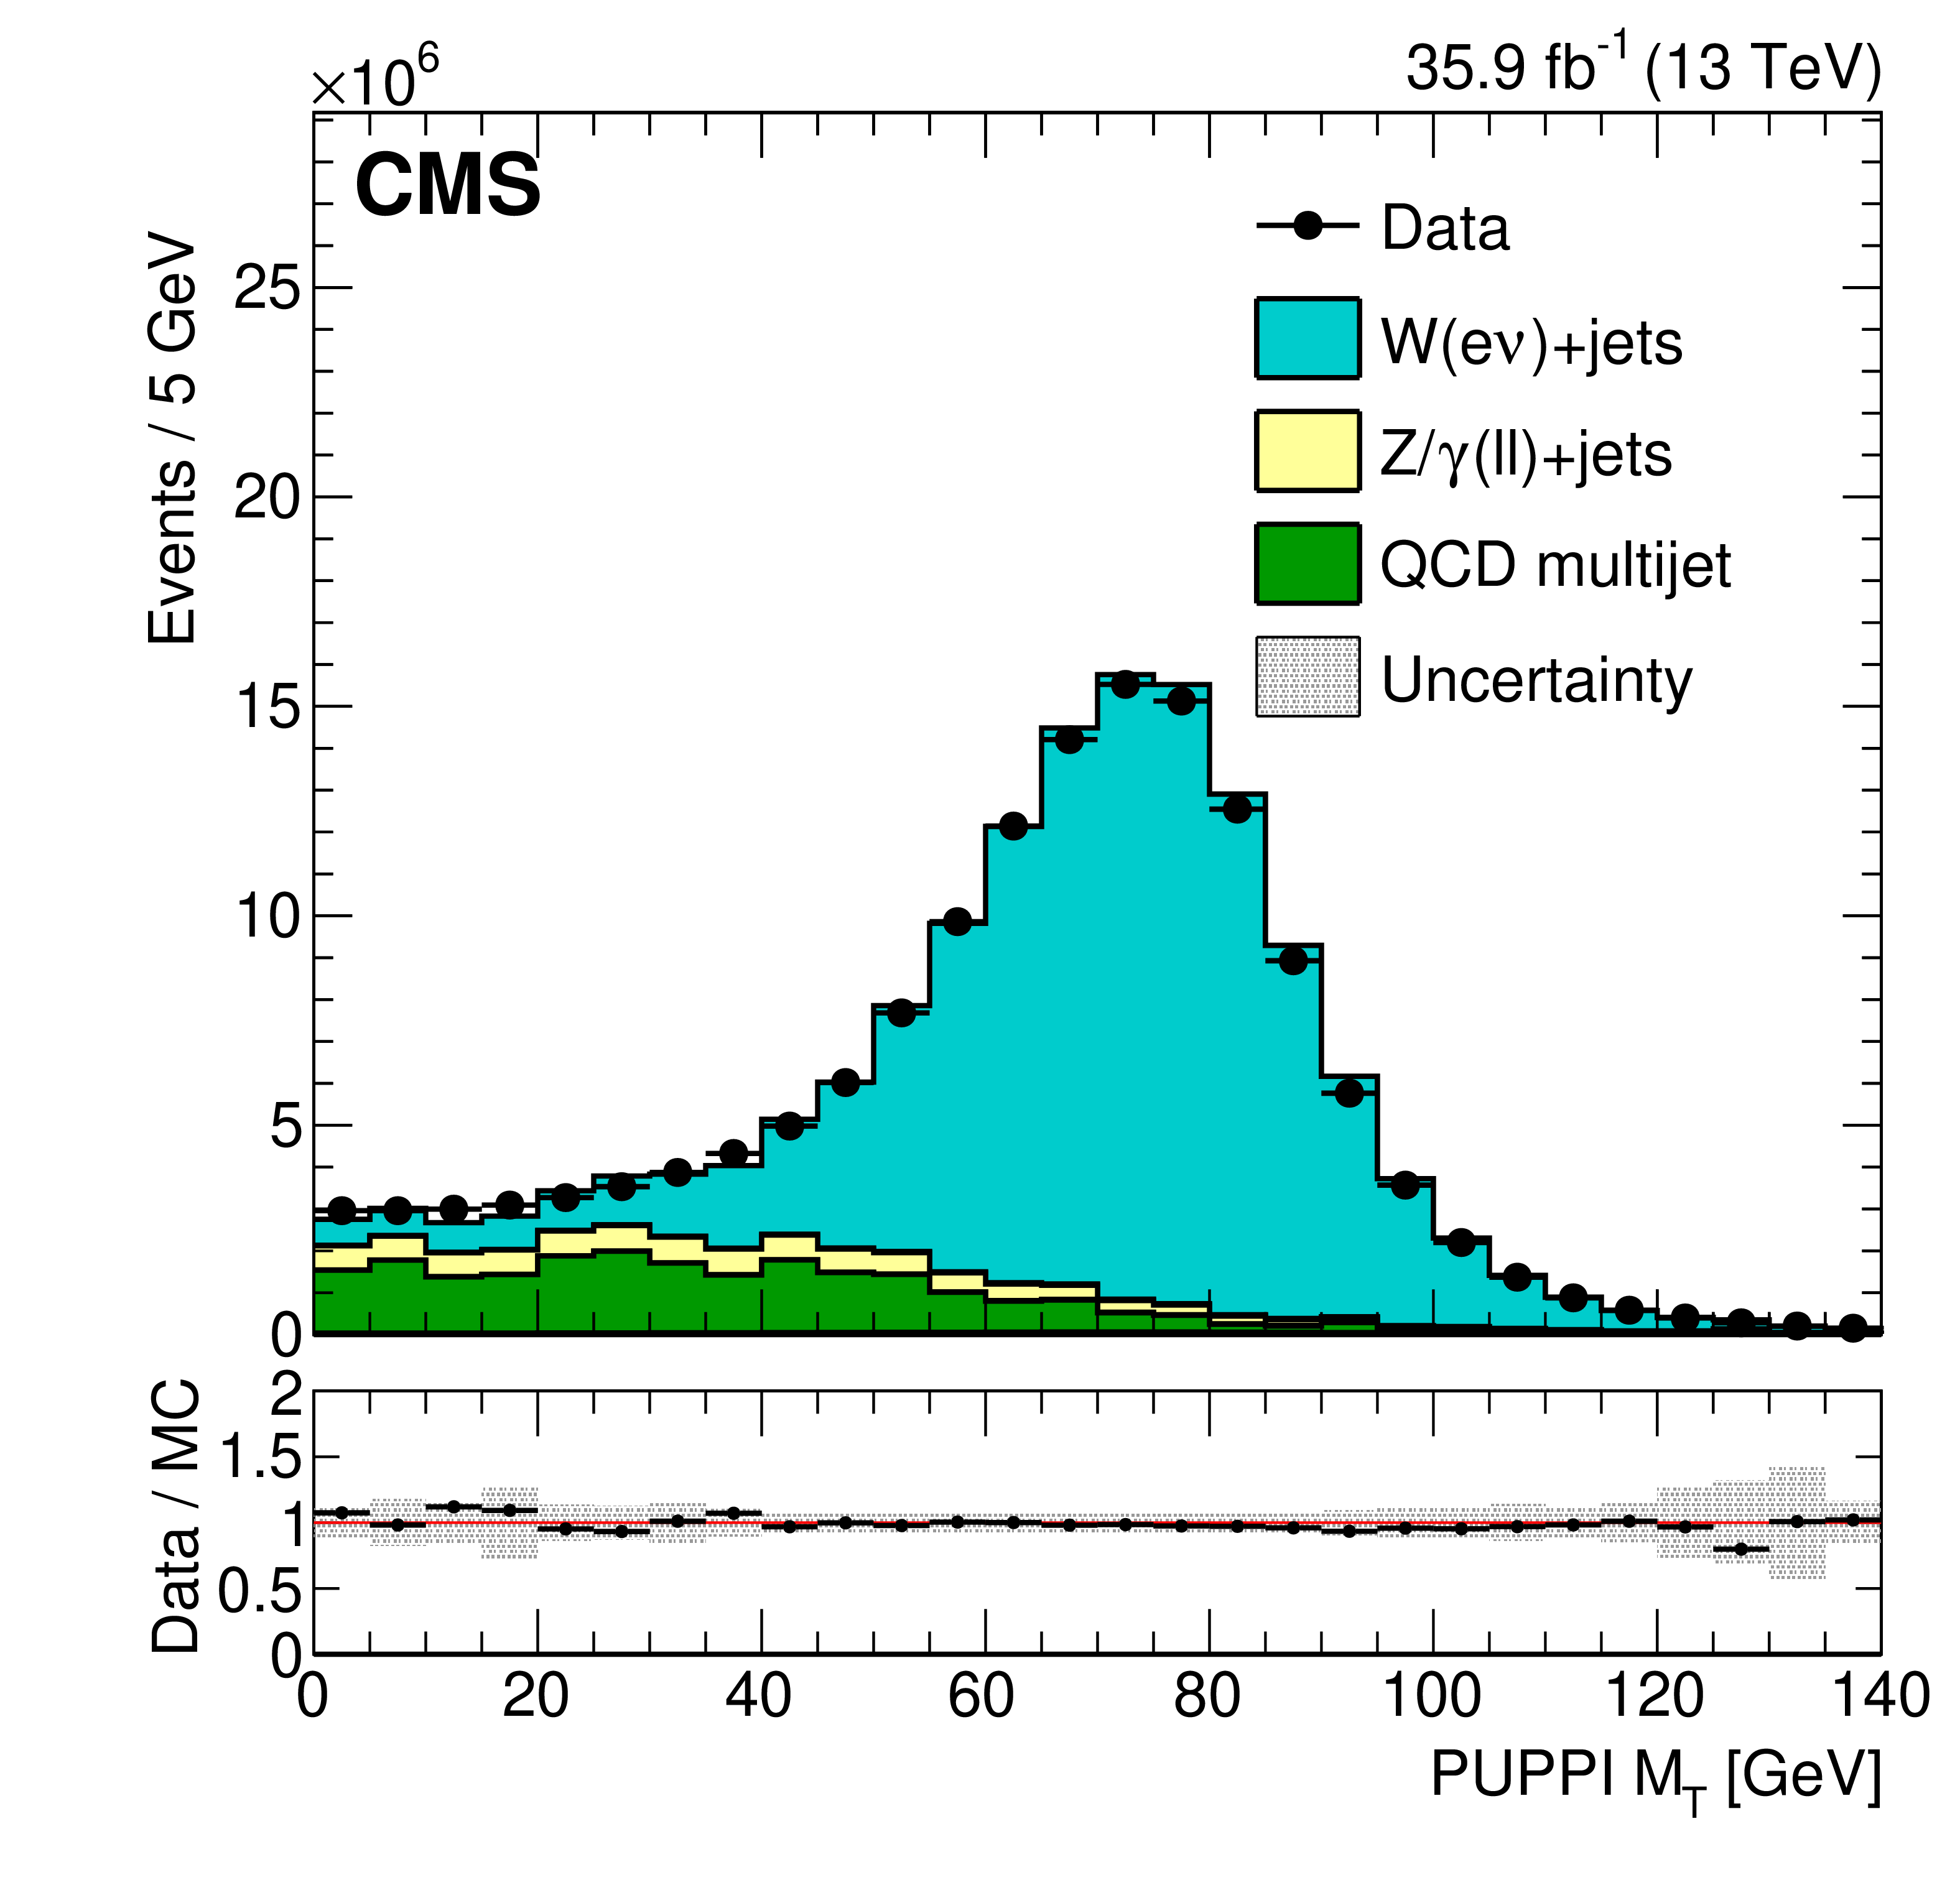
The PF (left) and PUPPI (right) ${M_\mathrm {T}}$ distribution are shown for single-muon (upper) and single-electron (lower) events. The last bin includes all events with $ {M_\mathrm {T}} > $ 135 GeV. In all the distributions, the lower panel shows the ratio of data to simulation. The systematic uncertainties due to the JES, the JER, and variations in the $E_{U}$ are added in quadrature and represented by the shaded band. |
png pdf |
Figure 17-a:
The PF ${M_\mathrm {T}}$ distribution are shown for single-muon events. The last bin includes all events with $ {M_\mathrm {T}} > $ 135 GeV. The lower panel shows the ratio of data to simulation. The systematic uncertainties due to the JES, the JER, and variations in the $E_{U}$ are added in quadrature and represented by the shaded band. |
png pdf |
Figure 17-b:
The PUPPI ${M_\mathrm {T}}$ distribution are shown for single-muon events. The last bin includes all events with $ {M_\mathrm {T}} > $ 135 GeV. The lower panel shows the ratio of data to simulation. The systematic uncertainties due to the JES, the JER, and variations in the $E_{U}$ are added in quadrature and represented by the shaded band. |

png pdf |
Figure 17-c:
The PF ${M_\mathrm {T}}$ distribution are shown for single-electron events. The last bin includes all events with $ {M_\mathrm {T}} > $ 135 GeV. The lower panel shows the ratio of data to simulation. The systematic uncertainties due to the JES, the JER, and variations in the $E_{U}$ are added in quadrature and represented by the shaded band. |
png pdf |
Figure 17-d:
The PUPPI ${M_\mathrm {T}}$ distribution are shown for single-electron events. The last bin includes all events with $ {M_\mathrm {T}} > $ 135 GeV. The lower panel shows the ratio of data to simulation. The systematic uncertainties due to the JES, the JER, and variations in the $E_{U}$ are added in quadrature and represented by the shaded band. |
png pdf |
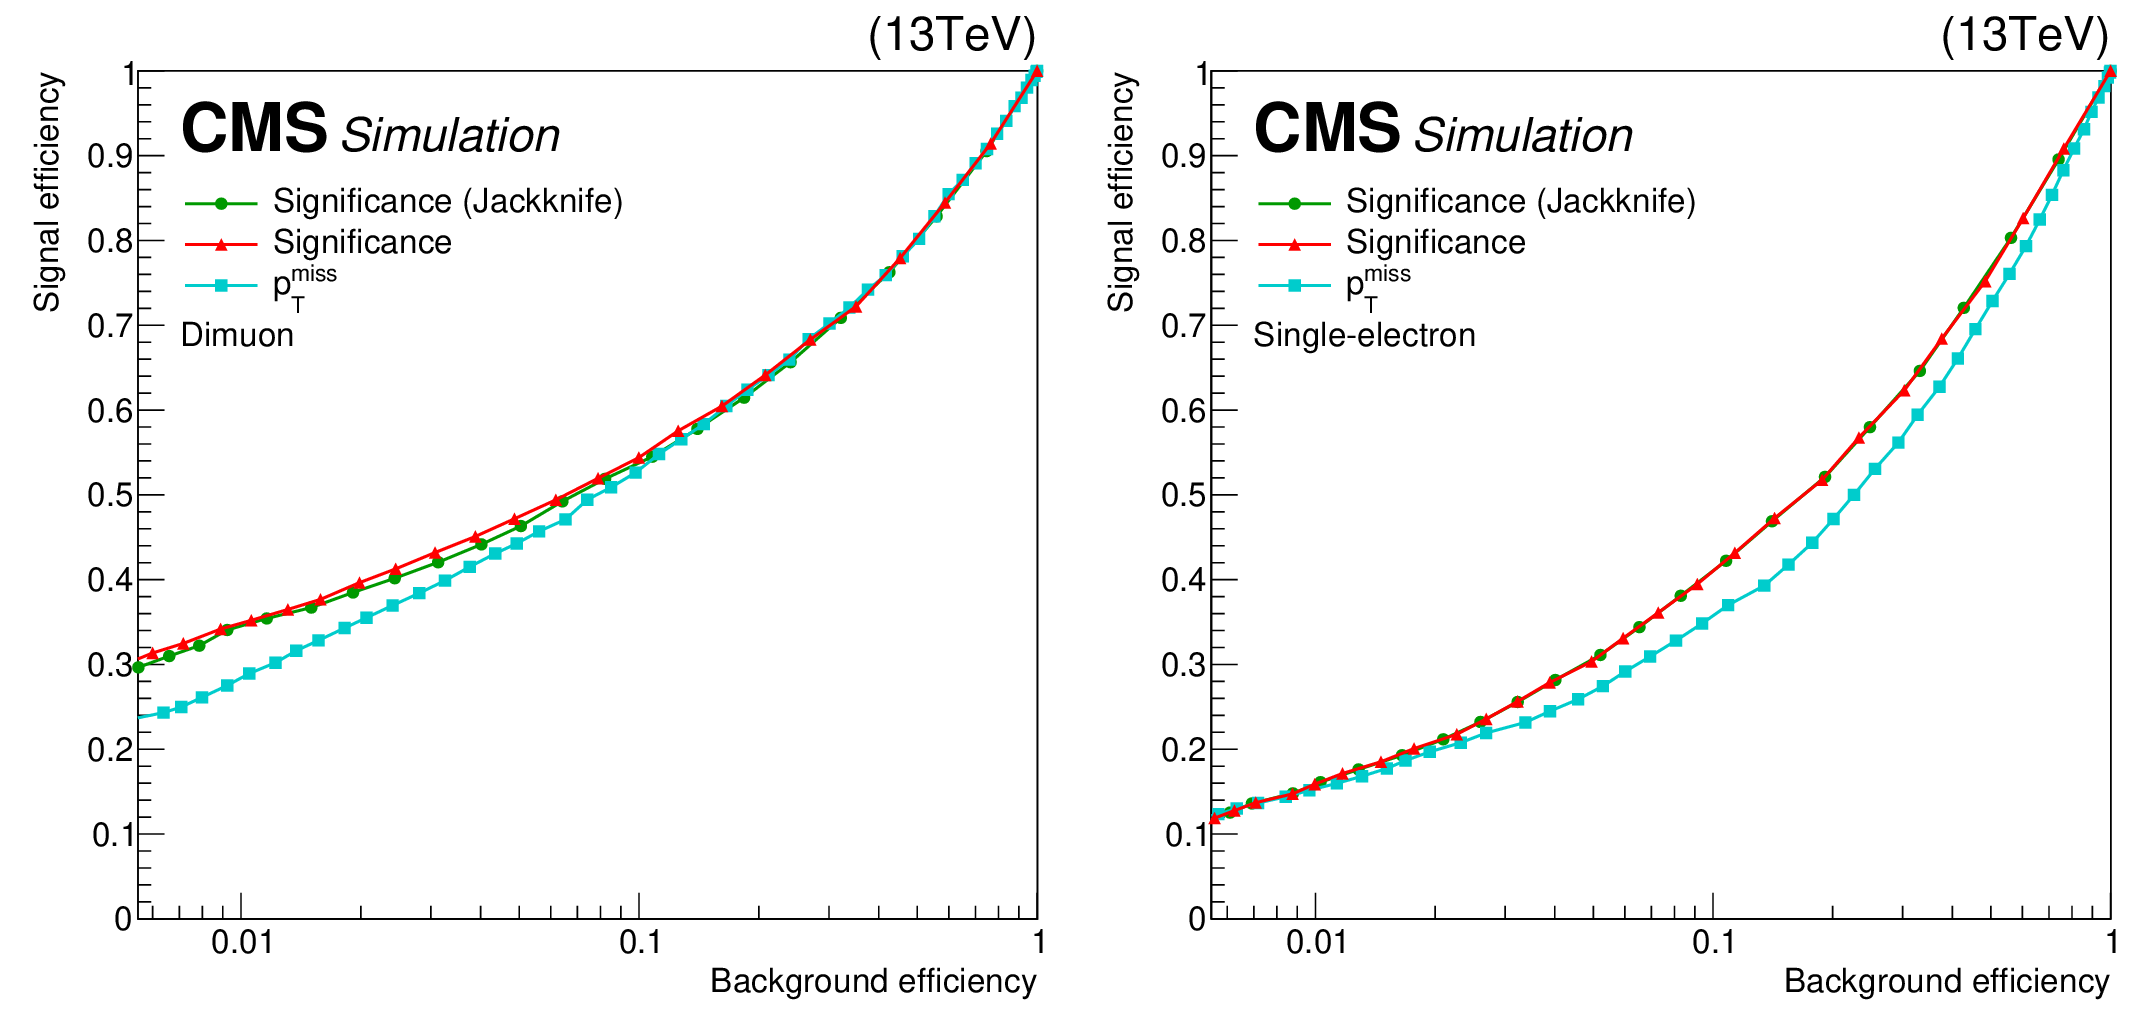
Figure 18:
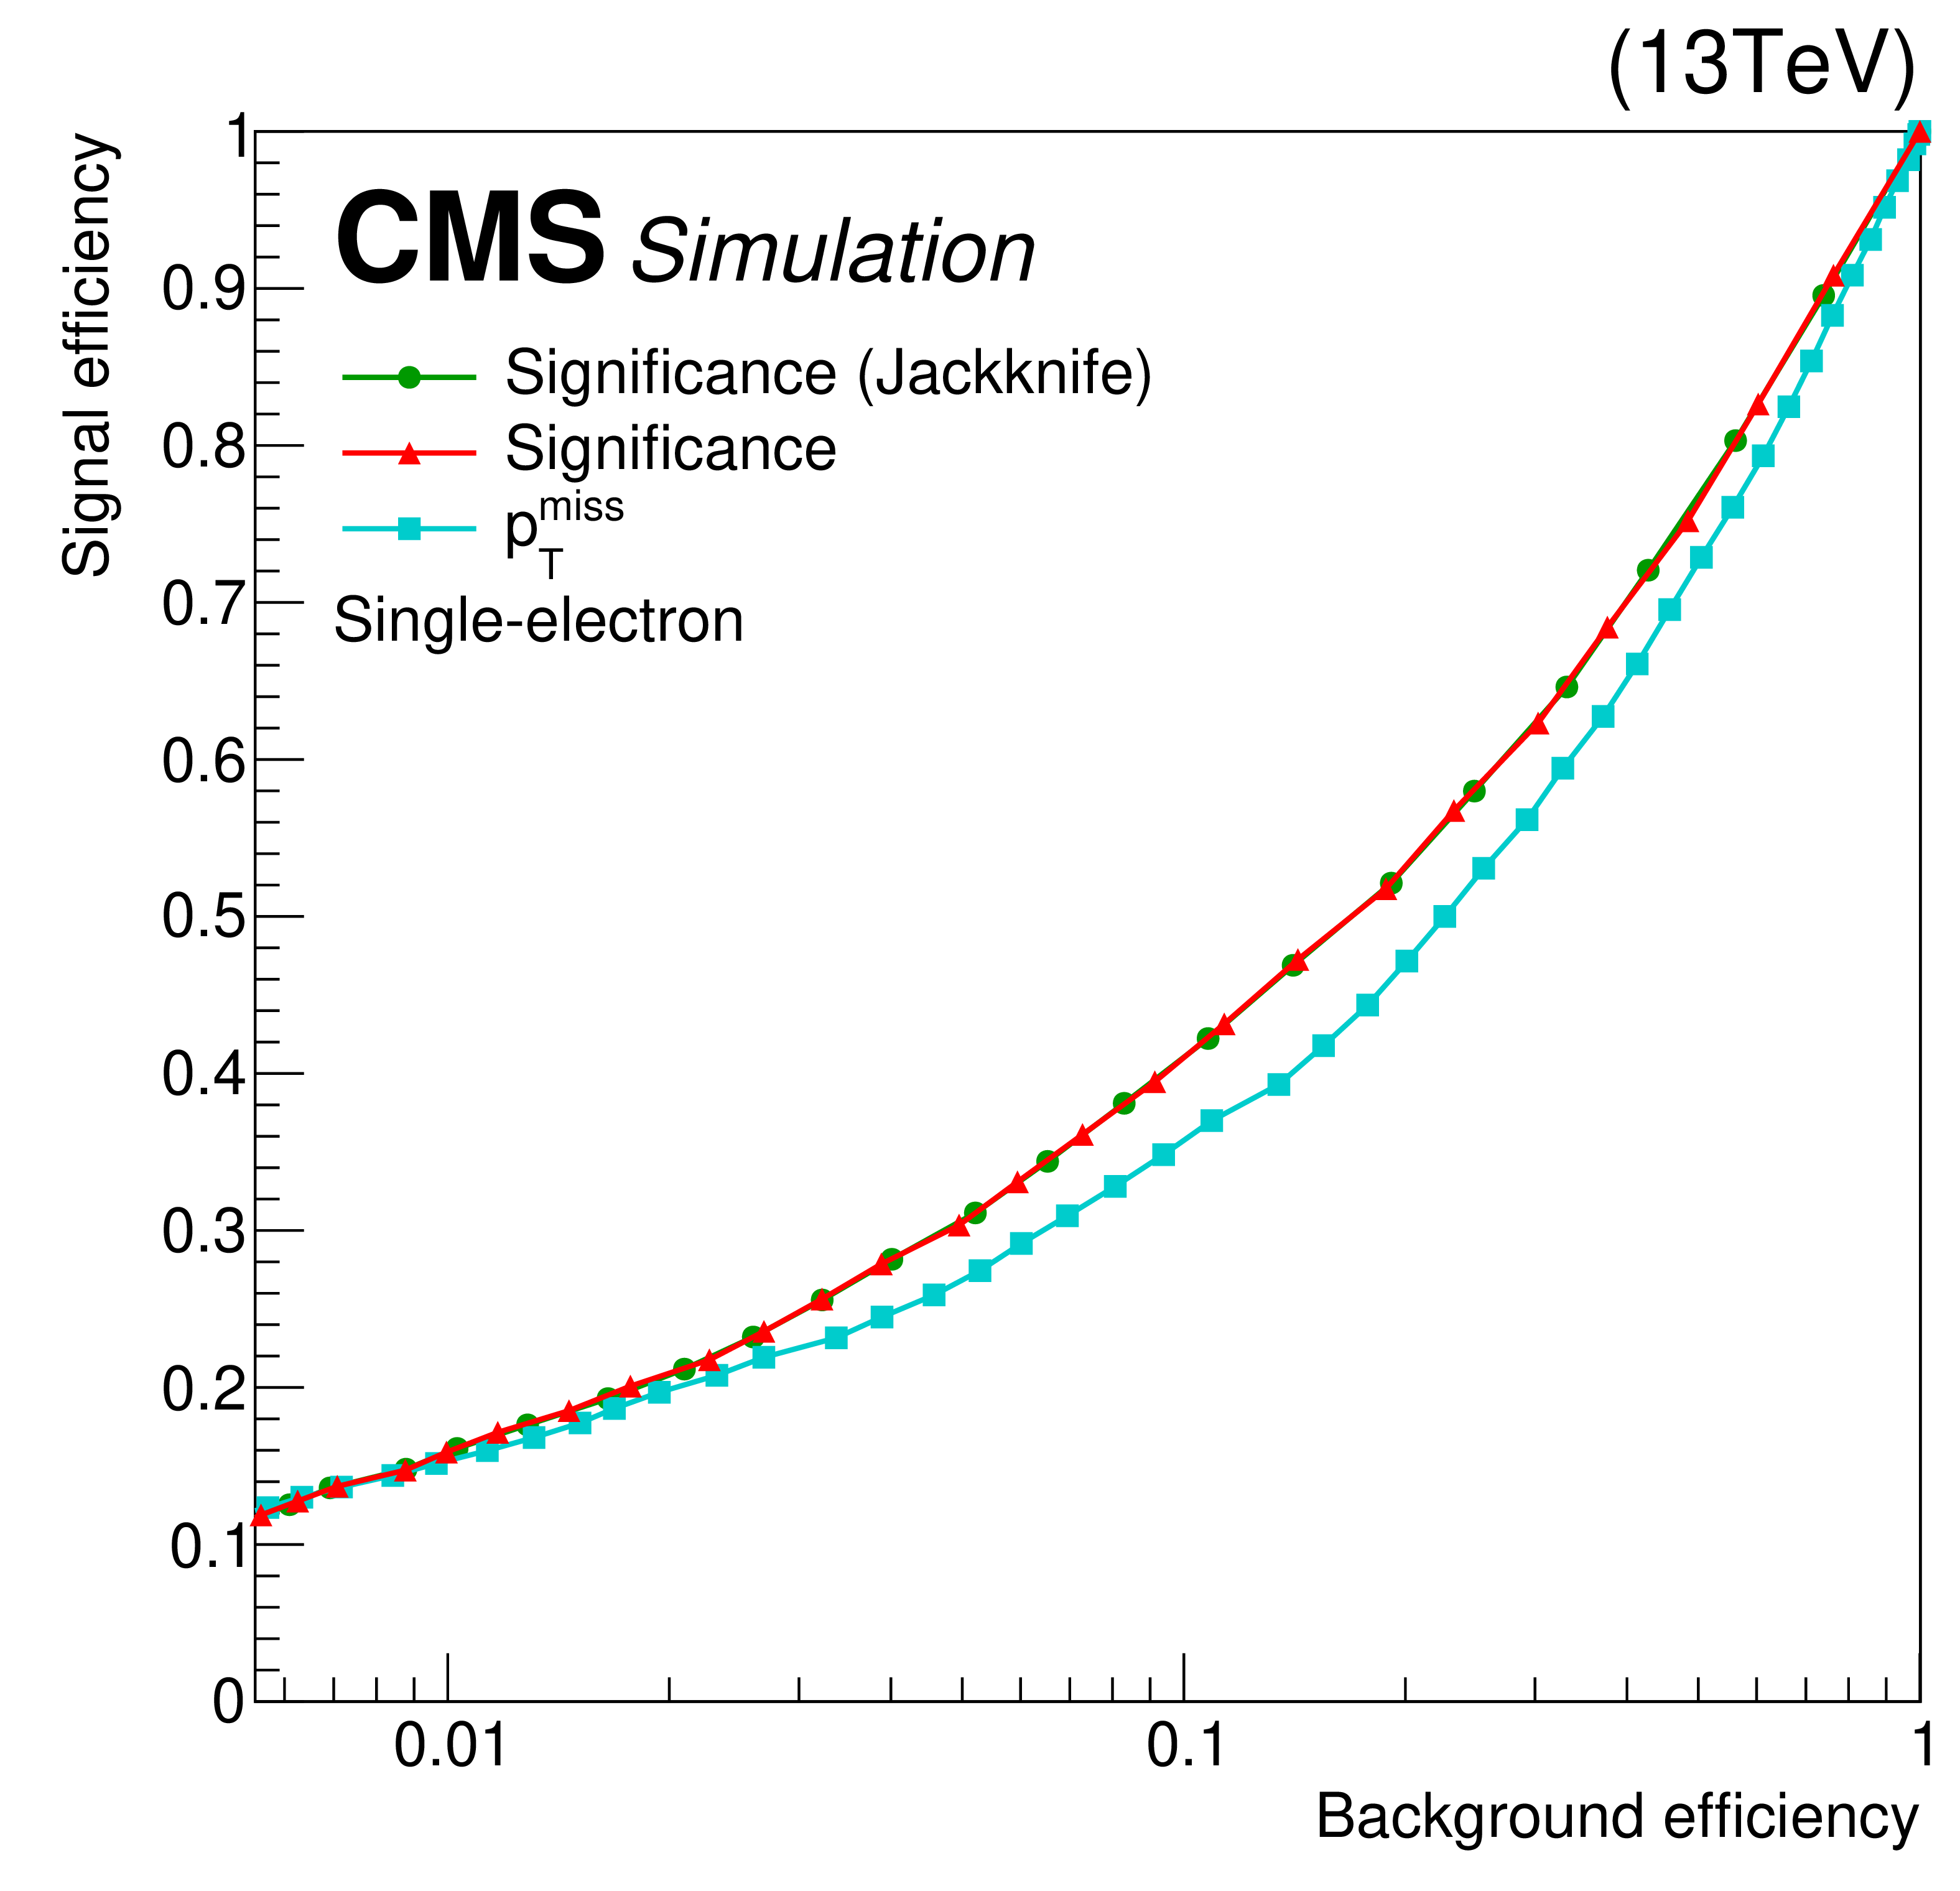
ROC curves comparing the signal (events with genuine ${{p_{\mathrm {T}}} ^\text {miss}}$) versus background (events with no genuine ${{p_{\mathrm {T}}} ^\text {miss}}$) efficiency for the standard version of ${{\mathcal S}}$ (red line), the jackknife version of ${{\mathcal S}}$ (yellow line), and ${{p_{\mathrm {T}}} ^\text {miss}}$ (cyan line) using simulated dimuon events (left) and single-electron events (right). Similar performance is observed between the two versions of ${{\mathcal S}}$, which perform better than ${{p_{\mathrm {T}}} ^\text {miss}}$ especially in regions with small background efficiency. |
png pdf |
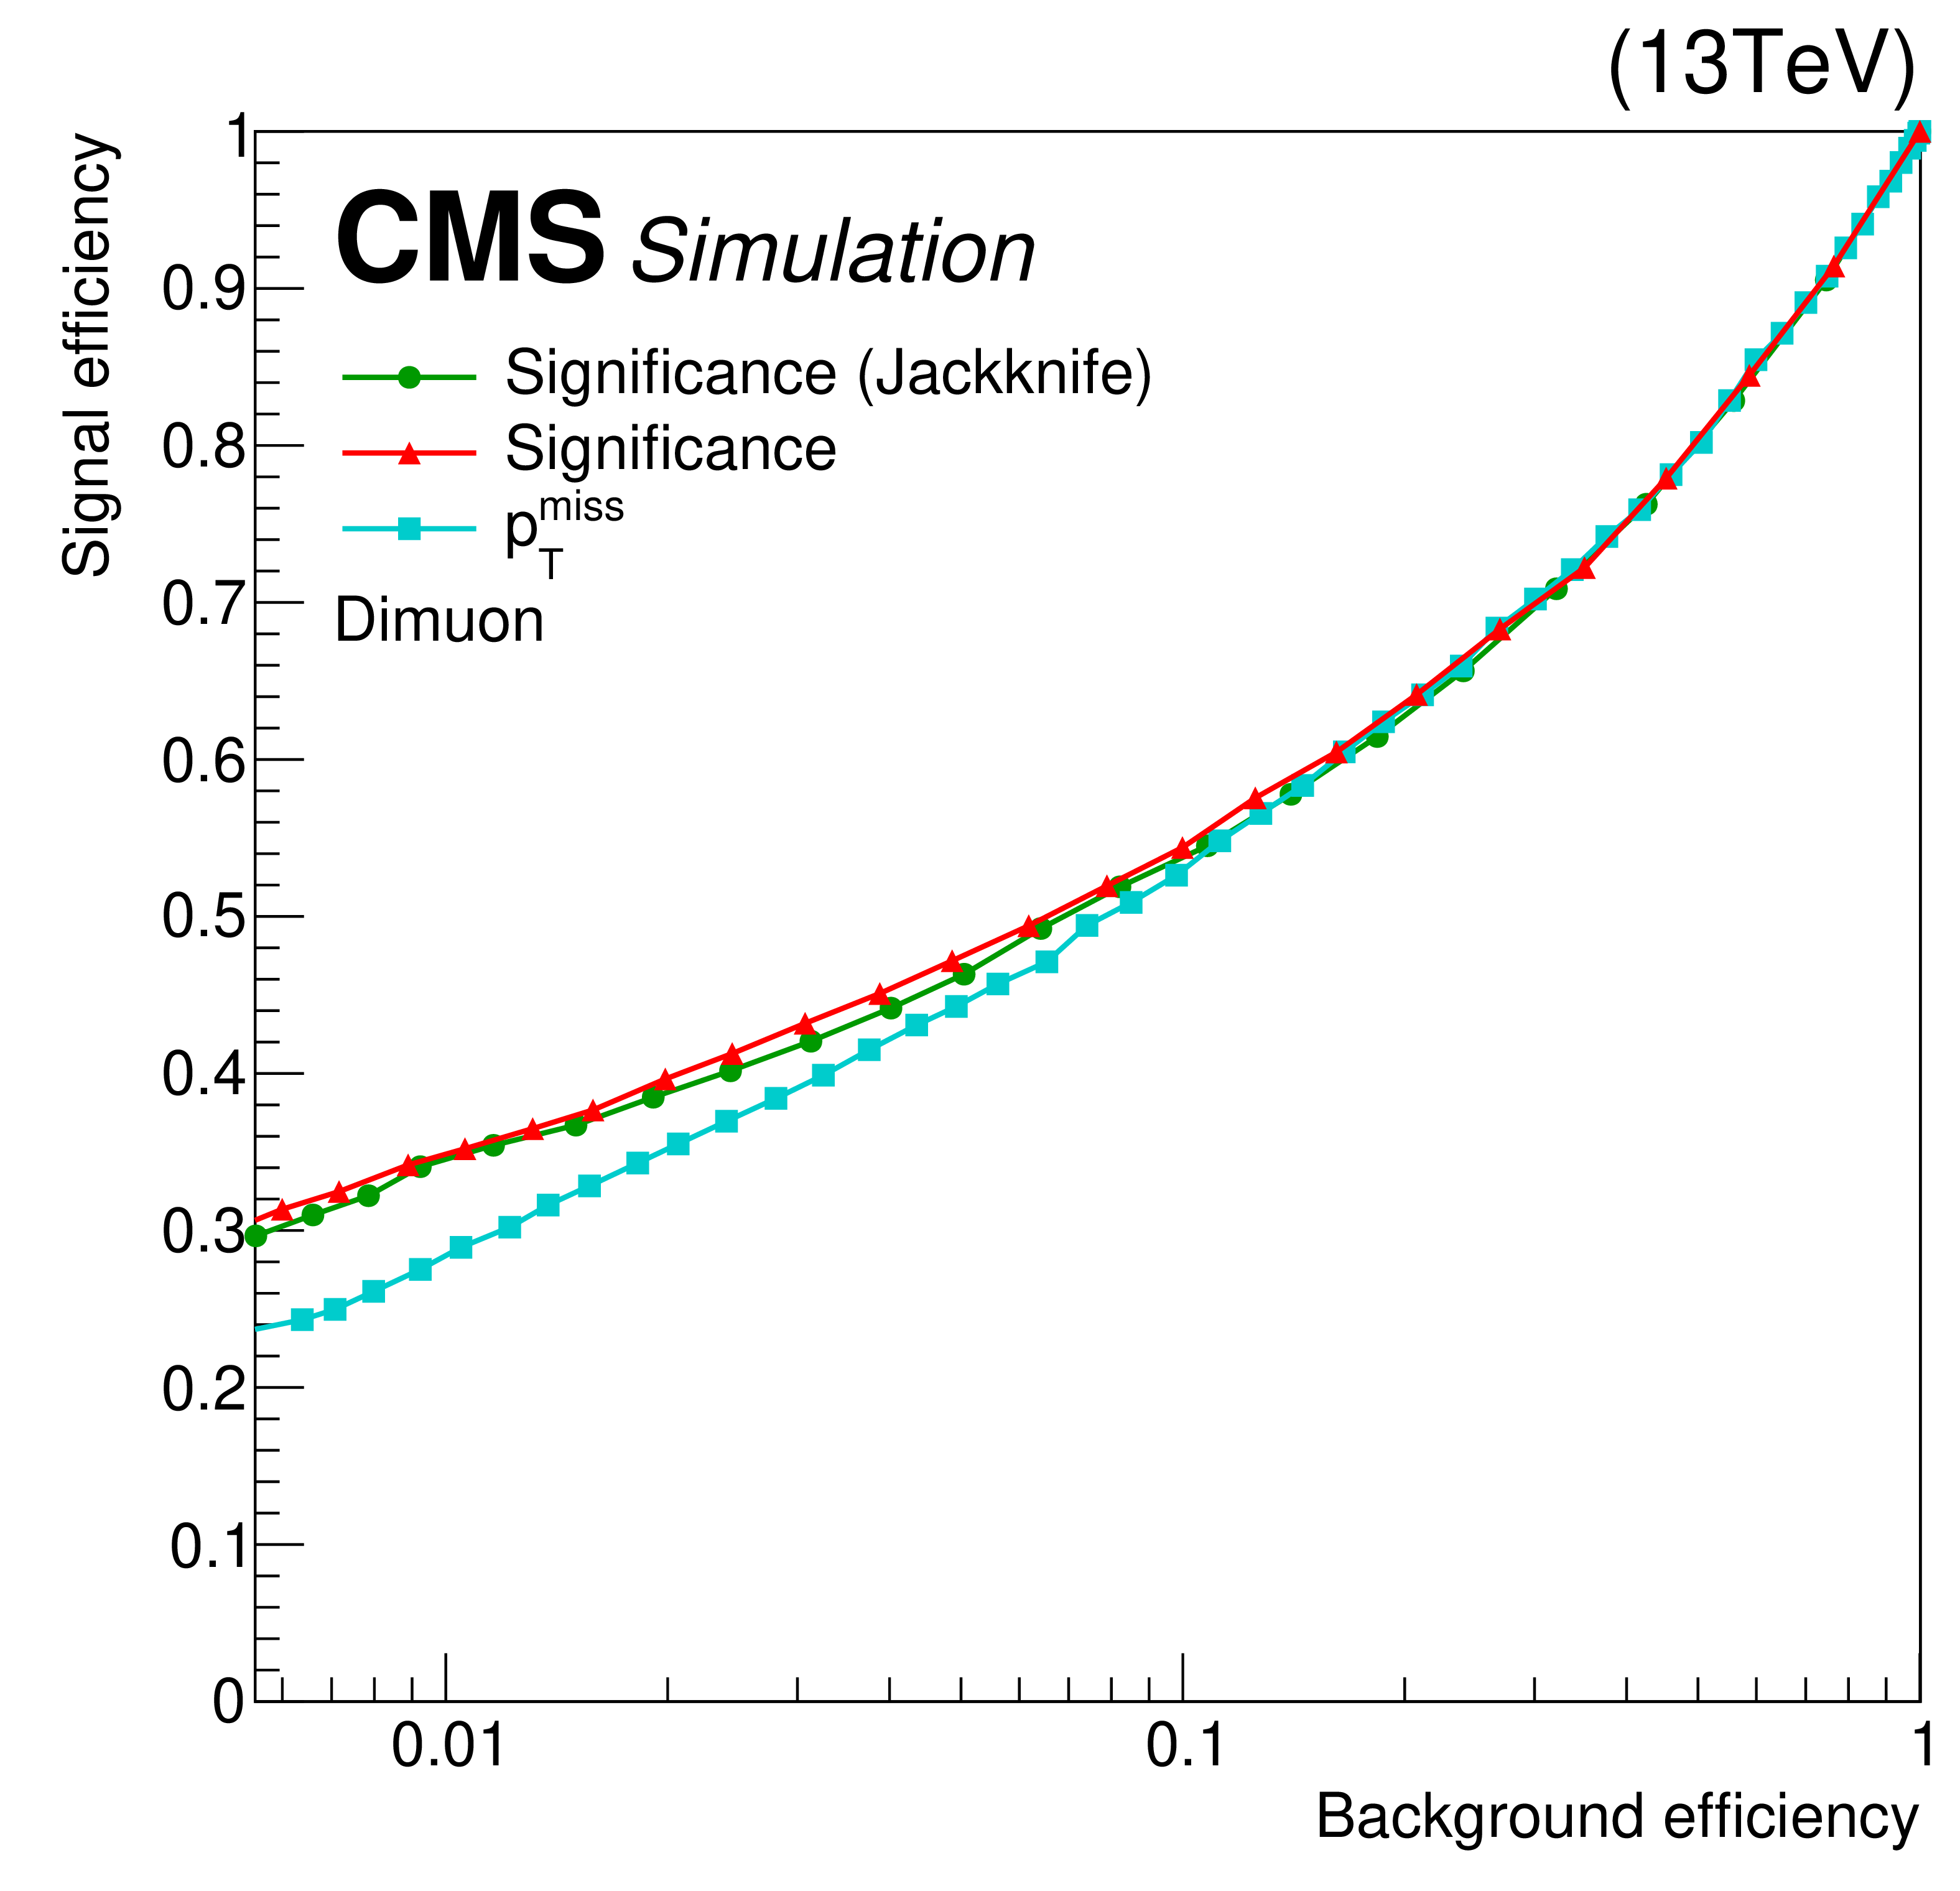
Figure 18-a:
ROC curves comparing the signal (events with genuine ${{p_{\mathrm {T}}} ^\text {miss}}$) versus background (events with no genuine ${{p_{\mathrm {T}}} ^\text {miss}}$) efficiency for the standard version of ${{\mathcal S}}$ (red line), the jackknife version of ${{\mathcal S}}$ (yellow line), and ${{p_{\mathrm {T}}} ^\text {miss}}$ (cyan line) using simulated dimuon events (right). Similar performance is observed between the two versions of ${{\mathcal S}}$, which perform better than ${{p_{\mathrm {T}}} ^\text {miss}}$ especially in regions with small background efficiency. |
png pdf |
Figure 18-b:
ROC curves comparing the signal (events with genuine ${{p_{\mathrm {T}}} ^\text {miss}}$) versus background (events with no genuine ${{p_{\mathrm {T}}} ^\text {miss}}$) efficiency for the standard version of ${{\mathcal S}}$ (red line), the jackknife version of ${{\mathcal S}}$ (yellow line), and ${{p_{\mathrm {T}}} ^\text {miss}}$ (cyan line) using simulated single-electron events (right). Similar performance is observed between the two versions of ${{\mathcal S}}$, which perform better than ${{p_{\mathrm {T}}} ^\text {miss}}$ especially in regions with small background efficiency. |
png pdf |
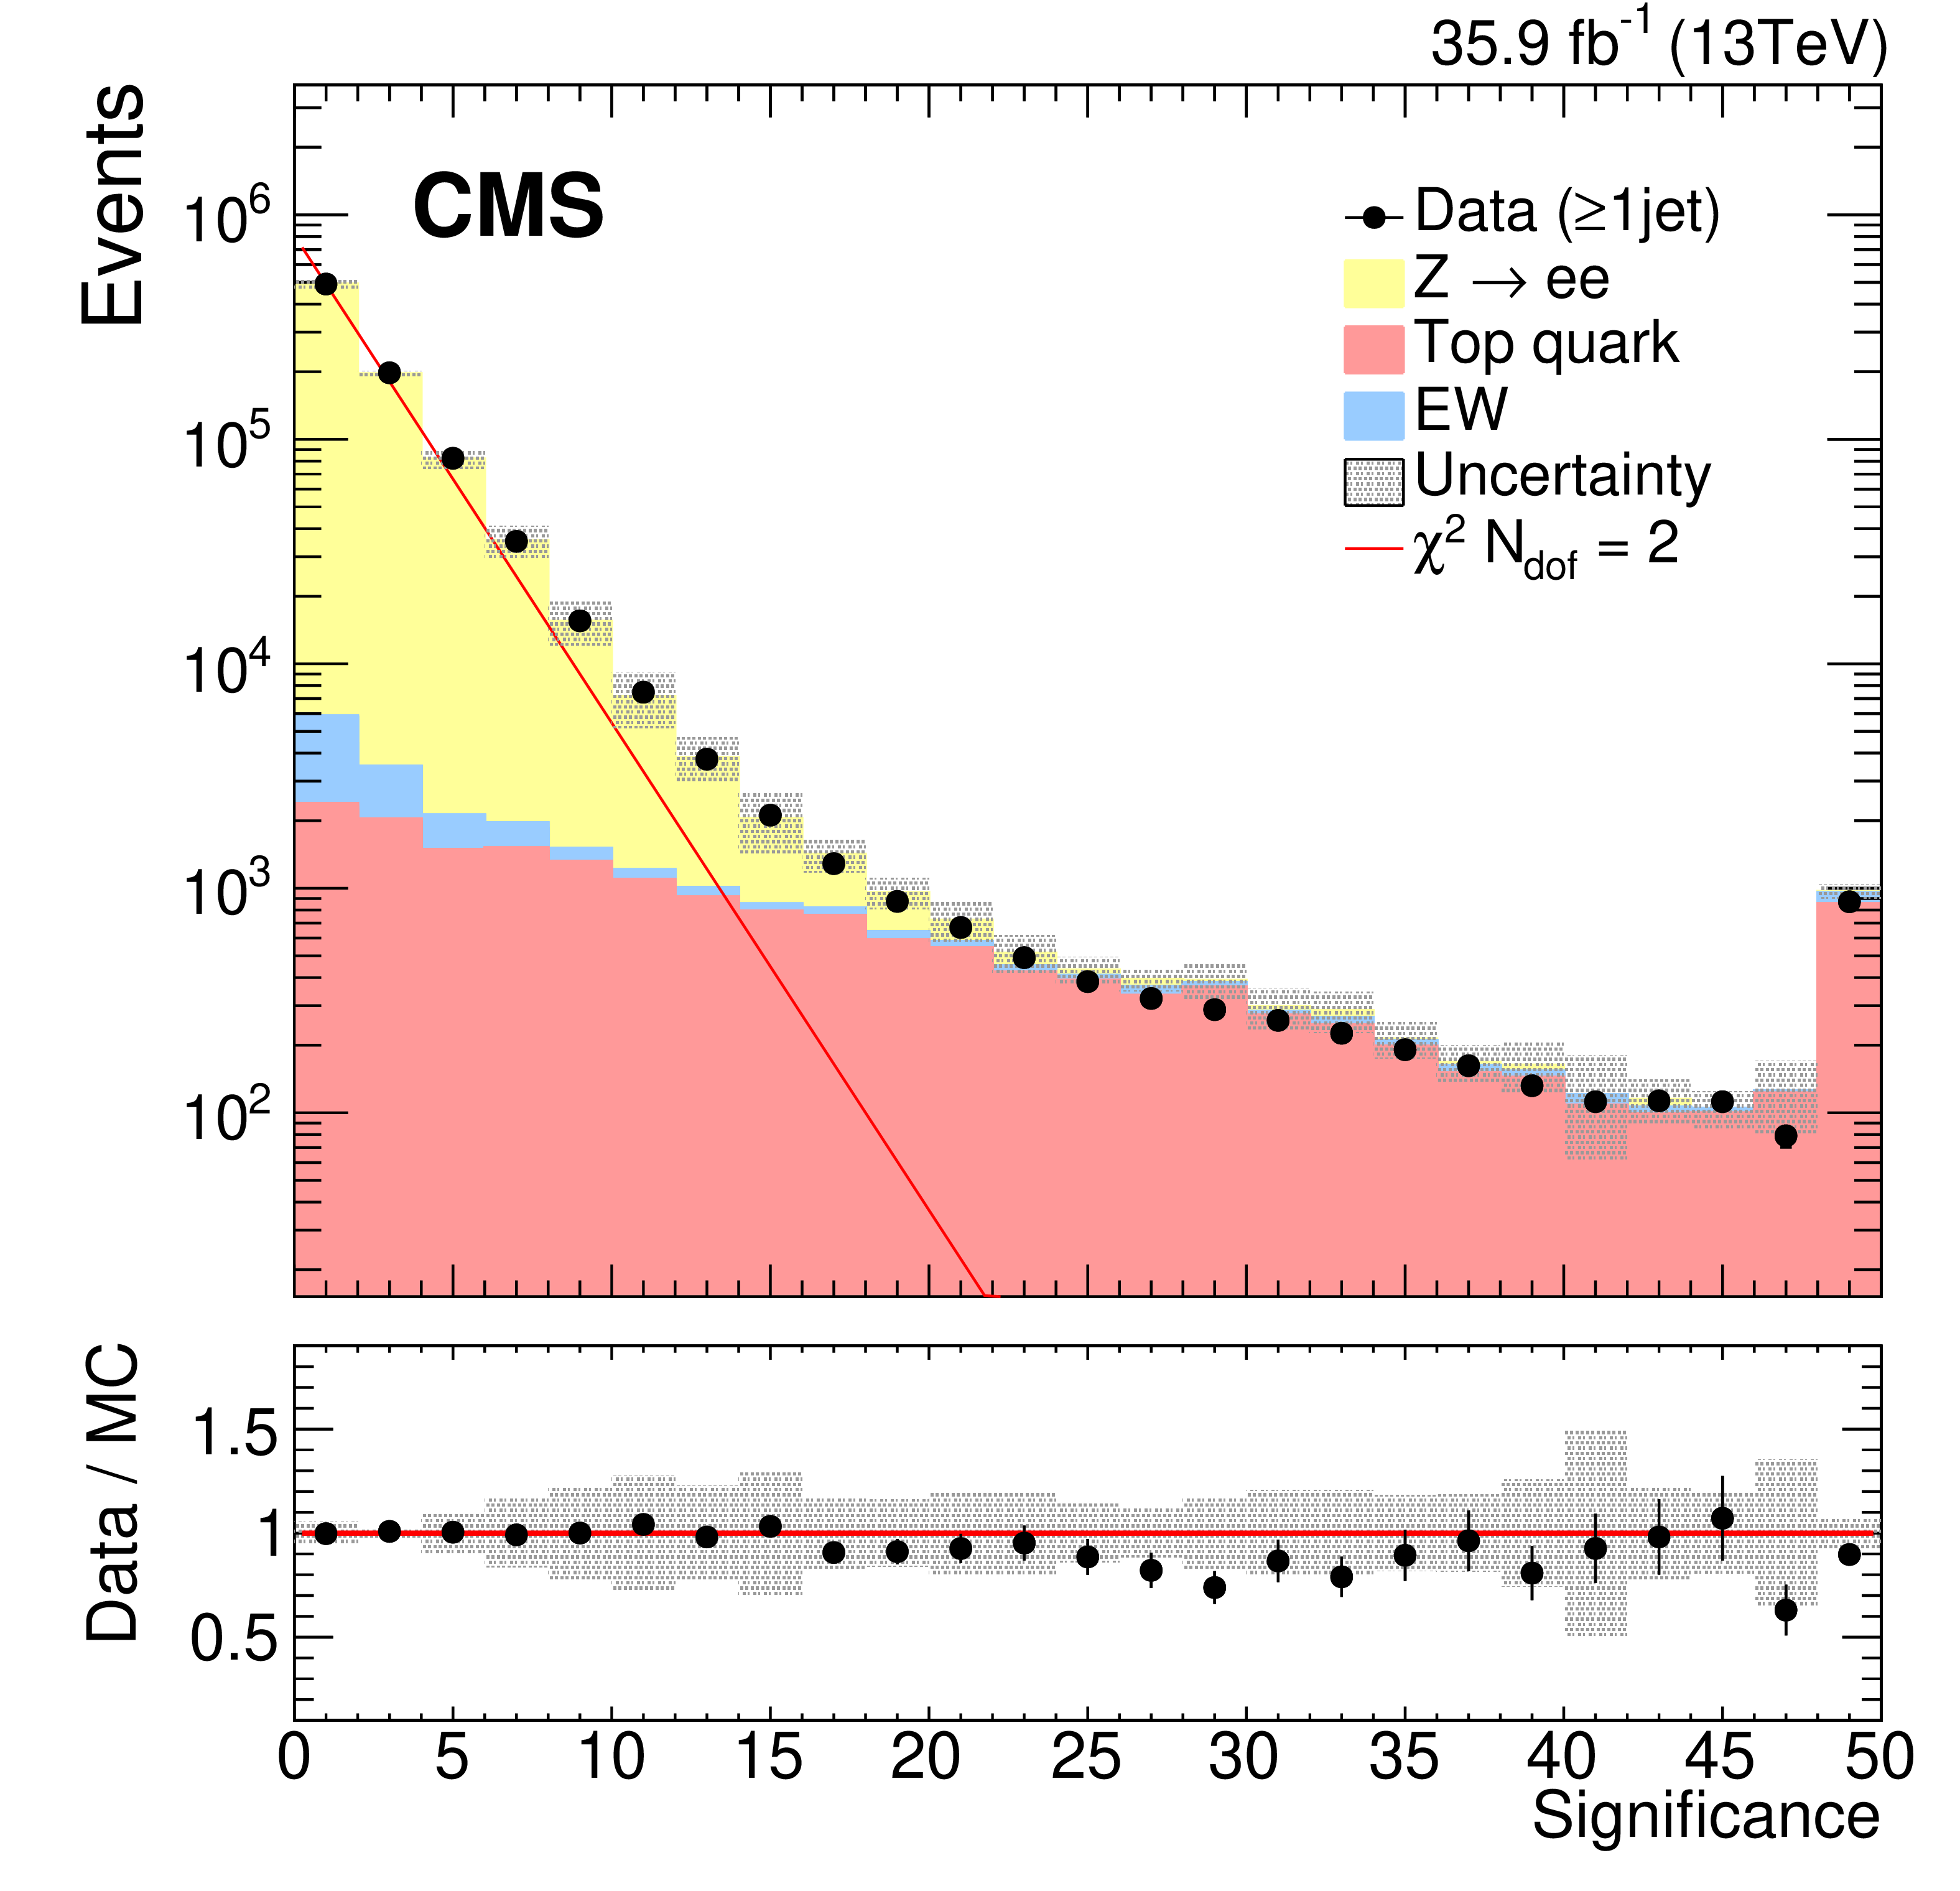
Figure 19:
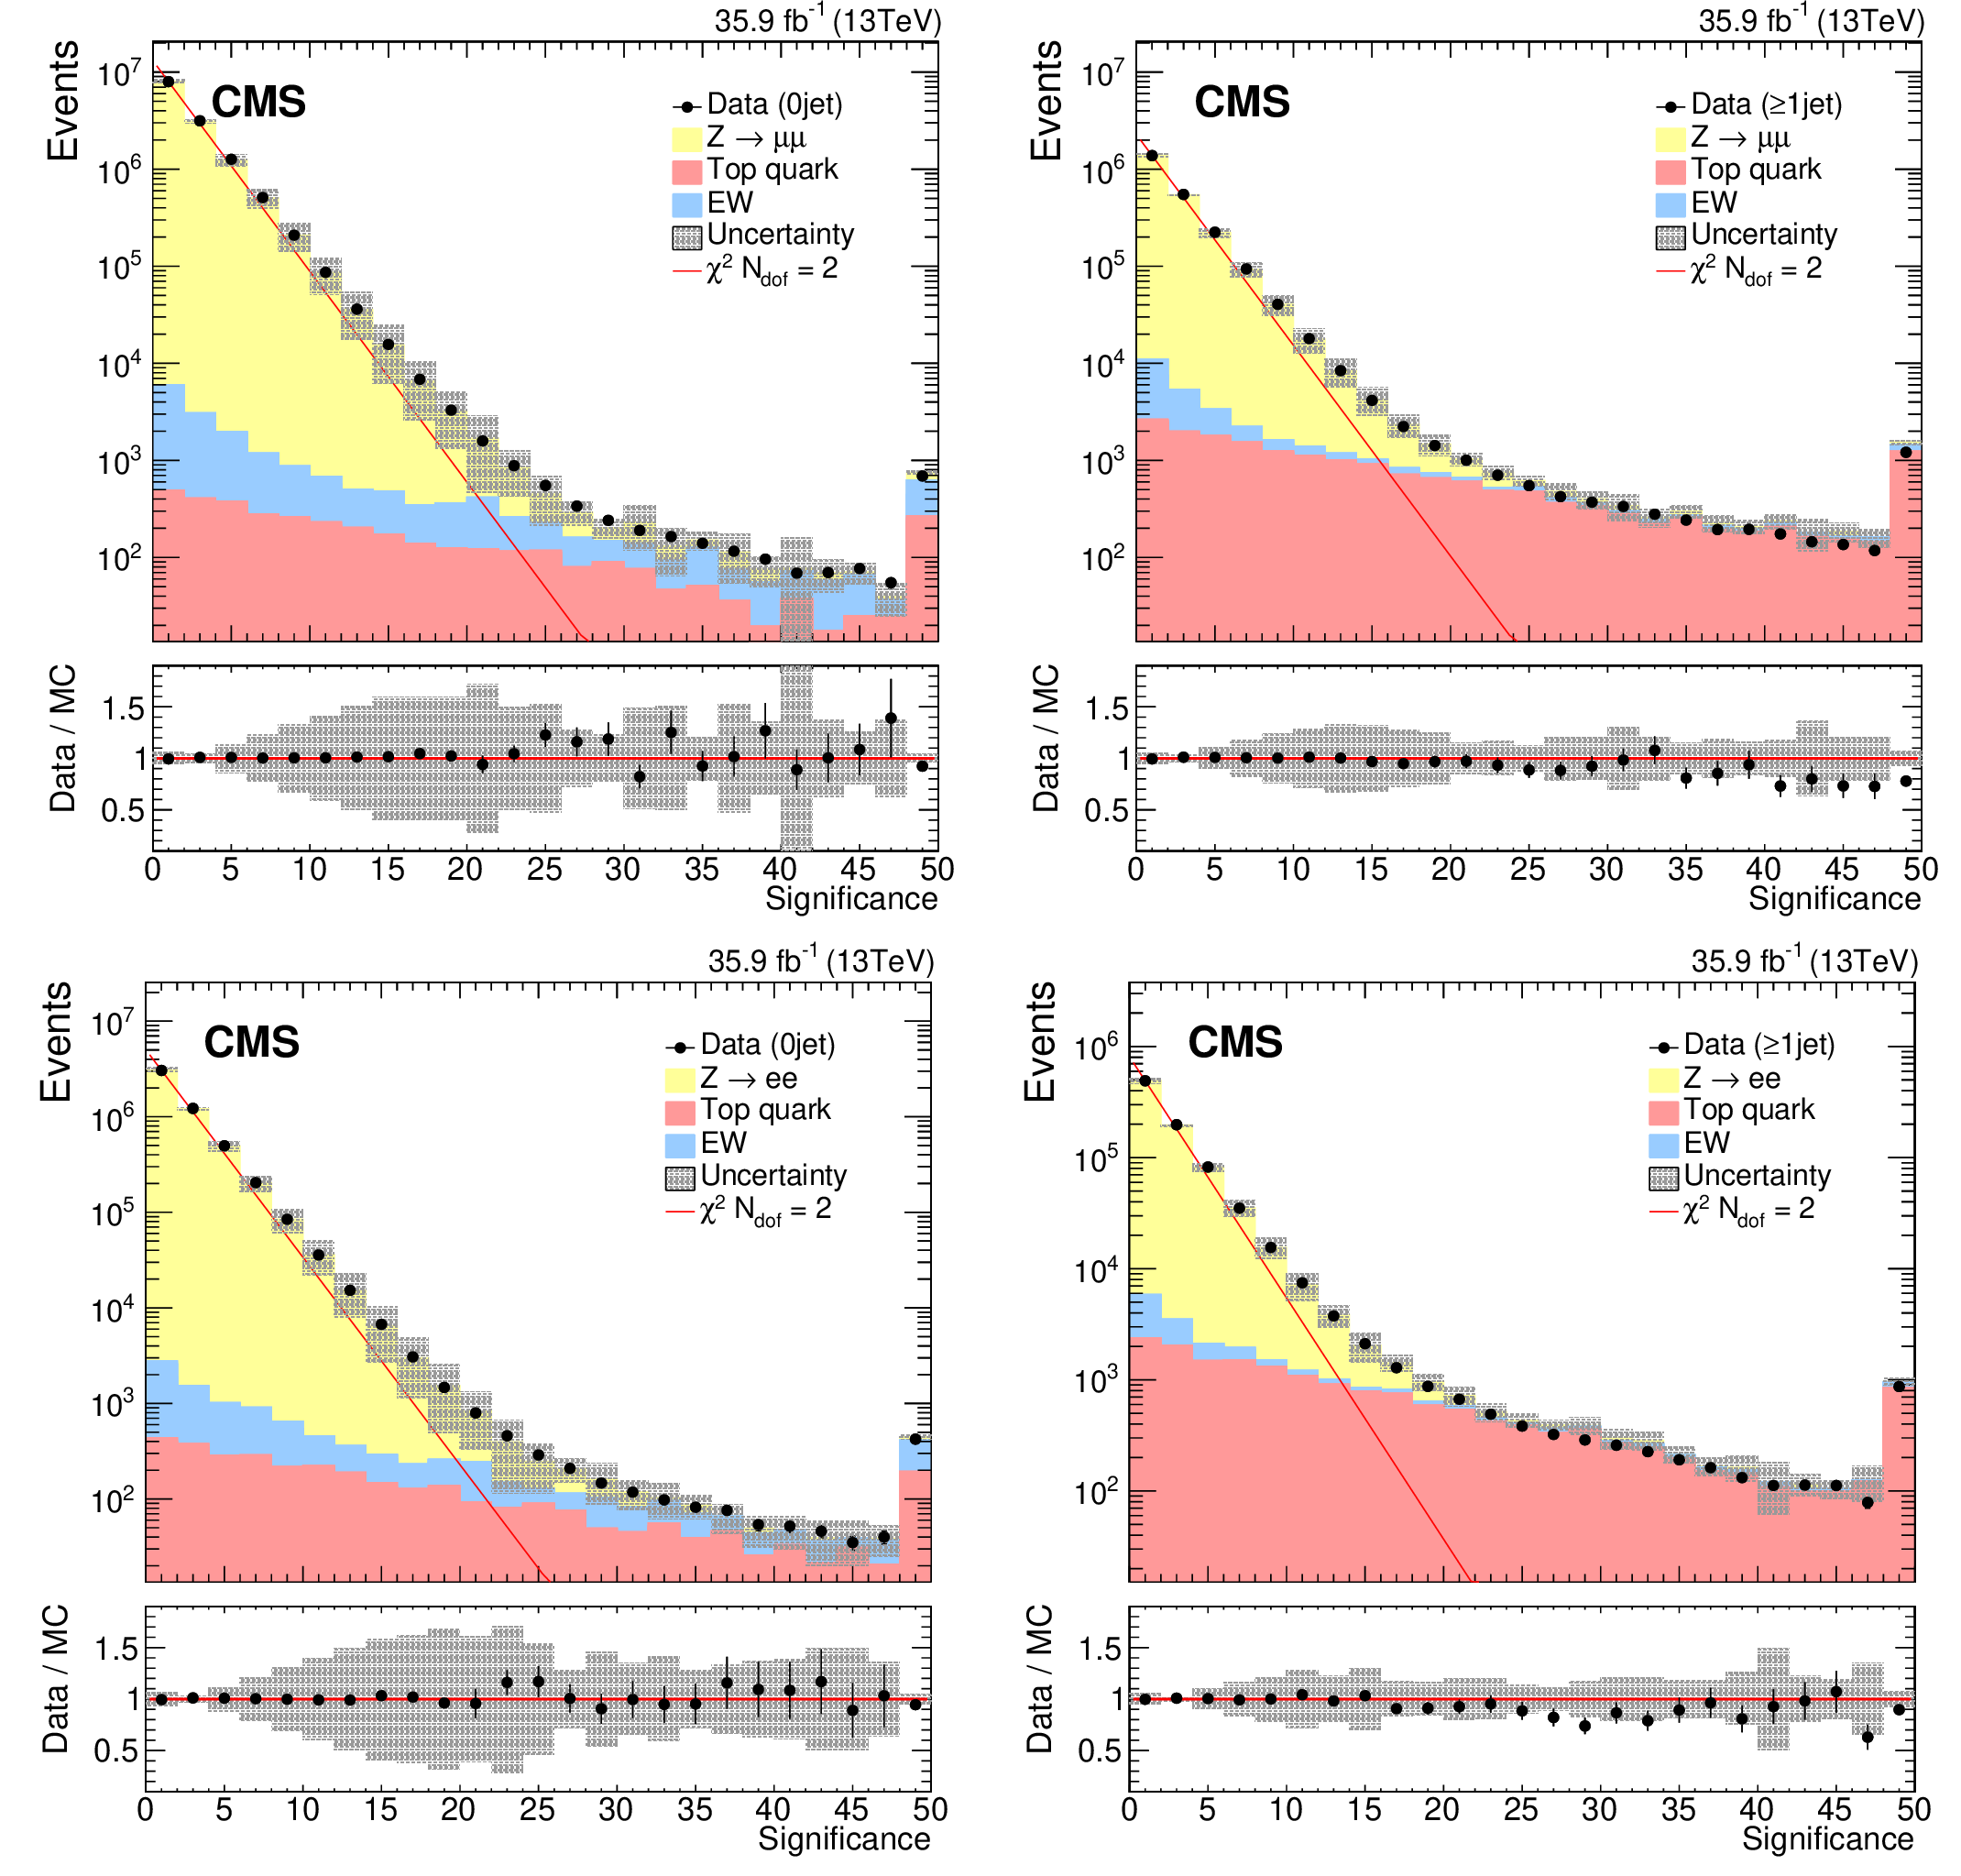
Distributions of ${{\mathcal S}}$ in data and simulation in dimuon (upper) and dielectron (lower) samples, for events with zero jet (left) and $\geq $ 1 jet (right). The last bin includes all events with $ {{\mathcal S}} > $ 48. The red straight line corresponds to a $\chi ^2$ distribution with two degrees of freedom. The bands in the bottom panel display systematic uncertainties due to effects from the JES, the JER, and variations in the $E_{U}$ in simulation. Good agreement between data and simulation is observed. |
png pdf |
Figure 19-a:
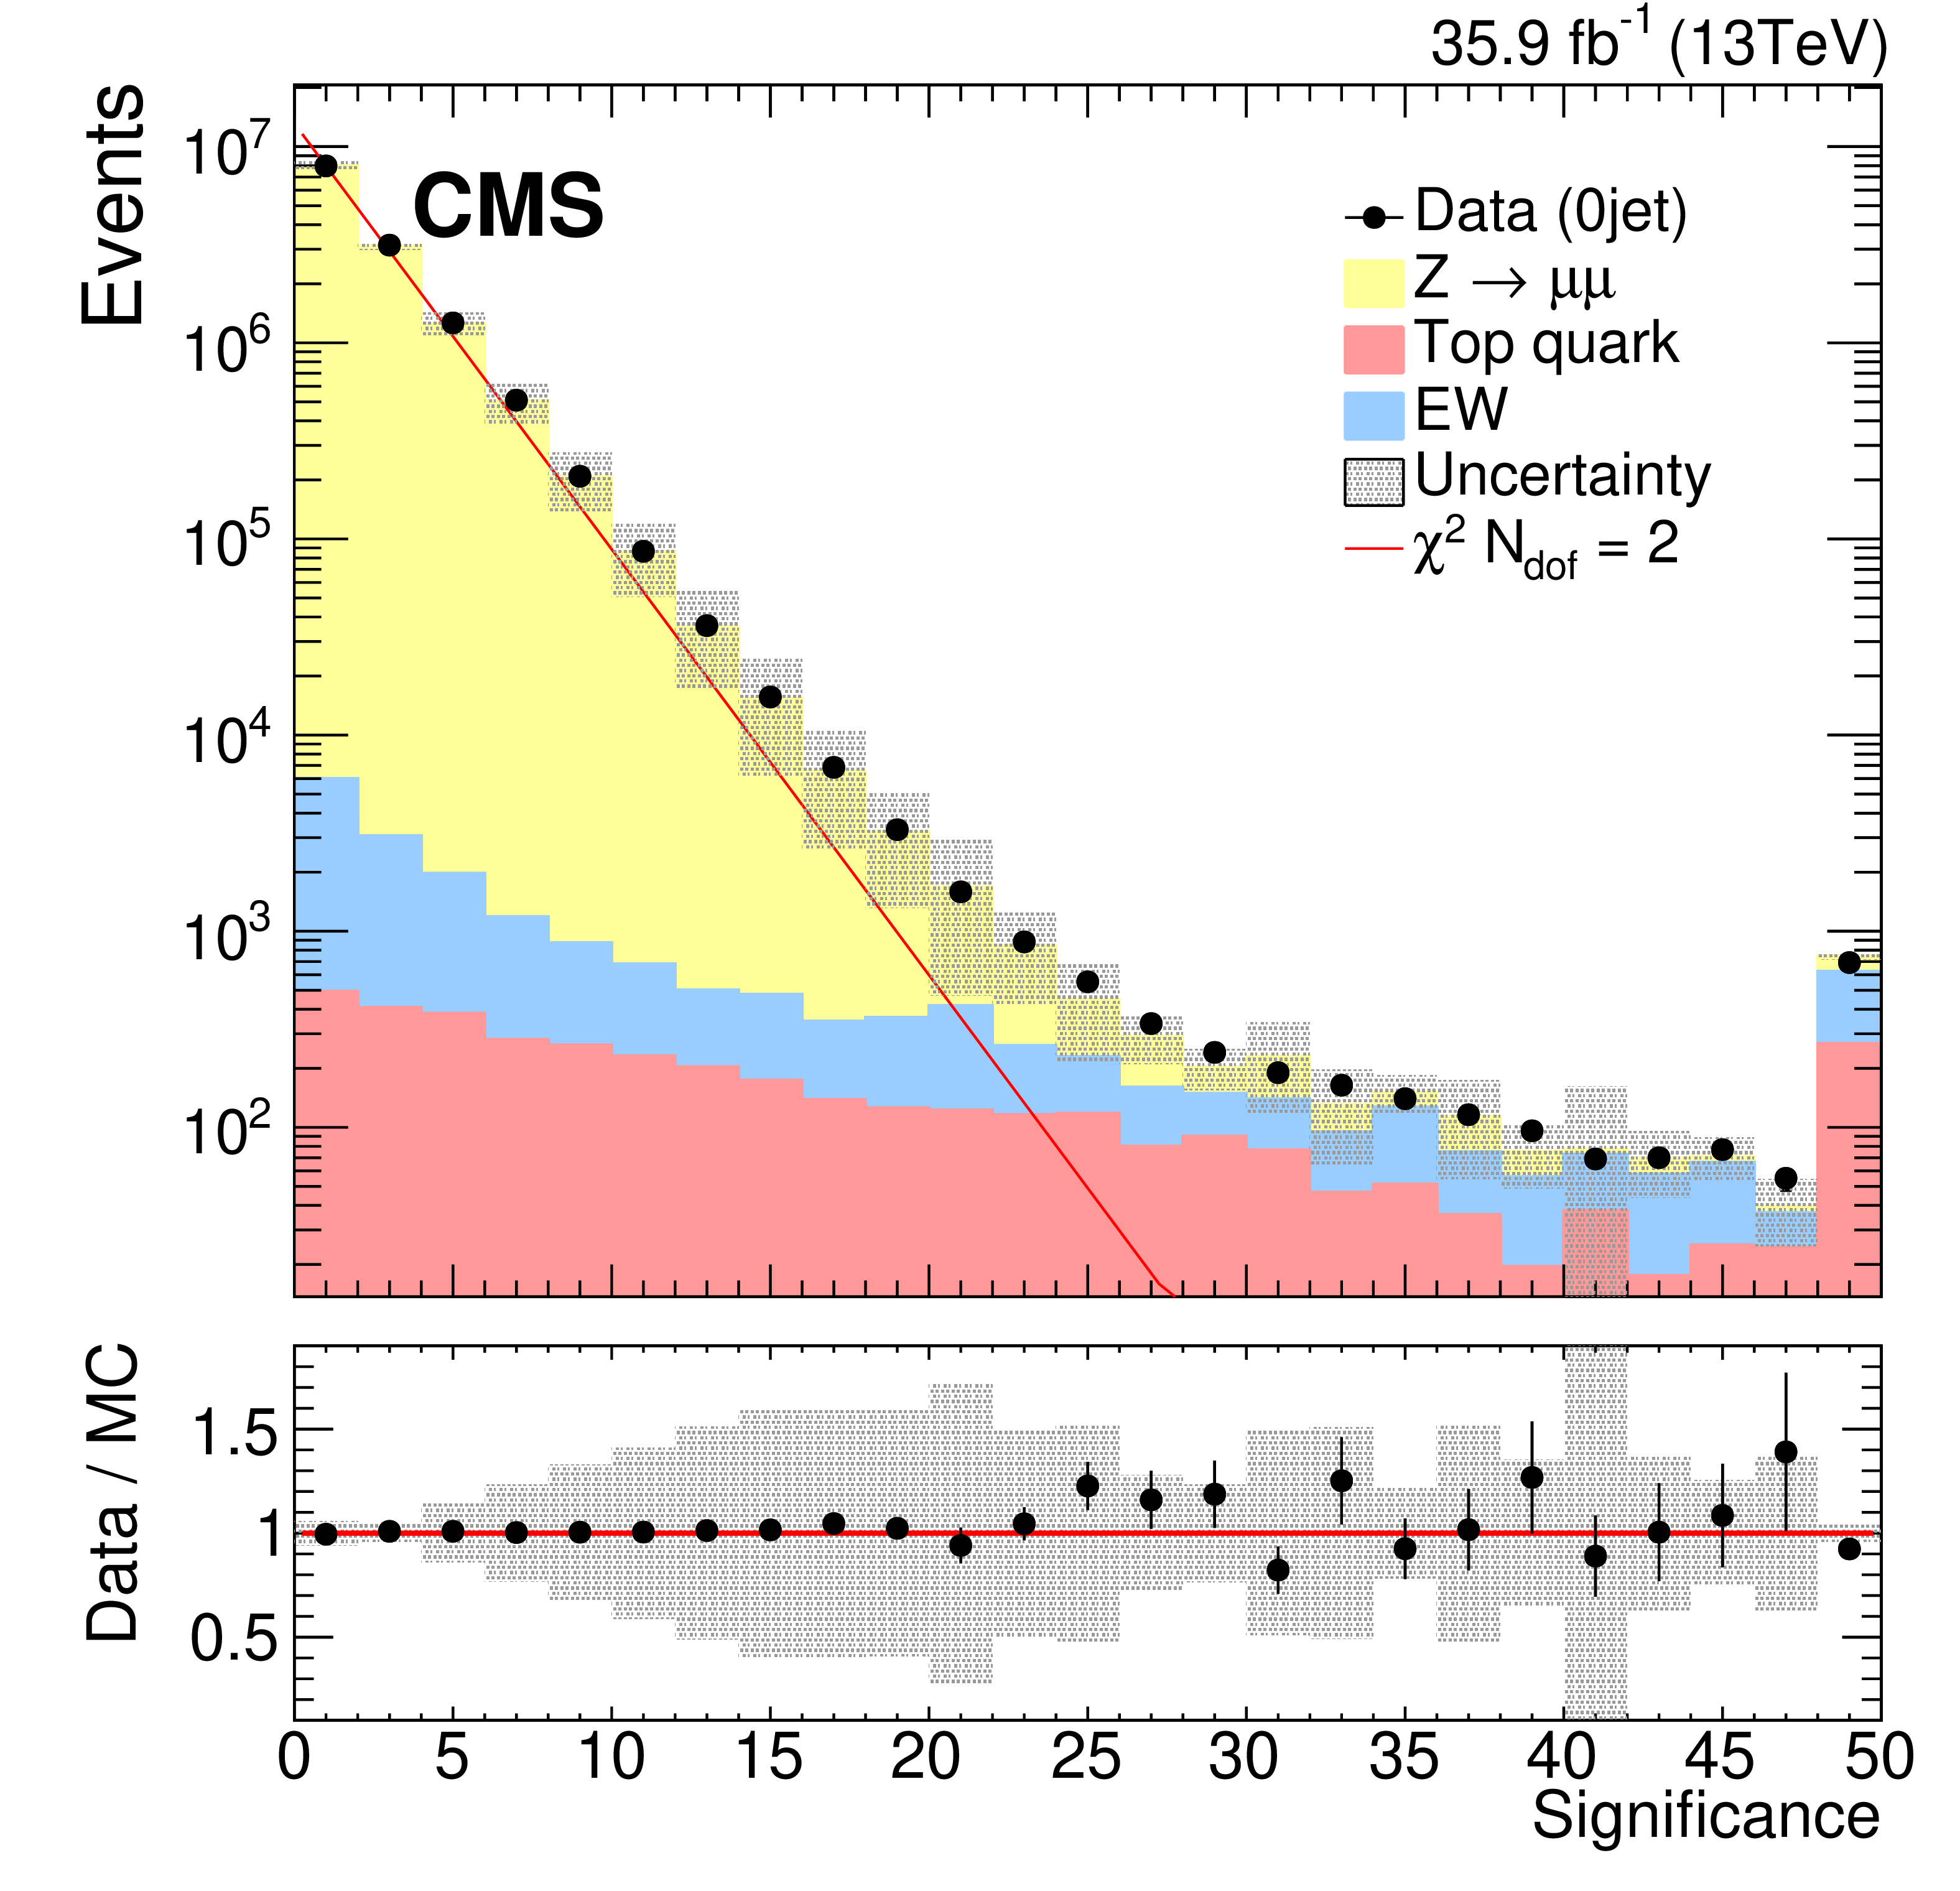
Distribution of ${{\mathcal S}}$ in data and simulation in the dimuon sample, for events with zero jet. The last bin includes all events with $ {{\mathcal S}} > $ 48. The red straight line corresponds to a $\chi ^2$ distribution with two degrees of freedom. The bands in the bottom panel display systematic uncertainties due to effects from the JES, the JER, and variations in the $E_{U}$ in simulation. Good agreement between data and simulation is observed. |

png pdf |
Figure 19-b:
Distribution of ${{\mathcal S}}$ in data and simulation in the dimuon sample, for events with$\geq $ 1 jet. The last bin includes all events with $ {{\mathcal S}} > $ 48. The red straight line corresponds to a $\chi ^2$ distribution with two degrees of freedom. The bands in the bottom panel display systematic uncertainties due to effects from the JES, the JER, and variations in the $E_{U}$ in simulation. Good agreement between data and simulation is observed. |
png pdf |
Figure 19-c:
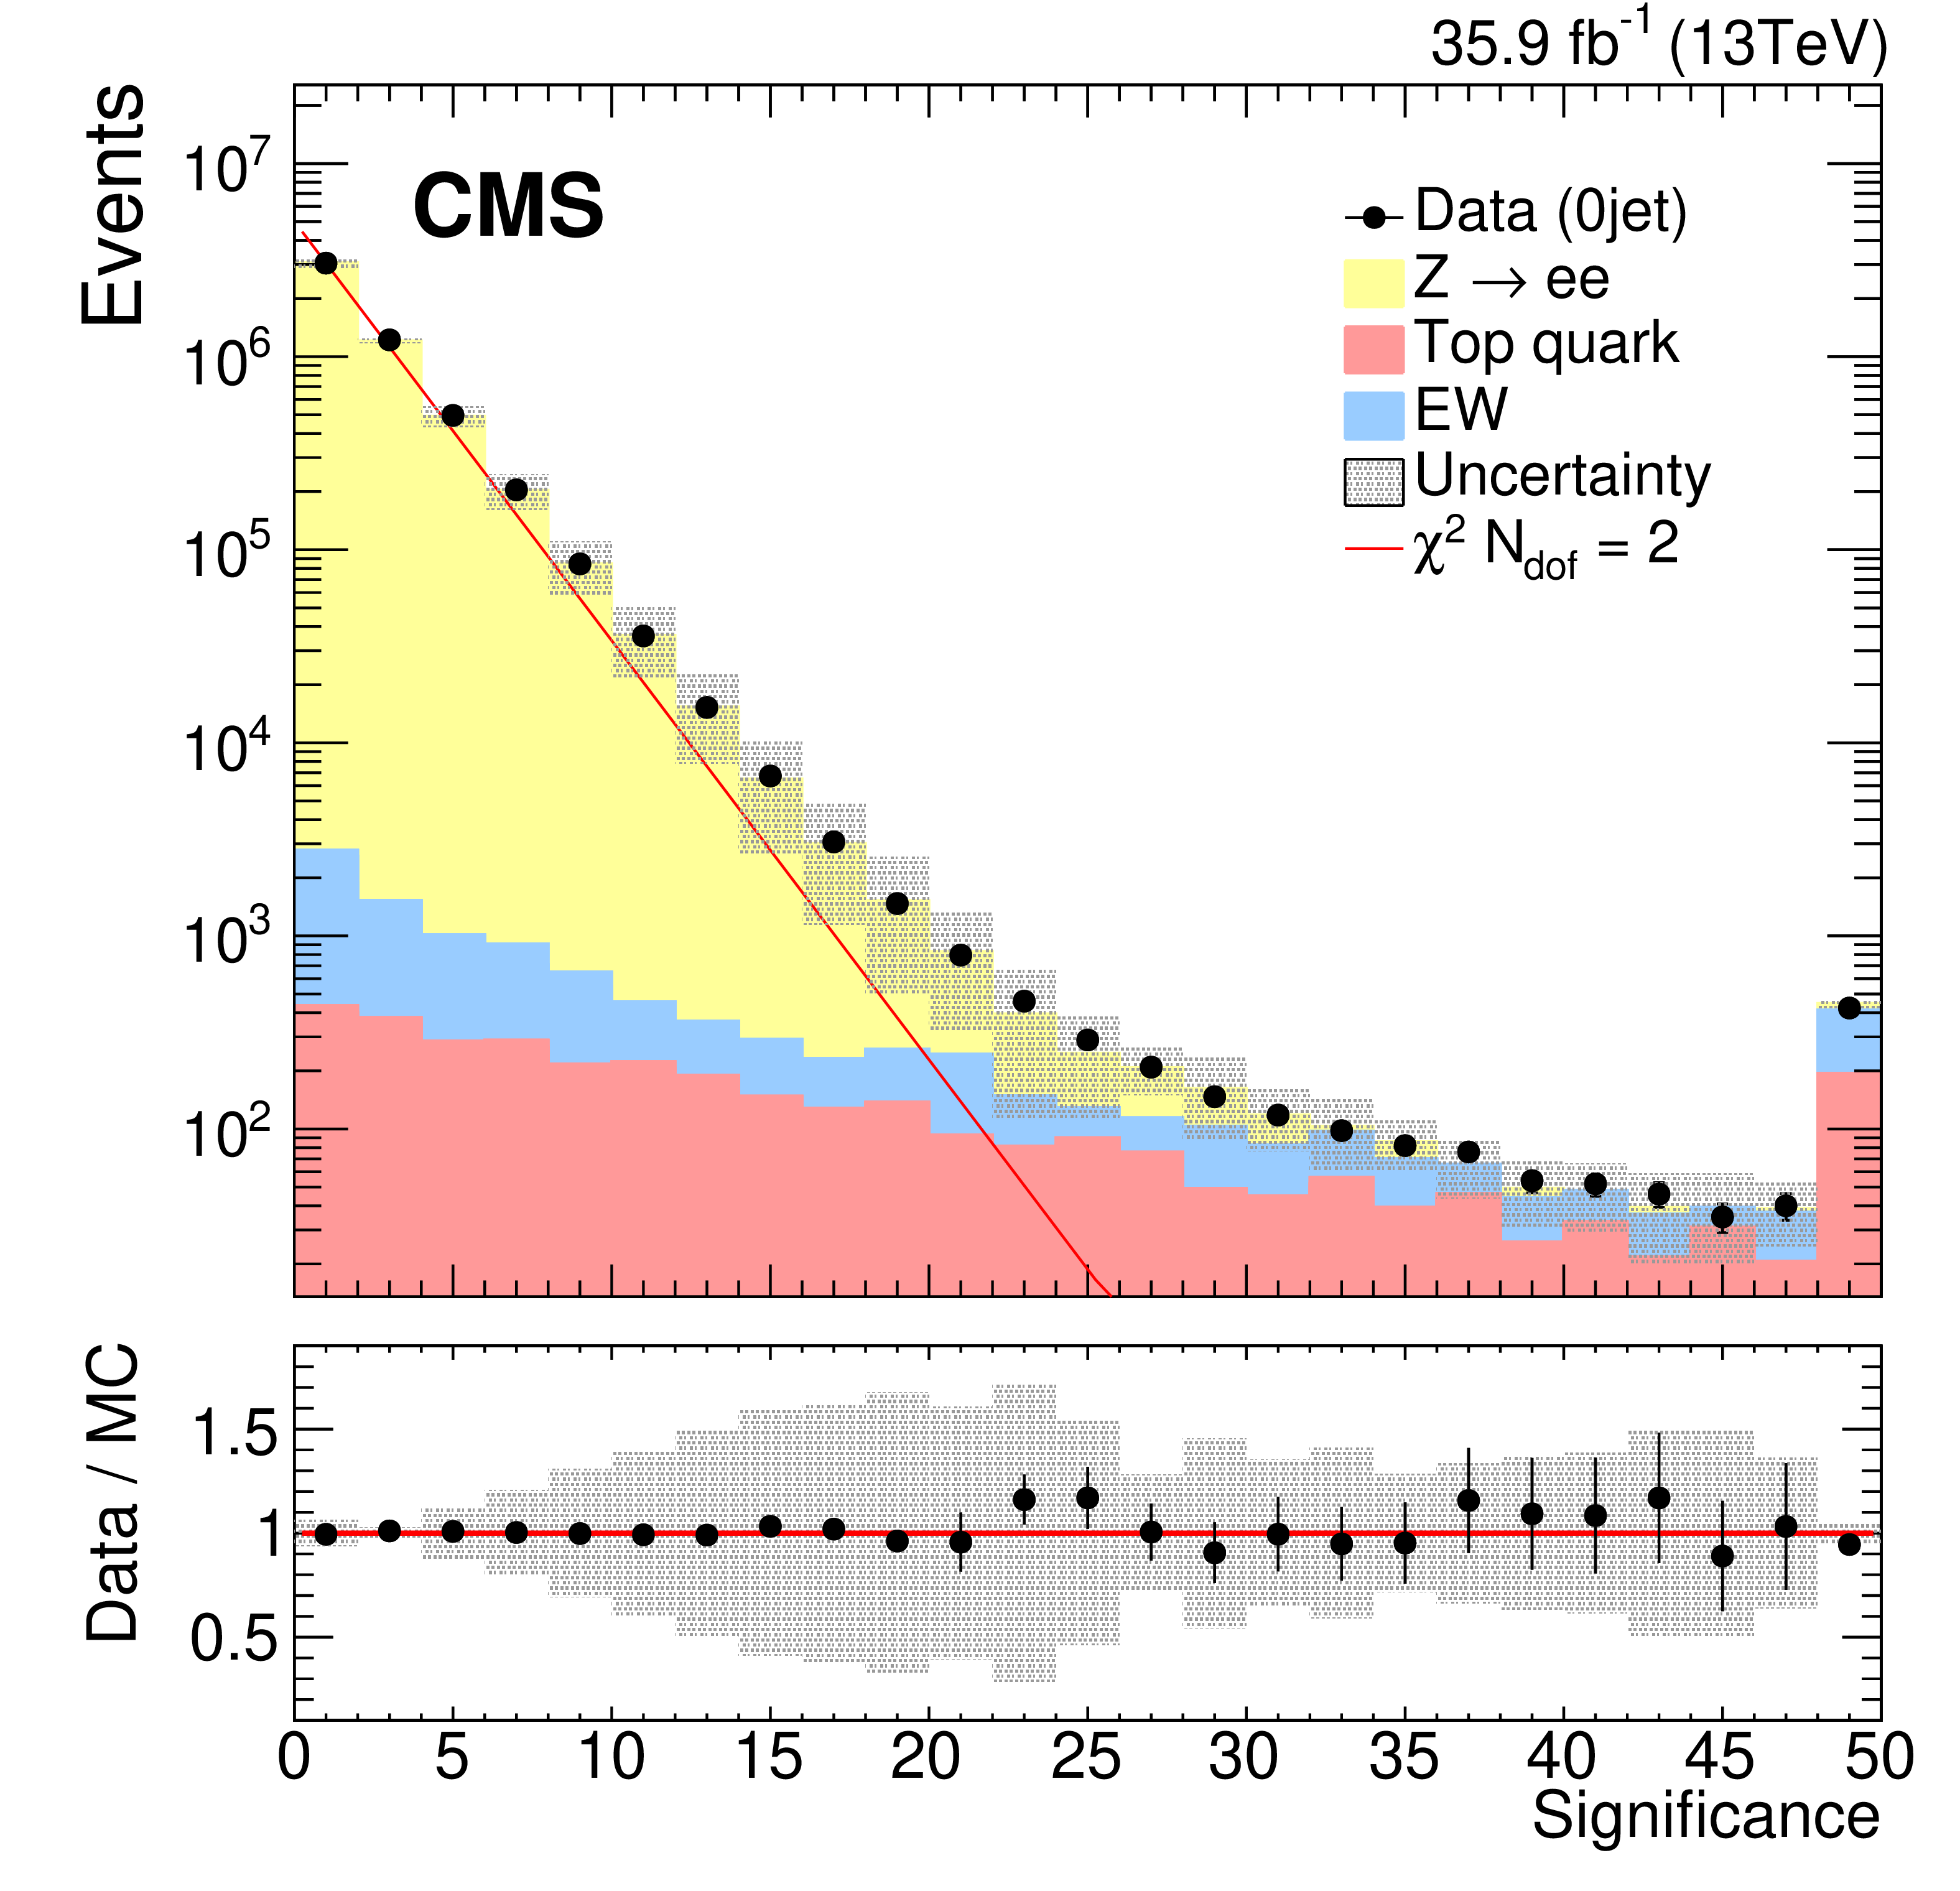
Distribution of ${{\mathcal S}}$ in data and simulation in the dielectron sample, for events with zero jet. The last bin includes all events with $ {{\mathcal S}} > $ 48. The red straight line corresponds to a $\chi ^2$ distribution with two degrees of freedom. The bands in the bottom panel display systematic uncertainties due to effects from the JES, the JER, and variations in the $E_{U}$ in simulation. Good agreement between data and simulation is observed. |
png pdf |
Figure 19-d:
Distribution of ${{\mathcal S}}$ in data and simulation in the dielectron sample, for events with $\geq $ 1 jet. The last bin includes all events with $ {{\mathcal S}} > $ 48. The red straight line corresponds to a $\chi ^2$ distribution with two degrees of freedom. The bands in the bottom panel display systematic uncertainties due to effects from the JES, the JER, and variations in the $E_{U}$ in simulation. Good agreement between data and simulation is observed. |
png pdf |
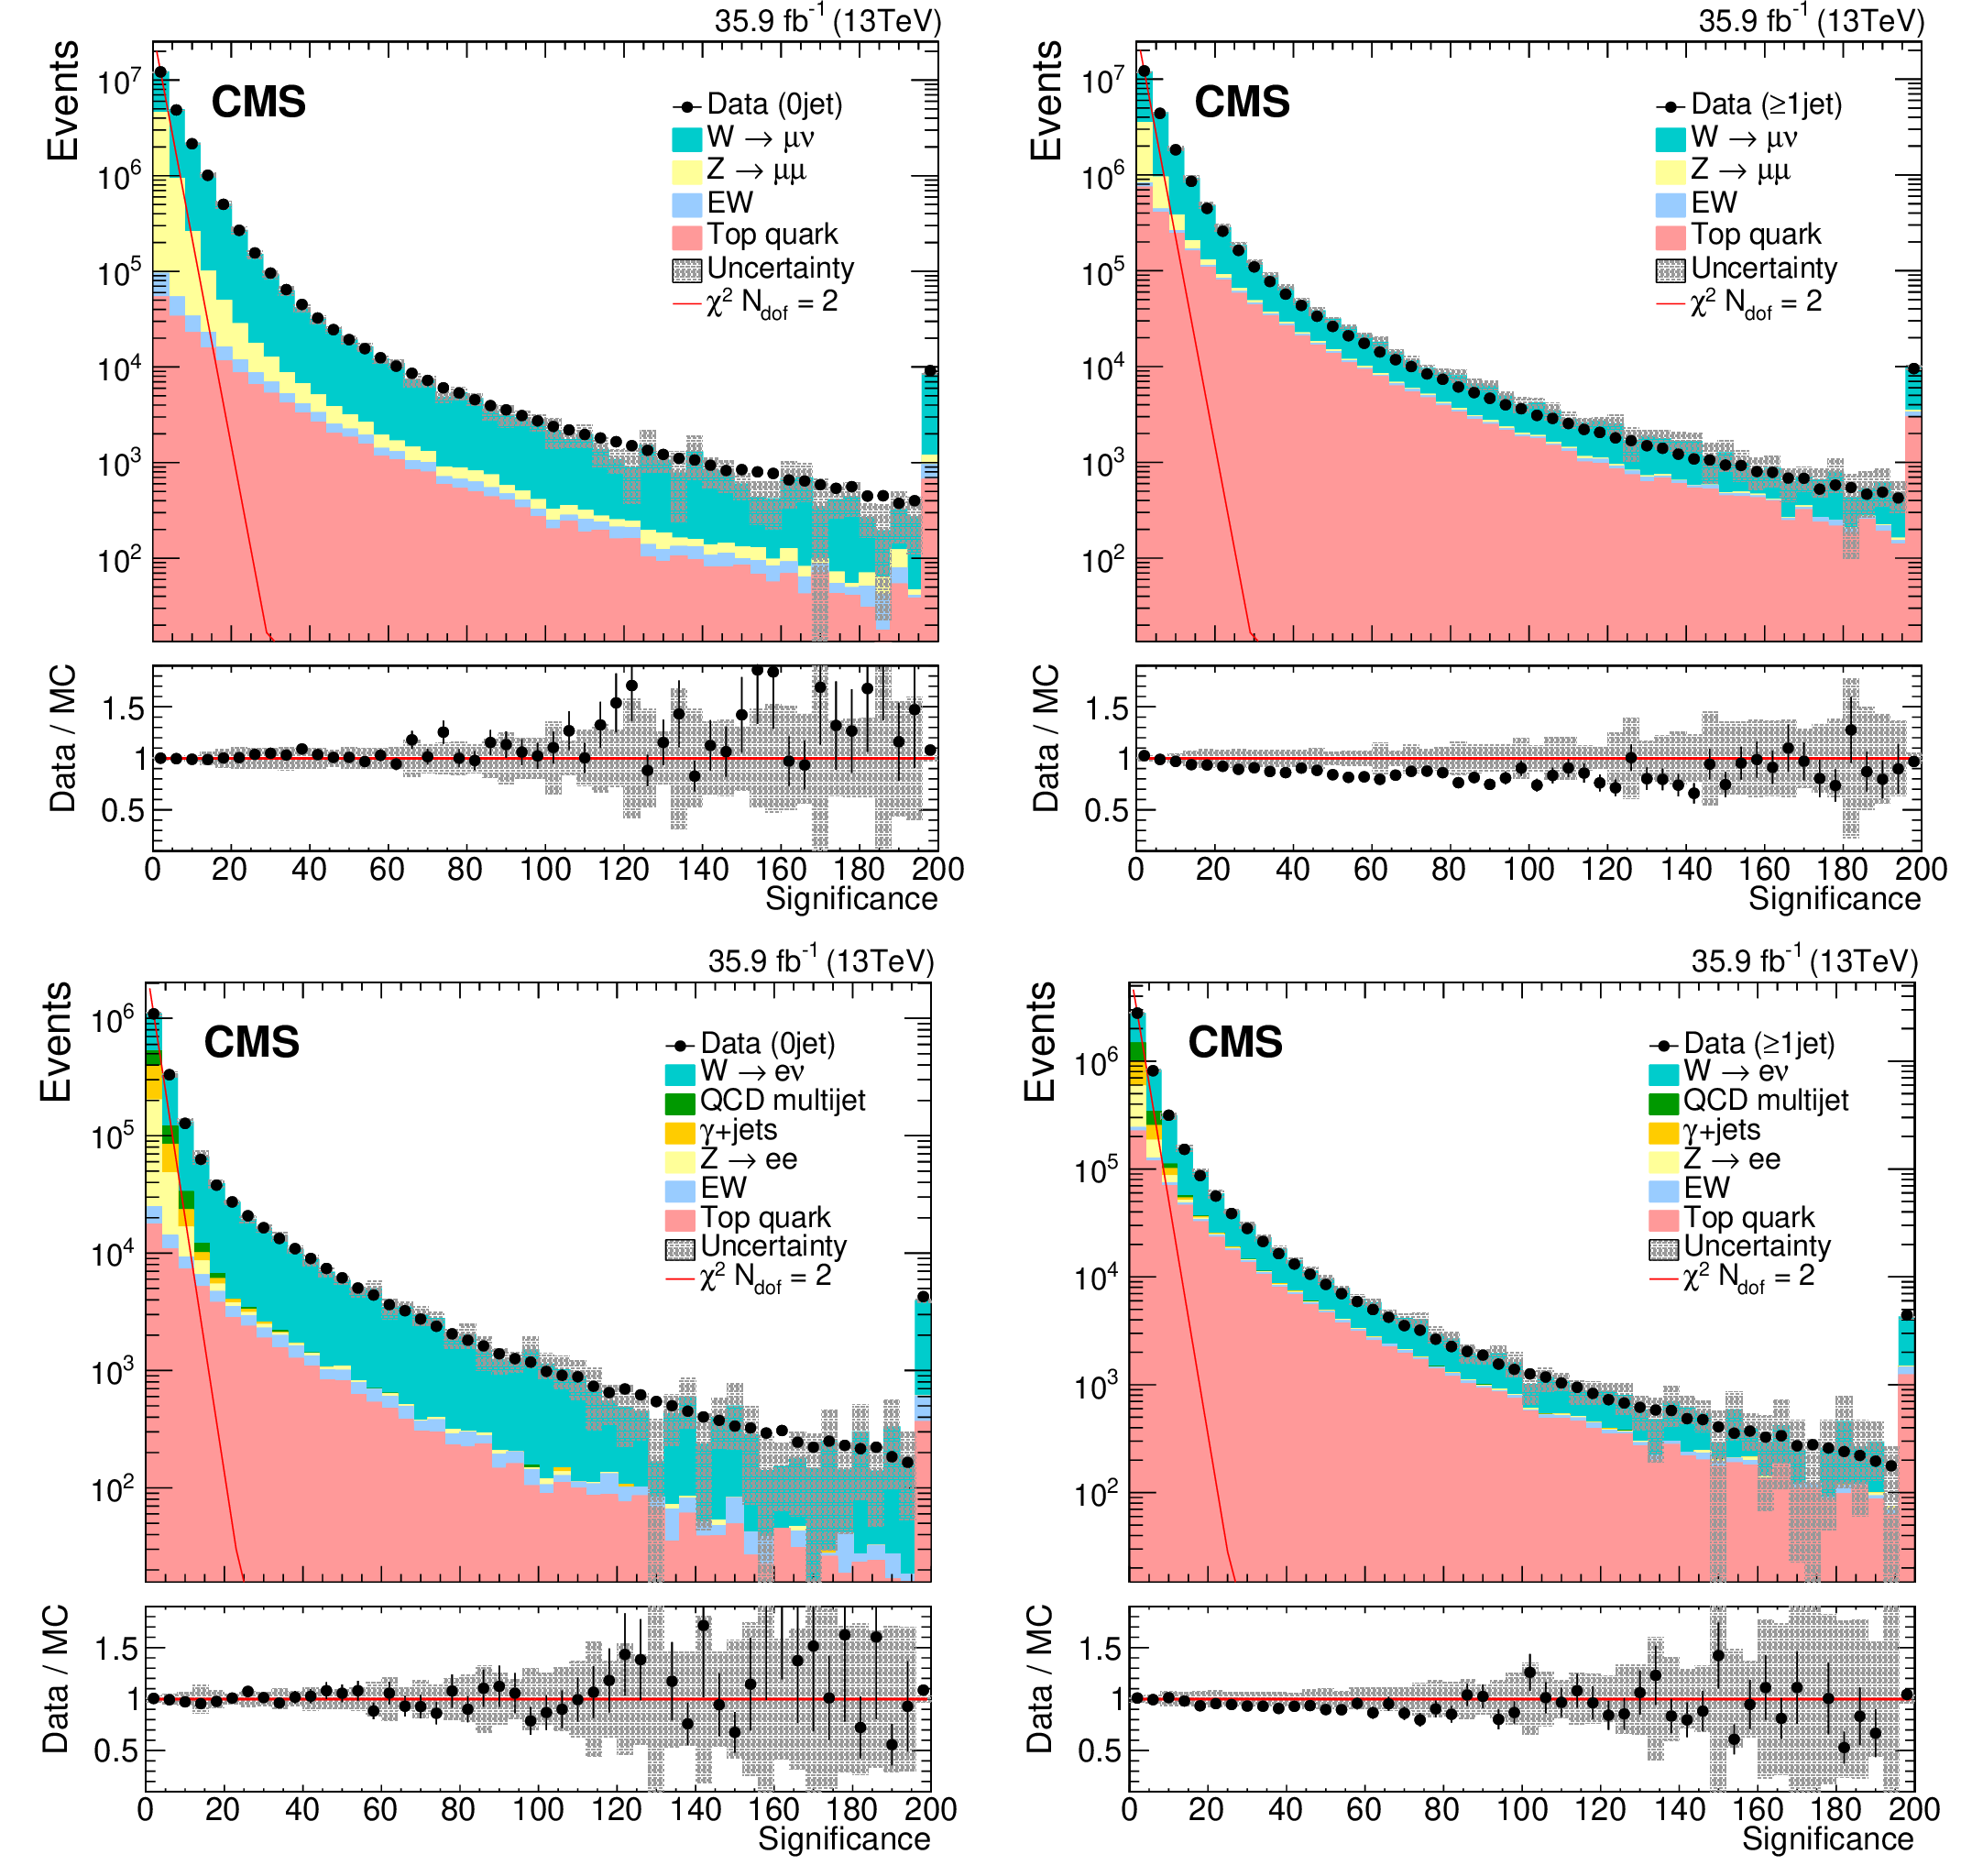
Figure 20:
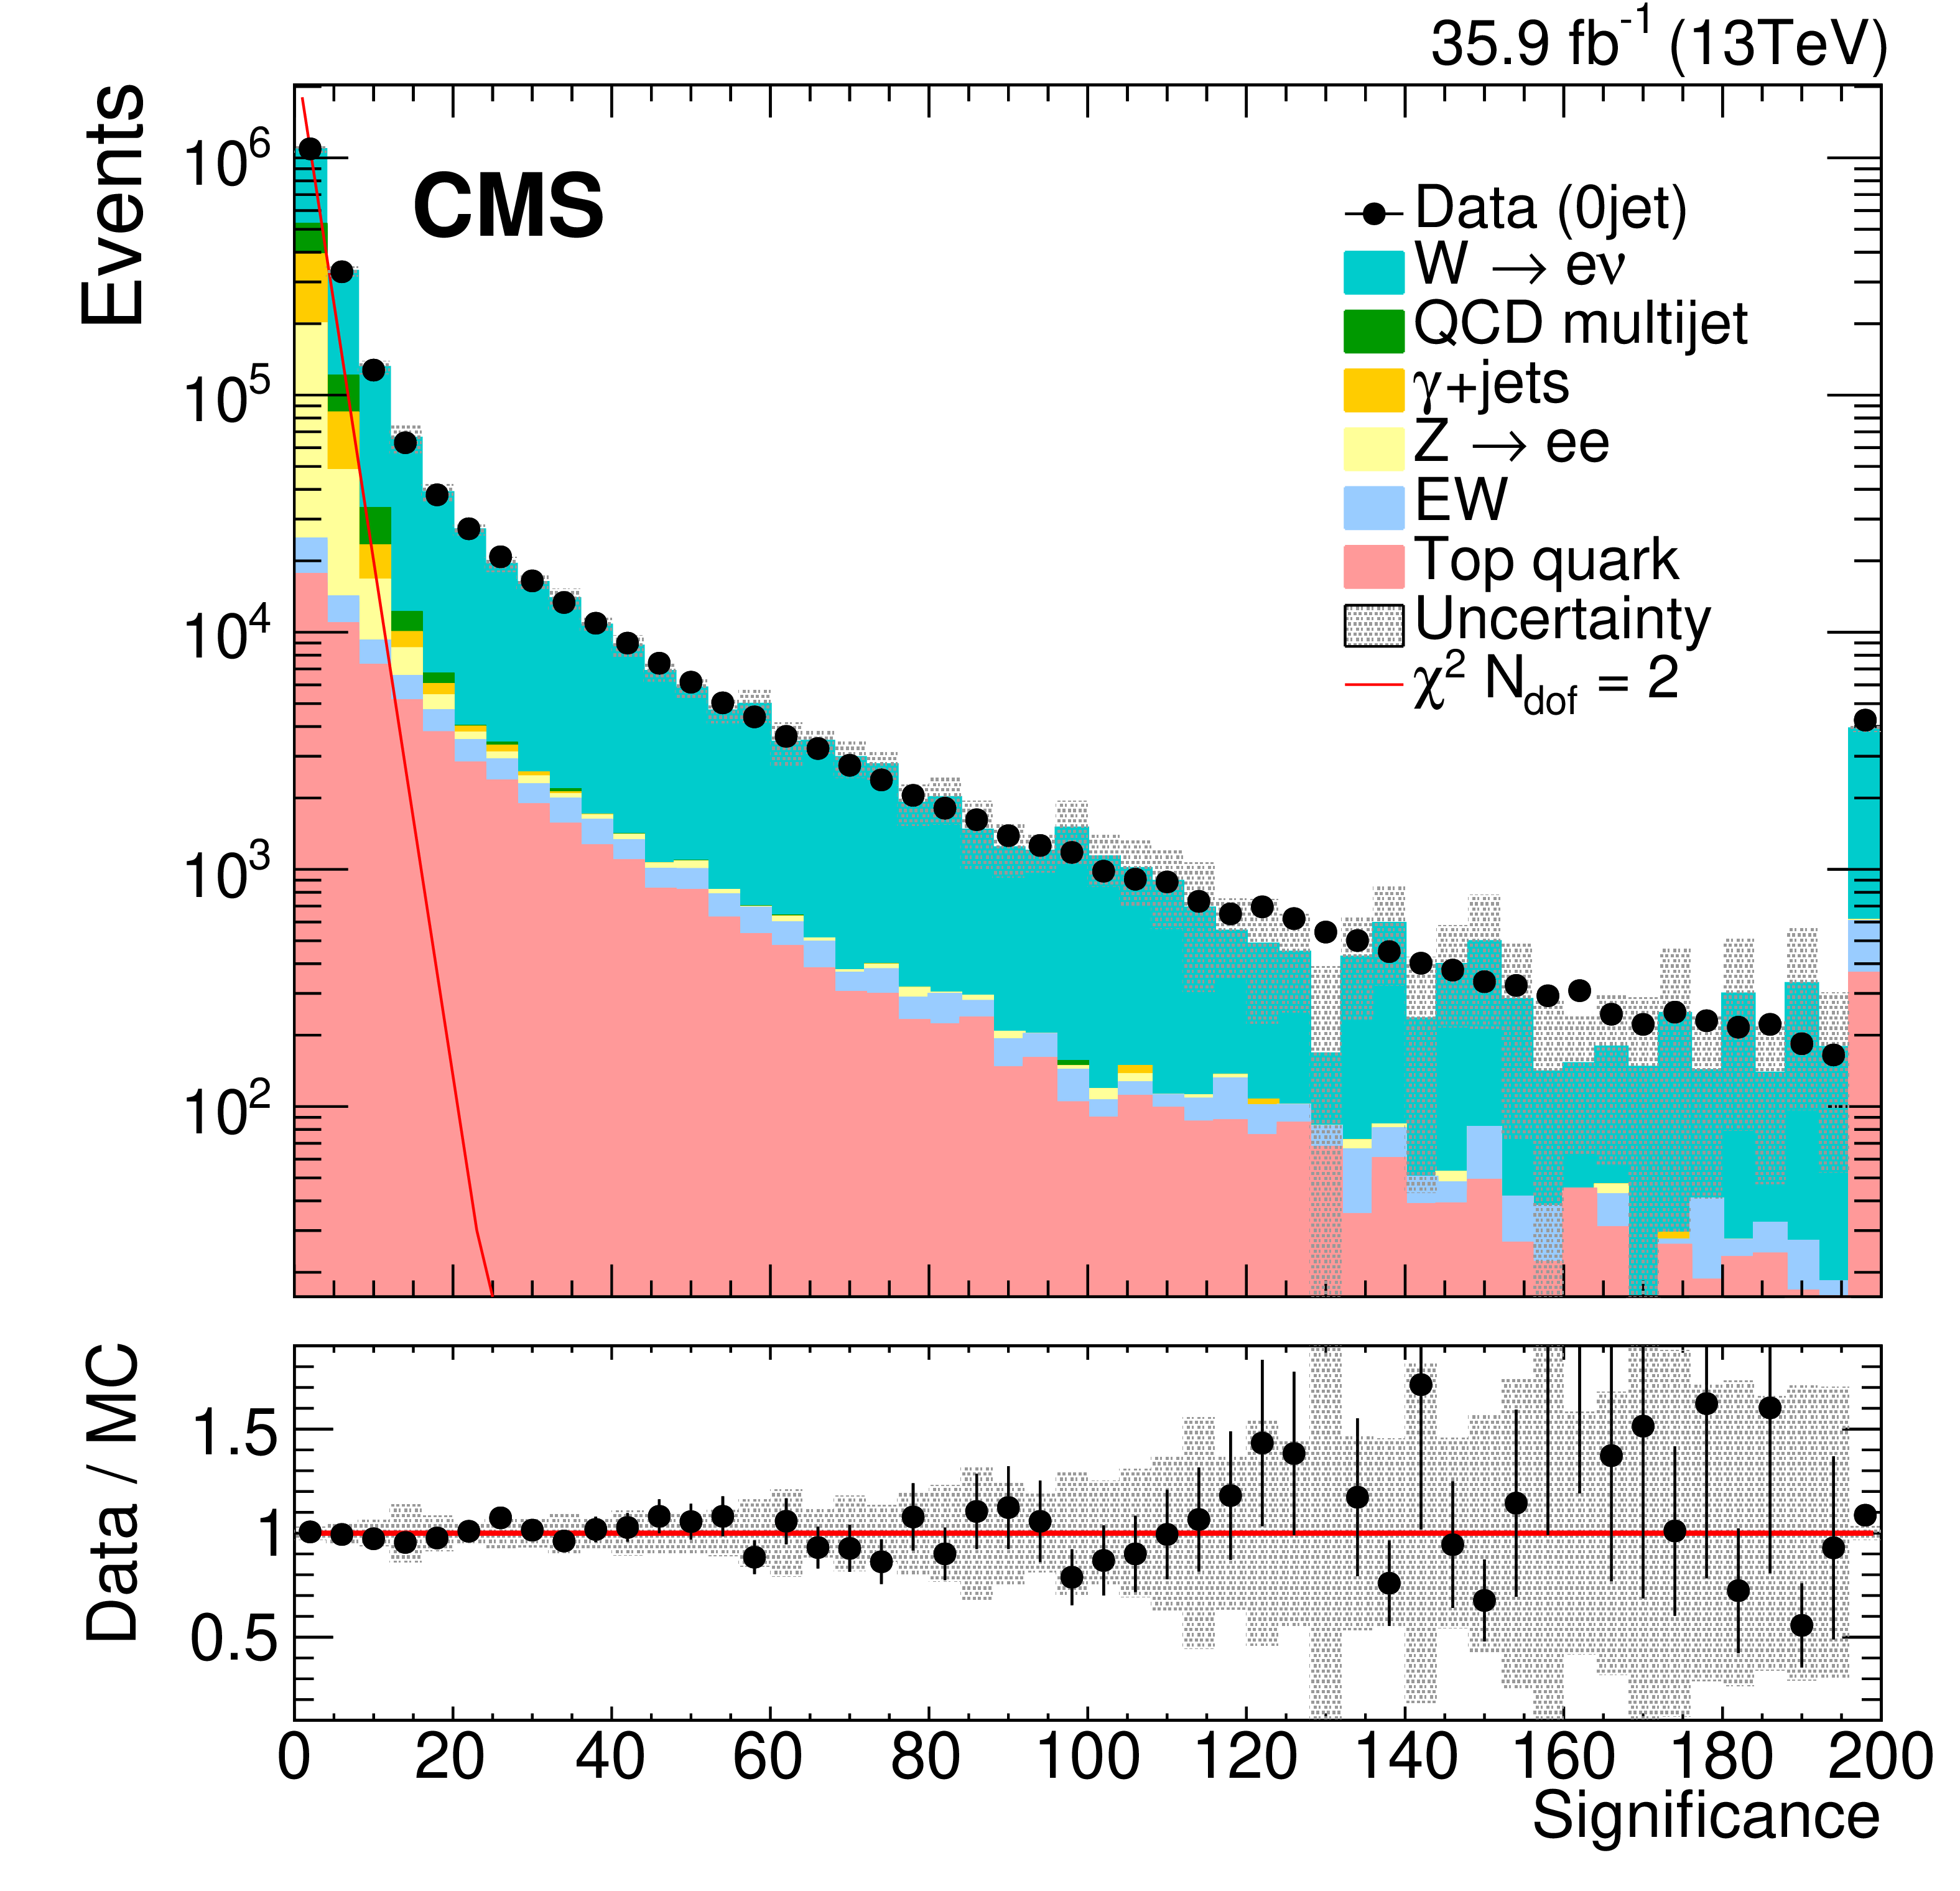
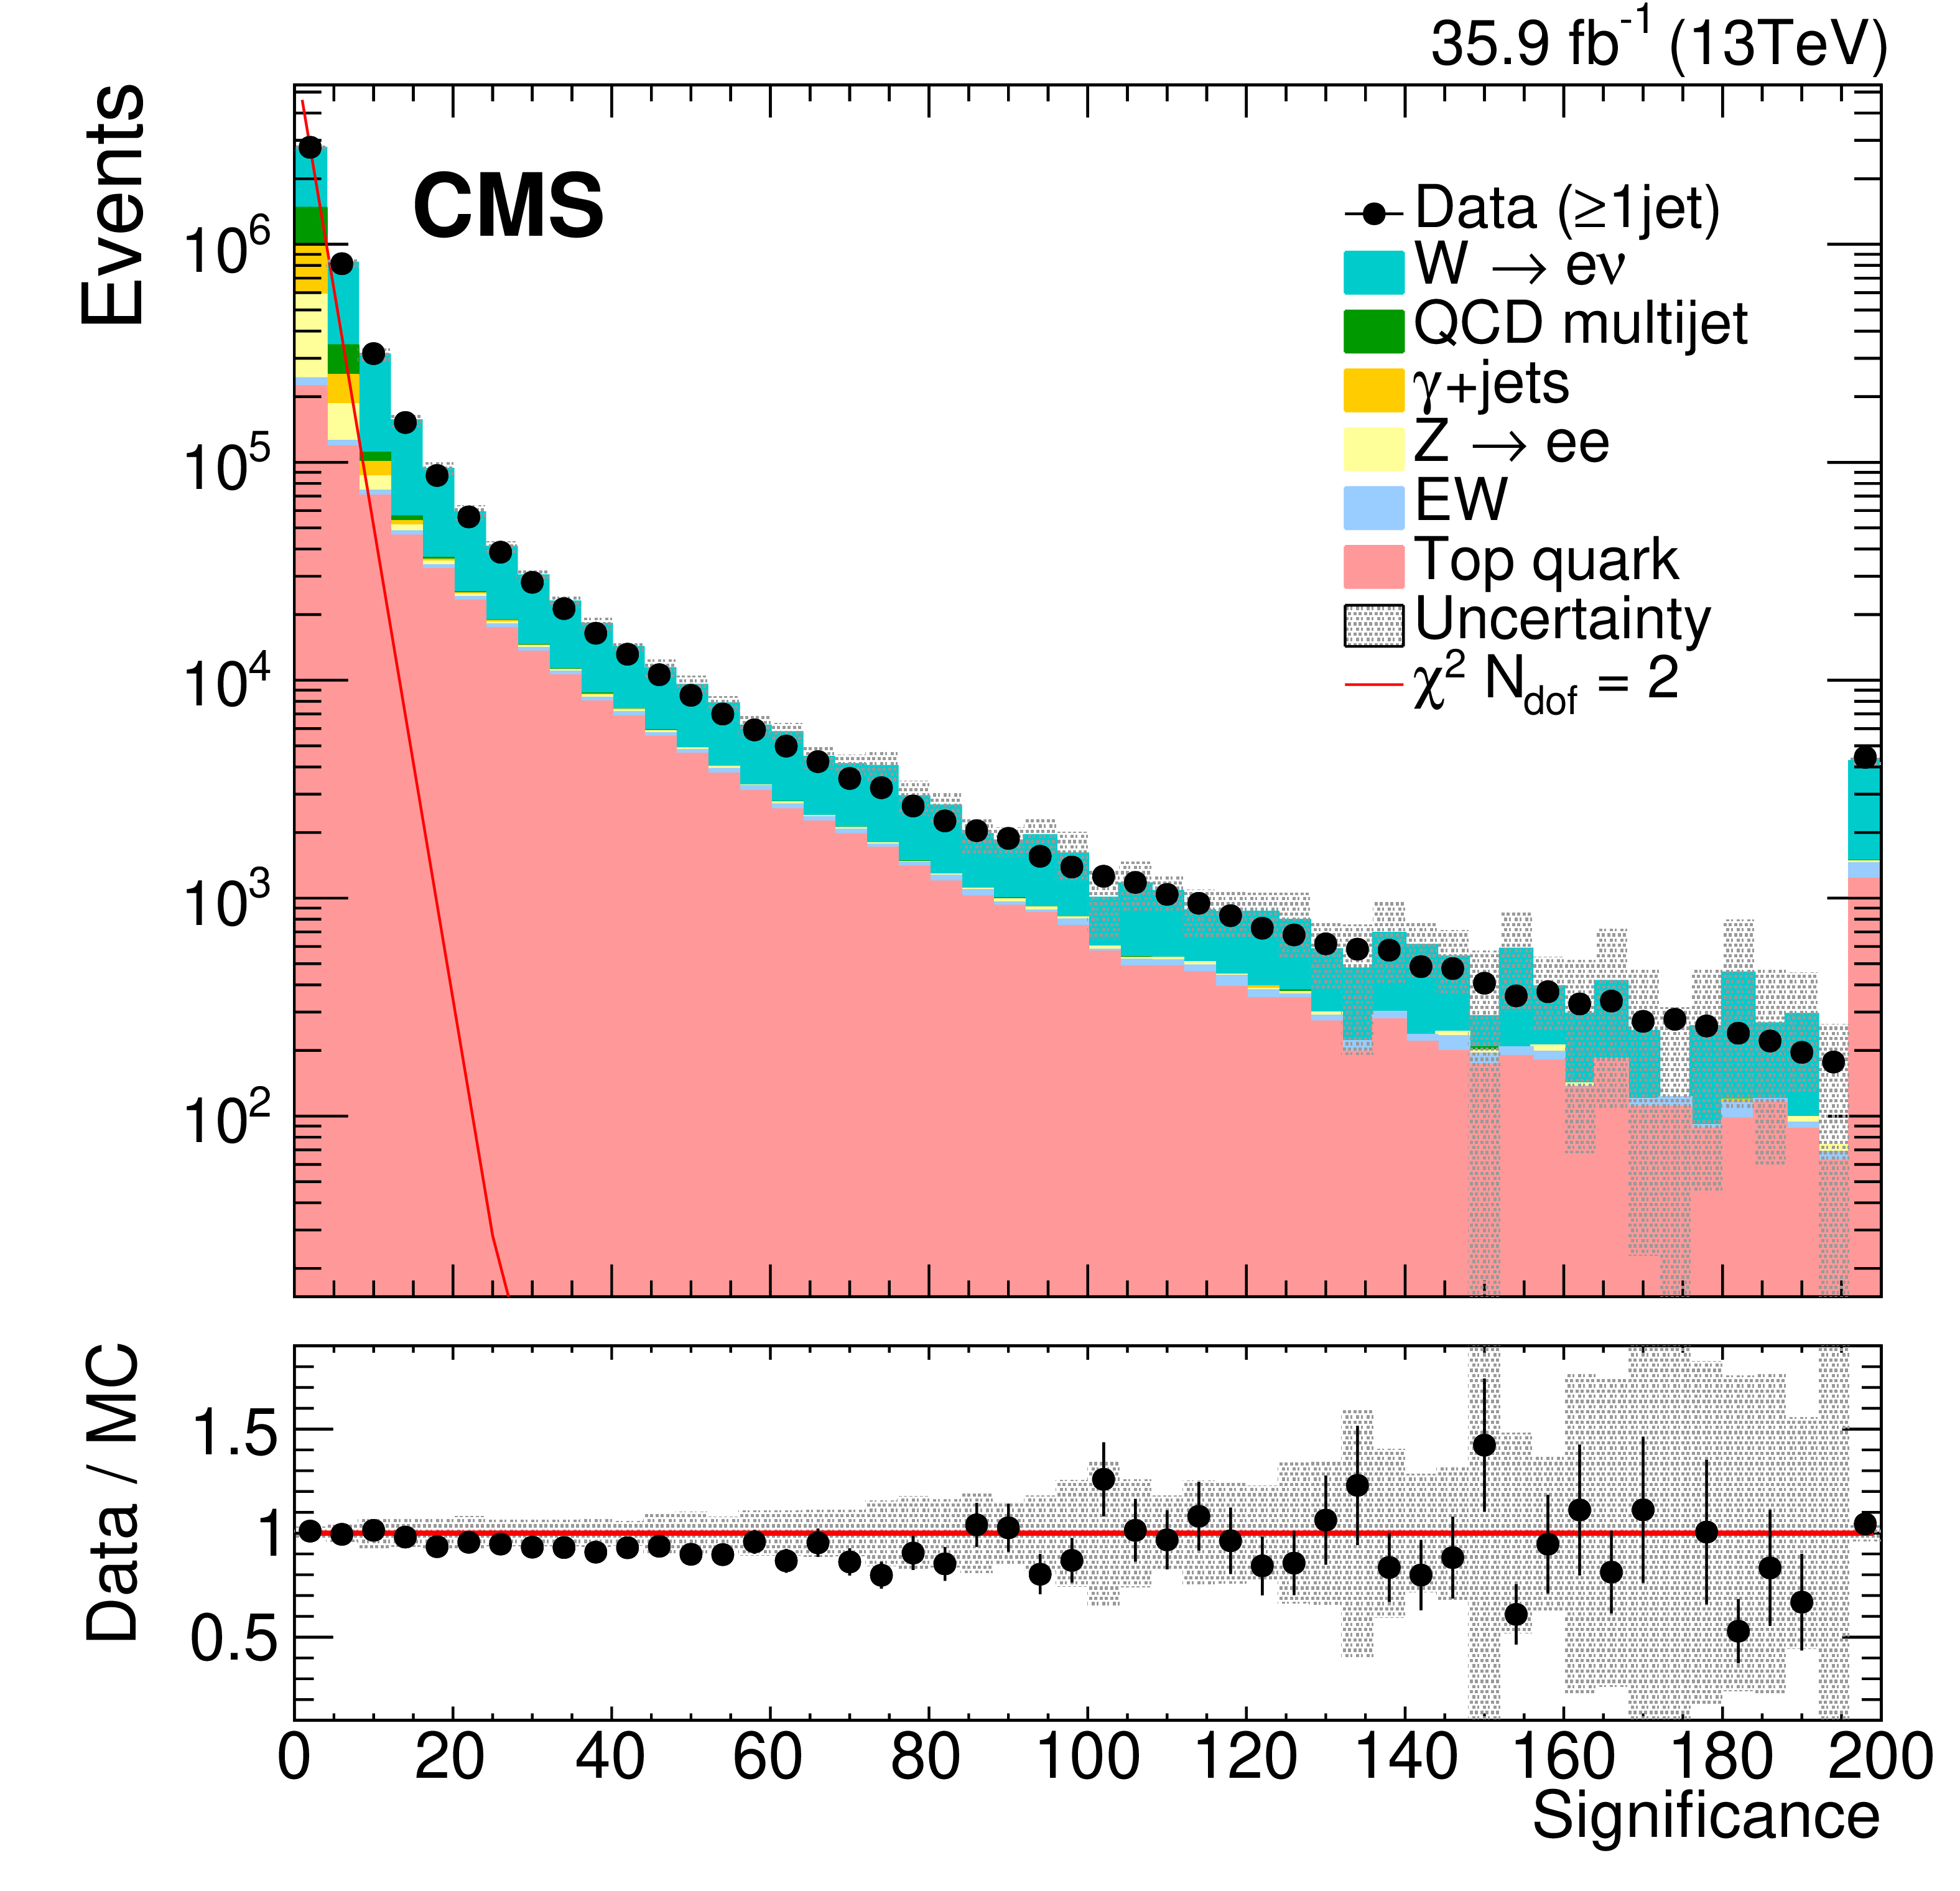
Distributions of ${{\mathcal S}}$ in data and simulation in single-muon (upper) and single-electron (lower) samples, for events with zero jet (left) and $\geq $ 1 jet (right). The last bin includes all events with $ {{\mathcal S}} > $ 48. The red straight line corresponds to a $\chi ^2$ distribution with two degrees of freedom. The bands in the bottom panel display systematic uncertainties due to effects from the JES, the JER, and variations in the $E_{U}$ in simulation. Good agreement between data and simulation is observed. |
png pdf |
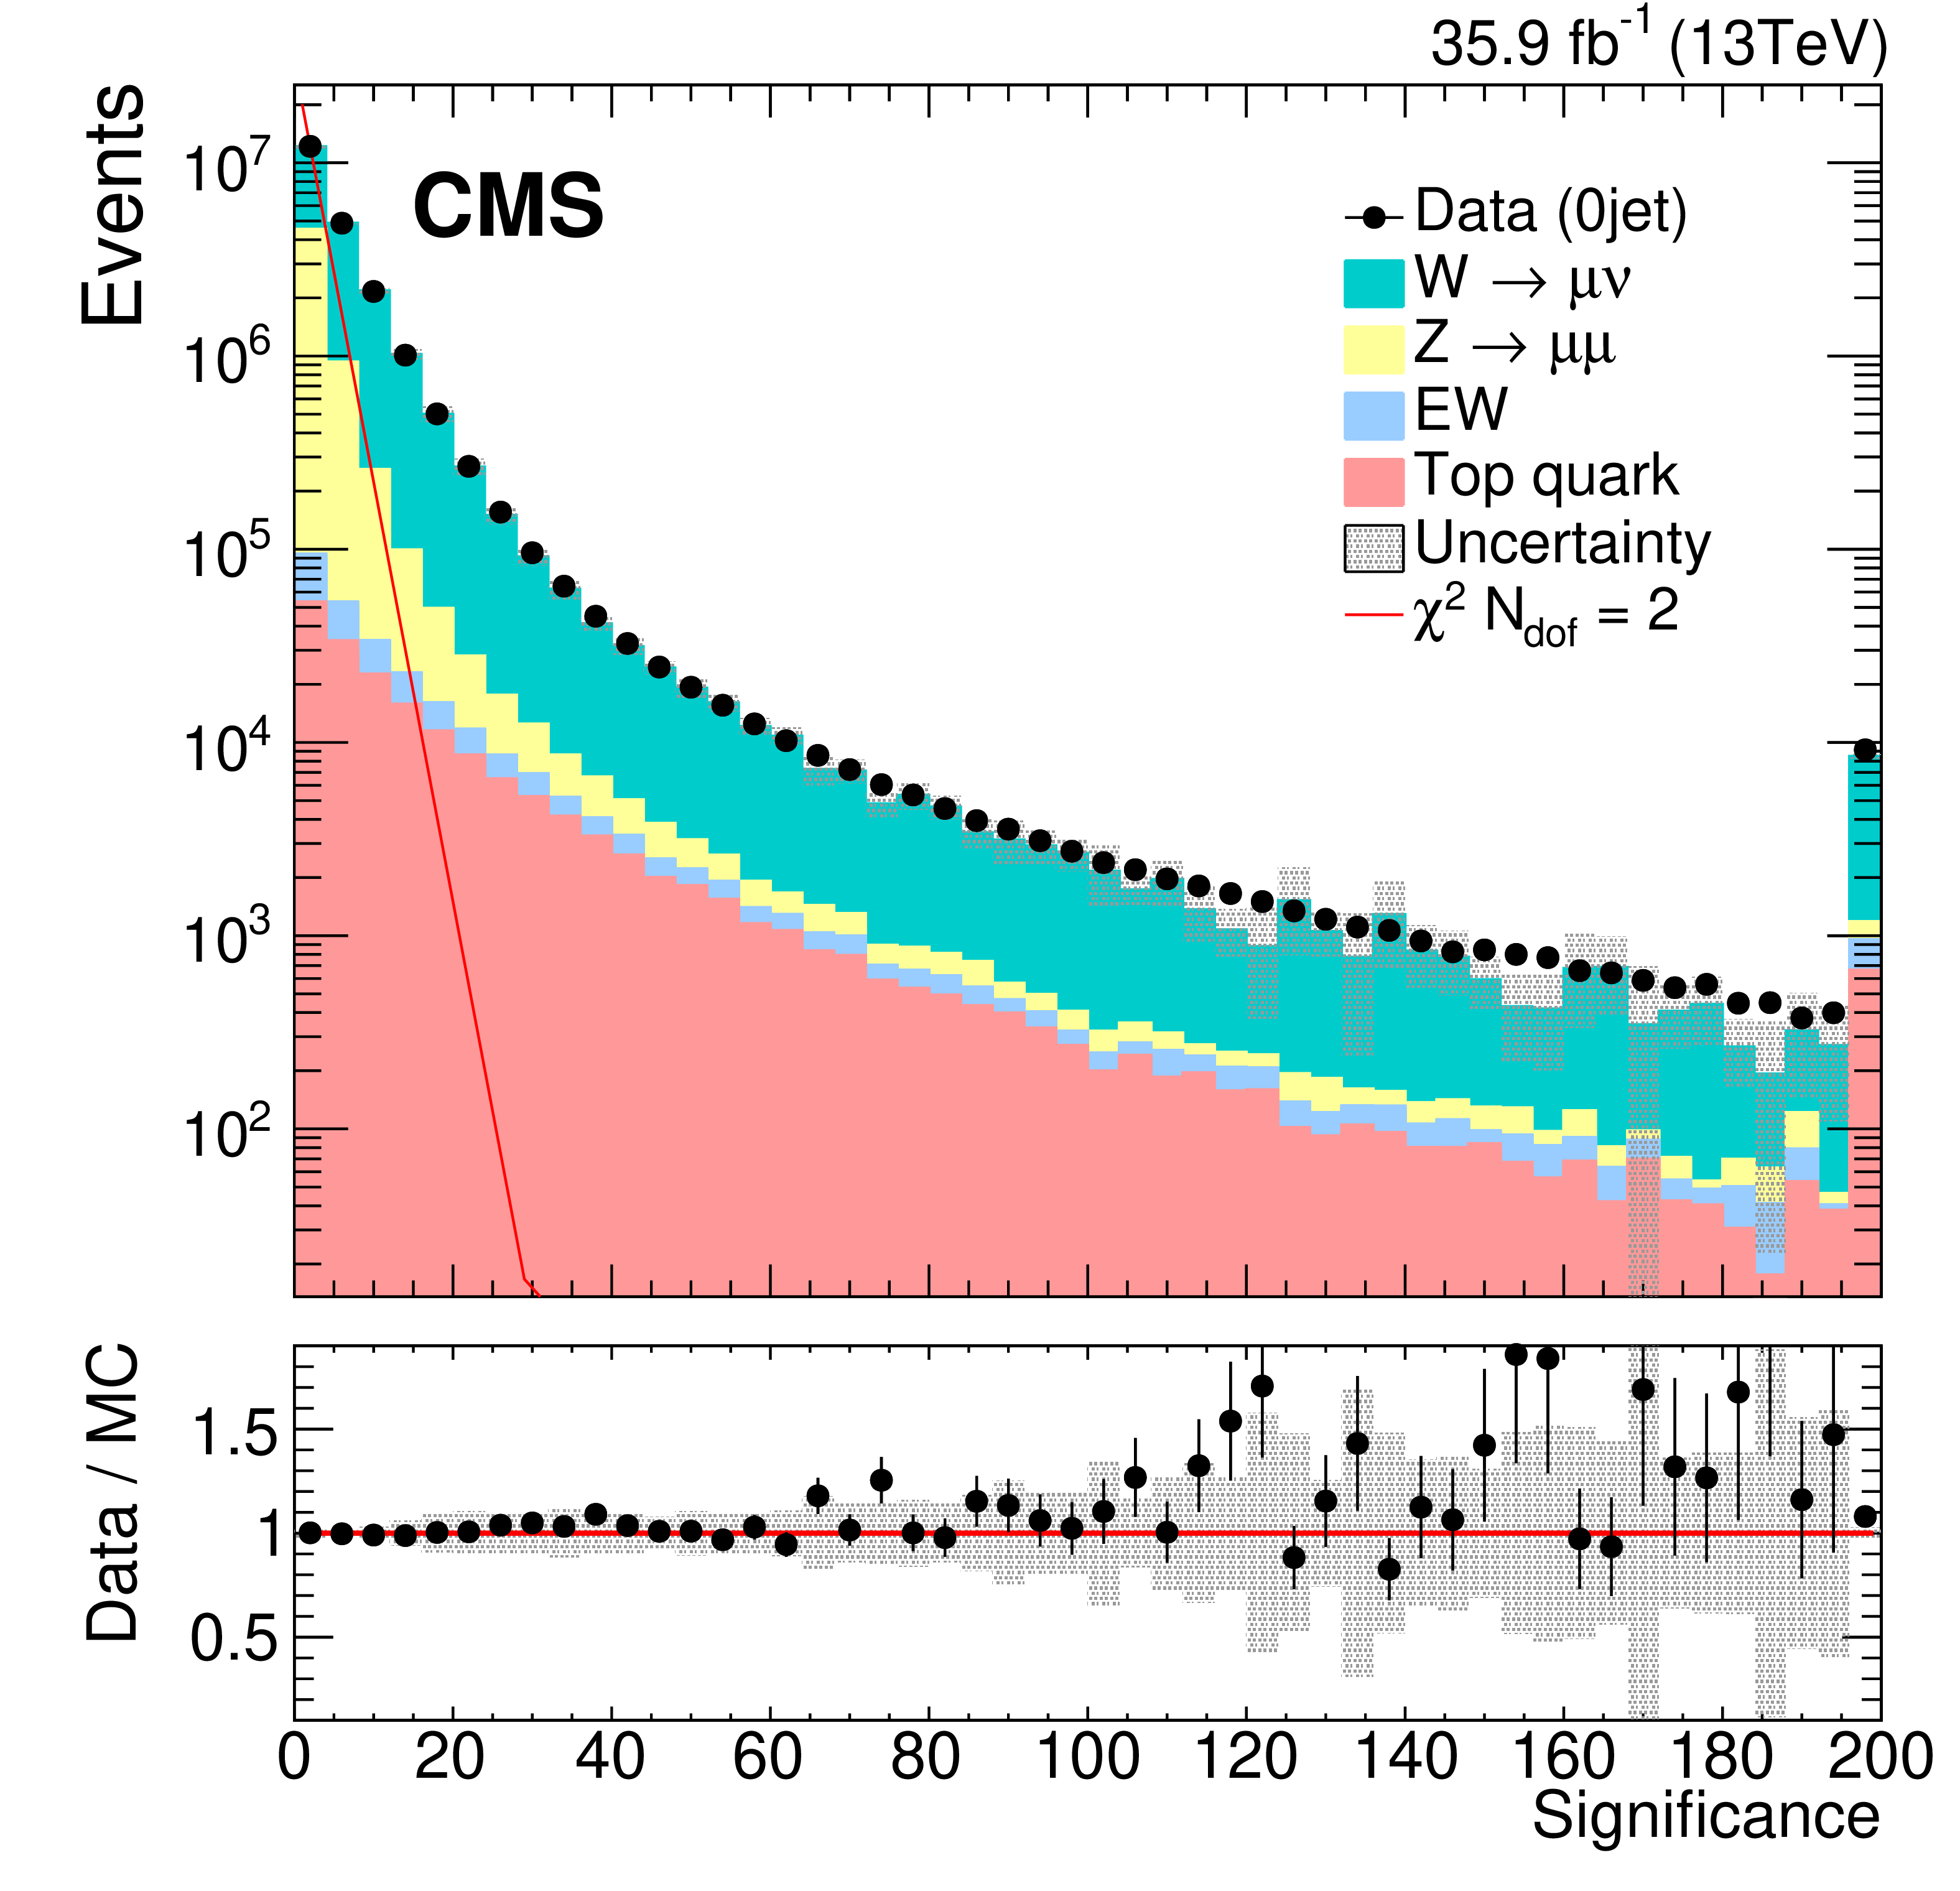
Figure 20-a:
Distribution of ${{\mathcal S}}$ in data and simulation in the single-muon sample, for events with zero jet. The last bin includes all events with $ {{\mathcal S}} > $ 48. The red straight line corresponds to a $\chi ^2$ distribution with two degrees of freedom. The bands in the bottom panel display systematic uncertainties due to effects from the JES, the JER, and variations in the $E_{U}$ in simulation. Good agreement between data and simulation is observed. |
png pdf |
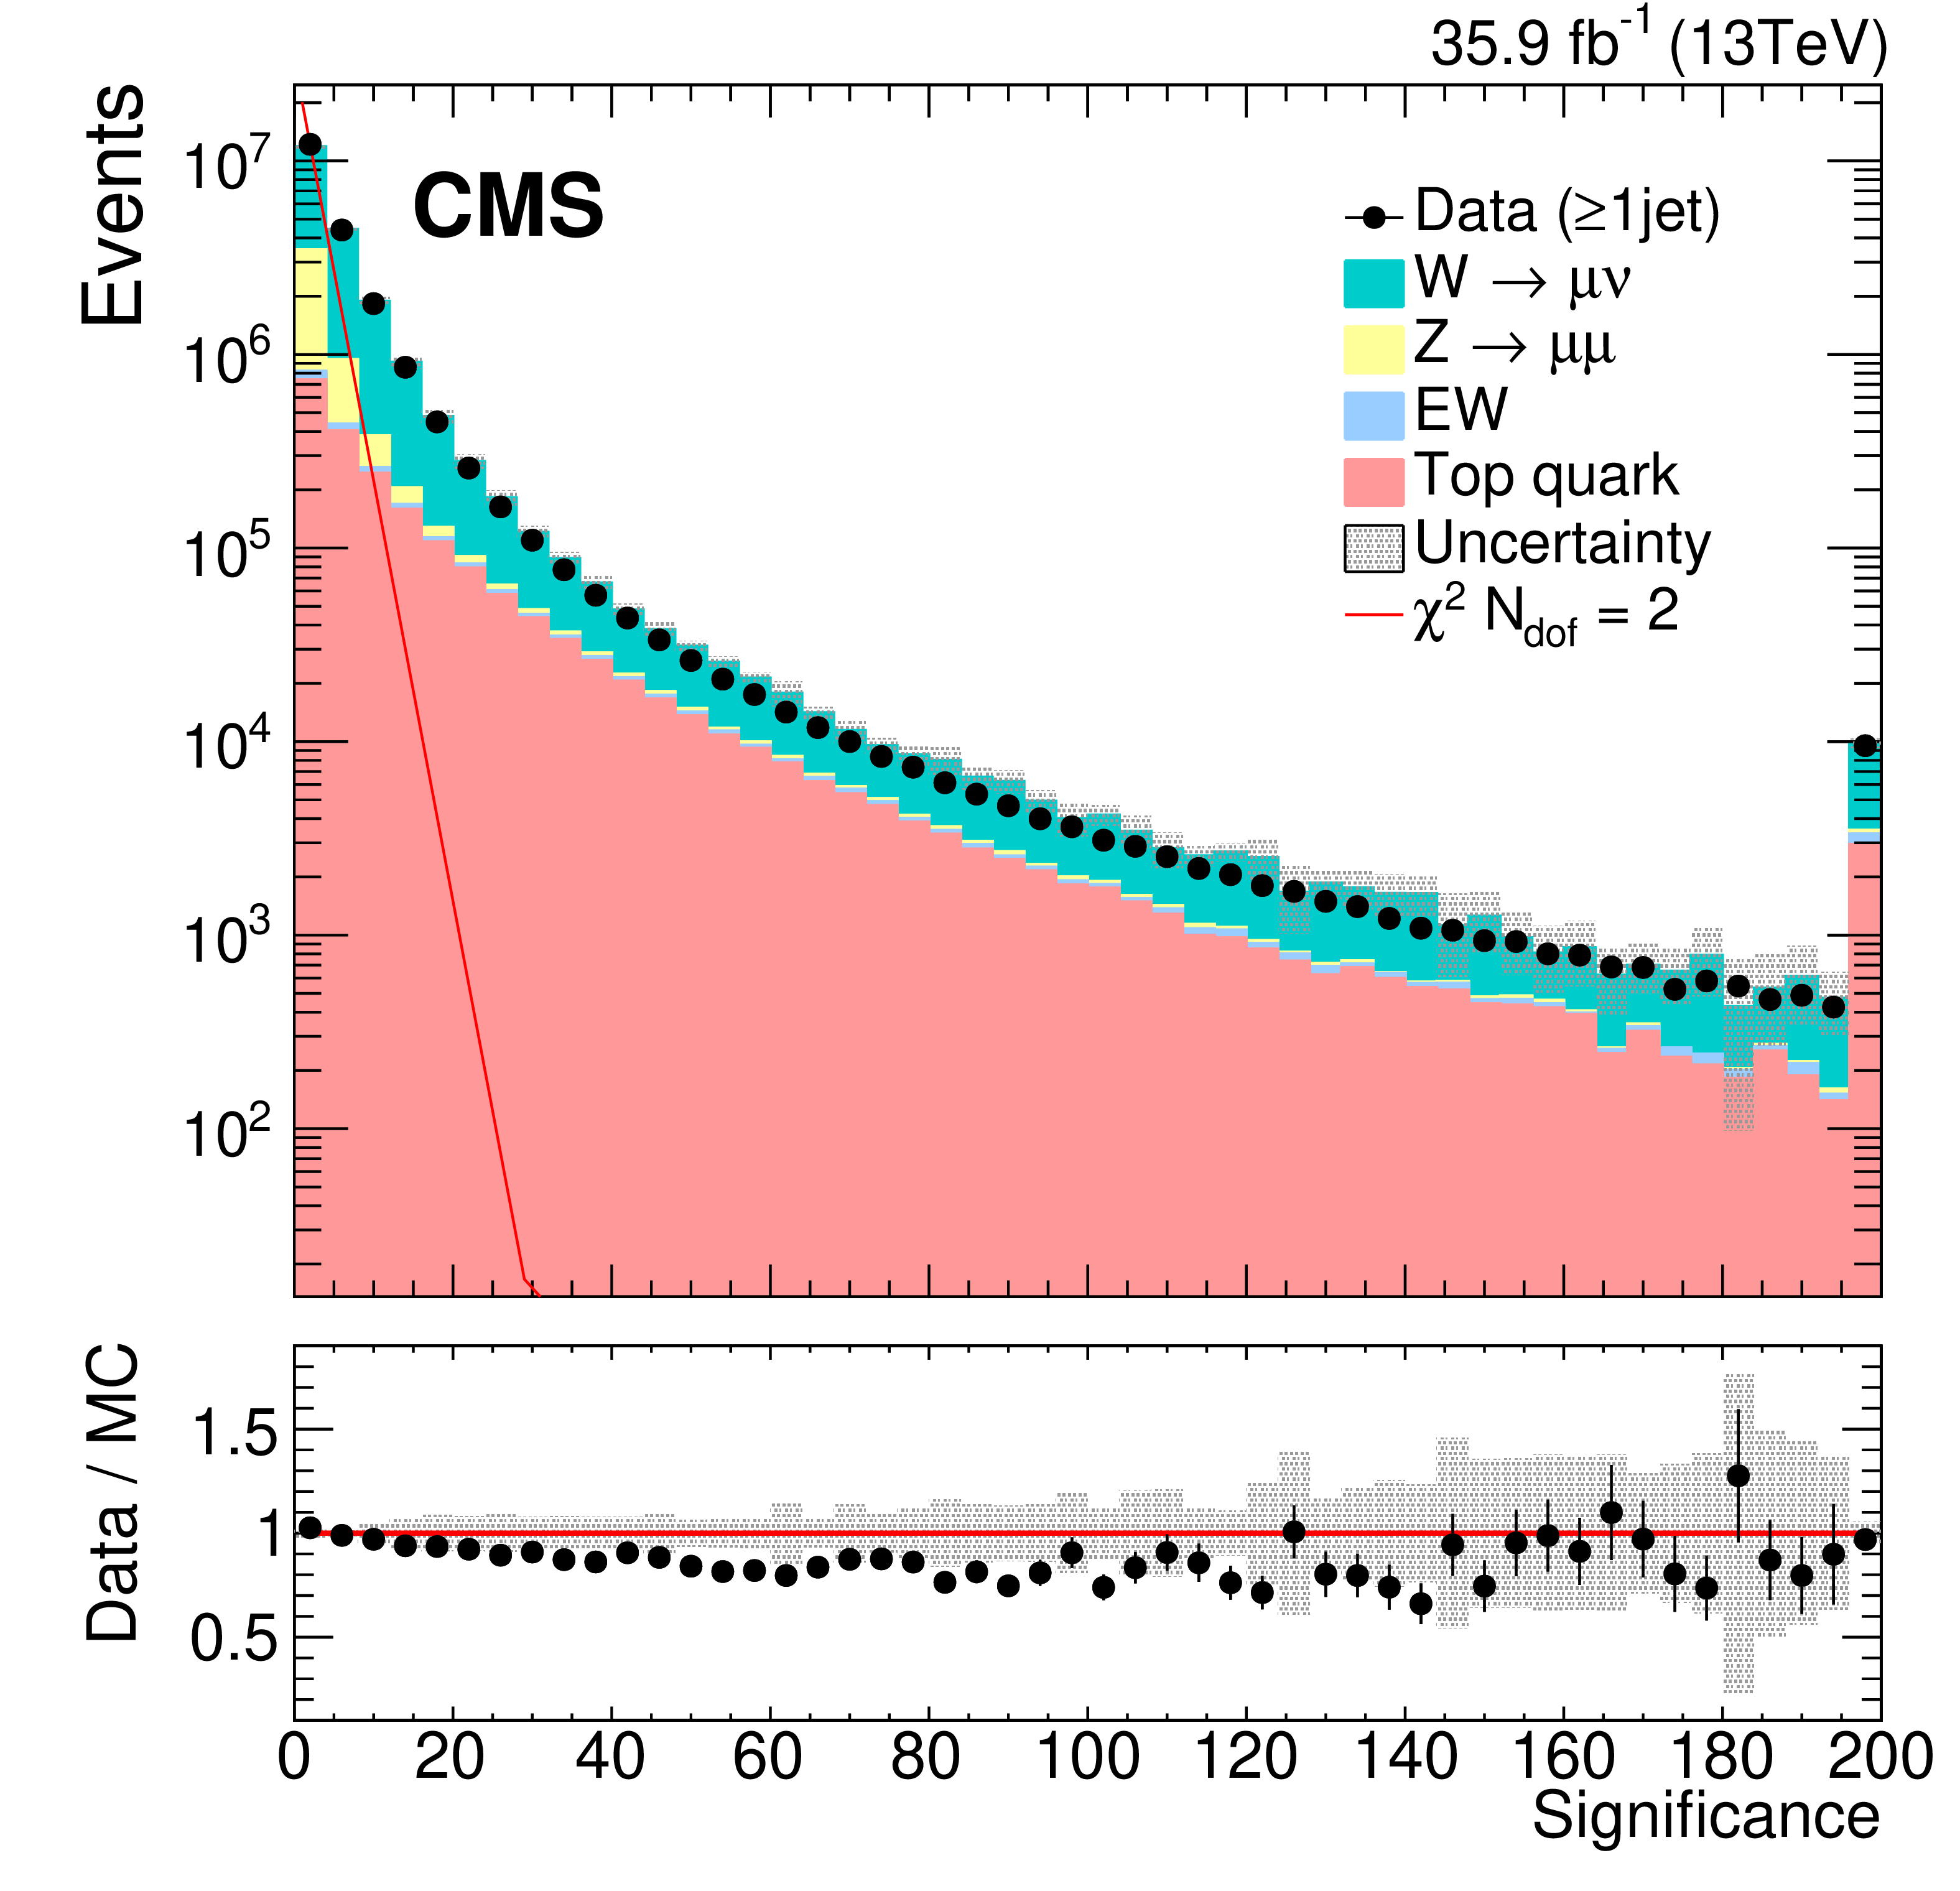
Figure 20-b:
Distribution of ${{\mathcal S}}$ in data and simulation in the single-muon sample, for events with $\geq $ 1 jet. The last bin includes all events with $ {{\mathcal S}} > $ 48. The red straight line corresponds to a $\chi ^2$ distribution with two degrees of freedom. The bands in the bottom panel display systematic uncertainties due to effects from the JES, the JER, and variations in the $E_{U}$ in simulation. Good agreement between data and simulation is observed. |
png pdf |
Figure 20-c:
Distribution of ${{\mathcal S}}$ in data and simulation in the single-electron sample, for events with zero jet. The last bin includes all events with $ {{\mathcal S}} > $ 48. The red straight line corresponds to a $\chi ^2$ distribution with two degrees of freedom. The bands in the bottom panel display systematic uncertainties due to effects from the JES, the JER, and variations in the $E_{U}$ in simulation. Good agreement between data and simulation is observed. |
png pdf |
Figure 20-d:
Distribution of ${{\mathcal S}}$ in data and simulation in the single-electron sample, for events with $\geq $ 1 jet. The last bin includes all events with $ {{\mathcal S}} > $ 48. The red straight line corresponds to a $\chi ^2$ distribution with two degrees of freedom. The bands in the bottom panel display systematic uncertainties due to effects from the JES, the JER, and variations in the $E_{U}$ in simulation. Good agreement between data and simulation is observed. |
png pdf |
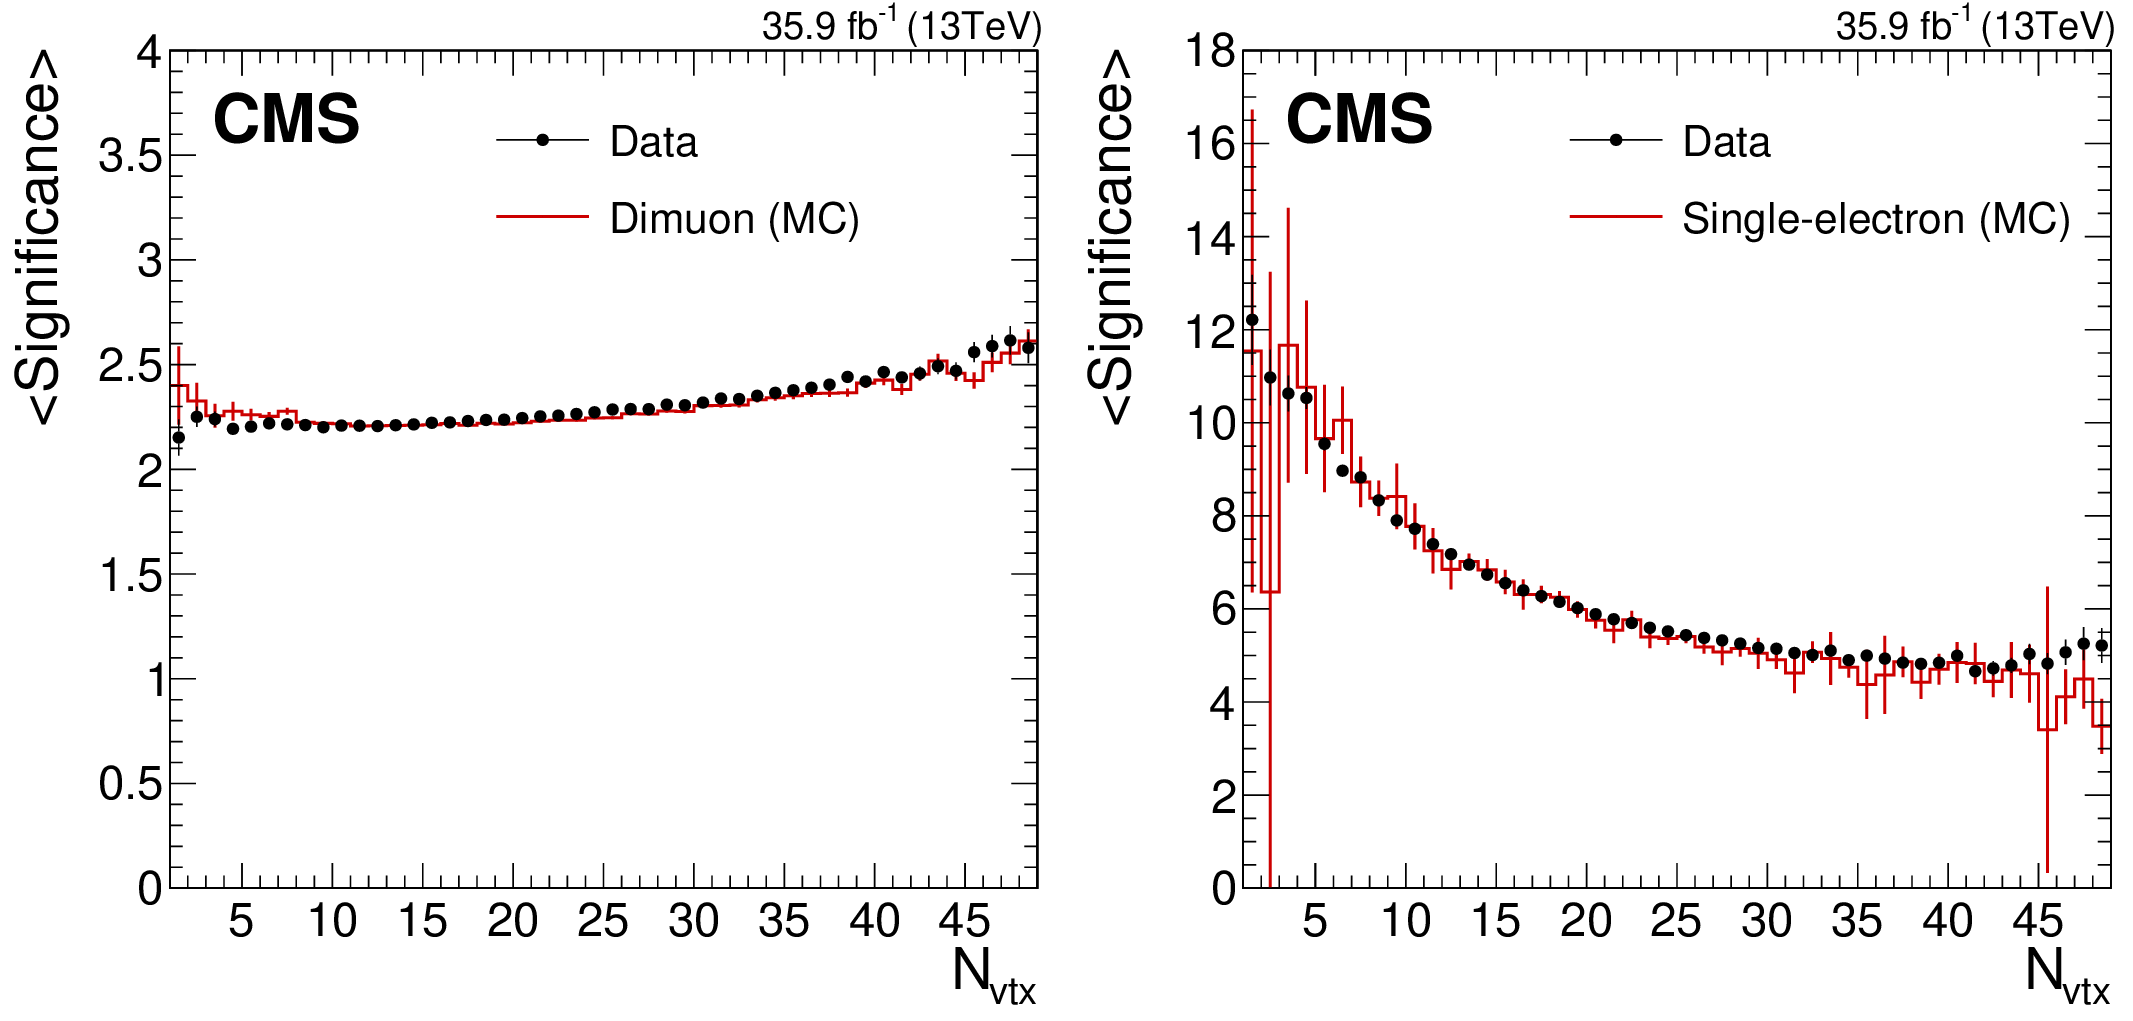
Figure 21:
Dependence of the average ${{\mathcal S}}$ on pileup, for dimuon (left) and single-electron (right) events. Weak dependence is observed for processes with no genuine ${{p_{\mathrm {T}}} ^\text {miss}}$, whereas in events with genuine ${{p_{\mathrm {T}}} ^\text {miss}}$ the behavior of ${{\mathcal S}}$ depends strongly on primary vertex multiplicity. |

png pdf |
Figure 21-a:
Dependence of the average ${{\mathcal S}}$ on pileup, for dimuon events. Weak dependence is observed for processes with no genuine ${{p_{\mathrm {T}}} ^\text {miss}}$, whereas in events with genuine ${{p_{\mathrm {T}}} ^\text {miss}}$ the behavior of ${{\mathcal S}}$ depends strongly on primary vertex multiplicity. |
png pdf |
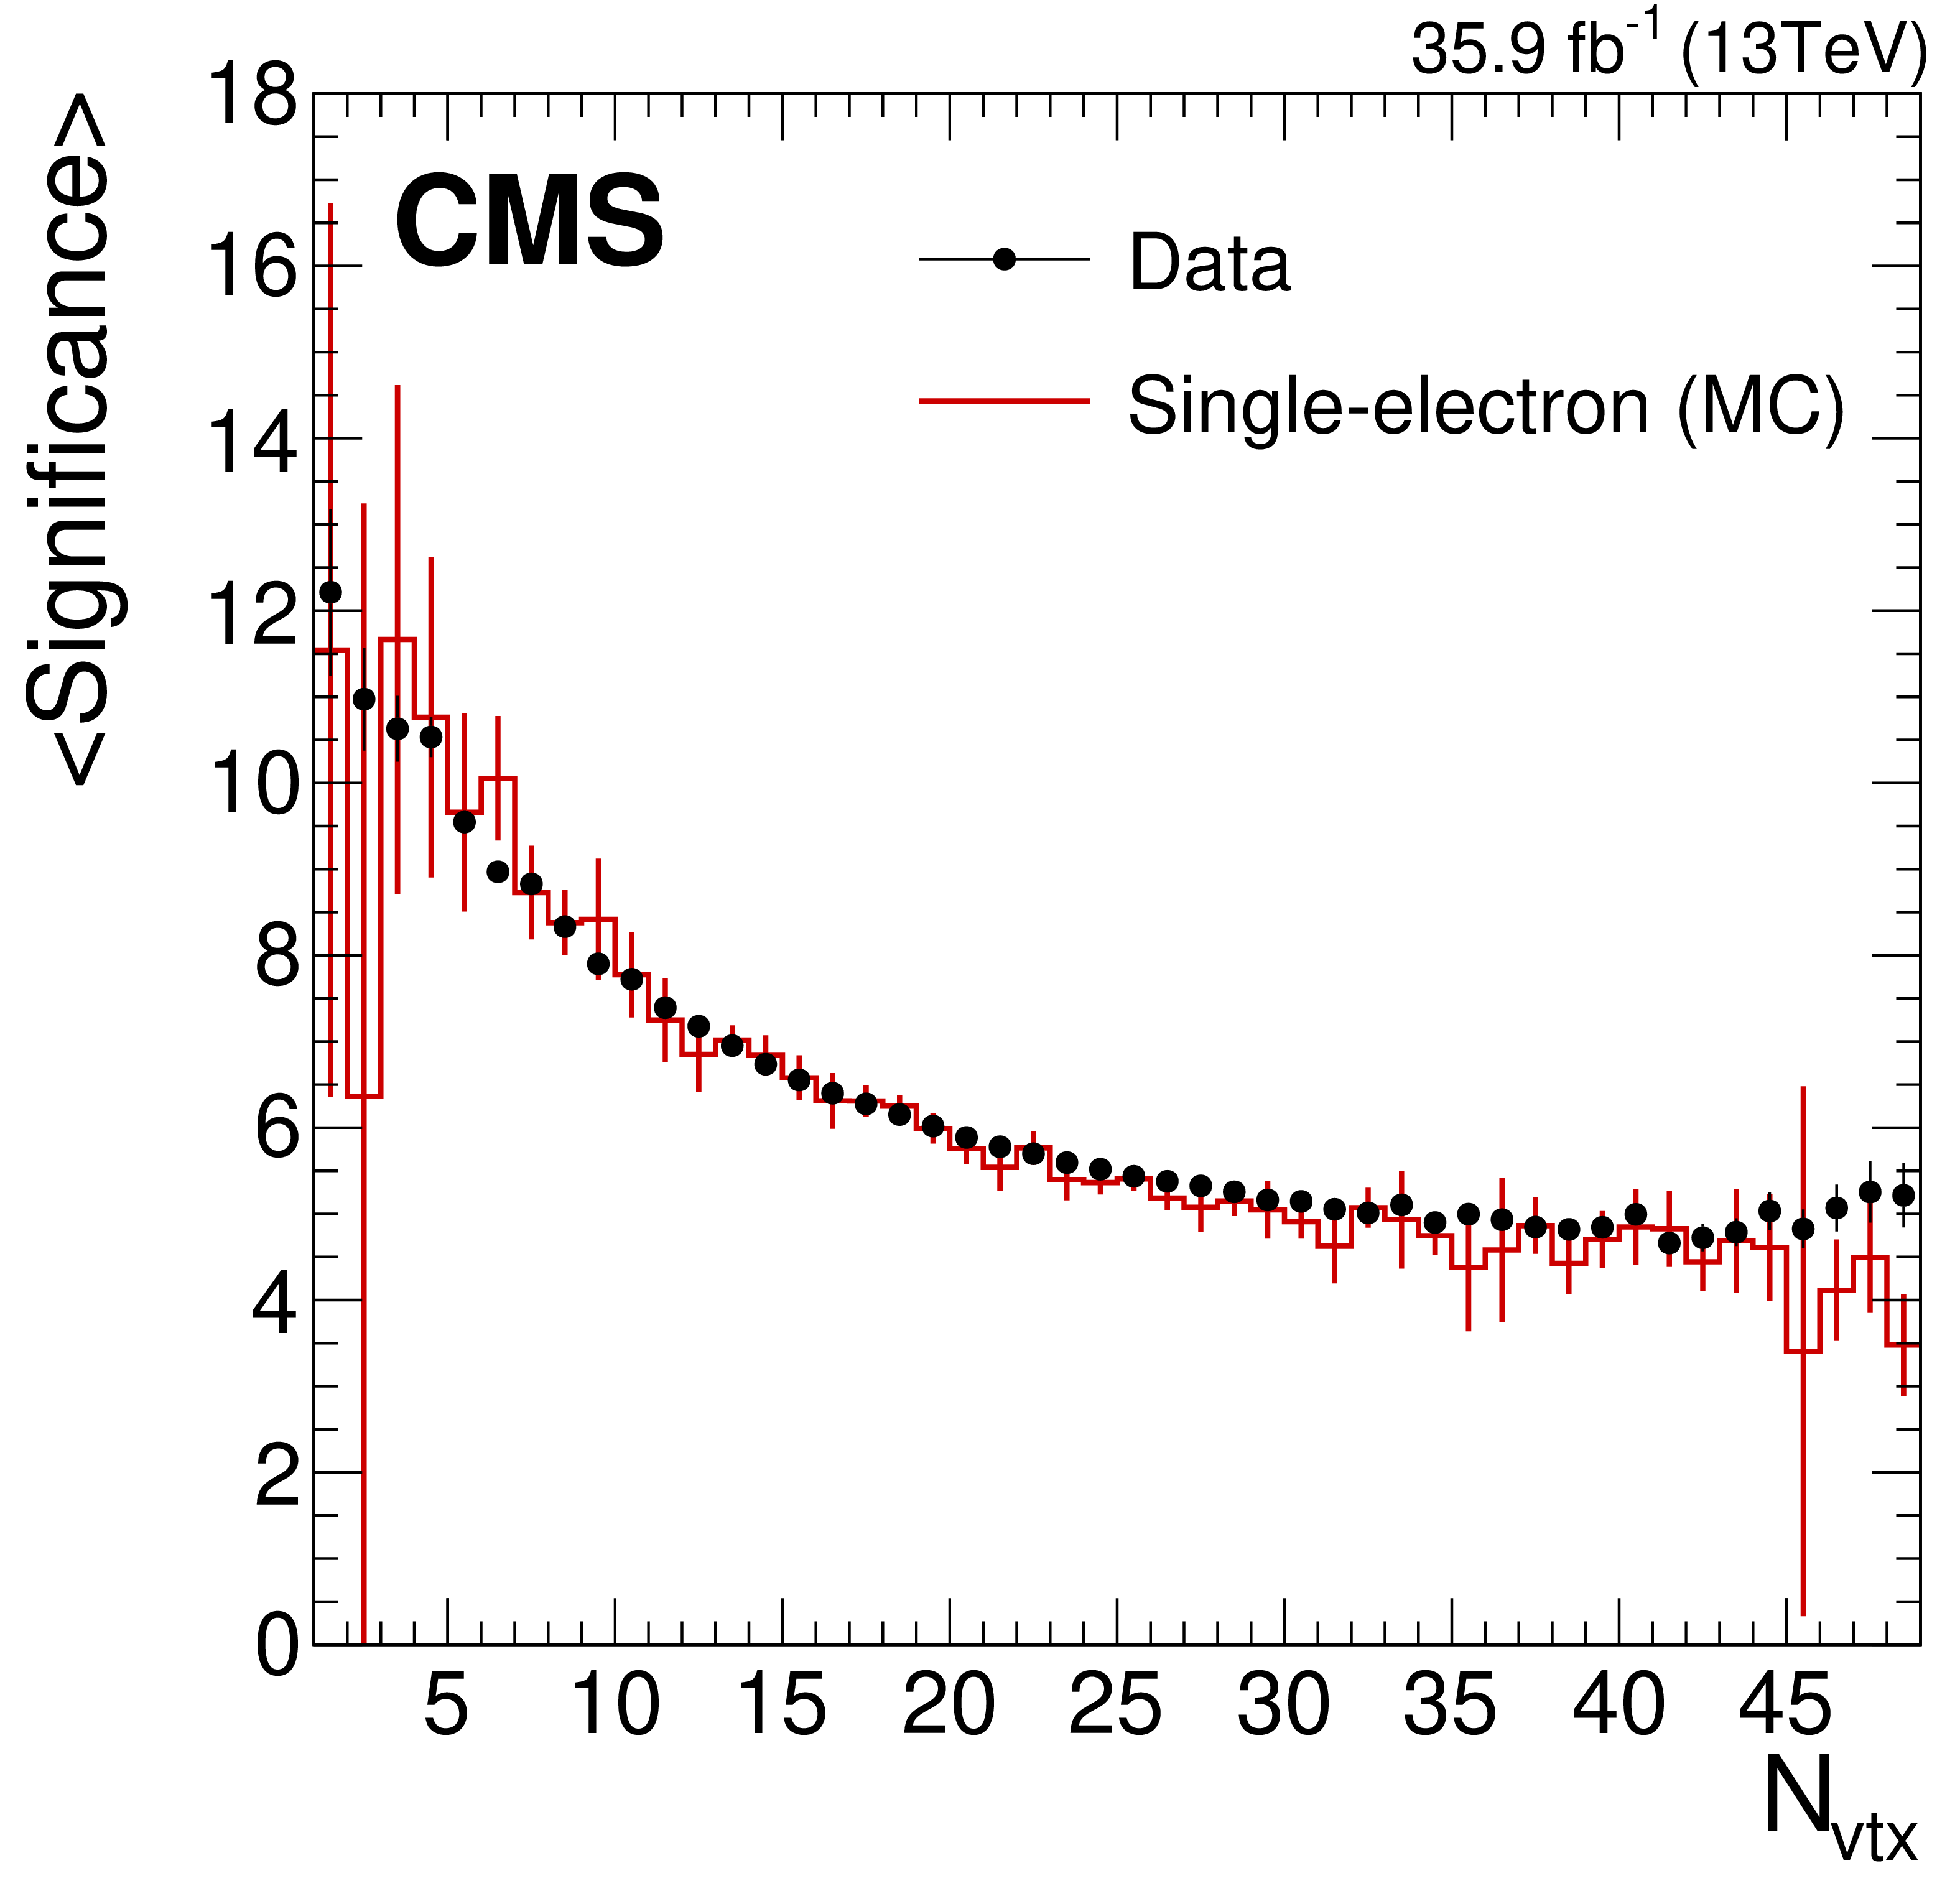
Figure 21-b:
Dependence of the average ${{\mathcal S}}$ on pileup, for single-electron events. Weak dependence is observed for processes with no genuine ${{p_{\mathrm {T}}} ^\text {miss}}$, whereas in events with genuine ${{p_{\mathrm {T}}} ^\text {miss}}$ the behavior of ${{\mathcal S}}$ depends strongly on primary vertex multiplicity. |
| Tables | |
png pdf |
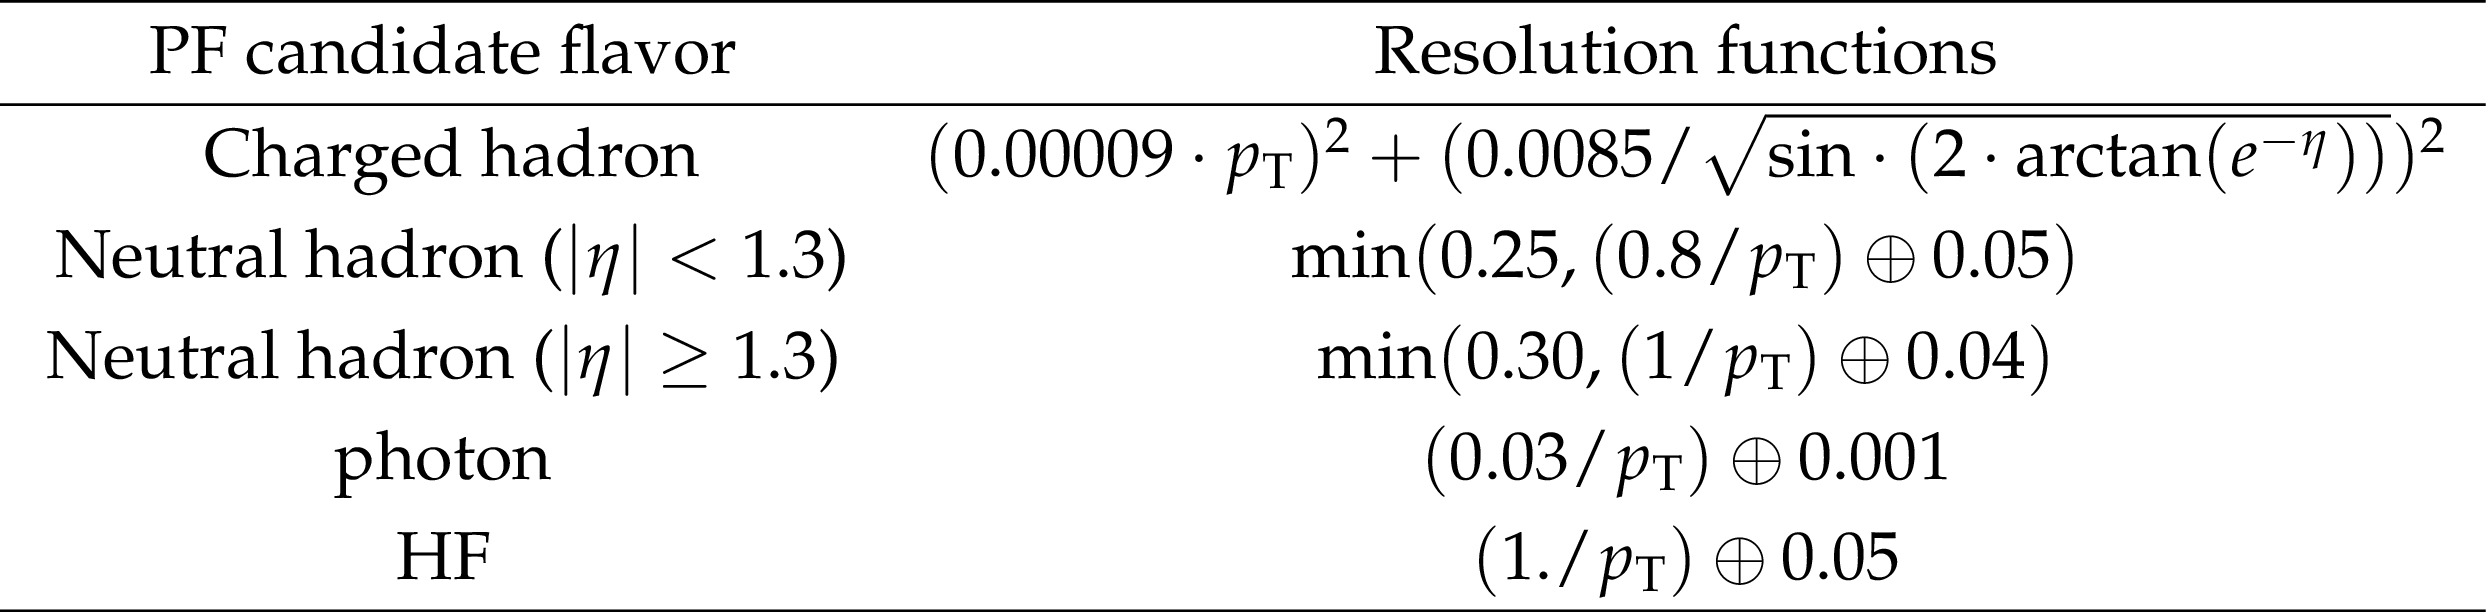
Table 1:
Functional forms of the resolutions in the ${p_{\mathrm {T}}}$ measurement for each PF candidate flavor contributing to the $E_{U}$ [6,3,7]. The mathematical symbol $\oplus $ indicates that the quantities are added in quadrature. |
png pdf |
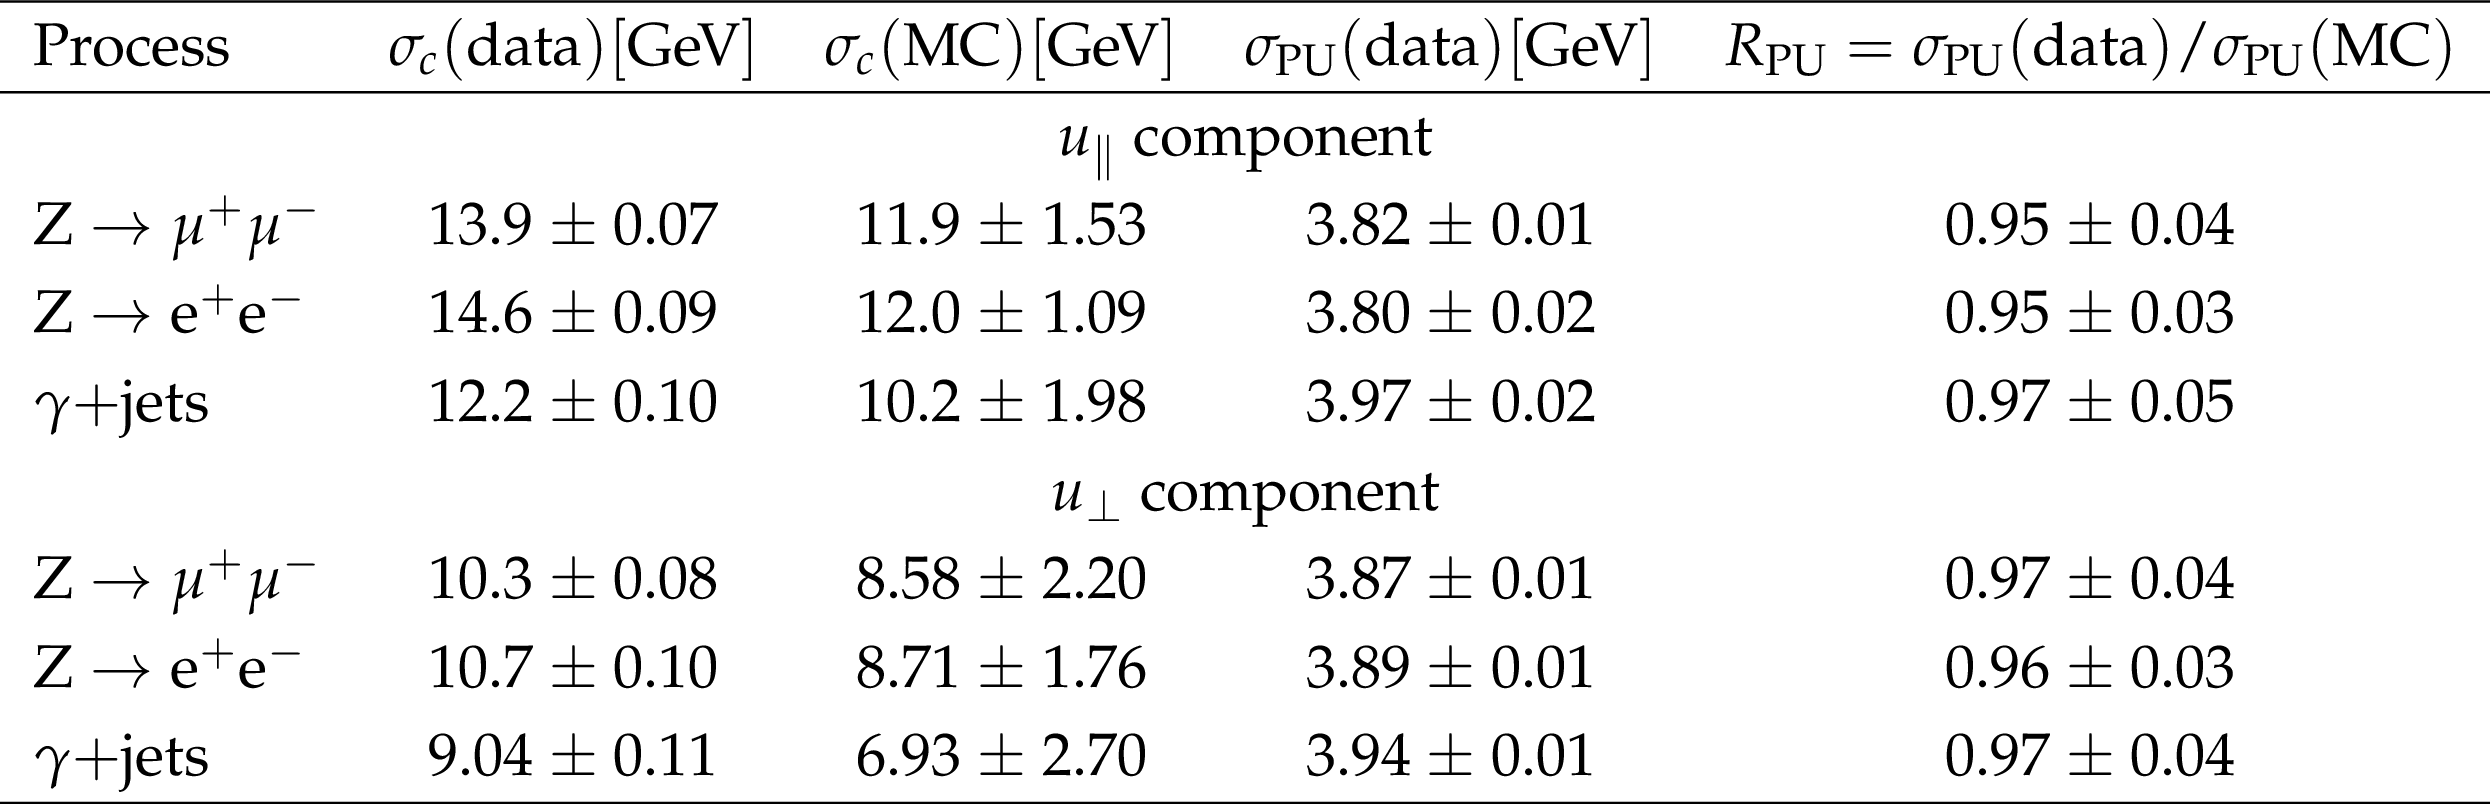
Table 2:
Parametrization results of the resolution curves for the ${u_{\perp}}$ and ${u_{\perp}}$ components as a function of ${\text {N}_{\text {vtx}}}$. The parameter values for $\sigma _{\mathrm {c}}$ are obtained from data and simulation, and the values for $\sigma _{\mathrm {PU}}$ are obtained from data, along with a ratio $R_{\mathrm {PU}}$ of data and simulation. The uncertainties displayed for both components are obtained from the fit, and for simulation the JES, the JER, and $E_{U}$ uncertainties are added in quadrature. |

png pdf |
Table 3:
Parametrization results of the resolution curves for ${u_{\perp}}$ and ${u_{\perp}}$ components as a function of the scalar ${p_{\mathrm {T}}}$ sum of all PF candidates. The parameter values for $\sigma _{\mathrm {0}}$ are obtained from data and simulation, whereas the $\sigma _{s}$ are obtained from data along with the ratio $R_{\mathrm {s}}$, the ratio of data and simulation. The uncertainties displayed for both components are obtained from the fit, and for simulation the JES, the JER, and $E_{U}$ uncertainties are added in quadrature. |
png pdf |
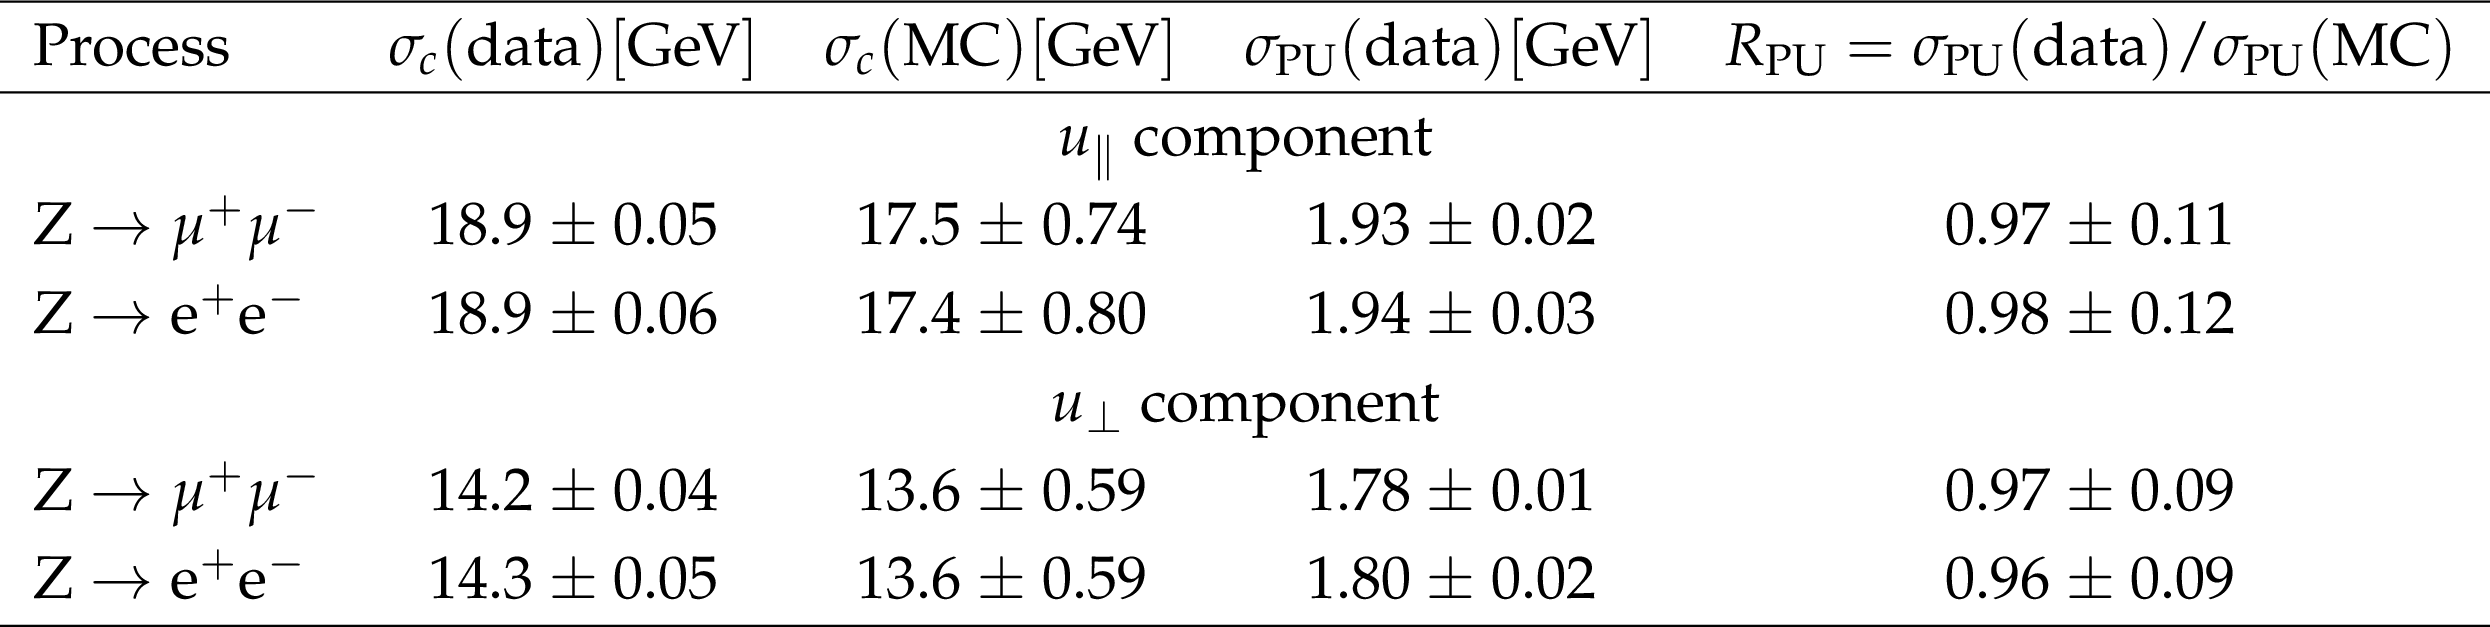
Table 4:
Parameterization results of the resolution curves for PUPPI ${u_{\perp}}$ and ${u_{\perp}}$ components as a function of ${\text {N}_{\text {vtx}}}$. The parameter values for $\sigma _{\mathrm {c}}$ are obtained from data and simulation, and the values for $\sigma _{\mathrm {\mathrm {PU}}}$ are obtained from data, along with the ratio $R_{\mathrm {PU}}$ of data and simulation. The uncertainties displayed for both the components are obtained from the fit, and for simulation the JES, the JER, and $E_{U}$ uncertainties are added in quadrature. |
png pdf |
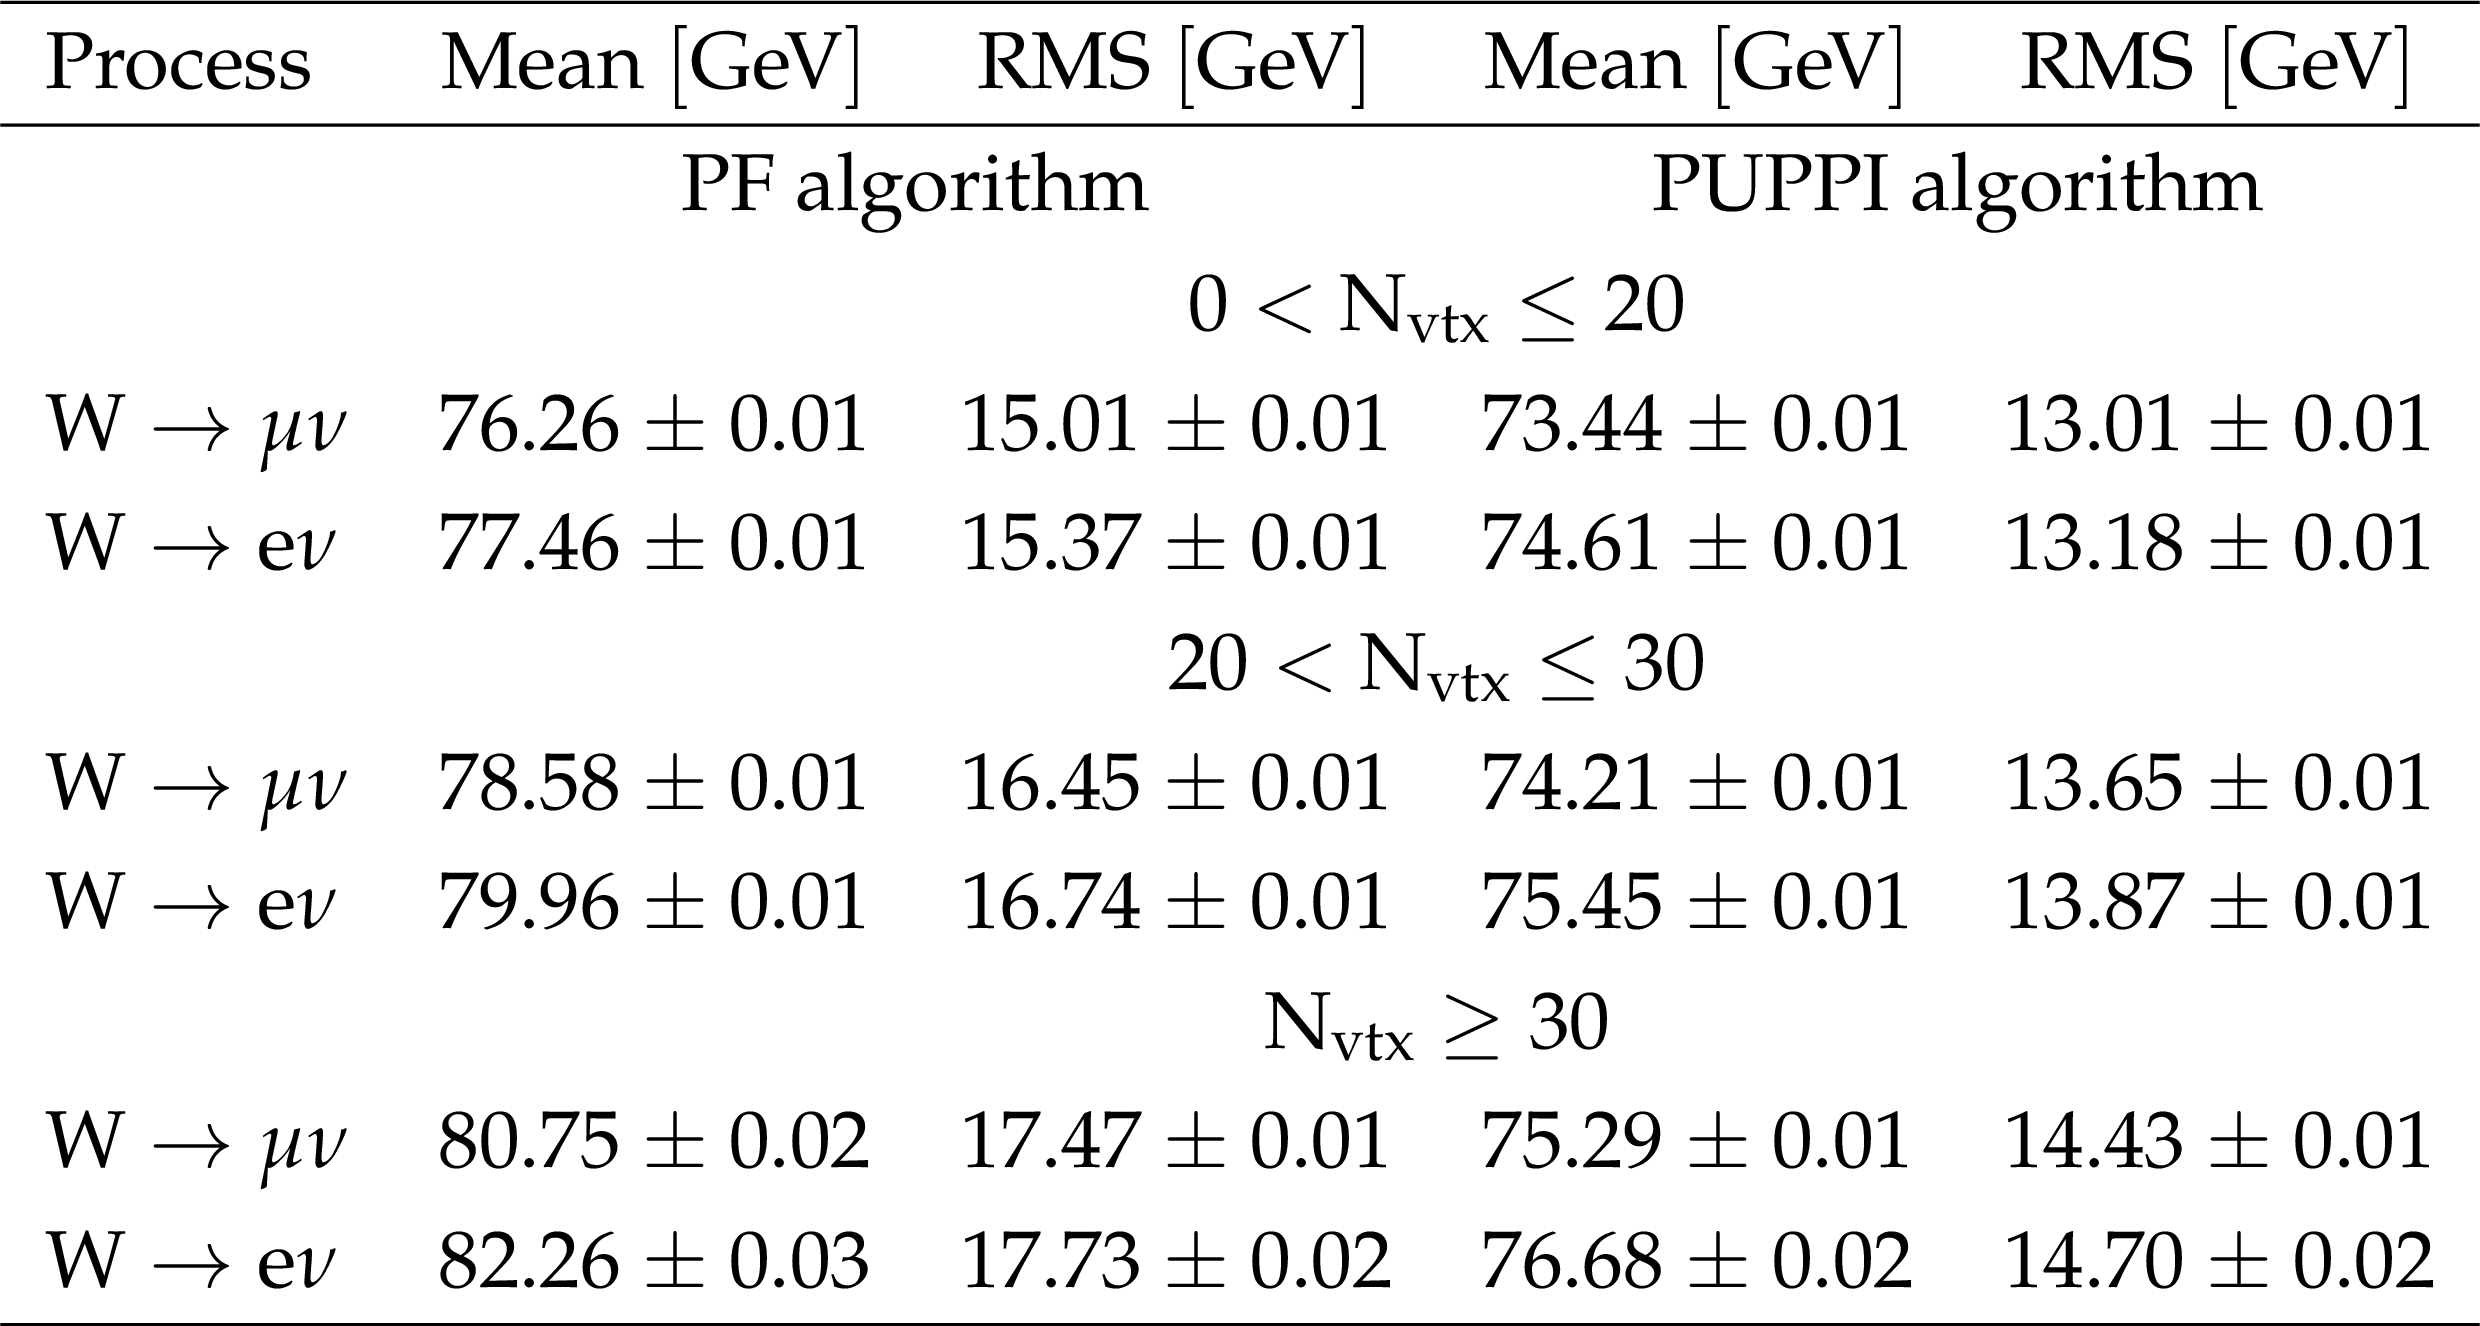
Table 5:
The summary of the mean and the spread of the Jacobian mass peak in the ${M_\mathrm {T}}$ distribution in single-lepton events for PF and PUPPI ${{p_{\mathrm {T}}} ^\text {miss}}$ algorithms. The results are obtained using simulated $ {\mathrm {W}}+$jets events. |
| Summary |
|
The performance of missing transverse momentum (${p_{\mathrm{T}}^{\text{miss}}}$) reconstruction algorithms in events with or without genuine ${p_{\mathrm{T}}^{\text{miss}}}$ is presented. The results are based on a sample of proton-proton collisions recorded by the CMS experiment at $\sqrt{s} = 13$ TeV in 2016, corresponding to an integrated luminosity of 35.9 fb$^{-1}$. The performance of algorithms used to identify and remove events with anomalous ${p_{\mathrm{T}}^{\text{miss}}}$ is also studied in events with one or more jets. The scale and resolution of ${p_{\mathrm{T}}^{\text{miss}}}$ is determined using events with an identified leptonically decaying Z boson or an isolated photon. The measured scale and resolution in data are in agreement with the expectations from simulation. Also presented is the performance of an advanced ${p_{\mathrm{T}}^{\text{miss}}}$ reconstruction algorithm, the "pileup per particle identification'' ${p_{\mathrm{T}}^{\text{miss}}}$, specifically developed to cope with the large pileup collisions expected at the high-luminosity LHC. This algorithm shows a significantly reduced dependence of the ${p_{\mathrm{T}}^{\text{miss}}}$ resolution on the number of pileup collisions ($> $10), particularly important for the upcoming LHC data-taking periods. |
| References | ||||
| 1 | CMS Collaboration | The CMS experiment at the CERN LHC | JINST 3 (2008) S08004 | CMS-00-001 |
| 2 | L. Evans and P. Bryant (editors) | LHC machine | JINST 3 (2008) S08001 | |
| 3 | CMS Collaboration | Description and performance of track and primary-vertex reconstruction with the CMS tracker | JINST 9 (2014) P10009 | CMS-TRK-11-001 1405.6569 |
| 4 | CMS Collaboration | Performance of the CMS muon detector and muon reconstruction with proton-proton collisions at $ \sqrt{s}= $ 13 TeV | JINST 13 (2018) P06015 | CMS-MUO-16-001 1804.04528 |
| 5 | CMS Collaboration | The CMS trigger system | JINST 12 (2017) P01020 | CMS-TRG-12-001 1609.02366 |
| 6 | CMS Collaboration | Particle-flow reconstruction and global event description with the CMS detector | JINST 12 (2017) P10003 | CMS-PRF-14-001 1706.04965 |
| 7 | CMS Collaboration | Performance of photon reconstruction and identification with the CMS detector in proton-proton collisions at $ \sqrt{s} = $ 8 TeV | JINST 10 (2015) P08010 | CMS-EGM-14-001 1502.02702 |
| 8 | CMS Collaboration | Performance of electron reconstruction and selection with the CMS detector in proton-proton collisions at $ \sqrt{s} = $ 8 TeV | JINST 10 (2015) P06005 | CMS-EGM-13-001 1502.02701 |
| 9 | CMS Collaboration | Reconstruction and identification of $ \tau $ lepton decays to hadrons and $ \nu_{\tau} $ at CMS | JINST 11 (2016) P01019 | CMS-TAU-14-001 1510.07488 |
| 10 | M. Cacciari, G. P. Salam, and G. Soyez | The anti-$ {k_{\mathrm{T}}} $ jet clustering algorithm | JHEP 04 (2008) 063 | 0802.1189 |
| 11 | CMS Collaboration | Jet energy scale and resolution in the CMS experiment in pp collisions at 8 TeV | JINST 12 (2017) P02014 | CMS-JME-13-004 1607.03663 |
| 12 | CMS Collaboration | Identification of heavy-flavour jets with the CMS detector in pp collisions at 13 TeV | JINST 13 (2018) P05011 | CMS-BTV-16-002 1712.07158 |
| 13 | CMS Collaboration | Missing transverse energy performance of the CMS detector | JINST 6 (2011) P09001 | CMS-JME-10-009 1106.5048 |
| 14 | CMS Collaboration | Performance of the CMS missing transverse momentum reconstruction in pp data at $ \sqrt{s} = $ 8 TeV | JINST 10 (2015) P02006 | CMS-JME-13-003 1411.0511 |
| 15 | D. Bertolini, P. Harris, M. Low, and N. Tran | Pileup per particle identification | JHEP 10 (2014) 059 | 1407.6013 |
| 16 | CMS Collaboration | Jet algorithms performance in 13 TeV data | CMS-PAS-JME-16-003 | CMS-PAS-JME-16-003 |
| 17 | J. Alwall et al. | The automated computation of tree-level and next-to-leading order differential cross sections, and their matching to parton shower simulations | JHEP 07 (2014) 079 | 1405.0301 |
| 18 | C. Oleari | The POWHEG-BOX | NPPS 205-206 (2010) 36 | 1007.3893 |
| 19 | S. Alioli, P. Nason, C. Oleari, and E. Re | NLO single-top production matched with shower in POWHEG: $ s $- and $ t $-channel contributions | JHEP 09 (2009) 111 | 0907.4076 |
| 20 | T. Sjostrand et al. | An introduction to PYTHIA 8.2 | CPC 191 (2015) 159 | 1410.3012 |
| 21 | CMS Collaboration | Event generator tunes obtained from underlying event and multiparton scattering measurements | EPJC 76 (2016) 155 | CMS-GEN-14-001 1512.00815 |
| 22 | M. L. Mangano, M. Moretti, F. Piccinini, and M. Treccani | Matching matrix elements and shower evolution for top quark production in hadronic collisions | JHEP 01 (2007) 013 | hep-ph/0611129 |
| 23 | R. Frederix and S. Frixione | Merging meets matching in MC@NLO | JHEP 12 (2012) 061 | 1209.6215 |
| 24 | NNPDF Collaboration | Parton distributions for the LHC Run II | JHEP 04 (2015) 040 | 1410.8849 |
| 25 | GEANT4 Collaboration | GEANT4---a simulation toolkit | NIMA 506 (2003) 250 | |
| 26 | CMS Collaboration | CMS luminosity measurements for the 2016 data taking period | CMS-PAS-LUM-17-001 | CMS-PAS-LUM-17-001 |
| 27 | Particle Data Group, M. Tanabashi et al. | Review of particle physics | PRD 98 (2018) 030001 | |
| 28 | CMS Collaboration | Technical proposal for the upgrade of the CMS detector through 2020 | CDS | |
| 29 | CMS Collaboration | Identification and filtering of uncharacteristic noise in the CMS hadron calorimeter | JINST 5 (2010) T03014 | CMS-CFT-09-019 0911.4881 |
| 30 | N. Tosi | The CMS beam halo monitor at the LHC: implementation and first measurements | in Proceedings, 5th International Beam Instrumentation Conference (IBIC 2016): Barcelona, Spain, September 11-15, 2016, p. TUPG20 2017 | |
| 31 | CMS Collaboration | 2017 tracking performance plots | CDS | |
| 32 | M. H. Quenouille | Approximate tests of correlation in time-series | J. Roy. Stat. Soc. Ser. B (Methodological) 11 (1949) 68 | |
| 33 | J. W. Tukey | Bias and confidence in not quite large samples | Ann. Math. Statist. 29 (1958) 1261 | |
|
|
Compact Muon Solenoid LHC, CERN |
|

|

|

|

|

|