

Compact Muon Solenoid
LHC, CERN
| CMS-EXO-19-013 ; CERN-EP-2021-052 | ||
| Search for long-lived particles decaying to jets with displaced vertices in proton-proton collisions at $\sqrt{s} = $ 13 TeV | ||
| CMS Collaboration | ||
| 28 April 2021 | ||
| Phys. Rev. D 104 (2021) 052011 | ||
| Abstract: A search is presented for long-lived particles produced in pairs in proton-proton collisions at the LHC operating at a center-of-mass energy of 13 TeV. The data were collected with the CMS detector during the period from 2015 through 2018, and correspond to a total integrated luminosity of 140 fb$^{-1}$. This search targets pairs of long-lived particles with mean proper decay lengths between 0.1 and 100 mm, each of which decays into at least two quarks that hadronize to jets, resulting in a final state with two displaced vertices. No significant excess of events with two displaced vertices is observed. In the context of $R$-parity violating supersymmetry models, the pair production of long-lived neutralinos, gluinos, and top squarks is excluded at 95% confidence level for cross sections larger than 0.08fb, masses between 800 and 3000 GeV, and mean proper decay lengths between 1 and 25 mm. | ||
| Links: e-print arXiv:2104.13474 [hep-ex] (PDF) ; CDS record ; inSPIRE record ; HepData record ; CADI line (restricted) ; | ||
| Figures & Tables | Summary | Additional Figures | References | CMS Publications |
|---|
| Figures | |
png pdf |
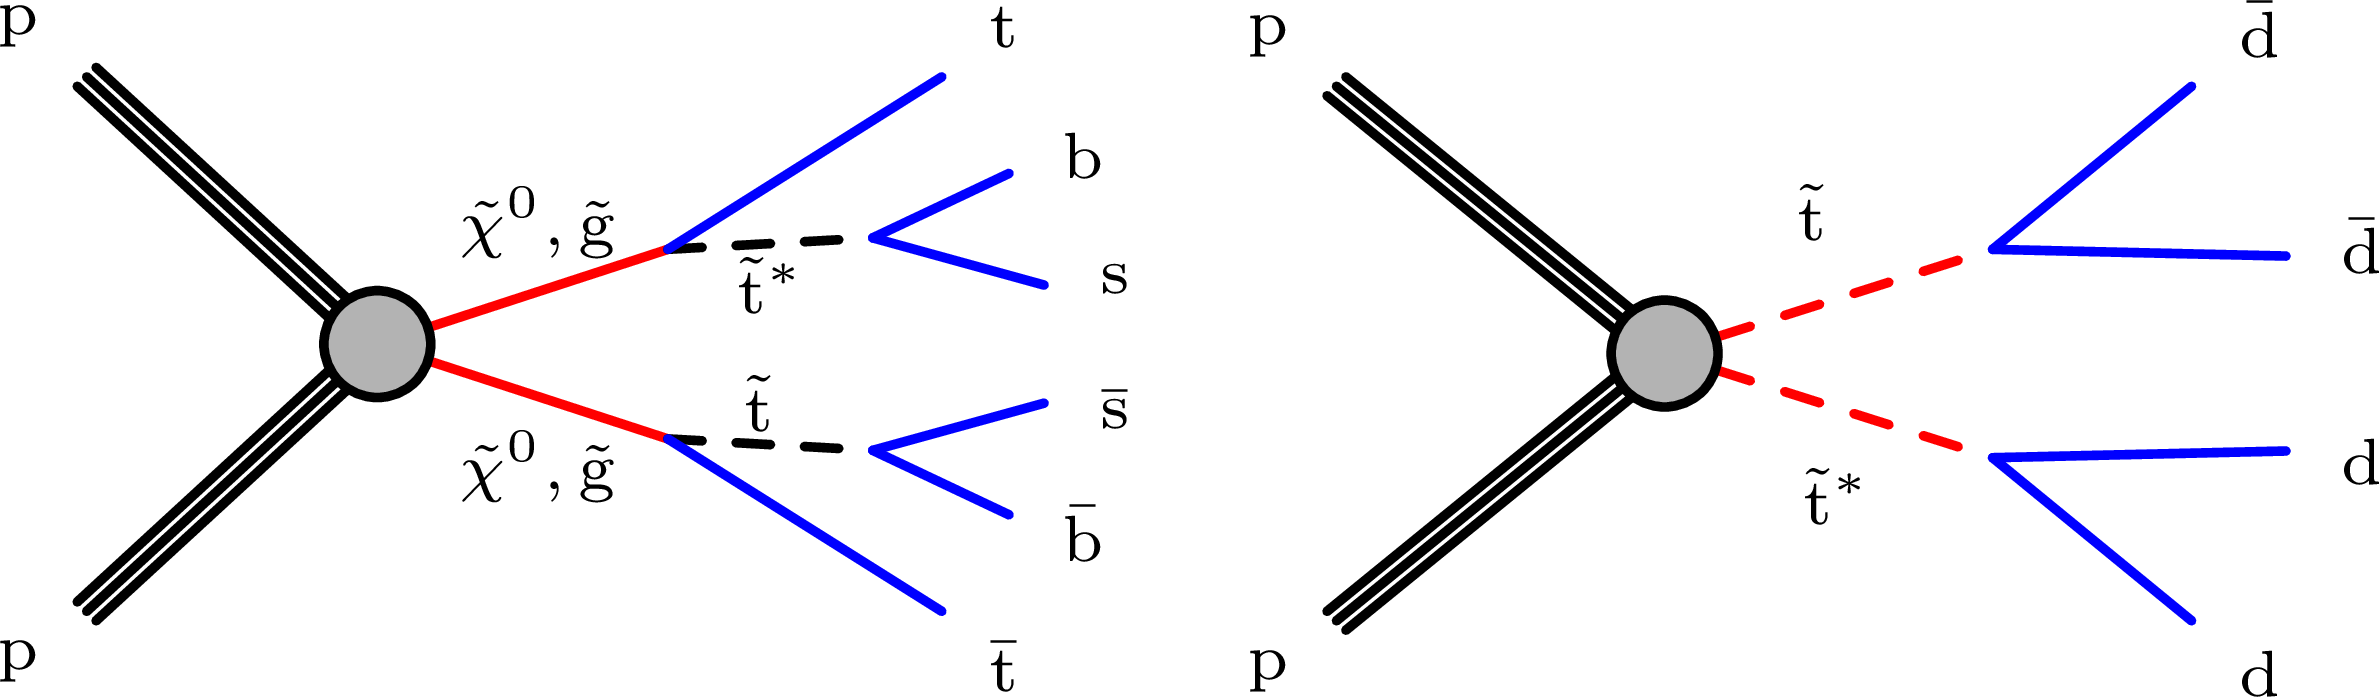
Figure 1:
Diagrams of the multijet signal model (left) showing long-lived neutralinos ($\tilde{\chi}^0$) or gluinos (${\mathrm{\tilde{g}}}$) decaying into top, bottom, and strange quarks via virtual top squarks ($\tilde{\mathrm{t}}$), and the dijet signal model (right) showing long-lived top and anti-top squarks decaying into two down-type quarks. In both cases, the long-lived particles are the LSPs in their respective models. |

png pdf |
Figure 1-a:
Diagram of the multijet signal model showing long-lived neutralinos ($\tilde{\chi}^0$) or gluinos (${\mathrm{\tilde{g}}}$) decaying into top, bottom, and strange quarks via virtual top squarks ($\tilde{\mathrm{t}}$). The long-lived particle is the LSP in the model. |
png pdf |
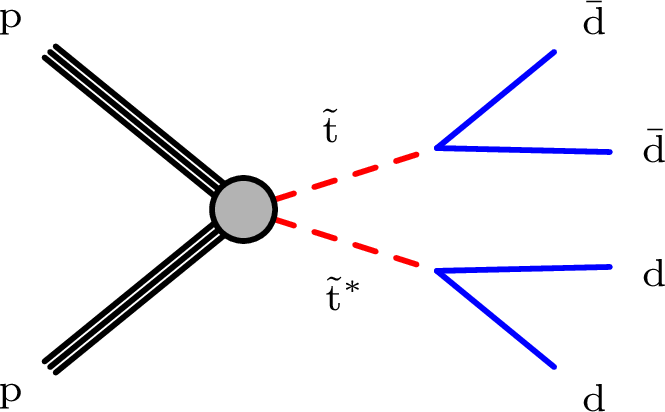
Figure 1-b:
Diagram of the dijet signal model showing long-lived top and anti-top squarks decaying into two down-type quarks. The long-lived particle is the LSP in the model. |
png pdf |
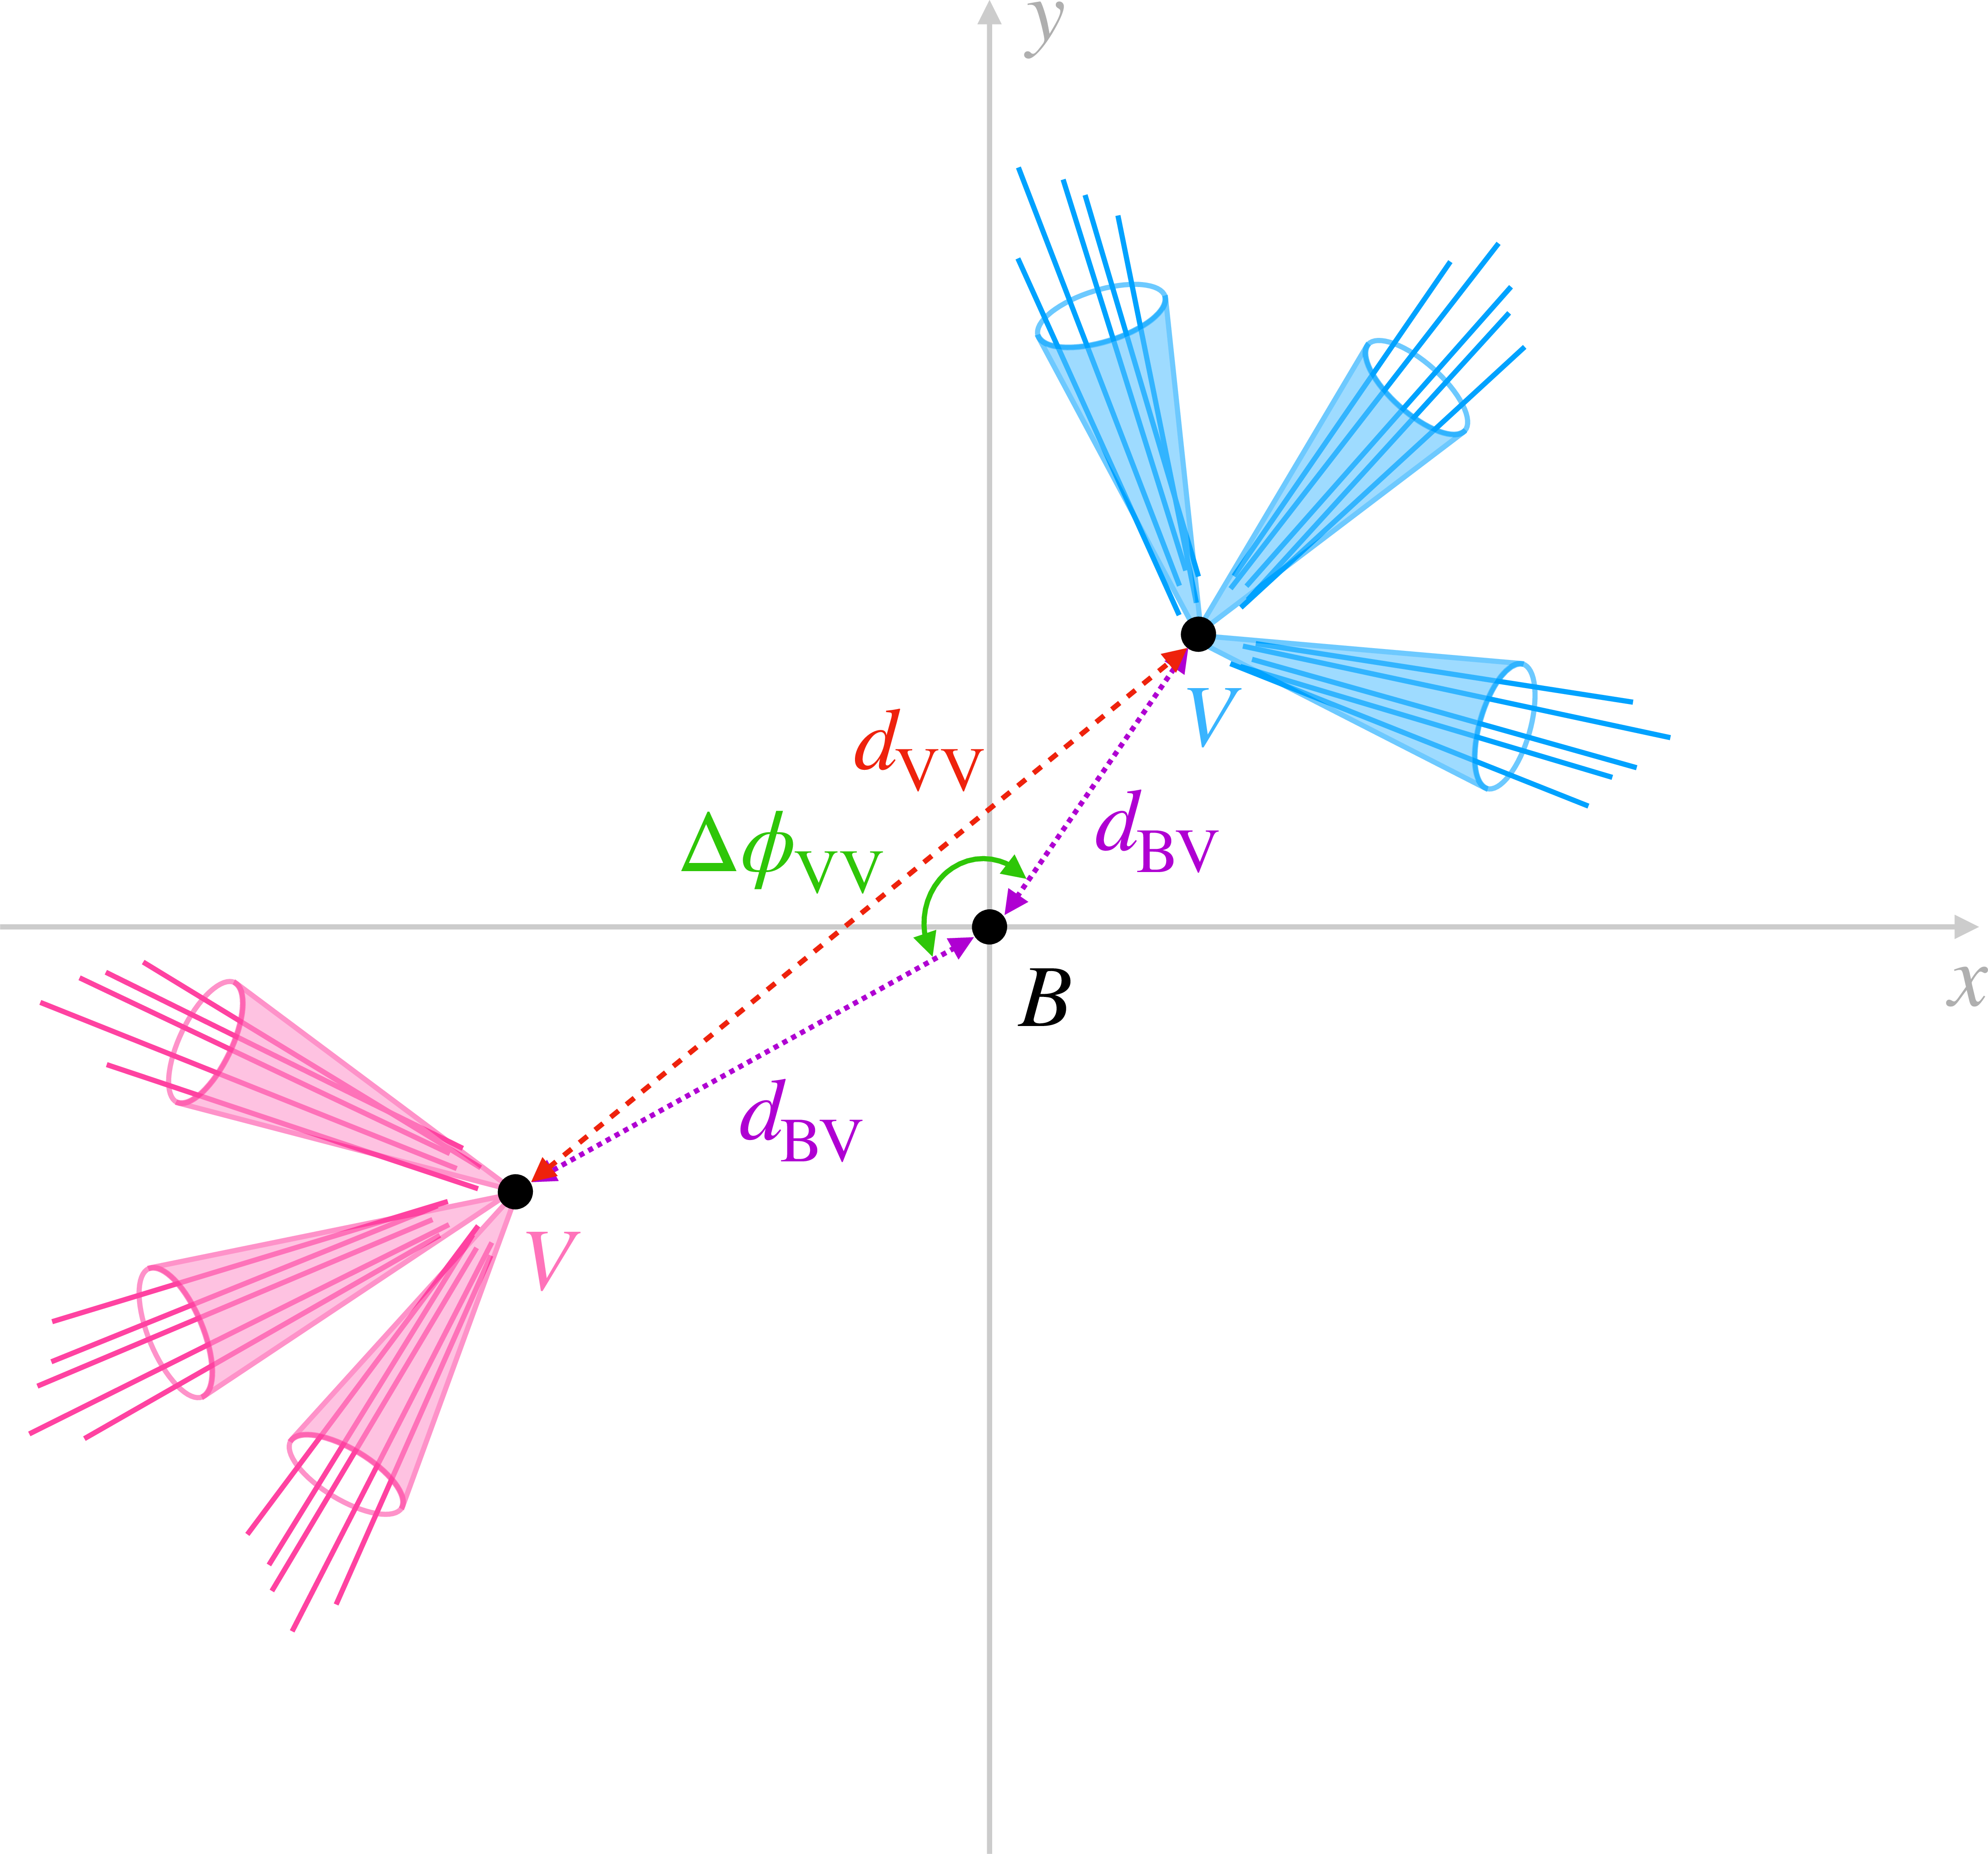
Figure 2:
Schematic diagram of an event with two signal vertices with the beam spot $B$ at the origin. The beam direction is perpendicular to the $x$-$y$ plane shown. The distance between the vertices is defined as ${d_{\mathrm {VV}}}$. The distance from the beam spot to the vertices is defined as ${d_{\mathrm {BV}}}$ and the angle between the vertex displacement vectors is defined as ${\Delta \phi _{\mathrm {VV}}}$. |
png pdf |
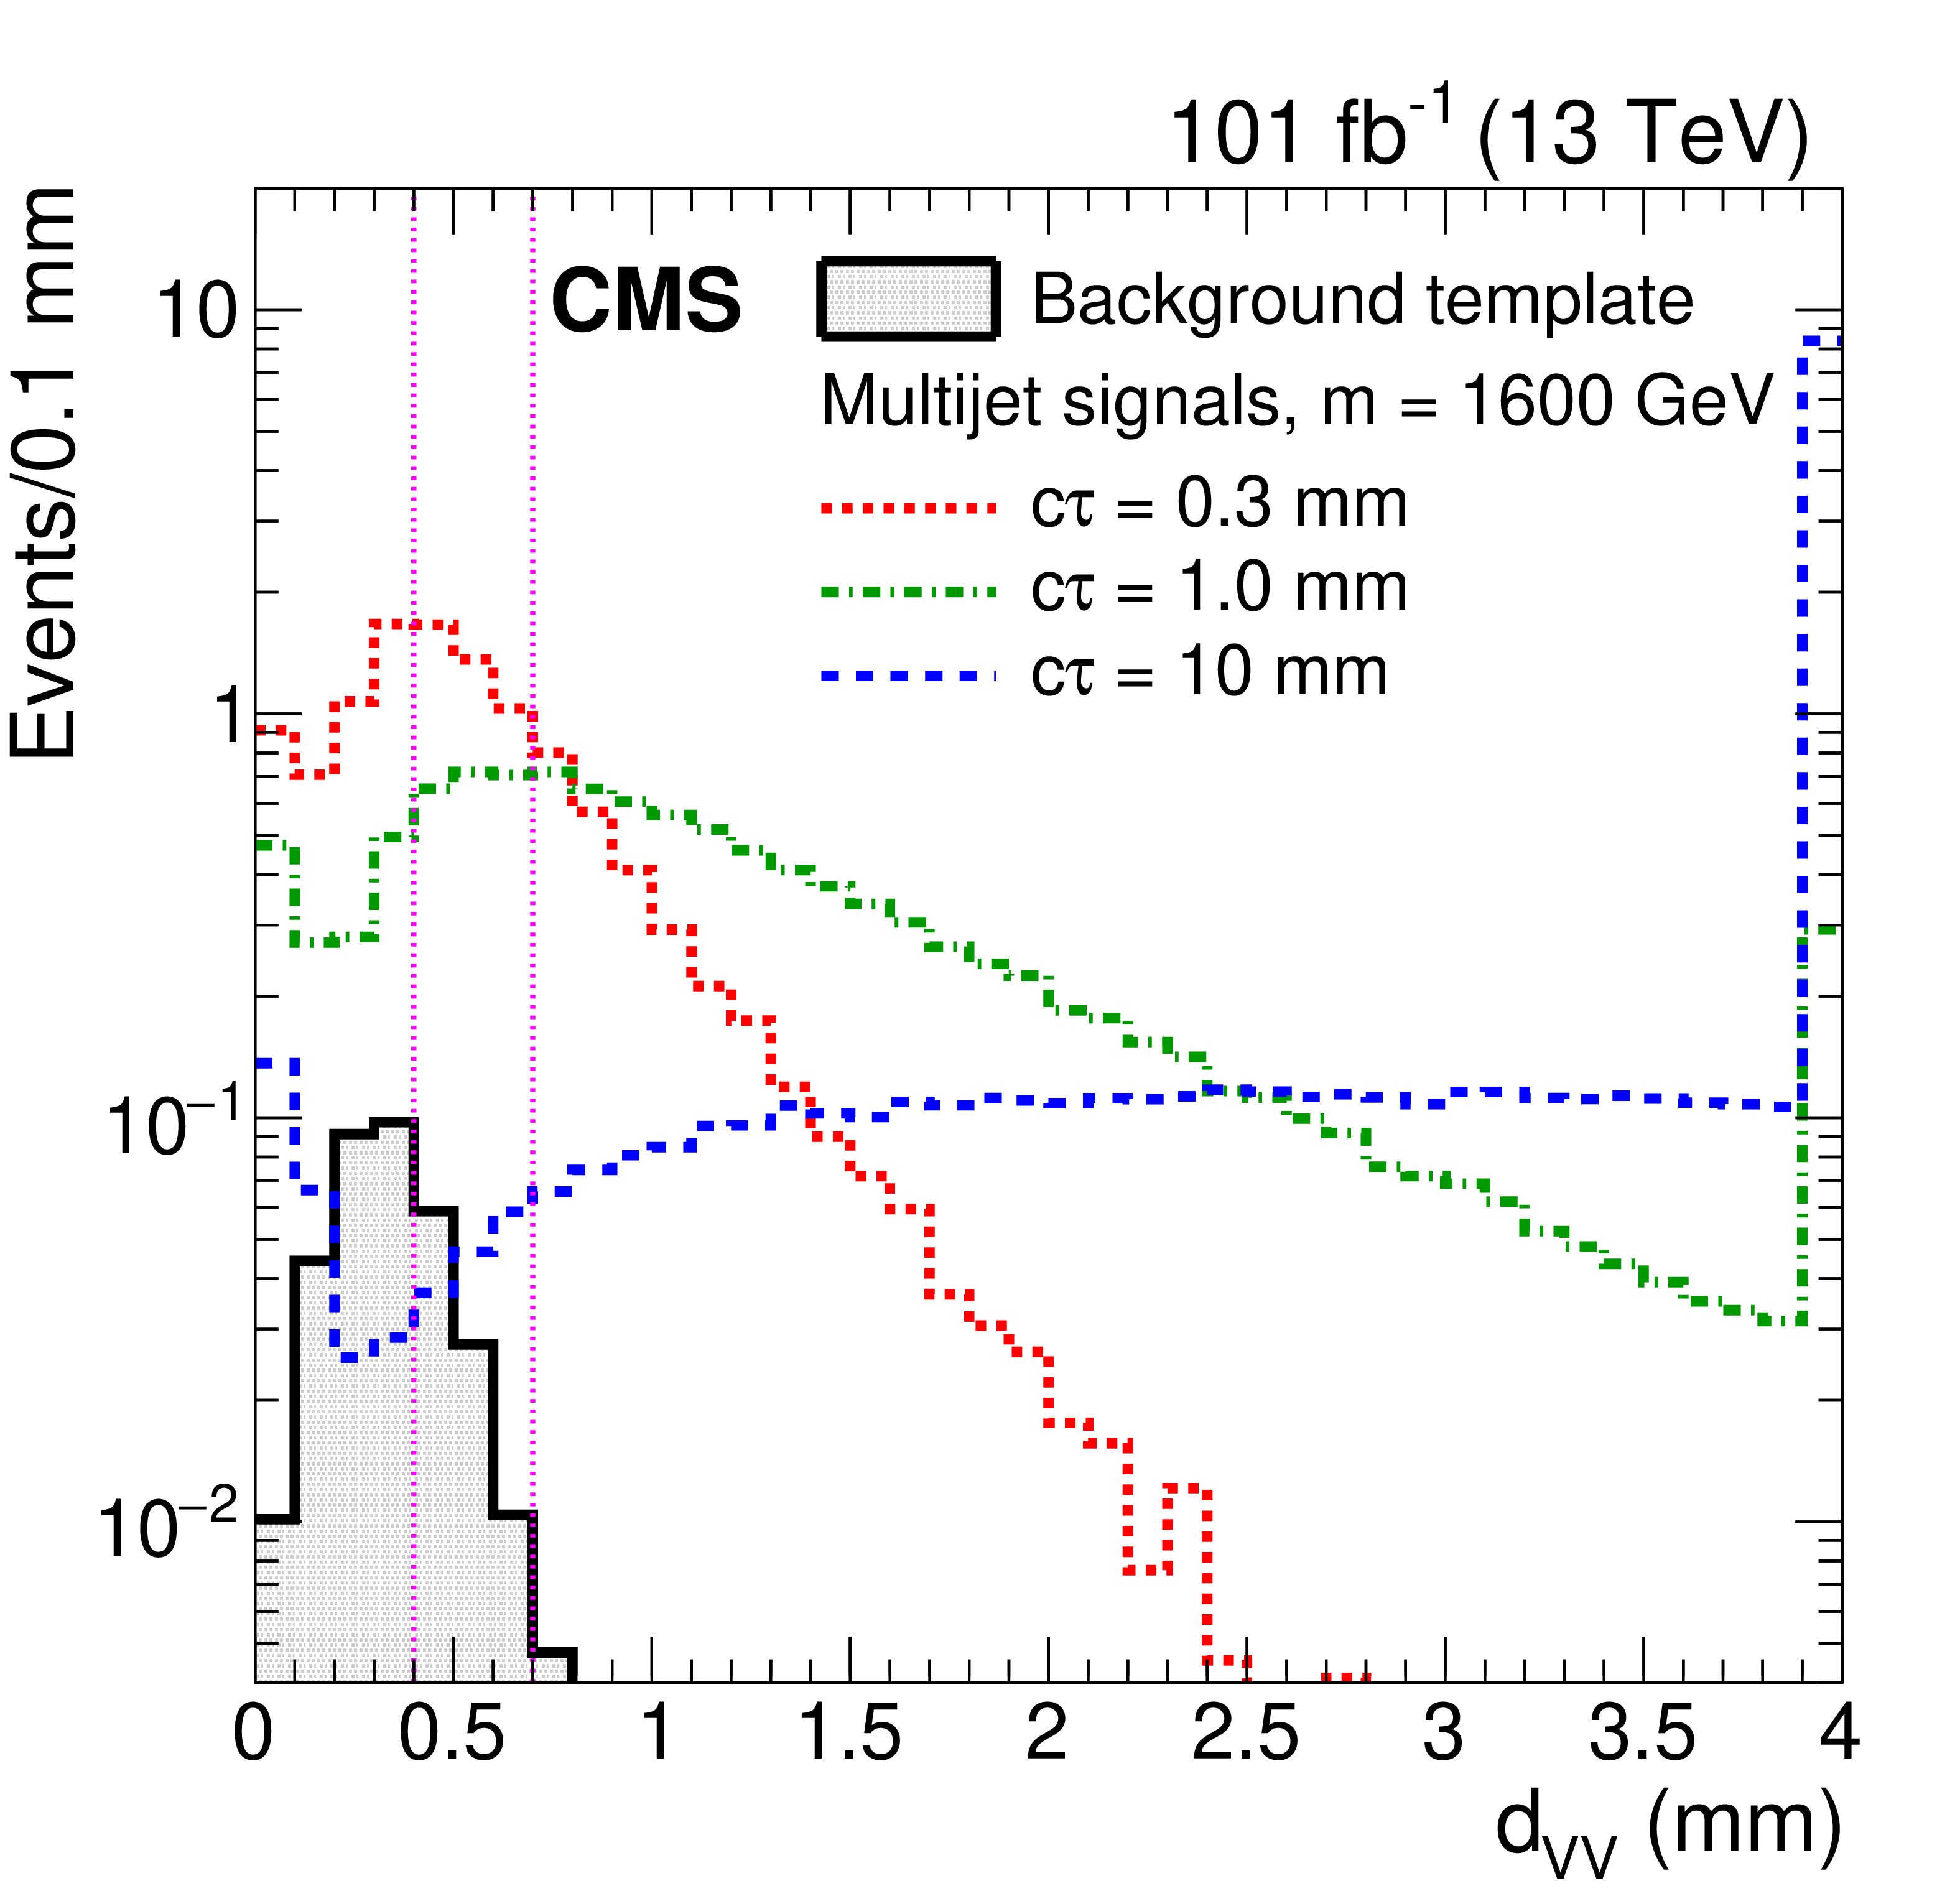
Figure 3:
The distribution of distances between vertices in the $x$-$y$ plane, ${d_{\mathrm {VV}}}$, for three simulated multijet signals each with a mass of 1600 GeV, with the background template distribution overlaid. The production cross section for each signal model is assumed to be the lower limit excluded by Ref. [25], corresponding to values of 0.8, 0.25, and 0.15 fb for the samples with $c\tau = $ 0.3, 1.0, and 10 mm, respectively. The last bin includes the overflow events. The two vertical pink dashed lines separate the regions used in the fit. |

png pdf |
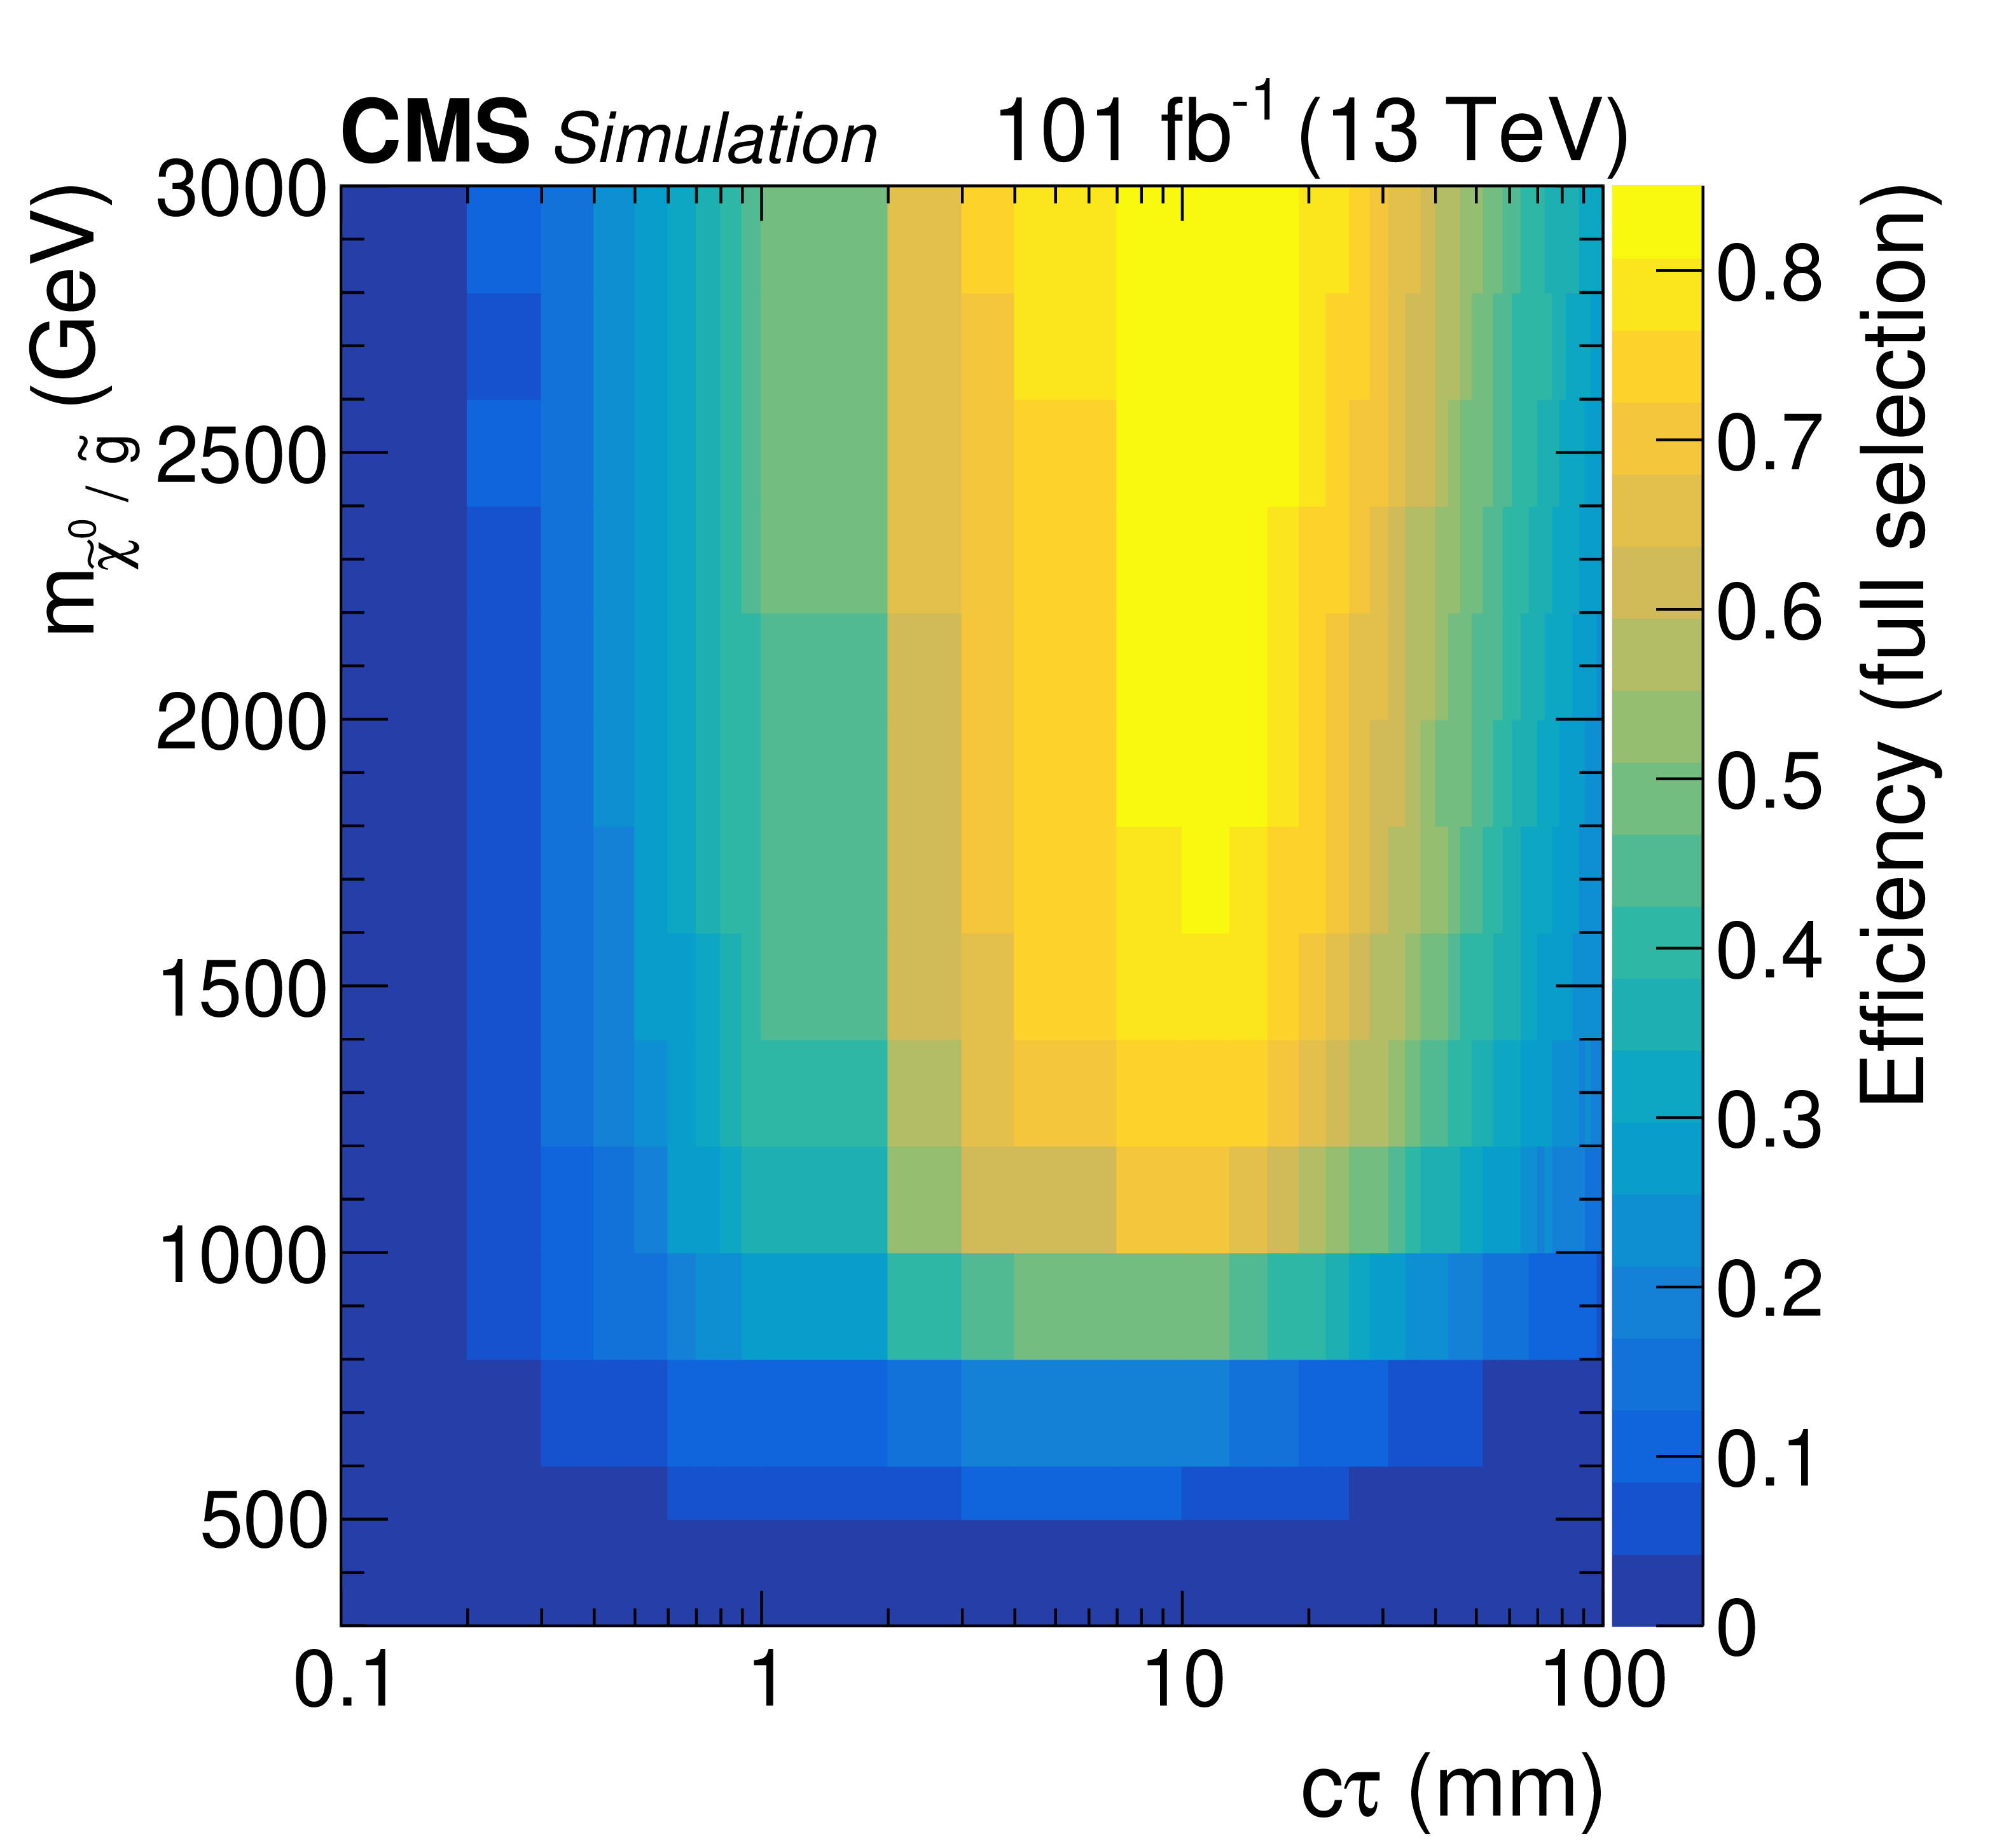
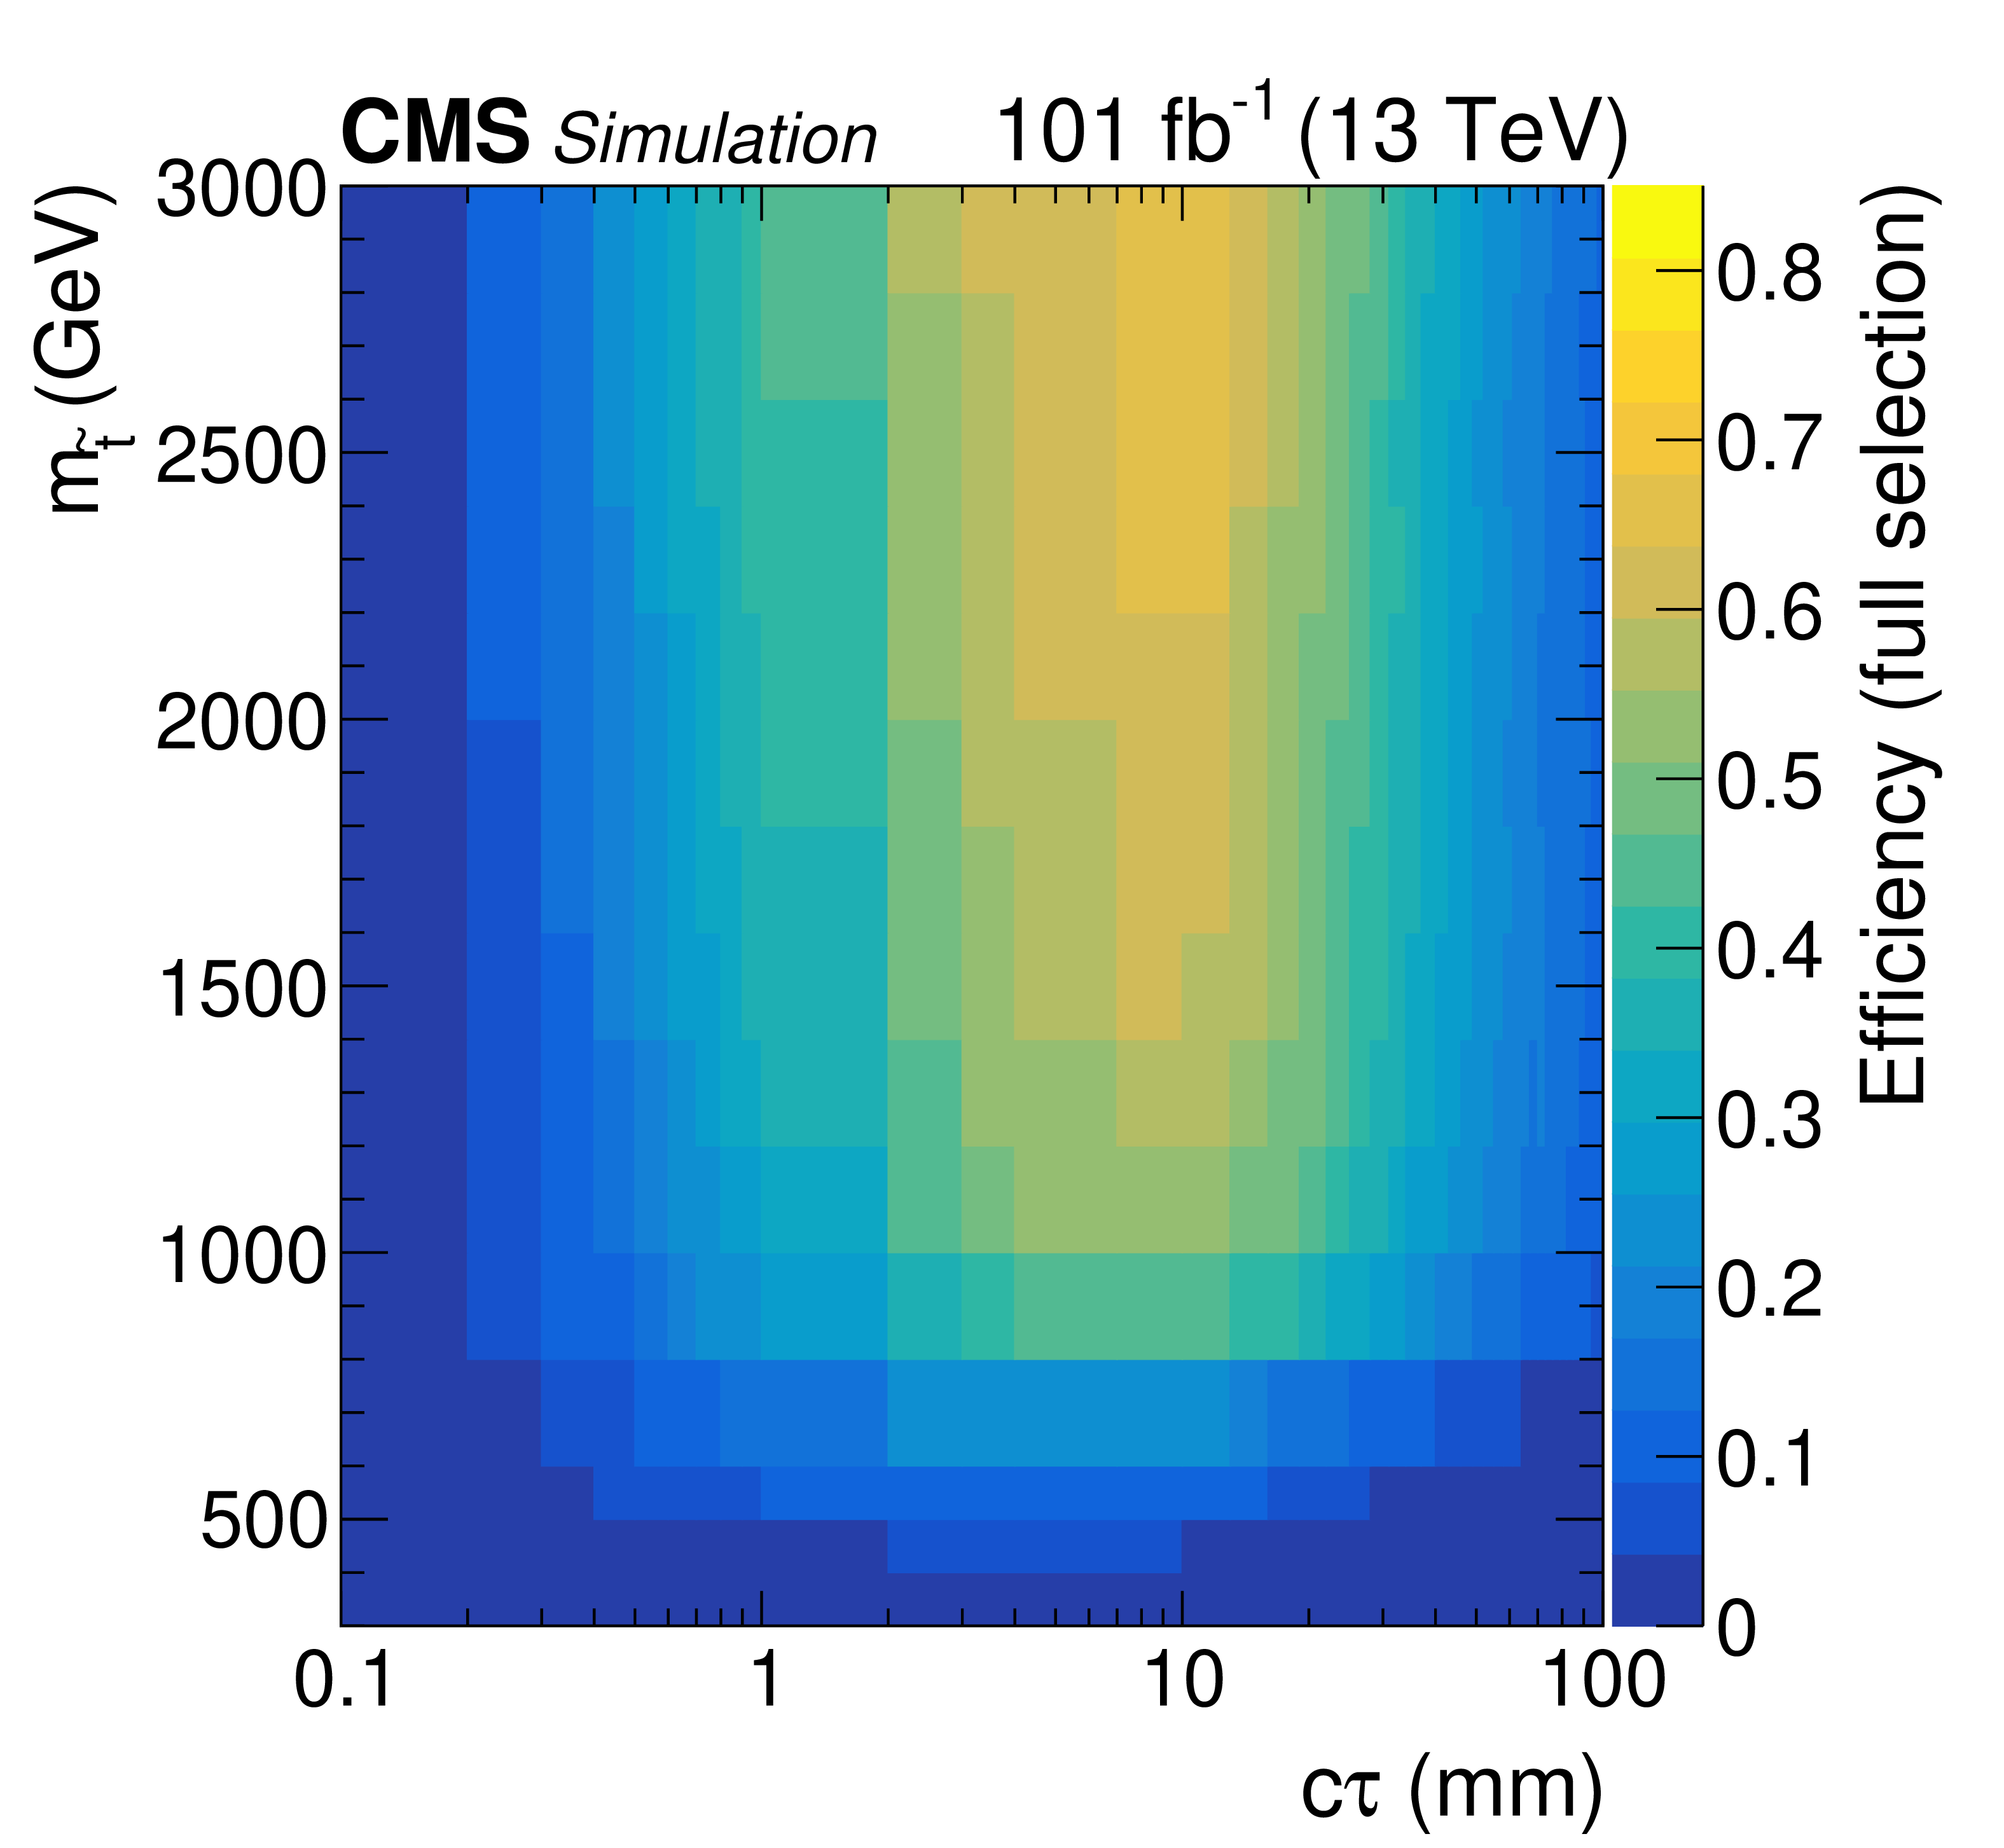
Figure 4:
Multijet (left) and dijet (right) signal efficiencies as a function of the signal mass and lifetime for events satisfying all event and vertex requirements, with corrections based on systematic differences in the vertex reconstruction efficiency between data and simulation. |
png pdf |
Figure 4-a:
Multijet signal efficiency as a function of the signal mass and lifetime for events satisfying all event and vertex requirements, with corrections based on systematic differences in the vertex reconstruction efficiency between data and simulation. |
png pdf |
Figure 4-b:
Dijet signal efficiency as a function of the signal mass and lifetime for events satisfying all event and vertex requirements, with corrections based on systematic differences in the vertex reconstruction efficiency between data and simulation. |
png pdf |
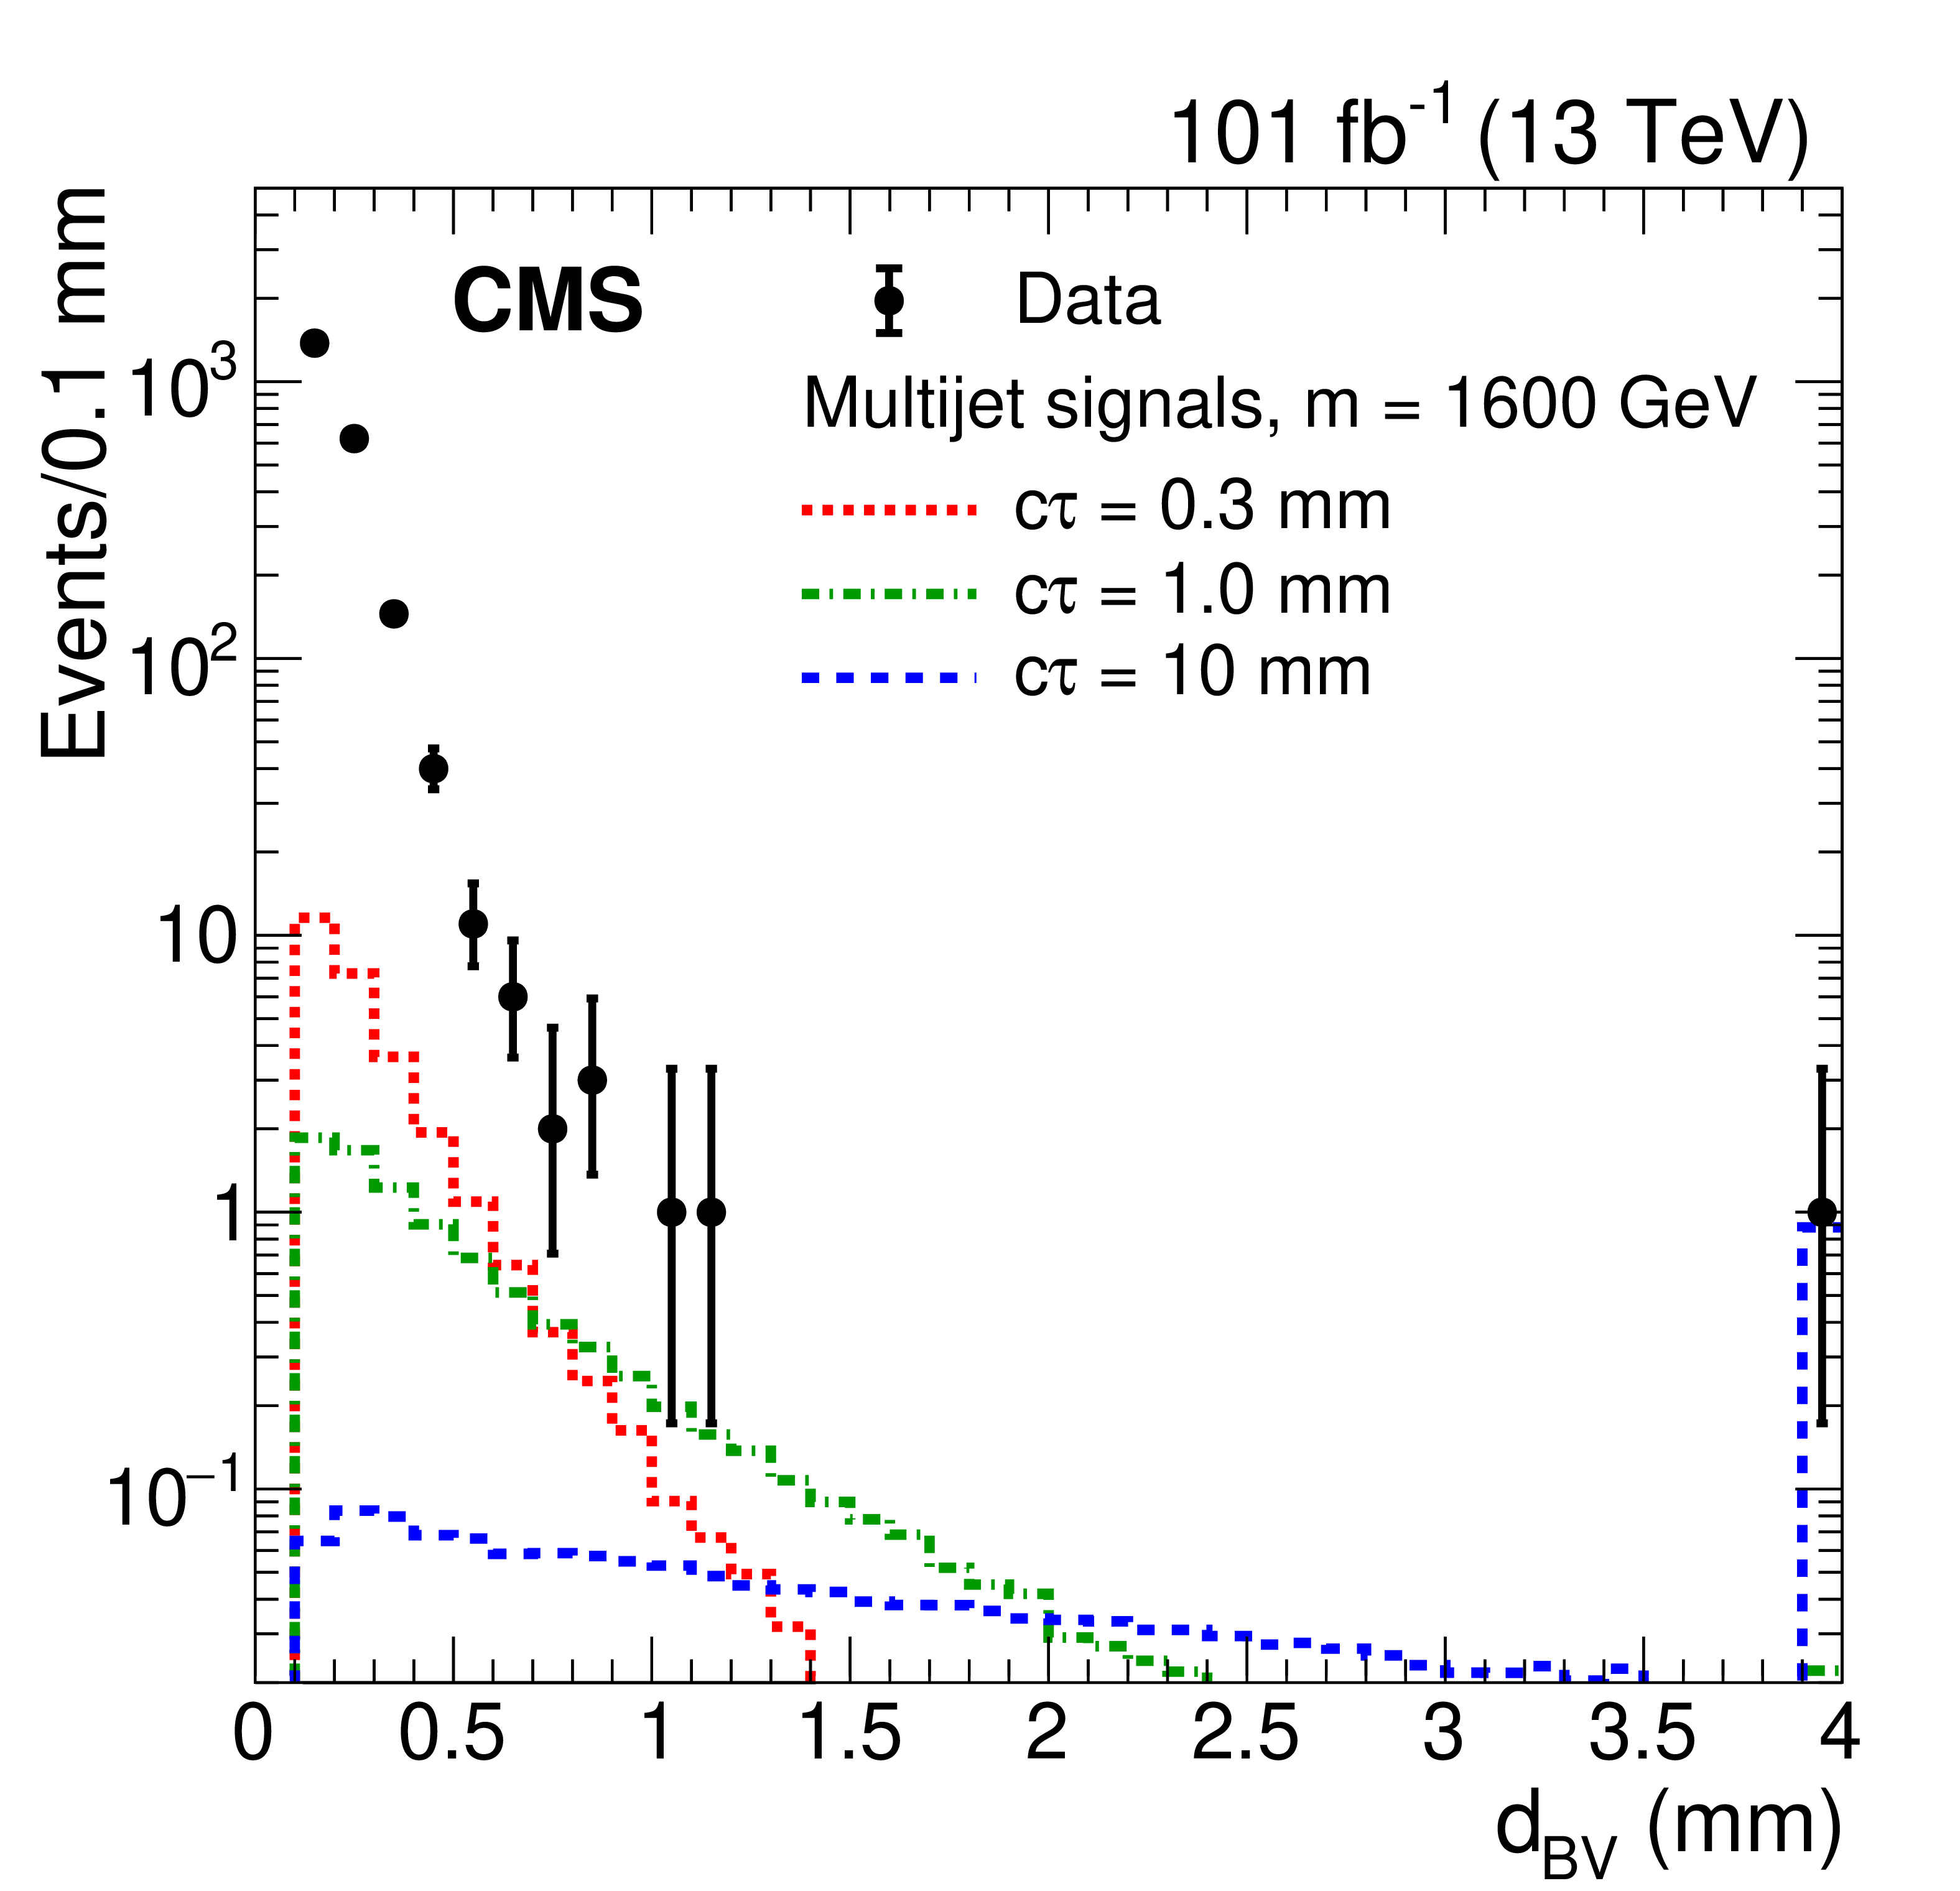
Figure 5:
The distribution of ${d_{\mathrm {BV}}}$ for $\geq $5-track one-vertex events in data and three simulated multijet signal samples each with a mass of 1600 GeV. The production cross section for each signal model is assumed to be the lower limit excluded by Ref. [25], corresponding to values of 0.8, 0.25, and 0.15 fb for the samples with $c\tau = $ 0.3, 1.0, and 10 mm, respectively. The last bin includes the overflow events. |
png pdf |
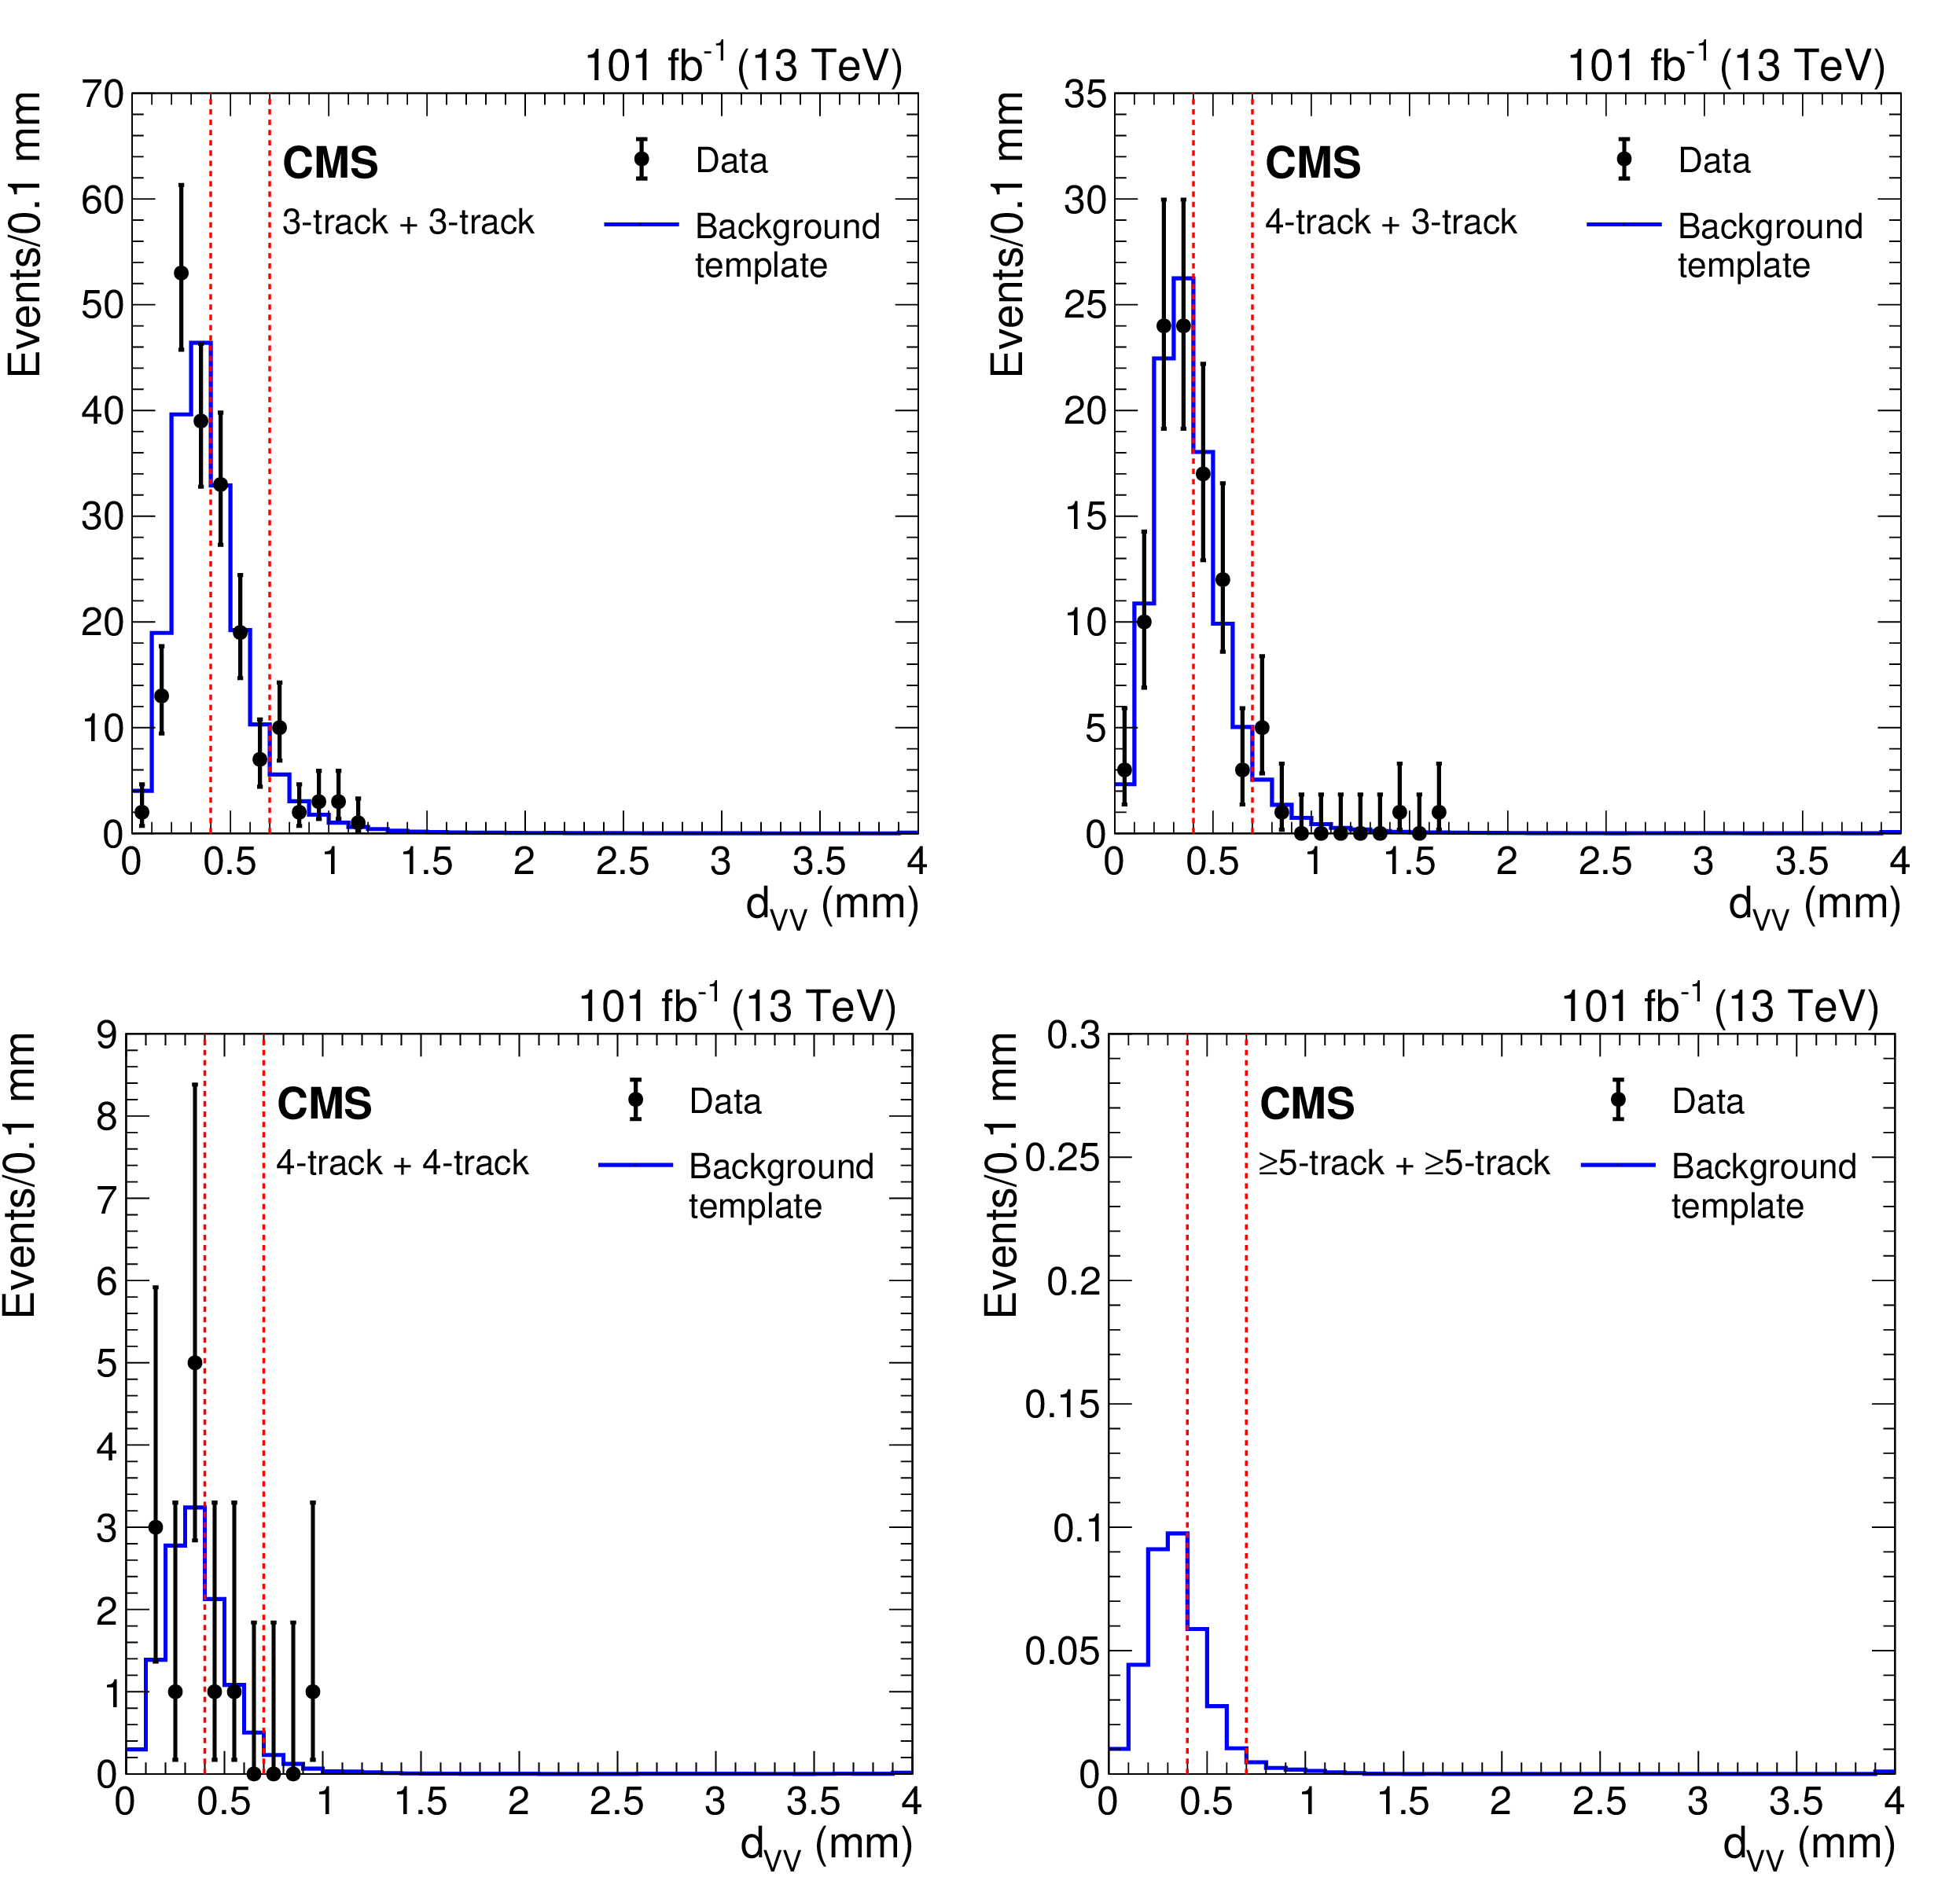
Figure 6:
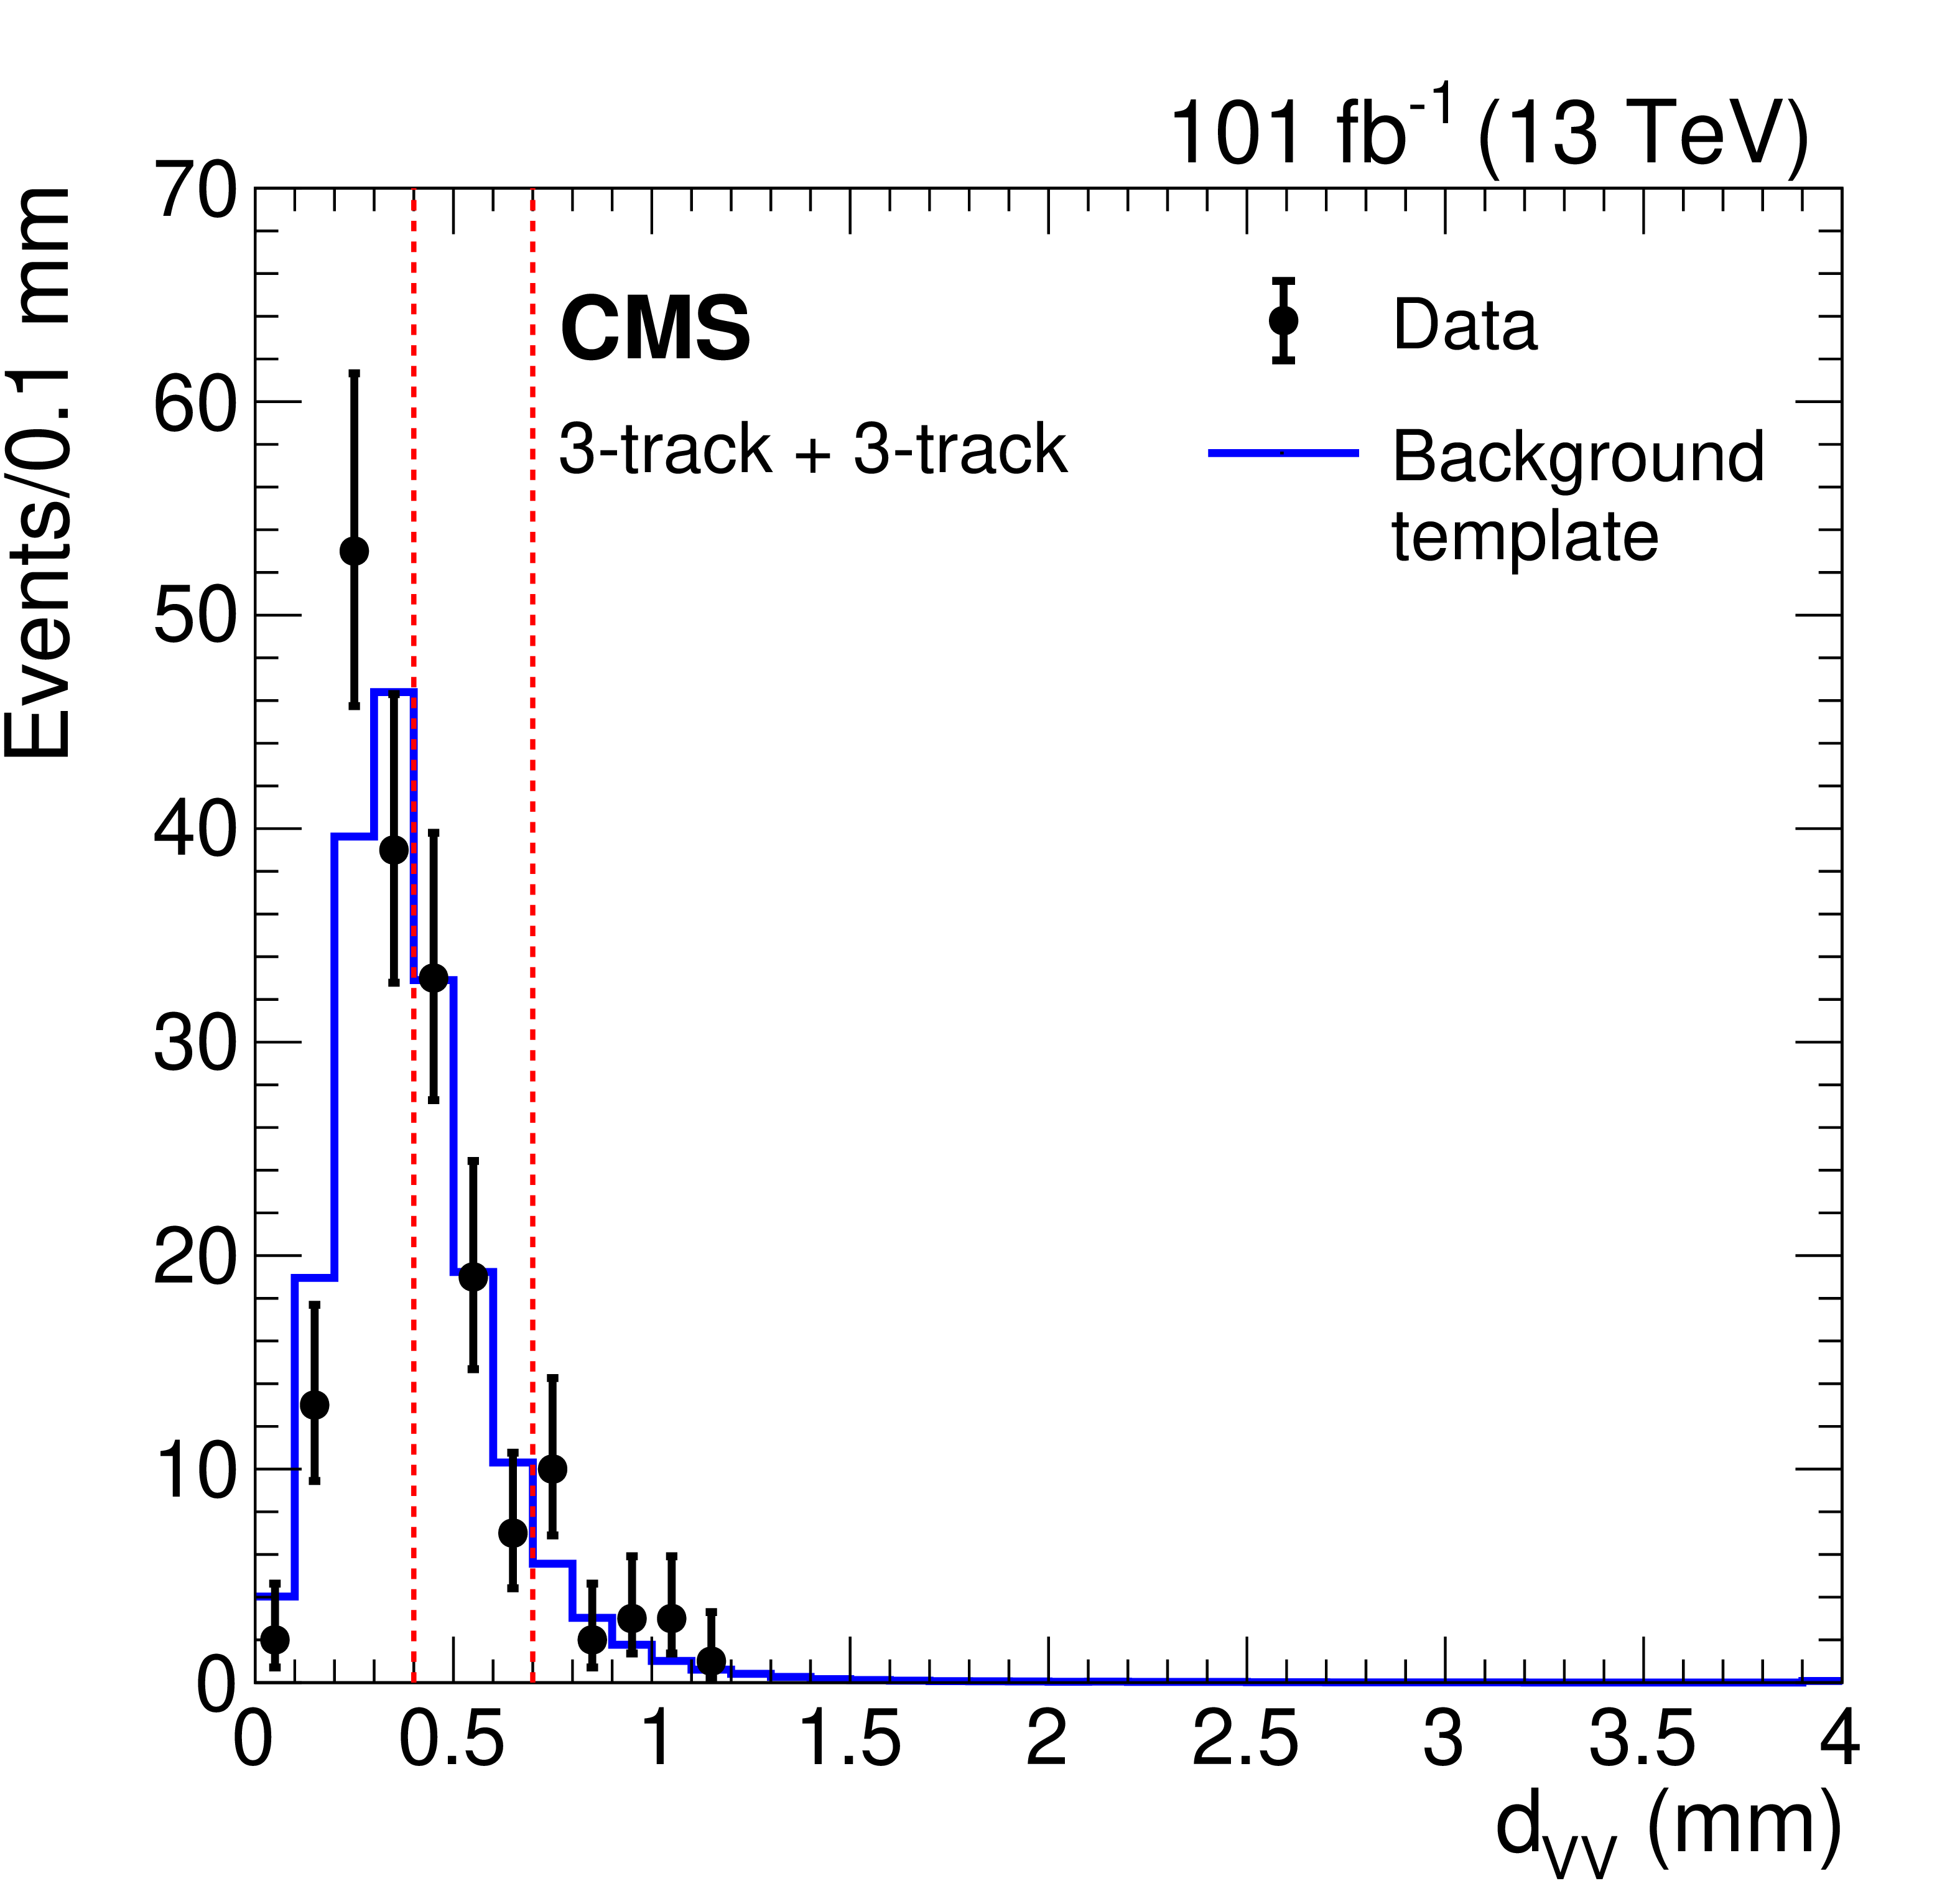
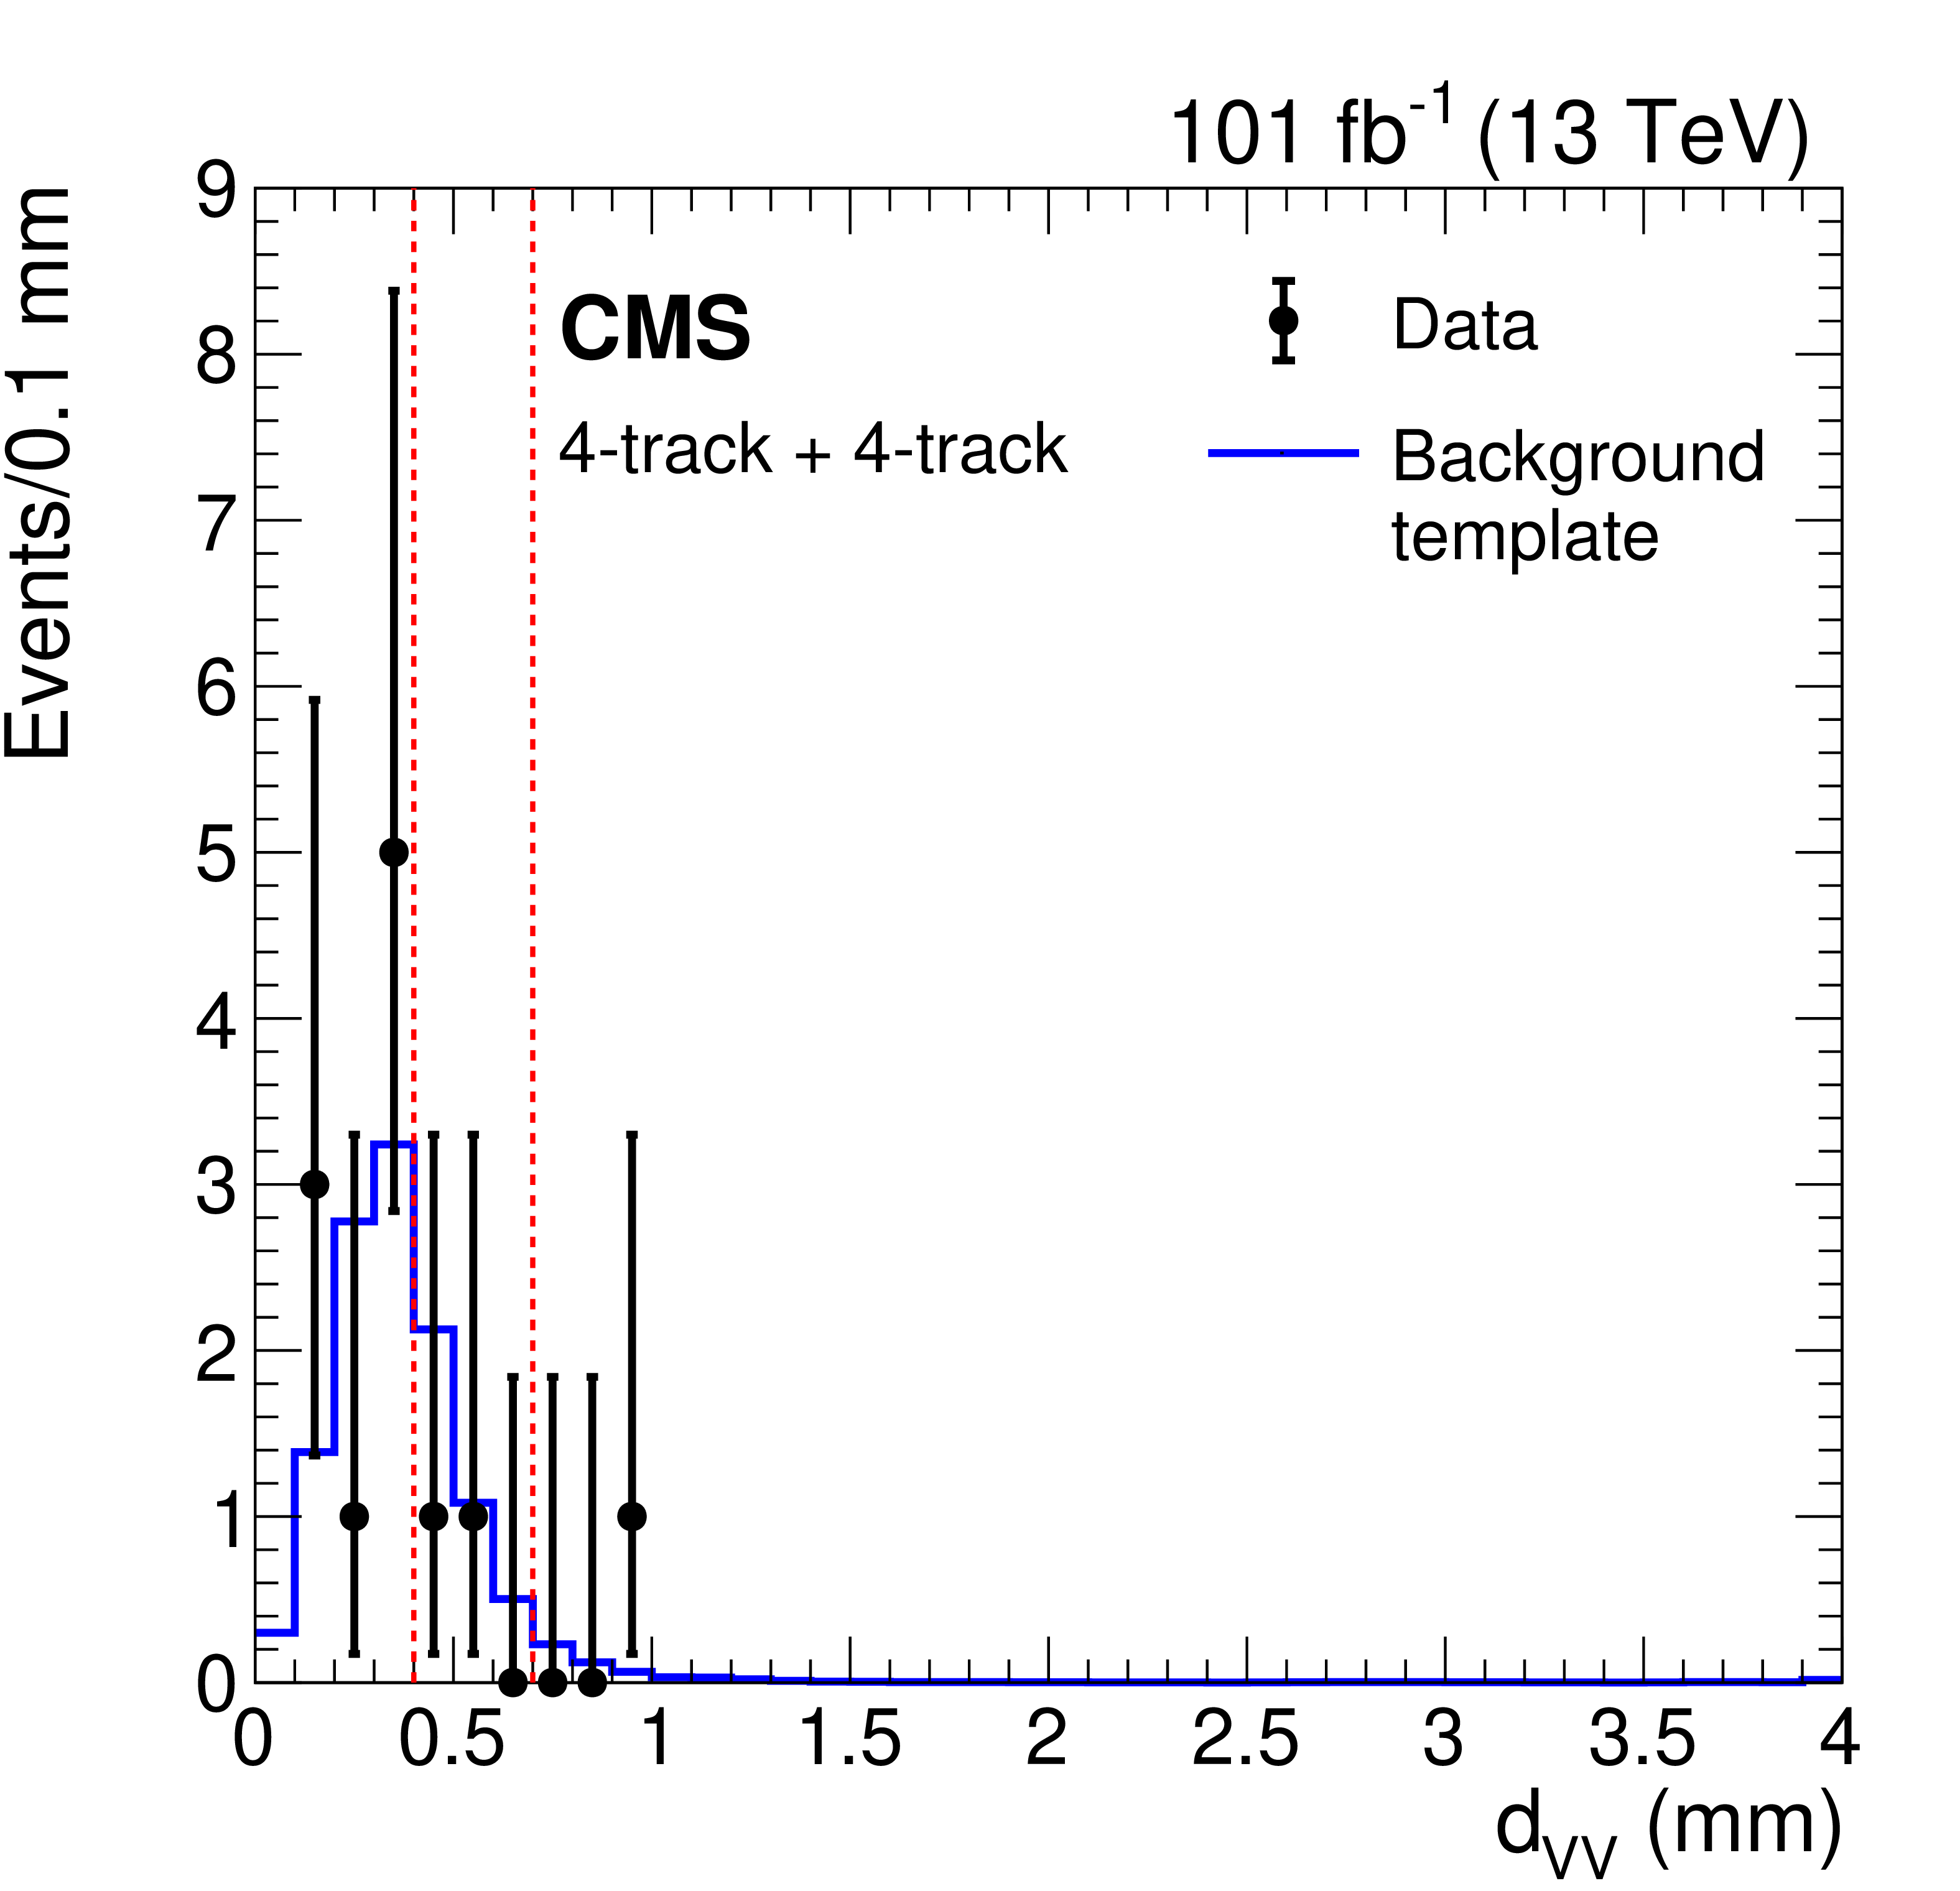
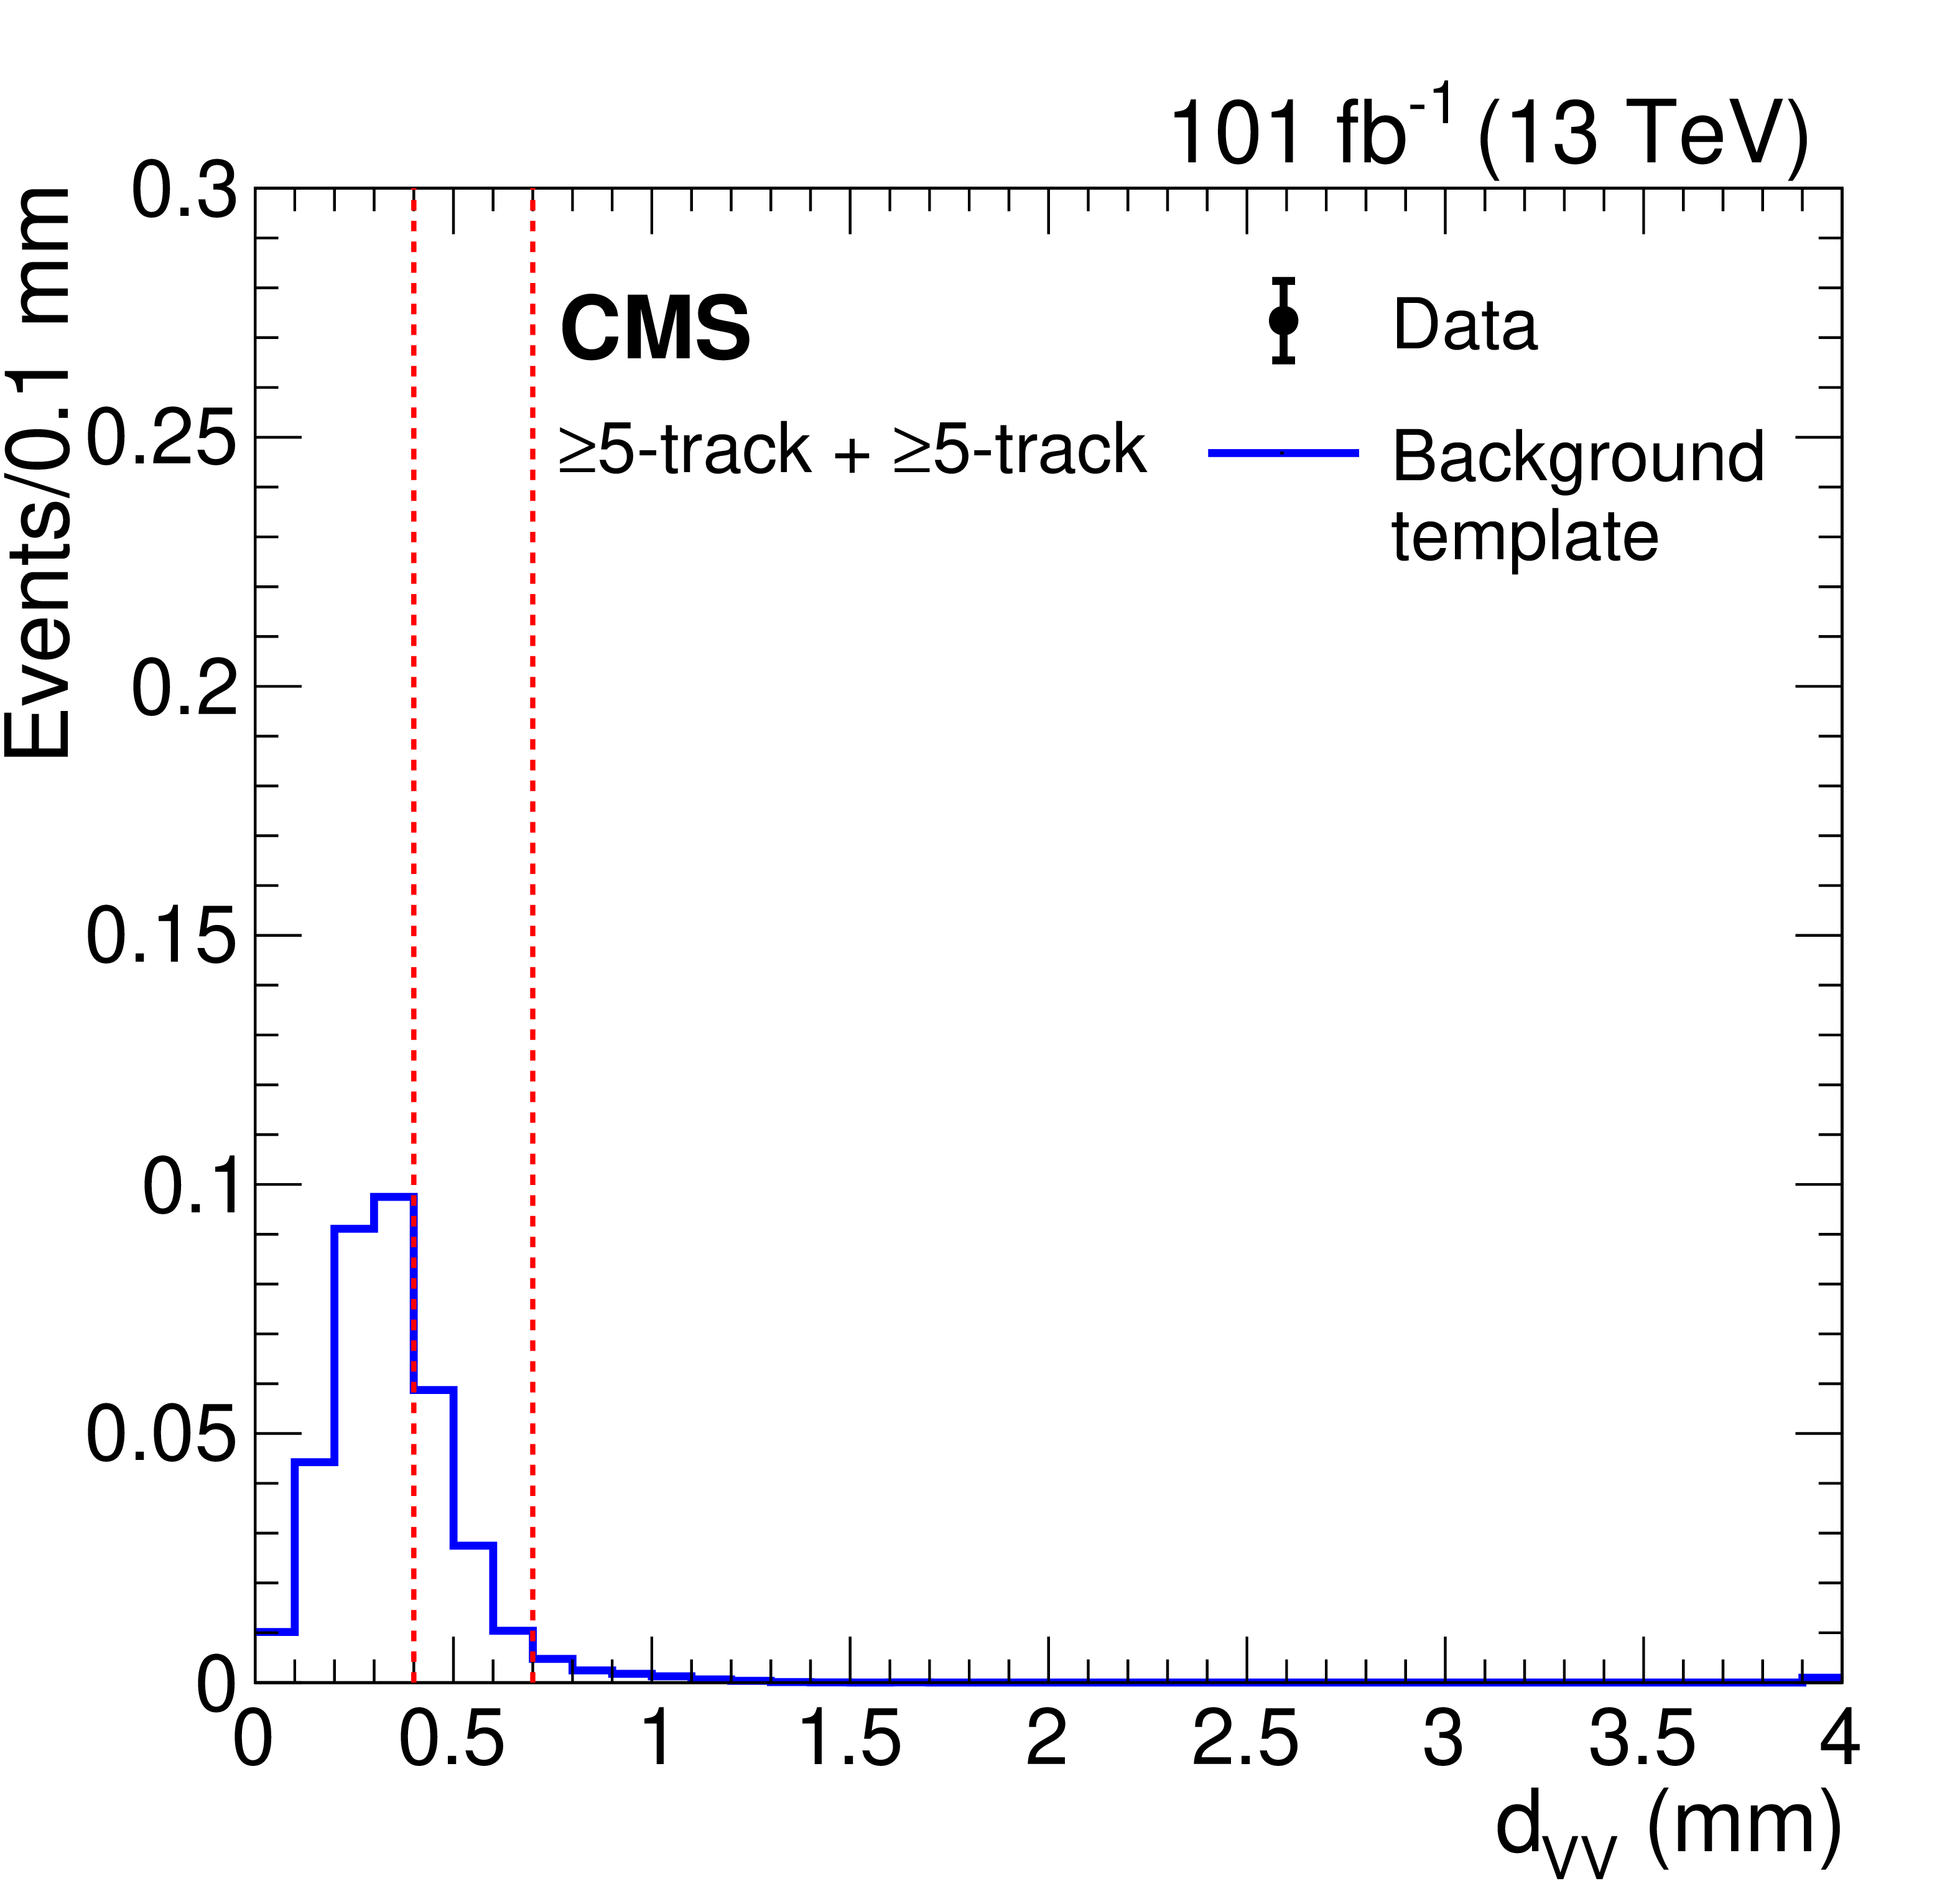
Distribution of the $x$-$y$ distances between vertices, ${d_{\mathrm {VV}}}$, for 2017 and 2018 data with a background distribution ${d_{\mathrm {VV}}^{\,\mathrm {C}}}$ constructed from one-vertex events in data normalized to the two-vertex data for events with 3-track vertices (upper left), events with exactly one 4-track vertex and one 3-track vertex (upper right), and events with 4-track vertices (lower left). The background distribution ${d_{\mathrm {VV}}^{\,\mathrm {C}}}$ for $\geq $5-track two-vertex events (lower right) is normalized using one-vertex event information as described in the text. The two vertical red dashed lines separate the regions used in the fit. |
png pdf |
Figure 6-a:
Distribution of the $x$-$y$ distances between vertices, ${d_{\mathrm {VV}}}$, for 2017 and 2018 data with a background distribution ${d_{\mathrm {VV}}^{\,\mathrm {C}}}$ constructed from one-vertex events in data normalized to the two-vertex data for events with 3-track vertices. The two vertical red dashed lines separate the regions used in the fit. |

png pdf |
Figure 6-b:
Distribution of the $x$-$y$ distances between vertices, ${d_{\mathrm {VV}}}$, for 2017 and 2018 data with a background distribution ${d_{\mathrm {VV}}^{\,\mathrm {C}}}$ constructed from one-vertex events in data normalized to the two-vertex data for events with exactly one 4-track vertex and one 3-track vertex. The two vertical red dashed lines separate the regions used in the fit. |
png pdf |
Figure 6-c:
Distribution of the $x$-$y$ distances between vertices, ${d_{\mathrm {VV}}}$, for 2017 and 2018 data with a background distribution ${d_{\mathrm {VV}}^{\,\mathrm {C}}}$ constructed from one-vertex events in data normalized to the two-vertex data for events with 4-track vertices. The two vertical red dashed lines separate the regions used in the fit. |
png pdf |
Figure 6-d:
Background distribution ${d_{\mathrm {VV}}^{\,\mathrm {C}}}$ for $\geq $5-track two-vertex events, normalized using one-vertex event information as described in the text. The two vertical red dashed lines separate the regions used in the fit. |

png pdf |
Figure 7:
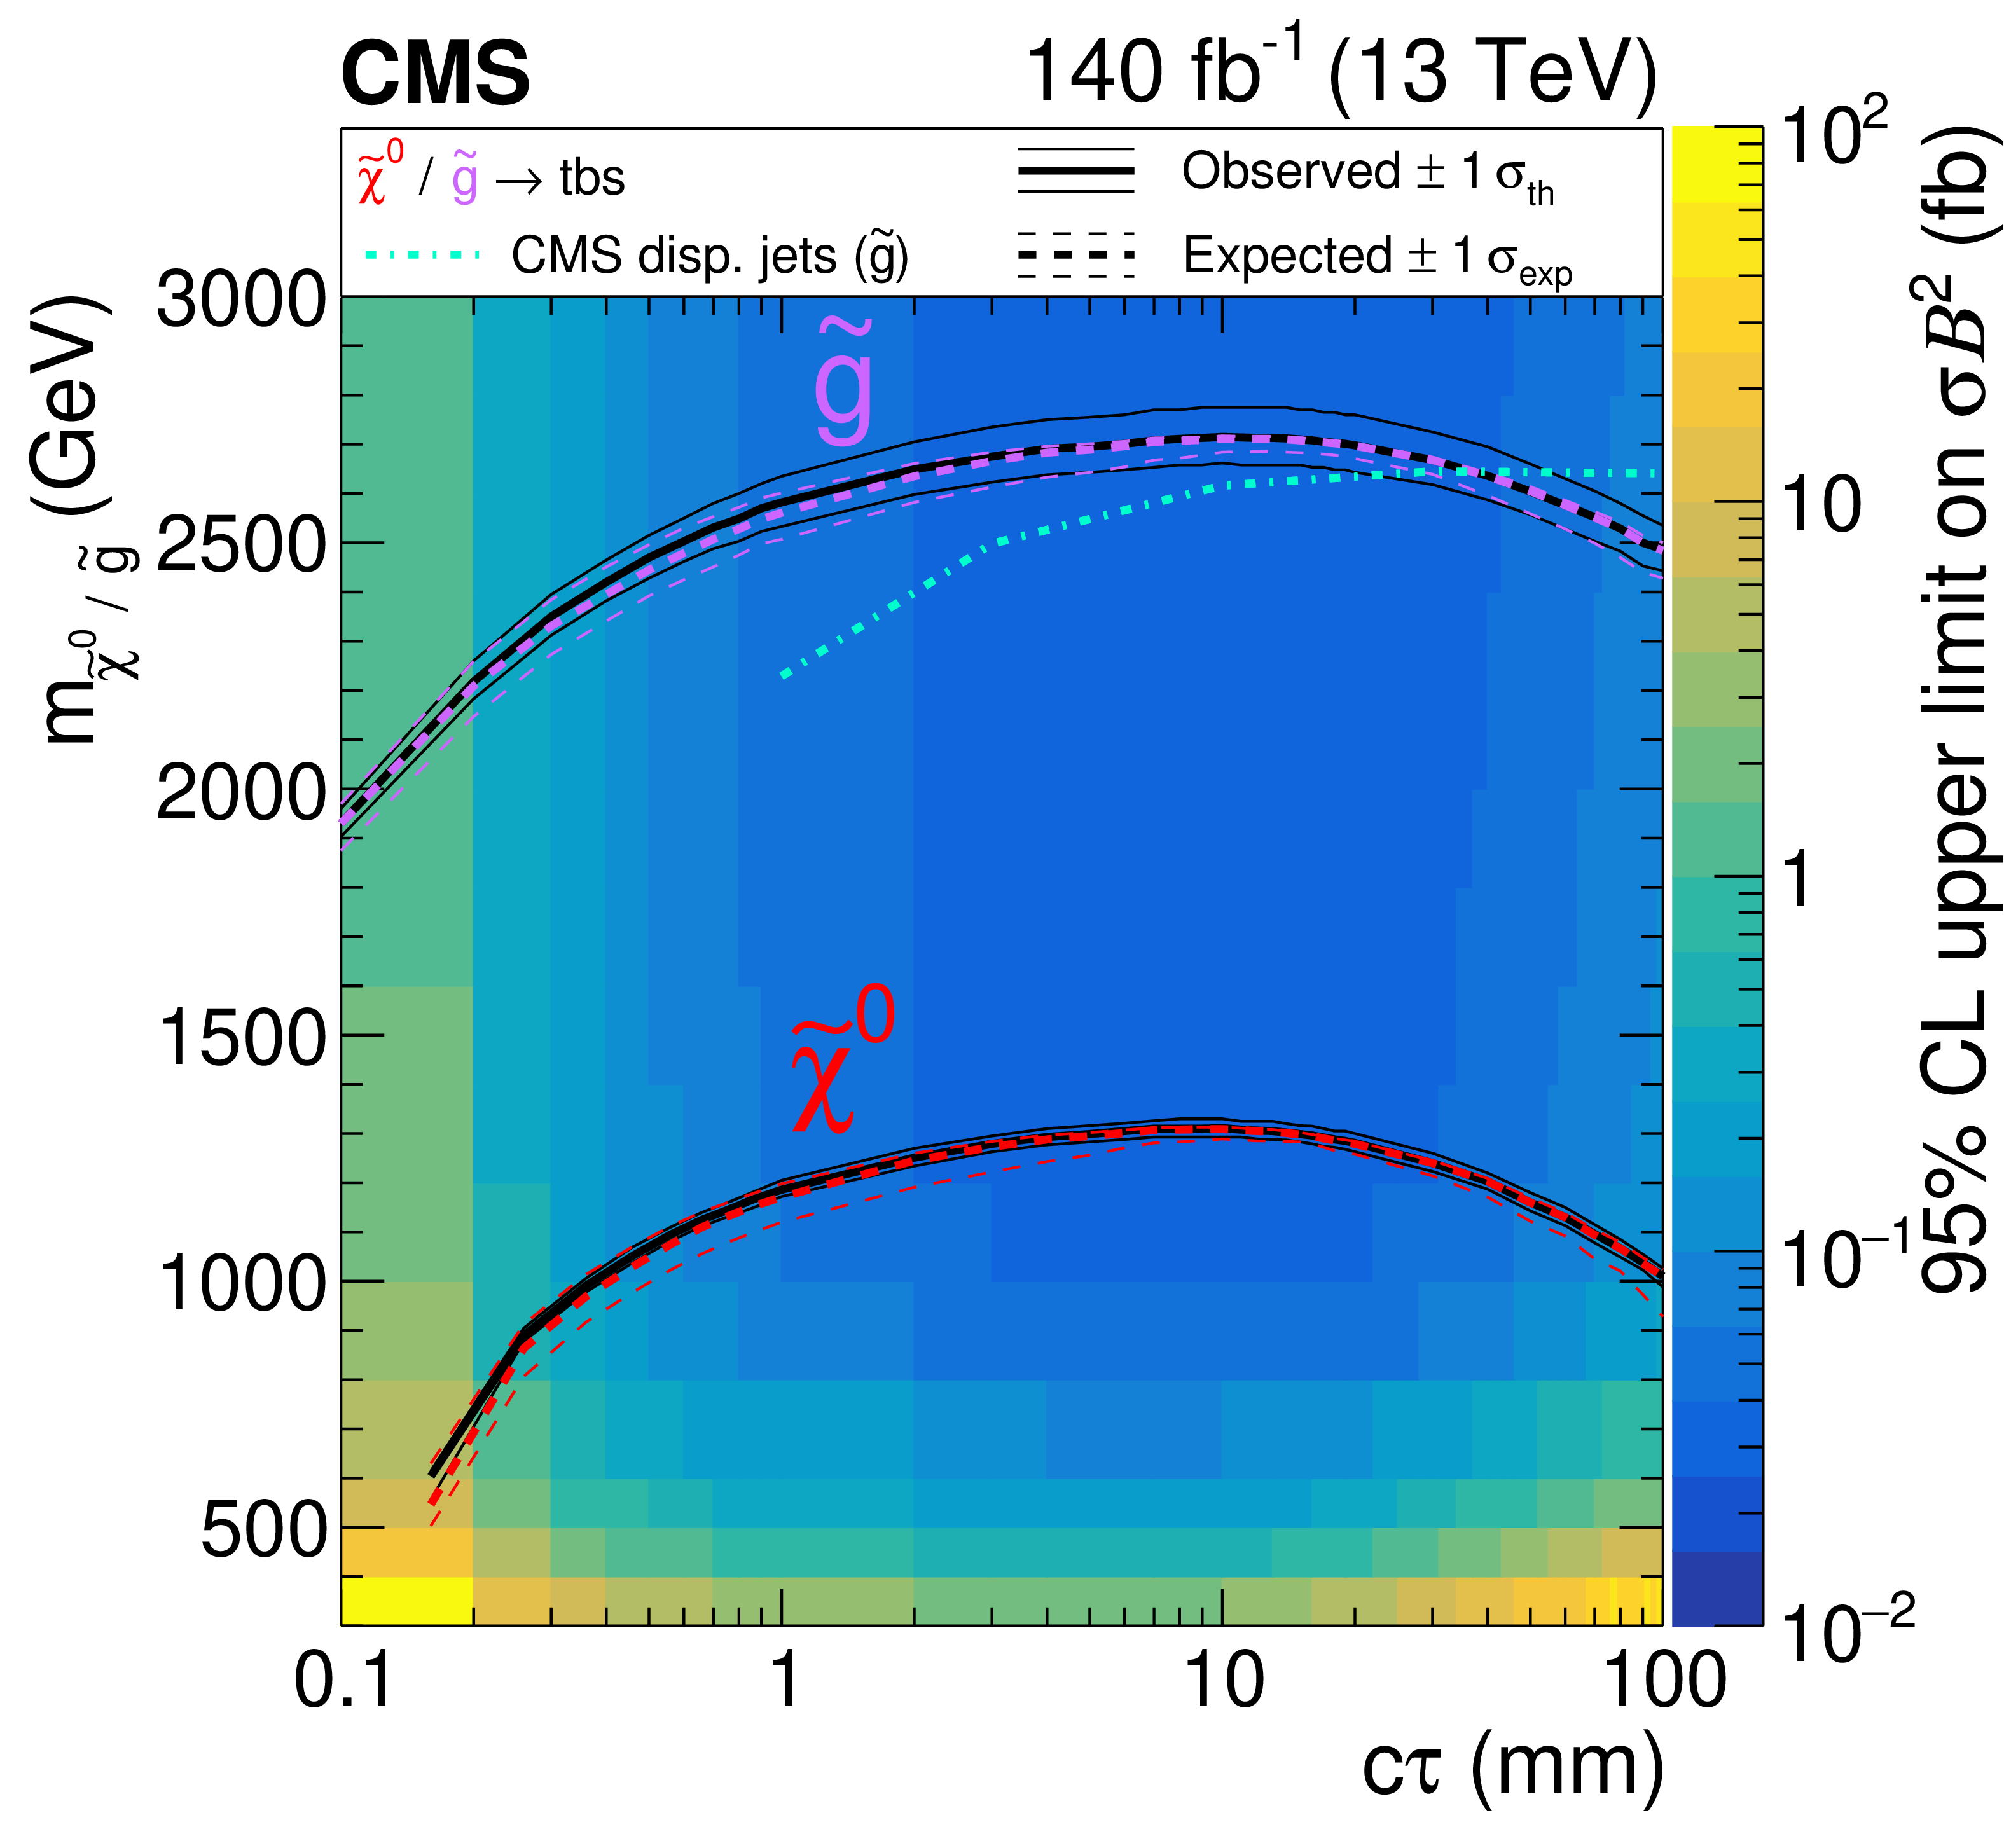
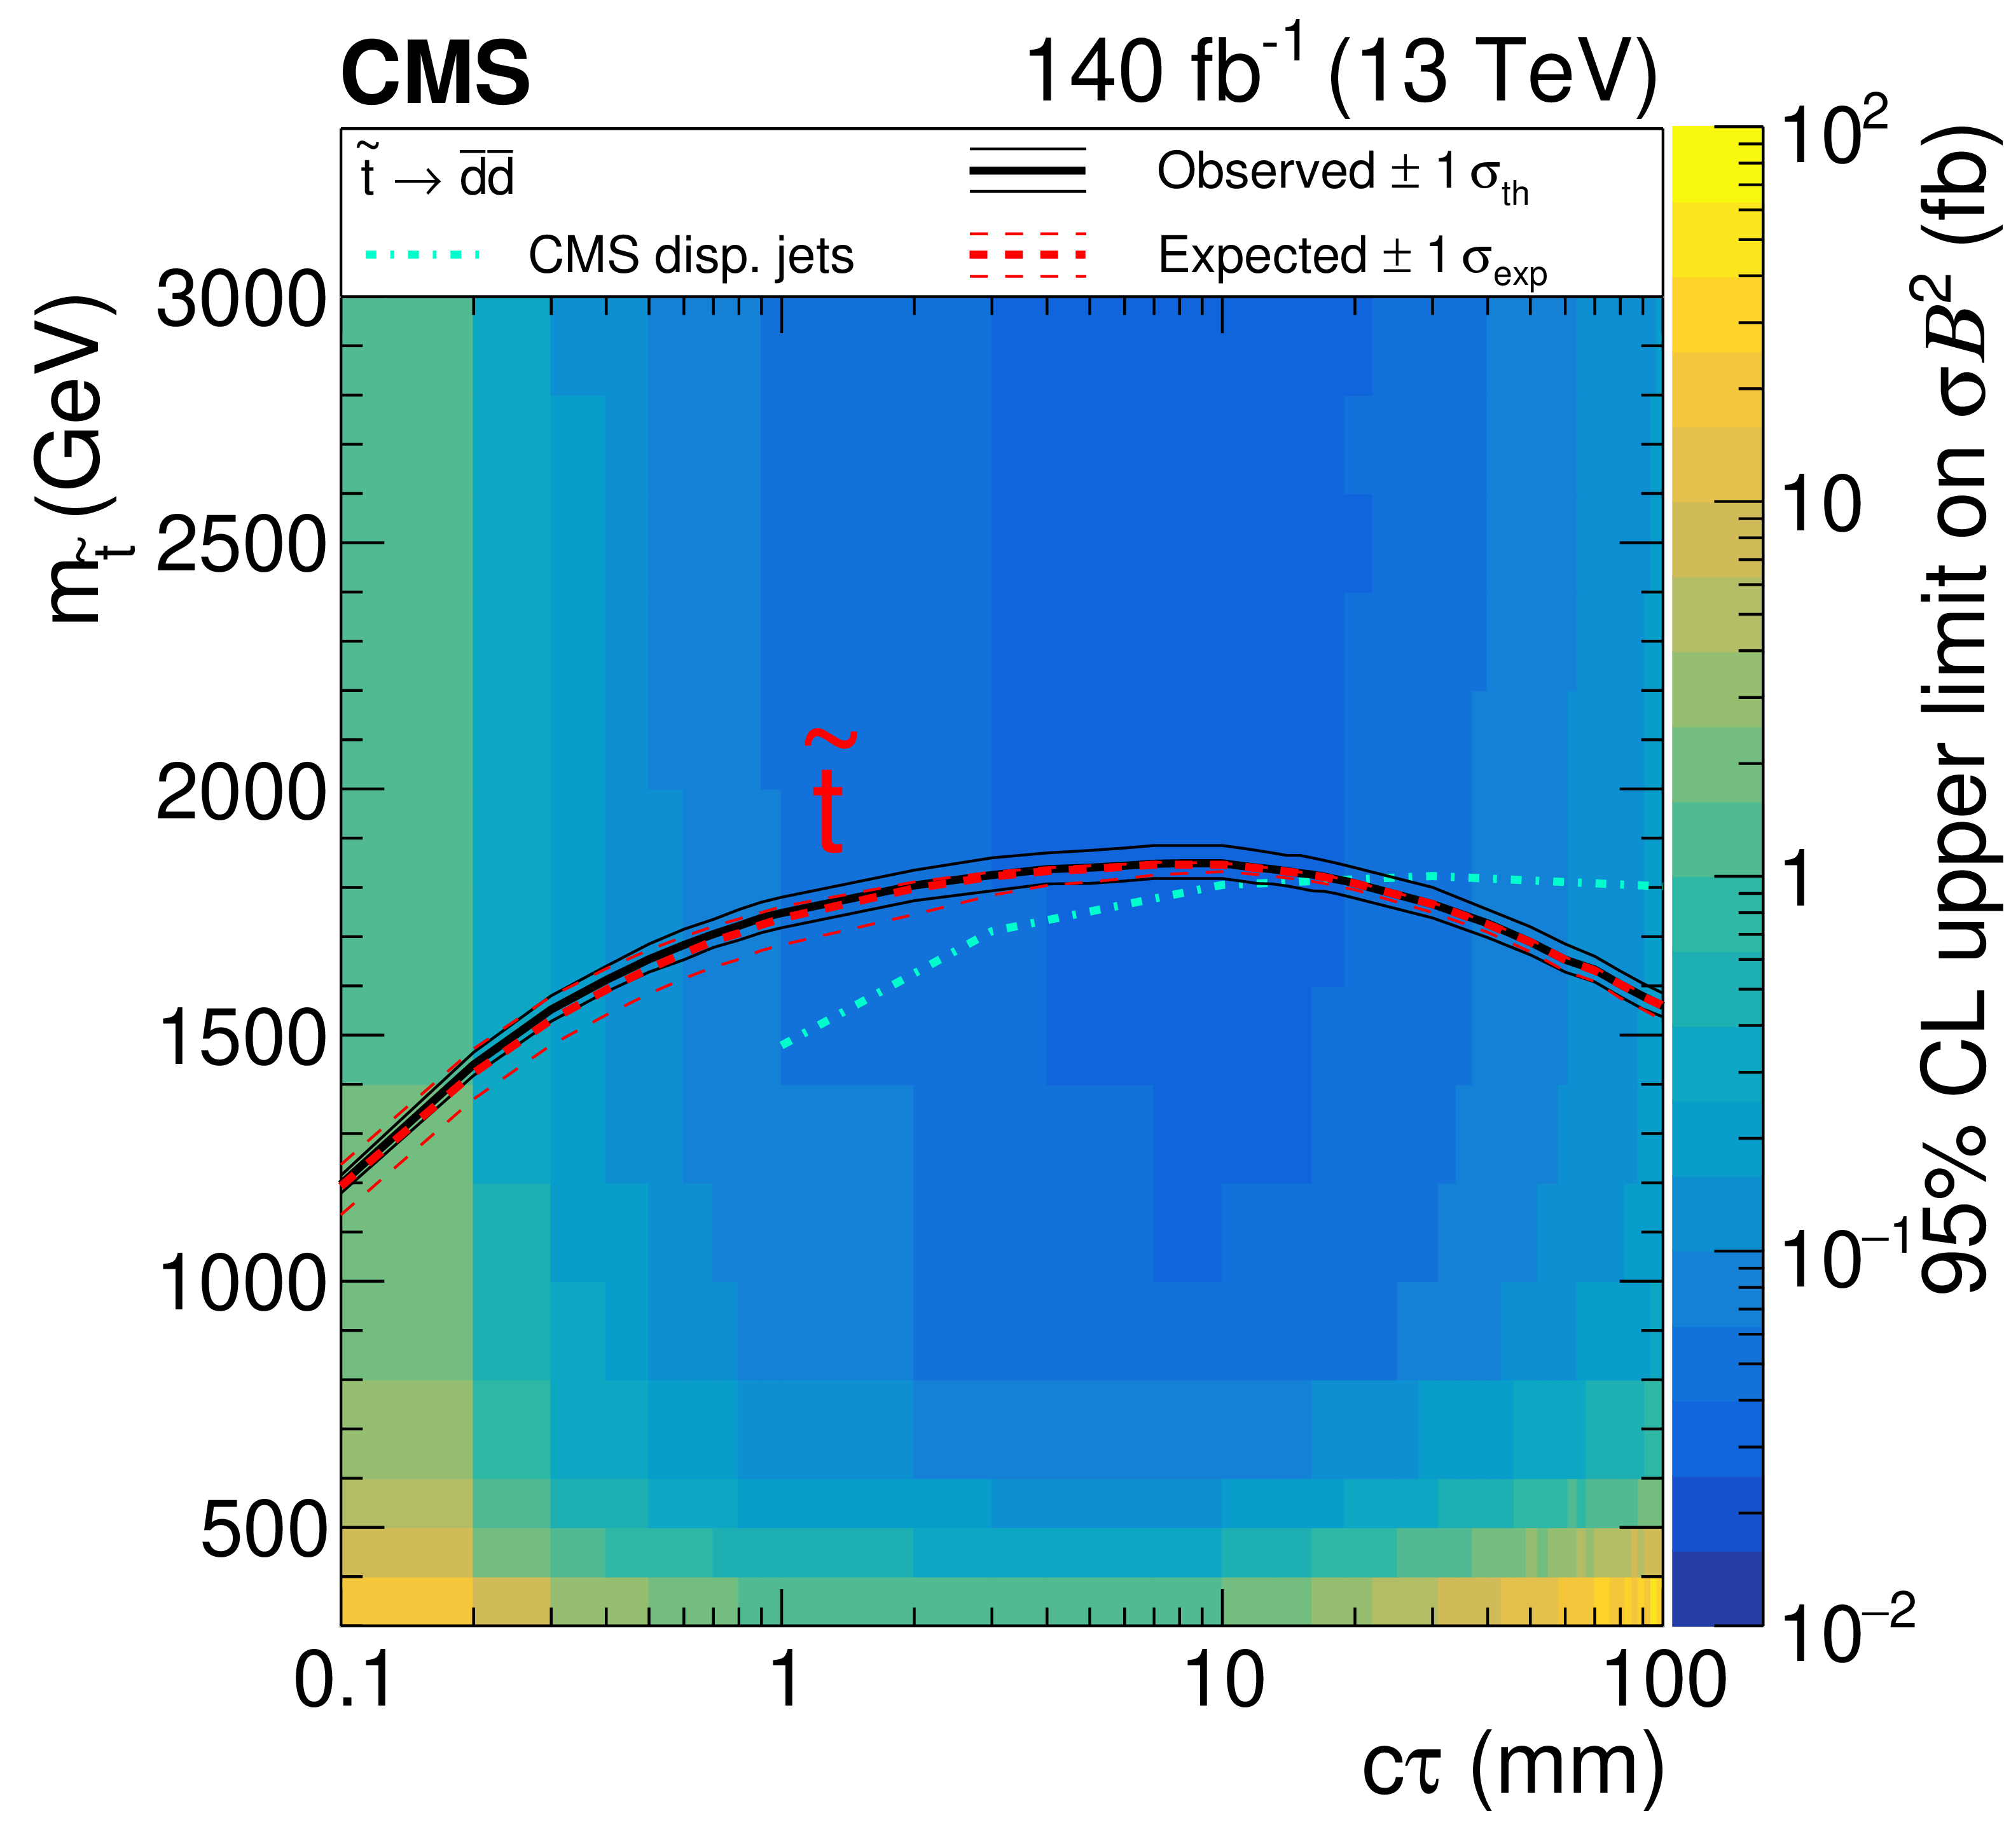
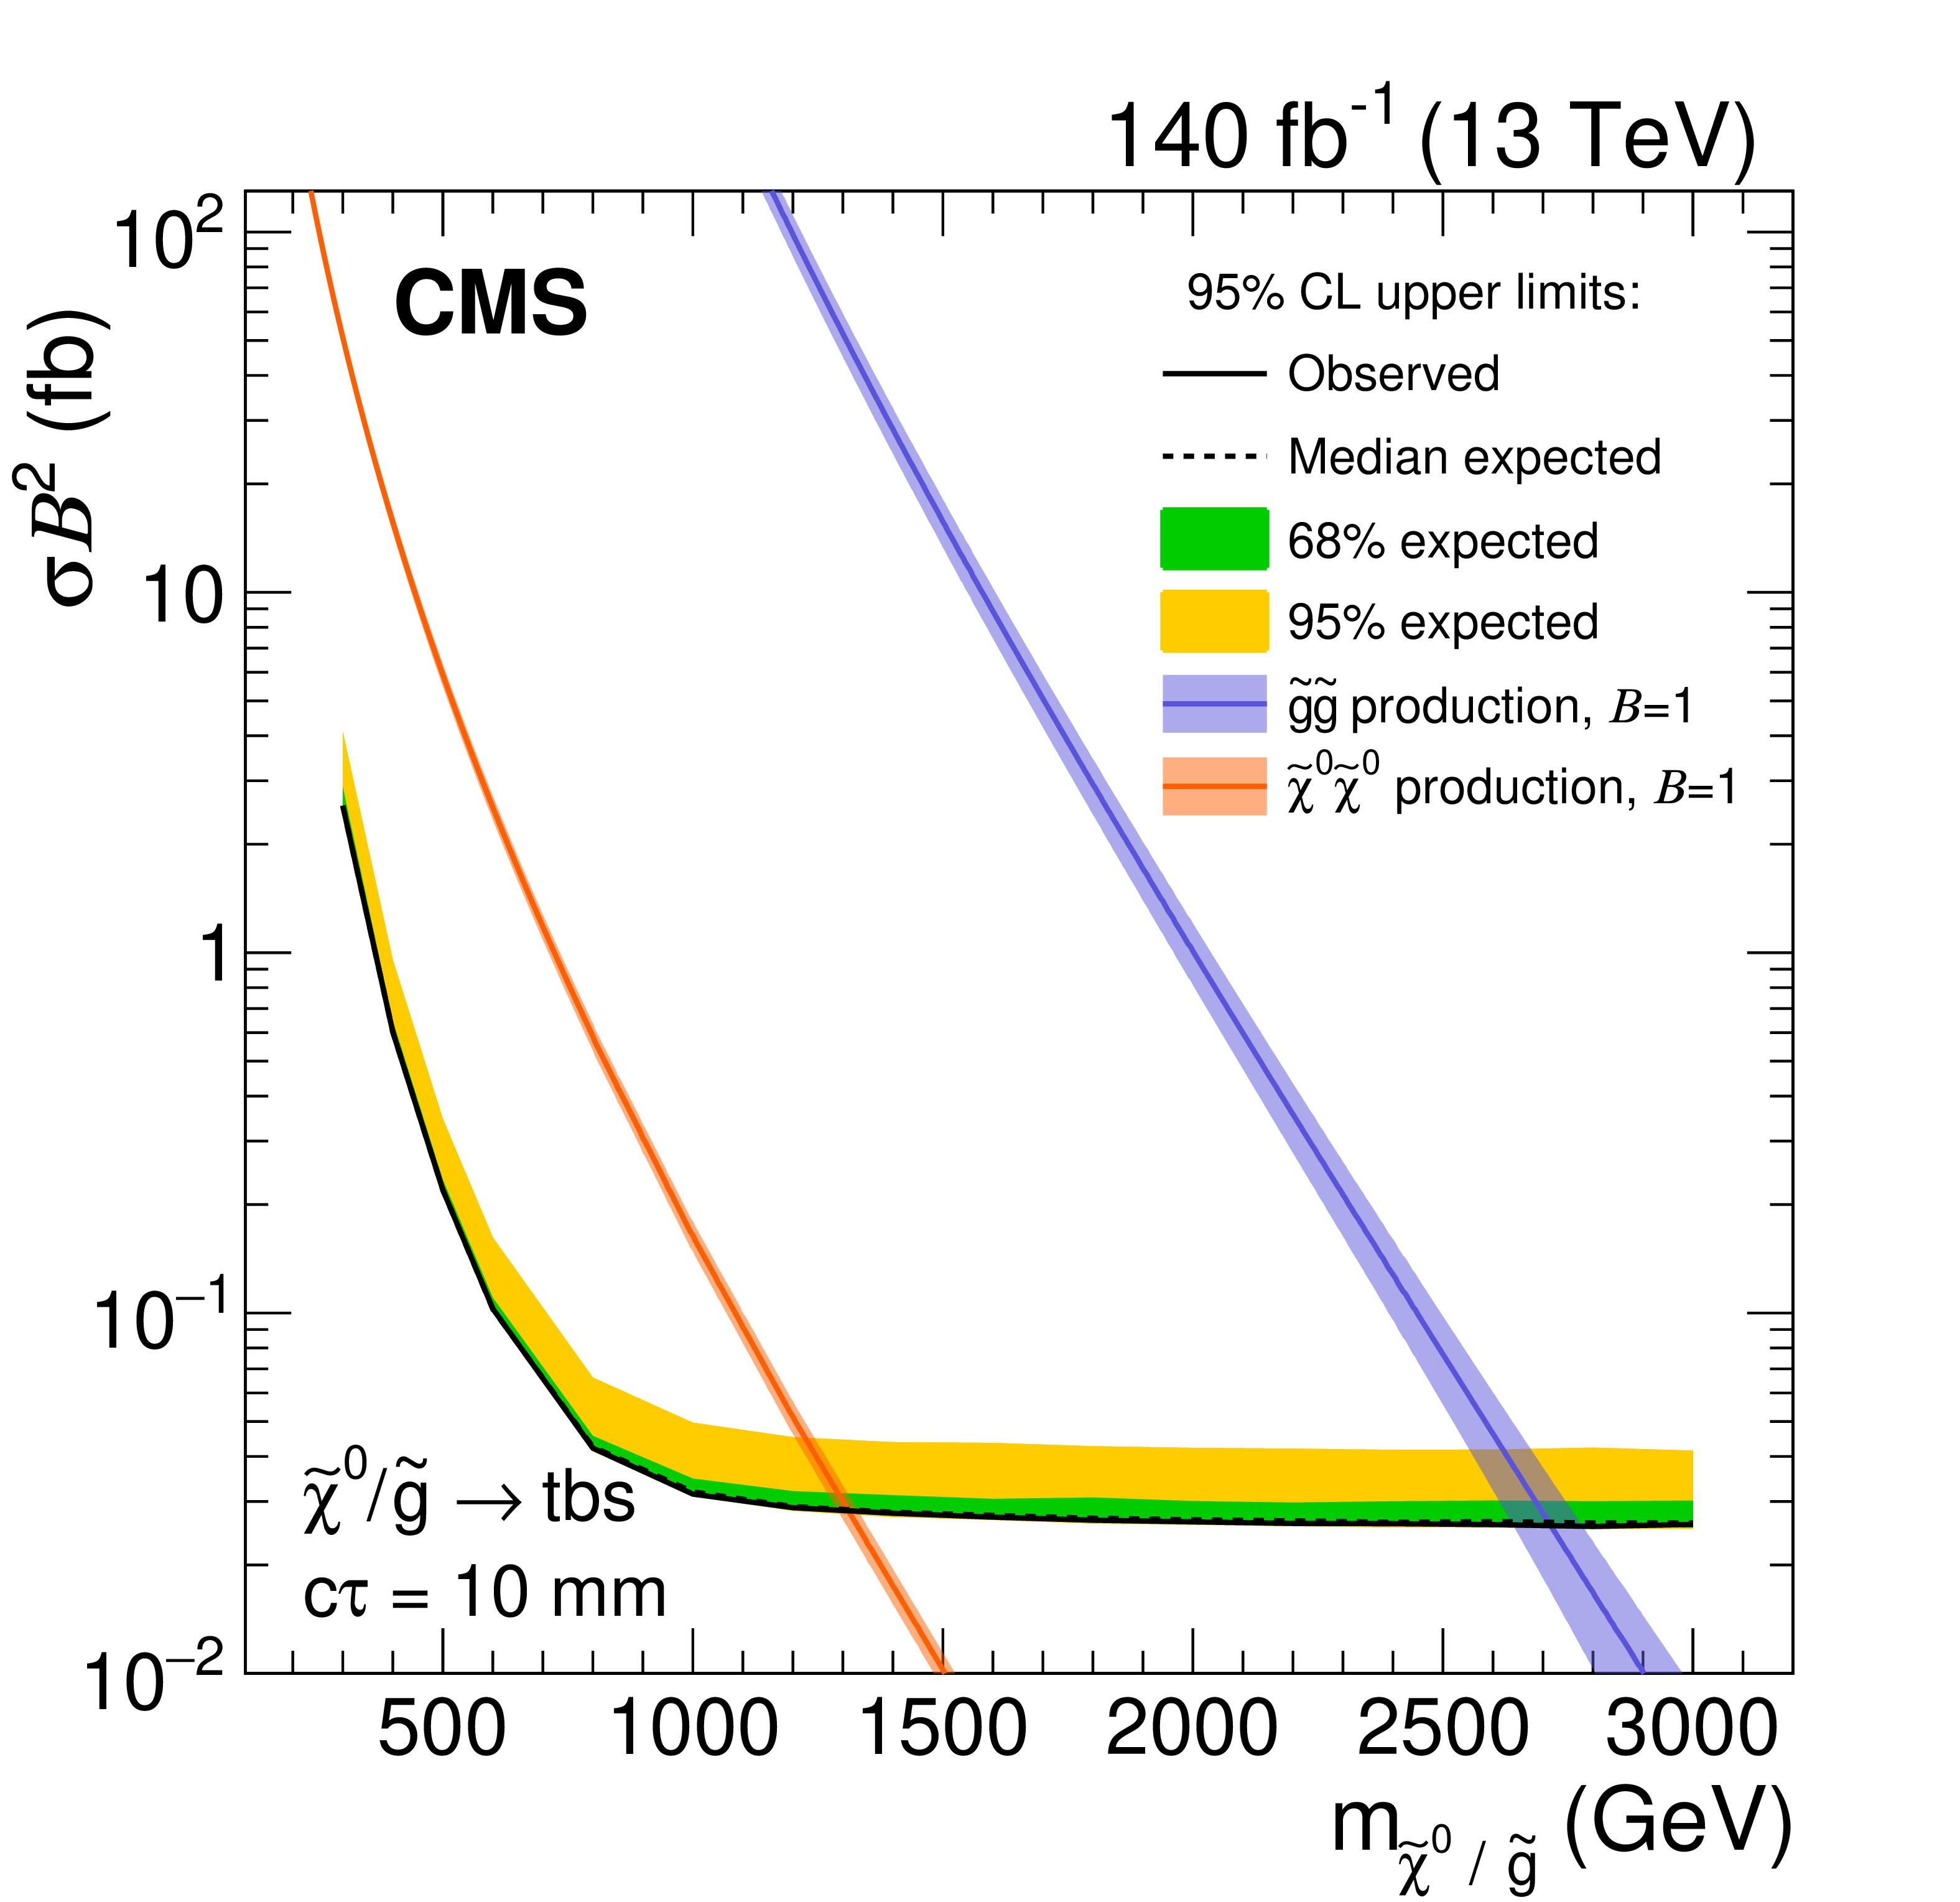
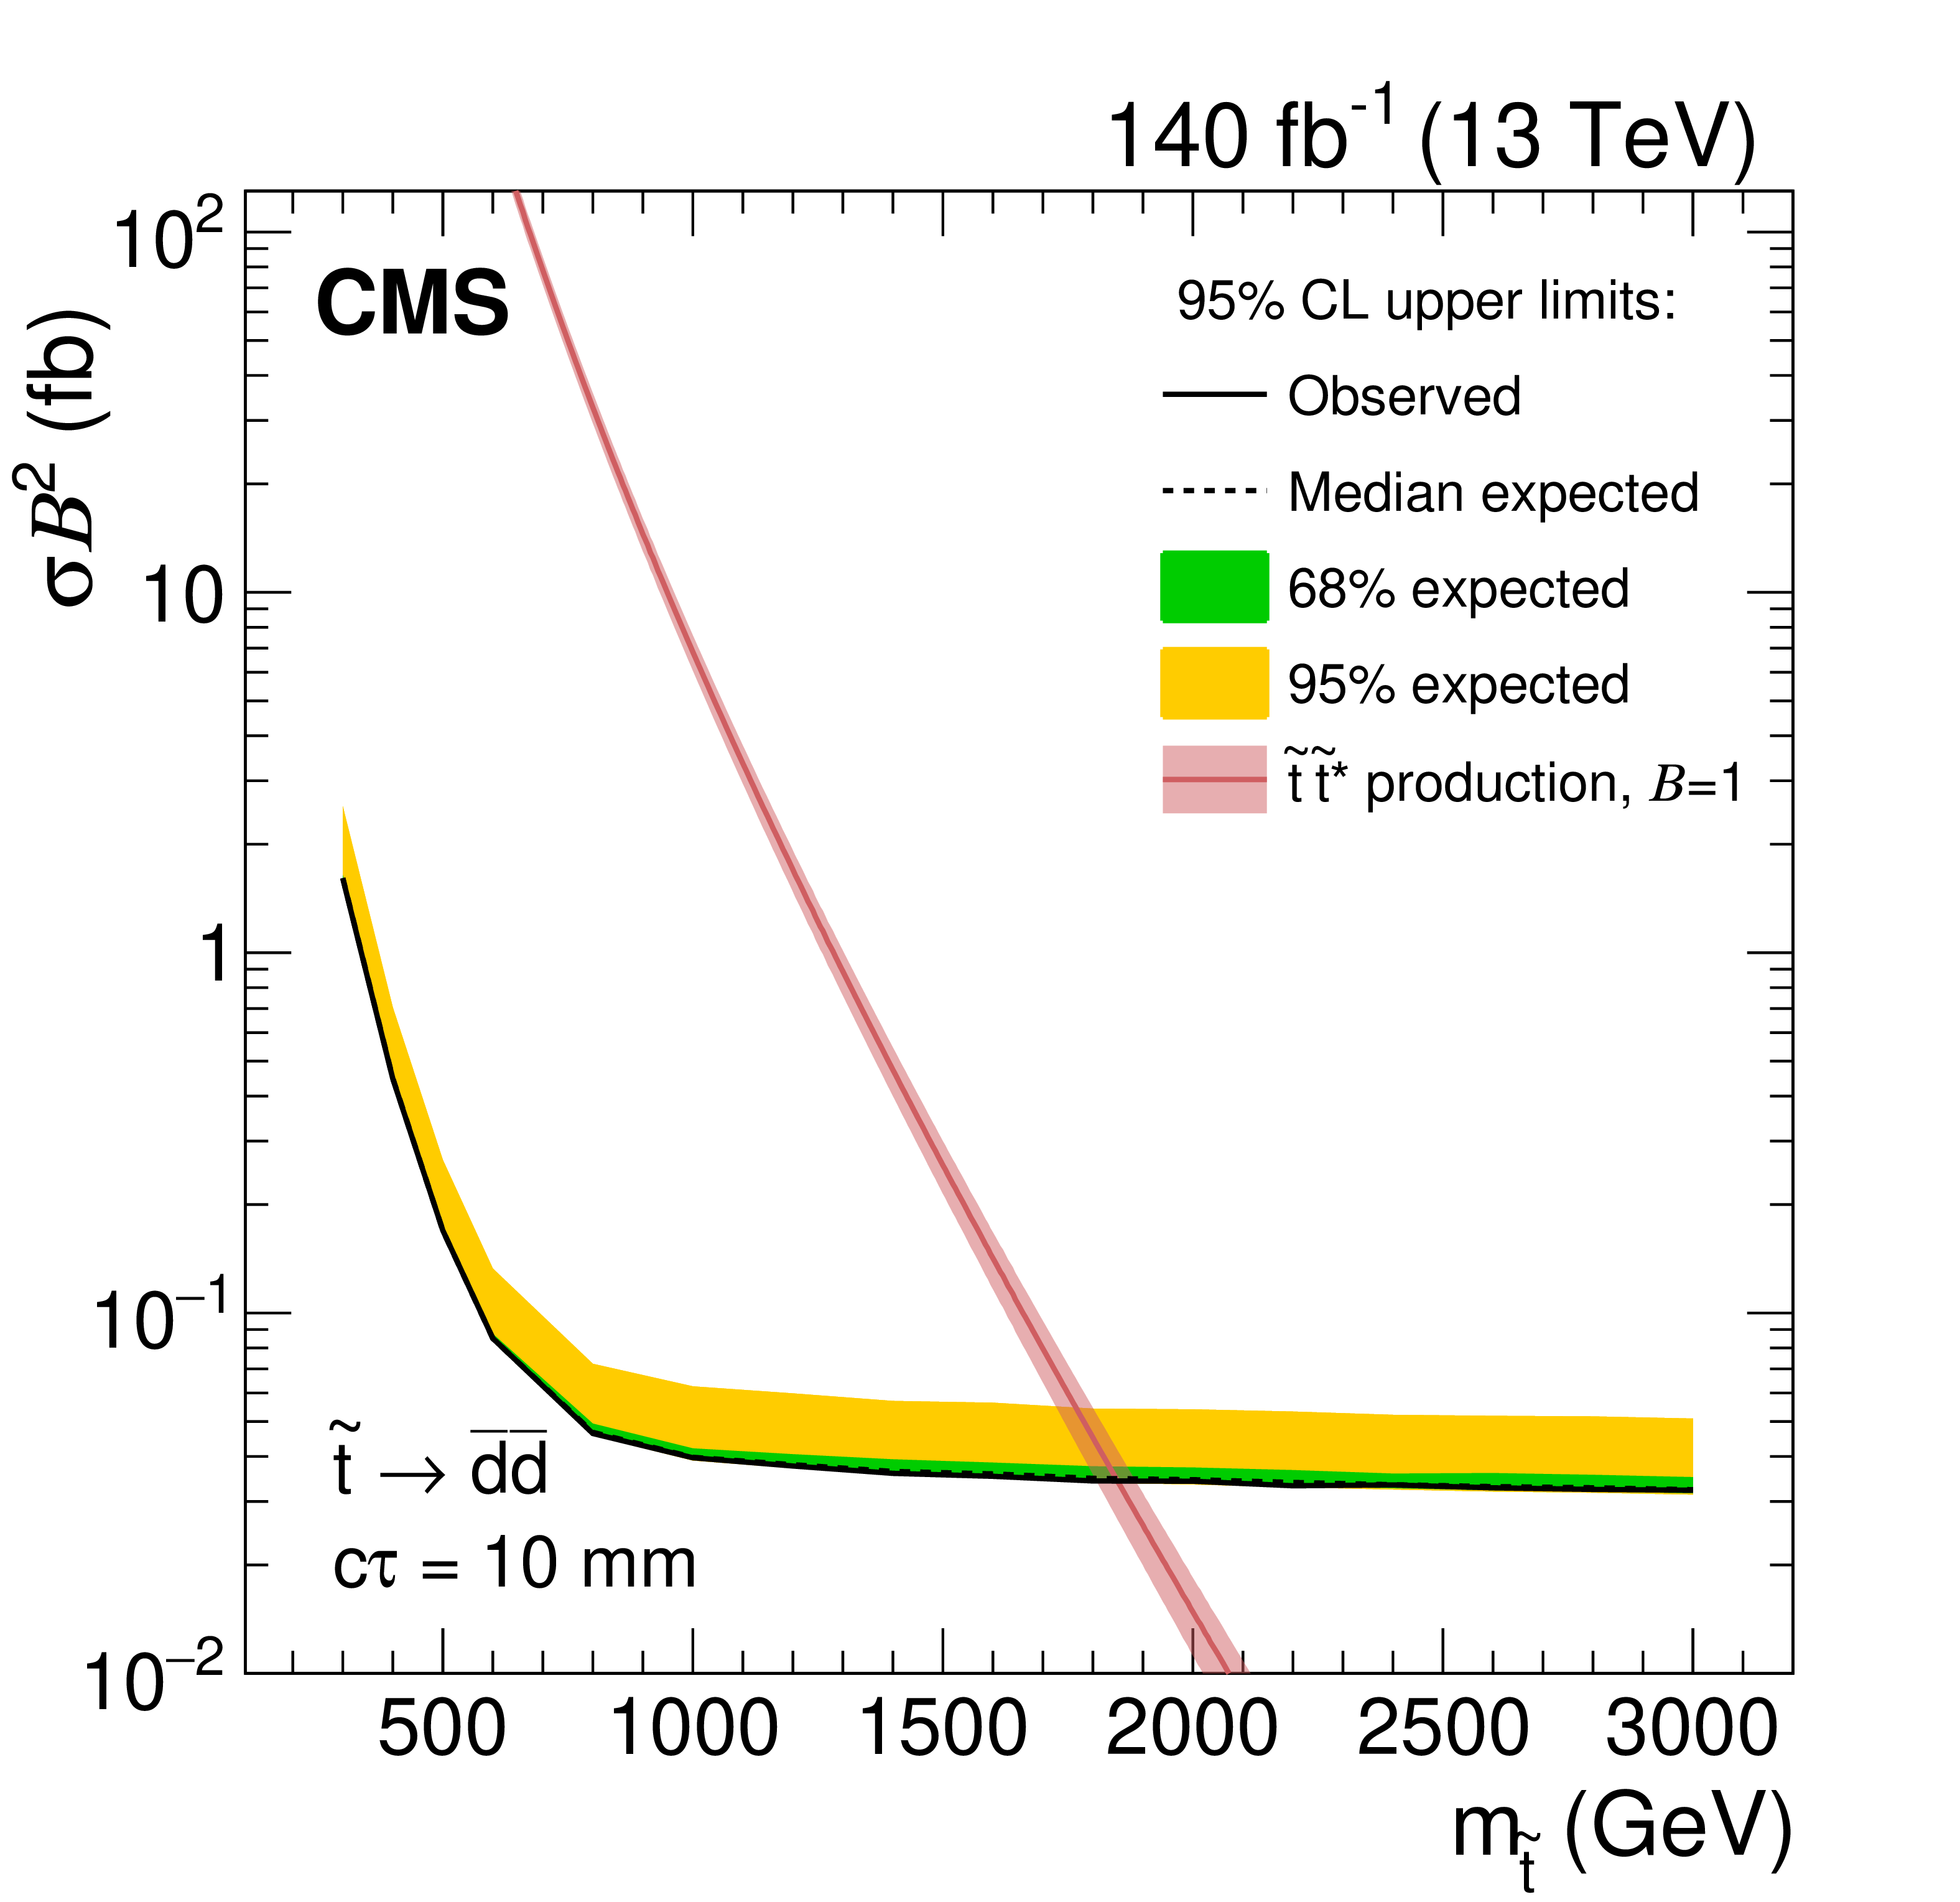
Observed 95% CL upper limits on the product of cross section and branching fraction squared for the multijet (left) and dijet (right) signals, as a function of mass and $c\tau $. The overlaid mass-lifetime exclusion curves assume pair-production cross sections for the neutralino (red) and gluino (purple) in multijet signals and top squark cross sections for the dijet signals with 100% branching fraction to each model's respective decay mode specified. The solid black (dashed colored) lines represent the observed (median expected) limits at 95% CL. The thin black lines represent the variation of the observed limit within theoretical uncertainties of the signal cross section. The thin dashed colored lines represent the region containing 68% of the expected limit distribution under the background-only hypothesis. The observed limits from the CMS displaced jets search [29] are also shown in teal for comparison. |
png pdf |
Figure 7-a:
Observed 95% CL upper limits on the product of cross section and branching fraction squared for the multijet signal, as a function of mass and $c\tau $. The overlaid mass-lifetime exclusion curves assume pair-production cross sections for the neutralino (red) and gluino (purple) in multijet signals and top squark cross sections for the dijet signals with 100% branching fraction to each model's respective decay mode specified. The solid black (dashed colored) lines represent the observed (median expected) limits at 95% CL. The thin black lines represent the variation of the observed limit within theoretical uncertainties of the signal cross section. The thin dashed colored lines represent the region containing 68% of the expected limit distribution under the background-only hypothesis. The observed limits from the CMS displaced jets search [29] are also shown in teal for comparison. |
png pdf |
Figure 7-b:
Observed 95% CL upper limits on the product of cross section and branching fraction squared for the dijet signal, as a function of mass and $c\tau $. The overlaid mass-lifetime exclusion curves assume pair-production cross sections for the neutralino (red) and gluino (purple) in multijet signals and top squark cross sections for the dijet signals with 100% branching fraction to each model's respective decay mode specified. The solid black (dashed colored) lines represent the observed (median expected) limits at 95% CL. The thin black lines represent the variation of the observed limit within theoretical uncertainties of the signal cross section. The thin dashed colored lines represent the region containing 68% of the expected limit distribution under the background-only hypothesis. The observed limits from the CMS displaced jets search [29] are also shown in teal for comparison. |

png pdf |
Figure 8:
Observed and expected 95% CL upper limits on the product of cross section and branching fraction squared, as a function of mass for multijet signals (left) and dijet signals (right), for a fixed $c\tau $ of 0.3 mm (upper), 1 mm (middle), and 10 mm (lower) in the full Run-2 data set. The neutralino and gluino pair production cross sections are shown for the multijet signals, and the top squark pair-production cross section is shown for the dijet signals. |

png pdf |
Figure 8-a:
Observed and expected 95% CL upper limits on the product of cross section and branching fraction squared, as a function of mass for multijet signals, for a fixed $c\tau $ of 0.3 mm in the full Run-2 data set. The neutralino and gluino pair production cross sections are shown for the multijet signals, and the top squark pair-production cross section is shown for the dijet signals. |
png pdf |
Figure 8-b:
Observed and expected 95% CL upper limits on the product of cross section and branching fraction squared, as a function of mass for dijet signals, for a fixed $c\tau $ of 0.3 mm in the full Run-2 data set. The neutralino and gluino pair production cross sections are shown for the multijet signals, and the top squark pair-production cross section is shown for the dijet signals. |
png pdf |
Figure 8-c:
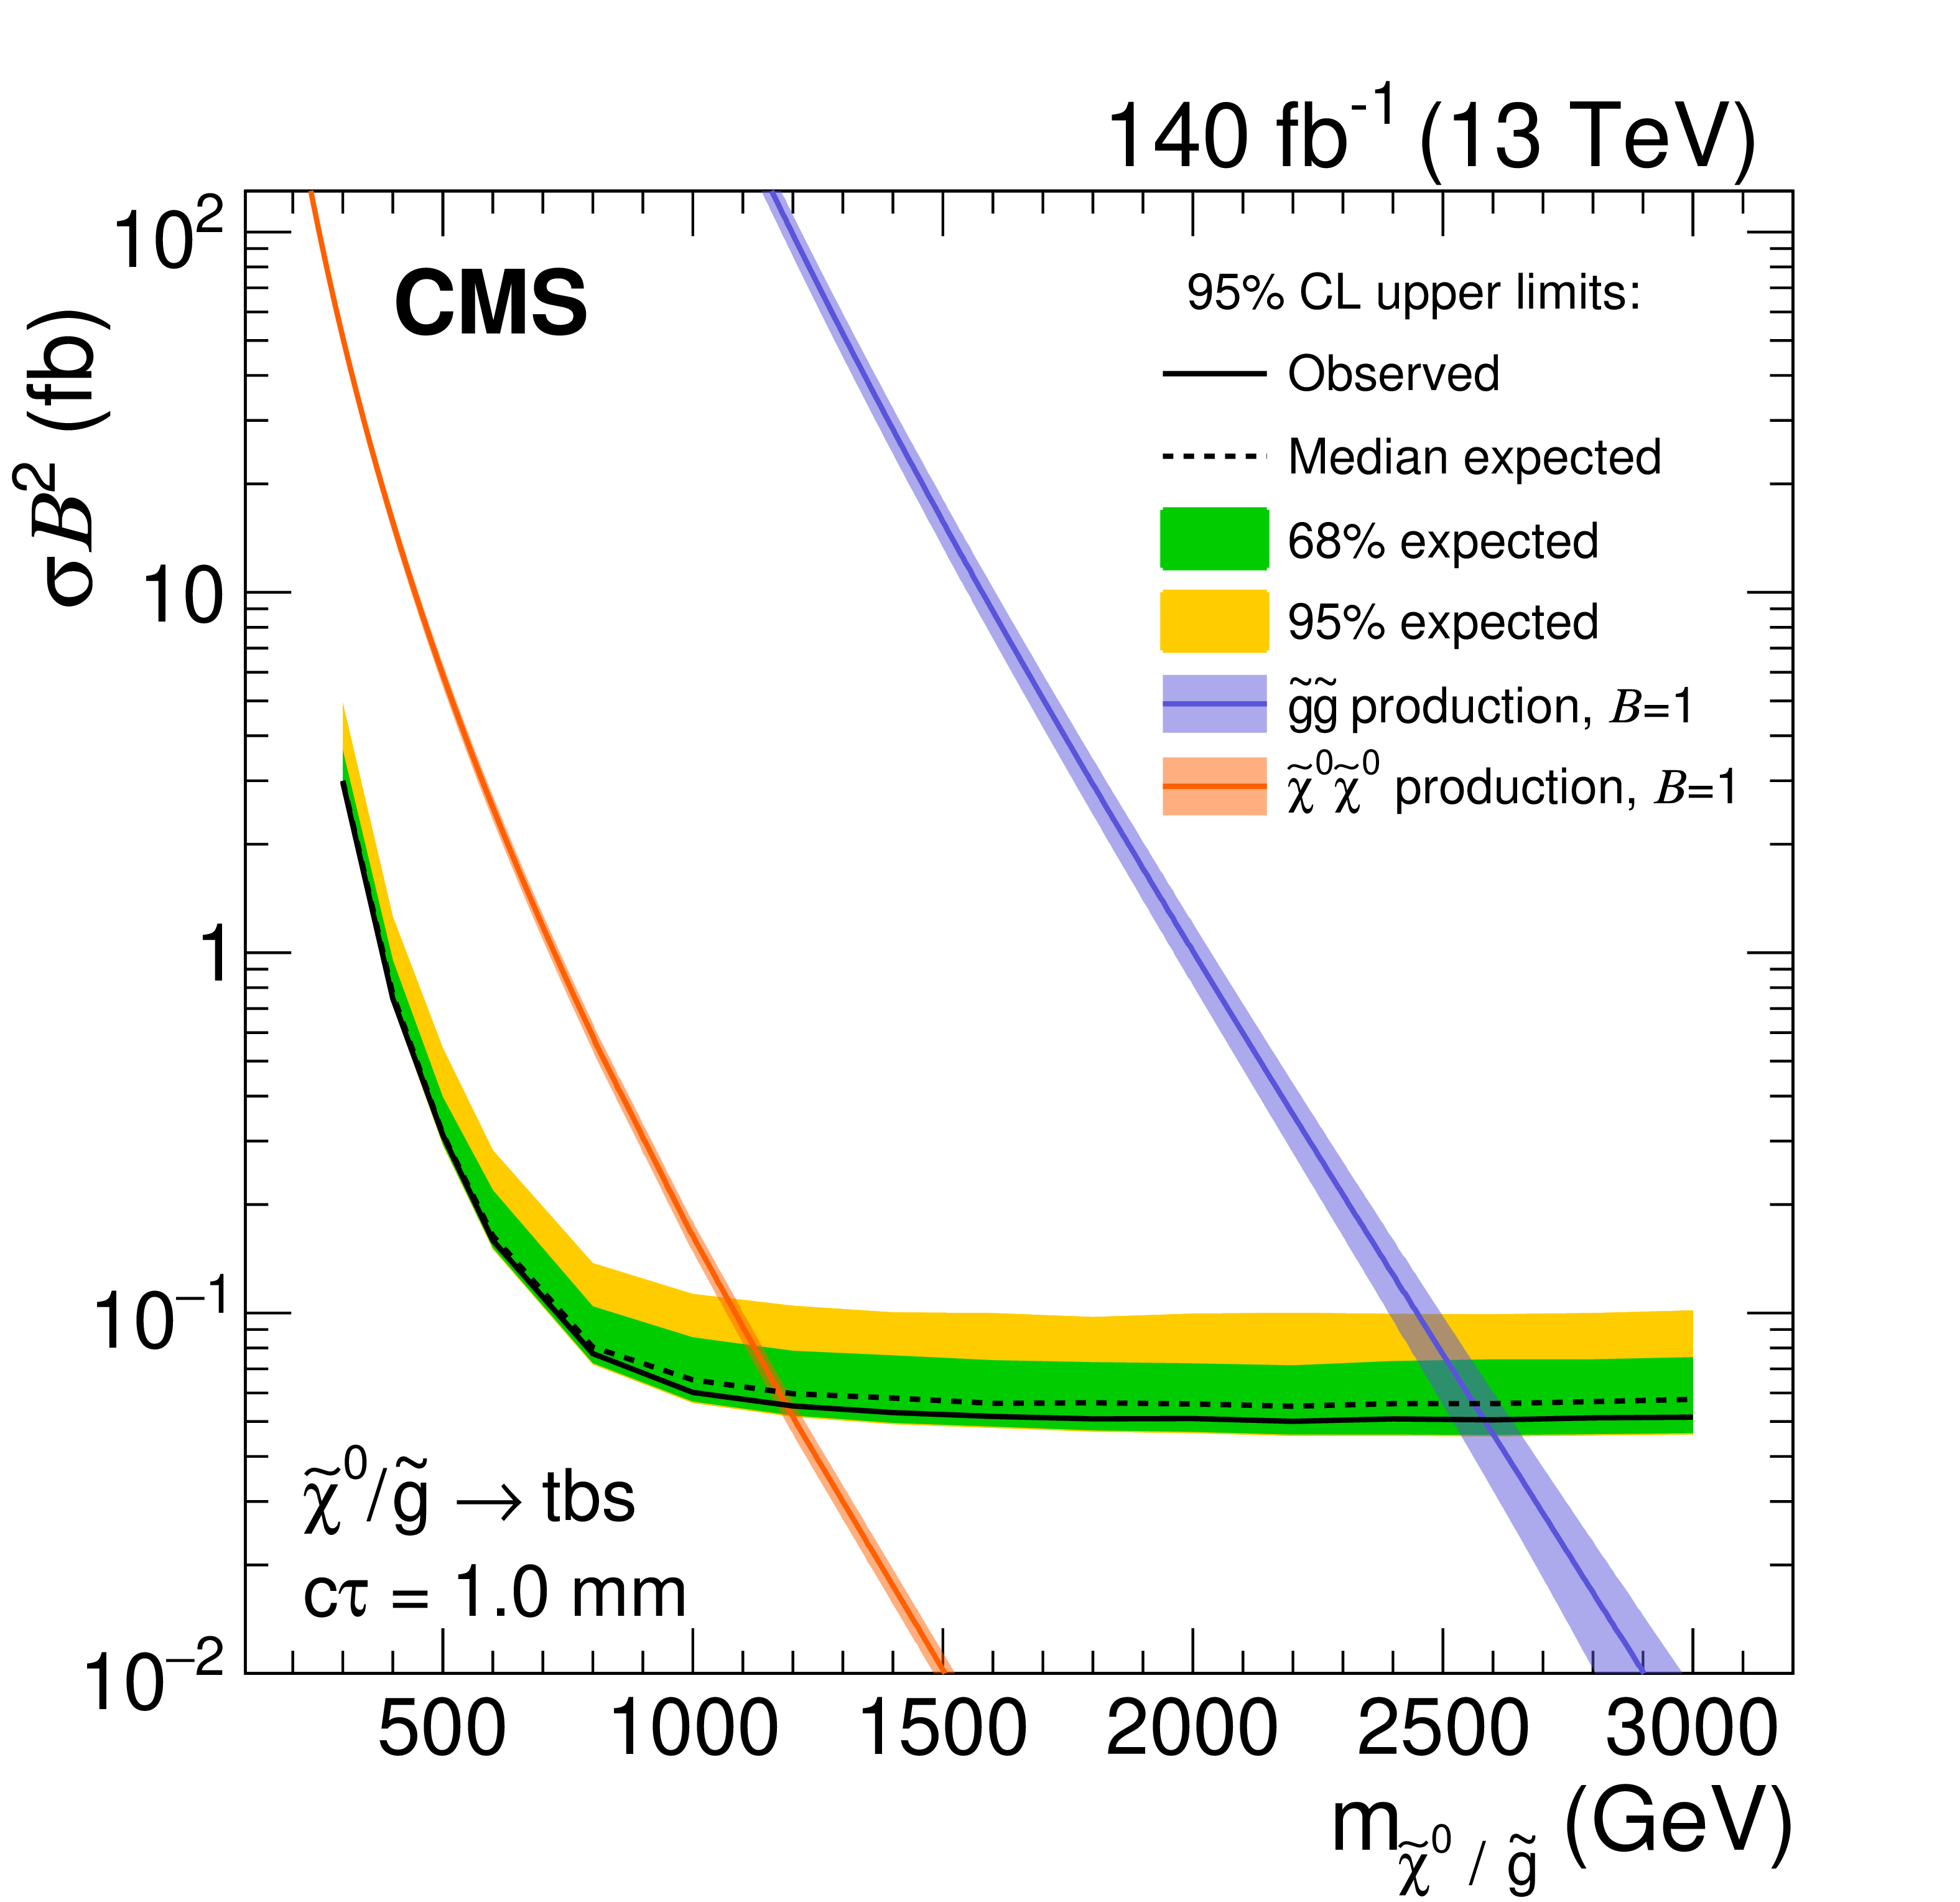
Observed and expected 95% CL upper limits on the product of cross section and branching fraction squared, as a function of mass for multijet signals, for a fixed $c\tau $ of 1 mm in the full Run-2 data set. The neutralino and gluino pair production cross sections are shown for the multijet signals, and the top squark pair-production cross section is shown for the dijet signals. |
png pdf |
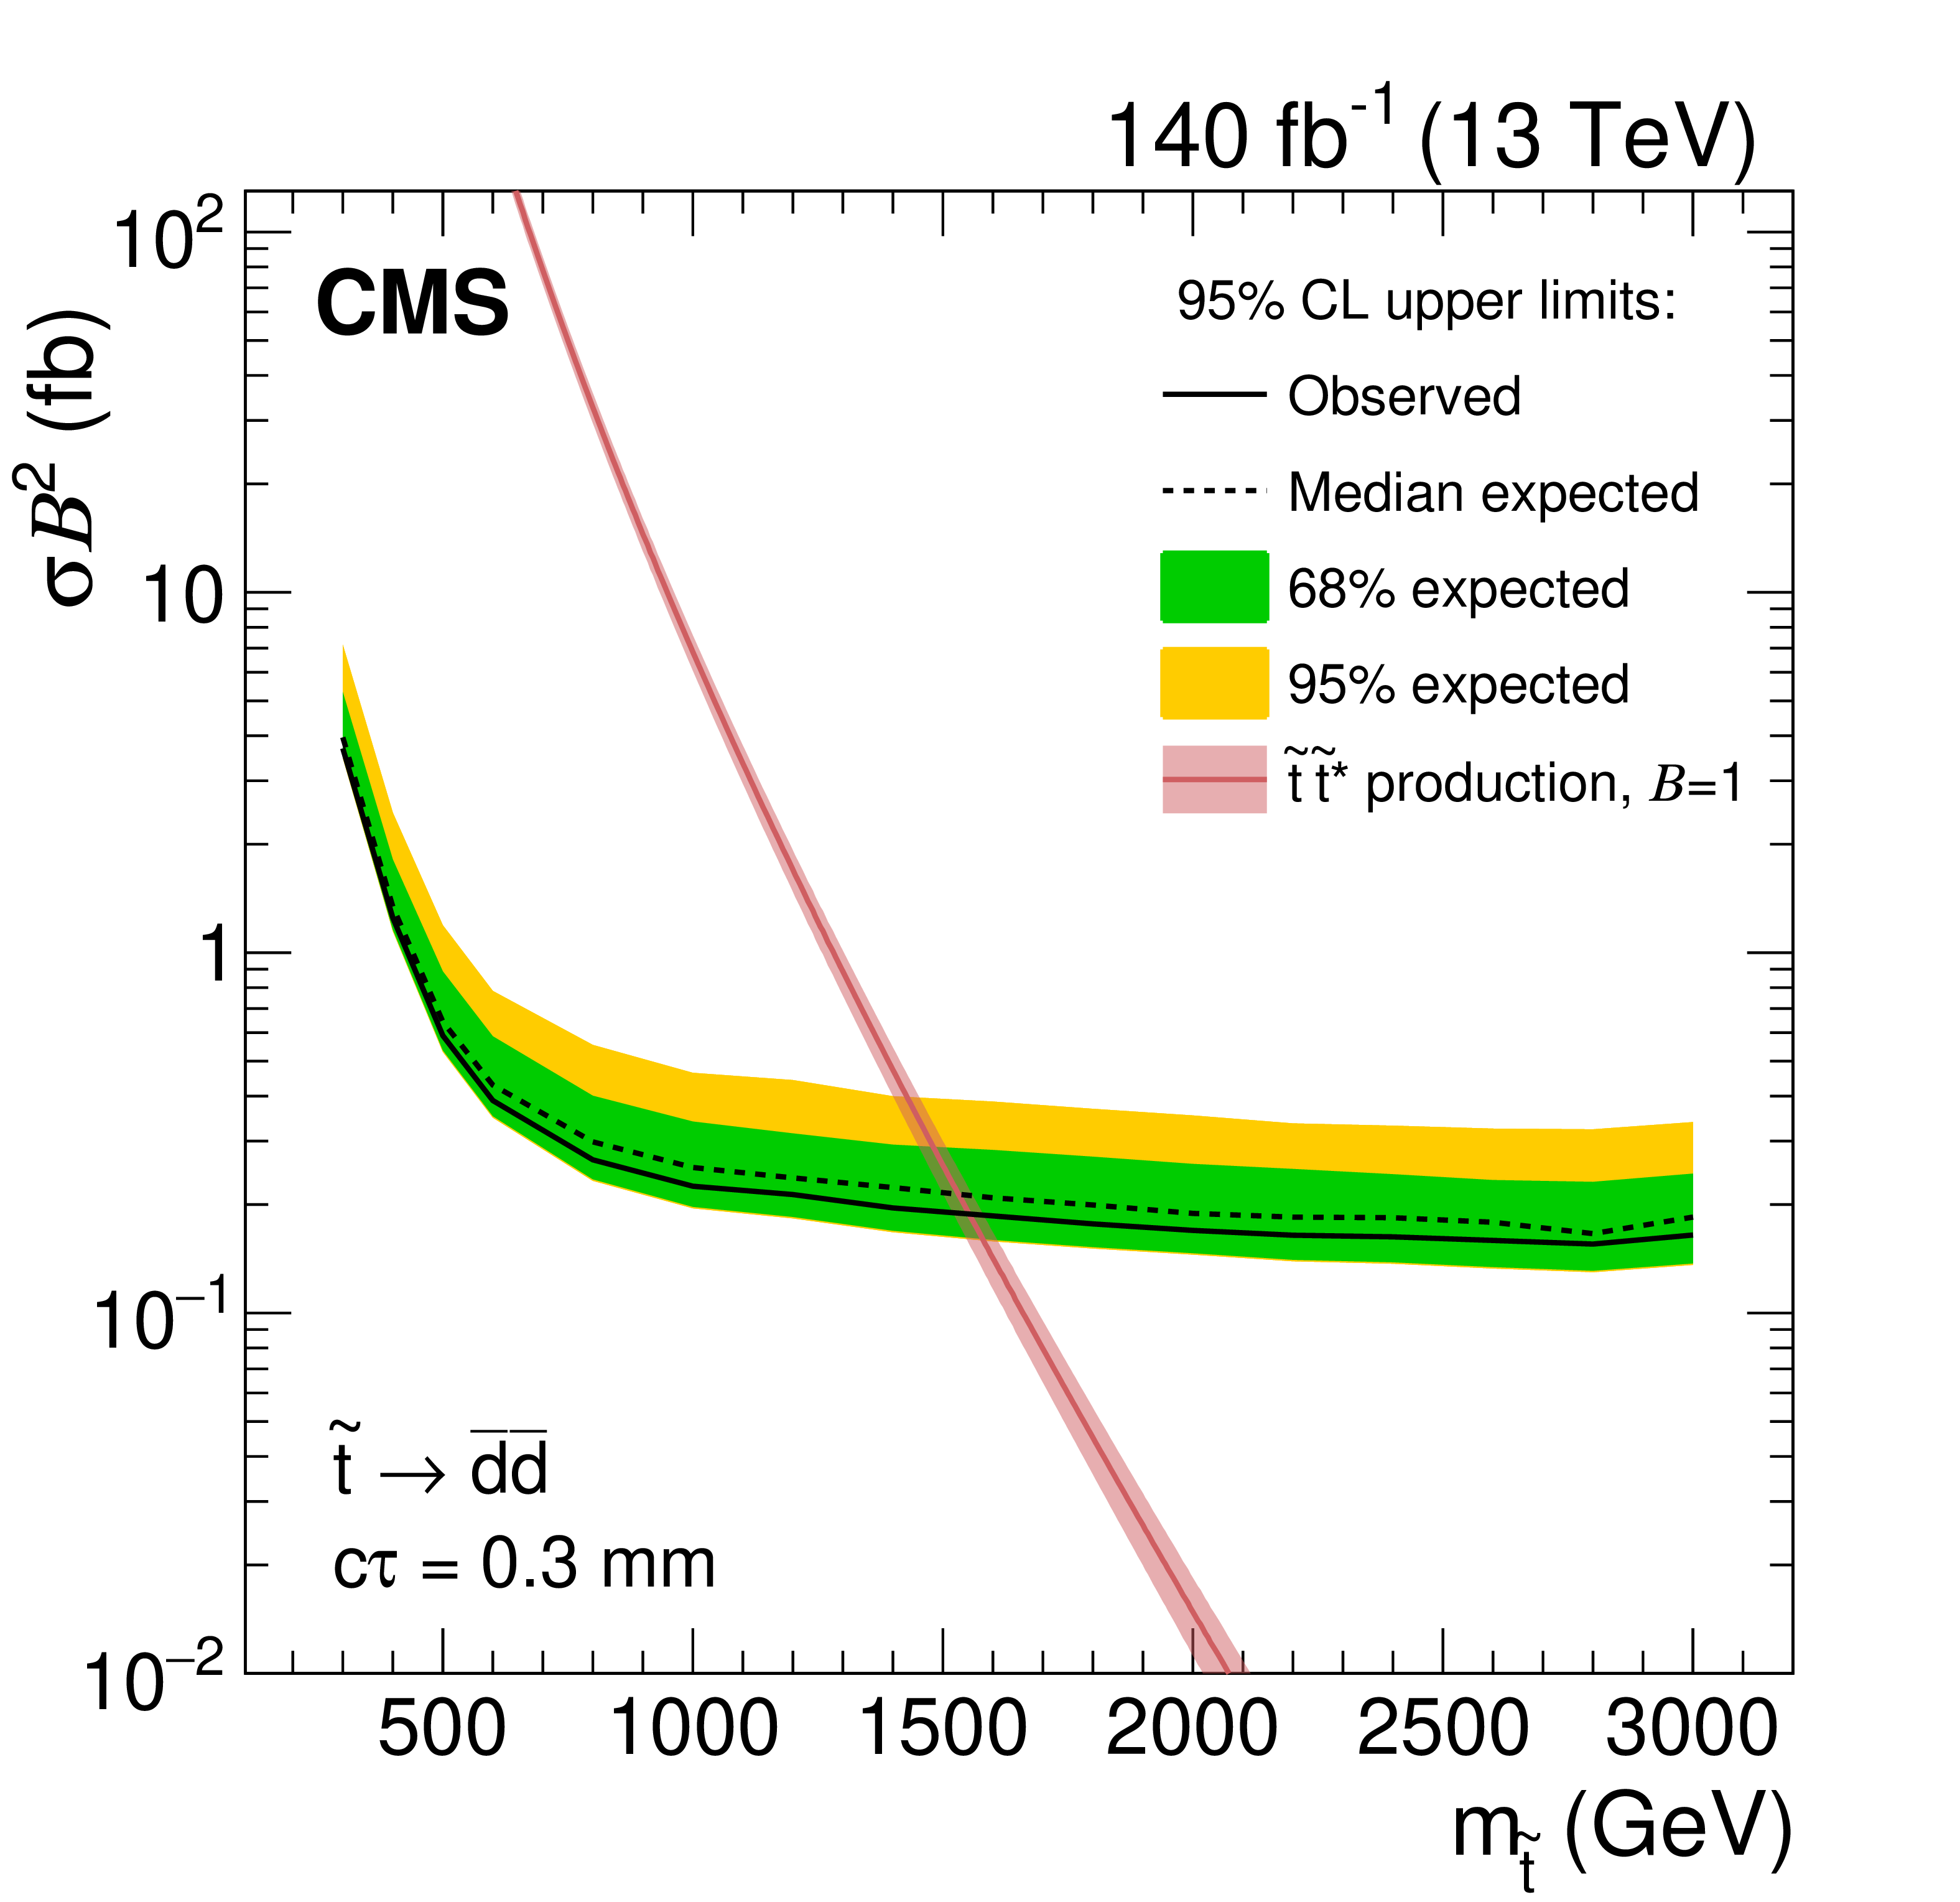
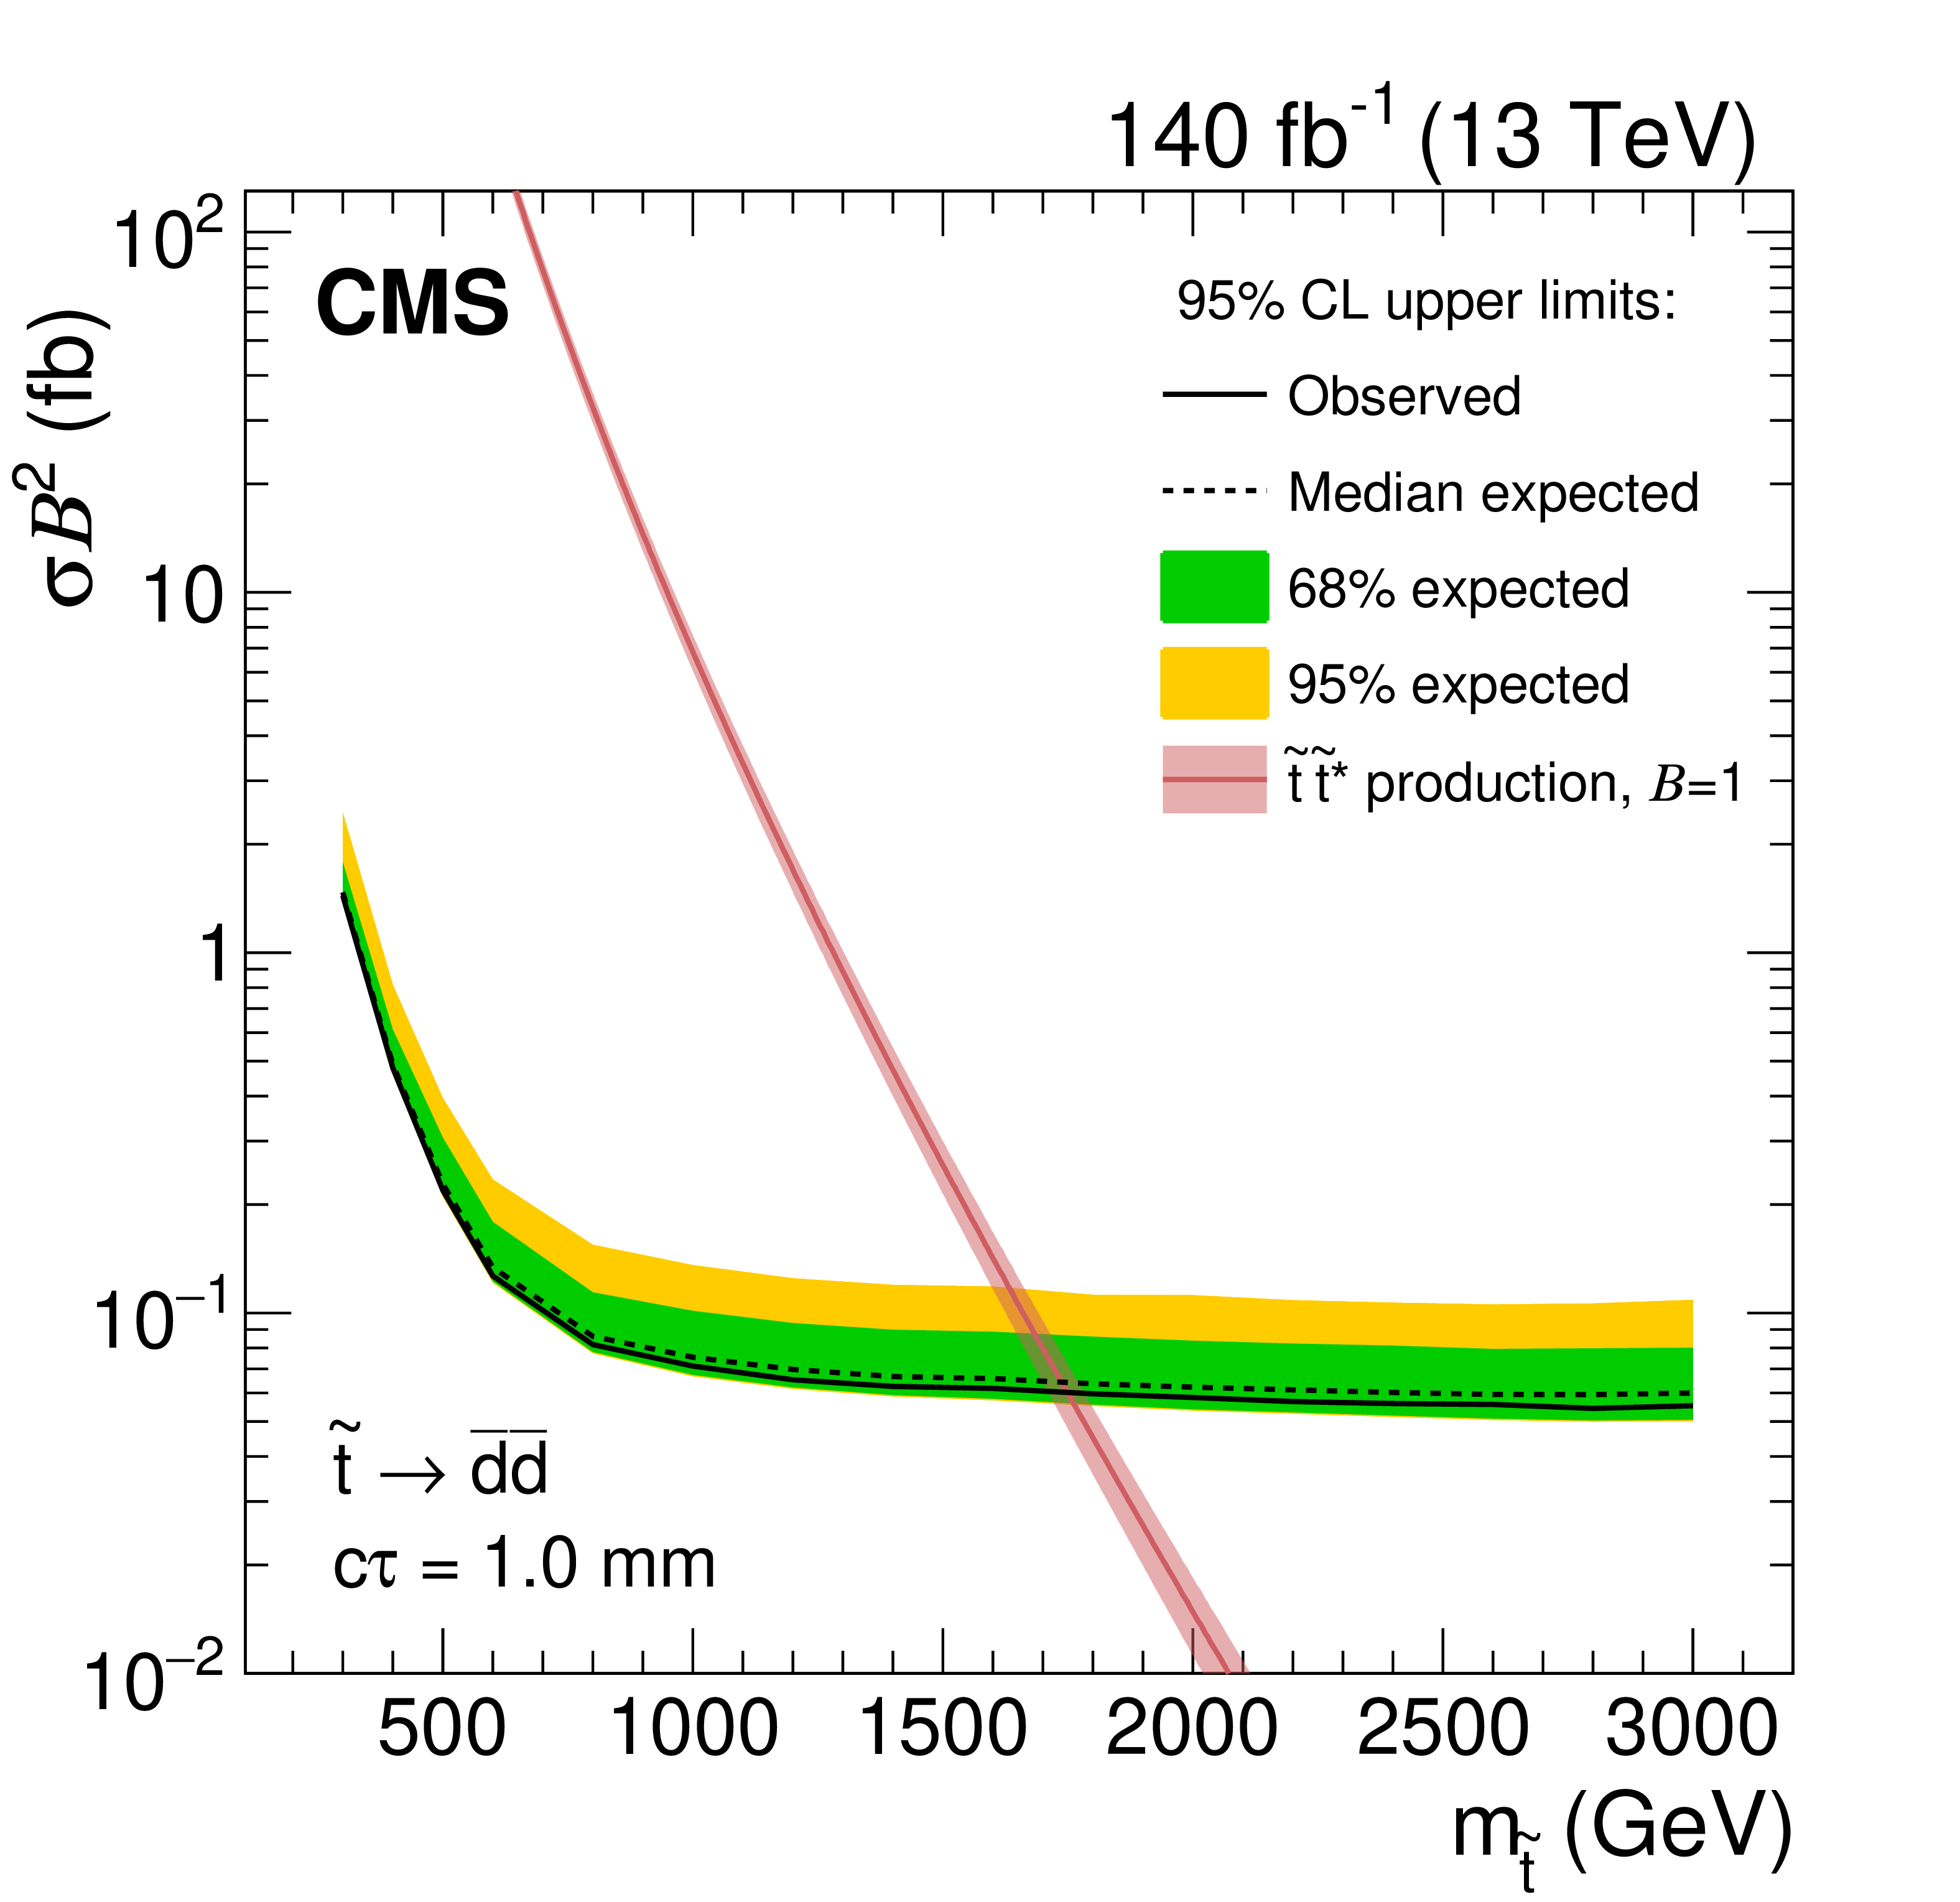
Figure 8-d:
Observed and expected 95% CL upper limits on the product of cross section and branching fraction squared, as a function of mass for dijet signals, for a fixed $c\tau $ of 1 mm in the full Run-2 data set. The neutralino and gluino pair production cross sections are shown for the multijet signals, and the top squark pair-production cross section is shown for the dijet signals. |
png pdf |
Figure 8-e:
Observed and expected 95% CL upper limits on the product of cross section and branching fraction squared, as a function of mass for multijet signals, for a fixed $c\tau $ of 10 mm in the full Run-2 data set. The neutralino and gluino pair production cross sections are shown for the multijet signals, and the top squark pair-production cross section is shown for the dijet signals. |
png pdf |
Figure 8-f:
Observed and expected 95% CL upper limits on the product of cross section and branching fraction squared, as a function of mass for dijet signals, for a fixed $c\tau $ of 10 mm in the full Run-2 data set. The neutralino and gluino pair production cross sections are shown for the multijet signals, and the top squark pair-production cross section is shown for the dijet signals. |
png pdf |
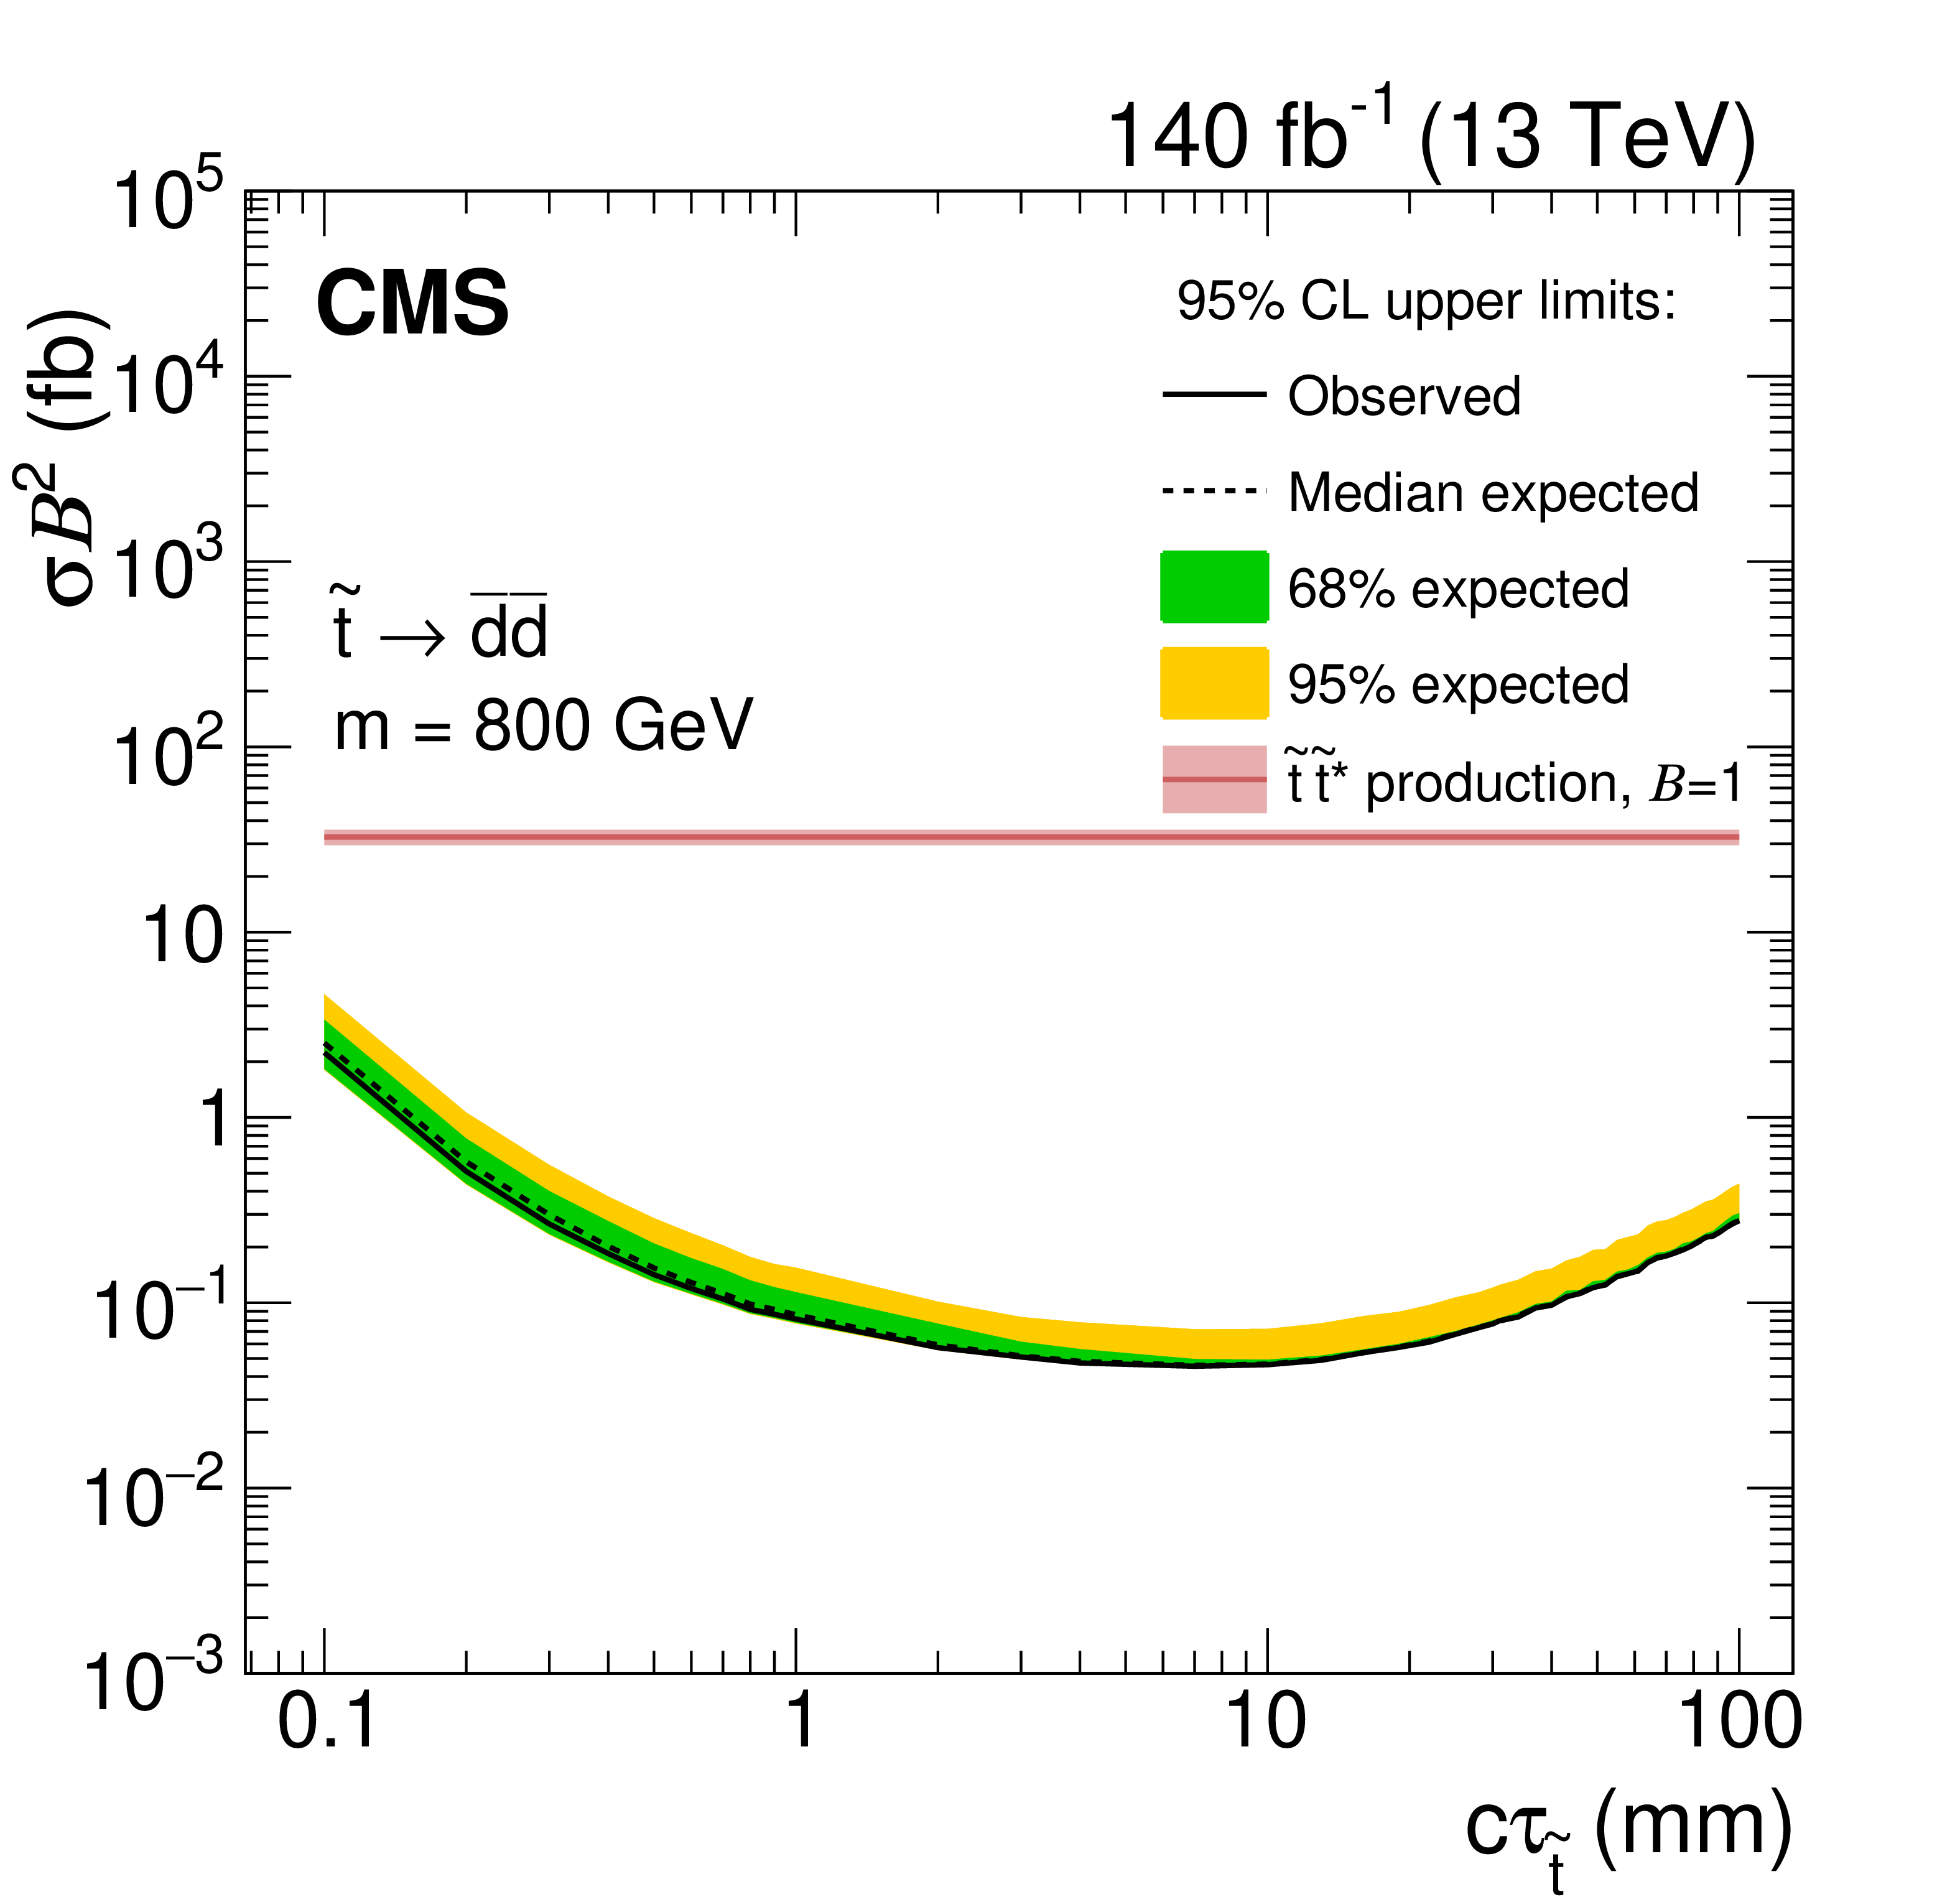
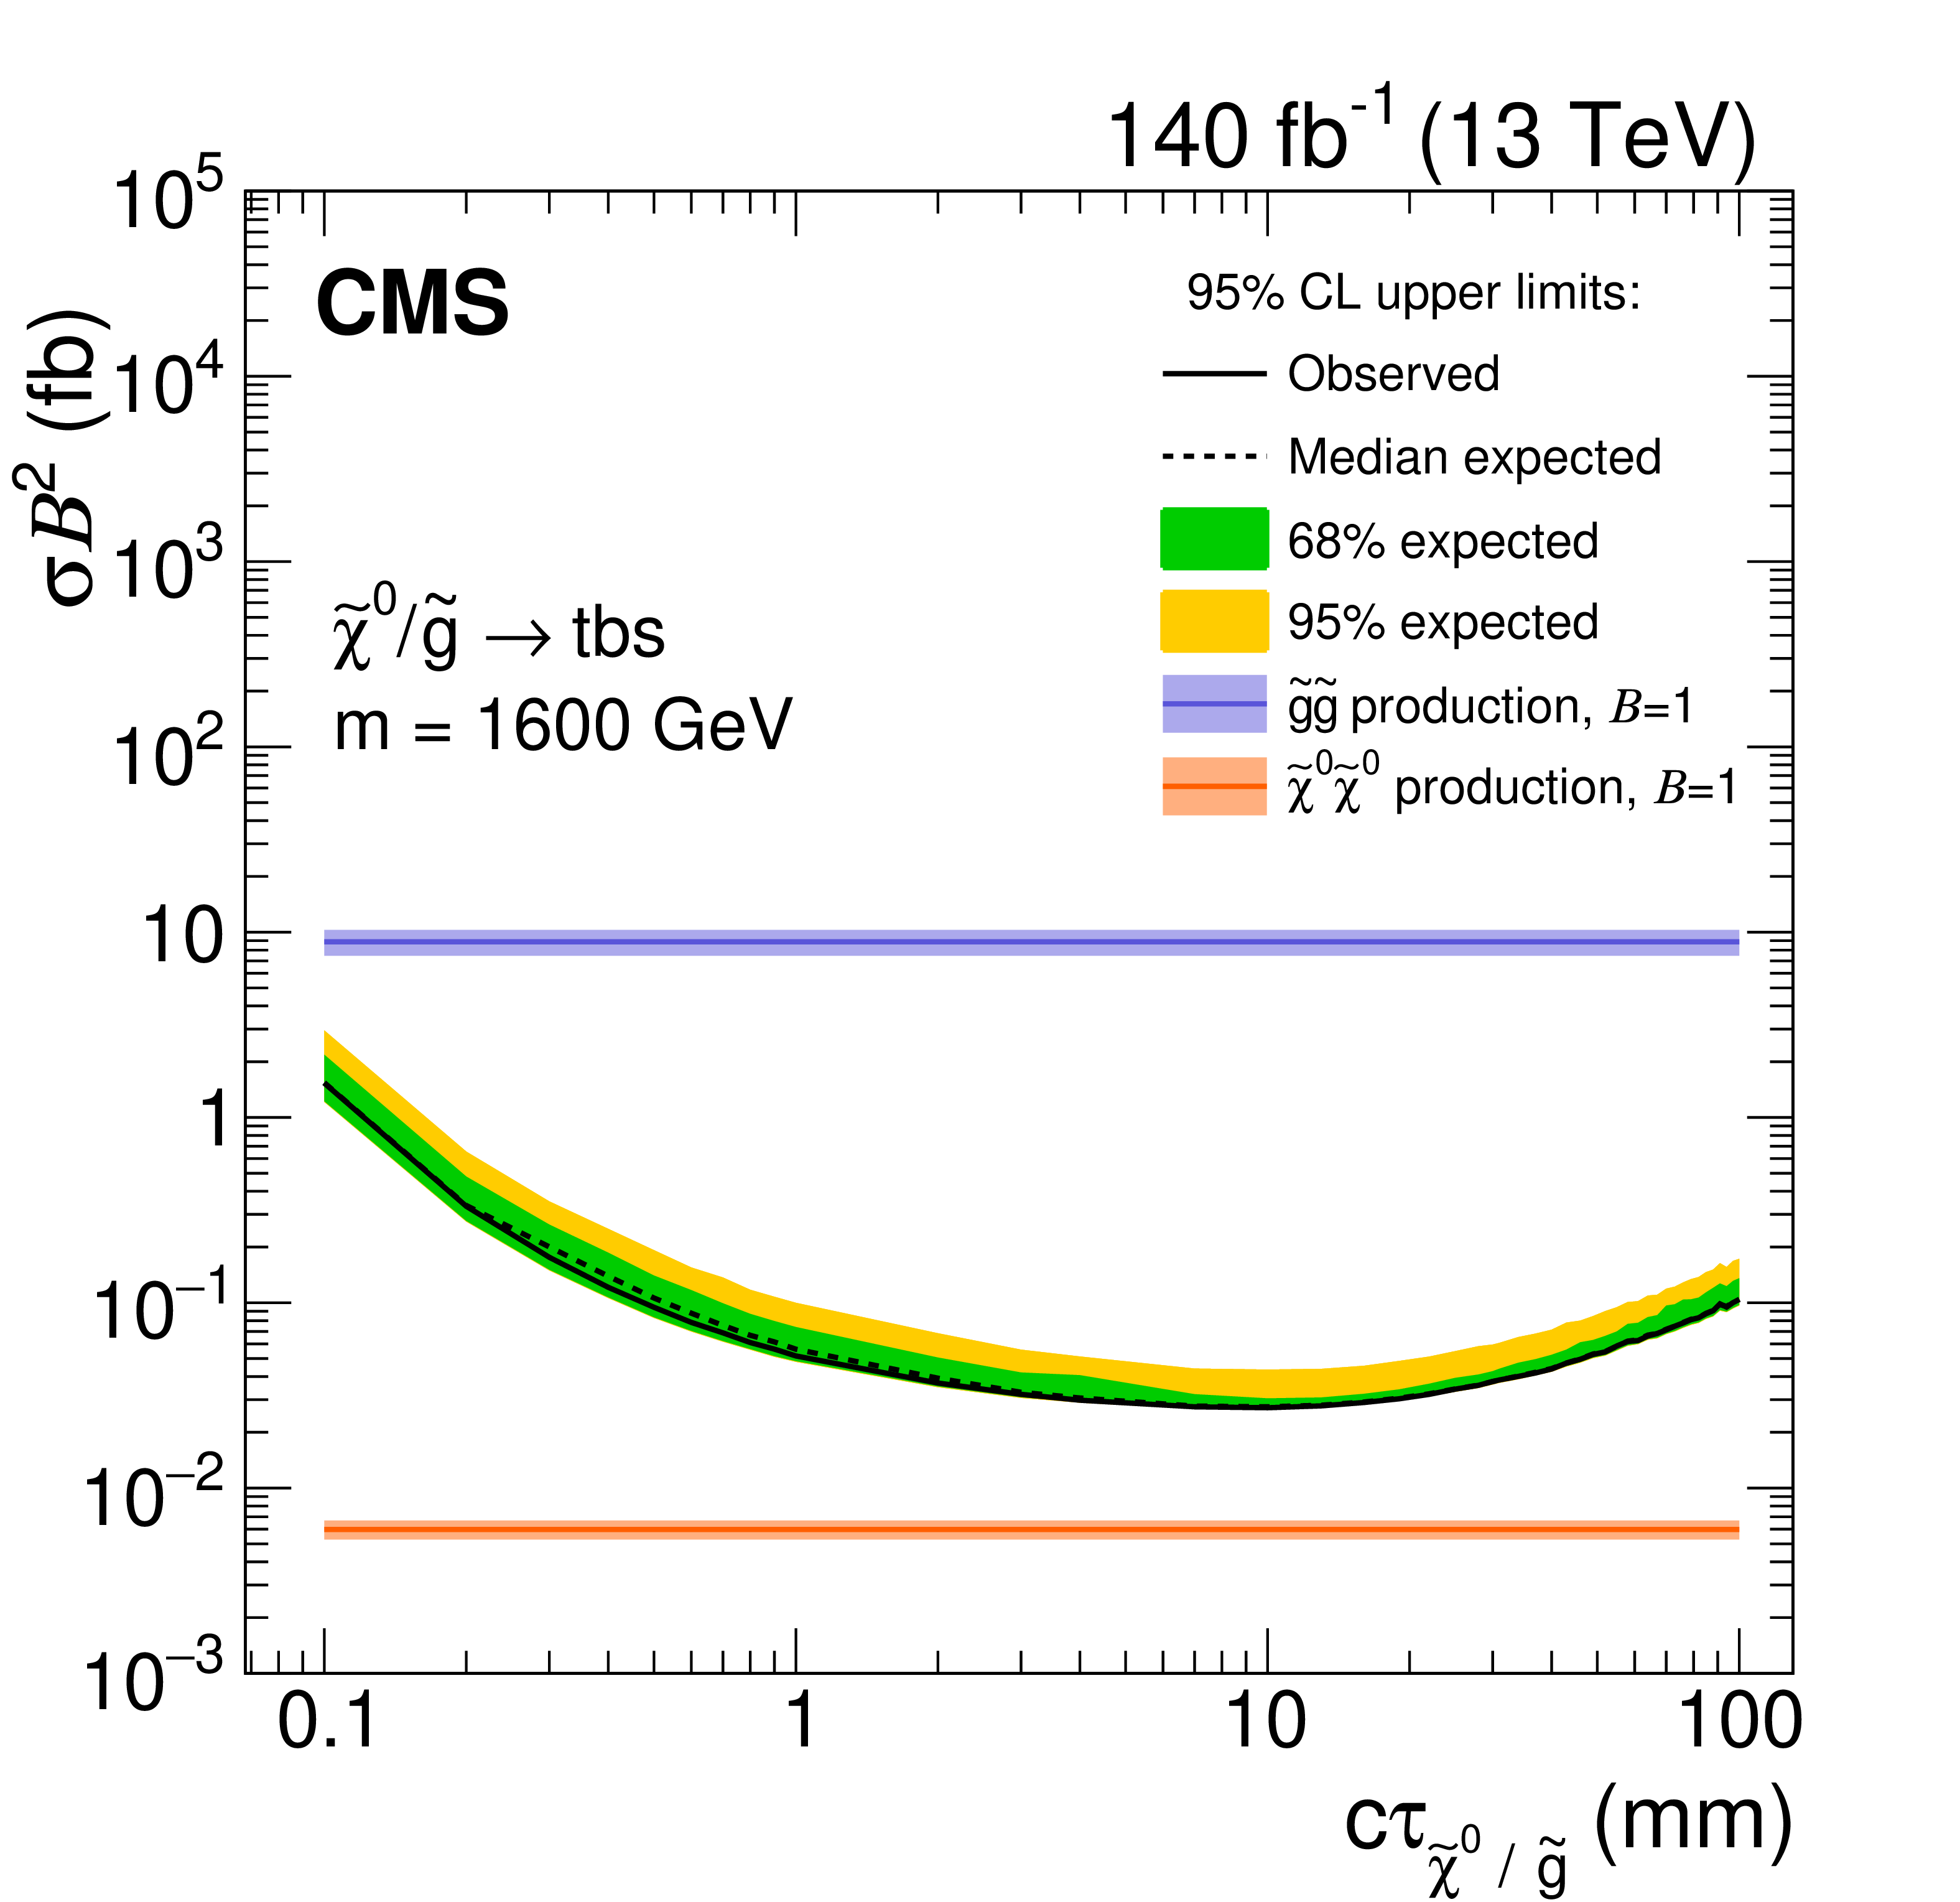
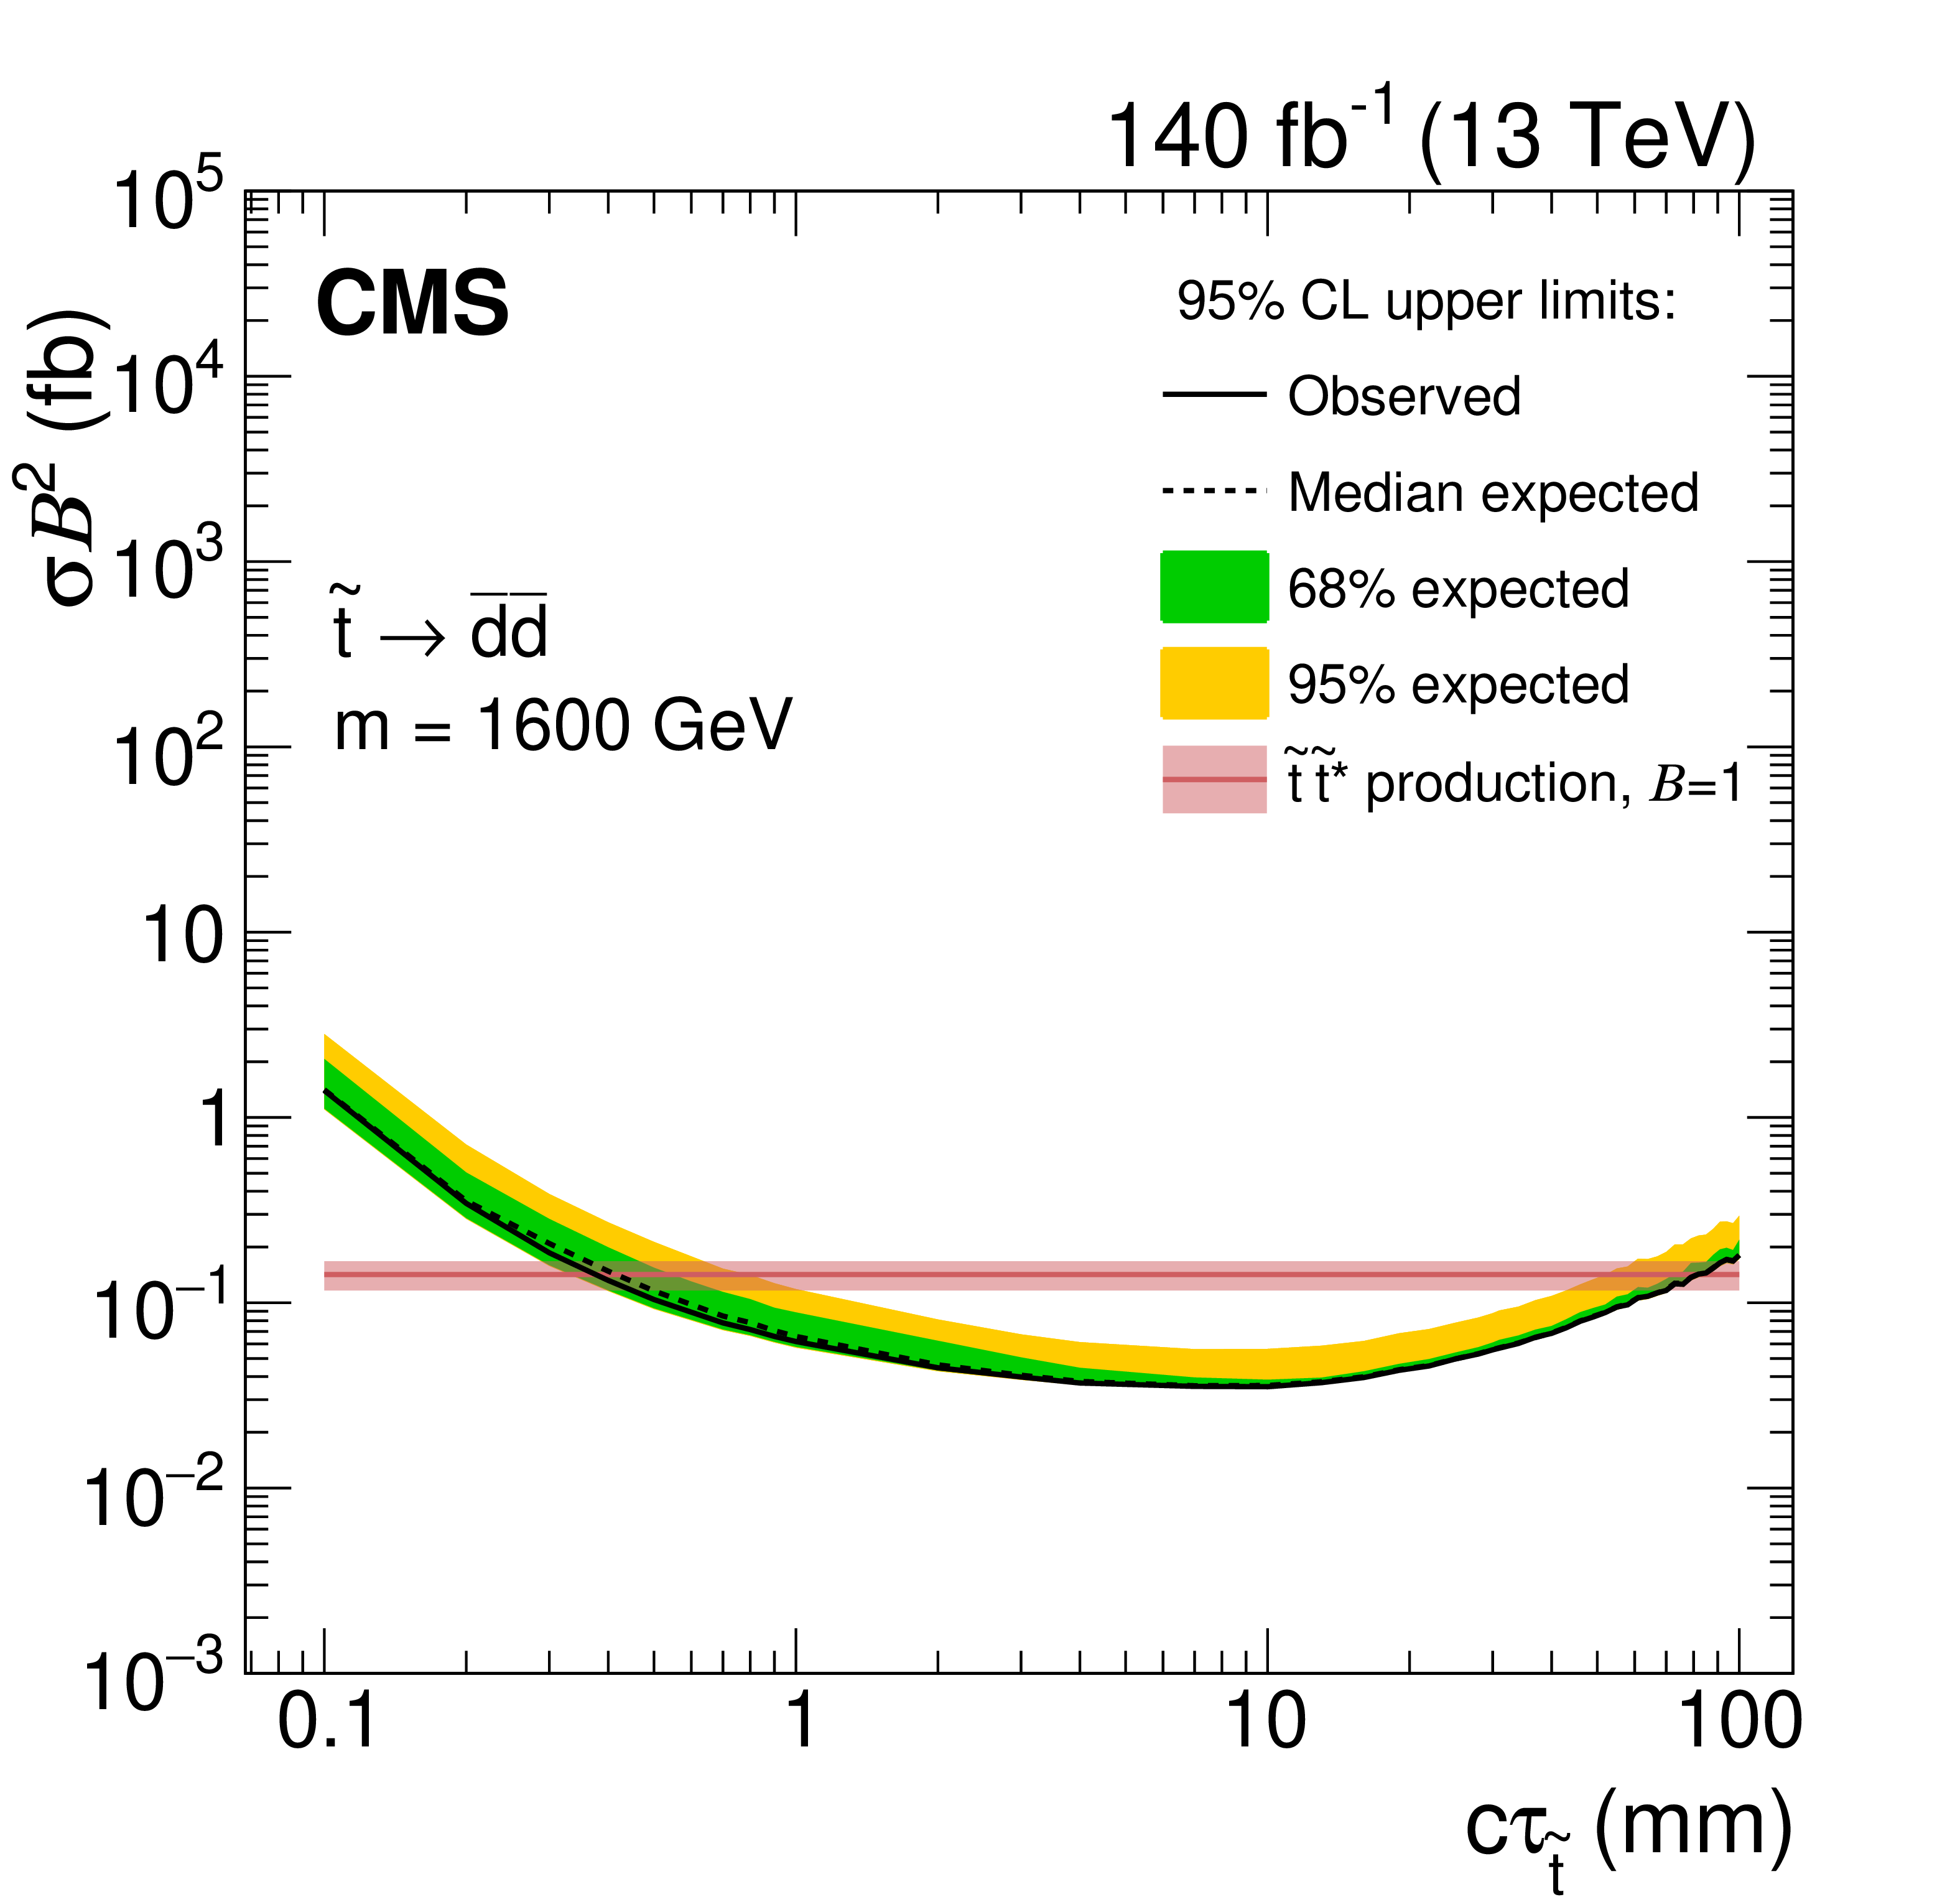
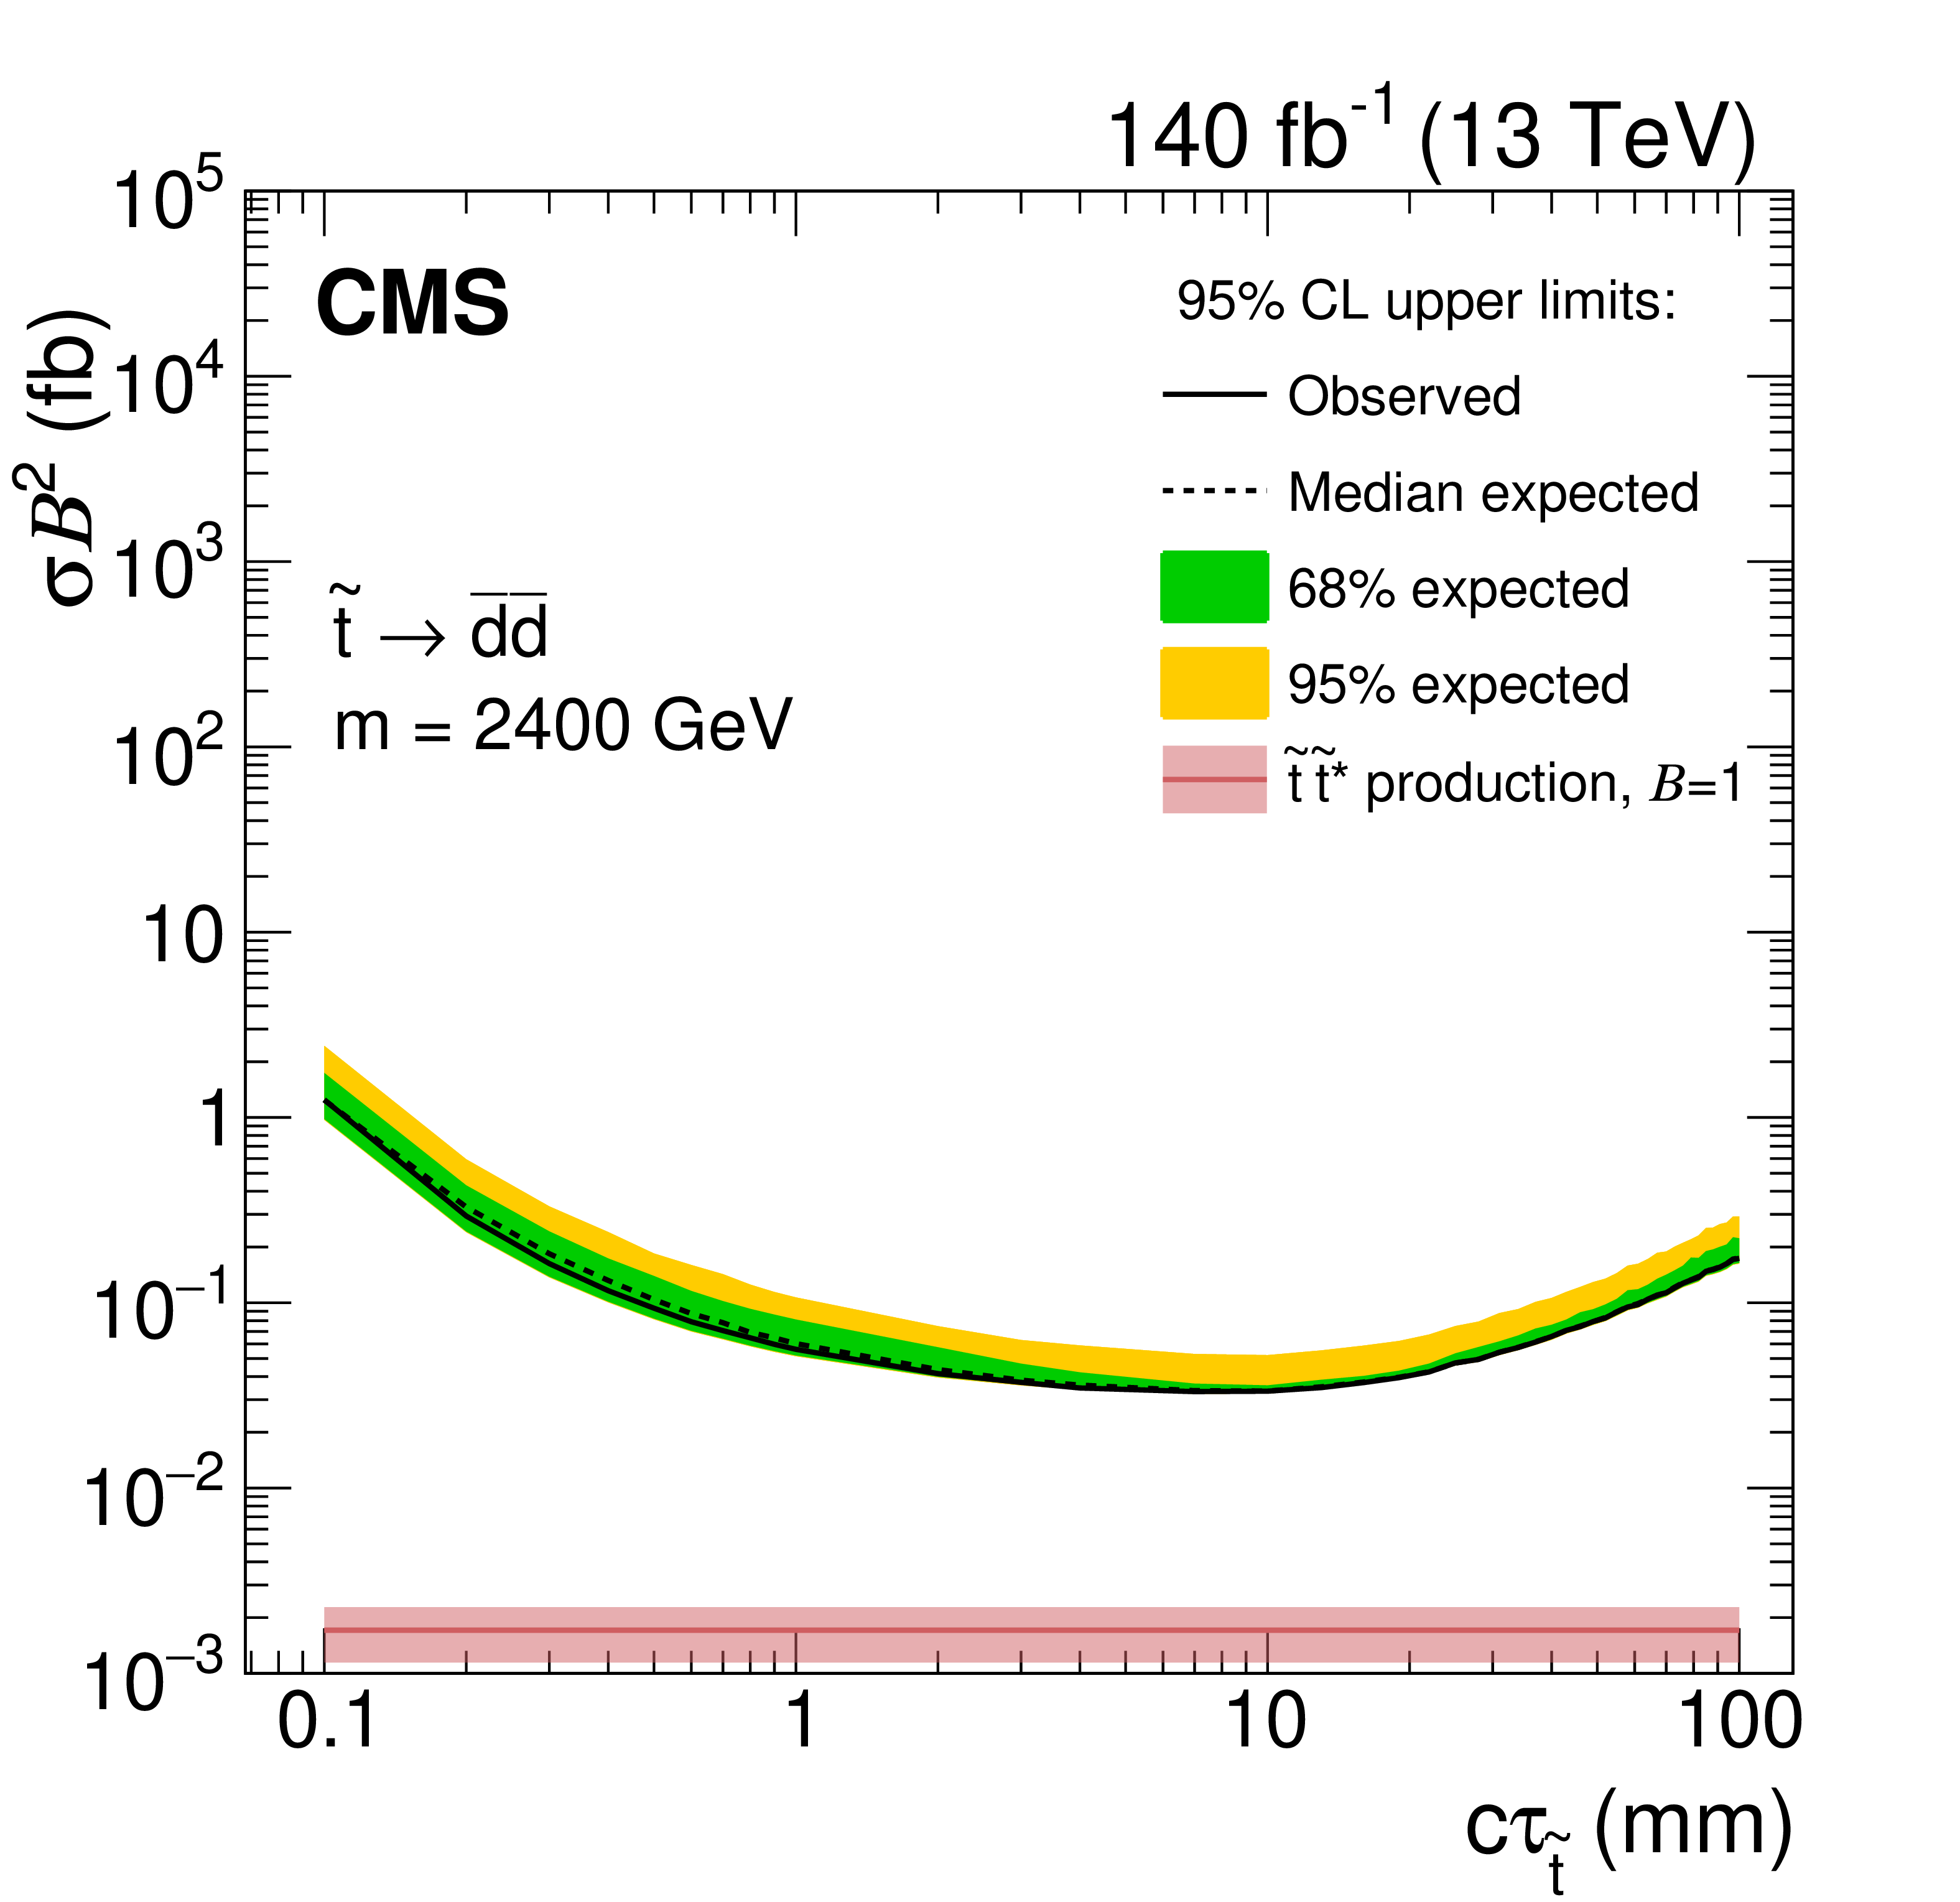
Figure 9:
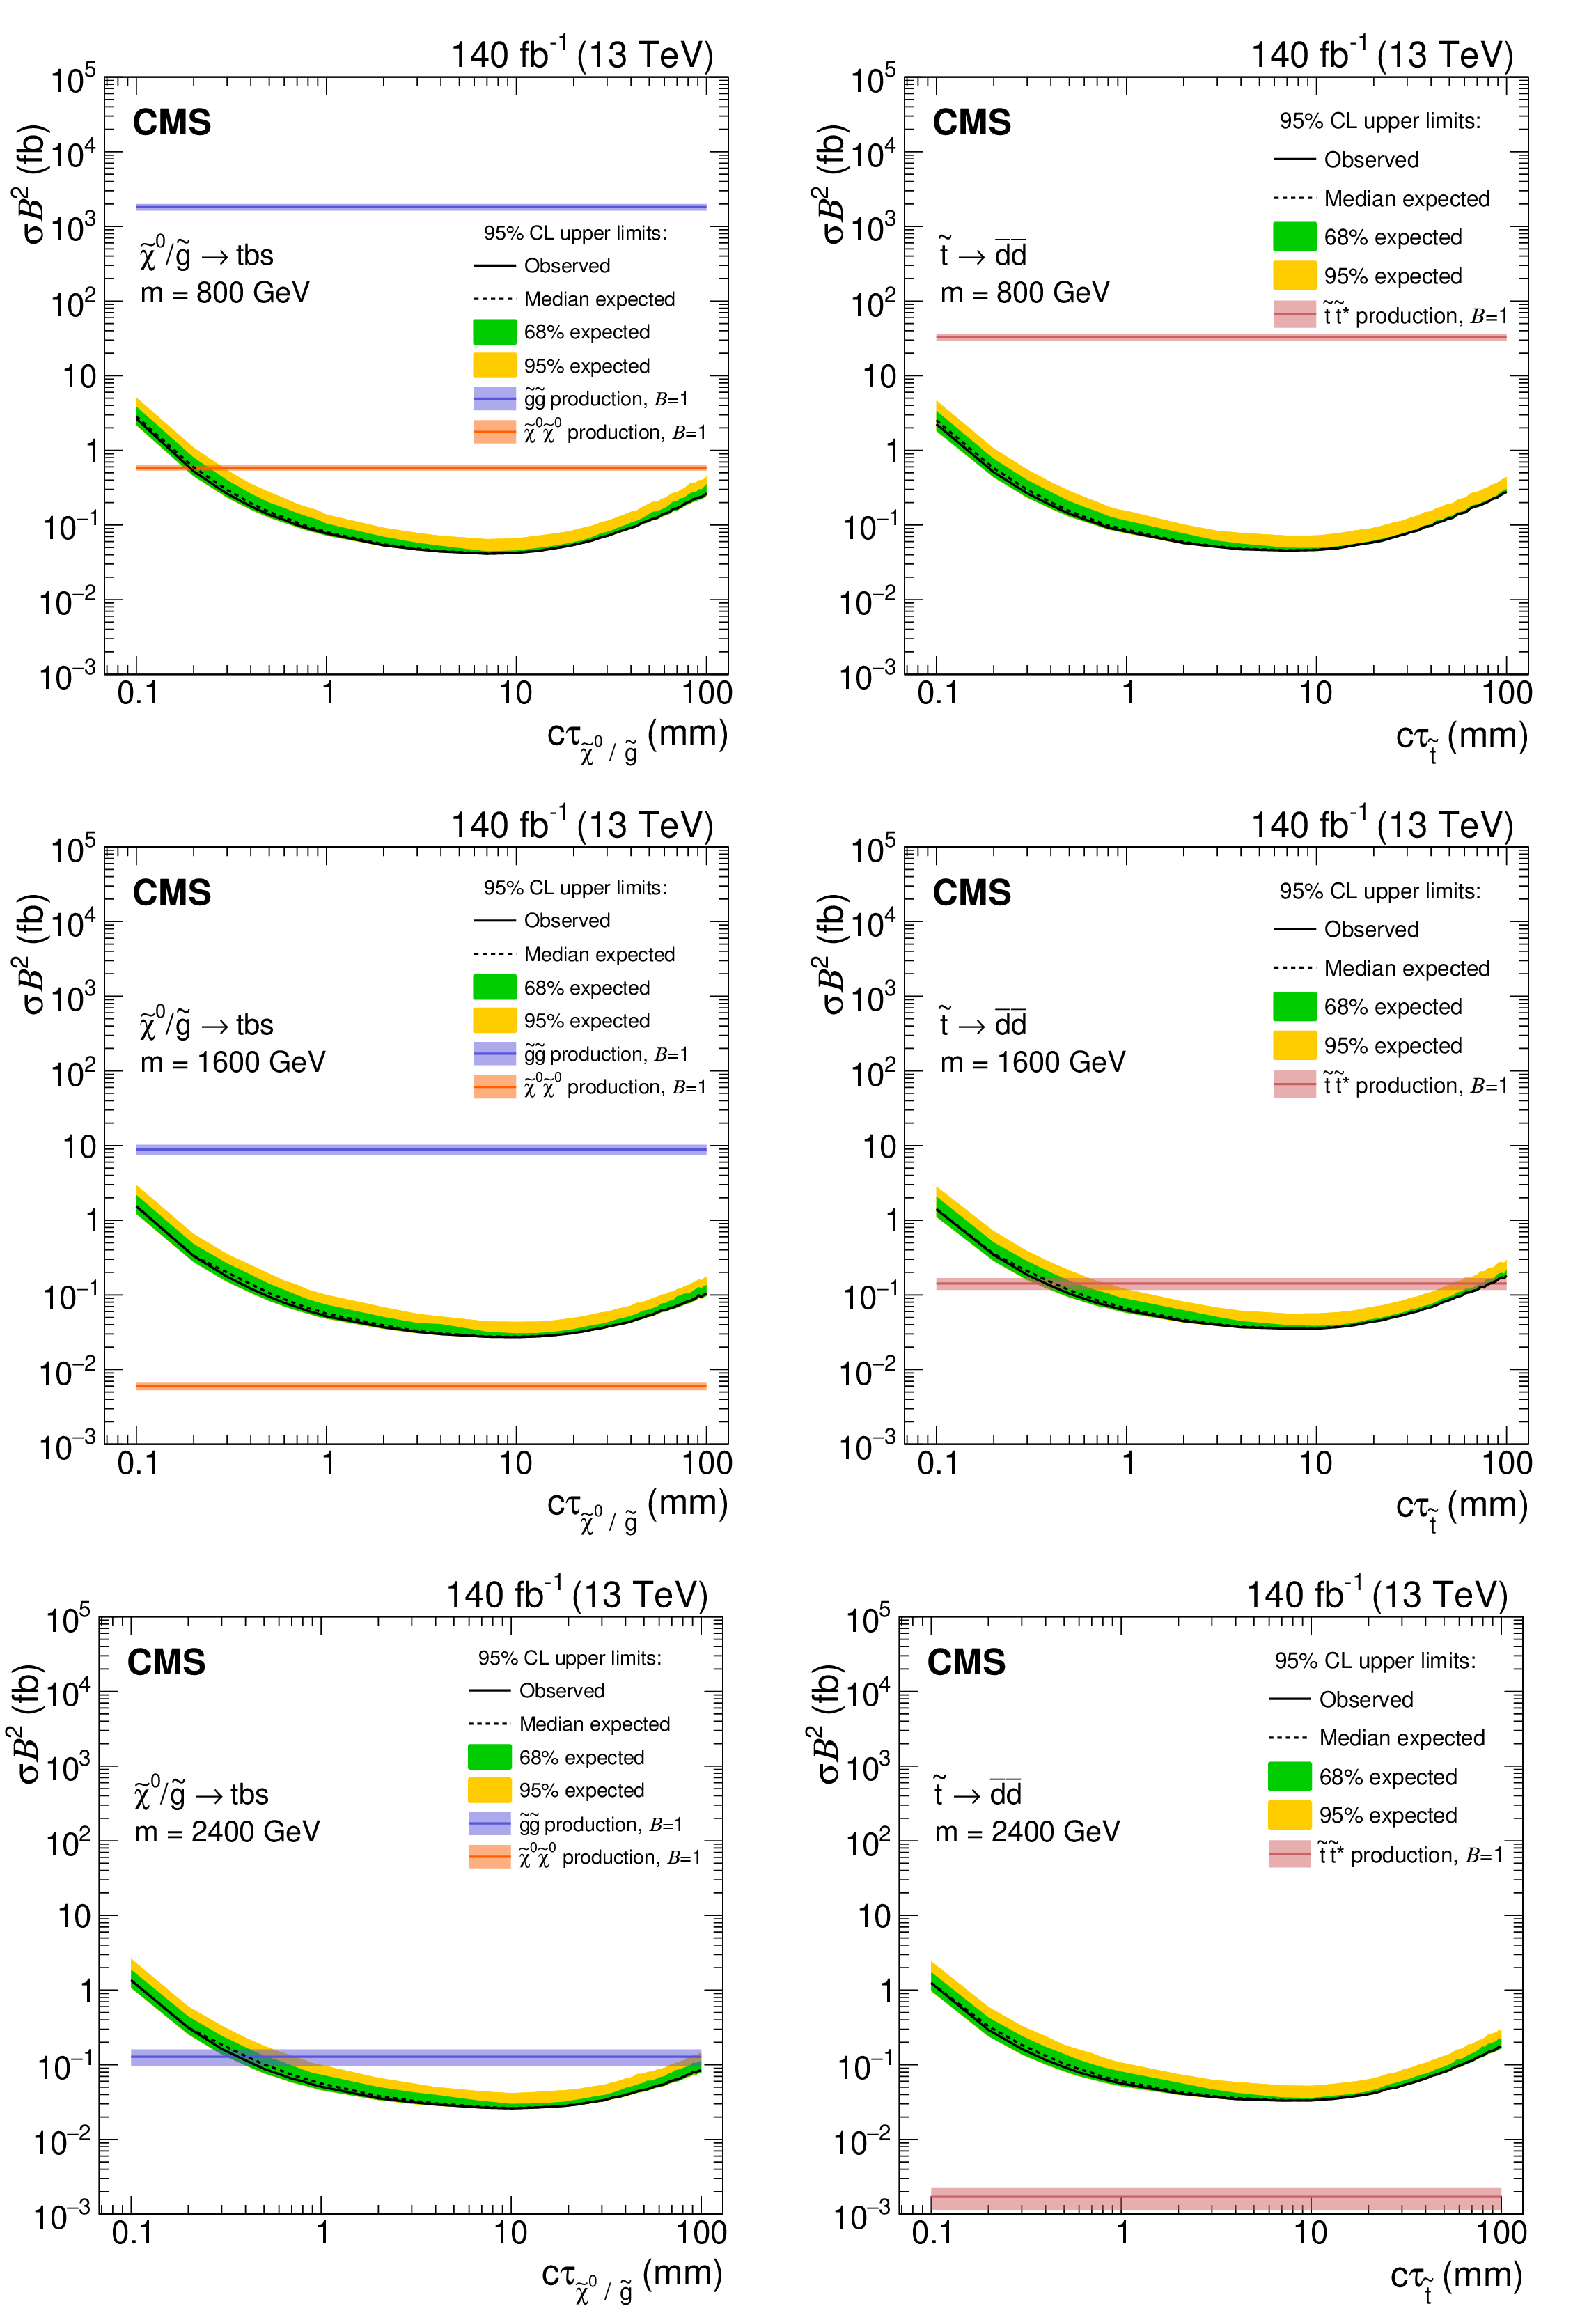
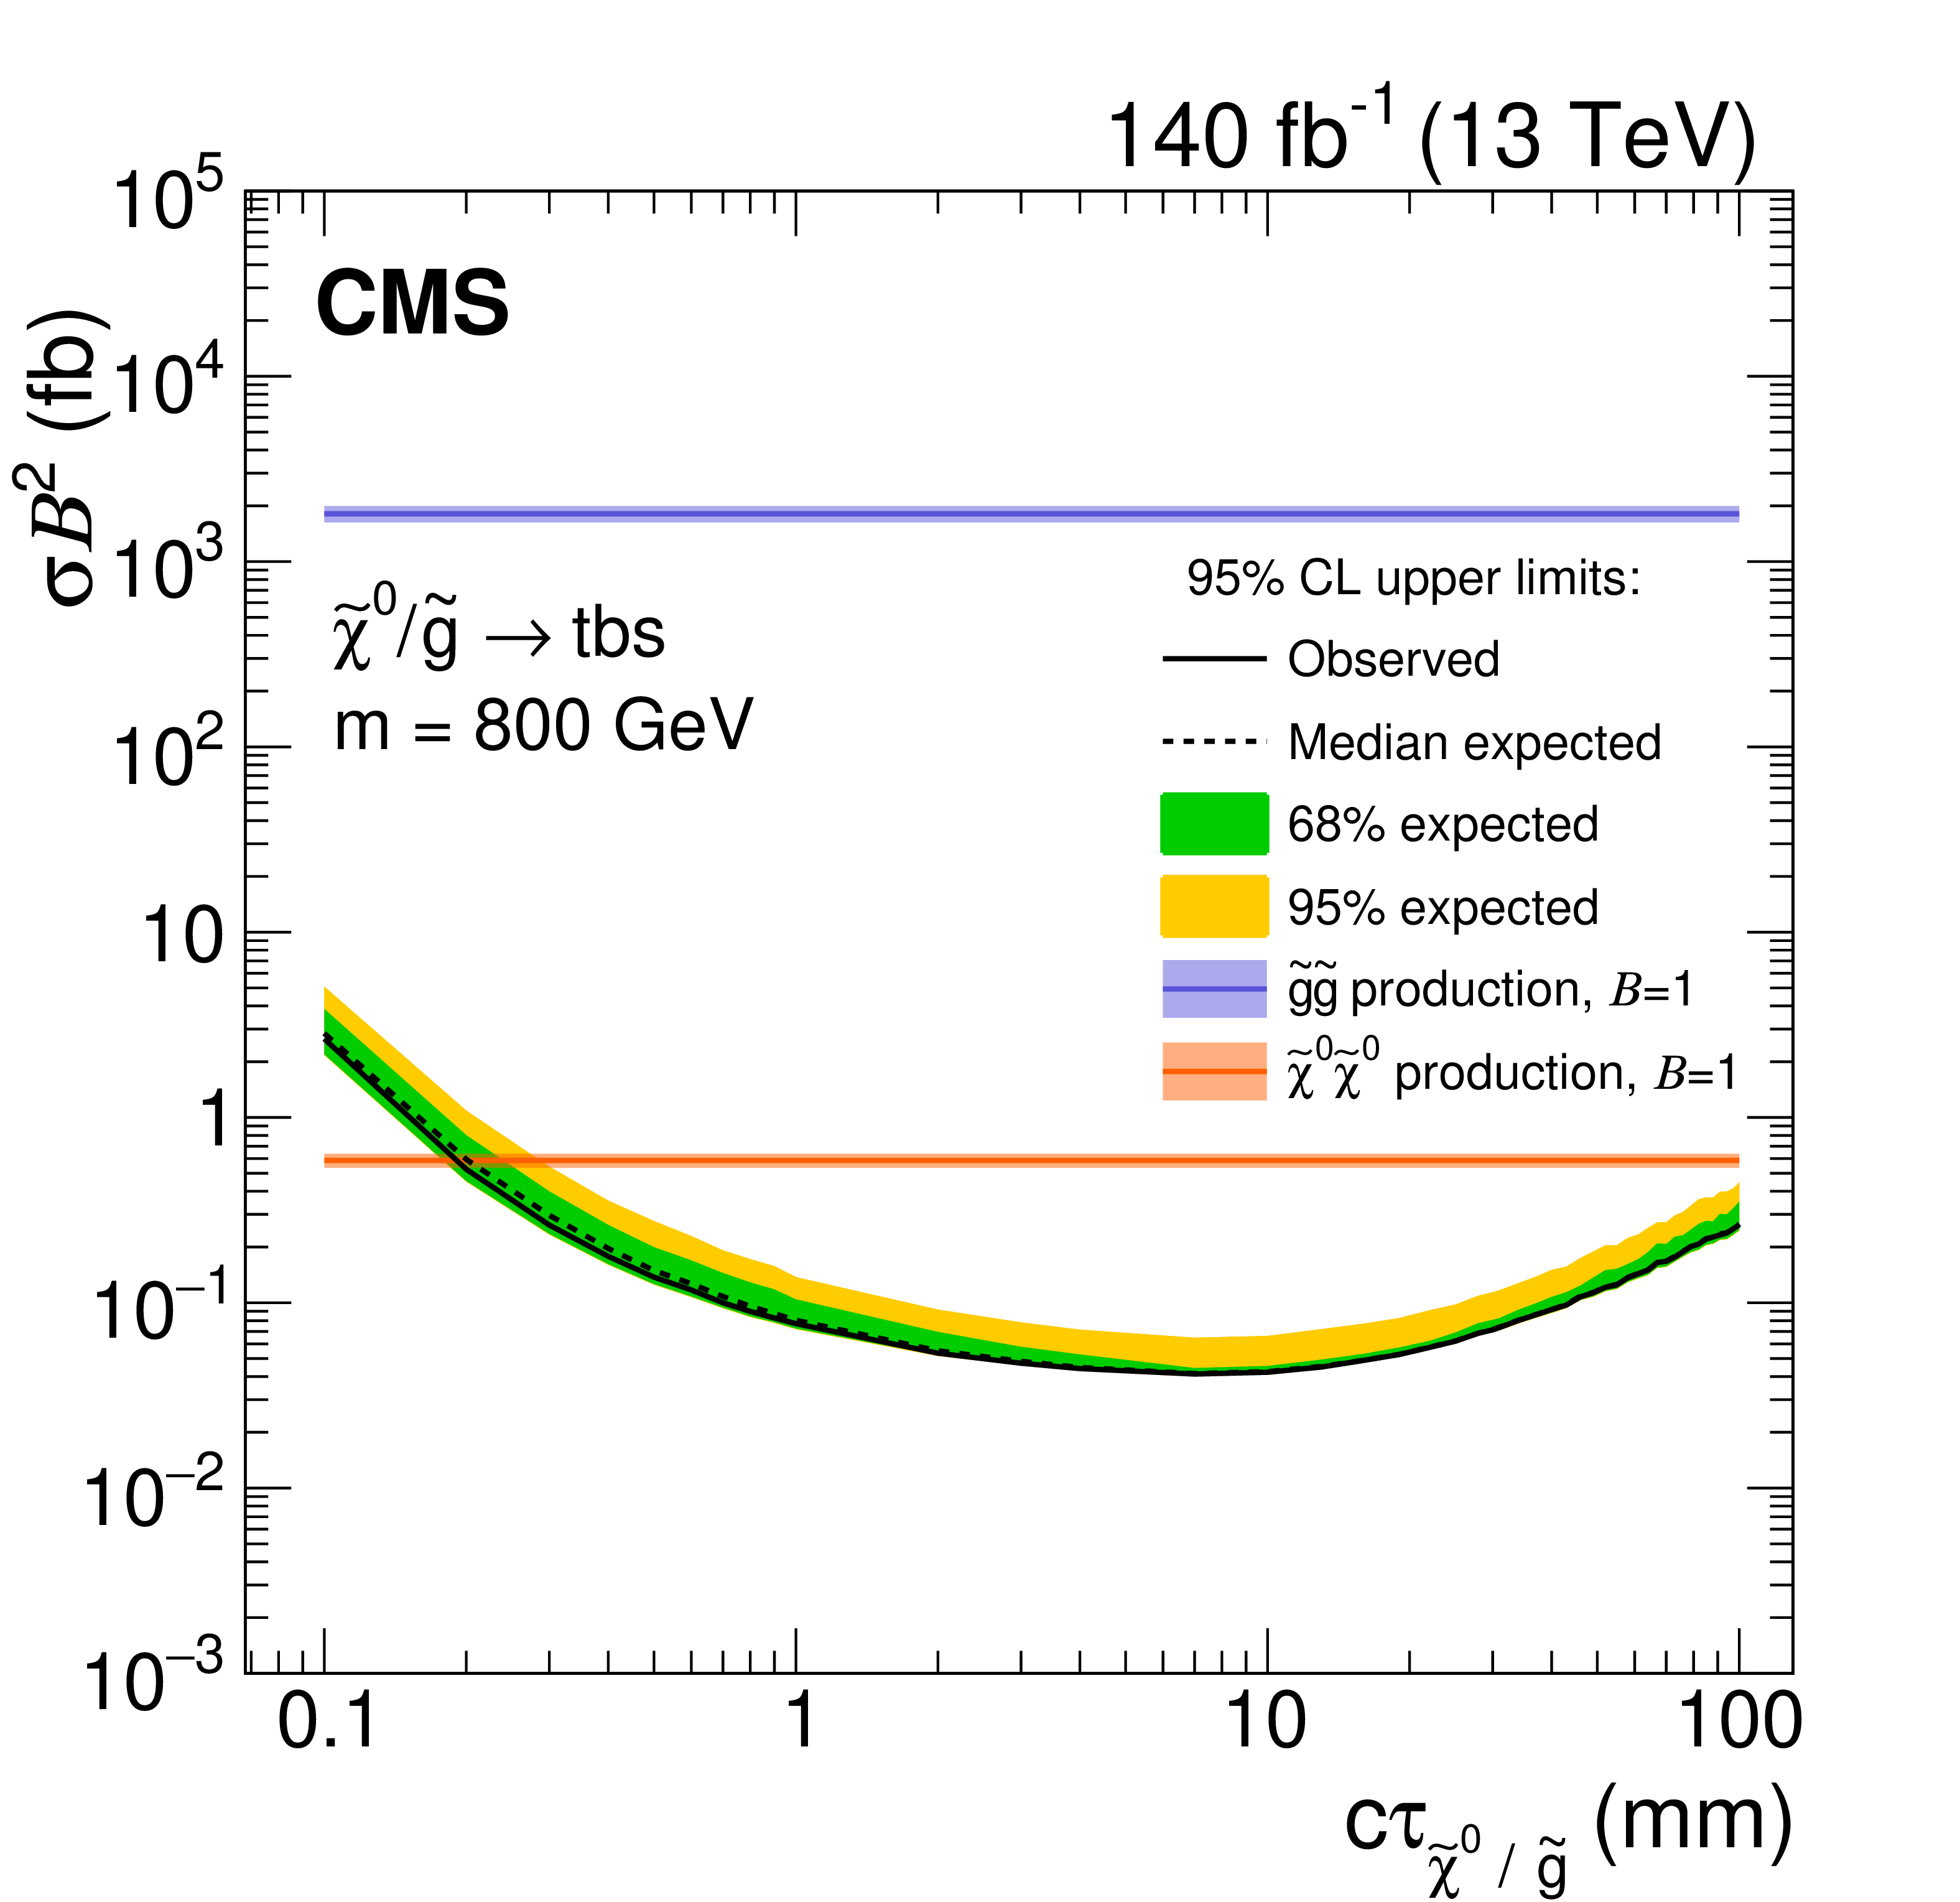
Observed and expected 95% CL upper limits on the product of cross section and branching fraction squared, as a function of $c\tau $ for multijet signals (left) and dijet signals (right), for a fixed mass of 800 GeV (upper), 1600 GeV (middle), and 2400 GeV (lower) in the full Run-2 data set. The neutralino and gluino pair production cross sections are shown for the multijet signals, and the top squark pair-production cross section is shown for the dijet signals. For $m = $ 2400 GeV, the expected neutralino cross section is $\approx $8$\times 10^{-5}$ fb and is not shown. |
png pdf |
Figure 9-a:
Observed and expected 95% CL upper limits on the product of cross section and branching fraction squared, as a function of $c\tau $ for multijet signals, for a fixed mass of 800 GeV in the full Run-2 data set. The neutralino and gluino pair production cross sections are shown for the multijet signals, and the top squark pair-production cross section is shown for the dijet signals. For $m = $ 2400 GeV, the expected neutralino cross section is $\approx $8$\times 10^{-5}$ fb and is not shown. |
png pdf |
Figure 9-b:
Observed and expected 95% CL upper limits on the product of cross section and branching fraction squared, as a function of $c\tau $ for dijet signals, for a fixed mass of 800 GeV in the full Run-2 data set. The neutralino and gluino pair production cross sections are shown for the multijet signals, and the top squark pair-production cross section is shown for the dijet signals. For $m = $ 2400 GeV, the expected neutralino cross section is $\approx $8$\times 10^{-5}$ fb and is not shown. |
png pdf |
Figure 9-c:
Observed and expected 95% CL upper limits on the product of cross section and branching fraction squared, as a function of $c\tau $ for multijet signals, for a fixed mass of 1600 GeV in the full Run-2 data set. The neutralino and gluino pair production cross sections are shown for the multijet signals, and the top squark pair-production cross section is shown for the dijet signals. For $m = $ 2400 GeV, the expected neutralino cross section is $\approx $8$\times 10^{-5}$ fb and is not shown. |
png pdf |
Figure 9-d:
Observed and expected 95% CL upper limits on the product of cross section and branching fraction squared, as a function of $c\tau $ for dijet signals, for a fixed mass of 1600 GeV in the full Run-2 data set. The neutralino and gluino pair production cross sections are shown for the multijet signals, and the top squark pair-production cross section is shown for the dijet signals. For $m = $ 2400 GeV, the expected neutralino cross section is $\approx $8$\times 10^{-5}$ fb and is not shown. |

png pdf |
Figure 9-e:
Observed and expected 95% CL upper limits on the product of cross section and branching fraction squared, as a function of $c\tau $ for multijet signals, for a fixed mass of 2400 GeV in the full Run-2 data set. The neutralino and gluino pair production cross sections are shown for the multijet signals, and the top squark pair-production cross section is shown for the dijet signals. For $m = $ 2400 GeV, the expected neutralino cross section is $\approx $8$\times 10^{-5}$ fb and is not shown. |
png pdf |
Figure 9-f:
Observed and expected 95% CL upper limits on the product of cross section and branching fraction squared, as a function of $c\tau $ for dijet signals, for a fixed mass of 2400 GeV in the full Run-2 data set. The neutralino and gluino pair production cross sections are shown for the multijet signals, and the top squark pair-production cross section is shown for the dijet signals. For $m = $ 2400 GeV, the expected neutralino cross section is $\approx $8$\times 10^{-5}$ fb and is not shown. |
| Tables | |
png pdf |
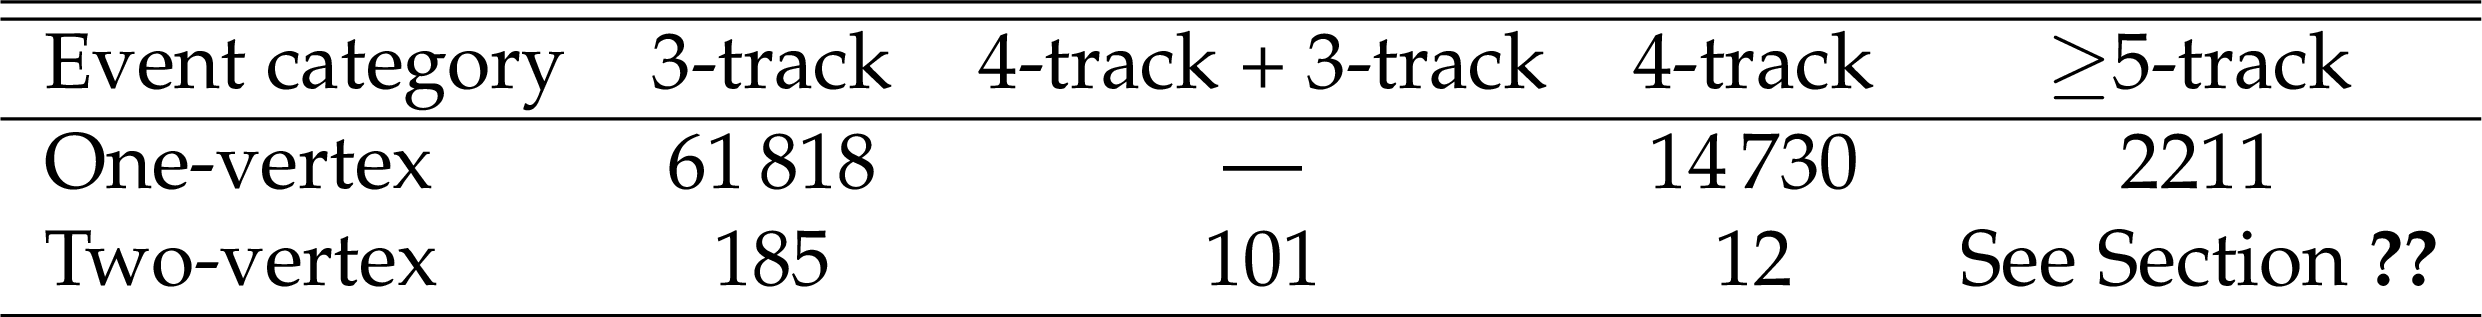
Table 1:
Event yields in the control regions in data. The "one-vertex'' events correspond to events containing exactly one vertex with the specified number of tracks. The "two-vertex'' events have two or more vertices containing the specified numbers of tracks. We seek the signal in the $\geq $5-track two-vertex sample. |
png pdf |
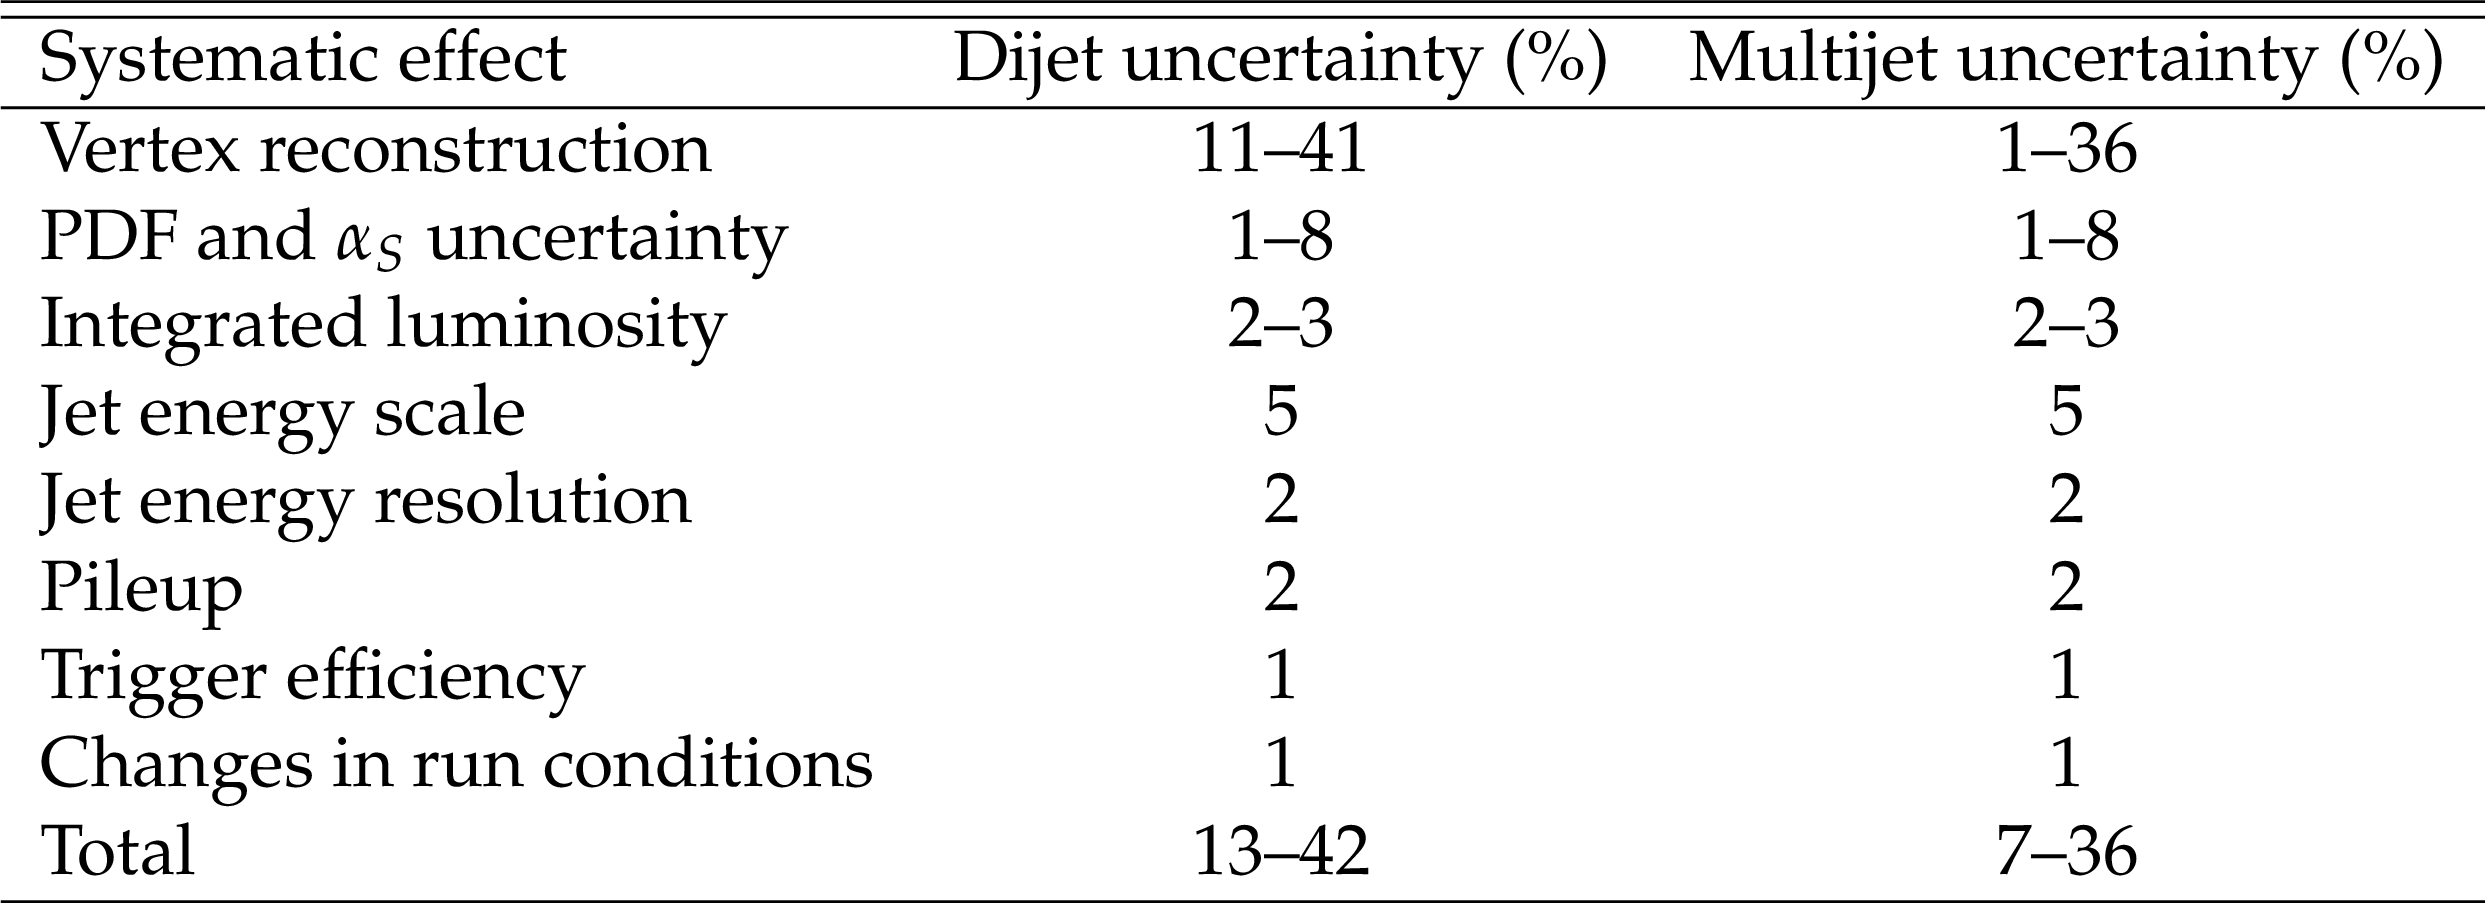
Table 2:
Signal-related systematic uncertainties for dijet and multijet signal models. The total uncertainty is the sum in quadrature of the individual components. The ranges presented reflect differences among the various signal mass and lifetime hypotheses, as well as differences between the 2017 and 2018 data. |

png pdf |
Table 3:
Systematic uncertainties in the background prediction in each ${d_{\mathrm {VV}}^{\,\mathrm {C}}}$ bin arising from varying the construction of the ${d_{\mathrm {VV}}^{\,\mathrm {C}}}$ template. The total systematic uncertainty in each bin is the sum in quadrature of the values, assuming no correlations among the sources. |
png pdf |
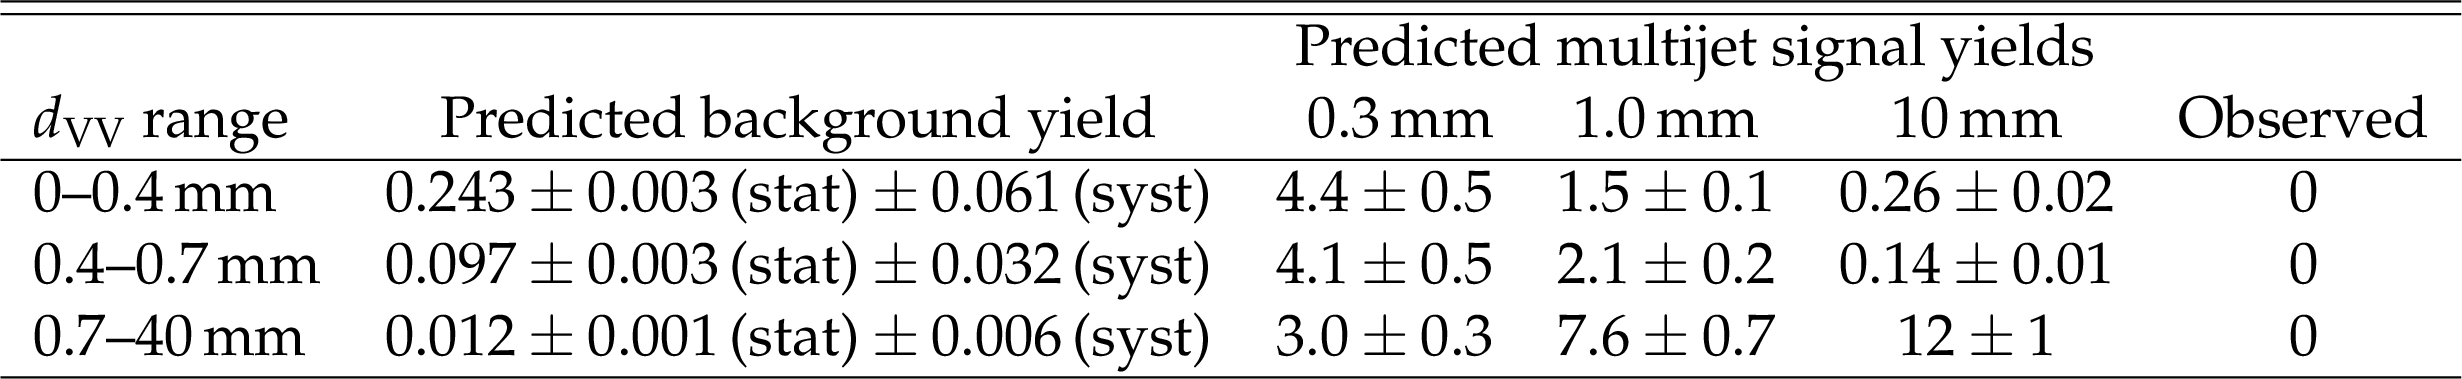
Table 4:
Predicted yields for the background-only normalized template, predicted yields for three simulated multijet signals each with a mass of 1600 GeV, and the observed yield in each ${d_{\mathrm {VV}}}$ bin. The production cross section for each signal model is assumed to be the lower limit excluded by Ref. [25], corresponding to values of 0.8, 0.25, and 0.15 fb for samples with $c\tau = $ 0.3, 1.0, and 10 mm, respectively. The uncertainties in the signal yields and the systematic uncertainties in the background prediction reflect the systematic uncertainties given in Tables 2 and 4, respectively. |
| Summary |
|
A search for pair-produced long-lived particles decaying into multijet and dijet final states in proton-proton collisions collected with the CMS detector at a center-of-mass energy of 13 TeV has been described. No events in the signal region in the 2017 and 2018 data sets, and no excess yield beyond the standard model prediction in the full Run-2 data set, which corresponds to an integrated luminosity of 140 fb$^{-1}$, are observed. This analysis extends a previous CMS search that used the 2015 and 2016 data sets, with improvements in background rejection, background estimation techniques, and uncertainty estimation. At 95% confidence level, upper limits are set on an $R$-parity violating (RPV) supersymmetry (SUSY) model in which a long-lived neutralino or gluino decays into a multijet final state with top, bottom, and strange quarks. Signal pair-production cross sections larger than 0.08fb are excluded for long-lived neutralino, gluino, and top squark masses between 800 and 3000 GeV and mean proper decay lengths between 1 and 25 mm. For the range of mean proper decay lengths between 0.6 and 90 mm, the data exclude gluino masses up to 2500 GeV. For the case where the lightest SUSY particle is a neutralino, the data exclude neutralino masses up to 1100 GeV for mean proper decay lengths between 0.6 and 70 mm. Additionally, limits are placed for an RPV SUSY model in which a long-lived top squark decays into a dijet final state with two down-type quarks. The data exclude top squark masses up to 1600 GeV for mean proper decay lengths between 0.4 and 80 mm. These results, which supersede those in Ref. [25], are the most stringent bounds on these models for mean proper decay lengths between 0.1 and 15 mm for all masses considered, and complement the results of the CMS displaced jets search [29]. While the search directly constrains these two RPV SUSY models, the techniques and methodology are generic and, as described in the Appendix, the results are applicable to other models of pair-produced long-lived particles that decay into jets. |
| Additional Figures | |

png pdf |
Additional Figure 1:
Distribution of the azimuthal angle between vertices, $\Delta \phi _{\mathrm {VV}}$, for 2017 and 2018 data. The background distribution (blue continuous line) is constructed from 3-track one-vertex events in data, and is normalized to the number of 3-track two-vertex events in data. |
png pdf |
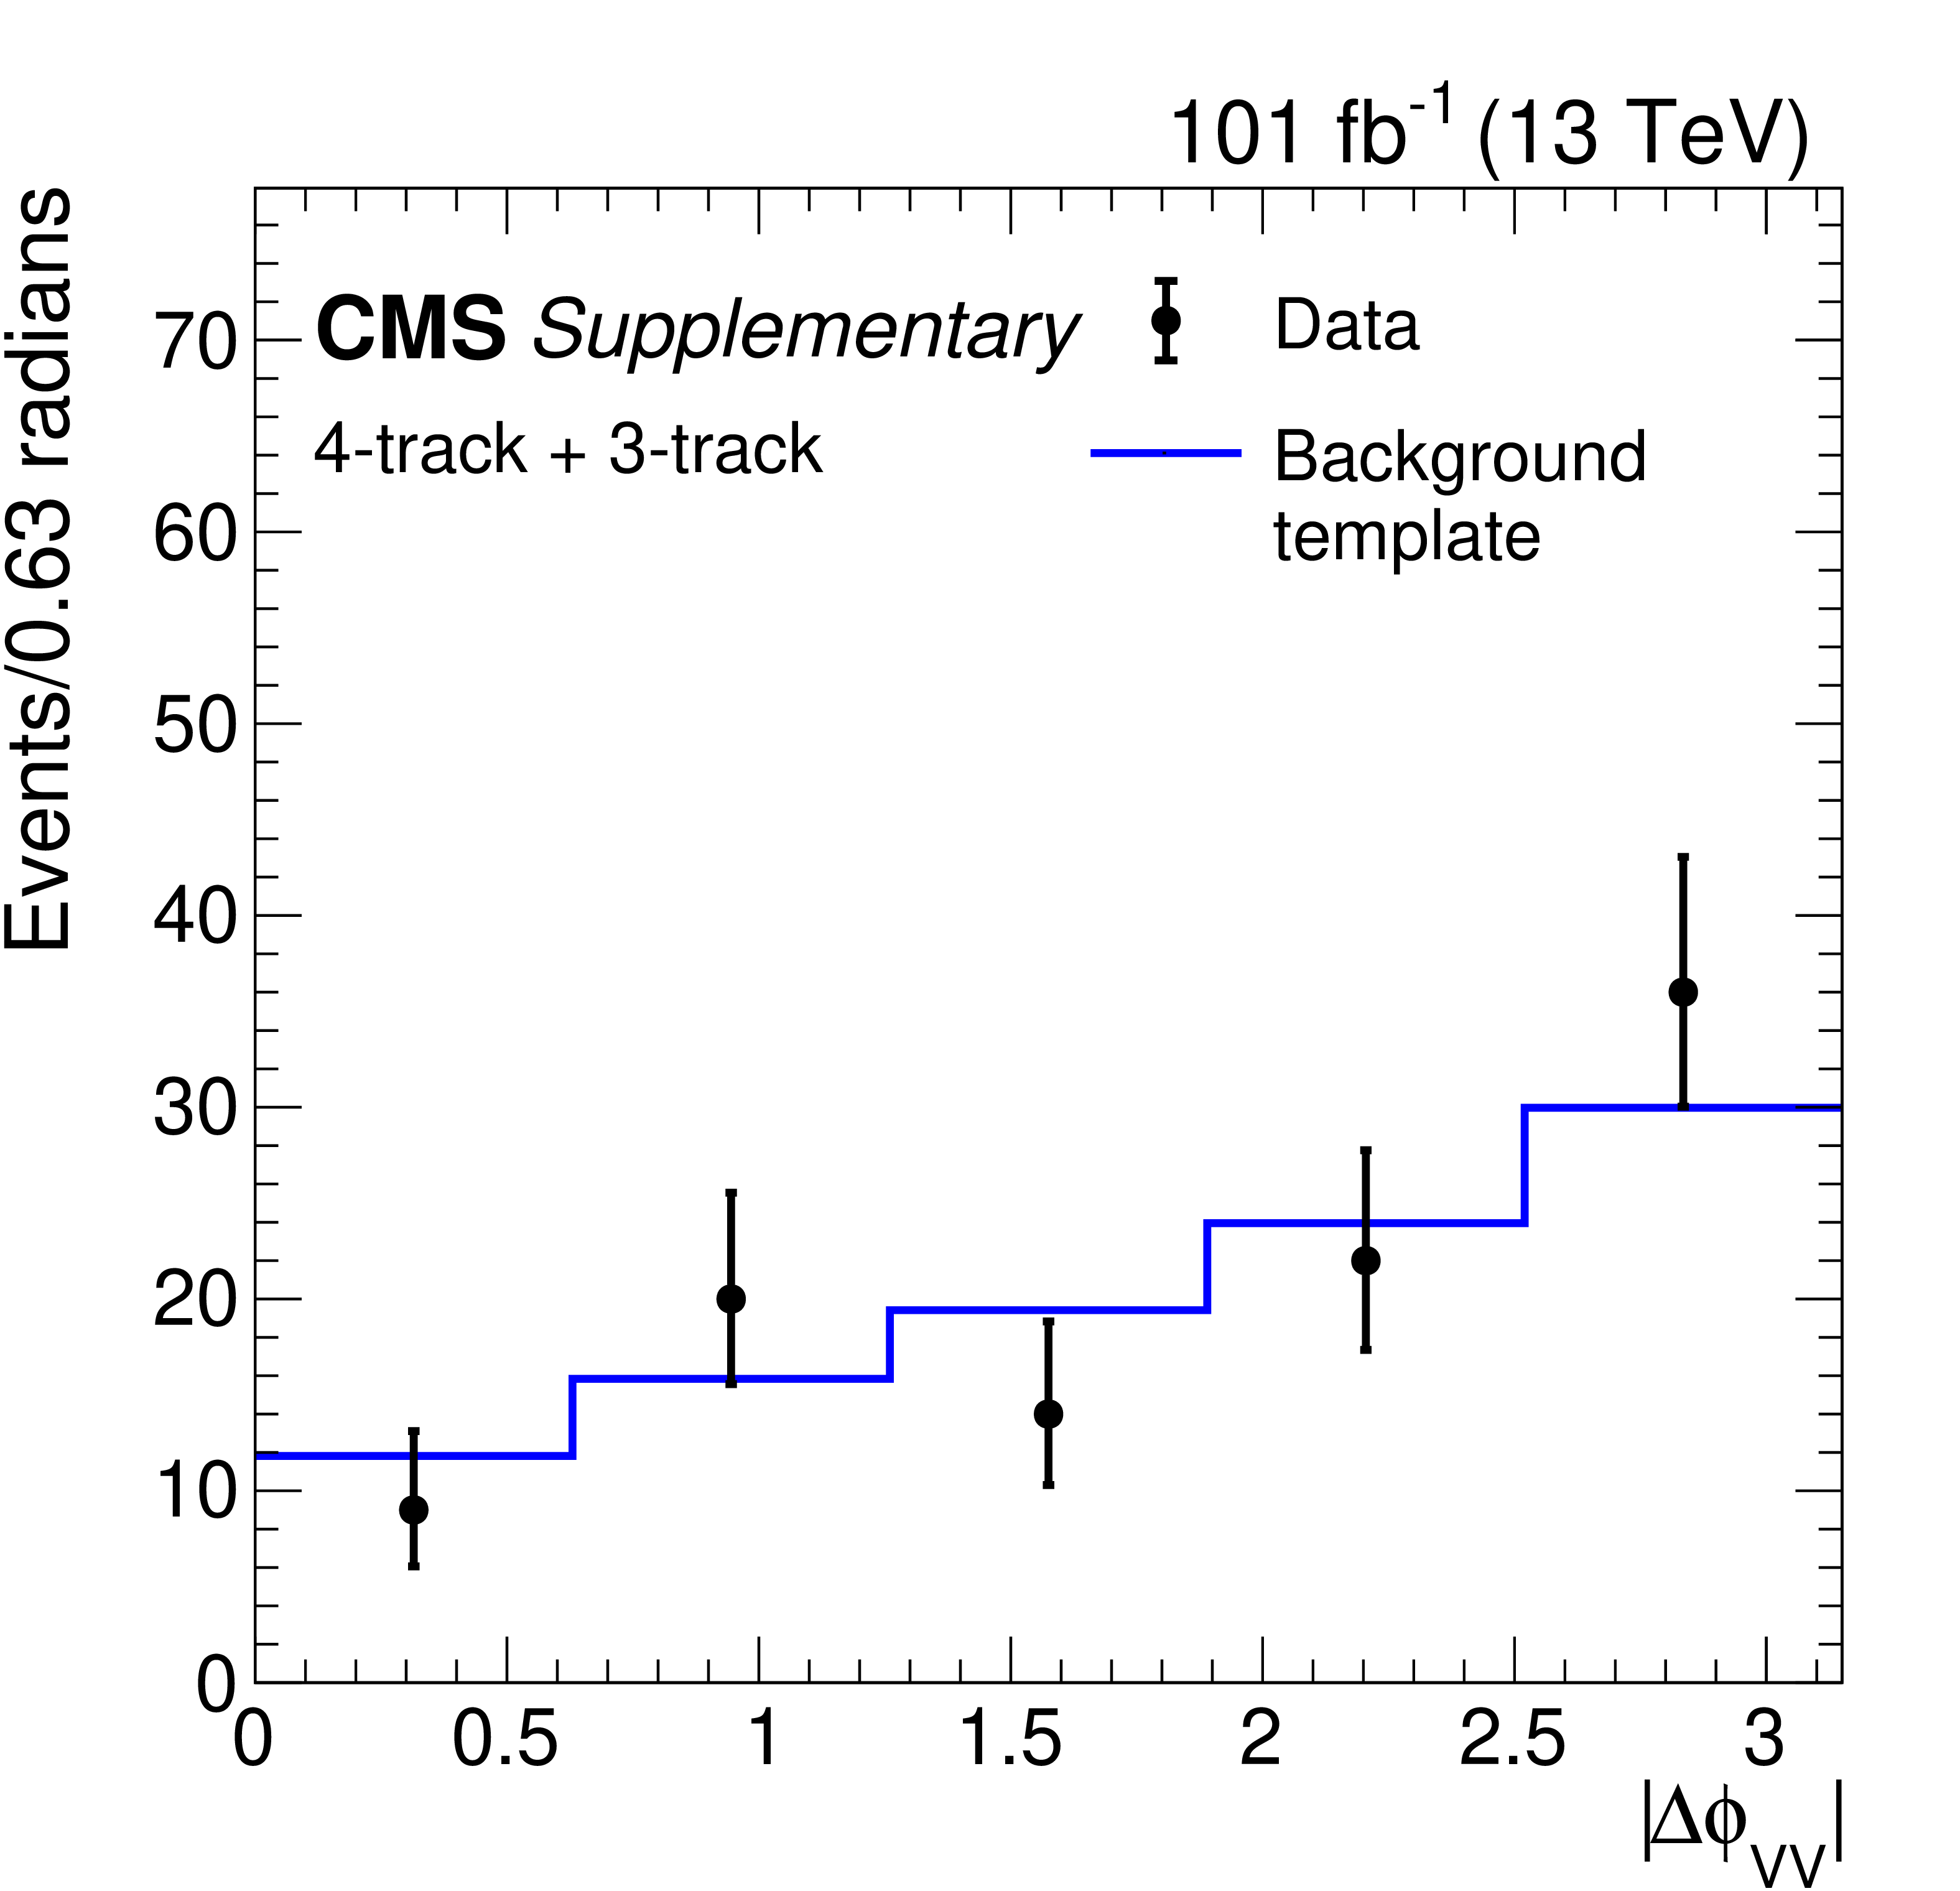
Additional Figure 2:
Distribution of the azimuthal angle between vertices, $\Delta \phi _{\mathrm {VV}}$, for 2017 and 2018 data. The background distribution (blue continuous line) is constructed from 4-track and 3-track one-vertex events in data, and is normalized to the number of two-vertex events in data which have exactly one 4-track vertex and one 3-track vertex. |
png pdf |
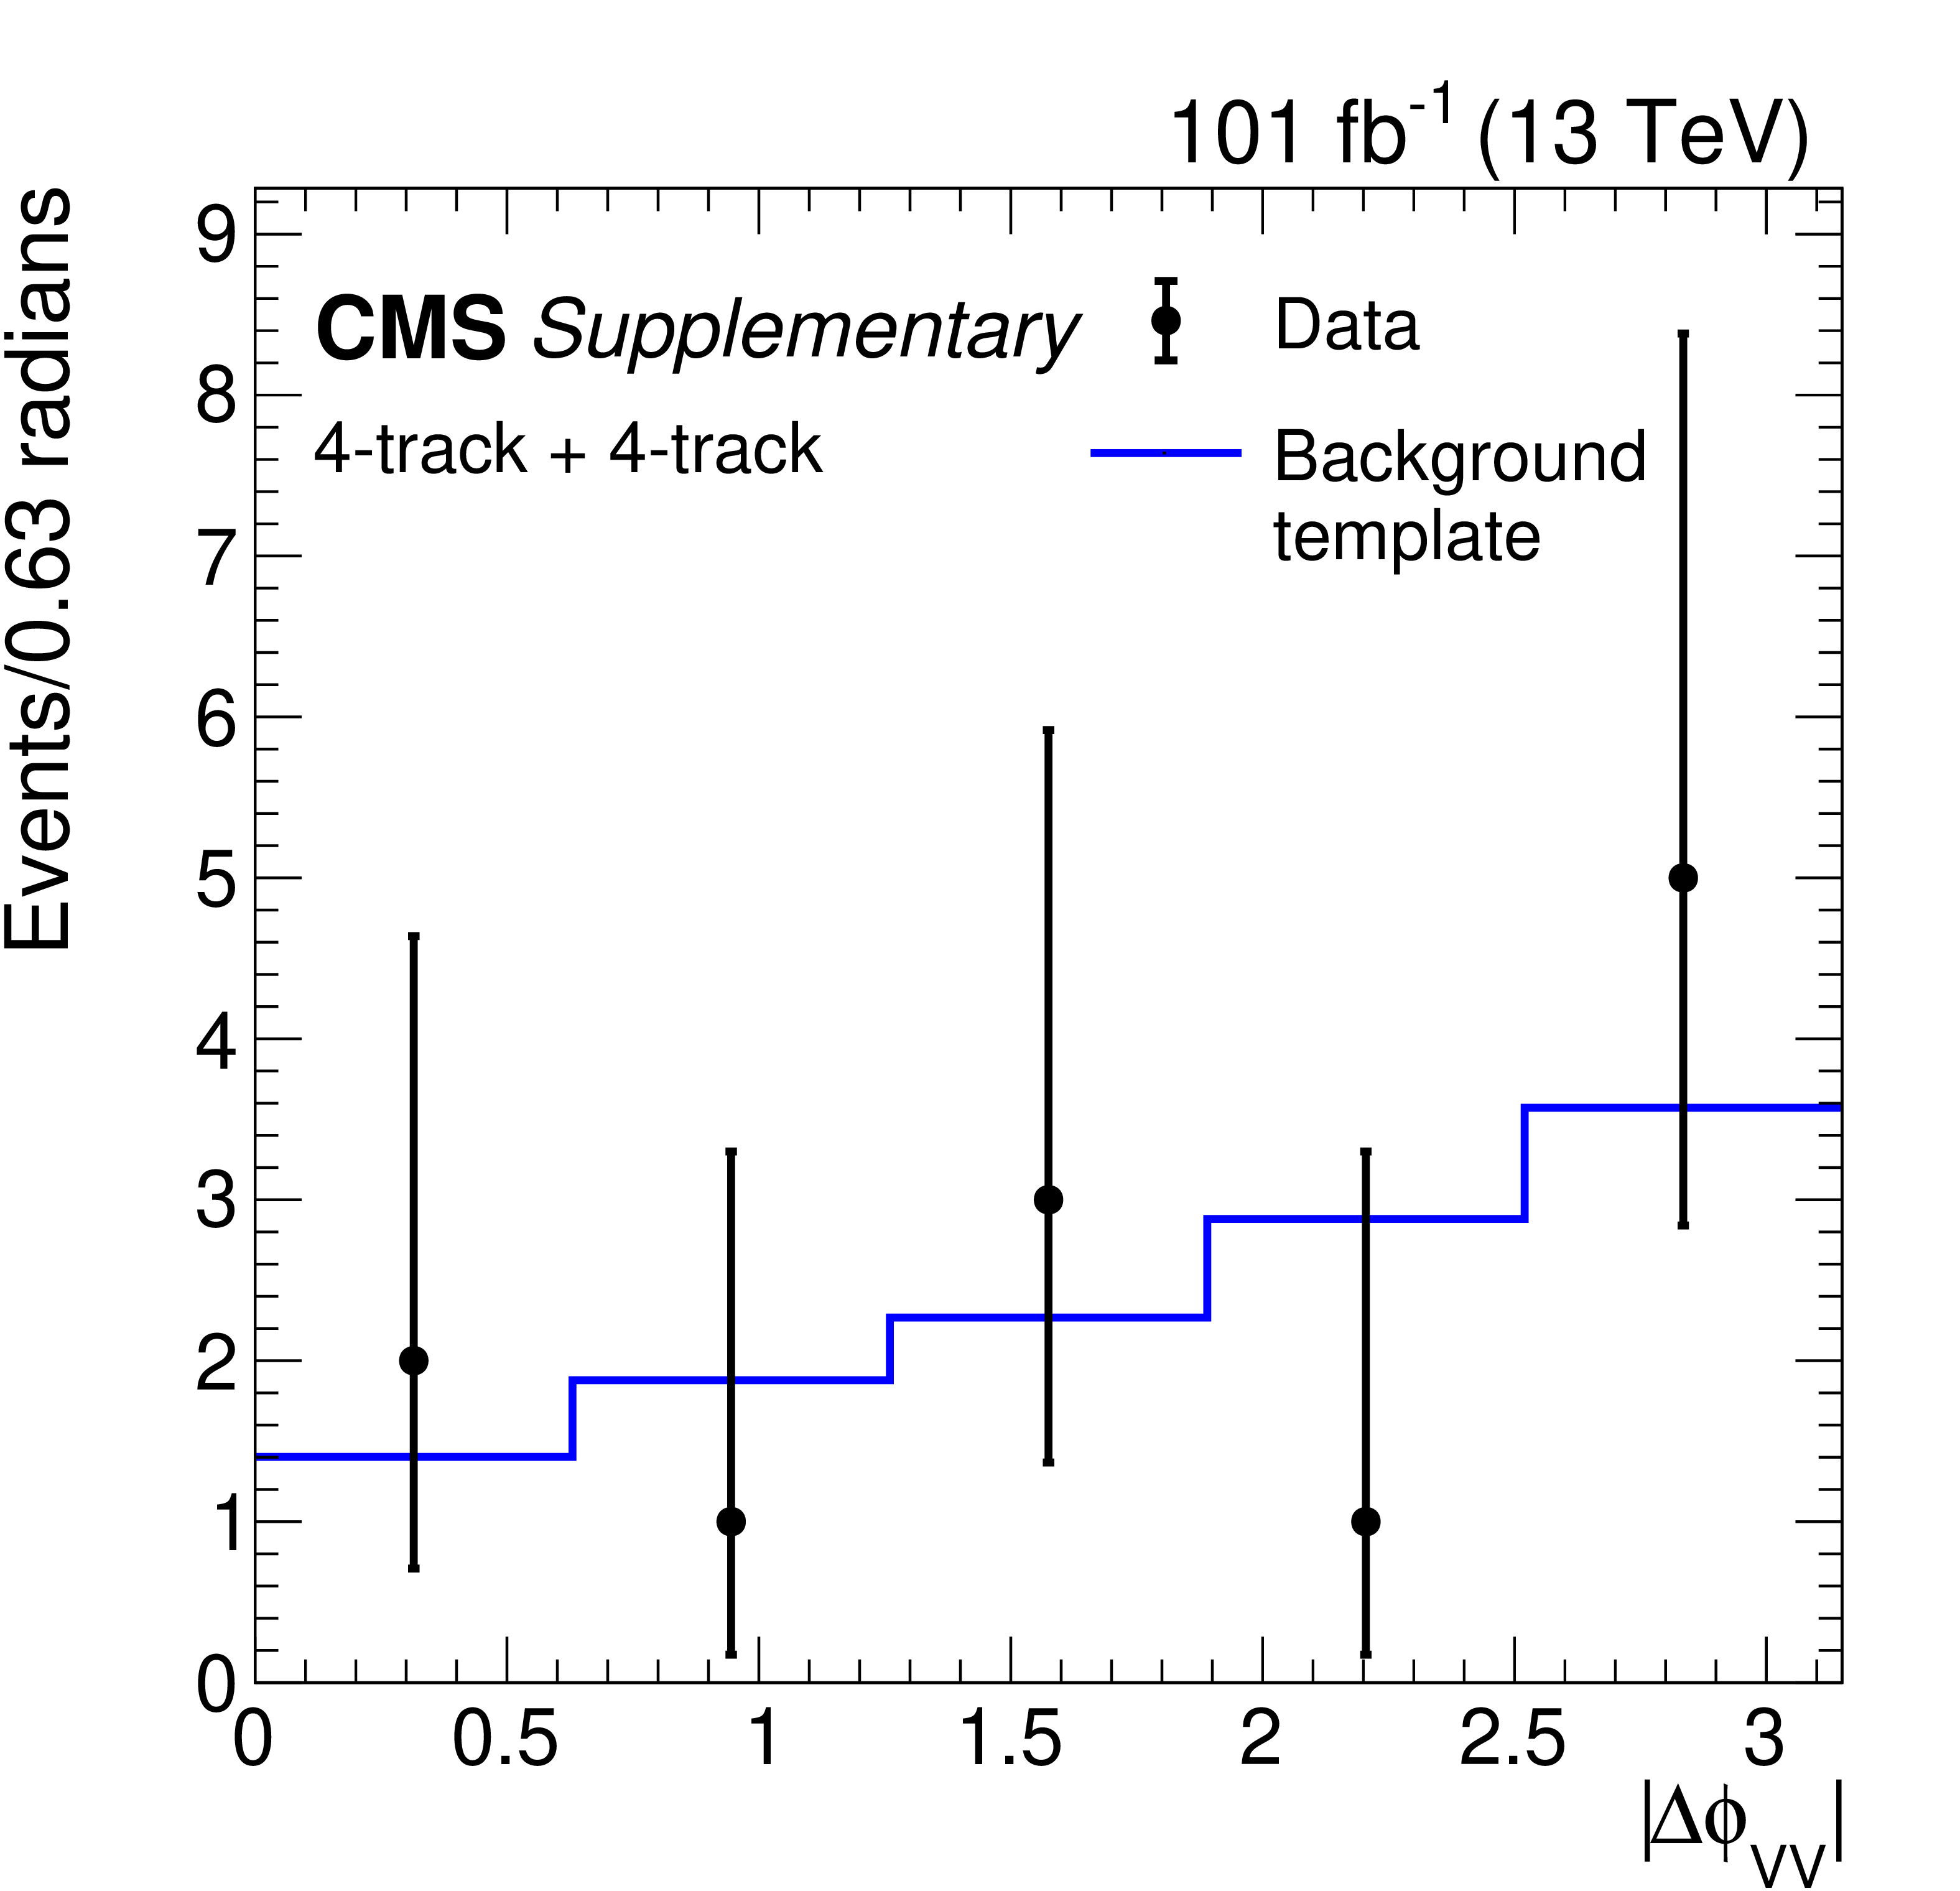
Additional Figure 3:
Distribution of the azimuthal angle between vertices, $\Delta \phi _{\mathrm {VV}}$, for 2017 and 2018 data. The background distribution (blue continuous line) is constructed from 4-track one-vertex events in data, and is normalized to the number of 4-track two-vertex events in data. |

png pdf |
Additional Figure 4:
Distribution of the azimuthal angle between vertices, $\Delta \phi _{\mathrm {VV}}$, for 2017 and 2018 data. The background distribution (blue continuous line) is constructed from $\geq $5-track one-vertex events in data, and is normalized using one-vertex event information. No $\geq $5-track two-vertex data events pass the selection. |
| References | ||||
| 1 | R. Barbier et al. | $ R $-parity violating supersymmetry | PR 420 (2005) 1 | hep-ph/0406039 |
| 2 | C. Csàki, Y. Grossman, and B. Heidenreich | Minimal flavor violation supersymmetry: a natural theory for $ R $-parity violation | PRD 85 (2012) 095009 | 1111.1239 |
| 3 | C. Csàki et al. | Phenomenology of a long-lived LSP with $ R $-parity violation | JHEP 08 (2015) 016 | 1505.00784 |
| 4 | L. J. Hall and M. Suzuki | Explicit $ R $-parity breaking in supersymmetric models | NPB 231 (1984) 419 | |
| 5 | N. Arkani-Hamed and S. Dimopoulos | Supersymmetric unification without low energy supersymmetry and signatures for fine-tuning at the LHC | JHEP 06 (2005) 073 | hep-th/0405159 |
| 6 | N. Arkani-Hamed, S. Dimopoulos, G. F. Giudice, and A. Romanino | Aspects of split supersymmetry | NPB 709 (2005) 3 | hep-ph/0409232 |
| 7 | N. Arkani-Hamed et al. | Simply unnatural supersymmetry | 1212.6971 | |
| 8 | A. Arvanitaki, N. Craig, S. Dimopoulos, and G. Villadoro | Mini-split | JHEP 02 (2013) 126 | 1210.0555 |
| 9 | P. Gambino, G. F. Giudice, and P. Slavich | Gluino decays in split supersymmetry | NPB 726 (2005) 35 | hep-ph/0506214 |
| 10 | G. F. Giudice and A. Romanino | Split supersymmetry | NPB 699 (2004) 65 | hep-ph/0406088 |
| 11 | J. L. Hewett, B. Lillie, M. Masip, and T. G. Rizzo | Signatures of long-lived gluinos in split supersymmetry | JHEP 09 (2004) 070 | hep-ph/0408248 |
| 12 | T. Han, Z. Si, K. M. Zurek, and M. J. Strassler | Phenomenology of hidden valleys at hadron colliders | JHEP 07 (2008) 008 | 0712.2041 |
| 13 | M. J. Strassler and K. M. Zurek | Echoes of a hidden valley at hadron colliders | PLB 651 (2007) 374 | hep-ph/0604261 |
| 14 | M. J. Strassler and K. M. Zurek | Discovering the Higgs through highly-displaced vertices | PLB 661 (2008) 263 | hep-ph/0605193 |
| 15 | J. Fan, M. Reece, and J. T. Ruderman | Stealth supersymmetry | JHEP 11 (2011) 012 | 1105.5135 |
| 16 | J. Fan, M. Reece, and J. T. Ruderman | A stealth supersymmetry sampler | JHEP 07 (2012) 196 | 1201.4875 |
| 17 | L. Calibbi, L. Lopez-Honorez, S. Lowette, and A. Mariotti | Singlet-doublet dark matter freeze-in: LHC displaced signatures versus cosmology | JHEP 09 (2018) 037 | 1805.04423 |
| 18 | R. T. Co, F. D'Eramo, L. J. Hall, and D. Pappadopulo | Freeze-in dark matter with displaced signatures at colliders | J. Cosm. Astro. Phys. 12 (2015) 024 | 1506.07532 |
| 19 | Y. Cui, L. Randall, and B. Shuve | A WIMPy baryogenesis miracle | JHEP 04 (2012) 075 | 1112.2704 |
| 20 | Y. Cui and R. Sundrum | Baryogenesis for weakly interacting massive particles | PRD 87 (2013) 116013 | 1212.2973 |
| 21 | Y. Cui and B. Shuve | Probing baryogenesis with displaced vertices at the LHC | JHEP 02 (2015) 049 | 1409.6729 |
| 22 | L. J. Hall, K. Jedamzik, J. March-Russell, and S. M. West | Freeze-in production of FIMP dark matter | JHEP 03 (2010) 080 | 0911.1120 |
| 23 | D. E. Kaplan, M. A. Luty, and K. M. Zurek | Asymmetric dark matter | PRD 79 (2009) 115016 | 0901.4117 |
| 24 | I.-W. Kim and K. M. Zurek | Flavor and collider signatures of asymmetric dark matter | PRD 89 (2014) 035008 | 1310.2617 |
| 25 | CMS Collaboration | Search for long-lived particles with displaced vertices in multijet events in proton-proton collisions at $ \sqrt{s} = $ 13 TeV | PRD 98 (2018) 092011 | CMS-EXO-17-018 1808.03078 |
| 26 | CMS Collaboration | CMS Technical Design Report for the pixel detector upgrade | CMS Technical Design Report CERN-LHCC-2012-016, CMS-TDR-011 | |
| 27 | ATLAS Collaboration | Search for long-lived, massive particles in events with displaced vertices and missing transverse momentum in $ \sqrt{s} = $ 13 TeV pp collisions with the ATLAS detector | PRD 97 (2018) 052012 | 1710.04901 |
| 28 | ATLAS Collaboration | Search for long-lived, massive particles in events with a displaced vertex and a muon with large impact parameter in pp collisions at $ \sqrt{s} = $ 13 TeV with the ATLAS detector | PRD 102 (2020) 032006 | 2003.11956 |
| 29 | CMS Collaboration | Search for long-lived particles using displaced jets in proton-proton collisions at $ \sqrt{s} = $ 13 TeV | Submitted to PRD | CMS-EXO-19-021 2012.01581 |
| 30 | CMS Collaboration | Hepdata record for this analysis | link | |
| 31 | CMS Collaboration | The CMS experiment at the CERN LHC | JINST 3 (2008) S08004 | CMS-00-001 |
| 32 | CMS Collaboration | Track impact parameter resolution for the full pseudo rapidity coverage in the 2017 dataset with the CMS Phase-1 pixel detector | CDS | |
| 33 | CMS Collaboration | Description and performance of track and primary-vertex reconstruction with the CMS tracker | JINST 9 (2014) P10009 | CMS-TRK-11-001 1405.6569 |
| 34 | CMS Collaboration | The CMS trigger system | JINST 12 (2017) P01020 | CMS-TRG-12-001 1609.02366 |
| 35 | CMS Collaboration | Particle-flow reconstruction and global event description with the CMS detector | JINST 12 (2017) P10003 | CMS-PRF-14-001 1706.04965 |
| 36 | M. Cacciari, G. P. Salam, and G. Soyez | The anti-$ {k_{\mathrm{T}}} $ jet clustering algorithm | JHEP 04 (2008) 063 | 0802.1189 |
| 37 | M. Cacciari, G. P. Salam, and G. Soyez | FastJet user manual | EPJC 72 (2012) 1896 | 1111.6097 |
| 38 | CMS Collaboration | Jet energy scale and resolution in the CMS experiment in pp collisions at 8 TeV | JINST 12 (2017) P02014 | CMS-JME-13-004 1607.03663 |
| 39 | CMS Collaboration | Jet algorithms performance in 13 TeV data | CMS-PAS-JME-16-003 | CMS-PAS-JME-16-003 |
| 40 | E. Bols et al. | Jet flavour classification using DeepJet | JINST 15 (2020) P12012 | 2008.10519 |
| 41 | CMS Collaboration | Identification of heavy-flavour jets with the CMS detector in pp collisions at 13 TeV | JINST 13 (2018) P05011 | CMS-BTV-16-002 1712.07158 |
| 42 | CMS Collaboration | Performance of the DeepJet b tagging algorithm using 41.9/fb of data from proton-proton collisions at 13 TeV with Phase 1 CMS detector | CDS | |
| 43 | T. Sjostrand et al. | An introduction to PYTHIA 8.2 | CPC 191 (2015) 159 | 1410.3012 |
| 44 | NNPDF Collaboration | Parton distributions from high-precision collider data | EPJC 77 (2017) 663 | 1706.00428 |
| 45 | CMS Collaboration | Extraction and validation of a new set of CMS PYTHIA8 tunes from underlying-event measurements | EPJC 80 (2020) 4 | CMS-GEN-17-001 1903.12179 |
| 46 | J. Alwall et al. | The automated computation of tree-level and next-to-leading order differential cross sections, and their matching to parton shower simulations | JHEP 07 (2014) 079 | 1405.0301 |
| 47 | NNPDF Collaboration | Parton distributions for the LHC Run II | JHEP 04 (2015) 040 | 1410.8849 |
| 48 | J. Alwall et al. | Comparative study of various algorithms for the merging of parton showers and matrix elements in hadronic collisions | EPJC 53 (2008) 473 | 0706.2569 |
| 49 | GEANT4 Collaboration | GEANT4--a simulation toolkit | NIMA 506 (2003) 250 | |
| 50 | R. Fruhwirth | Application of Kalman filtering to track and vertex fitting | NIMA 262 (1987) 444 | |
| 51 | P. Billoir and S. Qian | Simultaneous pattern recognition and track fitting by the Kalman filtering method | NIMA 294 (1990) 219 | |
| 52 | P. Billoir and S. Qian | Fast vertex fitting with a local parametrization of tracks | NIMA 311 (1992) 139 | |
| 53 | Tracker Group of the CMS Collaboration | The CMS Phase-1 pixel detector upgrade | JINST 16 (2021) P02027 | 2012.14304 |
| 54 | J. Butterworth et al. | PDF4LHC recommendations for LHC Run II | JPG 43 (2016) 023001 | 1510.03865 |
| 55 | CMS Collaboration | CMS luminosity measurement for the 2017 data-taking period at $ \sqrt{s}= $ 13 TeV | CMS-PAS-LUM-17-004 | CMS-PAS-LUM-17-004 |
| 56 | CMS Collaboration | CMS luminosity measurement for the 2018 data-taking period at $ \sqrt{s}= $ 13 TeV | CMS-PAS-LUM-18-002 | CMS-PAS-LUM-18-002 |
| 57 | B. Fuks, M. Klasen, D. R. Lamprea, and M. Rothering | Gaugino production in proton-proton collisions at a center-of-mass energy of 8 TeV | JHEP 10 (2012) 081 | 1207.2159 |
| 58 | B. Fuks, M. Klasen, D. R. Lamprea, and M. Rothering | Precision predictions for electroweak superpartner production at hadron colliders with Resummino | EPJC 73 (2013) 2480 | 1304.0790 |
| 59 | C. Borschensky et al. | Squark and gluino production cross sections in pp collisions at $ \sqrt{s}= $ 13, 14, 33 and 100 TeV | EPJC 74 (2014) 3174 | 1407.5066 |
| 60 | W. Beenakker et al. | NNLL resummation for stop pair-production at the LHC | JHEP 05 (2016) 153 | 1601.02954 |
| 61 | M. Beneke, J. Piclum, C. Schwinn, and C. Wever | NNLL soft and Coulomb resummation for squark and gluino production at the LHC | JHEP 10 (2016) 054 | 1607.07574 |
| 62 | CMS Collaboration | Search for pair-produced resonances decaying to quark pairs in proton-proton collisions at $ \sqrt{s}= $ 13 TeV | PRD 98 (2018) 112014 | CMS-EXO-17-021 1808.03124 |
| 63 | CMS Collaboration | Search for pair-produced three-jet resonances in proton-proton collisions at $ \sqrt s = $ 13 TeV | PRD 99 (2019) 012010 | CMS-EXO-17-030 1810.10092 |
|
|
Compact Muon Solenoid LHC, CERN |
|

|

|

|

|

|