

Compact Muon Solenoid
LHC, CERN
| CMS-FSQ-16-012 ; CERN-EP-2018-271 | ||
| Evidence for light-by-light scattering and searches for axion-like particles in ultraperipheral PbPb collisions at $\sqrt {\smash [b]{s_{_{\mathrm {NN}}}}} = $ 5.02 TeV | ||
| CMS Collaboration | ||
| 10 October 2018 | ||
| Phys. Lett. B 797 (2019) 134826 | ||
| Abstract: Evidence for the light-by-light scattering process, ${\gamma\gamma}\to{\gamma\gamma}$, in ultraperipheral PbPb collisions at a centre-of-mass energy per nucleon pair of 5.02 TeV is reported. The analysis is conducted using a data sample corresponding to an integrated luminosity of 390 $\mu$b$^{-1}$ recorded by the CMS experiment at the LHC. Light-by-light scattering processes are selected in events with two photons exclusively produced, each with transverse energy $E_{\mathrm{T}}^{\gamma} > $ 2 GeV, pseudorapidity $|{\eta^{\gamma}}| < $ 2.4, diphoton invariant mass ${m^{{\gamma\gamma}}} > $ 5 GeV, diphoton transverse momentum ${p_{\mathrm{T}}}^{{\gamma\gamma}} < $ 1 GeV, and diphoton acoplanarity below 0.01. After all selection criteria are applied, 14 events are observed, compared to expectations of 11.1 $\pm$ 1.1 (theo) events for the signal and 4.0 $\pm$ 1.2 (stat) for the background processes. The excess observed in data relative to the background-only expectation corresponds to a significance of 4.1 standard deviations, and has properties consistent with those expected for the light-by-light scattering signal. The measured fiducial light-by-light scattering cross section, $\sigma_\text{fid} ({\gamma\gamma} \to {\gamma\gamma})= $ 120 $\pm$ 46 (stat) $\pm$ 28 (syst) $\pm$ 4 (theo) nb, is consistent with the standard model prediction. The ${m^{{\gamma\gamma}}}$ distribution is used to set new exclusion limits on the production of pseudoscalar axion-like particles, via the ${\gamma\gamma} \to \mathrm{a} \to {\gamma\gamma}$ process, in the mass range $m_{\mathrm{a}} = $ 5-90 GeV. | ||
| Links: e-print arXiv:1810.04602 [hep-ex] (PDF) ; CDS record ; inSPIRE record ; HepData record ; CADI line (restricted) ; | ||
| Figures | |
png pdf |
Figure 1:
Schematic diagrams of light-by-light scattering ($ {\gamma \gamma}\to {\gamma \gamma}$, left), QED dielectron ($ {\gamma \gamma}\to {{\mathrm {e}^+} {\mathrm {e}^-}}$, centre), and central exclusive diphoton ($ {\mathrm {g}} {\mathrm {g}} \to {\gamma \gamma}$, right) production in ultraperipheral PbPb collisions. The (*) superscript indicates a potential electromagnetic excitation of the outgoing ions. |
png pdf |
Figure 2:
Acoplanarity distribution of exclusive $ {{\mathrm {e}^+} {\mathrm {e}^-}}$ events measured in data (circles), compared to the expected QED $ {{\mathrm {e}^+} {\mathrm {e}^-}}$ spectrum in the STARLIGHT MC simulation (histogram), scaled as described in the text. The curve shows a $\chi ^2$ fit to the sum of two exponential distributions corresponding to exclusive $ {{\mathrm {e}^+} {\mathrm {e}^-}}$ plus any residual (nonacoplanar) background pairs. Error bars around the data points indicate statistical uncertainties, and hashed bands around the histogram include systematic and MC statistical uncertainties added in quadrature. The horizontal bars around the data symbols indicate the bin size. |

png pdf |
Figure 3:
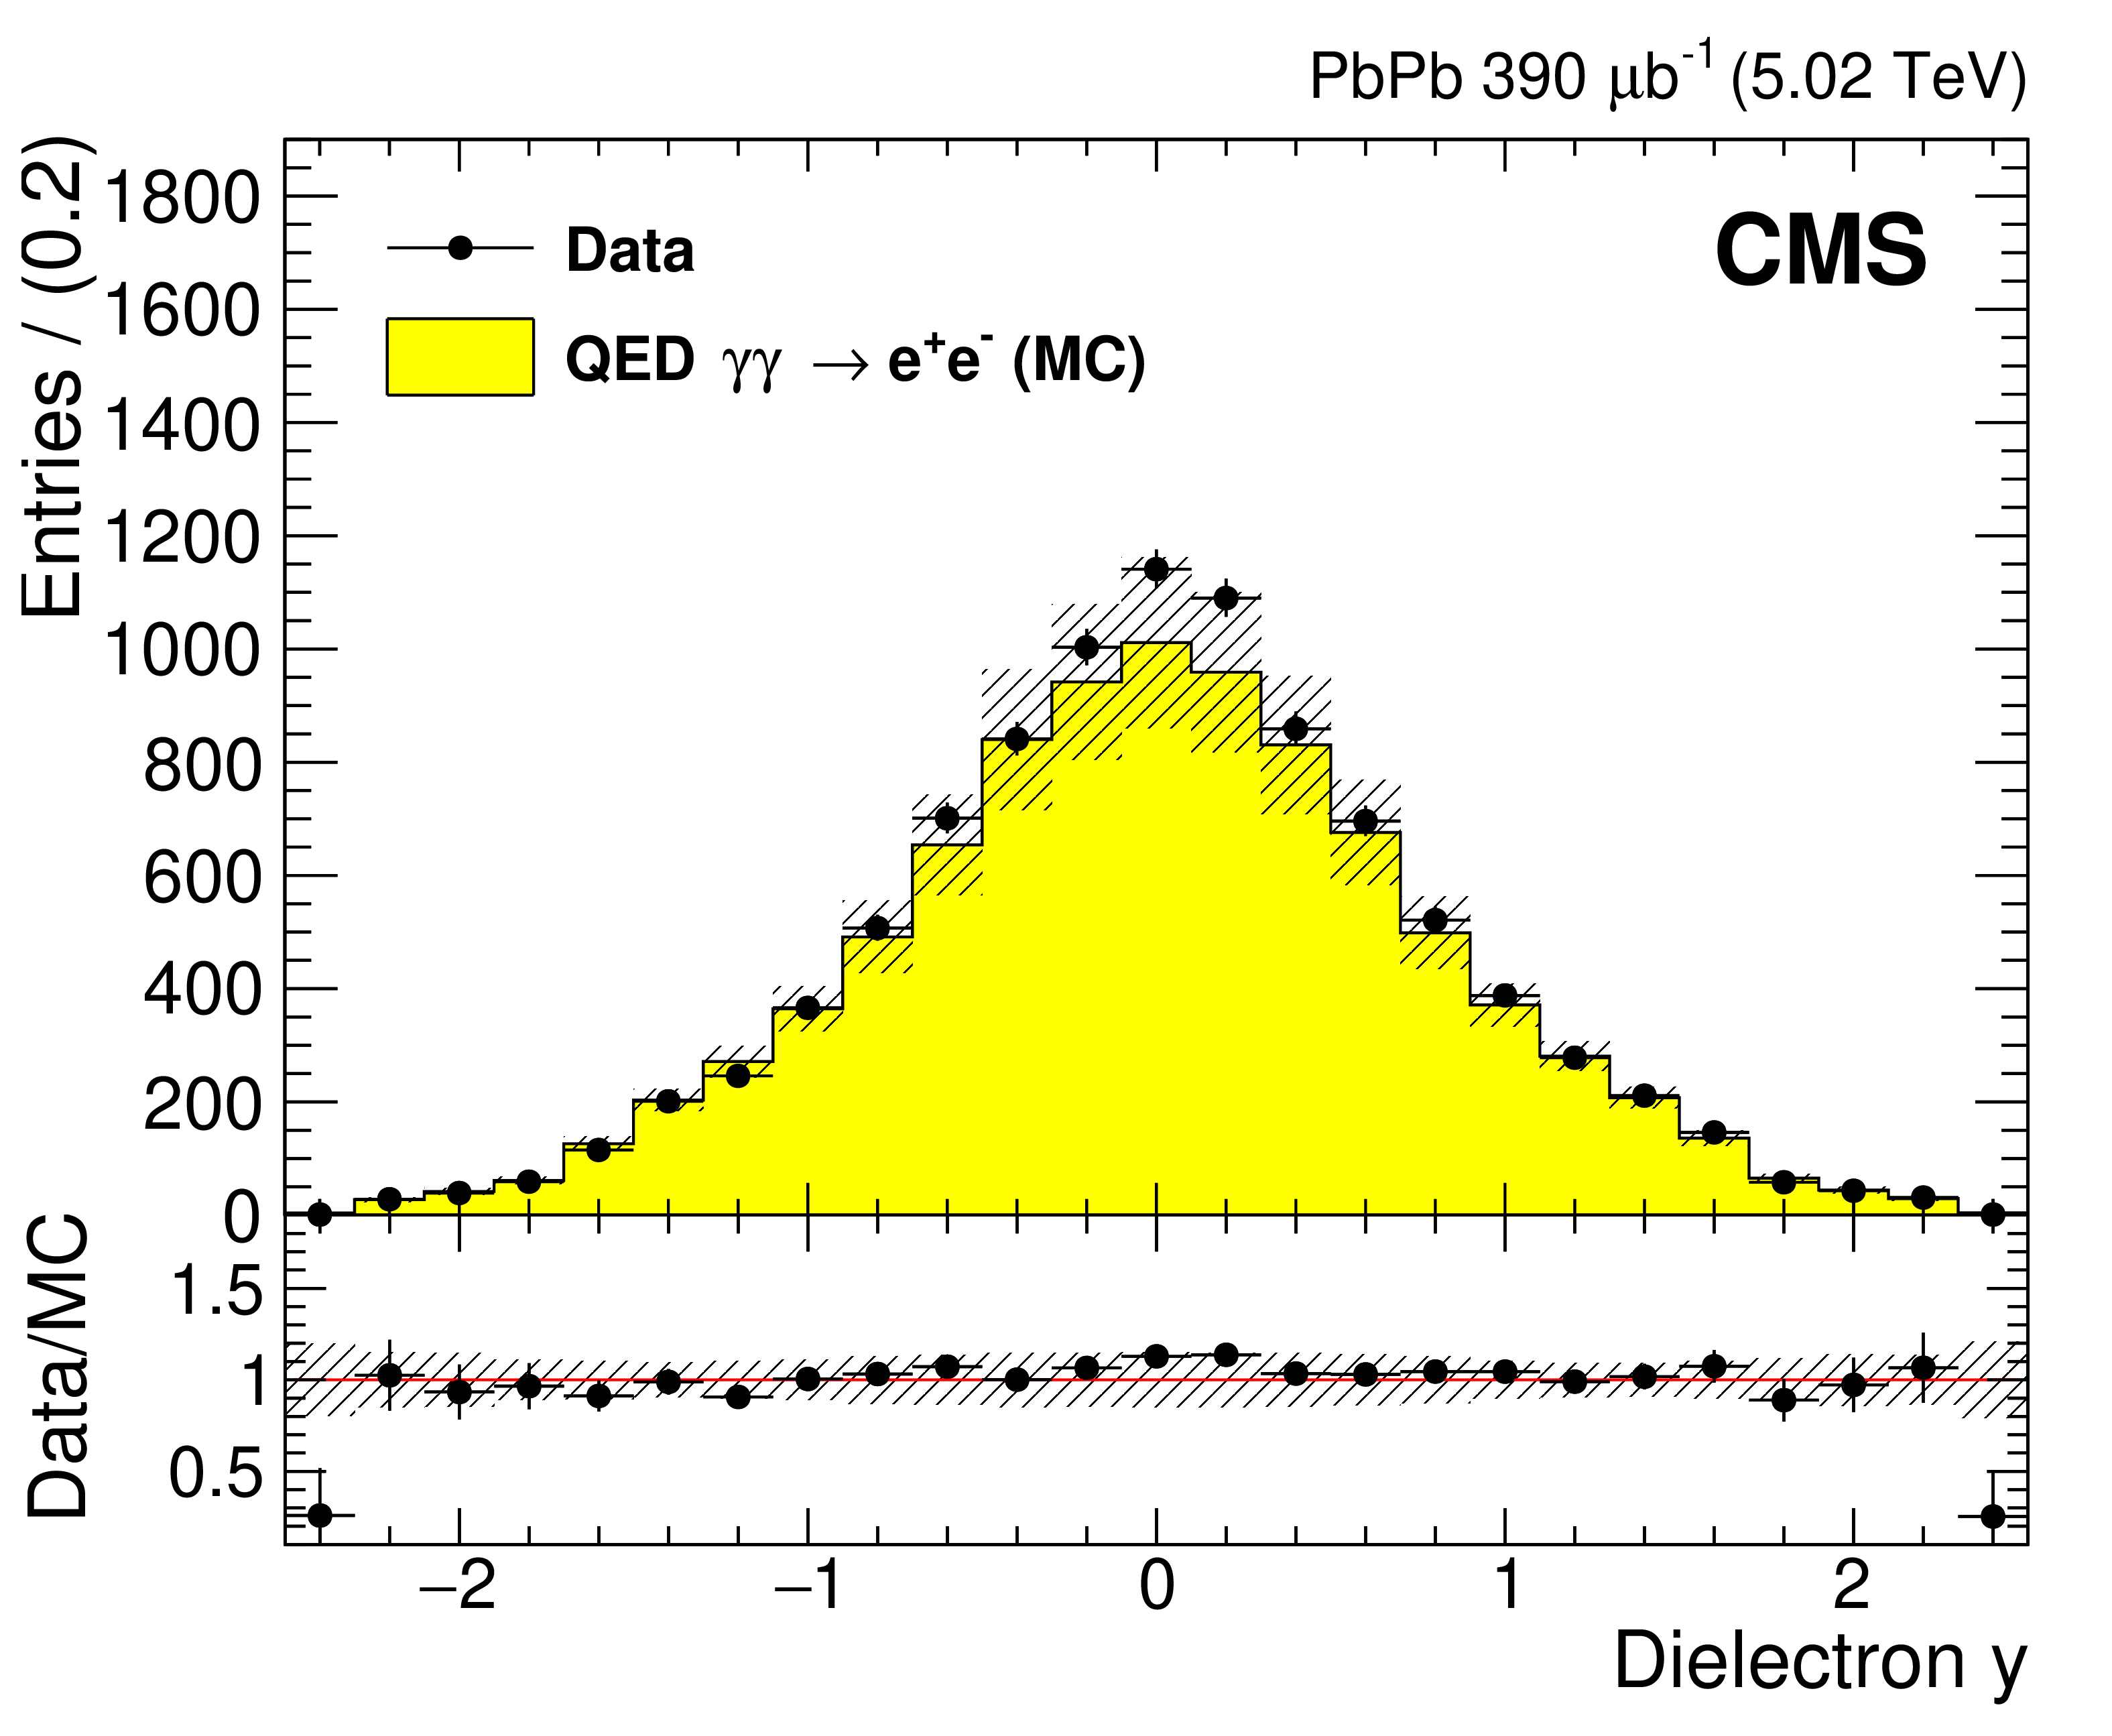
Comparison of data (circles) and STARLIGHT MC expectation (histogram, scaled as described in the text) for the exclusive $ {{\mathrm {e}^+} {\mathrm {e}^-}}$ events passing all selection criteria, as a function of dielectron acoplanarity (top left), mass (top right), ${p_{\mathrm {T}}}$ (bottom left), and rapidity $y$ (bottom right). Error bars around the data points indicate statistical uncertainties, and hashed bands around the histograms include systematic and MC statistical uncertainties added in quadrature. The horizontal bars around the data symbols indicate the bin size. The ratio of the data to the MC expectation is shown in the bottom panels. |
png pdf |
Figure 3-a:
Comparison of data (circles) and STARLIGHT MC expectation (histogram, scaled as described in the text) for the exclusive $ {{\mathrm {e}^+} {\mathrm {e}^-}}$ events passing all selection criteria, as a function of dielectron acoplanarity. Error bars around the data points indicate statistical uncertainties, and hashed bands around the histograms include systematic and MC statistical uncertainties added in quadrature. The horizontal bars around the data symbols indicate the bin size. The ratio of the data to the MC expectation is shown in the bottom panel. |
png pdf |
Figure 3-b:
Comparison of data (circles) and STARLIGHT MC expectation (histogram, scaled as described in the text) for the exclusive $ {{\mathrm {e}^+} {\mathrm {e}^-}}$ events passing all selection criteria, as a function of mass. Error bars around the data points indicate statistical uncertainties, and hashed bands around the histograms include systematic and MC statistical uncertainties added in quadrature. The horizontal bars around the data symbols indicate the bin size. The ratio of the data to the MC expectation is shown in the bottom panel. |

png pdf |
Figure 3-c:
Comparison of data (circles) and STARLIGHT MC expectation (histogram, scaled as described in the text) for the exclusive $ {{\mathrm {e}^+} {\mathrm {e}^-}}$ events passing all selection criteria, as a function of ${p_{\mathrm {T}}}$. Error bars around the data points indicate statistical uncertainties, and hashed bands around the histograms include systematic and MC statistical uncertainties added in quadrature. The horizontal bars around the data symbols indicate the bin size. The ratio of the data to the MC expectation is shown in the bottom panel. |
png pdf |
Figure 3-d:
Comparison of data (circles) and STARLIGHT MC expectation (histogram, scaled as described in the text) for the exclusive $ {{\mathrm {e}^+} {\mathrm {e}^-}}$ events passing all selection criteria, as a function of rapidity $y$. Error bars around the data points indicate statistical uncertainties, and hashed bands around the histograms include systematic and MC statistical uncertainties added in quadrature. The horizontal bars around the data symbols indicate the bin size. The ratio of the data to the MC expectation is shown in the bottom panel. |
png pdf |
Figure 4:
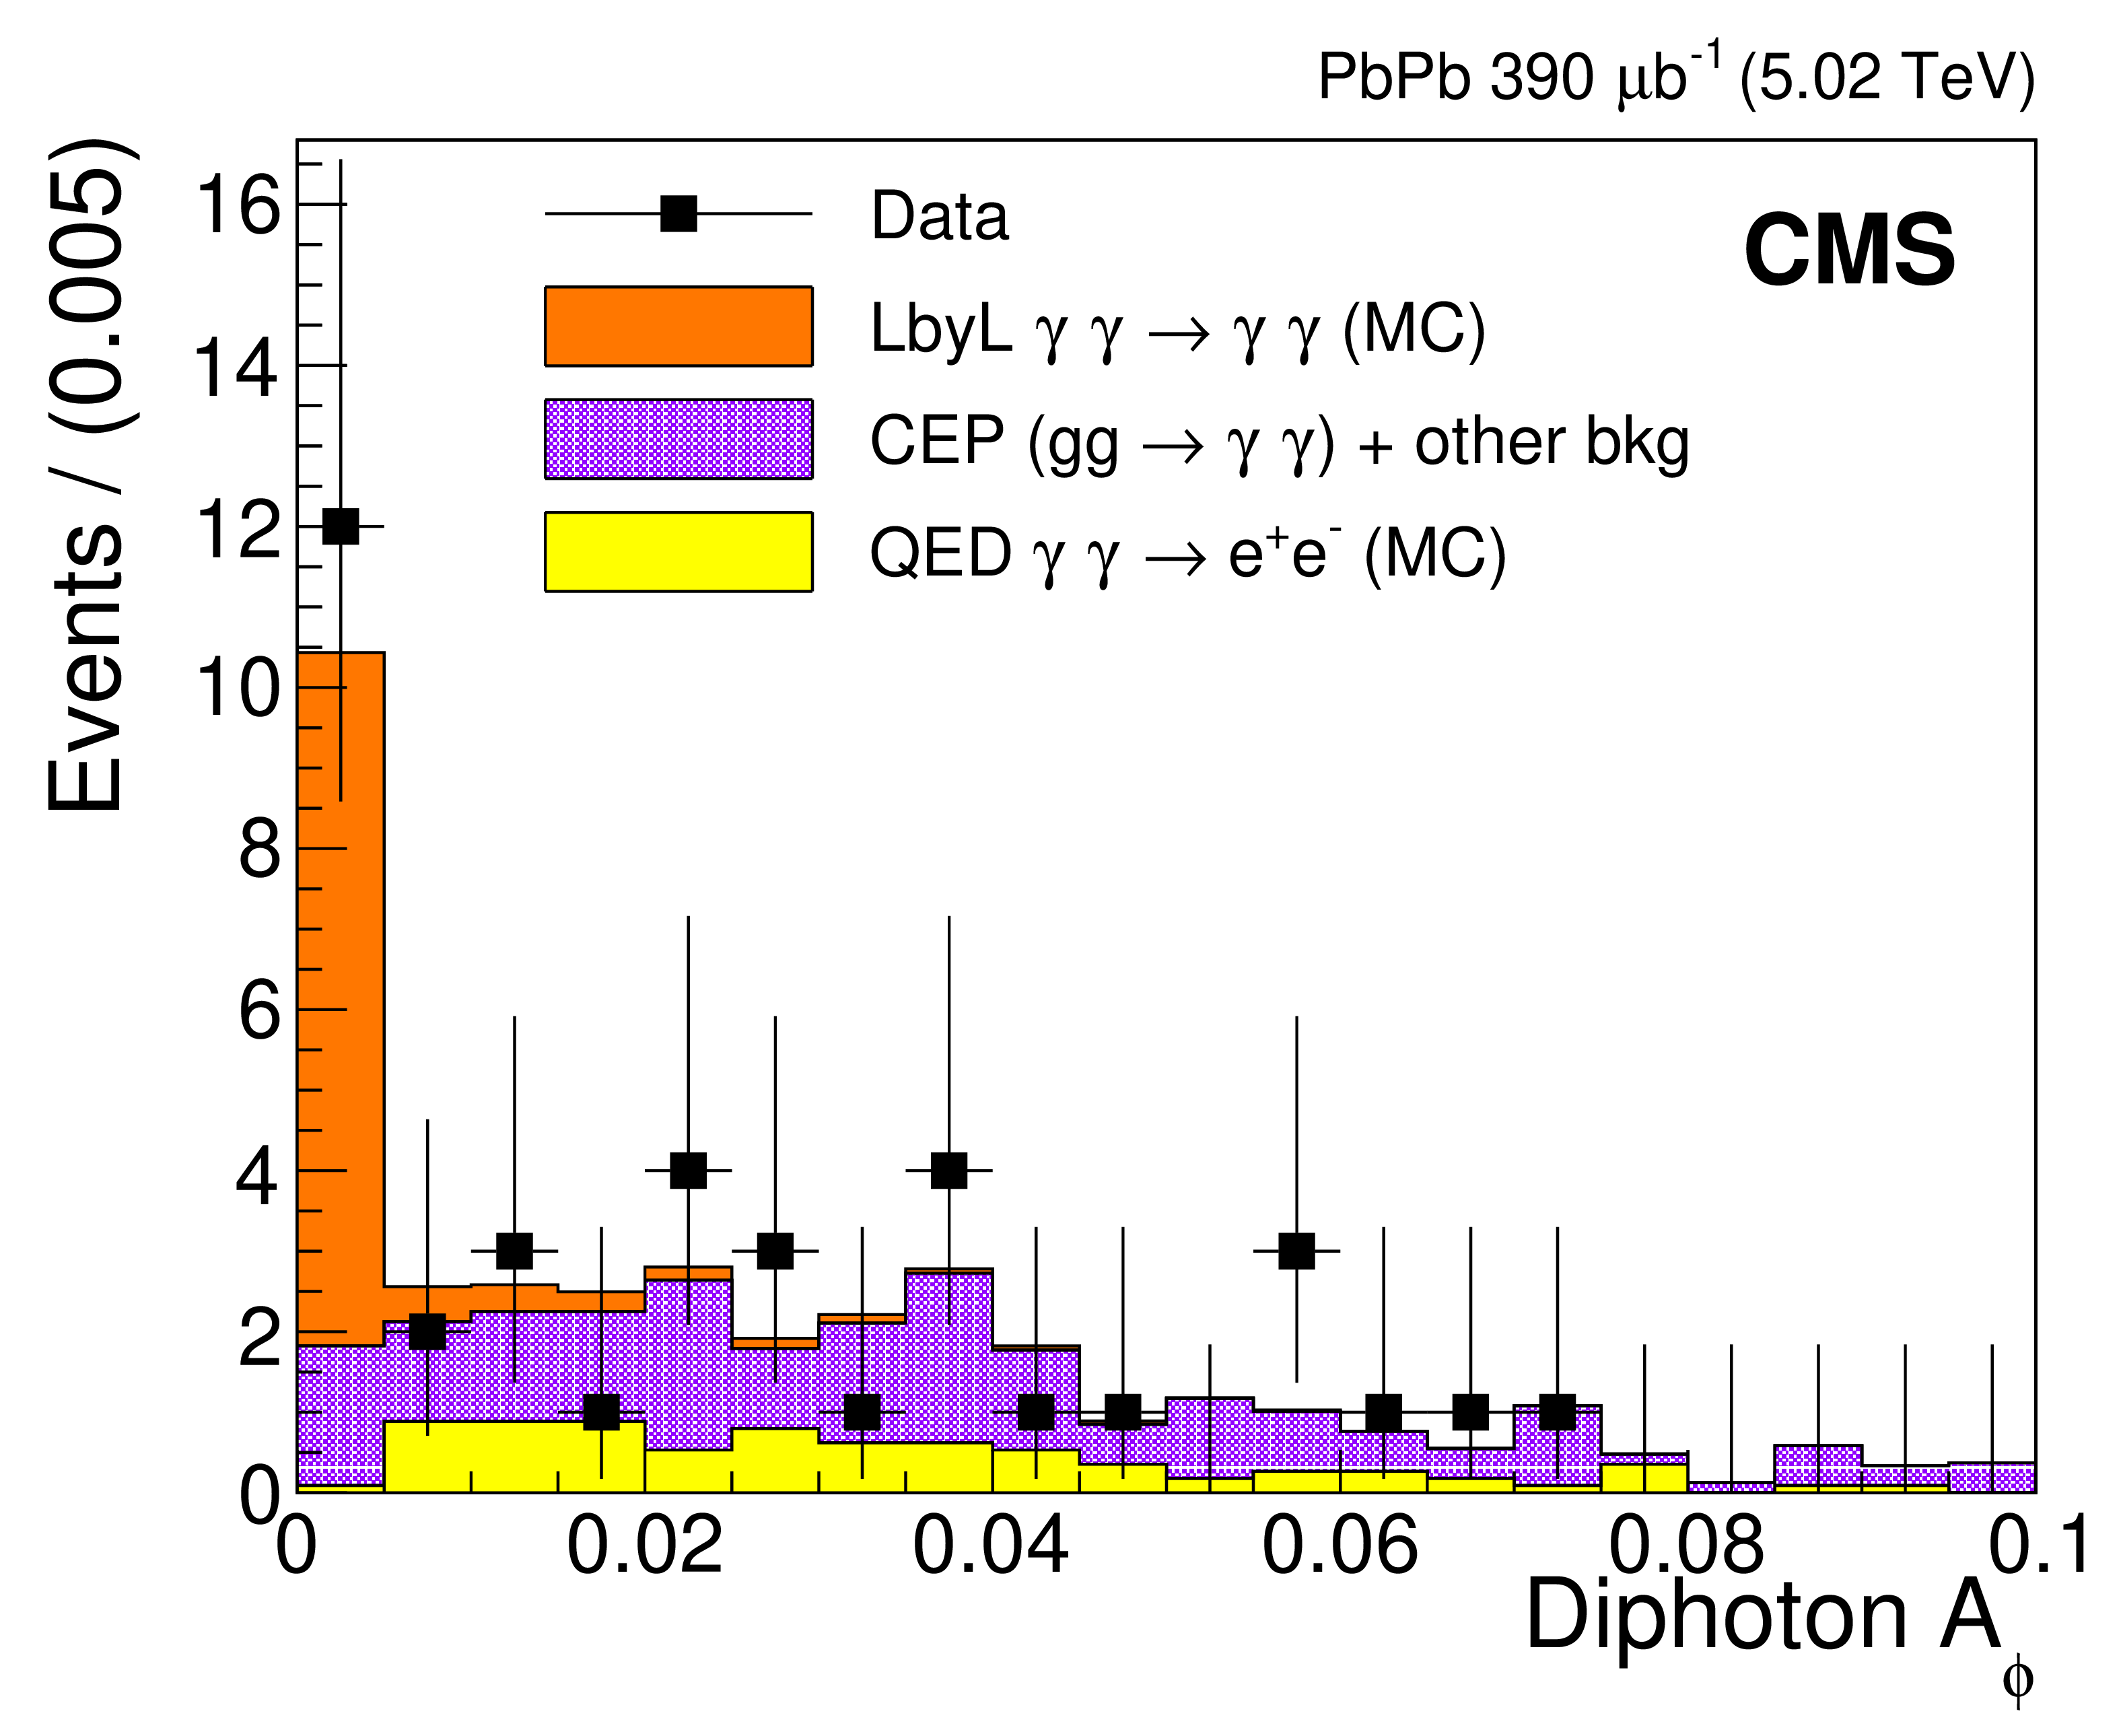
Diphoton acoplanarity distribution for exclusive events measured in the data after selection criteria (squares), compared to the expected LbL scattering signal (orange histogram), QED $ {{\mathrm {e}^+} {\mathrm {e}^-}}$ (yellow histogram), and the CEP+other (light blue histogram, scaled to match the data in the $\text {A}_{\phi} > $ 0.02 region as described in the text) backgrounds. Signal and QED $ {{\mathrm {e}^+} {\mathrm {e}^-}}$ MC samples are scaled according to their theoretical cross sections and integrated luminosity. The error bars around the data points indicate statistical uncertainties. The horizontal bars around the data symbols indicate the bin size. |
png pdf |
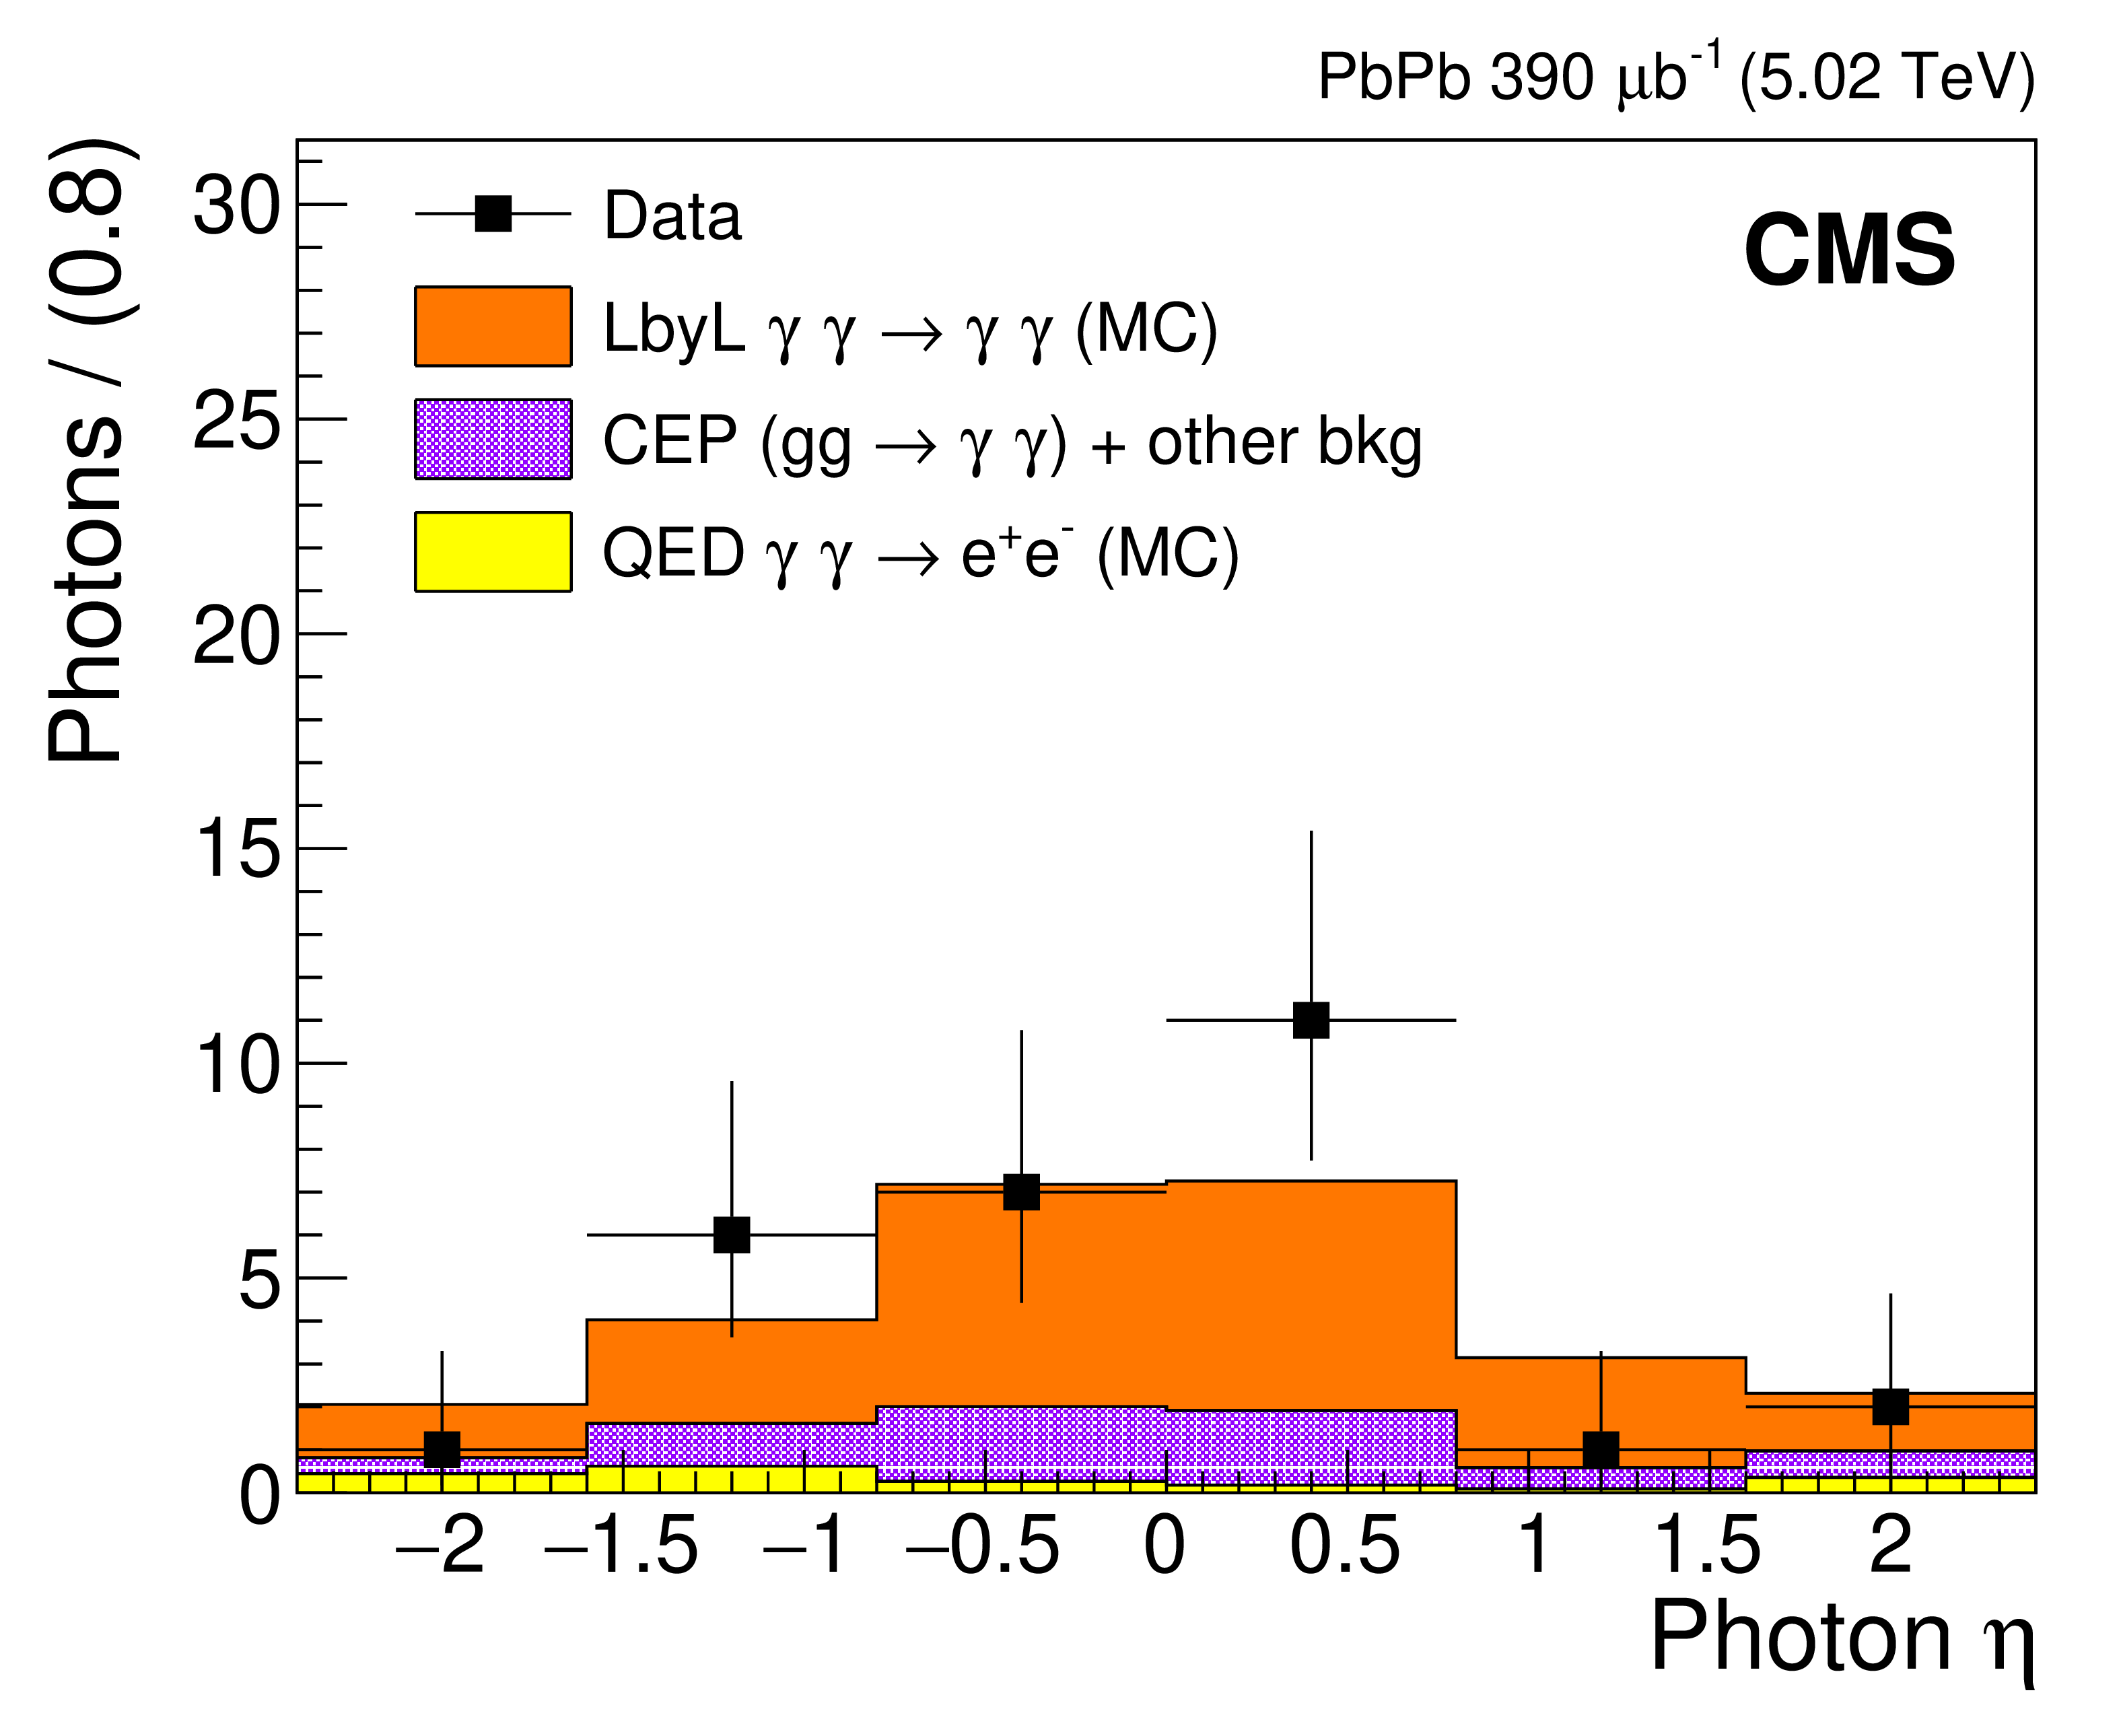
Figure 5:
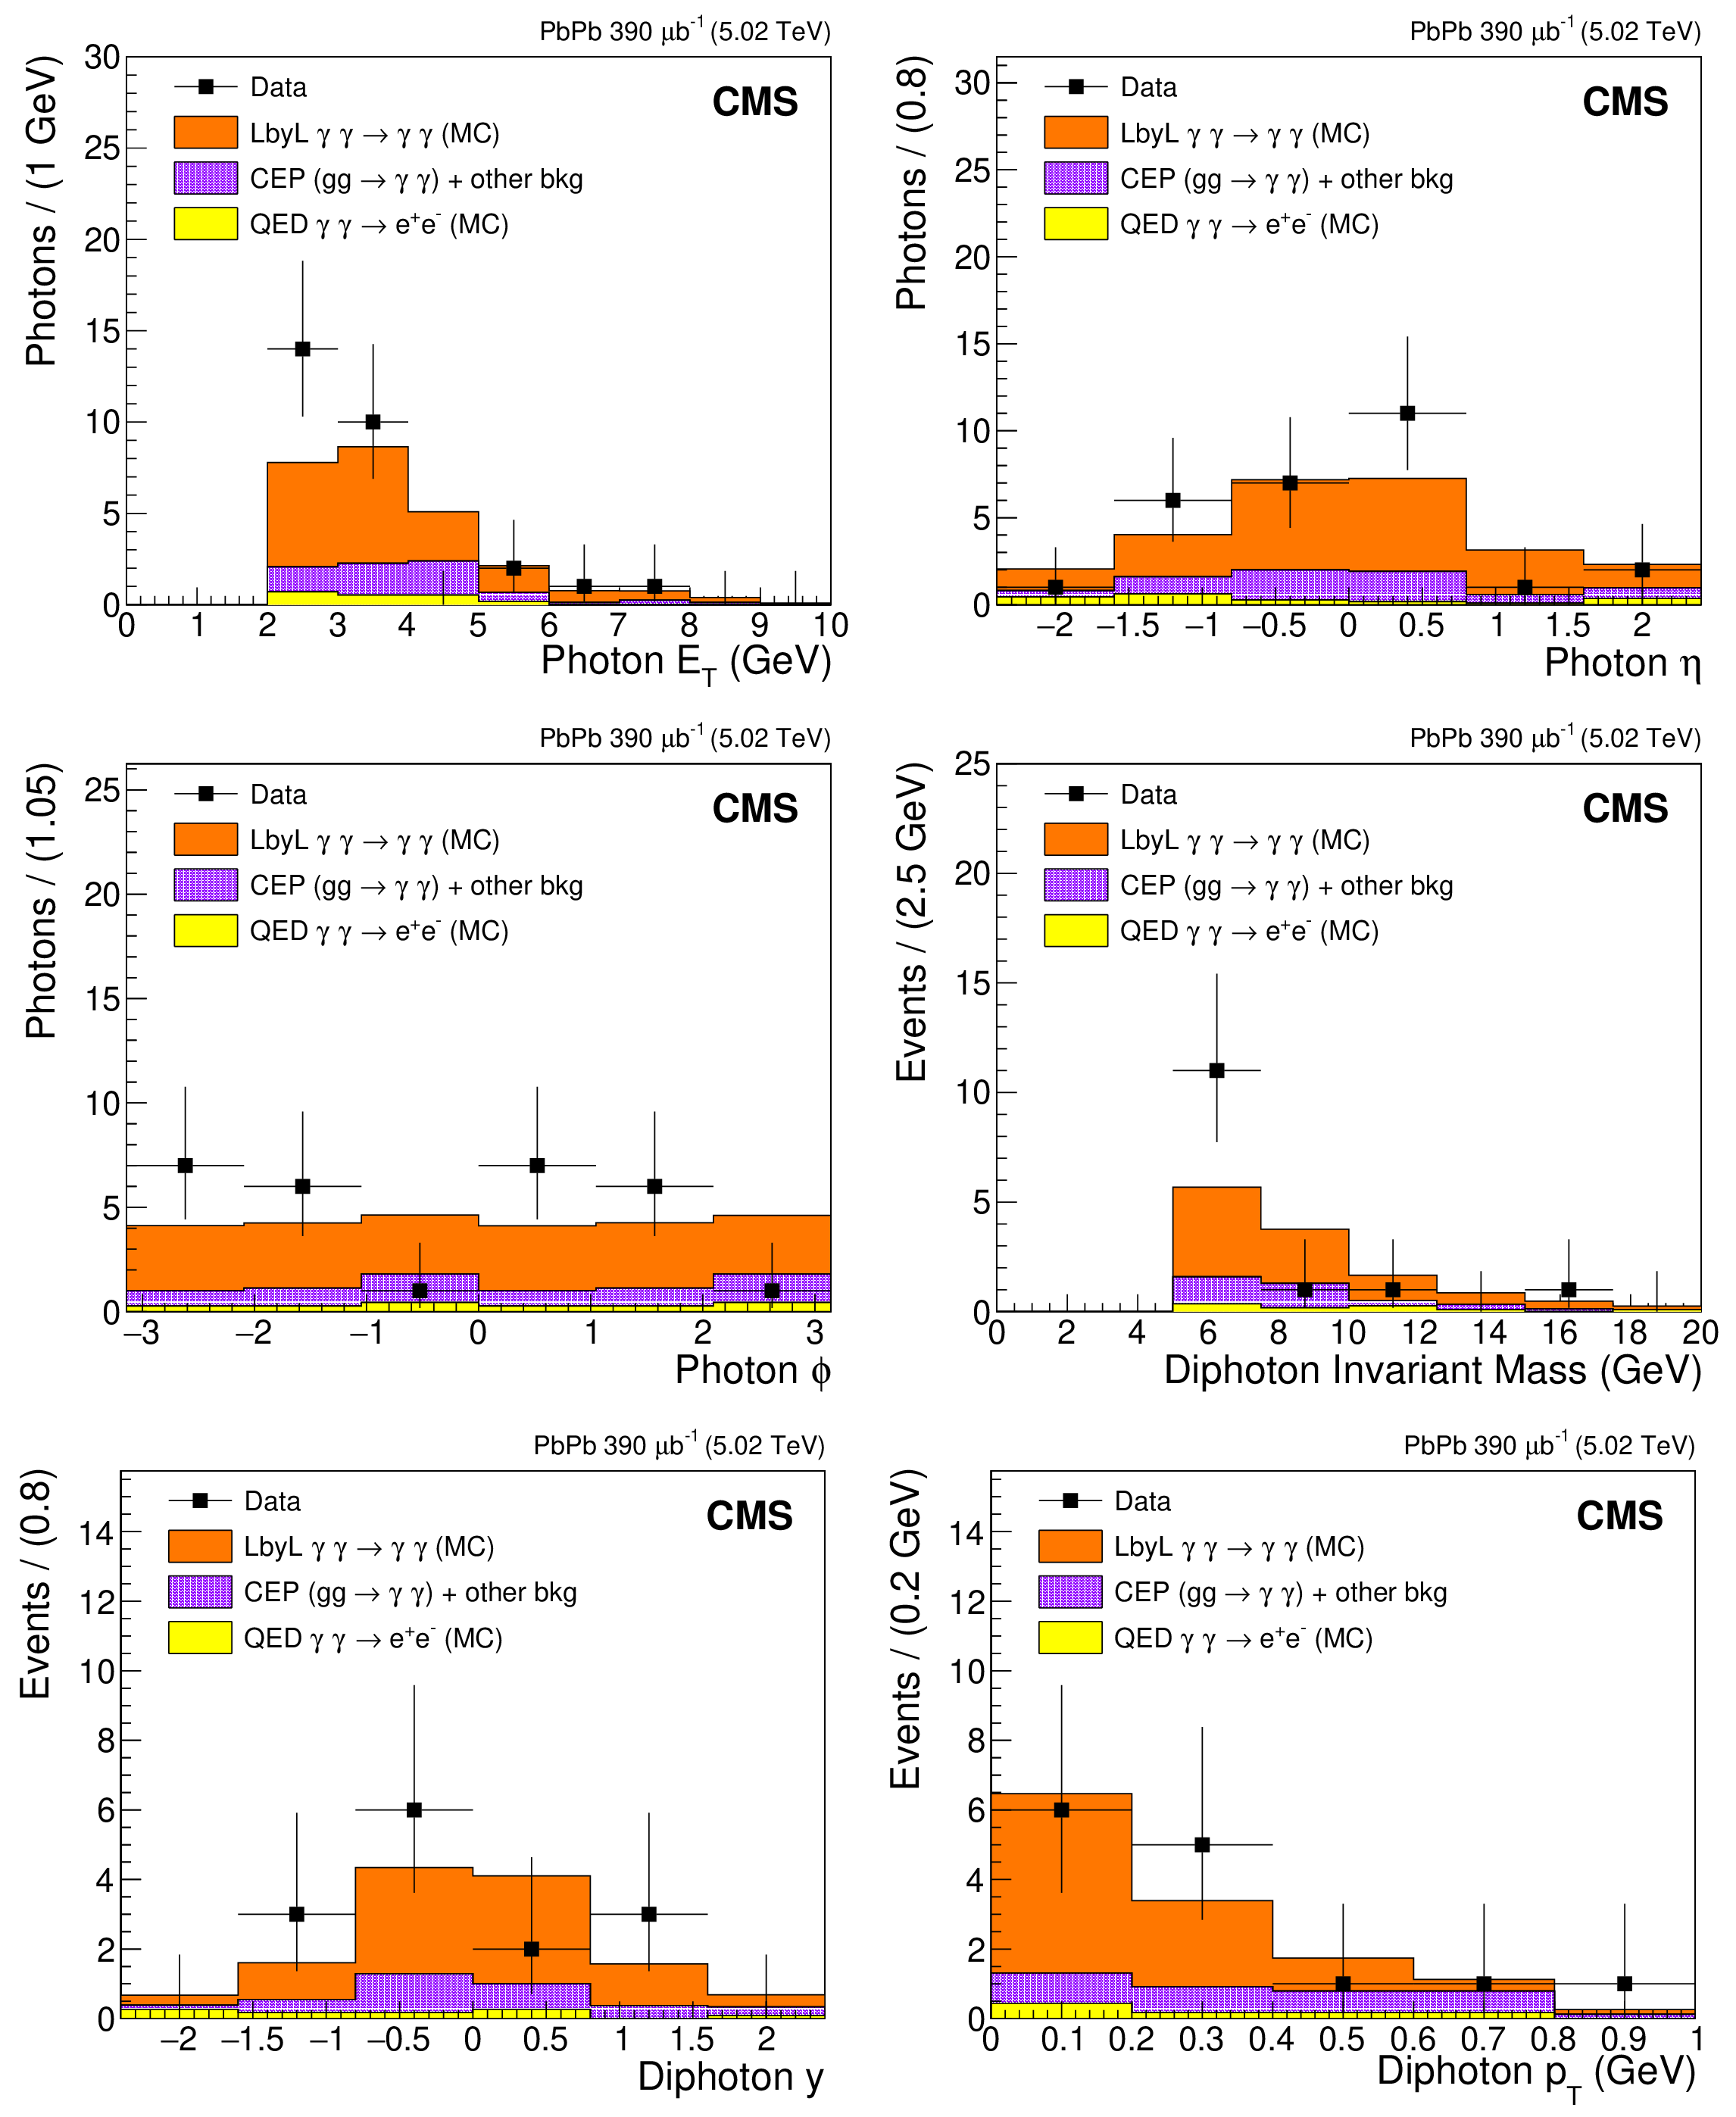
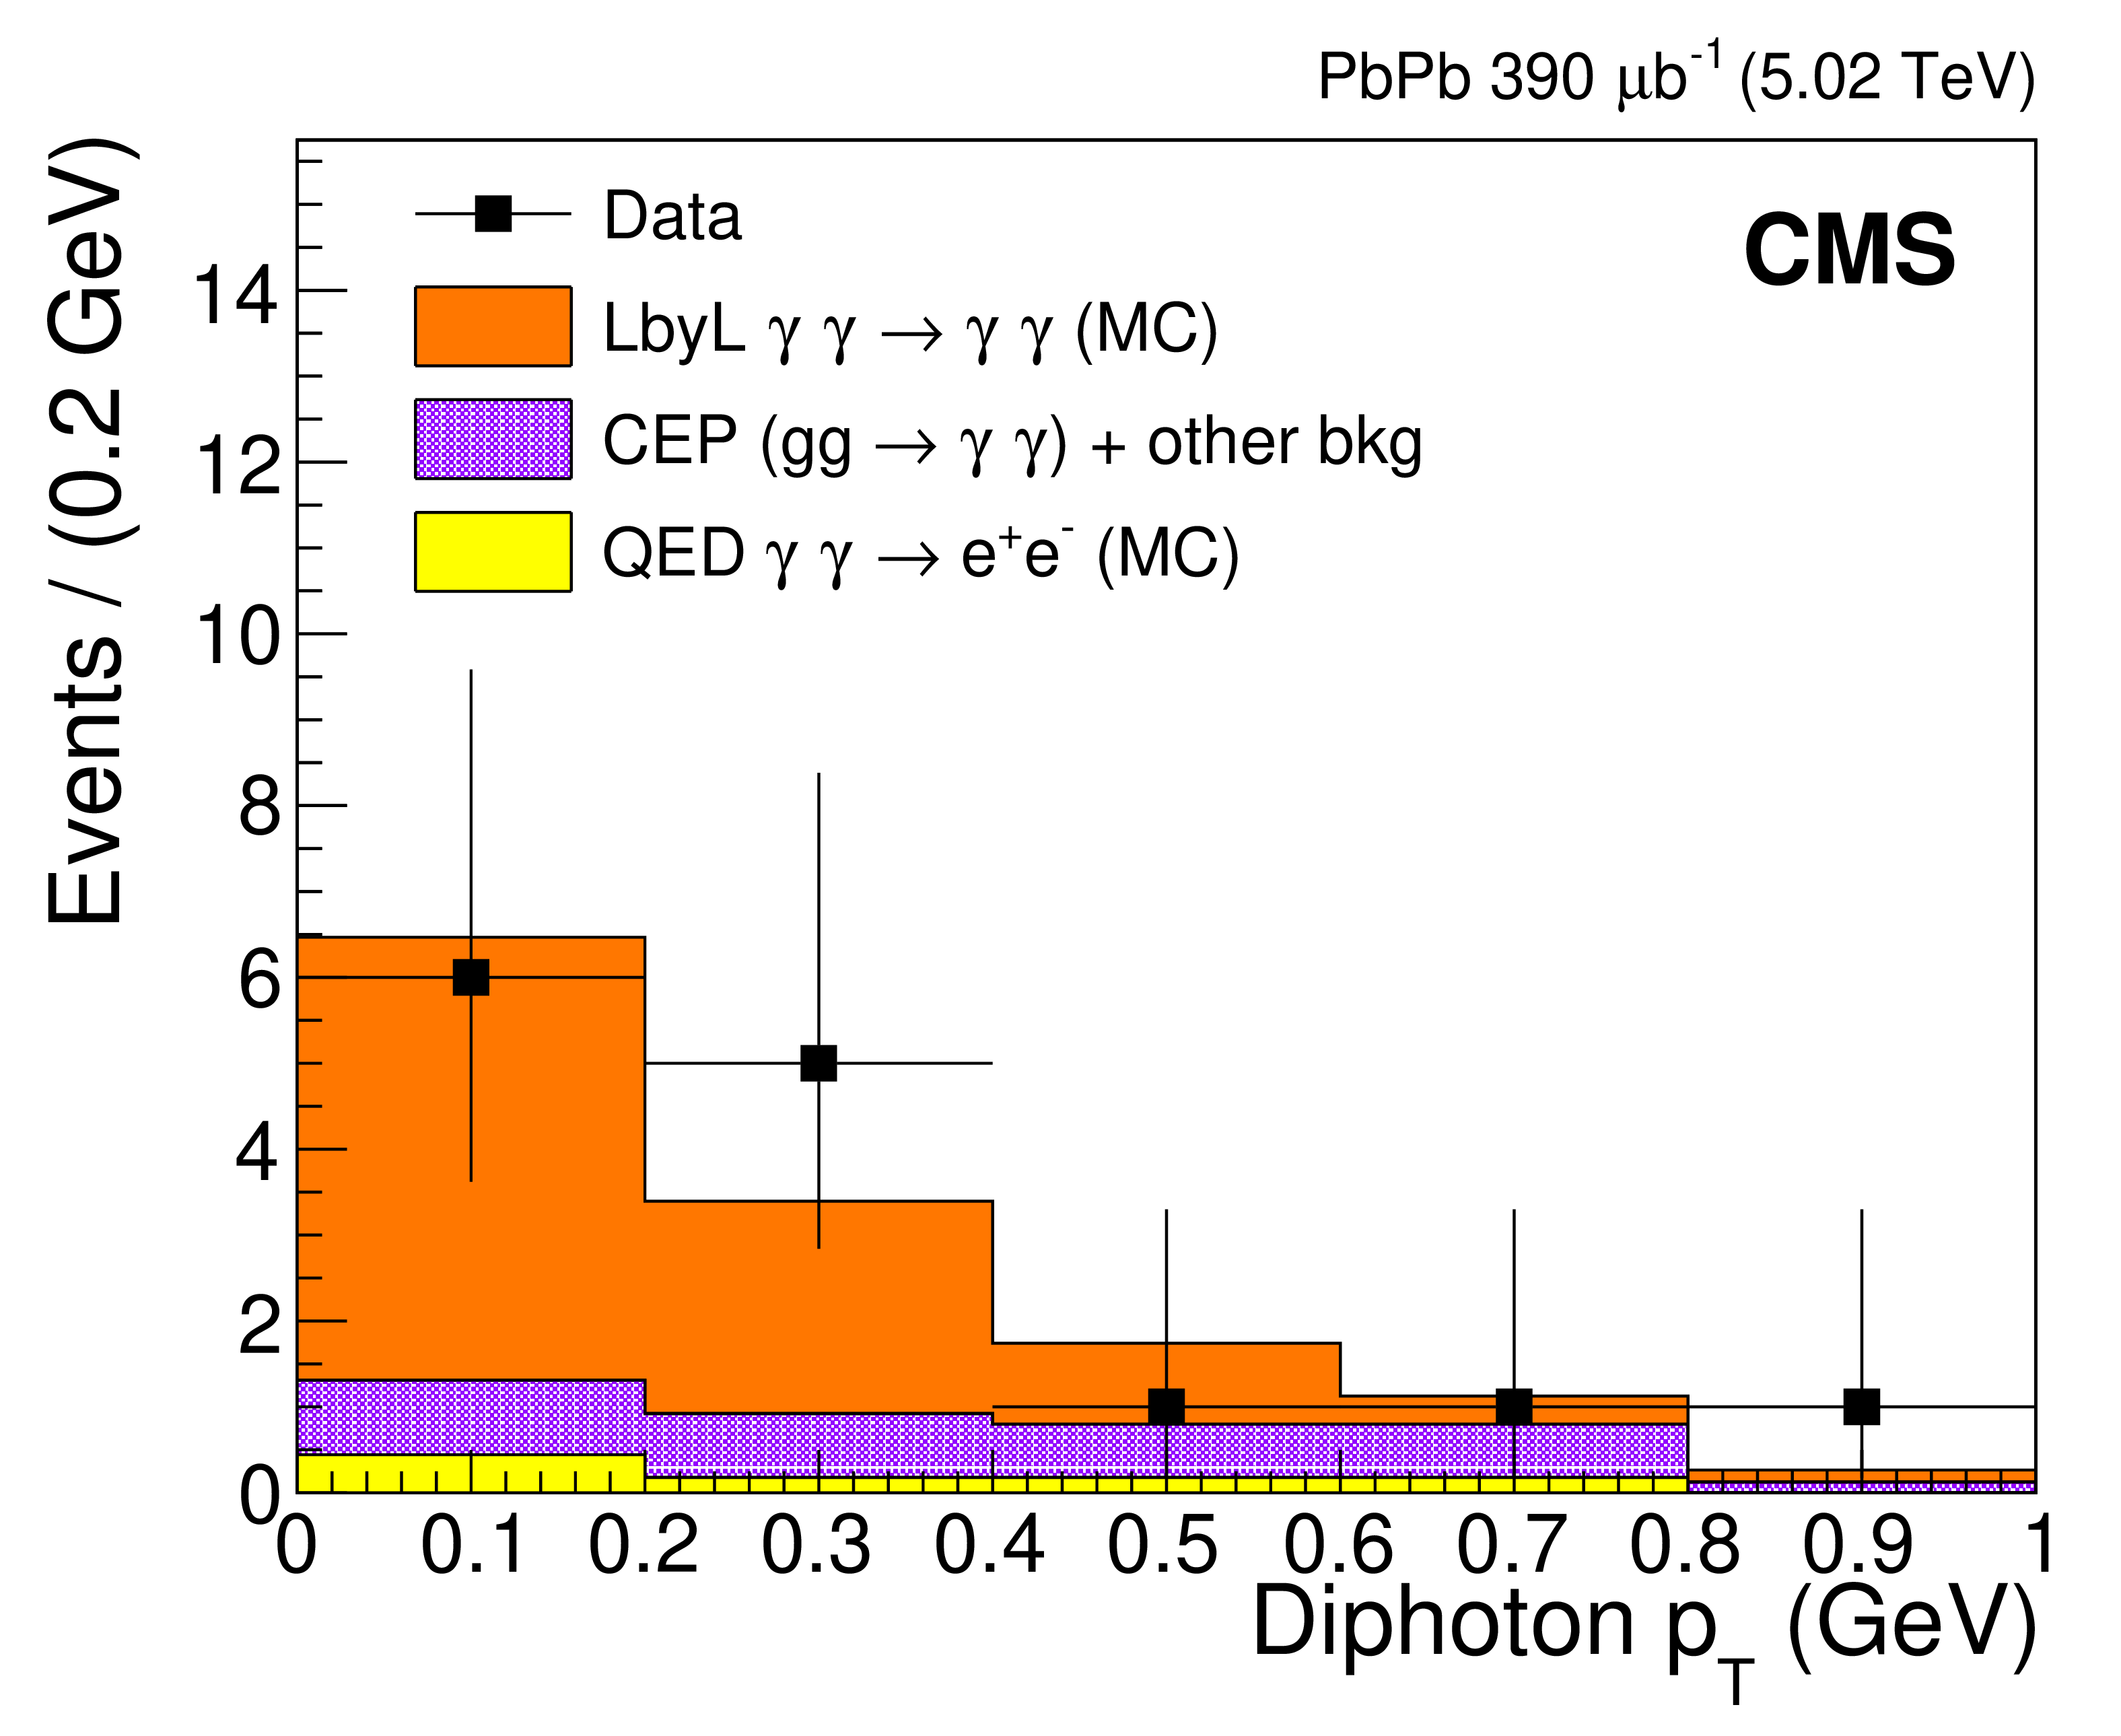
Distributions of the single photon ${E_{\mathrm {T}}}$, $\eta $, and $\phi $, as well as diphoton ${p_{\mathrm {T}}}$, rapidity, and invariant mass measured for the fourteen exclusive events passing all selection criteria (squares), compared to the expectations of LbL scattering signal (orange histogram), QED $ {{\mathrm {e}^+} {\mathrm {e}^-}}$ MC predictions (yellow histogram), and the CEP plus other backgrounds (light blue histogram, scaled to match the data in the $\text {A}_{\phi} > $ 0.02 region). Signal and QED $ {{\mathrm {e}^+} {\mathrm {e}^-}}$ MC samples are scaled according to their theoretical cross sections and integrated luminosity. The error bars around the data points indicate statistical uncertainties. The horizontal bars around the data symbols indicate the bin size. |
png pdf |
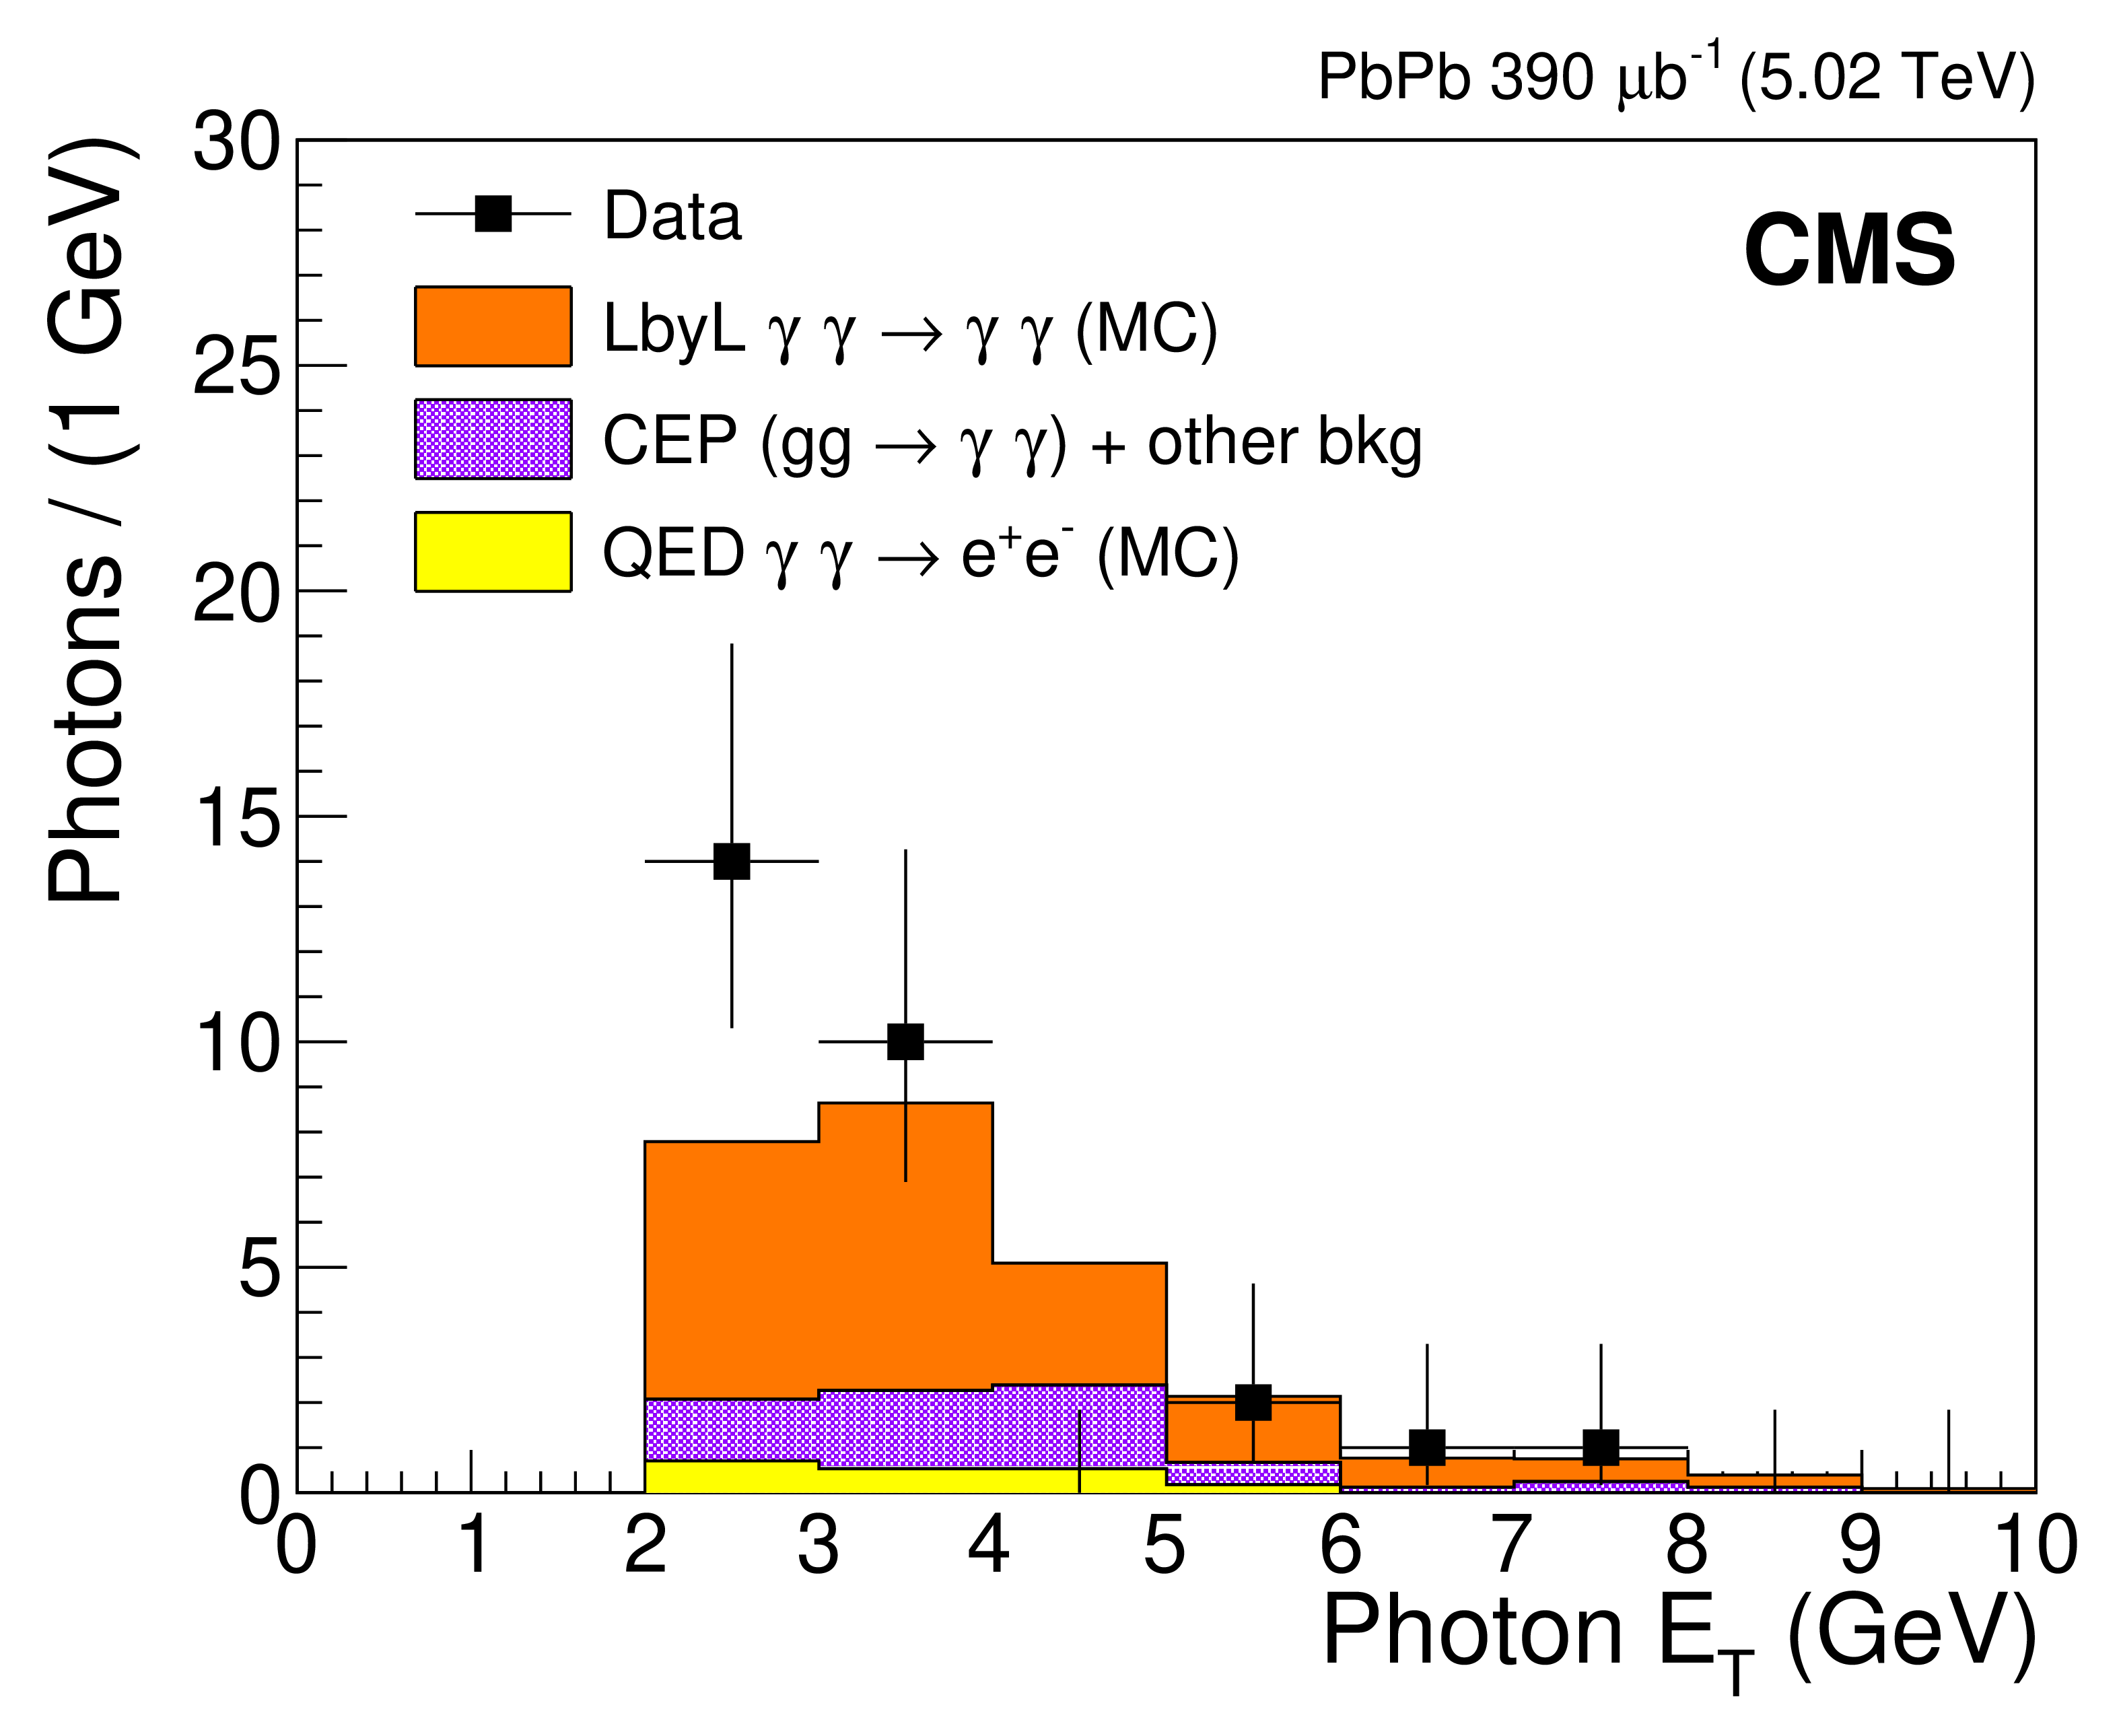
Figure 5-a:
Distribution of the single photon ${E_{\mathrm {T}}}$, measured for the fourteen exclusive events passing all selection criteria (squares), compared to the expectations of LbL scattering signal (orange histogram), QED $ {{\mathrm {e}^+} {\mathrm {e}^-}}$ MC predictions (yellow histogram), and the CEP plus other backgrounds (light blue histogram, scaled to match the data in the $\text {A}_{\phi} > $ 0.02 region). Signal and QED $ {{\mathrm {e}^+} {\mathrm {e}^-}}$ MC samples are scaled according to their theoretical cross sections and integrated luminosity. The error bars around the data points indicate statistical uncertainties. The horizontal bars around the data symbols indicate the bin size. |
png pdf |
Figure 5-b:
Distribution of the single photon $\eta $, measured for the fourteen exclusive events passing all selection criteria (squares), compared to the expectations of LbL scattering signal (orange histogram), QED $ {{\mathrm {e}^+} {\mathrm {e}^-}}$ MC predictions (yellow histogram), and the CEP plus other backgrounds (light blue histogram, scaled to match the data in the $\text {A}_{\phi} > $ 0.02 region). Signal and QED $ {{\mathrm {e}^+} {\mathrm {e}^-}}$ MC samples are scaled according to their theoretical cross sections and integrated luminosity. The error bars around the data points indicate statistical uncertainties. The horizontal bars around the data symbols indicate the bin size. |
png pdf |
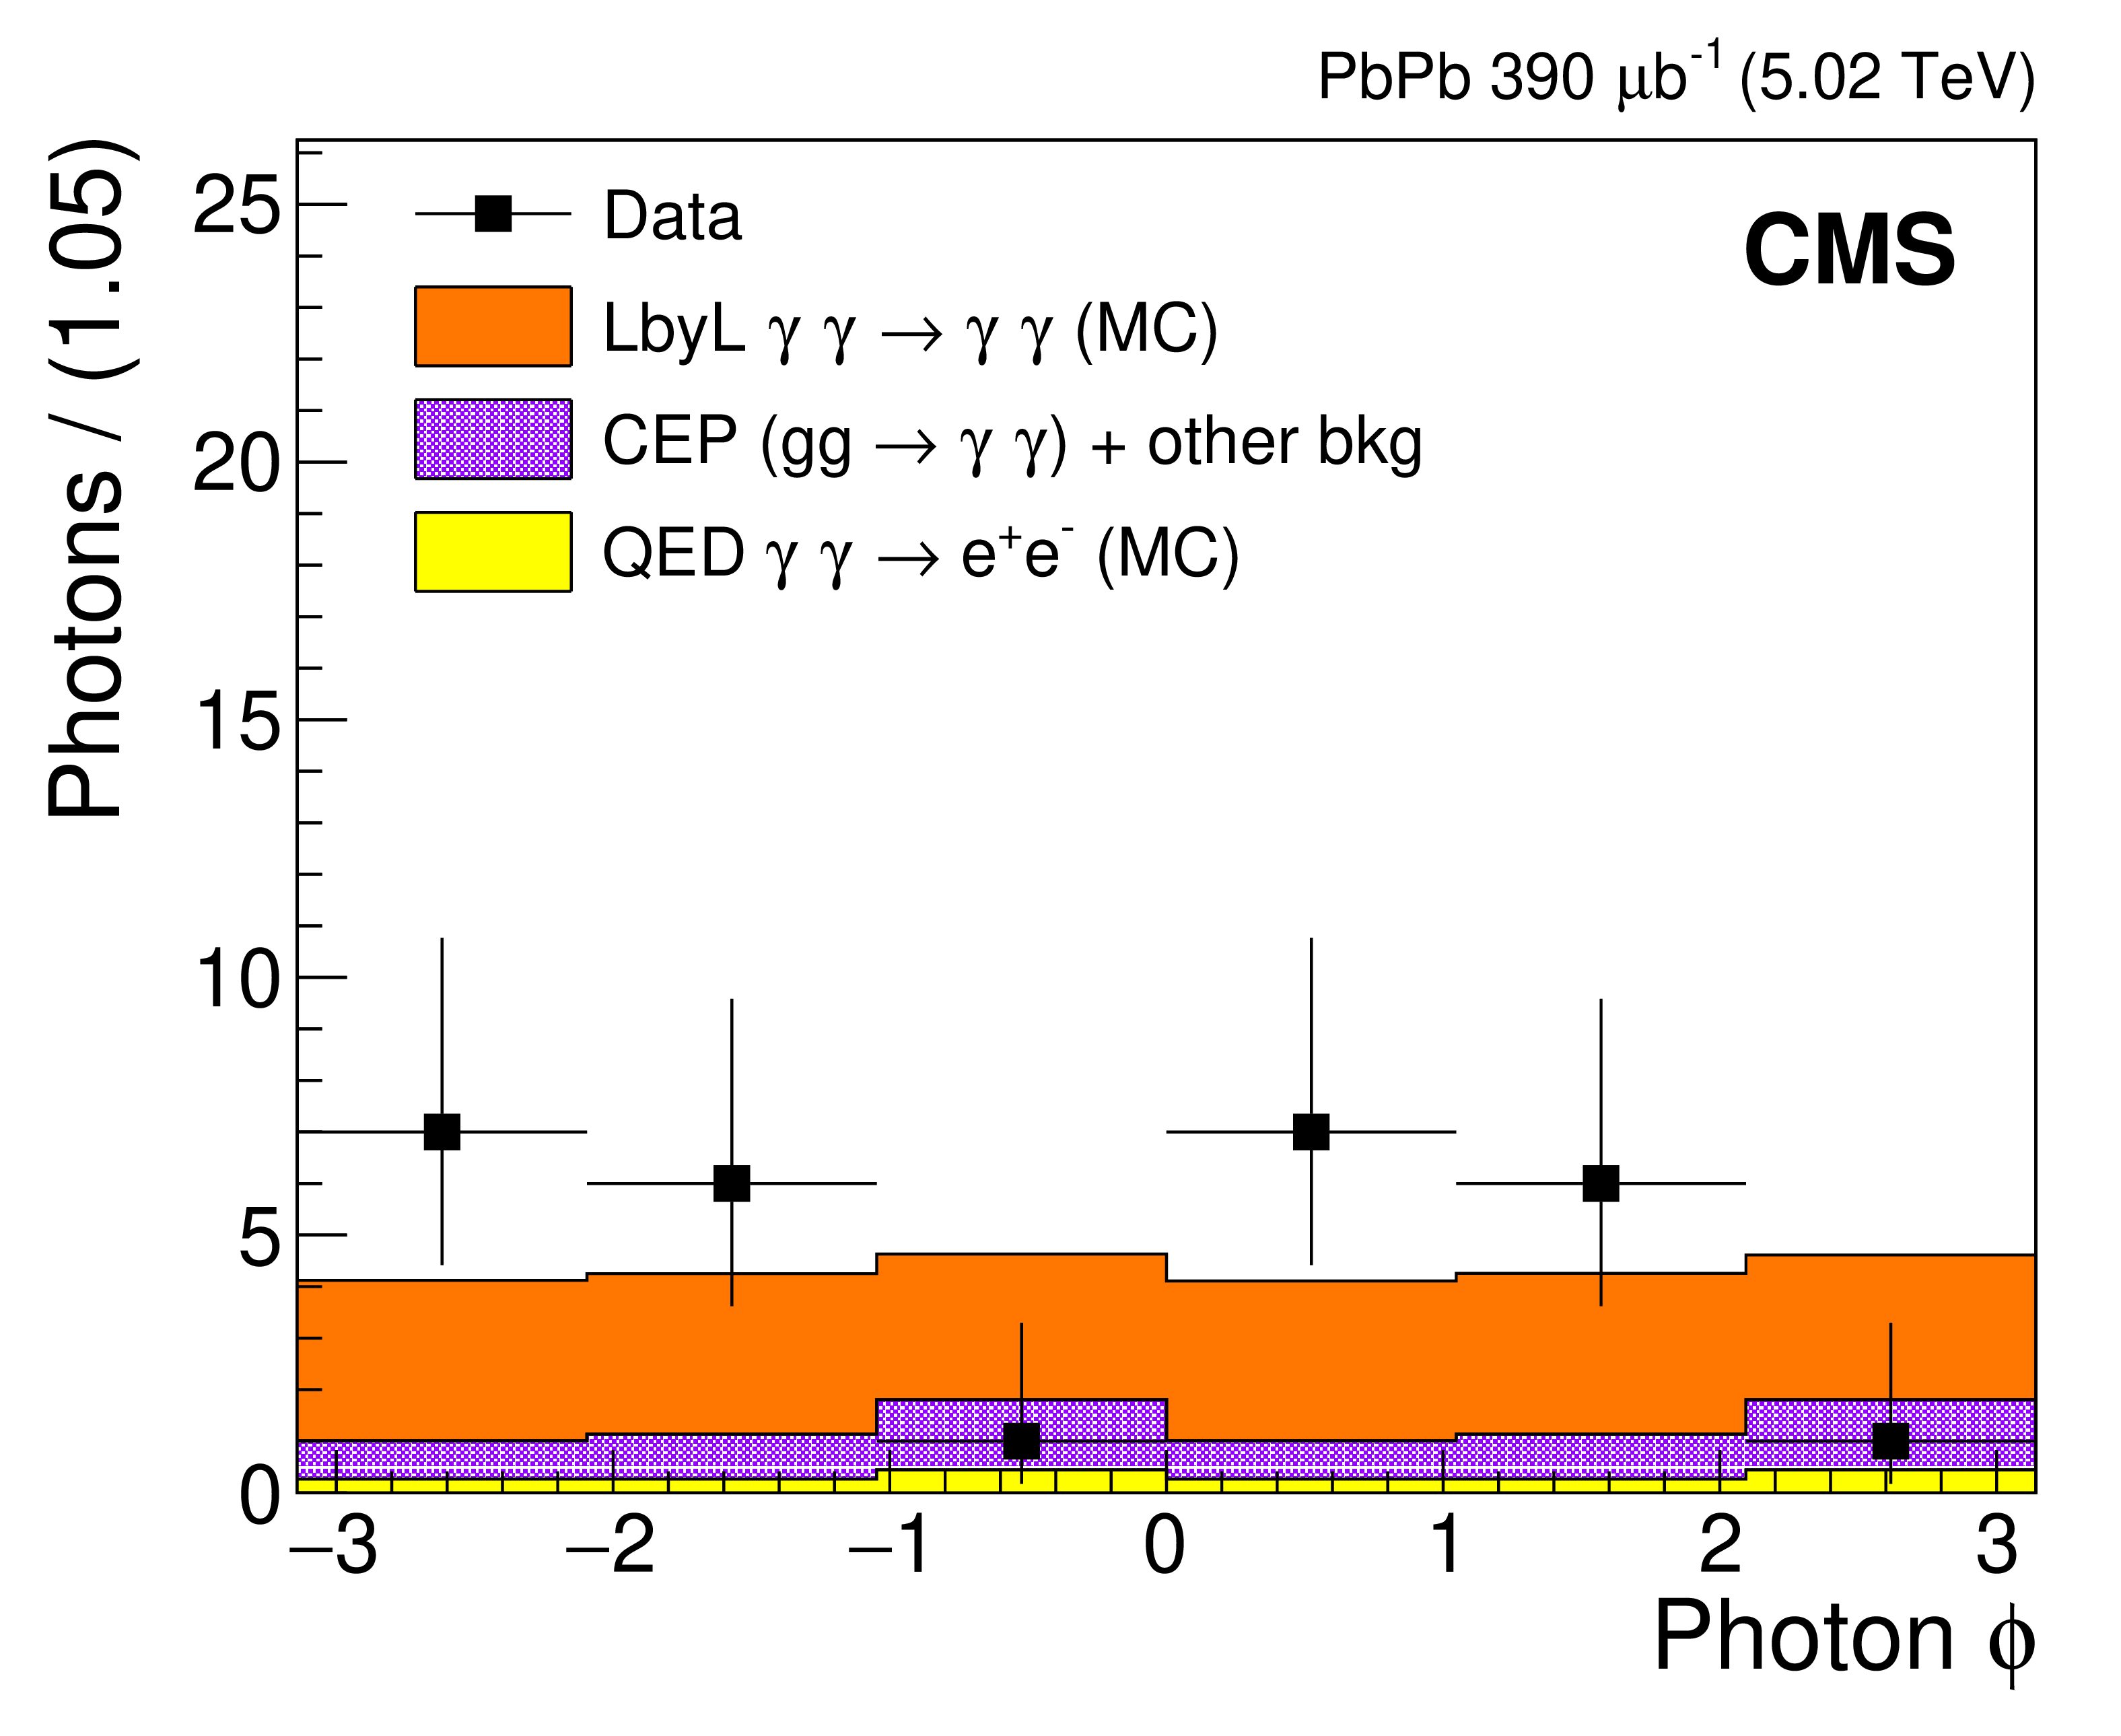
Figure 5-c:
Distribution of the single photon $\phi $, measured for the fourteen exclusive events passing all selection criteria (squares), compared to the expectations of LbL scattering signal (orange histogram), QED $ {{\mathrm {e}^+} {\mathrm {e}^-}}$ MC predictions (yellow histogram), and the CEP plus other backgrounds (light blue histogram, scaled to match the data in the $\text {A}_{\phi} > $ 0.02 region). Signal and QED $ {{\mathrm {e}^+} {\mathrm {e}^-}}$ MC samples are scaled according to their theoretical cross sections and integrated luminosity. The error bars around the data points indicate statistical uncertainties. The horizontal bars around the data symbols indicate the bin size. |
png pdf |
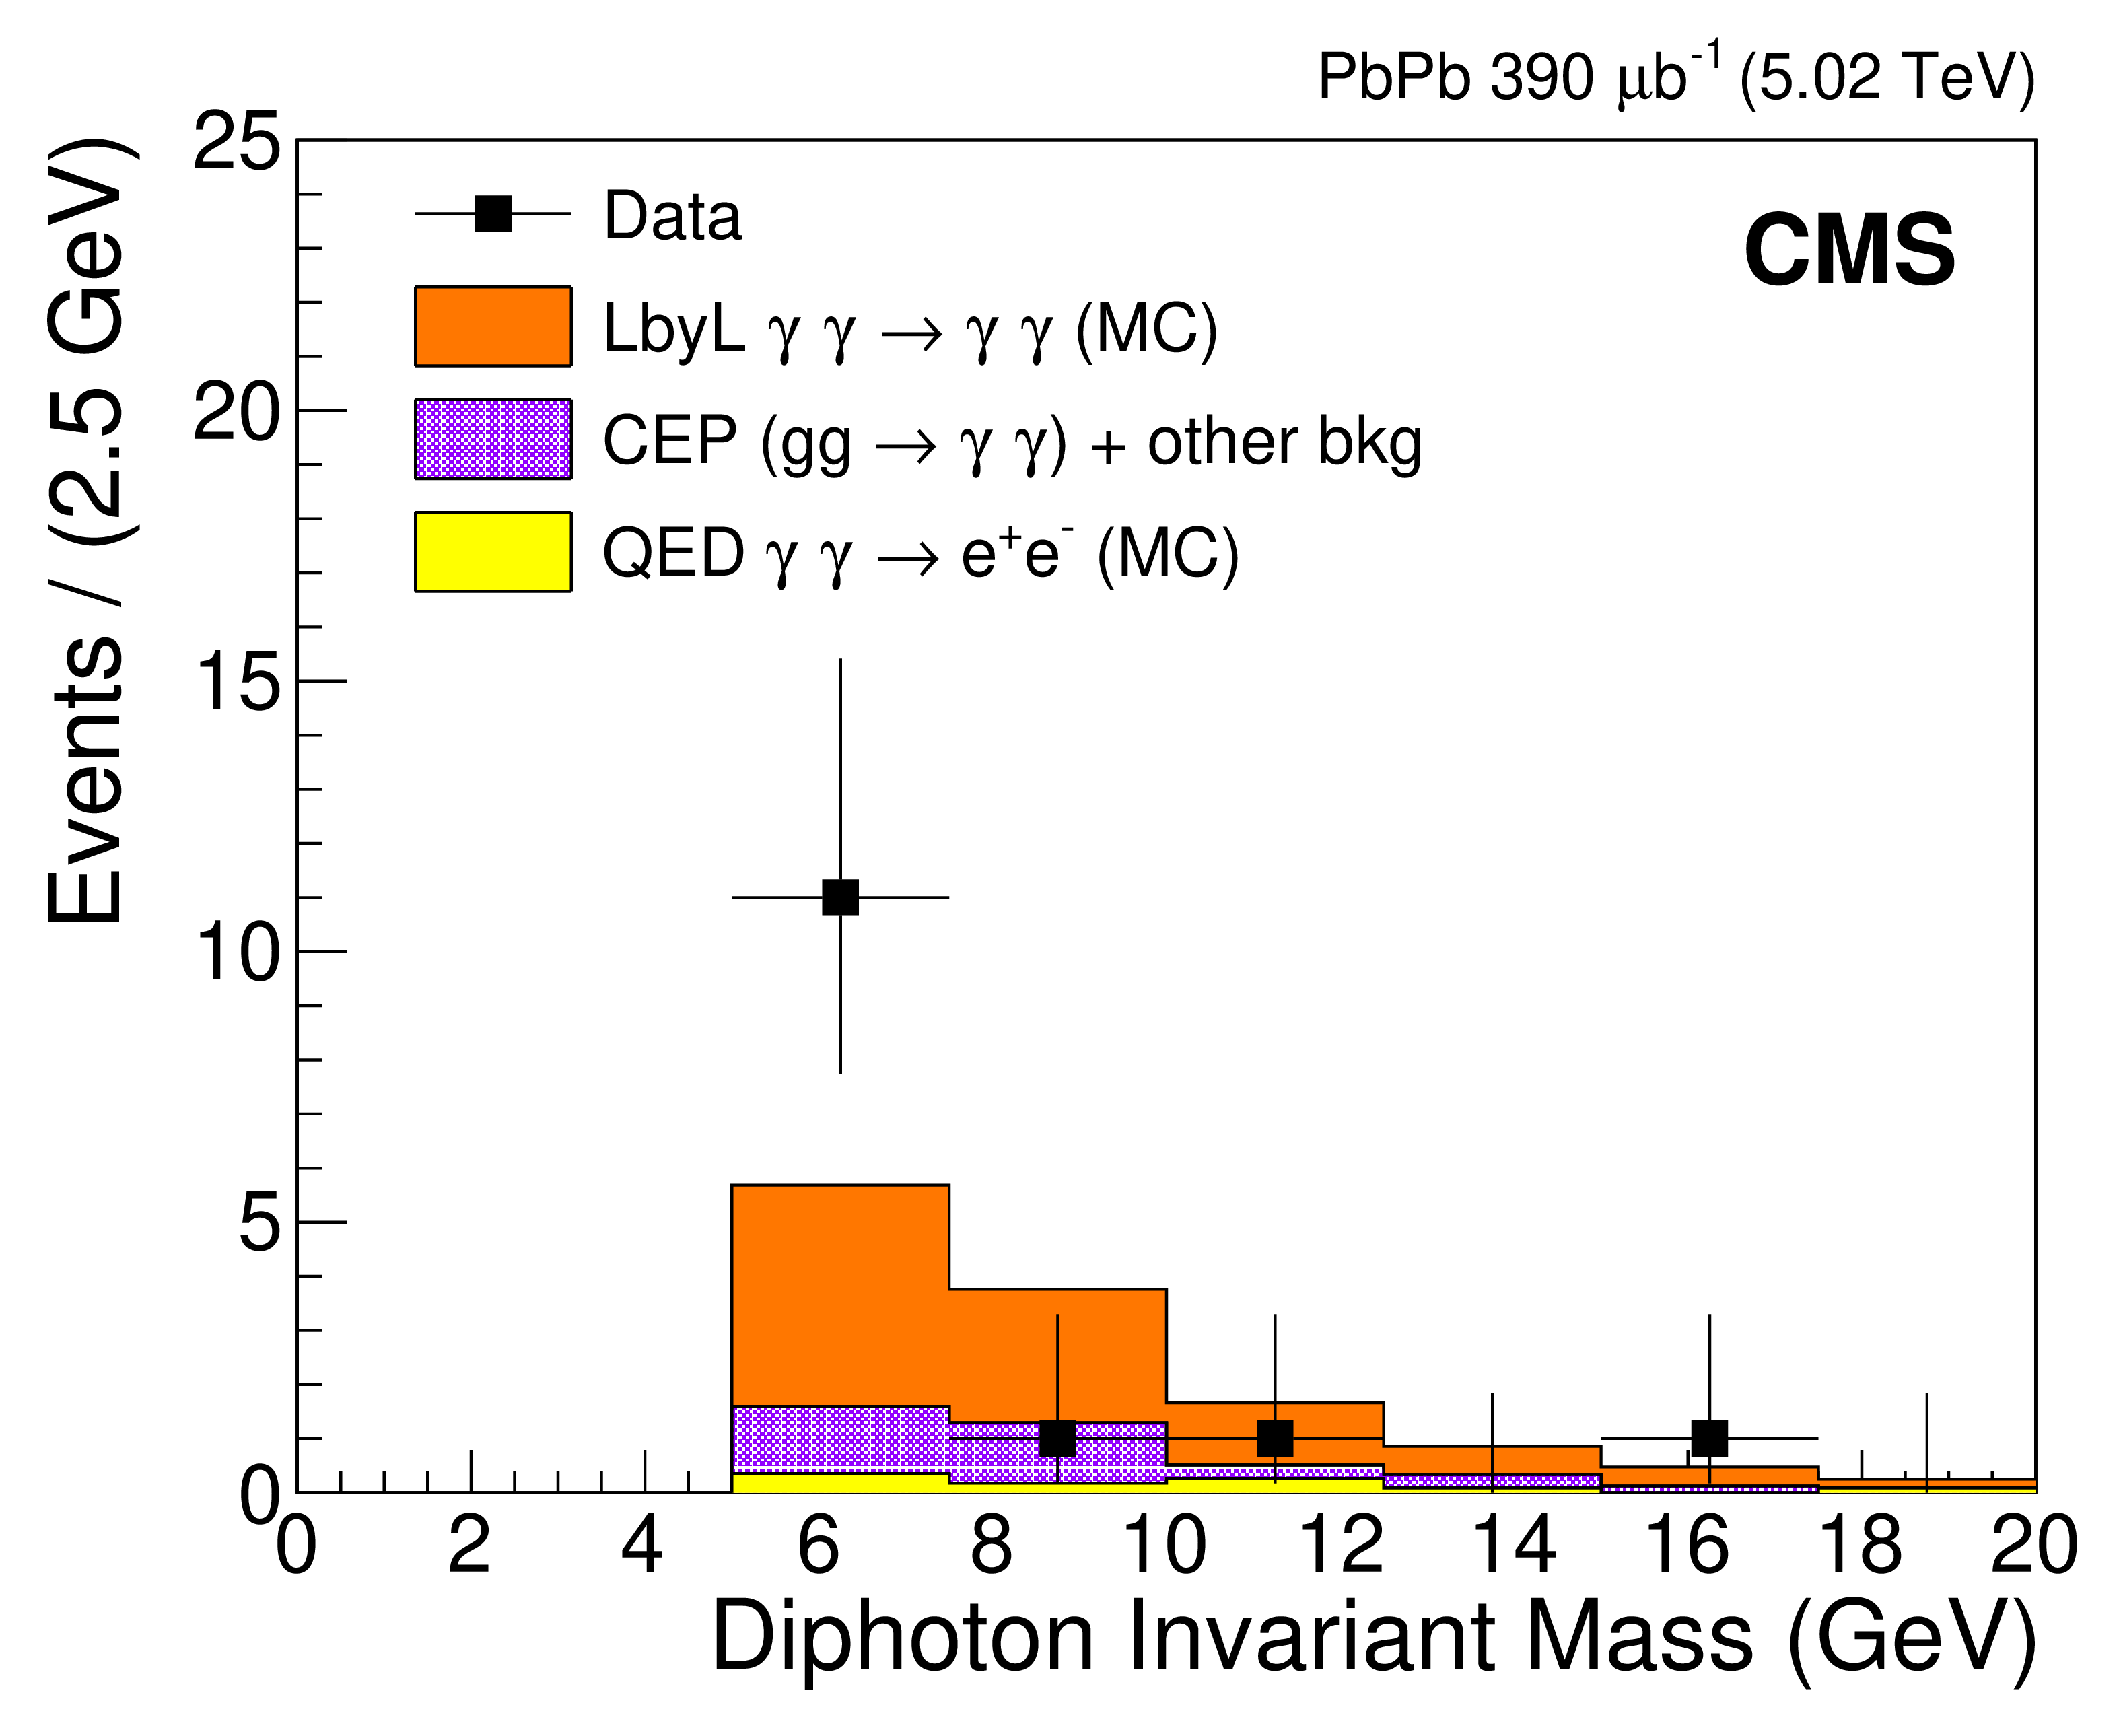
Figure 5-d:
Distribution of diphoton invariant mass, measured for the fourteen exclusive events passing all selection criteria (squares), compared to the expectations of LbL scattering signal (orange histogram), QED $ {{\mathrm {e}^+} {\mathrm {e}^-}}$ MC predictions (yellow histogram), and the CEP plus other backgrounds (light blue histogram, scaled to match the data in the $\text {A}_{\phi} > $ 0.02 region). Signal and QED $ {{\mathrm {e}^+} {\mathrm {e}^-}}$ MC samples are scaled according to their theoretical cross sections and integrated luminosity. The error bars around the data points indicate statistical uncertainties. The horizontal bars around the data symbols indicate the bin size. |
png pdf |
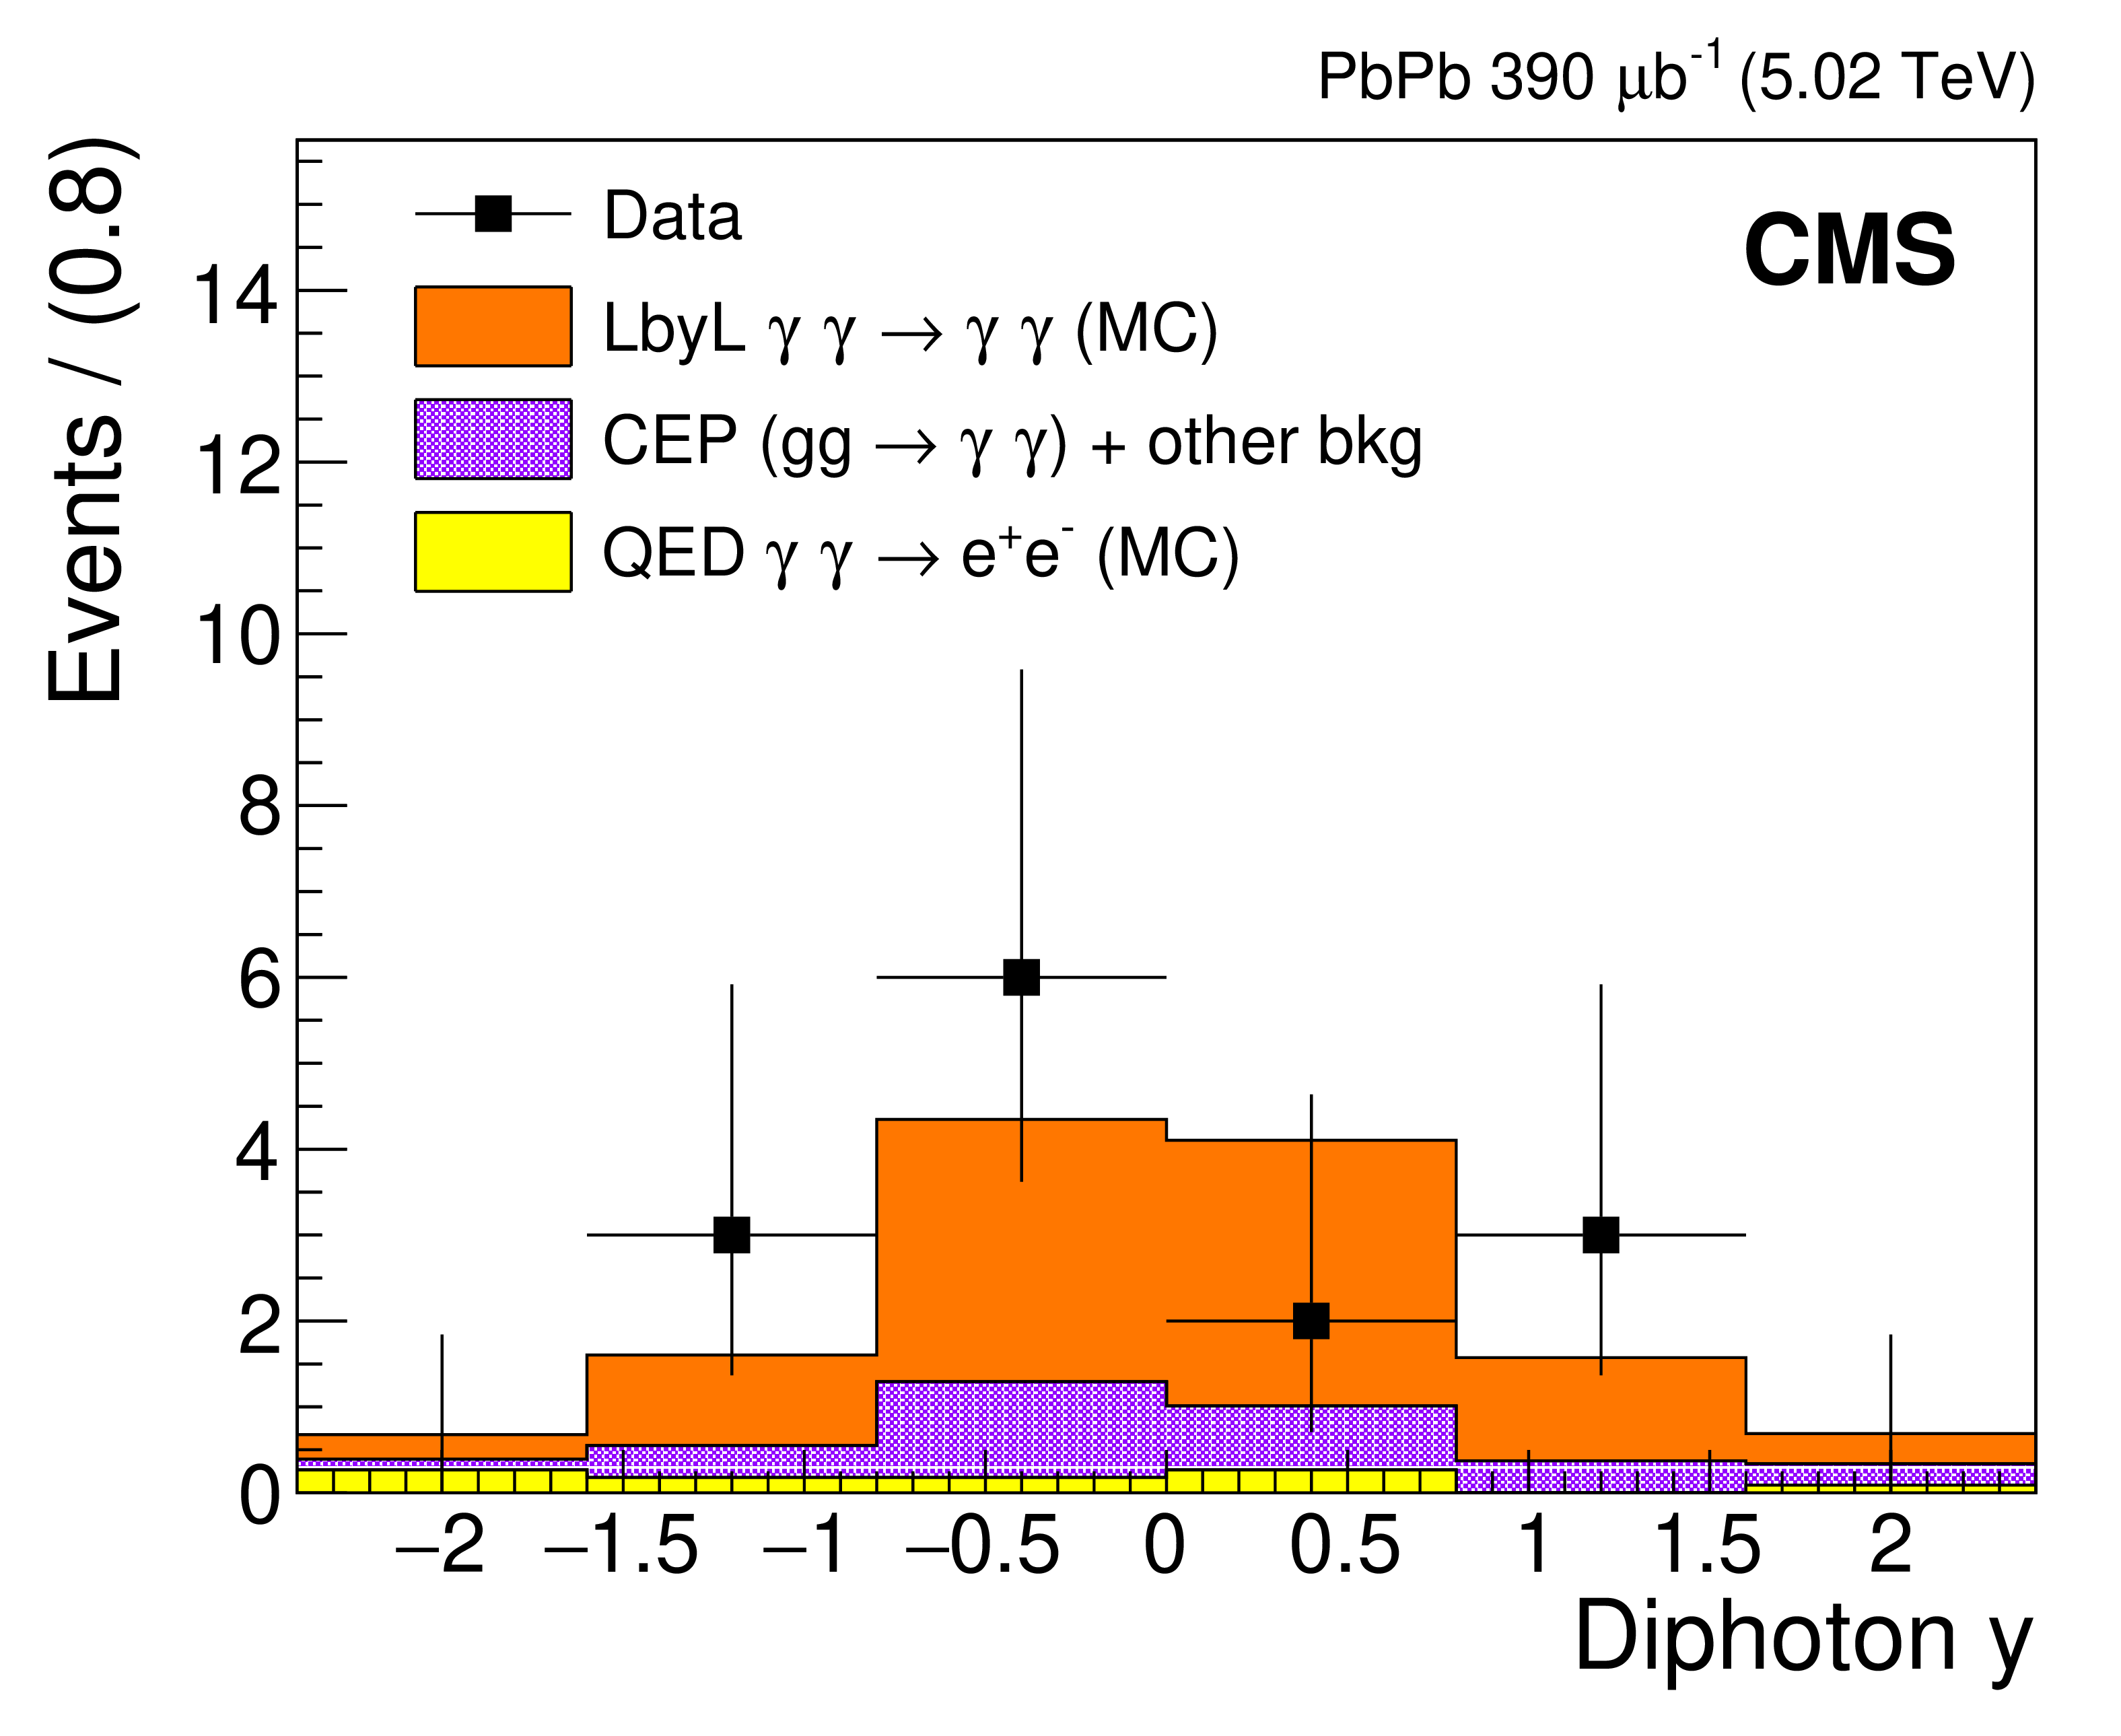
Figure 5-e:
Distribution of diphoton rapidity, measured for the fourteen exclusive events passing all selection criteria (squares), compared to the expectations of LbL scattering signal (orange histogram), QED $ {{\mathrm {e}^+} {\mathrm {e}^-}}$ MC predictions (yellow histogram), and the CEP plus other backgrounds (light blue histogram, scaled to match the data in the $\text {A}_{\phi} > $ 0.02 region). Signal and QED $ {{\mathrm {e}^+} {\mathrm {e}^-}}$ MC samples are scaled according to their theoretical cross sections and integrated luminosity. The error bars around the data points indicate statistical uncertainties. The horizontal bars around the data symbols indicate the bin size. |
png pdf |
Figure 5-f:
Distribution of diphoton ${p_{\mathrm {T}}}$, measured for the fourteen exclusive events passing all selection criteria (squares), compared to the expectations of LbL scattering signal (orange histogram), QED $ {{\mathrm {e}^+} {\mathrm {e}^-}}$ MC predictions (yellow histogram), and the CEP plus other backgrounds (light blue histogram, scaled to match the data in the $\text {A}_{\phi} > $ 0.02 region). Signal and QED $ {{\mathrm {e}^+} {\mathrm {e}^-}}$ MC samples are scaled according to their theoretical cross sections and integrated luminosity. The error bars around the data points indicate statistical uncertainties. The horizontal bars around the data symbols indicate the bin size. |
png pdf |
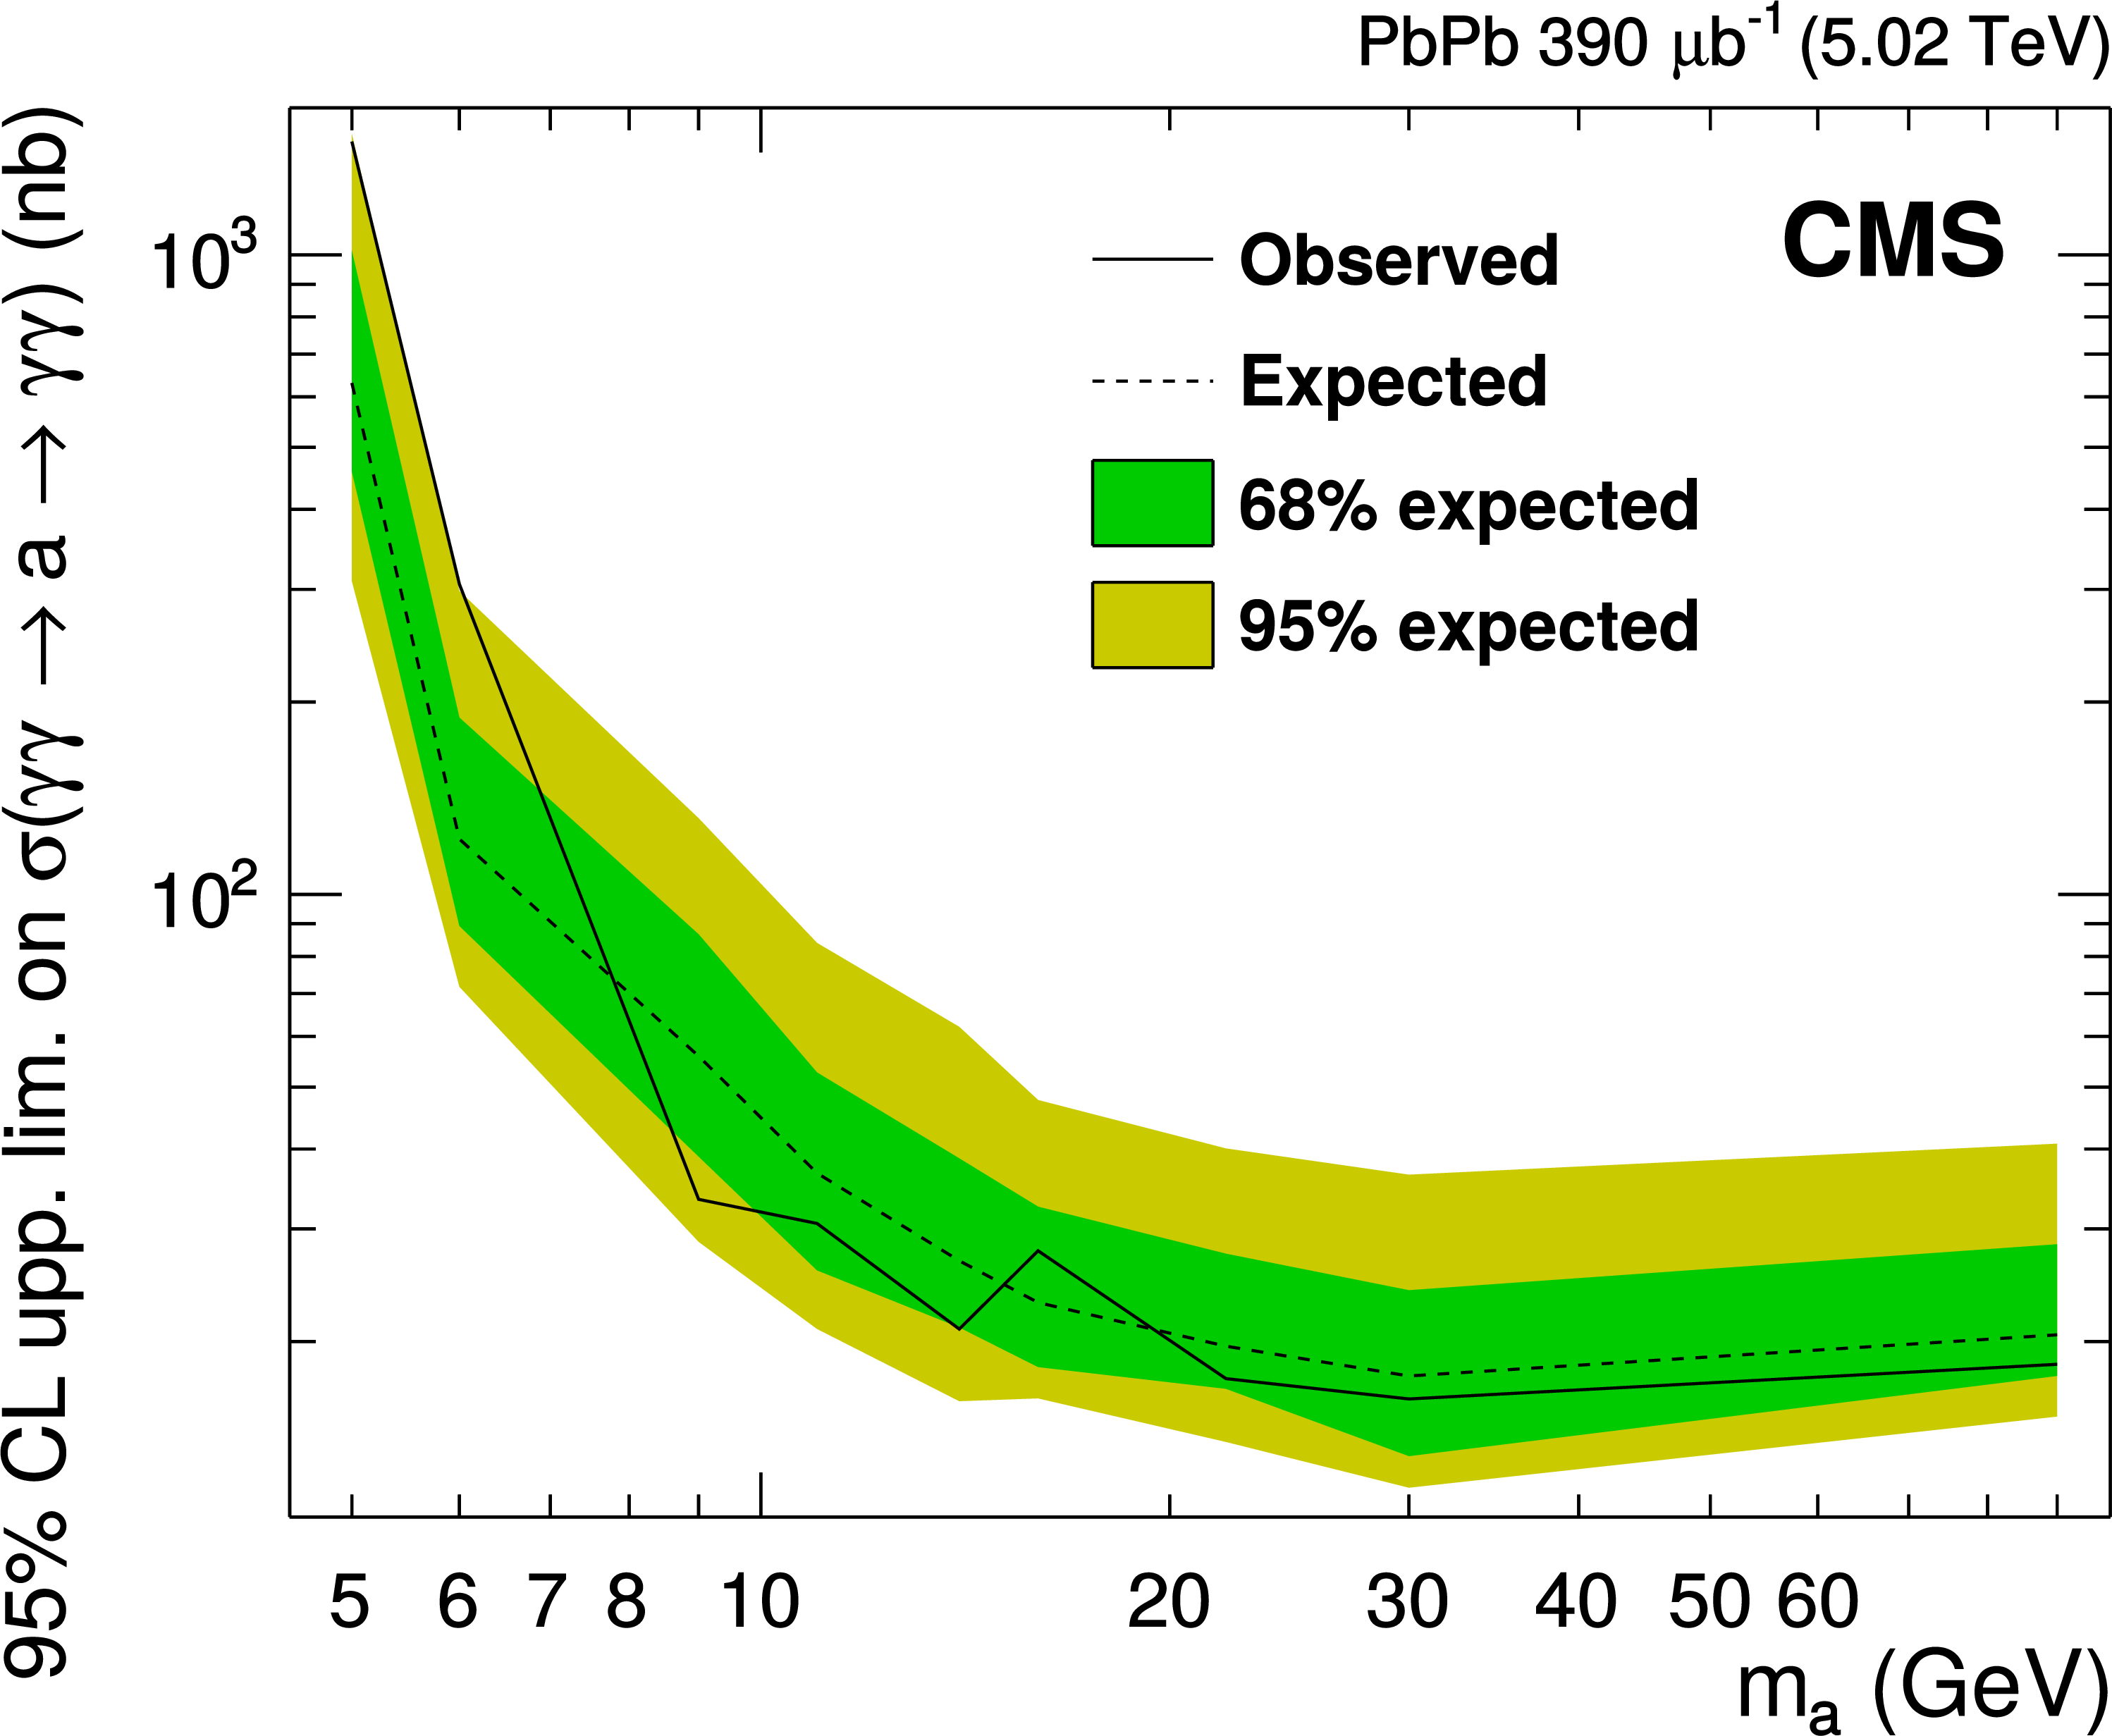
Figure 6:
Observed (full line) and expected (dotted line) 95% CL limits on the production cross section $\sigma ({\gamma \gamma}\to {\mathrm {a}} \to {\gamma \gamma})$ as a function of the ALP mass $m_ {\mathrm {a}} $ in ultraperipheral PbPb collisions at $ {\sqrt {\smash [b]{s_{_{\mathrm {NN}}}}}} = $ 5.02 TeV. The inner (green)and outer (yellow) bands indicate the regions containing 68 and 95%, respectively, of the distribution of limits expected under the background-only hypothesis. |

png pdf |
Figure 7:
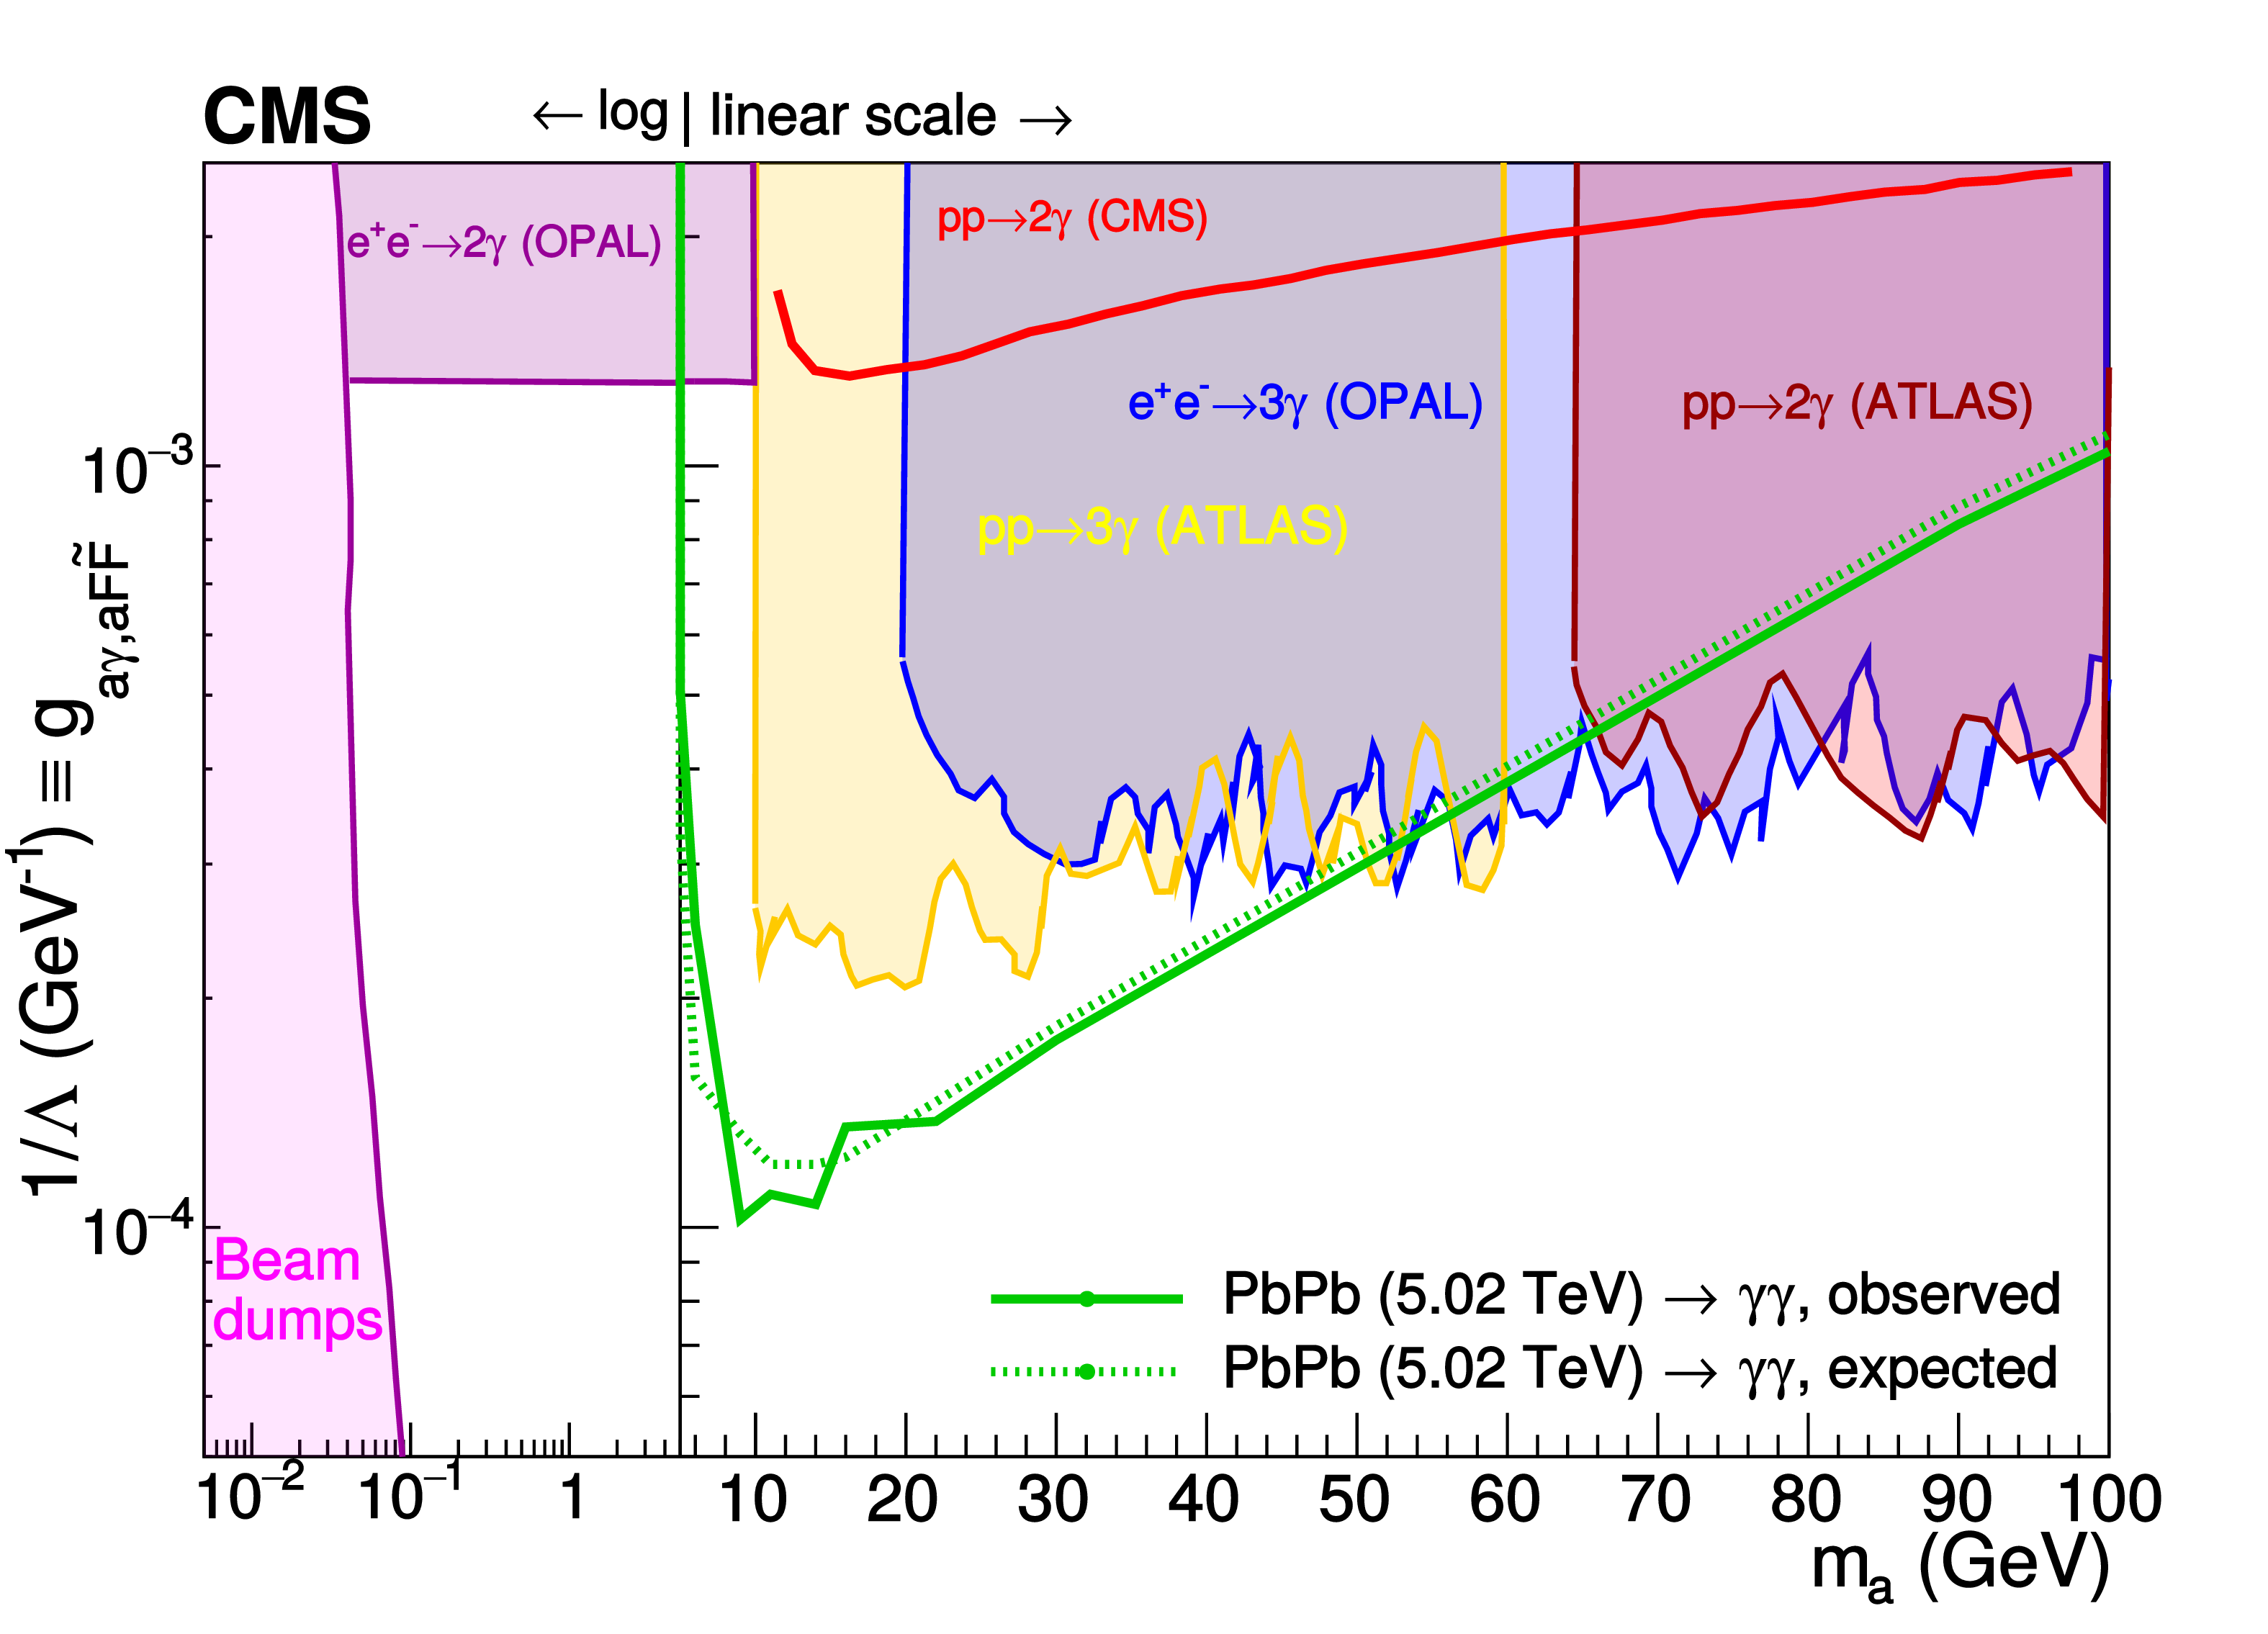
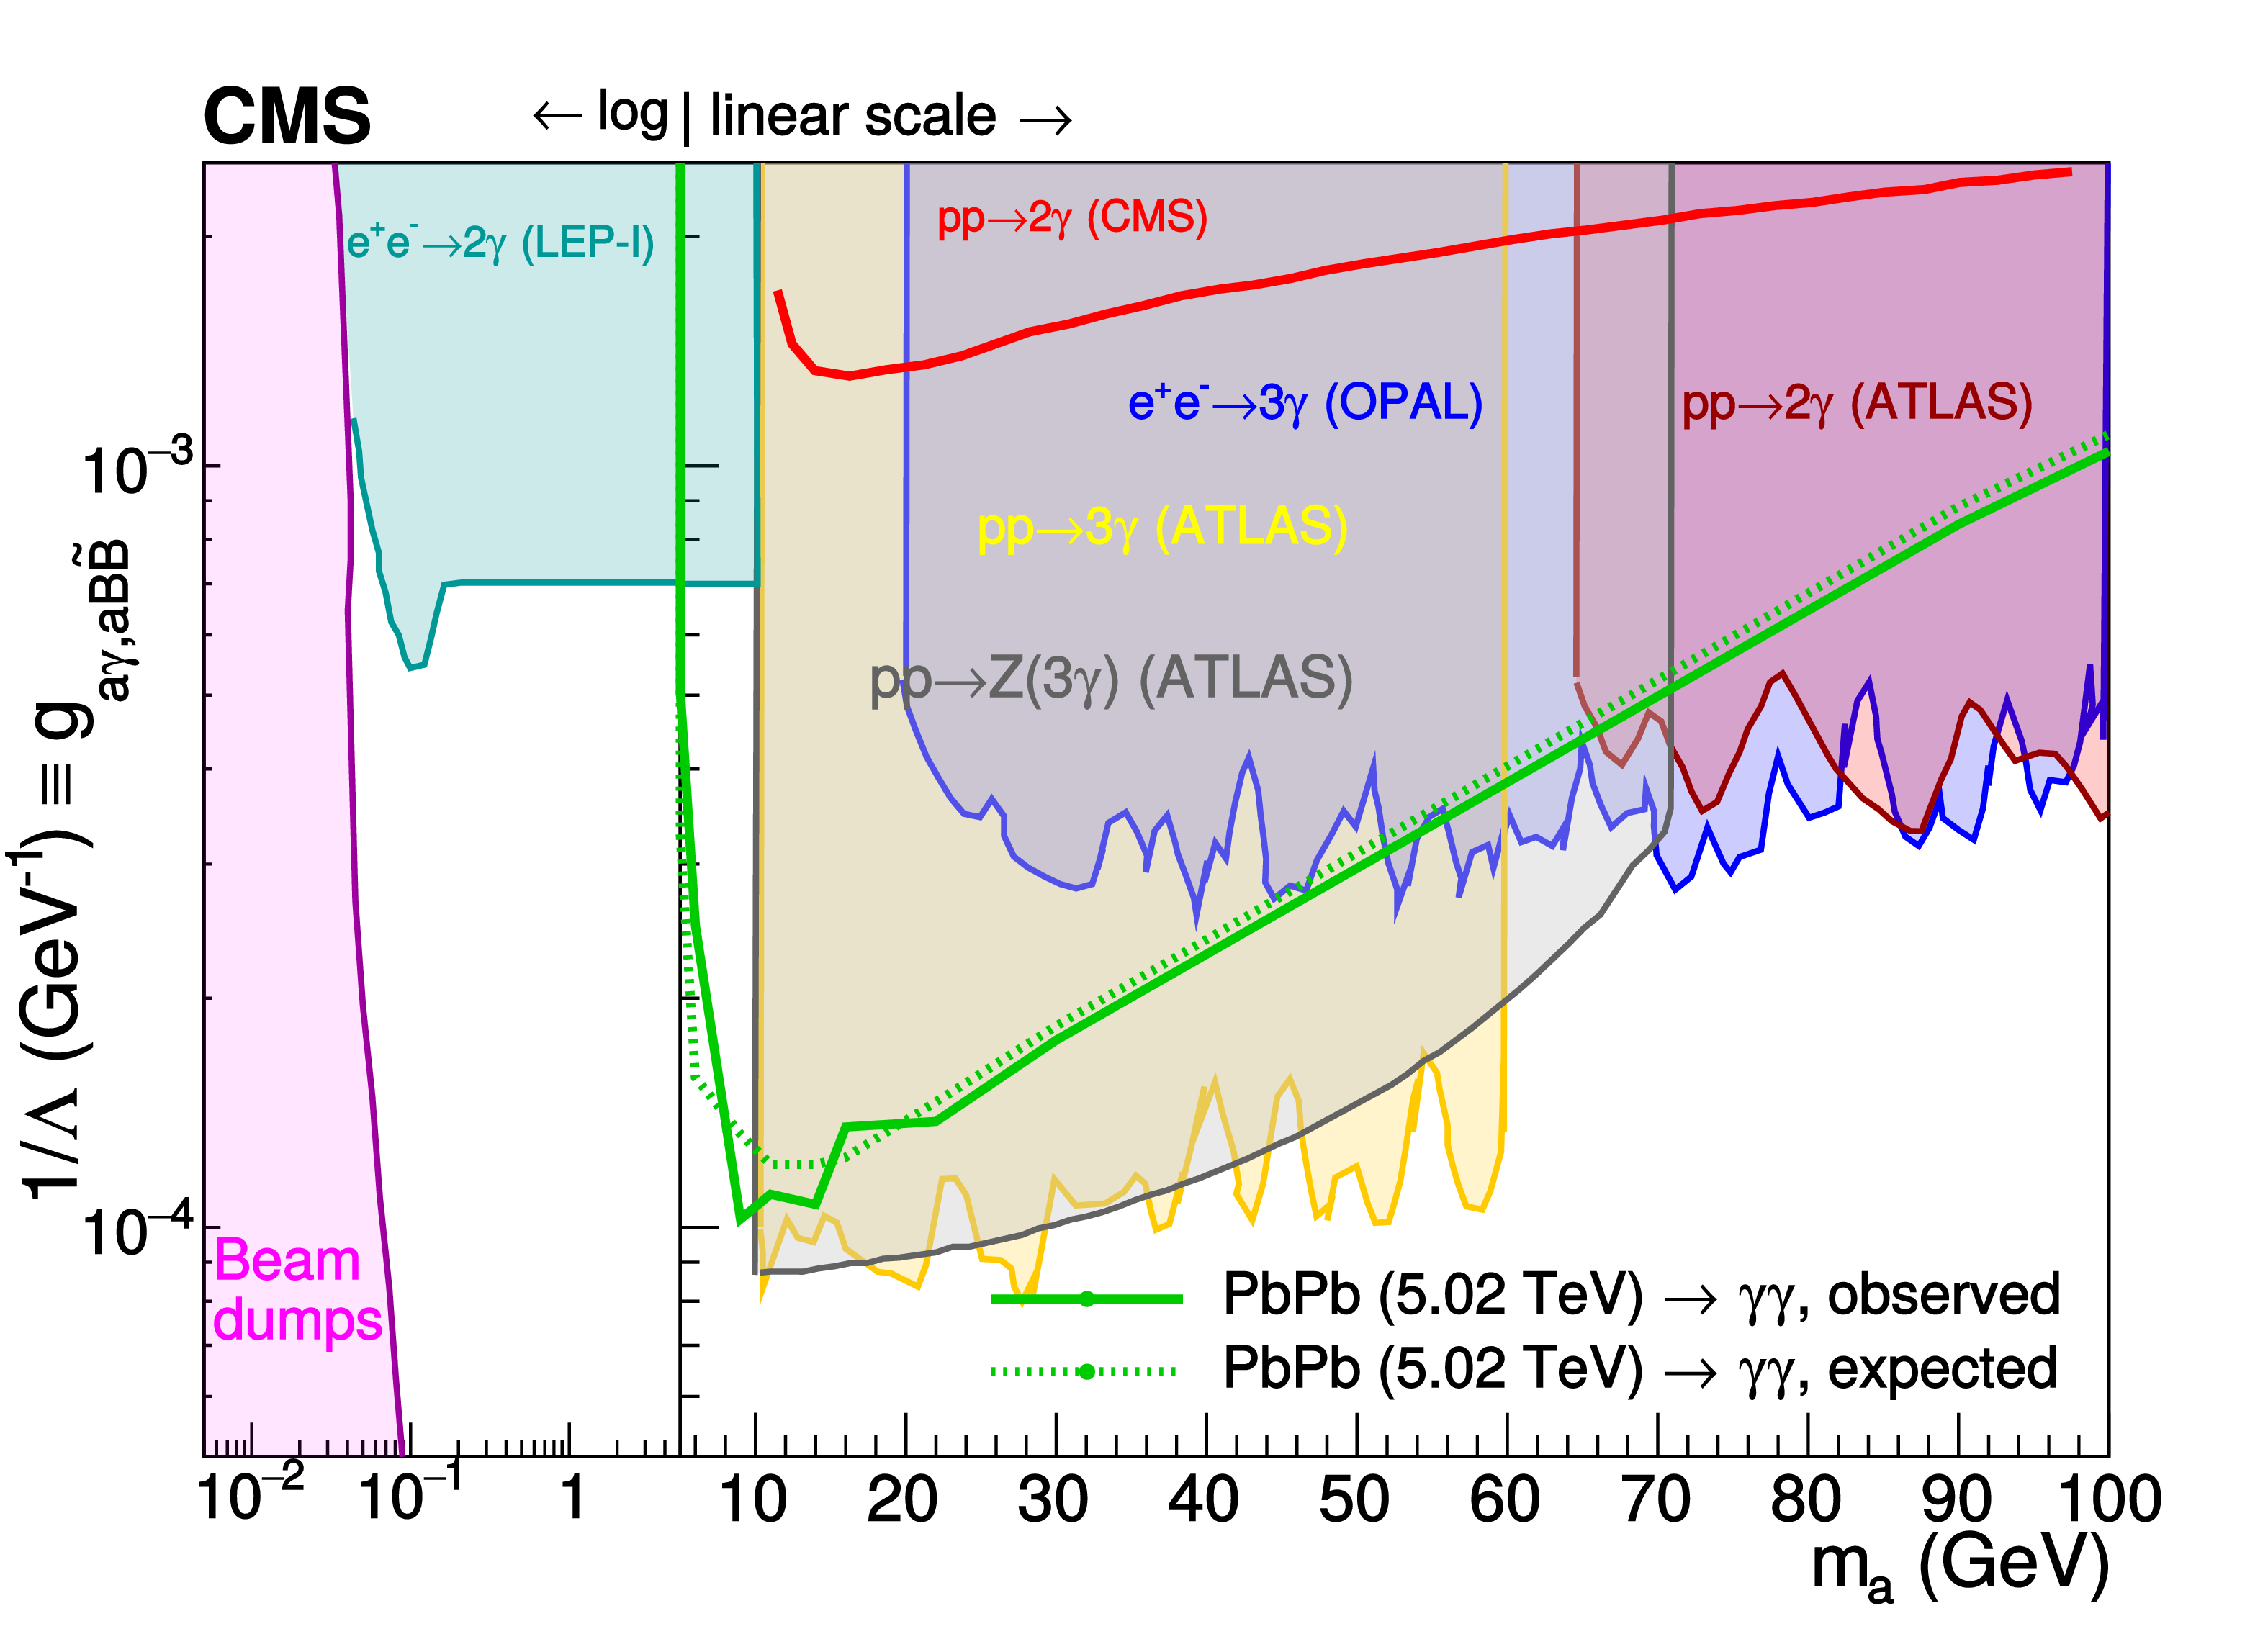
Exclusion limits at 95% CL in the ALP-photon coupling $g_{{\mathrm {a}} \gamma}$ versus ALP mass $m_ {\mathrm {a}} $ plane, for the operators $ {\mathrm {a}} F\tilde{F}/4\Lambda $ (left, assuming ALP coupling to photons only) and $ {\mathrm {a}} B\tilde{B}/4\Lambda \cos^2\theta _\textrm {W}$ (right, including also the hypercharge coupling, thus processes involving the ${{\mathrm {Z}}}$ boson) derived in Refs. [30,55] from measurements at beam dumps [59], in ${\mathrm {e}^+} {\mathrm {e}^-}$ collisions at LEP-I [55] and LEP-II [56], and in pp collisions at the LHC [13,57,58], and compared to the present PbPb limits. |
png pdf |
Figure 7-a:
Exclusion limits at 95% CL in the ALP-photon coupling $g_{{\mathrm {a}} \gamma}$ versus ALP mass $m_ {\mathrm {a}} $ plane, for the operators $ {\mathrm {a}} F\tilde{F}/4\Lambda $, assuming ALP coupling to photons only, derived in Refs. [30,55] from measurements at beam dumps [59], in ${\mathrm {e}^+} {\mathrm {e}^-}$ collisions at LEP-I [55] and LEP-II [56], and in pp collisions at the LHC [13,57,58], and compared to the present PbPb limits. |
png pdf |
Figure 7-b:
Exclusion limits at 95% CL in the ALP-photon coupling $g_{{\mathrm {a}} \gamma}$ versus ALP mass $m_ {\mathrm {a}} $ plane, for the operators $ {\mathrm {a}} B\tilde{B}/4\Lambda \cos^2\theta _\textrm {W}$, including also the hypercharge coupling, thus processes involving the ${{\mathrm {Z}}}$ boson, derived in Refs. [30,55] from measurements at beam dumps [59], in ${\mathrm {e}^+} {\mathrm {e}^-}$ collisions at LEP-I [55] and LEP-II [56], and in pp collisions at the LHC [13,57,58], and compared to the present PbPb limits. |
| Tables | |
png pdf |
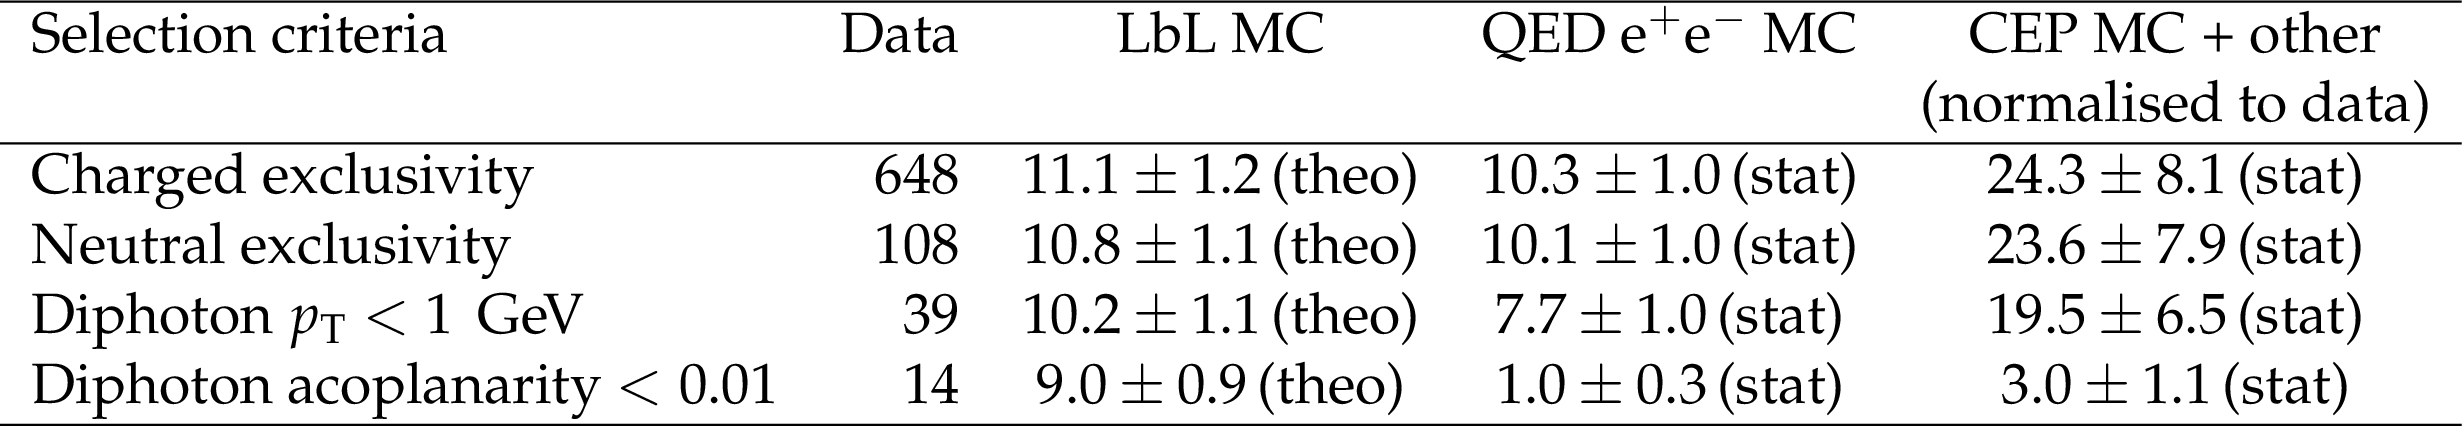
Table 1:
Number of diphoton candidates measured in data and expected from MC simulation for LbL scattering, QED $ {{\mathrm {e}^+} {\mathrm {e}^-}}$ production, and from the CEP+other contributions, after each event selection step (cumulative) described in the text. The yields of the simulated processes are scaled according to their theoretical cross sections and the integrated luminosity of the analysed data set. The CEP+other values are normalised from the high-acoplanarity tail with a scale factor estimated from the data as described in the text. The LbL scattering simulation uncertainty quoted is that of the theoretical uncertainty of the prediction, whereas the uncertainties in the QED $ {{\mathrm {e}^+} {\mathrm {e}^-}}$ and CEP+others yields are statistical. |
png pdf |
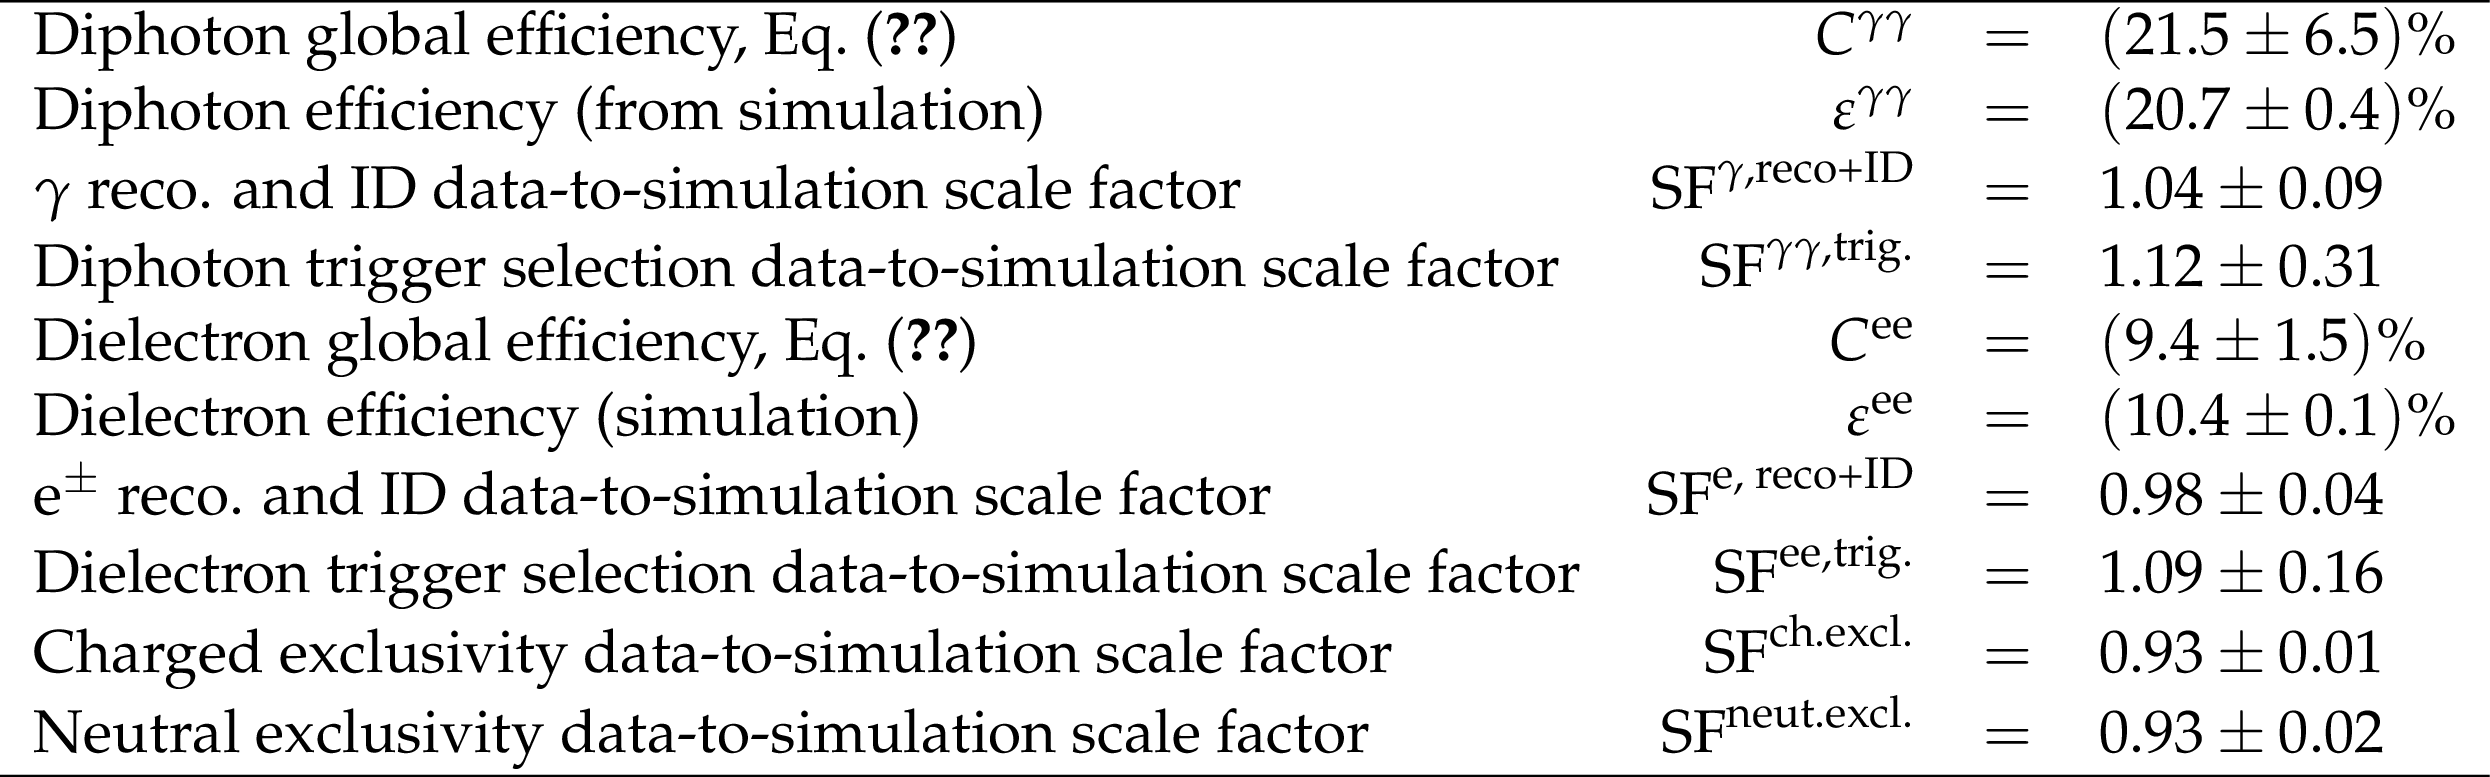
Table 2:
Summary of the overall cross section measurement efficiencies $C^{{\gamma \gamma}, {\mathrm {e}} {\mathrm {e}}}$, efficiencies from simulation $\varepsilon ^{{\gamma \gamma}, {\mathrm {e}} {\mathrm {e}}}$, and individual data-to-simulation scale factors $\text {SF}^{{\gamma \gamma}, {\mathrm {e}} {\mathrm {e}}}$, obtained for the diphoton and dielectron analyses. "Reco. and ID'' stands for reconstruction and identification. All quoted uncertainties are systematic. |

png pdf |
Table 3:
Summary of the systematic uncertainties in the ratio of the fiducial LbL scattering to total QED $ {{\mathrm {e}^+} {\mathrm {e}^-}}$ cross sections. |
| Summary |
| Evidence for light-by-light (LbL) scattering, ${\gamma\gamma} \to {\gamma\gamma}$, in ultraperipheral PbPb collisions at a centre-of-mass energy per nucleon pair of 5.02 TeV has been reported, based on a data sample corresponding to an integrated luminosity of 390 $\mu$b$^{-1}$ recorded by the CMS experiment at the LHC in 2015. Fourteen LbL-scattering candidate events passing all selection requirements have been observed, with photon transverse energy above $2 GeV$ and pseudorapidity $|{\eta}| < $ 2.4, diphoton invariant mass greater than 5 GeV, diphoton transverse momentum lower than 1 GeV, and diphoton acoplanarity below 0.01. Both the measured total yields and kinematic distributions are in accord with the expectations for the LbL scattering signal plus small residual backgrounds that are mostly from misidentified exclusive dielectron (${\gamma\gamma}\to{\mathrm{e^{+}}\mathrm{e^{-}}}$) and gluon-induced central exclusive ($\mathrm{g}\mathrm{g}\to {\gamma\gamma}$) processes. The observed (expected) significance of the LbL scattering signal over the background-only expectation is 4.1 (4.4) standard deviations. The measured fiducial light-by-light scattering cross section, $\sigma_\text{fid} ({\gamma\gamma} \to {\gamma\gamma}) = $ 120 $\pm$ 46 (stat) $\pm$ 28 (syst) $\pm$ 4 (theo) nb, is consistent with the standard model expectation. The measured exclusive diphoton invariant mass distribution is used to set new exclusion limits on the production of pseudoscalar axion-like particles (ALPs), via the process ${\gamma\gamma} \to {\mathrm{a}} \to {\gamma\gamma}$, over the $m_{\mathrm{a}} = $ 5-90 GeV mass range. For ALPs coupling to the electromagnetic (and electroweak) current, the derived exclusion limits are currently the best over the $m_{\mathrm{a}} = $ 5-50 GeV (5-10 GeV) mass range. |
| References | ||||
| 1 | R. S. Van Dyck, P. B. Schwinberg, and H. G. Dehmelt | New high precision comparison of electron and positron g-factors | PRL 59 (1987) 26 | |
| 2 | Muon g-2 Collaboration | Precise measurement of the positive muon anomalous magnetic moment | PRL 86 (2001) 2227 | hep-ex/0102017 |
| 3 | A. I. Milstein and M. Schumacher | Present status of Delbr$ uck $ scattering | PR 243 (1994) 183 | |
| 4 | S. L. Adler | Photon splitting and photon dispersion in a strong magnetic field | Annals Phys. 67 (1971) 599 | |
| 5 | PVLAS Collaboration | Limits on low energy photon-photon scattering from an experiment on magnetic vacuum birefringence | PRD 78 (2008) 032006 | 0805.3036 |
| 6 | G. Jarlskog et al. | Measurement of Delbr$ uck $ scattering and observation of photon splitting at high energies | PRD 8 (1973) 3813 | |
| 7 | D. d'Enterria and G. G. da Silveira | Observing light-by-light scattering at the Large Hadron Collider | PRL 111 (2013) 080405 | 1305.7142 |
| 8 | A. J. Baltz et al. | The physics of ultraperipheral collisions at the LHC | PR 458 (2008) 1 | 0706.3356 |
| 9 | C. F. von Weizsacker | Radiation emitted in collisions of very fast electrons | Z. Phys. 88 (1934) 612 | |
| 10 | E. J. Williams | Nature of the high-energy particles of penetrating radiation and status of ionization and radiation formulae | PR45 (1934) 729 | |
| 11 | E. Fermi | On the theory of collisions between atoms and electrically charged particles | Nuovo Cim. 2 (1925) 143 | hep-th/0205086 |
| 12 | CMS Collaboration | Exclusive photon-photon production of muon pairs in proton-proton collisions at $ \sqrt{s} = $ 7 TeV | JHEP 01 (2012) 052 | CMS-FWD-10-005 1111.5536 |
| 13 | CMS Collaboration | Search for exclusive or semi-exclusive photon pair production and observation of exclusive and semi-exclusive electron pair production in pp collisions at $ \sqrt{s} = $ 7 TeV | JHEP 11 (2012) 080 | CMS-FWD-11-004 1209.1666 |
| 14 | CMS and TOTEM Collaborations | Observation of proton-tagged, central (semi)exclusive production of high-mass lepton pairs in pp collisions at 13 TeV with the CMS-TOTEM precision proton spectrometer | JHEP 07 (2018) 153 | 1803.04496 |
| 15 | ALICE Collaboration | Coherent $ \mathrm{J/\psi} $ photoproduction in ultra-peripheral Pb-Pb collisions at $ \sqrt {\smash [b]{s_{_{\mathrm {NN}}}}} = $ 2.76 TeV | PLB 718 (2013) 1273 | 1209.3715 |
| 16 | ALICE Collaboration | Charmonium and $ \mathrm{e^{+}e^{-}} $ pair photoproduction at mid-rapidity in ultra-peripheral Pb-Pb collisions at $ \sqrt {\smash [b]{s_{_{\mathrm {NN}}}}} = $ 2.76 TeV | EPJC 73 (2013) 2617 | 1305.1467 |
| 17 | ALICE Collaboration | Exclusive $ \mathrm{J/\psi} $ photoproduction off protons in ultra-peripheral p-Pb collisions at $ \sqrt {\smash [b]{s_{_{\mathrm {NN}}}}} = $ 5.02 TeV | PRL 113 (2014) 232504 | 1406.7819 |
| 18 | ATLAS Collaboration | Measurement of exclusive $ \gamma\gamma \to \mathrm{e^{+}e^{-}} $ production in proton-proton collisions at $ \sqrt{s} = $ 7 TeV with the ATLAS detector | PLB 749 (2015) 242 | 1506.07098 |
| 19 | ATLAS Collaboration | Measurement of the exclusive $ \gamma\gamma \to \mu^+ \mu^- $ process in proton-proton collisions at $ \sqrt{s} = $ 13 TeV with the ATLAS detector | PLB 777 (2018) 303 | 1708.04053 |
| 20 | LHCb Collaboration | Exclusive $ \mathrm{J/\psi} $ and $ \psi(\text{2S}) $ production in pp collisions at $ \sqrt{s} = $ 7 TeV | JPG 40 (2013) 045001 | 1301.7084 |
| 21 | LHCb Collaboration | Updated measurements of exclusive $ \mathrm{J/\psi} $ and $ \psi(\text{2S}) $ production cross-sections in pp collisions at $ \sqrt{s} = $ 7 TeV | JPG 41 (2014) 055002 | 1401.3288 |
| 22 | CMS Collaboration | Study of exclusive two-photon production of $ \mathrm{W}^+\mathrm{W}^- $ in pp collisions at $ \sqrt{s} = $ 7 TeV and constraints on anomalous quartic gauge couplings | JHEP 07 (2013) 116 | CMS-FSQ-12-010 1305.5596 |
| 23 | CMS Collaboration | Evidence for exclusive $ \gamma\gamma \to \mathrm{W}^+\mathrm{W}^- $ production and constraints on anomalous quartic gauge couplings in pp collisions at $ \sqrt{s} = $ 7 and 8 TeV | JHEP 08 (2016) 119 | CMS-FSQ-13-008 1604.04464 |
| 24 | ATLAS Collaboration | Measurement of exclusive $ \gamma\gamma\to \mathrm{W}^+\mathrm{W}^- $ production and search for exclusive Higgs boson production in pp collisions at $ \sqrt{s} = $ 8 TeV using the ATLAS detector | PRD 94 (2016) 032011 | 1607.03745 |
| 25 | ATLAS Collaboration | Evidence for light-by-light scattering in heavy-ion collisions with the ATLAS detector at the LHC | NP 13 (2017) 852 | 1702.01625 |
| 26 | V. A. Khoze, A. D. Martin, M. G. Ryskin, and W. J. Stirling | Diffractive $ \gamma\gamma $ production at hadron colliders | EPJC 38 (2005) 475 | hep-ph/0409037 |
| 27 | I. F. Ginzburg and A. Schiller | Search for a heavy magnetic monopole at the Tevatron and CERN LHC | PRD 57 (1998) 6599 | hep-ph/9802310 |
| 28 | S. Fichet et al. | Light-by-light scattering with intact protons at the LHC: from standard model to new physics | JHEP 02 (2015) 165 | 1411.6629 |
| 29 | S. Fichet | Shining light on polarizable dark particles | JHEP 04 (2017) 088 | 1609.01762 |
| 30 | S. Knapen, T. Lin, H. K. Lou, and T. Melia | Searching for axionlike particles with ultraperipheral heavy-ion collisions | PRL 118 (2017) 171801 | 1607.06083 |
| 31 | H. Sun | Large extra dimension effects through light-by-light scattering at the CERN LHC | EPJC 74 (2014) 2977 | 1406.3897 |
| 32 | J. Ellis, N. E. Mavromatos, and T. You | Light-by-light scattering constraint on Born-Infeld theory | PRL 118 (2017) 261802 | 1703.08450 |
| 33 | E. Chapon, C. Royon, and O. Kepka | Anomalous quartic $ \mathrm{W}\mathrm{W}\gamma\gamma $, $ \mathrm{Z}\mathrm{Z}\gamma\gamma $, and trilinear $ \mathrm{W}\mathrm{W}\gamma $ couplings in two-photon processes at high luminosity at the LHC | PRD 81 (2010) 074003 | 0912.5161 |
| 34 | CMS Collaboration | Description and performance of track and primary-vertex reconstruction with the CMS tracker | JINST 9 (2014) P10009 | CMS-TRK-11-001 1405.6569 |
| 35 | CMS Collaboration | The CMS trigger system | JINST 12 (2017) P01020 | CMS-TRG-12-001 1609.02366 |
| 36 | CMS Collaboration | The CMS experiment at the CERN LHC | JINST 3 (2008) S08004 | CMS-00-001 |
| 37 | J. Alwall et al. | The automated computation of tree-level and next-to-leading order differential cross sections, and their matching to parton shower simulations | JHEP 07 (2014) 079 | 1405.0301 |
| 38 | D. d'Enterria and J.-P. Lansberg | Study of Higgs boson production and its $ \mathrm{b\bar{b}} $ decay in $ \gamma\gamma $ processes in proton-nucleus collisions at the LHC | PRD 81 (2010) 014004 | 0909.3047 |
| 39 | Z. Bern et al. | QCD and QED corrections to light by light scattering | JHEP 11 (2001) 031 | hep-ph/0109079 |
| 40 | S. R. Klein and J. Nystrand | Photoproduction of quarkonium in proton-proton and nucleus-nucleus collisions | PRL 92 (2004) 142003 | hep-ex/0311164 |
| 41 | S. R. Klein et al. | STARlight: A Monte Carlo simulation program for ultra-peripheral collisions of relativistic ions | CPC 212 (2017) 258 | 1607.03838 |
| 42 | L. A. Harland-Lang, V. A. Khoze, and M. G. Ryskin | Exclusive physics at the LHC with SuperChic 2 | EPJC 76 (2016) 9 | 1508.02718 |
| 43 | K. J. Eskola, P. Paakkinen, H. Paukkunen, and C. A. Salgado | EPPS16: Nuclear parton distributions with LHC data | EPJC 77 (2017) 163 | 1612.05741 |
| 44 | GEANT4 Collaboration | GEANT4--a simulation toolkit | NIMA 506 (2003) 250 | |
| 45 | CMS Collaboration | Precision measurement of the structure of the CMS inner tracking system using nuclear interactions | Submitted to JINST | CMS-TRK-17-001 1807.03289 |
| 46 | CMS Collaboration | Particle-flow reconstruction and global event description with the CMS detector | JINST 12 (2017) P10003 | CMS-PRF-14-001 1706.04965 |
| 47 | CMS Collaboration | Performance of photon reconstruction and identification with the CMS detector in proton-proton collisions at $ \sqrt{s} = $ 8 TeV | JINST 10 (2015) P08010 | CMS-EGM-14-001 1502.02702 |
| 48 | CMS Collaboration | Measurements of inclusive W and Z cross sections in pp collisions at $ \sqrt{s} = $ 7 TeV | JHEP 01 (2011) 080 | CMS-EWK-10-002 1012.2466 |
| 49 | R. J. Barlow and C. Beeston | Fitting using finite Monte Carlo samples | CPC 77 (1993) 219 | |
| 50 | J. S. Conway | Incorporating nuisance parameters in likelihoods for multisource spectra | in Proceedings, PHYSTAT 2011 Workshop on Statistical Issues Related to Discovery Claims in Search Experiments and Unfolding, CERN,Geneva, Switzerland 17-20 January 2011, p. 115 2011 | 1103.0354 |
| 51 | C. Loizides, J. Kamin, and D. d'Enterria | Improved Monte Carlo Glauber predictions at present and future nuclear colliders | PRC 97 (2018) 054910 | 1710.07098 |
| 52 | T. Junk | Confidence level computation for combining searches with small statistics | NIMA 434 (1999) 435 | hep-ex/9902006 |
| 53 | A. L. Read | Presentation of search results: The CL$ _{\text{s}} $ technique | JPG 28 (2002) 2693 | |
| 54 | The ATLAS Collaboration, The CMS Collaboration, The LHC Higgs Combination Group | Procedure for the LHC Higgs boson search combination in Summer 2011 | CMS-NOTE-2011-005 | |
| 55 | J. Jaeckel and M. Spannowsky | Probing MeV to 90 GeV axion-like particles with LEP and LHC | PLB 753 (2016) 482 | 1509.00476 |
| 56 | OPAL Collaboration | Multiphoton production in $ \mathrm{e^{+}e^{-}} $ collisions at $ \sqrt{s} = $ 181--209 GeV | EPJC 26 (2003) 331 | hep-ex/0210016 |
| 57 | ATLAS Collaboration | Search for scalar diphoton resonances in the mass range 65--600 GeV with the ATLAS detector in pp collision data at $ \sqrt{s} = $ 8 TeV | PRL 113 (2014) 171801 | 1407.6583 |
| 58 | ATLAS Collaboration | Search for new phenomena in events with at least three photons collected in pp collisions at $ \sqrt{s} = $ 8 TeV with the ATLAS detector | EPJC 76 (2016) 210 | 1509.05051 |
| 59 | B. Dobrich et al. | ALPtraum: ALP production in proton beam dump experiments | JHEP 02 (2016) 018 | 1512.03069 |
|
|
Compact Muon Solenoid LHC, CERN |
|

|

|

|

|

|