

Compact Muon Solenoid
LHC, CERN
| CMS-HIG-17-018 ; CERN-EP-2018-017 | ||
| Evidence for associated production of a Higgs boson with a top quark pair in final states with electrons, muons, and hadronically decaying $\tau$ leptons at $\sqrt{s} = $ 13 TeV | ||
| CMS Collaboration | ||
| 14 March 2018 | ||
| JHEP 08 (2018) 066 | ||
| Abstract: Results of a search for the standard model Higgs boson produced in association with a top quark pair ($\mathrm{ t \bar{t} H }$) in final states with electrons, muons, and hadronically decaying $\tau$ leptons are presented. The analyzed data set corresponds to an integrated luminosity of 35.9 fb$^{-1}$ recorded in proton-proton collisions at $\sqrt{s} = $ 13 TeV by the CMS experiment in 2016. The sensitivity of the search is improved by using matrix element and machine learning methods to separate the signal from backgrounds. The measured signal rate amounts to 1.23$^{+0.45}_{-0.43}$ times the production rate expected in the standard model, with an observed (expected) significance of 3.2$\sigma$ (2.8$\sigma$), which represents evidence for $\mathrm{ t \bar{t} H }$ production in those final states. An upper limit on the signal rate of 2.1 times the standard model production rate is set at 95% confidence level. | ||
| Links: e-print arXiv:1803.05485 [hep-ex] (PDF) ; CDS record ; inSPIRE record ; HepData record ; CADI line (restricted) ; | ||
| Figures & Tables | Summary | Additional Figures | References | CMS Publications |
|---|
| Figures | |
png pdf |
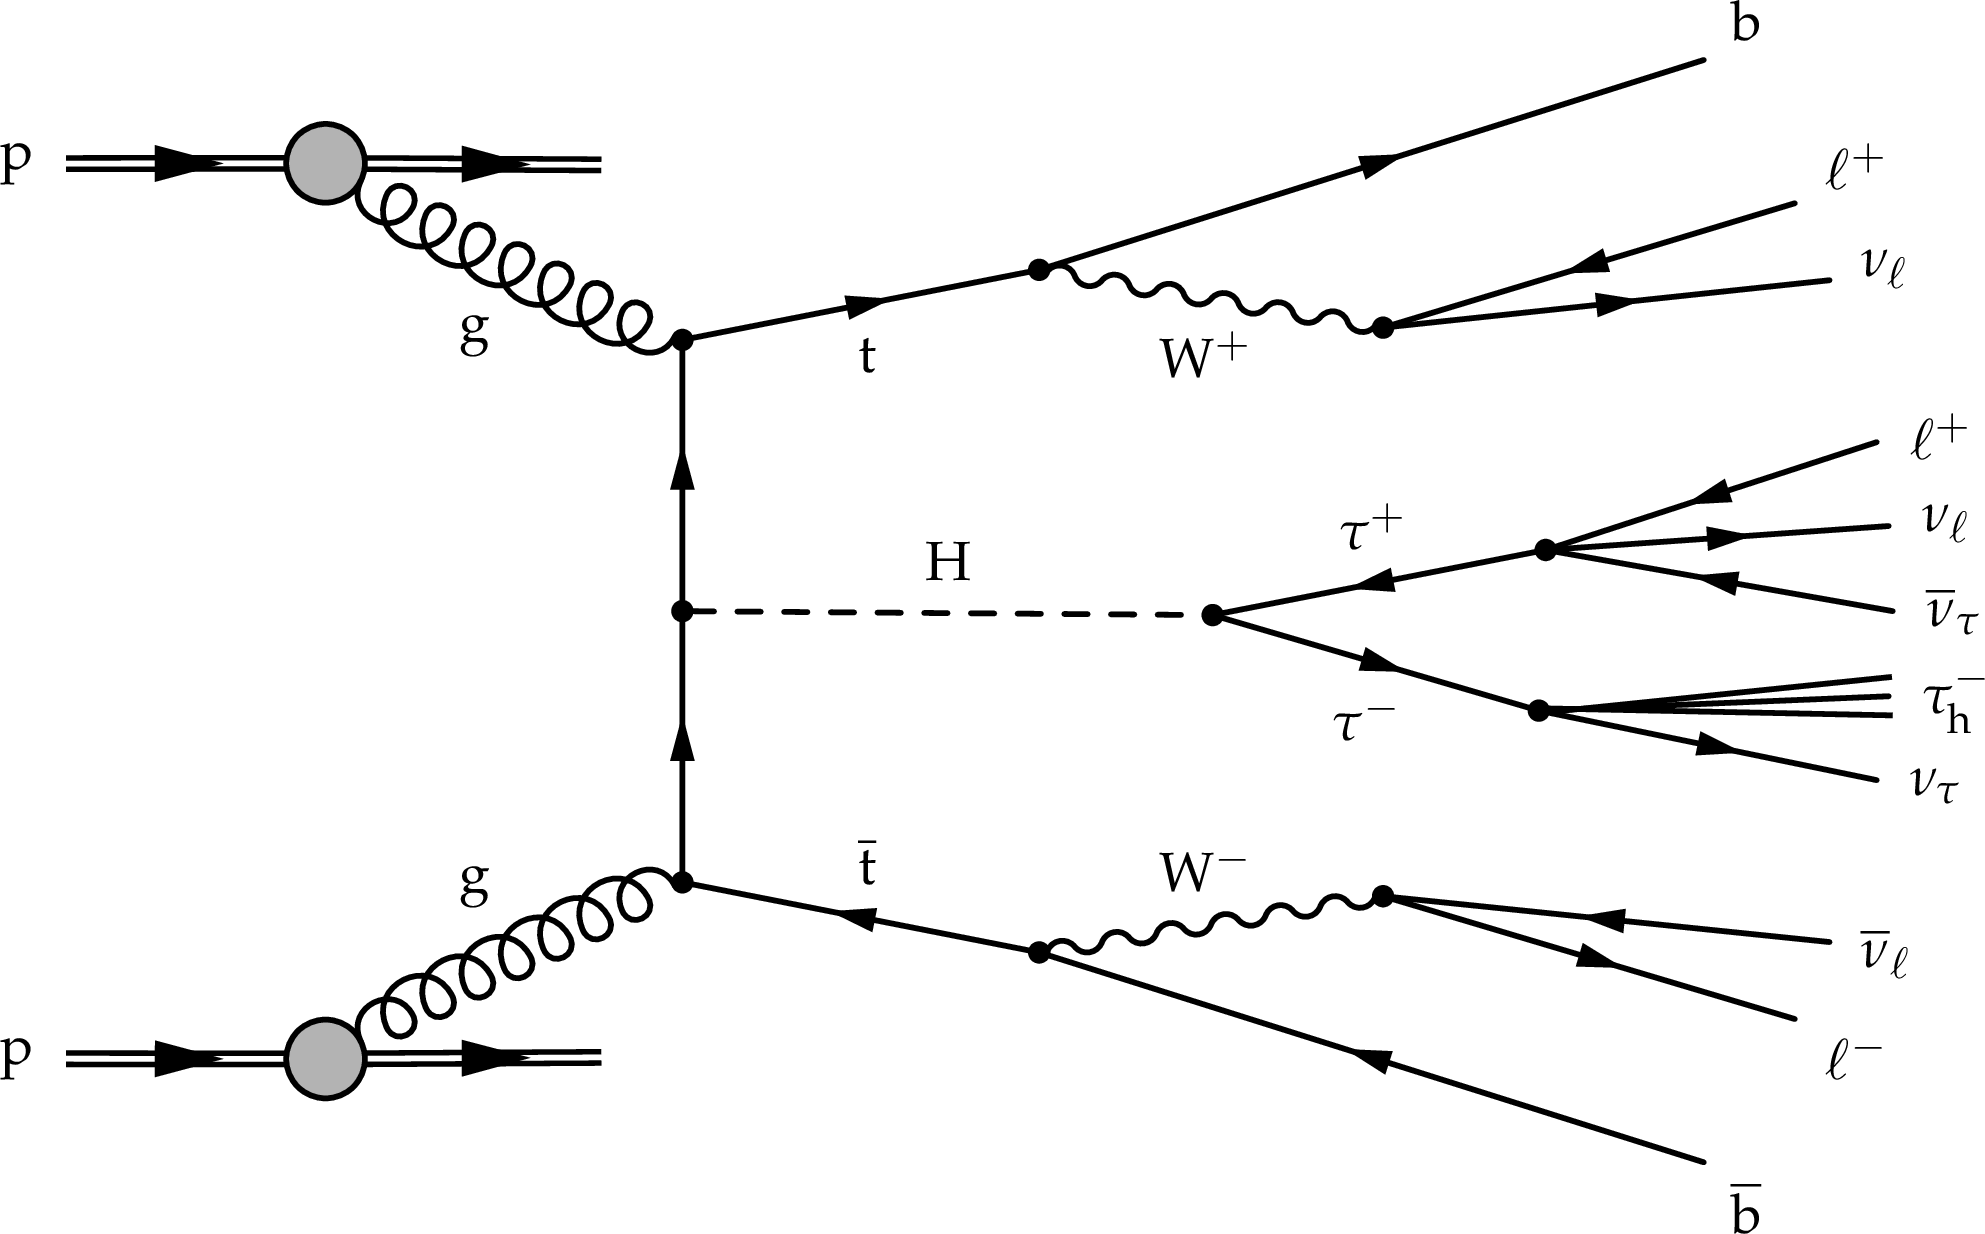
Figure 1:
An example of a Feynman diagram for $ {\mathrm {t}} {\overline {\mathrm {t}}} {{\mathrm {H}}}$ production, with subsequent decay of the Higgs boson to a pair of $ {\tau}$ leptons. |

png pdf |
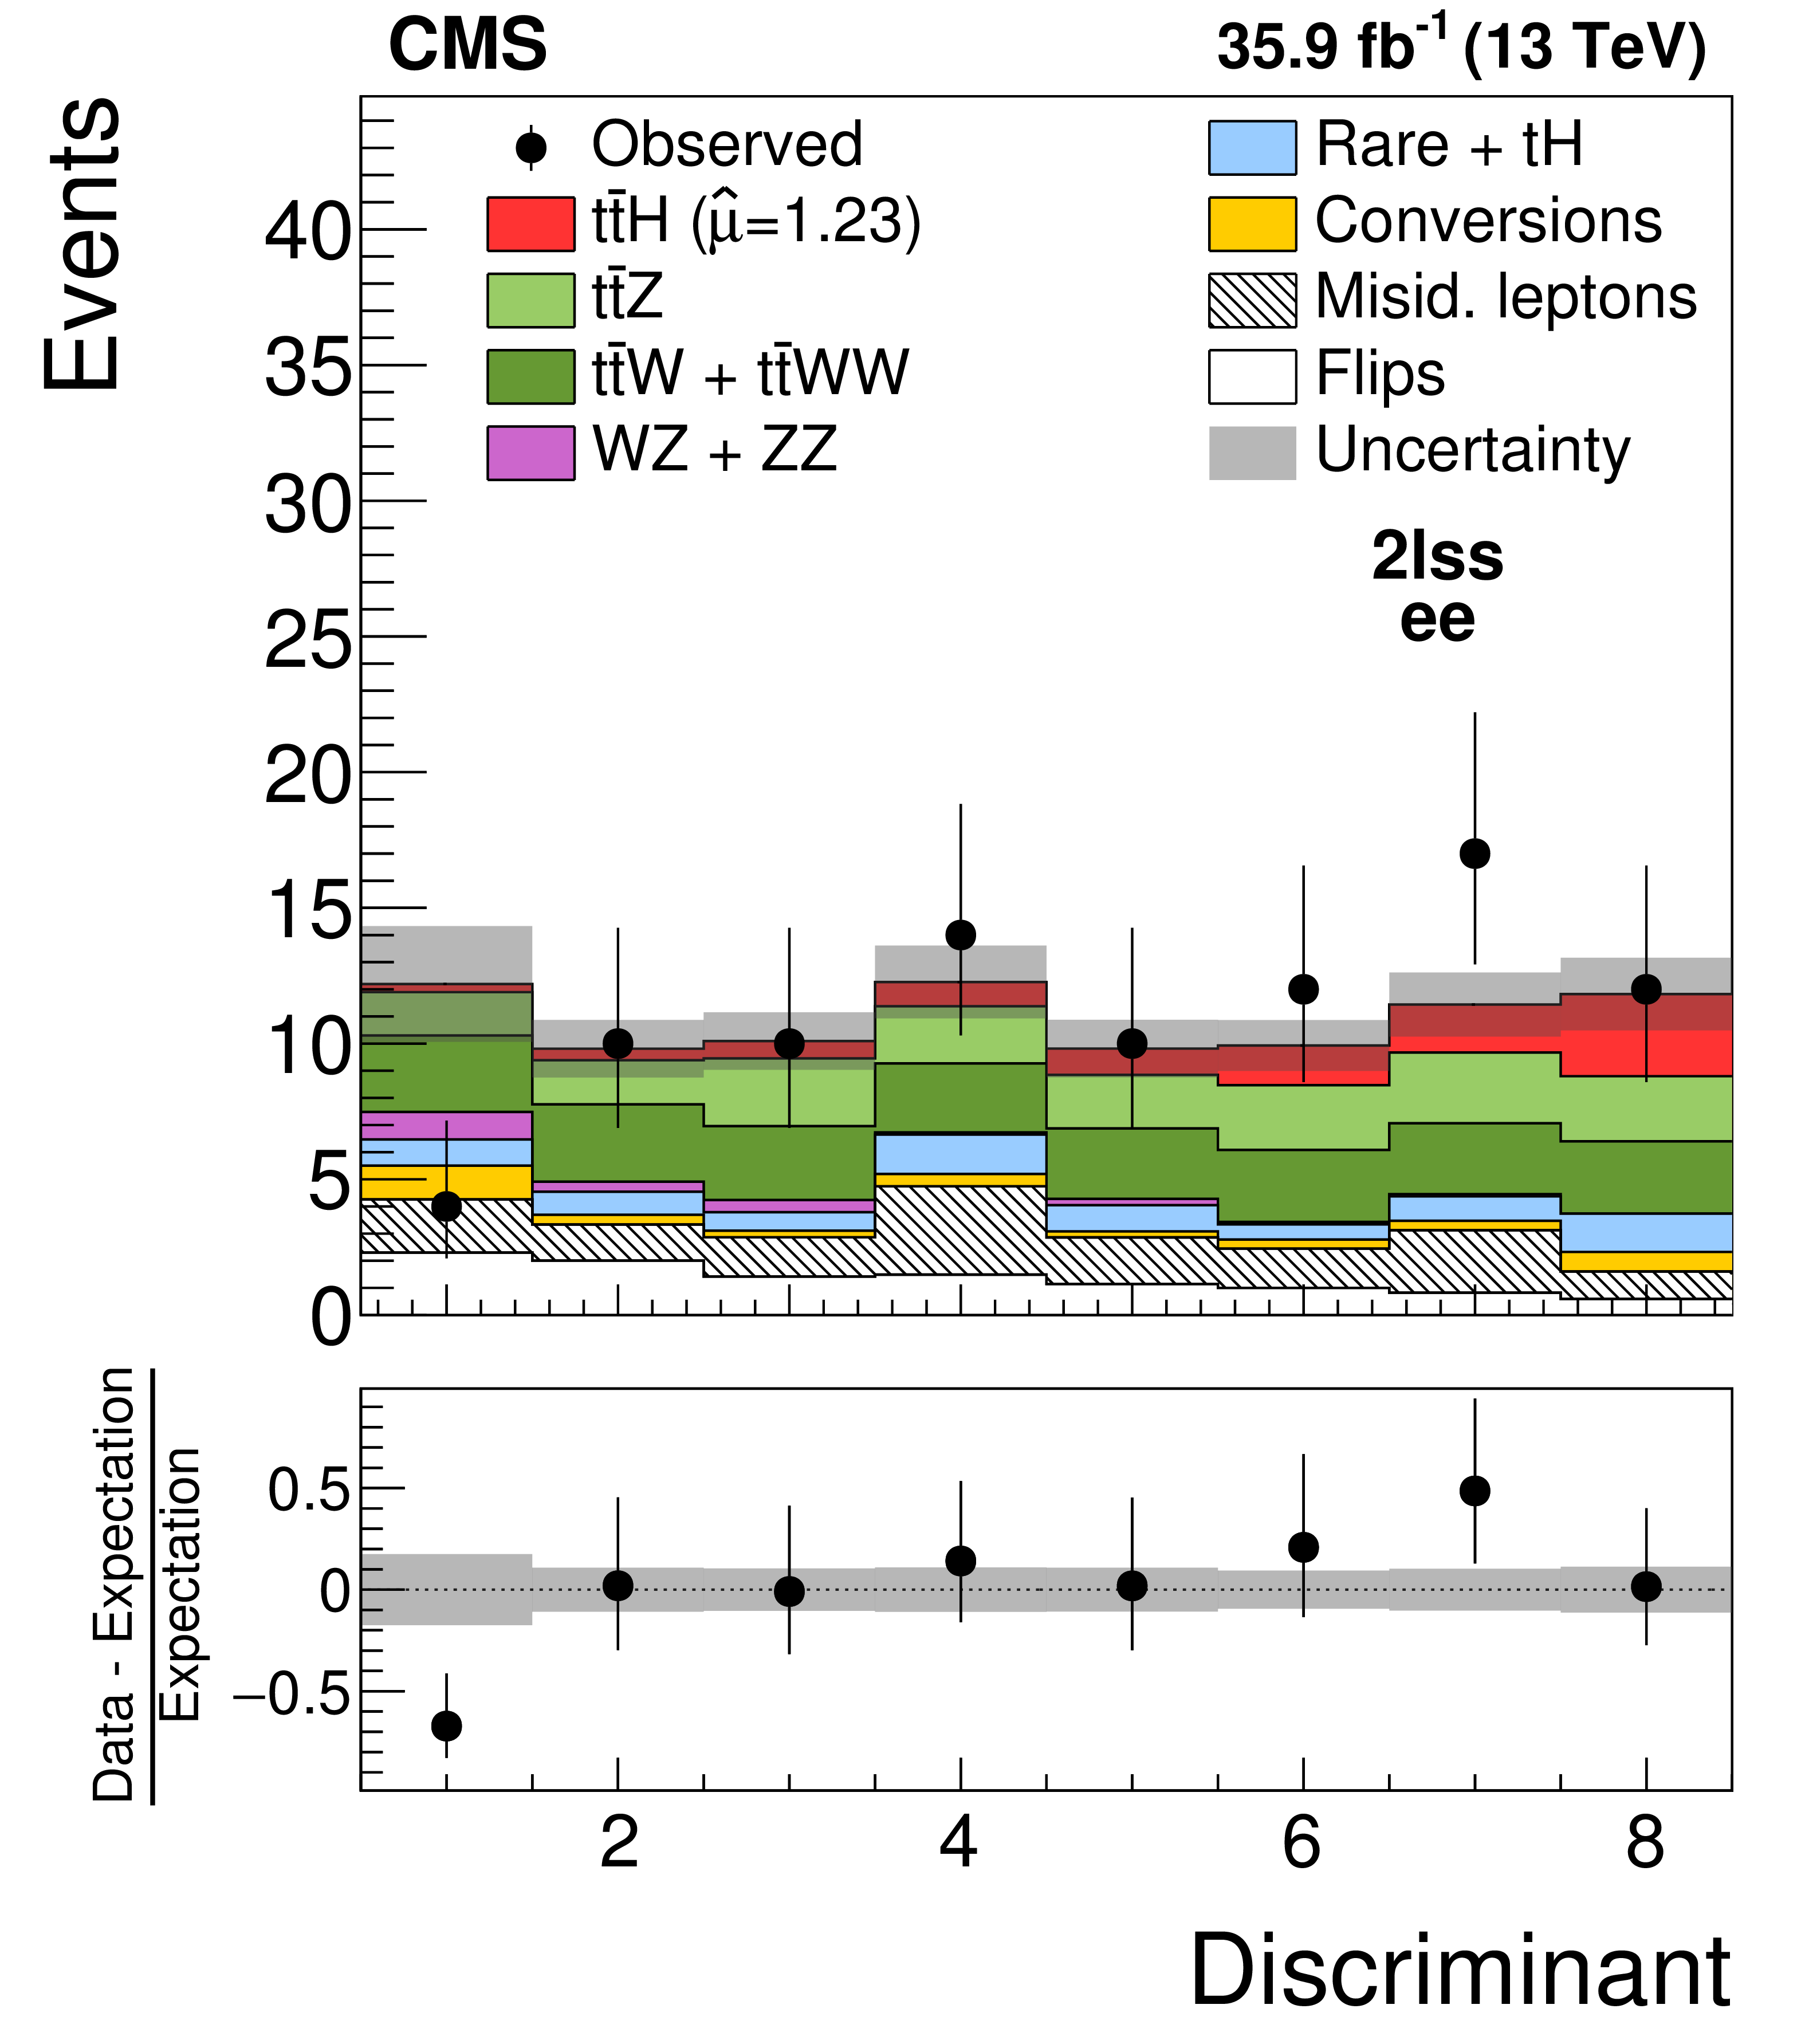
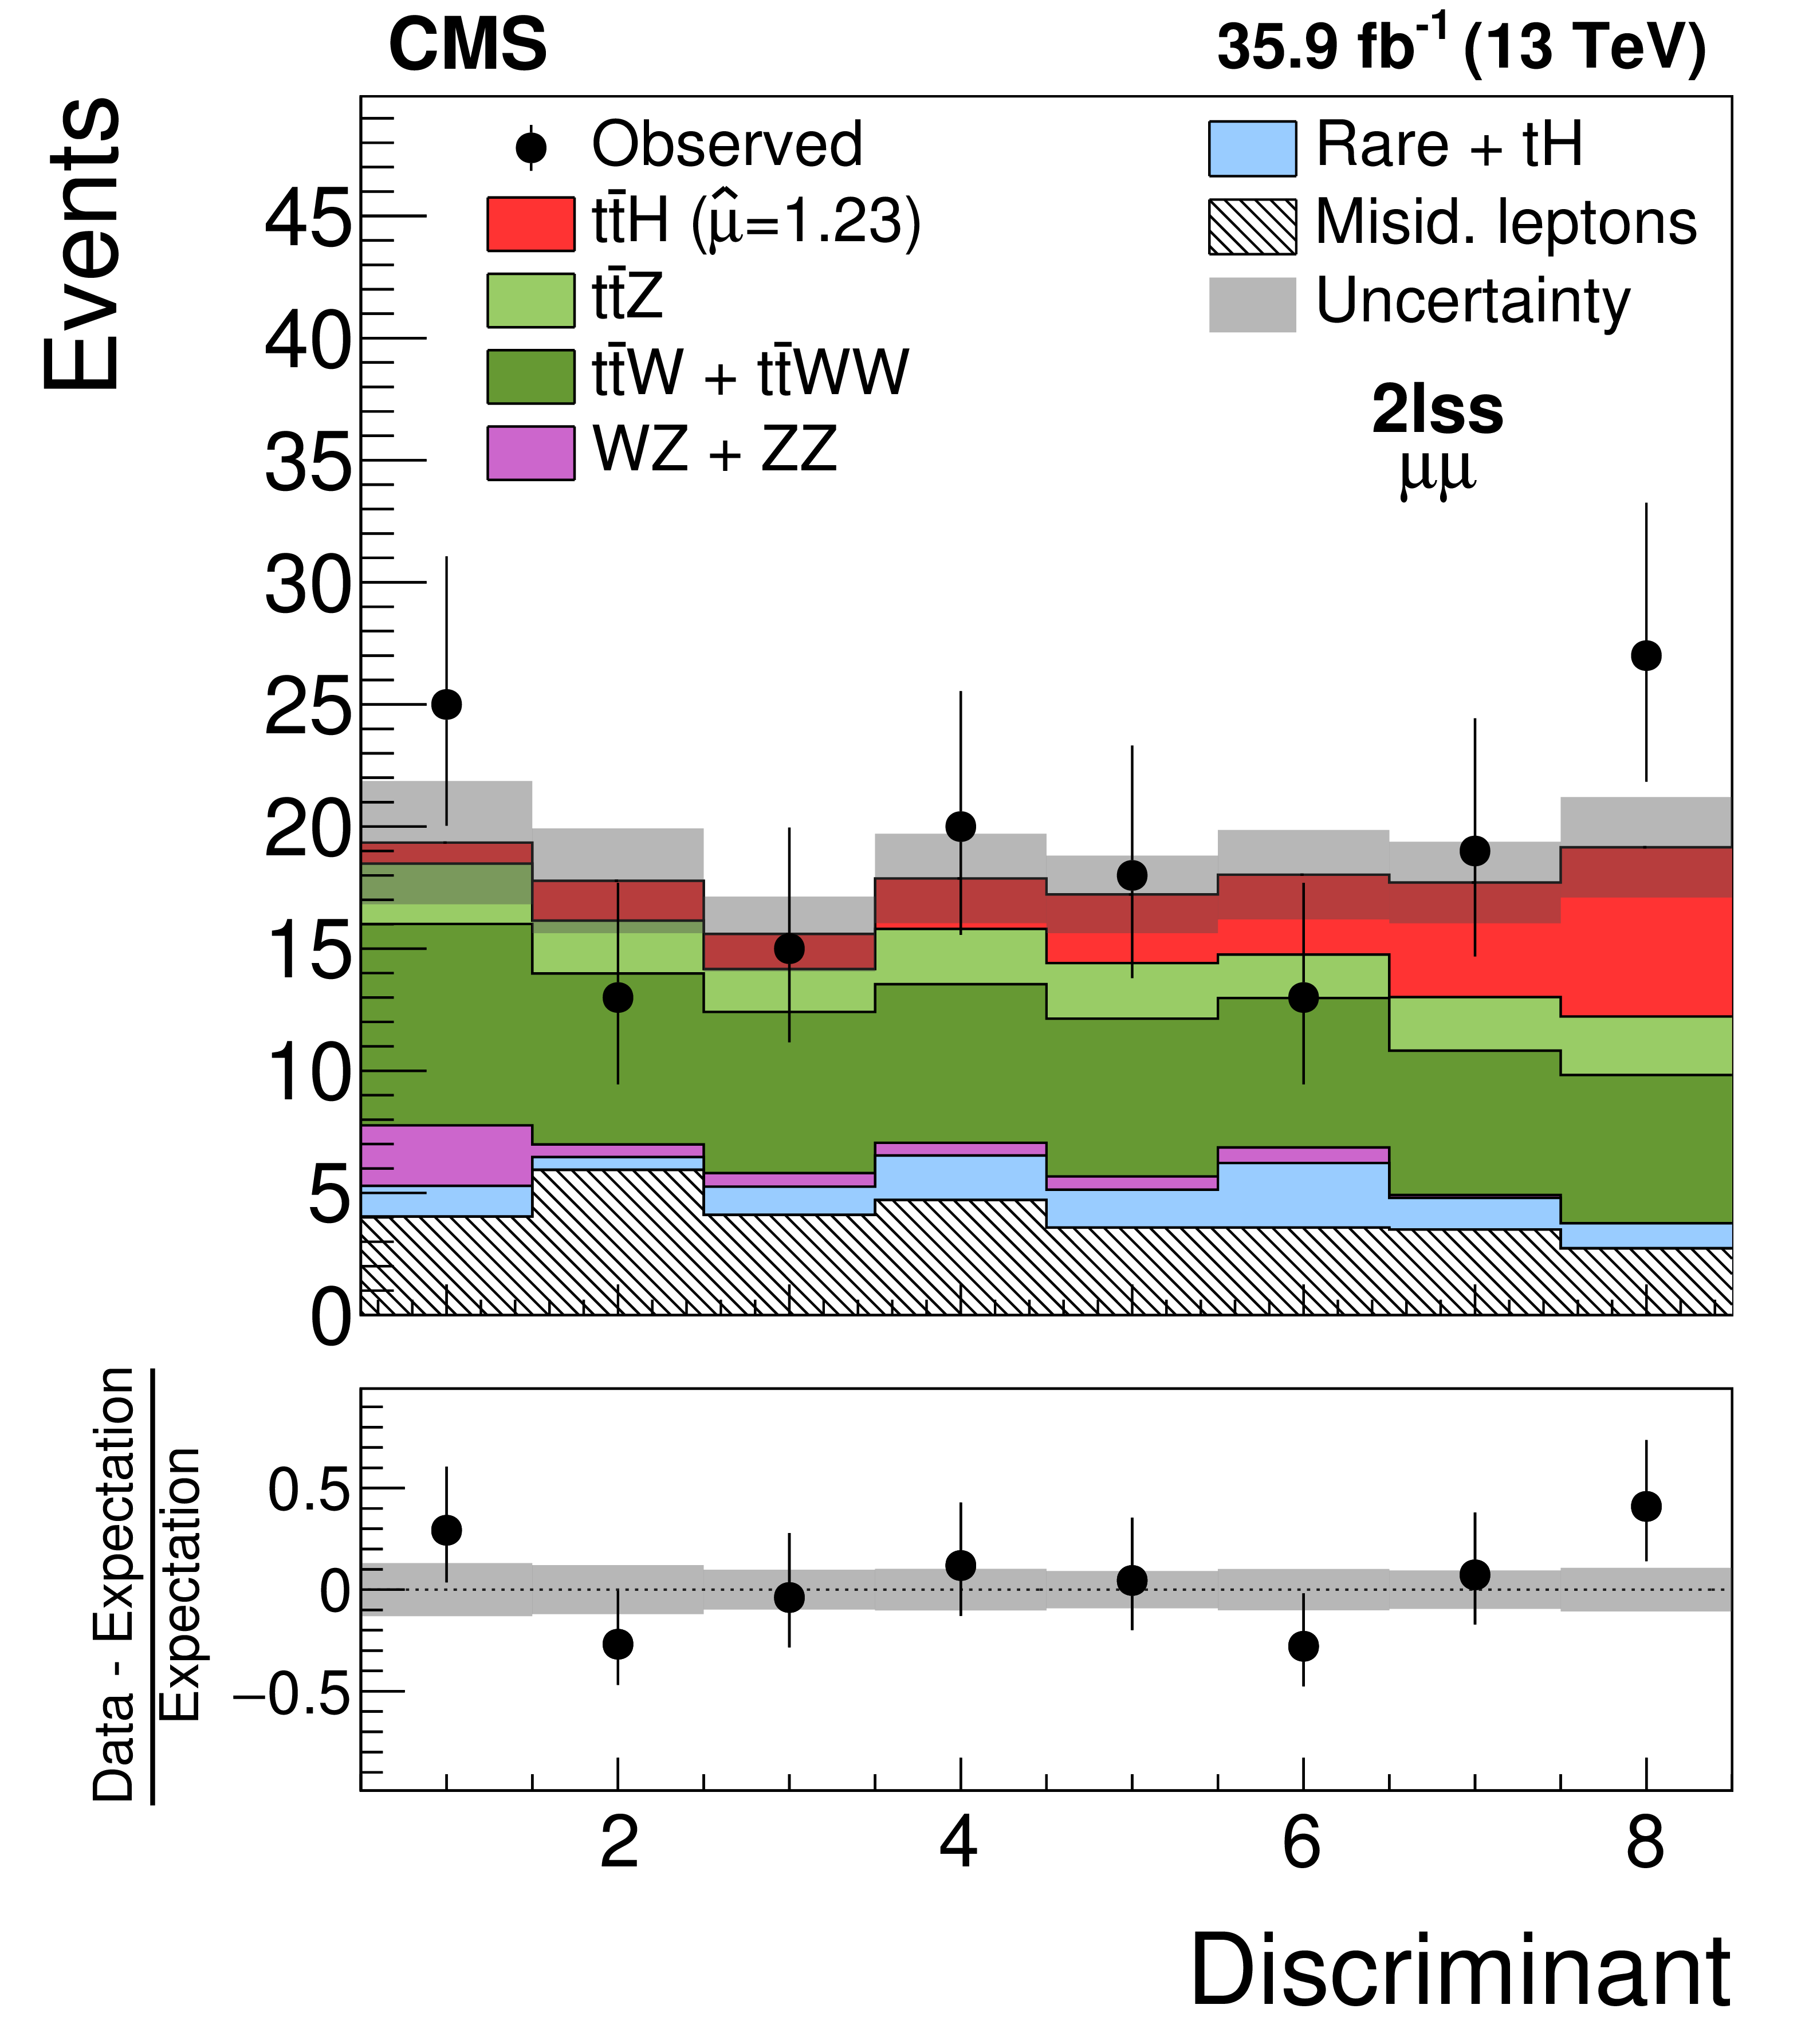
Figure 2:
Distributions in the discriminating observables used for the signal extraction in the $1 {\ell}+2 {{\tau}_{\mathrm {h}}} $ category (top left) and in different subcategories of the $2 {\ell} {\text {ss}}$ category (top right and bottom row), compared to the SM expectation for the $ {{{\mathrm {t}}} {{\overline {\mathrm {t}}}} {{\mathrm {H}}}}$ signal and for background processes. A BDT trained to separate the $ {{{\mathrm {t}}} {{\overline {\mathrm {t}}}} {{\mathrm {H}}}}$ signal from the $ {{{\mathrm {t}}} {{\overline {\mathrm {t}}}}\text {+jets}}$ background is used in the $1 {\ell}+2 {{\tau}_{\mathrm {h}}} $ category, while a $ {\mathrm {D}_{\text {MVA}}}$ variable, combining the outputs of two BDTs trained to discriminate the $ {{{\mathrm {t}}} {{\overline {\mathrm {t}}}} {{\mathrm {H}}}}$ signal from the $ {{{\mathrm {t}}} {{\overline {\mathrm {t}}}}\mathrm {V}}$ and $ {{{\mathrm {t}}} {{\overline {\mathrm {t}}}}\text {+jets}}$ backgrounds respectively, is used in the $2 {\ell} {\text {ss}}$ subcategories. The distributions expected for signal and background processes are shown for the values of nuisance parameters obtained from the combined ML fit and $\mu = \hat{\mu}=1.23$, corresponding to the best-fit value from the ML fit. |

png pdf |
Figure 2-a:
Distribution in the discriminating observable used for the signal extraction in the $1 {\ell}+2 {{\tau}_{\mathrm {h}}} $ category, compared to the SM expectation for the $ {{{\mathrm {t}}} {{\overline {\mathrm {t}}}} {{\mathrm {H}}}}$ signal and for background processes. A BDT trained to separate the $ {{{\mathrm {t}}} {{\overline {\mathrm {t}}}} {{\mathrm {H}}}}$ signal from the $ {{{\mathrm {t}}} {{\overline {\mathrm {t}}}}\text {+jets}}$ background is used in the $1 {\ell}+2 {{\tau}_{\mathrm {h}}} $ category, while a $ {\mathrm {D}_{\text {MVA}}}$ variable, combining the outputs of two BDTs trained to discriminate the $ {{{\mathrm {t}}} {{\overline {\mathrm {t}}}} {{\mathrm {H}}}}$ signal from the $ {{{\mathrm {t}}} {{\overline {\mathrm {t}}}}\mathrm {V}}$ and $ {{{\mathrm {t}}} {{\overline {\mathrm {t}}}}\text {+jets}}$ backgrounds respectively, is used in the $2 {\ell} {\text {ss}}$ subcategories. The distributions expected for signal and background processes are shown for the values of nuisance parameters obtained from the combined ML fit and $\mu = \hat{\mu}=1.23$, corresponding to the best-fit value from the ML fit. |
png pdf |
Figure 2-b:
Distribution in the discriminating observable used for the signal extraction in the $\mathrm{ee} {\text {ss}}$ category, compared to the SM expectation for the $ {{{\mathrm {t}}} {{\overline {\mathrm {t}}}} {{\mathrm {H}}}}$ signal and for background processes. A BDT trained to separate the $ {{{\mathrm {t}}} {{\overline {\mathrm {t}}}} {{\mathrm {H}}}}$ signal from the $ {{{\mathrm {t}}} {{\overline {\mathrm {t}}}}\text {+jets}}$ background is used in the $1 {\ell}+2 {{\tau}_{\mathrm {h}}} $ category, while a $ {\mathrm {D}_{\text {MVA}}}$ variable, combining the outputs of two BDTs trained to discriminate the $ {{{\mathrm {t}}} {{\overline {\mathrm {t}}}} {{\mathrm {H}}}}$ signal from the $ {{{\mathrm {t}}} {{\overline {\mathrm {t}}}}\mathrm {V}}$ and $ {{{\mathrm {t}}} {{\overline {\mathrm {t}}}}\text {+jets}}$ backgrounds respectively, is used in the $2 {\ell} {\text {ss}}$ subcategories. The distributions expected for signal and background processes are shown for the values of nuisance parameters obtained from the combined ML fit and $\mu = \hat{\mu}=1.23$, corresponding to the best-fit value from the ML fit. |

png pdf |
Figure 2-c:
Distribution in the discriminating observable used for the signal extraction in the $\mathrm{e}\mu {\text {ss}}$ category, compared to the SM expectation for the $ {{{\mathrm {t}}} {{\overline {\mathrm {t}}}} {{\mathrm {H}}}}$ signal and for background processes. A BDT trained to separate the $ {{{\mathrm {t}}} {{\overline {\mathrm {t}}}} {{\mathrm {H}}}}$ signal from the $ {{{\mathrm {t}}} {{\overline {\mathrm {t}}}}\text {+jets}}$ background is used in the $1 {\ell}+2 {{\tau}_{\mathrm {h}}} $ category, while a $ {\mathrm {D}_{\text {MVA}}}$ variable, combining the outputs of two BDTs trained to discriminate the $ {{{\mathrm {t}}} {{\overline {\mathrm {t}}}} {{\mathrm {H}}}}$ signal from the $ {{{\mathrm {t}}} {{\overline {\mathrm {t}}}}\mathrm {V}}$ and $ {{{\mathrm {t}}} {{\overline {\mathrm {t}}}}\text {+jets}}$ backgrounds respectively, is used in the $2 {\ell} {\text {ss}}$ subcategories. The distributions expected for signal and background processes are shown for the values of nuisance parameters obtained from the combined ML fit and $\mu = \hat{\mu}=1.23$, corresponding to the best-fit value from the ML fit. |
png pdf |
Figure 2-d:
Distribution in the discriminating observable used for the signal extraction in the $ \mu\mu {\text {ss}}$ category, |

png pdf |
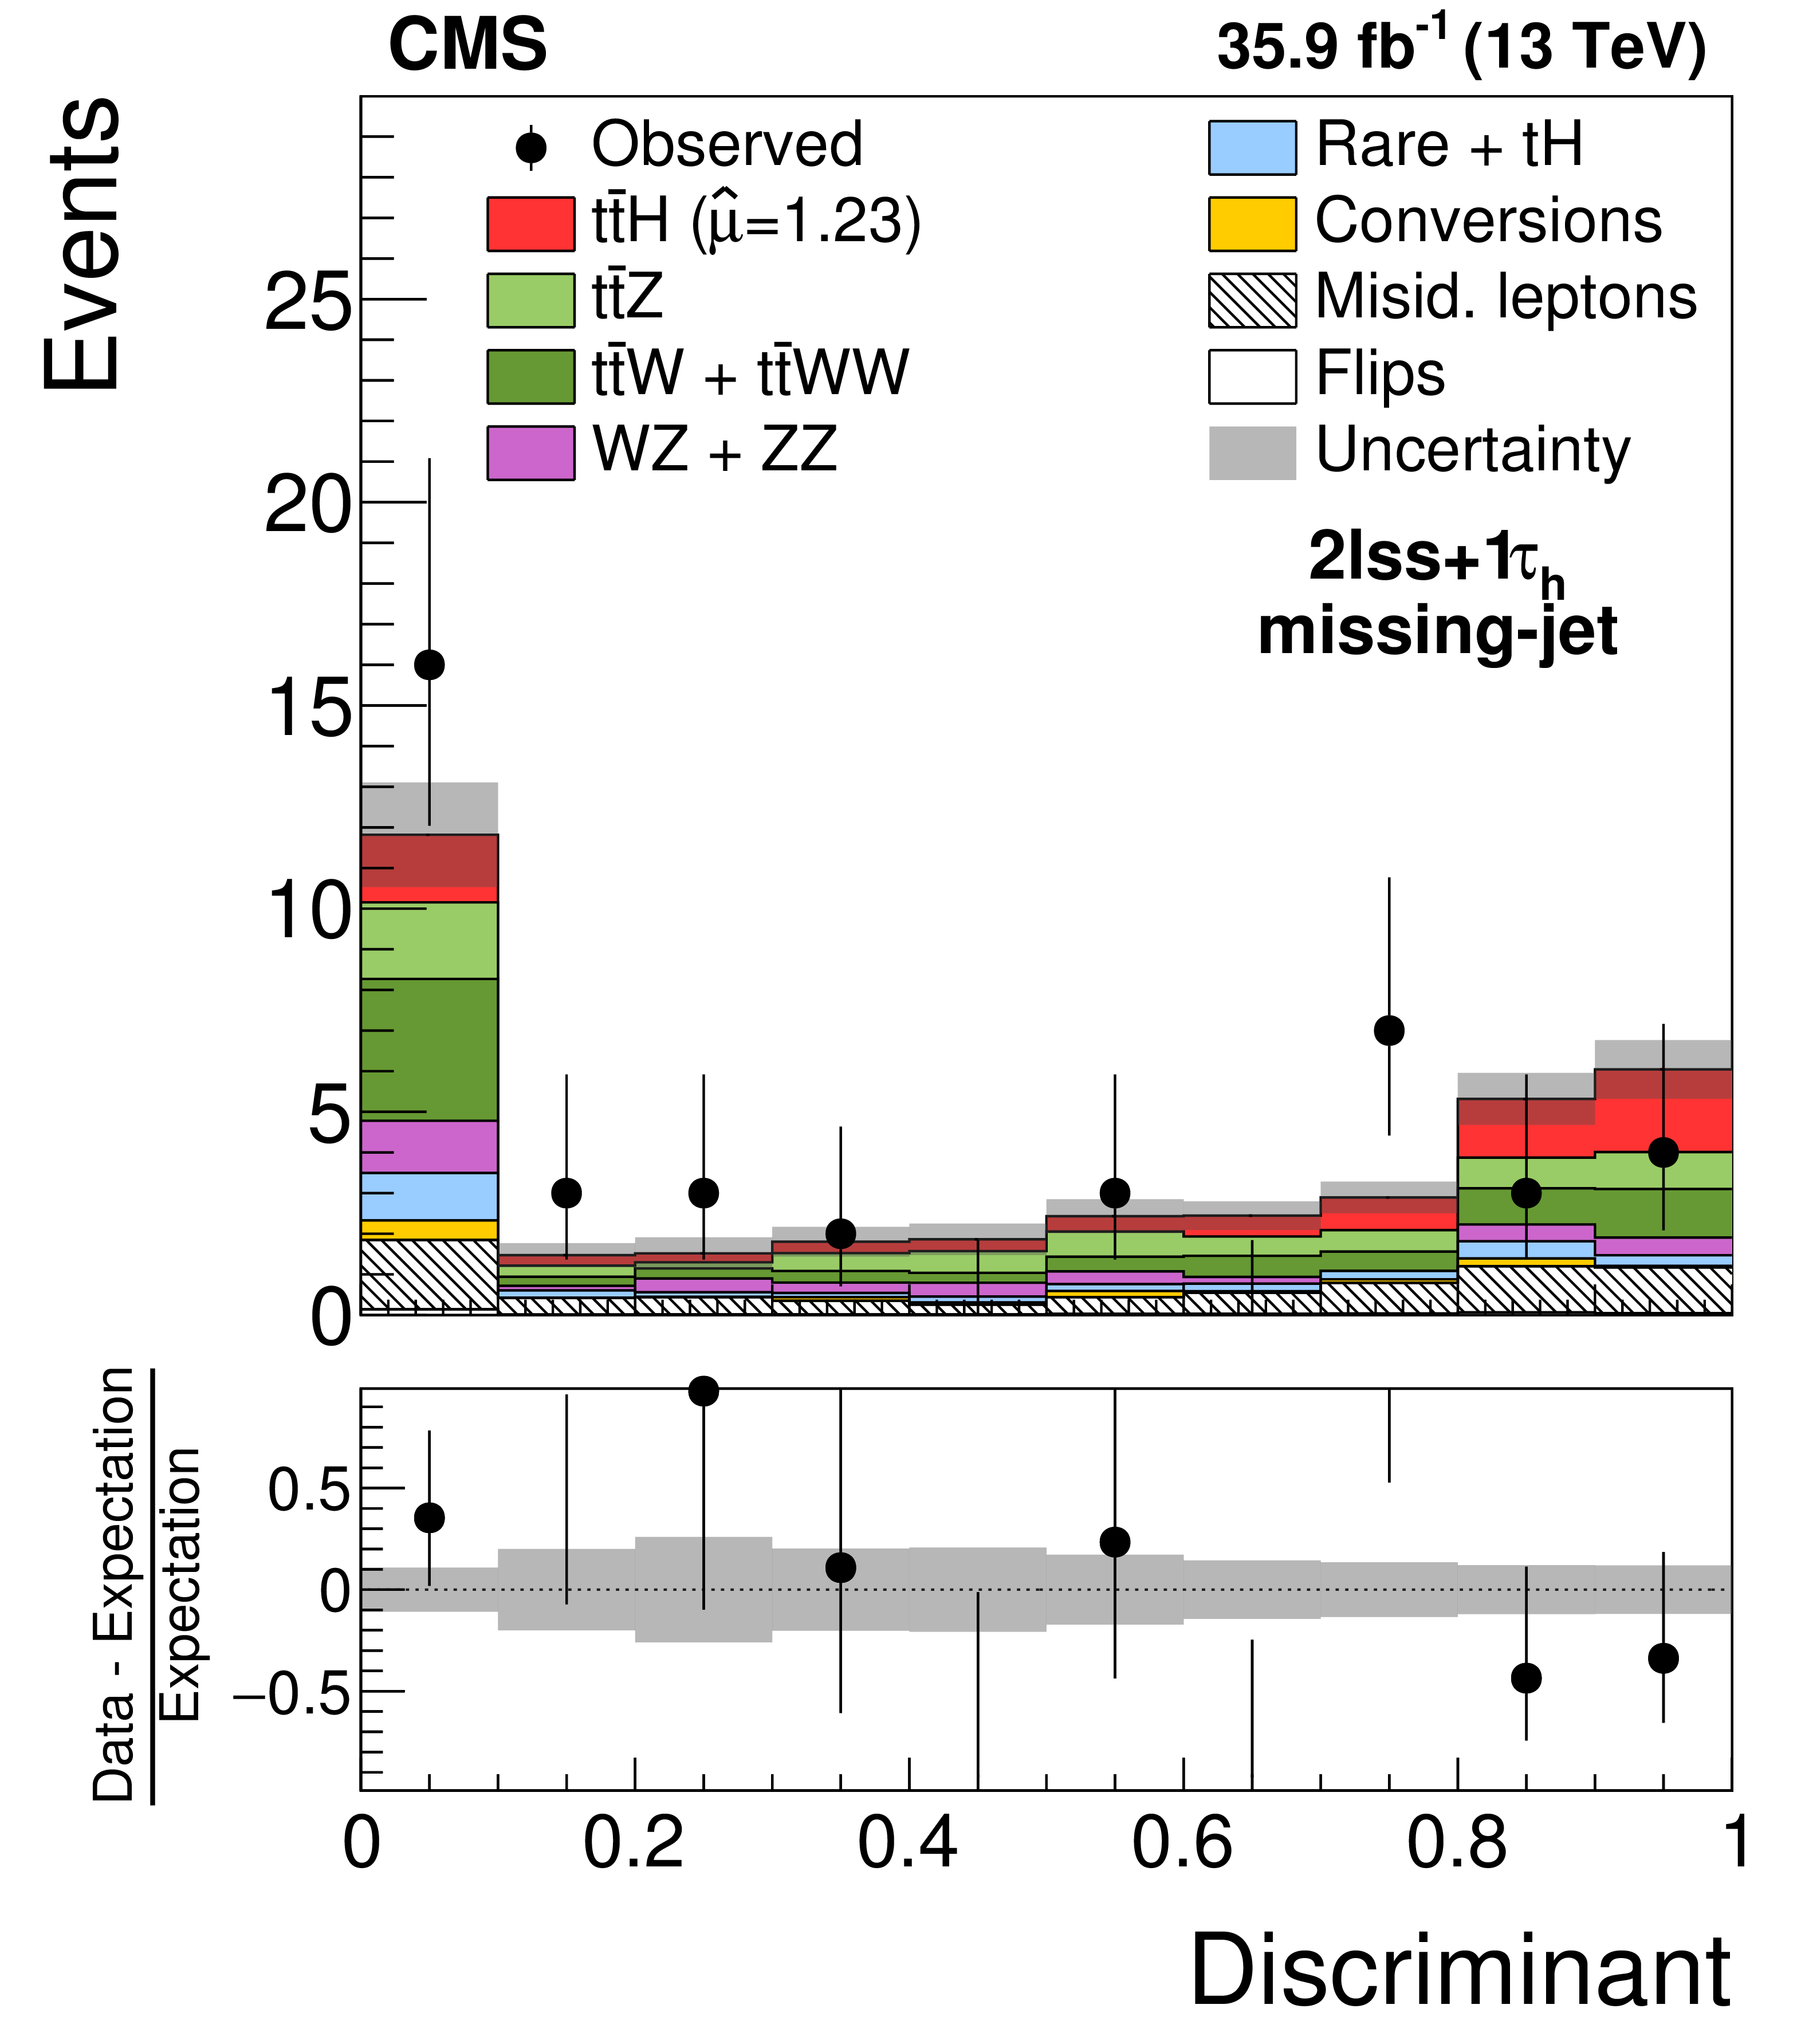
Figure 3:
Distributions in the discriminating observables used for the signal extraction in the "no-missing-jet'' (top left) and "missing-jet'' (top right) subcategories of the $2 {\ell} {\text {ss}}+1 {{\tau}_{\mathrm {h}}} $ category, the $3 {\ell}$ category (bottom left), and the $3 {\ell}+ 1 {{\tau}_{\mathrm {h}}} $ category (bottom right), compared to the SM expectation for the $ {{{\mathrm {t}}} {{\overline {\mathrm {t}}}} {{\mathrm {H}}}}$ signal and for background processes. The MEM discriminant $ {\text {LR}}(2 {\ell} {\text {ss}}+1 {{\tau}_{\mathrm {h}}})$ is used in the $2 {\ell} {\text {ss}}+1 {{\tau}_{\mathrm {h}}} $ subcategories, while a $ {\mathrm {D}_{\text {MVA}}}$ variable, combining the outputs of two BDTs trained to discriminate the $ {{{\mathrm {t}}} {{\overline {\mathrm {t}}}} {{\mathrm {H}}}}$ signal from the $ {{{\mathrm {t}}} {{\overline {\mathrm {t}}}}\mathrm {V}}$ and $ {{{\mathrm {t}}} {{\overline {\mathrm {t}}}}\text {+jets}}$ backgrounds respectively, is used in the $3 {\ell}$ and $3 {\ell}+ 1 {{\tau}_{\mathrm {h}}} $ categories. The distributions expected for signal and background processes are shown for the values of nuisance parameters obtained from the combined ML fit and $\mu = \hat{\mu} = $ 1.23, corresponding to the best-fit value from the ML fit. The lowest bin of the MEM discriminant in the "missing-jet'' subcategory of the $2 {\ell} {\text {ss}}+1 {{\tau}_{\mathrm {h}}} $ category collects events for which the kinematics of the reconstructed objects is not compatible with the $ {{{\mathrm {t}}} {{\overline {\mathrm {t}}}} {{\mathrm {H}}}}$, $ {{\mathrm {H}}}\to {\tau} {\tau}$ signal hypothesis. |

png pdf |
Figure 3-a:
Distribution in the discriminating observable used for the signal extraction in the "no-missing-jet'' subcategory of the $2 {\ell} {\text {ss}}+1 {{\tau}_{\mathrm {h}}} $ category, compared to the SM expectation for the $ {{{\mathrm {t}}} {{\overline {\mathrm {t}}}} {{\mathrm {H}}}}$ signal and for background processes. The MEM discriminant $ {\text {LR}}(2 {\ell} {\text {ss}}+1 {{\tau}_{\mathrm {h}}})$ is used. The distributions expected for signal and background processes are shown for the values of nuisance parameters obtained from the combined ML fit and $\mu = \hat{\mu} = $ 1.23, corresponding to the best-fit value from the ML fit. |
png pdf |
Figure 3-b:
Distribution in the discriminating observable used for the signal extraction |
png pdf |
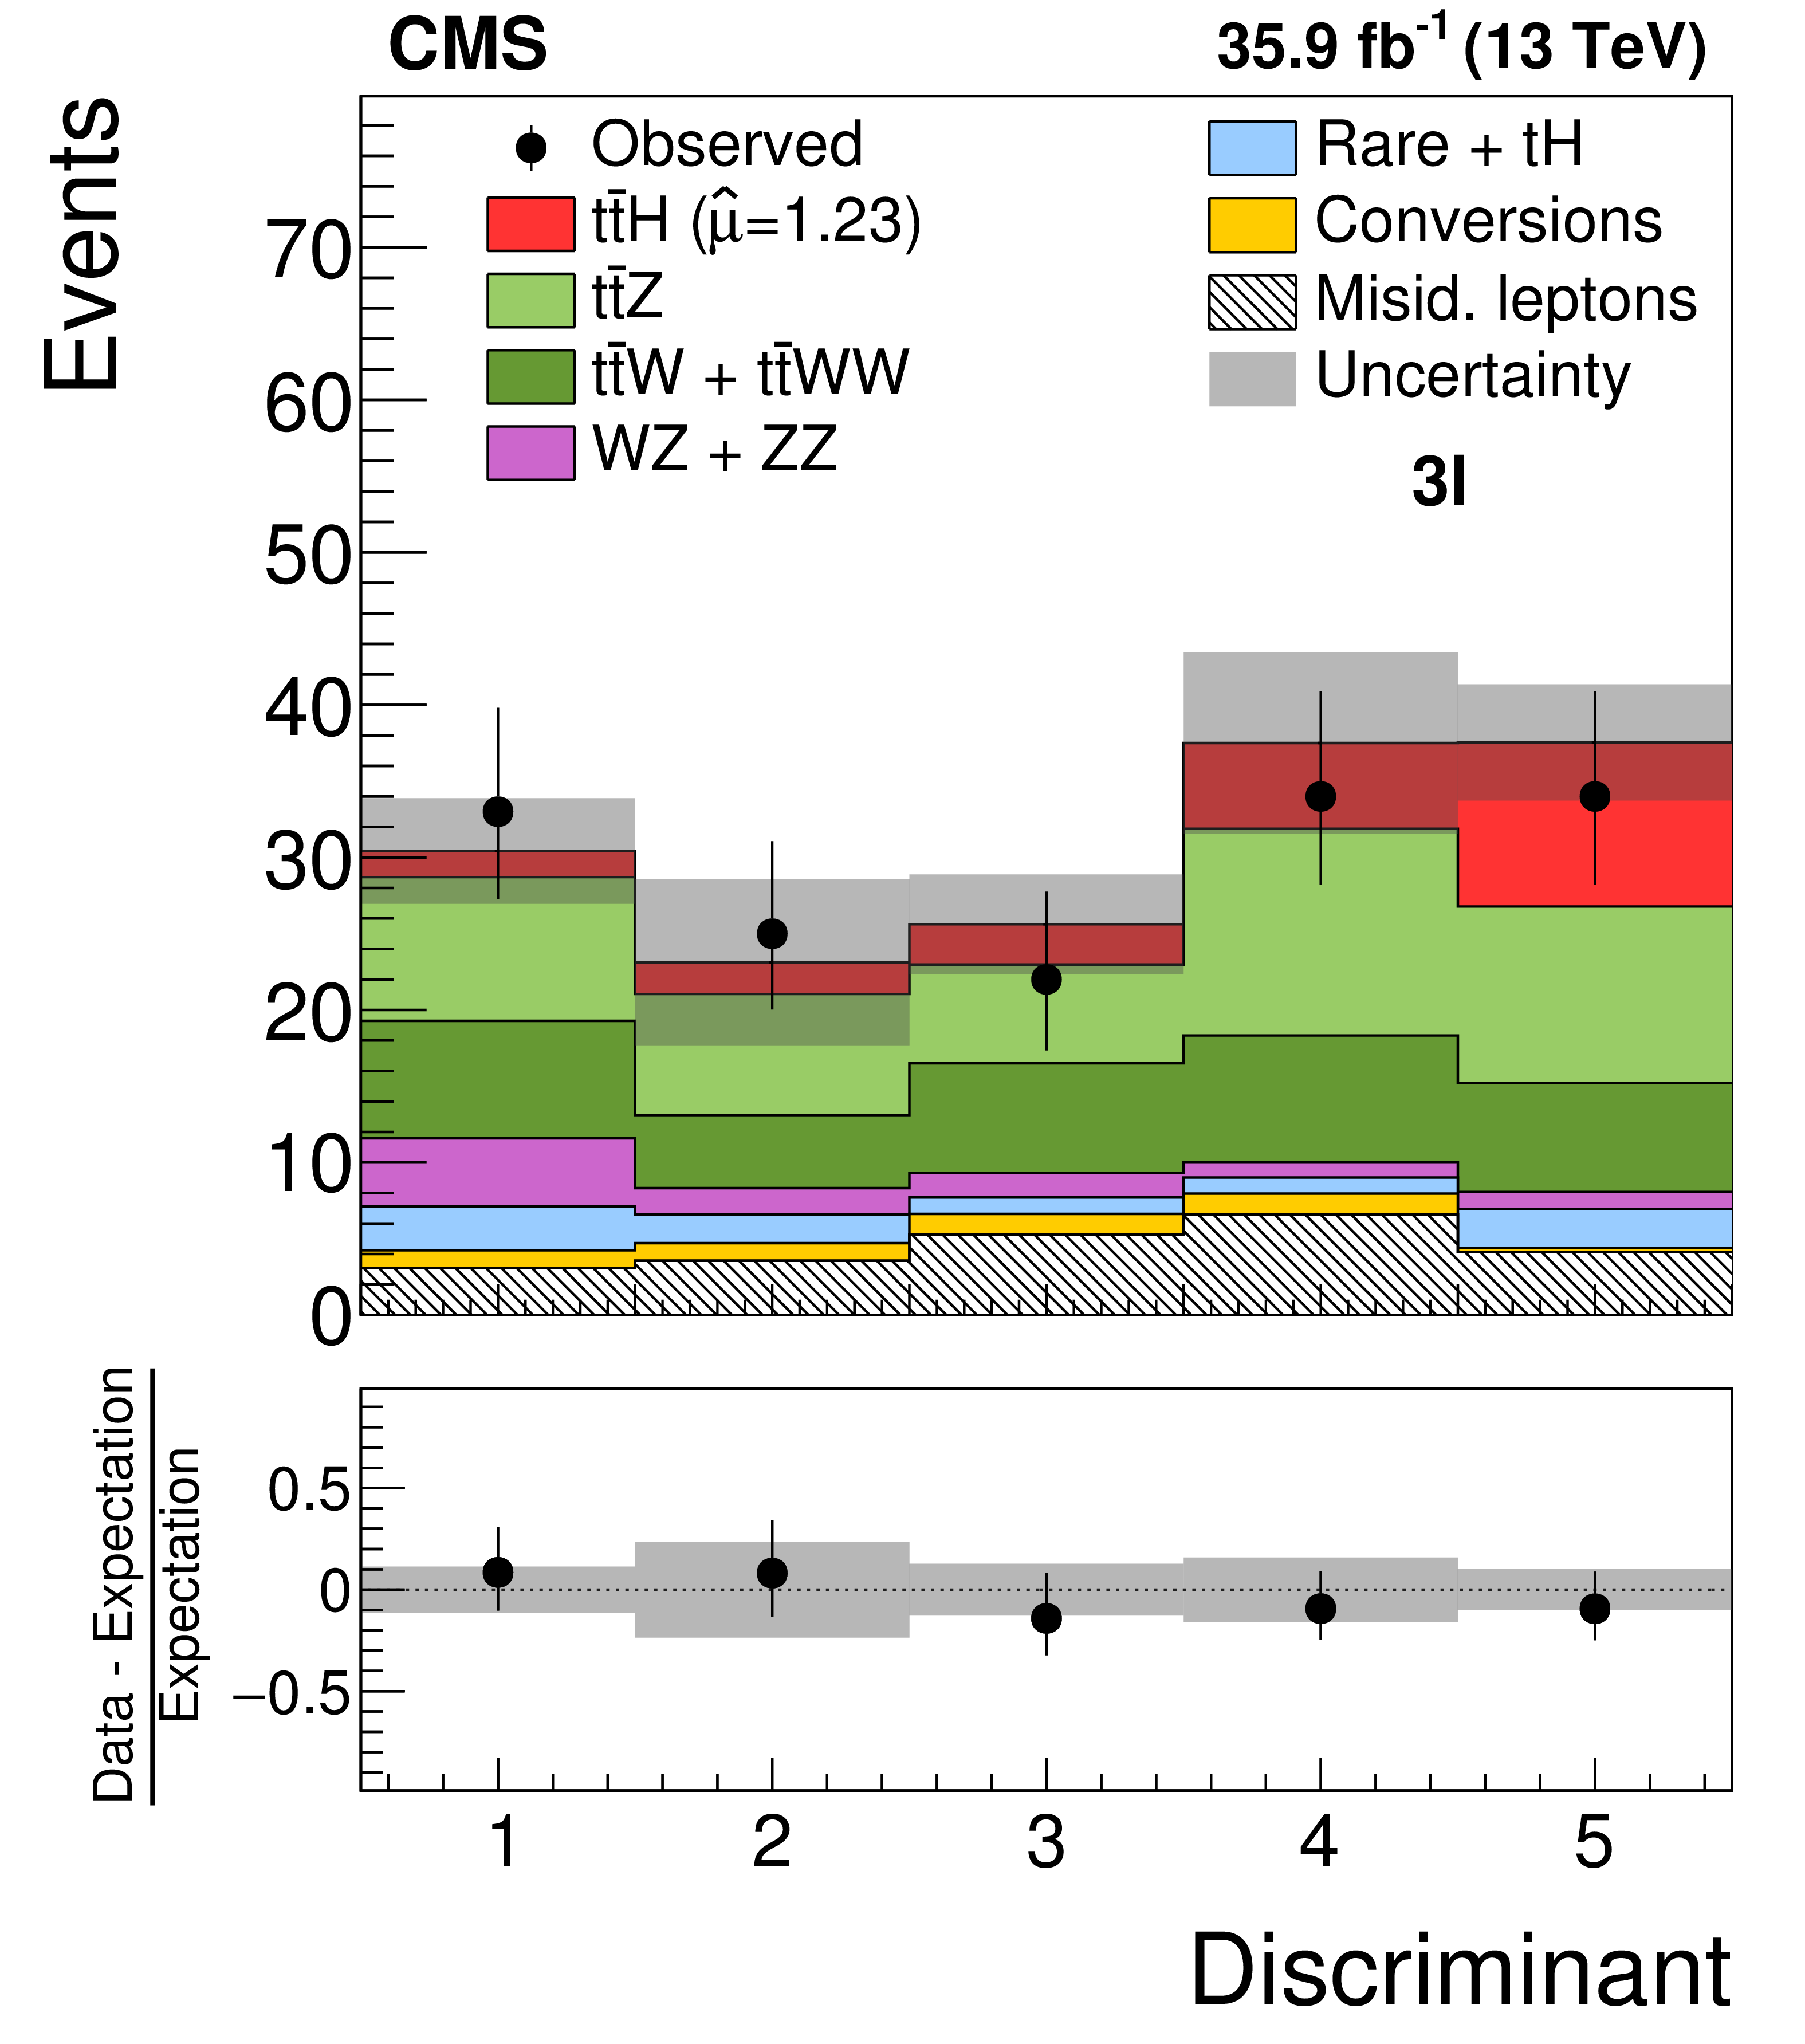
Figure 3-c:
Distribution in the discriminating observable used for the signal extraction in the $3 {\ell}$ category, compared to the SM expectation for the $ {{{\mathrm {t}}} {{\overline {\mathrm {t}}}} {{\mathrm {H}}}}$ signal and for background processes. A $ {\mathrm {D}_{\text {MVA}}}$ variable, combining the outputs of two BDTs trained to discriminate the $ {{{\mathrm {t}}} {{\overline {\mathrm {t}}}} {{\mathrm {H}}}}$ signal from the $ {{{\mathrm {t}}} {{\overline {\mathrm {t}}}}\mathrm {V}}$ and $ {{{\mathrm {t}}} {{\overline {\mathrm {t}}}}\text {+jets}}$ backgrounds respectively, is used. The distributions expected for signal and background processes are shown for the values of nuisance parameters obtained from the combined ML fit and $\mu = \hat{\mu} = $ 1.23, corresponding to the best-fit value from the ML fit. |

png pdf |
Figure 3-d:
Distribution in the discriminating observable used for the signal extraction in the $3 {\ell}+ 1 {{\tau}_{\mathrm {h}}} $ category, compared to the SM expectation for the $ {{{\mathrm {t}}} {{\overline {\mathrm {t}}}} {{\mathrm {H}}}}$ signal and for background processes. A $ {\mathrm {D}_{\text {MVA}}}$ variable, combining the outputs of two BDTs trained to discriminate the $ {{{\mathrm {t}}} {{\overline {\mathrm {t}}}} {{\mathrm {H}}}}$ signal from the $ {{{\mathrm {t}}} {{\overline {\mathrm {t}}}}\mathrm {V}}$ and $ {{{\mathrm {t}}} {{\overline {\mathrm {t}}}}\text {+jets}}$ backgrounds respectively, is used. The distributions expected for signal and background processes are shown for the values of nuisance parameters obtained from the combined ML fit and $\mu = \hat{\mu} = $ 1.23, corresponding to the best-fit value from the ML fit. |
png pdf |
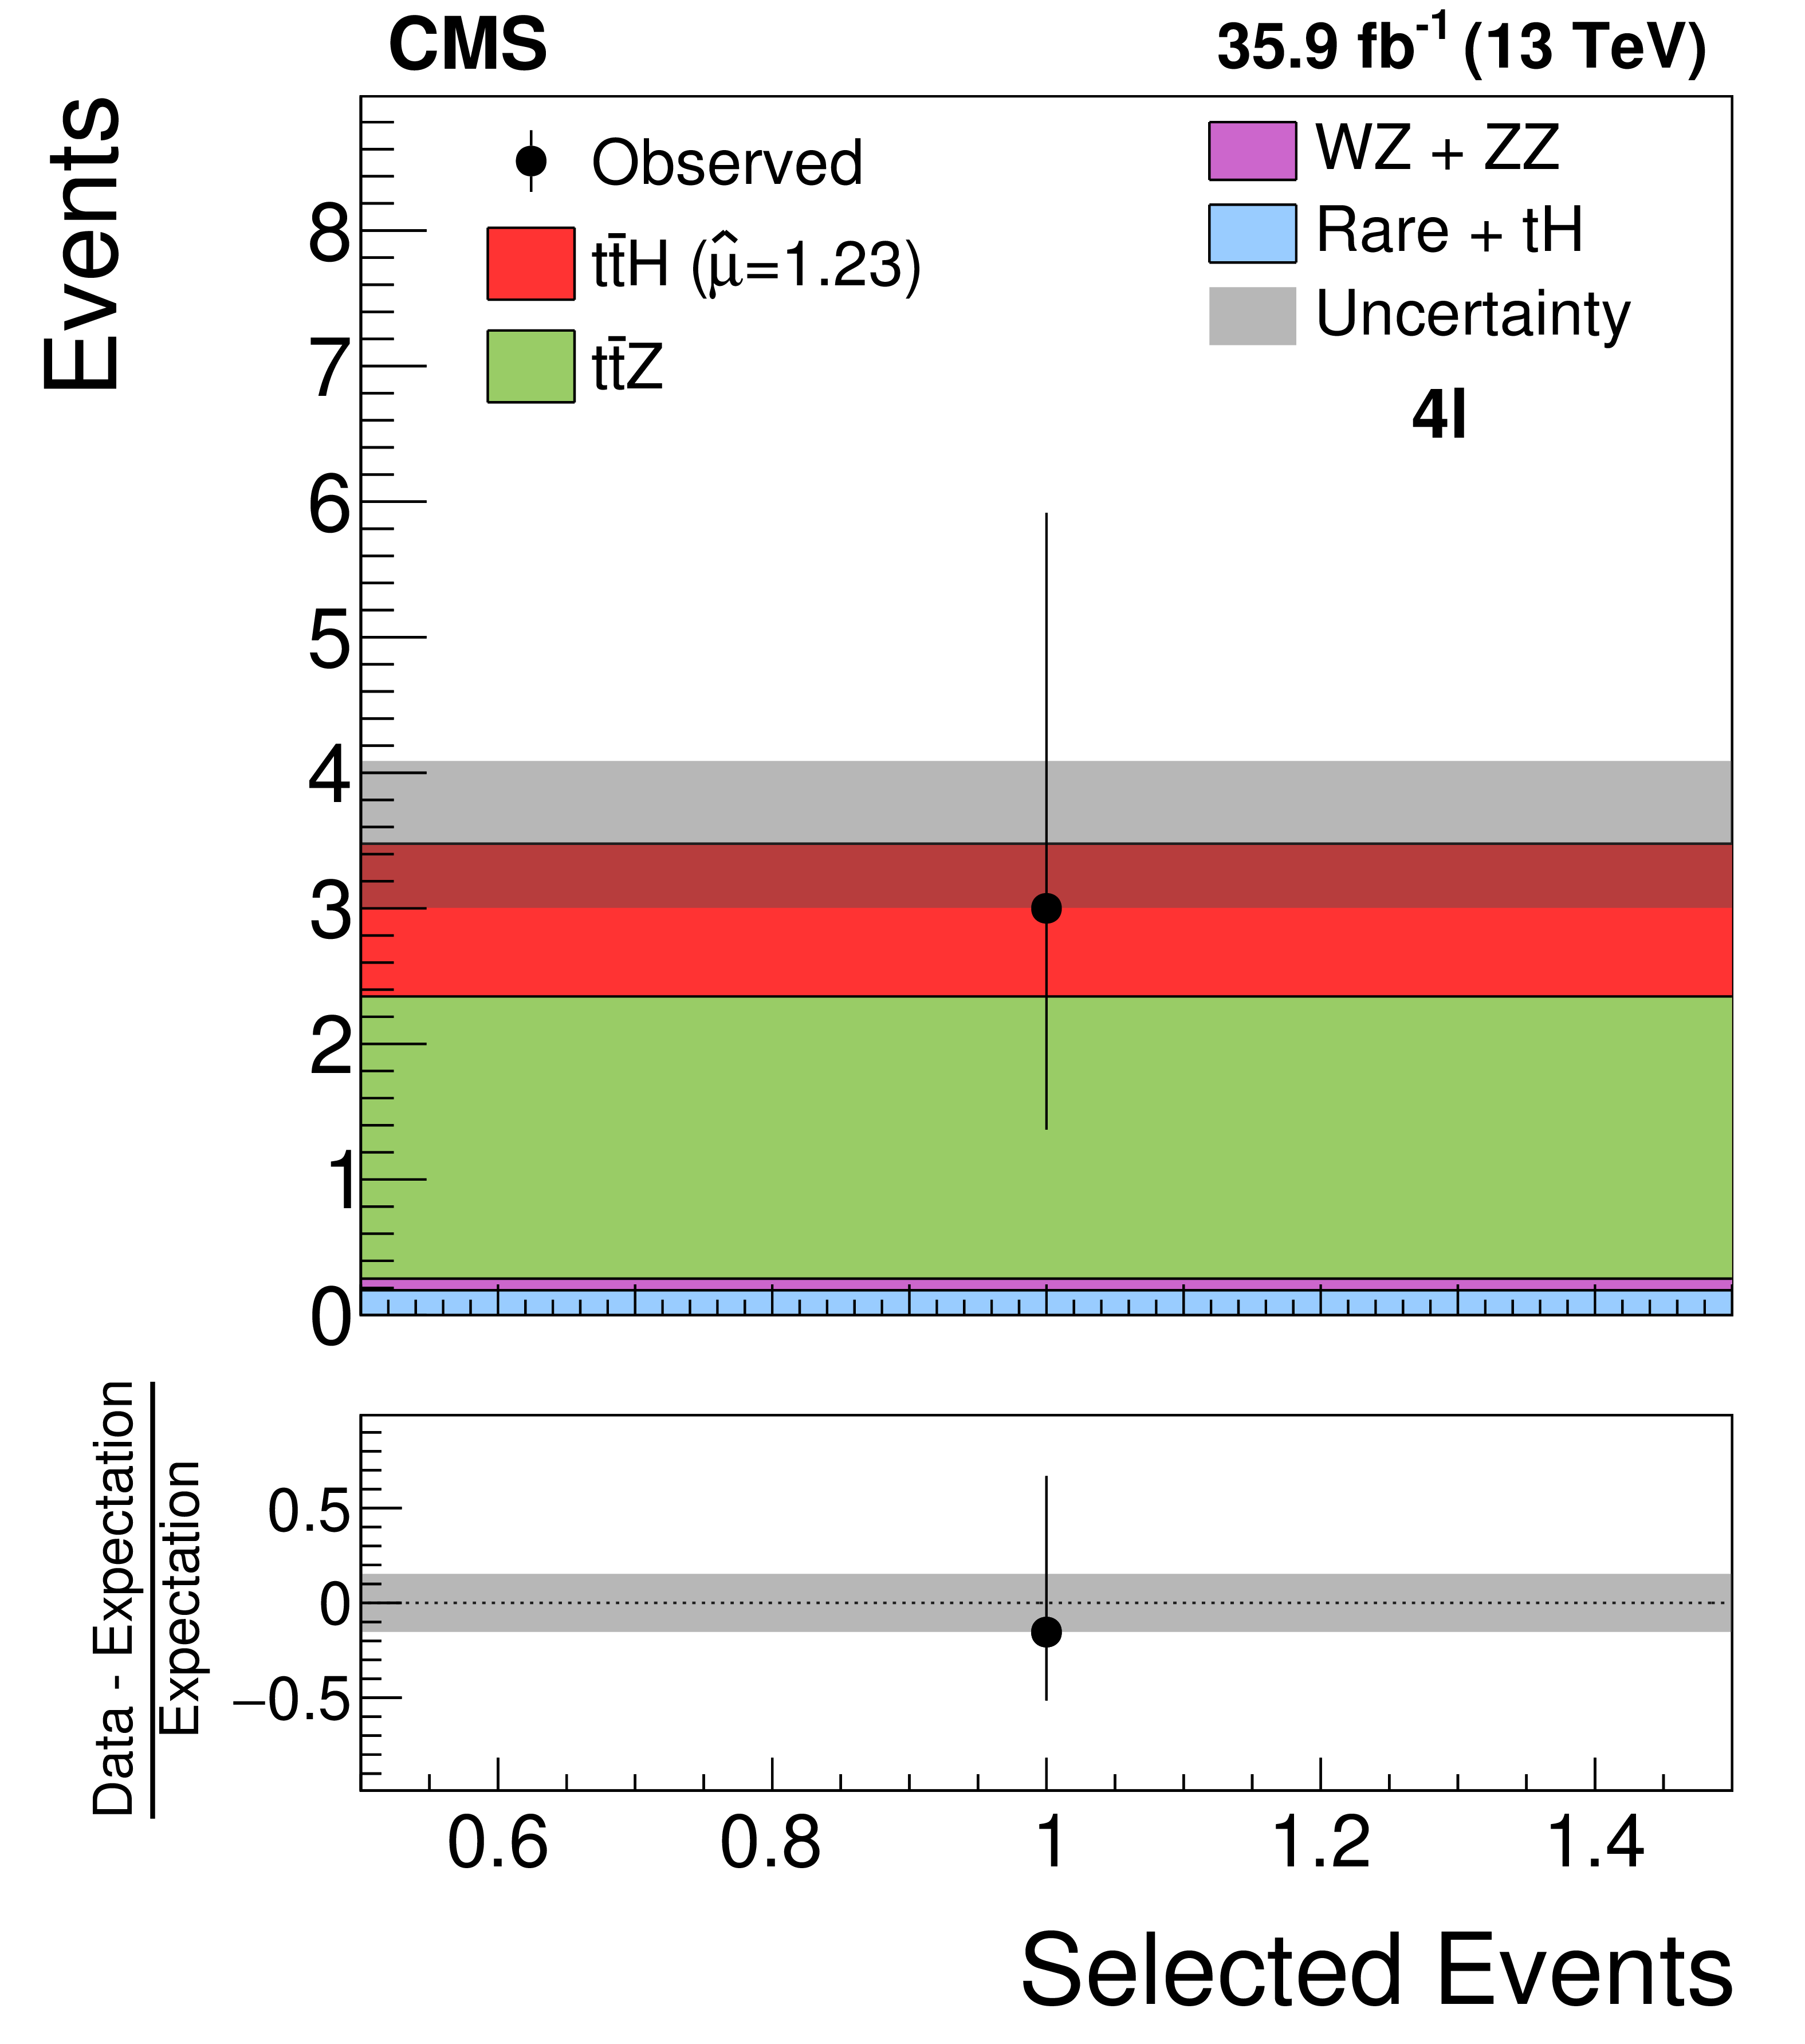
Figure 4:
Number of events observed and expected in the $4 {\ell}$ category. The distributions expected for signal and background processes are shown for the values of nuisance parameters obtained from the combined ML fit and $\mu = \hat{\mu} = $ 1.23, corresponding to the best-fit value from the ML fit. |

png pdf |
Figure 5:
Distribution of the decimal logarithm of the ratio between the expected signal and expected background in each bin of the distributions used for the signal extraction. The distributions expected for signal and background processes are shown for the values of nuisance parameters obtained from the combined ML fit and $\mu = \hat{\mu}=$ 1.23, corresponding to the best-fit value from the ML fit. |
png pdf |
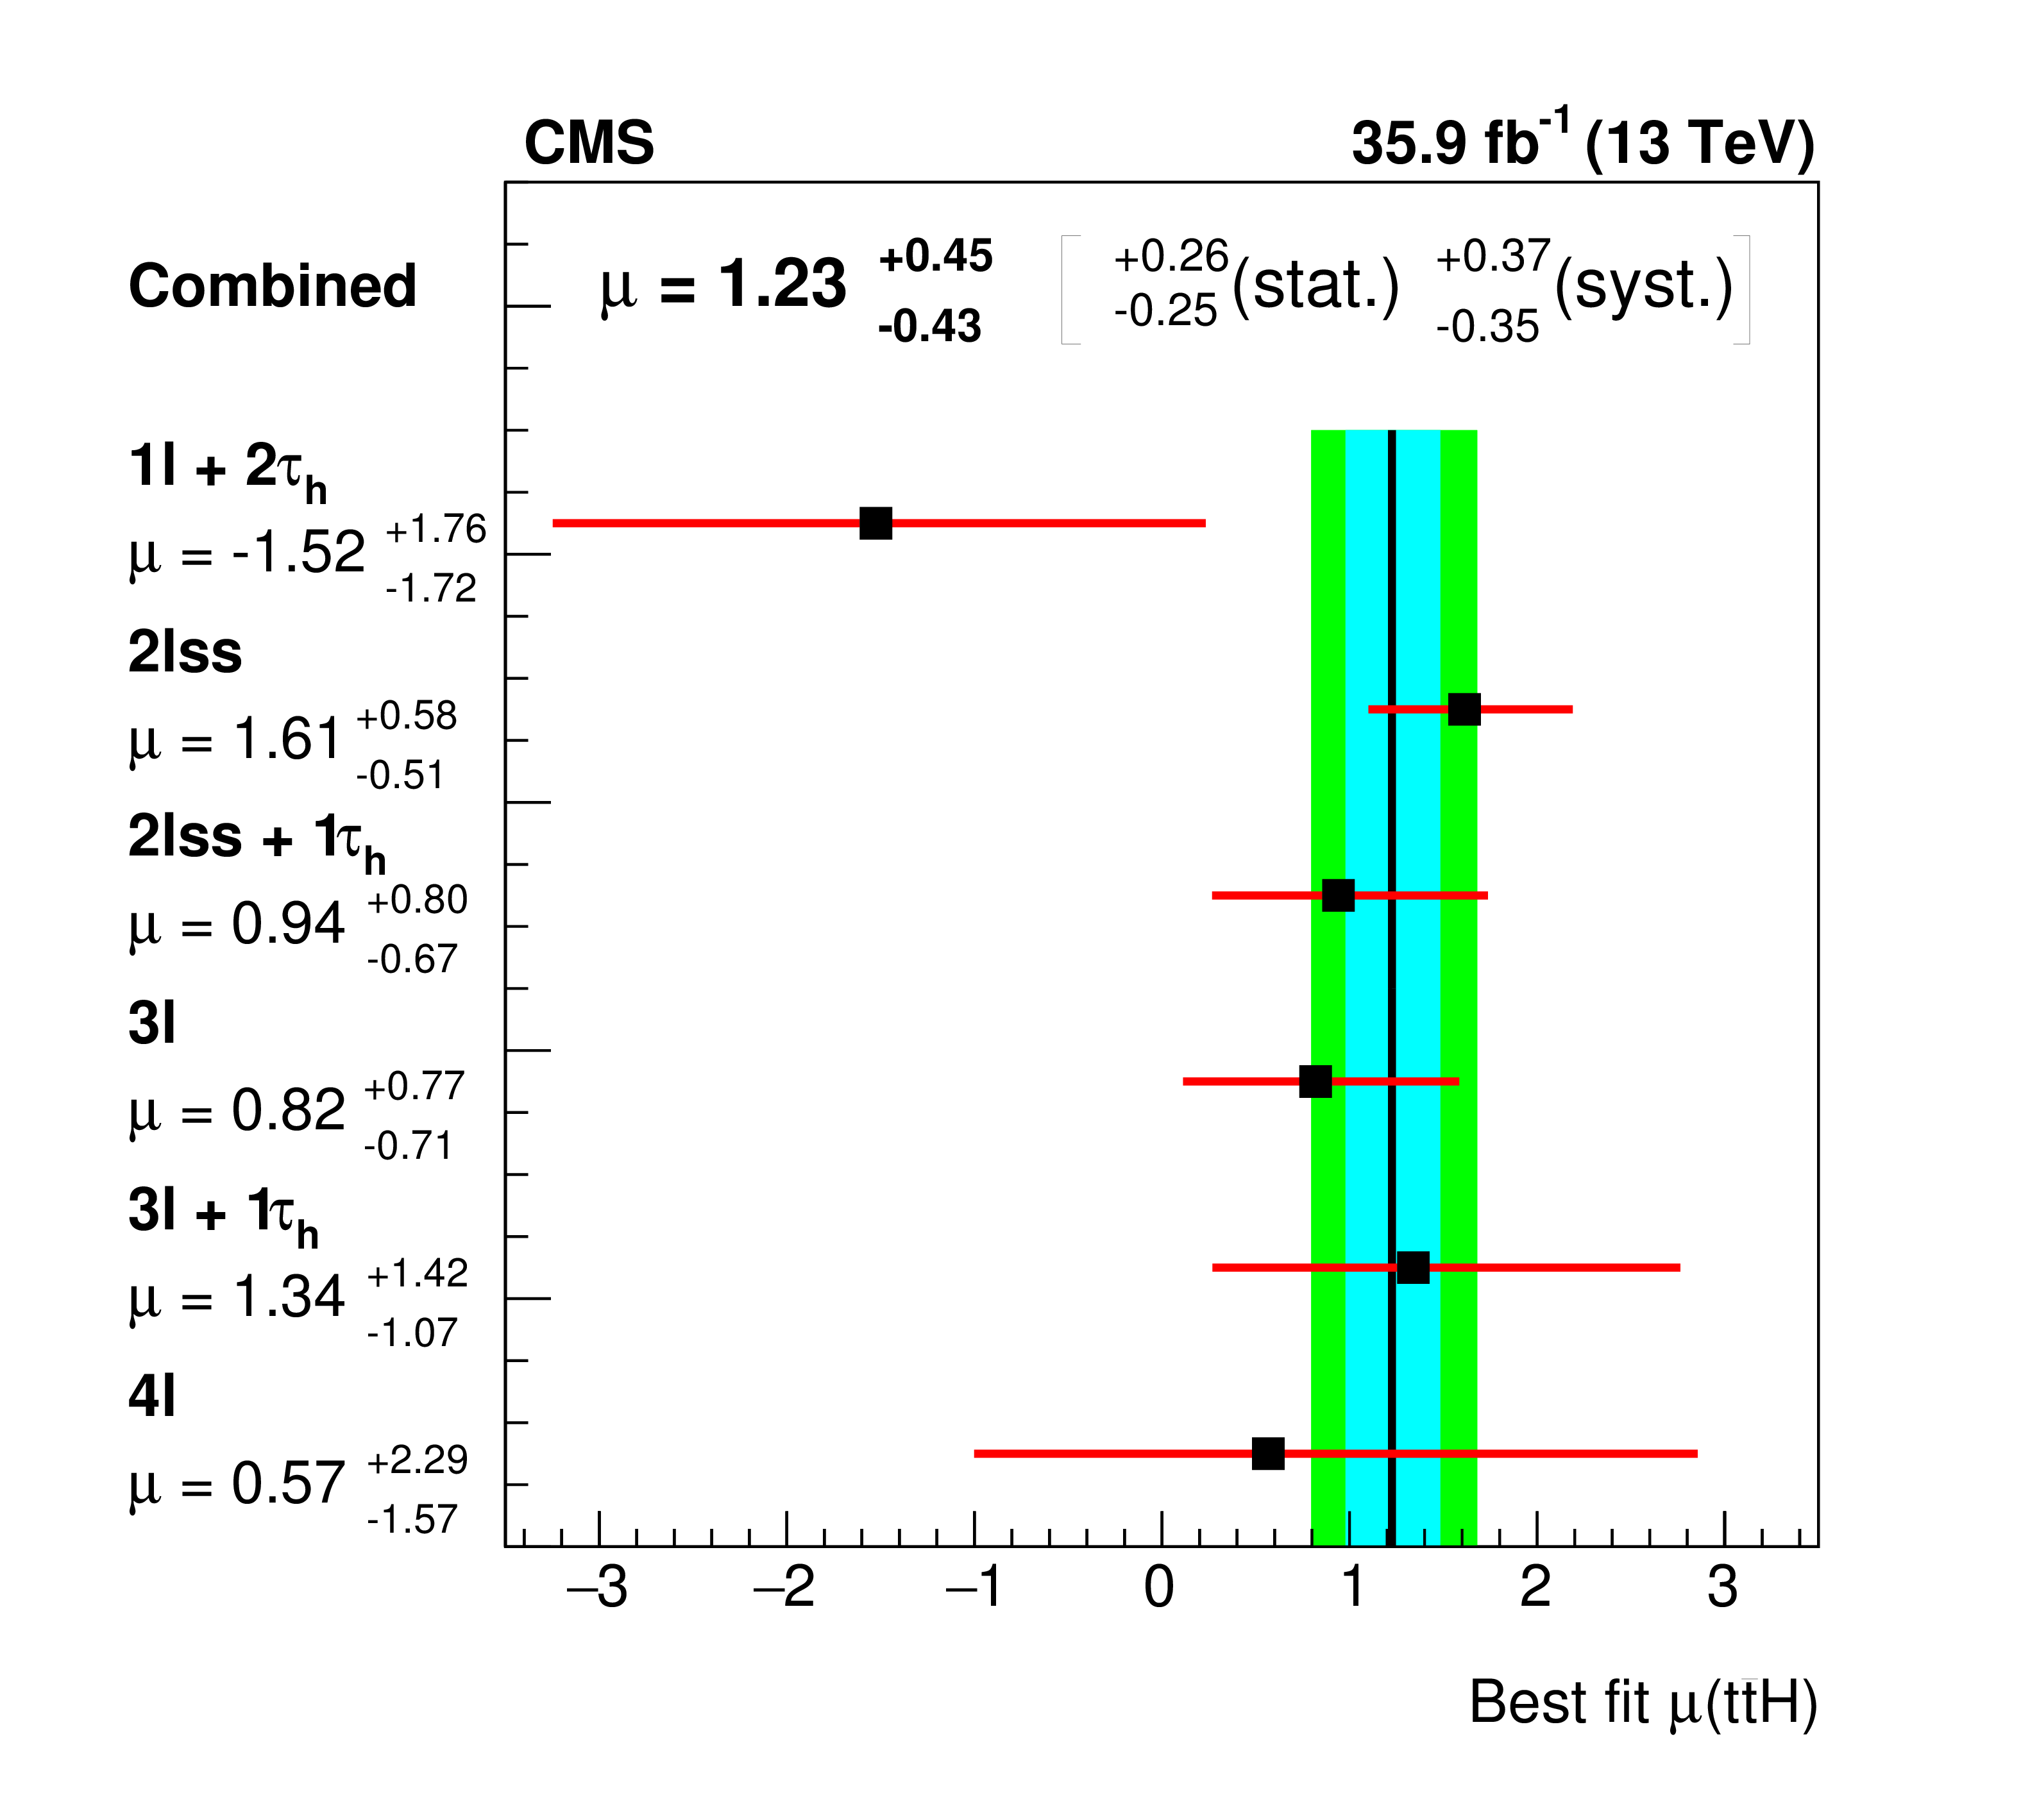
Figure 6:
Signal rates $\mu $, in units of the SM $ {{{\mathrm {t}}} {{\overline {\mathrm {t}}}} {{\mathrm {H}}}}$ production rate, measured in each of the categories individually and for the combination of all six categories. |
| Tables | |

png pdf |
Table 1:
Event selections applied in the $2 {\ell} {\text {ss}}$, $2 {\ell} {\text {ss}}+1 {{\tau}_{\mathrm {h}}} $, $3 {\ell}$, and $3 {\ell}+1 {{\tau}_{\mathrm {h}}} $ categories. |

png pdf |
Table 2:
Event selections applied in the $1 {\ell}+2 {{\tau}_{\mathrm {h}}} $ and $4 {\ell}$ categories. |

png pdf |
Table 3:
Observables used as input to the BDTs that separate the $ {{{\mathrm {t}}} {{\overline {\mathrm {t}}}} {{\mathrm {H}}}}$ signal from the $ {{{\mathrm {t}}} {{\overline {\mathrm {t}}}}\mathrm {V}}$ and $ {{{\mathrm {t}}} {{\overline {\mathrm {t}}}}\text {+jets}}$ backgrounds in the $1 {\ell}+2 {{\tau}_{\mathrm {h}}} $, $2 {\ell} {\text {ss}}$, $3 {\ell}$, and $3 {\ell}+1 {{\tau}_{\mathrm {h}}} $ categories. |

png pdf |
Table 4:
Summary of the main sources of systematic uncertainty and their impact on the combined measured $ {{{\mathrm {t}}} {{\overline {\mathrm {t}}}} {{\mathrm {H}}}}$ signal rate $\mu $. $\Delta \mu /\mu $ corresponds to the relative shift in signal strength obtained from varying the systematic source within its associated uncertainty. |

png pdf |
Table 5:
Numbers of events selected in the different categories compared to the SM expectations for the $ {{{\mathrm {t}}} {{\overline {\mathrm {t}}}} {{\mathrm {H}}}}$ signal and background processes. The event yields expected for the $ {{{\mathrm {t}}} {{\overline {\mathrm {t}}}} {{\mathrm {H}}}}$ signal and for the backgrounds are shown for the values of nuisance parameters obtained from the ML fit and $\mu = 1$. Quoted uncertainties represent the combination of statistical and systematic components. |
png pdf |
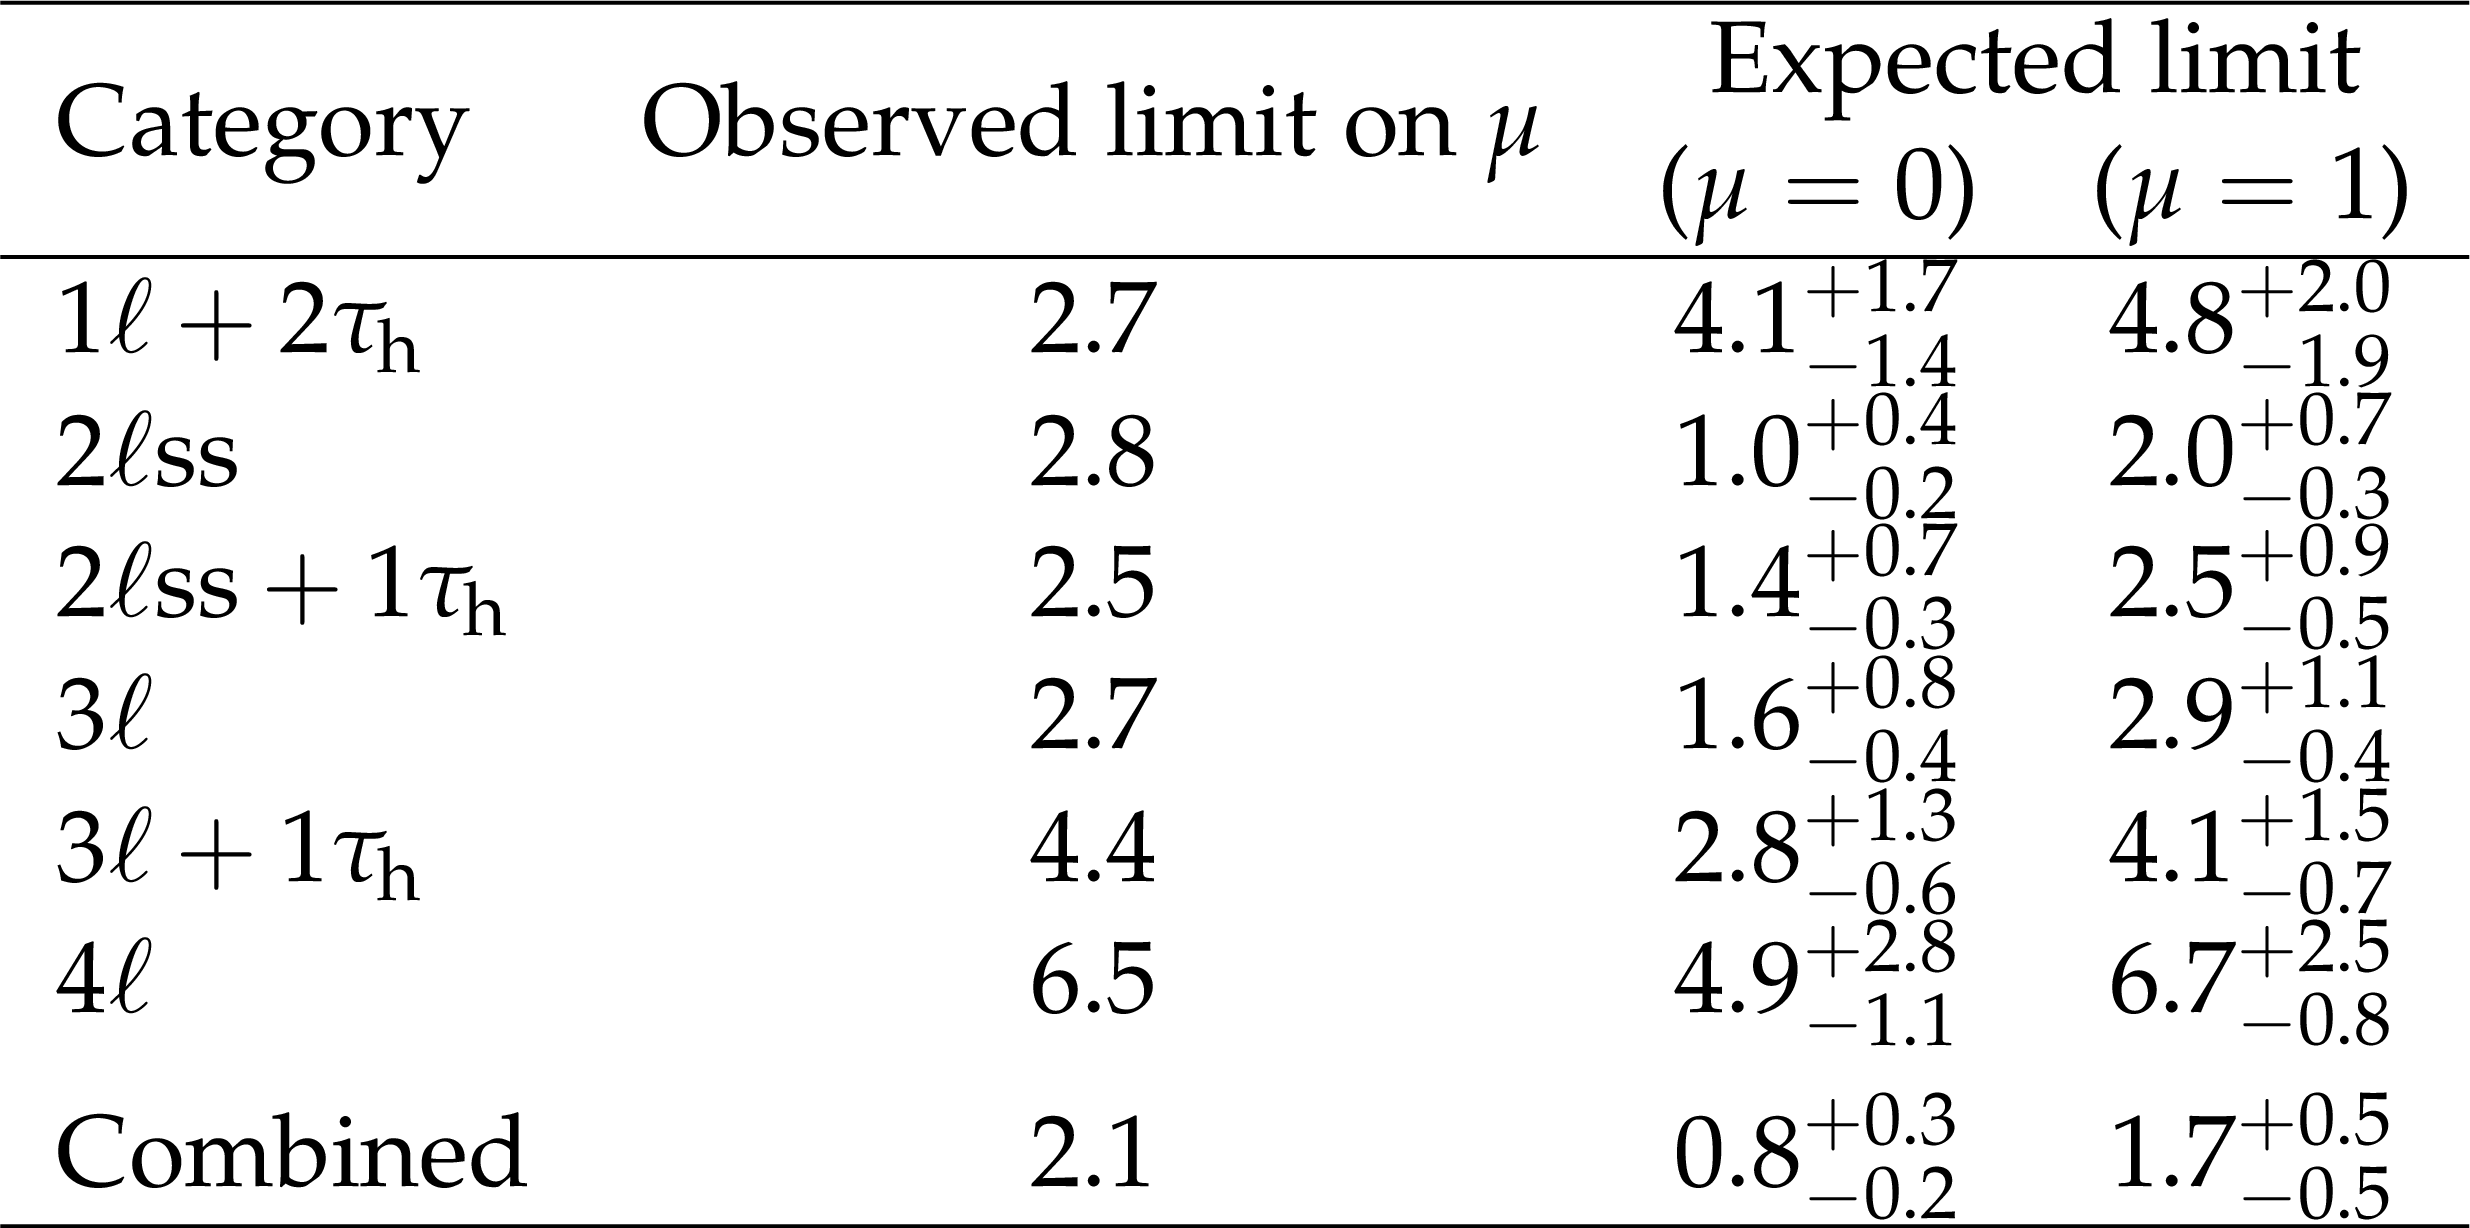
Table 6:
The 95% {\text {CL}} upper limits on the $ {{{\mathrm {t}}} {{\overline {\mathrm {t}}}} {{\mathrm {H}}}}$ signal rate, in units of the SM $ {{{\mathrm {t}}} {{\overline {\mathrm {t}}}} {{\mathrm {H}}}}$ production rate, obtained in each of the categories individually and for the combination of all six event categories. The observed limit is compared to the limits expected for the background-only hypothesis ($\mu =$ 0) and for the case that a $ {{{\mathrm {t}}} {{\overline {\mathrm {t}}}} {{\mathrm {H}}}}$ signal of SM production rate is present in the data ($\mu =1$). The $ \pm $1 standard deviation uncertainty intervals on the expected limits are also given in the table. |
| Summary |
| A search has been presented for the associated production of a Higgs boson with a top quark pair in final states with electrons, muons, and hadronically decaying $\tau$ leptons (${\tau_\mathrm{h}}$). The analyzed data set corresponds to an integrated luminosity of 35.9 fb$^{-1}$ of ${\mathrm{p}}{\mathrm{p}}$ collision data recorded by the CMS experiment at $\sqrt{s} = $ 13 TeV. The analysis is performed in six mutually exclusive event categories, based on different lepton and ${\tau_\mathrm{h}}$ multiplicity requirements. The sensitivity of the analysis is enhanced by using multivariate analysis techniques based on boosted decision trees and on the matrix element method. The results of the analysis are in agreement with the standard model (SM) expectation. The measured signal rate amounts to 1.23$^{+0.45}_{-0.43}$ times the SM $\mathrm{ t \bar{t} H }$ production rate, with an observed (expected) significance of 3.2$\sigma$ (2.8$\sigma$), which represents evidence for $\mathrm{ t \bar{t} H }$ production in those final states. An upper limit on the signal rate of 2.1 times the SM $\mathrm{ t \bar{t} H }$ production rate is set at 95% confidence level, for an expected limit of 1.7 times the SM production rate in the presence of a $\mathrm{ t \bar{t} H }$ signal. |
| Additional Figures | |
png pdf |
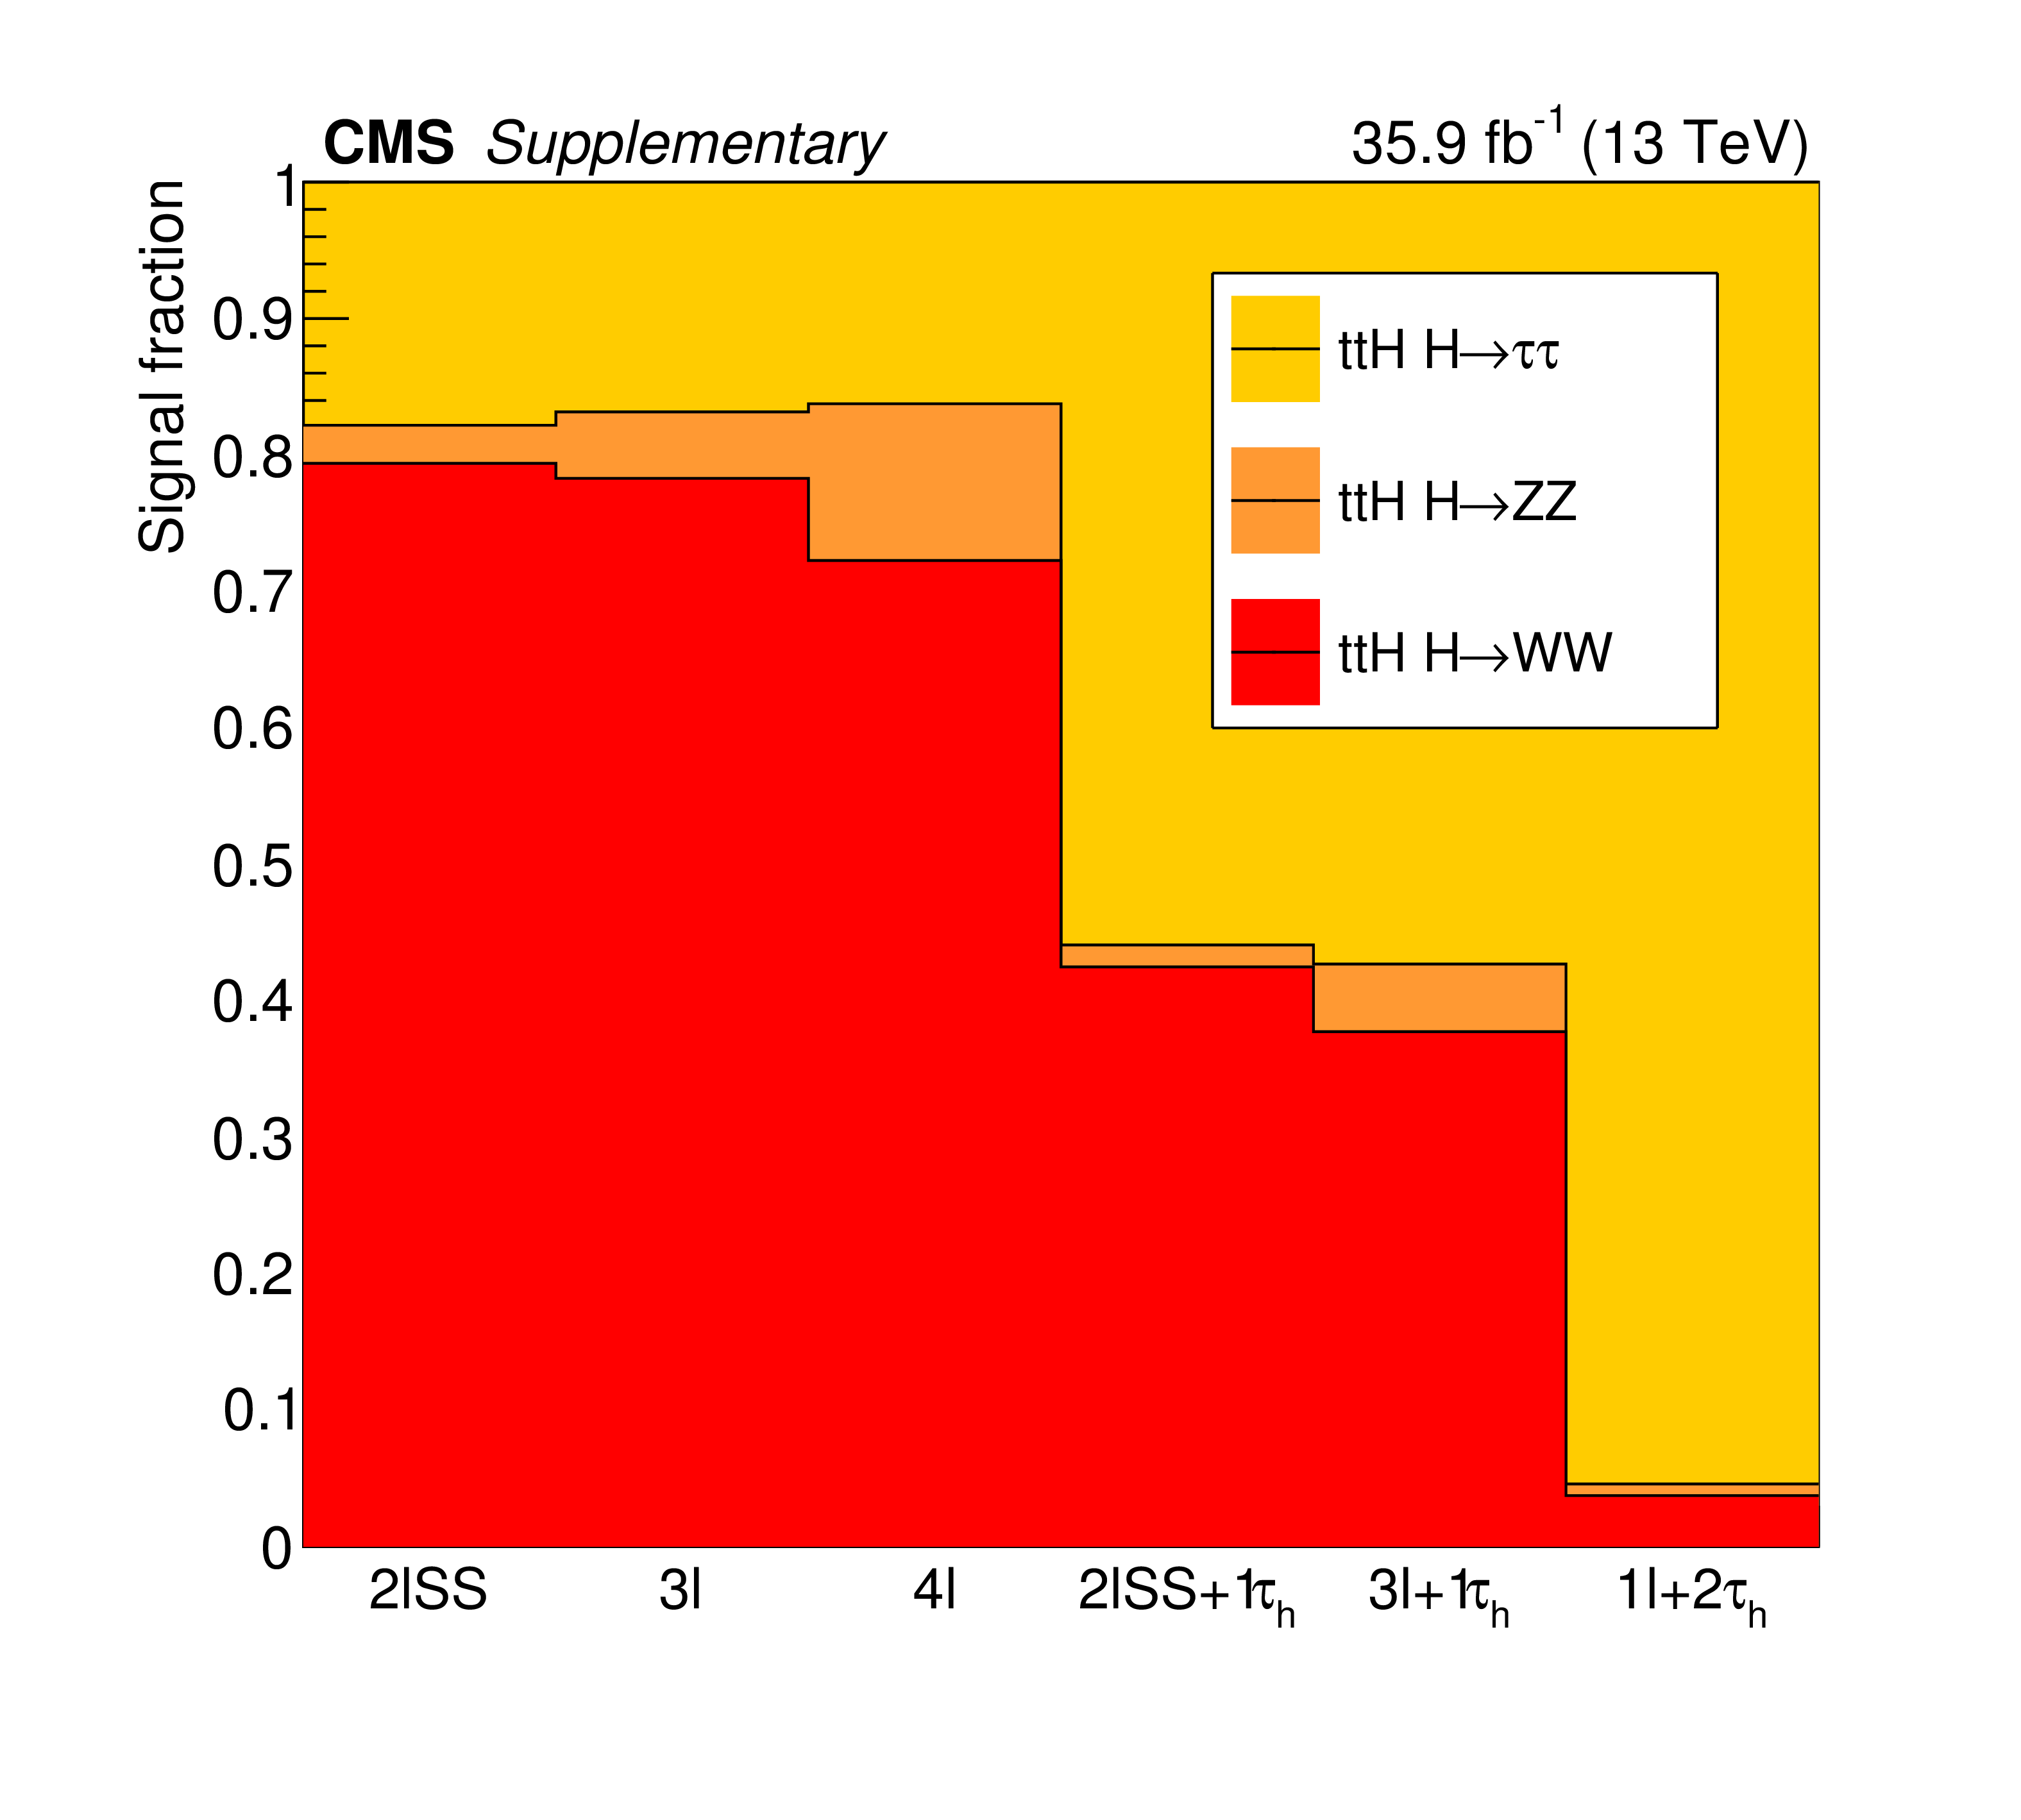
Additional Figure 1:
Relative contribution of the $\mathrm {t \bar{t} H }$, H $\rightarrow $ WW, ZZ and $\tau \tau$ decay modes in the different analysis categories. |
png pdf |
Additional Figure 2:
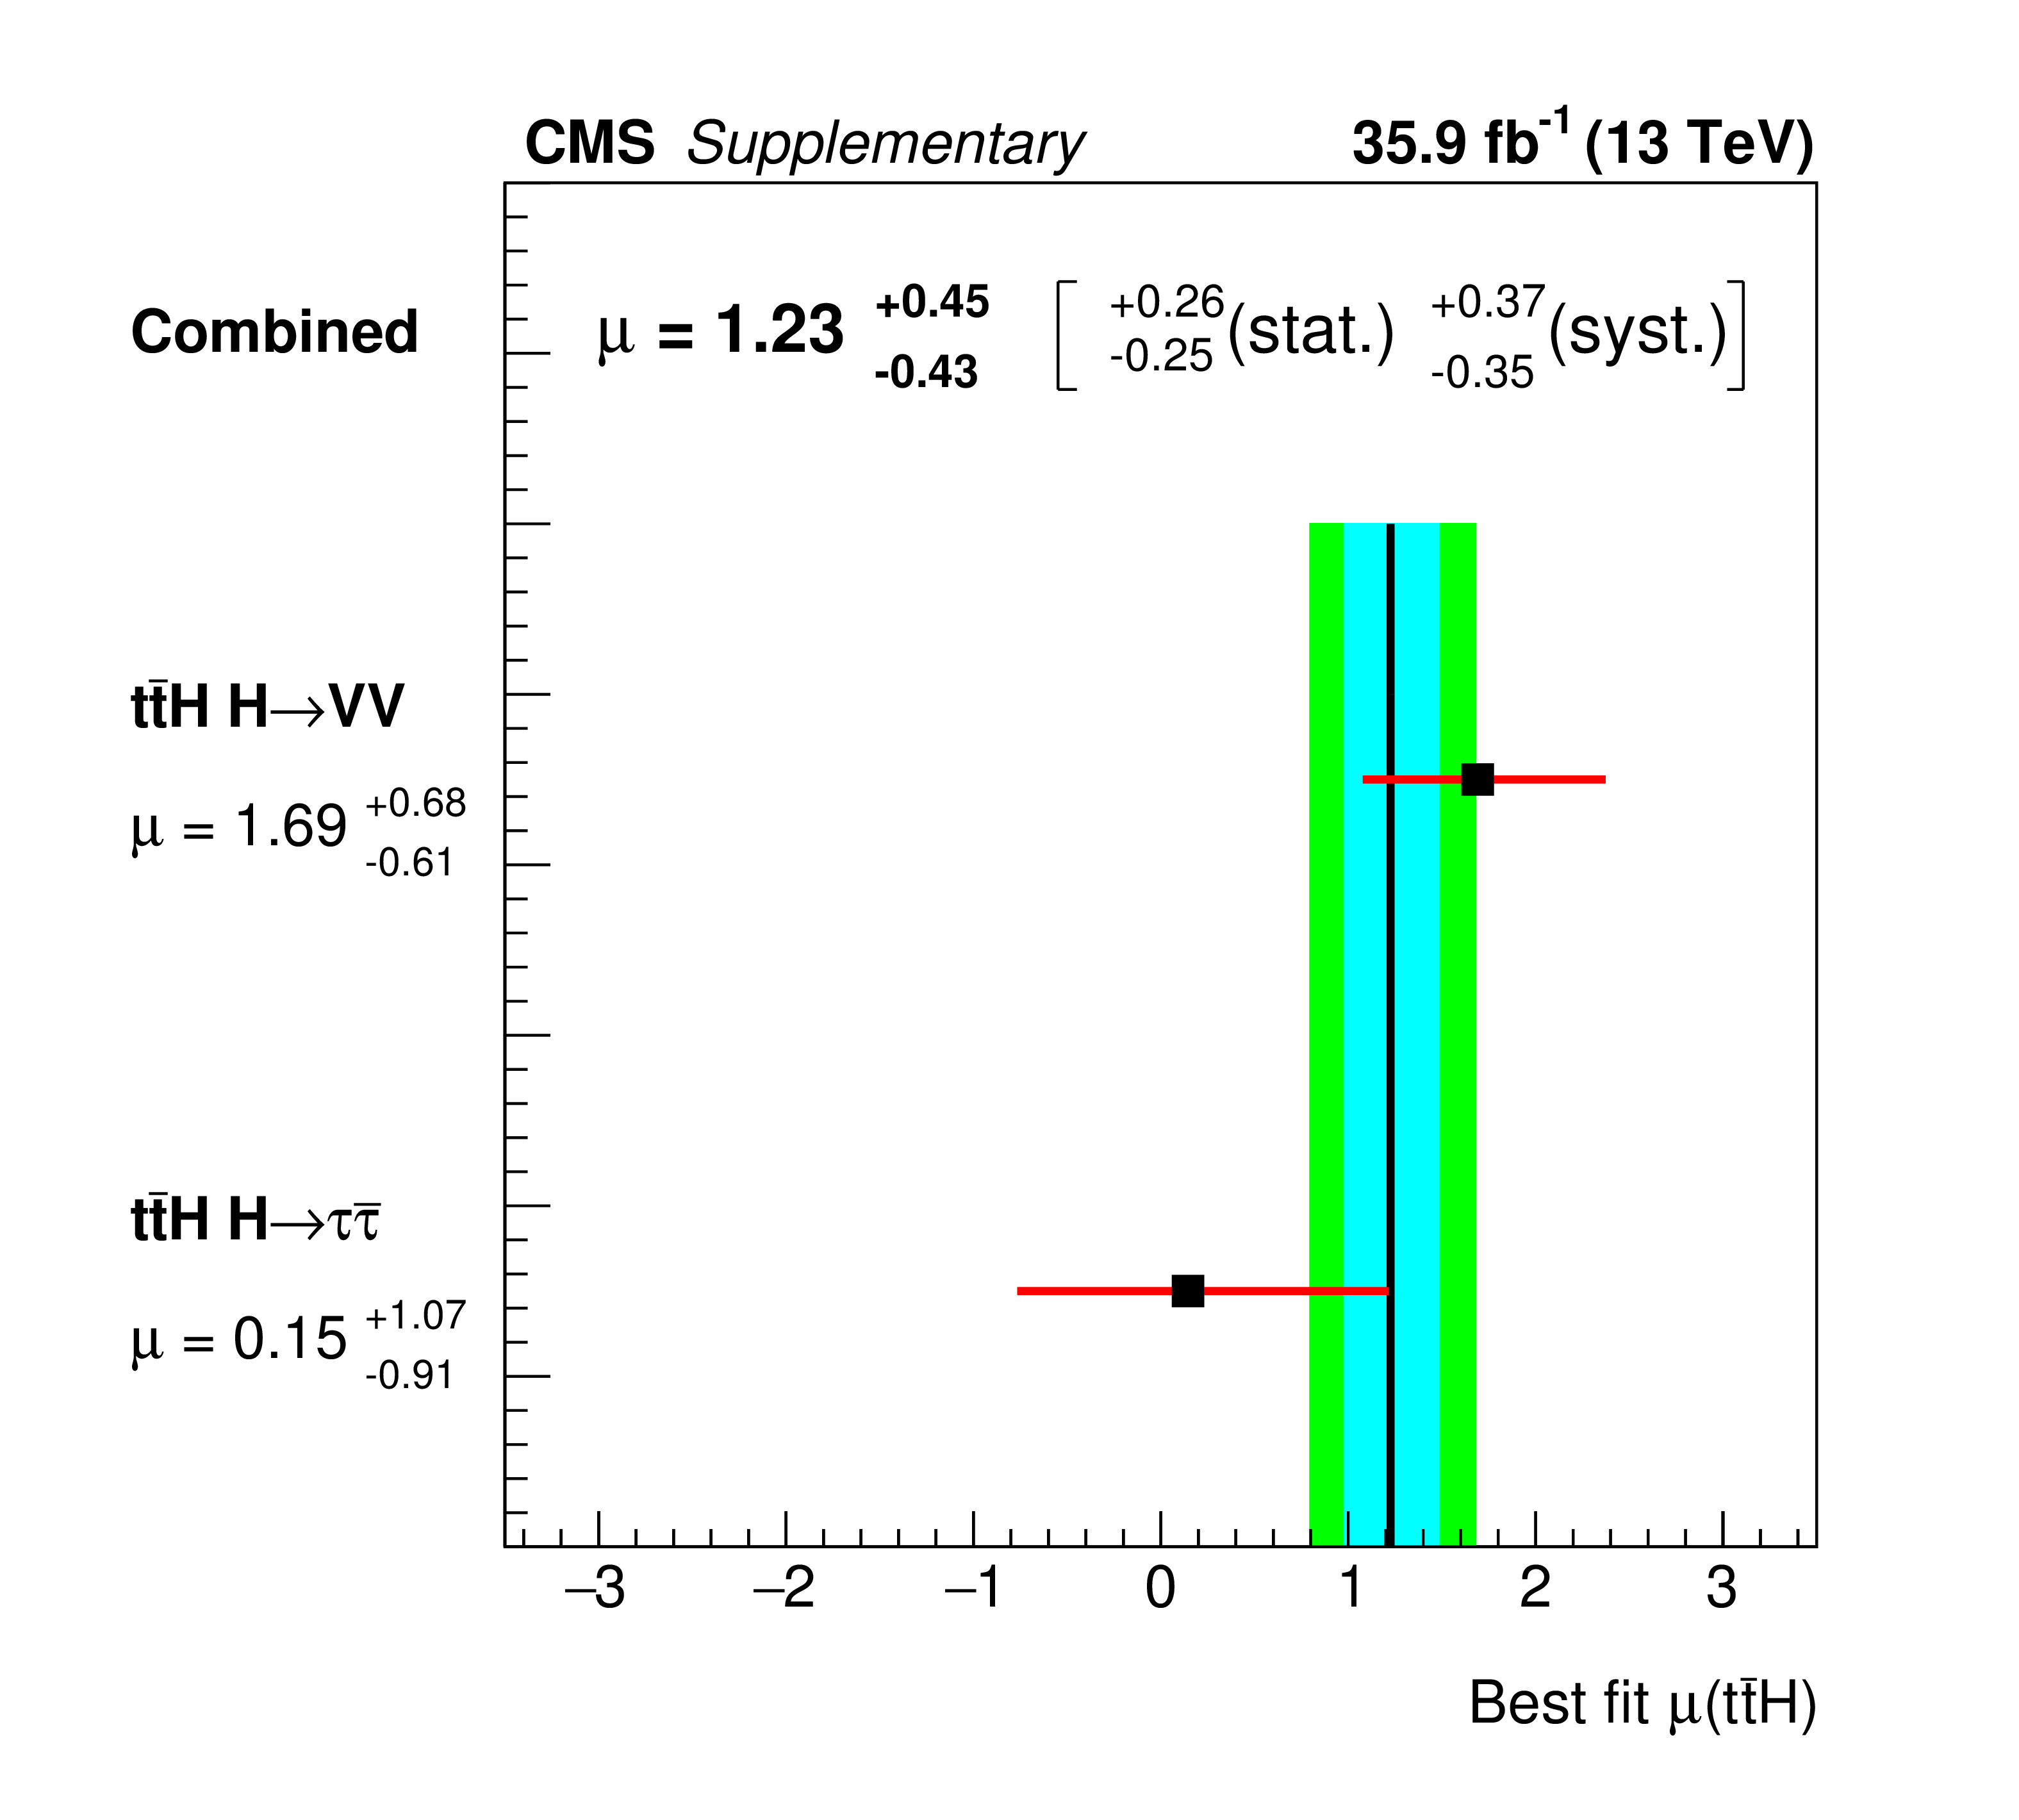
Signal rates $\mu $, in units of the SM $\mathrm {t \bar{t} H } $ production rate, measured either assuming the same signal strength for all decay modes (combined) or independently for the Higgs boson decays into two electroweak bosons ($\mathrm {t \bar{t} H } + \mathrm{ H \to VV} $) and into two $\tau $ leptons ($\mathrm {t \bar{t} H } + \mathrm{ H\to \tau \bar{\tau}} $). |

png pdf |
Additional Figure 3:
The 95% CL upper limits on the $\mathrm {t \bar{t} H }$ signal rate, obtained in each of the categories individually and for the combination of all six event categories. The expected limits are computed for the background-only ($\mu =$ 0) and signal ($\mu =$ 1) plus background hypotheses. |
| References | ||||
| 1 | ATLAS Collaboration | Observation of a new particle in the search for the standard model Higgs boson with the ATLAS detector at the LHC | PLB 716 (2012) 1 | 1207.7214 |
| 2 | CMS Collaboration | Observation of a new boson at a mass of 125 GeV with the CMS experiment at the LHC | PLB 716 (2012) 30 | CMS-HIG-12-028 1207.7235 |
| 3 | CMS Collaboration | Observation of a new boson with mass near 125 GeV in pp collisions at $ \sqrt{s} = $ 7 and 8 TeV | JHEP 06 (2013) 081 | CMS-HIG-12-036 1303.4571 |
| 4 | CMS Collaboration | Measurements of properties of the Higgs boson decaying into the four-lepton final state in pp collisions at $ \sqrt{s}= $ 13 TeV | JHEP 11 (2017) 047 | CMS-HIG-16-041 1706.09936 |
| 5 | ATLAS Collaboration | Evidence for the spin- 0 nature of the Higgs boson using ATLAS data | PLB 726 (2013) 120 | 1307.1432 |
| 6 | CMS Collaboration | Constraints on the spin-parity and anomalous HVV couplings of the Higgs boson in proton collisions at 7 and 8TeV | PRD 92 (2015) 012004 | CMS-HIG-14-018 1411.3441 |
| 7 | ATLAS Collaboration | Search for the standard model Higgs boson produced in association with top quarks and decaying into $ \mathrm{ b \bar{b} } $ in pp collisions at $ \sqrt{s}= $ 8 TeV with the ATLAS detector | EPJC 75 (2015) 349 | 1503.05066 |
| 8 | ATLAS Collaboration | Search for the standard model Higgs boson decaying into $ \mathrm{ b \bar{b} } $ produced in association with top quarks decaying hadronically in pp collisions at $ \sqrt{s}= $ 8 TeV with the ATLAS detector | JHEP 05 (2016) 160 | 1604.03812 |
| 9 | ATLAS Collaboration | Search for the associated production of the Higgs boson with a top quark pair in multilepton final states with the ATLAS detector | PLB 749 (2015) 519 | 1506.05988 |
| 10 | ATLAS Collaboration | Search for $ \mathrm{H}iggs \to \gamma\gamma $ produced in association with top quarks and constraints on the Yukawa coupling between the top quark and the Higgs boson using data taken at 7TeV and 8TeV with the ATLAS detector | PLB 740 (2015) 222 | 1409.3122 |
| 11 | CMS Collaboration | Search for the associated production of the Higgs boson with a top-quark pair | JHEP 09 (2014) 087 | CMS-HIG-13-029 1408.1682 |
| 12 | CMS Collaboration | Search for a standard model Higgs boson produced in association with a top-quark pair and decaying to bottom quarks using a matrix element method | EPJC 75 (2015) 251 | CMS-HIG-14-010 1502.02485 |
| 13 | ATLAS Collaboration | Search for the standard model Higgs boson produced in association with top quarks and decaying into a $ b\bar{b} $ pair in $ pp $ collisions at $ \sqrt{s} = $ 13 TeV with the ATLAS detector | Submitted to \it PRD | 1712.08895 |
| 14 | ATLAS Collaboration | Evidence for the associated production of the Higgs boson and a top quark pair with the ATLAS detector | Submitted to \it PRD | 1712.08891 |
| 15 | A. Hoecker et al. | TMVA --- toolkit for multivariate data analysis | PoS ACAT (2007) 040 | physics/0703039 |
| 16 | F. Pedregosa et al. | Scikit-learn: Machine learning in Python | JMLR 12 (2011) 2825 | 1201.0490 |
| 17 | K. Kondo | Dynamical likelihood method for reconstruction of events with missing momentum. 1: method and toy models | J. Phys. Soc. Jap. 57 (1988) 4126 | |
| 18 | K. Kondo | Dynamical likelihood method for reconstruction of events with missing momentum. 2: mass spectra for $ 2 \to 2 $ processes | J. Phys. Soc. Jap. 60 (1991) 836 | |
| 19 | CMS Collaboration | Description and performance of track and primary-vertex reconstruction with the CMS tracker | JINST 9 (2014) P10009 | CMS-TRK-11-001 1405.6569 |
| 20 | CMS Collaboration | The CMS trigger system | JINST 12 (2017) P01020 | CMS-TRG-12-001 1609.02366 |
| 21 | CMS Collaboration | The CMS experiment at the CERN LHC | JINST 3 (2008) S08004 | CMS-00-001 |
| 22 | J. Alwall et al. | The automated computation of tree-level and next-to-leading order differential cross sections, and their matching to parton shower simulations | JHEP 07 (2014) 079 | 1405.0301 |
| 23 | J. Alwall et al. | Comparative study of various algorithms for the merging of parton showers and matrix elements in hadronic collisions | EPJC 53 (2008) 473 | 0706.2569 |
| 24 | P. Artoisenet, R. Frederix, O. Mattelaer, and R. Rietkerk | Automatic spin-entangled decays of heavy resonances in Monte Carlo simulations | JHEP 03 (2013) 015 | 1212.3460 |
| 25 | R. Frederix and S. Frixione | Merging meets matching in $ MCatNLO $ | JHEP 12 (2012) 061 | 1209.6215 |
| 26 | P. Nason | A new method for combining NLO QCD with shower Monte Carlo algorithms | JHEP 11 (2004) 040 | hep-ph/0409146 |
| 27 | S. Frixione, P. Nason, and C. Oleari | Matching NLO QCD computations with parton shower simulations: the POWHEG method | JHEP 11 (2007) 070 | 0709.2092 |
| 28 | S. Alioli, P. Nason, C. Oleari, and E. Re | A general framework for implementing NLO calculations in shower Monte Carlo programs: the POWHEG BOX | JHEP 06 (2010) 043 | 1002.2581 |
| 29 | NNPDF Collaboration | Parton distributions with QED corrections | NPB 877 (2013) 290 | 1308.0598 |
| 30 | NNPDF Collaboration | Unbiased global determination of parton distributions and their uncertainties at NNLO and at LO | NPB 855 (2012) 153 | 1107.2652 |
| 31 | NNPDF Collaboration | Parton distributions for the LHC Run II | JHEP 04 (2015) 040 | 1410.8849 |
| 32 | T. Sjostrand, S. Mrenna, and P. Z. Skands | A brief introduction to $ PYTHIA $ 8.1 | CPC 178 (2008) 852 | 0710.3820 |
| 33 | CMS Collaboration | Event generator tunes obtained from underlying event and multiparton scattering measurements | EPJC 76 (2016) 155 | CMS-GEN-14-001 1512.00815 |
| 34 | Y. Li and F. Petriello | Combining QCD and electroweak corrections to dilepton production in $ FEWZ $ | PRD 86 (2012) 094034 | 1208.5967 |
| 35 | M. Czakon and A. Mitov | Top++: A program for the calculation of the top-pair cross section at hadron colliders | CPC 185 (2014) 2930 | 1112.5675 |
| 36 | P. Kant et al. | HATHOR for single top-quark production: Updated predictions and uncertainty estimates for single top-quark production in hadronic collisions | CPC 191 (2015) 74 | 1406.4403 |
| 37 | M. Aliev et al. | HATHOR: HAdronic Top and Heavy quarks crOss section calculatoR | CPC 182 (2011) 1034 | 1007.1327 |
| 38 | N. Kidonakis | Two-loop soft anomalous dimensions for single top quark associated production with a $ \mathrm{W}^{-} $ or $ \mathrm{H}iggs^{-} $ | PRD 82 (2010) 054018 | 1005.4451 |
| 39 | J. M. Campbell, R. K. Ellis, and C. Williams | Vector boson pair production at the LHC | JHEP 07 (2011) 018 | 1105.0020 |
| 40 | GEANT4 Collaboration | GEANT4---a simulation toolkit | NIMA 506 (2003) 250 | |
| 41 | CMS Collaboration | Performance of reconstruction and identification of $ \tau $ leptons in their decays to hadrons and $ {\mathrm{n}}ut $ in LHC Run 2 | CMS-PAS-TAU-16-002 | CMS-PAS-TAU-16-002 |
| 42 | CMS Collaboration | Identification of b quark jets with the CMS experiment | JINST 8 (2013) P04013 | CMS-BTV-12-001 1211.4462 |
| 43 | CMS Collaboration | Performance of missing energy reconstruction in 13 $ TeV {\mathrm{p}}{\mathrm{p}} $ collision data using the CMS detector | CMS-PAS-JME-16-004 | CMS-PAS-JME-16-004 |
| 44 | CMS Collaboration | Performance of the CMS missing transverse momentum reconstruction in pp data at $ \sqrt{s} = $ 8 TeV | JINST 10 (2015) P02006 | CMS-JME-13-003 1411.0511 |
| 45 | CMS Collaboration | Particle-flow reconstruction and global event description with the CMS detector | JINST 12 (2017) P10003 | CMS-PRF-14-001 1706.04965 |
| 46 | E. Chabanat and N. Estre | Deterministic annealing for vertex finding at CMS | in Computing in high energy physics and nuclear physics. Proceedings, Conference, CHEP 04, Interlaken, Switzerland, September 27-October 1, 2004, p. 2872005 | |
| 47 | W. Waltenberger, R. Fruhwirth, and P. Vanlaer | Adaptive vertex fitting | JPG 34 (2007) N343 | |
| 48 | M. Cacciari, G. P. Salam, and G. Soyez | The anti-$ {k_{\mathrm{T}}} $ jet clustering algorithm | JHEP 04 (2008) 063 | 0802.1189 |
| 49 | M. Cacciari, G. P. Salam, and G. Soyez | $ FastJet $ user manual | EPJC 72 (2012) 1896 | 1111.6097 |
| 50 | CMS Collaboration | Performance of electron reconstruction and selection with the CMS detector in pp collisions at $ \sqrt{s} = $ 8 TeV | JINST 10 (2015) P06005 | CMS-EGM-13-001 1502.02701 |
| 51 | CMS Collaboration | Performance of CMS muon reconstruction in pp collision events at $ \sqrt{s} = $ 7 TeV | JINST 7 (2012) P10002 | CMS-MUO-10-004 1206.4071 |
| 52 | M. Cacciari, G. P. Salam, and G. Soyez | The catchment area of jets | JHEP 04 (2008) 005 | 0802.1188 |
| 53 | M. Cacciari and G. P. Salam | Pileup subtraction using jet areas | PLB 659 (2008) 119 | 0707.1378 |
| 54 | CMS Collaboration | Reconstruction and identification of $ \tau $ lepton decays to hadrons and $ {\mathrm{n}}ut $ at CMS | JINST 11 (2016) P01019 | CMS-TAU-14-001 1510.07488 |
| 55 | CMS Collaboration | Jet algorithms performance in 13 TeV data | CMS-PAS-JME-16-003 | CMS-PAS-JME-16-003 |
| 56 | CMS Collaboration | Determination of jet energy calibration and transverse momentum resolution in CMS | JINST 6 (2011) P11002 | CMS-JME-10-011 1107.4277 |
| 57 | CMS Collaboration | Identification of b quark jets at the CMS experiment in the LHC Run 2 | CMS-PAS-BTV-15-001 | CMS-PAS-BTV-15-001 |
| 58 | J. MacQueen | Some methods for classification and analysis of multivariate observations | in Proceedings of the Fifth Berkeley Symposium on Mathematical Statistics and Probability, Volume 1: Statistics, Berkeley, California 1967, p. 281 University of California Press | |
| 59 | ATLAS and CMS Collaborations and LHC Higgs Combination Group | Procedure for the LHC Higgs boson search combination in summer 2011 | technical report | |
| 60 | CMS Collaboration | Combined results of searches for the standard model Higgs boson in pp collisions at $ \sqrt{s} = $ 7 TeV | PLB 710 (2012) 26 | CMS-HIG-11-032 1202.1488 |
| 61 | T. Junk | Confidence level computation for combining searches with small statistics | NIMA 434 (1999) 435 | hep-ex/9902006 |
| 62 | A. L. Read | Presentation of search results: The $ \textrm{CL}_{s} $ technique | JPG 28 (2002) 2693 | |
| 63 | J. S. Conway | Incorporating nuisance parameters in likelihoods for multisource spectra | 1103.0354 | |
| 64 | CMS Collaboration | Measurements of inclusive $ \mathrm{W} $ and $ \mathrm{Z} $ cross sections in pp collisions at $ \sqrt{s} = $ 7 TeV | JHEP 01 (2011) 080 | CMS-EWK-10-002 1012.2466 |
| 65 | CMS Collaboration | Jet energy scale and resolution at $ \sqrt{s} = $ 13 TeV | ||
| 66 | CMS Collaboration | CMS luminosity measurement for the 2016 data-taking period | CMS-PAS-LUM-17-001 | CMS-PAS-LUM-17-001 |
| 67 | LHC Higgs Cross Section Working Group Collaboration | Handbook of LHC Higgs Cross Sections: 4. Deciphering the Nature of the Higgs Sector | 1610.07922 | |
| 68 | M. Cacciari et al. | The $ \mathrm{ t \bar{t} } $ cross-section at 1.8 TeV and 1.96 TeV: a study of the systematics due to parton densities and scale dependence | JHEP 04 (2004) 068 | hep-ph/0303085 |
| 69 | S. Catani, D. de Florian, M. Grazzini, and P. Nason | Soft gluon resummation for Higgs boson production at hadron colliders | JHEP 07 (2003) 028 | hep-ph/0306211 |
| 70 | R. Frederix et al. | Four-lepton production at hadron colliders: aMC@NLO predictions with theoretical uncertainties | JHEP 02 (2012) 099 | 1110.4738 |
| 71 | ATLAS Collaboration | Measurement of the $ W^{\pm}Z $ boson pair-production cross section in $ pp $ collisions at $ \sqrt{s}= $ 13 TeV with the ATLAS Detector | PLB 762 (2016) 1 | 1606.04017 |
| 72 | CMS Collaboration | Measurement of the WZ production cross section in pp collisions at $ \sqrt(s) = $ 13 TeV | PLB 766 (2017) 268 | CMS-SMP-16-002 1607.06943 |
| 73 | J. D. Bjorken | Asymptotic sum rules at infinite momentum | PR179 (1969) 1547 | |
| 74 | P. M. Nadolsky et al. | Implications of CTEQ global analysis for collider observables | PRD 78 (2008) 013004 | 0802.0007 |
| 75 | G. P. Lepage | A new algorithm for adaptive multidimensional integration | J. Comput. Phys. 27 (1978) 192 | |
| 76 | J. Alwall, A. Freitas, and O. Mattelaer | The matrix element method and QCD radiation | PRD 83 (2011) 074010 | 1010.2263 |
| 77 | J. Neyman | Outline of a theory of statistical estimation based on the classical theory of probability | Phil. Trans. Royal Soc. of London A 236 (1937) 333 | |
|
|
Compact Muon Solenoid LHC, CERN |
|

|

|

|

|

|