

Compact Muon Solenoid
LHC, CERN
| CMS-SMP-14-010 ; CERN-EP-2016-254 | ||
| Measurements of the associated production of a Z boson and b jets in pp collisions at $ \sqrt{s} = $ 8 TeV | ||
| CMS Collaboration | ||
| 20 November 2016 | ||
| Eur. Phys. J. C 77 (2017) 751 | ||
| Abstract: Measurements of the associated production of a Z boson with at least one jet originating from a b quark in proton-proton collisions at $ \sqrt{s} = $ 8 TeV are presented. Differential cross sections are measured with data collected by the CMS experiment corresponding to an integrated luminosity of 19.8 fb$^{-1}$. Z bosons are reconstructed through their decays to electrons and muons. Cross sections are measured as a function of observables characterizing the kinematics of the b jet and the Z boson. Ratios of differential cross sections for the associated production with at least one b jet to the associated production with any jet are also presented. The production of a Z boson with two b jets is investigated, and differential cross sections are measured for the dijet system. Results are compared to theoretical predictions, testing two different flavour schemes for the choice of initial-state partons. | ||
| Links: e-print arXiv:1611.06507 [hep-ex] (PDF) ; CDS record ; inSPIRE record ; HepData record ; CADI line (restricted) ; | ||
| Figures | |
png pdf |
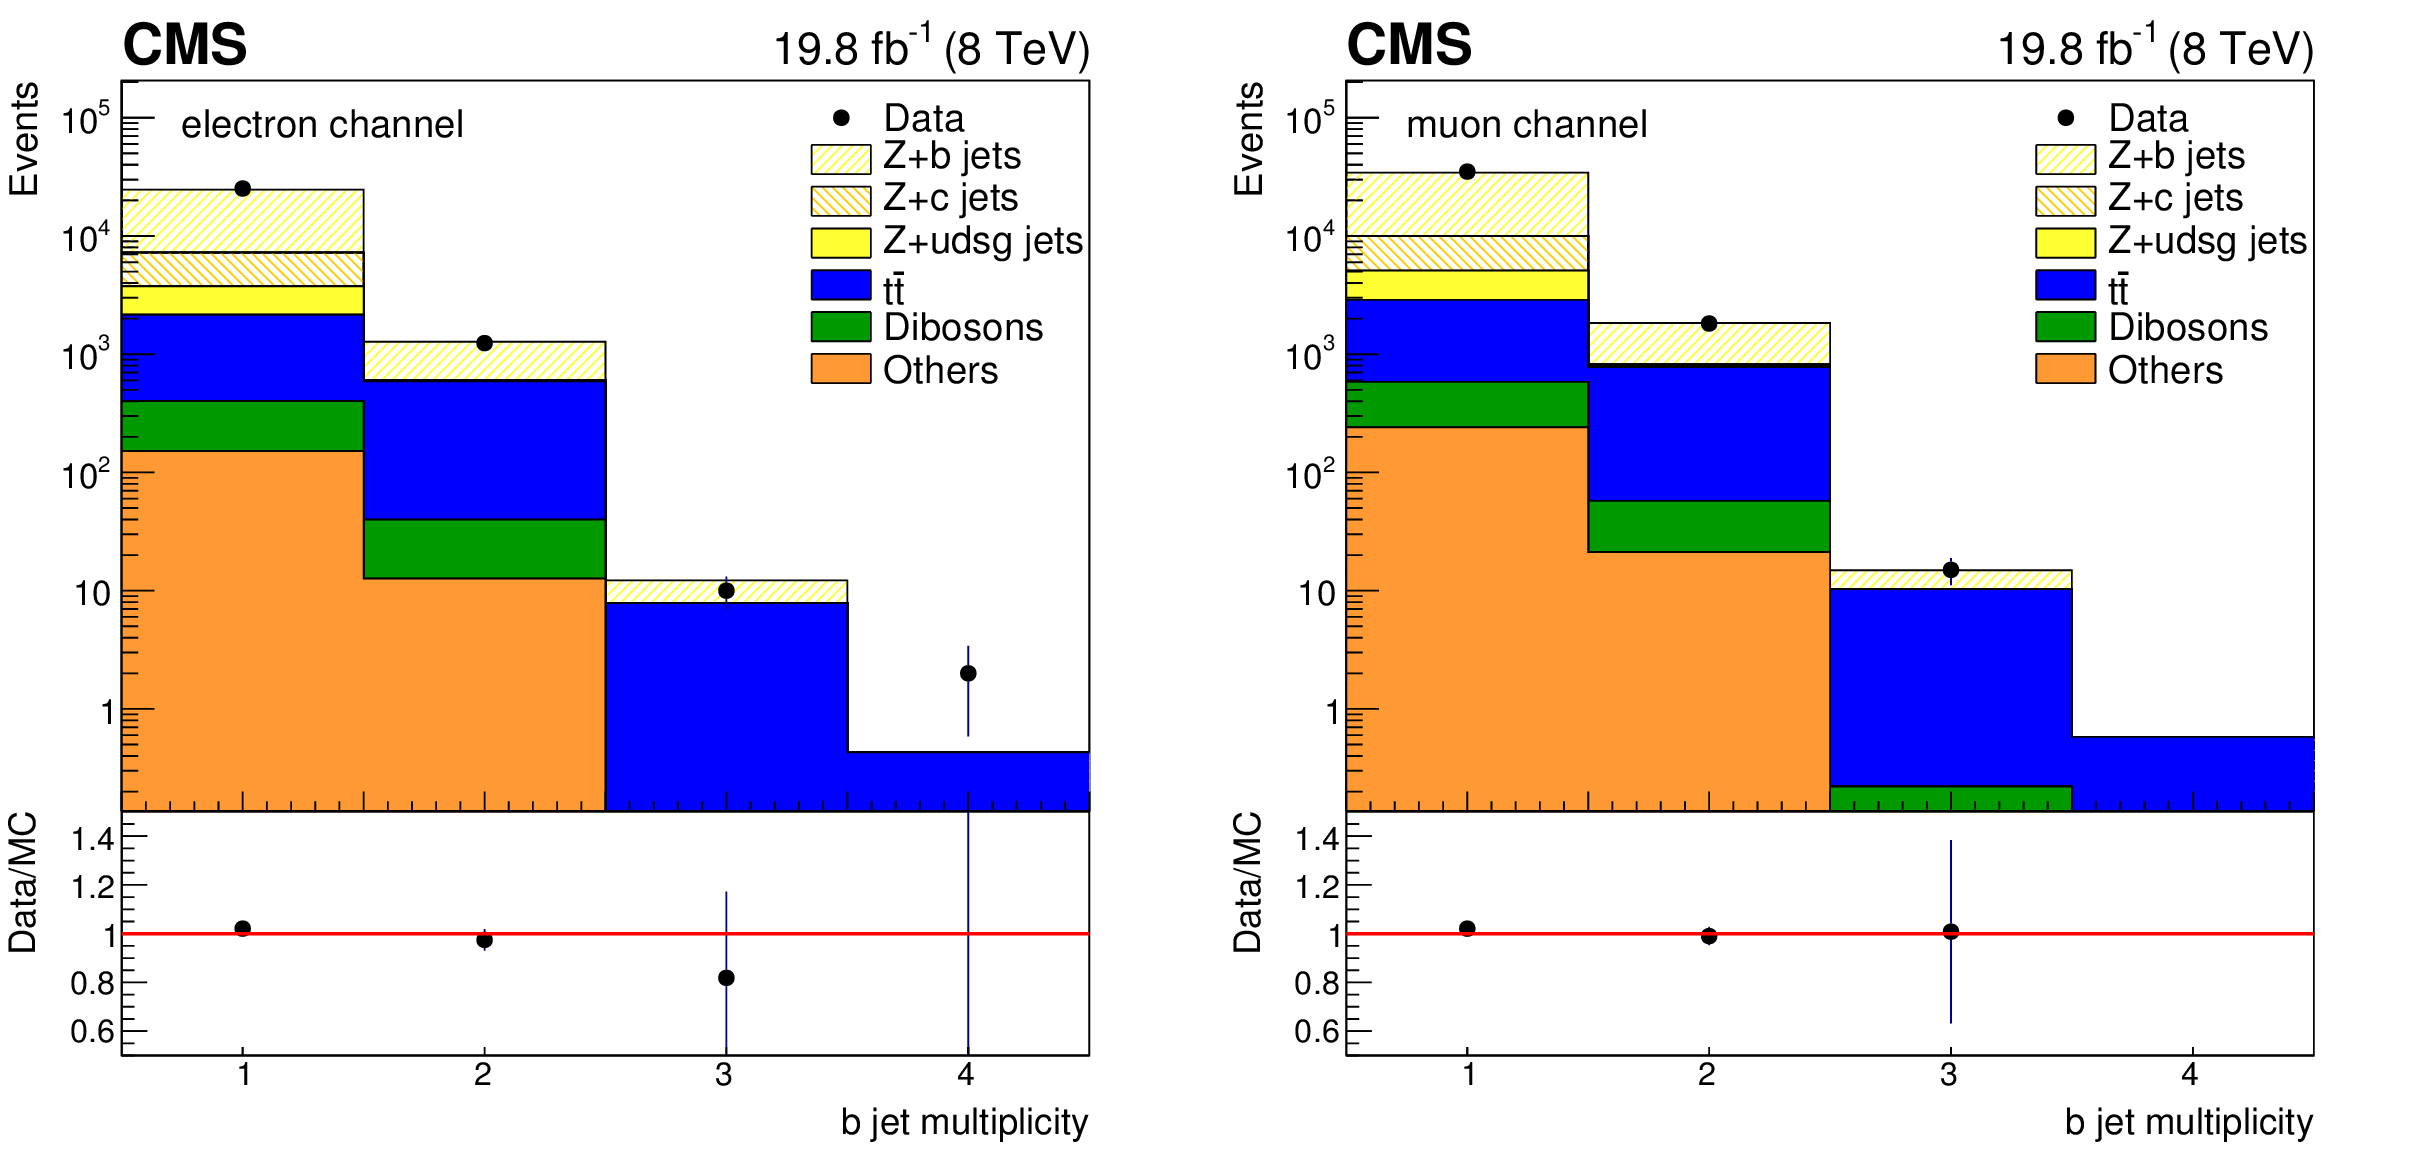
Figure 1:
Exclusive b-tagged jet multiplicity distributions for Z (1b) events, for the electron (left) and muon (right) decay channel of Z boson. Error bars account for statistical uncertainties in data in the upper plots and in both data and simulation in the bottom ratio plots. |
png pdf |
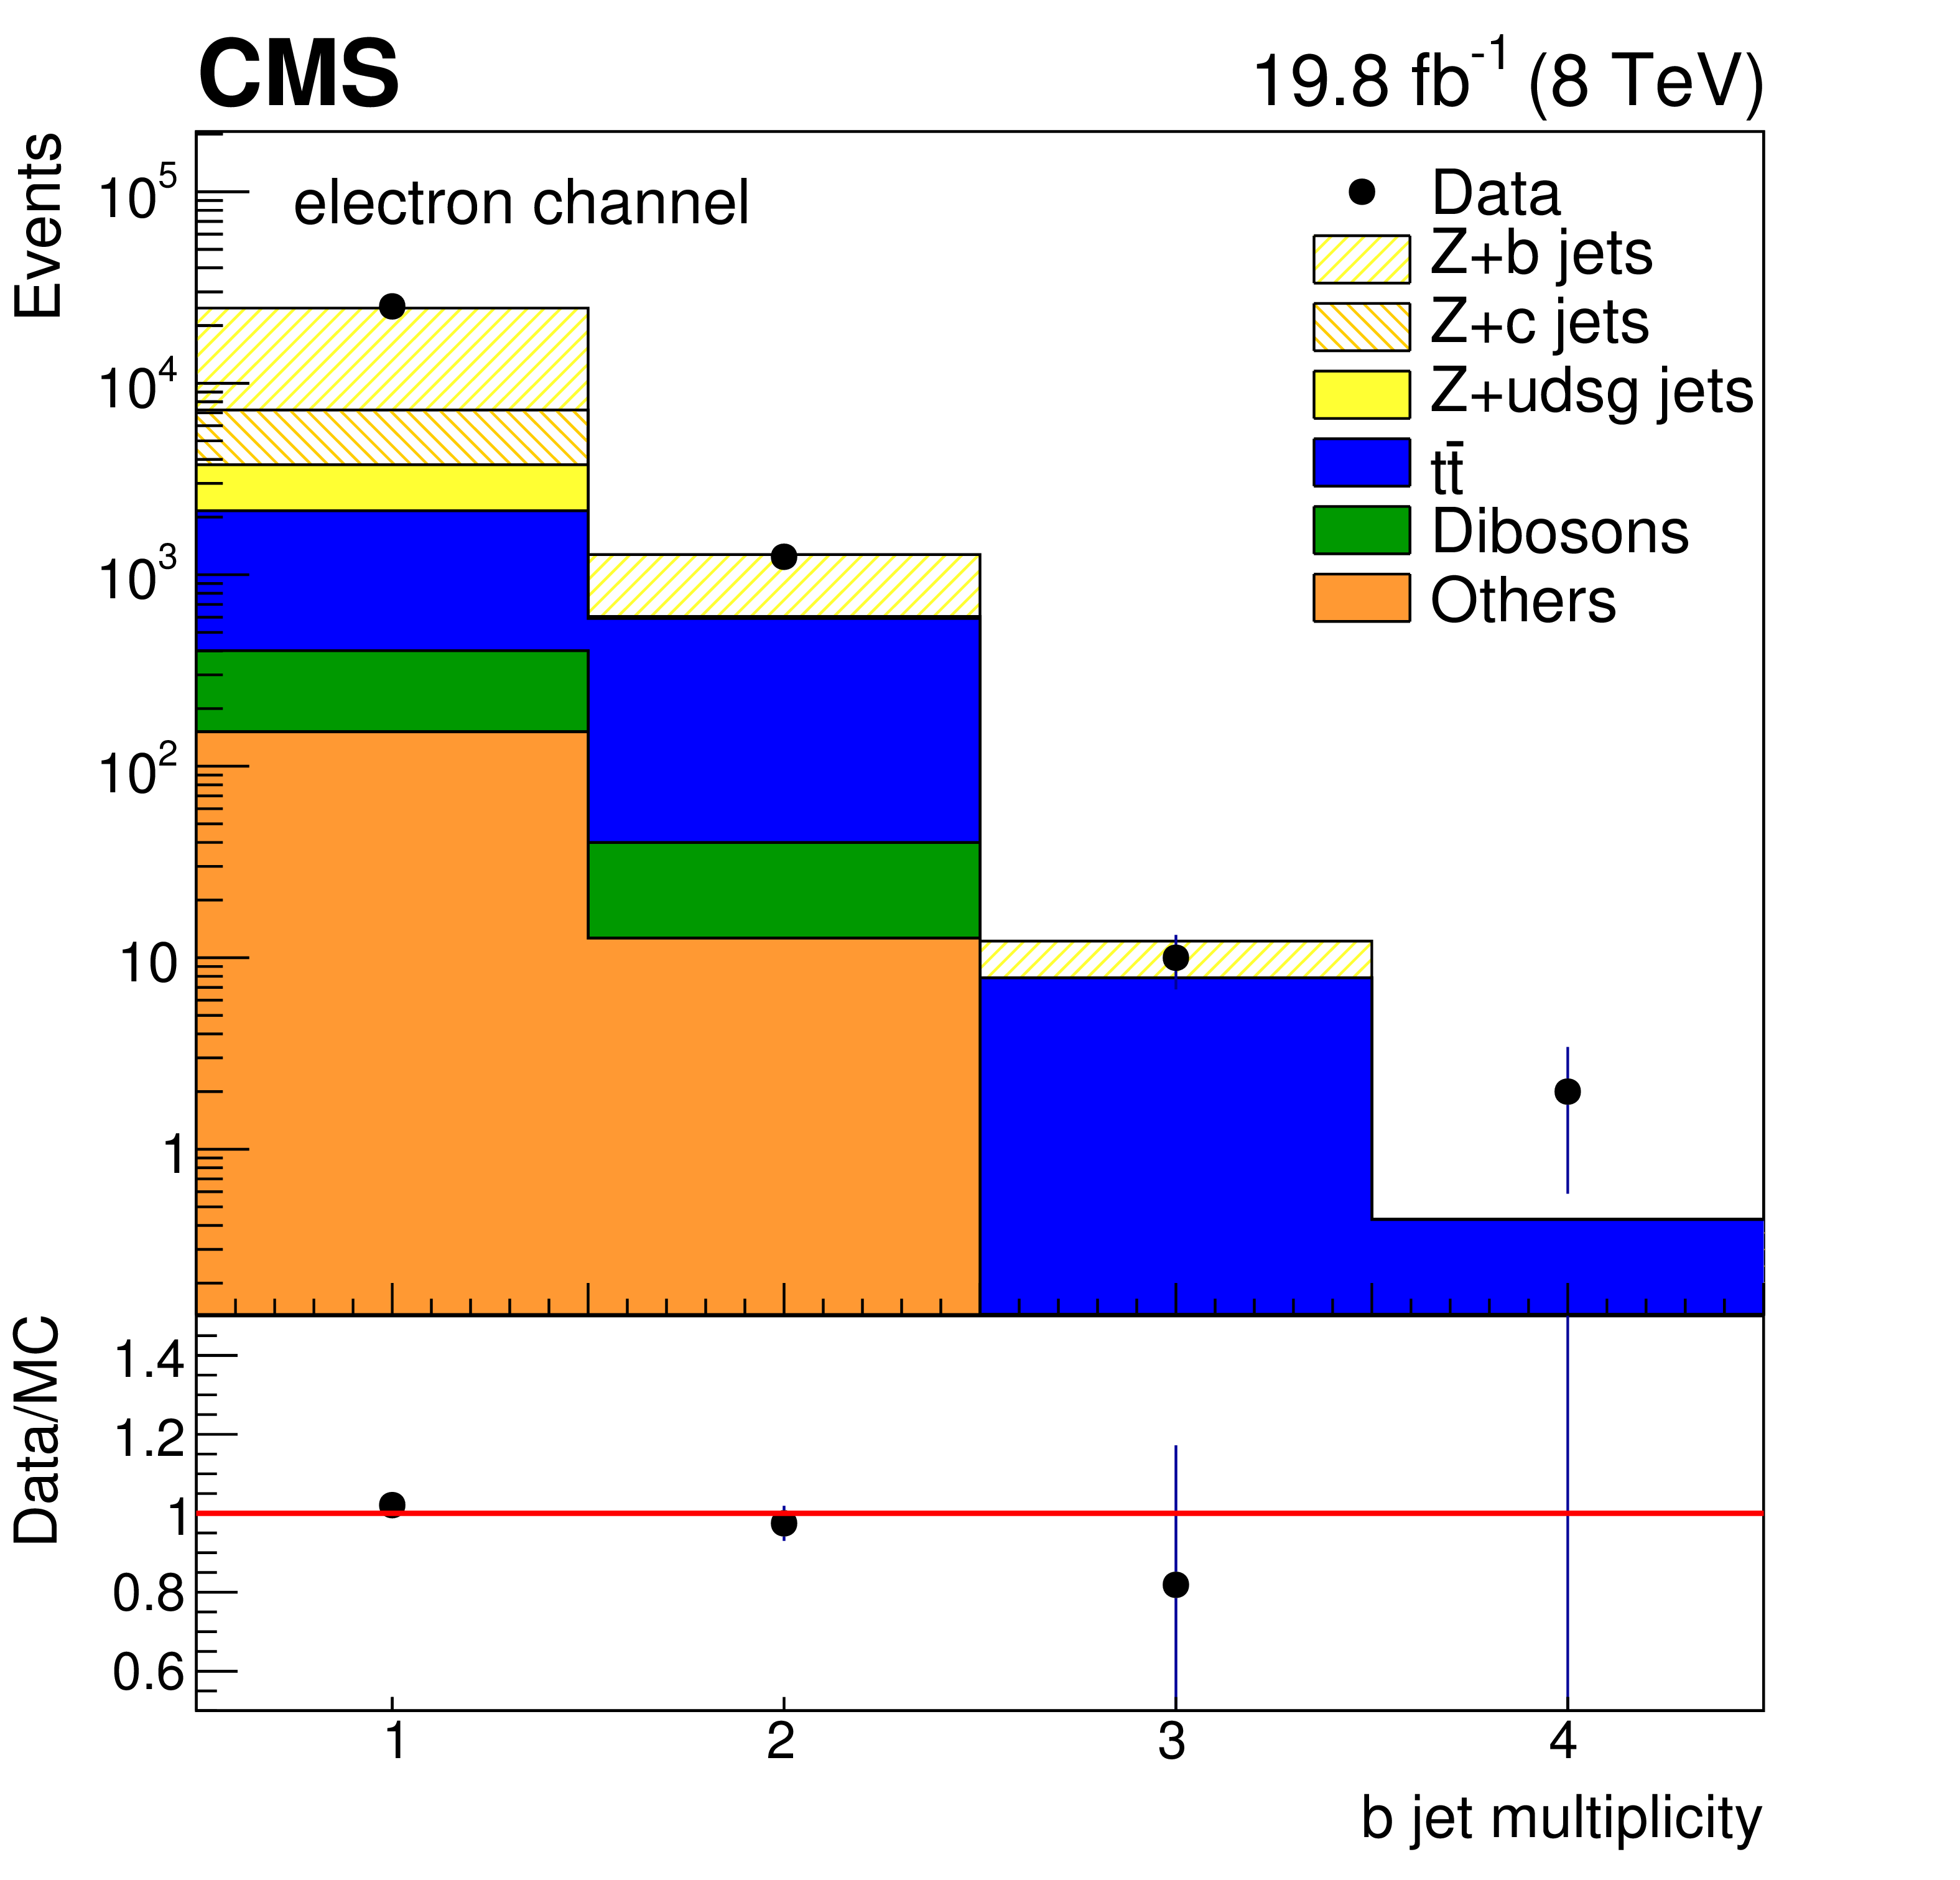
Figure 1-a:
Exclusive b-tagged jet multiplicity distributions for Z (1b) events, for the electron decay channel of Z boson. Error bars account for statistical uncertainties in data in the upper plots and in both data and simulation in the bottom ratio plots. |
png pdf |
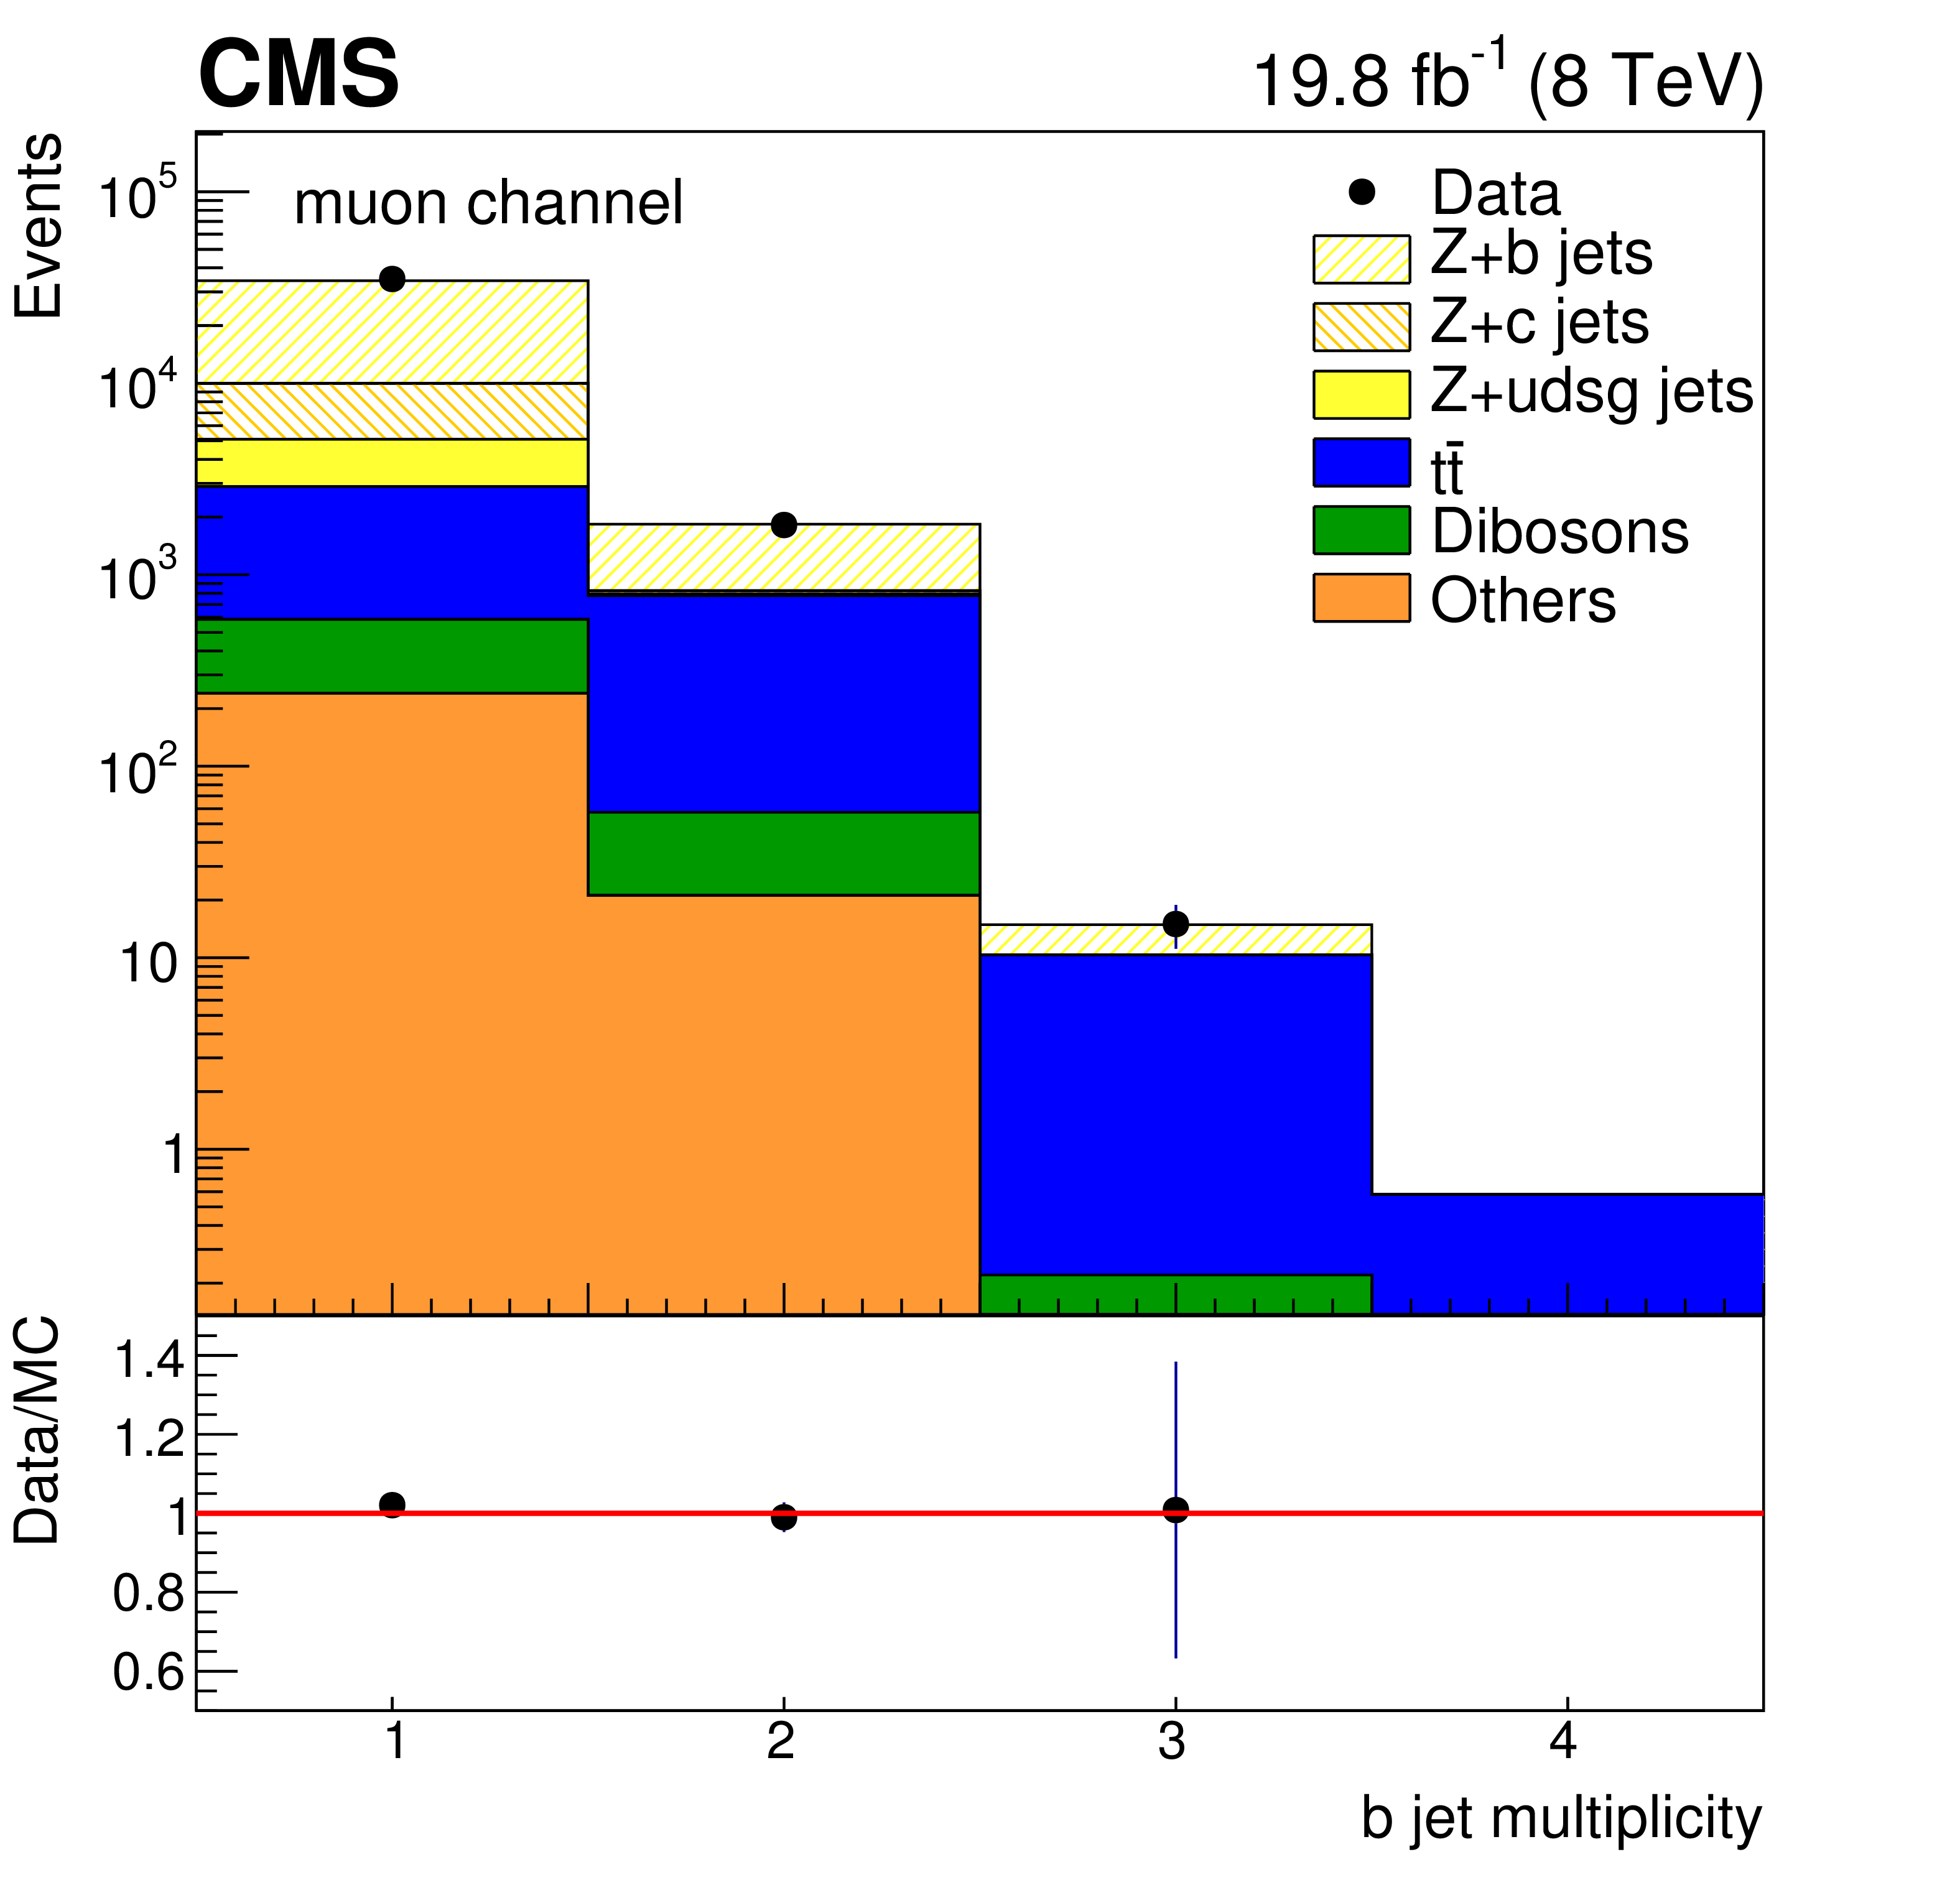
Figure 1-b:
Exclusive b-tagged jet multiplicity distributions for Z (1b) events, for the muon decay channel of Z boson. Error bars account for statistical uncertainties in data in the upper plots and in both data and simulation in the bottom ratio plots. |
png pdf |
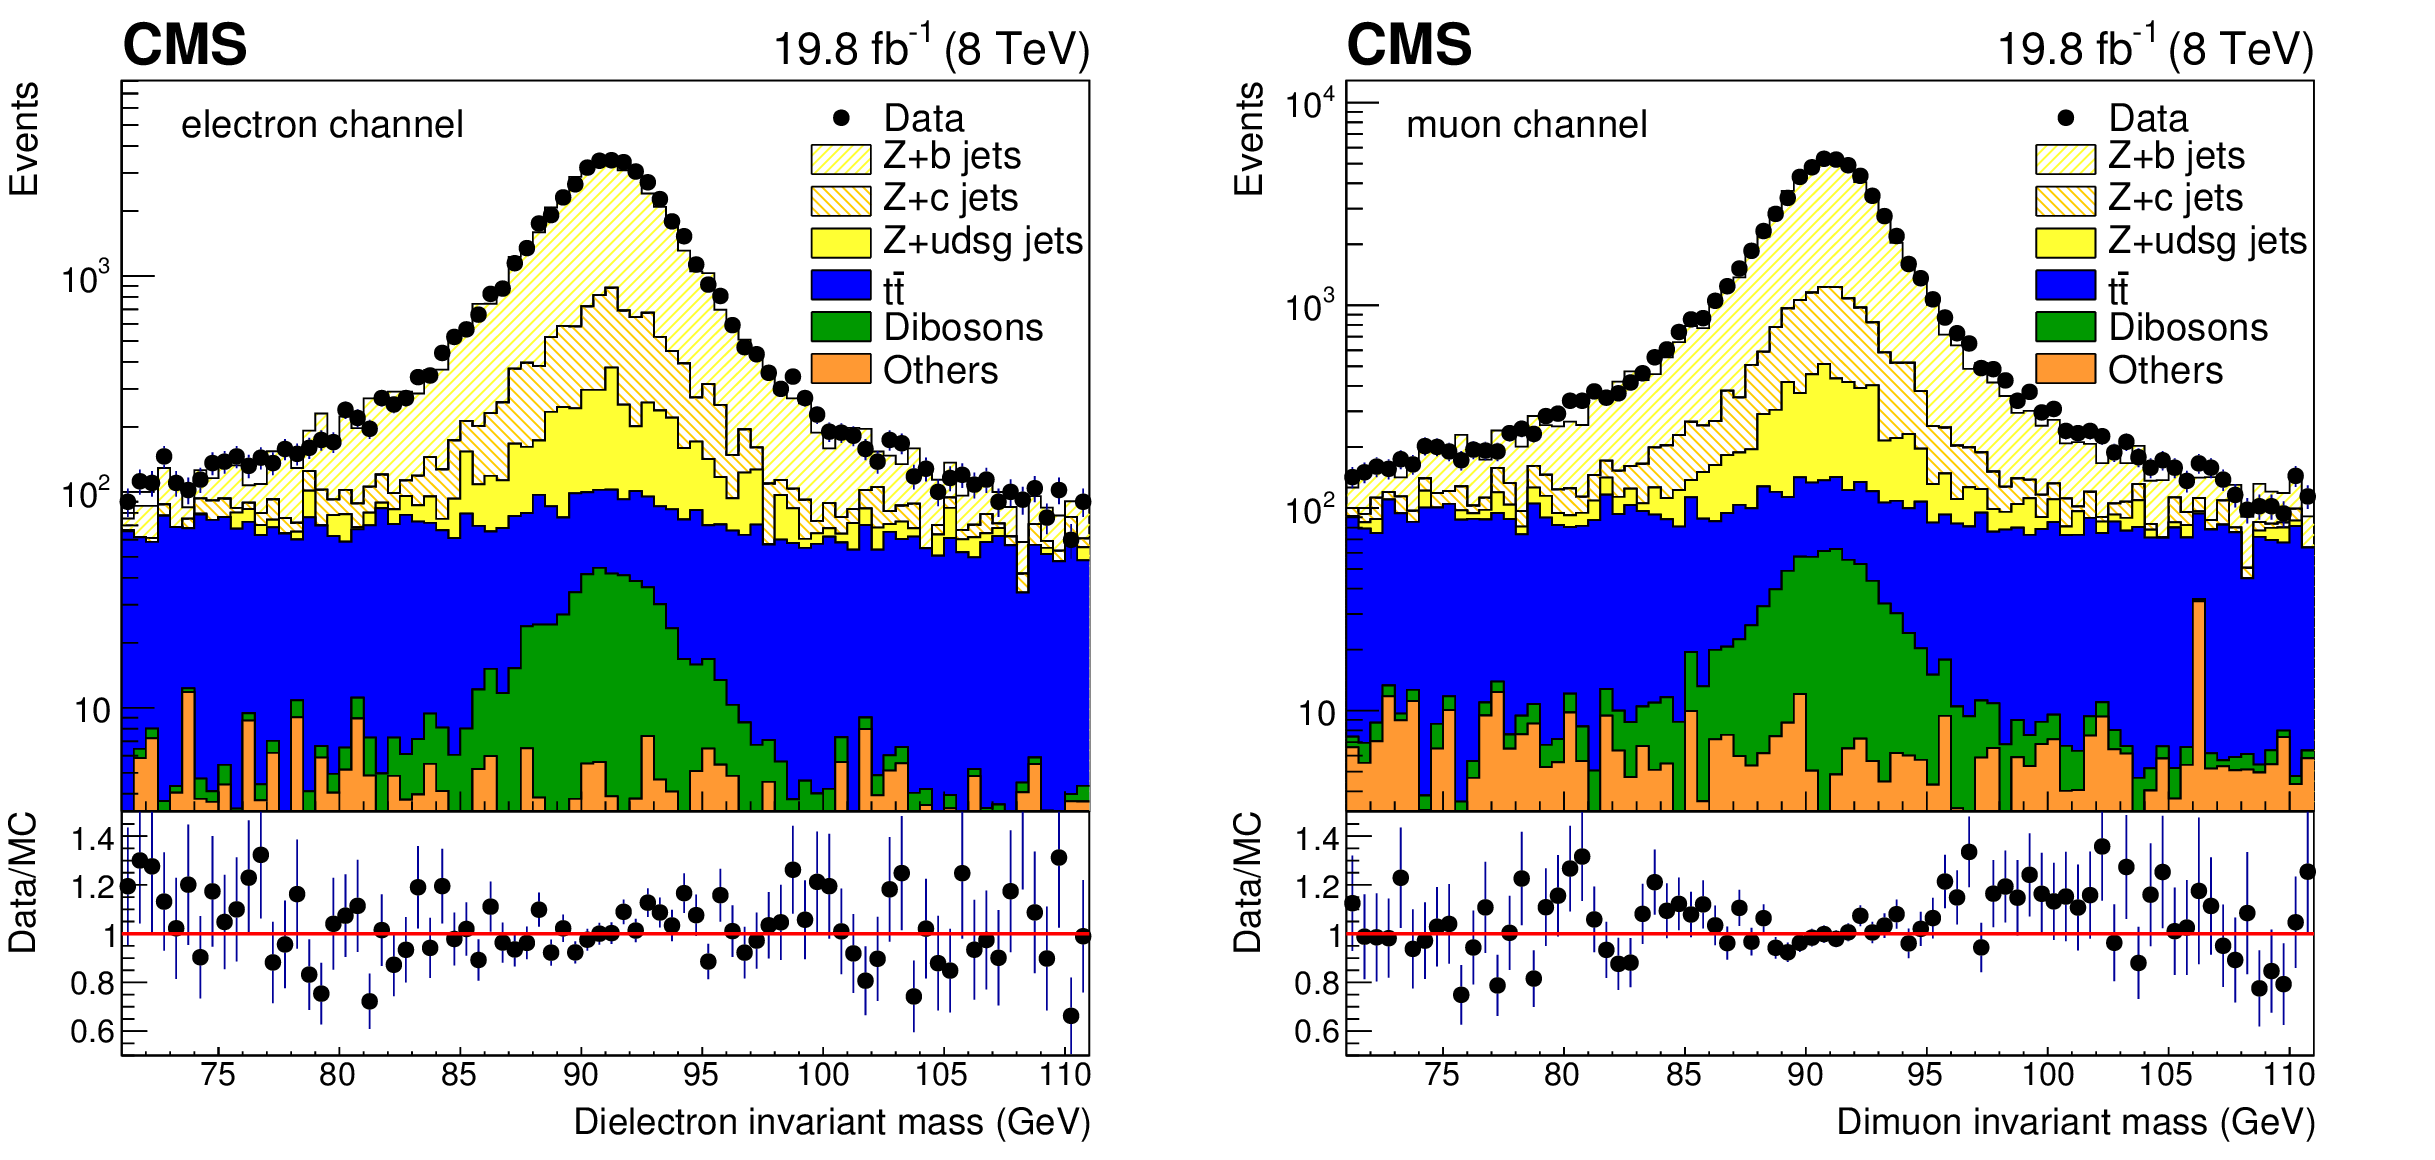
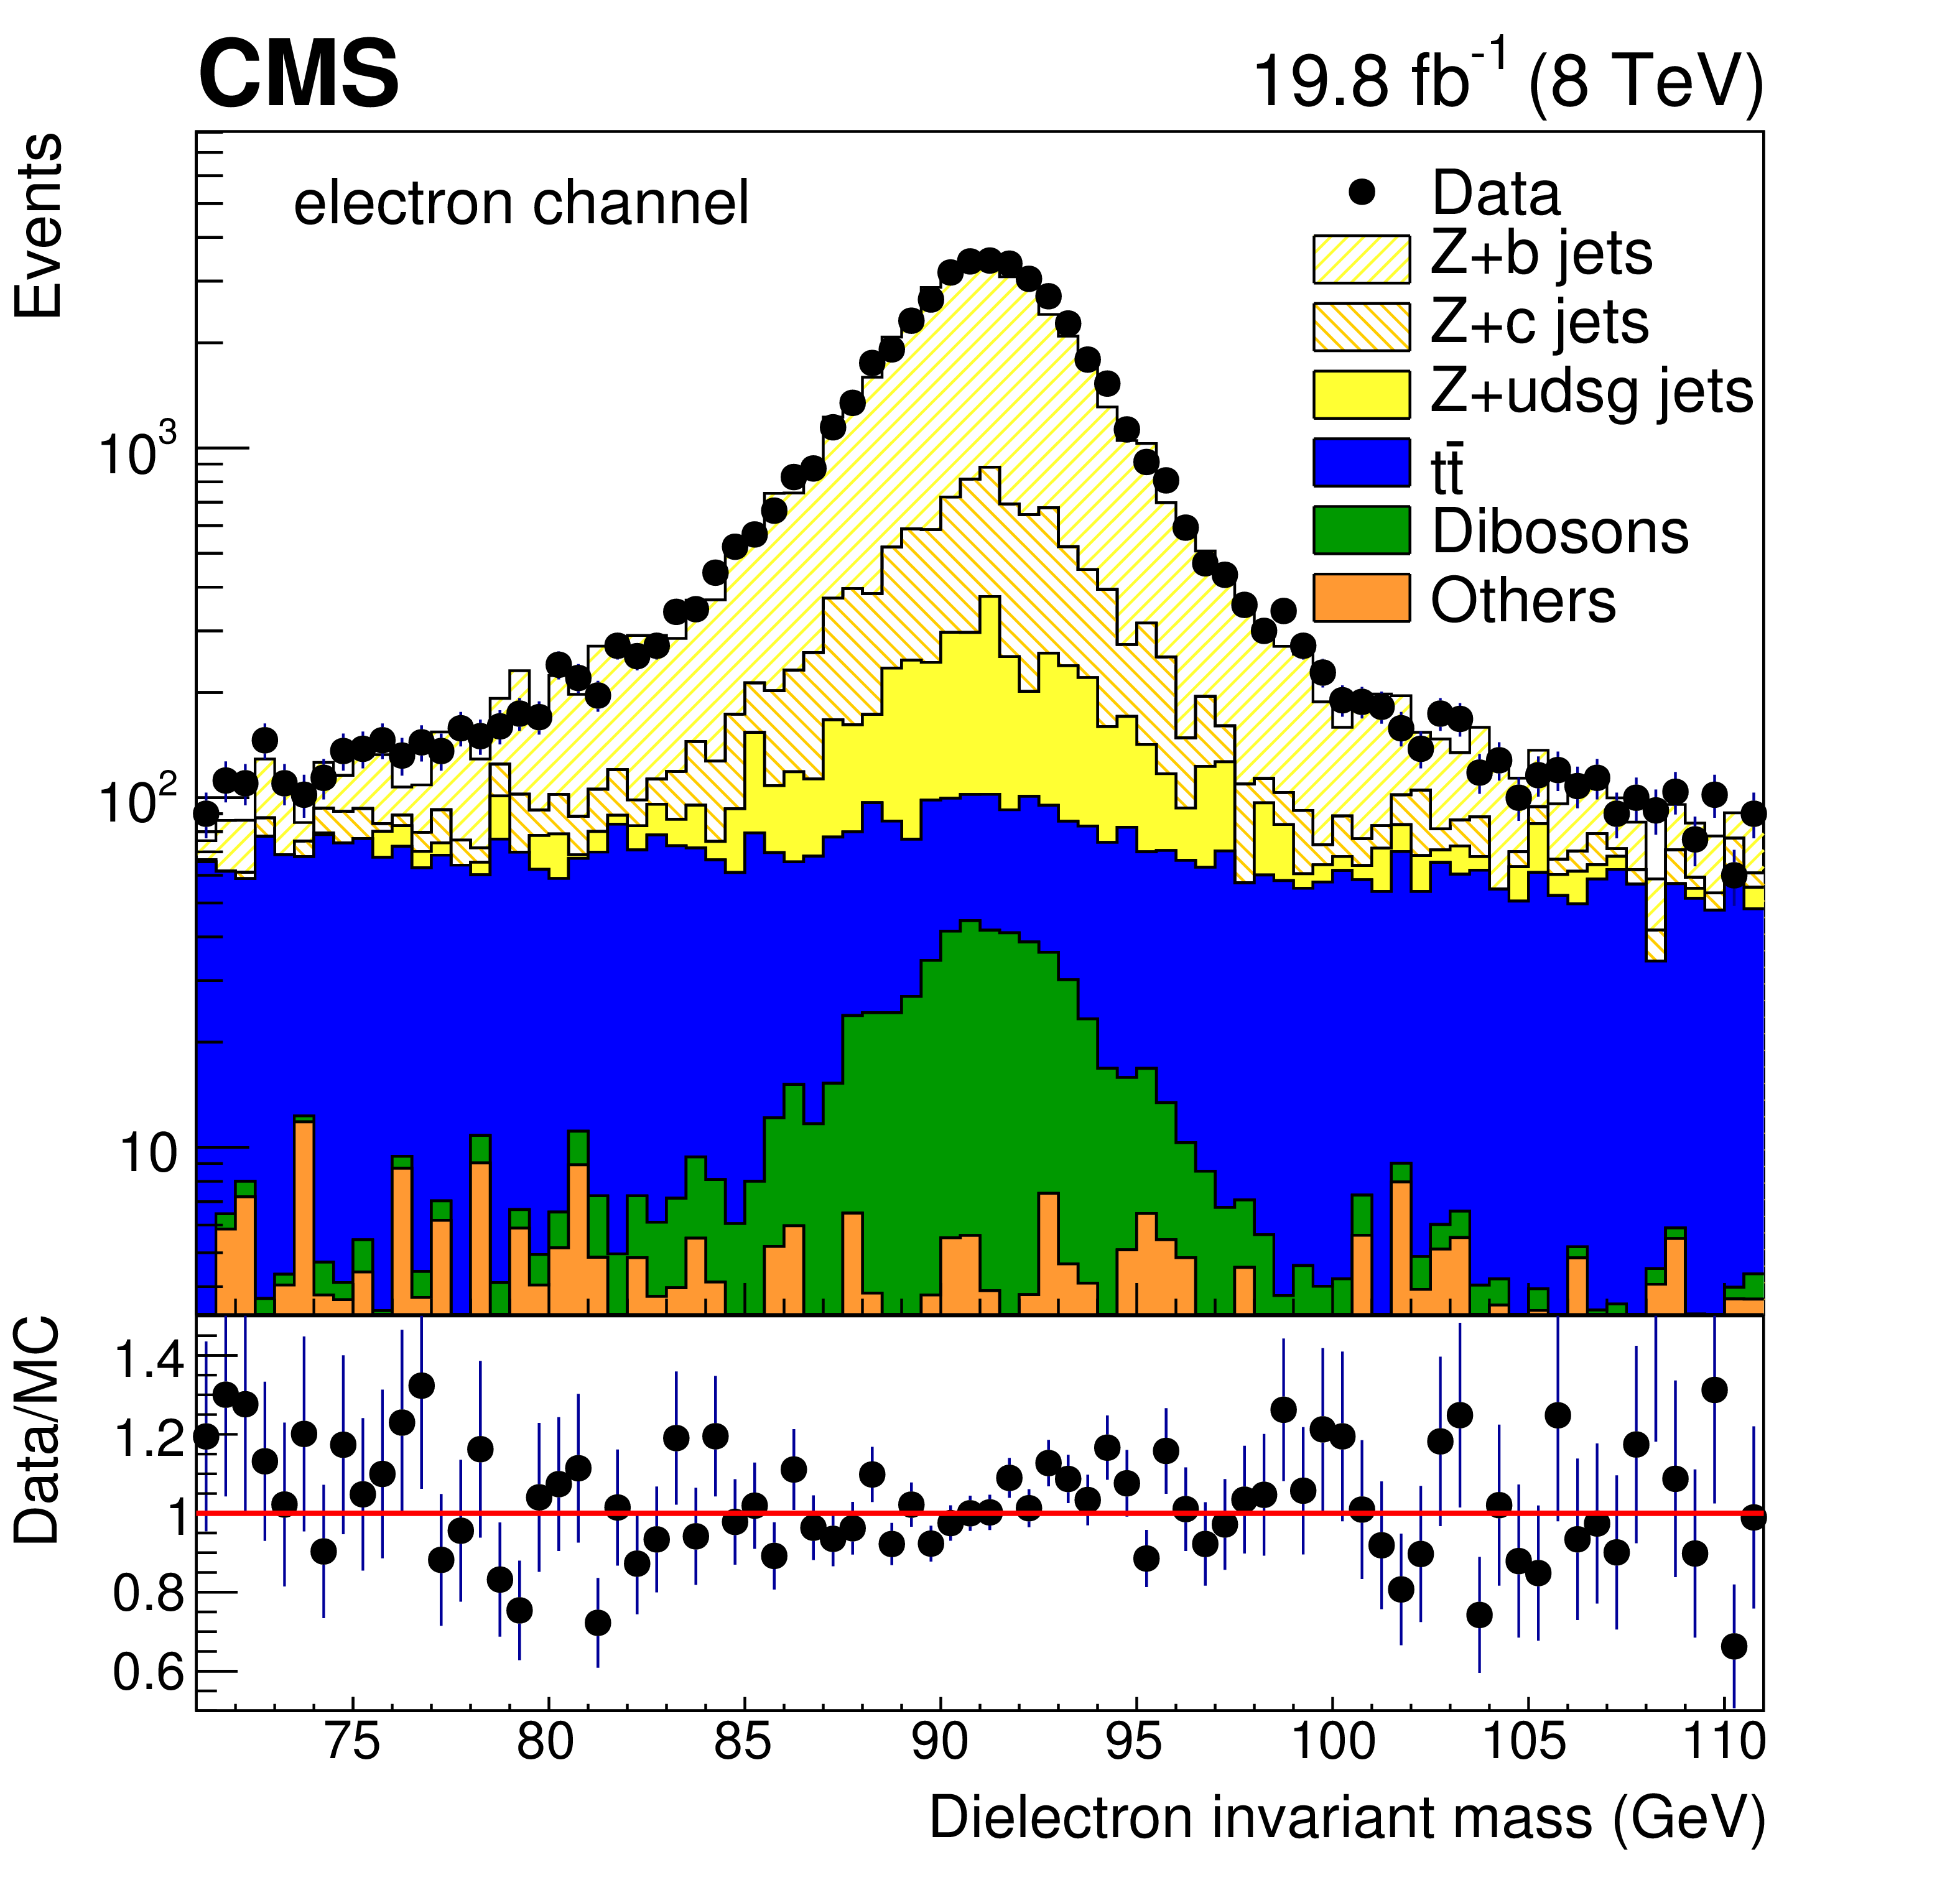
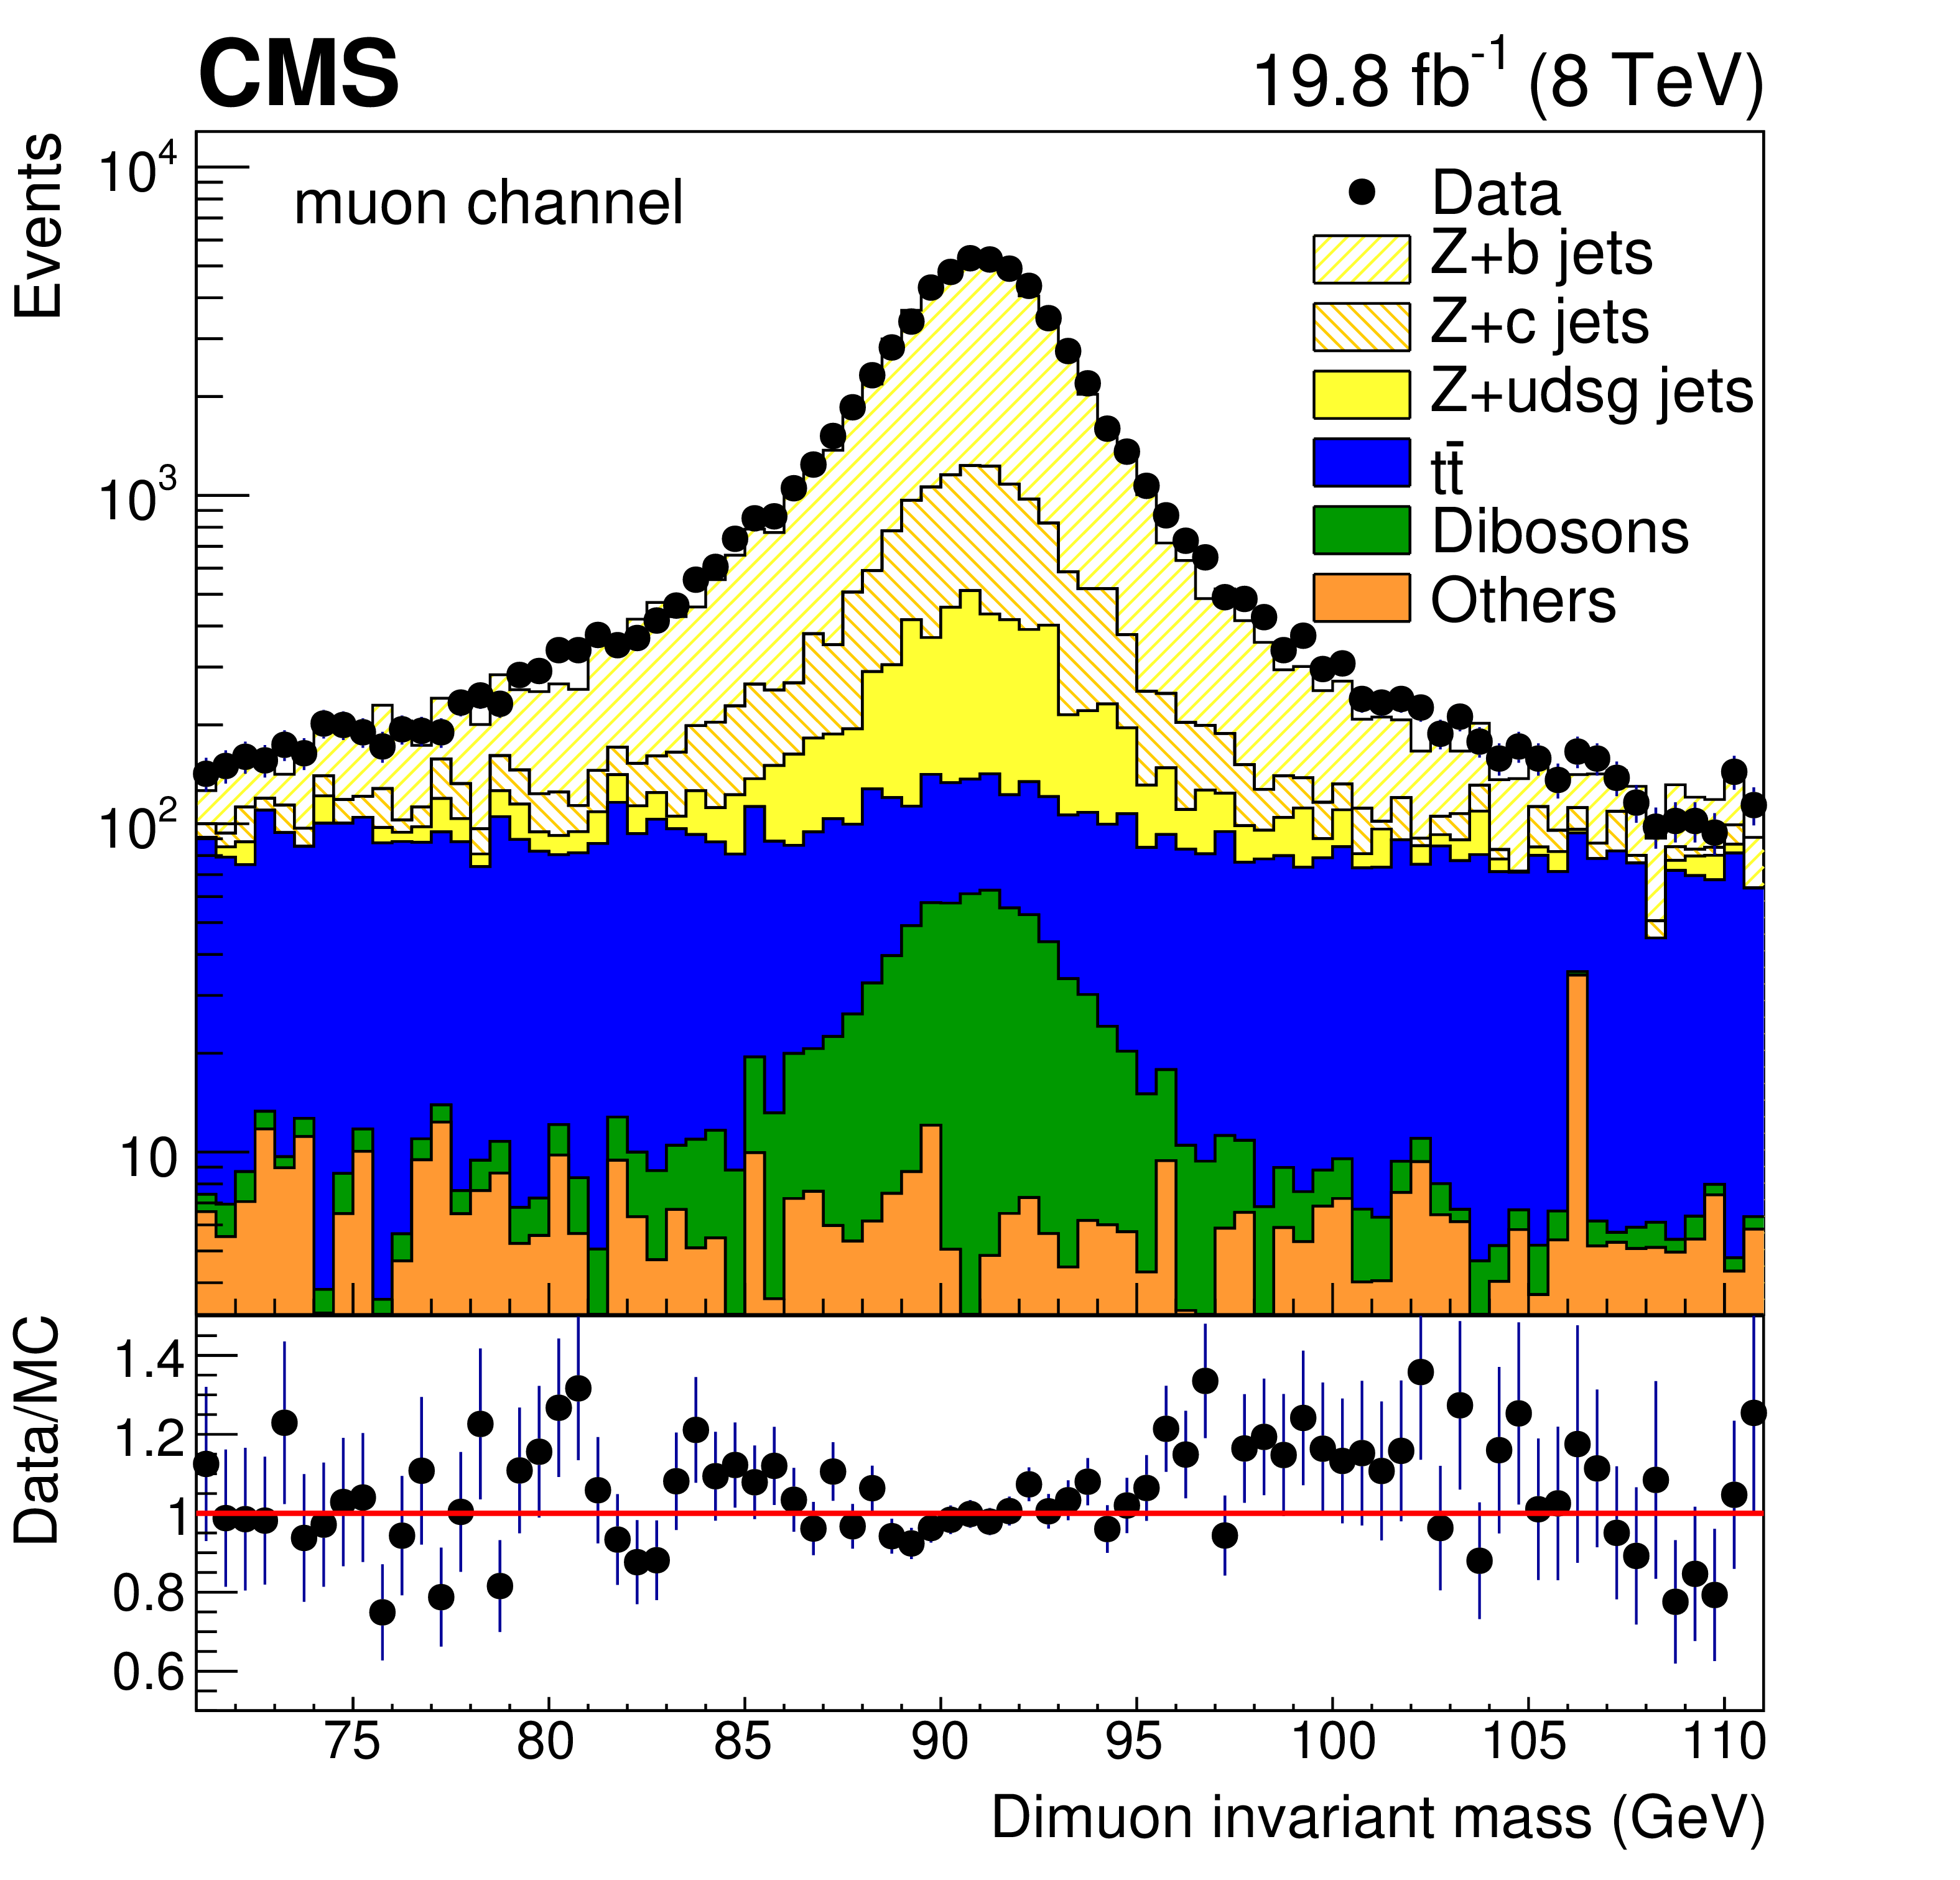
Figure 2:
Dilepton invariant mass distributions for Z (1b) events, for the electron (left) and muon (right) Z boson decay channels. Error bars account for statistical uncertainties in data in the upper plots and in both data and simulation in the bottom ratio plots. |
png pdf |
Figure 2-a:
Dilepton invariant mass distributions for Z (1b) events, for the electron Z boson decay channels. Error bars account for statistical uncertainties in data in the upper plots and in both data and simulation in the bottom ratio plots. |
png pdf |
Figure 2-b:
Dilepton invariant mass distributions for Z (1b) events, for the muon Z boson decay channels. Error bars account for statistical uncertainties in data in the upper plots and in both data and simulation in the bottom ratio plots. |
png pdf |
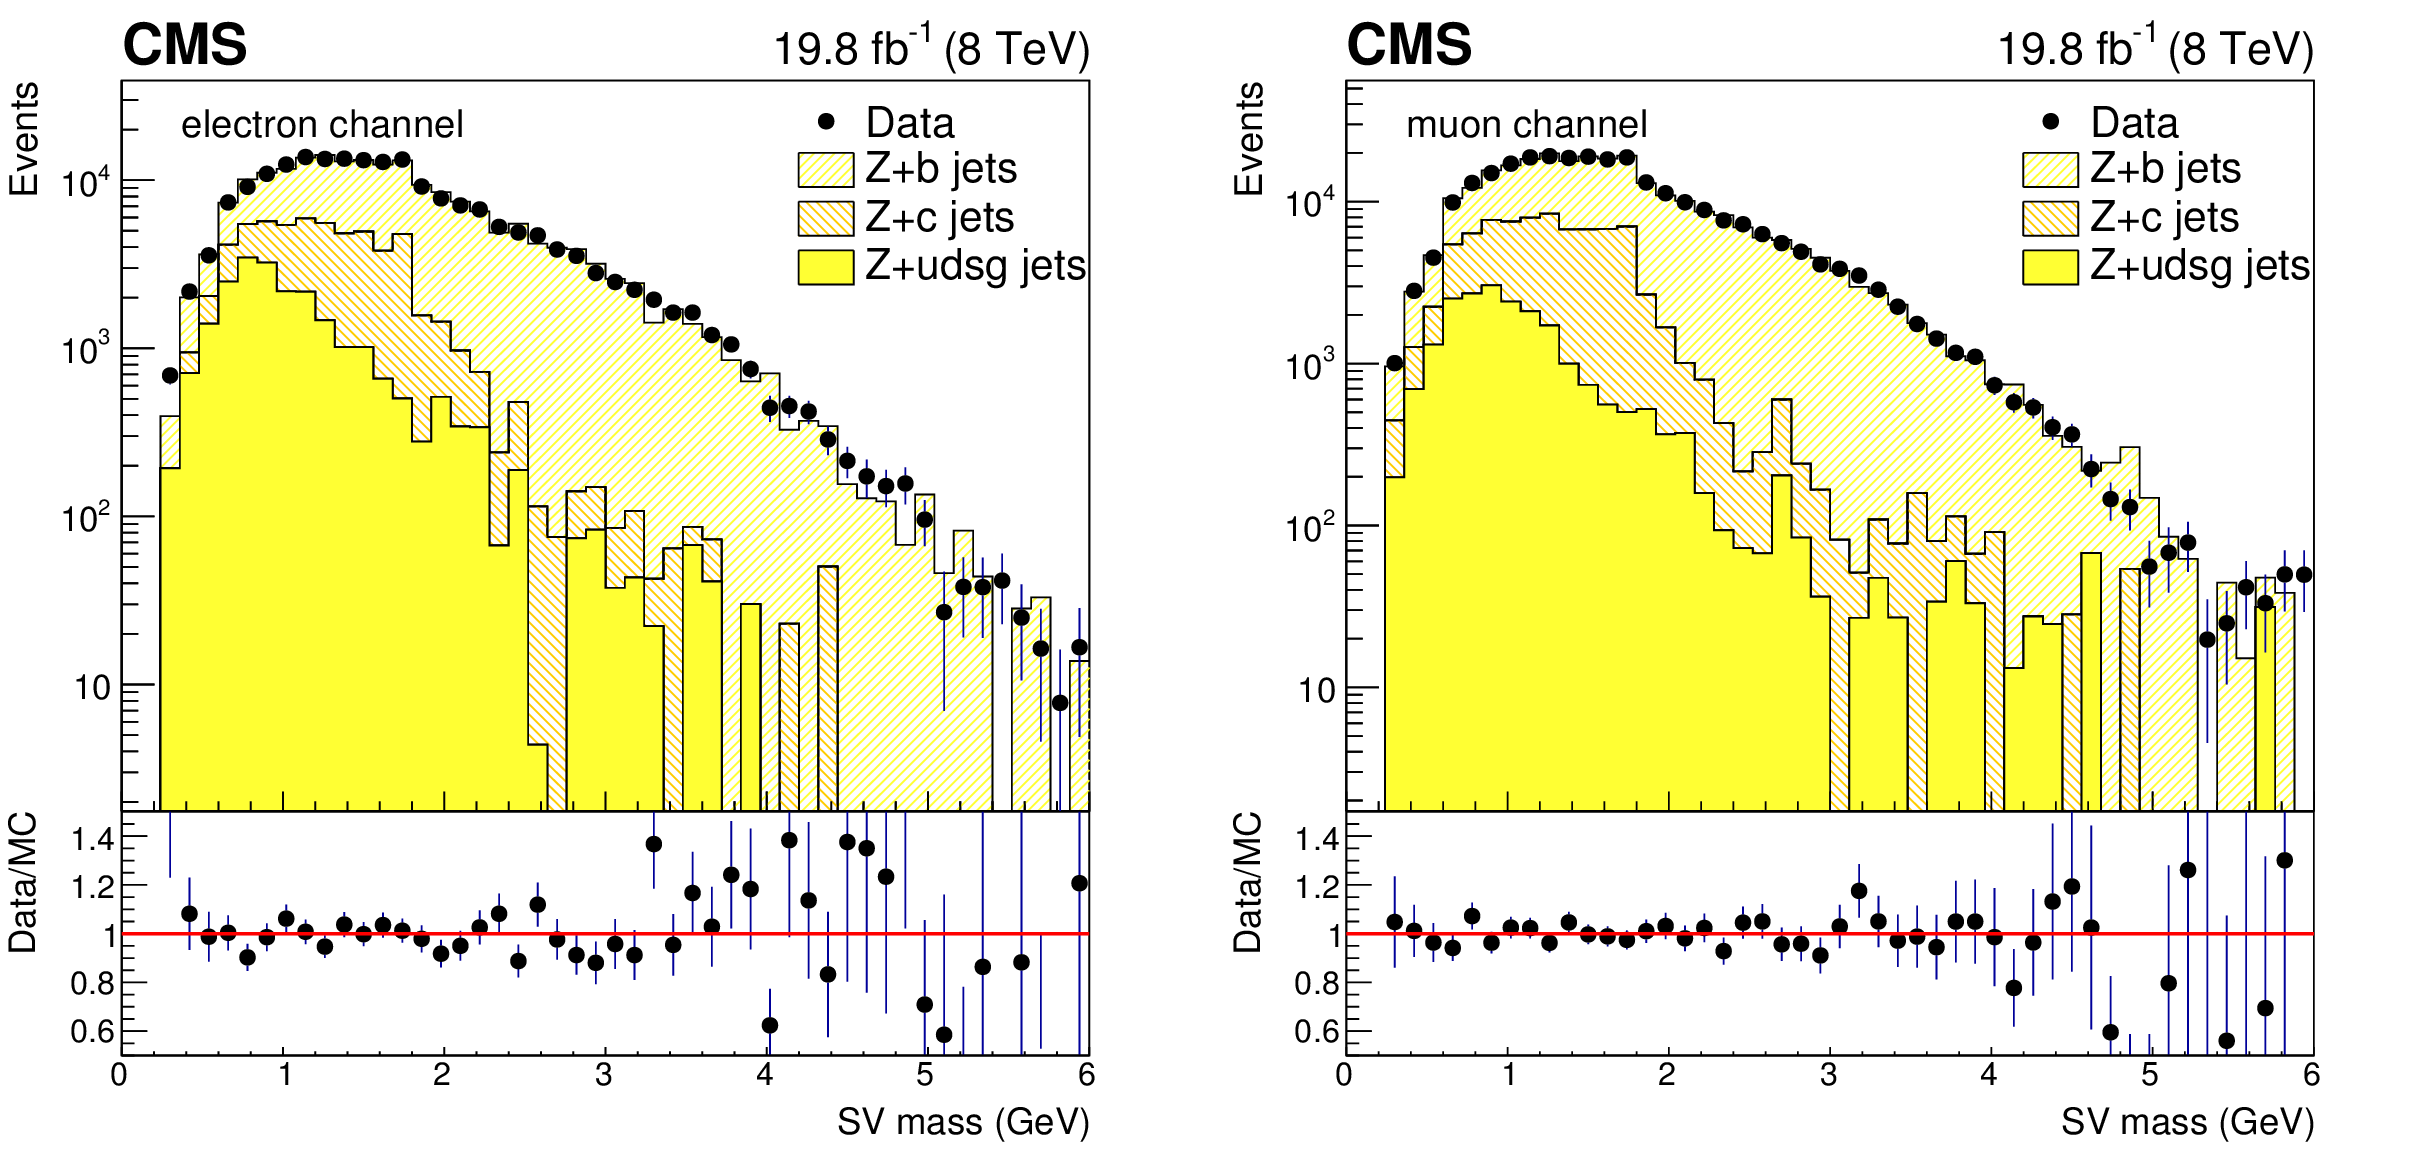
Figure 3:
Distributions of the secondary vertex (SV) mass of the leading jet after the Z (1b) selection with the Z boson decaying into electrons (left) and muons (right). The subsamples corresponding to b-tagged jets originating from b, c, and light-flavour quarks or gluons are shown, with normalizations determined in the fit to data. Non-Drell-Yan background sources are subtracted. Error bars account for statistical uncertainties in data in the upper plots and in both data and simulation in the bottom ratio plots. |
png pdf |
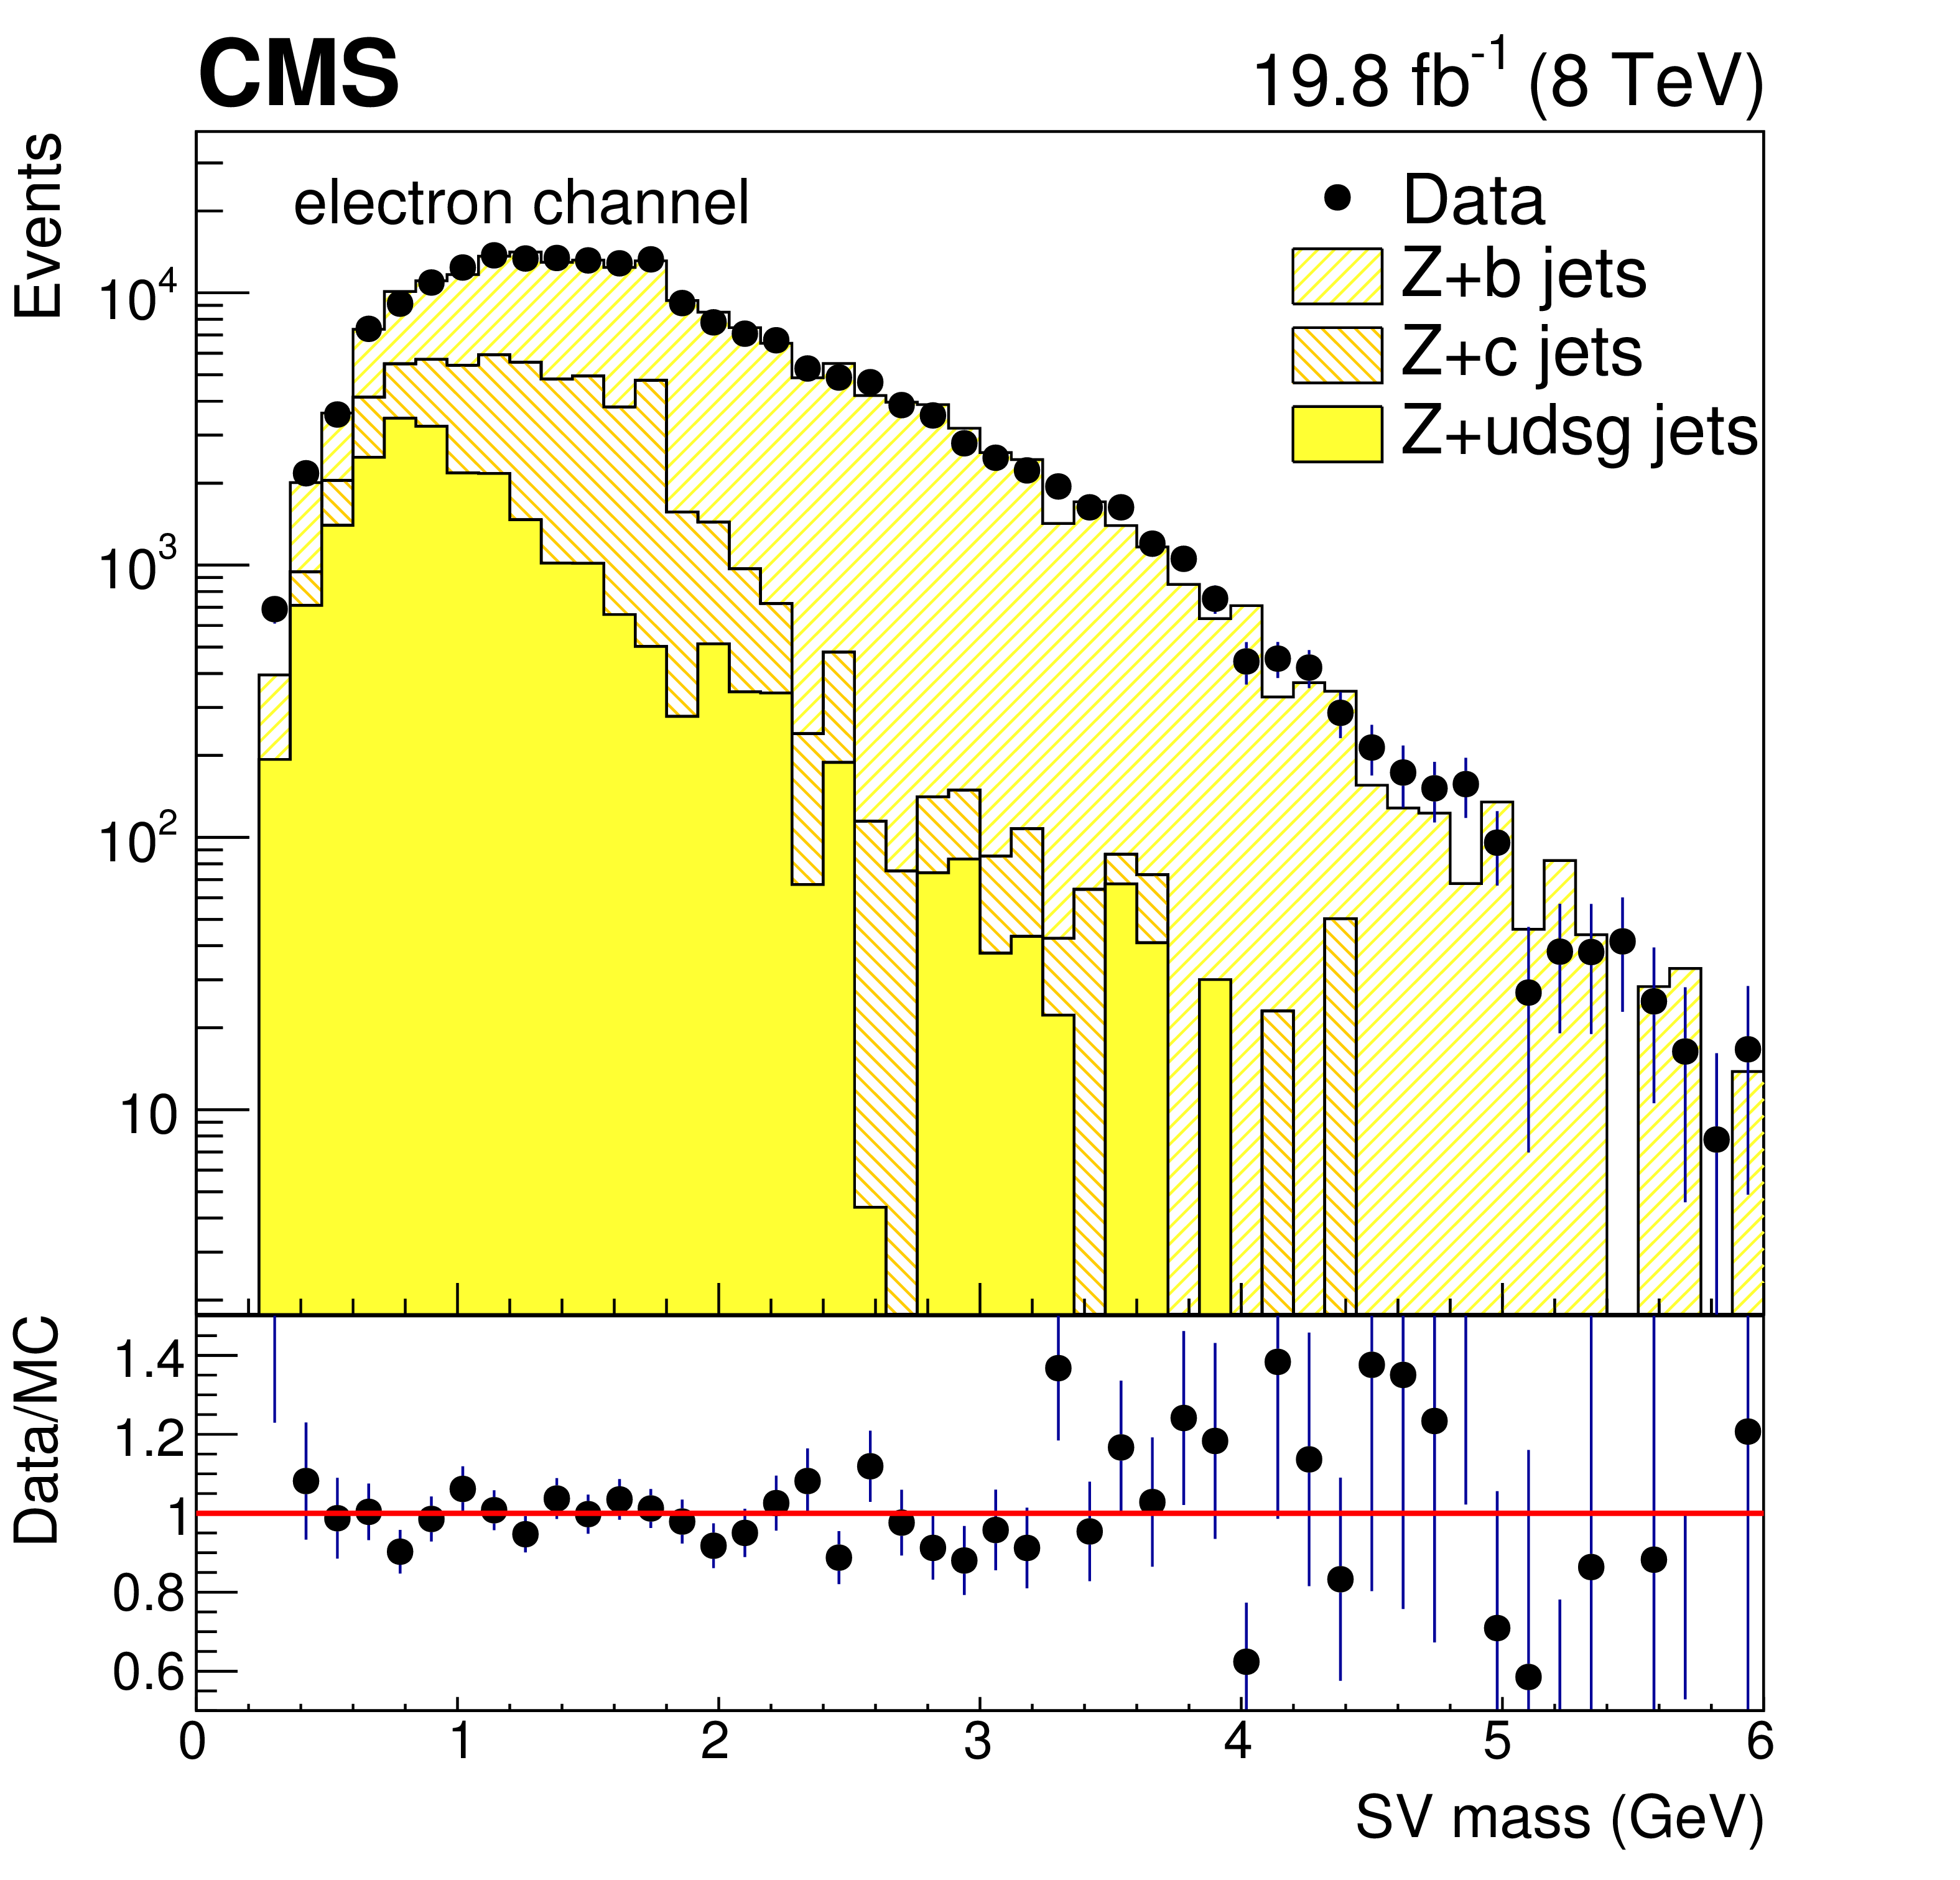
Figure 3-a:
Distributions of the secondary vertex (SV) mass of the leading jet after the Z (1b) selection with the Z boson decaying into electrons. The subsamples corresponding to b-tagged jets originating from b, c, and light-flavour quarks or gluons are shown, with normalizations determined in the fit to data. Non-Drell-Yan background sources are subtracted. Error bars account for statistical uncertainties in data in the upper plots and in both data and simulation in the bottom ratio plots. |
png pdf |
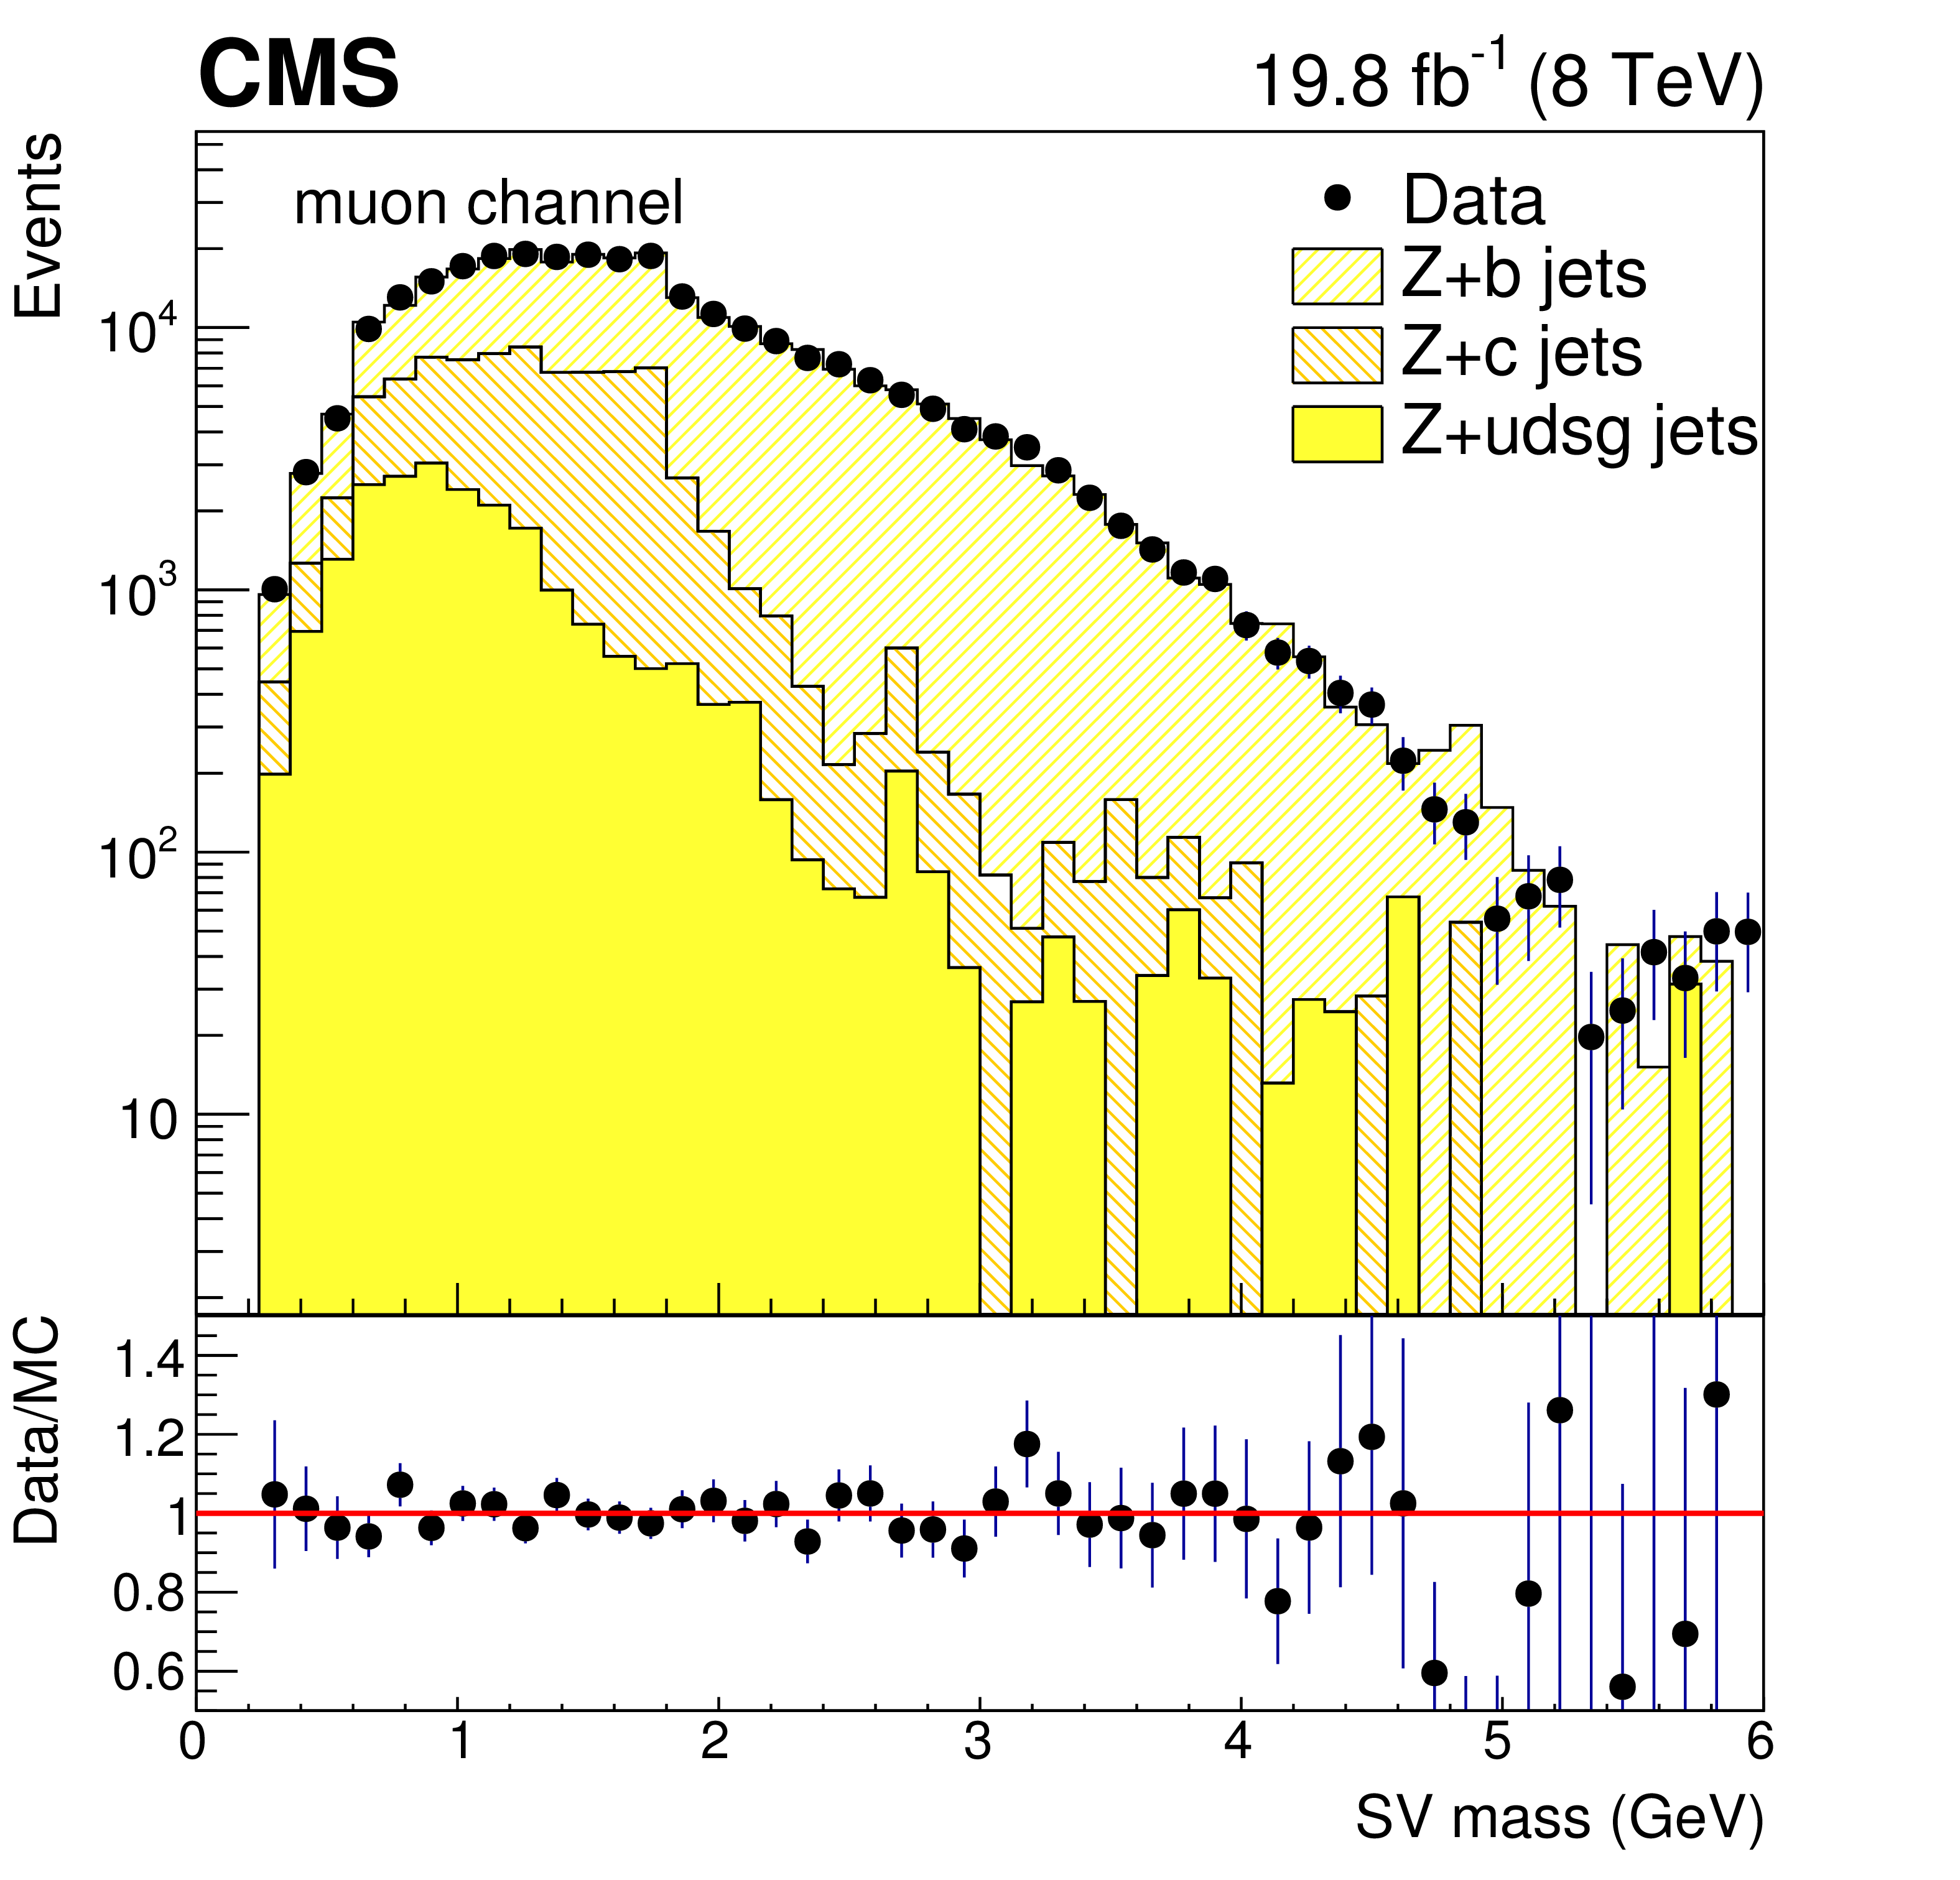
Figure 3-b:
Distributions of the secondary vertex (SV) mass of the leading jet after the Z (1b) selection with the Z boson decaying into muons. The subsamples corresponding to b-tagged jets originating from b, c, and light-flavour quarks or gluons are shown, with normalizations determined in the fit to data. Non-Drell-Yan background sources are subtracted. Error bars account for statistical uncertainties in data in the upper plots and in both data and simulation in the bottom ratio plots. |

png pdf |
Figure 4:
Differential fiducial cross section for Z(1b) production as a function of the leading b jet ${p_{\mathrm {T}}}$ (left), and the cross section ratio for Z(1b) and Z+jets production as a function of the leading b/inclusive (j) jet ${p_{\mathrm {T}}}$ (right), compared with the MadGraph 5FS, MadGraph 4FS, MadGraph5-aMC@NLO, and POWHEG / MINLO theoretical predictions (shaded bands), normalized to the theoretical cross sections described in the text. For each data point the statistical and the total (sum in quadrature of statistical and systematic) uncertainties are represented by the double error bar. The width of the shaded bands represents the uncertainty in the theoretical predictions, and, for NLO calculations, the inner darker area represents the statistical component only. |
png pdf |
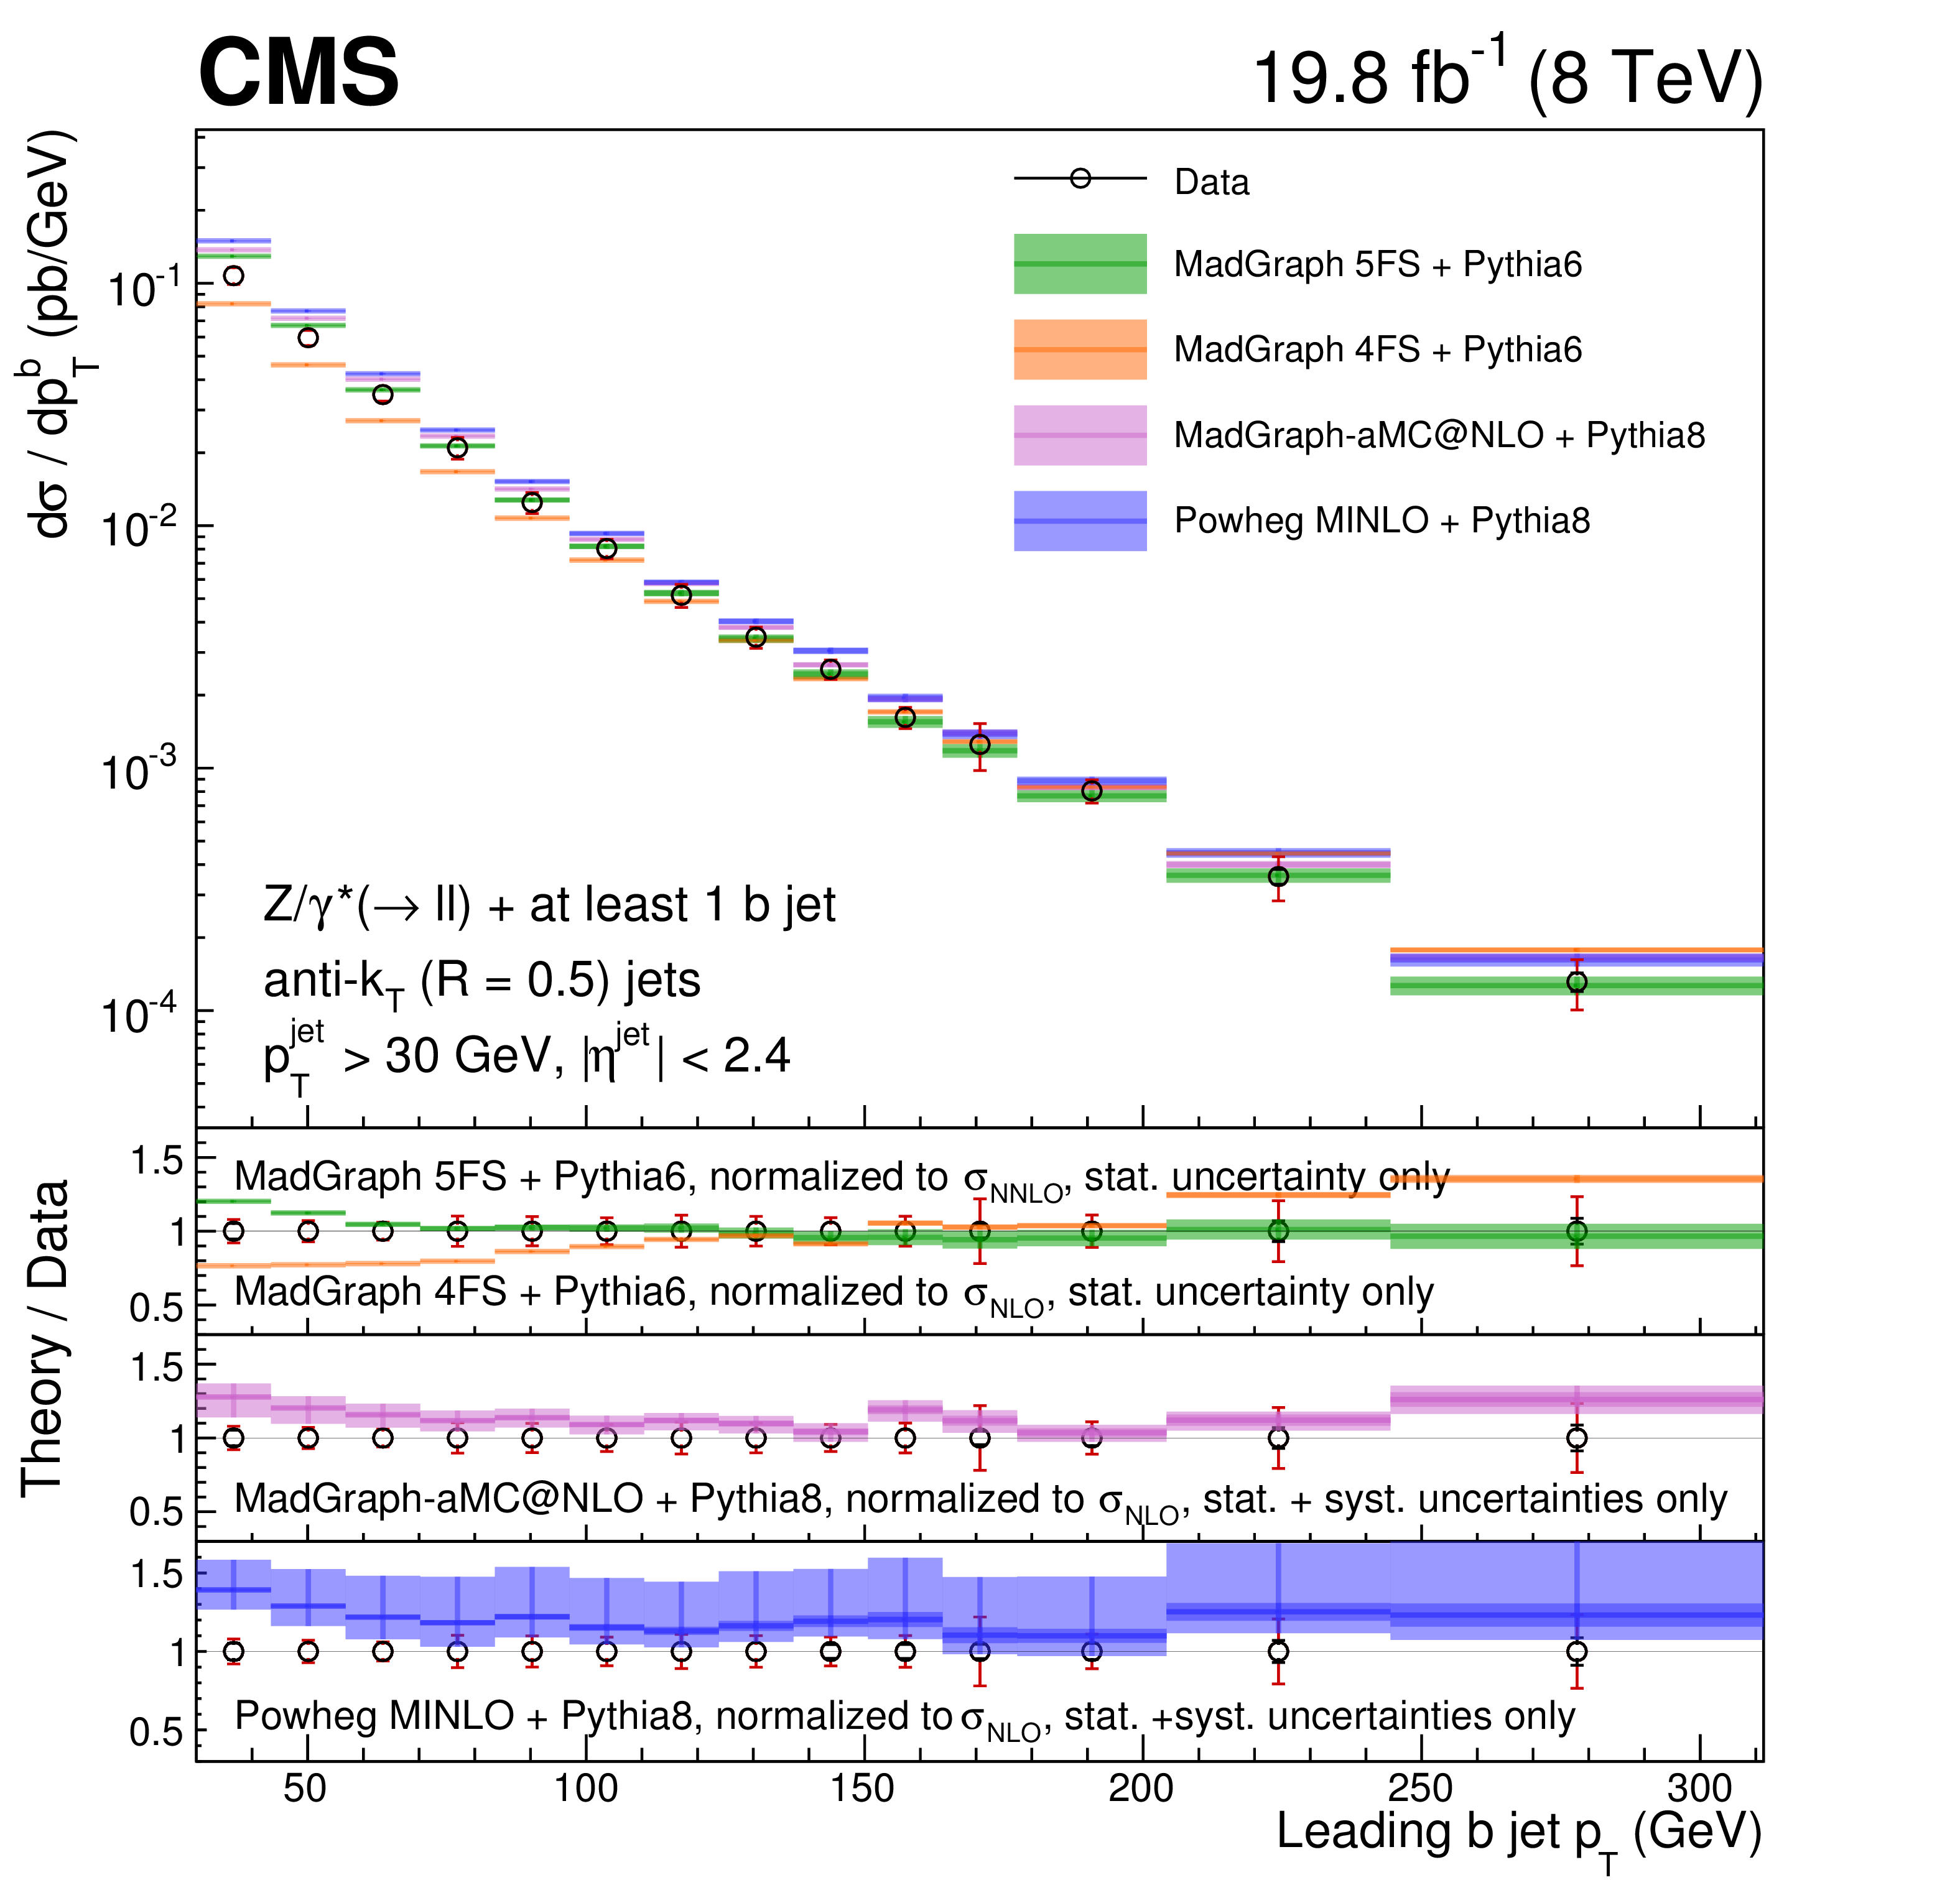
Figure 4-a:
Differential fiducial cross section for Z(1b) production as a function of the leading b jet ${p_{\mathrm {T}}}$, compared with the MadGraph 5FS, MadGraph 4FS, MadGraph5-aMC@NLO, and POWHEG / MINLO theoretical predictions (shaded bands), normalized to the theoretical cross sections described in the text. For each data point the statistical and the total (sum in quadrature of statistical and systematic) uncertainties are represented by the double error bar. The width of the shaded bands represents the uncertainty in the theoretical predictions, and, for NLO calculations, the inner darker area represents the statistical component only. |

png pdf |
Figure 4-b:
Cross section ratio for Z(1b) and Z+jets production as a function of the leading b/inclusive (j) jet ${p_{\mathrm {T}}}$, compared with the MadGraph 5FS, MadGraph 4FS, MadGraph5-aMC@NLO, and POWHEG / MINLO theoretical predictions (shaded bands), normalized to the theoretical cross sections described in the text. For each data point the statistical and the total (sum in quadrature of statistical and systematic) uncertainties are represented by the double error bar. The width of the shaded bands represents the uncertainty in the theoretical predictions, and, for NLO calculations, the inner darker area represents the statistical component only. |
png pdf |
Figure 5:
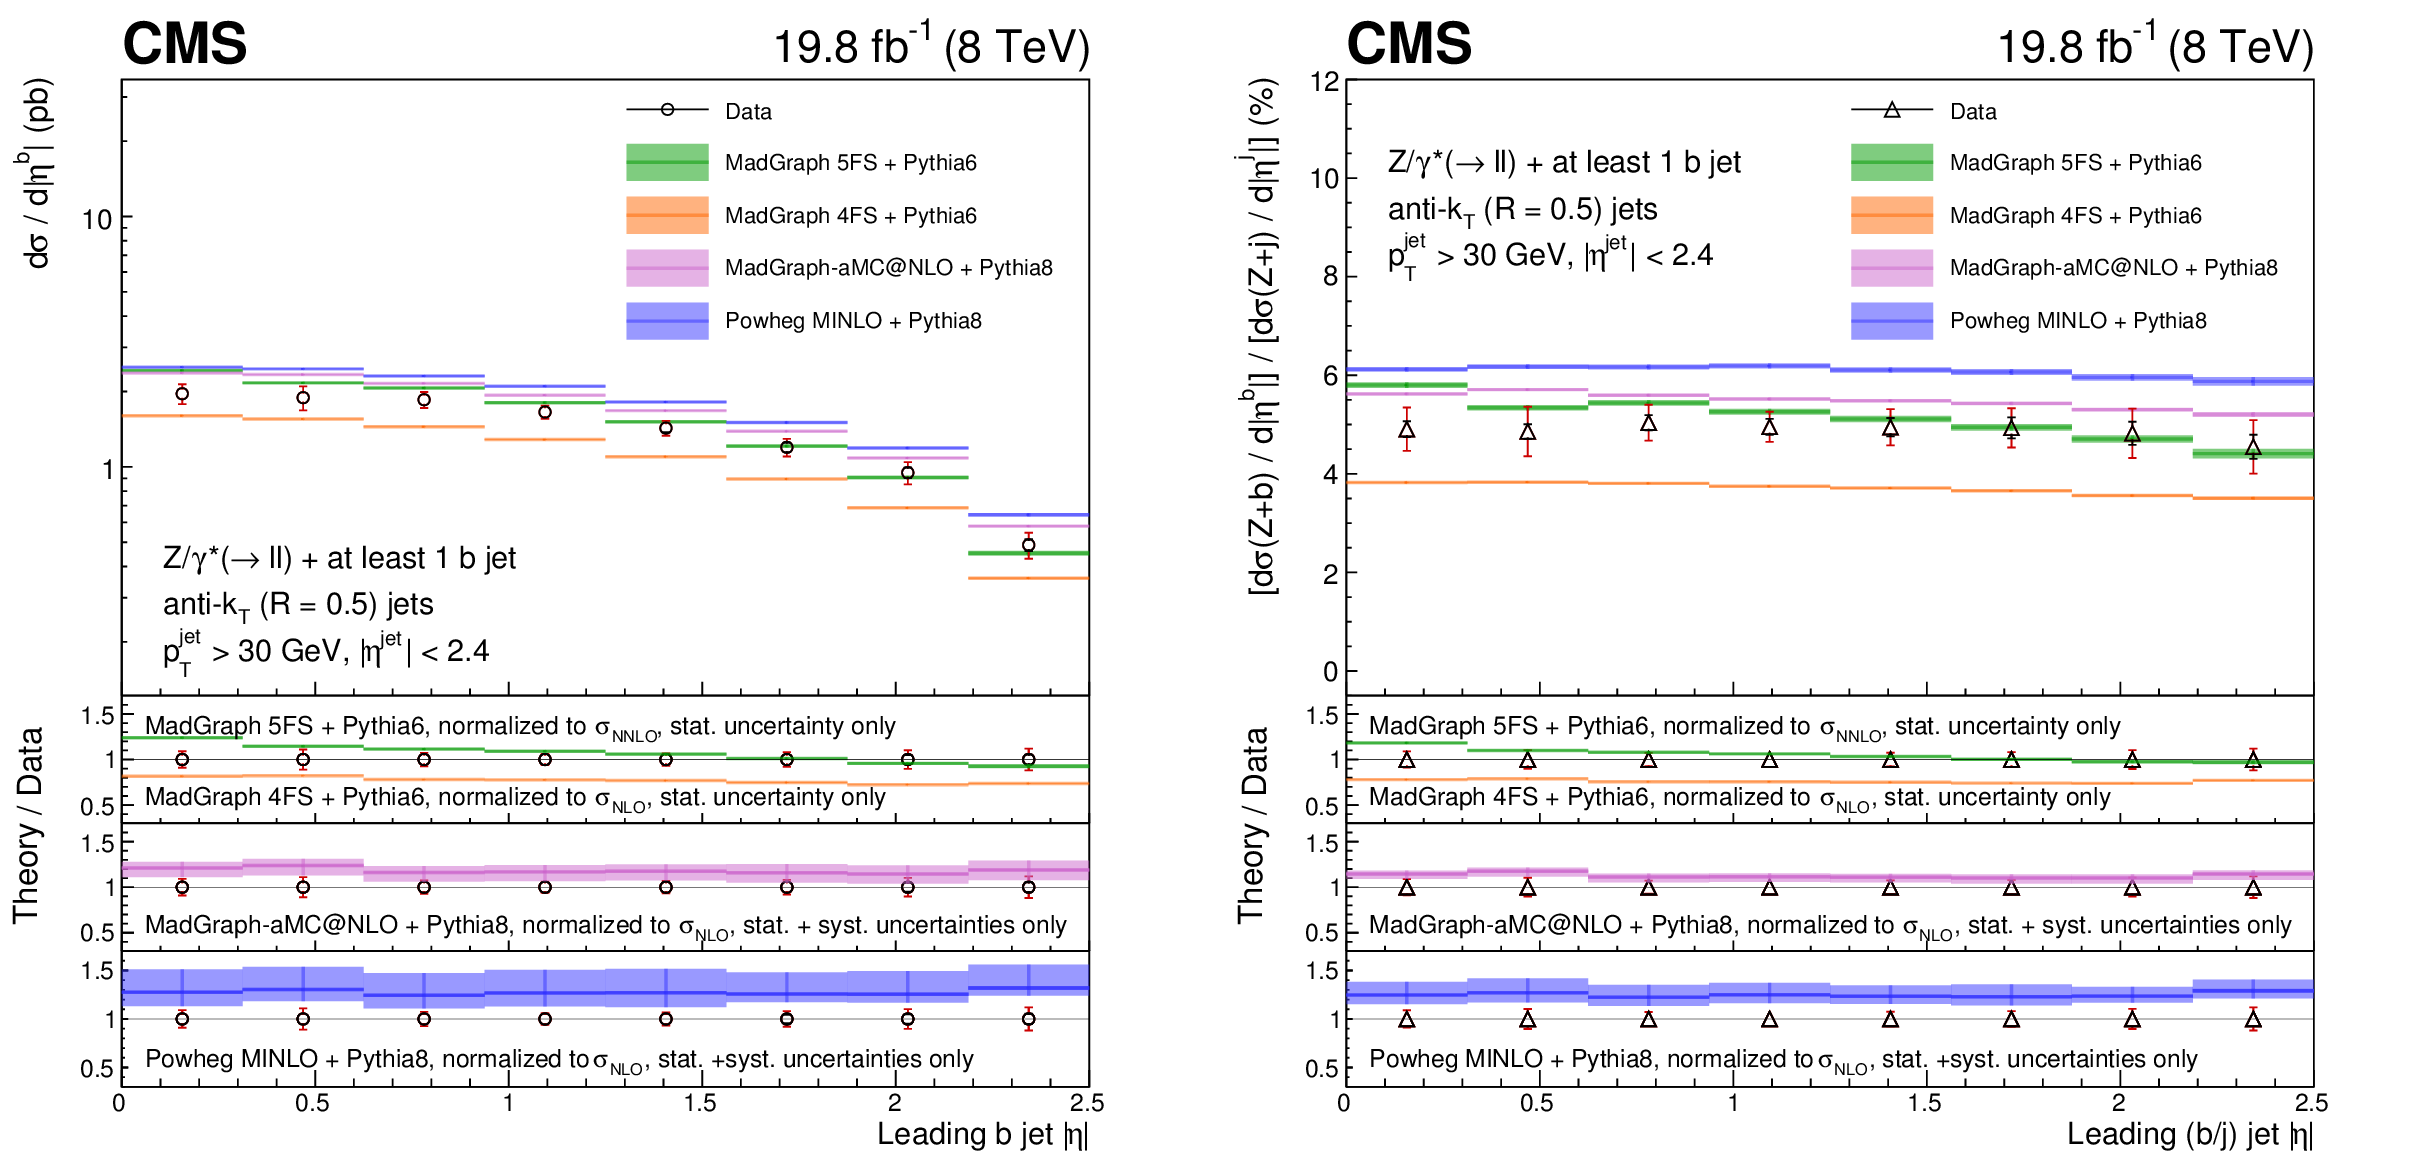
Differential fiducial cross section for Z(1b) production as a function of the leading b jet $|\eta |$ (left), and the cross section ratio for Z(1b) and Z+jets production as a function of the leading b/inclusive (j) jet $|\eta |$ (right), compared with the MadGraph 5FS, MadGraph 4FS, MadGraph5-aMC@NLO, and POWHEG / MINLO theoretical predictions (shaded bands), normalized to the theoretical cross sections described in the text. For each data point the statistical and the total (sum in quadrature of statistical and systematic) uncertainties are represented by the double error bar. The width of the shaded bands represents the uncertainty in the theoretical predictions, and, for NLO calculations, the inner darker area represents the statistical component only. |

png pdf |
Figure 5-a:
Differential fiducial cross section for Z(1b) production as a function of the leading b jet $|\eta |$, compared with the MadGraph 5FS, MadGraph 4FS, MadGraph5-aMC@NLO, and POWHEG / MINLO theoretical predictions (shaded bands), normalized to the theoretical cross sections described in the text. For each data point the statistical and the total (sum in quadrature of statistical and systematic) uncertainties are represented by the double error bar. The width of the shaded bands represents the uncertainty in the theoretical predictions, and, for NLO calculations, the inner darker area represents the statistical component only. |
png pdf |
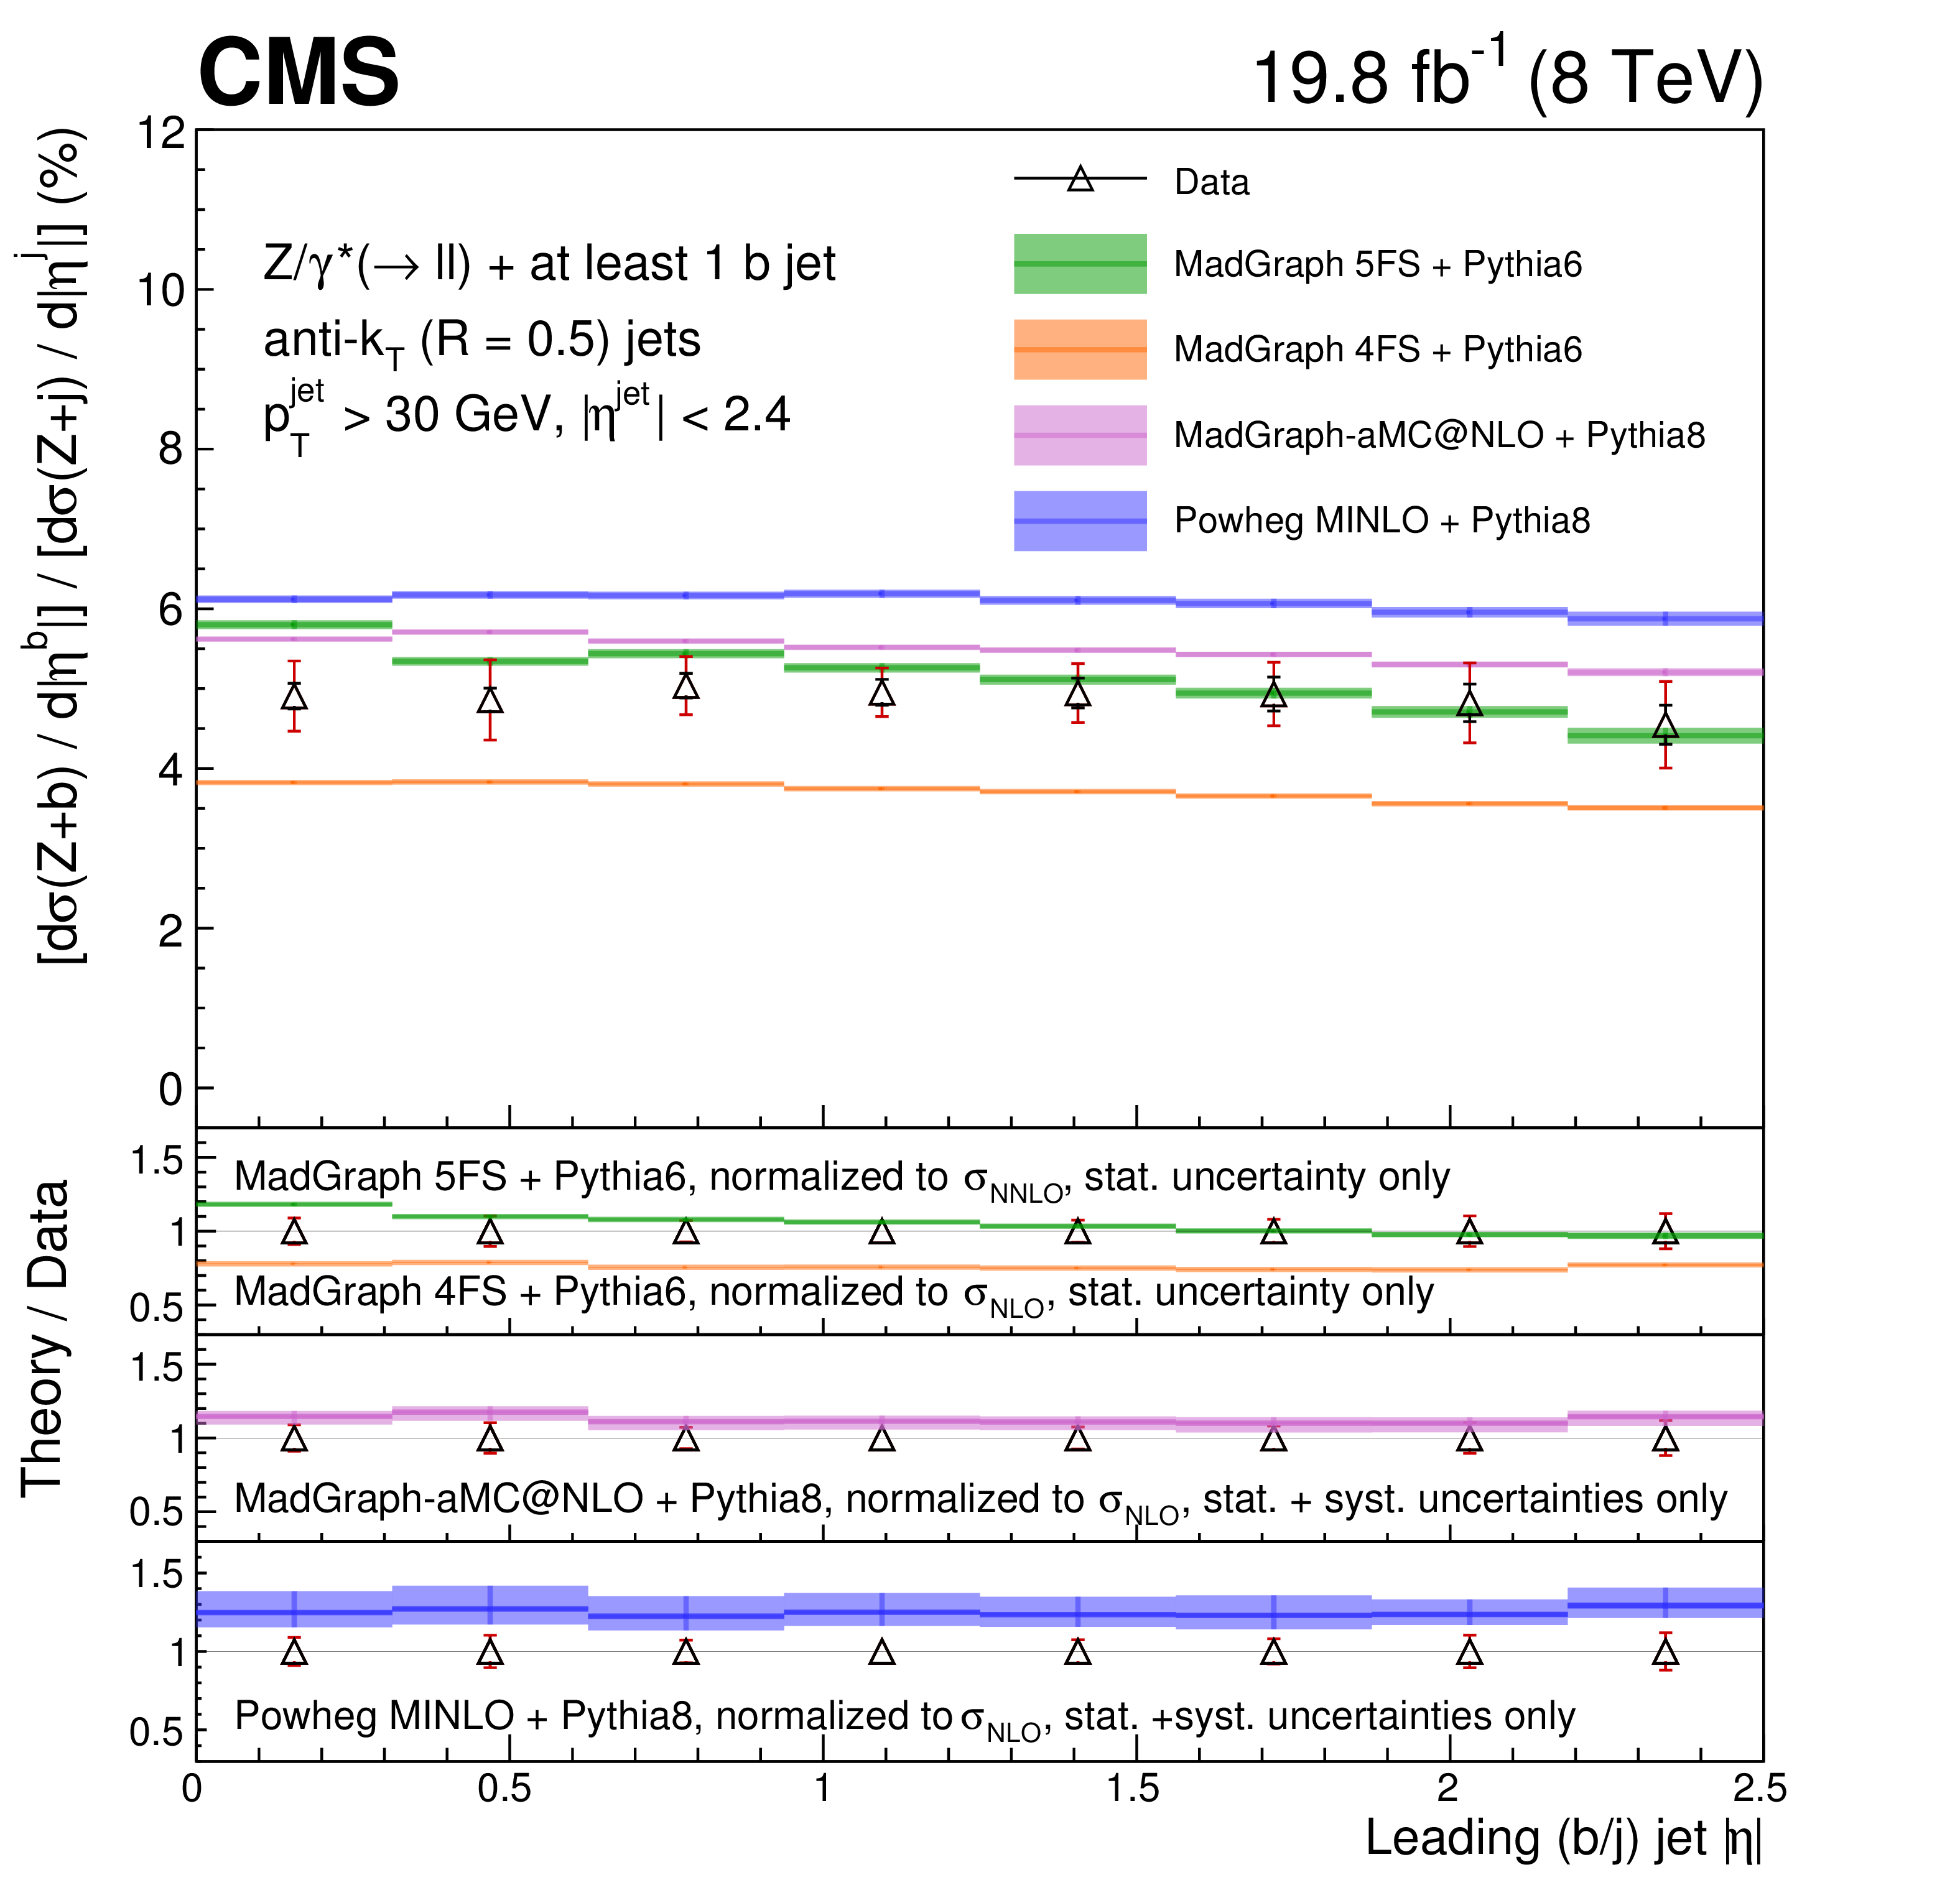
Figure 5-b:
Cross section ratio for Z(1b) and Z+jets production as a function of the leading b/inclusive (j) jet $|\eta |$, compared with the MadGraph 5FS, MadGraph 4FS, MadGraph5-aMC@NLO, and POWHEG / MINLO theoretical predictions (shaded bands), normalized to the theoretical cross sections described in the text. For each data point the statistical and the total (sum in quadrature of statistical and systematic) uncertainties are represented by the double error bar. The width of the shaded bands represents the uncertainty in the theoretical predictions, and, for NLO calculations, the inner darker area represents the statistical component only. |
png pdf |
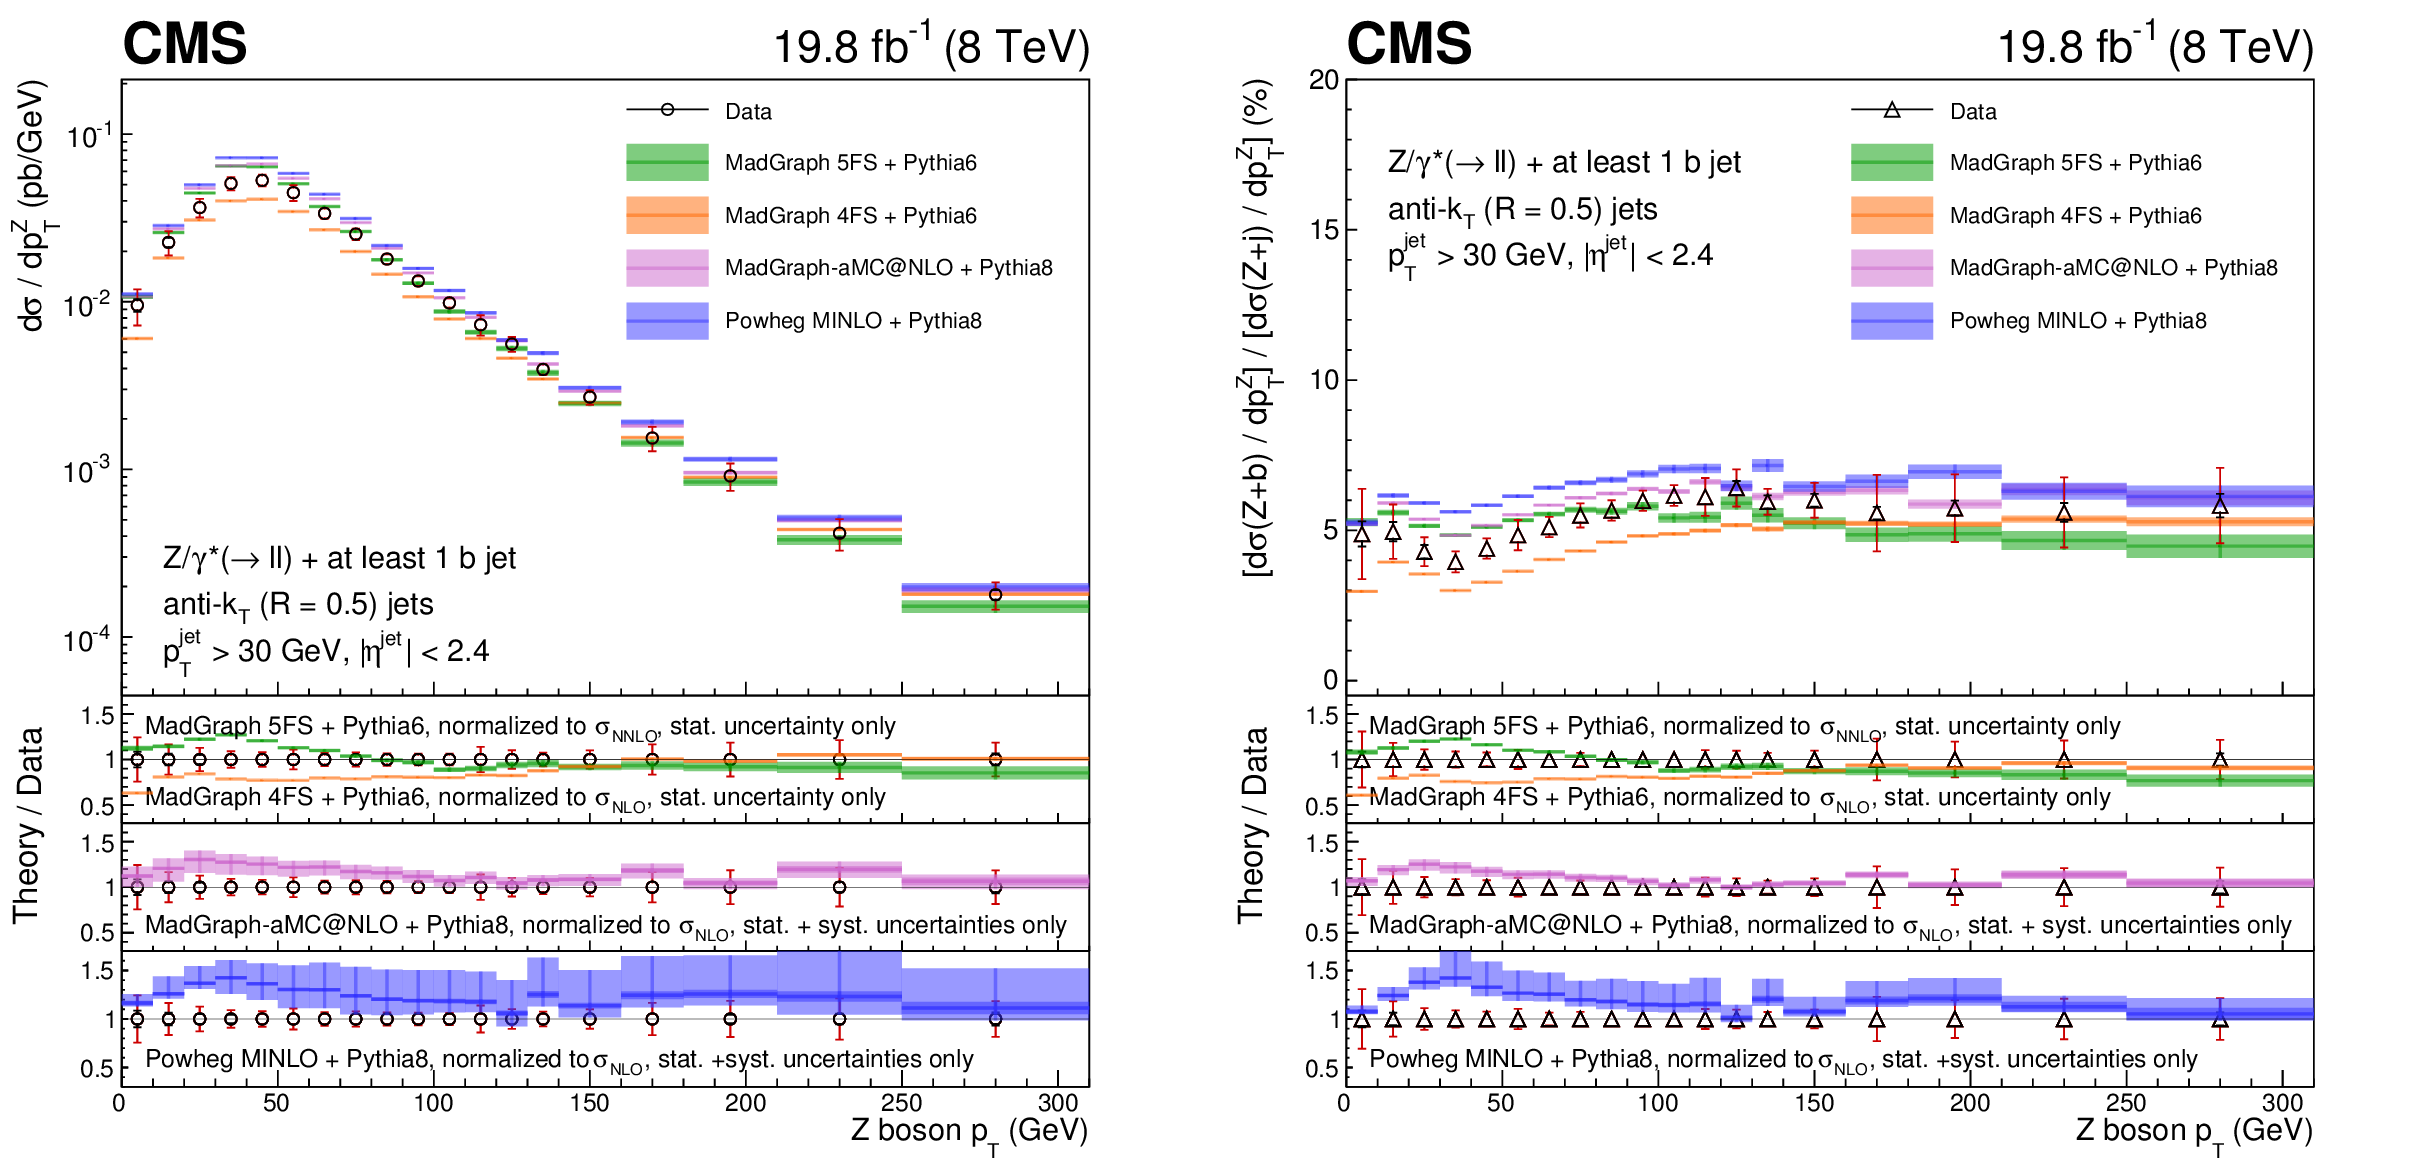
Figure 6:
Differential fiducial cross section for Z(1b) production as a function of the Z boson ${p_{\mathrm {T}}}$ (left), and the cross section ratio for Z(1b) and Z+jets production as a function of the Z boson ${p_{\mathrm {T}}}$ (right), compared with the MadGraph 5FS, MadGraph 4FS, MadGraph5-aMC@NLO, and POWHEG / MINLO theoretical predictions (shaded bands), normalized to the theoretical cross sections described in the text. For each data point the statistical and the total (sum in quadrature of statistical and systematic) uncertainties are represented by the double error bar. The width of the shaded bands represents the uncertainty in the theoretical predictions, and, for NLO calculations, the inner darker area represents the statistical component only. |
png pdf |
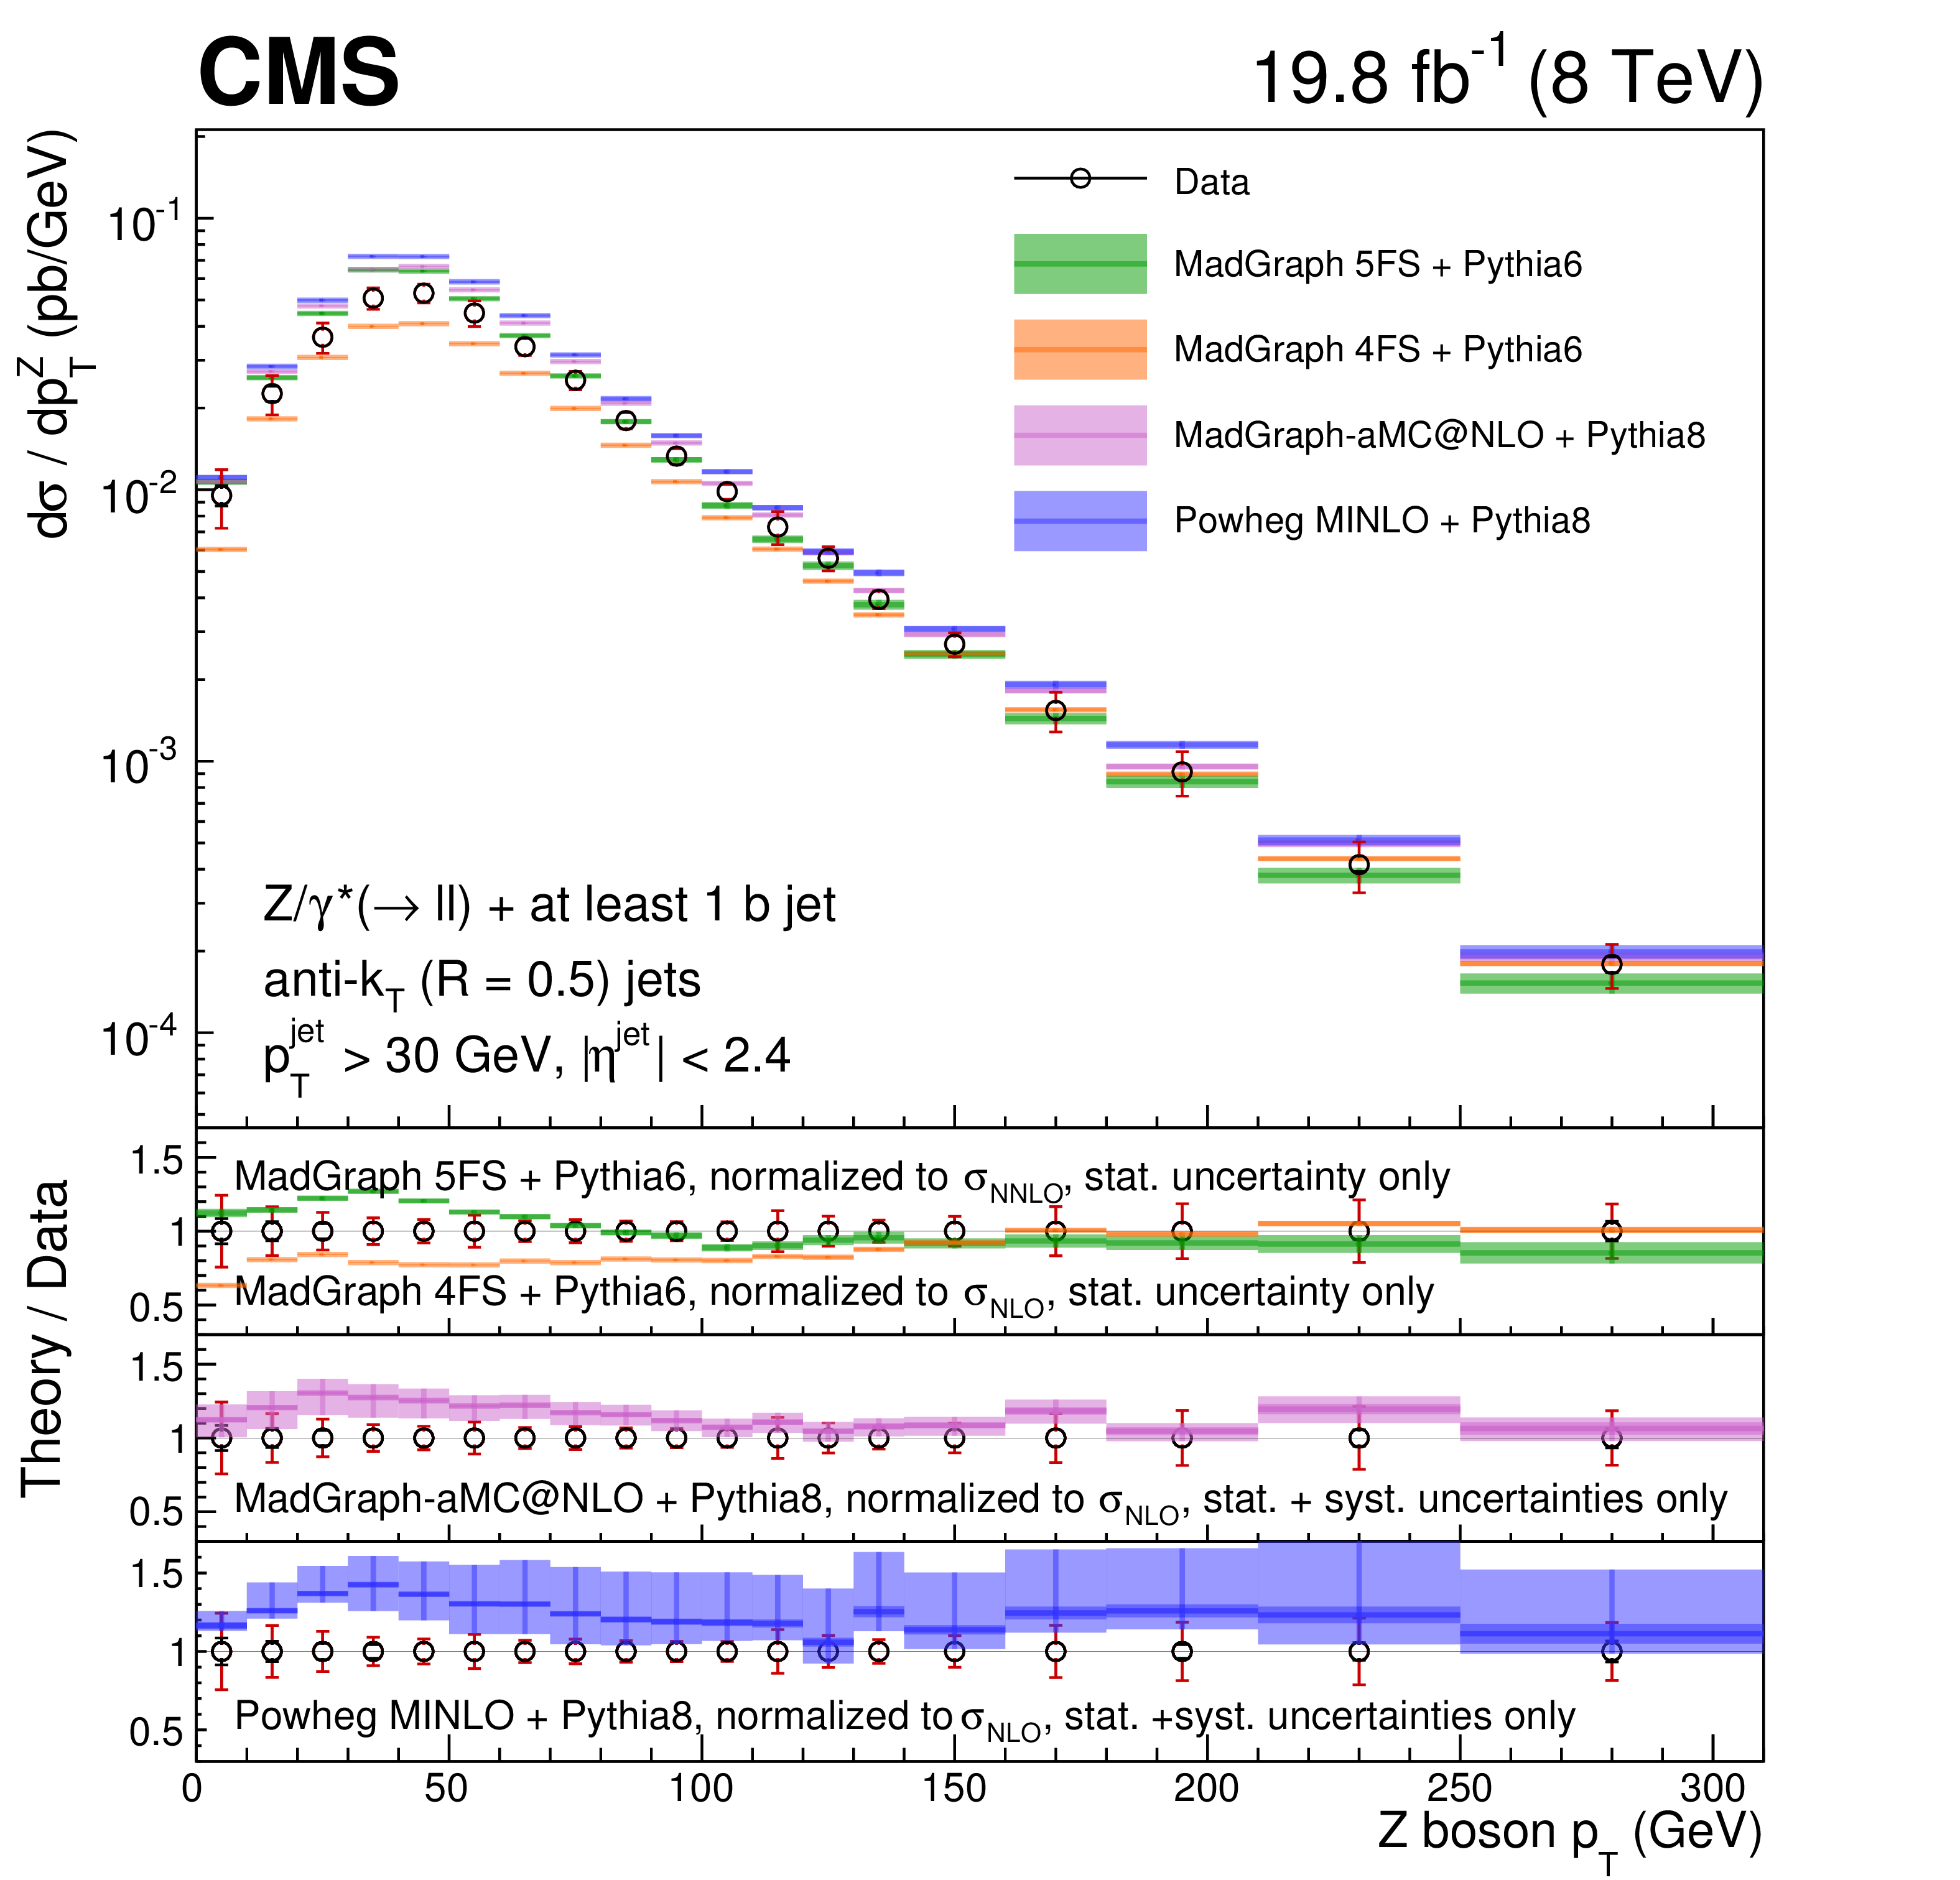
Figure 6-a:
Differential fiducial cross section for Z(1b) production as a function of the Z boson ${p_{\mathrm {T}}}$, compared with the MadGraph 5FS, MadGraph 4FS, MadGraph5-aMC@NLO, and POWHEG / MINLO theoretical predictions (shaded bands), normalized to the theoretical cross sections described in the text. For each data point the statistical and the total (sum in quadrature of statistical and systematic) uncertainties are represented by the double error bar. The width of the shaded bands represents the uncertainty in the theoretical predictions, and, for NLO calculations, the inner darker area represents the statistical component only. |
png pdf |
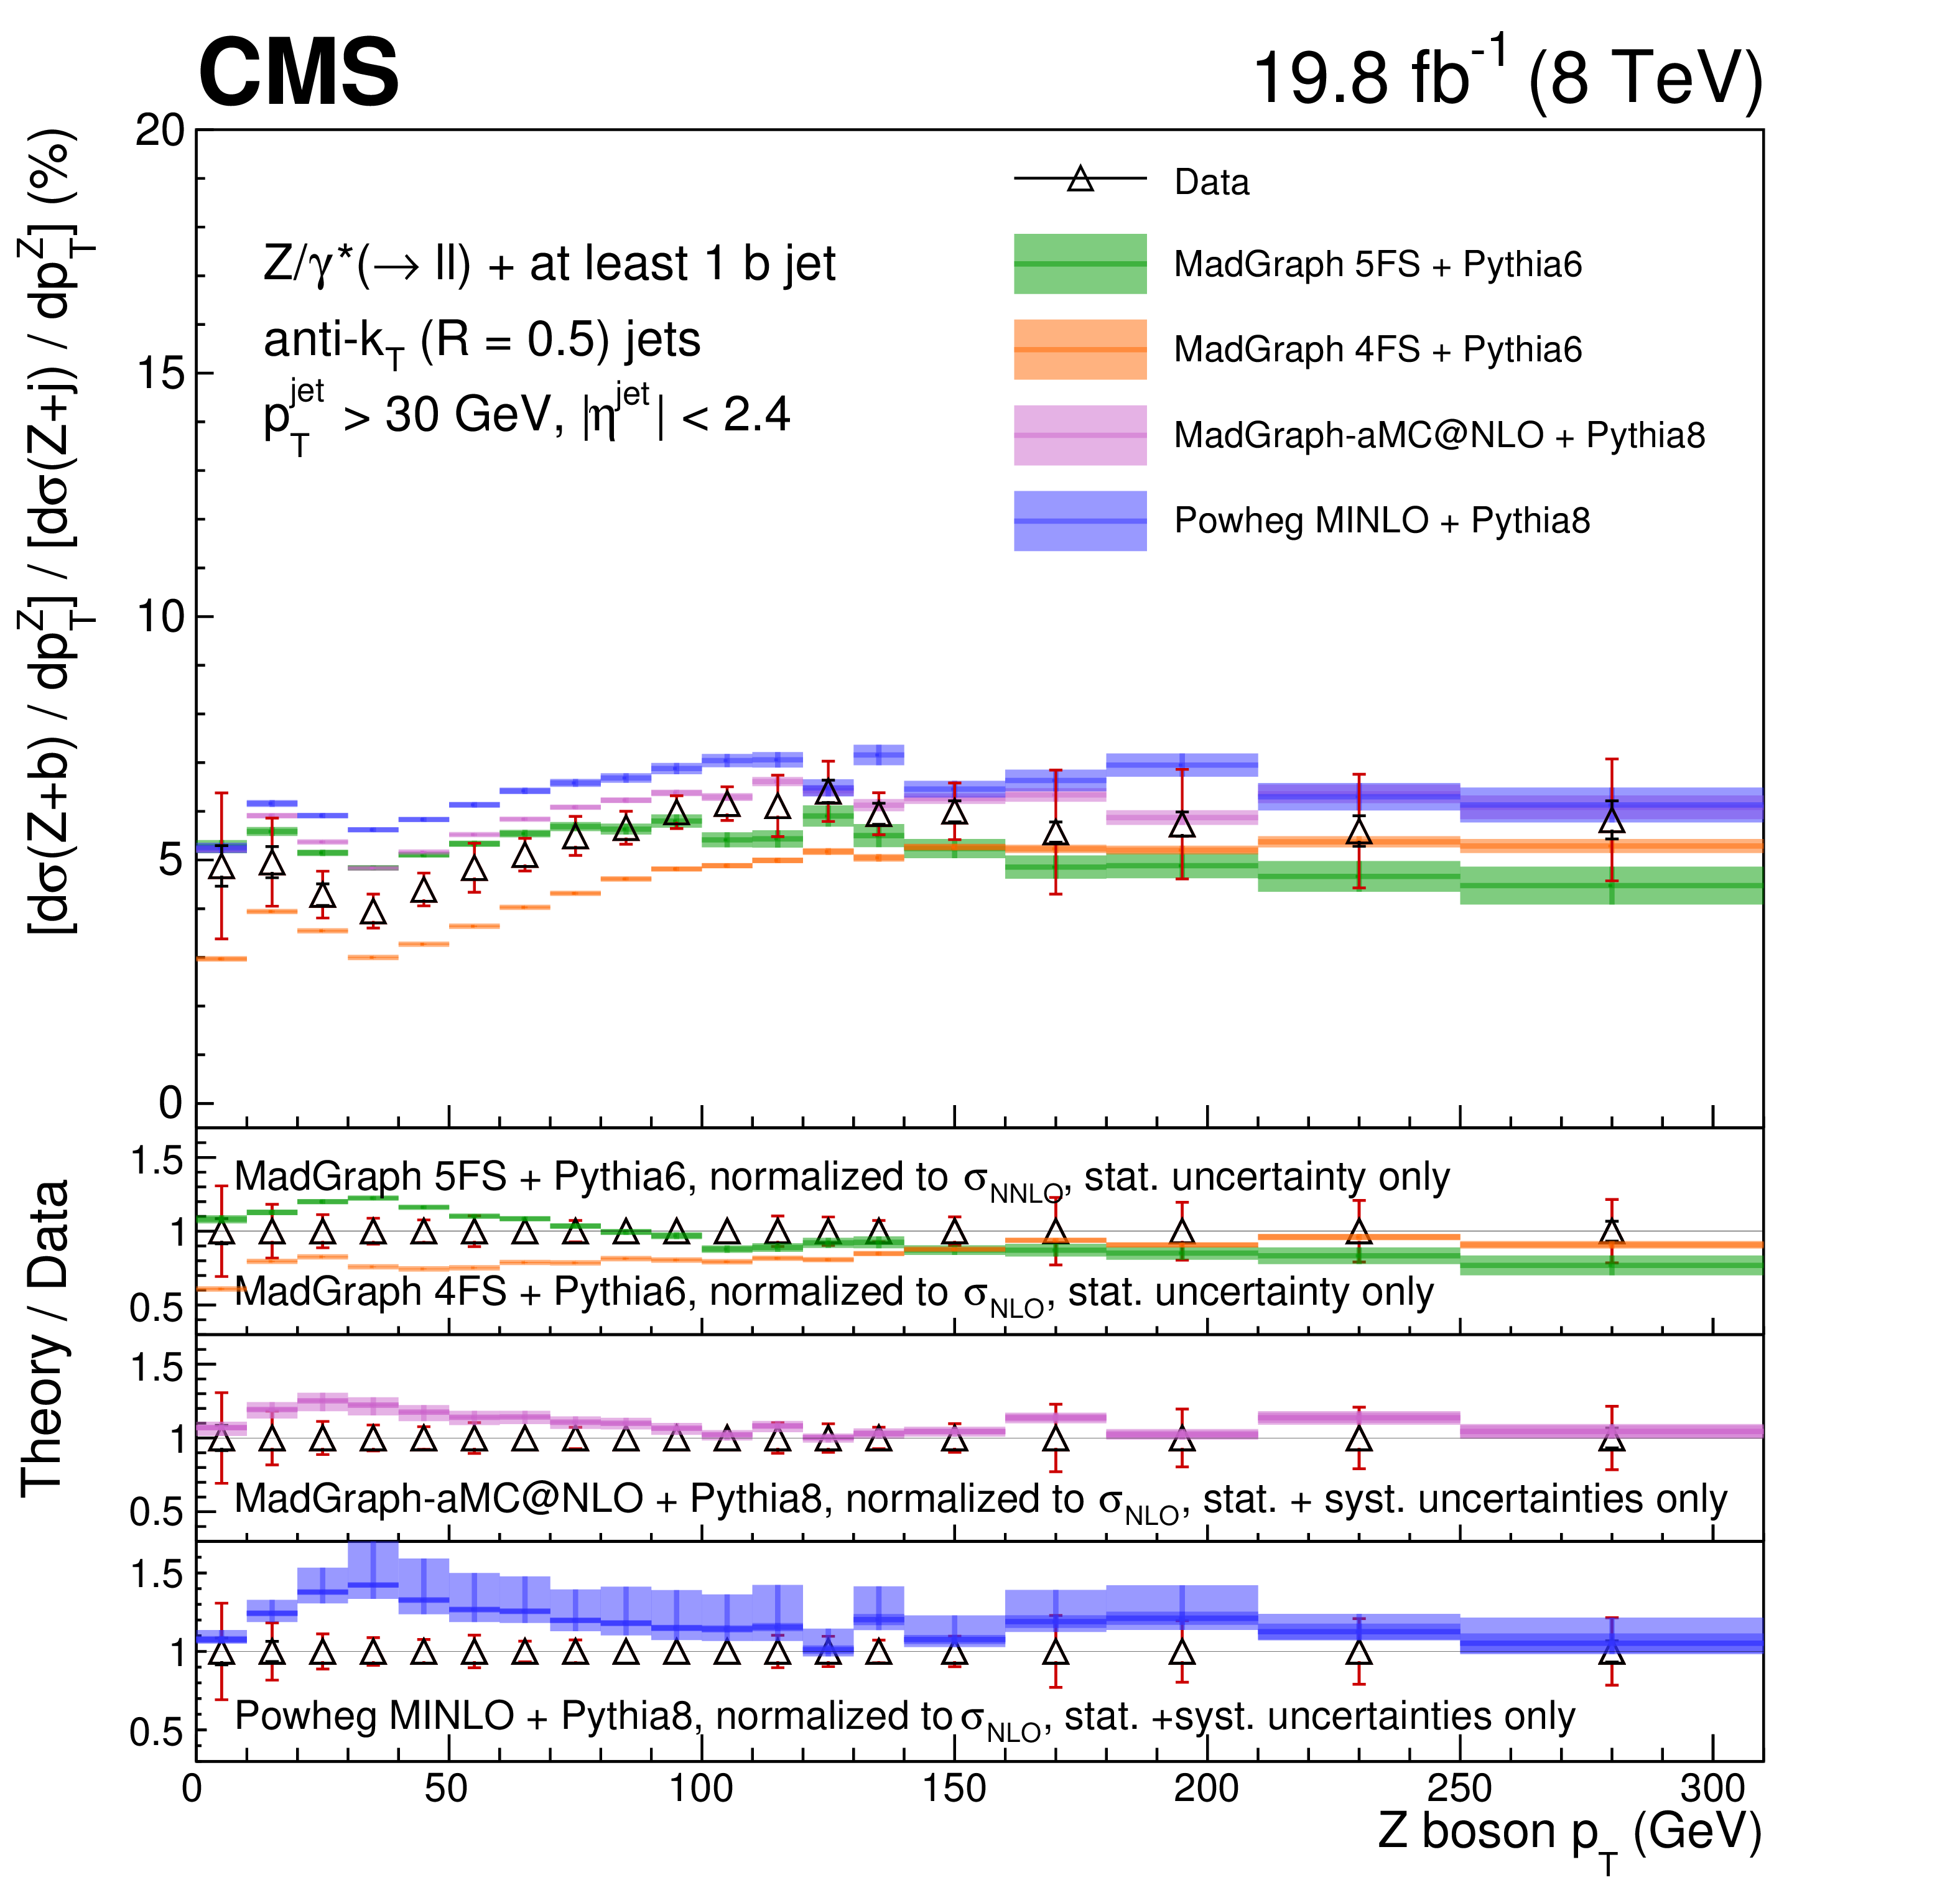
Figure 6-b:
Cross section ratio for Z(1b) and Z+jets production as a function of the Z boson ${p_{\mathrm {T}}}$ (right), compared with the MadGraph 5FS, MadGraph 4FS, MadGraph5-aMC@NLO, and POWHEG / MINLO theoretical predictions (shaded bands), normalized to the theoretical cross sections described in the text. For each data point the statistical and the total (sum in quadrature of statistical and systematic) uncertainties are represented by the double error bar. The width of the shaded bands represents the uncertainty in the theoretical predictions, and, for NLO calculations, the inner darker area represents the statistical component only. |
png pdf |
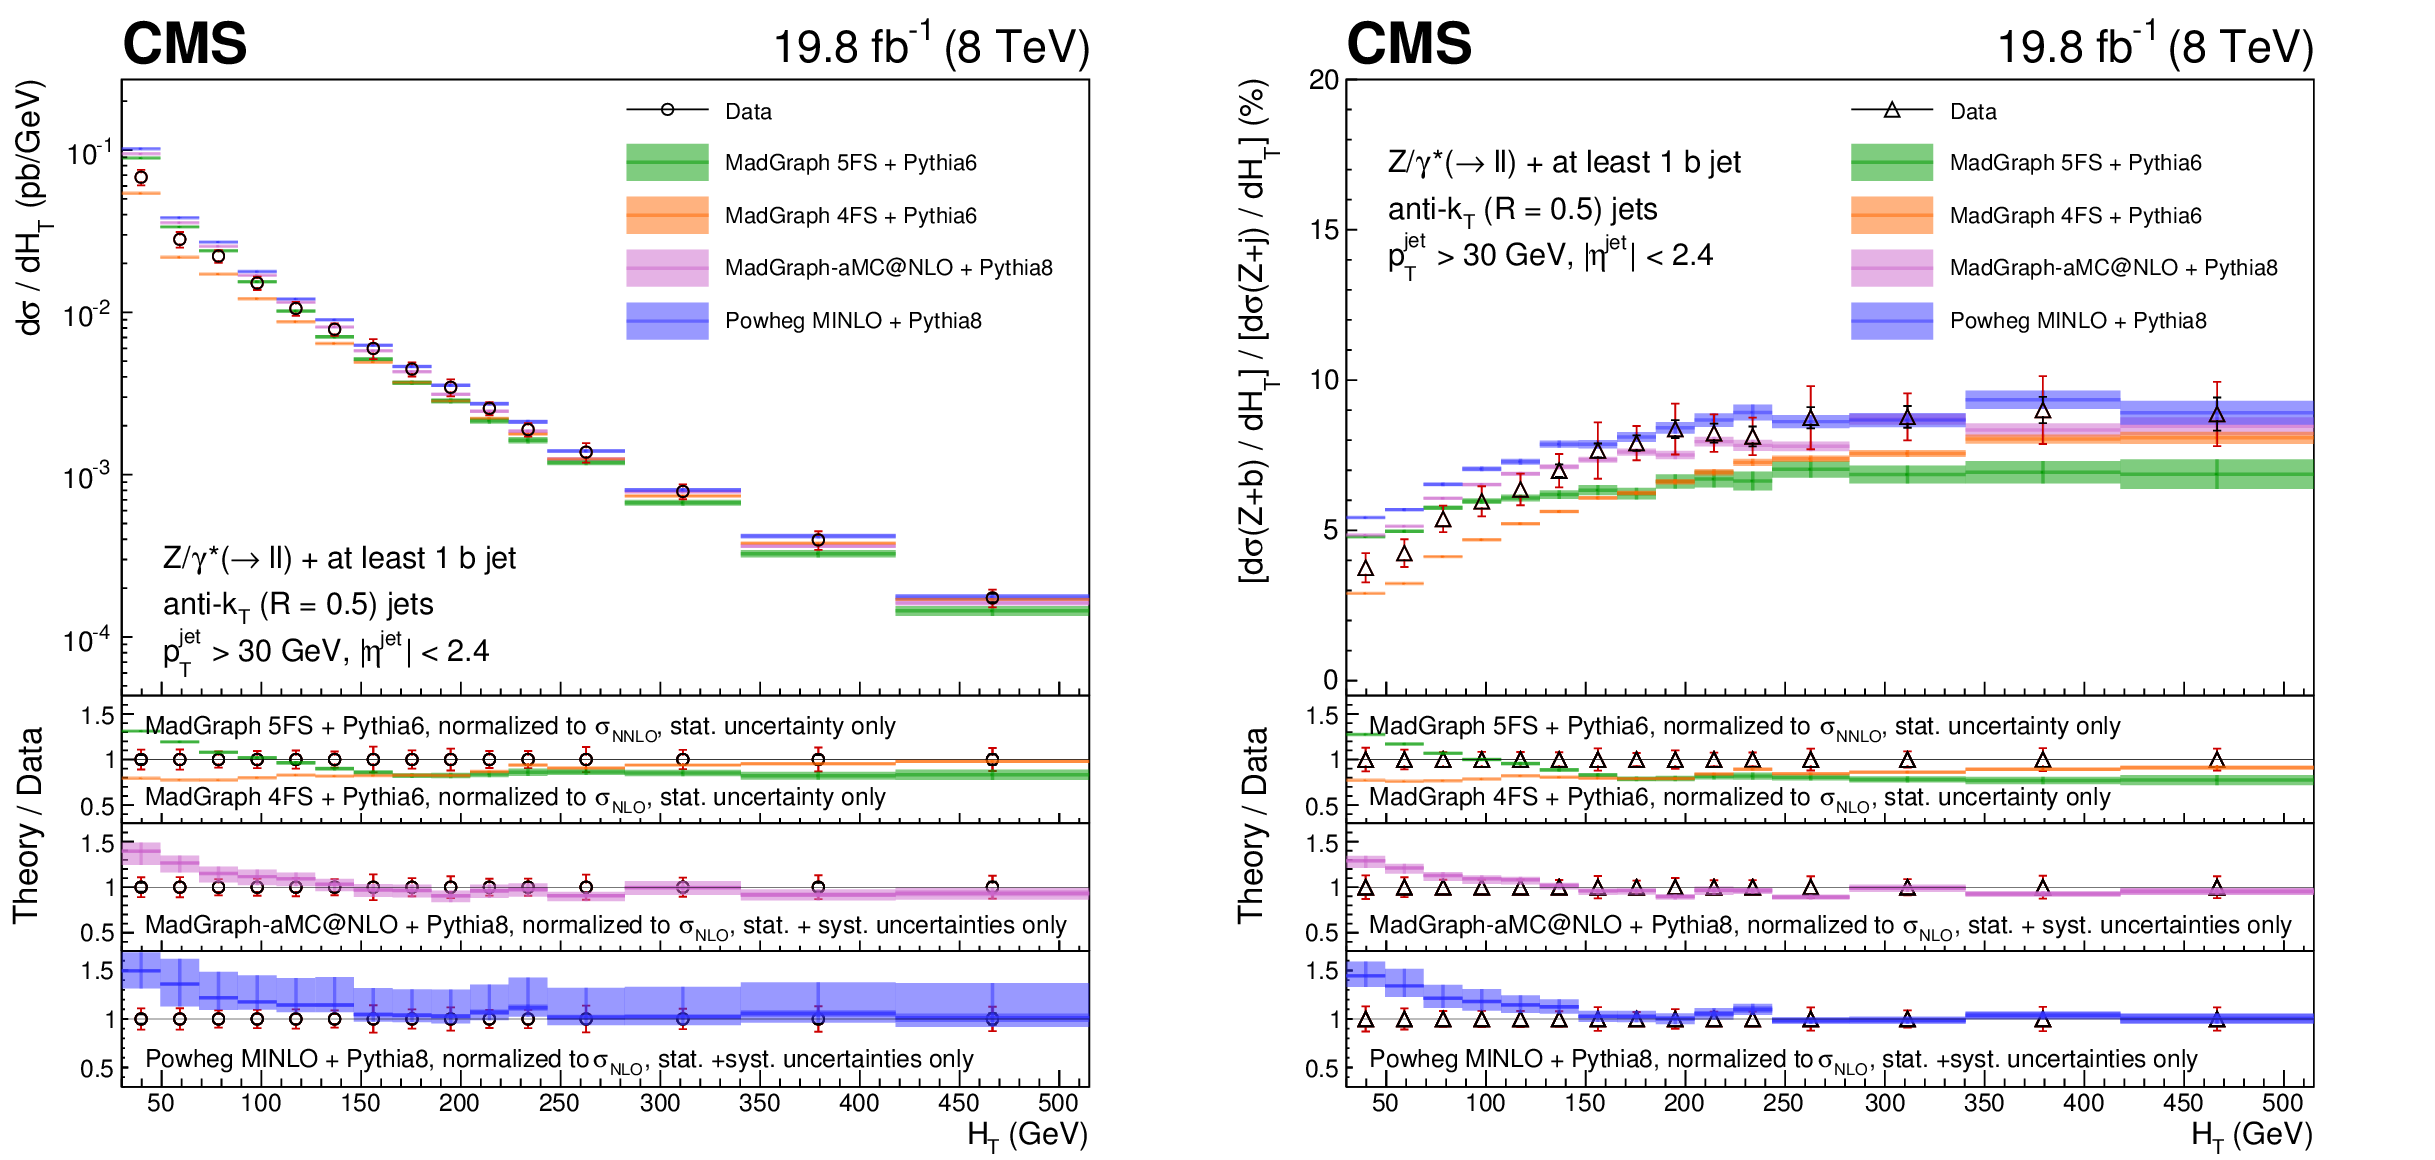
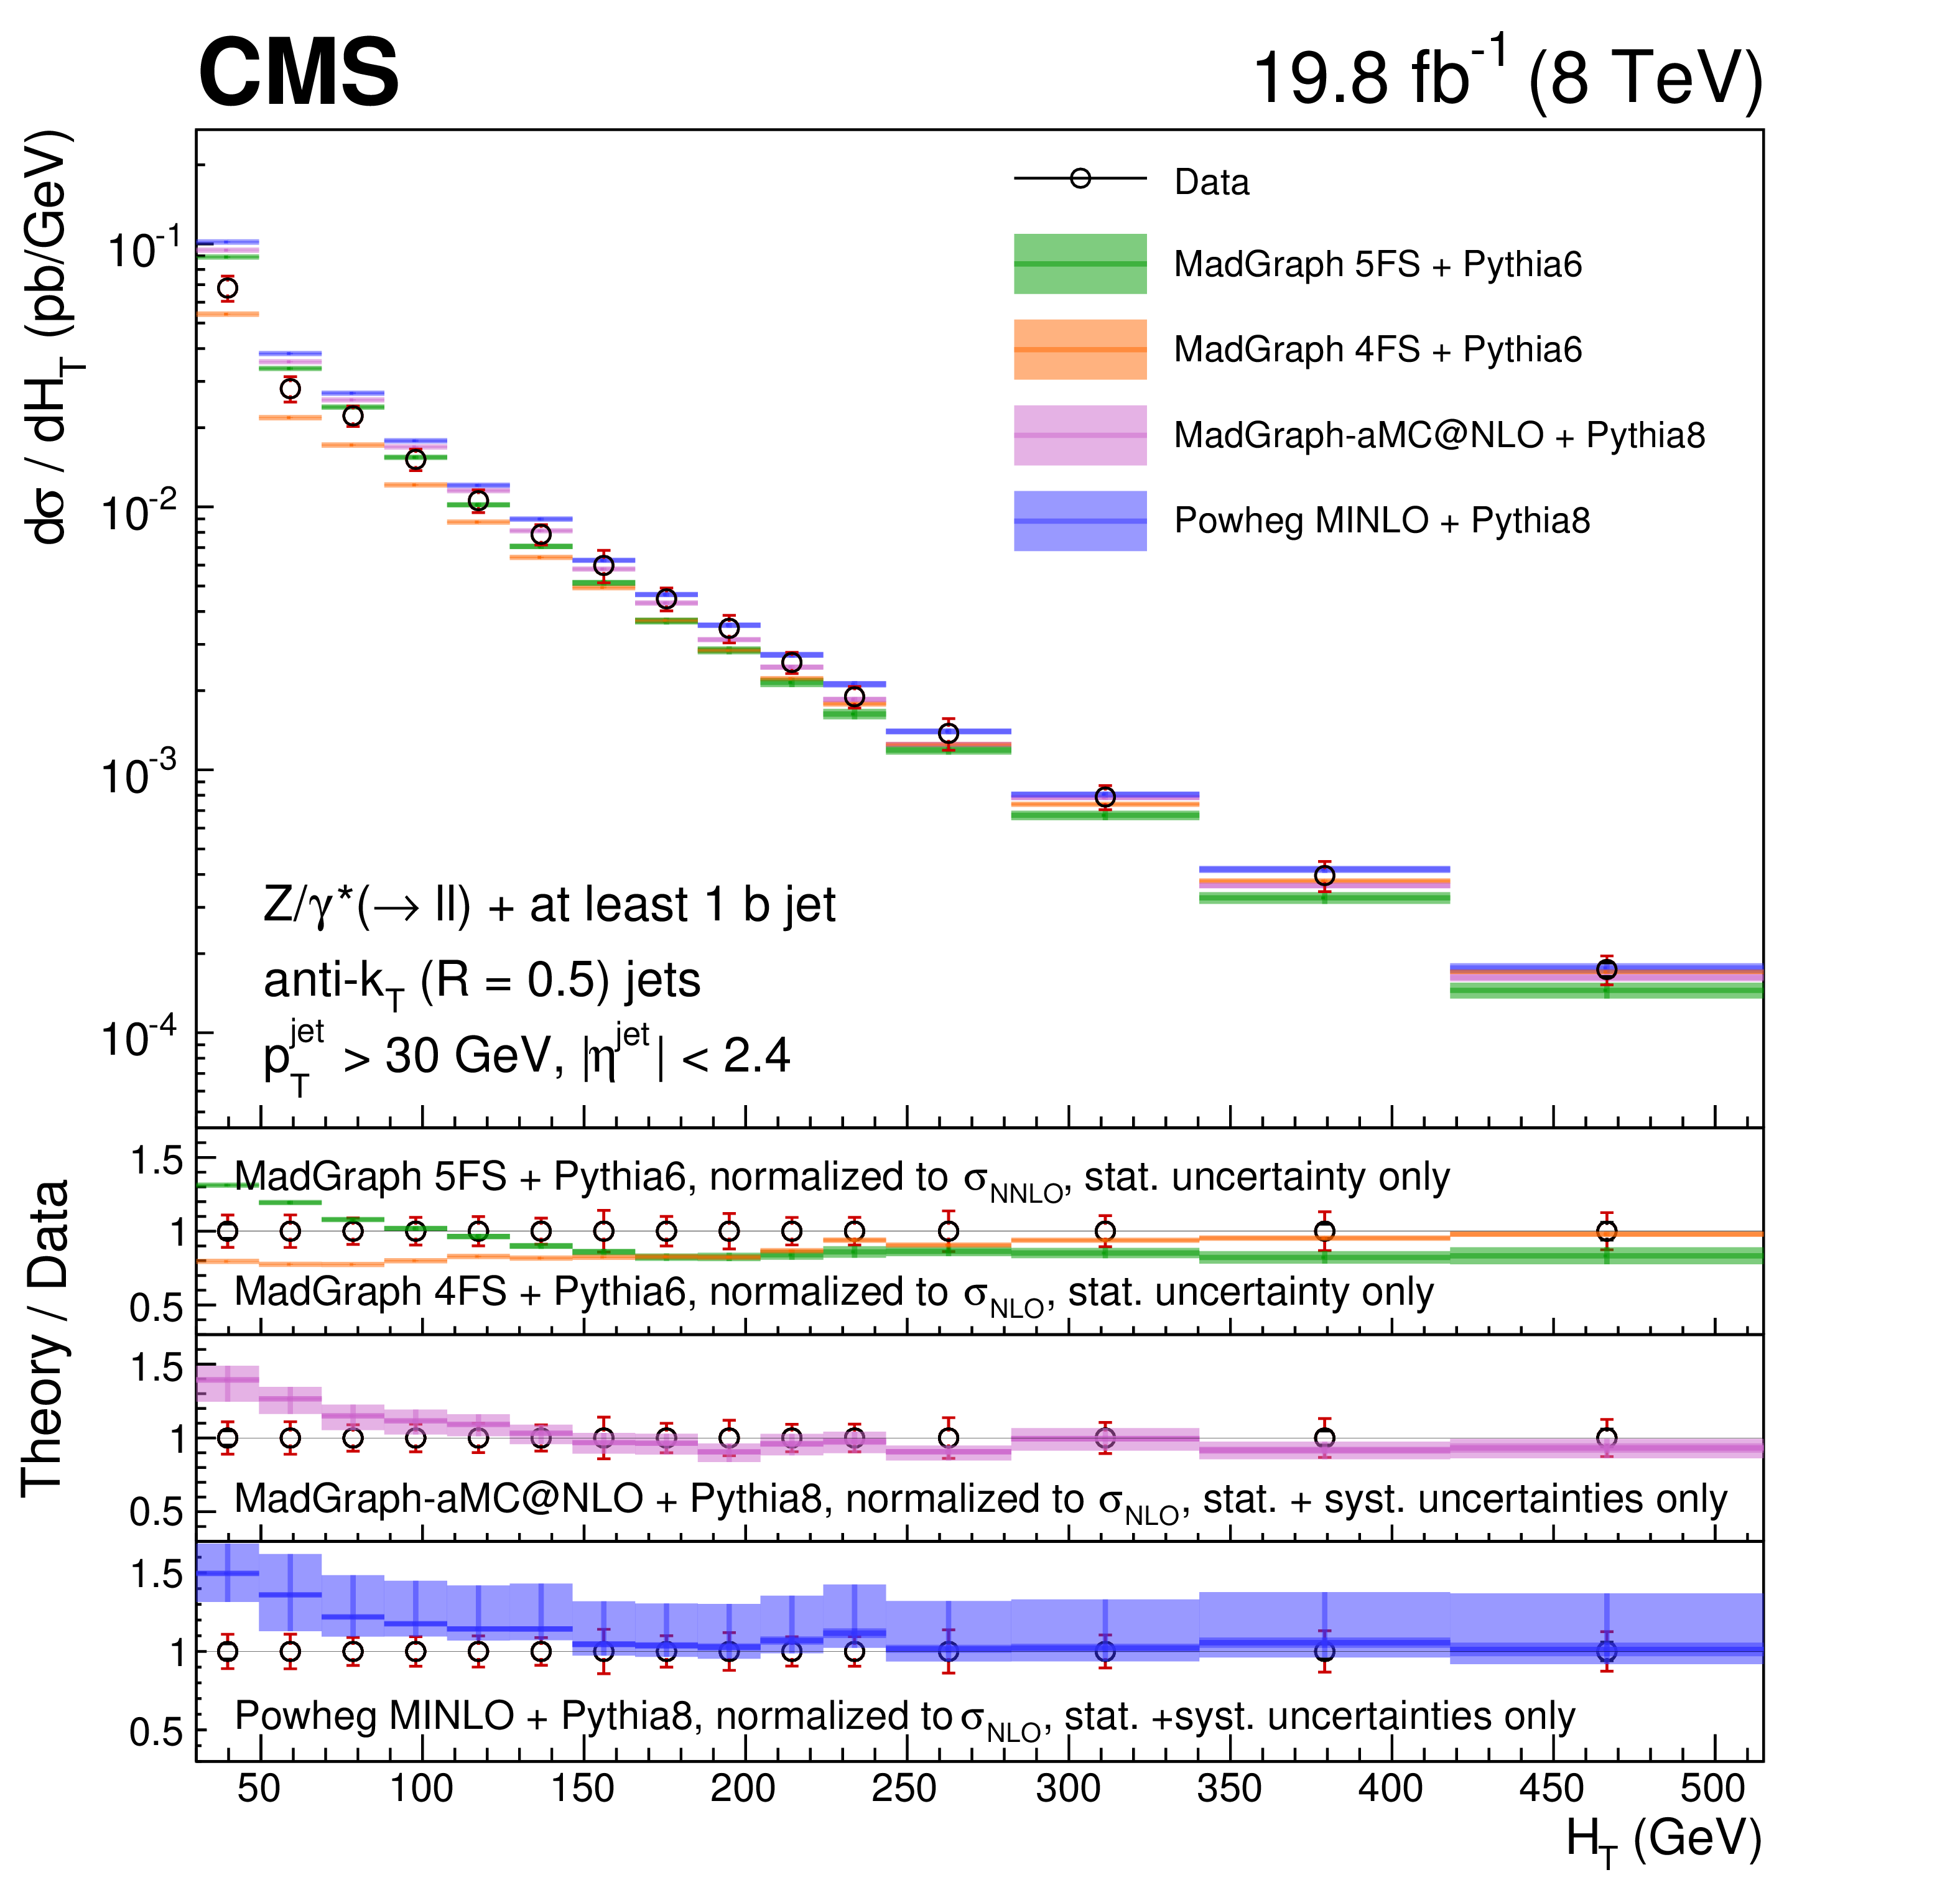
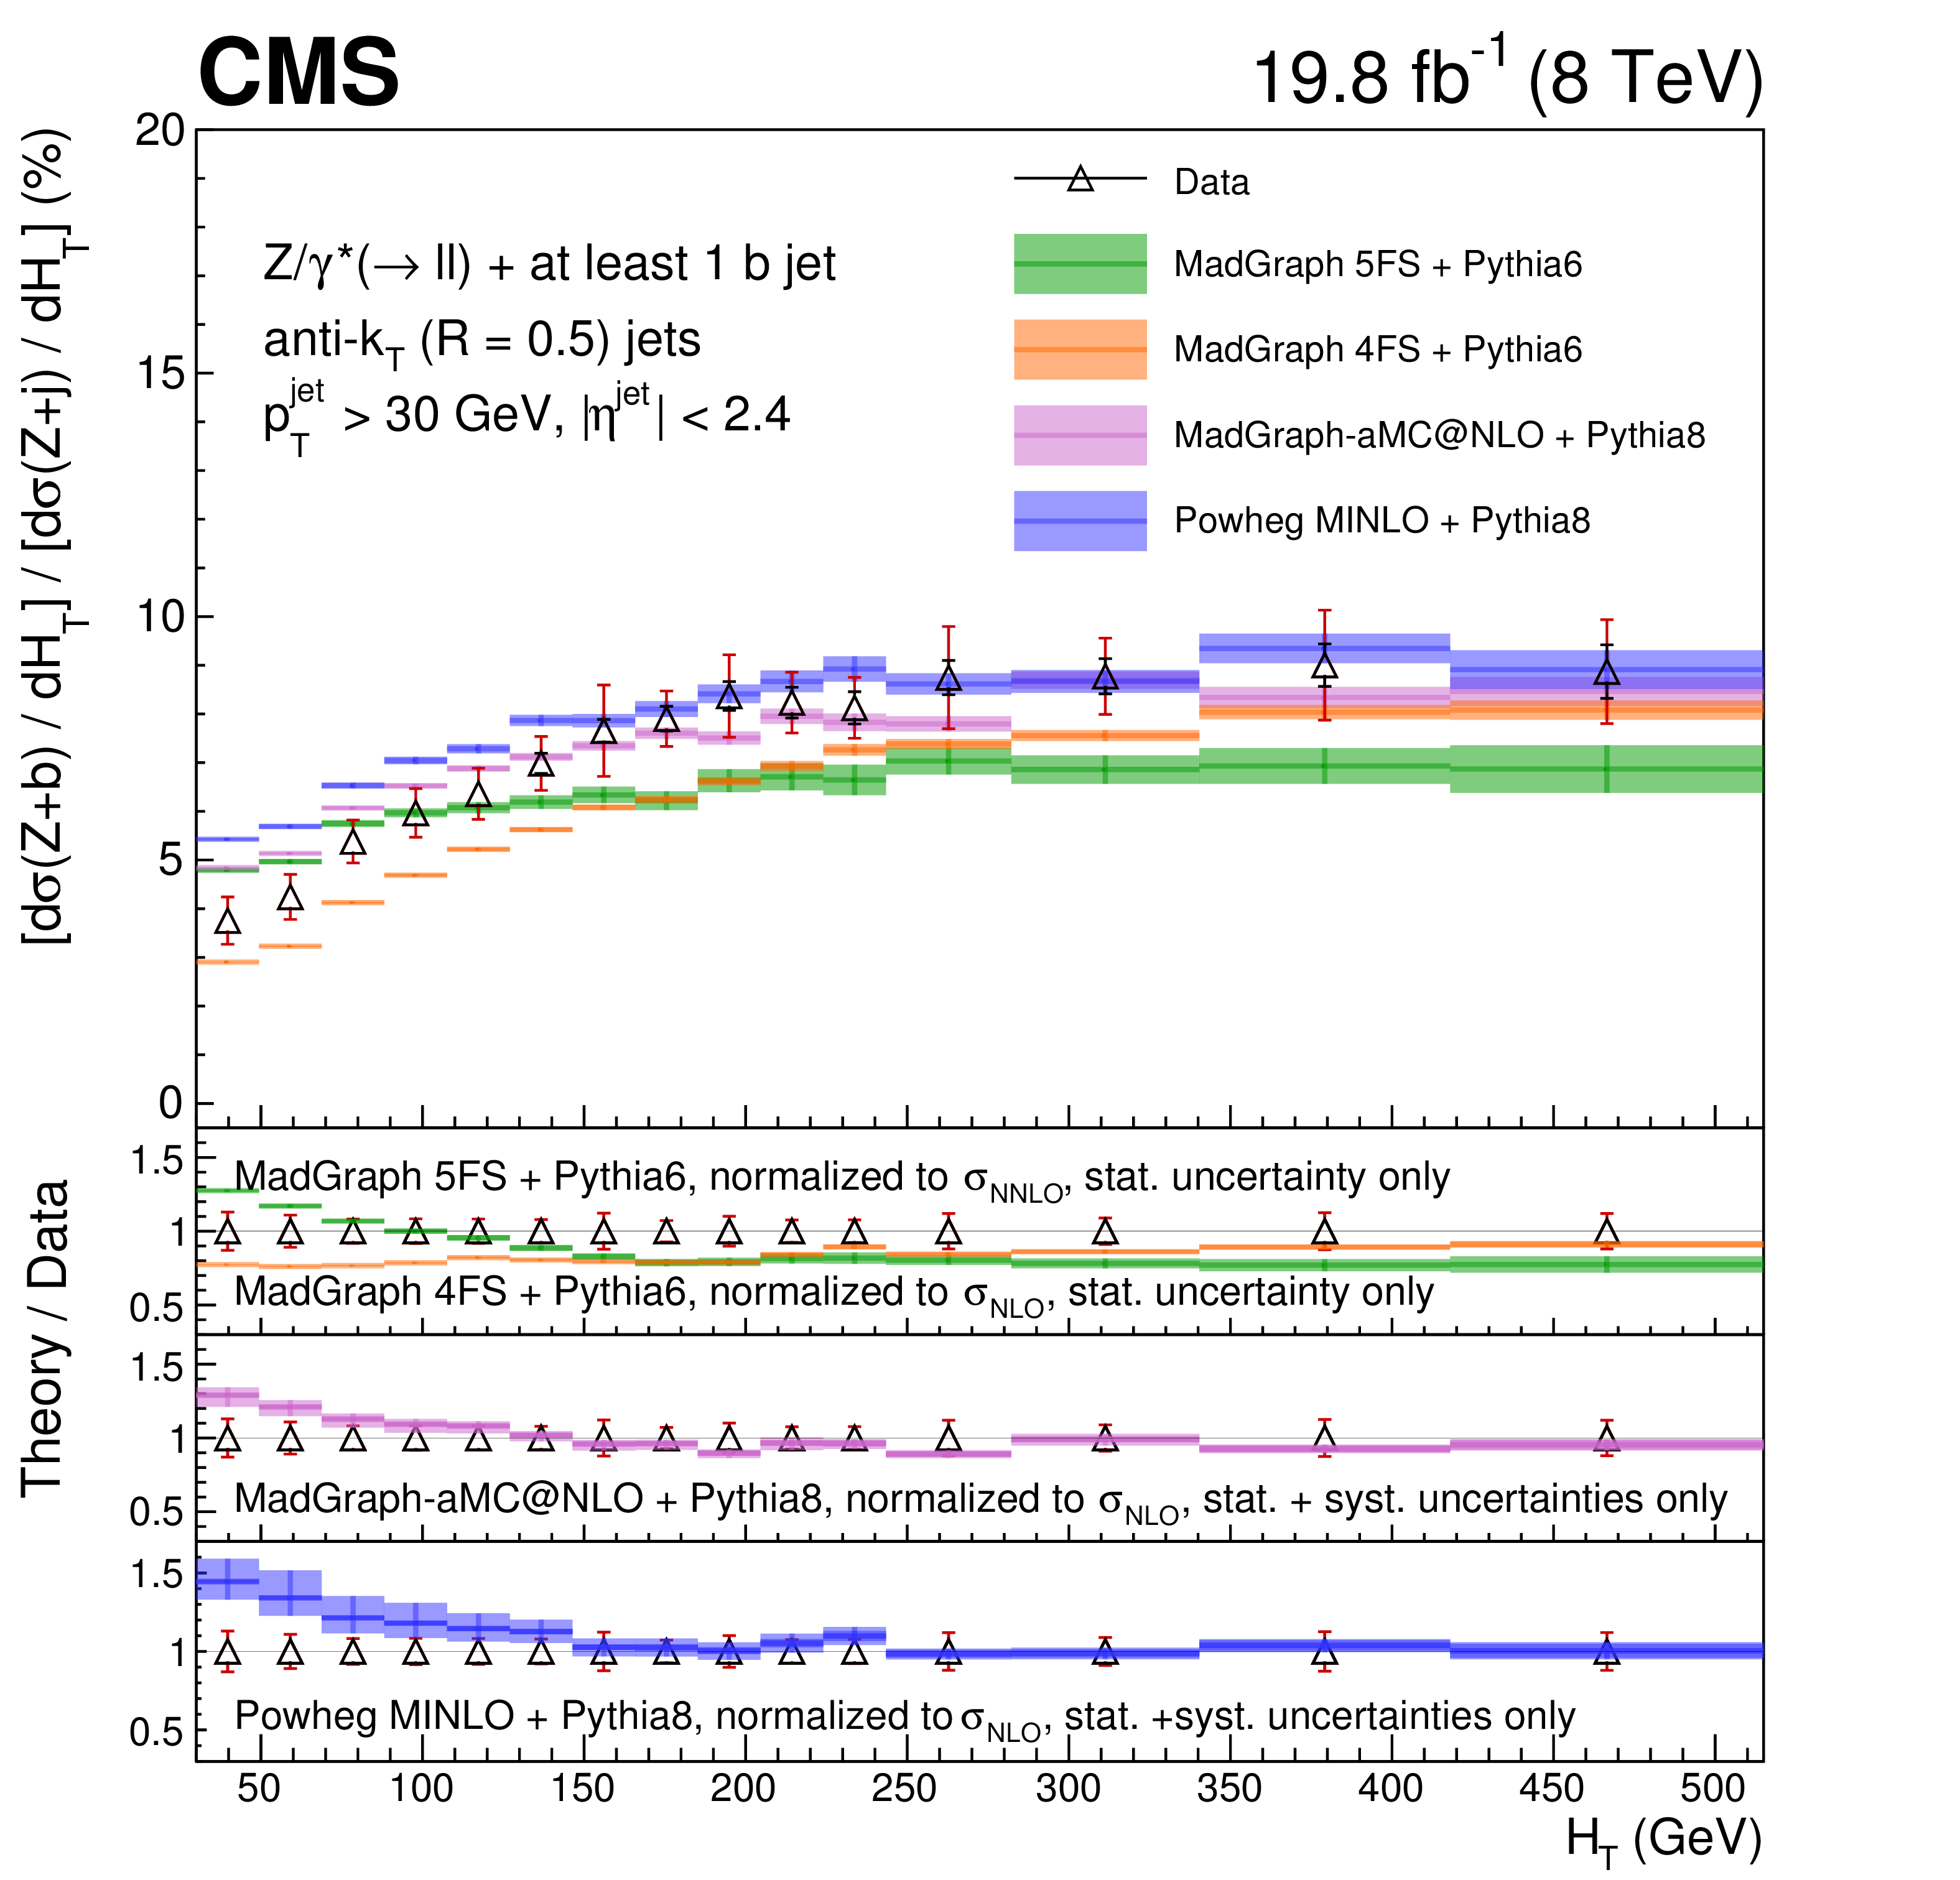
Figure 7:
Differential fiducial cross section for Z(1b) production as a function of ${H_{\mathrm {T}}}$ (left), and the cross section ratio for Z(1b) and Z+jets production as a function of ${H_{\mathrm {T}}}$ (right), compared with the MadGraph 5FS, MadGraph 4FS, MadGraph5-aMC@NLO, and POWHEG / MINLO theoretical predictions (shaded bands), normalized to the theoretical cross sections described in the text. For each data point the statistical and the total (sum in quadrature of statistical and systematic) uncertainties are represented by the double error bar. The width of the shaded bands represents the uncertainty in the theoretical predictions, and, for NLO calculations, the inner darker area represents the statistical component only. |
png pdf |
Figure 7-a:
Differential fiducial cross section for Z(1b) production as a function of ${H_{\mathrm {T}}}$ (left), compared with the MadGraph 5FS, MadGraph 4FS, MadGraph5-aMC@NLO, and POWHEG / MINLO theoretical predictions (shaded bands), normalized to the theoretical cross sections described in the text. For each data point the statistical and the total (sum in quadrature of statistical and systematic) uncertainties are represented by the double error bar. The width of the shaded bands represents the uncertainty in the theoretical predictions, and, for NLO calculations, the inner darker area represents the statistical component only. |
png pdf |
Figure 7-b:
Cross section ratio for Z(1b) and Z+jets production as a function of ${H_{\mathrm {T}}}$, compared with the MadGraph 5FS, MadGraph 4FS, MadGraph5-aMC@NLO, and POWHEG / MINLO theoretical predictions (shaded bands), normalized to the theoretical cross sections described in the text. For each data point the statistical and the total (sum in quadrature of statistical and systematic) uncertainties are represented by the double error bar. The width of the shaded bands represents the uncertainty in the theoretical predictions, and, for NLO calculations, the inner darker area represents the statistical component only. |
png pdf |
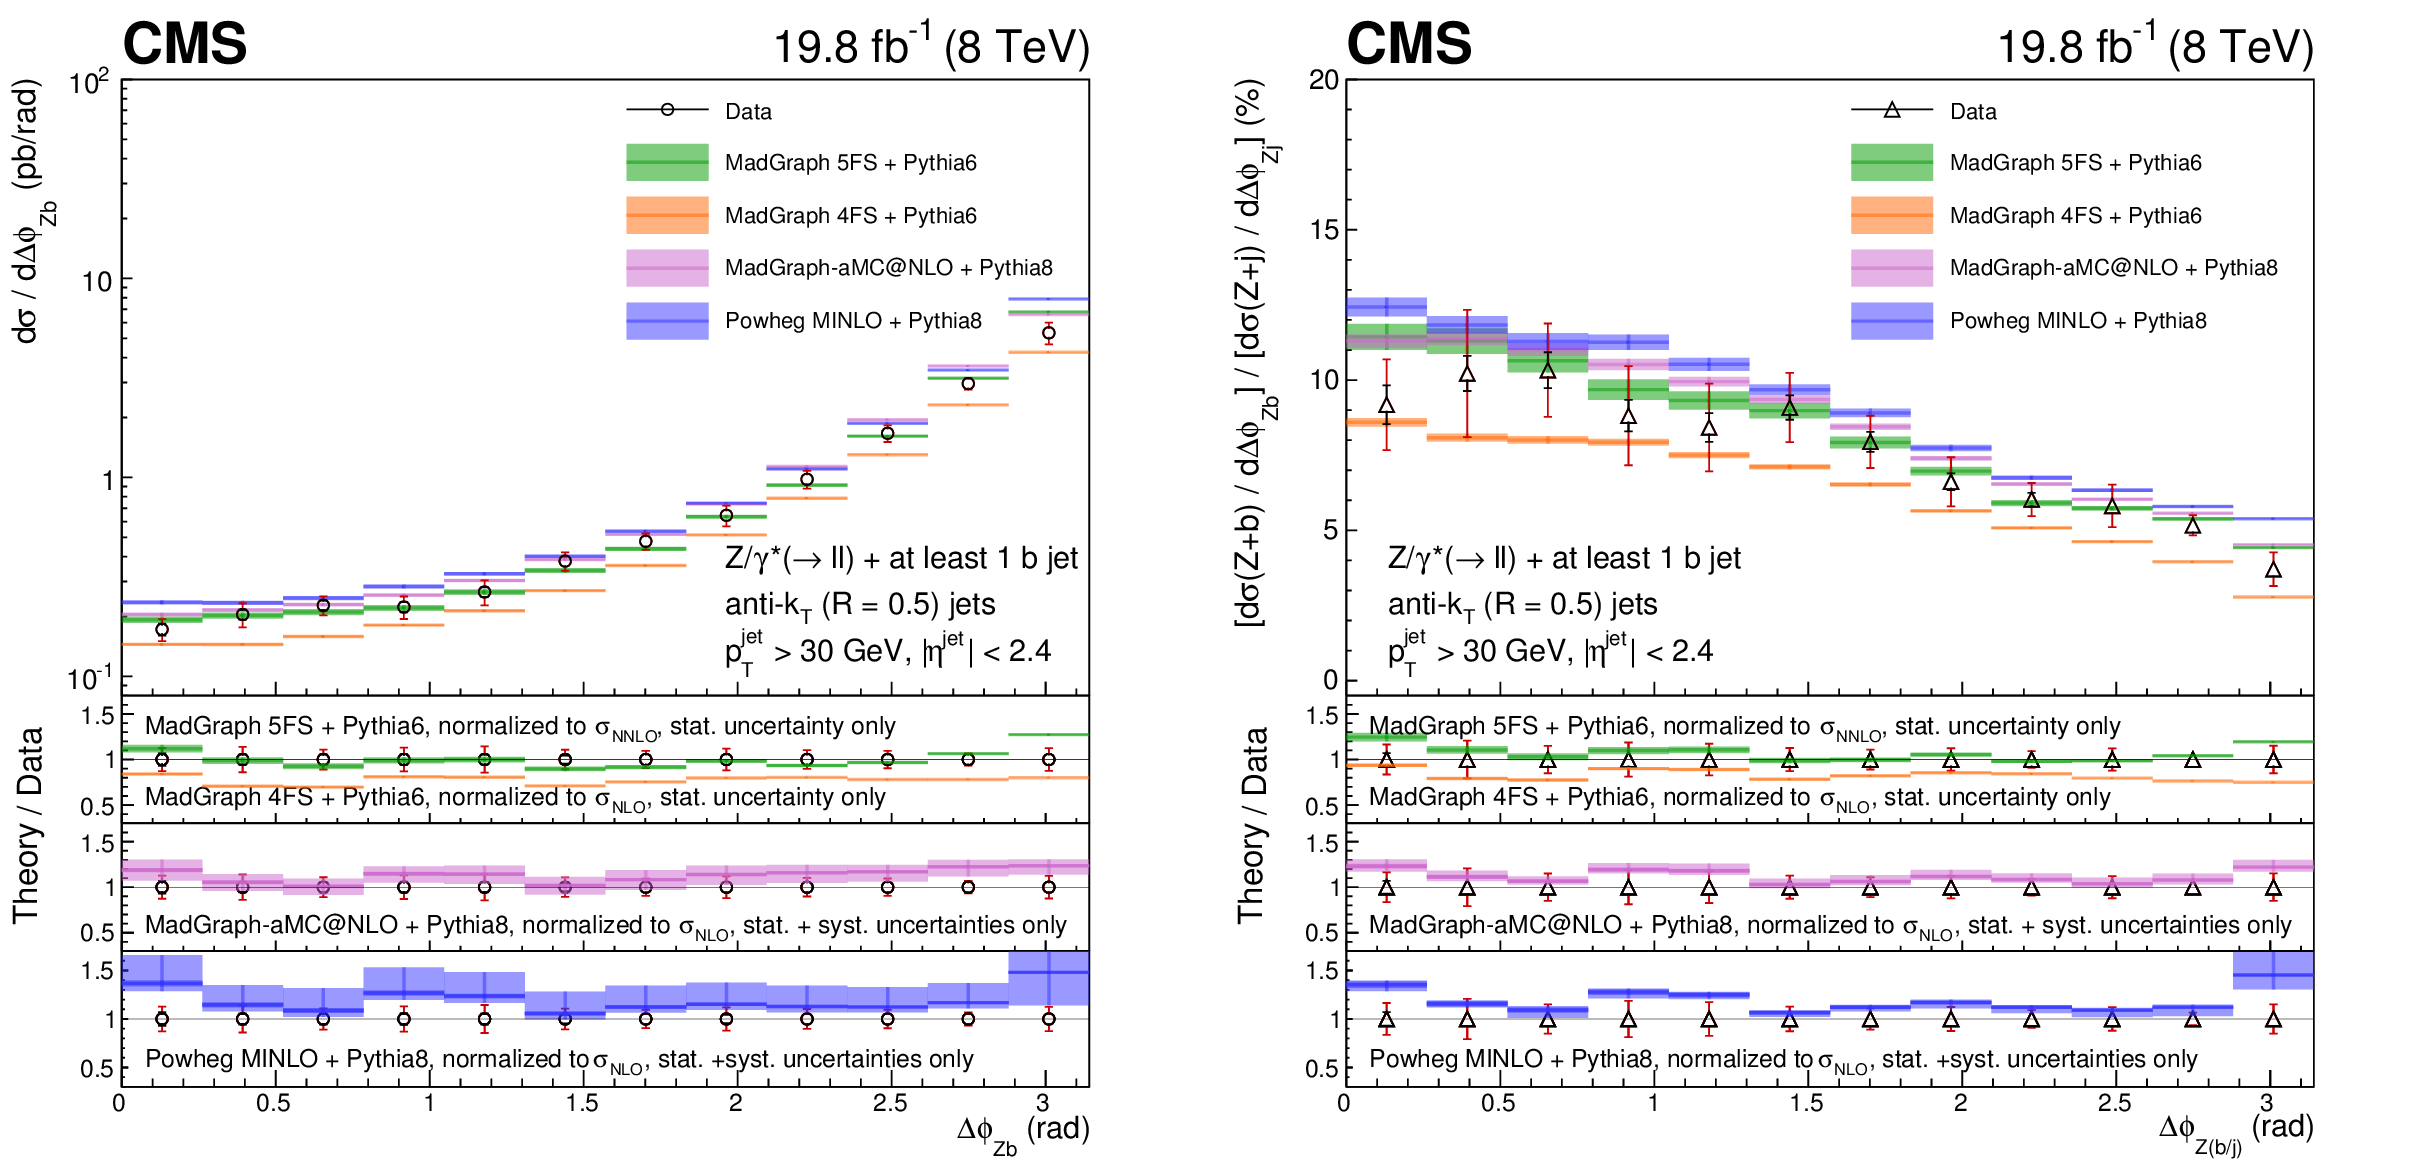
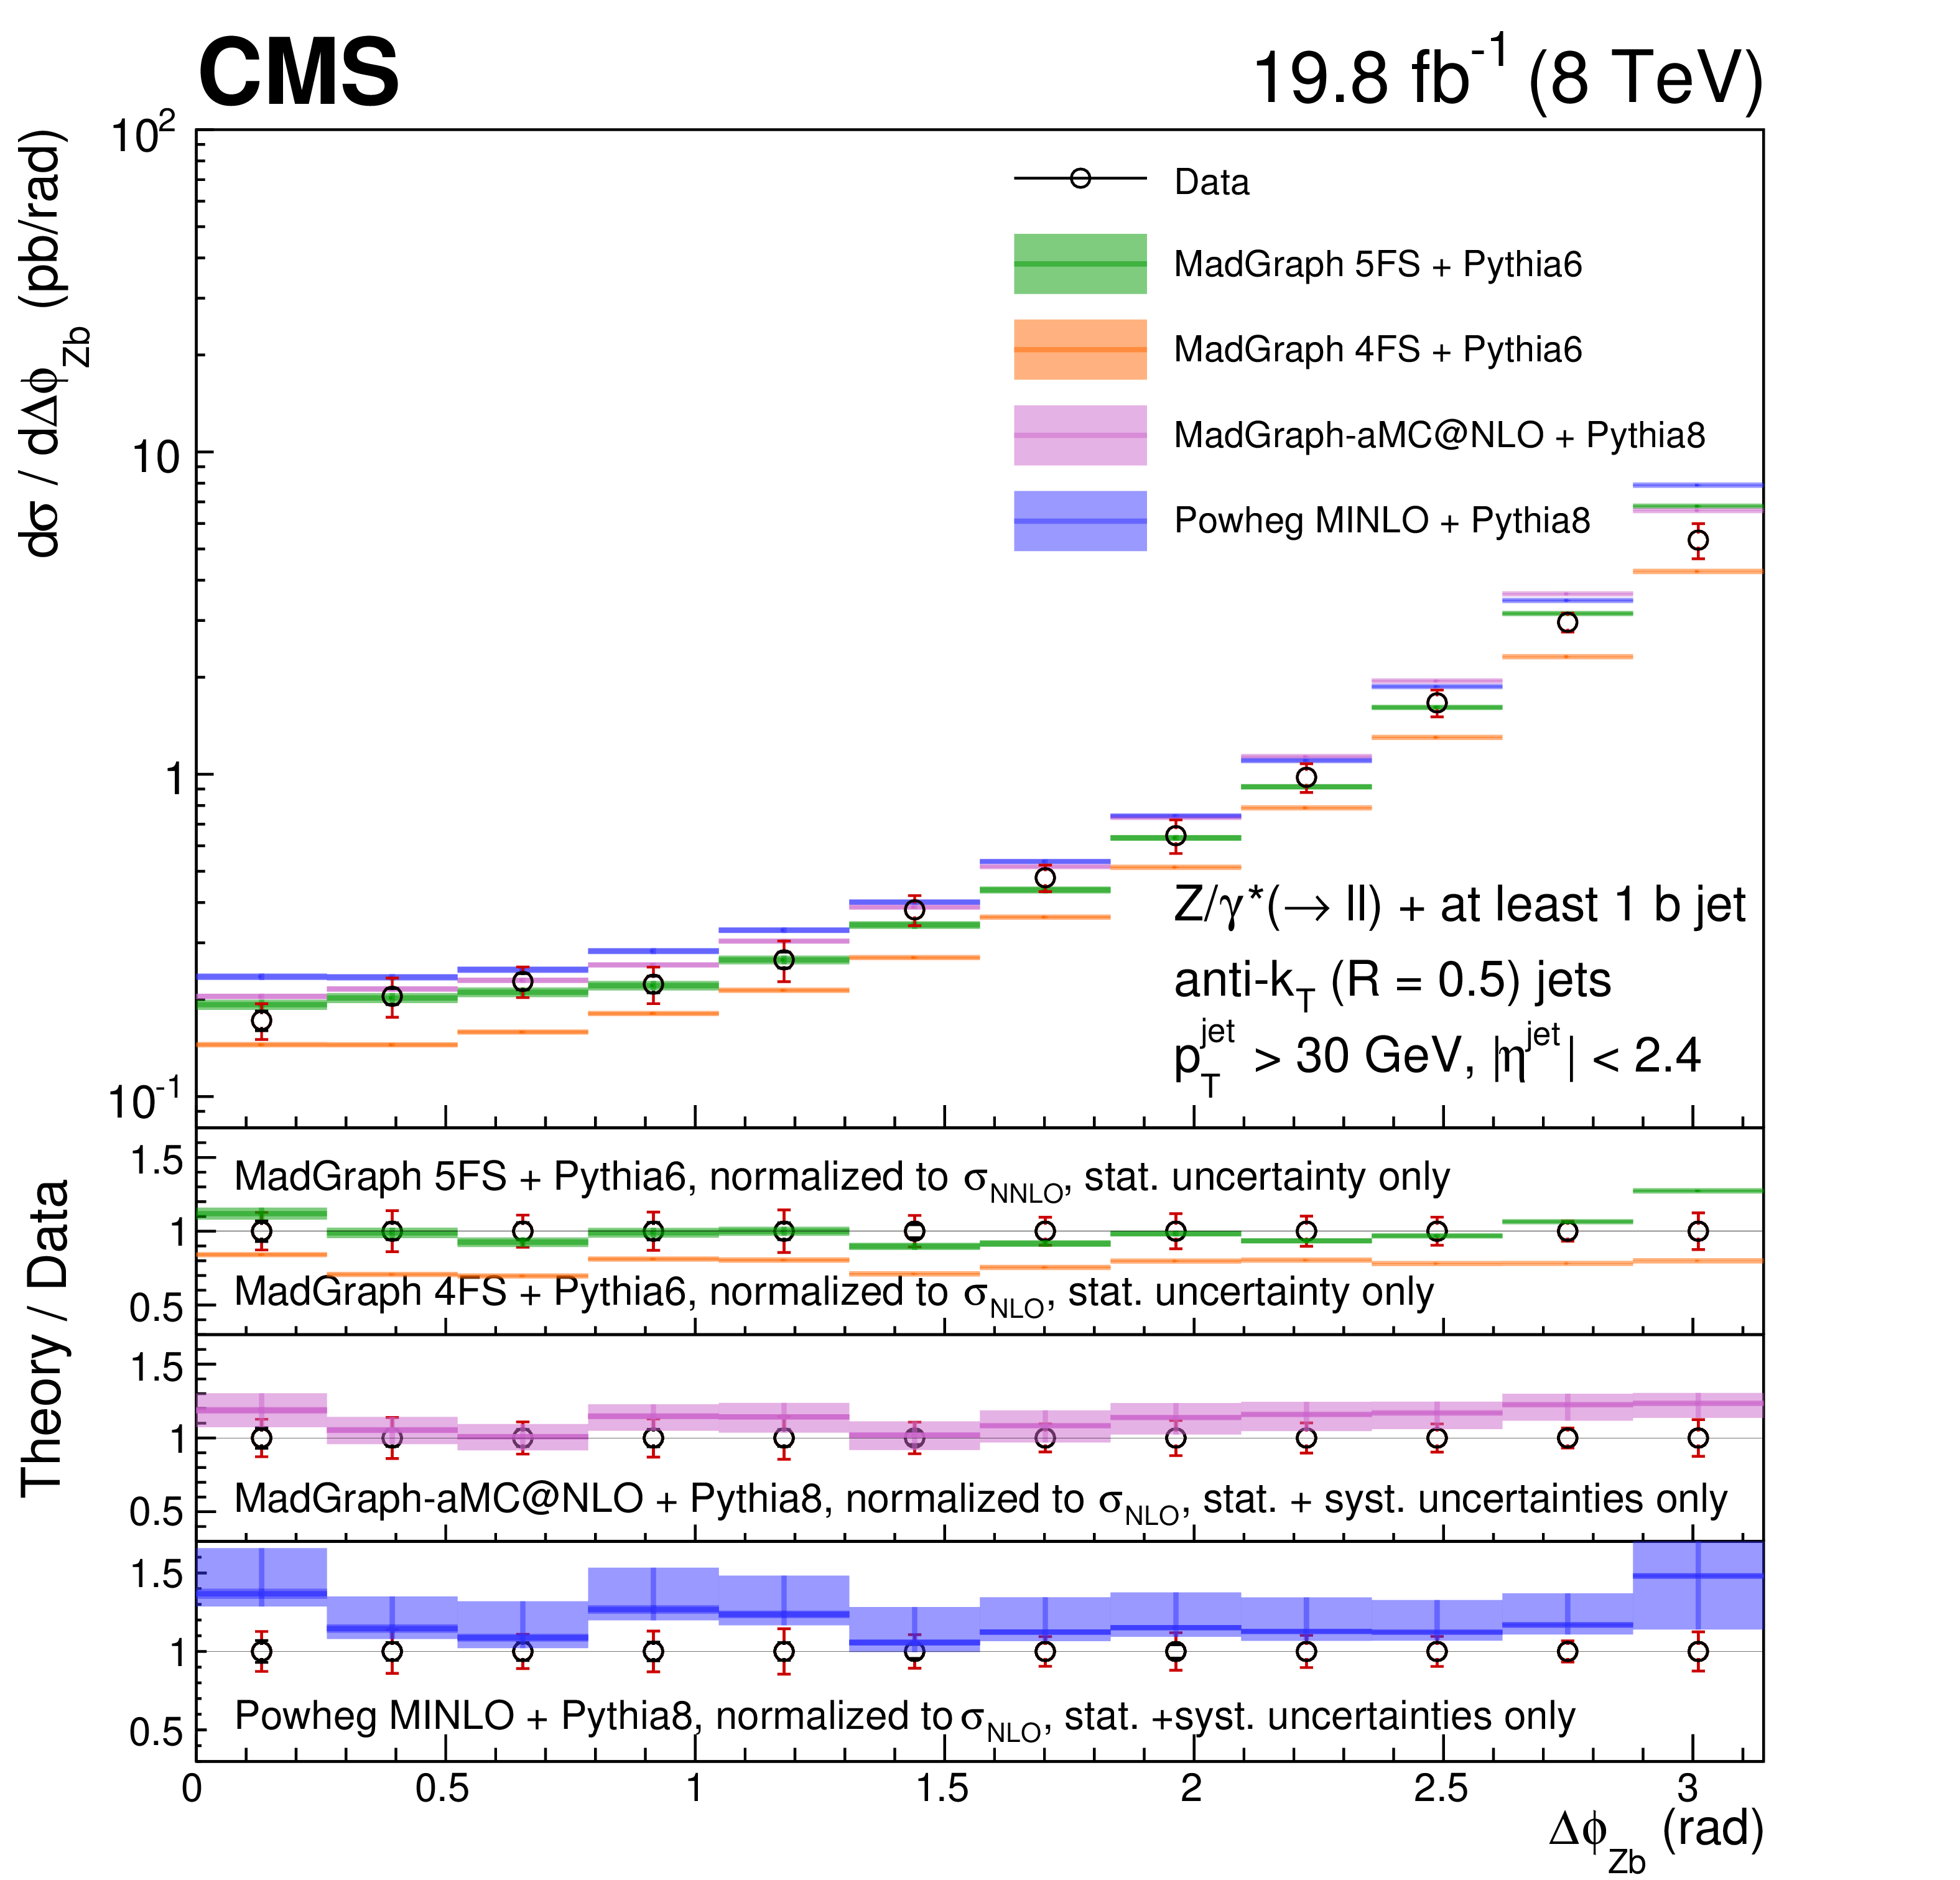
Figure 8:
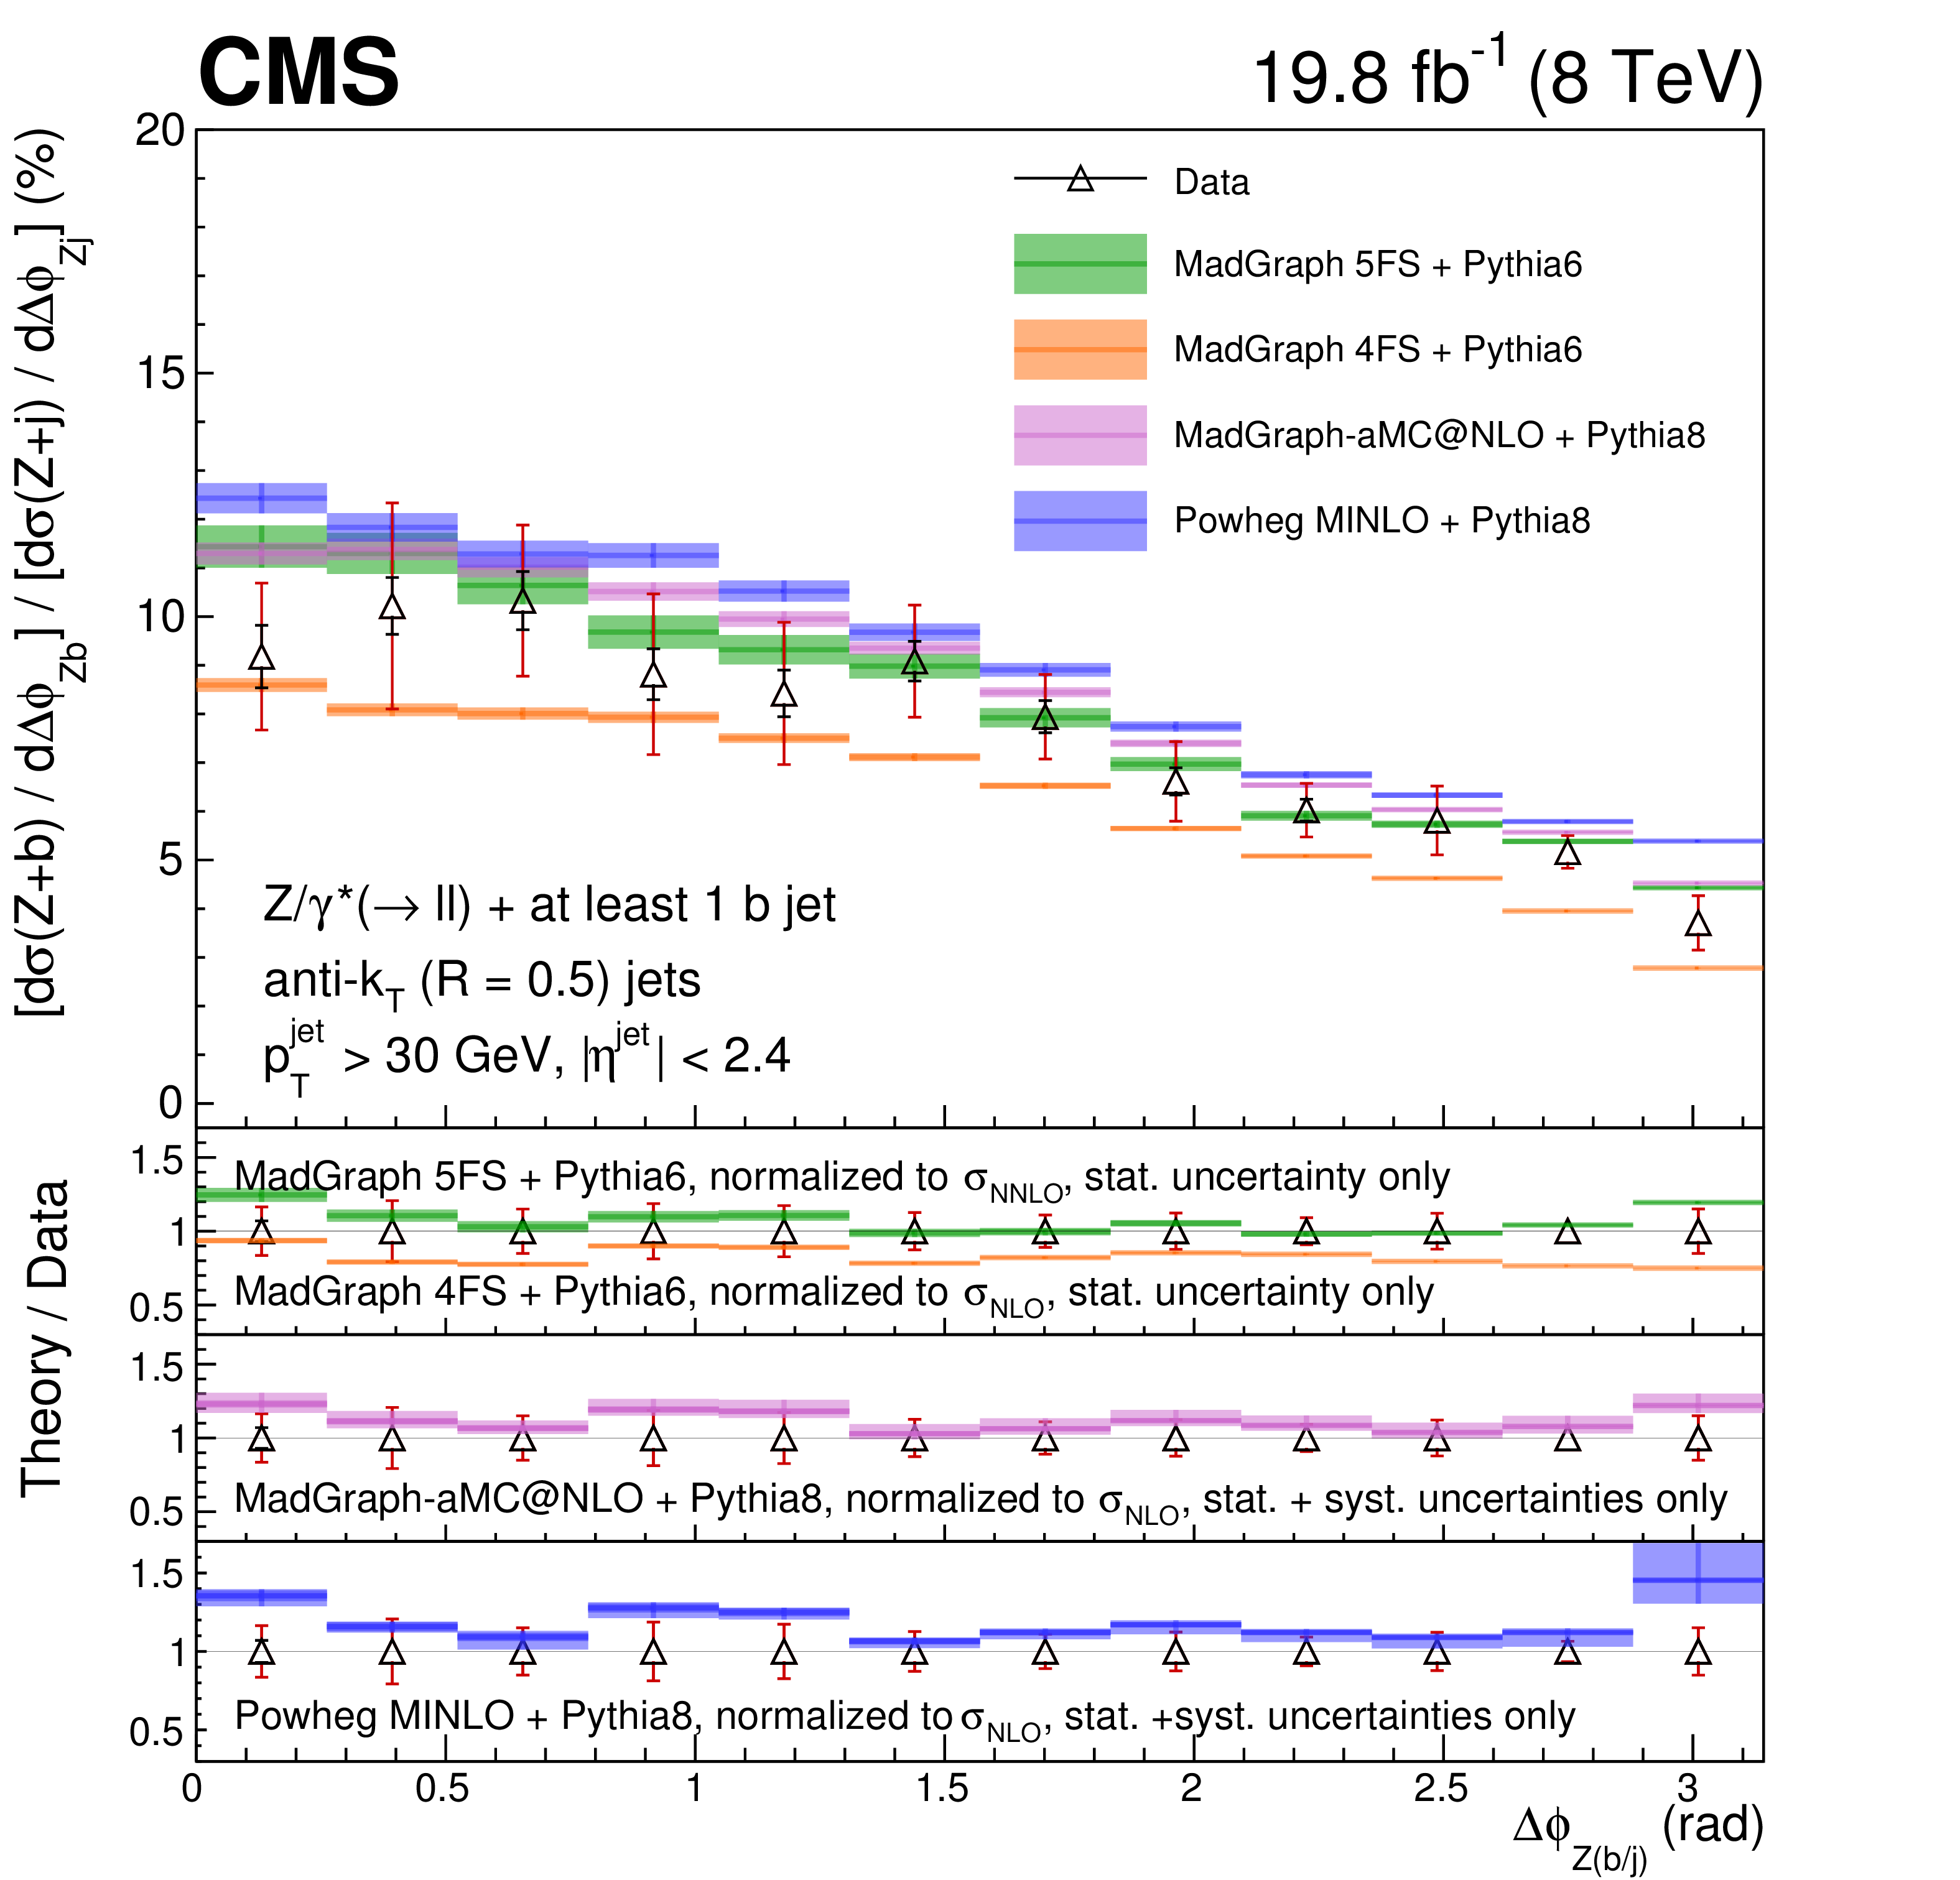
Differential fiducial cross section for Z(1b) production as a function of $\Delta \phi _{\mathrm{ Z } \mathrm{ b } }$ (left), and the cross section ratio for Z(1b) and Z+jets production as a function of $\Delta \phi _{\mathrm {Z(b/j)}}$ (right), compared with the MadGraph 5FS, MadGraph 4FS, MadGraph5-aMC@NLO, and POWHEG / MINLO theoretical predictions (shaded bands), normalized to the theoretical cross sections described in the text. For each data point the statistical and the total (sum in quadrature of statistical and systematic) uncertainties are represented by the double error bar. The width of the shaded bands represents the uncertainty in the theoretical predictions, and, for NLO calculations, the inner darker area represents the statistical component only. |
png pdf |
Figure 8-a:
Differential fiducial cross section for Z(1b) production as a function of $\Delta \phi _{\mathrm{ Z } \mathrm{ b } }$, compared with the MadGraph 5FS, MadGraph 4FS, MadGraph5-aMC@NLO, and POWHEG / MINLO theoretical predictions (shaded bands), normalized to the theoretical cross sections described in the text. For each data point the statistical and the total (sum in quadrature of statistical and systematic) uncertainties are represented by the double error bar. The width of the shaded bands represents the uncertainty in the theoretical predictions, and, for NLO calculations, the inner darker area represents the statistical component only. |
png pdf |
Figure 8-b:
Cross section ratio for Z(1b) and Z+jets production as a function of $\Delta \phi _{\mathrm {Z(b/j)}}$, compared with the MadGraph 5FS, MadGraph 4FS, MadGraph5-aMC@NLO, and POWHEG / MINLO theoretical predictions (shaded bands), normalized to the theoretical cross sections described in the text. For each data point the statistical and the total (sum in quadrature of statistical and systematic) uncertainties are represented by the double error bar. The width of the shaded bands represents the uncertainty in the theoretical predictions, and, for NLO calculations, the inner darker area represents the statistical component only. |

png pdf |
Figure 9:
Differential fiducial cross section for Z(2b) production as a function of the leading b jet ${p_{\mathrm {T}}}$, compared with the MadGraph 5FS, MadGraph 4FS, MadGraph5-aMC@NLO, and POWHEG / MINLO theoretical predictions (shaded bands), normalized to the theoretical cross sections described in the text. For each data point the statistical and the total (sum in quadrature of statistical and systematic) uncertainties are represented by the double error bar. The width of the shaded bands represents the uncertainty in the theoretical predictions, and, for NLO calculations, the inner darker area represents the statistical component only. |
png pdf |
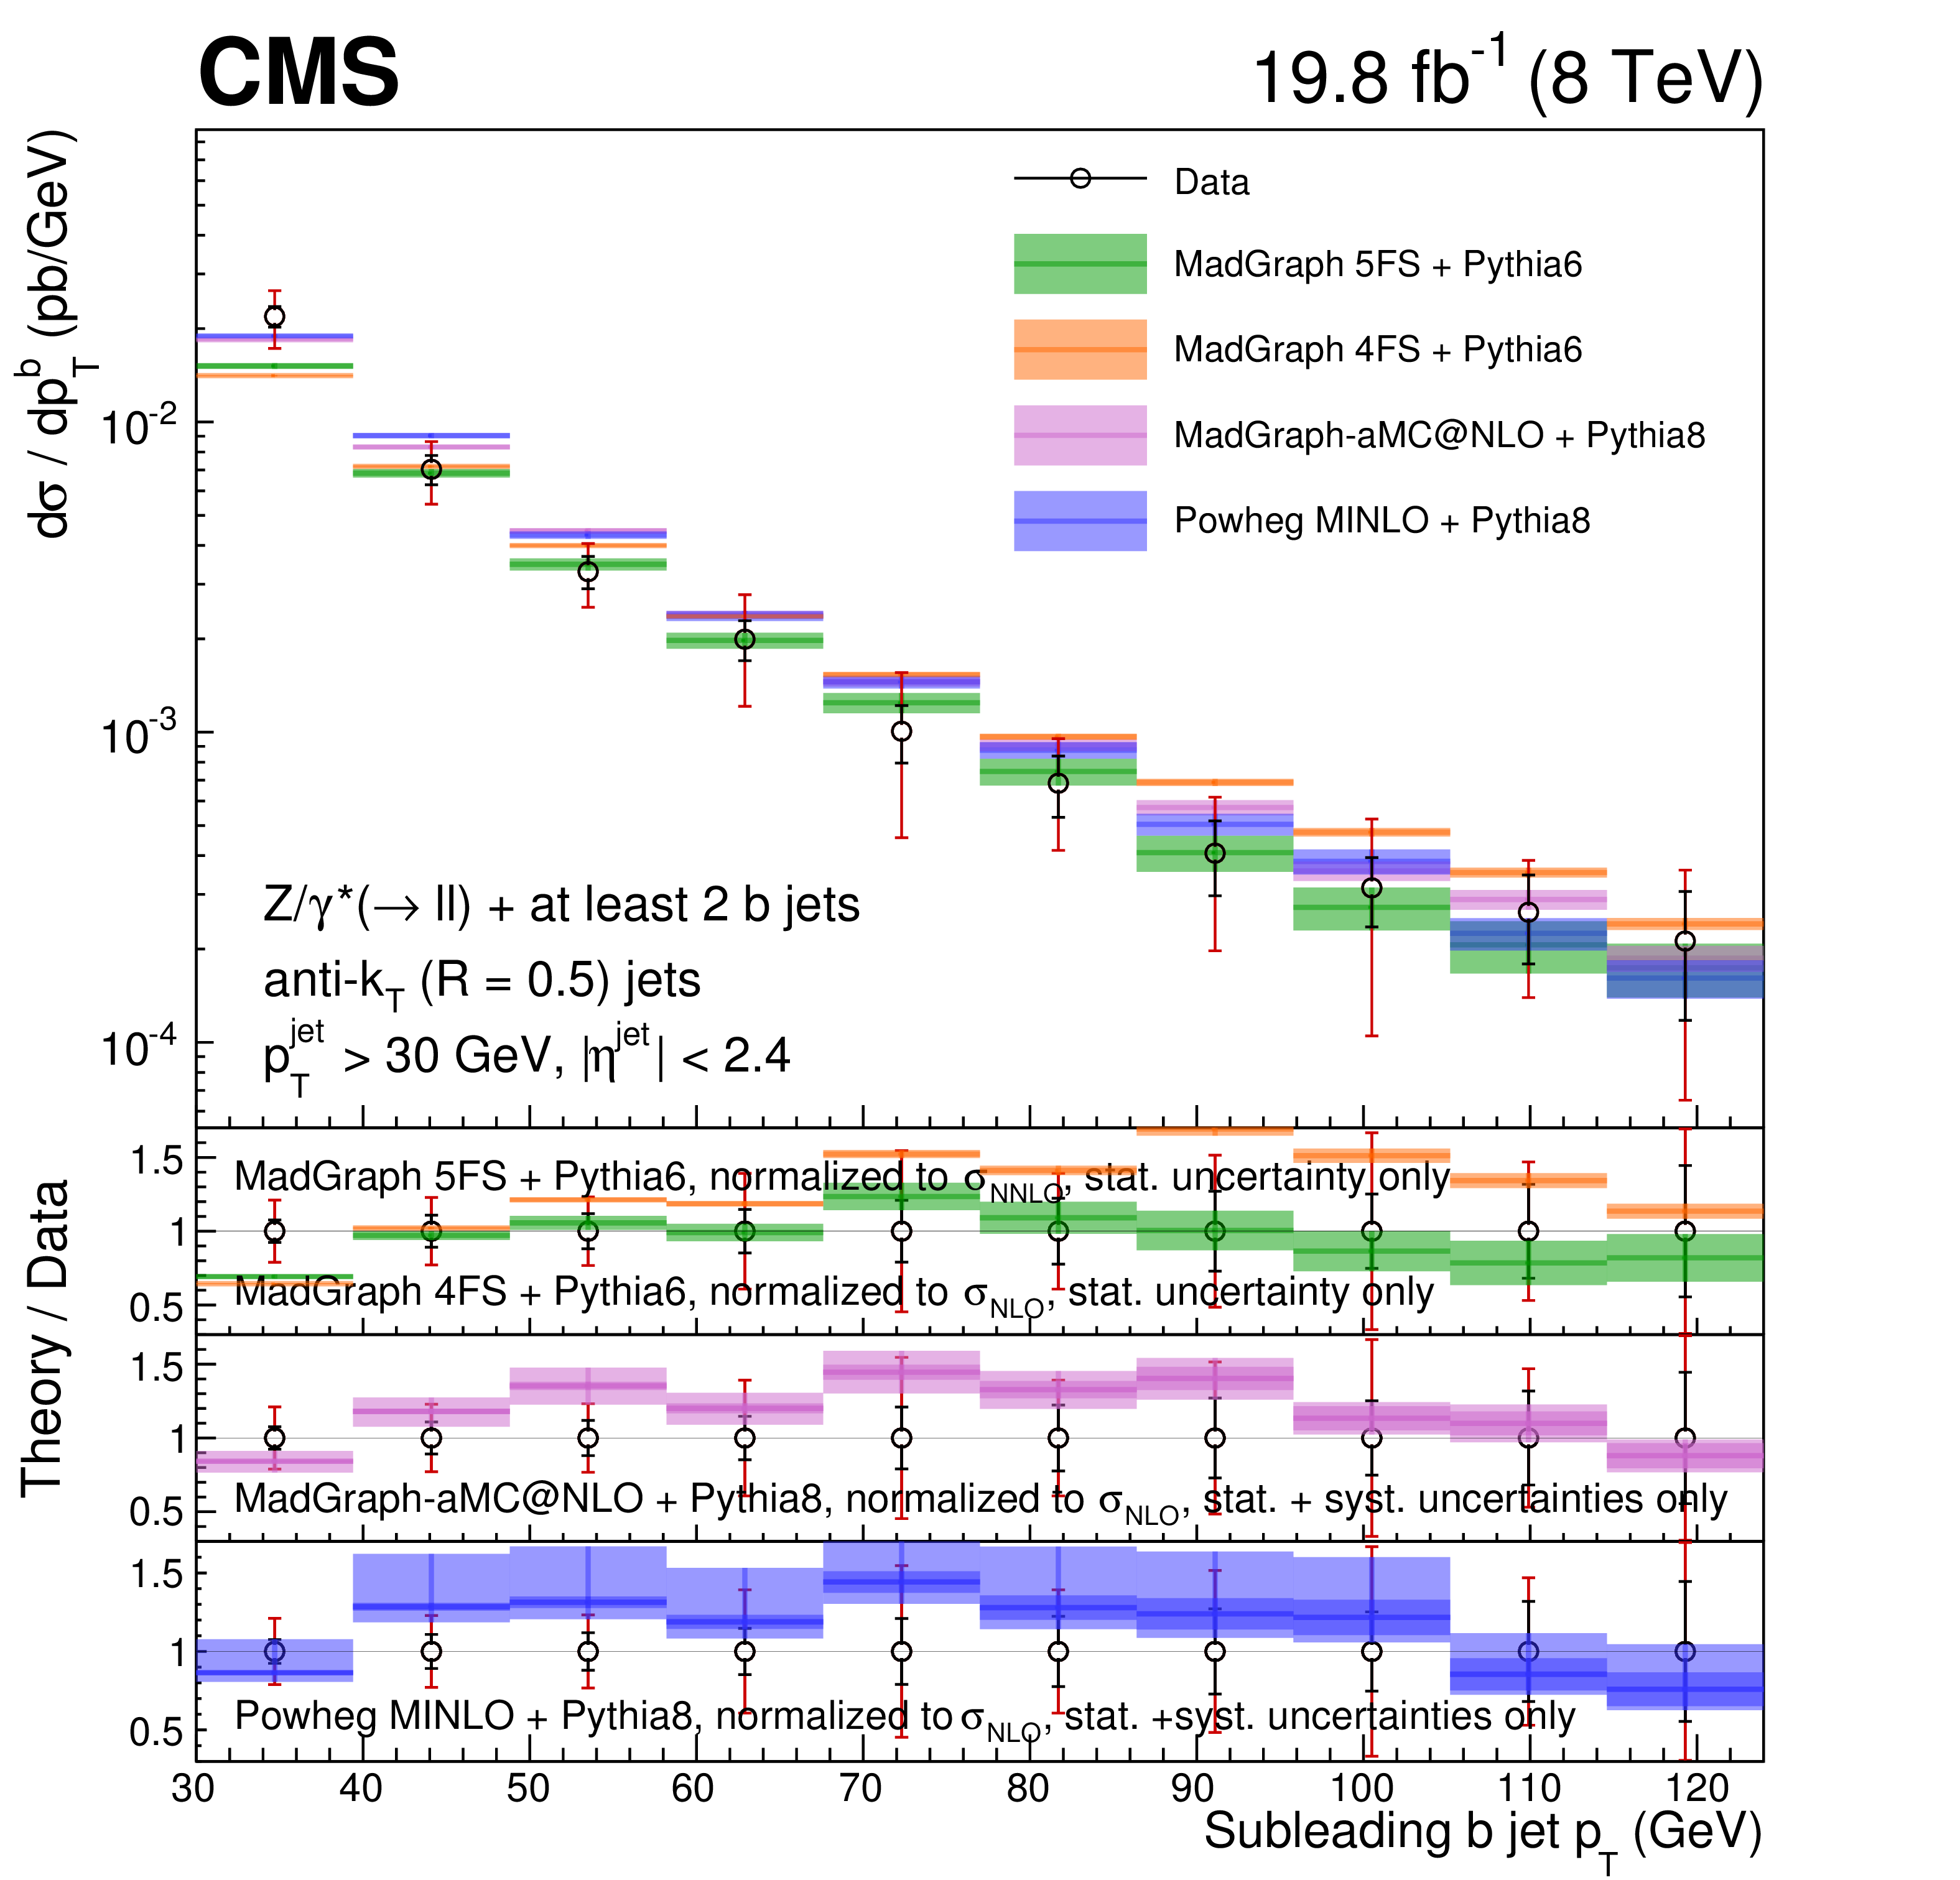
Figure 10:
Differential fiducial cross section for Z(2b) production as a function of the subleading b jet ${p_{\mathrm {T}}}$, compared with the MadGraph 5FS, MadGraph 4FS, MadGraph5-aMC@NLO, and POWHEG / MINLO theoretical predictions (shaded bands), normalized to the theoretical cross sections described in the text. For each data point the statistical and the total (sum in quadrature of statistical and systematic) uncertainties are represented by the double error bar. The width of the shaded bands represents the uncertainty in the theoretical predictions, and, for NLO calculations, the inner darker area represents the statistical component only. |

png pdf |
Figure 11:
Differential fiducial cross section for Z(2b) production as a function of the Z boson ${p_{\mathrm {T}}}$, compared with the MadGraph 5FS, MadGraph 4FS, MadGraph5-aMC@NLO, and POWHEG / MINLO theoretical predictions (shaded bands), normalized to the theoretical cross sections described in the text. For each data point the statistical and the total (sum in quadrature of statistical and systematic) uncertainties are represented by the double error bar. The width of the shaded bands represents the uncertainty in the theoretical predictions, and, for NLO calculations, the inner darker area represents the statistical component only. |
png pdf |
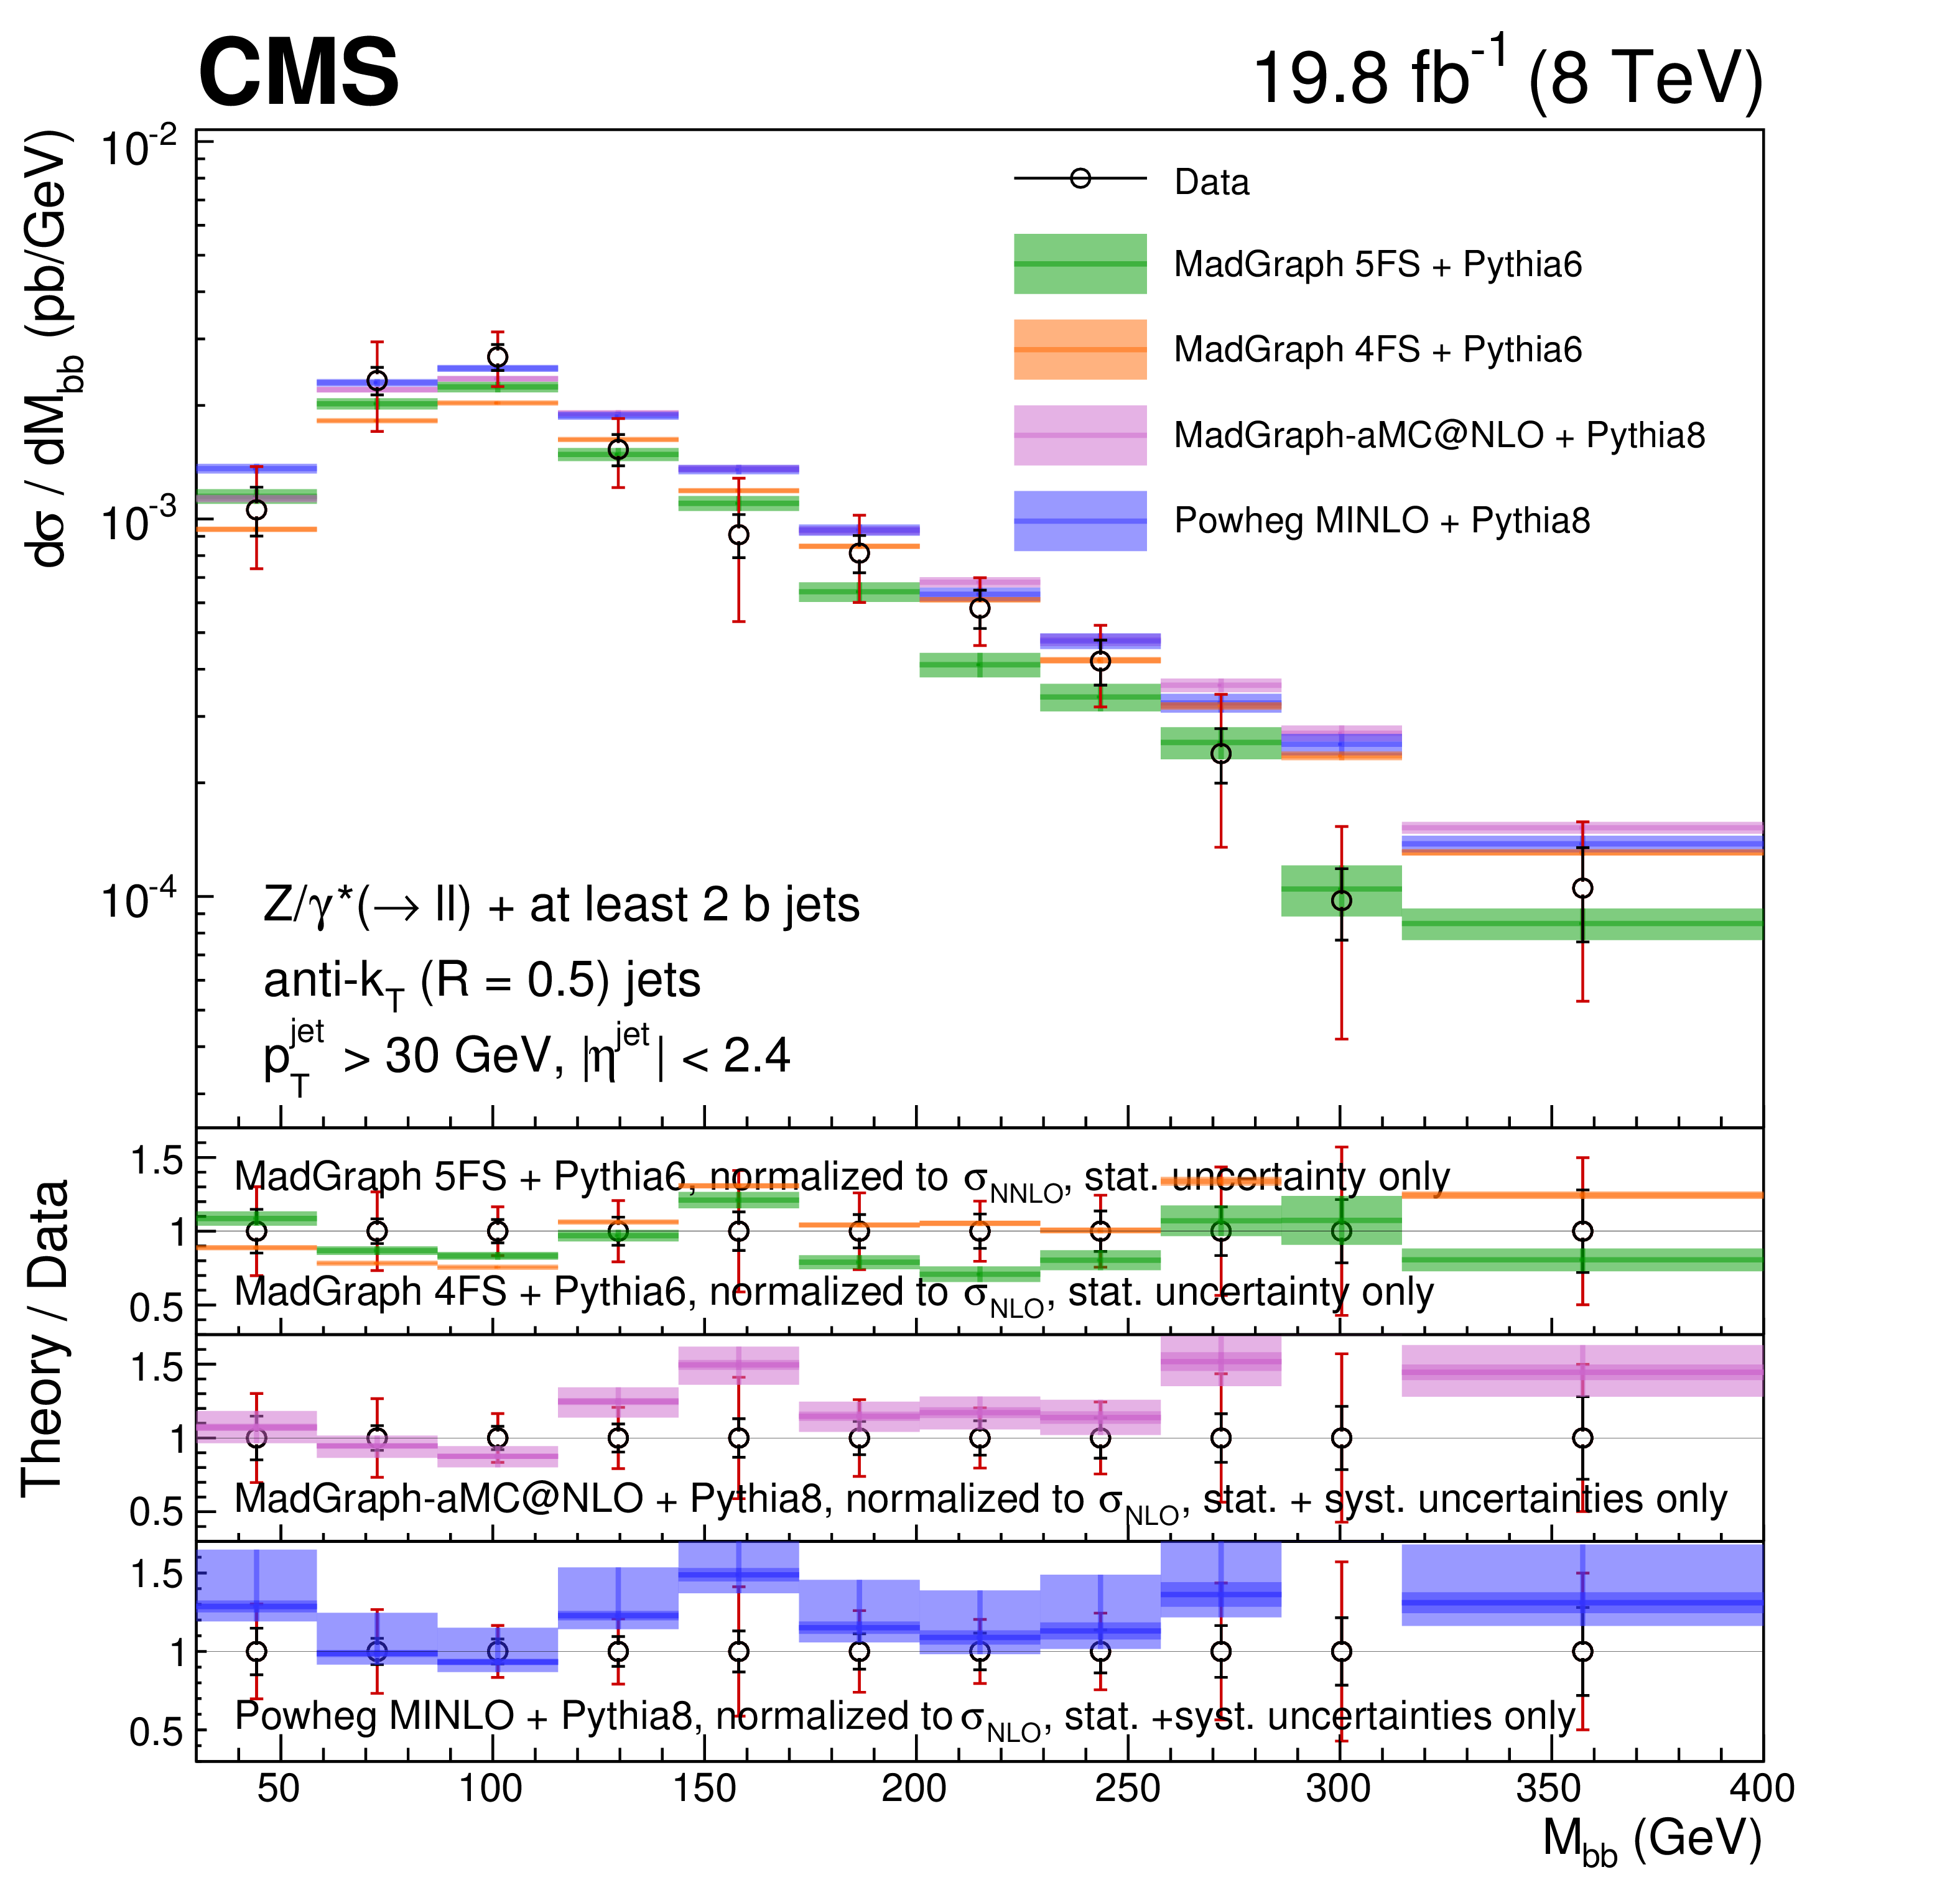
Figure 12:
Differential fiducial cross section for Z(2b) production as a function of the invariant mass of the b jet pair, $M_{\mathrm{ b } \mathrm{ b } }$, compared with the MadGraph 5FS, MadGraph 4FS, MadGraph5-aMC@NLO, and POWHEG / MINLO theoretical predictions (shaded bands), normalized to the theoretical cross sections described in the text. For each data point the statistical and the total (sum in quadrature of statistical and systematic) uncertainties are represented by the double error bar. The width of the shaded bands represents the uncertainty in the theoretical predictions, and, for NLO calculations, the inner darker area represents the statistical component only. |
png pdf |
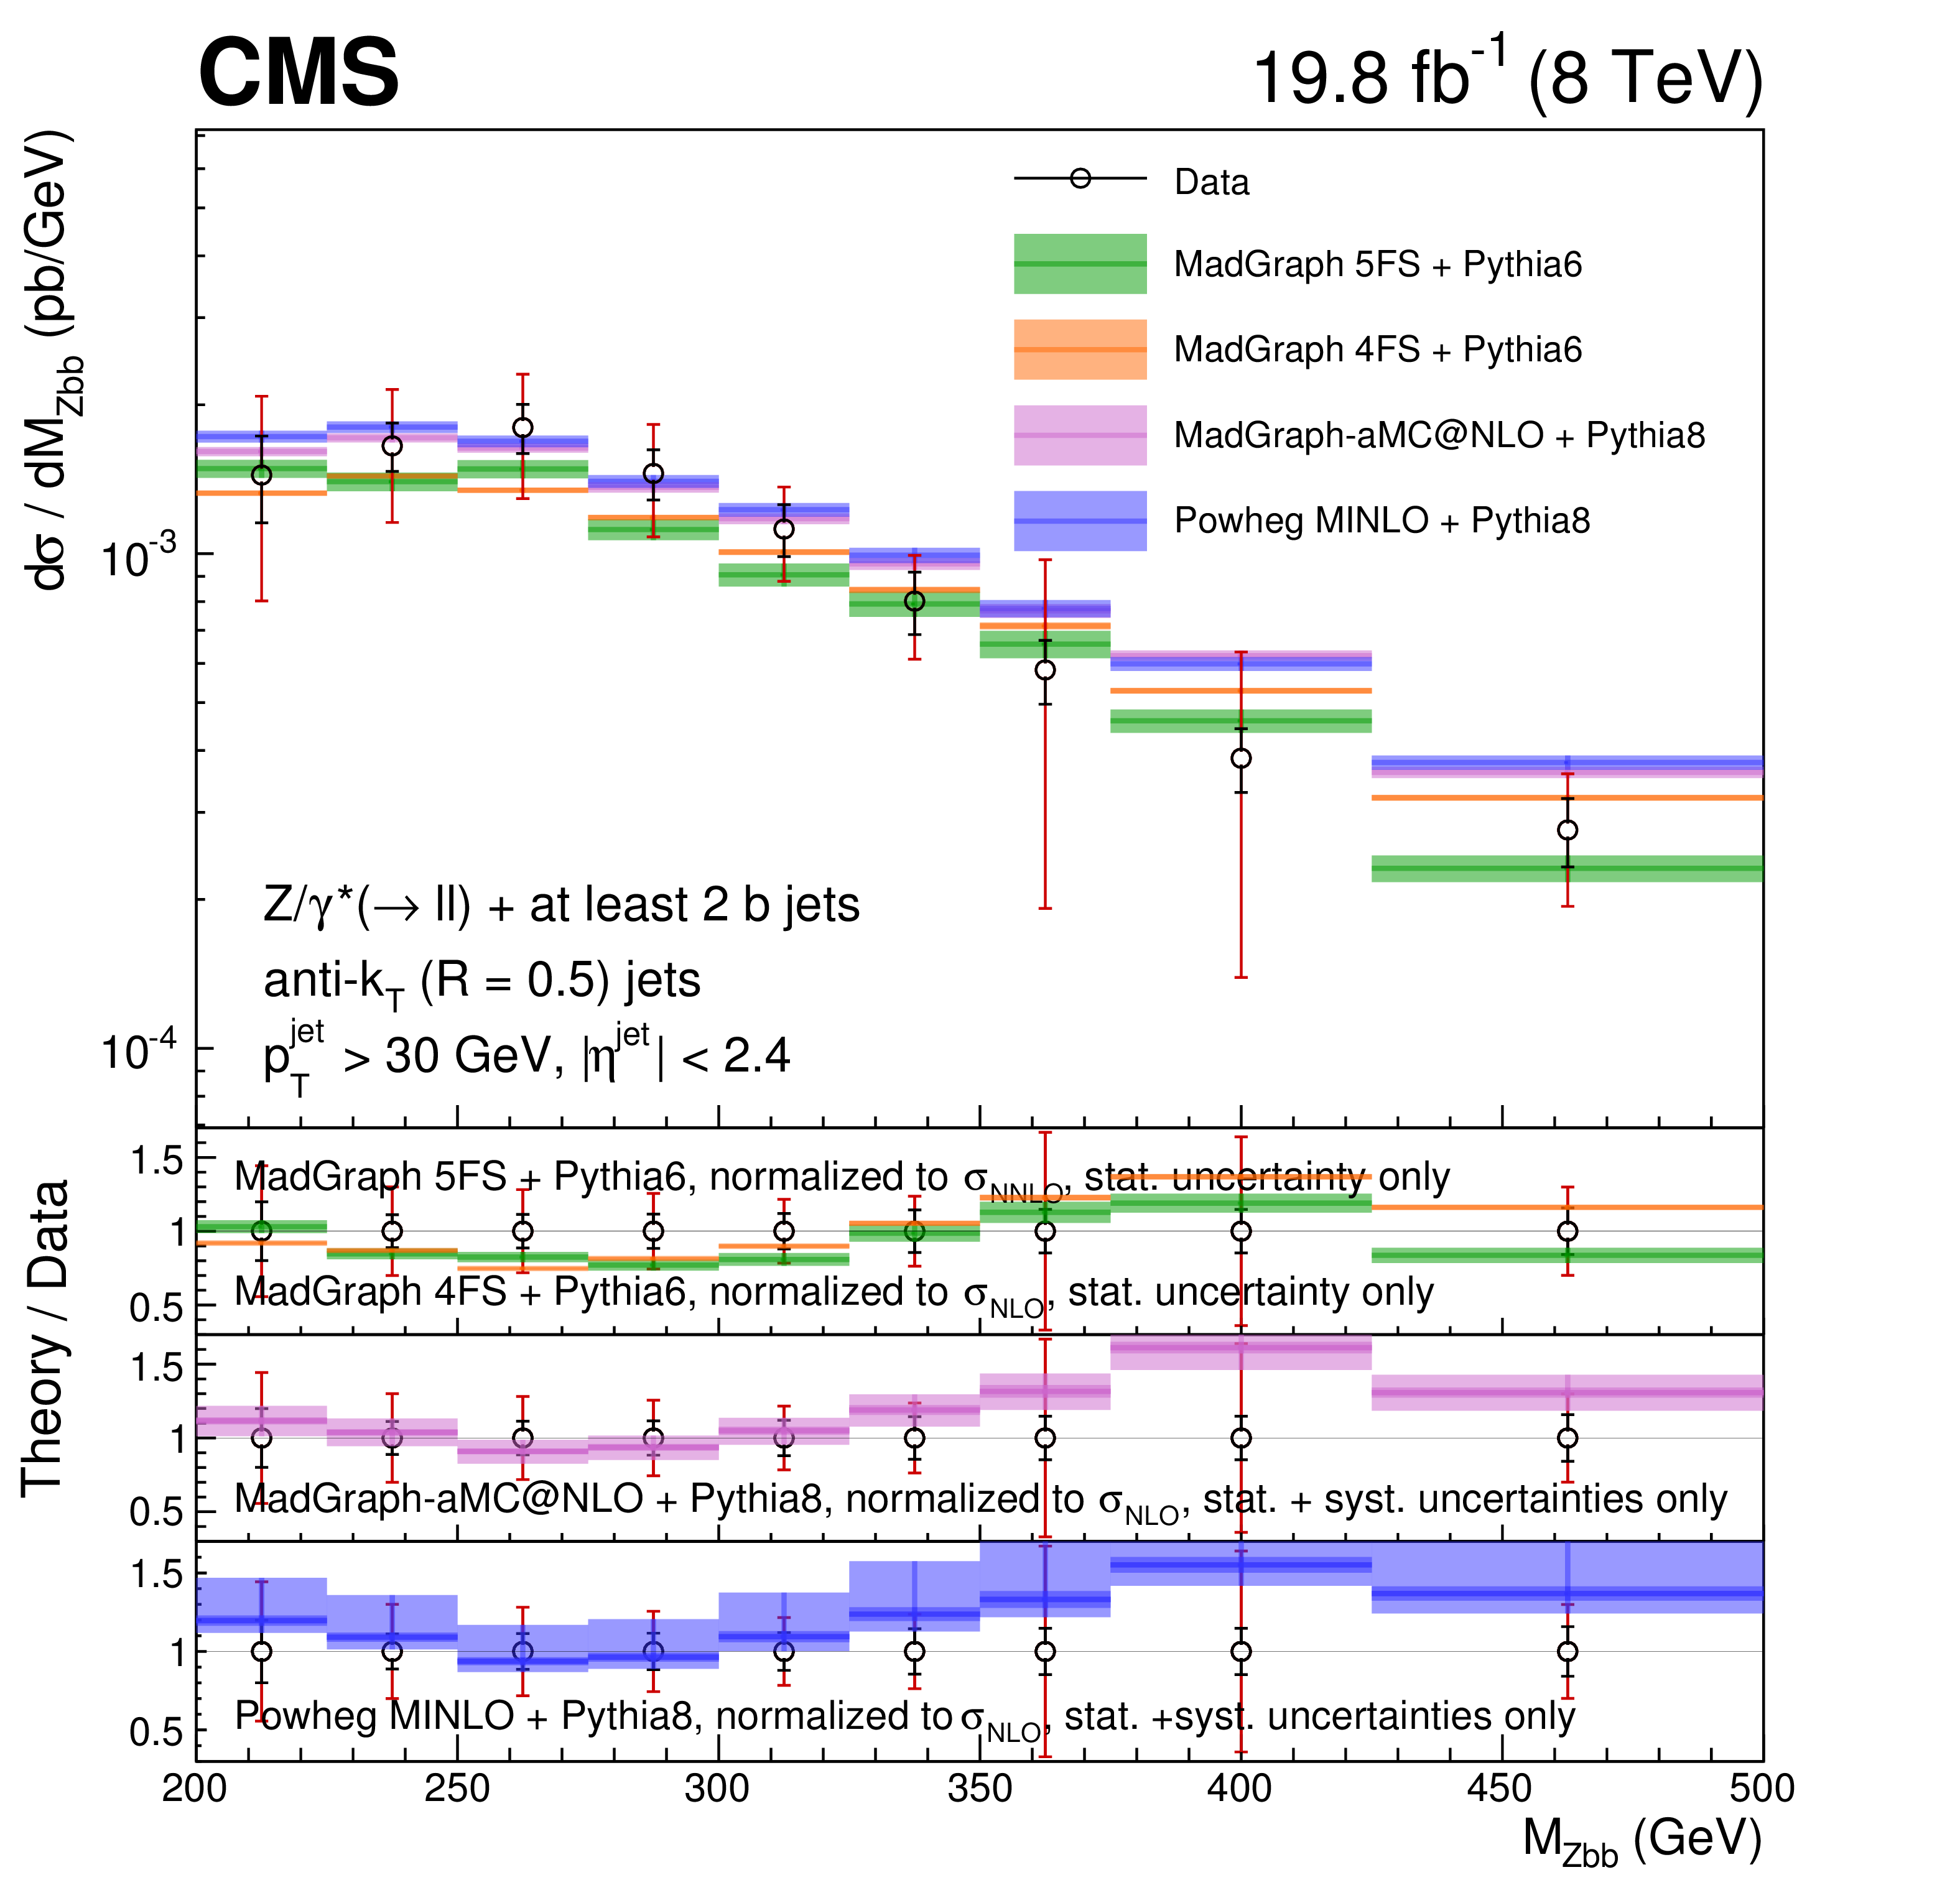
Figure 13:
Differential fiducial cross section for Z(2b) production as a function of the invariant mass of the Zbb system, $M_\mathrm {Zbb}$, compared with the MadGraph 5FS, MadGraph 4FS, MadGraph5-aMC@NLO, and POWHEG / MINLO theoretical predictions (shaded bands), normalized to the theoretical cross sections described in the text. For each data point the statistical and the total (sum in quadrature of statistical and systematic) uncertainties are represented by the double error bar. The width of the shaded bands represents the uncertainty in the theoretical predictions, and, for NLO calculations, the inner darker area represents the statistical component only. |
png pdf |
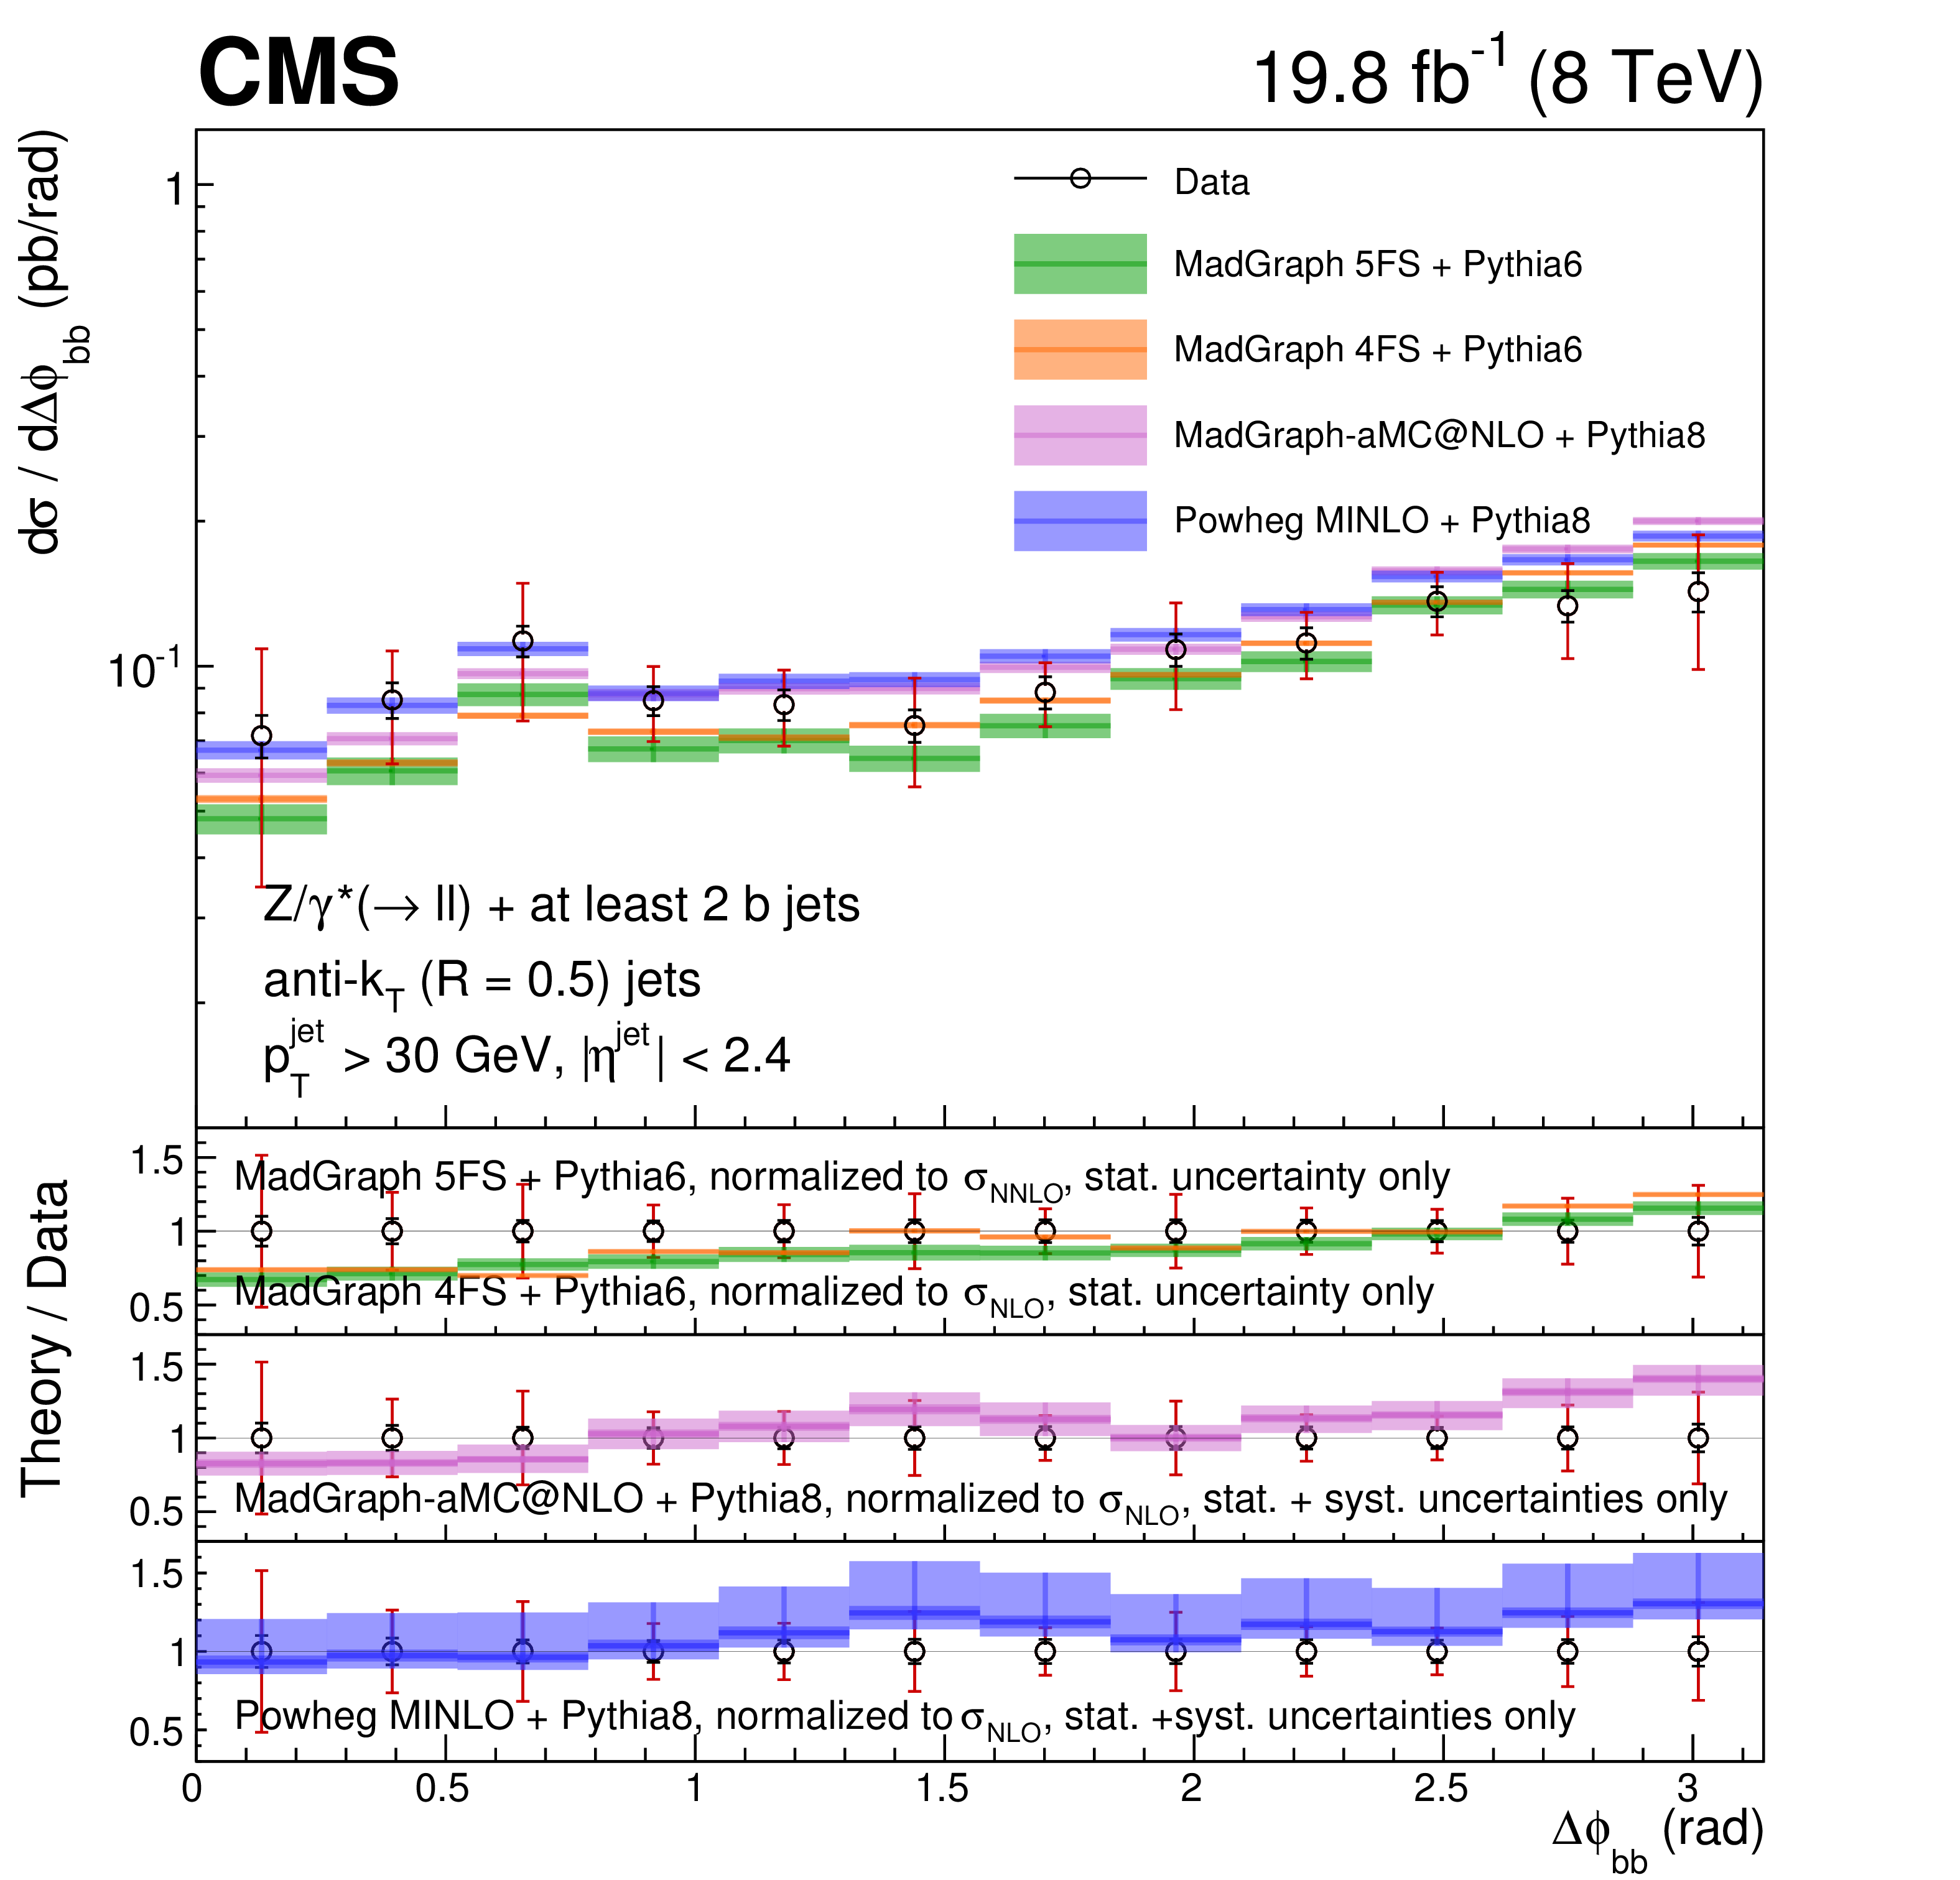
Figure 14:
Differential fiducial cross section for Z(2b) production as a function of $\Delta \phi _{\mathrm{ b } \mathrm{ b } }$, compared with the MadGraph 5FS, MadGraph 4FS, MadGraph5-aMC@NLO, and POWHEG / MINLO theoretical predictions (shaded bands), normalized to the theoretical cross sections described in the text. For each data point the statistical and the total (sum in quadrature of statistical and systematic) uncertainties are represented by the double error bar. The width of the shaded bands represents the uncertainty in the theoretical predictions, and, for NLO calculations, the inner darker area represents the statistical component only. |
png pdf |
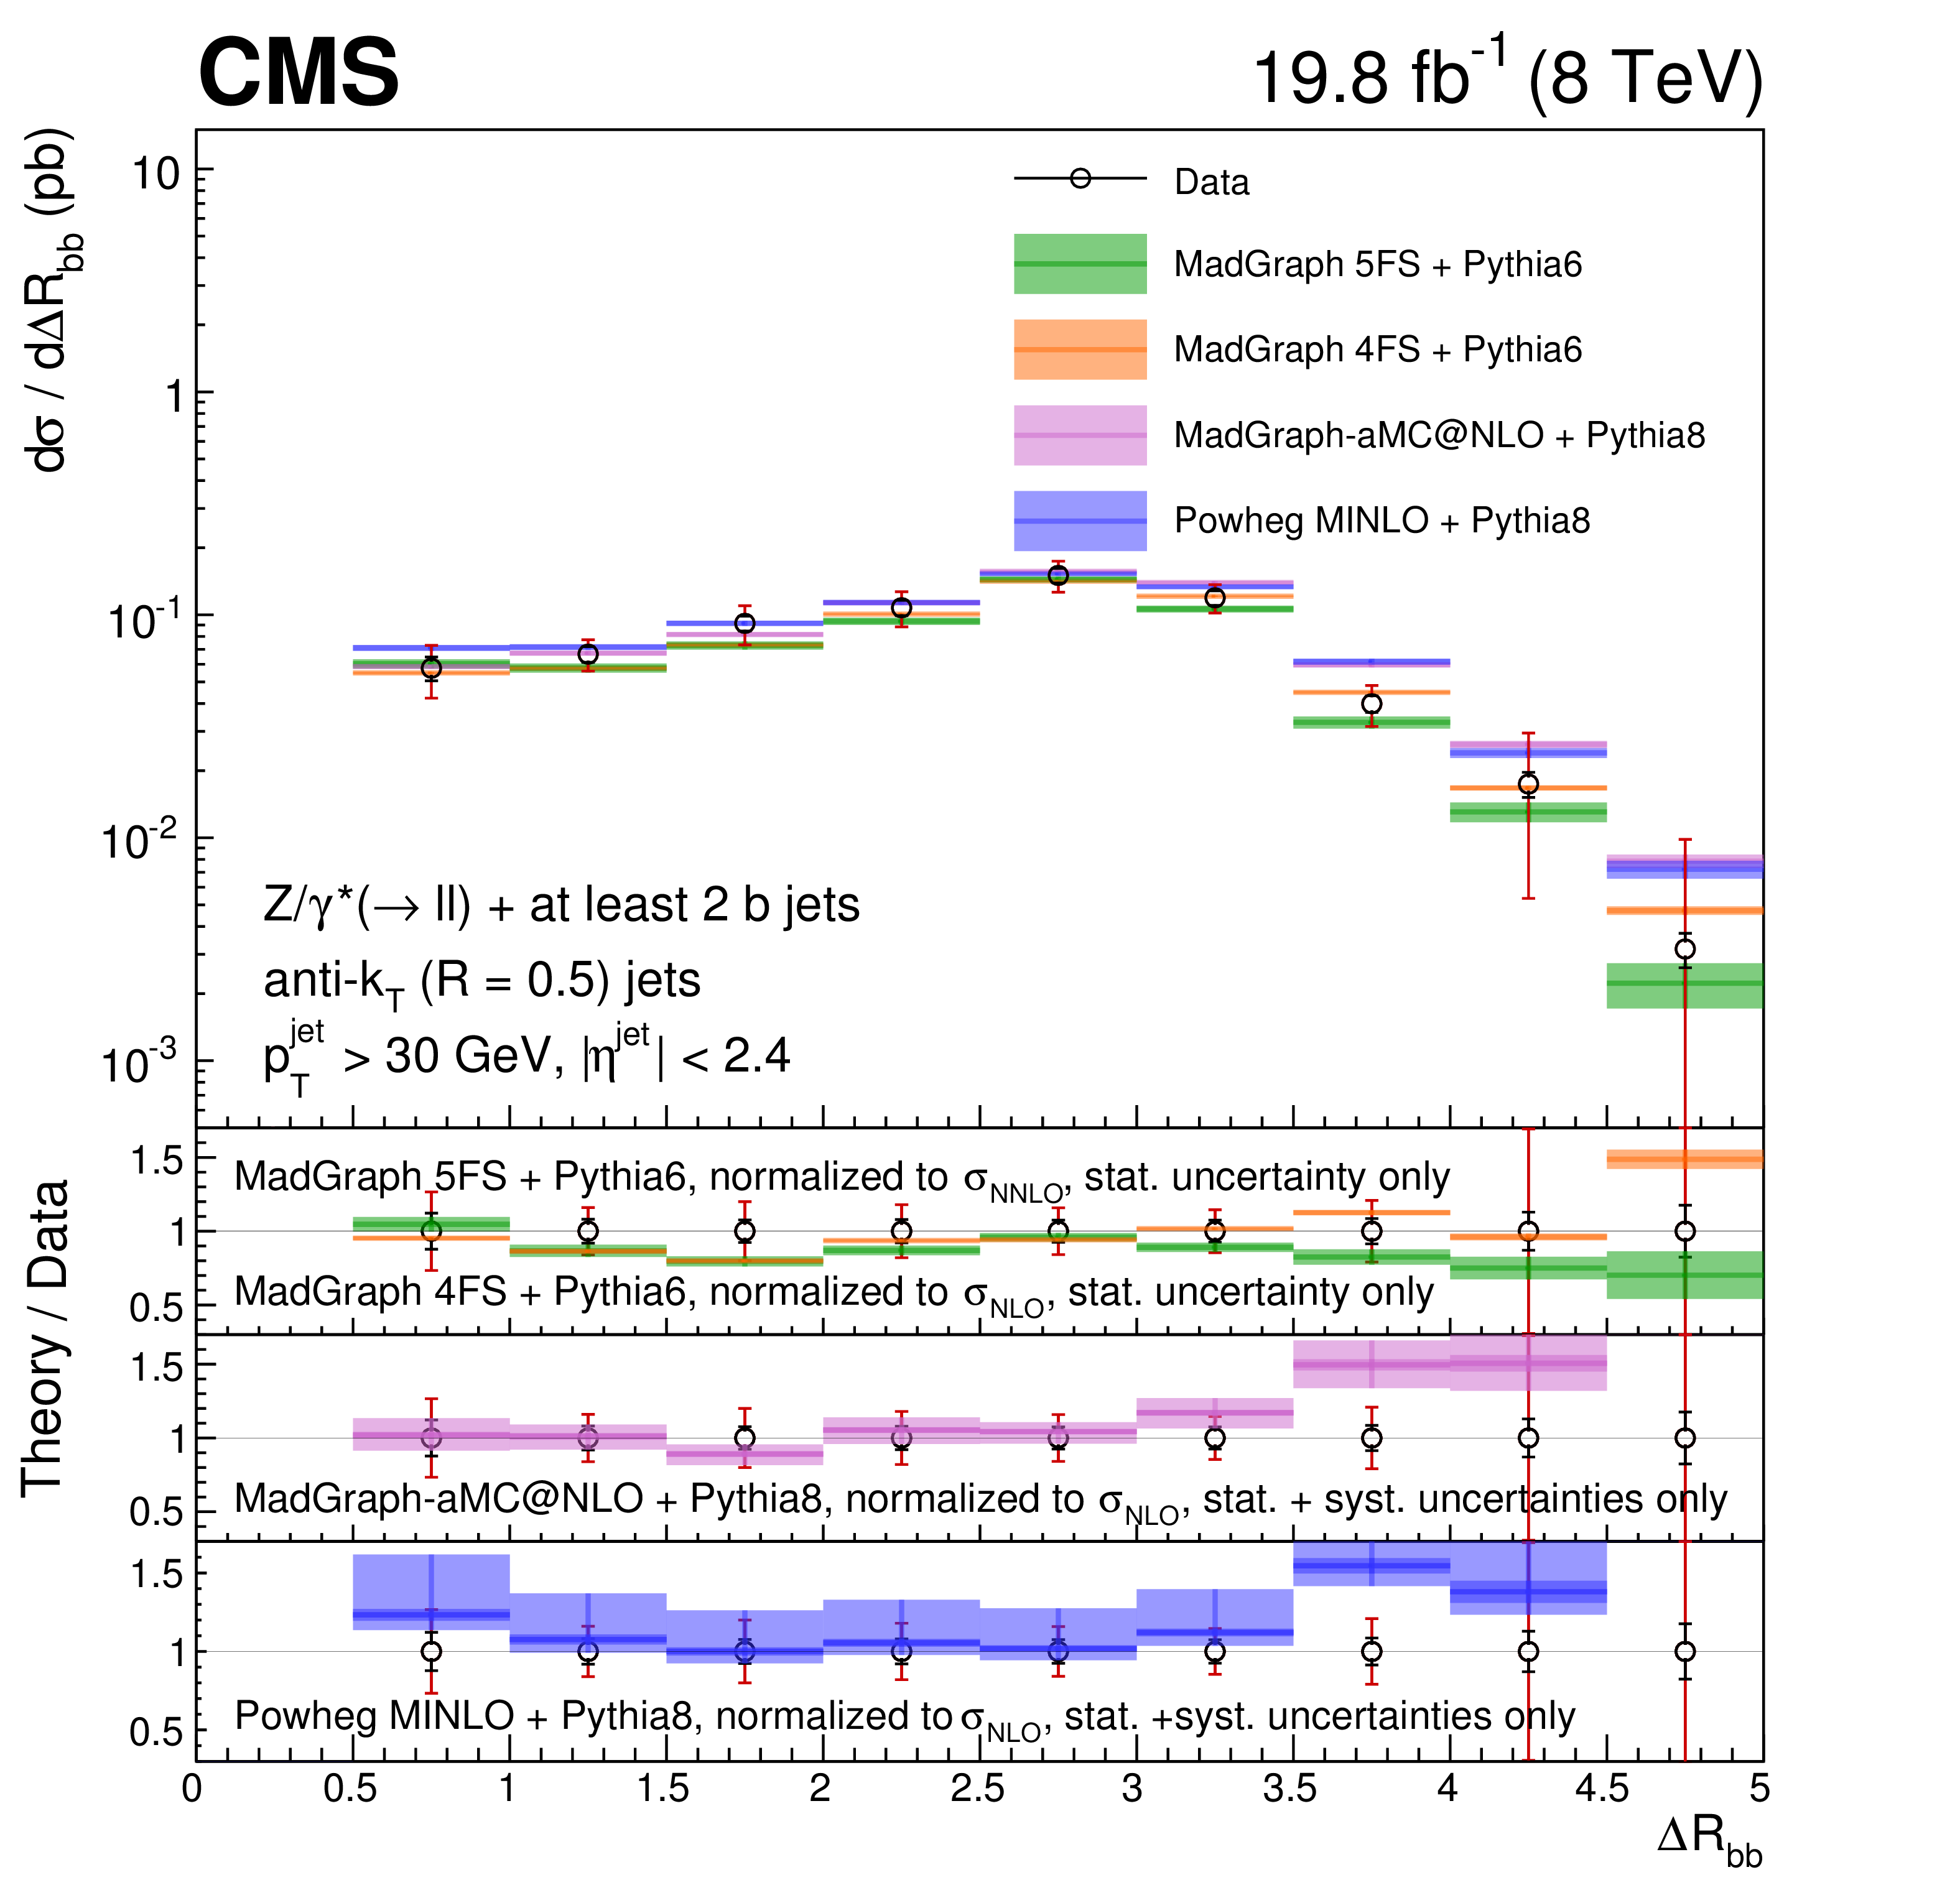
Figure 15:
Differential fiducial cross section for Z(2b) production as a function of $\Delta R_{\mathrm{ b } \mathrm{ b } }$, compared with the MadGraph 5FS, MadGraph 4FS, MadGraph5-aMC@NLO, and POWHEG / MINLO theoretical predictions (shaded bands), normalized to the theoretical cross sections described in the text. For each data point the statistical and the total (sum in quadrature of statistical and systematic) uncertainties are represented by the double error bar. The width of the shaded bands represents the uncertainty in the theoretical predictions, and, for NLO calculations, the inner darker area represents the statistical component only. |

png pdf |
Figure 16:
Differential fiducial cross section for Z(2b) production as a function of $\Delta R_\mathrm{ Z } \mathrm{ b } ^\mathrm {min}$, compared with the MadGraph 5FS, MadGraph 4FS, MadGraph5-aMC@NLO, and POWHEG / MINLO theoretical predictions (shaded bands), normalized to the theoretical cross sections described in the text. For each data point the statistical and the total (sum in quadrature of statistical and systematic) uncertainties are represented by the double error bar. The width of the shaded bands represents the uncertainty in the theoretical predictions, and, for NLO calculations, the inner darker area represents the statistical component only. |
png pdf |
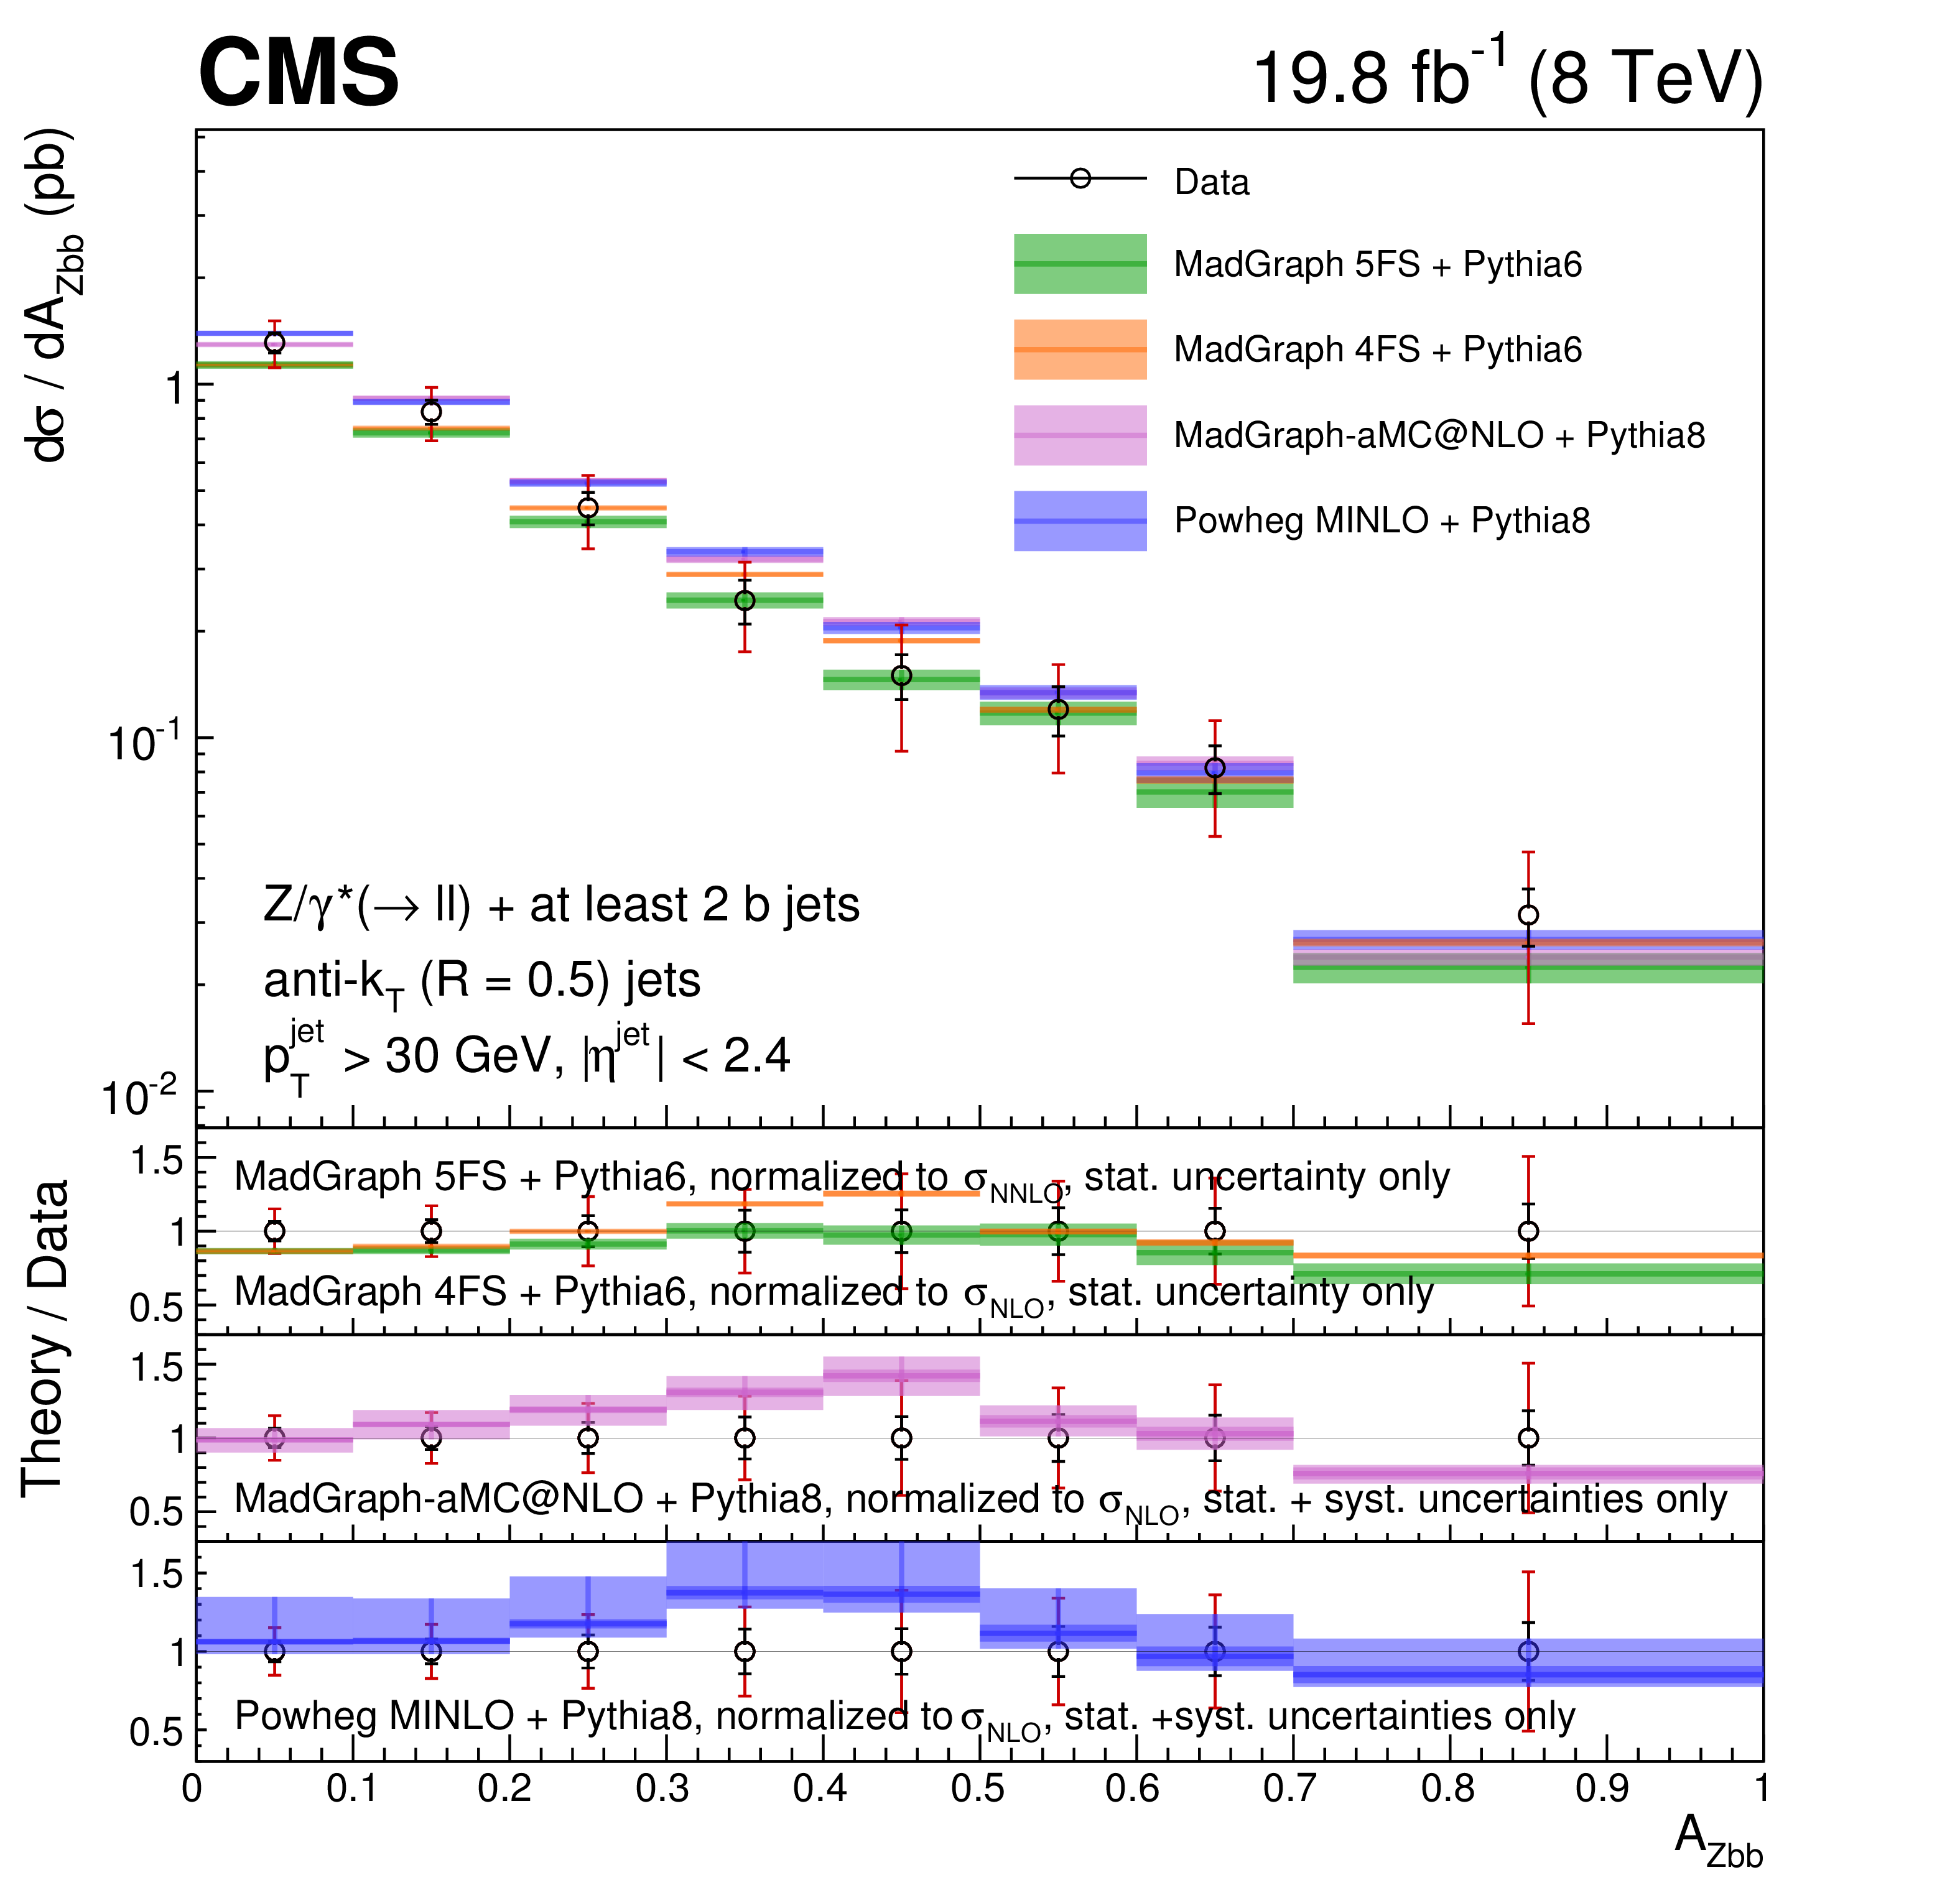
Figure 17:
Differential fiducial cross section for Z(2b) production as a function of $A_\mathrm {Zbb}$, compared with the MadGraph 5FS, MadGraph 4FS, MadGraph5-aMC@NLO, and POWHEG / MINLO theoretical predictions (shaded bands), normalized to the theoretical cross sections described in the text. For each data point the statistical and the total (sum in quadrature of statistical and systematic) uncertainties are represented by the double error bar. The width of the shaded bands represents the uncertainty in the theoretical predictions, and, for NLO calculations, the inner darker area represents the statistical component only. |
| Tables | |
png pdf |
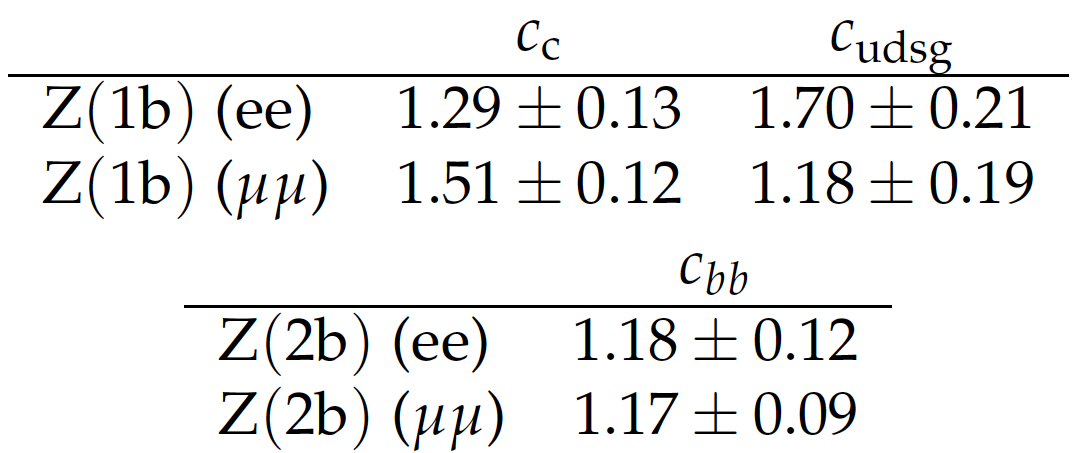
Table 1:
Normalization scale factors for c and light-flavour (u, d, s quark and gluon) components in the selected Z (1b) events, and for b in the selected Z (2b) events, obtained from a fit to the secondary vertex mass distribution for dielectron and dimuon final states. |
png pdf |
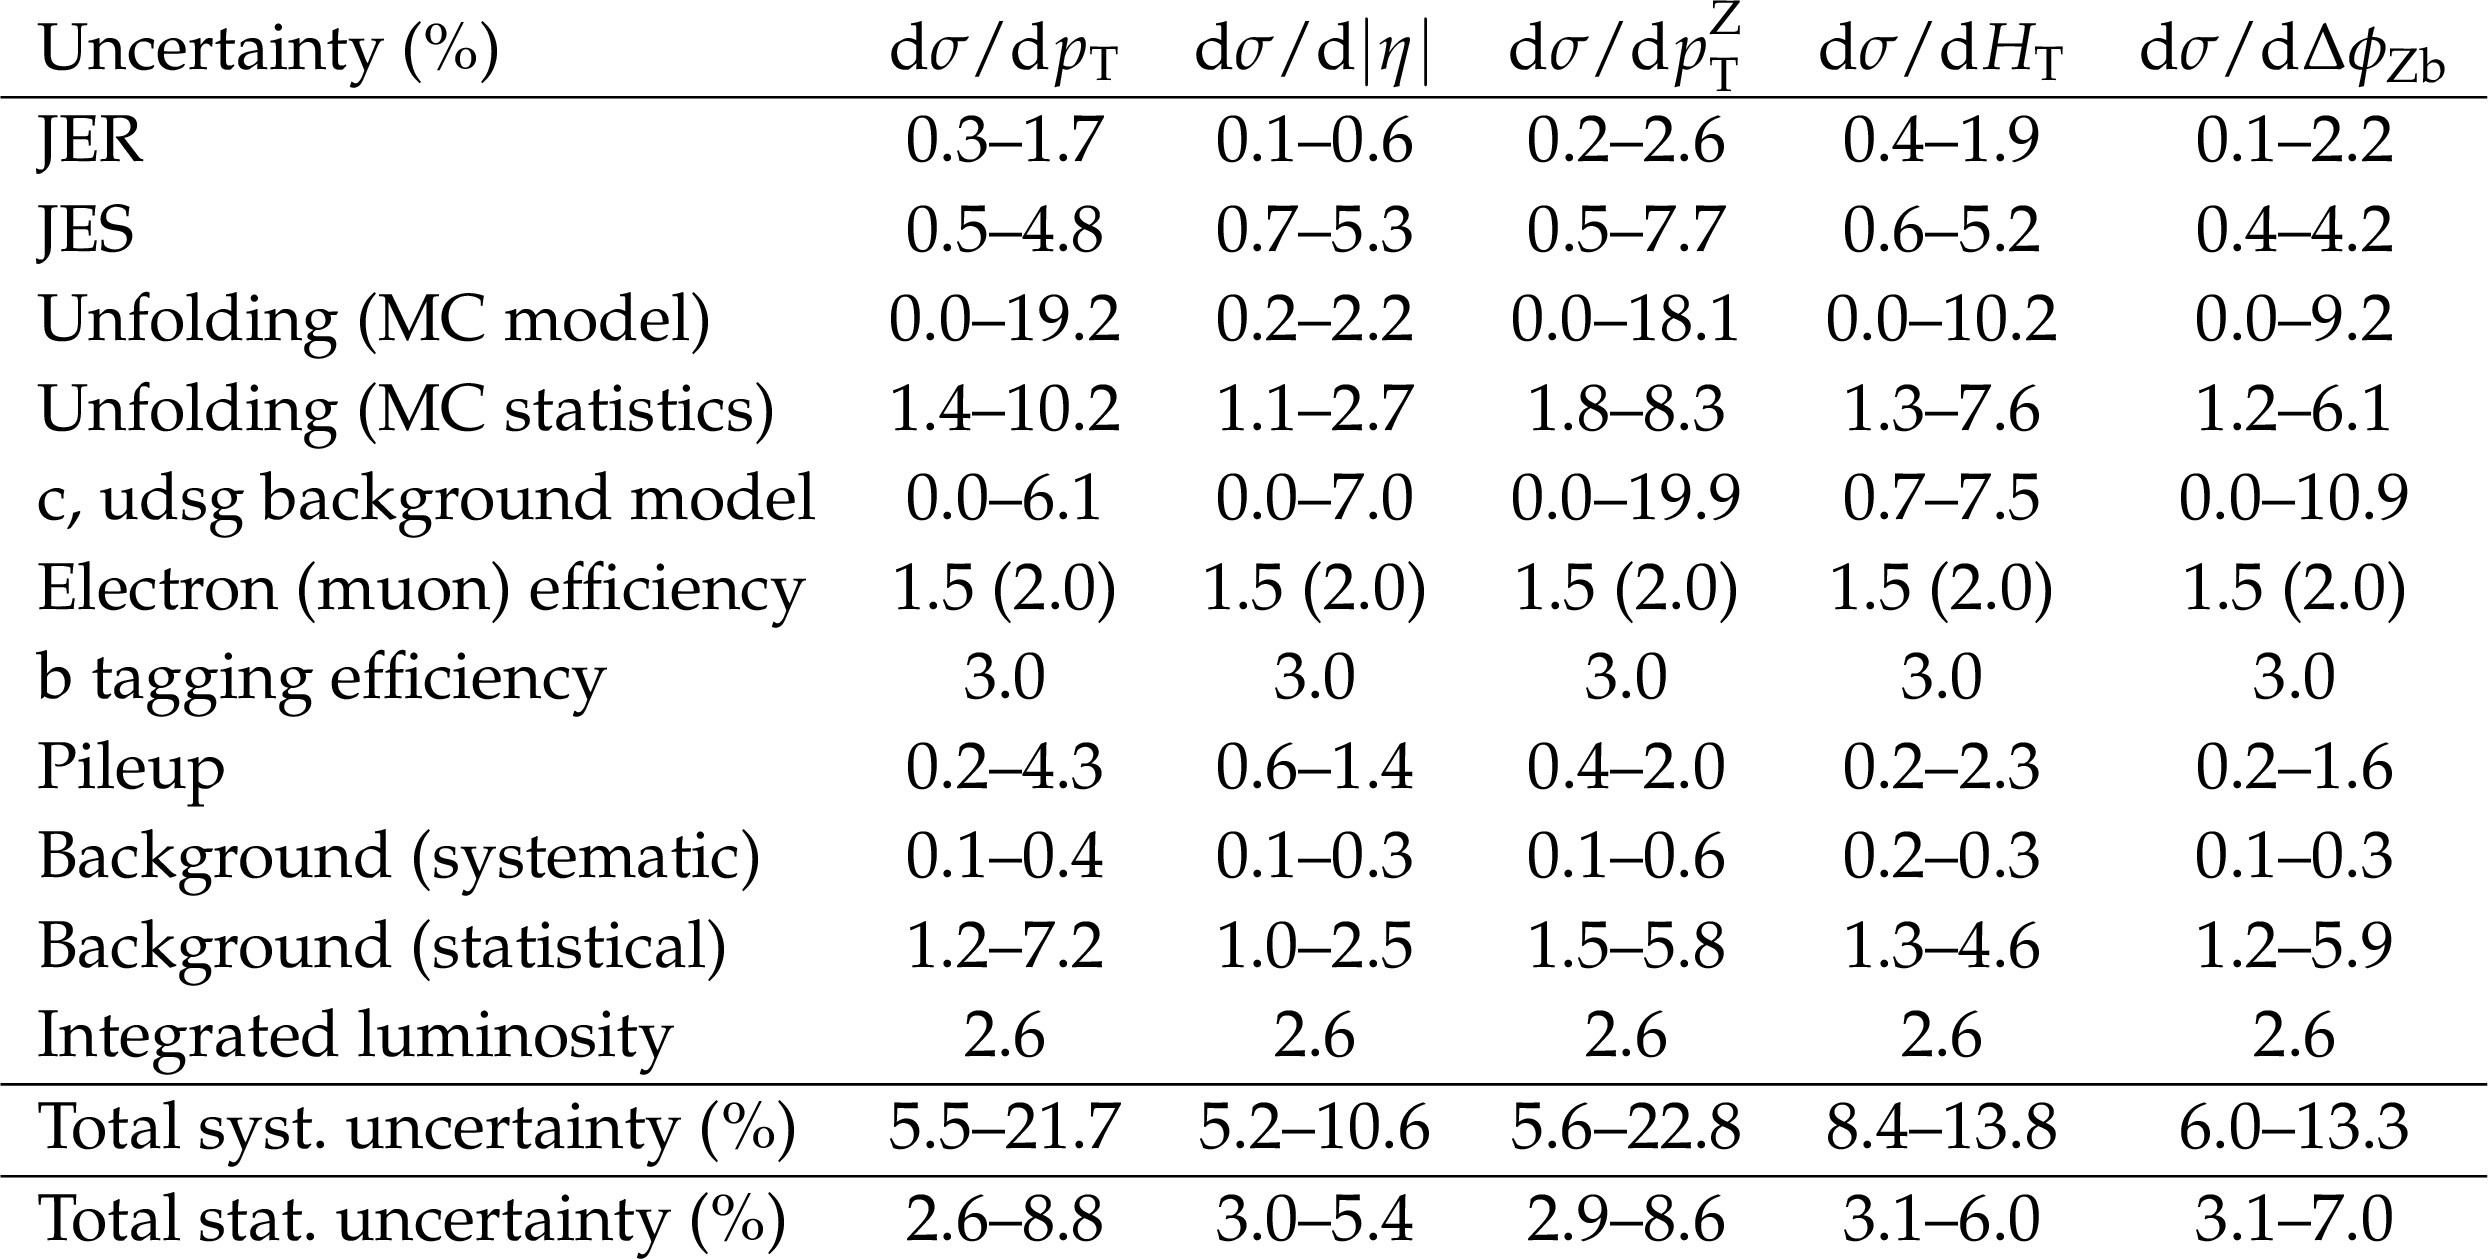
Table 2:
Uncertainties (in percent) in the differential cross sections as a function of the leading b jet ${p_{\mathrm {T}}}$ and $|\eta |$, the Z boson ${p_{\mathrm {T}}}$, ${H_{\mathrm {T}}}$, and $\Delta \phi _{\mathrm{ Z } \mathrm{ b } }$ between the Z boson and the leading b jet, for the Z (1b) sample. |
png pdf |
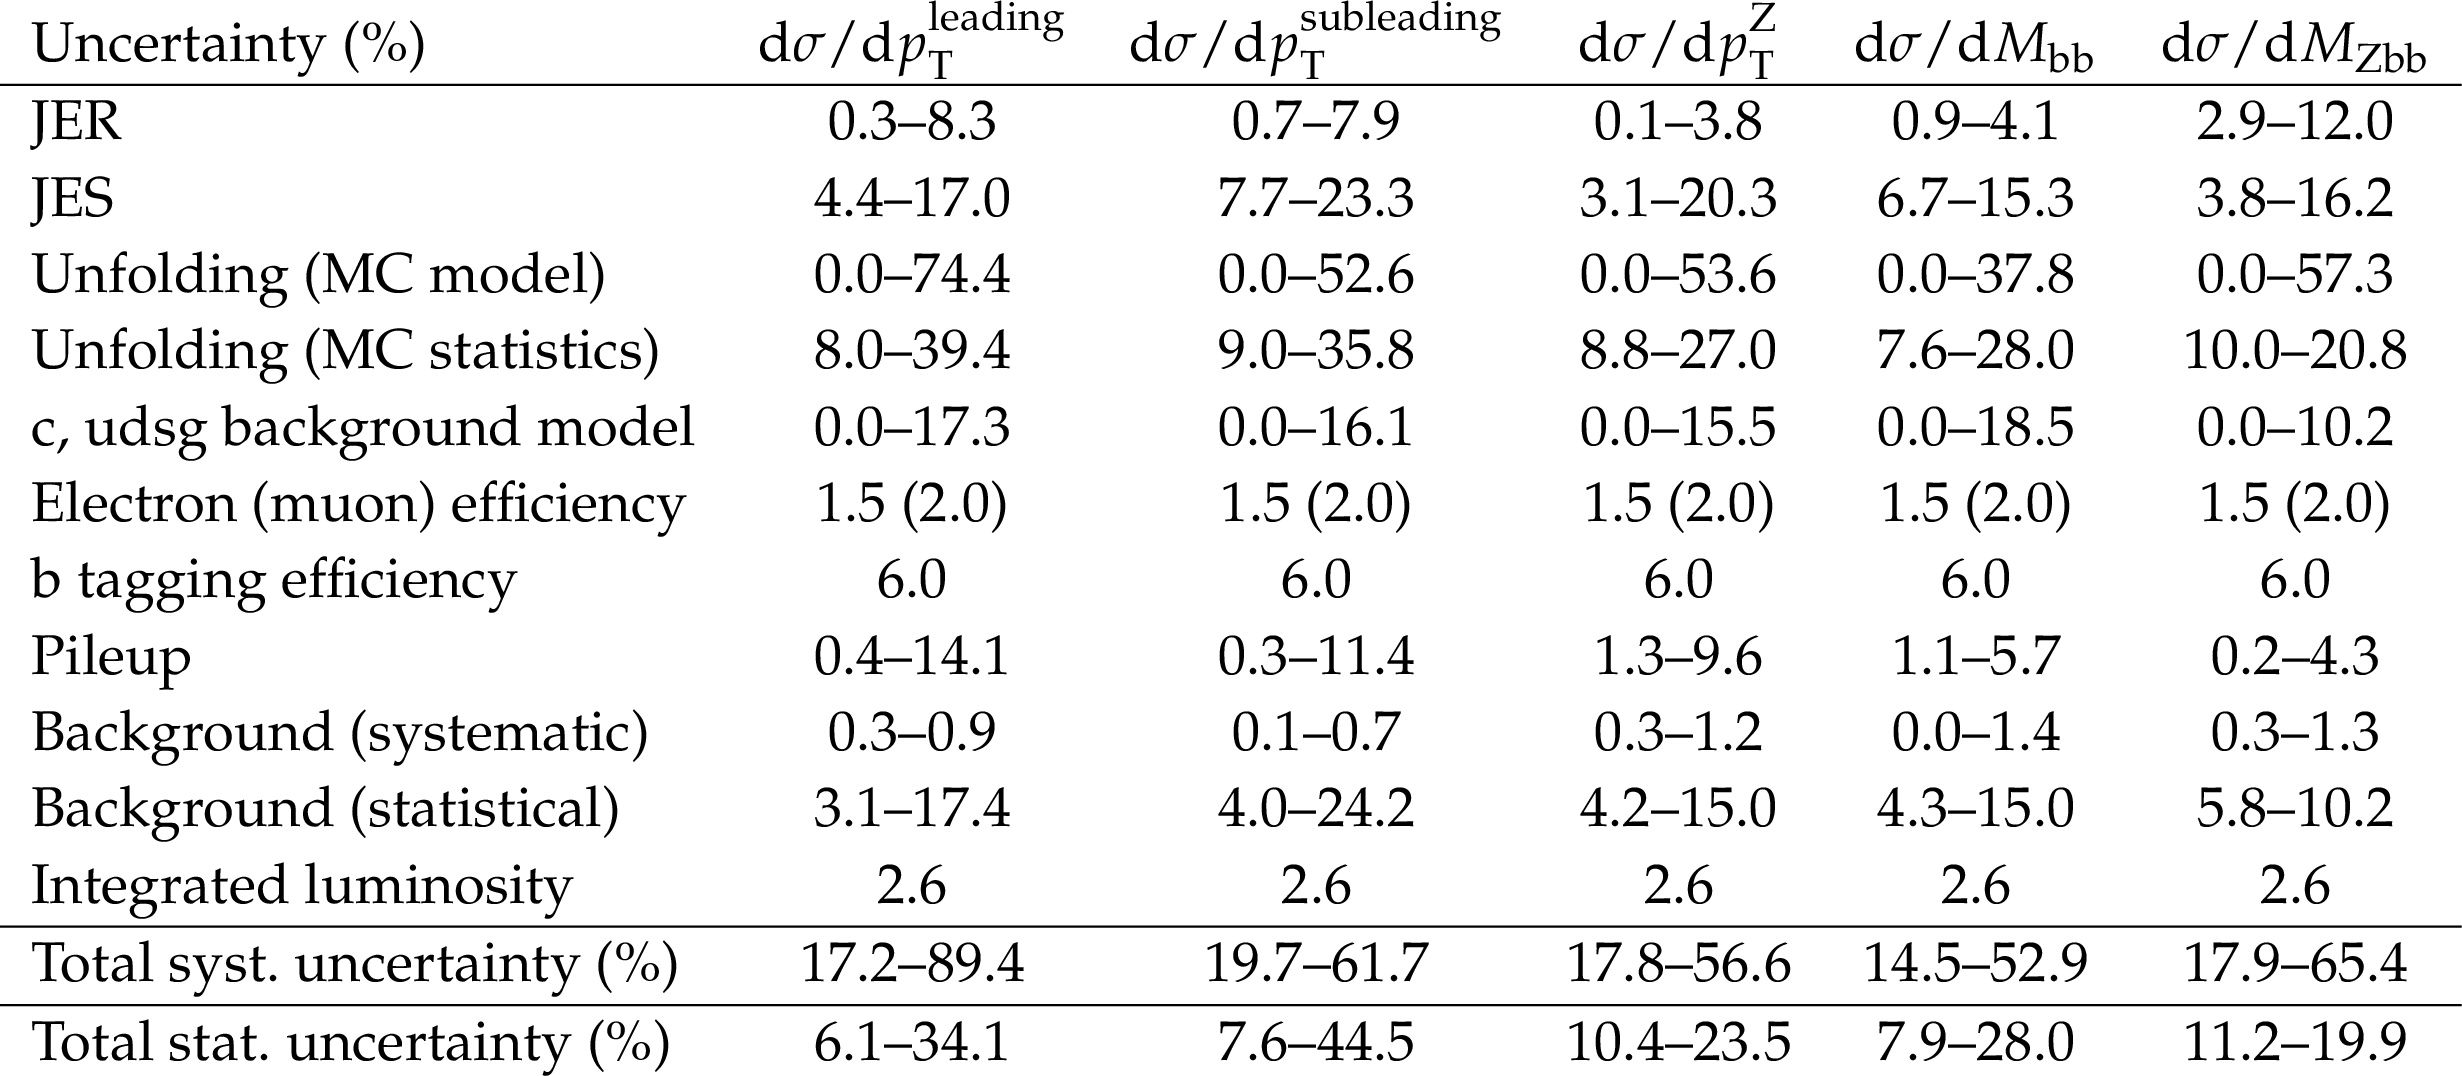
Table 3:
Uncertainties (in percent) in the differential cross sections as a function of the leading and subleading b jet ${p_{\mathrm {T}}}$, the Z boson ${p_{\mathrm {T}}}$, the invariant mass of the two b-tagged jets, and the invariant mass of the Z boson and the two b-tagged jets, for the Z (2b) sample. |

png pdf |
Table 4:
Uncertainties (in percent) in the differential cross sections as a function of $ {\Delta R}$ and $\Delta \phi $ between the two b-tagged jets, $ {\Delta R}$ between the Z boson and the closer b-tagged jet, and the asymmetry $A_{\mathrm {Zbb}}$, for the Z (2b) sample. |
| Summary |
| The process of associated production of jets, including b jets, and a Z boson decaying into lepton pairs ($\ell=\mathrm{ e },\mu$) are measured in LHC pp collisions at $ \sqrt{s} = $ 8 TeV with the CMS experiment, using a data set corresponding to an integrated luminosity of 19.8 fb$^{-1}$. The measured fiducial cross sections are compared to several theoretical predictions. The cross sections are measured as a function of various kinematic observables describing the event topology with a Z boson and at least one b jet: the ${p_{\mathrm {T}}}$ and $\eta$ of the leading b jet, the Z boson ${p_{\mathrm {T}}}$, the scalar sum $H_{\mathrm{T}}$ of the jet transverse momenta, and the azimuthal angular difference between the directions of the leading b jet and the Z boson. A comparison is made of the unfolded data with leading-order pQCD predictions based on matrix element calculations matched with parton showering, testing models using the MadGraph event generator, or with the NLO calculations, merging predictions for zero, one, and two extra jets with aMCatNLO, or for the first two jets with POWHEG in the MINLO approach. In most cases the theoretical predictions agree with the data, with the shape of the b jet ${p_{\mathrm {T}}}$ distribution below 80 GeV slightly better reproduced by MadGraph 4FS, while its normalization is underestimated by about 20%. The ratios of differential cross sections for the production of a Z boson in association with at least one b jet and the inclusive Z+jets production are measured and compared with theoretical expectations. The 4FS-based prediction fails to describe the shape of the ratio as a function of the leading b jet ${p_{\mathrm {T}}}$, and discrepancies in the shape are also observed for high values of the Z boson ${p_{\mathrm {T}}}$. The production of a Z boson in association with two b jets is also investigated. In this case the kinematic observables are the transverse momenta of the leading and subleading b jets, the ${p_{\mathrm {T}}}$ of the Z boson, the separations of the b jets both in azimuthal angle and in the $\eta$-$\phi$ plane, the minimal distance in the $\eta$-$\phi$ plane between the Z boson and a b jet, the asymmetry between the minimal and the maximal distances between the Z boson and a b jet, and the invariant masses of the bb and the Zbb systems. The measured distributions are generally well reproduced by the predictions. |
| References | ||||
| 1 | CMS Collaboration | Search for the standard model Higgs boson produced in association with a W or a Z boson and decaying to bottom quarks | PRD 89 (2014) 012003 | CMS-HIG-13-012 1310.3687 |
| 2 | B. Holdom et al. | Four statements about the fourth generation | PMC Phys. A 3 (2009) 4 | 0904.4698 |
| 3 | L. J. Hall, D. Pinner, and J. T. Ruderman | A natural SUSY Higgs near 126 GeV | JHEP 04 (2012) 131 | 1112.2703 |
| 4 | D. Choudhury, T. M. P. Tait, and C. E. M. Wagner | Beautiful mirrors and precision electroweak data | PRD 65 (2002) 053002 | hep-ph/0109097 |
| 5 | CDF Collaboration | Measurement of cross sections for b jet production in events with a Z boson in $ \mathrm{ p } \mathrm{ \bar{p} } $ collisions at $ \sqrt{s} = $ 1.96 TeV | PRD 79 (2009) 052008 | 0812.4458 |
| 6 | D0 Collaboration | A measurement of the ratio of inclusive cross sections $ \sigma( \mathrm{ p } \mathrm{ \bar{p} } \rightarrow \mathrm{ Z }+ \mathrm{ b } \text{jet} )/ \sigma( \mathrm{ p } \mathrm{ \bar{p} } \rightarrow \mathrm{ Z } + \text{ jet} ) $ at $ \sqrt{s} = $ 1.96 TeV | PRD 83 (2011) 031105 | 1010.6203 |
| 7 | ATLAS Collaboration | Measurement of differential production cross-sections for a Z boson in association with $ \mathrm{ b }-jets $ in 7 TeV proton-proton collisions with the ATLAS detector | JHEP 10 (2014) 141 | 1407.3643 |
| 8 | CMS Collaboration | Measurement of the production cross sections for a Z boson and one or more $ \mathrm{ b } $ jets in $ \mathrm{ p }\mathrm{ p } $ collisions at $ \sqrt{s} = $ 7 TeV | JHEP 06 (2014) 120 | CMS-SMP-13-004 1402.1521 |
| 9 | CMS Collaboration | Measurement of the cross section and angular correlations for associated production of a Z boson with $ \mathrm{ b } $ hadrons in $ \mathrm{ p }\mathrm{ p } $ collisions at $ \sqrt{s} = $ 7 TeV | JHEP 12 (2013) 039 | CMS-EWK-11-015 1310.1349 |
| 10 | D0 Collaboration | Measurement of the ratio of differential cross sections $ {\sigma}(\mathrm{ p }\mathrm{ \bar{p} } \to \mathrm{ Z } + \mathrm{ b } \text{jet})/ {\sigma}(\mathrm{ p }\mathrm{ \bar{p} } \to \mathrm{ Z } + \text{jet}) $ in $ \mathrm{ p }\mathrm{ \bar{p} } $ collisions at $ \sqrt{s} = $ 1.96 TeV | PRD 87 (2013) 092010 | 1301.2233 |
| 11 | CMS Collaboration | The CMS experiment at the CERN LHC | JINST 3 (2008) S08004 | CMS-00-001 |
| 12 | CMS Collaboration | Description and performance of track and primary-vertex reconstruction with the CMS tracker | JINST 9 (2014) P10009 | CMS-TRK-11-001 1405.6569 |
| 13 | CMS Collaboration | Performance of electron reconstruction and selection with the CMS detector in proton-proton collisions at $ \sqrt{s} = $ 8 TeV | JINST 10 (2015) P06005 | CMS-EGM-13-001 1502.02701 |
| 14 | CMS Collaboration | Performance of CMS muon reconstruction in $ \mathrm{ p }\mathrm{ p } $ collision events at $ \sqrt{s} = $ 7 TeV | JINST 7 (2012) P10002 | CMS-MUO-10-004 1206.4071 |
| 15 | J. Alwall et al. | MadGraph 5: going beyond | JHEP 06 (2011) 128 | 1106.0522 |
| 16 | J. Pumplin et al. | New generation of parton distributions with uncertainties from global QCD analysis | JHEP 07 (2002) 012 | hep-ph/0201195 |
| 17 | T. Sjostrand, S. Mrenna, and P. Z. Skands | PYTHIA 6.4 physics and manual | JHEP 05 (2006) 026 | hep-ph/0603175 |
| 18 | R. Field | Early LHC underlying event data -- findings and surprises | in Proceedings of the 22nd Hadron Collider Physics Conference, HCP 2010, Toronto, Canada 2010 | 1010.3558 |
| 19 | J. Alwall et al. | Comparative study of various algorithms for the merging of parton showers and matrix elements in hadronic collisions | EPJC 53 (2008) 473 | 0706.2569 |
| 20 | J. Alwall et al. | The automated computation of tree-level and next-to-leading order differential cross sections, and their matching to parton shower simulations | JHEP 07 (2014) 079 | 1405.0301 |
| 21 | R. Frederix and S. Frixione | Merging meets matching in MC@NLO | JHEP 12 (2012) 061 | 1209.6215 |
| 22 | T. Sjostrand, S. Mrenna, and P. Z. Skands | A brief introduction to PYTHIA 8.1 | CPC 178 (2008) 852 | 0710.3820 |
| 23 | NNPDF Collaboration | Parton distributions for the LHC Run II | JHEP 04 (2015) 040 | 1410.8849 |
| 24 | S. Frixione, P. Nason, and C. Oleari | Matching NLO QCD computations with parton shower simulations: the POWHEG method | JHEP 11 (2007) 070 | 0709.2092 |
| 25 | P. Nason | A new method for combining NLO QCD with shower Monte Carlo algorithms | JHEP 11 (2004) 040 | hep-ph/0409146 |
| 26 | S. Alioli, P. Nason, C. Oleari, and E. Re | A general framework for implementing NLO calculations in shower Monte Carlo programs: the POWHEG BOX | JHEP 06 (2010) 043 | 1002.2581 |
| 27 | S. Alioli, P. Nason, C. Oleari, and E. Re | NLO single-top production matched with shower in POWHEG: $ s $- and $ t $-channel contributions | JHEP 09 (2009) 111 | 0907.4076 |
| 28 | E. Re | Single-top W $ t $-channel production matched with parton showers using the POWHEG method | EPJC 71 (2011) 1547 | 1009.2450 |
| 29 | GEANT4 Collaboration | GEANT4---a simulation toolkit | NIMA 506 (2003) 250 | |
| 30 | CMS Collaboration | Particle--flow event reconstruction in CMS and performance for jets, taus, and $ E_{\mathrm{T}}^{\text{miss}} $ | CDS | |
| 31 | CMS Collaboration | Commissioning of the particle-flow event reconstruction with the first LHC collisions recorded in the CMS detector | CDS | |
| 32 | M. Cacciari and G. P. Salam | Pileup subtraction using jet areas | PLB 659 (2008) 119 | 0707.1378 |
| 33 | CMS Collaboration | Measurements of inclusive W and Z cross sections in $ \mathrm{ p }\mathrm{ p } $ Collisions at $ \sqrt{s} = $ 7 TeV | JHEP 01 (2011) 080 | CMS-EWK-10-002 1012.2466 |
| 34 | M. Cacciari, G. P. Salam, and G. Soyez | The anti-$ k_t $ jet clustering algorithm | JHEP 04 (2008) 063 | 0802.1189 |
| 35 | M. Cacciari, G. P. Salam, and G. Soyez | FastJet user manual | EPJC 72 (2012) 1896 | 1111.6097 |
| 36 | CMS Collaboration | Determination of jet energy calibration and transverse momentum resolution in CMS | JINST 6 (2011) P11002 | CMS-JME-10-011 1107.4277 |
| 37 | CMS Collaboration | Jet energy scale and resolution in the CMS experiment in $ \mathrm{ p }\mathrm{ p } $ collisions at 8 TeV | Submitted to JINST | CMS-JME-13-004 1607.03663 |
| 38 | CMS Collaboration | Identification of $ \mathrm{ b }-quark $ jets with the CMS experiment | JINST 8 (2013) P04013 | CMS-BTV-12-001 1211.4462 |
| 39 | CMS Collaboration | Missing transverse energy performance of the CMS detector | JINST 6 (2011) P09001 | |
| 40 | CMS Collaboration | Performance of the CMS missing transverse momentum reconstruction in $ \mathrm{ p }\mathrm{ p } $ data at $ \sqrt{s} = $ 8 TeV | JINST 10 (2015), no. 02, P02006 | CMS-JME-13-003 1411.0511 |
| 41 | CMS Collaboration | Event shapes and azimuthal correlations in Z+jets events in $ \mathrm{ p }\mathrm{ p } $ collisions at $ \sqrt{s} = $ 7 TeV | PLB 722 (2013) 238 | CMS-EWK-11-021 1301.1646 |
| 42 | A. Hocker and V. Kartvelishvili | SVD approach to data unfolding | NIMA 372 (1996) 469 | hep-ph/9509307 |
| 43 | T. Adye | Unfolding algorithms and tests using RooUnfold | in PHYSTAT 2011 Workshop on Statistical Issues Related to Discovery Claims in Search Experiments and Unfolding, H. Prosper and L. Lyons, eds. | 1105.1160 |
| 44 | G. D'Agostini | A multidimensional unfolding method based on Bayes theorem | NIMA 362 (1995) 487 | |
| 45 | CMS Collaboration | CMS luminosity based on pixel cluster counting -- summer 2013 update | CMS-PAS-LUM-13-001 | CMS-PAS-LUM-13-001 |
| 46 | F. Febres Cordero, L. Reina, and D. Wackeroth | W and Z boson production with a massive bottom-quark pair at the Large Hadron Collider | PRD 80 (2009) 034015 | 0906.1923 |
| 47 | J. M. Campbell, R. K. Ellis, F. Maltoni, and S. Willenbrock | Associated production of a Z boson and a single heavy quark jet | PRD 69 (2004) 074021 | hep-ph/0312024 |
| 48 | F. Maltoni, G. Ridolfi, and M. Ubiali | b-initiated processes at the LHC: a reappraisal | JHEP 07 (2012) 022 | 1203.6393 |
| 49 | J. Alwall, S. de Visscher, and F. Maltoni | QCD radiation in the production of heavy colored particles at the LHC | JHEP 02 (2009) 017 | 0810.5350 |
| 50 | R. Gavin, Y. Li, F. Petriello, and S. Quackenbush | FEWZ 2.0: a code for hadronic Z production at next-to-next-to-leading order | CPC 182 (2011) 2388 | 1011.3540 |
| 51 | Y. Li and F. Petriello | Combining QCD and electroweak corrections to dilepton production in FEWZ | PRD 86 (2012) 094034 | 1208.5967 |
| 52 | A. D. Martin, W. J. Stirling, R. S. Thorne, and G. Watt | Parton distributions for the LHC | EPJC 63 (2009) 189 | 0901.0002 |
| 53 | J. M. Campbell and R. K. Ellis | MCFM for the Tevatron and the LHC | NPPS 205-206 (2010) 10 | 1007.3492 |
| 54 | CMS Collaboration | Event generator tunes obtained from underlying event and multiparton scattering measurements | EPJC 76 (2016) 155 | CMS-GEN-14-001 1512.00815 |
| 55 | J. M. Campbell, R. K. Ellis, P. Nason, and G. Zanderighi | W and Z bosons in association with two jets using the POWHEG method | JHEP 08 (2013) 005 | 1303.5447 |
| 56 | K. Hamilton, P. Nason, and G. Zanderighi | MINLO: multi-scale improved NLO | JHEP 10 (2012) 155 | 1206.3572 |
|
|
Compact Muon Solenoid LHC, CERN |
|

|

|

|

|

|