

Compact Muon Solenoid
LHC, CERN
| CMS-SMP-16-015 ; CERN-EP-2018-071 | ||
| Measurement of differential cross sections for Z boson production in association with jets in proton-proton collisions at $\sqrt{s} = $ 13 TeV | ||
| CMS Collaboration | ||
| 14 April 2018 | ||
| Eur. Phys. J. C 78 (2018) 965 | ||
| Abstract: The production of a Z boson, decaying to two charged leptons, in association with jets in proton-proton collisions at a centre-of-mass energy of 13 TeV is measured. Data recorded with the CMS detector at the LHC are used that correspond to an integrated luminosity of 2.19 fb$^{-1}$. The cross section is measured as a function of the jet multiplicity and its dependence on the transverse momentum of the Z boson, the jet kinematic variables (transverse momentum and rapidity), the scalar sum of the jet momenta, which quantifies the hadronic activity, and the balance in transverse momentum between the reconstructed jet recoil and the Z boson. The measurements are compared with predictions from four different calculations. The first two merge matrix elements with different parton multiplicities in the final state and parton showering, one of which includes one-loop corrections. The third is a fixed-order calculation with next-to-next-to-leading order accuracy for the process with a Z boson and one parton in the final state. The fourth combines the fully differential next-to-next-to-leading order calculation with next-to-next-to-leading logarithm resummation and parton showering. | ||
| Links: e-print arXiv:1804.05252 [hep-ex] (PDF) ; CDS record ; inSPIRE record ; HepData record ; CADI line (restricted) ; | ||
| Figures | |

png pdf |
Figure 1:
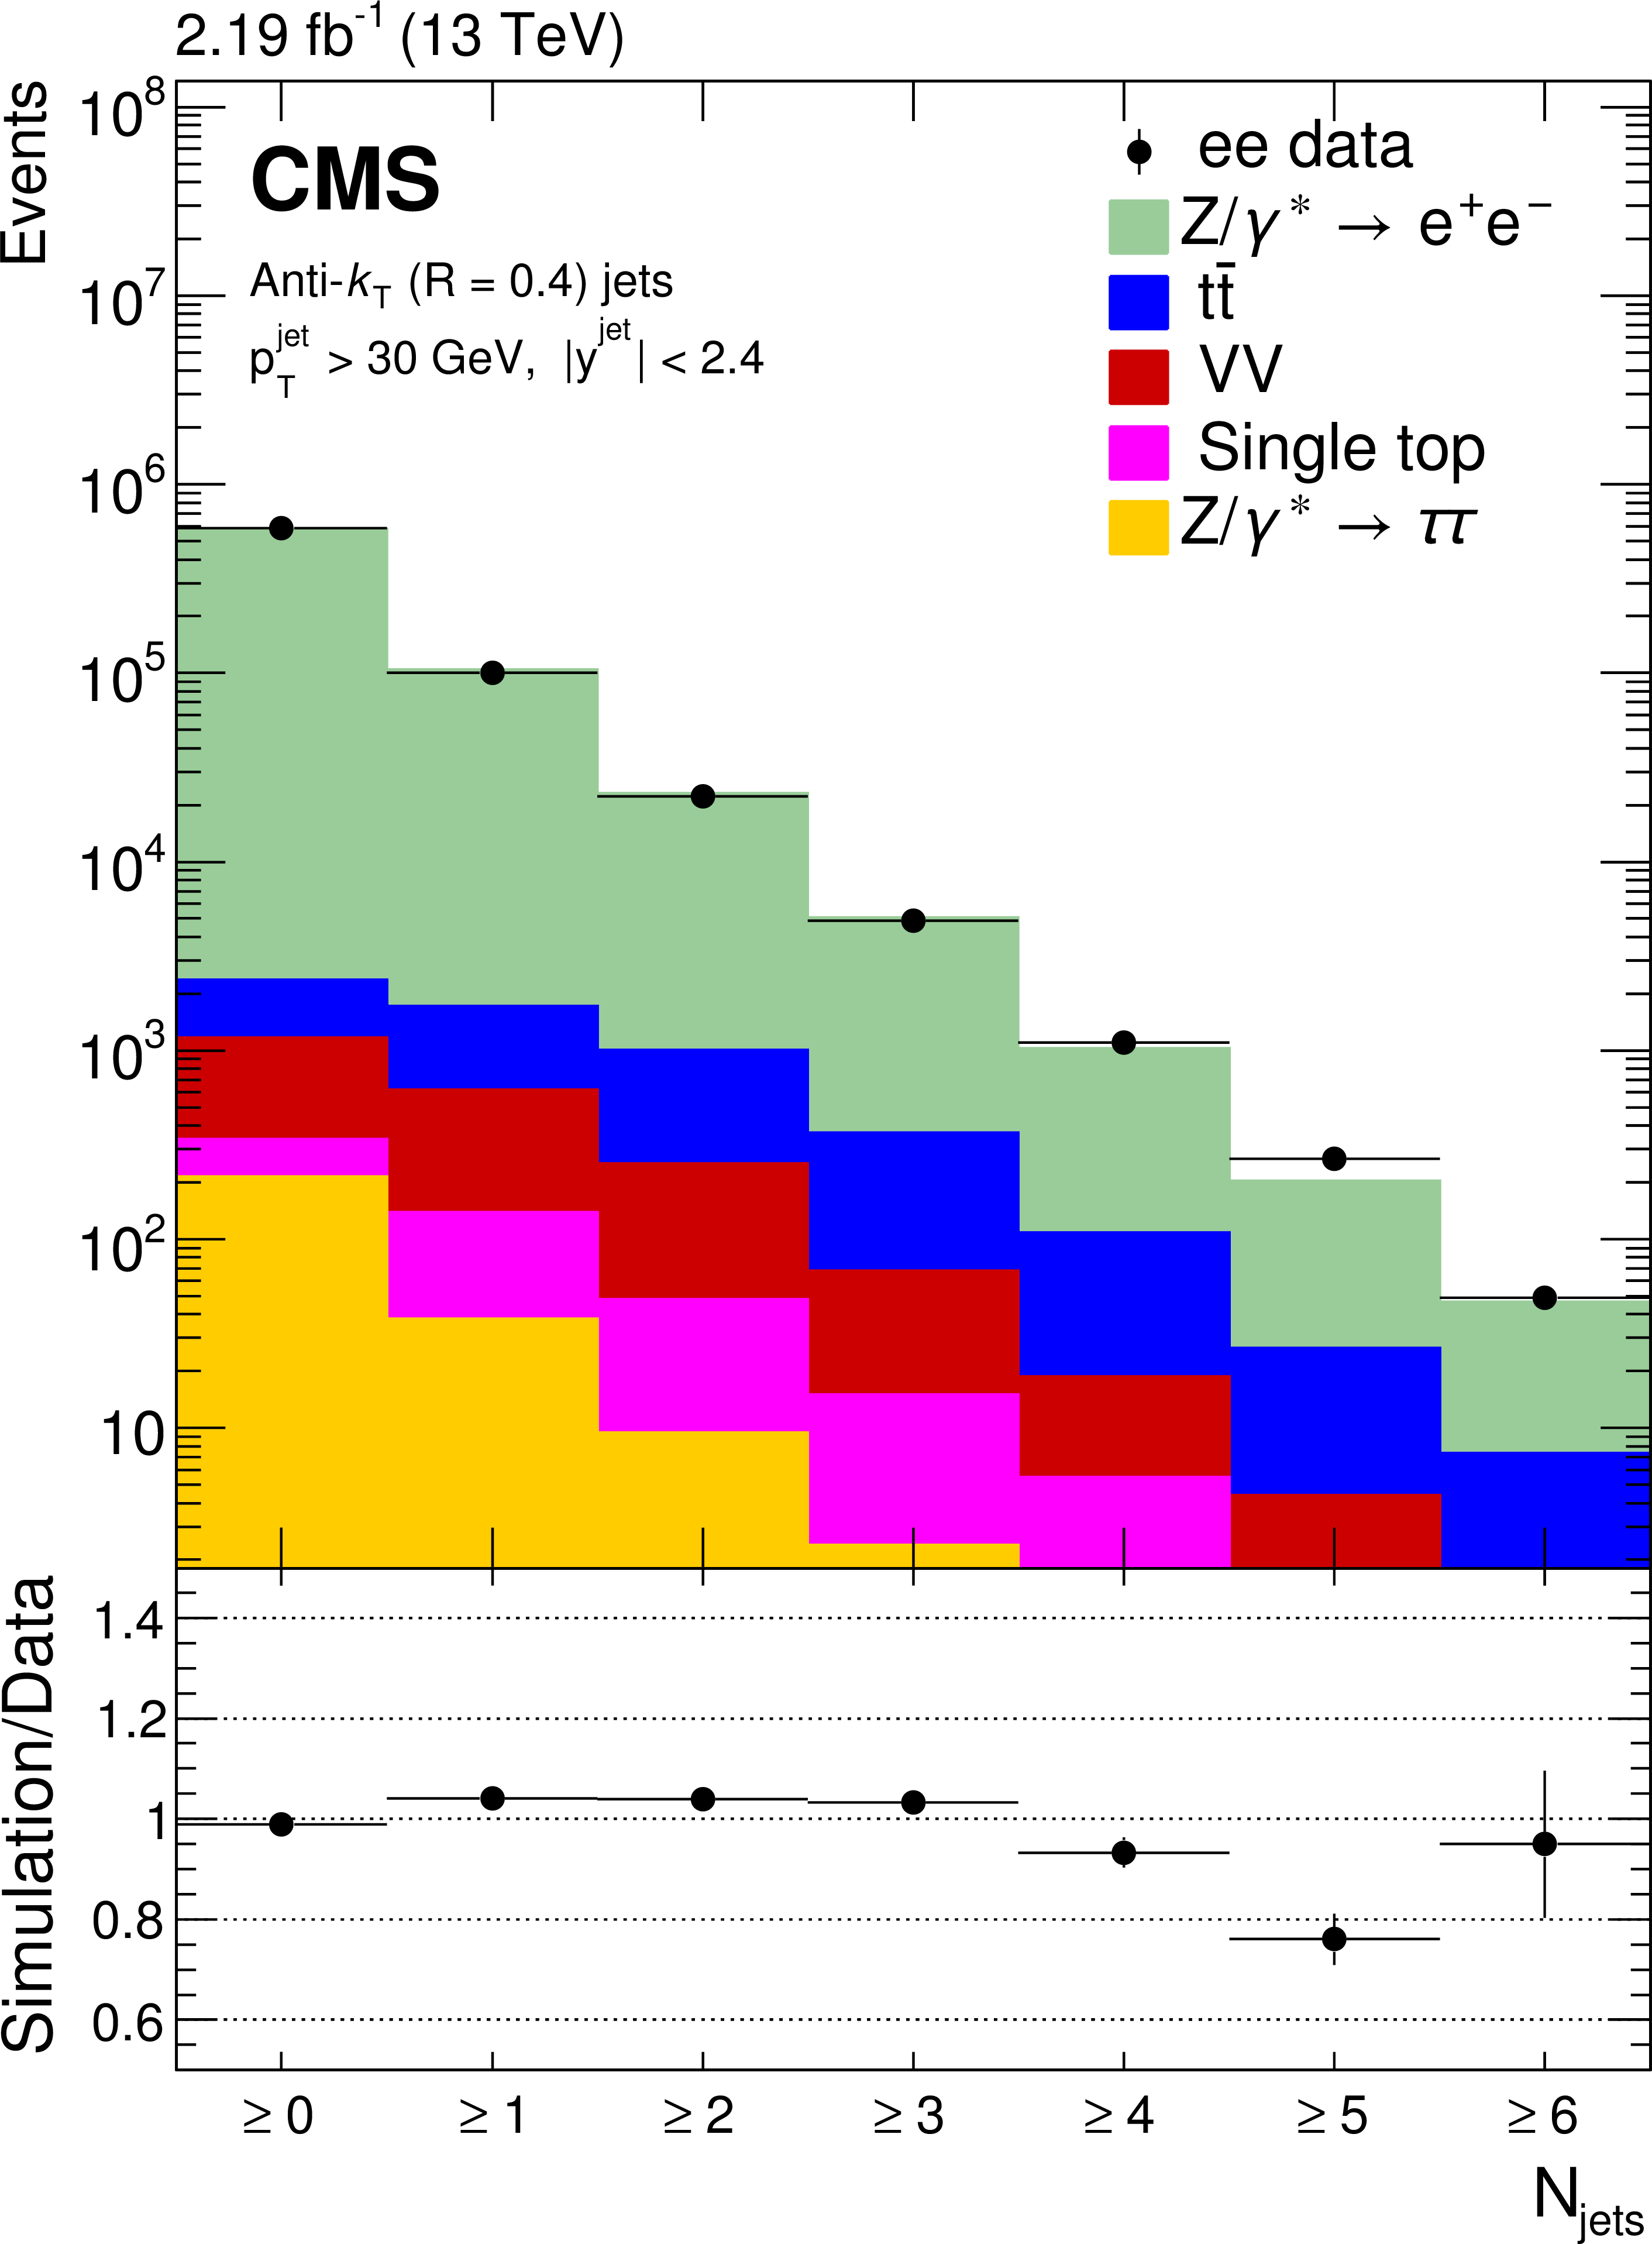
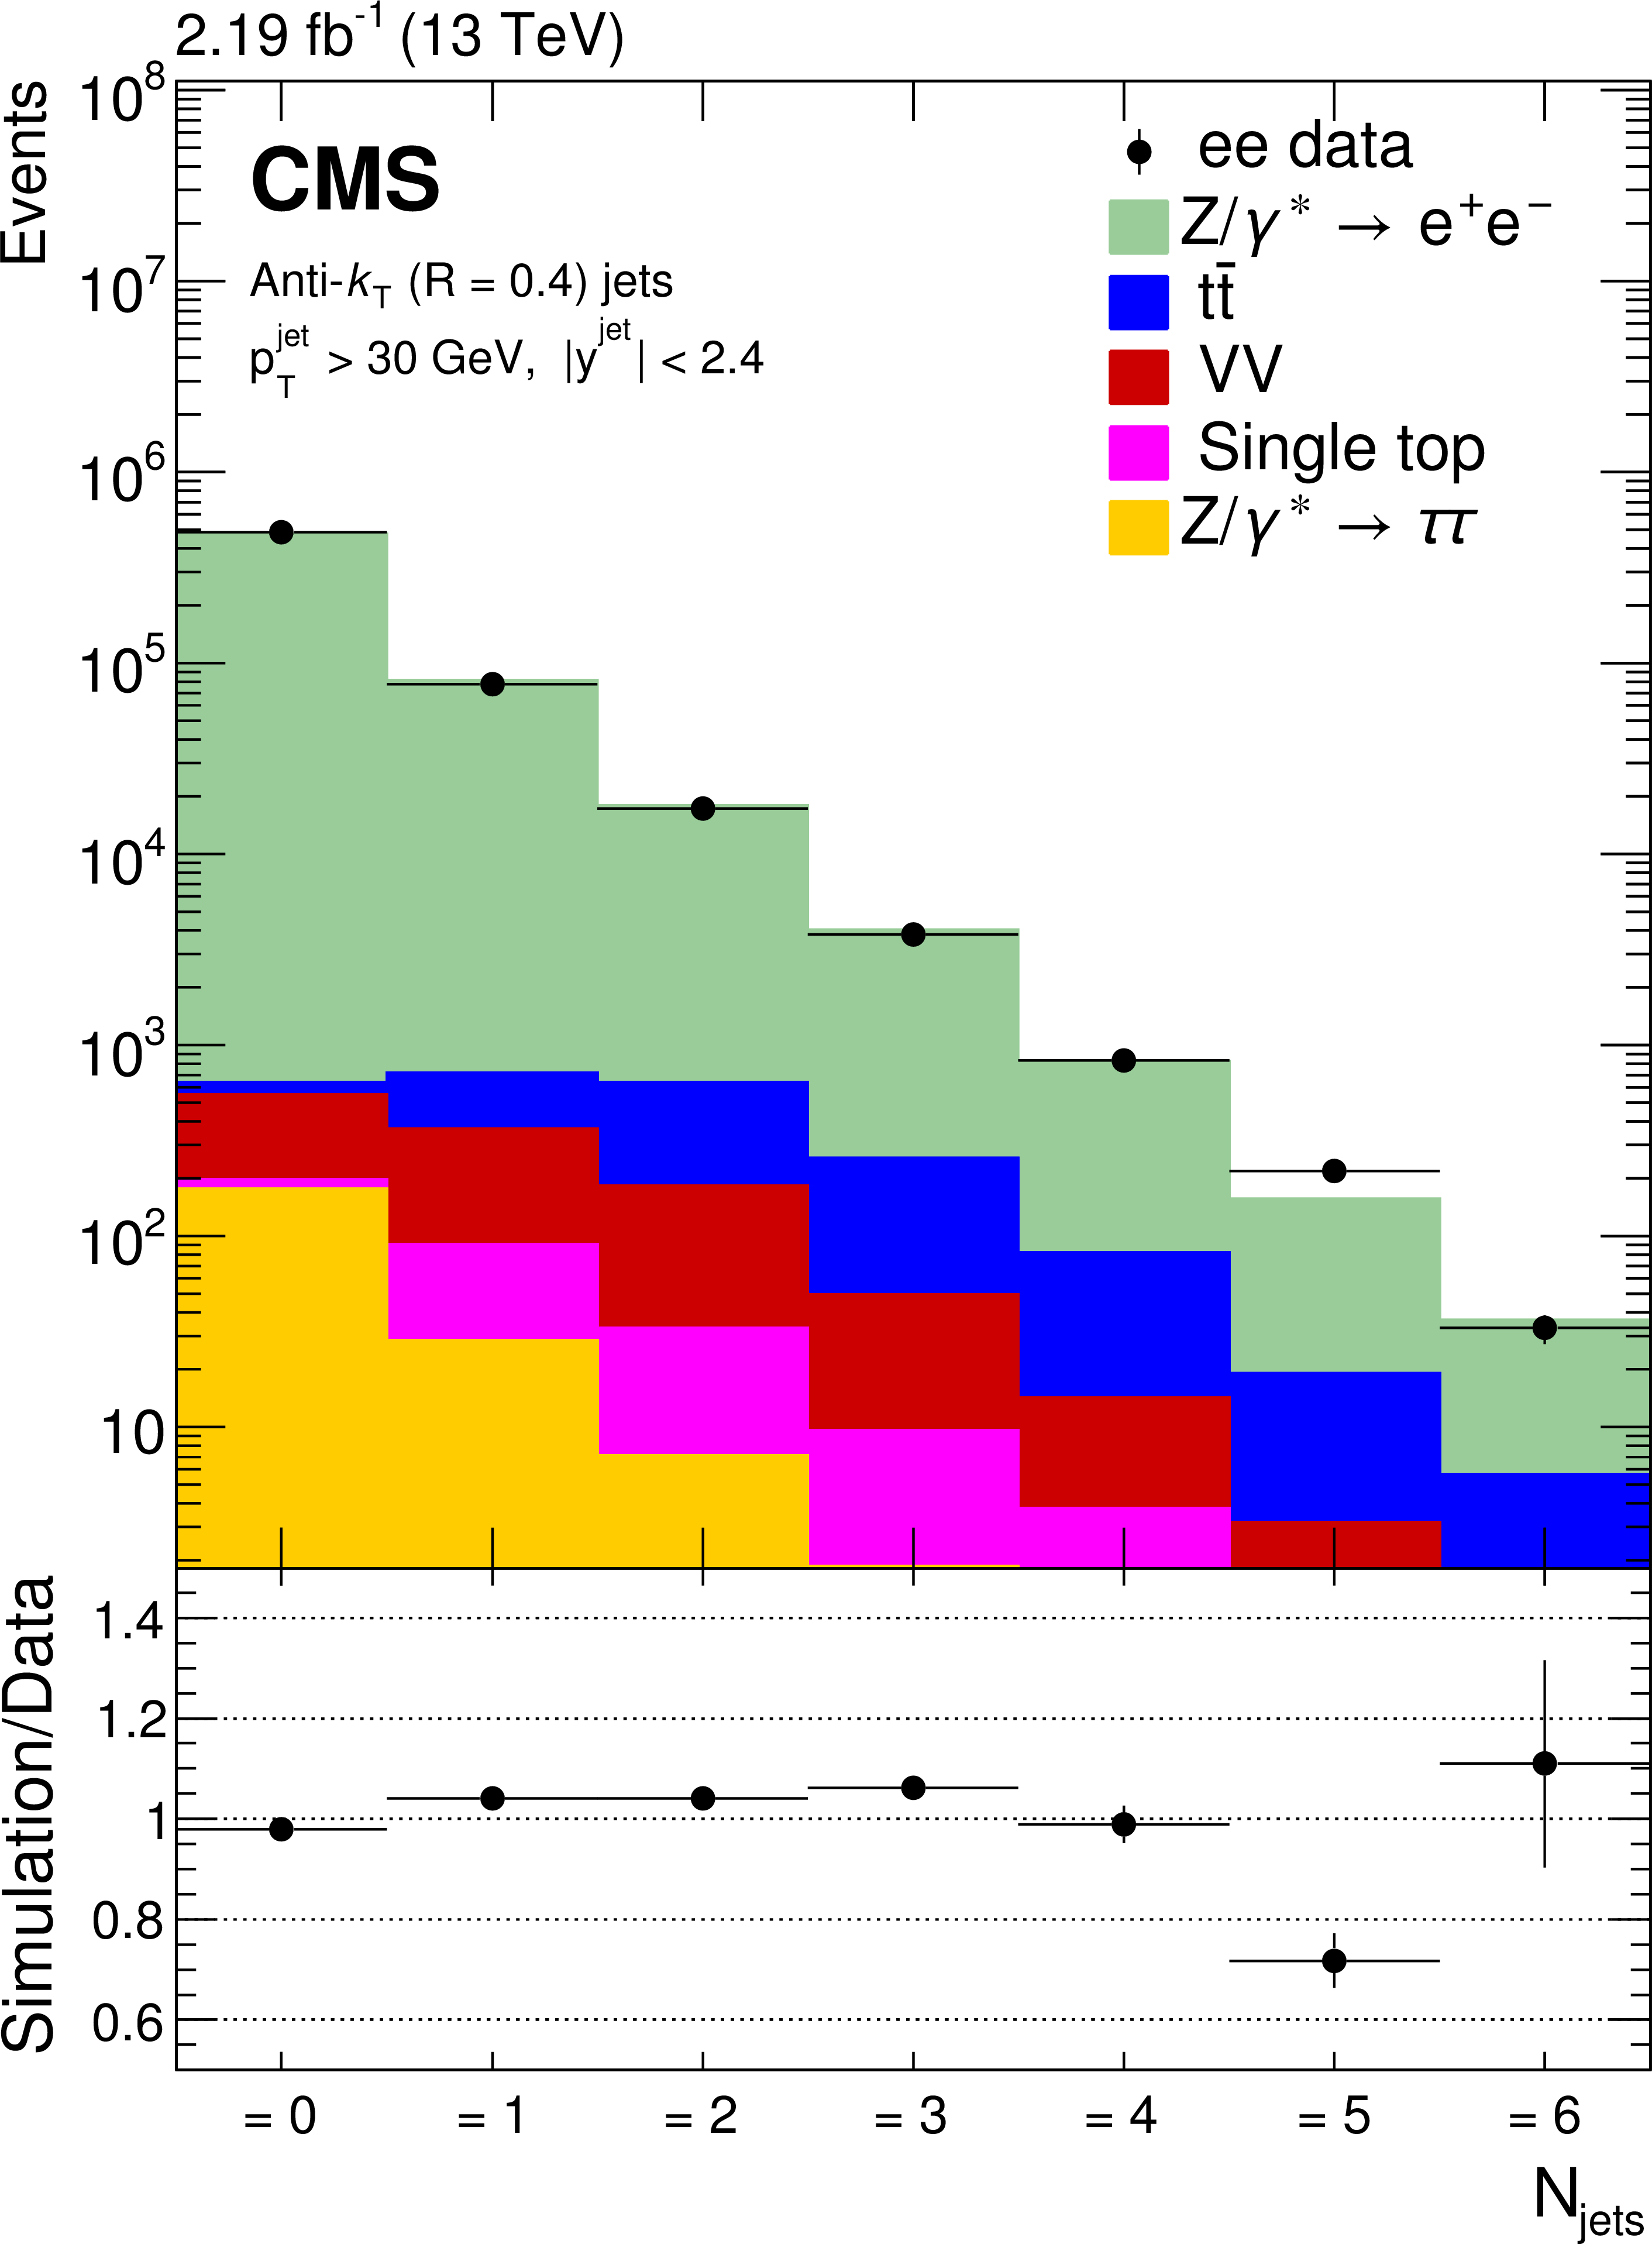
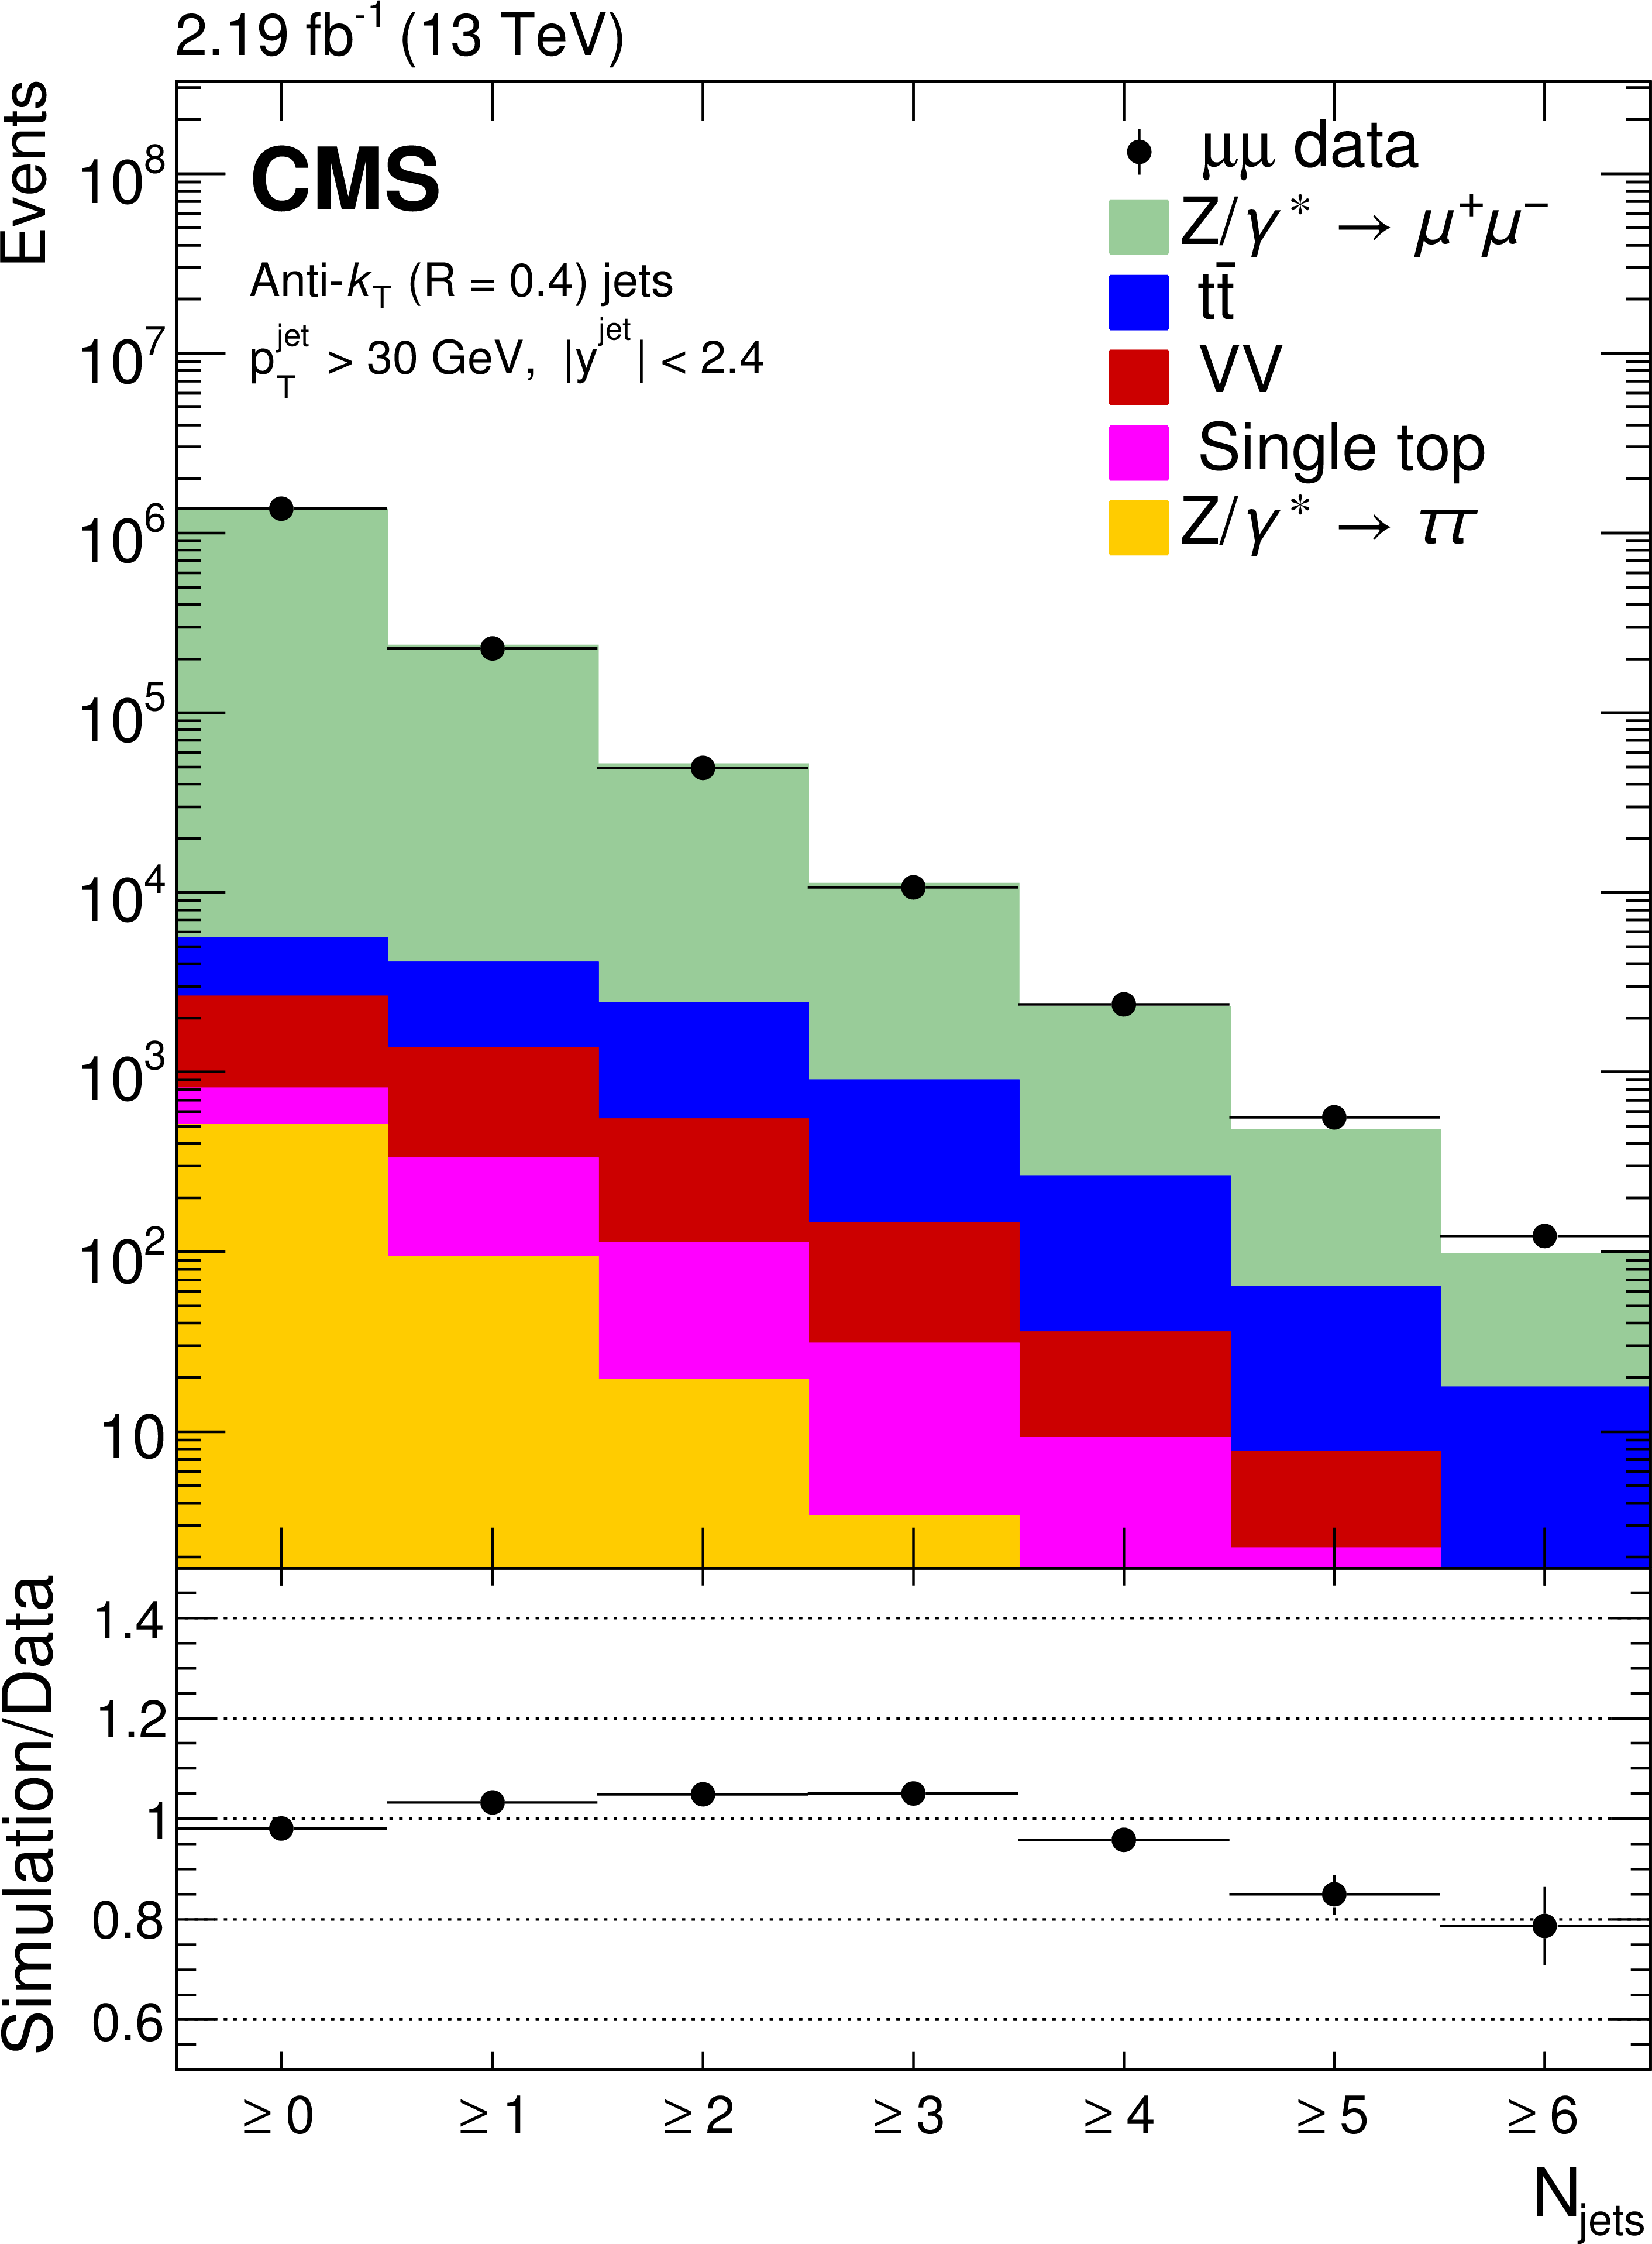
Reconstructed data, simulated signal, and background distributions of the inclusive (left) and exclusive (right) jet multiplicity for the electron (upper) and muon (lower) channels. The background distributions are obtained from the simulation, except for the $ {\mathrm {t}} {\overline {\mathrm {t}}} $ contribution which is estimated from the data as explained in the text. The error bars correspond to the statistical uncertainty. In the ratio plots, they include both the uncertainties from data and from simulation. The set of generators described in Section 5 has been used for the simulation. |
png pdf |
Figure 1-a:
Reconstructed data, simulated signal, and background distributions of the inclusive jet multiplicity for the electron channel. The background distributions are obtained from the simulation, except for the $ {\mathrm {t}} {\overline {\mathrm {t}}} $ contribution which is estimated from the data as explained in the text. The error bars correspond to the statistical uncertainty. In the ratio plot, they include both the uncertainties from data and from simulation. The set of generators described in Section 5 has been used for the simulation. |
png pdf |
Figure 1-b:
Reconstructed data, simulated signal, and background distributions of the exclusive jet multiplicity for the electron channel. The background distributions are obtained from the simulation, except for the $ {\mathrm {t}} {\overline {\mathrm {t}}} $ contribution which is estimated from the data as explained in the text. The error bars correspond to the statistical uncertainty. In the ratio plot, they include both the uncertainties from data and from simulation. The set of generators described in Section 5 has been used for the simulation. |
png pdf |
Figure 1-c:
Reconstructed data, simulated signal, and background distributions of the inclusive jet multiplicity for the muon channel. The background distributions are obtained from the simulation, except for the $ {\mathrm {t}} {\overline {\mathrm {t}}} $ contribution which is estimated from the data as explained in the text. The error bars correspond to the statistical uncertainty. In the ratio plot, they include both the uncertainties from data and from simulation. The set of generators described in Section 5 has been used for the simulation. |

png pdf |
Figure 1-d:
Reconstructed data, simulated signal, and background distributions of the exclusive jet multiplicity for the muon channel. The background distributions are obtained from the simulation, except for the $ {\mathrm {t}} {\overline {\mathrm {t}}} $ contribution which is estimated from the data as explained in the text. The error bars correspond to the statistical uncertainty. In the ratio plot, they include both the uncertainties from data and from simulation. The set of generators described in Section 5 has been used for the simulation. |
png pdf |
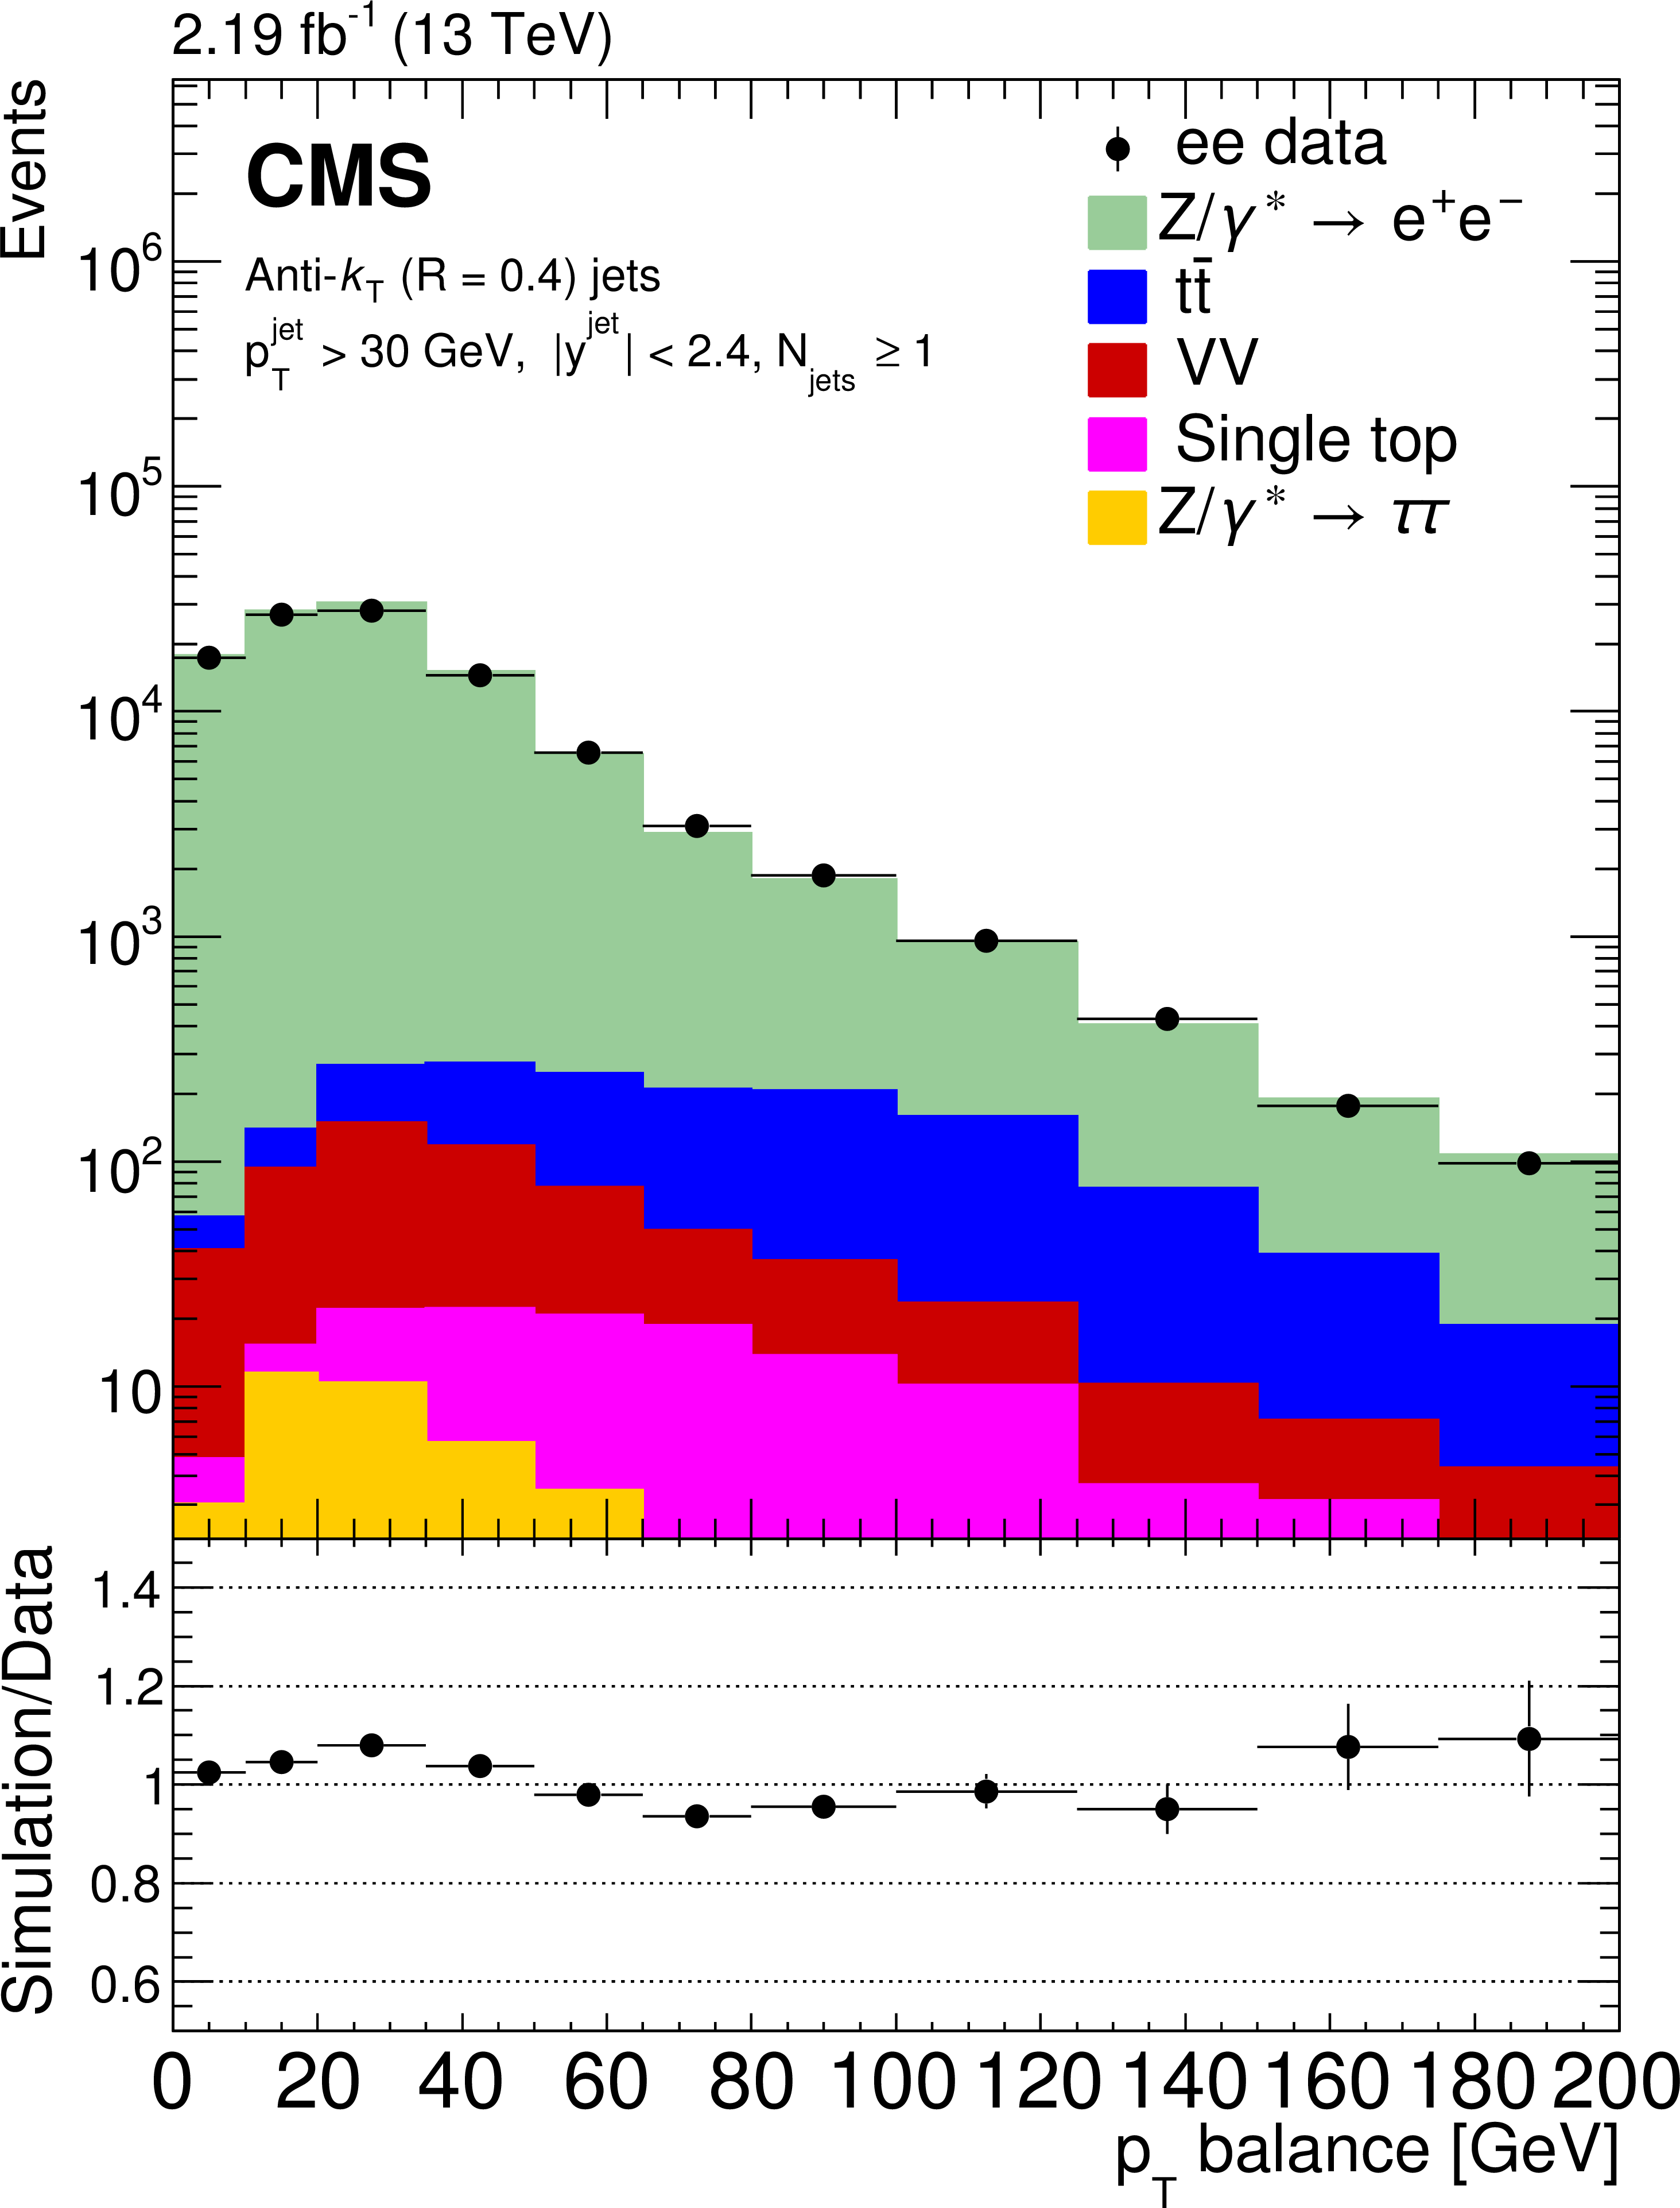
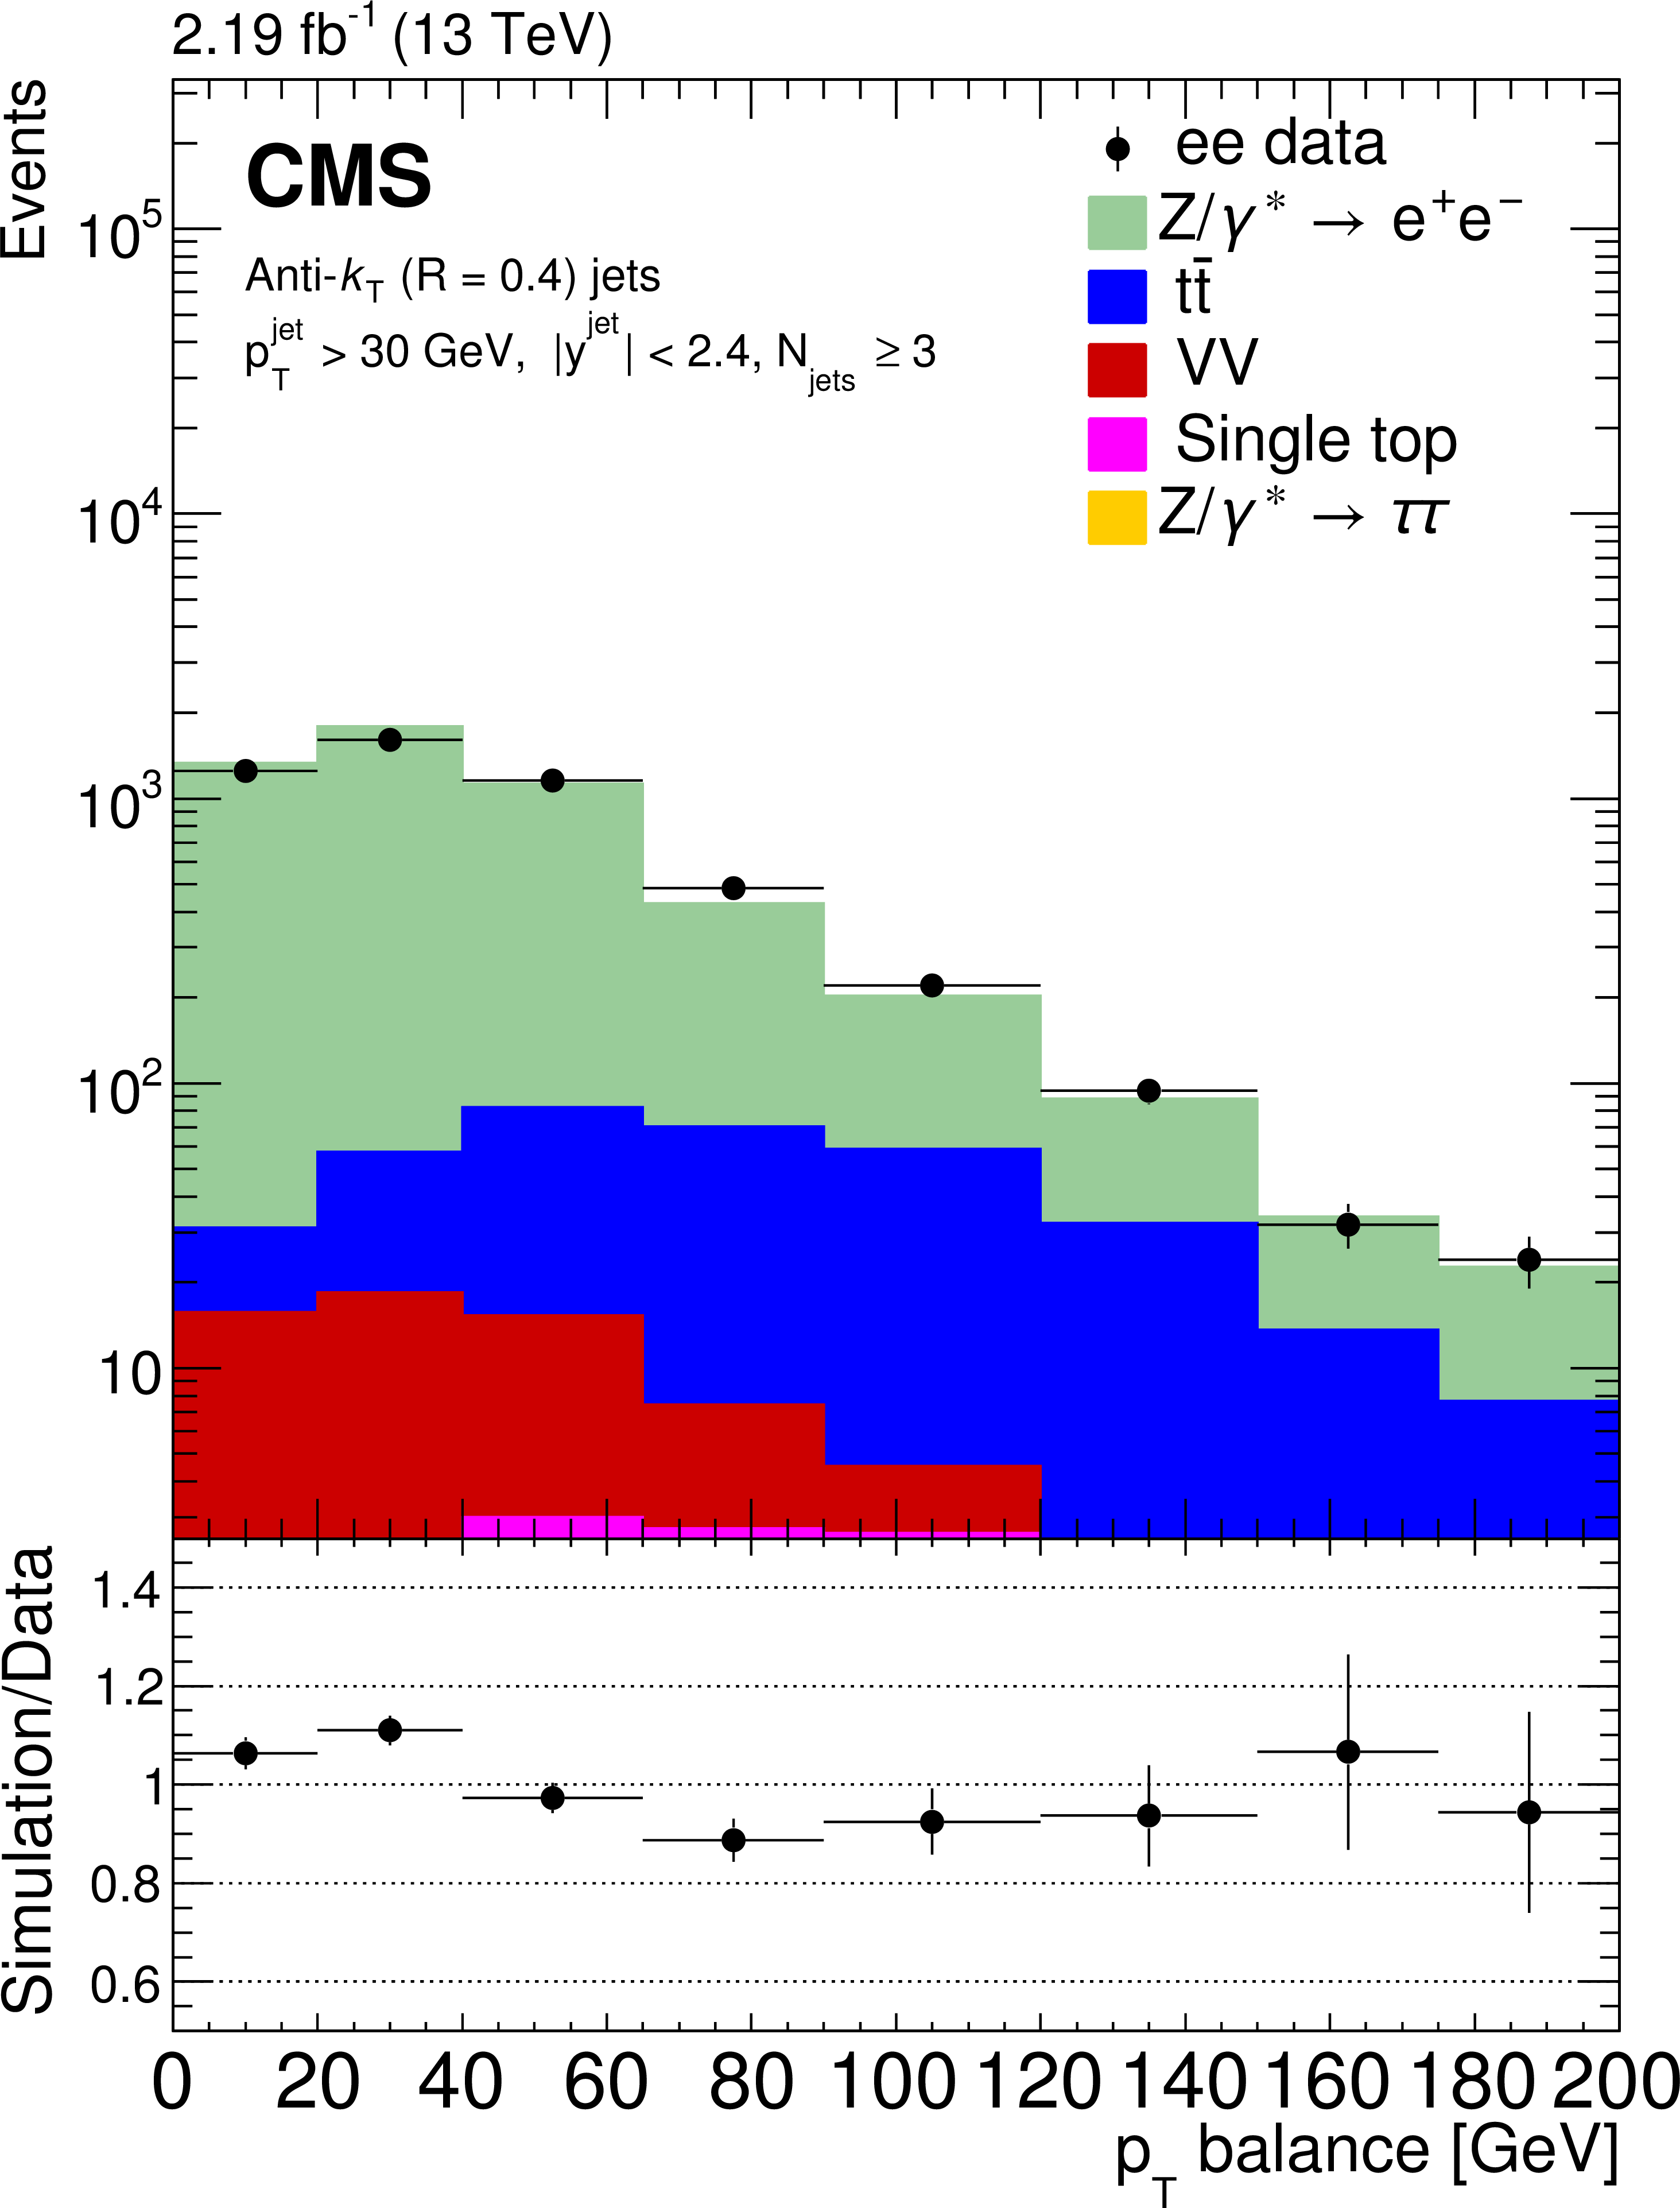
Figure 2:
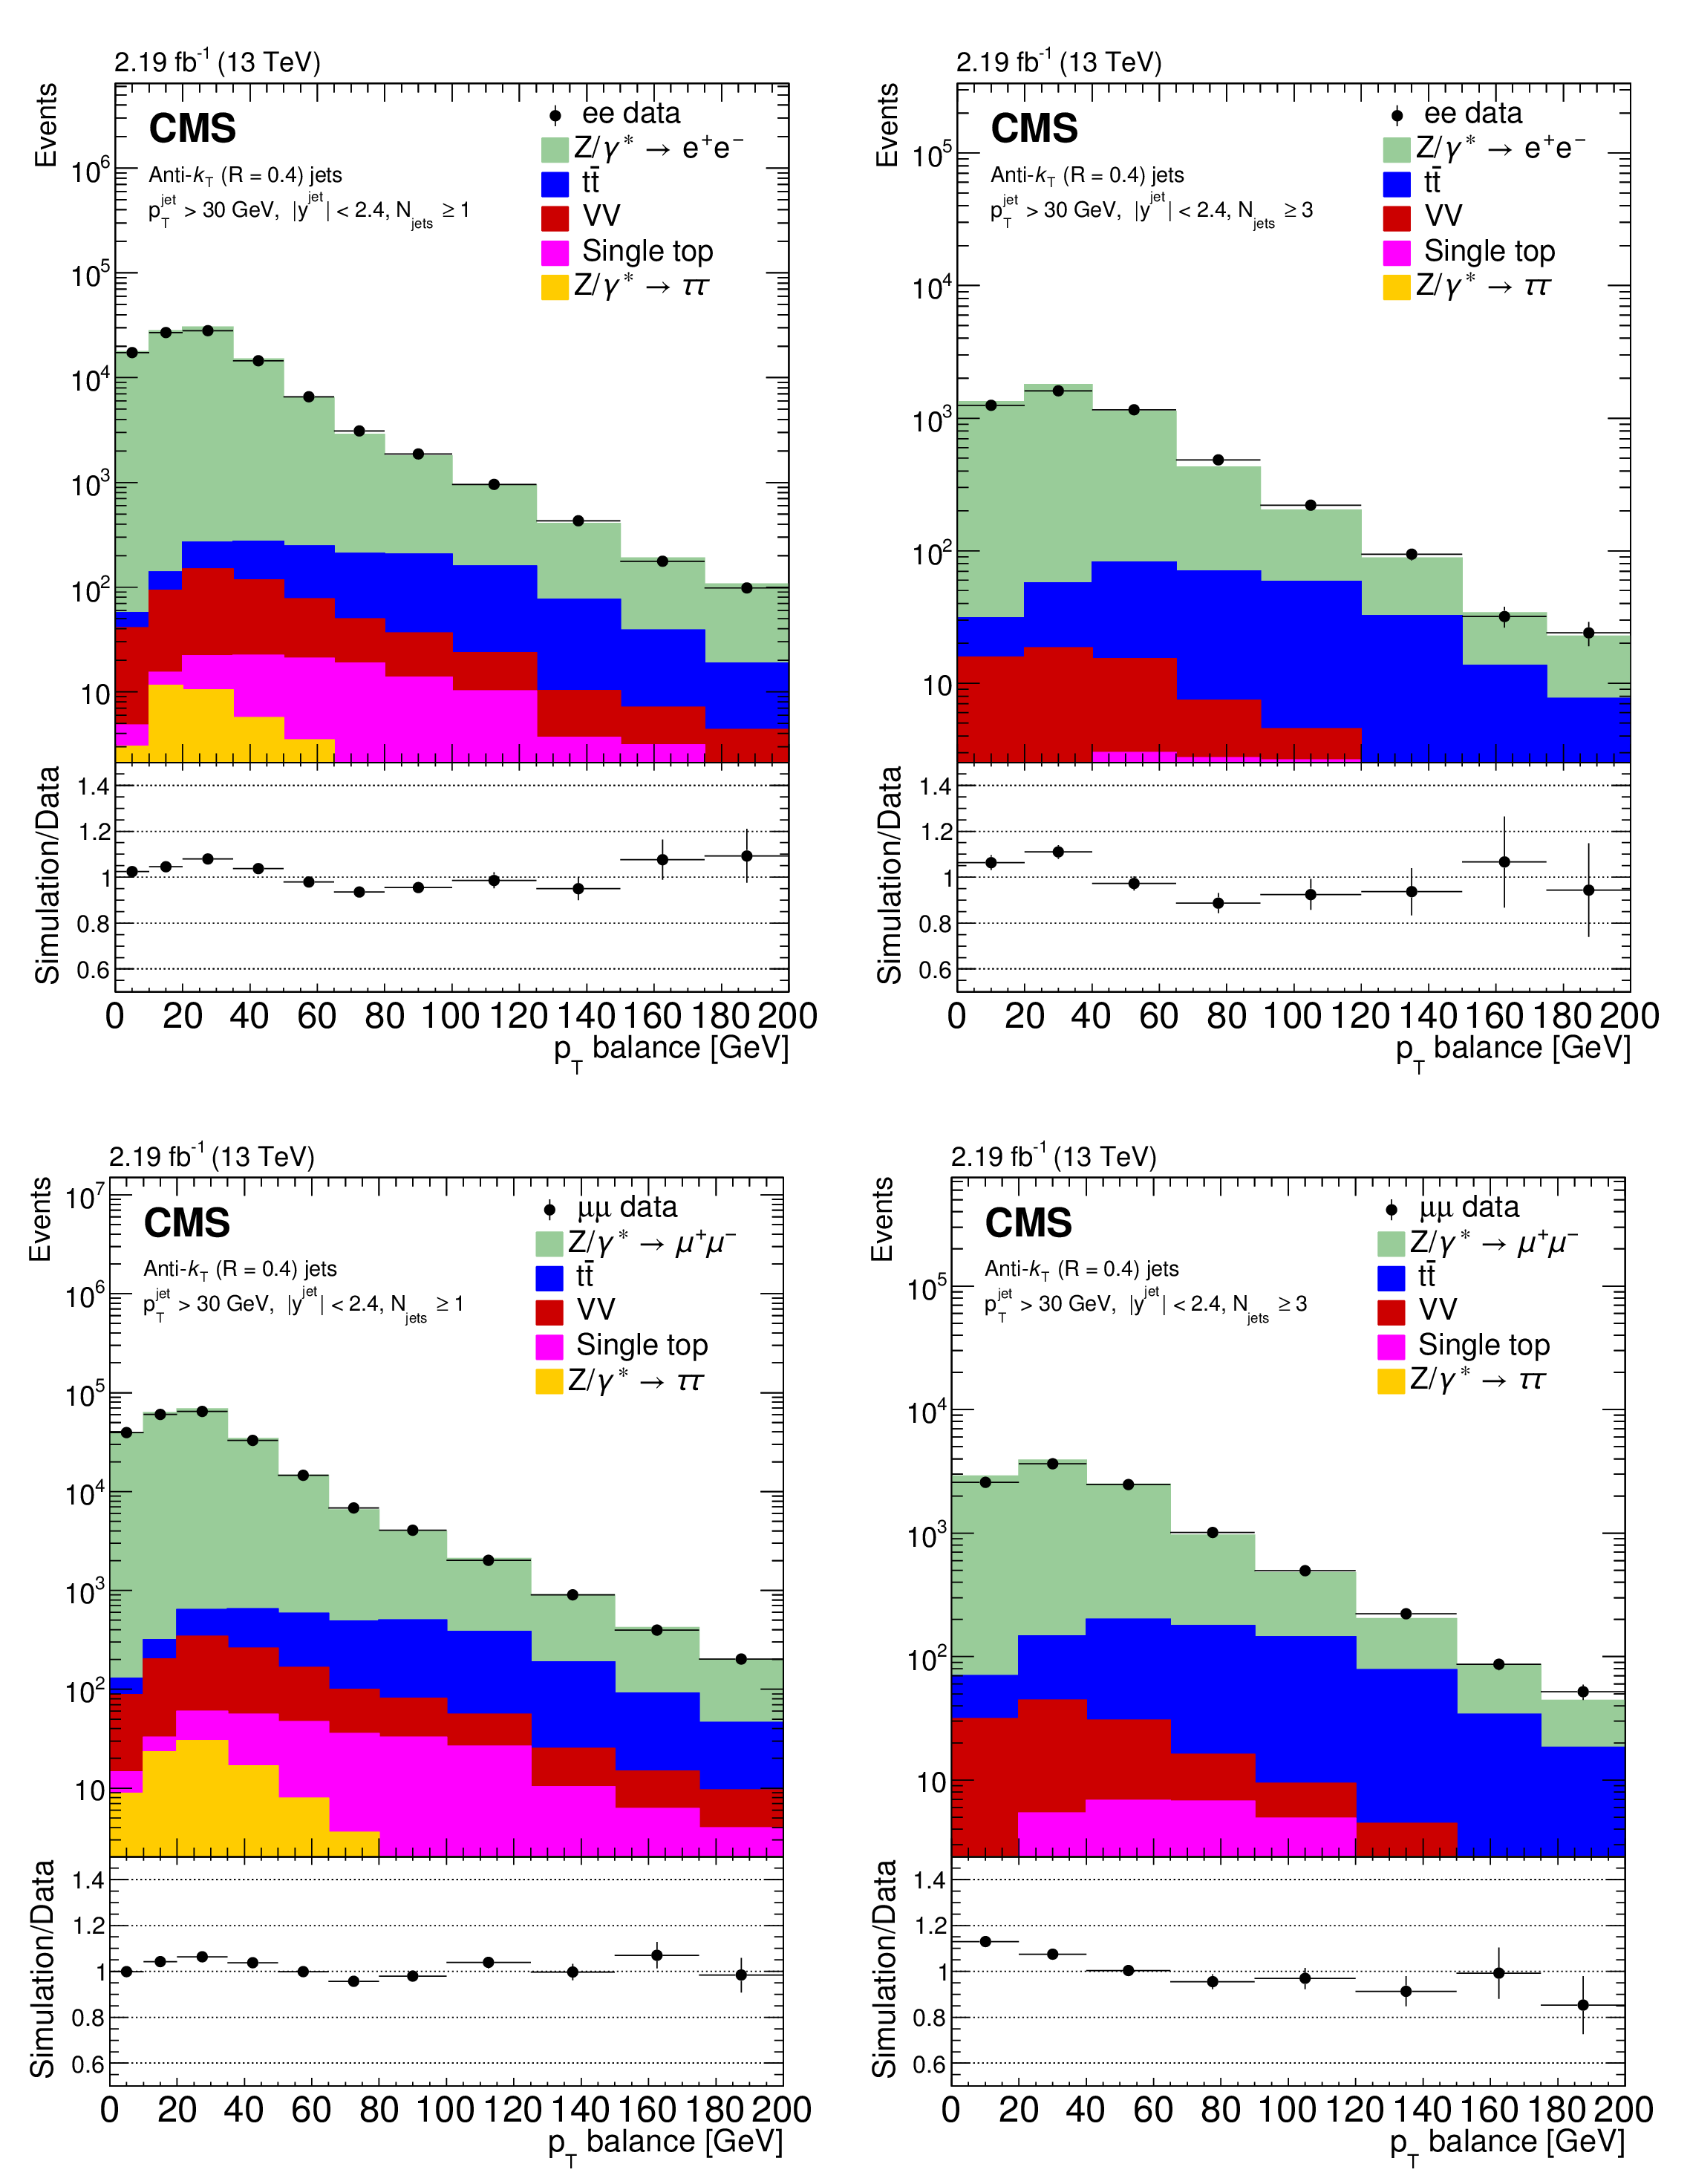
Reconstructed data, simulated signal, and background distributions of the transverse momentum balance between the Z boson and the sum of the jets with at least one jet (left) and three jets (right) for the electron (upper) and muon (lower) channels. The background distributions are obtained from the simulation, except for the $ {\mathrm {t}} {\overline {\mathrm {t}}} $ contribution which is estimated from the data as explained in the text. The error bars correspond to the statistical uncertainty. In the ratio plots, they include both the uncertainties from data and from simulation. The set of generators described in Section 5 has been used for the simulation. |
png pdf |
Figure 2-a:
Reconstructed data, simulated signal, and background distributions of the transverse momentum balance between the Z boson and the sum of the jets with at least one jet for the electron channel. The background distributions are obtained from the simulation, except for the $ {\mathrm {t}} {\overline {\mathrm {t}}} $ contribution which is estimated from the data as explained in the text. The error bars correspond to the statistical uncertainty. In the ratio plot, they include both the uncertainties from data and from simulation. The set of generators described in Section 5 has been used for the simulation. |
png pdf |
Figure 2-b:
Reconstructed data, simulated signal, and background distributions of the transverse momentum balance between the Z boson and the sum of the jets with at least three jets for the electron channel. The background distributions are obtained from the simulation, except for the $ {\mathrm {t}} {\overline {\mathrm {t}}} $ contribution which is estimated from the data as explained in the text. The error bars correspond to the statistical uncertainty. In the ratio plot, they include both the uncertainties from data and from simulation. The set of generators described in Section 5 has been used for the simulation. |

png pdf |
Figure 2-c:
Reconstructed data, simulated signal, and background distributions of the transverse momentum balance between the Z boson and the sum of the jets with at least one jet for the muon channel. The background distributions are obtained from the simulation, except for the $ {\mathrm {t}} {\overline {\mathrm {t}}} $ contribution which is estimated from the data as explained in the text. The error bars correspond to the statistical uncertainty. In the ratio plot, they include both the uncertainties from data and from simulation. The set of generators described in Section 5 has been used for the simulation. |

png pdf |
Figure 2-d:
Reconstructed data, simulated signal, and background distributions of the transverse momentum balance between the Z boson and the sum of the jets with at least three jets for the muon channel. The background distributions are obtained from the simulation, except for the $ {\mathrm {t}} {\overline {\mathrm {t}}} $ contribution which is estimated from the data as explained in the text. The error bars correspond to the statistical uncertainty. In the ratio plot, they include both the uncertainties from data and from simulation. The set of generators described in Section 5 has been used for the simulation. |
png pdf |
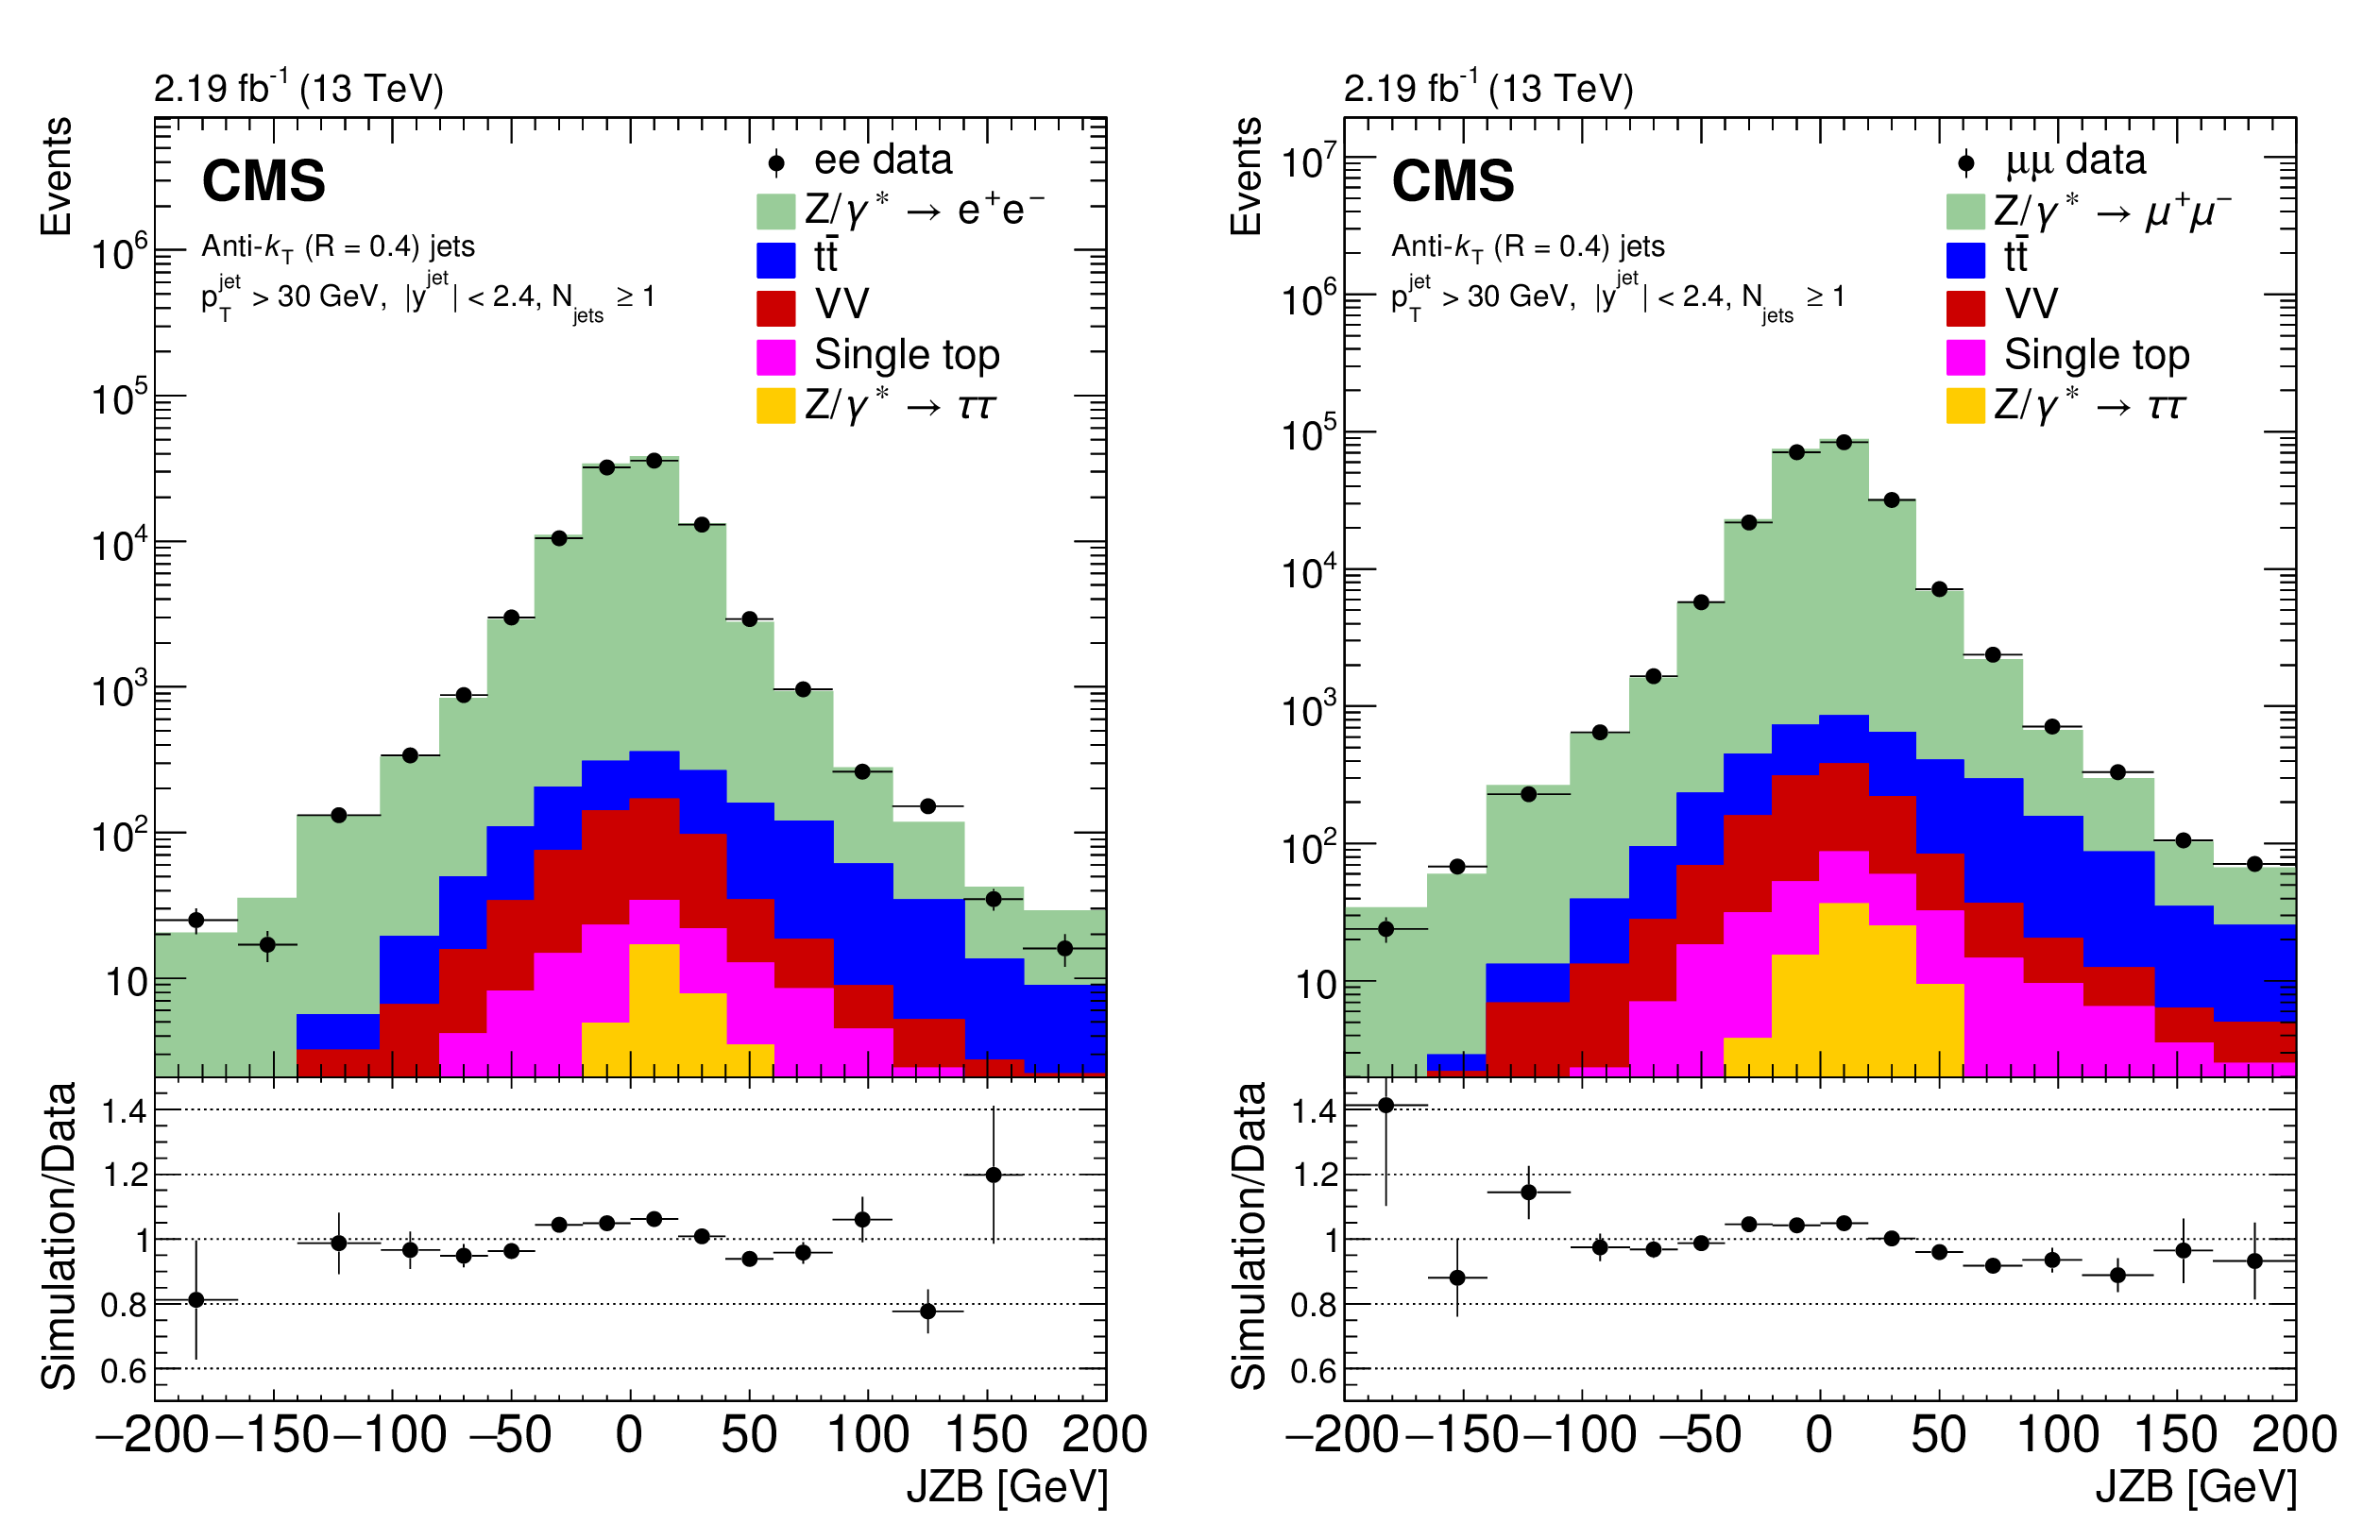
Figure 3:
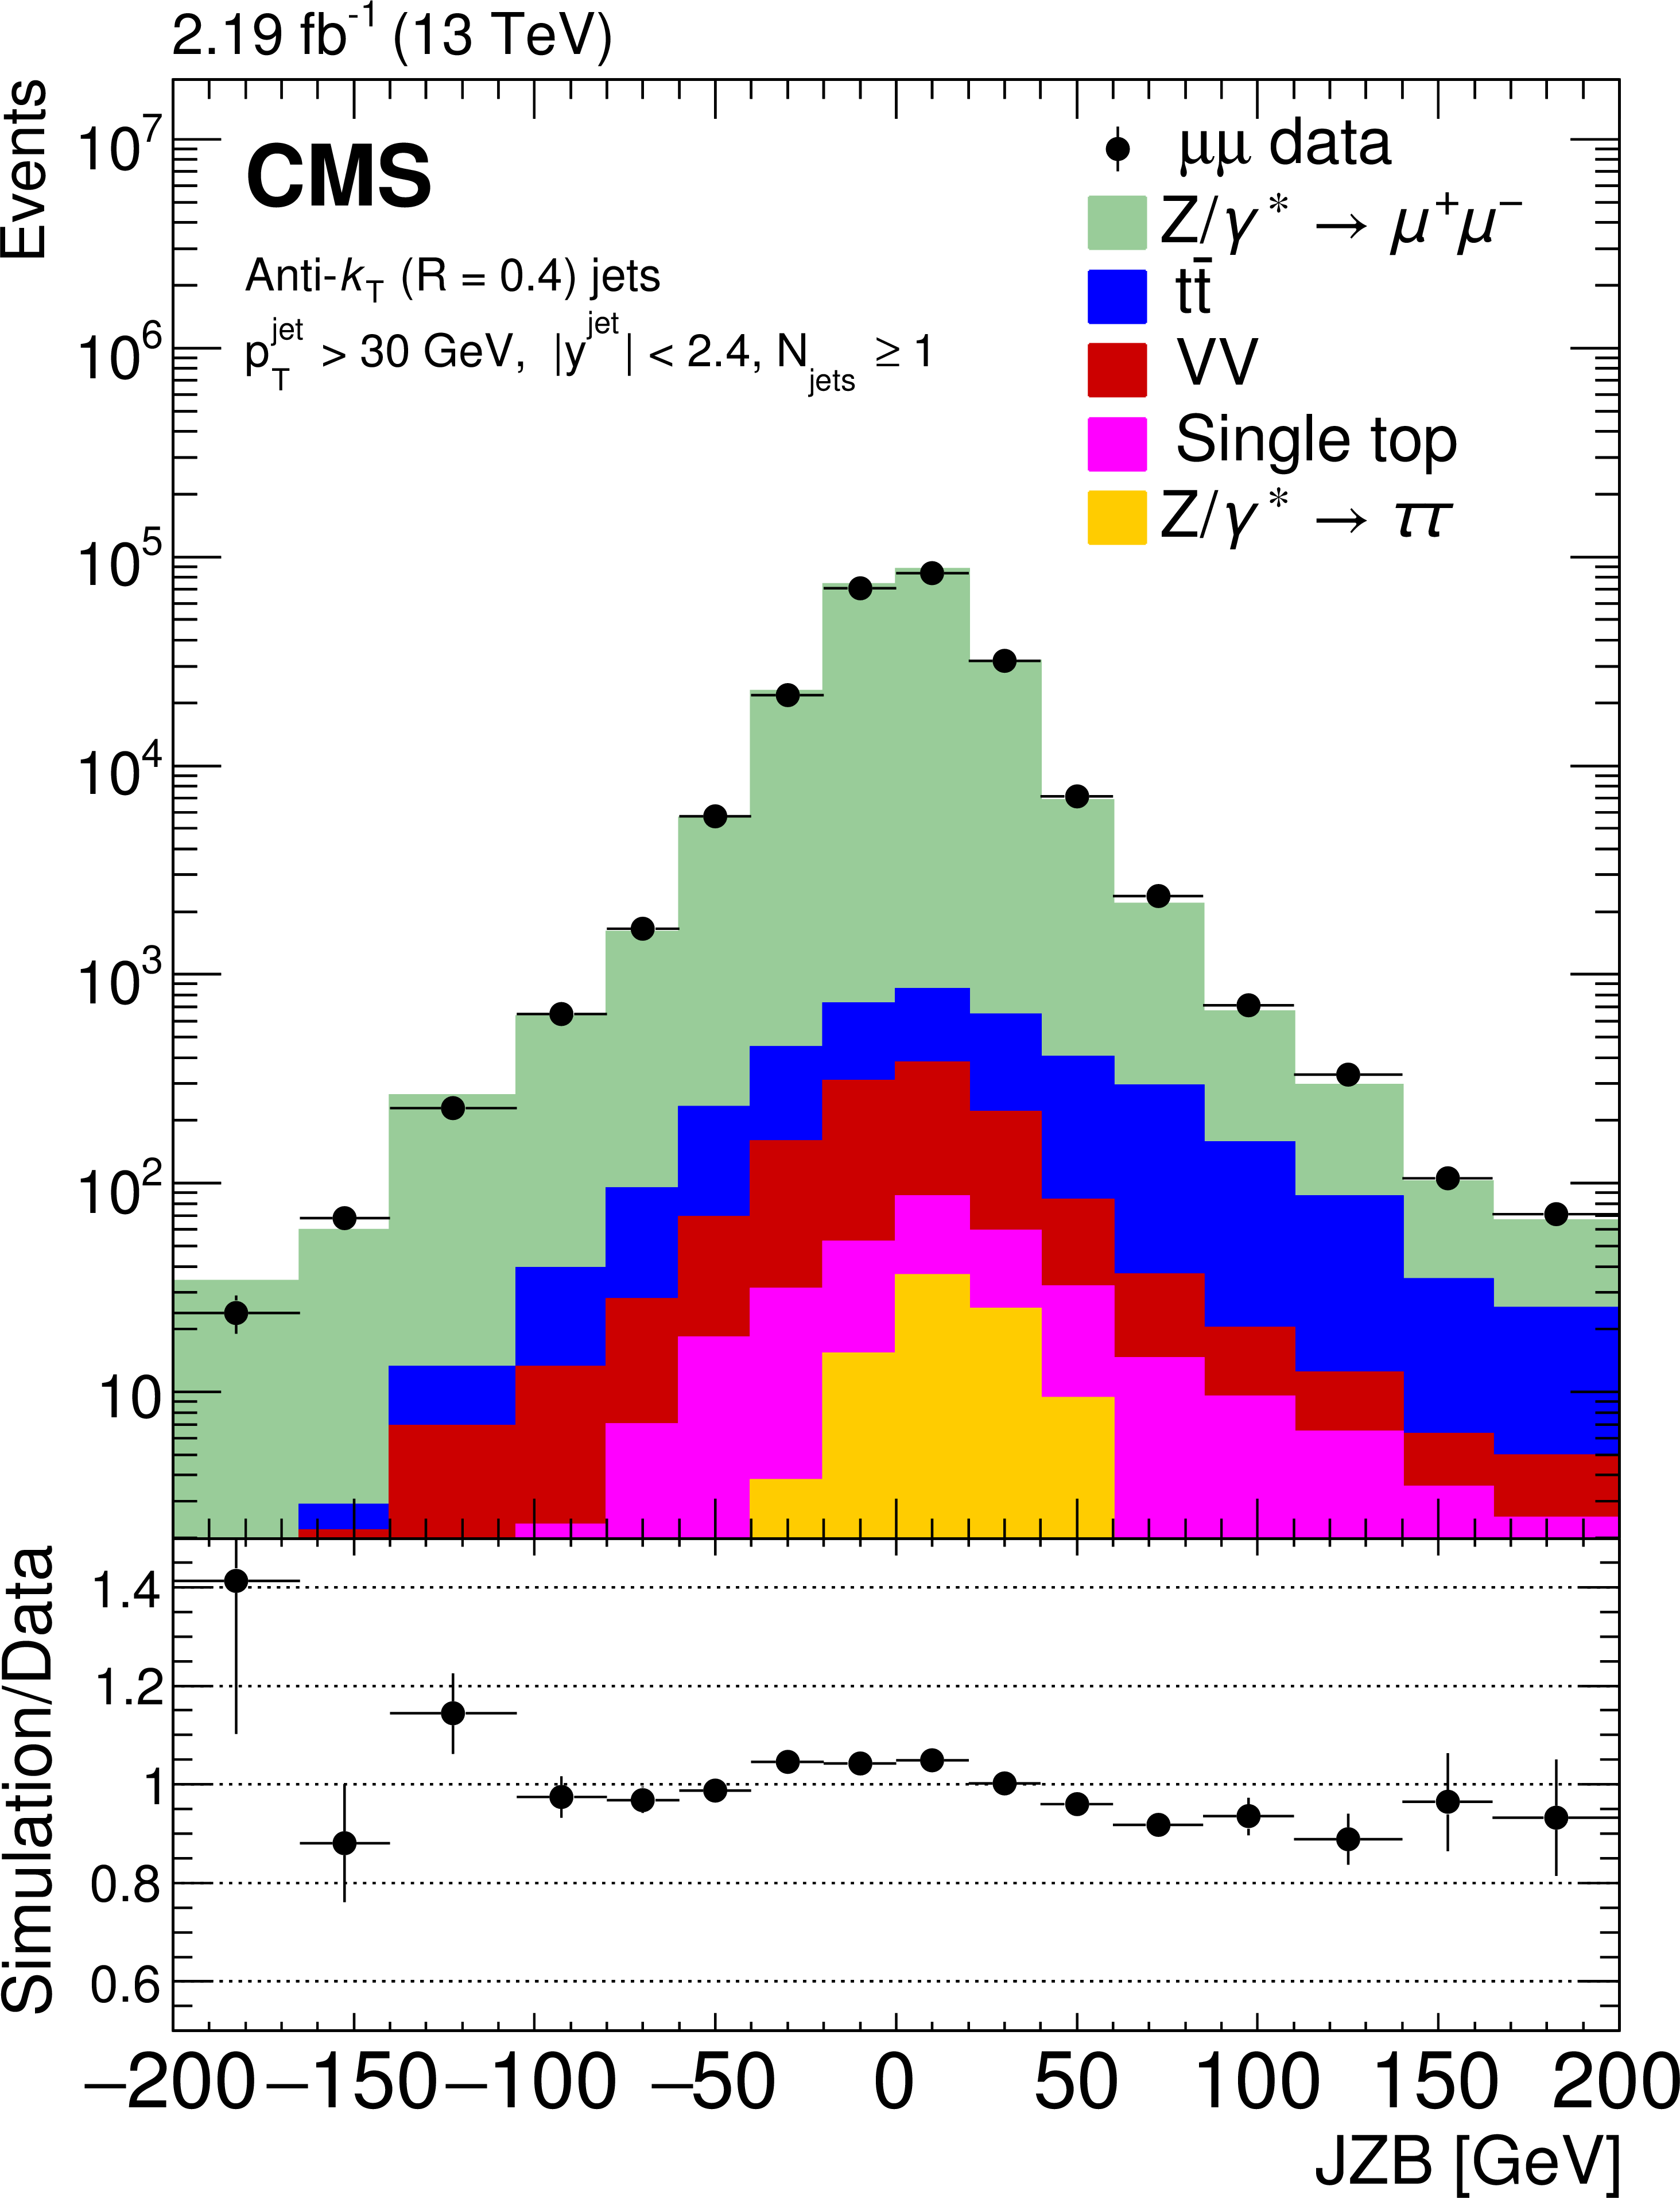
Reconstructed data, simulated signal, and background distributions of the JZB variable for the electron (left) and muon (right) channels. The background distributions are obtained from the simulation, except for the $ {\mathrm {t}} {\overline {\mathrm {t}}} $ contribution which is estimated from the data as explained in the text. The error bars correspond to the statistical uncertainty. In the ratio plots, they include both the uncertainties from data and from simulation. The set of generators described in Section 5 has been used for the simulation. |
png pdf |
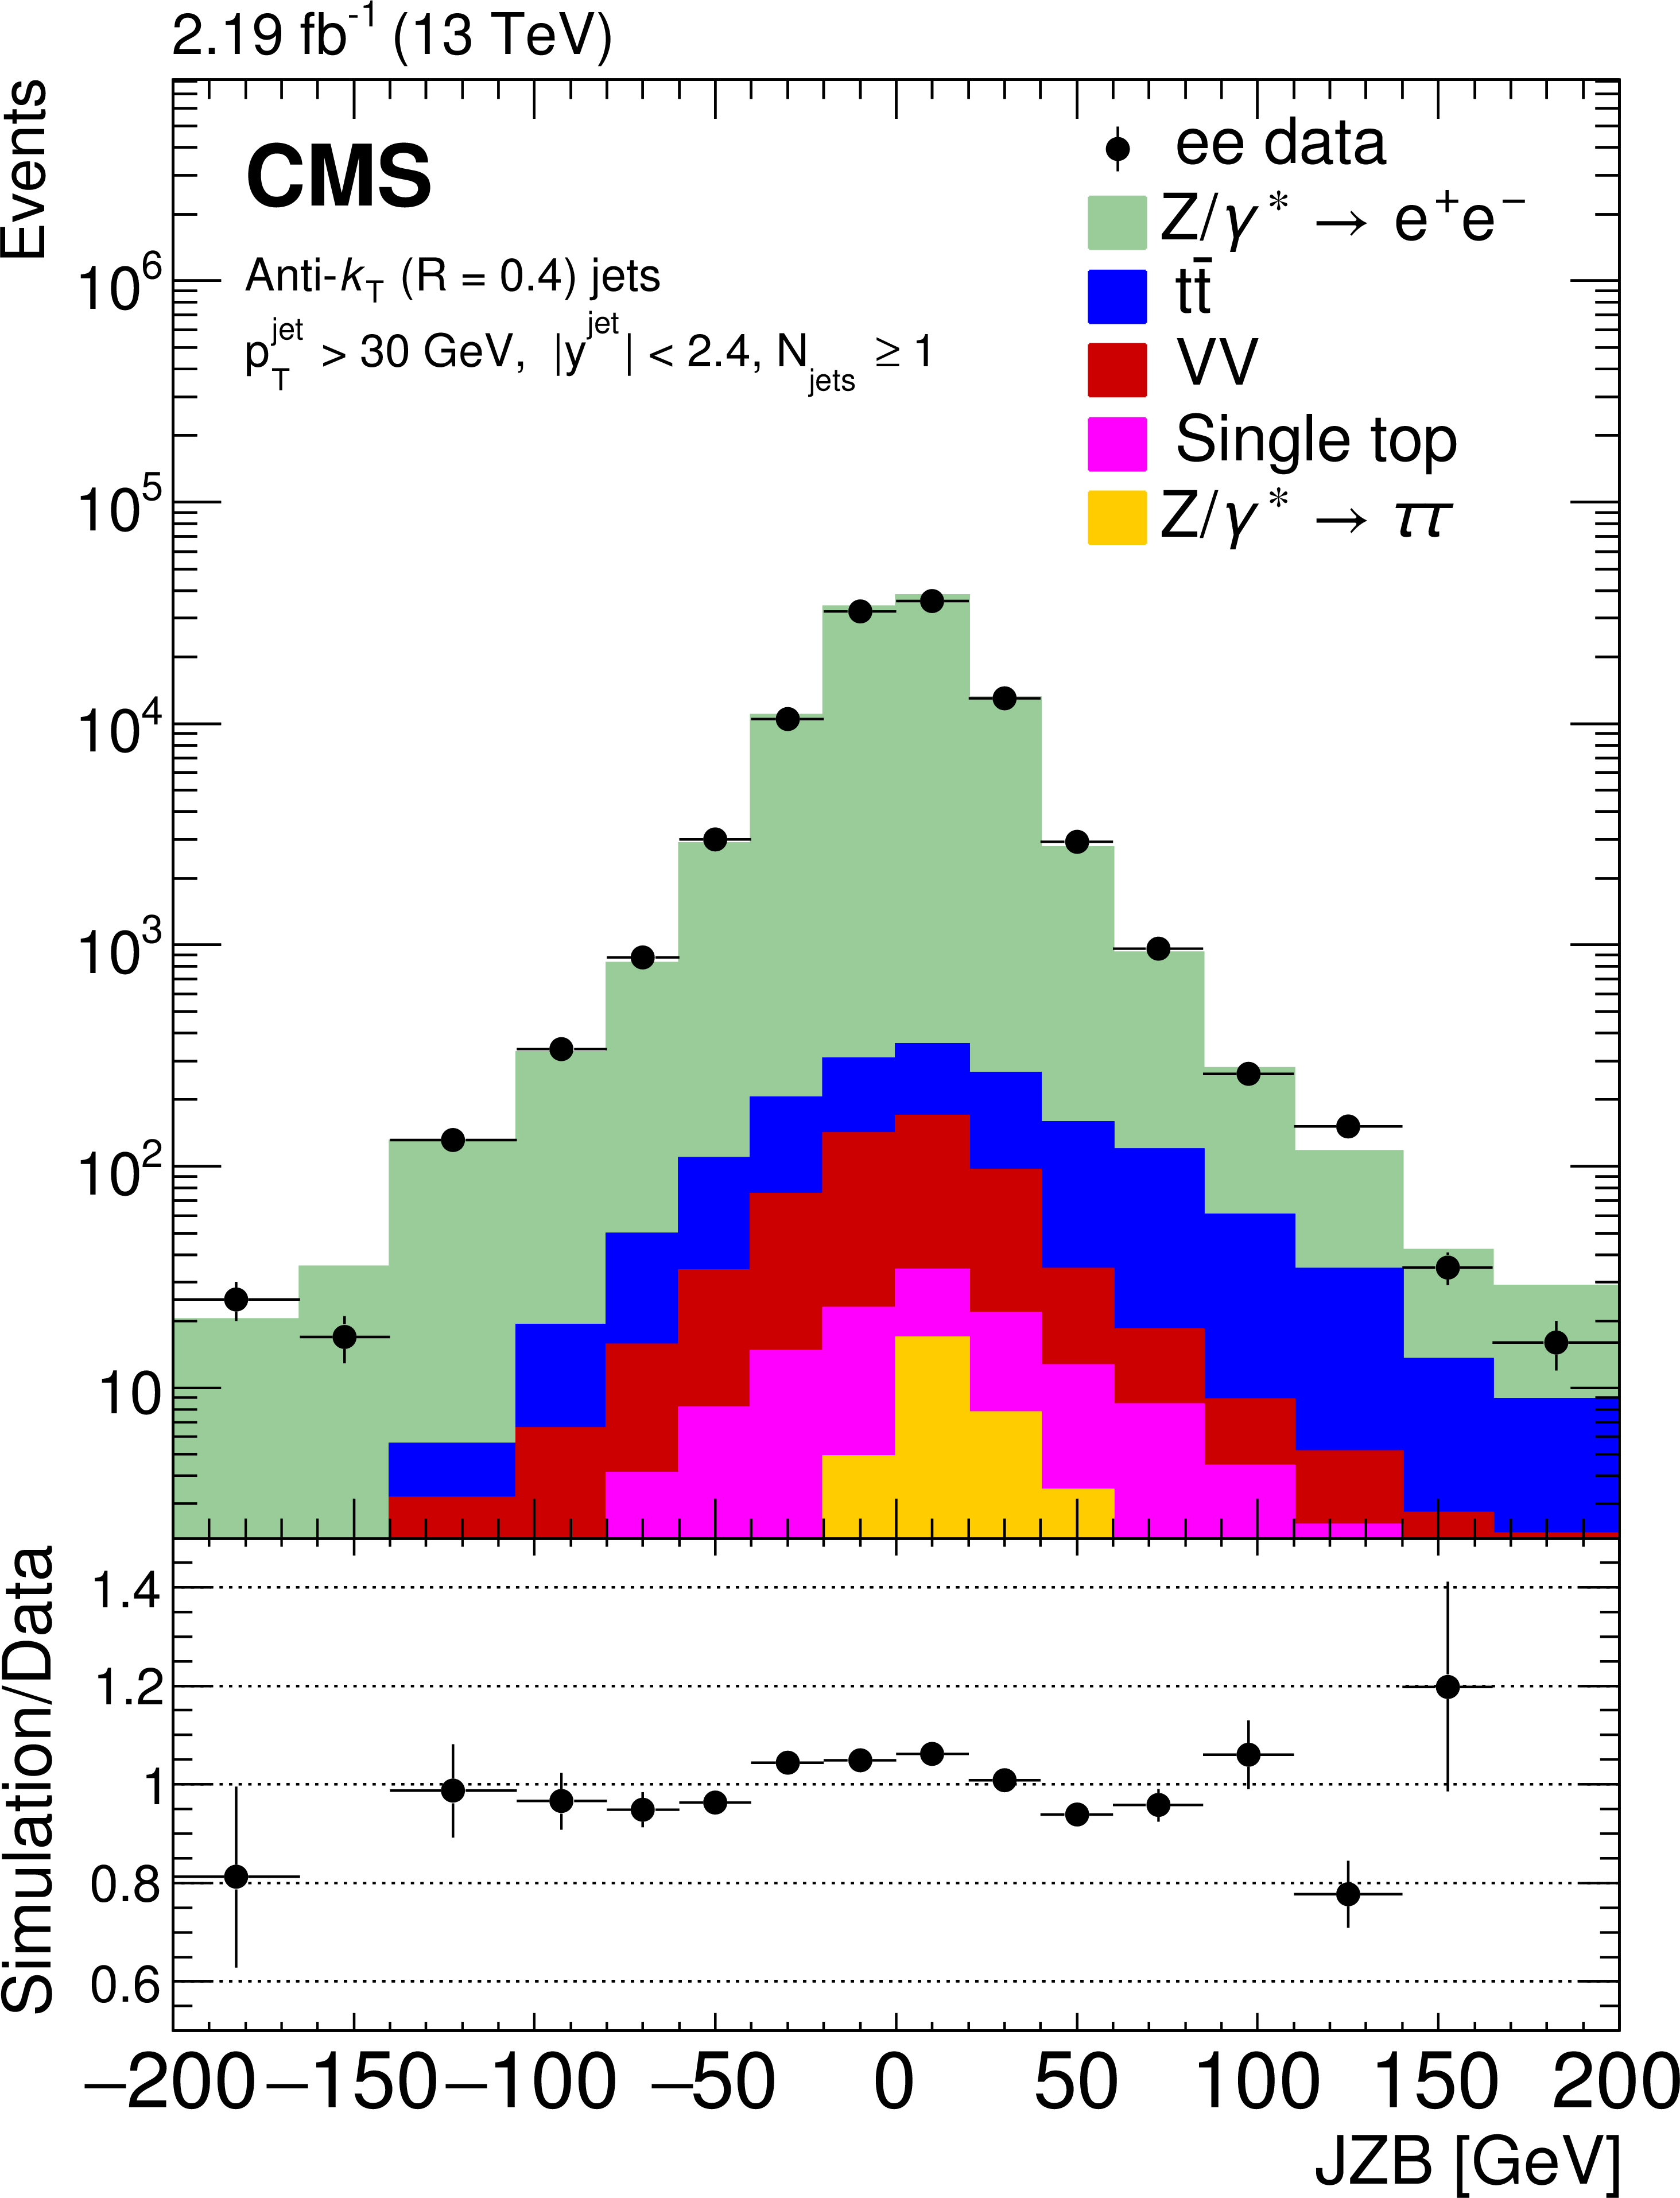
Figure 3-a:
Reconstructed data, simulated signal, and background distributions of the JZB variable for the electron channel. The background distributions are obtained from the simulation, except for the $ {\mathrm {t}} {\overline {\mathrm {t}}} $ contribution which is estimated from the data as explained in the text. The error bars correspond to the statistical uncertainty. In the ratio plot, they include both the uncertainties from data and from simulation. The set of generators described in Section 5 has been used for the simulation. |
png pdf |
Figure 3-b:
Reconstructed data, simulated signal, and background distributions of the JZB variable for the muon channel. The background distributions are obtained from the simulation, except for the $ {\mathrm {t}} {\overline {\mathrm {t}}} $ contribution which is estimated from the data as explained in the text. The error bars correspond to the statistical uncertainty. In the ratio plot, they include both the uncertainties from data and from simulation. The set of generators described in Section 5 has been used for the simulation. |
png pdf |
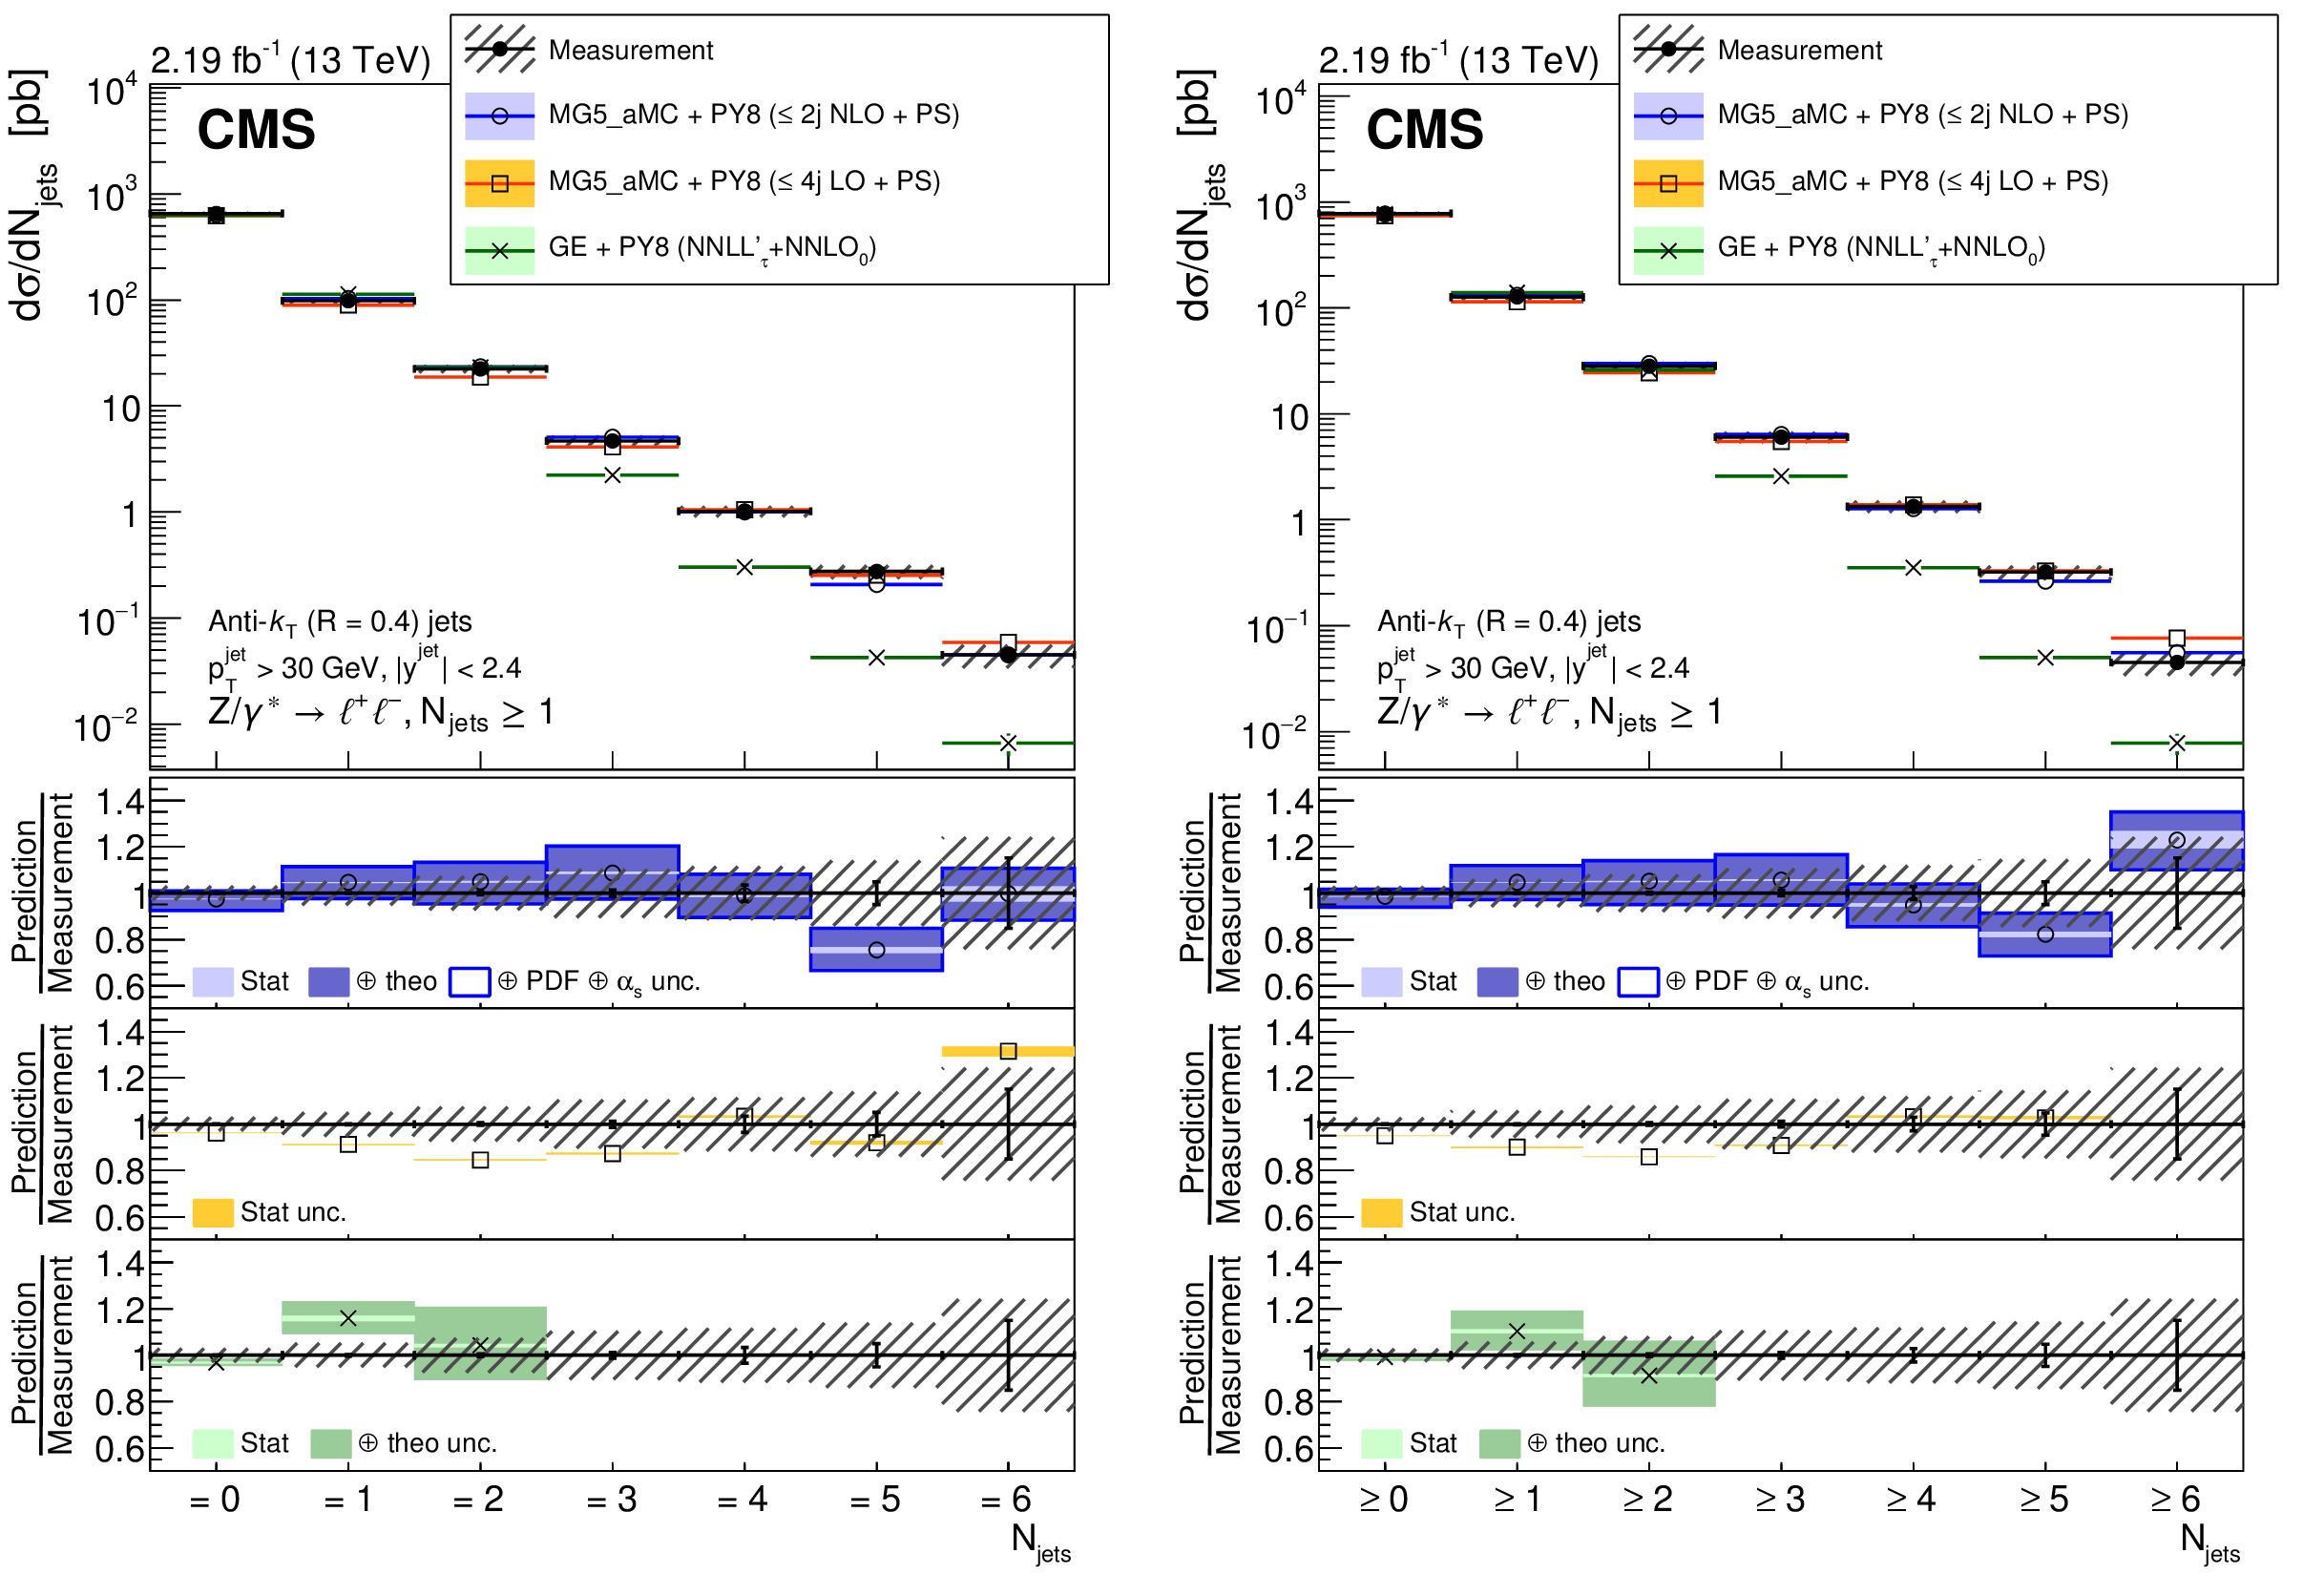
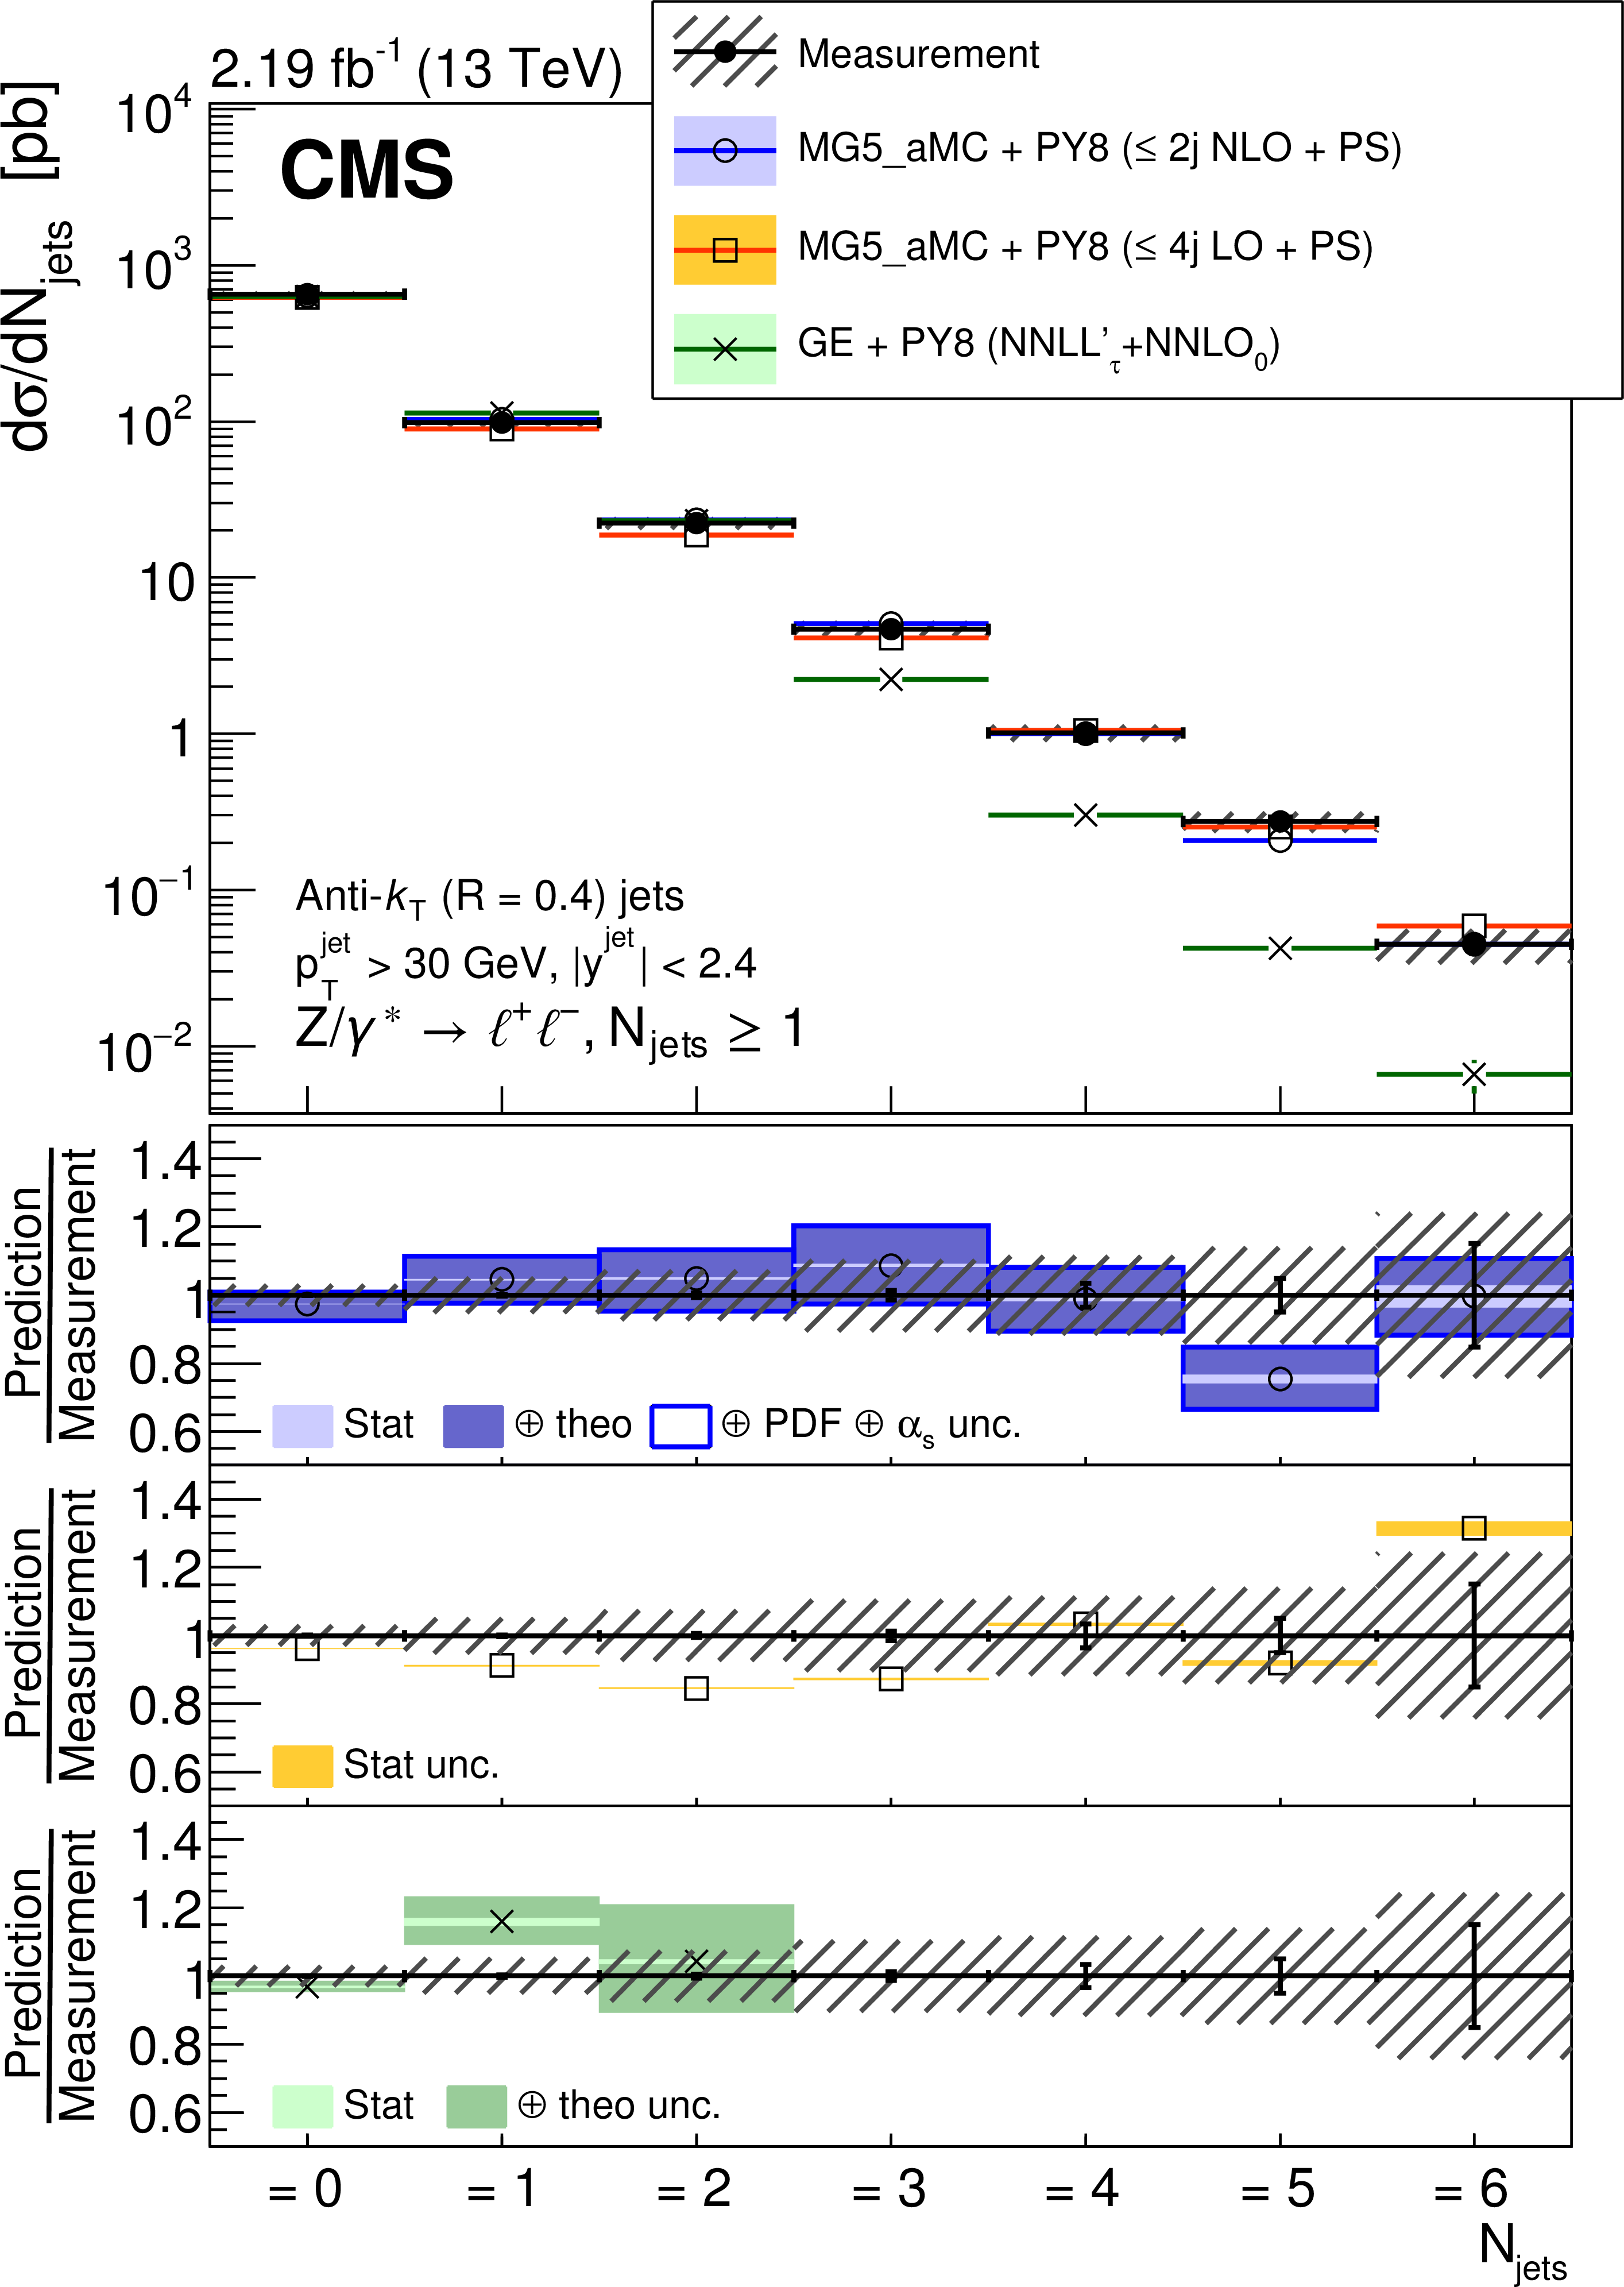
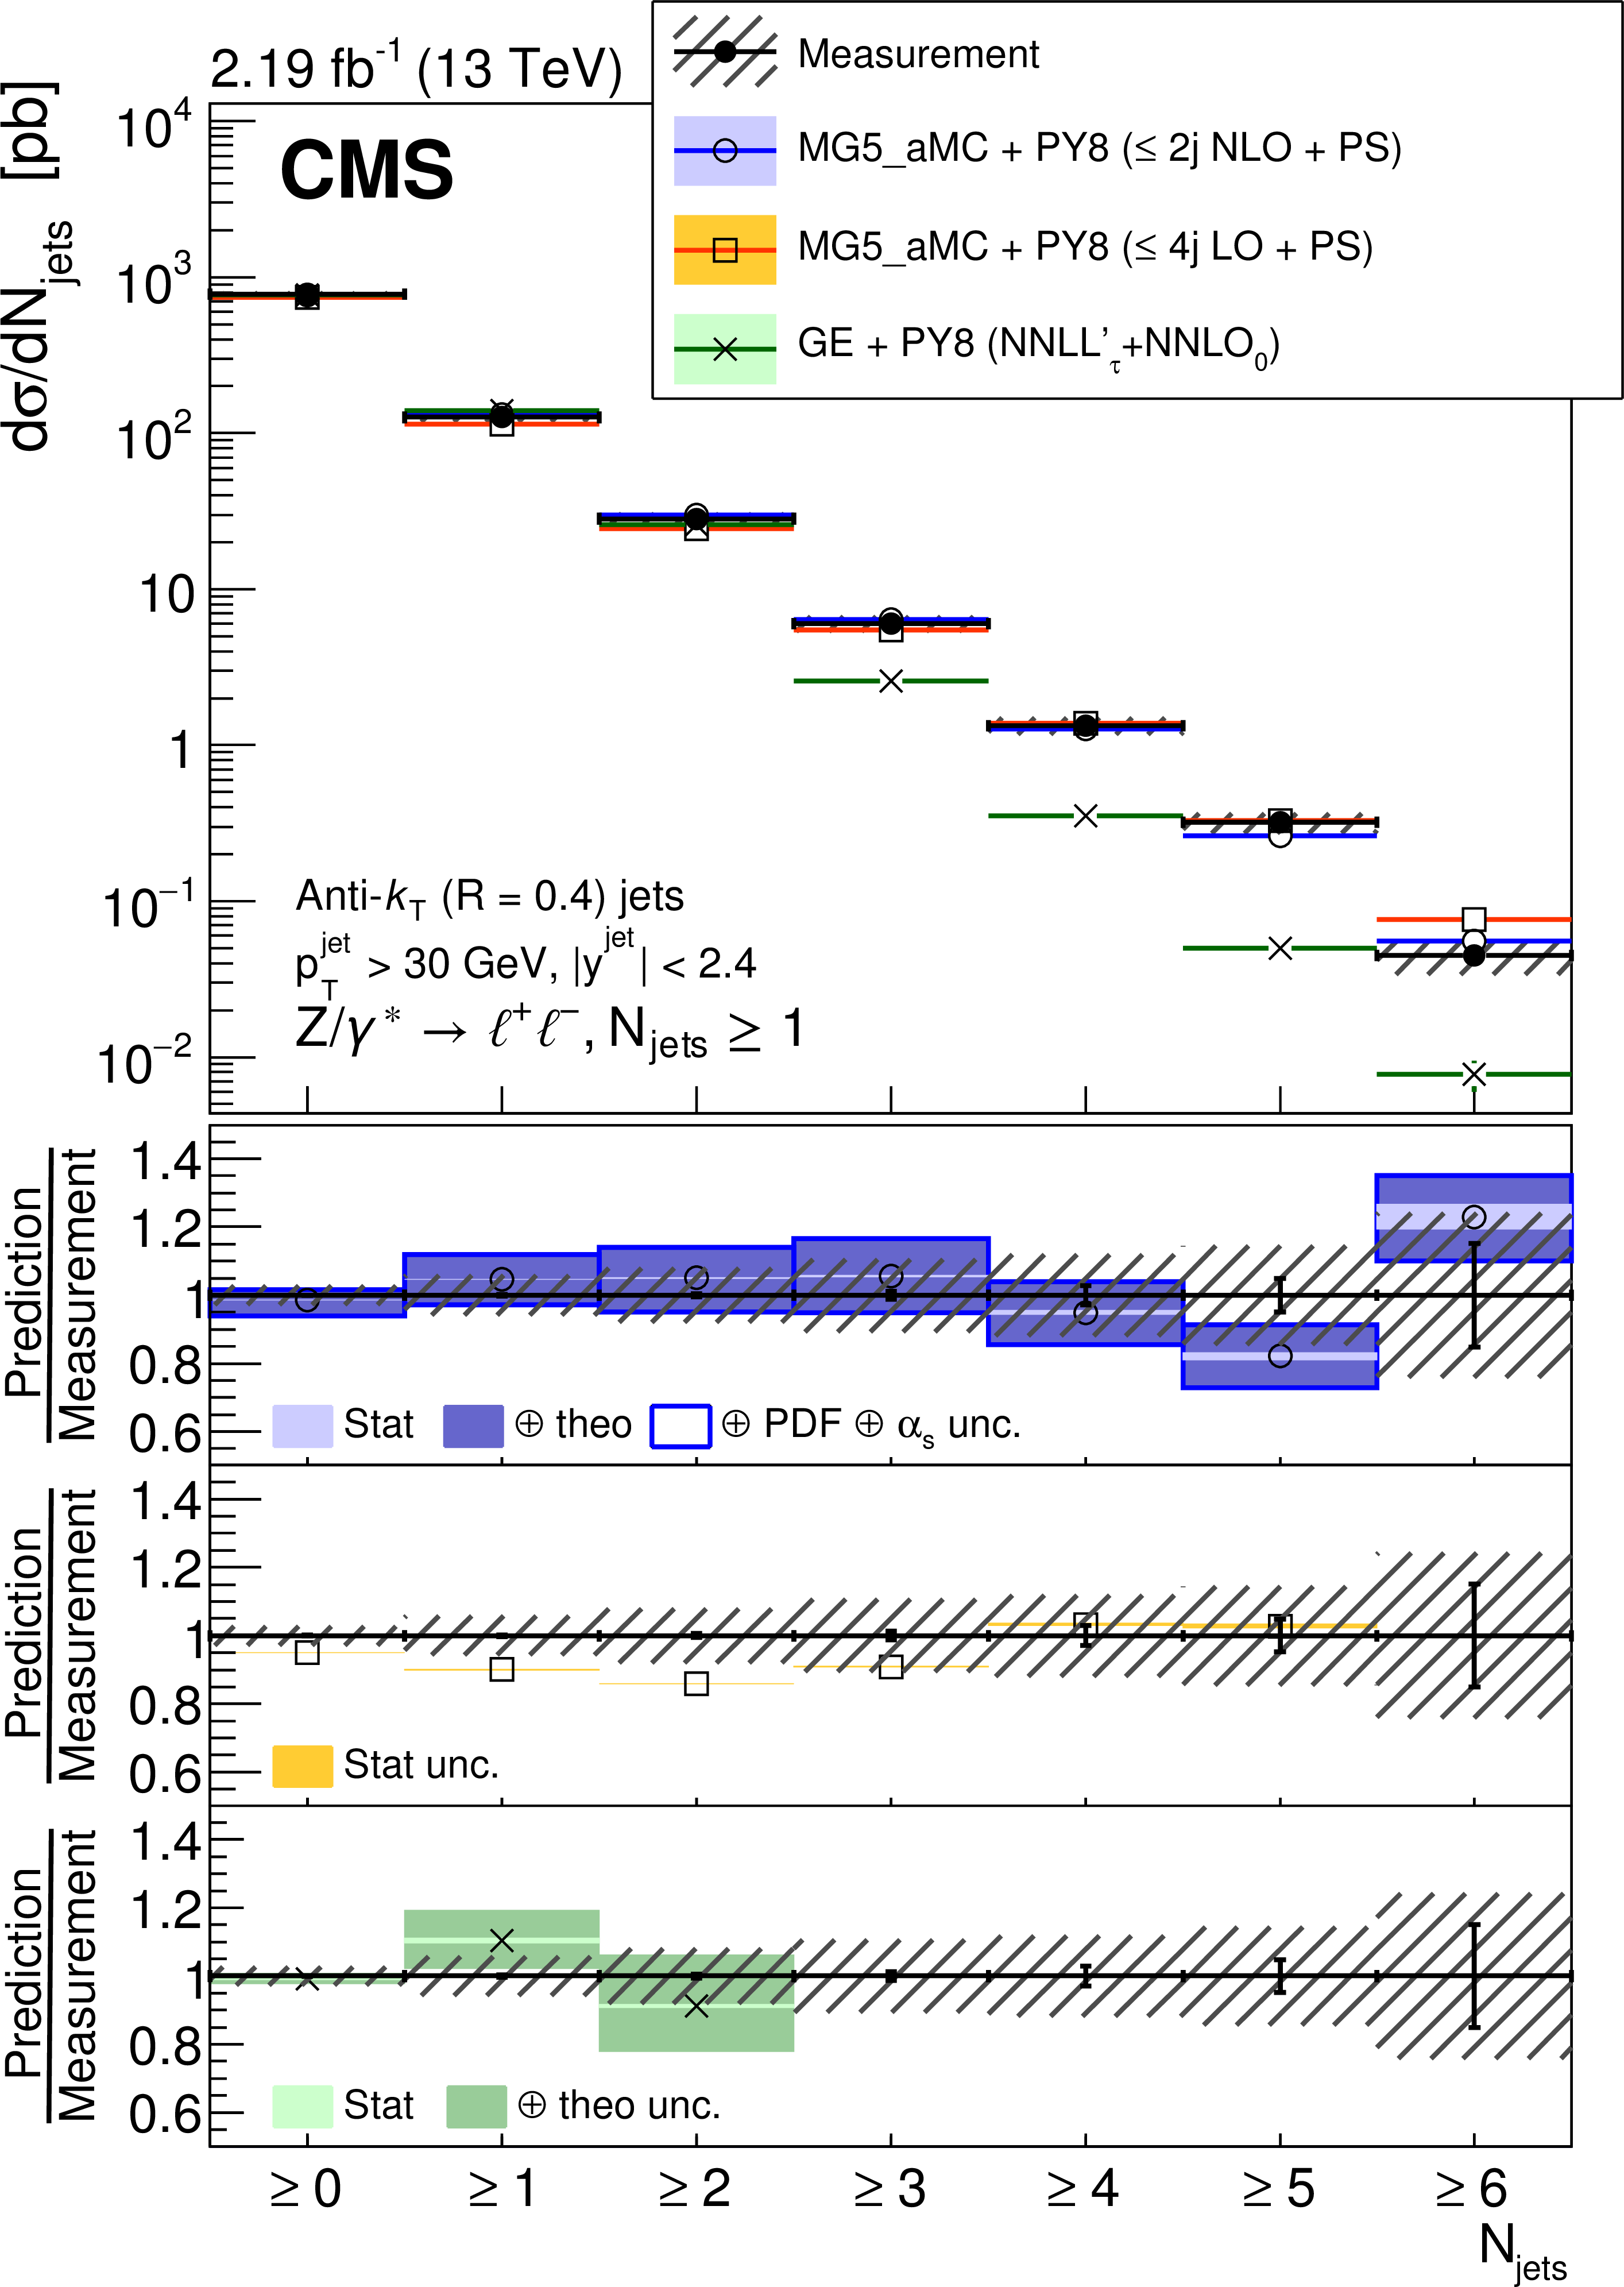
Figure 4:
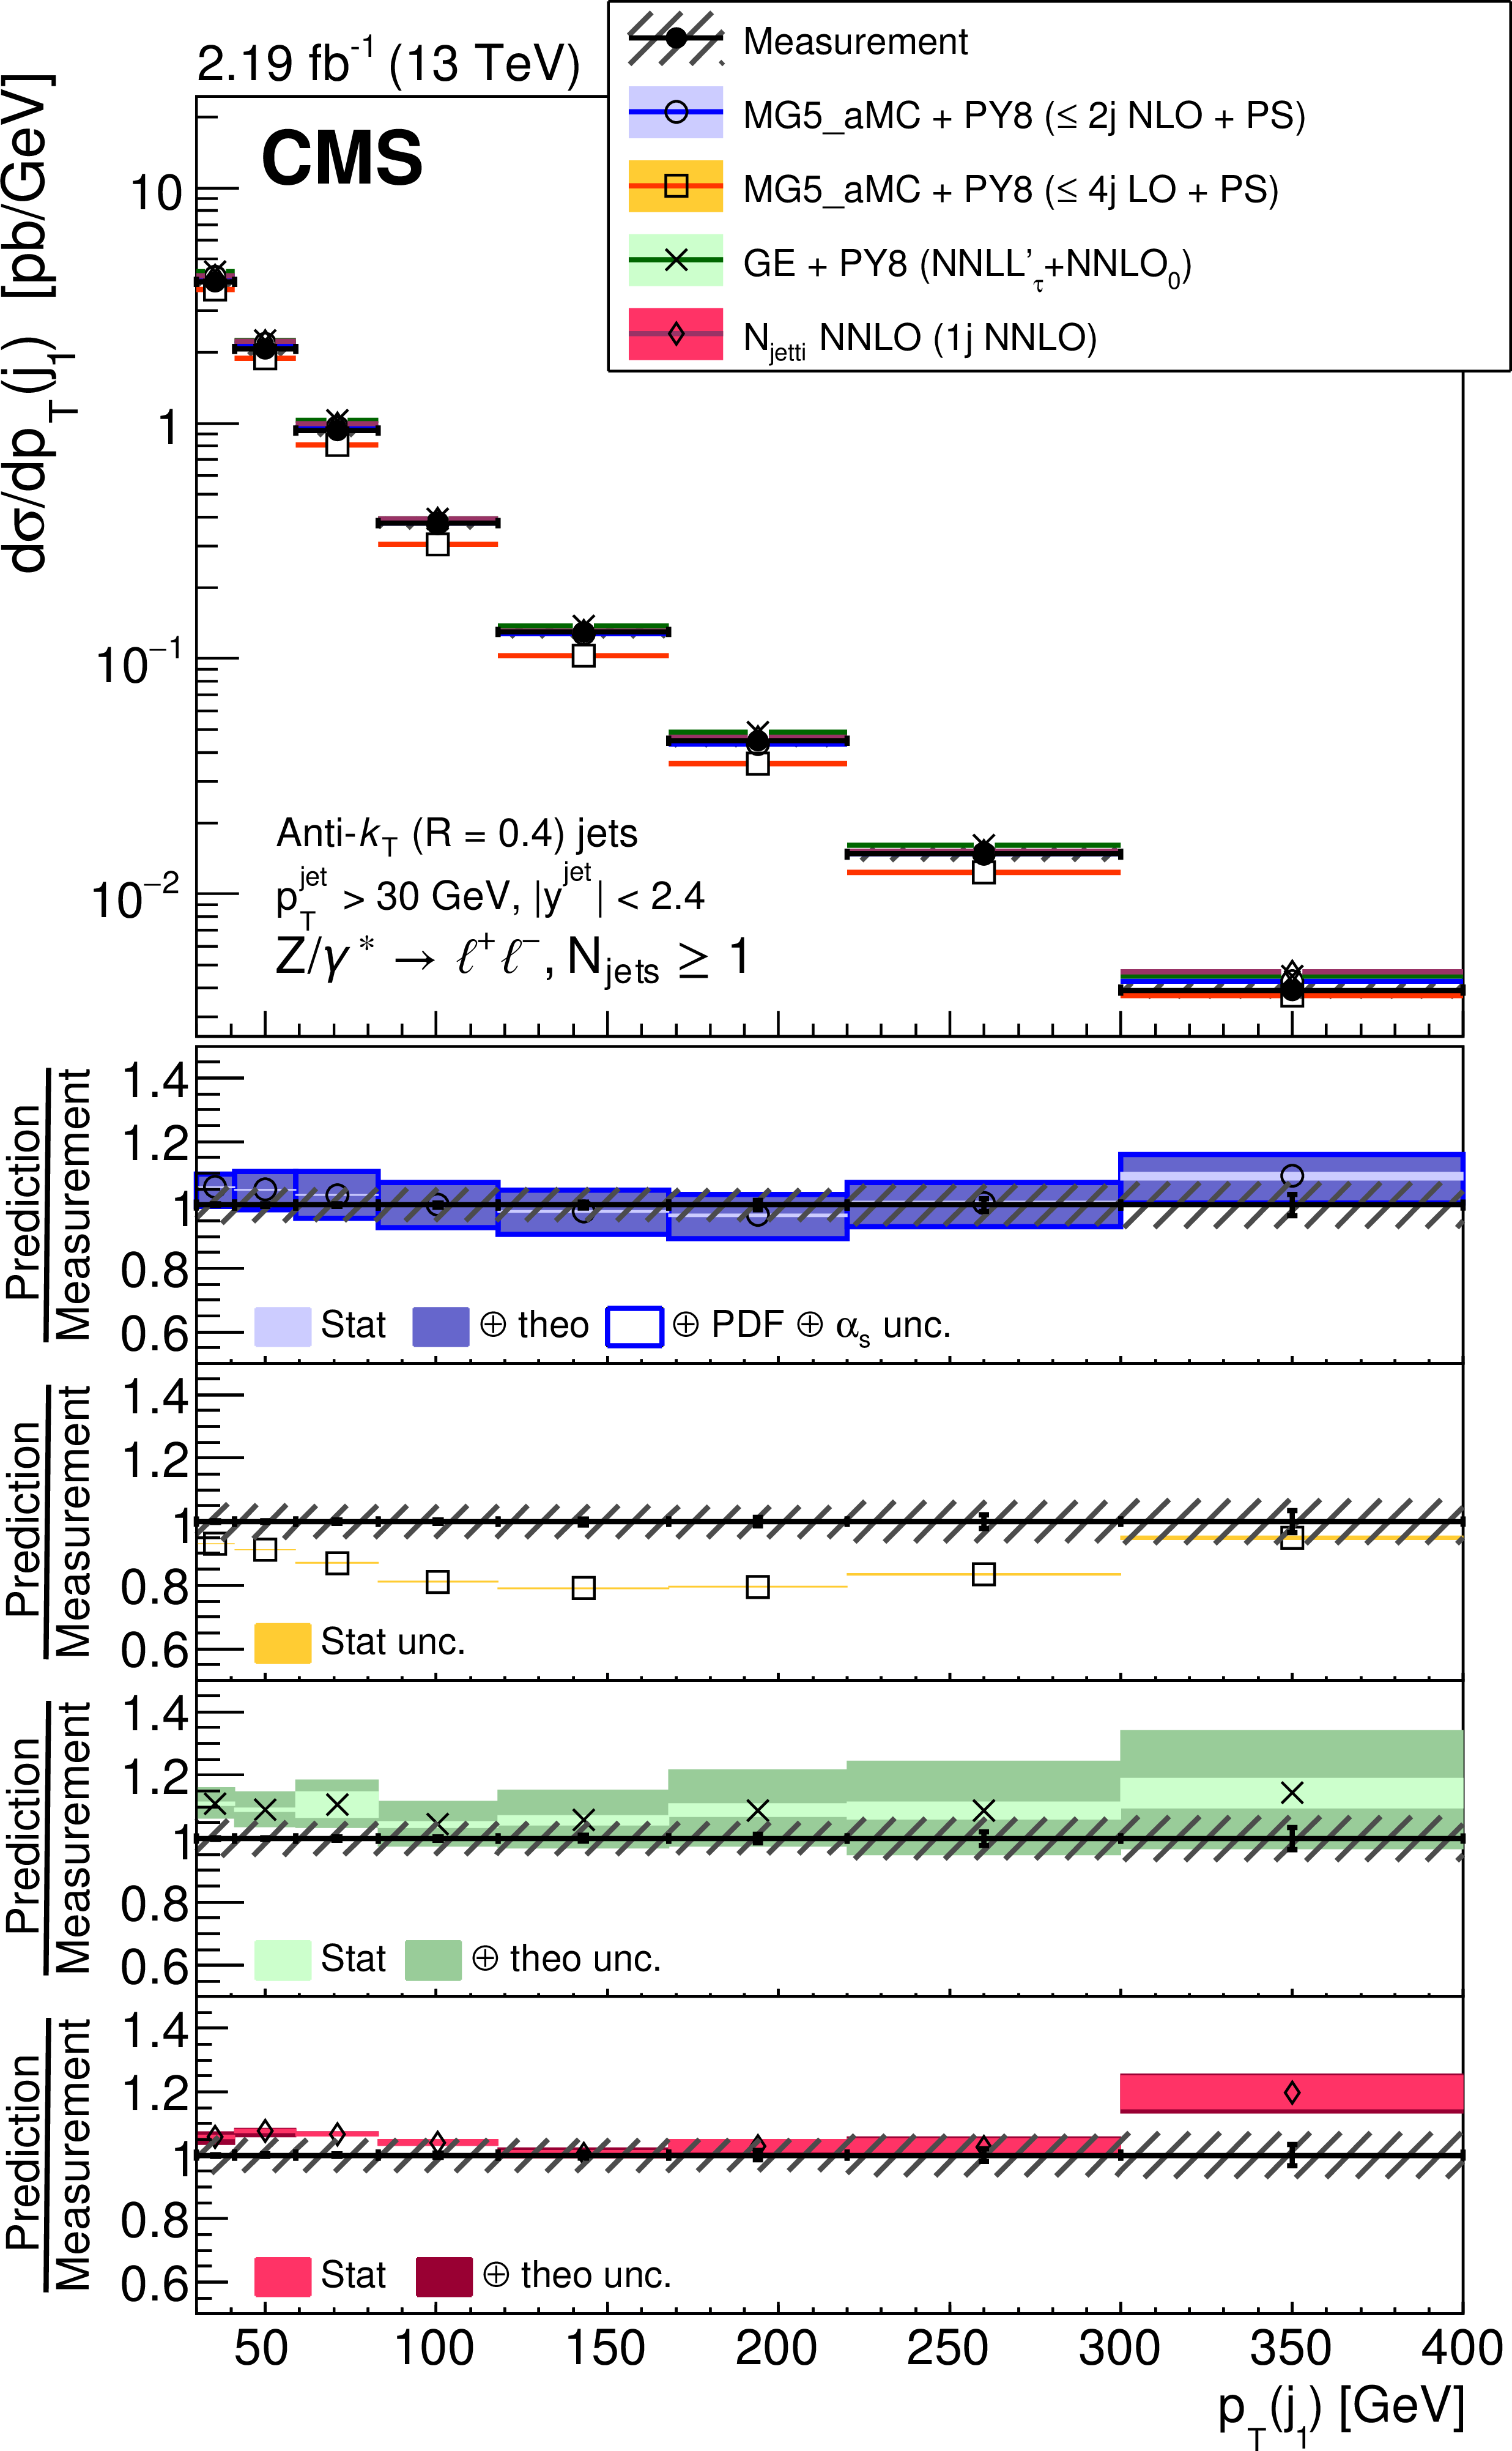
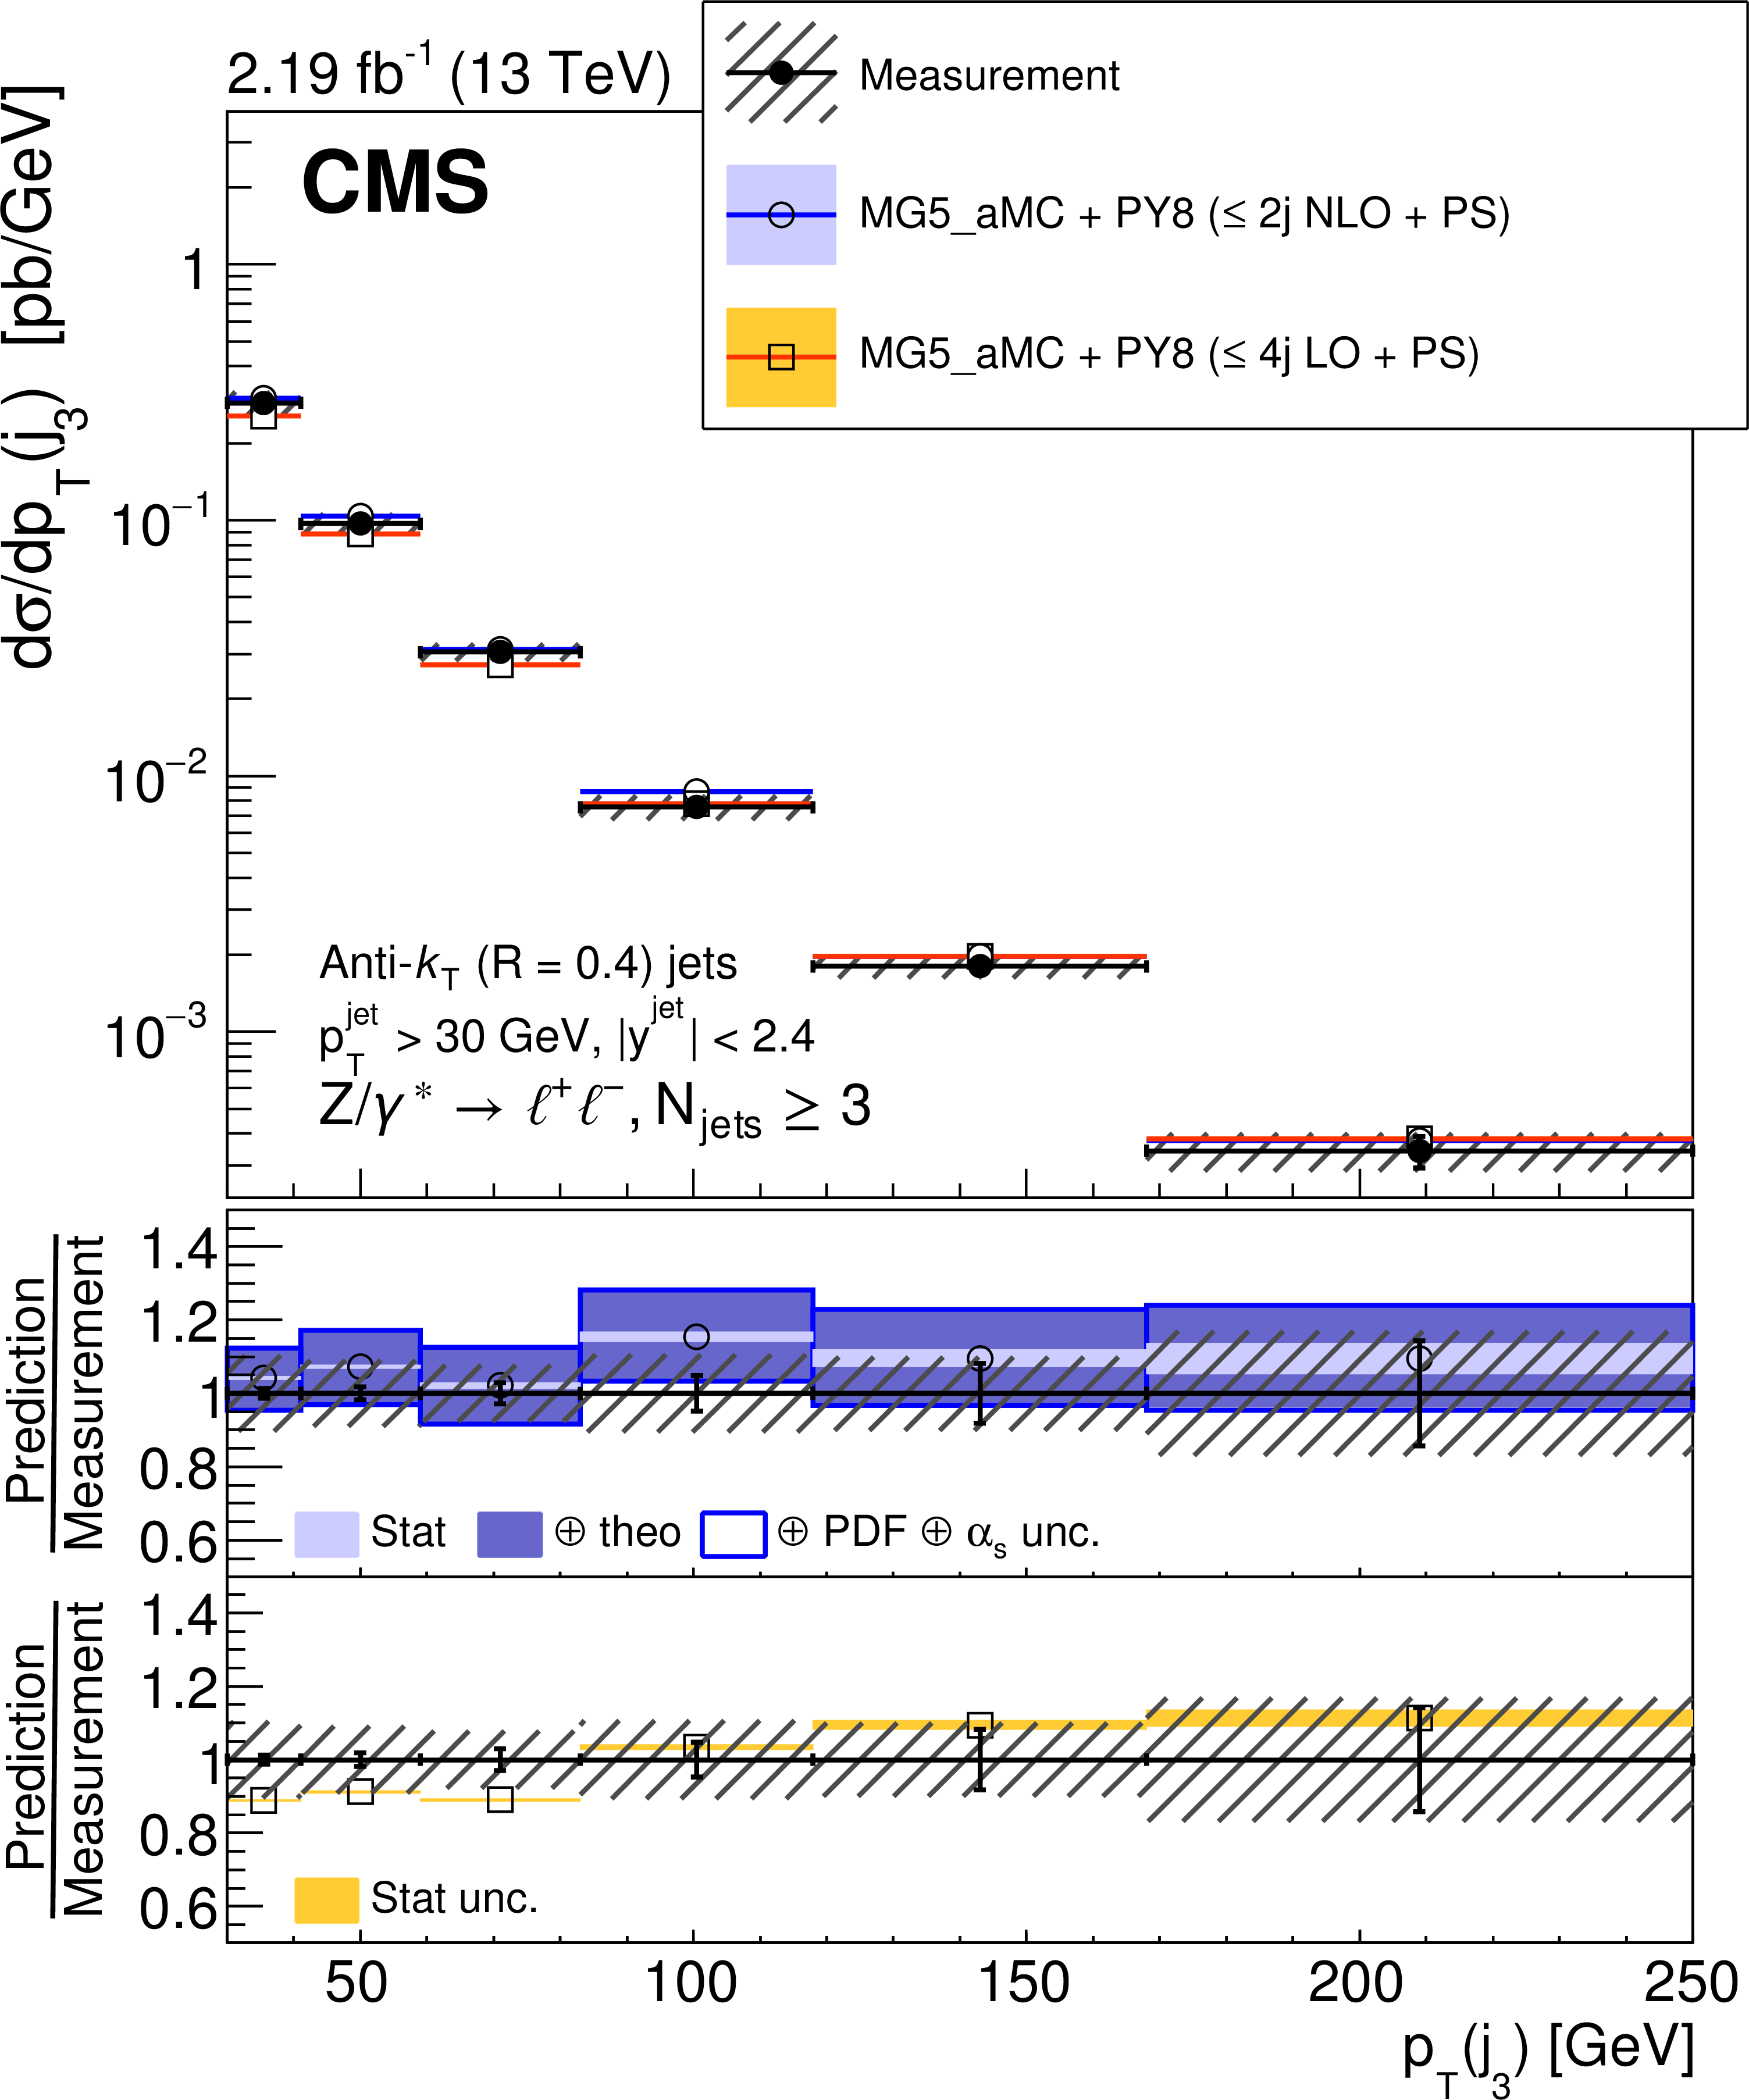
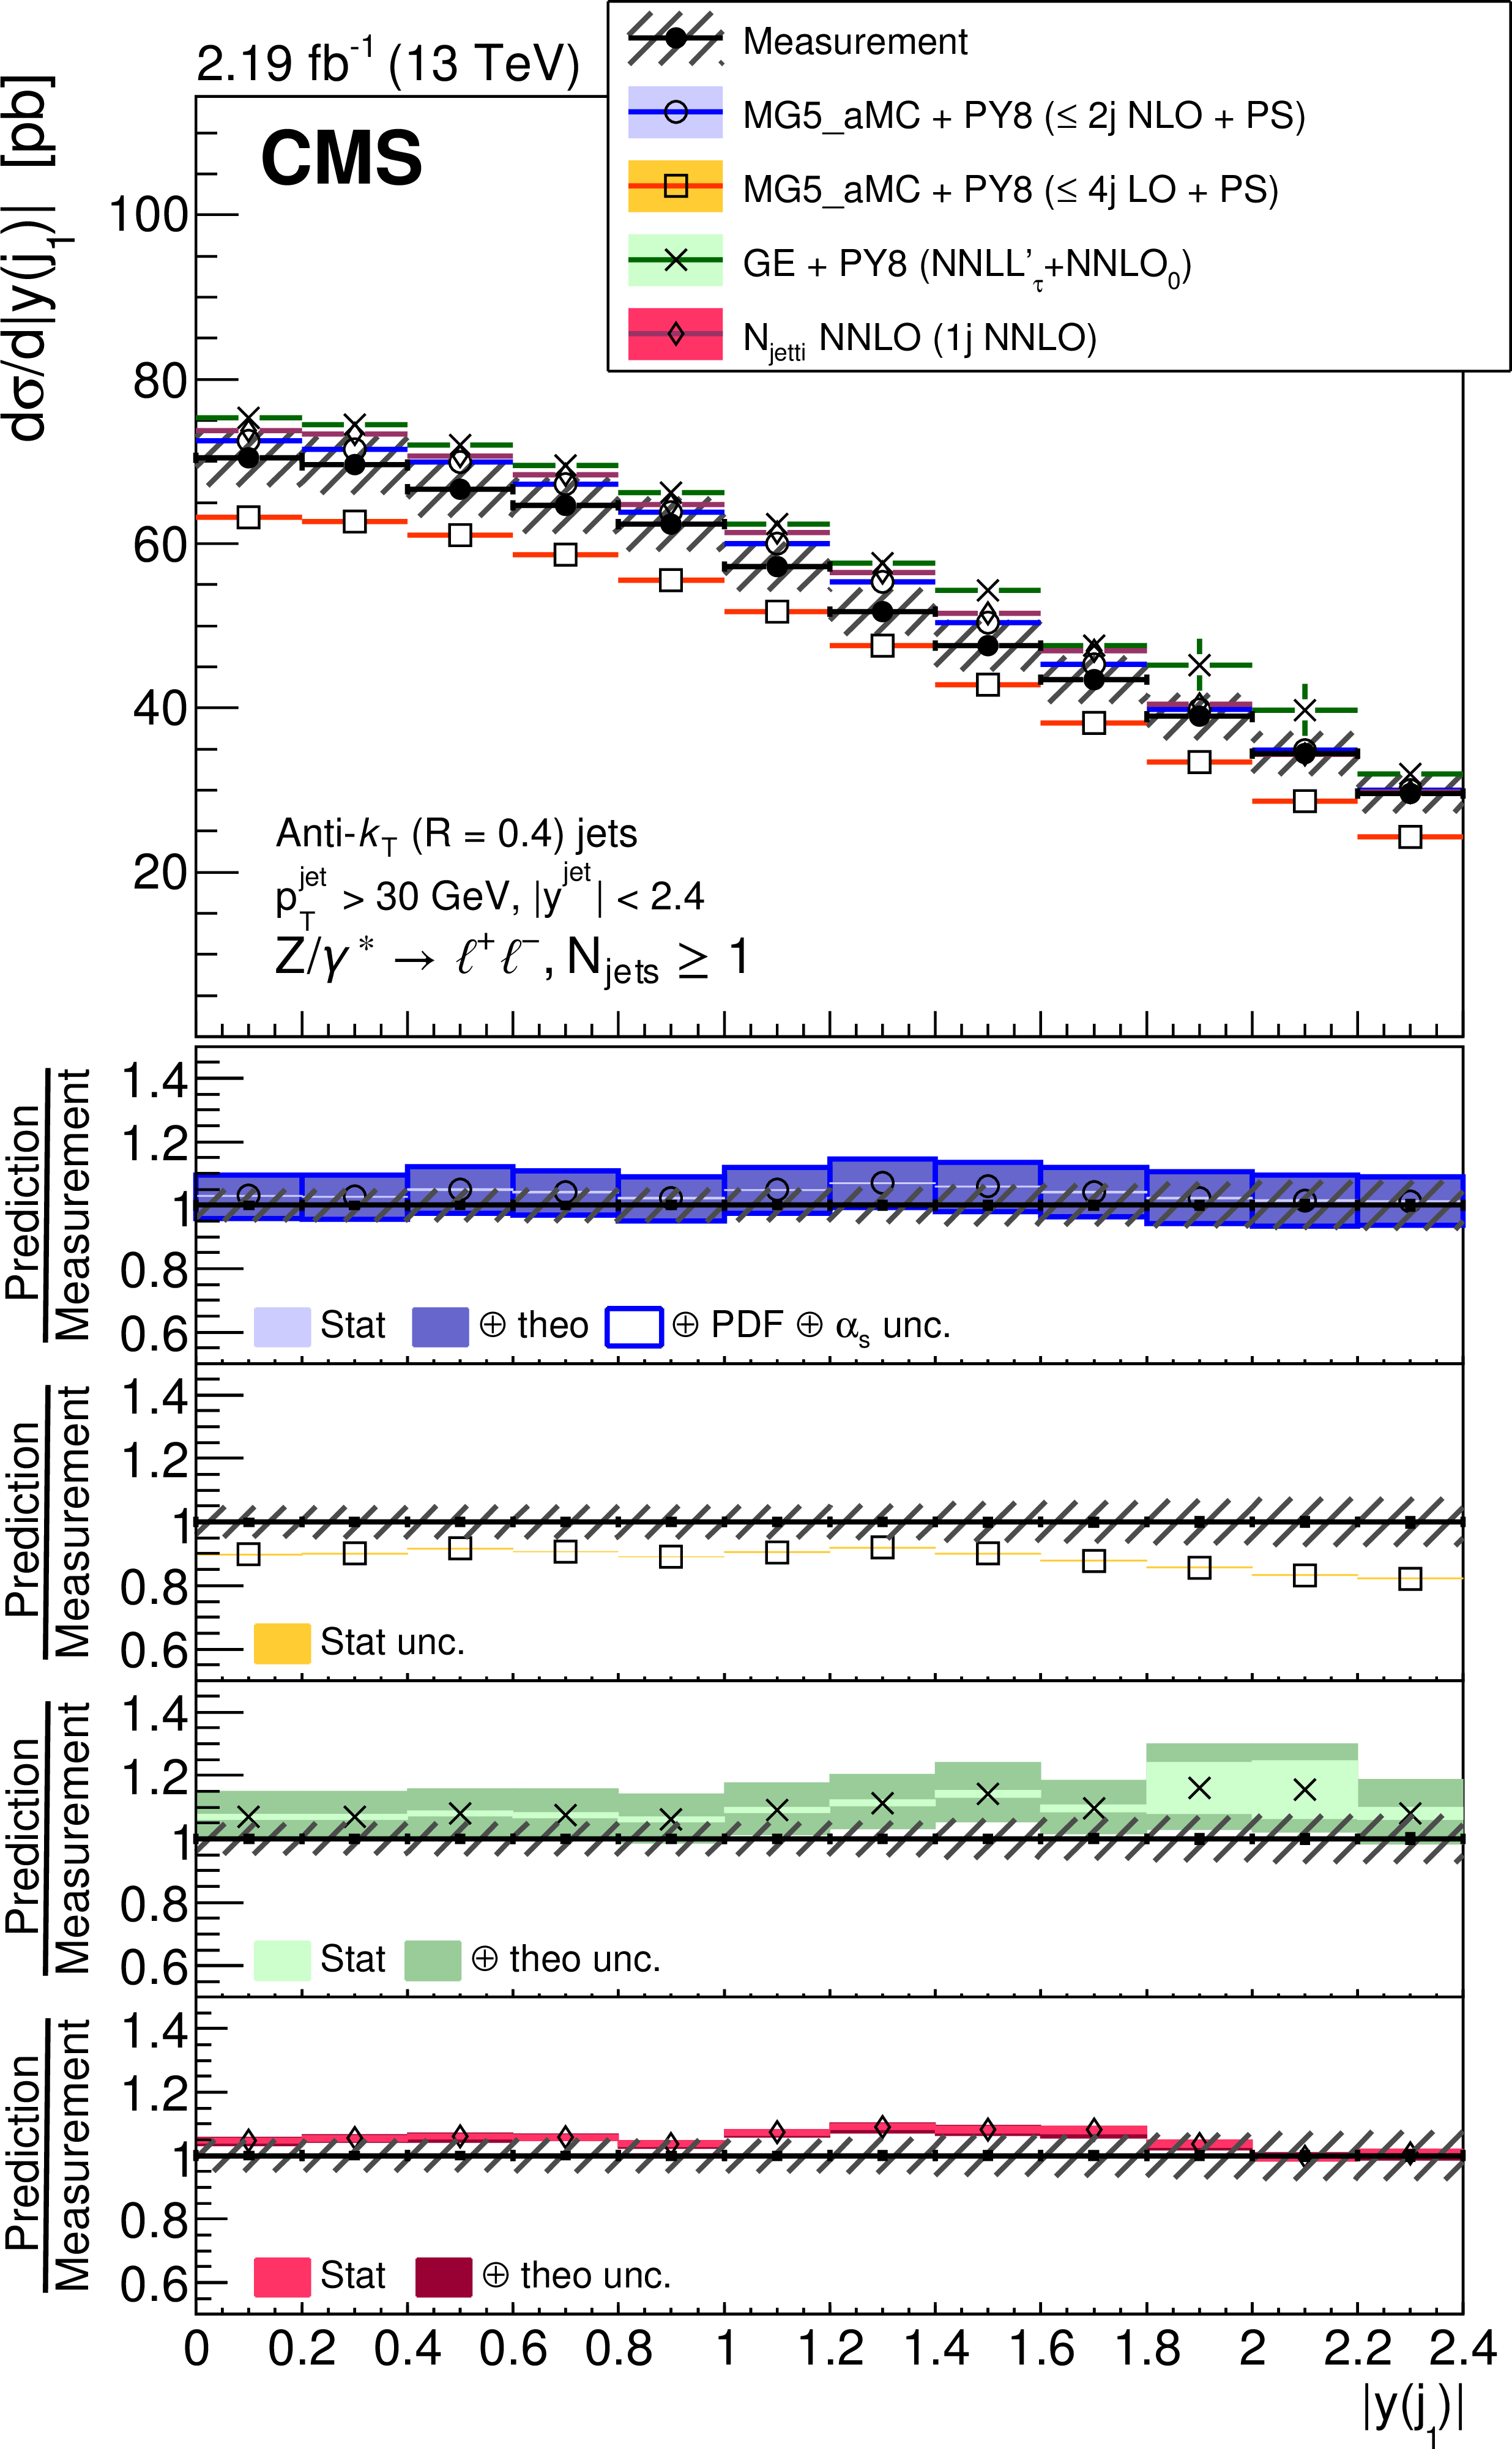
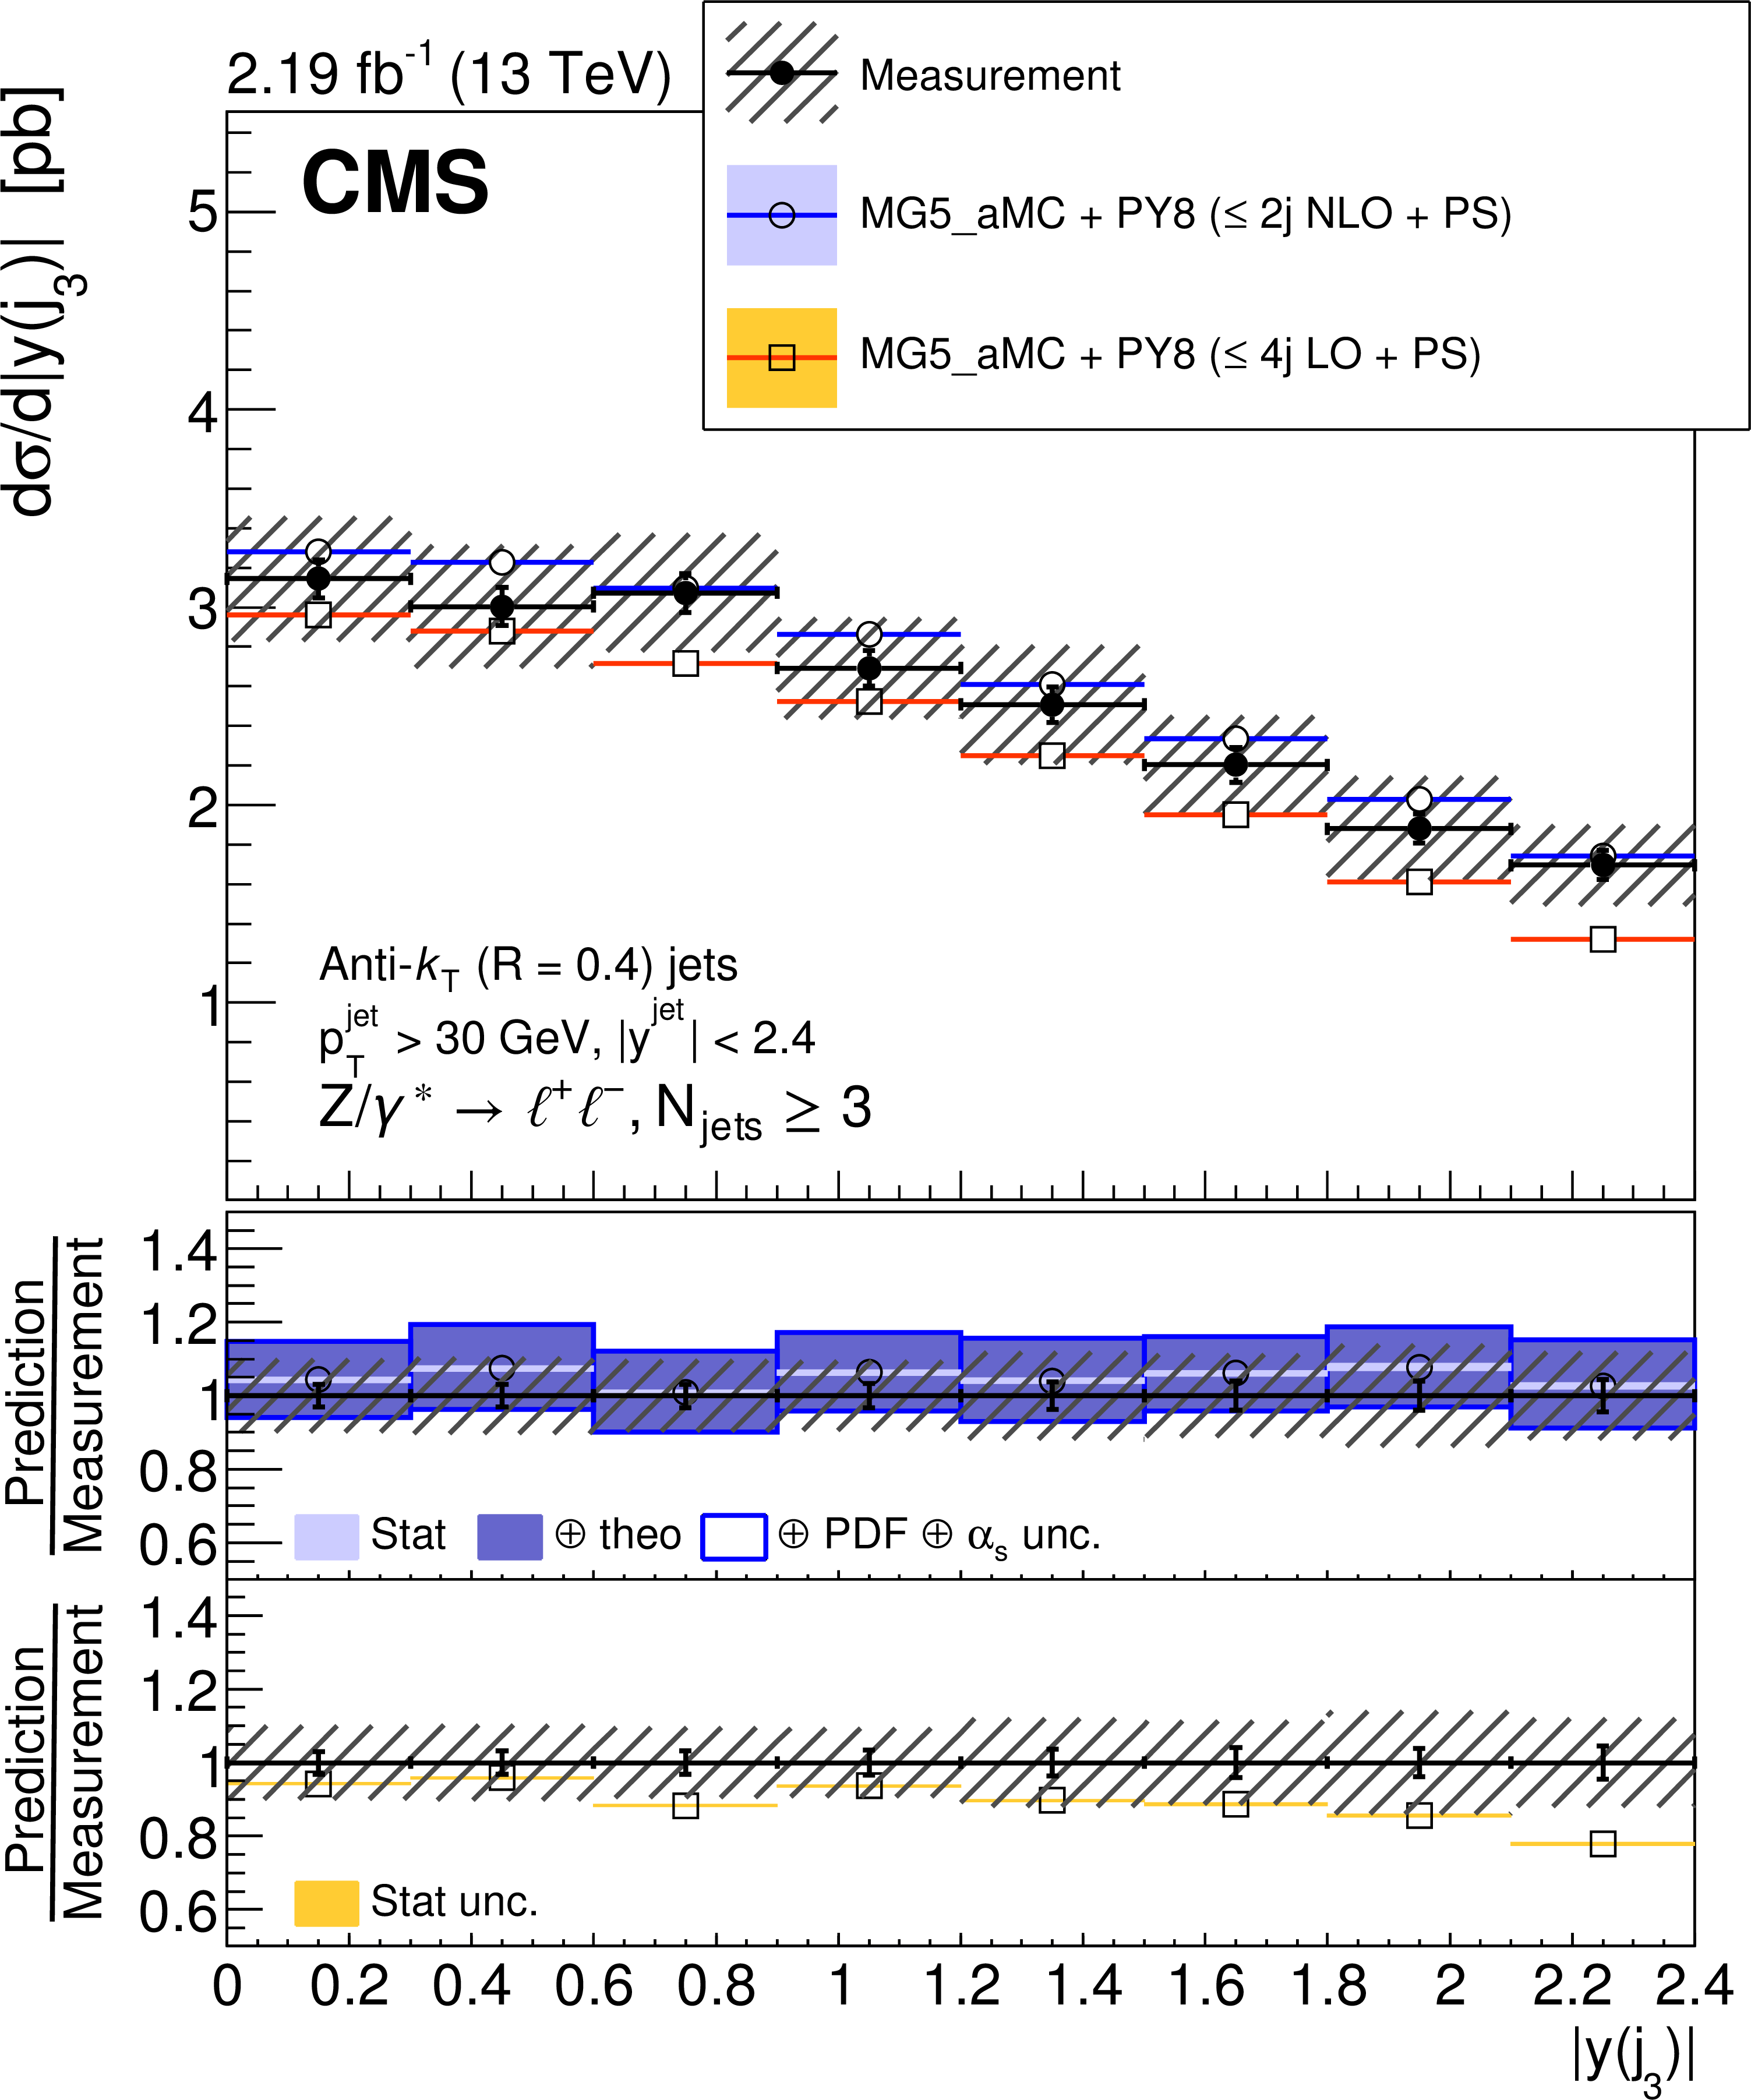
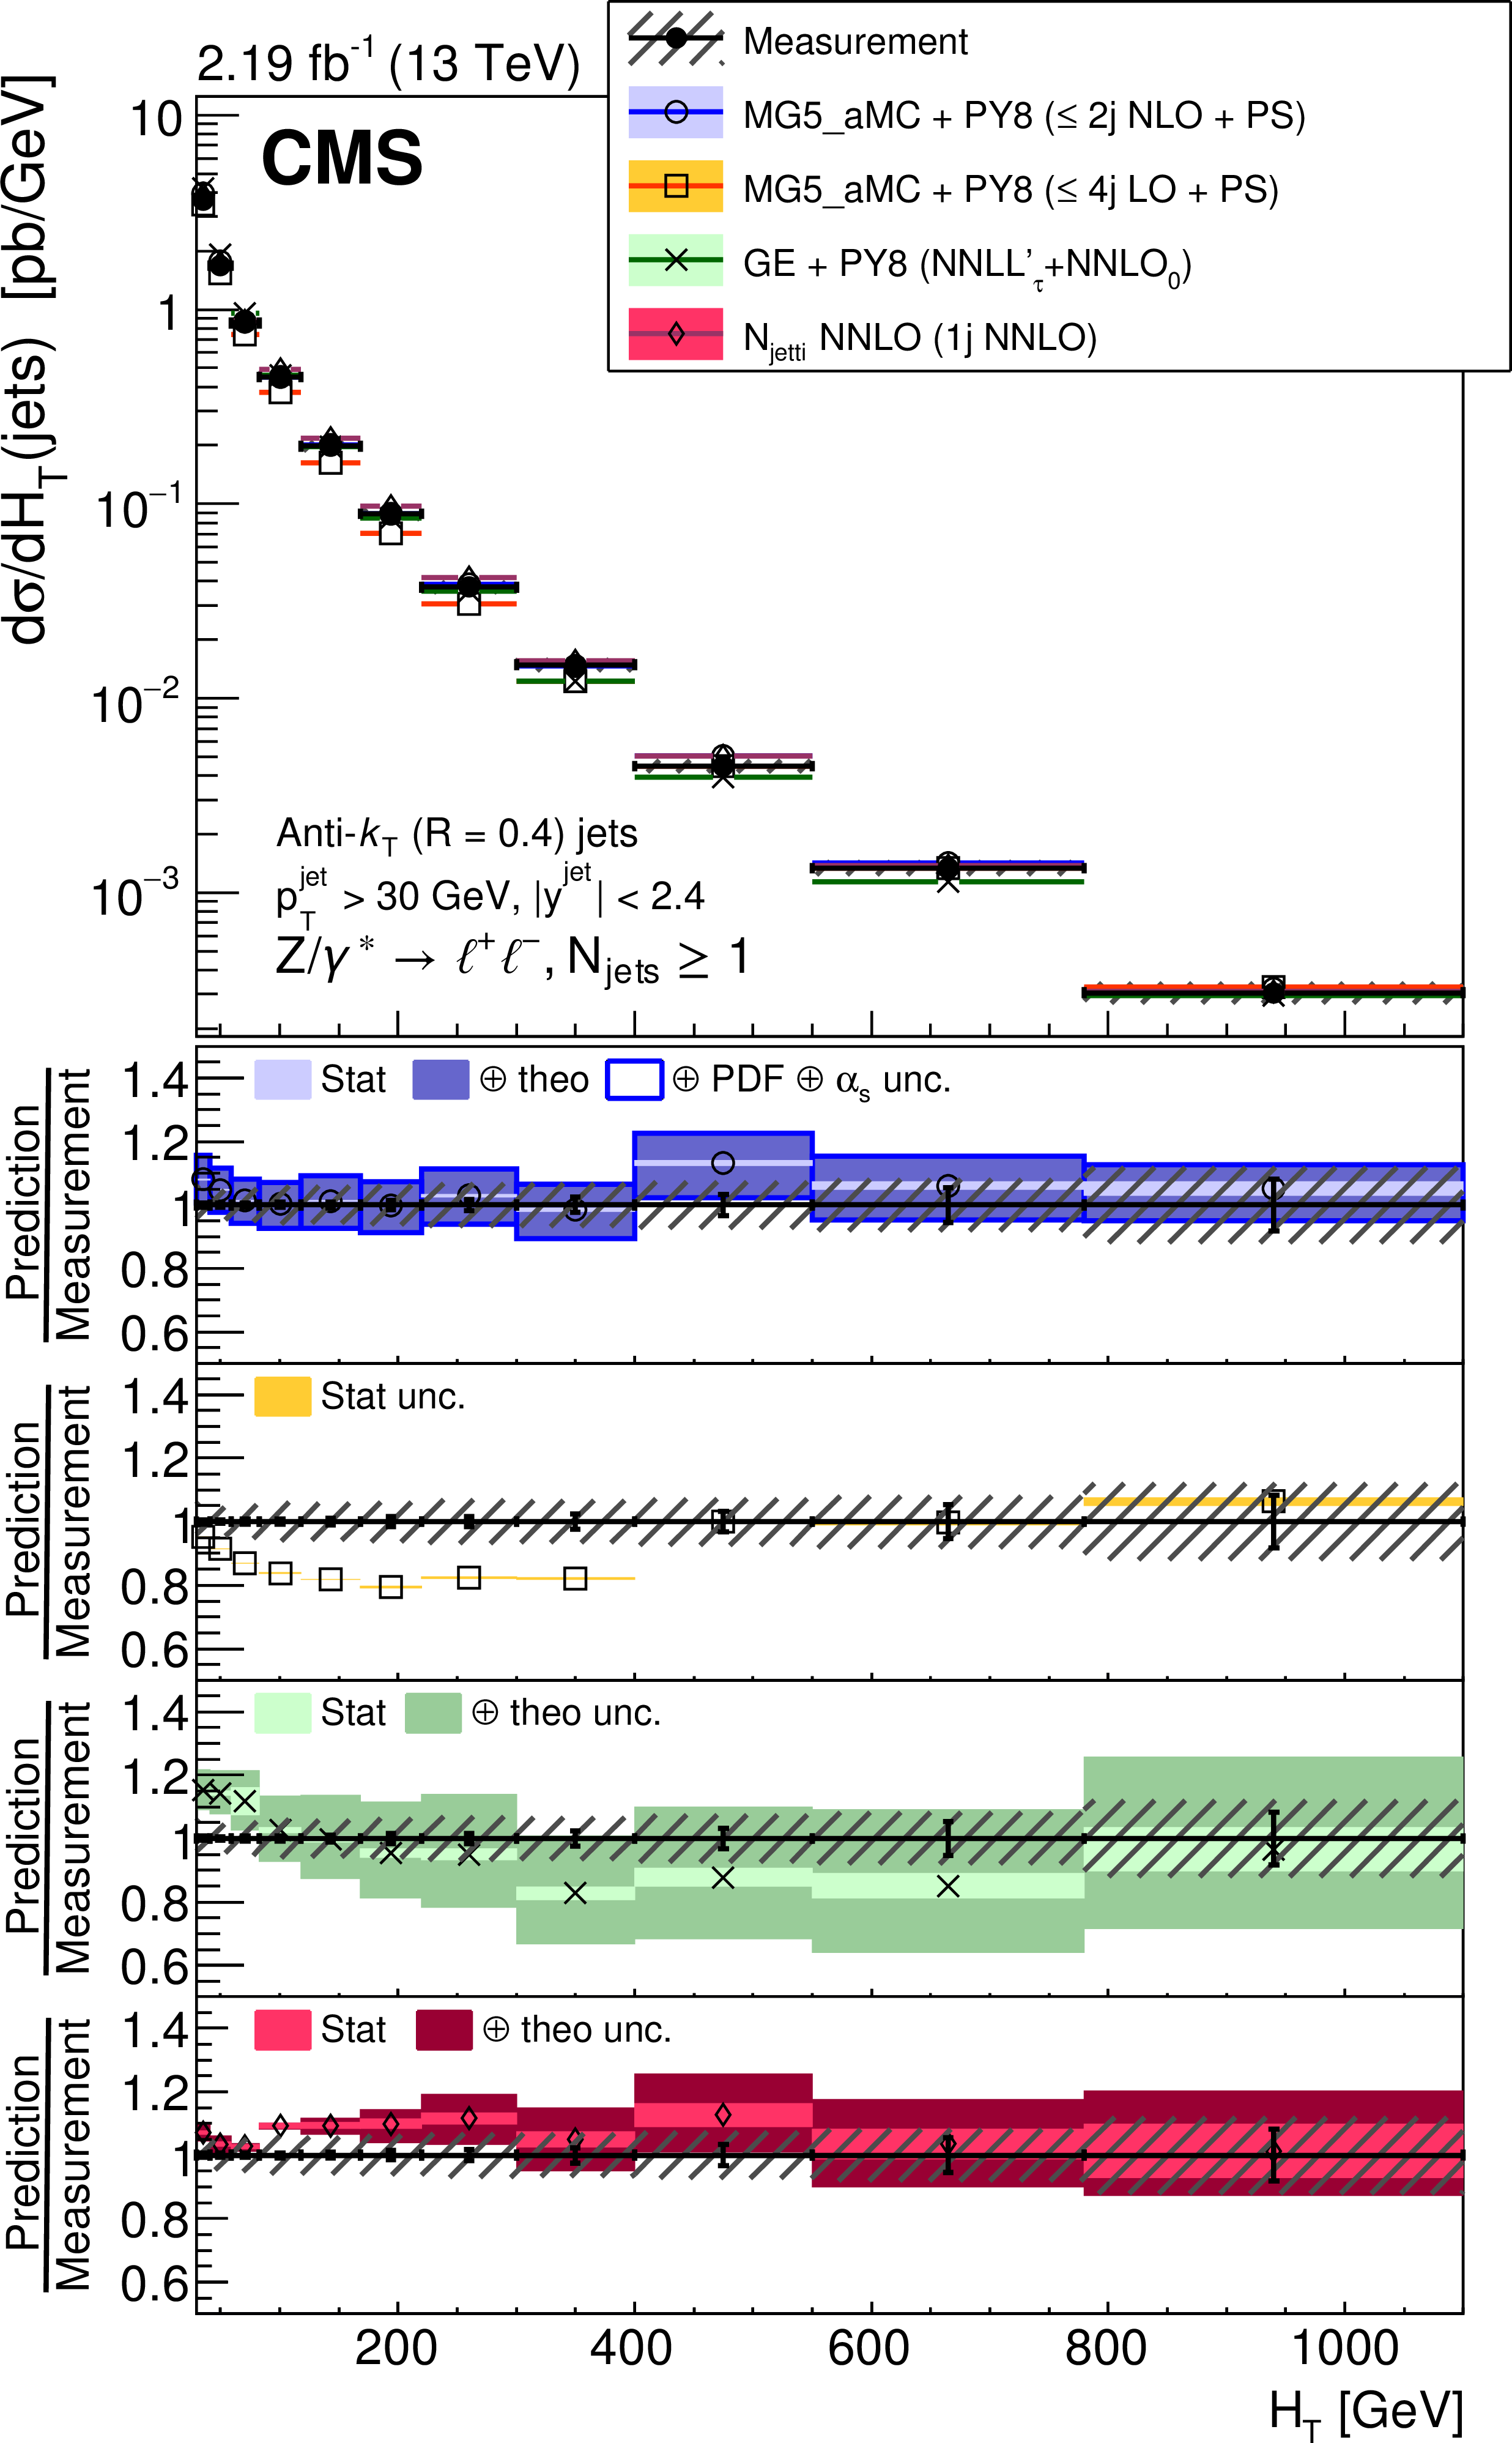
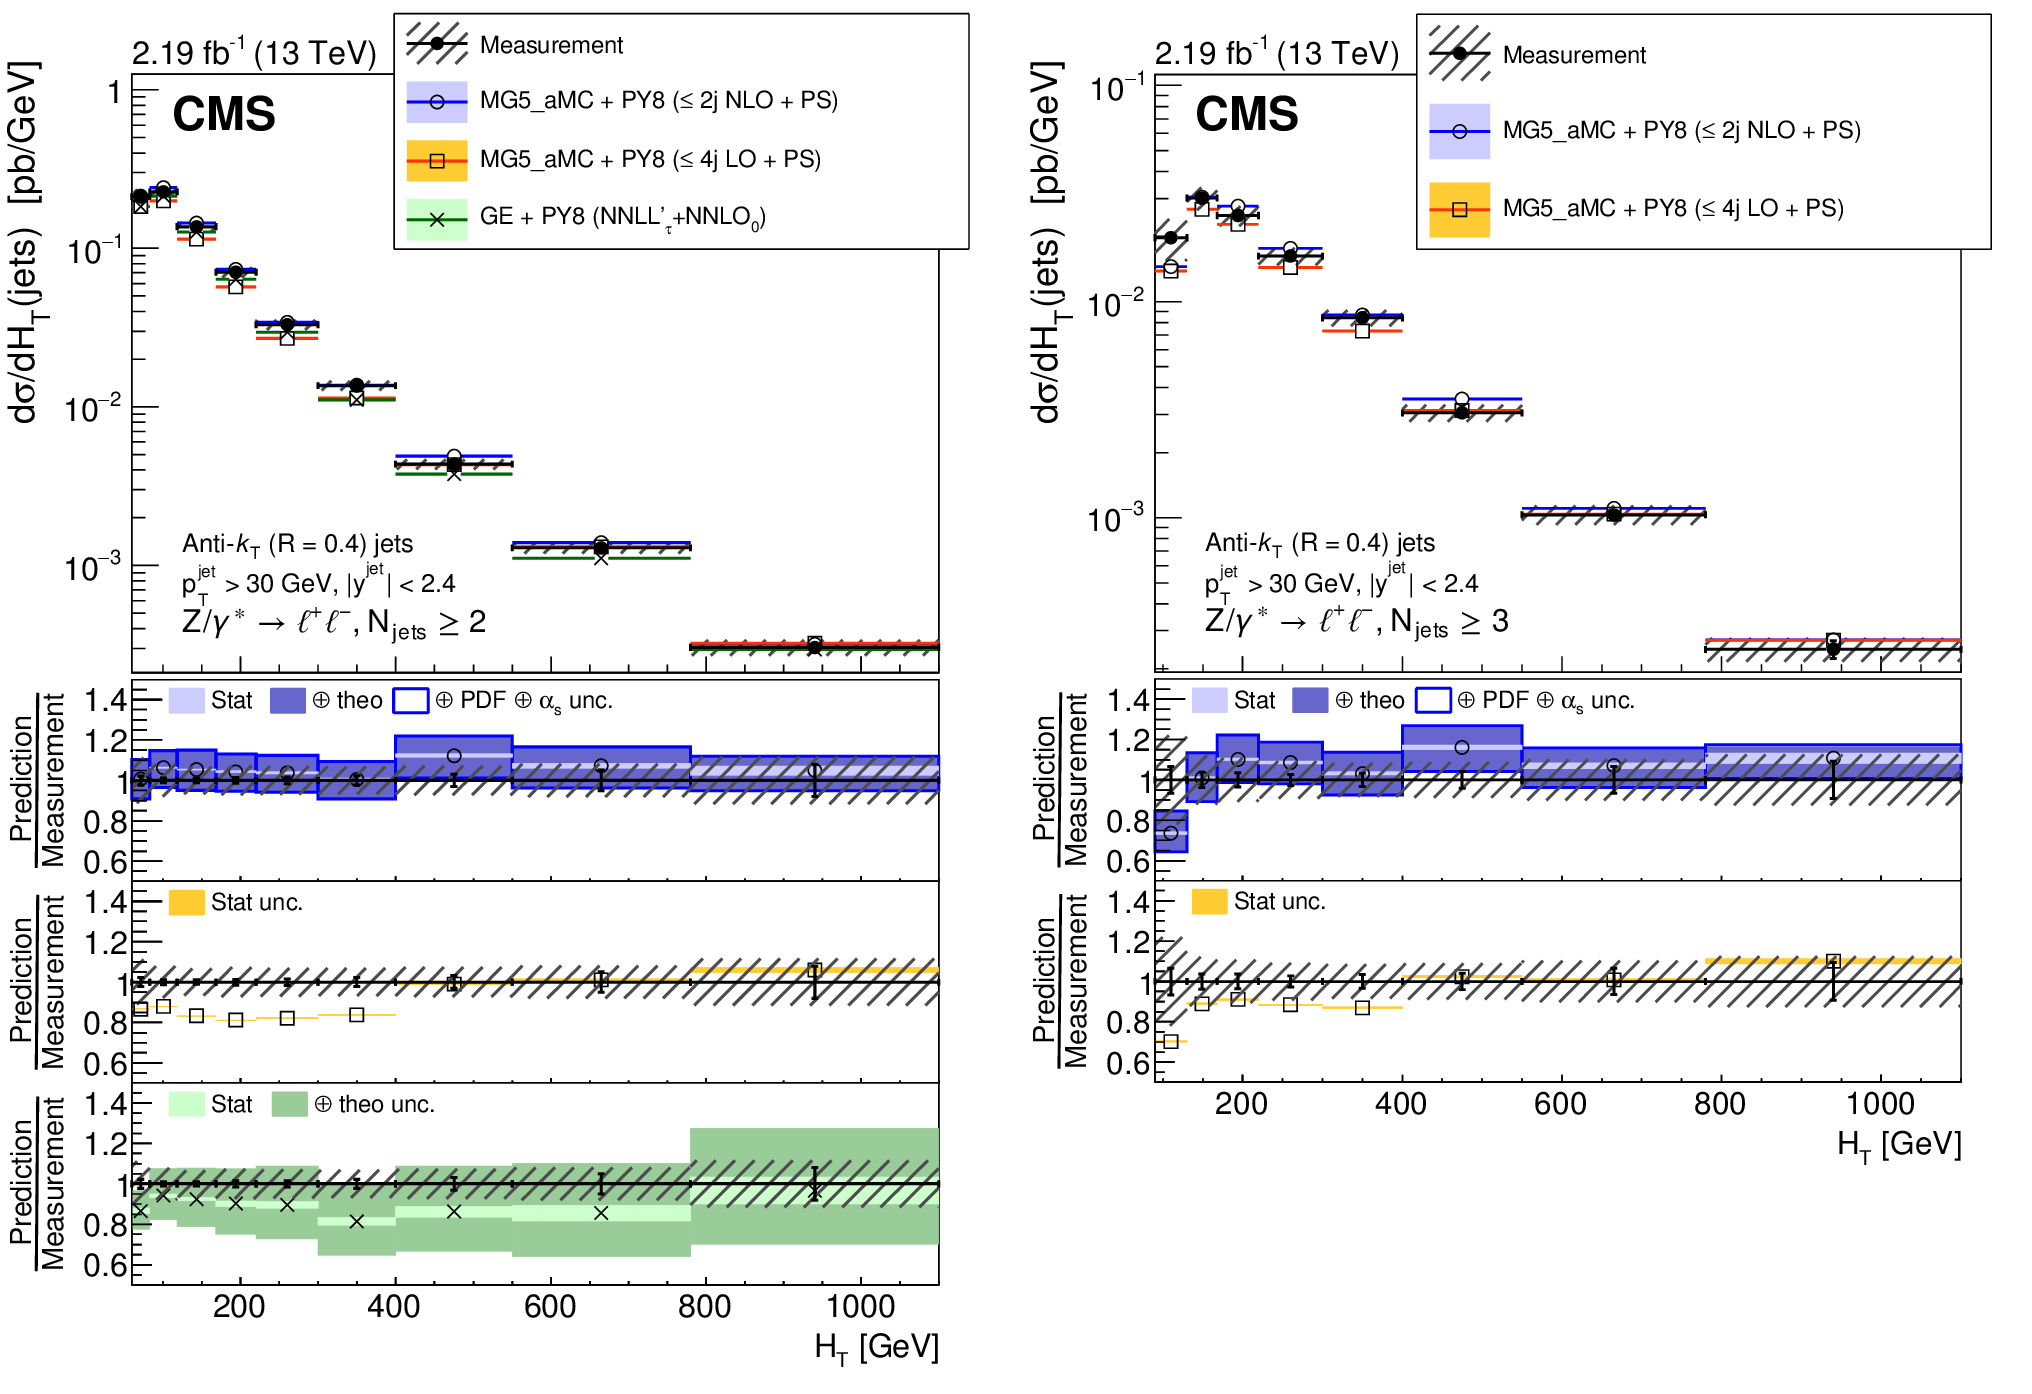
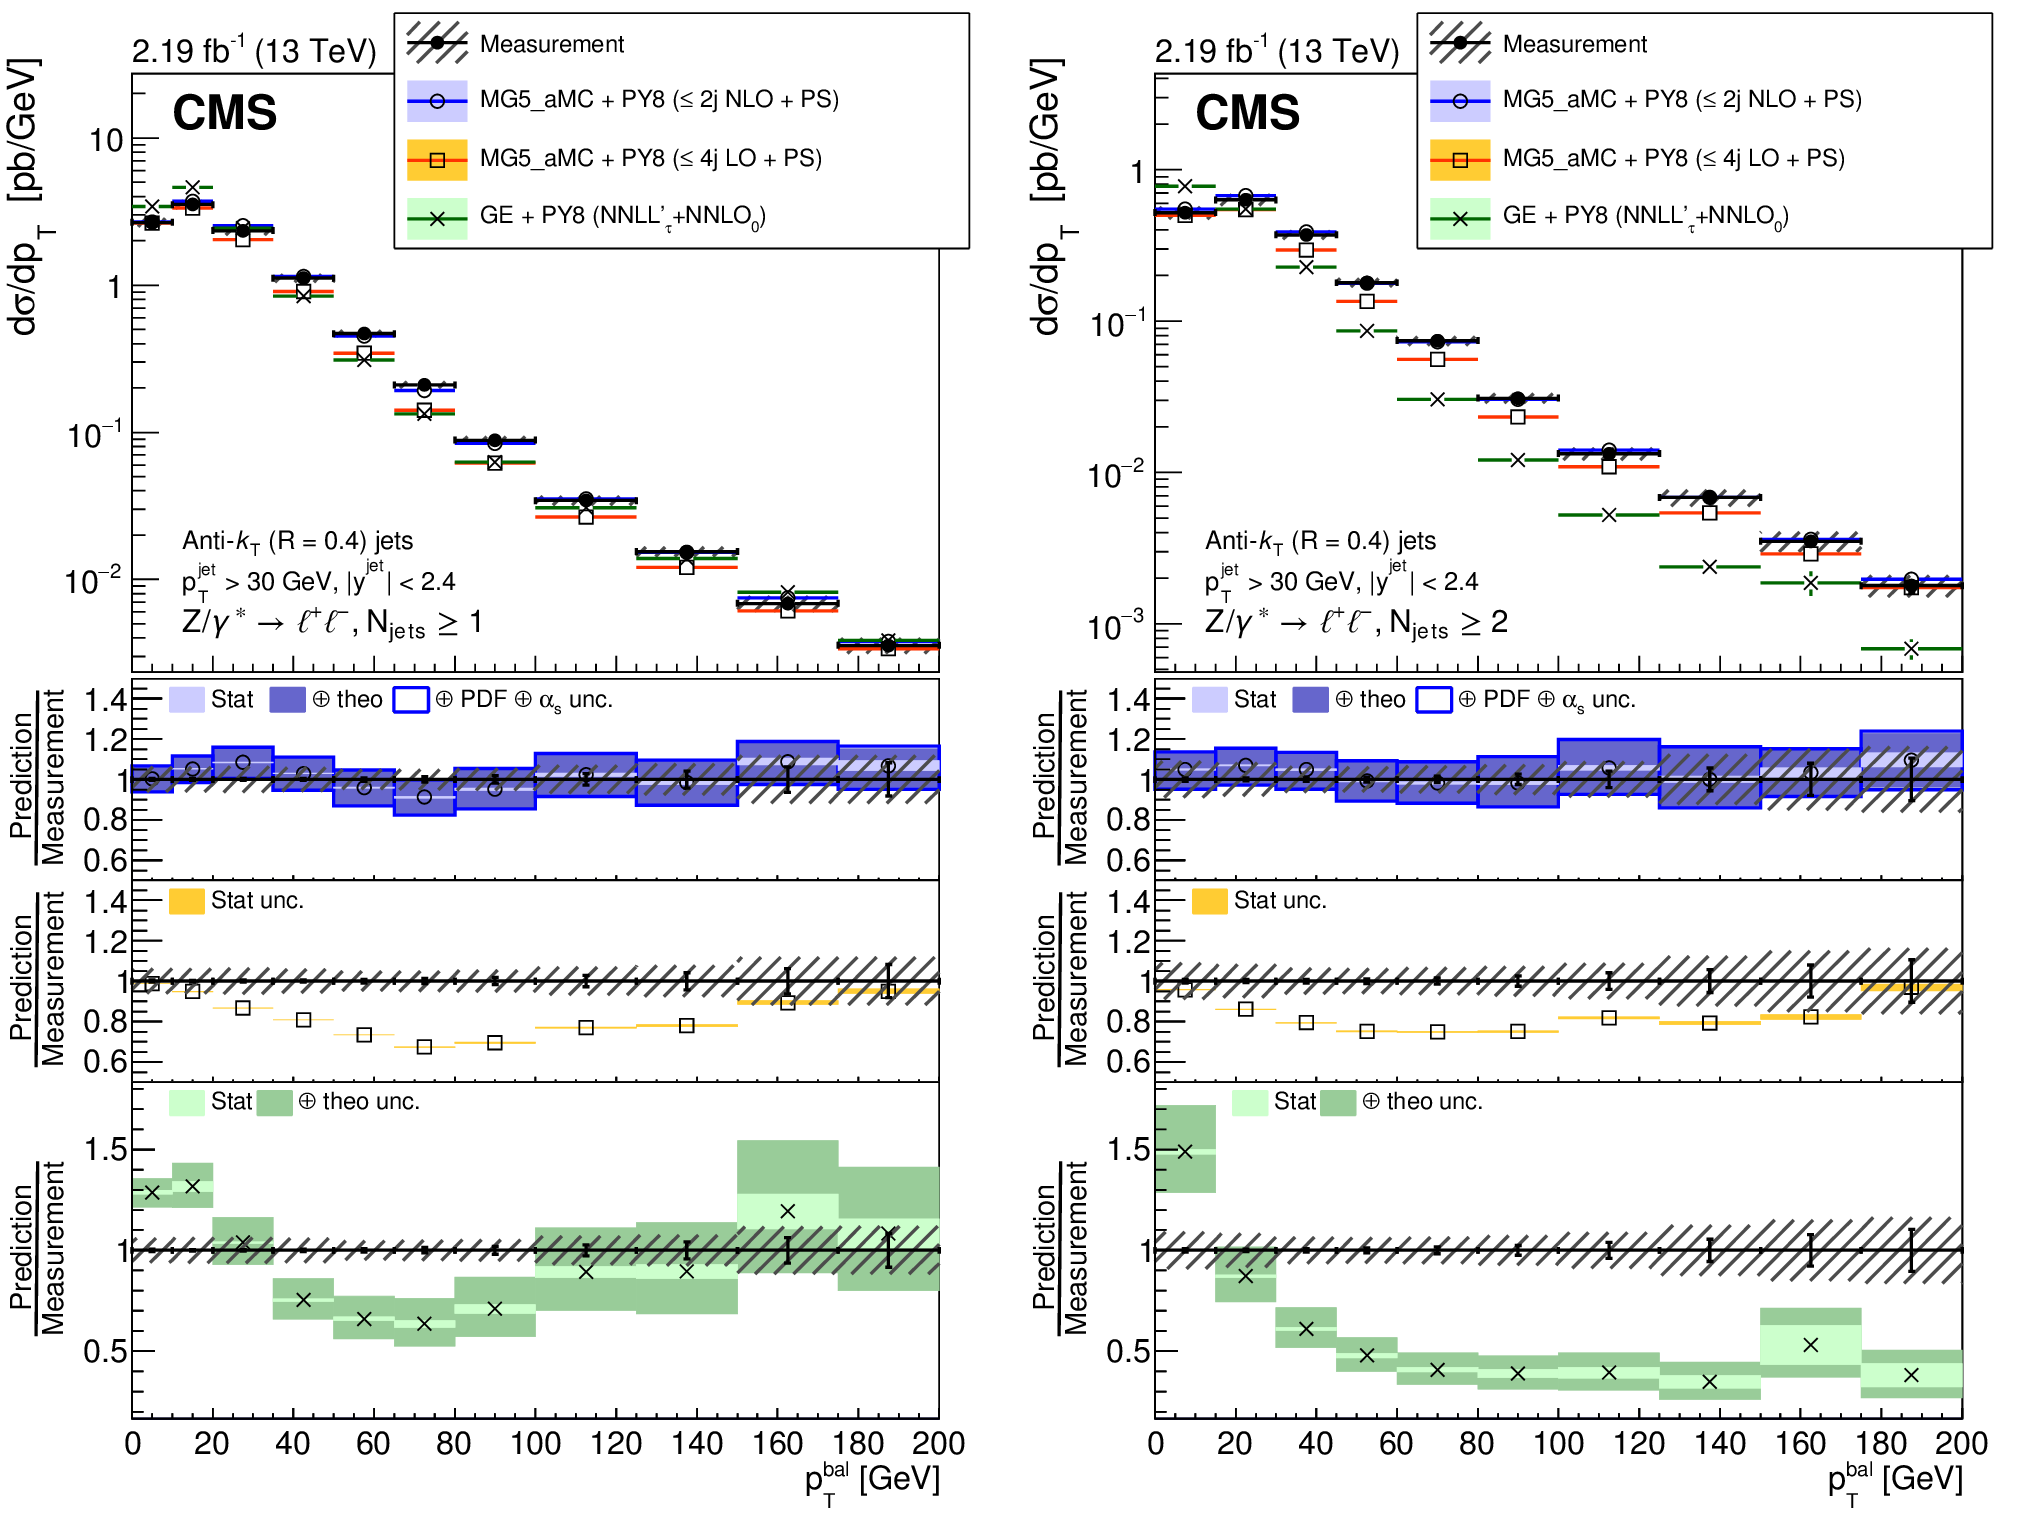
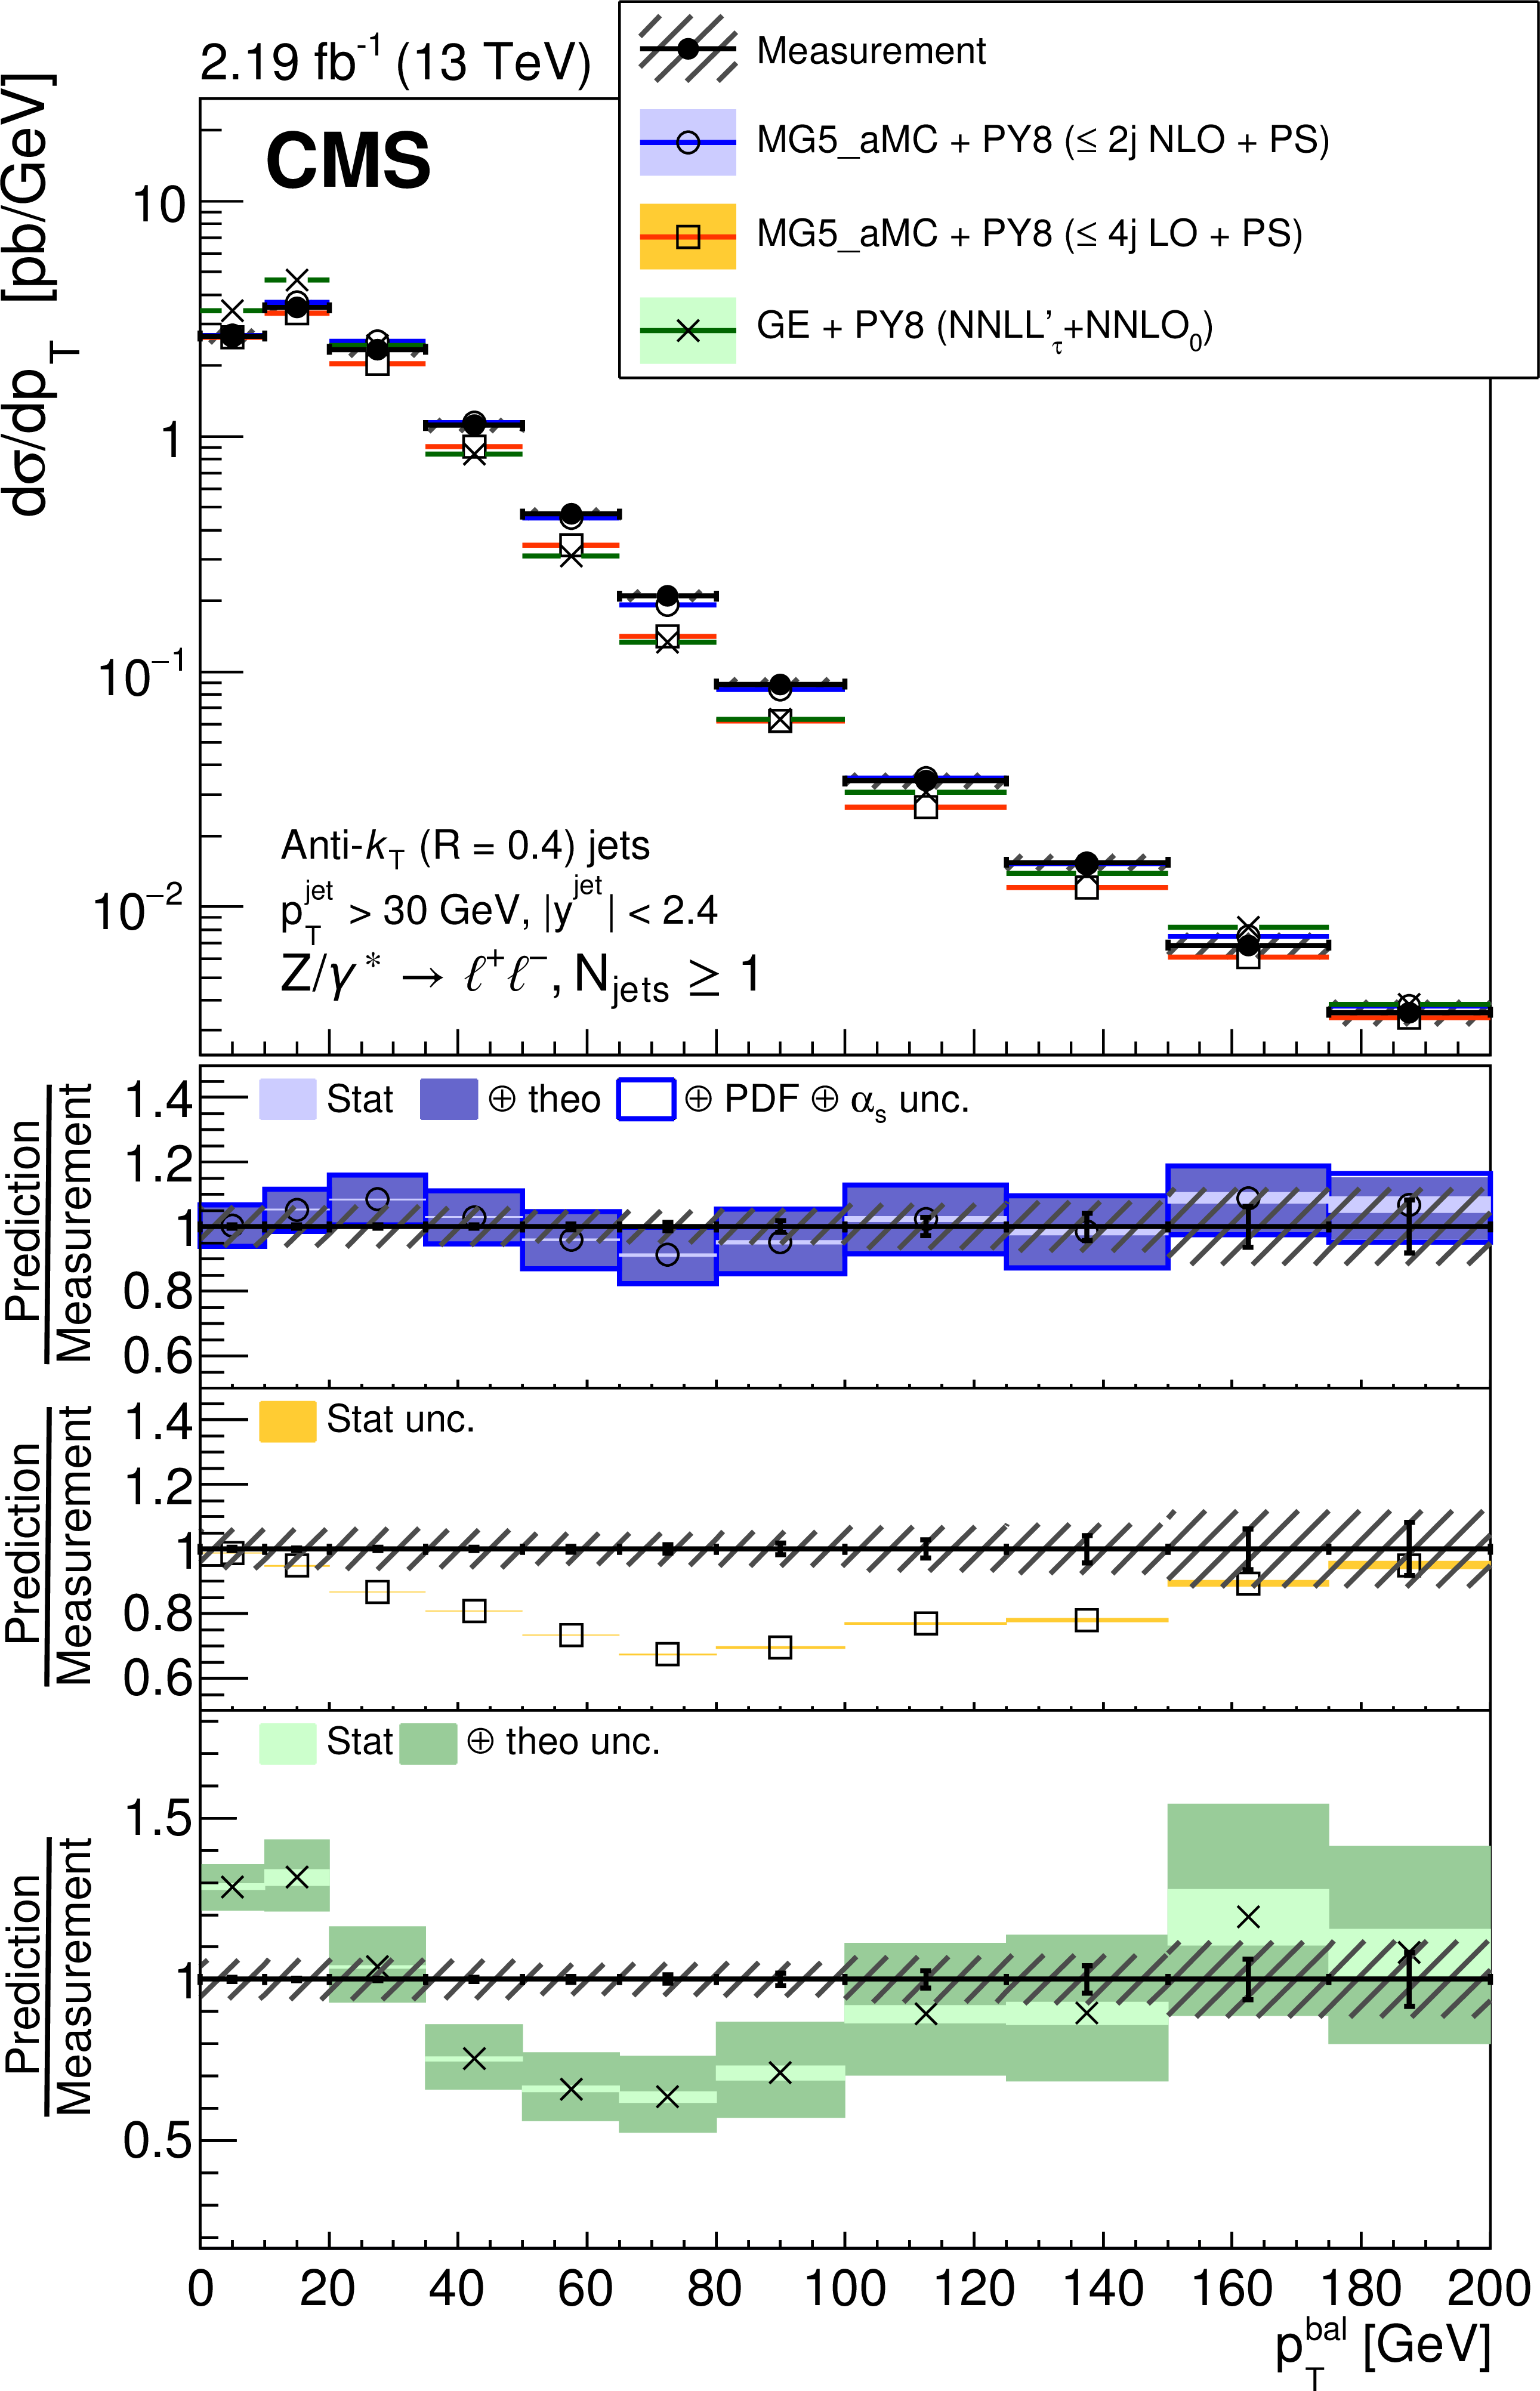
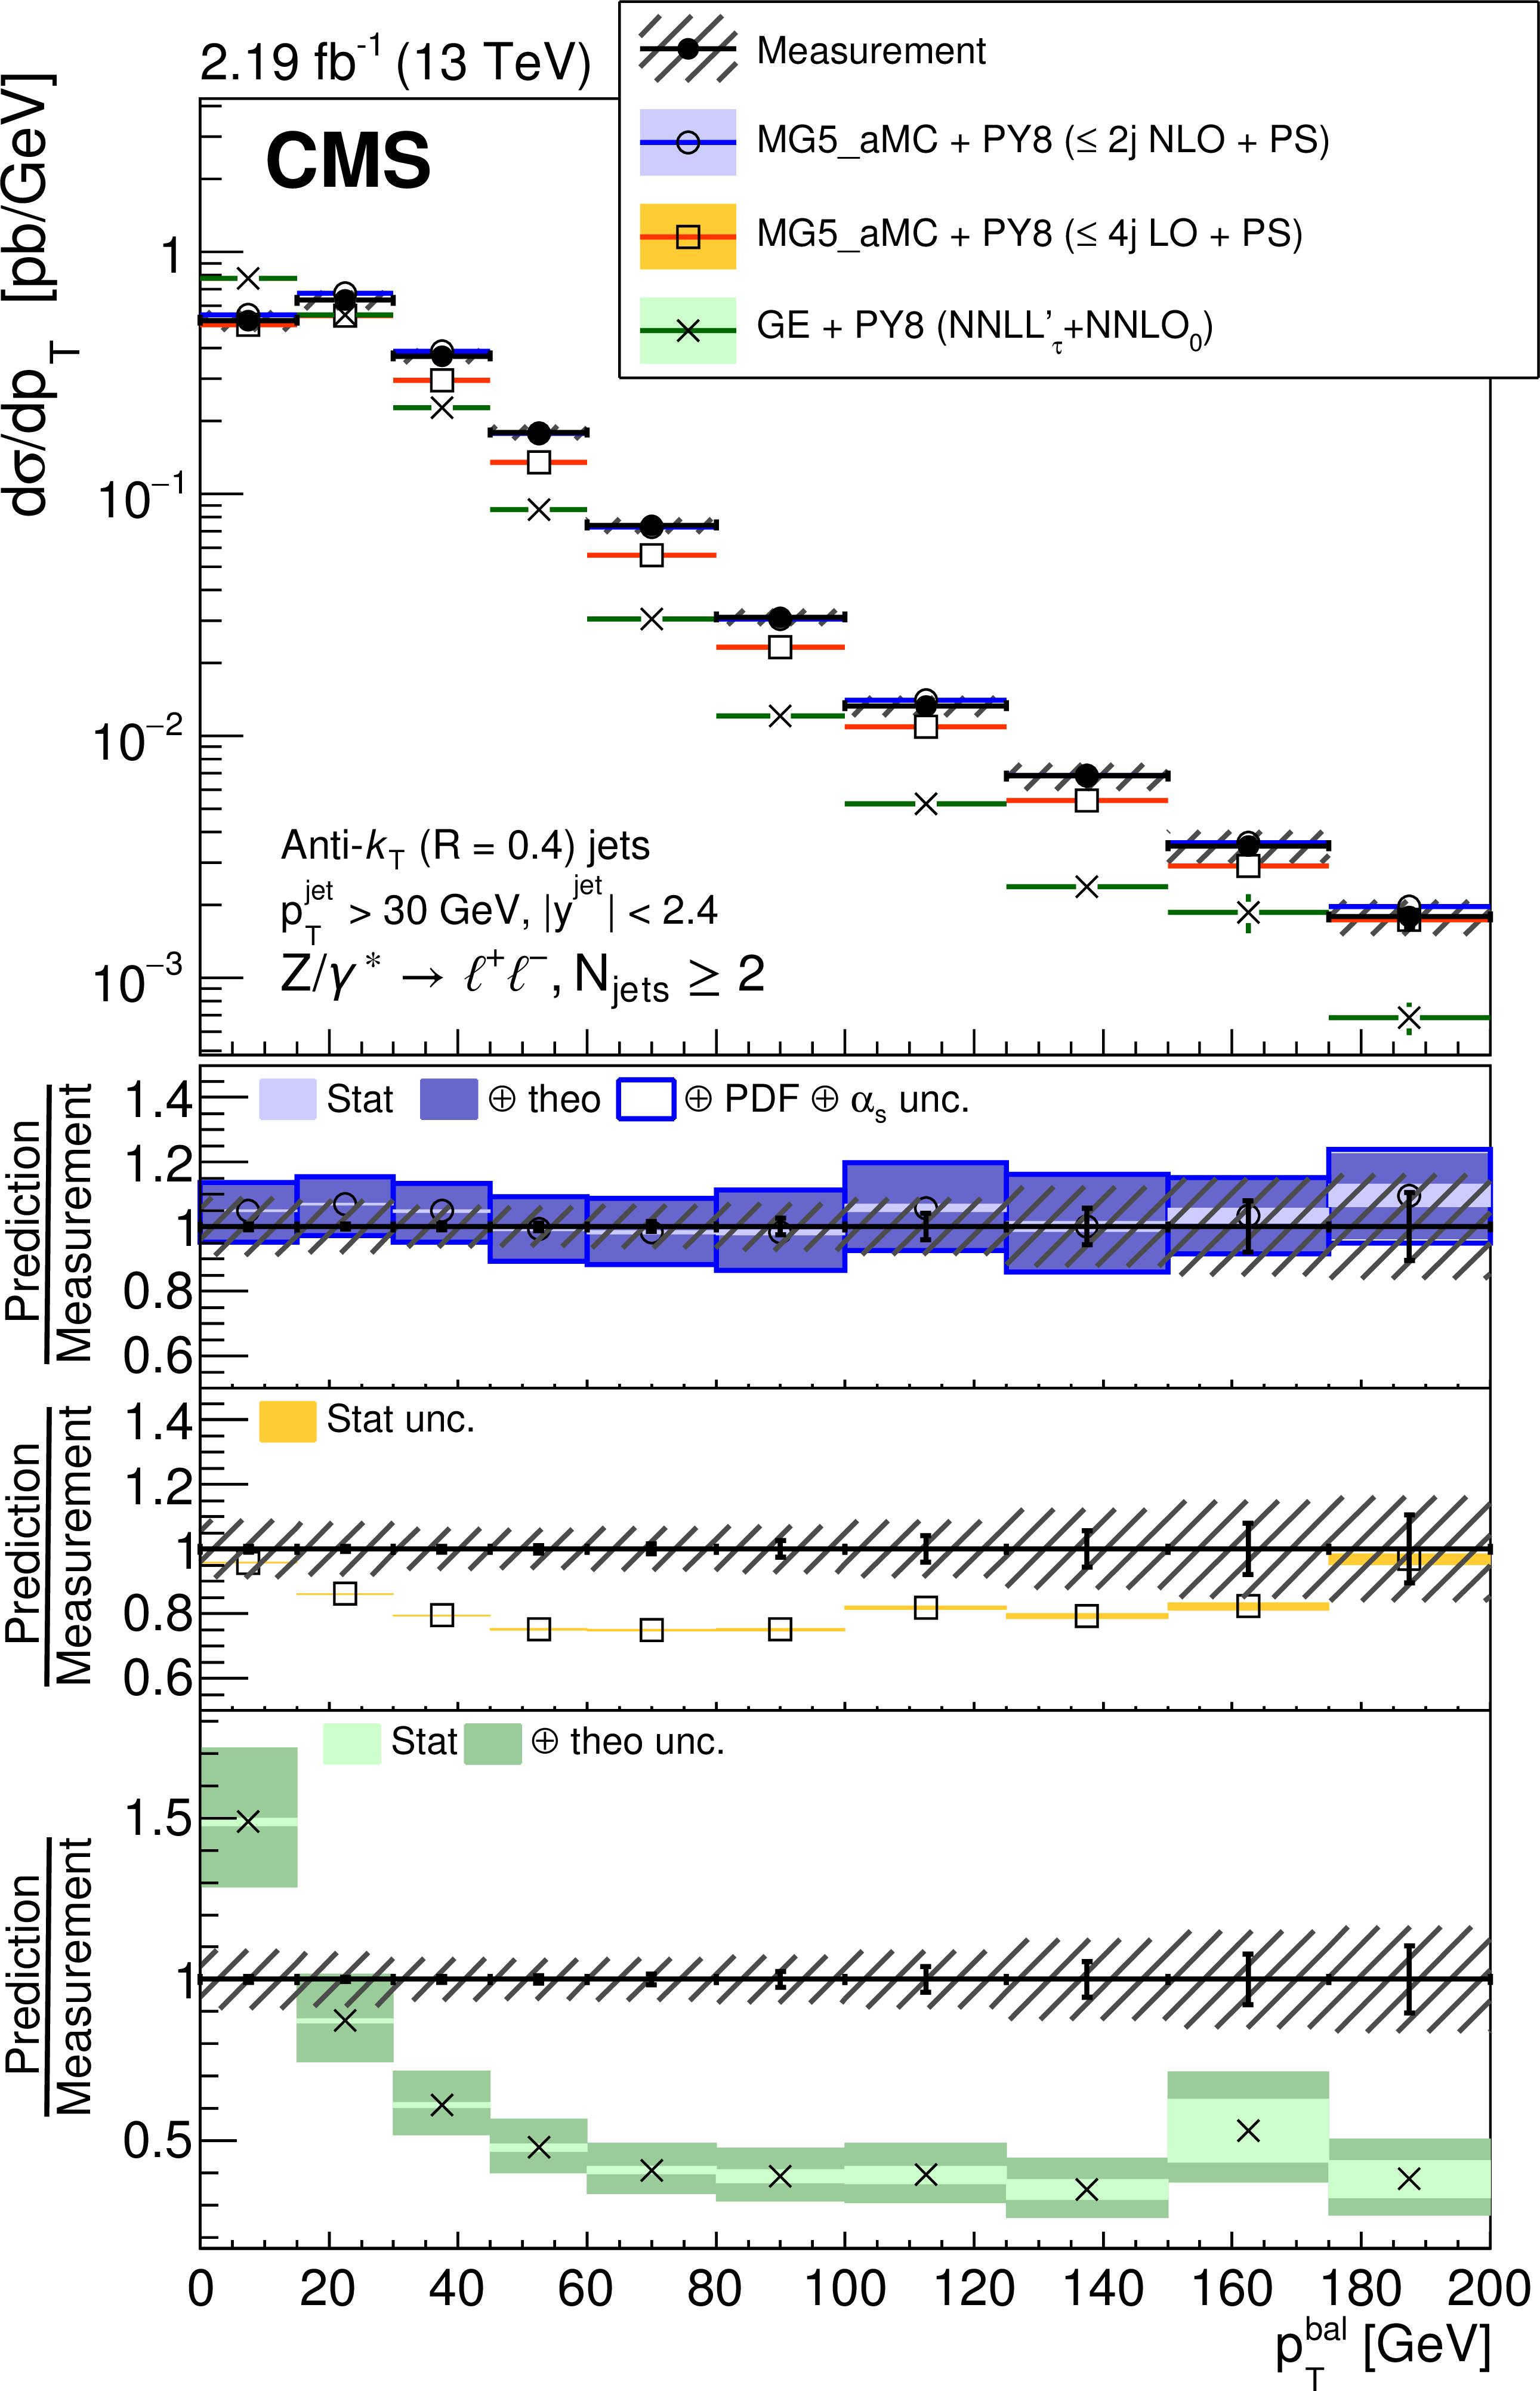
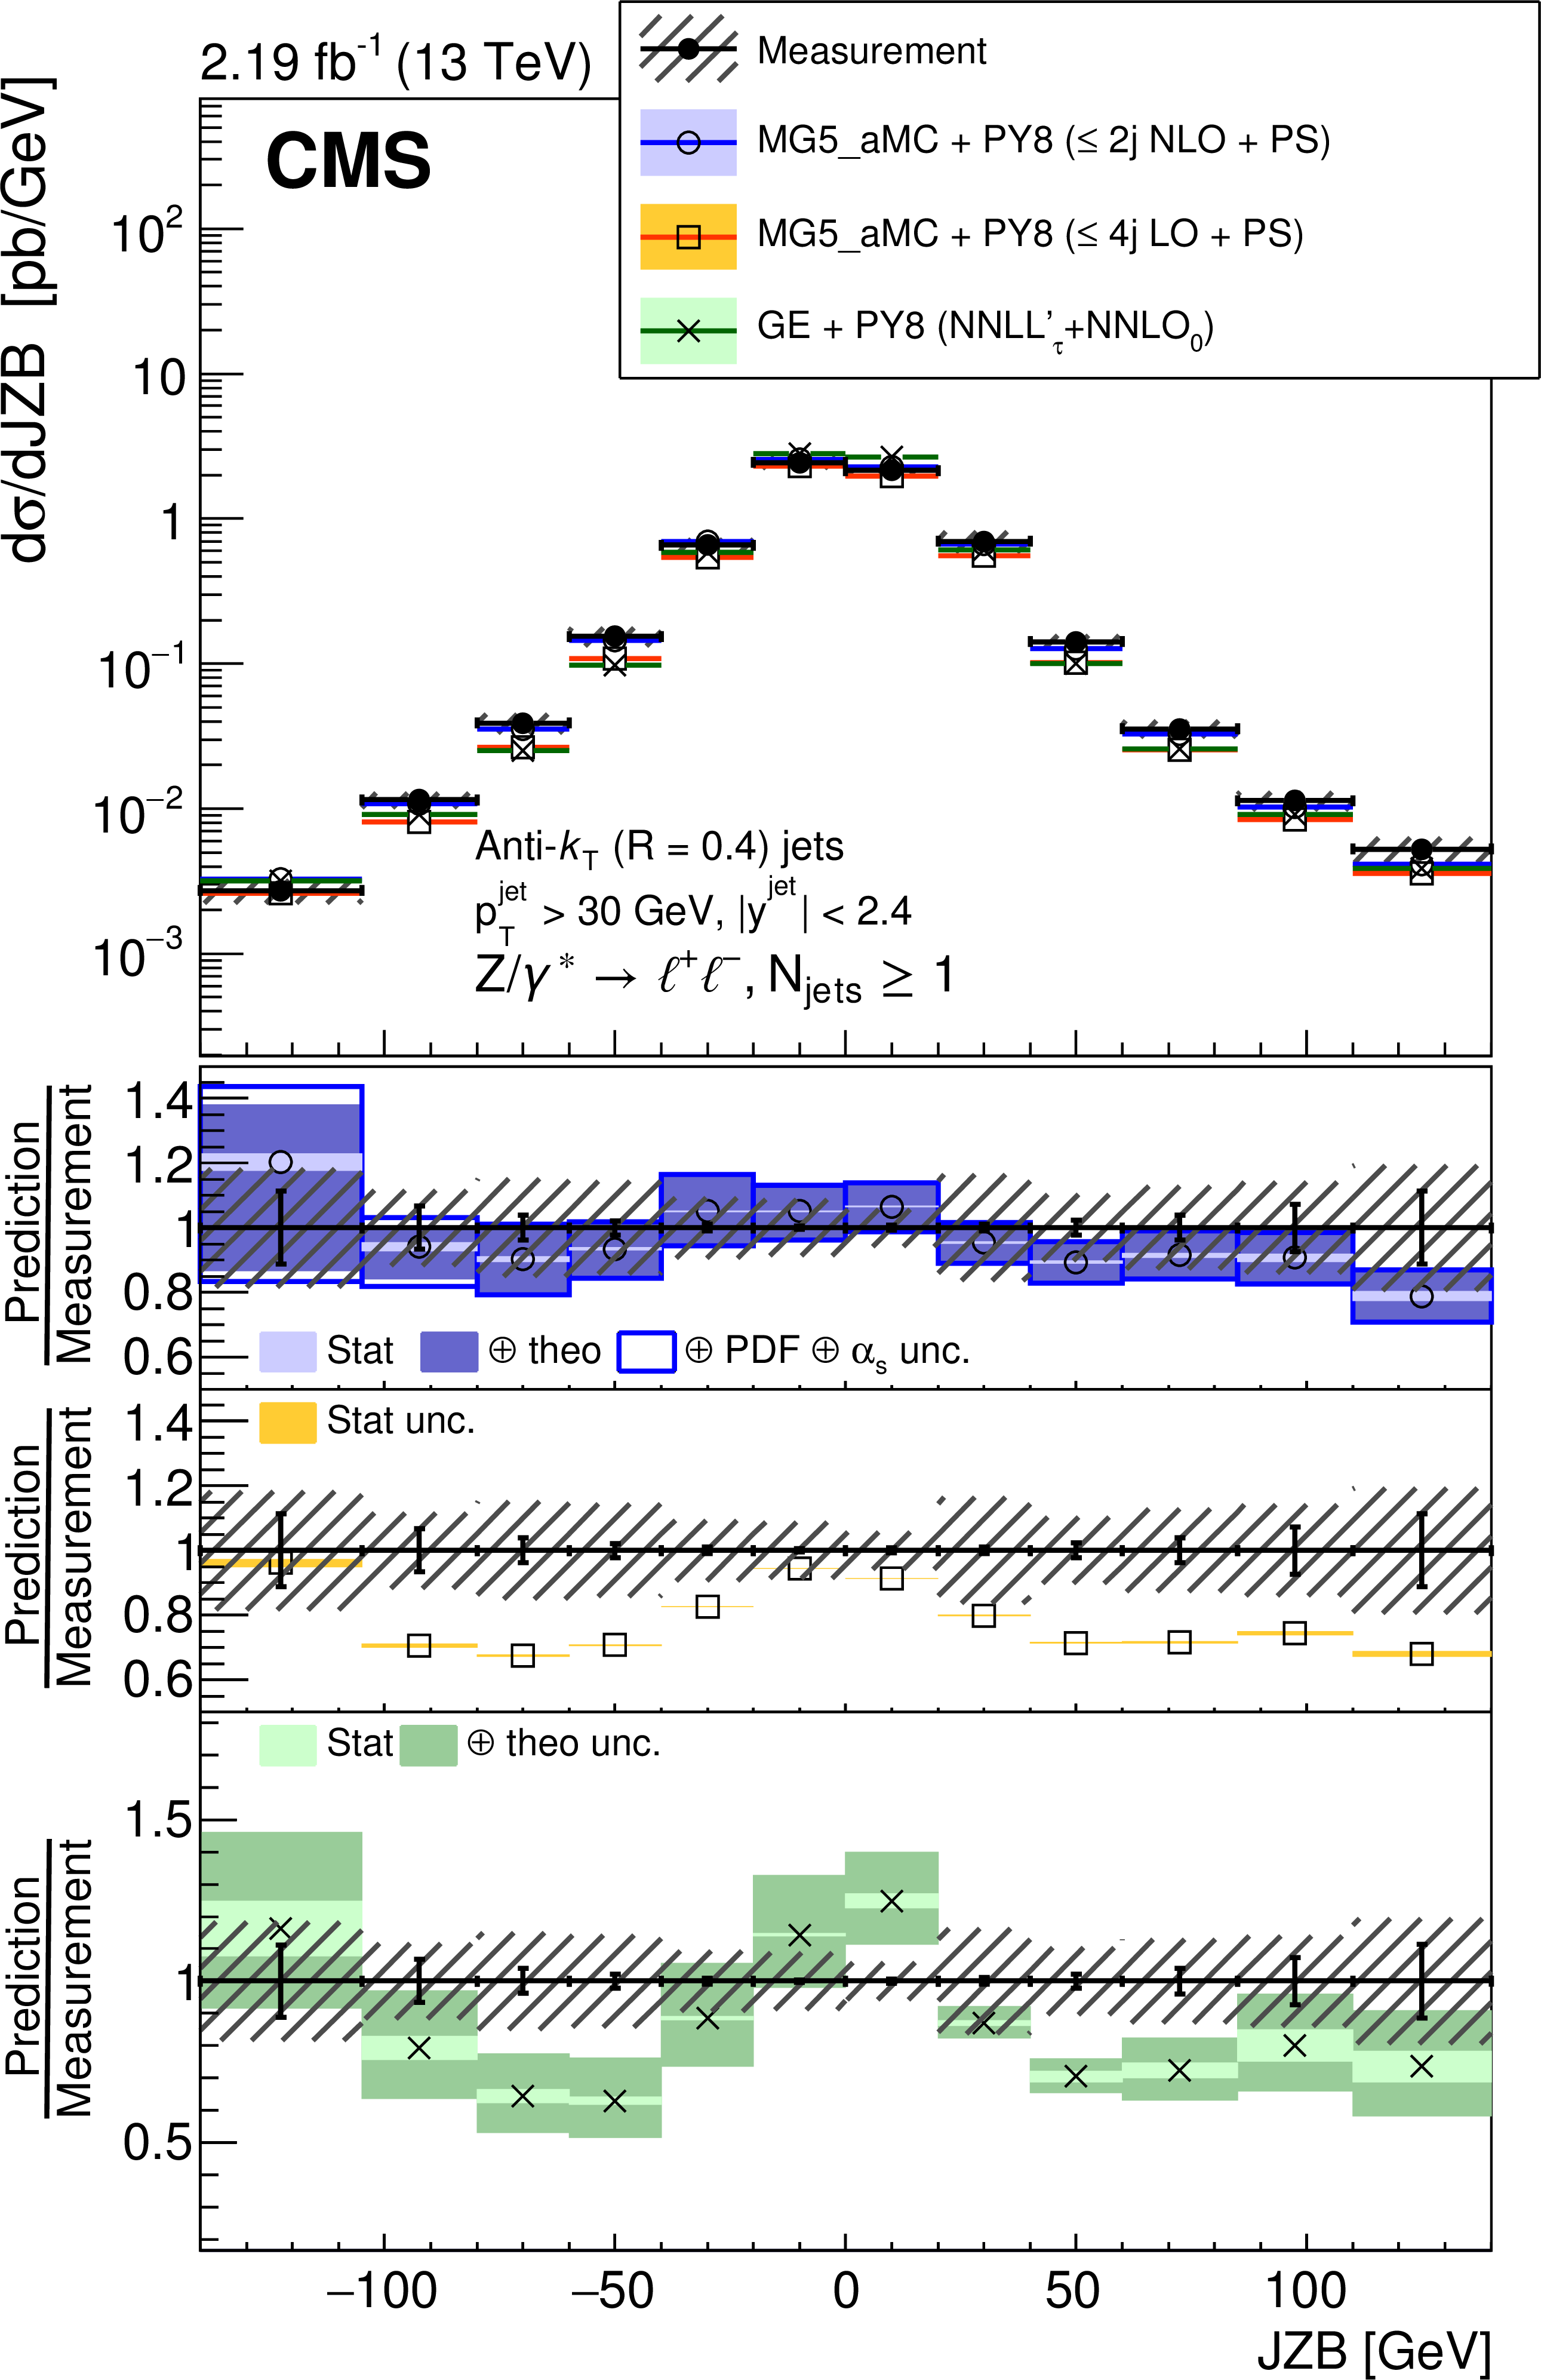
Measured cross section for Z+jets as a function of the jet exclusive (left) and inclusive (right) multiplicity. The error bars represent the statistical uncertainty and the grey hatched bands represent the total uncertainty, including the systematic and statistical components. The measurement is compared with different predictions, which are described in the text. The ratio of each prediction to the measurement is shown together with the measurement statistical (black bars) and total (black hatched bands) uncertainties and the prediction (coloured bands) uncertainties. Different uncertainties were considered for the predictions: statistical (stat), ME calculation (theo), and PDF together with the strong coupling constant ($ {\alpha _S} $). The complete set was computed for one of the predictions. These uncertainties were added together in quadrature (represented by the $\oplus $ sign in the legend). |
png pdf |
Figure 4-a:
Measured cross section for Z+jets as a function of the jet exclusive multiplicity. The error bars represent the statistical uncertainty and the grey hatched bands represent the total uncertainty, including the systematic and statistical components. The measurement is compared with different predictions, which are described in the text. The ratio of each prediction to the measurement is shown together with the measurement statistical (black bars) and total (black hatched bands) uncertainties and the prediction (coloured bands) uncertainties. Different uncertainties were considered for the predictions: statistical (stat), ME calculation (theo), and PDF together with the strong coupling constant ($ {\alpha _S} $). The complete set was computed for one of the predictions. These uncertainties were added together in quadrature (represented by the $\oplus $ sign in the legend). |
png pdf |
Figure 4-b:
Measured cross section for Z+jets as a function of the jet inclusive multiplicity. The error bars represent the statistical uncertainty and the grey hatched bands represent the total uncertainty, including the systematic and statistical components. The measurement is compared with different predictions, which are described in the text. The ratio of each prediction to the measurement is shown together with the measurement statistical (black bars) and total (black hatched bands) uncertainties and the prediction (coloured bands) uncertainties. Different uncertainties were considered for the predictions: statistical (stat), ME calculation (theo), and PDF together with the strong coupling constant ($ {\alpha _S} $). The complete set was computed for one of the predictions. These uncertainties were added together in quadrature (represented by the $\oplus $ sign in the legend). |

png pdf |
Figure 5:
Measured cross section for Z+jets as a function of the transverse momentum of the Z boson for events with at least one jet. Other details are as mentioned in the Fig. 4 caption. |
png pdf |
Figure 6:
Measured cross section for Z+jets as a function of the transverse momentum of the first jet. Other details are as mentioned in the Fig. 4 caption. |
png pdf |
Figure 7:
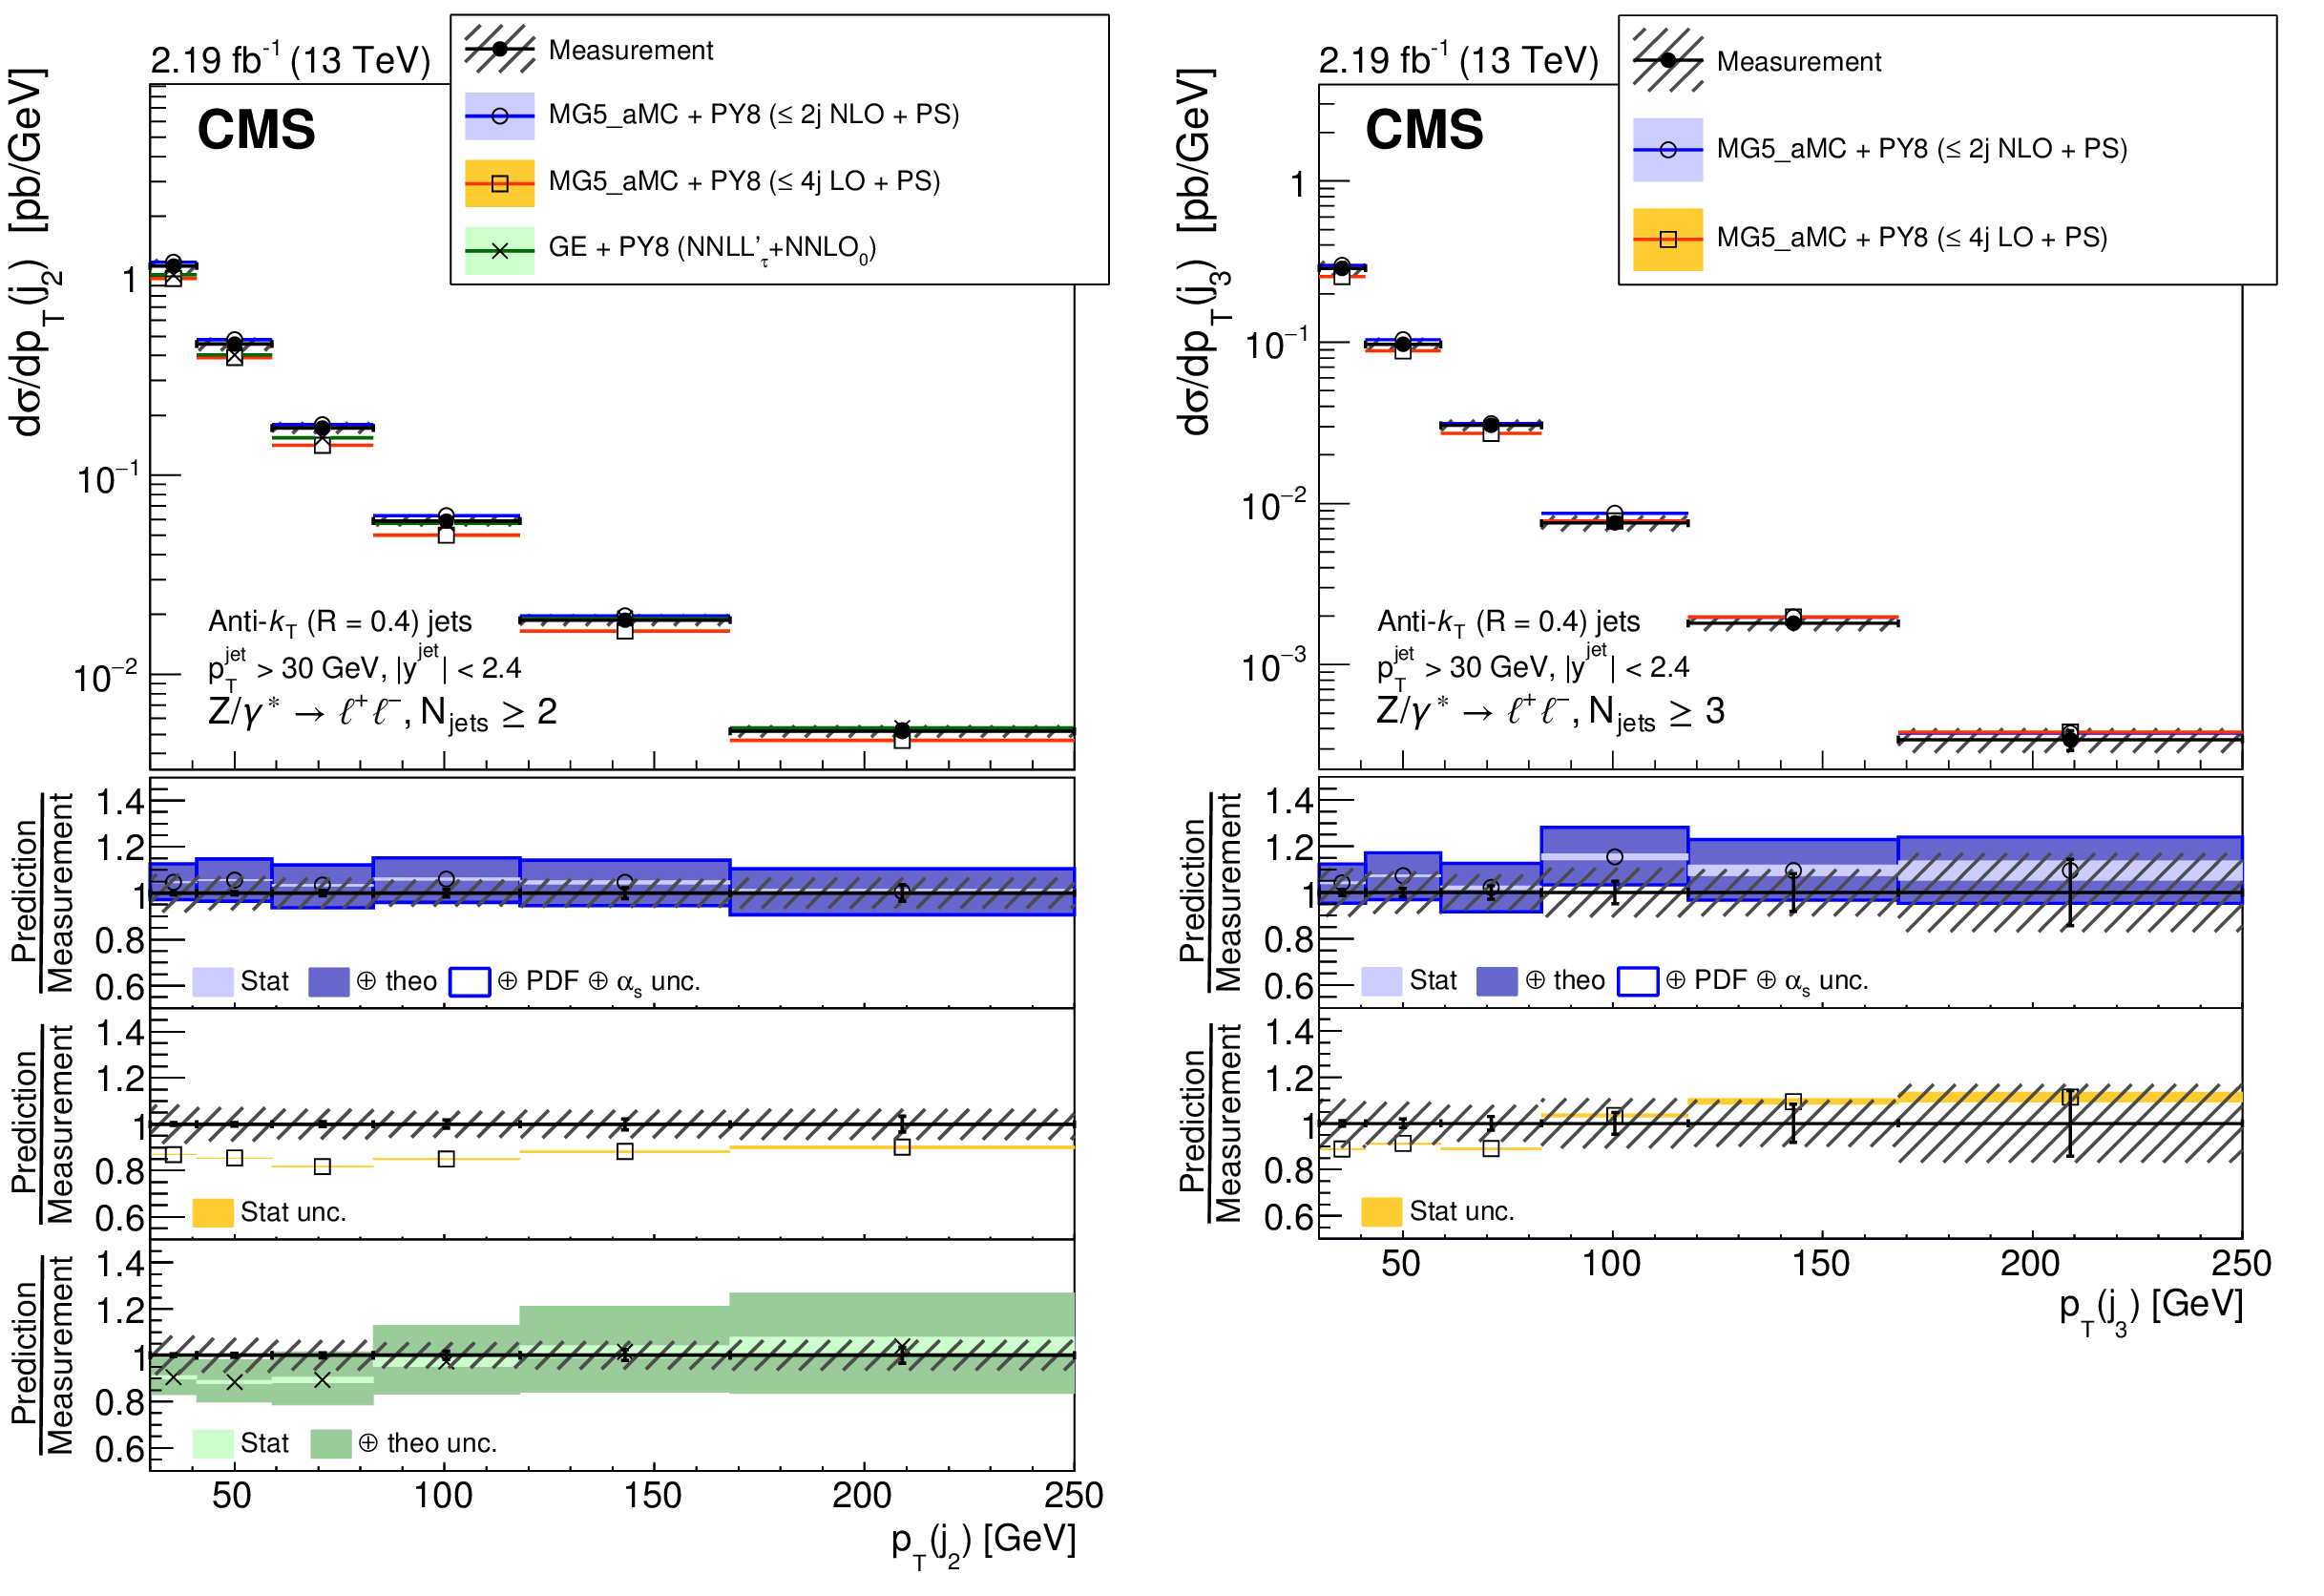
Measured cross section for Z+jets as a function of the transverse momentum of the second (left) and third (right) jet. Other details are as mentioned in the Fig. 4 caption. |

png pdf |
Figure 7-a:
Measured cross section for Z+jets as a function of the transverse momentum of the second jet. Other details are as mentioned in the Fig. 4 caption. |
png pdf |
Figure 7-b:
Measured cross section for Z+jets as a function of the transverse momentum of the third jet. Other details are as mentioned in the Fig. 4 caption. |
png pdf |
Figure 8:
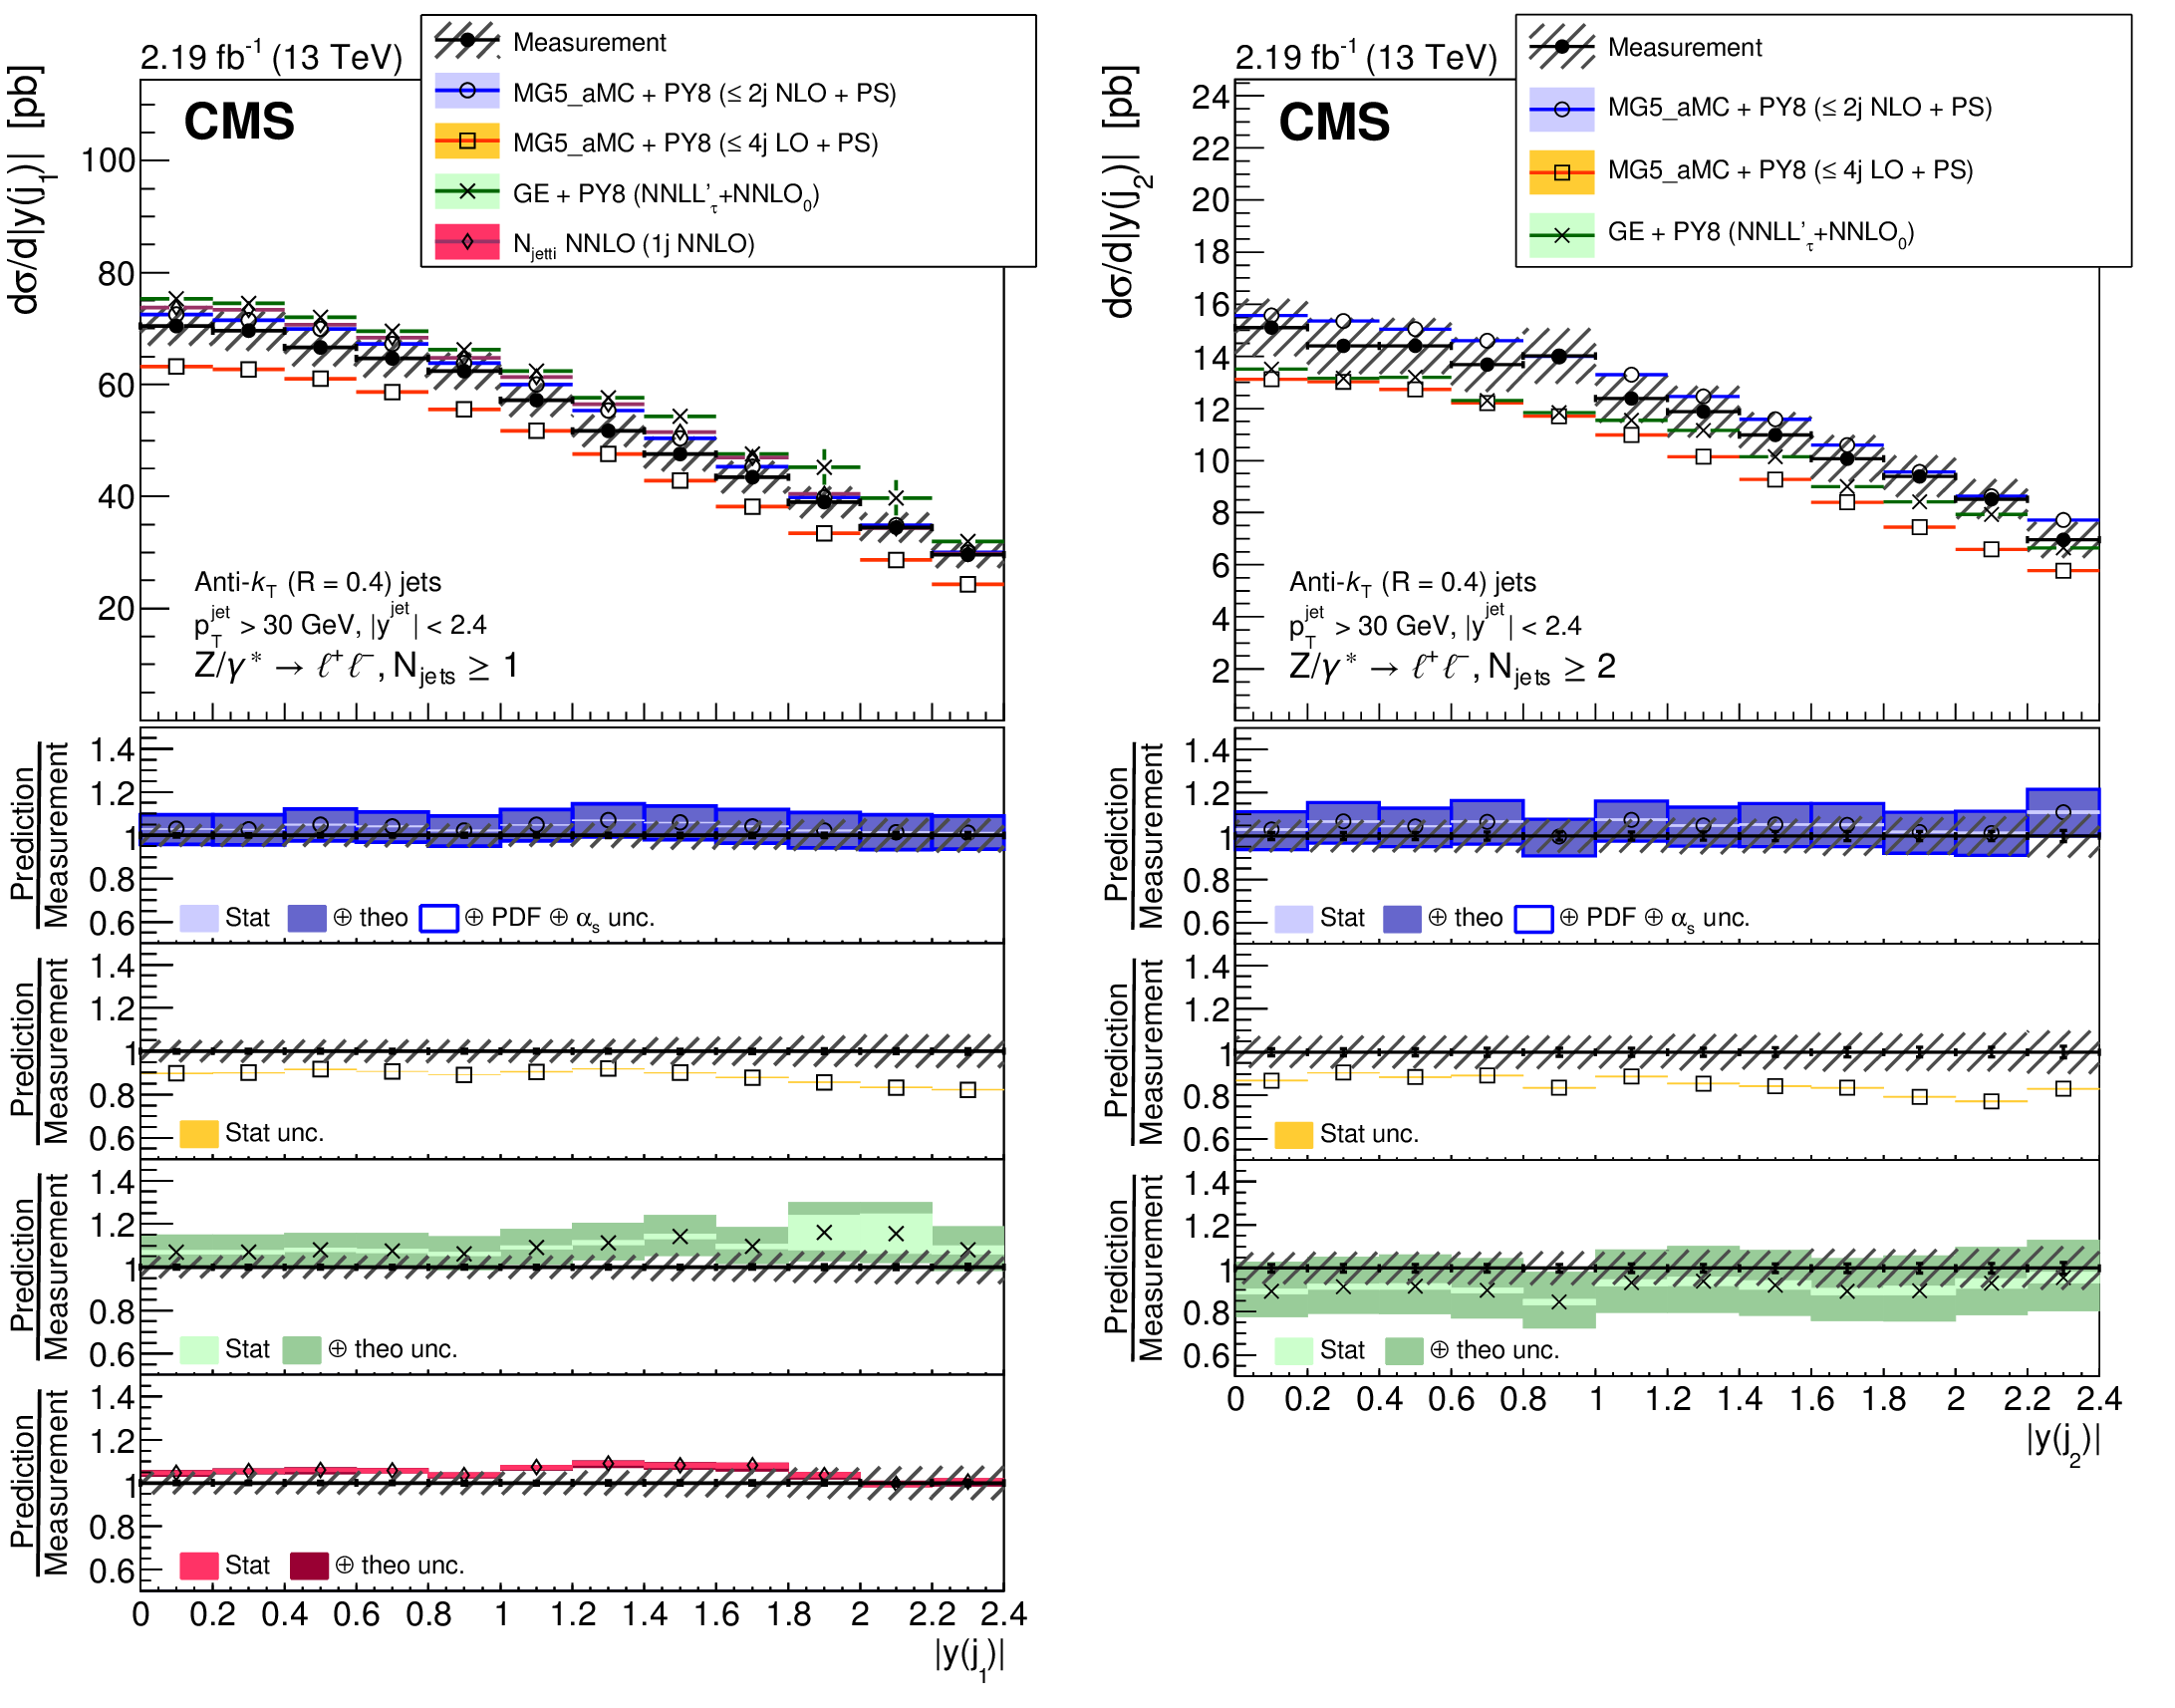
Measured cross section for Z+jets as a function of the absolute rapidity of the first (left) and second (right) jet. Other details are as mentioned in the Fig. 4 caption. |
png pdf |
Figure 8-a:
Measured cross section for Z+jets as a function of the absolute rapidity of the first jet. Other details are as mentioned in the Fig. 4 caption. |
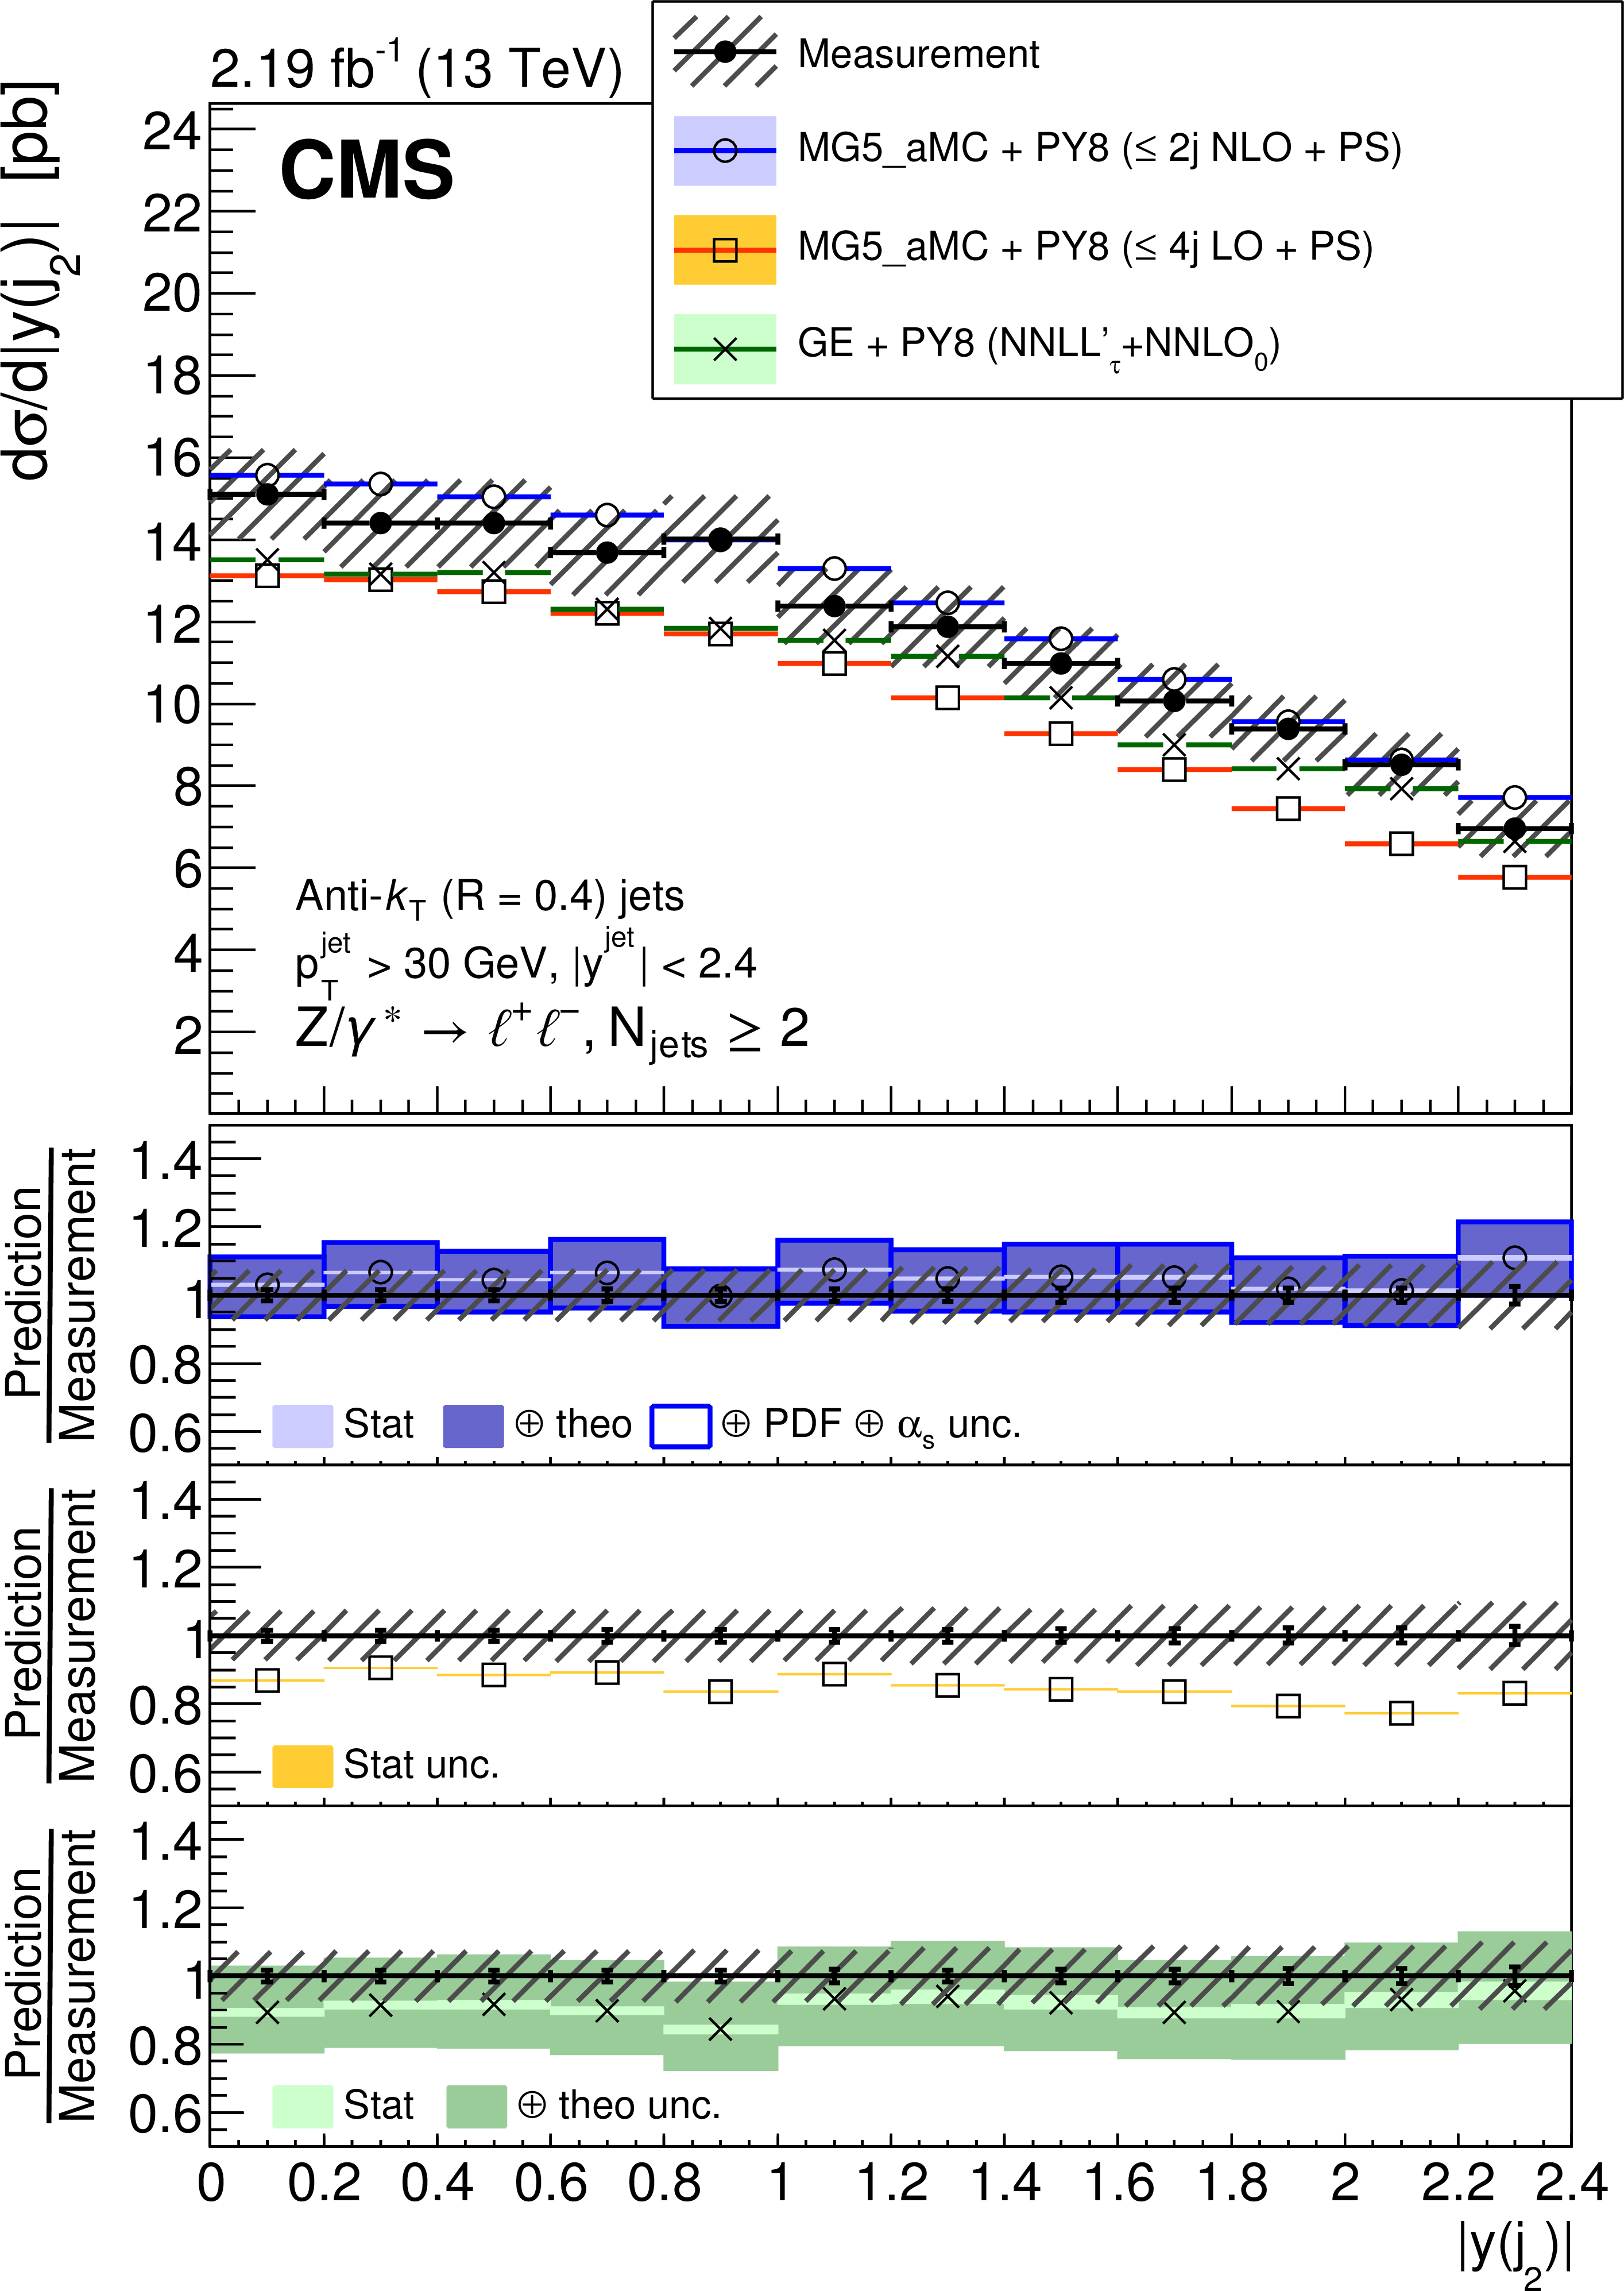
png pdf |
Figure 8-b:
Measured cross section for Z+jets as a function of the absolute rapidity of the second jet. Other details are as mentioned in the Fig. 4 caption. |
png pdf |
Figure 9:
Measured cross section for Z+jets as a function of the absolute rapidity of the third jet. Other details are as mentioned in the Fig. 4 caption. |
png pdf |
Figure 10:
Measured cross section for Z+jets as a function of the $ {H_{\mathrm {T}}} $ observable for events with at least one jet. Other details are as mentioned in the Fig. 4 caption. |
png pdf |
Figure 11:
Measured cross section for Z+jets as a function of the $ {H_{\mathrm {T}}} $ observable of jets for events with at least two (left) and three (right) jets. Other details are as mentioned in the Fig. 4 caption. |

png pdf |
Figure 11-a:
Measured cross section for Z+jets as a function of the $ {H_{\mathrm {T}}} $ observable of jets for events with at least two jets. Other details are as mentioned in the Fig. 4 caption. |

png pdf |
Figure 11-b:
Measured cross section for Z+jets as a function of the $ {H_{\mathrm {T}}} $ observable of jets for events with at least three jets. Other details are as mentioned in the Fig. 4 caption. |
png pdf |
Figure 12:
Measured cross section for Z+jets as a function of the transverse momentum balance between the Z boson and the accompanying jets for events with at least one (left) and two (right) jets. Other details are as mentioned in the Fig. 4 caption. |
png pdf |
Figure 12-a:
Measured cross section for Z+jets as a function of the transverse momentum balance between the Z boson and the accompanying jets for events with at least one jet. Other details are as mentioned in the Fig. 4 caption. |
png pdf |
Figure 12-b:
Measured cross section for Z+jets as a function of the transverse momentum balance between the Z boson and the accompanying jets for events with at least two jets. Other details are as mentioned in the Fig. 4 caption. |

png pdf |
Figure 13:
Measured cross section for Z+jets as a function of the transverse momentum balance between the Z boson and the accompanying jets for events with at least three jets. Other details are as mentioned in the Fig. 4 caption. |
png pdf |
Figure 14:
Measured cross section for Z+jets as a function of the JZB variable (see text), with no restriction on $ {p_{\mathrm {T}}} ({\mathrm {Z}})$. Other details are as mentioned in the Fig. 4 caption. |
png pdf |
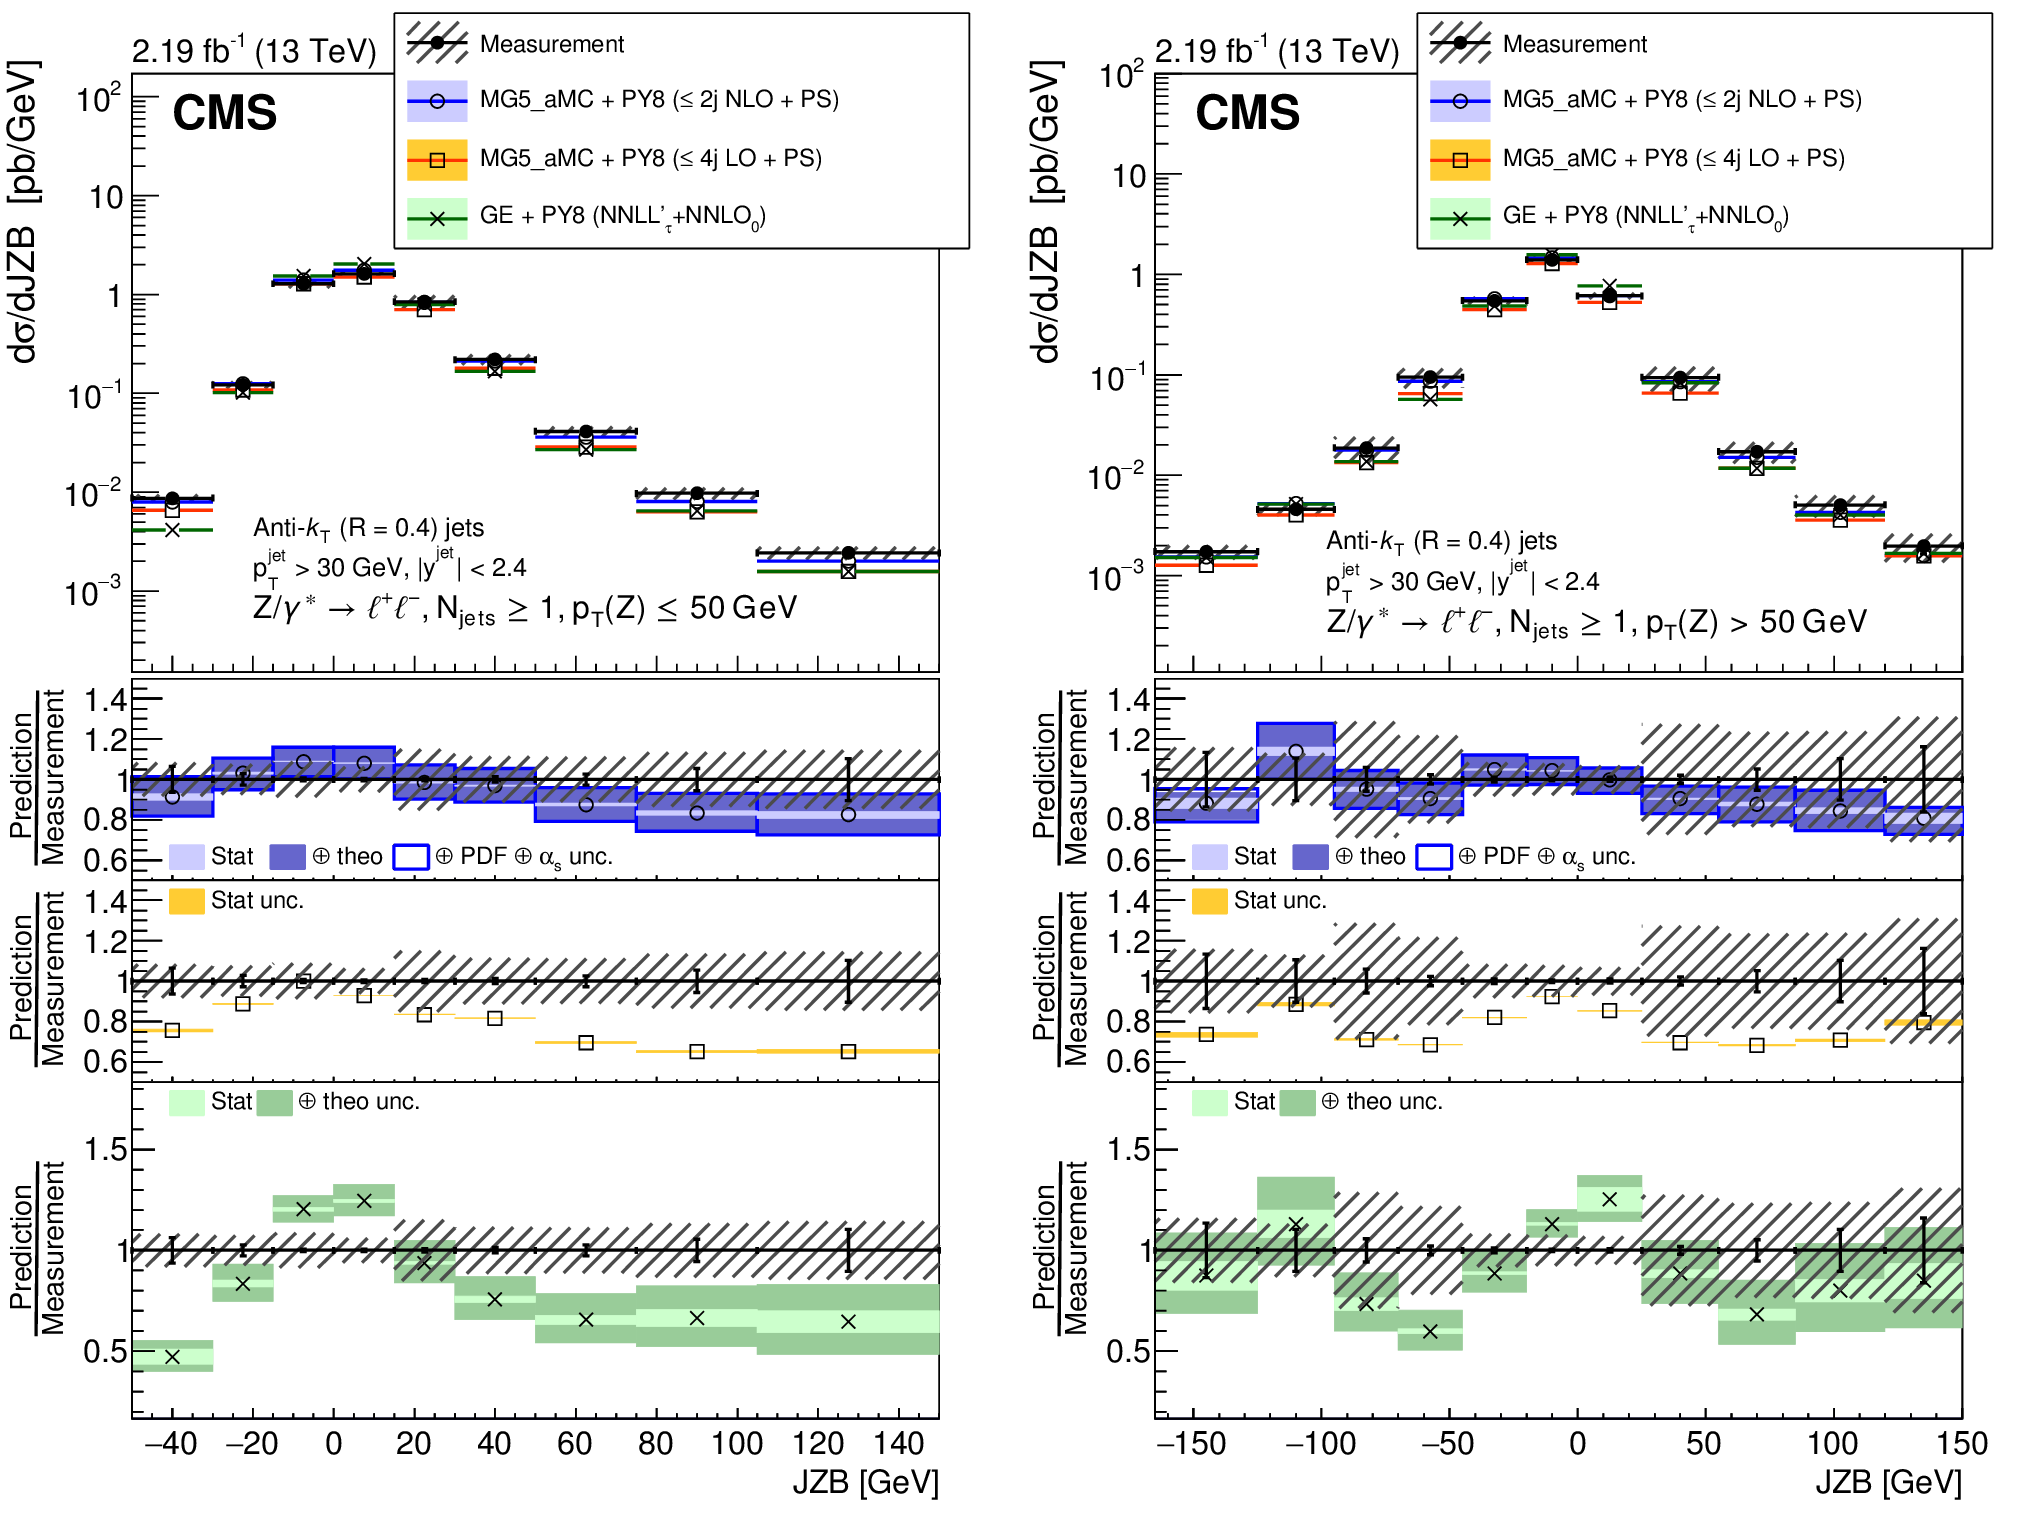
Figure 15:
Measured cross section for Z+jets as a function of the JZB variable (see text), for $ {p_{\mathrm {T}}} ({\mathrm {Z}}) < $ 50 GeV (left) and $ {p_{\mathrm {T}}} ({\mathrm {Z}}) > $ 50 GeV (right). Other details are as mentioned in the Fig. 4 caption. |
png pdf |
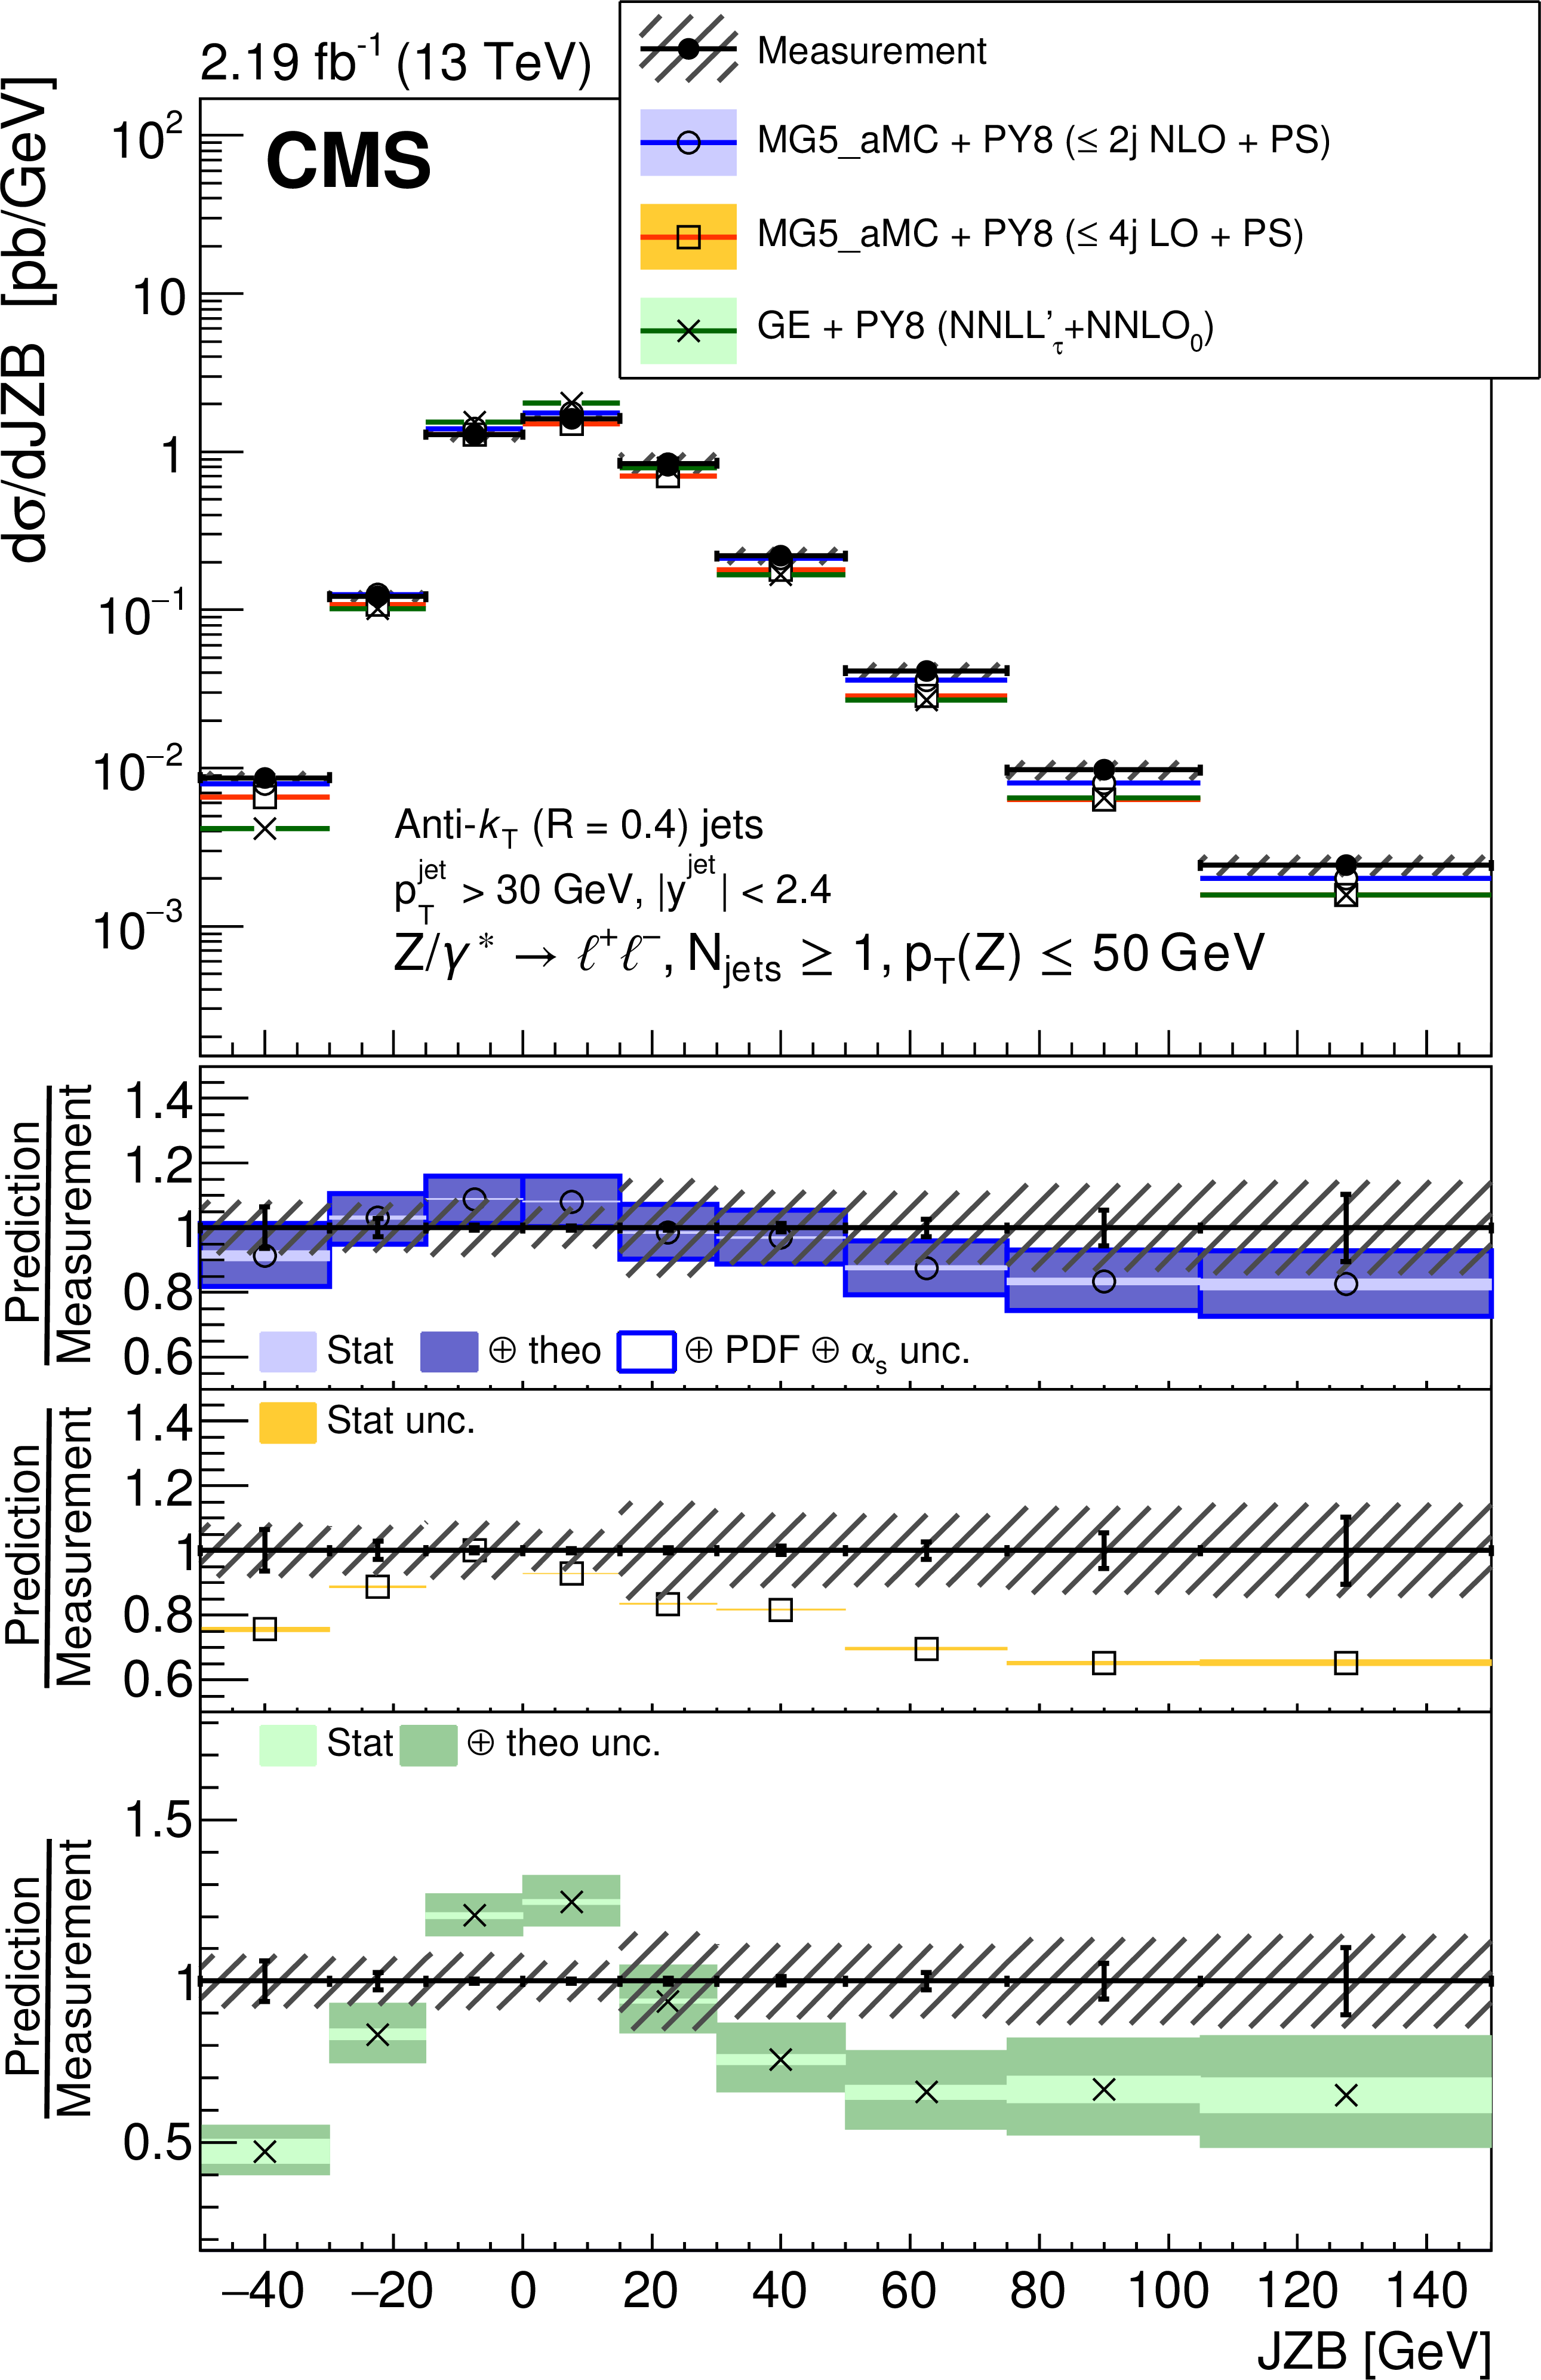
Figure 15-a:
Measured cross section for Z+jets as a function of the JZB variable (see text), for $ {p_{\mathrm {T}}} ({\mathrm {Z}}) < $ 50 GeV. Other details are as mentioned in the Fig. 4 caption. |
png pdf |
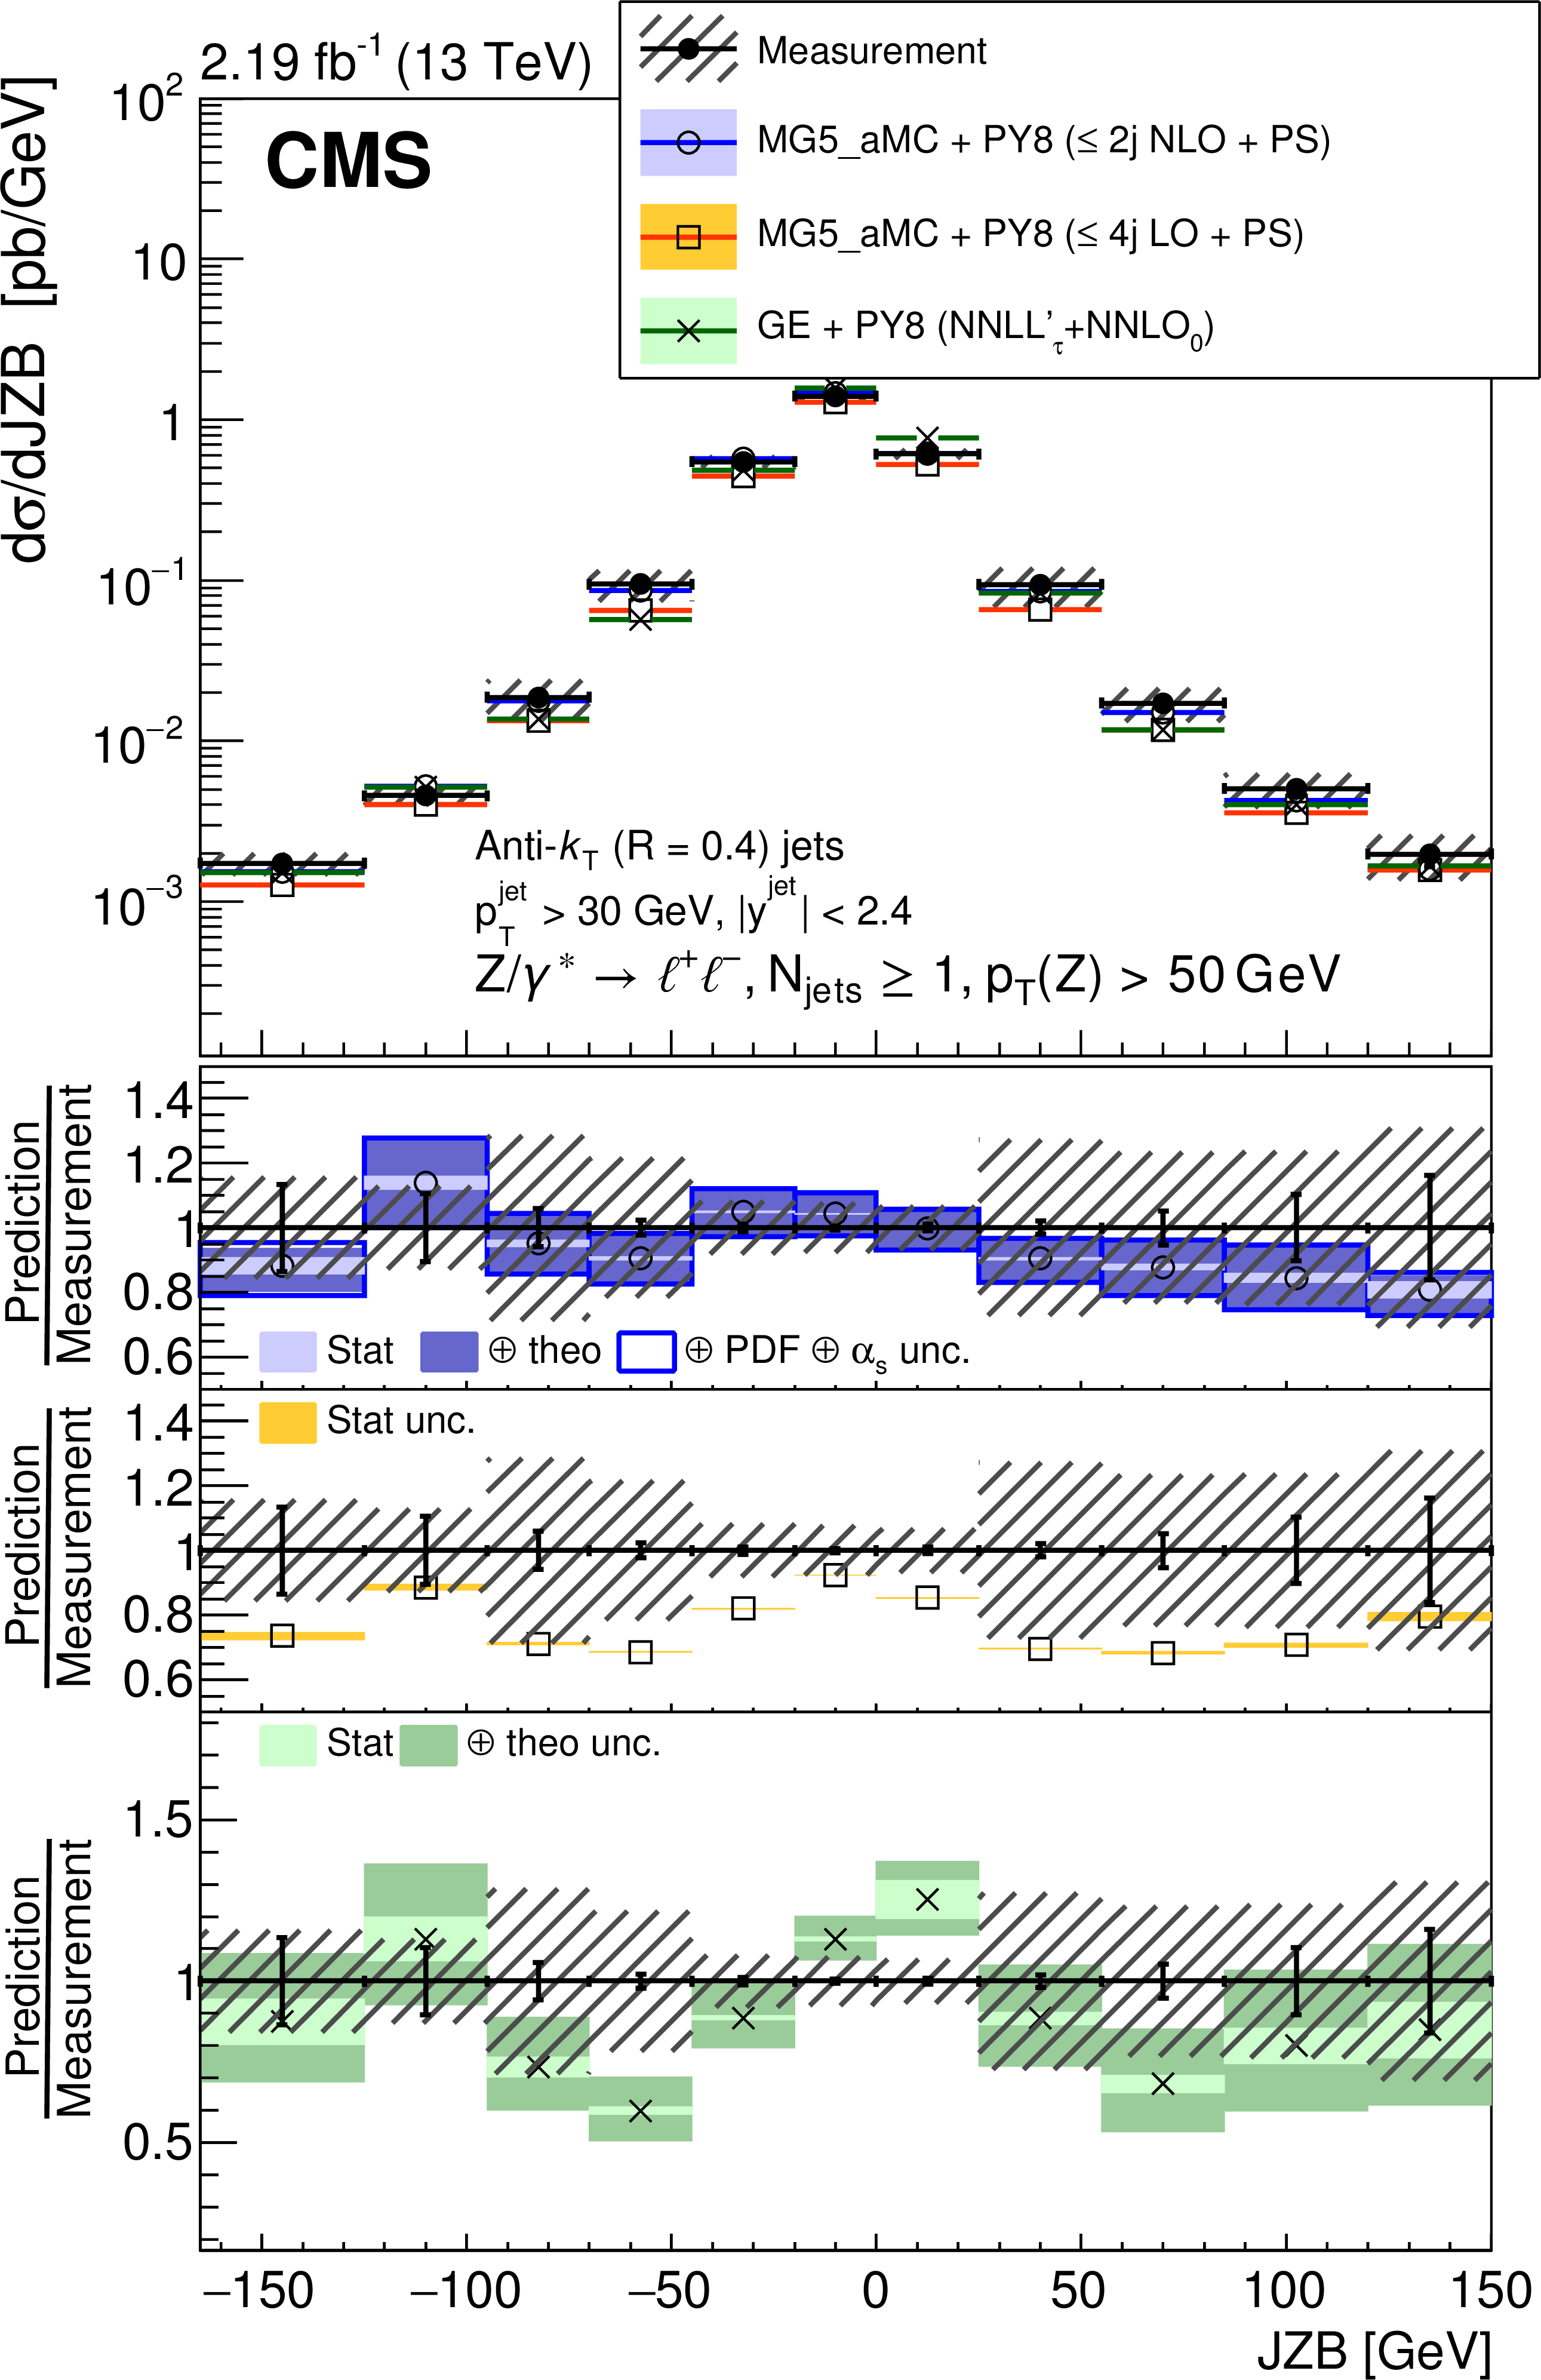
Figure 15-b:
Measured cross section for Z+jets as a function of the JZB variable (see text), for $ {p_{\mathrm {T}}} ({\mathrm {Z}}) > $ 50 GeV. Other details are as mentioned in the Fig. 4 caption. |
| Tables | |
png pdf |
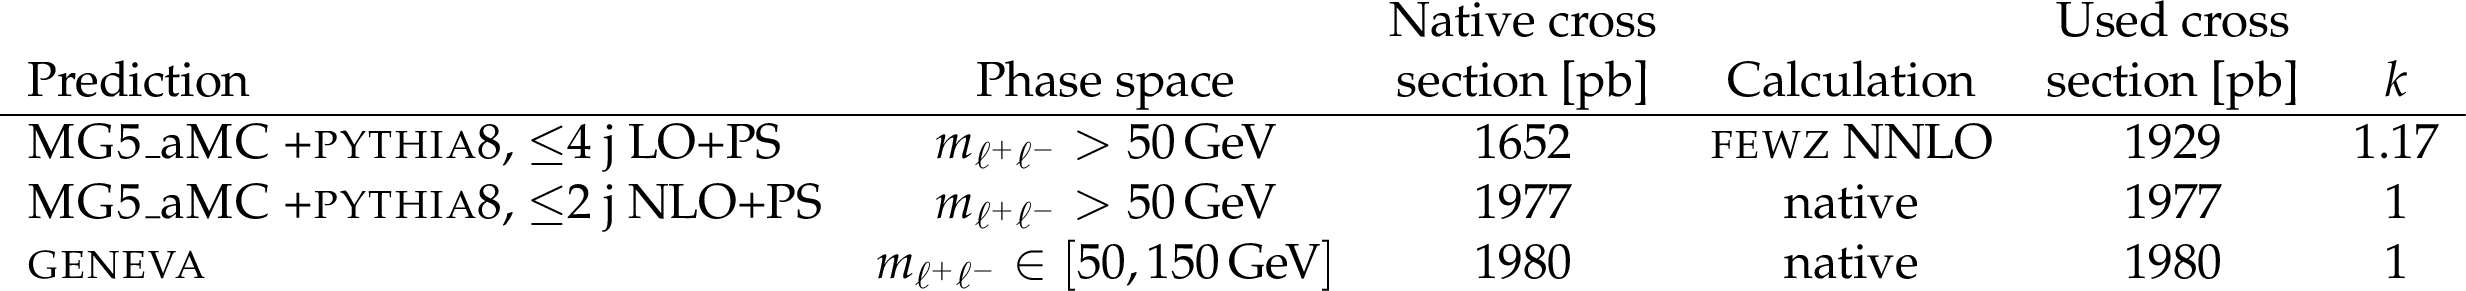
Table 1:
Values of the $ {\mathrm {p}} {\mathrm {p}}\to \ell ^+\ell ^-$ total cross section used for the calculation in data-theory comparison plots. The cross section used, the cross section from the MC generator ("native''), and the ratio of the two ($k$) are provided. The phase space of the sample to which the cross section values correspond is indicated in the second column. |
png pdf |
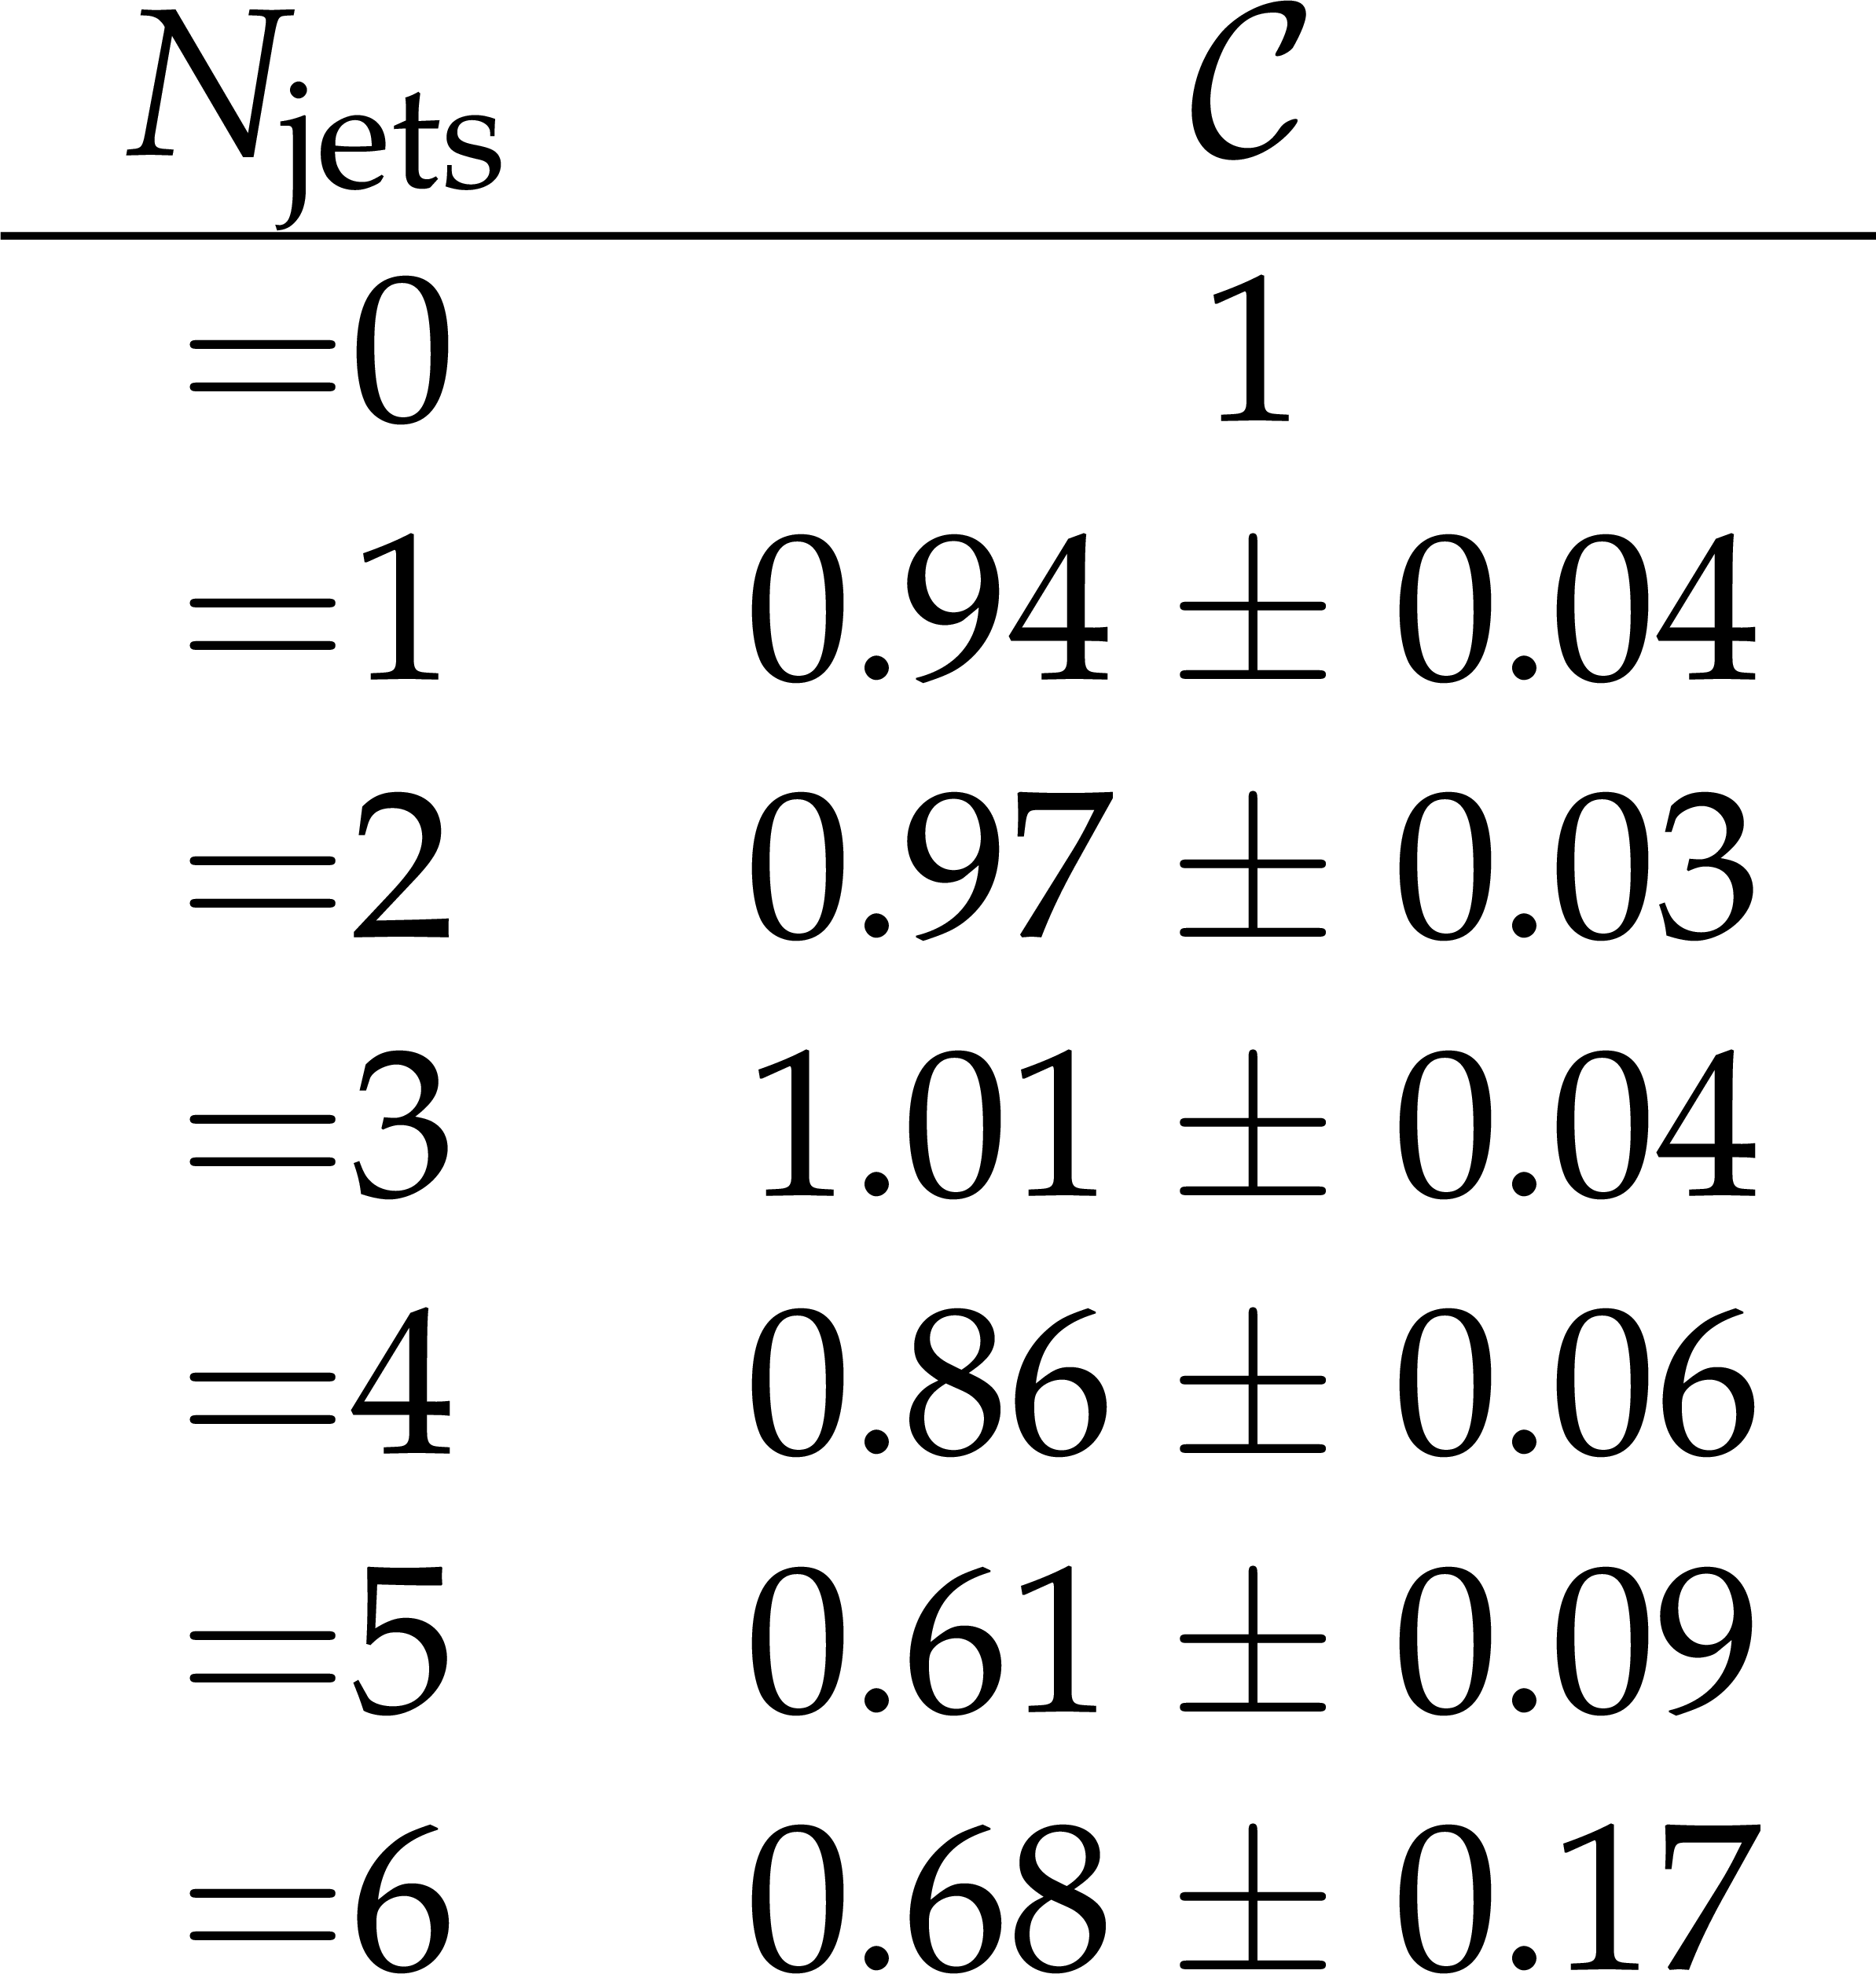
Table 2:
The correction factors ($\mathcal {C}$) applied to the simulated $ {{\mathrm {t}\overline {\mathrm {t}}}} $ sample. |
png pdf |
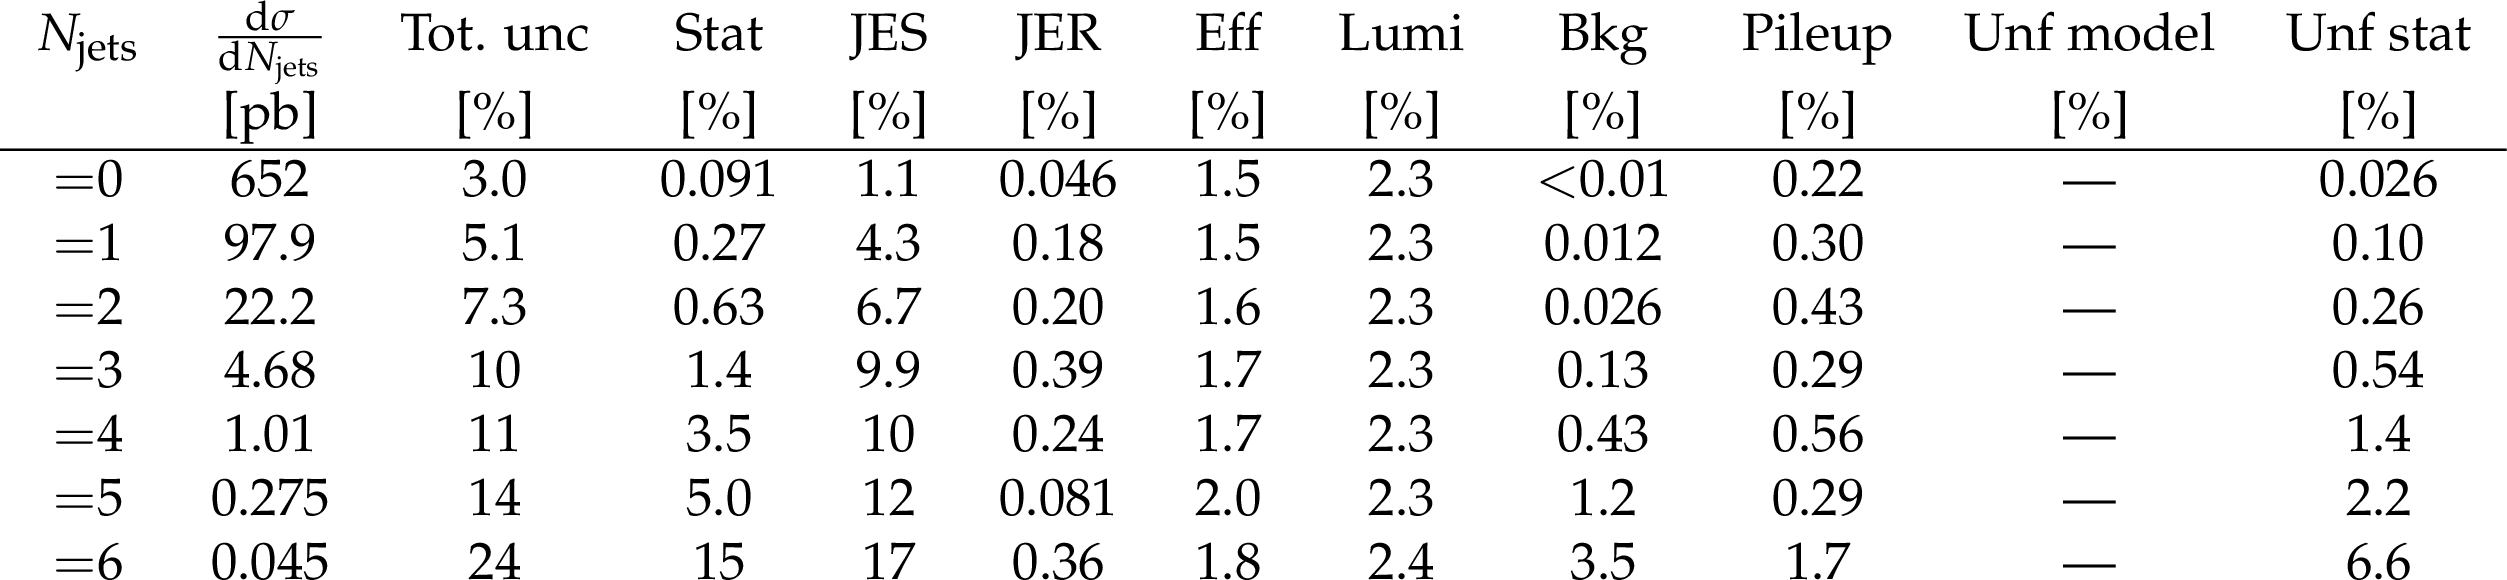
Table 3:
Cross section in exclusive jet multiplicity for the combination of both decay channels and breakdown of the uncertainties. |
png pdf |
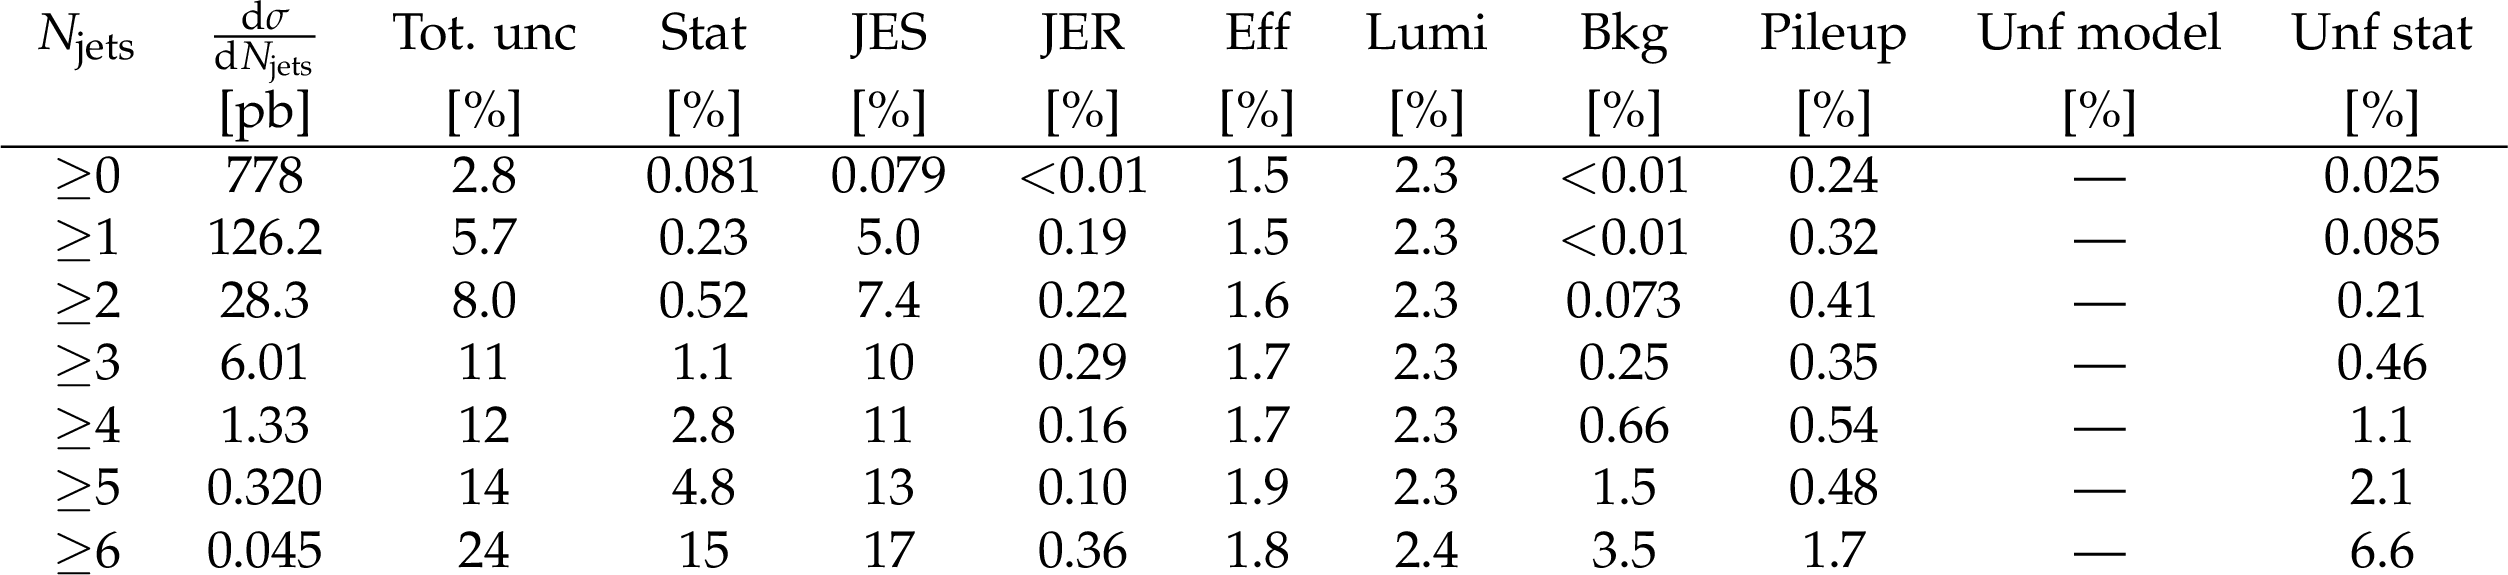
Table 4:
Cross section in inclusive jet multiplicity for the combination of both decay channels and breakdown of the uncertainties. |
png pdf |
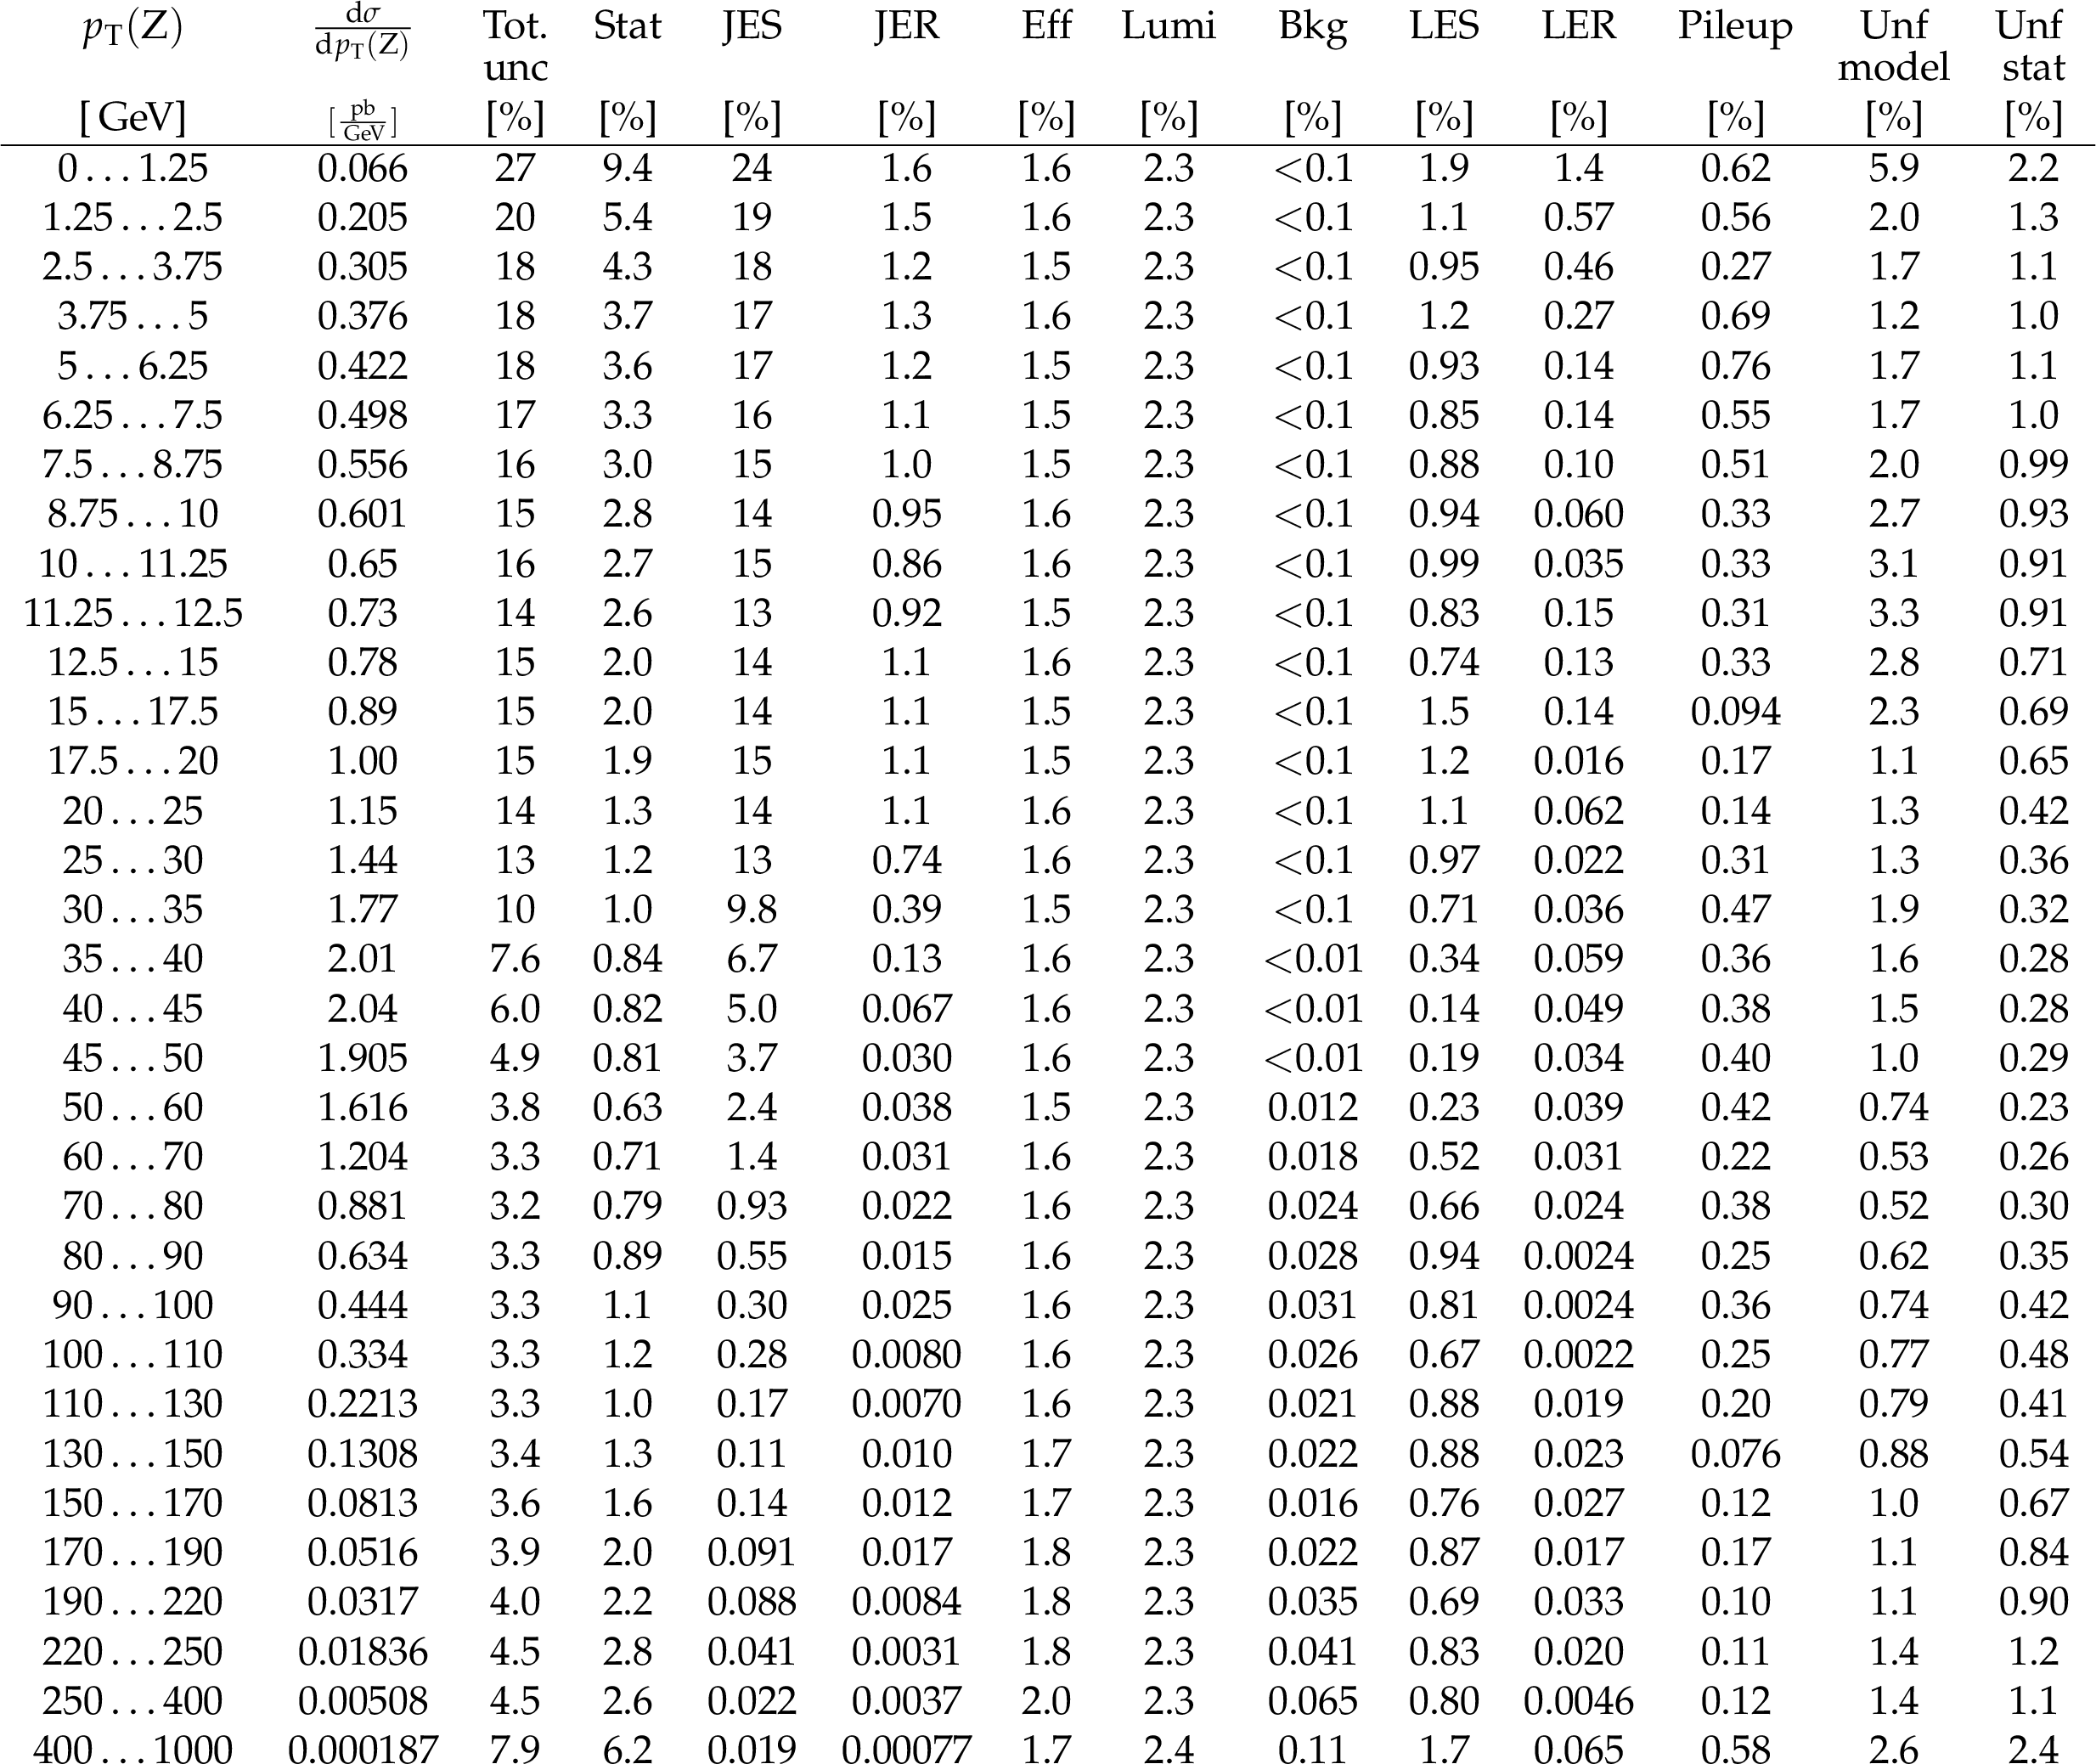
Table 5:
Differential cross section in $ {p_{\mathrm {T}}} ({\mathrm {Z}})$ ($ {N_{\text {jets}}}\geq$ 1) for the combination of both decay channels and breakdown of the uncertainties. |
png pdf |
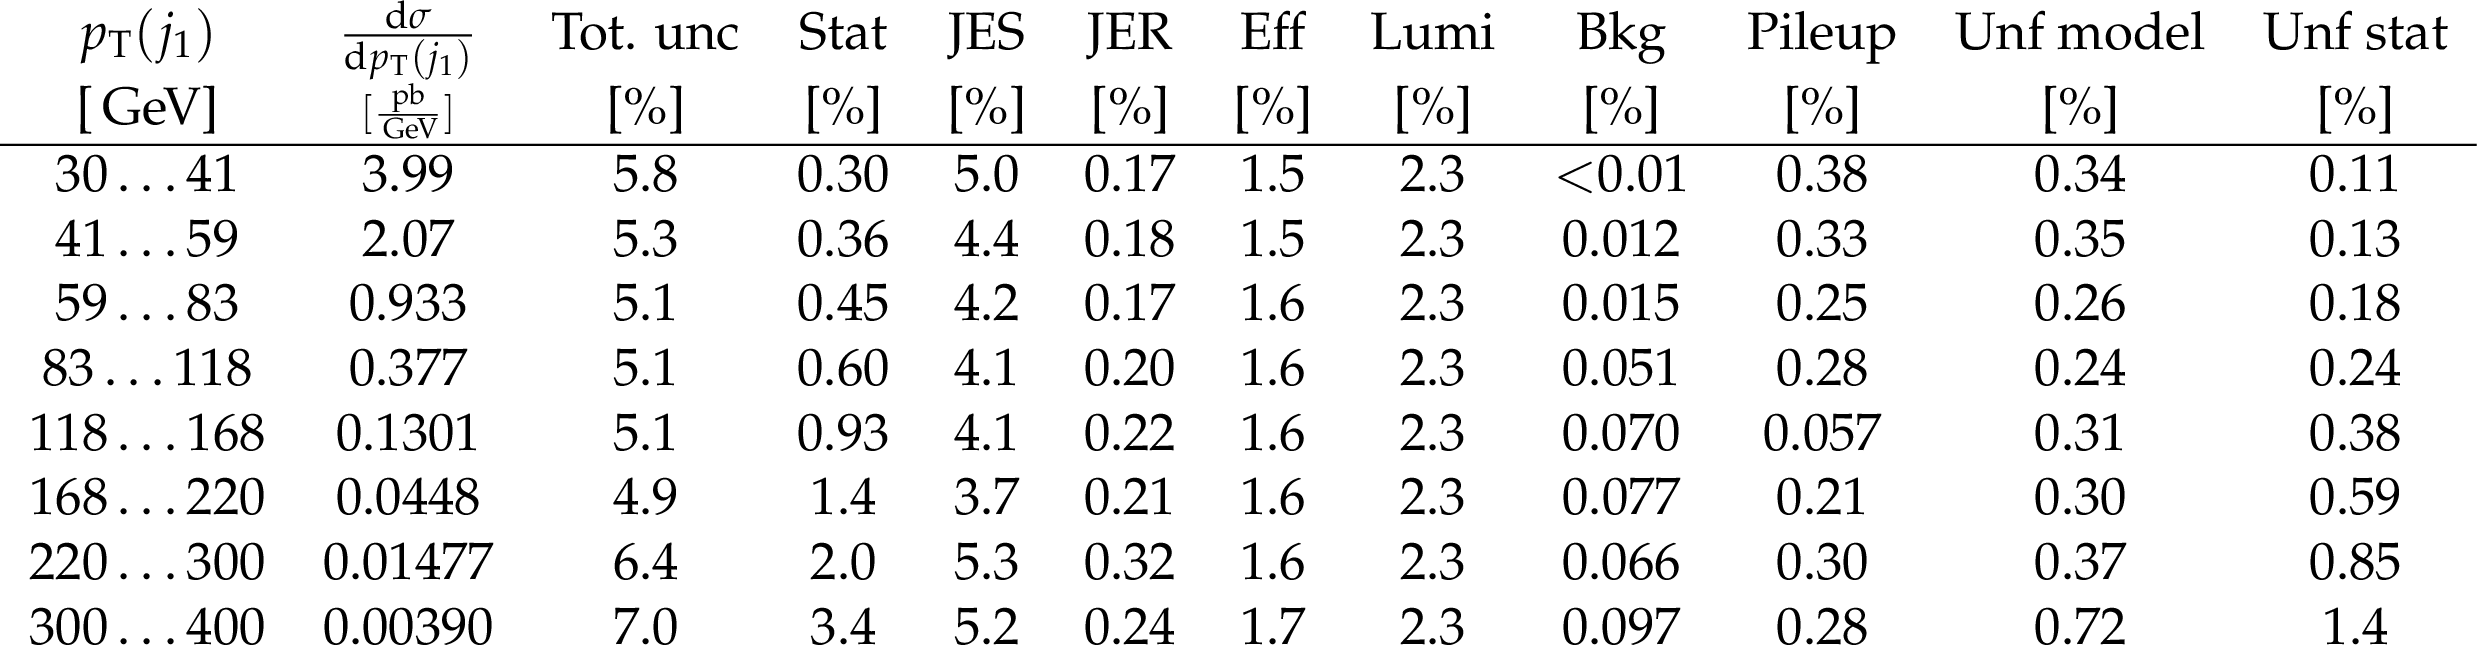
Table 6:
Differential cross section in first jet $ {p_{\mathrm {T}}} $ ($ {N_{\text {jets}}}\geq$ 1) for the combination of both decay channels and breakdown of the uncertainties. |
png pdf |
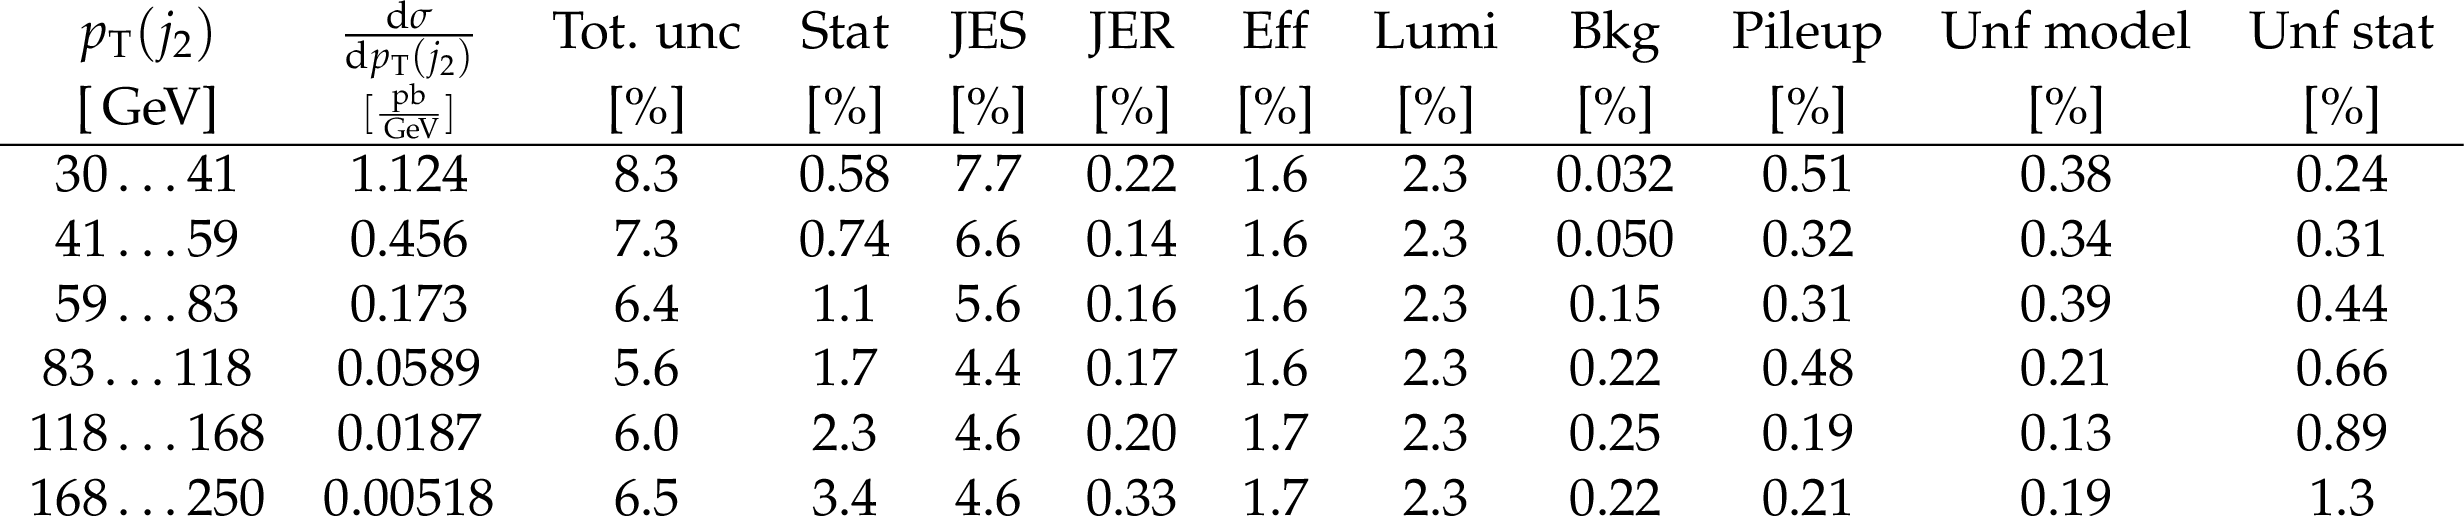
Table 7:
Differential cross section in second jet $ {p_{\mathrm {T}}} $ ($ {N_{\text {jets}}}\geq$ 2) for the combination of both decay channels and breakdown of the uncertainties. |

png pdf |
Table 8:
Differential cross section in third jet $ {p_{\mathrm {T}}} $ ($ {N_{\text {jets}}}\geq$ 3) for the combination of both decay channels and breakdown of the uncertainties. |
png pdf |
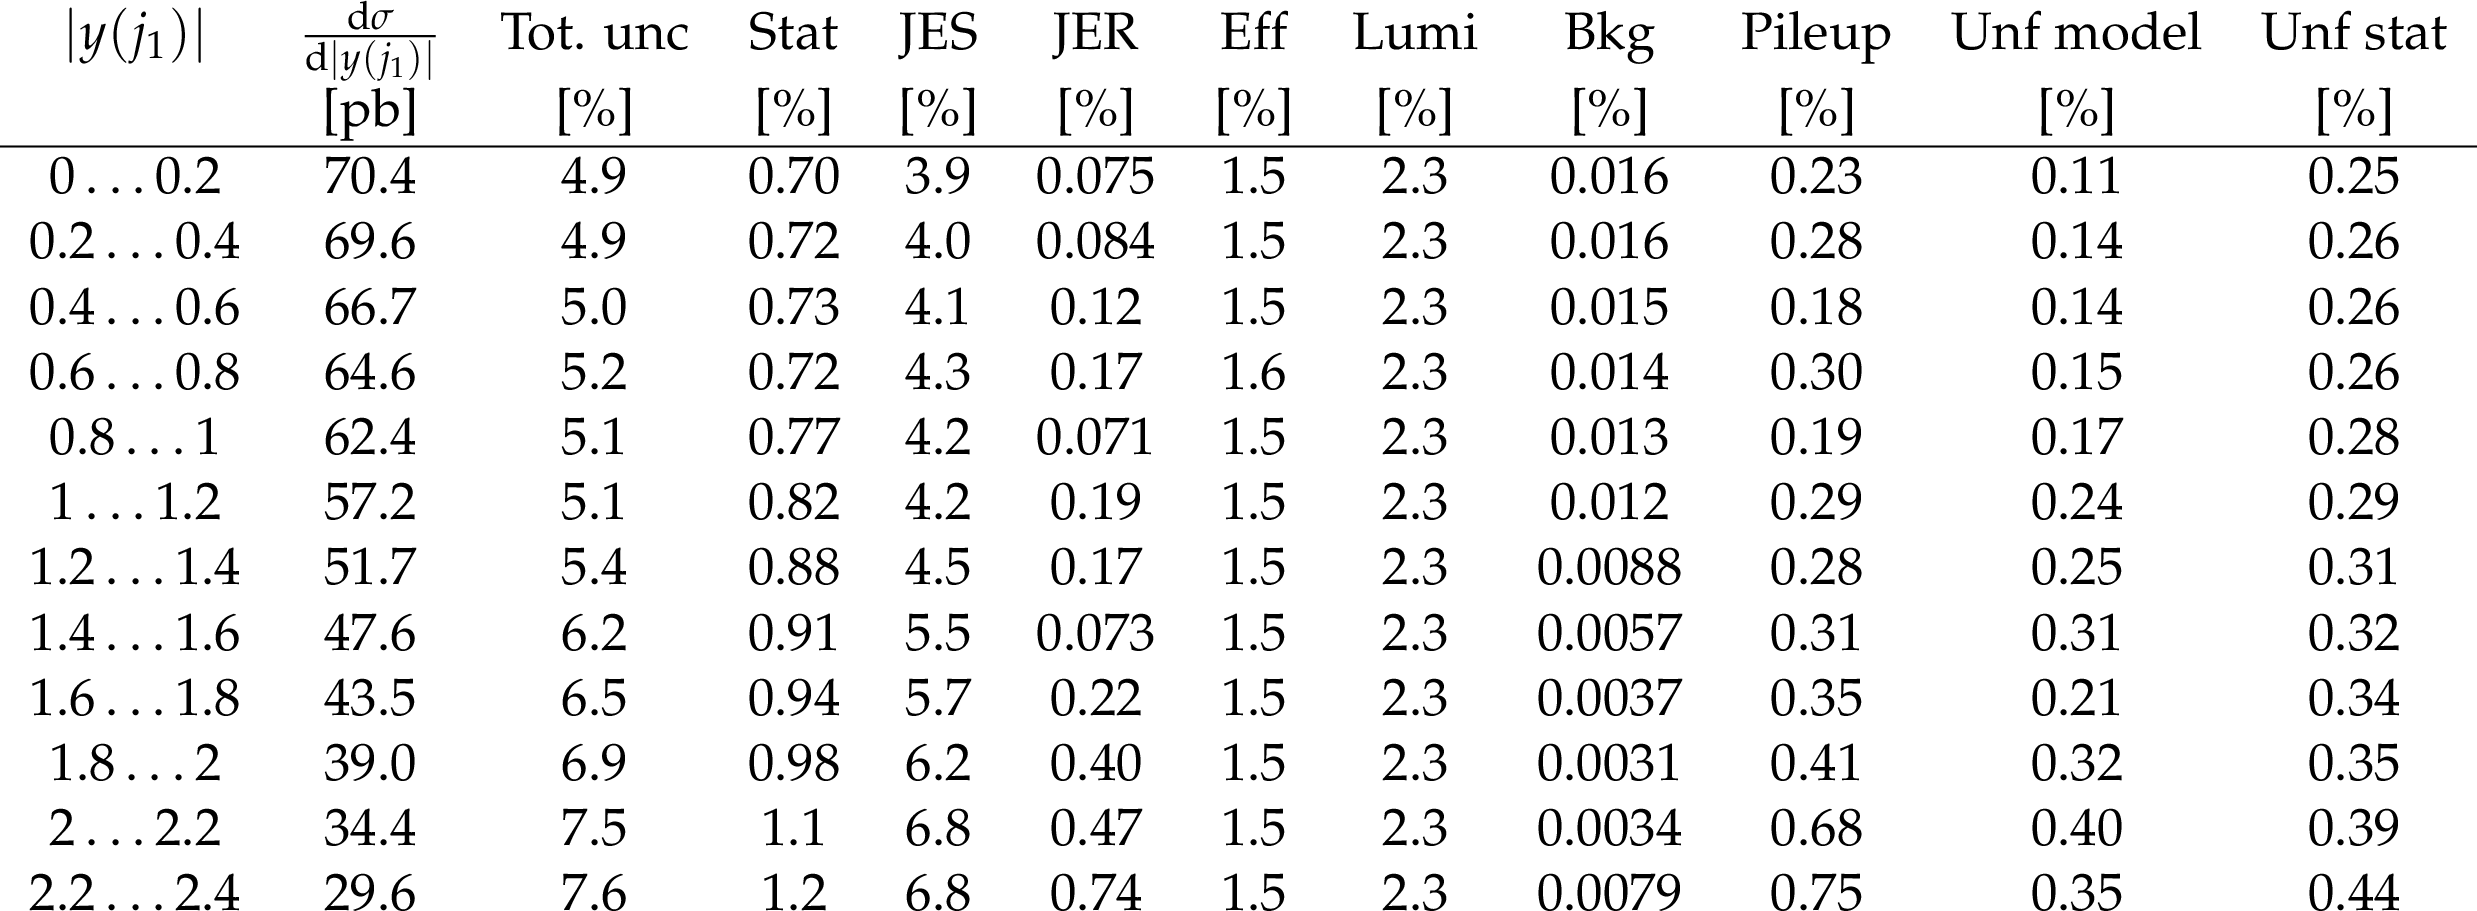
Table 9:
Differential cross section in first jet $| y | $ ($ {N_{\text {jets}}}\geq$ 1) for the combination of both decay channels and breakdown of the uncertainties. |
png pdf |
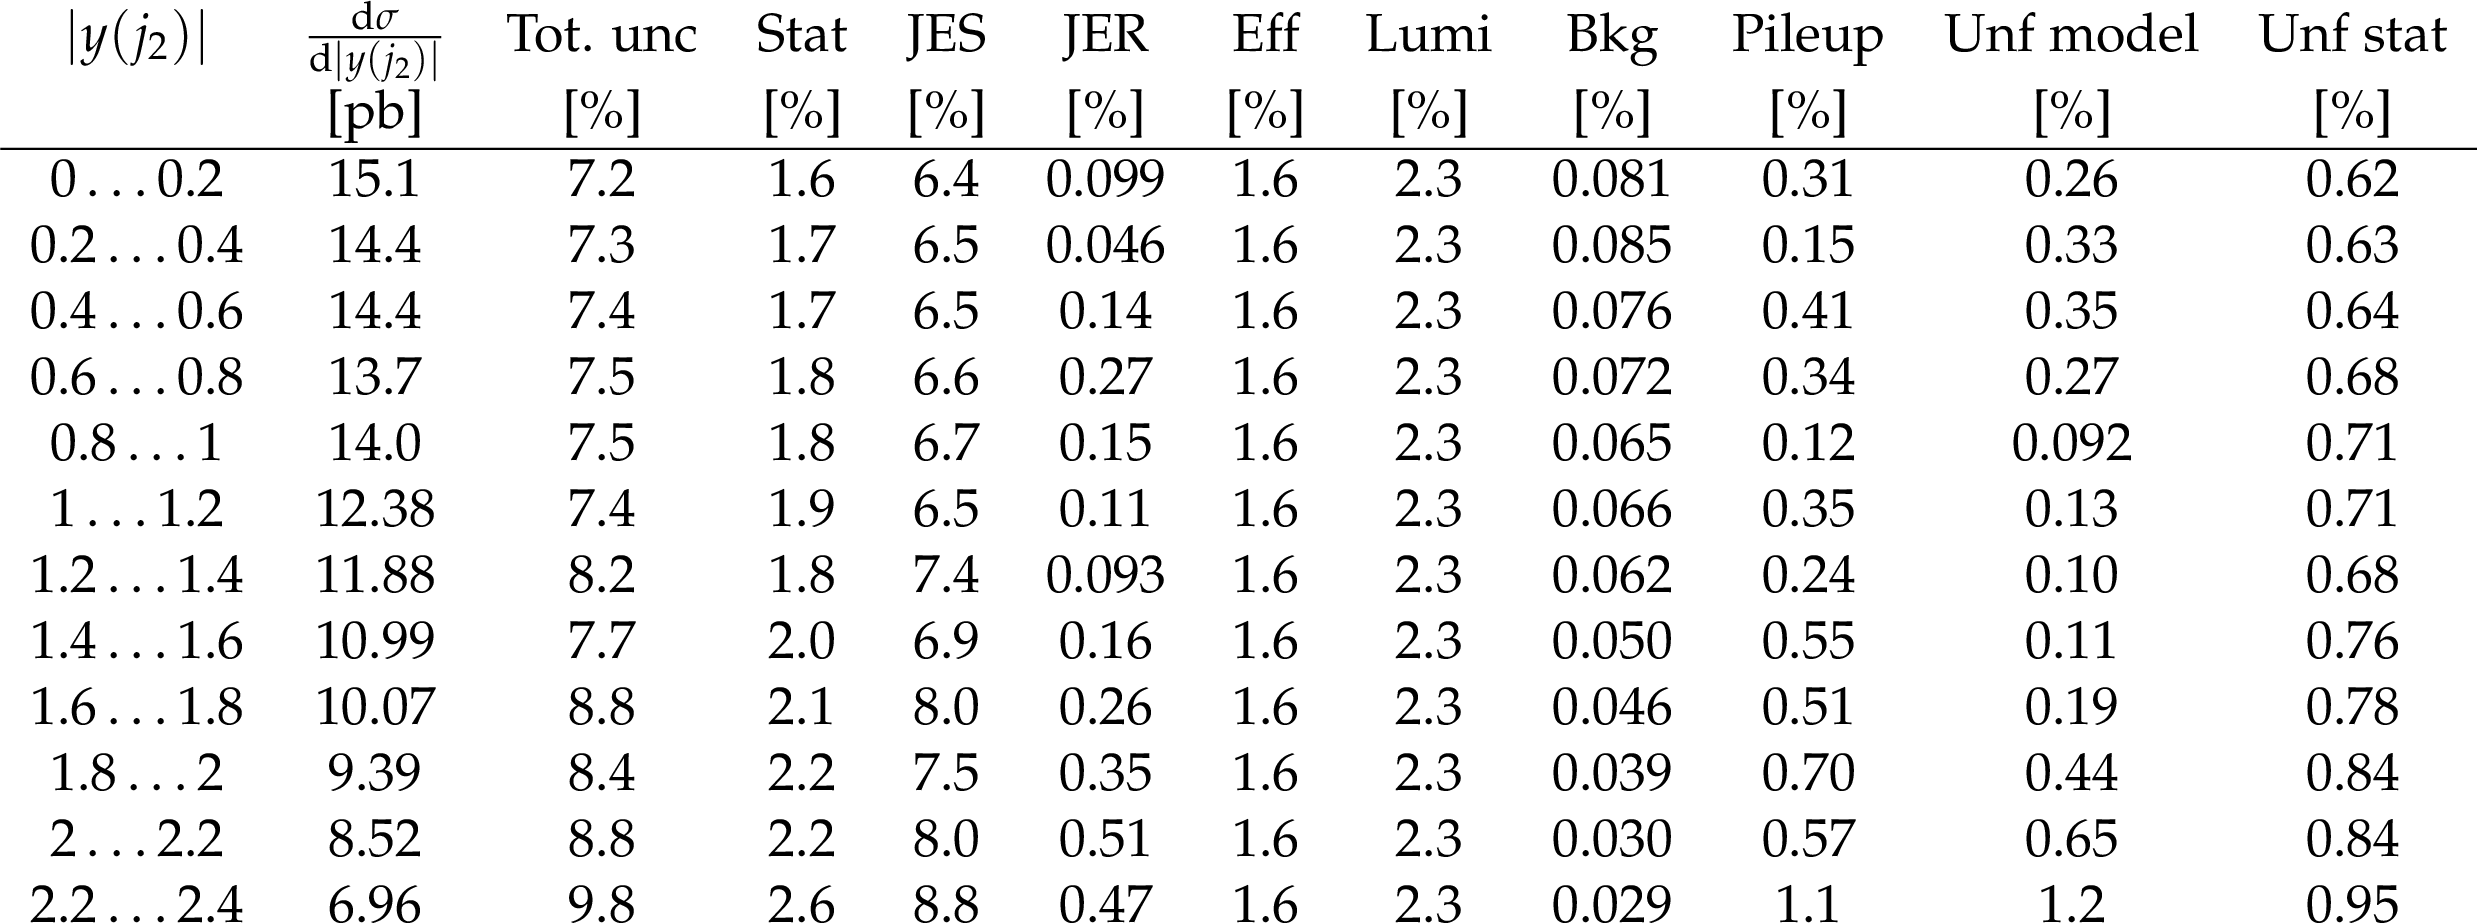
Table 10:
Differential cross section in second jet $| y | $ ($ {N_{\text {jets}}}\geq$ 2) for the combination of both decay channels and breakdown of the uncertainties. |
png pdf |
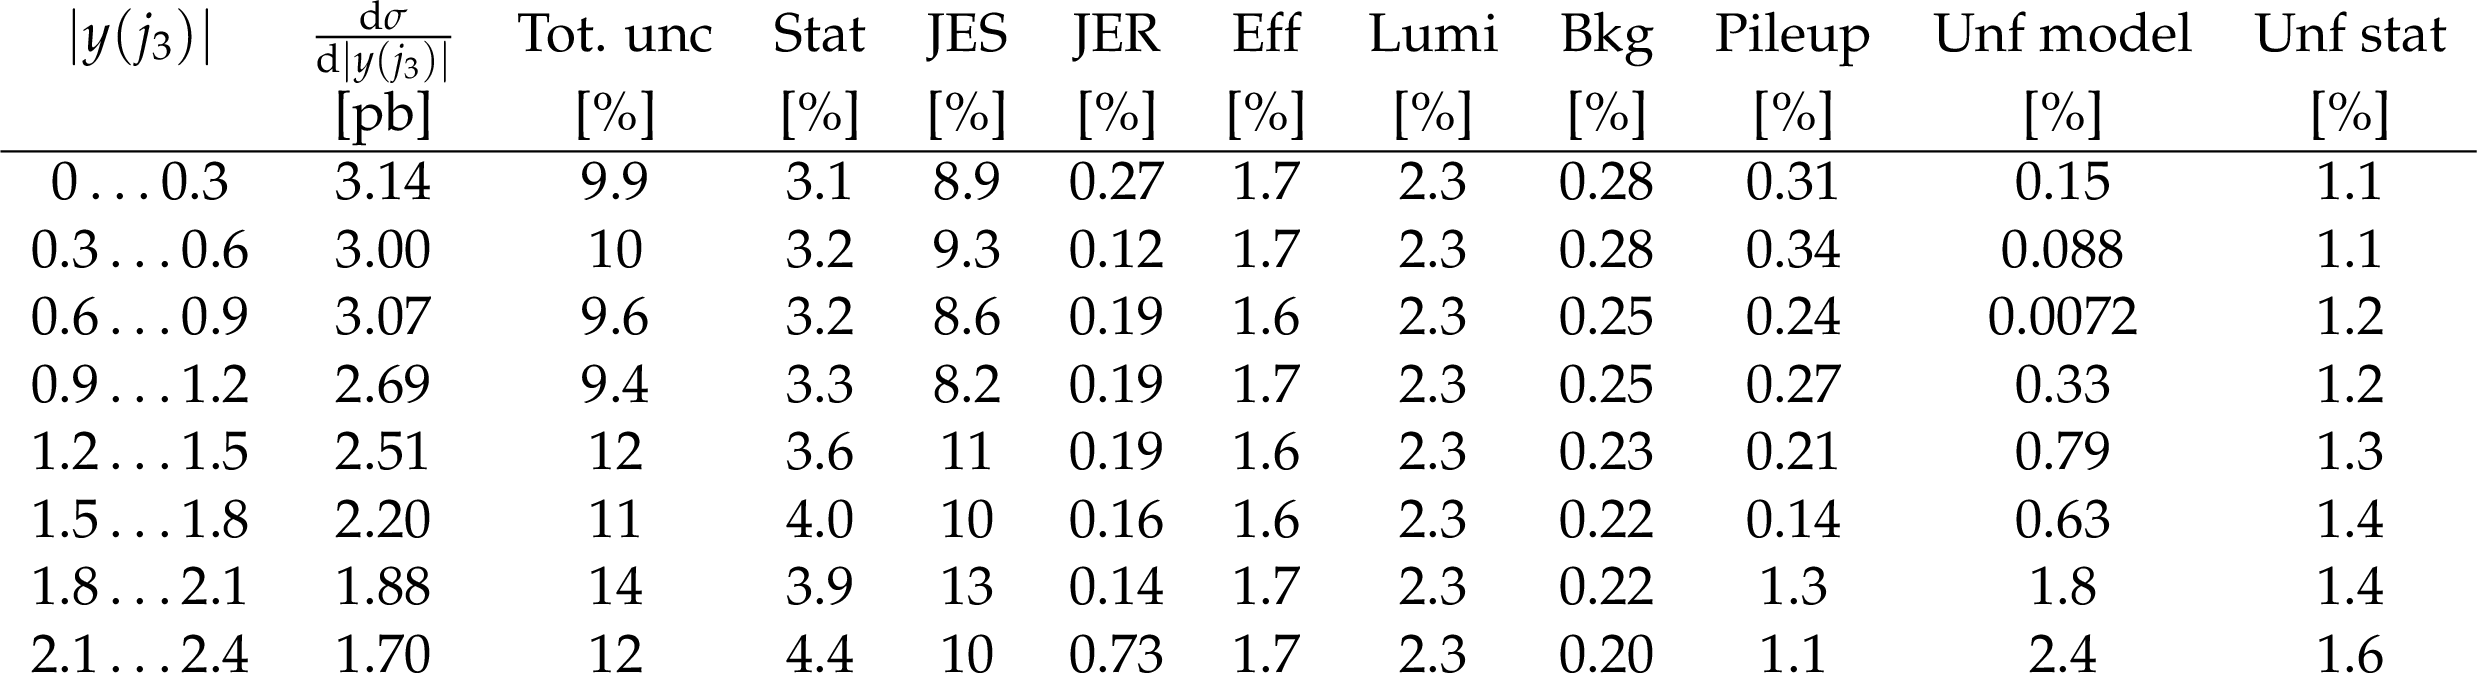
Table 11:
Differential cross section in third jet $ | y |$ ($ {N_{\text {jets}}}\geq$ 3) for the combination of both decay channels and breakdown of the uncertainties. |
png pdf |
Table 12:
Differential cross section in $ {H_{\mathrm {T}}} $ ($ {N_{\text {jets}}}\geq$ 1) for the combination of both decay channels and breakdown of the uncertainties. |

png pdf |
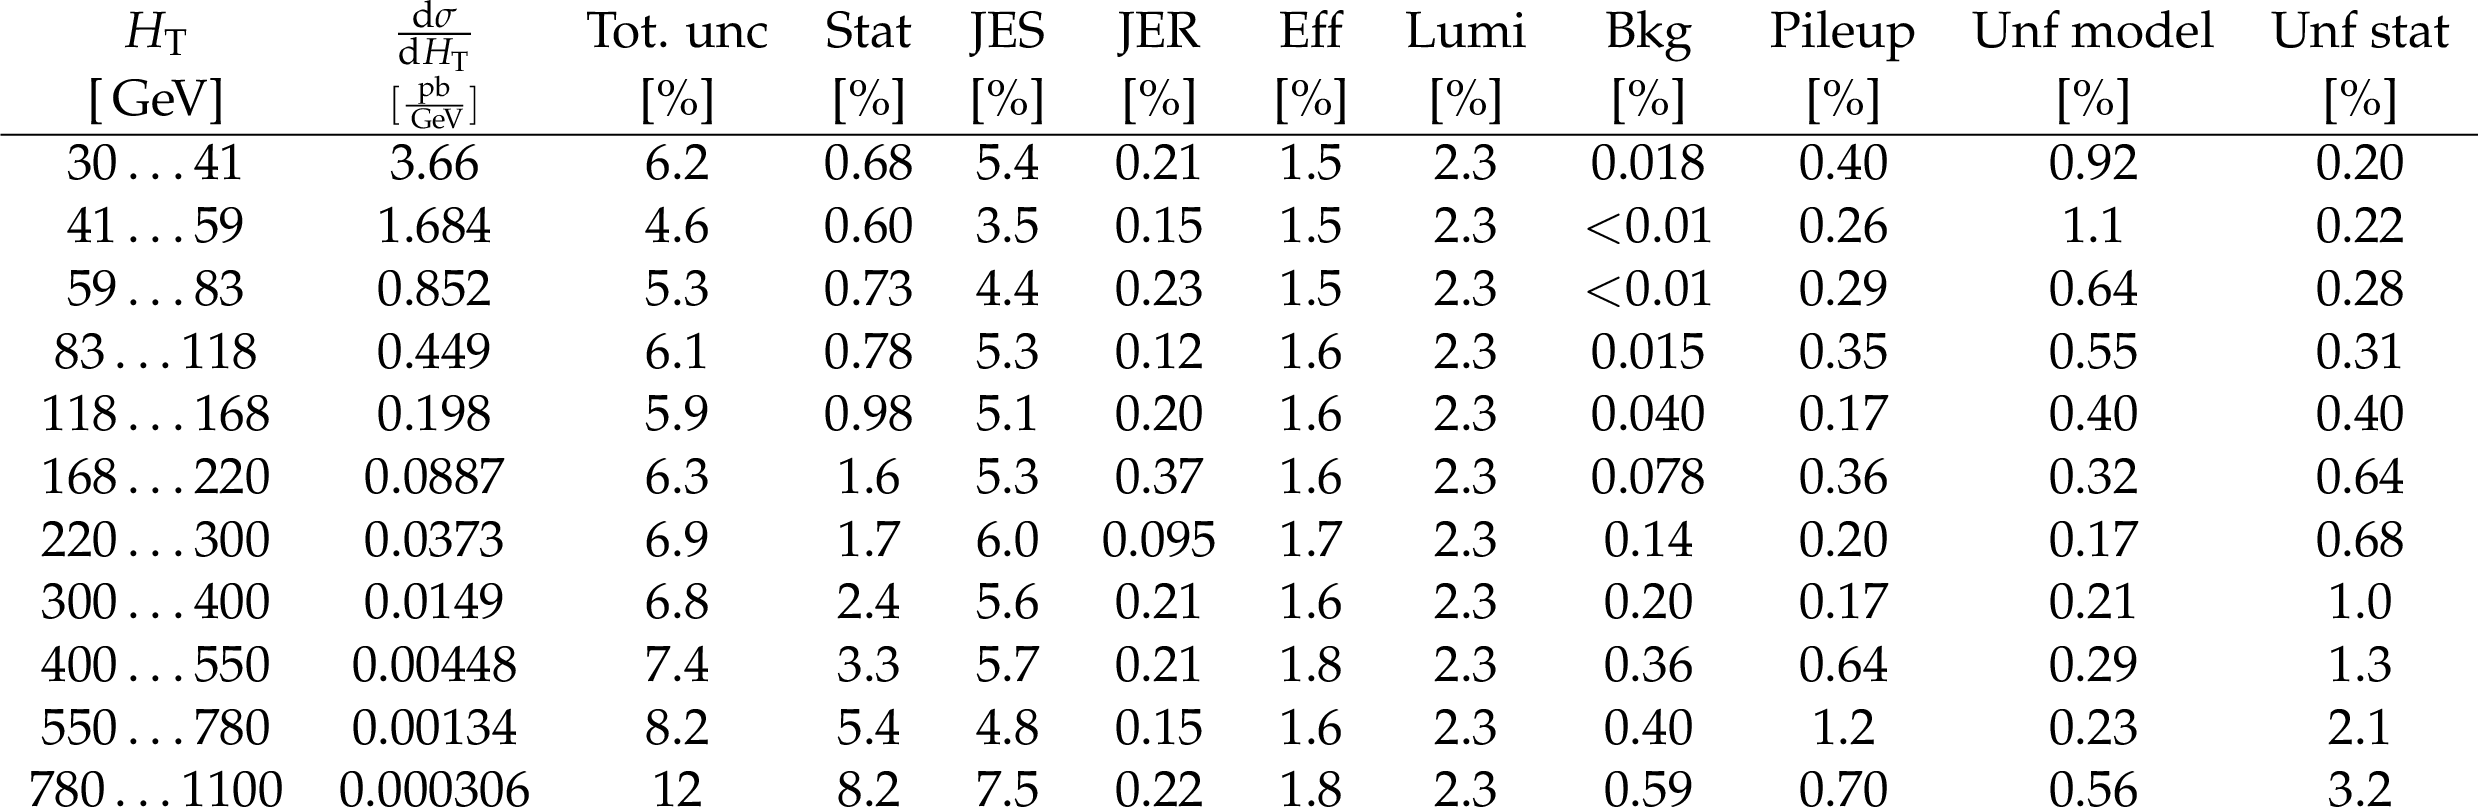
Table 13:
Differential cross section in $ {H_{\mathrm {T}}} $ ($ {N_{\text {jets}}}\geq$ 2) for the combination of both decay channels and breakdown of the uncertainties. |
png pdf |
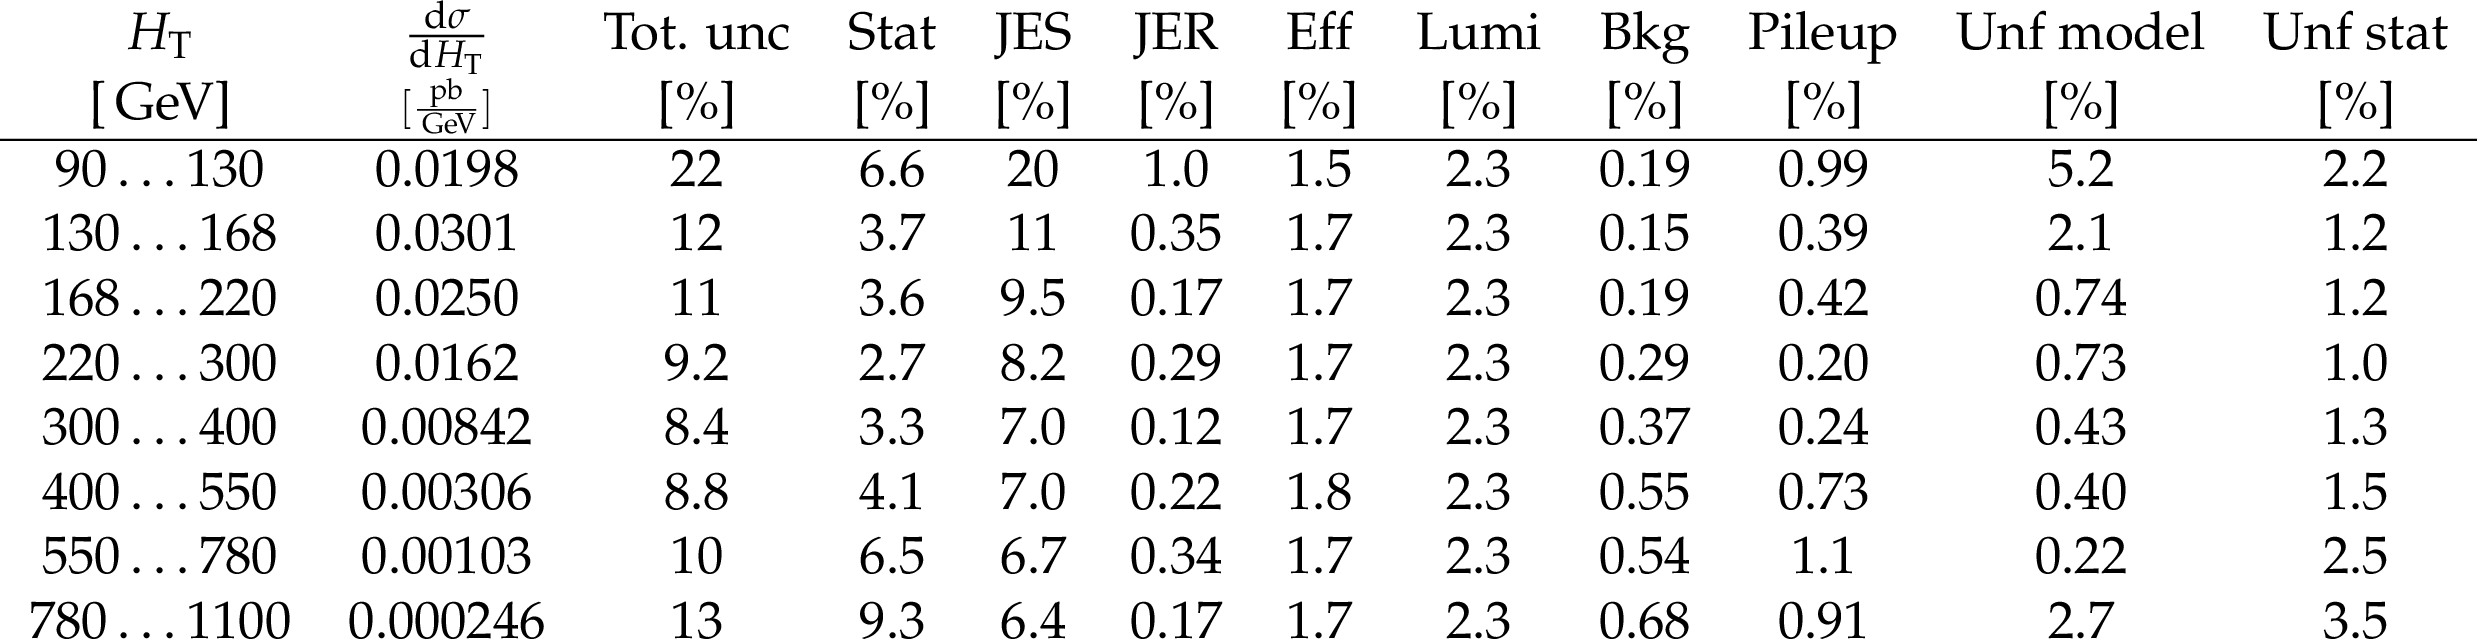
Table 14:
Differential cross section in $ {H_{\mathrm {T}}} $ ($ {N_{\text {jets}}}\geq$ 3) for the combination of both decay channels and breakdown of the uncertainties. |
png pdf |
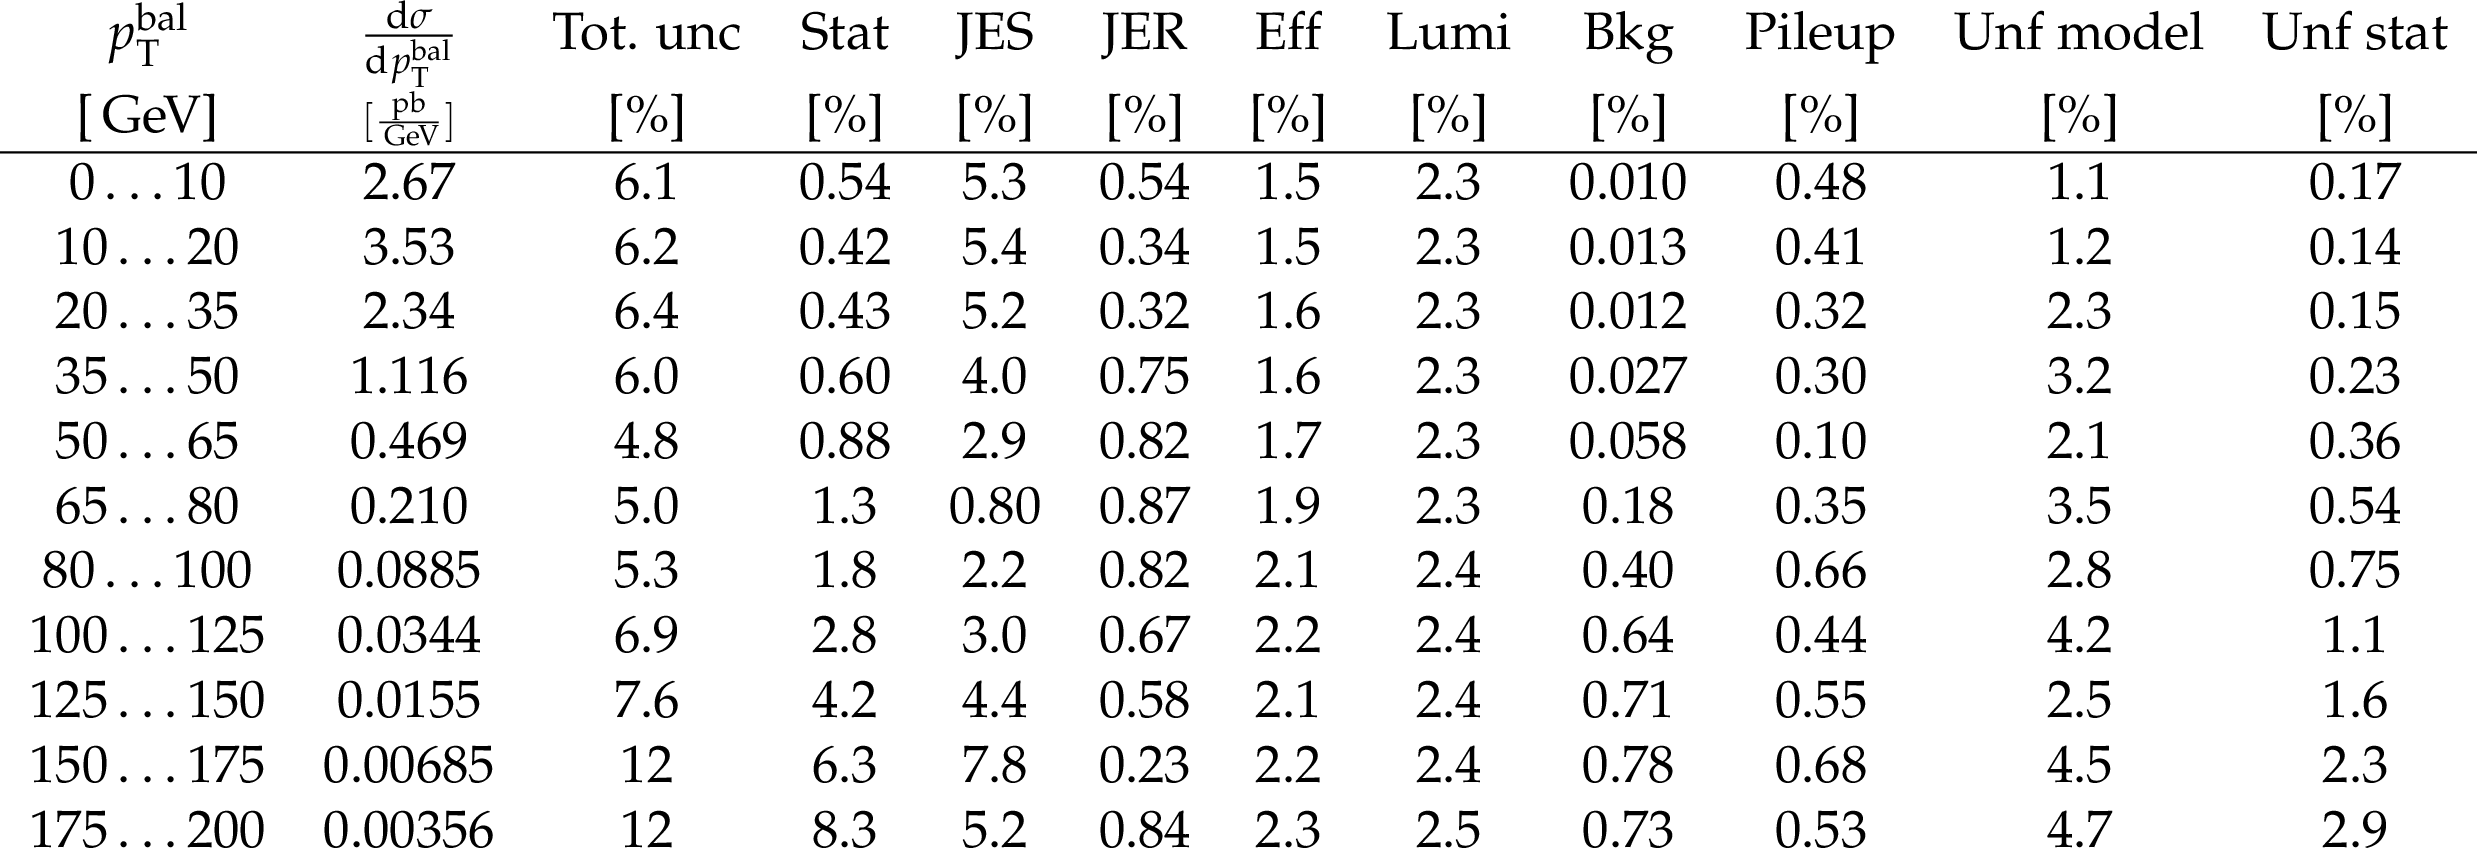
Table 15:
Differential cross section in $ {{p_{\mathrm {T}}} ^{\text {bal}}} $ ($ {N_{\text {jets}}}\geq$ 1) for the combination of both decay channels and breakdown of the uncertainties. |

png pdf |
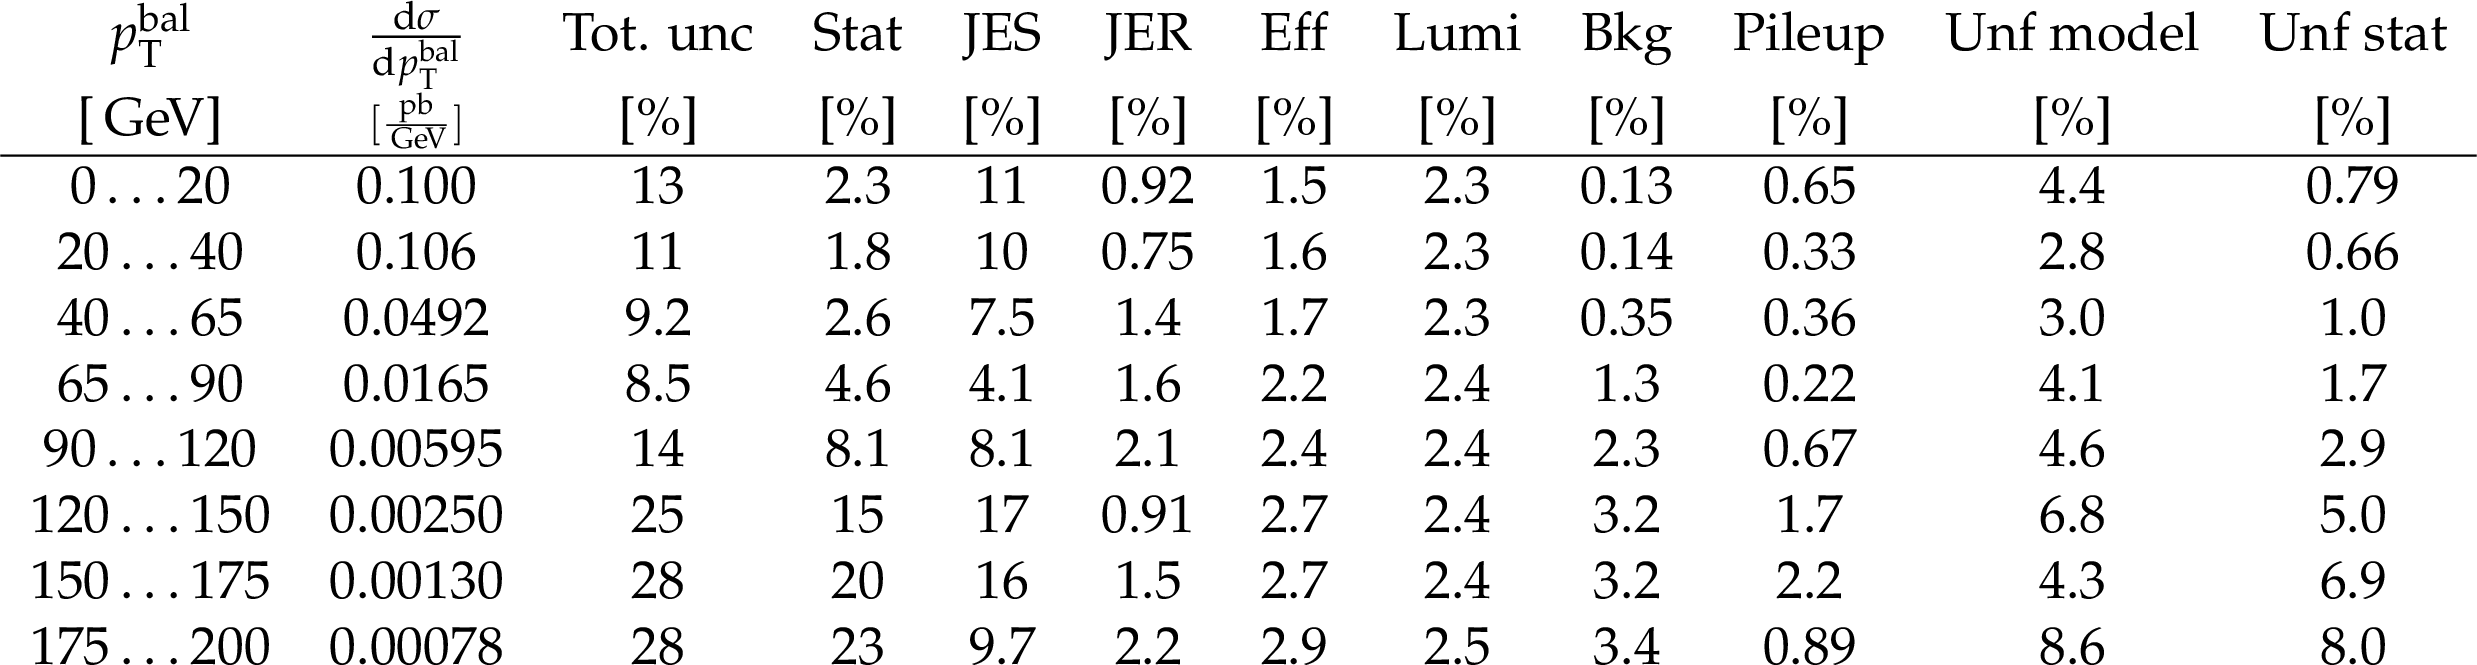
Table 16:
Differential cross section in $ {{p_{\mathrm {T}}} ^{\text {bal}}} $ ($ {N_{\text {jets}}}\geq$ 2) for the combination of both decay channels and breakdown of the uncertainties. |
png pdf |
Table 17:
Differential cross section in $ {{p_{\mathrm {T}}} ^{\text {bal}}} $ ($ {N_{\text {jets}}}\geq$ 3) for the combination of both decay channels and breakdown of the uncertainties. |
png pdf |
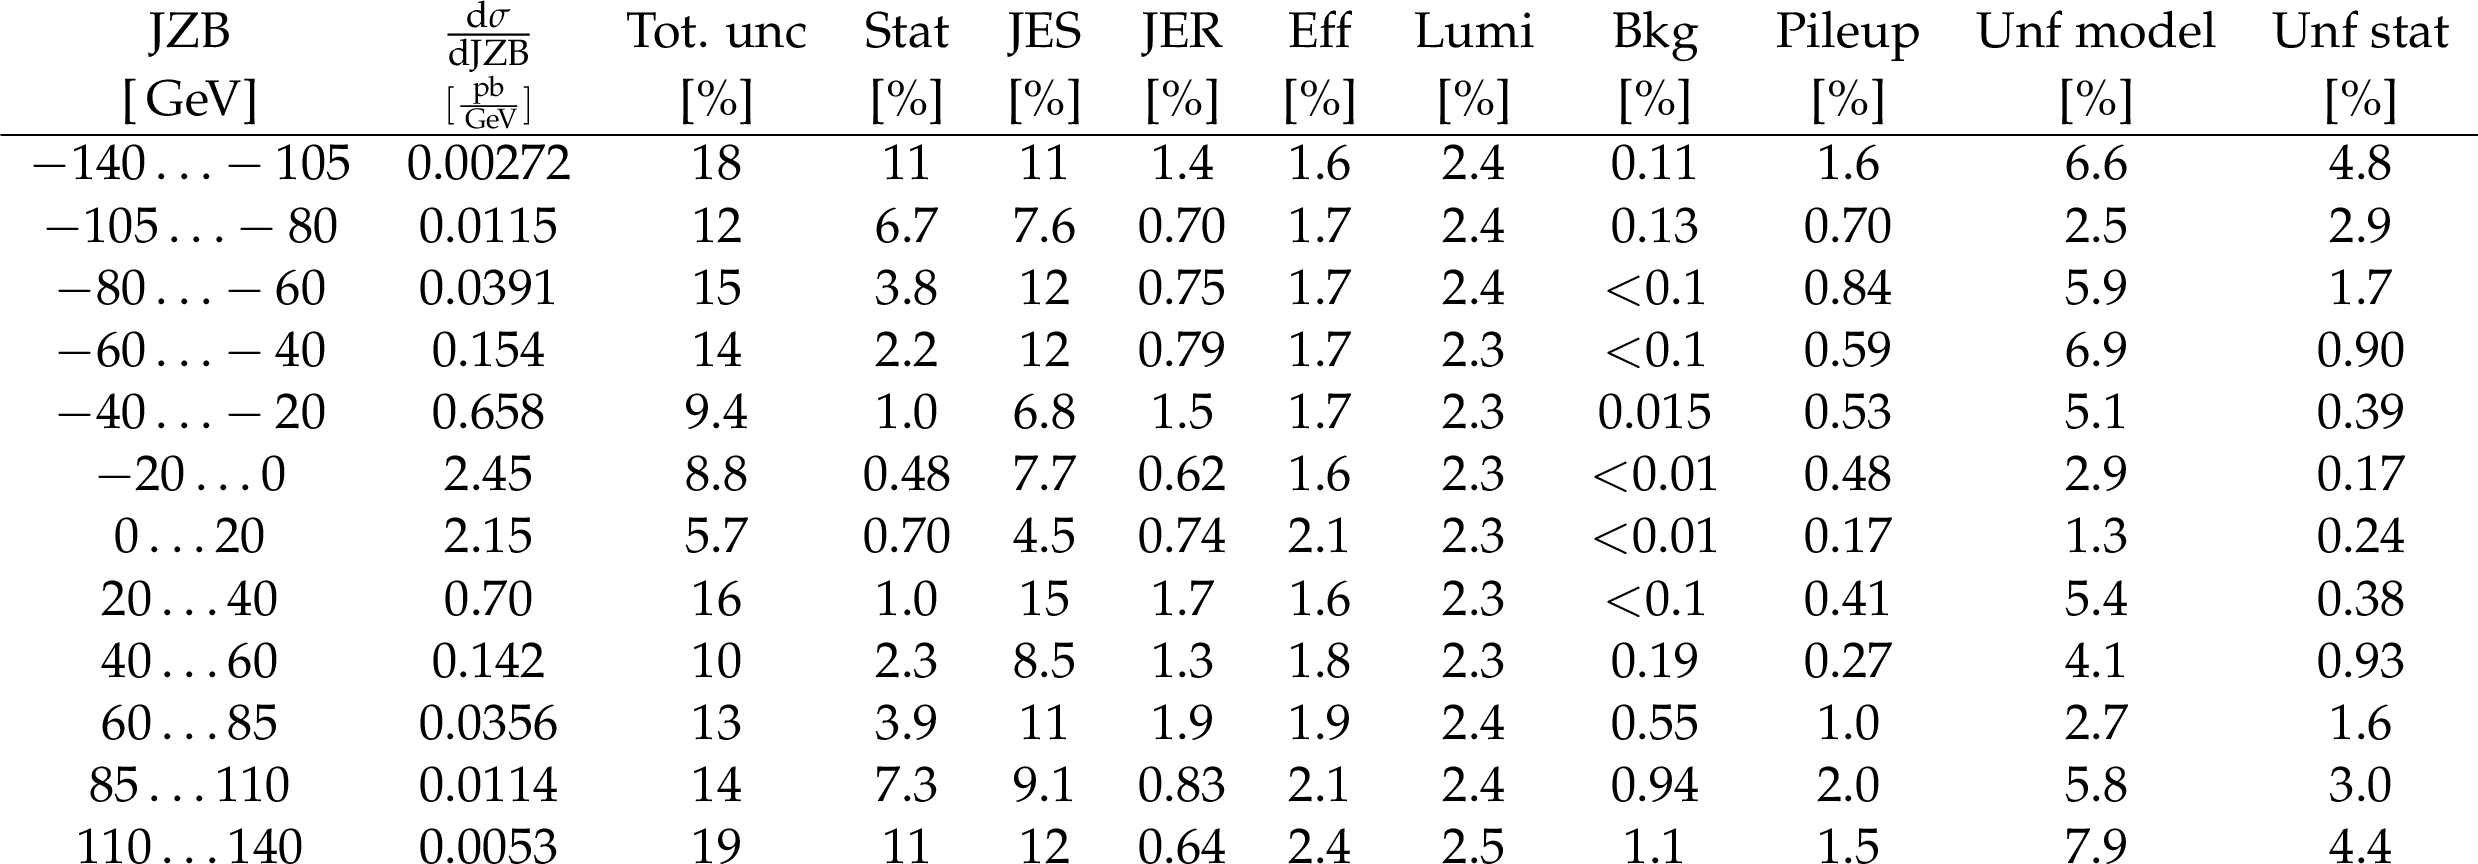
Table 18:
Differential cross section in JZB (full phase space) for the combination of both decay channels and breakdown of the uncertainties. |

png pdf |
Table 19:
Differential cross section in JZB ($ {p_{\mathrm {T}}} ({\mathrm {Z}}) < $ 50 GeV) for the combination of both decay channels and breakdown of the uncertainties. |

png pdf |
Table 20:
Differential cross section in JZB ($ {p_{\mathrm {T}}} ({\mathrm {Z}}) > $ 50 GeV) for the combination of both decay channels and breakdown of the uncertainties. |
| Summary |
|
We have measured differential cross sections for the production of a Z boson in association with jets, where the Z boson decays into two charged leptons with ${p_{\mathrm{T}}} > $ 20 GeV and $| \eta | < $ 2.4. The data sample corresponds to an integrated luminosity of 2.19 fb$^{-1}$ collected with the CMS detector during the 2015 proton-proton LHC run at a centre-of-mass energy of 13 TeV. The cross section has been measured as functions of the exclusive and inclusive jet multiplicities up to 6, of the transverse momentum of the Z boson, jet kinematic variables including jet transverse momentum ($ {p_{\mathrm{T}}} $), the scalar sum of jet transverse momenta ($ {H_{\mathrm{T}}} $), and the jet rapidity ($y$) for inclusive jet multiplicities of 1, 2, and 3. The balance in transverse momentum between the reconstructed jet recoil and the Z boson has been measured for different jet multiplicities. This balance has also been measured separating events with a recoil smaller and larger than the boson $ {p_{\mathrm{T}}} $ using the JZB variable. Jets with ${p_{\mathrm{T}}} > $ 30 GeV and $| y | < $ 2.4 are used in the definition of the different jet quantities. The results are compared to the predictions of four different calculations. The first two merge matrix elements with different final-state parton multiplicities. The first is LO for multiplicities up to 4, the second NLO for multiplicities up to 2 and LO for a jet multiplicity of 3, and both are based on MG5_aMC . The third is a combination of NNLO calculation with NNLL resummation, based on geneva . The fourth is a fixed order NNLO calculation of one Z boson and one jet. The first three calculations include parton showering, based on PYTHIAeight. The measurements are in good agreement with the results of the NLO multiparton calculation. Even the measurements for events with more than 2 jets agree within the $\approx $10% measurement and 10% theoretical uncertainties, although this part of the calculation is only LO. The multiparton LO prediction does not agree as well as the NLO multiparton one. It exhibits significant discrepancies with data in jet multiplicity and in both transverse momentum and rapidity distributions of the leading jet. The transverse momentum balance between the Z boson and the hadronic recoil, which is expected to be sensitive to soft-gluon radiation, has been measured for the first time at the LHC. The multiparton LO prediction fails to describe the measurement, while the multiparton NLO prediction provides a very good description for jet multiplicities computed with NLO accuracy. Inclusive measurement for events with at least one jet have been compared with the fixed order calculation. The agreement is good, even for the $ {H_{\mathrm{T}}} $ observable, which is sensitive to events of different jet multiplicities. The NNLO+NNLL predictions provide similar agreement for the measurements of the kinematic variables of the two leading jets, but fail to describe observables sensitive to extra jets. At low transverse momentum of the Z boson, the NLO multiparton calculation provides a better description than the NNLO+NNLL calculation, whereas both calculations provide a similar description at high transverse momentum. The results suggest using multiparton NLO predictions for the estimation of the Z+jets contribution at the LHC in measurements and searches, and its associated uncertainty. |
| References | ||||
| 1 | ATLAS Collaboration | Measurement of the production cross section of jets in association with a Z boson in pp collisions at $ \sqrt{s} = $ 7 TeV with the ATLAS detector | JHEP 07 (2013) 032 | 1304.7098 |
| 2 | ATLAS Collaboration | Measurement of the production cross section for Z$ /\gamma^* $ in association with jets in pp collisions at $ \sqrt{s}= $ 7 TeV with the ATLAS detector | PRD 85 (2012) 032009 | 1111.2690 |
| 3 | CMS Collaboration | Jet production rates in association with W and Z bosons in pp collisions at $ \sqrt{s}= $ 7 TeV | JHEP 01 (2012) 010 | CMS-EWK-10-012 1110.3226 |
| 4 | CMS Collaboration | Measurements of jet multiplicity and differential production cross sections of Z $ + $ jets events in proton-proton collisions at $ \sqrt{s} = $ 7 TeV | PRD 91 (2015) 052008 | CMS-SMP-12-017 1408.3104 |
| 5 | CMS Collaboration | Comparison of the Z/$ \gamma^{*} $ + jets to $ \gamma $ + jets cross sections in pp collisions at $ \sqrt{s}= $ 8 TeV | JHEP 10 (2015) 128 | CMS-SMP-14-005 1505.06520 |
| 6 | CMS Collaboration | Measurements of differential production cross sections for a Z boson in association with jets in pp collisions at $ \sqrt{s}= $ 8 TeV | JHEP 04 (2017) 022 | CMS-SMP-14-013 1611.03844 |
| 7 | LHCb Collaboration | Measurement of forward W and Z boson production in association with jets in proton-proton collisions at $ \sqrt{s}= $ 8 TeV | JHEP 05 (2016) 131 | 1605.00951 |
| 8 | ATLAS Collaboration | Measurements of the production cross section of a Z boson in association with jets in pp collisions at $ \sqrt{s} = $ 13 TeV with the ATLAS detector | EPJC 77 (2017) 361 | 1702.05725 |
| 9 | CDF Collaboration | Measurement of inclusive jet cross sections in Z/$ \gamma^* \rightarrow $e$ ^+ $ e$ ^- $ + jets production in p$ \bar{\text{p}} $ collisions at $ \sqrt{s} = $ 1.96 TeV | PRL 100 (2008) 102001 | 0711.3717 |
| 10 | D0 Collaboration | Measurement of differential Z$ / \gamma^{*} $ + jet + X cross sections in p$ \bar{\text{p}} $ collisions at $ \sqrt{s} = $ 1.96 TeV | PLB 669 (2008) 278 | 0808.1296 |
| 11 | CMS Collaboration | Performance of electron reconstruction and selection with the CMS detector in proton-proton collisions at $ \sqrt{s} = $ 8 TeV | JINST 10 (2015) P06005 | CMS-EGM-13-001 1502.02701 |
| 12 | CMS Collaboration | Performance of CMS muon reconstruction in pp collision events at $ \sqrt{s} = $ 7 TeV | JINST 7 (2012) P10002 | CMS-MUO-10-004 1206.4071 |
| 13 | CMS Collaboration | The CMS trigger system | JINST 12 (2017) P01020 | CMS-TRG-12-001 1609.02366 |
| 14 | F. De Almeida Dias, E. Nurse, and G. Hesketh | LO versus NLO comparisons for Z + jets: MC as a tool for background determination for NP searches at LHC | 1102.0917 | |
| 15 | CMS Collaboration | Search for physics beyond the standard model in events with a Z boson, jets, and missing transverse energy in pp collisions at $ \sqrt{s}= $ 7 TeV | PLB 716 (2012) 260 | CMS-SUS-11-021 1204.3774 |
| 16 | Y. L. Dokshitzer, D. Diakonov, and S. I. Troian | On the transverse momentum distribution of massive lepton pairs | PLB 79 (1978) 269 | |
| 17 | J. C. Collins, D. E. Soper, and G. F. Sterman | Transverse momentum distribution in Drell--Yan pair and W and Z boson production | NPB 250 (1985) 199 | |
| 18 | J. Alwall et al. | The automated computation of tree-level and next-to-leading order differential cross sections, and their matching to parton shower simulations | JHEP 07 (2014) 079 | 1405.0301 |
| 19 | T. Sjostrand et al. | An introduction to PYTHIA 8.2 | CPC 191 (2015) 159 | 1410.3012 |
| 20 | CMS Collaboration | Event generator tunes obtained from underlying event and multiparton scattering measurements | EPJC 76 (2016) 155 | CMS-GEN-14-001 1512.00815 |
| 21 | R. D. Ball et al. | Parton distributions with LHC data | NPB 867 (2013) 244 | 1207.1303 |
| 22 | J. Alwall et al. | Comparative study of various algorithms for the merging of parton showers and matrix elements in hadronic collisions | EPJC 53 (2008) 473 | 0706.2569 |
| 23 | J. Alwall, S. de Visscher, and F. Maltoni | QCD radiation in the production of heavy colored particles at the LHC | JHEP 02 (2009) 017 | 0810.5350 |
| 24 | NNPDF Collaboration | Parton distributions for the LHC run II | JHEP 04 (2015) 040 | 1410.8849 |
| 25 | R. Frederix and S. Frixione | Merging meets matching in MC@NLO | JHEP 12 (2012) 061 | 1209.6215 |
| 26 | S. Alioli et al. | Drell--Yan production at NNLL'+NNLO matched to parton showers | PRD 92 (2015) 094020 | 1508.01475 |
| 27 | S. Alioli et al. | Combining Higher-Order Resummation with Multiple NLO Calculations and Parton Showers in GENEVA | JHEP 09 (2013) 120 | 1211.7049 |
| 28 | I. W. Stewart, F. J. Tackmann, and W. J. Waalewijn | N-jettiness: An inclusive event shape to veto jets | PRL 105 (2010) 092002 | 1004.2489 |
| 29 | J. Butterworth et al. | PDF4LHC recommendations for LHC run II | J. Phys G. 43 (2016) 023001 | 1510.03865 |
| 30 | R. Boughezal, X. Liu, and F. Petriello | Phenomenology of the Z-boson plus jet process at NNLO | PRD 94 (2016) 074015 | 1602.08140 |
| 31 | R. Boughezal et al. | Z boson production in association with a jet at next-to-next-to-leading order in perturbative QCD | PRL 116 (2016) 152001 | 1512.01291 |
| 32 | S. Dulat et al. | New parton distribution functions from a global analysis of quantum chromodynamics | PRD 93 (2016) 033006 | 1506.07443 |
| 33 | K. Melnikov and F. Petriello | Electroweak gauge boson production at hadron colliders through $ O(\alpha_s^2) $ | PRD 74 (2006) 114017 | hep-ph/0609070 |
| 34 | R. Abbate et al. | Thrust at N$ ^3 $LL with Power Corrections and a Precision Global Fit for $ \alpha_s(m_Z) $ | PRD 83 (2011) 074021 | 1006.3080 |
| 35 | Z. Ligeti, I. W. Stewart, and F. J. Tackmann | Treating the b quark distribution function with reliable uncertainties | PRD 78 (2008) 114014 | 0807.1926 |
| 36 | R. Frederix et al. | Four-lepton production at hadron colliders: aMC@NLO predictions with theoretical uncertainties | JHEP 02 (2012) 099 | 1110.4738 |
| 37 | \GEANTfour Collaboration | GEANT4--a simulation toolkit | NIMA 506 (2003) 250 | |
| 38 | P. Nason | A new method for combining NLO QCD with shower Monte Carlo algorithms | JHEP 11 (2004) 040 | hep-ph/0409146 |
| 39 | S. Frixione, P. Nason, and C. Oleari | Matching NLO QCD computations with parton shower simulations: the POWHEG method | JHEP 11 (2007) 070 | 0709.2092 |
| 40 | S. Alioli, P. Nason, C. Oleari, and E. Re | A general framework for implementing NLO calculations in shower Monte Carlo programs: the POWHEG BOX | JHEP 06 (2010) 043 | 1002.2581 |
| 41 | S. Frixione, P. Nason, and G. Ridolfi | A positive-weight next-to-leading-order Monte Carlo for heavy flavour hadroproduction | JHEP 09 (2007) 126 | 0707.3088 |
| 42 | P. Nason and G. Zanderighi | $ \mathrm{W}^+ \mathrm{W}^- $, $ \mathrm{W} \mathrm{Z} $ and $ \mathrm{Z} \mathrm{Z} $ production in the POWHEG-BOX-v2 | EPJC 74 (2014) 2702 | 1311.1365 |
| 43 | CMS Collaboration | Particle-flow reconstruction and global event description with the CMS detector | JINST 12 (2017) P10003 | CMS-PRF-14-001 1706.04965 |
| 44 | M. Cacciari, G. P. Salam, and G. Soyez | The anti-$ {k_{\mathrm{T}}} $ jet clustering algorithm | JHEP 04 (2008) 063 | 0802.1189 |
| 45 | M. Cacciari, G. P. Salam, and G. Soyez | FastJet user manual | EPJC 72 (2012) 1896 | 1111.6097 |
| 46 | M. Cacciari and G. P. Salam | Pileup subtraction using jet areas | PLB 659 (2008) 119 | 0707.1378 |
| 47 | CMS Collaboration | Determination of jet energy calibration and transverse momentum resolution in CMS | JINST 6 (2011) P11002 | CMS-JME-10-011 1107.4277 |
| 48 | CMS Collaboration | Jet energy scale and resolution in the CMS experiment in pp collisions at 8 TeV | JINST 12 (2017) P02014 | CMS-JME-13-004 1607.03663 |
| 49 | CMS Collaboration | Jet algorithms performance in 13TeV data | CMS-PAS-JME-16-003 | CMS-PAS-JME-16-003 |
| 50 | CMS Collaboration | Pileup jet identification | CMS-PAS-JME-13-005 | CMS-PAS-JME-13-005 |
| 51 | G. D'Agostini | A multidimensional unfolding method based on Bayes' theorem | NIMA 362 (1995) 487 | |
| 52 | T. Adye | Unfolding algorithms and tests using RooUnfold | in Proceedings of the PHYSTAT 2011 Workshop, CERN, Geneva, Switzerland, January 2011, CERN-2011-006, p. 313 2011 | 1105.1160 |
| 53 | CMS Collaboration | CMS luminosity measurement for the 2015 data taking period | CMS-PAS-LUM-15-001 | CMS-PAS-LUM-15-001 |
|
|
Compact Muon Solenoid LHC, CERN |
|

|

|

|

|

|