

Compact Muon Solenoid
LHC, CERN
| CMS-SMP-17-014 ; CERN-EP-2018-282 | ||
| Measurement of associated production of a W boson and a charm quark in proton-proton collisions at $\sqrt{s} = $ 13 TeV | ||
| CMS Collaboration | ||
| 26 November 2018 | ||
| Eur. Phys. J. C 79 (2019) 269 | ||
| Abstract: Measurements are presented of associated production of a W boson and a charm quark (W+c) in proton-proton collisions at a center-of-mass energy of 13 TeV. The data correspond to an integrated luminosity of 35.7 fb$^{-1}$ collected by the CMS experiment at the CERN LHC. The W bosons are identified by their decay into a muon and a neutrino. The charm quarks are tagged via the full reconstruction of ${{\mathrm{D}^{*}(2010)^{\pm}}}$ mesons that decay via ${{\mathrm{D}^{*}(2010)^{\pm}}} \to {\mathrm{D^0}} \pi^{\pm} \to \mathrm{K}^{\mp} \pi^{\pm} \pi^{\pm}$. A cross section is measured in the fiducial region defined by the muon transverse momentum ${p_{\mathrm{T}}}^{\mu} > $ 26 GeV, muon pseudorapidity $|\eta^{\mu}| < 2.4$, and charm quark transverse momentum ${p_{\mathrm{T}}}^{\mathrm{c}} > $ 5 GeV. The inclusive cross section for this kinematic range is $\sigma(\mathrm{W}+\mathrm{c})= $ 1026 $\pm$ 31 (stat)$^{+76}_{-72}$ (syst) pb. The cross section is also measured differentially as a function of the pseudorapidity of the muon from the W boson decay. These measurements are compared with theoretical predictions and are used to probe the strange quark content of the proton. | ||
| Links: e-print arXiv:1811.10021 [hep-ex] (PDF) ; CDS record ; inSPIRE record ; HepData record ; CADI line (restricted) ; | ||
| Figures | |

png pdf |
Figure 1:
Dominant contributions to ${{\mathrm {W}}{+} {\mathrm {c}}}$ production at the LHC at leading order in pQCD. |

png pdf |
Figure 1-a:
Dominant contribution to ${{\mathrm {W}^+} {+}{\mathrm {\bar{c}}}}$ production at the LHC at leading order in pQCD. |

png pdf |
Figure 1-b:
Dominant contribution to ${{\mathrm {W}^-} {+}{\mathrm {c}}}$ production at the LHC at leading order in pQCD. |

png pdf |
Figure 2:
Distributions of the reconstructed invariant mass of $ {{\mathrm {K}}^{\mp}} {\pi ^\mathrm {{\pm}}}$ candidates (left) in the range $ | {\Delta m({\mathrm {D}}^*, {\mathrm {D^0}})} -0.1454 | < $ 0.001 GeV, and the reconstructed mass difference ${\Delta m({\mathrm {D}}^*, {\mathrm {D^0}})}$ (right). The SS combinations are subtracted. The data (filled circles) are compared to MC simulation with contributions from different processes shown as histograms of different shades. |

png pdf |
Figure 2-a:
Distribution of the reconstructed invariant mass of $ {{\mathrm {K}}^{\mp}} {\pi ^\mathrm {{\pm}}}$ candidates in the range $ | {\Delta m({\mathrm {D}}^*, {\mathrm {D^0}})} -0.1454 | < $ 0.001 GeV. The SS combinations are subtracted. The data (filled circles) are compared to MC simulation with contributions from different processes shown as histograms of different shades. |

png pdf |
Figure 2-b:
Distribution of the reconstructed mass difference ${\Delta m({\mathrm {D}}^*, {\mathrm {D^0}})}$. The SS combinations are subtracted. The data (filled circles) are compared to MC simulation with contributions from different processes shown as histograms of different shades. |
png pdf |
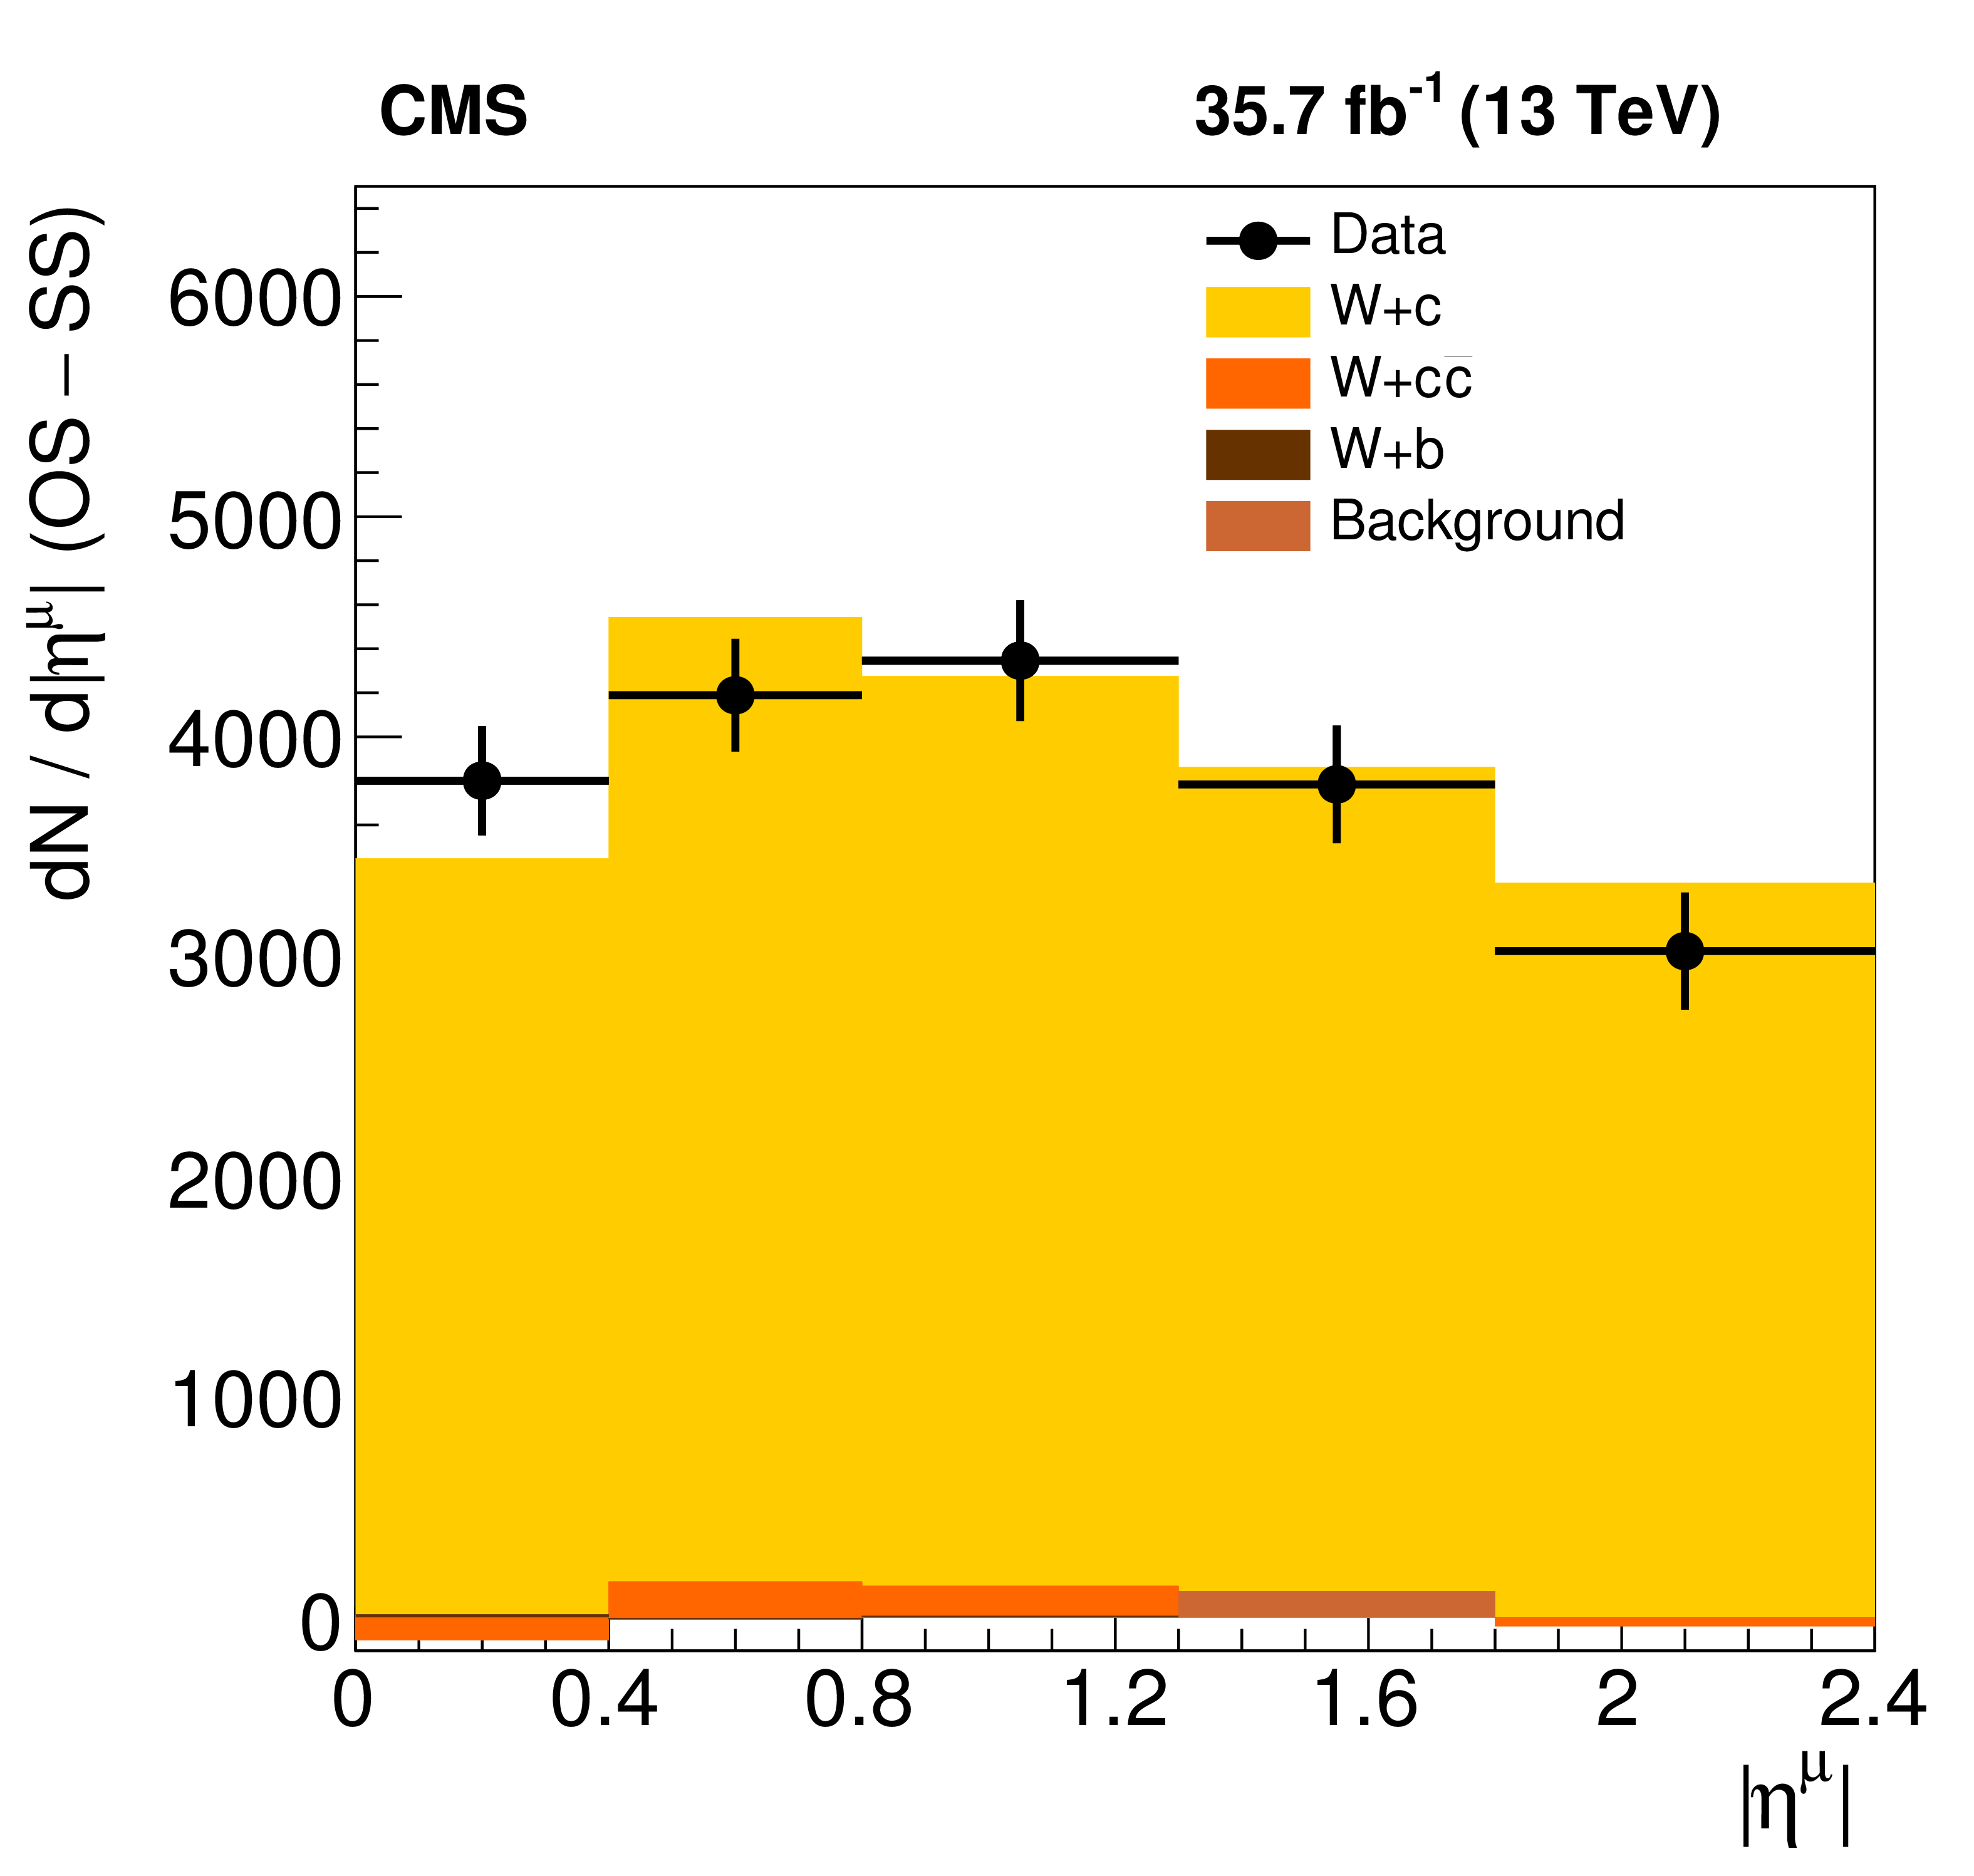
Figure 3:
Number of events after OS$-$SS subtraction for data (filled circles) and MC simulation (filled histograms) as a function of $ {{| \eta ^{{\mu}} |}} $. |
png pdf |
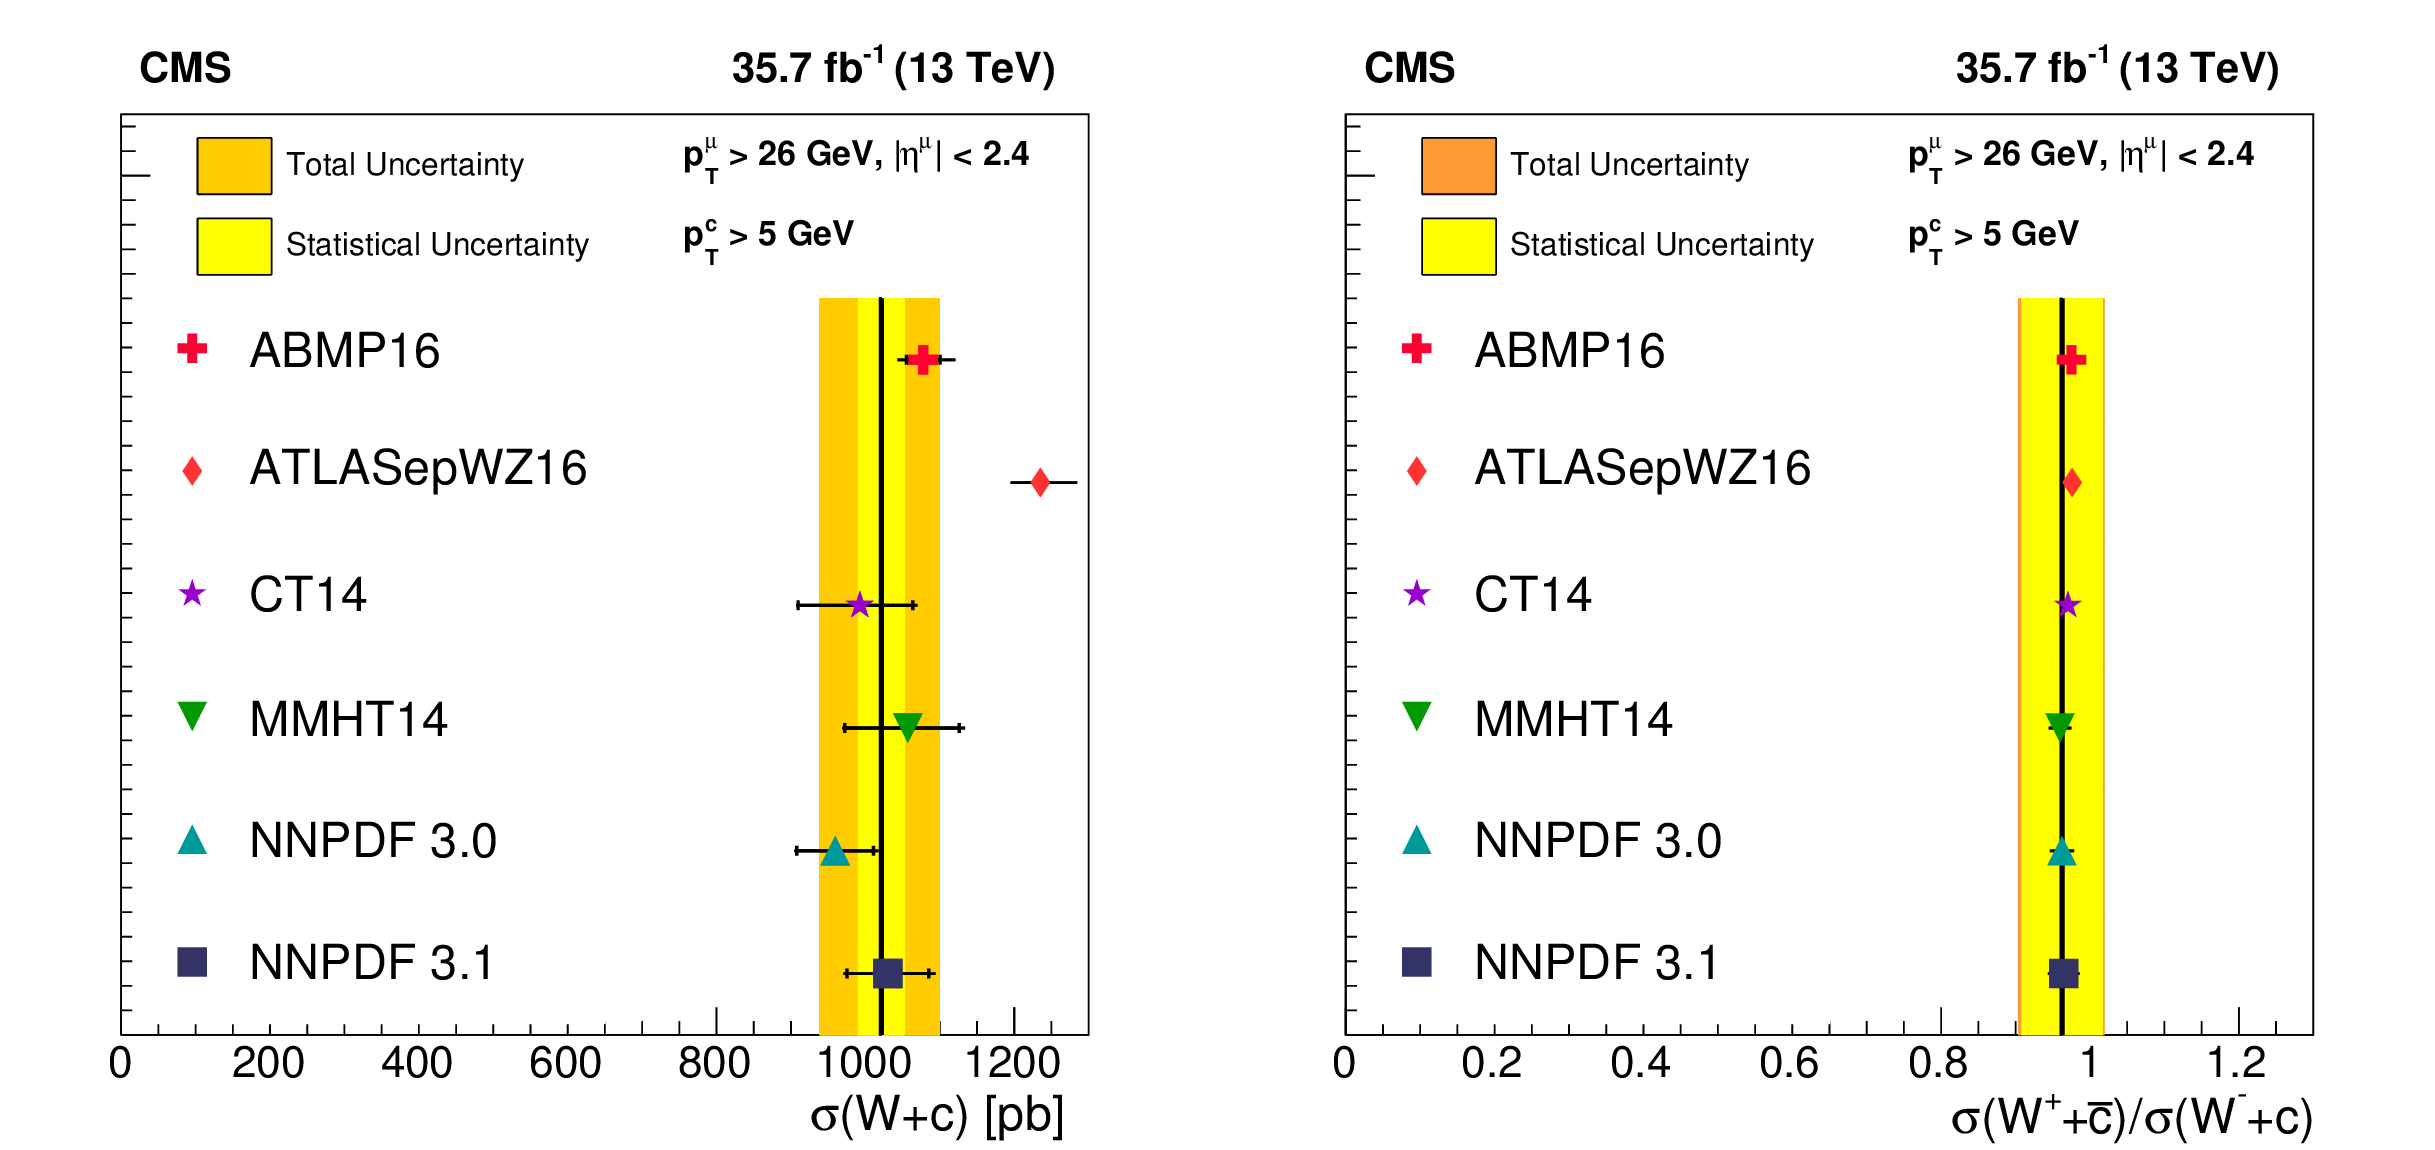
Figure 4:
Inclusive fiducial cross section $ {\sigma ({{\mathrm {W}}{+} {\mathrm {c}}})} $ and the cross section ratio $ {\sigma ({{\mathrm {W^+}}{+} {\overline {\mathrm {c}}}})} / {\sigma ({{\mathrm {W^-}}{+} {\mathrm {c}}})} $ at 13 TeV. The data are represented by a line with the statistical (total) uncertainty shown by a light (dark) shaded band. The measurements are compared to the NLO QCD prediction using several PDF sets, represented by symbols of different types. All used PDF sets are evaluated at NLO, except for ATLASepWZ16, which is obtained at NNLO. The error bars depict the total theoretical uncertainty, including the PDF and the scale variation uncertainty. |

png pdf |
Figure 4-a:
Inclusive fiducial cross section $ {\sigma ({{\mathrm {W}}{+} {\mathrm {c}}})} $ at 13 TeV. The data are represented by a line with the statistical (total) uncertainty shown by a light (dark) shaded band. The measurements are compared to the NLO QCD prediction using several PDF sets, represented by symbols of different types. All used PDF sets are evaluated at NLO, except for ATLASepWZ16, which is obtained at NNLO. The error bars depict the total theoretical uncertainty, including the PDF and the scale variation uncertainty. |

png pdf |
Figure 4-b:
Cross section ratio $ {\sigma ({{\mathrm {W^+}}{+} {\overline {\mathrm {c}}}})} / {\sigma ({{\mathrm {W^-}}{+} {\mathrm {c}}})} $ at 13 TeV. The data are represented by a line with the statistical (total) uncertainty shown by a light (dark) shaded band. The measurements are compared to the NLO QCD prediction using several PDF sets, represented by symbols of different types. All used PDF sets are evaluated at NLO, except for ATLASepWZ16, which is obtained at NNLO. The error bars depict the total theoretical uncertainty, including the PDF and the scale variation uncertainty. |
png pdf |
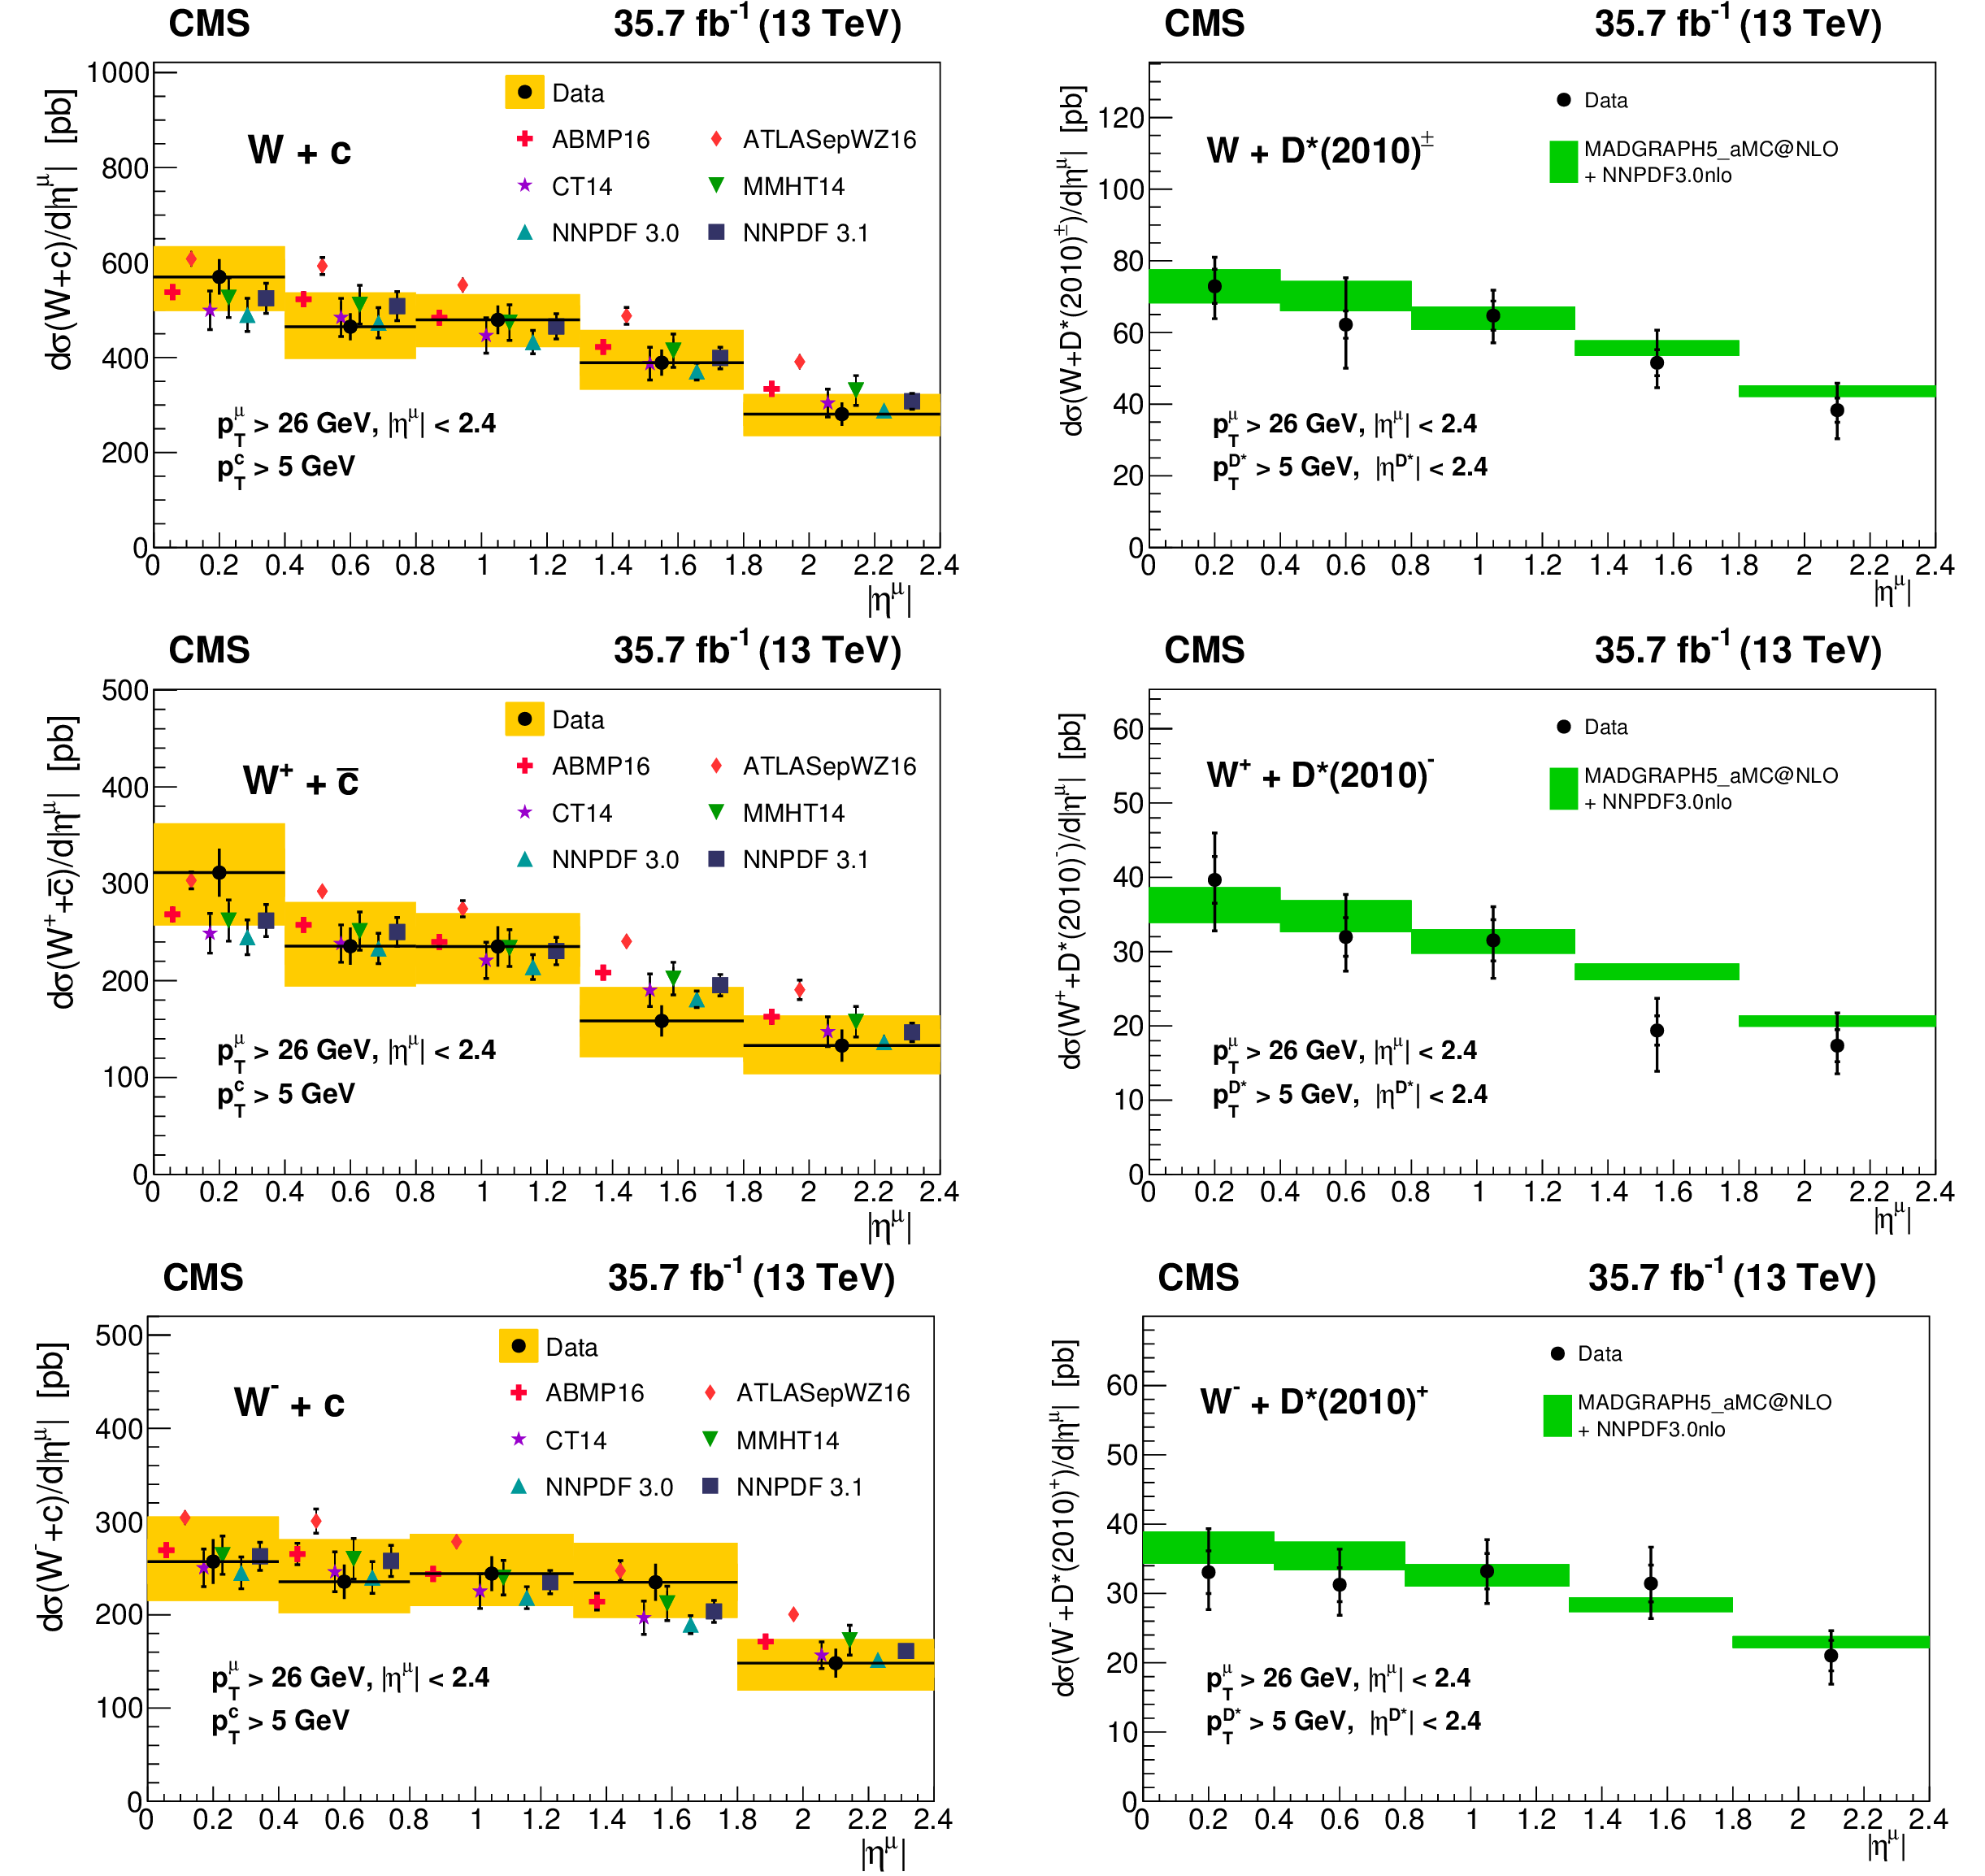
Figure 5:
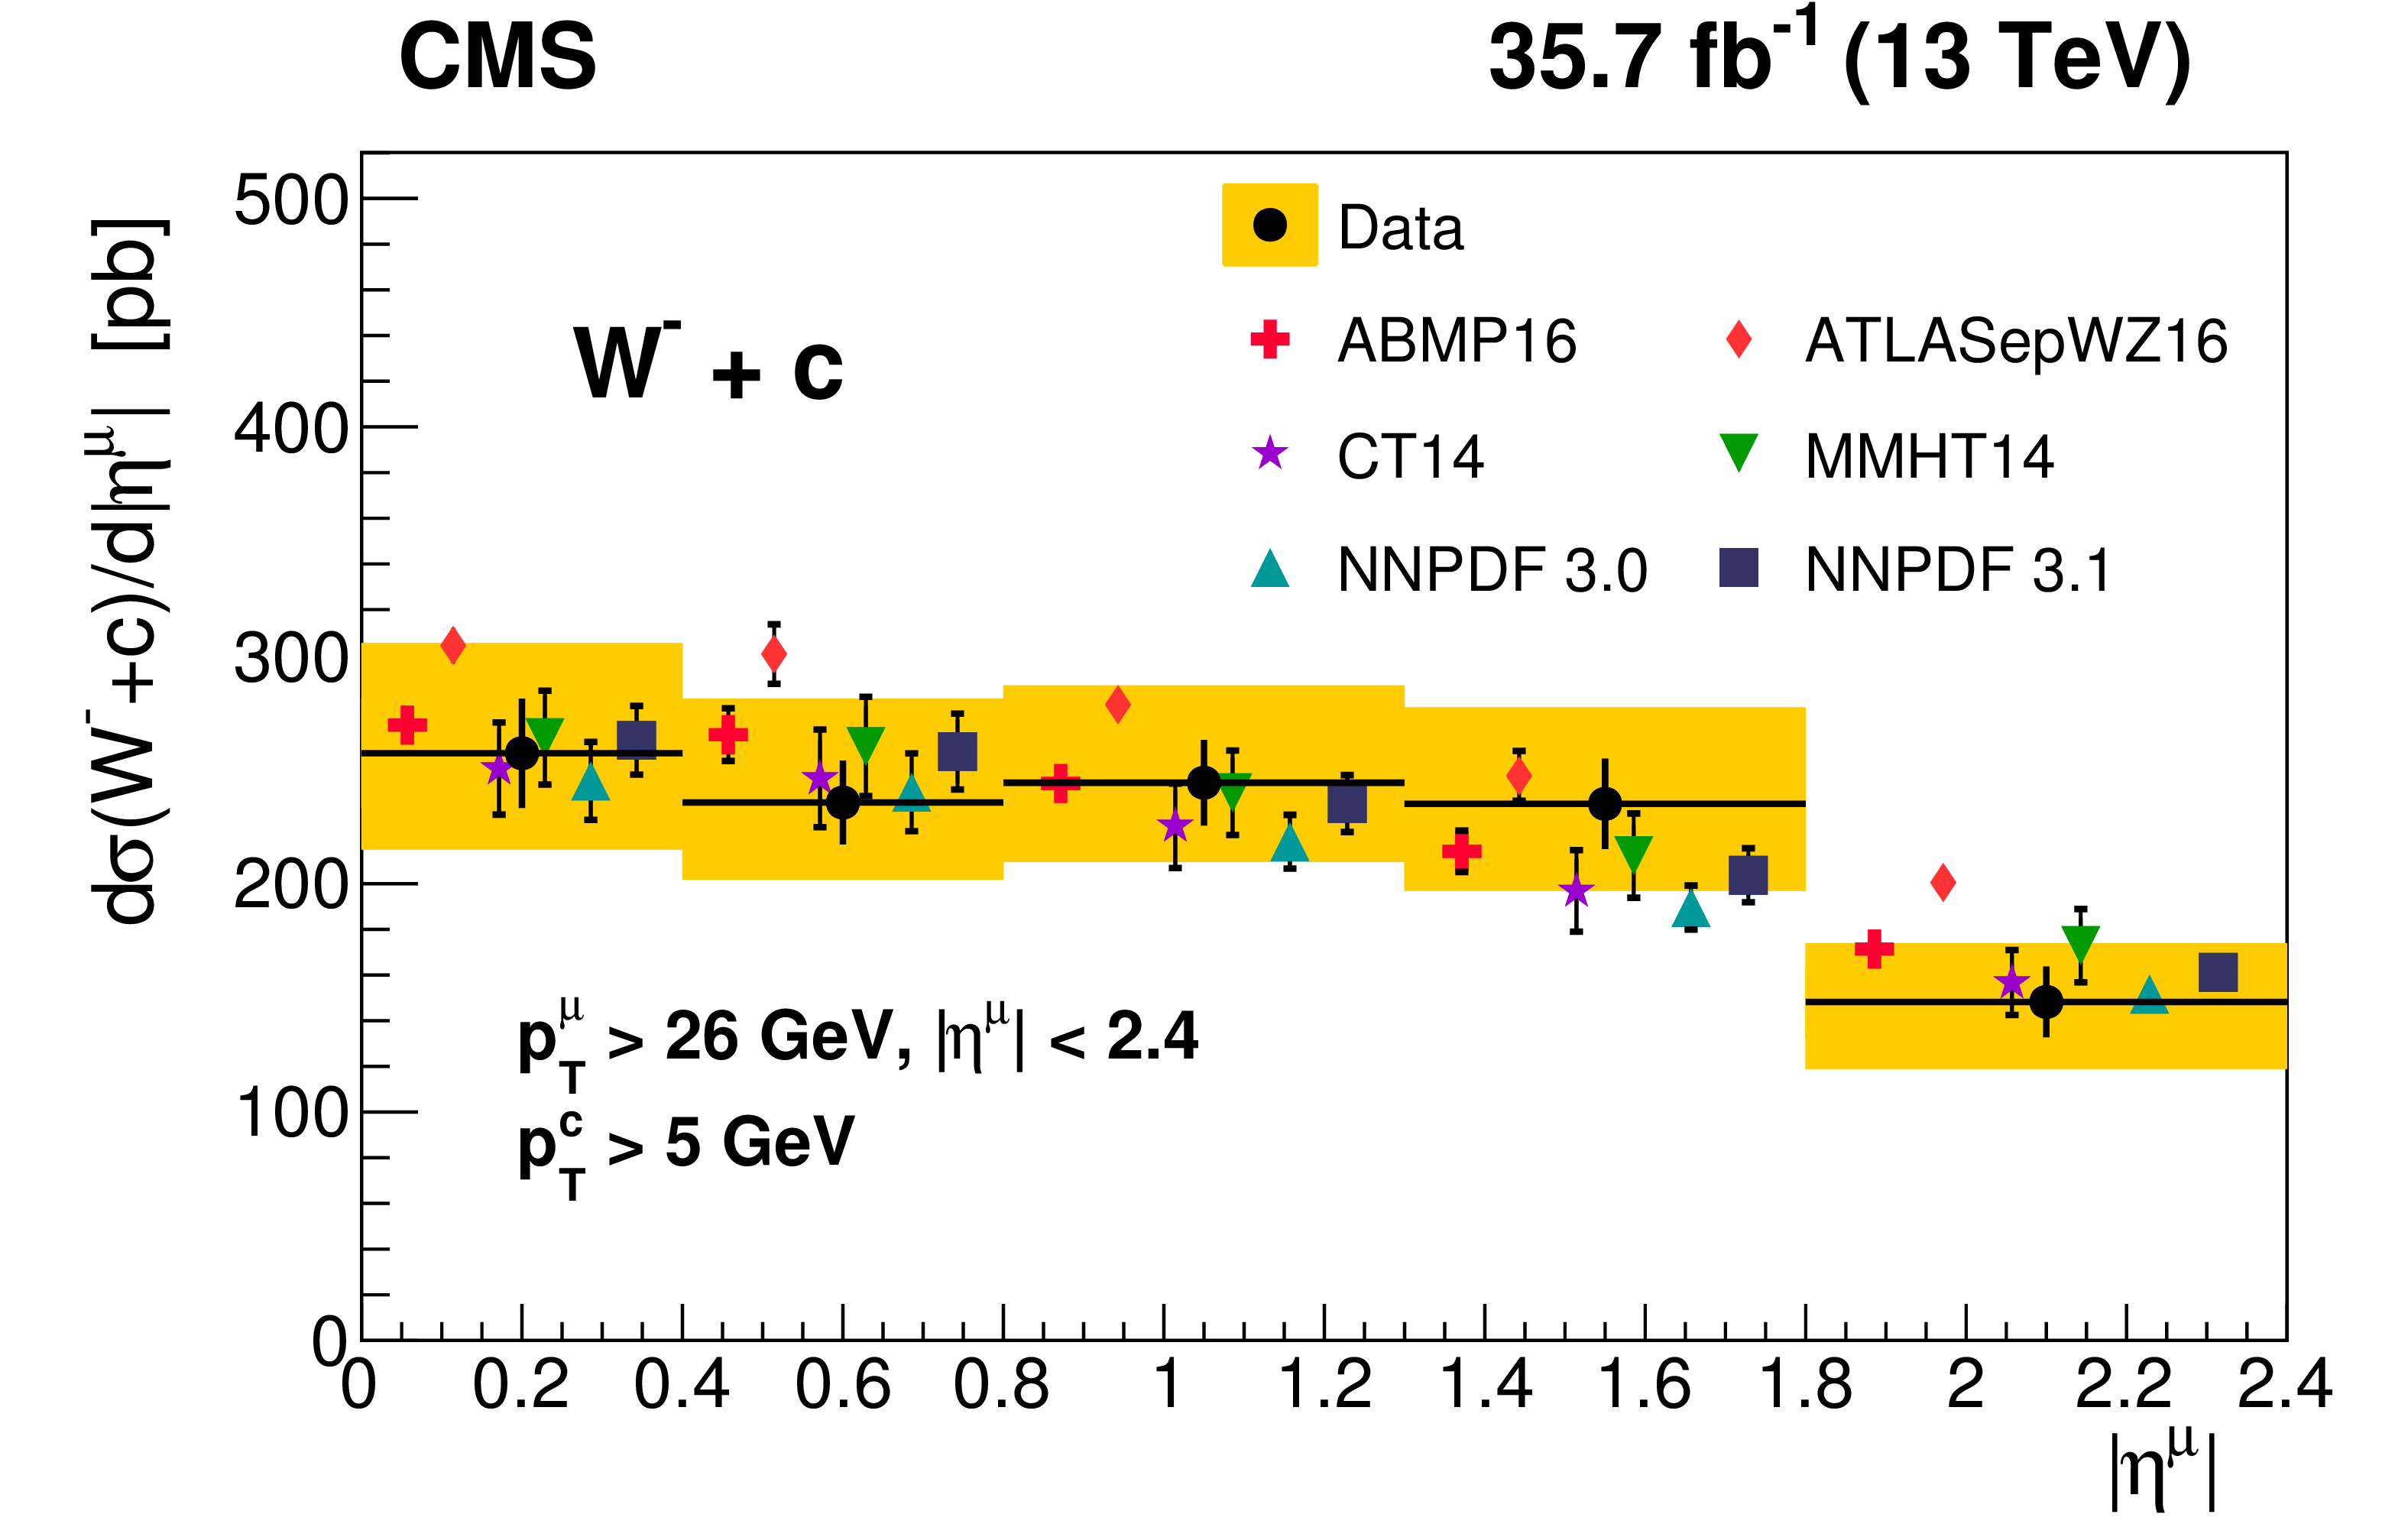
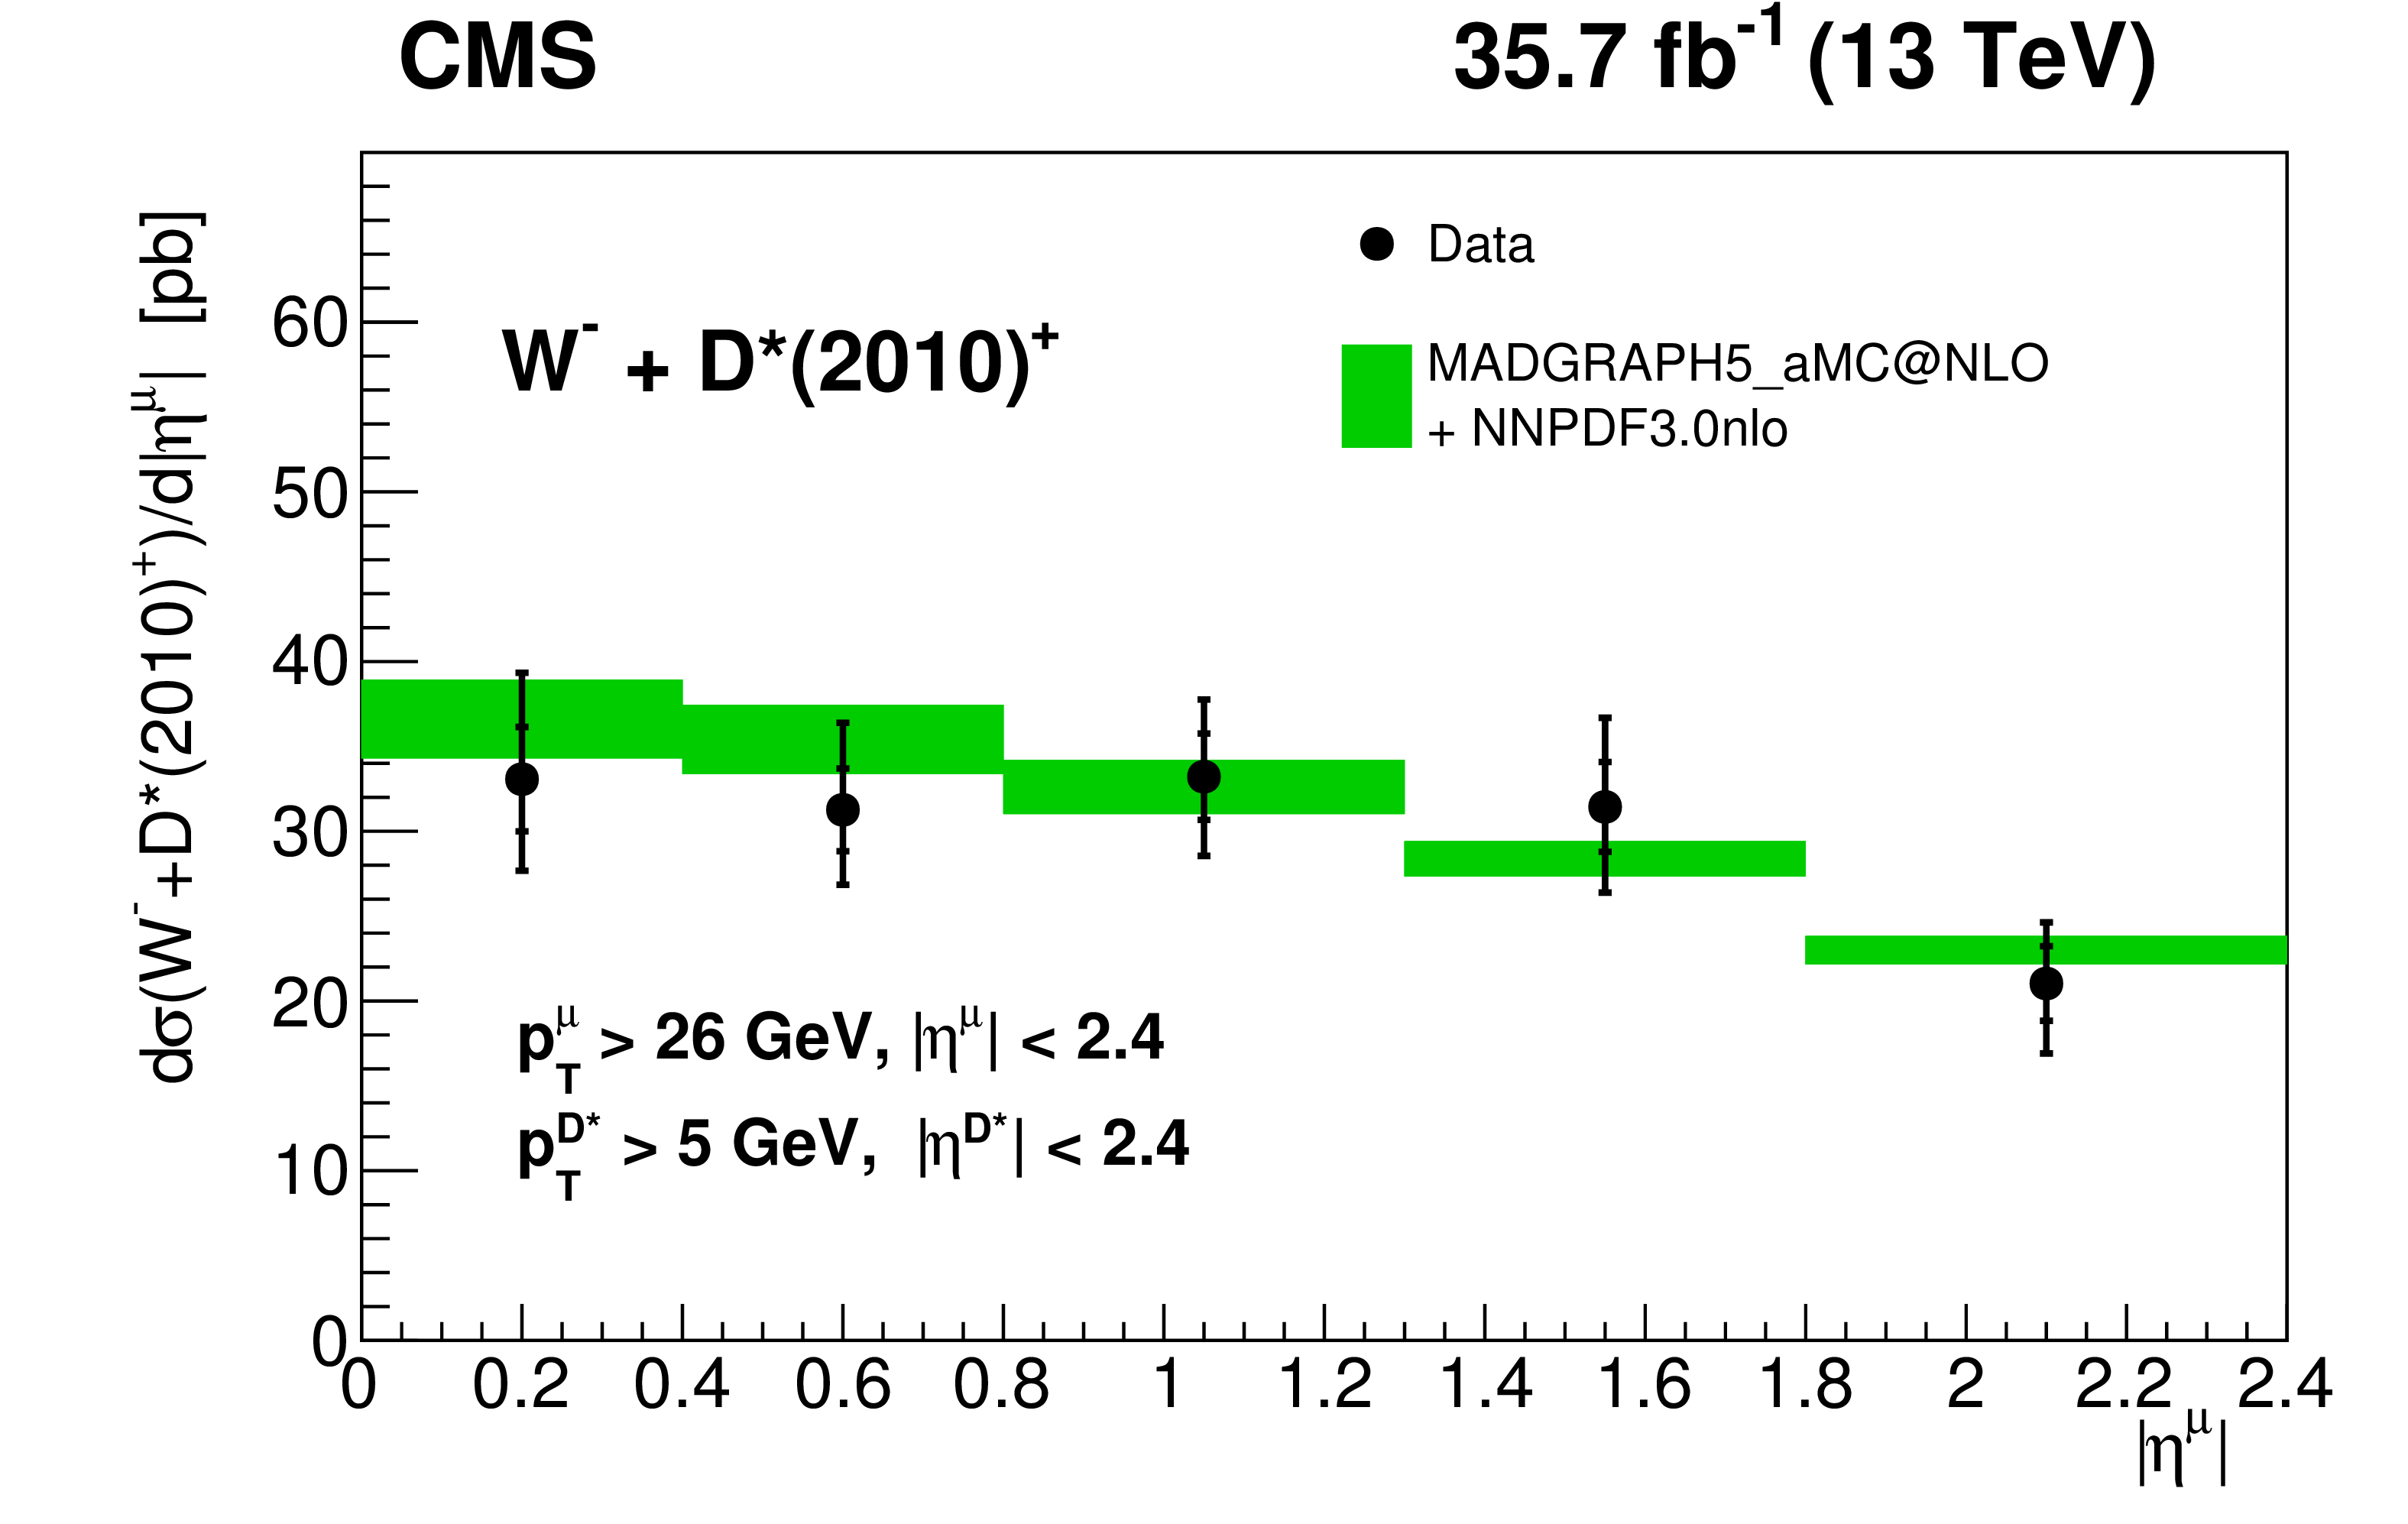
Left: differential cross sections of $ {\sigma ({{\mathrm {W}}{+} {\mathrm {c}}})} $ production at 13 TeV measured as a function $ {{| \eta ^{{\mu}} |}} $. The data are presented by filled circles with the statistical (total) uncertainties shown by vertical error bars (light shaded bands). The measurements are compared to the QCD predictions calculated with MCFM at NLO using different PDF sets, presented by symbols of different style. All used PDF sets are evaluated at NLO, except for ATLASepWZ16, which is obtained at NNLO. The error bars represent theoretical uncertainties, which include PDF and scale variation uncertainty. Right: $ {\sigma ({\mathrm {W}}{+} {{\mathrm {D}^{*}(2010)^{\pm}}})} $ differential production cross sections presented as a function of $ {{| \eta ^{{\mu}} |}} $. The data (filled circles) are shown with their total (outer error bars) and statistical (inner error bars) uncertainties and are compared to the predictions of the signal MC generated with MadGraph 5_amc@nlo and using NNPDF3.0nlo to describe the proton structure. PDF uncertainties and scale variations are accounted for and added in quadrature (shaded band). |
png pdf |
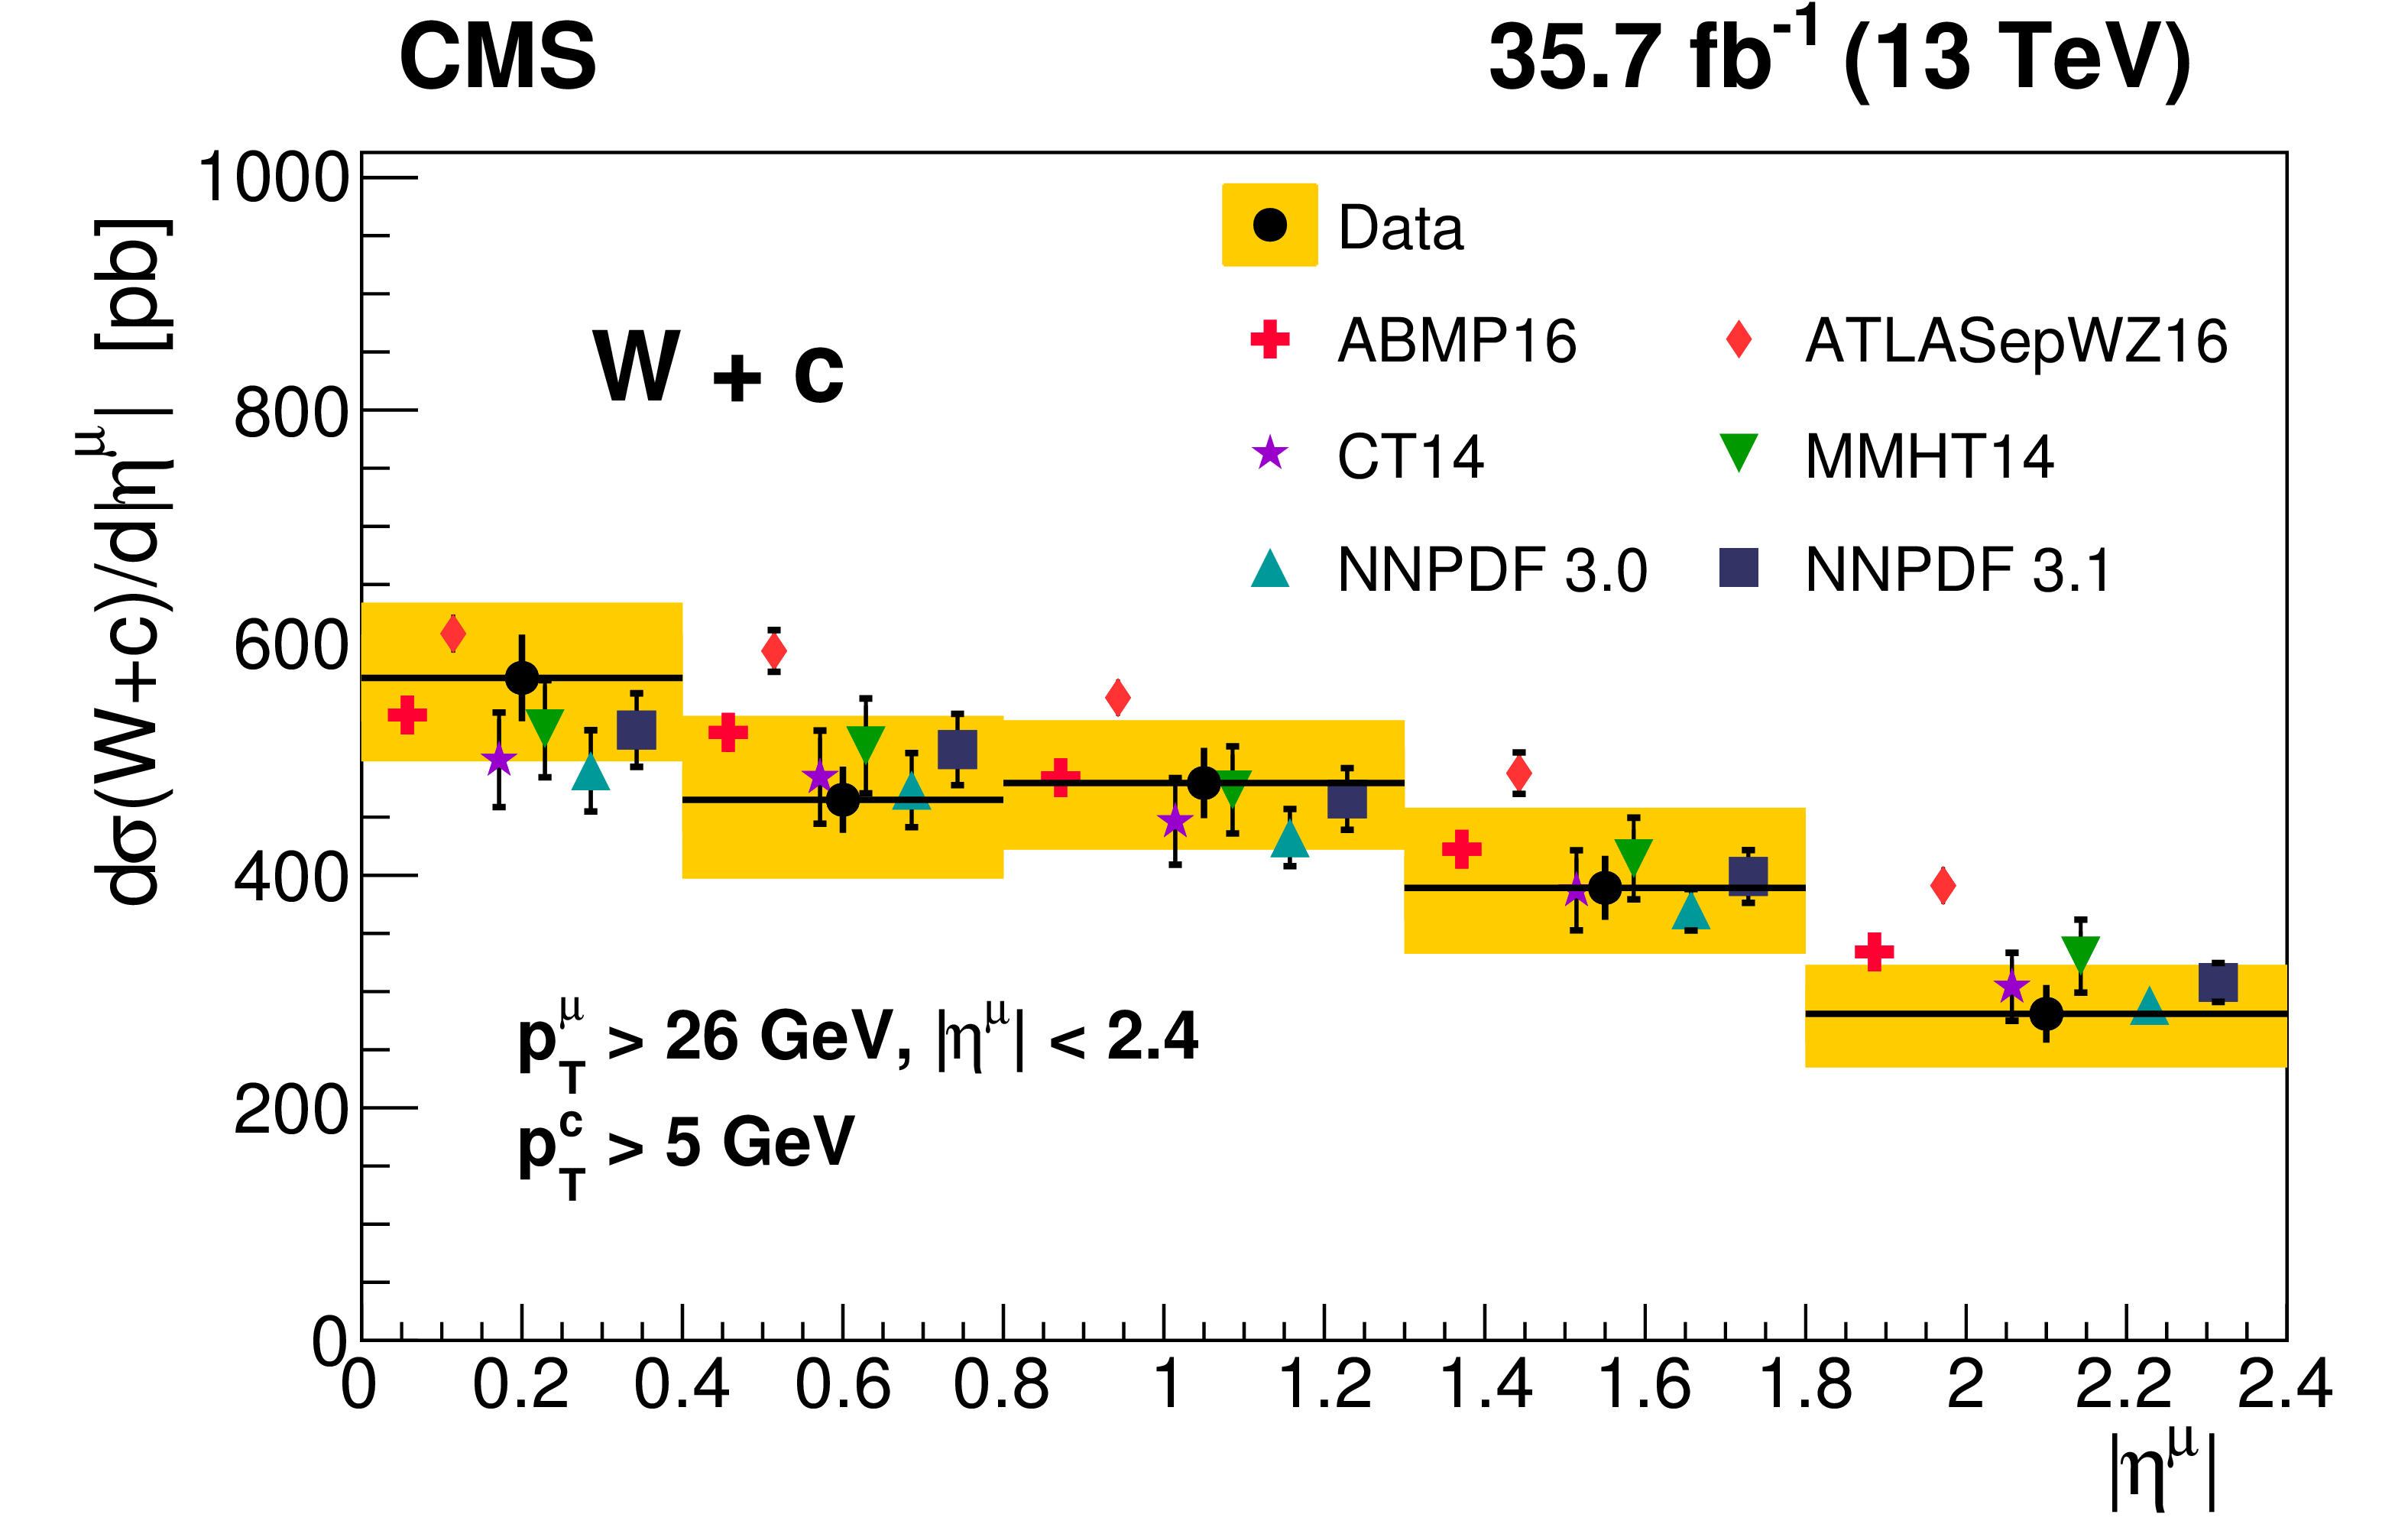
Figure 5-a:
Differential cross sections of $ {\sigma ({{\mathrm {W}}{+} {\mathrm {c}}})} $ production at 13 TeV measured as a function $ {{| \eta ^{{\mu}} |}} $. The data are presented by filled circles with the statistical (total) uncertainties shown by vertical error bars (light shaded bands). The measurements are compared to the QCD predictions calculated with MCFM at NLO using different PDF sets, presented by symbols of different style. All used PDF sets are evaluated at NLO, except for ATLASepWZ16, which is obtained at NNLO. The error bars represent theoretical uncertainties, which include PDF and scale variation uncertainty. |

png pdf |
Figure 5-b:
$ {\sigma ({\mathrm {W^{-}}}{+} {{\mathrm {D}^{*}(2010)^{+}}})} $ differential production cross sections presented as a function of $ {{| \eta ^{{\mu}} |}} $. The data (filled circles) are shown with their total (outer error bars) and statistical (inner error bars) uncertainties and are compared to the predictions of the signal MC generated with MadGraph 5_amc@nlo and using NNPDF3.0nlo to describe the proton structure. PDF uncertainties and scale variations are accounted for and added in quadrature (shaded band). |

png pdf |
Figure 5-c:
Differential cross sections of $ {\sigma ({{\mathrm {W^{+}}}{+} {\mathrm {\bar{c}}}})} $ production at 13 TeV measured as a function $ {{| \eta ^{{\mu}} |}} $. The data are presented by filled circles with the statistical (total) uncertainties shown by vertical error bars (light shaded bands). The measurements are compared to the QCD predictions calculated with MCFM at NLO using different PDF sets, presented by symbols of different style. All used PDF sets are evaluated at NLO, except for ATLASepWZ16, which is obtained at NNLO. The error bars represent theoretical uncertainties, which include PDF and scale variation uncertainty. |

png pdf |
Figure 5-d:
$ {\sigma ({\mathrm {W^{+}}}{+} {{\mathrm {D}^{*}(2010)^{-}}})} $ differential production cross sections presented as a function of $ {{| \eta ^{{\mu}} |}} $. The data (filled circles) are shown with their total (outer error bars) and statistical (inner error bars) uncertainties and are compared to the predictions of the signal MC generated with MadGraph 5_amc@nlo and using NNPDF3.0nlo to describe the proton structure. PDF uncertainties and scale variations are accounted for and added in quadrature (shaded band). |
png pdf |
Figure 5-e:
Differential cross sections of $ {\sigma ({{\mathrm {W^{-}}}{+} {\mathrm {c}}})} $ production at 13 TeV measured as a function $ {{| \eta ^{{\mu}} |}} $. The data are presented by filled circles with the statistical (total) uncertainties shown by vertical error bars (light shaded bands). The measurements are compared to the QCD predictions calculated with MCFM at NLO using different PDF sets, presented by symbols of different style. All used PDF sets are evaluated at NLO, except for ATLASepWZ16, which is obtained at NNLO. The error bars represent theoretical uncertainties, which include PDF and scale variation uncertainty. |
png pdf |
Figure 5-f:
Left: differential cross sections of $ {\sigma ({{\mathrm {W}}{+} {\mathrm {c}}})} $ production at 13 TeV measured as a function $ {{| \eta ^{{\mu}} |}} $. The data are presented by filled circles with the statistical (total) uncertainties shown by vertical error bars (light shaded bands). The measurements are compared to the QCD predictions calculated with MCFM at NLO using different PDF sets, presented by symbols of different style. All used PDF sets are evaluated at NLO, except for ATLASepWZ16, which is obtained at NNLO. The error bars represent theoretical uncertainties, which include PDF and scale variation uncertainty. Right: $ {\sigma ({\mathrm {W}}{+} {{\mathrm {D}^{*}(2010)^{\pm}}})} $ differential production cross sections presented as a function of $ {{| \eta ^{{\mu}} |}} $. The data (filled circles) are shown with their total (outer error bars) and statistical (inner error bars) uncertainties and are compared to the predictions of the signal MC generated with MadGraph 5_amc@nlo and using NNPDF3.0nlo to describe the proton structure. PDF uncertainties and scale variations are accounted for and added in quadrature (shaded band). |
png pdf |
Figure 6:
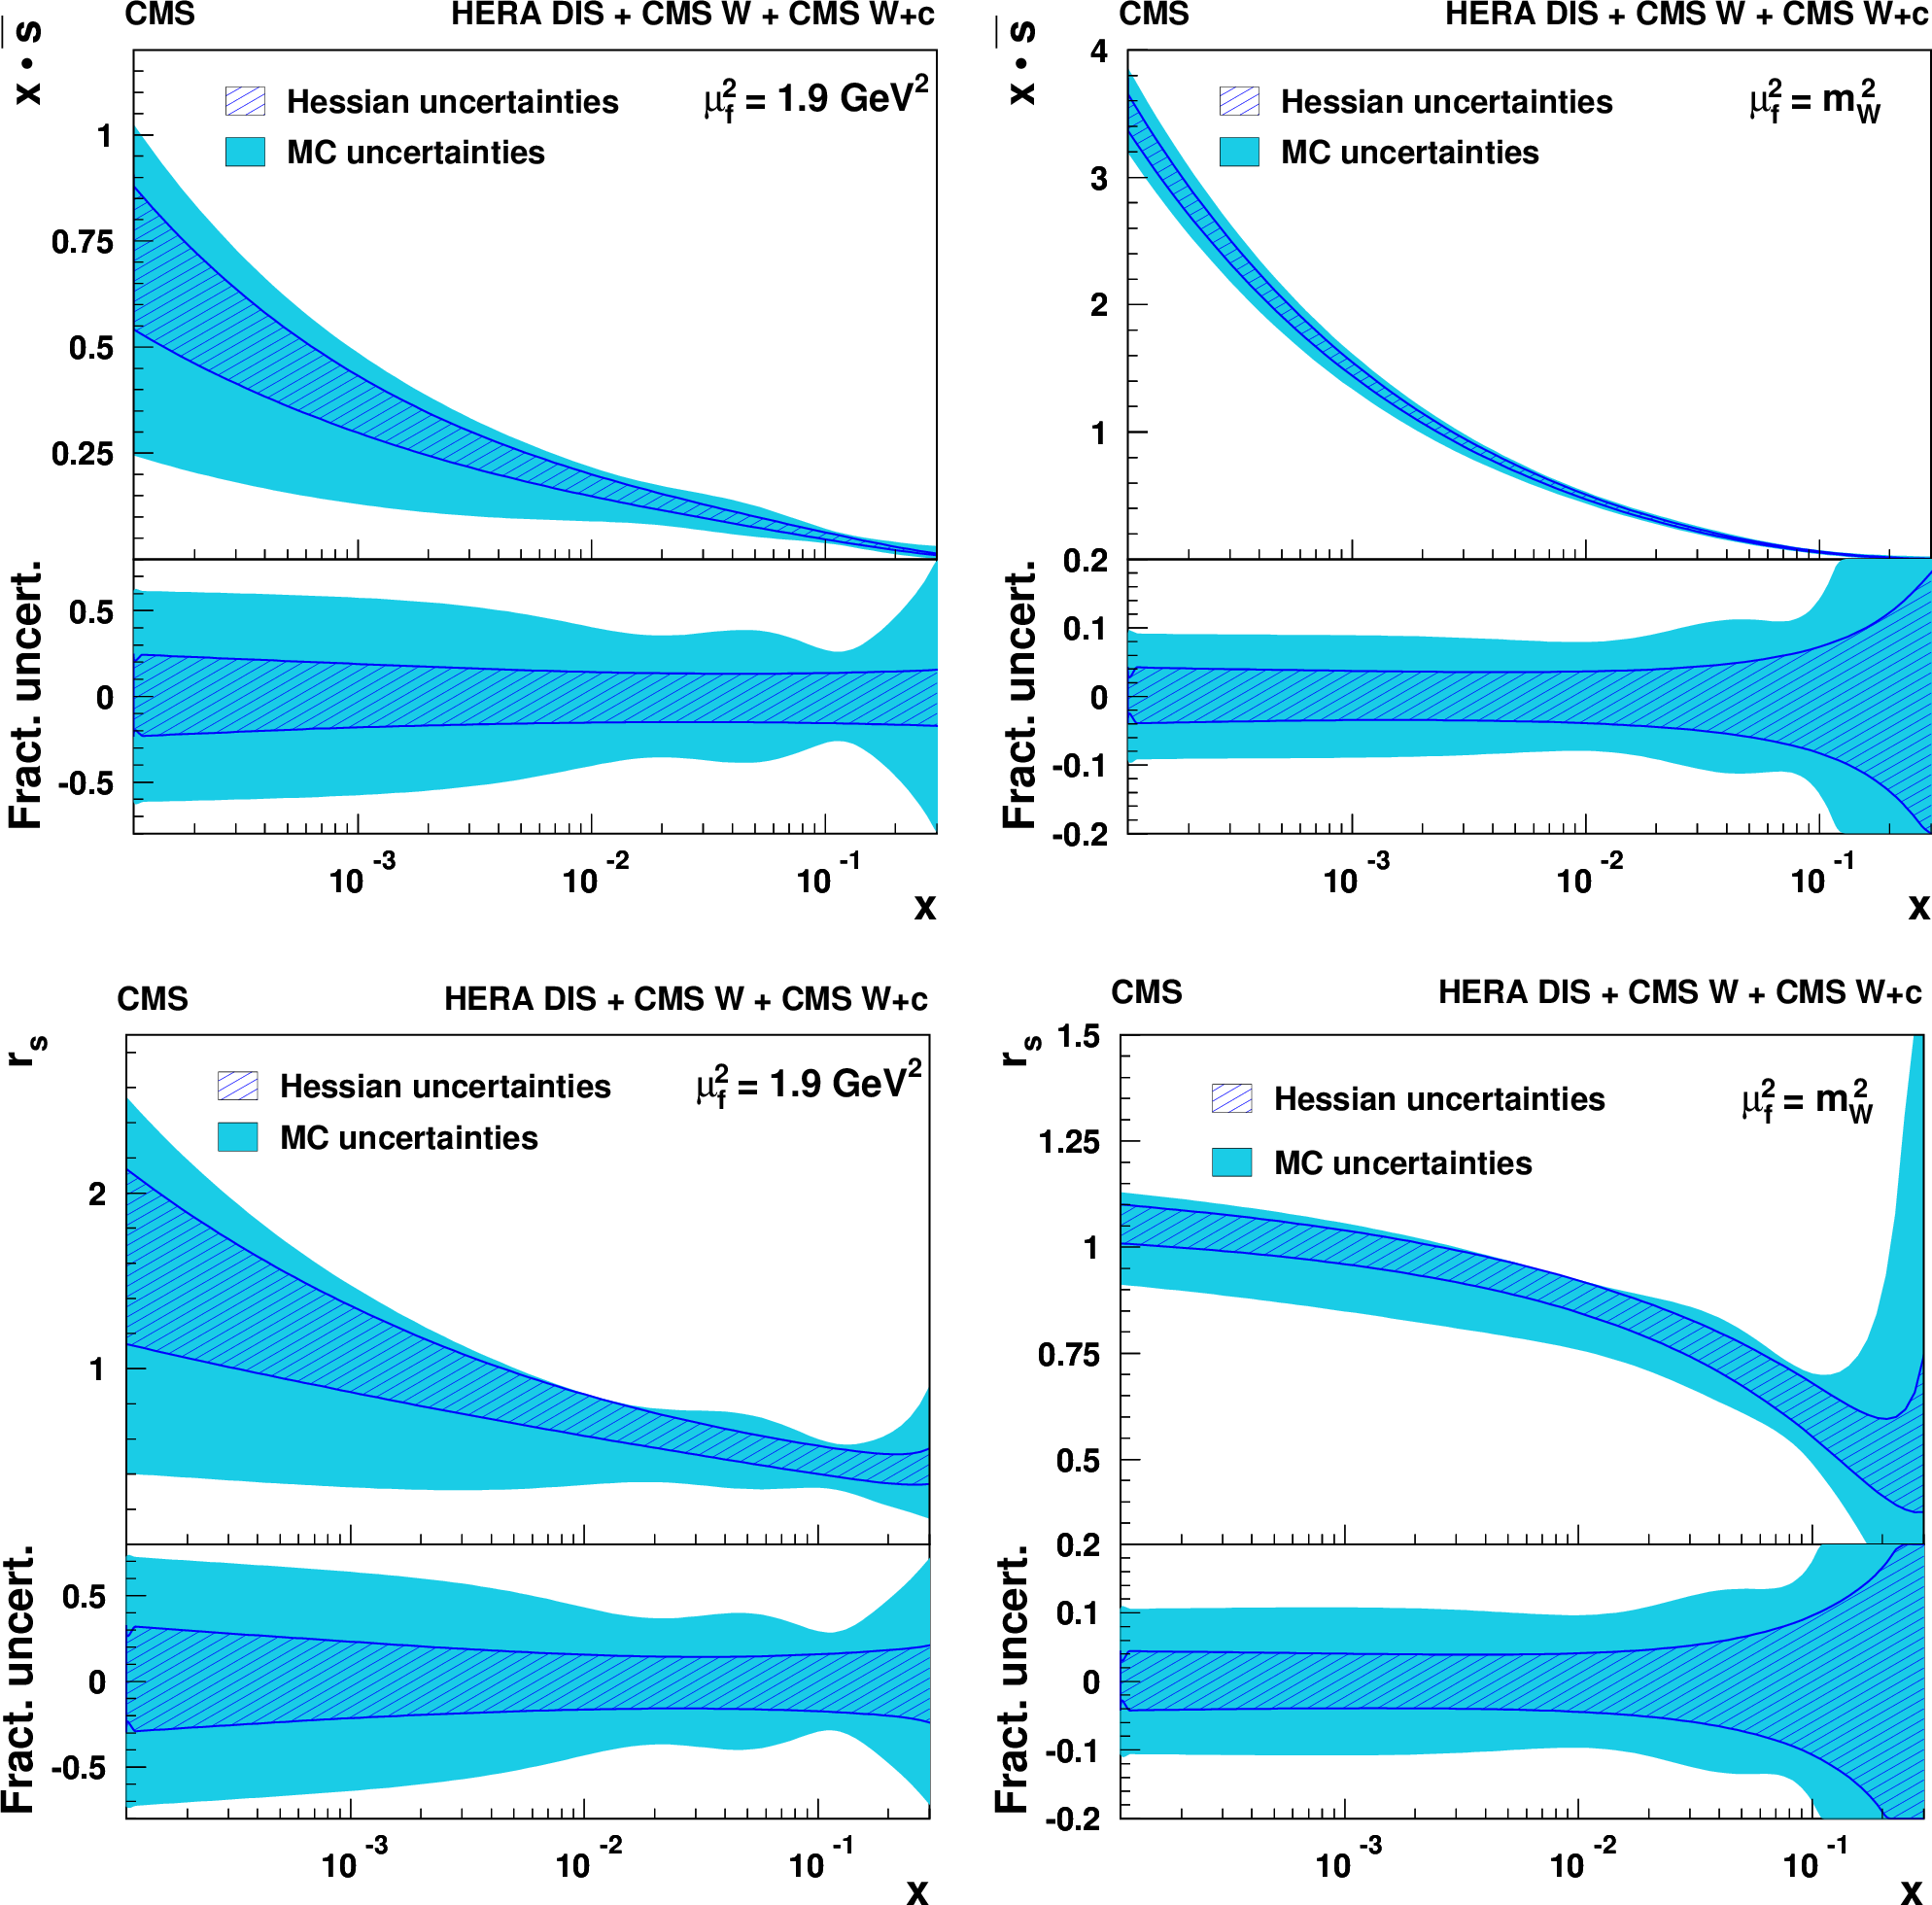
The s quark distribution (upper) and the strangeness suppression factor (lower) as functions of $x$ at the factorization scale of 1.9 GeV$^2$ (left) and $ {m^2_{{\mathrm {W}}}} $ (right). The results of the current analysis are presented with the fit uncertainties estimated by the Hessian method (hatched band) and using MC replicas (shaded band). |

png pdf |
Figure 6-a:
The s quark distribution as a function of $x$ at the factorization scale of 1.9 GeV$^2$. The results of the current analysis are presented with the fit uncertainties estimated by the Hessian method (hatched band) and using MC replicas (shaded band). |
png pdf |
Figure 6-b:
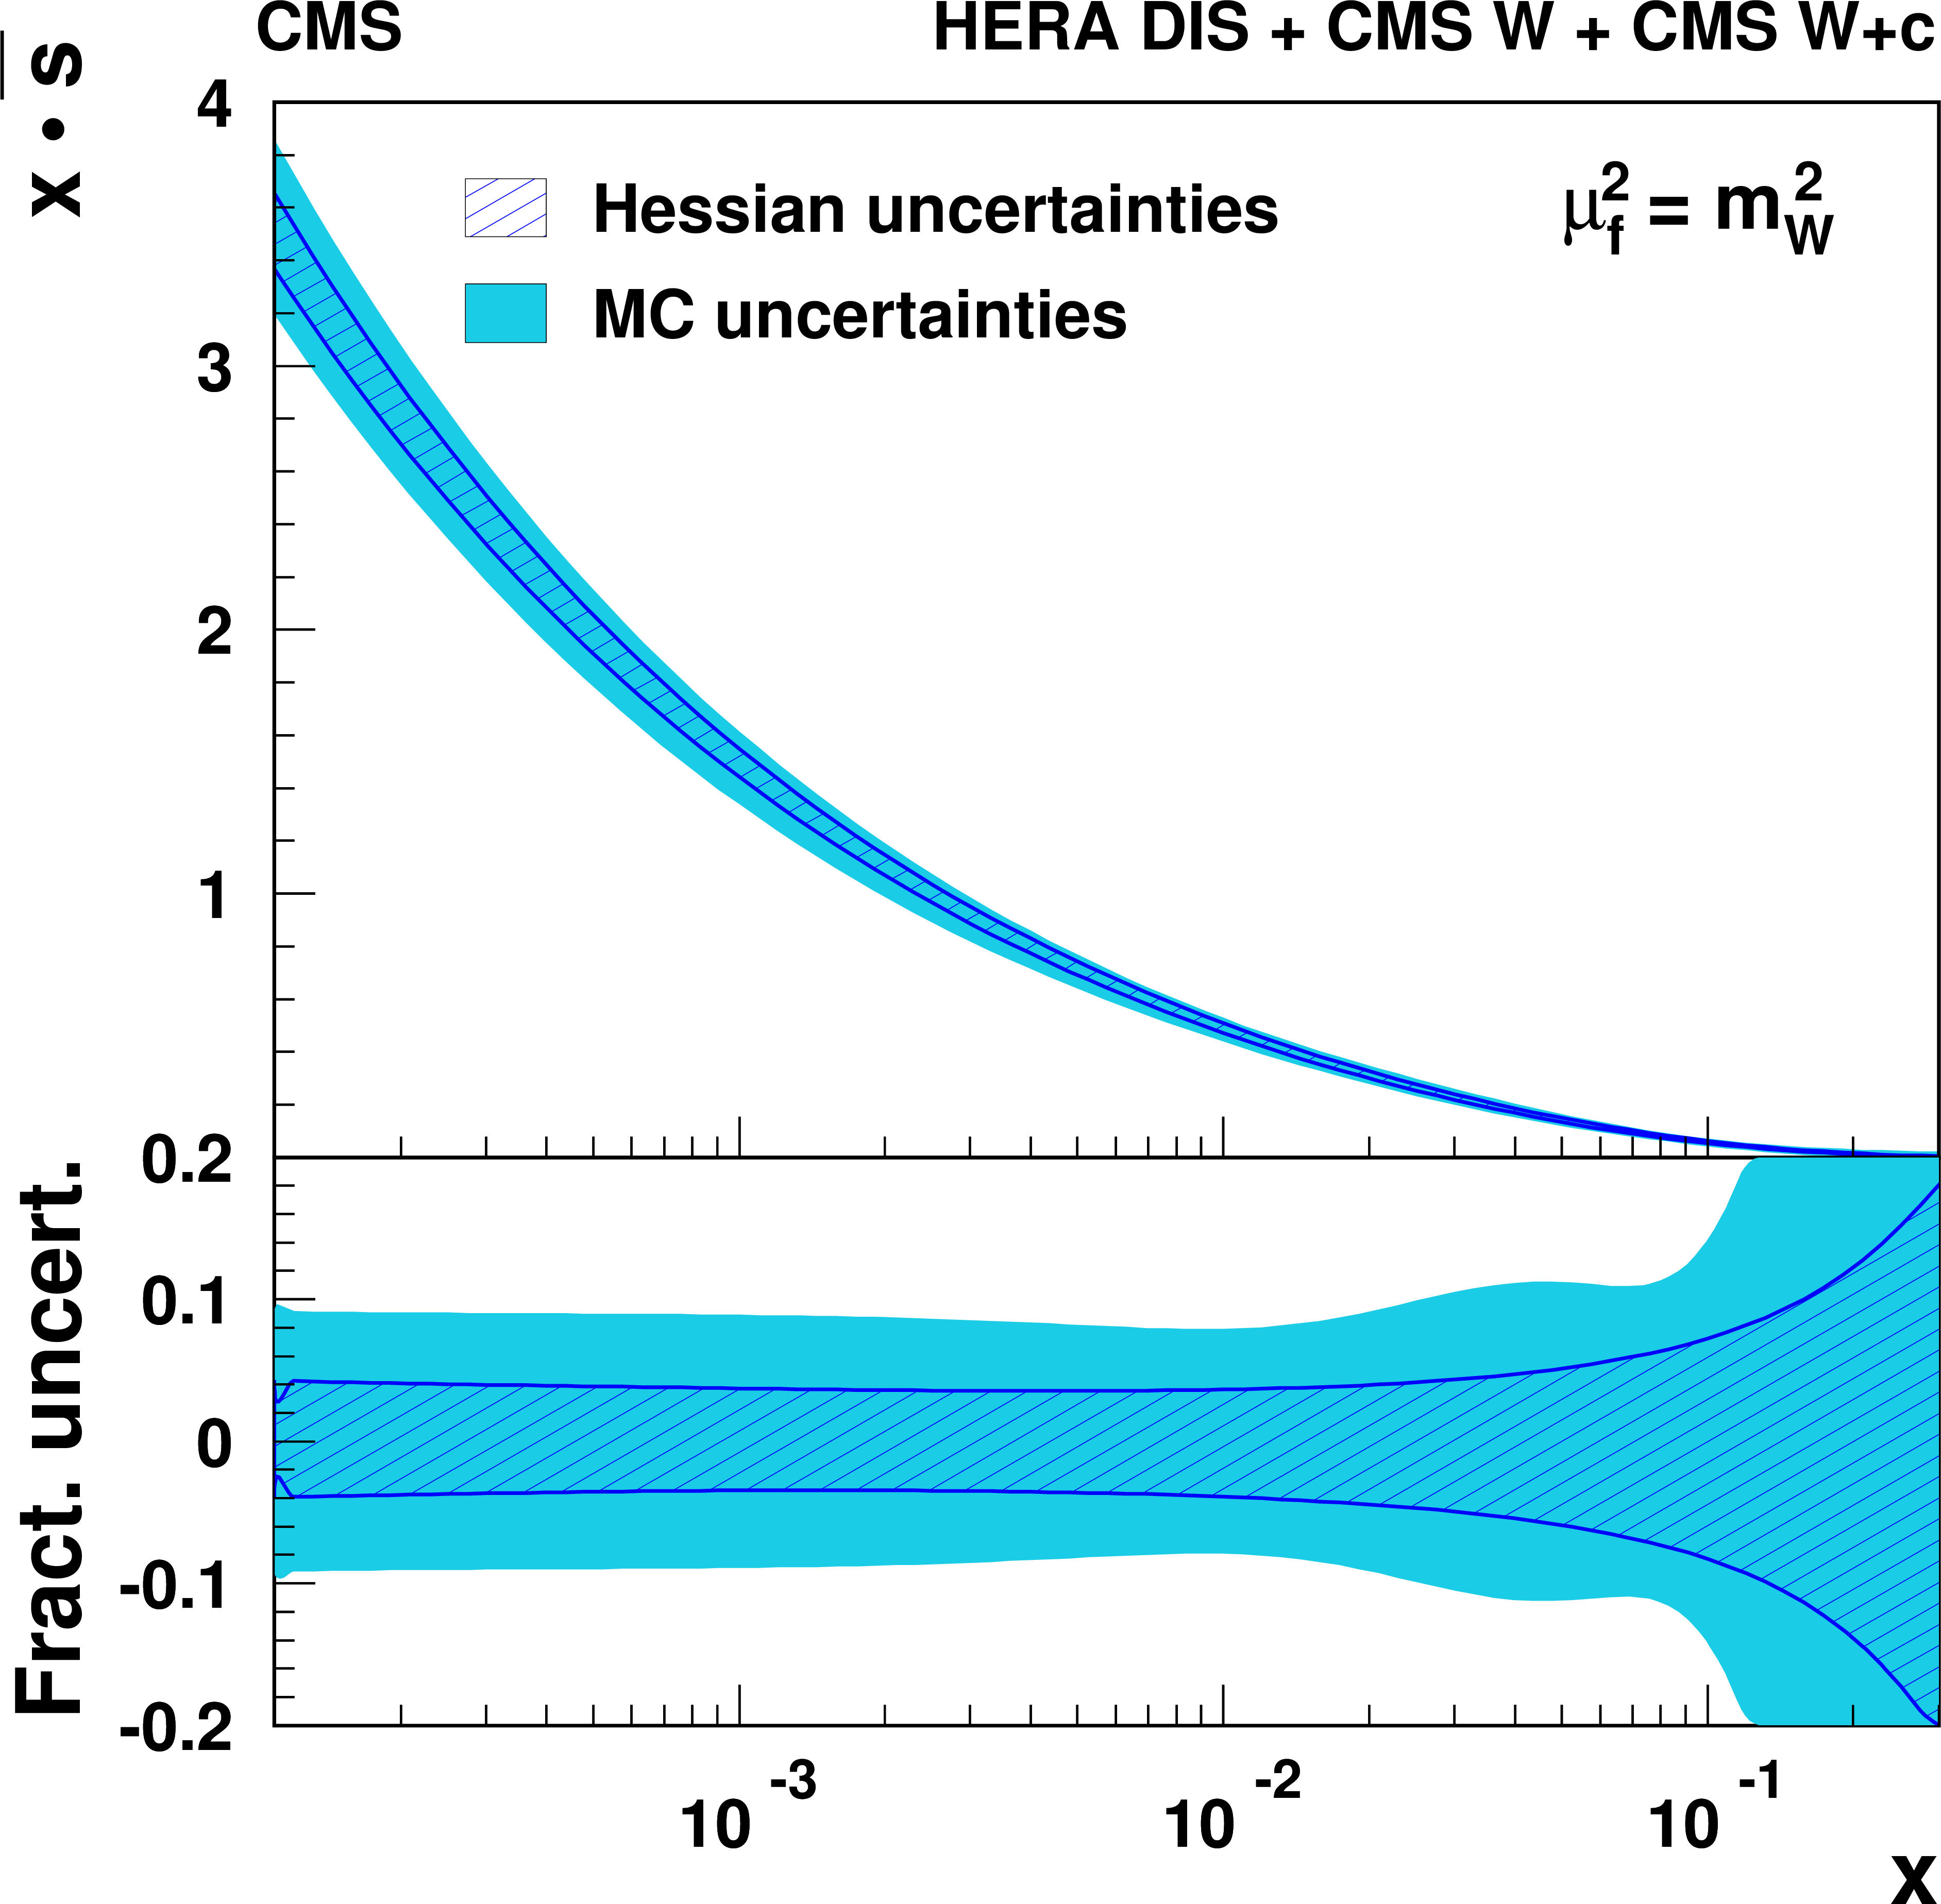
The s quark distribution as a function of $x$ at the factorization scale of $ {m^2_{{\mathrm {W}}}} $. The results of the current analysis are presented with the fit uncertainties estimated by the Hessian method (hatched band) and using MC replicas (shaded band). |

png pdf |
Figure 6-c:
Strangeness suppression factor as a function of $x$ at the factorization scale of 1.9 GeV$^2$. The results of the current analysis are presented with the fit uncertainties estimated by the Hessian method (hatched band) and using MC replicas (shaded band). |

png pdf |
Figure 6-d:
Strangeness suppression factor as a function of $x$ at the factorization scale of $ {m^2_{{\mathrm {W}}}} $. The results of the current analysis are presented with the fit uncertainties estimated by the Hessian method (hatched band) and using MC replicas (shaded band). |

png pdf |
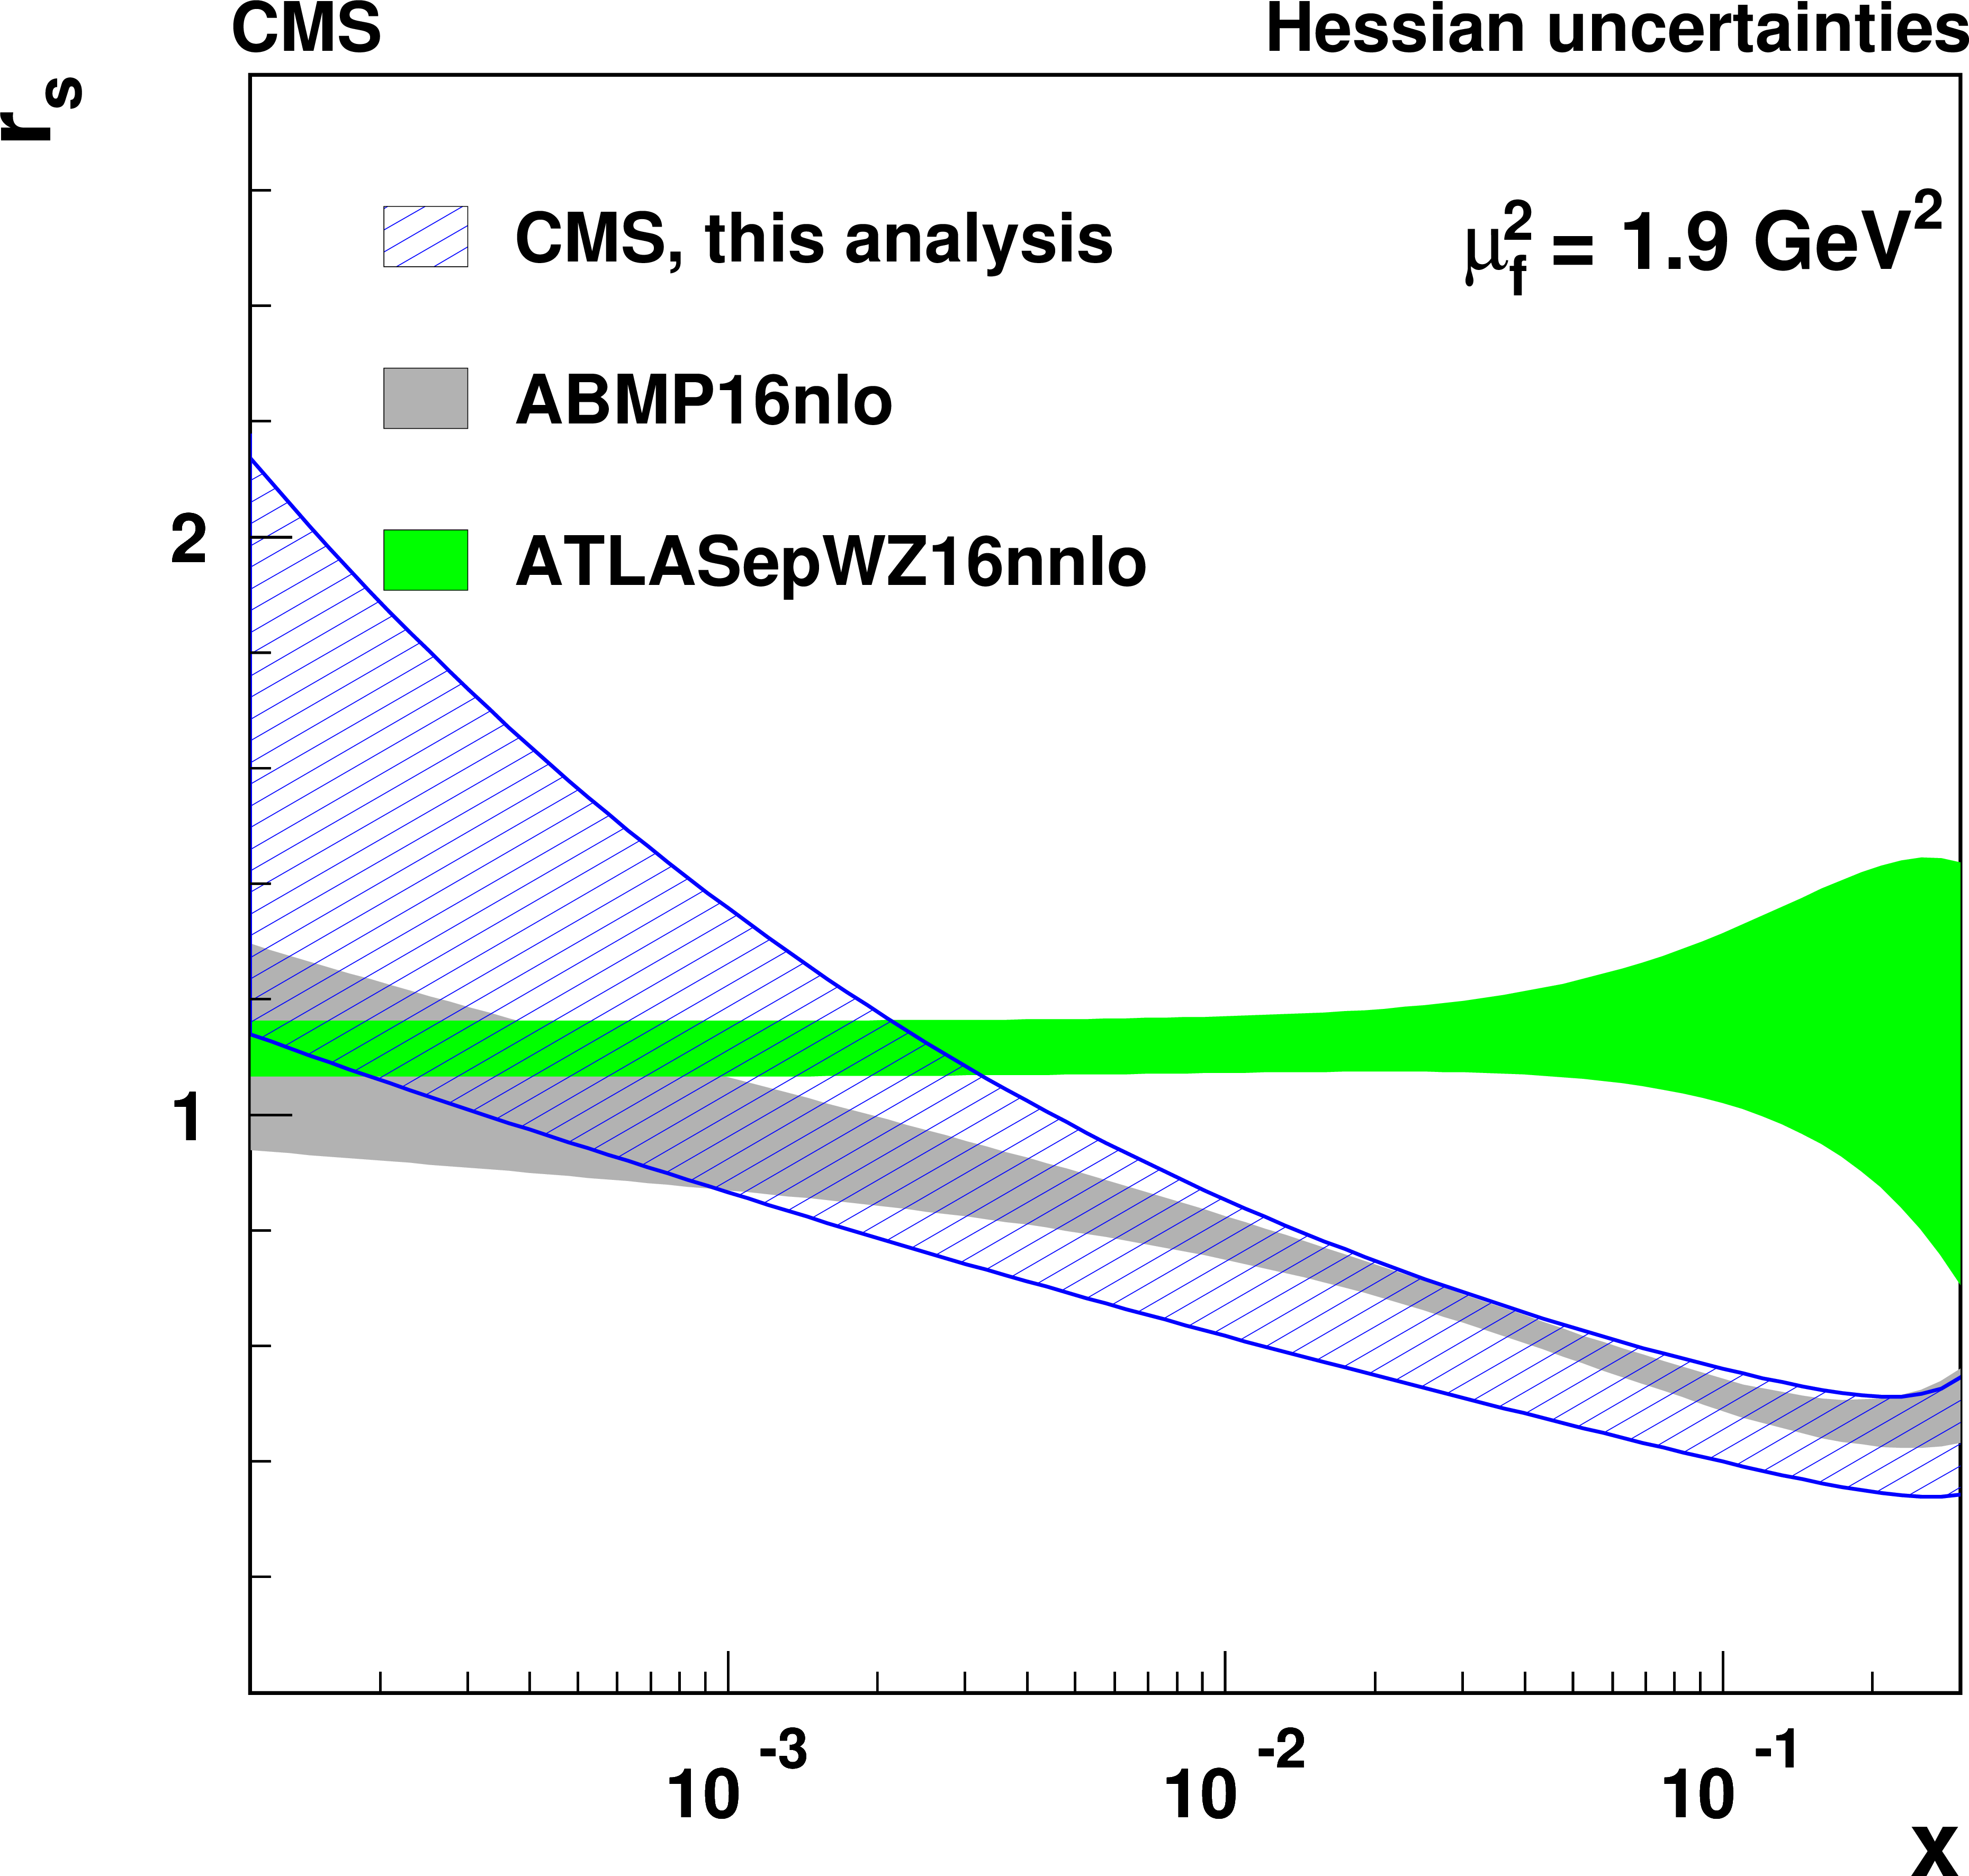
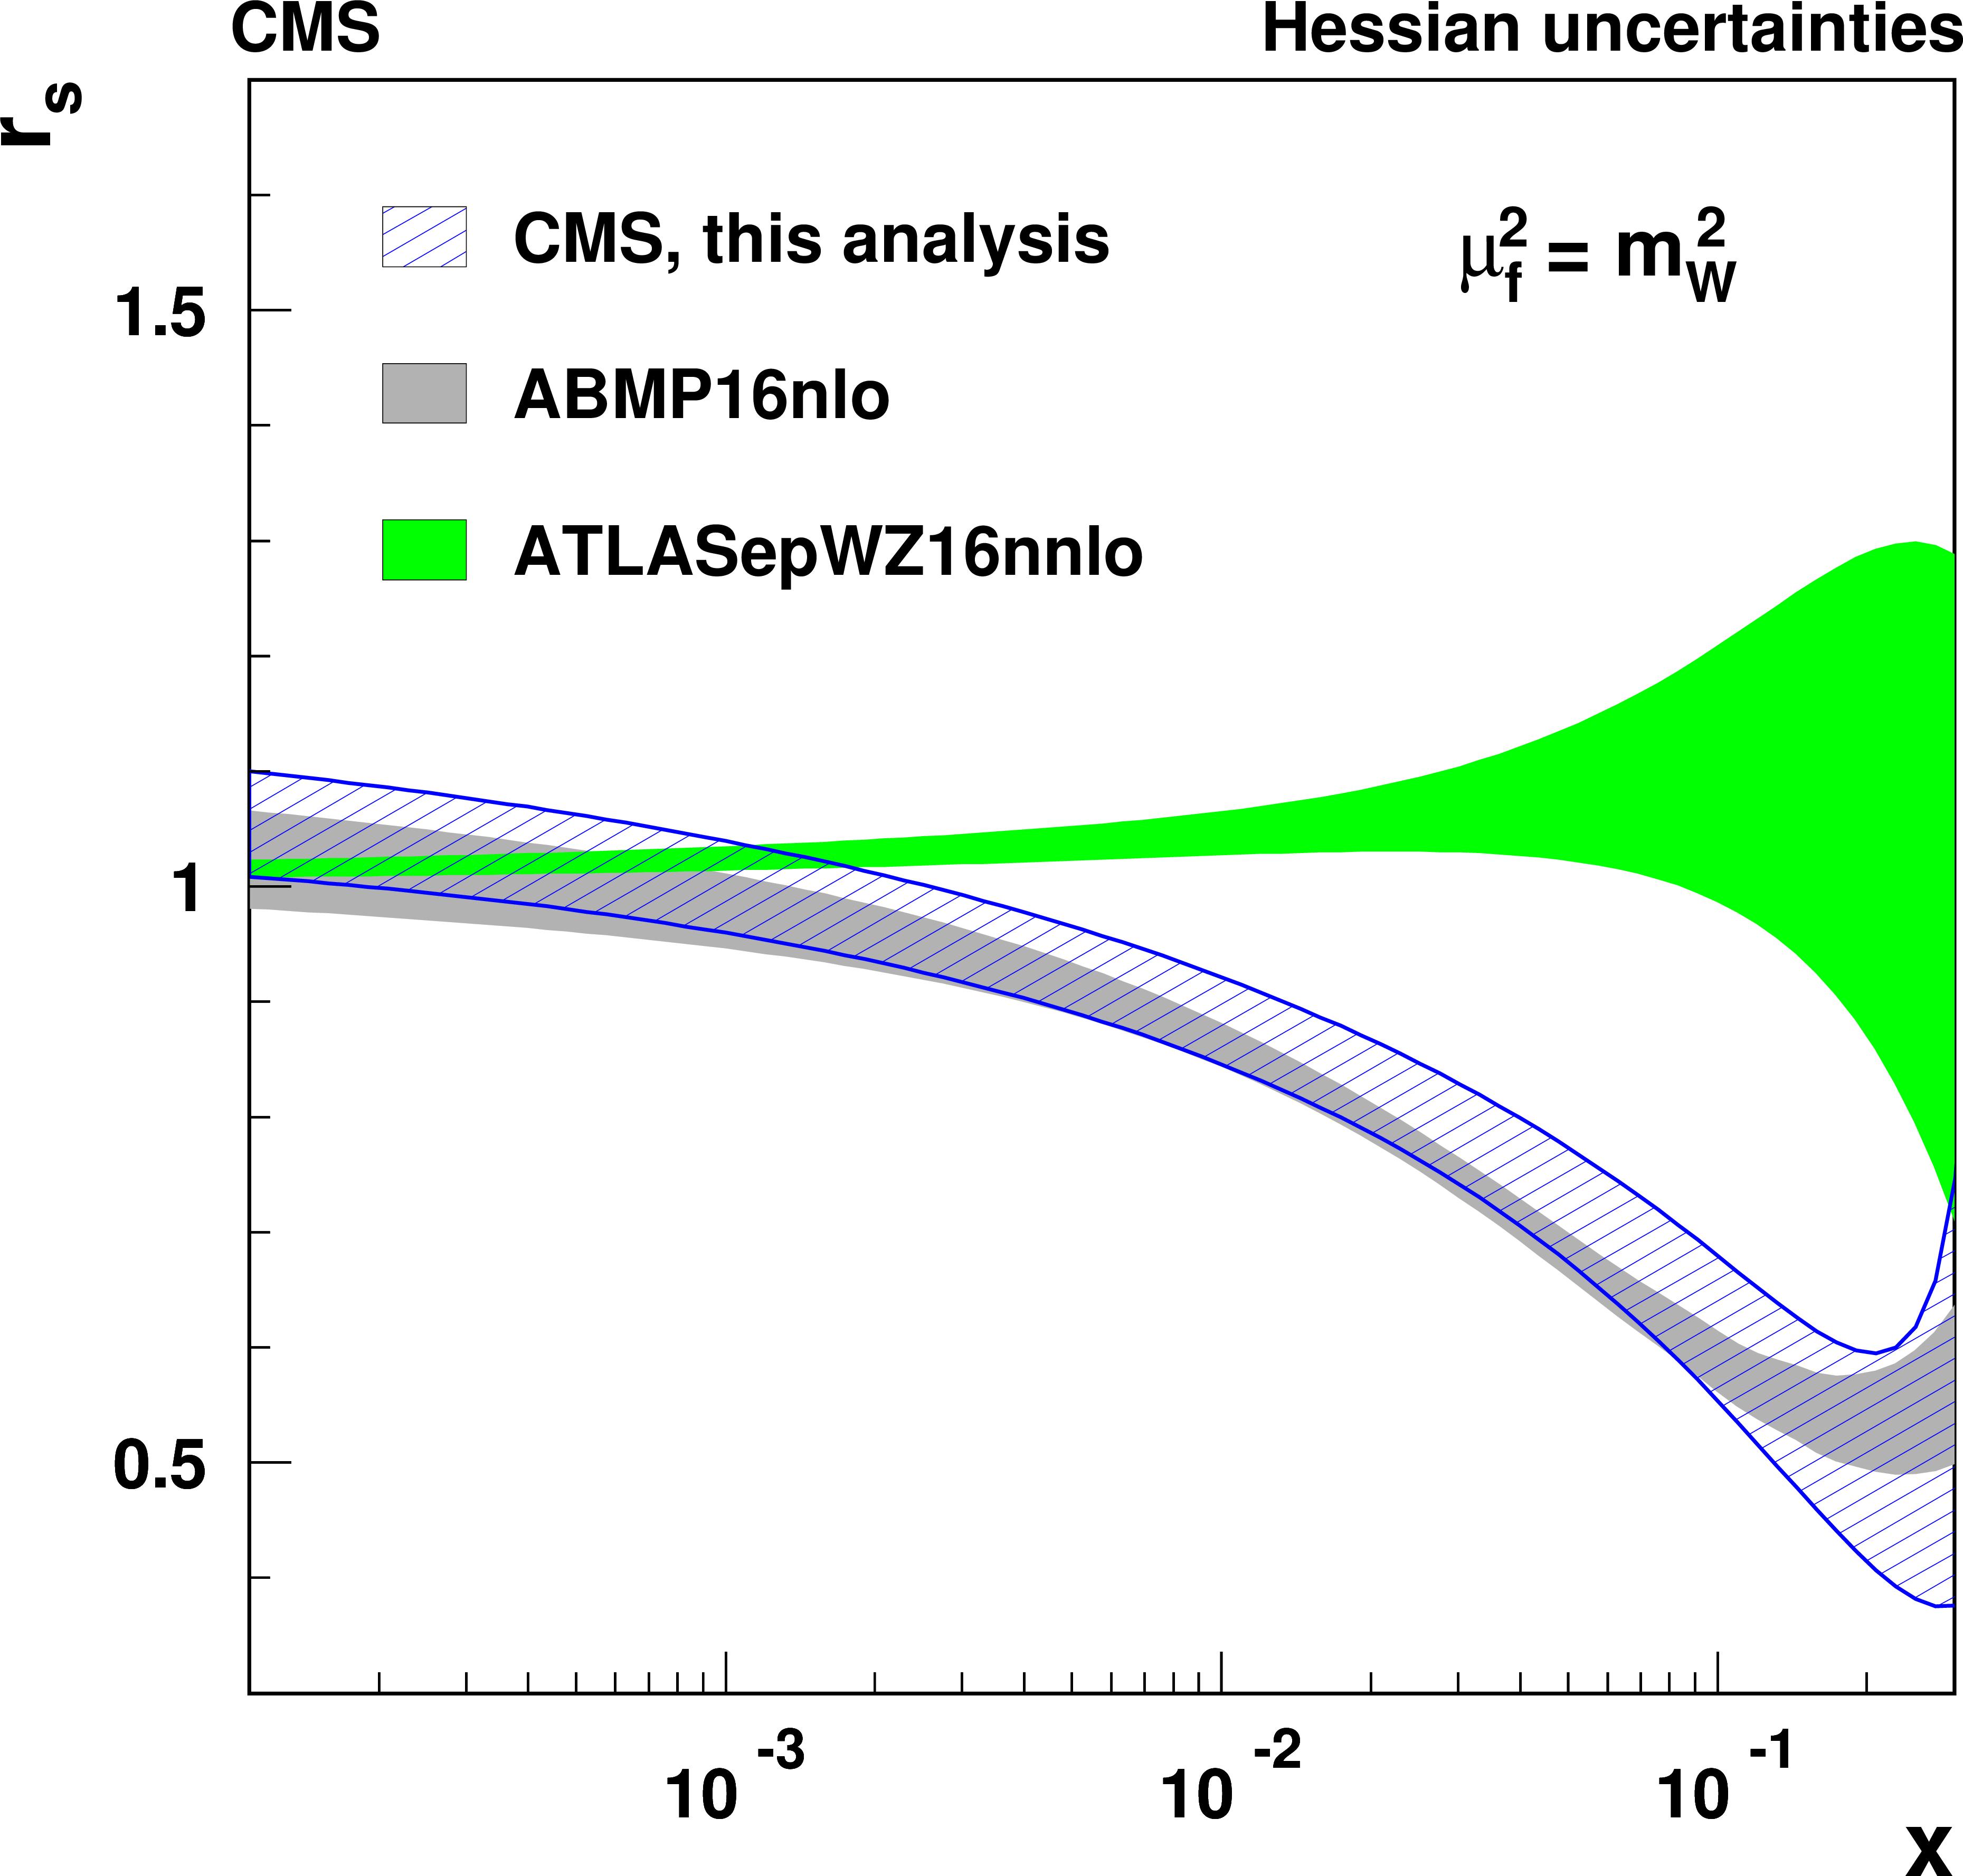
Figure 7:
The strangeness suppression factor as a function of $x$ at the factorization scale of 1.9 GeV$^2$ (left) and $ {m^2_{{\mathrm {W}}}} $ (right). The results of the current analysis (hatched band) are compared to ABMP16nlo (dark shaded band) and ATLASepWZ16nnlo (light shaded band) PDFs. |
png pdf |
Figure 7-a:
The strangeness suppression factor as a function of $x$ at the factorization scale of 1.9 GeV$^2$. The results of the current analysis (hatched band) are compared to ABMP16nlo (dark shaded band) and ATLASepWZ16nnlo (light shaded band) PDFs. |
png pdf |
Figure 7-b:
The strangeness suppression factor as a function of $x$ at the factorization scale of $ {m^2_{{\mathrm {W}}}} $. The results of the current analysis (hatched band) are compared to ABMP16nlo (dark shaded band) and ATLASepWZ16nnlo (light shaded band) PDFs. |
png pdf |
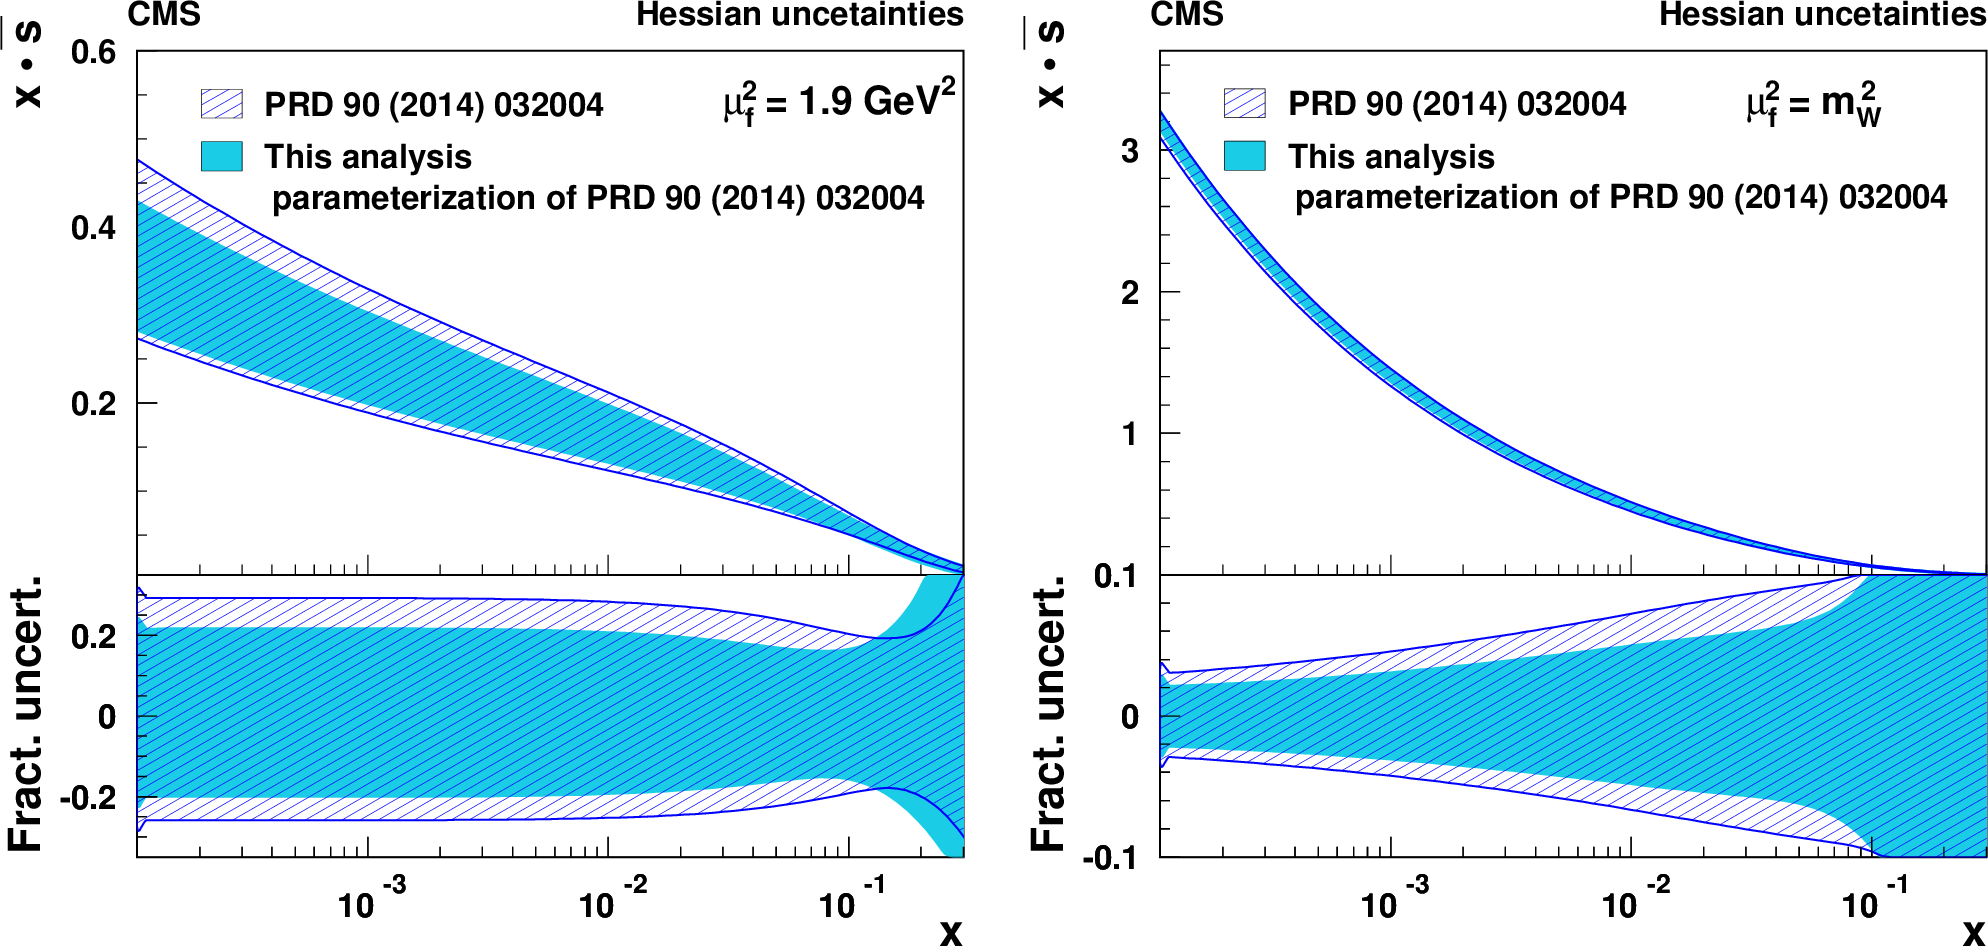
Figure 8:
The distributions of s quarks (upper panel) in the proton and their relative uncertainty (lower panel) as a functions of $x$ at the factorization scale of 1.9 GeV$^2$ (left) and $ {m^2_{{\mathrm {W}}}} $ (right). The result of the current analysis (filled band) is compared to the result of Ref. [11] (dashed band). The PDF uncertainties resulting from the fit are shown. |

png pdf |
Figure 8-a:
The distributions of s quarks (upper panel) in the proton and their relative uncertainty (lower panel) as a functions of $x$ at the factorization scale of 1.9 GeV$^2$. The result of the current analysis (filled band) is compared to the result of Ref. [11] (dashed band). The PDF uncertainties resulting from the fit are shown. |

png pdf |
Figure 8-b:
The distributions of s quarks (upper panel) in the proton and their relative uncertainty (lower panel) as a functions of $x$ at the factorization scale of $ {m^2_{{\mathrm {W}}}} $. The result of the current analysis (filled band) is compared to the result of Ref. [11] (dashed band). The PDF uncertainties resulting from the fit are shown. |
| Tables | |
png pdf |
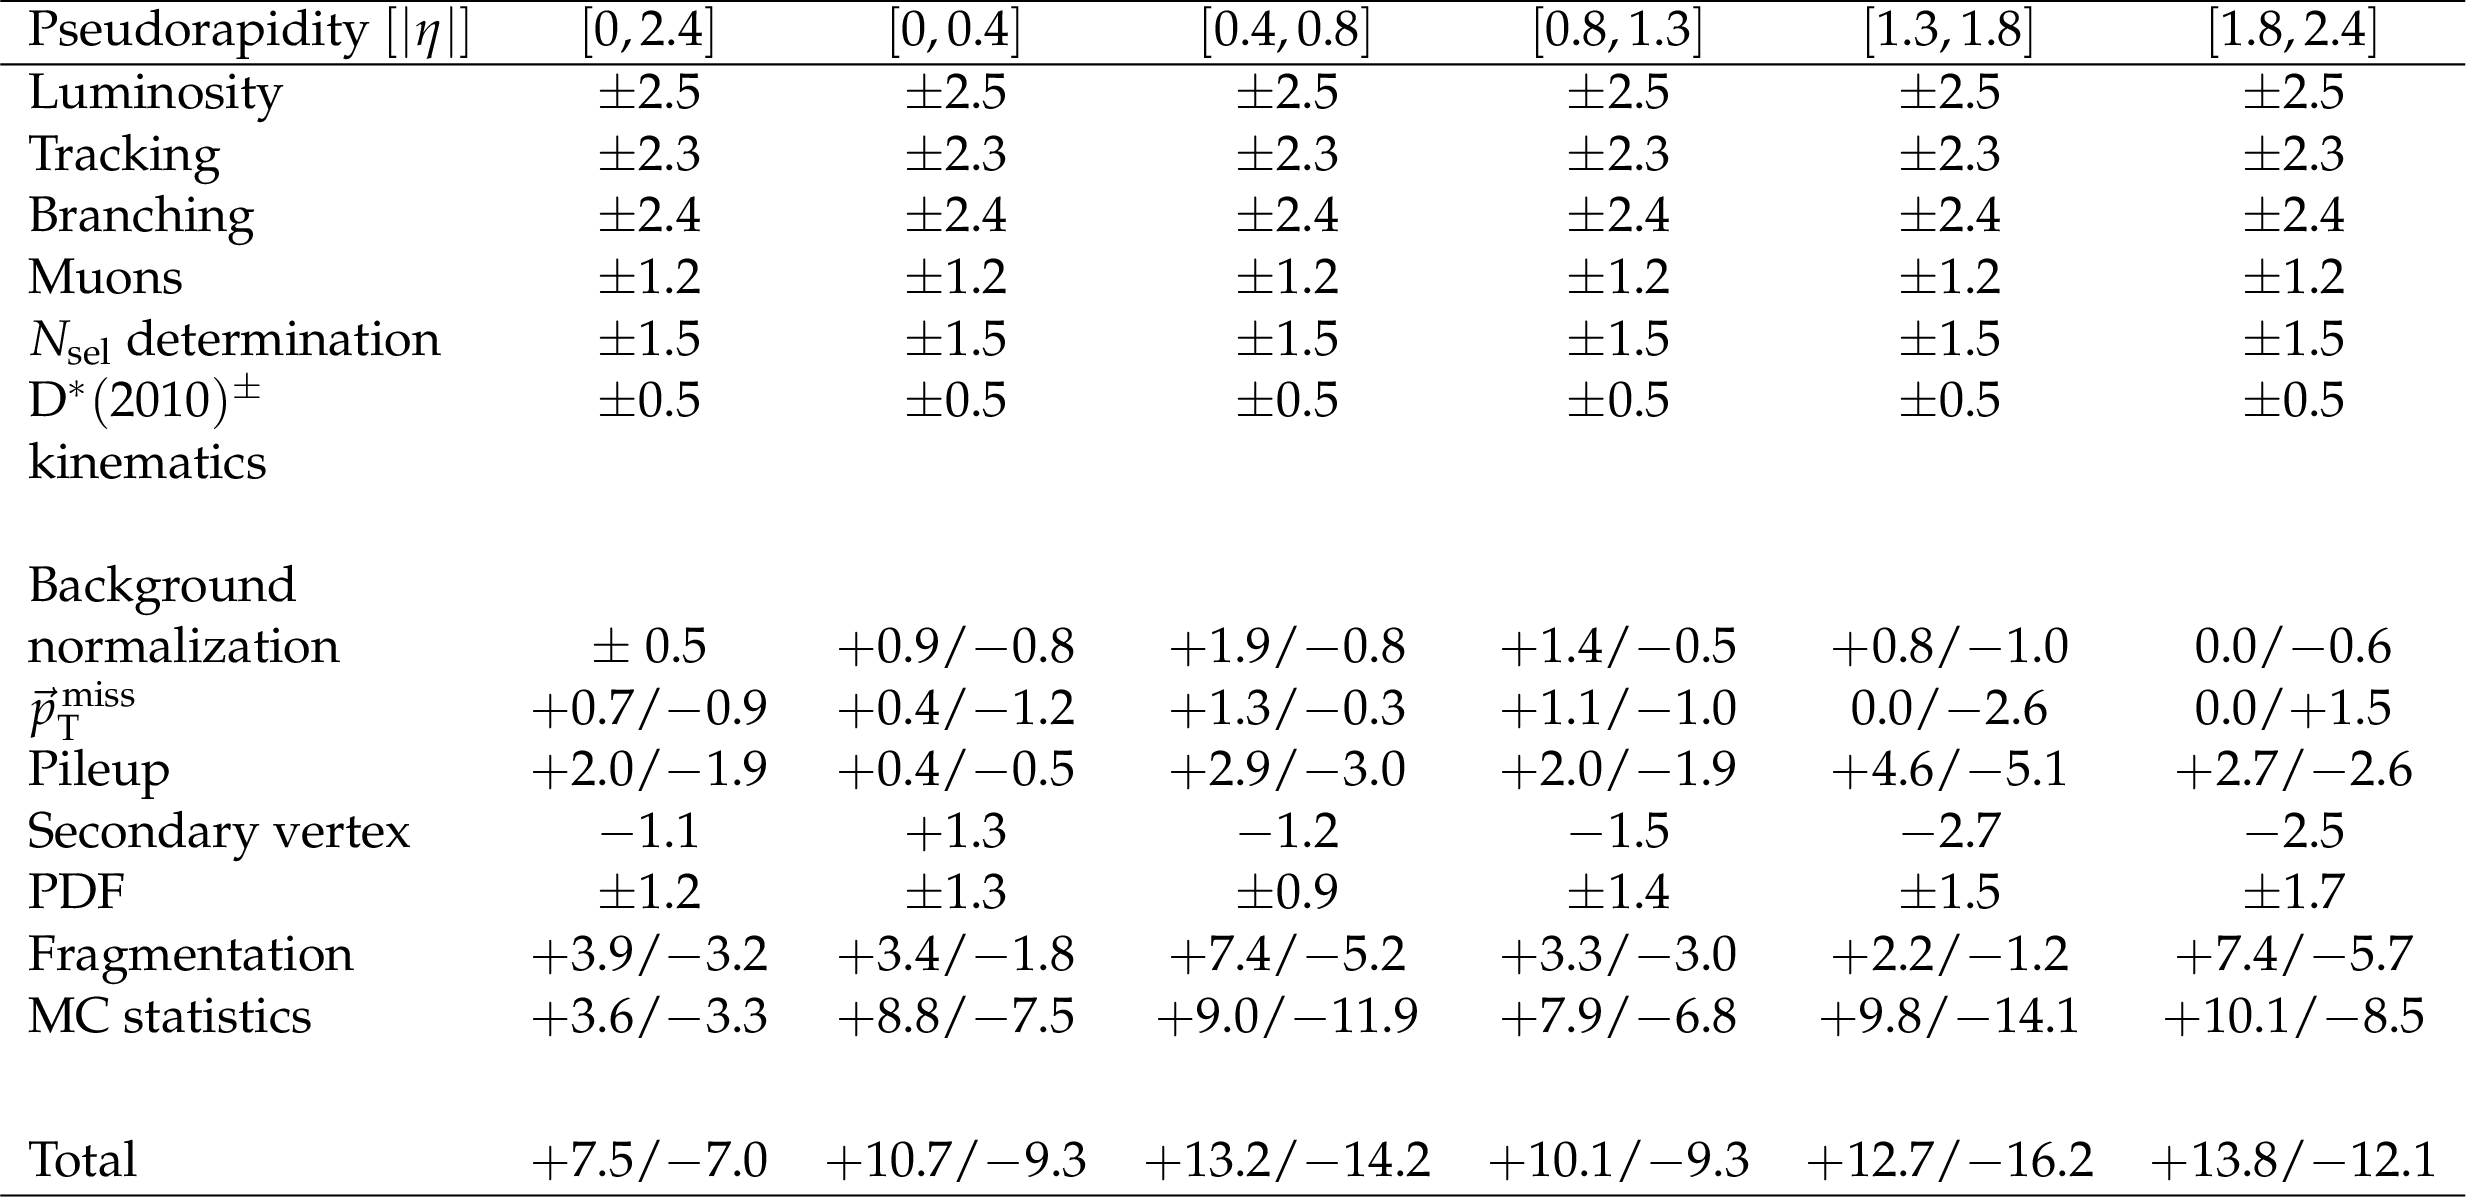
Table 1:
Systematic uncertainties [%] in the inclusive and differential W+c cross section measurement in the fiducial region of the analysis. The total uncertainty corresponds to the sum of the individual contributions in quadrature. The contributions listed in the top part of the table cancel in the ratio $ {\sigma ({{\mathrm {W^+}}{+} {\overline {\mathrm {c}}}})} / {\sigma ({{\mathrm {W^-}}{+} {\mathrm {c}}})} $. |

png pdf |
Table 2:
Inclusive cross sections of W+c and W+${\mathrm {D}^{*}(2010)^{\pm}}$ production in the fiducial range of the analysis. The correction factor $\mathcal {C}$ accounts for the acceptance and efficiency of the detector. |
png pdf |
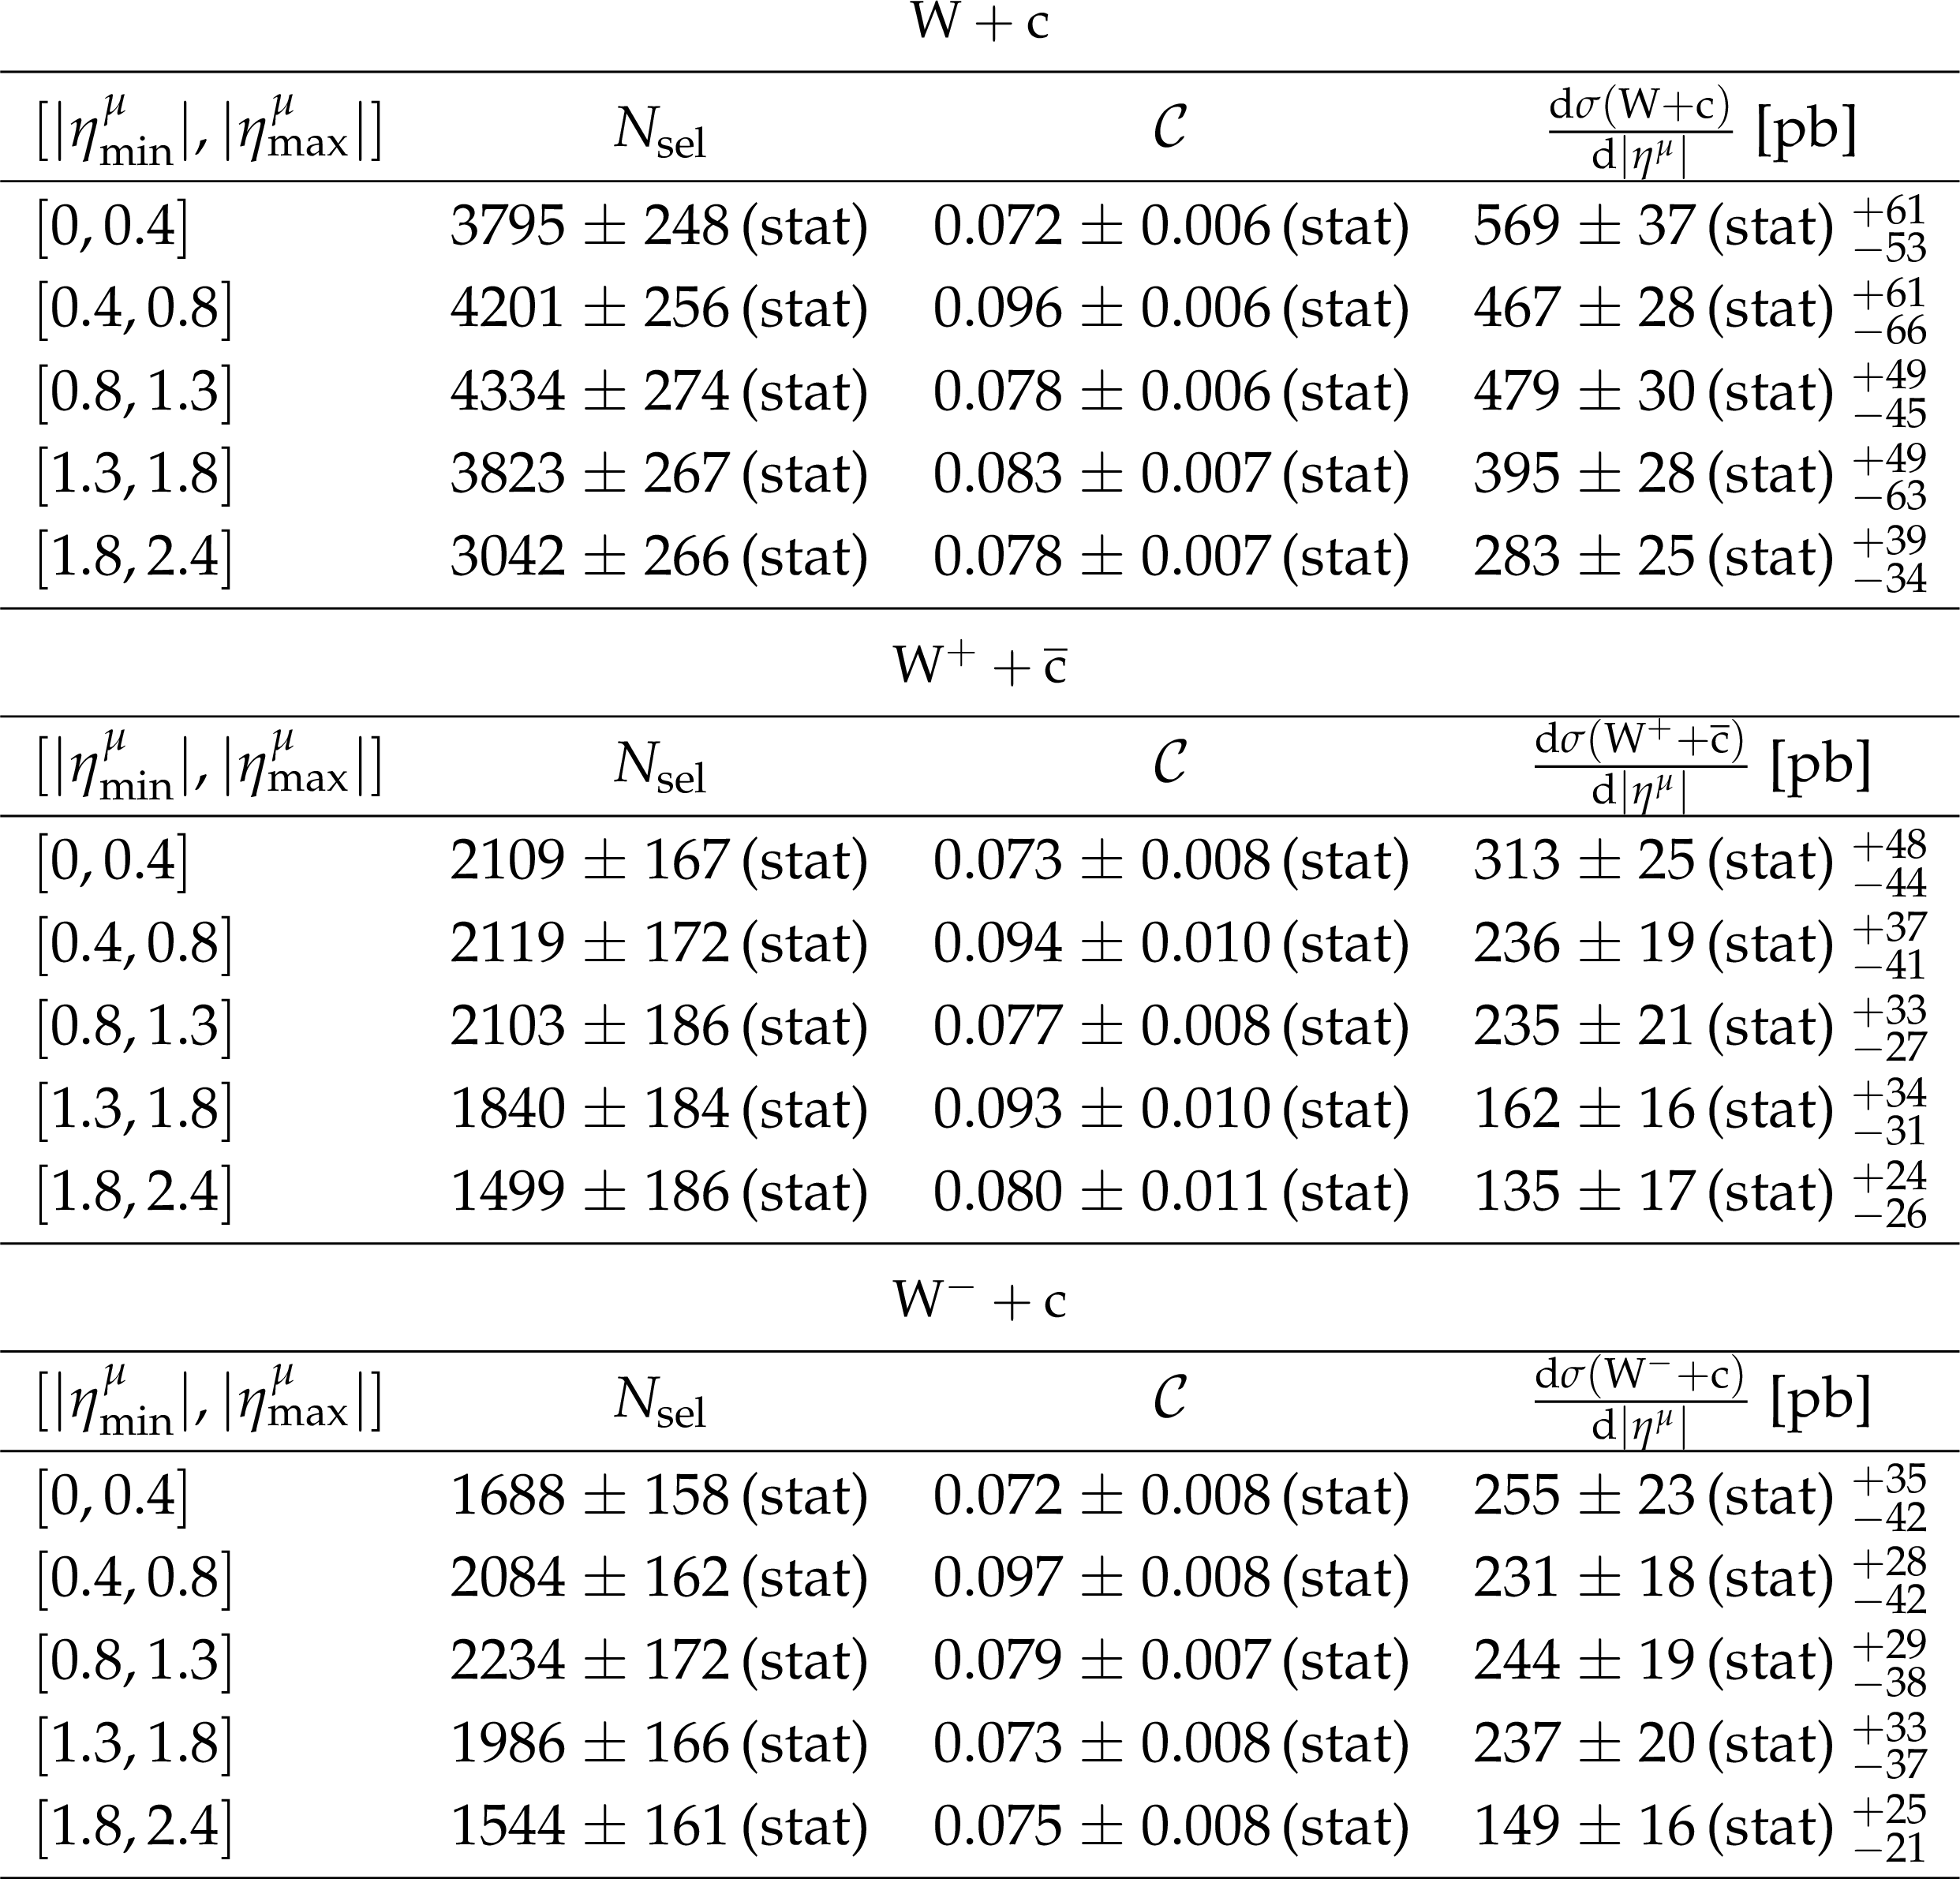
Table 3:
Number of signal events, correction factors $\mathcal {C}$, accounting for the acceptance and efficiency of the detector and the differential cross sections in each $ {{| \eta ^{{\mu}} |}} $ range for W+c (upper), ${{\mathrm {W^+}}{+} {\overline {\mathrm {c}}}}$ (middle) and ${{\mathrm {W^-}}{+} {\mathrm {c}}}$ (lower). |

png pdf |
Table 4:
The NLO predictions for $ {\sigma ({{\mathrm {W}}{+} {\mathrm {c}}})} $, obtained with MCFM [16,17,18]. The uncertainties account for PDF and scale variations. |
png pdf |
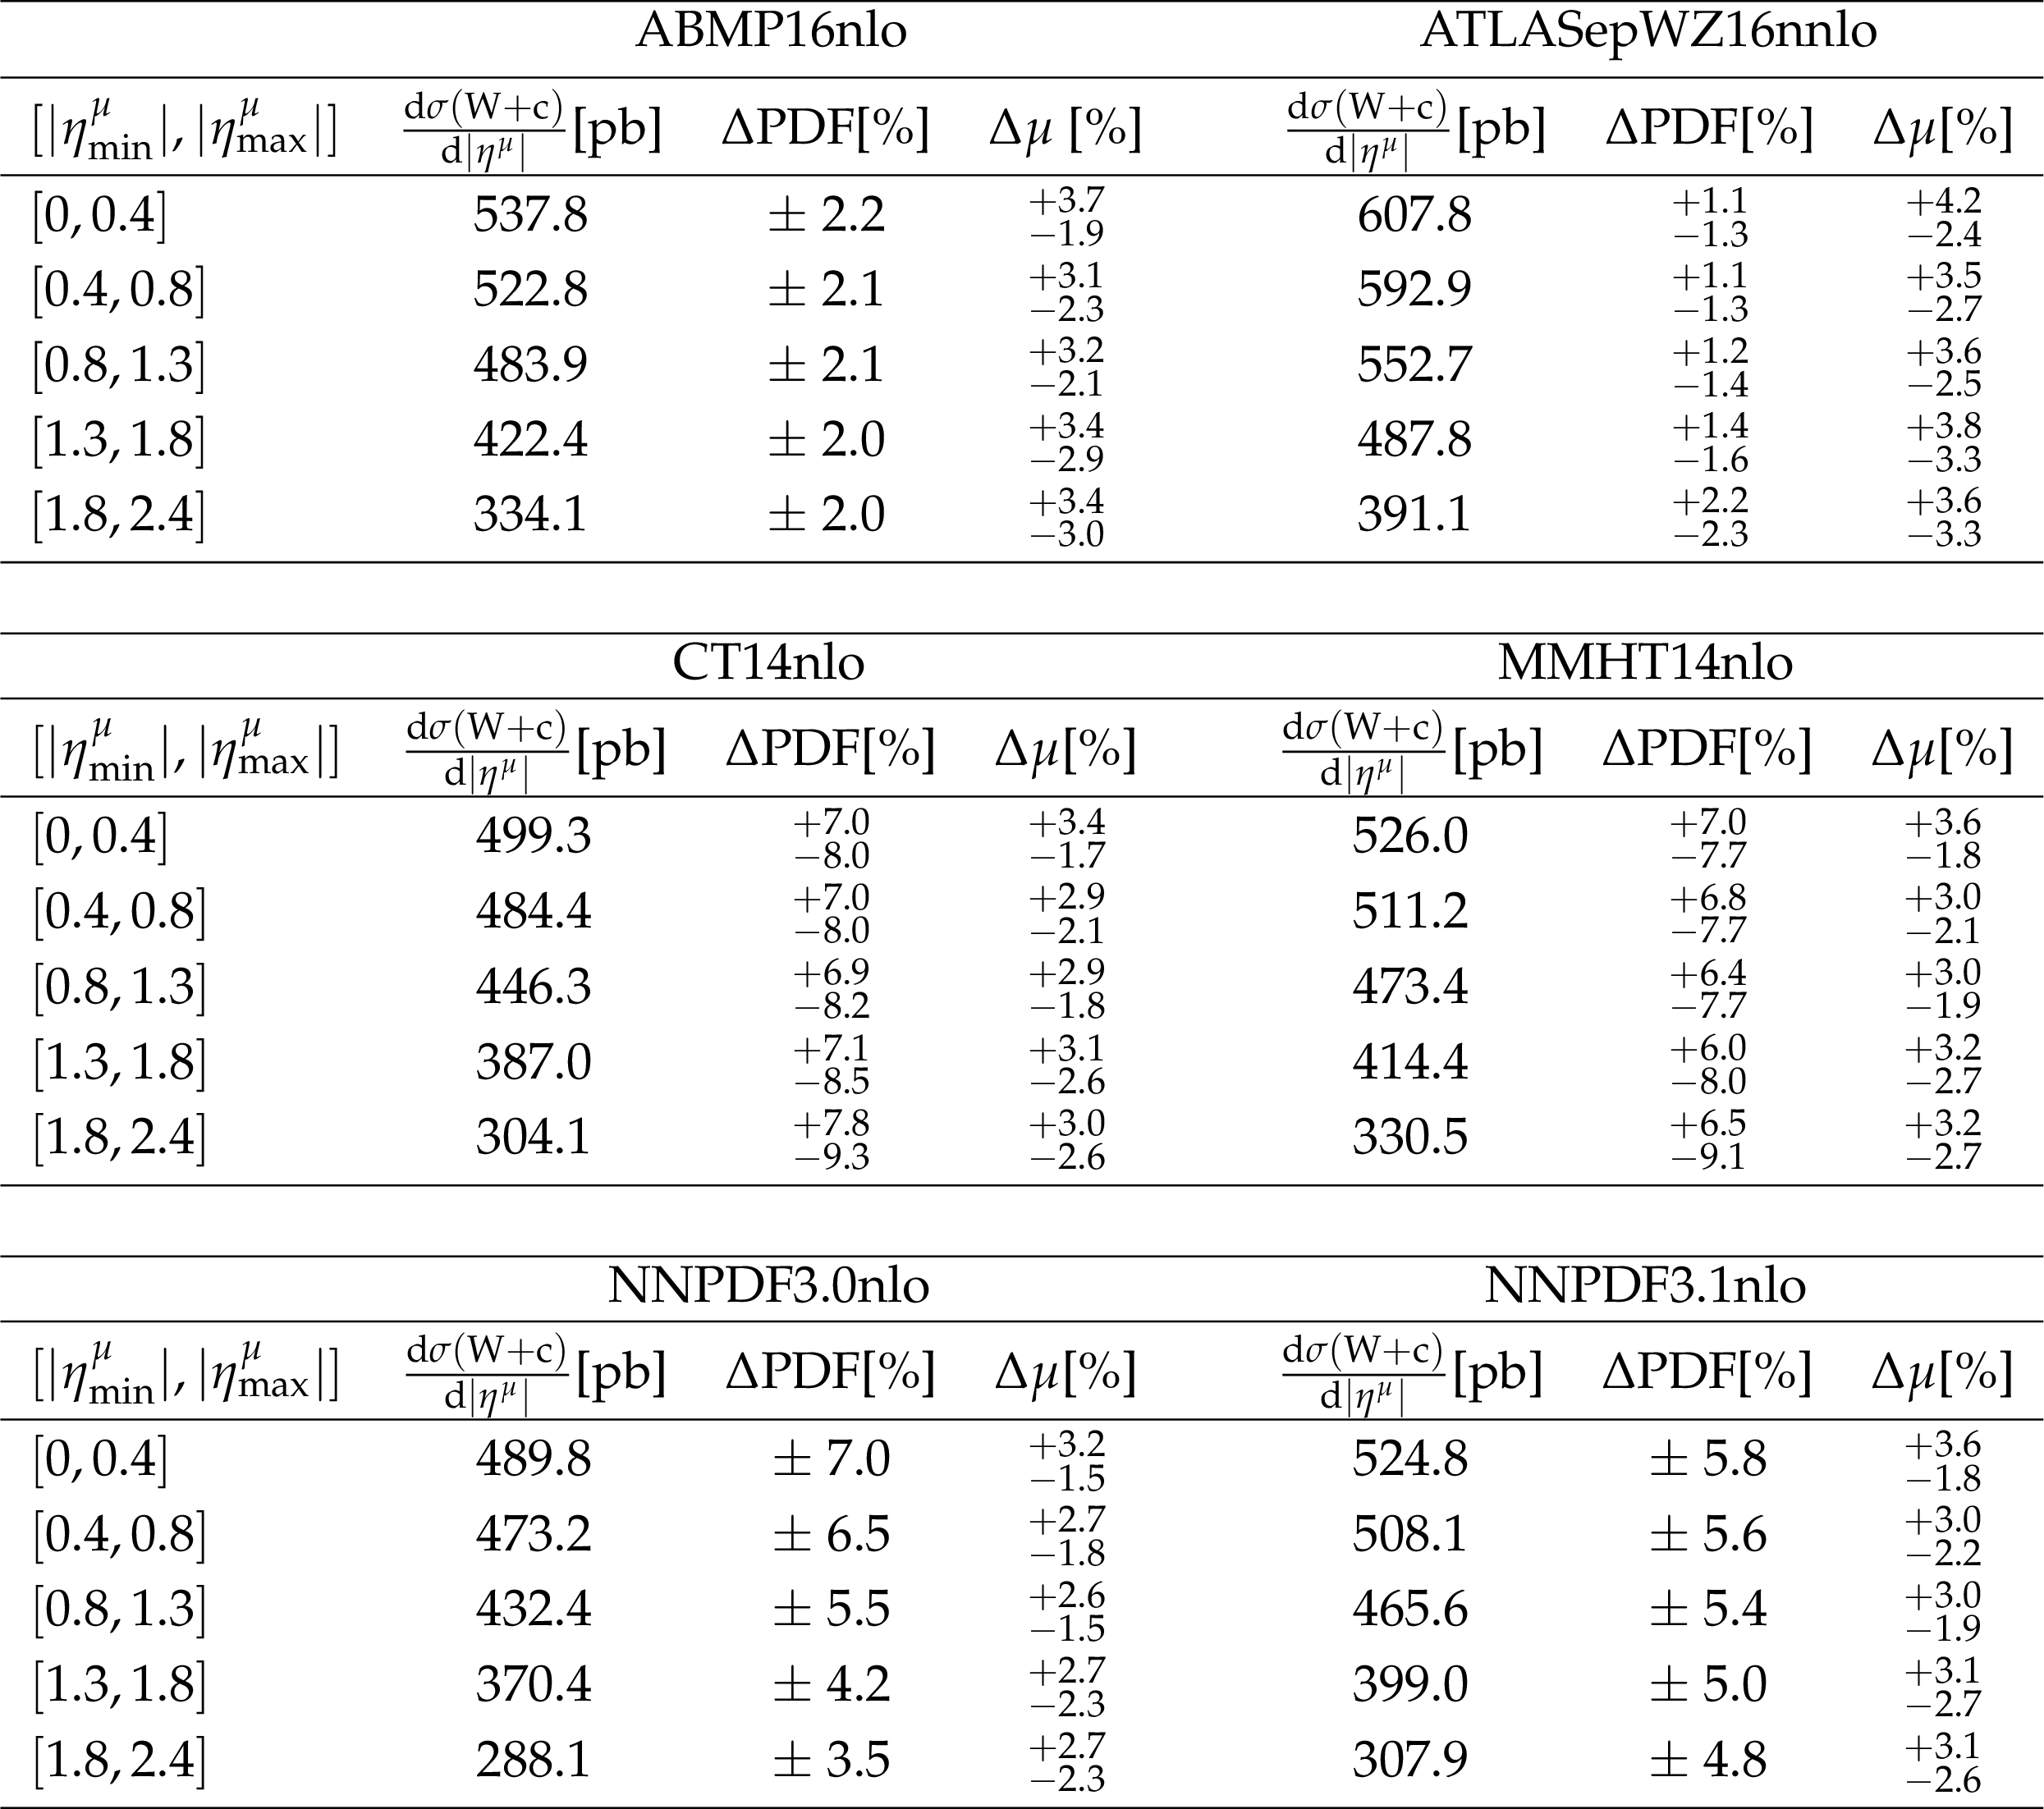
Table 5:
Theoretical predictions for $ {{\mathrm {d}} {\sigma ({{\mathrm {W}}{+} {\mathrm {c}}})}} / {{\mathrm {d}} {{| \eta ^{{\mu}} |}}} $ calculated with MCFM at NLO for different PDF sets. The relative uncertainties due to PDF and scale variations are shown. |
png pdf |
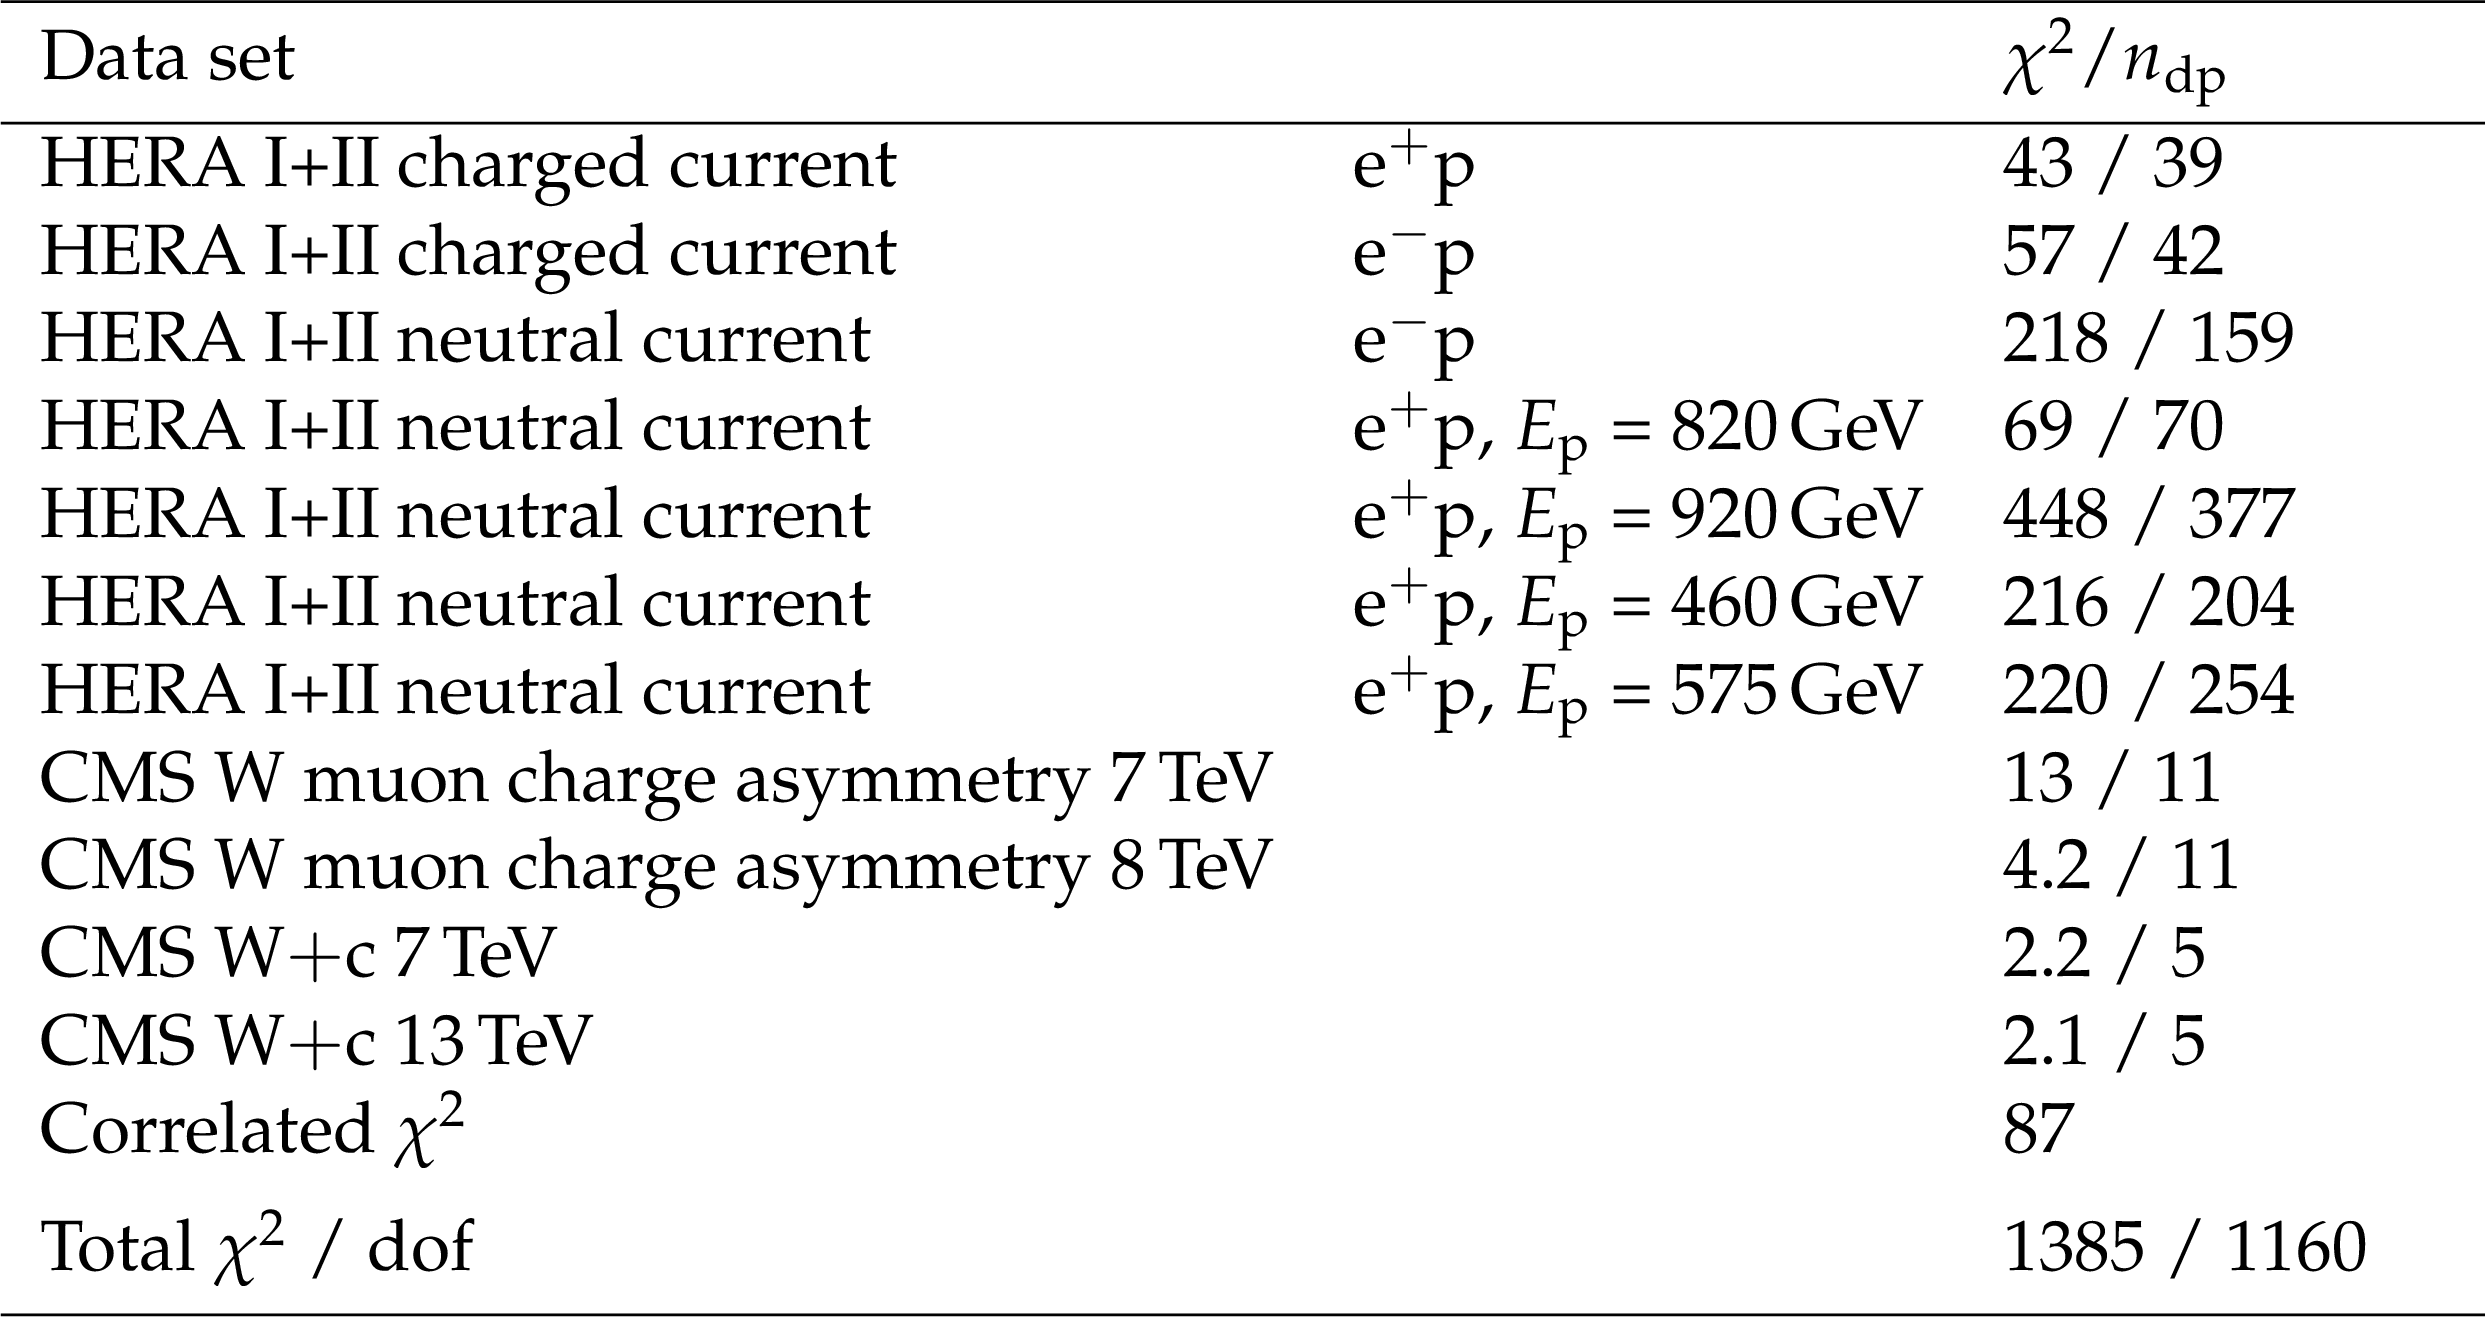
Table 6:
The partial $ {\chi ^2} $ per number of data points, $n_{\mathrm {dp}}$, and the global $ {\chi ^2} $ per number of degree of freedom, $n_{\mathrm {dof}}$, resulting from the PDF fit. |
| Summary |
|
Associated production of W bosons with charm quarks in proton-proton collisions at ${\sqrt{s}} = $ 13 TeV is measured using the data collected by the CMS experiment in 2016 and corresponding to an integrated luminosity of 35.7 fb$^{-1}$. The W boson is detected via the presence of a high-${p_{\mathrm{T}}}$ muon and missing transverse momentum, suggesting the presence of a neutrino. The charm quark is identified via the full reconstruction of the ${{{\mathrm{D}^{*}(2010)^{\pm}}}} $ meson decaying to ${\mathrm{D^0}} {\pi_{\text{slow}}^{\pm}} \to {\mathrm{K}^{\mp}} \pi^{\pm} {\pi_{\text{slow}}^{\pm}} $. Since in W+c production the W boson and the c quark have opposite charge, contributions from background processes, mainly c quark production from gluon splitting, are largely removed by subtracting the events in which the charges of the W boson and of the ${{{\mathrm{D}^{*}(2010)^{\pm}}}}$ meson have the same sign. The fiducial cross sections are measured in the kinematic range of the muon transverse momentum ${p_{\mathrm{T}}}Muon > $ 26 GeV, pseudorapidity $|{\eta^{\mu}}| < $ 2.4, and transverse momentum of the charm quark ${p_{\mathrm{T}}}^{\mathrm{c}} > $ 5 GeV. The fiducial cross section of ${\mathrm{W}{+}{{\mathrm{D}^{*}(2010)^{\pm}}}}$ production is measured in the kinematic range ${p_{\mathrm{T}}}^{\mu} > $ 26 GeV, $|{\eta^{\mu}}| < $ 2.4, transverse momentum of the ${{{\mathrm{D}^{*}(2010)^{\pm}}}}$ meson ${p_{\mathrm{T}}}^{\mathrm{D}^{*}} > $ 5 GeV and $|{\eta^{\mathrm{D}^*}}| < $ 2.4, and compared to the Monte Carlo prediction. The measurements are performed inclusively and in five bins of $|{\eta^{\mu}}| $. The obtained values for the inclusive fiducial W+c cross section and for the cross section ratio are: ${\sigma(\mathrm{W^{+}}{+}\mathrm{\bar{c}}) }/{\sigma(\mathrm{W^{-}}{+}\mathrm{c})} = $ 0.968 $\pm$ 0.055 (stat)$^{+0.015}_{-0.028}$ (syst). The measurements are in good agreement with the theoretical predictions at next-to-leading order (NLO) for different sets of parton distribution functions (PDF), except for the one using the ATLASepWZ16nnlo PDF. To illustrate the impact of these measurements in the determination of the strange quark distribution in the proton, the data is used in a QCD analysis at NLO together with inclusive DIS measurements and earlier results from CMS on W+c production and the lepton charge asymmetry in W boson production. The strange quark distribution and the strangeness suppression factor $r_{\mathrm{s}}(x,\mu_f^2)=(\mathrm{s}+\mathrm{\bar{s}})/(\mathrm{\bar{u}}+\mathrm{\bar{d}})$ are determined and agree with earlier results obtained in neutrino scattering experiments. The results do not support the hypothesis of an enhanced strange quark contribution in the proton quark sea reported by ATLAS [14]. |
| References | ||||
| 1 | ATLAS Collaboration | Measurement of the $ W $-boson mass in pp collisions at $ \sqrt{s}= $ 7 TeV with the ATLAS detector | EPJC 78 (2018) 110 | 1701.07240 |
| 2 | NuTeV Collaboration | Precise measurement of dimuon production cross-sections in muon neutrino Fe and muon anti-neutrino Fe deep inelastic scattering at the Tevatron | PRD 64 (2001) 112006 | hep-ex/0102049 |
| 3 | CCFR Collaboration | Determination of the strange quark content of the nucleon from a next-to-leading order QCD analysis of neutrino charm production | Z. Phys. C 65 (1995) 189 | hep-ex/9406007 |
| 4 | NOMAD Collaboration | A precision measurement of charm dimuon production in neutrino interactions from the NOMAD experiment | NPB 876 (2013) 339 | 1308.4750 |
| 5 | A. Kayis-Topaksu et al. | Measurement of charm production in neutrino charged-current interactions | New J. Phys. 13 (2011) 093002 | 1107.0613 |
| 6 | ATLAS Collaboration | Determination of the strange quark density of the proton from ATLAS measurements of the $ W \to \ell \nu $ and $ Z \to \ell\ell $ cross sections | PRL 109 (2012) 012001 | 1203.4051 |
| 7 | CDF Collaboration | First measurement of the production of a $ \mathrm{W} $ boson in association with a single charm quark in $ \mathrm{p} \bar{\mathrm{p}} $ collisions at $ \sqrt{s} = $ 1.96 TeV | PRL 100 (2008) 091803 | 0711.2901 |
| 8 | CDF Collaboration | Observation of the production of a W boson in association with a single charm quark | PRL 110 (2013) 071801 | 1209.1921 |
| 9 | D0 Collaboration | Measurement of the ratio of the $ {\mathrm{p}} \mathrm{\bar{p}} \to \mathrm{W} + \mathrm{c} $- jet cross section to the inclusive $ {\mathrm{p}} \mathrm{\bar{p}} \to \mathrm{W} + $ jets cross section | PLB 666 (2008) 23 | 0803.2259 |
| 10 | CMS Collaboration | Measurement of associated W+charm production in pp collisions at $ \sqrt{s} = $ 7 TeV | JHEP 02 (2014) 013 | CMS-SMP-12-002 1310.1138 |
| 11 | CMS Collaboration | Measurement of the muon charge asymmetry in inclusive $ \mathrm{pp} \to \mathrm{W}+X $ production at $ \sqrt s = $ 7 TeV and an improved determination of light parton distribution functions | PRD 90 (2014) 032004 | CMS-SMP-12-021 1312.6283 |
| 12 | ATLAS Collaboration | Measurement of the production of a $ \mathrm{W} $ boson in association with a charm quark in $ {\mathrm{p}}{\mathrm{p}} $ collisions at $ \sqrt{s} = $ 7 TeV with the ATLAS detector | JHEP 05 (2014) 068 | 1402.6263 |
| 13 | S. Alekhin et al. | Determination of strange sea quark distributions from fixed-target and collider data | PRD 91 (2015) 094002 | 1404.6469 |
| 14 | ATLAS Collaboration | Precision measurement and interpretation of inclusive $ W^+ $ , $ W^- $ and $ Z/\gamma ^* $ production cross sections with the ATLAS detector | EPJC 77 (2017) 367 | 1612.03016 |
| 15 | S. Alekhin, J. Blumlein, and S. Moch | Strange sea determination from collider data | PLB 777 (2018) 134 | 1708.01067 |
| 16 | J. M. Campbell and R. K. Ellis | An update on vector boson pair production at hadron colliders | PRD 60 (1999) 113006 | hep-ph/9905386 |
| 17 | J. M. Campbell and R. K. Ellis | MCFM for the Tevatron and the LHC | NPPS 205-206 (2010) 10 | 1007.3492 |
| 18 | J. M. Campbell and R. K. Ellis | Top quark processes at NLO in production and decay | JPG 42 (2015) 015005 | 1204.1513 |
| 19 | CMS Collaboration | Description and performance of track and primary vertex reconstruction with the CMS tracker | JINST 9 (2014) P10009 | CMS-TRK-11-001 1405.6569 |
| 20 | M. Cacciari, G. P. Salam, and G. Soyez | The anti-$ {k_{\mathrm{T}}} $ jet clustering algorithm | JHEP 04 (2008) 063 | 0802.1189 |
| 21 | M. Cacciari, G. P. Salam, and G. Soyez | FastJet user manual | EPJC 72 (2012) 1896 | 1111.6097 |
| 22 | CMS Collaboration | Performance of the CMS muon detector and muon reconstruction with proton-proton collisions at $ \sqrt{s}= $ 13 TeV | JINST 13 (2018) P06015 | CMS-MUO-16-001 1804.04528 |
| 23 | CMS Collaboration | The CMS experiment at the CERN LHC | JINST 3 (2008) S08004 | CMS-00-001 |
| 24 | CMS Collaboration | The CMS trigger system | JINST 12 (2017) P01020 | CMS-TRG-12-001 1609.02366 |
| 25 | CMS Collaboration | Particle-flow reconstruction and global event description with the CMS detector | JINST 12 (2017) P10003 | CMS-PRF-14-001 1706.04965 |
| 26 | GEANT4 Collaboration | GEANT4--a simulation toolkit | NIMA 506 (2003) 250 | |
| 27 | J. Alwall et al. | The automated computation of tree-level and next-to-leading order differential cross sections, and their matching to parton shower simulations | JHEP 07 (2014) 079 | 1405.0301 |
| 28 | T. Sjostrand, S. Mrenna, and P. Z. Skands | A brief introduction to PYTHIA 8.1 | CPC 178 (2008) 852 | 0710.3820 |
| 29 | R. Frederix and S. Frixione | Merging meets matching in MC@NLO | JHEP 12 (2012) 061 | 1209.6215 |
| 30 | NNPDF Collaboration | Parton distributions for the LHC Run II | JHEP 04 (2015) 040 | 1410.8849 |
| 31 | J. M. Campbell, R. K. Ellis, P. Nason, and E. Re | Top-pair production and decay at NLO matched with parton showers | JHEP 04 (2015) 114 | 1412.1828 |
| 32 | R. Frederix, E. Re, and P. Torrielli | Single-top $ t $-channel hadroproduction in the four-flavour scheme with POWHEG and aMC@NLO | JHEP 09 (2012) 130 | 1207.5391 |
| 33 | S. Alioli, P. Nason, C. Oleari, and E. Re | NLO single-top production matched with shower in POWHEG: $ s $- and $ t $-channel contributions | JHEP 09 (2009) 111 | 0907.4076 |
| 34 | E. Re | Single-top Wt-channel production matched with parton showers using the POWHEG method | EPJC 71 (2011) 1547 | 1009.2450 |
| 35 | CMS Collaboration | Event generator tunes obtained from underlying event and multiparton scattering measurements | EPJC 76 (2016) 155 | CMS-GEN-14-001 1512.00815 |
| 36 | CMS Collaboration | Investigations of the impact of the parton shower tuning in Pythia 8 in the modelling of $ \mathrm{t\overline{t}} $ at $ \sqrt{s}= $ 8 and 13 TeV | CMS-PAS-TOP-16-021 | CMS-PAS-TOP-16-021 |
| 37 | A. Buckley et al. | Rivet user manual | CPC 184 (2013) 2803 | 1003.0694 |
| 38 | Particle Data Group, M. Tanabashi et al. | Review of particle physics | PRD 98 (2018) 030001 | |
| 39 | G. J. Feldman et al. | Observation of the decay $ D^{*+} \to D^0 \pi^+ $ | PRL 38 (1977) 1313 | |
| 40 | R. Fruhwirth, W. Waltenberger, and P. Vanlaer | Adaptive vertex fitting | CMS-NOTE-2007-008 | |
| 41 | M. Lisovyi, A. Verbytskyi, and O. Zenaiev | Combined analysis of charm-quark fragmentation-fraction measurements | EPJC 76 (2016) 397 | 1509.01061 |
| 42 | CMS Collaboration | CMS luminosity measurements for the 2016 data taking Period | CMS-PAS-LUM-17-001 | CMS-PAS-LUM-17-001 |
| 43 | CMS Collaboration | Measurement of tracking efficiency | CMS-PAS-TRK-10-002 | |
| 44 | M. J. Oreglia | A study of the reactions $\psi' \to \gamma\gamma \psi$ | PhD thesis, Stanford University, 1980 SLAC Report SLAC-R-236, see A | |
| 45 | CMS Collaboration | Performance of missing energy reconstruction in 13 TeV pp collision data using the CMS detector | CMS-PAS-JME-16-004 | CMS-PAS-JME-16-004 |
| 46 | H1 Collaboration | Study of charm fragmentation into D$ ^{*\pm} $ mesons in deep-inelastic scattering at HERA | EPJC 59 (2009) 589 | 0808.1003 |
| 47 | M. G. Bowler | e$ ^+ $e$ ^- $ Production of heavy quarks in the string model | Z. Phys. C 11 (1981) 169 | |
| 48 | B. Andersson, G. Gustafson, G. Ingelman, and T. Sjostrand | Parton fragmentation and string dynamics | PR 97 (1983) 31 | |
| 49 | S. Alekhin, J. Blumlein, and S. Moch | NLO PDFs from the ABMP16 fit | EPJC 78 (2018) 477 | 1803.07537 |
| 50 | S. Dulat et al. | New parton distribution functions from a global analysis of quantum chromodynamics | PRD 93 (2016) 033006 | 1506.07443 |
| 51 | L. A. Harland-Lang, A. D. Martin, P. Motylinski, and R. S. Thorne | Parton distributions in the LHC era: MMHT 2014 PDFs | EPJC 75 (2015) 204 | 1412.3989 |
| 52 | NNPDF Collaboration | Parton distributions from high-precision collider data | EPJC 77 (2017) 663 | 1706.00428 |
| 53 | S. Alekhin, J. Blumlein, S. Moch, and R. Pla\v cakyt\. e | Parton distribution functions, $ \alpha_s $, and heavy-quark masses for LHC Run II | PRD 96 (2017) 014011 | 1701.05838 |
| 54 | S. Alekhin, J. Blumlein, S. Moch, and R. Pla\v cakyt\. e | Isospin asymmetry of quark distributions and implications for single top-quark production at the LHC | PRD 94 (2016) 114038 | 1508.07923 |
| 55 | H1 and ZEUS Collaborations | Combined measurement and QCD analysis of the inclusive $ \mathrm{e}^\pm {\mathrm{p}} $ scattering cross sections at HERA | JHEP 01 (2010) 109 | 0911.0884 |
| 56 | H1 and ZEUS Collaborations | Combination of measurements of inclusive deep inelastic $ {\mathrm{e}^{\pm}{\mathrm{p}}} $ scattering cross sections and QCD analysis of HERA data | EPJC 75 (2015) 580 | 1506.06042 |
| 57 | CMS Collaboration | Measurement of the differential cross section and charge asymmetry for inclusive $ \mathrm {p}\mathrm {p}\rightarrow \mathrm {W}^{\pm}+X $ production at $ {\sqrt{s}} = $ 8 TeV | EPJC 76 (2016) 469 | CMS-SMP-14-022 1603.01803 |
| 58 | T. Carli et al. | A posteriori inclusion of parton density functions in NLO QCD final-state calculations at hadron colliders: the APPLGRID project | EPJC 66 (2010) 503 | 0911.2985 |
| 59 | S. Alekhin et al. | HERAFitter | EPJC 75 (2015) 304 | 1410.4412 |
| 60 | xFitter Collaboration | xFitter | web site | |
| 61 | V. N. Gribov and L. N. Lipatov | Deep inelastic $ \mathrm{e} $-$ {\mathrm{p}} $ scattering in perturbation theory | Sov. J. NP 15 (1972)438 | |
| 62 | G. Altarelli and G. Parisi | Asymptotic freedom in parton language | NPB 126 (1977) 298 | |
| 63 | G. Curci, W. Furmanski, and R. Petronzio | Evolution of parton densities beyond leading order: the nonsinglet case | NPB 175 (1980) 27 | |
| 64 | W. Furmanski and R. Petronzio | Singlet parton densities beyond leading order | PLB 97 (1980) 437 | |
| 65 | S. Moch, J. A. M. Vermaseren, and A. Vogt | The three-loop splitting functions in QCD: the non-singlet case | NPB 688 (2004) 101 | hep-ph/0403192 |
| 66 | A. Vogt, S. Moch, and J. A. M. Vermaseren | The three-loop splitting functions in QCD: the singlet case | NPB 691 (2004) 129 | hep-ph/0404111 |
| 67 | M. Botje | QCDNUM: fast QCD evolution and convolution | CPC 182 (2011) 490 | 1005.1481 |
| 68 | R. S. Thorne | Variable-flavor number scheme for NNLO | PRD 73 (2006) 054019 | hep-ph/0601245 |
| 69 | A. D. Martin, W. J. Stirling, R. S. Thorne, and G. Watt | Parton distributions for the LHC | EPJC 63 (2009) 189 | 0901.0002 |
| 70 | J. Pumplin et al. | Uncertainties of predictions from parton distribution functions. II. The Hessian method | PRD 65 (2001) 014013 | hep-ph/0101032 |
| 71 | W. T. Giele and S. Keller | Implications of hadron collider observables on parton distribution function uncertainties | PRD 58 (1998) 094023 | hep-ph/9803393 |
| 72 | W. T. Giele, S. A. Keller, and D. A. Kosower | Parton distribution function uncertainties | hep-ph/0104052 | |
|
|
Compact Muon Solenoid LHC, CERN |
|

|

|

|

|

|