

Compact Muon Solenoid
LHC, CERN
| CMS-SUS-14-006 ; CERN-EP-2016-103 | ||
| Search for top squark pair production in compressed-mass-spectrum scenarios in proton-proton collisions at $ \sqrt{s} = $ 8 TeV using the ${\alpha_\mathrm{T}} $ variable | ||
| CMS Collaboration | ||
| 29 May 2016 | ||
| Phys. Lett. B 767 (2017) 403 | ||
| Abstract: An inclusive search is performed for supersymmetry in final states containing jets and an apparent imbalance in transverse momentum, $ \vec{p}_{\mathrm{T}}^{\text{miss}} $, due to the production of unobserved weakly interacting particles in pp collisions at a centre-of-mass energy of 8 TeV. The data, recorded with the CMS detector at the CERN LHC, correspond to an integrated luminosity of 18.5 fb$^{-1}$. The dimensionless kinematic variable $ {\alpha_\mathrm{T}} $ is used to discriminate between events with genuine $ \vec{p}_{\mathrm{T}}^{\text{miss}} $ associated with unobserved particles and spurious values of $ \vec{p}_{\mathrm{T}}^{\text{miss}} $ arising from jet energy mismeasurements. No excess of event yields above the expected standard model backgrounds is observed. The results are interpreted in terms of constraints on the parameter space of several simplified models of supersymmetry that assume the pair production of top squarks. The search provides sensitivity to a broad range of top squark ($\tilde{ \mathrm{ t } }$) decay modes, including the two-body decay $\tilde{ \mathrm{ t } } \to \mathrm{ c } \tilde{\chi}^0_1$, where c is a charm quark and $\tilde{\chi}^0_1$ is the lightest neutralino, as well as the four-body decay $\tilde{ \mathrm{ t } } \to \mathrm{ b } \mathrm{ f \bar{f}' } \tilde{\chi}^0_1$, where b is a bottom quark and $ \mathrm{f} $ and $\mathrm{ \bar{f} }'$ are fermions produced in the decay of an intermediate off-shell W boson. These modes dominate in scenarios in which the top squark and lightest neutralino are nearly degenerate in mass. For these modes, top squarks with masses as large as 260 and 225 GeV are excluded, respectively, for the two- and four-body decays. | ||
| Links: e-print arXiv:1605.08993 [hep-ex] (PDF) ; CDS record ; inSPIRE record ; CADI line (restricted) ; | ||
| Figures & Tables | Summary | Additional Figures & Tables | References | CMS Publications |
|---|
|
The result of the search, in .csv format, is available here. An implementation of the calculation of the alphaT variable in C++ is available at this link: code. |
| Figures | |

png pdf |
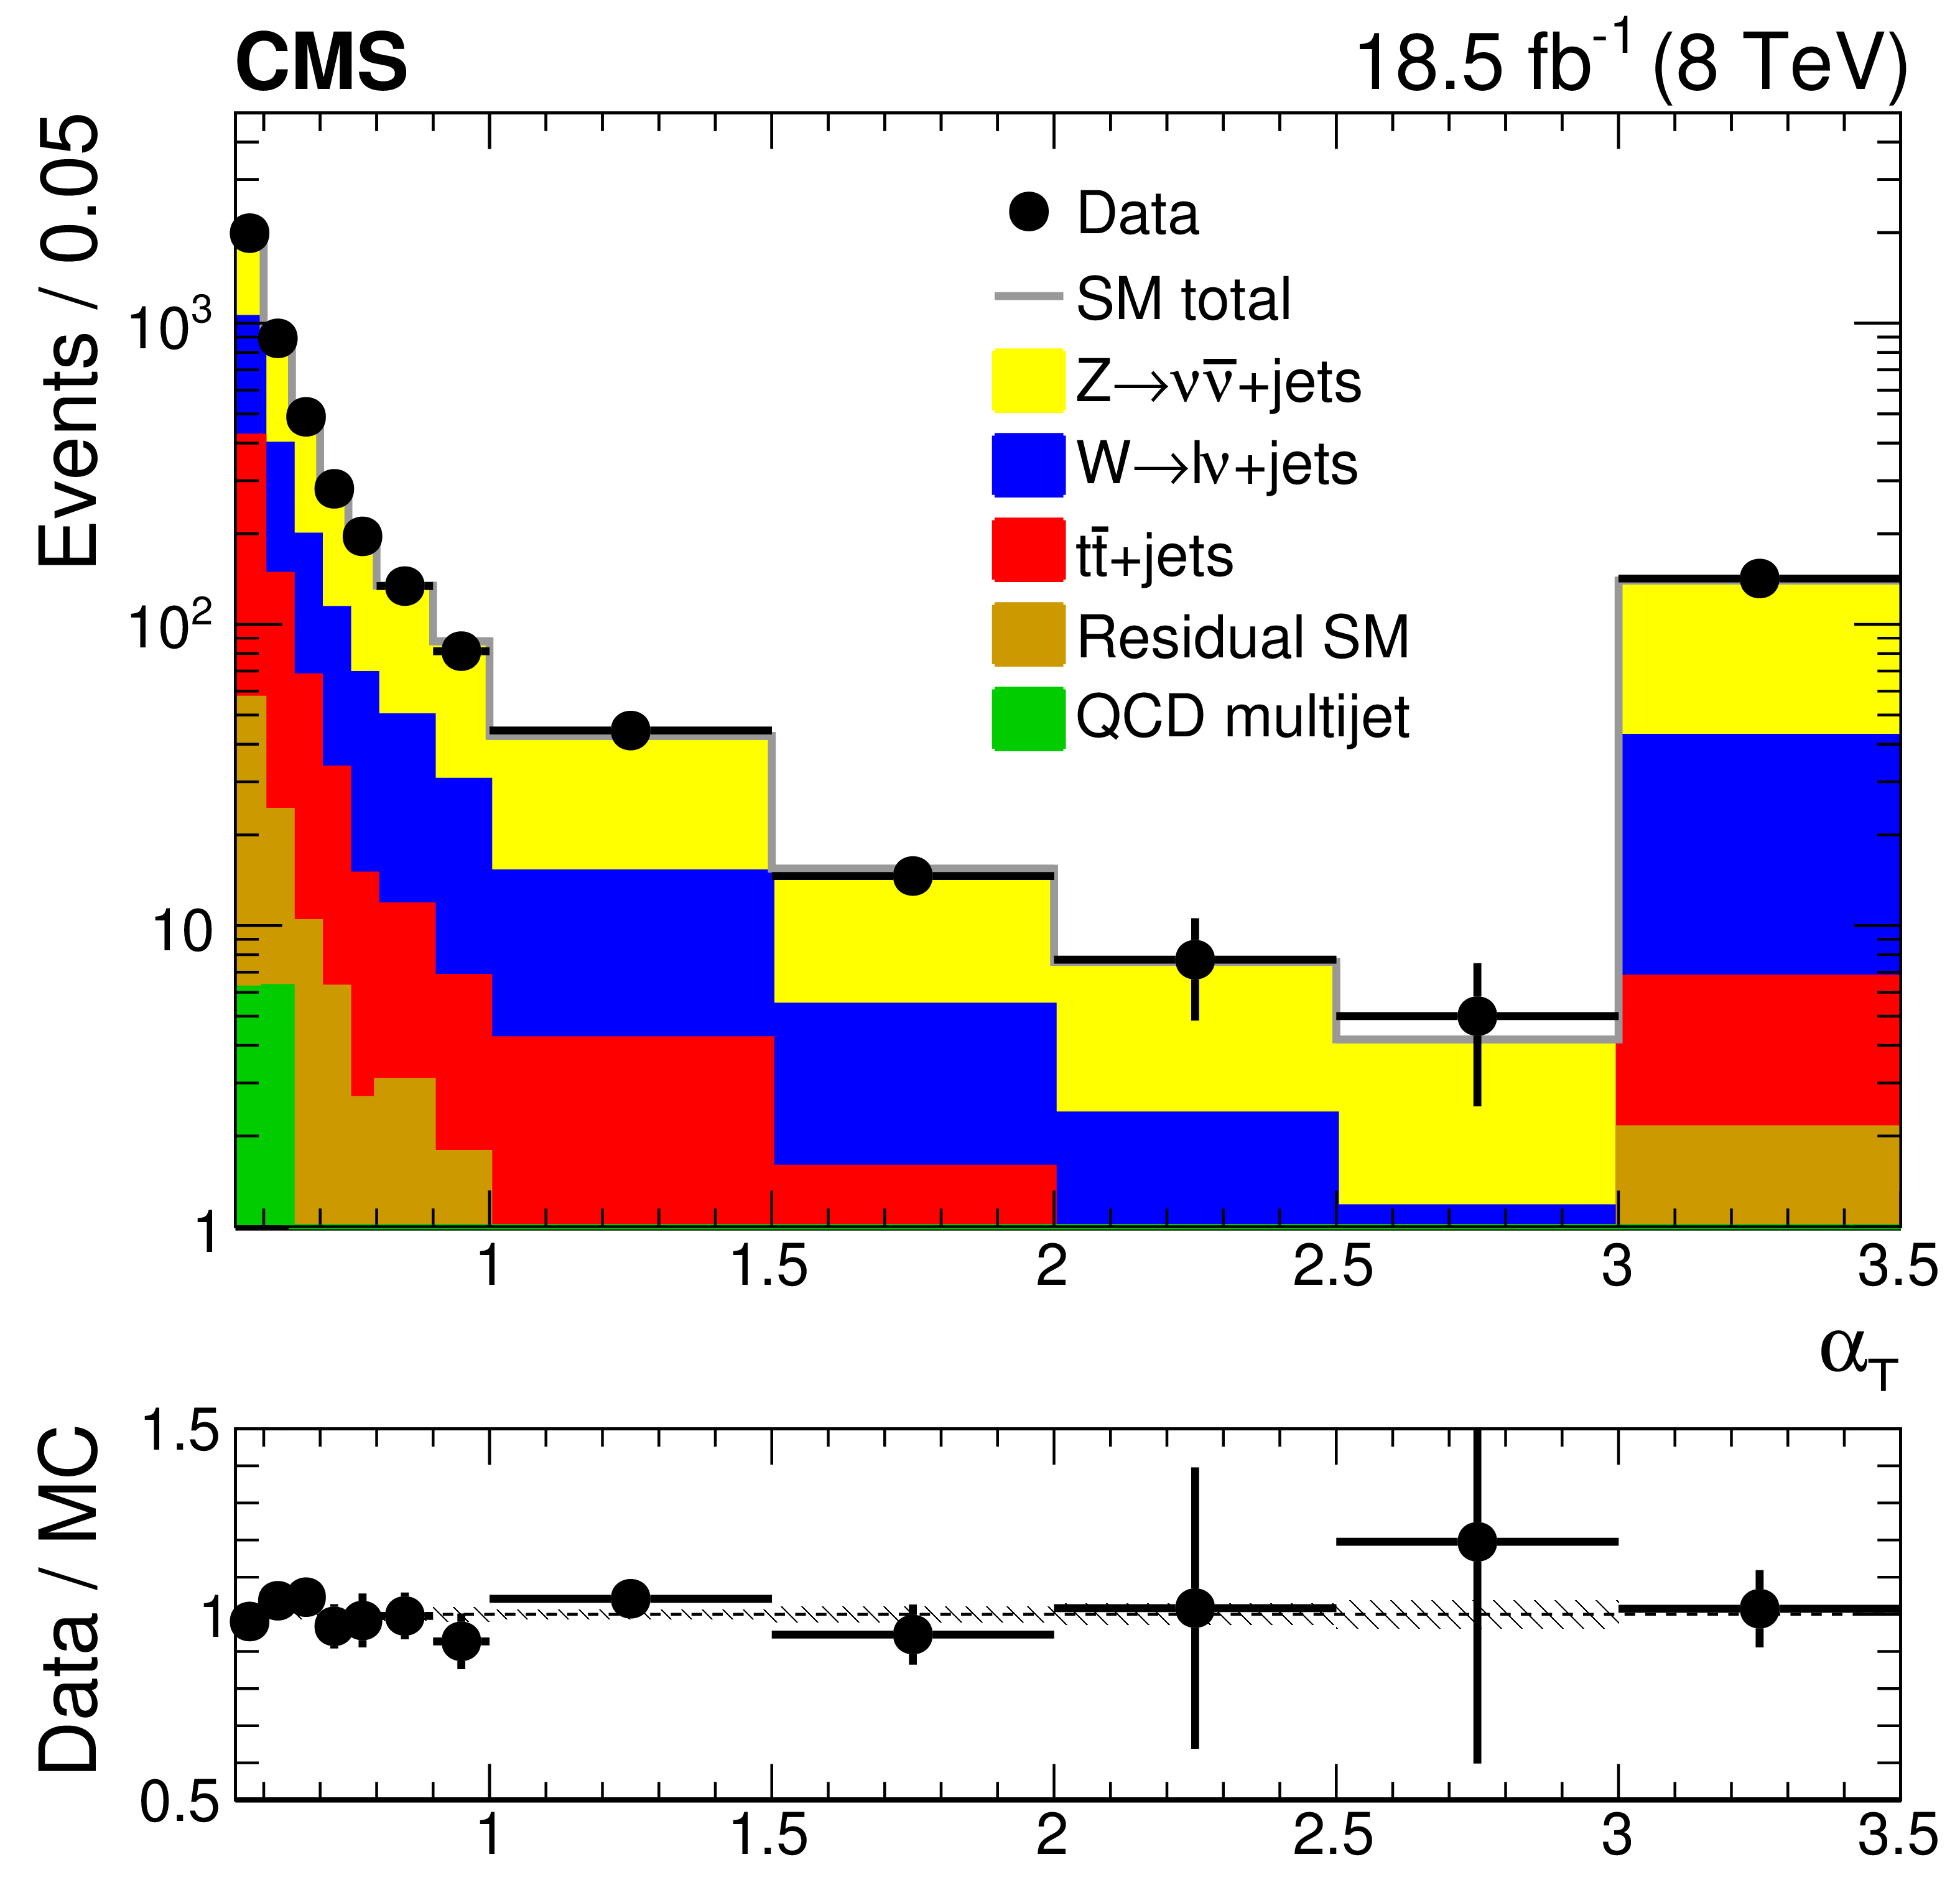
Figure 1:
The $ {\alpha _\mathrm {T}} $ distribution observed in data for event samples that are recorded with an inclusive set of trigger conditions and satisfy (left) the selection criteria that define the $\mu$+jets control region or (right) the criteria that define the signal region, with the additional requirement $ {H_\text {T}} > $ 375 GeV. Event yields observed in data (solid circles) and SM expectations determined from simulation (solid histograms) are shown. Contributions from single top quark, diboson, Drell-Yan, and $ {\mathrm{ t } {}\mathrm{ \bar{t} } } $ + gauge boson production are collectively labelled "Residual SM''. The final bin contains the overflow events. The lower panels show the ratios of the binned yields obtained from data and Monte Carlo (MC) simulation as a function of $\alpha _\text {T}$. The statistical uncertainties in the SM expectations are represented by the hatched areas. |

png pdf |
Figure 1-a:
The $ {\alpha _\mathrm {T}} $ distribution observed in data for event samples that are recorded with an inclusive set of trigger conditions and satisfy the selection criteria that define the $\mu$+jets control region. Event yields observed in data (solid circles) and SM expectations determined from simulation (solid histograms) are shown. Contributions from single top quark, diboson, Drell-Yan, and $ {\mathrm{ t } {}\mathrm{ \bar{t} } } $ + gauge boson production are collectively labelled "Residual SM''. The final bin contains the overflow events. The lower panel shows the ratios of the binned yields obtained from data and Monte Carlo (MC) simulation as a function of $\alpha _\text {T}$. The statistical uncertainties in the SM expectations are represented by the hatched areas. |
png pdf |
Figure 1-b:
The $ {\alpha _\mathrm {T}} $ distribution observed in data for event samples that are recorded with an inclusive set of trigger conditions and satisfy the criteria that define the signal region, with the additional requirement $ {H_\text {T}} > $ 375 GeV . Event yields observed in data (solid circles) and SM expectations determined from simulation (solid histograms) are shown. Contributions from single top quark, diboson, Drell-Yan, and $ {\mathrm{ t } {}\mathrm{ \bar{t} } } $ + gauge boson production are collectively labelled "Residual SM''. The final bin contains the overflow events. The lower panel shows the ratios of the binned yields obtained from data and Monte Carlo (MC) simulation as a function of $\alpha _\text {T}$. The statistical uncertainties in the SM expectations are represented by the hatched areas. |
png pdf |
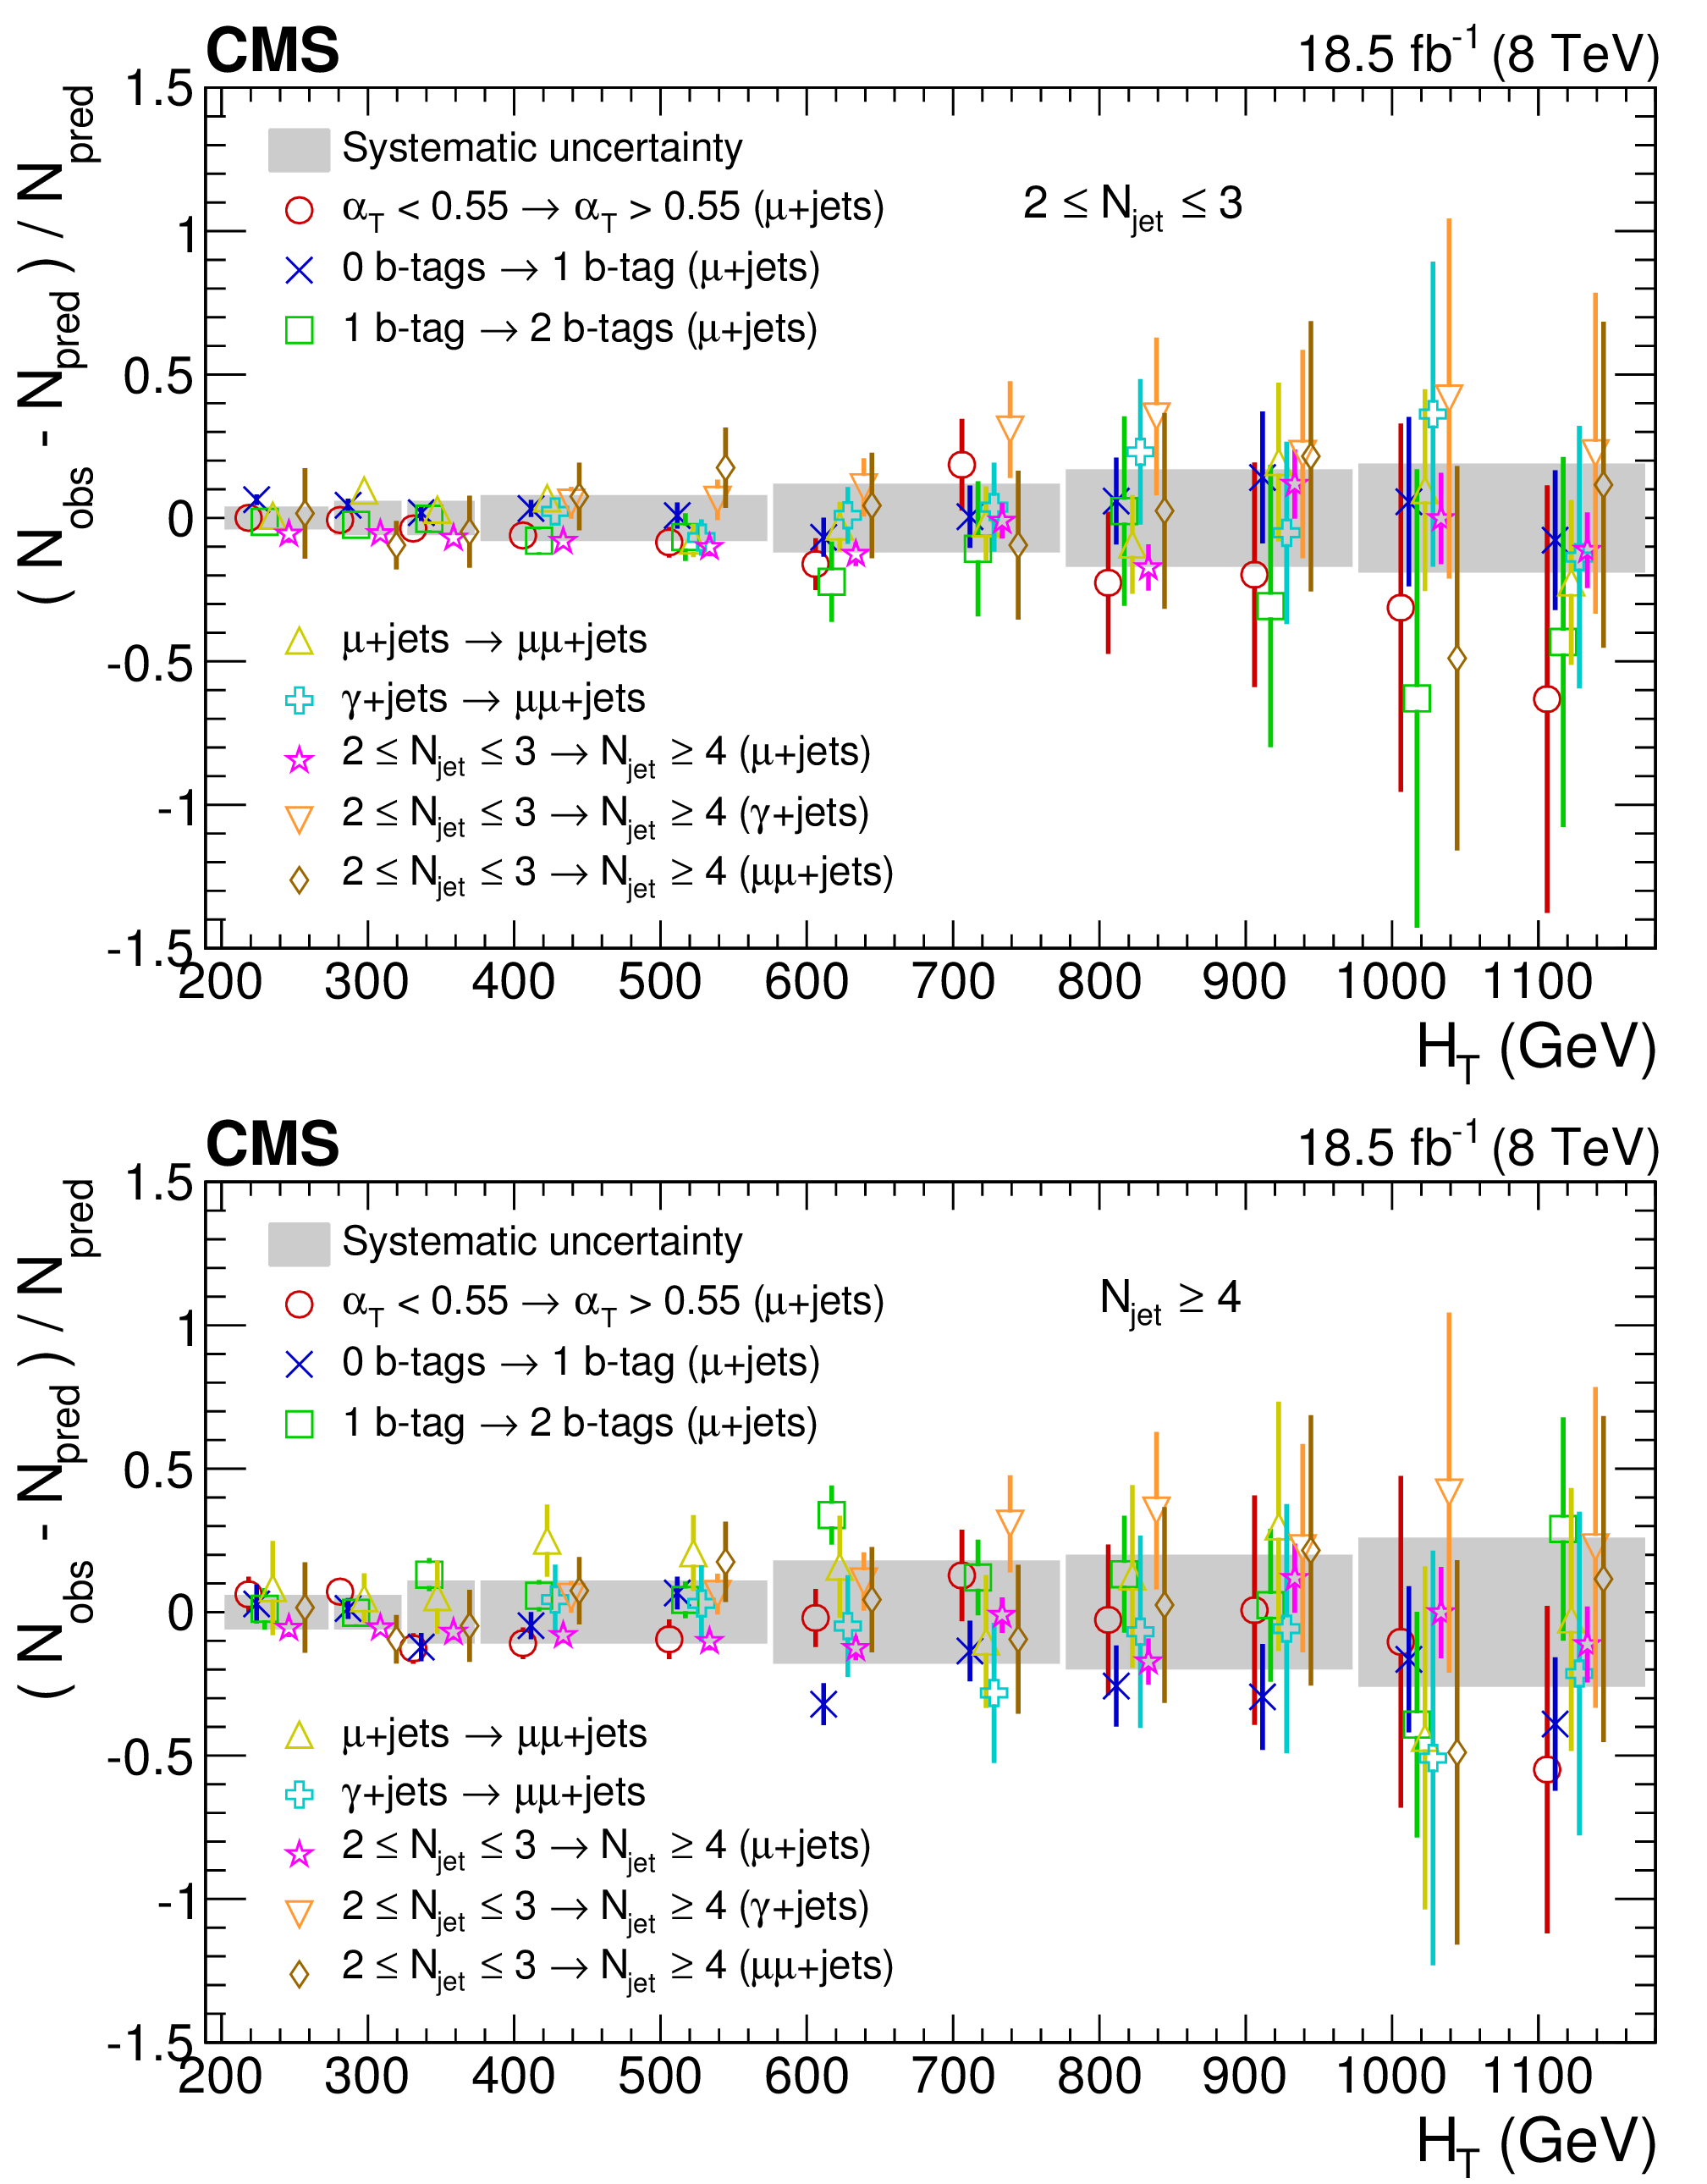
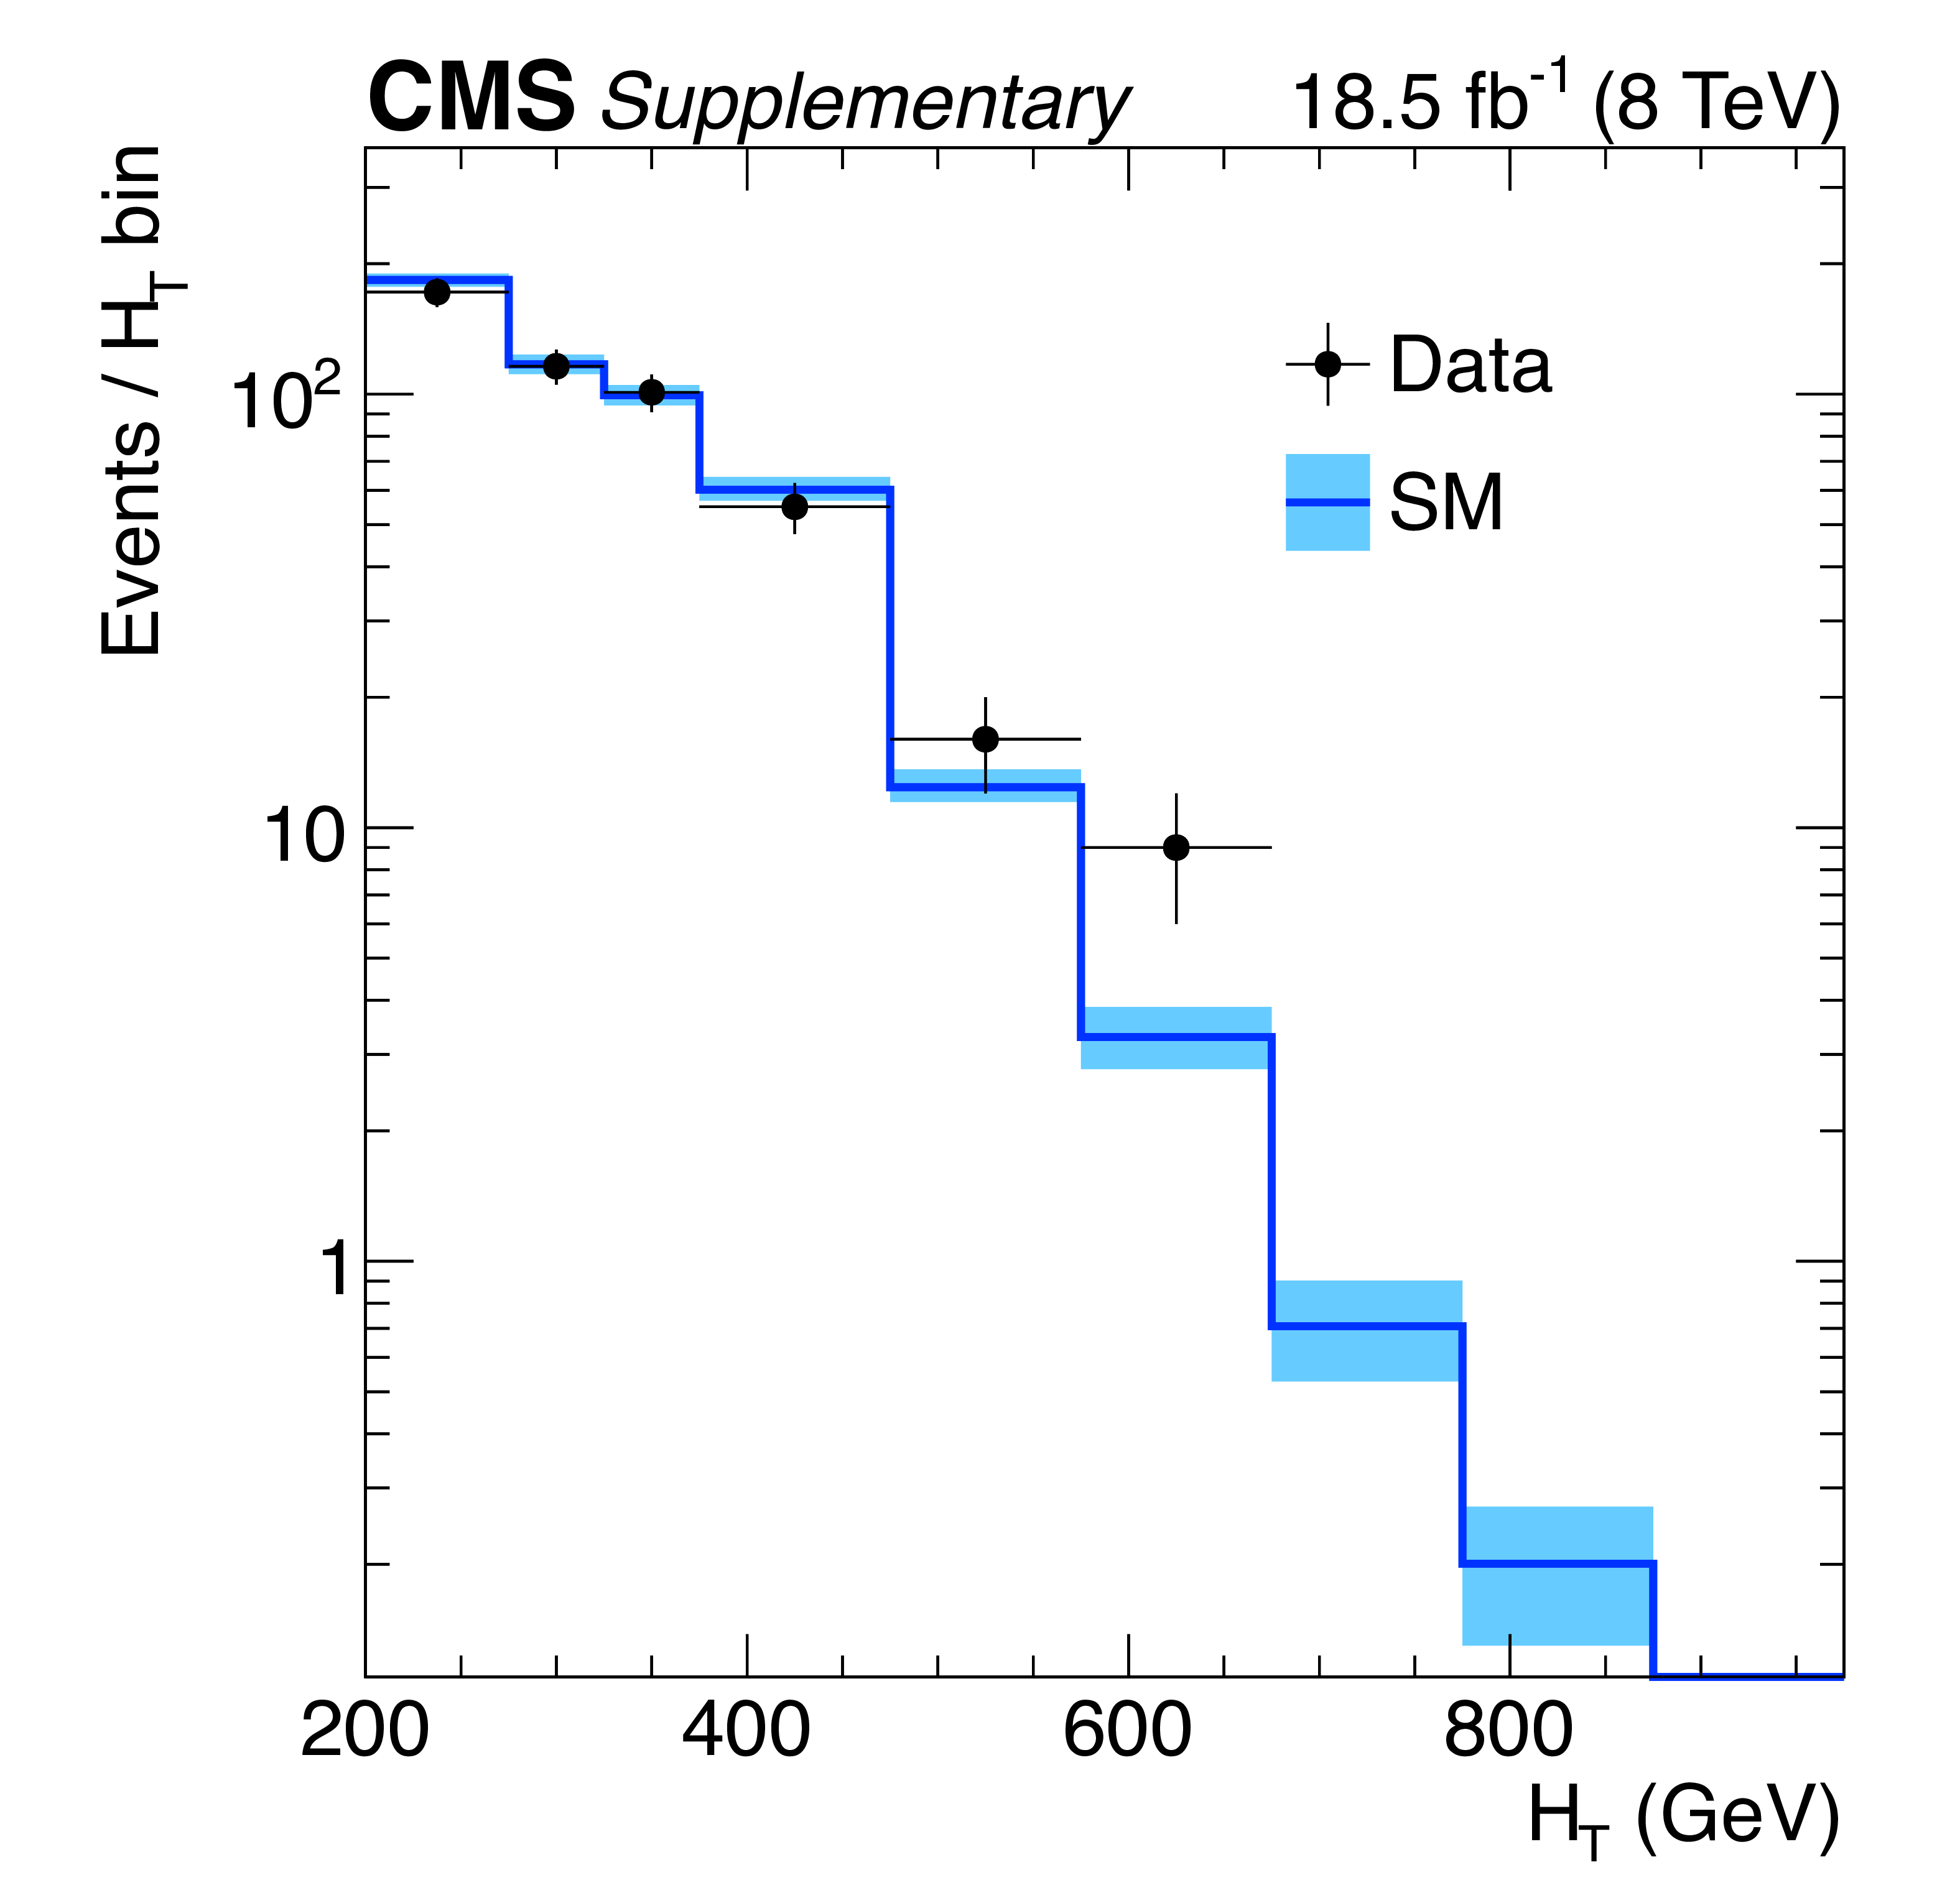
Figure 2:
Ratio $(N_\text {obs} - N_\text {pred})/N_\text {pred}$ as a function of $ {H_\text {T}} $ for different event categories and/or control regions for (upper) events with two or three jets, and (lower) events with four or more jets; "b tag'' refers to a reconstructed b quark candidate. Error bars represent statistical uncertainties only, while the grey shaded bands represent the $ {N_{\text {jet}}} $ - and $ {H_\text {T}} $ -dependent uncertainties assumed in the transfer factors, as determined from the procedure described in the text. |
png pdf |
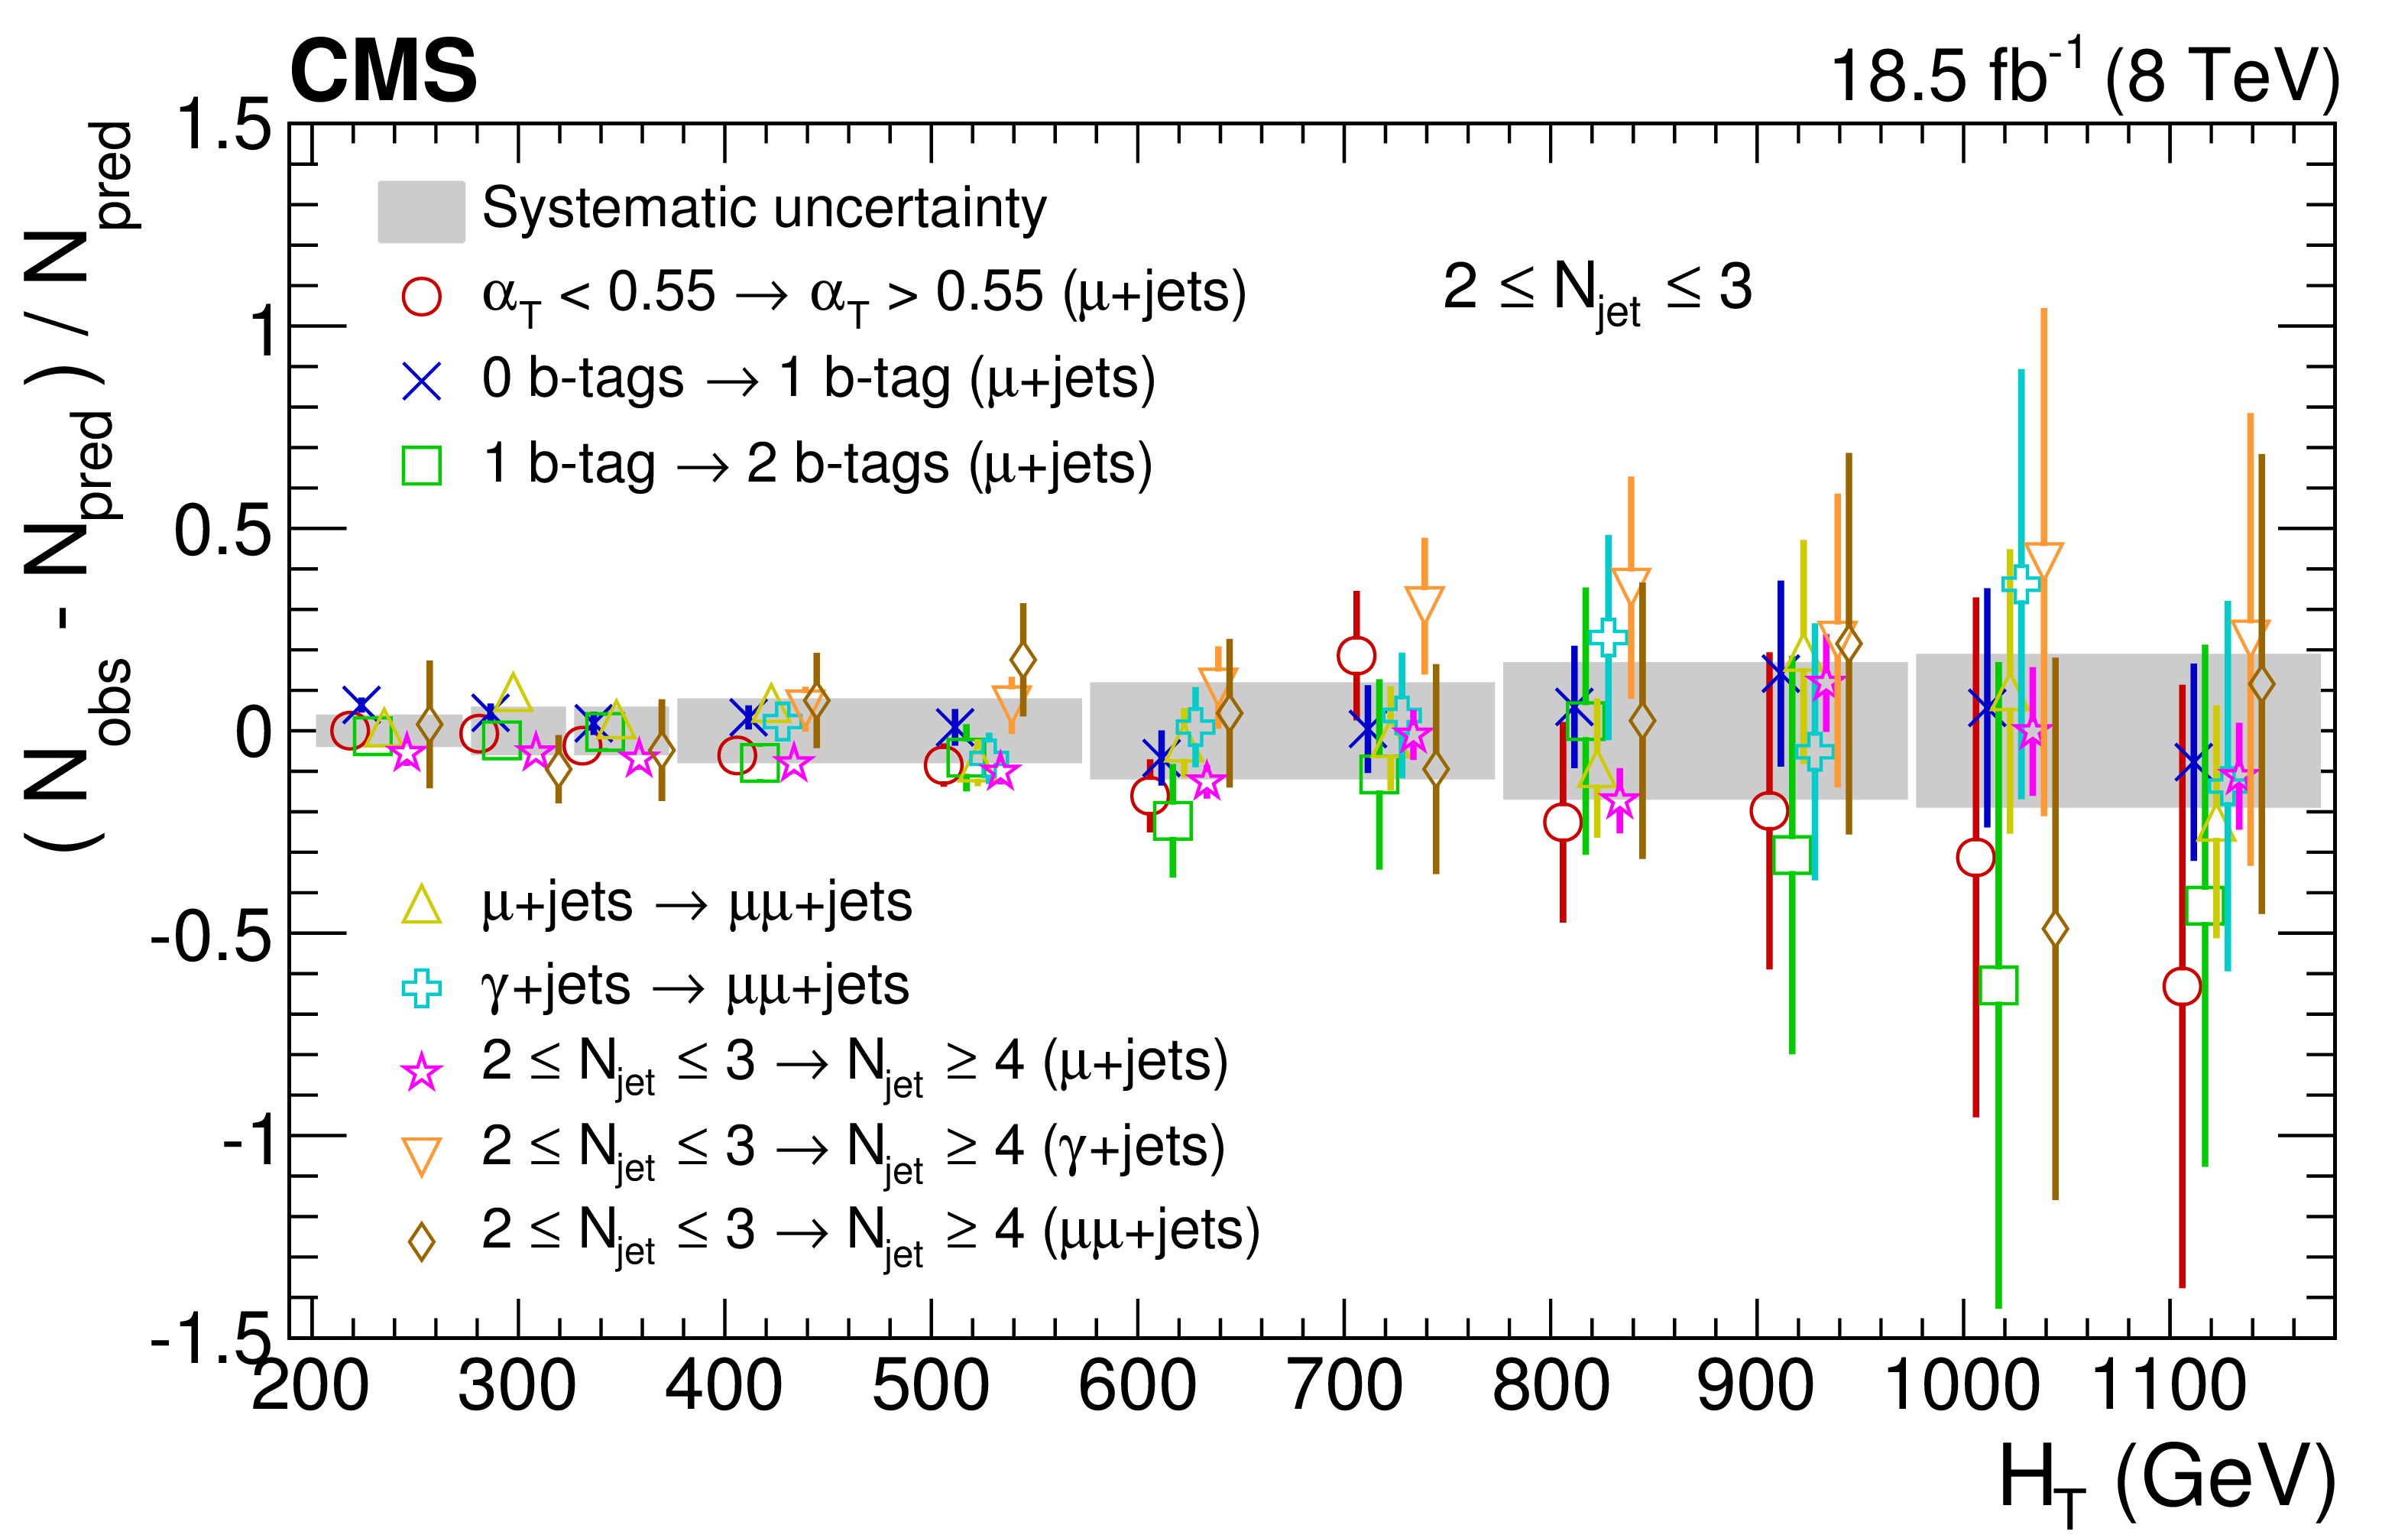
Figure 2-a:
Ratio $(N_\text {obs} - N_\text {pred})/N_\text {pred}$ as a function of $ {H_\text {T}} $ for different event categories and/or control regions for events with two or three jets; "b tag'' refers to a reconstructed b quark candidate. Error bars represent statistical uncertainties only, while the grey shaded bands represent the $ {N_{\text {jet}}} $ - and $ {H_\text {T}} $ -dependent uncertainties assumed in the transfer factors, as determined from the procedure described in the text. |
png pdf |
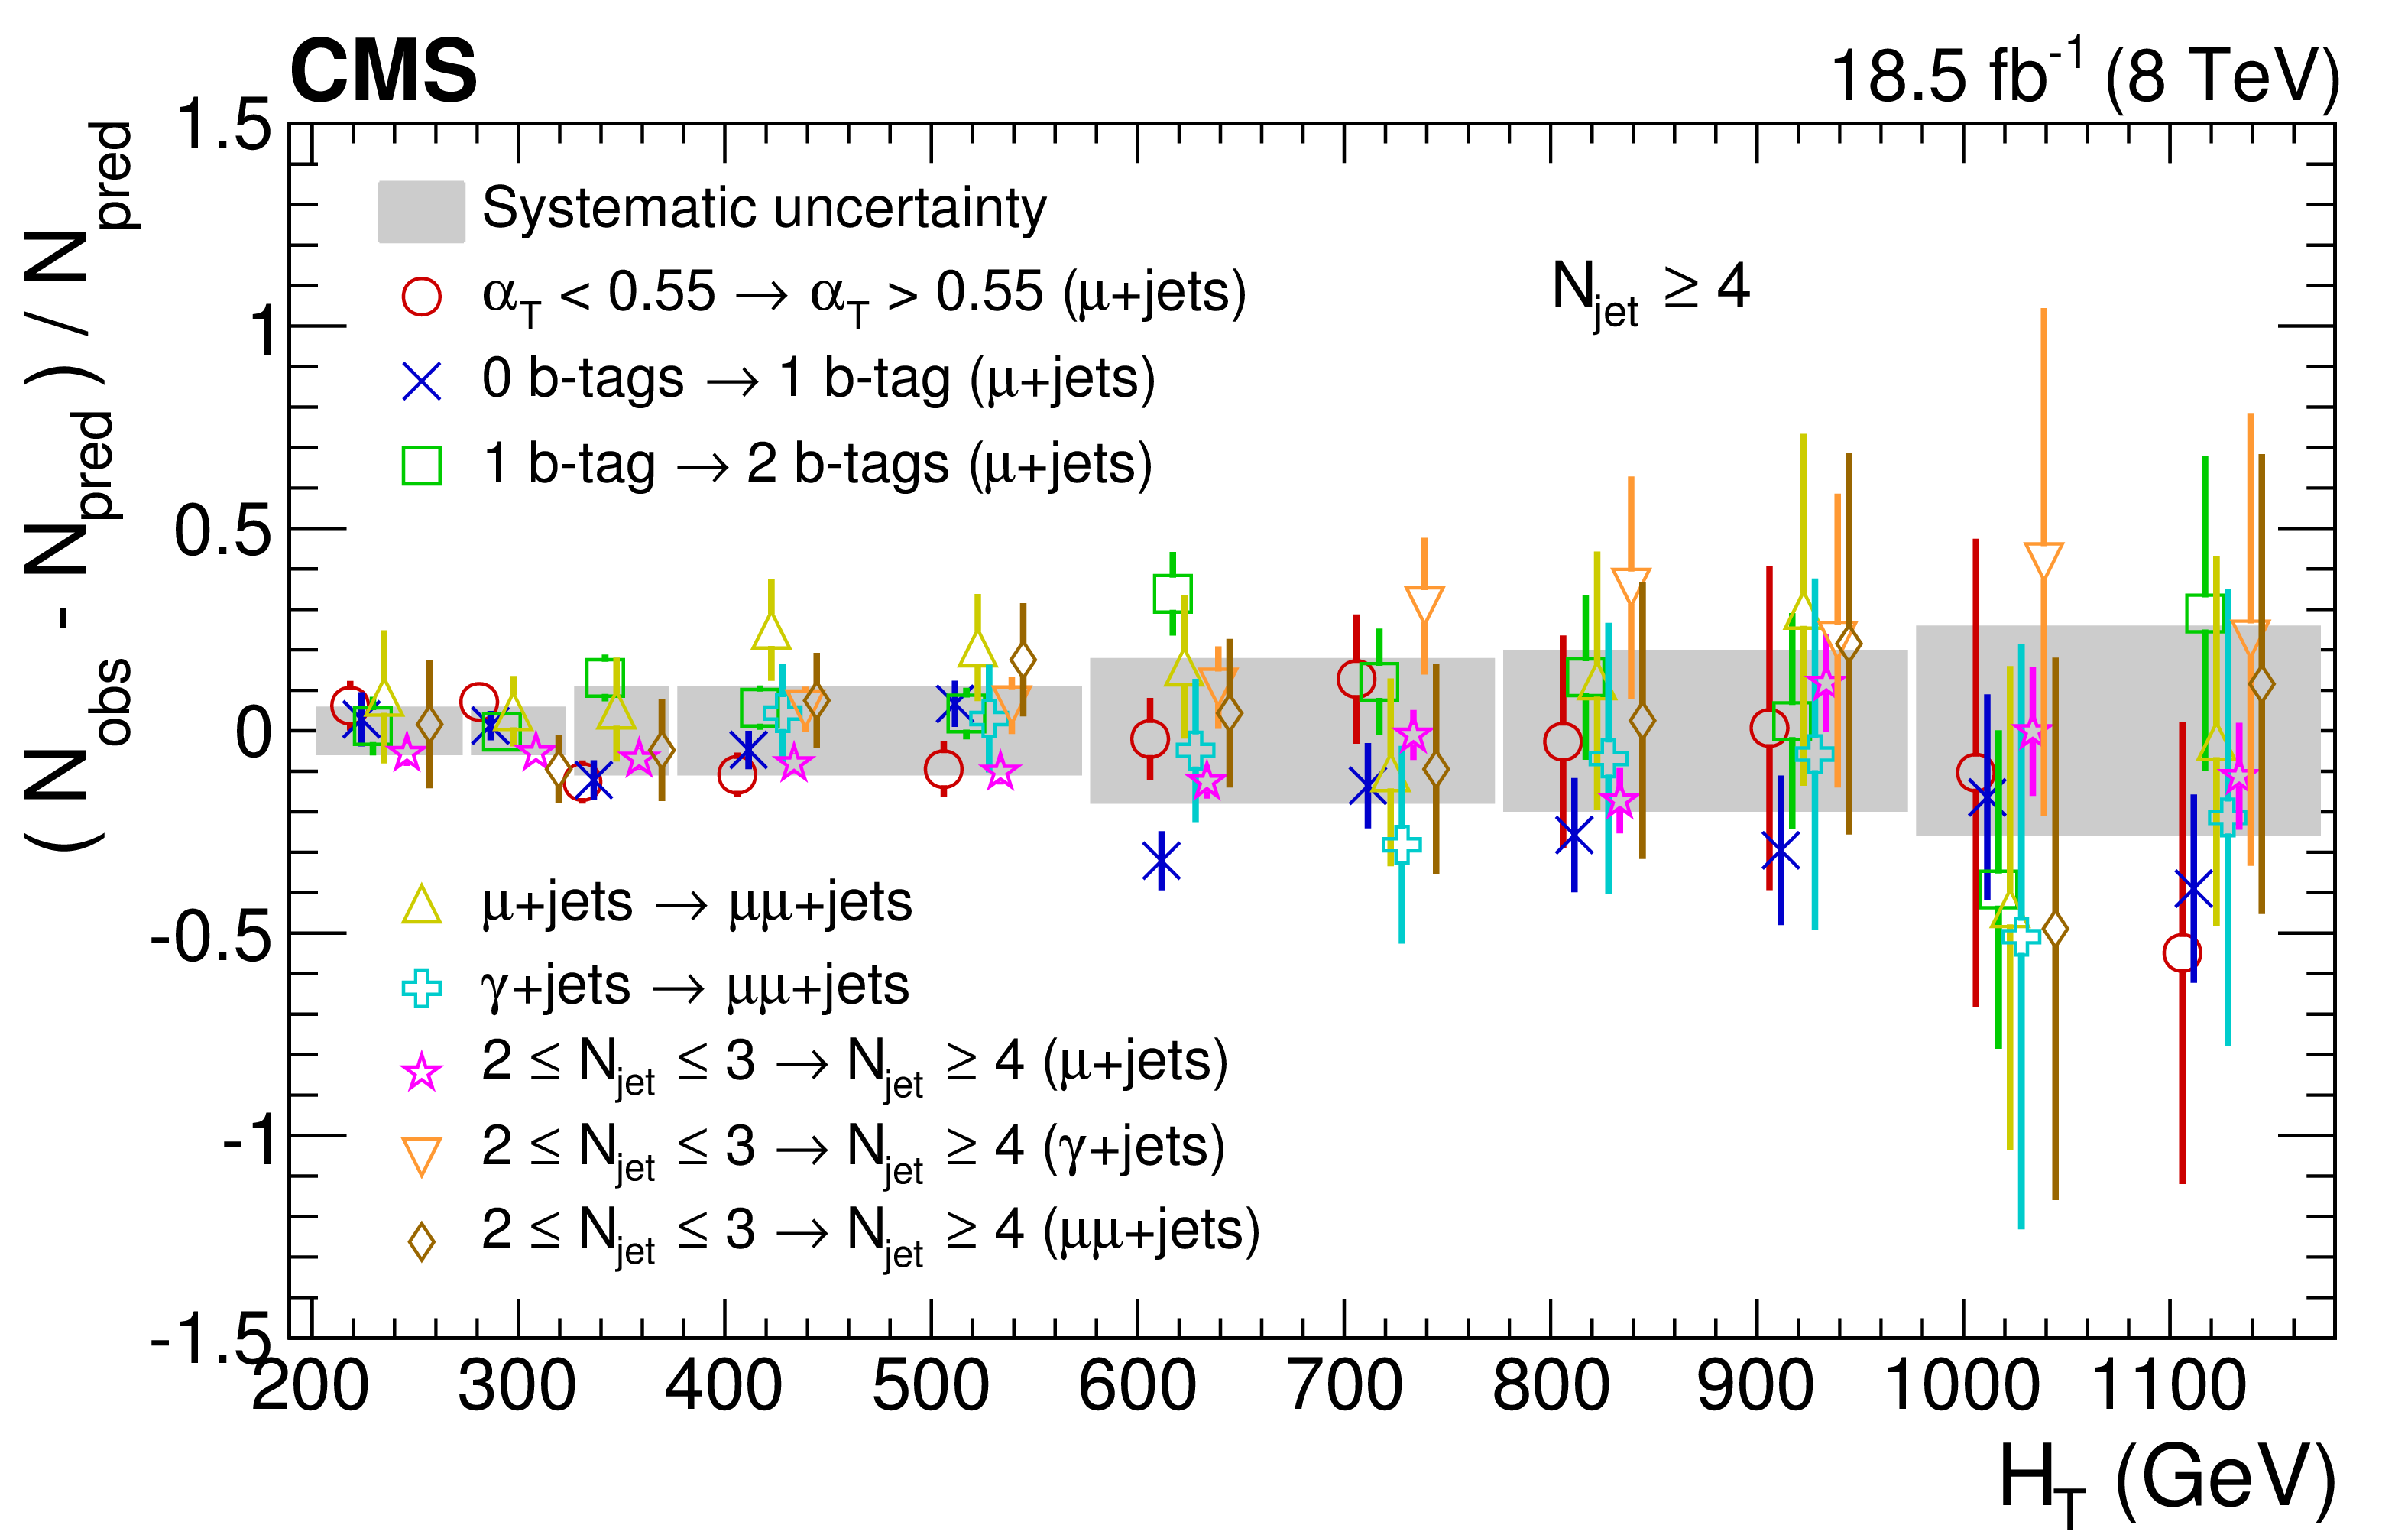
Figure 2-b:
Ratio $(N_\text {obs} - N_\text {pred})/N_\text {pred}$ as a function of $ {H_\text {T}} $ for different event categories and/or control regions for events with four or more jets; "b tag'' refers to a reconstructed b quark candidate. Error bars represent statistical uncertainties only, while the grey shaded bands represent the $ {N_{\text {jet}}} $ - and $ {H_\text {T}} $ -dependent uncertainties assumed in the transfer factors, as determined from the procedure described in the text. |
png pdf |
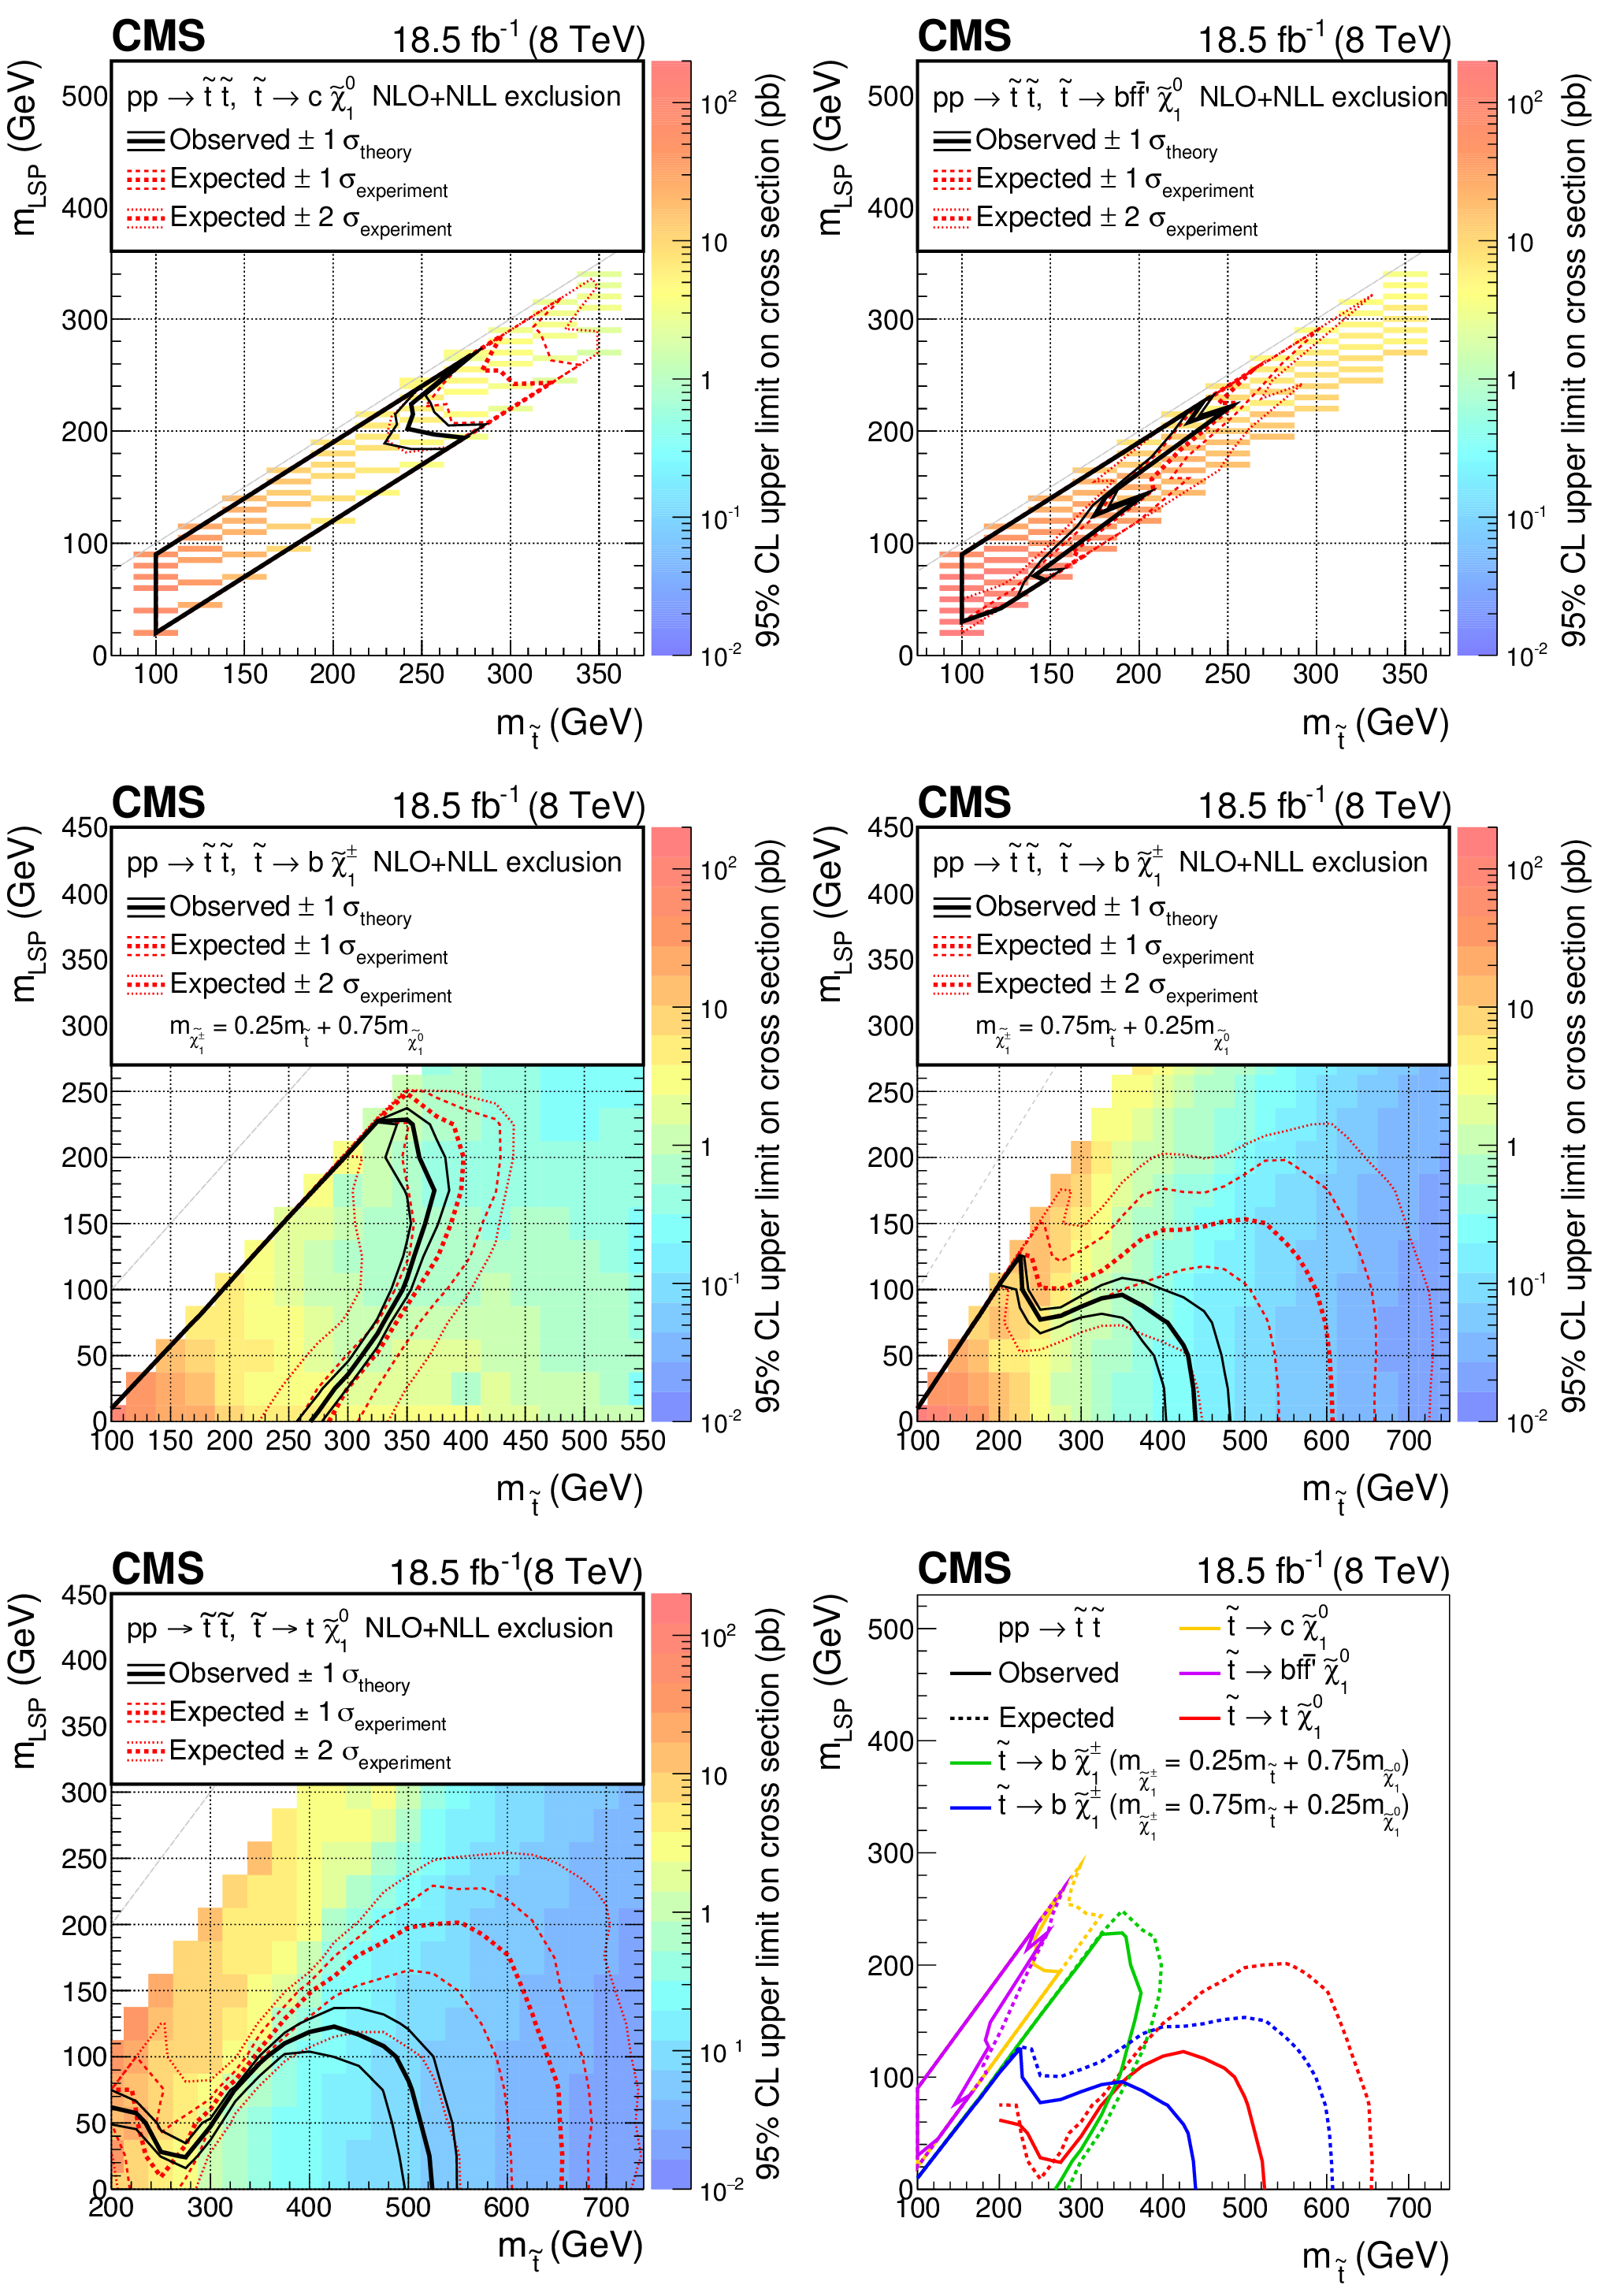
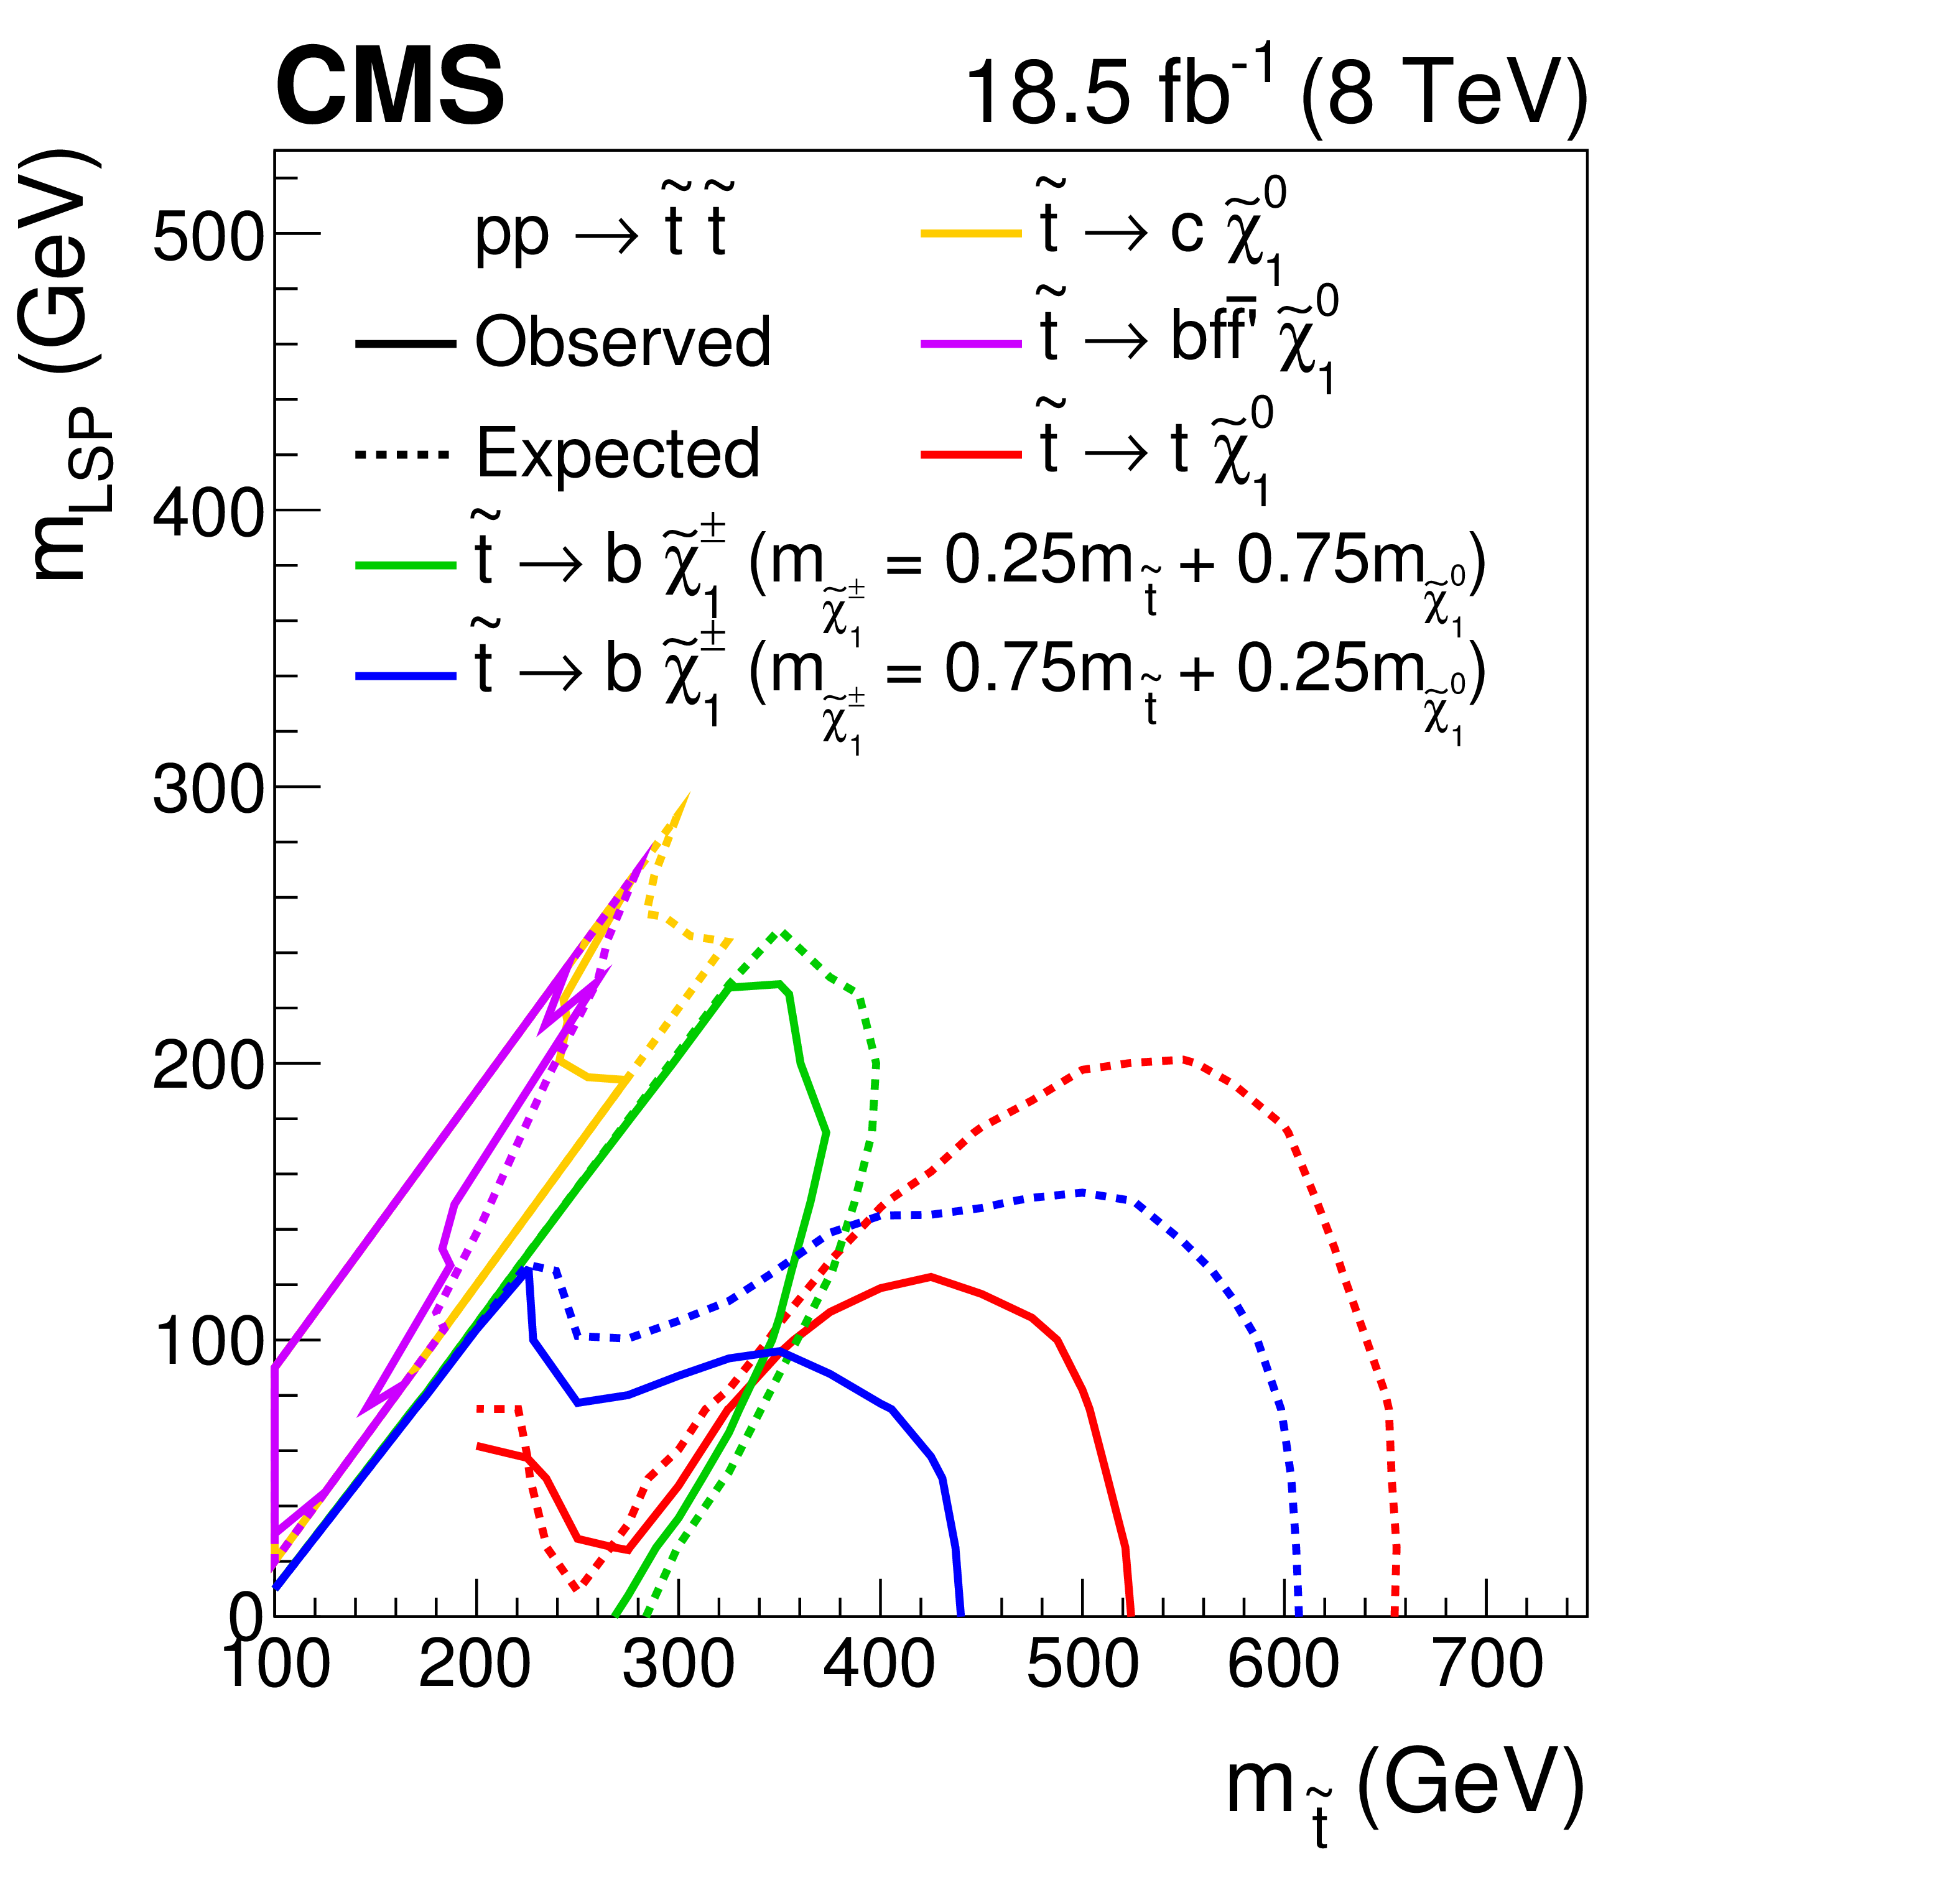
Figure 3:
Observed upper limits on the production cross section at 95% CL (indicated by the colour scale) as a function of the top squark and $\tilde{\chi}^0_1 $ masses for (upper left) $\tilde{ \mathrm{ t } } \to \mathrm{ c } \tilde{\chi}^0_1 $, (upper right) $\tilde{ \mathrm{ t } } \to {\mathrm{ b } \mathrm{{f{\bar{f}'}}} }\tilde{\chi}^0_1 $, (middle left) $\tilde{ \mathrm{ t } } \to \mathrm{ b } \tilde{\chi}^{\pm}_1 $ with $m_{\tilde{\chi}^{\pm}_1 } = 0.25m_{\tilde{ \mathrm{ t } } } + 0.75m_{\tilde{\chi}^0_1 }$, (middle right) $\tilde{ \mathrm{ t } } \to \mathrm{ b } \tilde{\chi}^{\pm}_1 $ with $m_{\tilde{\chi}^{\pm}_1 } = 0.75m_{\tilde{ \mathrm{ t } } } + 0.25m_{\tilde{\chi}^0_1 }$, and (lower left) $\tilde{ \mathrm{ t } } \to \mathrm{ t } \tilde{\chi}^0_1 $. The black solid thick curves indicate the observed exclusion assuming the NLO+NLL SUSY production cross sections; the thin black curves show corresponding ${\pm }1\sigma $ theoretical uncertainties. The red thick dashed curves indicate median expected exclusions and the thin dashed and dotted curves indicate, respectively, their ${\pm }1 \sigma $ and ${\pm }2\sigma $ experimental uncertainties. A summary of the observed (solid) and median expected (dotted) exclusion contours is presented (lower right). The grey dotted diagonal lines delimit the region for which $m_{\tilde{ \mathrm{ t } } } > m_{\tilde{\chi}^0_1 }$. |

png pdf |
Figure 3-a:
Observed upper limits on the production cross section at 95% CL (indicated by the colour scale) as a function of the top squark and $\tilde{\chi}^0_1 $ masses for $\tilde{ \mathrm{ t } } \to \mathrm{ c } \tilde{\chi}^0_1 $. The black solid thick curves indicate the observed exclusion assuming the NLO+NLL SUSY production cross sections; the thin black curves show corresponding ${\pm }1\sigma $ theoretical uncertainties. The red thick dashed curves indicate median expected exclusions and the thin dashed and dotted curves indicate, respectively, their ${\pm }1 \sigma $ and ${\pm }2\sigma $ experimental uncertainties. The grey dotted diagonal line delimits the region for which $m_{\tilde{ \mathrm{ t } } } > m_{\tilde{\chi}^0_1 }$. |
png pdf |
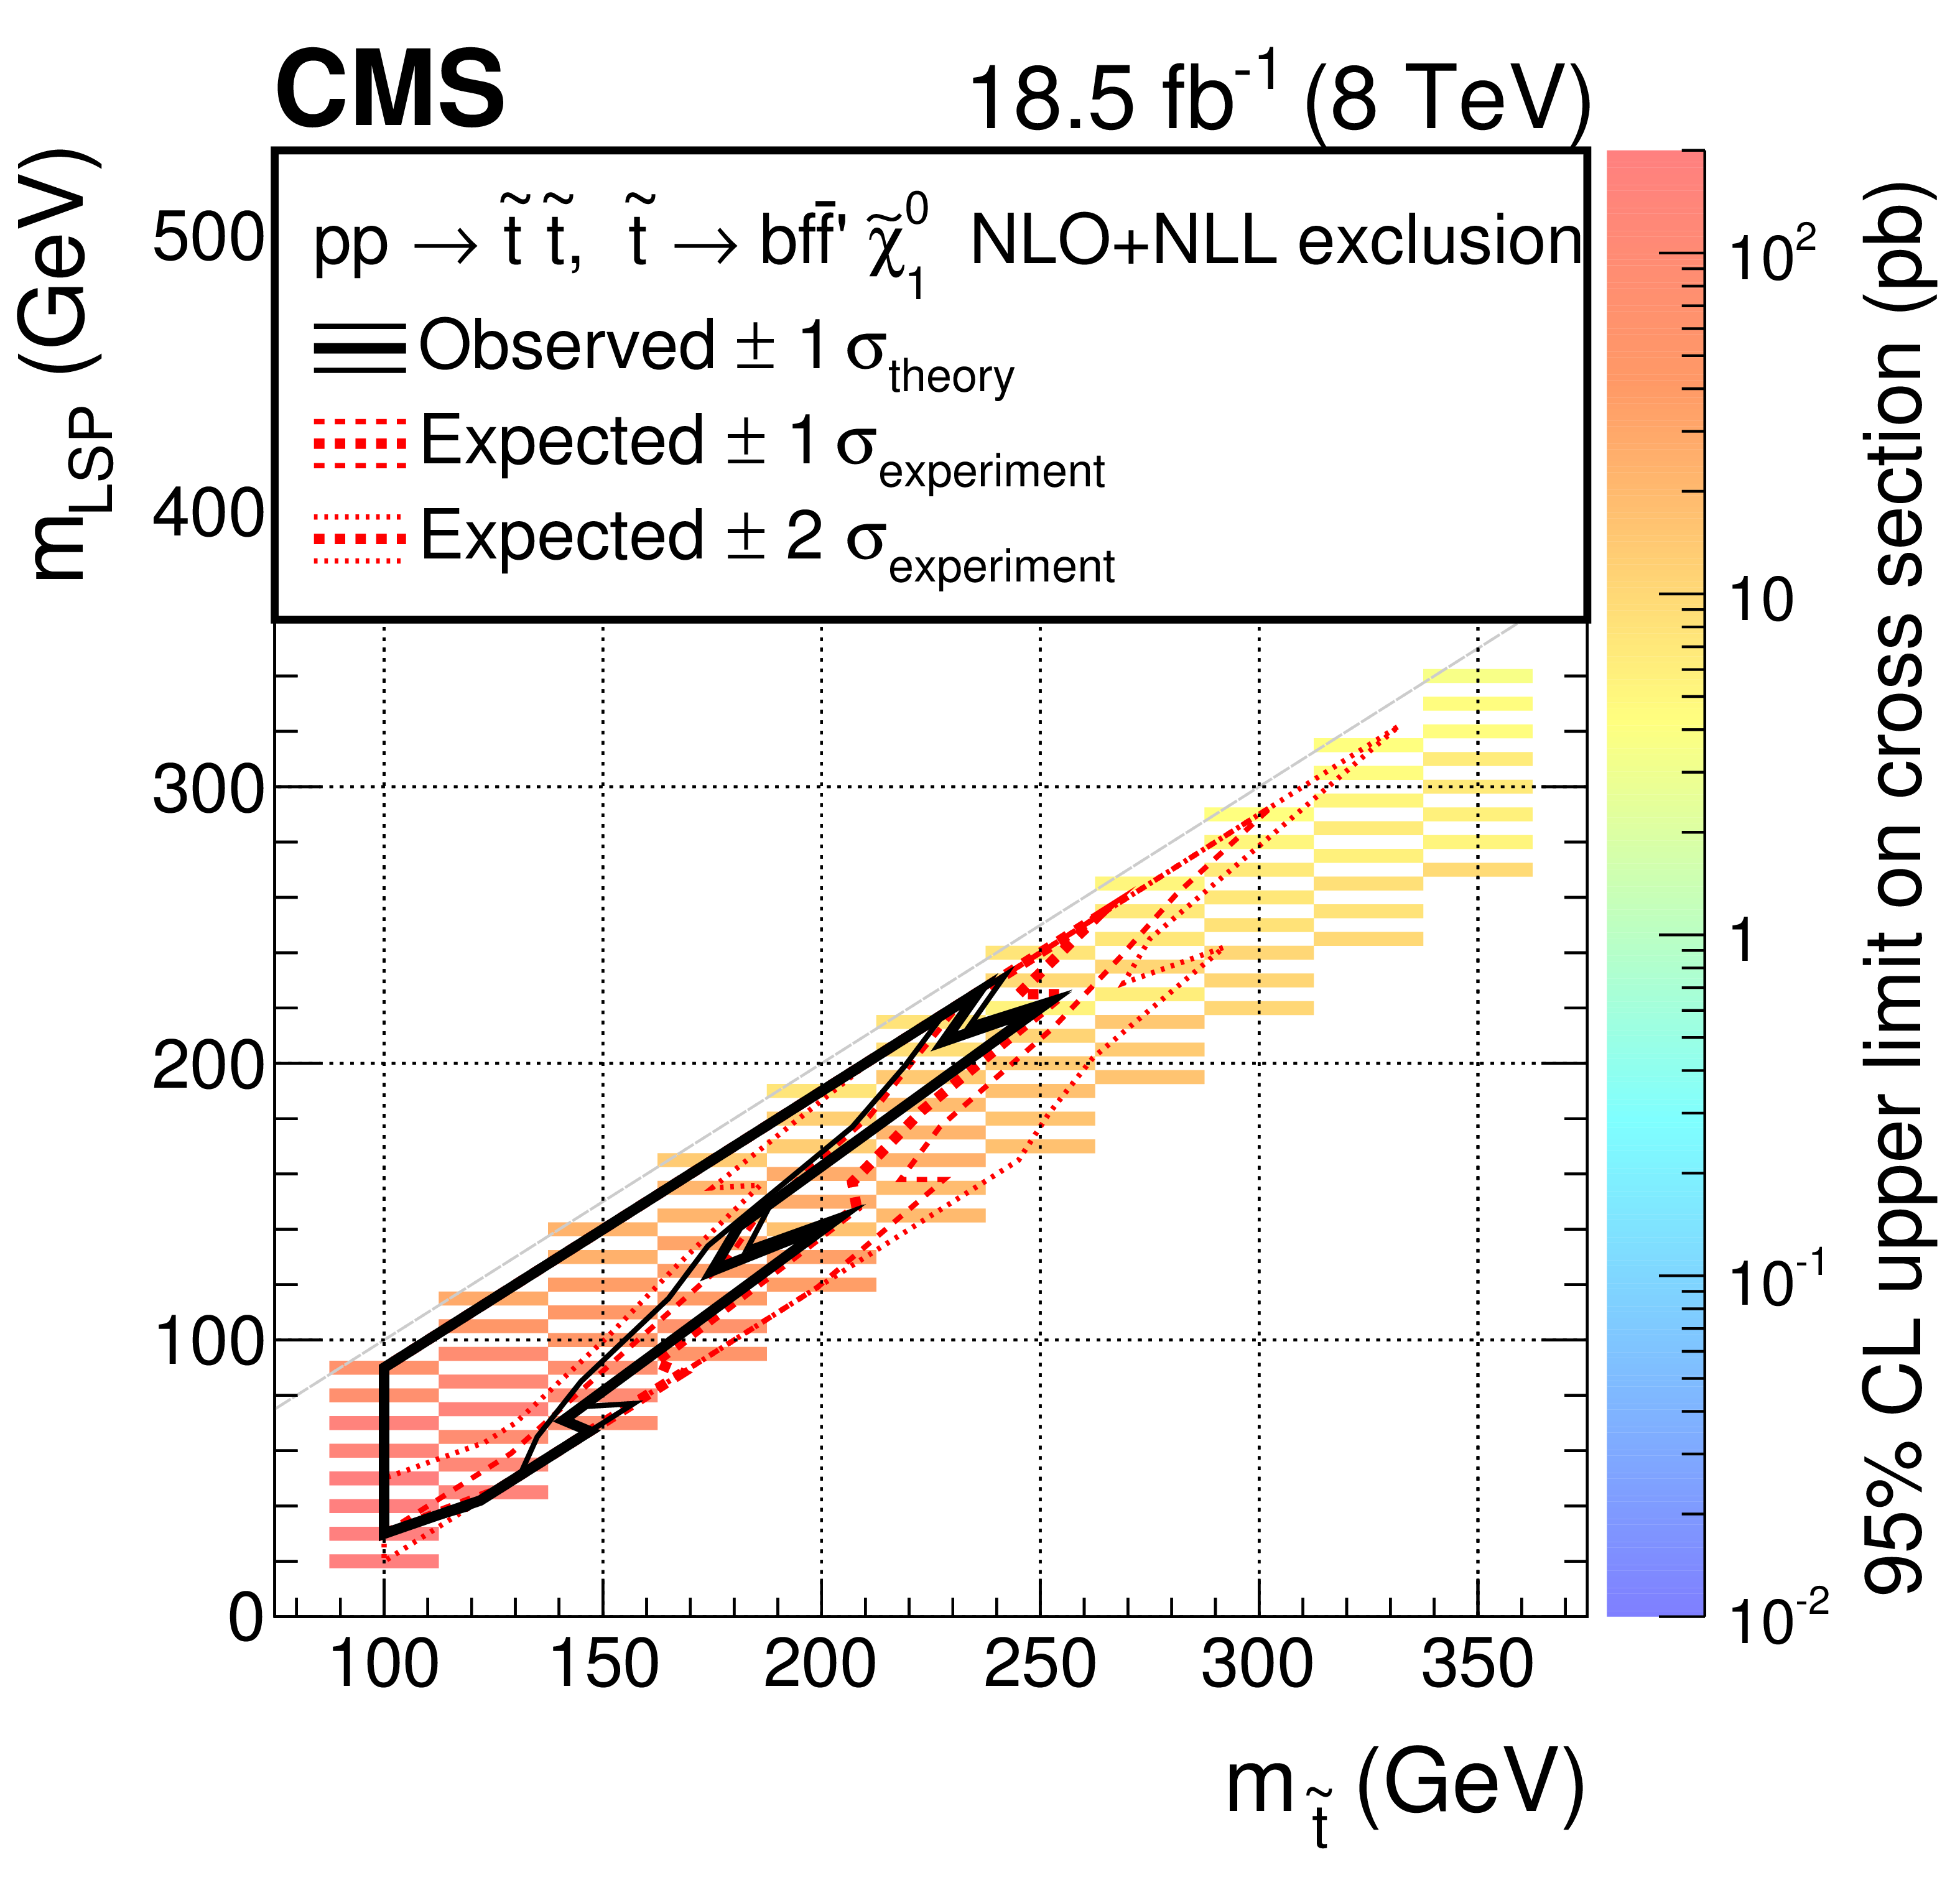
Figure 3-b:
Observed upper limits on the production cross section at 95% CL (indicated by the colour scale) as a function of the top squark and $\tilde{\chi}^0_1 $ masses for $\tilde{ \mathrm{ t } } \to {\mathrm{ b } \mathrm{{f{\bar{f}'}}} }\tilde{\chi}^0_1 $. The black solid thick curves indicate the observed exclusion assuming the NLO+NLL SUSY production cross sections; the thin black curves show corresponding ${\pm }1\sigma $ theoretical uncertainties. The red thick dashed curves indicate median expected exclusions and the thin dashed and dotted curves indicate, respectively, their ${\pm }1 \sigma $ and ${\pm }2\sigma $ experimental uncertainties. The grey dotted diagonal line delimits the region for which $m_{\tilde{ \mathrm{ t } } } > m_{\tilde{\chi}^0_1 }$. |
png pdf |
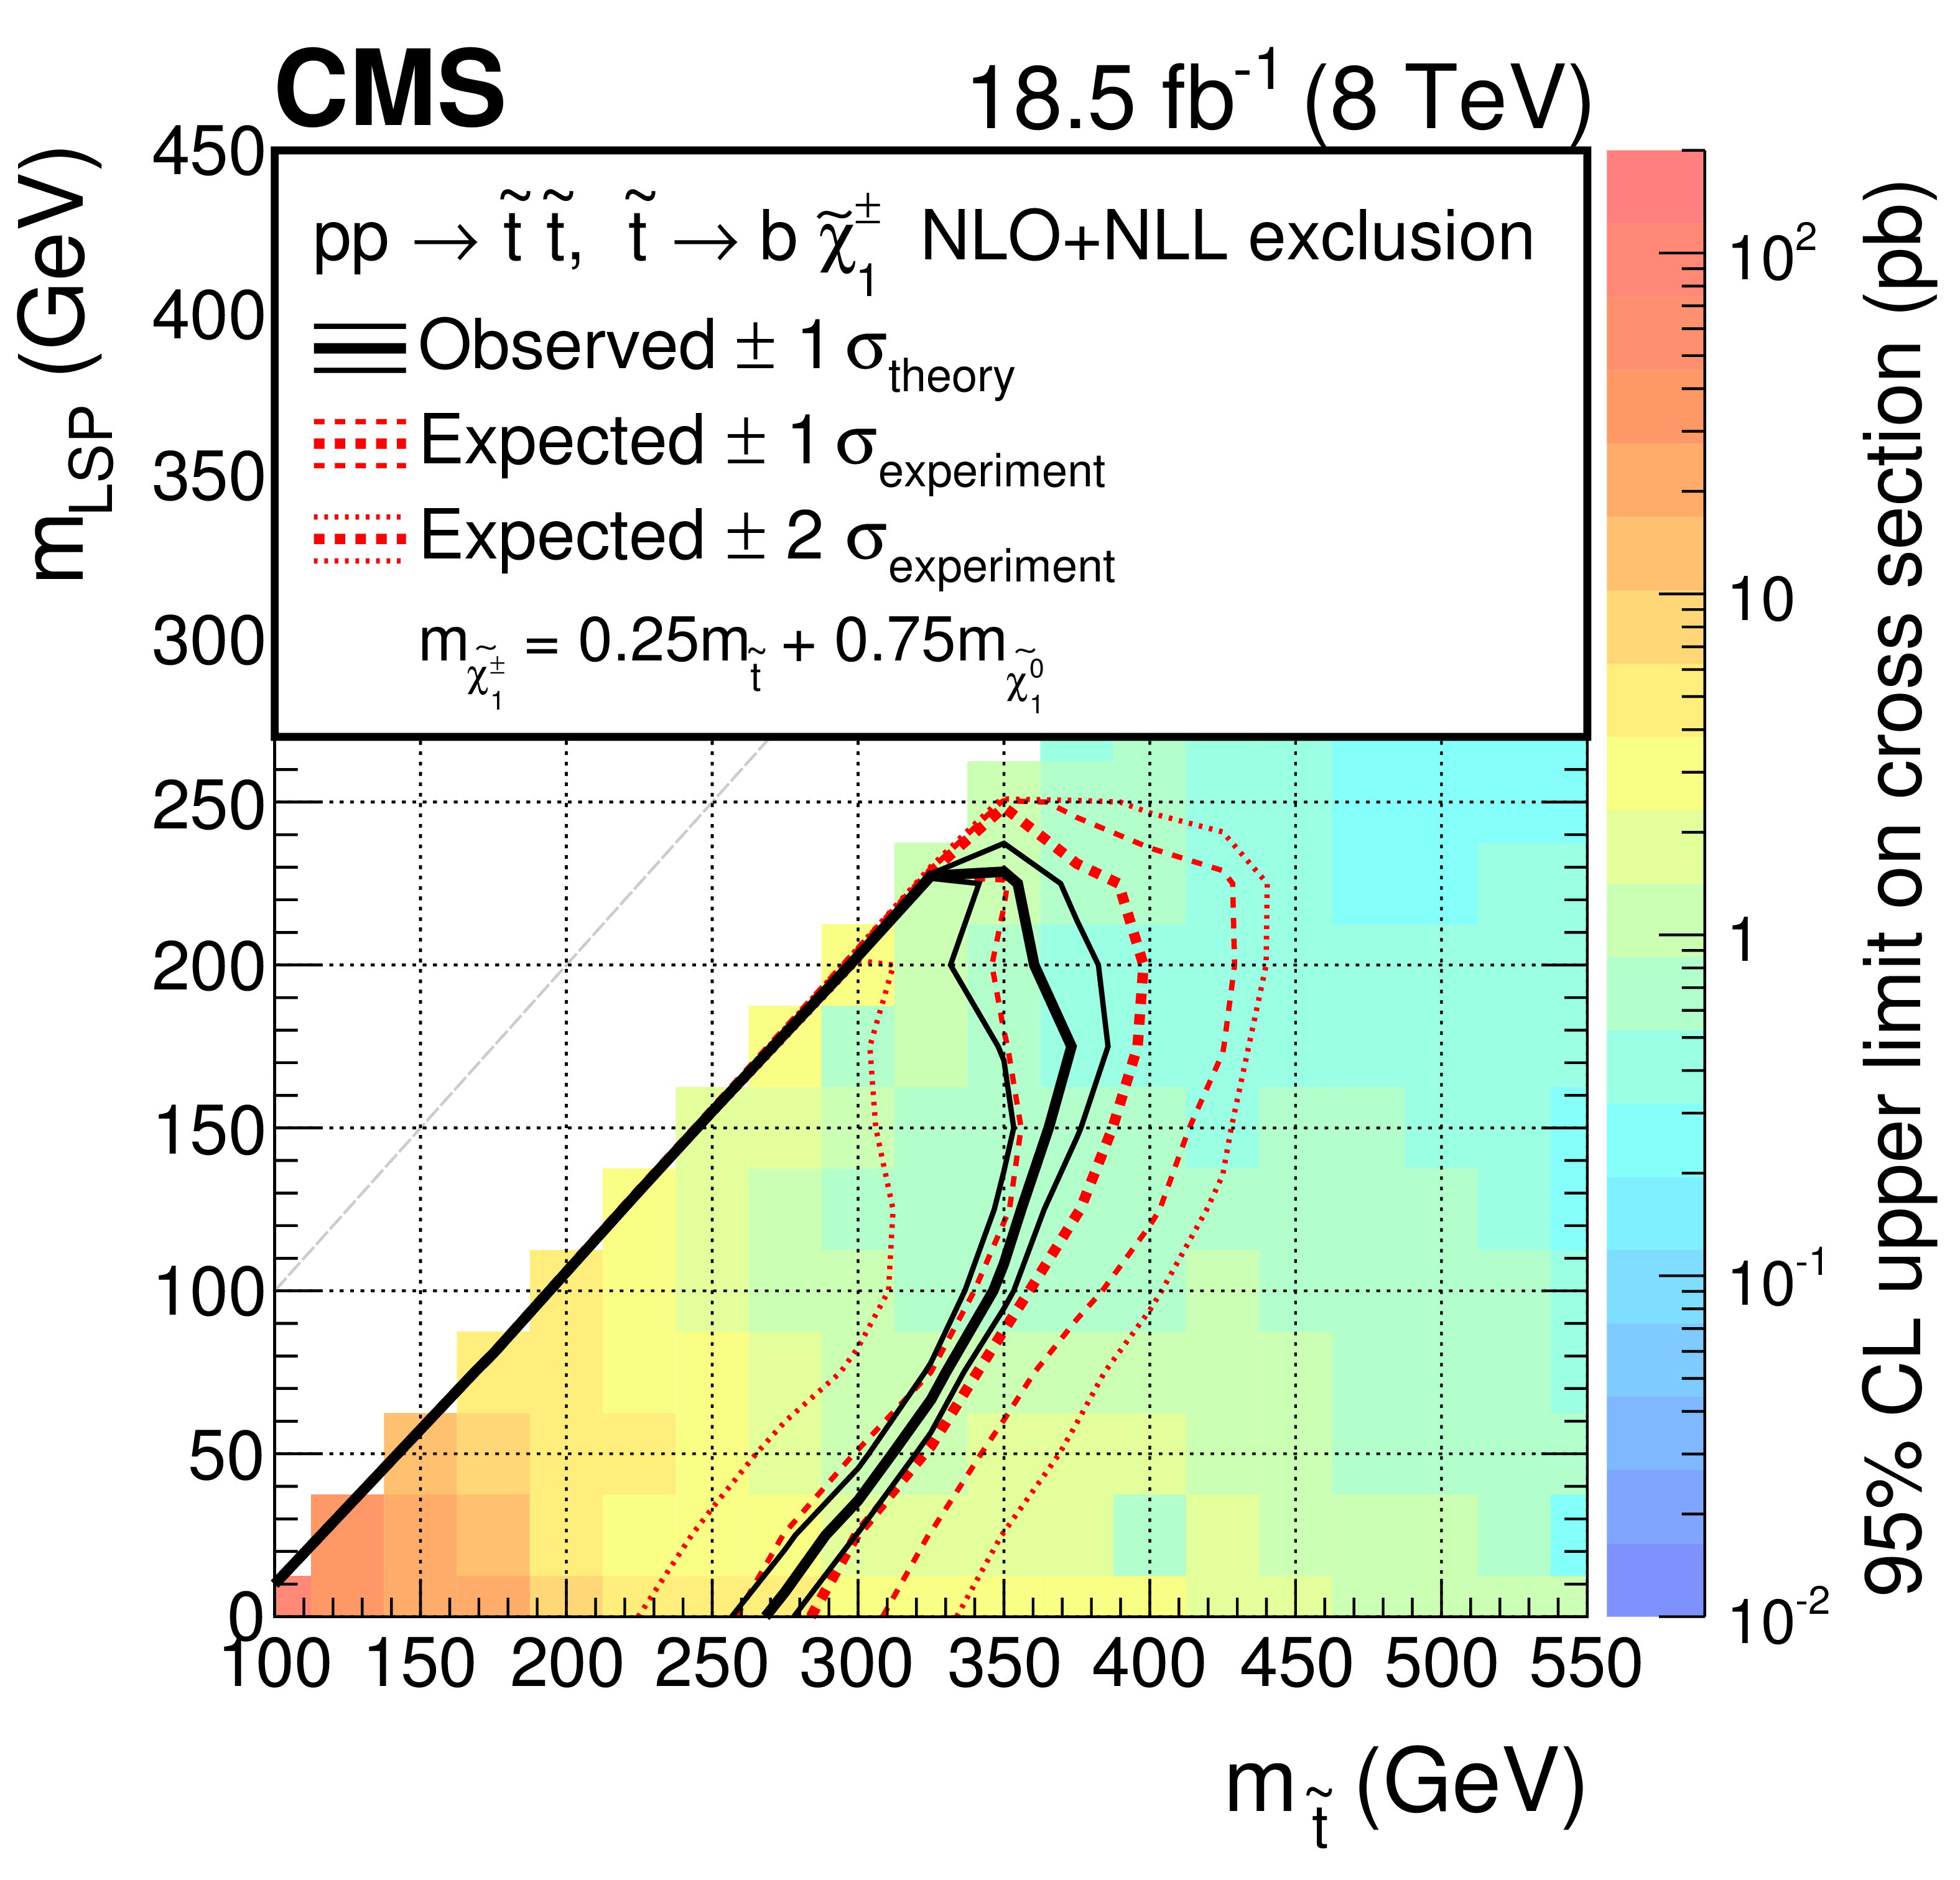
Figure 3-c:
Observed upper limits on the production cross section at 95% CL (indicated by the colour scale) as a function of the top squark and $\tilde{\chi}^0_1 $ masses for $\tilde{ \mathrm{ t } } \to \mathrm{ b } \tilde{\chi}^{\pm}_1 $. The black solid thick curves indicate the observed exclusion assuming the NLO+NLL SUSY production cross sections; the thin black curves show corresponding ${\pm }1\sigma $ theoretical uncertainties. The red thick dashed curves indicate median expected exclusions and the thin dashed and dotted curves indicate, respectively, their ${\pm }1 \sigma $ and ${\pm }2\sigma $ experimental uncertainties. The grey dotted diagonal line delimits the region for which $m_{\tilde{ \mathrm{ t } } } > m_{\tilde{\chi}^0_1 }$. |

png pdf |
Figure 3-d:
Observed upper limits on the production cross section at 95% CL (indicated by the colour scale) as a function of the top squark and $\tilde{\chi}^0_1 $ masses for $\tilde{ \mathrm{ t } } \to \mathrm{ b } \tilde{\chi}^{\pm}_1 $. The black solid thick curves indicate the observed exclusion assuming the NLO+NLL SUSY production cross sections; the thin black curves show corresponding ${\pm }1\sigma $ theoretical uncertainties. The red thick dashed curves indicate median expected exclusions and the thin dashed and dotted curves indicate, respectively, their ${\pm }1 \sigma $ and ${\pm }2\sigma $ experimental uncertainties. The grey dotted diagonal line delimits the region for which $m_{\tilde{ \mathrm{ t } } } > m_{\tilde{\chi}^0_1 }$. |
png pdf |
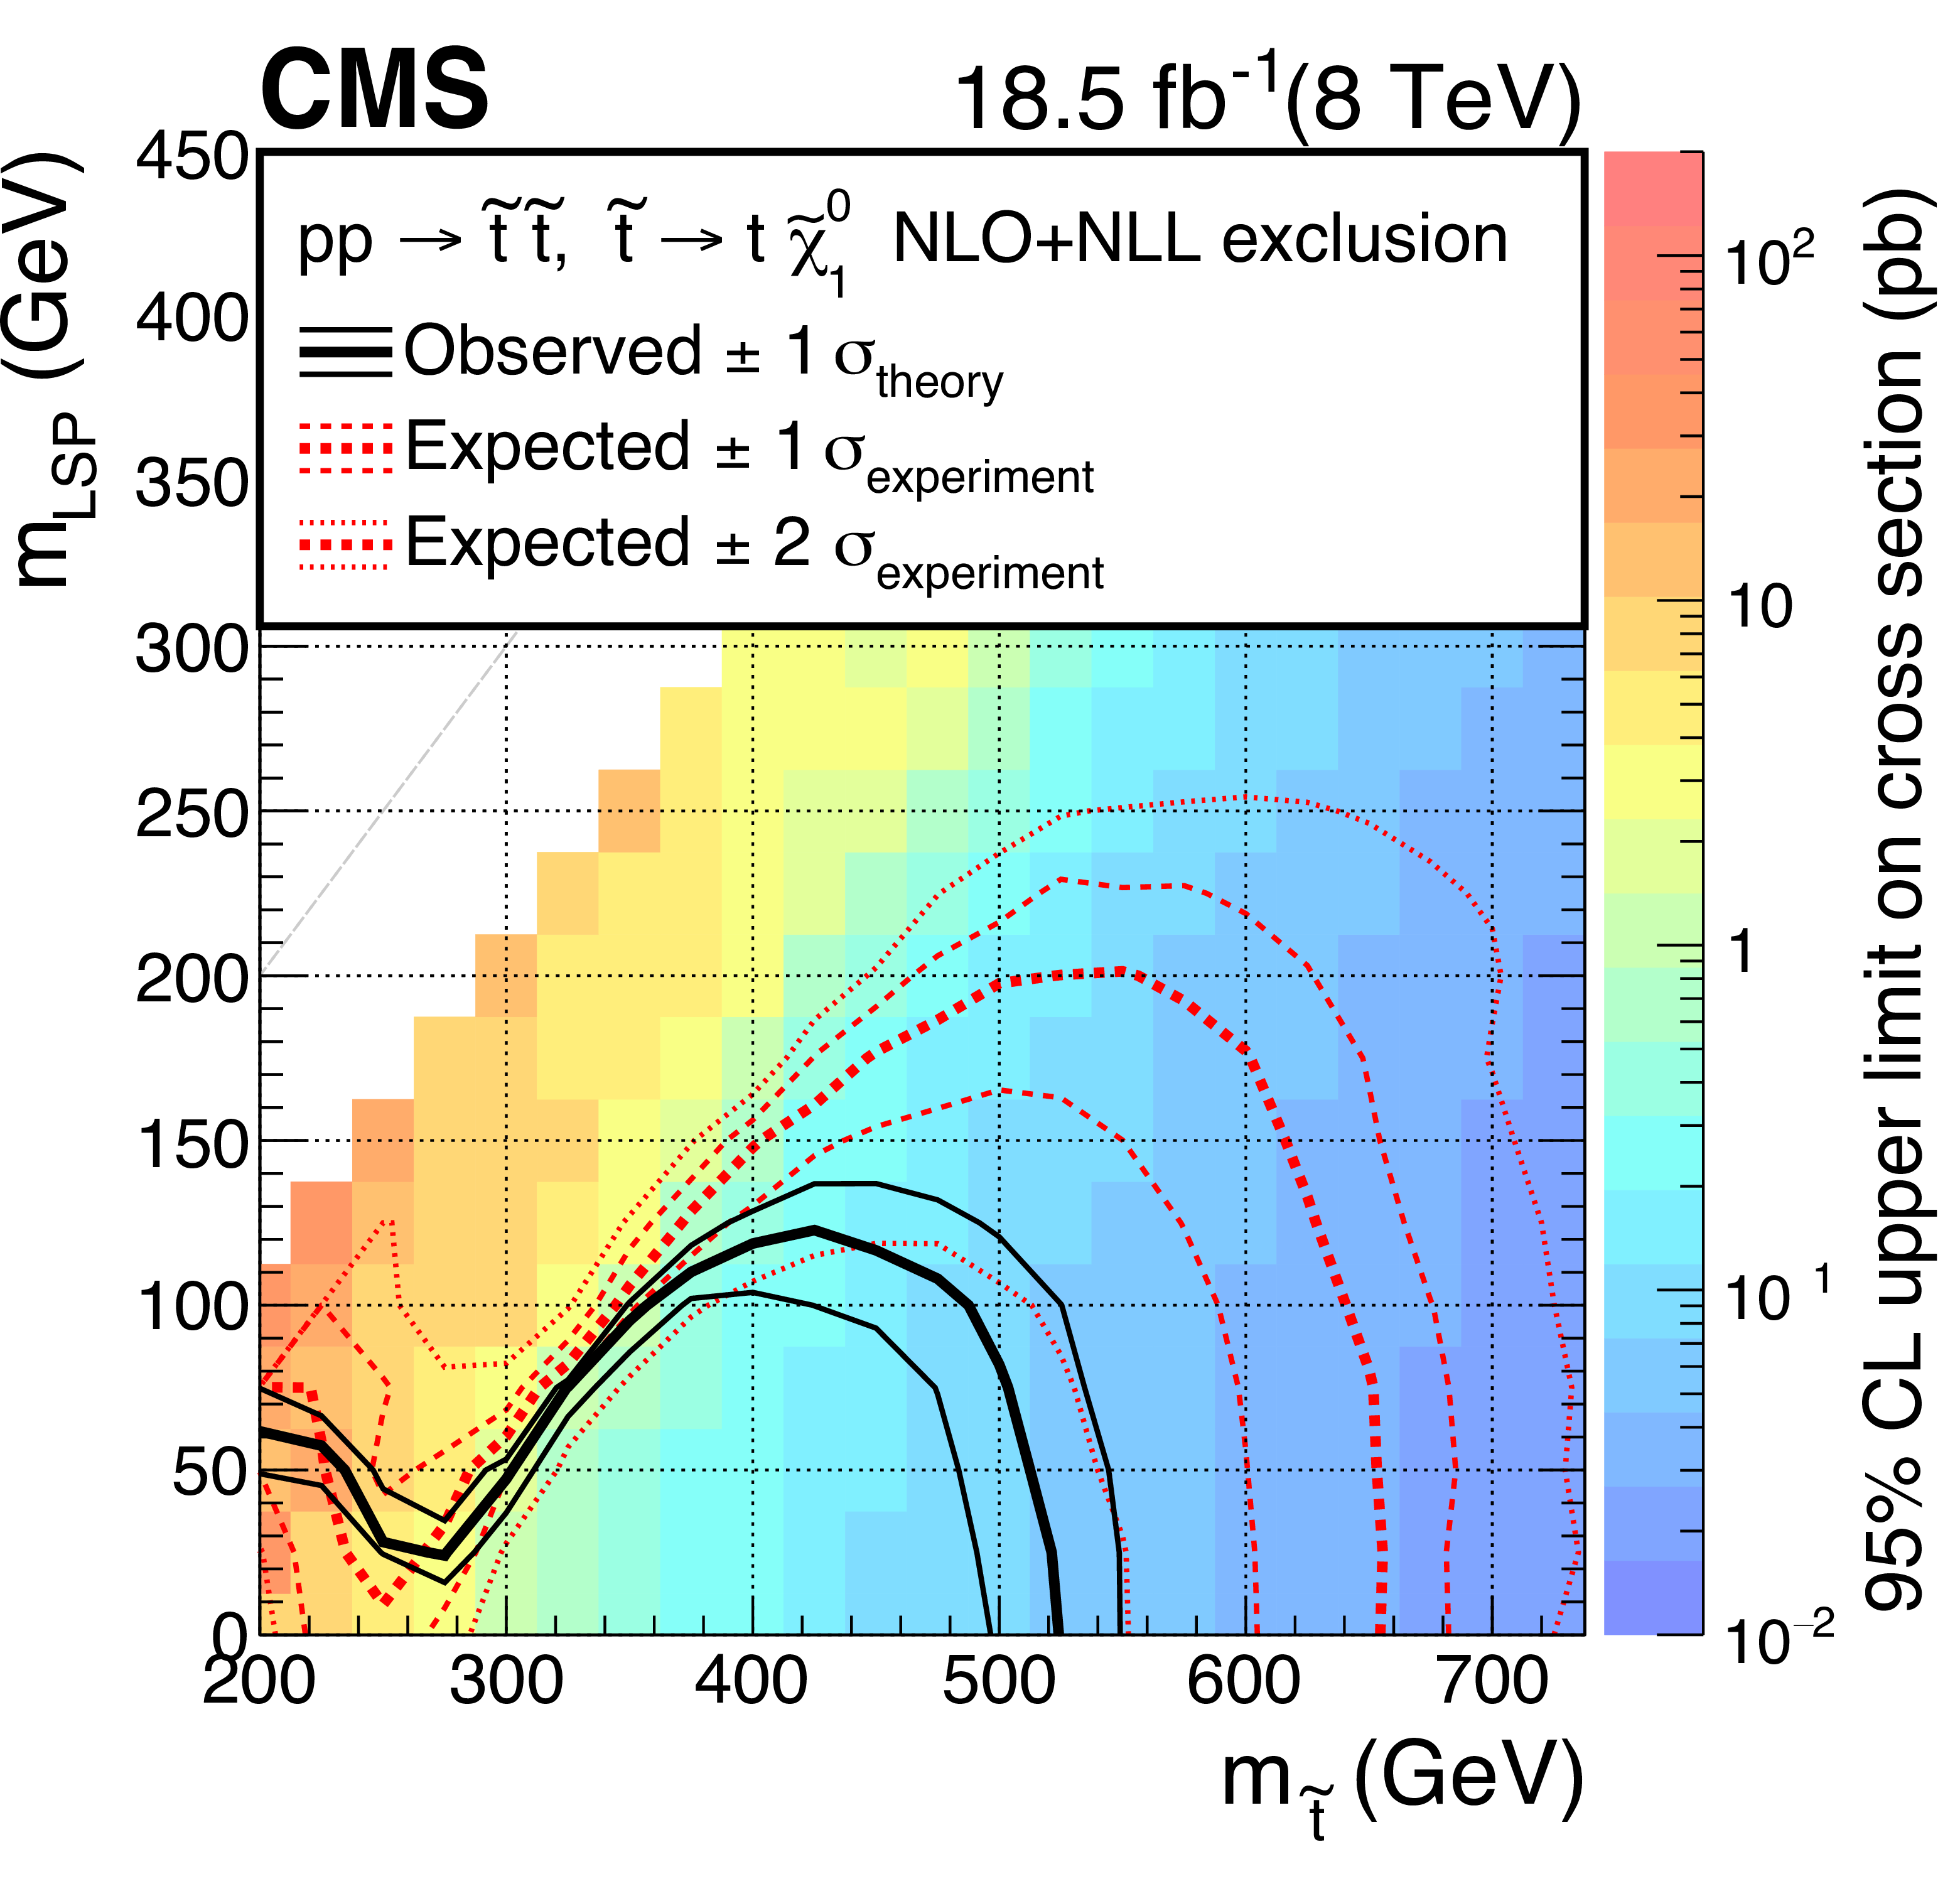
Figure 3-e:
Observed upper limits on the production cross section at 95% CL (indicated by the colour scale) as a function of the top squark and $\tilde{\chi}^0_1 $ masses for $\tilde{ \mathrm{ t } } \to \mathrm{ t } \tilde{\chi}^0_1 $. The black solid thick curves indicate the observed exclusion assuming the NLO+NLL SUSY production cross sections; the thin black curves show corresponding ${\pm }1\sigma $ theoretical uncertainties. The red thick dashed curves indicate median expected exclusions and the thin dashed and dotted curves indicate, respectively, their ${\pm }1 \sigma $ and ${\pm }2\sigma $ experimental uncertainties. The grey dotted diagonal line delimits the region for which $m_{\tilde{ \mathrm{ t } } } > m_{\tilde{\chi}^0_1 }$. |
png pdf |
Figure 3-f:
A summary of the observed (solid) and median expected (dotted) exclusion contours is presented. |
| Tables | |
png pdf |
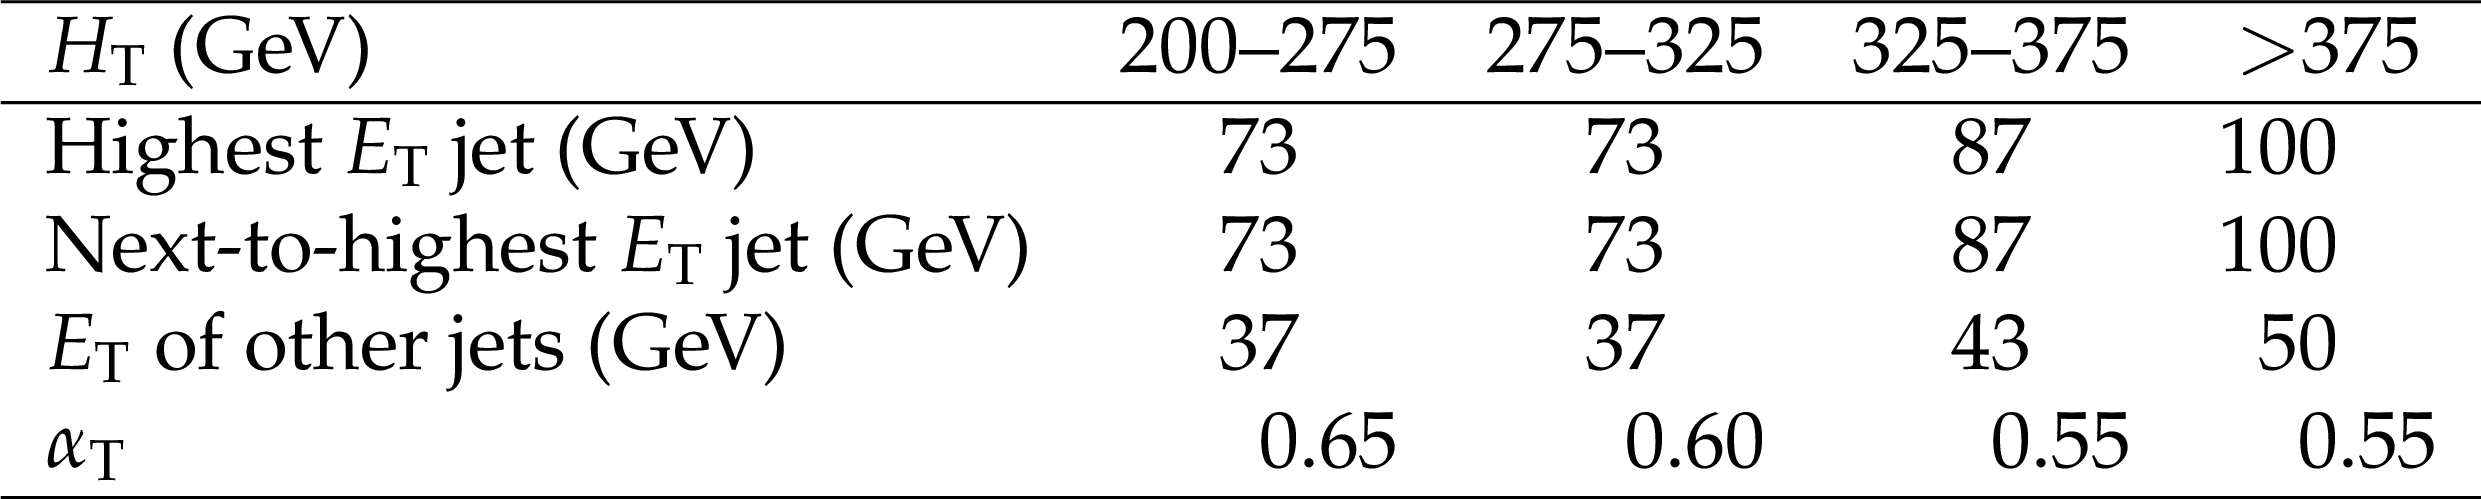
Table 1:
$ {H_\text {T}} $ -dependent thresholds on the $ {E_{\mathrm {T}}} $ values of jets and $ {\alpha _\mathrm {T}} $ values. |
png pdf |
Table 2:
Systematic uncertainties (%) in the transfer factors, in intervals of $ {N_{\text {jet}}} $ and $ {H_\text {T}} $. |
png pdf |
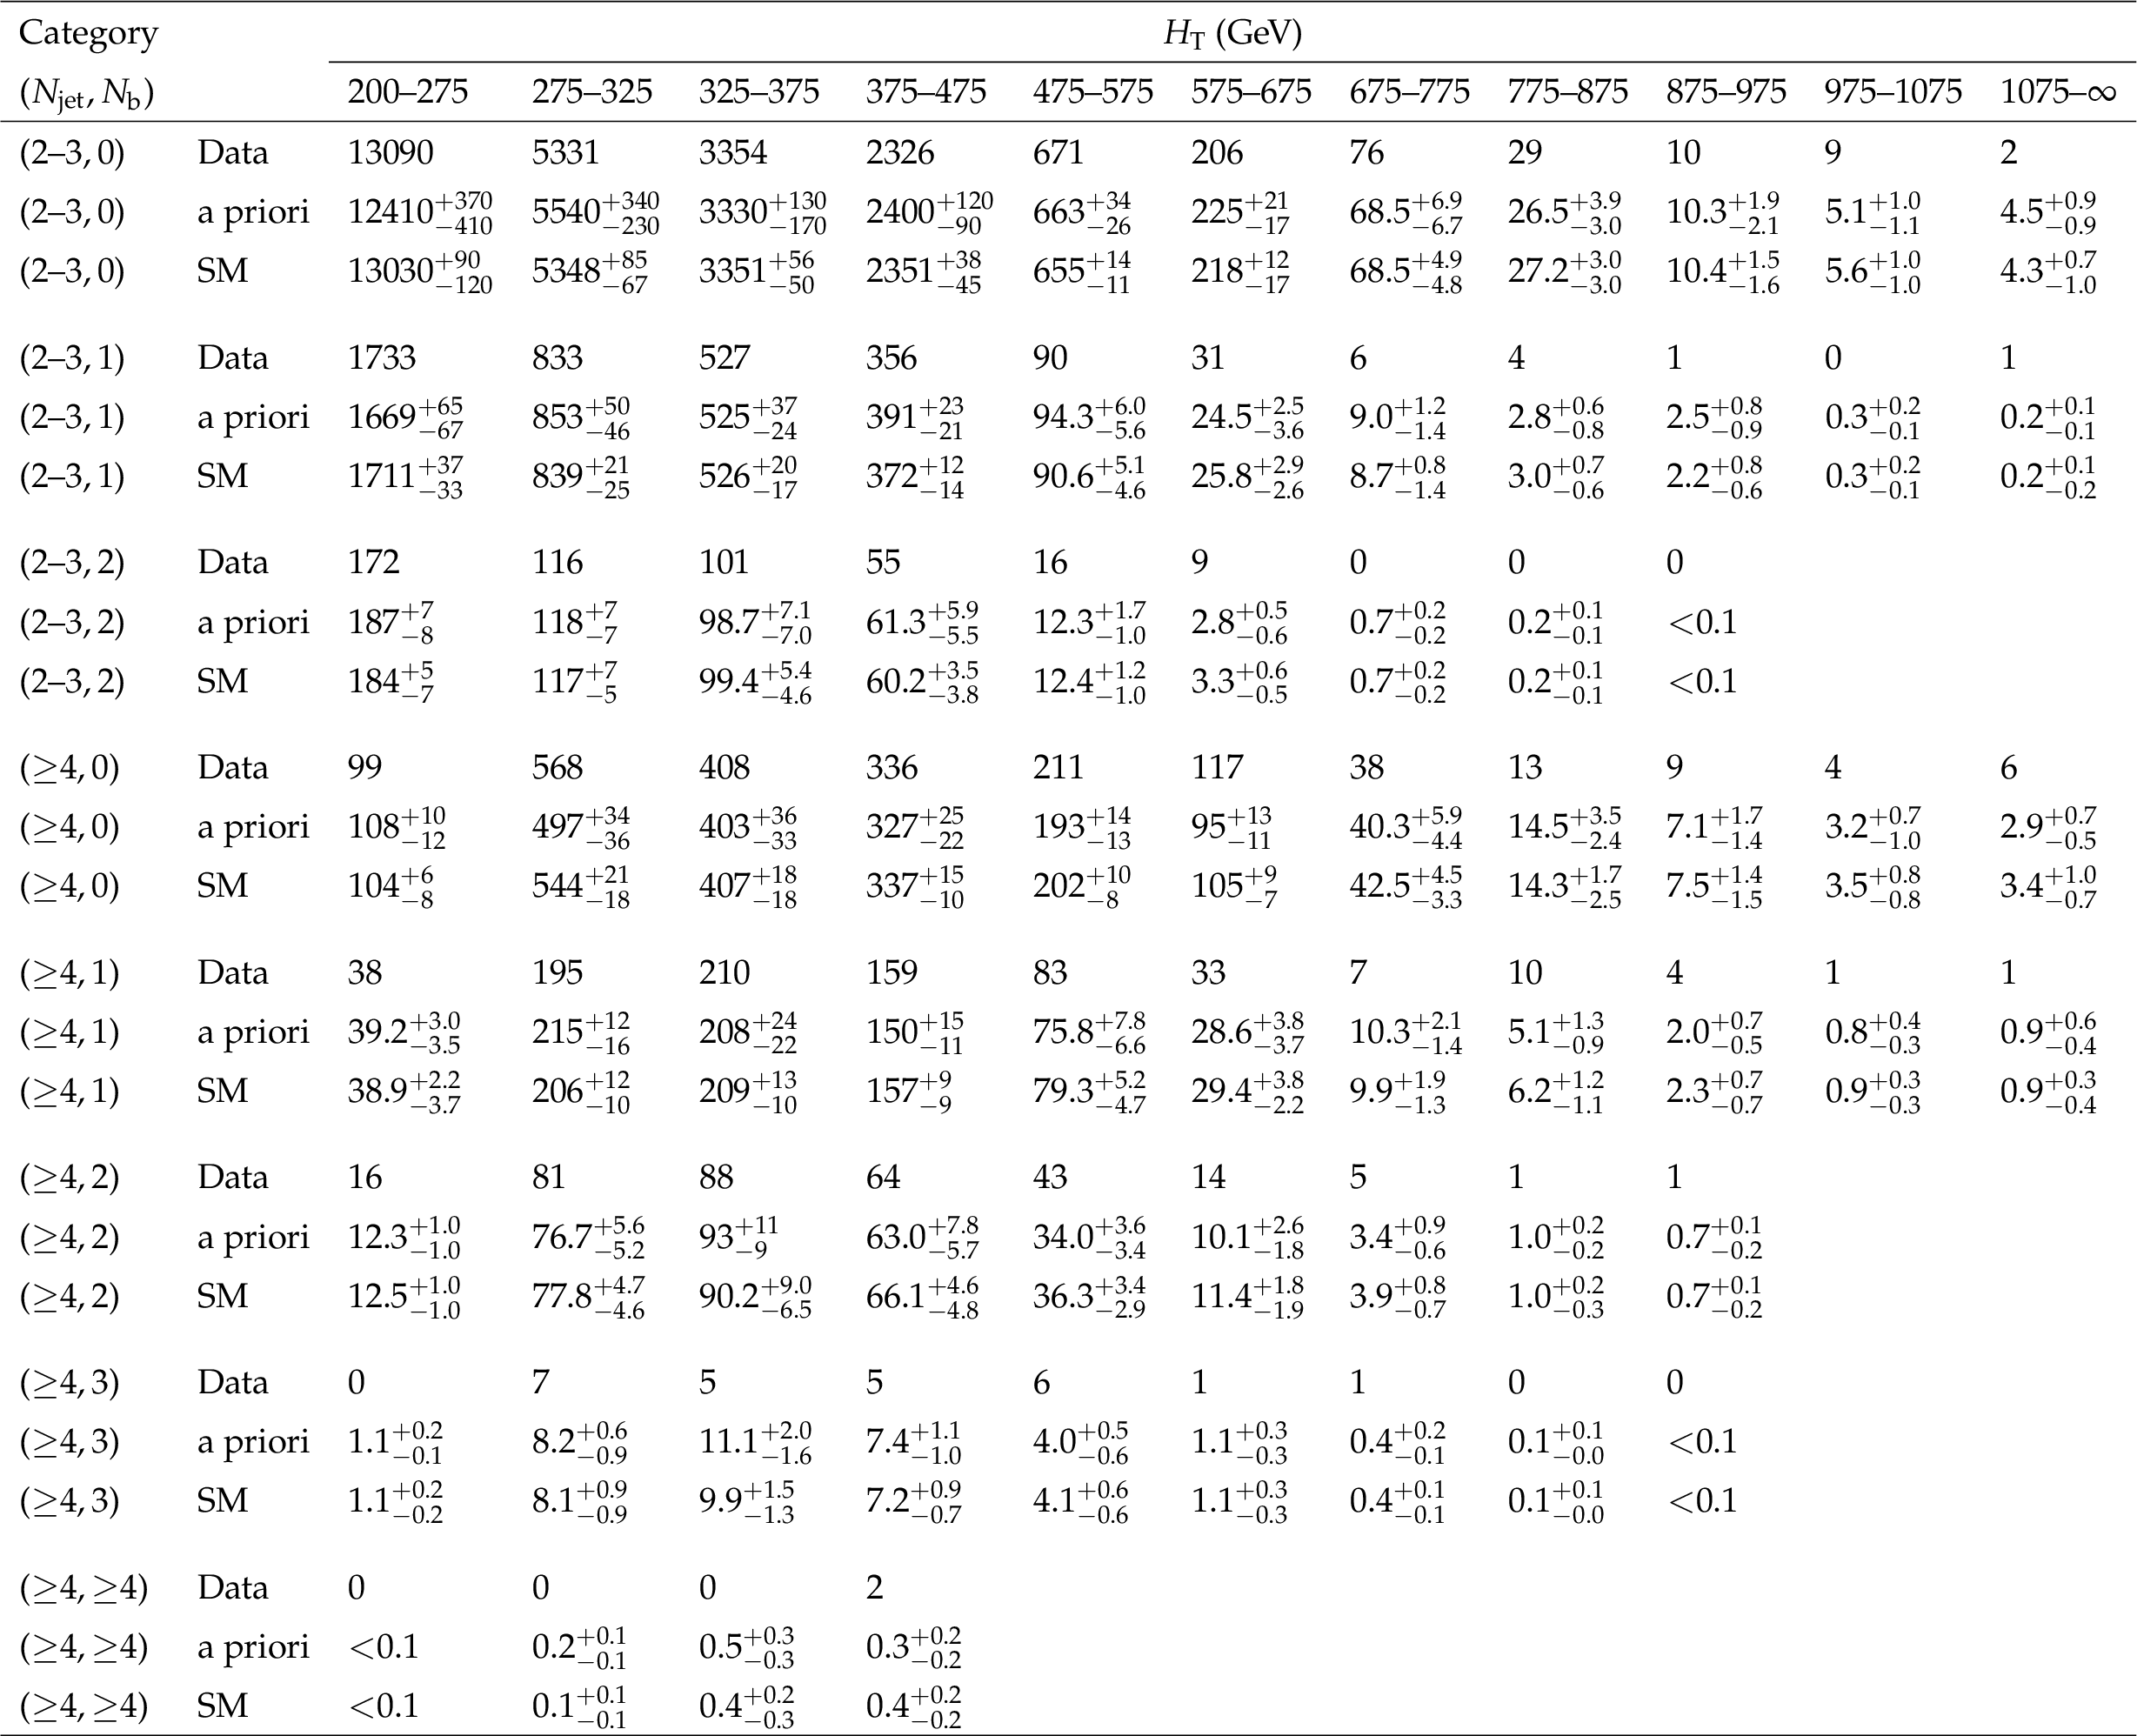
Table 3:
Observed event yields in data and the "a priori'' SM expectations determined from event counts in the data control samples and transfer factors from simulation, in bins of $ {H_\text {T}} $, and categorised according to $ {N_{\text {jet}}} $ and $ {N_{\mathrm{ b } }} $. Also shown are the SM expectations (labelled "SM'') obtained from a combined fit to control and signal regions under the SM hypothesis. The quoted uncertainties include the statistical as well as systematic components. For each row that lists fewer than the full set of columns, the final entry represents values obtained for an open final $ {H_\text {T}} $ bin. |
| Summary |
|
An inclusive search for supersymmetry with the CMS detector is reported, based on data from pp collisions collected at $ \sqrt{s} = $ 8 TeV, corresponding to an integrated luminosity of 18.5 $\pm$ 0.5 fb$^{-1}$. The final states analysed contain two or more jets with large transverse energies and a significant imbalance in the event transverse momentum, as expected in the production and decay of massive squarks and gluinos. Dedicated triggers made it possible to extend the phase space covered in this search to values of $ {H_\text{T}} $ and $ {H_\mathrm{T}}^{\text{miss}} $ as low as 200 and 130 GeV, respectively. These regions of low $ {H_\text{T}} $ and $ {H_\mathrm{T}}^{\text{miss}} $ correspond to regions of phase space that are highly populated in models with low-mass squarks and nearly degenerate mass spectra. The signal region is binned according to $ {H_\text{T}} $, the number of reconstructed jets, and the number of jets identified as originating from b quarks. The sum of standard model backgrounds in each bin is estimated from a simultaneous binned likelihood fit to the event yields in the signal region and in $\mu$+jets, $\mu\mu$+jets, and $\gamma$+jets control samples. The observed yields in the signal region are found to be in agreement with the expected contributions from standard model processes. Limits are determined in the mass parameter space of simplified models that assume the direct pair production of top squarks. A comprehensive study of top squark decay modes is performed and interpreted in the parameter space of the loop-induced two-body decays to the neutralino and one c quark ($\tilde{ \mathrm{ t } } \to \mathrm{ c }\tilde{\chi}^0_1$); four-body decays to the neutralino, one b quark, and an off-shell W boson ($\tilde{ \mathrm{ t } } \to {\mathrm{ b } \mathrm{ f \bar{f}' } } \tilde{\chi}^0_1$); decays to one b quark and the lightest chargino ($\tilde{ \mathrm{ t } } \to \mathrm{ b } \tilde{\chi}^{\pm}_1$), followed by the decay of the chargino to the lightest neutralino and an (off-shell) W boson; and the decay to a top quark and neutralino ($\tilde{ \mathrm{ t } } \to \mathrm{ t } \tilde{\chi}^0_1$). In the region $m_{\tilde{ \mathrm{ t } }} - m_{\tilde{\chi}^0_1} < m_{\mathrm{ W }}$, top squarks with masses as large as 260 and 225 GeV, and neutralino masses up to 240 and 215 GeV, are excluded, respectively, for the two- and four-body decay modes. For top squark decays to $\mathrm{ b }\tilde{\chi}^{\pm}_1$, top squark masses up to 400 GeV and neutralino masses up to 225 GeV are excluded, depending on the mass of the chargino. For top squarks decaying to a top quark and a neutralino, top squark masses up to 500 GeV and neutralino masses up to 105 GeV are excluded. In summary, the analysis provides sensitivity across a large region of parameter space in the ($m_{\tilde{ \mathrm{ t } }}, m_{\tilde{\chi}^0_1}$) plane, covering several relevant top squark decay modes. In particular, the application of low thresholds to maximise signal acceptance provides sensitivity to models with compressed mass spectra. For top squark decays to b$\tilde{\chi}^{\pm}_1$, where the W boson from the $\tilde{\chi}^{\pm}_1$ decay is off-shell, the presented studies improve on existing limits. Mass exclusions are reported in previously unexplored regions of the $(m_{\tilde{ \mathrm{ t } }}, m_{\tilde{\chi}^{\pm}_1}, m_{\tilde{\chi}^0_1})$ parameter space that satisfy 100 GeV $ < {\Delta m} < m_\mathrm{ t }$, of up to $m_{\tilde{ \mathrm{ t } }} = $ 325, $m_{\tilde{\chi}^{\pm}_1} = 250$, and $m_{\tilde{\chi}^0_1} = $ 225 GeV. For the region ${\Delta m} < m_\mathrm{ W }$, the search provides the strongest expected mass exclusions, up to $m_{\tilde{ \mathrm{ t } }} = $ 325 GeV, for the two-body decay $\tilde{ \mathrm{ t } } \to \mathrm{ c }\tilde{\chi}^0_1$ when 30 GeV $ < {\Delta m} < m_\mathrm{ W }$. |
| Additional Figures | |
png pdf |
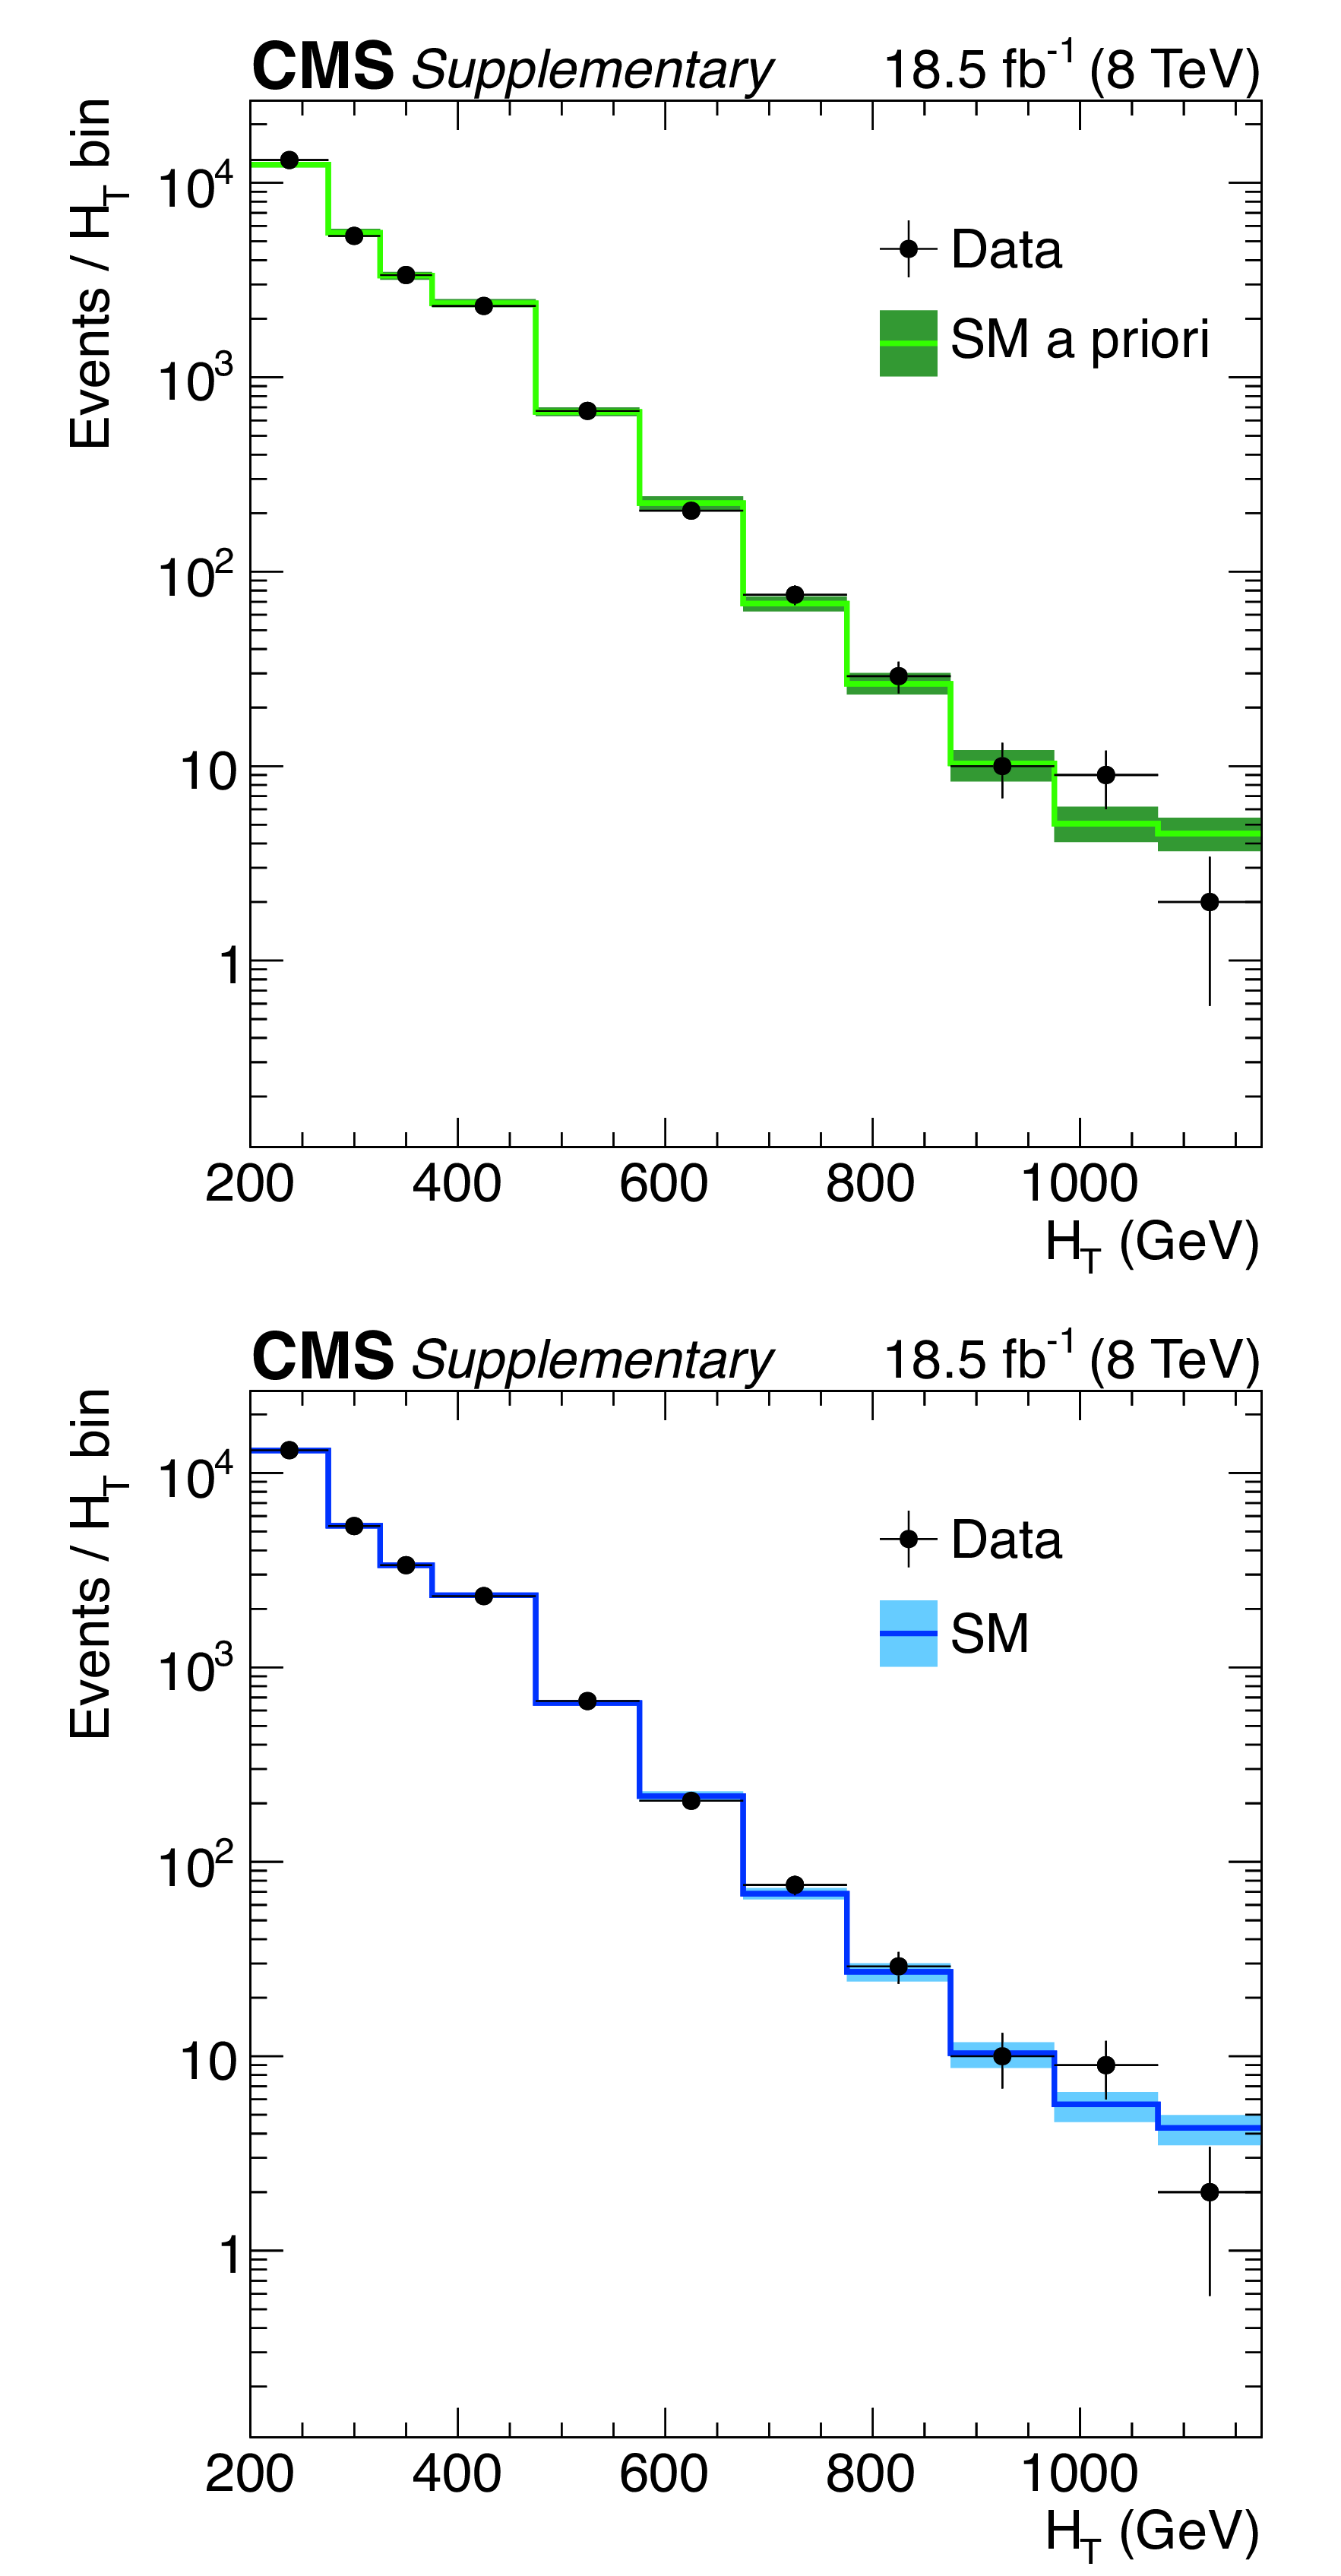
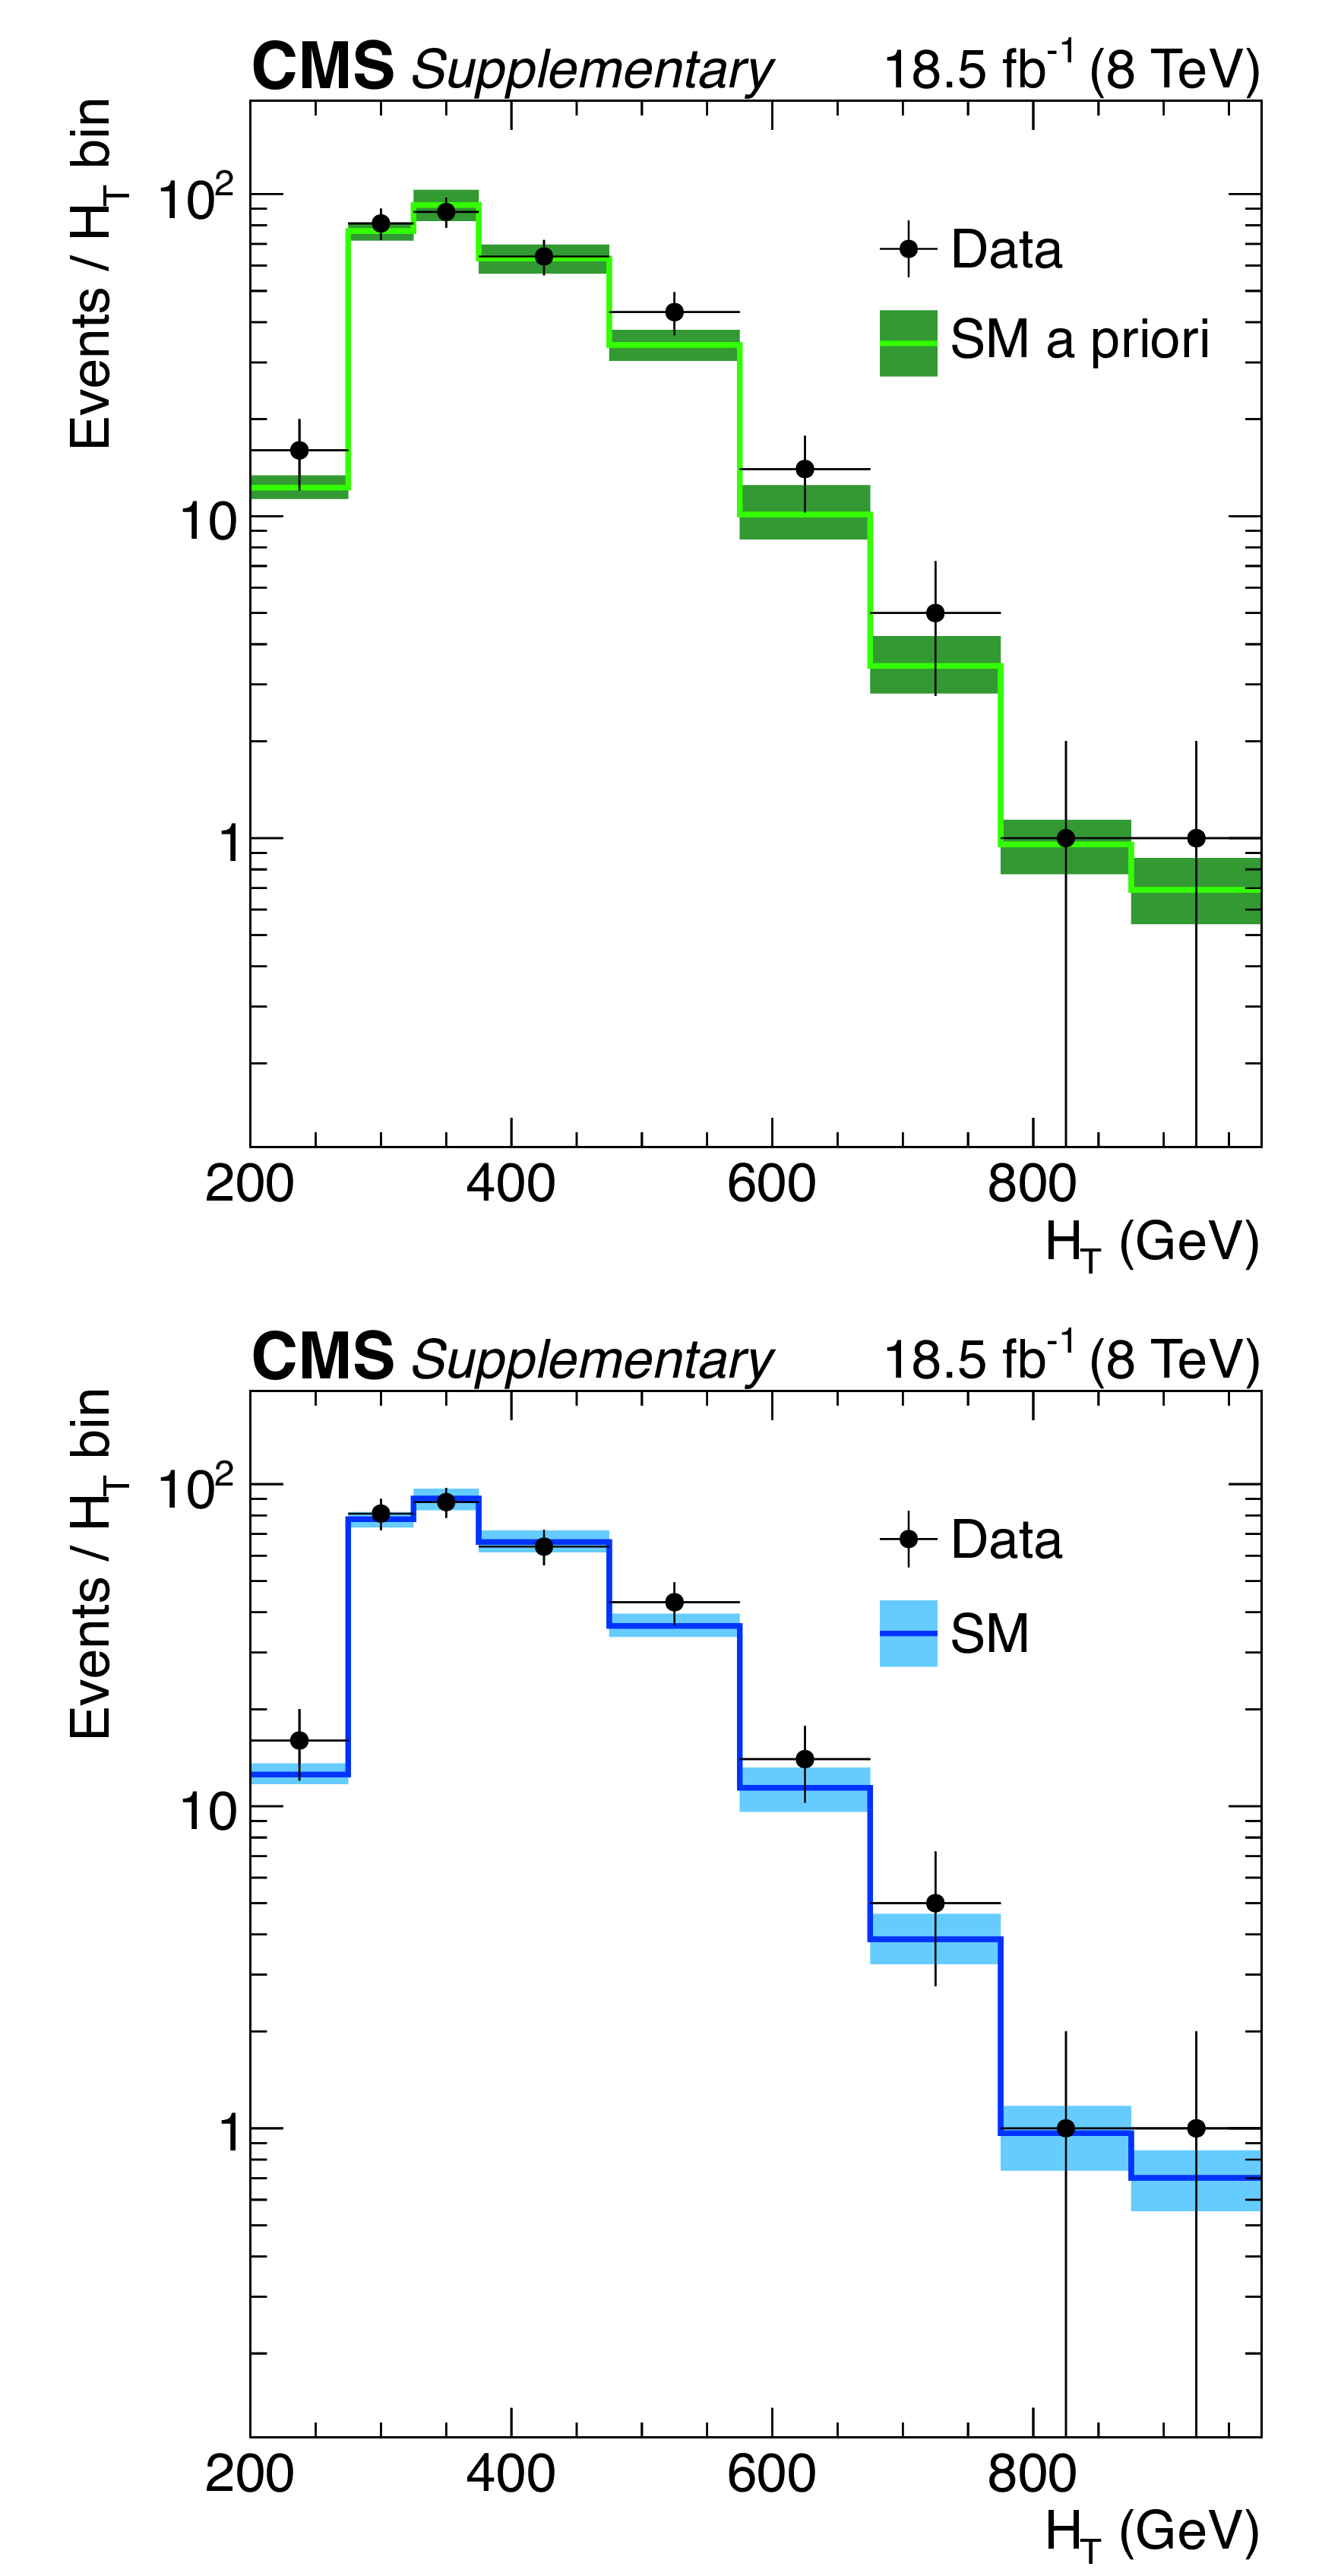
Additional Figure 1:
Candidate signal event yields observed in data (solid circles) and SM expectations with their associated uncertainties (solid lines with bands) in bins of $H_\text {T}$ for events that satisfy 2 $\geq n_\text {jet} \geq $ 3 and $n_\text {b} = $ 0. (a) SM a priori expectations. (b) SM expectations from the fit including the signal region. |

png pdf |
Additional Figure 1-a:
Candidate signal event yields observed in data (solid circles) and SM a priori expectations with their associated uncertainties (solid lines with bands) in bins of $H_\text {T}$ for events that satisfy 2 $\geq n_\text {jet} \geq $ 3 and $n_\text {b} = $ 0. |
png pdf |
Additional Figure 1-b:
Candidate signal event yields observed in data (solid circles) and SM expectations from the fit including the signal region with their associated uncertainties (solid lines with bands) in bins of $H_\text {T}$ for events that satisfy 2 $\geq n_\text {jet} \geq $ 3 and $n_\text {b} = $ 0. |

png pdf |
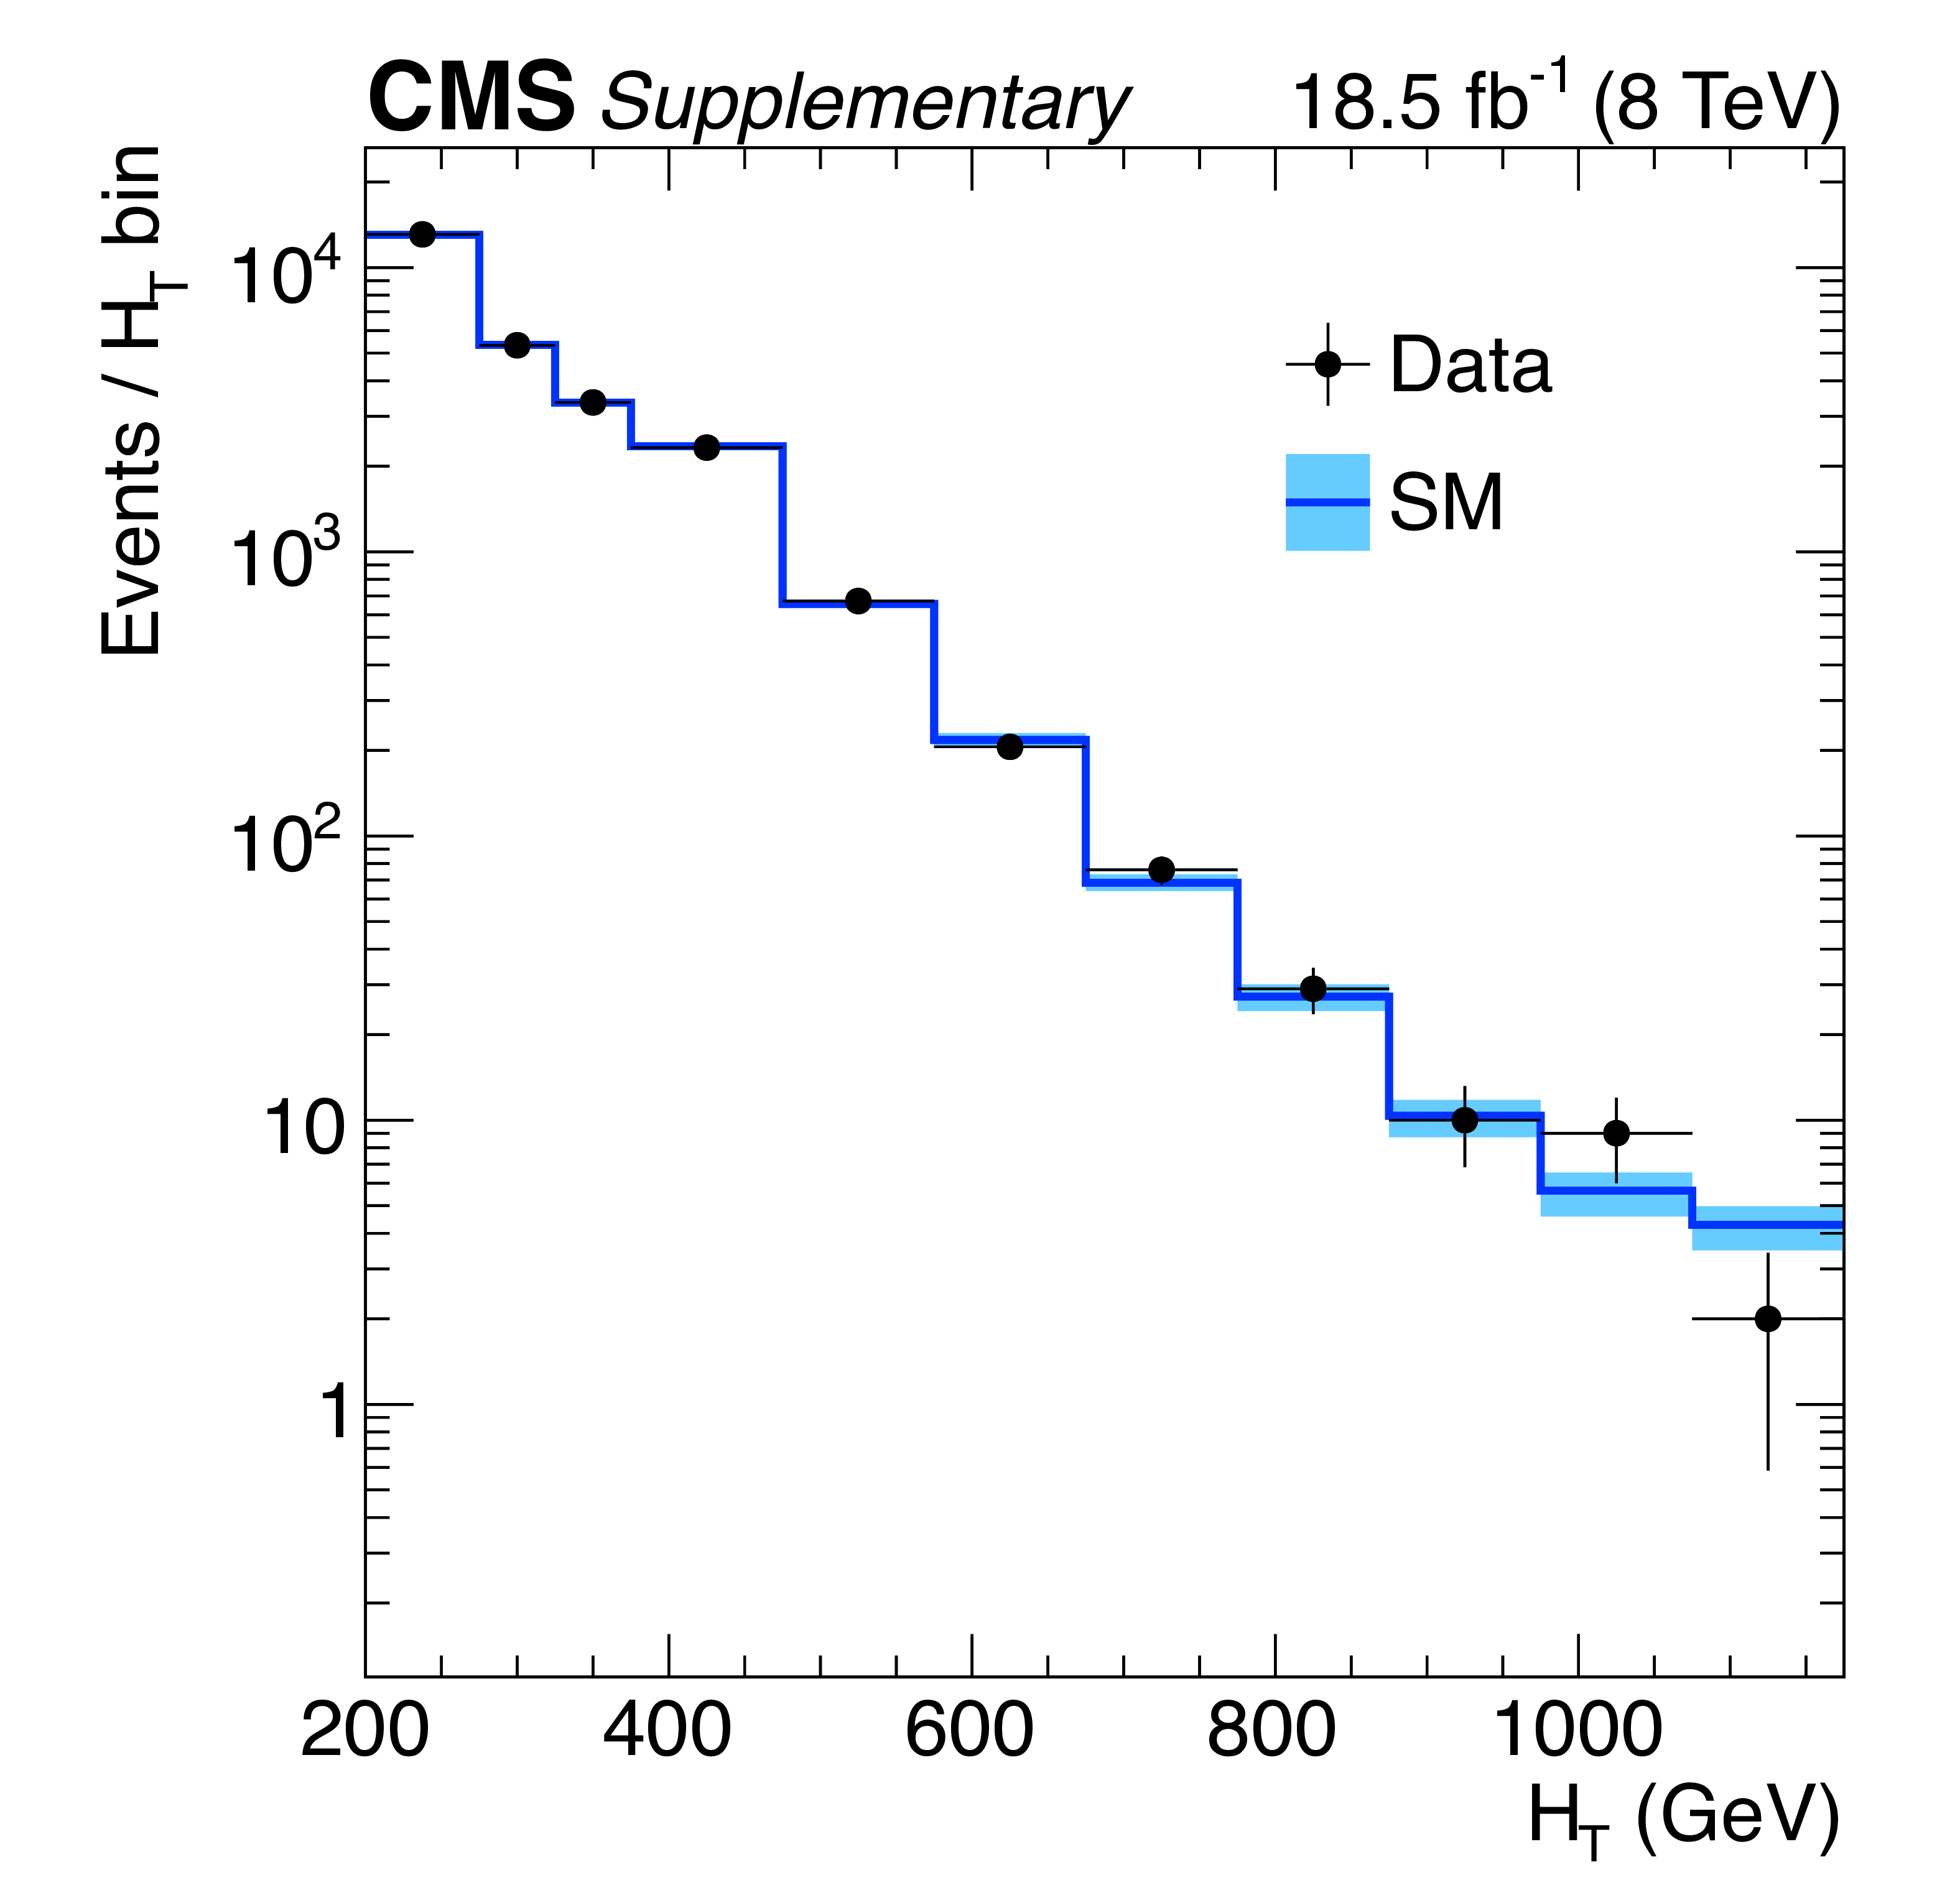
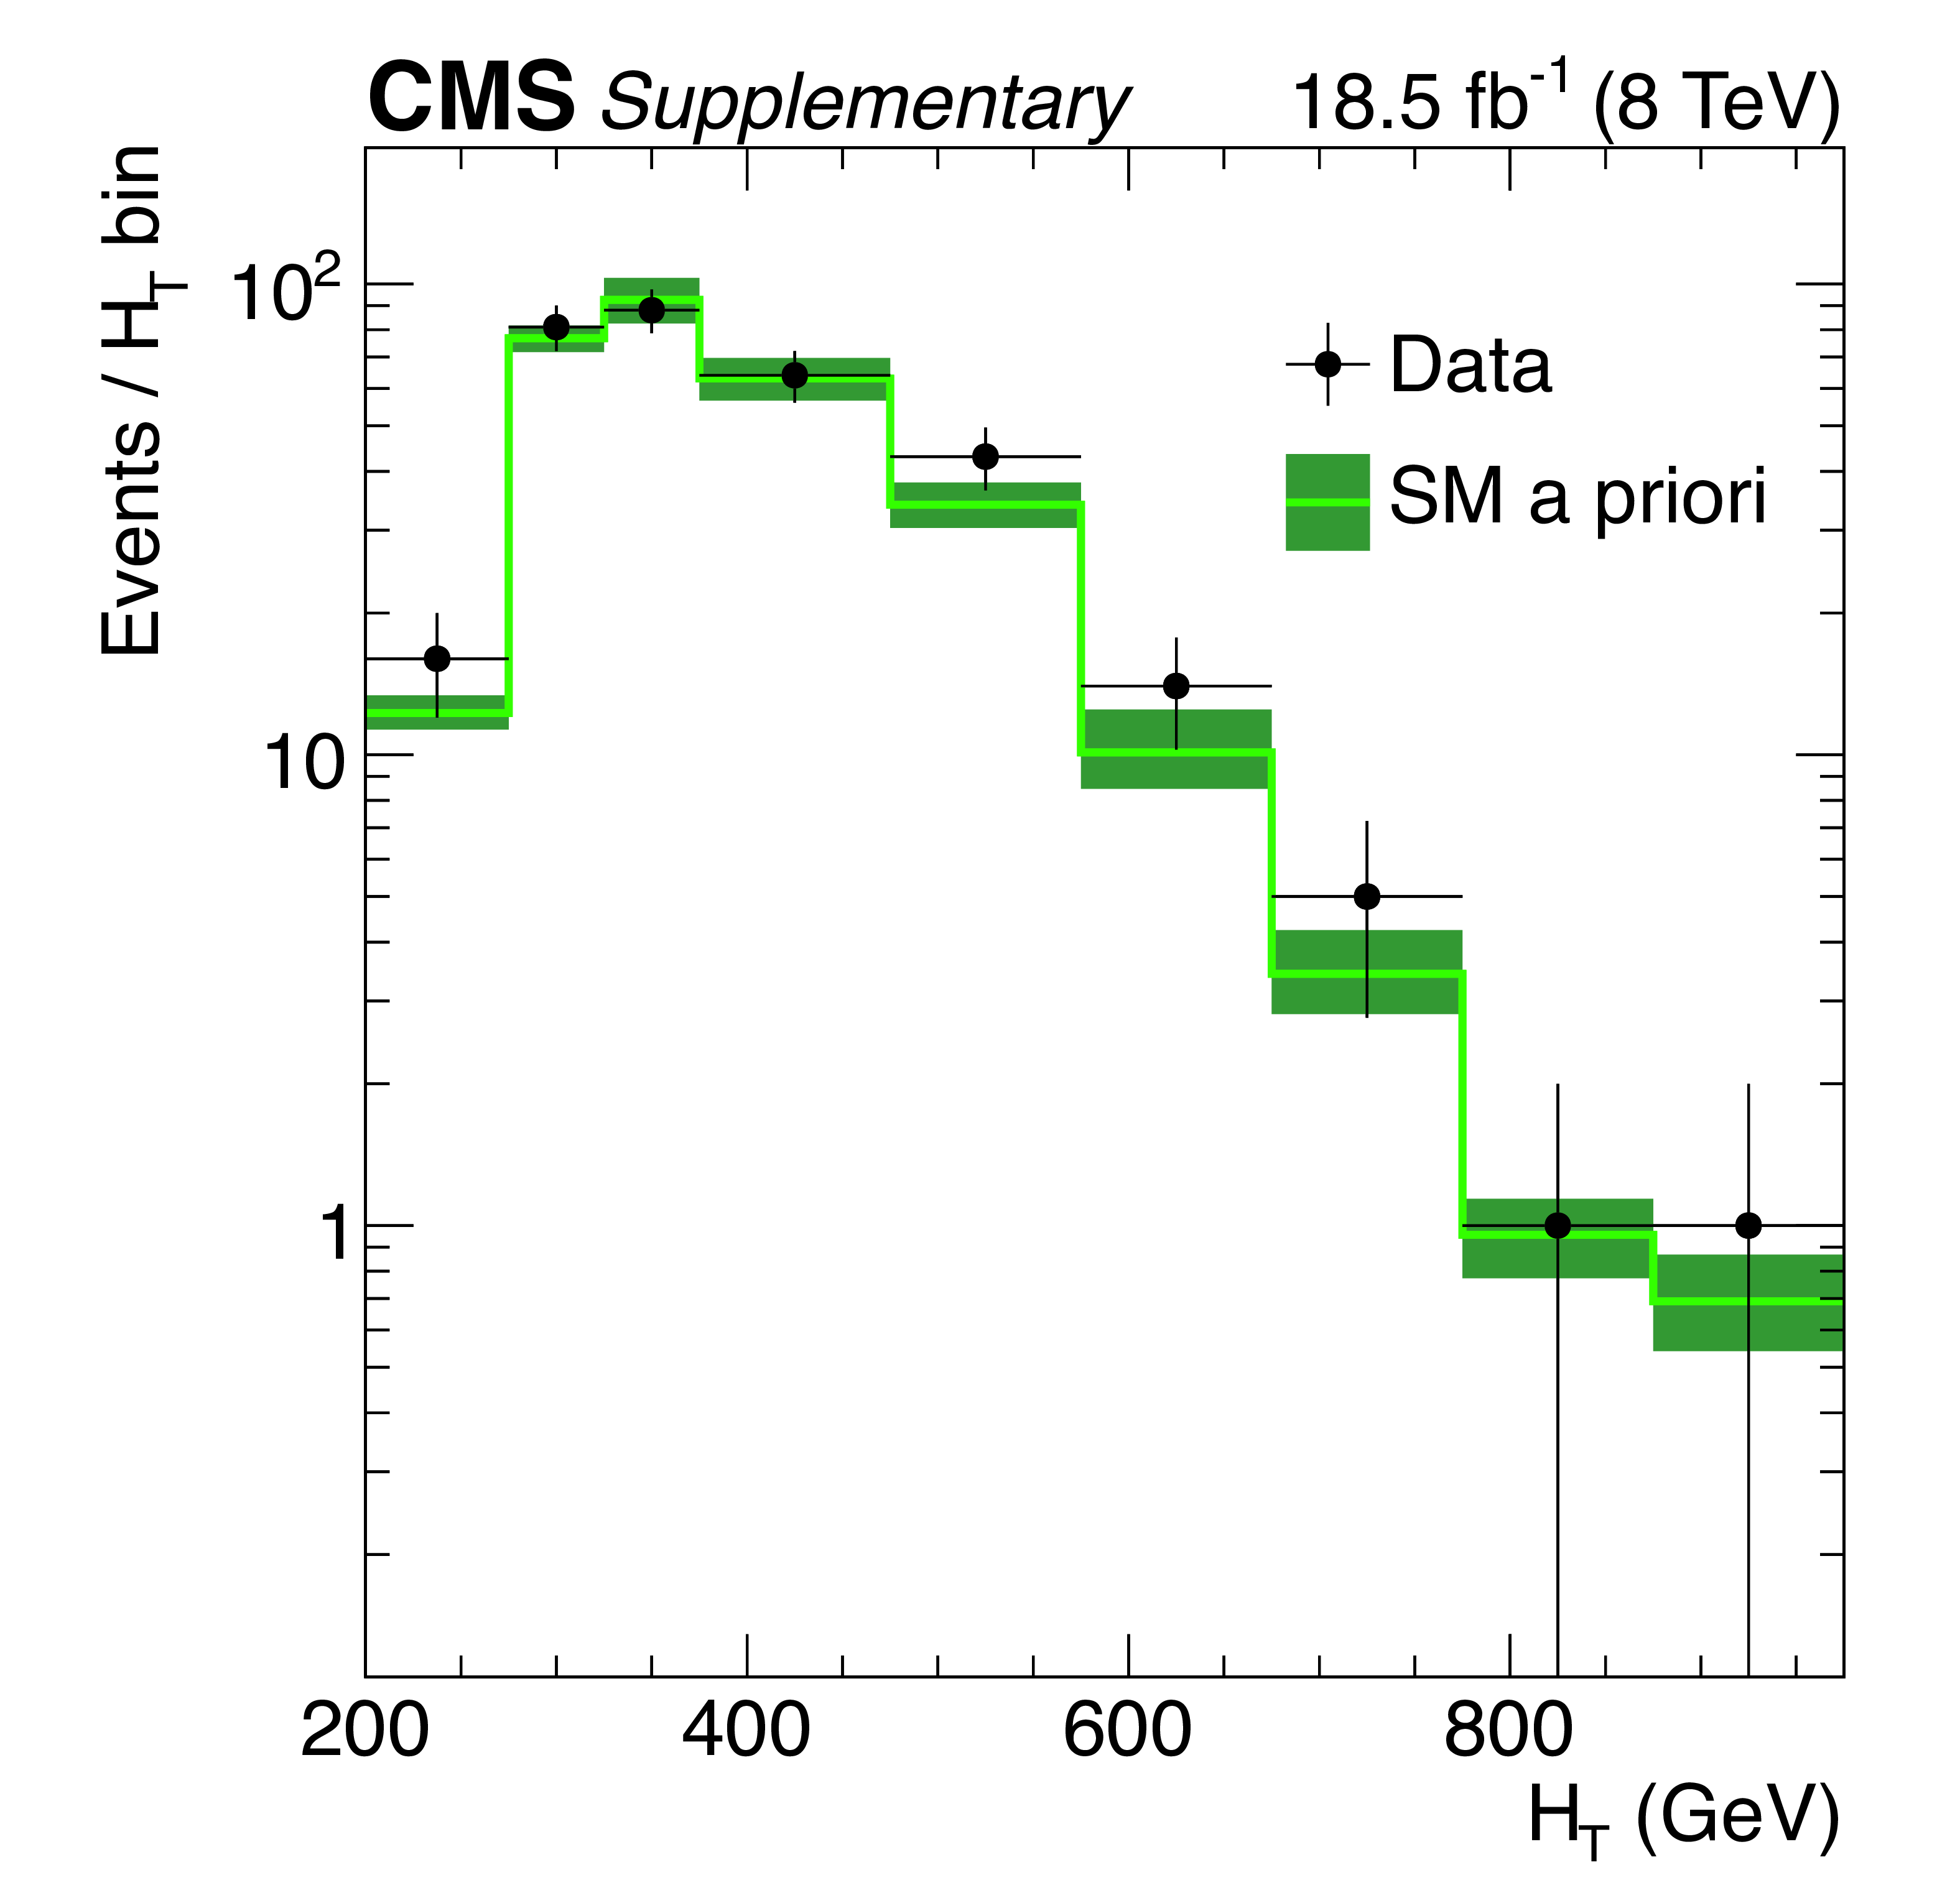
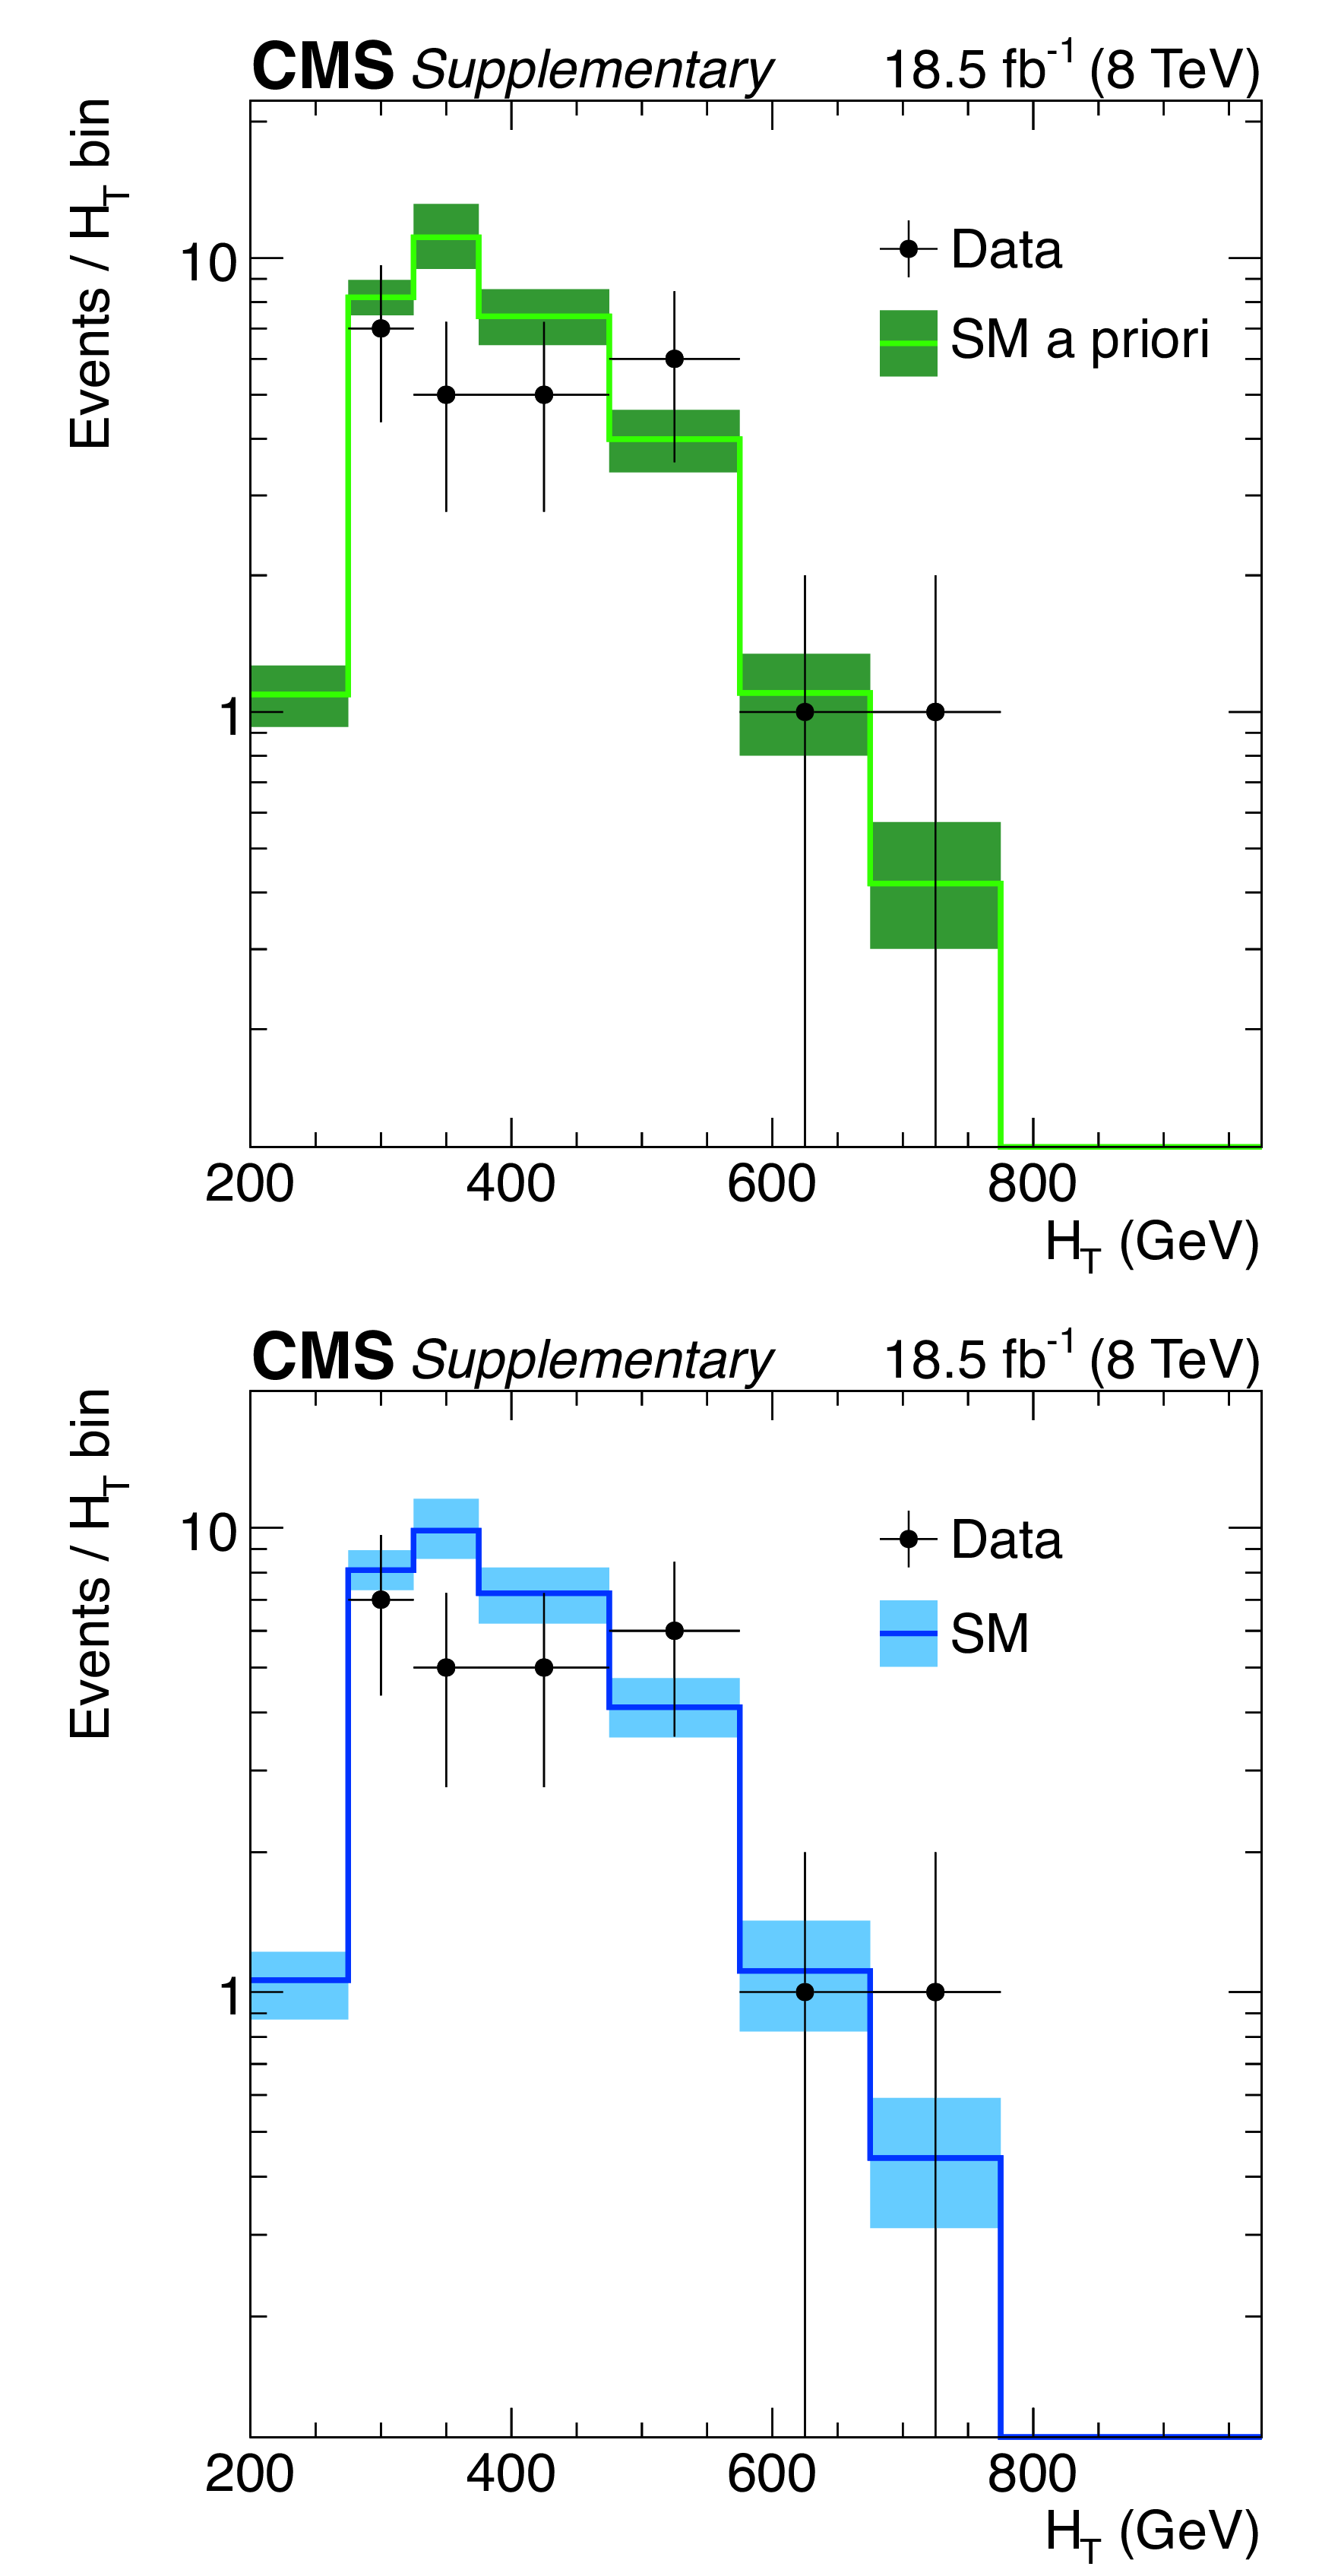
Additional Figure 2:
Candidate signal event yields observed in data (solid circles) and SM expectations with their associated uncertainties (solid lines with bands) in bins of $H_\text {T}$ for events that satisfy $n_\text {jet} \geq $ 4 and $n_\text {b} = $ 0. (a) SM a priori expectations. (b) SM expectations from the fit including the signal region. |
png pdf |
Additional Figure 2-a:
Candidate signal event yields observed in data (solid circles) and SM a priori expectations with their associated uncertainties (solid lines with bands) in bins of $H_\text {T}$ for events that satisfy $n_\text {jet} \geq $ 4 and $n_\text {b} = $ 0. |
png pdf |
Additional Figure 2-b:
Candidate signal event yields observed in data (solid circles) and SM expectations from the fit including the signal region with their associated uncertainties (solid lines with bands) in bins of $H_\text {T}$ for events that satisfy $n_\text {jet} \geq $ 4 and $n_\text {b} = $ 0. |
png pdf |
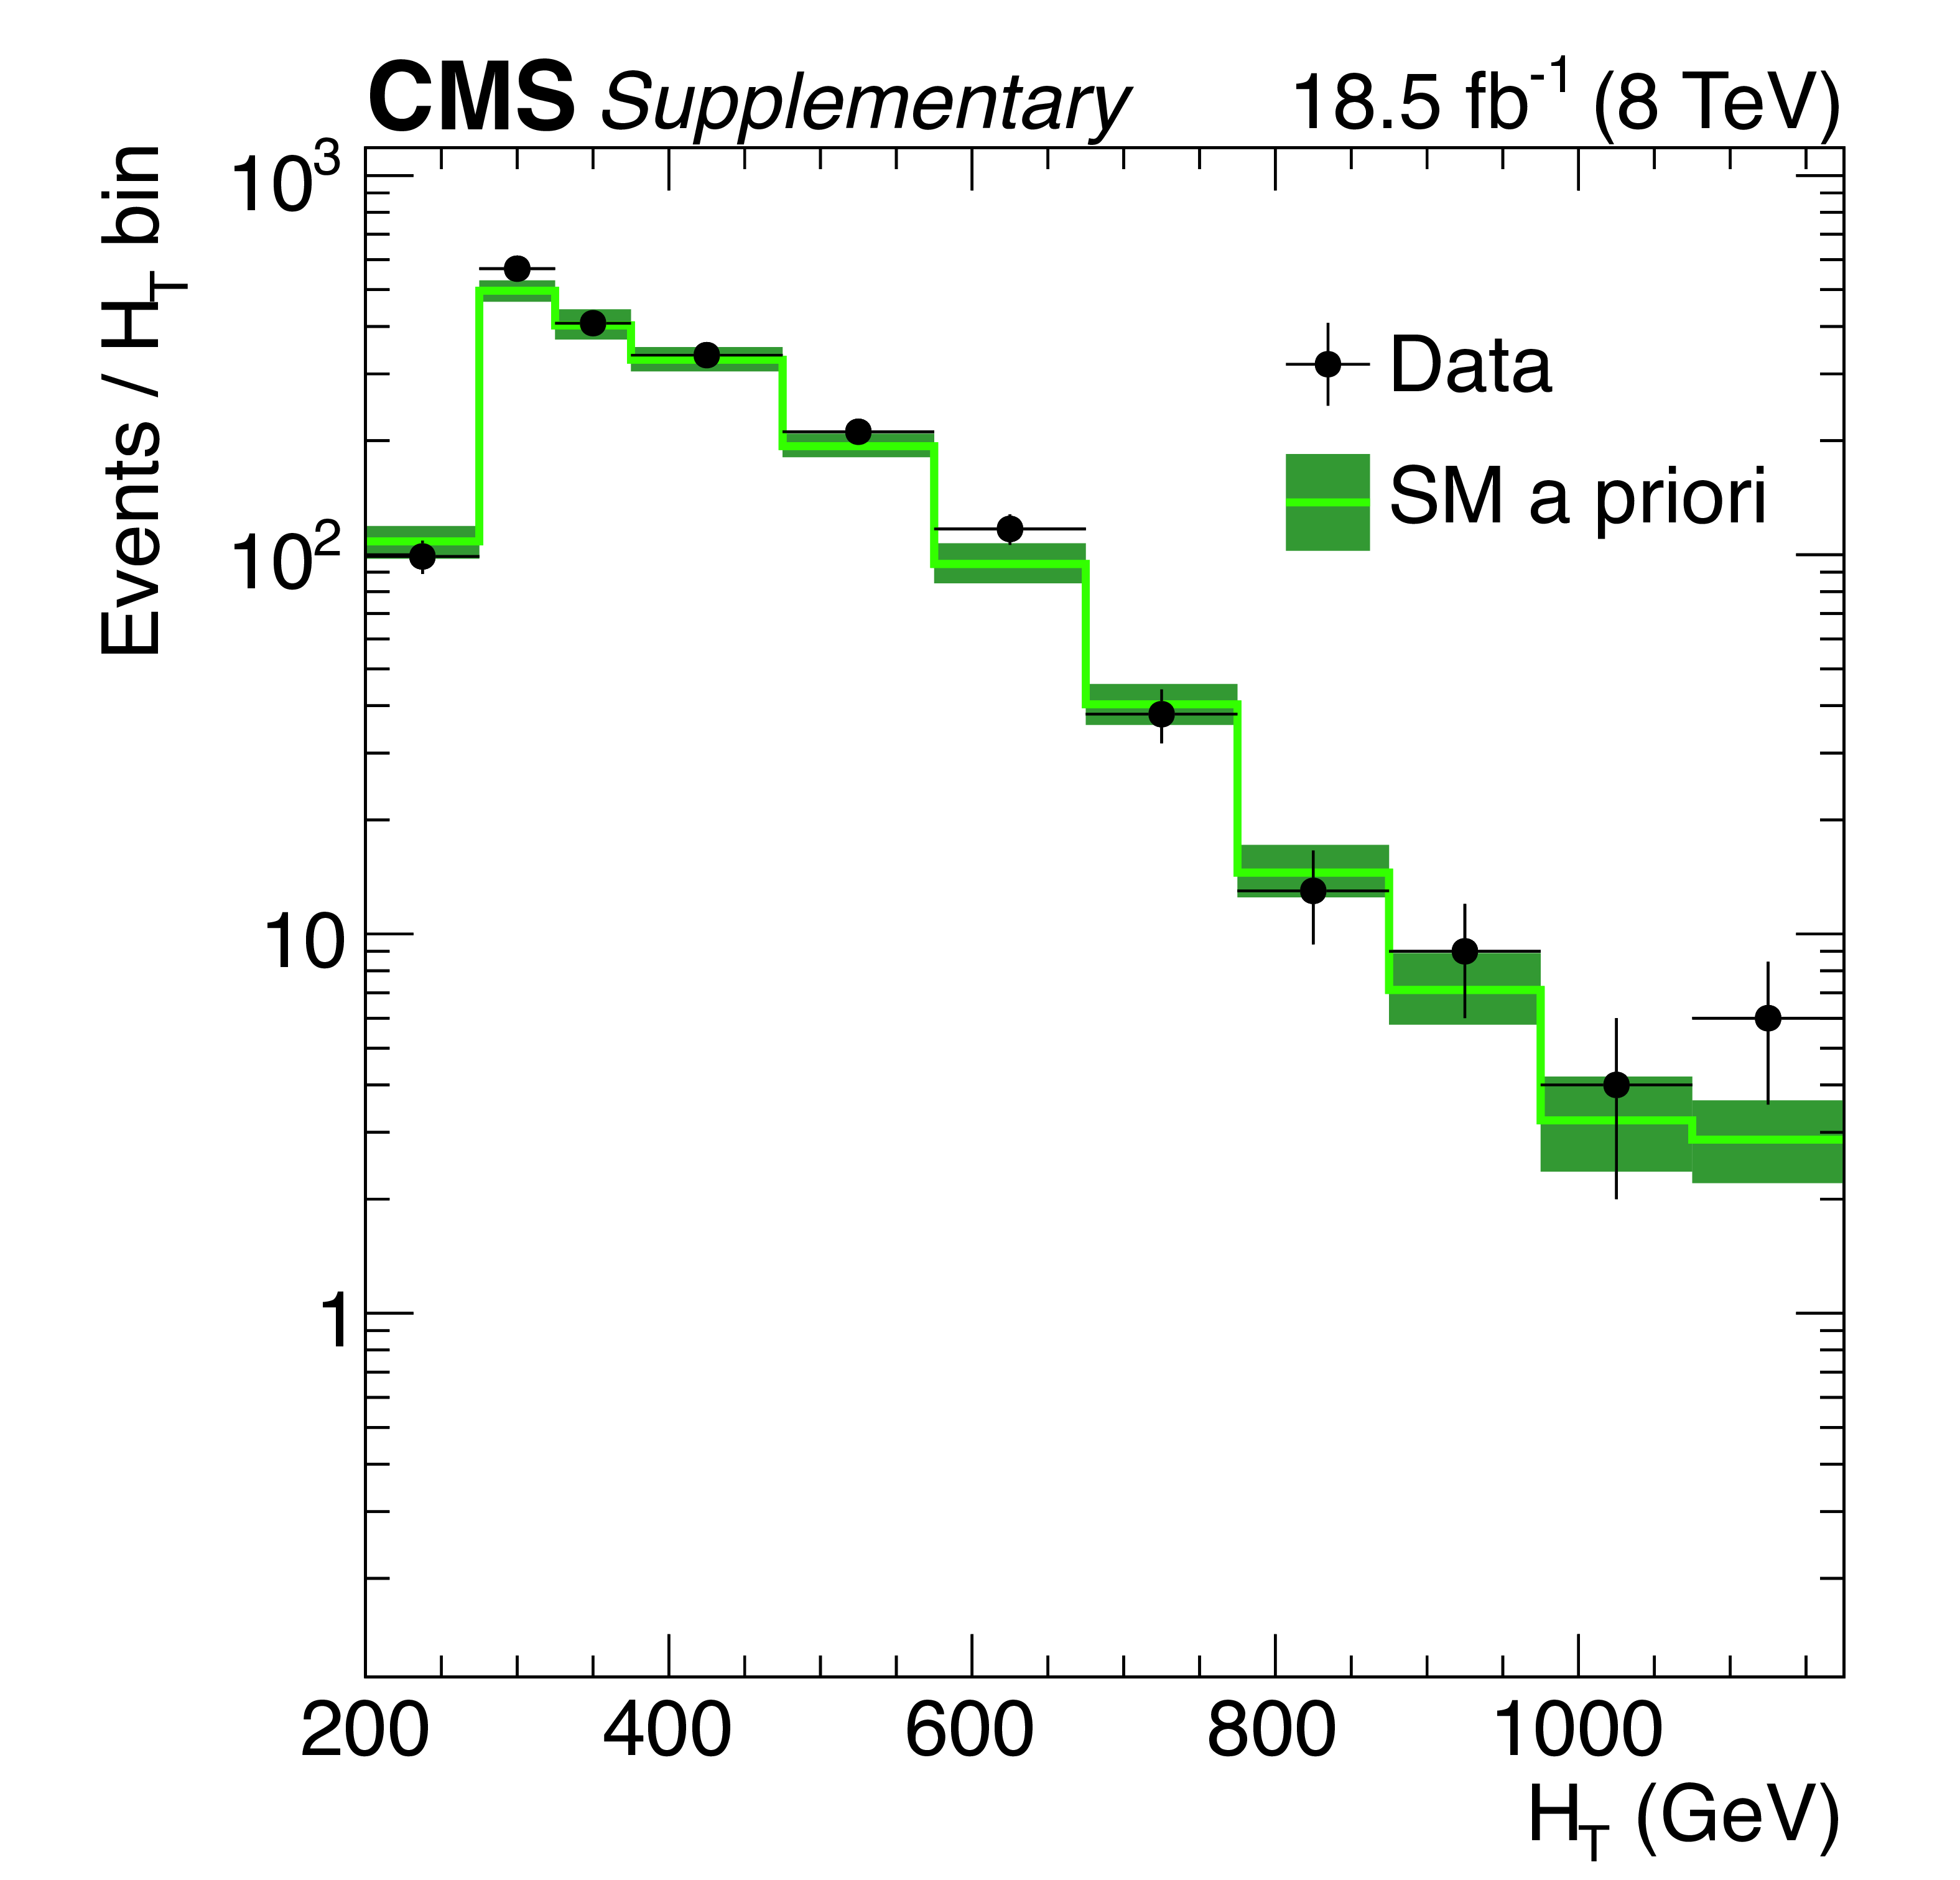
Additional Figure 3:
Candidate signal event yields observed in data (solid circles) and SM expectations with their associated uncertainties (solid lines with bands) in bins of $H_\text {T}$ for events that satisfy 2 $ \geq n_\text {jet} \geq $ 3 and $n_\text {b} = $ 1. (a) SM a priori expectations. (b) SM expectations from the fit including the signal region. |

png pdf |
Additional Figure 3-a:
Candidate signal event yields observed in data (solid circles) and SM a priori expectations with their associated uncertainties (solid lines with bands) in bins of $H_\text {T}$ for events that satisfy 2 $ \geq n_\text {jet} \geq $ 3 and $n_\text {b} = $ 1. |

png pdf |
Additional Figure 3-b:
Candidate signal event yields observed in data (solid circles) and SM expectations from the fit including the signal region with their associated uncertainties (solid lines with bands) in bins of $H_\text {T}$ for events that satisfy 2 $ \geq n_\text {jet} \geq $ 3 and $n_\text {b} = $ 1. |

png pdf |
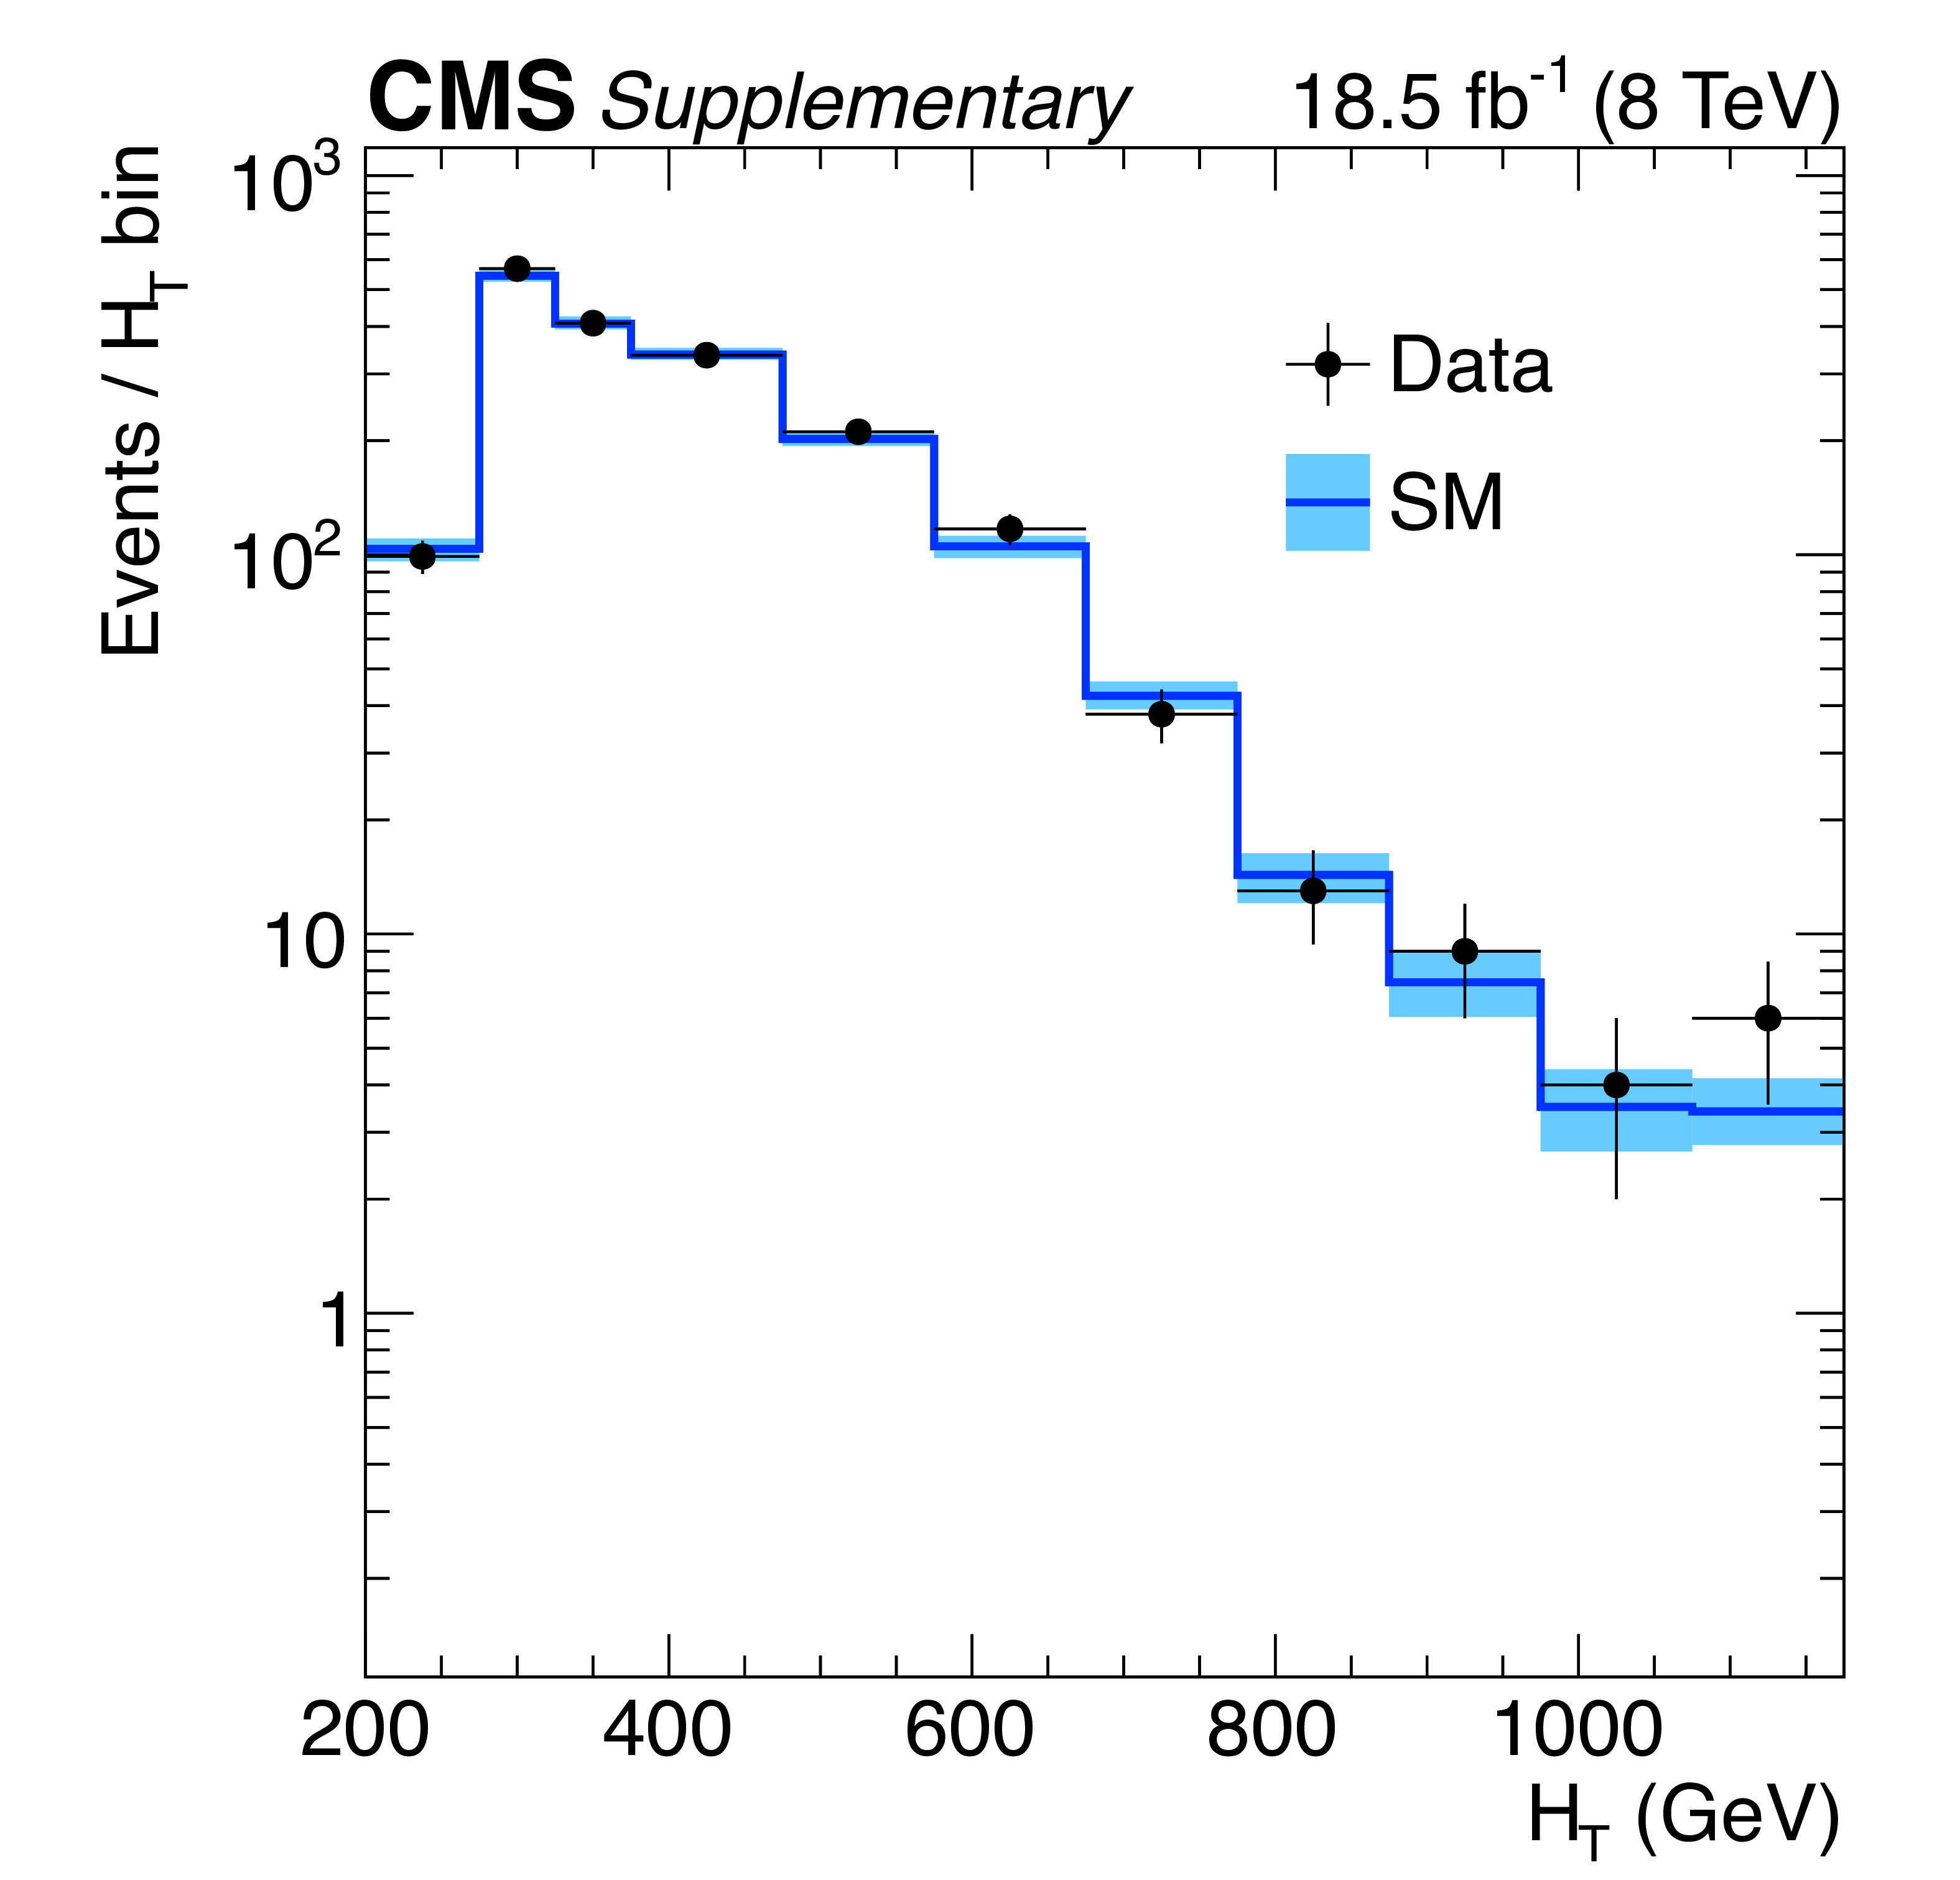
Additional Figure 4:
Candidate signal event yields observed in data (solid circles) and SM expectations with their associated uncertainties (solid lines with bands) in bins of $H_\text {T}$ for events that satisfy $n_\text {jet} \geq $ 4 and $n_\text {b} = 1$. (a) SM a priori expectations. (b) SM expectations from the fit including the signal region. |
png pdf |
Additional Figure 4-a:
Candidate signal event yields observed in data (solid circles) and SM a priori expectations with their associated uncertainties (solid lines with bands) in bins of $H_\text {T}$ for events that satisfy $n_\text {jet} \geq $ 4 and $n_\text {b} = 1$. |
png pdf |
Additional Figure 4-b:
Candidate signal event yields observed in data (solid circles) and SM expectations from the fit including the signal region with their associated uncertainties (solid lines with bands) in bins of $H_\text {T}$ for events that satisfy $n_\text {jet} \geq $ 4 and $n_\text {b} = 1$. |

png pdf |
Additional Figure 5:
Candidate signal event yields observed in data (solid circles) and SM expectations with their associated uncertainties (solid lines with bands) in bins of $H_\text {T}$ for events that satisfy 2 $ \geq n_\text {jet} \geq $ 3 and $n_\text {b} = $ 2. (a) SM a priori expectations. (b) SM expectations from the fit including the signal region. |
png pdf |
Additional Figure 5-a:
Candidate signal event yields observed in data (solid circles) and SM a priori expectations with their associated uncertainties (solid lines with bands) in bins of $H_\text {T}$ for events that satisfy 2 $ \geq n_\text {jet} \geq $ 3 and $n_\text {b} = $ 2. |
png pdf |
Additional Figure 5-b:
Candidate signal event yields observed in data (solid circles) and SM expectations from the fit including the signal region with their associated uncertainties (solid lines with bands) in bins of $H_\text {T}$ for events that satisfy 2 $ \geq n_\text {jet} \geq $ 3 and $n_\text {b} = $ 2. |
png pdf |
Additional Figure 6:
Candidate signal event yields observed in data (solid circles) and SM expectations with their associated uncertainties (solid lines with bands) in bins of $H_\text {T}$ for events that satisfy $n_\text {jet} \geq $ 4 and $n_\text {b} = $ 2. (a) SM a priori expectations. (b) SM expectations from the fit including the signal region. |
png pdf |
Additional Figure 6-a:
Candidate signal event yields observed in data (solid circles) and SM a priori expectations with their associated uncertainties (solid lines with bands) in bins of $H_\text {T}$ for events that satisfy $n_\text {jet} \geq $ 4 and $n_\text {b} = $ 2. |

png pdf |
Additional Figure 6-b:
Candidate signal event yields observed in data (solid circles) and SM expectations from the fit including the signal region with their associated uncertainties (solid lines with bands) in bins of $H_\text {T}$ for events that satisfy $n_\text {jet} \geq $ 4 and $n_\text {b} = $ 2. |
png pdf |
Additional Figure 7:
Candidate signal event yields observed in data (solid circles) and SM expectations with their associated uncertainties (solid lines with bands) in bins of $H_\text {T}$ for events that satisfy $n_\text {jet} \geq $ 4 and $n_\text {b} = $ 3. (a) SM a priori expectations. (b) SM expectations from the fit including the signal region. |

png pdf |
Additional Figure 7-a:
Candidate signal event yields observed in data (solid circles) and SM a priori expectations with their associated uncertainties (solid lines with bands) in bins of $H_\text {T}$ for events that satisfy $n_\text {jet} \geq $ 4 and $n_\text {b} = $ 3. |
png pdf |
Additional Figure 7-b:
Candidate signal event yields observed in data (solid circles) and SM expectations with their associated uncertainties (solid lines with bands) in bins of $H_\text {T}$ for events that satisfy $n_\text {jet} \geq $ 4 and $n_\text {b} = $ 3. |
png pdf |
Additional Figure 8:
Candidate signal event yields observed in data (solid circles) and SM expectations with their associated uncertainties (solid lines with bands) in bins of $H_\text {T}$ for events that satisfy $n_\text {jet} \geq $ 4 and $n_\text {b} \geq $ 4. (a) SM a priori expectations. (b) SM expectations from the fit including the signal region. |
png pdf |
Additional Figure 8-a:
Candidate signal event yields observed in data (solid circles) and SM a priori expectations with their associated uncertainties (solid lines with bands) in bins of $H_\text {T}$ for events that satisfy $n_\text {jet} \geq $ 4 and $n_\text {b} \geq $ 4. |
png pdf |
Additional Figure 8-b:
Candidate signal event yields observed in data (solid circles) and SM expectations from the fit including the signal region with their associated uncertainties (solid lines with bands) in bins of $H_\text {T}$ for events that satisfy $n_\text {jet} \geq $ 4 and $n_\text {b} \geq $ 4. |
| Additional Tables | |
png pdf |
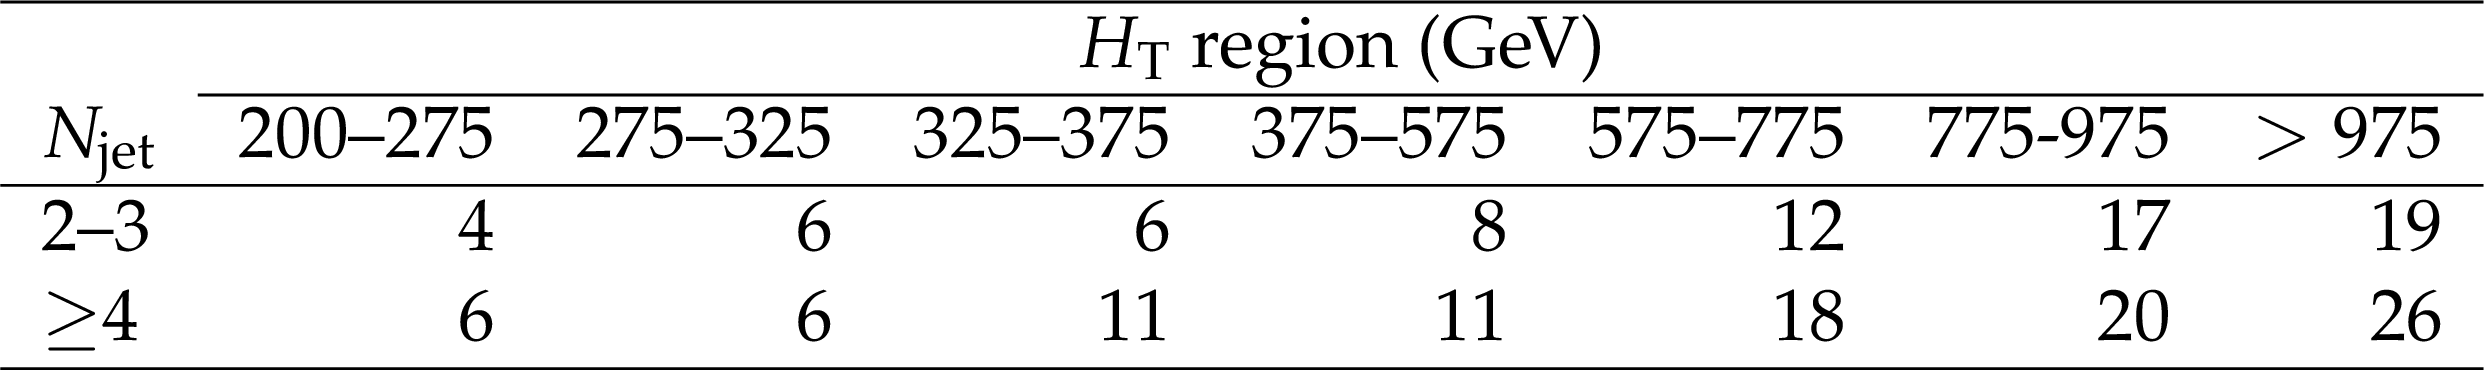
Additional Table 1:
Event categorisation, according to $n_\text {jet}$ and $n_\text {b}$, and the $H_\text {T}$ binning scheme used by the search. For each row that lists fewer than the full set of columns, the final entry represents values obtained for an open final $H_\text {T}$ bin. |
png pdf |
Additional Table 2:
Relative expected background contributions (%) in the signal region per ($n_\text {jet}$, $n_\text {b}$) event category per $H_\text {T}$ bin as determined from simulation. The individual contributions are shown for $ \mathrm{ Z } \rightarrow \nu \bar{\nu} $+jets, W+jets, and ${\mathrm{ t } {}\mathrm{ \bar{t} } } $. Contributions from the SM processes of single top quark, diboson, Drell-Yan, and ${\mathrm{ t } {}\mathrm{ \bar{t} } }$+gauge boson (W, Z, H) production are collectively labelled "Residual SM''. QCD multijet production is considered to be negligible. For each row that lists fewer than the full set of columns, the final entry represents values obtained for an open final $H_\text {T}$ bin. |
png pdf |
Additional Table 3:
Binned yields in the $\mu $+jets control sample, for events categorised according to $n_\text {jet}$, $n_\text {b}$, and $H_\text {T}$, and the corresponding SM expectations (labelled "SM'') as obtained from a combined fit to the control and signal regions under the background-only hypothesis. The quoted uncertainties include both statistical and systematic components. For each row that lists fewer than the full set of columns, the final entry represents values obtained for an open final $H_\text {T}$ bin. |

png pdf |
Additional Table 4:
Binned yields in the $\mu \mu $+jets control sample, for events categorised according to $n_\text {jet}$, $n_\text {b}$, and $H_\text {T}$, and the corresponding SM expectations (labelled "SM'') as obtained from a combined fit to the control and signal regions under the background-only hypothesis. The quoted uncertainties include both statistical and systematic components. For each row that lists fewer than the full set of columns, the final entry represents values obtained for an open final $H_\text {T}$ bin. |

png pdf |
Additional Table 5:
Binned yields in the $\gamma $+jets control sample, for events categorised according to $n_\text {jet}$, $n_\text {b}$, and $H_\text {T}$, and the corresponding SM expectations (labelled "SM'') as obtained from a combined fit to the control and signal regions under the background-only hypothesis. The quoted uncertainties include both statistical and systematic components. For each row that lists fewer than the full set of columns, the final entry represents values obtained for an open final $H_\text {T}$ bin. |
png pdf |
Additional Table 6:
Cumulative signal acceptance times efficiency (%) for the event selection criteria that define the signal region, for models involving the pair production of top squarks and the following decay modes: a loop-induced, flavour-changing neutral current decay to a charm quark and a neutralino, $\tilde{ \mathrm{ t } } \to \mathrm{c} \tilde{\chi}^0_1 $, or a four-body decay, $\tilde{ \mathrm{ t } } \to \mathrm{ b }\mathrm{ f \bar{f}' } \tilde{\chi}^0_1 $, where b is a bottom quark with $\mathrm{f}$ and $\mathrm{\bar{f}'}$ fermions from, for example, an off-shell W boson decay. The models are defined by the masses (GeV) of the top squark and the neutralino, ($m_{ \tilde{ \mathrm{ t } } }$, $m_{\tilde{\chi}^0_1 }$). |
| References | ||||
| 1 | Y. A. Gol'fand and E. P. Likhtman | Extension of the Algebra of Poincare Group Generators and Violation of p Invariance | JEPTL 13 (1971) 323 | |
| 2 | J. Wess and B. Zumino | Supergauge transformations in four dimensions | Nucl. Phys. B 70 (1974) 39 | |
| 3 | H. P. Nilles | Supersymmetry, supergravity and particle physics | Phys. Reports 110 (1984) 1 | |
| 4 | H. E. Haber and G. L. Kane | The search for supersymmetry: Probing physics beyond the standard model | Phys. Reports 117 (1987) 75 | |
| 5 | R. Barbieri, S. Ferrara, and C. A. Savoy | Gauge models with spontaneously broken local supersymmetry | PLB 119 (1982) 343 | |
| 6 | S. Dawson, E. Eichten, and C. Quigg | Search for supersymmetric particles in hadron-hadron collisions | PRD 31 (1985) 1581 | |
| 7 | E. Witten | Dynamical breaking of supersymmetry | Nucl. Phys. B 188 (1981) 513 | |
| 8 | S. Dimopoulos and H. Georgi | Softly broken supersymmetry and SU(5) | Nucl. Phys. B 193 (1981) 150 | |
| 9 | ATLAS Collaboration | Observation of a new particle in the search for the Standard Model Higgs boson with the ATLAS detector at the LHC | PLB 716 (2012) 1 | 1207.7214 |
| 10 | CMS Collaboration | Observation of a new boson with mass near 125 GeV in pp collisions at $ \sqrt{s} = $ 7 and 8 TeV | JHEP 06 (2013) 081 | CMS-HIG-12-036 1303.4571 |
| 11 | R. Barbieri and D. Pappadopulo | S-particles at their naturalness limits | JHEP 10 (2009) 061 | 0906.4546 |
| 12 | G. R. Farrar and P. Fayet | Phenomenology of the production, decay, and detection of new hadronic states associated with supersymmetry | PLB 76 (1978) 575 | |
| 13 | C. Boehm, A. Djouadi, and Y. Mambrini | Decays of the lightest top squark | PRD 61 (2000) 095006 | hep-ph/9907428 |
| 14 | C. Boehm, A. Djouadi, and M. Drees | Light scalar top quarks and supersymmetric dark matter | PRD 62 (2000) 035012 | hep-ph/9911496 |
| 15 | C. Balazs, M. S. Carena, and C. E. M. Wagner | Dark matter, light stops and electroweak baryogenesis | PRD 70 (2004) 015007 | hep-ph/0403224 |
| 16 | S. P. Martin | Compressed supersymmetry and natural neutralino dark matter from top squark-mediated annihilation to top quarks | PRD 75 (2007) 115005 | hep-ph/0703097 |
| 17 | S. P. Martin | Top squark-mediated annihilation scenario and direct detection of dark matter in compressed supersymmetry | PRD 76 (2007) 095005 | 0707.2812 |
| 18 | M. Carena, A. Freitas, and C. E. M. Wagner | Light stop searches at the LHC in events with one hard photon or jet and missing energy | JHEP 10 (2008) 109 | 0808.2298 |
| 19 | R. Grober, M. M. Muhlleitner, E. Popenda, and A. Wlotzka | Light stop decays: implications for LHC searches | EPJC 75 (2015) 420 | 1408.4662 |
| 20 | R. Grober, M. Muhlleitner, E. Popenda, and A. Wlotzka | Light stop decays into $ \text{Wb}\chi^0_1 $ near the kinematic threshold | PLB 747 (2015) 144 | 1502.05935 |
| 21 | ATLAS Collaboration | Search for new phenomena in final states with an energetic jet and large missing transverse momentum in pp collisions at $ \sqrt{s} = $ 13 TeV using the ATLAS detector | PRD 94 (2016) 032005 | 1604.07773 |
| 22 | ATLAS Collaboration | Search for pair-produced third-generation squarks decaying via charm quarks or in compressed supersymmetric scenarios in pp collisions at $ \sqrt{s} = $ 8 TeV with the ATLAS detector | PRD 90 (2014) 052008 | 1407.0608 |
| 23 | CMS Collaboration | Searches for third-generation squark production in fully hadronic final states in proton-proton collisions at $ \sqrt{s} = $ 8 TeV | JHEP 06 (2015) 116 | CMS-SUS-14-001 1503.08037 |
| 24 | CMS Collaboration | CMS Luminosity Based on Pixel Cluster Counting - Summer 2012 Update | CDS | |
| 25 | CMS Collaboration | Search for supersymmetry in pp collisions at 7 TeV in events with jets and missing transverse energy | PLB 698 (2011) 196 | CMS-SUS-10-003 1101.1628 |
| 26 | CMS Collaboration | Search for Supersymmetry at the LHC in Events with Jets and Missing Transverse Energy | PRL 107 (2011) 221804 | CMS-SUS-11-003 1109.2352 |
| 27 | CMS Collaboration | Search for supersymmetry in final states with missing transverse energy and 0, 1, 2, or at least 3 b-quark jets in 7 TeV pp collisions using the variable $ \alpha_\text{T} $ | JHEP 01 (2013) 077 | CMS-SUS-11-022 1210.8115 |
| 28 | CMS Collaboration | Search for supersymmetry in hadronic final states with missing transverse energy using the variables $ \alpha_\text{T} $ and b-quark multiplicity in pp collisions at $ \sqrt{s} = $ 8 TeV | EPJC 73 (2013) 2568 | CMS-SUS-12-028 1303.2985 |
| 29 | ATLAS Collaboration | Multi-channel search for squarks and gluinos in $ \sqrt{s} = $ 7 TeV pp collisions with the ATLAS detector | EPJC 73 (2013) 2362 | 1212.6149 |
| 30 | ATLAS Collaboration | Search for a Supersymmetric Partner to the Top Quark in Final States with Jets and Missing Transverse Momentum at $ \sqrt{s} = $ 7 TeV with the ATLAS Detector | PRL 109 (2012) 211802 | 1208.1447 |
| 31 | ATLAS Collaboration | Search for squarks and gluinos using final states with jets and missing transverse momentum with the ATLAS detector in $ \sqrt{s} = $ 7 TeV proton-proton collisions | PLB 710 (2012) 67 | 1109.6572 |
| 32 | ATLAS Collaboration | Search for top and bottom squarks from gluino pair production in final states with missing transverse energy and at least three b-jets with the ATLAS detector | EPJC 72 (2012) 2174 | 1207.4686 |
| 33 | ATLAS Collaboration | Hunt for new phenomena using large jet multiplicities and missing transverse momentum with ATLAS in 4.7 fb$ ^{-1} $ of $ \sqrt{s} = $ 7 TeV proton-proton collisions | JHEP 07 (2012) 167 | 1206.1760 |
| 34 | ATLAS Collaboration | Search for Scalar Bottom Quark Pair Production with the ATLAS Detector in pp Collisions at $ \sqrt{s} = $ 7 TeV | PRL 108 (2012) 181802 | 1112.3832 |
| 35 | ATLAS Collaboration | Search for new phenomena in final states with large jet multiplicities and missing transverse momentum using $ \sqrt{s} = $ 7 TeV pp collisions with the ATLAS detector | JHEP 11 (2011) 099 | 1110.2299 |
| 36 | ATLAS Collaboration | Search for strong production of supersymmetric particles in final states with missing transverse momentum and at least three b-jets at $ \sqrt{s} = $ 8 TeV proton-proton collisions with the ATLAS detector | JHEP 10 (2014) 24 | 1407.0600 |
| 37 | ATLAS Collaboration | Search for squarks and gluinos with the ATLAS detector in final states with jets and missing transverse momentum using $ \sqrt{s} = $ 8 TeV proton--proton collision data | JHEP 09 (2014) 176 | 1405.7875 |
| 38 | ATLAS Collaboration | Search for direct third-generation squark pair production in final states with missing transverse momentum and two b-jets in $ \sqrt{s} = $ 8 TeV pp collisions with the ATLAS detector | JHEP 10 (2013) 189 | 1308.2631 |
| 39 | ATLAS Collaboration | Search for direct pair production of the top squark in all-hadronic final states in proton-proton collisions at $ \sqrt{s} = $ 8 TeV with the ATLAS detector | JHEP 09 (2014) 015 | 1406.1122 |
| 40 | ATLAS Collaboration | Search for new phenomena in final states with large jet multiplicities and missing transverse momentum with ATLAS using $ \sqrt{s} = $ 13 TeV proton--proton collisions | PLB 757 (2016) 334 | 1602.06194 |
| 41 | ATLAS Collaboration | Search for pair production of gluinos decaying via stop and sbottom in events with $ b $-jets and large missing transverse momentum in pp collisions at $ \sqrt{s} = $ 13 TeV with the ATLAS detector | PRD 94 (2016) 032003 | 1605.09318 |
| 42 | ATLAS Collaboration | Search for squarks and gluinos in final states with jets and missing transverse momentum at $ \sqrt{s} = $ 13 TeV with the ATLAS detector | EPJC 76 (2016) 392 | 1605.03814 |
| 43 | CMS Collaboration | Search for supersymmetry in events with b-quark jets and missing transverse energy in pp collisions at 7 TeV | PRD 86 (2012) 072010 | CMS-SUS-12-003 1208.4859 |
| 44 | CMS Collaboration | Search for supersymmetry in hadronic final states using $M_{\mathrm{T2}} $ in pp collisions at $ \sqrt{s} = $ 7 TeV | JHEP 10 (2012) 018 | CMS-SUS-12-002 1207.1798 |
| 45 | CMS Collaboration | Search for New Physics in the Multijet and Missing Transverse Momentum Final State in Proton-Proton Collisions at $ \sqrt{s} = $ 7 TeV | PRL 109 (2012) 17180 | CMS-SUS-12-011 1207.1898 |
| 46 | CMS Collaboration | Inclusive search for squarks and gluinos in pp collisions at $ \sqrt{s} = $ 7 TeV | PRD 85 (2012) 012004 | CMS-SUS-10-009 1107.1279 |
| 47 | CMS Collaboration | Search for supersymmetry with razor variables in pp collisions at $ \sqrt{s} = $ 7 TeV | PRD 90 (2014) 112001 | CMS-SUS-12-005 1405.3961 |
| 48 | CMS Collaboration | Inclusive search for supersymmetry using the razor variables in pp collisions at $ \sqrt{s} = $ 7 TeV | PRL 111 (2013) 081802 | CMS-SUS-11-024 1212.6961 |
| 49 | CMS Collaboration | Search for supersymmetry using razor variables in events with $ b $-tagged jets in pp collisions at $ \sqrt{s} = $ 8 TeV | PRD 91 (2015) 052018 | CMS-SUS-13-004 1502.00300 |
| 50 | CMS Collaboration | Search for new physics in the multijet and missing transverse momentum final state in proton-proton collisions at $ \sqrt{s} = $ 8 TeV | JHEP 06 (2014) 055 | CMS-SUS-13-012 1402.4770 |
| 51 | CMS Collaboration | Search for gluino mediated bottom- and top-squark production in multijet final states in pp collisions at 8 TeV | PLB 725 (2013) 243 | CMS-SUS-12-024 1305.2390 |
| 52 | CMS Collaboration | Searches for supersymmetry using the $ M_{\mathrm{T2}} $ variable in hadronic events produced in pp collisions at 8 TeV | JHEP 05 (2015) 078 | CMS-SUS-13-019 1502.04358 |
| 53 | CMS Collaboration | Search for supersymmetry in the multijet and missing transverse momentum final state in pp collisions at 13 TeV | PLB 758 (2016) 152 | CMS-SUS-15-002 1602.06581 |
| 54 | CMS Collaboration | Search for new physics with the $ M_{\mathrm{T2}} $ variable in all-jets final states produced in pp collisions at $ \sqrt{s} = $ 13 TeV | JHEP 10 (2016) 006 | CMS-SUS-15-003 1603.04053 |
| 55 | ATLAS Collaboration | ATLAS Run 1 searches for direct pair production of third-generation squarks at the Large Hadron Collider | EPJC 75 (2015) 510 | 1506.08616 |
| 56 | CMS Collaboration | Search for direct pair production of scalar top quarks in the single- and dilepton channels in proton-proton collisions at $ \sqrt{s} = $ 8 TeV | JHEP 07 (2016) 027 | CMS-SUS-14-015 1602.03169 |
| 57 | ATLAS Collaboration | Search for top squarks in final states with one isolated lepton, jets, and missing transverse momentum in $ \sqrt{s} = $ 13 TeV pp collisions with the ATLAS detector | PRD 94 (2016) 052009 | 1606.03903 |
| 58 | J. Alwall, P. Schuster, and N. Toro | Simplified models for a first characterization of new physics at the LHC | PRD 79 (2009) 075020 | 0810.3921 |
| 59 | J. Alwall, M.-P. Le, M. Lisanti, and J. G. Wacker | Model-independent jets plus missing energy searches | PRD 79 (2009) 015005 | 0809.3264 |
| 60 | LHC New Physics Working Group Collaboration | Simplified models for LHC new physics searches | JPG 39 (2012) 105005 | 1105.2838 |
| 61 | CMS Collaboration | Data Parking and Data Scouting at the CMS Experiment | CDS | |
| 62 | CMS Collaboration | Description and performance of track and primary-vertex reconstruction with the CMS tracker | JINST 9 (2014) P10009 | CMS-TRK-11-001 1405.6569 |
| 63 | CMS Collaboration | Performance of CMS muon reconstruction in pp collision events at $ \sqrt{s} = $ 7 TeV | JINST 7 (2012) P10002 | |
| 64 | CMS Collaboration | The CMS experiment at the CERN LHC | JINST 3 (2008) S08004 | CMS-00-001 |
| 65 | L. Randall and D. Tucker-Smith | Dijet Searches for Supersymmetry at the Large Hadron Collider | PRL 101 (2008) 221803 | 0806.1049 |
| 66 | CMS Collaboration | Performance of electron reconstruction and selection with the CMS detector in proton-proton collisions at $ \sqrt{s} = $ 8 TeV | JINST 10 (2015) P06005 | CMS-EGM-13-001 1502.02701 |
| 67 | CMS Collaboration | Search for top-squark pair production in the single-lepton final state in pp collisions at $ \sqrt{s} = $ 8 TeV | EPJC 73 (2013) 2677 | CMS-SUS-13-011 1308.1586 |
| 68 | CMS Collaboration | Performance of photon reconstruction and identification with the CMS detector in proton-proton collisions at $ \sqrt{s} = $ 8 TeV | JINST 10 (2015) P08010 | CMS-EGM-14-001 1502.02702 |
| 69 | M. Cacciari, G. P. Salam, and G. Soyez | The anti-$ k_t $ jet clustering algorithm | JHEP 04 (2008) 063 | 0802.1189 |
| 70 | CMS Collaboration | Determination of jet energy calibration and transverse momentum resolution in CMS | JINST 6 (2011) P11002 | CMS-JME-10-011 1107.4277 |
| 71 | CMS Collaboration | Identification of b-quark jets with the CMS experiment | JINST 8 (2013) P04013 | CMS-BTV-12-001 1211.4462 |
| 72 | CMS Collaboration | identification and filtering of uncharacteristic noise in the CMS hadron calorimeter | JINST 5 (2010) T03014 | CMS-CFT-09-019 0911.4881 |
| 73 | CMS Collaboration | Missing transverse energy performance of the CMS detector | JINST 6 (2011) P09001 | CMS-JME-10-009 1106.5048 |
| 74 | CMS Collaboration | Particle--Flow Event Reconstruction in CMS and Performance for Jets, Taus, and $ E_{\mathrm{T}}^{\text{miss}} $ | CDS | |
| 75 | CMS Collaboration | Commissioning of the particle-flow event reconstruction with the first LHC collisions recorded in the CMS detector | CDS | |
| 76 | J. Alwall et al. | MadGraph 5: going beyond | JHEP 06 (2011) 128 | 1106.0522 |
| 77 | S. Frixione, P. Nason, and C. Oleari | Matching NLO QCD computations with parton shower simulations: the POWHEG method | JHEP 11 (2007) 070 | 0709.2092 |
| 78 | P. Nason | A New method for combining NLO QCD with shower Monte Carlo algorithms | JHEP 11 (2004) 040 | hep-ph/0409146 |
| 79 | S. Alioli, P. Nason, C. Oleari, and E. Re | A general framework for implementing NLO calculations in shower Monte Carlo programs: the POWHEG BOX | JHEP 06 (2010) 043 | 1002.2581 |
| 80 | S. Frixione, P. Nason, and G. Ridolfi | A positive-weight next-to-leading-order Monte Carlo for heavy flavour hadroproduction | JHEP 09 (2007) 126 | 0707.3088 |
| 81 | T. Sjostrand, S. Mrenna, and P. Z. Skands | PYTHIA 6.4 physics and manual | JHEP 05 (2006) 026 | hep-ph/0603175 |
| 82 | J. Pumplin et al. | New generation of parton distributions with uncertainties from global QCD analysis | JHEP 07 (2002) 012 | hep-ph/0201195 |
| 83 | H.-L. Lai et al. | New parton distributions for collider physics | PRD 82 (2010) 074024 | 1007.2241 |
| 84 | GEANT4 Collaboration | GEANT4---a simulation toolkit | NIMA 506 (2003) 250 | |
| 85 | R. Gavin, Y. Li, F. Petriello, and S. Quackenbush | FEWZ 2.0: A code for hadronic Z production at next-to-next-to-leading order | CPC 182 (2011) 2388 | 1011.3540 |
| 86 | R. Gavin, Y. Li, F. Petriello, and S. Quackenbush | W Physics at the LHC with FEWZ 2.1 | CPC 184 (2013) 208 | 1201.5896 |
| 87 | J. M. Campbell, R. K. Ellis, and C. Williams | Vector boson pair production at the LHC | JHEP 07 (2011) 018 | 1105.0020 |
| 88 | N. Kidonakis | Next-to-next-to-leading-order collinear and soft gluon corrections for t-channel single top quark production | PRD 83 (2011) 091503 | 1103.2792 |
| 89 | M. Czakon and A. Mitov | Top++: A Program for the Calculation of the Top-Pair Cross-Section at Hadron Colliders | CPC 185 (2014) 2930 | 1112.5675 |
| 90 | Z. Bern et al. | Driving missing data at next-to-leading order | PRD 84 (2011) 114002 | 1106.1423 |
| 91 | J. K. Lindsey | Oxford University Press, 1996 ISBN 0-19-852359-9 | ||
| 92 | A. L. Read | Presentation of search results: the $ CL_s $ technique | JPG 28 (2002) 2693 | |
| 93 | T. Junk | Confidence level computation for combining searches with small statistics | NIMA 434 (1999) 435 | hep-ex/9902006 |
| 94 | ATLAS and CMS Collaborations, LHC Higgs Combination Group | Procedure for the LHC Higgs boson search combination in Summer 2011 | Technical Report ATL-PHYS-PUB 2011-11, CMS NOTE 2011/005 | |
| 95 | W. Beenakker, R. Hopker, M. Spira, and P. M. Zerwas | Squark and gluino production at hadron colliders | Nucl. Phys. B 492 (1997) 51 | hep-ph/9610490 |
| 96 | A. Kulesza and L. Motyka | Soft gluon resummation for the production of gluino-gluino and squark-antisquark pairs at the LHC | PRD 80 (2009) 095004 | 0905.4749 |
| 97 | A. Kulesza and L. Motyka | Threshold Resummation for Squark-Antisquark and Gluino-Pair Production at the LHC | PRL 102 (2009) 111802 | 0807.2405 |
| 98 | W. Beenakker et al. | Soft-gluon resummation for squark and gluino hadroproduction | JHEP 12 (2009) 041 | 0909.4418 |
| 99 | W. Beenakker et al. | Squark and gluino hadroproduction | Int. J. Mod. Phys. A 26 (2011) 2637 | 1105.1110 |
| 100 | M. Kramer et al. | Supersymmetry production cross sections in pp collisions at $ \sqrt{s} = $ 7 TeV | 1206.2892 | |
| 101 | CMS Collaboration | The fast simulation of the CMS detector at LHC | J. Phys. Conf. Ser. 331 (2011) 032049 | |
| 102 | LEP2 SUSY working group (ALEPH, DELPHI, L3 and OPAL experiments) | Combined LEP Chargino Results, up to 208 GeV for large m$ _0 $ | Note LEPSUSYWG/01-03.1 | |
| 103 | LEP2 SUSY working group (ALEPH, DELPHI, L3 and OPAL experiments) | Combined LEP Chargino Results, up to 208 GeV for low DM | Note LEPSUSYWG/02-04.1 | |
| 104 | M. Perelstein and A. Weiler | Polarized Tops from Stop Decays at the LHC | JHEP 03 (2009) 141 | 0811.1024 |
|
|
Compact Muon Solenoid LHC, CERN |
|

|

|

|

|

|