

Compact Muon Solenoid
LHC, CERN
| CMS-SUS-16-008 ; CERN-EP-2016-284 | ||
| Searches for pair production of third-generation squarks in $ \sqrt{s} = $ 13 TeV pp collisions | ||
| CMS Collaboration | ||
| 12 December 2016 | ||
| Eur. Phys. J. C 77 (2017) 327 | ||
| Abstract: Searches are presented for direct production of top or bottom squark pairs in proton-proton collisions at the CERN LHC. Two searches, based on complementary techniques, are performed in all-jet final states that are characterized by a significant imbalance in transverse momentum. An additional search requires the presence of a charged lepton isolated from other activity in the event. The data were collected in 2015 at a centre-of-mass energy of 13 TeV with the CMS detector and correspond to an integrated luminosity of 2.3 fb$^{-1}$. No statistically significant excess of events is found beyond the expected contribution from standard model processes. Exclusion limits are set in the context of simplified models of top or bottom squark pair production. Models with top and bottom squark masses up to 830 and 890 GeV, respectively, are probed for light neutralinos. For models with top squark masses of 675 GeV, neutralino masses up to 260 GeV are excluded at 95% confidence level. | ||
| Links: e-print arXiv:1612.03877 [hep-ex] (PDF) ; CDS record ; inSPIRE record ; CADI line (restricted) ; | ||
| Figures | |

png pdf |
Figure 1:
Feynman diagrams for pair production of top and bottom squarks via the decay modes considered in this paper. The model with 50% branching fractions for $ {\tilde{ \mathrm{ t } } _{1}} \to \mathrm{ t } ^{(*)} \tilde{\chi}^0_1 $ and $ {\tilde{ \mathrm{ t } } _{1}} \to \mathrm{ b } \tilde{\chi}^{pm}_1 \to \mathrm{ b } {\mathrm{ W } } ^{\pm *} \tilde{\chi}^0_1 $ decays leads to the final states in diagrams (a)-(c). |

png pdf |
Figure 2:
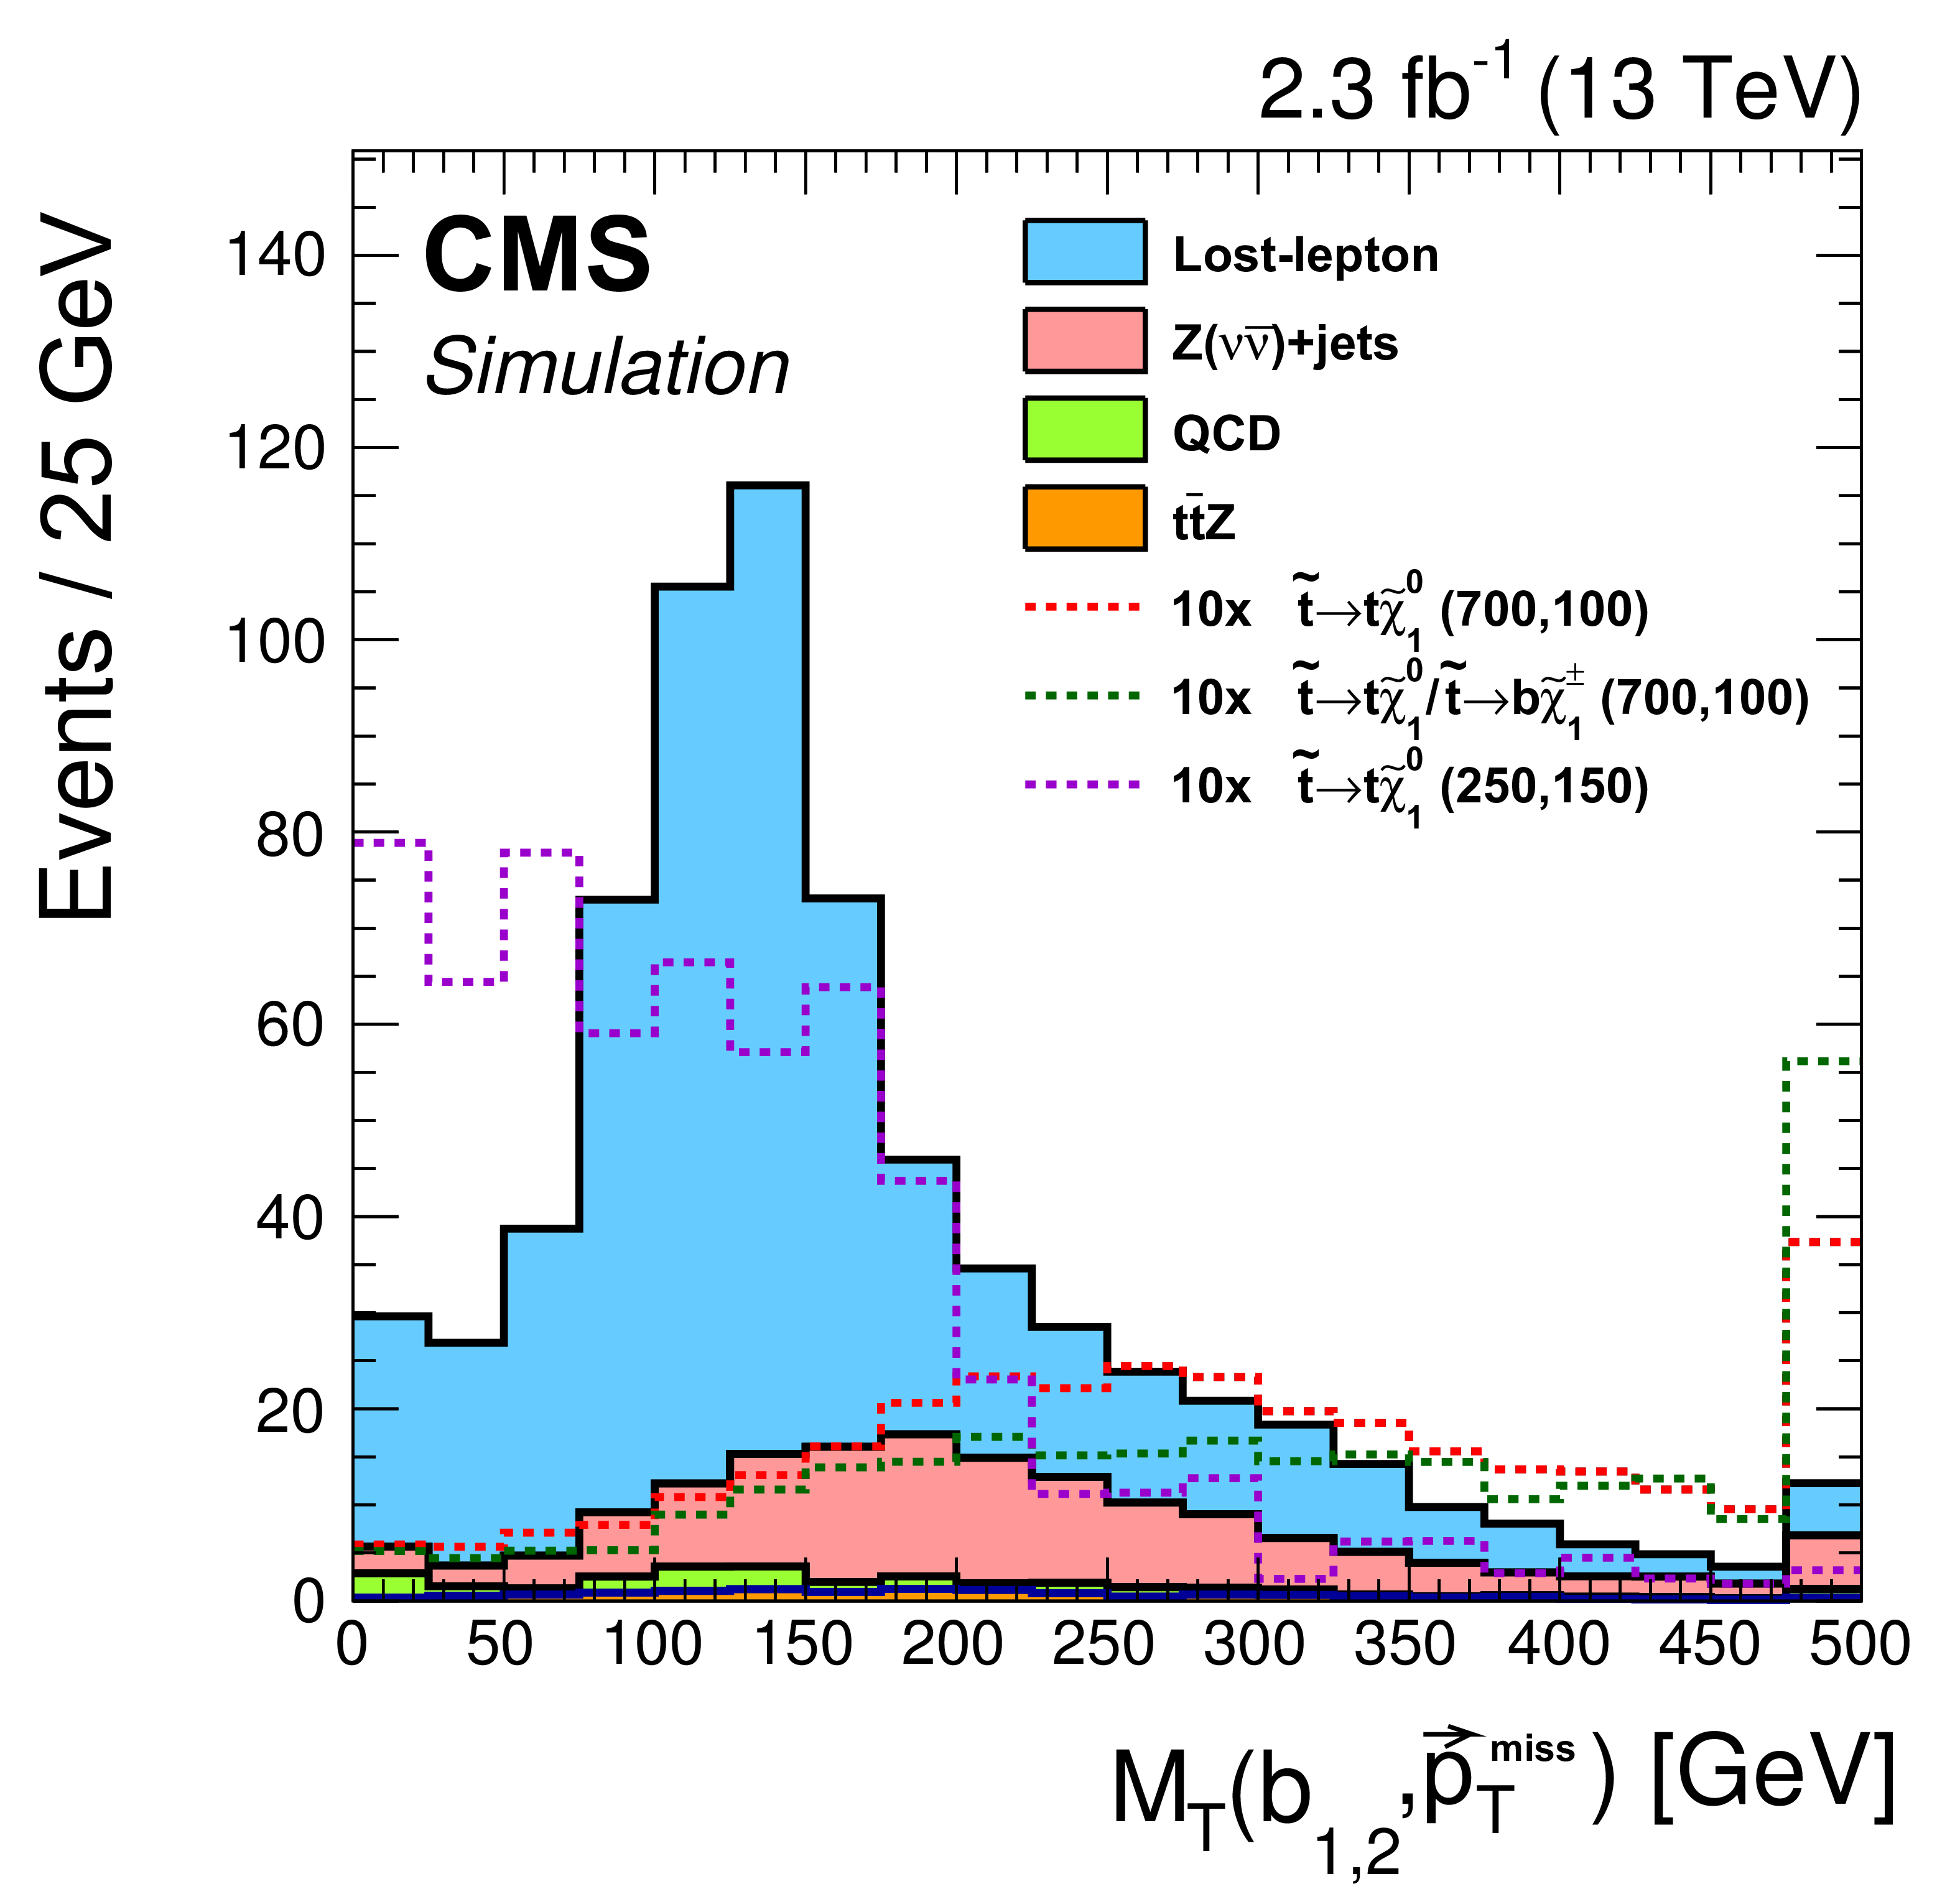
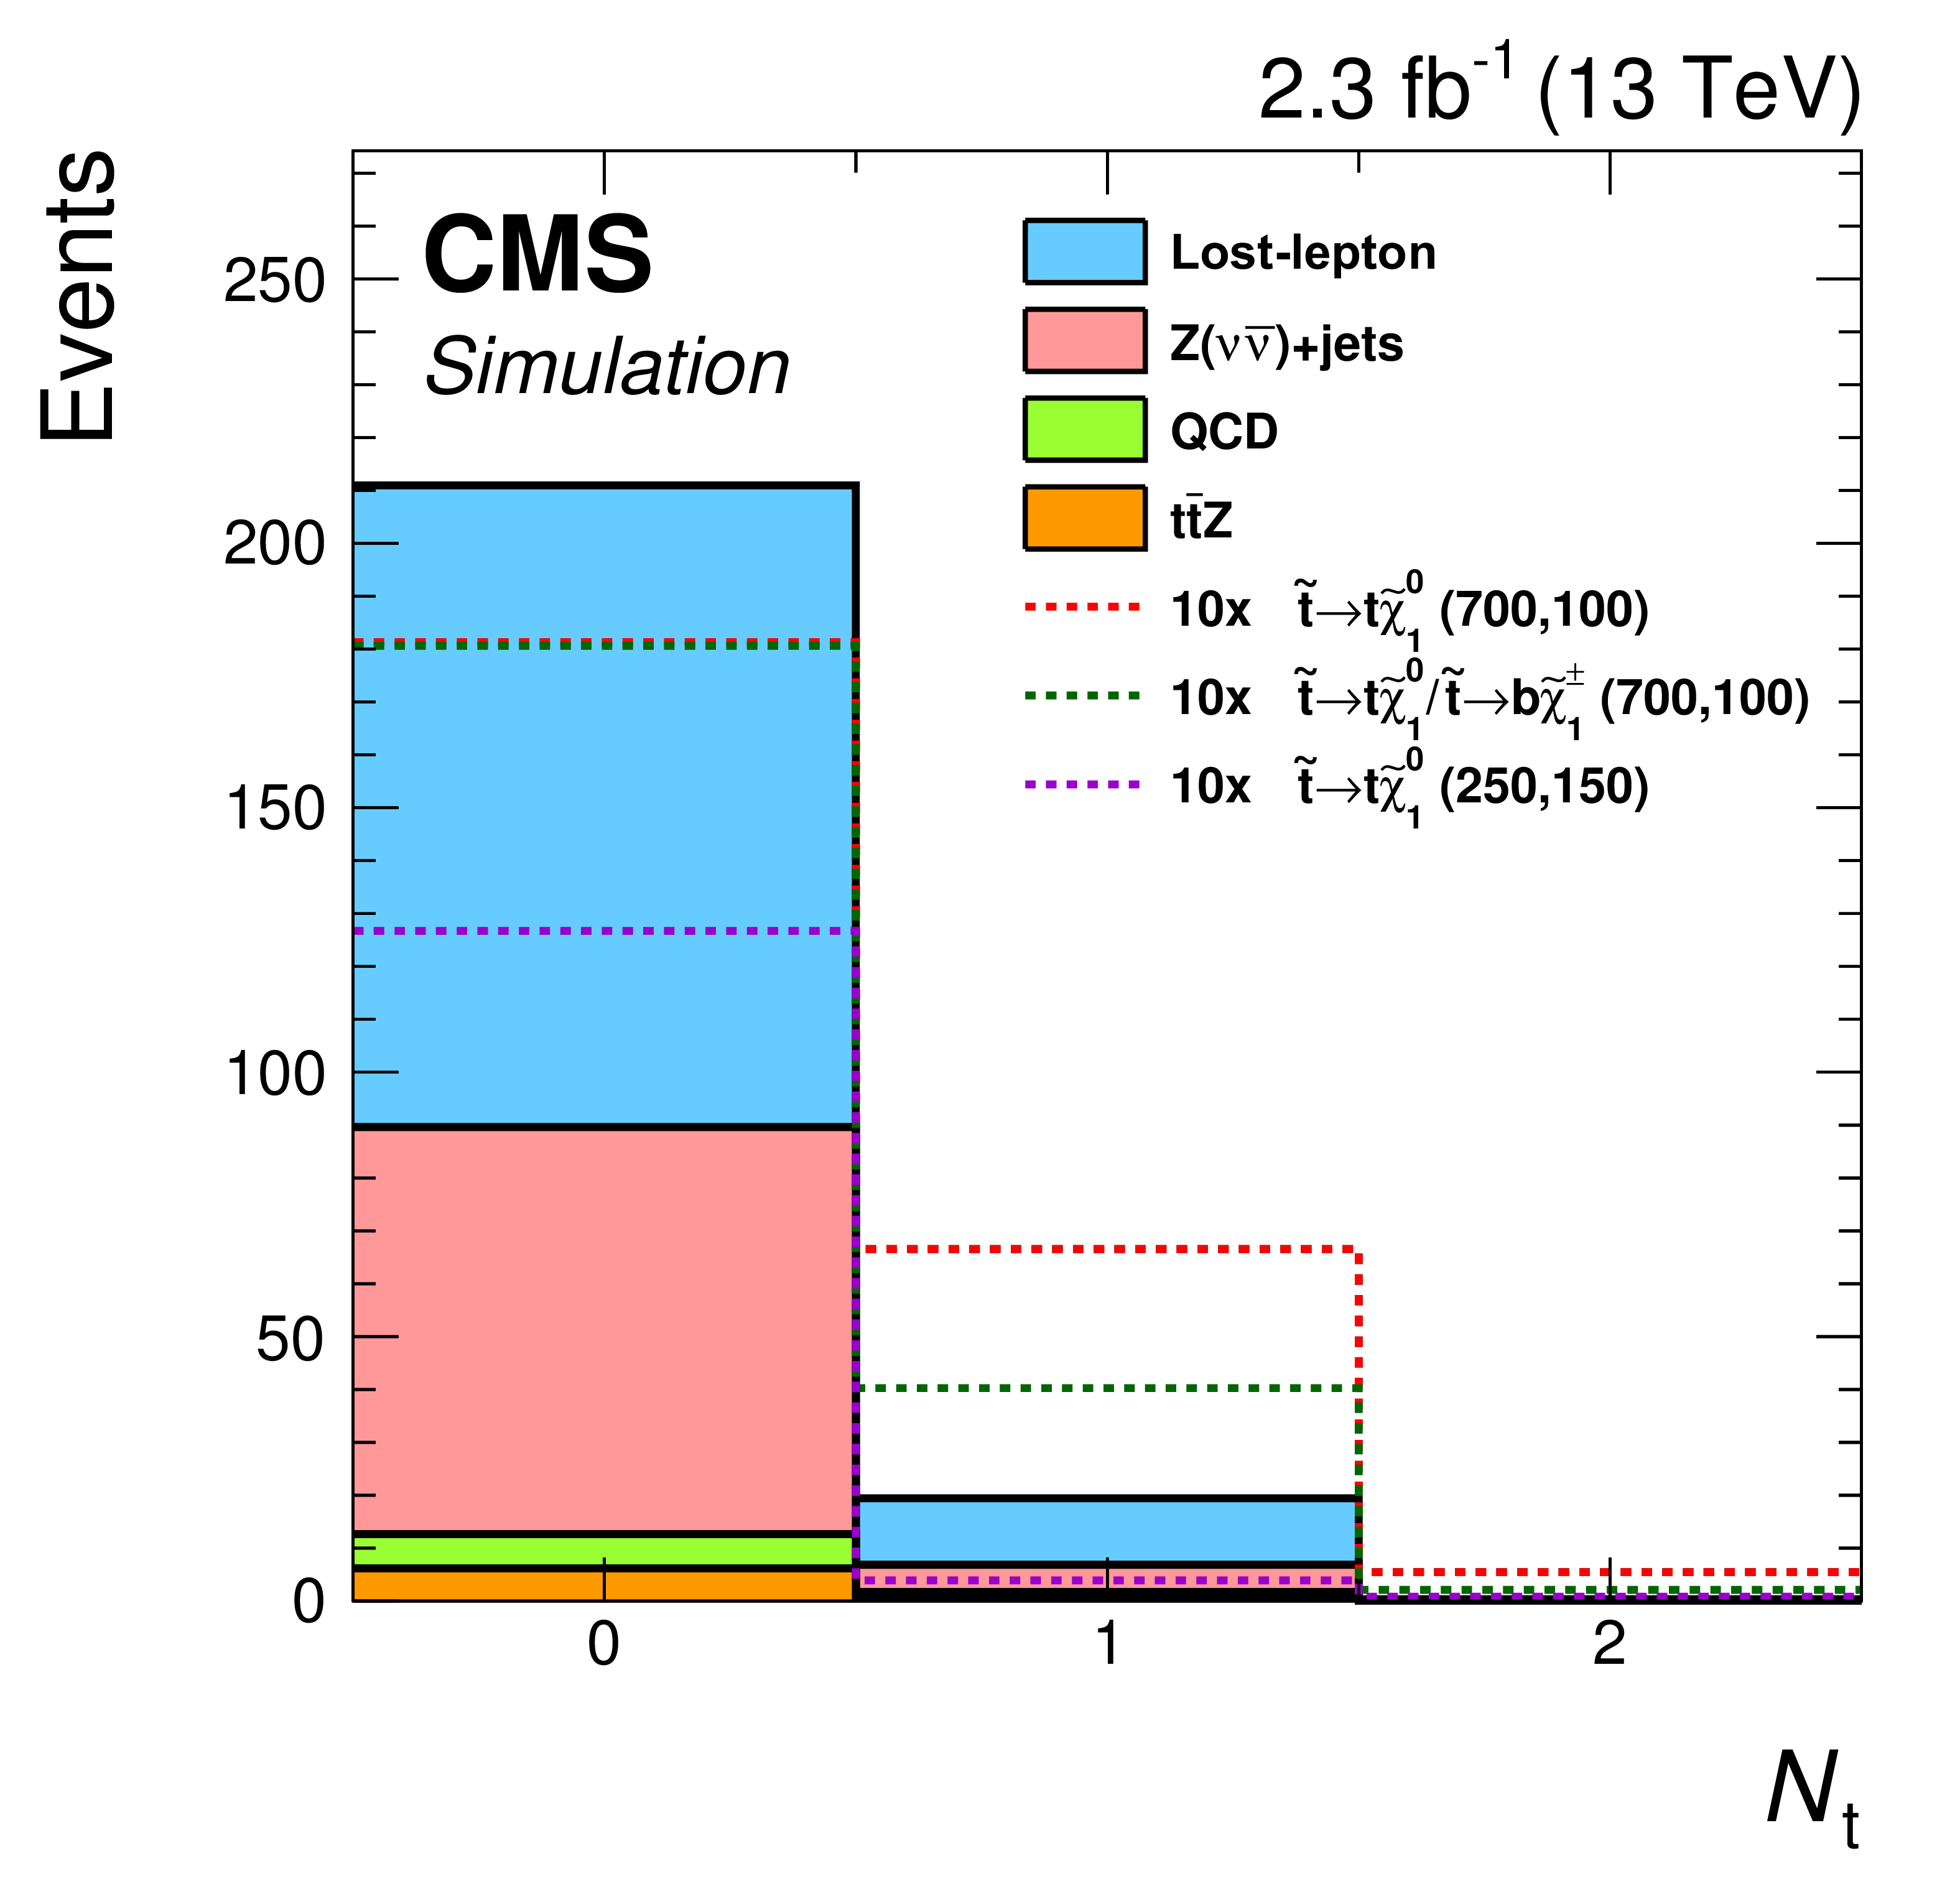
The $ {M_{\mathrm {T}}(\mathrm{ b } _{1,2}, {\vec{E}_{\mathrm {T}}^{\text {miss}}})} $ distribution after the baseline selection of the top squark search in the all-jet final state (left), and the number of reconstructed top quarks for events in the high-$ {M_{\mathrm {T}}(\mathrm{ b } _{1,2}, {\vec{E}_{\mathrm {T}}^{\text {miss}}})} $ category (right). Signal models with different top squark and neutralino mass hypotheses are shown, with the first number indicating the assumed top squark mass in units of GeV and the second the neutralino mass. The expected signal yields are scaled up by a factor of 10 to facilitate comparison of the distributions with expectations from SM backgrounds. In this and subsequent figures, the last bin shown includes the overflow events. |
png pdf |
Figure 2-a:
The $ {M_{\mathrm {T}}(\mathrm{ b } _{1,2}, {\vec{E}_{\mathrm {T}}^{\text {miss}}})} $ distribution after the baseline selection of the top squark search in the all-jet final state. Signal models with different top squark and neutralino mass hypotheses are shown, with the first number indicating the assumed top squark mass in units of GeV and the second the neutralino mass. The expected signal yields are scaled up by a factor of 10 to facilitate comparison of the distributions with expectations from SM backgrounds. In this and subsequent figures, the last bin shown includes the overflow events. |
png pdf |
Figure 2-b:
The number of reconstructed top quarks for events in the high-$ {M_{\mathrm {T}}(\mathrm{ b } _{1,2}, {\vec{E}_{\mathrm {T}}^{\text {miss}}})} $ category. Signal models with different top squark and neutralino mass hypotheses are shown, with the first number indicating the assumed top squark mass in units of GeV and the second the neutralino mass. The expected signal yields are scaled up by a factor of 10 to facilitate comparison of the distributions with expectations from SM backgrounds. In this and subsequent figures, the last bin shown includes the overflow events. |
png pdf |
Figure 3:
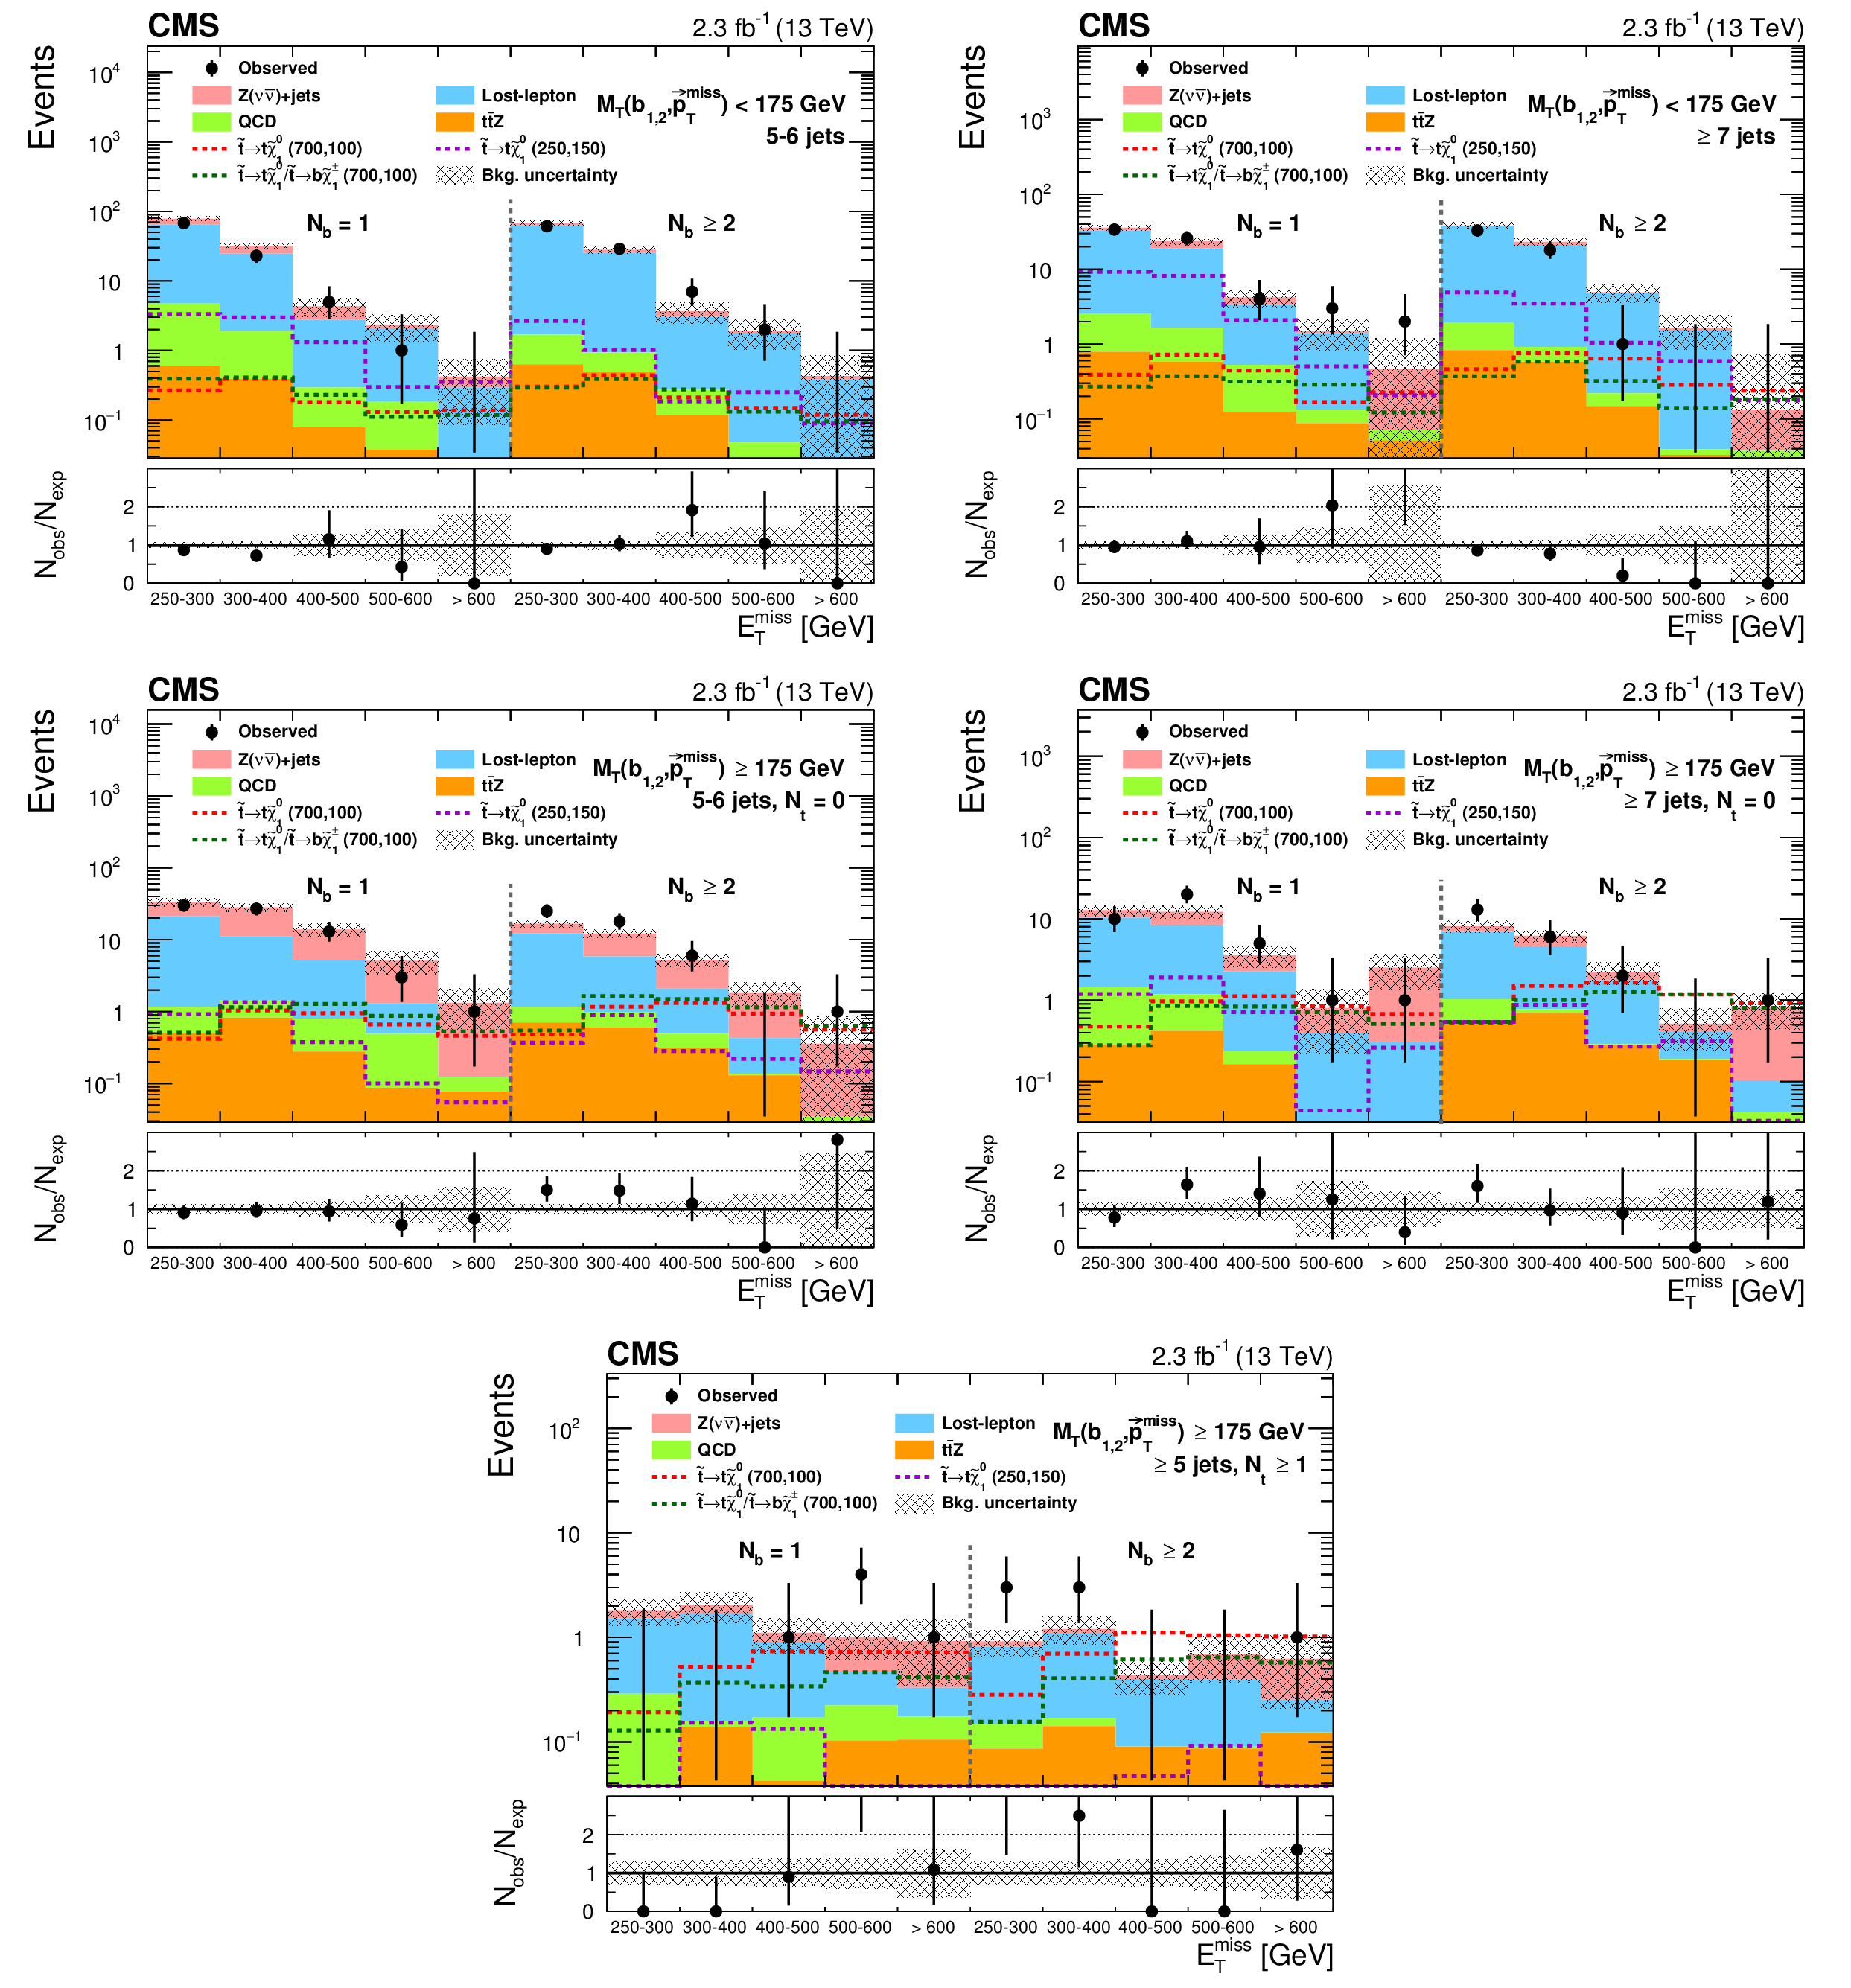
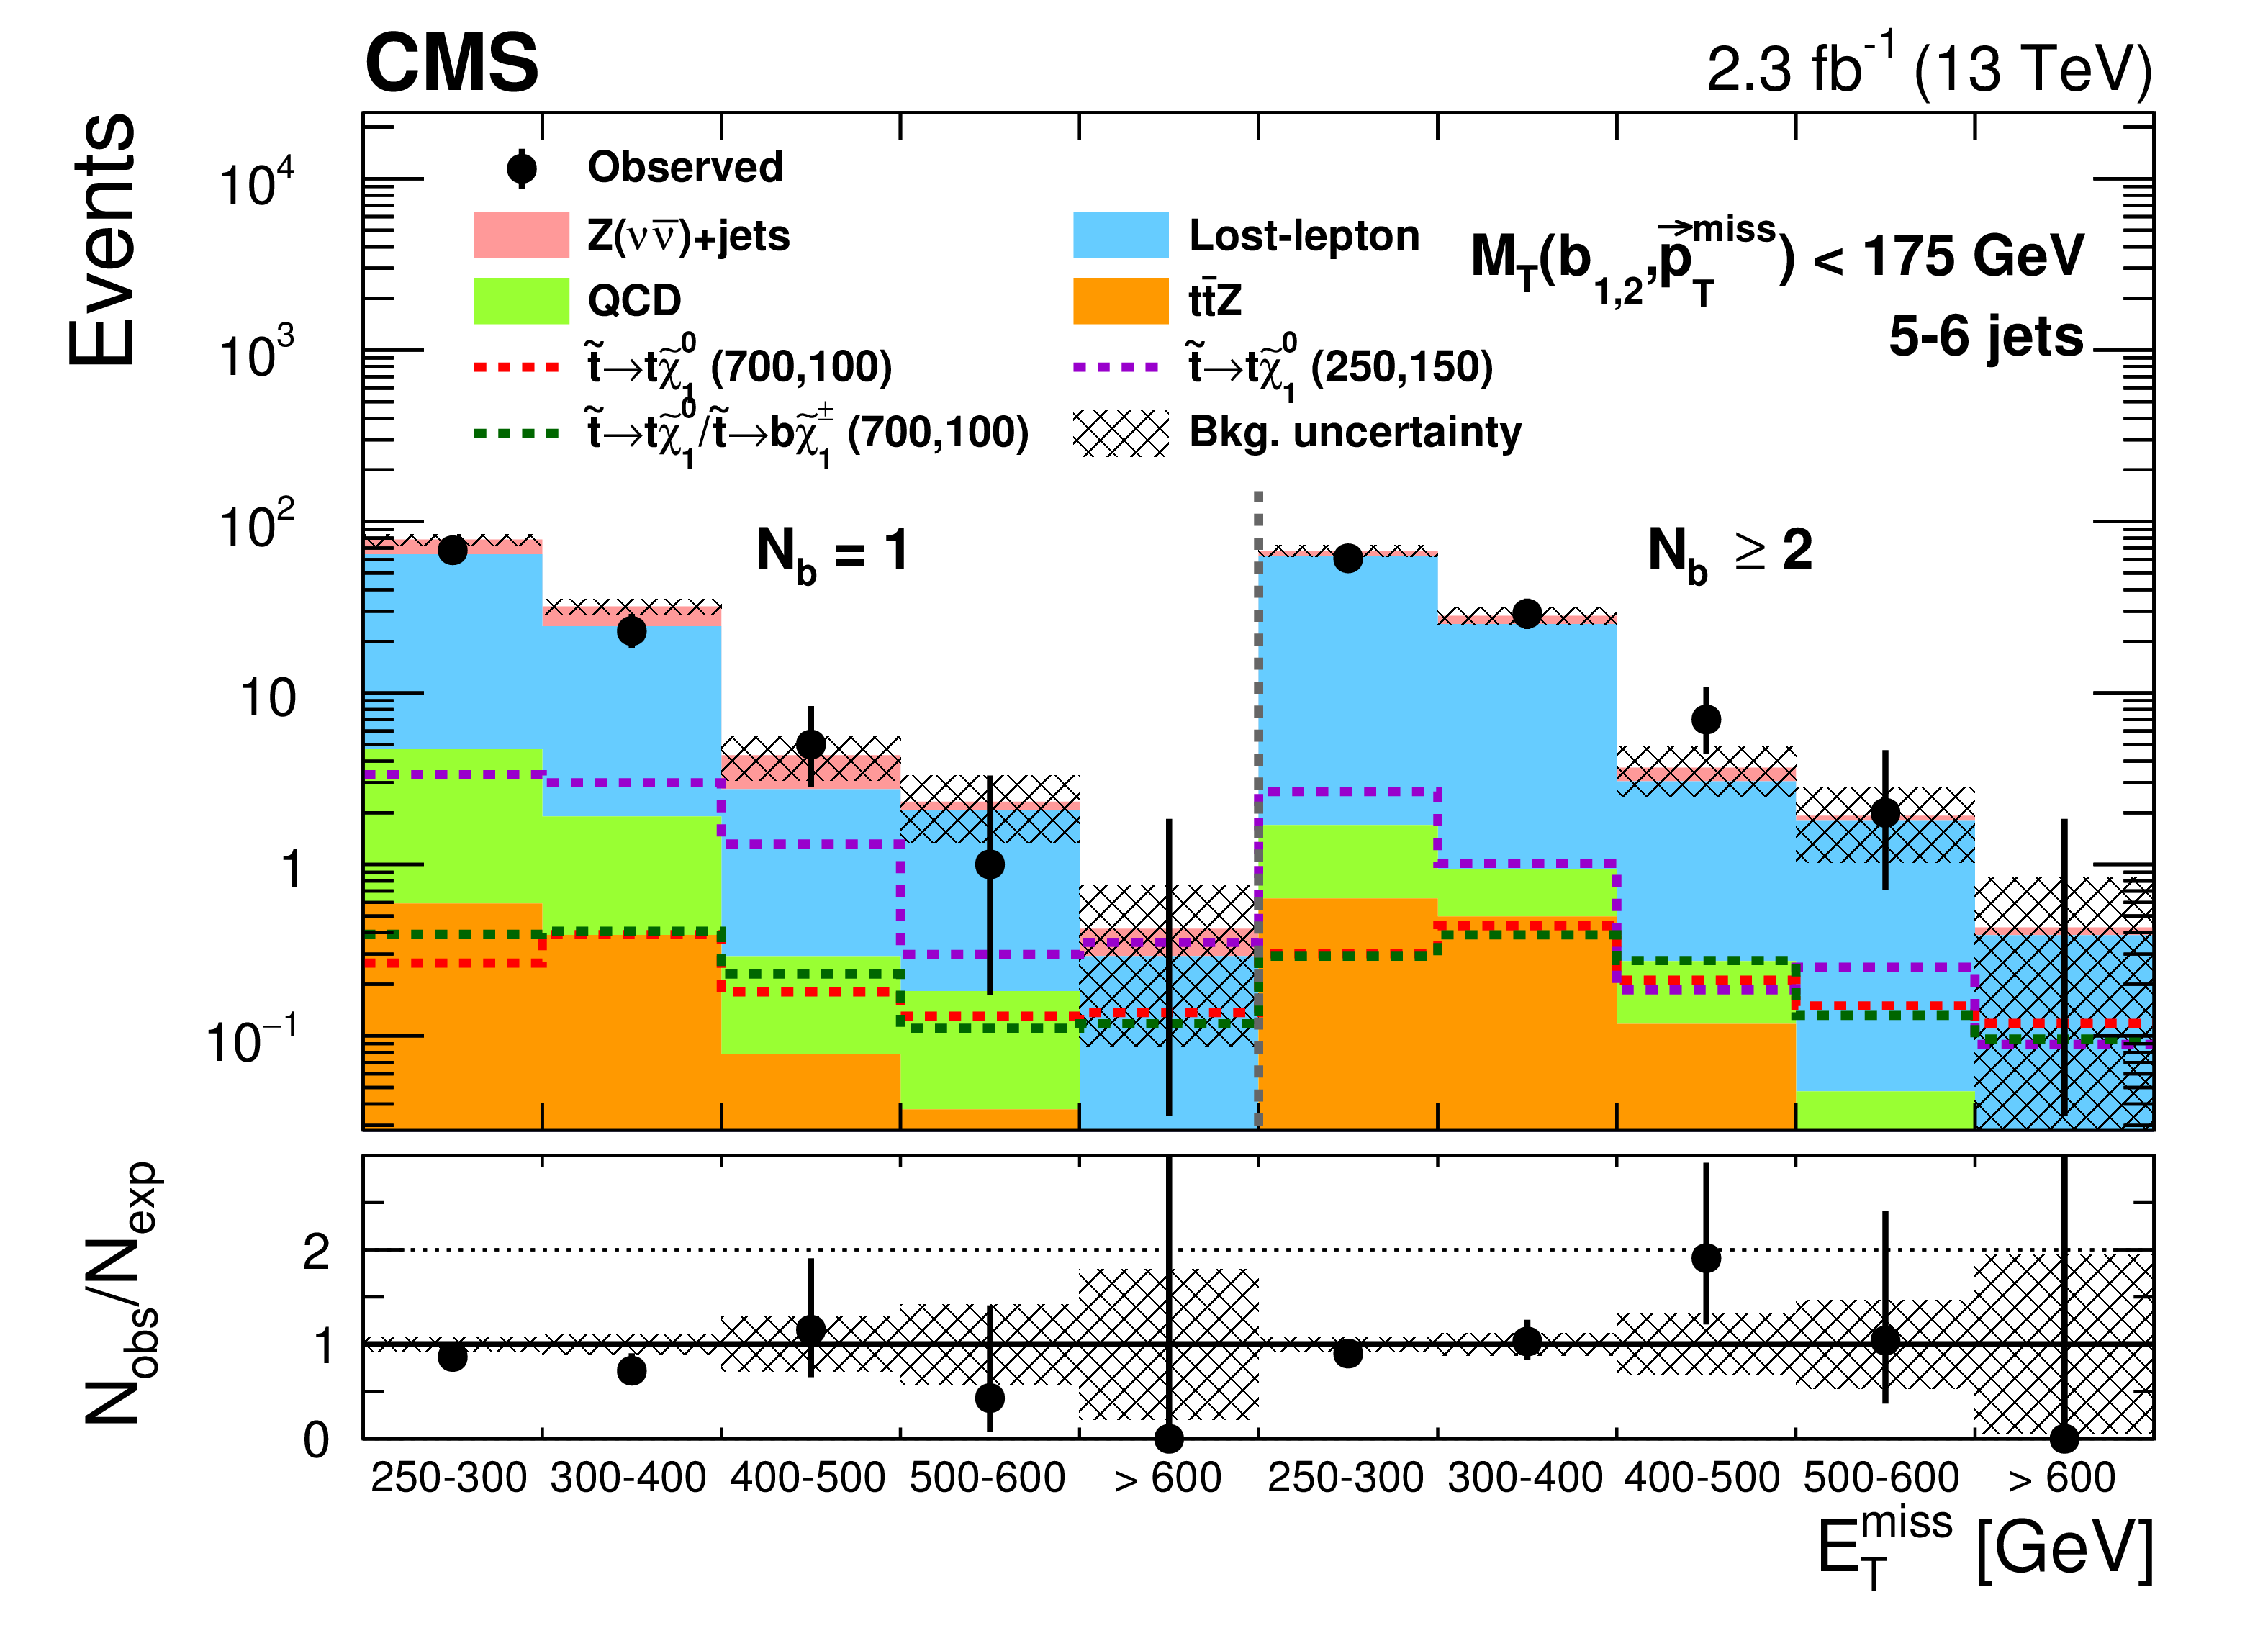
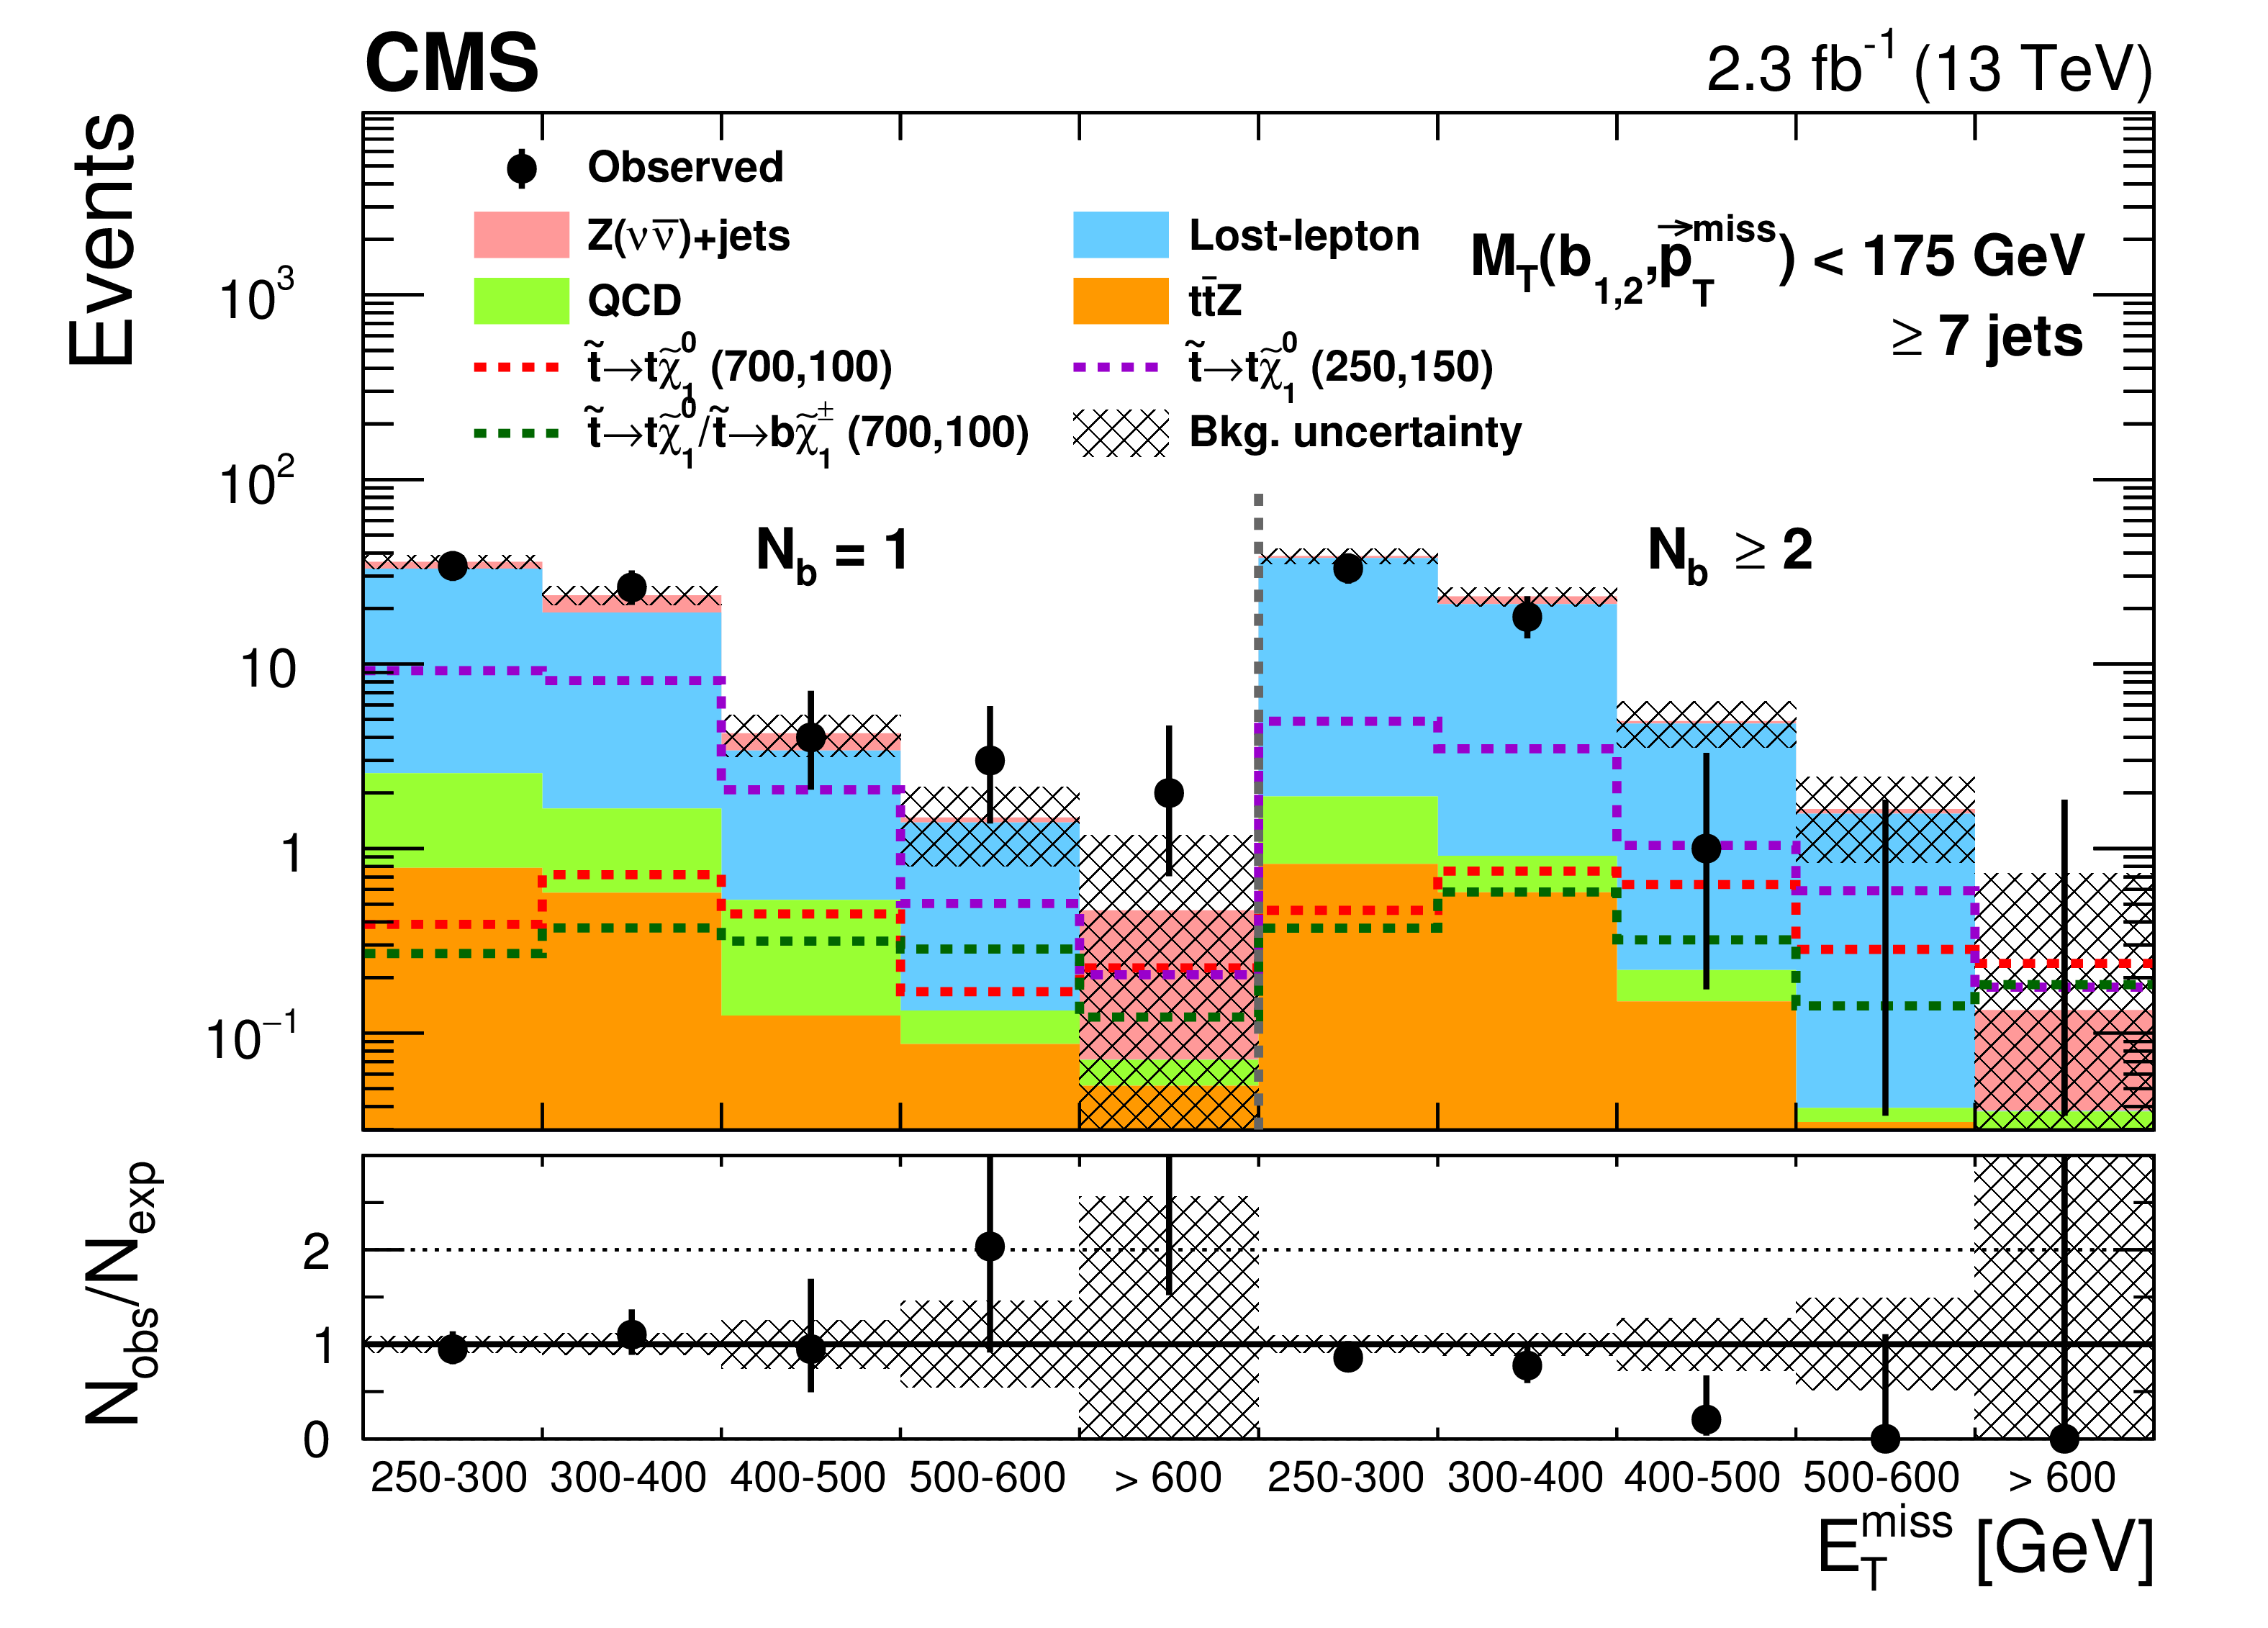
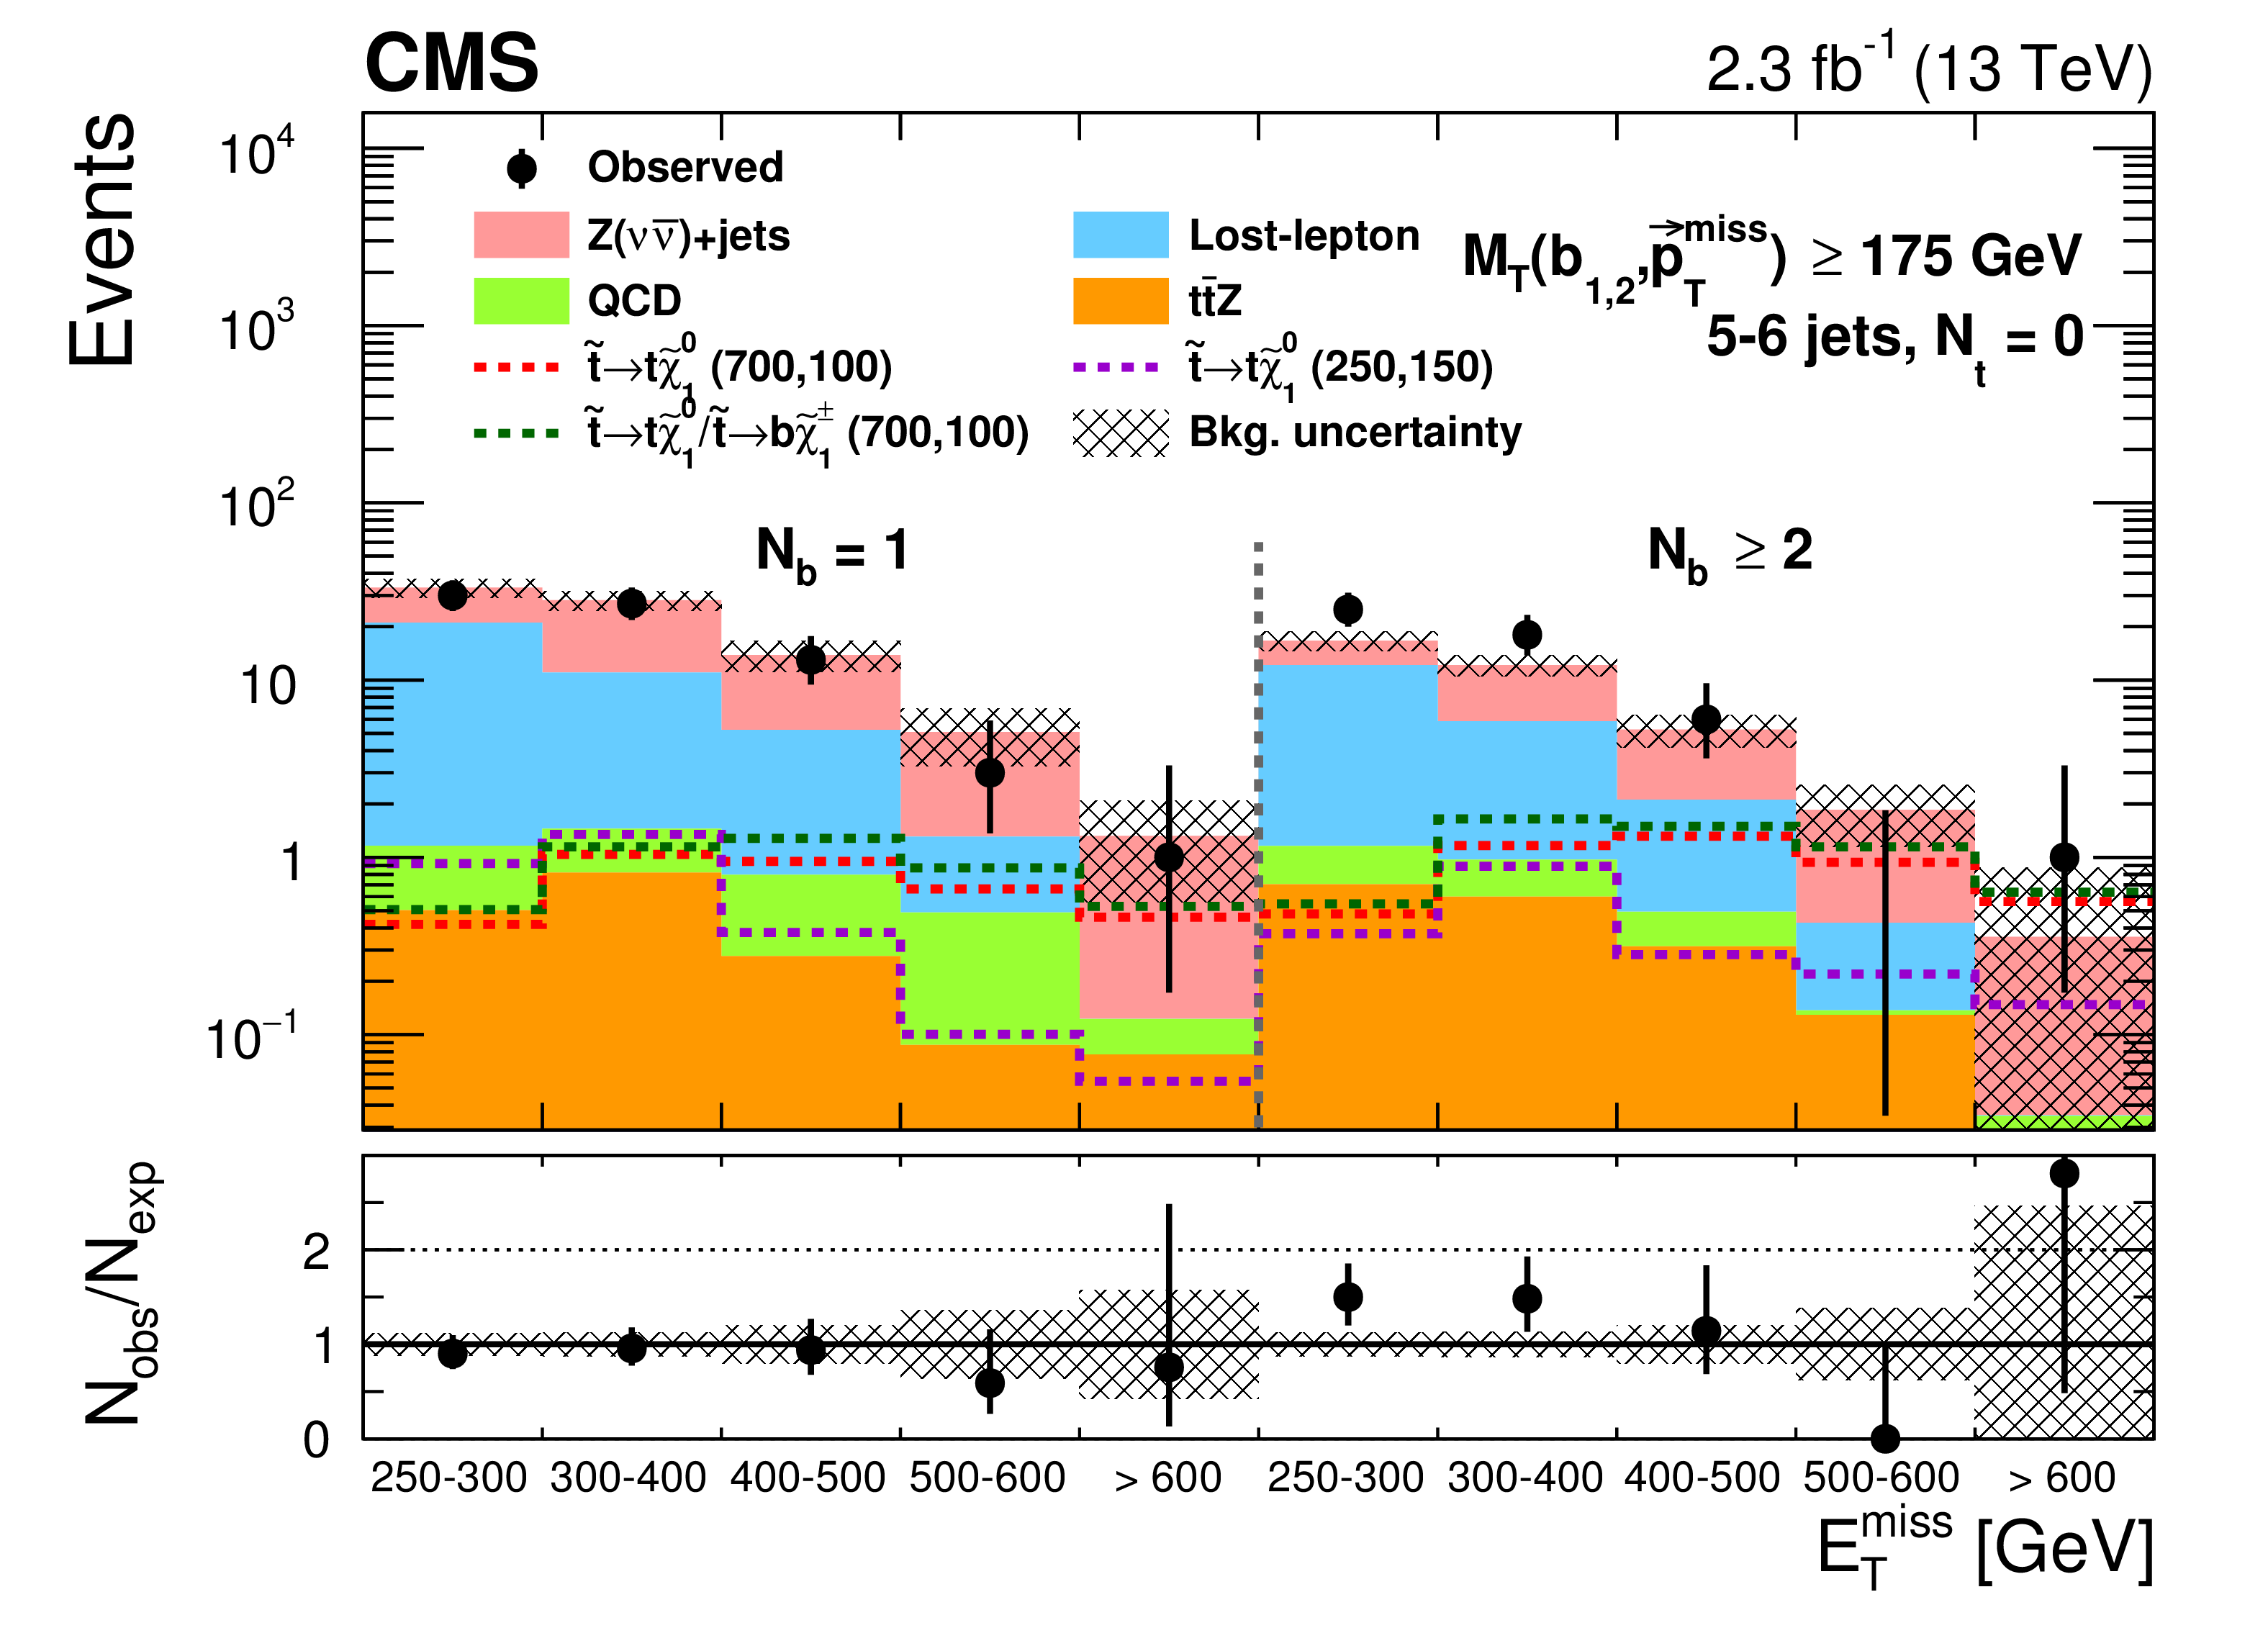
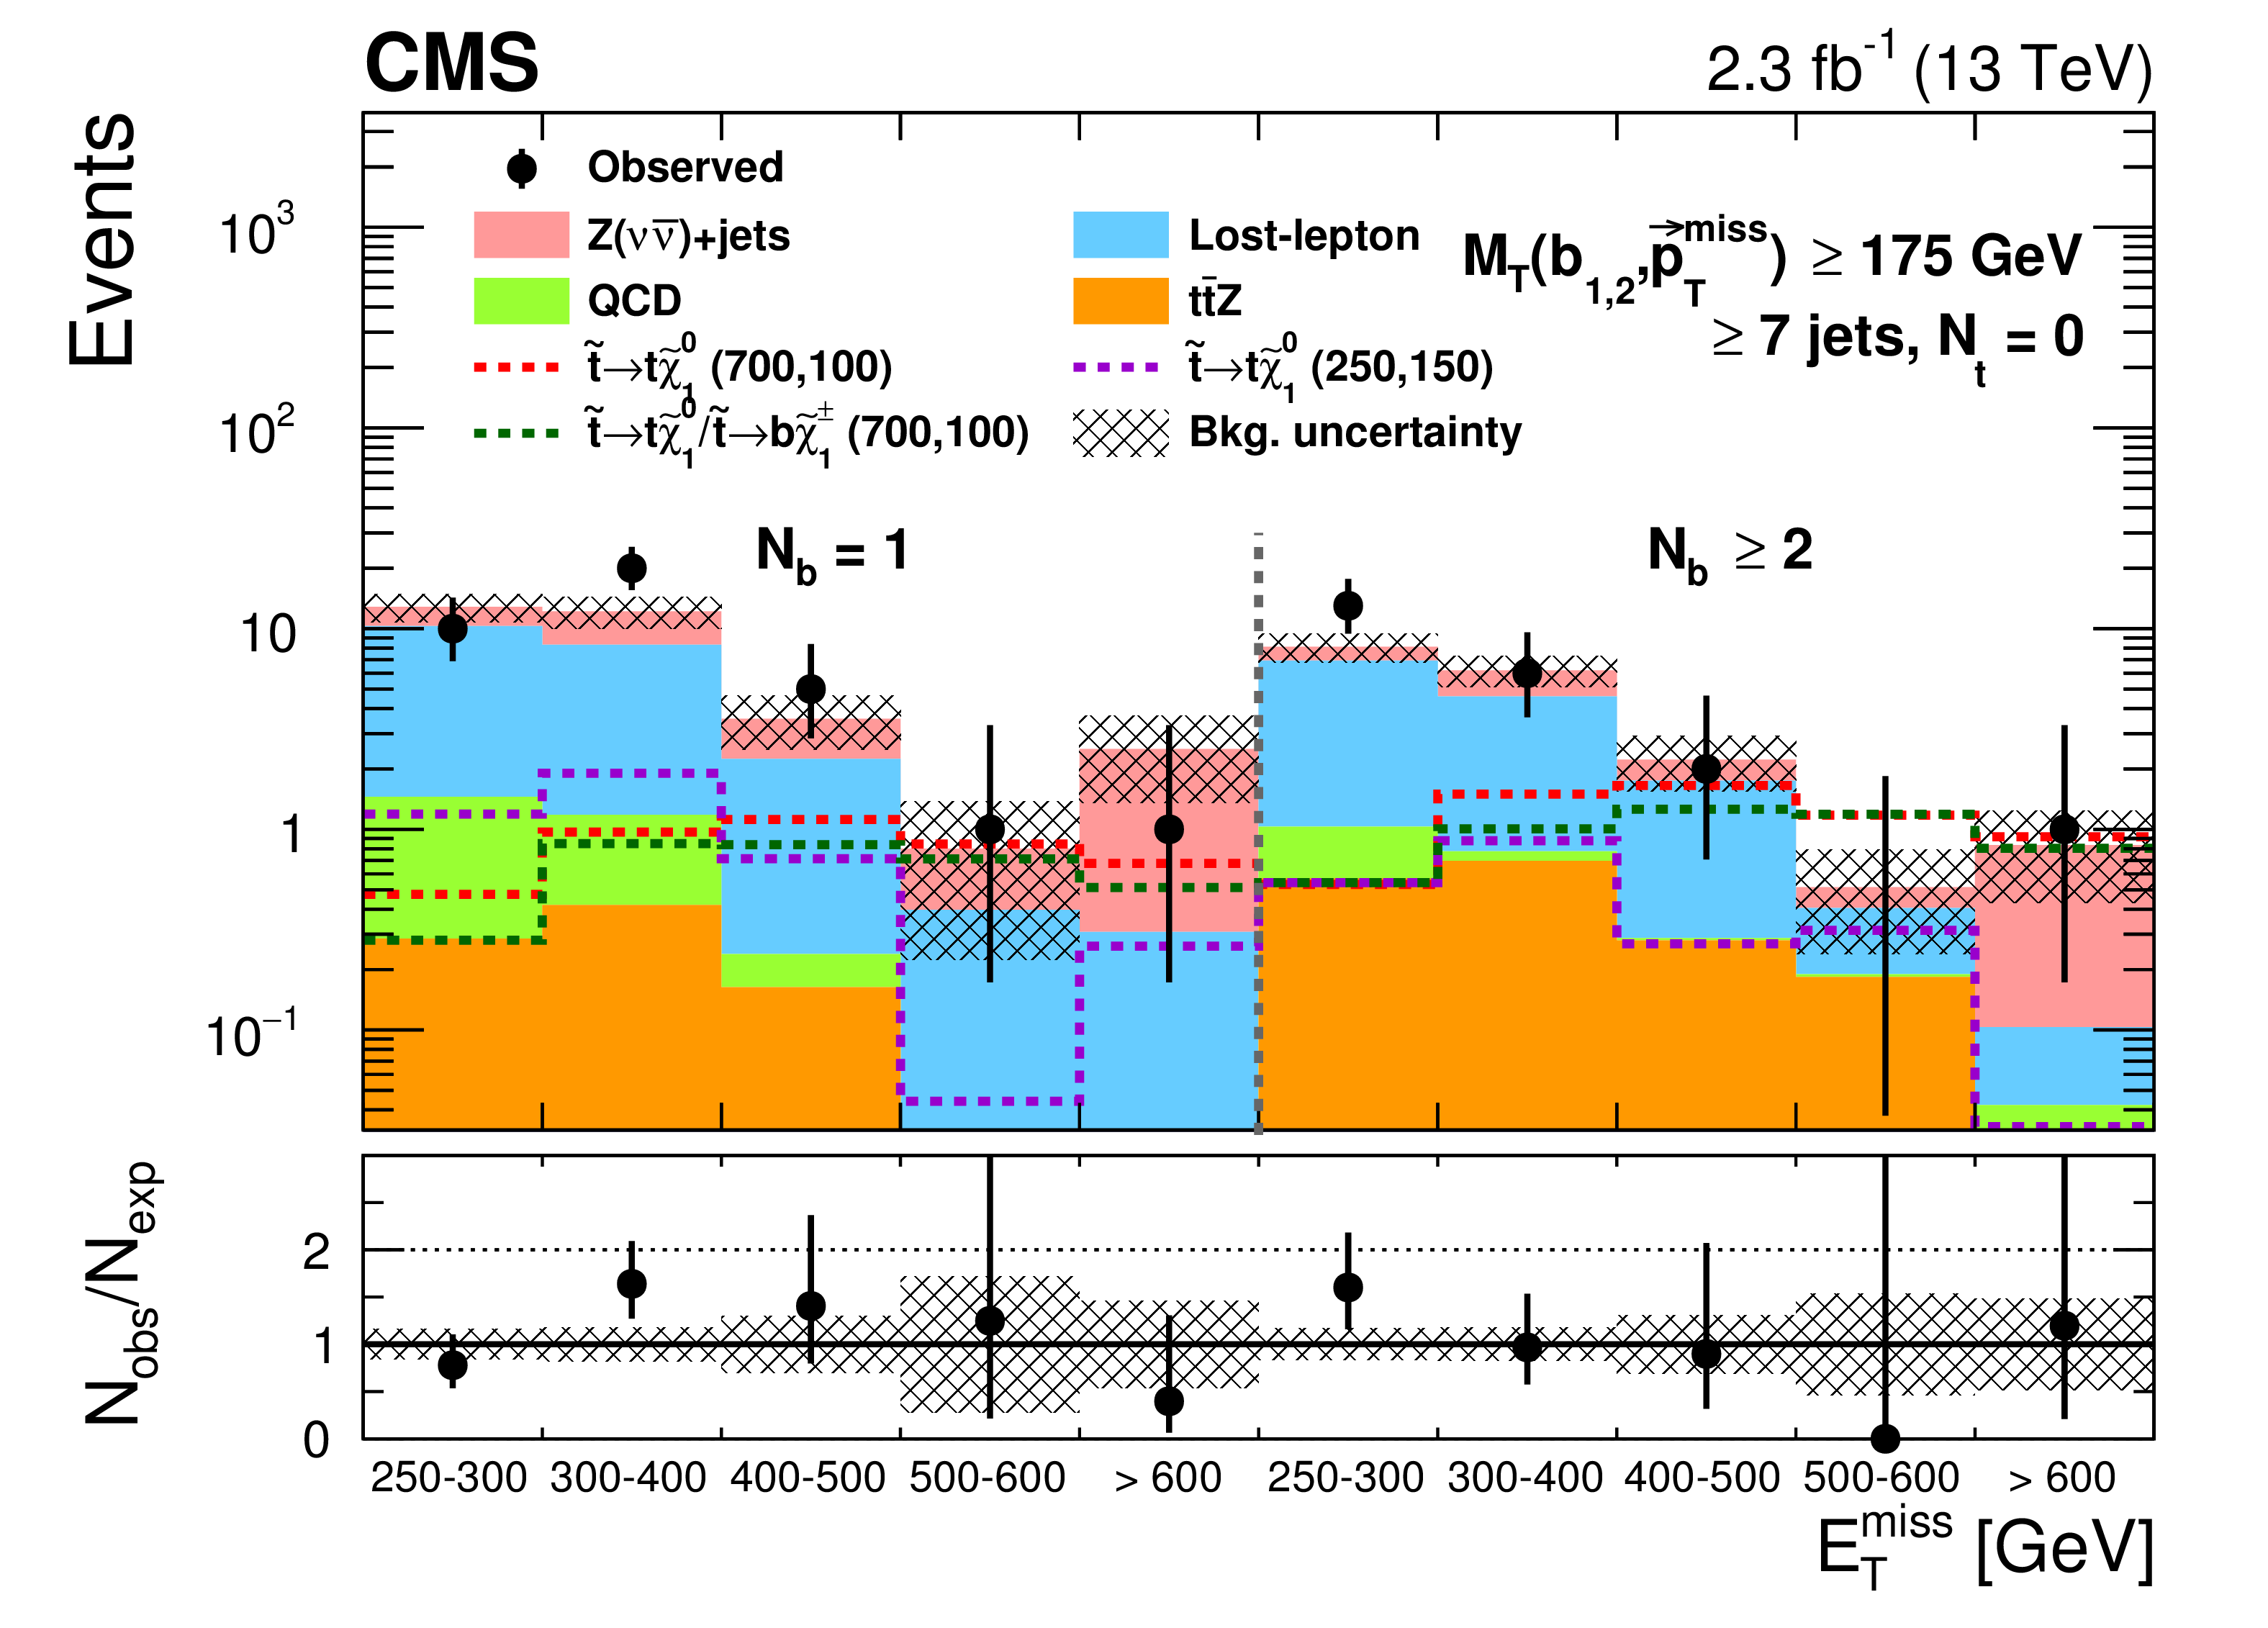
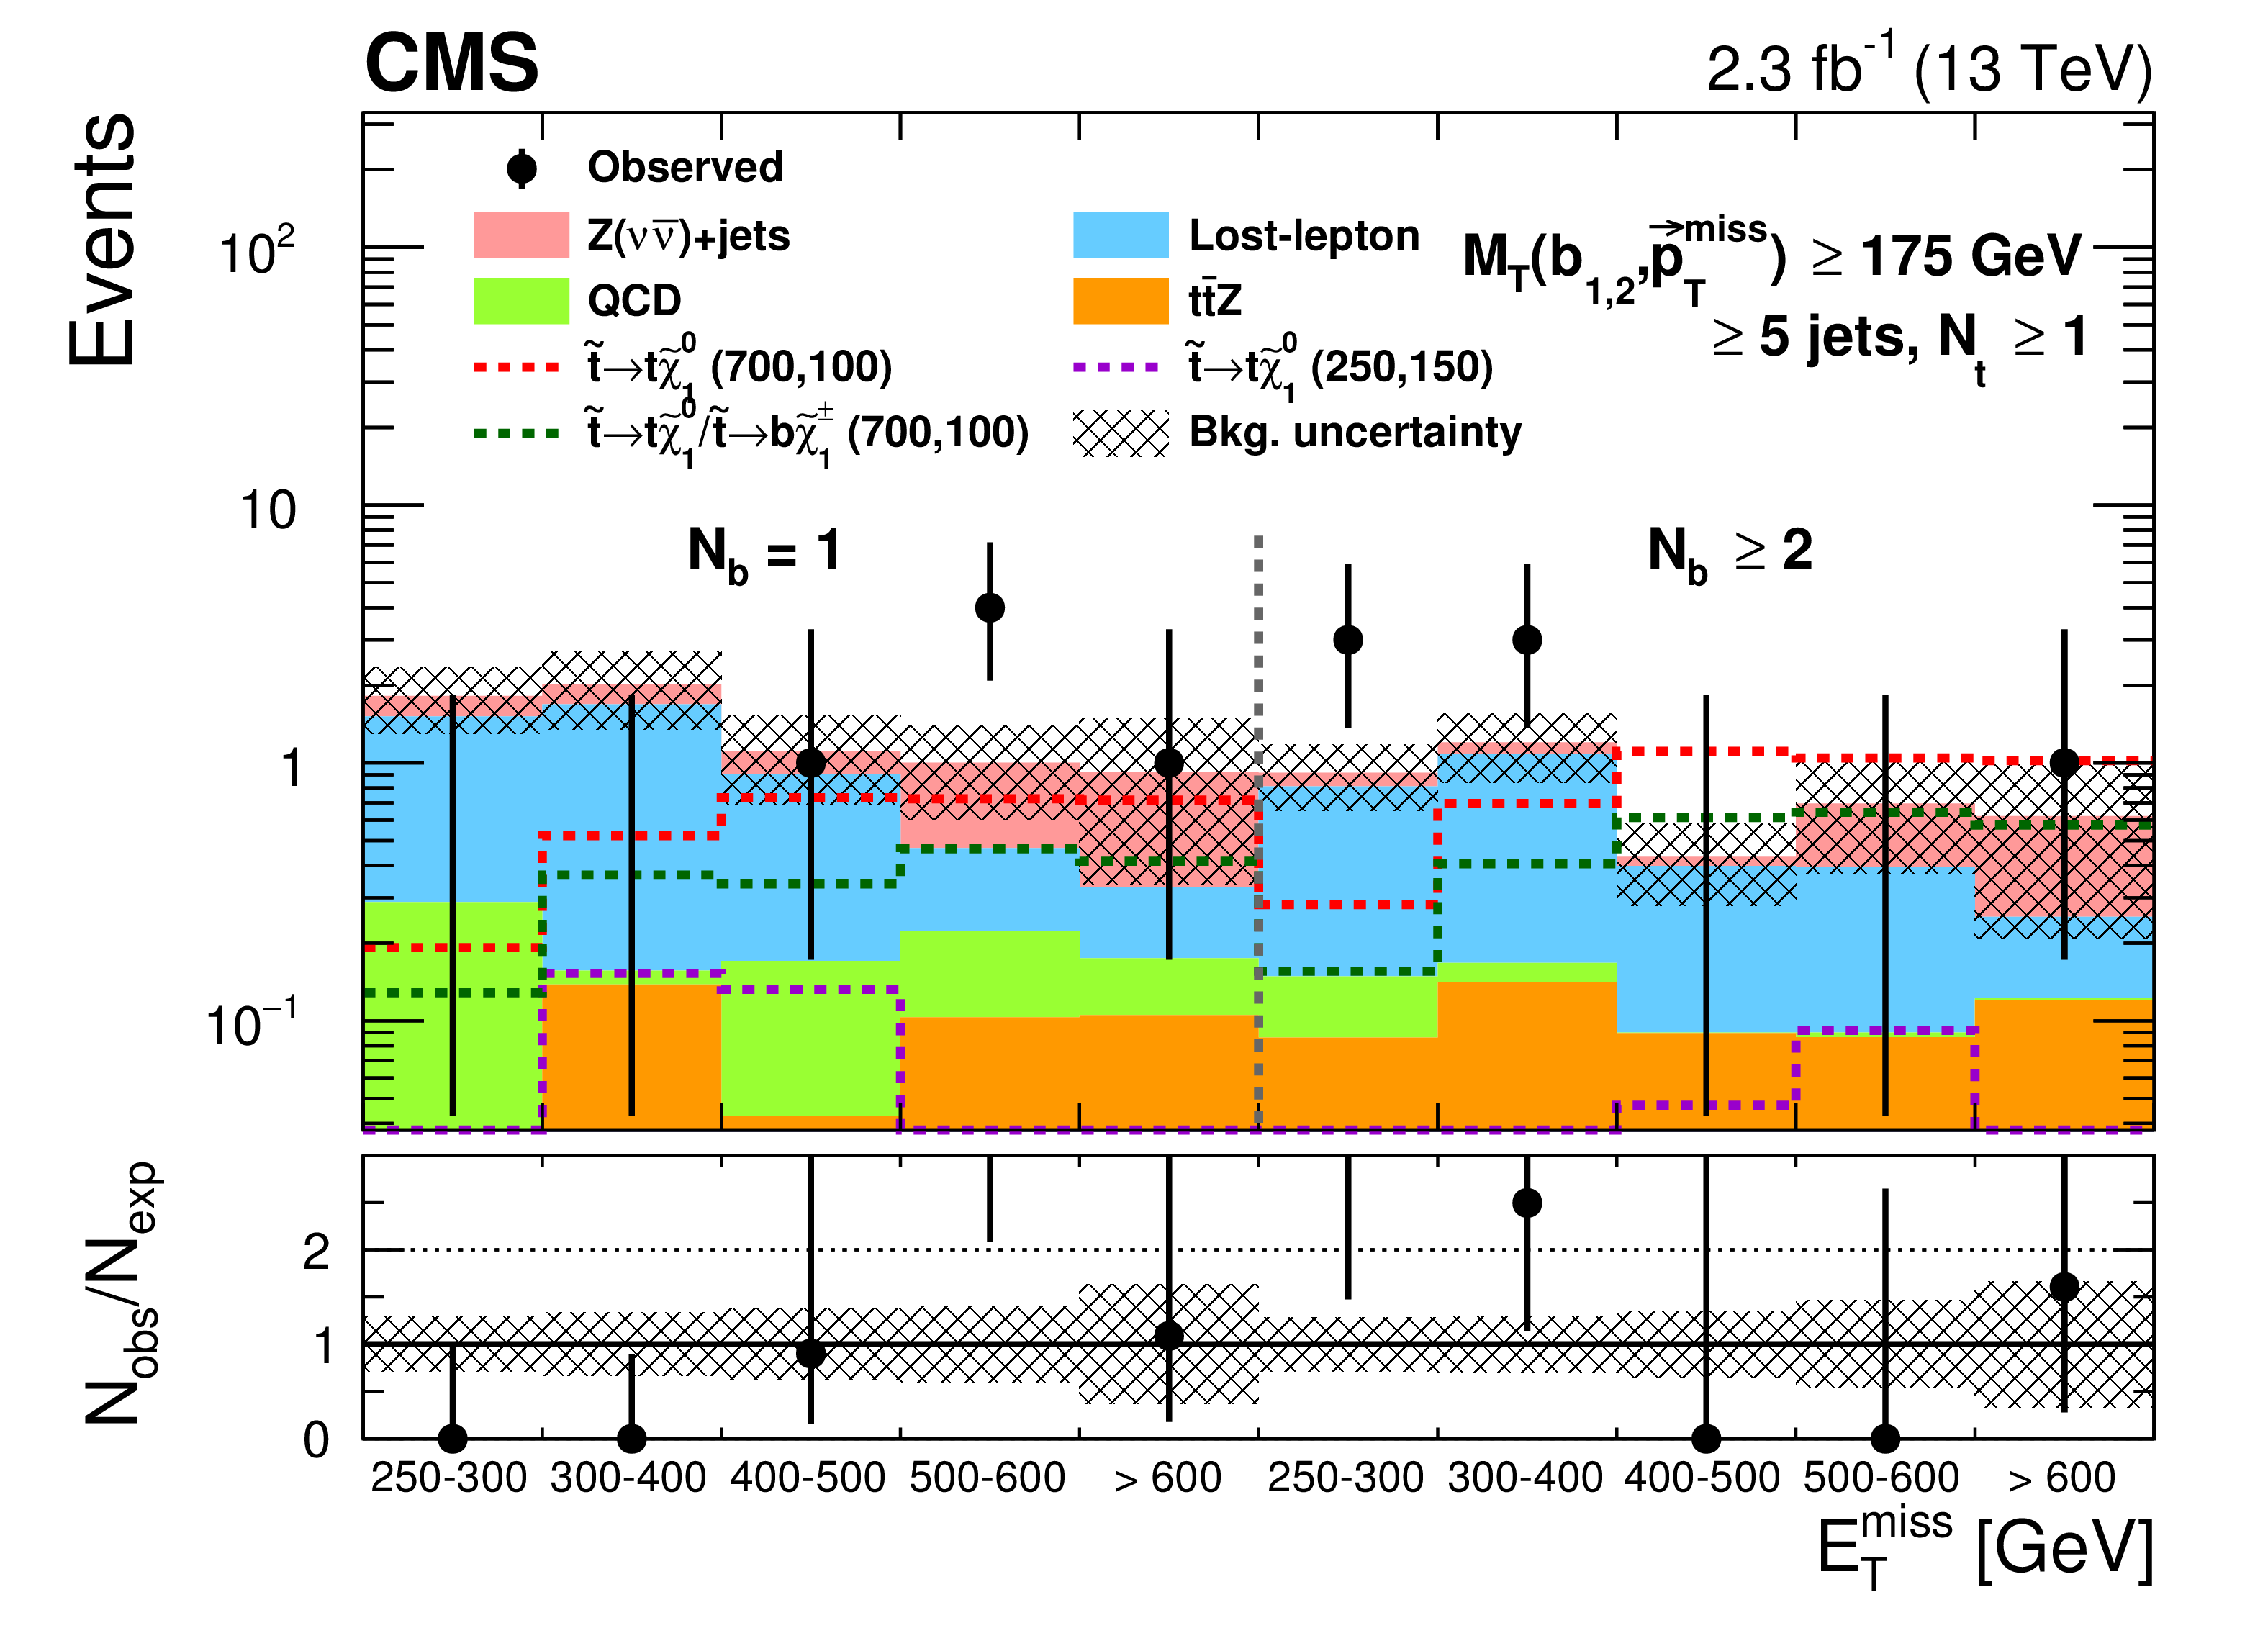
Observed and estimated SM background and signal yields in the SRs of the top squark search in the all-jet final state: $ {M_{\mathrm {T}}(\mathrm{ b } _{1,2}, {\vec{E}_{\mathrm {T}}^{\text {miss}}})} <$ 175 GeV, 5 $\leq {N_{\mathrm {j}}} \leq$ 6 (upper left), $ {M_{\mathrm {T}}(\mathrm{ b } _{1,2}, {\vec{E}_{\mathrm {T}}^{\text {miss}}})} <$ 175 GeV, $ {N_{\mathrm {j}}} \geq$ 7 (upper right), $ {M_{\mathrm {T}}(\mathrm{ b } _{1,2}, {\vec{E}_{\mathrm {T}}^{\text {miss}}})} \geq $ 175 GeV, $ {N_{\mathrm{ t } }} = $ 0, 5 $ \leq {N_{\mathrm {j}}} \leq$ 6 (middle left), $ {M_{\mathrm {T}}(\mathrm{ b } _{1,2}, {\vec{E}_{\mathrm {T}}^{\text {miss}}})} \geq $ 175 GeV, $ {N_{\mathrm{ t } }} = $ 0, ${N_{\mathrm {j}}} \geq $ 7 (middle right), $ {M_{\mathrm {T}}(\mathrm{ b } _{1,2}, {\vec{E}_{\mathrm {T}}^{\text {miss}}})} \geq $ 175 GeV, $ {N_{\mathrm{ t } }} \geq $ 1, ${N_{\mathrm {j}}} \geq $ 5 (bottom row). The first 5 bins in each plot correspond to $ {E_{\mathrm {T}}^{\text {miss}}} $ ranges of 250-300, 300-400, 400-500, 500-600, $>$ 600 GeV for $ {N_{\mathrm{ b } }} = $ 1, and the second 5 bins correspond to the same ${E_{\mathrm {T}}^{\text {miss}}}$ binning for $ {N_{\mathrm{ b } }} \geq $ 2. The SM background predictions shown do not include the effects of the maximum likelihood fit to the data. The ratio of the data to the SM prediction extracted from CRs is shown in the lower panel of each plot. |
png pdf |
Figure 3-a:
Observed and estimated SM background and signal yields in the SRs of the top squark search in the all-jet final state: $ {M_{\mathrm {T}}(\mathrm{ b } _{1,2}, {\vec{E}_{\mathrm {T}}^{\text {miss}}})} <$ 175 GeV, 5 $\leq {N_{\mathrm {j}}} \leq$ 6. The first 5 bins in the plot correspond to $ {E_{\mathrm {T}}^{\text {miss}}} $ ranges of 250-300, 300-400, 400-500, 500-600, $>$ 600 GeV for $ {N_{\mathrm{ b } }} = $ 1, and the second 5 bins correspond to the same ${E_{\mathrm {T}}^{\text {miss}}}$ binning for $ {N_{\mathrm{ b } }} \geq $ 2. The SM background predictions shown do not include the effects of the maximum likelihood fit to the data. The ratio of the data to the SM prediction extracted from CRs is shown in the lower panel of the plot. |
png pdf |
Figure 3-b:
Observed and estimated SM background and signal yields in the SRs of the top squark search in the all-jet final state: $ {M_{\mathrm {T}}(\mathrm{ b } _{1,2}, {\vec{E}_{\mathrm {T}}^{\text {miss}}})} <$ 175 GeV, $ {N_{\mathrm {j}}} \geq$ 7. The first 5 bins in the plot correspond to $ {E_{\mathrm {T}}^{\text {miss}}} $ ranges of 250-300, 300-400, 400-500, 500-600, $>$ 600 GeV for $ {N_{\mathrm{ b } }} = $ 1, and the second 5 bins correspond to the same ${E_{\mathrm {T}}^{\text {miss}}}$ binning for $ {N_{\mathrm{ b } }} \geq $ 2. The SM background predictions shown do not include the effects of the maximum likelihood fit to the data. The ratio of the data to the SM prediction extracted from CRs is shown in the lower panel of the plot. |
png pdf |
Figure 3-c:
Observed and estimated SM background and signal yields in the SRs of the top squark search in the all-jet final state: $ {M_{\mathrm {T}}(\mathrm{ b } _{1,2}, {\vec{E}_{\mathrm {T}}^{\text {miss}}})} \geq $ 175 GeV, $ {N_{\mathrm{ t } }} = $ 0, 5 $ \leq {N_{\mathrm {j}}} \leq$ 6. The first 5 bins in the plot correspond to $ {E_{\mathrm {T}}^{\text {miss}}} $ ranges of 250-300, 300-400, 400-500, 500-600, $>$ 600 GeV for $ {N_{\mathrm{ b } }} = $ 1, and the second 5 bins correspond to the same ${E_{\mathrm {T}}^{\text {miss}}}$ binning for $ {N_{\mathrm{ b } }} \geq $ 2. The SM background predictions shown do not include the effects of the maximum likelihood fit to the data. The ratio of the data to the SM prediction extracted from CRs is shown in the lower panel of the plot. |
png pdf |
Figure 3-d:
Observed and estimated SM background and signal yields in the SRs of the top squark search in the all-jet final state: $ {M_{\mathrm {T}}(\mathrm{ b } _{1,2}, {\vec{E}_{\mathrm {T}}^{\text {miss}}})} \geq $ 175 GeV, $ {N_{\mathrm{ t } }} = $ 0, ${N_{\mathrm {j}}} \geq $ 7. The first 5 bins in the plot correspond to $ {E_{\mathrm {T}}^{\text {miss}}} $ ranges of 250-300, 300-400, 400-500, 500-600, $>$ 600 GeV for $ {N_{\mathrm{ b } }} = $ 1, and the second 5 bins correspond to the same ${E_{\mathrm {T}}^{\text {miss}}}$ binning for $ {N_{\mathrm{ b } }} \geq $ 2. The SM background predictions shown do not include the effects of the maximum likelihood fit to the data. The ratio of the data to the SM prediction extracted from CRs is shown in the lower panel of the plot. |
png pdf |
Figure 3-e:
Observed and estimated SM background and signal yields in the SRs of the top squark search in the all-jet final state: $ {M_{\mathrm {T}}(\mathrm{ b } _{1,2}, {\vec{E}_{\mathrm {T}}^{\text {miss}}})} \geq $ 175 GeV, $ {N_{\mathrm{ t } }} \geq $ 1, ${N_{\mathrm {j}}} \geq $ 5. The first 5 bins in the plot correspond to $ {E_{\mathrm {T}}^{\text {miss}}} $ ranges of 250-300, 300-400, 400-500, 500-600, $>$ 600 GeV for $ {N_{\mathrm{ b } }} = $ 1, and the second 5 bins correspond to the same ${E_{\mathrm {T}}^{\text {miss}}}$ binning for $ {N_{\mathrm{ b } }} \geq $ 2. The SM background predictions shown do not include the effects of the maximum likelihood fit to the data. The ratio of the data to the SM prediction extracted from CRs is shown in the lower panel of the plot. |

png pdf |
Figure 4:
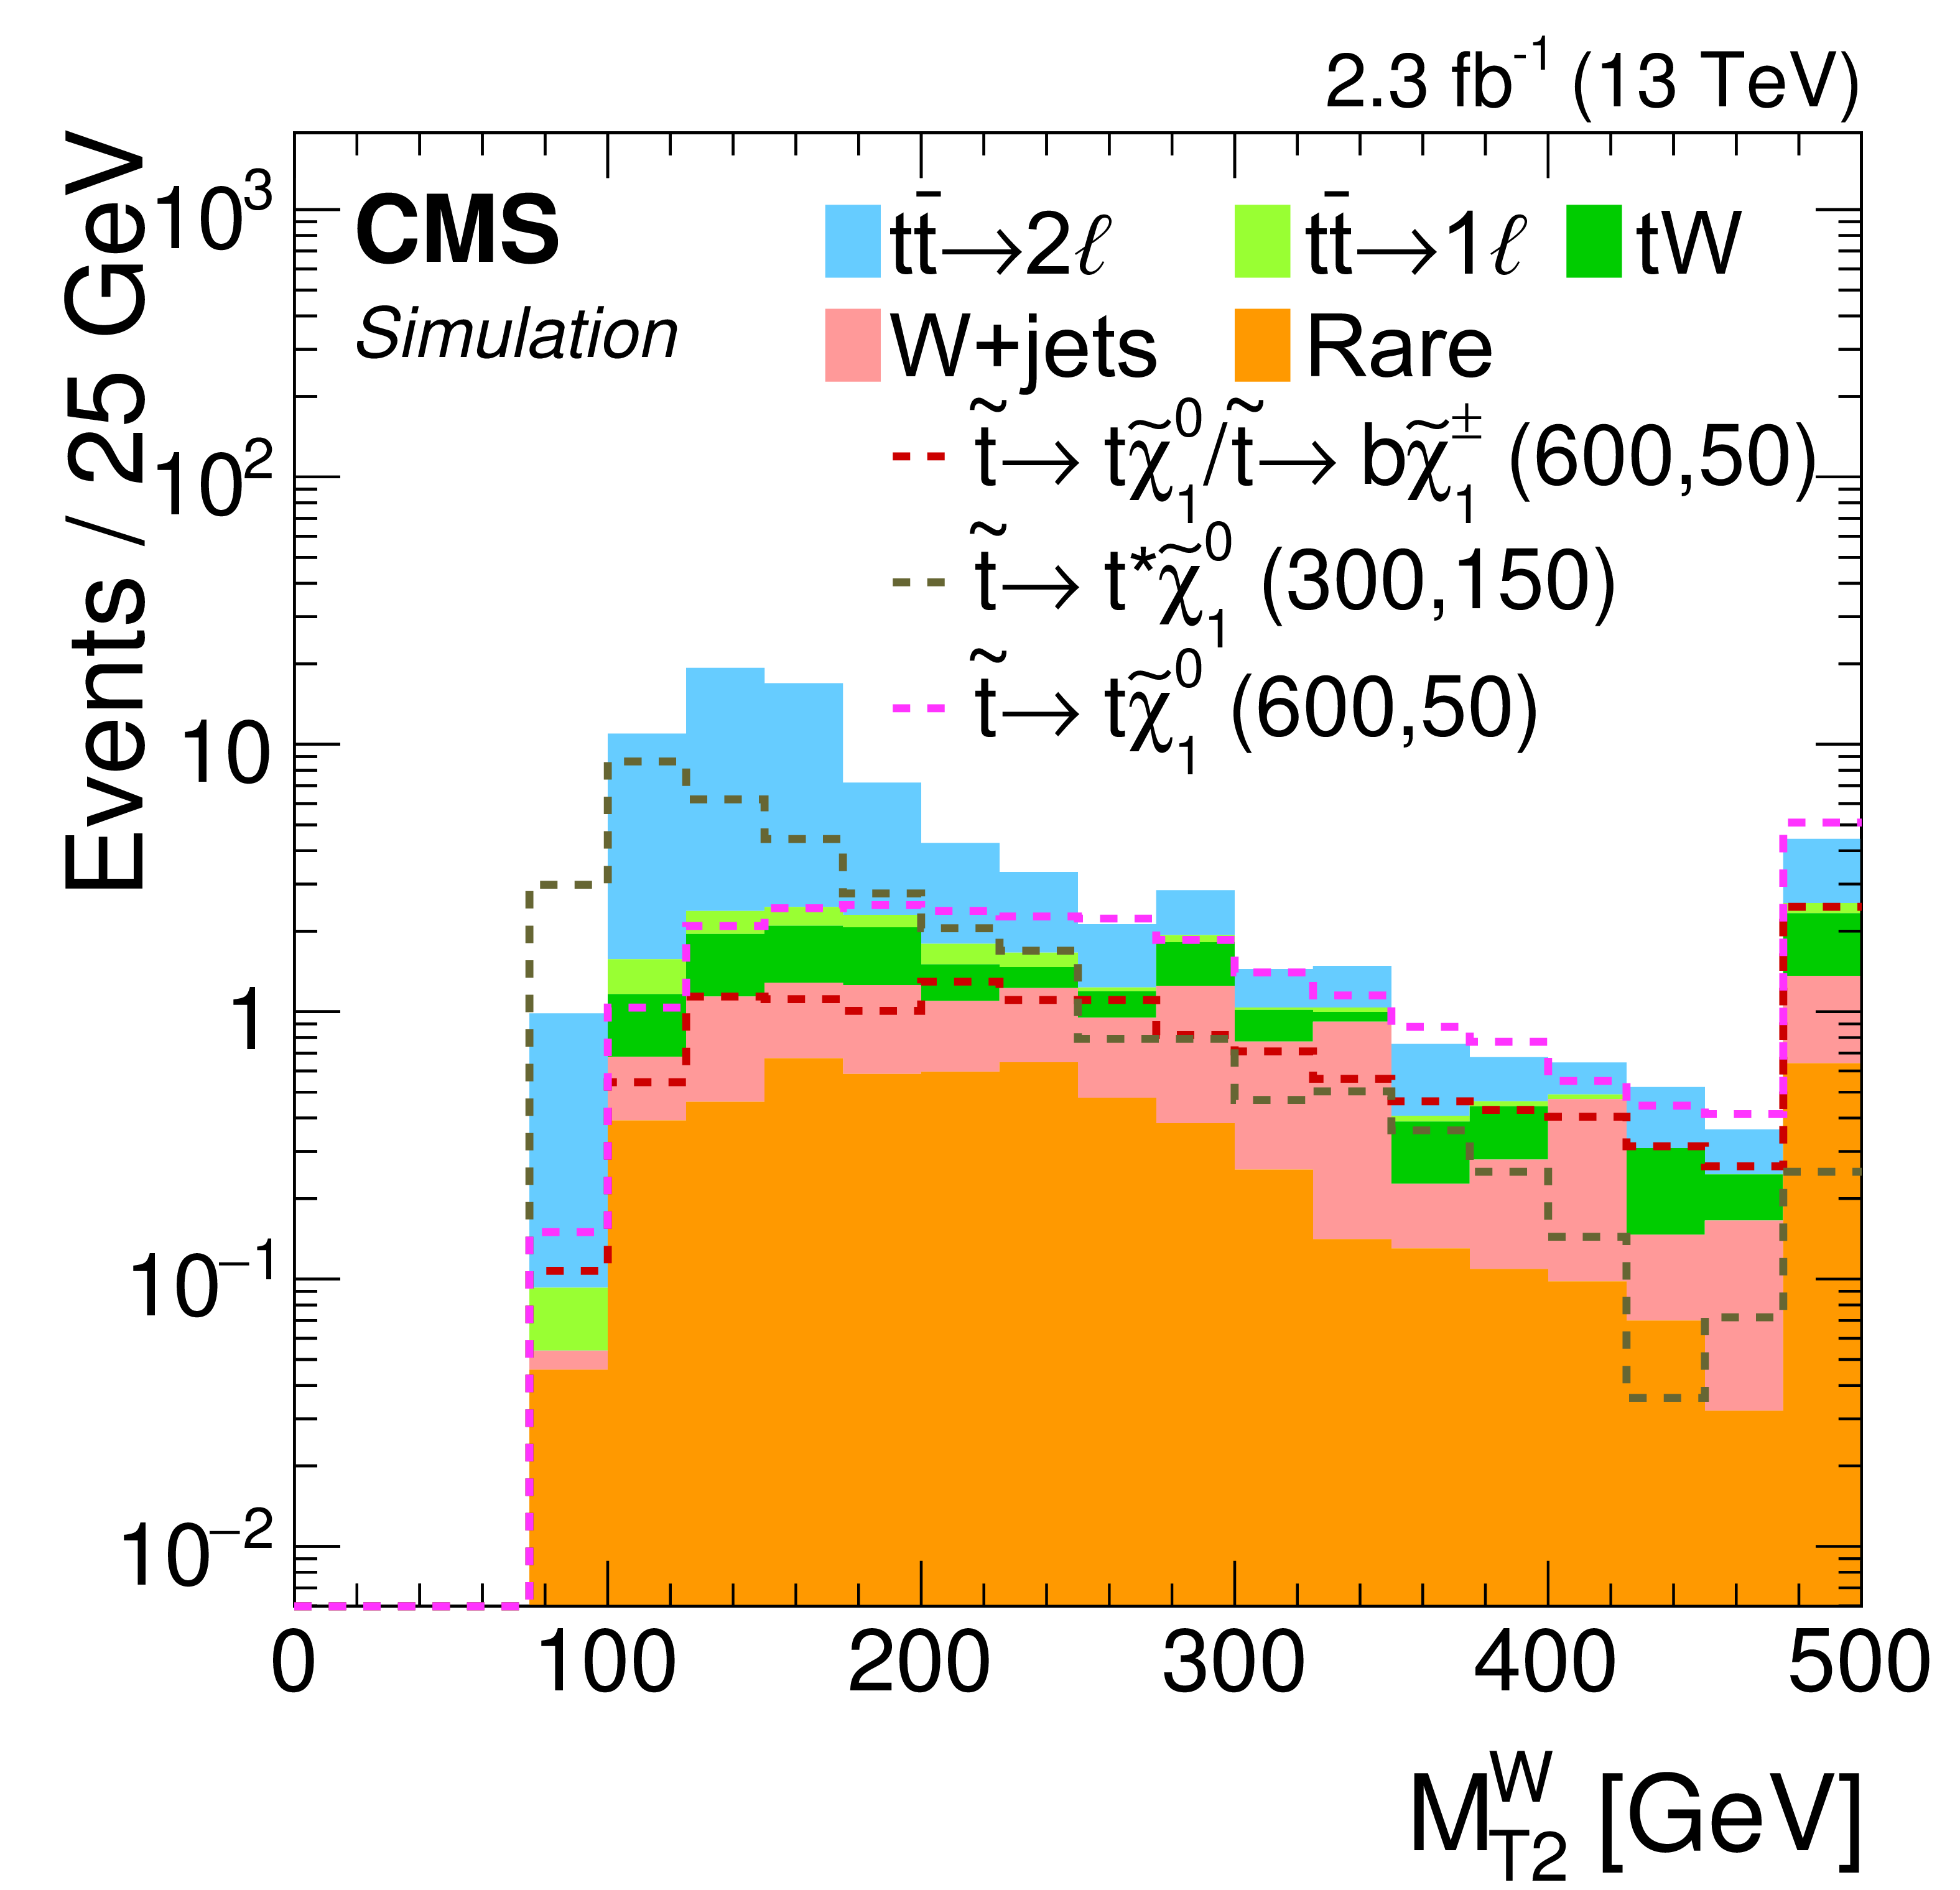
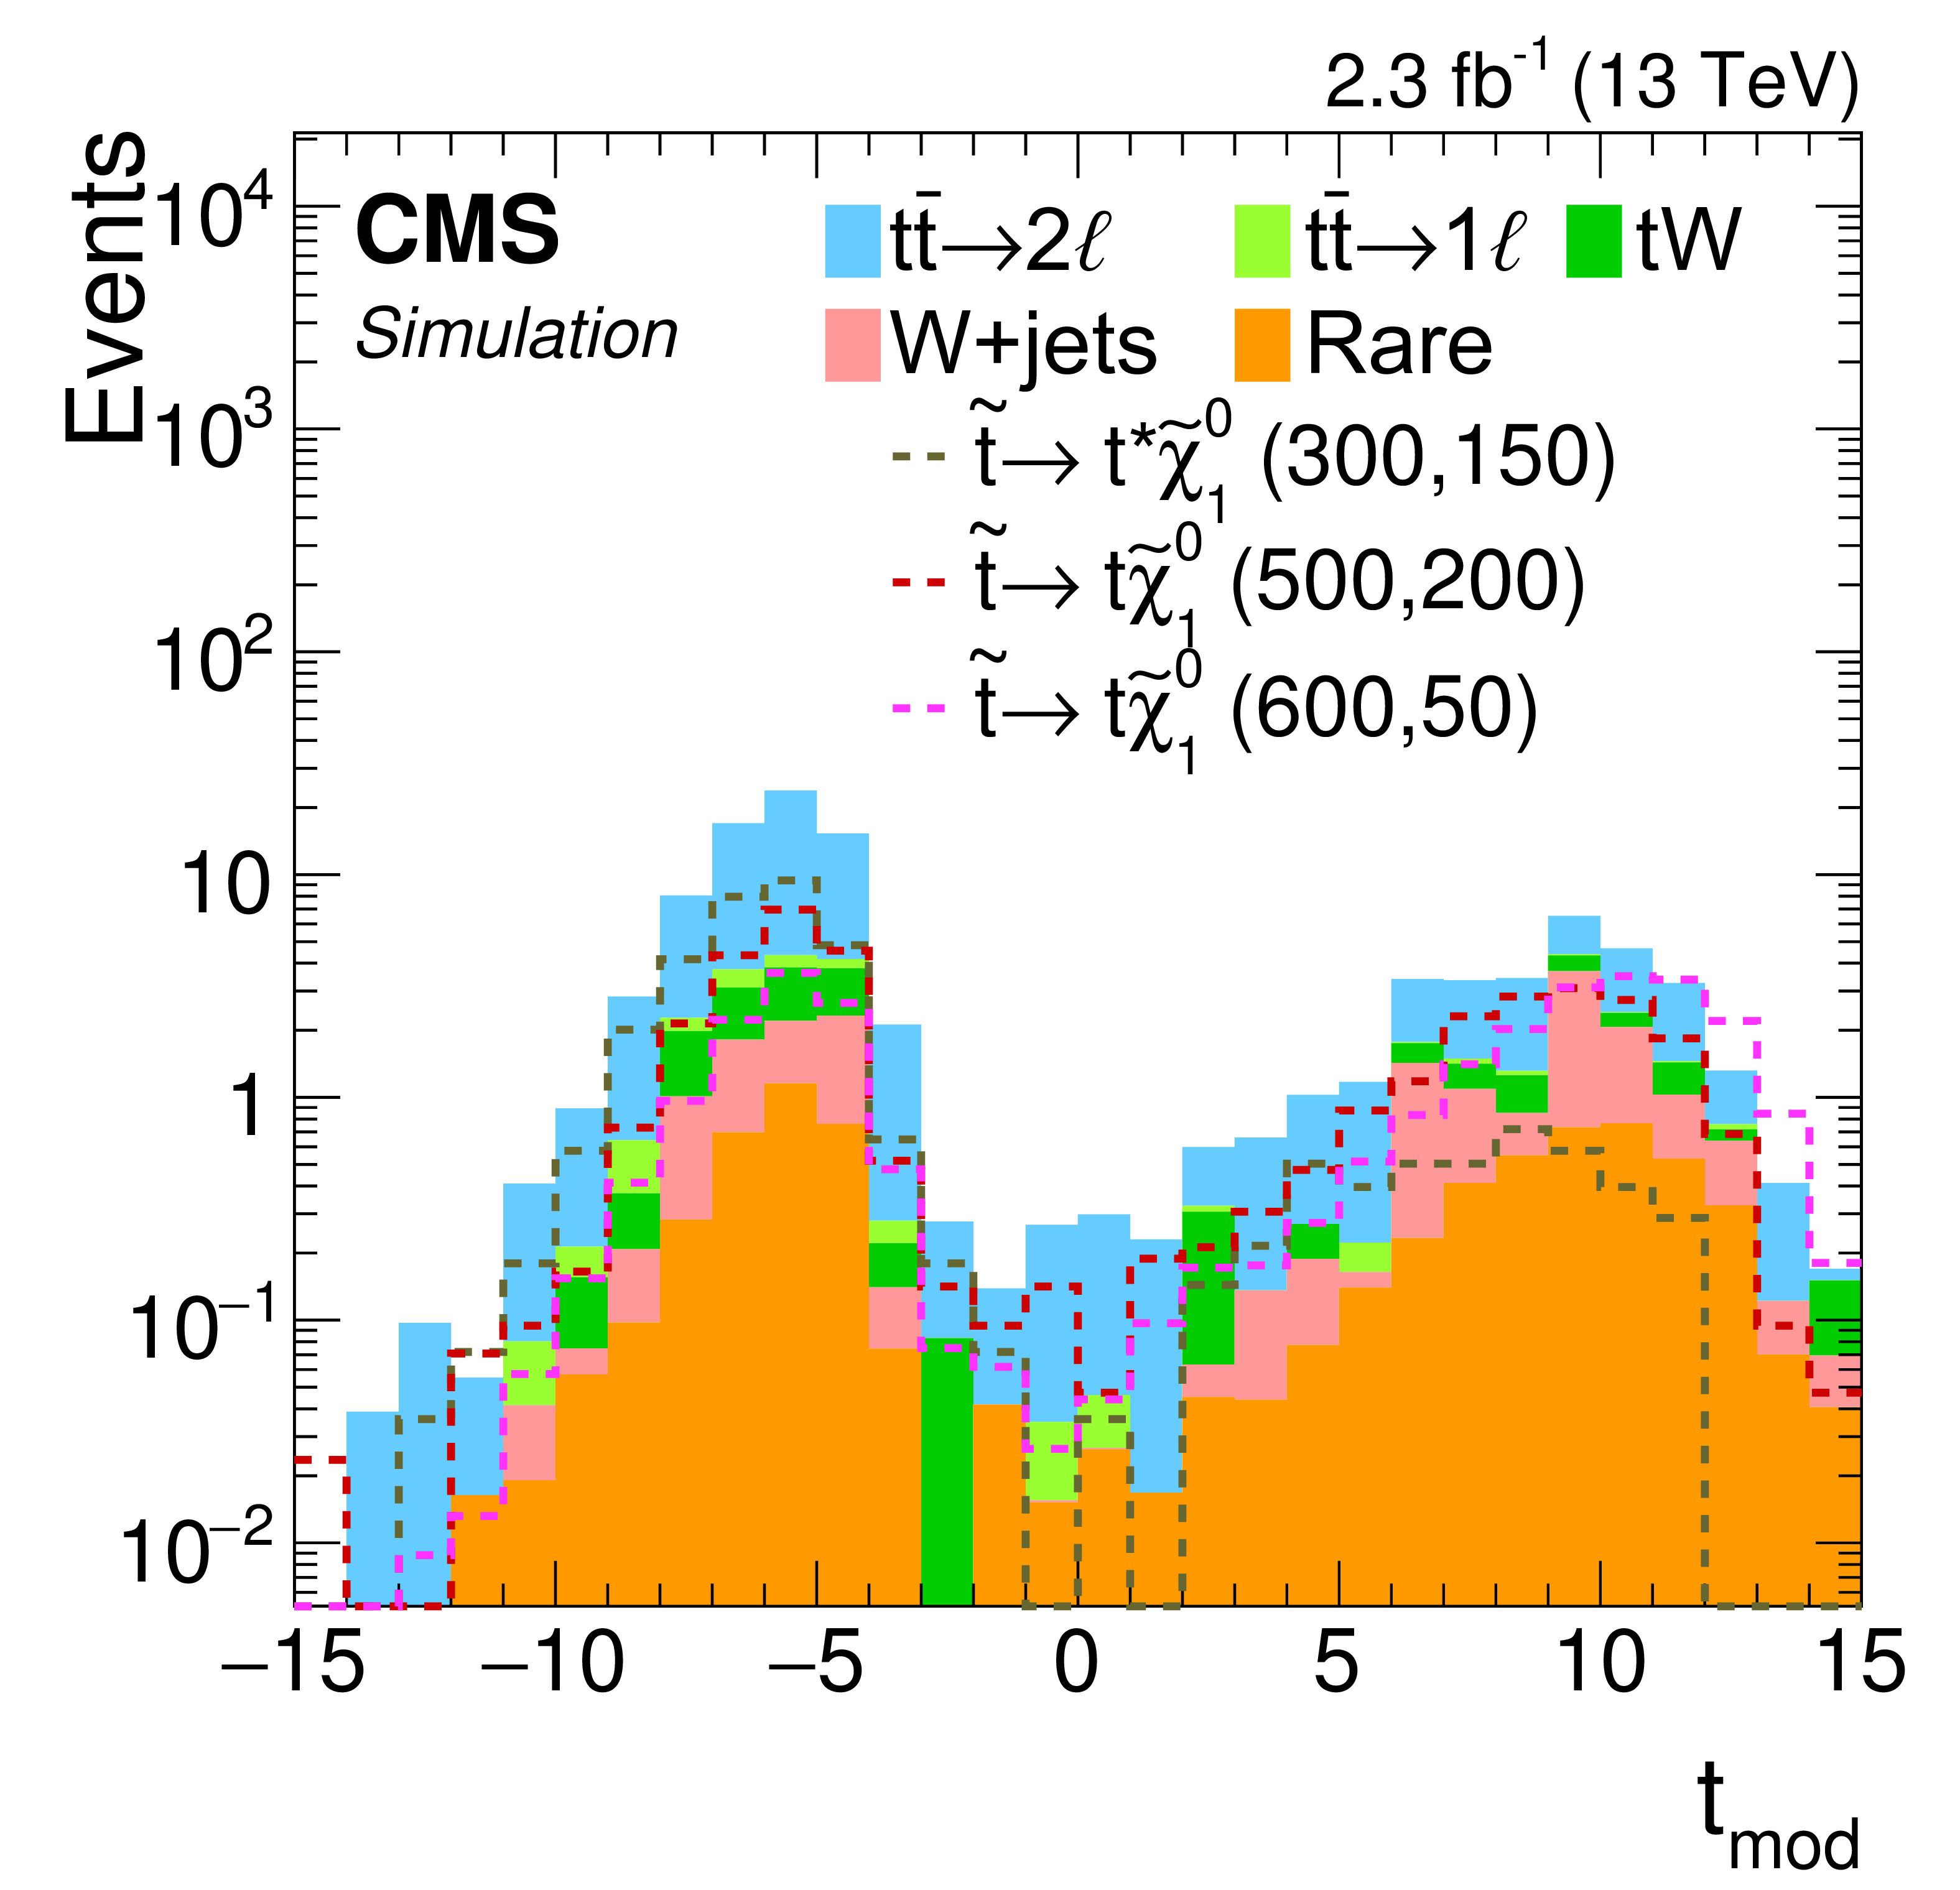
The ${M_{\mathrm {T2}}^{\mathrm{ W } }}$ (left) and $t_\text {mod}$ (right) distributions for signal and backgrounds after the preselection are shown. The ${M_{\mathrm {T2}}^{\mathrm{ W } }}$ variable is shown for events with four or more jets, while $t_\text {mod}$ is shown for events with at least two jets. Signal models with different top squark and neutralino mass hypotheses are shown for comparison. |
png pdf |
Figure 4-a:
The ${M_{\mathrm {T2}}^{\mathrm{ W } }}$ distribution for signal and backgrounds after the preselection is shown. The ${M_{\mathrm {T2}}^{\mathrm{ W } }}$ variable is shown for events with four or more jets. Signal models with different top squark and neutralino mass hypotheses are shown for comparison. |
png pdf |
Figure 4-b:
The $t_\text {mod}$ distribution for signal and backgrounds after the preselection is shown. The $t_\text {mod}$ is shown for events with at least two jets. Signal models with different top squark and neutralino mass hypotheses are shown for comparison. |

png pdf |
Figure 5:
Background estimates from data and simulation, together with the observed yields in the SRs of the single-lepton analysis, described in Table {tab1l:SR}. The uncertainties, which are the quadratic sums of statistical and systematic uncertainties, are indicated by the cross-hatched areas. Three signal hypotheses are overlaid. The hypothesis $ {\tilde{ \mathrm{ t } } _{1}} \to \mathrm{ t } \tilde{\chi}^0_1 / {\tilde{ \mathrm{ t } } _{1}} \to \mathrm{ b } \tilde{\chi}^{pm}_1 $ has branching fractions $\mathcal {B}( {\tilde{ \mathrm{ t } } _{1}} \to \mathrm{ t } \tilde{\chi}^0_1)=\mathcal {B}( {\tilde{ \mathrm{ t } } _{1}} \to \mathrm{ b } \tilde{\chi}^{pm}_1)=0.5$. |

png pdf |
Figure 6:
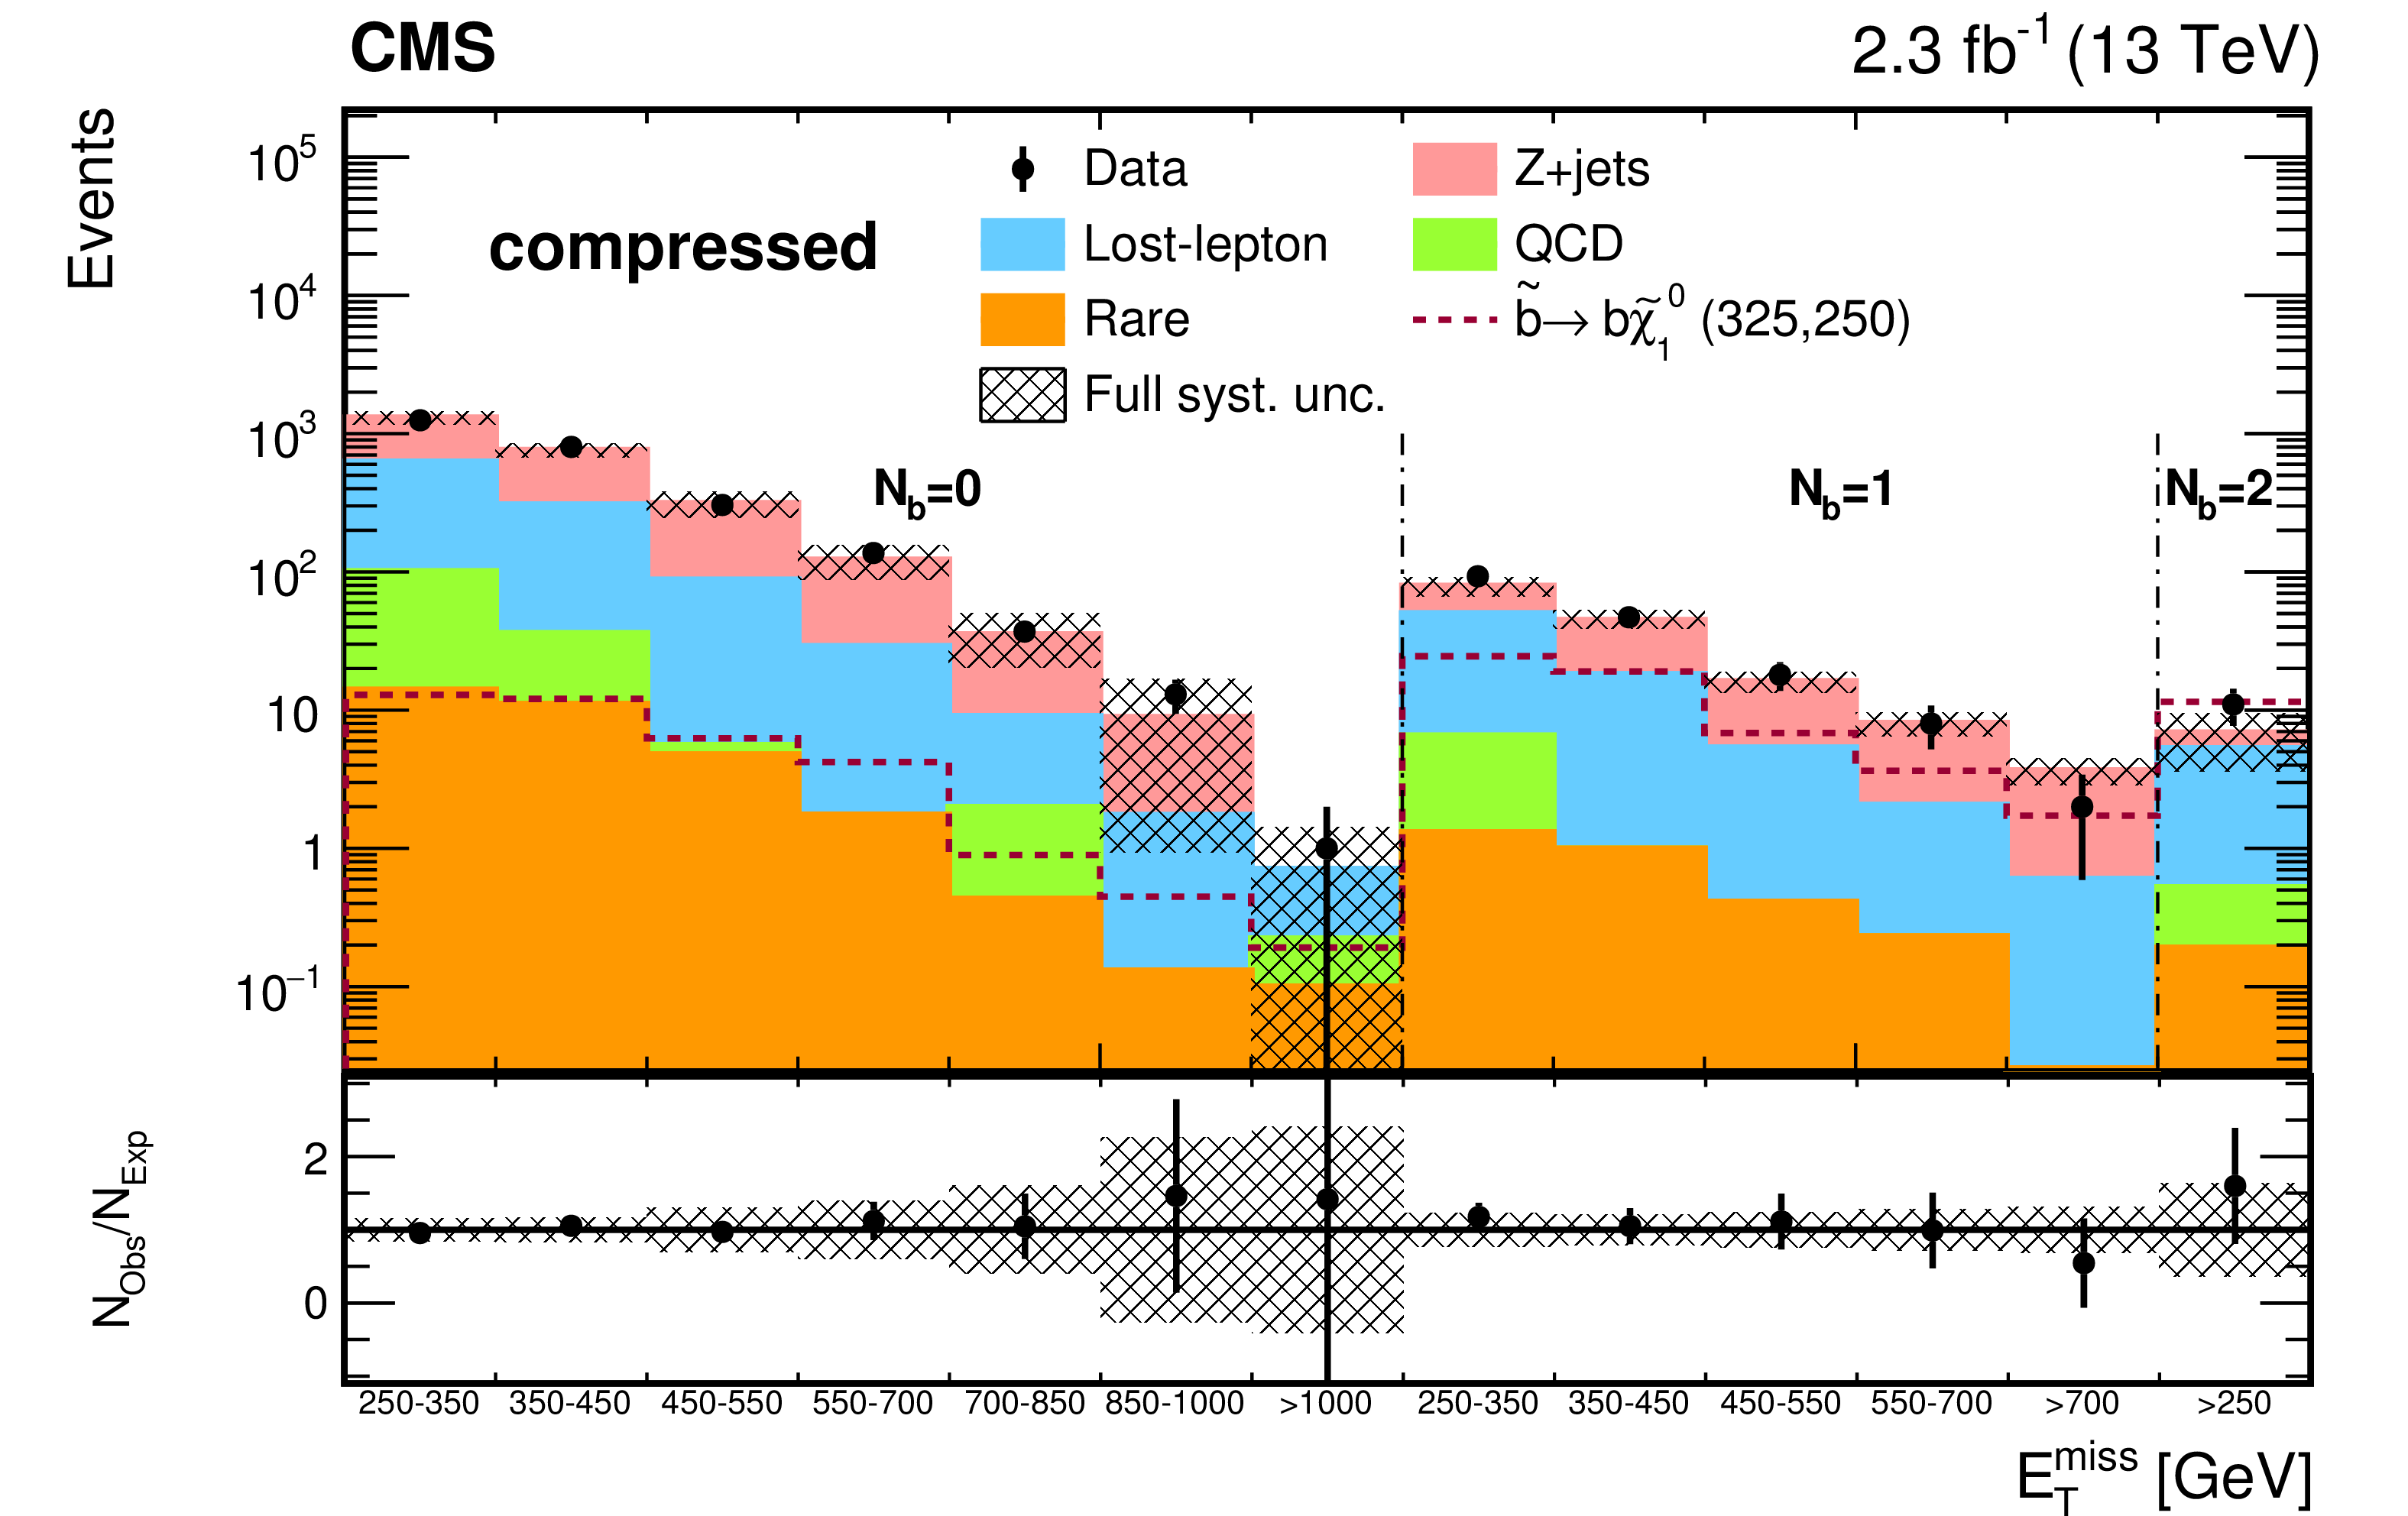
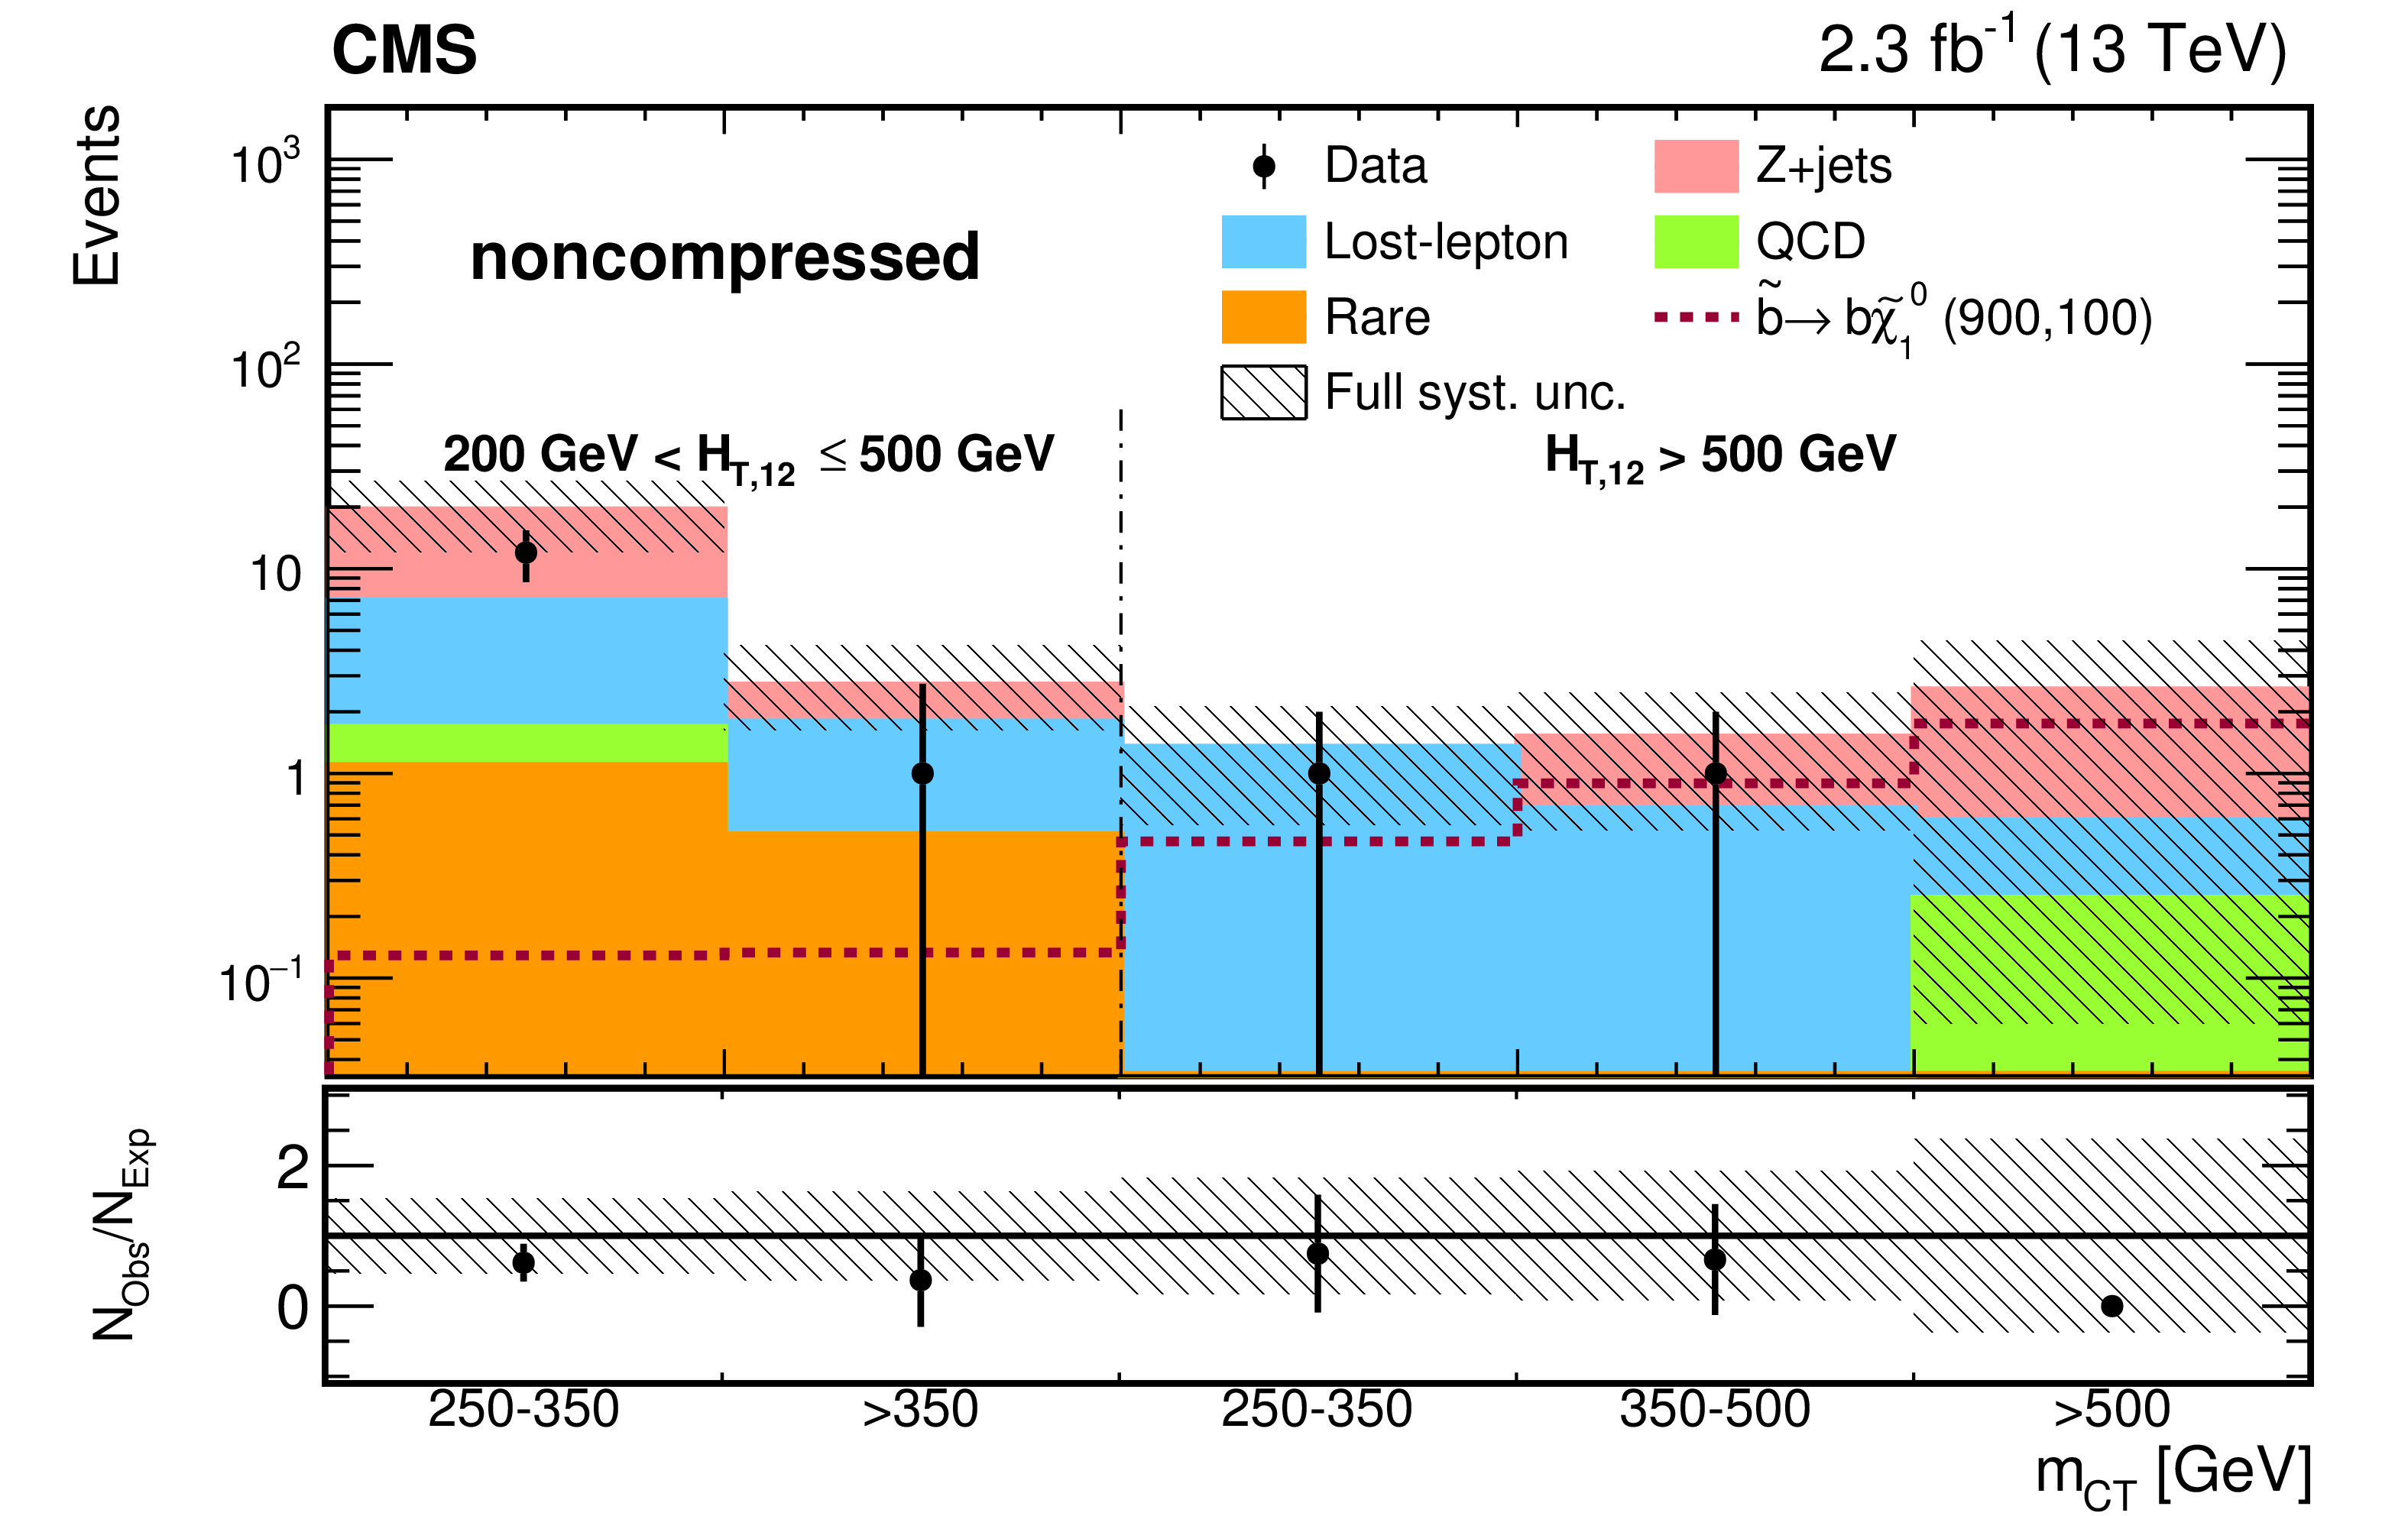
Observed events and estimated SM background and signal yields for the compressed (top) and noncompressed (bottom) SRs for the bottom squark search in the all-jet final state. The observed data yield is shown as black points and the total background predictions are shown in solid area. The bottom panel shows the ratio of data to the total background prediction in each search bin. Only statistical uncertainties are propagated to the ratio. |
png pdf |
Figure 6-a:
Observed events and estimated SM background and signal yields for the compressed SR for the bottom squark search in the all-jet final state. The observed data yield is shown as black points and the total background predictions are shown in solid area. The bottom panel shows the ratio of data to the total background prediction in each search bin. Only statistical uncertainties are propagated to the ratio. |
png pdf |
Figure 6-b:
Observed events and estimated SM background and signal yields for the noncompressed SR for the bottom squark search in the all-jet final state. The observed data yield is shown as black points and the total background predictions are shown in solid area. The bottom panel shows the ratio of data to the total background prediction in each search bin. Only statistical uncertainties are propagated to the ratio. |
png pdf |
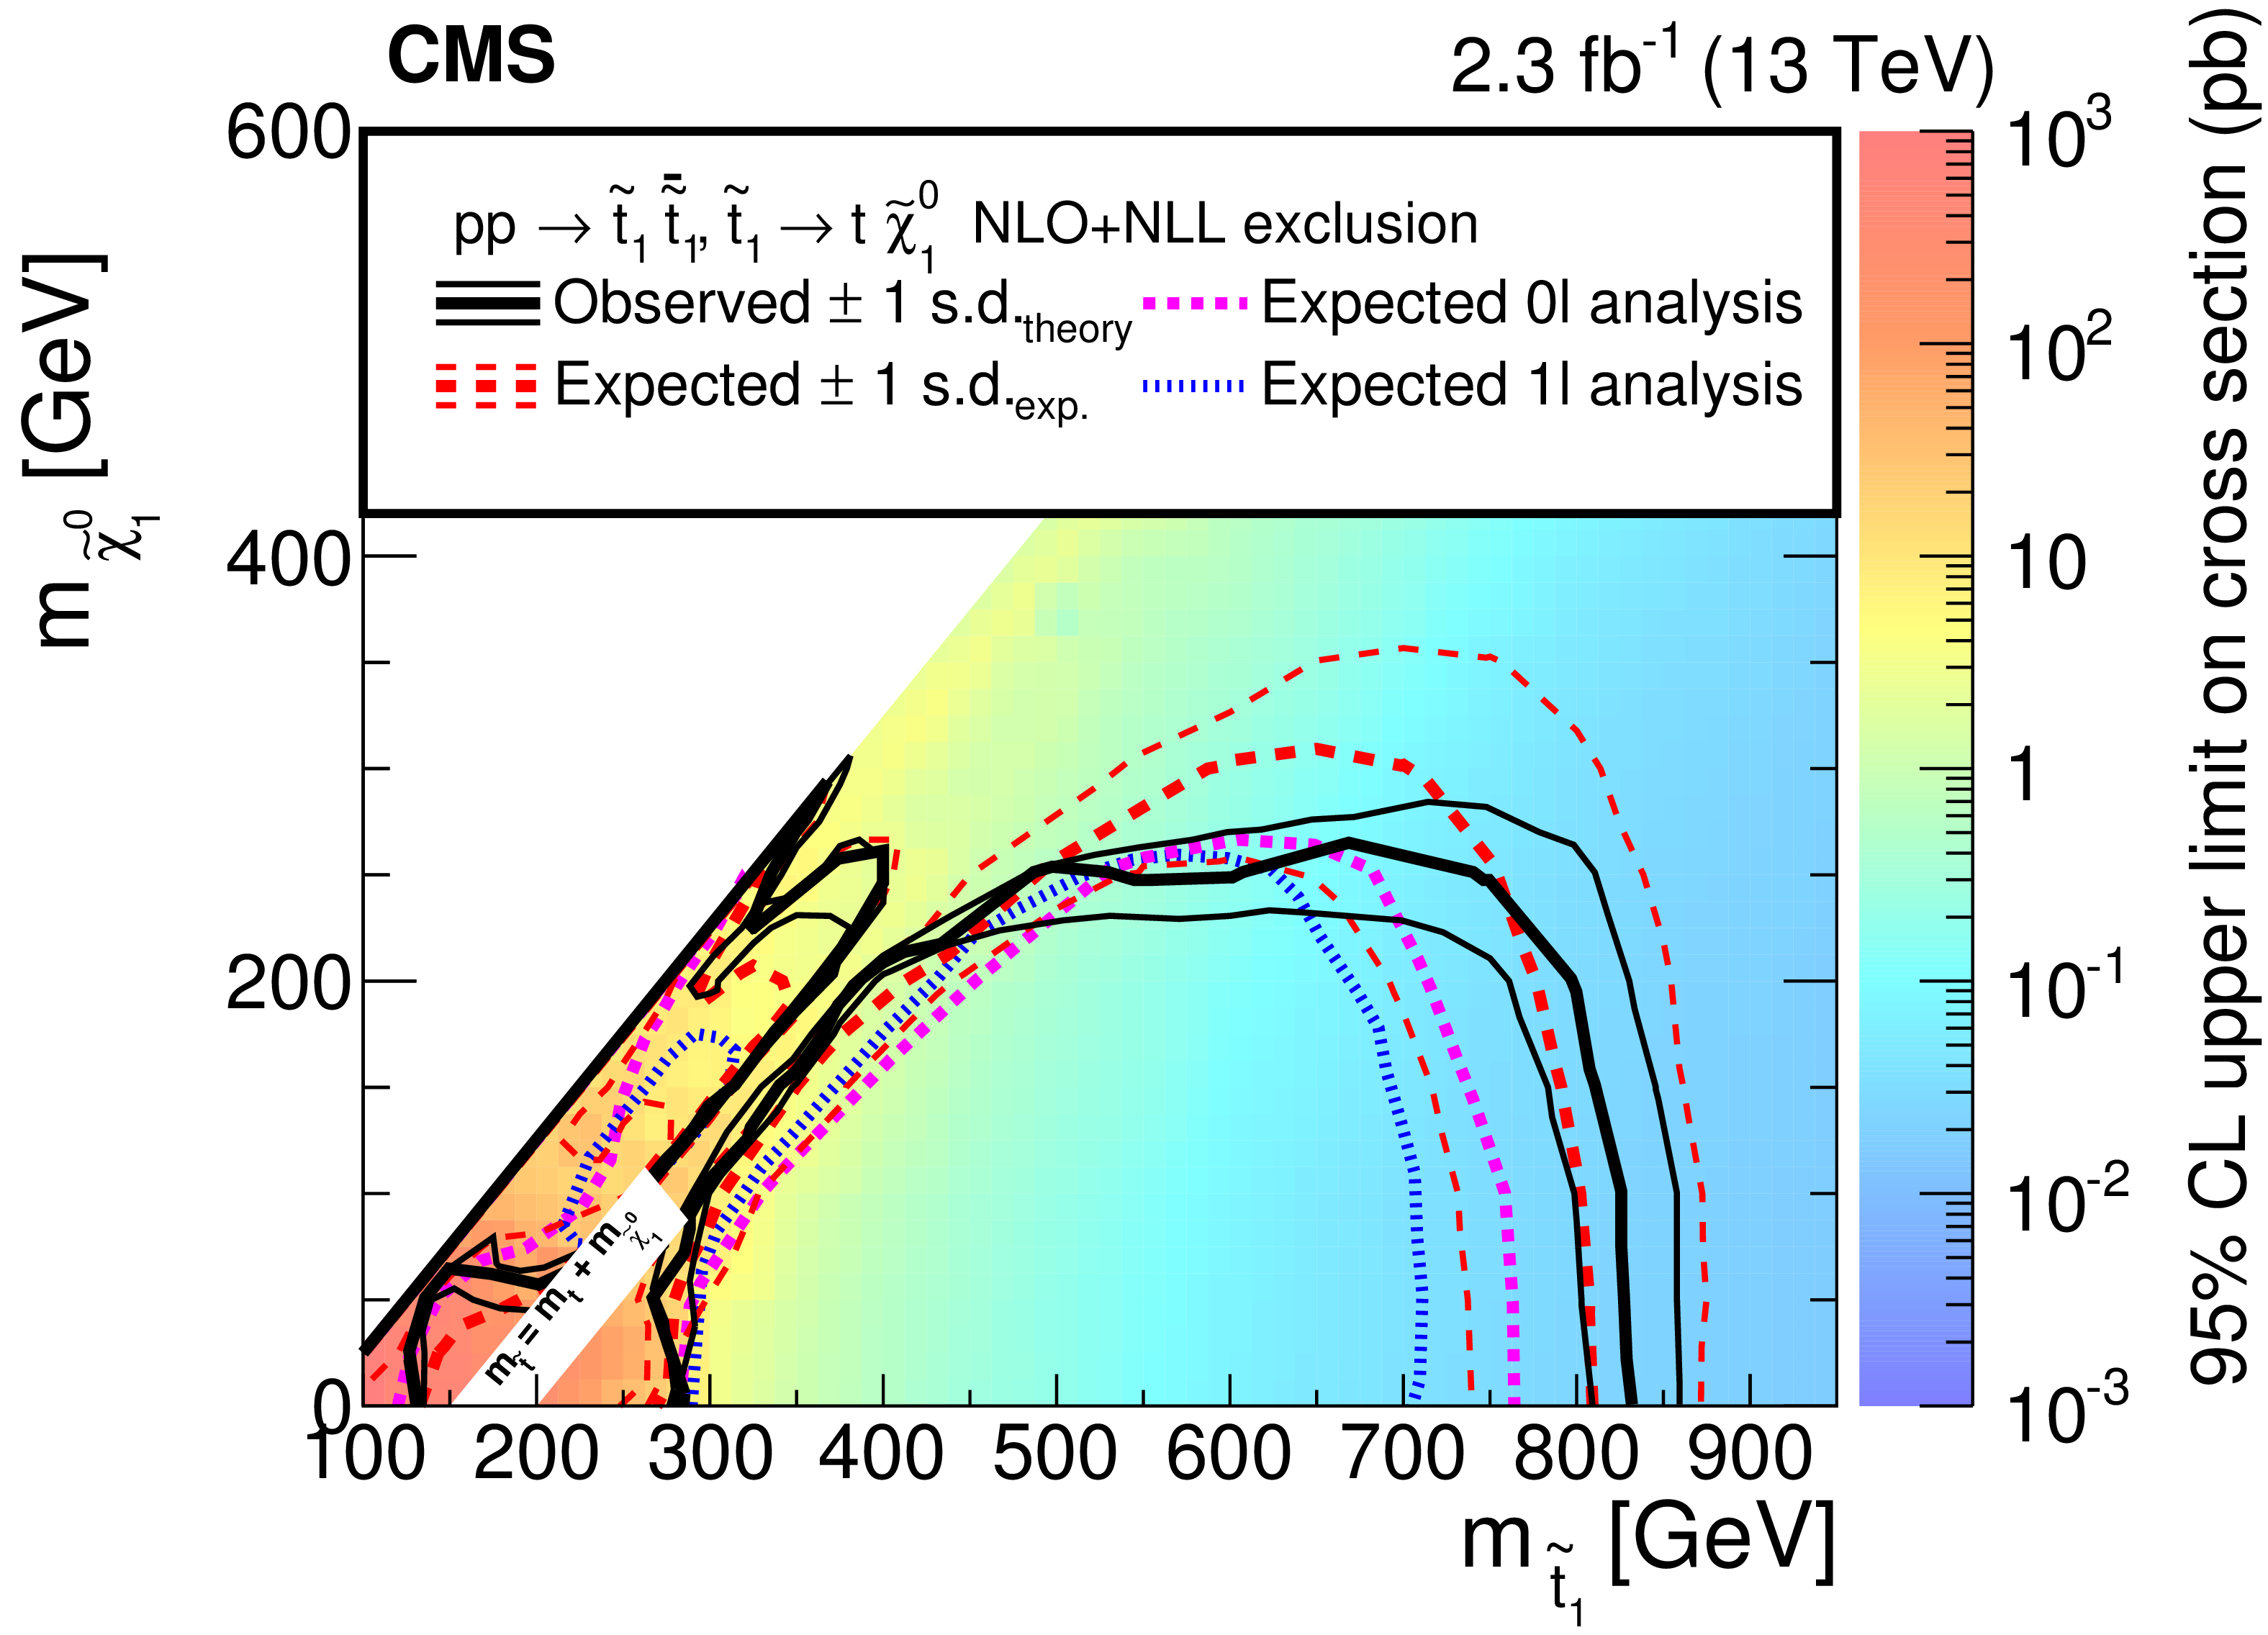
Figure 7:
Exclusion limits at 95% CL for direct top squark pair production for the decay mode $ {\tilde{ \mathrm{ t } } _{1}} \to \mathrm{ t } ^{(*)}\tilde{\chi}^0_1 $. The interpretation is performed in the two-dimensional space of $m_{ {\tilde{ \mathrm{ t } } _{1}} }$ vs. $m_{\tilde{\chi}^0_1 }$. The color indicates the 95% CL upper limit on the product of cross section and branching fraction at each point in the $m_{ {\tilde{ \mathrm{ t } } _{1}} }$-$m_{\tilde{\chi}^0_1 }$ plane. The regions enclosed by the thick black curves represent the observed exclusion at 95% CL, while the dashed red lines indicate the expected limits at 95% CL and their $\pm $1 s.d. experimental uncertainties. The thin black lines show the impact of the $\pm $1 s.d. theoretical uncertainties in the signal cross section. The blue dotted curve and the magenta short-dashed curves show the expected limits for the analysis in the all-jet (Section {sec:1lstop}) and single-lepton (Section {sec:stop0l}) final states, respectively. The limits in the region near $\Delta m\approx m_{\mathrm{ t } }$ and low $\tilde{\chi}^0_1 $ mass are not shown due to the difficulty in modelling rapidly varying kinematics in this region. |
png pdf |
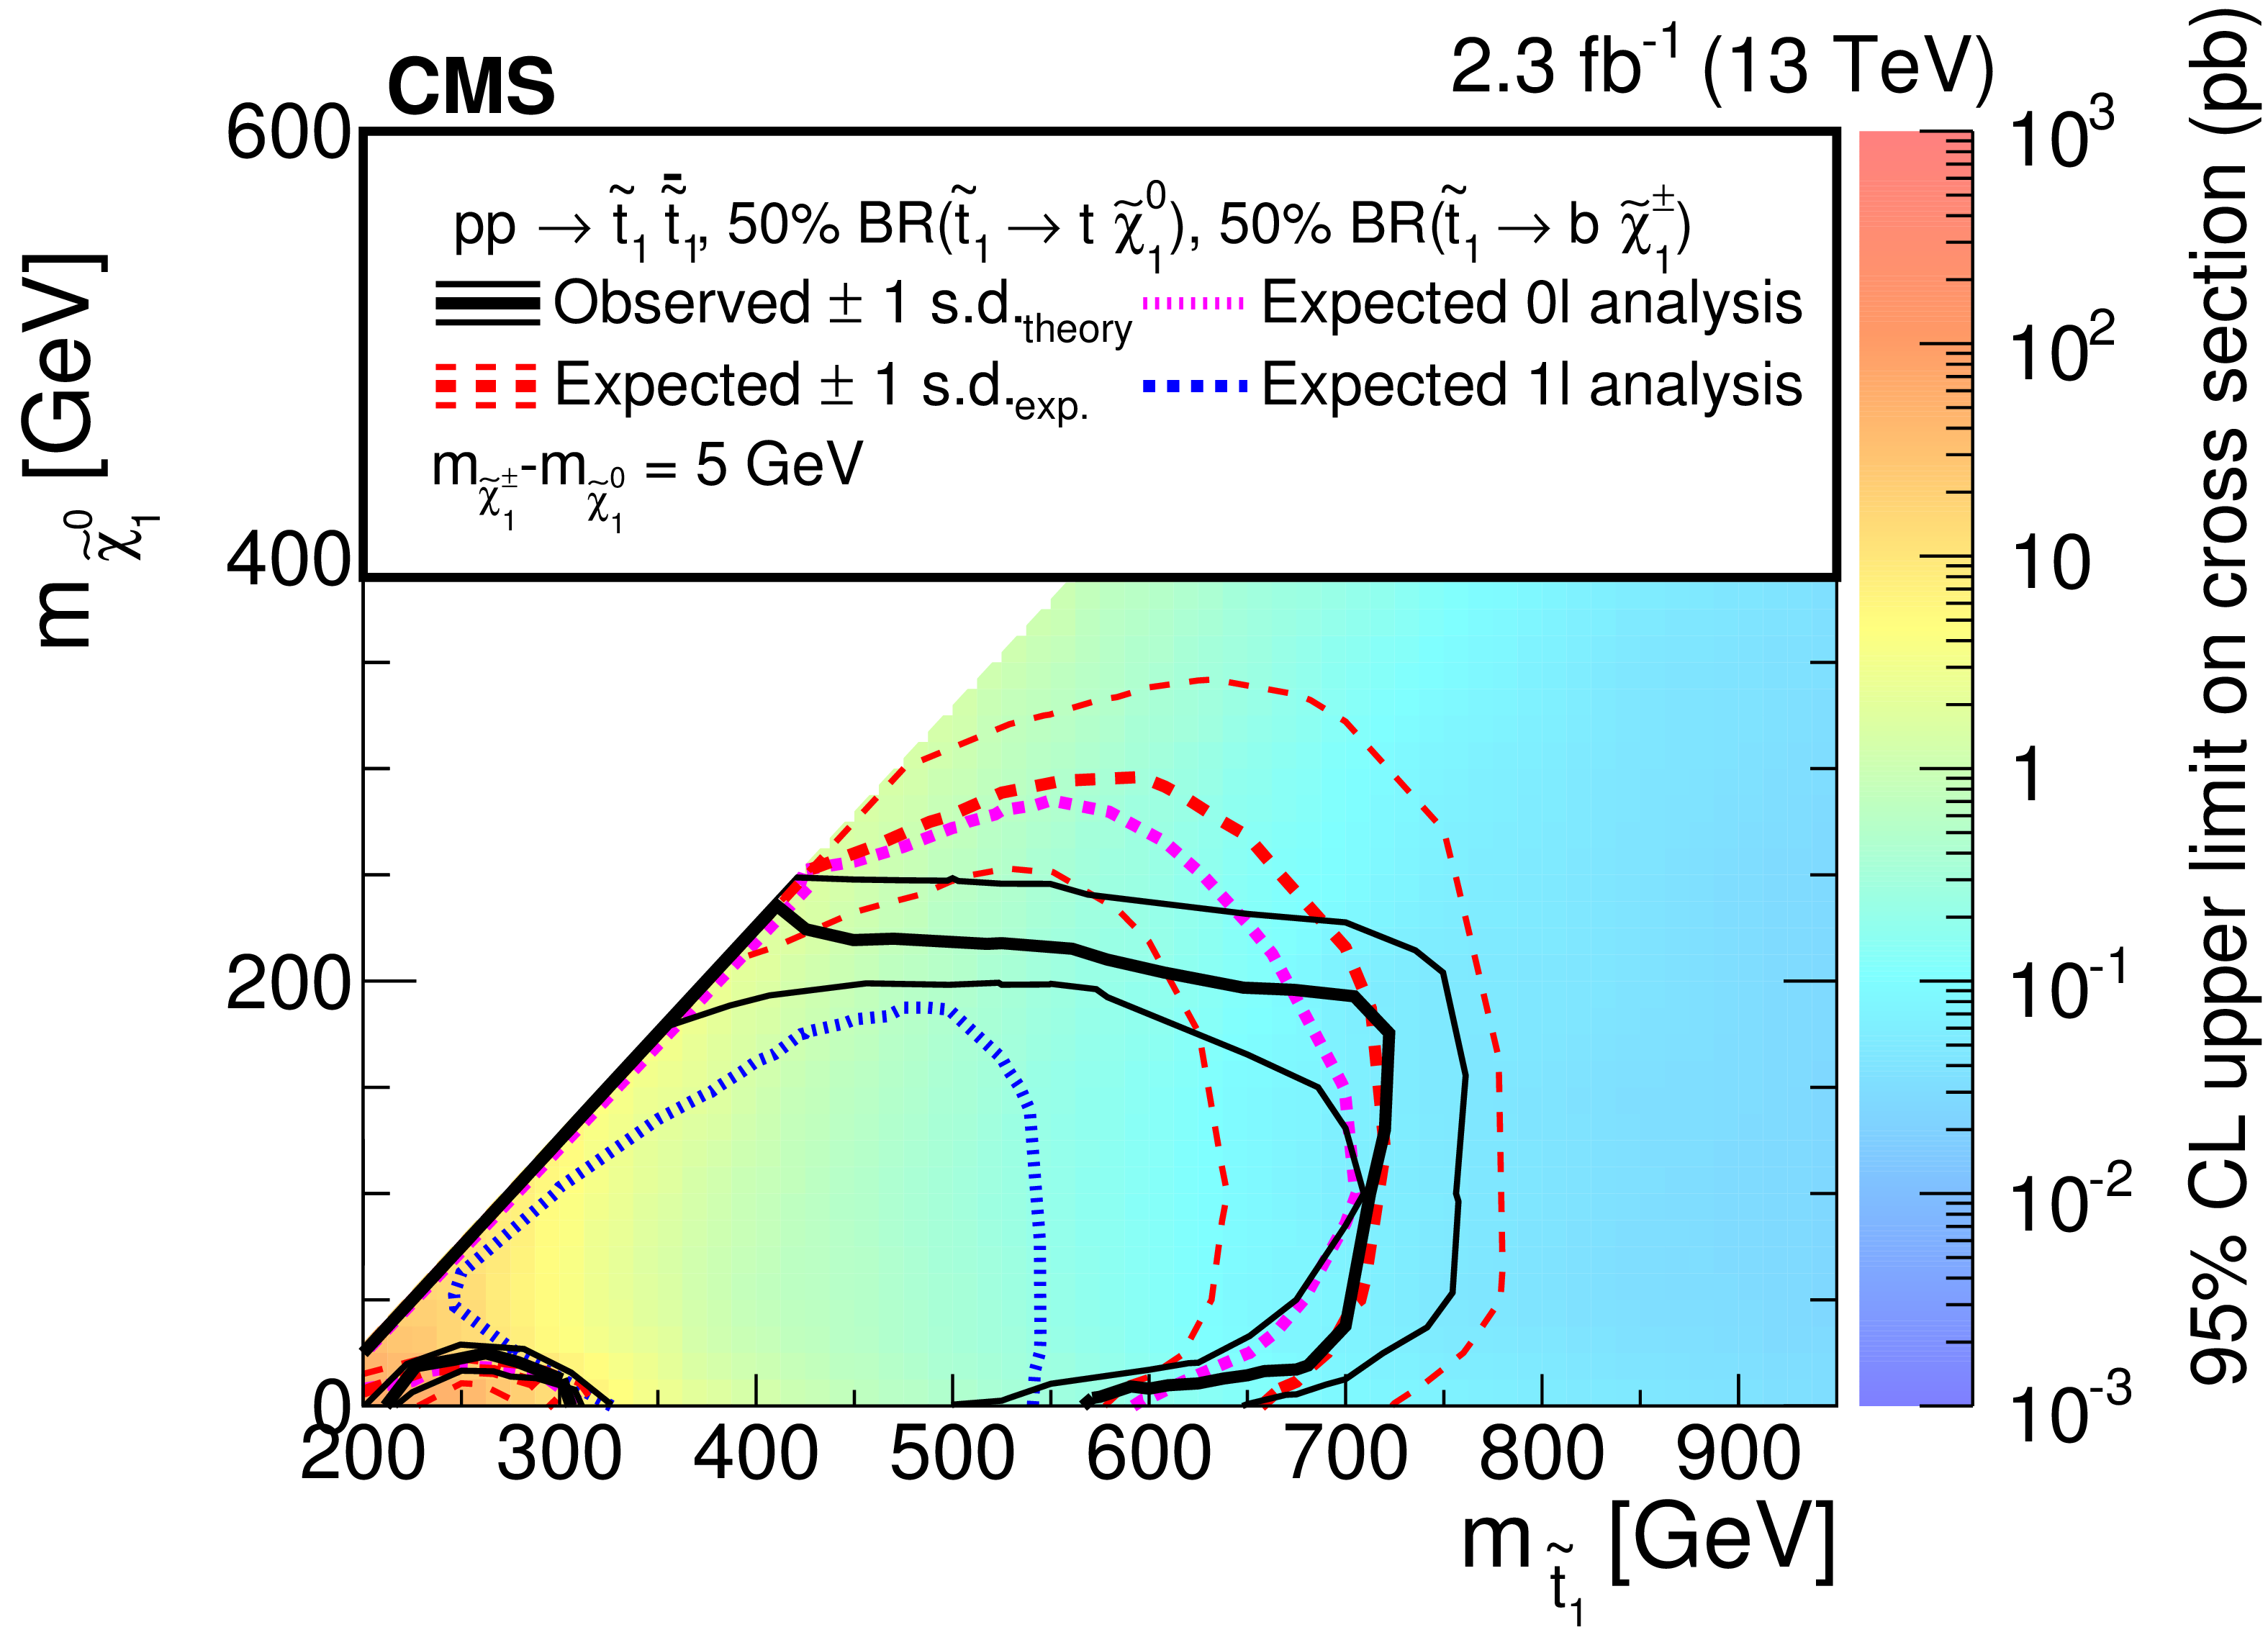
Figure 8:
Exclusion limits at 95% CL for direct top squark pair production assuming equal branching fractions for the decays $ {\tilde{ \mathrm{ t } } _{1}} \to \mathrm{ t } ^{(*)}\tilde{\chi}^0_1 $ and $ {\tilde{ \mathrm{ t } } _{1}} \to \mathrm{ b } \tilde{\chi}^{pm}_1 $. The interpretation is performed in the two-dimensional space of $m_{ {\tilde{ \mathrm{ t } } _{1}} }$ vs. $m_{\tilde{\chi}^0_1 }$. The chargino is considered to be nearly mass-degenerate with the LSP ($m_{\tilde{\chi}^{pm}_1 } = m_{\tilde{\chi}^0_1 } + 5$ GeV). The caption of Fig. {fig:limits:T2tt} explains the use of lines and colors in detail. |
png pdf |
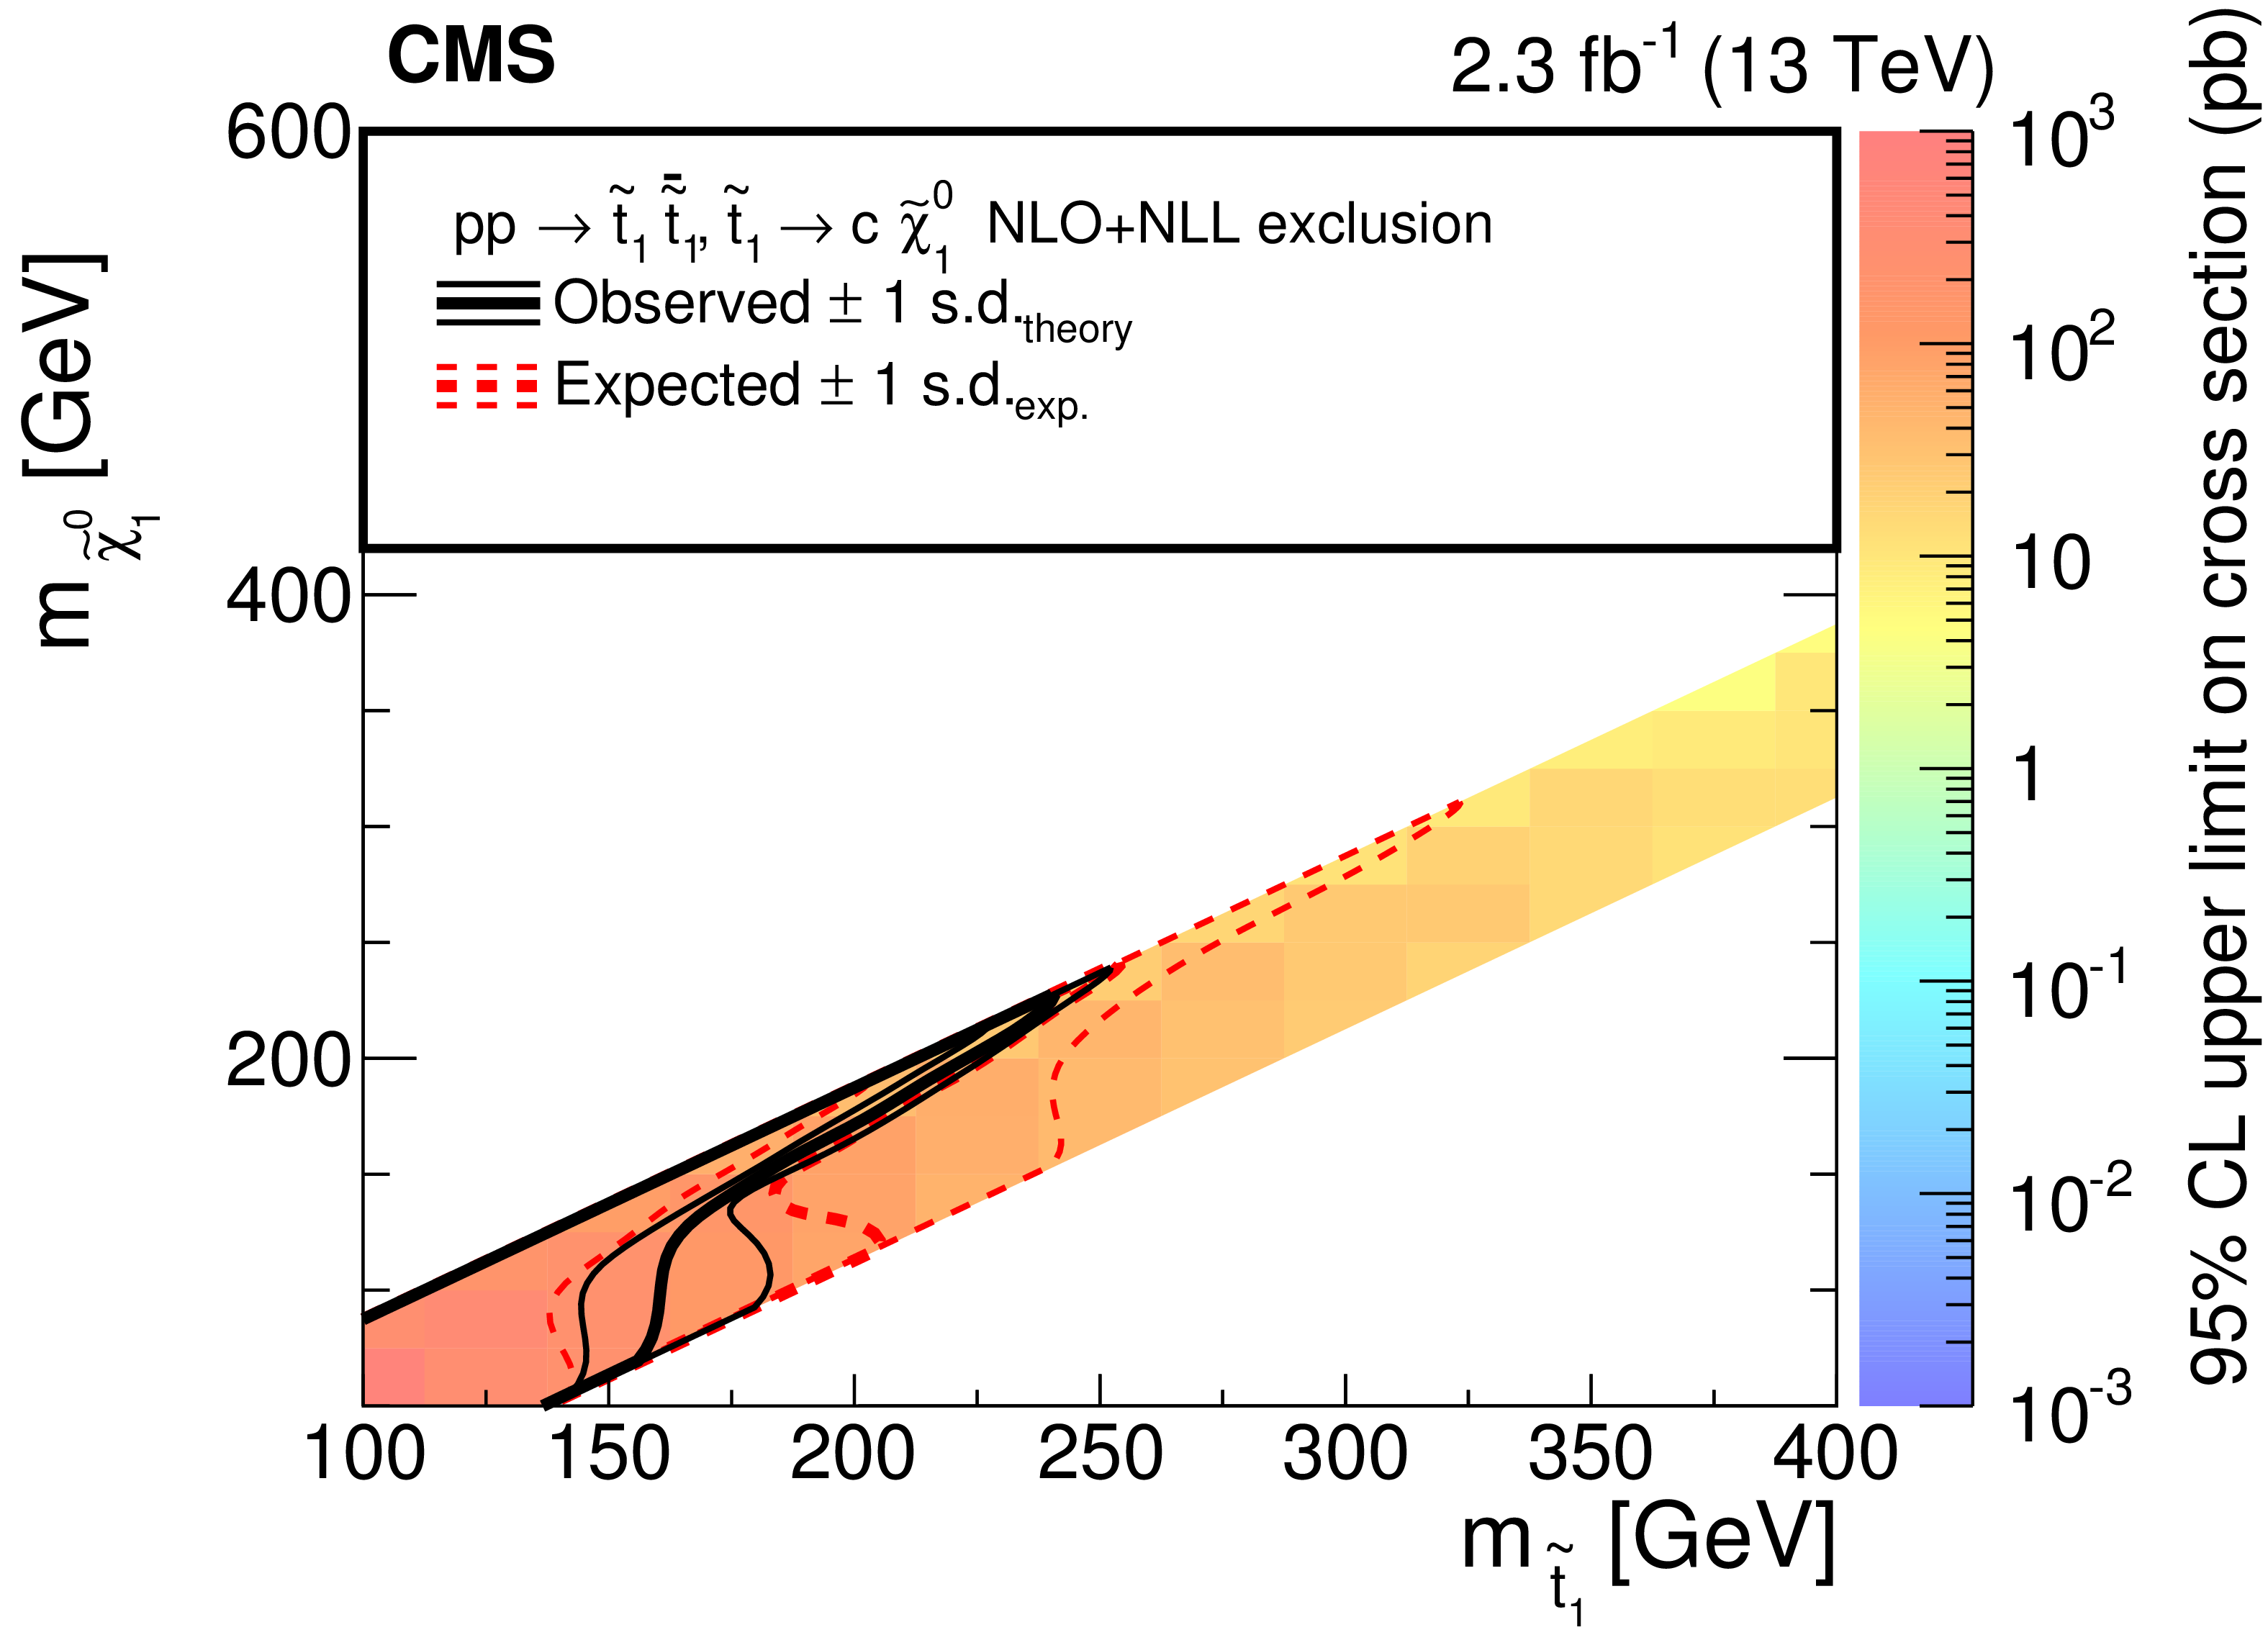
Figure 9:
Exclusion limits at 95% CL for direct top squark pair production with decay $ {\tilde{ \mathrm{ t } } _{1}} \to \mathrm{c} \tilde{\chi}^0_1 $ using the compressed SRs of the bottom squark analysis (Section {sec:sbottom}). The interpretation is done in the two-dimensional space of $m_{ {\tilde{ \mathrm{ t } } _{1}} }$ vs. $m_{\tilde{\chi}^0_1 }$. The caption of Fig. {fig:limits:T2tt} explains the use of lines and colors in detail. |
png pdf |
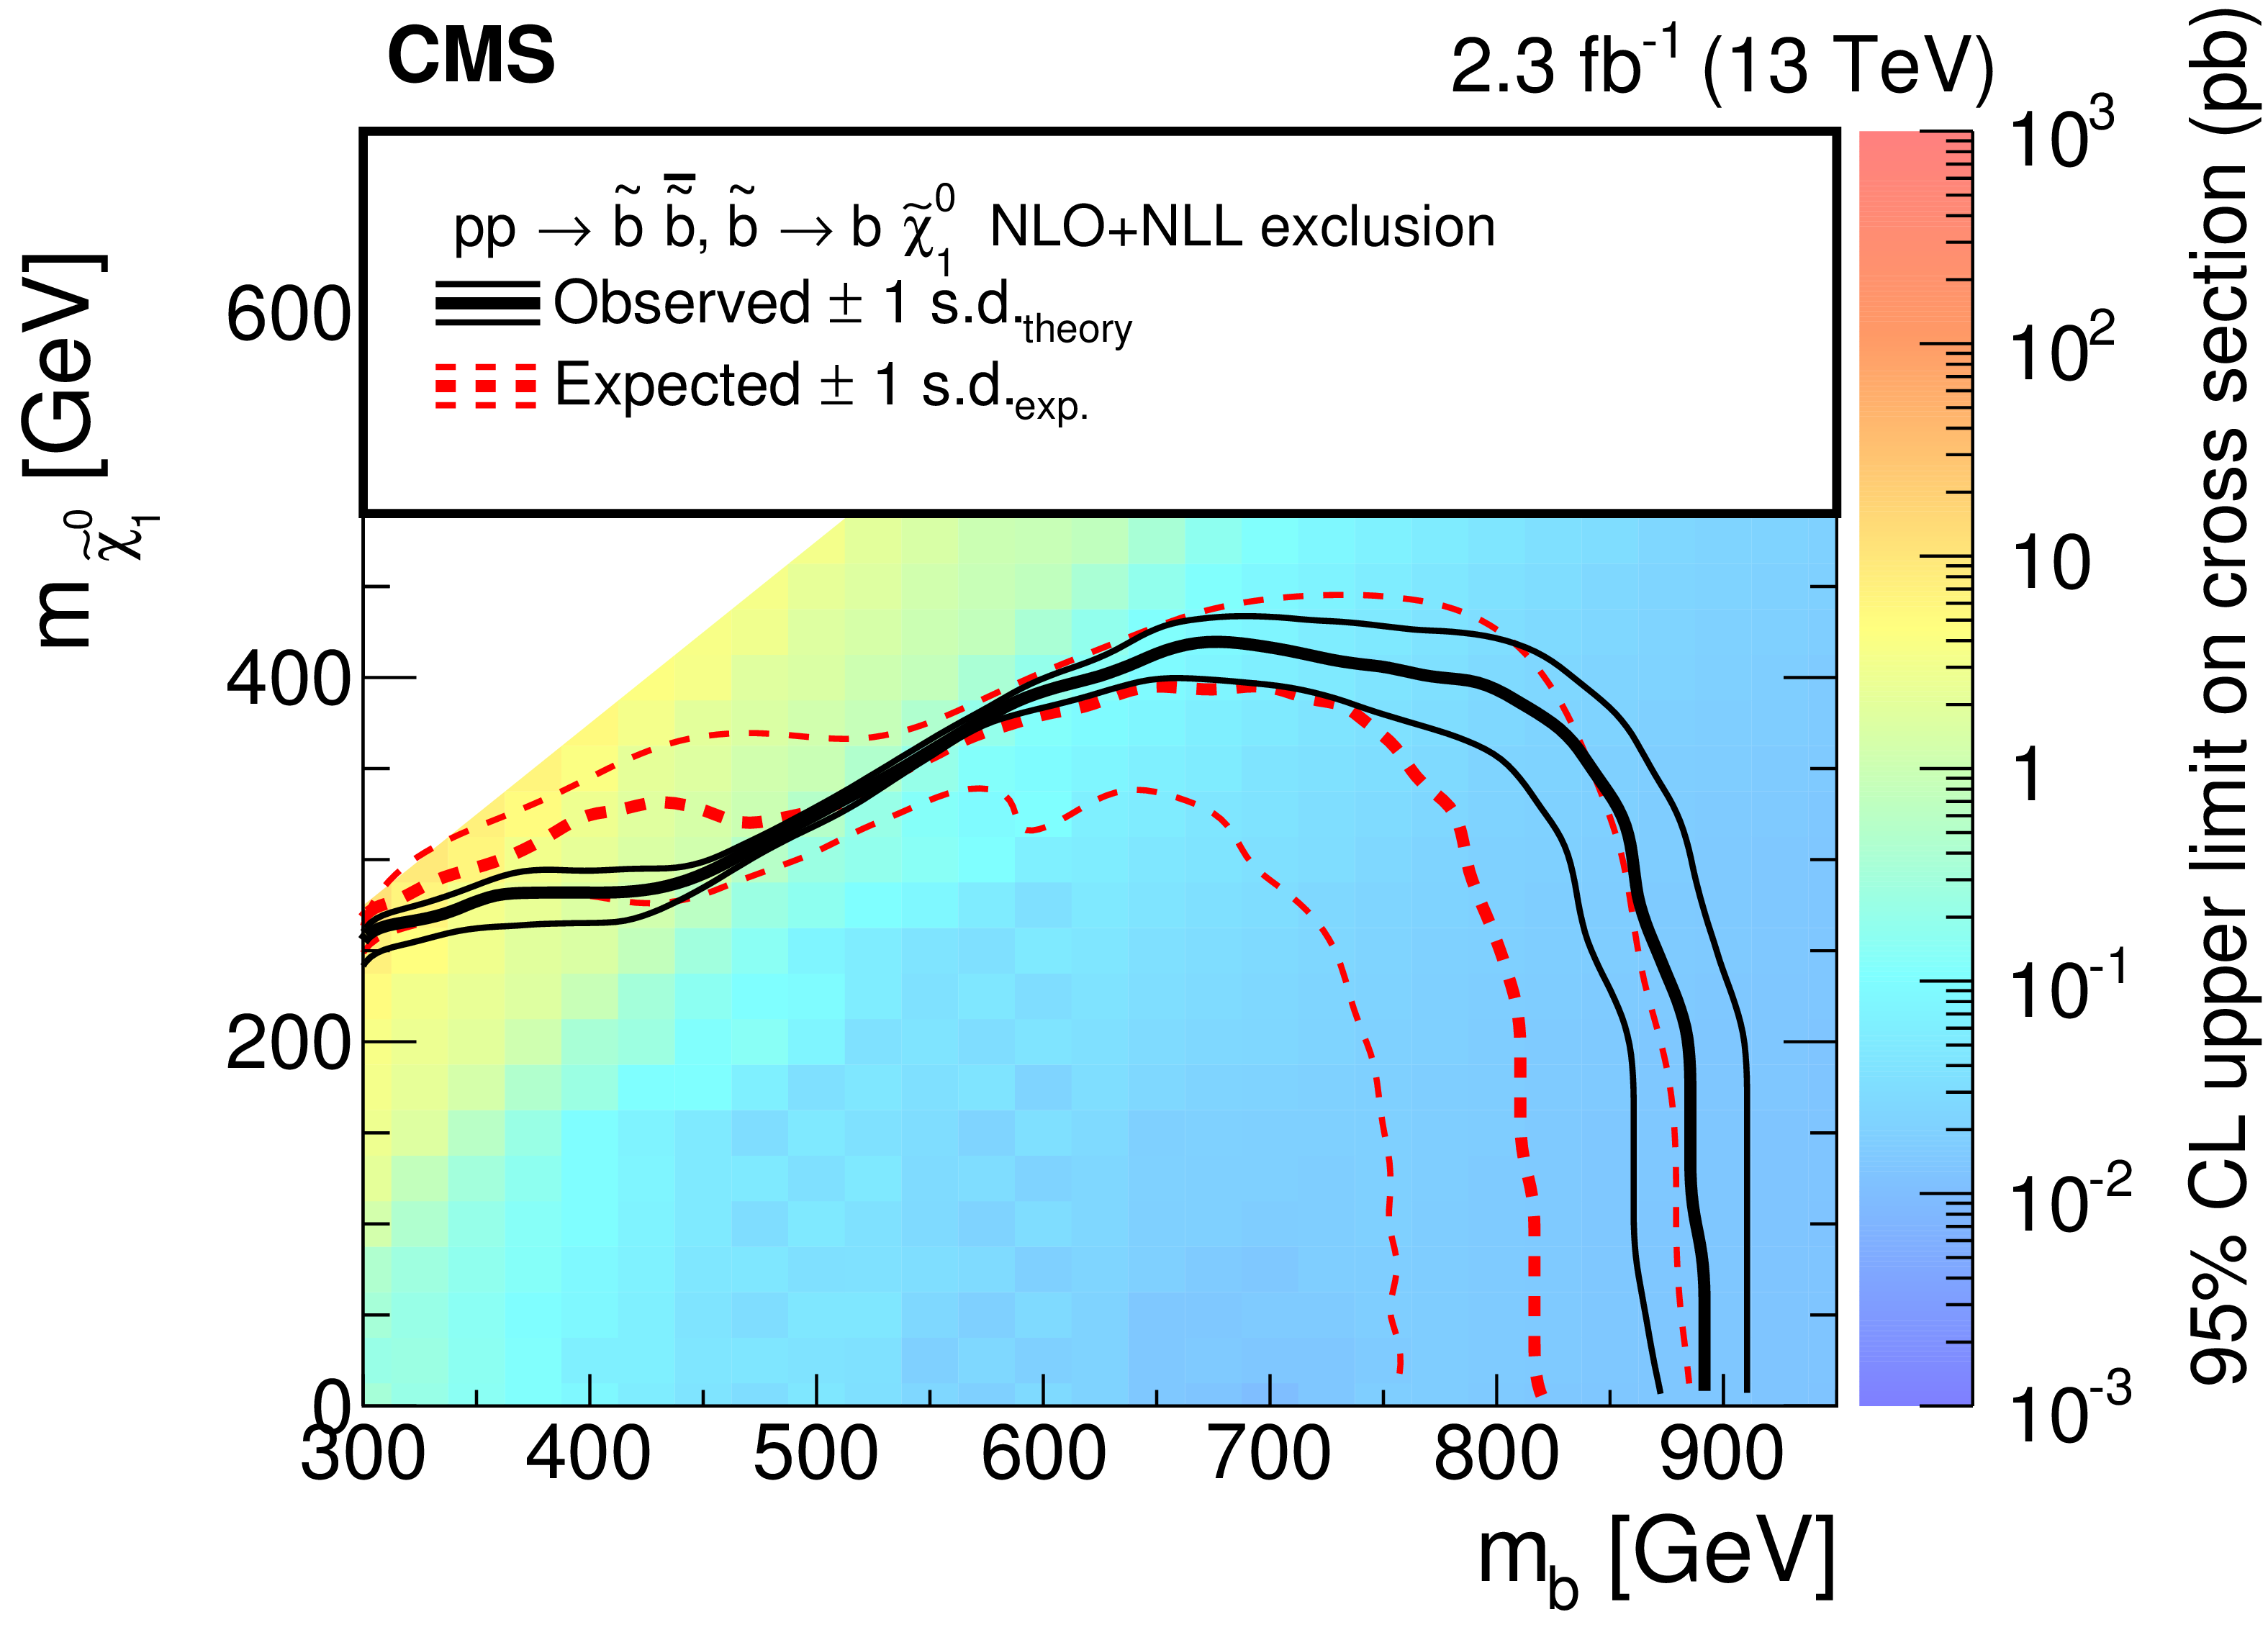
Figure 10:
Exclusion limits at 95% CL for direct bottom squark pair production with decay $ {\tilde{ \mathrm{ b } } _{1}} \to \mathrm{ b } \tilde{\chi}^0_1 $. The interpretation is performed in the two-dimensional space of $m_{ {\tilde{ \mathrm{ b } } _{1}} }$ vs. $m_{\tilde{\chi}^0_1 }$ using the results of the bottom squark analysis (Section {sec:sbottom}). The caption of Fig. {fig:limits:T2tt} explains the use of lines and colors in detail. |
| Tables | |
png pdf |
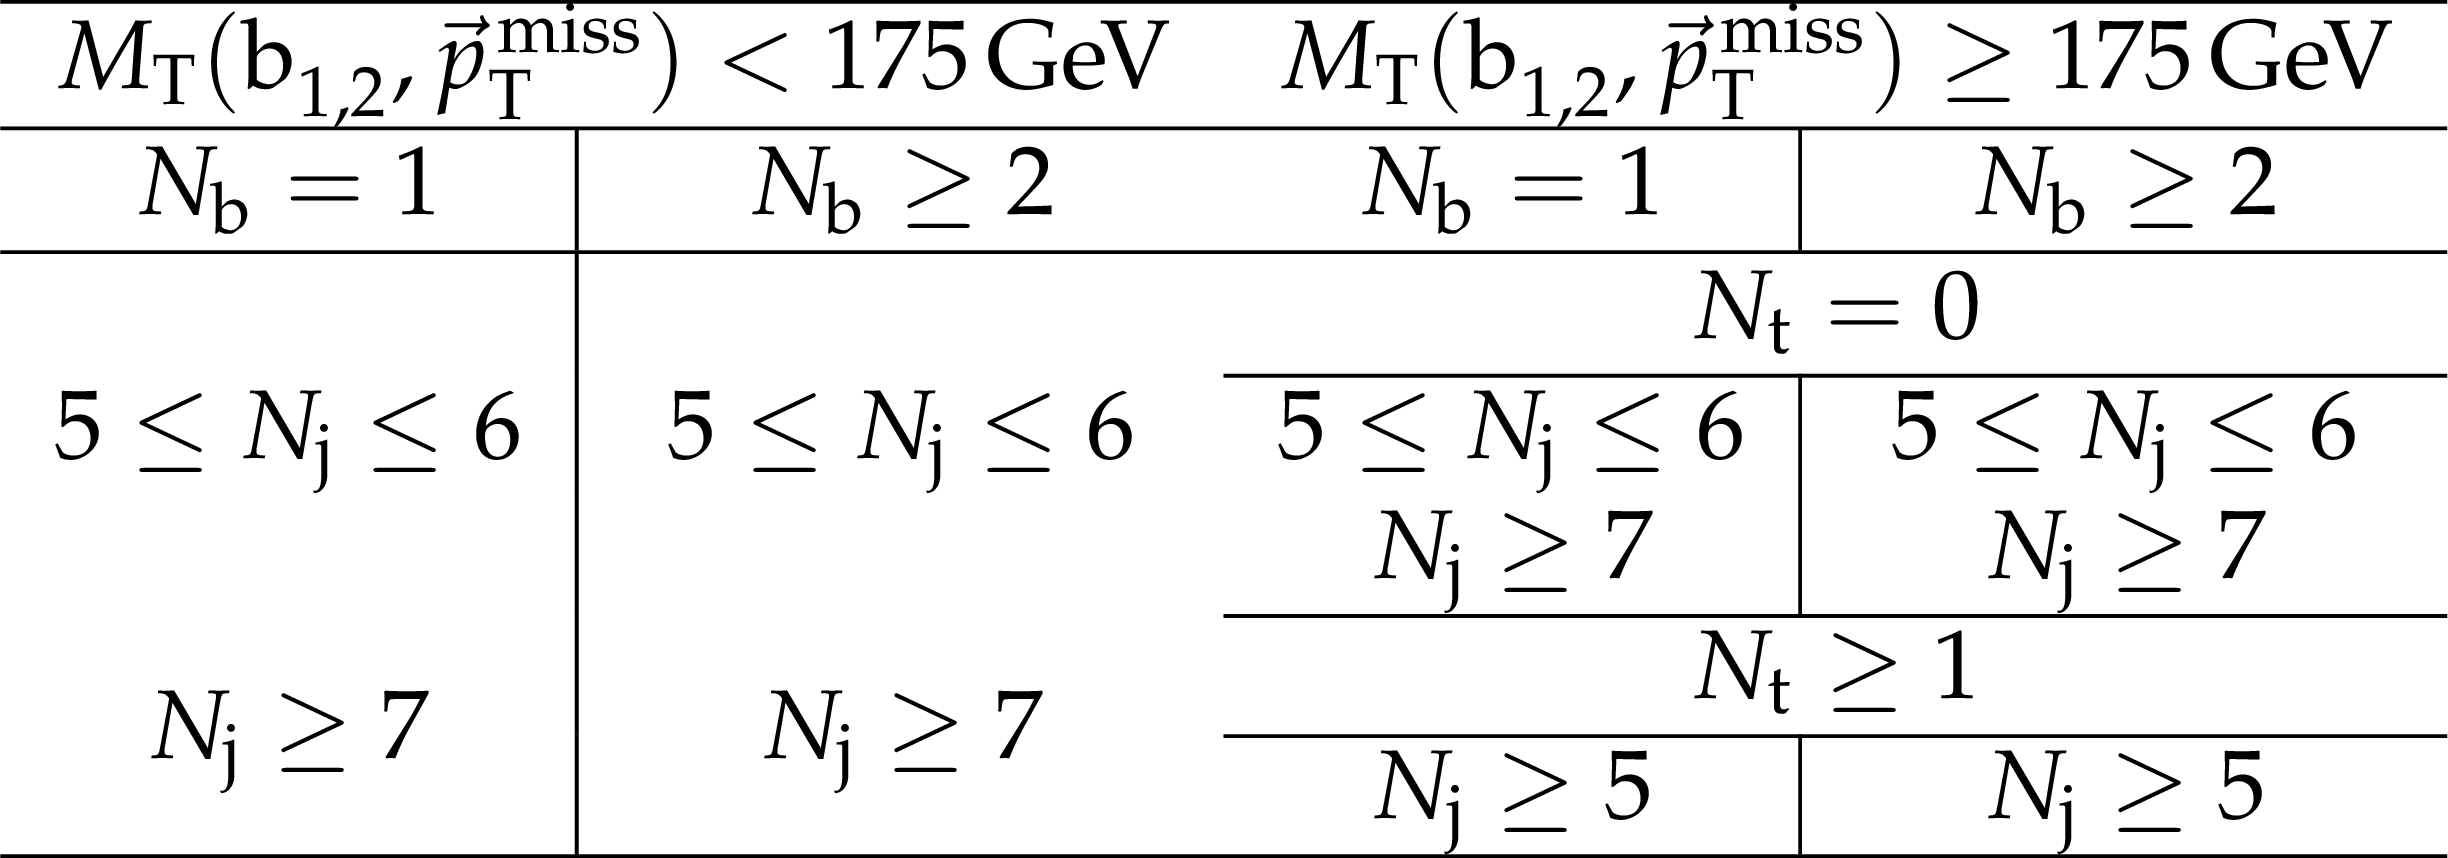
Table 1:
Categorization in $ {M_{\mathrm {T}}(\mathrm{ b } _{1,2}, {\vec{E}_{\mathrm {T}}^{\text {miss}}})} $, $ {N_{\mathrm {j}}} $, $ {N_{\mathrm{ b } }} $, and $ {N_{\mathrm{ t } }} $ used to define the SRs for the top squark search in the all-jet final state. Events in each category are further separated into the following ${E_{\mathrm {T}}^{\text {miss}}}$ regions: 250-300, 300-400, 400-500, 500-600, and $>$ 600 GeV, resulting in 50 disjoint SRs. |

png pdf |
Table 2:
Observed and predicted background yields in the different search regions for the top squark search in the all-jet final state. The total uncertainty is given for each background prediction. |
png pdf |
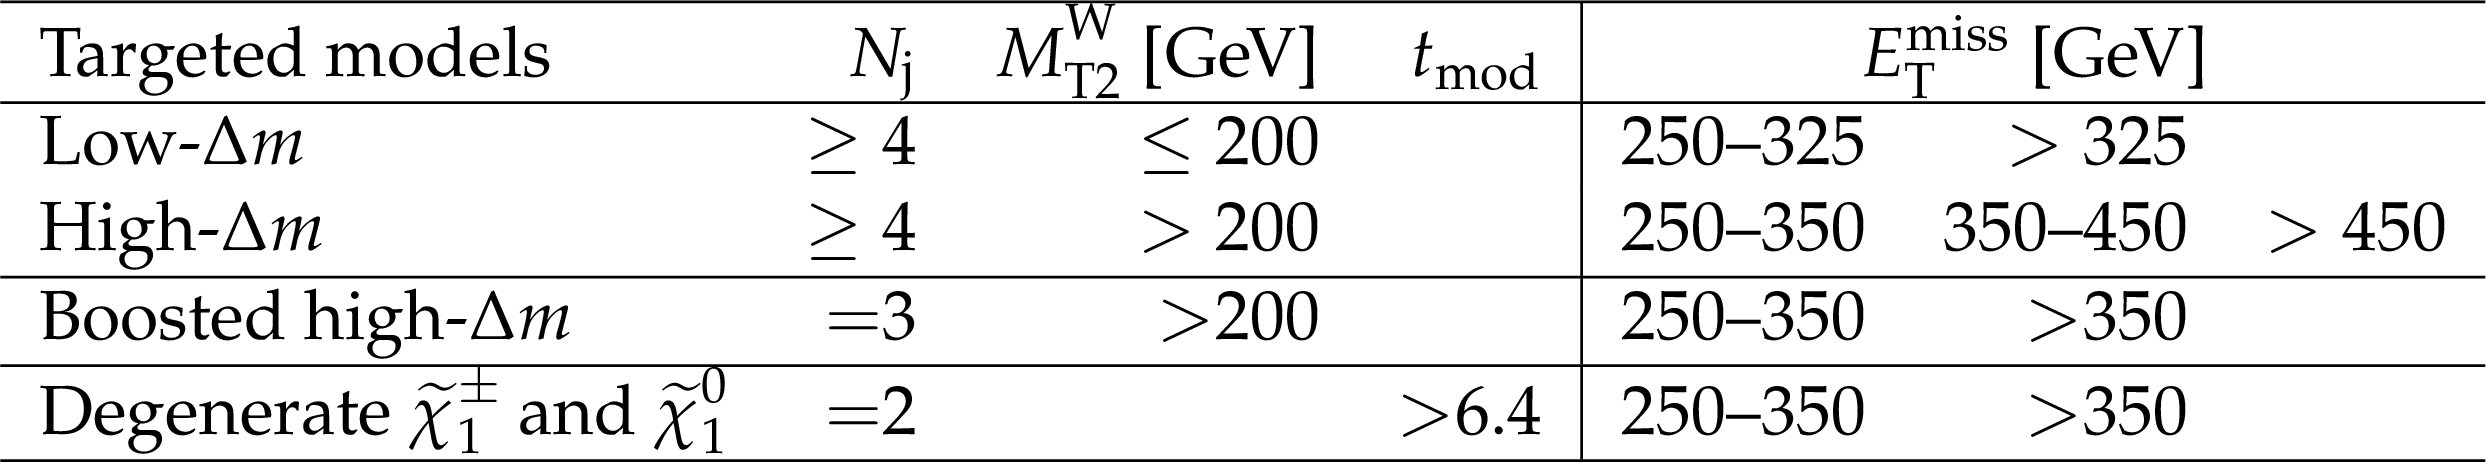
Table 3:
Summary of the SR definitions for the single-lepton search. |
png pdf |
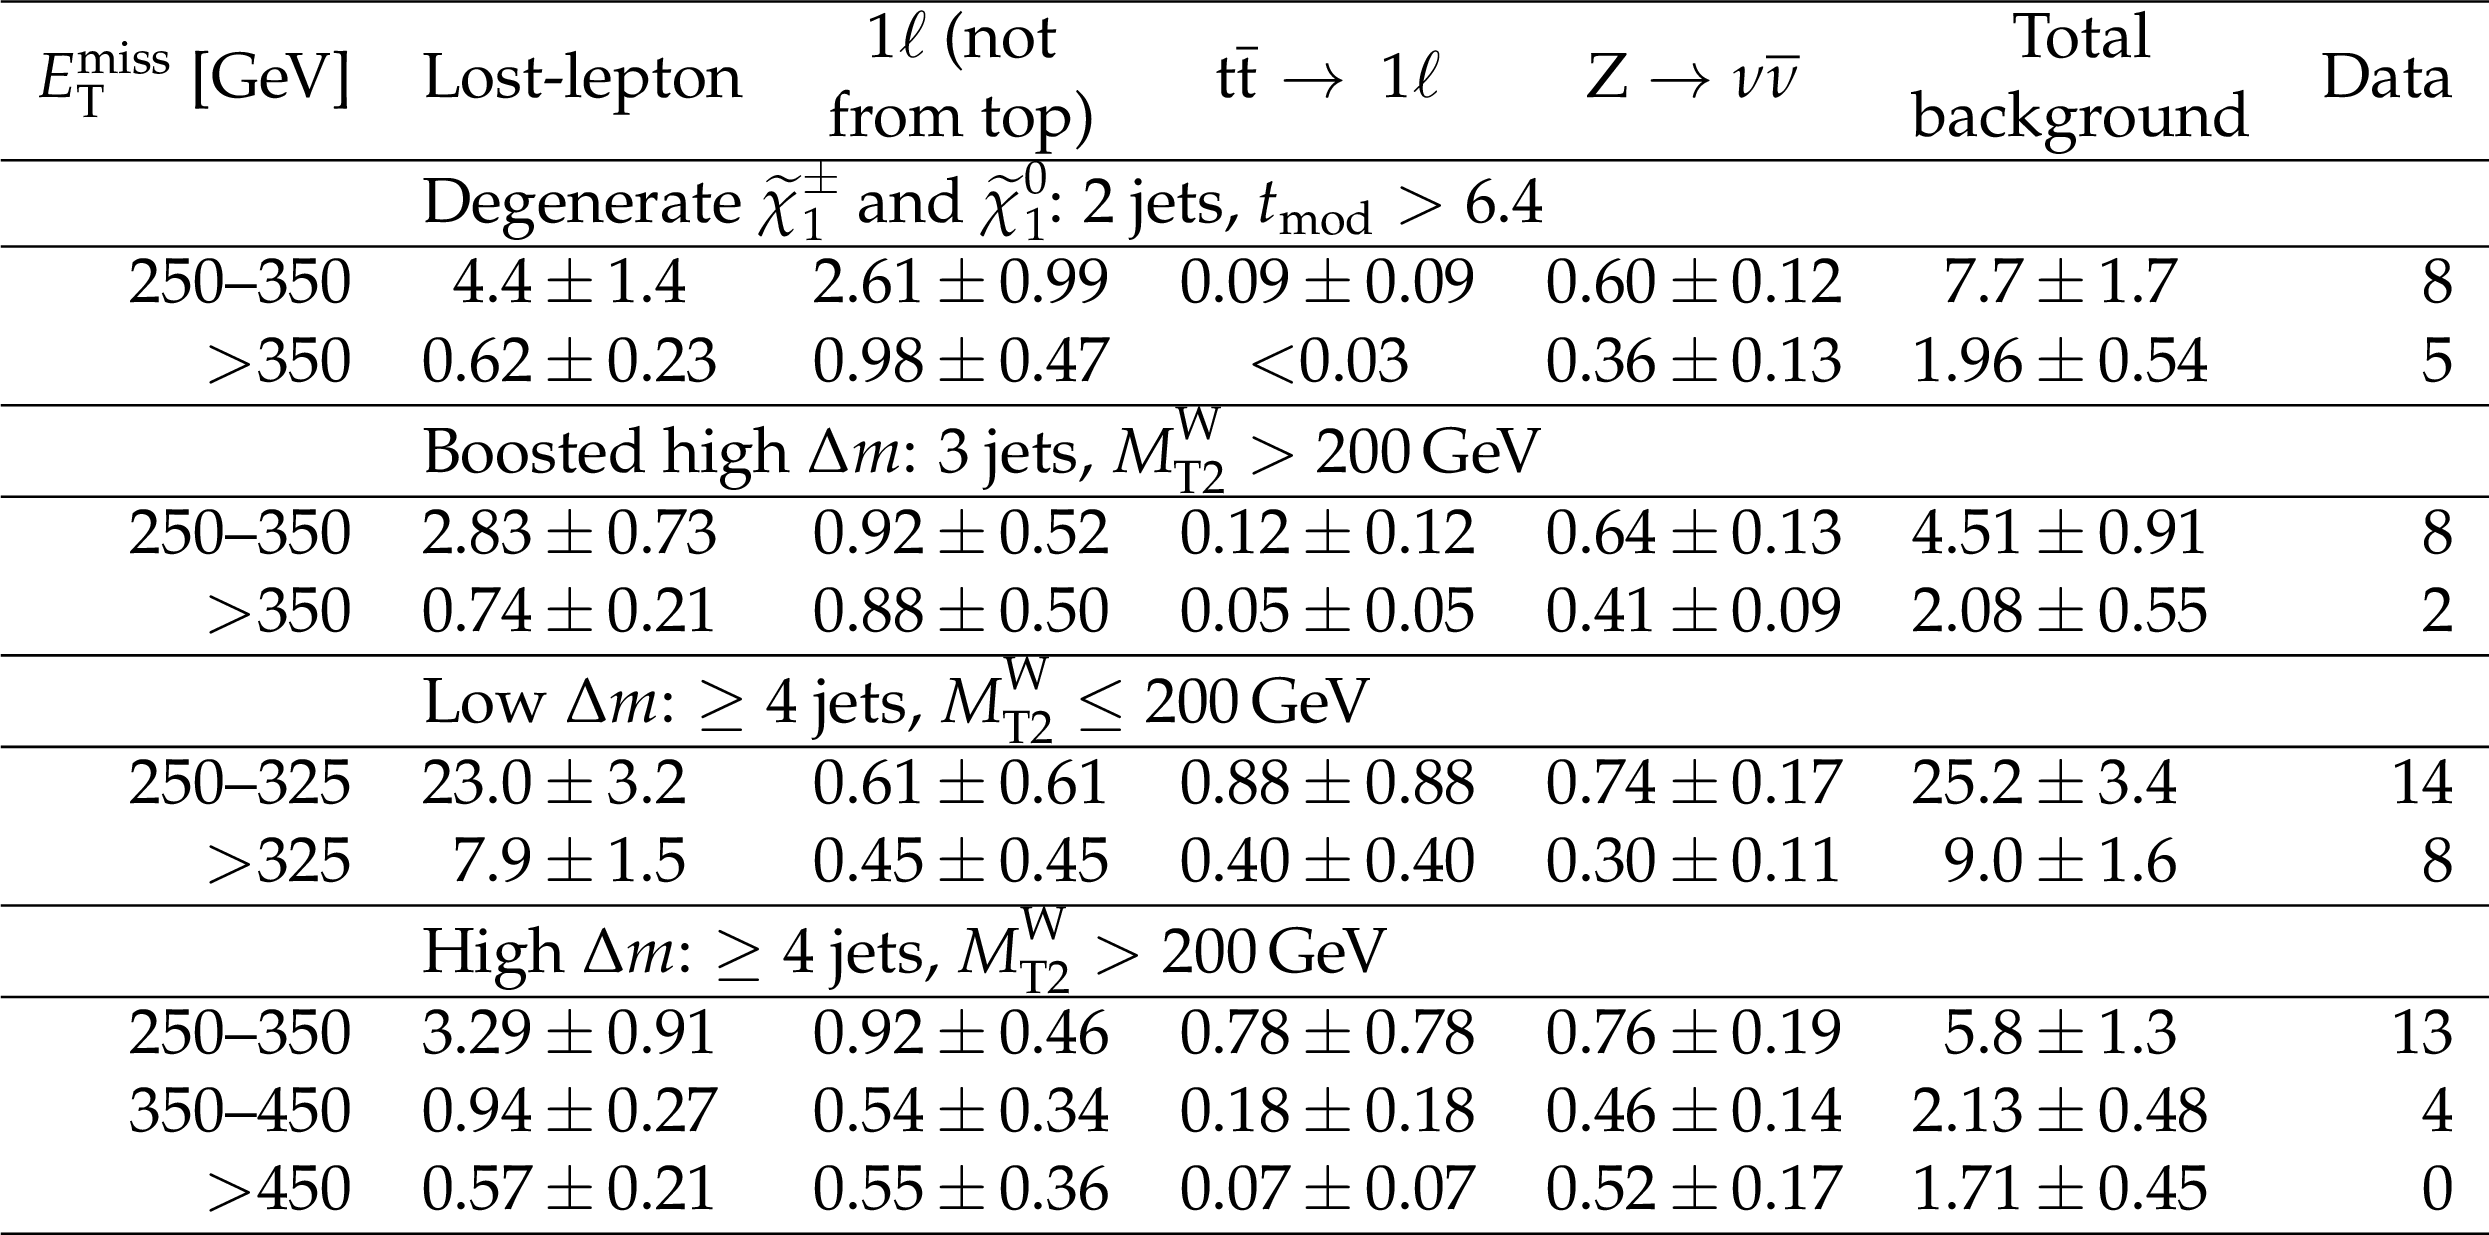
Table 4:
Background estimates from data and simulation, and observed data yields for the single-lepton top squark analysis using 2.3 fb$^{-1}$ of data collected during 2015 pp collisions. The uncertainties are the quadratic sums of statistical and systematic uncertainties. |
png pdf |
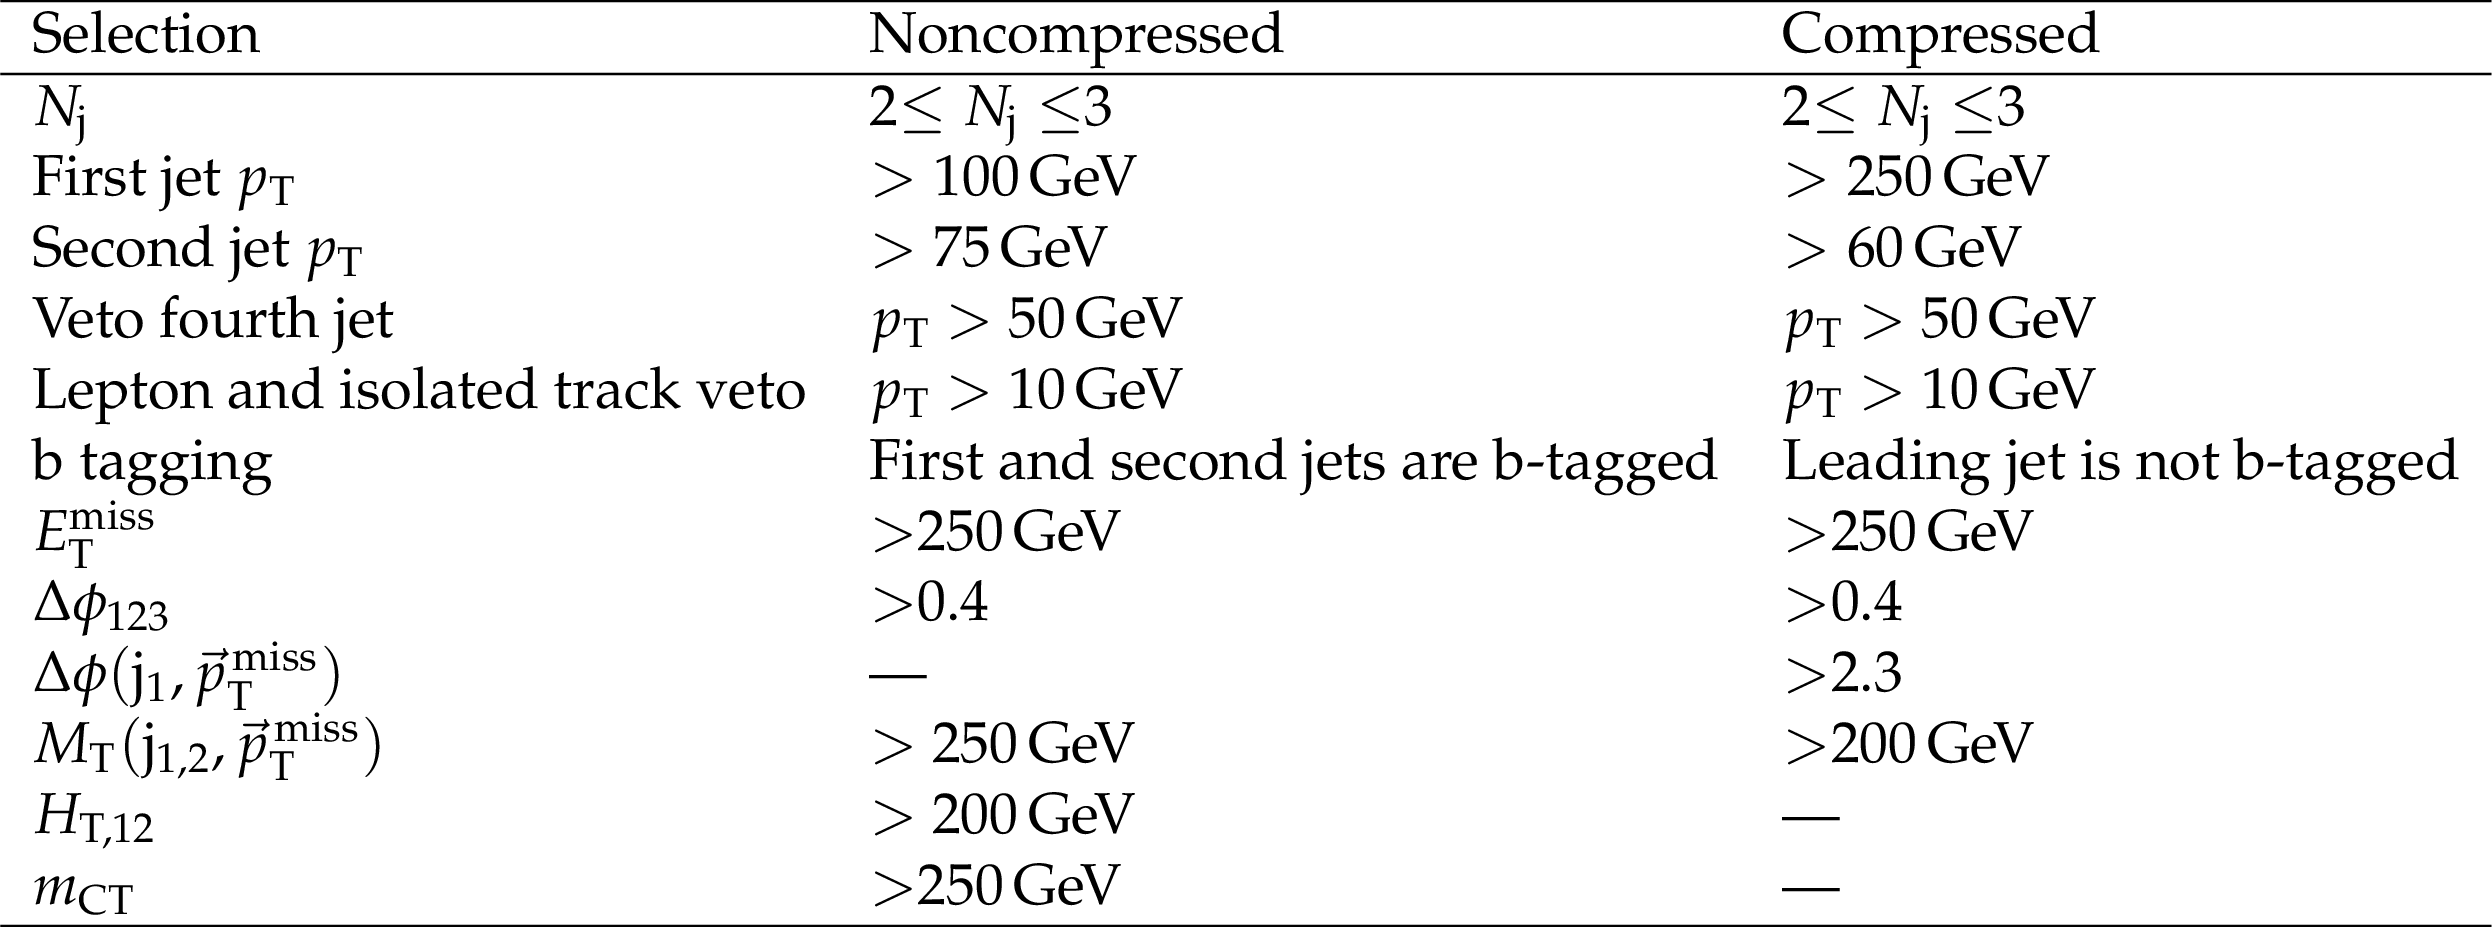
Table 5:
A summary of the baseline selections used for the noncompressed and compressed $ {\tilde{ \mathrm{ b } } _{1}} $ and $ {\tilde{ \mathrm{ t } } _{1}} \to \mathrm{c} \tilde{\chi}^0_1 $ compressed SRs. |
png pdf |
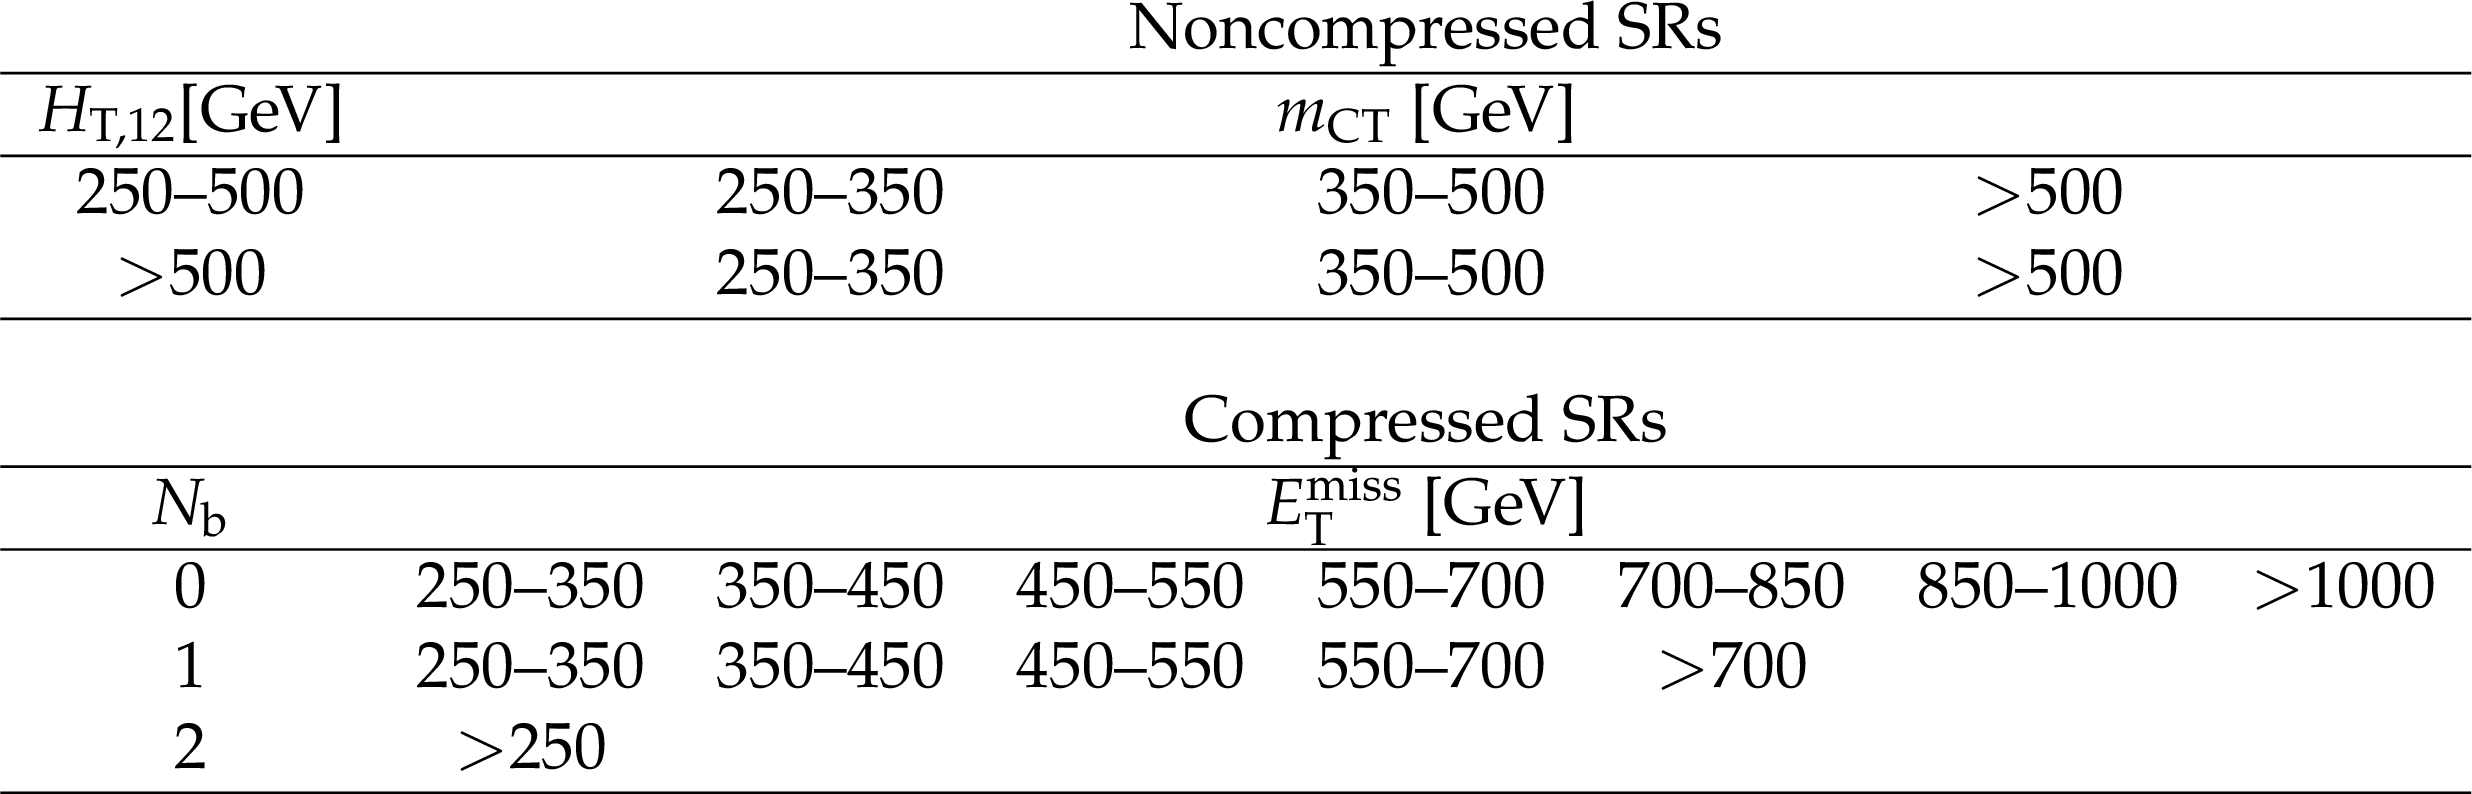
Table 6:
The categorization in ${H_{\mathrm {T,12}}}$ and ${m_{\mathrm {CT}}} $ for the SRs targeting noncompressed signal scenarios, and in $ {N_{\mathrm{ b } }} $ and ${E_{\mathrm {T}}^{\text {miss}}}$ for those targeting compressed signal scenarios. |
png pdf |
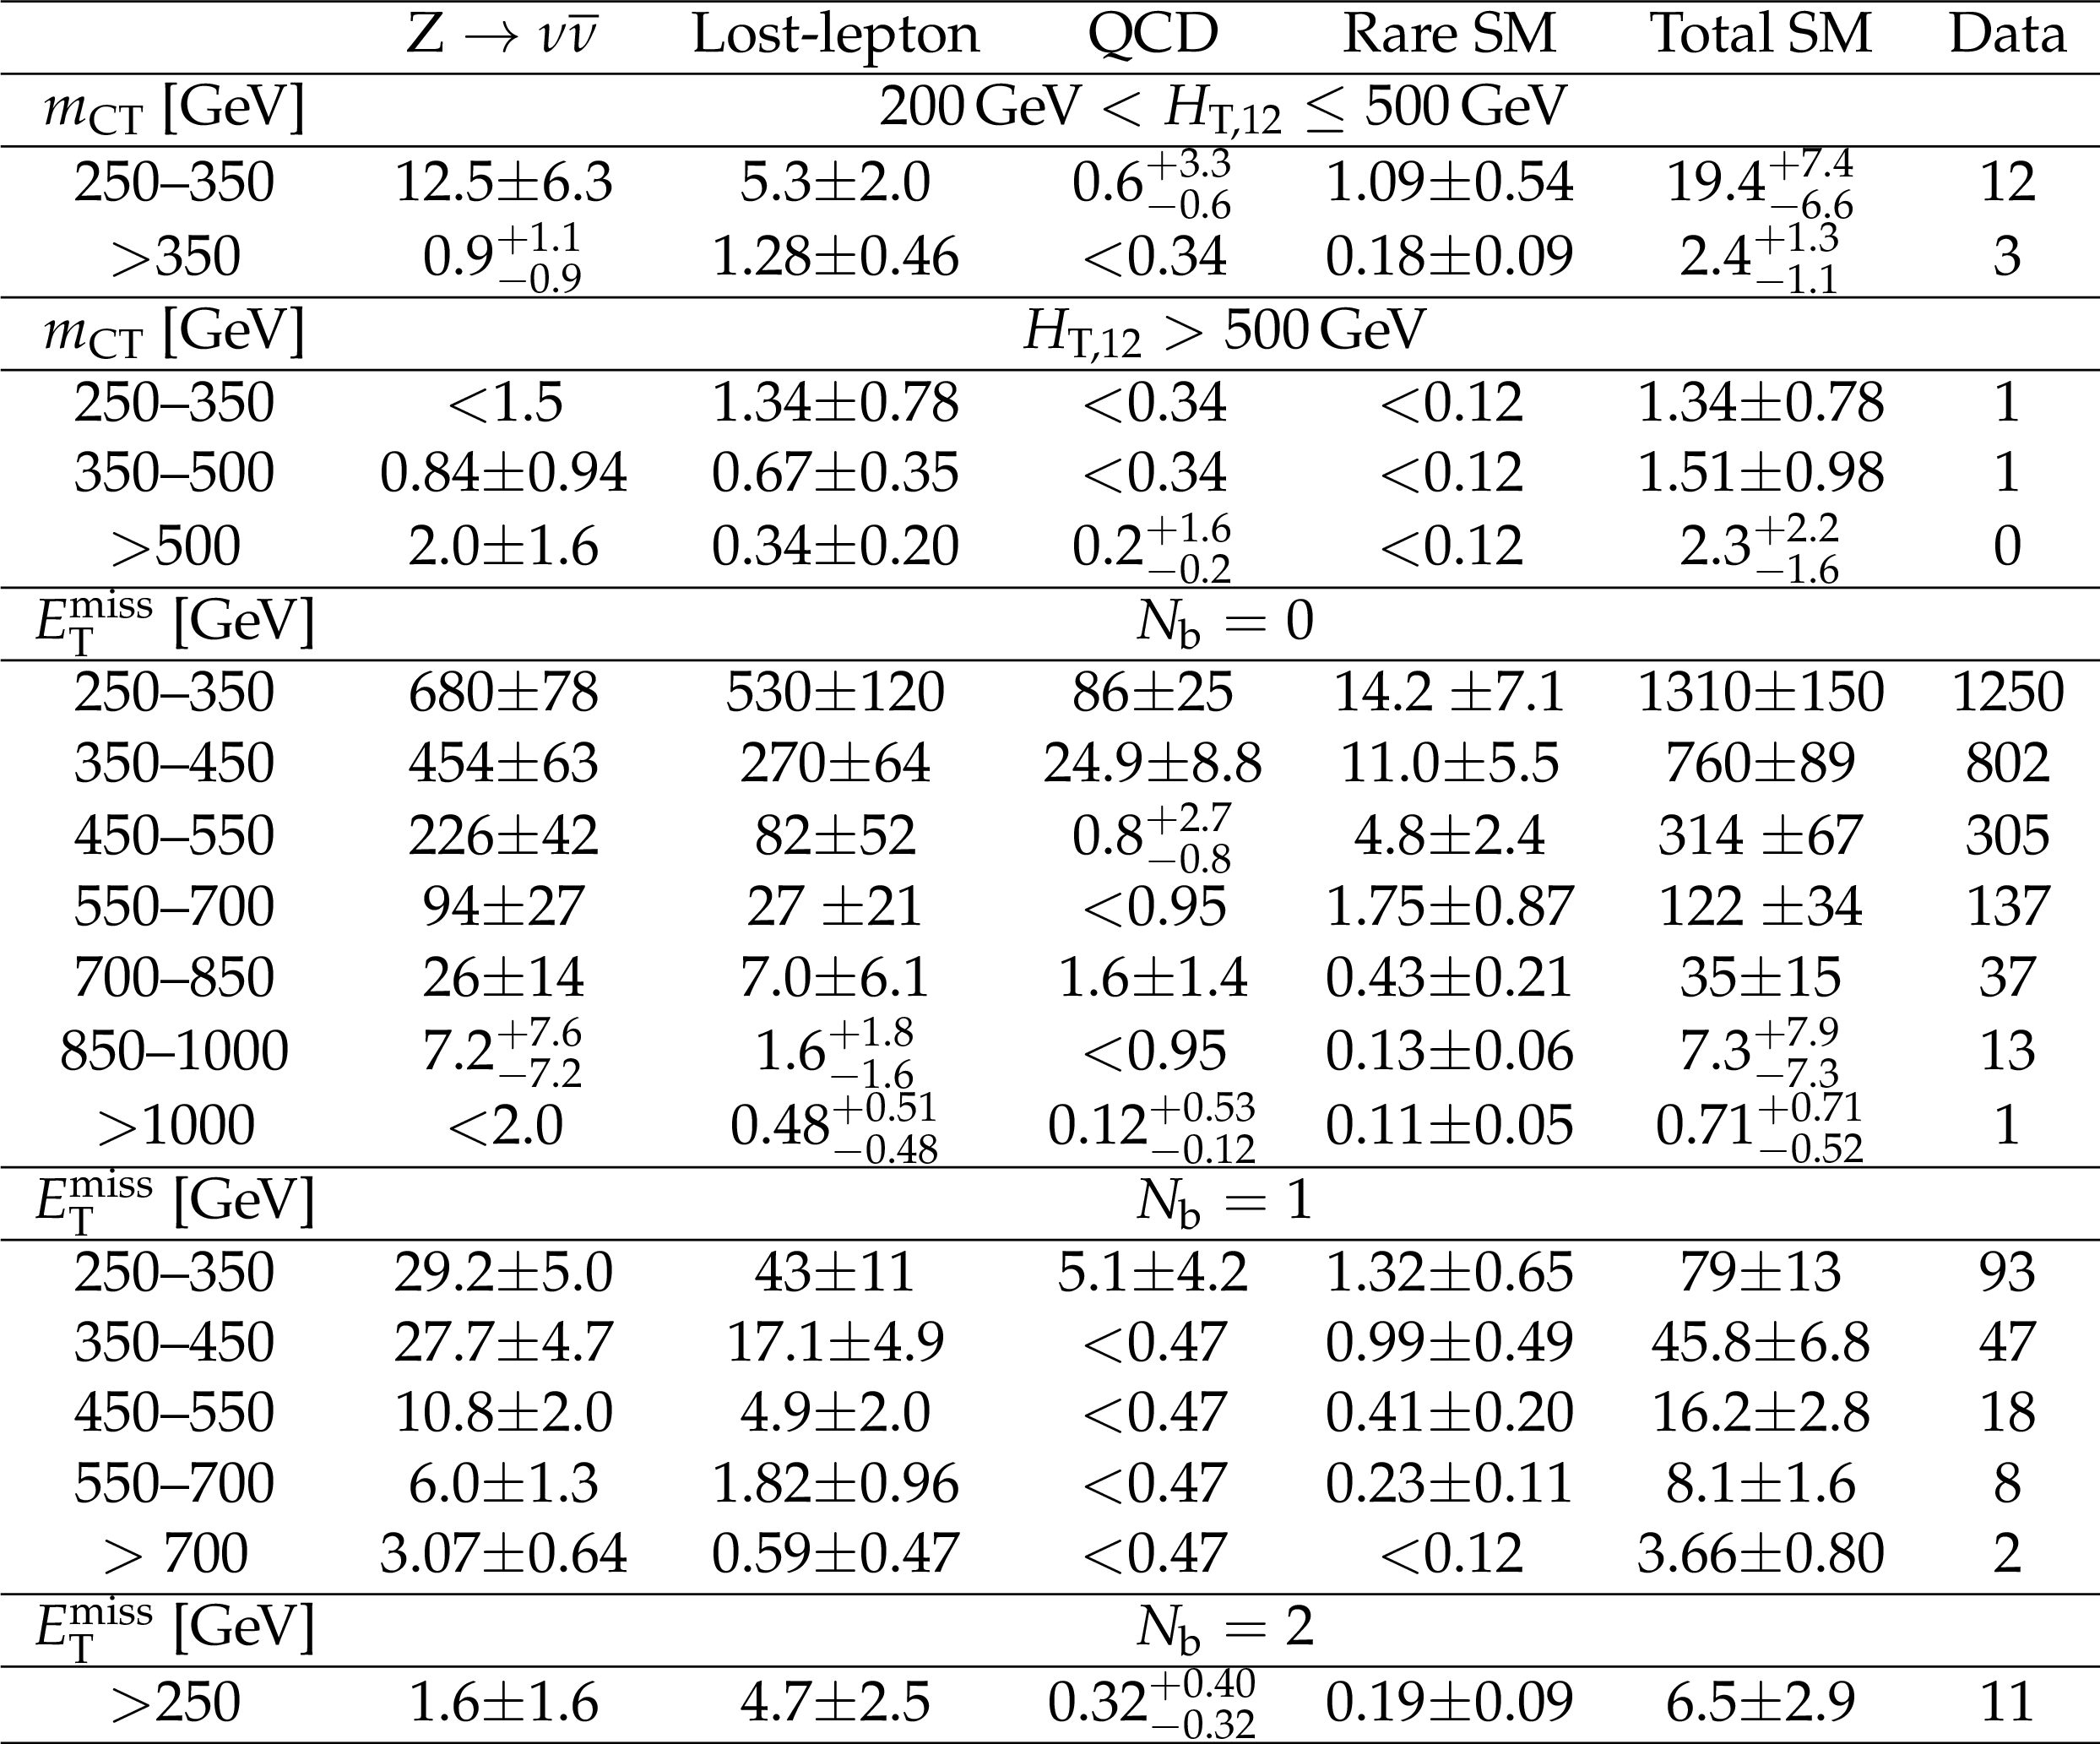
Table 7:
Observed number of events and background prediction in the different SRs for the $ {\tilde{ \mathrm{ b } } _{1}} $ and $ {\tilde{ \mathrm{ t } } _{1}} \to \mathrm{c} \tilde{\chi}^0_1 $ searches. The total uncertainty in the background predictions is also shown. |
| Summary |
| Results are presented from three complementary searches for top or bottom squark-antisquark pairs in data collected with the CMS detector in proton-proton collisions at a centre-of-mass energy of 13 TeV, corresponding to an integrated luminosity of 2.3 fb$^{-1}$. The search for top squarks is carried out in the all-jet and single-lepton final states, which are combined for the final result. A second search in all-jet events is designed for bottom squark pairs and for top squarks decaying to charm quarks through a flavour changing neutral current process. No statistically significant excess of events is observed above the expected standard model background, and exclusion limits are set at 95% confidence level in the context of simplified models of direct top and bottom squark pair production. Limits for top squark masses of 830 GeV are established for a massless lightest supersymmetric particle (LSP), and for LSP masses up to 260 GeV for a 675 GeV top squark mass, when all top squarks are assumed to decay to a top quark and an LSP. When the top squarks can also decay to a bottom quark and a chargino, this reach is reduced. Assuming a mass splitting between the top squark and the LSP close to 10 GeV, and top squarks that decay to a charm quark and an LSP, top squark mass limits up to 240 GeV are established. Finally, bottom squark mass limits up to 890 GeV are established for small LSP masses. The results extend the reach with respect to previous limits obtained from LHC Run 1 data in most of the parameter space. |
| References | ||||
| 1 | G. 't Hooft | Naturalness, chiral symmetry, and spontaneous chiral symmetry breaking | NATO Sci. Ser. B 59 (1980)135 | |
| 2 | E. Witten | Dynamical breaking of supersymmetry | Nucl. Phys. B 188 (1981) 513 | |
| 3 | M. Dine, W. Fischler, and M. Srednicki | Supersymmetric technicolor | Nucl. Phys. B 189 (1981) 575 | |
| 4 | S. Dimopoulos and S. Raby | Supercolor | Nucl. Phys. B 192 (1981) 353 | |
| 5 | S. Dimopoulos and H. Georgi | Softly broken supersymmetry and SU(5) | Nucl. Phys. B 193 (1981) 150 | |
| 6 | R. K. Kaul and P. Majumdar | Cancellation of quadratically divergent mass corrections in globally supersymmetric spontaneously broken gauge theories | Nucl. Phys. B 199 (1982) 36 | |
| 7 | J. Wess and B. Zumino | Supergauge transformations in four-dimensions | Nucl. Phys. B 70 (1974) 39 | |
| 8 | G. R. Farrar and P. Fayet | Phenomenology of the Production, Decay, and Detection of New Hadronic States Associated with Supersymmetry | PLB 76 (1978) 575 | |
| 9 | C. Boehm, A. Djouadi, and M. Drees | Light scalar top quarks and supersymmetric dark matter | PRD 62 (2000) 035012 | hep-ph/9911496 |
| 10 | C. Bal\'azs, M. Carena, and C. E. M. Wagner | Dark matter, light stops and electroweak baryogenesis | PRD 70 (2004) 015007 | hep-ph/403224 |
| 11 | G. Jungman, M. Kamionkowski, and K. Griest | Supersymmetric dark matter | PR 267 (1996) 195 | hep-ph/9506380 |
| 12 | ATLAS Collaboration | Search for a supersymmetric partner to the top quark in final states with jets and missing transverse momentum at $ \sqrt{s}=$ 7 TeV with the ATLAS detector | PRL 109 (2012) 211802 | 1208.1447 |
| 13 | ATLAS Collaboration | Search for direct top squark pair production in final states with one isolated lepton, jets, and missing transverse momentum in $ \sqrt{s}=$ 7 TeV $ pp $ collisions using 4.7 fb$ ^{-1} $ of ATLAS data | PRL 109 (2012) 211803 | 1208.2590 |
| 14 | ATLAS Collaboration | Search for a heavy top-quark partner in final states with two leptons with the ATLAS detector at the LHC | JHEP 11 (2012) 094 | 1209.4186 |
| 15 | ATLAS Collaboration | Search for direct top-squark pair production in final states with two leptons in pp collisions at $ \sqrt{s}= $ 8 TeV with the ATLAS detector | JHEP 06 (2014) 124 | 1403.4853 |
| 16 | ATLAS Collaboration | Search for direct third-generation squark pair production in final states with missing transverse momentum and two b-jets in $ \sqrt{s} = $ 8 TeV $ pp $ collisions with the ATLAS detector | JHEP 10 (2013) 189 | 1308.2631 |
| 17 | ATLAS Collaboration | Measurement of Spin Correlation in Top-Antitop Quark Events and Search for Top Squark Pair Production in pp Collisions at $ \sqrt{s}=$ 8 TeV Using the ATLAS Detector | PRL 114 (2015) 142001 | 1412.4742 |
| 18 | ATLAS Collaboration | Search for pair-produced third-generation squarks decaying via charm quarks or in compressed supersymmetric scenarios in $ pp $ collisions at $ \sqrt{s}=$ 8 TeV with the ATLAS detector | PRD 90 (2014) 052008 | 1407.0608 |
| 19 | ATLAS Collaboration | ATLAS Run 1 searches for direct pair production of third-generation squarks at the Large Hadron Collider | EPJC 75 (2015) 510 | arXiv:1506.08616 |
| 20 | CMS Collaboration | Search for top-squark pair production in the single-lepton final state in pp collisions at $ \sqrt{s} $ = 8 TeV | EPJC 73 (2013) 2677 | CMS-SUS-13-011 1308.1586 |
| 21 | CMS Collaboration | Search for supersymmetry in hadronic final states with missing transverse energy using the variables $ \alpha_\mathrm{T} $ and b-quark multiplicity in pp collisions at $ \sqrt{s} = $ 8 TeV | EPJC 73 (2013) 2568 | CMS-SUS-12-028 1303.2985 |
| 22 | CMS Collaboration | Search for supersymmetry using razor variables in events with $ b $-tagged jets in $ pp $ collisions at $ \sqrt{s} = $ 8 TeV | PRD 91 (2015) 052018 | CMS-SUS-13-004 1502.00300 |
| 23 | CMS Collaboration | Searches for third-generation squark production in fully hadronic final states in proton-proton collisions at $ \sqrt{s} = 8 $ TeV | JHEP 06 (2015) 116 | CMS-SUS-14-001 1503.08037 |
| 24 | CMS Collaboration | Search for direct pair production of supersymmetric top quarks decaying to all-hadronic final states in pp collisions at $ \sqrt{s} $ = 8 TeV | EPJC 76 (2016) 460 | CMS-SUS-13-023 1603.00765 |
| 25 | D0 Collaboration | Search for 3- and 4-body decays of the scalar top quark in $ \text{p}\bar{\text{p}} $ collisions at $ \sqrt{s}=$ 1.8 TeV | PLB 581 (2004) 147 | |
| 26 | D0 Collaboration | Search for pair production of the scalar top quark in muon+tau final states | PLB 710 (2012) 578 | 1202.1978 |
| 27 | D0 Collaboration | Search for the lightest scalar top quark in events with two leptons in $ \text{p}\bar{\text{p}} $ collisions at $ \sqrt{s} =$ 1.96 TeV | PLB 659 (2008) 500 | 0707.2864 |
| 28 | CDF Collaboration | Search for the supersymmetric partner of the top quark in $ \mathrm{p}\bar{\mathrm{p}} $ collisions at $ \sqrt{s} =$ 1.96 TeV | PRD 82 (2010) 092001 | 1009.0266 |
| 29 | CDF Collaboration | Search for the supersymmetric partner of the top quark in dilepton events from $ \mathrm{p}\bar{\mathrm{p}} $ collisions at $ \sqrt{s}=$ 1.8 TeV | PRL 90 (2003) 251801 | hep-ex/0302009 |
| 30 | C. Borschensky et al. | Squark and gluino production cross sections in pp collisions at $ \sqrt{s} = $ 13, 14, 33 and 100 TeV | EPJC 74 (2014) 3174 | 1407.5066 |
| 31 | LHC SUSY Cross Section Working Group | SUSY Cross Sections | link | |
| 32 | CMS Collaboration | Search for new physics in the all-hadronic final state with the M$ _{T2} $ variable | 10.1007/JHEP10(2016)006 | |
| 33 | CMS Collaboration | Inclusive search for supersymmetry using razor variables in pp collisions at $ \sqrt{s} $ = 13 TeV | Submitted to \it PRD | CMS-SUS-15-004 1609.07658 |
| 34 | CMS Collaboration | A search for new phenomena in pp collisions at $ \sqrt{s} $ = 13 TeV in final states with missing transverse momentum and at least one jet using the $ \alpha_\mathrm{T} $ variable | Submitted to \it EPJC | CMS-SUS-15-005 1611.00338 |
| 35 | ATLAS Collaboration | Search for top squarks in final states with one isolated lepton, jets, and missing transverse momentum in $ \sqrt{s} = 13 $ TeV collisions with the ATLAS detector | PRD 94 (2016) 052009 | 1606.03903 |
| 36 | CMS Collaboration | The CMS experiment at the CERN LHC | JINST 3 (2008) S08004 | CMS-00-001 |
| 37 | CMS Collaboration | Particle-Flow Event Reconstruction in CMS and Performance for Jets, Taus, and $ E_{\mathrm{T}}^{\text{miss}} $ | CDS | |
| 38 | CMS Collaboration | Commissioning of the Particle-flow Event Reconstruction with the first LHC collisions recorded in the CMS detector | CDS | |
| 39 | M. Cacciari, G. P. Salam, and G. Soyez | The anti-$ k_t $ jet clustering algorithm | JHEP 04 (2008) 063 | 0802.1189 |
| 40 | M. Cacciari, G. P. Salam, and G. Soyez | FastJet user manual | EPJC 72 (2012) 1896 | 1111.6097 |
| 41 | CMS Collaboration | Study of pileup removal algorithms for jets | CMS-PAS-JME-14-001 | CMS-PAS-JME-14-001 |
| 42 | CMS Collaboration | Identification of b-quark jets with the CMS experiment | JINST 8 (2013) P04013 | CMS-BTV-12-001 1211.4462 |
| 43 | CMS Collaboration | Identification of b quark jets at the CMS Experiment in the LHC Run 2 | CMS-PAS-BTV-15-001 | CMS-PAS-BTV-15-001 |
| 44 | CMS Collaboration | Boosted Top Jet Tagging at CMS | CMS-PAS-JME-13-007 | CMS-PAS-JME-13-007 |
| 45 | CMS Collaboration | Top Tagging with New Approaches | CDS | |
| 46 | D. E. Kaplan, K. Rehermann, M. D. Schwartz, and B. Tweedie | Top Tagging: A Method for Identifying Boosted Hadronically Decaying Top Quarks | PRL 101 (2008) 142001 | 0806.0848 |
| 47 | M. Dasgupta, A. Fregoso, S. Marzani, and G. P. Salam | Towards an understanding of jet substructure | JHEP 09 (2013) 029 | 1307.0007 |
| 48 | M. Cacciari and G. P. Salam | Dispelling the $ N^{3} $ myth for the $ k_t $ jet-finder | PLB 641 (2006) 57 | hep-ph/0512210 |
| 49 | Y. L. Dokshitzer, G. D. Leder, S. Moretti, and B. R. Webber | Better jet clustering algorithms | JHEP 08 (1997) 001 | hep-ph/9707323 |
| 50 | M. Wobisch and T. Wengler | Hadronization corrections to jet cross sections in deep- inelastic scattering | hep-ph/9907280 | |
| 51 | CMS Collaboration | Performance of electron reconstruction and selection with the CMS detector in proton-proton collisions at $ \sqrt{s} =$ 8 TeV | JINST 10 (2015) P06005 | CMS-EGM-13-001 1502.02701 |
| 52 | CMS Collaboration | Performance of CMS muon reconstruction in $ pp $ collision events at $ \sqrt{s} =$ 7 TeV | JINST 7 (2012) P10002 | CMS-MUO-10-004 1206.4071 |
| 53 | CMS Collaboration | Reconstruction and identification of $ \tau $ lepton decays to hadrons and $ \nu_\tau $ at CMS | JINST 11 (2016) P01019 | CMS-TAU-14-001 1510.07488 |
| 54 | CMS Collaboration | Performance of photon reconstruction and identification with the CMS detector in proton-proton collisions at $ \sqrt{s} = $ 8 TeV | JINST 10 (2015) P08010 | |
| 55 | J. Alwall et al. | The automated computation of tree-level and next-to-leading order differential cross sections, and their matching to parton shower simulations | JHEP 07 (2014) 079 | 1405.0301 |
| 56 | NNPDF Collaboration | Parton distributions for the LHC Run II | JHEP 04 (2015) 040 | 1410.8849 |
| 57 | P. Nason | A new method for combining NLO QCD with shower Monte Carlo algorithms | JHEP 11 (2004) 040 | hep-ph/0409146 |
| 58 | S. Frixione, P. Nason, and C. Oleari | Matching NLO QCD computations with Parton Shower simulations: the POWHEG method | JHEP 11 (2007) 070 | 0709.2092 |
| 59 | S. Alioli, P. Nason, C. Oleari, and E. Re | A general framework for implementing NLO calculations in shower Monte Carlo programs: the POWHEG BOX | JHEP 06 (2010) 043 | 1002.2581 |
| 60 | E. Re | Single-top $ Wt $-channel production matched with parton showers using the POWHEG method | EPJC 71 (2011) 1547 | 1009.2450 |
| 61 | T. Sjostrand et al. | An introduction to PYTHIA 8.2 | CPC 191 (2015) 159 | 1410.3012 |
| 62 | GEANT4 Collaboration | GEANT4 --- a simulation toolkit | NIMA 506 (2003) 250 | |
| 63 | S. Abdullin et al. | The fast simulation of the CMS detector at LHC | J. Phys. Conf. Ser. 331 (2011) 032049 | |
| 64 | CMS Collaboration | Observation of top quark pairs produced in association with a vector boson in pp collisions at $ \sqrt{s}=$ 8 TeV | JHEP 01 (2016) 096 | CMS-TOP-14-021 1510.01131 |
| 65 | Y. Bai, H.-C. Cheng, J. Gallicchio, and J. Gu | Stop the top background of the stop search | JHEP 07 (2012) 110 | 1203.4813 |
| 66 | M. L. Graesser and J. Shelton | Hunting Mixed Top Squark Decays | PRL 111 (2013) 121802 | 1212.4495 |
| 67 | Particle Data Group, K. A. Olive et al. | Review of Particle Physics | CPC 38 (2014) 090001 | |
| 68 | G. Polesello and D. Tovey | Supersymmetric particle mass measurement with boost-corrected constransverse mass | JHEP 03 (2010) 030 | 0910.0174 |
| 69 | D. Tovey | On measuring the masses of pair-produced semi-invisibly decaying particles at hadron colliders | JHEP 04 (2008) 034 | 0802.2879 |
| 70 | CMS Collaboration | Measurement of the production cross sections for a Z boson and one or more b jets in pp collisions at $ \sqrt{s} = $ 7 TeV | JHEP 06 (2014) 120 | |
| 71 | CMS Collaboration | CMS Luminosity Measurement for the 2015 Data Taking Period | CMS-PAS-LUM-15-001 | CMS-PAS-LUM-15-001 |
| 72 | S. Catani, D. de Florian, M. Grazzini, and P. Nason | Soft gluon resummation for Higgs boson production at hadron colliders | JHEP 07 (2003) 028 | hep-ph/0306211 |
| 73 | M. Cacciari et al. | The $ \mathrm{ t \bar{t} } $ cross-section at 1.8 TeV and 1.96 TeV: a study of the systematics due to parton densities and scale dependence | JHEP 04 (2004) 068 | hep-ph/0303085 |
| 74 | CMS Collaboration | Interpretation of searches for supersymmetry with simplified models | PRD 88 (2013) 052017 | CMS-SUS-11-016 1301.2175 |
| 75 | J. Alwall, P. Schuster, and N. Toro | Simplified Models for a First Characterization of New Physics at the LHC | PRD 79 (2009) 075020 | |
| 76 | J. Alwall, M.-P. Le, M. Lisanti, and J. Wacker | Model-independent jets plus missing energy searches | PRD 79 (2009) 015005 | |
| 77 | LHC New Physics Working Group, D. Alves et al. | Simplified Models for LHC new physics searches | JPG 39 (2012) 105005, ,%%CITATION = ARXIV | 1105.2838 |
| 78 | T. Junk | Confidence level computation for combining searches with small statistics | NIMA 434 (1999) 435 | hep-ex/9902006 |
| 79 | A. L. Read | Presentation of search results: the $ CL_{S} $ technique | JPG 28 (2002) 2693 | |
| 80 | ATLAS and CMS Collaborations, LHC Higgs Combination Group | Procedure for the LHC Higgs boson search combination in Summer 2011 | Technical Report ATL-PHYS-PUB 2011-11, CMS NOTE 2011/005 | |
| 81 | G. Cowan, K. Cranmer, E. Gross, and O. Vitells | Asymptotic formulae for likelihood-based tests of new physics | EPJC 71 (2011) 1554, , [Erratum: \DOI10.1140/epjc/s10052-013-2501-z] | 1007.1727 |
| 82 | CMS Collaboration | Measurement of the $ \mathrm{ t \bar{t} } $ production cross section in the e$ \mu $ channel in proton-proton collisions at $ \sqrt{s} = $ 7 and 8 TeV | JHEP 08 (2016) 029 | CMS-TOP-13-004 1603.02303 |
|
|
Compact Muon Solenoid LHC, CERN |
|

|

|

|

|

|