

Compact Muon Solenoid
LHC, CERN
| CMS-SUS-16-009 ; CERN-EP-2016-293 | ||
| Search for supersymmetry in the all-hadronic final state using top quark tagging in pp collisions at $ \sqrt{s} = $ 13 TeV | ||
| CMS Collaboration | ||
| 8 January 2017 | ||
| Phys. Rev. D 96 (2017) 012004 | ||
| Abstract: A search is presented for supersymmetry in all-hadronic events with missing transverse momentum based on tagging of top quarks. The data sample corresponds to an integrated luminosity of 2.3 fb$^{-1}$ of proton-proton collisions at a center-of-mass energy of 13 TeV, collected with the CMS detector at the LHC. Search regions are defined using the properties of reconstructed jets, the presence of bottom and top quark candidates, and an imbalance in transverse momentum. With no statistically significant excess of events observed beyond the expected contributions from the standard model, we set exclusion limits at 95% confidence level on the masses of new particles in the context of simplified models of direct and gluino-mediated top squark production. For direct top squark production with decays to a top quark and a neutralino, top squark masses up to 740 GeV and neutralino masses up to 240 GeV are excluded. Gluino masses up to 1550 GeV and neutralino masses up to 900 GeV are excluded for models of gluino pair production where each gluino decays to a top-antitop quark pair and a neutralino. | ||
| Links: e-print arXiv:1701.01954 [hep-ex] (PDF) ; CDS record ; inSPIRE record ; CADI line (restricted) ; | ||
| Figures & Tables | Summary | Additional Figures & Tables | References | CMS Publications |
|---|
| Additional technical material for CMS speakers can be found here. |
| Figures | |
png pdf |
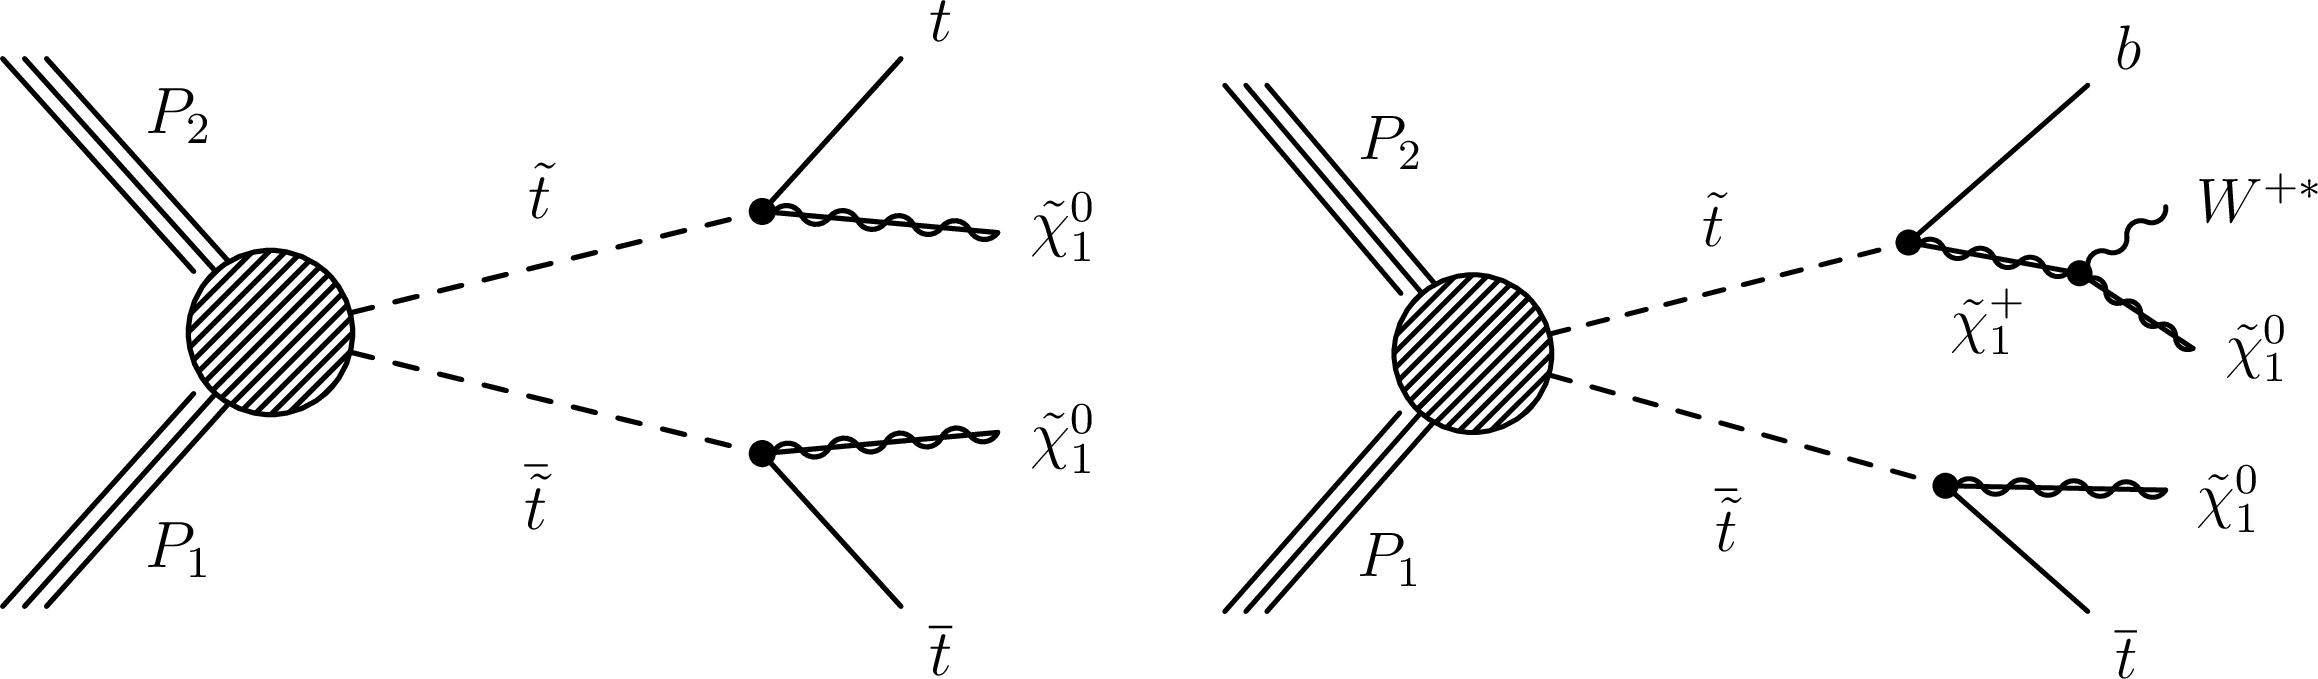
Figure 1:
Diagrams representing the two simplified models of direct top squark pair production and decay considered in this study: the T2tt model with top squark decay via a top quark (left), and the T2tb model with the top squark decaying either via a top quark or via an intermediate chargino (right). |
png pdf |
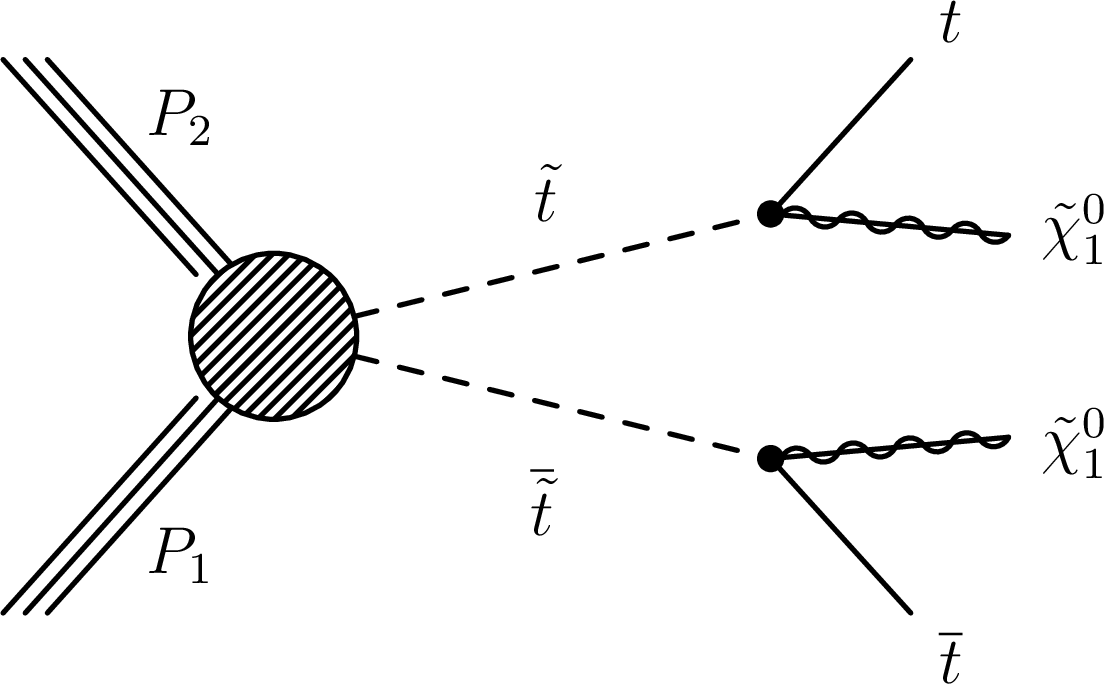
Figure 1-a:
Diagram representing one of the two simplified models of direct top squark pair production and decay considered in this study: the T2tt model with top squark decay via a top quark. |
png pdf |
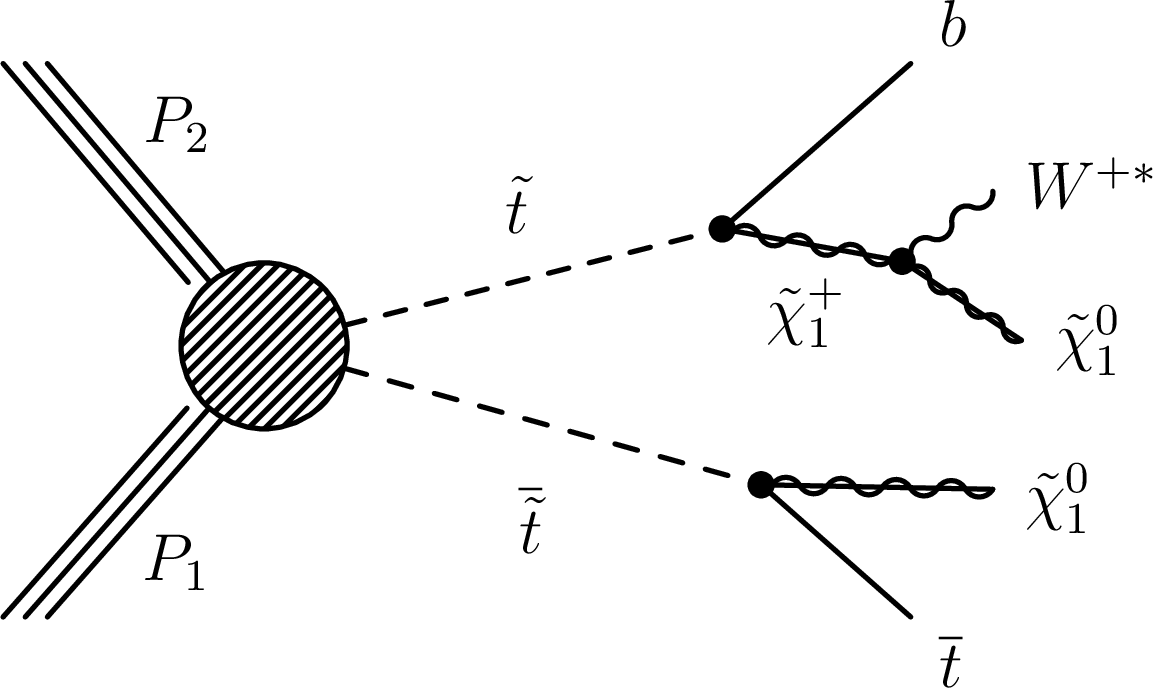
Figure 1-b:
Diagram representing one of the two simplified models of direct top squark pair production and decay considered in this study: the T2tb model with the top squark decaying either via a top quark or via an intermediate chargino. |
png pdf |
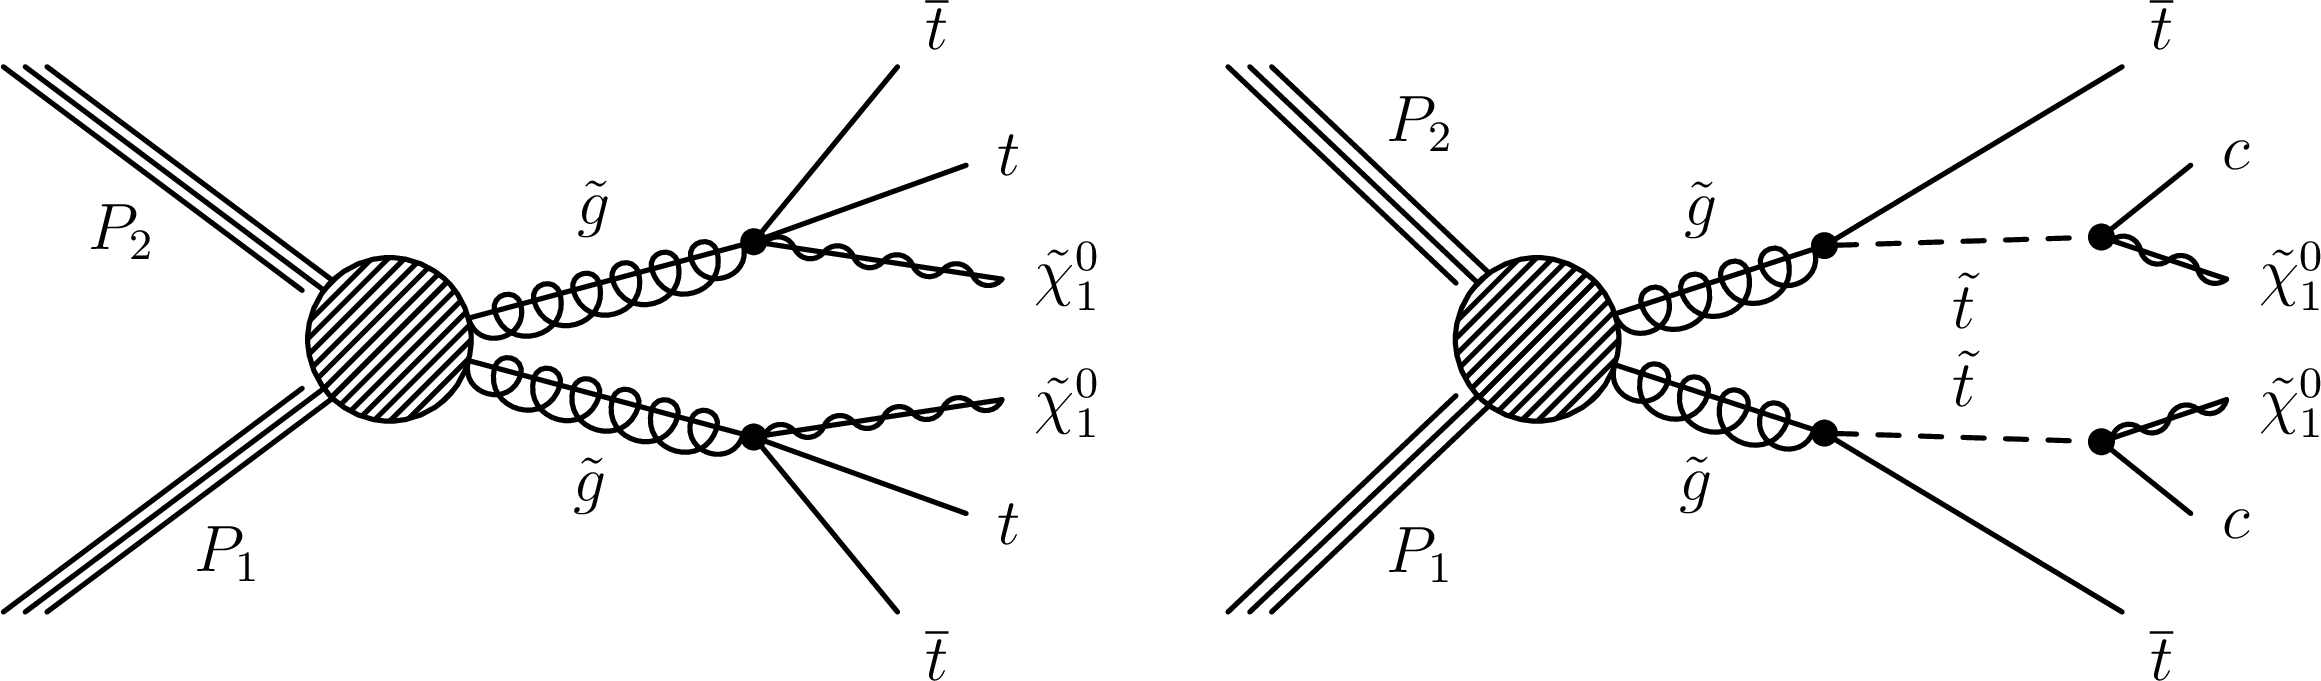
Figure 2:
Diagrams representing the simplified models of gluino-mediated top squark production considered in this study: the T1tttt model (left) where the gluino decays to top quarks and the LSP via an off-shell top squark, and the T5ttcc model (right) where the gluino decays to an on-shell top squark, which decays to a charm quark and the LSP. |

png pdf |
Figure 2-a:
Diagram representing a simplified model of gluino-mediated top squark production considered in this study: the T1tttt model, where the gluino decays to top quarks and the LSP via an off-shell top squark. |

png pdf |
Figure 2-b:
Diagram representing a simplified model of gluino-mediated top squark production considered in this study: the T5ttcc model, where the gluino decays to an on-shell top squark, which decays to a charm quark and the LSP. |
png pdf |
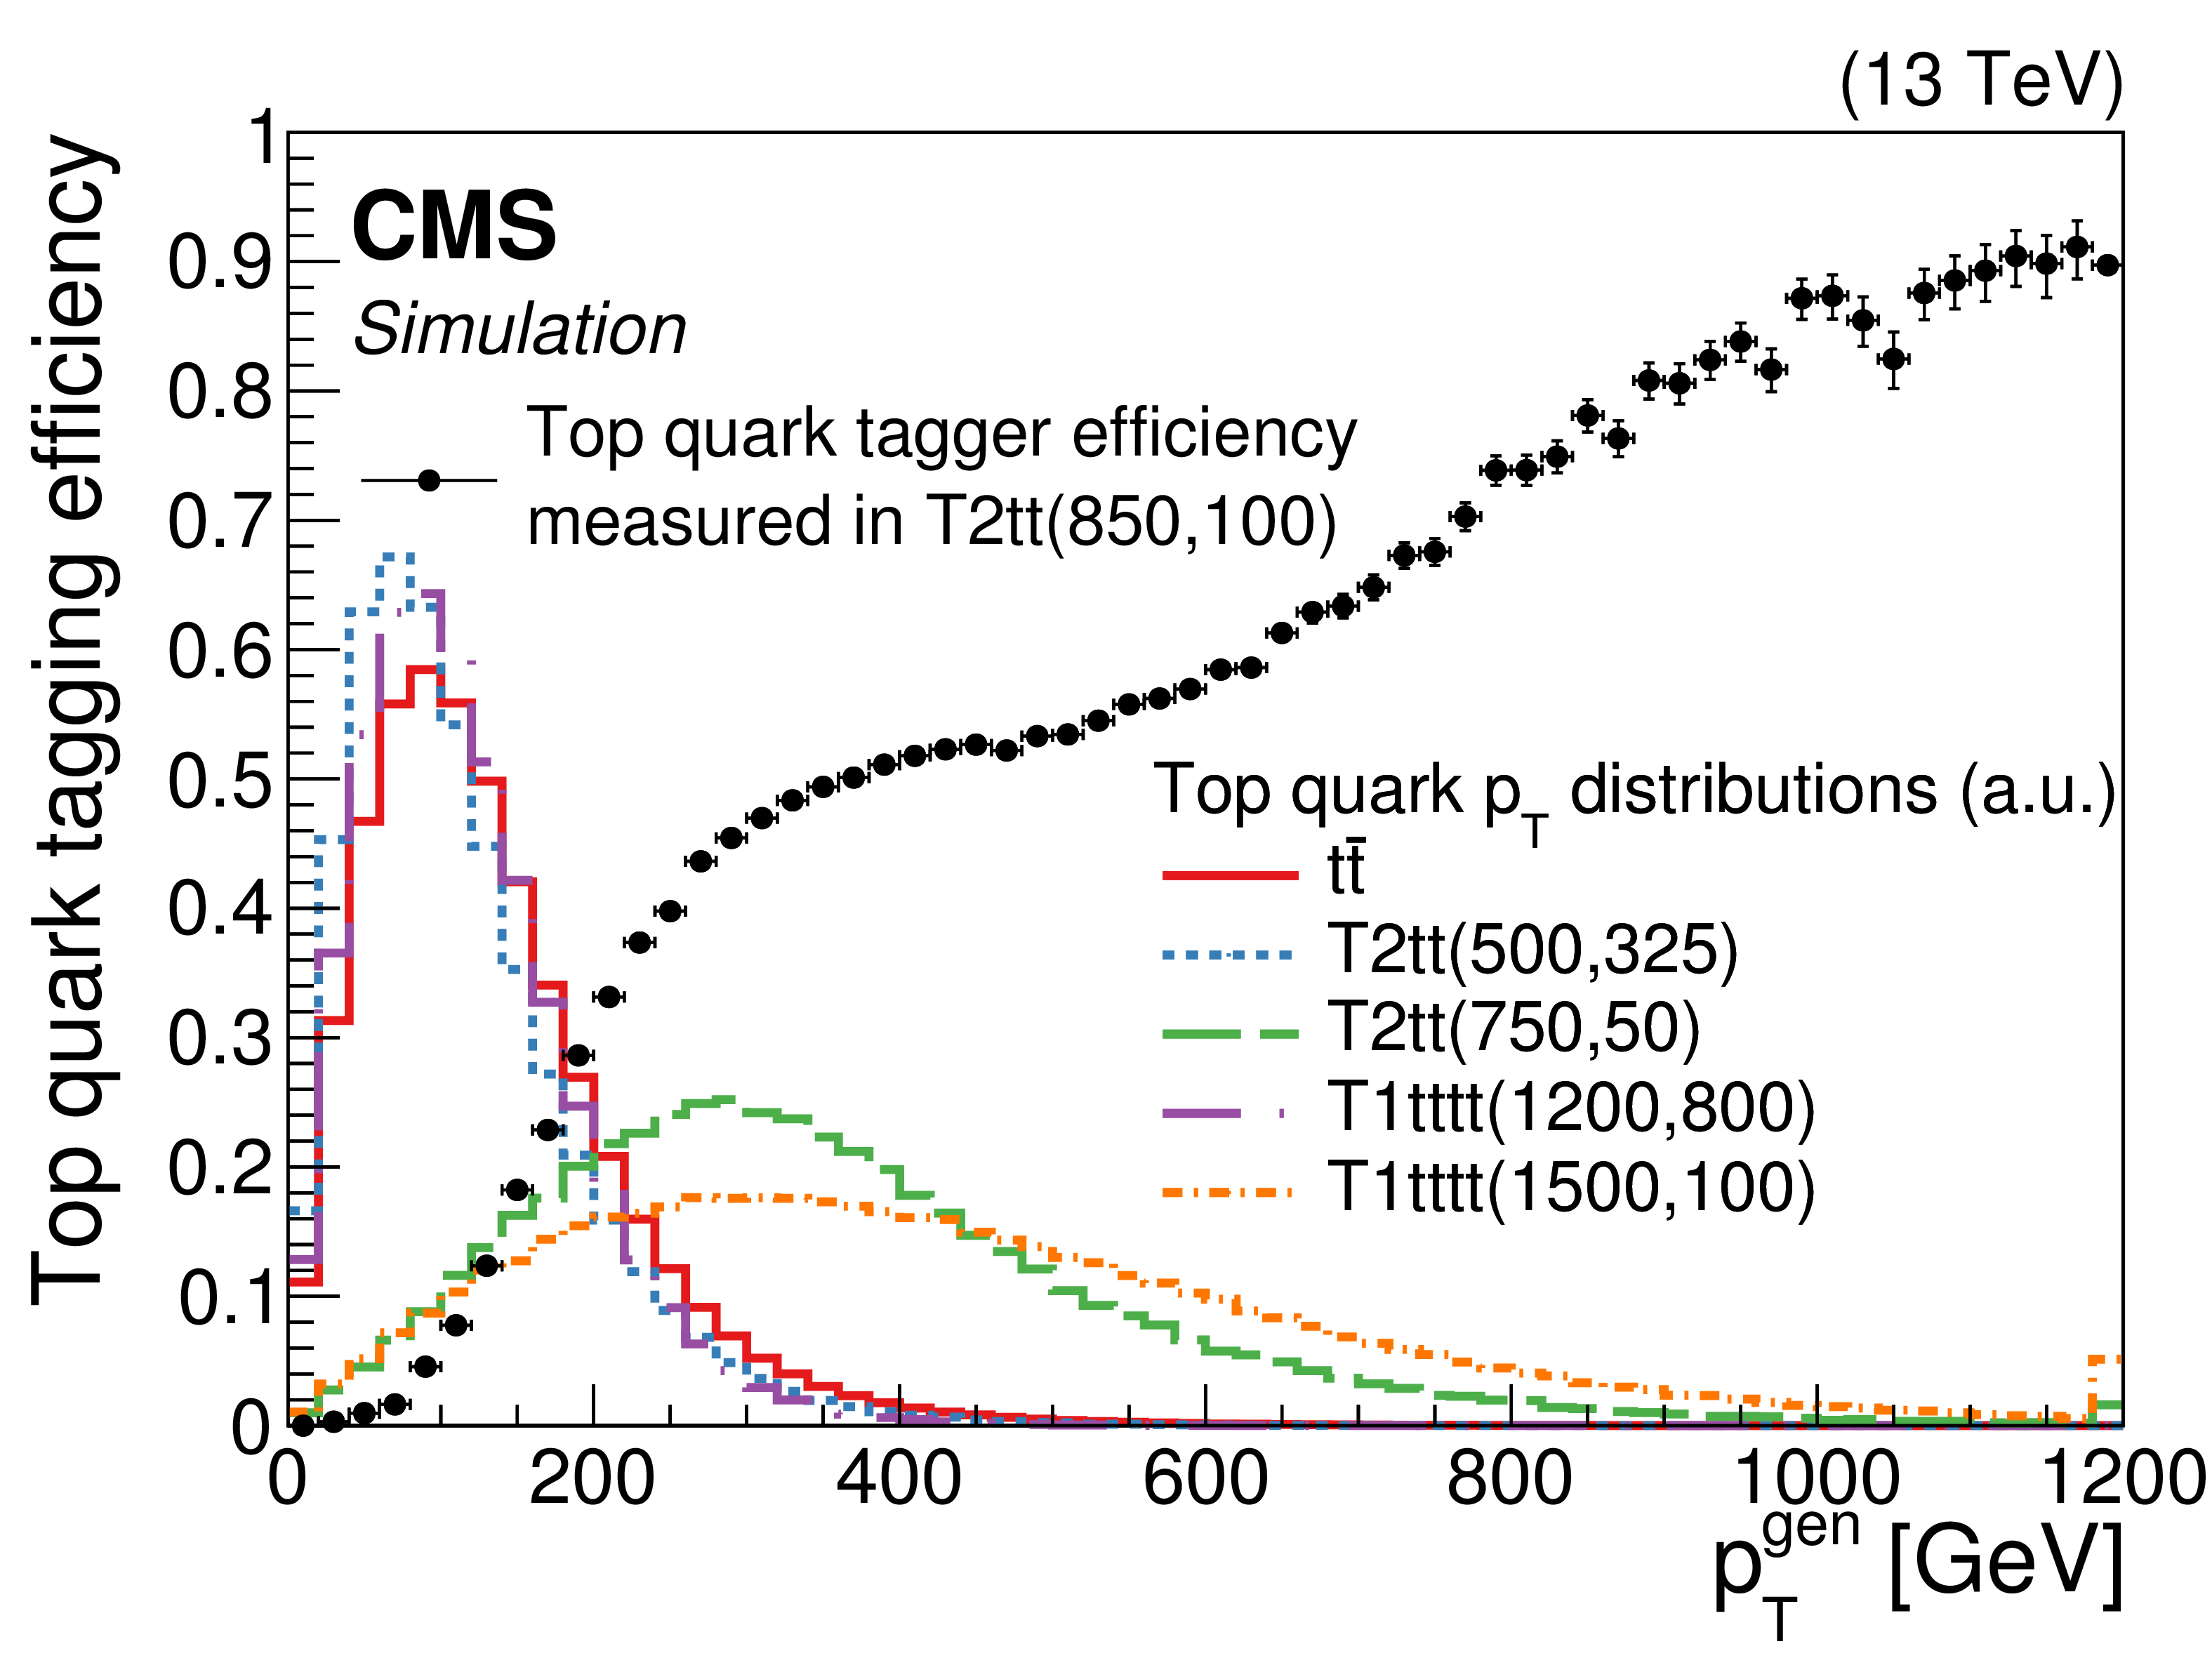
Figure 3:
The tagging efficiency of the top quark tagger as a function of the generator-level hadronically decaying top quark $ {p_{\mathrm {T}}} $ (black points). The efficiency was computed using the T2tt signal model with $m_{\tilde{ \mathrm{ t } } } = $ 850 GeV and $m_{\tilde{\chi}^0_1 } = $ 100 GeV, and it is similar for ${\mathrm{ t } \mathrm{ \bar{t} } } $ events. The vertical bars depict the statistical uncertainty. The colored lines show the expected hadronically decaying top quark $ {p_{\mathrm {T}}} $ distribution from ${\mathrm{ t } \mathrm{ \bar{t} } } $ (red solid line), the T2tt signal model with $m_{\tilde{ \mathrm{ t } } } = $ 500 GeV and $m_{\tilde{\chi}^0_1 } = $ 325 GeV (blue short-dashed line), the T2tt signal model with $m_{\tilde{ \mathrm{ t } } } = $ 750 GeV and $m_{\tilde{\chi}^0_1 } = $ 50 GeV (green long-dashed line), the T1tttt signal model with $m_{\tilde{ \mathrm{g} } } = $ 1200 GeV and $m_{\tilde{\chi}^0_1 } = $ 800 GeV (purple long-dash-dotted line), and the T1tttt signal model with $m_{\tilde{ \mathrm{g} } } = $ 1500 GeV and $m_{\tilde{\chi}^0_1 } = $ 100 GeV (orange short-dash-dotted line). The last bin contains the overflow entries and the top quark $ {p_{\mathrm {T}}} $ distributions are normalized to unit area. |
png pdf |
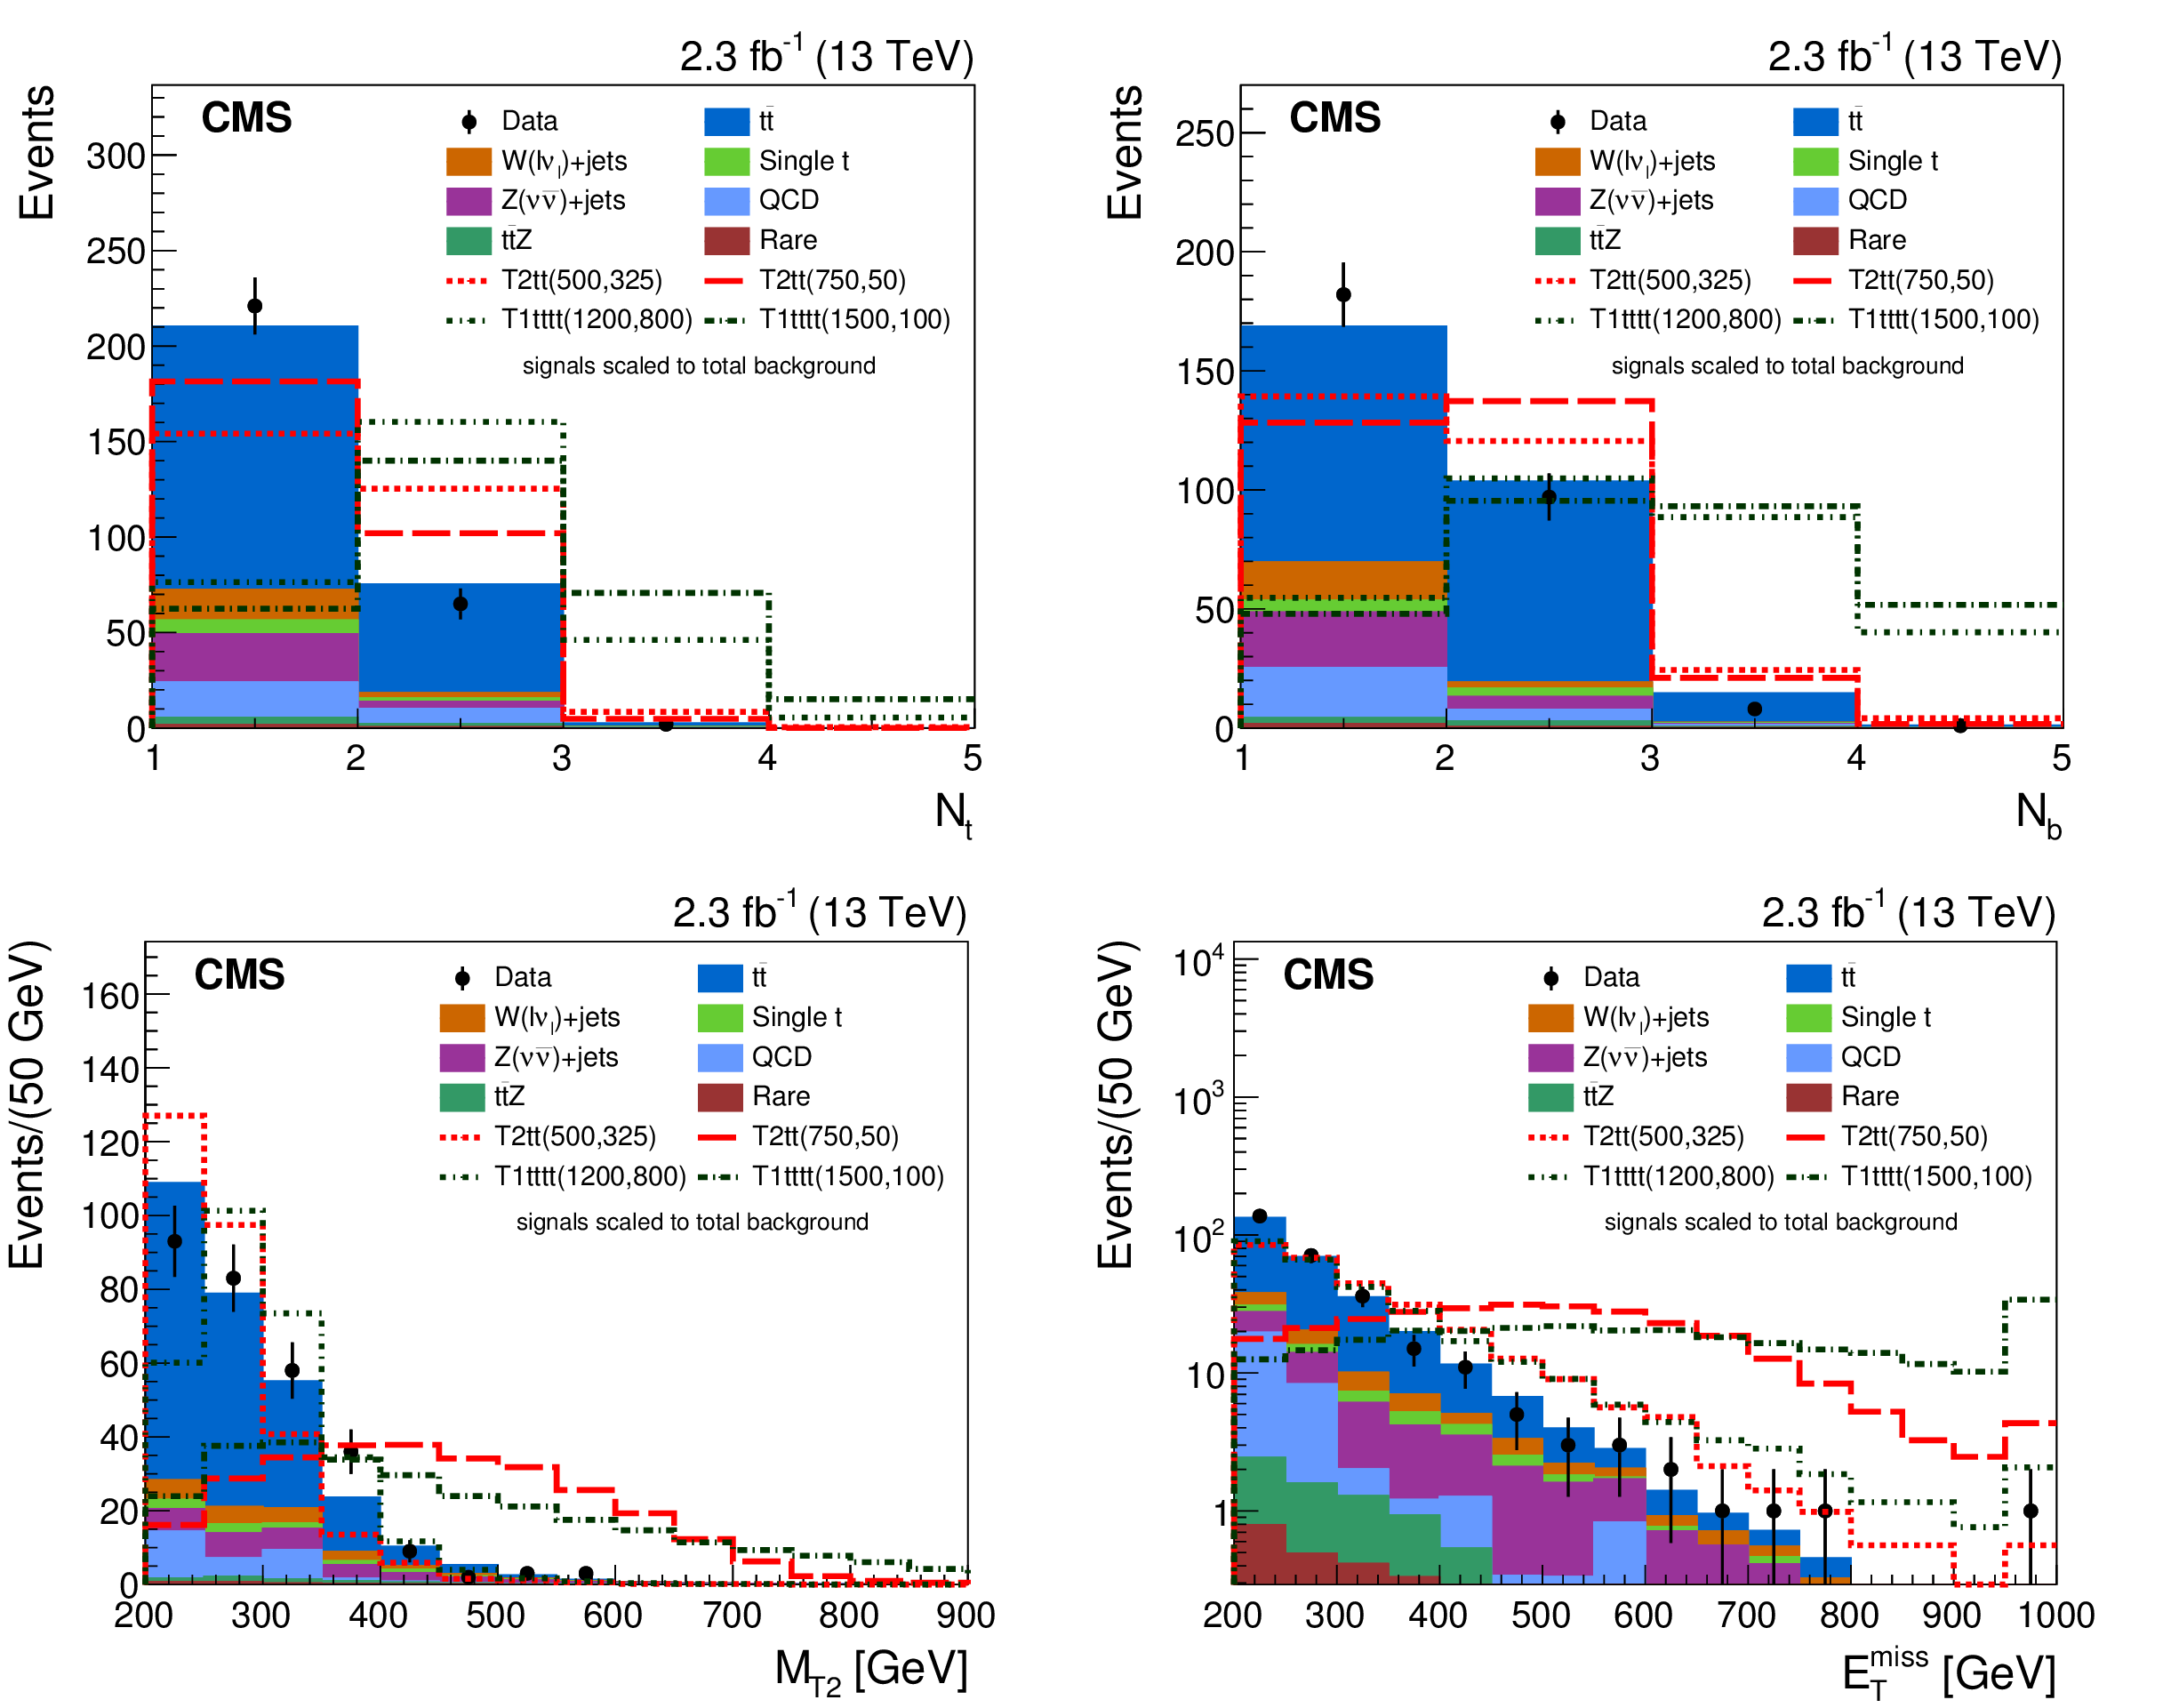
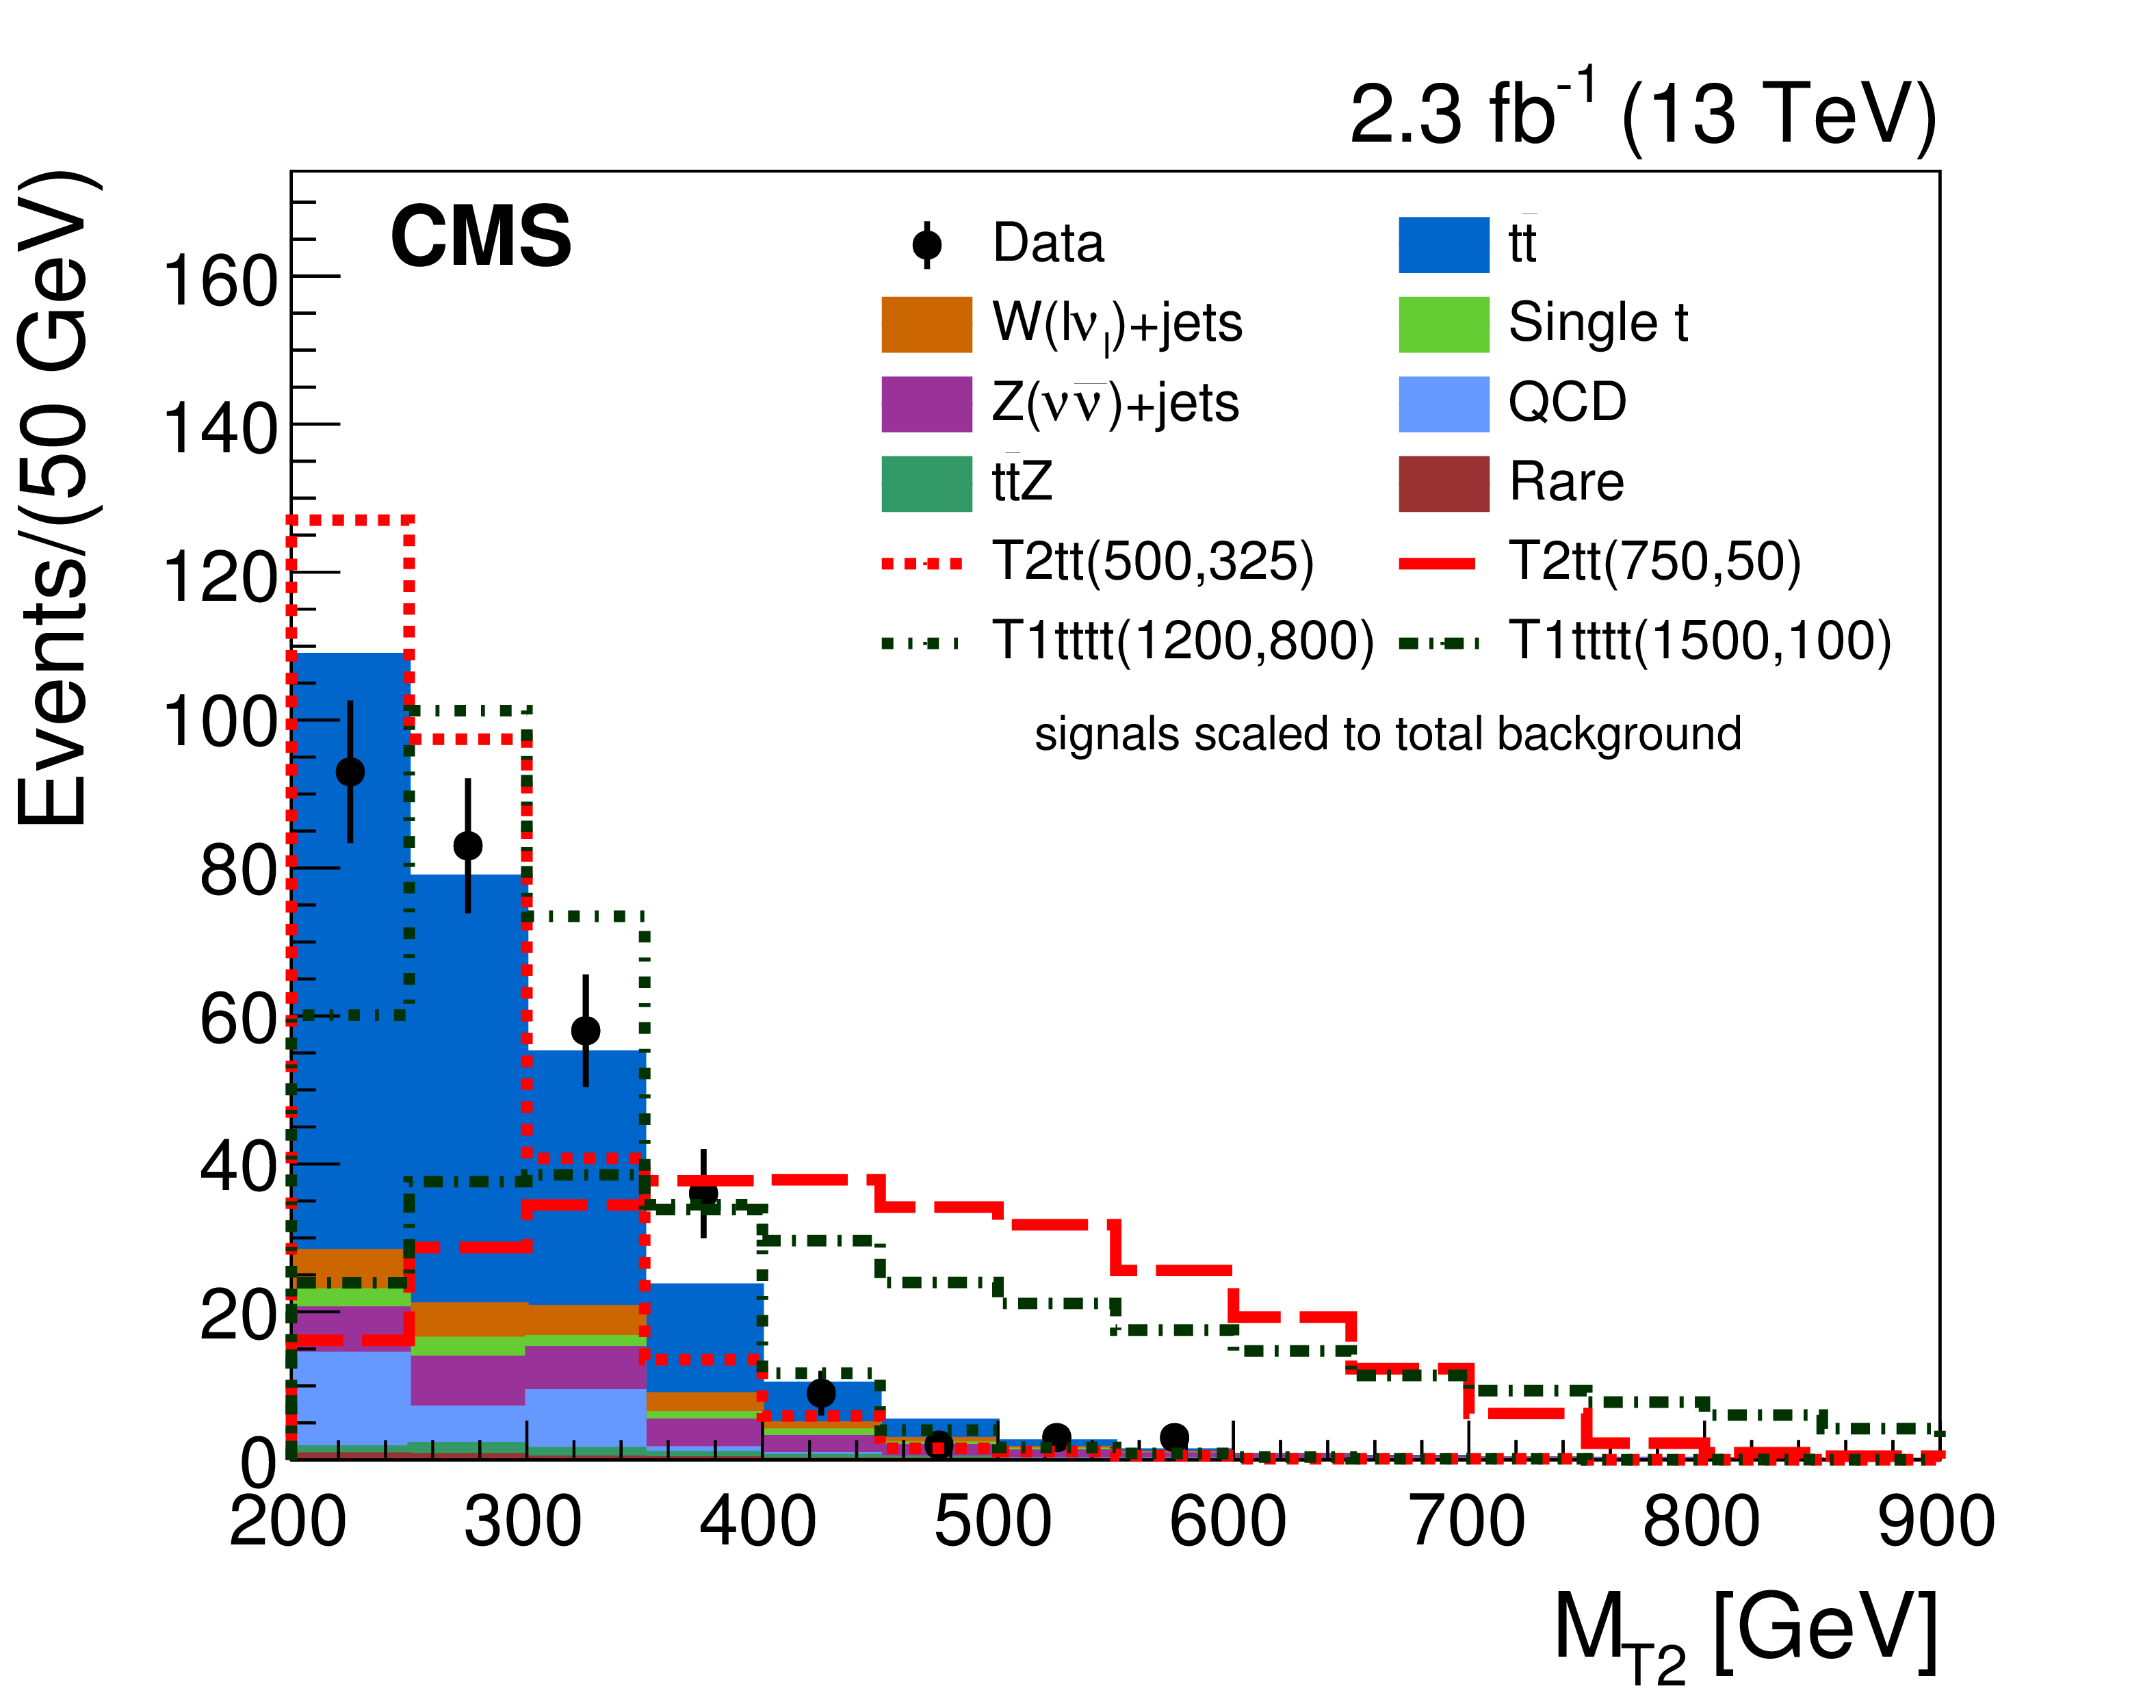
Figure 4:
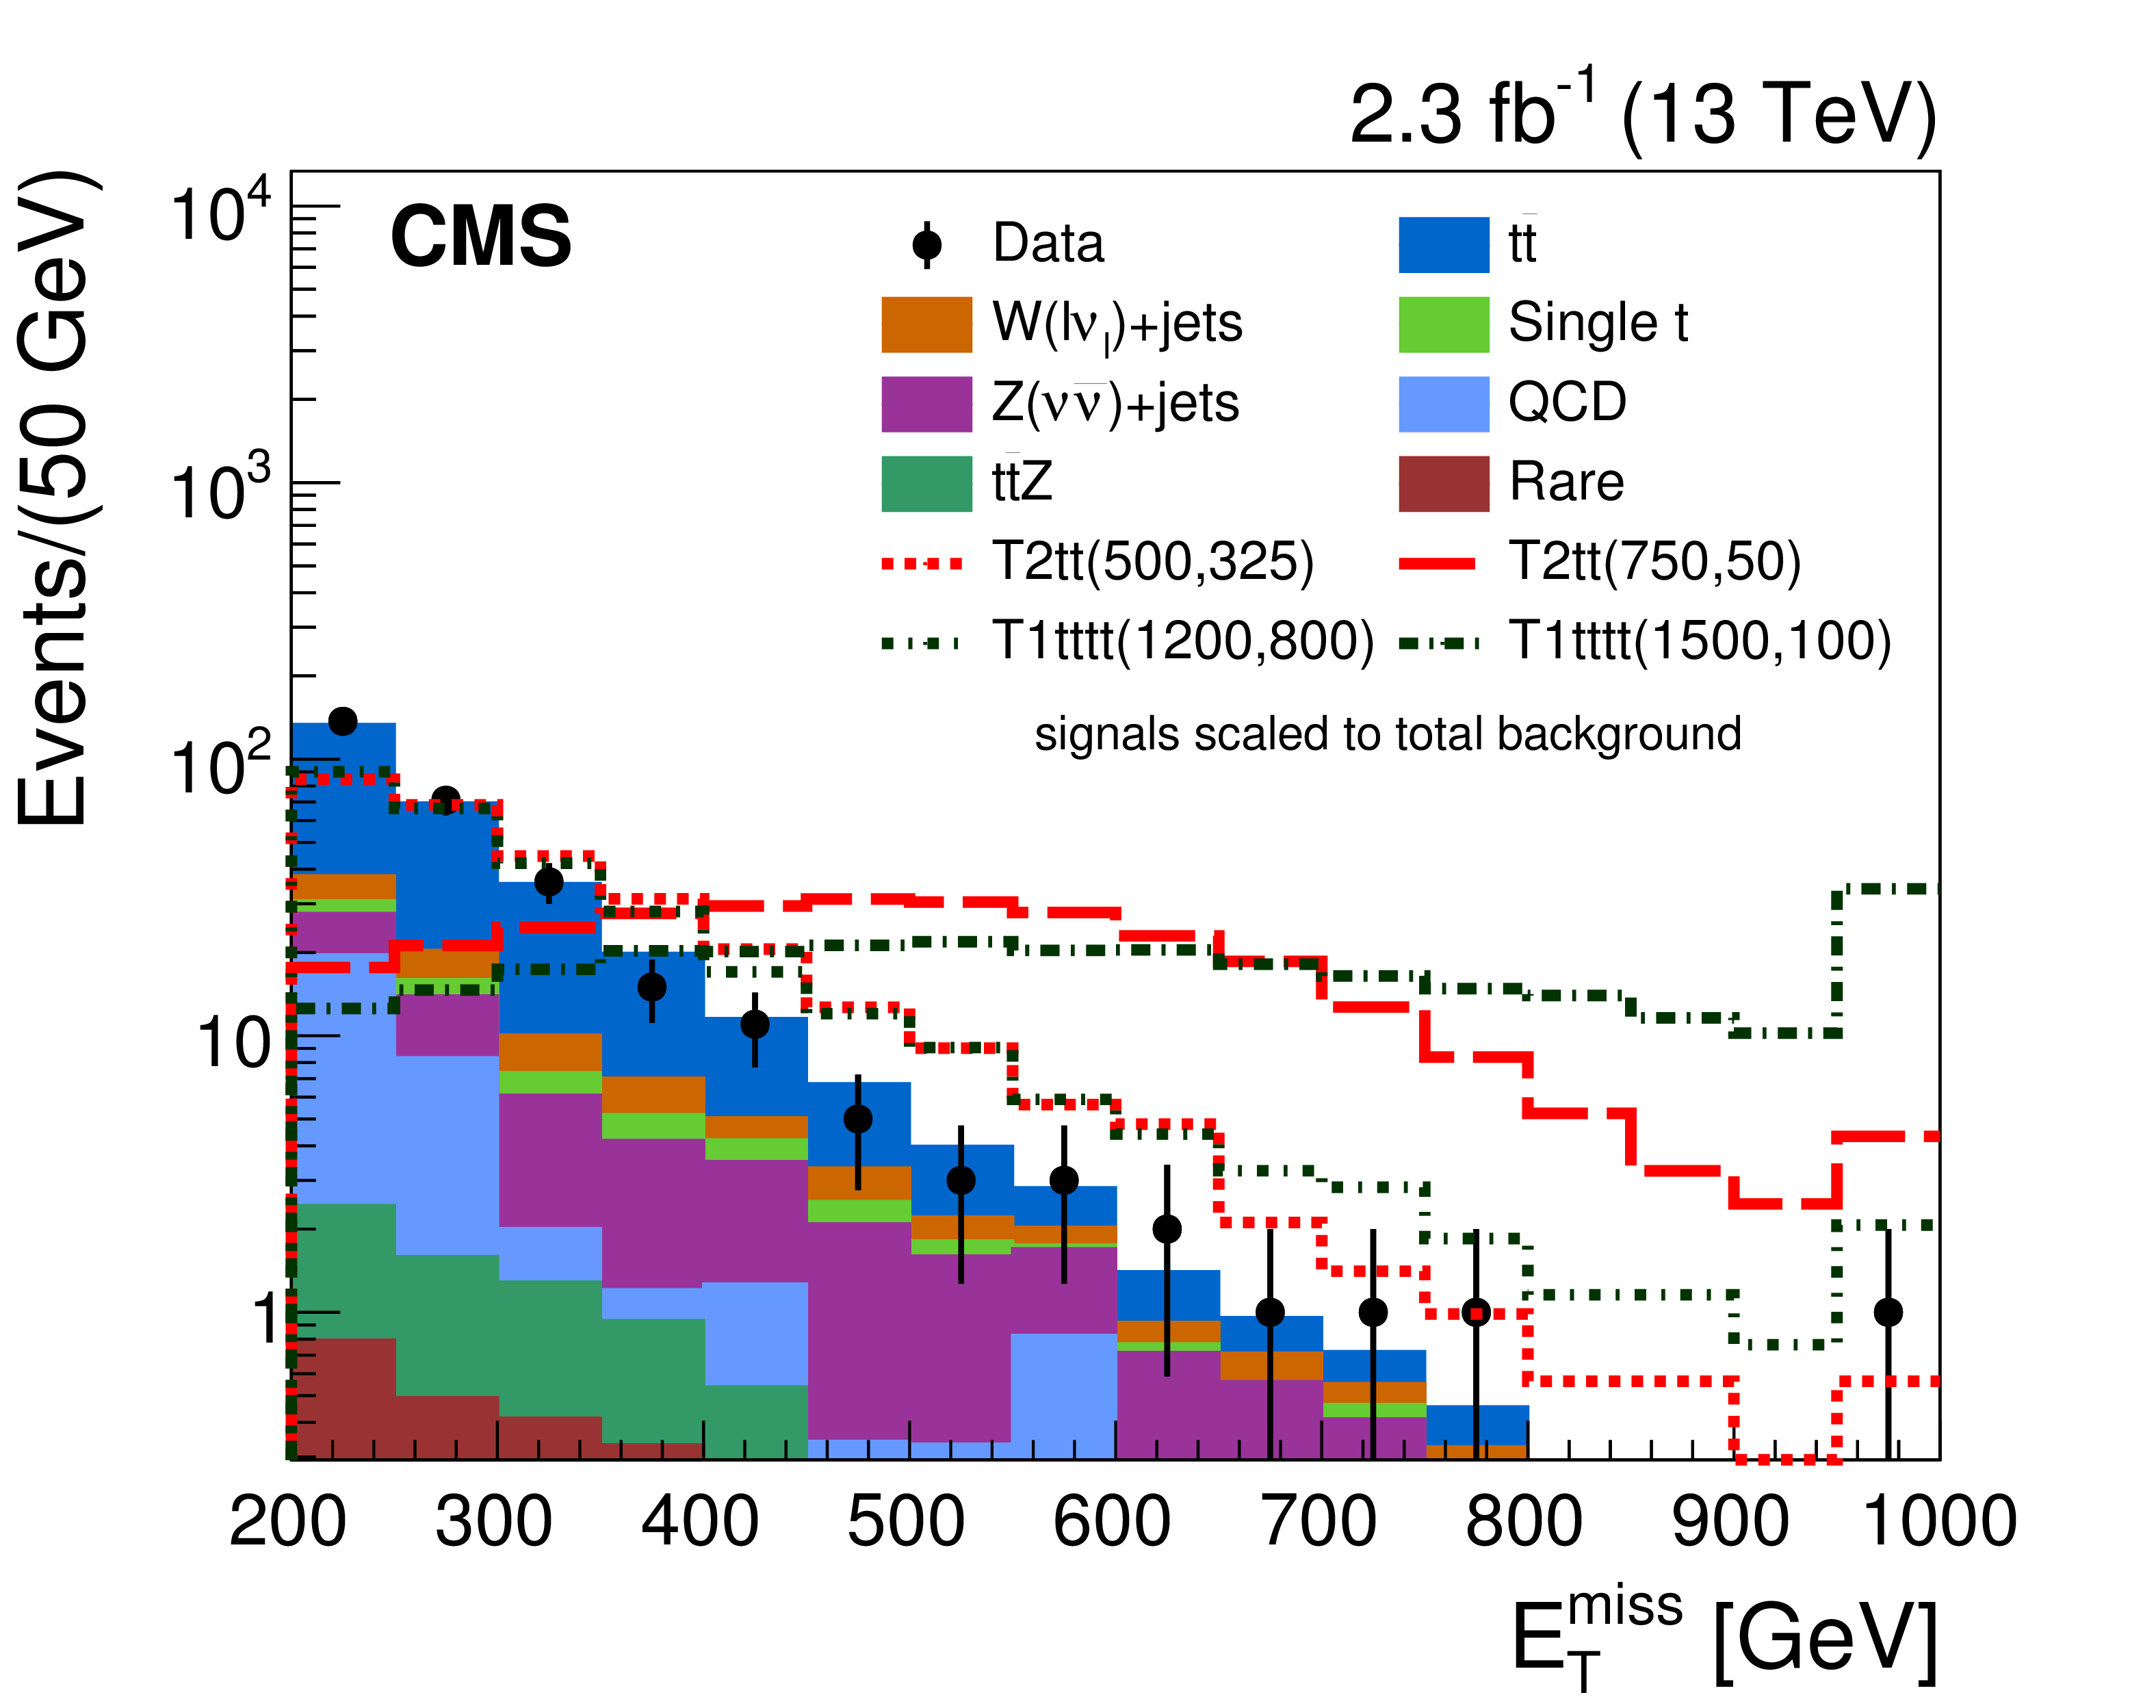
Comparison of the distributions in data (black points), simulated SM backgrounds (filled stacked histograms) and several signal models in ${N_{\mathrm{ t } }}$ (top left), ${N_{\mathrm{ b } }}$ (top right), ${M_{\mathrm {T2}}}$ (bottom left), and ${E_{\mathrm {T}}^{\text {miss}}}$ (bottom right), after the preselection requirements have been applied. The T2tt signal model with $m_{\tilde{ \mathrm{ t } } } = $ 500 (750) GeV and $m_{\tilde{\chi}^0_1 } = $ 325 (50) GeV is shown with a red short-dashed (long-dashed) line, and the T1tttt signal model with $m_{\tilde{ \mathrm{g} } } = $ 1200 (1500) GeV and $m_{\tilde{\chi}^0_1 } = $ 800 (100) GeV with a dark green short-dash-dotted (long-dash-dotted) line. The distributions for the signal events have been normalized to the same area as the total background distribution, and the last bin contains the overflow events. |
png pdf |
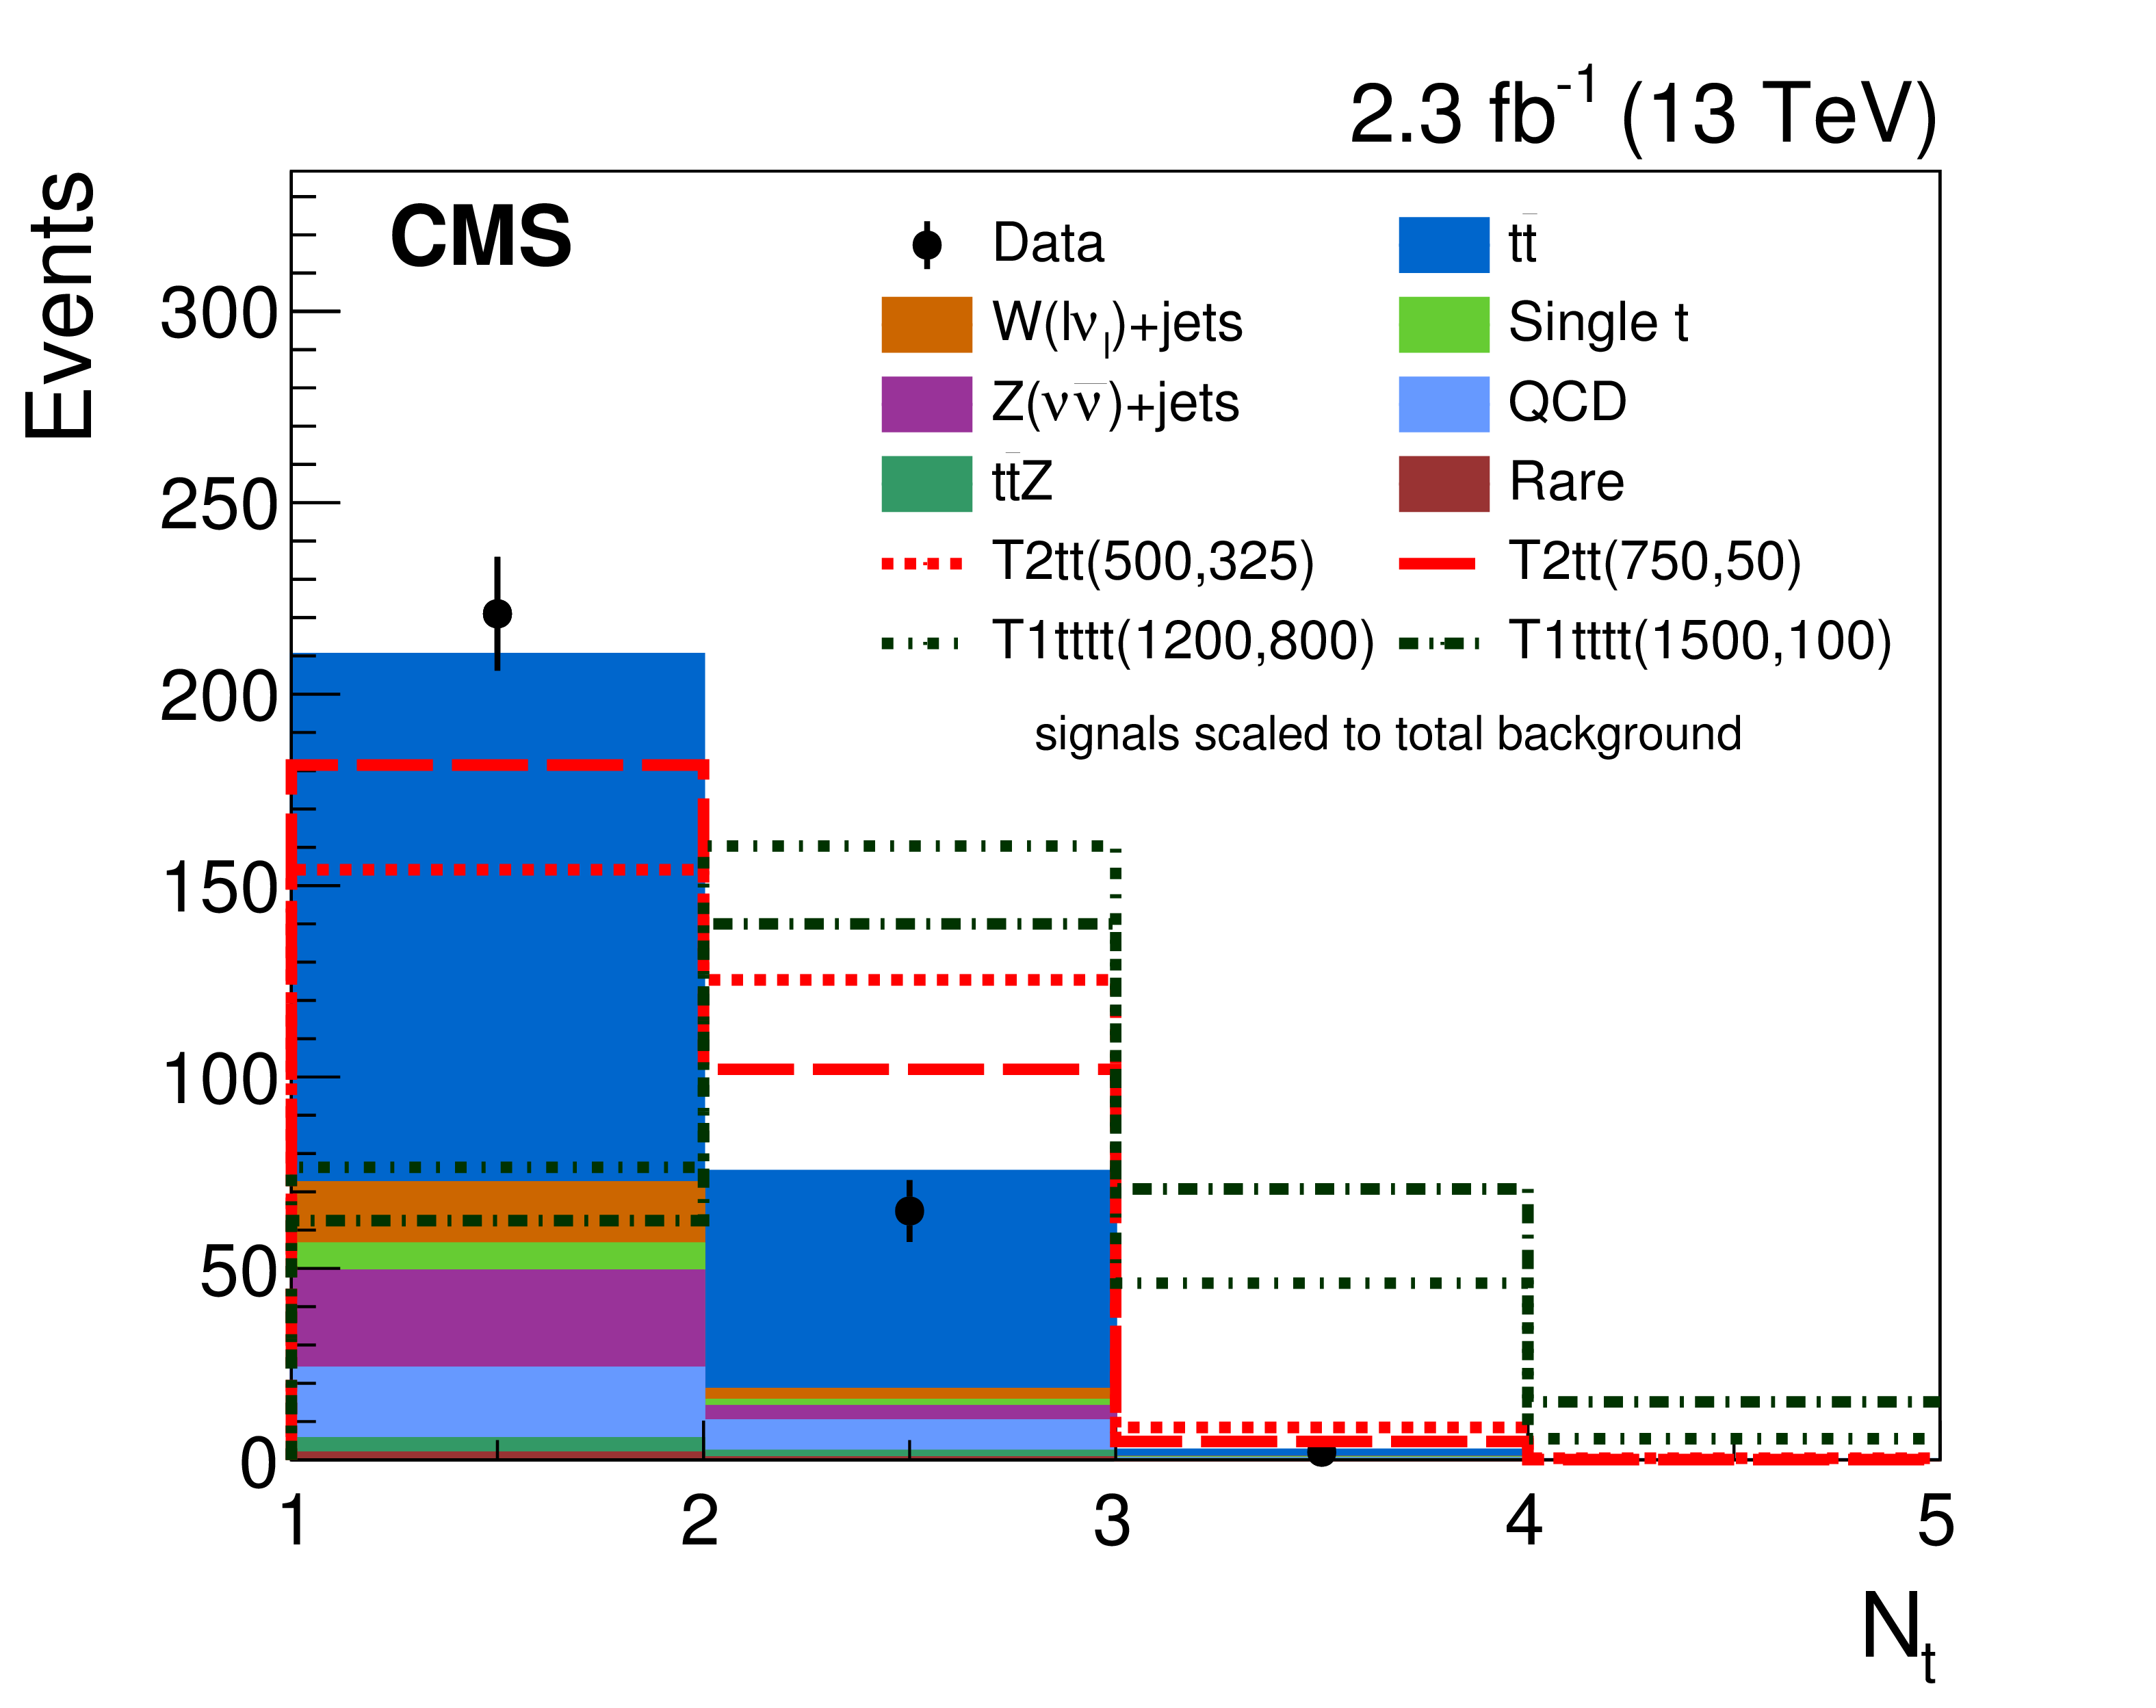
Figure 4-a:
Comparison of the distributions in data (black points), simulated SM backgrounds (filled stacked histograms) and several signal models in ${N_{\mathrm{ t } }}$, after the preselection requirements have been applied. The T2tt signal model with $m_{\tilde{ \mathrm{ t } } } = $ 500 (750) GeV and $m_{\tilde{\chi}^0_1 } = $ 325 (50) GeV is shown with a red short-dashed (long-dashed) line, and the T1tttt signal model with $m_{\tilde{ \mathrm{g} } } = $ 1200 (1500) GeV and $m_{\tilde{\chi}^0_1 } = $ 800 (100) GeV with a dark green short-dash-dotted (long-dash-dotted) line. The distribution for the signal events has been normalized to the same area as the total background distribution, and the last bin contains the overflow events. |
png pdf |
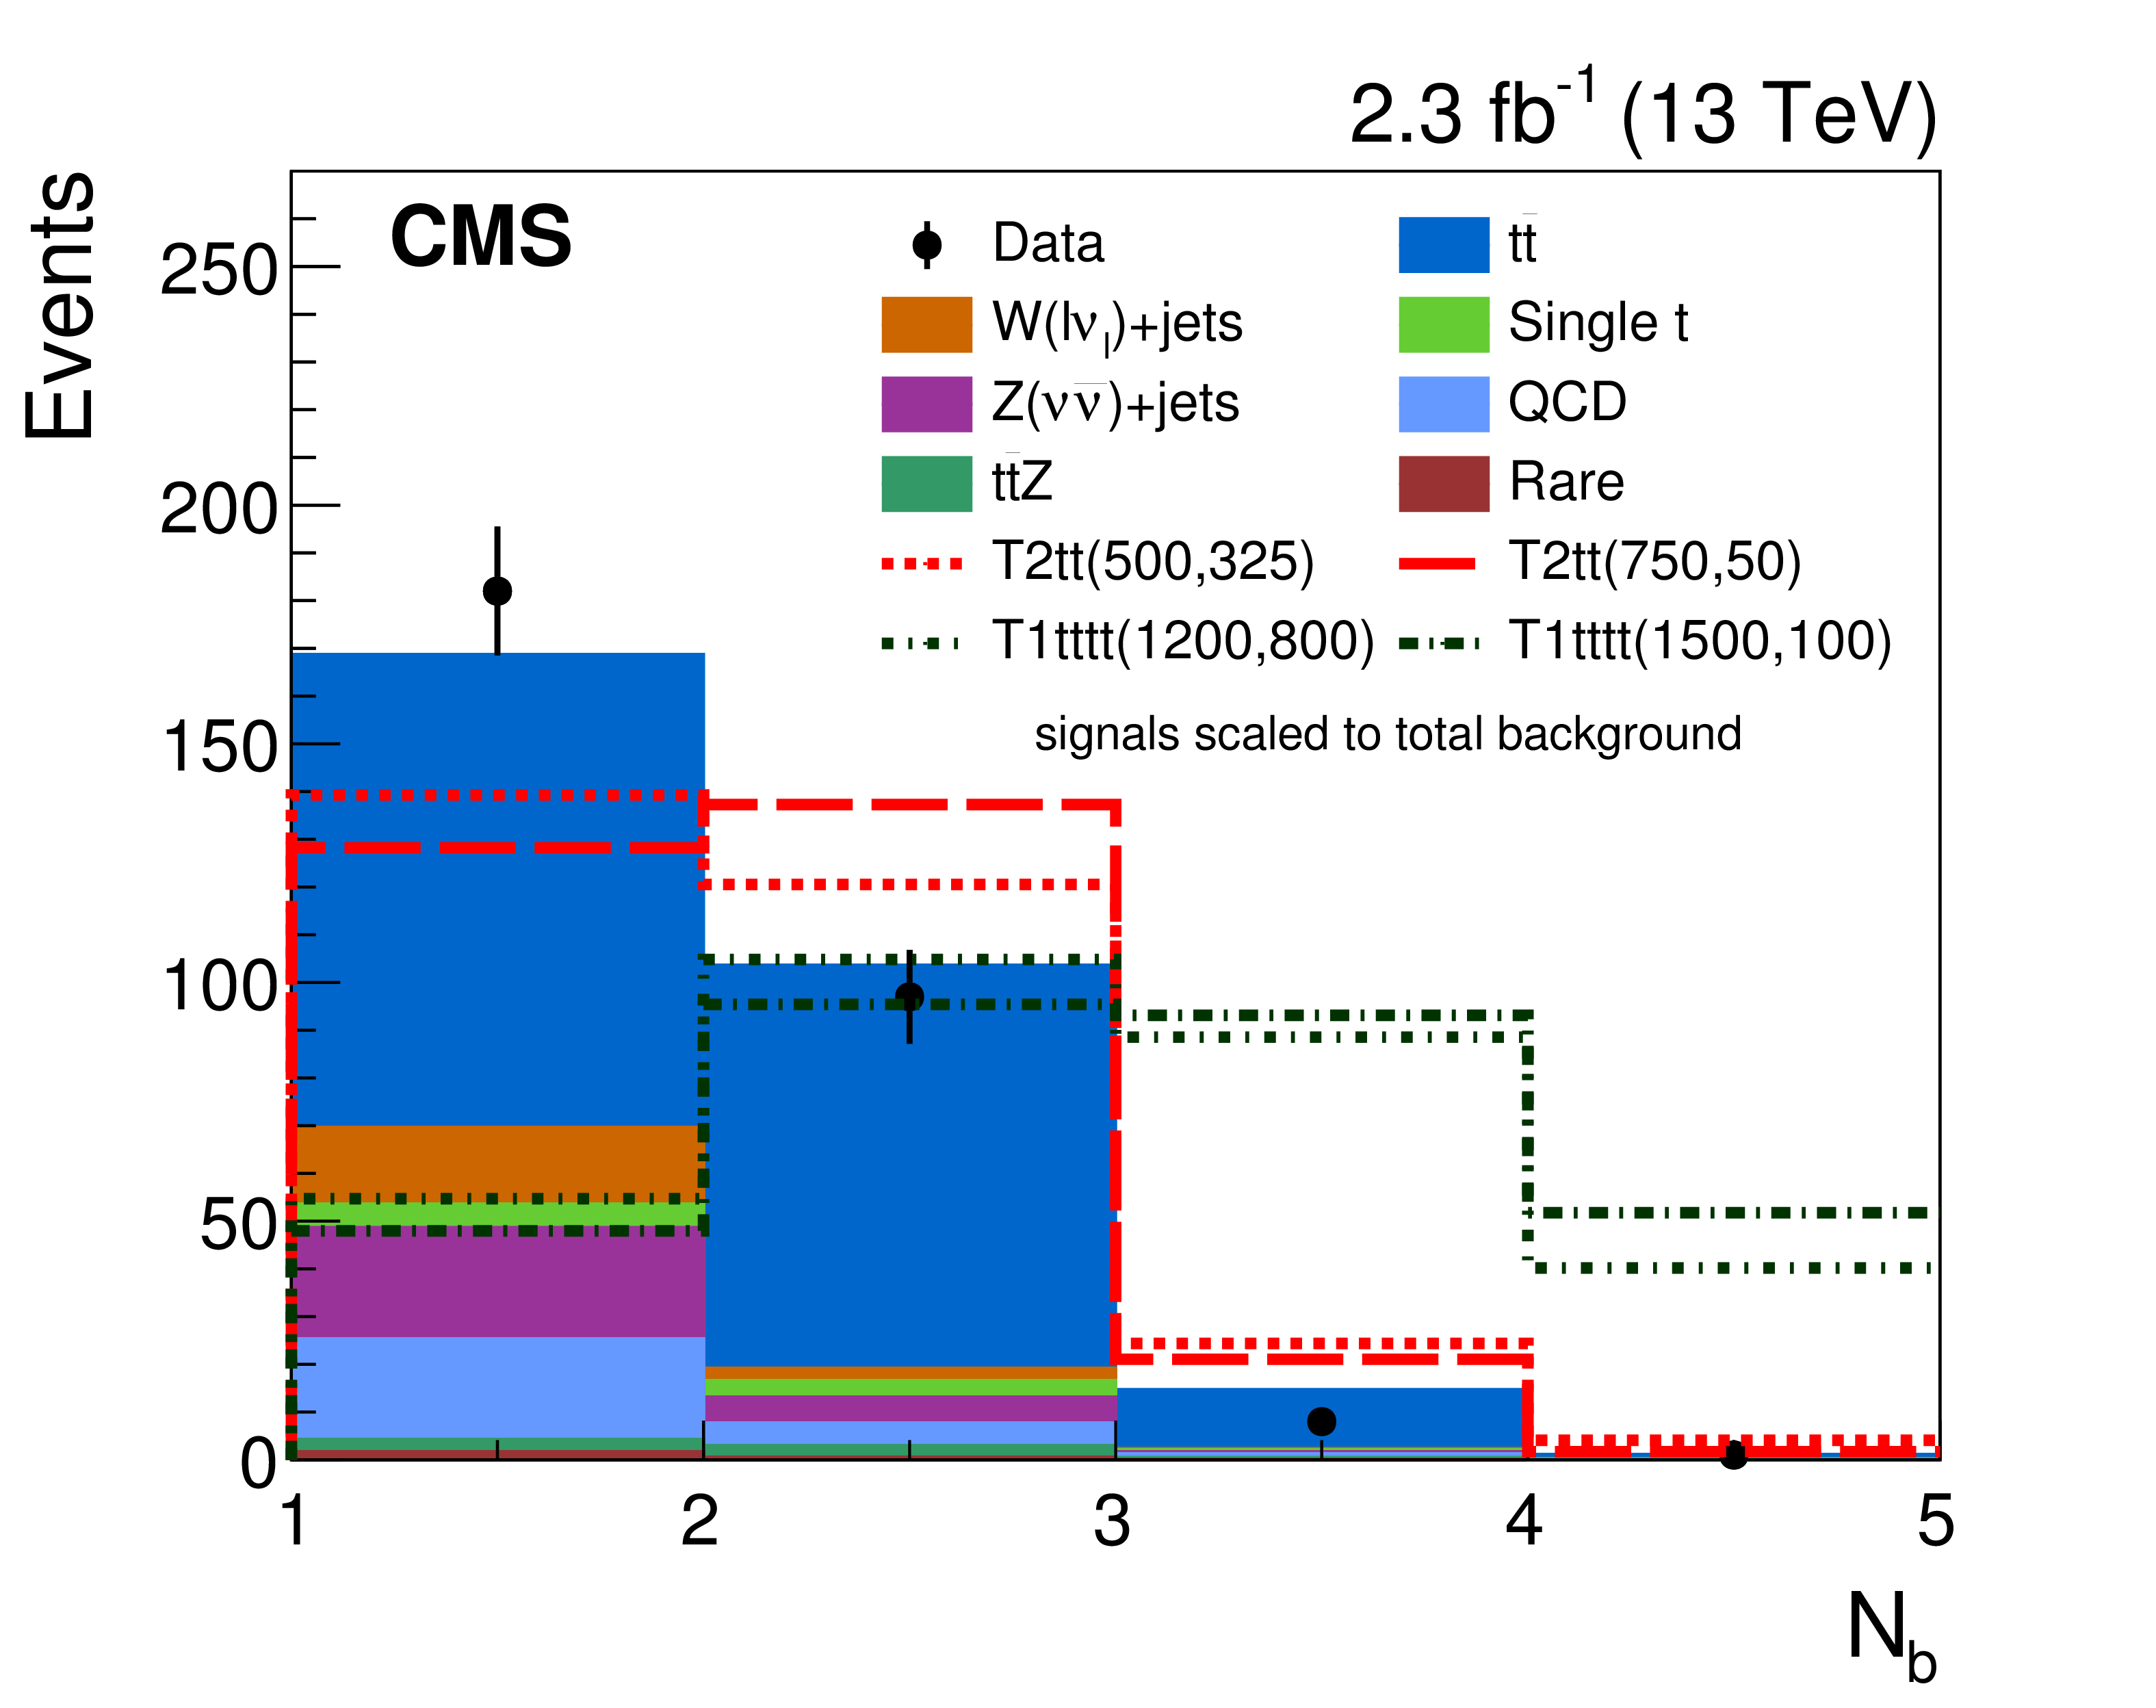
Figure 4-b:
Comparison of the distributions in data (black points), simulated SM backgrounds (filled stacked histograms) and several signal models in ${N_{\mathrm{ b } }}$, after the preselection requirements have been applied. The T2tt signal model with $m_{\tilde{ \mathrm{ t } } } = $ 500 (750) GeV and $m_{\tilde{\chi}^0_1 } = $ 325 (50) GeV is shown with a red short-dashed (long-dashed) line, and the T1tttt signal model with $m_{\tilde{ \mathrm{g} } } = $ 1200 (1500) GeV and $m_{\tilde{\chi}^0_1 } = $ 800 (100) GeV with a dark green short-dash-dotted (long-dash-dotted) line. The distribution for the signal events has been normalized to the same area as the total background distribution, and the last bin contains the overflow events. |
png pdf |
Figure 4-c:
Comparison of the distributions in data (black points), simulated SM backgrounds (filled stacked histograms) and several signal models in ${M_{\mathrm {T2}}}$, after the preselection requirements have been applied. The T2tt signal model with $m_{\tilde{ \mathrm{ t } } } = $ 500 (750) GeV and $m_{\tilde{\chi}^0_1 } = $ 325 (50) GeV is shown with a red short-dashed (long-dashed) line, and the T1tttt signal model with $m_{\tilde{ \mathrm{g} } } = $ 1200 (1500) GeV and $m_{\tilde{\chi}^0_1 } = $ 800 (100) GeV with a dark green short-dash-dotted (long-dash-dotted) line. The distribution for the signal events has been normalized to the same area as the total background distribution, and the last bin contains the overflow events. |
png pdf |
Figure 4-d:
Comparison of the distributions in data (black points), simulated SM backgrounds (filled stacked histograms) and several signal models in ${E_{\mathrm {T}}^{\text {miss}}}$, after the preselection requirements have been applied. The T2tt signal model with $m_{\tilde{ \mathrm{ t } } } = $ 500 (750) GeV and $m_{\tilde{\chi}^0_1 } = $ 325 (50) GeV is shown with a red short-dashed (long-dashed) line, and the T1tttt signal model with $m_{\tilde{ \mathrm{g} } } = $ 1200 (1500) GeV and $m_{\tilde{\chi}^0_1 } = $ 800 (100) GeV with a dark green short-dash-dotted (long-dash-dotted) line. The distribution for the signal events has been normalized to the same area as the total background distribution, and the last bin contains the overflow events. |
png pdf |
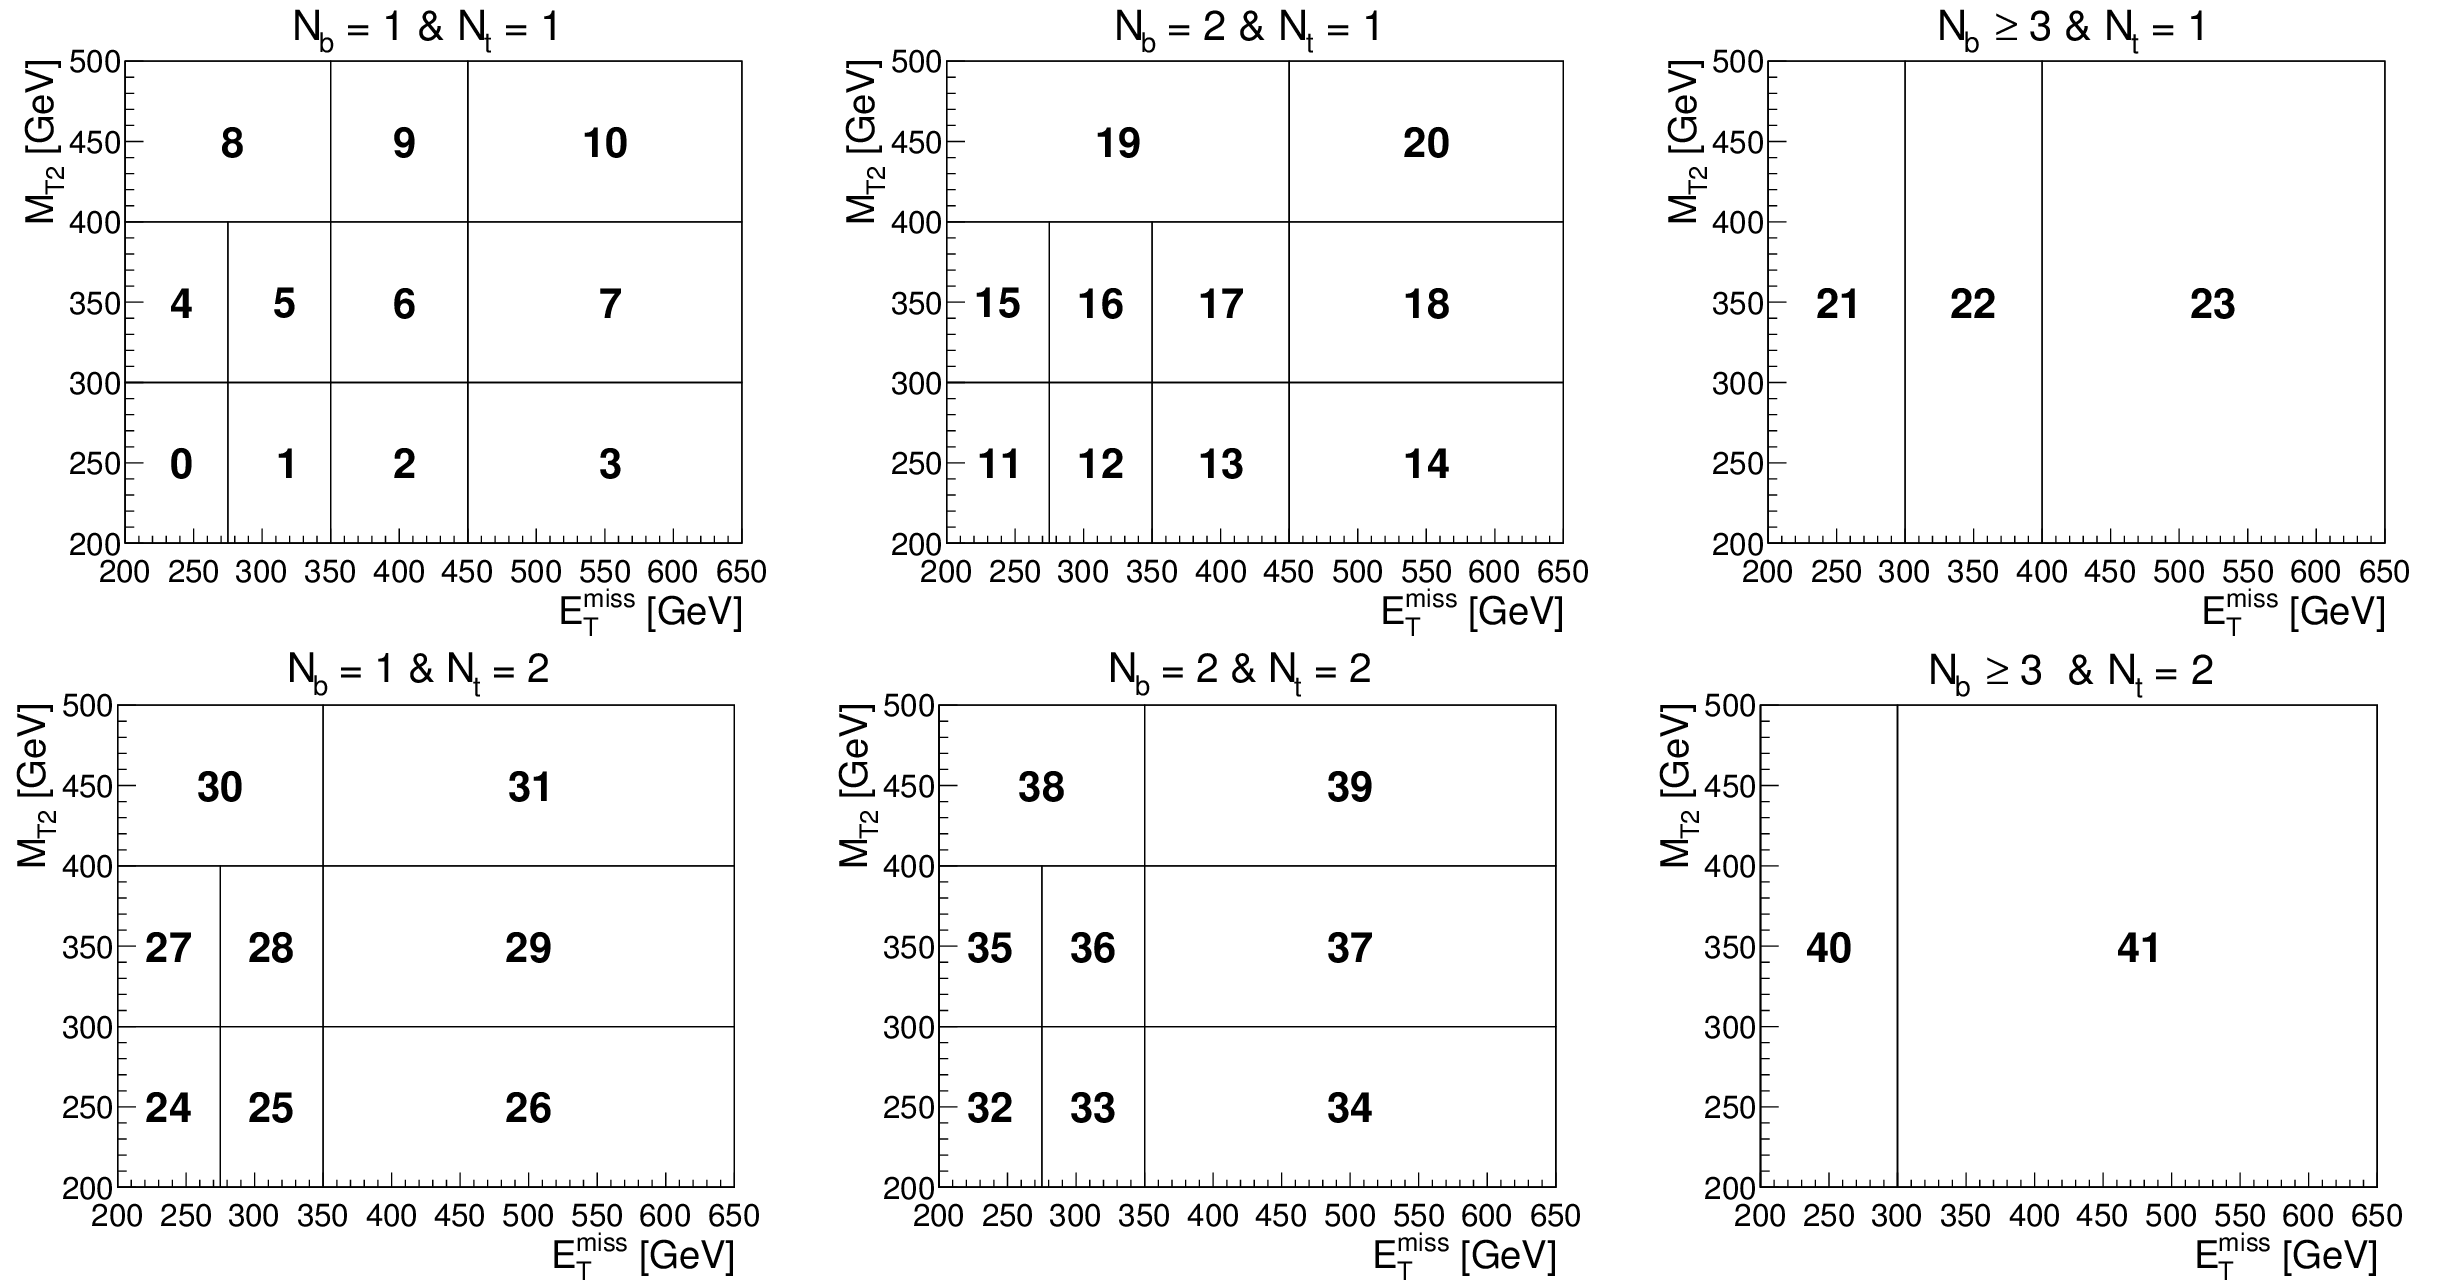
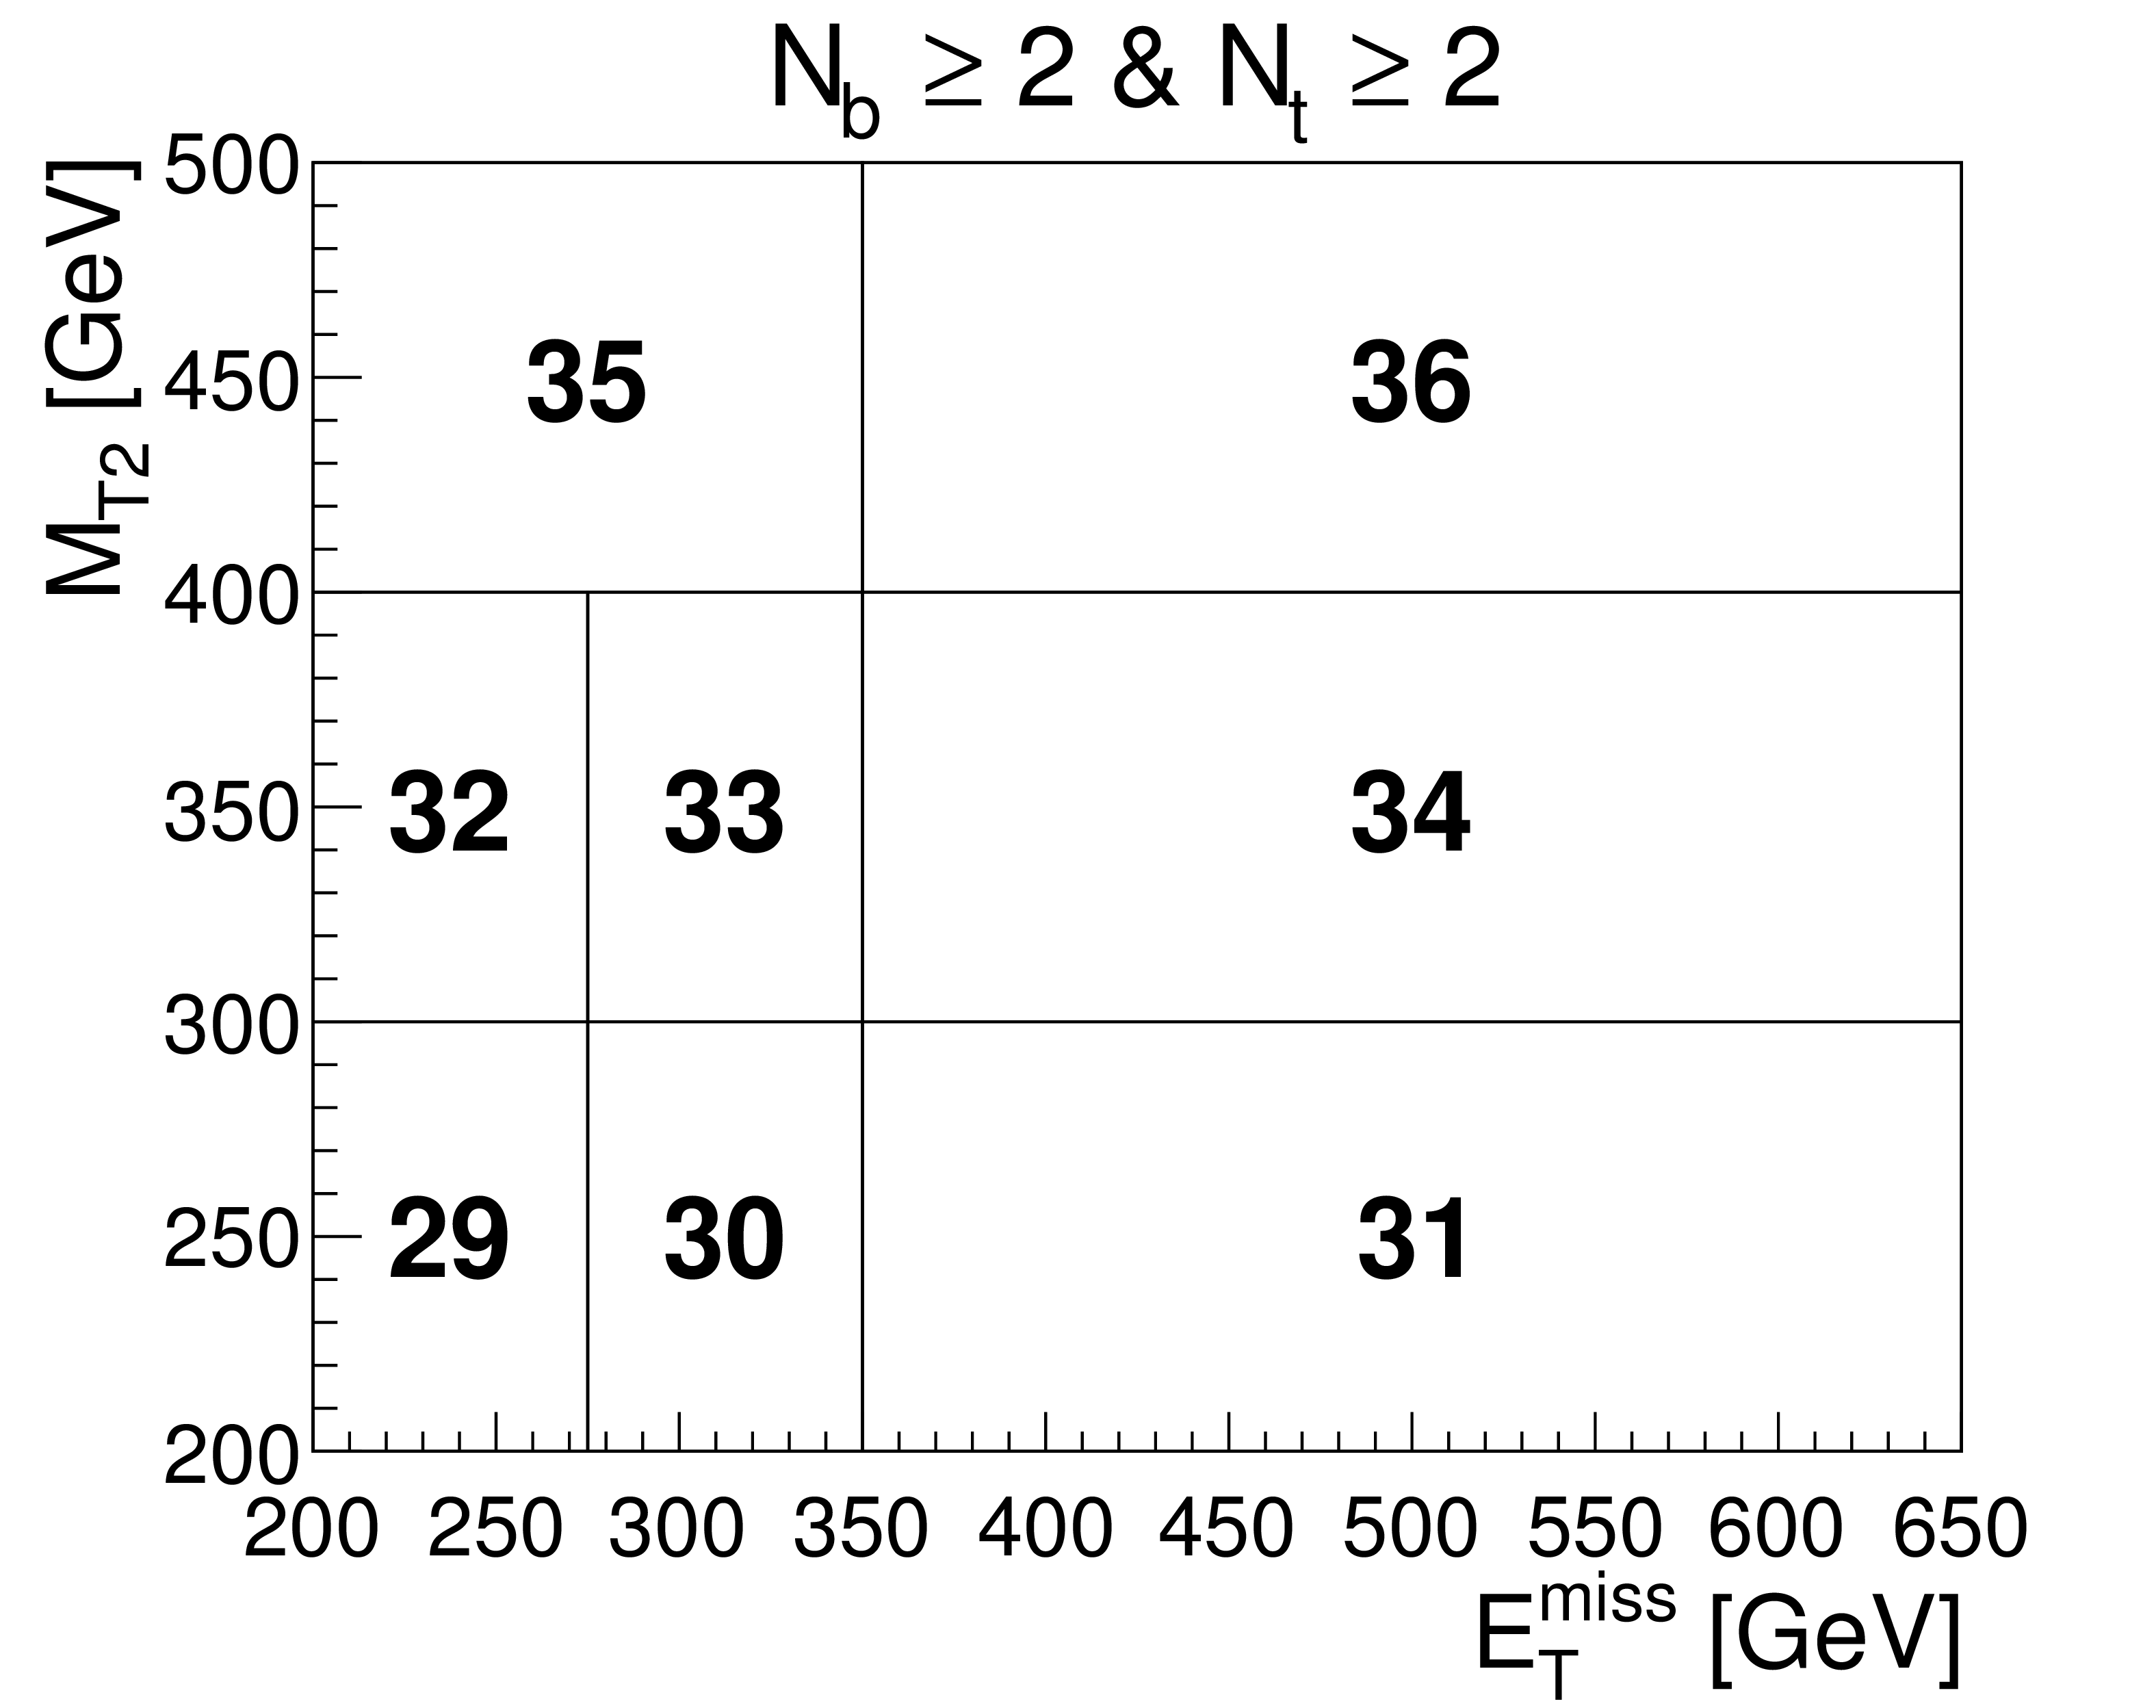
Figure 5:
Search region definitions for bin numbers 0-41 of the gluino-mediated production optimization, as defined in the text. The highest ${E_{\mathrm {T}}^{\text {miss}}}$ and ${M_{\mathrm {T2}}}$ bins are open-ended, e.g., bin 10 requires $ {E_{\mathrm {T}}^{\text {miss}}} > $ 450 GeV and $ {M_{\mathrm {T2}}} > $ 400 GeV. In addition to the search bins shown in this figure, there are three bins (42-44) with $ {N_{\mathrm{ t } }} \ge $ 3, one for each $ {N_{\mathrm{ b } }} $ bin, that contain no further binning in ${E_{\mathrm {T}}^{\text {miss}}}$ or ${M_{\mathrm {T2}}}$ beyond baseline selection requirements. |

png pdf |
Figure 5-a:
Search region definitions for bin numbers 0-8 of the gluino-mediated production optimization, as defined in the text. The highest ${E_{\mathrm {T}}^{\text {miss}}}$ and ${M_{\mathrm {T2}}}$ bins are open-ended, e.g., bin 10 requires $ {E_{\mathrm {T}}^{\text {miss}}} > $ 450 GeV and $ {M_{\mathrm {T2}}} > $ 400 GeV. |
png pdf |
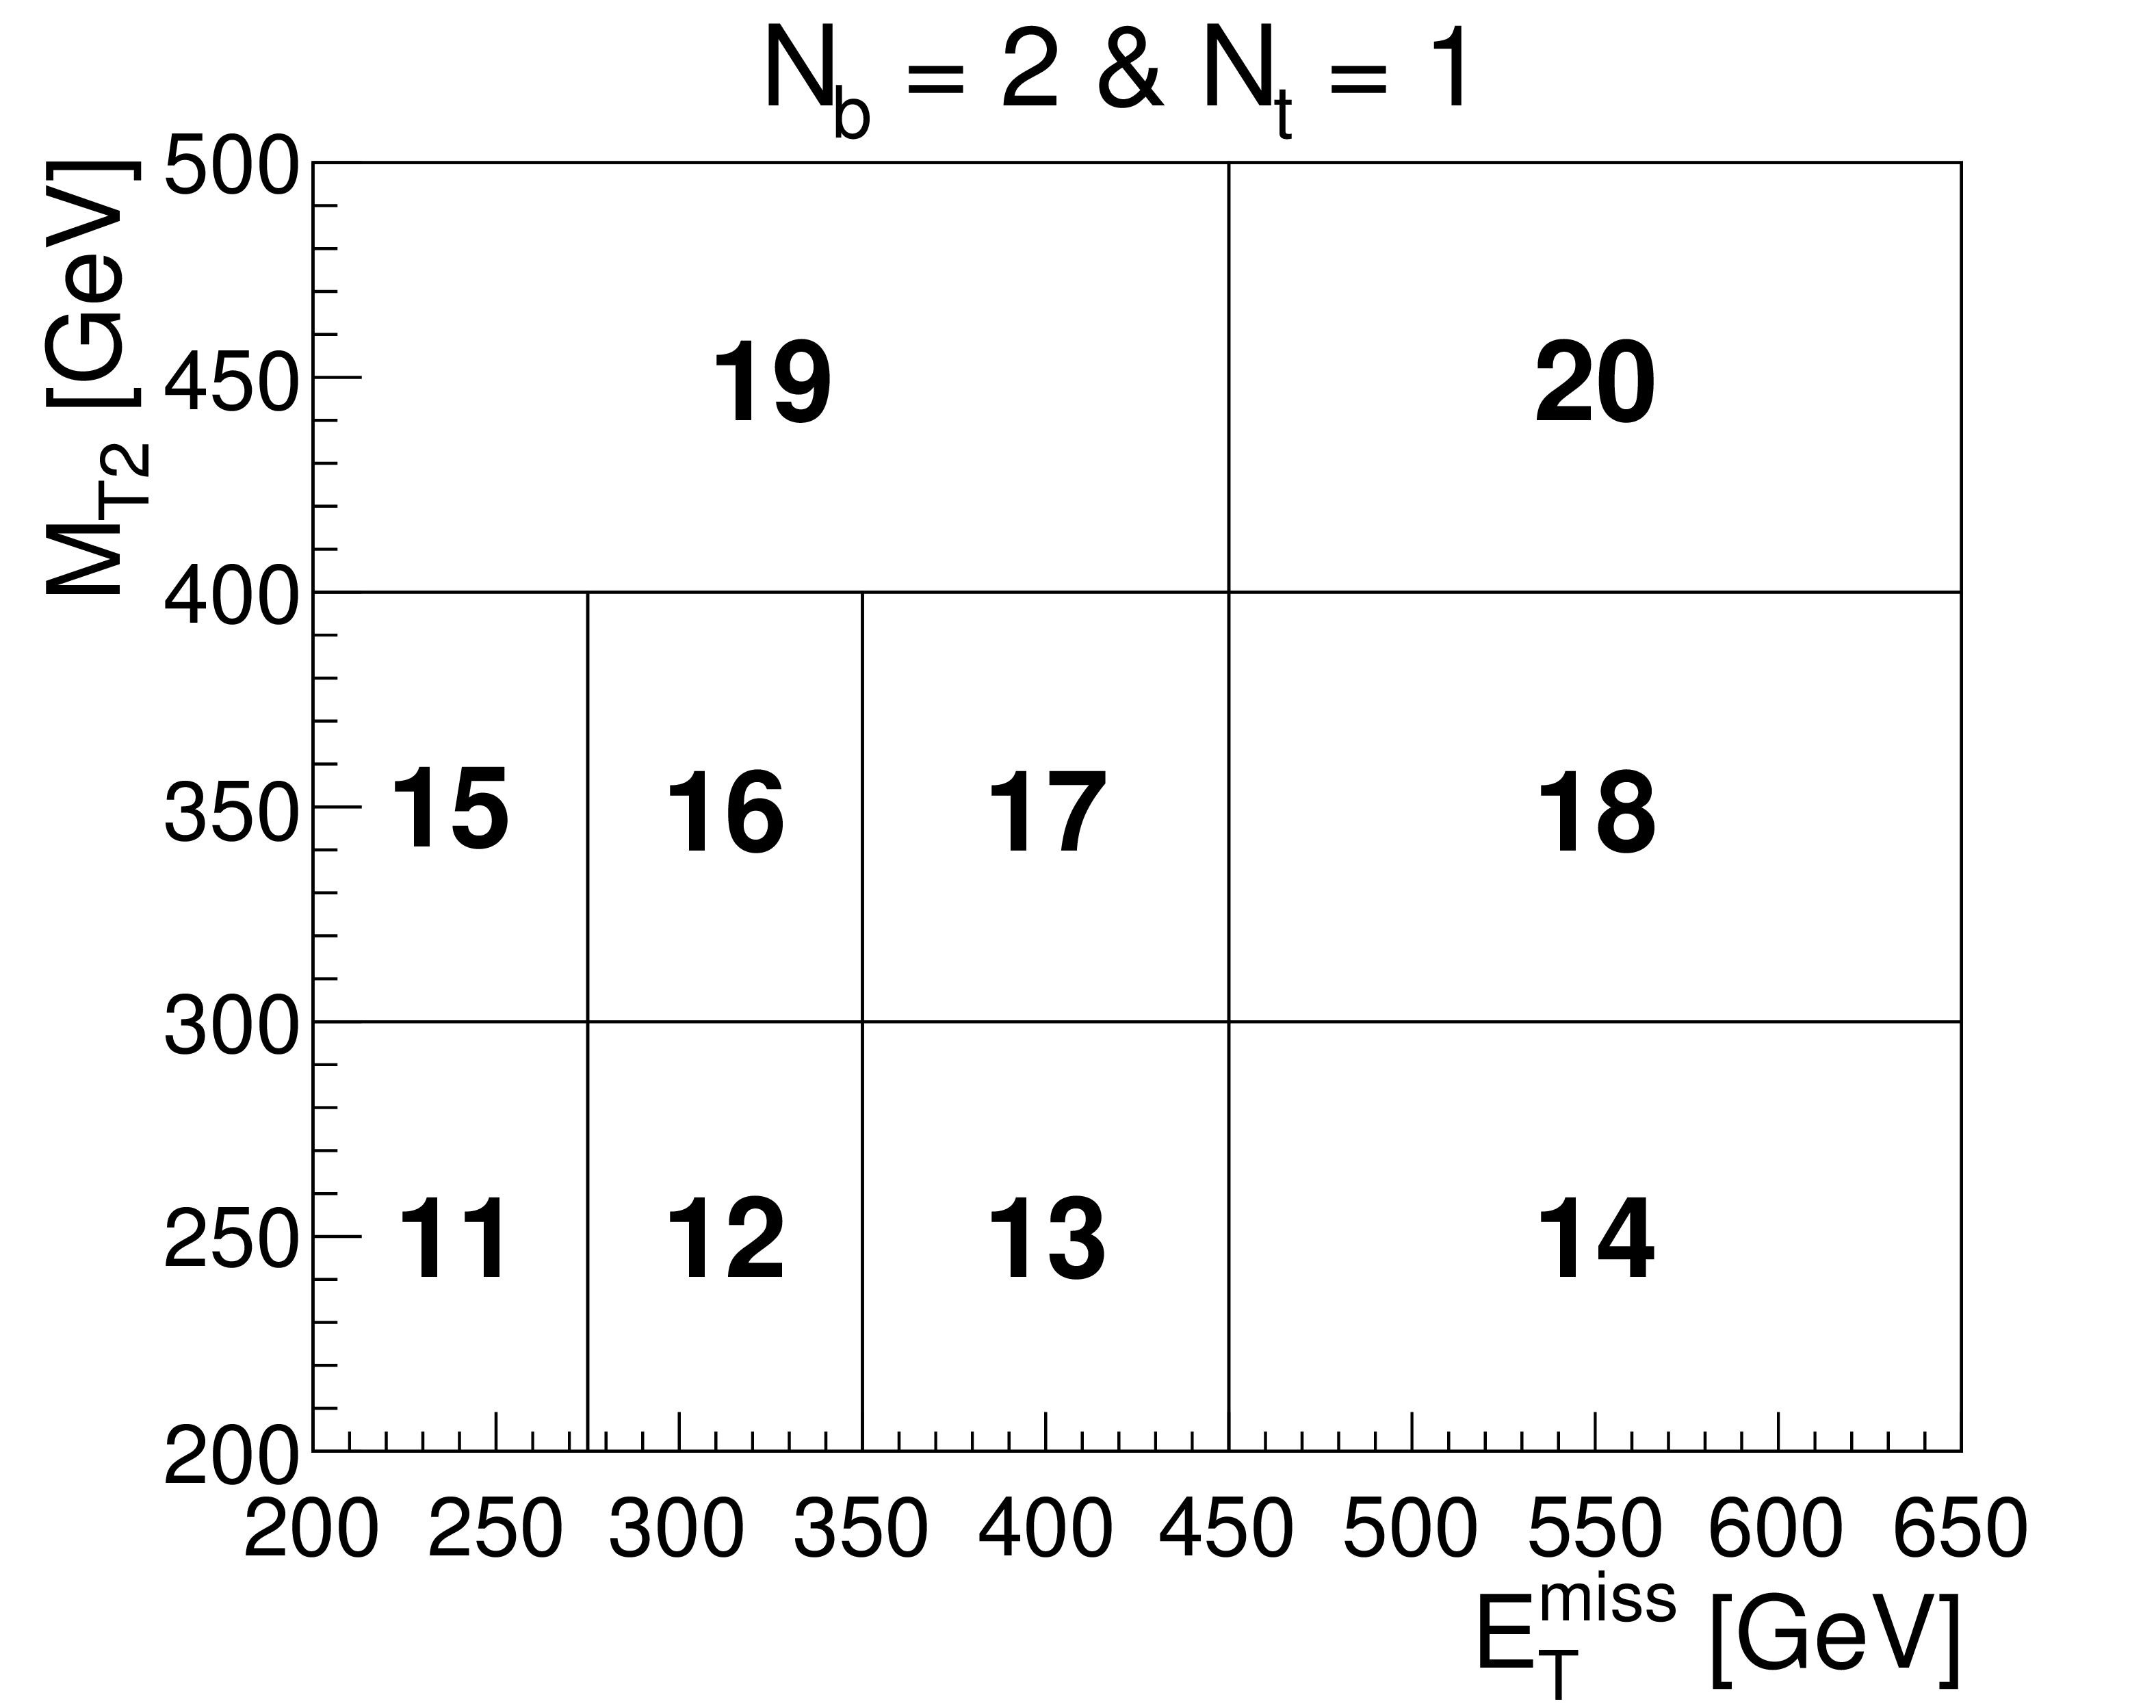
Figure 5-b:
Search region definitions for bin numbers 11-20 of the gluino-mediated production optimization, as defined in the text. The highest ${E_{\mathrm {T}}^{\text {miss}}}$ and ${M_{\mathrm {T2}}}$ bins are open-ended, e.g., bin 20 requires $ {E_{\mathrm {T}}^{\text {miss}}} > $ 450 GeV and $ {M_{\mathrm {T2}}} > $ 400 GeV. |
png pdf |
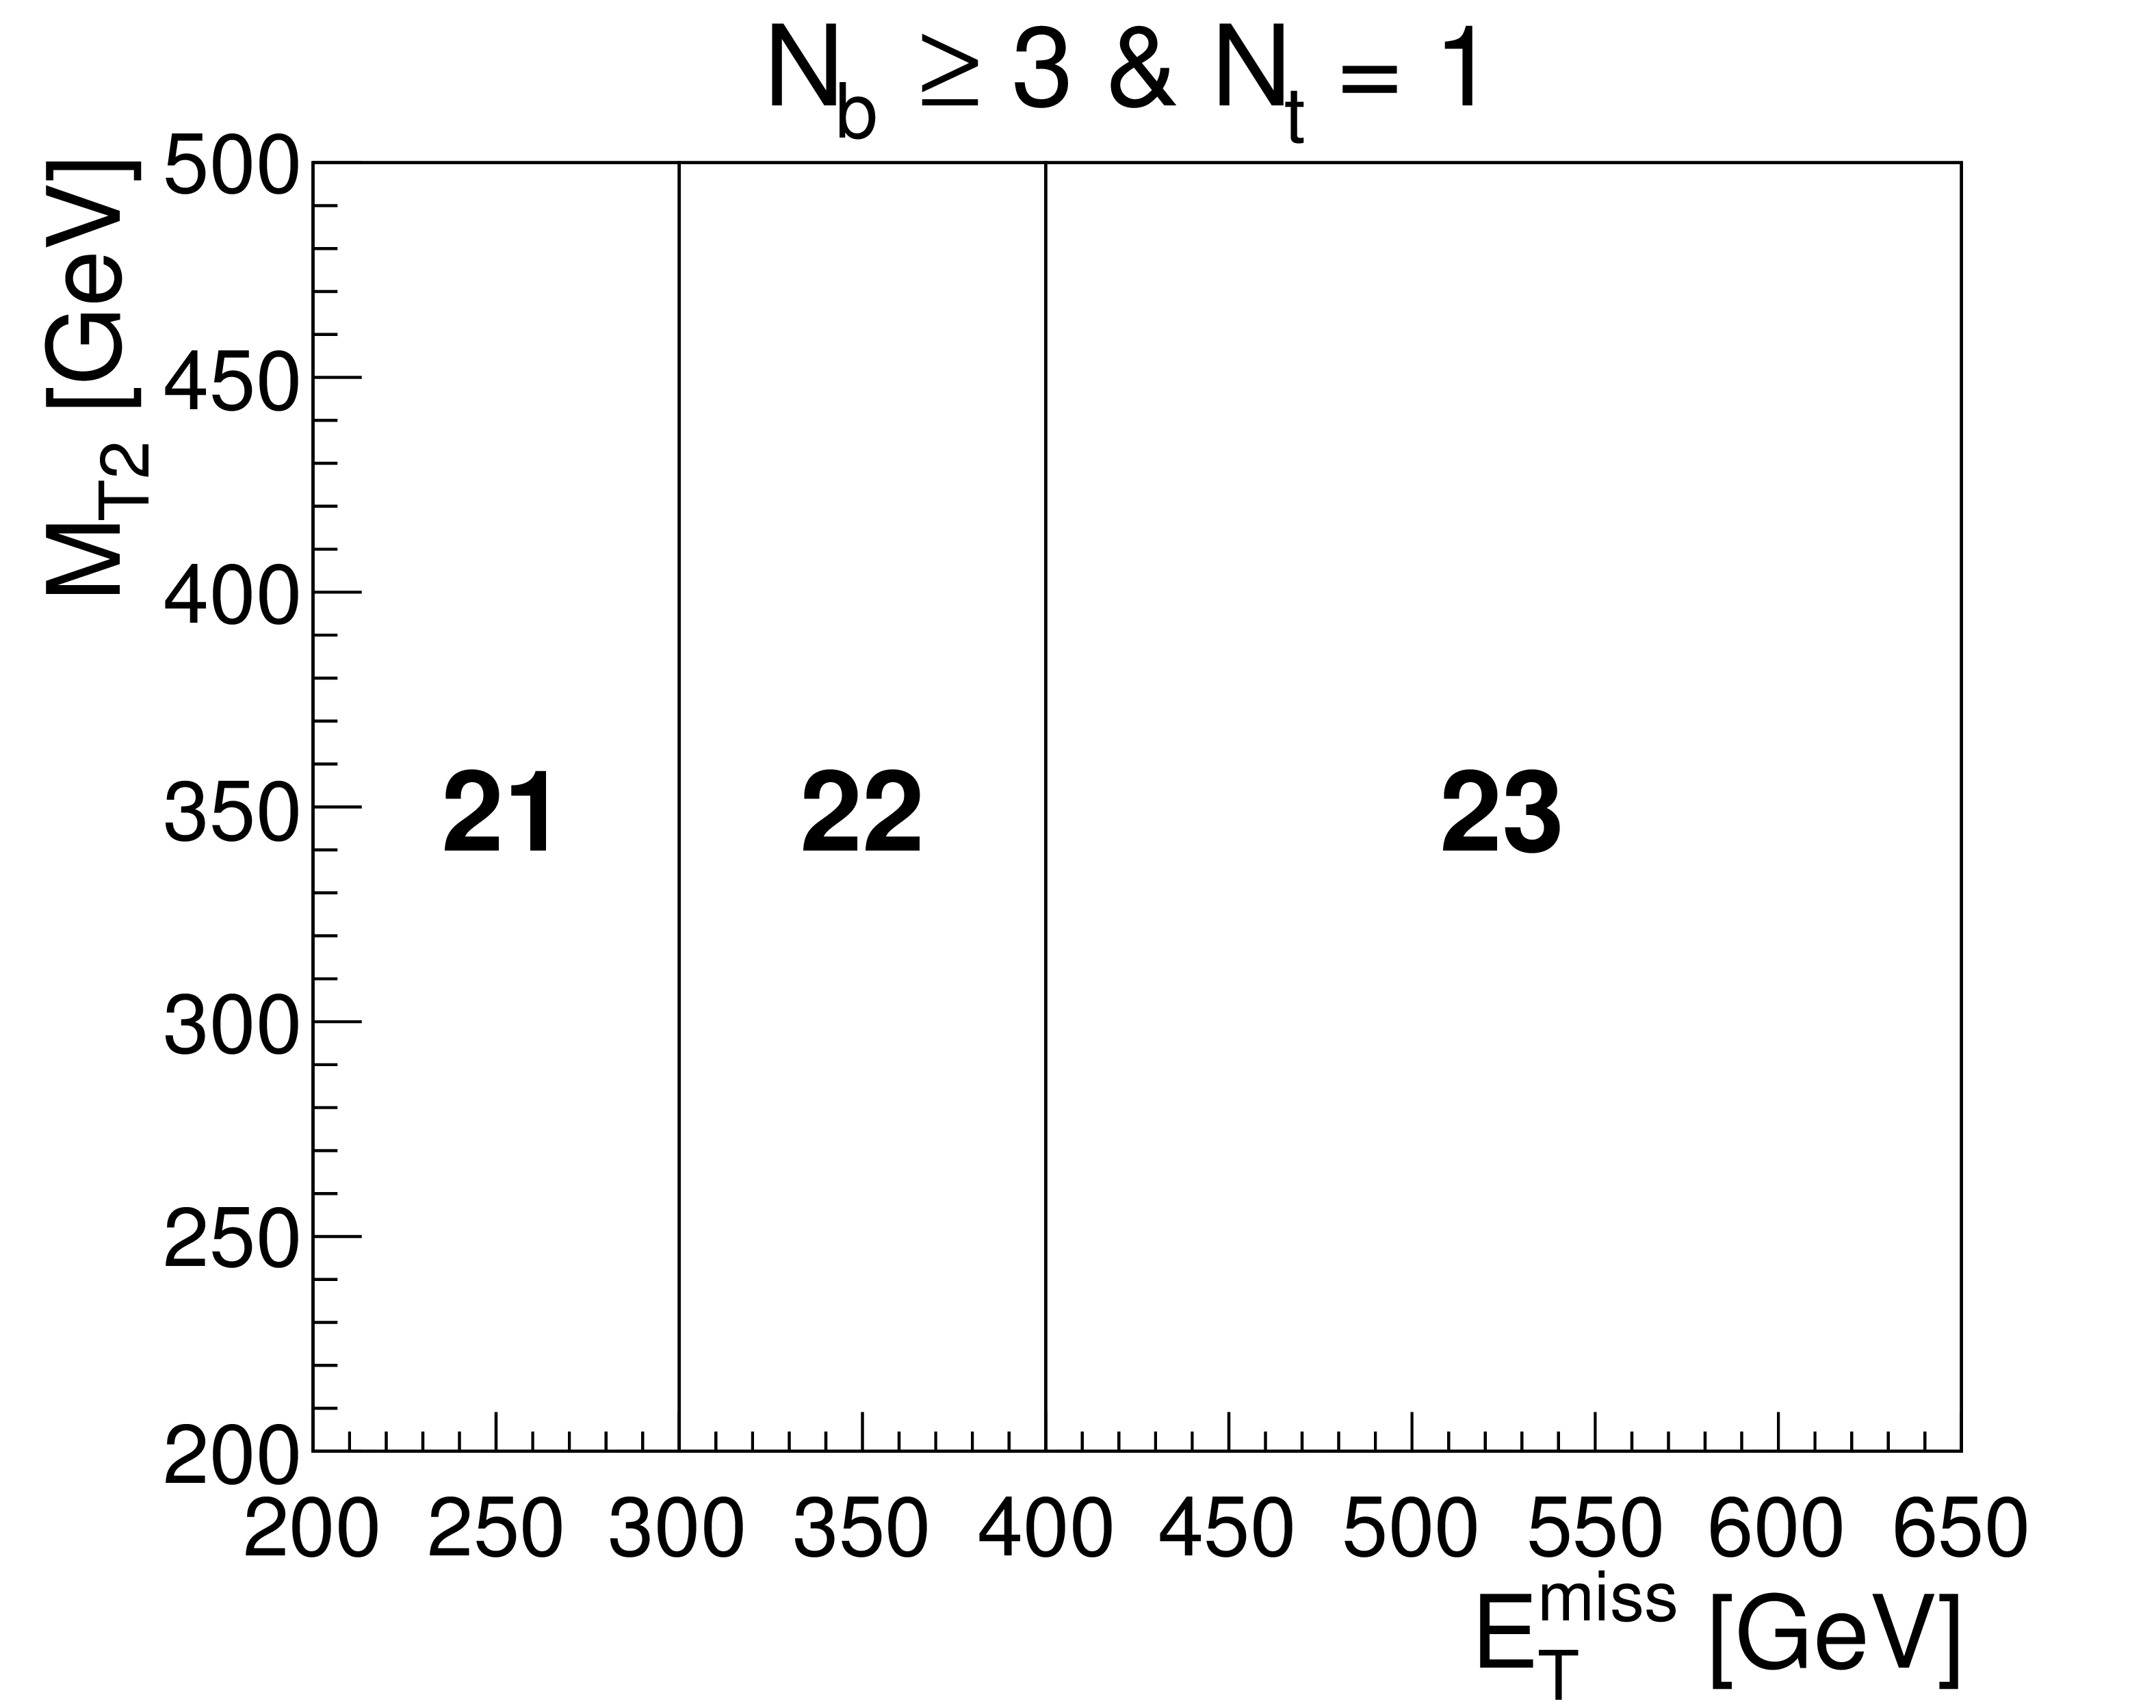
Figure 5-c:
Search region definitions for bin numbers 21-23 of the gluino-mediated production optimization, as defined in the text. The highest ${E_{\mathrm {T}}^{\text {miss}}}$ and ${M_{\mathrm {T2}}}$ bins are open-ended, e.g., bin 23 requires $ {E_{\mathrm {T}}^{\text {miss}}} > $ 450 GeV and $ {M_{\mathrm {T2}}} > $ 200 GeV. |

png pdf |
Figure 5-d:
Search region definitions for bin numbers 25-31 of the gluino-mediated production optimization, as defined in the text. The highest ${E_{\mathrm {T}}^{\text {miss}}}$ and ${M_{\mathrm {T2}}}$ bins are open-ended, e.g., bin 31 requires $ {E_{\mathrm {T}}^{\text {miss}}} > $ 350 GeV and $ {M_{\mathrm {T2}}} > $ 200 GeV. |

png pdf |
Figure 5-e:
Search region definitions for bin numbers 32-39 of the gluino-mediated production optimization, as defined in the text. The highest ${E_{\mathrm {T}}^{\text {miss}}}$ and ${M_{\mathrm {T2}}}$ bins are open-ended, e.g., bin 39 requires $ {E_{\mathrm {T}}^{\text {miss}}} > $ 350 GeV and $ {M_{\mathrm {T2}}} > $ 400 GeV. |

png pdf |
Figure 5-f:
Search region definitions for bin numbers 40-41 of the gluino-mediated production optimization, as defined in the text. The highest ${E_{\mathrm {T}}^{\text {miss}}}$ and ${M_{\mathrm {T2}}}$ bins are open-ended, e.g., bin 41 requires $ {E_{\mathrm {T}}^{\text {miss}}} > $ 300 GeV and $ {M_{\mathrm {T2}}} > $ 200 GeV. |
png pdf |
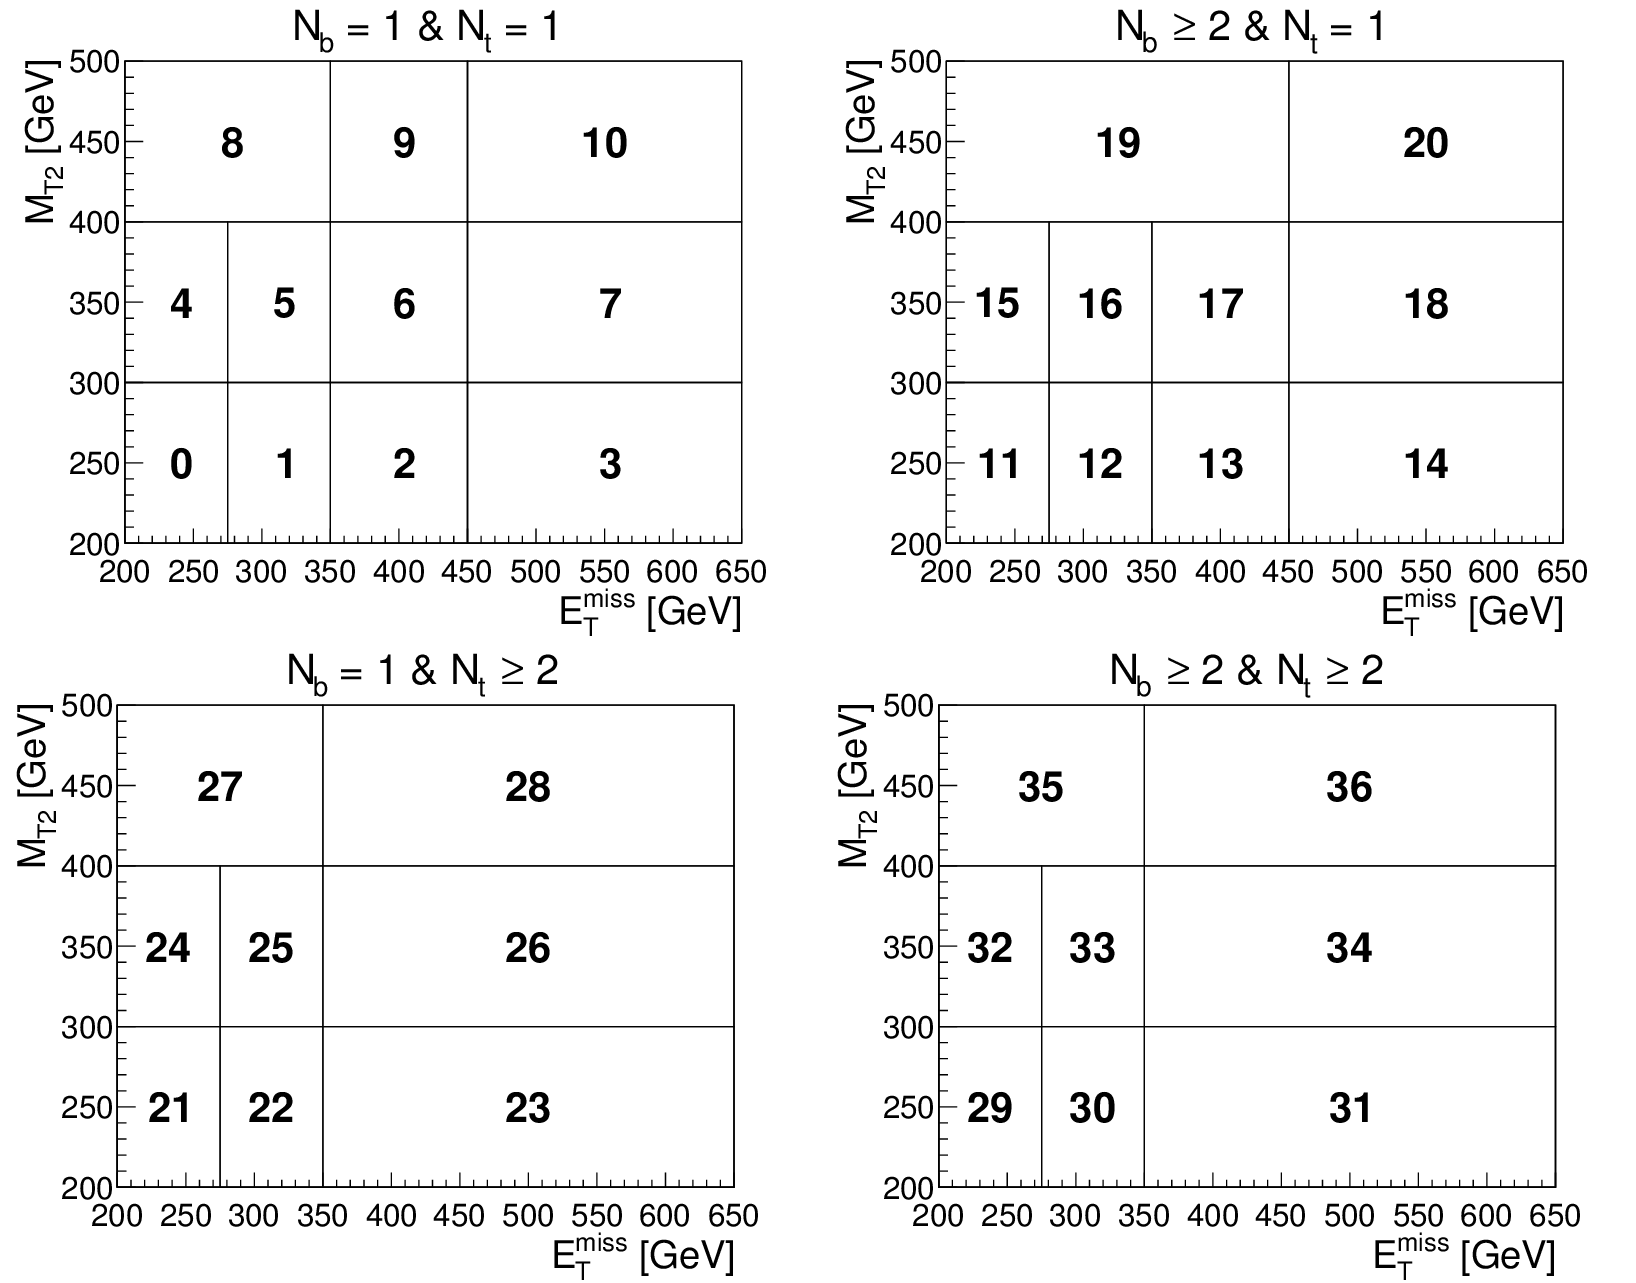
Figure 6:
Search region definitions for bin numbers 0-36 for the direct top squark production optimization, as defined in the text. The highest ${E_{\mathrm {T}}^{\text {miss}}}$ and ${M_{\mathrm {T2}}}$ bins are open-ended, e.g., bin 10 requires $ {E_{\mathrm {T}}^{\text {miss}}} > $ 450 GeV and $ {M_{\mathrm {T2}}} > $ 400 GeV. |
png pdf |
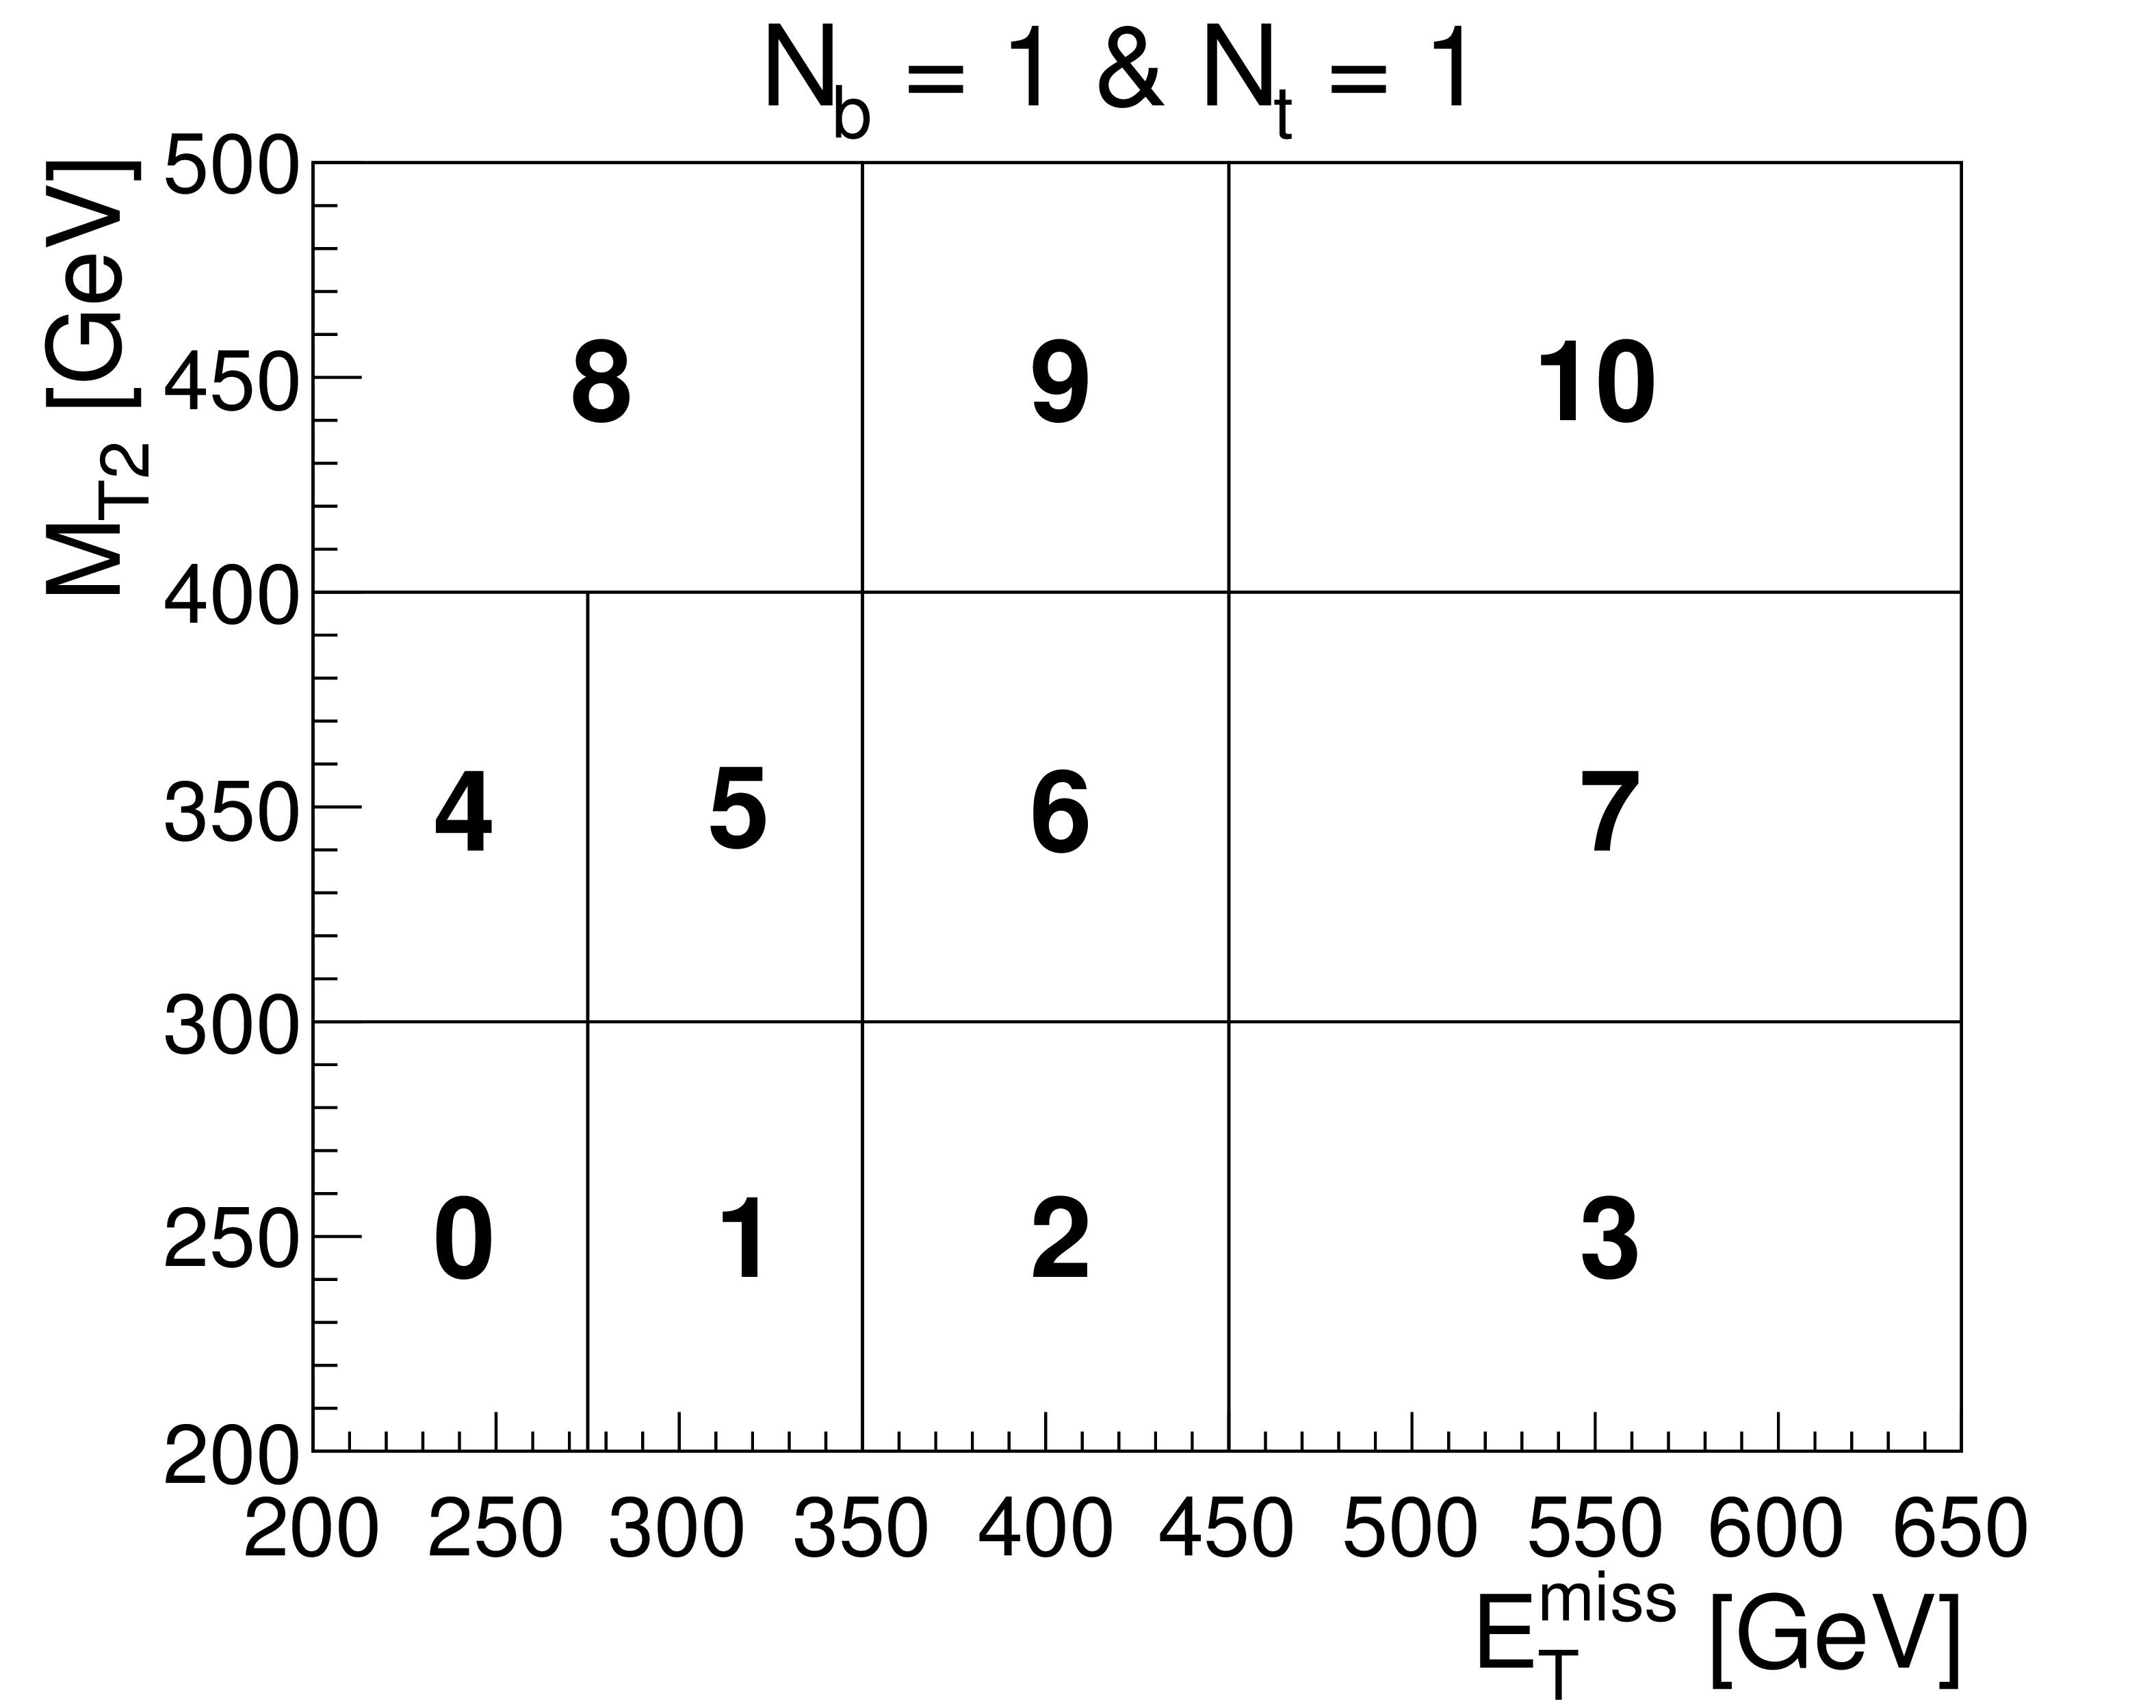
Figure 6-a:
Search region definitions for bin numbers 0-10 for the direct top squark production optimization, as defined in the text. The highest ${E_{\mathrm {T}}^{\text {miss}}}$ and ${M_{\mathrm {T2}}}$ bins are open-ended, e.g., bin 10 requires $ {E_{\mathrm {T}}^{\text {miss}}} > $ 450 GeV and $ {M_{\mathrm {T2}}} > $ 400 GeV. |

png pdf |
Figure 6-b:
Search region definitions for bin numbers 11-20 for the direct top squark production optimization, as defined in the text. The highest ${E_{\mathrm {T}}^{\text {miss}}}$ and ${M_{\mathrm {T2}}}$ bins are open-ended, e.g., bin 20 requires $ {E_{\mathrm {T}}^{\text {miss}}} > $ 450 GeV and $ {M_{\mathrm {T2}}} > $ 400 GeV. |
png pdf |
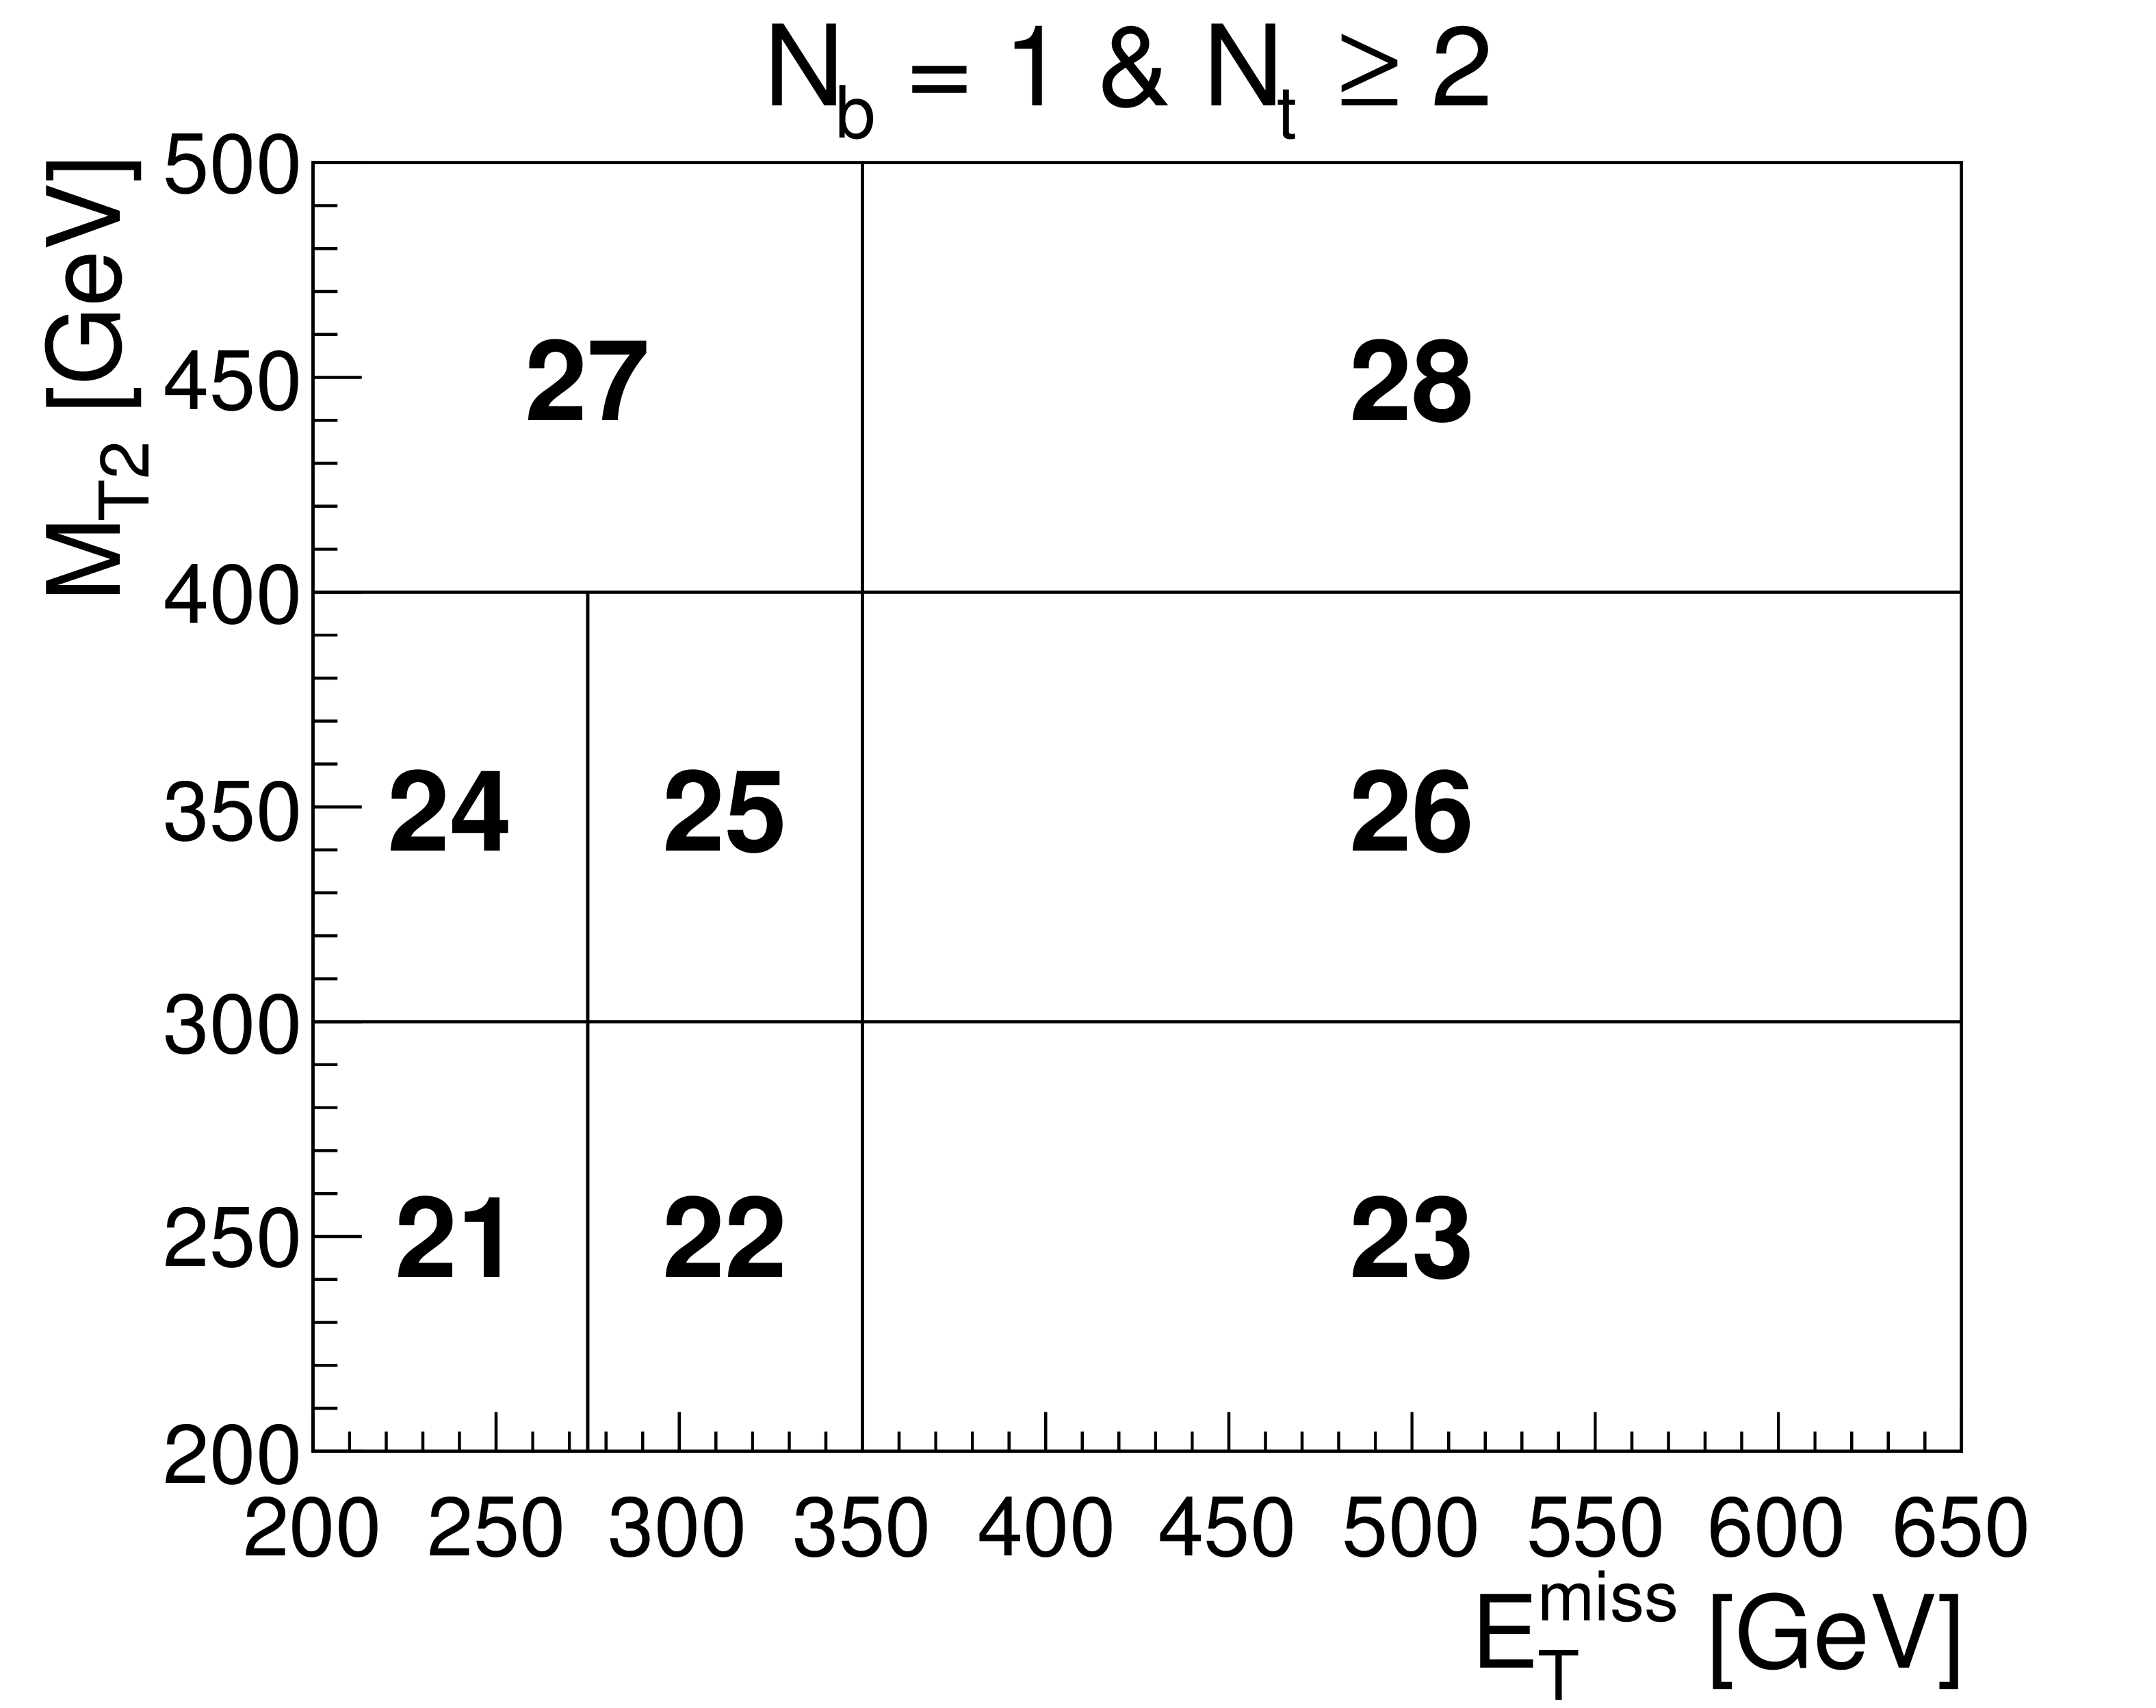
Figure 6-c:
Search region definitions for bin numbers 21-28 for the direct top squark production optimization, as defined in the text. The highest ${E_{\mathrm {T}}^{\text {miss}}}$ and ${M_{\mathrm {T2}}}$ bins are open-ended, e.g., bin 28 requires $ {E_{\mathrm {T}}^{\text {miss}}} > $ 350 GeV and $ {M_{\mathrm {T2}}} > $ 400 GeV. |
png pdf |
Figure 6-d:
Search region definitions for bin numbers 29-36 for the direct top squark production optimization, as defined in the text. The highest ${E_{\mathrm {T}}^{\text {miss}}}$ and ${M_{\mathrm {T2}}}$ bins are open-ended, e.g., bin 36 requires $ {E_{\mathrm {T}}^{\text {miss}}} > $ 350 GeV and $ {M_{\mathrm {T2}}} > $ 400 GeV. |
png pdf |
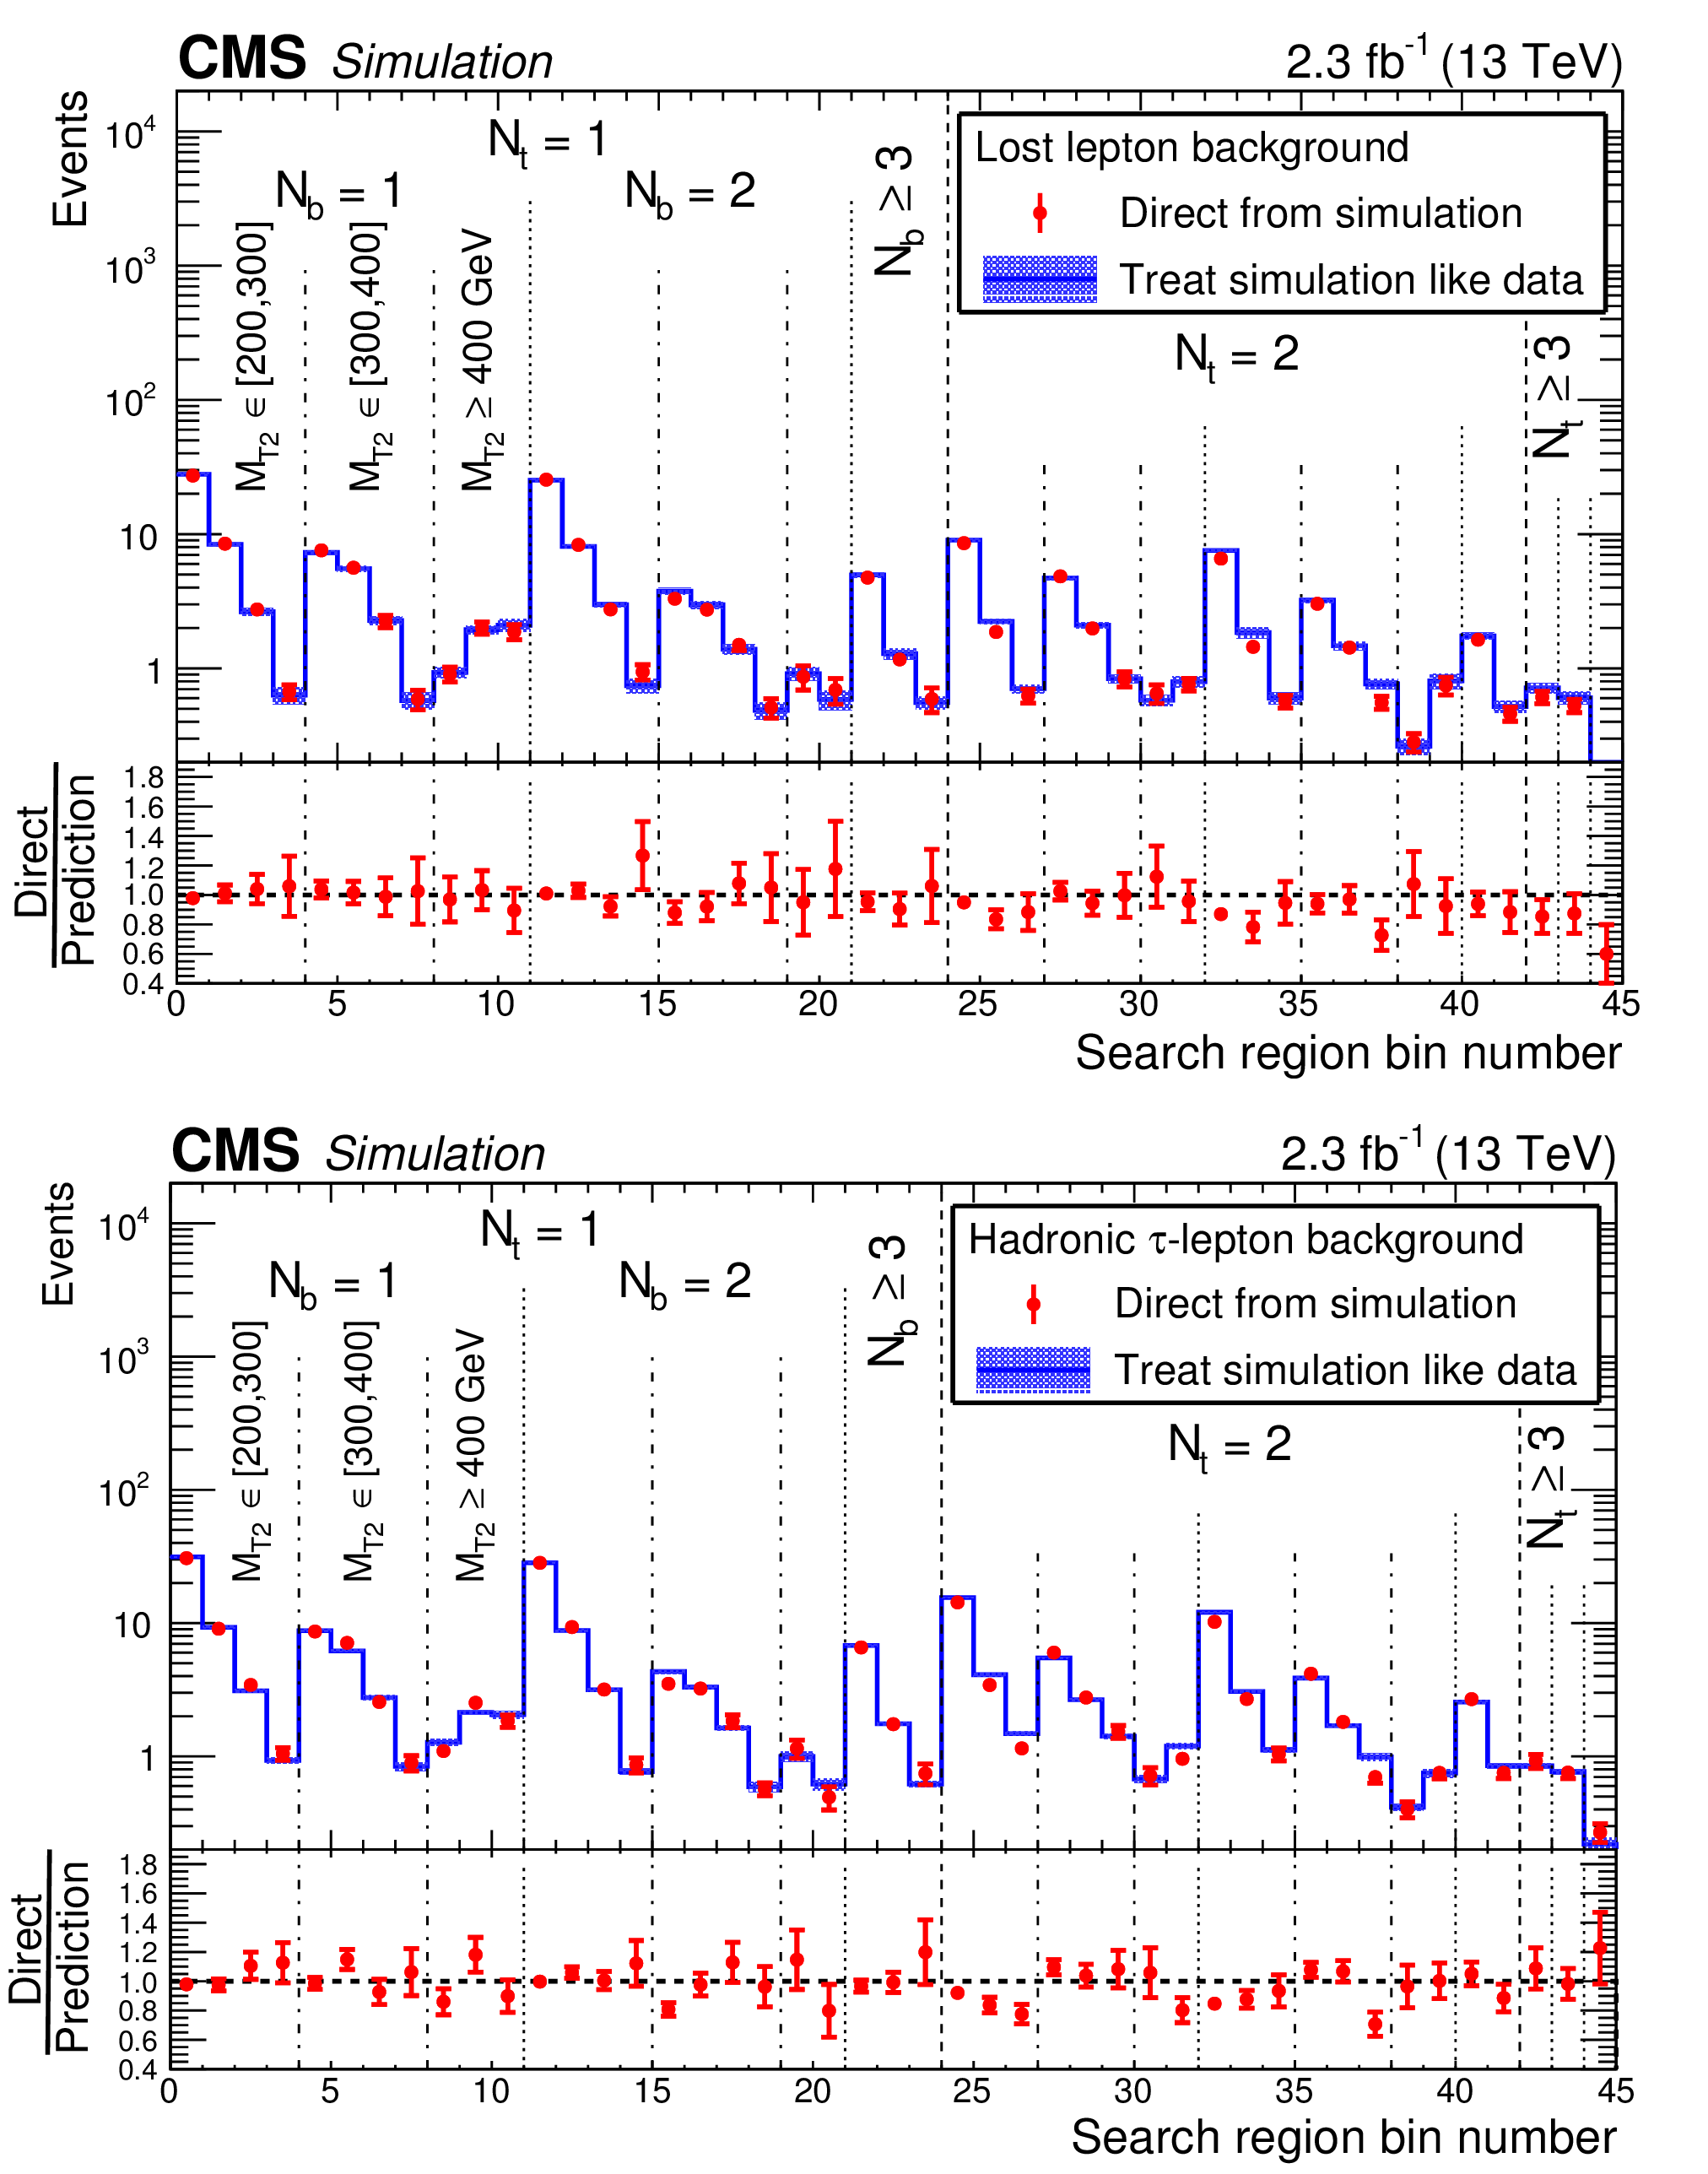
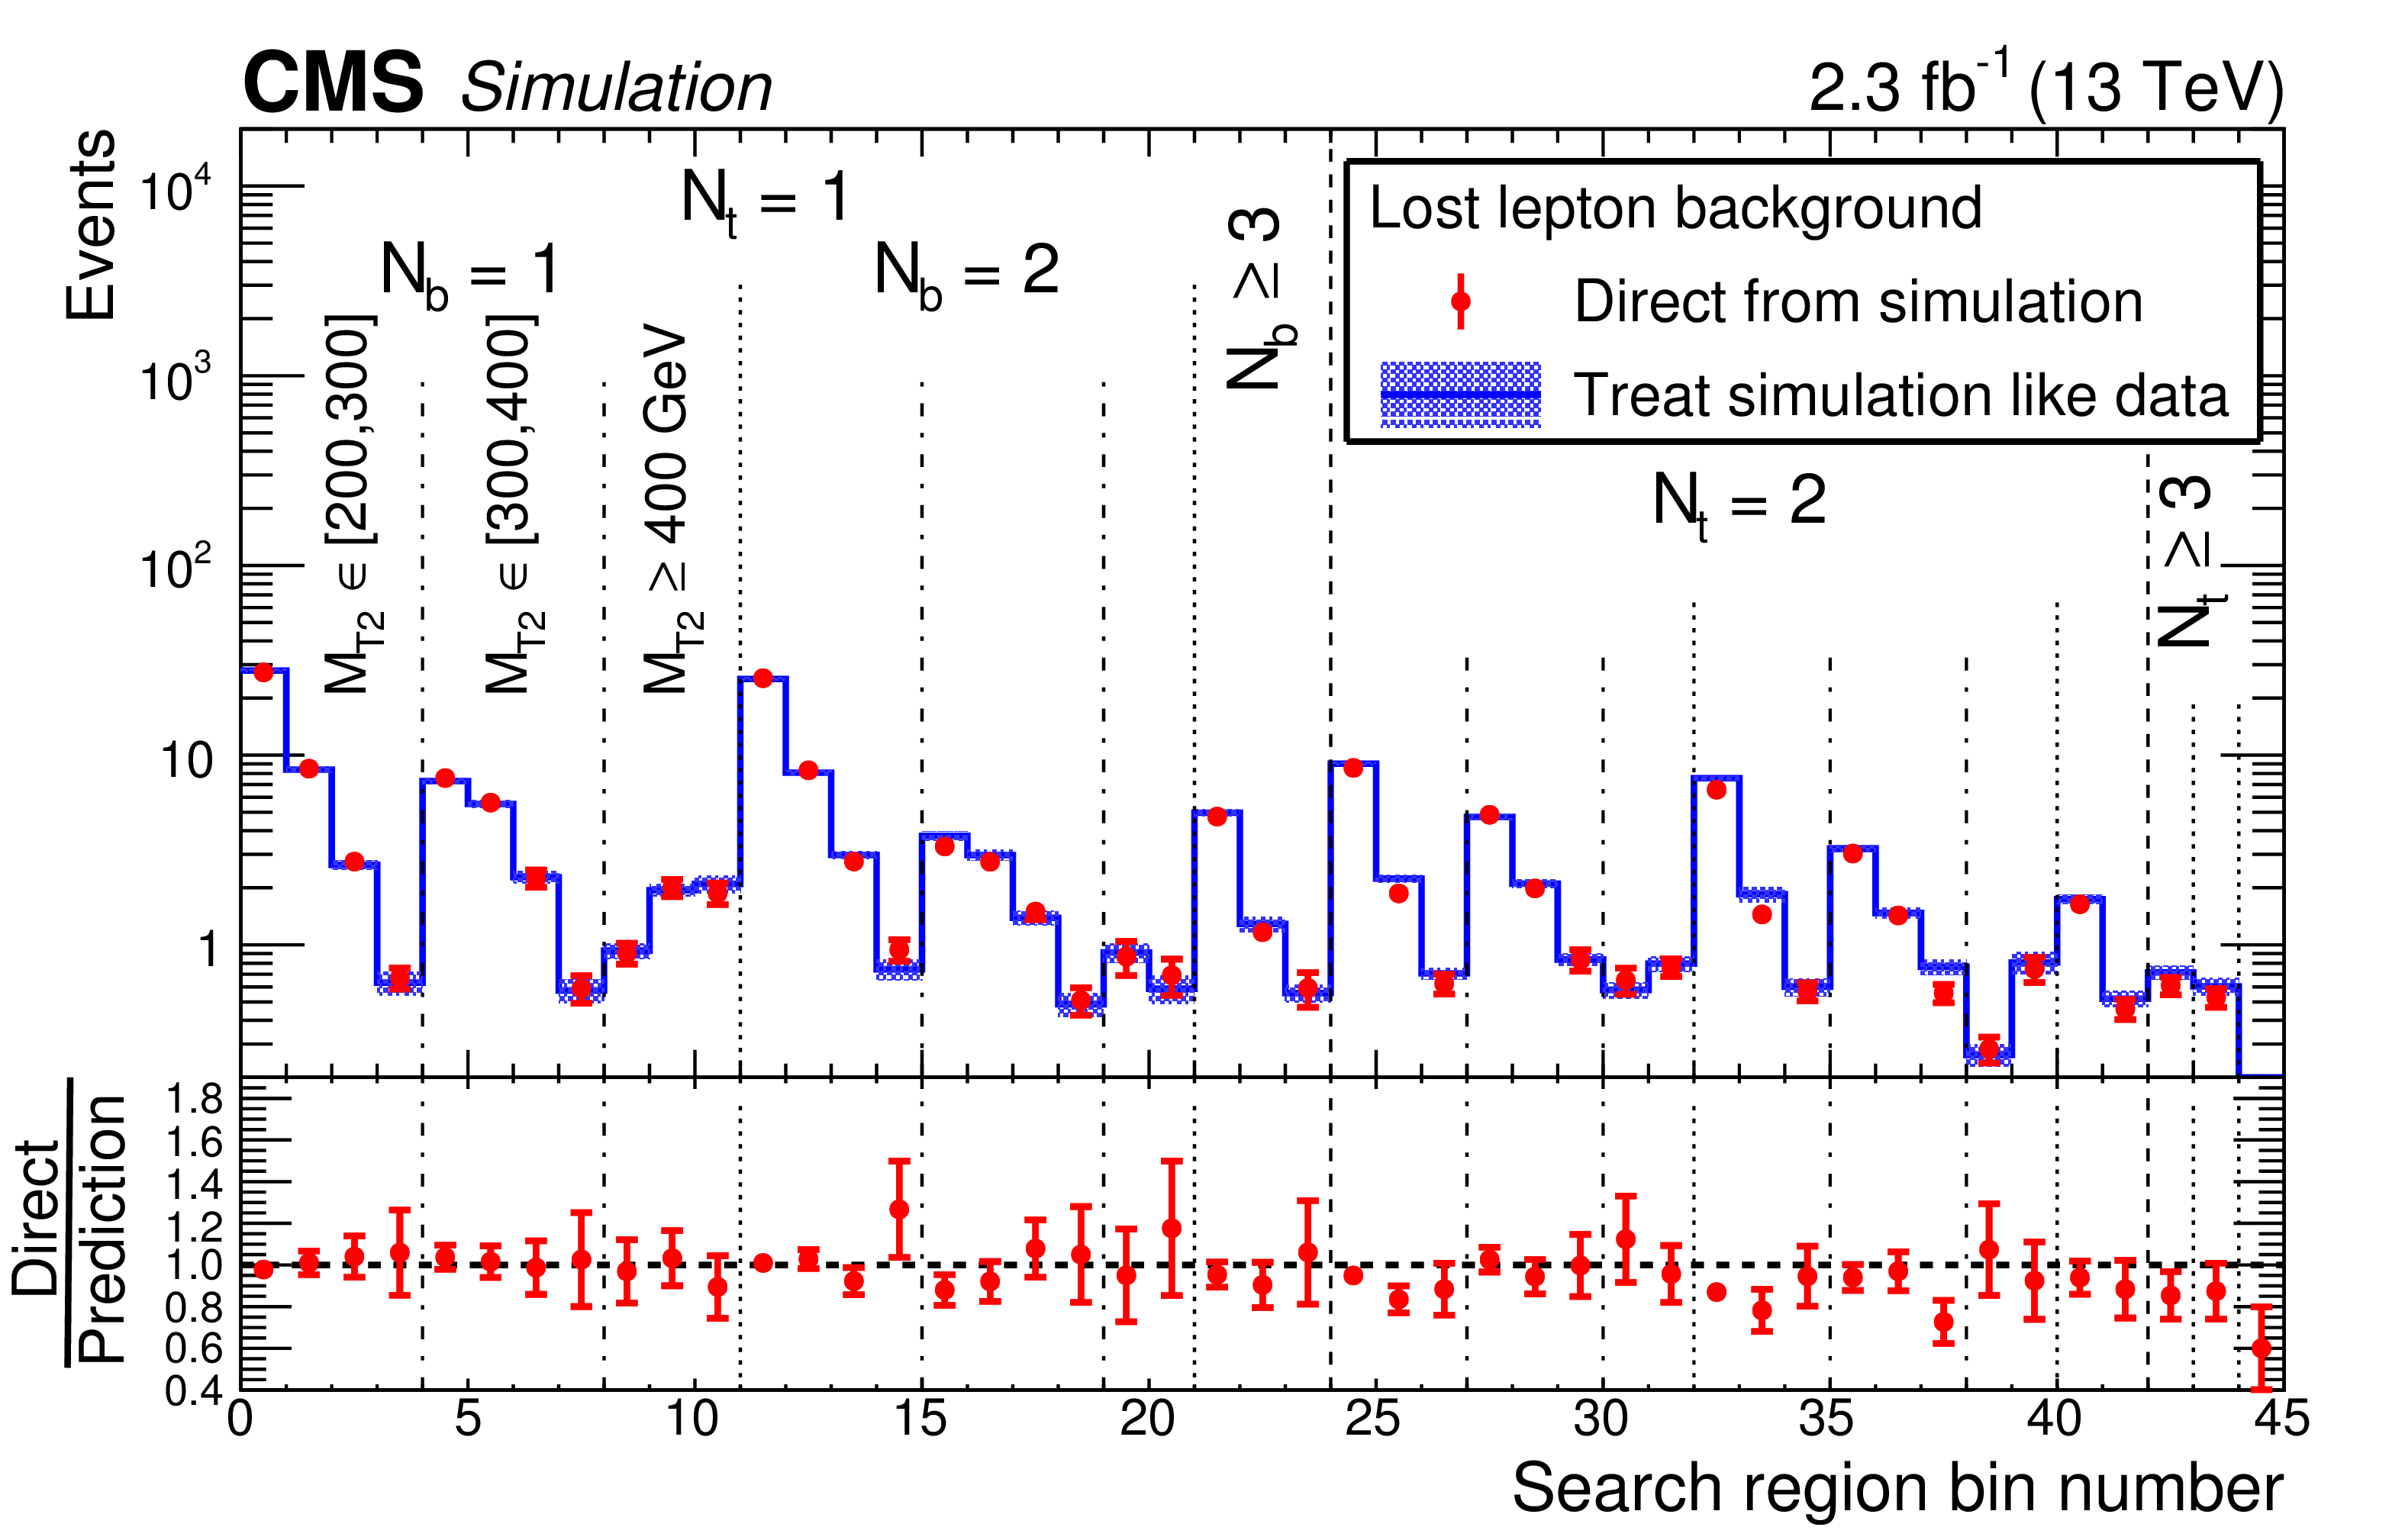
Figure 7:
(Top) The lost-lepton background in the 45 search regions optimized for gluino-mediated production as determined directly from ${\mathrm{ t } \mathrm{ \bar{t} } } $, single top quark, and W+jets simulation (points) and as predicted by applying the lost-lepton background determination procedure to the simulated muon control sample (histograms). The lower panel shows the same results after dividing by the predicted value. (Bottom) The corresponding simulated results for the background from hadronically decaying $\tau $ leptons. For both plots, vertical lines indicate search regions with different ${N_{\mathrm{ t } }}$, ${N_{\mathrm{ b } }}$, and ${M_{\mathrm {T2}}}$ values. Within each ($ {N_{\mathrm{ t } }}$, ${N_{\mathrm{ b } }}$, ${M_{\mathrm {T2}}}$) region, the bins indicate the different ${E_{\mathrm {T}}^{\text {miss}}}$ selections, as defined in Fig. 5. Only statistical uncertainties are shown. |
png pdf |
Figure 7-a:
The lost-lepton background in the 45 search regions optimized for gluino-mediated production as determined directly from ${\mathrm{ t } \mathrm{ \bar{t} } } $, single top quark, and W+jets simulation (points) and as predicted by applying the lost-lepton background determination procedure to the simulated muon control sample (histograms). The lower panel shows the same results after dividing by the predicted value. |
png pdf |
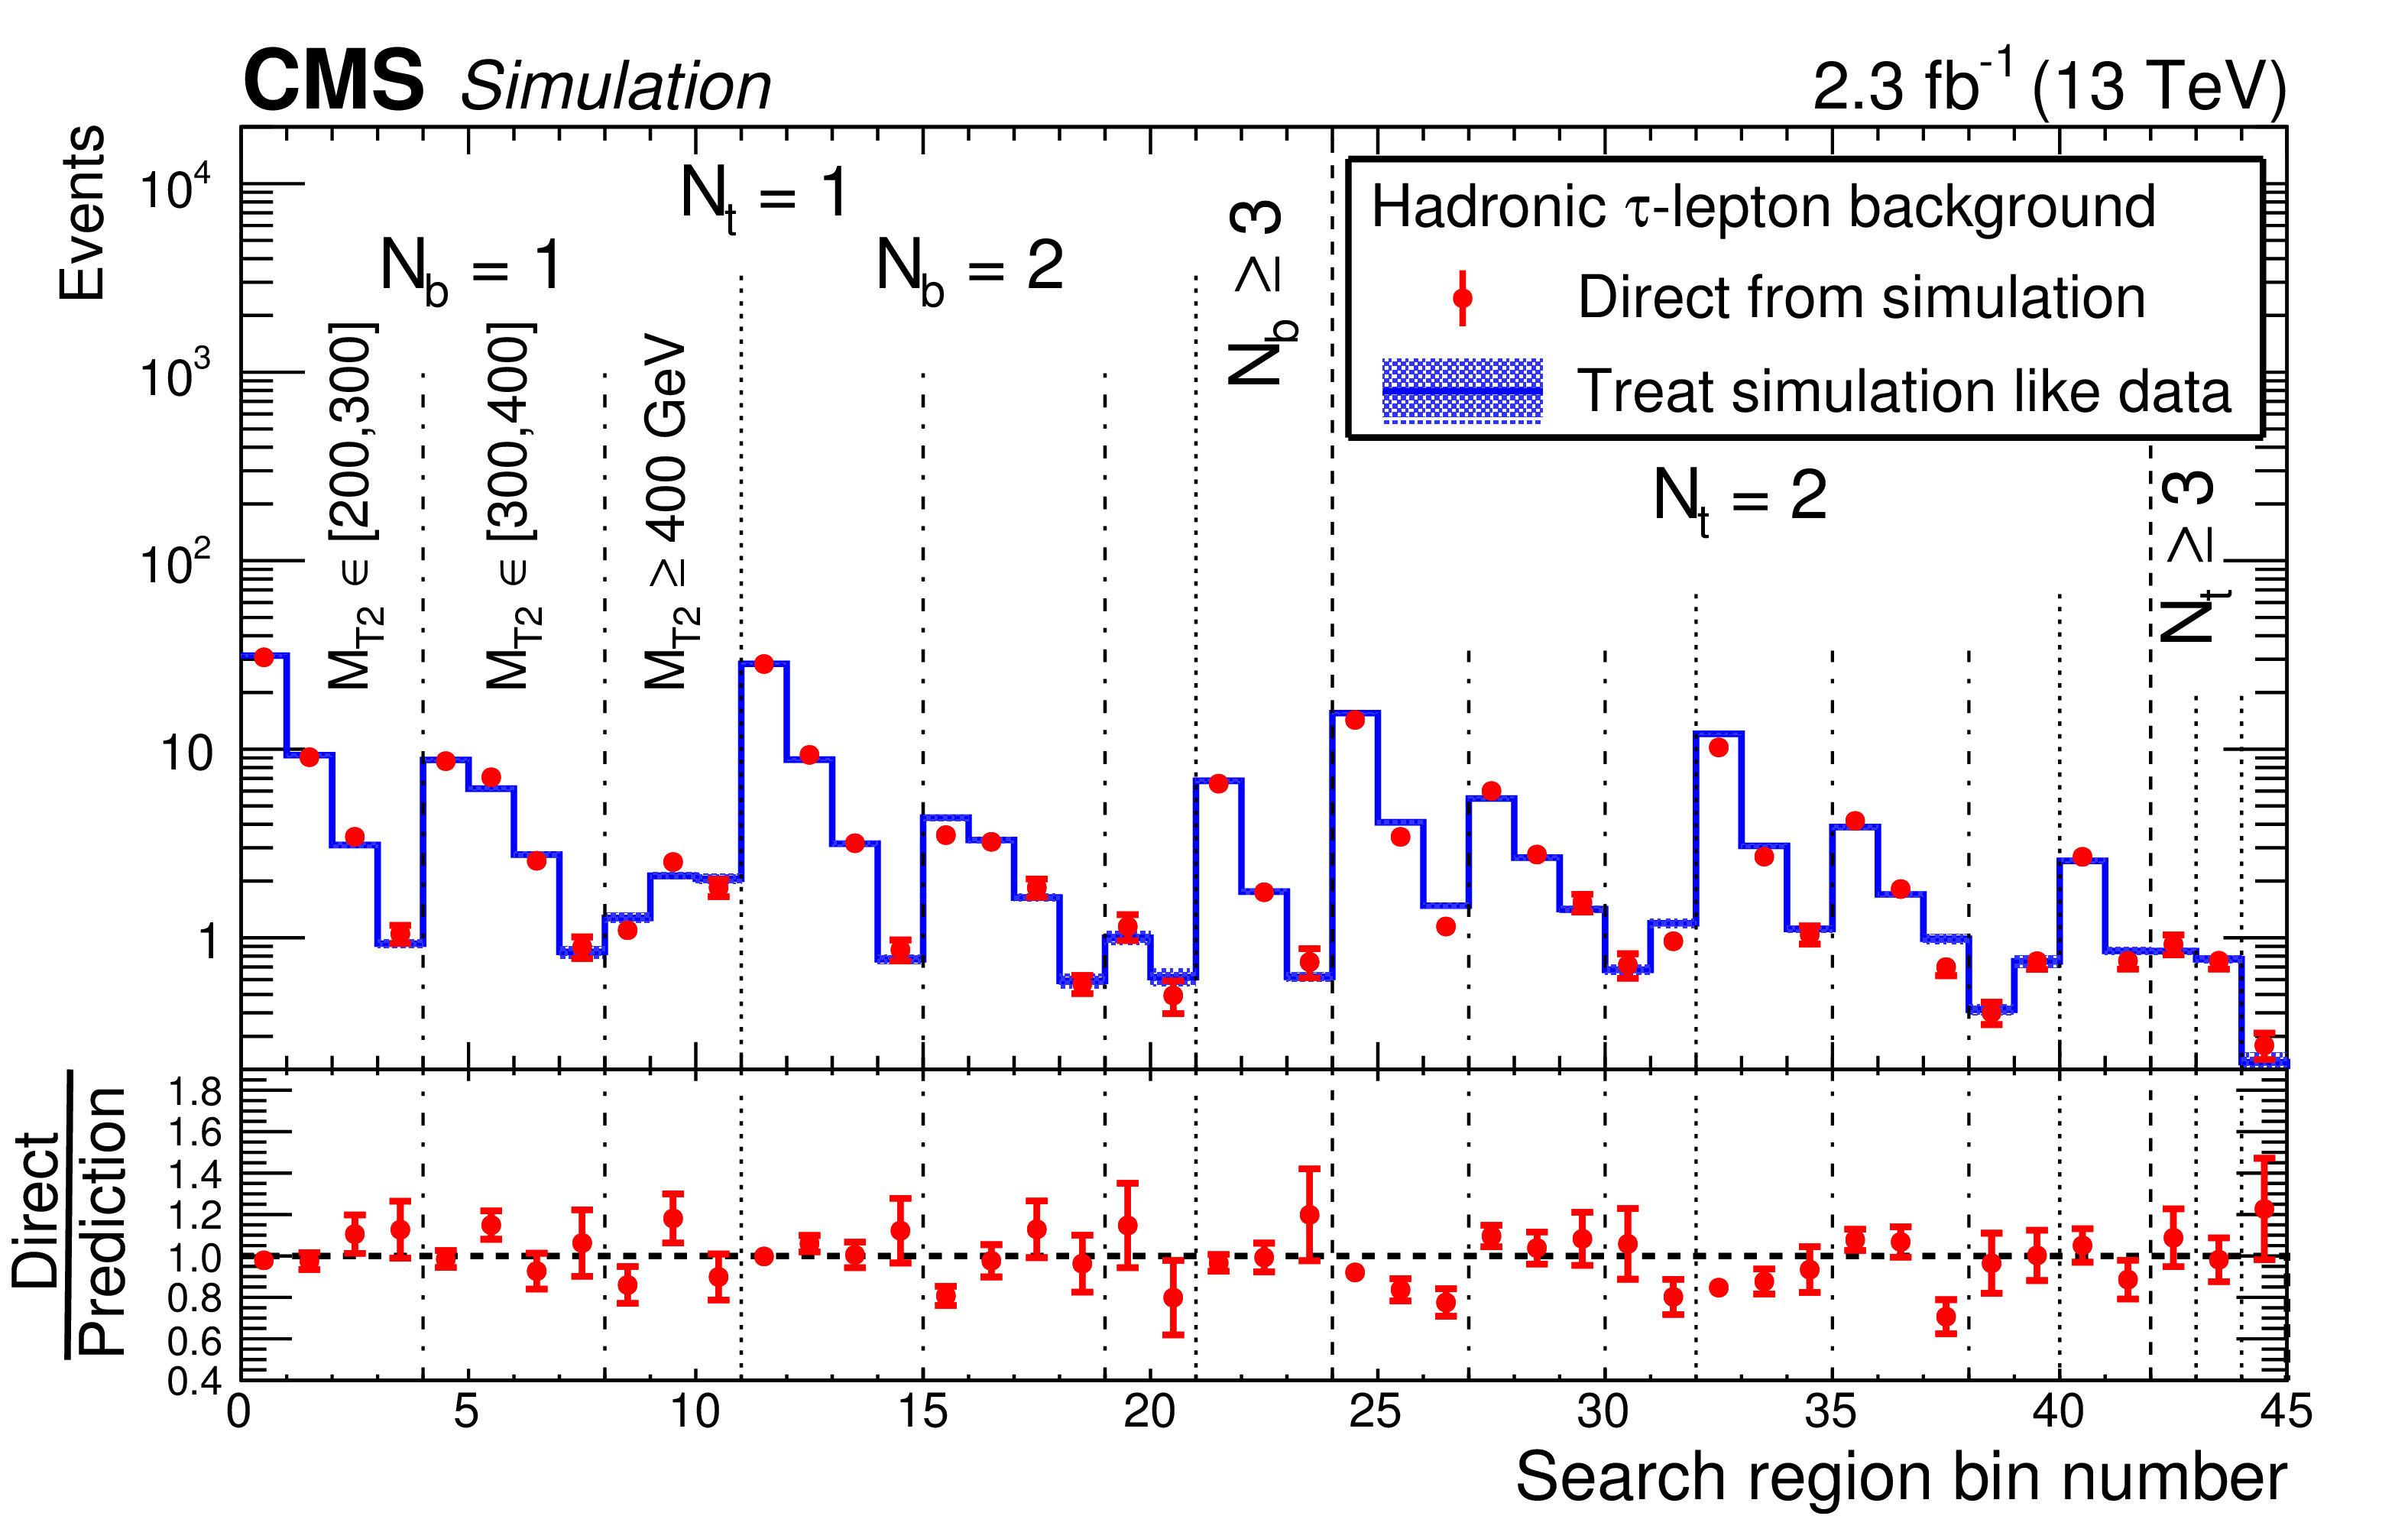
Figure 7-b:
The simulated results corresponding to Fig.007-a for the background from hadronically decaying $\tau $ leptons. For both plots, vertical lines indicate search regions with different ${N_{\mathrm{ t } }}$, ${N_{\mathrm{ b } }}$, and ${M_{\mathrm {T2}}}$ values. Within each ($ {N_{\mathrm{ t } }}$, ${N_{\mathrm{ b } }}$, ${M_{\mathrm {T2}}}$) region, the bins indicate the different ${E_{\mathrm {T}}^{\text {miss}}}$ selections, as defined in Fig. 5. Only statistical uncertainties are shown. |

png pdf |
Figure 8:
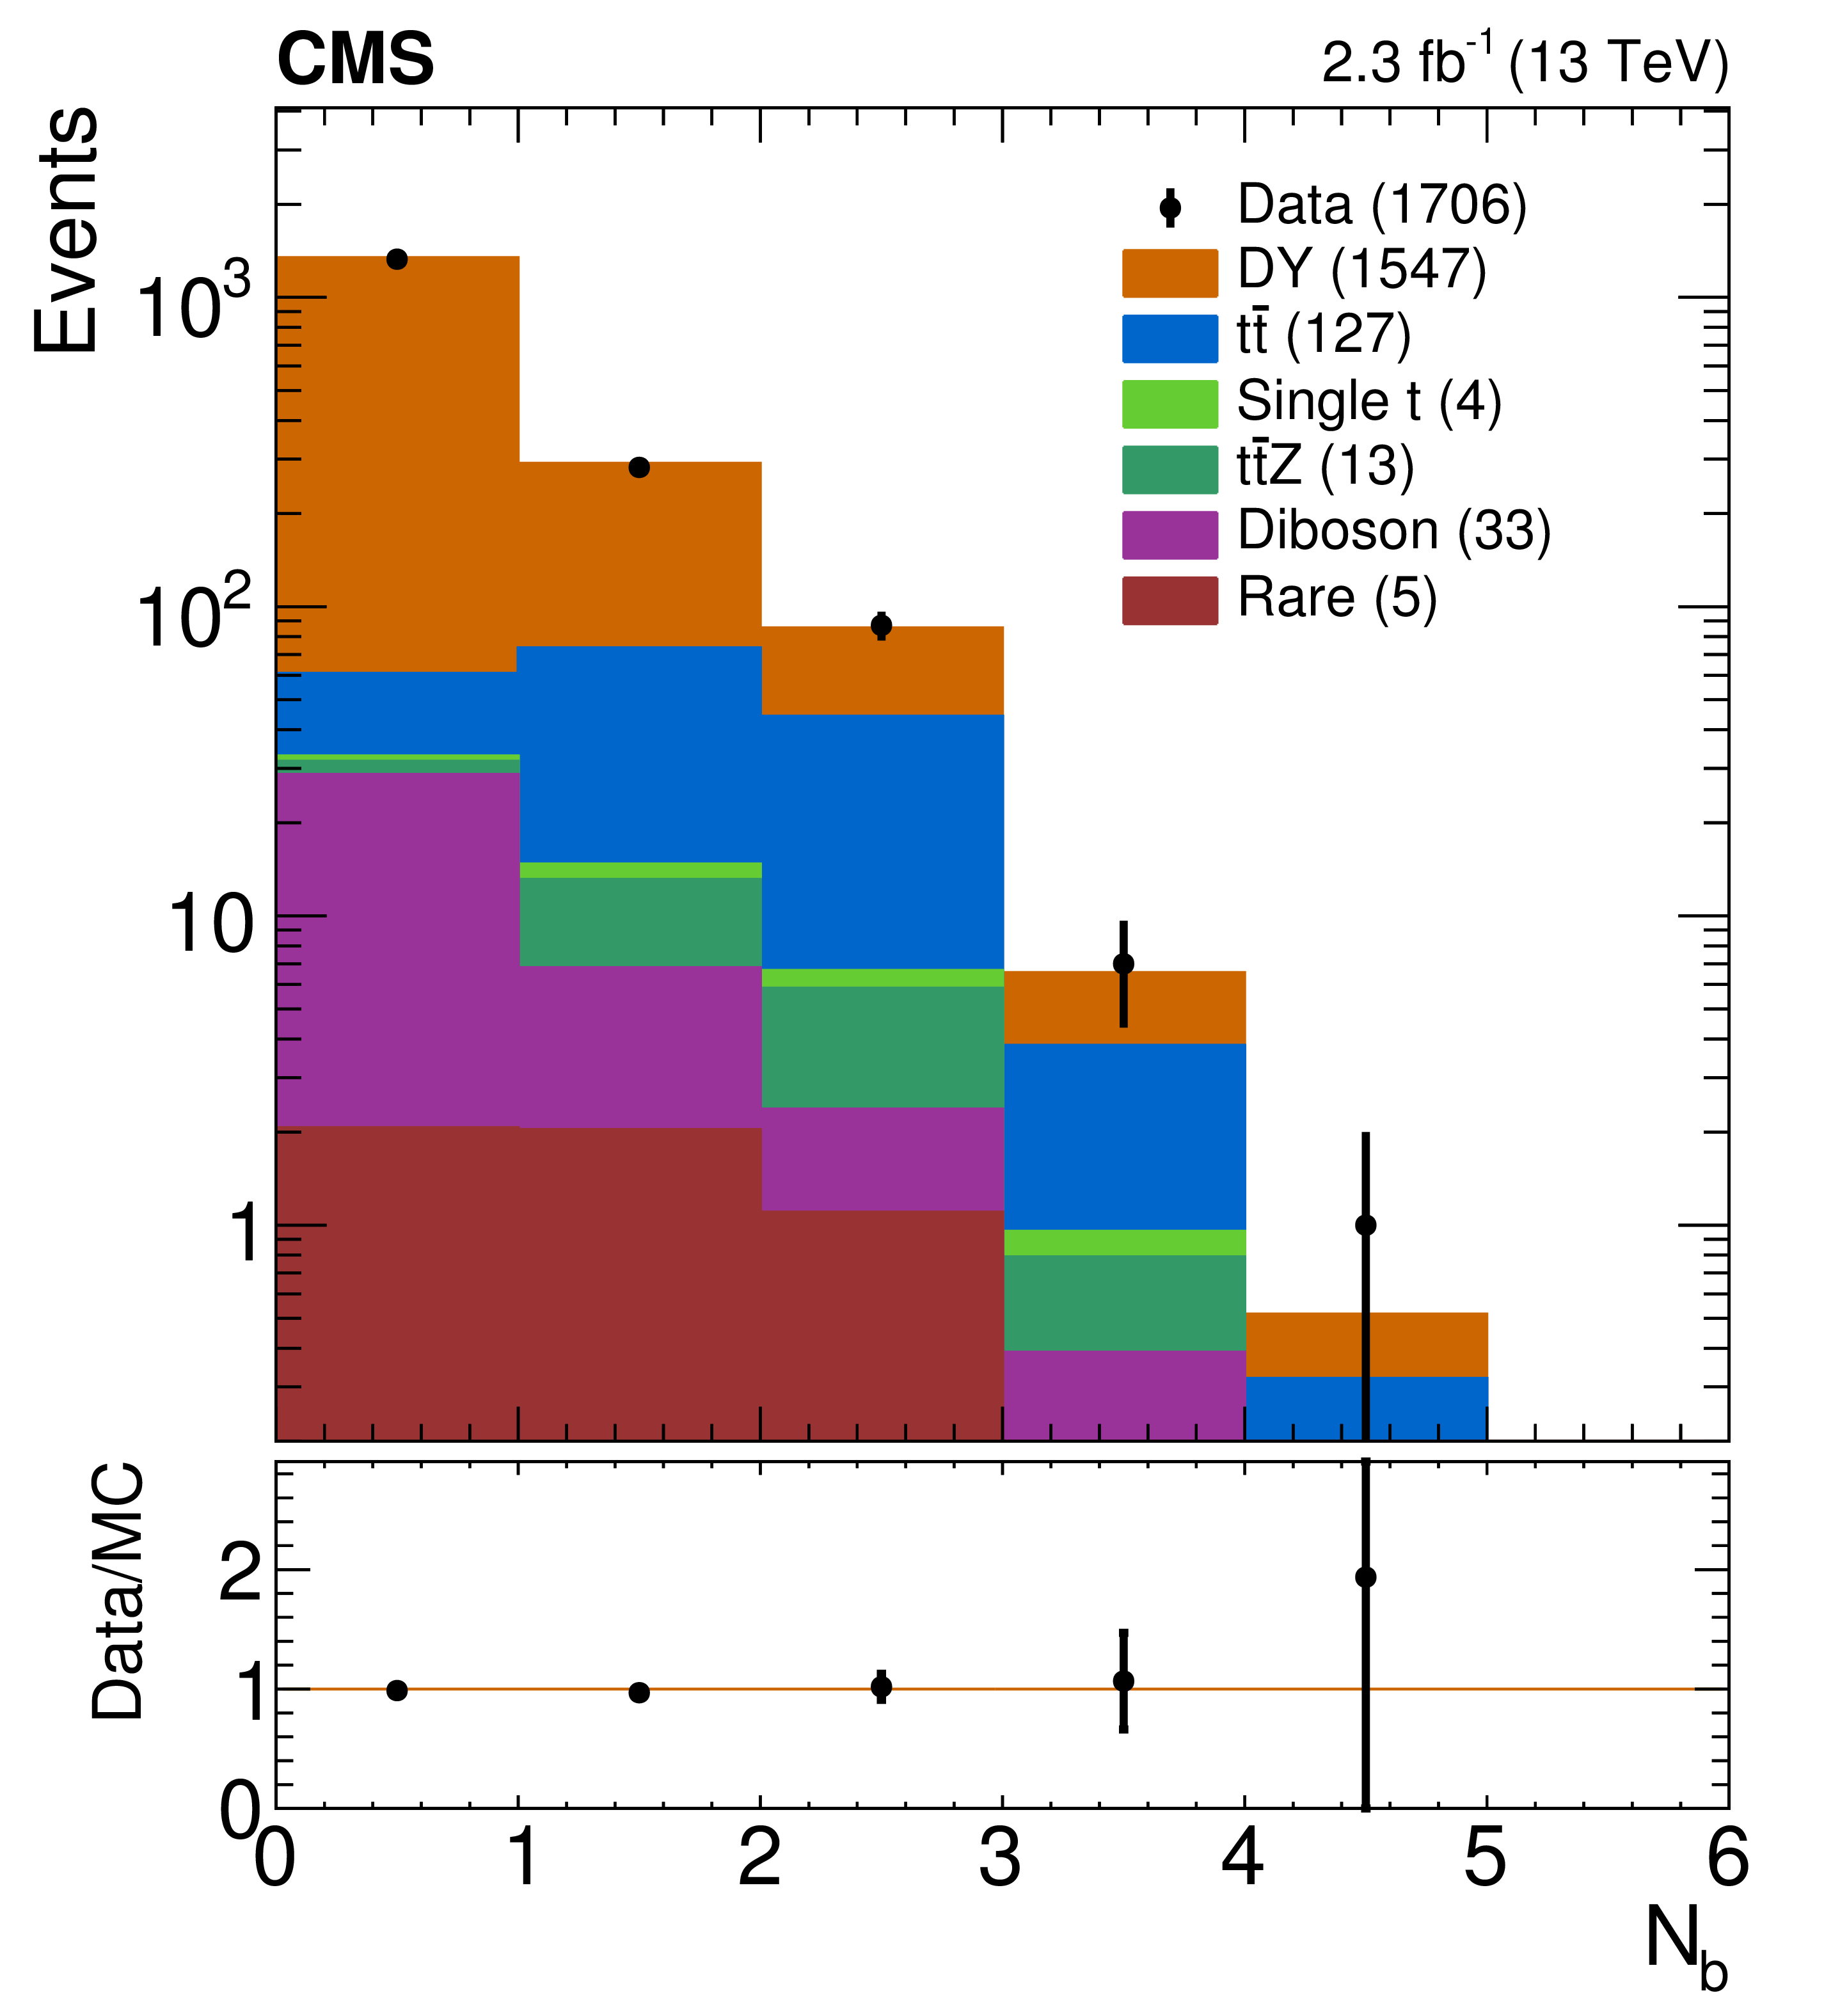
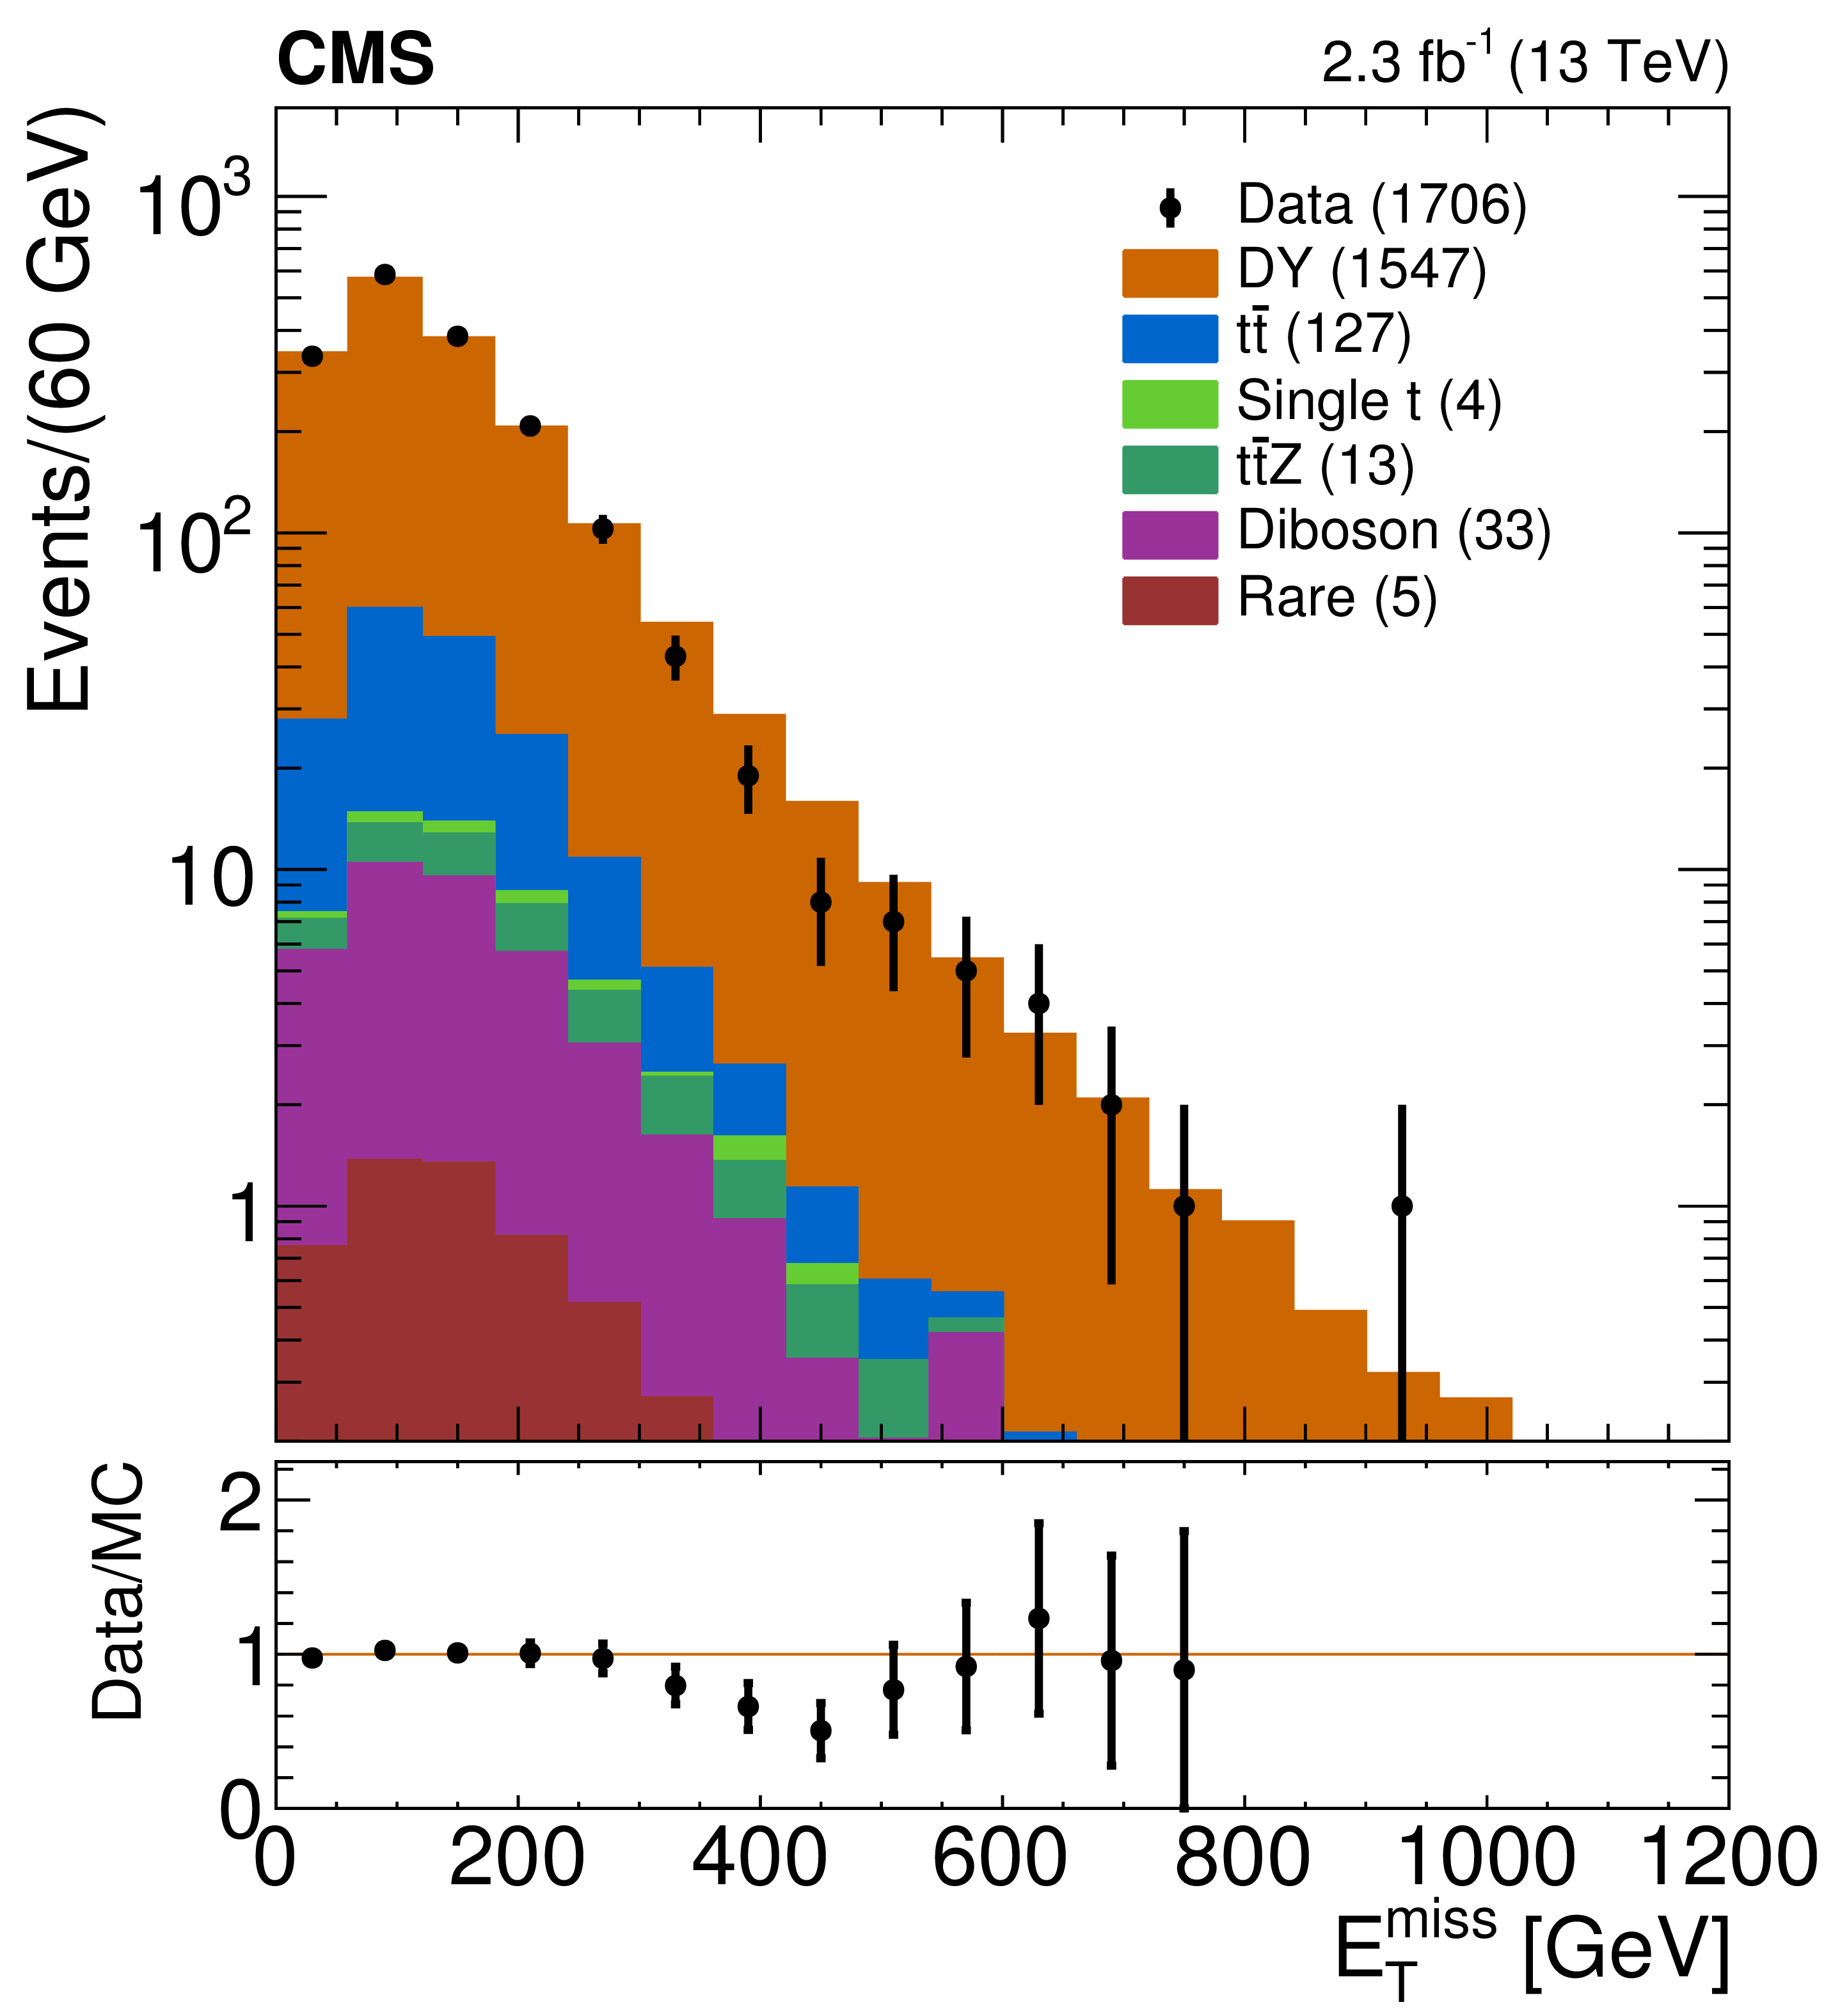
Determination of the $ {\mathrm{ Z } \to \nu \bar{\nu} } $ background: The ${N_{\mathrm{ b } }}$ (left) and ${E_{\mathrm {T}}^{\text {miss}}}$ (right) distributions in data and simulation in the loose $\mathrm{ Z } \to \mu \mu $ control region, after applying the $S_\mathrm {DY}(N_\mathrm {j})$ scale factor to the simulation. The lower panels show the ratio between data and simulation. Only statistical uncertainties are shown. The values in parentheses in the legend indicate the integrated yield for each given process. |
png pdf |
Figure 8-a:
Determination of the $ {\mathrm{ Z } \to \nu \bar{\nu} } $ background: The ${N_{\mathrm{ b } }}$ distributions in data and simulation in the loose $\mathrm{ Z } \to \mu \mu $ control region, after applying the $S_\mathrm {DY}(N_\mathrm {j})$ scale factor to the simulation. The lower panel shows the ratio between data and simulation. Only statistical uncertainties are shown. The values in parentheses in the legend indicate the integrated yield for each given process. |
png pdf |
Figure 8-b:
Determination of the $ {\mathrm{ Z } \to \nu \bar{\nu} } $ background: The ${E_{\mathrm {T}}^{\text {miss}}}$ distributions in data and simulation in the loose $\mathrm{ Z } \to \mu \mu $ control region, after applying the $S_\mathrm {DY}(N_\mathrm {j})$ scale factor to the simulation. The lower panel shows the ratio between data and simulation. Only statistical uncertainties are shown. The values in parentheses in the legend indicate the integrated yield for each given process. |
png pdf |
Figure 9:
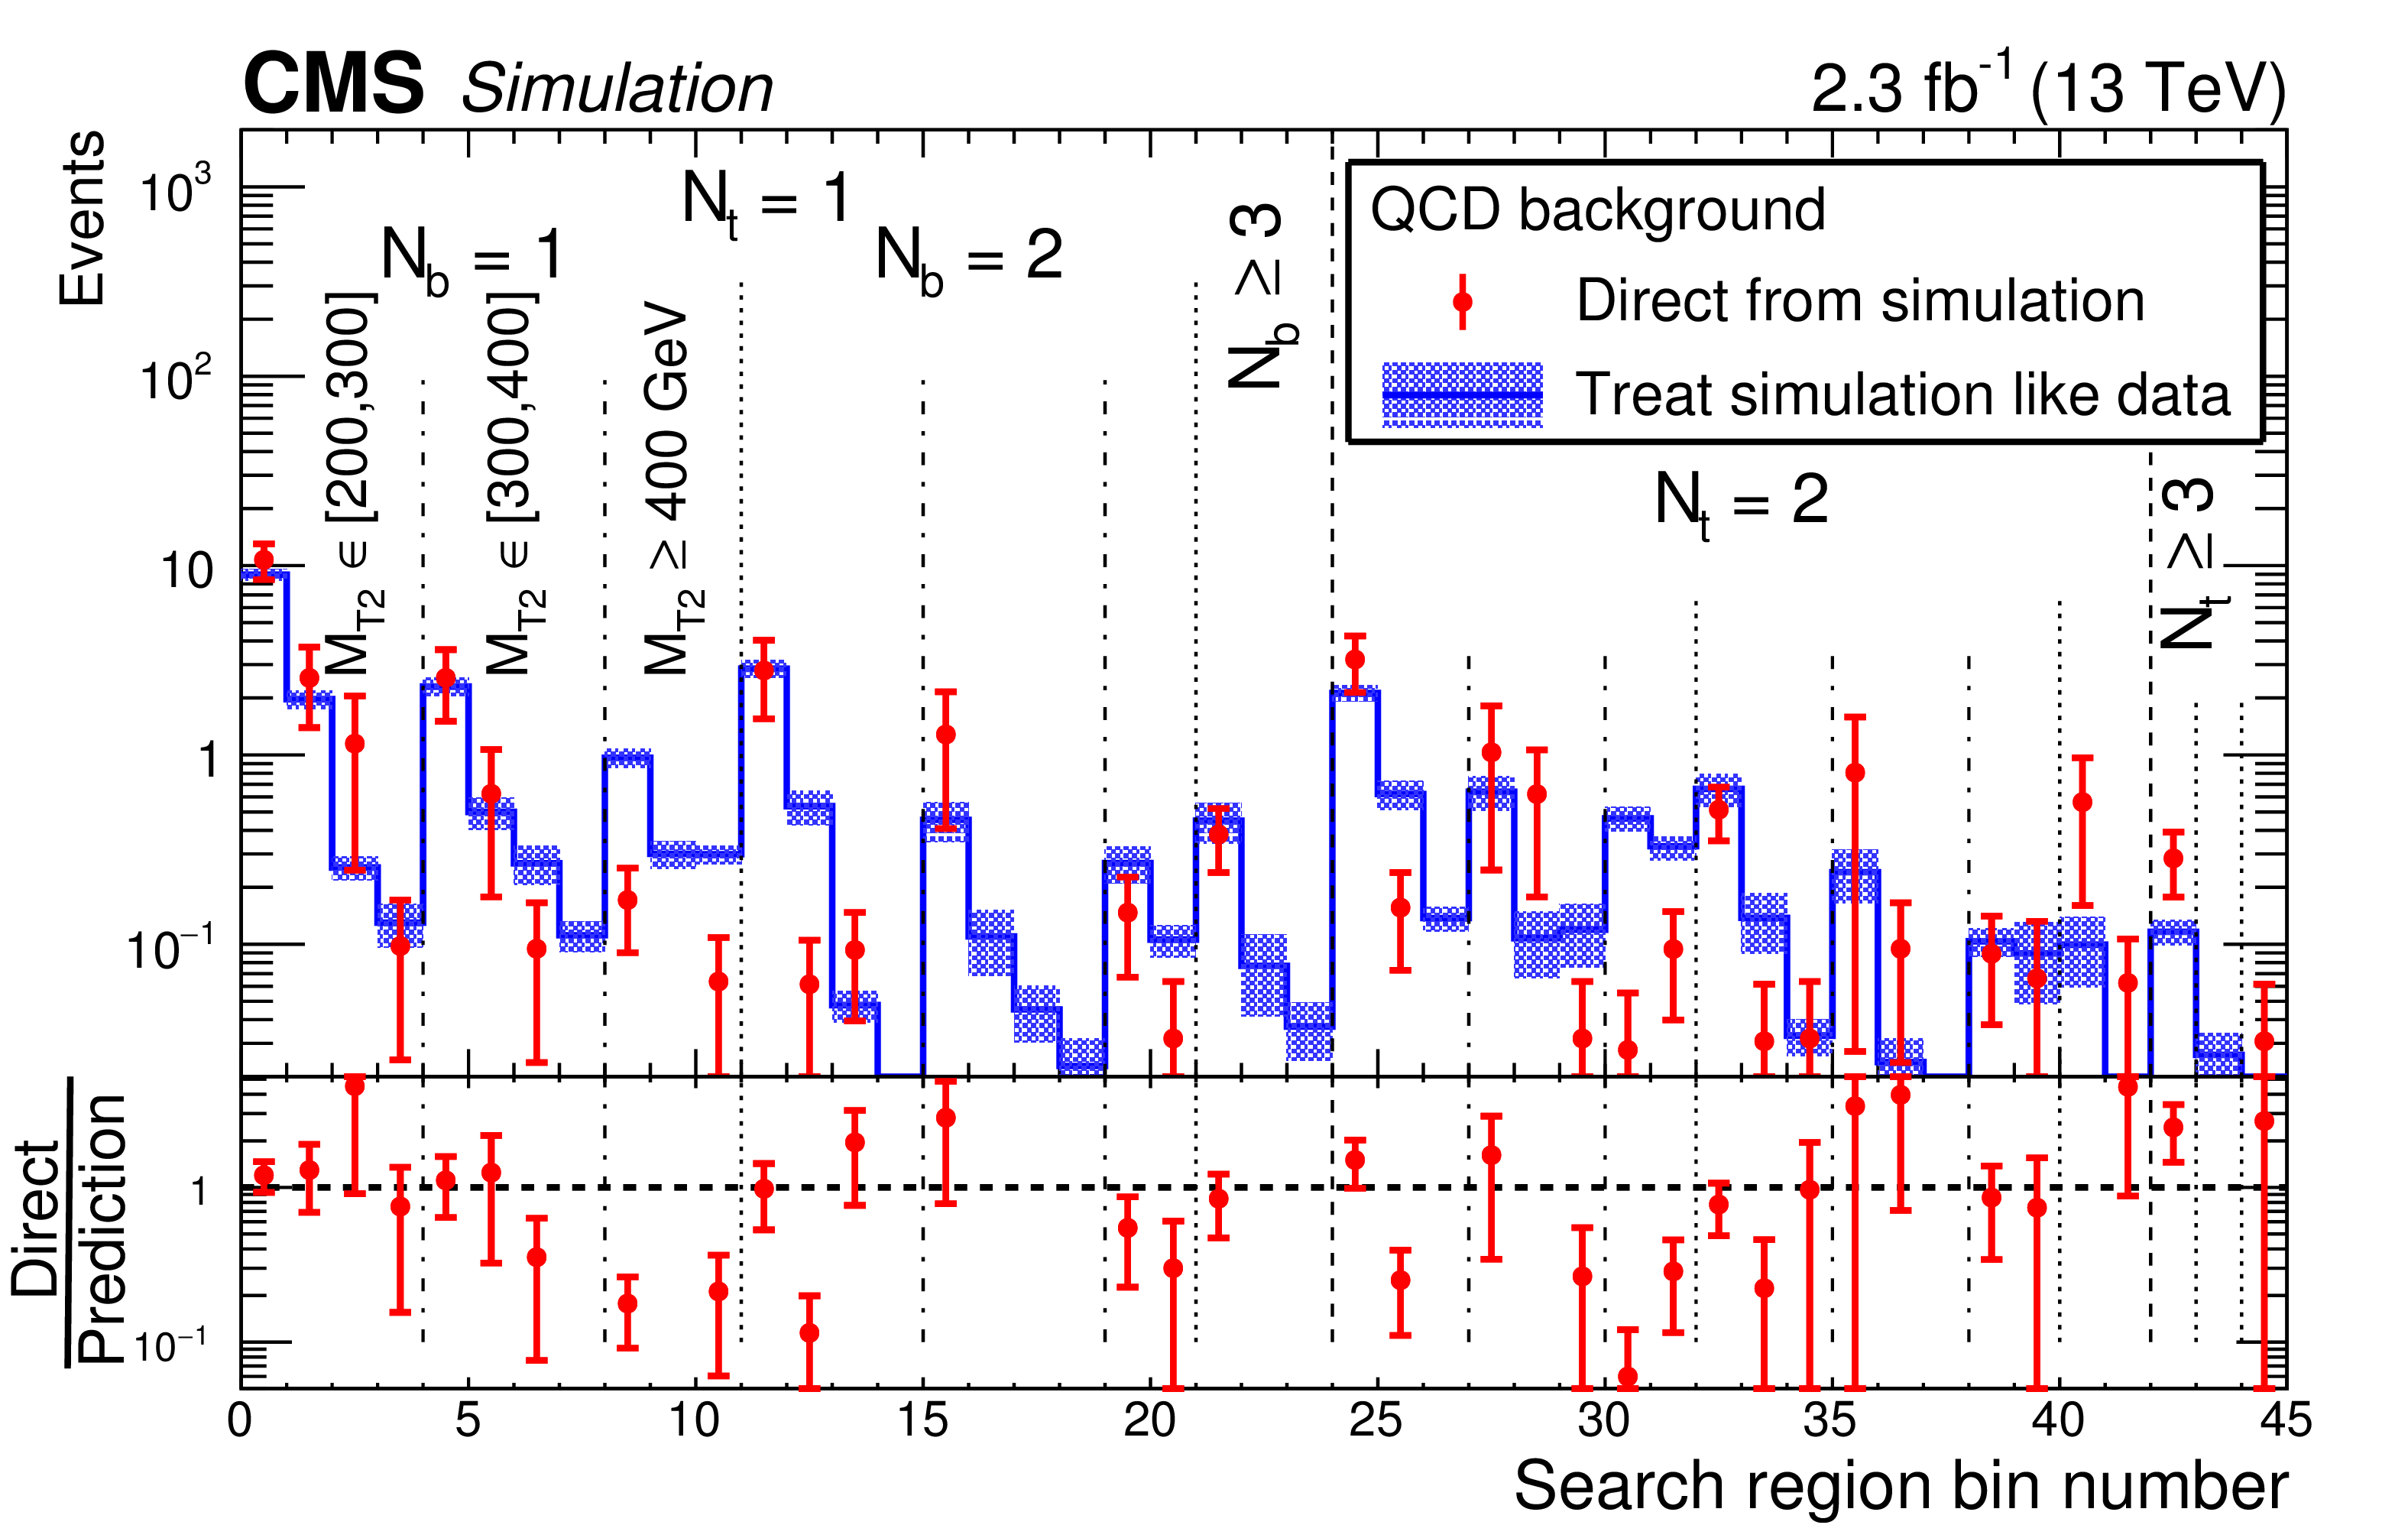
The QCD multijet background in the 45 search regions optimized for gluino-mediated production as determined directly from simulation (points) and as predicted by applying the QCD multijet background determination procedure to simulated event samples in the inverted-$\Delta \phi $ control region (histograms). The lower panel shows the same results after dividing by the predicted value. Only statistical uncertainties are shown. The labeling of the search regions is the same as in Fig. 7. |
png pdf |
Figure 10:
Observed event yields in data (black points) and predicted SM background (filled solid area) for the 37 search bins optimized for direct top squark production. The red and dark green lines indicate various signal models: the T2tt model with $m_{\tilde{ \mathrm{ t } } } = $ 500 GeV and $m_{\tilde{\chi}^0_1 } = $ 325 GeV (red short-dashed line), the T2tt model with $m_{\tilde{ \mathrm{ t } } } = $ 750 GeV and $m_{\tilde{\chi}^0_1 } = $ 50 GeV (red long-dashed line), and the T2tb model with $m_{\tilde{ \mathrm{ t } } } = $ 700 GeV and $m_{\tilde{\chi}^0_1 } = $ 100 GeV (dark green dashed-dotted line). The lower panel shows the ratio of data over total background prediction in each search bin. For both panels, the error bars show the statistical uncertainty associated with the observed data counts, and the grey (blue) hatched bands indicate the statistical (systematic) uncertainties in the total predicted background. |

png pdf |
Figure 11:
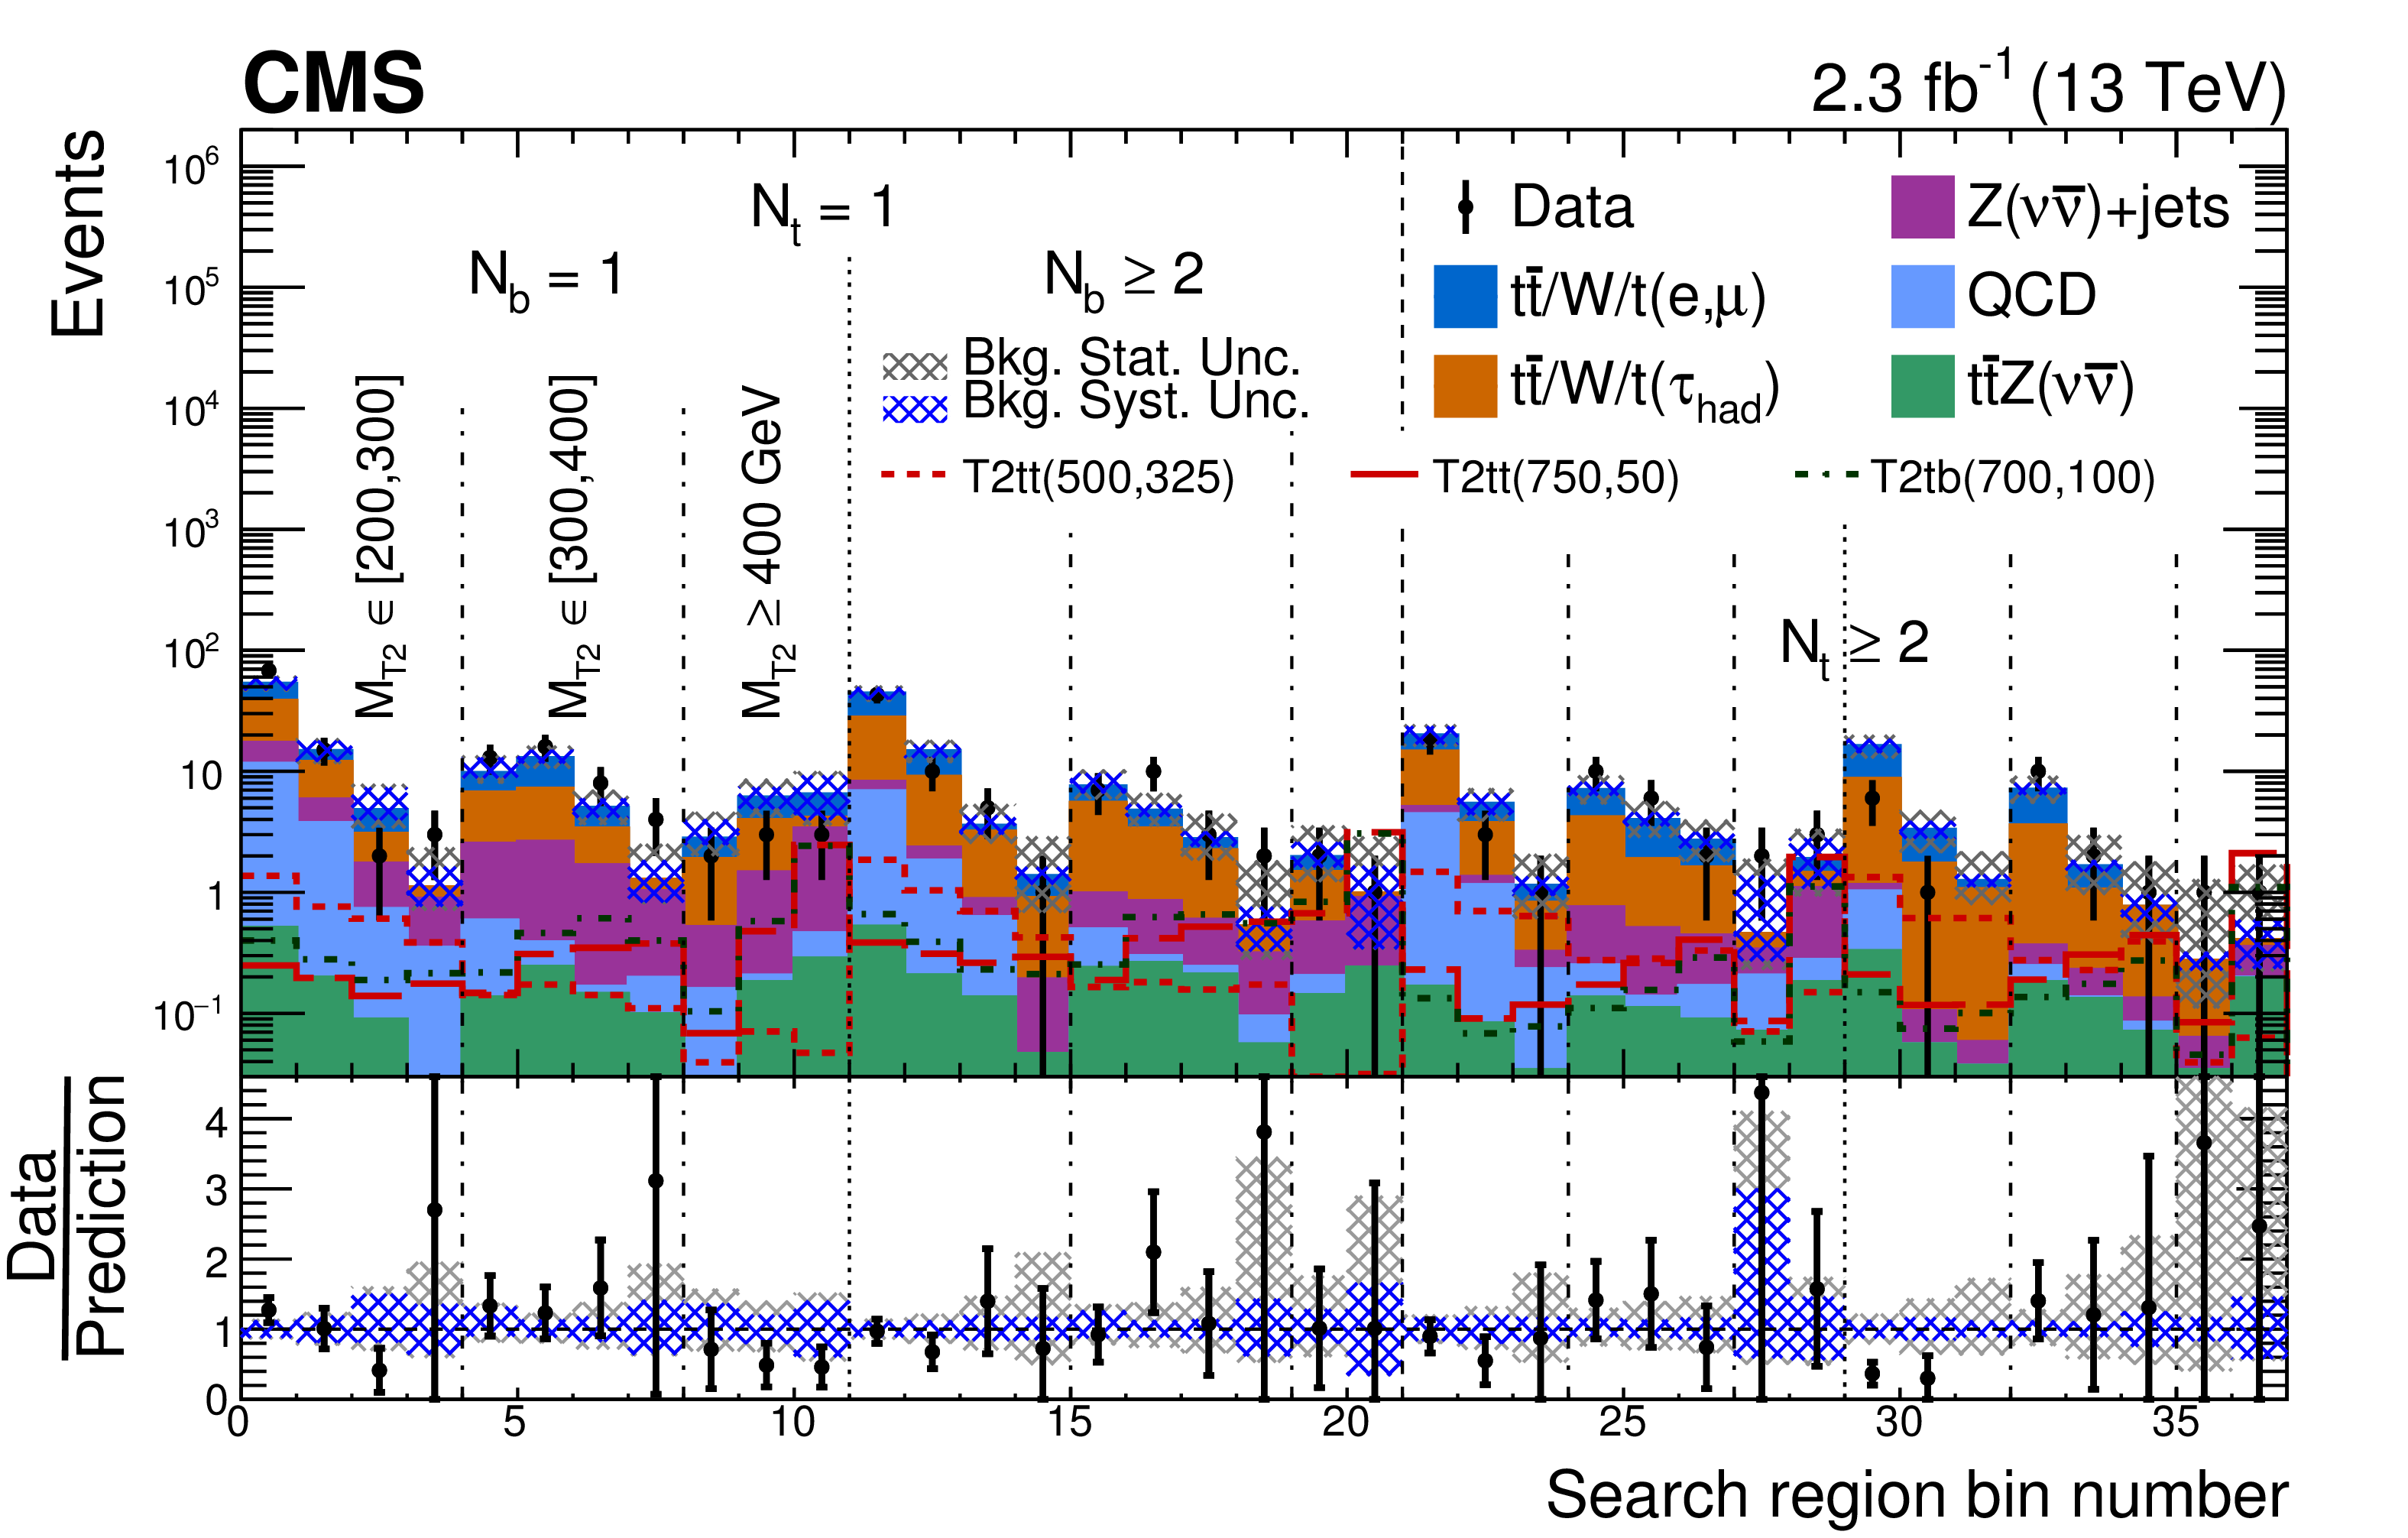
Observed event yields in data (black points) and predicted SM background (filled solid area) for the 45 search bins optimized for gluino models. The red and dark green lines indicate various signal models: the T1tttt model with $m_{\tilde{ \mathrm{g} } } = $ 1200 GeV and $m_{\tilde{\chi}^0_1 } = $ 800 GeV (dark green short-dashed line), the T1tttt model with $m_{\tilde{ \mathrm{g} } } = $ 1500 GeV and $m_{\tilde{\chi}^0_1 } = $ 100 GeV (dark green long-dashed line), and the T5ttcc model with $m_{\tilde{ \mathrm{g} } } = $ 1200 GeV and $m_{\tilde{\chi}^0_1 } = $ 800 GeV (red dashed-dotted line). The lower panel shows the ratio of data over total background prediction in each search bin. For both panels, the error bars show the statistical uncertainty associated with the observed data counts, and the grey (blue) hatched bands indicate the statistical (systematic) uncertainties in the total predicted background. |
png pdf |
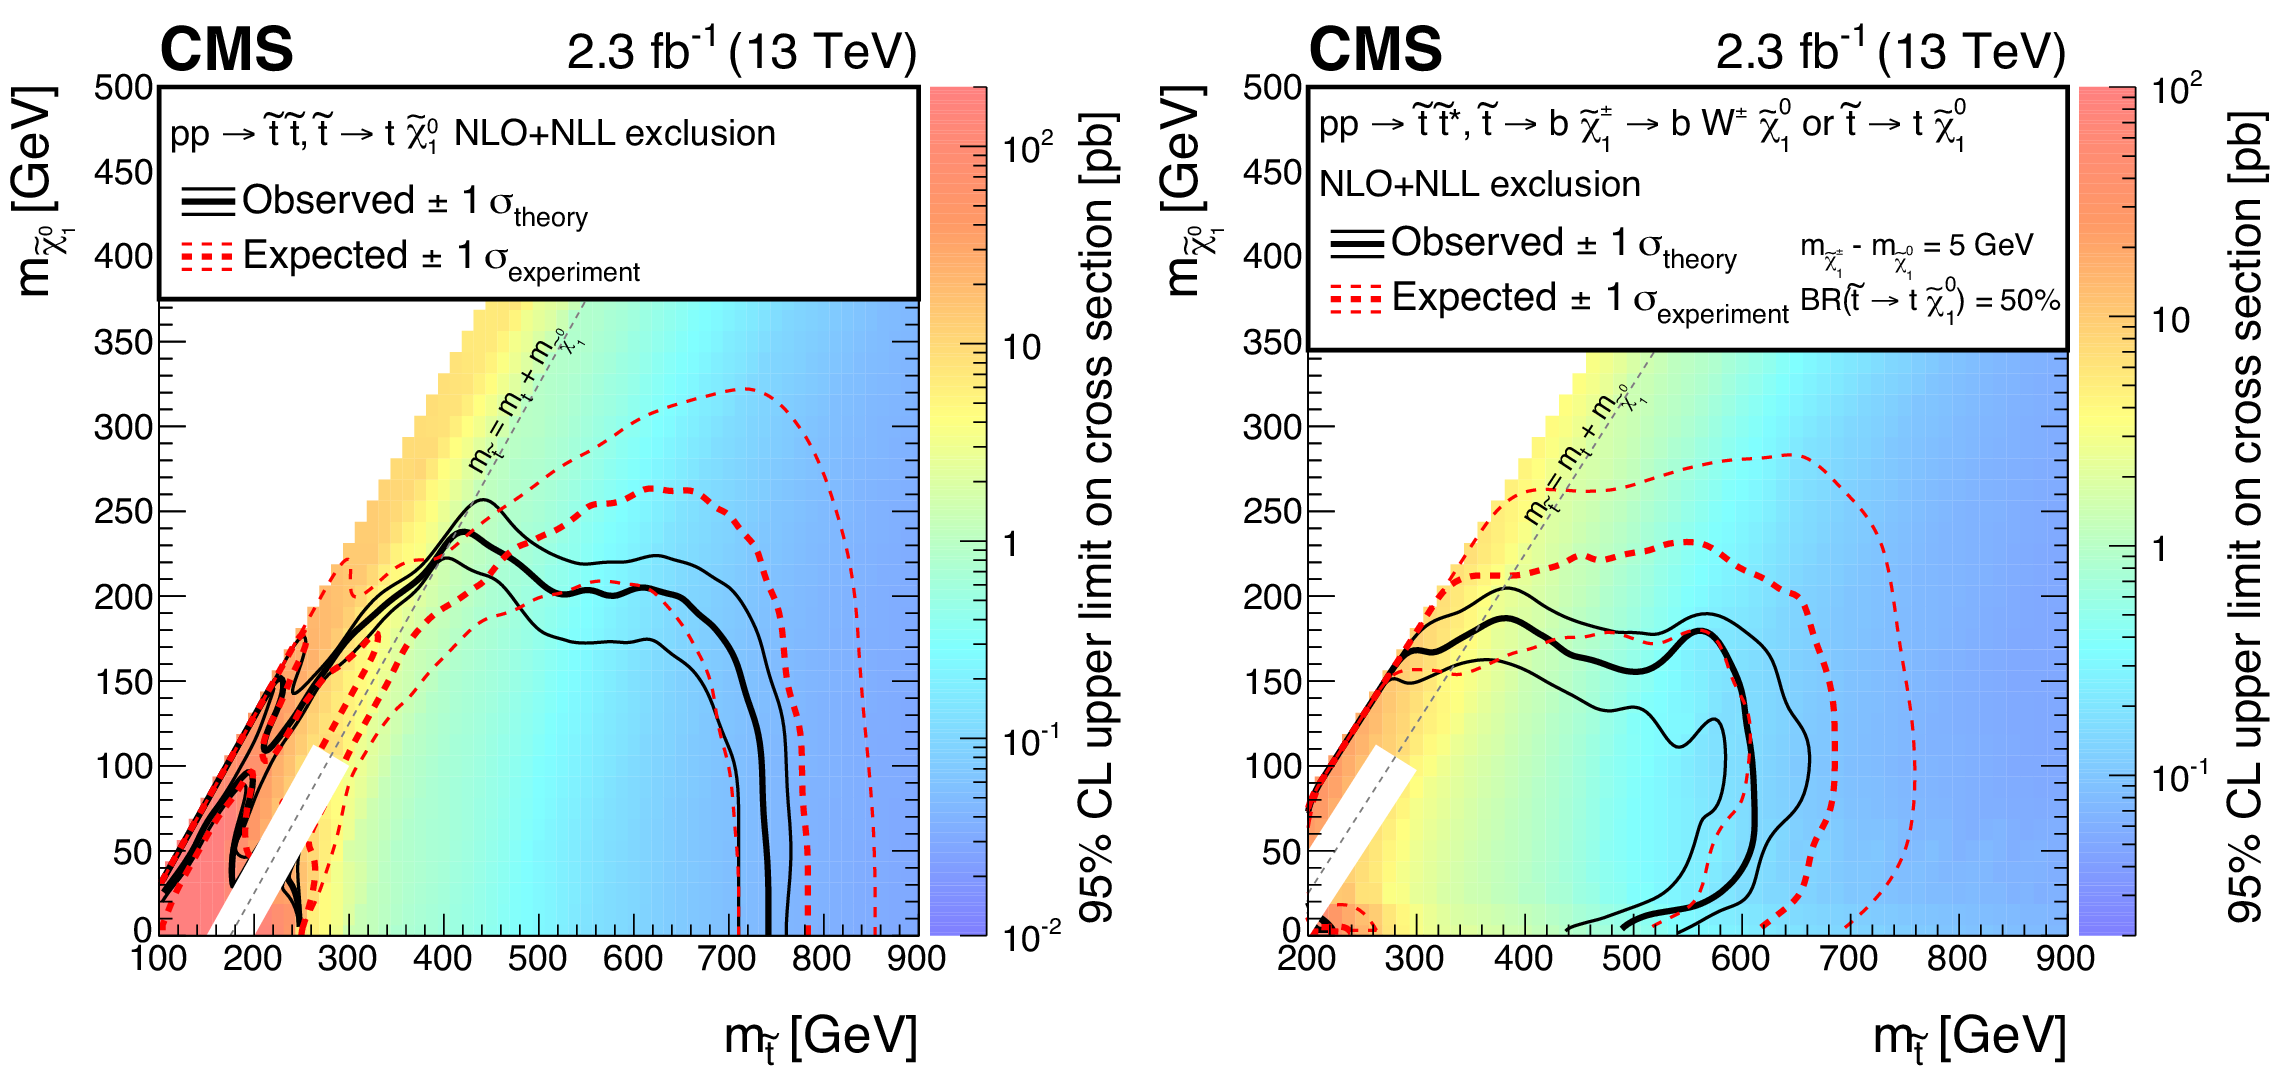
Figure 12:
Exclusion limits at 95% CL for simplified models of top squark pair production in the T2tt (left) and T2tb (right) scenario, assuming a 50% branching fraction for each of the $\tilde{ \mathrm{ t } } \to \mathrm{ t } \tilde{\chi}^0_1 /\tilde{ \mathrm{ t } } \to \mathrm{b} \tilde{\chi}^{pm}_1 $ modes and a 5 GeV mass difference between the $\tilde{\chi}^{pm}_1 $ and $\tilde{\chi}^0_1 $ (right). The solid black curves represent the observed exclusion contour with respect to NLO+NLL cross section calculations [89] and the corresponding $\pm $1 standard deviation uncertainties. The dashed red curves indicate the expected exclusion contour and the $\pm $1 standard deviation uncertainties including experimental uncertainties. No interpretation is provided for signal models for which $ {| m_{\tilde{ \mathrm{ t } } } - m_{\tilde{\chi}^0_1 } - m_{\mathrm{ t } } | } \le $ 25 GeV and $m_{\tilde{ \mathrm{ t } } } \leq $ 275 GeV because of significant differences between the fast simulation and the Geant4-based simulation for these low-$ {E_{\mathrm {T}}^{\text {miss}}}$ scenarios. |
png pdf root |
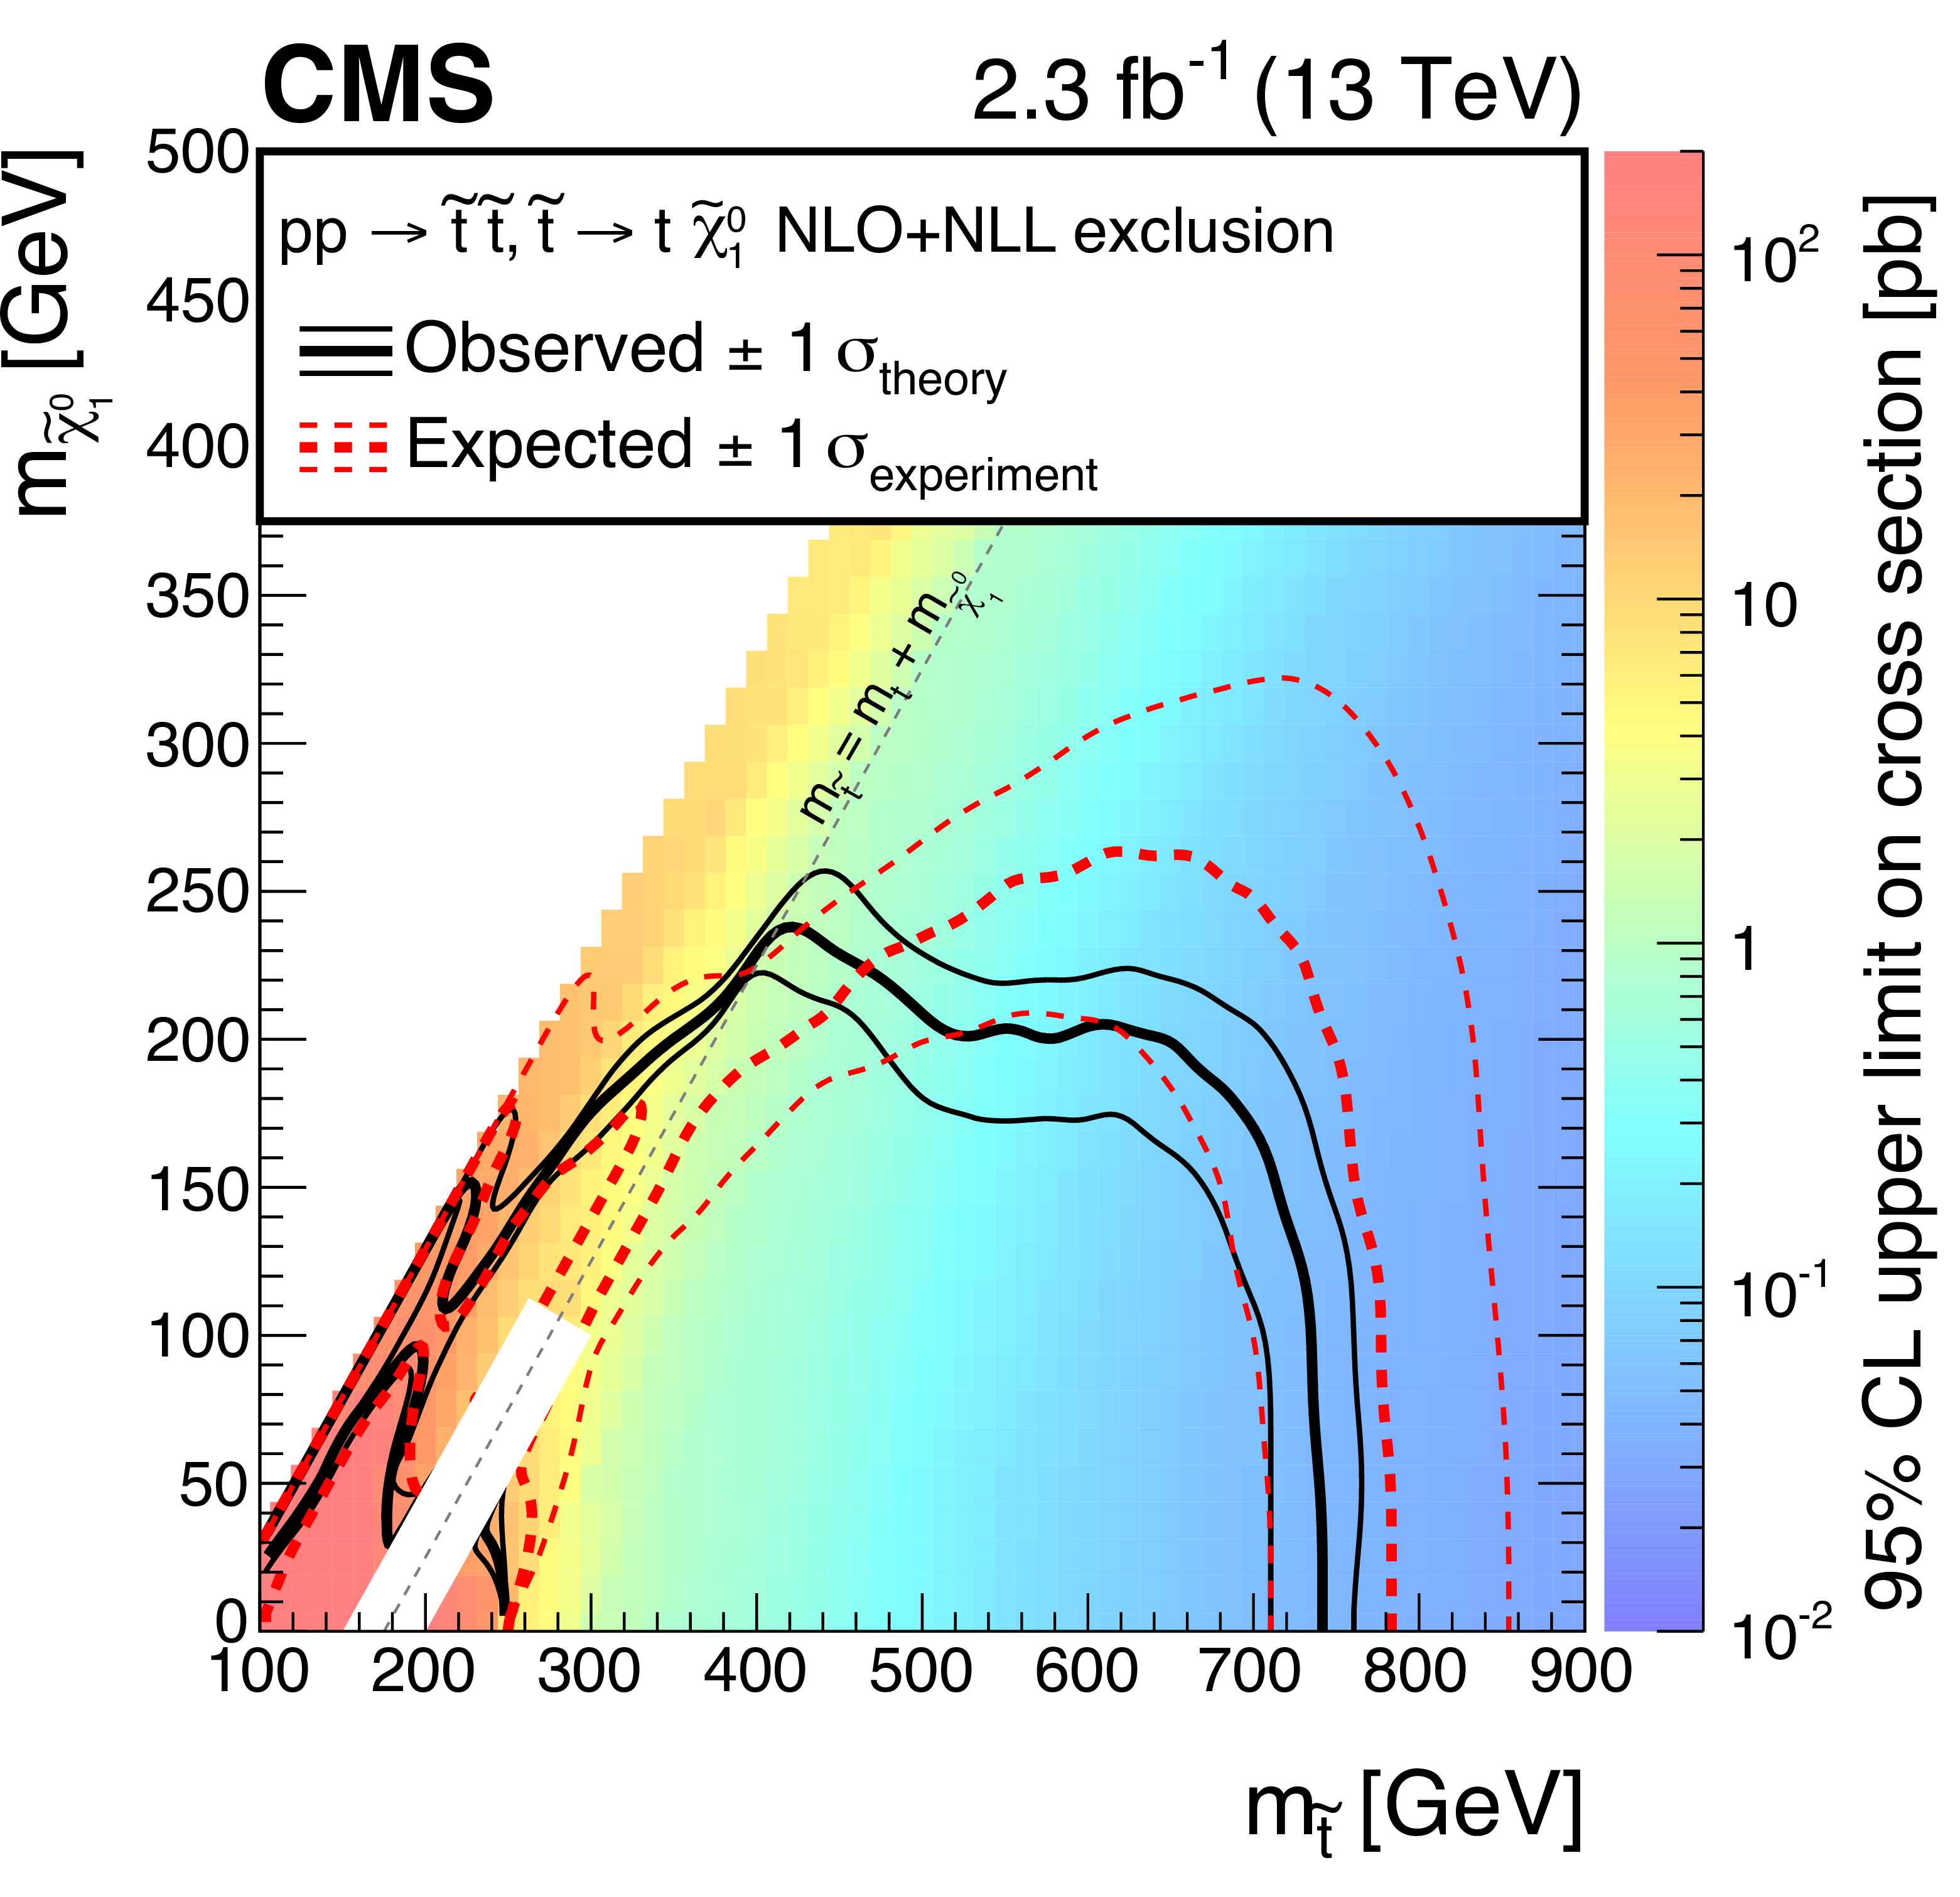
Figure 12-a:
Exclusion limits at 95% CL for simplified models of top squark pair production in the T2tt scenario, assuming a 50% branching fraction for each of the $\tilde{ \mathrm{ t } } \to \mathrm{ t } \tilde{\chi}^0_1 /\tilde{ \mathrm{ t } } \to \mathrm{b} \tilde{\chi}^{pm}_1 $ modes and a 5 GeV mass difference between the $\tilde{\chi}^{pm}_1 $ and $\tilde{\chi}^0_1 $ (right). The solid black curves represent the observed exclusion contour with respect to NLO+NLL cross section calculations [89] and the corresponding $\pm $1 standard deviation uncertainties. The dashed red curves indicate the expected exclusion contour and the $\pm $1 standard deviation uncertainties including experimental uncertainties. No interpretation is provided for signal models for which $ {| m_{\tilde{ \mathrm{ t } } } - m_{\tilde{\chi}^0_1 } - m_{\mathrm{ t } } | } \le $ 25 GeV and $m_{\tilde{ \mathrm{ t } } } \leq $ 275 GeV because of significant differences between the fast simulation and the Geant4-based simulation for these low-$ {E_{\mathrm {T}}^{\text {miss}}}$ scenarios. |
png pdf root |
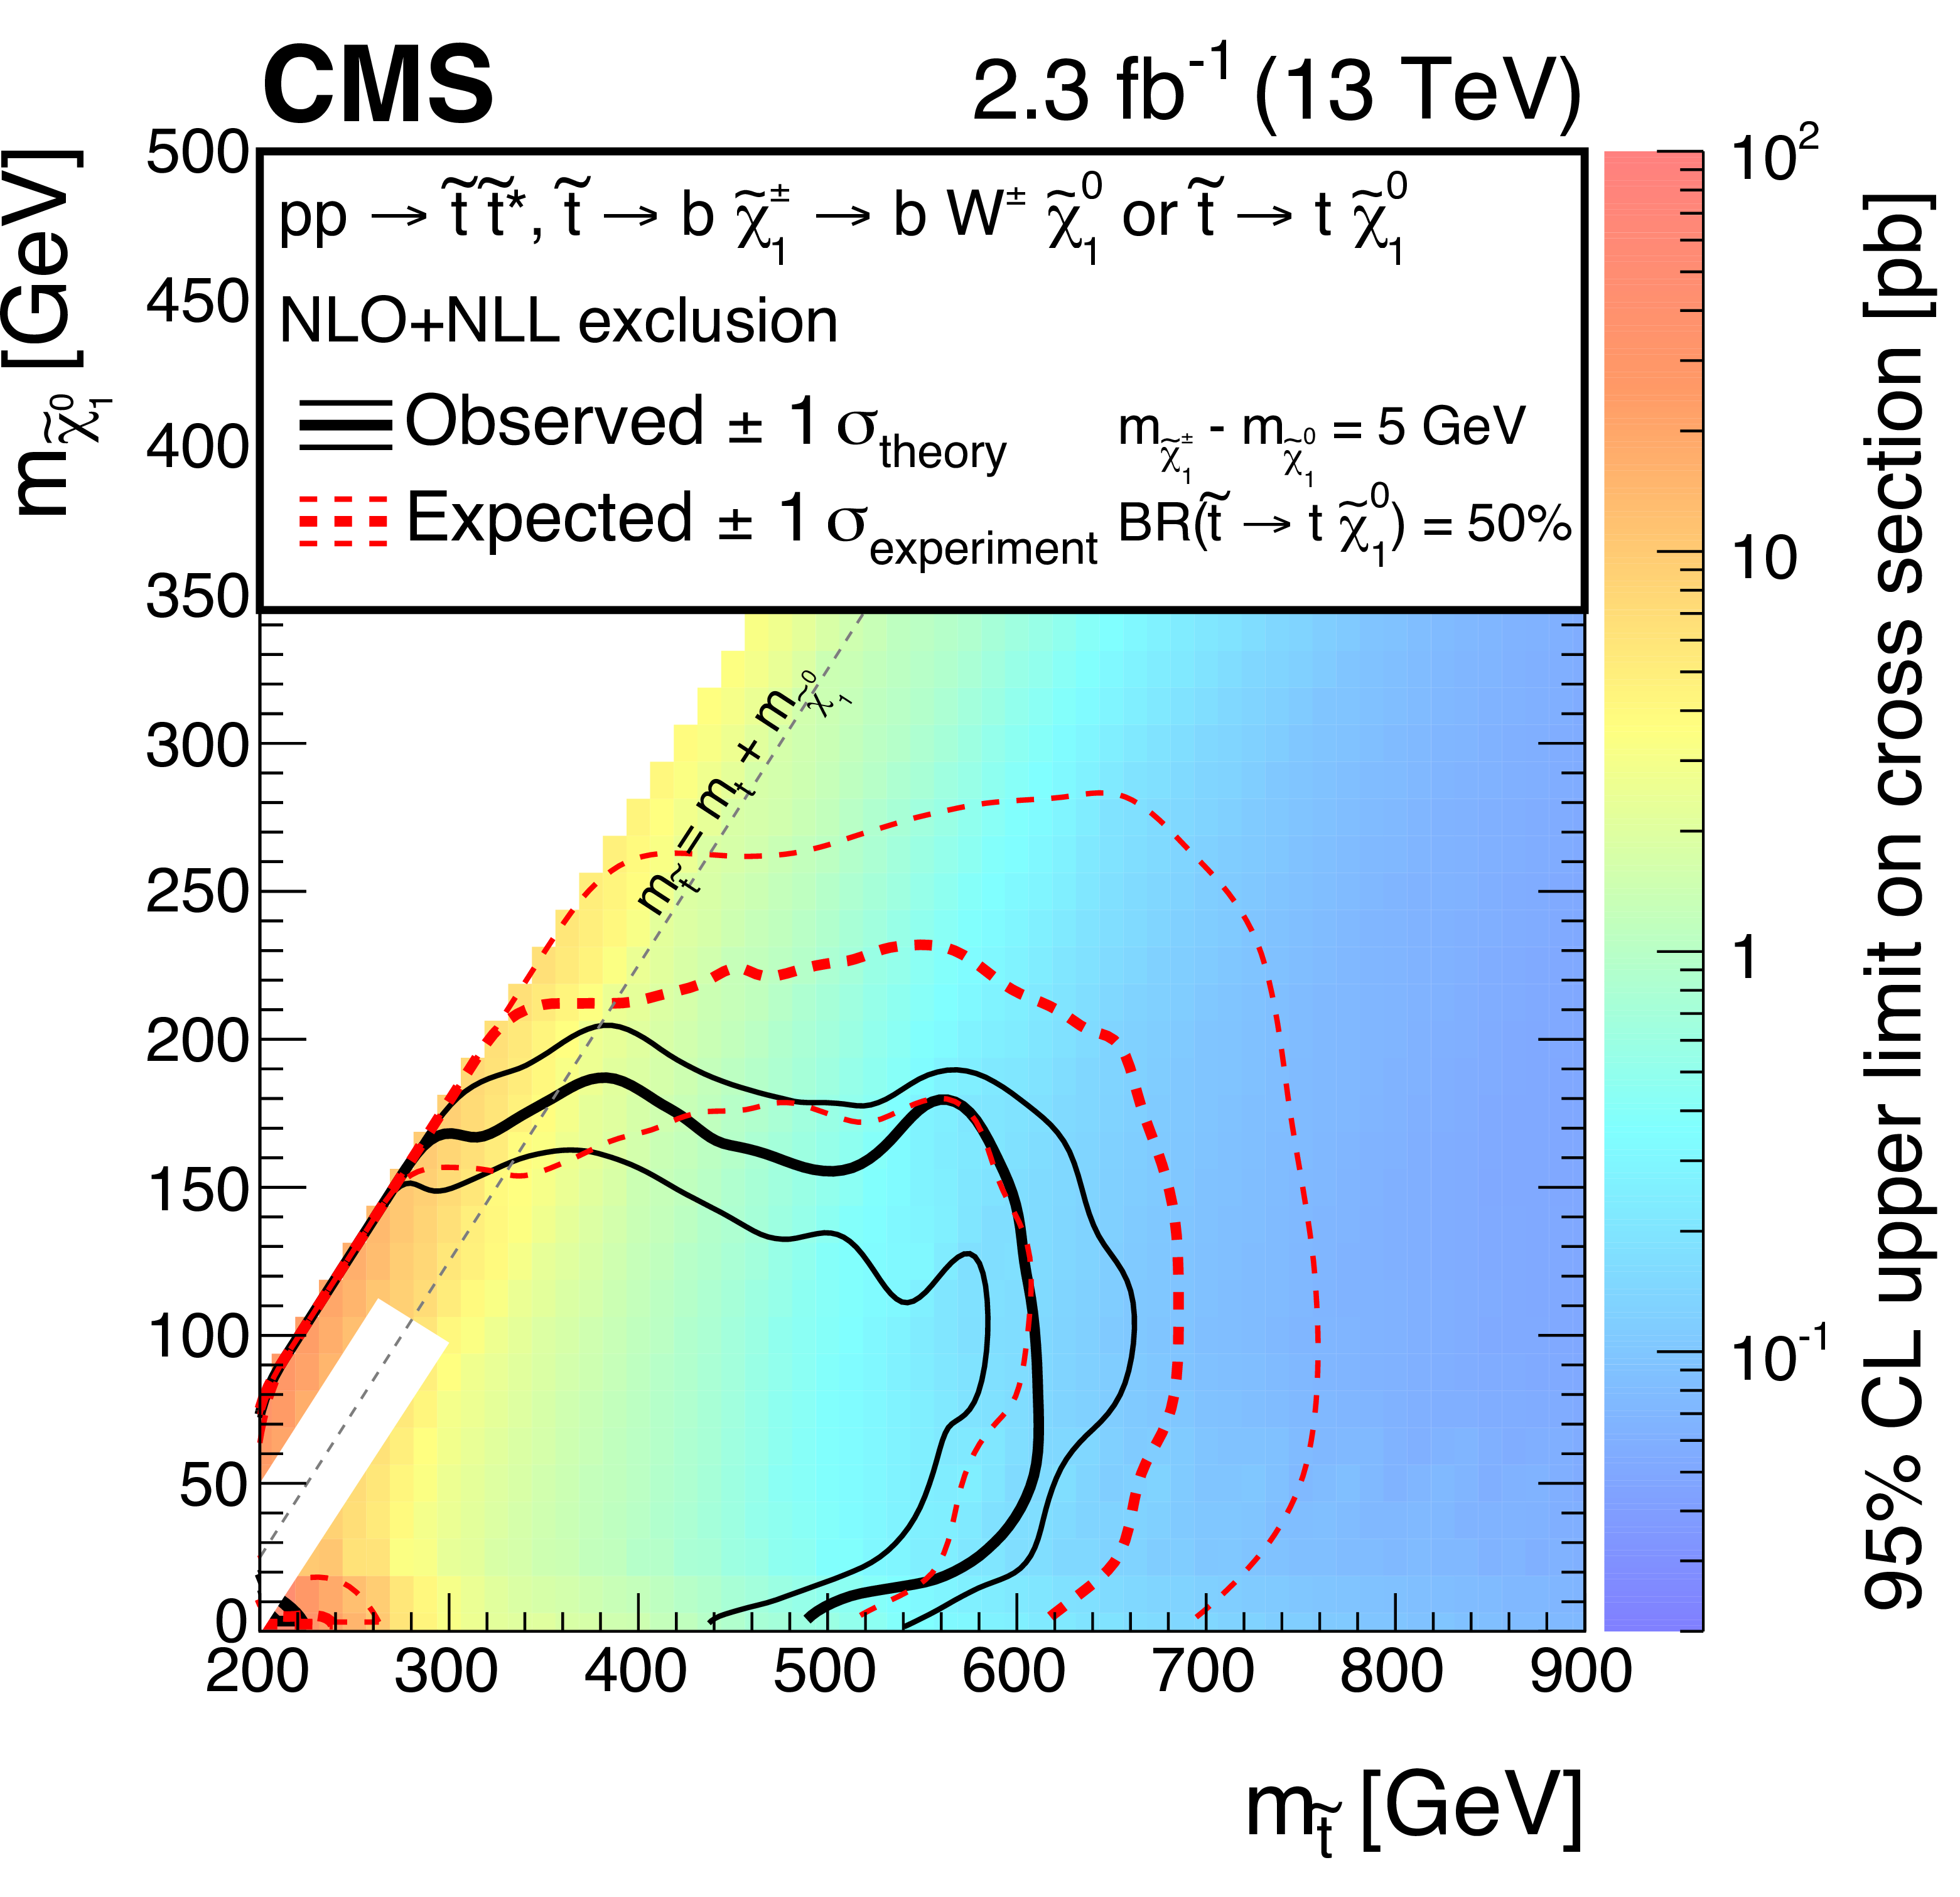
Figure 12-b:
Exclusion limits at 95% CL for simplified models of top squark pair production in the T2tb scenario, assuming a 50% branching fraction for each of the $\tilde{ \mathrm{ t } } \to \mathrm{ t } \tilde{\chi}^0_1 /\tilde{ \mathrm{ t } } \to \mathrm{b} \tilde{\chi}^{pm}_1 $ modes and a 5 GeV mass difference between the $\tilde{\chi}^{pm}_1 $ and $\tilde{\chi}^0_1 $ (right). The solid black curves represent the observed exclusion contour with respect to NLO+NLL cross section calculations [89] and the corresponding $\pm $1 standard deviation uncertainties. The dashed red curves indicate the expected exclusion contour and the $\pm $1 standard deviation uncertainties including experimental uncertainties. No interpretation is provided for signal models for which $ {| m_{\tilde{ \mathrm{ t } } } - m_{\tilde{\chi}^0_1 } - m_{\mathrm{ t } } | } \le $ 25 GeV and $m_{\tilde{ \mathrm{ t } } } \leq $ 275 GeV because of significant differences between the fast simulation and the Geant4-based simulation for these low-$ {E_{\mathrm {T}}^{\text {miss}}}$ scenarios. |
png pdf |
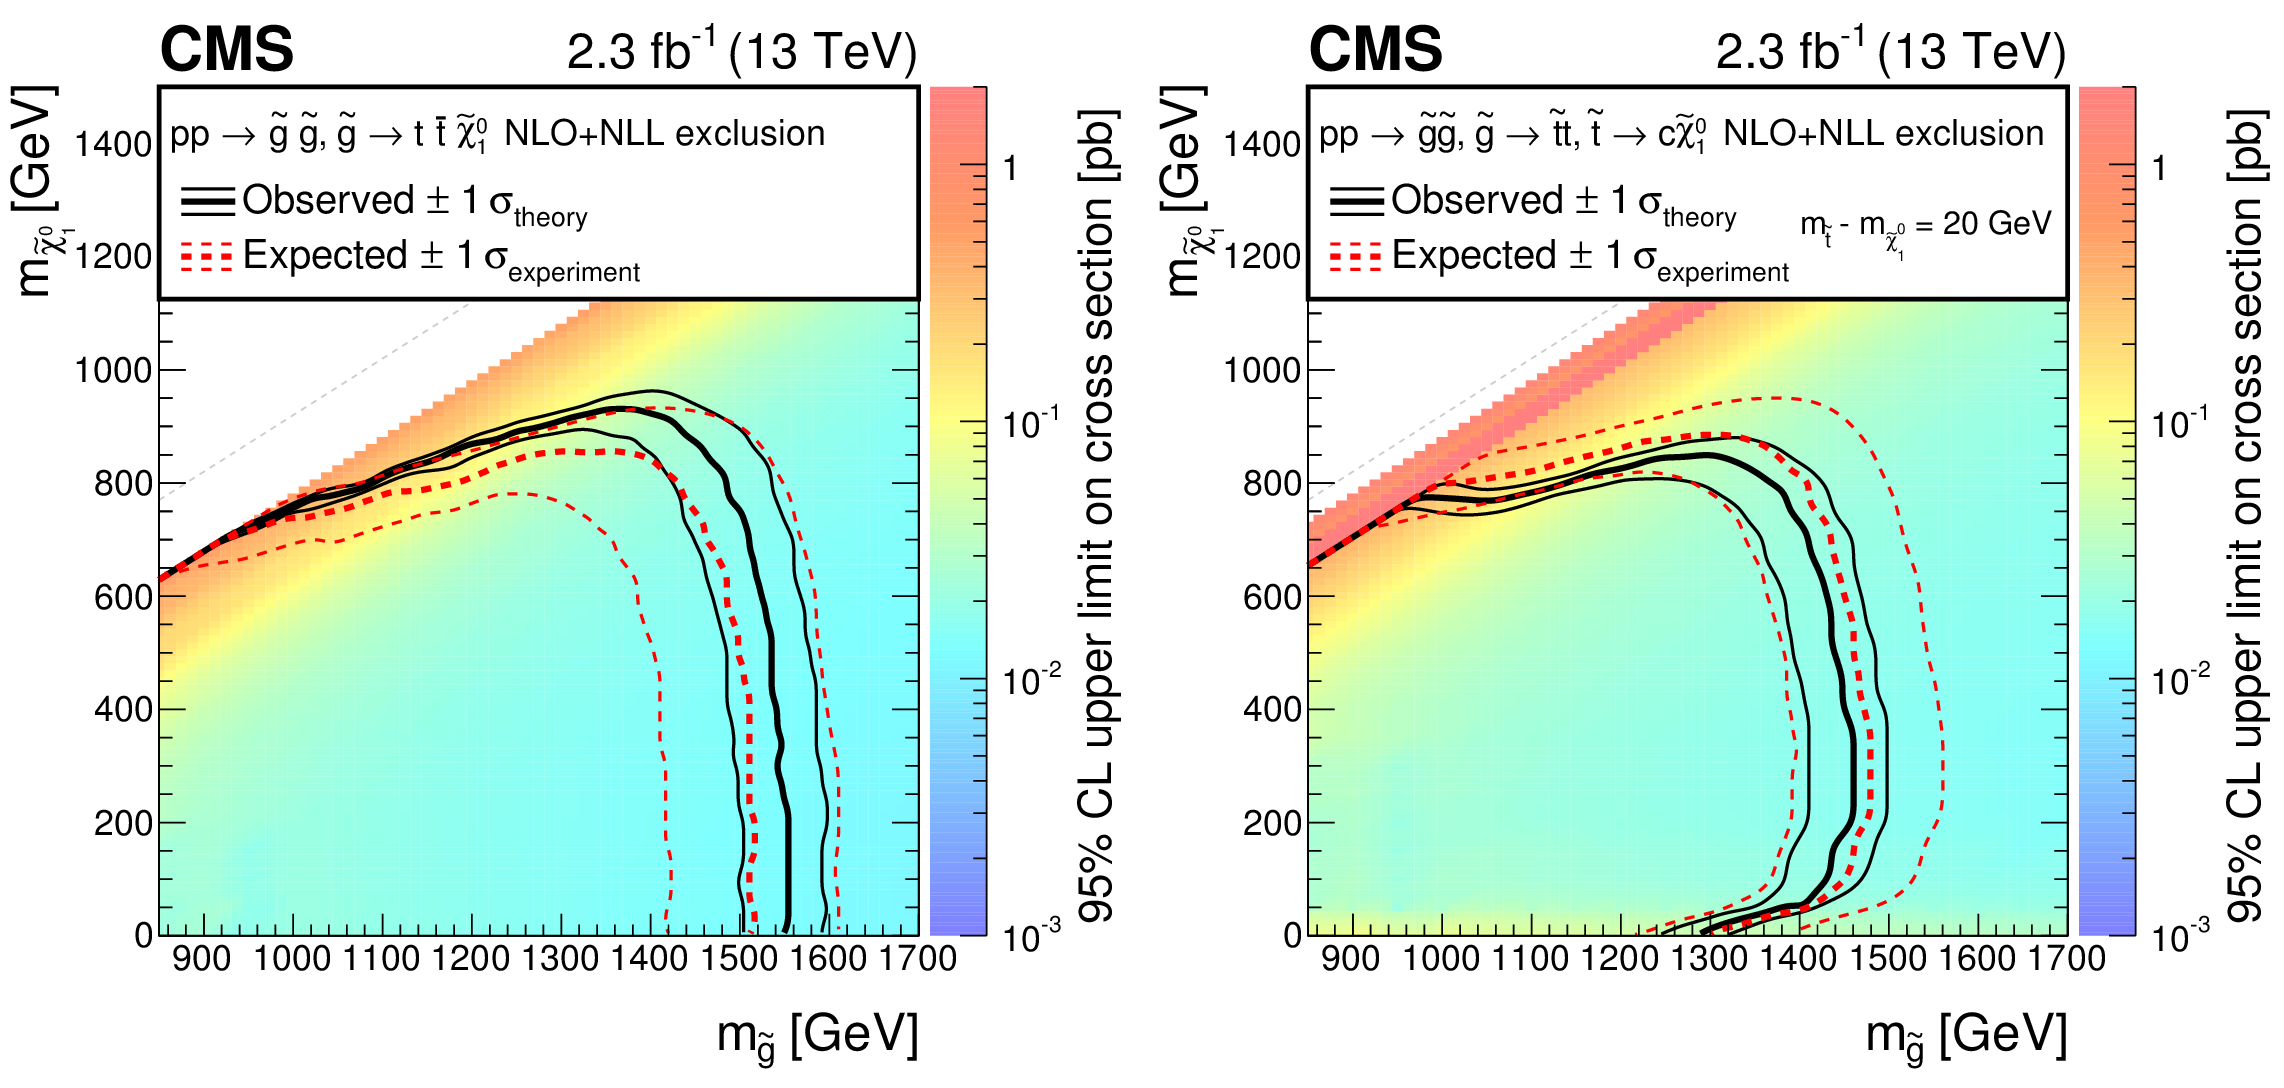
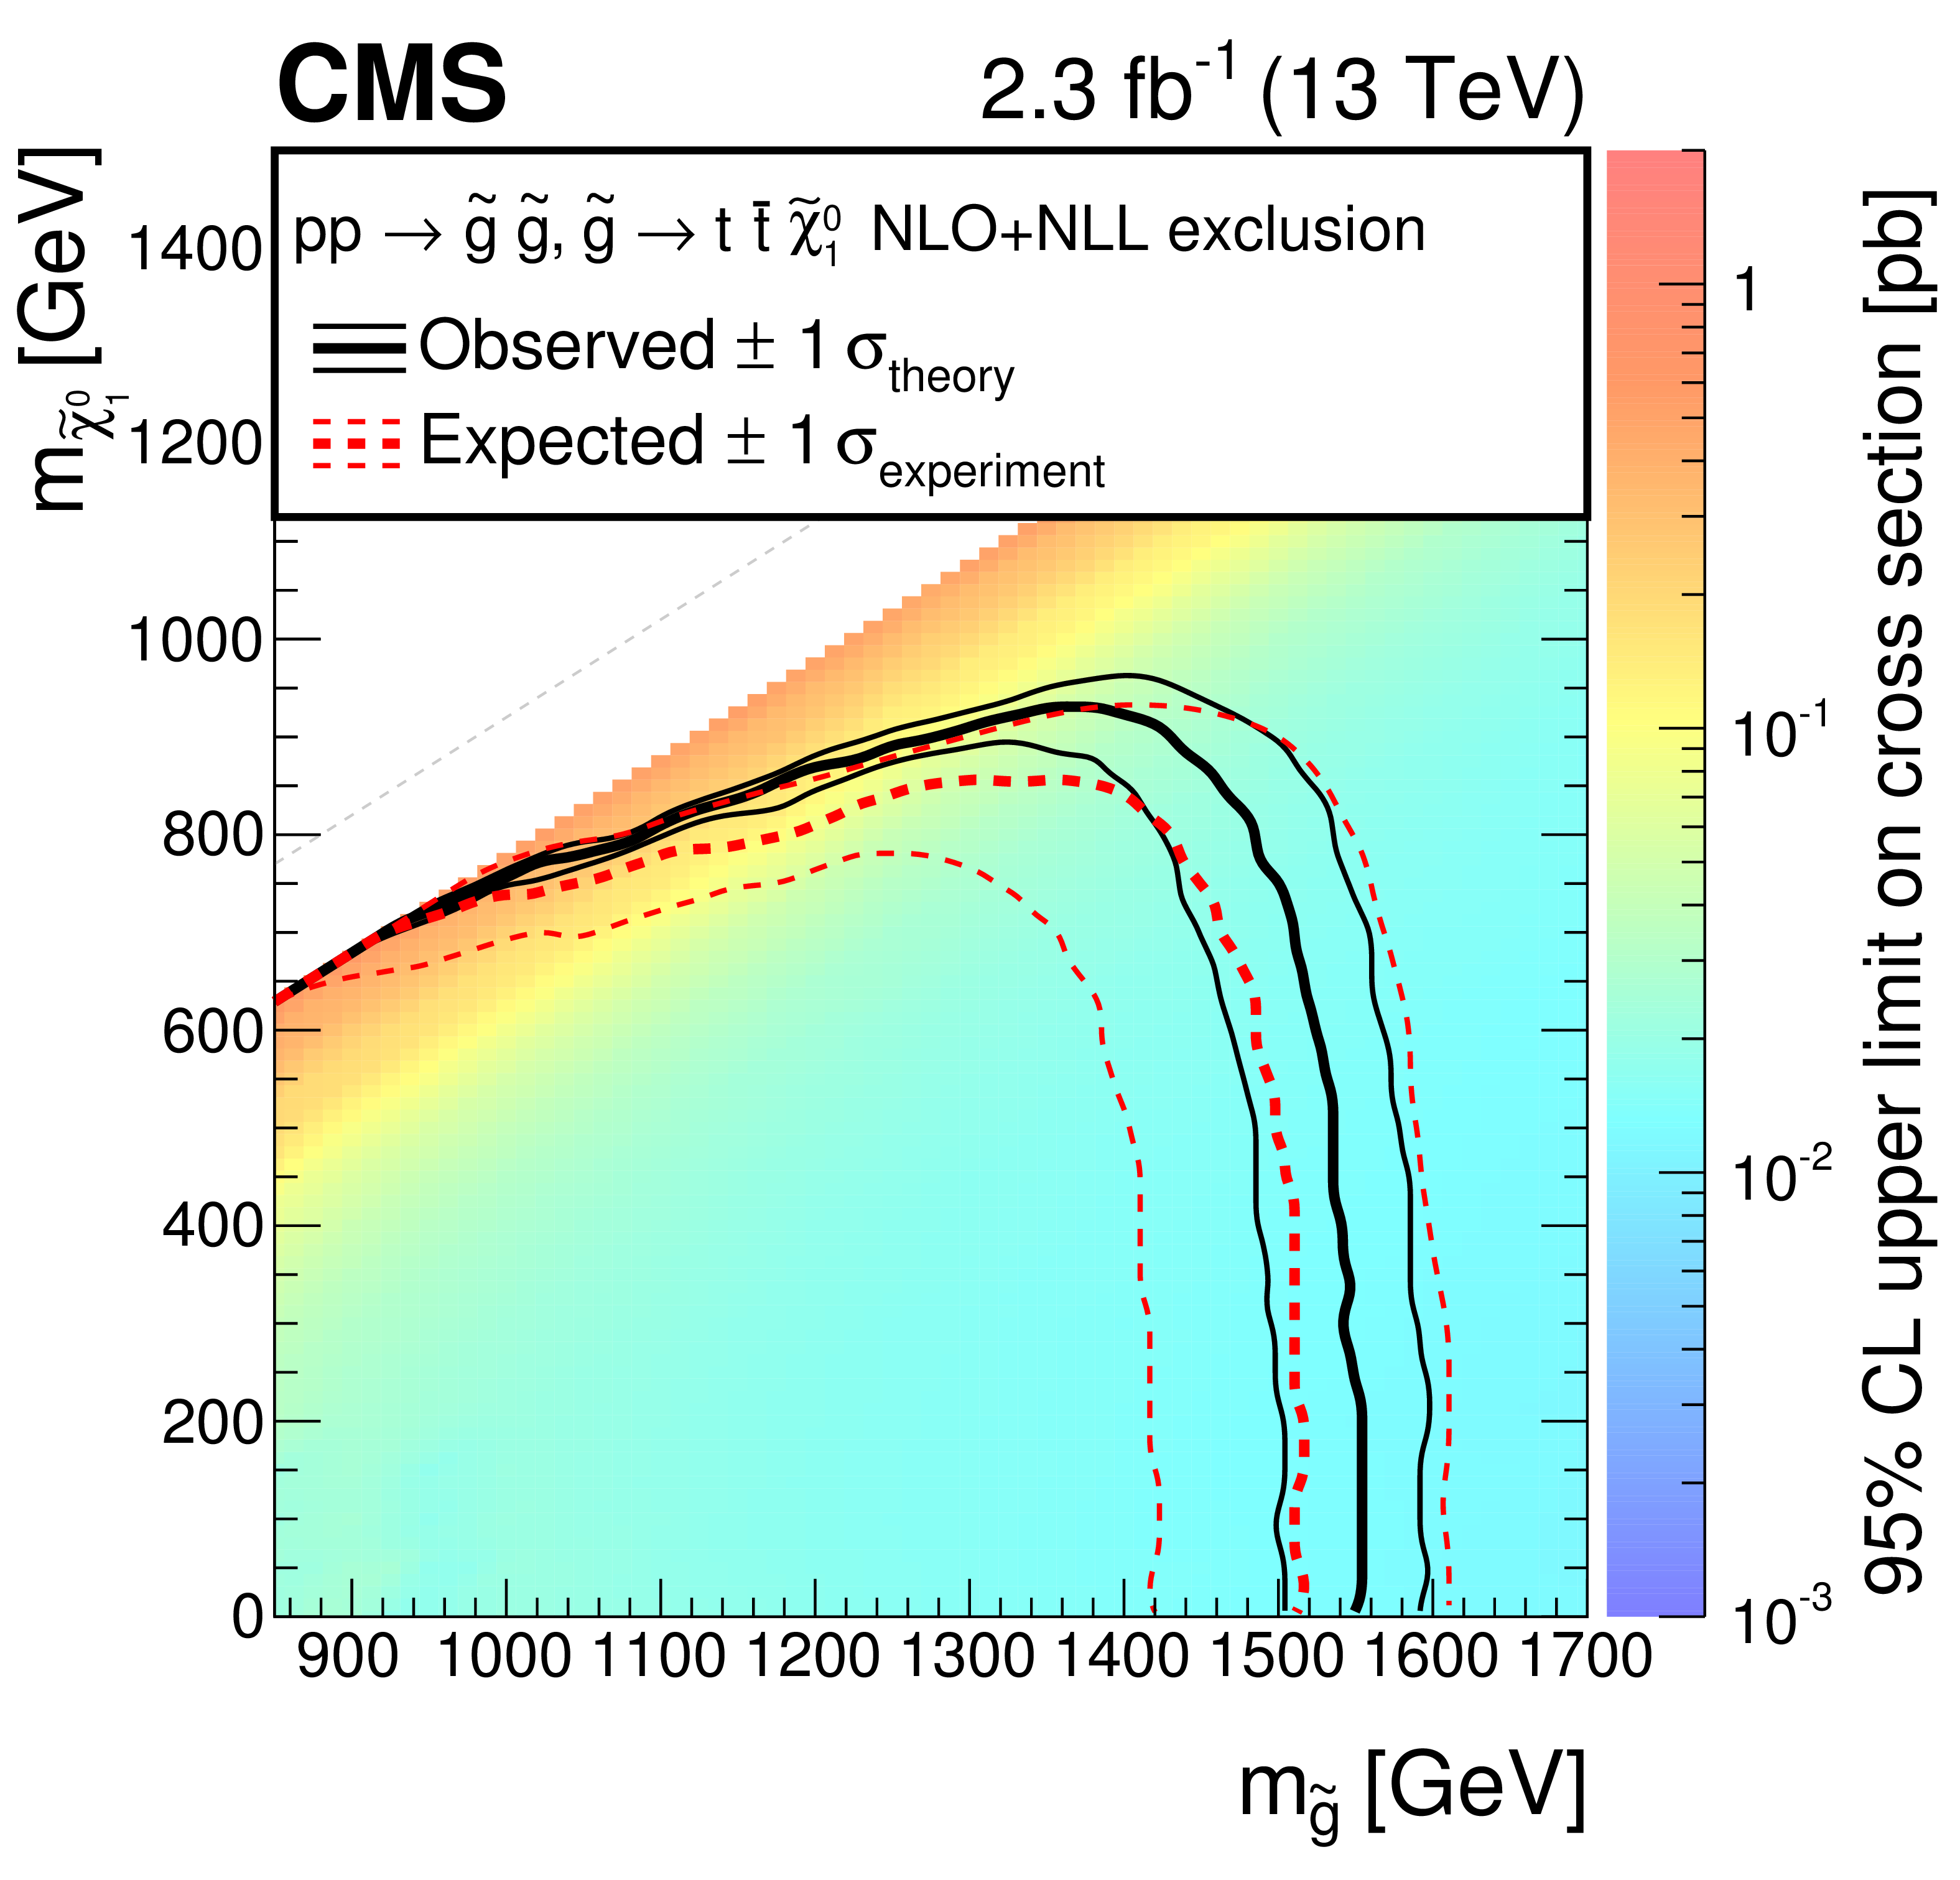
Figure 13:
Exclusion limits at 95% CL for simplified models of top squarks produced via decays of gluino pairs in the T1tttt (left) and T5ttcc (right) scenarios. The solid black curves represent the observed exclusion contour with respect to NLO+NLL cross section calculations [89] and the corresponding $\pm $1 standard deviation uncertainties. The dashed red curves indicate the expected exclusion contour and the $\pm $1 standard deviation uncertainties including experimental uncertainties. |
png pdf root |
Figure 13-a:
Exclusion limits at 95% CL for simplified models of top squarks produced via decays of gluino pairs in the T1tttt scenario. The solid black curves represent the observed exclusion contour with respect to NLO+NLL cross section calculations [89] and the corresponding $\pm $1 standard deviation uncertainties. The dashed red curves indicate the expected exclusion contour and the $\pm $1 standard deviation uncertainties including experimental uncertainties. |

png pdf root |
Figure 13-b:
Exclusion limits at 95% CL for simplified models of top squarks produced via decays of gluino pairs in the T5ttcc scenario. The solid black curves represent the observed exclusion contour with respect to NLO+NLL cross section calculations [89] and the corresponding $\pm $1 standard deviation uncertainties. The dashed red curves indicate the expected exclusion contour and the $\pm $1 standard deviation uncertainties including experimental uncertainties. |
| Tables | |
png pdf |
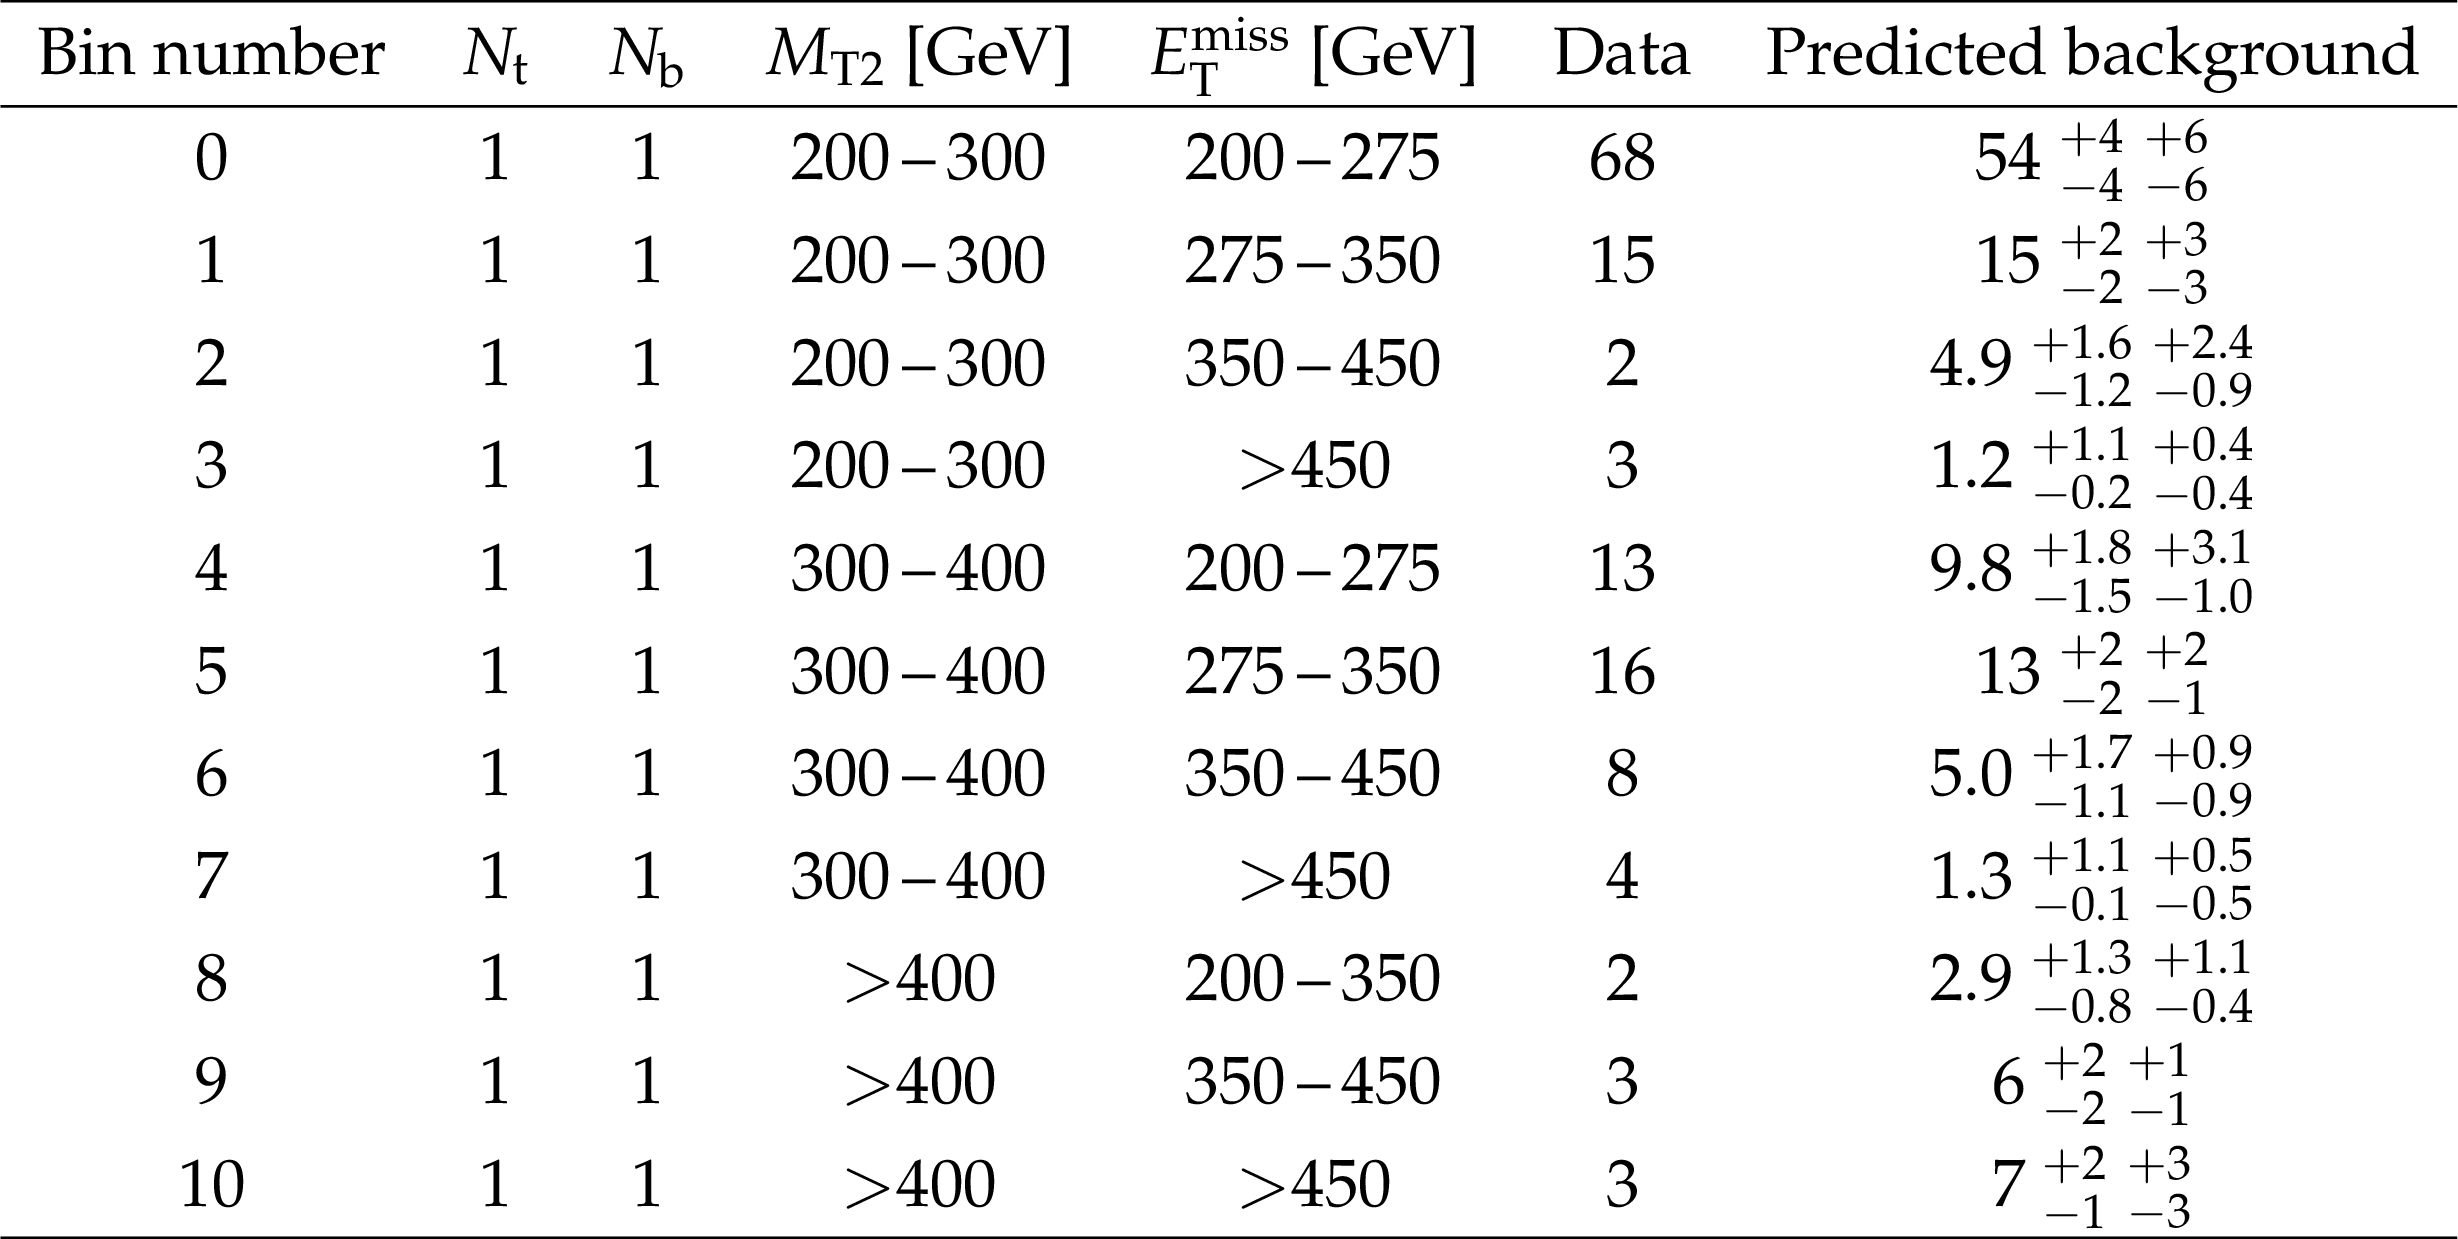
Table 1:
Observed yields from the data compared to the total background predictions for the search bins that are common between the direct top squark and gluino-mediated production optimizations. The quoted uncertainties on the predicted background yields are statistical and systematic, respectively. |
png pdf |
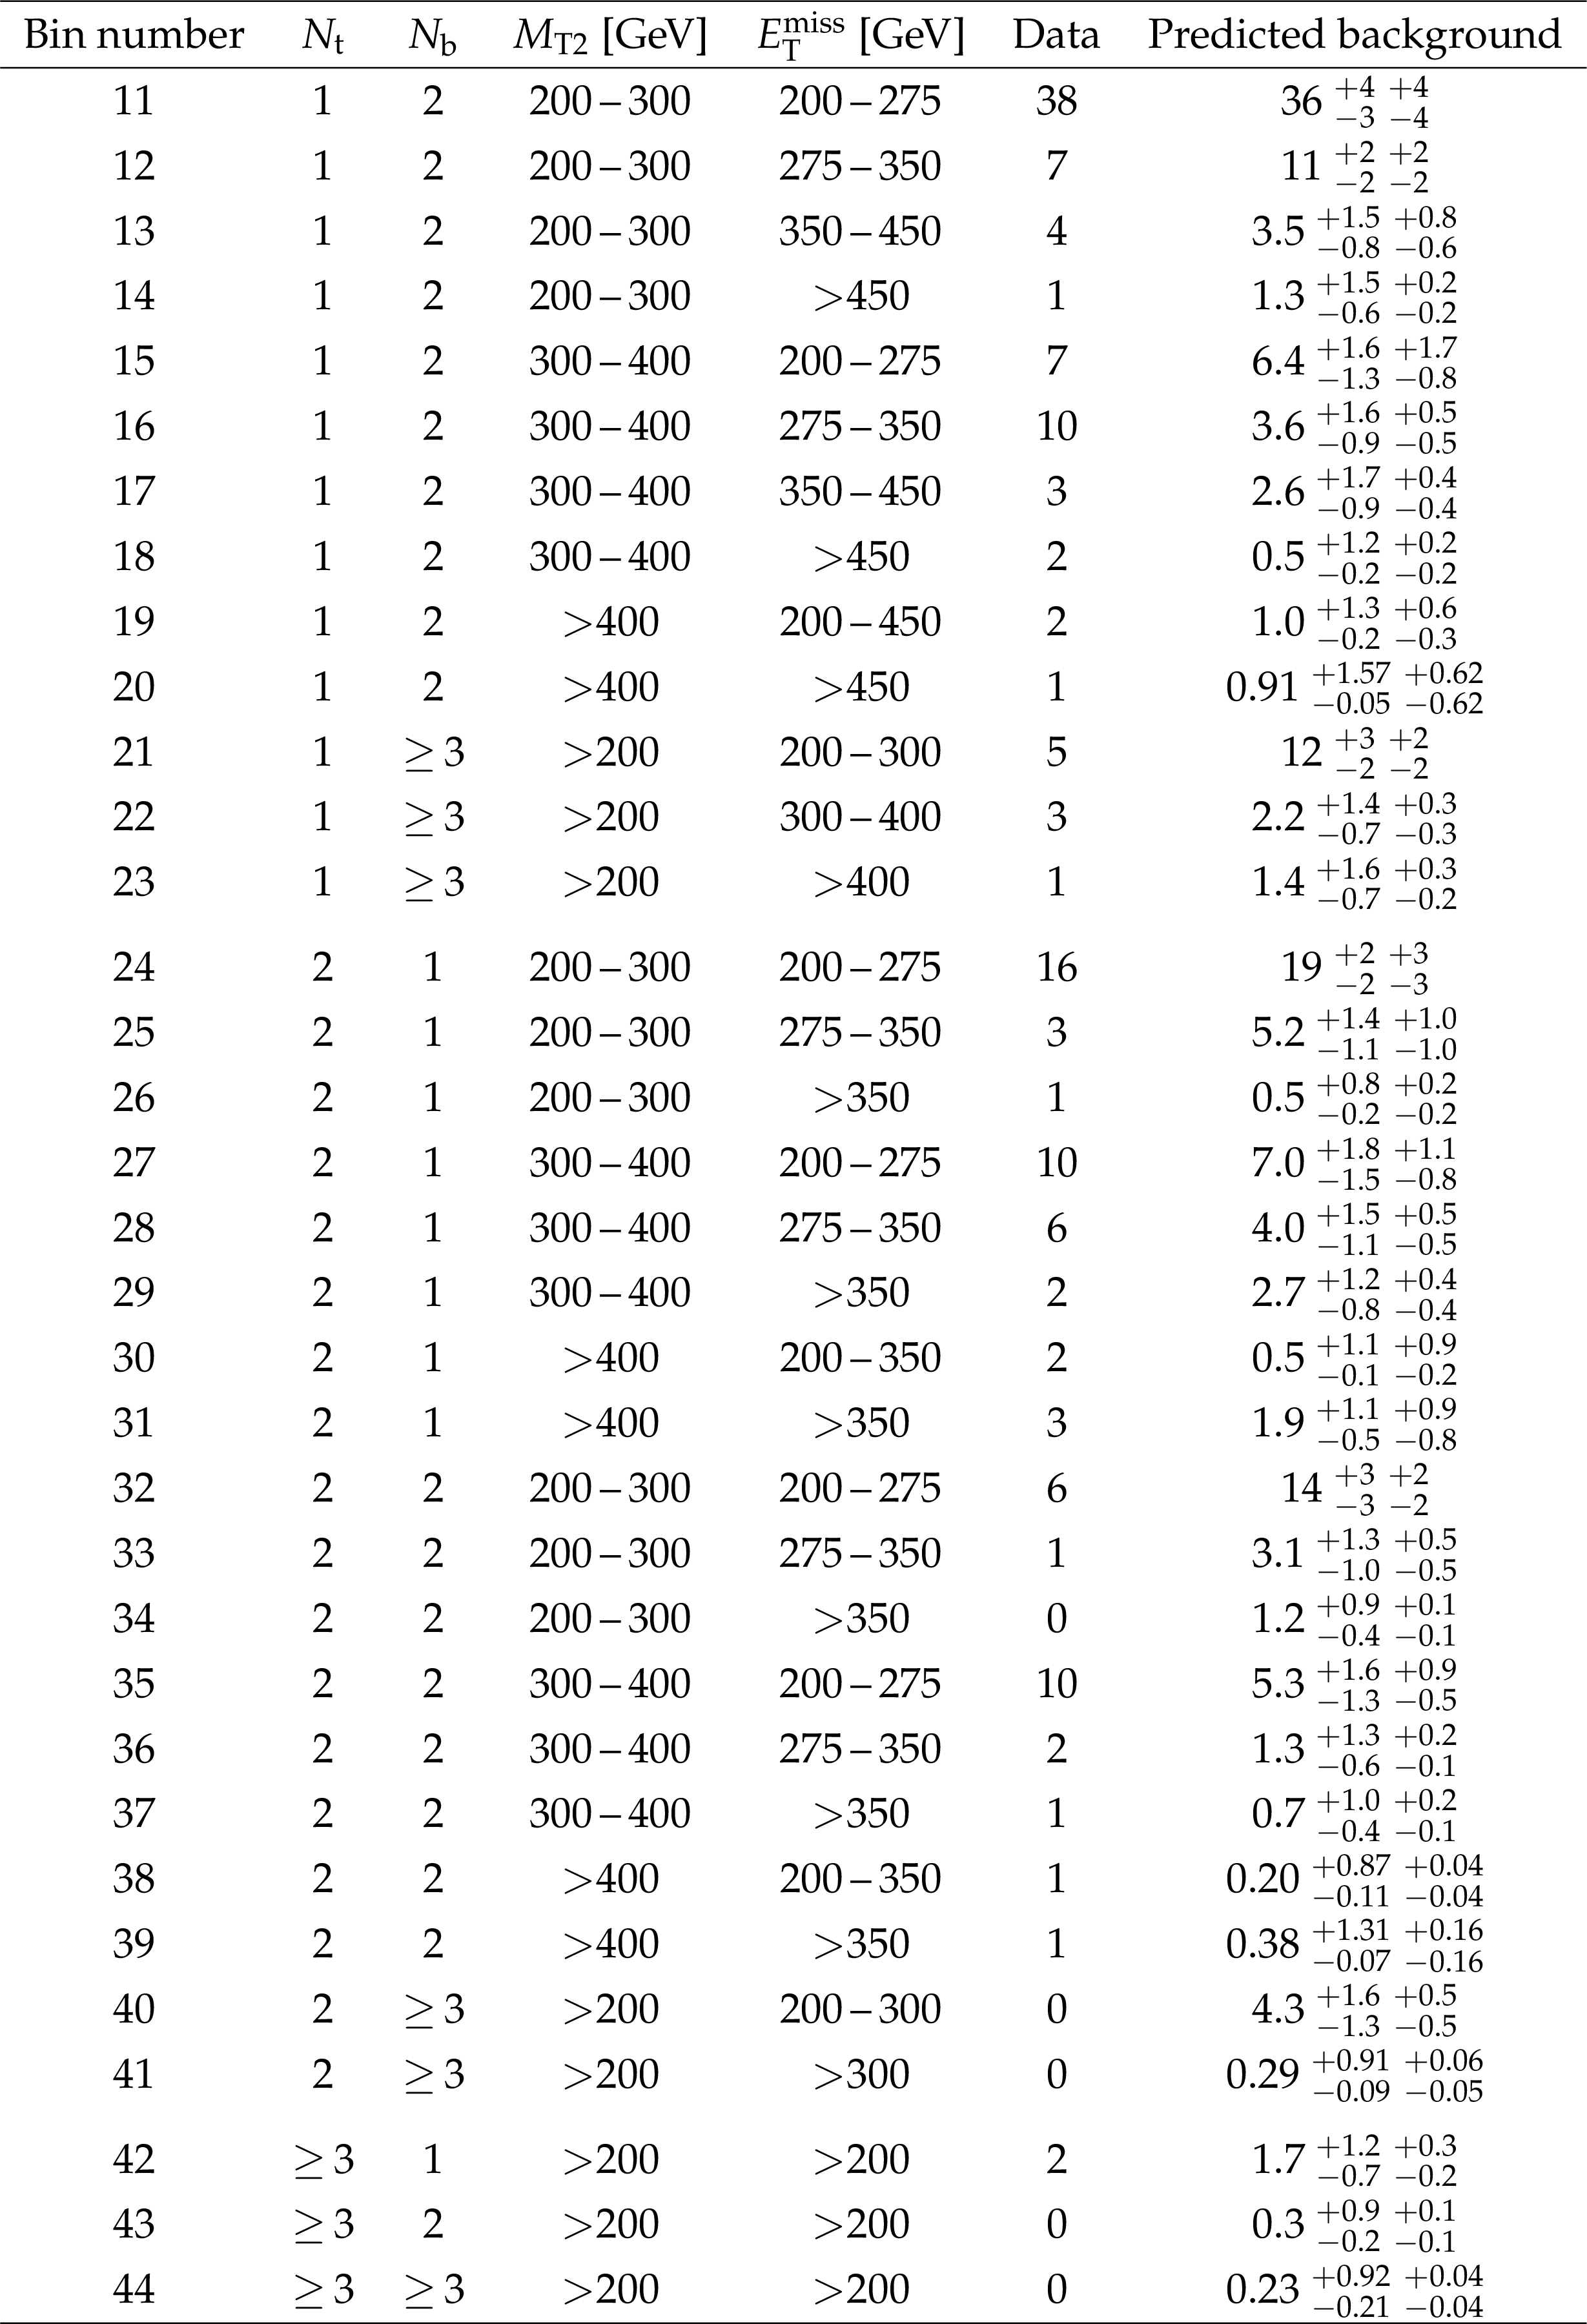
Table 2:
Observed yields from the data compared to the total background predictions for the search bins that are specific to the direct top squark production optimization. The quoted uncertainties on the predicted background yields are statistical and systematic, respectively. |
png pdf |
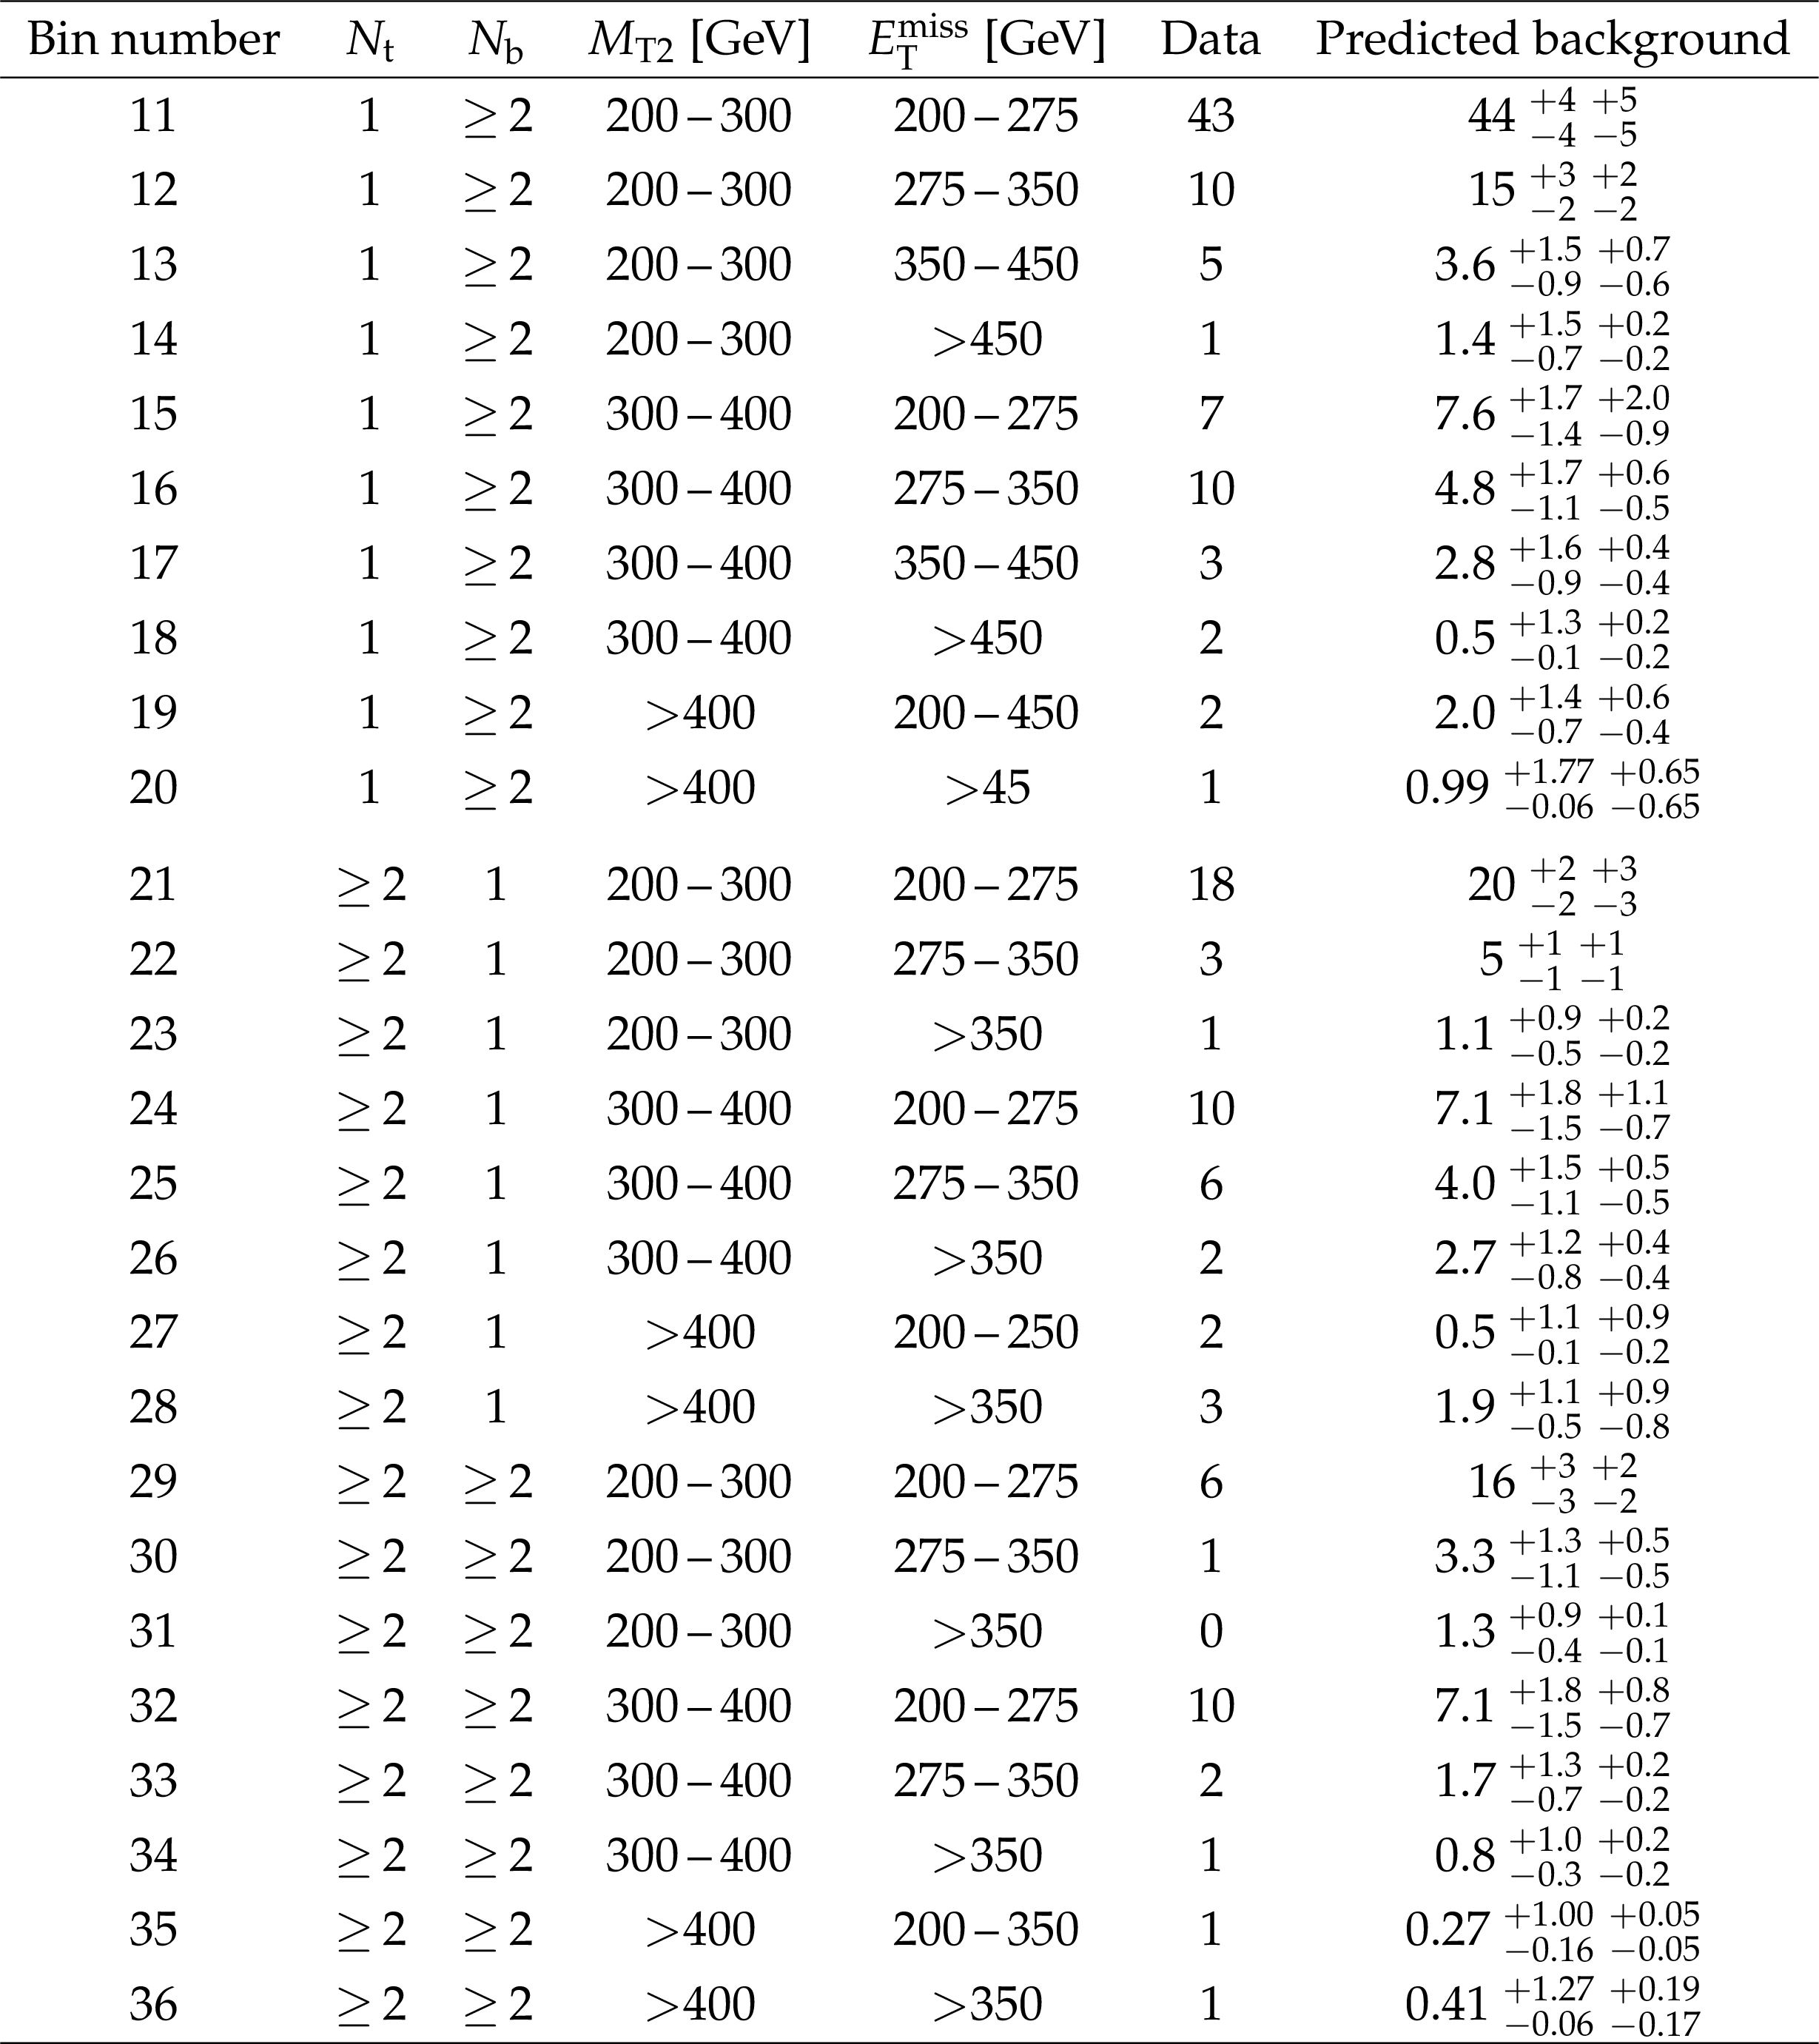
Table 3:
Observed yields from the data compared to the total background predictions for the search bins that are specific to the gluino-mediated production optimization. The quoted uncertainties on the predicted background yields are statistical and systematic, respectively. |
| Summary |
| Results have been presented from a search for direct and gluino-mediated top squark production in final states that include tagged top quark decays. The search uses all-hadronic events with at least four jets and a large imbalance in transverse momentum ($E_{\mathrm{T}}^{\text{miss}}$), selected from data corresponding to an integrated luminosity of 2.3 fb$^{-1}$ collected in proton-proton collisions at a center-of-mass energy of 13 TeV with the CMS detector. A set of search regions is defined based on $E_{\mathrm{T}}^{\text{miss}}$, ${M_{\mathrm{T2}}} $, the number of top quark tagged objects, and the number of b-tagged jets. No statistically significant excess of events is observed above the expected standard model background. Exclusion limits are set at 95% confidence level for simplified models of direct top squark pair production and of gluino pair production, where the gluinos decay to final states that include top quarks. For simplified models of pair production of top squarks, which decay to a top quark and a neutralino (T2tt), top squark masses of up to 740 GeV and neutralino masses up to 240 GeV are excluded at 95% confidence level. For models that assume 50% branching fractions for top squark decays to a top quark and a neutralino, or to a bottom quark and a chargino that is nearly degenerate in mass with the neutralino (T2tb), top squark masses of up to 610 GeV and neutralino masses up to 190 GeV are also excluded. For simplified models of gluino pair production where each gluino decays to a top-antitop quark pair and a neutralino (T1tttt), gluino masses of up to 1550 GeV, and neutralino masses up to 900 GeV are excluded. Gluino masses of up to 1450 GeV, and neutralino masses up to 820 GeV are excluded for models in which the gluino decays to an on-shell top squark and a top quark, and the top squarks decays to a charm quark and a neutralino (T5ttcc). These are among the most restrictive currently available limits. |
| Additional Figures | |
png pdf |
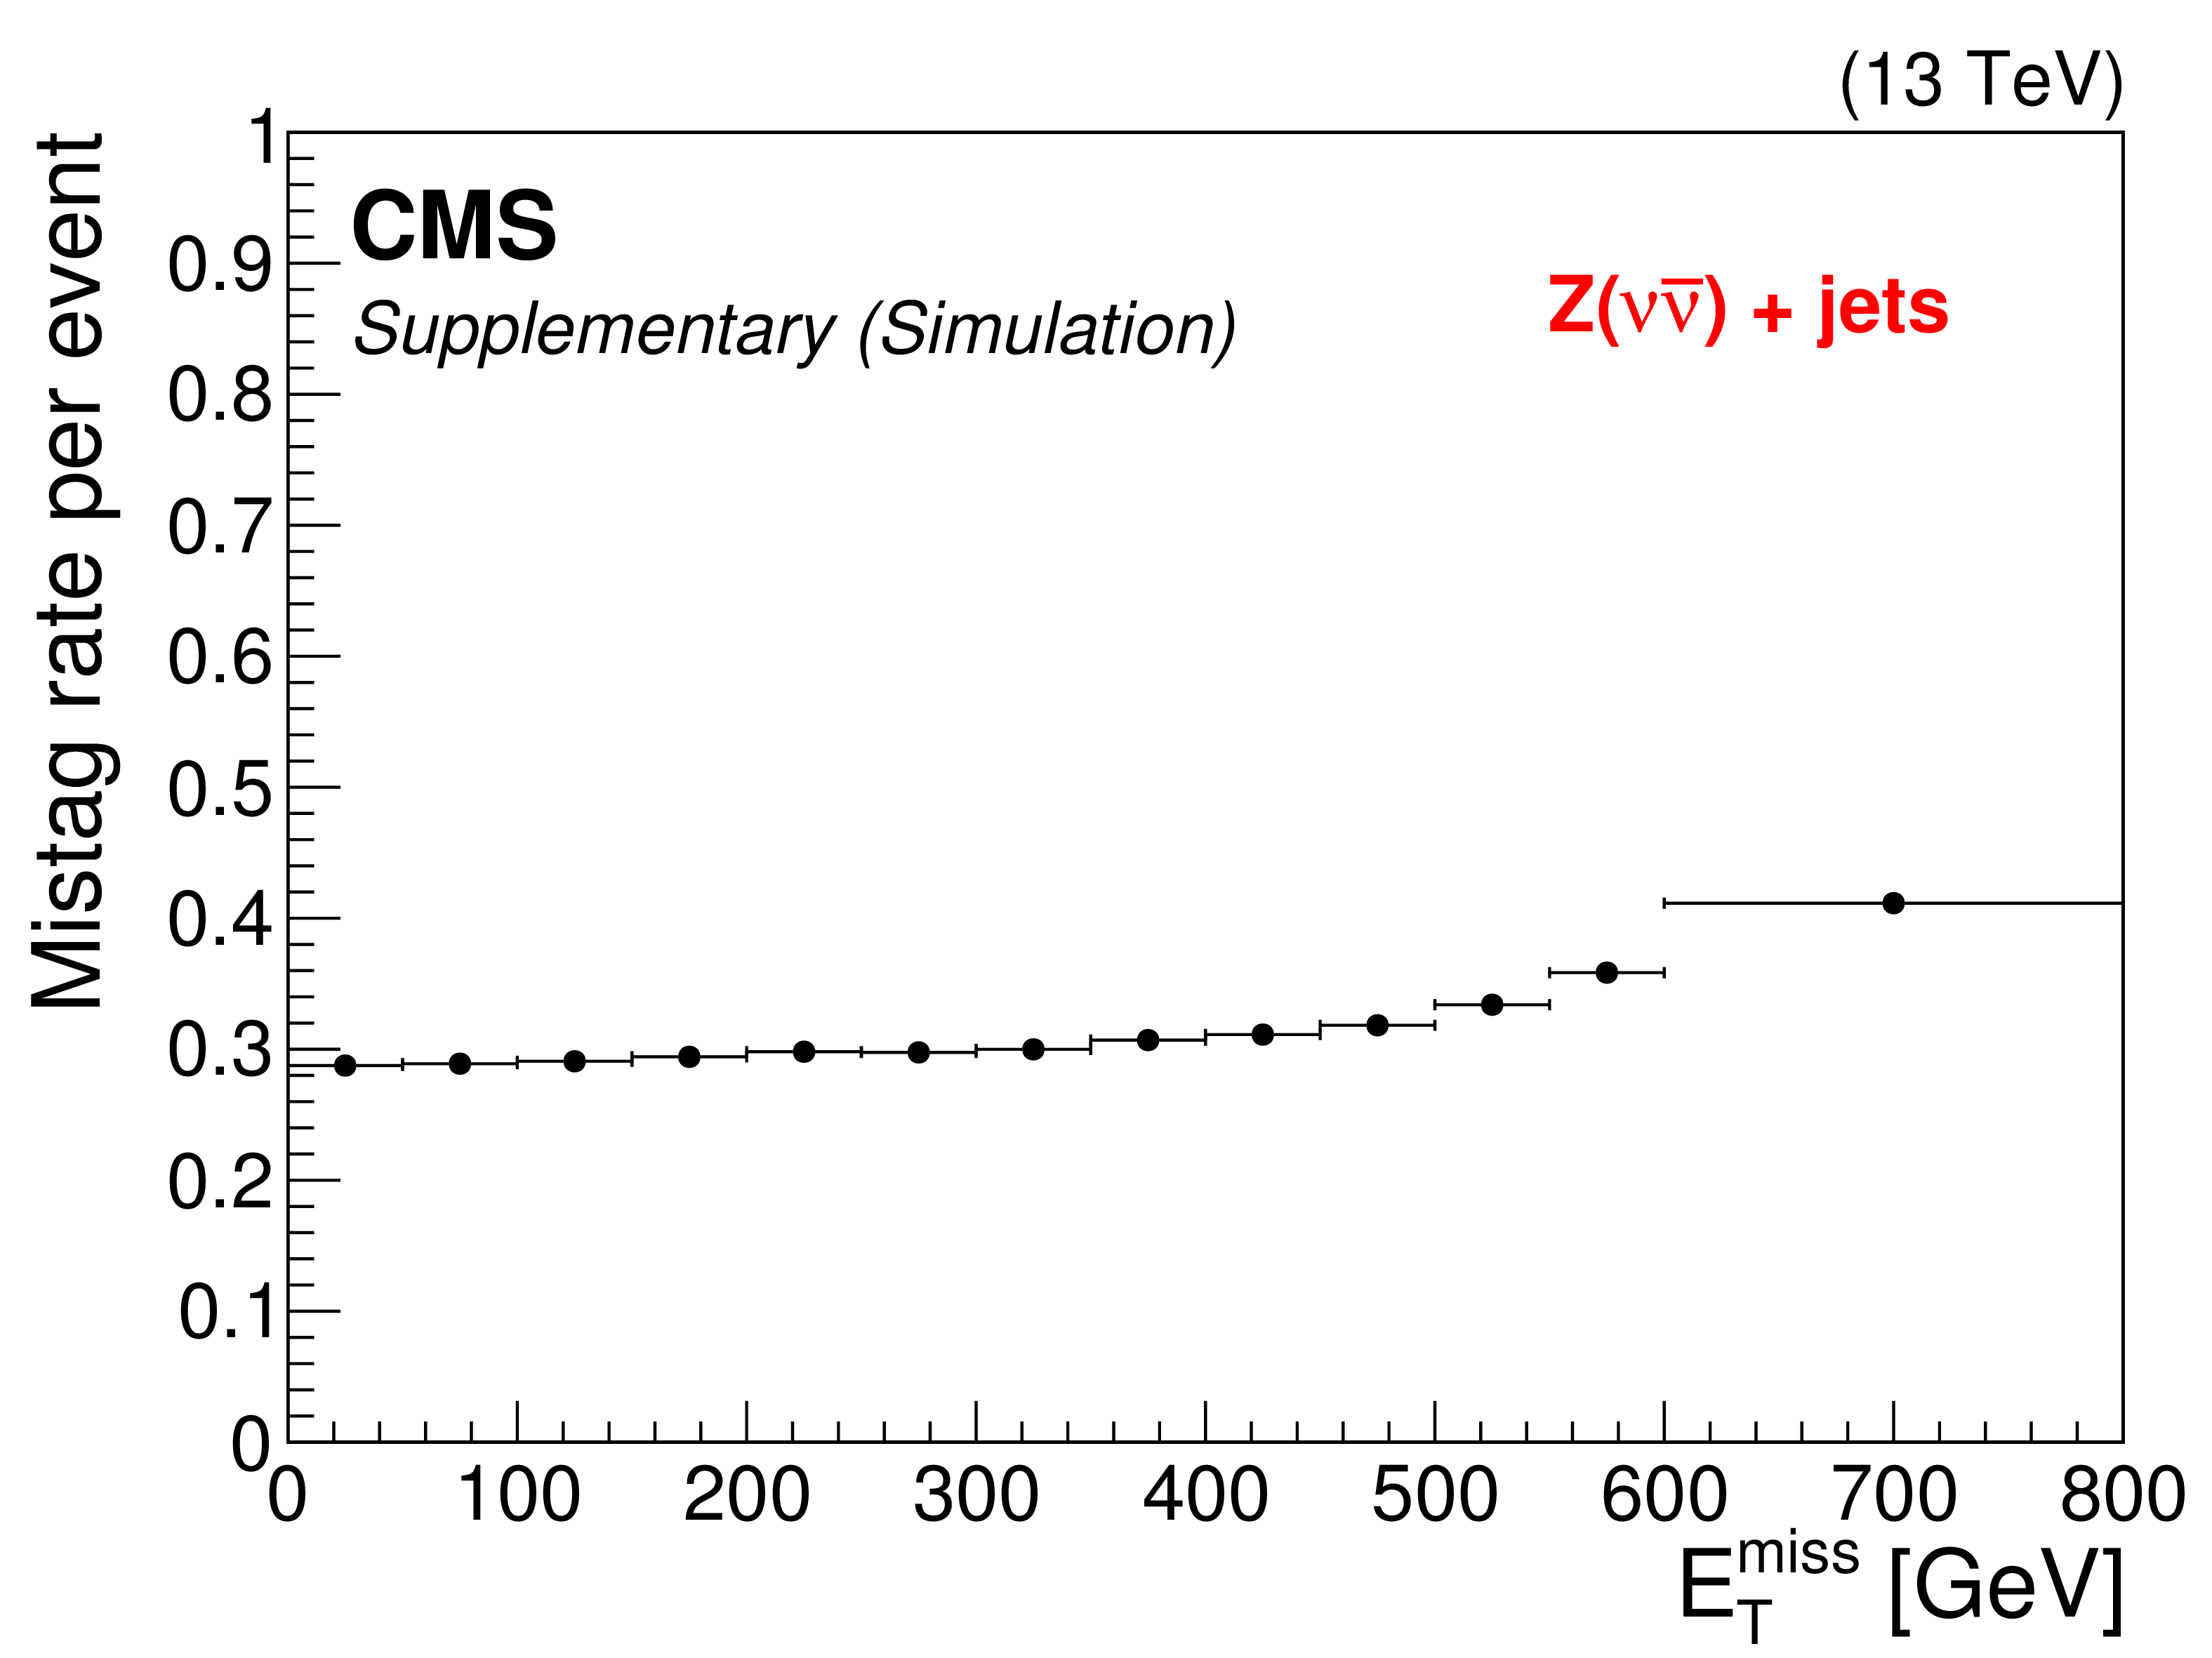
Additional Figure 1:
The event mistag rate of the top quark tagger as a function of $E_\text {T}^\text {miss}$ in the $\mathrm{ Z } \rightarrow \nu \nu $ simulated sample, with the following event selection requirements applied: $N_{\text {j}} \ge $ 4 for $ {p_{\mathrm {T}}} > $ 30 GeV, $|\eta | < $ 2.4 and $N_{\text {j}} \ge $ 2 for $ {p_{\mathrm {T}}} > $ 50 GeV, $|\eta | < $ 2.4; no electrons, muons, or isolated tracks; $\Delta \phi (E_\text {T}^\text {miss}, \text {jets})$ matching preselection requirements; and $N_{\text {b}} \ge $ 1. |
png pdf |
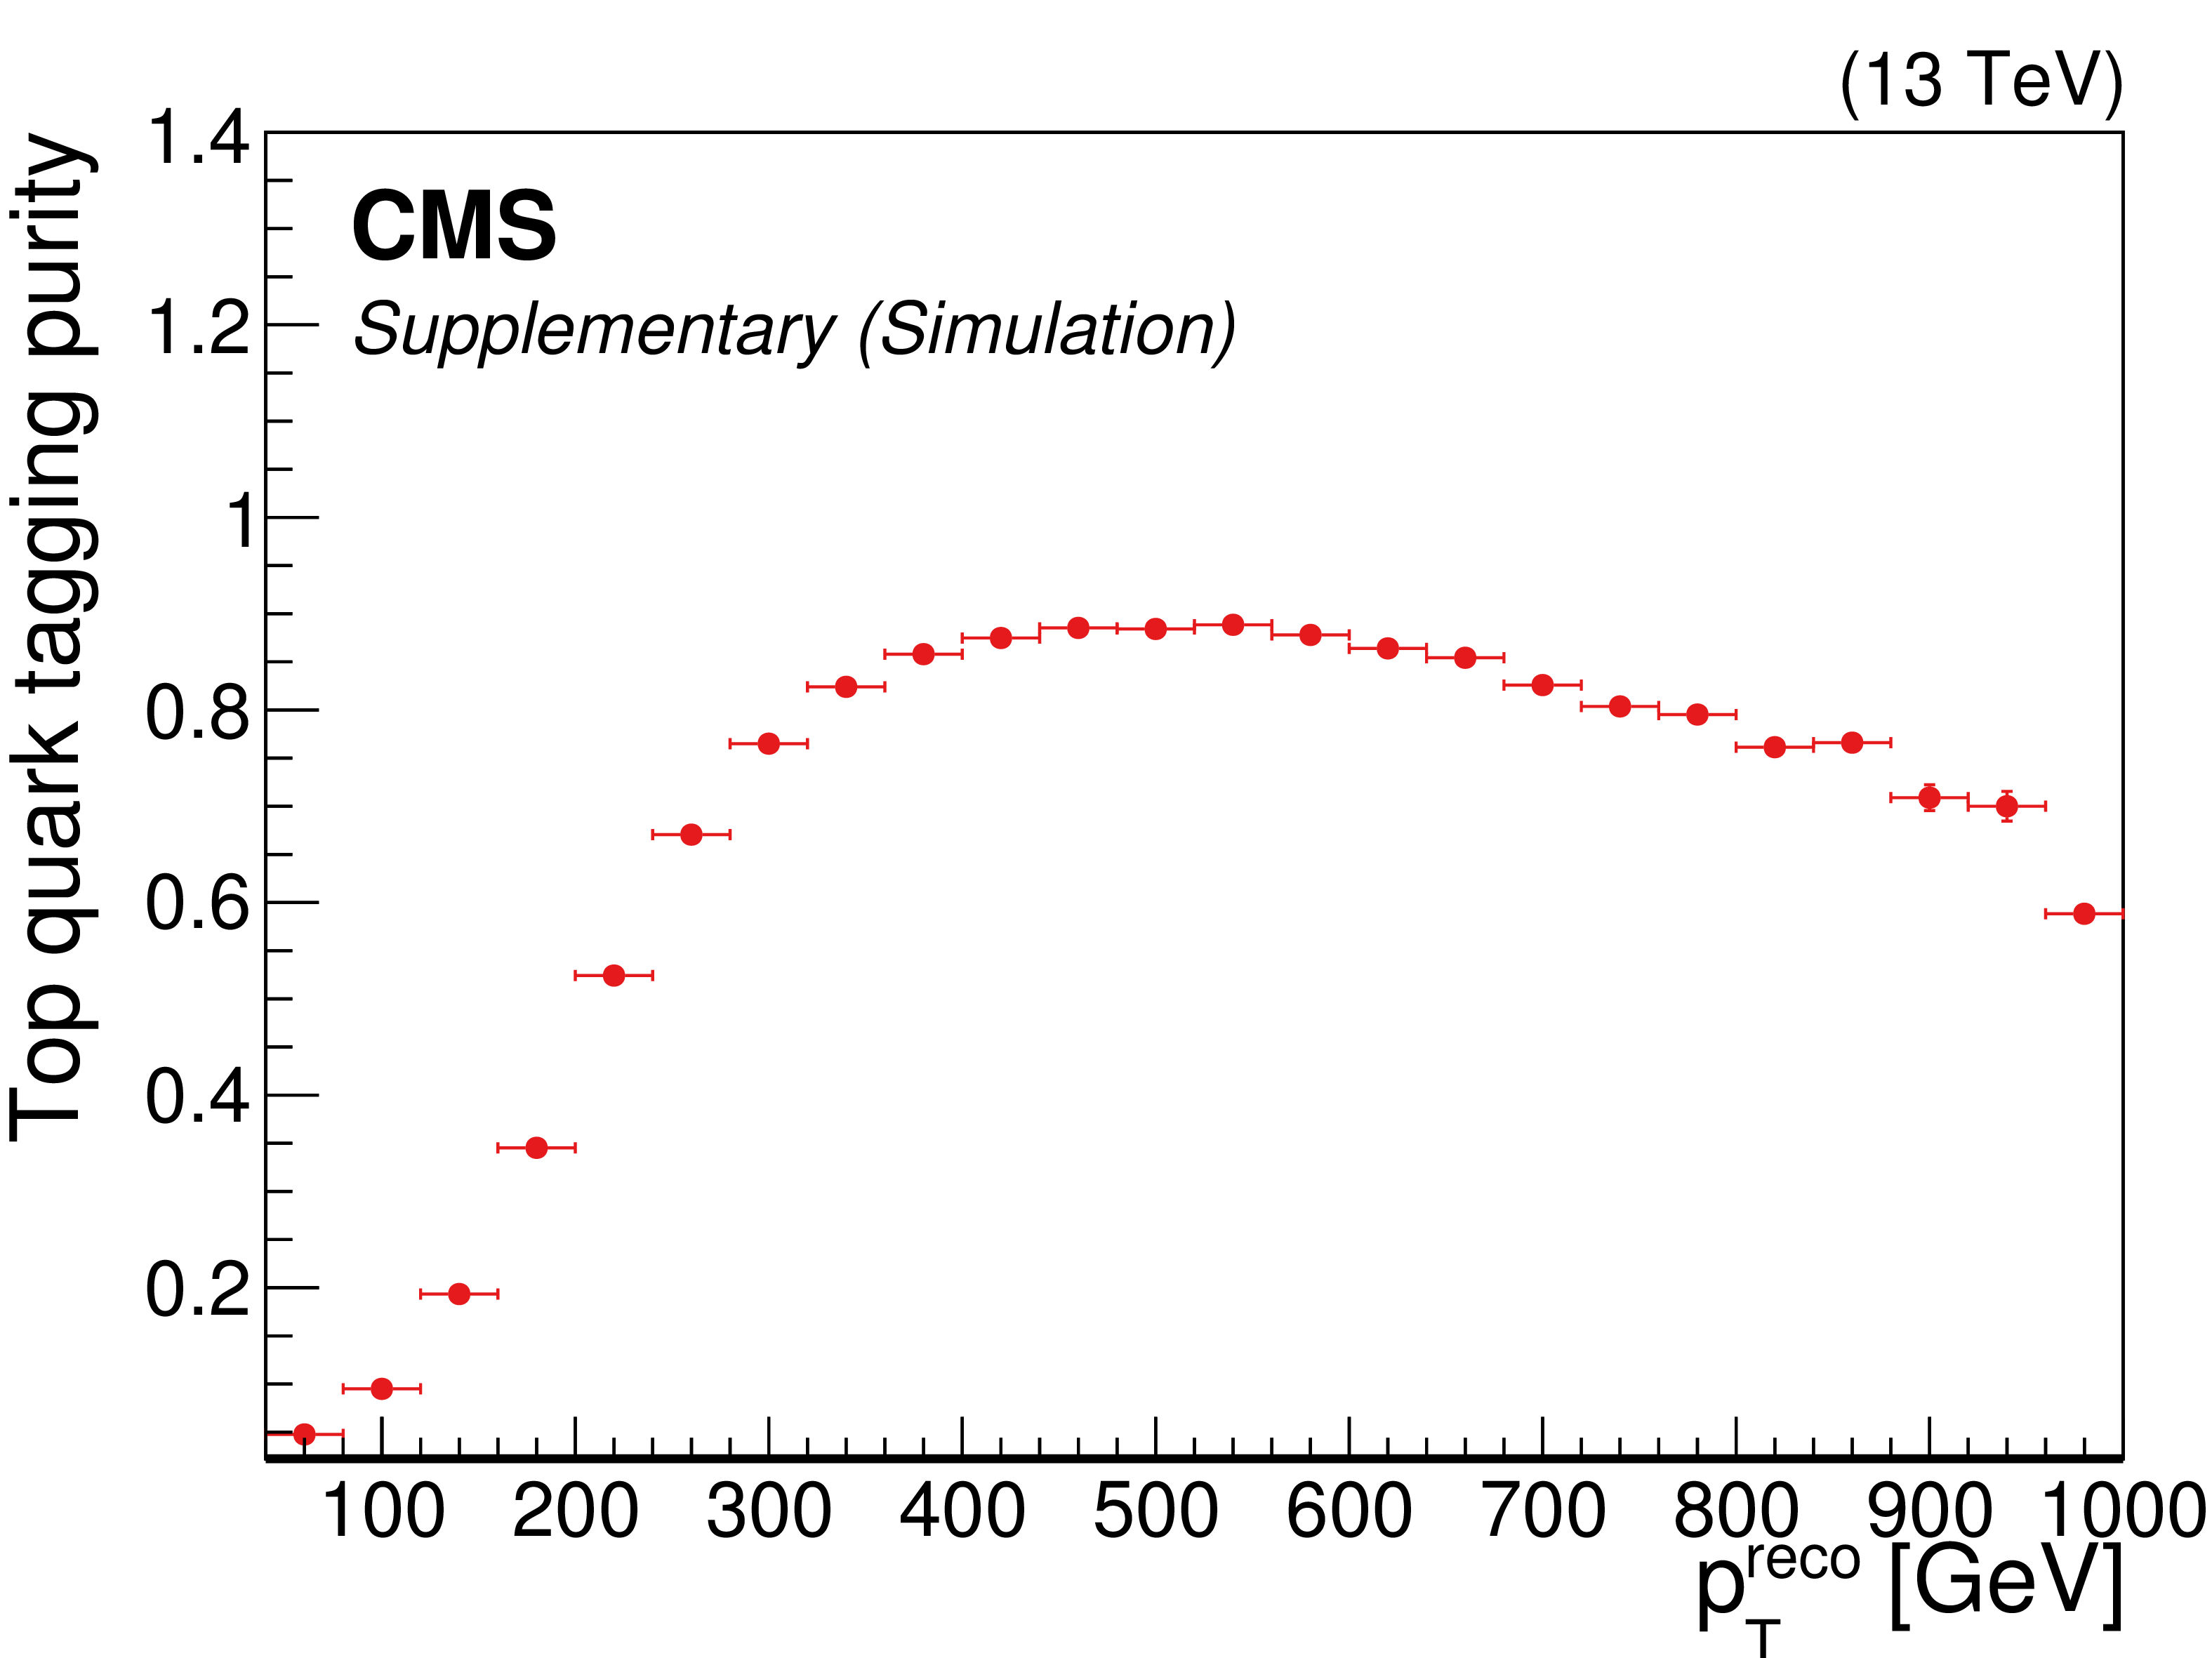
Additional Figure 2:
The purity of the top quark tagger as a function of the reconstructed top quark $p_{\text {T}}$. The purity is defined as the fraction of reconstructed top quarks that are matched to a generator-level hadronically decaying top quark within a cone of $\Delta R=$ 0.4, and was measured in a sample of simulated one-lepton $\mathrm{ t \bar{t} } $ events. The following event selection requirements were applied: $N_{\text {j}} \ge $ 4 for $ {p_{\mathrm {T}}} > $ 30 GeV, $|\eta | < $ 2.4 and $N_{\text {j}} \ge $ 2 for $ {p_{\mathrm {T}}} > $ 50 GeV, $|\eta | < $ 2.4; $N_{\text {b}} \ge $ 1; and $E_\text {T}^\text {miss}> $ 200 GeV. |
png pdf |
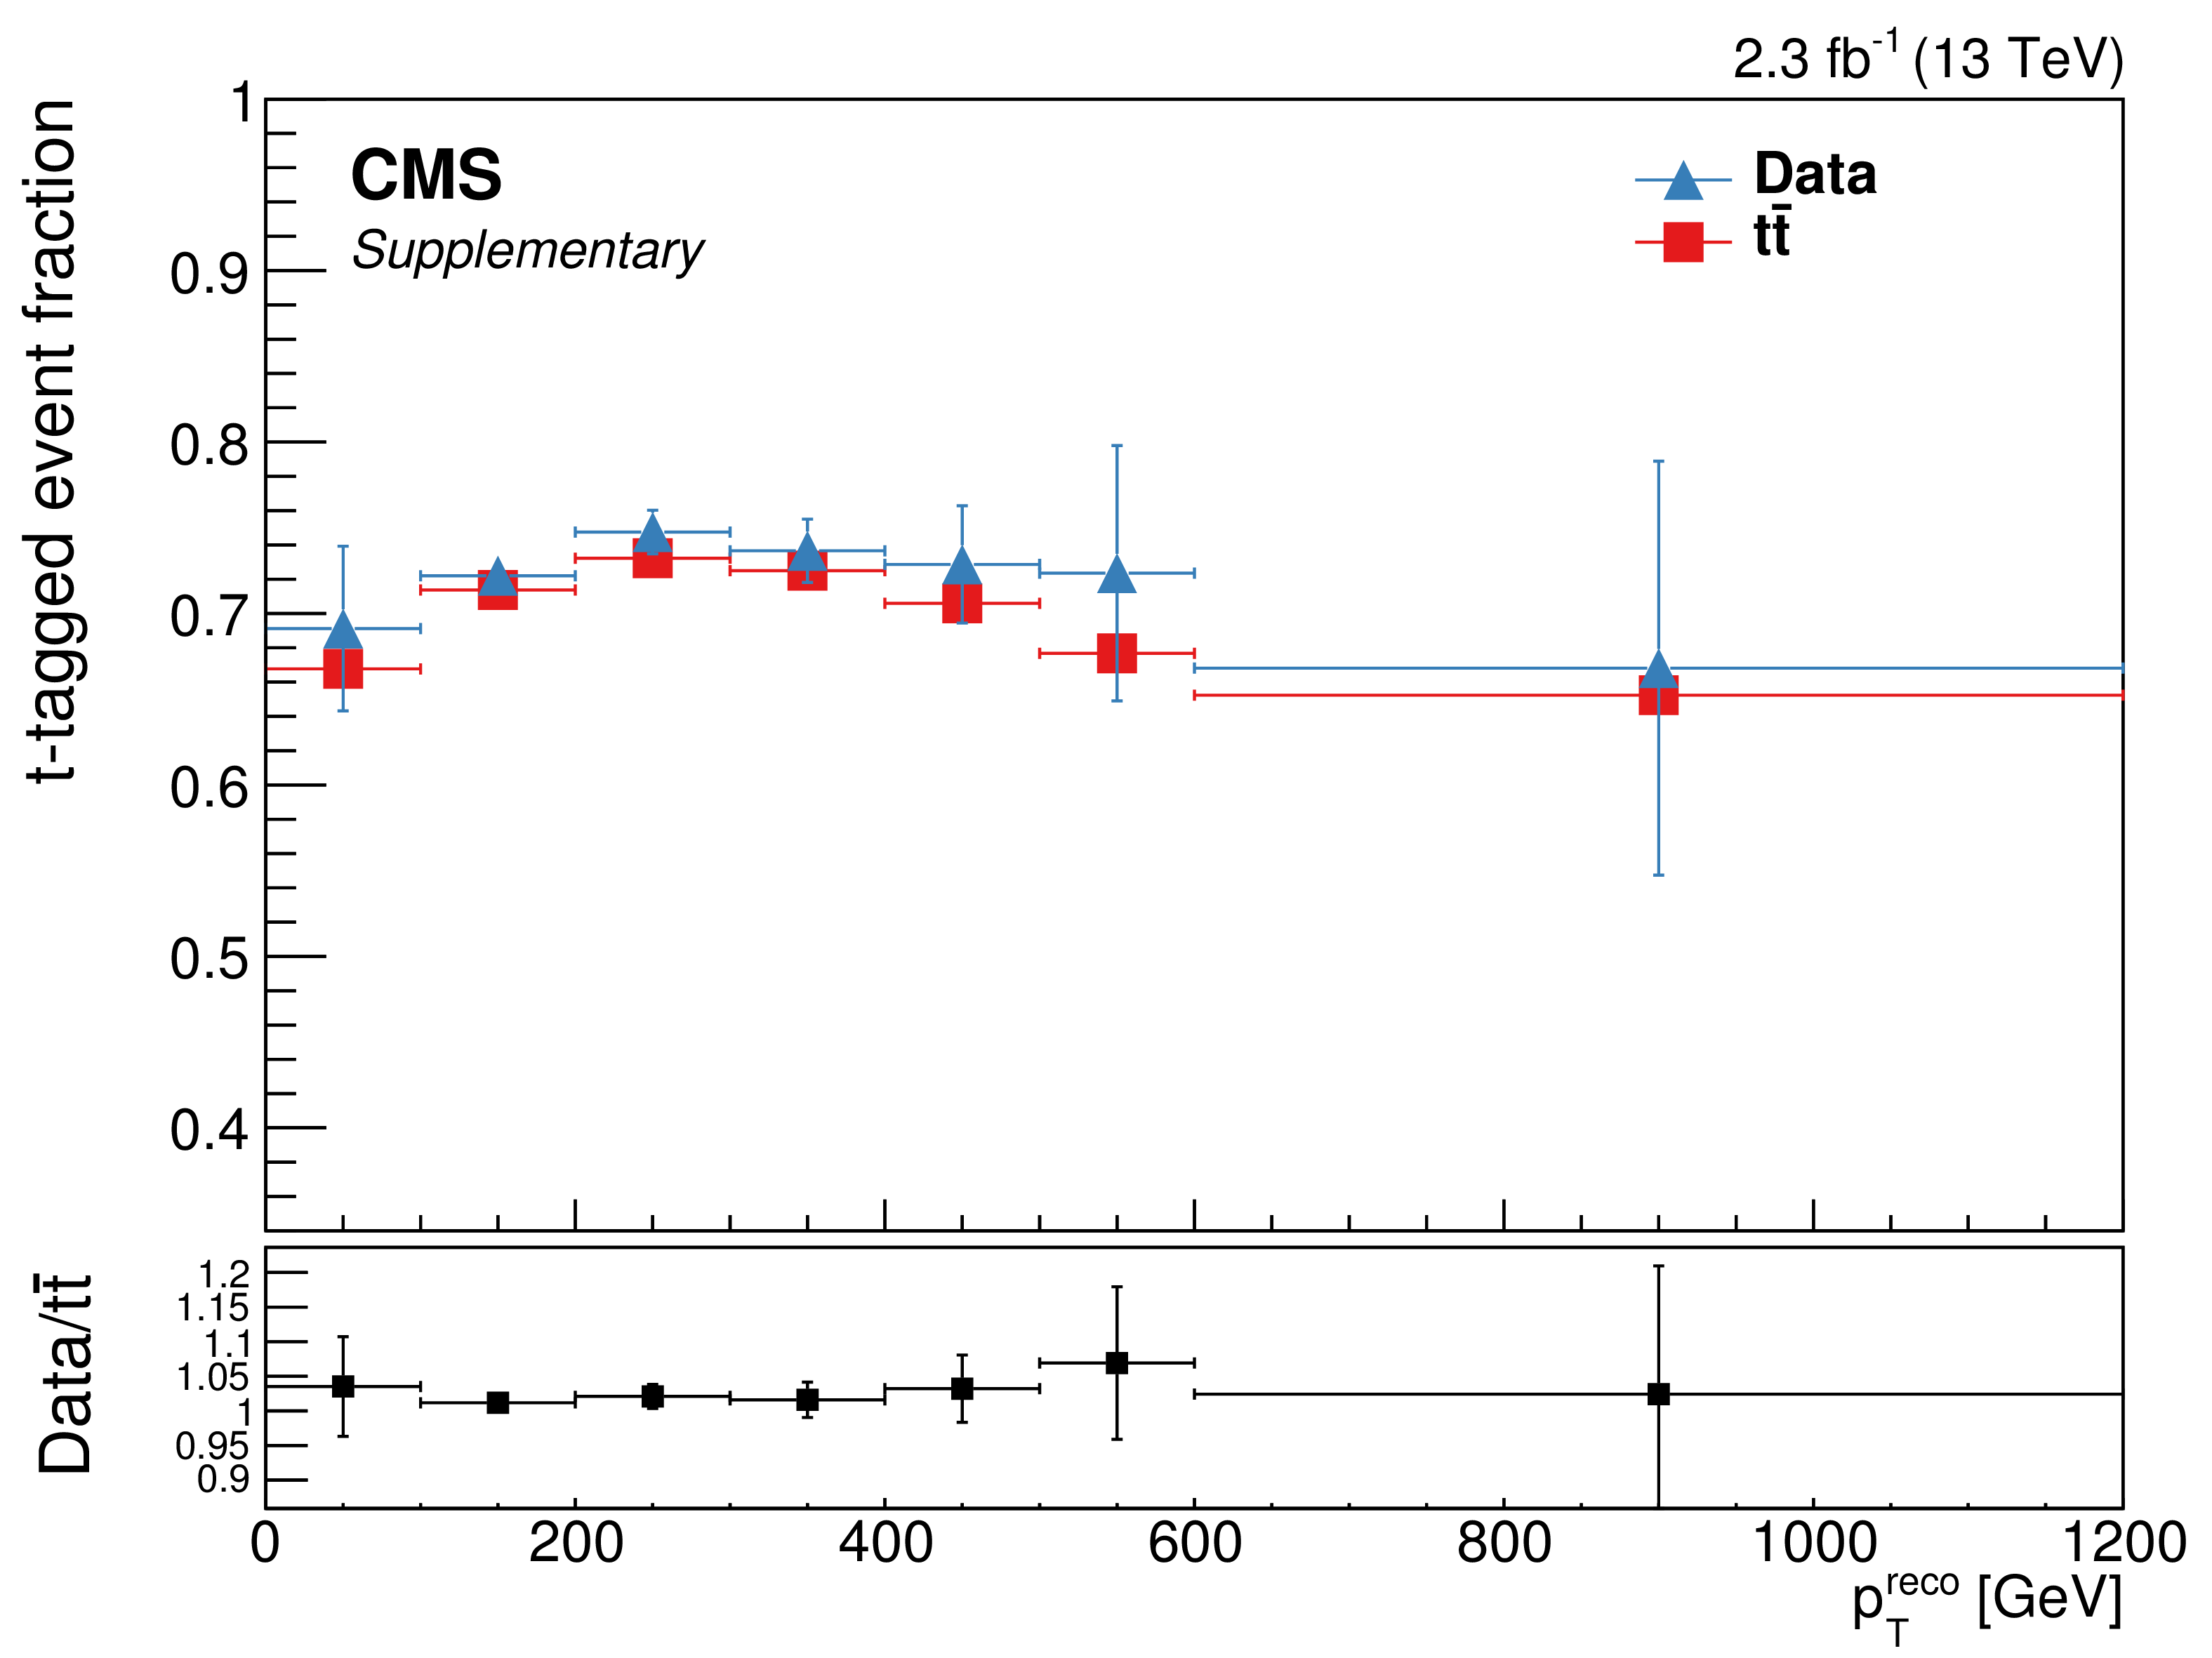
Additional Figure 3:
The t-tagged event fraction measured in data and $\mathrm{ t \bar{t} } $ simulated samples, as a function of the reconstructed top quark candidate ${p_{\mathrm {T}}} $. The data are selected from a single muon dataset with the following selection applied: events pass noise filters; $N_{\text {j}} \ge $ 4 for $ {p_{\mathrm {T}}} > $ 30 GeV, $|\eta | < $ 2.4 and $N_{\text {j}} \ge $ 2 for $ {p_{\mathrm {T}}} > $ 50 GeV, $|\eta | < $ 2.4; at least one muon with $ {p_{\mathrm {T}}} > $ 45 GeV, $|\eta | < $ 2.1; no electrons; muon $ {p_{\mathrm {T}}} + E_\text {T}^\text {miss} > $ 150 GeV; $\Delta \phi (E_\text {T}^\text {miss}, \text {jets})$ matching preselection requirements; $N_{\text {b}} \ge $ 1; and $E_\text {T}^\text {miss} > $ 20 GeV. We also require the presence of at least one candidate from the t-tagger in the event. This candidate can be either: (i) a trijet candidate, composed of three jets with $p_\text {T}> $ 30 GeV that are within $\Delta R= $ 1.5 of the candidate four-momentum, (ii) a dijet candidate, composed of two jets that are within $\Delta R= $ 1.5 of the candidate four-momentum, one of which should have a mass between 70 and 110 GeV, or (iii) a monojet candidate, which is simply a single jet with a mass between 110 and 220 GeV. The candidate used to compute the t-tagged event fraction is the candidate whose mass is closest to the top quark mass. The t-tagged event fraction then is defined as the fraction of events for which this top quark candidate satisfies all requirements of the top quark tagging algorithm. The error bar depicts the statistical uncertainty. The ratio of the t-tagged event fraction in data and simulated $\mathrm{ t \bar{t} } $ is shown in the lower plot, indicating good agreement. |
| Additional Tables | |
png pdf |
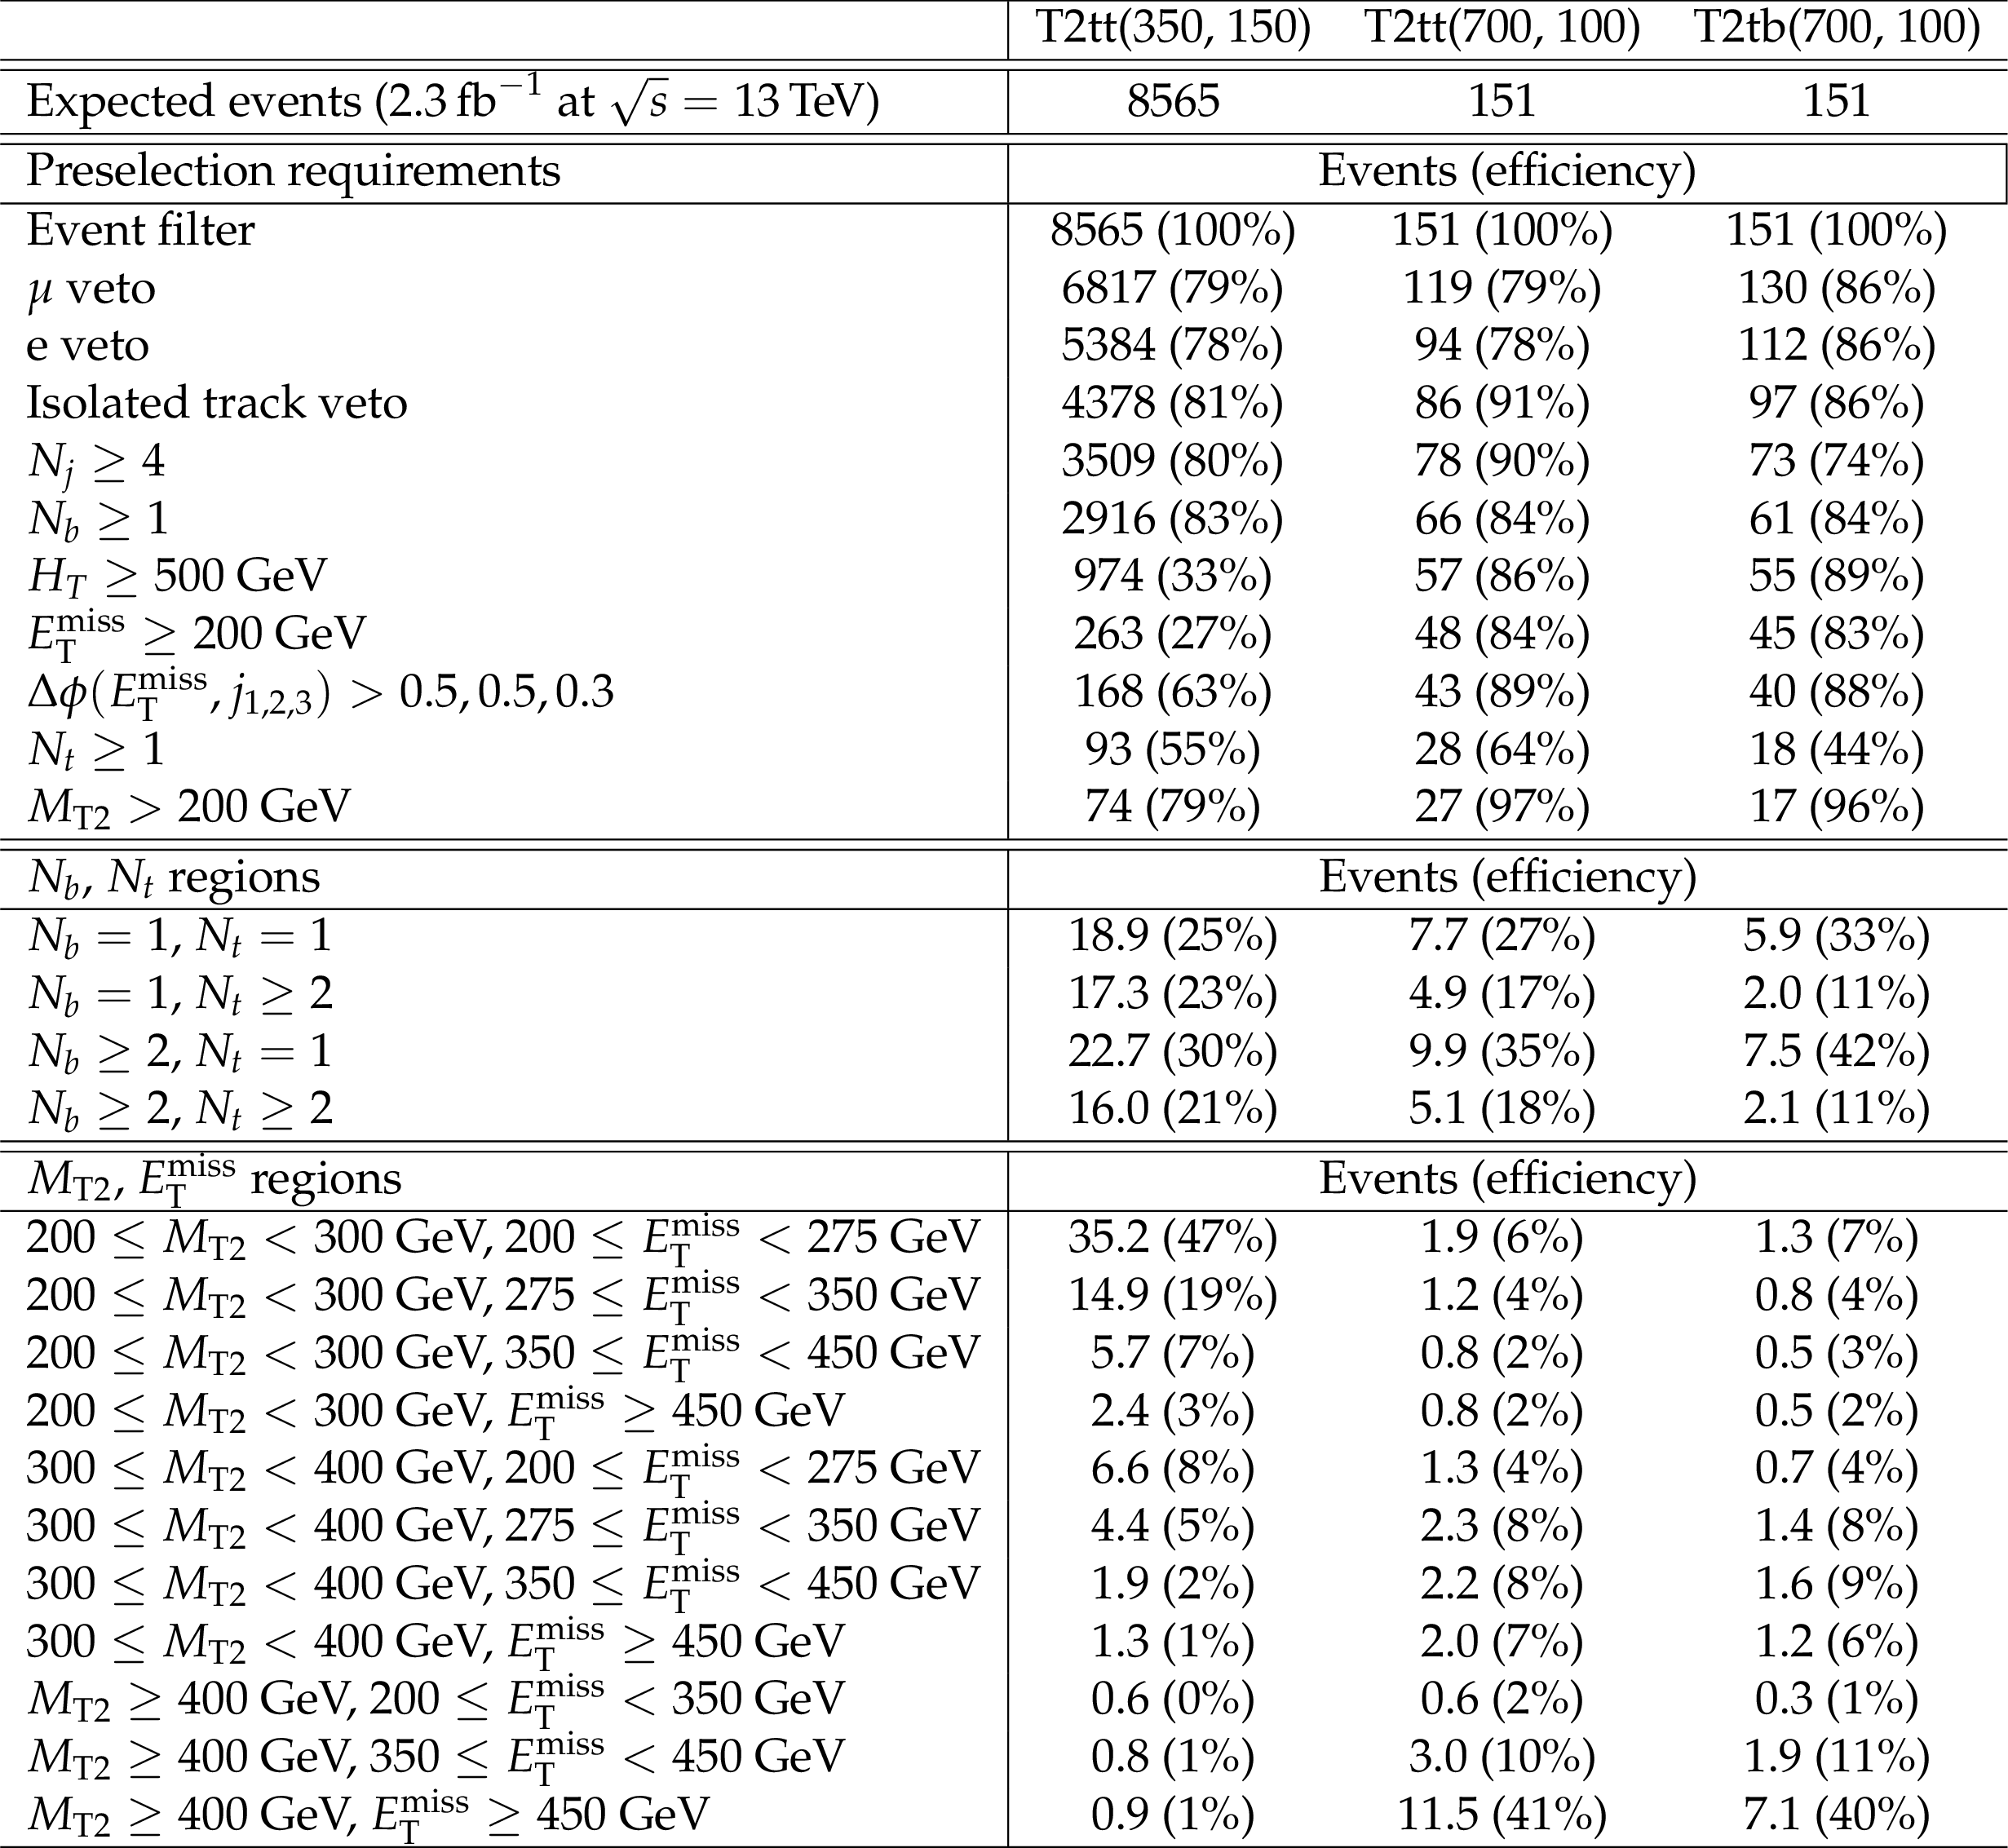
Additional Table 1:
The cut flow for a few benchmark signal models of direct top squark production. For entries in the block labeled "Preselection requirements'', each efficiency is computed with respect to the previous one. For the other two blocks, all efficiencies are computed with respect to the last line of the "Preselection requirements" block. |
png pdf |
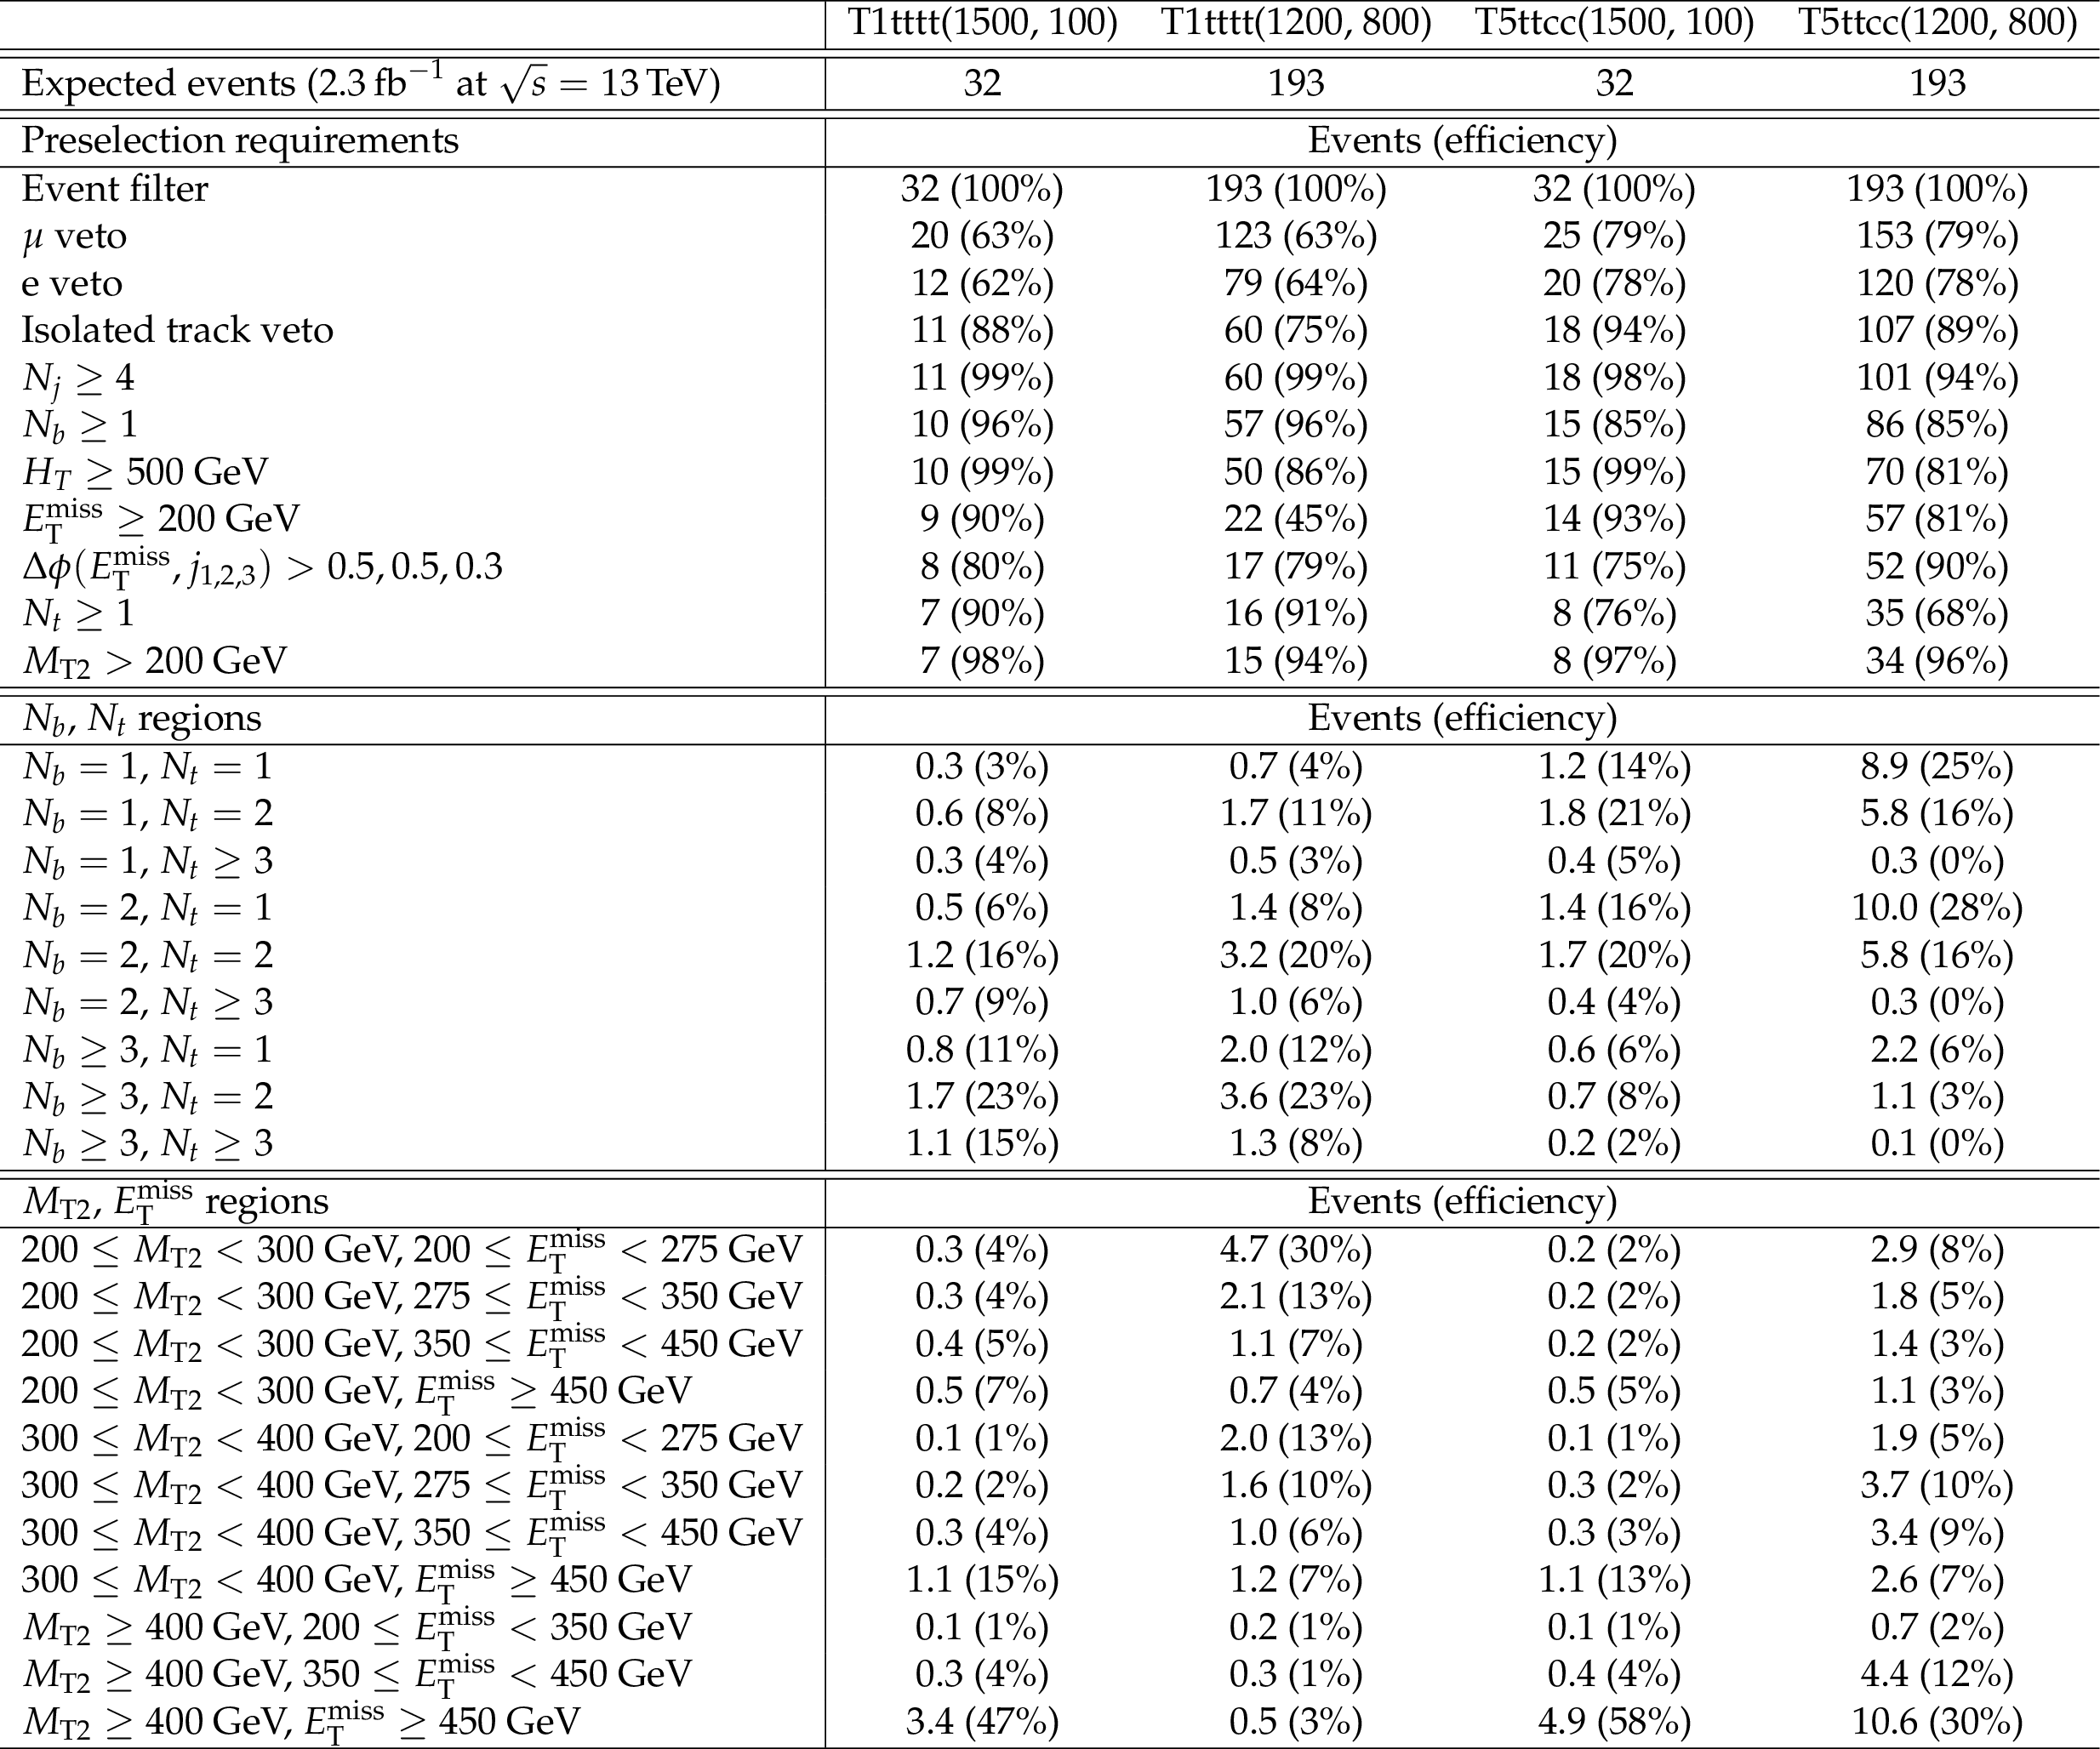
Additional Table 2:
The cut flow for a few benchmark signal models of gluino mediated top squark production. For entries in the block labeled "Preselection requirements'', each efficiency is computed with respect to the previous one. For the other two blocks, all efficiencies are computed with respect to the last line of the "Preselection requirements" block. |
ROOT files with efficiency maps for each simplified model and each search region bin are provided in the following files:
|
| References | ||||
| 1 | ATLAS Collaboration | Observation of a new particle in the search for the Standard Model Higgs boson with the ATLAS detector at the LHC | PLB 716 (2012) 1 | 1207.7214 |
| 2 | CMS Collaboration | Observation of a new boson at a mass of 125 GeV with the CMS experiment at the LHC | PLB 716 (2012) 30 | CMS-HIG-12-028 1207.7235 |
| 3 | CMS Collaboration | Observation of a new boson with mass near 125 GeV in pp collisions at $ \sqrt{s} = $ 7 and 8 TeV | JHEP 06 (2013) 081 | CMS-HIG-12-036 1303.4571 |
| 4 | L. Evans and P. Bryant | LHC Machine | JINST 3 (2008) S08001 | |
| 5 | ATLAS and CMS Collaborations | Combined Measurement of the Higgs Boson Mass in $ pp $ Collisions at $ \sqrt{s}= $ 7 and 8 TeV with the ATLAS and CMS Experiments | PRL 114 (2015) 191803 | 1503.07589 |
| 6 | S. Dimopoulos and S. Raby | Supercolor | Nucl. Phys. B 192 (1981) 353 | |
| 7 | E. Witten | Dynamical Breaking of Supersymmetry | Nucl. Phys. B 188 (1981) 513 | |
| 8 | M. Dine, W. Fischler, and M. Srednicki | Supersymmetric Technicolor | Nucl. Phys. B 189 (1981) 575 | |
| 9 | S. Dimopoulos and H. Georgi | Softly Broken Supersymmetry and SU(5) | Nucl. Phys. B 193 (1981) 150 | |
| 10 | R. K. Kaul and P. Majumdar | Cancellation of quadratically divergent mass corrections in globally supersymmetric spontaneously broken gauge theories | Nucl. Phys. B 199 (1982) 36 | |
| 11 | R. Barbieri, S. Ferrara, and C. A. Savoy | Gauge models with spontaneously broken local supersymmetry | PLB 119 (1982) 343 | |
| 12 | R. Barbieri and G. F. Giudice | Upper bounds on supersymmetric particle masses | Nucl. Phys. B 306 (1988) 63 | |
| 13 | J. Wess and B. Zumino | Supergauge transformations in four-dimensions | Nucl. Phys. B 70 (1974) 39 | |
| 14 | Y. A. Gol'fand and E. P. Likhtman | Extension of the algebra of Poincar$ \'e $ group generators and violation of P invariance | JEPTL 13 (1971)323 | |
| 15 | D. V. Volkov and V. P. Akulov | Possible universal neutrino interaction | JEPTL 16 (1972) 438 | |
| 16 | A. H. Chamseddine, R. L. Arnowitt, and P. Nath | Locally Supersymmetric Grand Unification | PRL 49 (1982) 970 | |
| 17 | G. L. Kane, C. F. Kolda, L. Roszkowski, and J. D. Wells | Study of constrained minimal supersymmetry | PRD 49 (1994) 6173 | hep-ph/9312272 |
| 18 | P. Fayet | Supergauge invariant extension of the Higgs mechanism and a model for the electron and its neutrino | Nucl. Phys. B 90 (1975) 104 | |
| 19 | L. J. Hall, J. D. Lykken, and S. Weinberg | Supergravity as the messenger of supersymmetry breaking | PRD 27 (1983) 2359 | |
| 20 | P. Ramond | Dual theory for free fermions | PRD 3 (1971) 2415 | |
| 21 | B. de Carlos and J. A. Casas | One-loop analysis of the electroweak breaking in supersymmetric models and the fine-tuning problem | PLB 309 (1993) 320 | hep-ph/9303291 |
| 22 | S. Dimopoulos and G. F. Giudice | Naturalness constraints in supersymmetric theories with non-universal soft terms | PLB 357 (1995) 573 | hep-ph/9507282 |
| 23 | N. Sakai | Naturalness in supersymmetric GUTS | Z. Phys. C 11 (1981) 153 | |
| 24 | M. Papucci, J. T. Ruderman, and A. Weiler | Natural SUSY Endures | JHEP 09 (2012) 035 | 1110.6926 |
| 25 | C. Brust, A. Katz, S. Lawrence, and R. Sundrum | SUSY, the Third Generation and the LHC | JHEP 03 (2012) 103 | 1110.6670 |
| 26 | J. L. Feng | Naturalness and the Status of Supersymmetry | Ann. Rev. Nucl. Part. Sci. 63 (2013) 351 | 1302.6587 |
| 27 | A. Delgado et al. | The light stop window | EPJC 73 (2013) 2370 | 1212.6847 |
| 28 | G. R. Farrar and P. Fayet | Phenomenology of the production, decay, and detection of new hadronic states associated with supersymmetry | PLB 76 (1978) 575 | |
| 29 | J. L. Feng | Dark Matter Candidates from Particle Physics and Methods of Detection | Ann. Rev. Astron. Astrophys. 48 (2010) 495 | 1003.0904 |
| 30 | J. Alwall, P. Schuster, and N. Toro | Simplified Models for a First Characterization of New Physics at the LHC | PRD 79 (2009) 075020 | 0810.3921 |
| 31 | J. Alwall, M.-P. Le, M. Lisanti, and J. G. Wacker | Model-Independent Jets plus Missing Energy Searches | PRD 79 (2009) 015005 | 0809.3264 |
| 32 | LHC New Physics Working Group Collaboration | Simplified Models for LHC New Physics Searches | JPG 39 (2012) 105005 | 1105.2838 |
| 33 | D. Alves, E. Izaguirre, and J. G. Wacker | Where the sidewalk ends: jets and missing energy search strategies for the 7$ TeV $ LHC | JHEP 10 (2011) 012 | 1102.5338 |
| 34 | CMS Collaboration | Interpretation of searches for supersymmetry with simplified models | PRD 88 (2013) 052017 | CMS-SUS-11-016 1301.2175 |
| 35 | ATLAS Collaboration | ATLAS Run 1 searches for direct pair production of third-generation squarks at the Large Hadron Collider | EPJC 75 (2015) 510 | 1506.08616 |
| 36 | ATLAS Collaboration | Search for pair-produced third-generation squarks decaying via charm quarks or in compressed supersymmetric scenarios in $ pp $ collisions at $ \sqrt{s}= 8 $ TeV with the ATLAS detector | PRD 90 (2014) 052008 | 1407.0608 |
| 37 | ATLAS Collaboration | Search for direct pair production of the top squark in all-hadronic final states in proton-proton collisions at $ \sqrt{s} = $ 8 TeV with the ATLAS detector | JHEP 09 (2014) 015 | 1406.1122 |
| 38 | ATLAS Collaboration | Search for direct third-generation squark pair production in final states with missing transverse momentum and two $ b $-jets in $ \sqrt{s} = $ 8 TeV $ pp $ collisions with the ATLAS detector | JHEP 10 (2013) 189 | 1308.2631 |
| 39 | ATLAS Collaboration | Search for direct top-squark pair production in final states with two leptons in pp collisions at $ \sqrt{s}= $ 8 TeV with the ATLAS detector | JHEP 06 (2014) 124 | 1403.4853 |
| 40 | ATLAS Collaboration | Search for supersymmetry at $ \sqrt{s}= $ 8 TeV in final states with jets and two same-sign leptons or three leptons with the ATLAS detector | JHEP 06 (2014) 035 | 1404.2500 |
| 41 | CMS Collaboration | Searches for third-generation squark production in fully hadronic final states in proton-proton collisions at $ \sqrt{s} = $ 8 TeV | JHEP 06 (2015) 116 | CMS-SUS-14-001 1503.08037 |
| 42 | CMS Collaboration | Search for direct pair production of supersymmetric top quarks decaying to all-hadronic final states in pp collisions at $ \sqrt{s} = 8\;\text {TeV} $ | EPJC 76 (2016) 460 | CMS-SUS-13-023 1603.00765 |
| 43 | CMS Collaboration | Search for direct pair production of scalar top quarks in the single- and dilepton channels in proton-proton collisions at $ \sqrt{s} = $ 8 TeV | JHEP 07 (2016) 027 | CMS-SUS-14-015 1602.03169 |
| 44 | CMS Collaboration | Search for top-squark pair production in the single-lepton final state in pp collisions at $ \sqrt{s} = $ 8 TeV | EPJC 73 (2013) 2677 | CMS-SUS-13-011 1308.1586 |
| 45 | CMS Collaboration | Search for supersymmetry in events with soft leptons, low jet multiplicity, and missing transverse energy in proton-proton collisions at $ \sqrt{s} = $ 8 TeV | PLB 759 (2016) 9 | CMS-SUS-14-021 1512.08002 |
| 46 | ATLAS Collaboration | Summary of the searches for squarks and gluinos using $ \sqrt{s} = $ 8 TeV $ pp $ collisions with the ATLAS experiment at the LHC | JHEP 10 (2015) 054 | 1507.05525 |
| 47 | ATLAS Collaboration | Search for squarks and gluinos with the ATLAS detector in final states with jets and missing transverse momentum using $ \sqrt{s} = $ 8 TeV proton-proton collision data | JHEP 09 (2014) 176 | 1405.7875 |
| 48 | ATLAS Collaboration | Search for new phenomena in final states with large jet multiplicities and missing transverse momentum at $ \sqrt{s}= $ 8 TeV proton-proton collisions using the ATLAS experiment | JHEP 10 (2013) 130 | 1308.1841 |
| 49 | ATLAS Collaboration | Search for new phenomena in final states with an energetic jet and large missing transverse momentum in $ pp $ collisions at $ \sqrt{s}= $ 8 TeV with the ATLAS detector | EPJC 75 (2015) 299 | 1502.01518 |
| 50 | ATLAS Collaboration | Search for squarks and gluinos in events with isolated leptons, jets and missing transverse momentum at $ \sqrt{s} = $ 8 TeV with the ATLAS detector | JHEP 04 (2015) 116 | 1501.03555 |
| 51 | ATLAS Collaboration | Search for strong production of supersymmetric particles in final states with missing transverse momentum and at least three $ b $-jets at $ \sqrt{s}= $ 8 TeV proton-proton collisions with the ATLAS detector | JHEP 10 (2014) 024 | 1407.0600 |
| 52 | CMS Collaboration | Search for supersymmetry in pp collisions at $ \sqrt{s} = $ 8 TeV in events with a single lepton, large jet multiplicity, and multiple b jets | PLB 733 (2014) 328 | CMS-SUS-13-007 1311.4937 |
| 53 | CMS Collaboration | Searches for supersymmetry based on events with b jets and four W bosons in pp collisions at 8 TeV | PLB 745 (2015) 5 | CMS-SUS-14-010 1412.4109 |
| 54 | CMS Collaboration | Search for supersymmetry in pp collisions at $ \sqrt{s} = $ 8 TeV in final states with boosted W bosons and b jets using razor variables | PRD 93 (2016) 092009 | CMS-SUS-14-007 1602.02917 |
| 55 | CMS Collaboration | Searches for supersymmetry using the M$ _\text{T2} $ variable in hadronic events produced in pp collisions at 8 TeV | JHEP 05 (2015) 078 | CMS-SUS-13-019 1502.04358 |
| 56 | CMS Collaboration | Search for supersymmetry using razor variables in events with b-tagged jets in pp collisions at $ \sqrt{s} = $ 8 TeV | PRD 91 (2015) 052018 | CMS-SUS-13-004 1502.00300 |
| 57 | CMS Collaboration | Search for new physics in the multijet and missing transverse momentum final state in proton-proton collisions at $ \sqrt{s} = $ 8 TeV | JHEP 06 (2014) 055 | CMS-SUS-13-012 1402.4770 |
| 58 | ATLAS Collaboration | Search for top squarks in final states with one isolated lepton, jets, and missing transverse momentum in $ \sqrt{s} = $ 13 TeV pp collisions with the ATLAS detector | PRD 94 (2016) 052009 | 1606.03903 |
| 59 | CMS Collaboration | Search for new physics with the M$ _{T2} $ variable in all-jets final states produced in pp collisions at $ \sqrt{s} = $ 13 TeV | JHEP 10 (2016) 006 | CMS-SUS-15-003 1603.04053 |
| 60 | CMS Collaboration | Searches for pair production of third-generation squarks in $ \sqrt{s} = $ 13 TeV pp collisions | Submitted to EPJC | CMS-SUS-16-008 1612.03877 |
| 61 | ATLAS Collaboration | Search for pair production of gluinos decaying via stop and sbottom in events with b-jets and large missing transverse momentum in $ pp $ collisions at $ \sqrt{s} = $ 13 TeV with the ATLAS detector | PRD 94 (2016) 032003 | 1605.09318 |
| 62 | ATLAS Collaboration | Search for supersymmetry at $ \sqrt{s} = $ 13 TeV in final states with jets and two same-sign leptons or three leptons with the ATLAS detector | EPJC 76 (2016) 259 | 1602.09058 |
| 63 | CMS Collaboration | Search for supersymmetry in the multijet and missing transverse momentum final state in pp collisions at 13 TeV | PLB 758 (2016) 152 | CMS-SUS-15-002 1602.06581 |
| 64 | CMS Collaboration | Search for new physics in same-sign dilepton events in proton--proton collisions at $ \sqrt{s} = $ 13 TeV | EPJC 76 (2016) 439 | CMS-SUS-15-008 1605.03171 |
| 65 | CMS Collaboration | Search for supersymmetry in pp collisions at $ \sqrt{s} = $ 13 TeV in the single-lepton final state using the sum of masses of large-radius jets | JHEP 08 (2016) 122 | CMS-SUS-15-007 1605.04608 |
| 66 | C. G. Lester and D. J. Summers | Measuring masses of semi-invisibly decaying particles pair produced at hadron colliders | PLB 463 (1999) 99 | hep-ph/9906349 |
| 67 | A. Barr, C. Lester, and P. Stephens | A variable for measuring masses at hadron colliders when missing energy is expected; $ m_{T2} $: the truth behind the glamour | JPG 29 (2003) 2343 | hep-ph/0304226 |
| 68 | CMS Collaboration | The CMS experiment at the CERN LHC | JINST 3 (2008) S08004 | CMS-00-001 |
| 69 | CMS Collaboration | Commissioning of the Particle-flow Event Reconstruction with the first LHC collisions recorded in the CMS detector | CDS | |
| 70 | CMS Collaboration | Particle-Flow Event Reconstruction in CMS and Performance for Jets, Taus, and $ E_{\mathrm{T}}^{\text{miss}} $ | CDS | |
| 71 | M. Cacciari, G. P. Salam, and G. Soyez | The anti-$ k_t $ jet clustering algorithm | JHEP 04 (2008) 063 | 0802.1189 |
| 72 | M. Cacciari and G. P. Salam | Pileup subtraction using jet areas | PLB 659 (2007) 119 | 0707.1378 |
| 73 | M. Cacciari, G. P. Salam, and G. Soyez | FastJet user manual | EPJC 72 (2012) 1896 | 1111.6097 |
| 74 | CMS Collaboration | Jet energy scale and resolution in the CMS experiment in pp collisions at 8 TeV | Submitted to JINST (2016) | CMS-JME-13-004 1607.03663 |
| 75 | CMS Collaboration | Identification of b quark jets at the CMS Experiment in the LHC Run 2 | CMS-PAS-BTV-15-001 | CMS-PAS-BTV-15-001 |
| 76 | CMS Collaboration | Identification of b-quark jets with the CMS experiment | JINST 8 (2013) P04013 | CMS-BTV-12-001 1211.4462 |
| 77 | CMS Collaboration | Performance of CMS muon reconstruction in pp collision events at $ \sqrt{s} = $ 7 TeV | JINST 7 (2012) P10002 | CMS-MUO-10-004 1206.4071 |
| 78 | CMS Collaboration | Performance of electron reconstruction and selection with the CMS detector in proton-proton collisions at $ \sqrt{s} = $ 8 TeV | JINST 10 (2015) P06005 | CMS-EGM-13-001 1502.02701 |
| 79 | J. Alwall et al. | The automated computation of tree-level and next-to-leading order differential cross sections, and their matching to parton shower simulations | JHEP 07 (2014) 079 | 1405.0301 |
| 80 | NNPDF Collaboration | Parton distributions for the LHC Run II | JHEP 04 (2015) 040 | 1410.8849 |
| 81 | P. Nason | A new method for combining NLO QCD with shower Monte Carlo algorithms | JHEP 11 (2004) 040 | hep-ph/0409146 |
| 82 | S. Frixione, P. Nason, and C. Oleari | Matching NLO QCD computations with Parton Shower simulations: the POWHEG method | JHEP 11 (2007) 070 | 0709.2092 |
| 83 | S. Alioli, P. Nason, C. Oleari, and E. Re | A general framework for implementing NLO calculations in shower Monte Carlo programs: the POWHEG BOX | JHEP 06 (2010) 043 | 1002.2581 |
| 84 | E. Re | Single-top $ Wt $-channel production matched with parton showers using the POWHEG method | EPJC 71 (2011) 1547 | 1009.2450 |
| 85 | T. Sjostrand, S. Mrenna, and P. Z. Skands | A brief introduction to PYTHIA 8.1 | CPC 178 (2008) 852 | 0710.3820 |
| 86 | CMS Collaboration | Event generator tunes obtained from underlying event and multiparton scattering measurements | EPJC 76 (2016) 155 | CMS-GEN-14-001 1512.00815 |
| 87 | GEANT4 Collaboration | GEANT4---a simulation toolkit | NIMA 506 (2003) 250 | |
| 88 | S. Abdullin et al. | The fast simulation of the CMS detector at LHC | J. Phys. Conf. Ser. 331 (2011) 032049 | |
| 89 | C. Borschensky et al. | Squark and gluino production cross sections in pp collisions at $ \sqrt{s} =$ 13, 14, 33 and 100 TeV | EPJC 74 (2014) 3174 | 1407.5066 |
| 90 | M. Czakon and A. Mitov | Top++: A Program for the Calculation of the Top-Pair Cross-Section at Hadron Colliders | CPC 185 (2014) 2930 | 1112.5675 |
| 91 | P. Kant et al. | HATHOR for single top-quark production: Updated predictions and uncertainty estimates for single top-quark production in hadronic collisions | CPC 191 (2015) 74 | 1406.4403 |
| 92 | M. Aliev et al. | HATHOR: HAdronic Top and Heavy quarks crOss section calculatoR | CPC 182 (2011) 1034 | 1007.1327 |
| 93 | T. Gehrmann et al. | W$ ^+ $W$ ^- $ Production at Hadron Colliders in Next to Next to Leading Order QCD | PRL 113 (2014) 212001 | 1408.5243 |
| 94 | J. M. Campbell and R. K. Ellis | An update on vector boson pair production at hadron colliders | PRD 60 (1999) 113006 | hep-ph/9905386 |
| 95 | J. M. Campbell, R. K. Ellis, and C. Williams | Vector boson pair production at the LHC | JHEP 07 (2011) 018 | 1105.0020 |
| 96 | Y. Li and F. Petriello | Combining QCD and electroweak corrections to dilepton production in FEWZ | PRD 86 (2012) 094034 | 1208.5967 |
| 97 | D. E. Kaplan, K. Rehermann, M. D. Schwartz, and B. Tweedie | Top Tagging: A Method for Identifying Boosted Hadronically Decaying Top Quarks | PRL 101 (2008) 142001 | 0806.0848 |
| 98 | T. Plehn, M. Spannowsky, M. Takeuchi, and D. Zerwas | Stop reconstruction with tagged tops | JHEP 10 (2010) 078 | 1006.2833 |
| 99 | D. E. Kaplan, K. Rehermann, and D. Stolarski | Searching for Direct Stop Production in Hadronic Top Data at the LHC | JHEP 07 (2012) 119 | 1205.5816 |
| 100 | Particle Data Group, K. A. Olive et al. | Review of particle physics | CPC 38 (2014) 090001 | |
| 101 | CMS Collaboration | Jet Performance in pp Collisions at 7 TeV | CDS | |
| 102 | ATLAS and CMS Collaborations | Procedure for the LHC Higgs boson search combination in summer 2011 | Technical Report ATL-PHYS-PUB-2011-011, CMS NOTE-2011/005 | |
| 103 | A. L. Read | Presentation of search results: the $ CL_s $ technique | JPG 28 (2002) 2693 | |
| 104 | T. Junk | Confidence level computation for combining searches with small statistics | NIMA 434 (1999) 435 | hep-ex/9902006 |
| 105 | G. Cowan, K. Cranmer, E. Gross, and O. Vitells | Asymptotic formulae for likelihood-based tests of new physics | EPJC 71 (2011) 1554 | 1007.1727 |
|
|
Compact Muon Solenoid LHC, CERN |
|

|

|

|

|

|