

Compact Muon Solenoid
LHC, CERN
| CMS-TOP-16-010 ; CERN-EP-2017-069 | ||
| Measurements of $\mathrm{ t \bar{t} }$ cross sections in association with b jets and inclusive jets and their ratio using dilepton final states in pp collisions at $\sqrt{s} = $ 13 TeV | ||
| CMS Collaboration | ||
| 29 May 2017 | ||
| Phys. Lett. B 776 (2018) 355 | ||
| Abstract: The cross sections for the production of ${\mathrm{ t \bar{t} }\mathrm{ b \bar{b} }}$ and ${\mathrm{ t \bar{t} }\mathrm{jj}} $ events and their ratio $\sigma_{\mathrm{ t \bar{t} }\mathrm{ b \bar{b} }}/\sigma_{{\mathrm{ t \bar{t} }\mathrm{jj}} } $ are measured using data corresponding to an integrated luminosity of 2.3 fb$^{-1}$ collected in pp collisions at $\sqrt{s} = $ 13 TeV with the CMS detector at the LHC. Events with two leptons (e or $\mu$) and at least four reconstructed jets, including at least two identified as b quark jets, in the final state are selected. In the full phase space, the measured ratio is 0.022 $\pm$ 0.003 (stat) $\pm$ 0.006 (syst), the cross section $ \sigma_{\mathrm{ t \bar{t} }\mathrm{ b \bar{b} }}$ is 4.0 $\pm$ 0.6 (stat) $\pm$ 1.3 (syst) pb and $ \sigma_{{\mathrm{ t \bar{t} }\mathrm{jj}} }$ is 184 $\pm$ 6 (stat) $\pm$ 33 (syst) pb. The measurements are compared with the standard model expectations obtained from a POWHEG simulation at next-to-leading-order interfaced with PYTHIA. | ||
| Links: e-print arXiv:1705.10141 [hep-ex] (PDF) ; CDS record ; inSPIRE record ; CADI line (restricted) ; | ||
| Figures & Tables | Summary | Additional Figures | References | CMS Publications |
|---|
| Figures | |
png pdf |
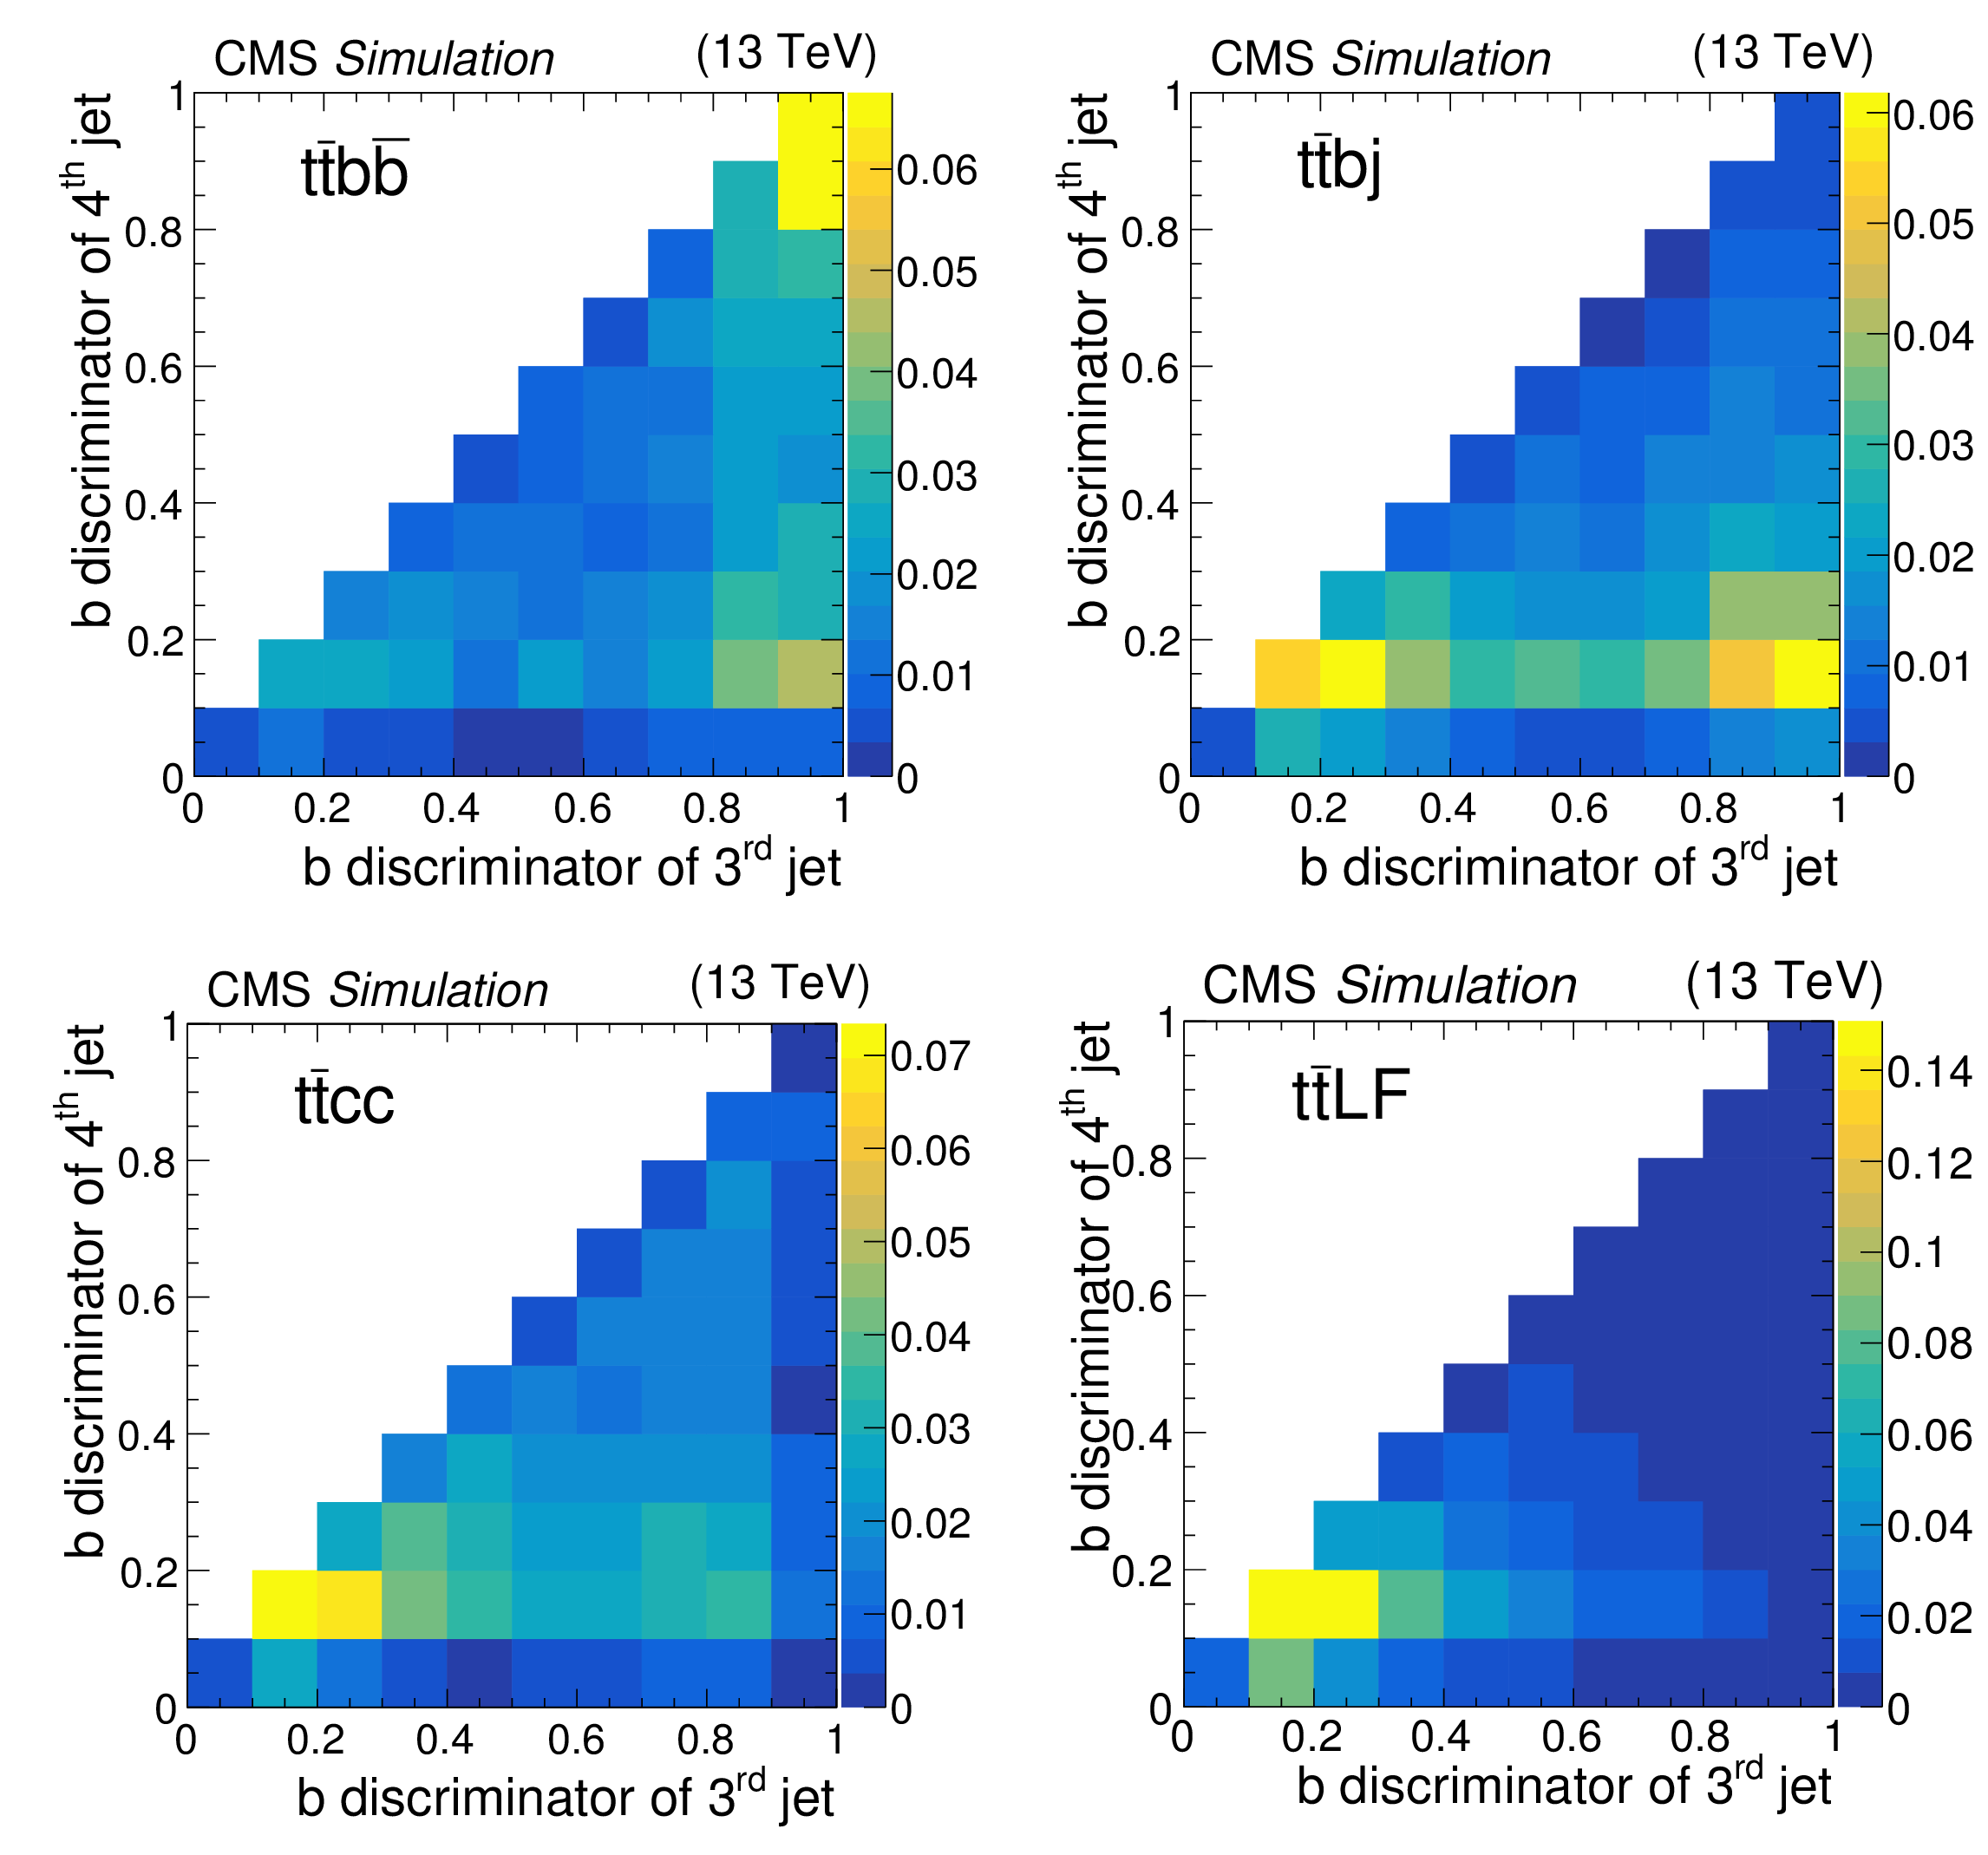
Figure 1:
Normalized 2D distributions of the b jet discriminators of the third ($x$-axis) and the fourth ($y$-axis) jets sorted in decreasing order of b tagging discriminator value, after the full event selection for $ { {\mathrm{ t } \mathrm{ \bar{t} } } {\mathrm{ b \bar{b} } } } $ (upper left), $ { {\mathrm{ t } \mathrm{ \bar{t} } } \mathrm{ b } \mathrm {j}} $ (upper right), $ { {\mathrm{ t } \mathrm{ \bar{t} } } \mathrm{c} \bar{\mathrm{c}} } $ (lower left), and $ { {\mathrm{ t } \mathrm{ \bar{t} } } \mathrm {LF}} $ (lower right) processes. |

png pdf |
Figure 1-a:
Normalized 2D distributions of the b jet discriminators of the third ($x$-axis) and the fourth ($y$-axis) jets sorted in decreasing order of b tagging discriminator value, after the full event selection for the $ { {\mathrm{ t } \mathrm{ \bar{t} } } {\mathrm{ b \bar{b} } } } $ process. |
png pdf |
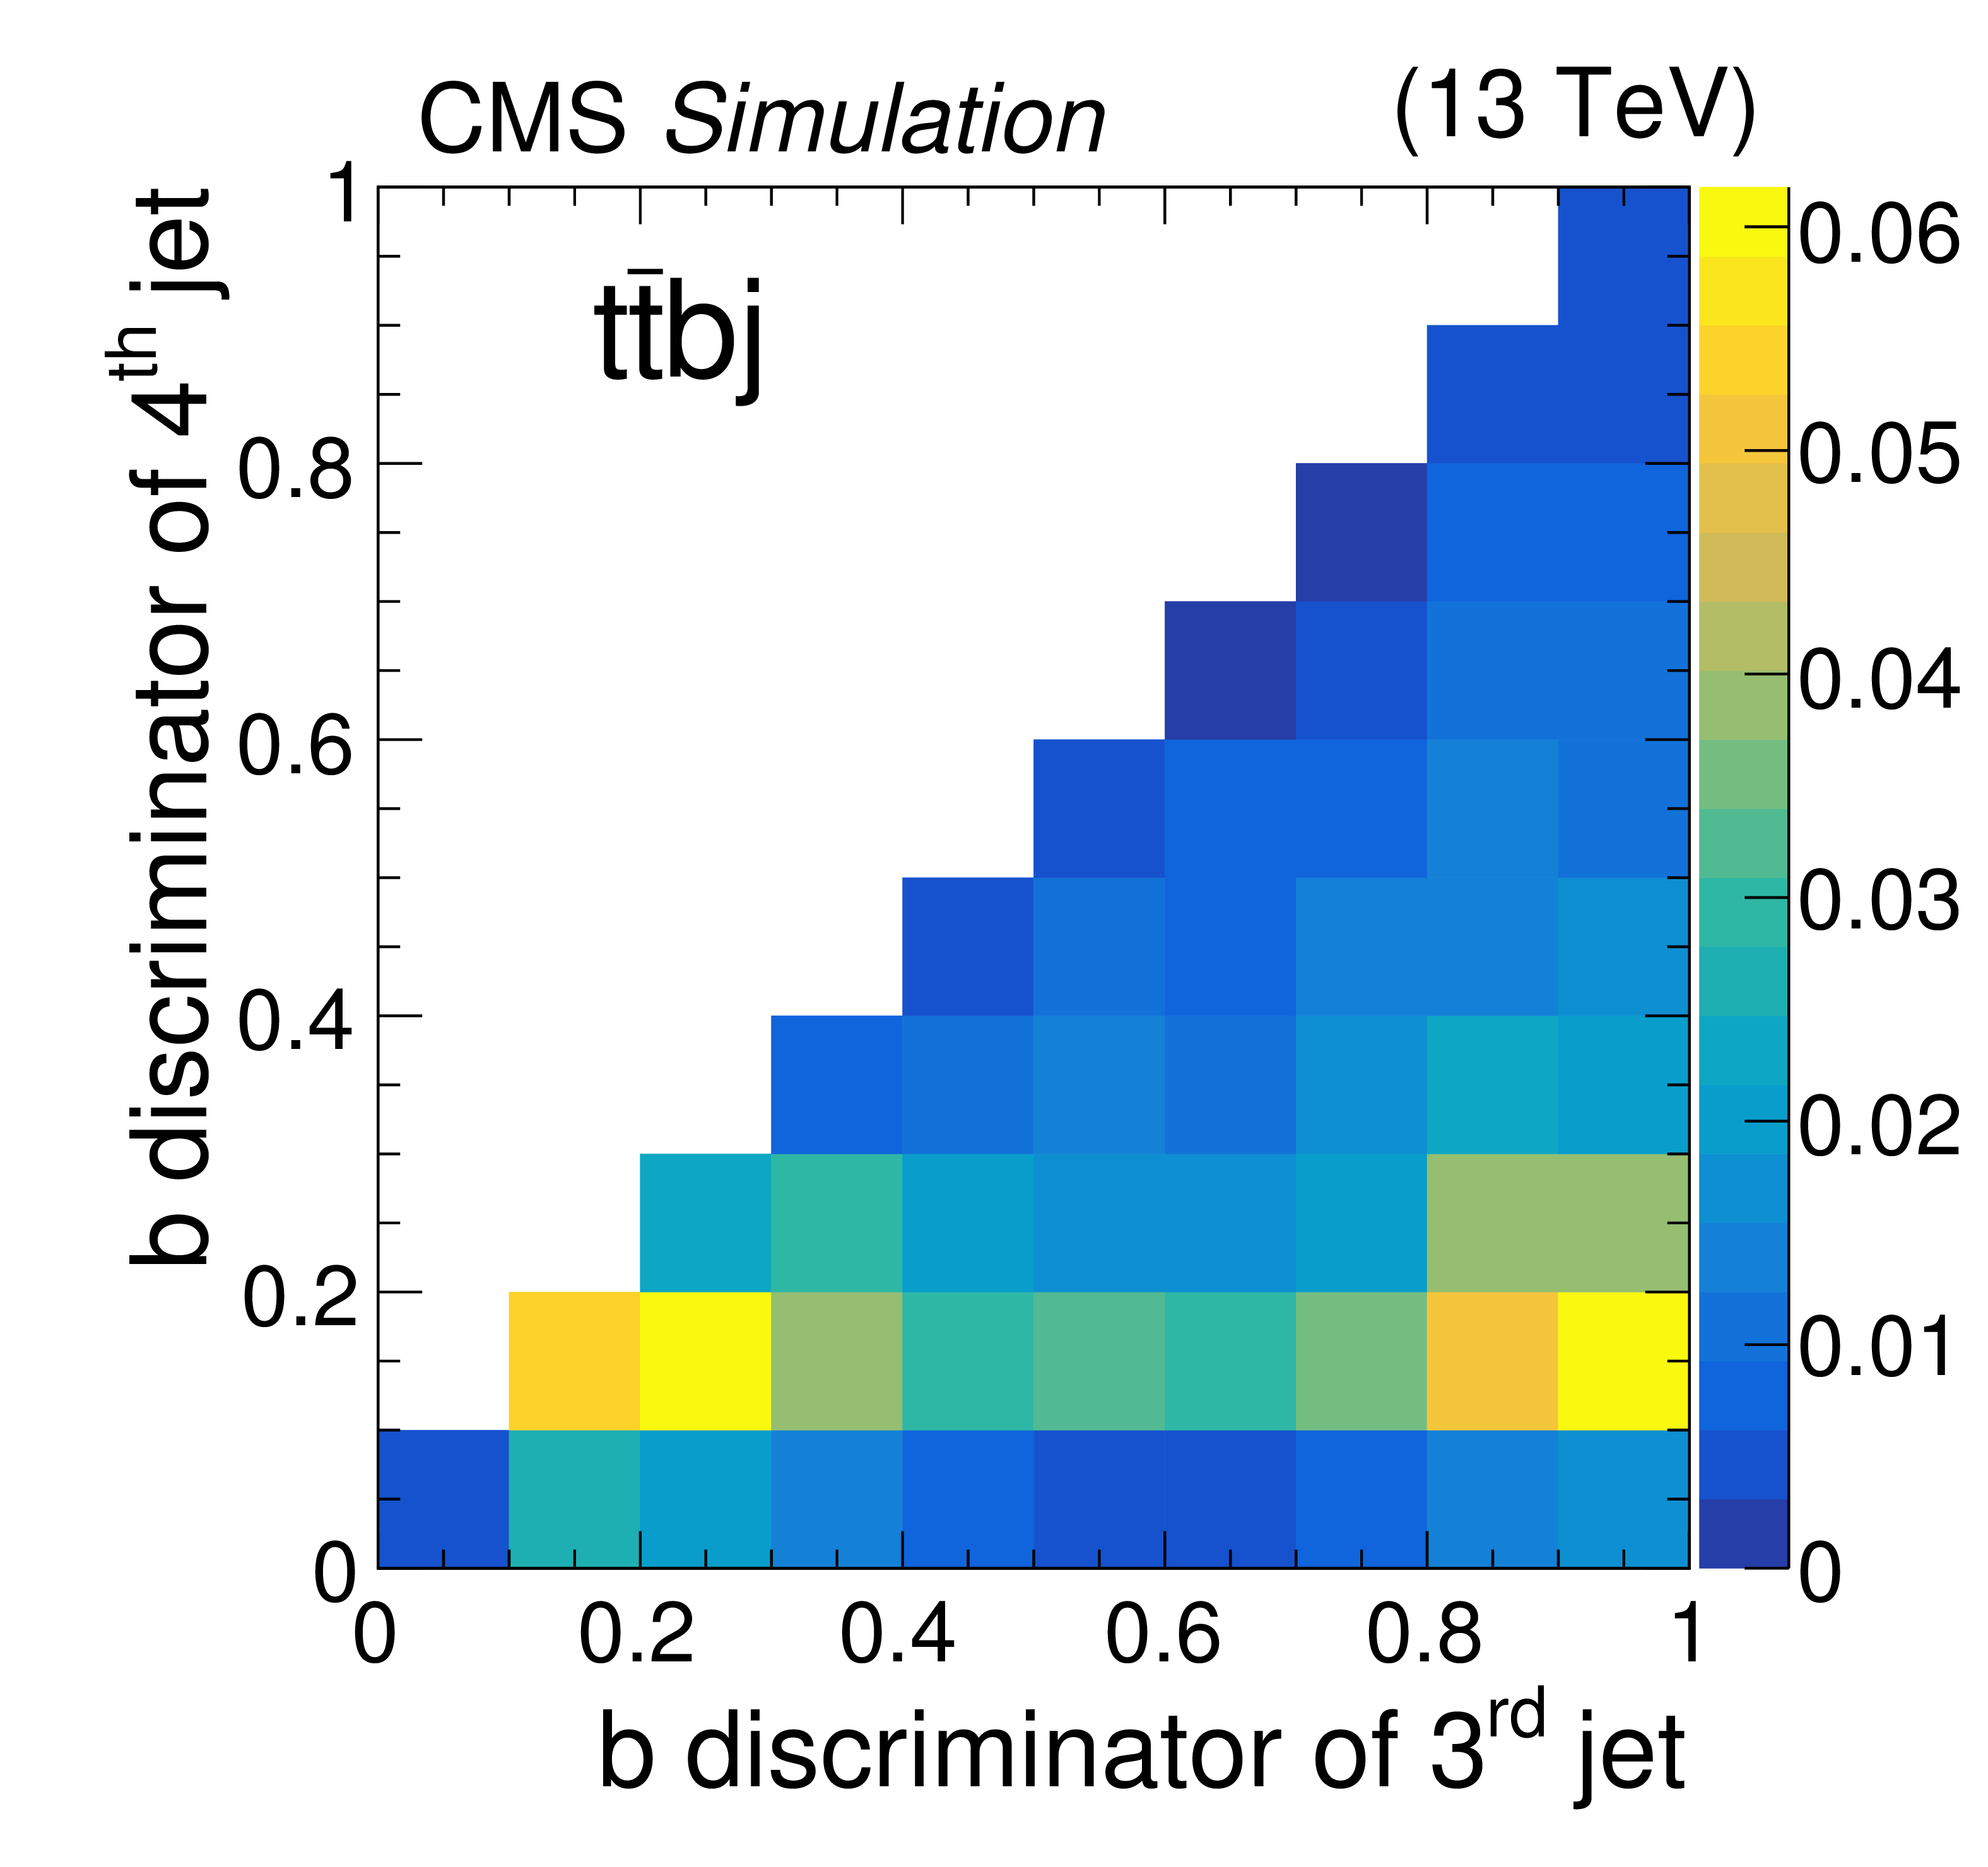
Figure 1-b:
Normalized 2D distributions of the b jet discriminators of the third ($x$-axis) and the fourth ($y$-axis) jets sorted in decreasing order of b tagging discriminator value, after the full event selection for the $ { {\mathrm{ t } \mathrm{ \bar{t} } } \mathrm{ b } \mathrm {j}} $ process. |
png pdf |
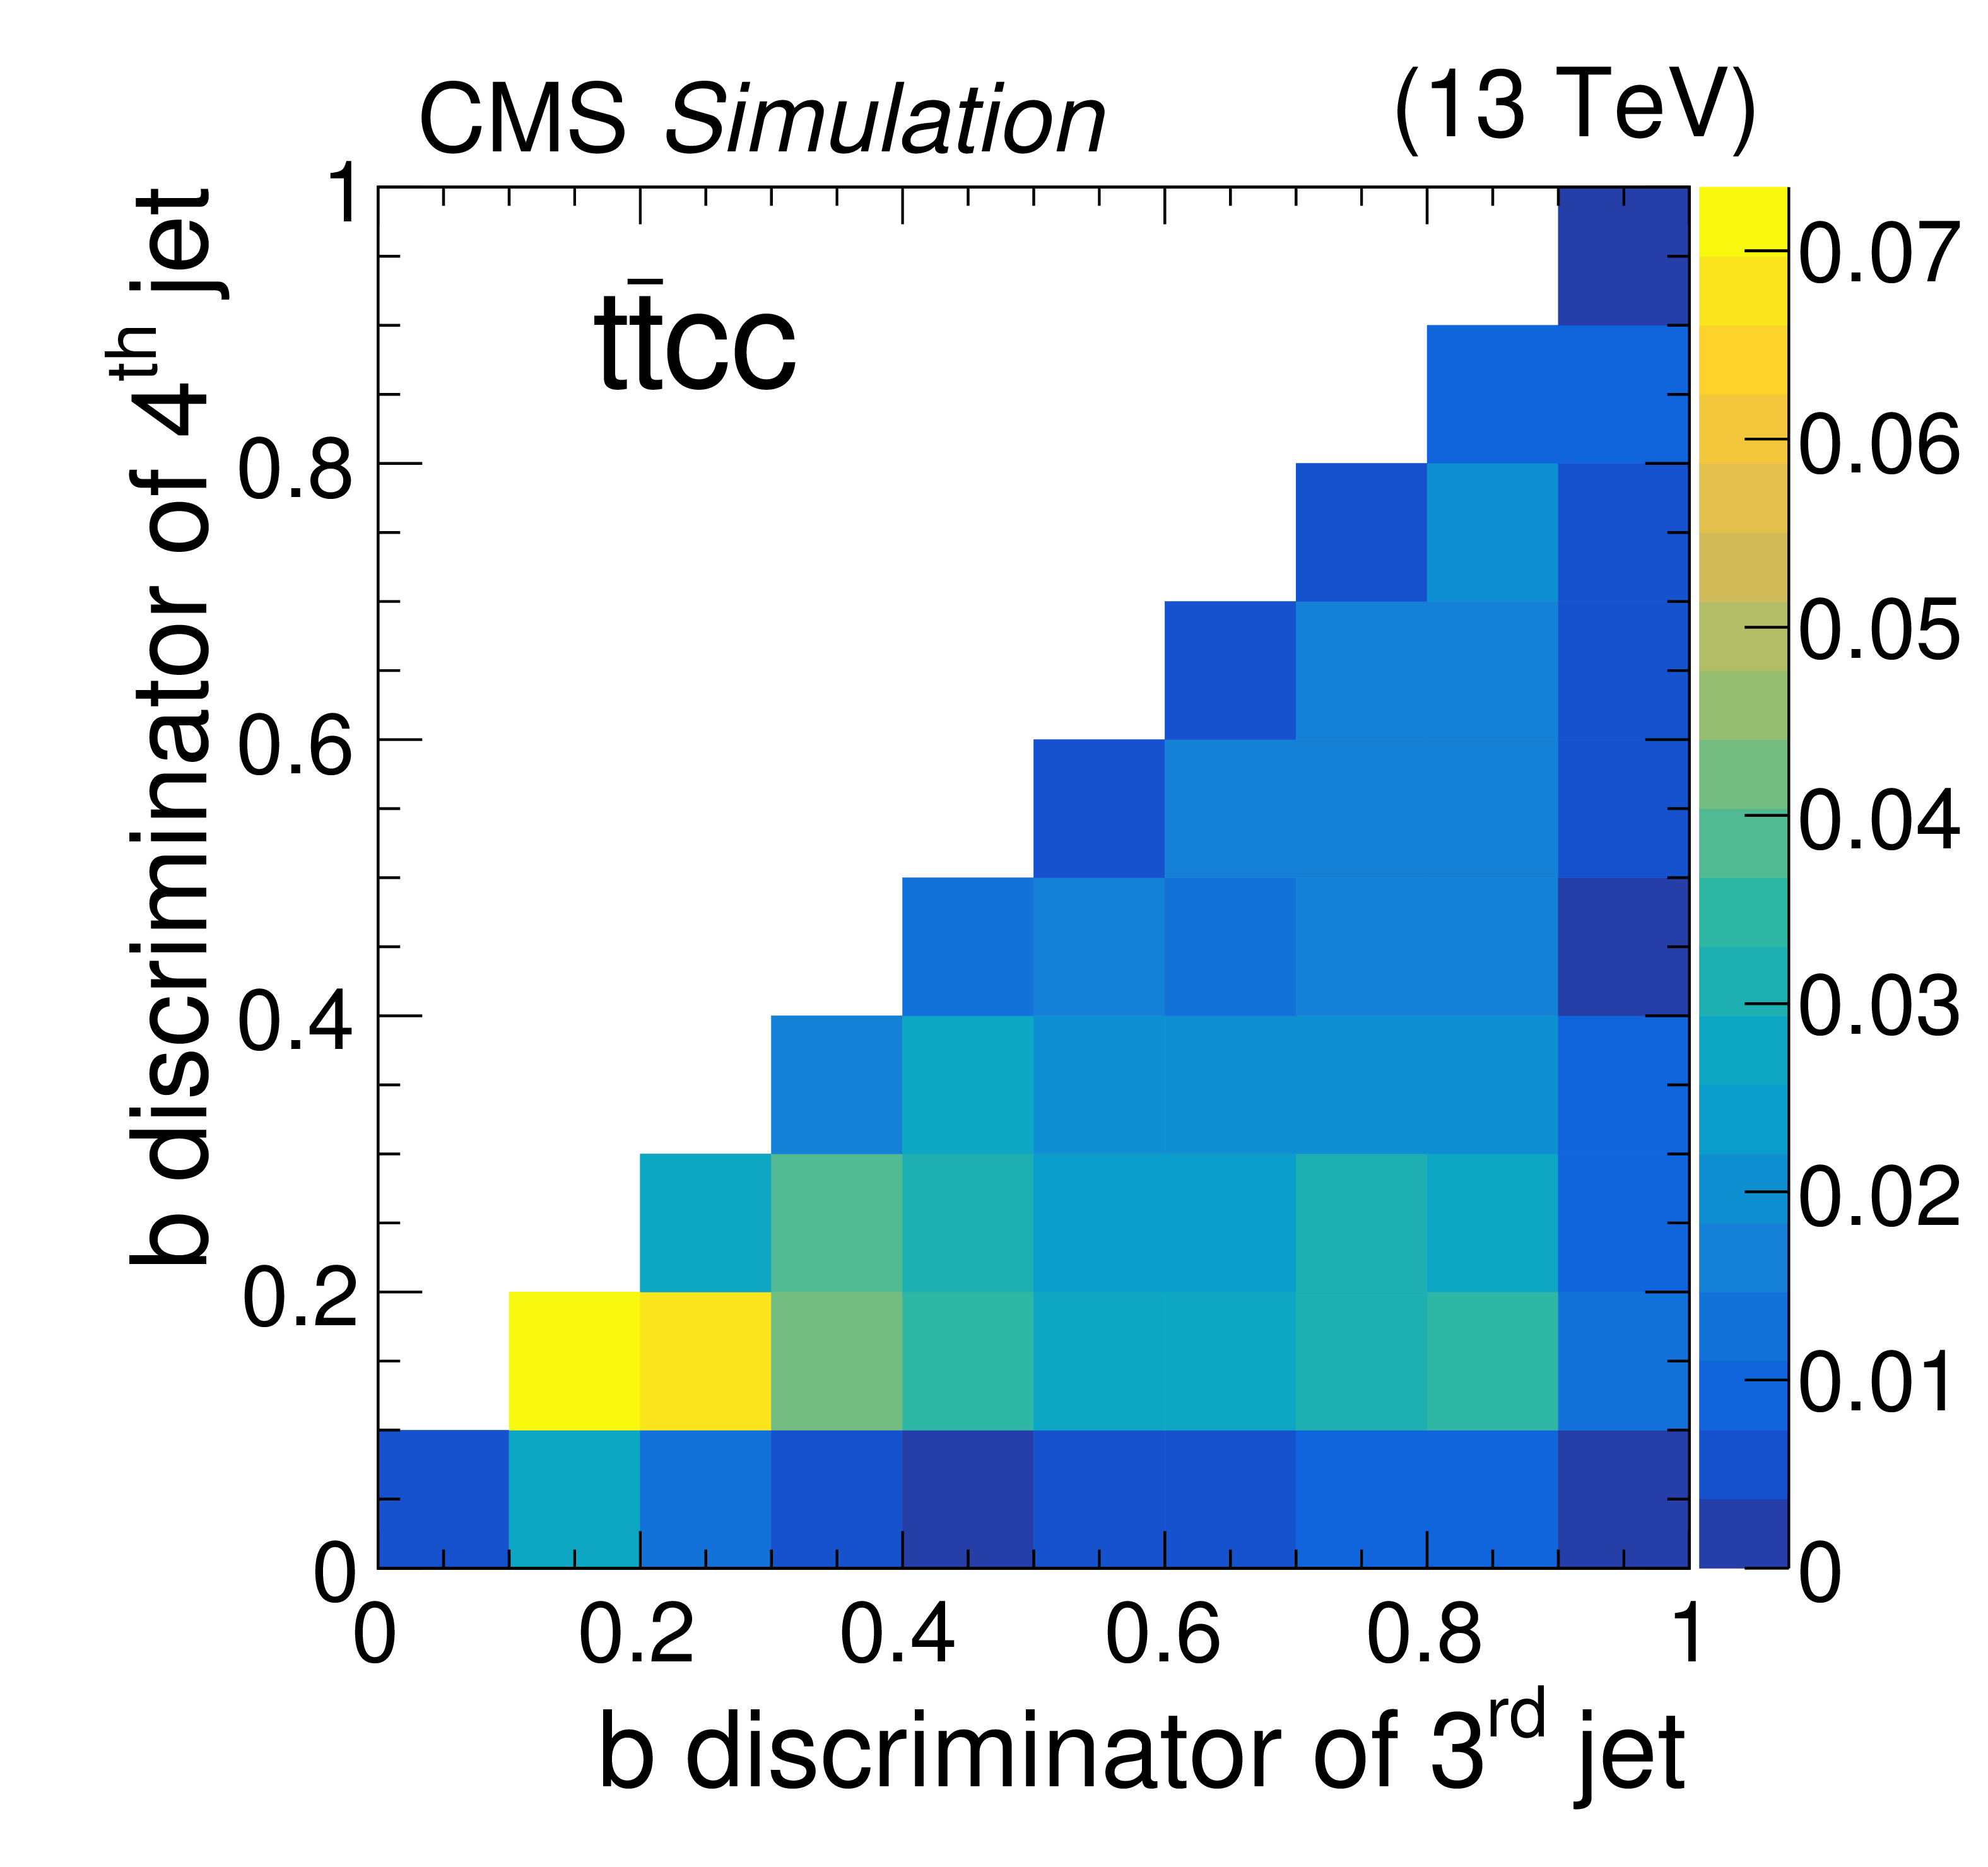
Figure 1-c:
Normalized 2D distributions of the b jet discriminators of the third ($x$-axis) and the fourth ($y$-axis) jets sorted in decreasing order of b tagging discriminator value, after the full event selection for the $ { {\mathrm{ t } \mathrm{ \bar{t} } } \mathrm{c} \bar{\mathrm{c}} } $ process. |
png pdf |
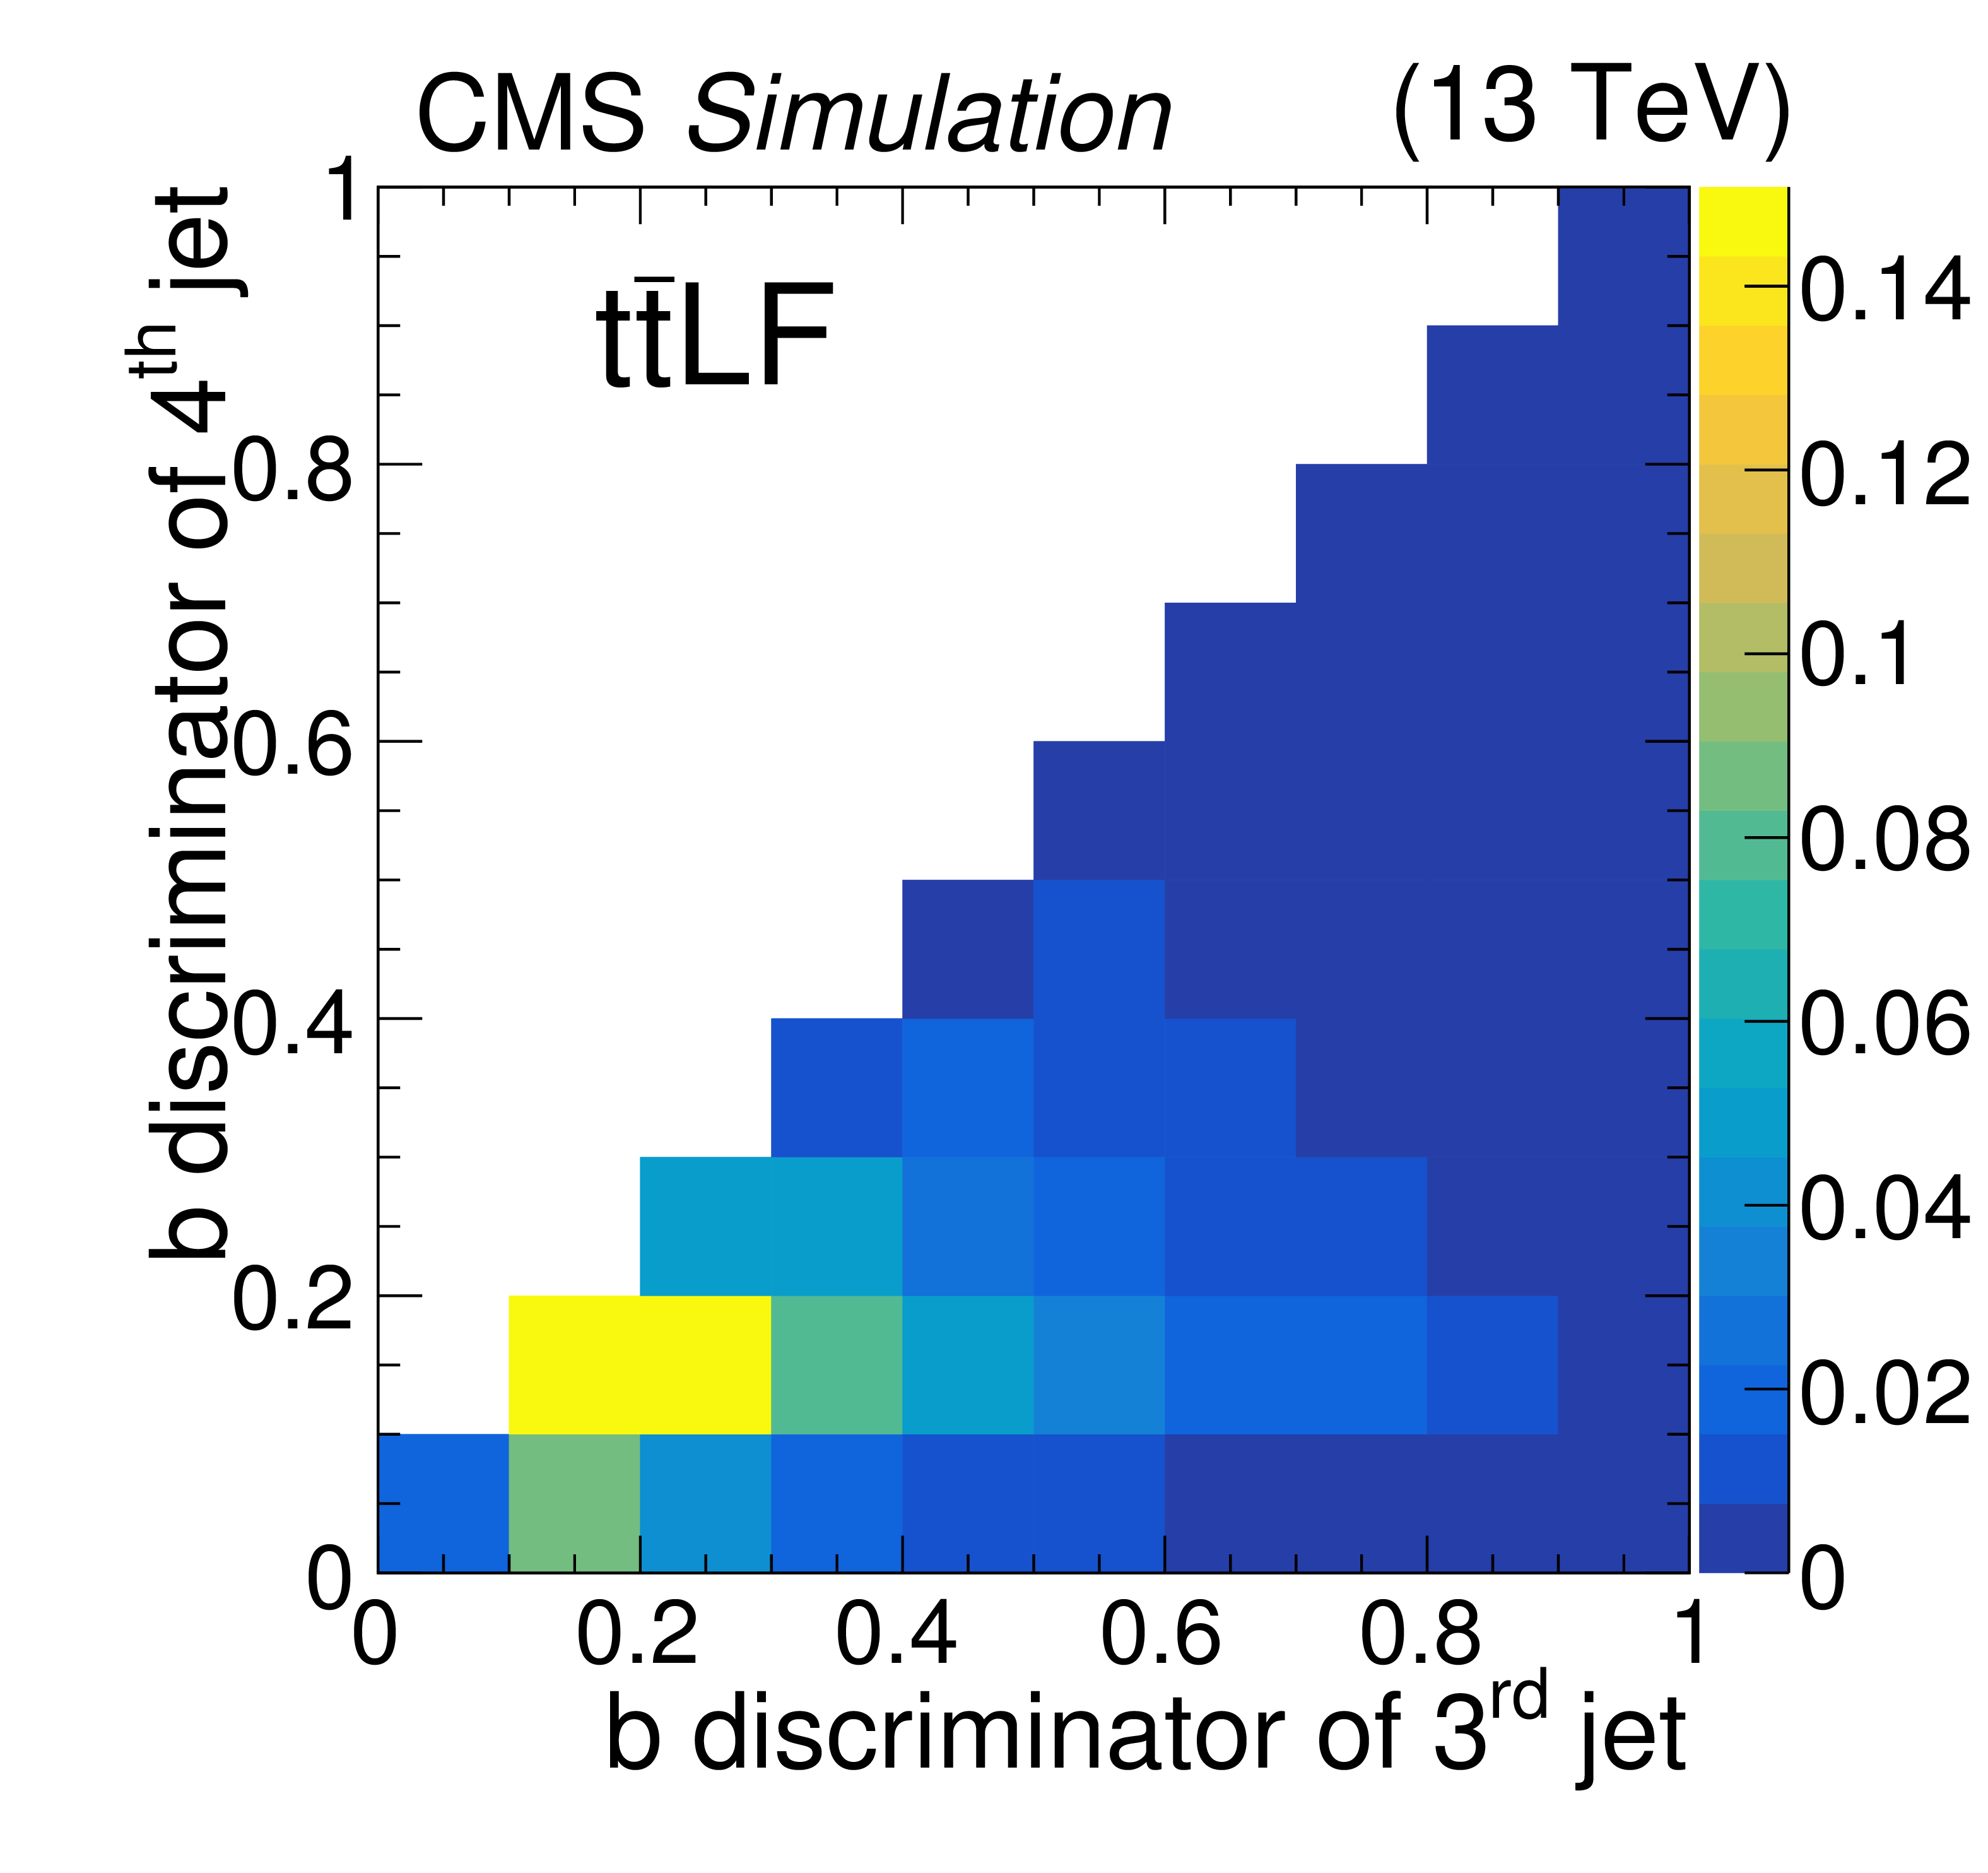
Figure 1-d:
Normalized 2D distributions of the b jet discriminators of the third ($x$-axis) and the fourth ($y$-axis) jets sorted in decreasing order of b tagging discriminator value, after the full event selection for the $ { {\mathrm{ t } \mathrm{ \bar{t} } } \mathrm {LF}} $ process. |

png pdf |
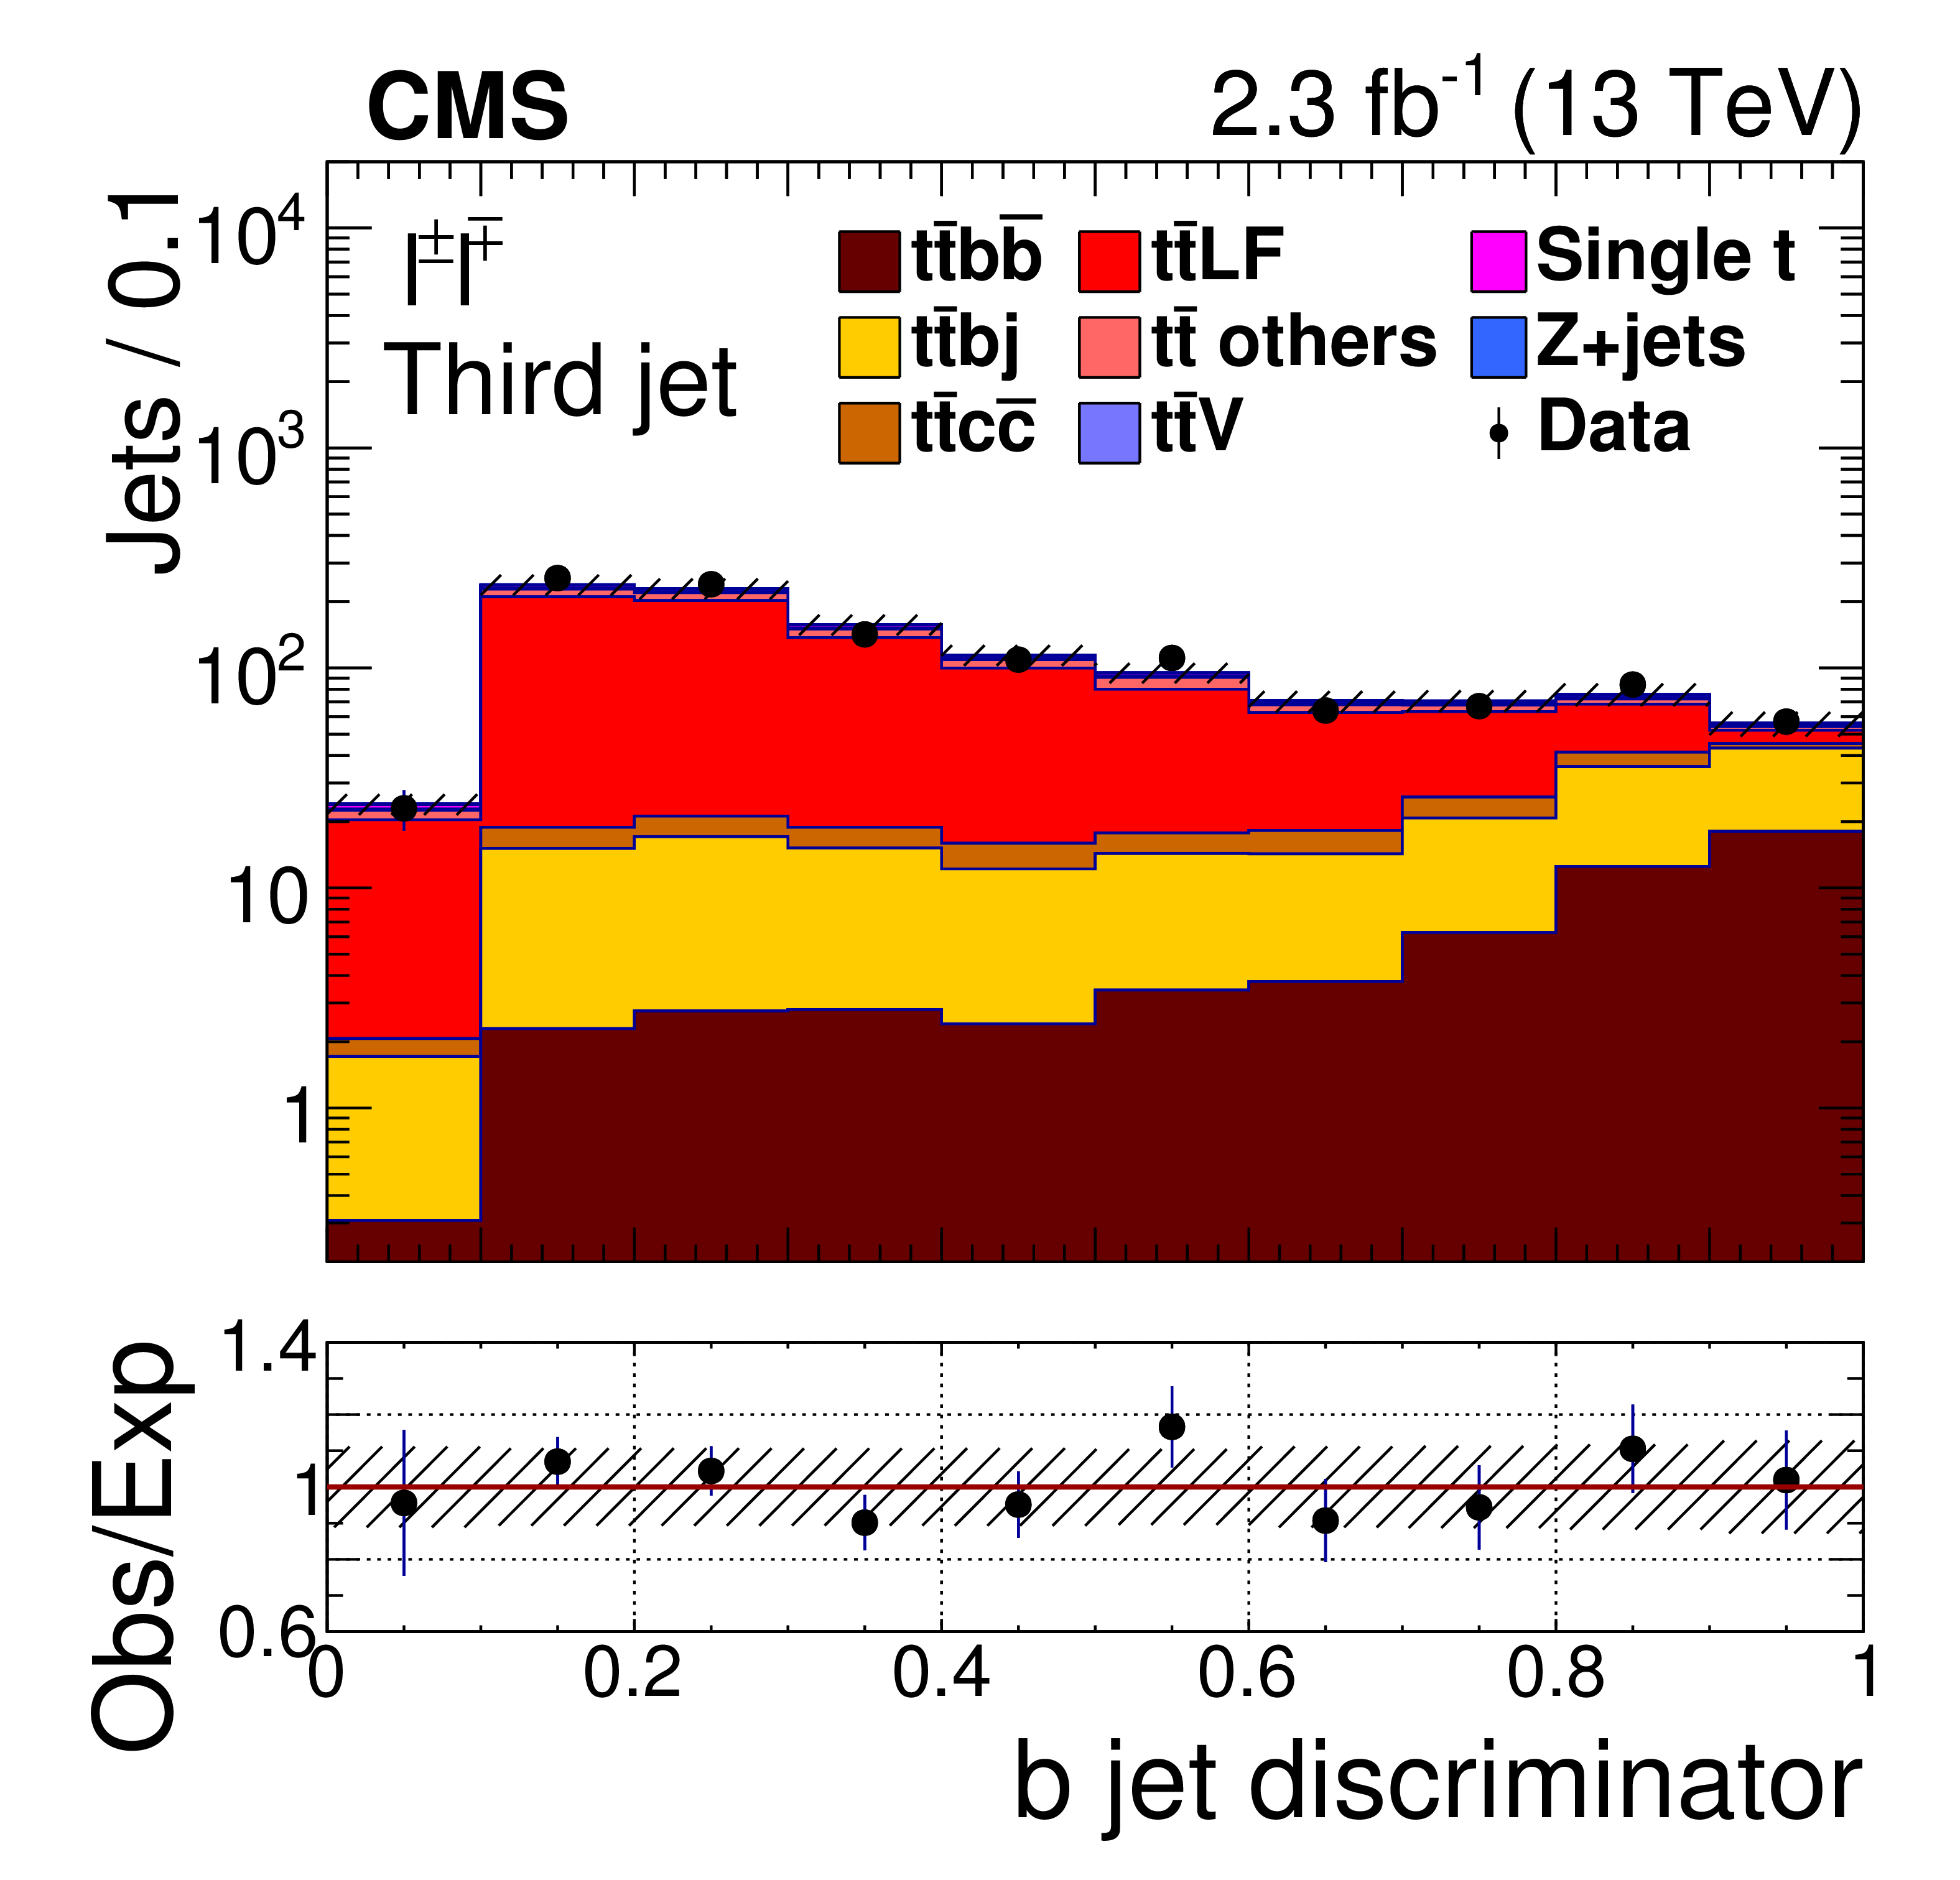
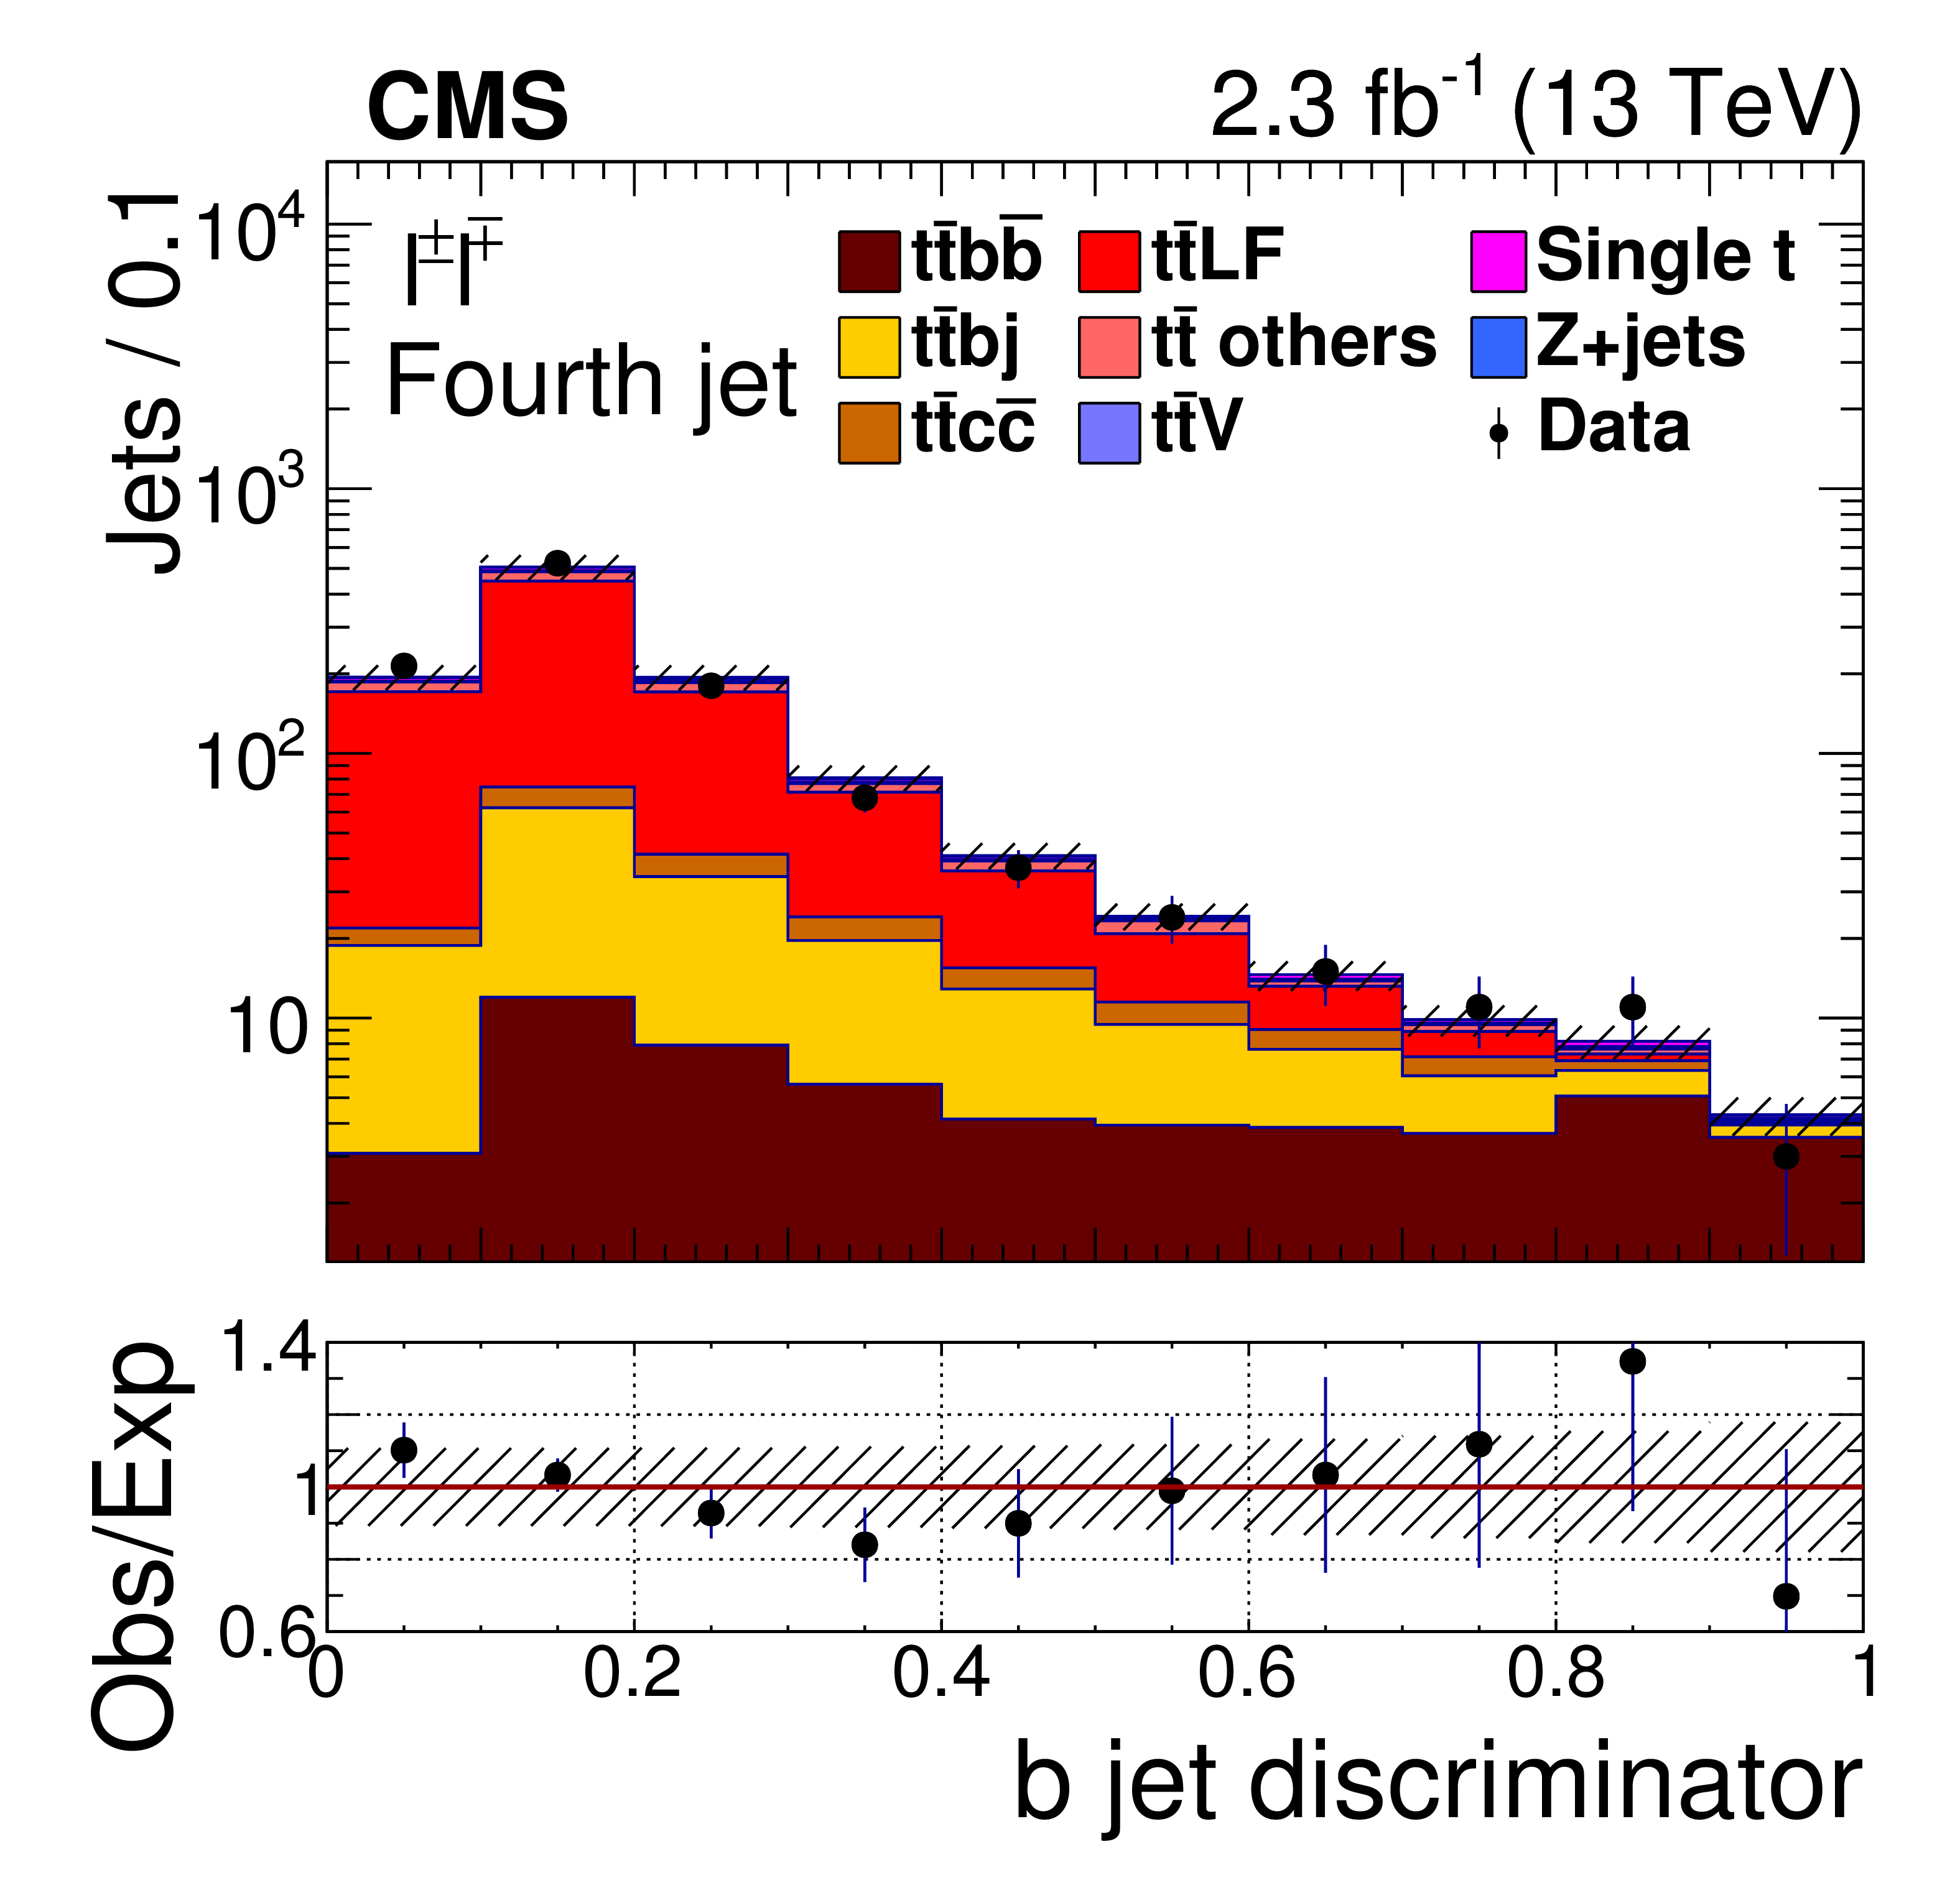
Figure 2:
Distributions of b jet discriminator for the third (left) and the fourth (right) jets in decreasing order of b tagging discriminator value, after the full event selection. The points show the data and the stacked histograms are from simulated events, normalized by the results of the fit. The ratio of the number of data events to the expected number, as given by the stacked histograms, is shown in the lower panels. The hatched region indicates the modelling uncertainty in the MC simulation. |
png pdf |
Figure 2-a:
Distributions of b jet discriminator for the third jet in decreasing order of b tagging discriminator value, after the full event selection. The points show the data and the stacked histograms are from simulated events, normalized by the results of the fit. The ratio of the number of data events to the expected number, as given by the stacked histograms, is shown in the lower panels. The hatched region indicates the modelling uncertainty in the MC simulation. |
png pdf |
Figure 2-b:
Distributions of b jet discriminator for the fourth jet in decreasing order of b tagging discriminator value, after the full event selection. The points show the data and the stacked histograms are from simulated events, normalized by the results of the fit. The ratio of the number of data events to the expected number, as given by the stacked histograms, is shown in the lower panels. The hatched region indicates the modelling uncertainty in the MC simulation. |
png pdf |
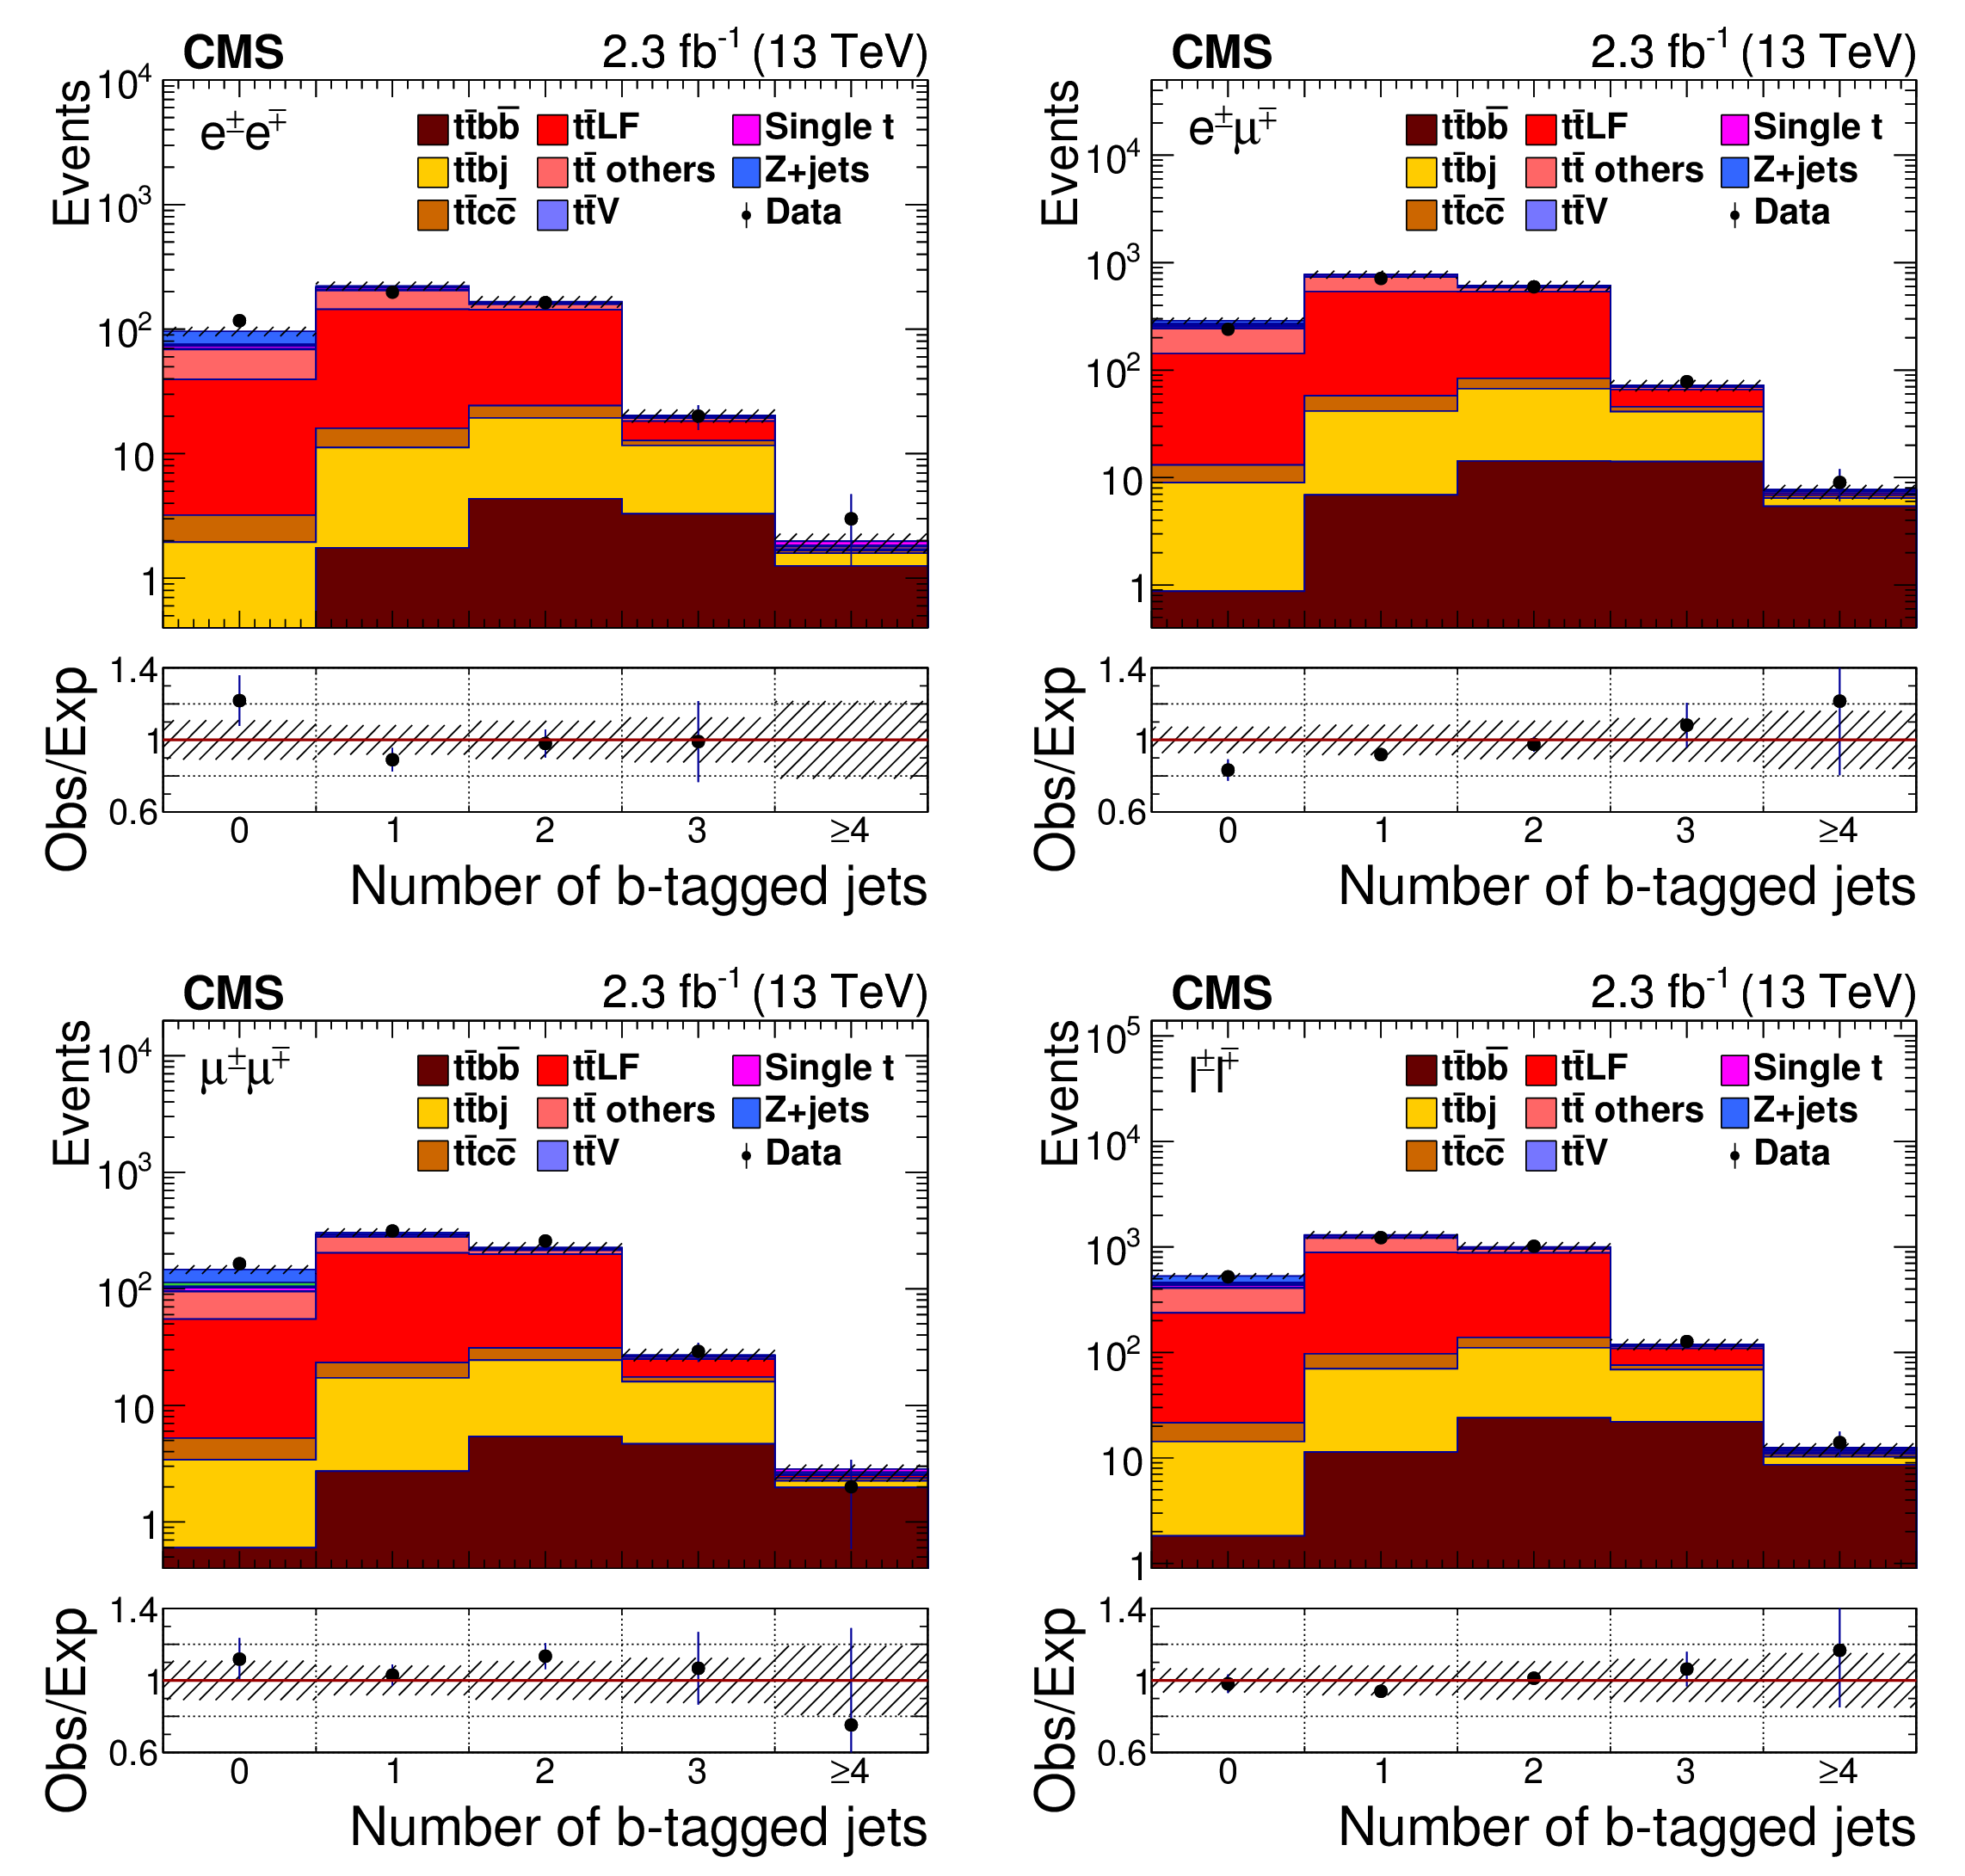
Figure 3:
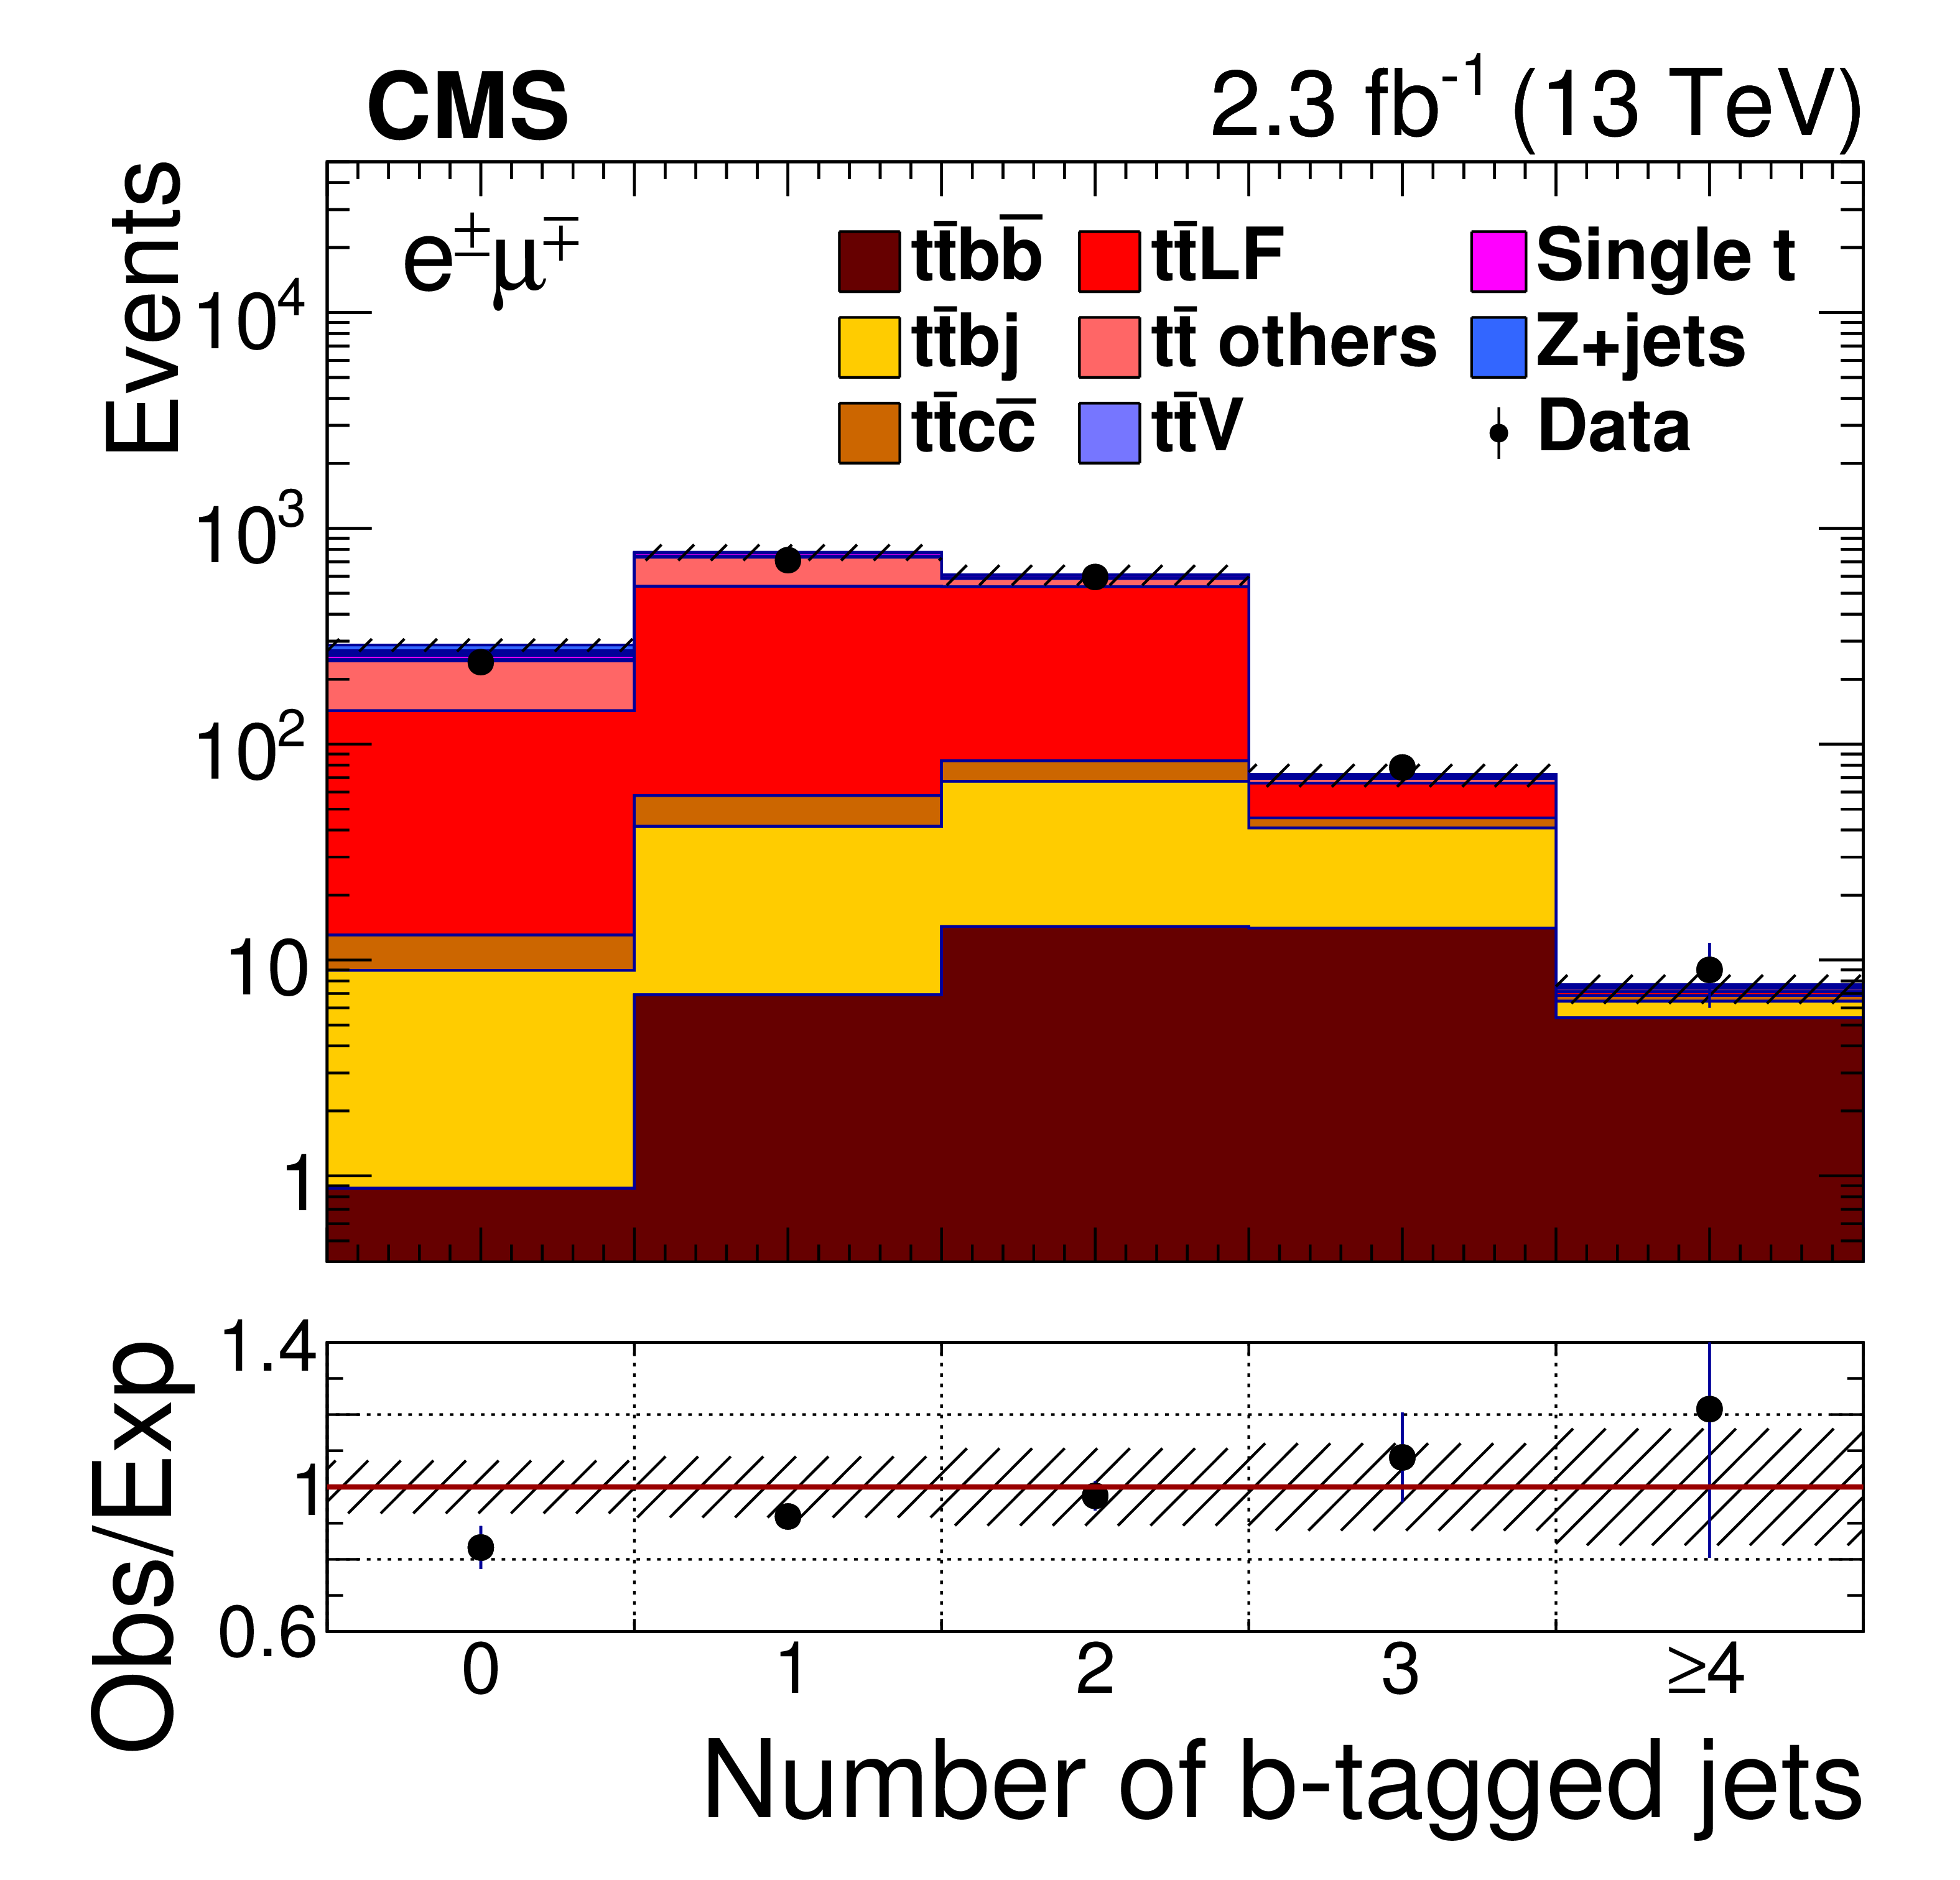
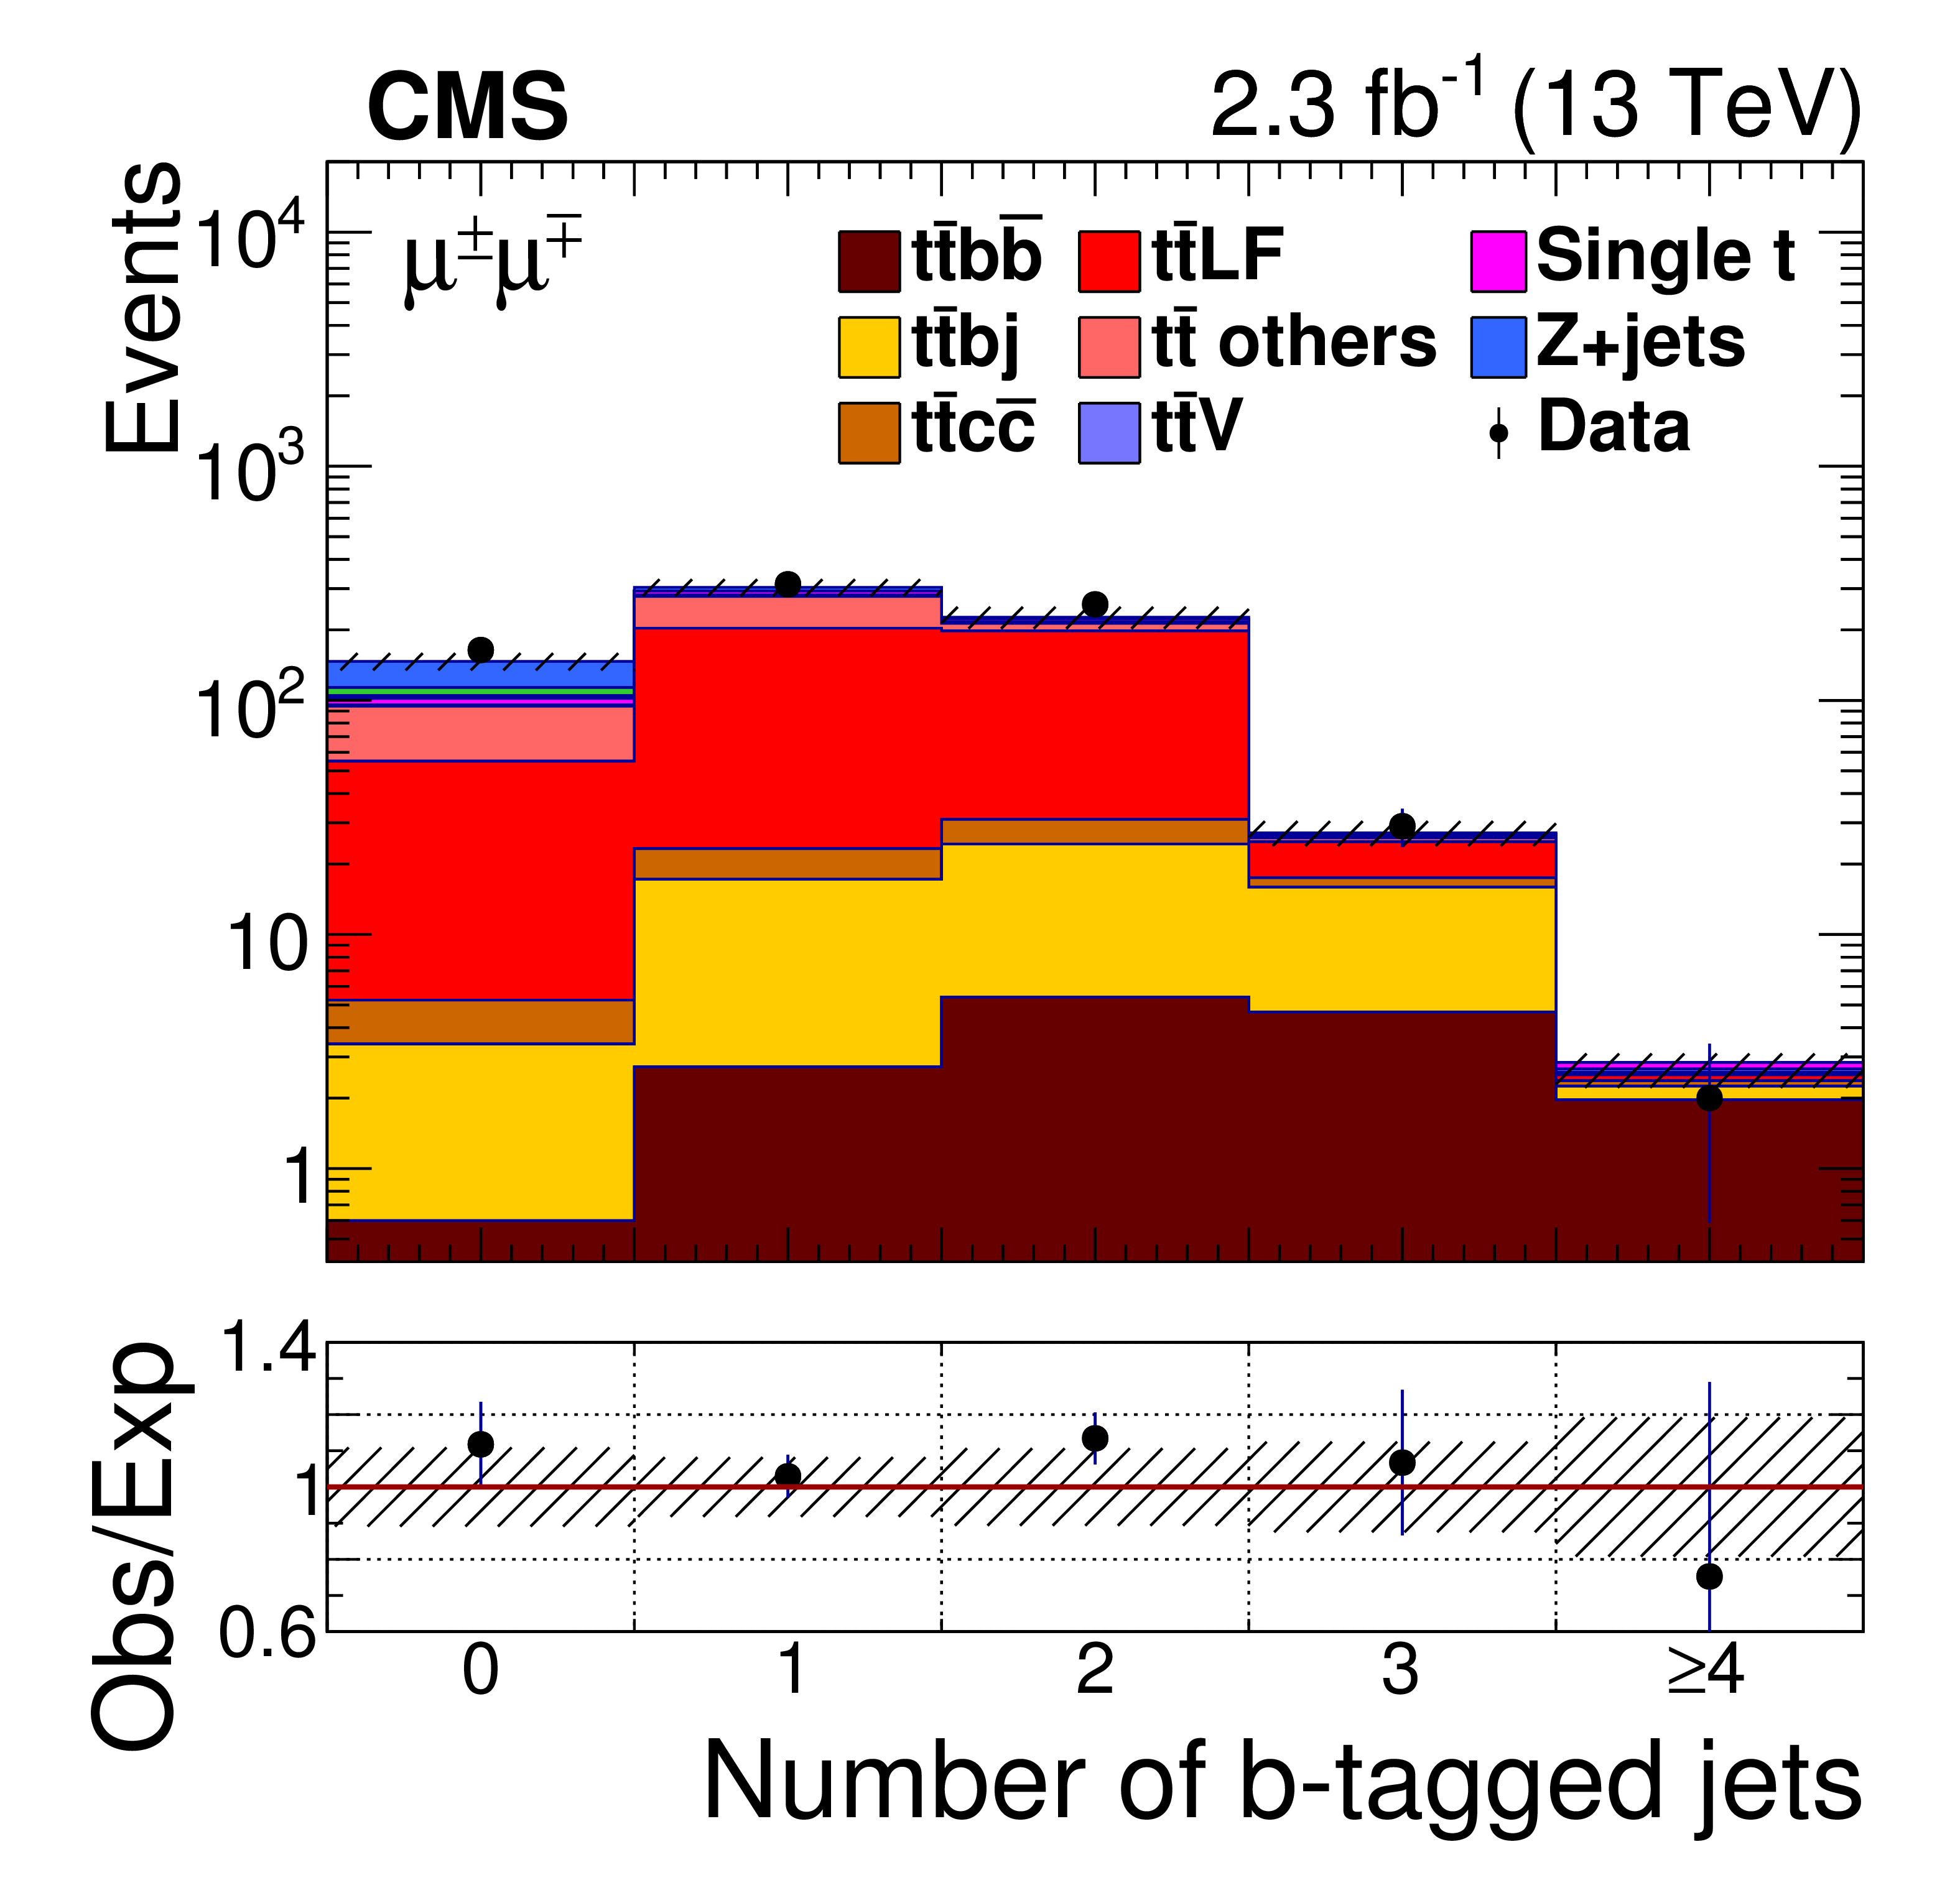
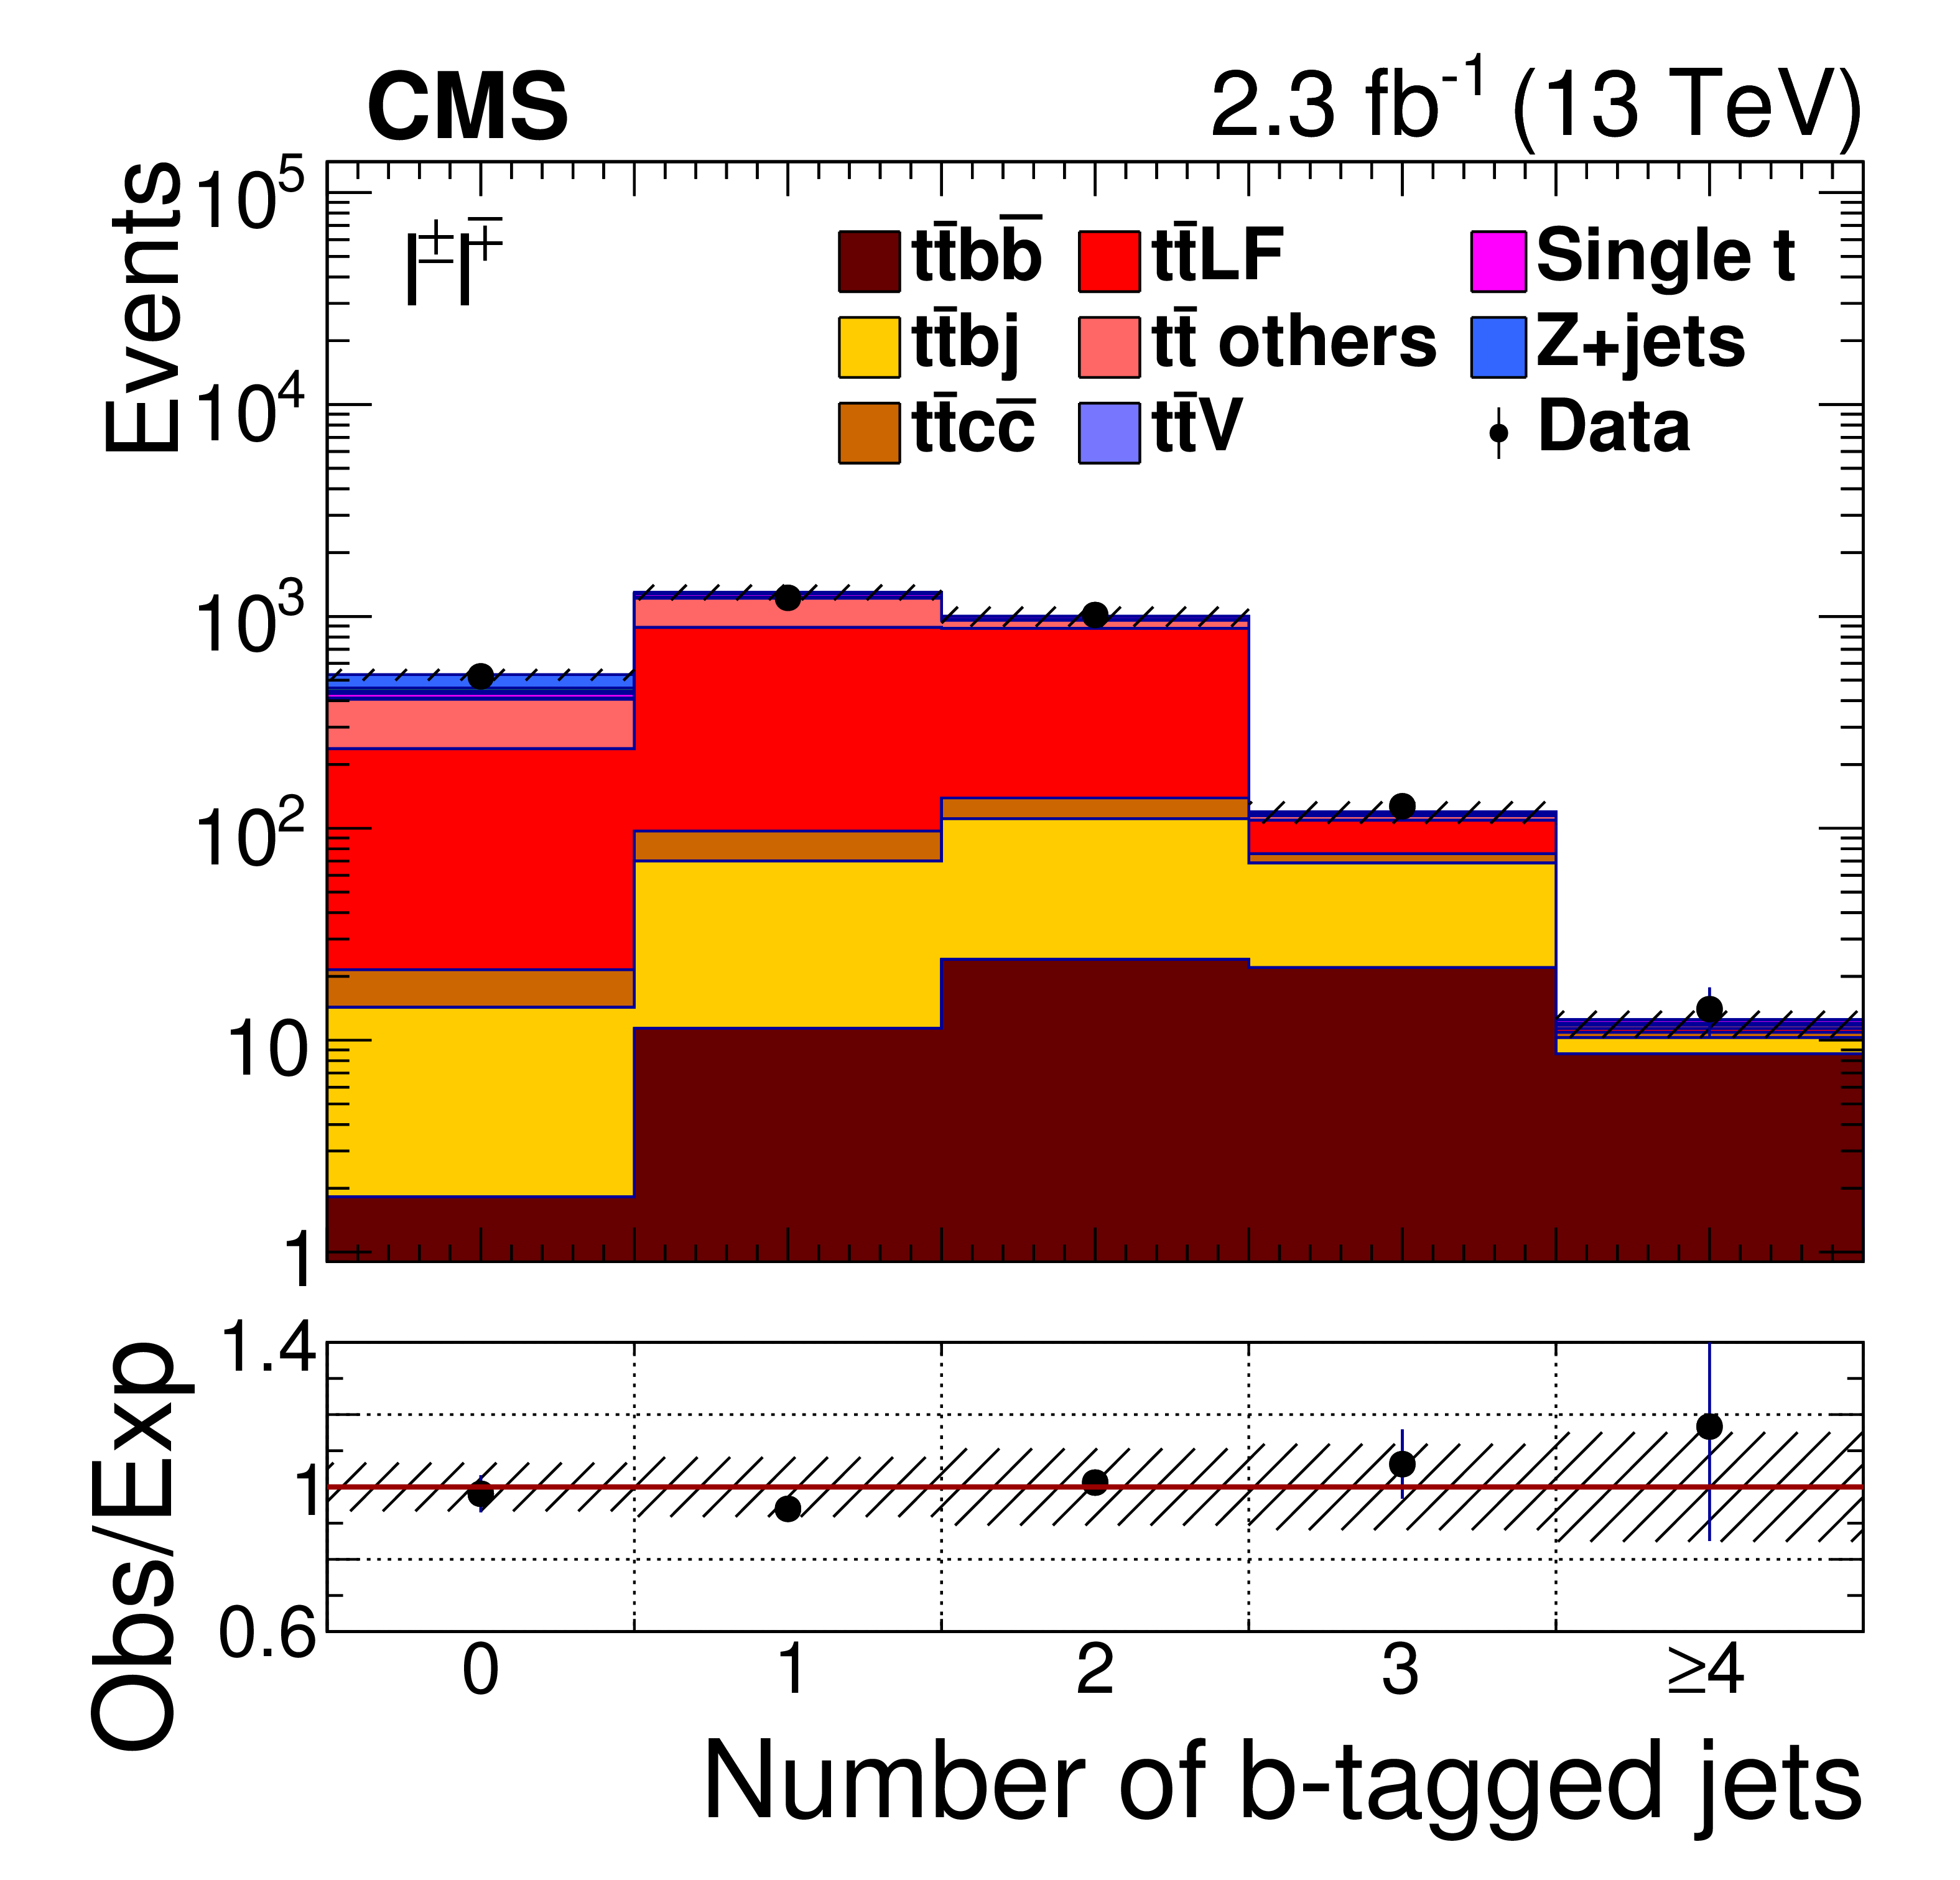
Distribution of b jet multiplicity after the four-jet requirement, but without the b tagging requirement, for the ${\mathrm{ e } ^\pm \mathrm{ e } ^\mp }$ (upper left), ${\mathrm{ e } ^\pm \mu ^\mp }$ (upper right), and ${\mu ^\pm \mu ^\mp }$ (lower left) final states and the sum of the three final states (lower right). The points show the data and the stacked histograms are from simulated events, normalized by the results of the fit. The ratio of the number of data events to the expected number, as given by the stacked histograms, is shown in the lower panels. The hatched region indicates the modelling uncertainty in the MC simulation. |
png pdf |
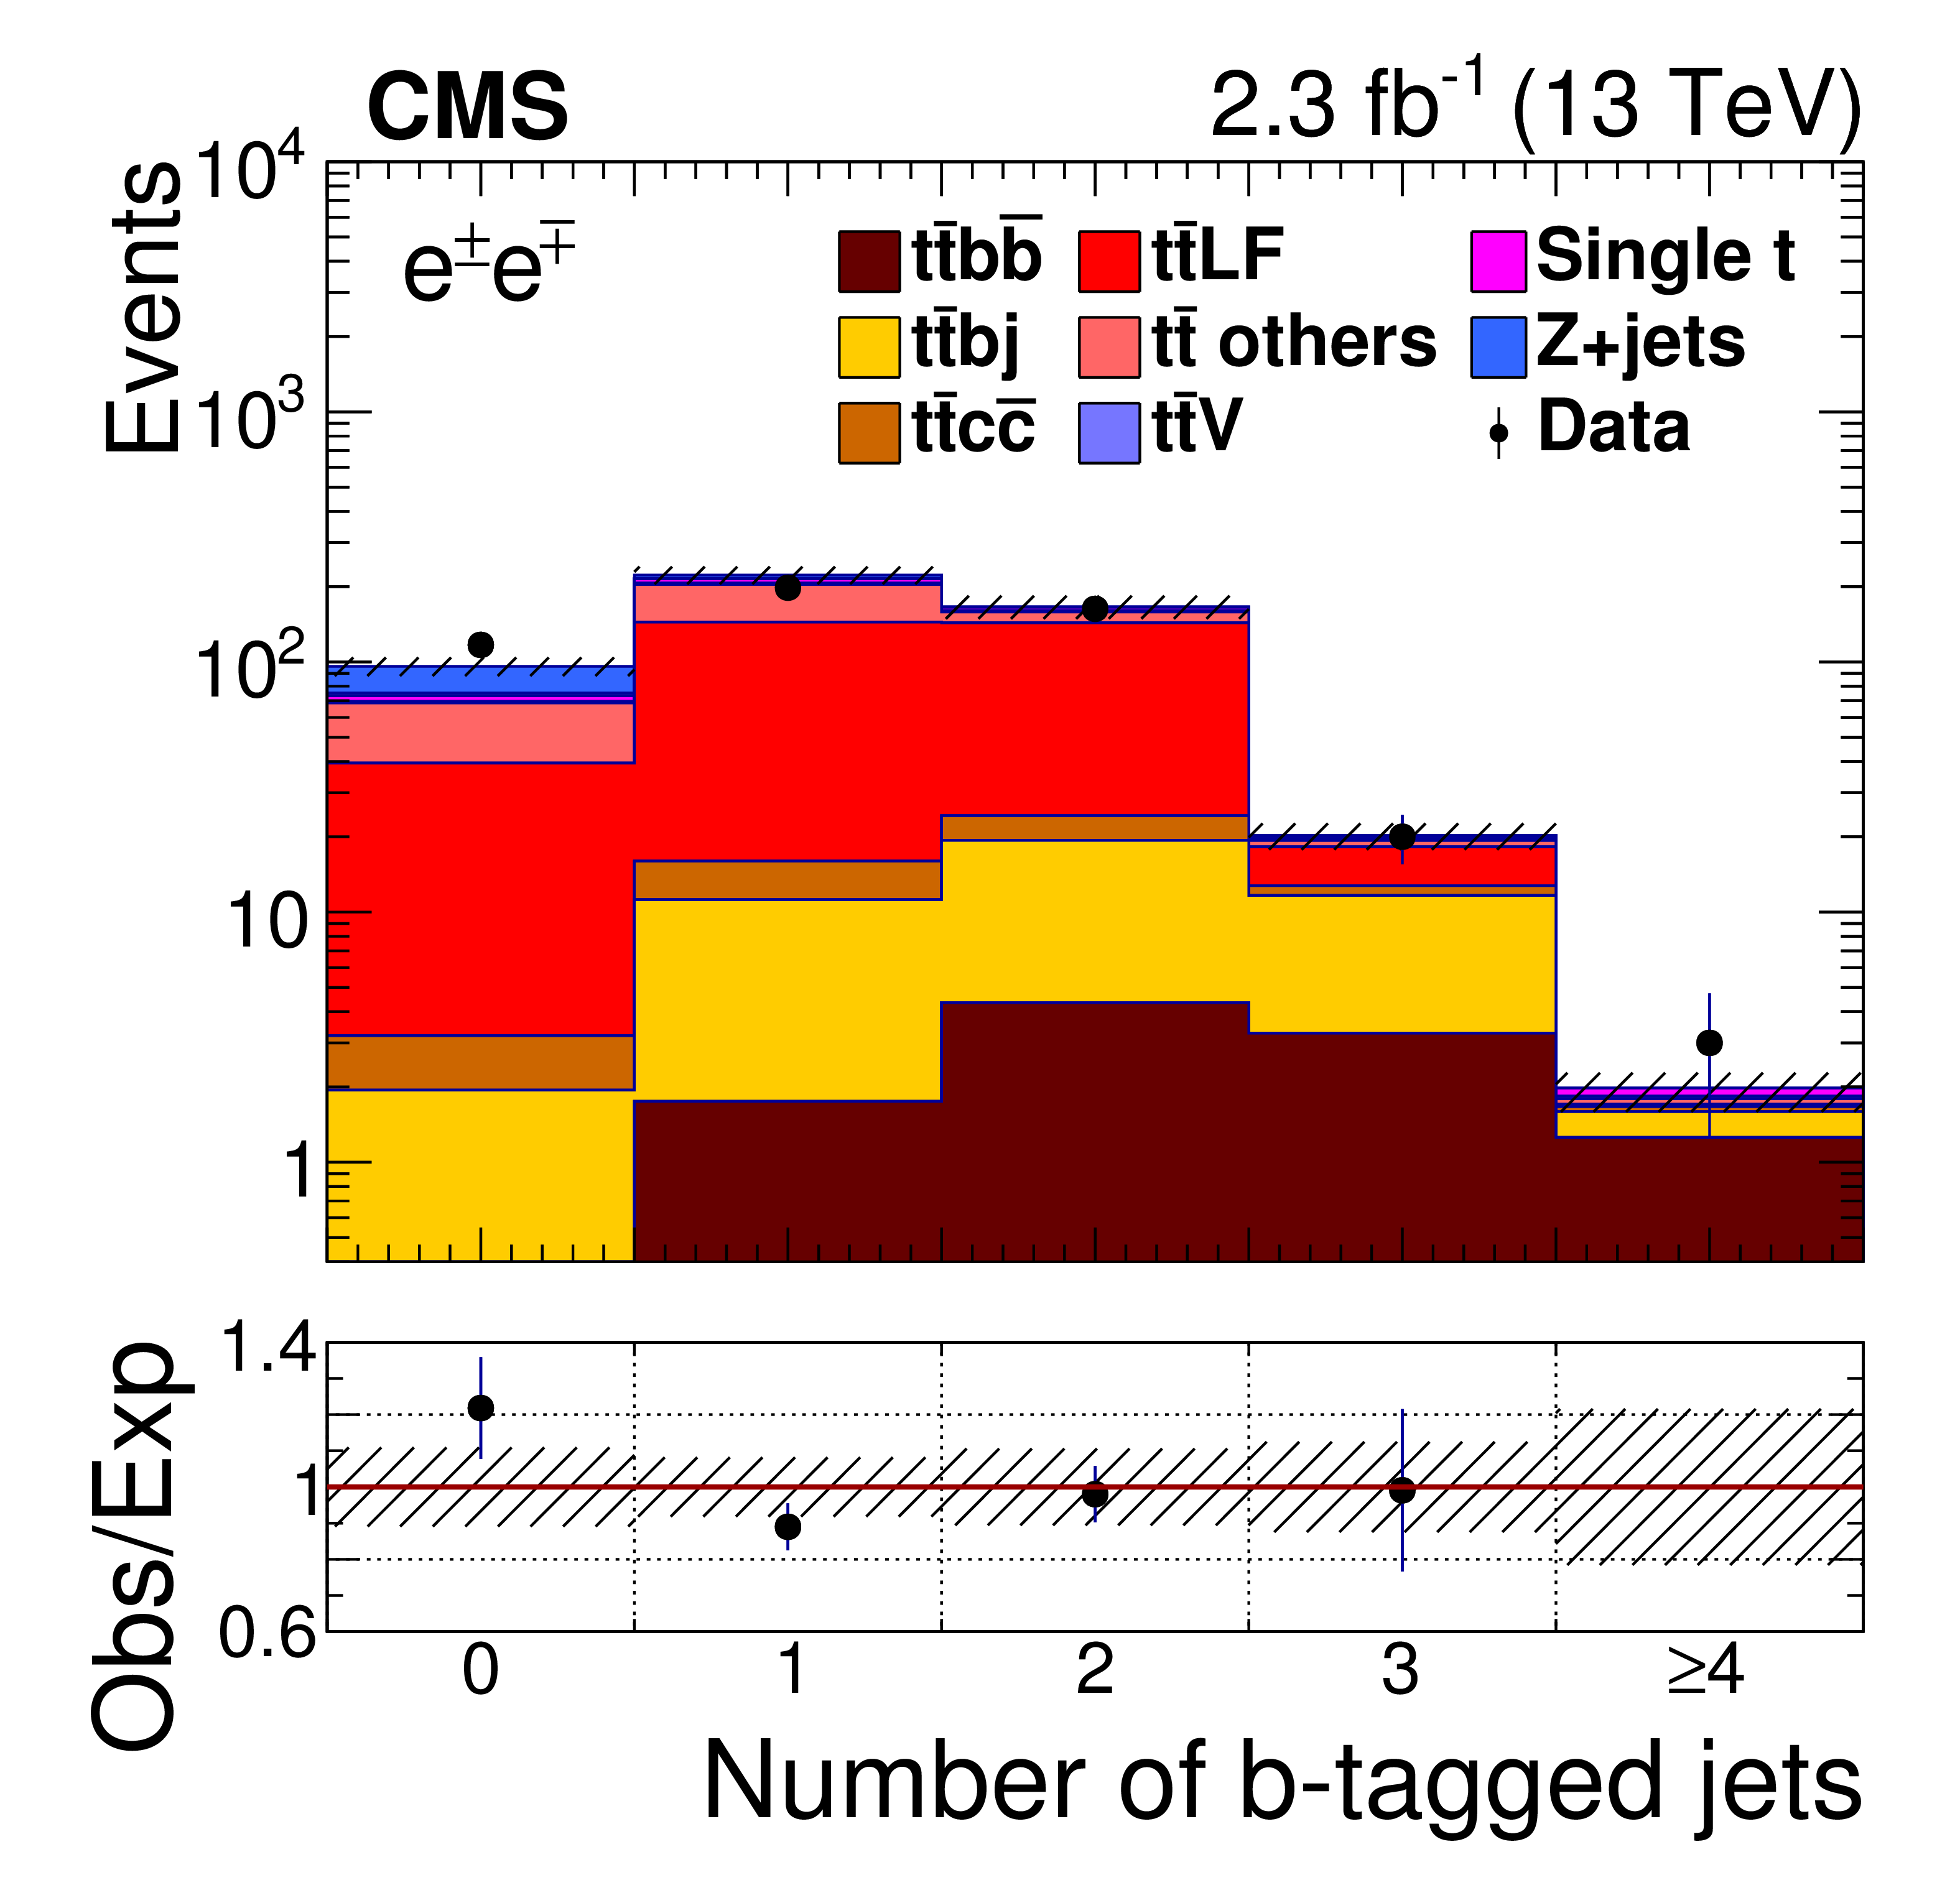
Figure 3-a:
Distribution of b jet multiplicity after the four-jet requirement, but without the b tagging requirement, for the ${\mathrm{ e } ^\pm \mathrm{ e } ^\mp }$ final state. The points show the data and the stacked histograms are from simulated events, normalized by the results of the fit. The ratio of the number of data events to the expected number, as given by the stacked histograms, is shown in the lower panels. The hatched region indicates the modelling uncertainty in the MC simulation. |
png pdf |
Figure 3-b:
Distribution of b jet multiplicity after the four-jet requirement, but without the b tagging requirement, for the ${\mathrm{ e } ^\pm \mu ^\mp }$ final state. The points show the data and the stacked histograms are from simulated events, normalized by the results of the fit. The ratio of the number of data events to the expected number, as given by the stacked histograms, is shown in the lower panels. The hatched region indicates the modelling uncertainty in the MC simulation. |
png pdf |
Figure 3-c:
Distribution of b jet multiplicity after the four-jet requirement, but without the b tagging requirement, for the ${\mu ^\pm \mu ^\mp }$ final states. The points show the data and the stacked histograms are from simulated events, normalized by the results of the fit. The ratio of the number of data events to the expected number, as given by the stacked histograms, is shown in the lower panels. The hatched region indicates the modelling uncertainty in the MC simulation. |
png pdf |
Figure 3-d:
Distribution of b jet multiplicity after the four-jet requirement, but without the b tagging requirement, for the sum of the ${\mathrm{ e } ^\pm \mathrm{ e } ^\mp }$, ${\mathrm{ e } ^\pm \mu ^\mp }$, and ${\mu ^\pm \mu ^\mp }$ final states. The points show the data and the stacked histograms are from simulated events, normalized by the results of the fit. The ratio of the number of data events to the expected number, as given by the stacked histograms, is shown in the lower panels. The hatched region indicates the modelling uncertainty in the MC simulation. |
| Tables | |
png pdf |
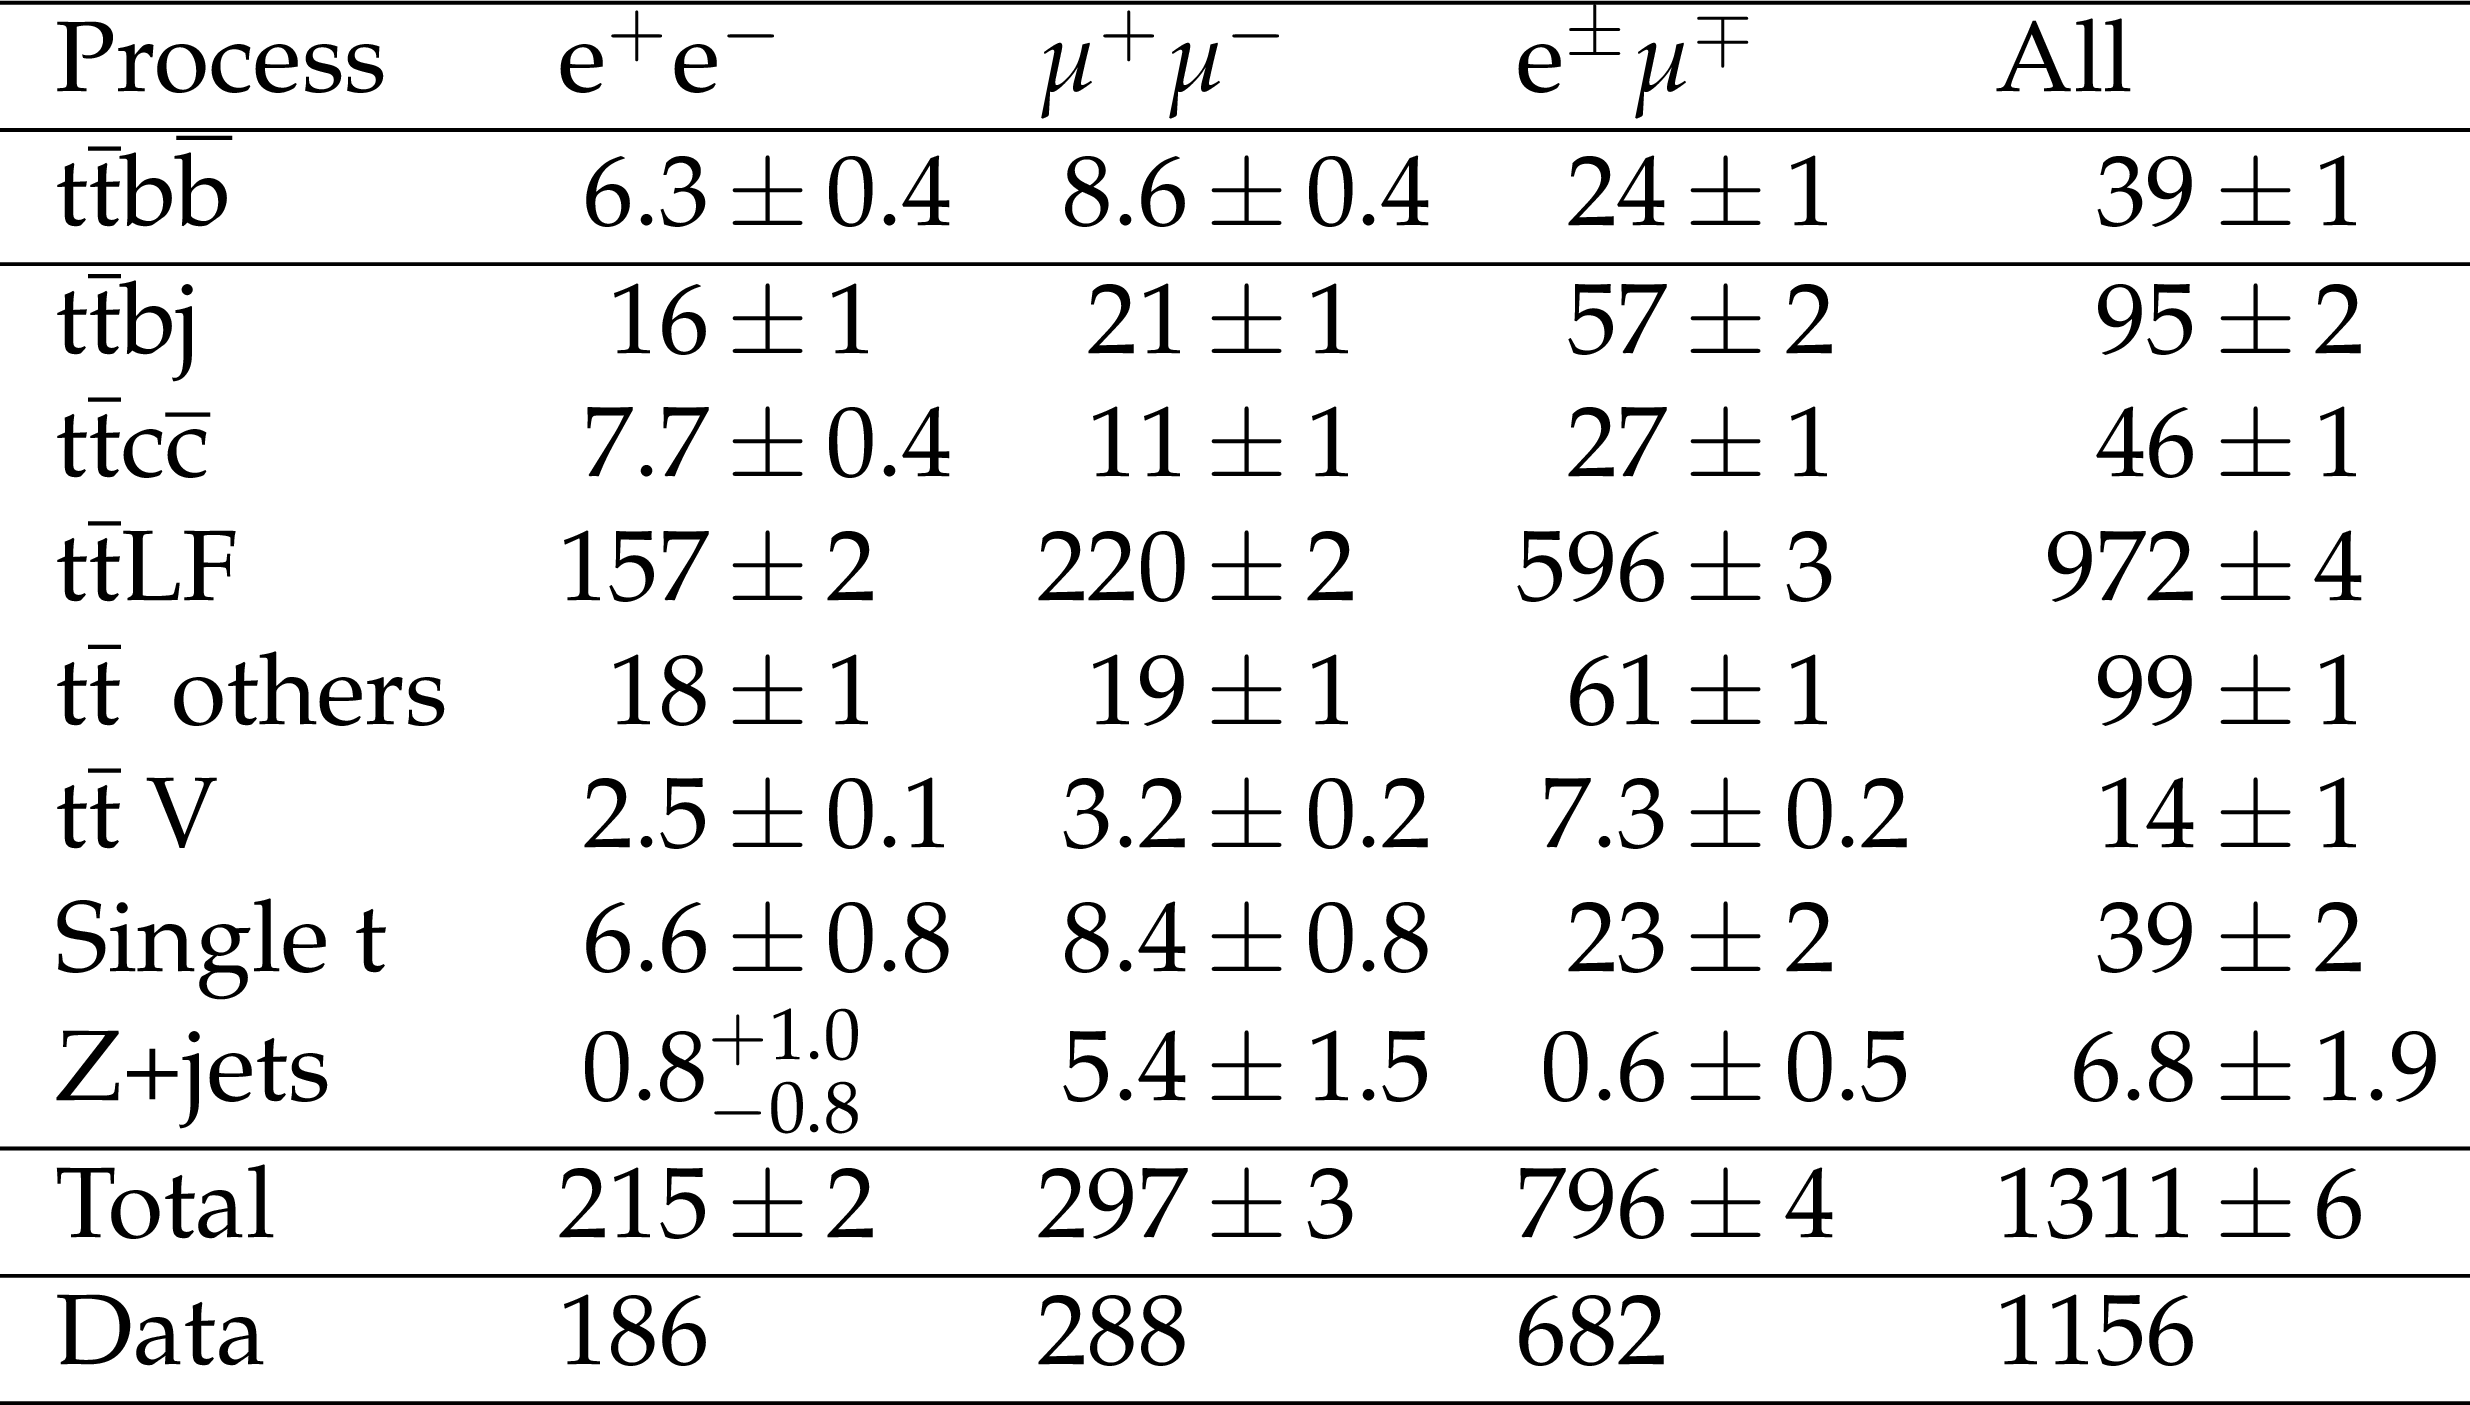
Table 1:
Predicted number of events for each physics process and for each dilepton category, their total, and the observed number of events. Results are shown after the final event selection. The Z+jets normalization and uncertainty are calculated from data, while all other predictions and uncertainties come from simulated data samples. The $ {\mathrm{ t } \mathrm{ \bar{t} } } $ sample for event categorization is from the POWHEG (v2) event generator interfaced with PYTHIA (v8.205). |
png pdf |
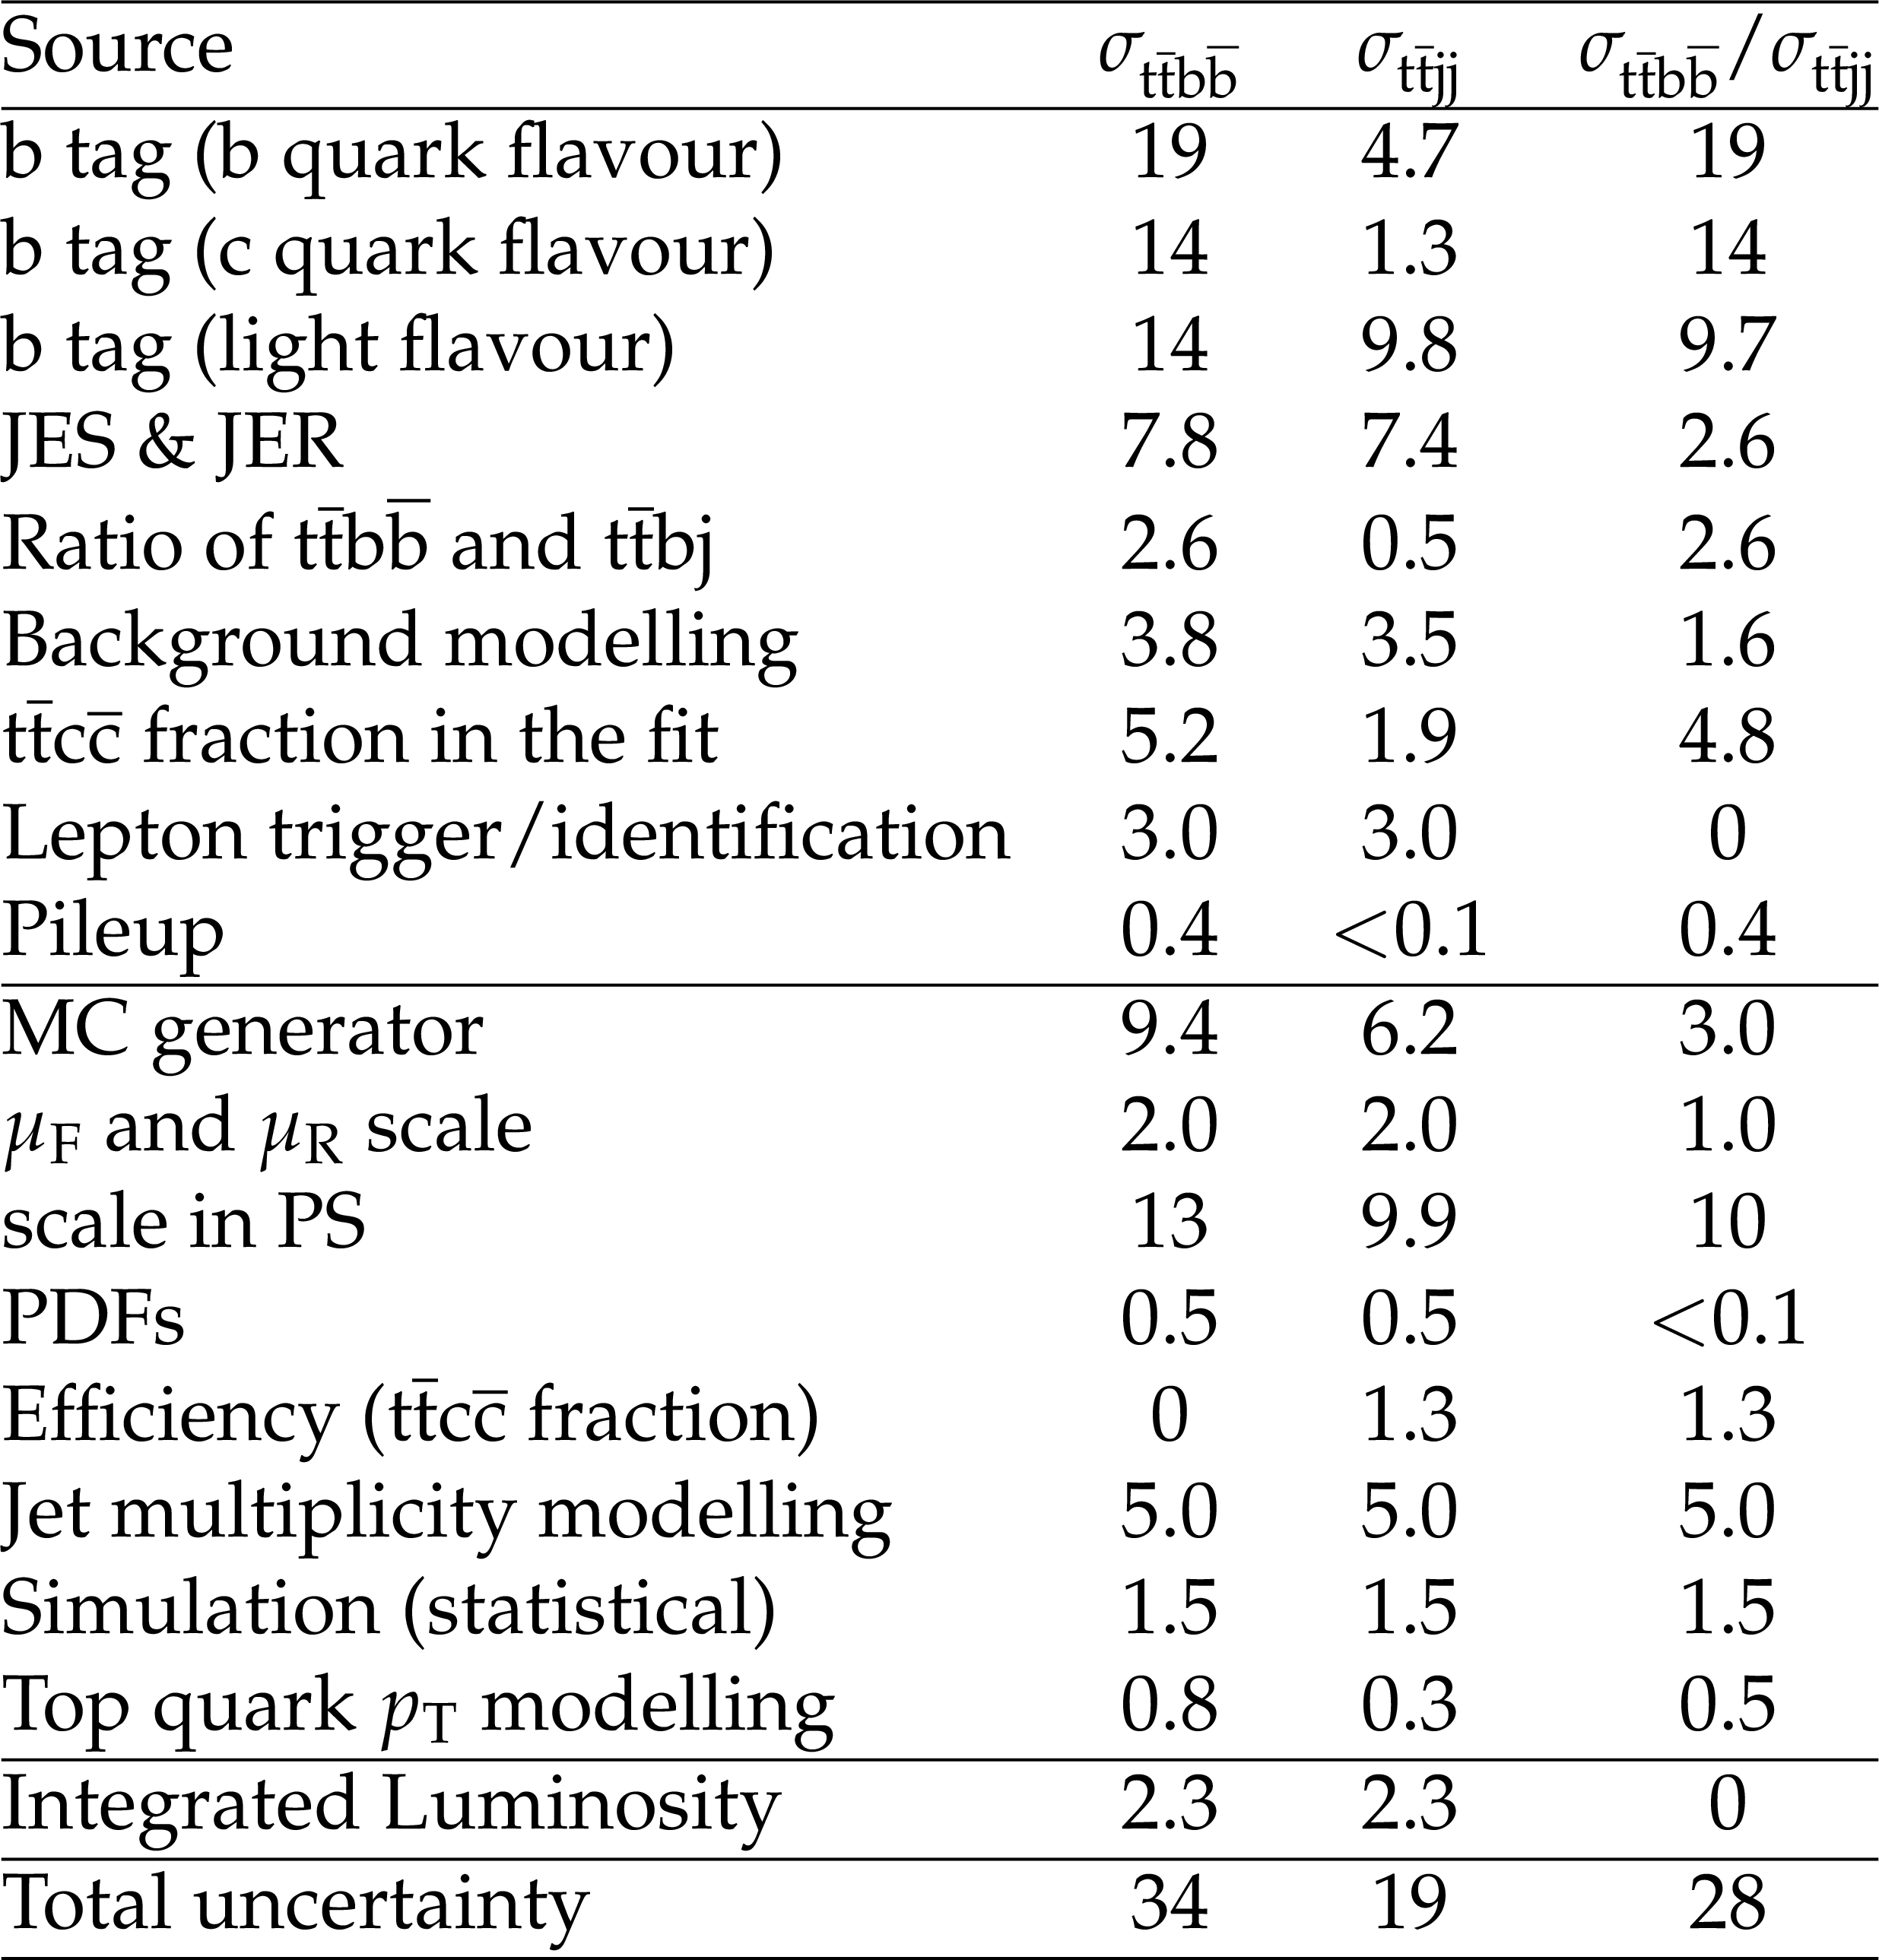
Table 2:
Summary of the systematic uncertainties in percentage (%) from various sources contributing to $ {\sigma _{ { {\mathrm{ t } \mathrm{ \bar{t} } } {\mathrm{ b \bar{b} } } } }} $, $ {\sigma _{ { {\mathrm{ t } \mathrm{ \bar{t} } } \mathrm {jj}} }} $, and the ratio $ {\sigma _{ { {\mathrm{ t } \mathrm{ \bar{t} } } {\mathrm{ b \bar{b} } } } }} $/$ {\sigma _{ { {\mathrm{ t } \mathrm{ \bar{t} } } \mathrm {jj}} }} $, for a jet ${p_{\mathrm {T}}}$ threshold of ${p_{\mathrm {T}}} > $ 20 GeV in the visible phase space. |

png pdf |
Table 3:
The measured cross sections ${\sigma _{ { {\mathrm{ t } \mathrm{ \bar{t} } } {\mathrm{ b \bar{b} } } } }} $ and ${\sigma _{ { {\mathrm{ t } \mathrm{ \bar{t} } } \mathrm {jj}} }} $ and their ratio for the visible and the full phase space, corrected for acceptance and branching fractions. The uncertainties on the measurements show separately the statistical and systematic components, while those are combined for the POWHEG predictions. |
| Summary |
| Measurements of the cross sections ${\sigma_{{\mathrm{ t \bar{t} }\mathrm{ b \bar{b} }}}} $ and ${\sigma_{{\mathrm{ t \bar{t} }\mathrm{jj}} }} $ and their ratio ${\sigma_{{\mathrm{ t \bar{t} }\mathrm{ b \bar{b} }}}} /{\sigma_{{\mathrm{ t \bar{t} }\mathrm{jj}} }} $ are presented using a data sample recorded in pp collisions at $\sqrt{s} = $ 13 TeV, corresponding to an integrated luminosity of 2.3 fb$^{-1}$. The cross section ratio has been measured in a visible phase space region using the dilepton decay mode of $\mathrm{ t \bar{t} }$ events and corrected to the particle level, corresponding to the detector acceptance. The measured cross section ratios in the visible and the full phase space are ${\sigma_{{\mathrm{ t \bar{t} }\mathrm{ b \bar{b} }}}} /{\sigma_{{\mathrm{ t \bar{t} }\mathrm{jj}} }} = $ 0.024 $\pm$ 0.003 (stat) $\pm$ 0.007 (syst) and ${\sigma_{{\mathrm{ t \bar{t} }\mathrm{ b \bar{b} }}}} /{\sigma_{{\mathrm{ t \bar{t} }\mathrm{jj}} }} = $ 0.022 $\pm$ 0.003 (stat) $\pm$ 0.006 (syst), respectively, where a minimum transverse momentum for the particle-level jets of 20 GeV is required. Theoretical ratios predicted from the POWHEG simulation (interfaced with PYTHIA) are 0.014 $\pm$ 0.001 for the visible and 0.012 $\pm$ 0.001 for the full phase space, which are lower than the measured values but consistent within two standard deviations. The individual cross sections ${\sigma_{{\mathrm{ t \bar{t} }\mathrm{ b \bar{b} }}}} = $ 4.0 $\pm$ 0.6 (stat) $\pm$ 1.3 (syst) pb and ${\sigma_{{\mathrm{ t \bar{t} }\mathrm{jj}} }} = $ 184 $\pm$ 6 (stat) $\pm$ 33 (syst) pb have also been measured. These results, in particular the ratio of the cross sections, provide important information for the ${\mathrm{ t \bar{t} }\mathrm{ H }} $ search, permitting the reduction of a dominant systematic uncertainty that derives from the uncertainty in the ${\mathrm{ t \bar{t} }\mathrm{ b \bar{b} }} $ background. They can also be used as a figure of merit for testing the validity of next-to-leading-order QCD calculations at $\sqrt{s} = $ 13 TeV. |
| Additional Figures | |
png pdf |
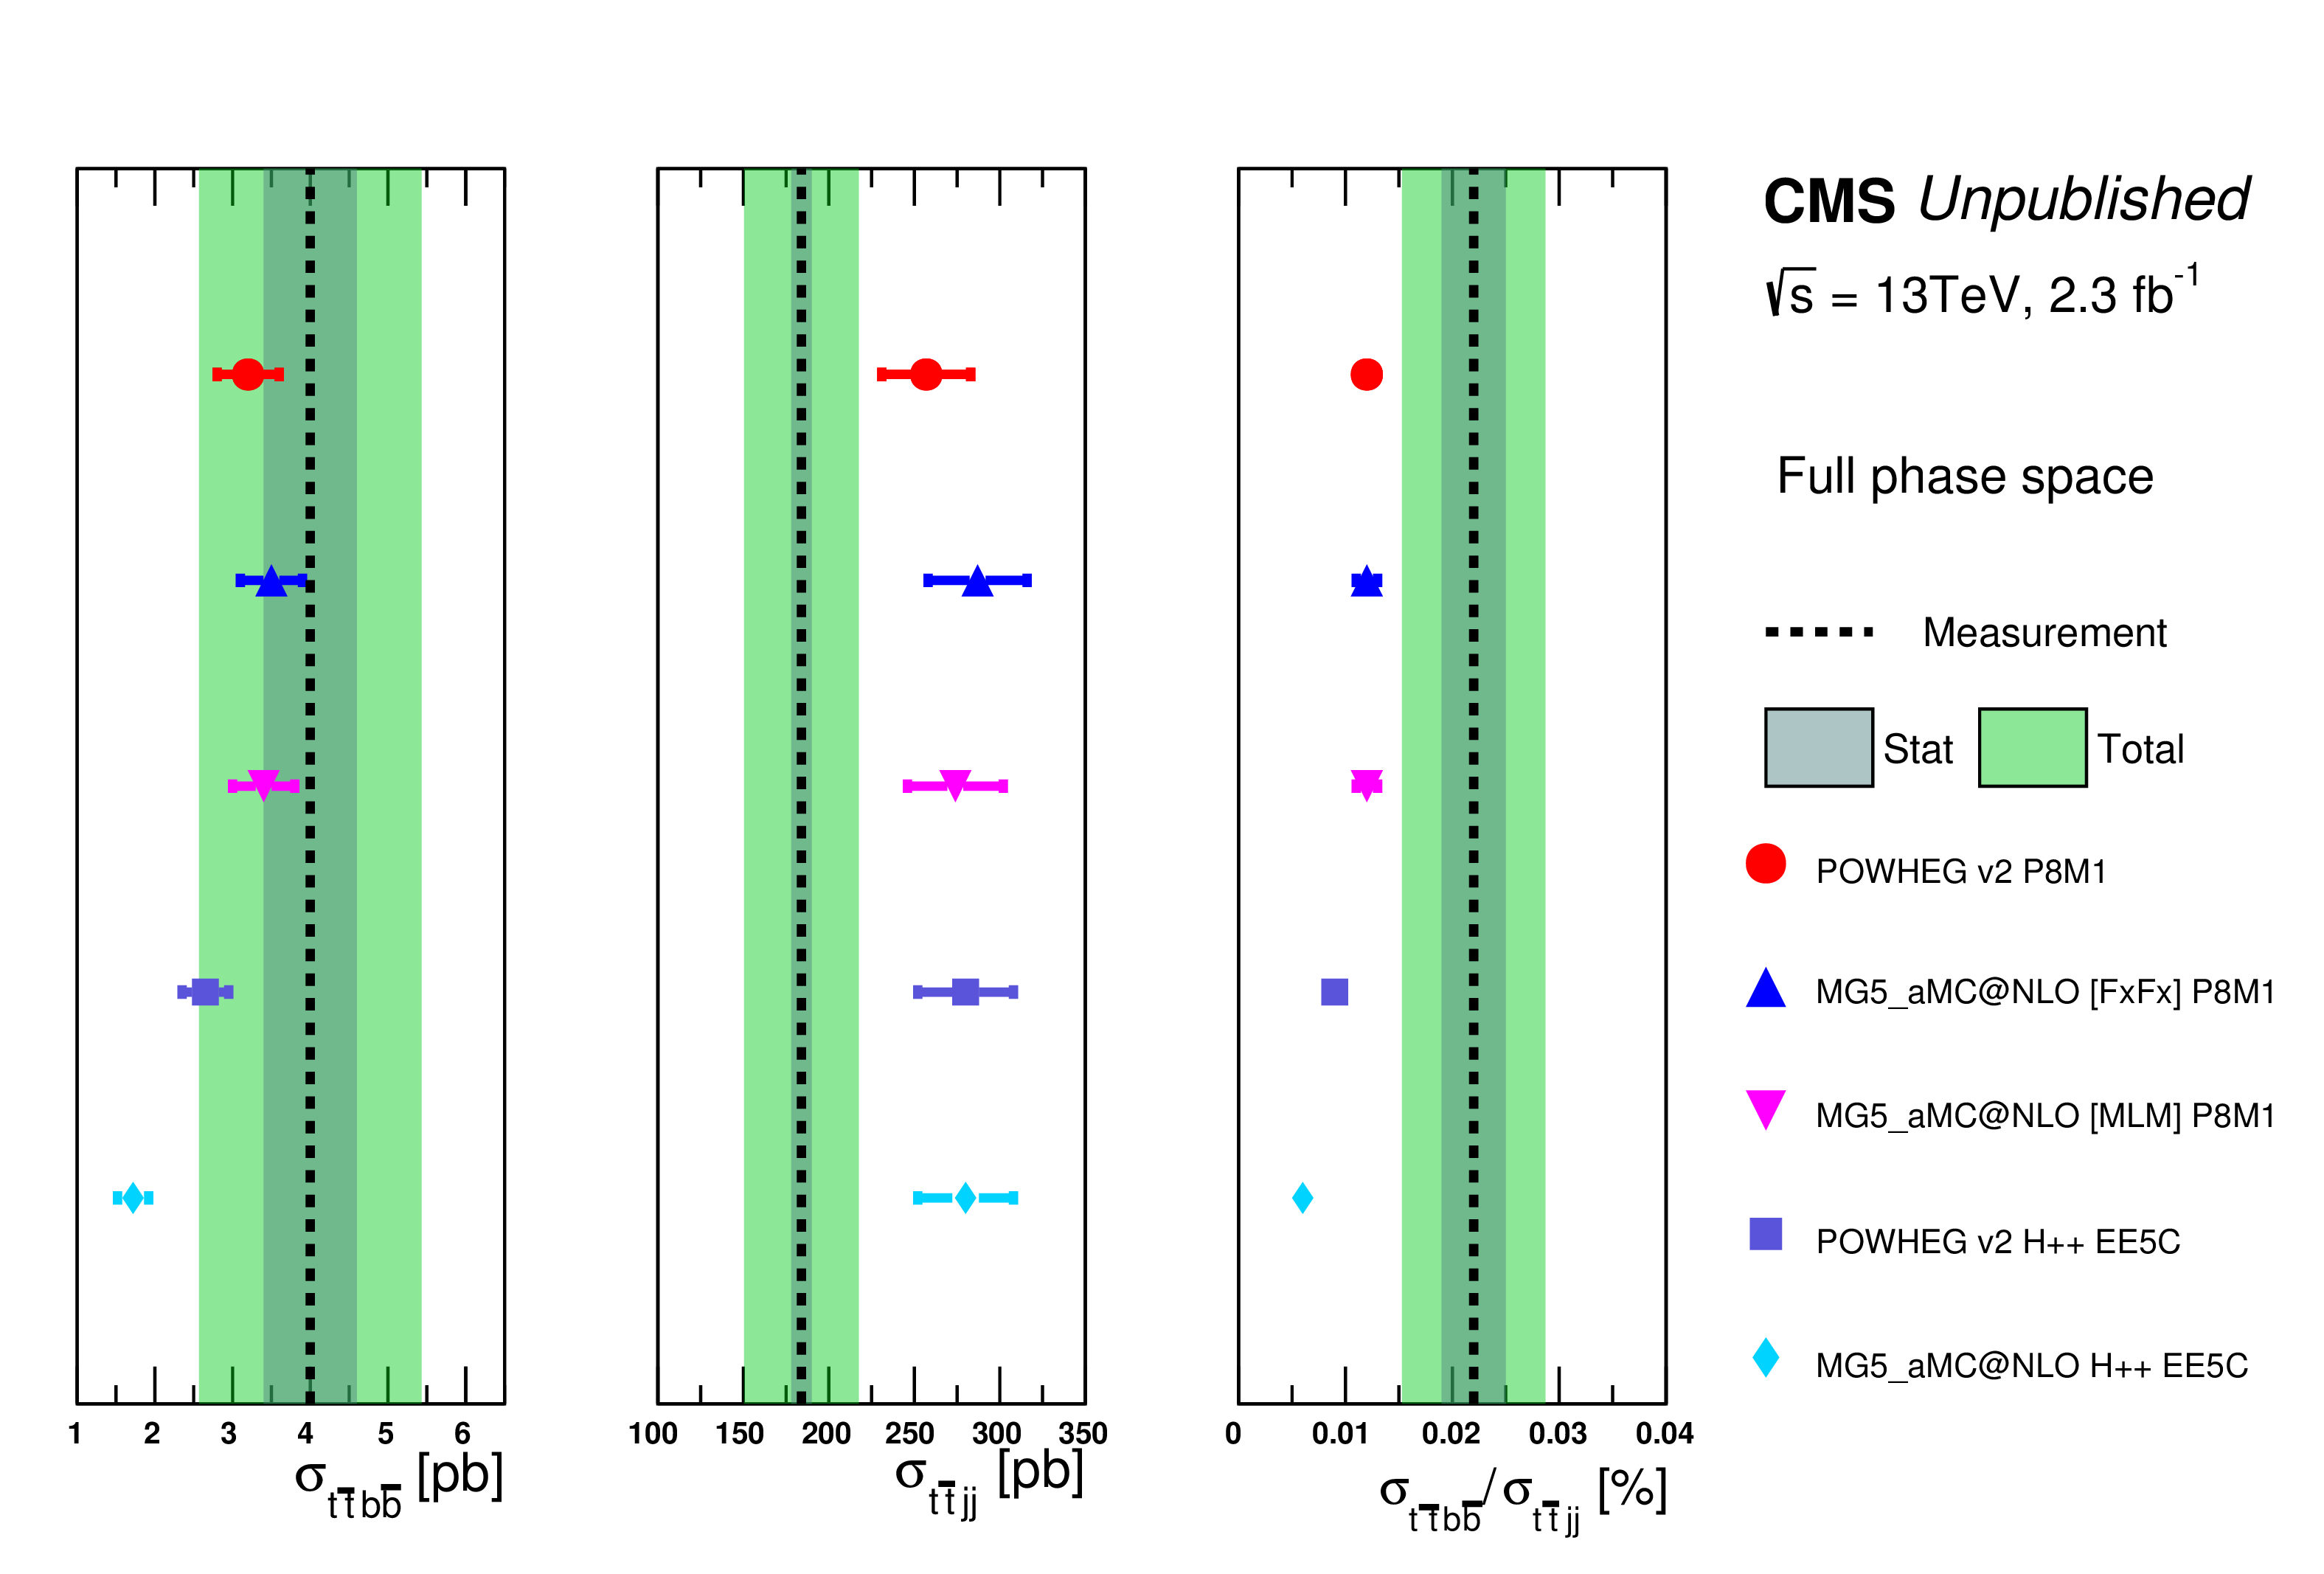
Additional Figure 1:
The measured cross sections for ${\mathrm{ t } {}\mathrm{ \bar{t} } } {\mathrm{ b \bar{b} } } $ (left), ${\mathrm{ t } {}\mathrm{ \bar{t} } } \mathrm {jj}$ (middle) and their ratio (right) for the full phase space in comparison with the theoretical calculations. Error bars for the Monte Carlo predictions correspond the scale uncertainty. |
png pdf |
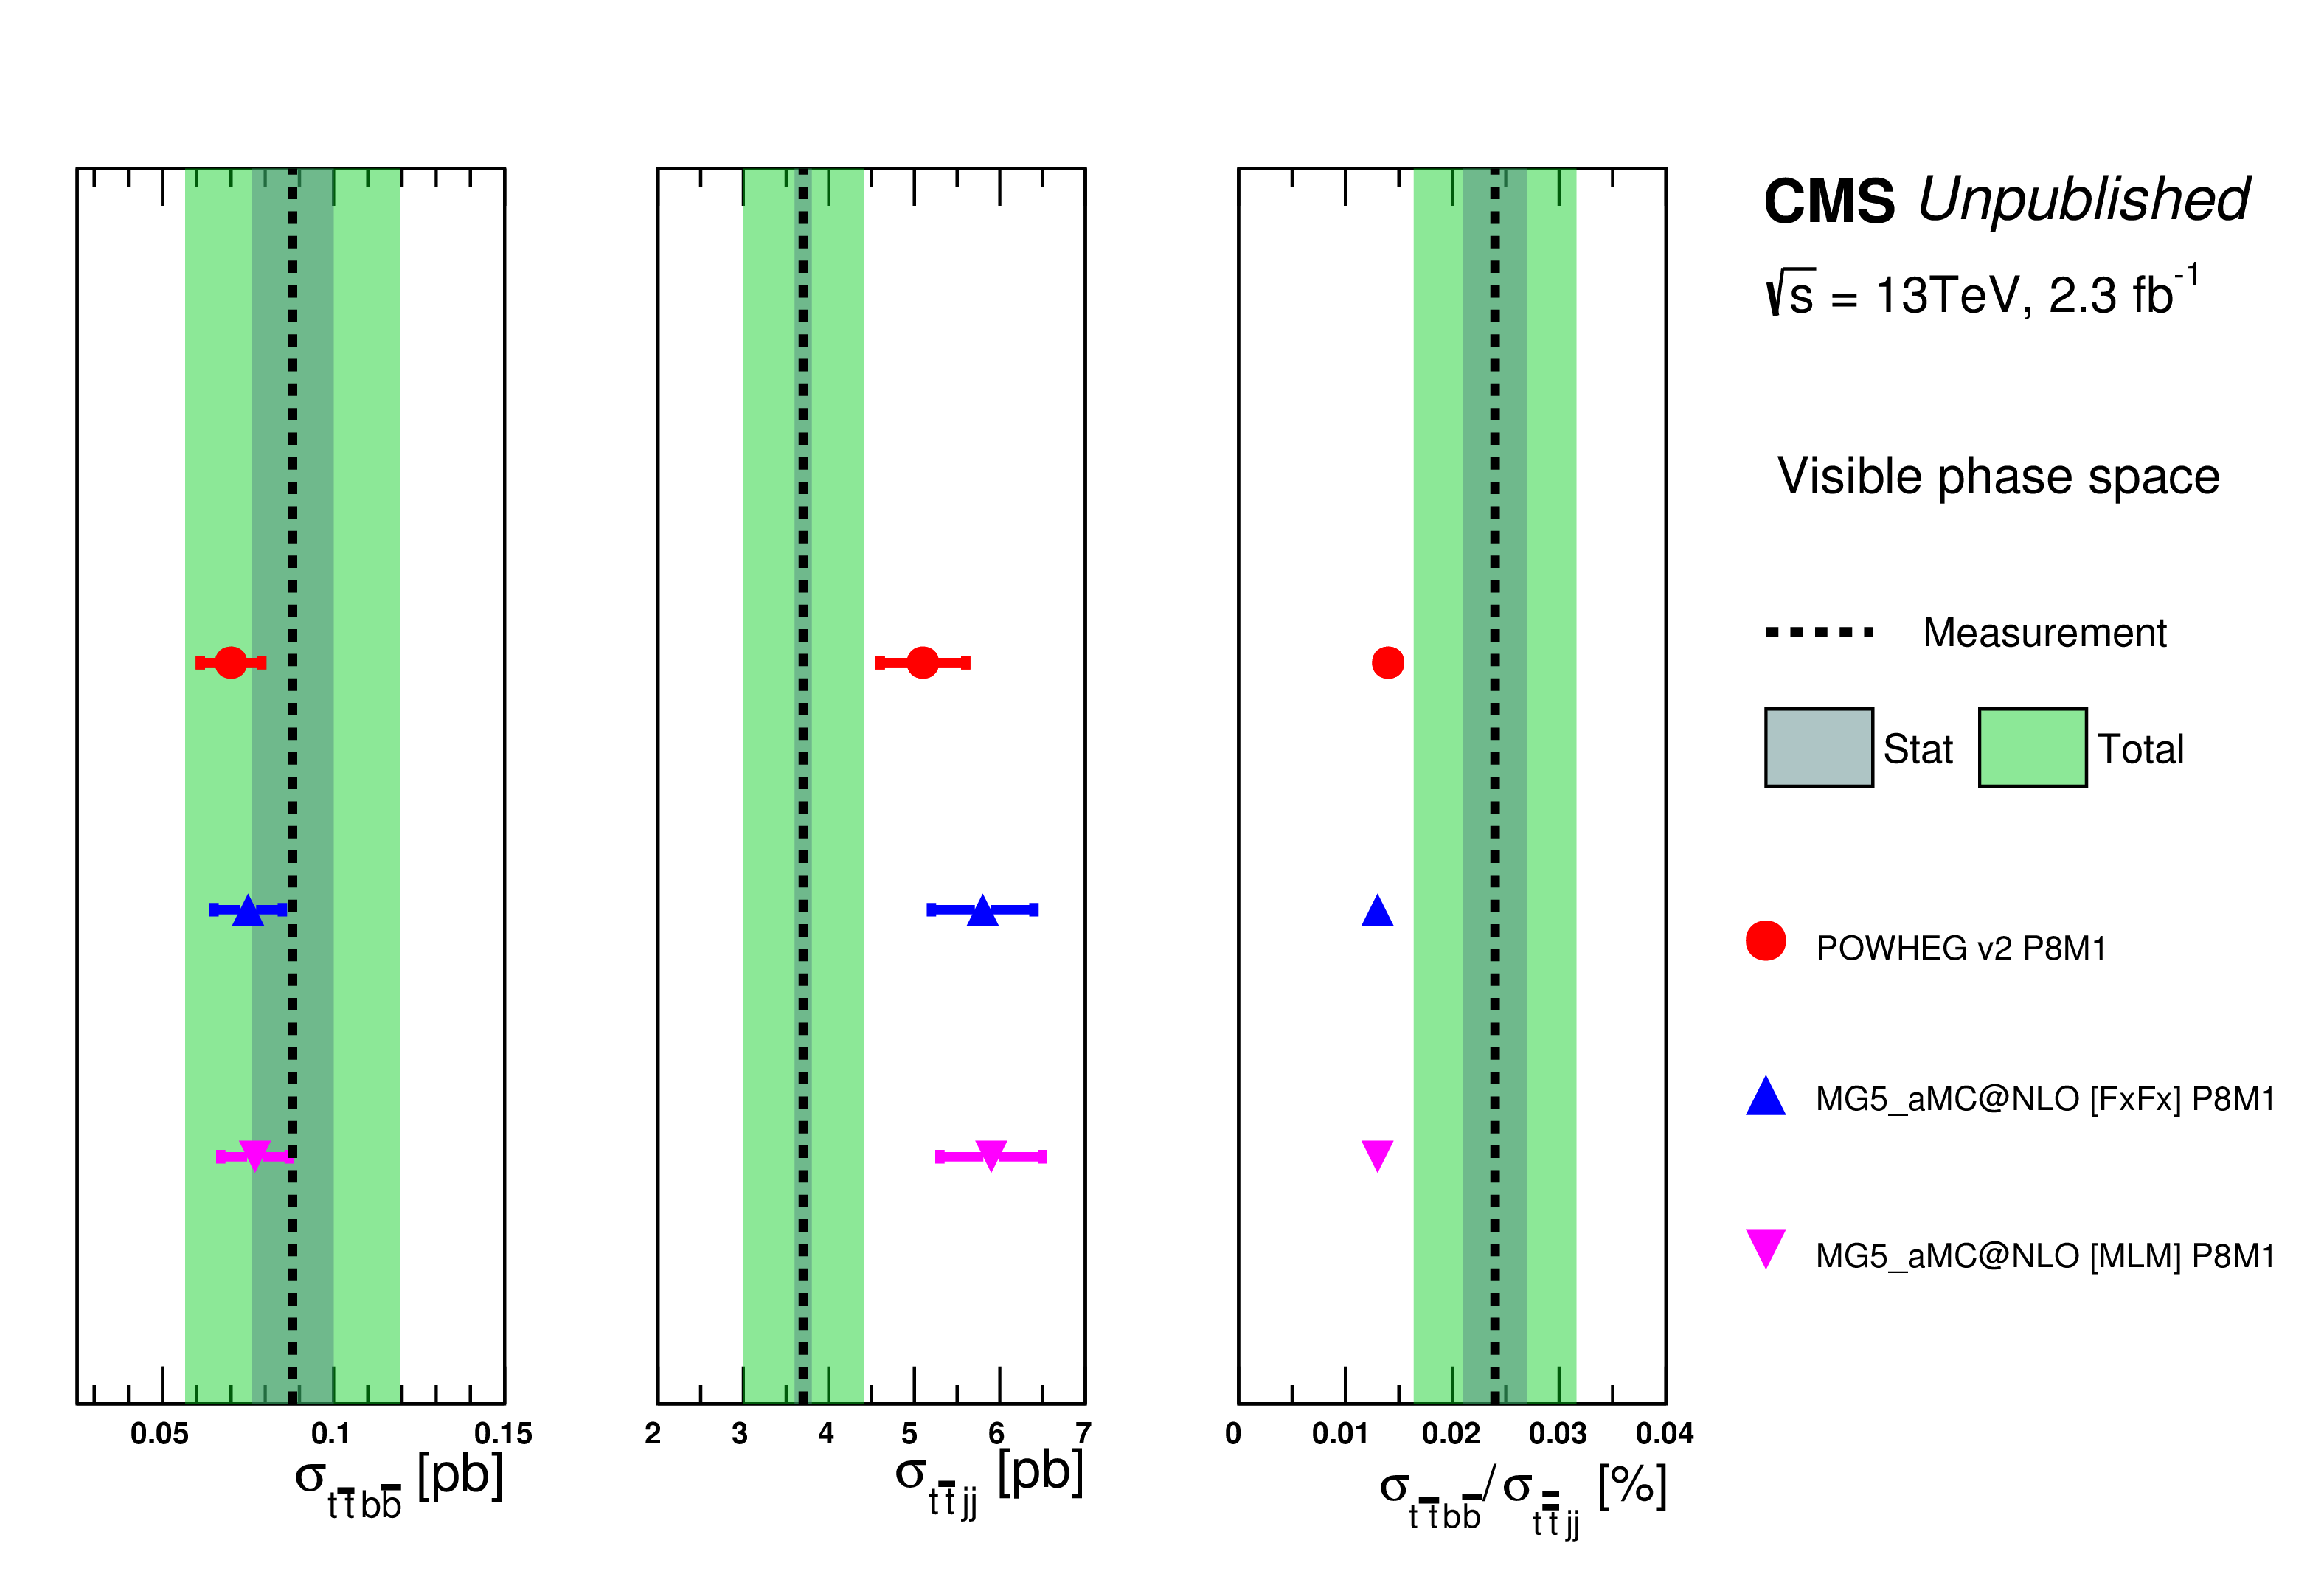
Additional Figure 2:
The measured cross sections for ${\mathrm{ t } {}\mathrm{ \bar{t} } } {\mathrm{ b \bar{b} } } $ (left), ${\mathrm{ t } {}\mathrm{ \bar{t} } } \mathrm {jj}$ (middle) and their ratio (right) for the visible phase space in comparison with the theoretical calculations. Error bars for the Monte Carlo predictions correspond to the scale uncertainty. |
| References | ||||
| 1 | ATLAS Collaboration | Observation of a new particle in the search for the Standard Model Higgs boson with the ATLAS detector at the LHC | PLB 716 (2012) 1 | 1207.7214 |
| 2 | CMS Collaboration | Observation of a new boson at a mass of 125 GeV with the CMS experiment at the LHC | PLB 716 (2012) 30 | CMS-HIG-12-028 1207.7235 |
| 3 | CMS Collaboration | Observation of a new boson with mass near 125 GeV in pp collisions at $ \sqrt{s} = $ 7 and 8 TeV | JHEP 06 (2013) 081 | CMS-HIG-12-036 1303.4571 |
| 4 | CMS Collaboration | Measurement of the properties of a Higgs boson in the four-lepton final state | Phy. Rev. D 89 (2014) 092007 | CMS-HIG-13-002 1312.5353 |
| 5 | CMS Collaboration | Measurement of Higgs boson production and properties in the WW decay channel with leptonic final states | JHEP 01 (2014) 096 | CMS-HIG-13-023 1312.1129 |
| 6 | CMS Collaboration | Evidence for the 125 GeV Higgs boson decaying to a pair of $ \tau $ leptons | JHEP 05 (2014) 104 | CMS-HIG-13-004 1401.5041 |
| 7 | CMS Collaboration | Search for the standard model Higgs boson produced in association with a W or a Z boson and decaying to bottom quarks | PRD 89 (2014) 012003 | CMS-HIG-13-012 1310.3687 |
| 8 | ATLAS Collaboration | Measurements of Higgs boson production and couplings in diboson final states with the ATLAS detector at the LHC | PLB 726 (2013) 88 | 1307.1427 |
| 9 | ATLAS Collaboration | Evidence for the spin-0 nature of the Higgs boson using ATLAS data | PLB 726 (2013) 120 | 1307.1432 |
| 10 | ATLAS and CMS Collaboration | Measurements of the Higgs boson production and decay rates and constraints on its couplings from a combined ATLAS and CMS analysis of the LHC $ pp $ collision data at $ \sqrt{s}= $ 7 and 8 TeV | JHEP 08 (2016) 045 | |
| 11 | M. Worek and G. Bevilacqua | On the ratio of $ \mathrm{ t \bar{t} }\mathrm{ b \bar{b} } $ and $ \mathrm{ t \bar{t} } \mathrm{ jj } $ cross sections at the CERN Large Hadron Collider | JHEP 07 (2014) 135 | 1403.2046 |
| 12 | A. Bredenstein, A. Denner, S. Dittmaier, and S. Pozzorini | Next-to-leading order QCD corrections to pp $ \to \mathrm{ t \bar{t} }\mathrm{ b \bar{b} }$+X at the LHC | PRL 103 (2009) 012002 | 0905.0110 |
| 13 | A. Bredenstein, A. Denner, S. Dittmaier, and S. Pozzorini | NLO QCD corrections to $ \mathrm{ t \bar{t} }\mathrm{ b \bar{b} } $ production at the LHC: 1. quark-antiquark annihilation | JHEP 08 (2008) 108 | 0807.1248 |
| 14 | CMS Collaboration | Measurement of the cross section ratio $ \sigma_{\mathrm{t}\overline{\mathrm{t}}\mathrm{b}\overline{\mathrm{b}}}/\sigma_{\mathrm{t}\overline{\mathrm{t}}\mathrm{jj}} $ in pp collisions at $ \sqrt{s} = $ 8 TeV | PLB 746 (2015) 132 | |
| 15 | CMS Collaboration | Measurement of $ \mathrm{t}\overline{\mathrm{t}} $ production with additional jet activity, including b quark jets, in the dilepton decay channel using pp collisions at $ \sqrt{s} = $ 8 TeV | EPJC 76 (2016) 379 | |
| 16 | ATLAS Collaboration | Measurements of fiducial cross-sections for $ \mathrm{t\bar{t}} $ production with one of two additional b-jets in pp collisions at $ \sqrt{s} = $ 8 TeV using the ATLAS detector | EPJC 76 (2016) 11 | 1508.06868 |
| 17 | CMS Collaboration | CMS luminosity measurement for the 2015 data-taking period | CMS-PAS-LUM-15-001 | CMS-PAS-LUM-15-001 |
| 18 | CMS Collaboration | The CMS experiment at the CERN LHC | JINST 3 (2008) S08004 | CMS-00-001 |
| 19 | P. Nason | A new method for combining NLO QCD with shower Monte Carlo algorithms | JHEP 11 (2004) 040 | hep-ph/0409146 |
| 20 | S. Frixione, P. Nason, and C. Oleari | Matching NLO QCD computations with parton shower simulations: the POWHEG method | JHEP 11 (2007) 070 | 0709.2092 |
| 21 | S. Alioli, P. Nason, C. Oleari, and E. Re | A general framework for implementing NLO calculations in shower Monte Carlo programs: the POWHEG BOX | JHEP 06 (2010) 043 | 1002.2581 |
| 22 | T. Sjostrand, S. Mrenna, and P. Skands | PYTHIA 6.4 physics and manual | JHEP 05 (2006) 026 | hep-ph/0603175 |
| 23 | T. Sjostrand, S. Mrenna, and P. Skands | A brief introduction to PYTHIA 8.1 | Comp. Phys. Comm. 178 (2008) 852 | 0710.3820 |
| 24 | P. Skands, S. Carrazza, and J. Rojo | Tuning PYTHIA 8.1: the Monash 2013 tune | EPJC 74 (2014) 3024 | |
| 25 | NNPDF Collaboration | Parton distributions for the LHC Run II | JHEP 04 (2015) 040 | 1410.8849 |
| 26 | J. Alwall et al. | MadGraph 5: going beyond | JHEP 06 (2011) 128 | 1106.0522 |
| 27 | J. Alwall et al. | The automated computation of tree-level and next-to-leading order differential cross sections, and their matching to parton shower simulations | JHEP 07 (2014) 079 | 1405.0301 |
| 28 | M. Czakon and A. Mitov | Top++: A program for the calculation of the top-pair cross-section at hadron colliders | CPC 185 (2014) 2930 | 1112.5675 |
| 29 | Y. Li and F. Petriello | Combining QCD and electroweak corrections to dilepton production in FEWZ | PRD 86 (2012) 094034 | 1208.5967 |
| 30 | N. Kidonakis | NNLL threshold resummation for top-pair and single-top production | Phys. Part. Nucl. 45 (2014) 714 | 1210.7813 |
| 31 | GEANT4 Collaboration | GEANT4---a simulation toolkit | NIMA 506 (2003) 250 | |
| 32 | ATLAS Collaboration | Measurement of the inelastic proton-proton cross section at $ \sqrt{s} = $ 13 TeV with ATLAS detector at the LHC | PRL 117 (2016) 182002 | 1606.02625 |
| 33 | M. Cacciari, G. P. Salam, and G. Soyez | The anti-$ k_t $ jet clustering algorithm | JHEP 04 (2008) 063 | 0802.1189 |
| 34 | M. Cacciari, G. P. Salam, and G. Soyez | The catchment area of jets | JHEP 04 (2008) 005 | 0802.1188 |
| 35 | CMS Collaboration | The CMS trigger system | JINST 12 (2017) P01020 | CMS-TRG-12-001 1609.02366 |
| 36 | CMS Collaboration | Particle-Flow Event Reconstruction in CMS and Performance for Jets, Taus, and $ {E_{\mathrm{T}}}miss $ | CDS | |
| 37 | CMS Collaboration | Commissioning of the particle-flow event reconstruction with the first LHC collisions recorded in the CMS detector | CDS | |
| 38 | CMS Collaboration | Performance of CMS muon reconstruction in pp collision events at $ \sqrt{s} = $ 7 TeV | JINST 7 (2012) P10002 | |
| 39 | CMS Collaboration | Performance of electron reconstruction and selection with the CMS detector in proton-proton collisions at $ \sqrt{s} = $ 8 TeV | JINST 10 (2015) P06005 | CMS-EGM-13-001 1502.02701 |
| 40 | CMS Collaboration | Performance of photon reconstruction and identification with the CMS detector in proton-proton collisions at $ \sqrt{s} = $ 8 TeV | JINST 10 (2015) P08010 | CMS-EGM-14-001 1502.02702 |
| 41 | CMS Collaboration | Electron and photon performance using data collected by CMS at $ \sqrt{s} = $ 13 TeV and 25 ns | CDS | |
| 42 | CMS Collaboration | Determination of jet energy calibration and transverse momentum resolution in CMS | JINST 6 (2011) P11002 | CMS-JME-10-011 1107.4277 |
| 43 | CMS Collaboration | Identification of b-quark jets with the CMS experiment | JINST 8 (2013) P04013 | CMS-BTV-12-001 1211.4462 |
| 44 | CMS Collaboration | Identification of b quark jets at the CMS Experiment in the LHC Run 2 | CMS-PAS-BTV-15-001 | CMS-PAS-BTV-15-001 |
| 45 | CMS Collaboration | Measurement of differential cross sections for top quark pair production using the lepton+jets final state in proton-proton collisions at 13 TeV | PRD 95 (2017) 092001 | CMS-TOP-16-008 1610.04191 |
| 46 | Particle Data Group, C. Patrignani et al. | Review of Particle Physics | CPC 40 (2016), no. 10, 100001 | |
| 47 | CMS Collaboration | Search for the associated production of the Higgs boson with a top-quark pair | JHEP 09 (2014) 087 | CMS-HIG-13-029 1408.1682 |
| 48 | R. Barlow and C. Beeston | Fitting using finite Monte Carlo samples | CPC 77 (1993) 219 | |
| 49 | CMS Collaboration | Measurement of the differential cross section for top quark pair production in pp collisions at $ \sqrt{s} = $ 8 TeV | EPJC 75 (2015) 542 | |
|
|
Compact Muon Solenoid LHC, CERN |
|

|

|

|

|

|