

Compact Muon Solenoid
LHC, CERN
| CMS-B2G-16-003 ; CERN-EP-2016-226 | ||
| Search for heavy resonances decaying into a vector boson and a Higgs boson in final states with charged leptons, neutrinos, and b quarks | ||
| CMS Collaboration | ||
| 25 October 2016 | ||
| Phys. Lett. B 768 (2017) 137 | ||
| Abstract: A search for heavy resonances decaying to a Higgs boson and a vector boson is presented. The analysis is performed using data samples collected in 2015 by the CMS experiment at the LHC in proton-proton collisions at a center-of-mass energy of 13 TeV, corresponding to integrated luminosities of 2.2-2.5 fb$^{-1}$. The search is performed in channels in which the vector boson decays into leptonic final states ($\mathrm{ Z } \to \nu\nu$, $\mathrm{ W }\to \ell \nu$, and $\mathrm{ Z } \to \ell \ell$, with $\ell = \mathrm{ e }$, $\mu$), while the Higgs boson decays to collimated b quark pairs detected as a single massive jet. The discriminating power of a jet mass requirement and a b jet tagging algorithm are exploited to suppress the standard model backgrounds. The event yields observed in data are consistent with the background expectation. In the context of a theoretical model with a heavy vector triplet, a resonance with mass less than 2 TeV is excluded at 95% confidence level. The results are also interpreted in terms of limits on the parameters of the model, improving on the reach of previous searches. | ||
| Links: e-print arXiv:1610.08066 [hep-ex] (PDF) ; CDS record ; inSPIRE record ; CADI line (restricted) ; | ||
| Figures | |
png pdf |
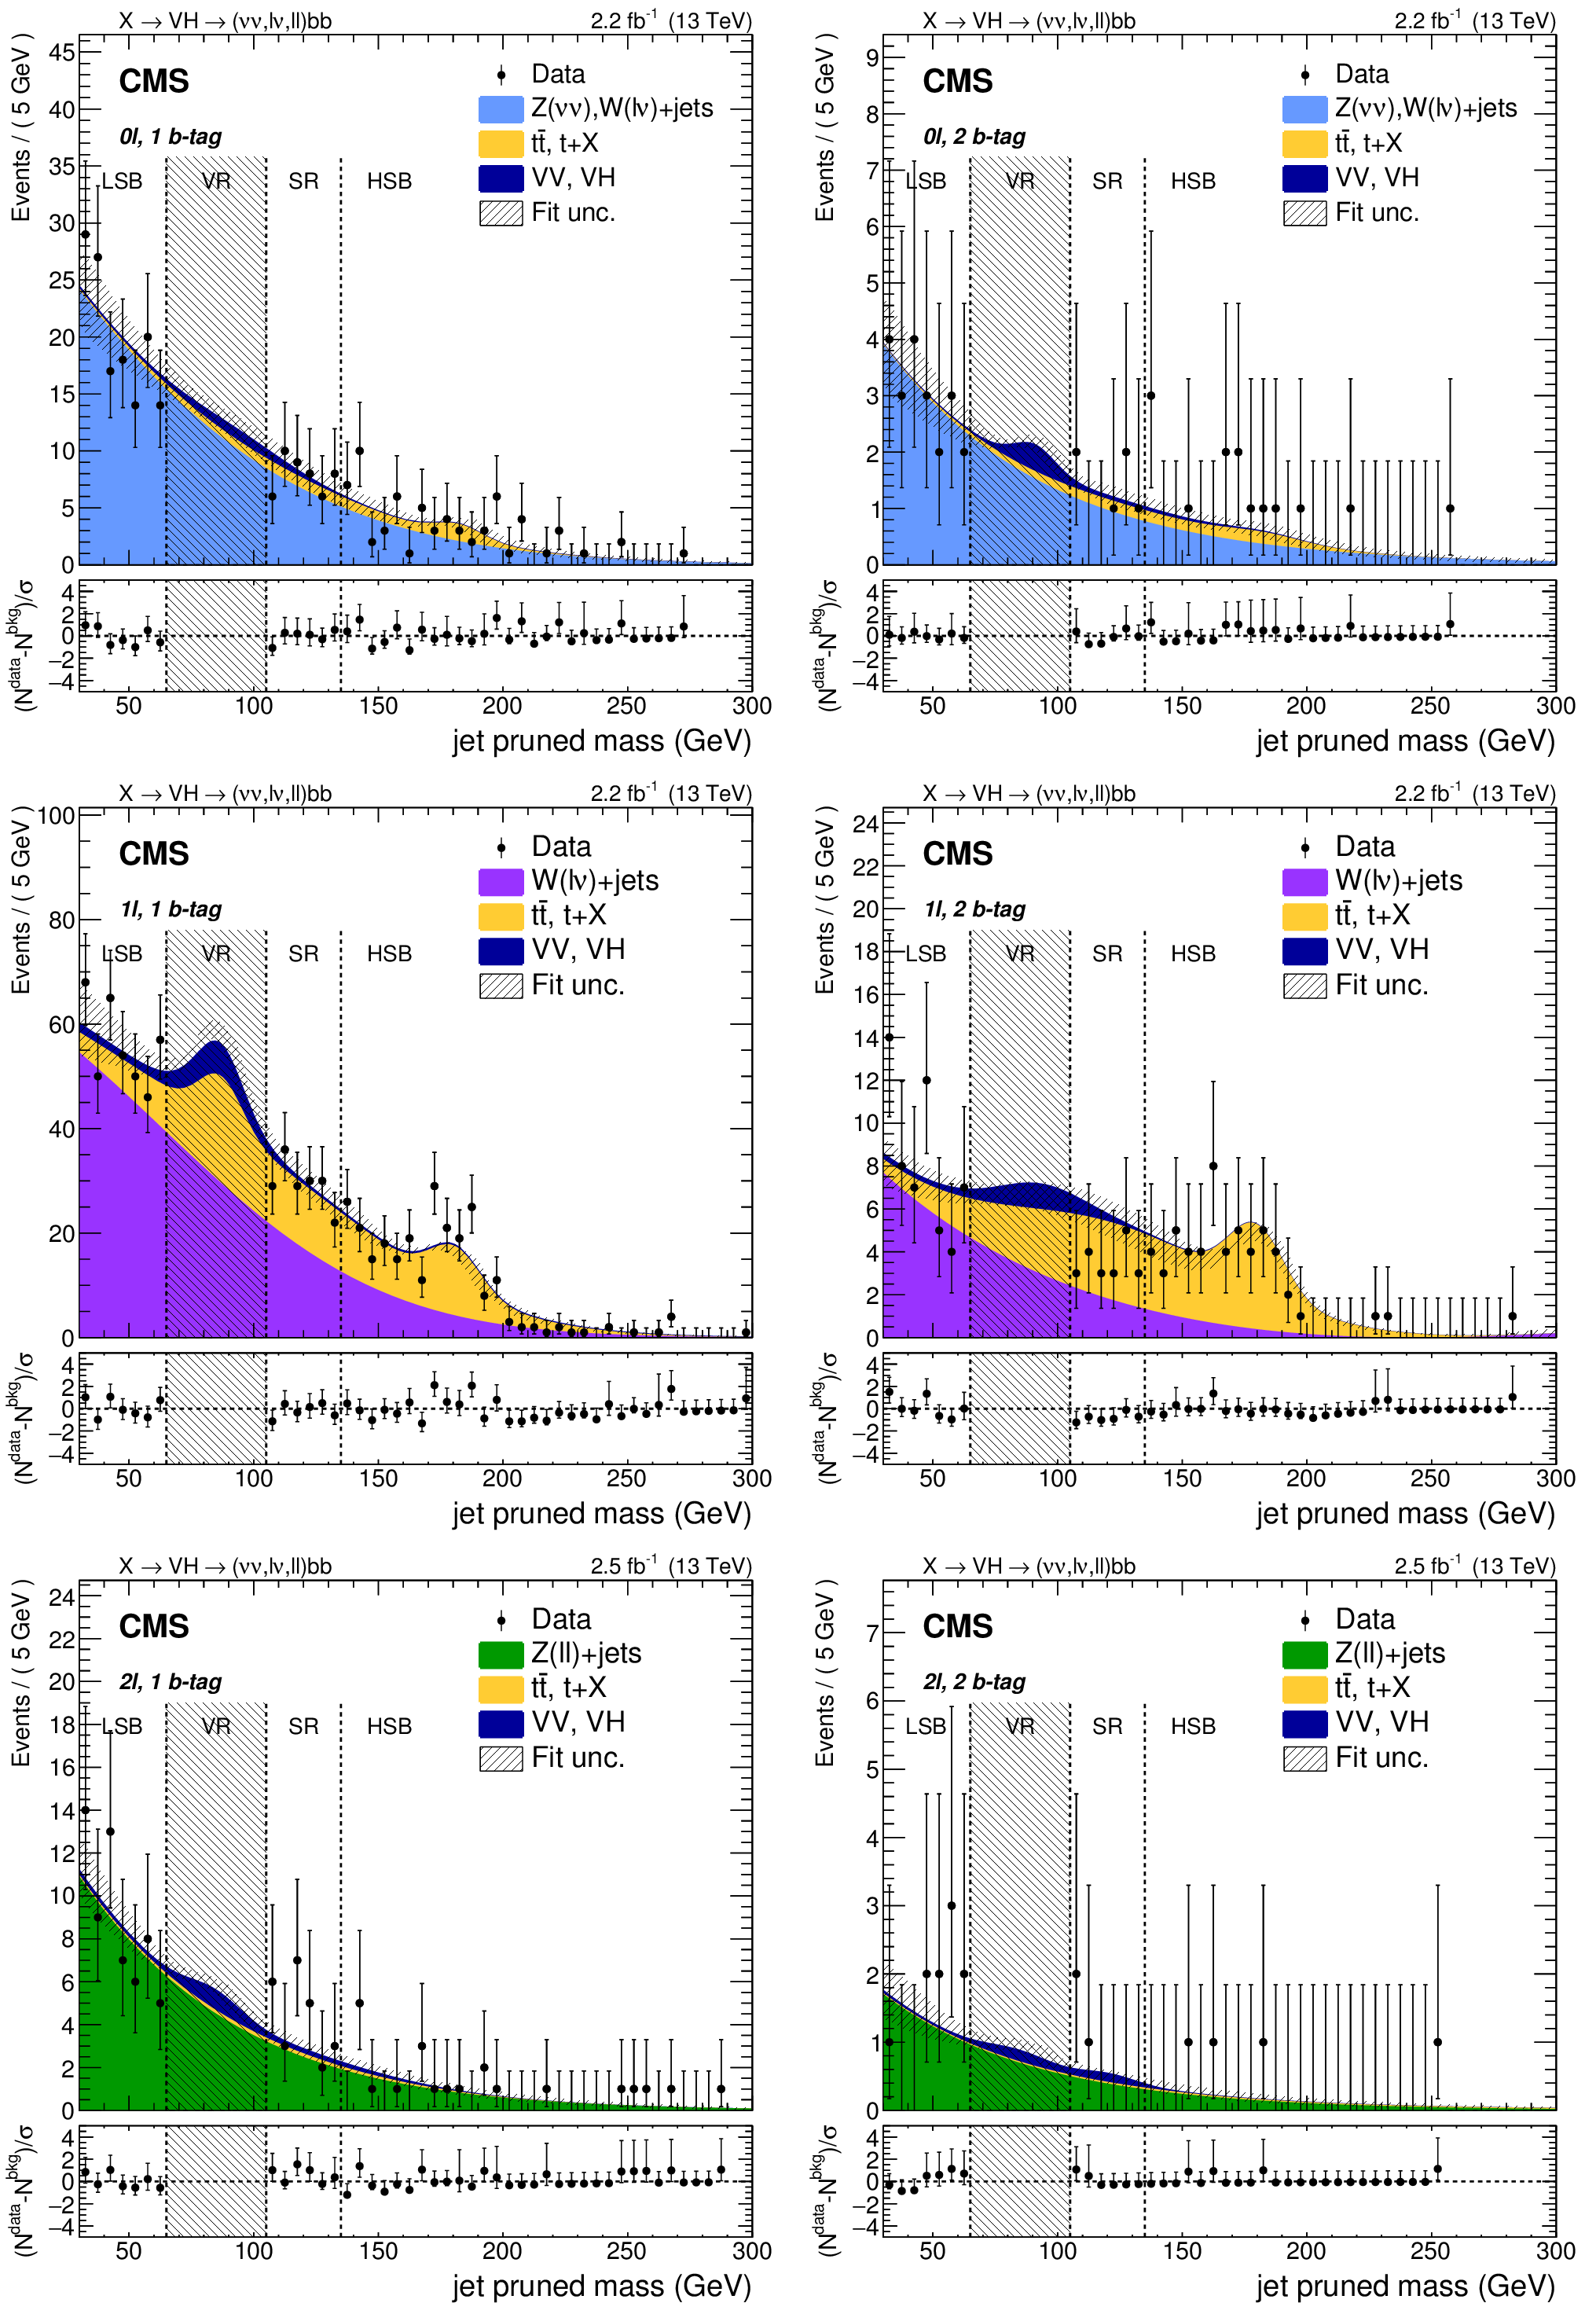
Figure 1:
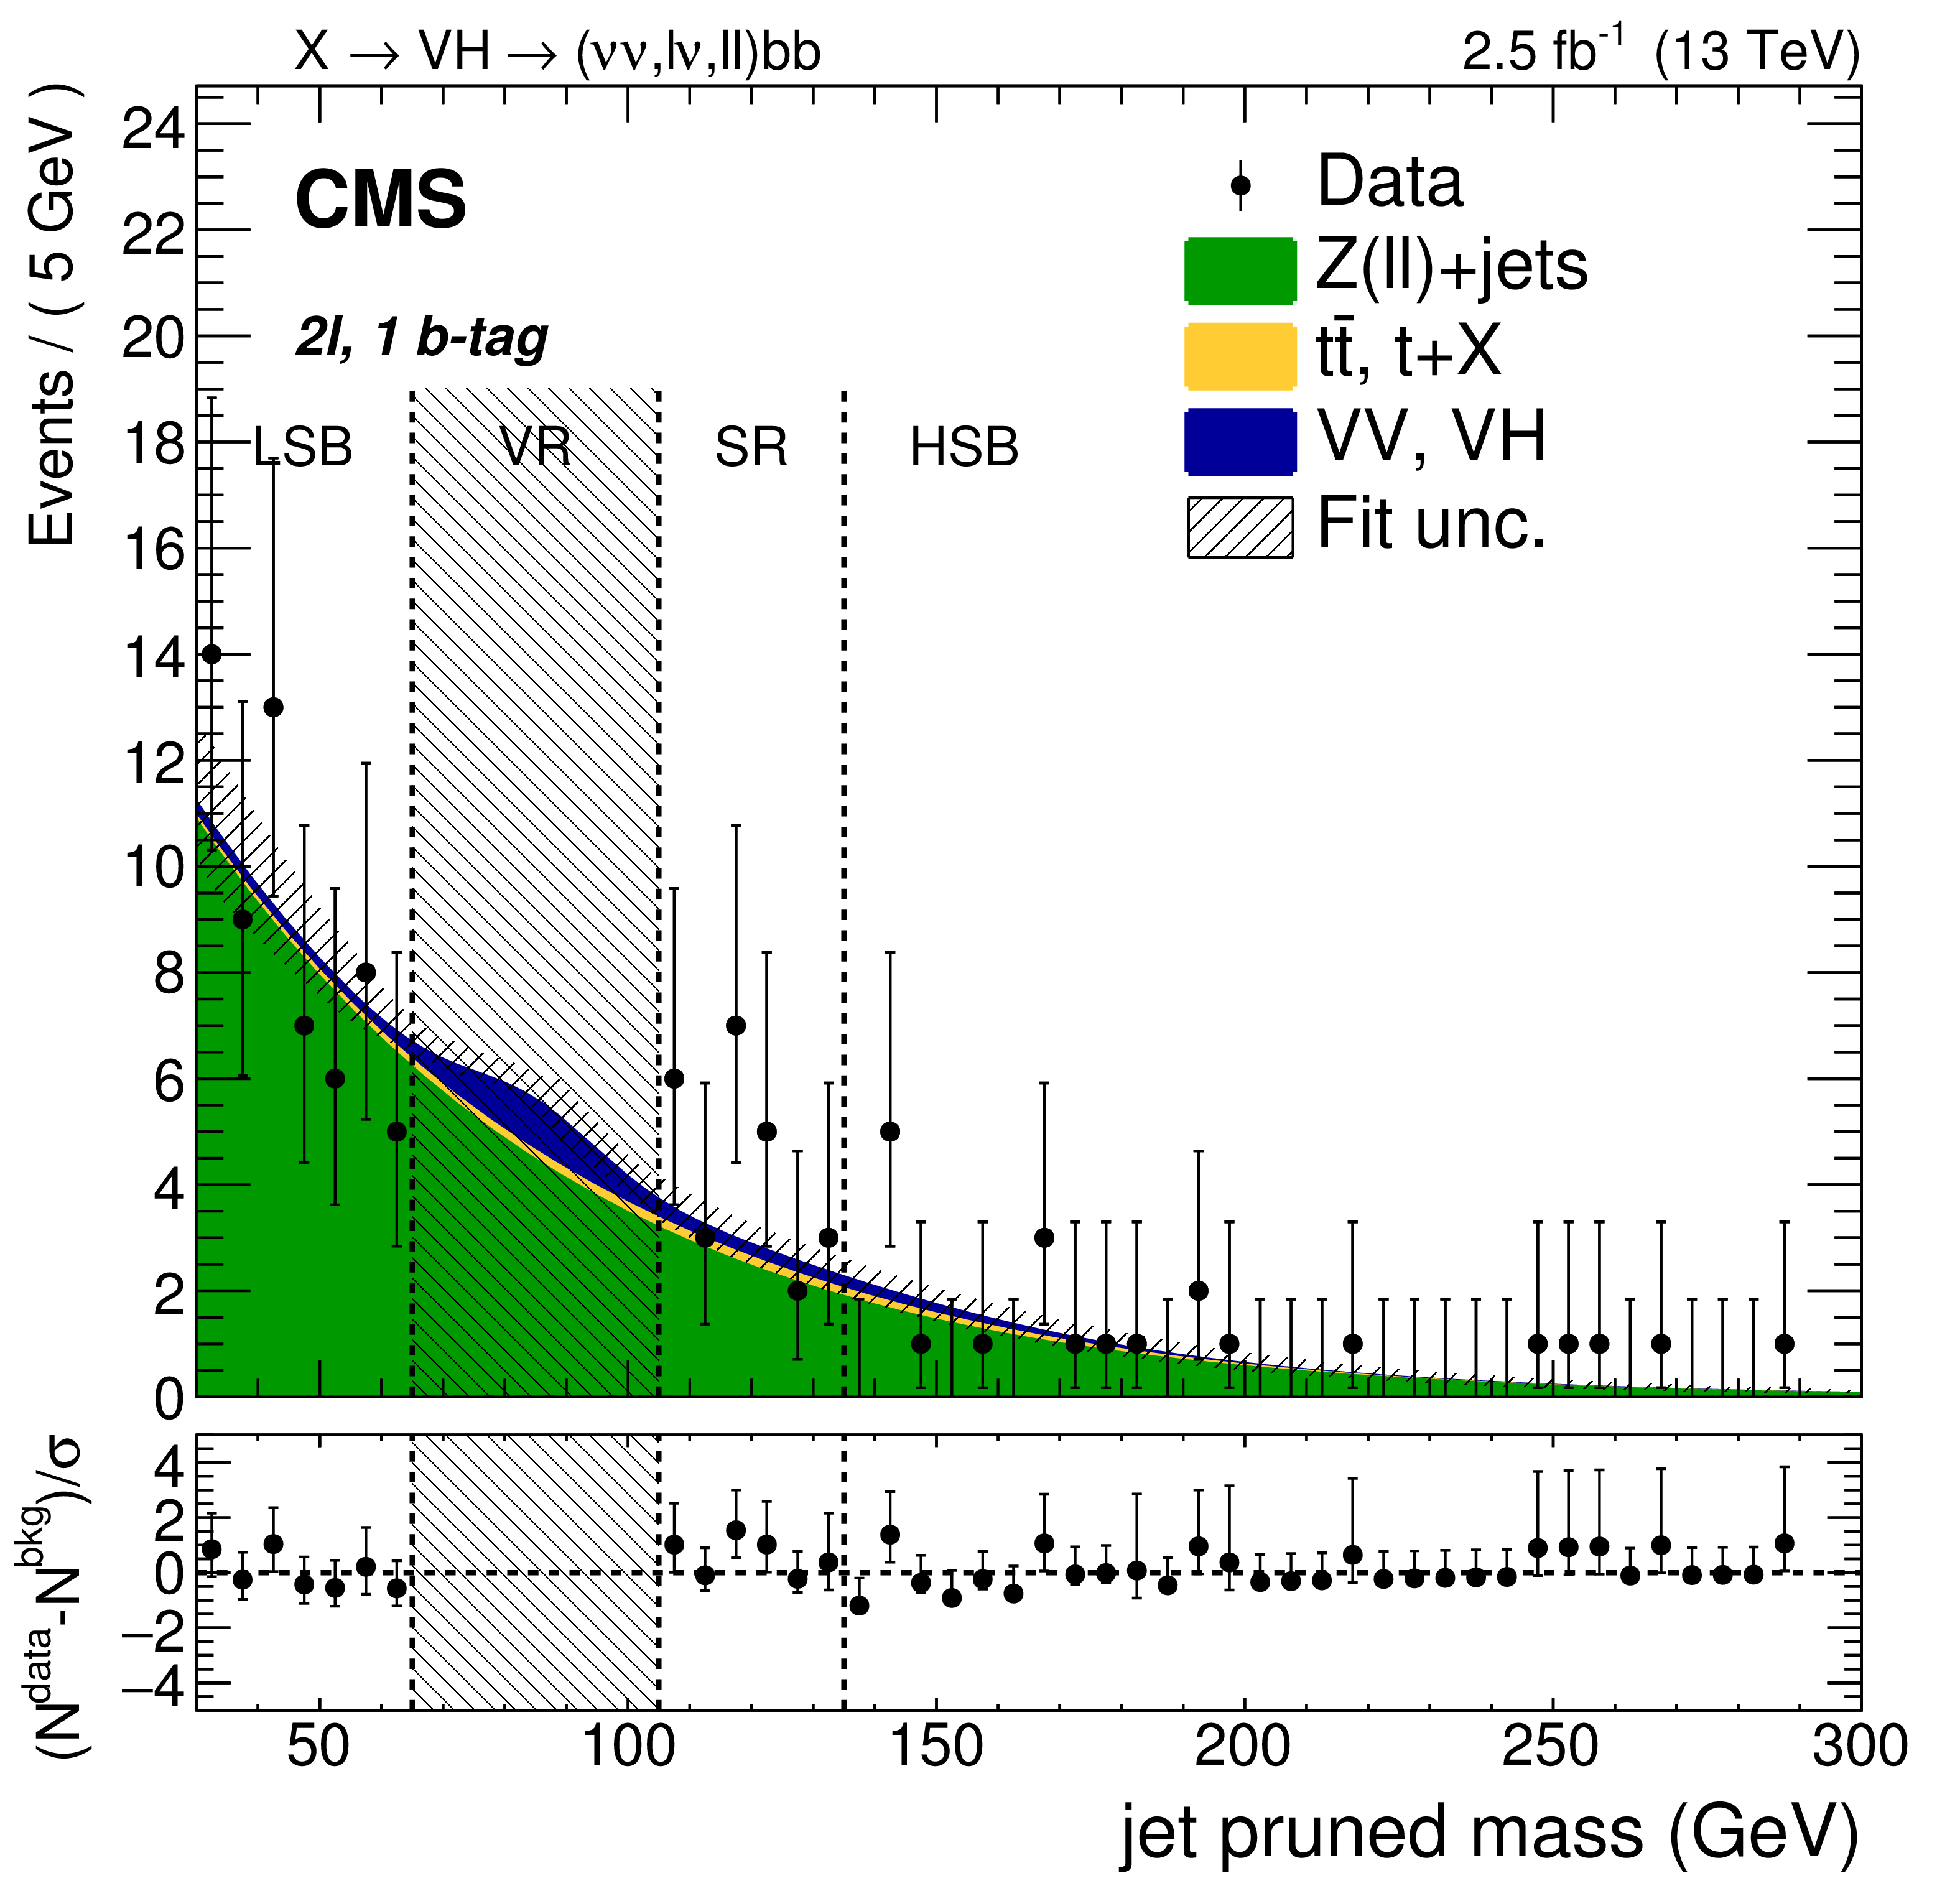
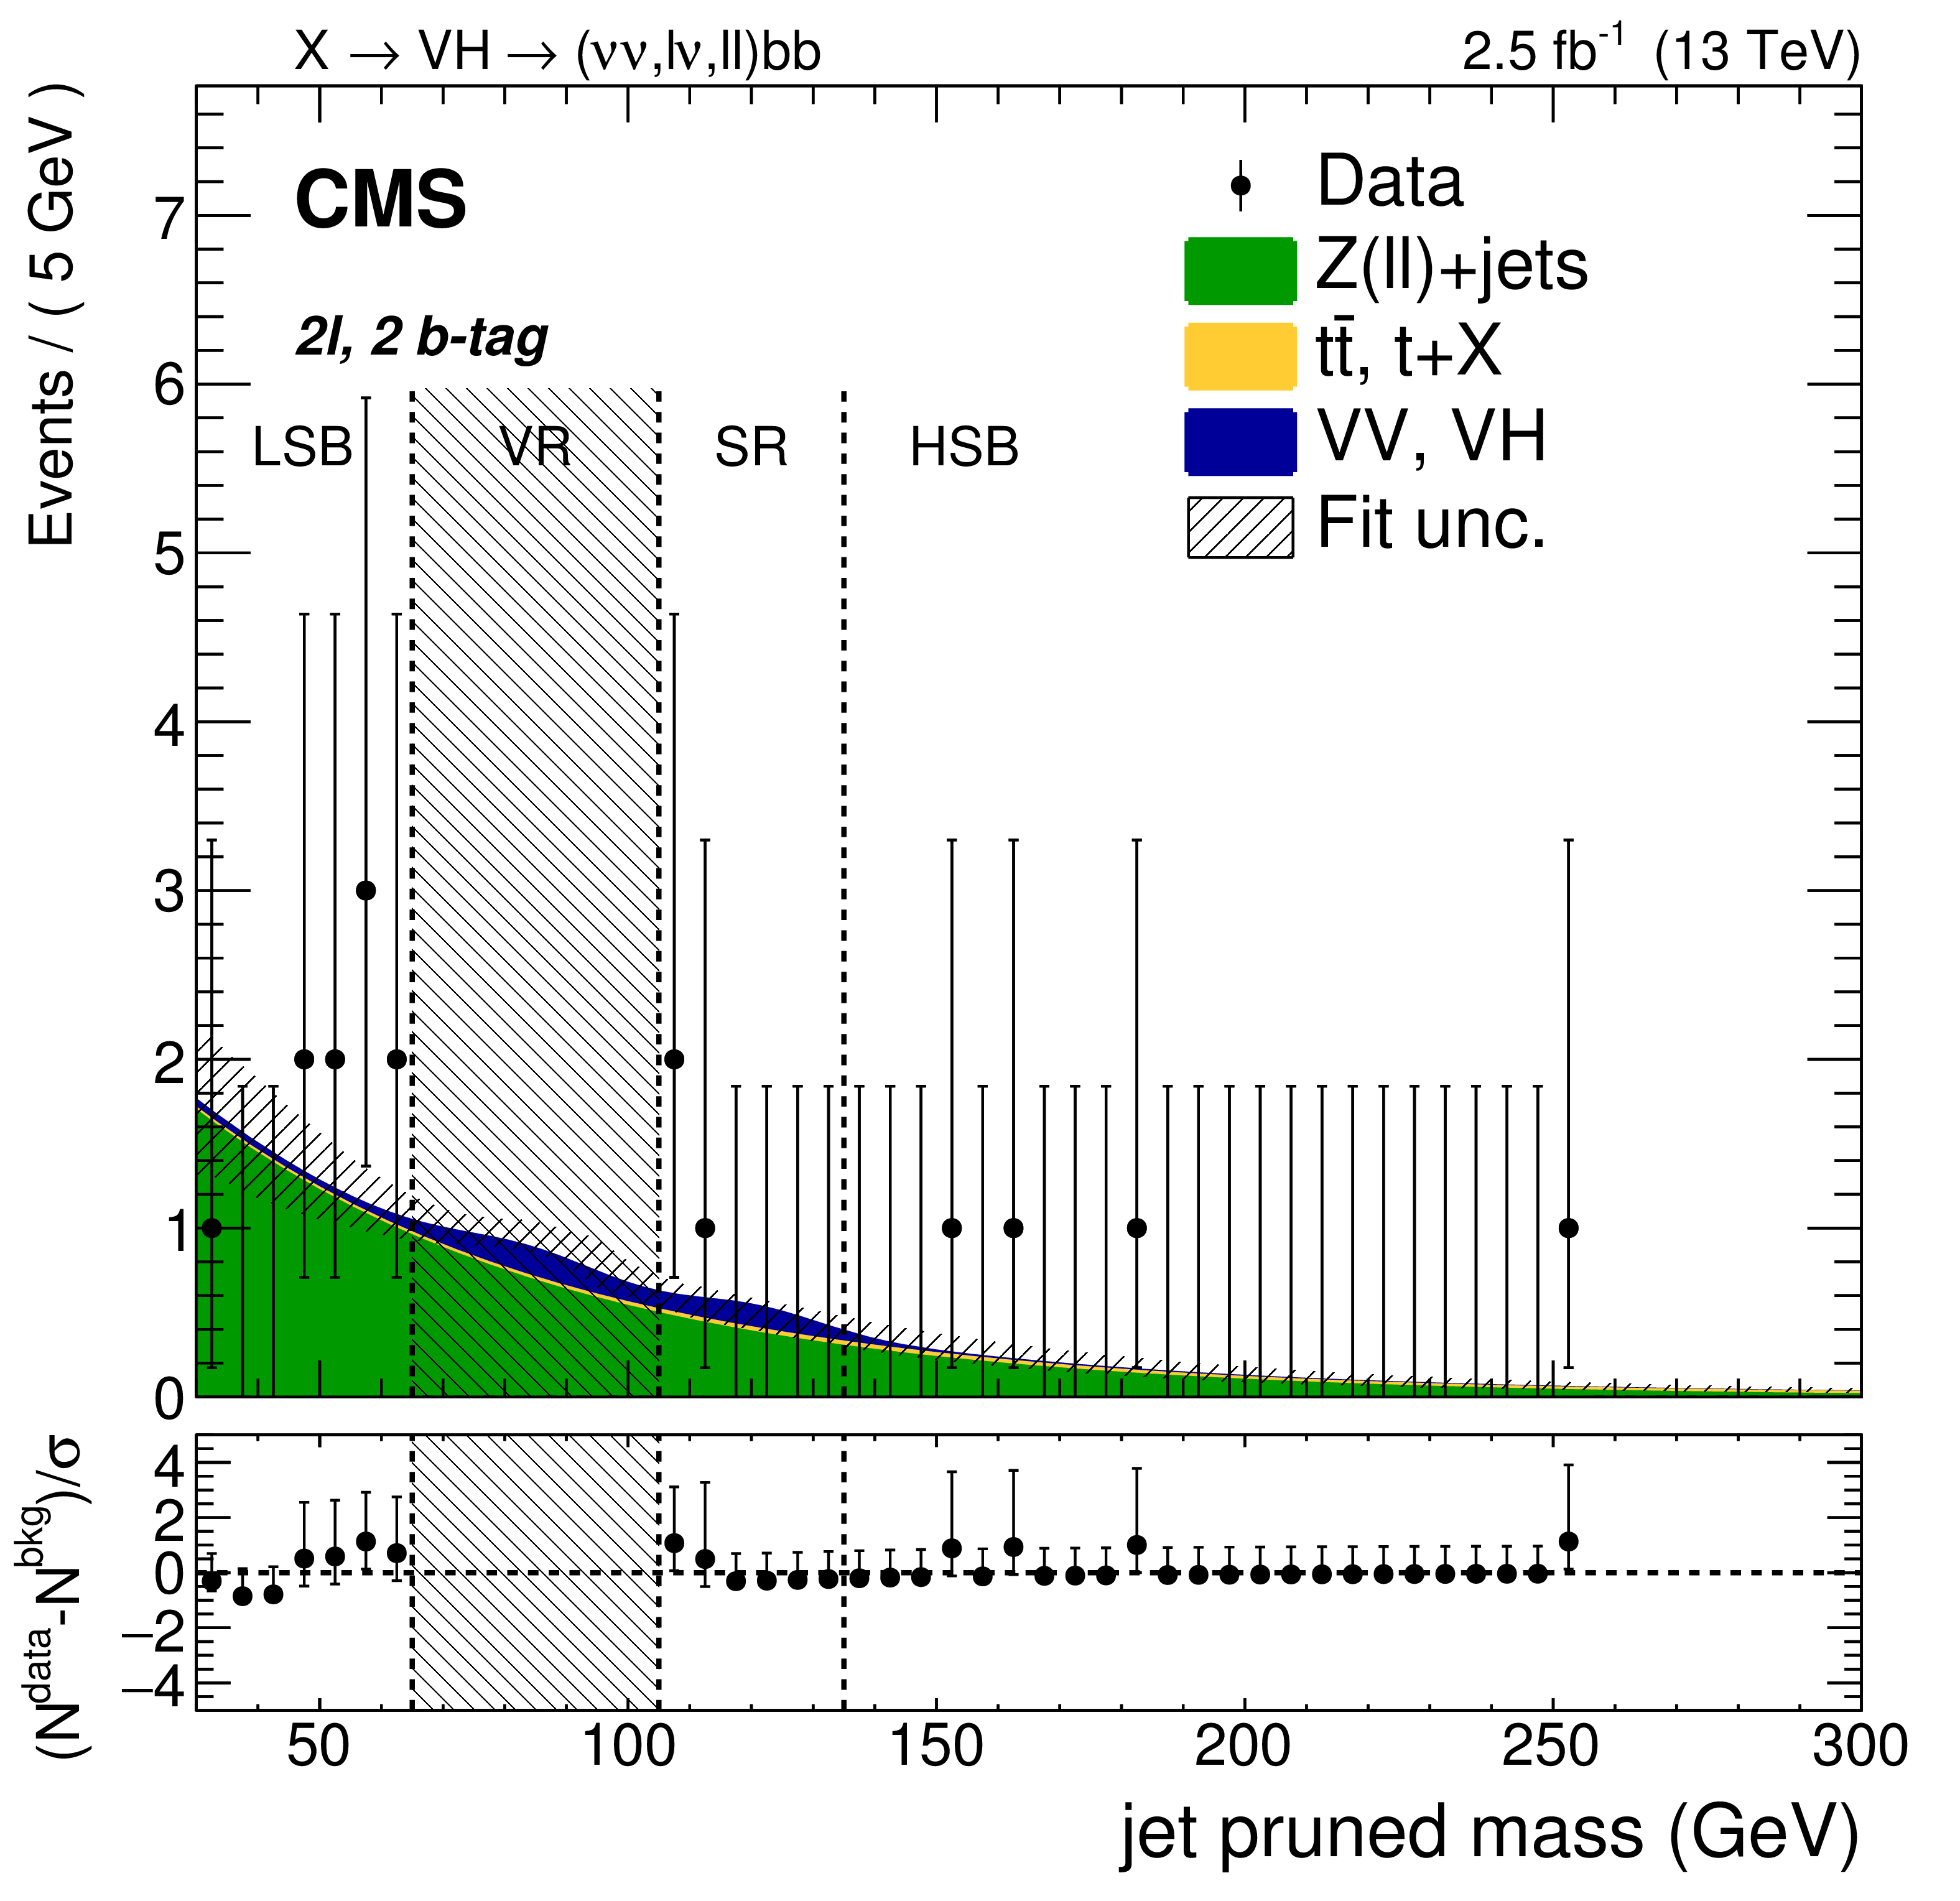
Pruned jet mass distribution of the leading AK8 jet in the 0$\ell $ (upper), 1$\ell $ (middle), and 2$\ell $ (lower) categories, and separately for the 1 (left ) and 2 (right ) b-tagged subjet selections. The shaded band representing the uncertainty from the fit to data in the pruned jet mass sidebands. The observed data are indicated by black markers. The dashed vertical lines separate the lower (LSB) and upper (HSB) sidebands, the W and Z bosons mass region (VR), and the signal region (SR). The bottom panels report the pulls in each bin, $(N^\text {data}-N^\text {bkg})/\sigma $, where $\sigma $ is the Poisson uncertainty in data. The error bars represent the normalized Poisson errors on the data. |
png pdf |
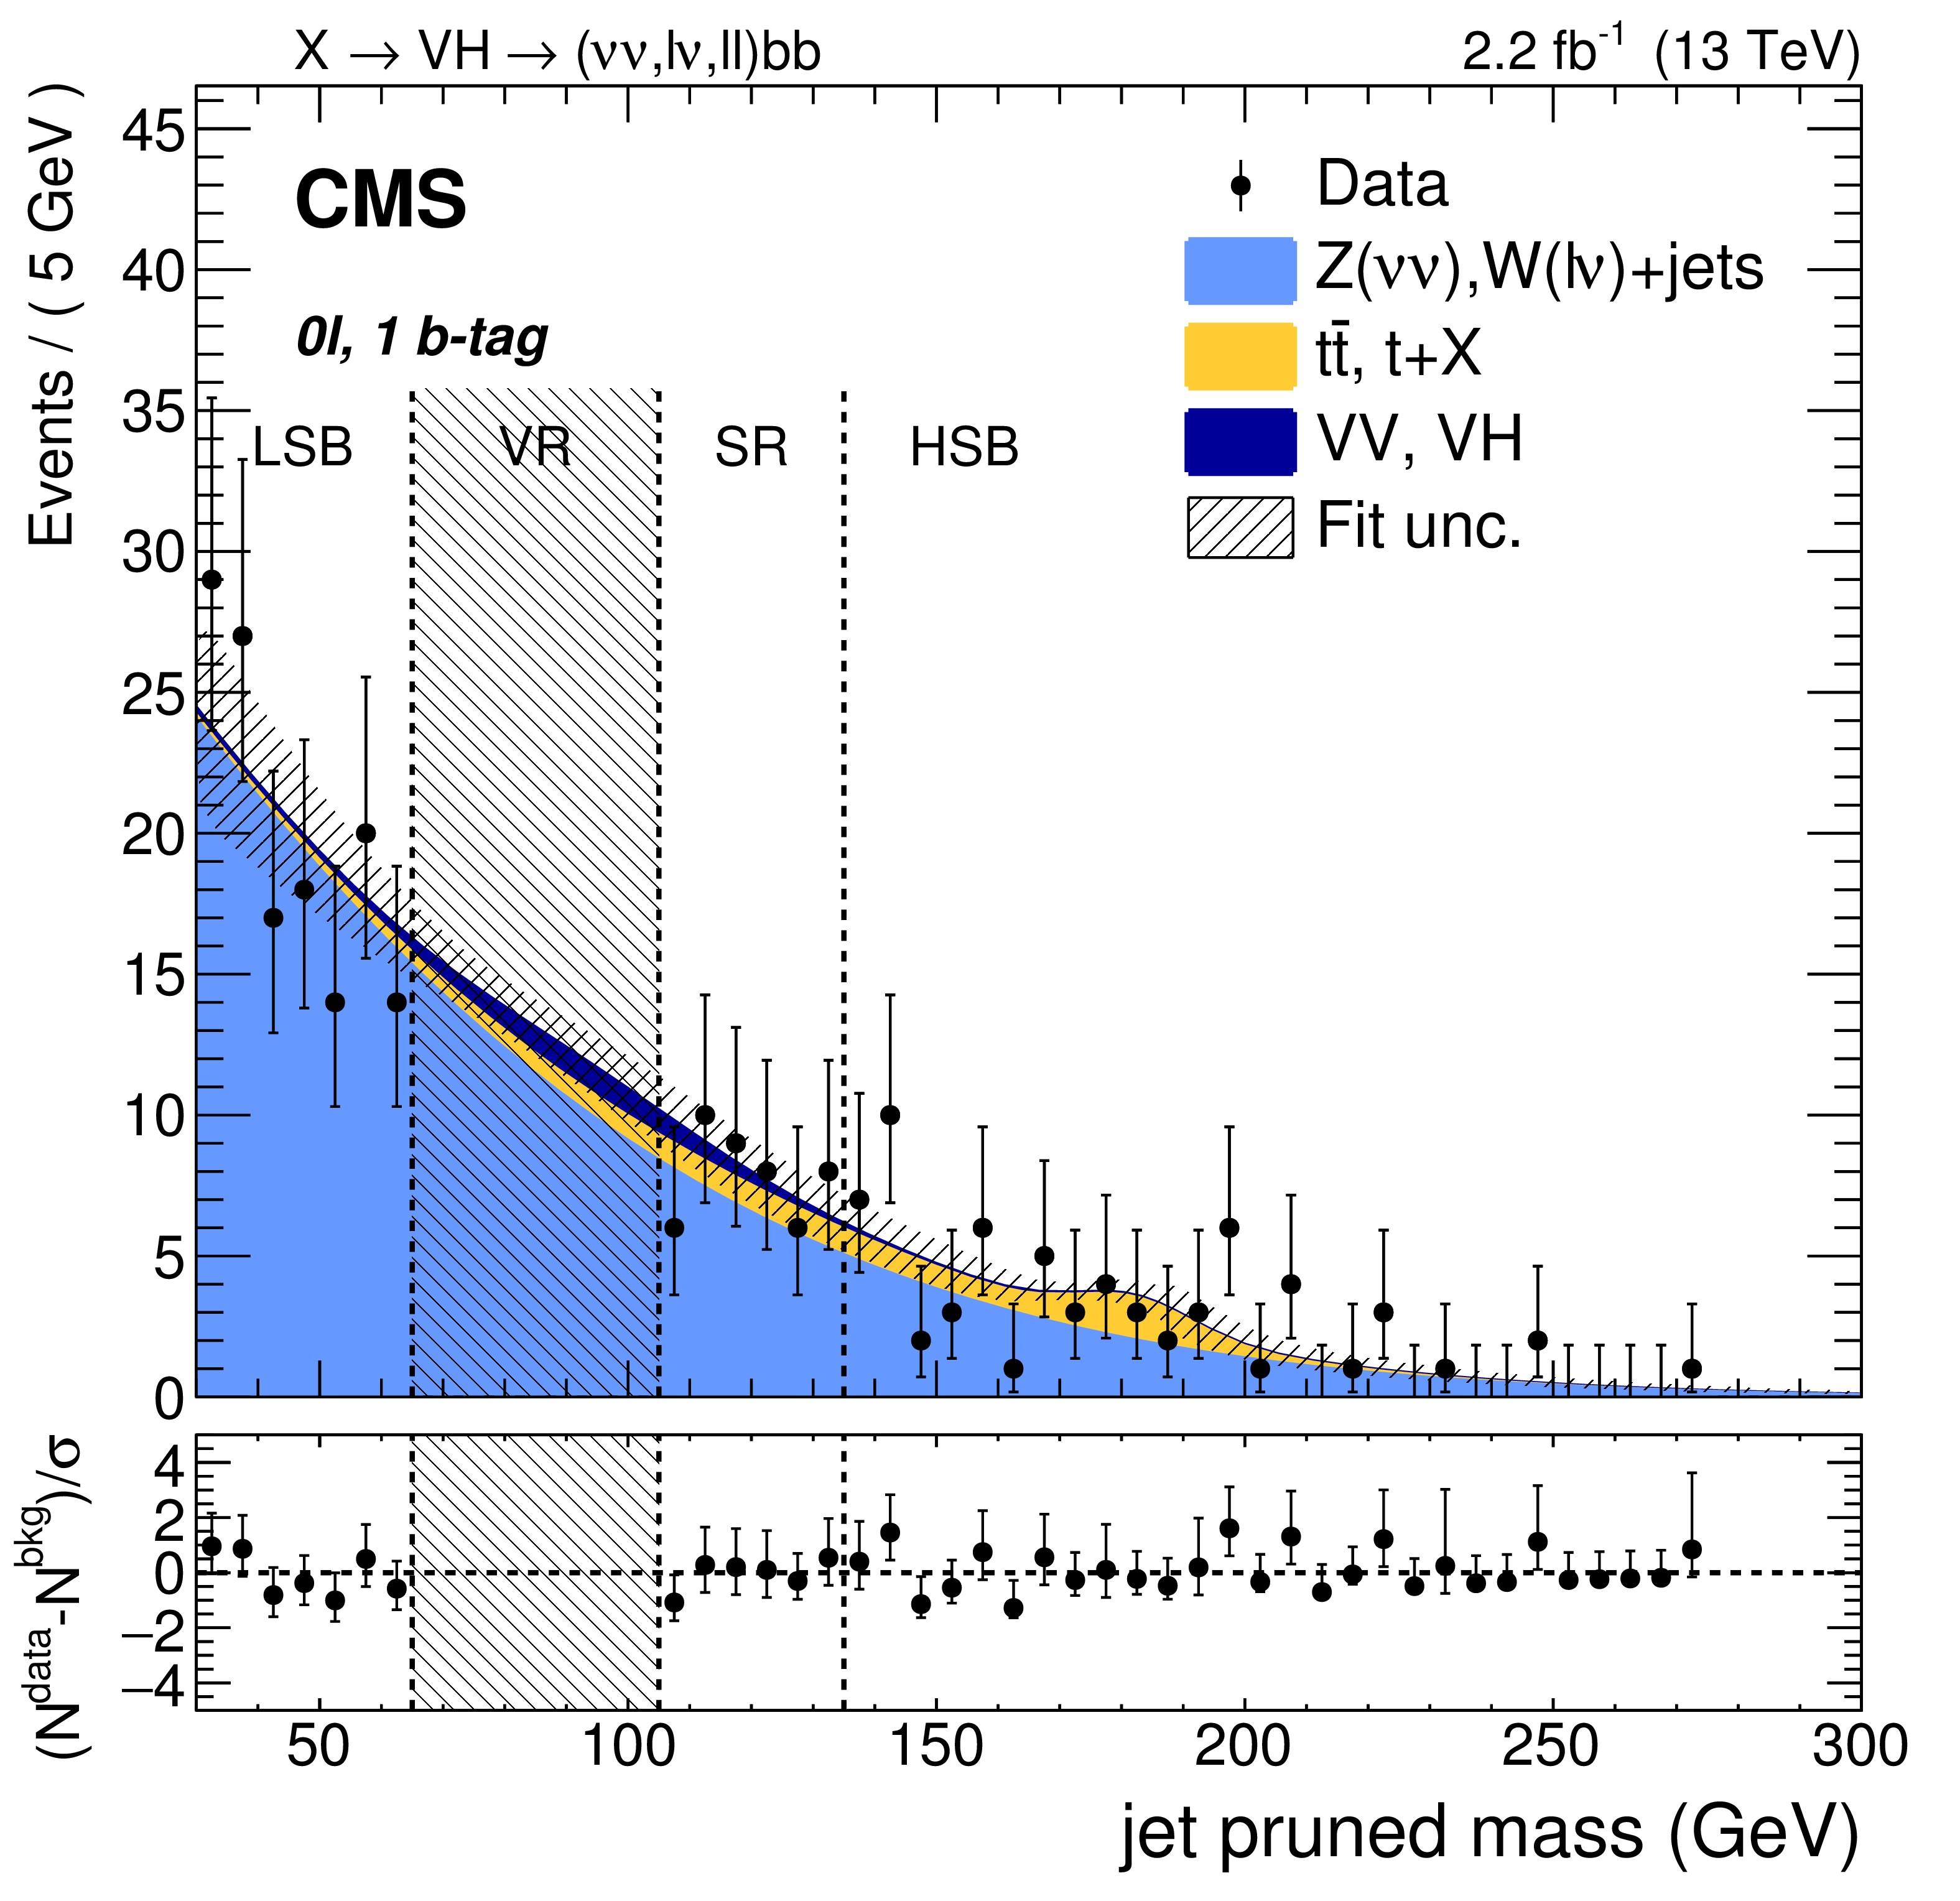
Figure 1-a:
Pruned jet mass distribution of the leading AK8 jet in the 0$\ell $ category, for the 1 b-tagged subjet selection. The shaded band representing the uncertainty from the fit to data in the pruned jet mass sidebands. The observed data are indicated by black markers. The dashed vertical lines separate the lower (LSB) and upper (HSB) sidebands, the W and Z bosons mass region (VR), and the signal region (SR). The bottom panel reports the pulls in each bin, $(N^\text {data}-N^\text {bkg})/\sigma $, where $\sigma $ is the Poisson uncertainty in data. The error bars represent the normalized Poisson errors on the data. |

png pdf |
Figure 1-b:
Pruned jet mass distribution of the leading AK8 jet in the 0$\ell $ category, for the 2 b-tagged subjet selection. The shaded band representing the uncertainty from the fit to data in the pruned jet mass sidebands. The observed data are indicated by black markers. The dashed vertical lines separate the lower (LSB) and upper (HSB) sidebands, the W and Z bosons mass region (VR), and the signal region (SR). The bottom panel reports the pulls in each bin, $(N^\text {data}-N^\text {bkg})/\sigma $, where $\sigma $ is the Poisson uncertainty in data. The error bars represent the normalized Poisson errors on the data. |
png pdf |
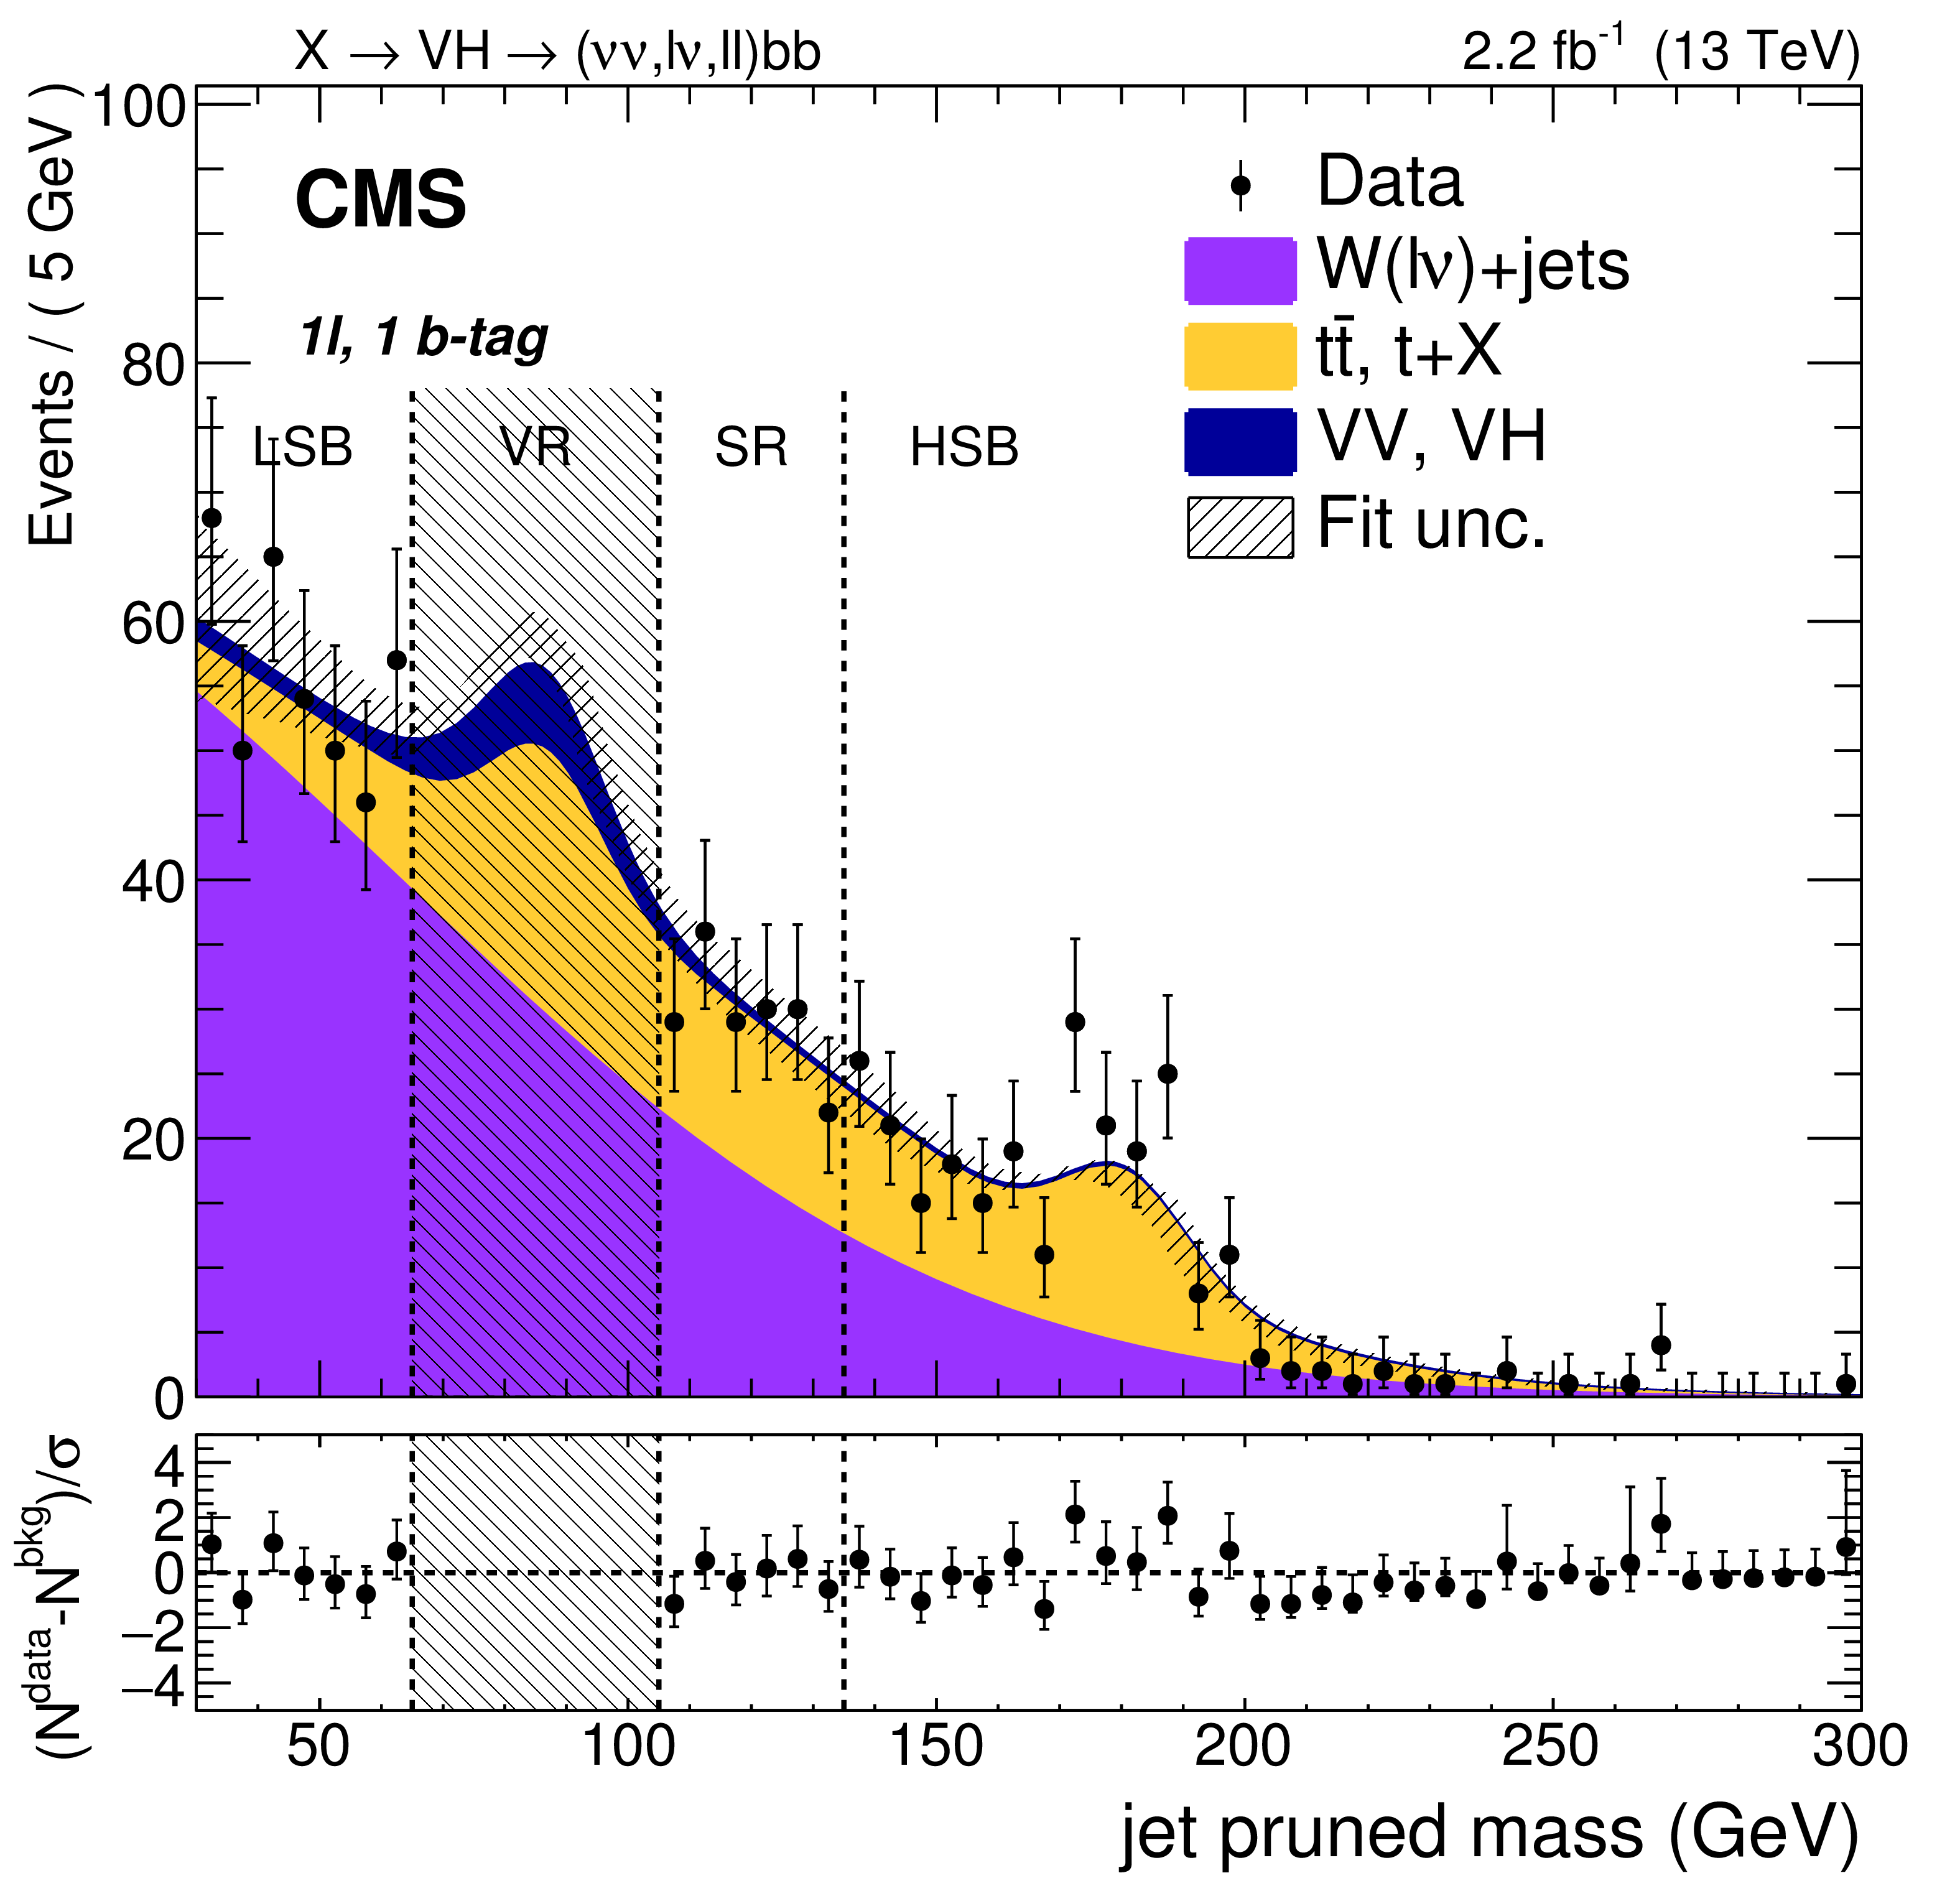
Figure 1-c:
Pruned jet mass distribution of the leading AK8 jet in the 1$\ell $ category, for the 1 b-tagged subjet selection. The shaded band representing the uncertainty from the fit to data in the pruned jet mass sidebands. The observed data are indicated by black markers. The dashed vertical lines separate the lower (LSB) and upper (HSB) sidebands, the W and Z bosons mass region (VR), and the signal region (SR). The bottom panel reports the pulls in each bin, $(N^\text {data}-N^\text {bkg})/\sigma $, where $\sigma $ is the Poisson uncertainty in data. The error bars represent the normalized Poisson errors on the data. |
png pdf |
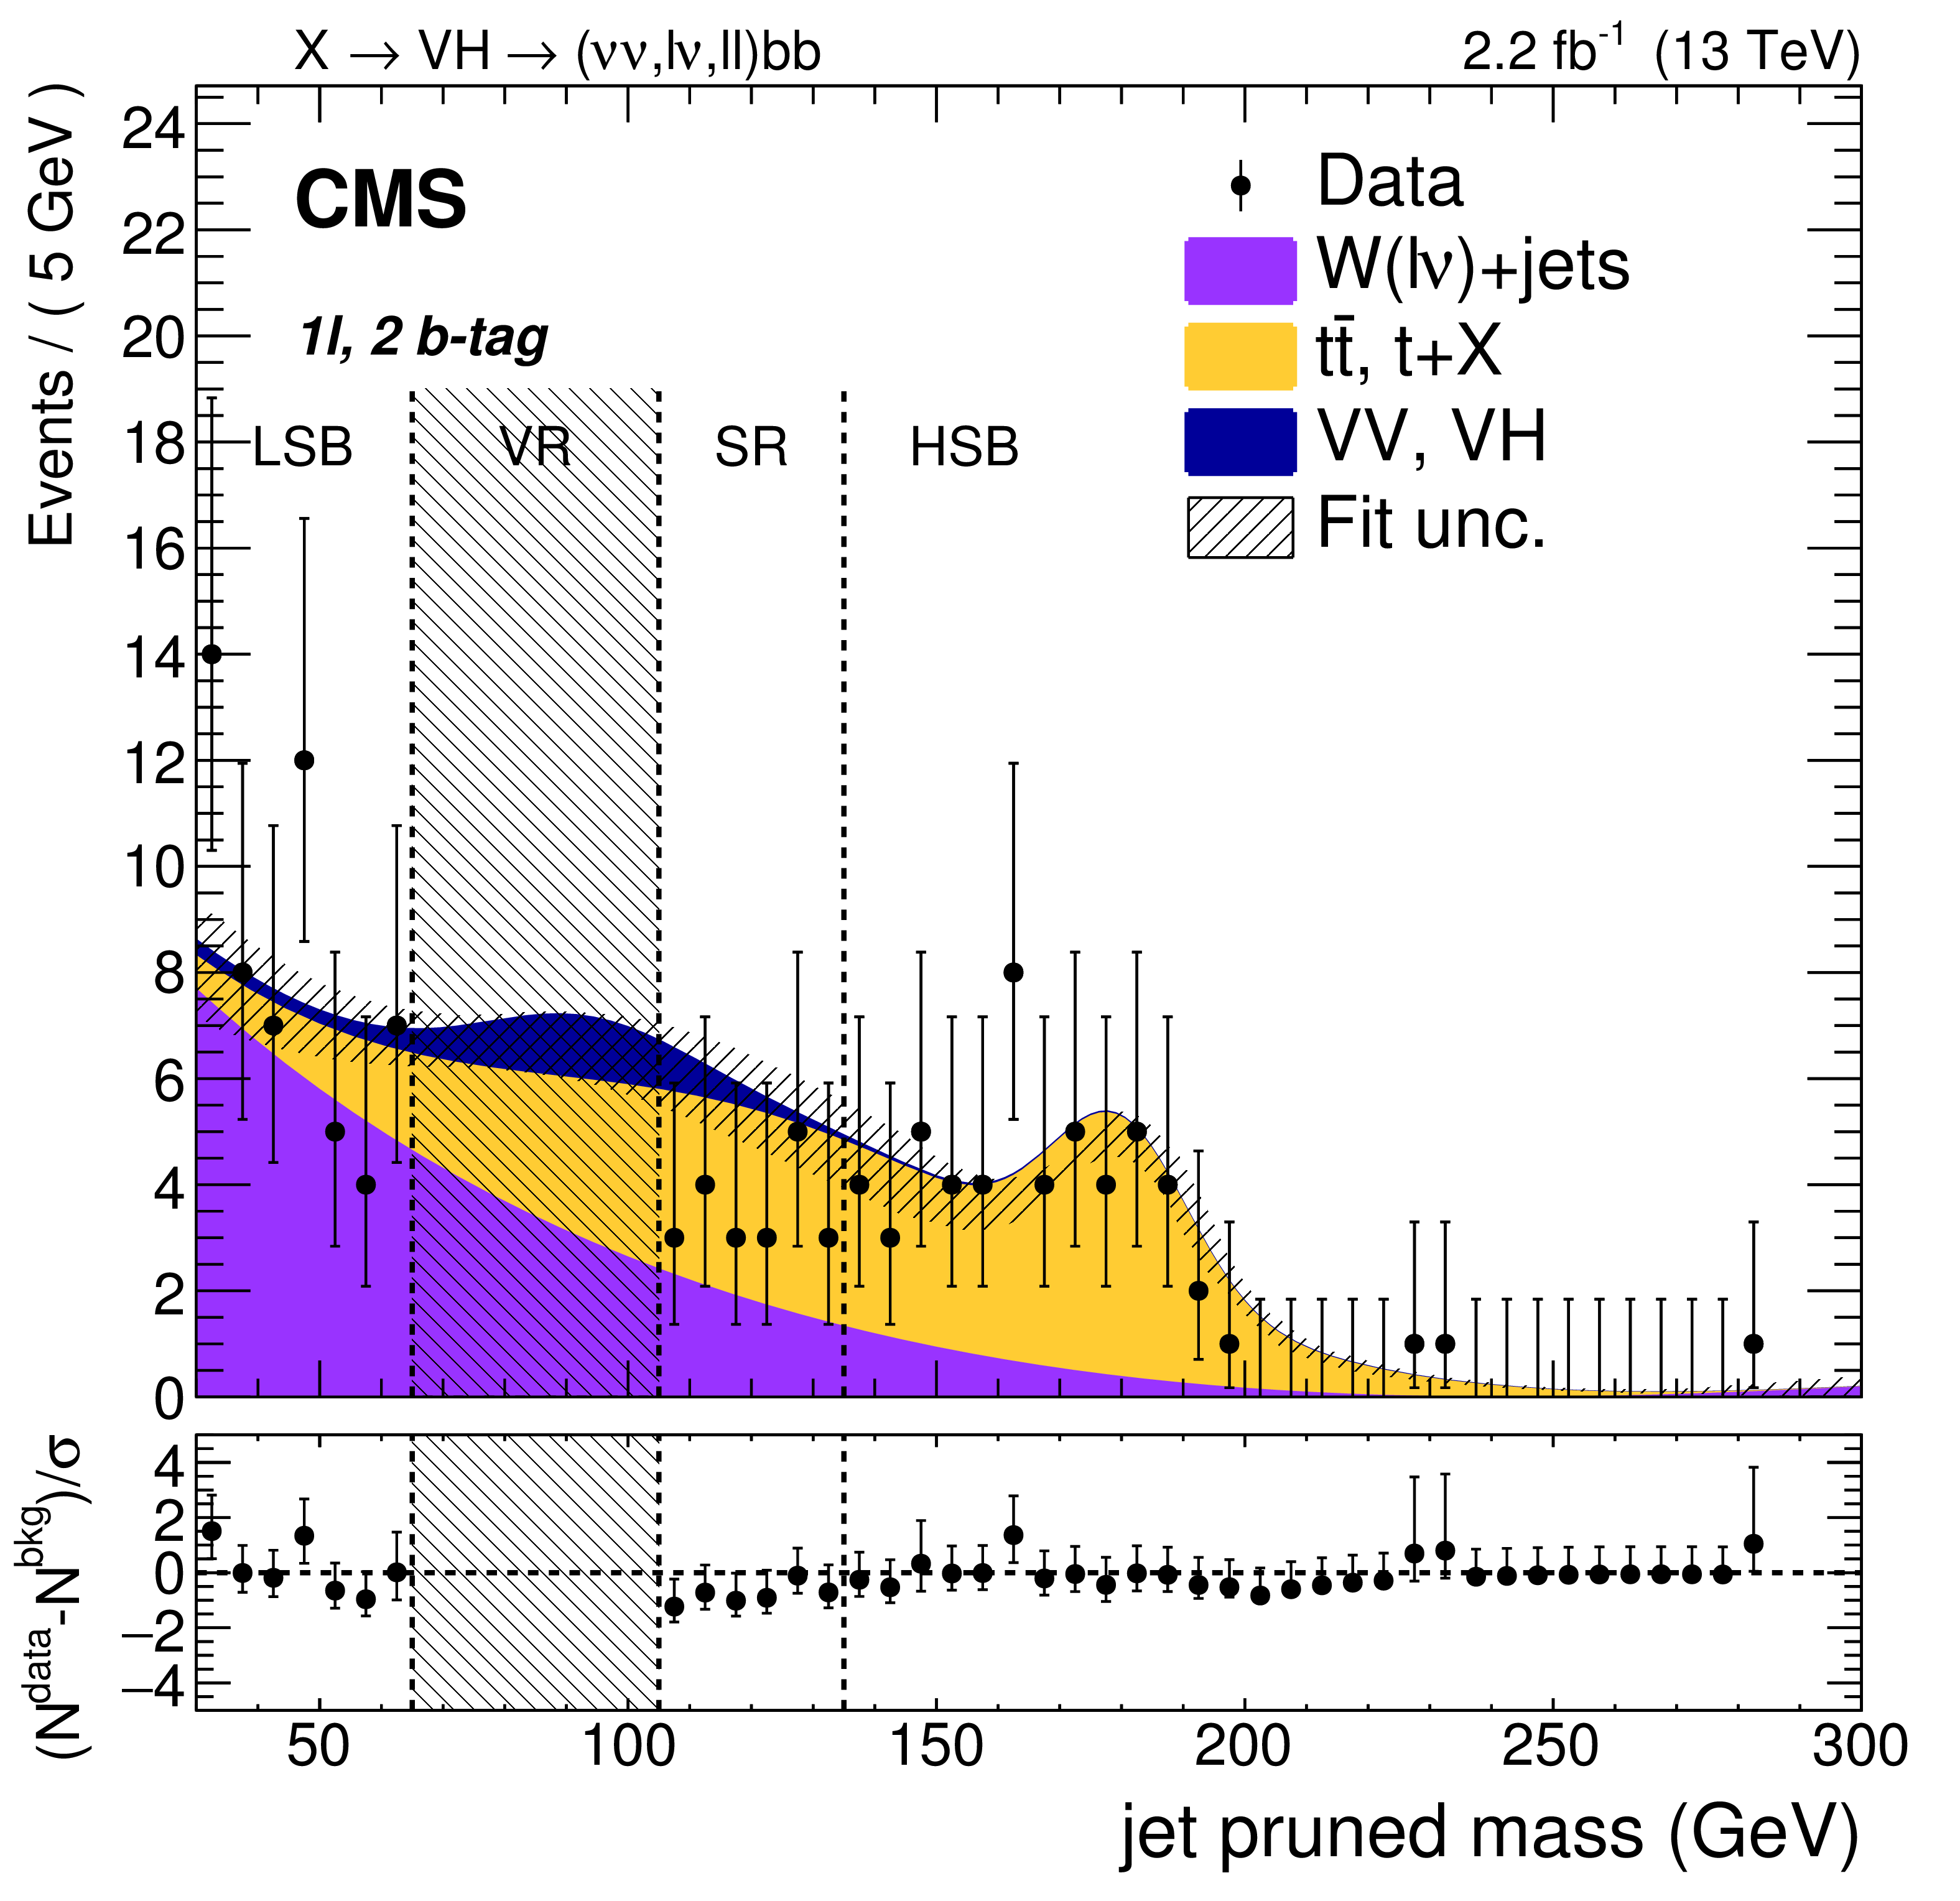
Figure 1-d:
Pruned jet mass distribution of the leading AK8 jet in the 1$\ell $ category, for the 2 b-tagged subjet selection. The shaded band representing the uncertainty from the fit to data in the pruned jet mass sidebands. The observed data are indicated by black markers. The dashed vertical lines separate the lower (LSB) and upper (HSB) sidebands, the W and Z bosons mass region (VR), and the signal region (SR). The bottom panel reports the pulls in each bin, $(N^\text {data}-N^\text {bkg})/\sigma $, where $\sigma $ is the Poisson uncertainty in data. The error bars represent the normalized Poisson errors on the data. |
png pdf |
Figure 1-e:
Pruned jet mass distribution of the leading AK8 jet in the 2$\ell $ category, for the 1 b-tagged subjet selection. The shaded band representing the uncertainty from the fit to data in the pruned jet mass sidebands. The observed data are indicated by black markers. The dashed vertical lines separate the lower (LSB) and upper (HSB) sidebands, the W and Z bosons mass region (VR), and the signal region (SR). The bottom panel reports the pulls in each bin, $(N^\text {data}-N^\text {bkg})/\sigma $, where $\sigma $ is the Poisson uncertainty in data. The error bars represent the normalized Poisson errors on the data. |
png pdf |
Figure 1-f:
Pruned jet mass distribution of the leading AK8 jet in the 2$\ell $ category, for the 2 b-tagged subjet selection. The shaded band representing the uncertainty from the fit to data in the pruned jet mass sidebands. The observed data are indicated by black markers. The dashed vertical lines separate the lower (LSB) and upper (HSB) sidebands, the W and Z bosons mass region (VR), and the signal region (SR). The bottom panel reports the pulls in each bin, $(N^\text {data}-N^\text {bkg})/\sigma $, where $\sigma $ is the Poisson uncertainty in data. The error bars represent the normalized Poisson errors on the data. |
png pdf |
Figure 2:
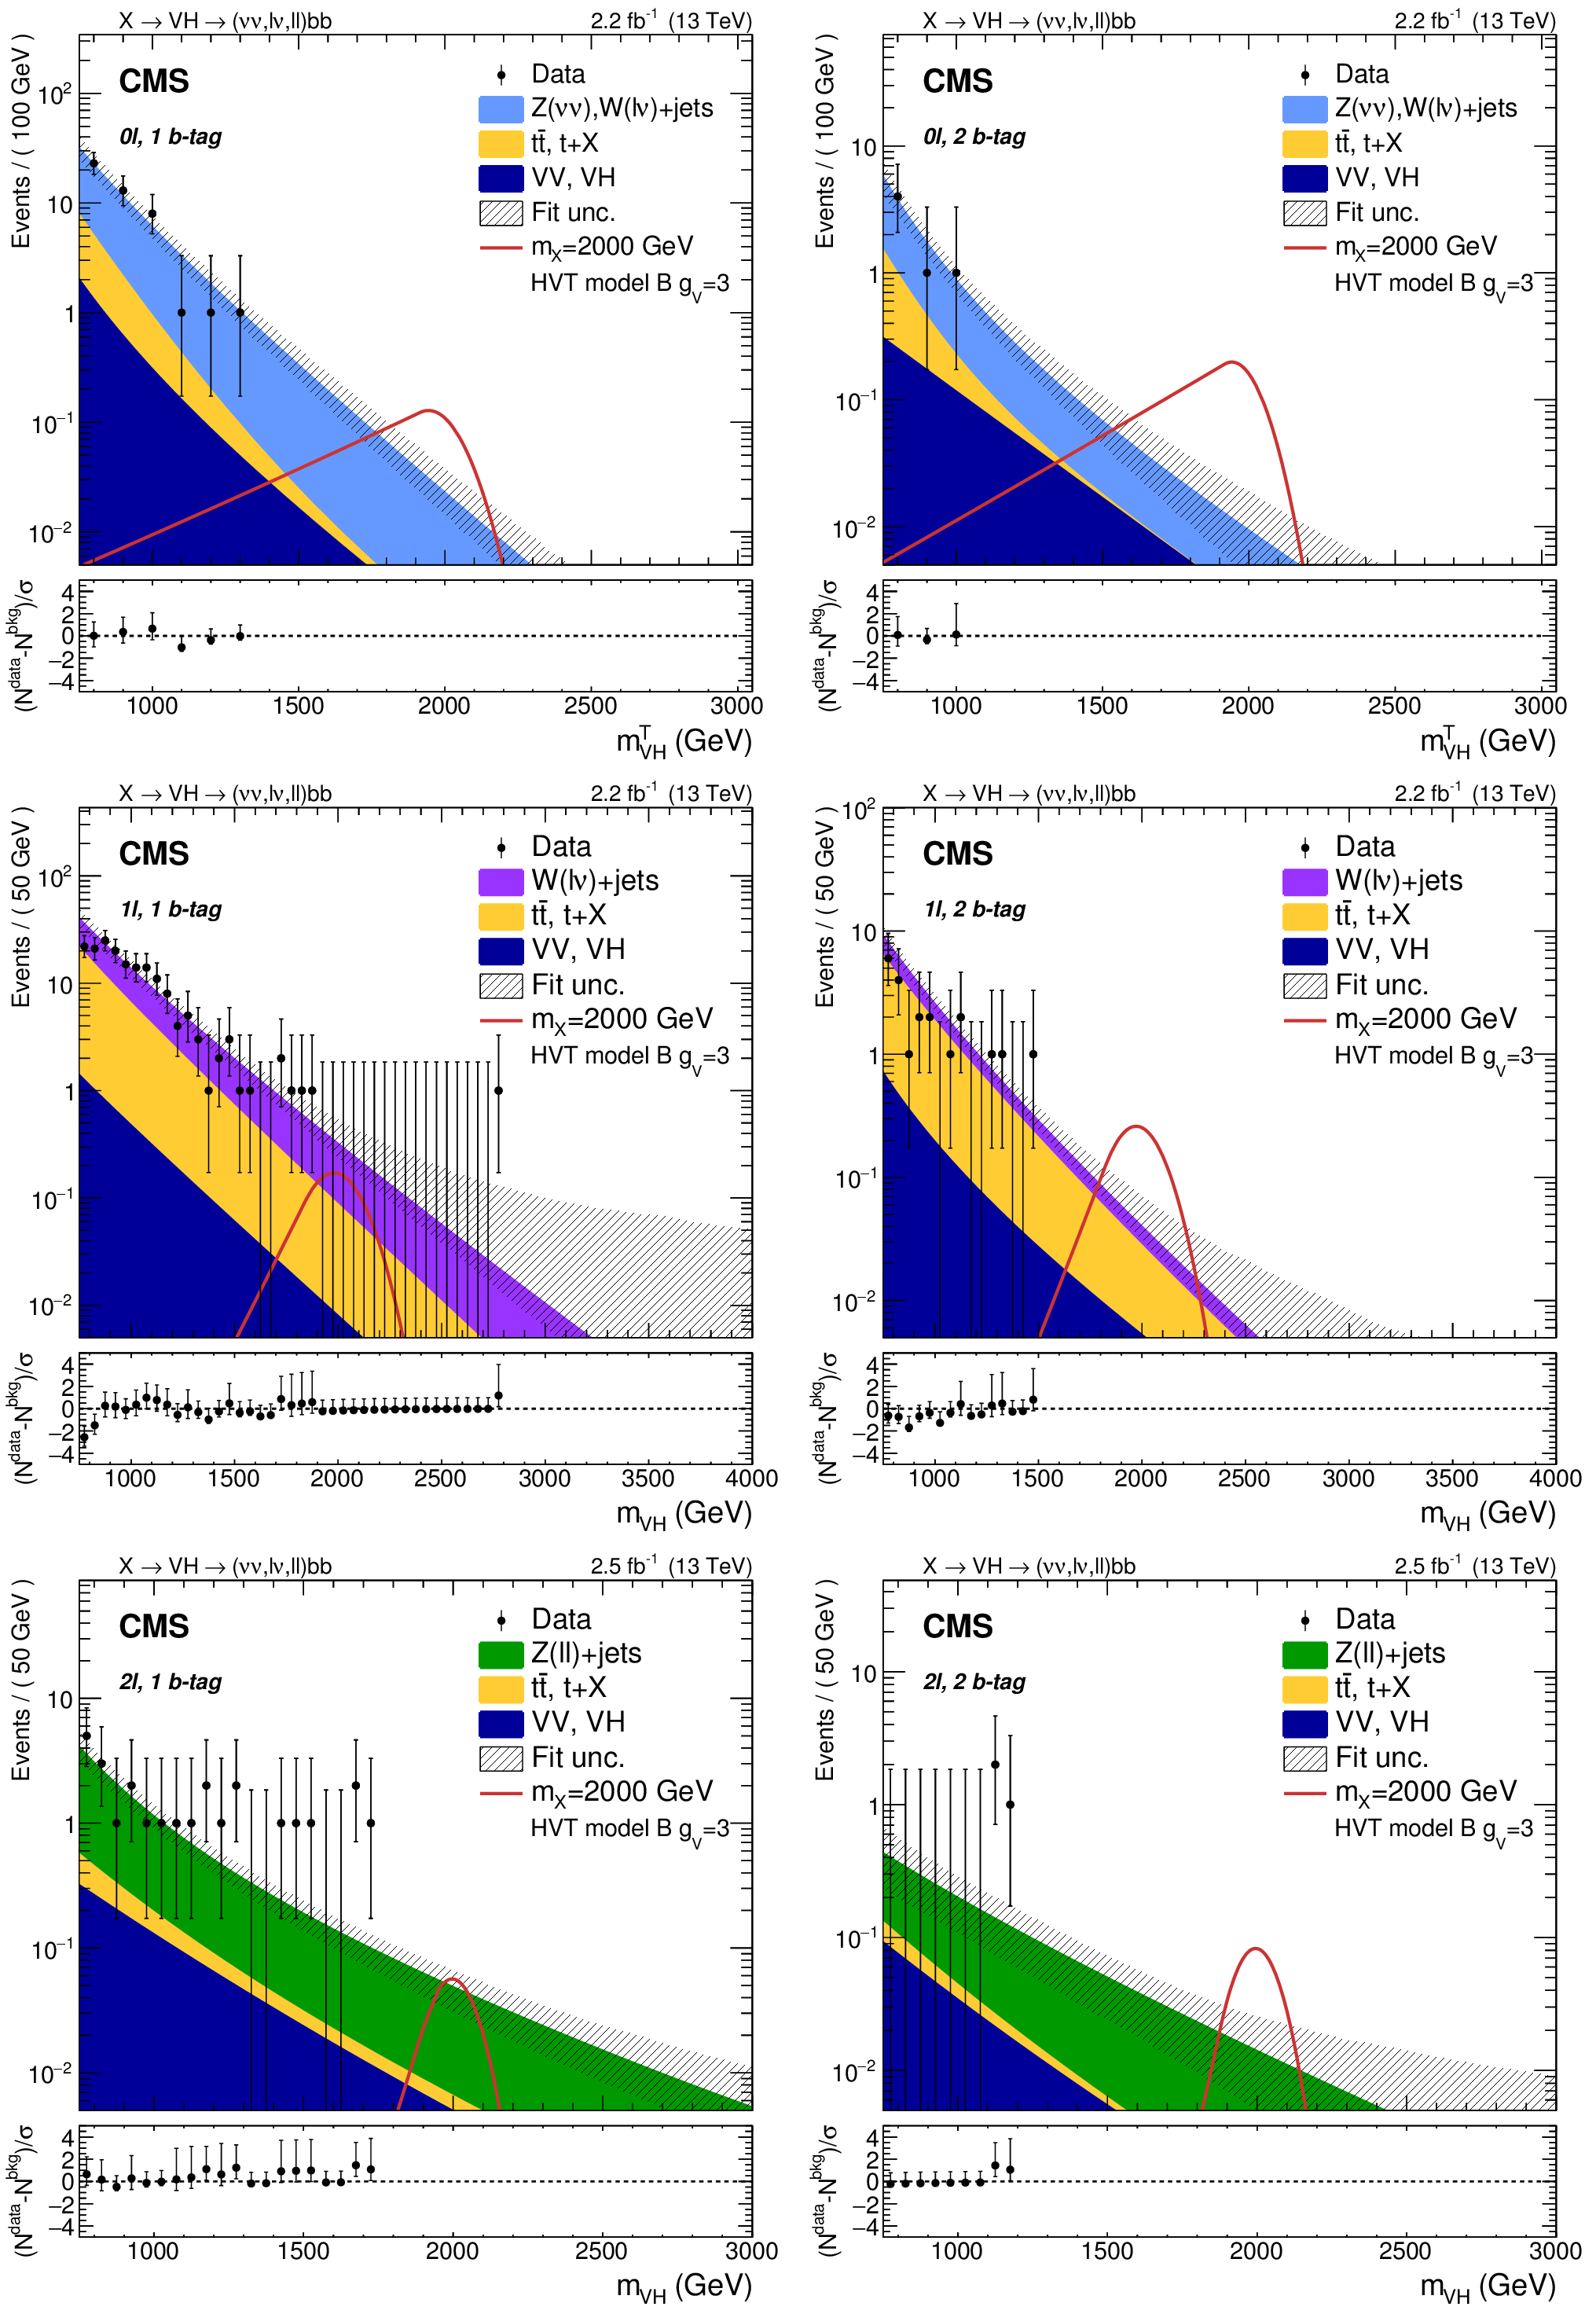
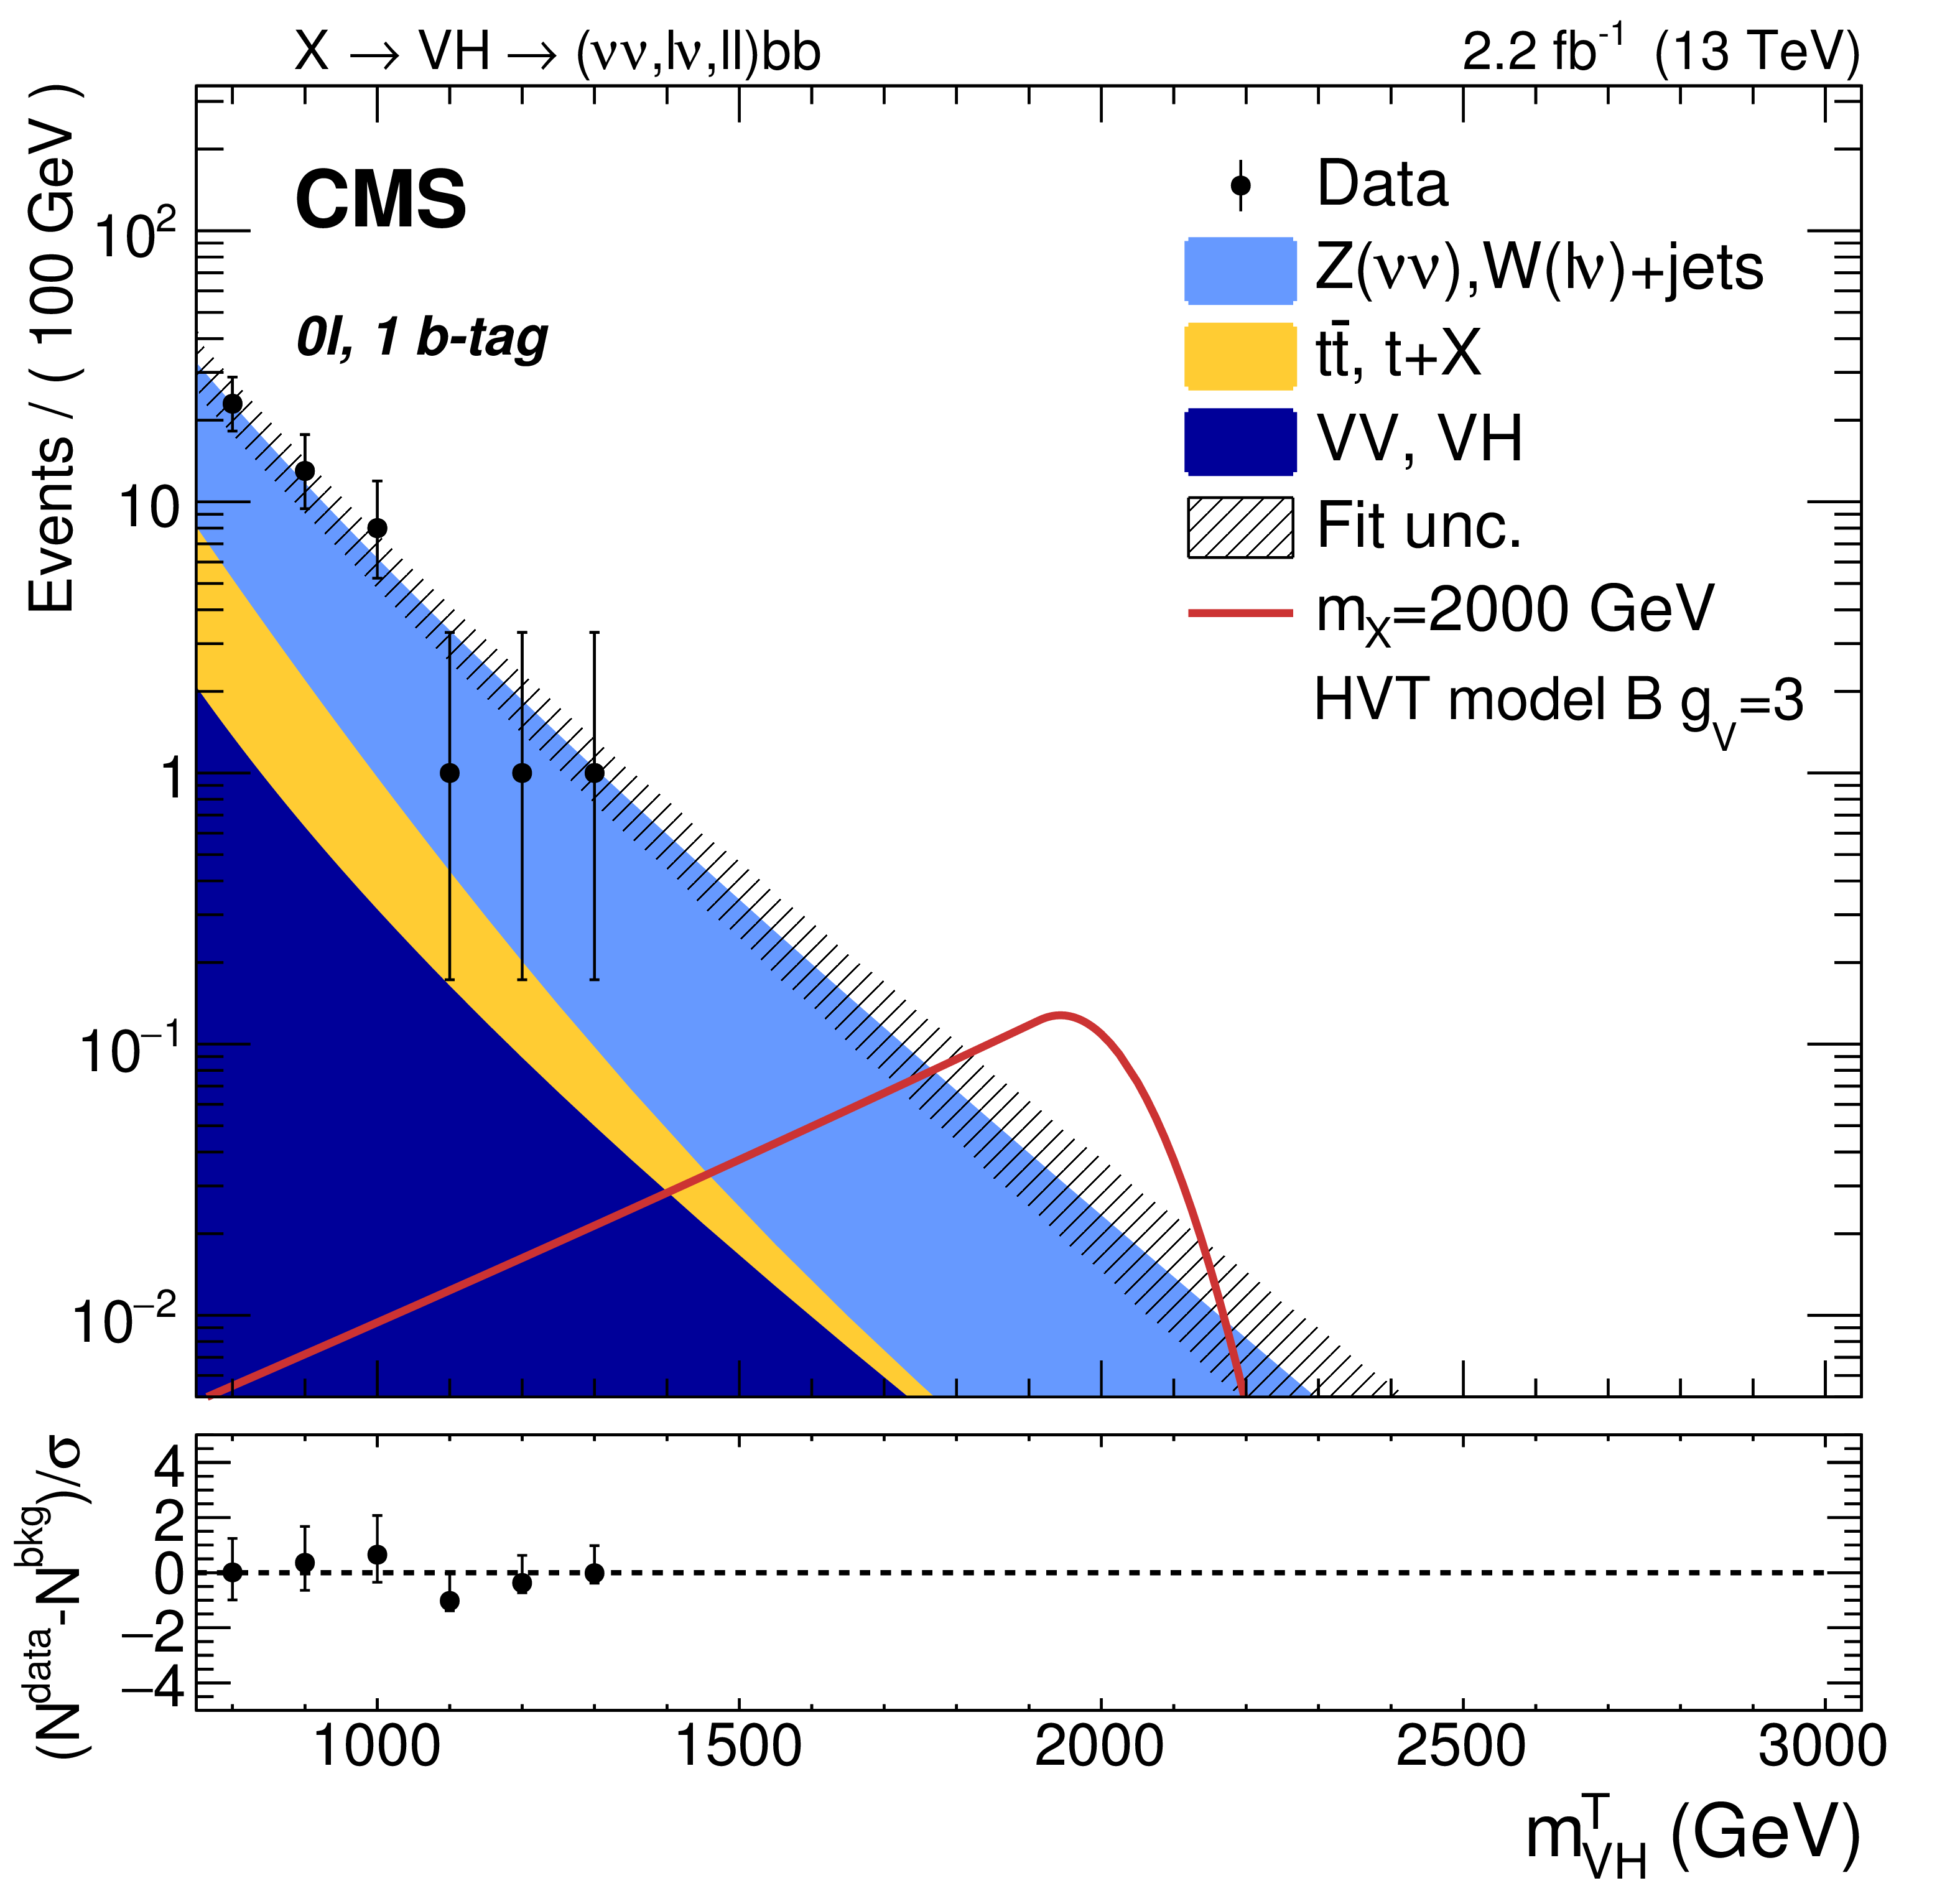
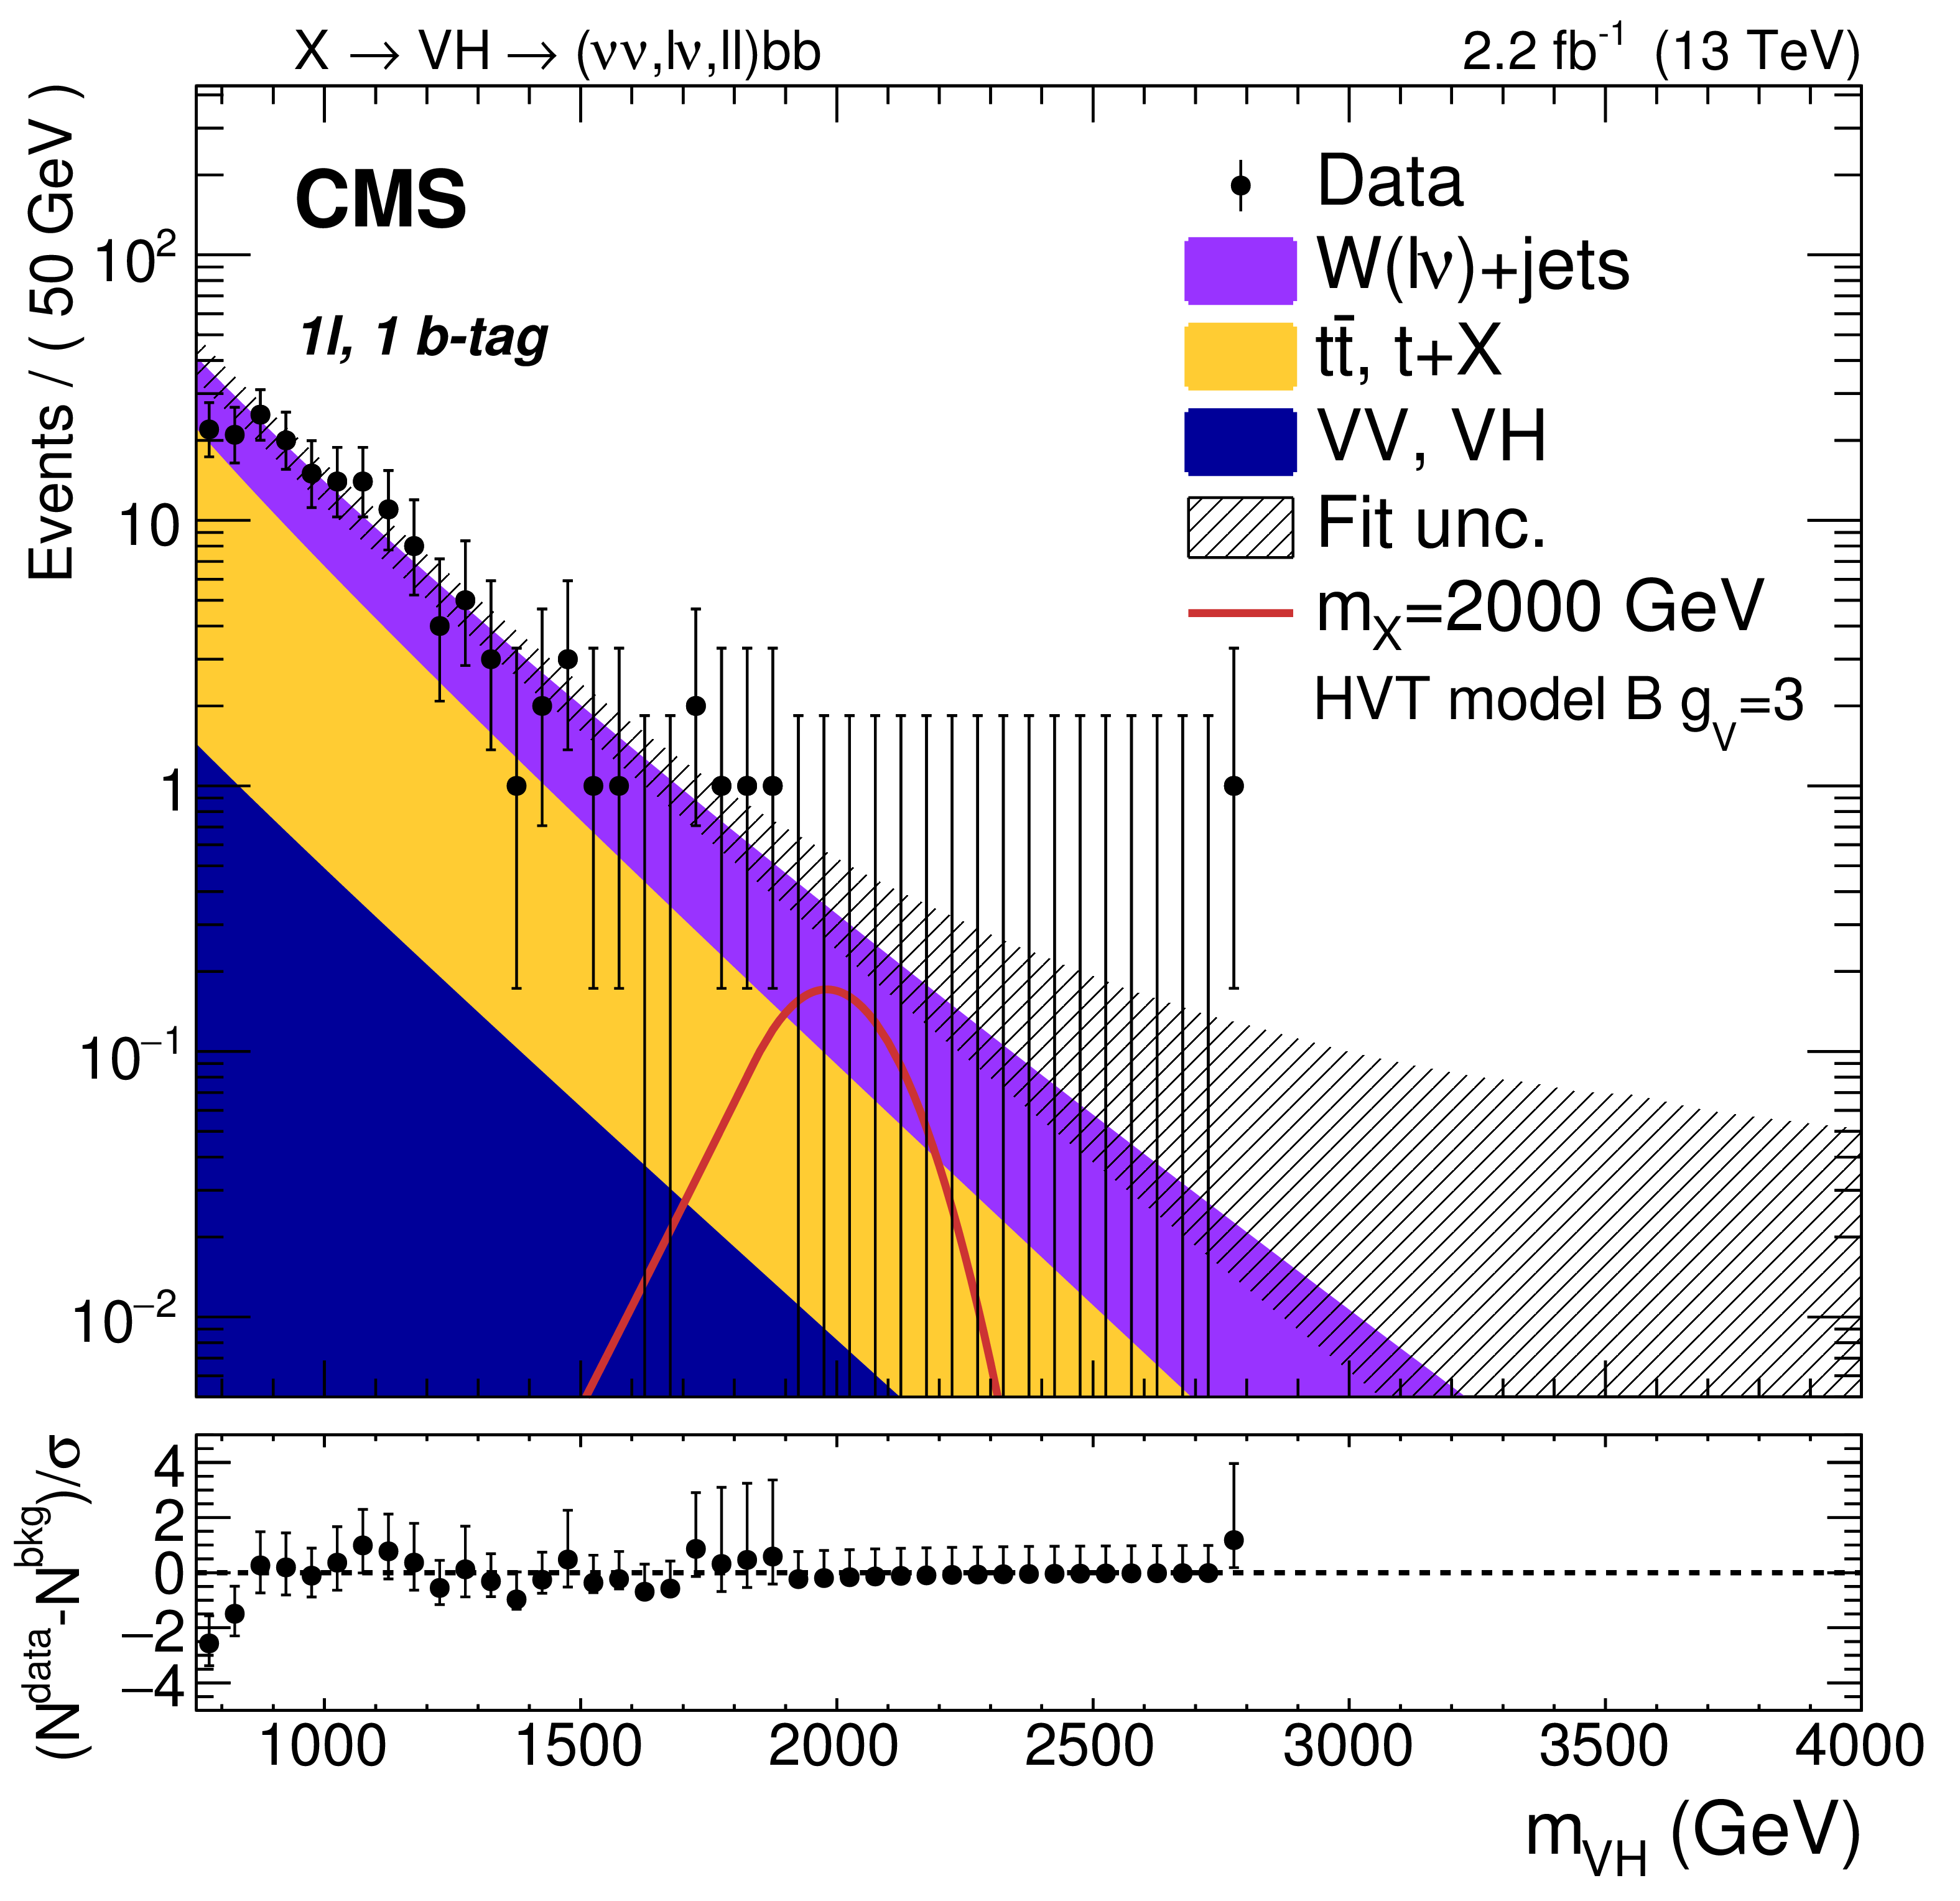
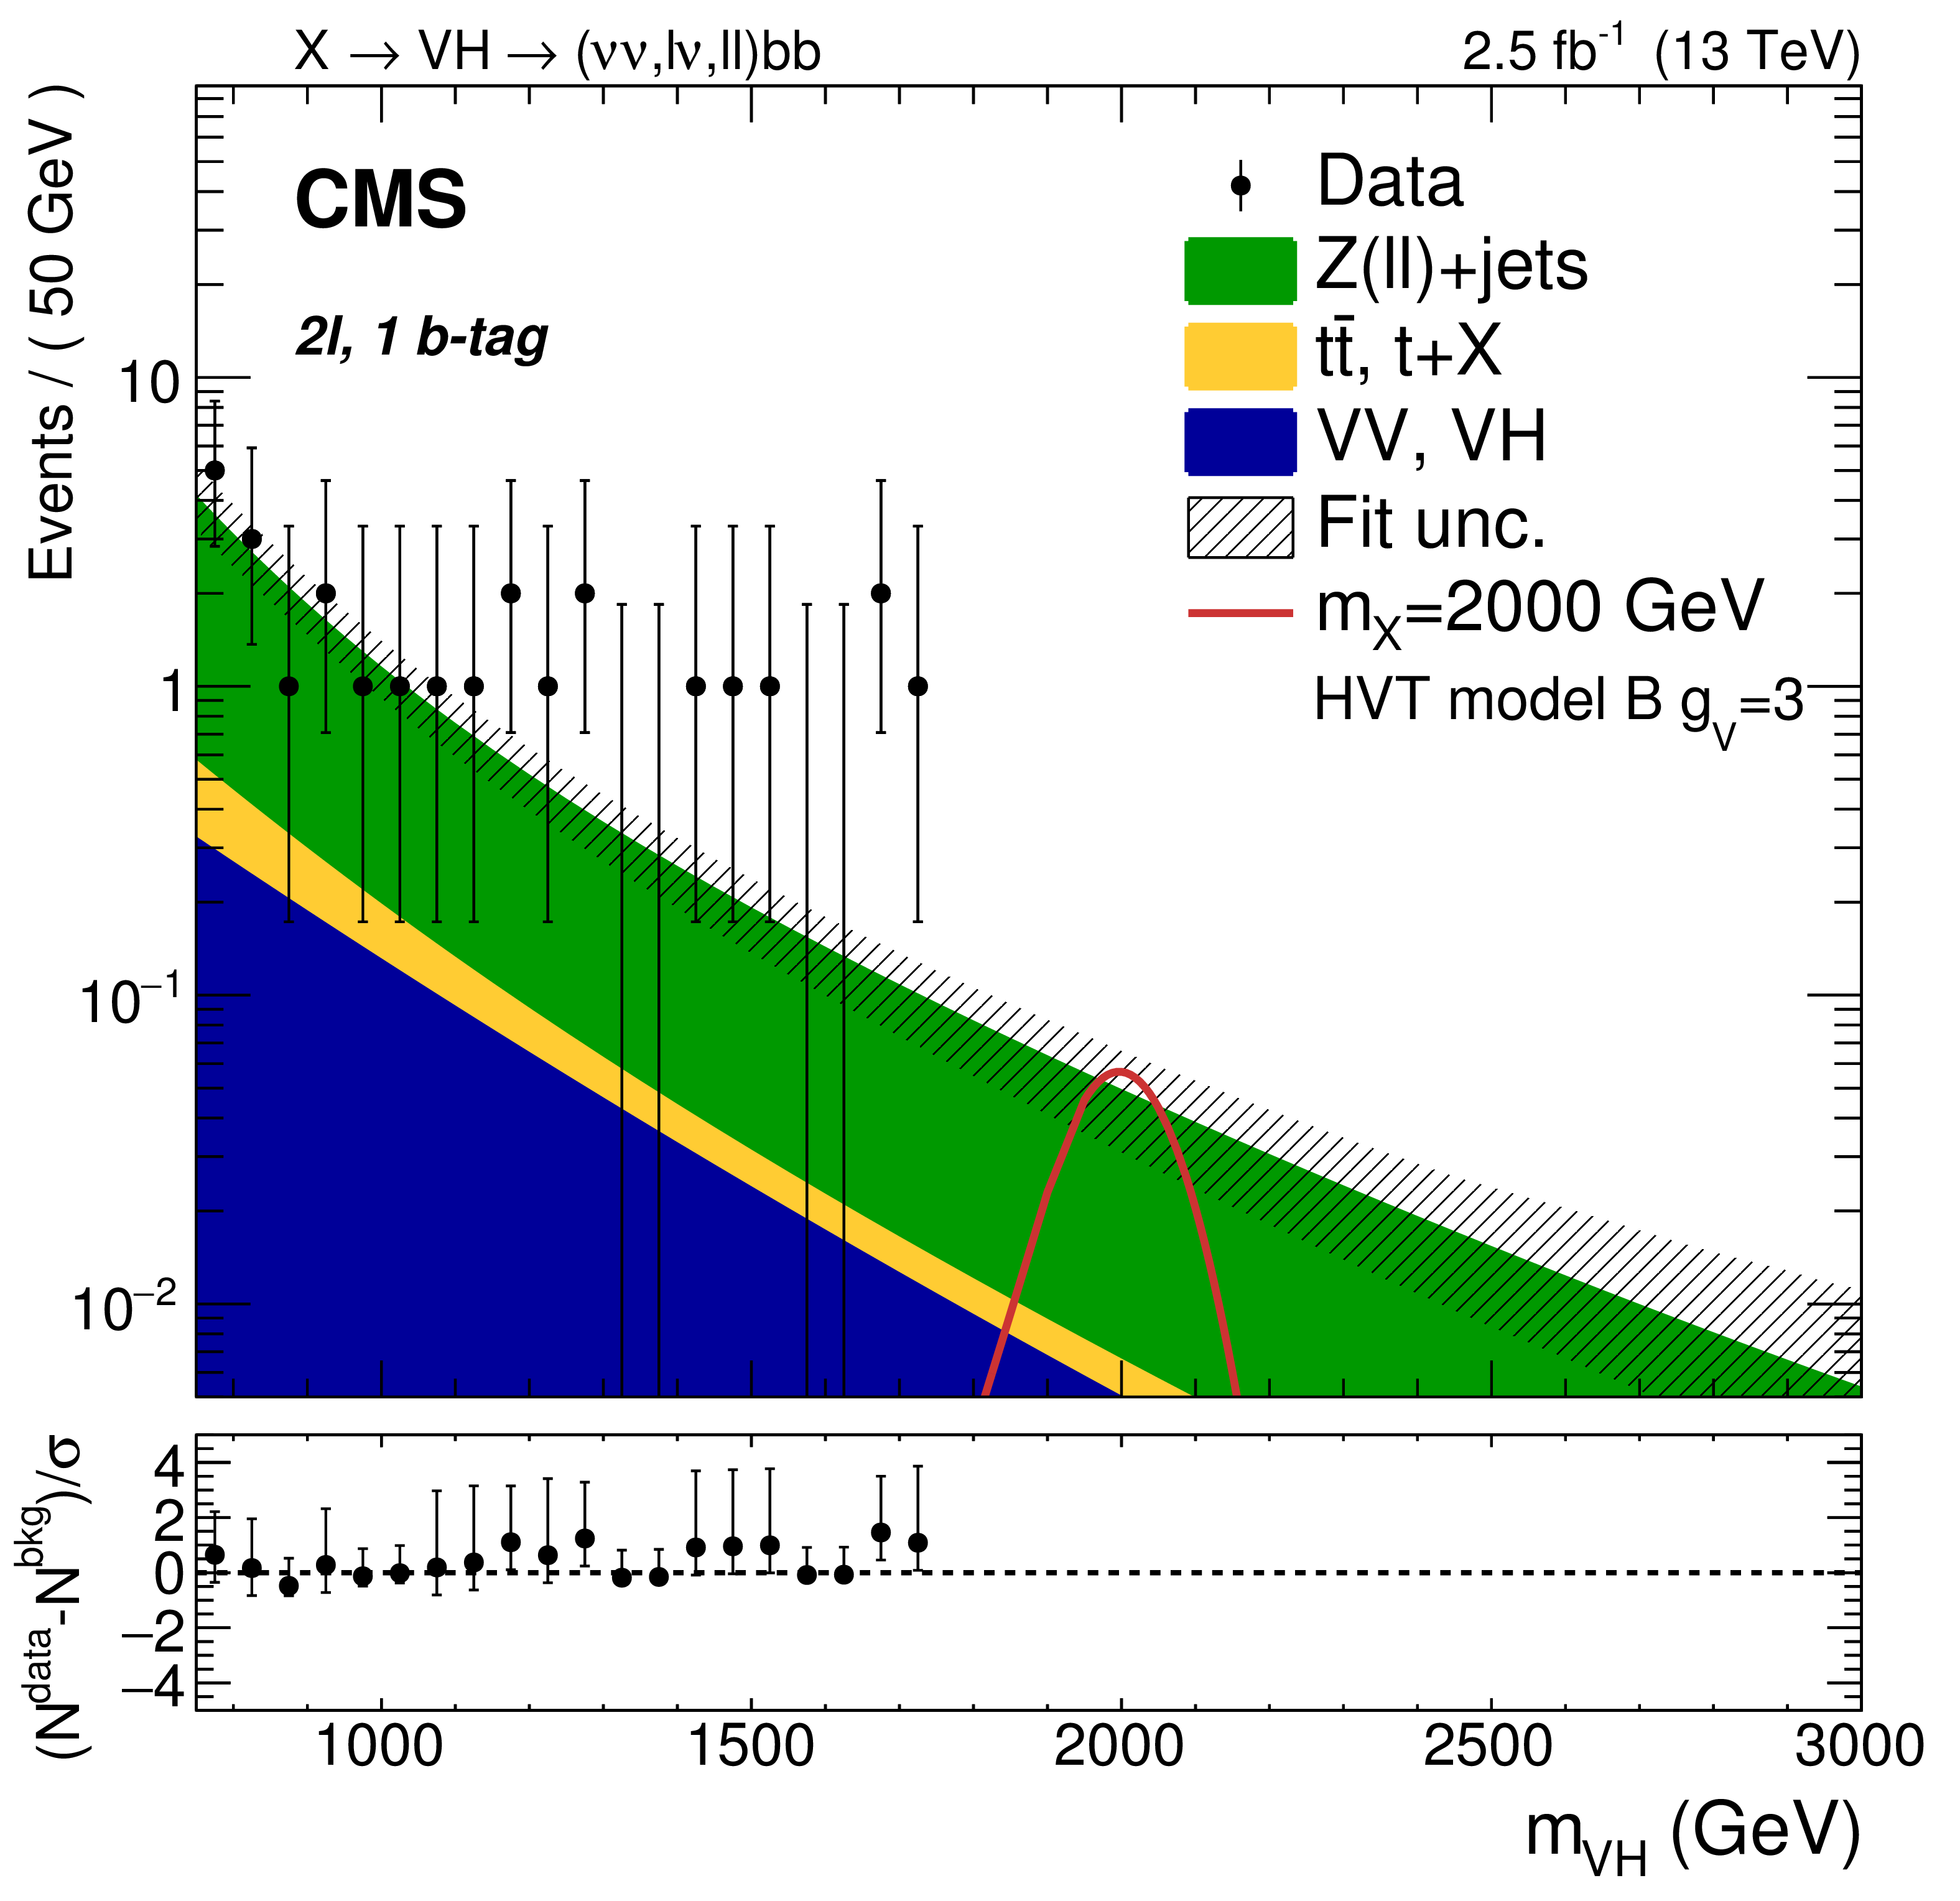
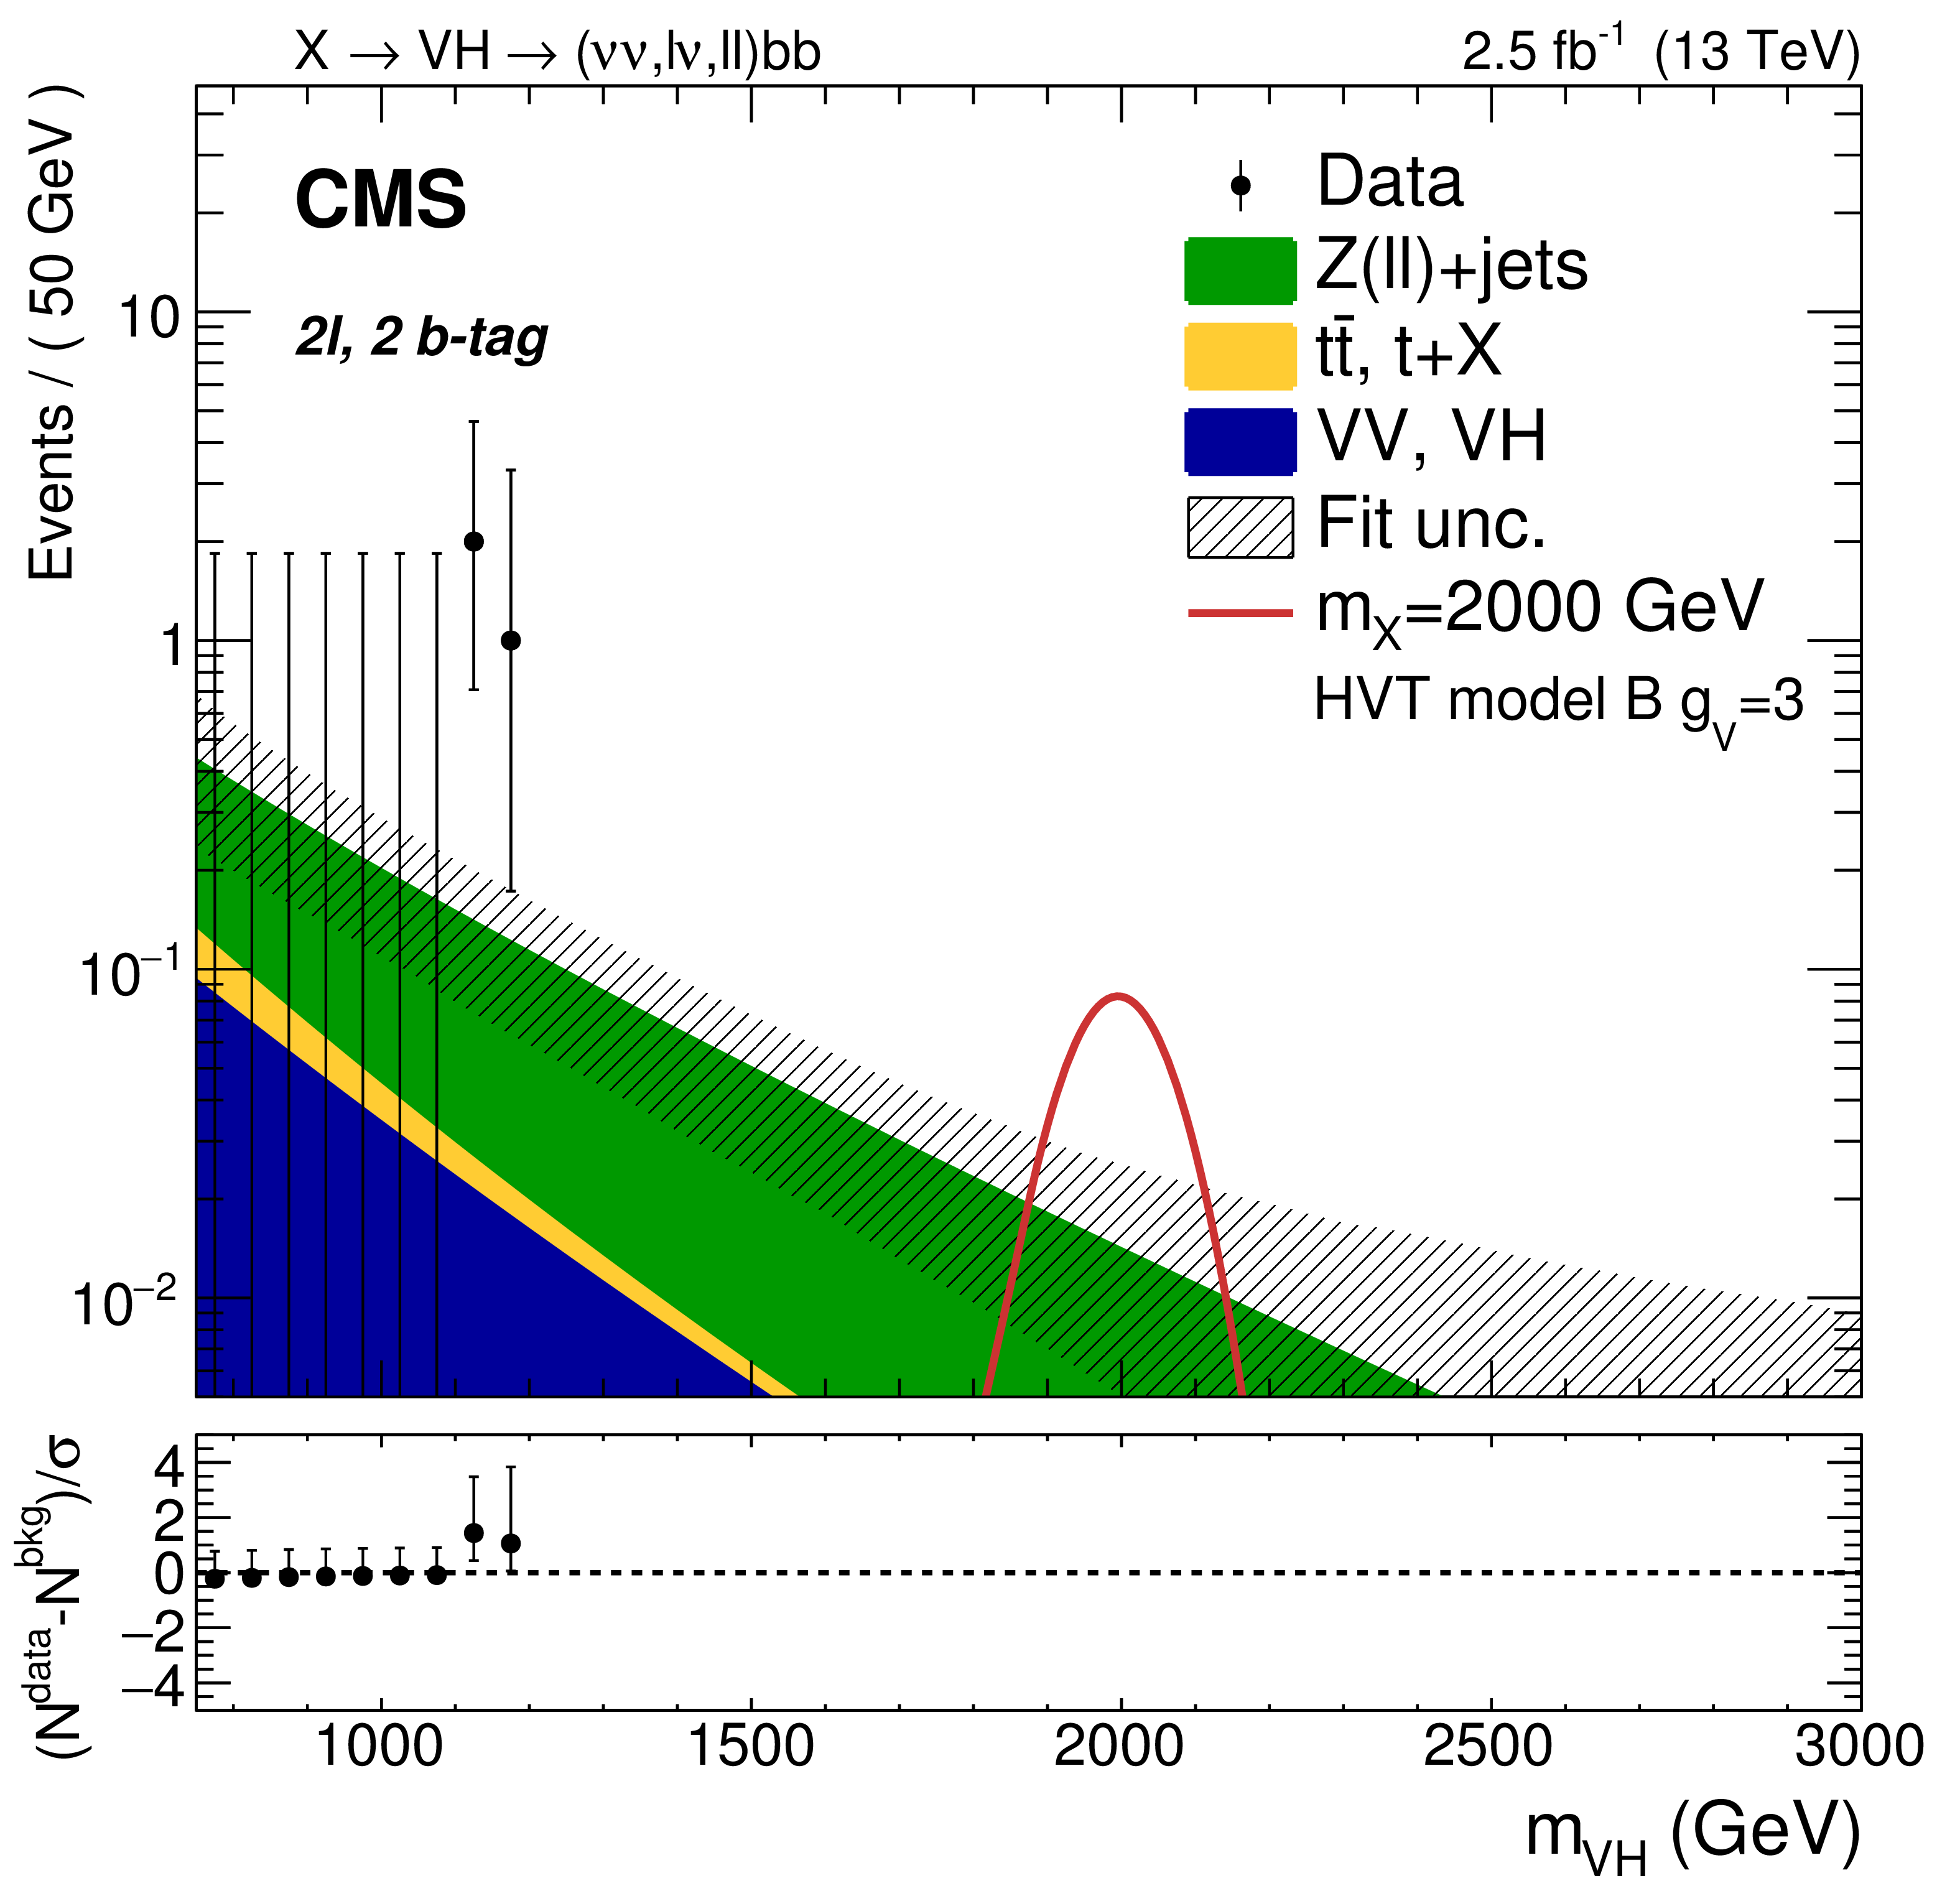
Resonance candidate mass ${m_{ { {\mathrm {V}} \mathrm{ H } } }}$ distributions in the 0$\ell $ (upper), 1$\ell $ (middle), and 2$\ell $ (lower) categories, and separately for the 1 (left ) and 2 (right ) b-tagged subjet selections. The expected background events are shown with the filled area, and the shaded band represents the total background uncertainty. The observed data are indicated by black markers, and the potential contribution of a resonance with ${m_{ {\mathrm {X}} }} =$ 2000 GeV produced in the context of the HVT model B with $ {g_\text {V}} =$ 3 is shown with a solid red line. The bottom panels report the pulls in each bin, $(N^\text {data}-N^\text {bkg})/\sigma $, where $\sigma $ is the Poisson uncertainty in data. The error bars represent the normalized Poisson errors on the data. |
png pdf |
Figure 2-a:
Resonance candidate mass ${m_{ { {\mathrm {V}} \mathrm{ H } } }}$ distributions in the 0$\ell$ category, for the 1 b-tagged subjet selection. The expected background events are shown with the filled area, and the shaded band represents the total background uncertainty. The observed data are indicated by black markers, and the potential contribution of a resonance with ${m_{ {\mathrm {X}} }} =$ 2000 GeV produced in the context of the HVT model B with $ {g_\text {V}} =$ 3 is shown with a solid red line. The bottom panels report the pulls in each bin, $(N^\text {data}-N^\text {bkg})/\sigma $, where $\sigma $ is the Poisson uncertainty in data. The error bars represent the normalized Poisson errors on the data. |

png pdf |
Figure 2-b:
Resonance candidate mass ${m_{ { {\mathrm {V}} \mathrm{ H } } }}$ distributions in the 0 $\ell$ category, for the 2 b-tagged subjet selection. The expected background events are shown with the filled area, and the shaded band represents the total background uncertainty. The observed data are indicated by black markers, and the potential contribution of a resonance with ${m_{ {\mathrm {X}} }} =$ 2000 GeV produced in the context of the HVT model B with $ {g_\text {V}} =$ 3 is shown with a solid red line. The bottom panels report the pulls in each bin, $(N^\text {data}-N^\text {bkg})/\sigma $, where $\sigma $ is the Poisson uncertainty in data. The error bars represent the normalized Poisson errors on the data. |
png pdf |
Figure 2-c:
Resonance candidate mass ${m_{ { {\mathrm {V}} \mathrm{ H } } }}$ distributions in the 1$\ell $ category, for the 1 b-tagged subjet selection. The expected background events are shown with the filled area, and the shaded band represents the total background uncertainty. The observed data are indicated by black markers, and the potential contribution of a resonance with ${m_{ {\mathrm {X}} }} =$ 2000 GeV produced in the context of the HVT model B with $ {g_\text {V}} =$ 3 is shown with a solid red line. The bottom panels report the pulls in each bin, $(N^\text {data}-N^\text {bkg})/\sigma $, where $\sigma $ is the Poisson uncertainty in data. The error bars represent the normalized Poisson errors on the data. |

png pdf |
Figure 2-d:
Resonance candidate mass ${m_{ { {\mathrm {V}} \mathrm{ H } } }}$ distributions in the 1$\ell $ category, for the 2 b-tagged subjet selection. The expected background events are shown with the filled area, and the shaded band represents the total background uncertainty. The observed data are indicated by black markers, and the potential contribution of a resonance with ${m_{ {\mathrm {X}} }} =$ 2000 GeV produced in the context of the HVT model B with $ {g_\text {V}} =$ 3 is shown with a solid red line. The bottom panels report the pulls in each bin, $(N^\text {data}-N^\text {bkg})/\sigma $, where $\sigma $ is the Poisson uncertainty in data. The error bars represent the normalized Poisson errors on the data. |
png pdf |
Figure 2-e:
Resonance candidate mass ${m_{ { {\mathrm {V}} \mathrm{ H } } }}$ distributions in the 2$\ell $ category, for the 1 b-tagged subjet selection. The expected background events are shown with the filled area, and the shaded band represents the total background uncertainty. The observed data are indicated by black markers, and the potential contribution of a resonance with ${m_{ {\mathrm {X}} }} =$ 2000 GeV produced in the context of the HVT model B with $ {g_\text {V}} =$ 3 is shown with a solid red line. The bottom panels report the pulls in each bin, $(N^\text {data}-N^\text {bkg})/\sigma $, where $\sigma $ is the Poisson uncertainty in data. The error bars represent the normalized Poisson errors on the data. |
png pdf |
Figure 2-f:
Resonance candidate mass ${m_{ { {\mathrm {V}} \mathrm{ H } } }}$ distributions in the 2$\ell $ category, for the 2 b-tagged subjet selection. The expected background events are shown with the filled area, and the shaded band represents the total background uncertainty. The observed data are indicated by black markers, and the potential contribution of a resonance with ${m_{ {\mathrm {X}} }} =$ 2000 GeV produced in the context of the HVT model B with $ {g_\text {V}} =$ 3 is shown with a solid red line. The bottom panels report the pulls in each bin, $(N^\text {data}-N^\text {bkg})/\sigma $, where $\sigma $ is the Poisson uncertainty in data. The error bars represent the normalized Poisson errors on the data. |
png pdf |
Figure 3:
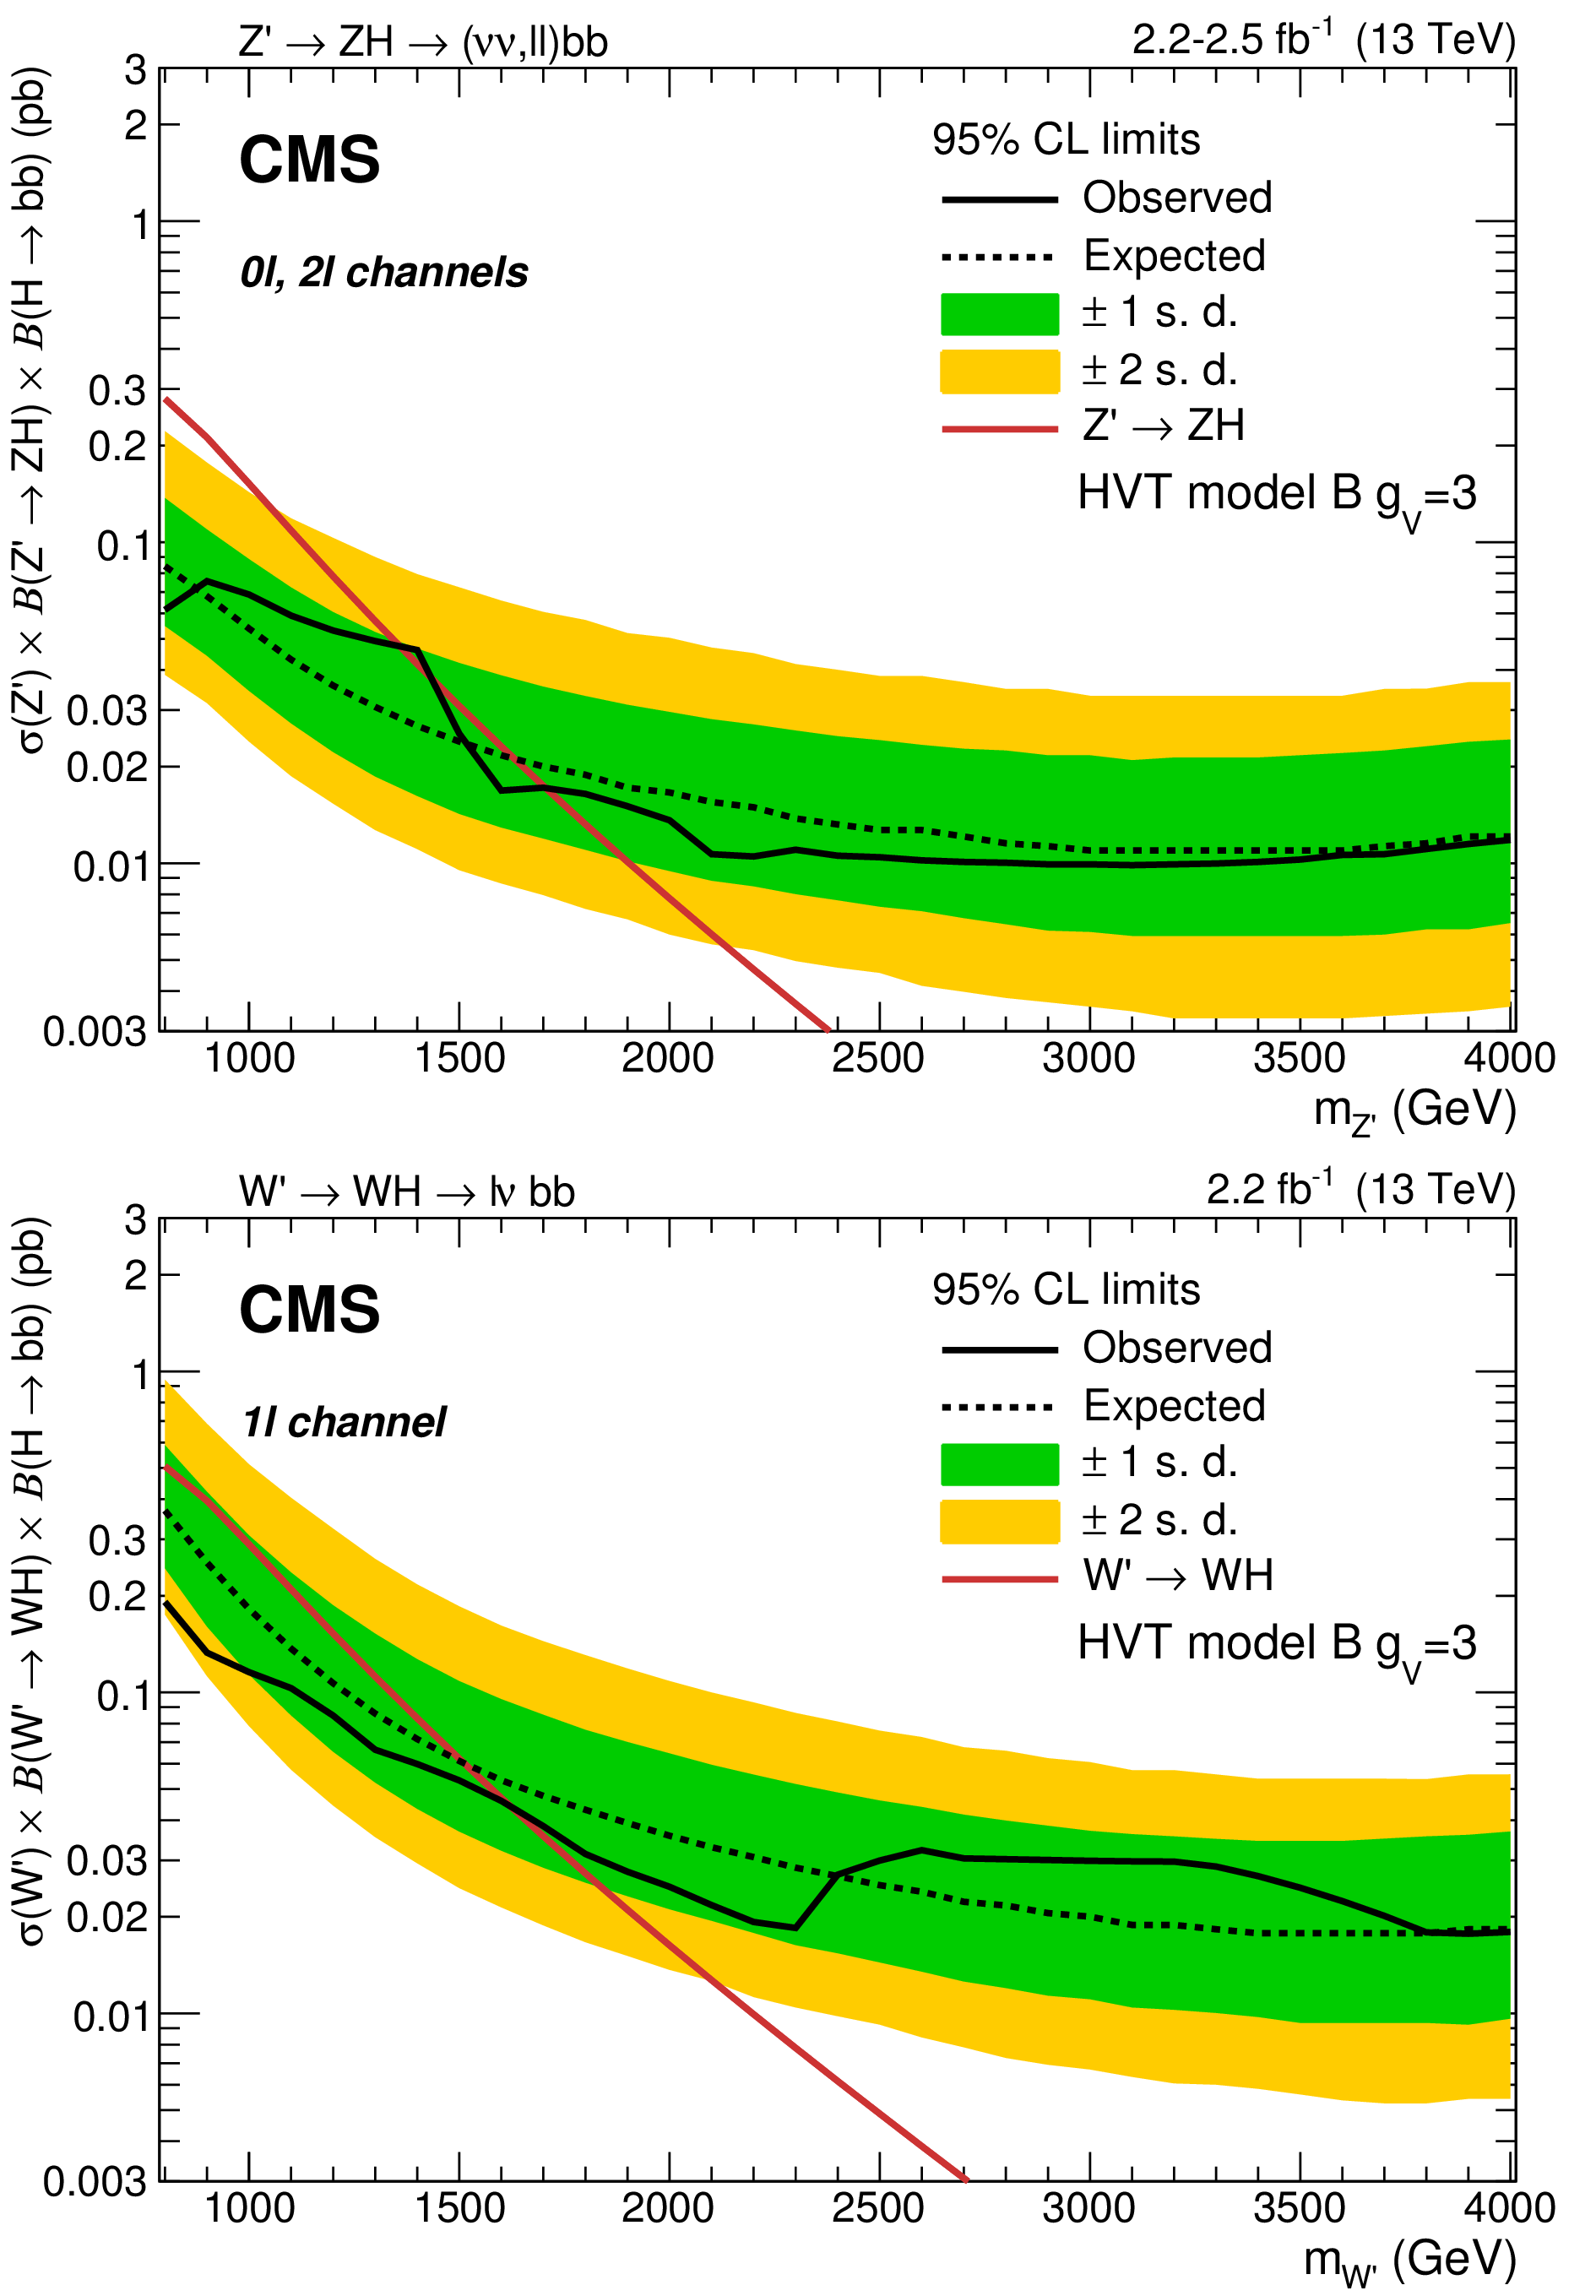
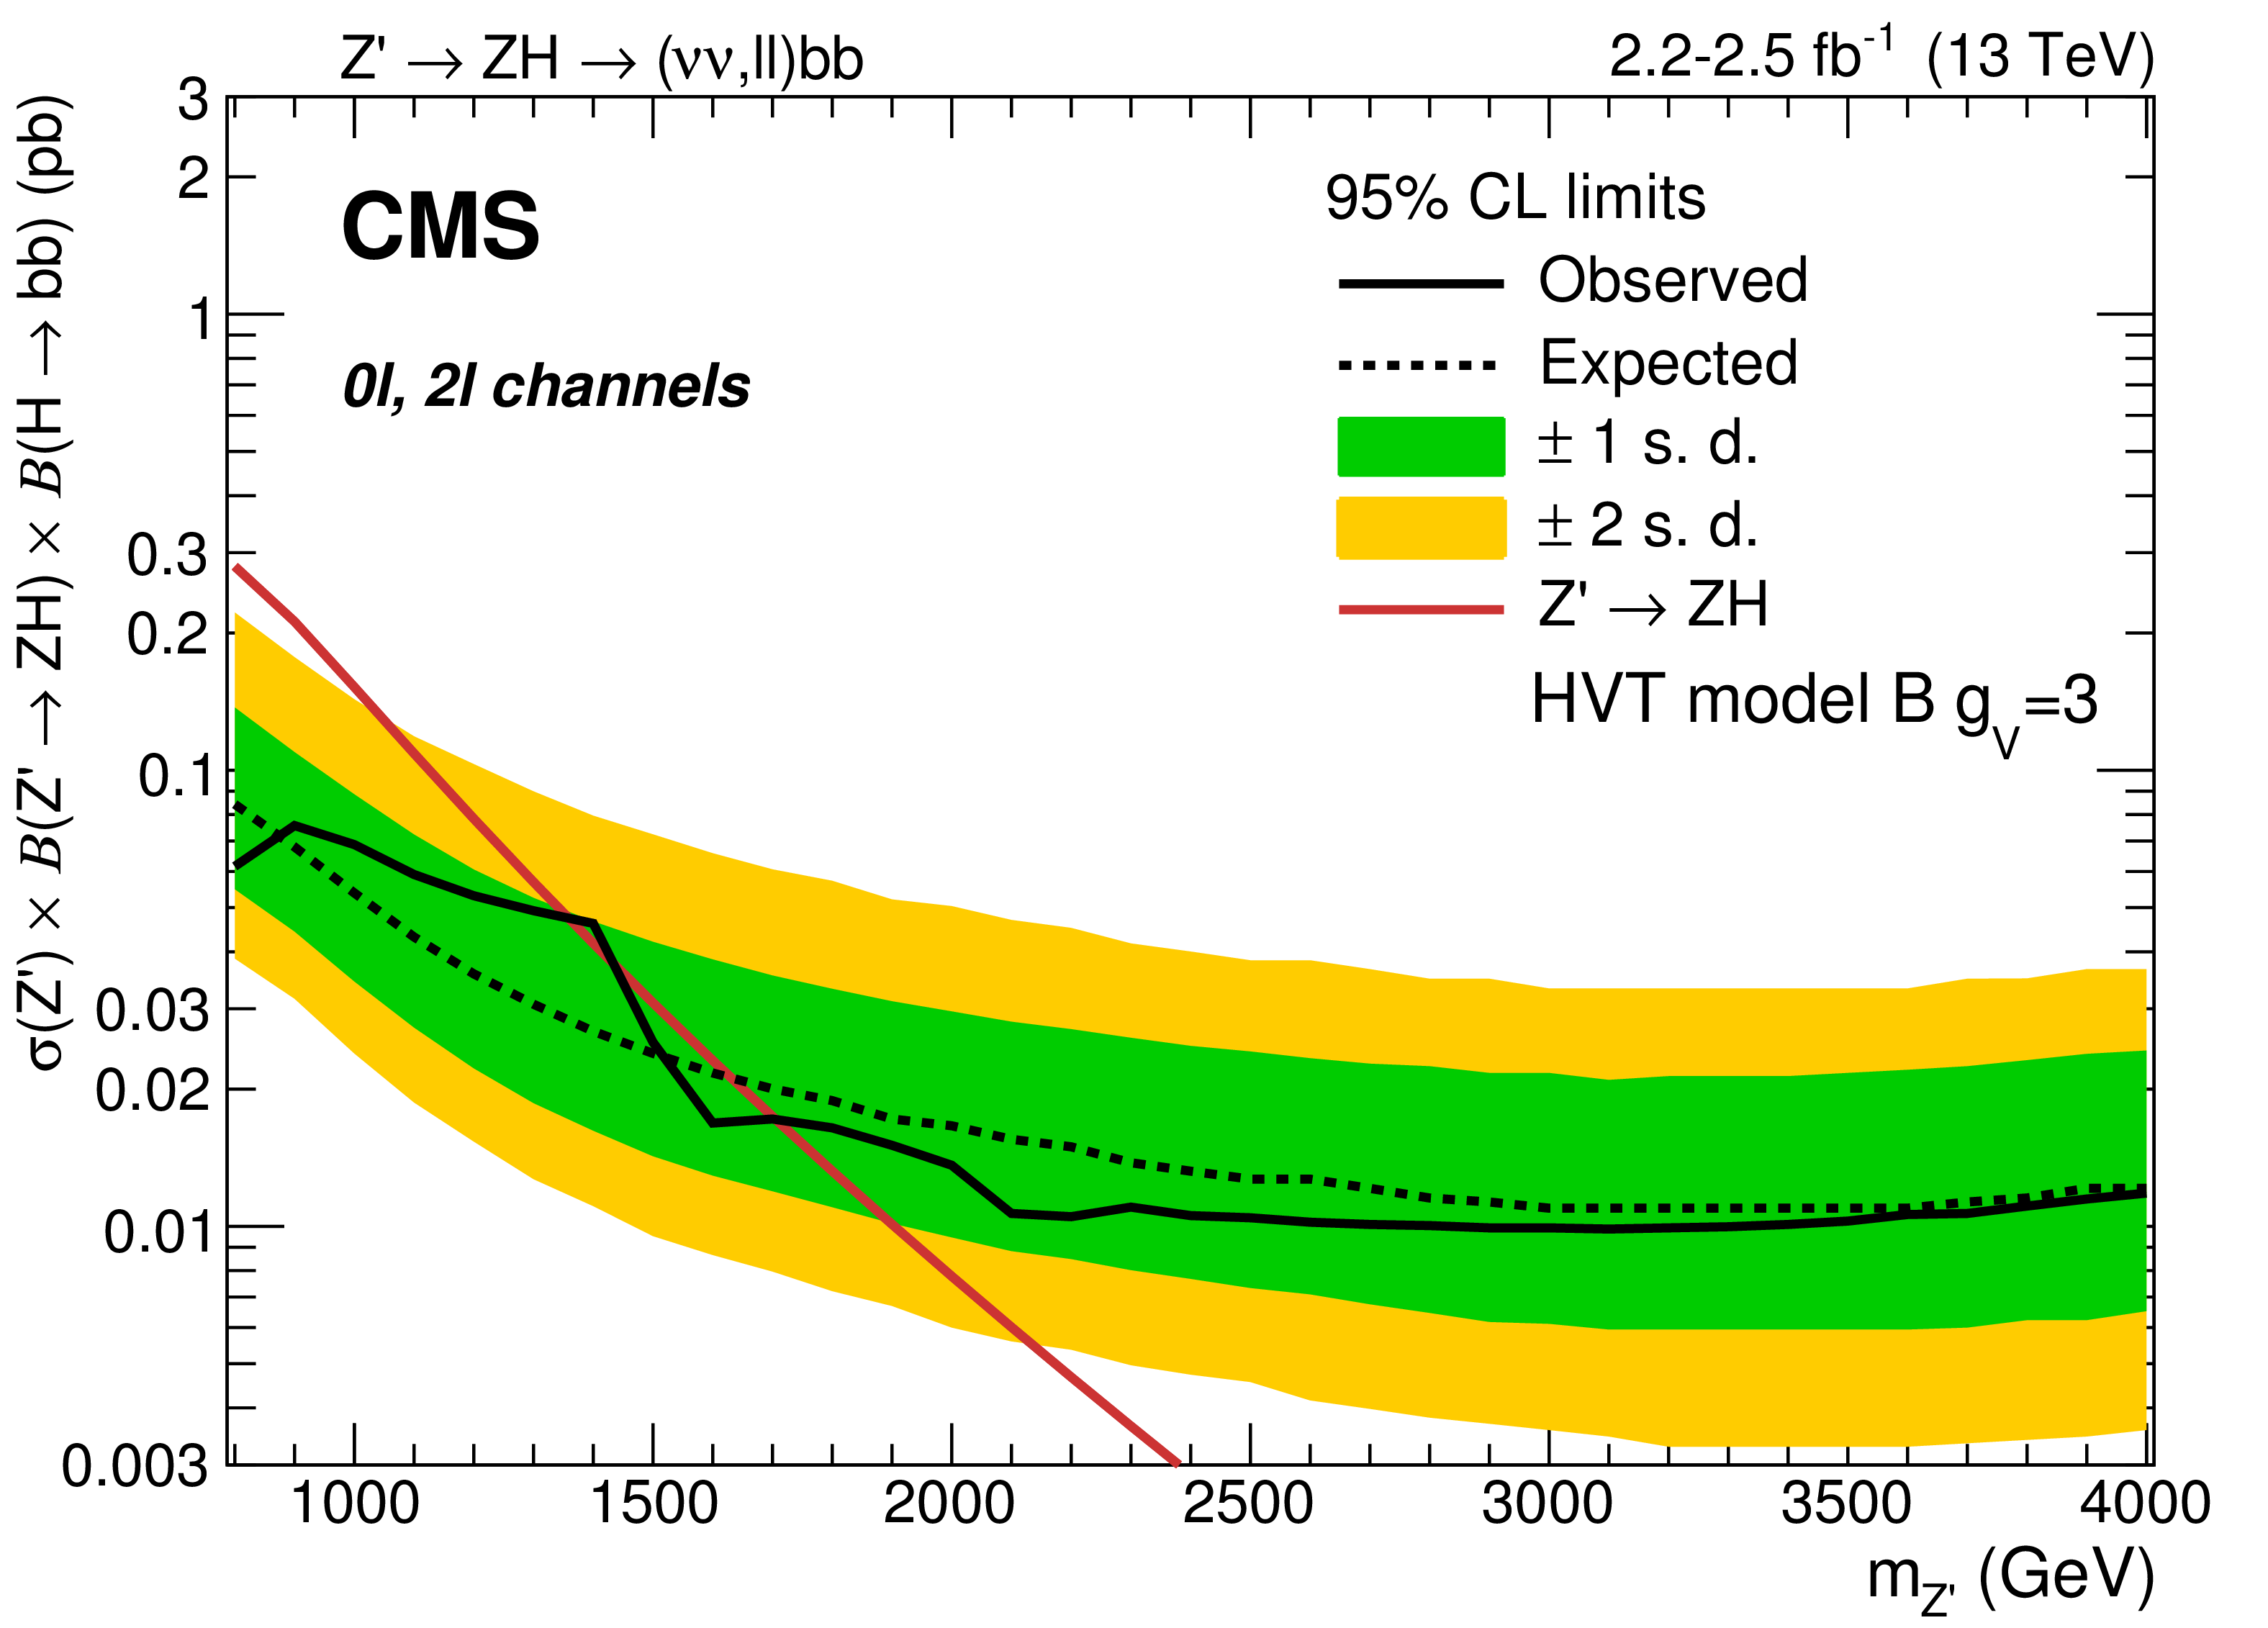
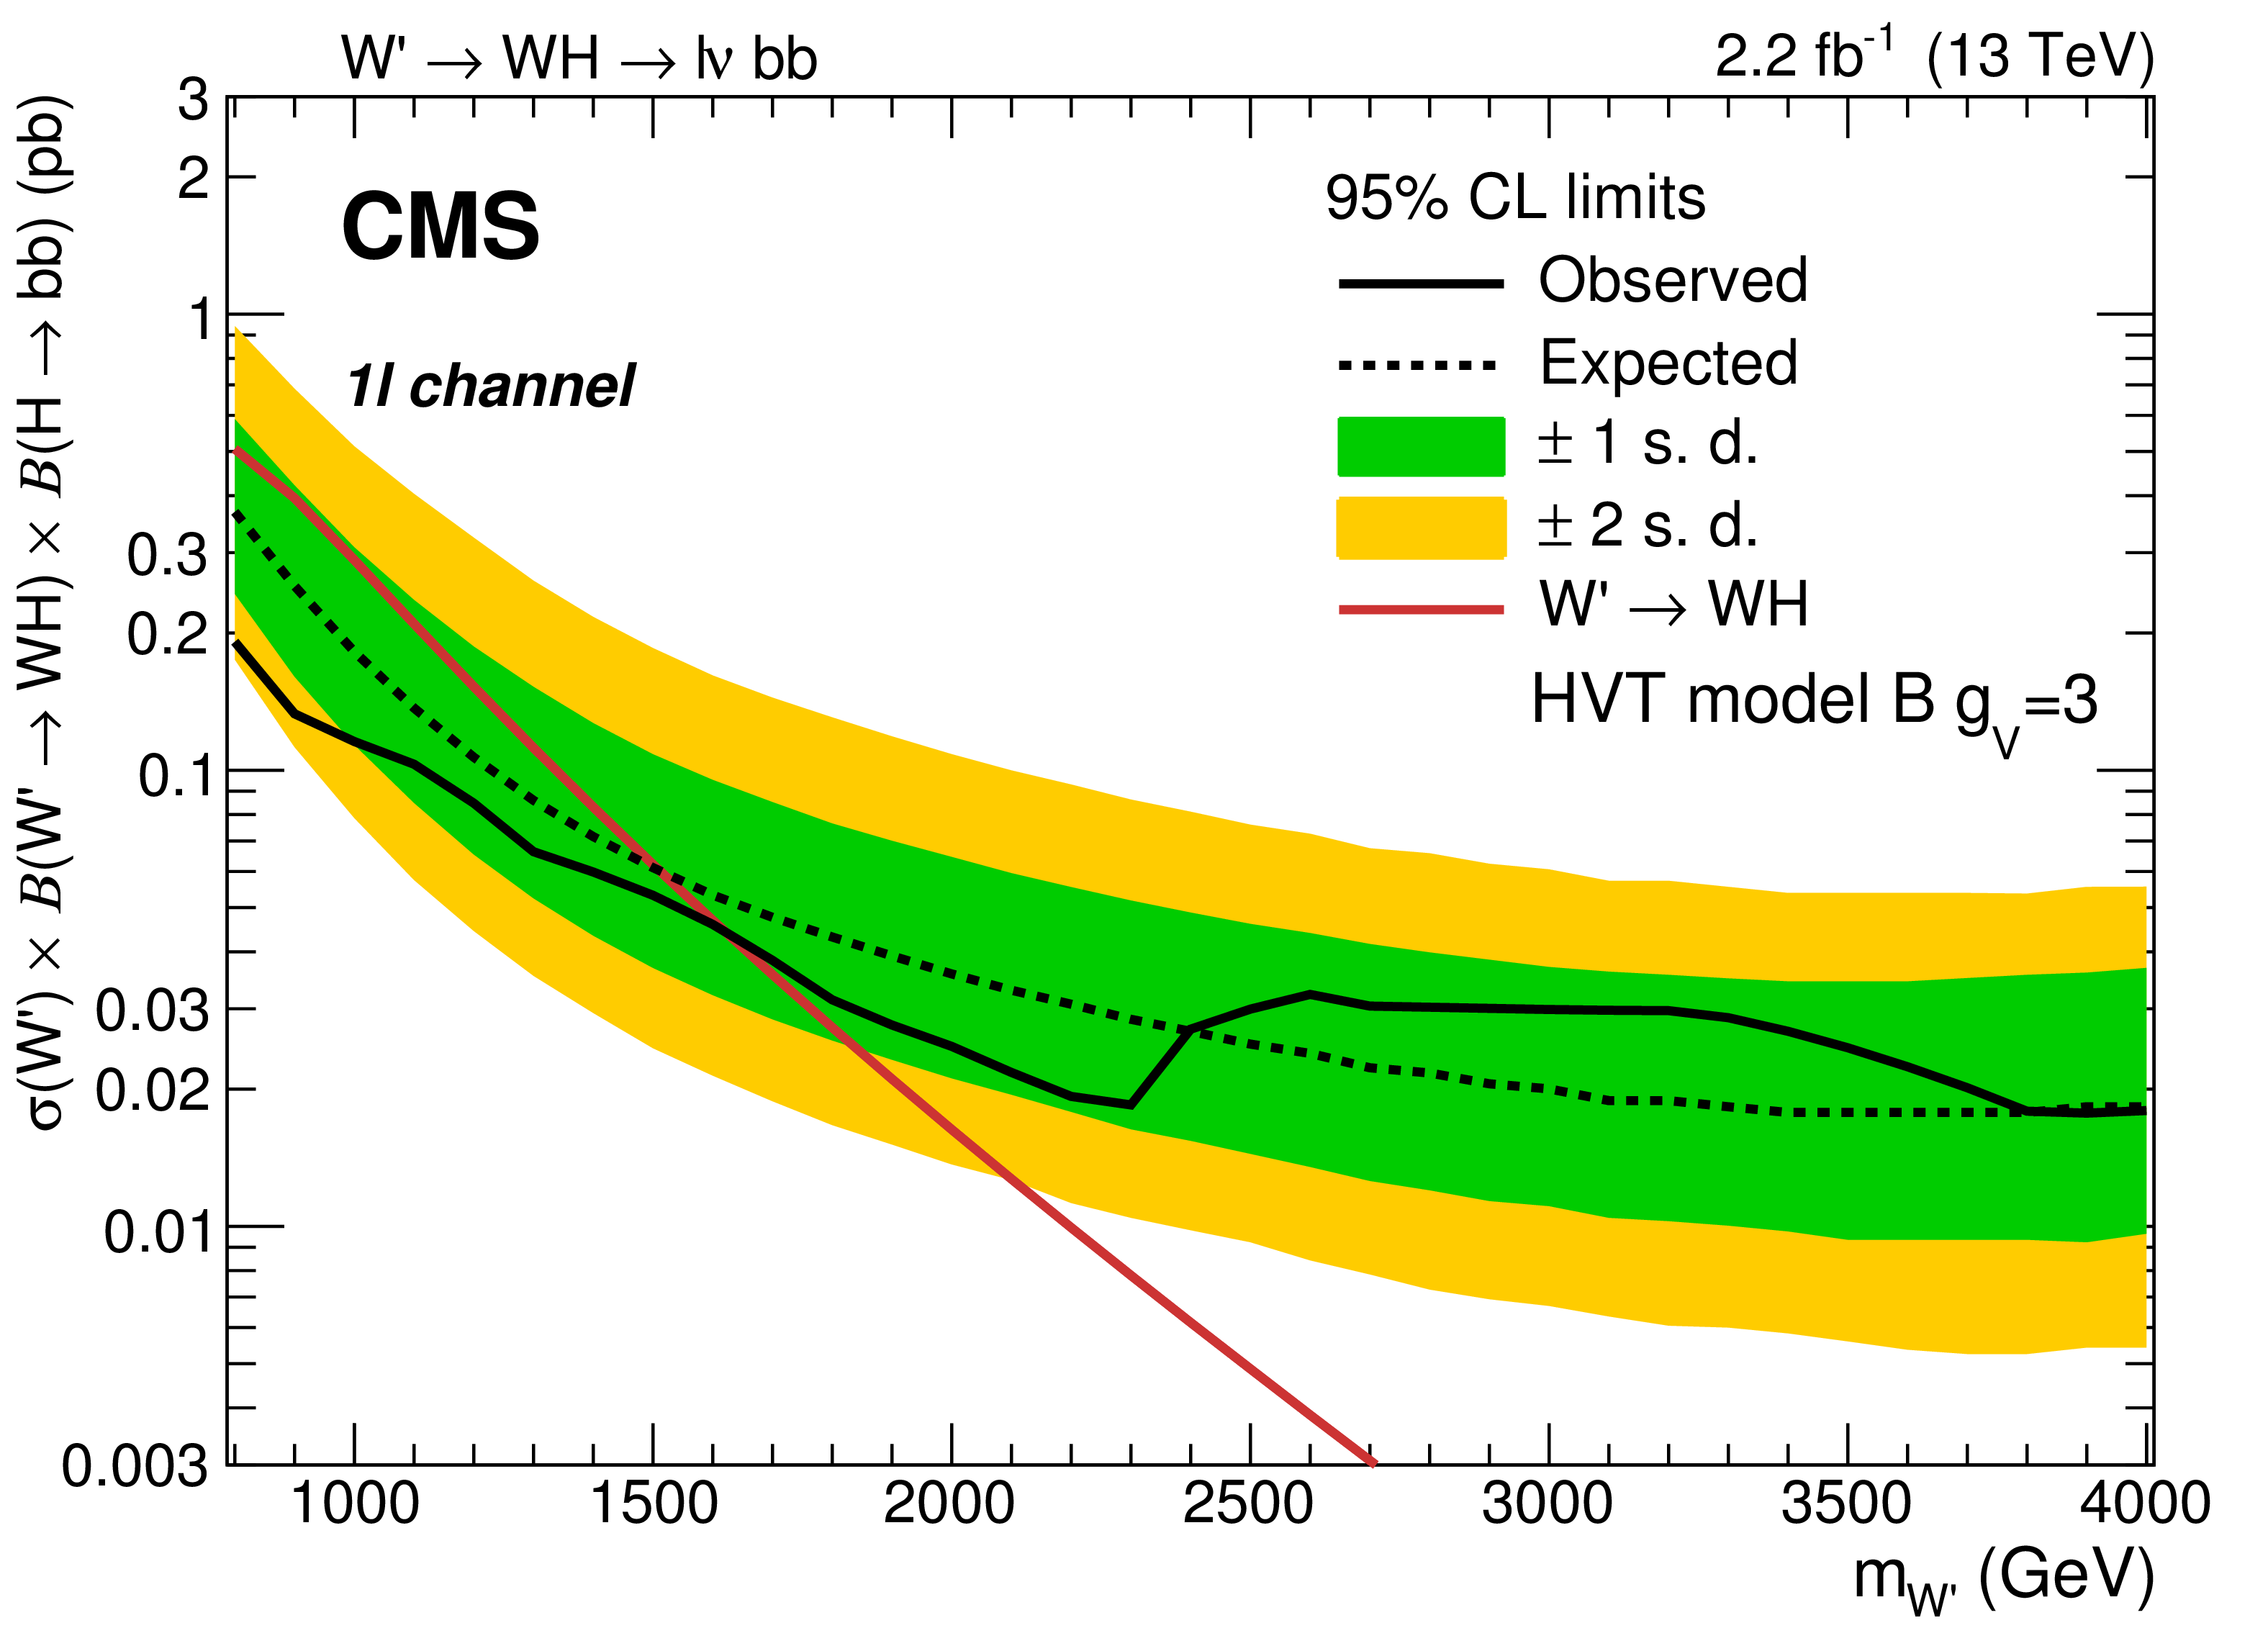
Observed and expected 95% CL upper limits on $\sigma (\mathrm{ Z }' ) {\mathcal {B}}(\mathrm{ Z }' \to {\mathrm{ Z } } {\mathrm {H}} ) {\mathcal {B}}( {\mathrm{ H } \to {\mathrm{ b \bar{b} } } } )$ (left ) and $\sigma ( {\mathrm {W}} ') {\mathcal {B}}( {\mathrm {W}} '\to {\mathrm {W}} {\mathrm {H}} ) {\mathcal {B}}( {\mathrm{ H } \to {\mathrm{ b \bar{b} } } } )$ (right ) as a function of the resonance mass for a single narrow spin-1 resonance, including all statistical and systematic uncertainties. The inner green and outer yellow bands represent the ${\pm }$1 and ${\pm }$2 standard deviation uncertainties on the expected limit. The red solid curve corresponds to the cross sections predicted by the HVT modelB with $ {g_\text {V}} =$ 3. |
png pdf |
Figure 3-a:
Observed and expected 95% CL upper limit on $\sigma (\mathrm{ Z }' ) {\mathcal {B}}(\mathrm{ Z }' \to {\mathrm{ Z } } {\mathrm {H}} ) {\mathcal {B}}( {\mathrm{ H } \to {\mathrm{ b \bar{b} } } } )$ as a function of the resonance mass for a single narrow spin-1 resonance, including all statistical and systematic uncertainties. The inner green and outer yellow bands represent the ${\pm }$1 and ${\pm }$2 standard deviation uncertainties on the expected limit. The red solid curve corresponds to the cross sections predicted by the HVT modelB with $ {g_\text {V}} =$ 3. |
png pdf |
Figure 3-b:
Observed and expected 95% CL upper limit on $\sigma ( {\mathrm {W}} ') {\mathcal {B}}( {\mathrm {W}} '\to {\mathrm {W}} {\mathrm {H}} ) {\mathcal {B}}( {\mathrm{ H } \to {\mathrm{ b \bar{b} } } } )$ as a function of the resonance mass for a single narrow spin-1 resonance, including all statistical and systematic uncertainties. The inner green and outer yellow bands represent the ${\pm }$1 and ${\pm }$2 standard deviation uncertainties on the expected limit. The red solid curve corresponds to the cross sections predicted by the HVT modelB with $ {g_\text {V}} =$ 3. |
png pdf |
Figure 4:
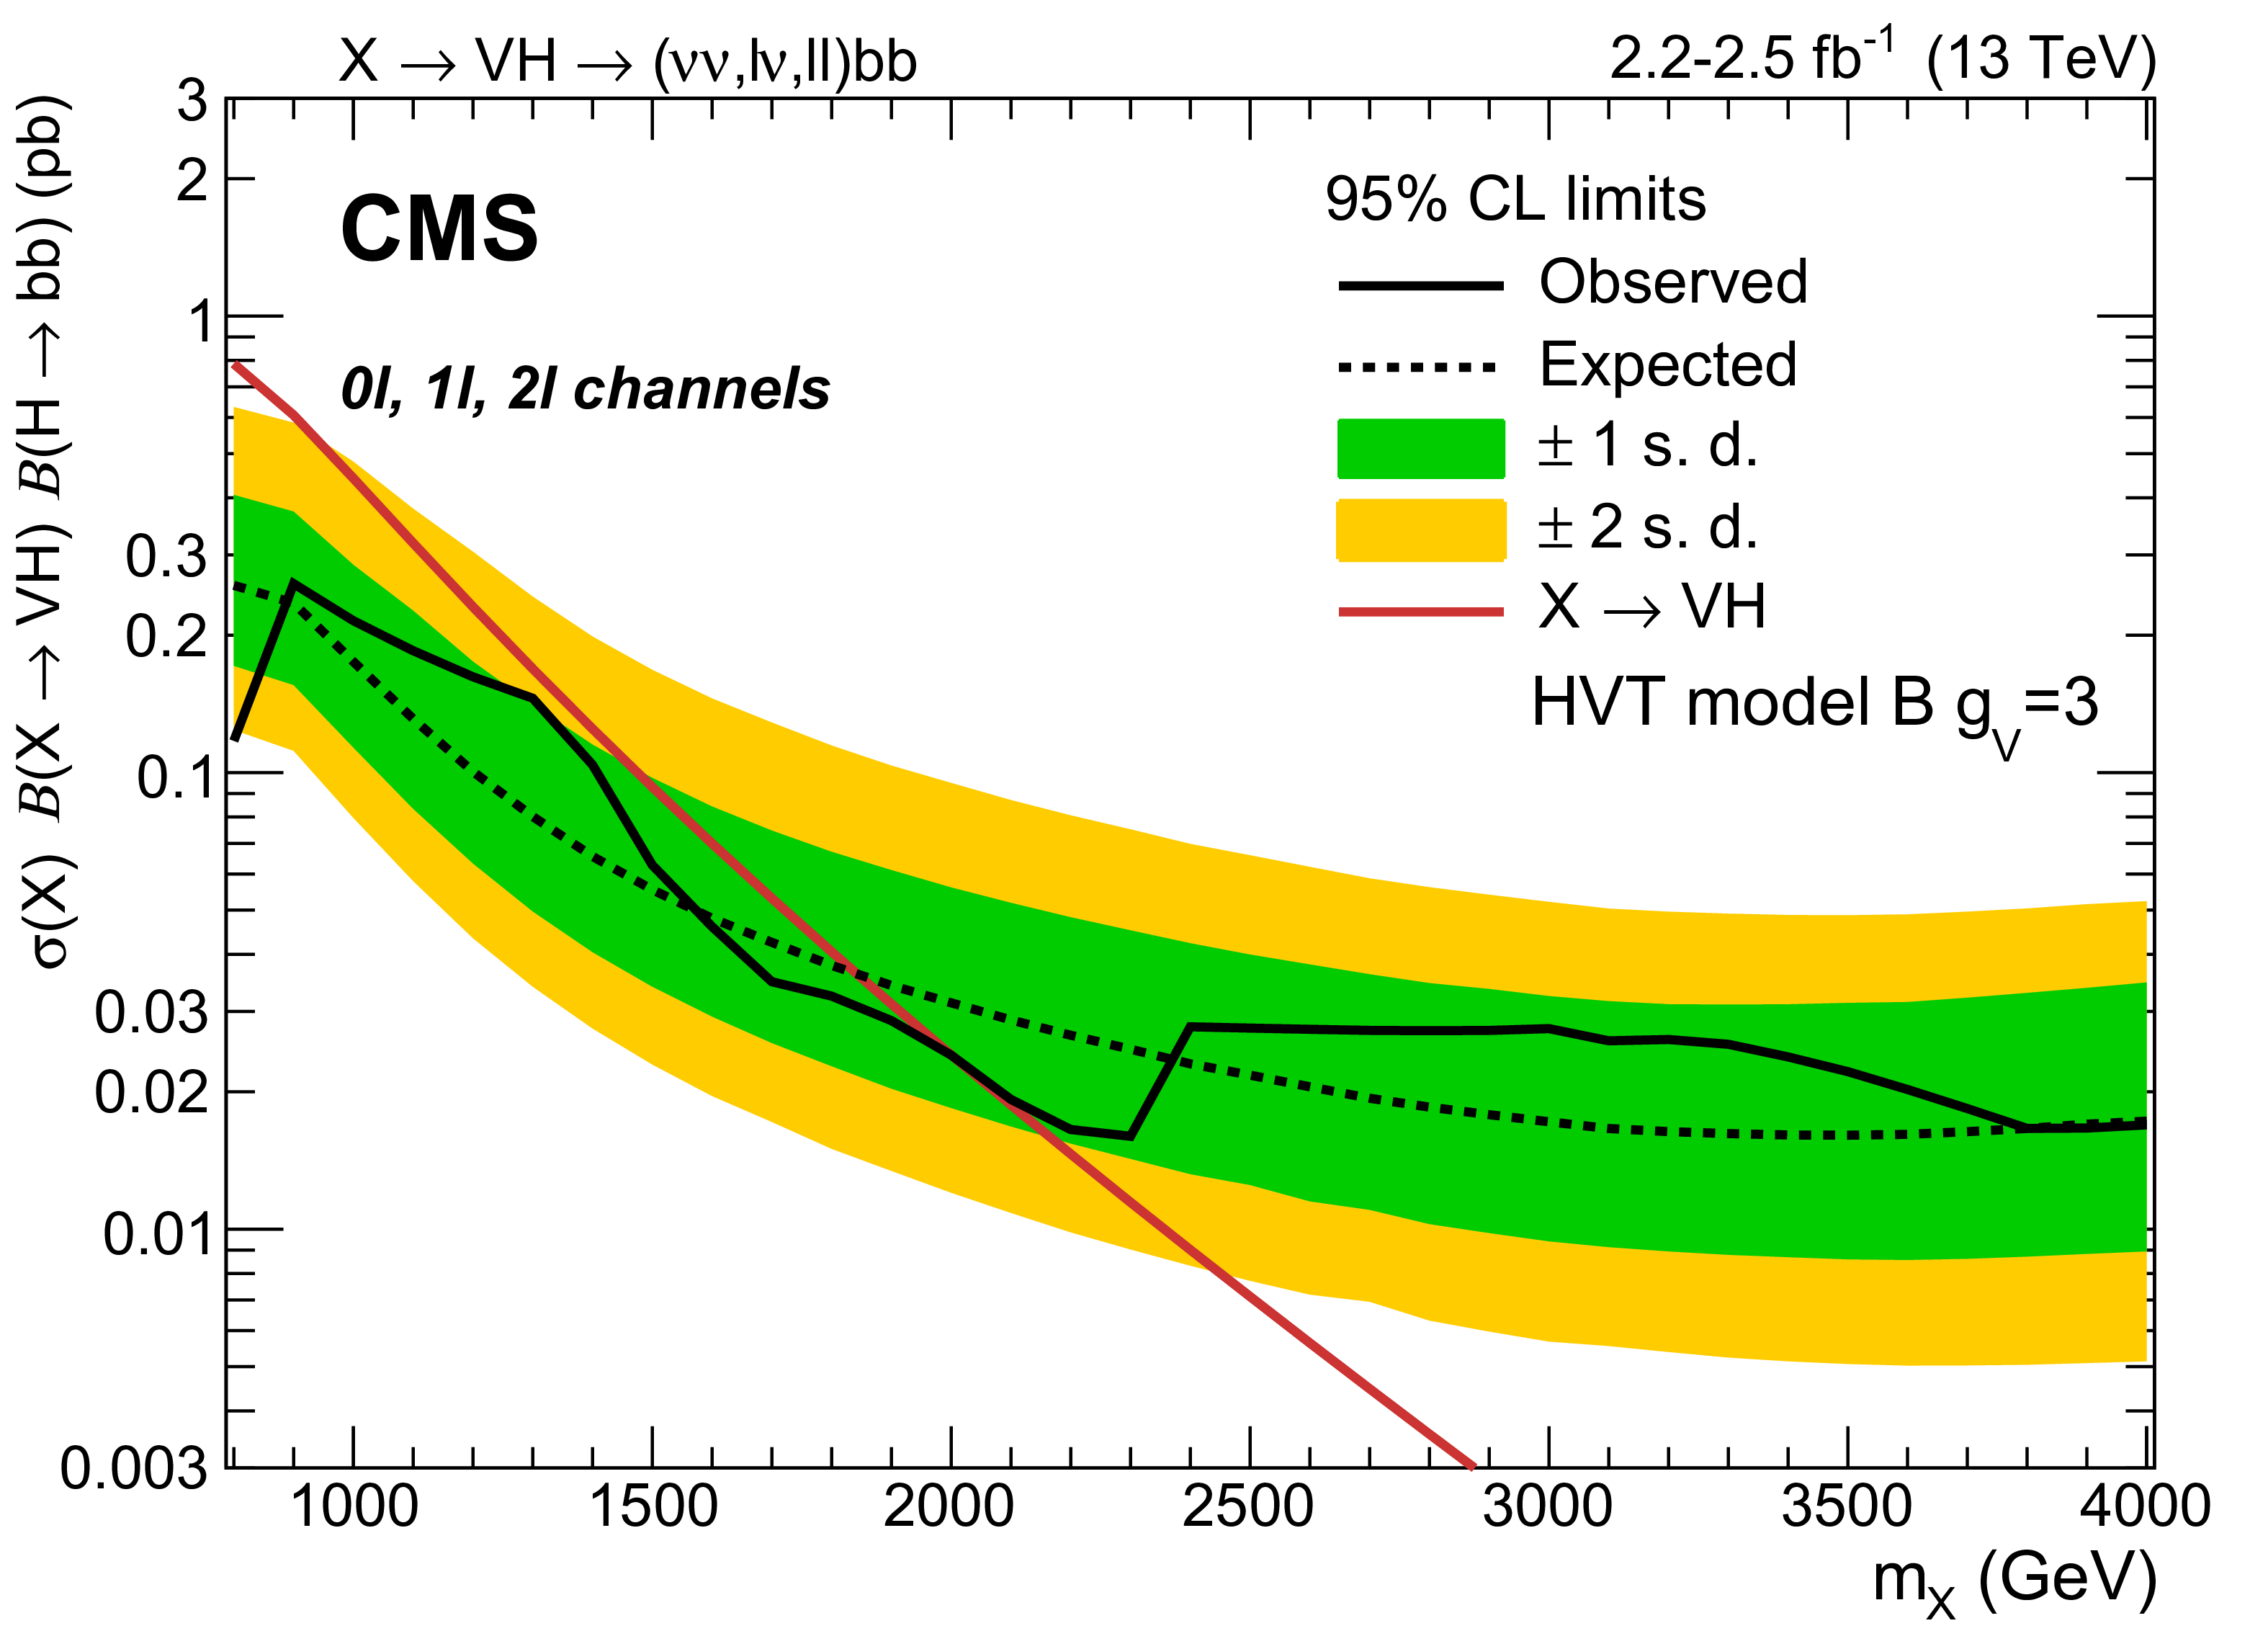
Observed and expected 95% CL upper limit with the ${\pm }$1 and ${\pm }$2 standard deviation uncertainty bands on $\sigma ( {\mathrm {X}} ) {\mathcal {B}}( {\mathrm {X}} \to { {\mathrm {V}} \mathrm{ H } } ) {\mathcal {B}}( {\mathrm{ H } \to {\mathrm{ b \bar{b} } } } )$ in the HVT modelB benchmark scenario with $ {g_\text {V}} =$ 3 as a function of the resonance mass, for the combination of all the considered channels. |
png pdf |
Figure 5:
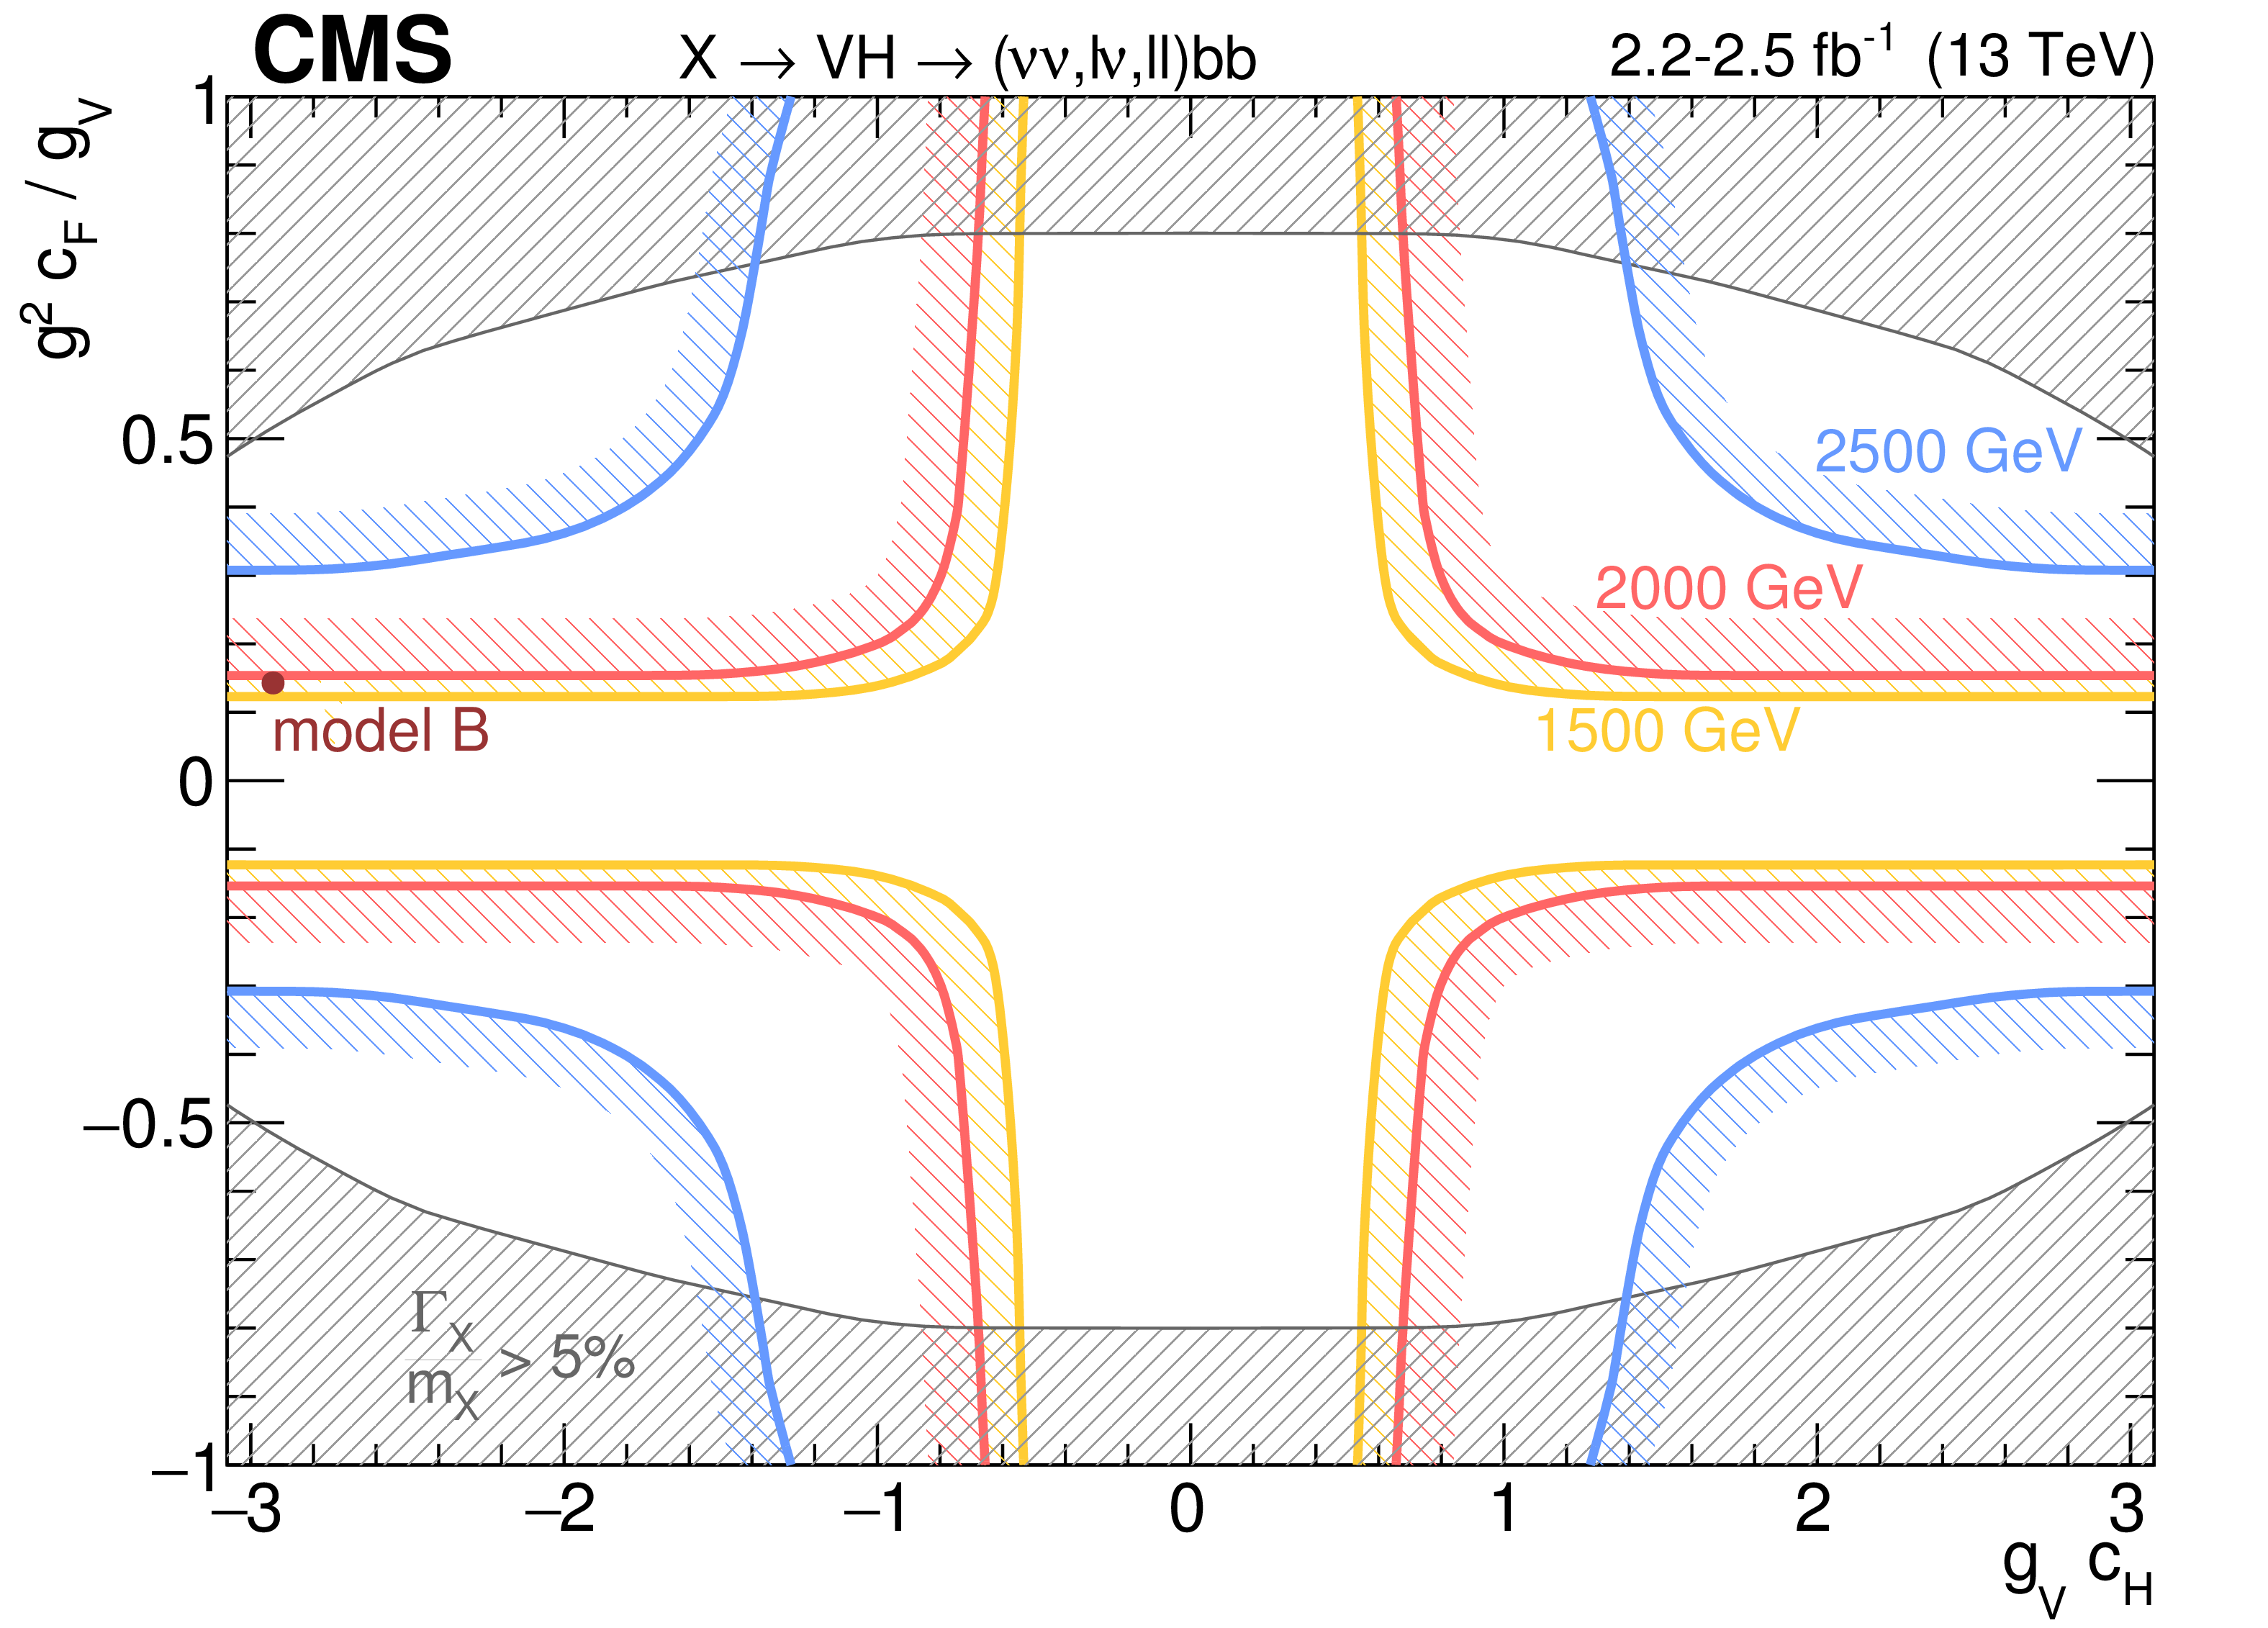
Observed exclusion in the HVT parameter plane $\left [ {g_\text {V}} {c_\text {H}} , \ g^2 {c_\text {F}} / {g_\text {V}} \right ]$ for three different resonance masses (1.5, 2.0, and 2.5 TeV). The parameter $ {g_\text {V}} $ represents the coupling strength of the new interaction, $ {c_\text {H}} $ the coupling between the HVT bosons and the Higgs boson and longitudinally polarized SM vector bosons, and $ {c_\text {F}} $ the coupling between the heavy vector bosons and the SM fermions. The benchmark scenarioB with $ {g_\text {V}} = $ 3 is represented by the red point. The gray shaded area corresponds to the region where the resonance natural width is predicted to be larger than the typical experimental resolution (5%), and thus the narrow-width approximation breaks down. |
| Tables | |

png pdf |
Table 1:
Scale factors derived for the normalization of the estimated ${\mathrm{ t } {}\mathrm{ \bar{t} } }$ and $\mathrm{t}$+X backgrounds from simulation, for different event categories. Electron and muon categories are merged. Uncertainties due to the limited size of the event samples (stat) and the uncertainty in the b tagging efficiency (syst) are reported separately. |

png pdf |
Table 2:
Expected and observed numbers of events in the signal region, for all event categories. Three separate sources of uncertainty in the expected numbers are reported: statistical uncertainty from the fit procedure (fit), the shape of the top quark and diboson background distributions (${\mathrm{ t } {}\mathrm{ \bar{t} } } $, ${ {\mathrm {V}} {\mathrm {V}} } $), and the difference between the nominal and alternative function choice for the fit (alt. function). |
| Summary |
| A search for a heavy resonance with mass between 800 and 4000 GeV, decaying into a vector boson and a Higgs boson, has been described. The data samples were collected by the CMS experiment at $ \sqrt{s} = $ 13 TeV during 2015, and correspond to integrated luminosities of 2.2-2.5 fb$^{-1}$, depending on the channel. The final states explored include the leptonic decay modes of the vector boson, events with zero ($\mathrm{ Z } \to \nu\nu$), exactly one ($\mathrm{ W } \to \ell\nu$), and two ($\mathrm{ Z } \to \ell\ell$) charged leptons, with $\ell = \mathrm{ e }$, $\mu$. Higgs bosons are reconstructed from their decays to $\mathrm{ b \bar{b} }$ pairs. Depending on the resonance mass, upper limits in the range 10-200 fb are set on the product of the cross section for a narrow spin-1 resonance and the branching fractions for the decay of the resonance into a Higgs and a vector boson, and for the decay of the Higgs boson into a pair of b quarks. Resonances with masses lower than 2 TeV are excluded within the heavy vector triplet model in the benchmark scenario B with ${g_\text{V}} =3$. These results represent a significant reduction in the allowed parameter space for the large number of models generalized within the heavy vector triplet framework. |
| References | ||||
| 1 | ATLAS Collaboration | Observation of a new particle in the search for the Standard Model Higgs boson with the ATLAS detector at the LHC | PLB 716 (2012) 1 | 1207.7214 |
| 2 | CMS Collaboration | Observation of a new boson at a mass of 125 GeV with the CMS experiment at the LHC | PLB 716 (2012) 30 | CMS-HIG-12-028 1207.7235 |
| 3 | CMS Collaboration | Observation of a new boson with mass near 125 GeV in pp collisions at $ \sqrt{s} = $ 7 and 8 TeV | JHEP 06 (2013) 081 | CMS-HIG-12-036 1303.4571 |
| 4 | ATLAS Collaboration | Measurement of the Higgs boson mass from the $ H\rightarrow{}\gamma{}\gamma{} $ and $ H\rightarrow{}Z{Z}^{*}\rightarrow{}4\ell{} $ channels in $ pp $ collisions at center-of-mass energies of 7 and 8~TeV with the ATLAS detector | PRD 90 (2014) 052004 | 1406.3827 |
| 5 | CMS Collaboration | Precise determination of the mass of the Higgs boson and tests of compatibility of its couplings with the standard model predictions using proton collisions at 7 and 8 TeV | EPJC 75 (2015) 212 | CMS-HIG-14-009 1412.8662 |
| 6 | CMS Collaboration | Evidence for the direct decay of the 125 GeV Higgs boson to fermions | Nat. Phys. 10 (2014) 557 | CMS-HIG-13-033 1401.6527 |
| 7 | ATLAS and CMS Collaborations | Combined Measurement of the Higgs Boson Mass in $ pp $ Collisions at $ \sqrt{s}= $ 7 and 8 TeV with the ATLAS and CMS Experiments | PRL 114 (2015) 191803 | 1503.07589 |
| 8 | R. Barbieri and G. F. Giudice | Upper bounds on supersymmetric particle masses | Nuc. Phys. B 306 (August, 1988) 63 | |
| 9 | V. D. Barger, W.-Y. Keung, and E. Ma | A gauge model with light $ W $ and $ Z $ bosons | PRD 22 (1980) 727 | |
| 10 | E. Salvioni, G. Villadoro, and F. Zwirner | Minimal z' models: present bounds and early lhc reach | JHEP 09 (2009) 068 | 0909.1320 |
| 11 | C. Grojean, E. Salvioni, and R. Torre | A weakly constrained W$ ' $ at the early LHC | JHEP 07 (2011) 002 | 1103.2761 |
| 12 | R. Contino, D. Pappadopulo, D. Marzocca, and R. Rattazzi | On the effect of resonances in composite higgs phenomenology | JHEP 10 (2011) 081 | |
| 13 | D. Marzocca, M. Serone, and J. Shu | General composite Higgs models | JHEP 08 (2012) 13 | |
| 14 | B. Bellazzini, C. Csaki, and J. Serra | Composite Higgses | EPJC 74 (2014) 2766 | 1401.2457 |
| 15 | T. Han, H. E. Logan, B. McElrath, and L.-T. Wang | Phenomenology of the little Higgs model | PRD 67 (2003) 095004 | hep-ph/0301040 |
| 16 | M. Schmaltz and D. Tucker-Smith | Little higgs theories | Ann. Rev. Nucl. Part. Sci. 55 (2005) 229 | |
| 17 | M. Perelstein | Little Higgs models and their phenomenology | Prog. Part. NP 58 (2007) 247 | hep-ph/0512128 |
| 18 | D. Pappadopulo, A. Thamm, R. Torre, and A. Wulzer | Heavy vector triplets: bridging theory and data | JHEP 09 (2014) 60 | 1402.4431 |
| 19 | CMS Collaboration | Search for a pseudoscalar boson decaying into a Z boson and the 125 GeV Higgs boson in $ \ell^+\ell^- b\overline{b} $ final states | PLB 748 (2015) 221 | CMS-HIG-14-011 1504.04710 |
| 20 | CMS Collaboration | Search for a massive resonance decaying into a Higgs boson and a W or Z boson in hadronic final states in proton-proton collisions at $ \sqrt{s}= $ 8 TeV | JHEP 02 (2016) 145 | CMS-EXO-14-009 1506.01443 |
| 21 | CMS Collaboration | Search for narrow high-mass resonances in proton-proton collisions at $ \sqrt{s} = $ 8 TeV decaying to a Z and a Higgs boson | PLB 748 (2015) 255 | CMS-EXO-13-007 1502.04994 |
| 22 | CMS Collaboration | Search for massive WH resonances decaying into the $ \ell \nu\mathrm{ b \overline{b} } $ final state at $ \sqrt{s}= $ 8 TeV | EPJC 76 (2016) 1 | CMS-EXO-14-010 1601.06431 |
| 23 | J. Alwall et al. | The automated computation of tree-level and next-to-leading order differential cross sections, and their matching to parton shower simulations | JHEP 07 (2014) 079 | 1405.0301 |
| 24 | Y. Li and F. Petriello | Combining QCD and electroweak corrections to dilepton production in FEWZ | PRD 86 (2012) 094034 | 1208.5967 |
| 25 | S. Kallweit et al. | NLO QCD+EW predictions for V+jets including off-shell vector-boson decays and multijet merging | JHEP 04 (2016) 021 | 1511.08692 |
| 26 | P. Nason | A new method for combining NLO QCD with shower Monte Carlo algorithms | JHEP 11 (2004) 040 | hep-ph/0409146 |
| 27 | S. Frixione, P. Nason, and C. Oleari | Matching NLO QCD computations with Parton Shower simulations: the POWHEG method | JHEP 11 (2007) 070 | 0709.2092 |
| 28 | S. Alioli, P. Nason, C. Oleari, and E. Re | A general framework for implementing NLO calculations in shower Monte Carlo programs: the POWHEG BOX | JHEP 06 (2010) 043 | 1002.2581 |
| 29 | M. Czakon and A. Mitov | Top++: A program for the calculation of the top-pair cross-section at hadron colliders | CPC 185 (2014) 2930 | 1112.5675 |
| 30 | T. Sjostrand, S. Mrenna, and P. Skands | A brief introduction to PYTHIA 8.1 | CPC 178 (2008) 852 | 0710.3820 |
| 31 | T. Sjostrand, S. Mrenna, and P. Skands | PYTHIA 6.4 physics and manual | JHEP 05 (2006) 026 | hep-ph/0603175 |
| 32 | P. Skands, S. Carrazza, and J. Rojo | Tuning PYTHIA 8.1: the Monash 2013 Tune | EPJC 74 (2014) 3024 | 1404.5630 |
| 33 | CMS Collaboration | Event generator tunes obtained from underlying event and multiparton scattering measurements | EPJC 76 (2016) 155 | CMS-GEN-14-001 1512.00815 |
| 34 | NNPDF Collaboration | Parton distributions for the LHC Run II | JHEP 04 (2015) 040 | 1410.8849 |
| 35 | GEANT4 Collaboration | GEANT4---a simulation toolkit | NIMA 506 (2003) 250 | |
| 36 | CMS Collaboration | The CMS experiment at the CERN LHC | JINST 3 (2008) S08004 | CMS-00-001 |
| 37 | CMS Collaboration | Description and performance of track and primary-vertex reconstruction with the CMS tracker | JINST 9 (2014) P10009 | CMS-TRK-11-001 1405.6569 |
| 38 | CMS Collaboration | Performance of CMS muon reconstruction in pp collision events at $ \sqrt{s}= $ 7 TeV | JINST 7 (2012) P10002 | CMS-MUO-10-004 1206.4071 |
| 39 | CMS Collaboration | Particle-flow event reconstruction in CMS and performance for jets, taus, and $ E_{\mathrm{T}}^{\text{miss}} $ | CMS-PAS-PFT-09-001 | |
| 40 | CMS Collaboration | Commissioning of the particle-flow event with the first LHC collisions recorded in the CMS detector | CMS-PAS-PFT-10-001 | |
| 41 | M. Cacciari, G. P. Salam, and G. Soyez | The anti-$ k_\text{t} $ jet clustering algorithm | JHEP 04 (2008) 063 | 0802.1189 |
| 42 | M. Cacciari, G. P. Salam, and G. Soyez | FastJet user manual | EPJC 72 (2012) 1896 | 1111.6097 |
| 43 | M. Cacciari, G. P. Salam, and G. Soyez | The catchment area of jets | JHEP 04 (2008) 005 | 0802.1188 |
| 44 | CMS Collaboration | Jet energy scale and resolution in the CMS experiment in pp collisions at 8 TeV | Submitted to JINST | CMS-JME-13-004 1607.03663 |
| 45 | S. D. Ellis, C. K. Vermilion, and J. R. Walsh | Recombination Algorithms and Jet Substructure: Pruning as a Tool for Heavy Particle Searches | PRD 81 (2010) 094023 | 0912.0033 |
| 46 | M. Dasgupta, A. Fregoso, S. Marzani, and G. P. Salam | Towards an understanding of jet substructure | JHEP 09 (2013) 029 | 1307.0007 |
| 47 | A. J. Larkoski, S. Marzani, G. Soyez, and J. Thaler | Soft drop | JHEP 05 (2014) 146 | 1402.2657 |
| 48 | CMS Collaboration | Identification of b quark jets at the CMS Experiment in the LHC Run 2 | CMS-PAS-BTV-15-001 | CMS-PAS-BTV-15-001 |
| 49 | CMS Collaboration | Performance of missing energy reconstruction in 13 TeV pp collision data using the CMS detector | CDS | |
| 50 | CMS Collaboration | Performance of electron reconstruction and selection with the CMS detector in proton-proton collisions at $ \sqrt{s} = $ 8 TeV | JINST 10 (2015) P06005 | CMS-EGM-13-001 1502.02701 |
| 51 | CMS Collaboration | Reconstruction and identification of $ \tau $ lepton decays to hadrons and $ \nu_\tau $ at CMS | JINST 11 (2016) P01019 | CMS-TAU-14-001 1510.07488 |
| 52 | J. Bellm et al. | Herwig 7.0/Herwig++ 3.0 release note | EPJC 76 (2016) 196 | 1512.01178 |
| 53 | M. Bahr et al. | Herwig++ physics and manual | EPJC 58 (2008) 639 | 0803.0883 |
| 54 | CMS Collaboration | CMS Luminosity Measurement for the 2015 Data Taking Period | CMS-PAS-LUM-15-001 | CMS-PAS-LUM-15-001 |
| 55 | J. Butterworth et al. | PDF4LHC recommendations for LHC Run II | JPG 43 (2016) 23001 | 1510.03865 |
| 56 | T. Junk | Confidence level computation for combining searches with small statistics | NIMA 434 (1999) 435 | hep-ex/9902006 |
| 57 | A. L. Read | Presentation of search results: the $ CL_s $ technique | JPG 28 (2002) 2693 | |
| 58 | CMS and ATLAS Collaborations | Procedure for the lhc higgs boson search combination in summer 2011 | CMS-NOTE-2011-005 | |
| 59 | G. Cowan, K. Cranmer, E. Gross, and O. Vitells | Asymptotic formulae for likelihood-based tests of new physics | EPJC 71 (2011) 1554 | 1007.1727 |
| 60 | ATLAS Collaboration | Search for new resonances decaying to a $ W $ or $ Z $ boson and a Higgs boson in the $ \ell^+ \ell^- b\bar b $, $ \ell \nu b\bar b $, and $ \nu\bar{\nu} b\bar b $ channels with $ pp $ collisions at $ \sqrt{s} = $ 13 TeV with the ATLAS detector | PLB 765 (2016) 32 | 1607.05621 |
|
|
Compact Muon Solenoid LHC, CERN |
|

|

|

|

|

|