

Compact Muon Solenoid
LHC, CERN
| CMS-BPH-21-006 ; CERN-EP-2022-270 | ||
| Measurement of the $ \mathrm{B}_{s}^{0} \to\mu^{+}\mu^{-} $ decay properties and search for the $ {\mathrm{B}^0} \to \mu^{+}\mu^{-} $ decay in proton-proton collisions at $ \sqrt{s}= $ 13 TeV | ||
| CMS Collaboration | ||
| 20 December 2022 | ||
| Phys. Lett. B 842 (2023) 137955 | ||
| Abstract: Measurements are presented of the $ \mathrm{B}_{s}^{0} \to\mu^{+}\mu^{-} $ branching fraction and the $ \mathrm{B}_{s}^{0} $ effective lifetime, as well as results of a search for the $ {\mathrm{B}^0} \to \mu^{+}\mu^{-} $ decay in proton-proton collisions at $ \sqrt{s}= $ 13 TeV at the LHC. The analysis is based on data collected with the CMS detector in 2016-2018 corresponding to an integrated luminosity of 140 fb$ ^{-1} $. The branching fraction of the $ \mathrm{B}_{s}^{0} \to\mu^{+}\mu^{-} $ decay and the effective $ \mathrm{B}_{s}^{0} $ meson lifetime are the most precise single measurements to date. No evidence for the $ {\mathrm{B}^0} \to \mu^{+}\mu^{-} $ decay has been found. All results are found to be consistent with the standard model predictions and previous measurements. | ||
| Links: e-print arXiv:2212.10311 [hep-ex] (PDF) ; CDS record ; inSPIRE record ; HepData record ; Physics Briefing ; CADI line (restricted) ; | ||
| Figures & Tables | Summary | Additional Figures | References | CMS Publications |
|---|
| Figures | |
png pdf |
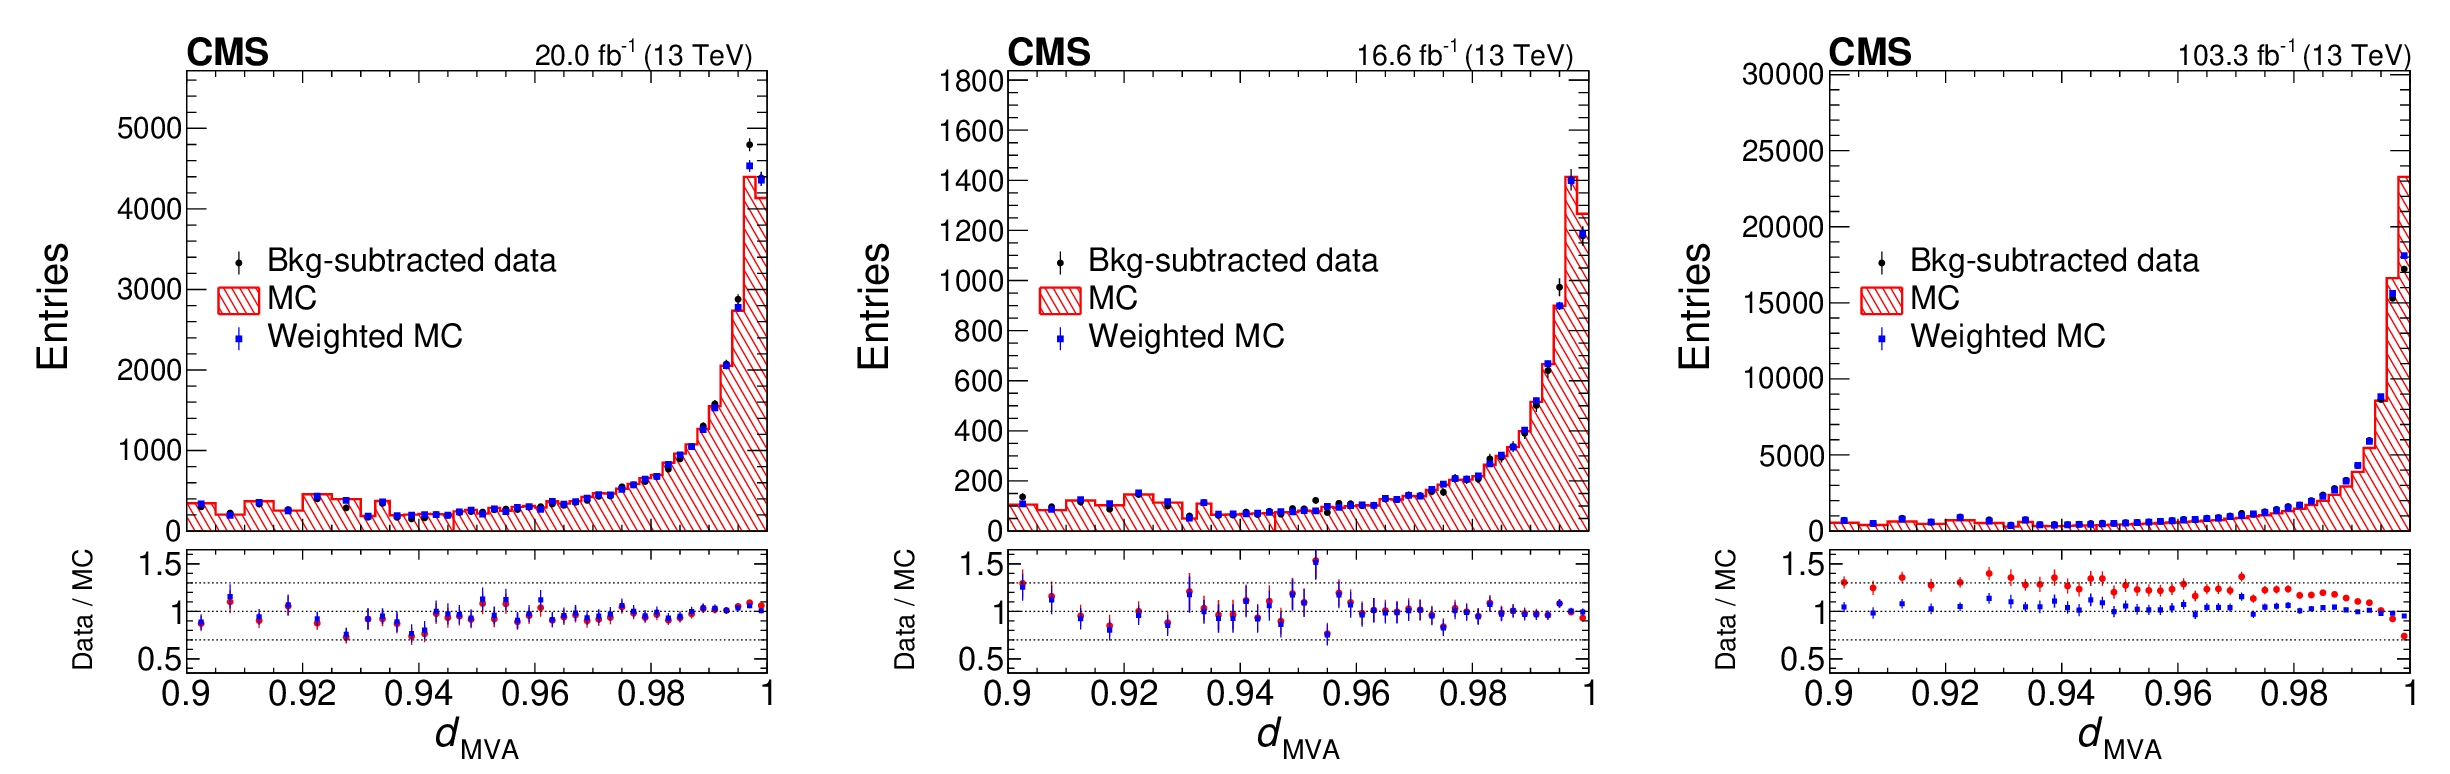
Figure 1:
Distributions of the $ d_{\text{MVA}} $ output for the 2016a (left), 2016b (center), and 2017-2018 (right) data and the corresponding MC samples. The blue squares represent the weighted simulated distributions using the XGBOOST reweighting method. In the lower panel, the blue squares and red points are the ratio of the data to weighted and not weighted simulated distribution respectively. The MC distributions are normalized to the total number of events in data. |
png pdf |
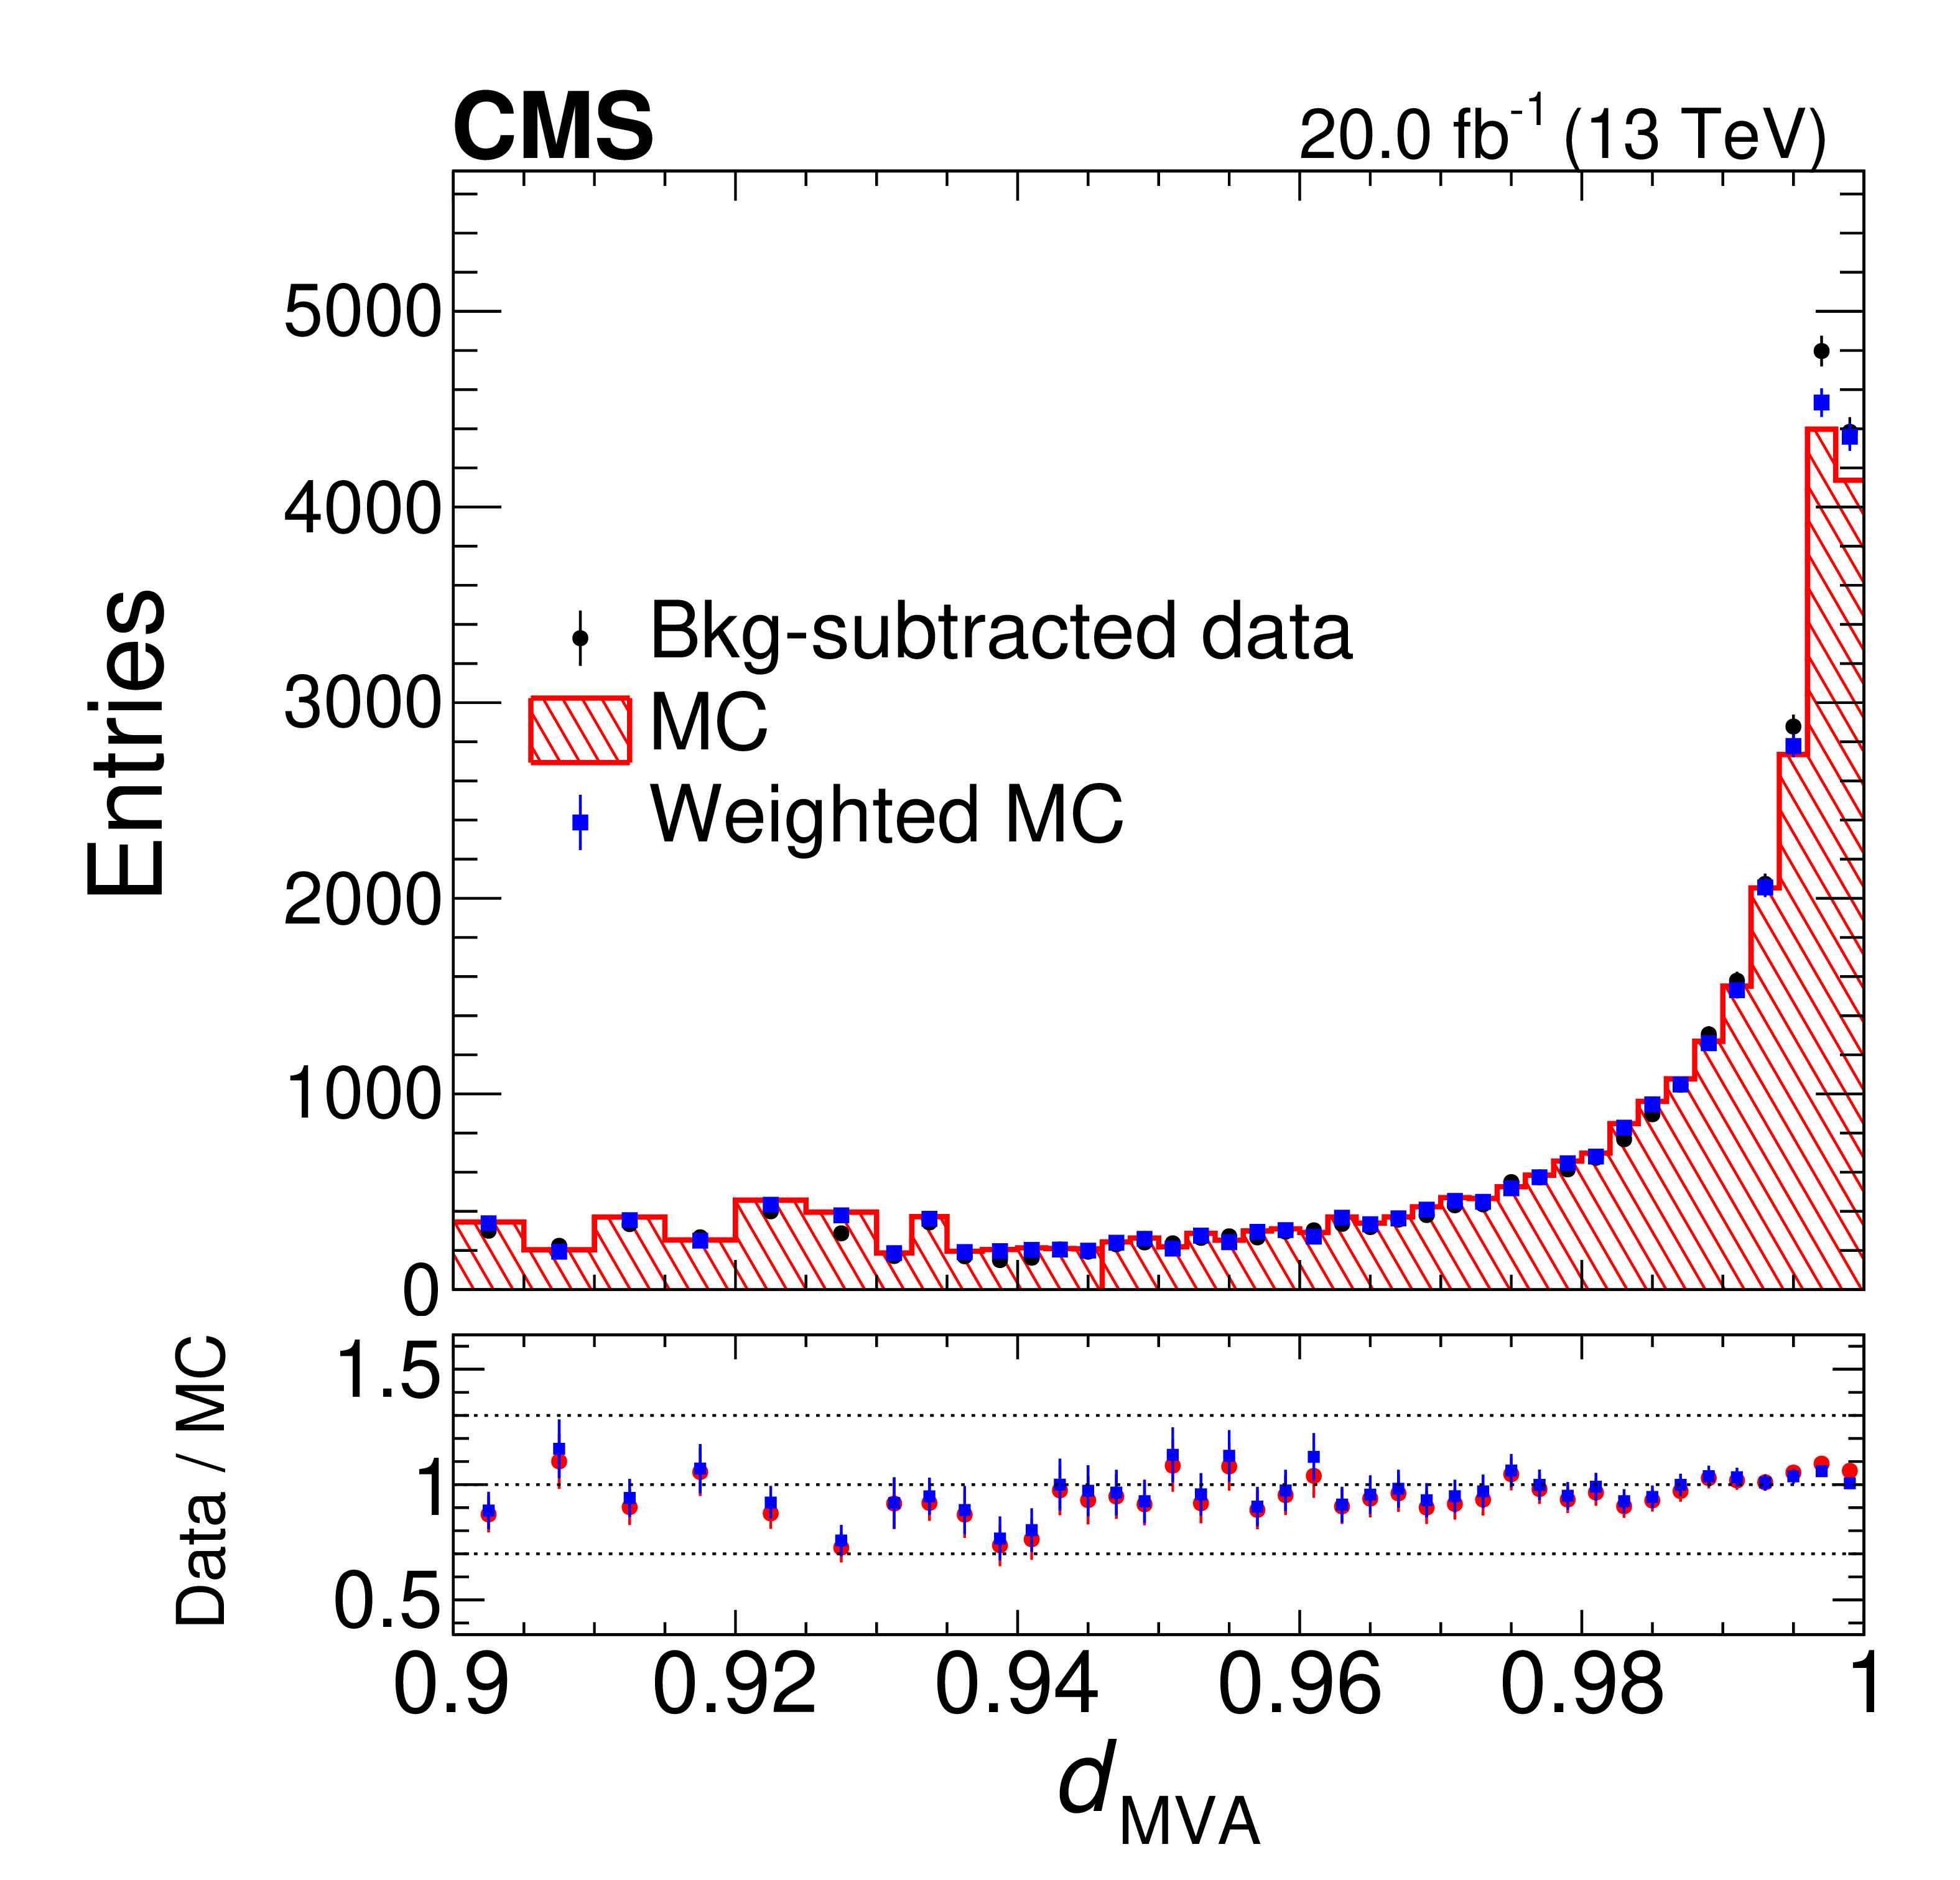
Figure 1-a:
Distributions of the $ d_{\text{MVA}} $ output for the 2016a data and the corresponding MC samples. The blue squares represent the weighted simulated distributions using the XGBOOST reweighting method. In the lower panel, the blue squares and red points are the ratio of the data to weighted and not weighted simulated distribution respectively. The MC distributions are normalized to the total number of events in data. |
png pdf |
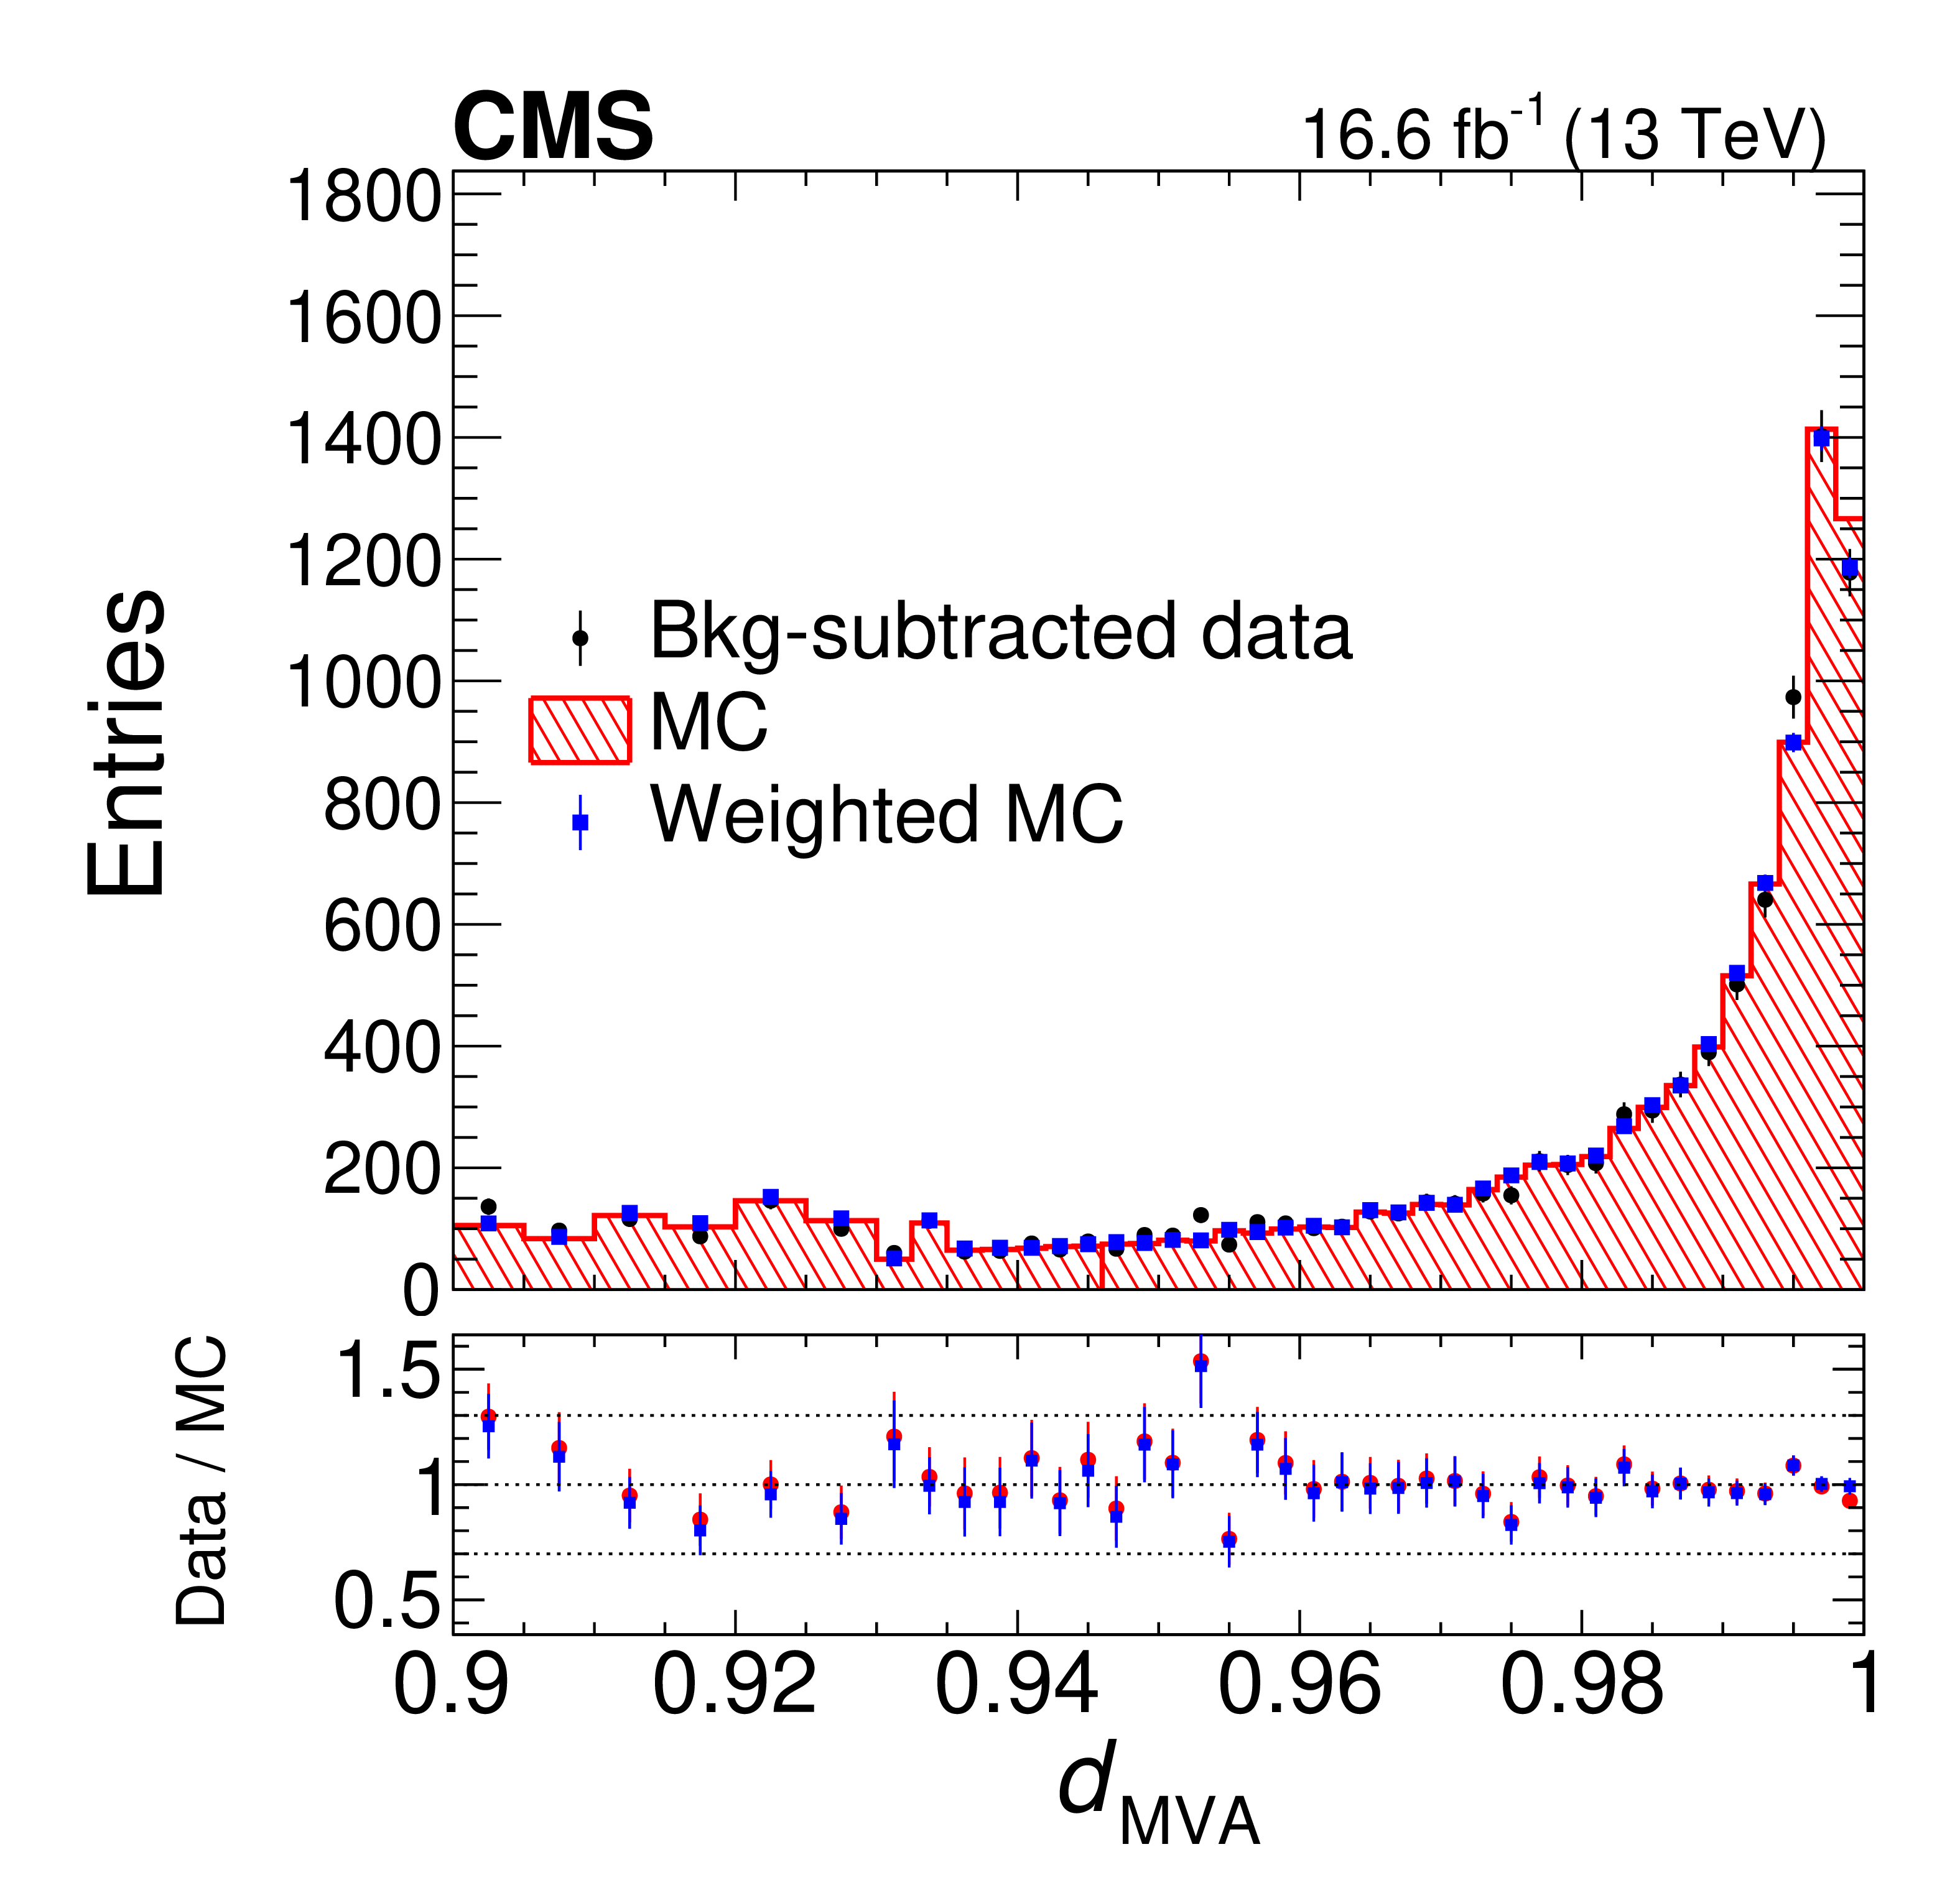
Figure 1-b:
Distributions of the $ d_{\text{MVA}} $ output for the 2016b data and the corresponding MC samples. The blue squares represent the weighted simulated distributions using the XGBOOST reweighting method. In the lower panel, the blue squares and red points are the ratio of the data to weighted and not weighted simulated distribution respectively. The MC distributions are normalized to the total number of events in data. |
png pdf |
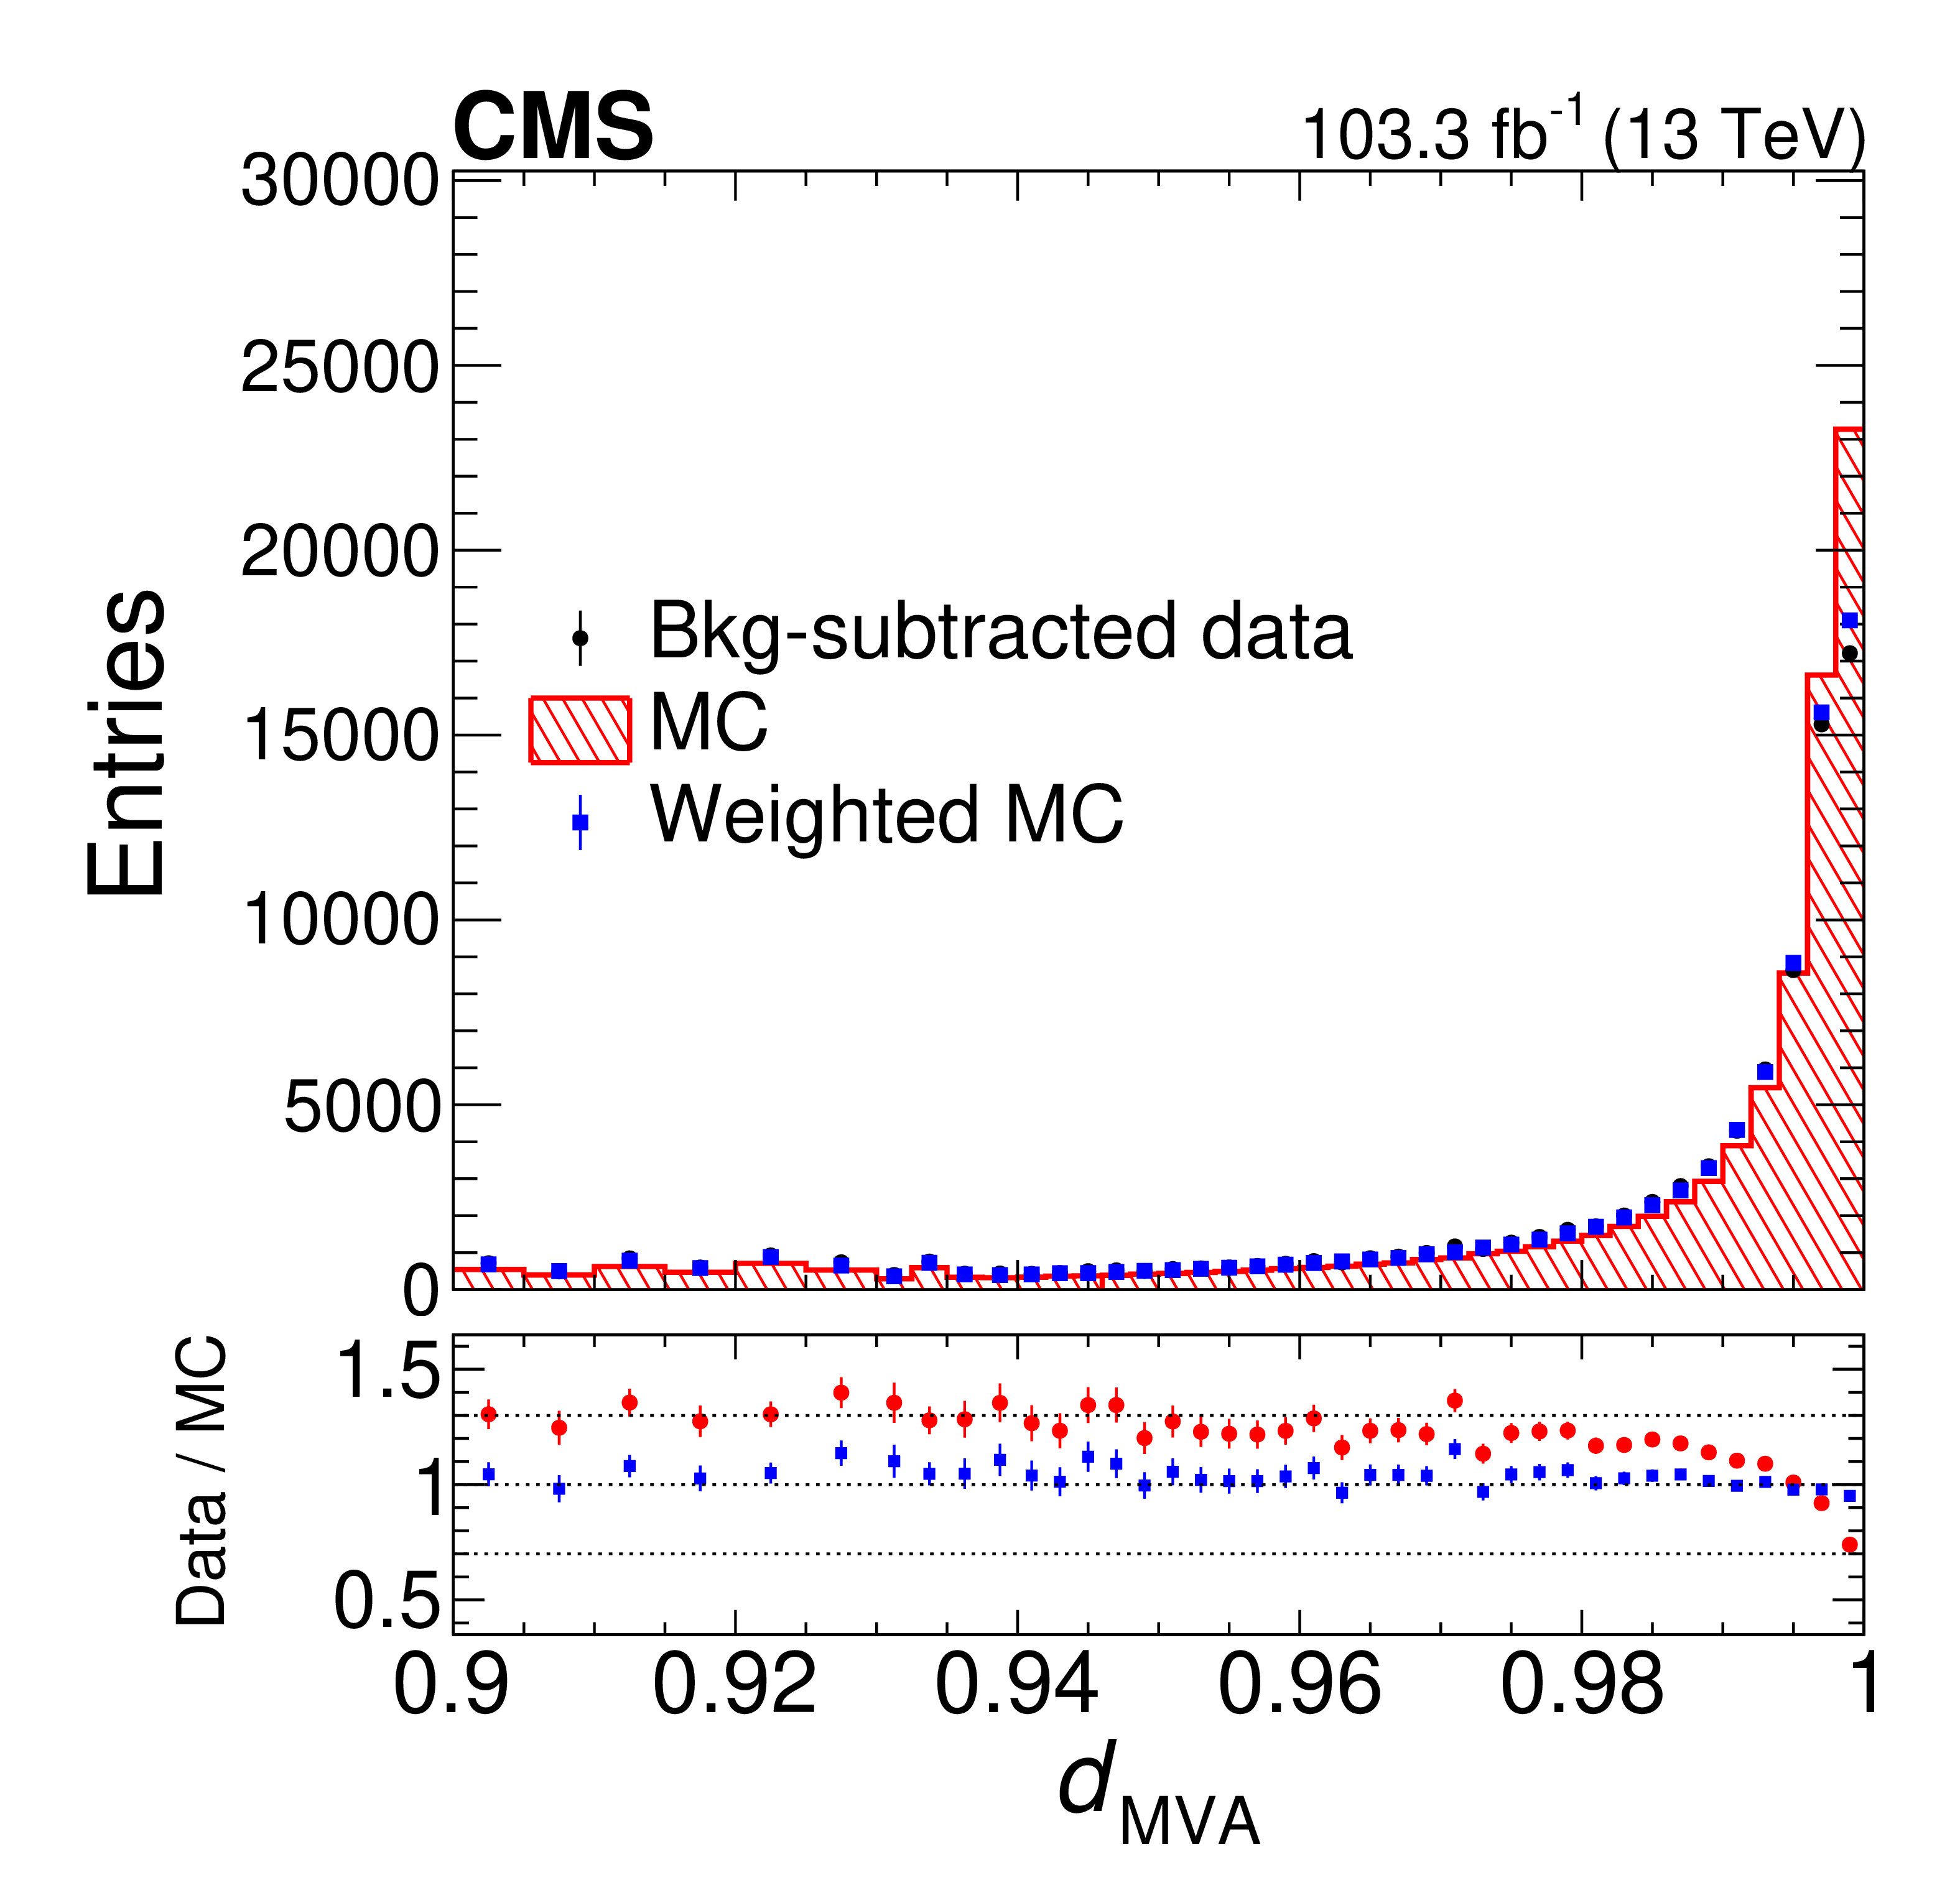
Figure 1-c:
Distributions of the $ d_{\text{MVA}} $ output for the 2017-2018 data and the corresponding MC samples. The blue squares represent the weighted simulated distributions using the XGBOOST reweighting method. In the lower panel, the blue squares and red points are the ratio of the data to weighted and not weighted simulated distribution respectively. The MC distributions are normalized to the total number of events in data. |
png pdf |
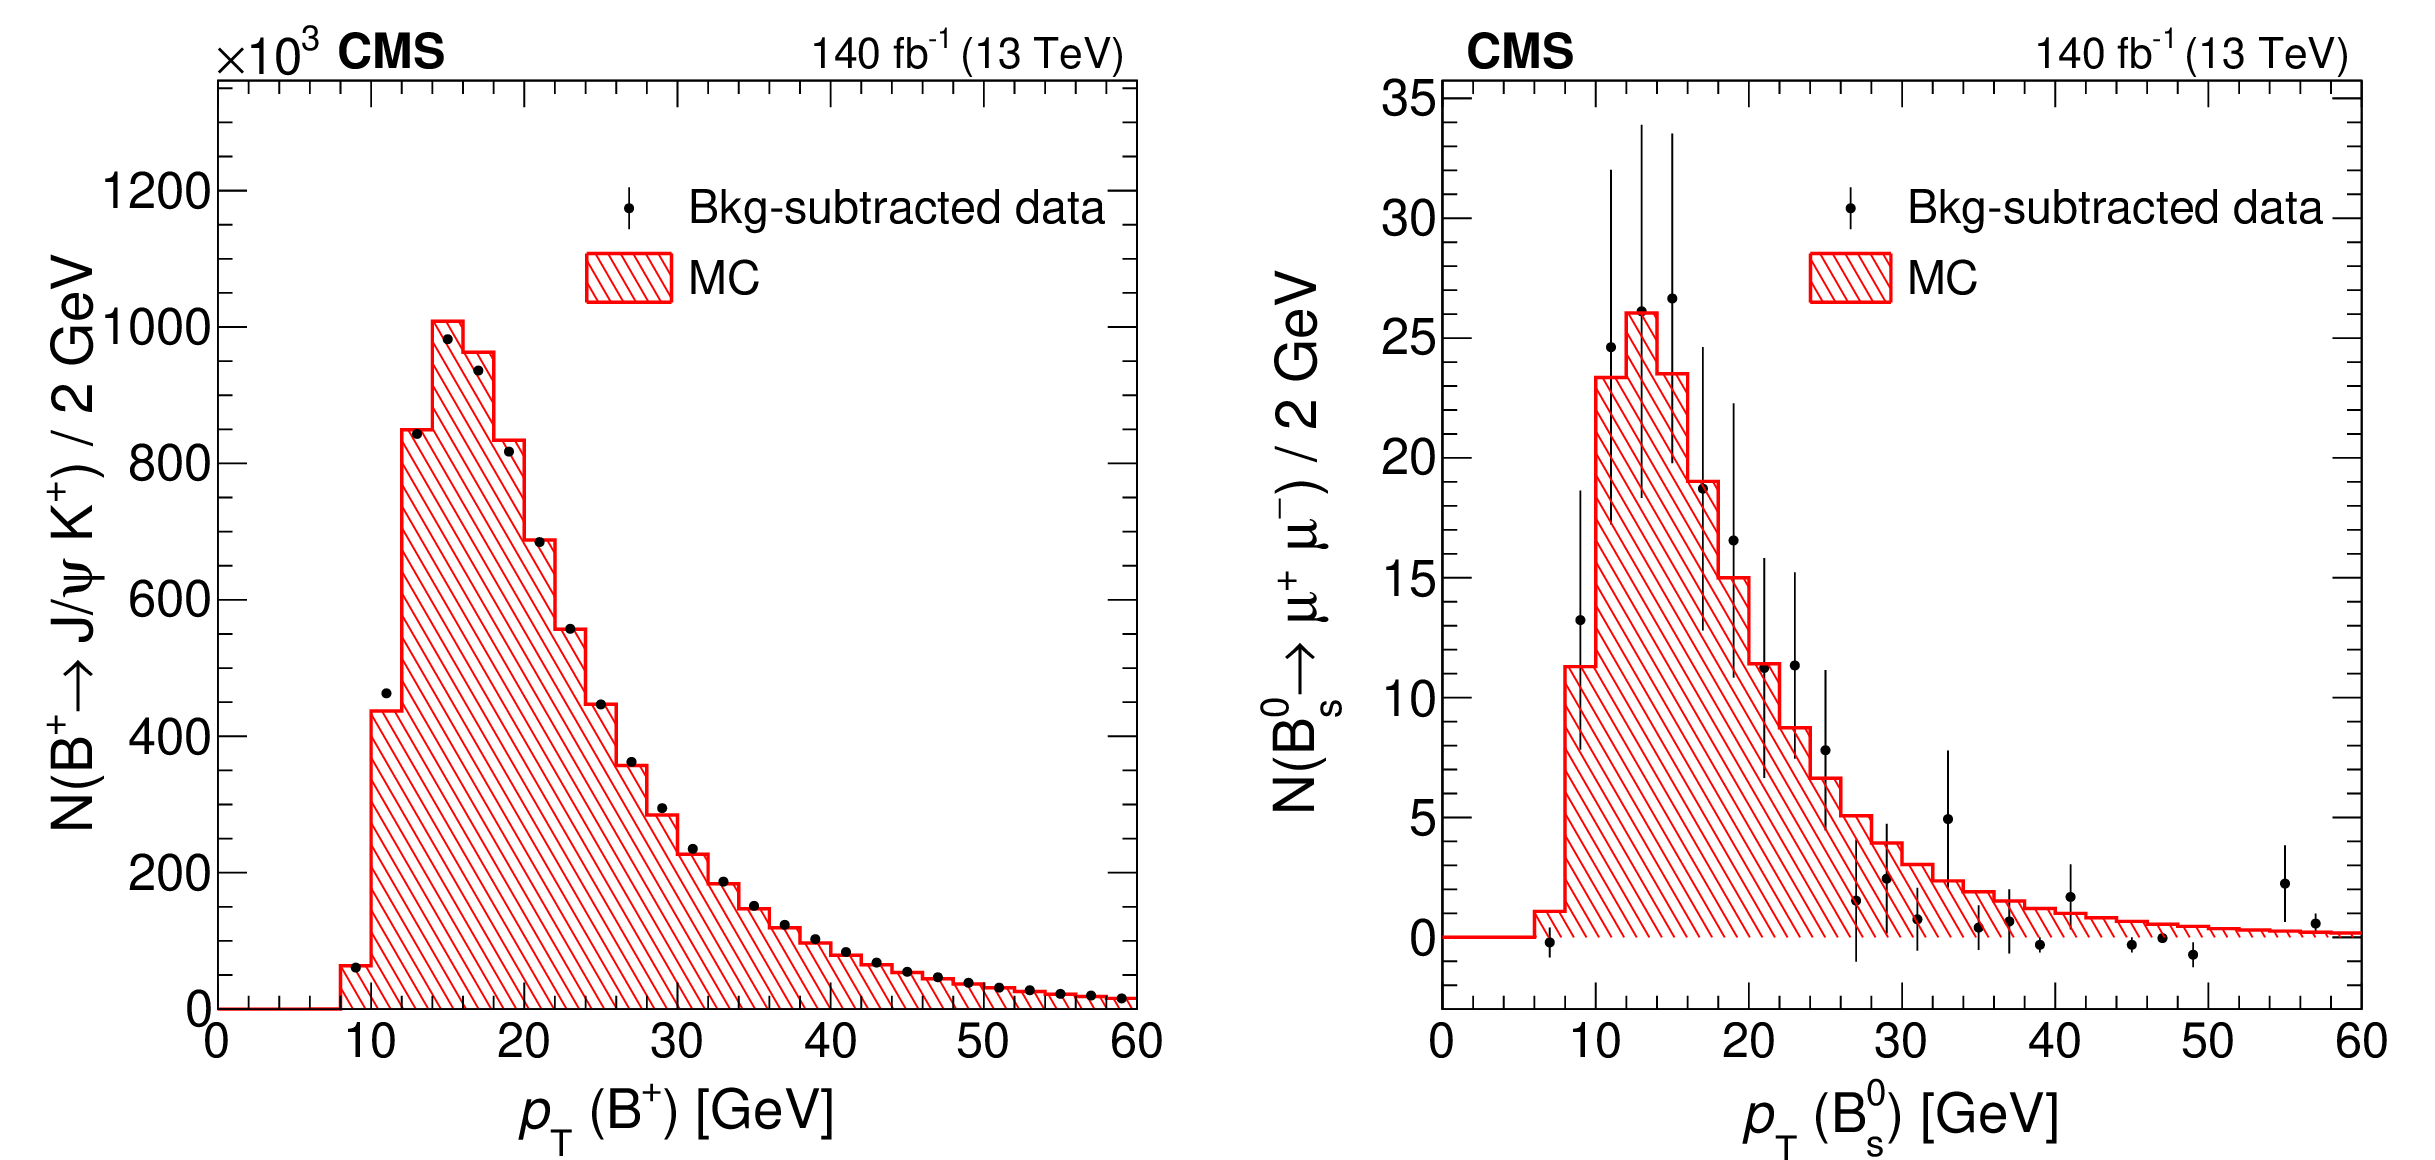
Figure 2:
The distribution of the $ {\mathrm{B}} $ meson $ p_{\mathrm{T}} $ after the sPlot background subtraction in data (points with error bars) and simulation (hatched histogram) for $ {\mathrm{B}^{+}} \to \mathrm{J}/\psi\mathrm{K^+} $ (left) and $ \mathrm{B}_{s}^{0} \to\mu^{+}\mu^{-} $ (right) events. The MC distributions are normalized to the total number of events in data. |
png pdf |
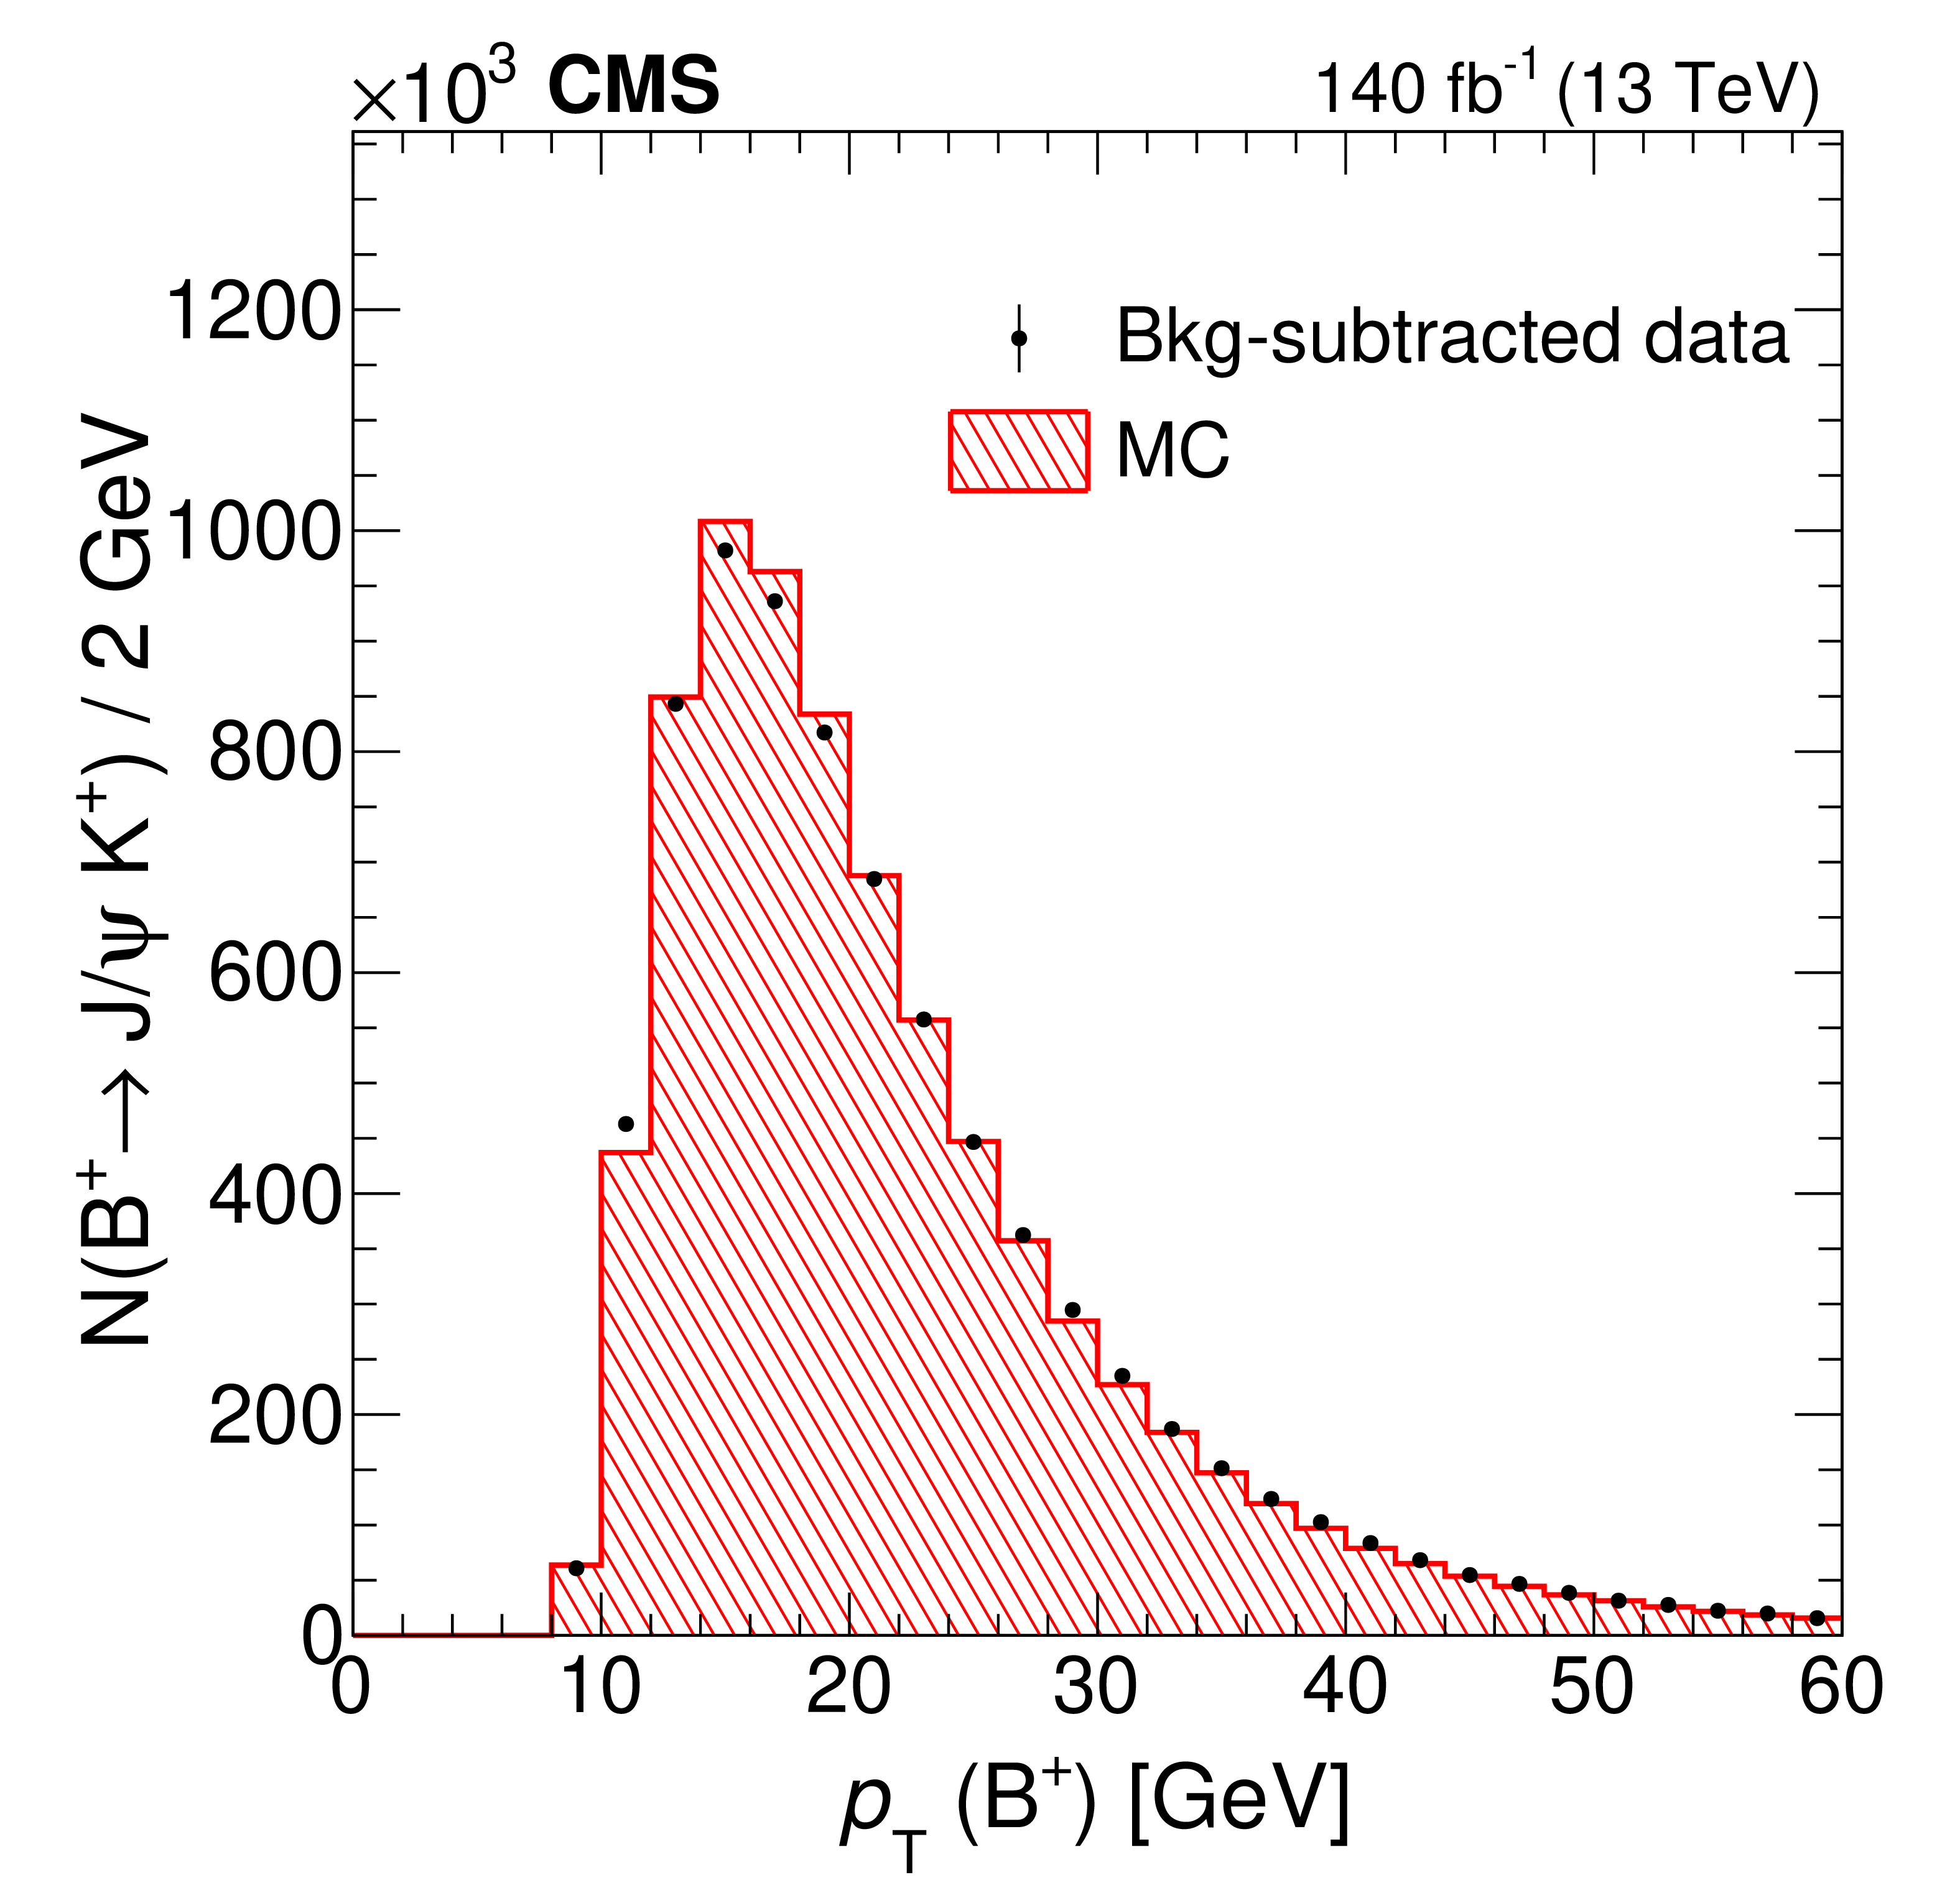
Figure 2-a:
The distribution of the $ {\mathrm{B}} $ meson $ p_{\mathrm{T}} $ after the sPlot background subtraction in data (points with error bars) and simulation (hatched histogram) for $ {\mathrm{B}^{+}} \to \mathrm{J}/\psi\mathrm{K^+} $ events. The MC distributions are normalized to the total number of events in data. |

png pdf |
Figure 2-b:
The distribution of the $ {\mathrm{B}} $ meson $ p_{\mathrm{T}} $ after the sPlot background subtraction in data (points with error bars) and simulation (hatched histogram) for $ \mathrm{B}_{s}^{0} \to\mu^{+}\mu^{-} $ events. The MC distributions are normalized to the total number of events in data. |
png pdf |
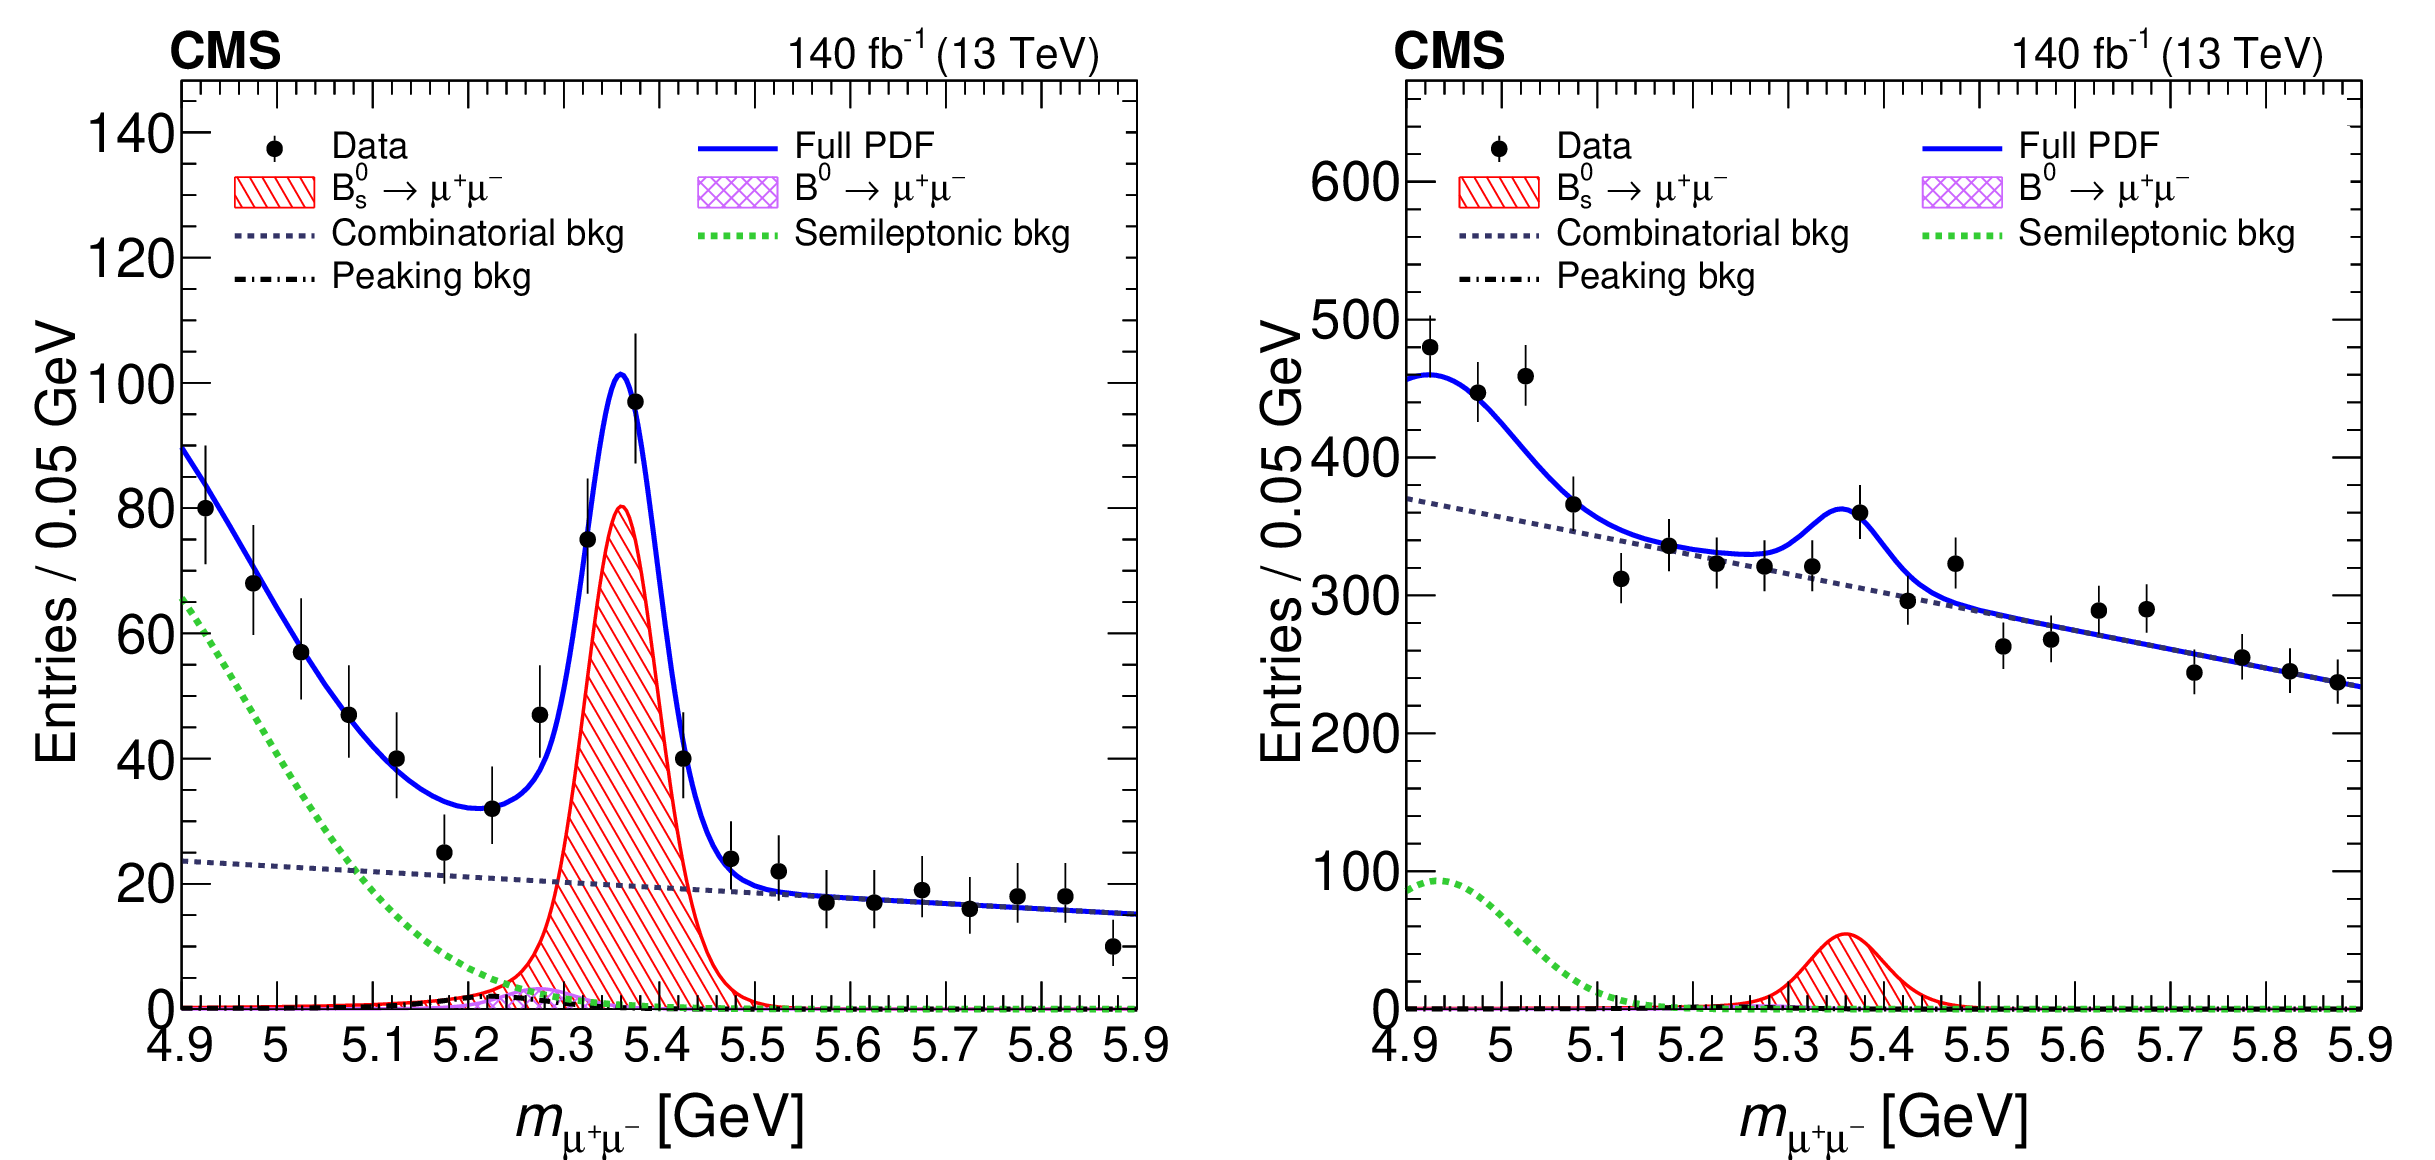
Figure 3:
The projections on the dimuon mass axis of the fit to the branching fraction for the $ d_{\text{MVA}} > $ 0.99 (left) and 0.99 $ > d_{\text{MVA}} > $ 0.90 (right) categories. The solid blue curves represent the corresponding projections of the final fit model, while the individual components of the fit are represented by the dashed curves (backgrounds) and hatched histograms (signals). |

png pdf |
Figure 3-a:
The projection on the dimuon mass axis of the fit to the branching fraction for the $ d_{\text{MVA}} > $ 0.99 category. The solid blue curves represent the corresponding projections of the final fit model, while the individual components of the fit are represented by the dashed curves (backgrounds) and hatched histograms (signals). |
png pdf |
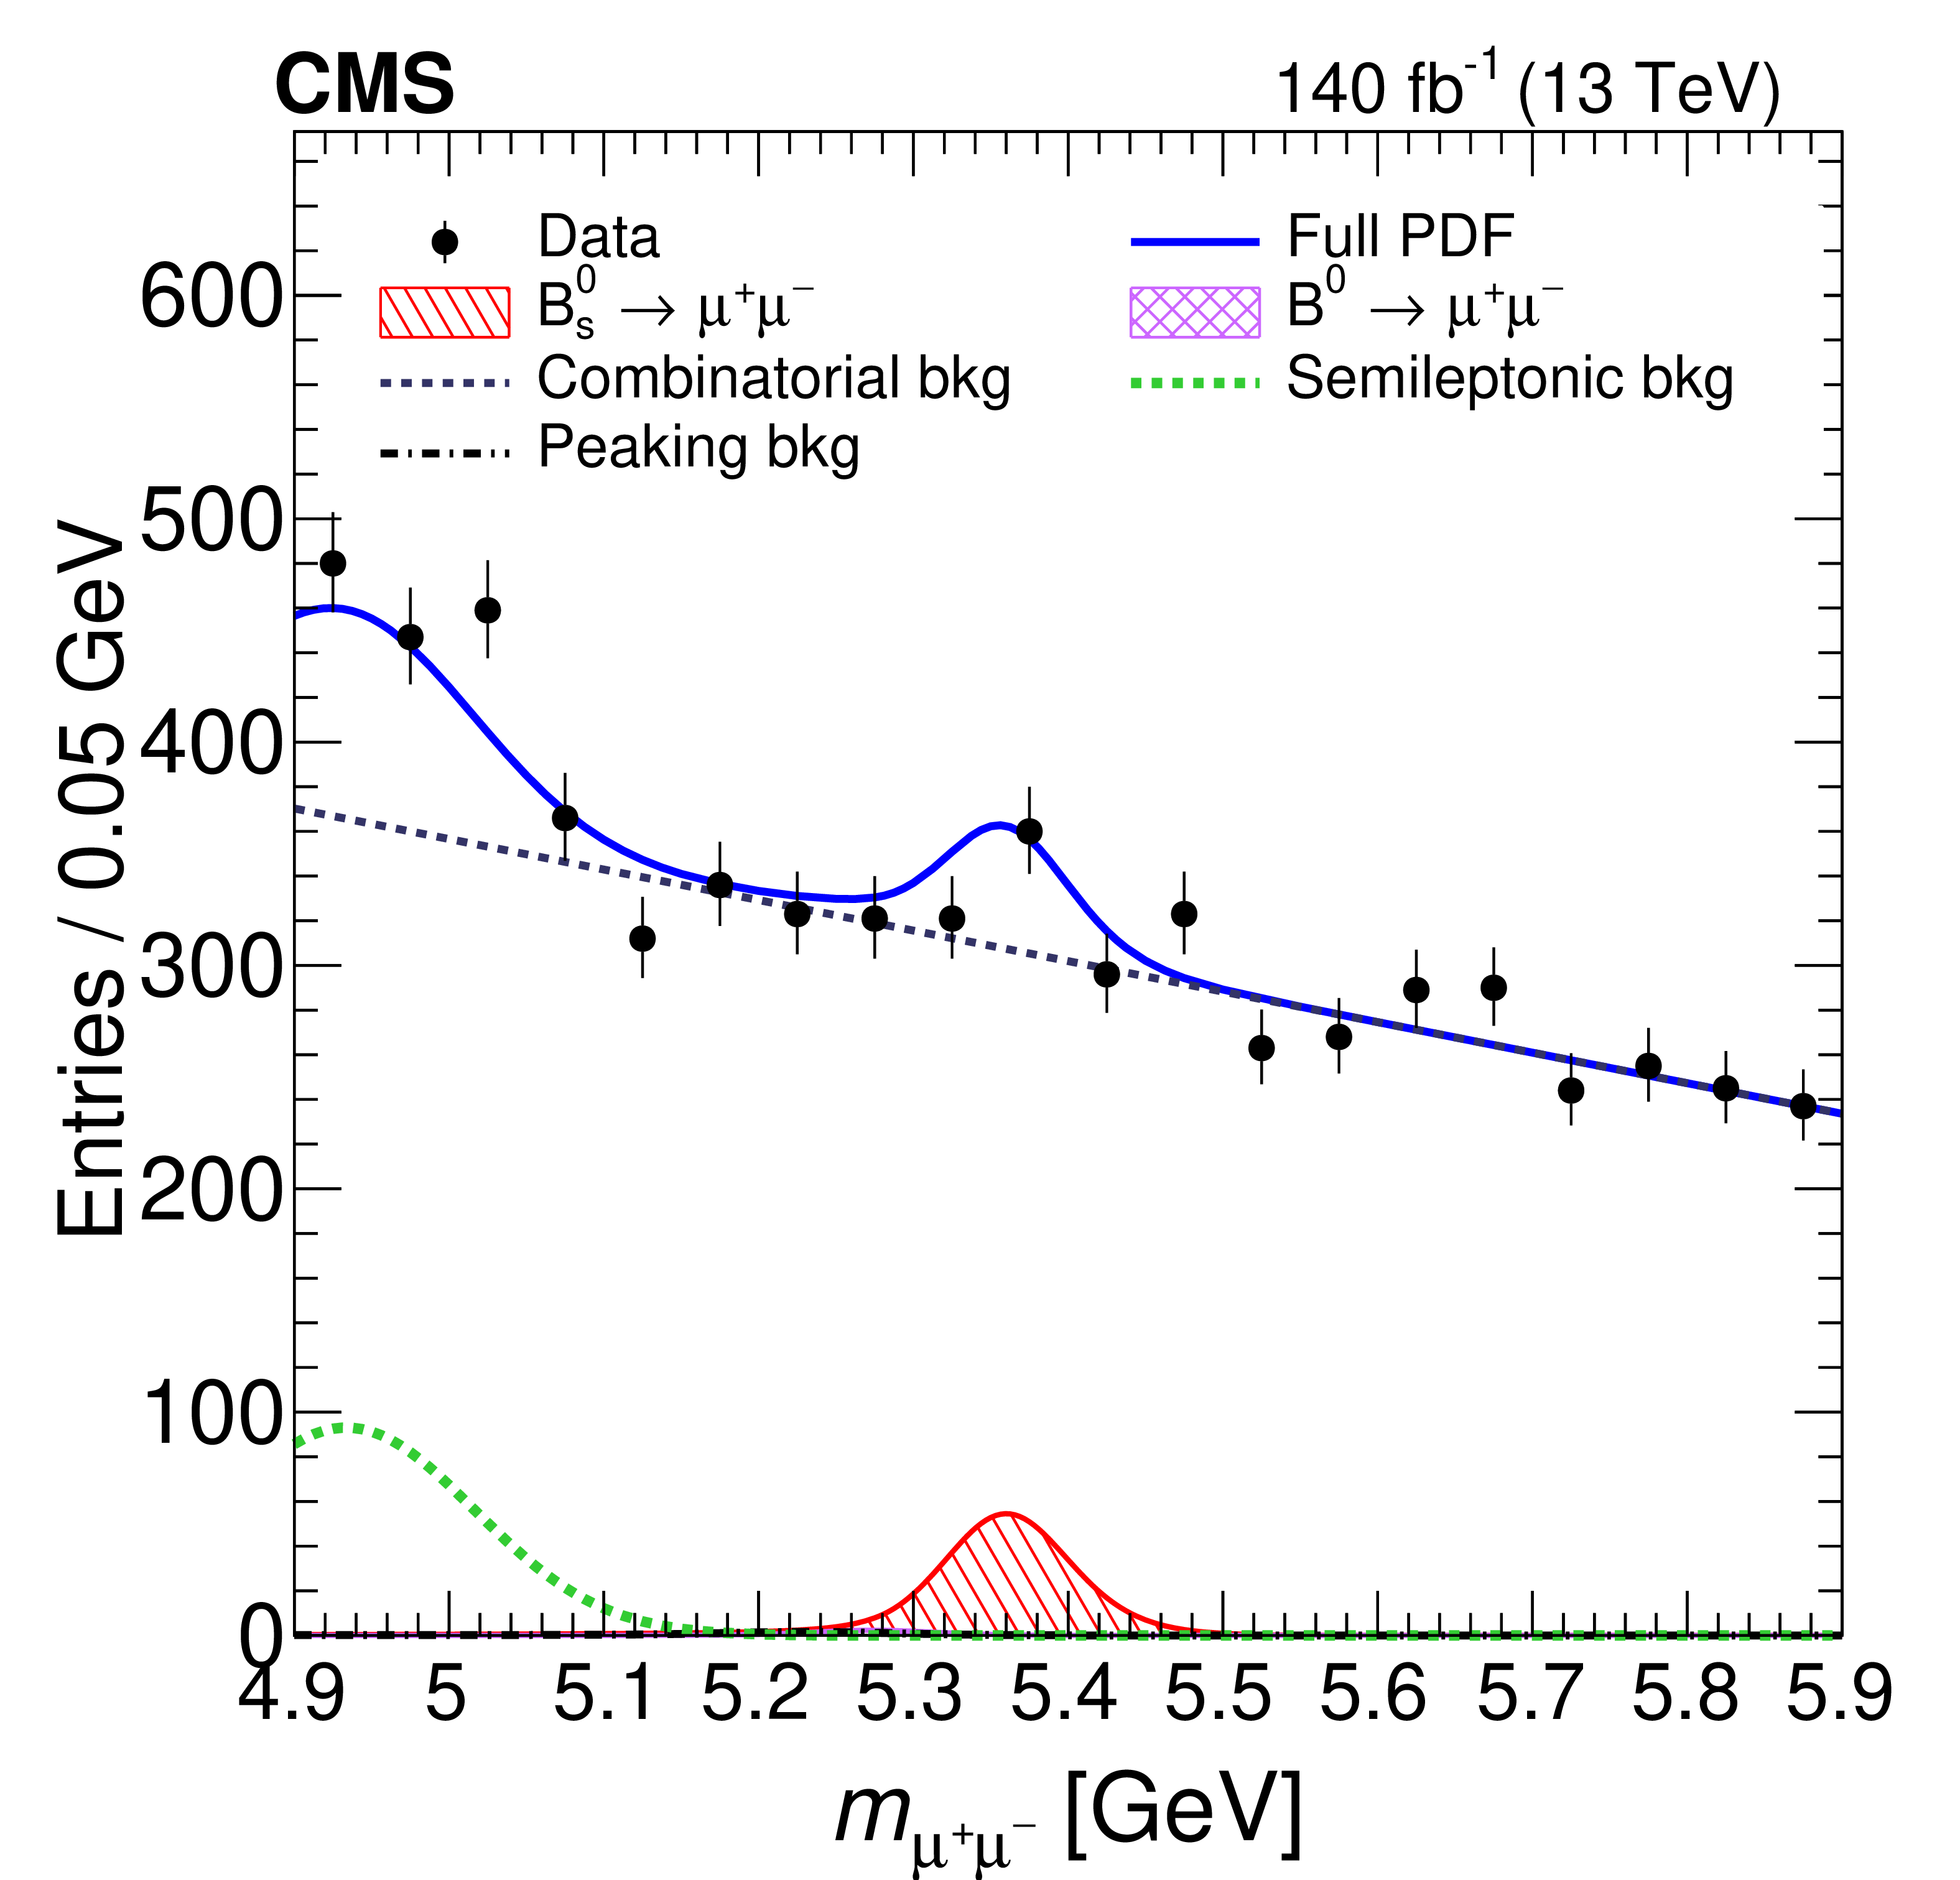
Figure 3-b:
The projection on the dimuon mass axis of the fit to the branching fraction for the 0.99 $ > d_{\text{MVA}} > $ 0.90 category. The solid blue curves represent the corresponding projections of the final fit model, while the individual components of the fit are represented by the dashed curves (backgrounds) and hatched histograms (signals). |
png pdf |
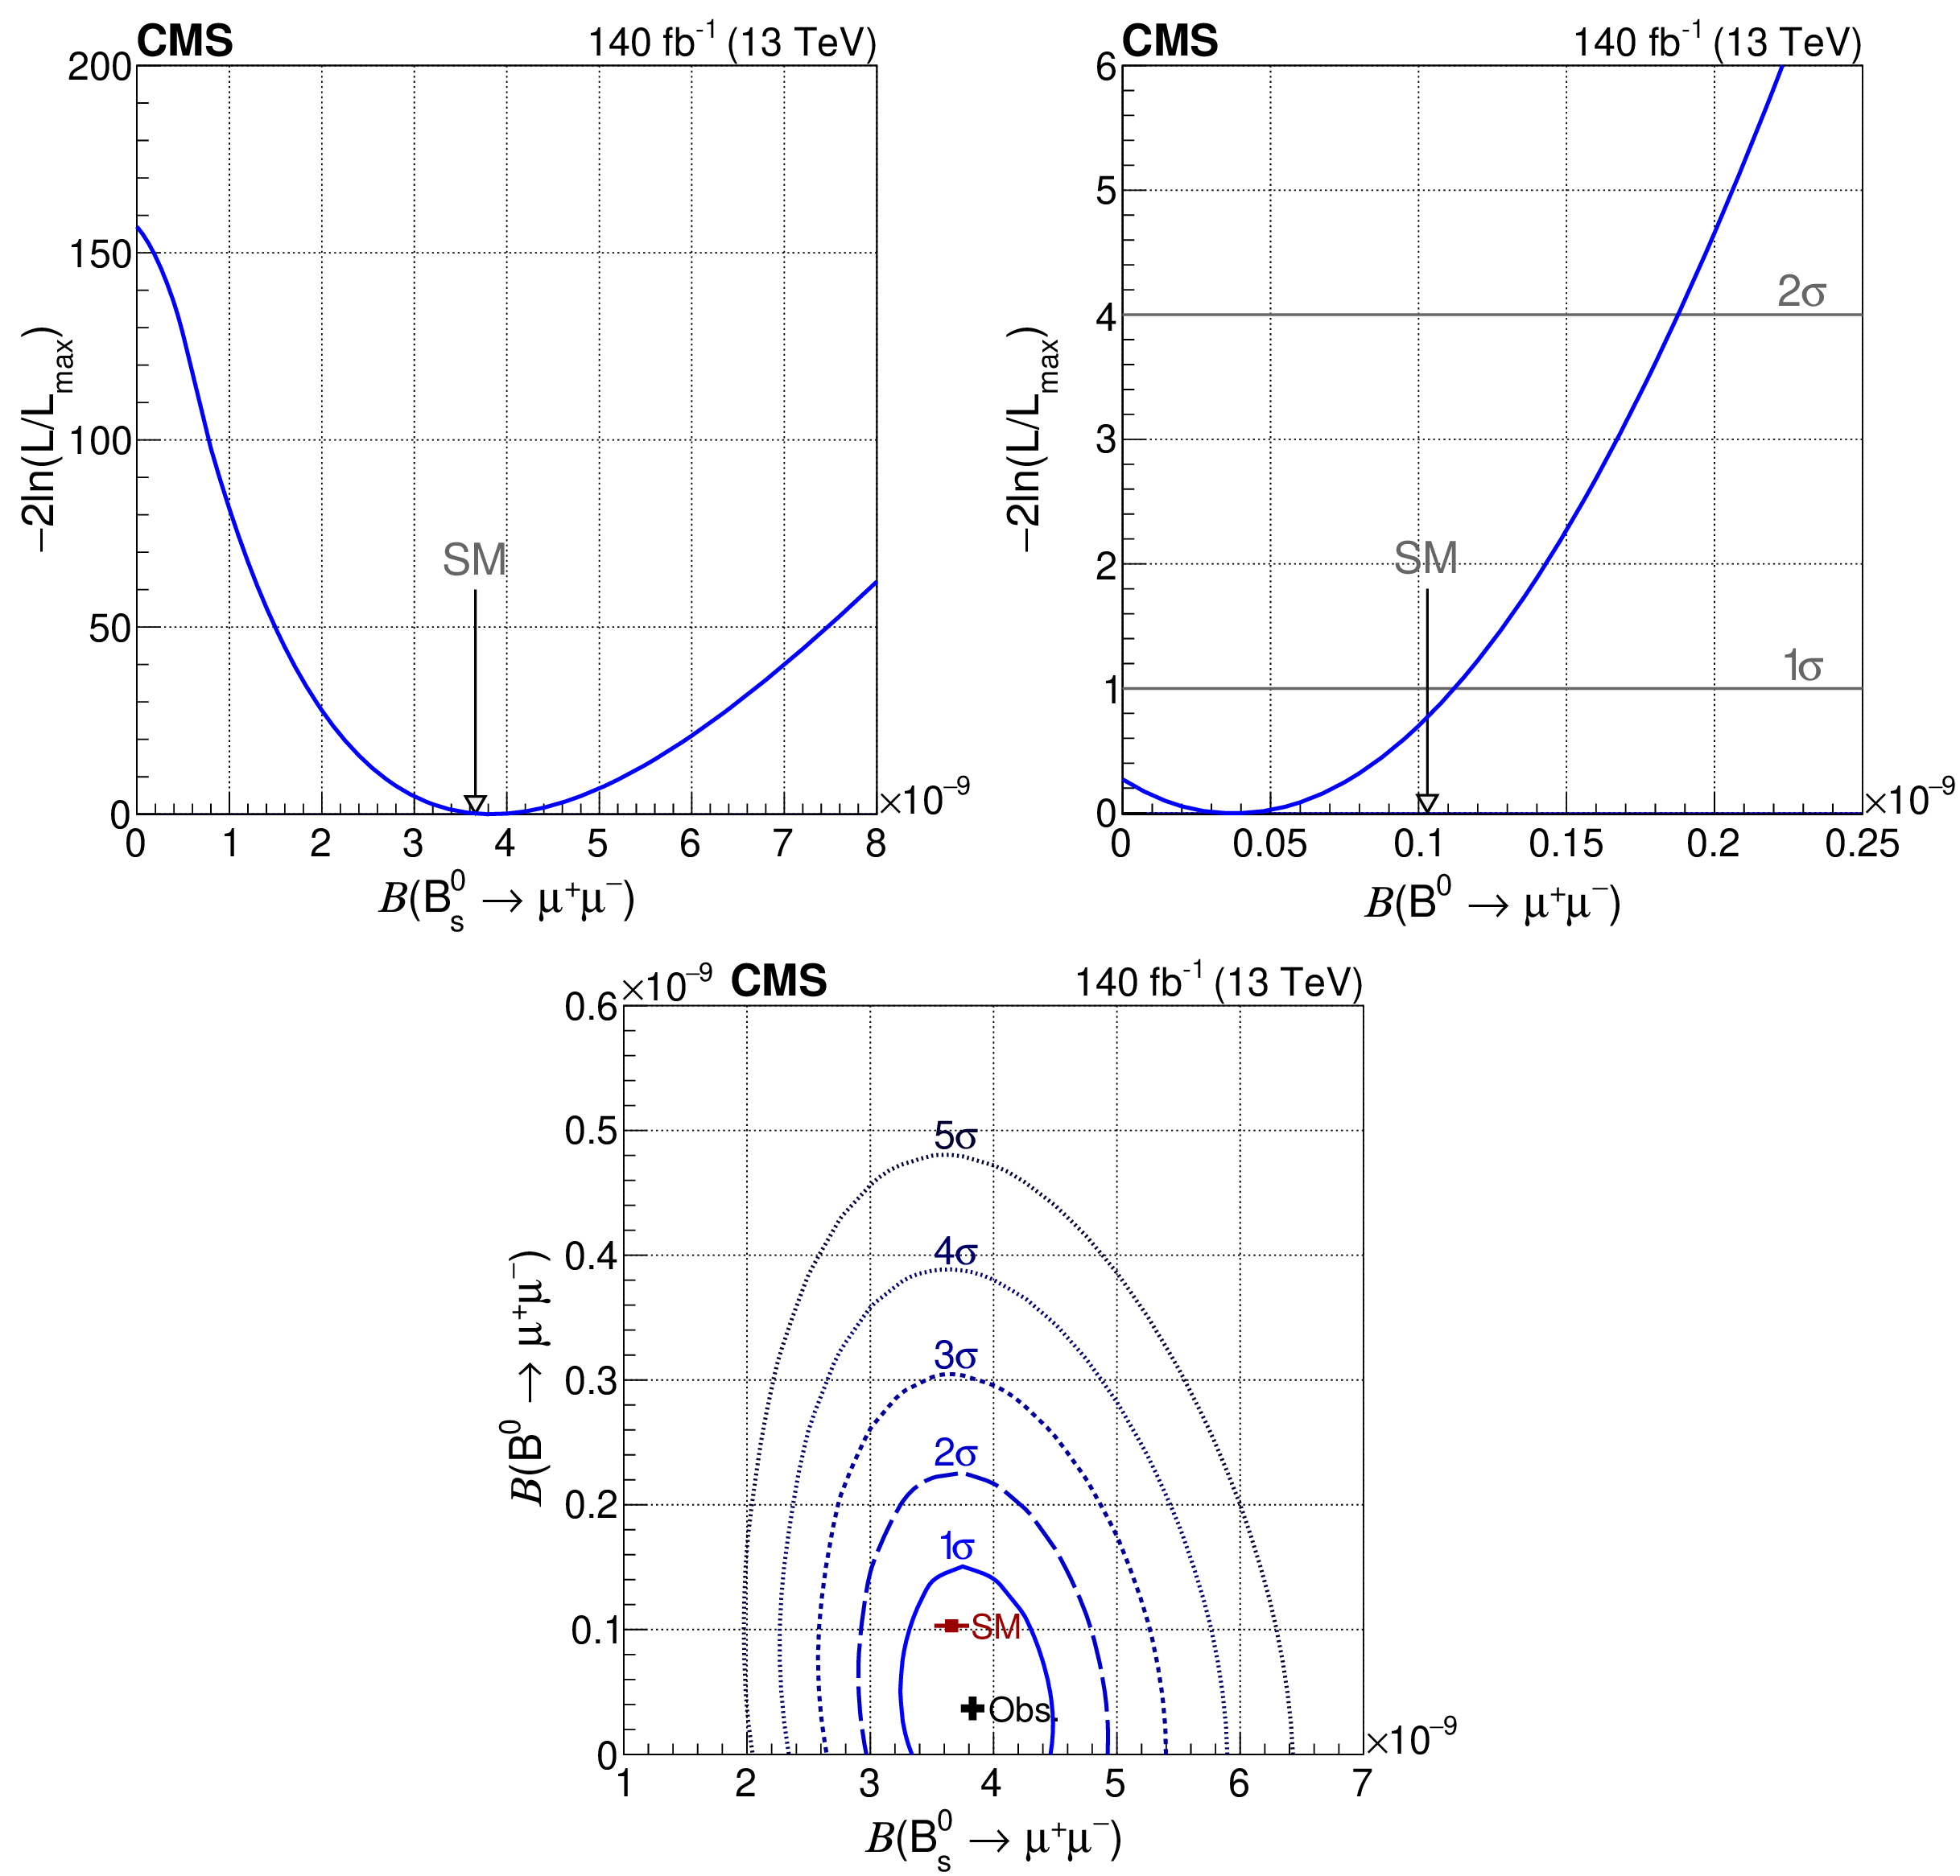
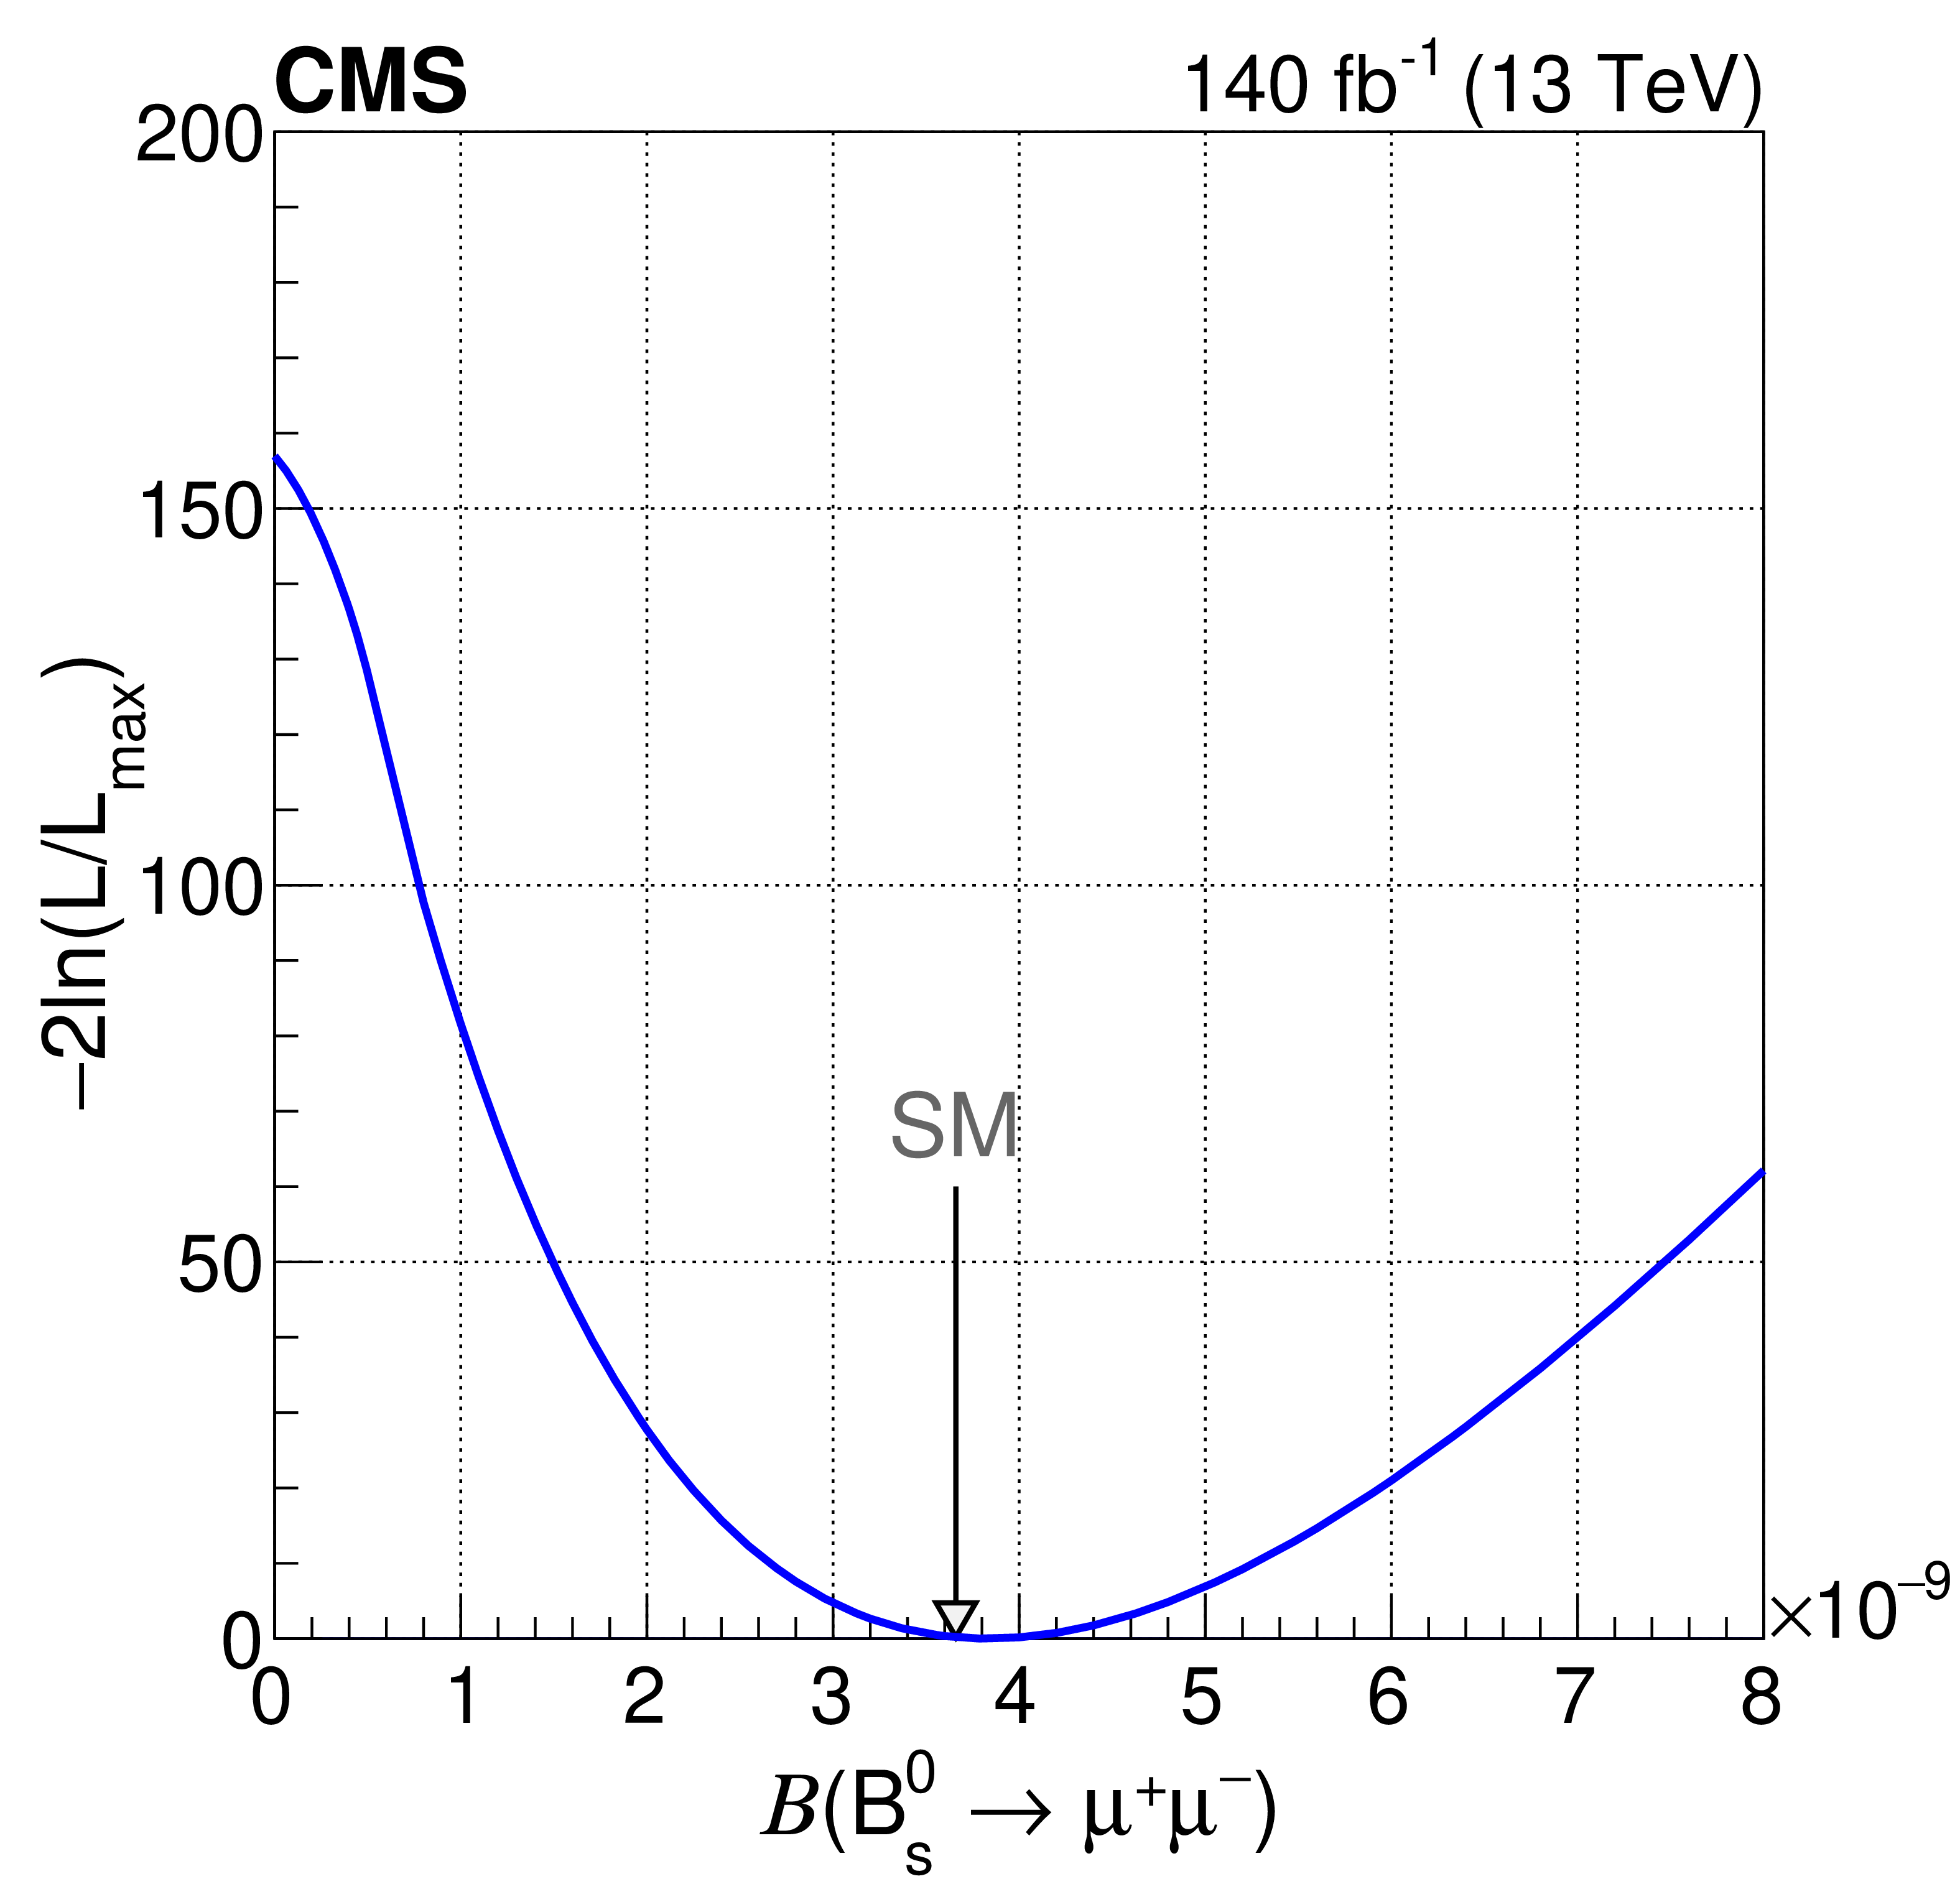
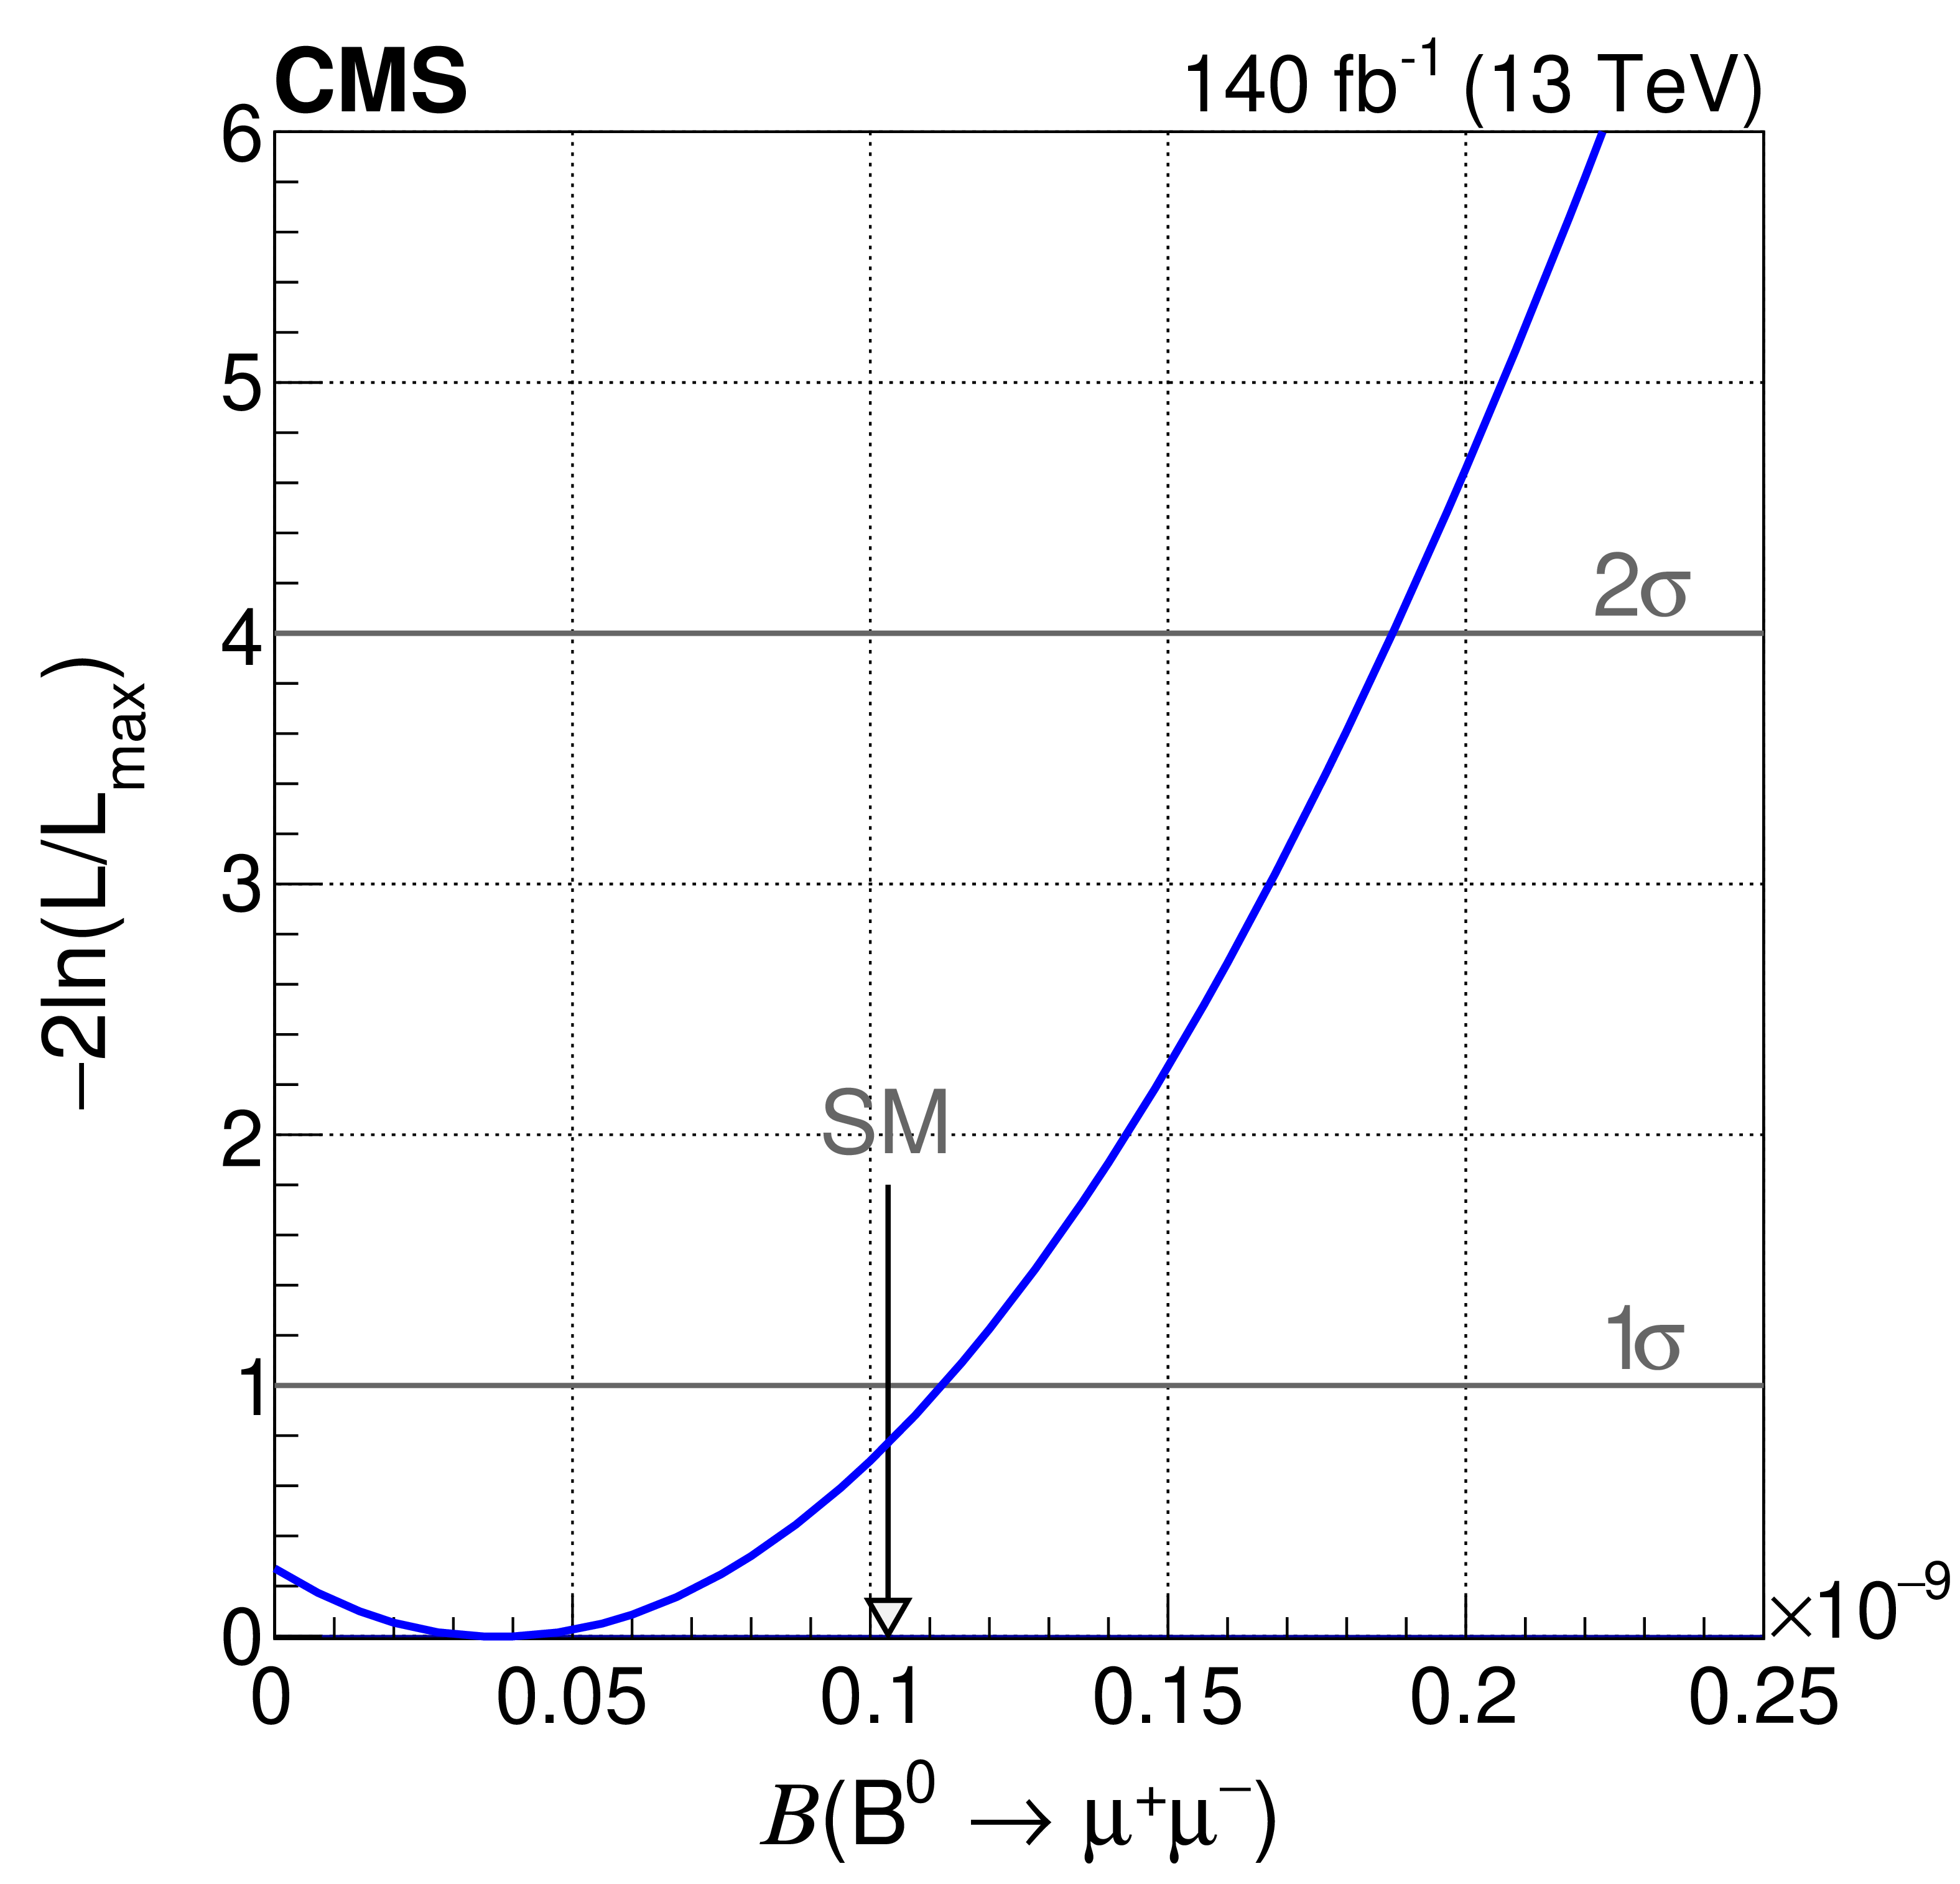
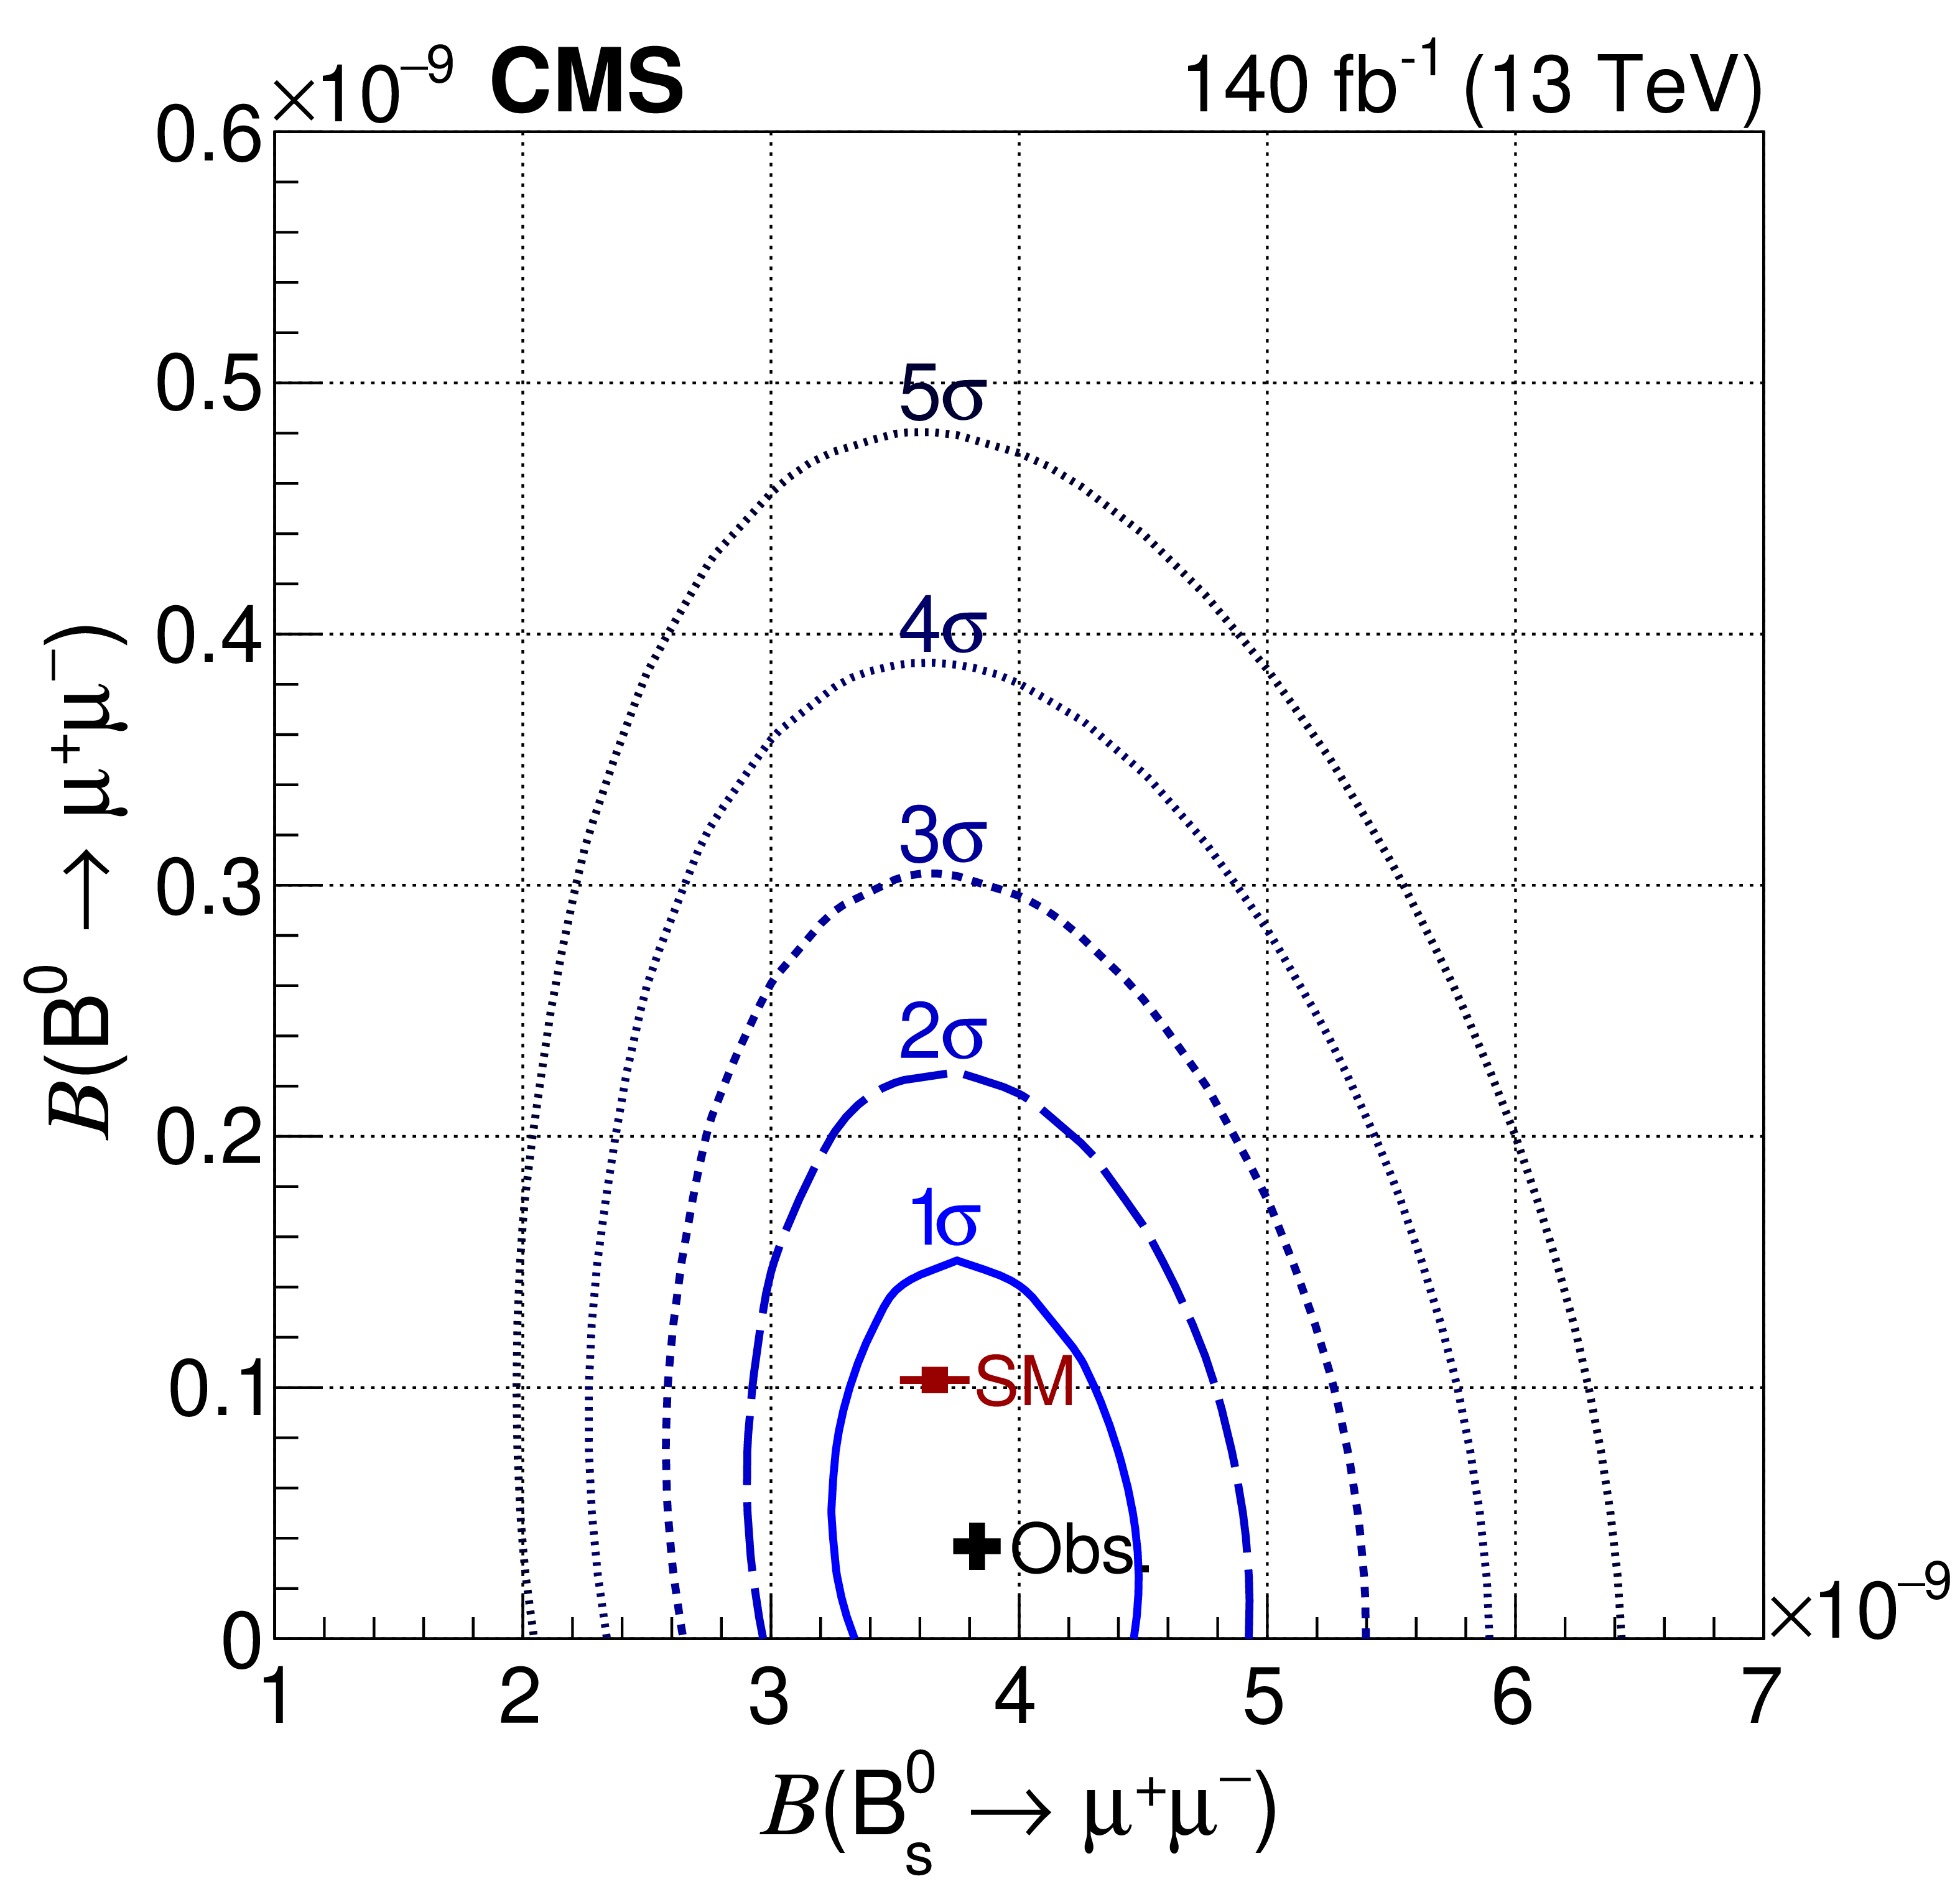
Figure 4:
The profile likelihood as a function of $ \mathrm{B}_{s}^{0} \to\mu^{+}\mu^{-} $ (left) and $ {\mathrm{B}^0} \to \mu^{+}\mu^{-} $ (middle) decay branching fractions in 1D (top and middle plots) and in 2D (lower plot). The contours in 2D enclose the regions with 1-5$ \sigma $ coverage, where 1, 2, and 3$ \sigma $ regions correspond to 68.3, 95.4, and 99.7% confidence levels, respectively. |
png pdf |
Figure 4-a:
The profile likelihood as a function of the $ \mathrm{B}_{s}^{0} \to\mu^{+}\mu^{-} $ decay branching fraction in 1D. |
png pdf |
Figure 4-b:
The profile likelihood as a function of the $ {\mathrm{B}^0} \to \mu^{+}\mu^{-} $ decay branching fraction in 1D. |
png pdf |
Figure 4-c:
The profile likelihood as a function of $ \mathrm{B}_{s}^{0} \to\mu^{+}\mu^{-} $ and $ {\mathrm{B}^0} \to \mu^{+}\mu^{-} $ decay branching fractions in 2D. The contours enclose the regions with 1-5$ \sigma $ coverage, where 1, 2, and 3$ \sigma $ regions correspond to 68.3, 95.4, and 99.7% confidence levels, respectively. |
png pdf |
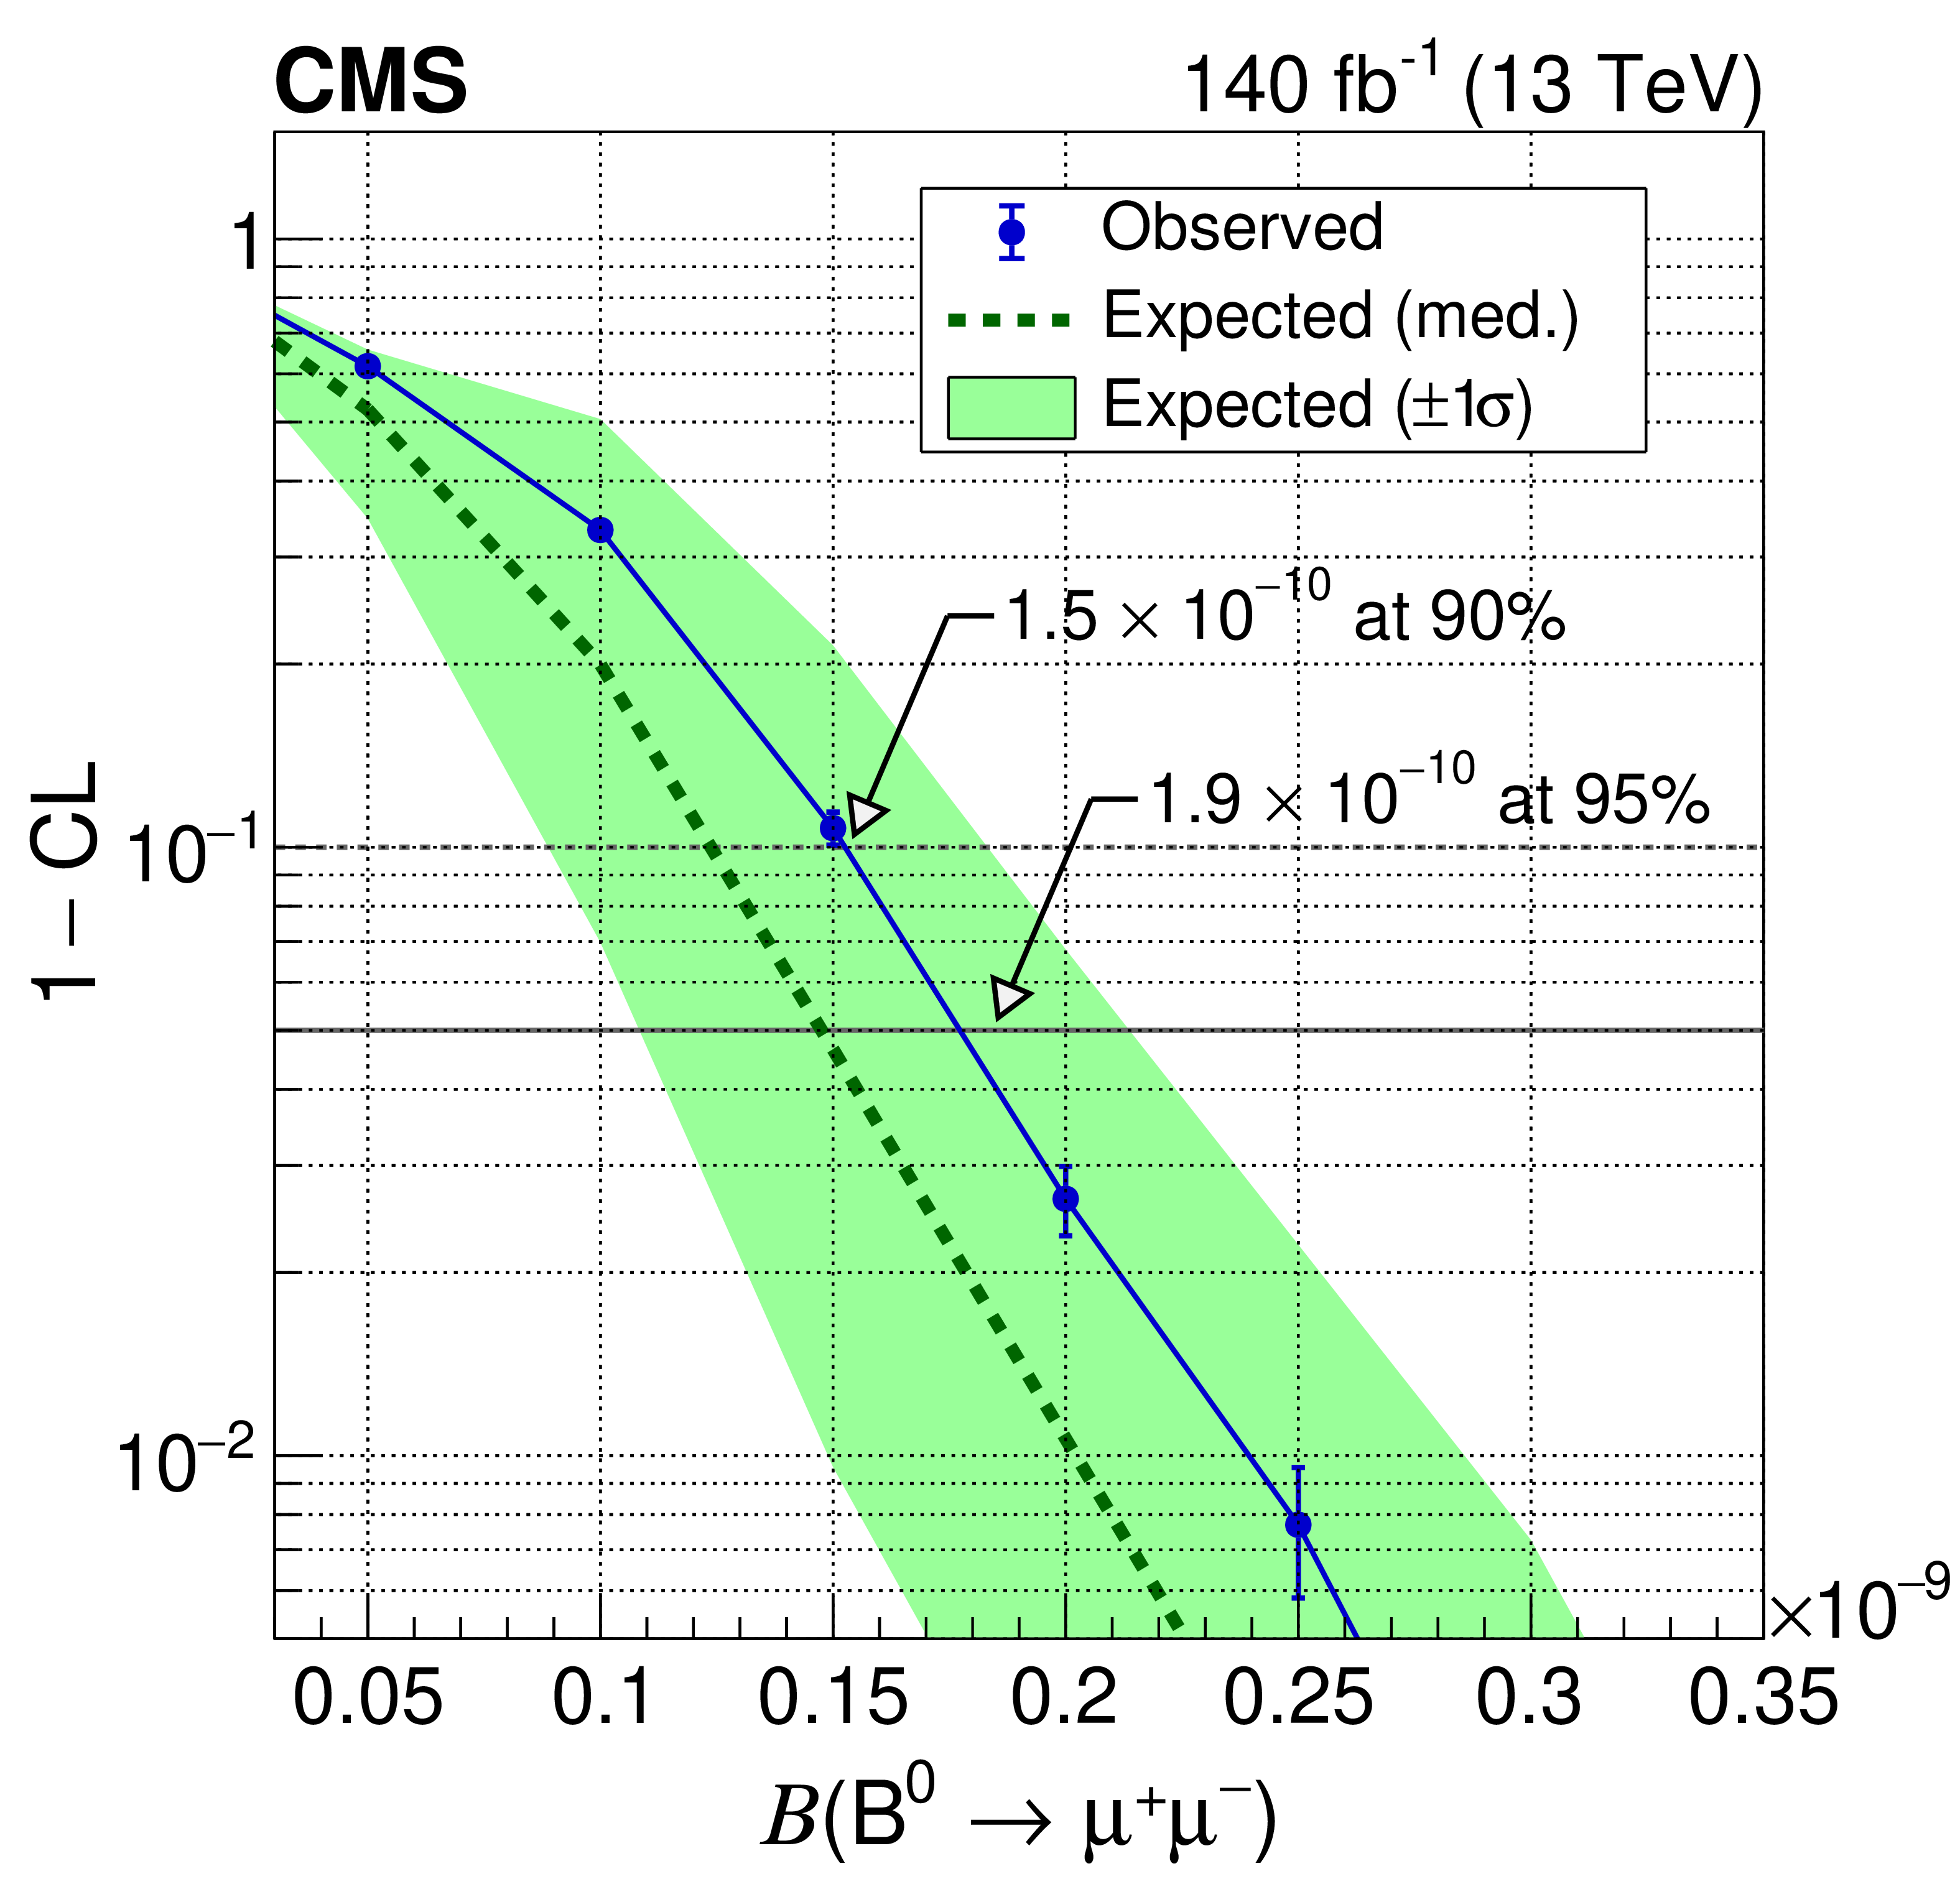
Figure 5:
The upper limits on the $ {\mathrm{B}^0} \to \mu^{+}\mu^{-} $ decay branching fraction using the $ \text{CL}_\text{s} $ method. The dashed line represents the expected median value of the quantity 1$-$CL for the background-only hypothesis, while the solid line shows the observed value. The shaded region indicates the $ \pm$1$\sigma $ band. |

png pdf |
Figure 6:
The UML fit projection on the decay time axis for the signal region 5.28 $ < m_{\mu^{+}\mu^{-}} < $ 5.48 GeV. |
| Tables | |
png pdf |
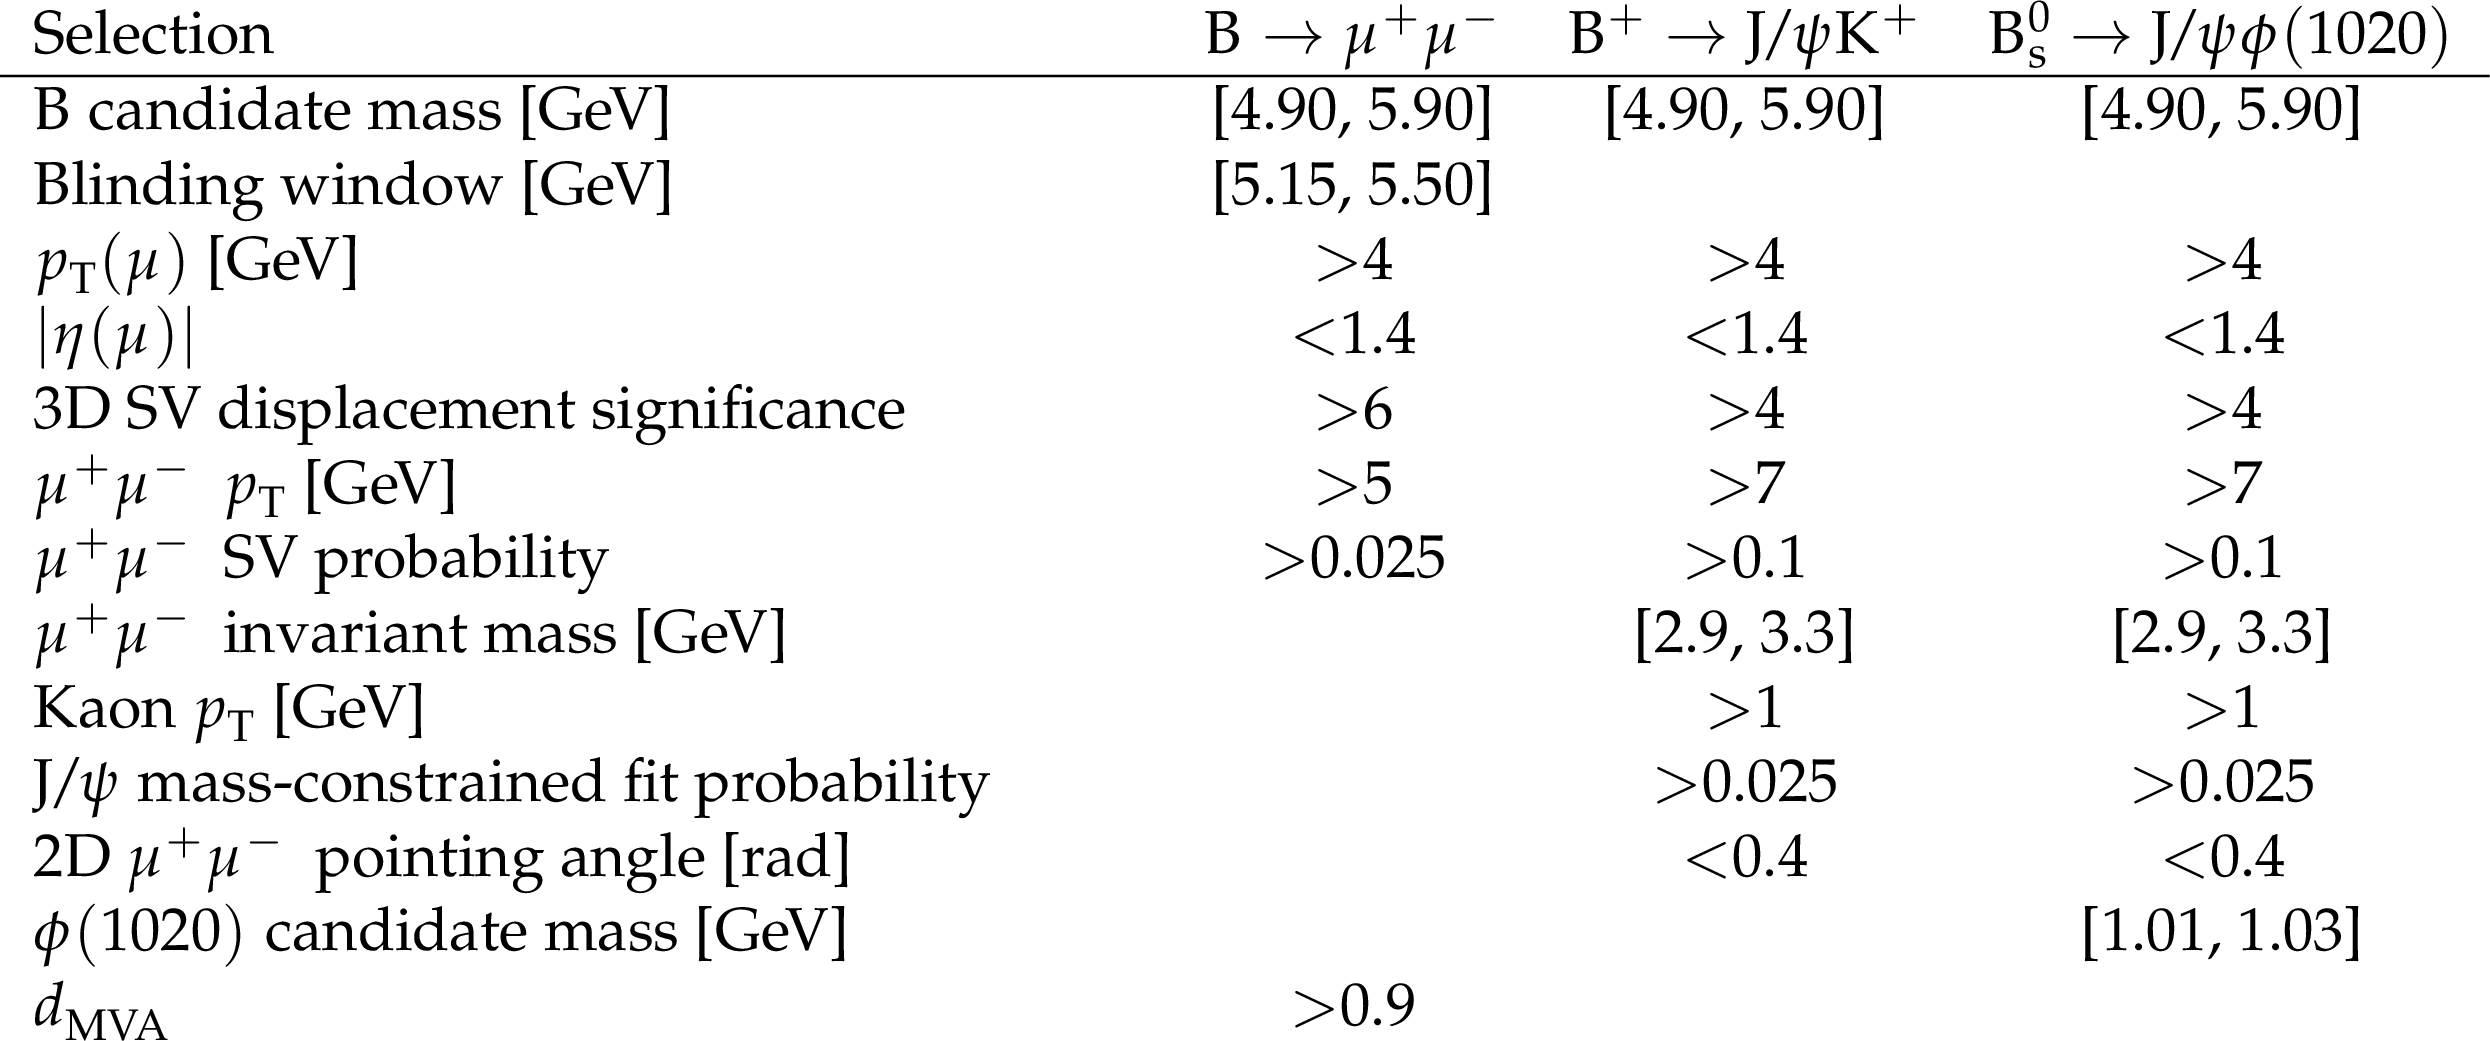
Table 1:
Selection requirements for the three decay channels used in the signal yield and normalization fits. Addition selection requirements are applied for the $ {\mathrm{B}^{+}} \to \mathrm{J}/\psi\mathrm{K^+} $ control sample used in systematic studies. |

png pdf |
Table 2:
Efficiency corrections for the $ \mathrm{B}_{s}^{0} \to\mu^{+}\mu^{-} $ decays derived using two different methods: the efficiency ratio between data and simulation, and the XGBOOST reweighting in $ {\mathrm{B}^{+}} \to \mathrm{J}/\psi\mathrm{K^+} $ events. The quoted uncertainties are statistical only. |

png pdf |
Table 3:
Summary of the systematic uncertainties for the $ \mathrm{B}_{s}^{0} \to\mu^{+}\mu^{-} $ and $ {\mathrm{B}^0} \to \mu^{+}\mu^{-} $ branching fraction measurements. |

png pdf |
Table 4:
Summary of the systematic uncertainties in the $ \mathrm{B}_{s}^{0} \to\mu^{+}\mu^{-} $ effective lifetime measurement (in ps) in four data-taking periods. |
png pdf |
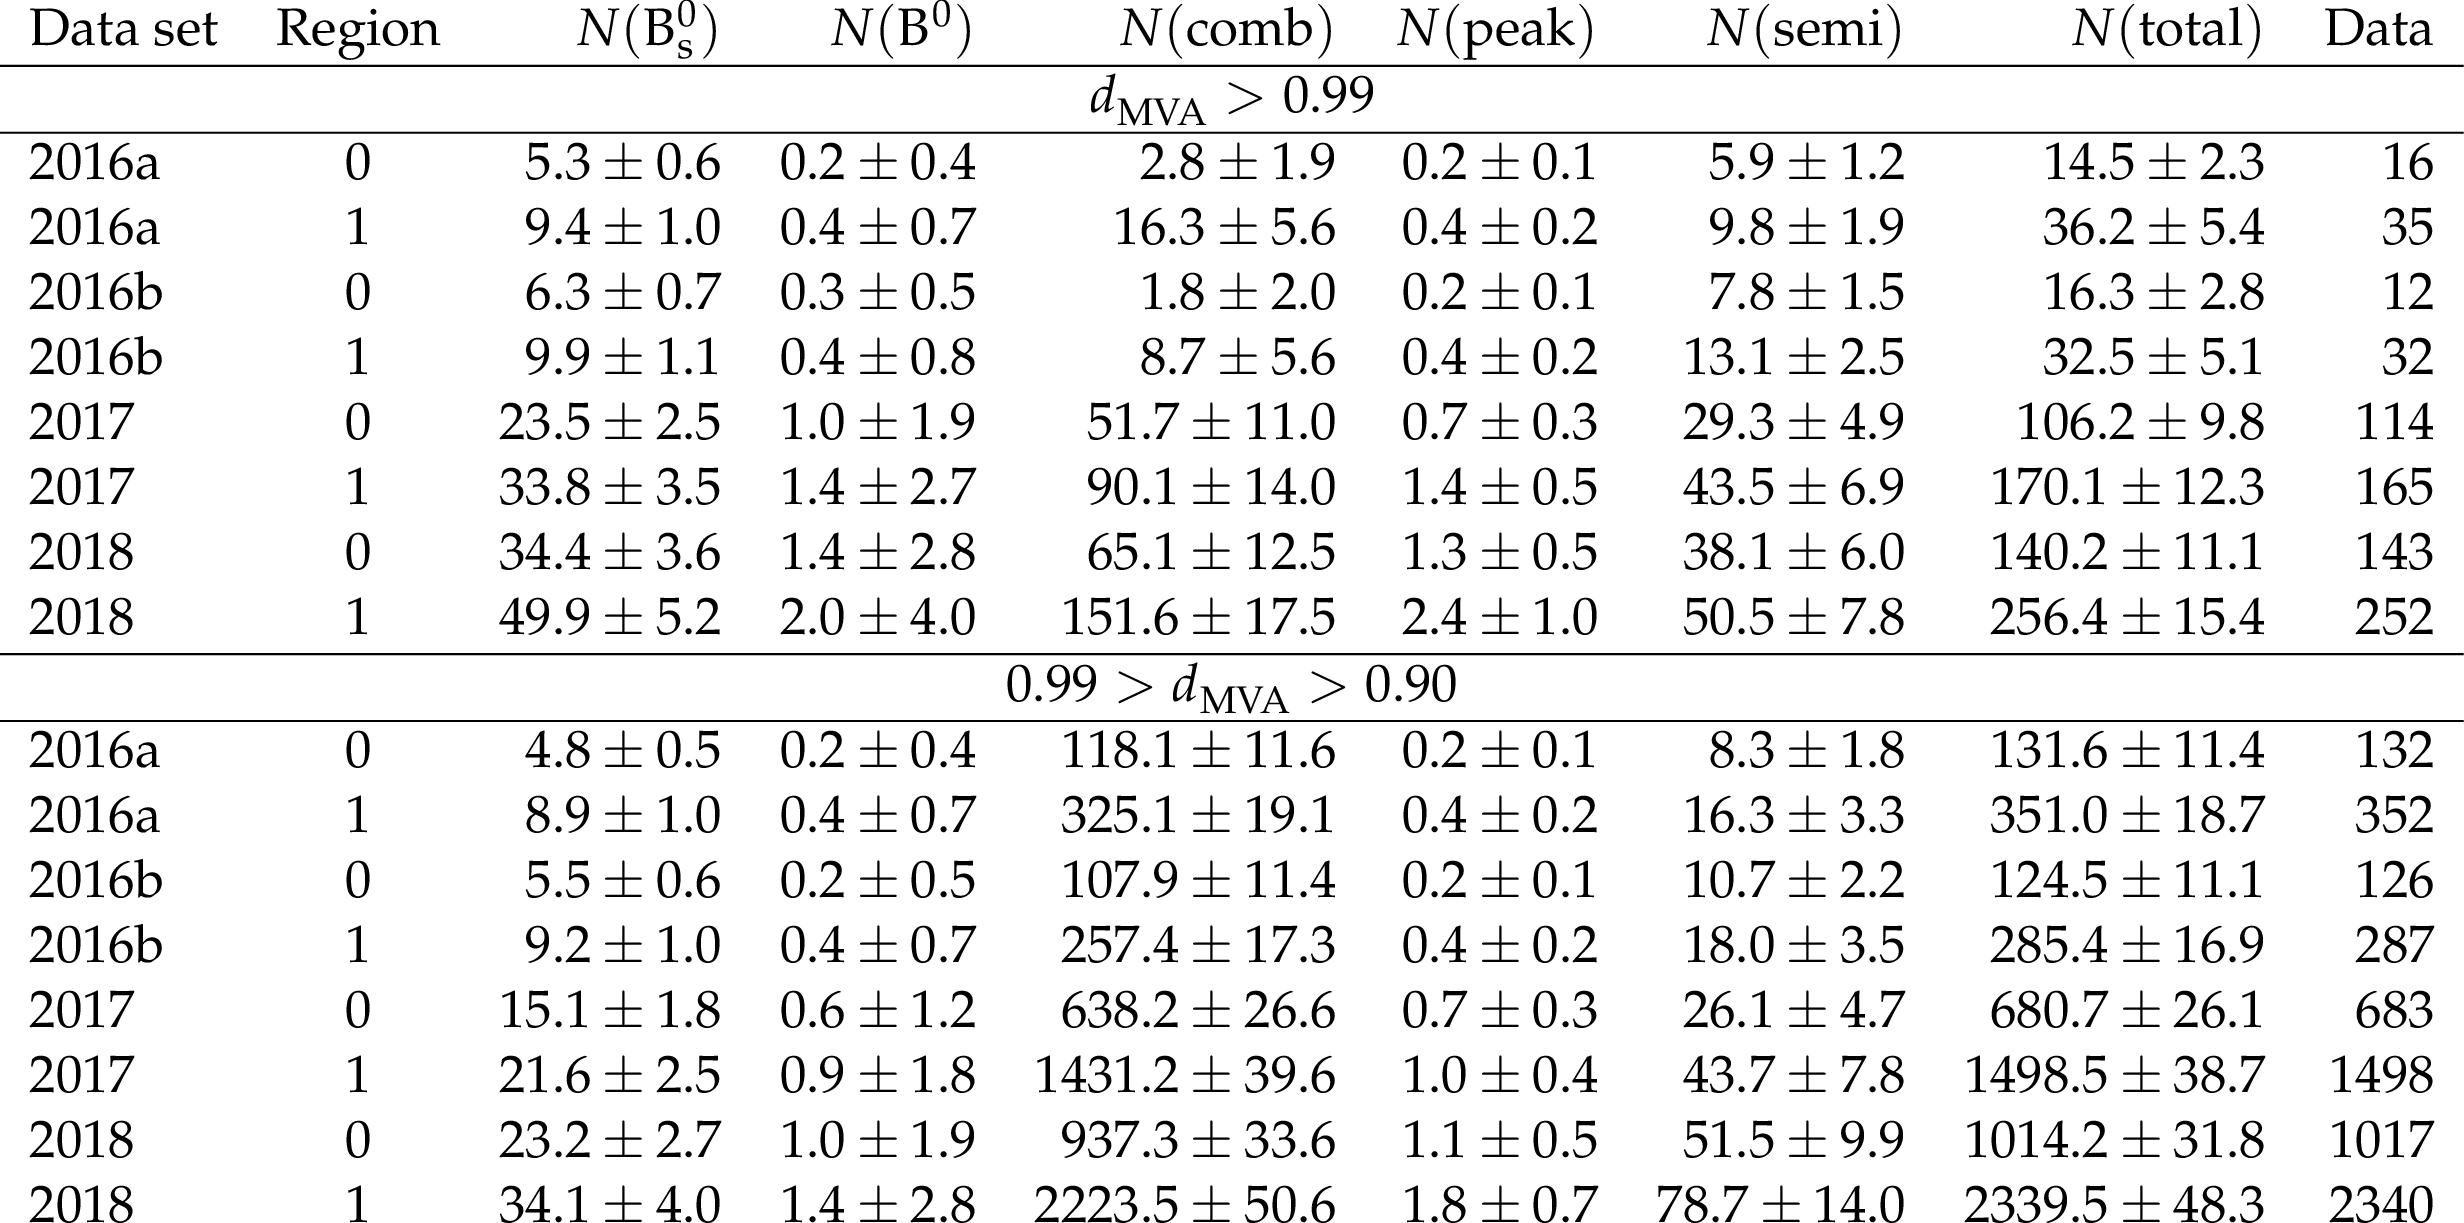
Table 5:
The expected event yields for $ \mathrm{B}_{s}^{0} \to\mu^{+}\mu^{-} $ ($ N(\mathrm{B}_{s}^{0}) $), $ {\mathrm{B}^0} \to \mu^{+}\mu^{-} $ ($ N({\mathrm{B}^0}) $), the combinatorial background ($ N $ (comb) ), the peaking background ($ N $ (peak)), and the semileptonic background ($ N $ (semi)) are summarized for each category (post-fit). The total expected and observed event yields are given in $ N $ (total) and Data column, respectively. Regions 0 and 1 refer to the ranges of 0.0-0.7 and 0.7-1.4, respectively, for the $ |\eta| $ of the most forward muon. The uncertainties are statistical only. |
| Summary |
|
Measurements of the branching fraction ($ \mathcal{B} $) of the $ \mathrm{B}_{s}^{0} \to\mu^{+}\mu^{-} $ decay and the effective $ \mathrm{B}_{s}^{0} $ meson lifetime in this decay based on a data set of proton-proton collisions at $ \sqrt{s} = $ 13 TeV corresponding to an integrated luminosity of 140 fb$ ^{-1} $ have been presented and found to be: |
| Additional Figures | |
png pdf |
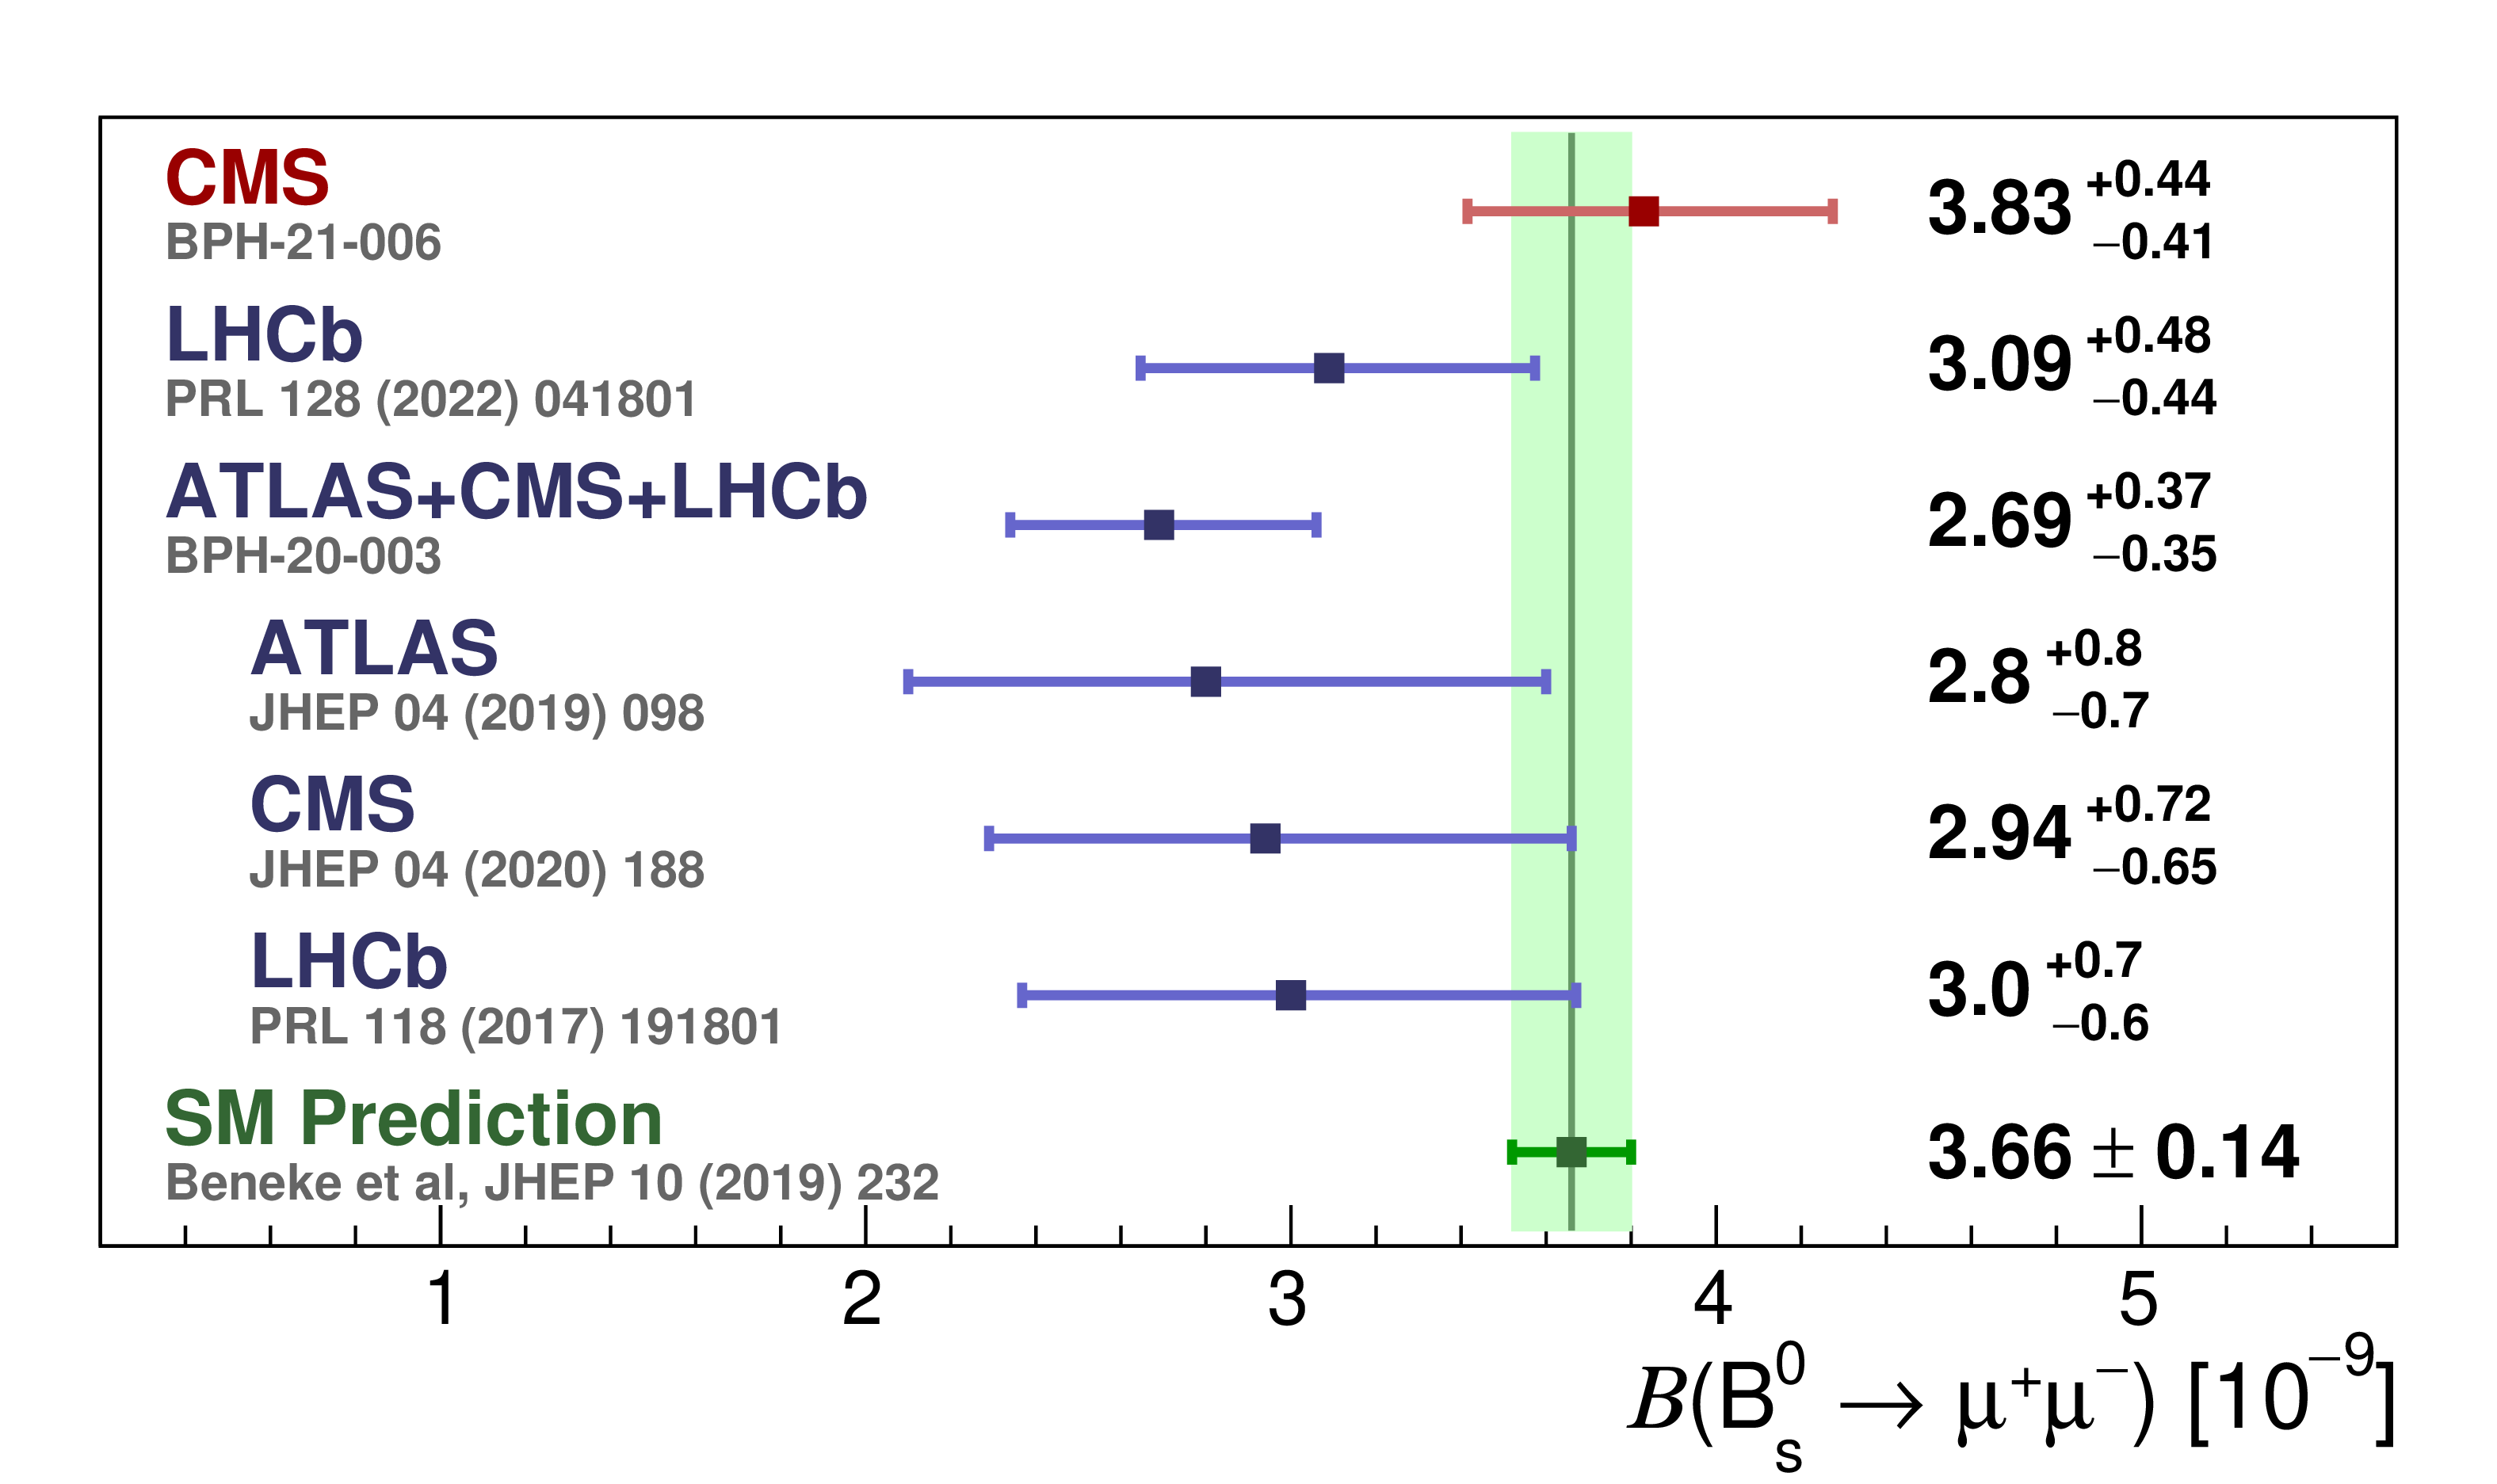
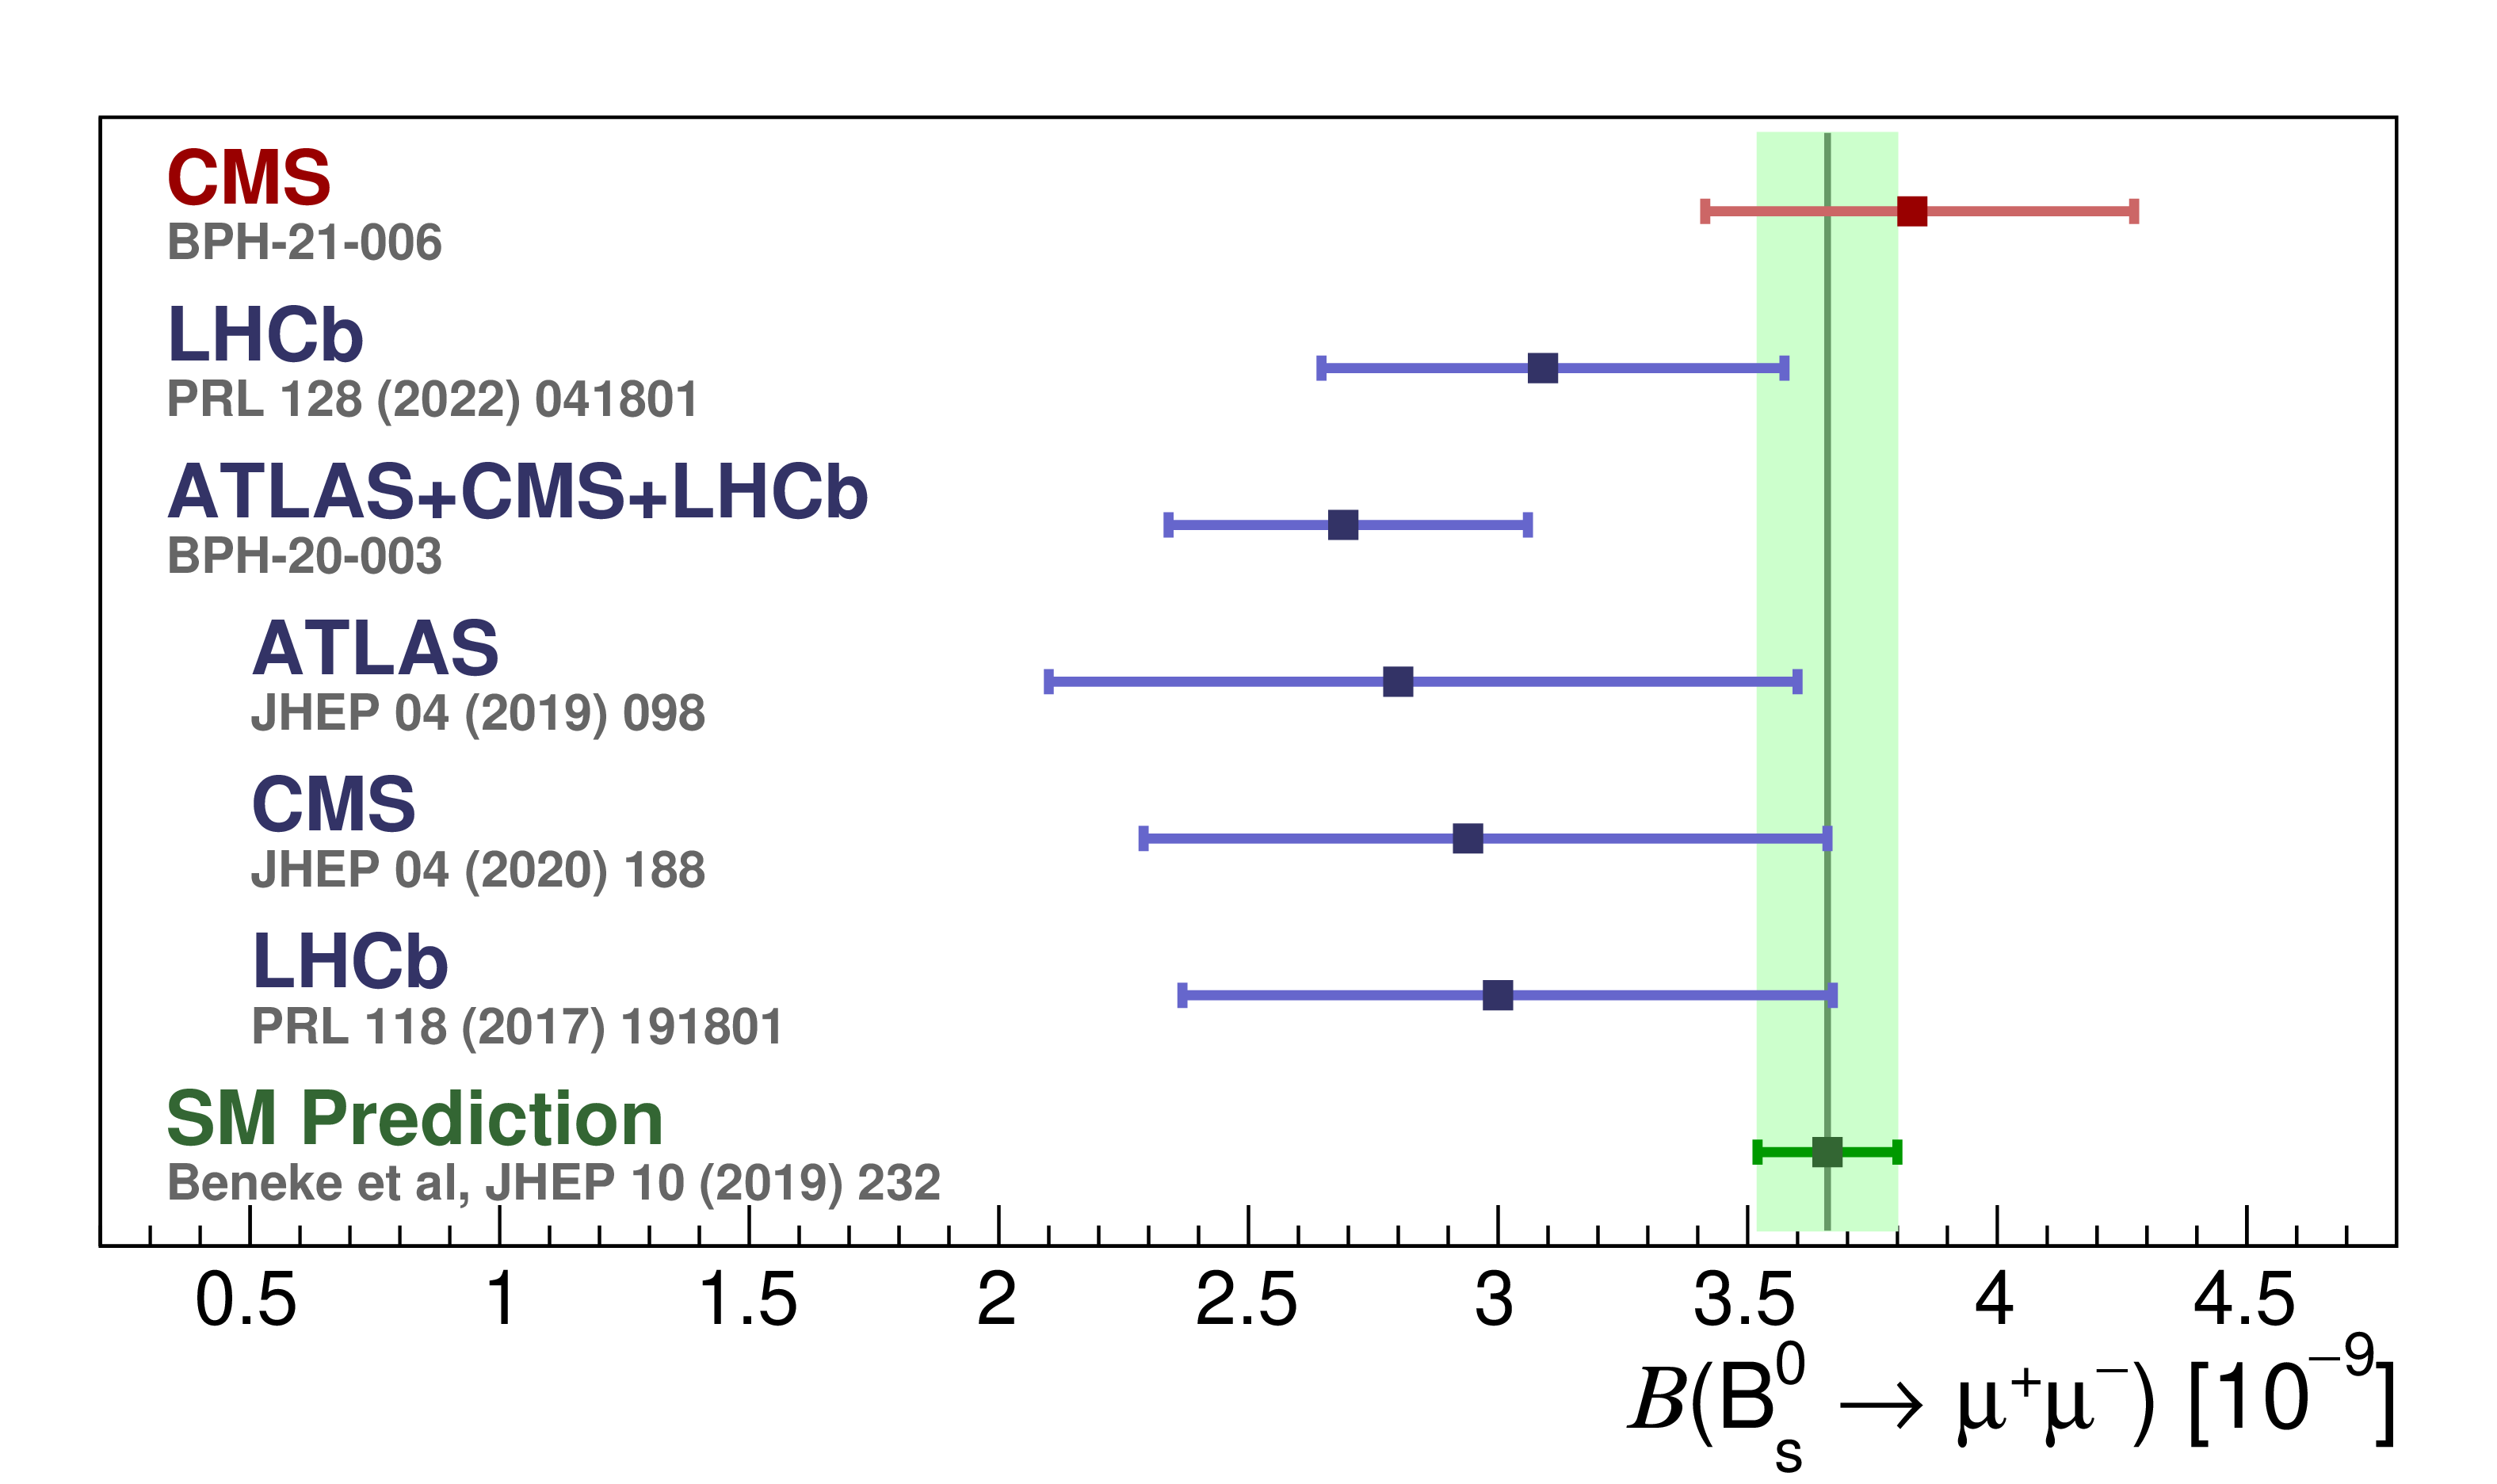
Additional Figure 1:
Comparison of the $ \mathrm{B}_{s}^{0} \to\mu^{+}\mu^{-} $ branching fraction measurement with the most recent results and the Standard Model. |
png pdf |
Additional Figure 2:
Comparison of the $ \mathrm{B}_{s}^{0} \to\mu^{+}\mu^{-} $ branching fraction measurement with the most recent results and the Standard Model. |
png pdf |
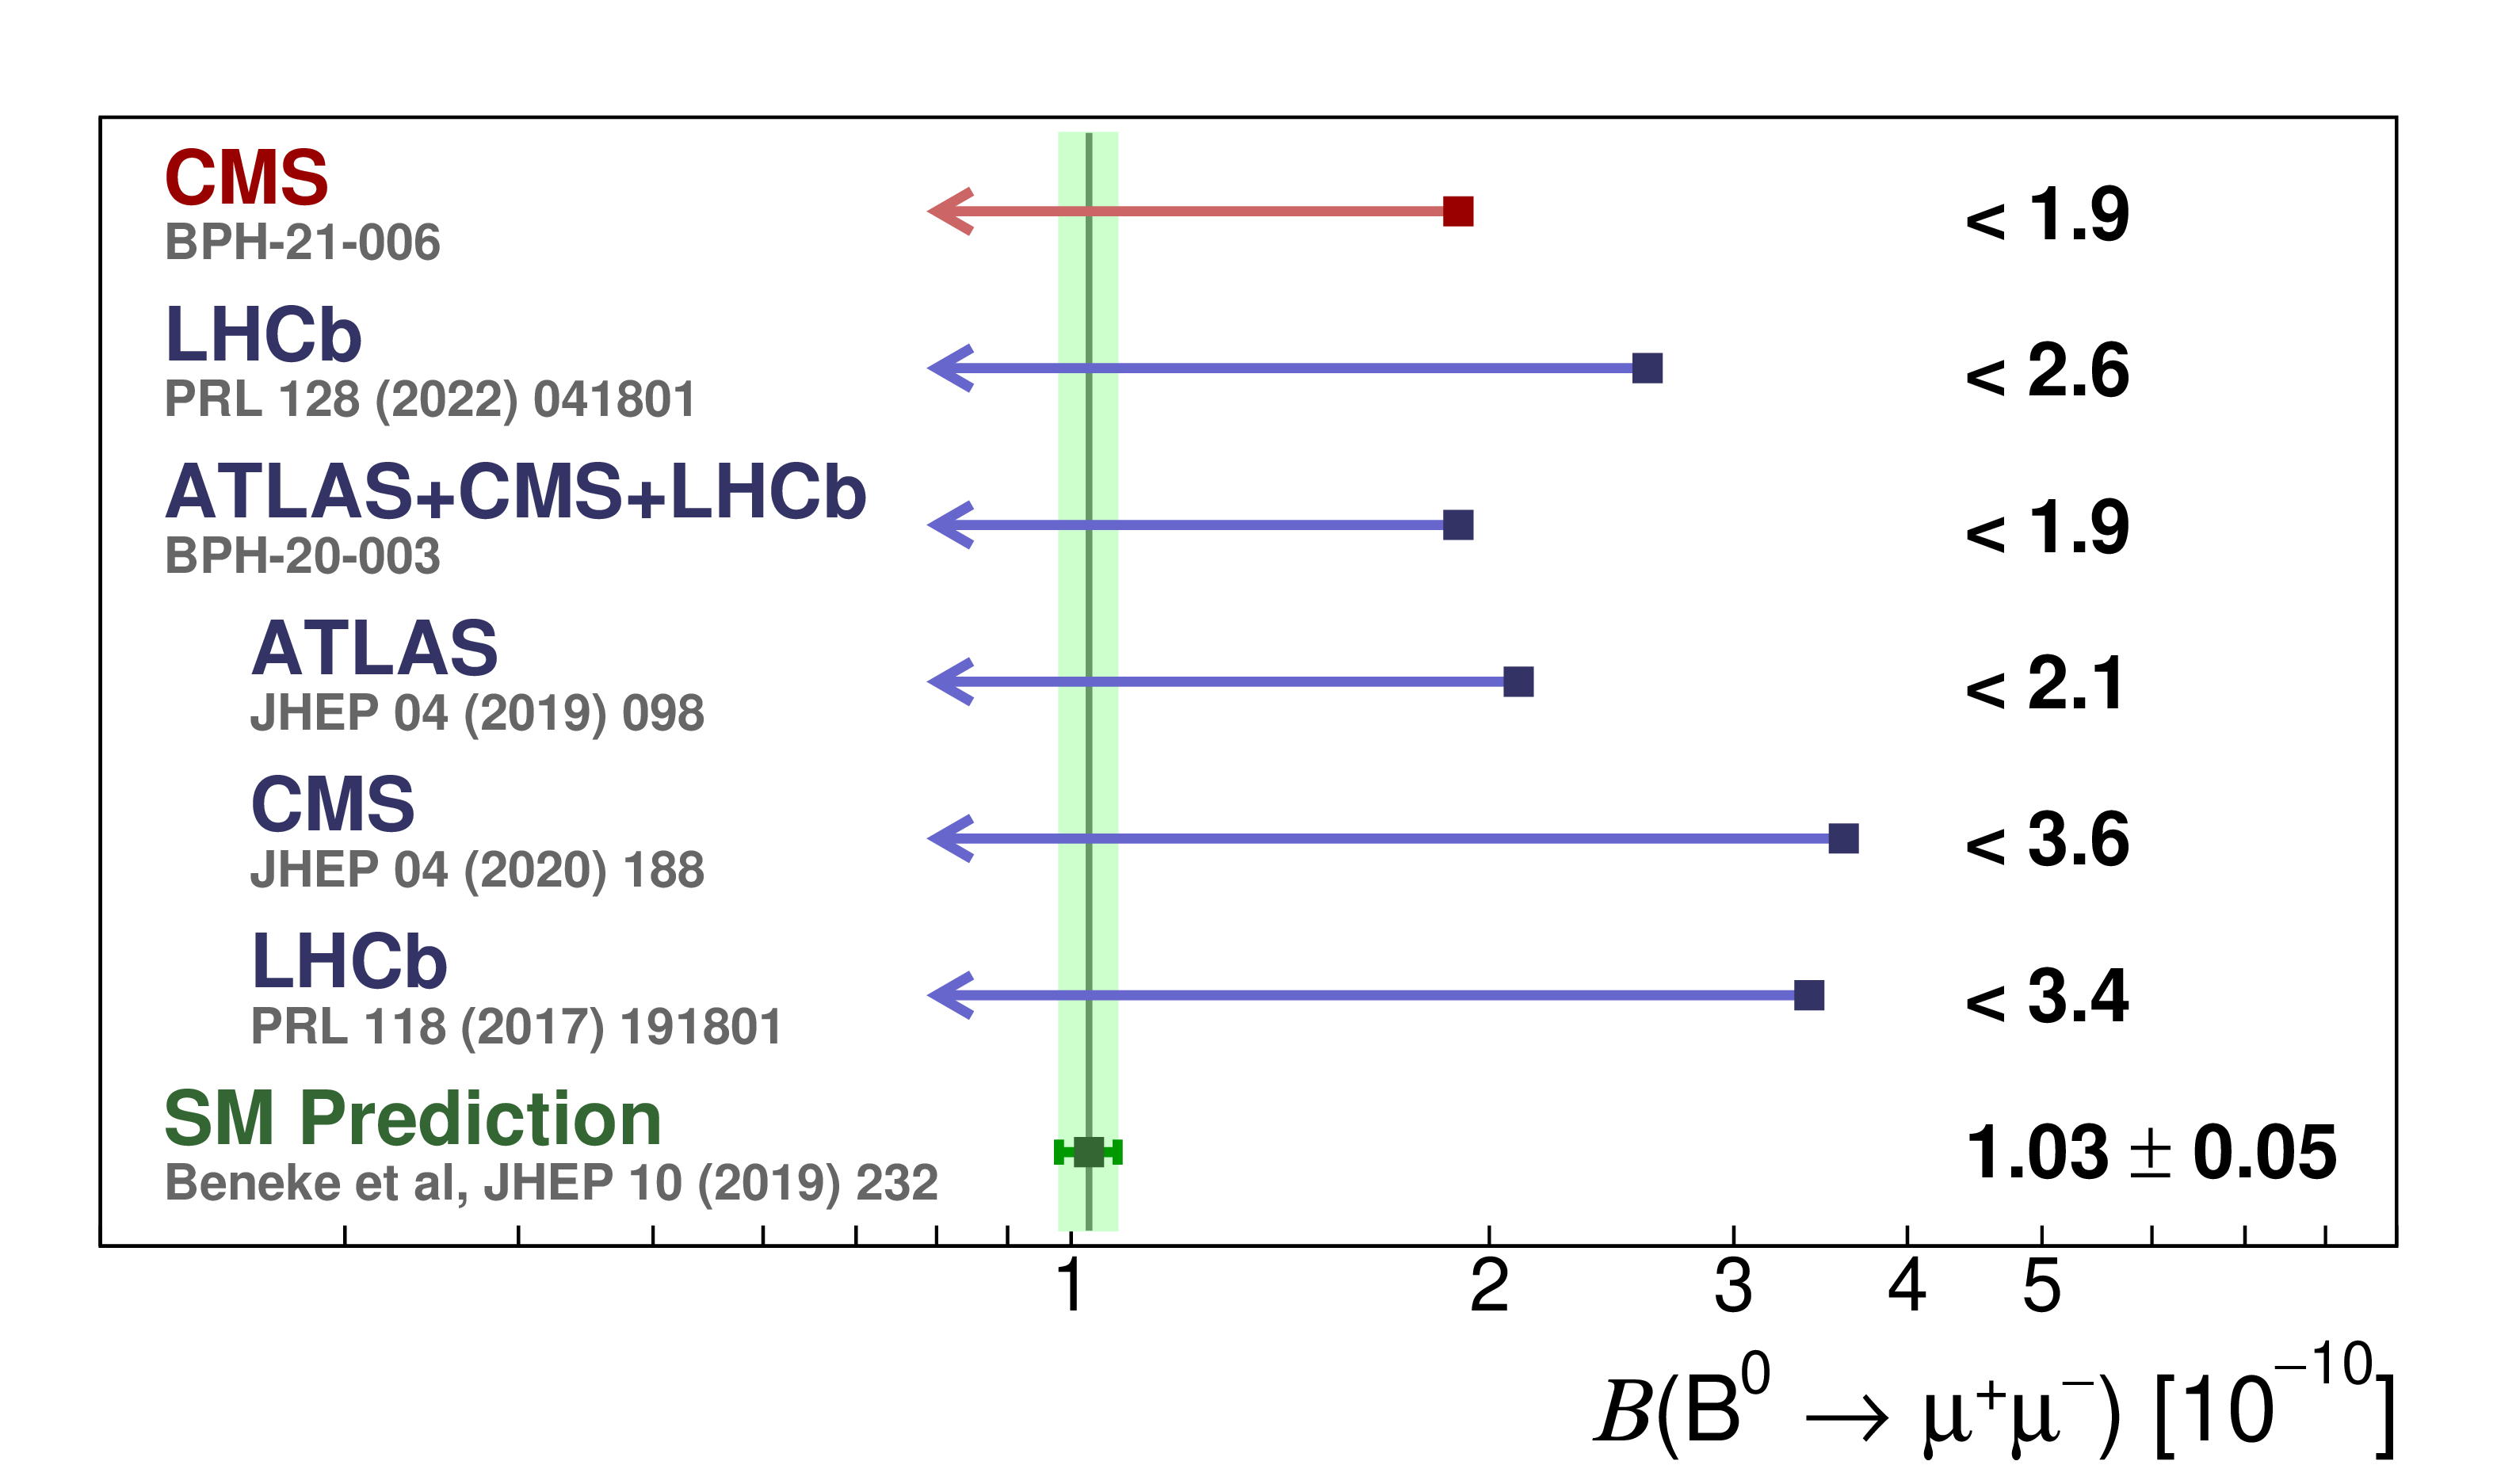
Additional Figure 3:
Comparison of the $ {\mathrm{B}^0} \to \mu^{+}\mu^{-} $ branching fraction measurement with the most recent results and the Standard Model. |

png pdf |
Additional Figure 4:
Comparison of the $ {\mathrm{B}^0} \to \mu^{+}\mu^{-} $ branching fraction measurement with the most recent results and the Standard Model. |
png pdf |
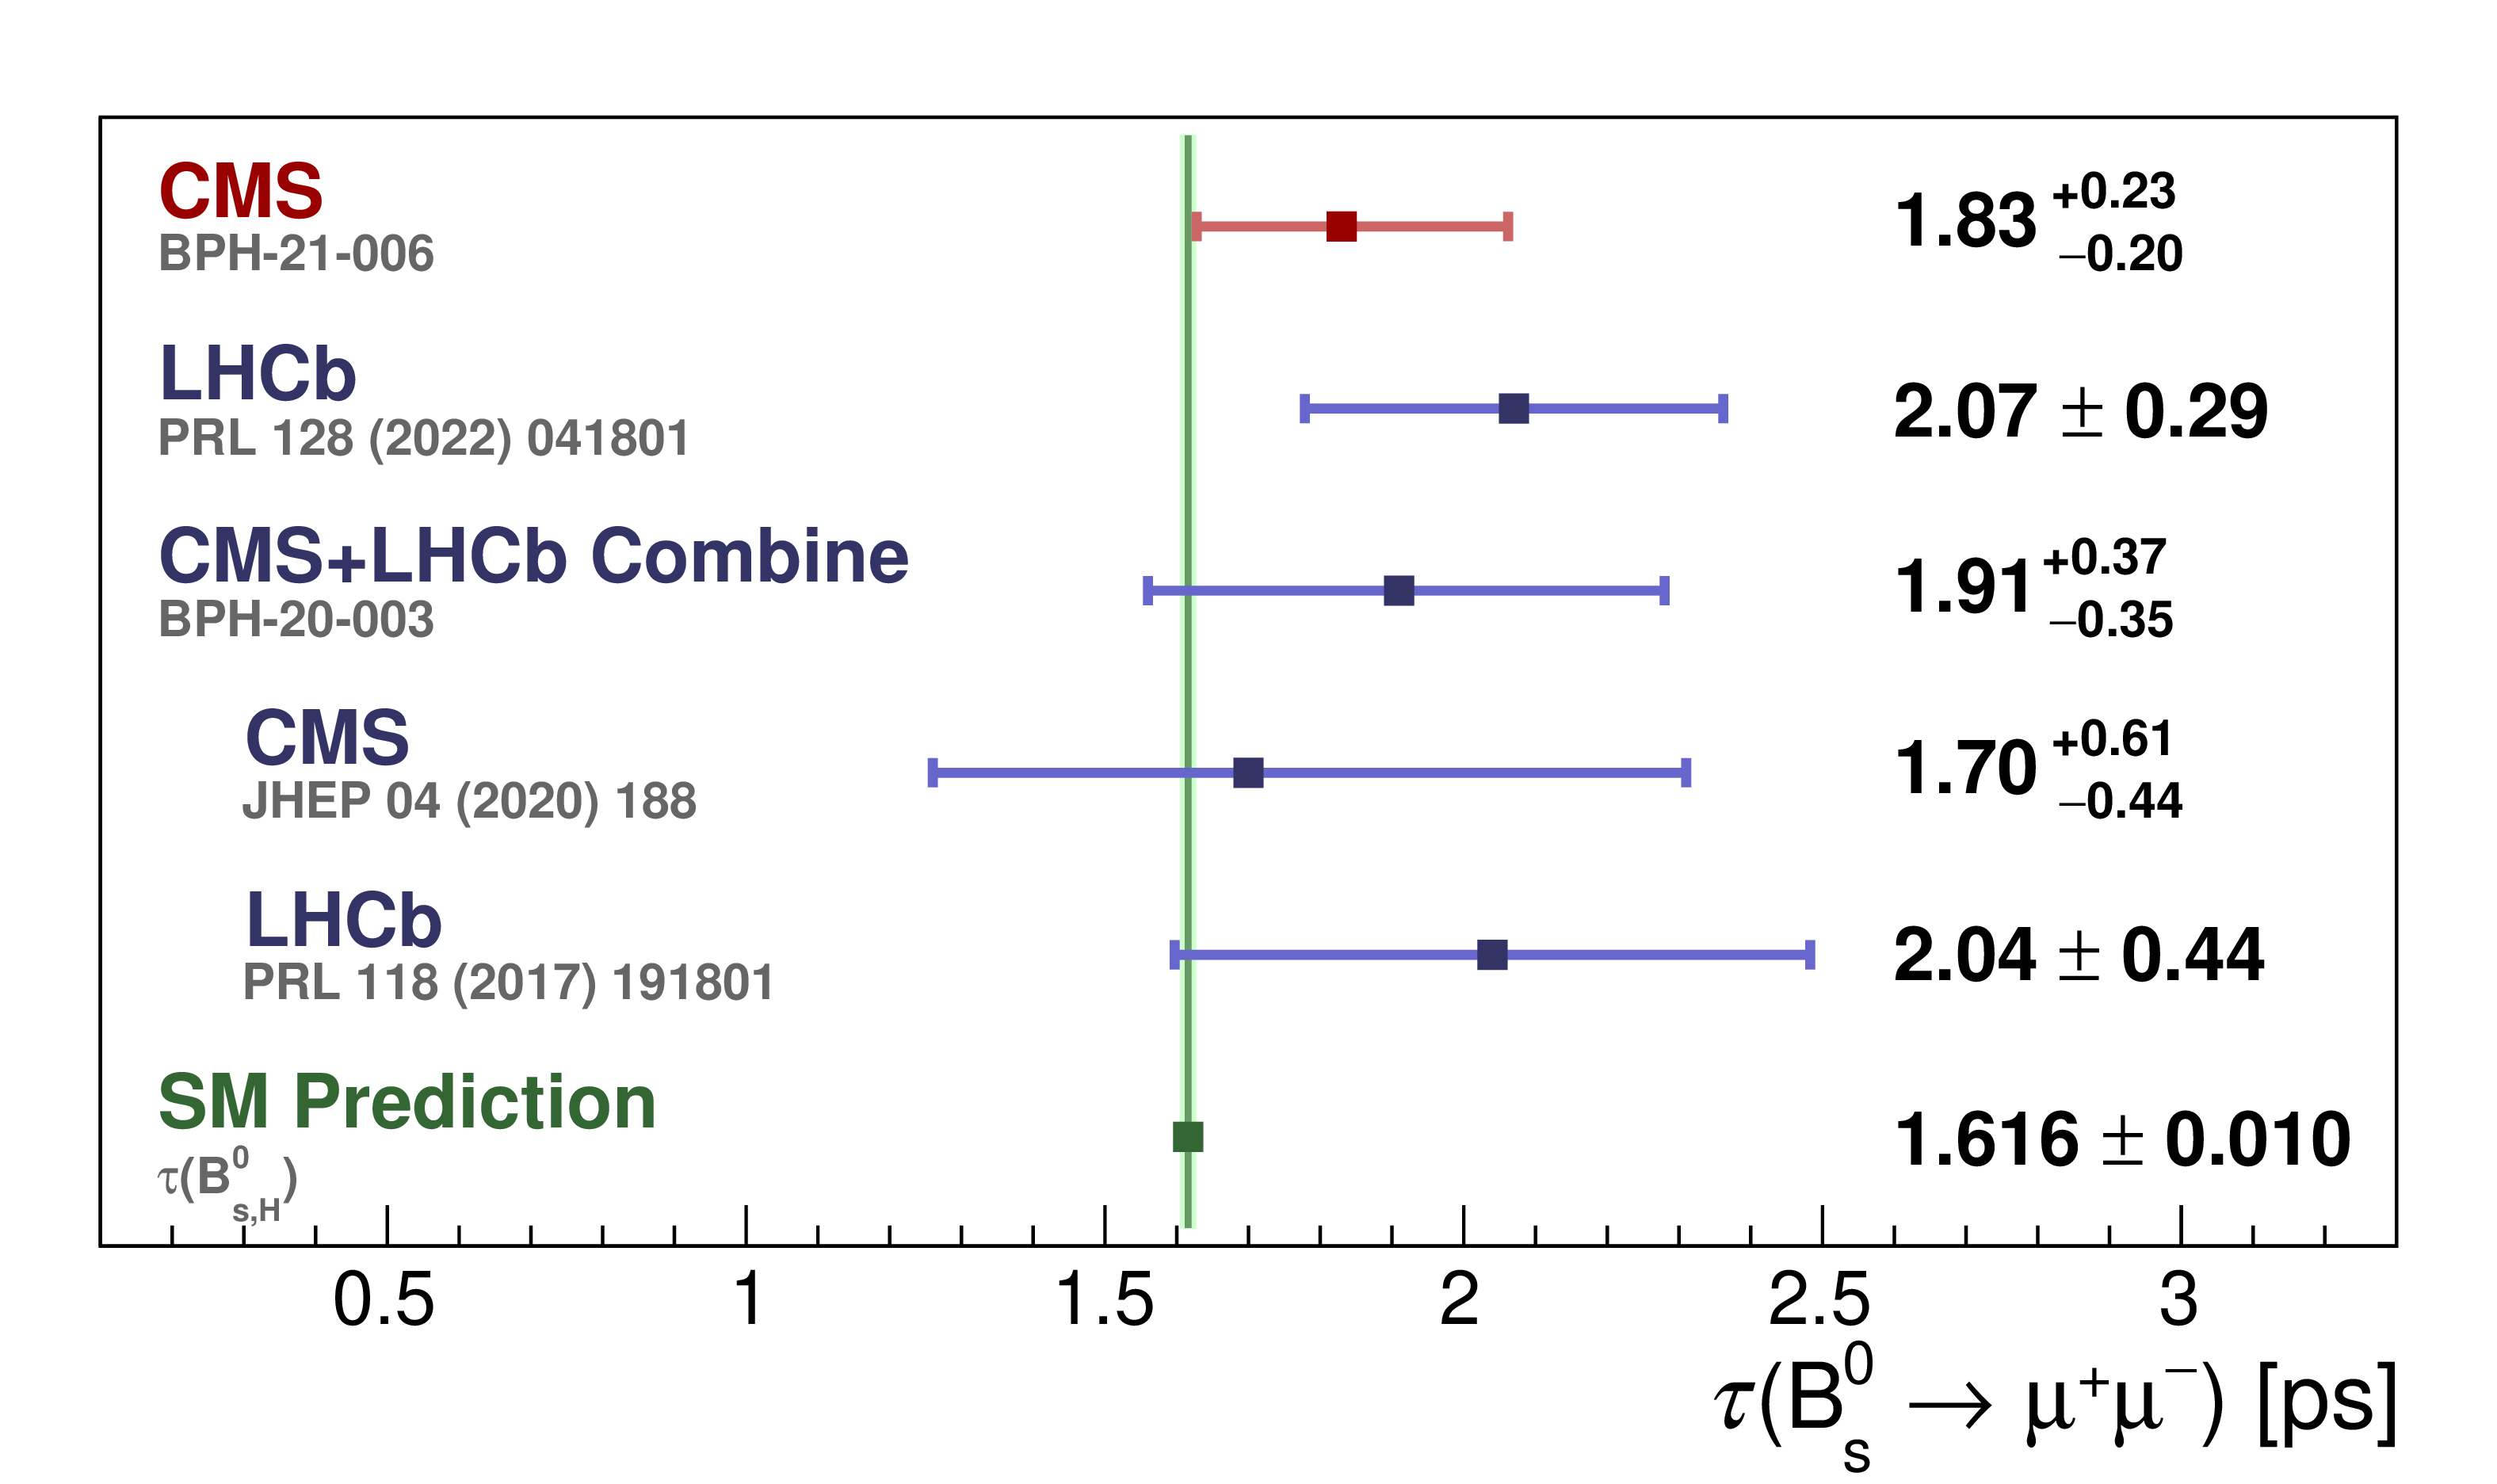
Additional Figure 5:
Comparison of the $ \mathrm{B}_{s}^{0} \to\mu^{+}\mu^{-} $ effective lifetime measurement with the most recent results and the Standard Model. |

png pdf |
Additional Figure 6:
Comparison of the $ \mathrm{B}_{s}^{0} \to\mu^{+}\mu^{-} $ effective lifetime measurement with the most recent results and the Standard Model. |

png pdf |
Additional Figure 7:
The dimuon mass distribution projection for the branching fraction fit for high purity event category. The blue curves represent the corresponding projections of the final fit model. |
png pdf |
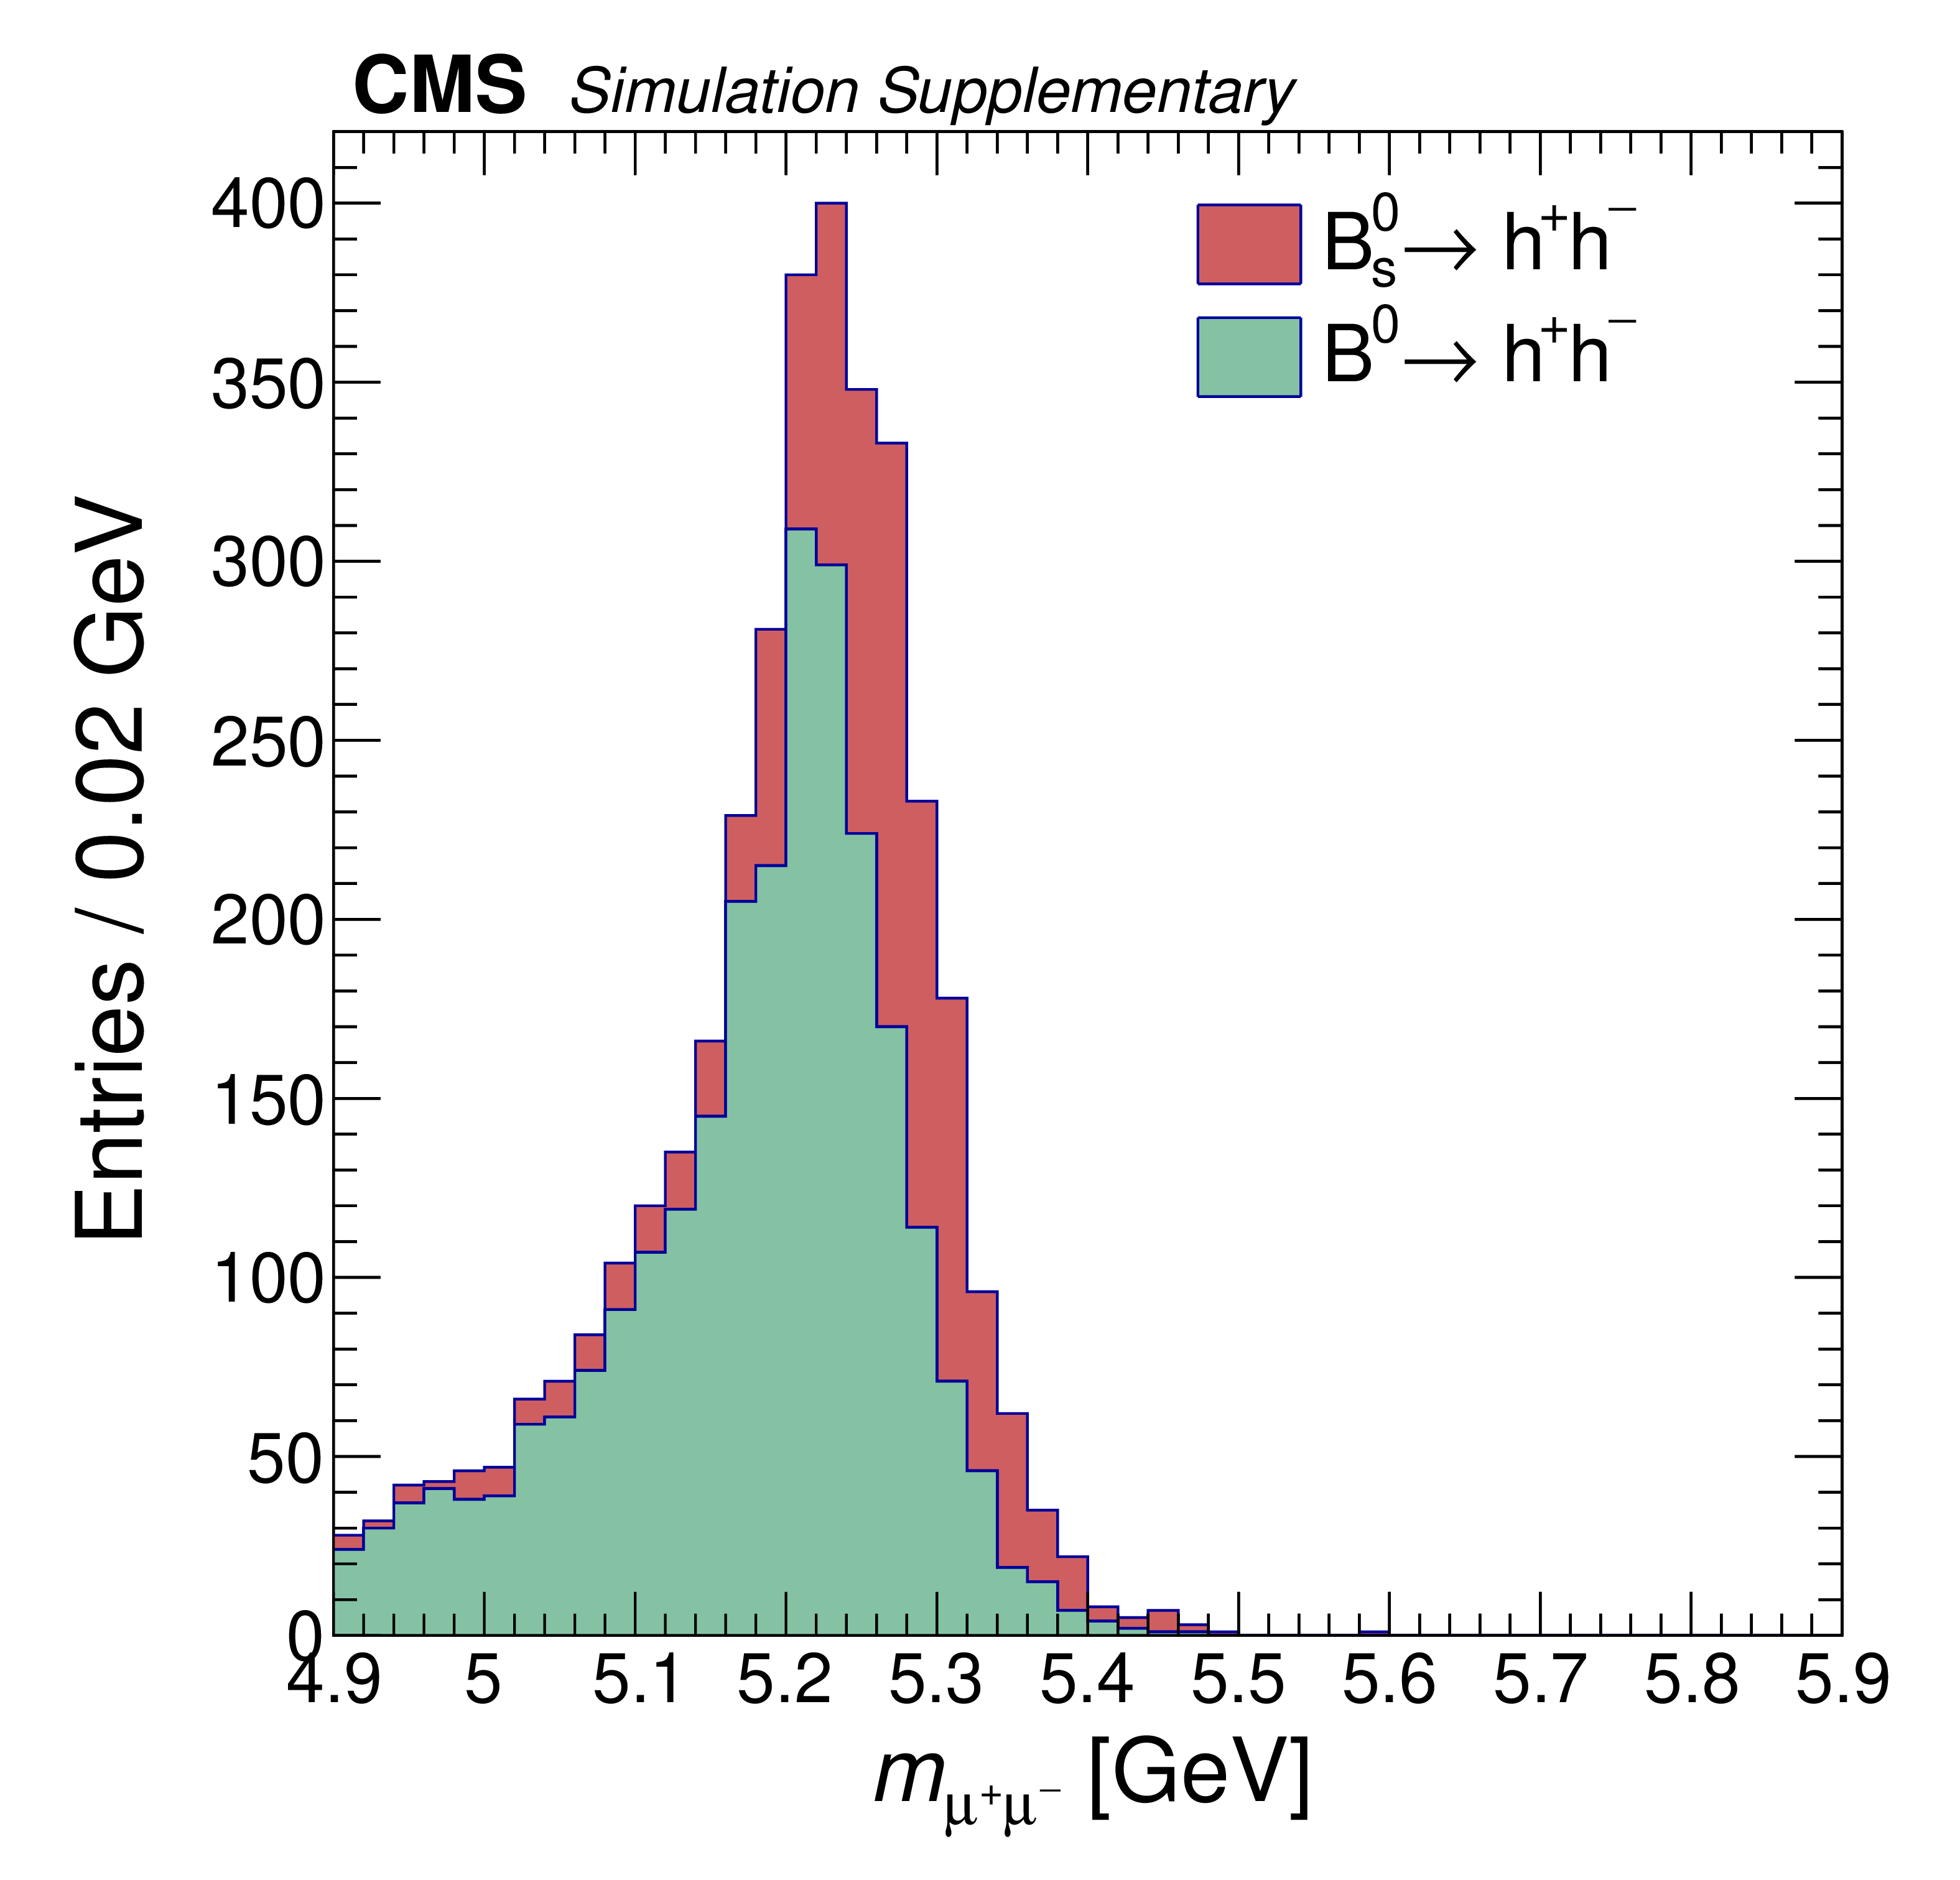
Additional Figure 8:
Simulated $ {\mathrm{B}}\to \mathrm{h}^+\mathrm{h}^- $ mass distribution using the nominal event selection. |

png pdf |
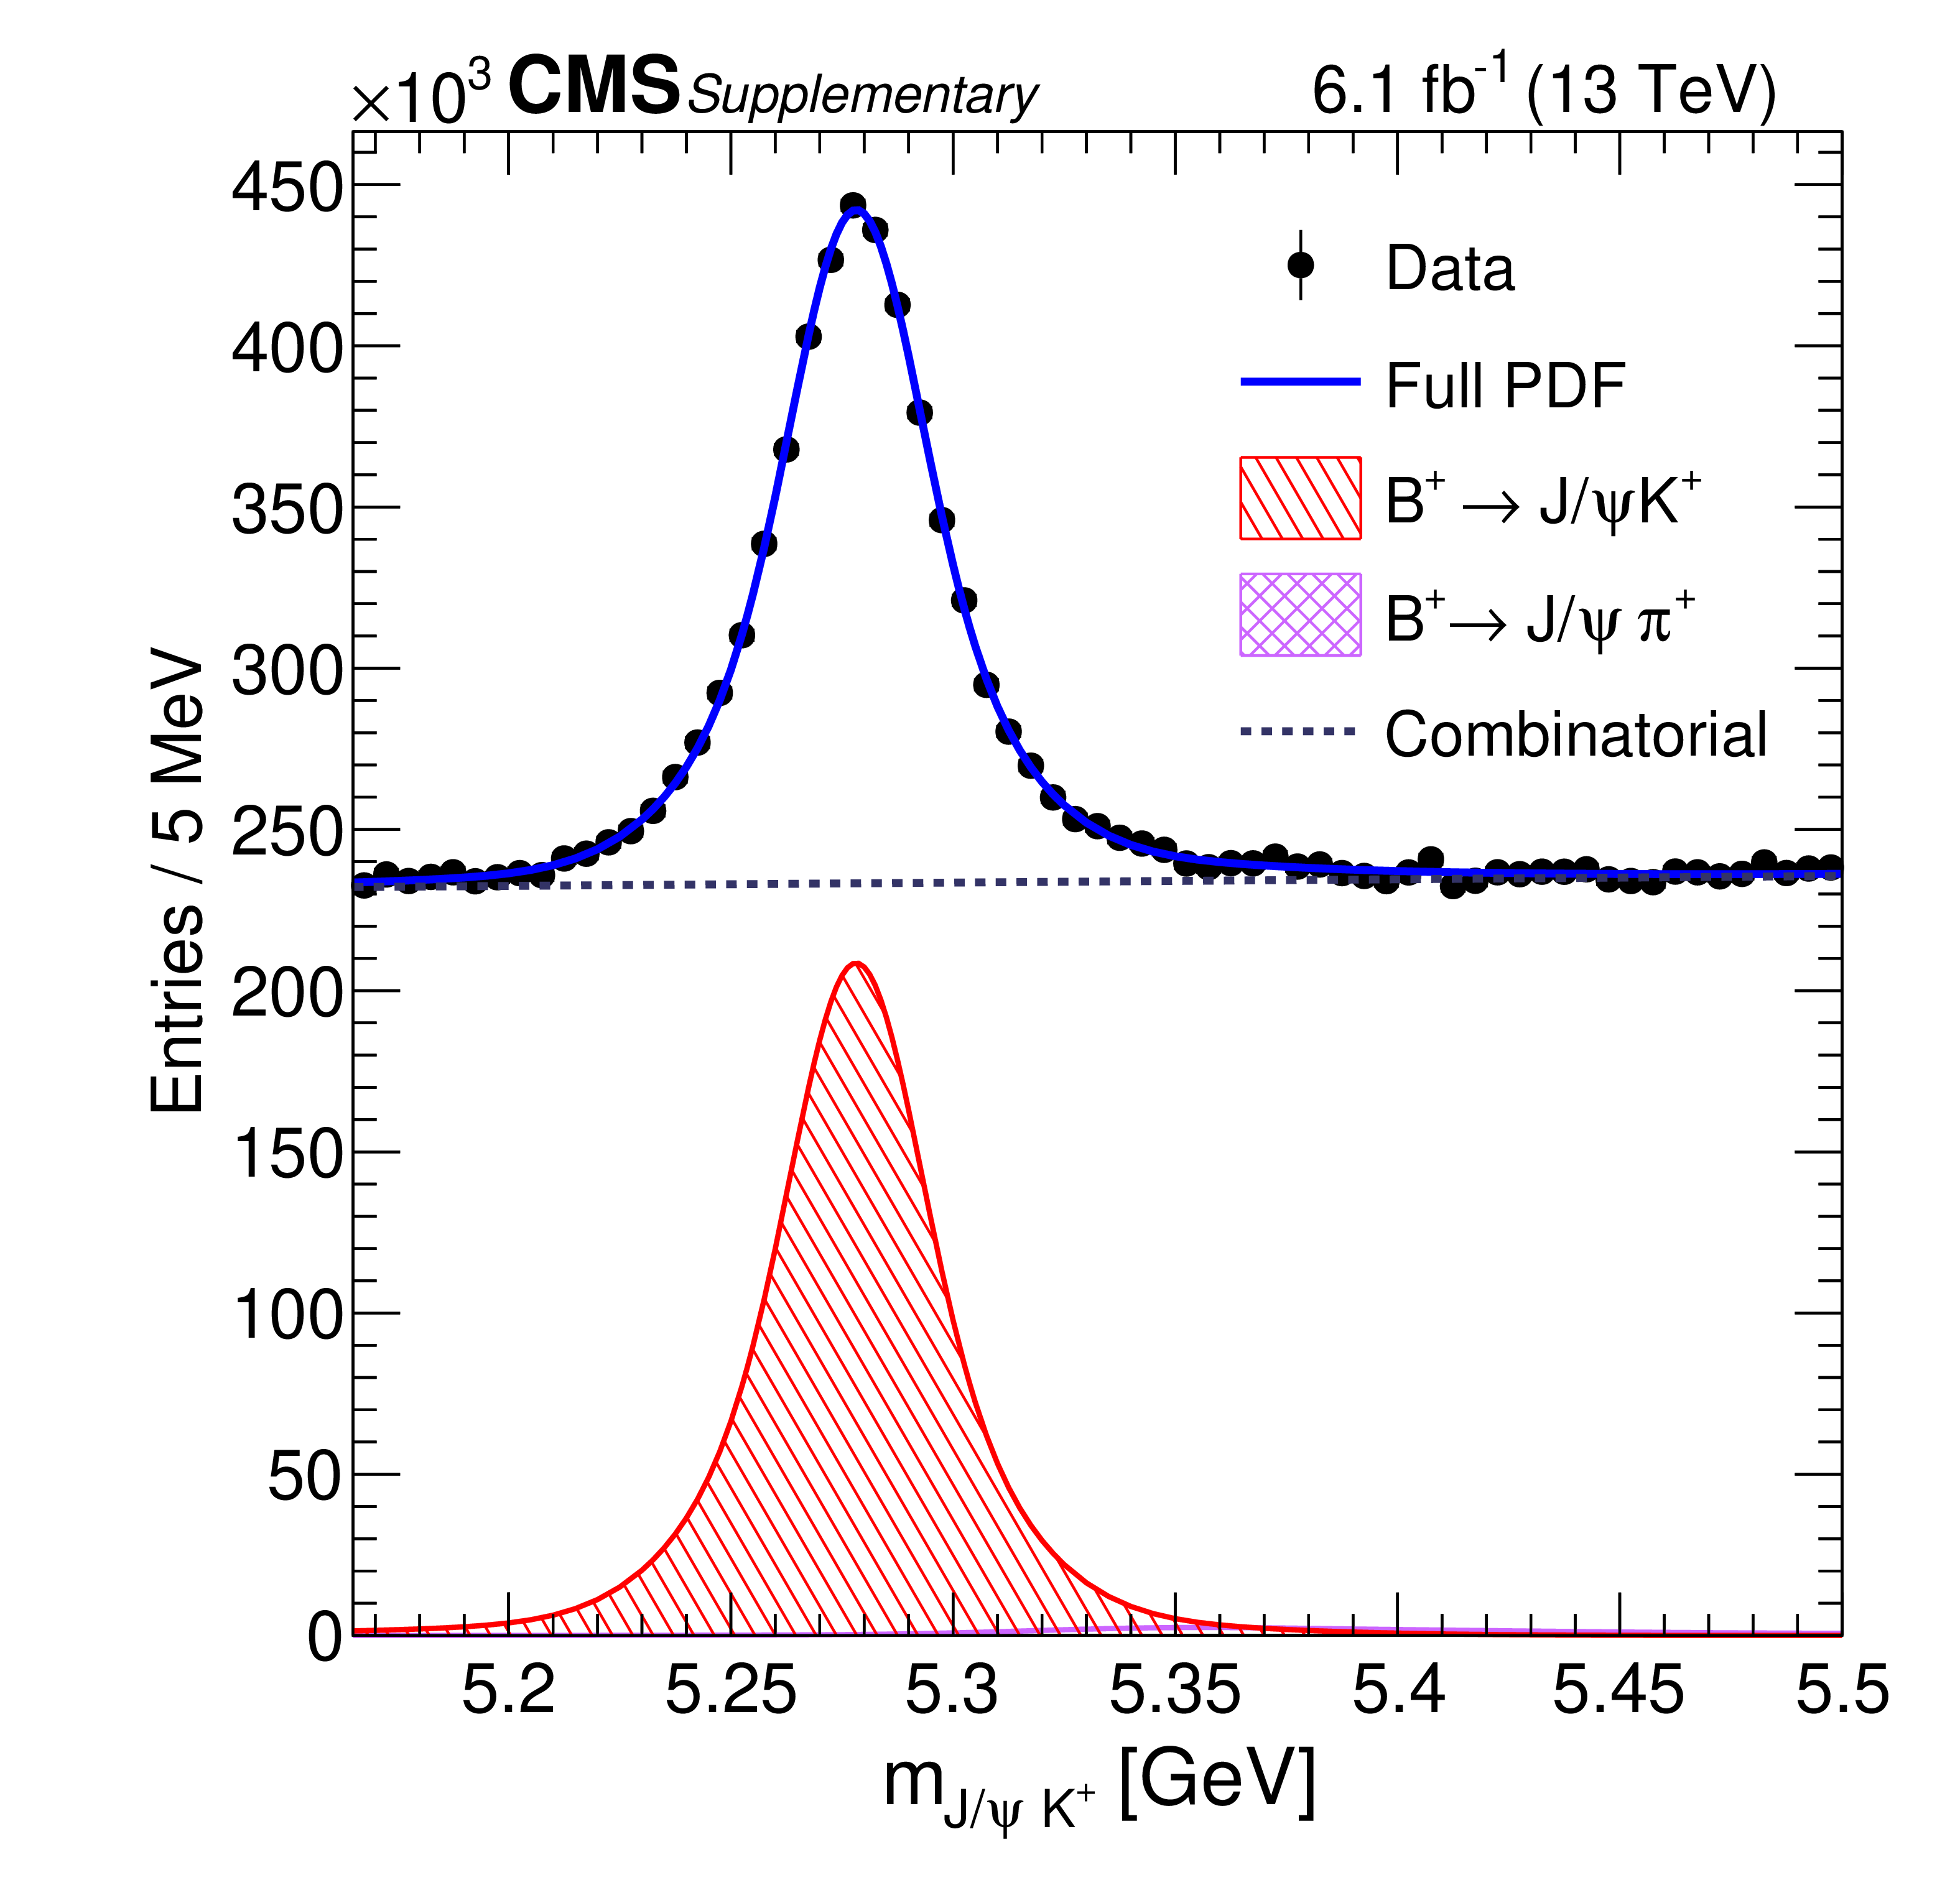
Additional Figure 9:
The mass distribution of the $ {\mathrm{B}^{+}} \to \mathrm{J}/\psi\mathrm{K^+} $ decays observed in Run2018 data for events where $ |\eta_{\mu}| < $ 0.7. The blue curve shows the result of the unbinned maximum likelihood fit. The signal event yield, extracted from the fit, is used for normalization of the $ \mathrm{B}_{s}^{0} \to\mu^{+}\mu^{-} $ branching fraction. The selection requirements are optimized for the most precise estimation of the normalization. |
png pdf |
Additional Figure 10:
The mass distribution of the $ {\mathrm{B}^{+}} \to \mathrm{J}/\psi\mathrm{K^+} $ decays observed in Run2018 data for events where $ |\eta_{\mu 1}| > $ 0.7 or $ |\eta_{\mu 2}| > $ 0.7. The blue curve shows the result of the unbinned maximum likelihood fit. The signal event yield, extracted from the fit, is used for normalization of the $ \mathrm{B}_{s}^{0} \to\mu^{+}\mu^{-} $ branching fraction. The selection requirements are optimized for the most precise estimation of the normalization. |
png pdf |
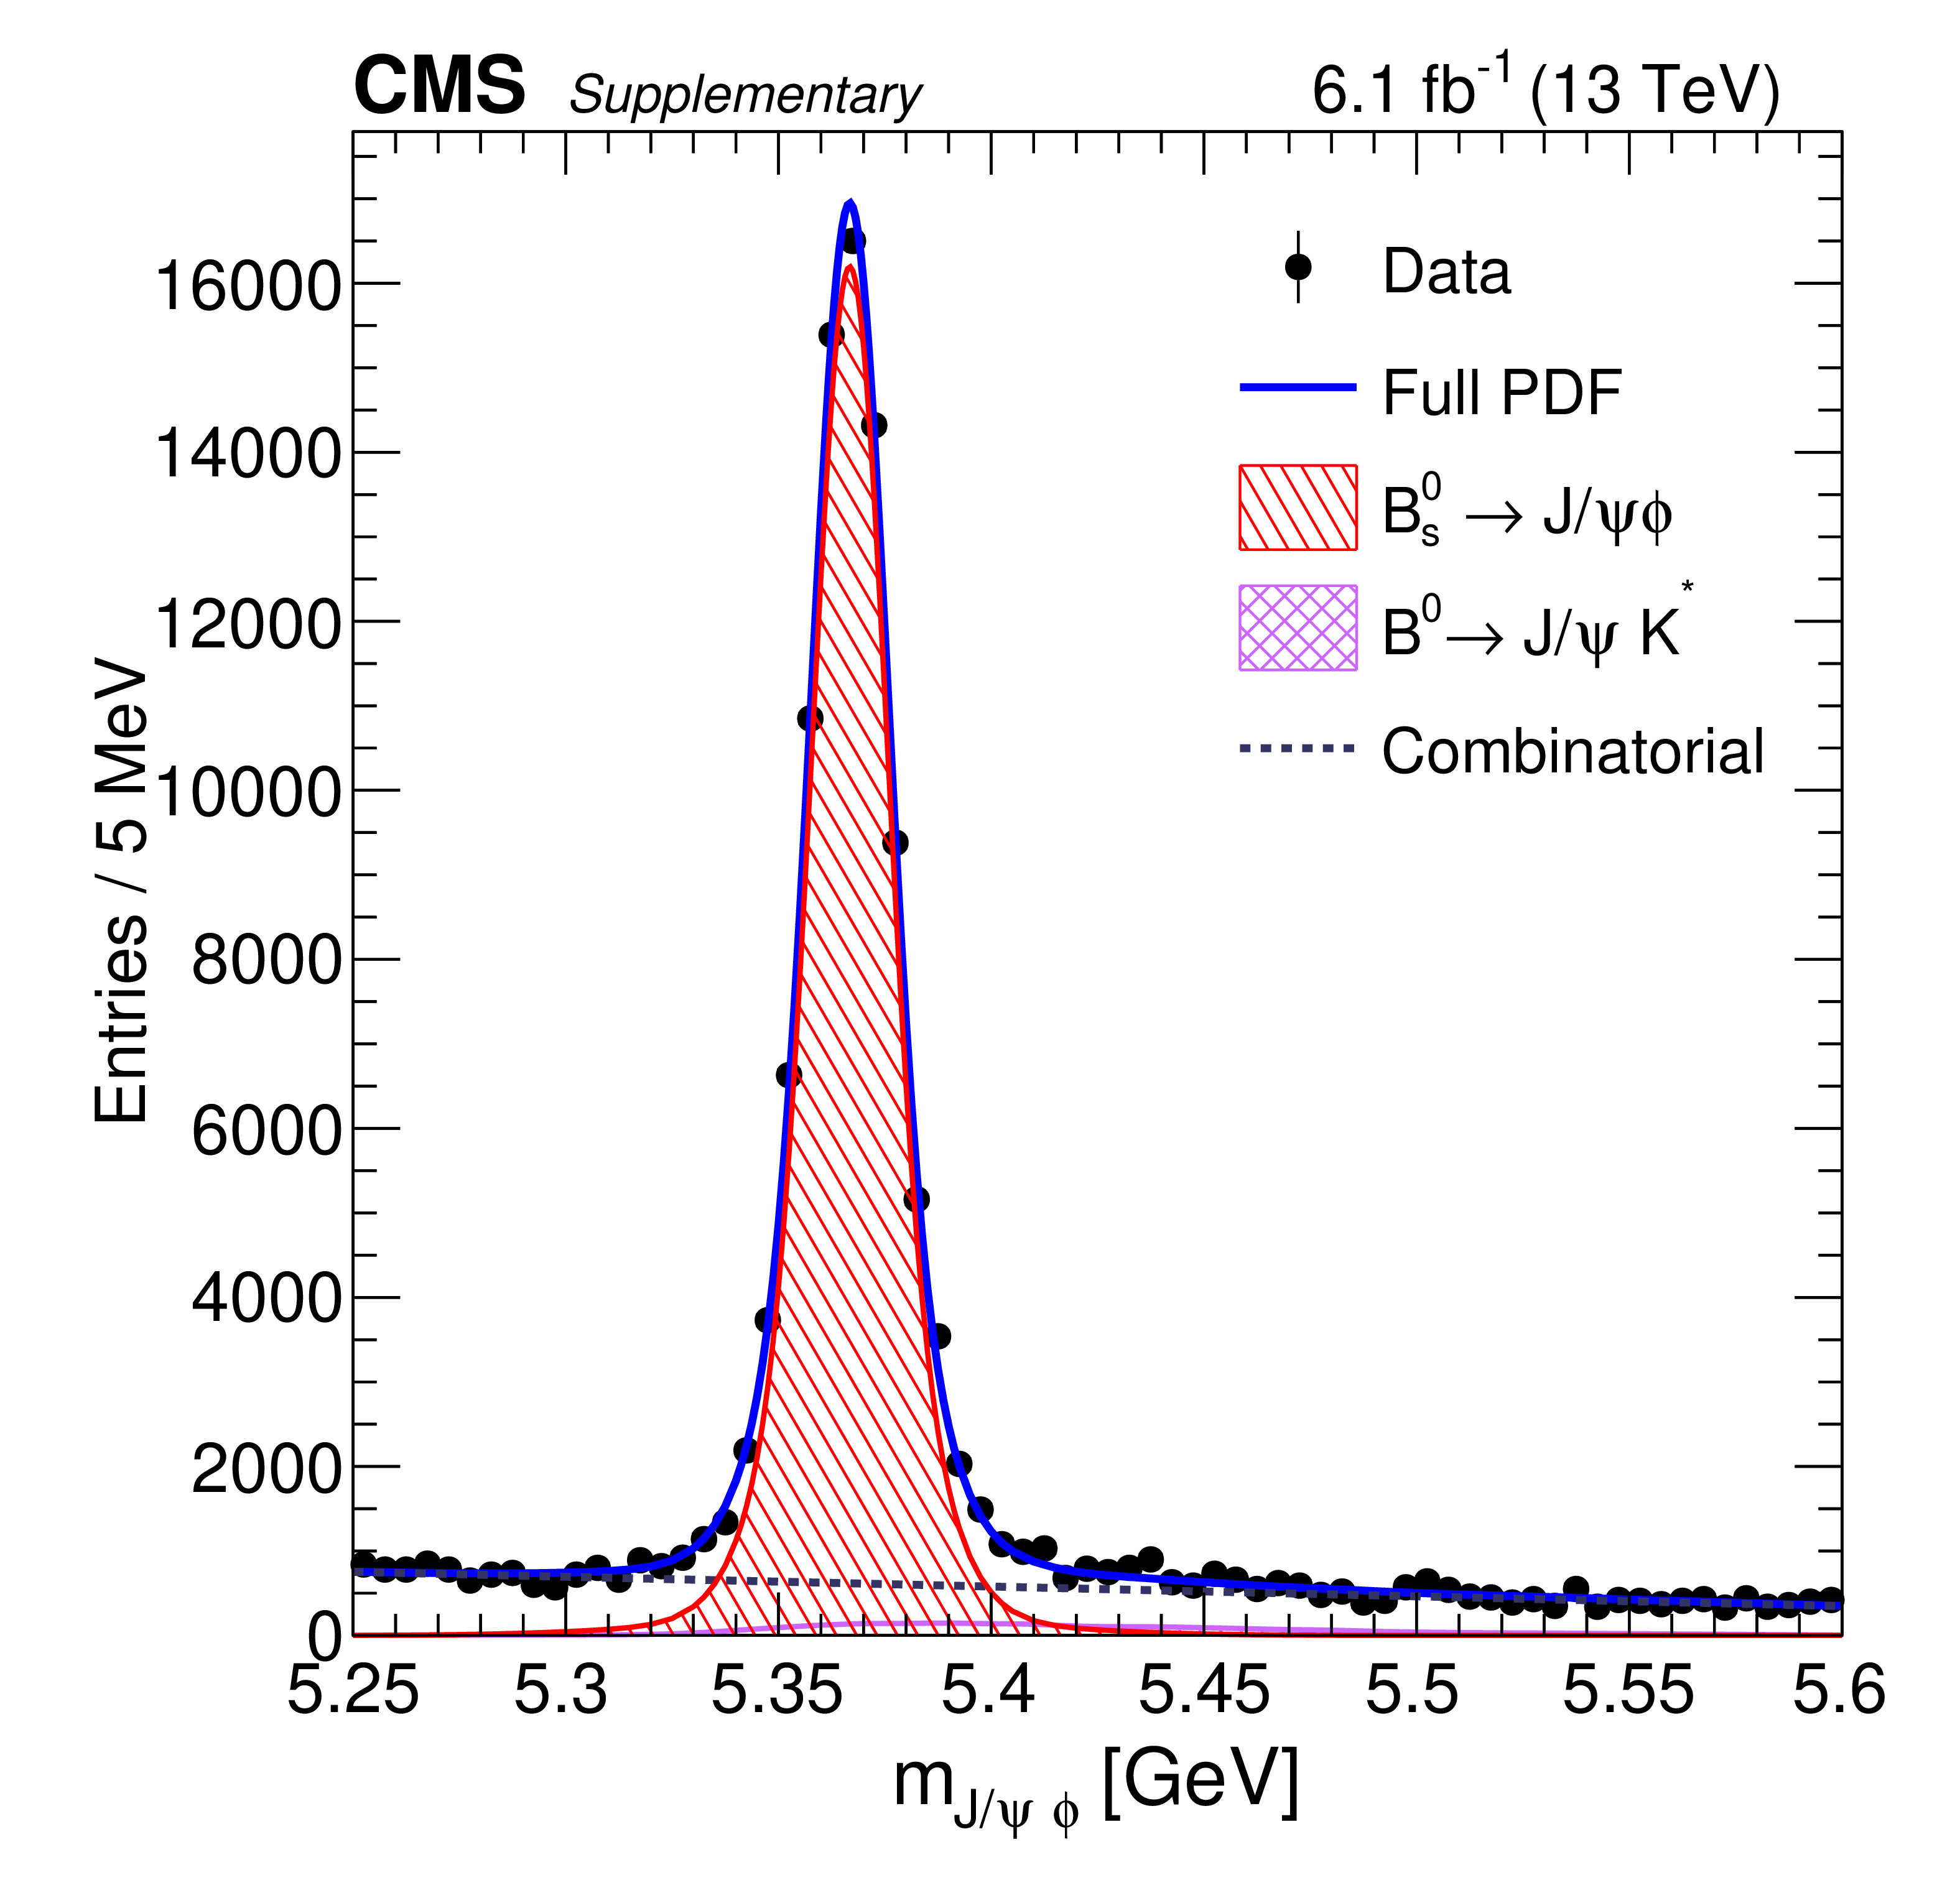
Additional Figure 11:
The mass distribution of the $ \mathrm{B}_{s}^{0}\to\mathrm{J}/\psi\phi(1020) $ decays observed in Run2018 data for events where $ |\eta_{\mu}| < $ 0.7. The blue curve shows the result of the unbinned maximum likelihood fit. The signal event yield, extracted from the fit, is used for normalization of the $ \mathrm{B}_{s}^{0} \to\mu^{+}\mu^{-} $ branching fraction. The selection requirements are optimized for the most precise estimation of the normalization. |
png pdf |
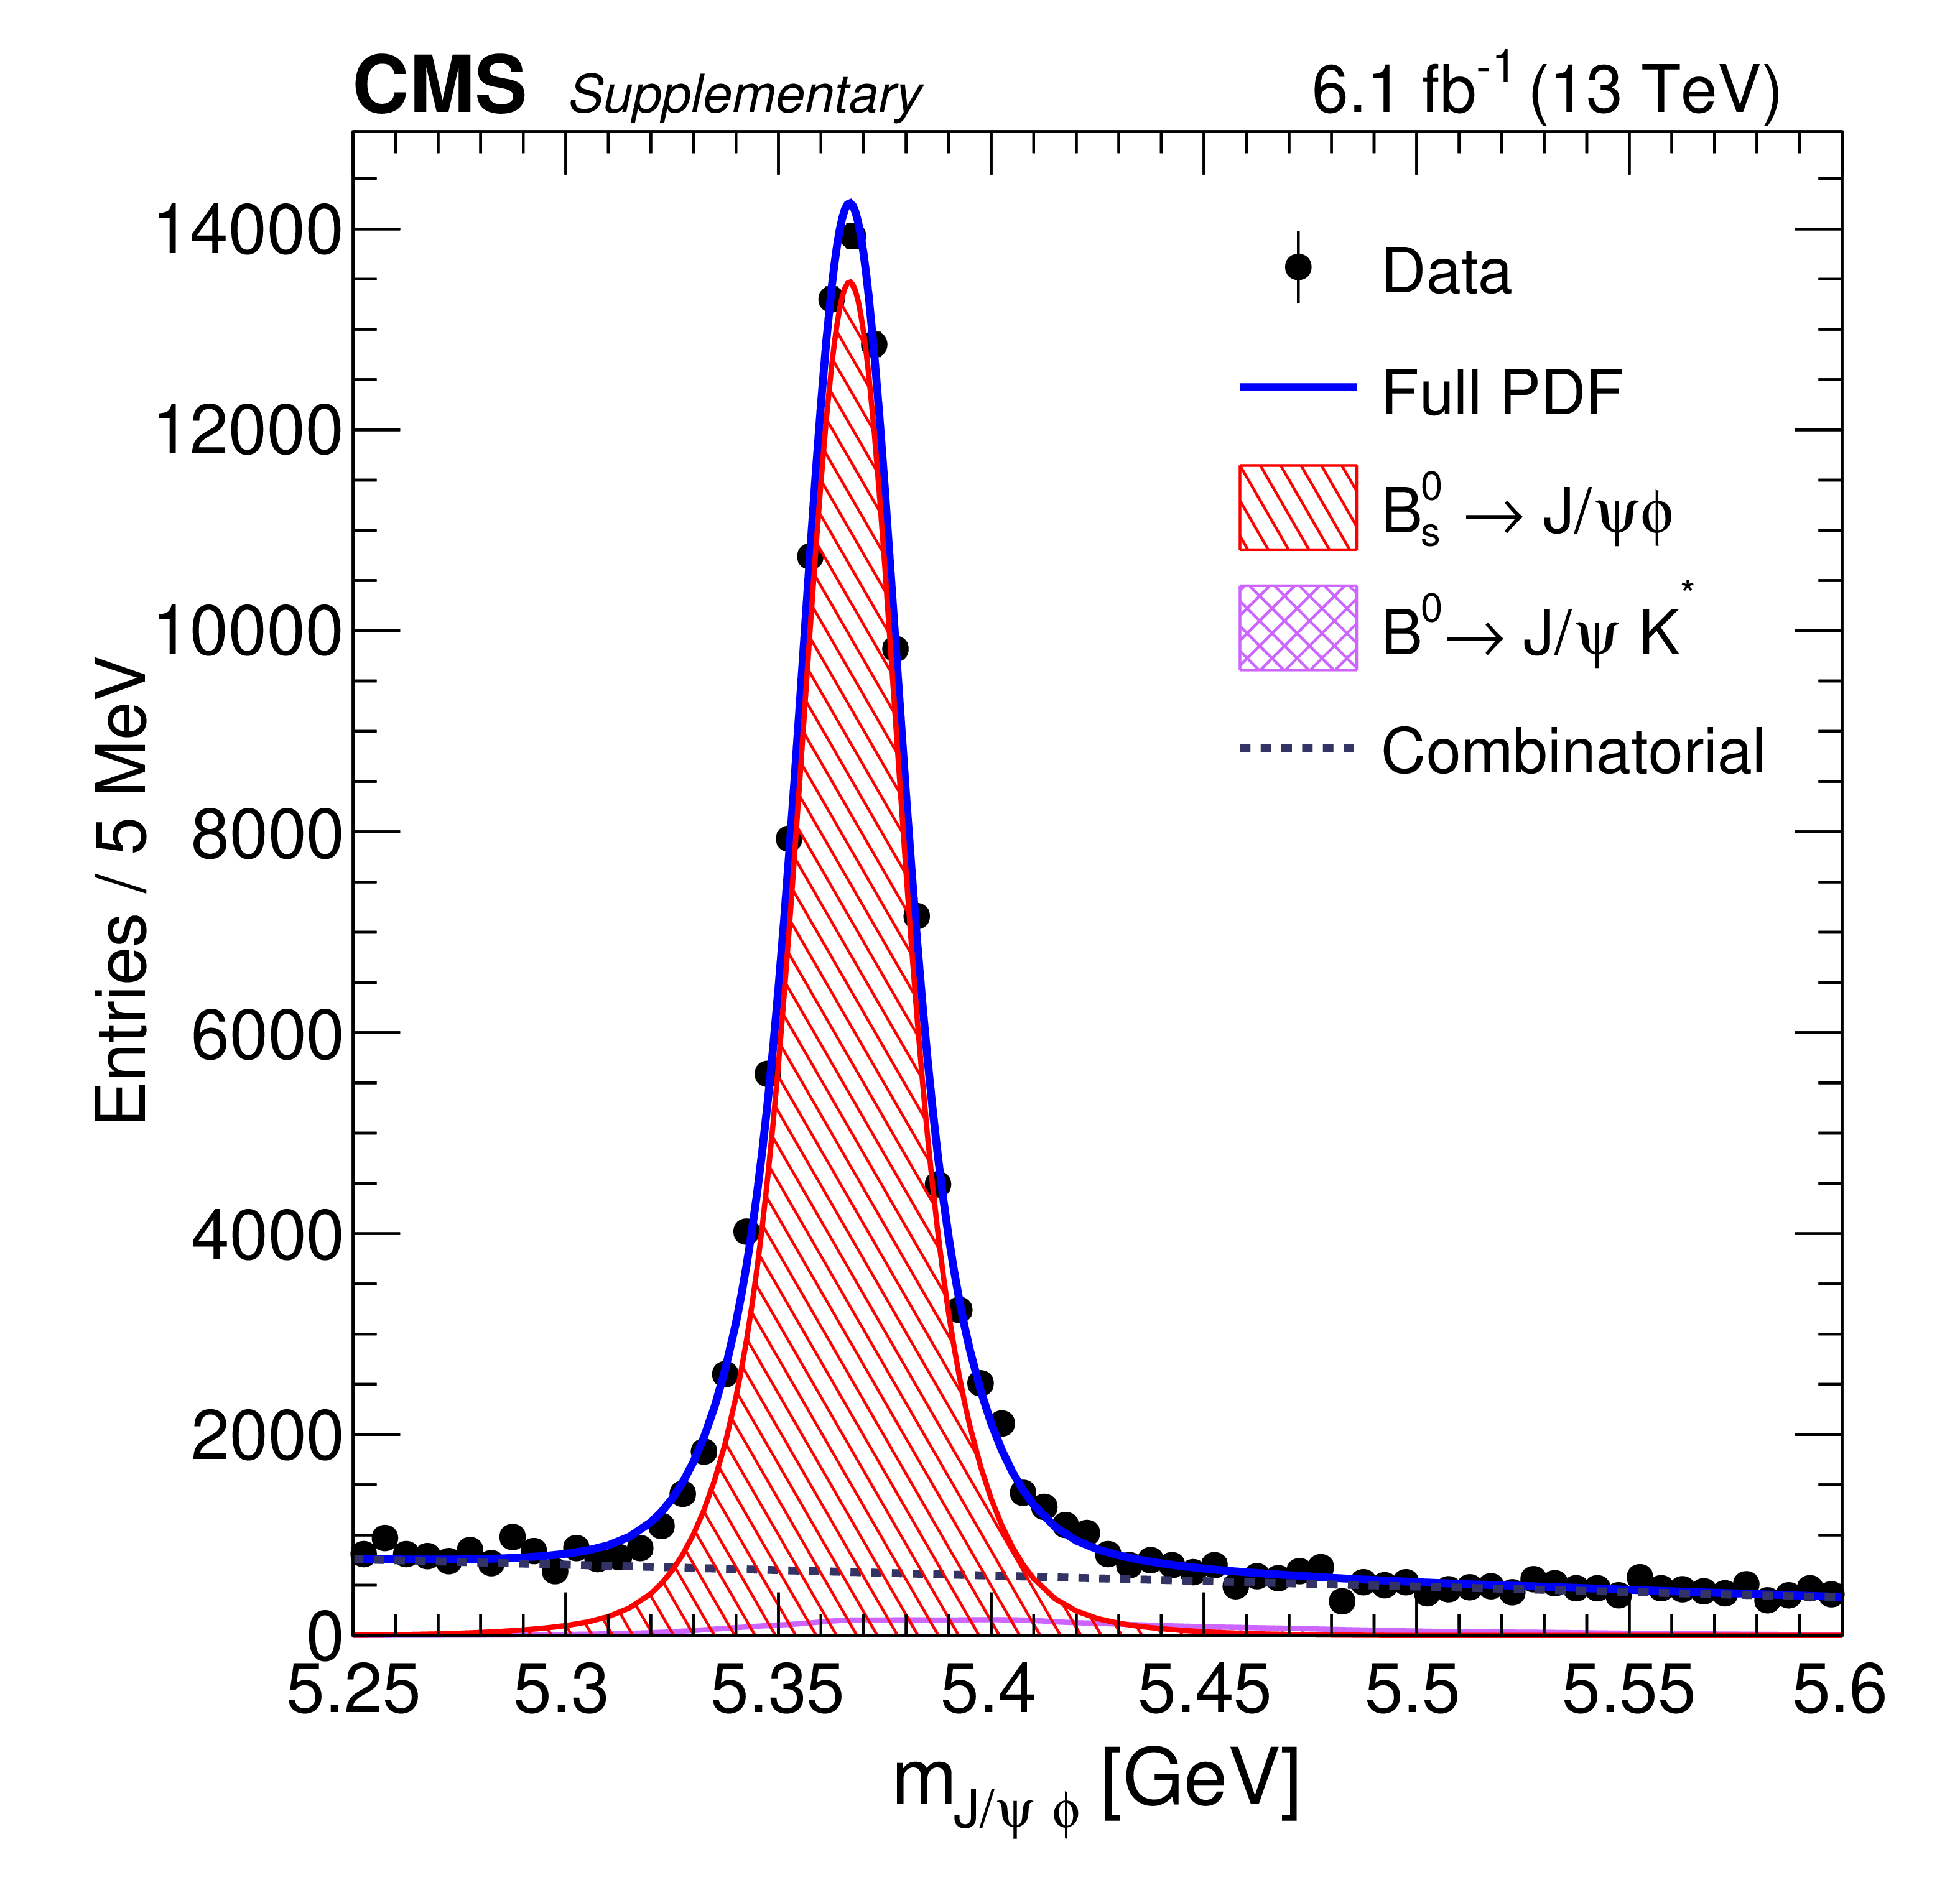
Additional Figure 12:
The mass distribution of the $ \mathrm{B}_{s}^{0}\to\mathrm{J}/\psi\phi(1020) $ decays observed in Run2018 data for events where $ |\eta_{\mu 1}| > $ 0.7 or $ |\eta_{\mu 2}| > $ 0.7. The blue curve shows the result of the unbinned maximum likelihood fit. The signal event yield, extracted from the fit, is used for normalization of the $ \mathrm{B}_{s}^{0} \to\mu^{+}\mu^{-} $ branching fraction. The selection requirements are optimized for the most precise estimation of the normalization. |
png pdf |
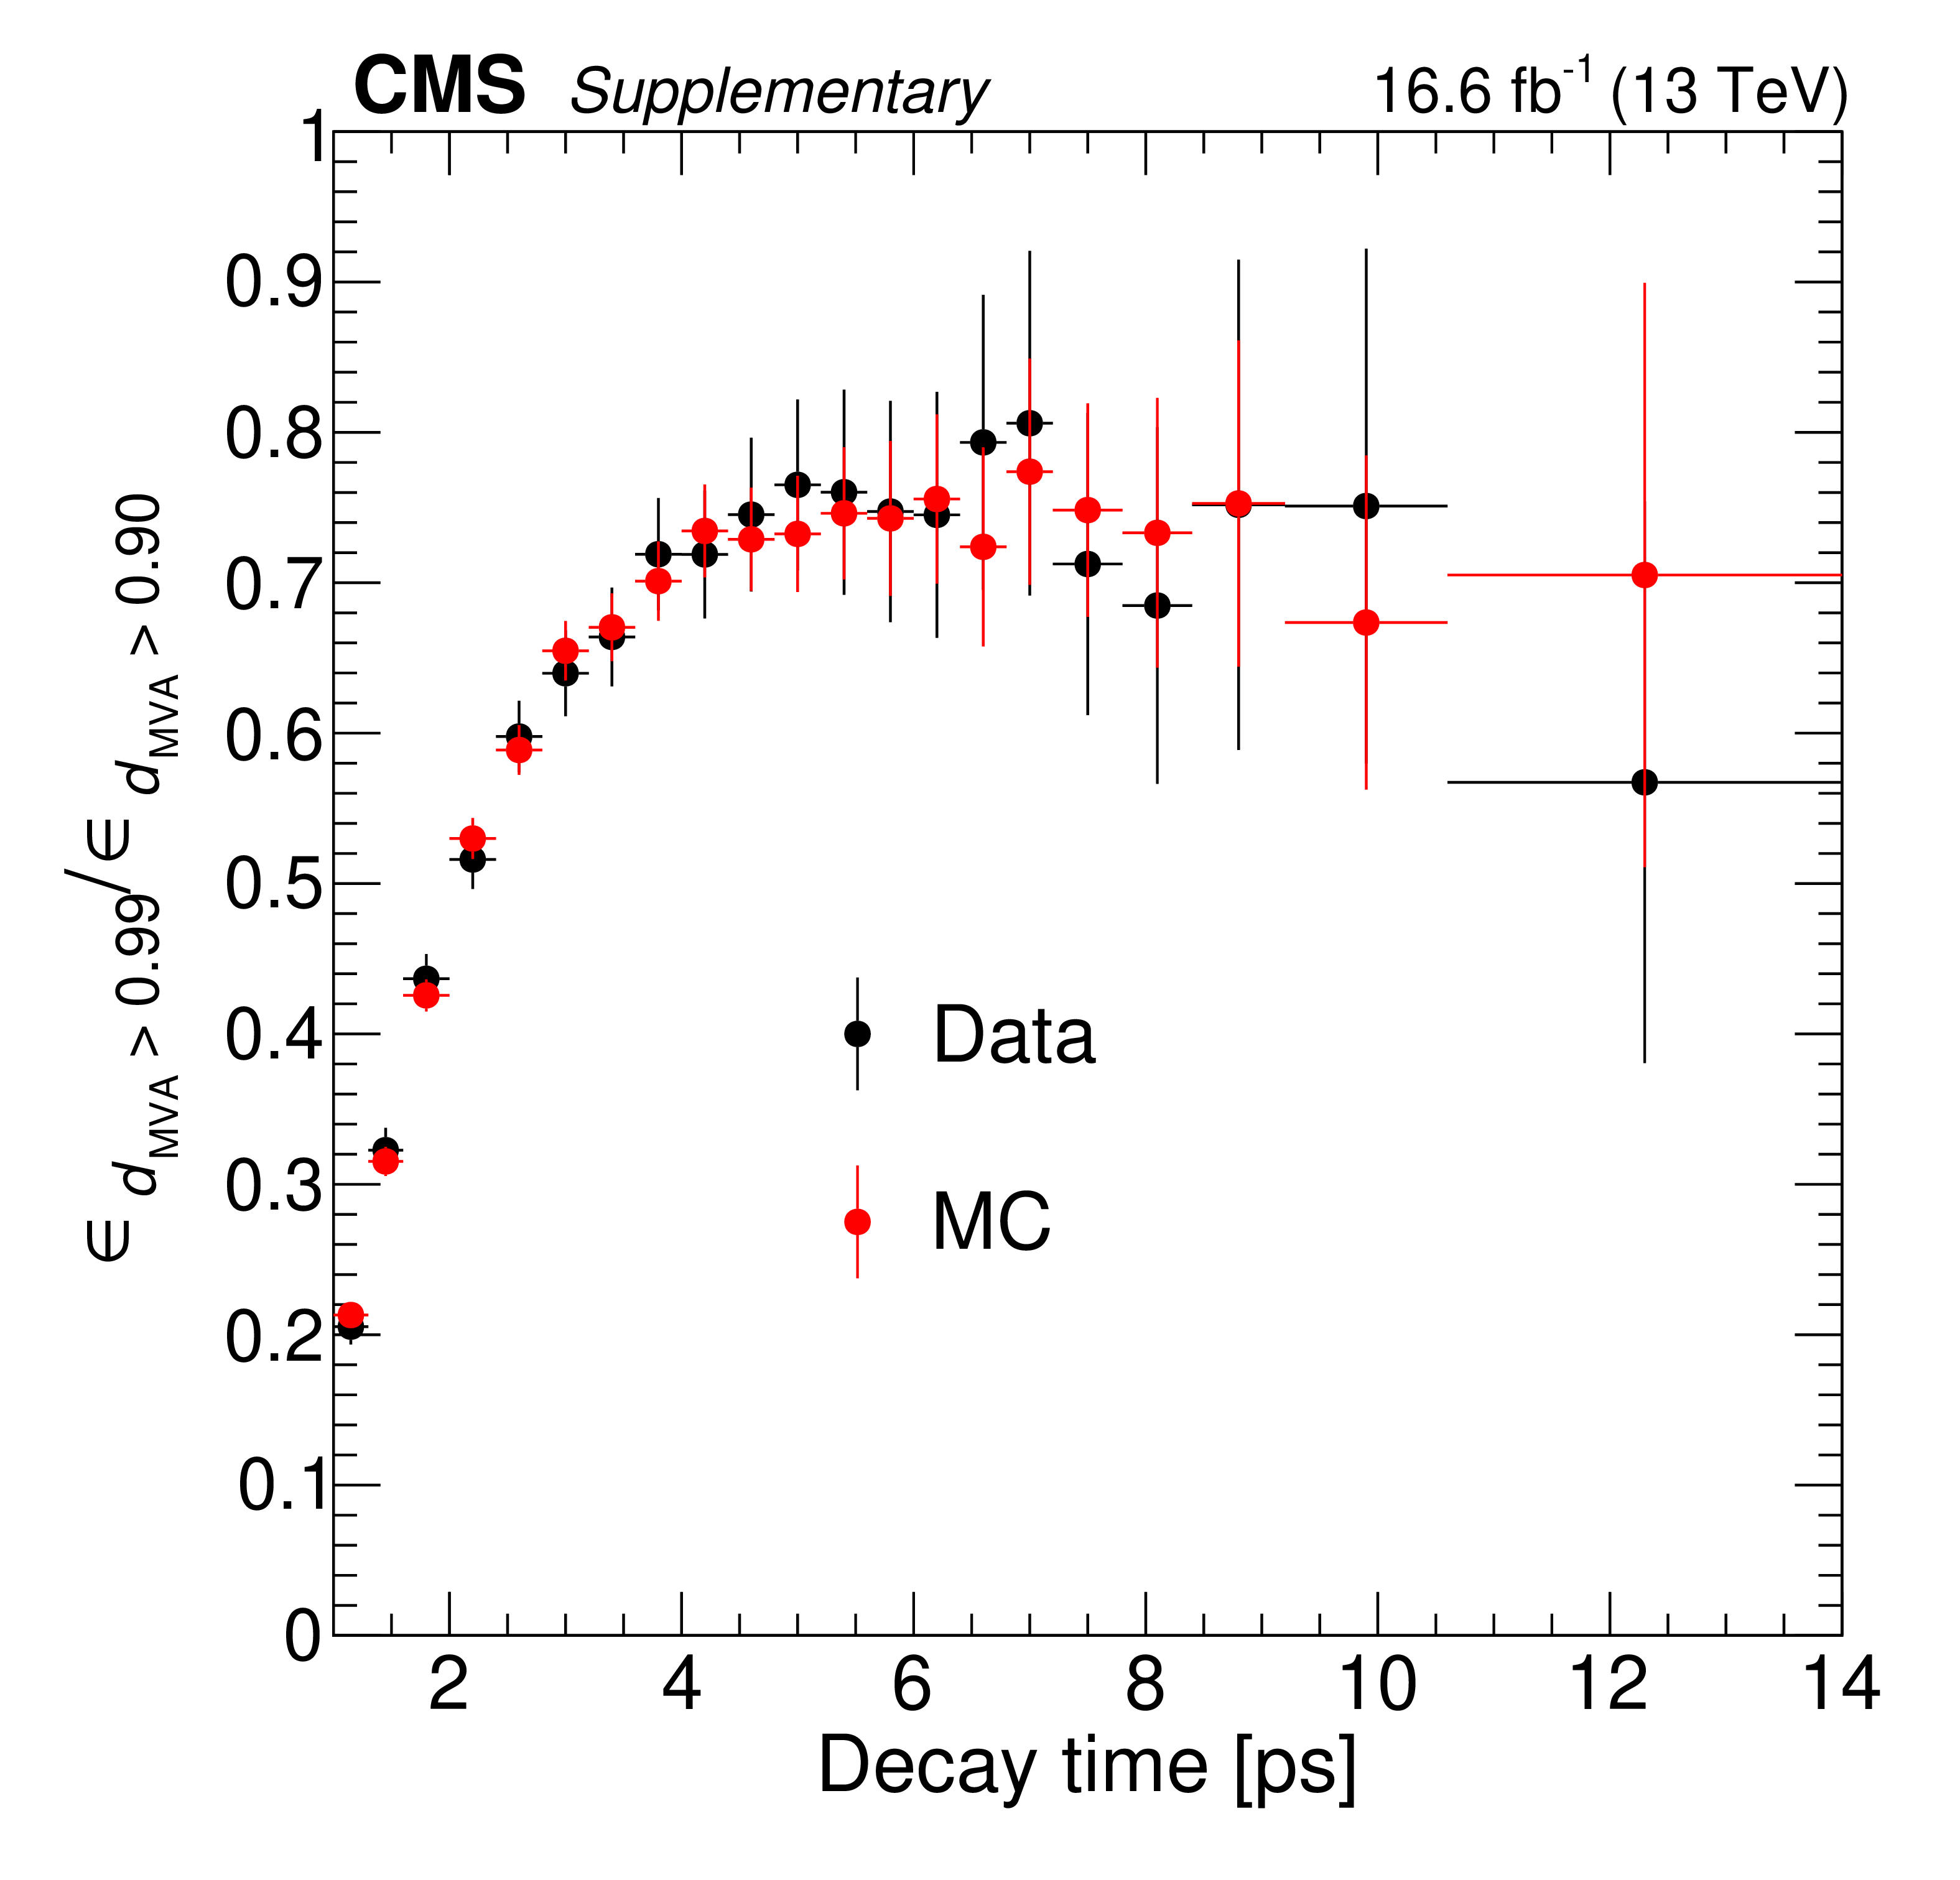
Additional Figure 13:
Ratios of the decay time efficiencies for the tight ($ d_{\text{MVA}} > $ 0.99) and loose ($ d_{\text{MVA}} > $ 0.90) selections observed in Run2016a Data and MC simulations for $ {\mathrm{B}^{+}} \to \mathrm{J}/\psi\mathrm{K^+} $ decays. The difference between the two ratios is used to correct the decay time efficiency for $ \mathrm{B}_{s}^{0} \to\mu^{+}\mu^{-} $ decays. |
png pdf |
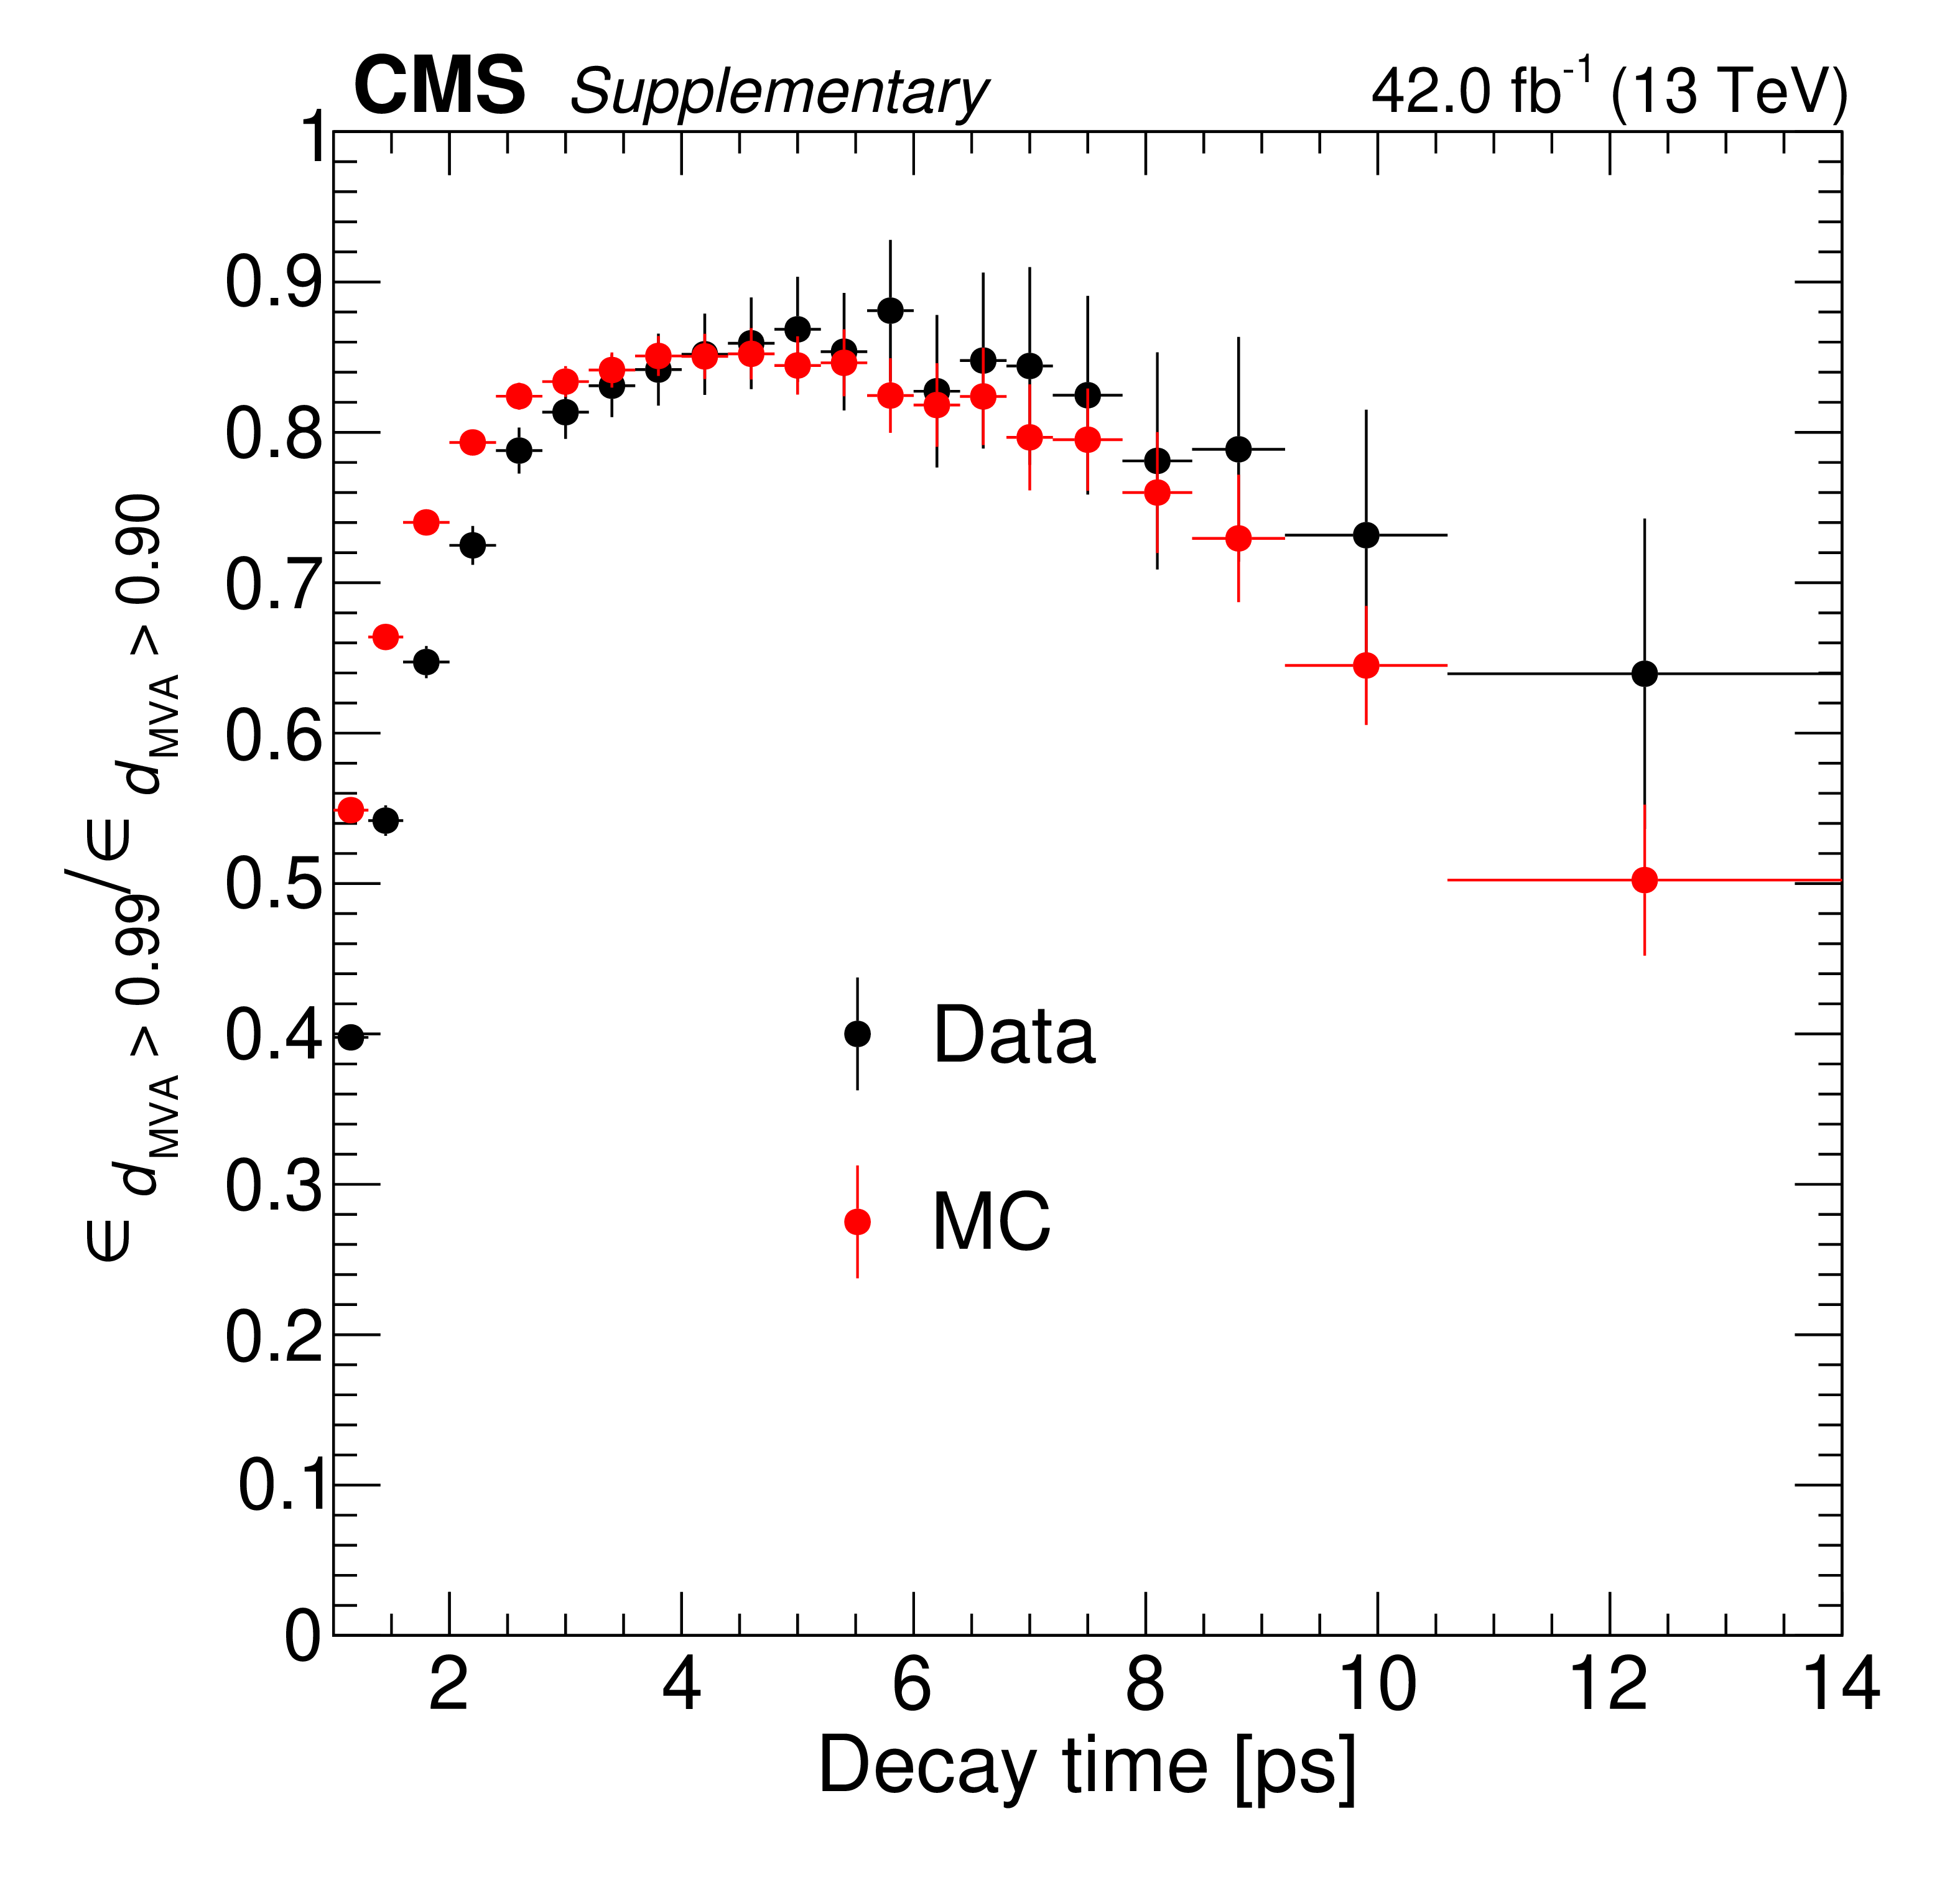
Additional Figure 14:
Ratios of the decay time efficiencies for the tight ($ d_{\text{MVA}} > $ 0.99) and loose ($ d_{\text{MVA}} > $ 0.90) selections observed in Run2016b Data and MC simulations for $ {\mathrm{B}^{+}} \to \mathrm{J}/\psi\mathrm{K^+} $ decays. The difference between the two ratios is used to correct the decay time efficiency for $ \mathrm{B}_{s}^{0} \to\mu^{+}\mu^{-} $ decays. |
png pdf |
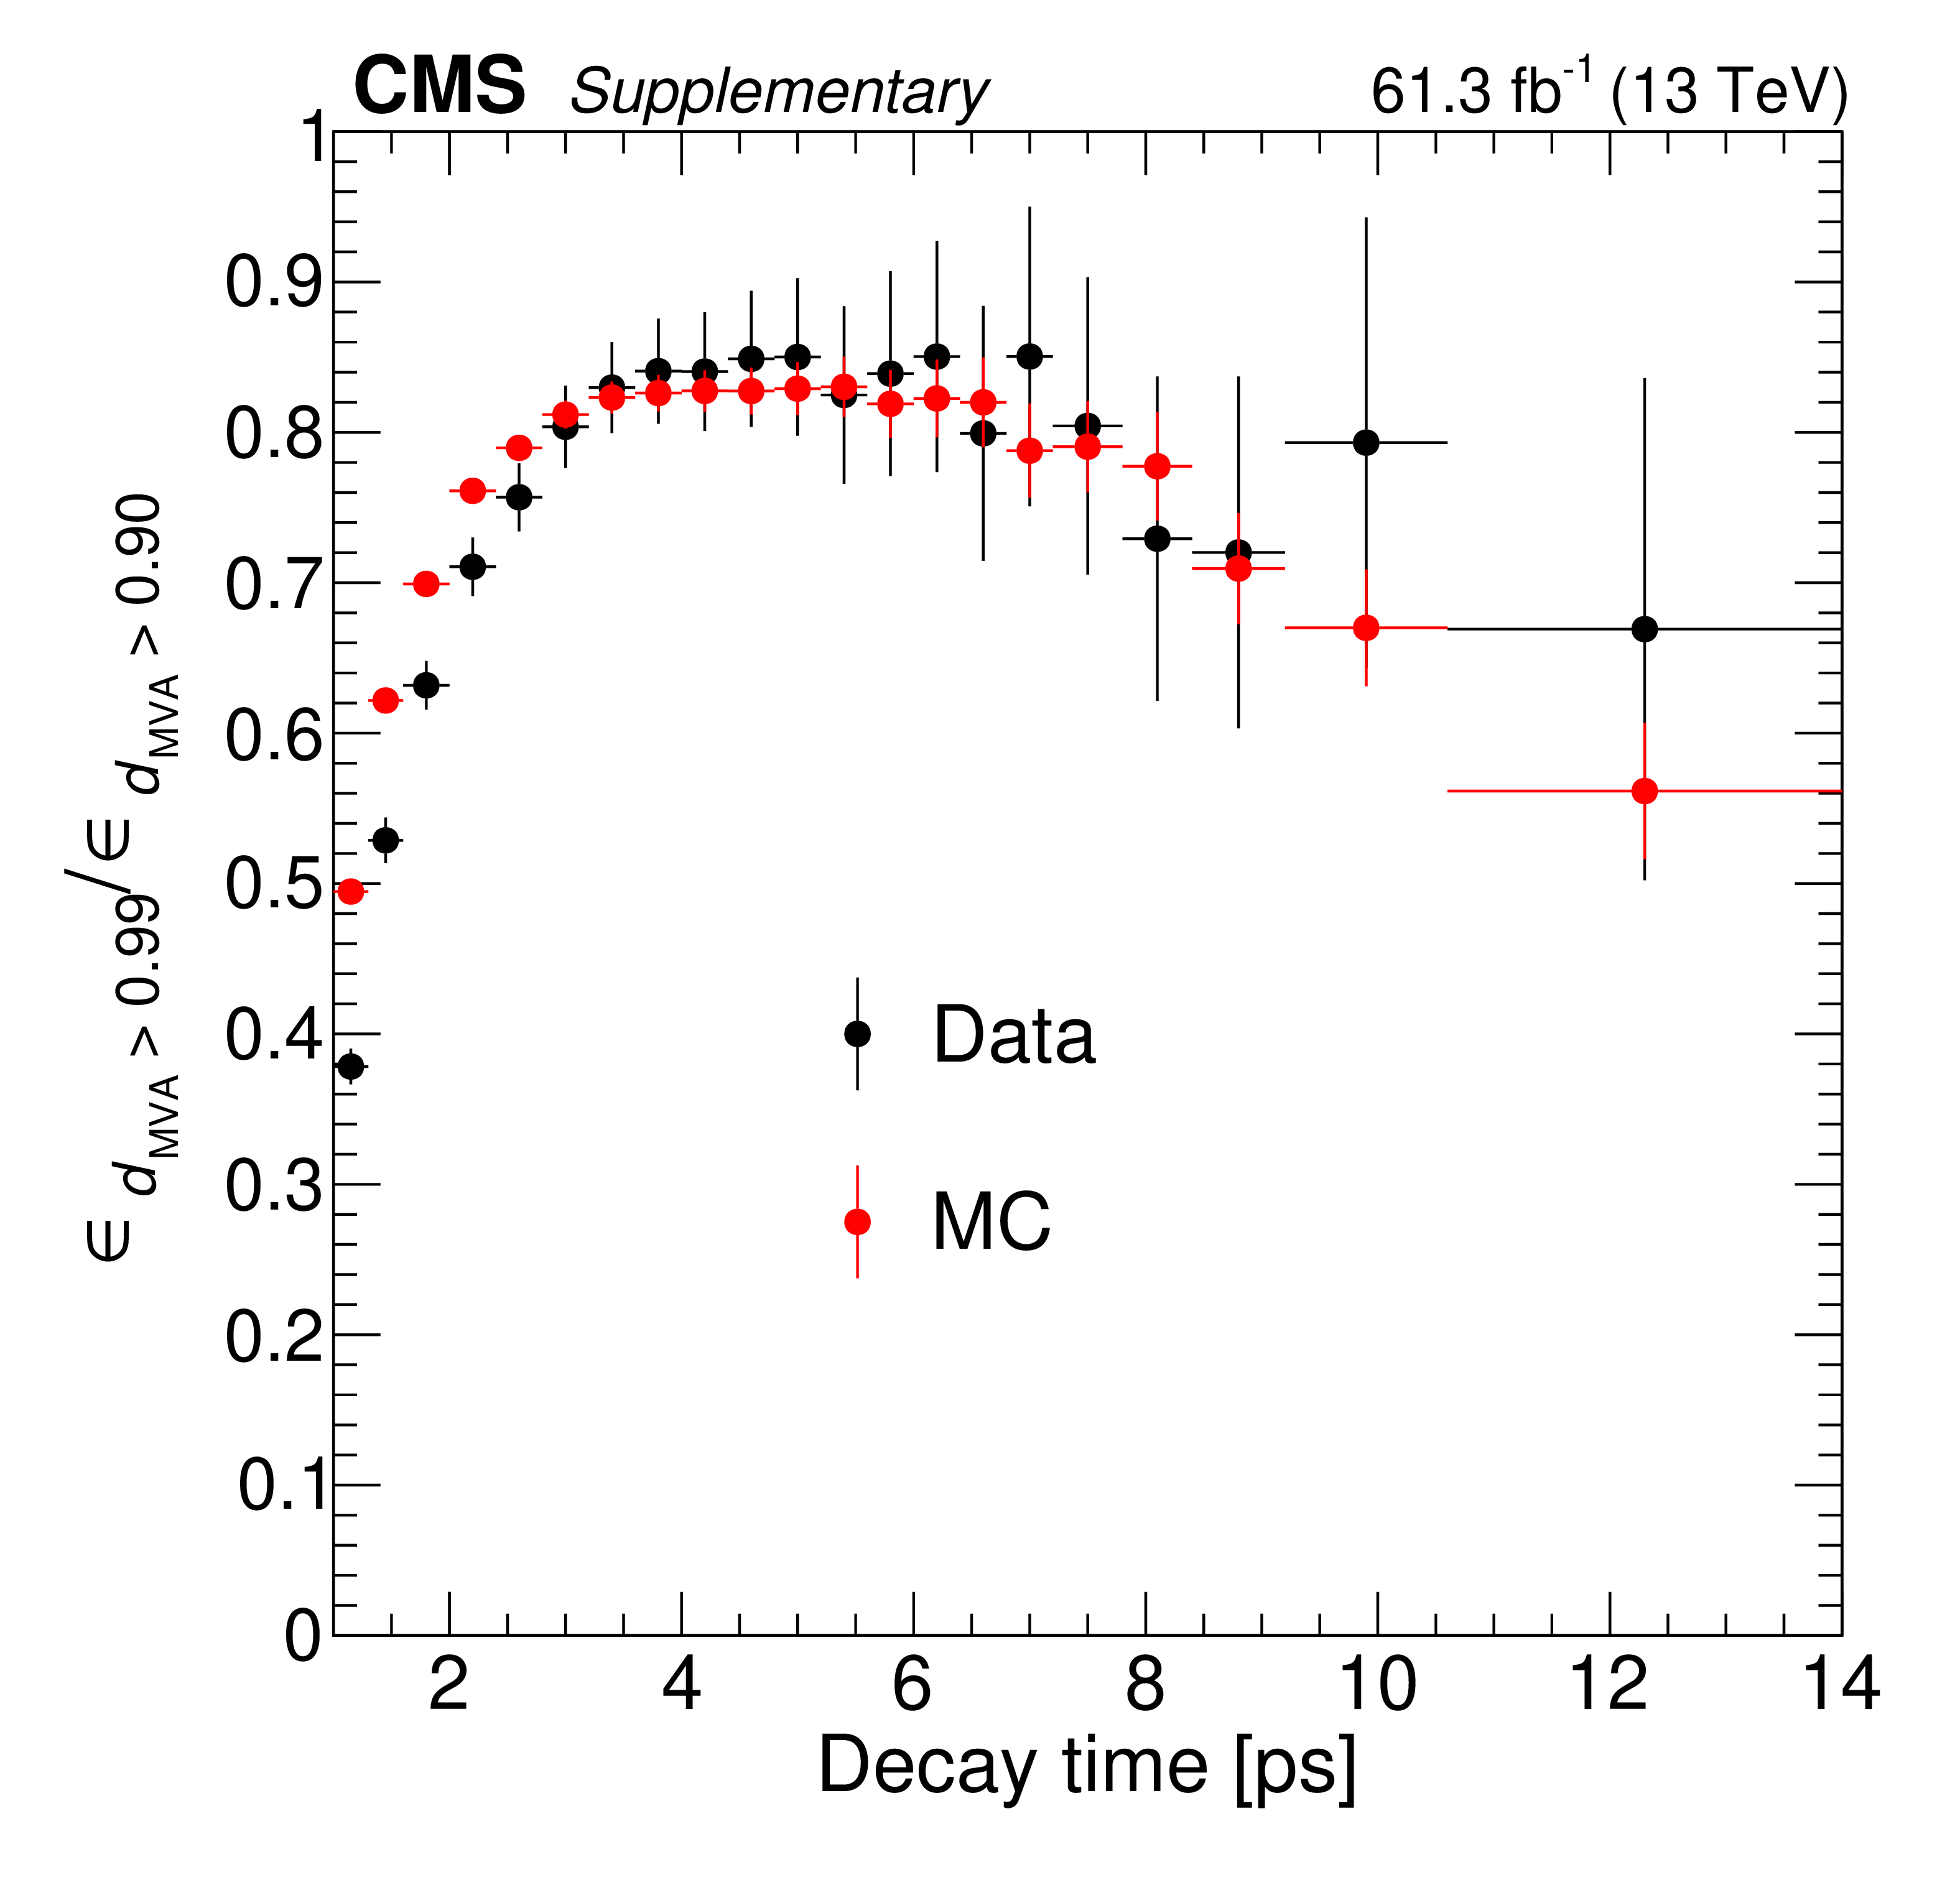
Additional Figure 15:
Ratios of the decay time efficiencies for the tight ($ d_{\text{MVA}} > $ 0.99) and loose ($ d_{\text{MVA}} > $ 0.90) selections observed in Run2017 Data and MC simulations for $ {\mathrm{B}^{+}} \to \mathrm{J}/\psi\mathrm{K^+} $ decays. The difference between the two ratios is used to correct the decay time efficiency for $ \mathrm{B}_{s}^{0} \to\mu^{+}\mu^{-} $ decays. |
png pdf |
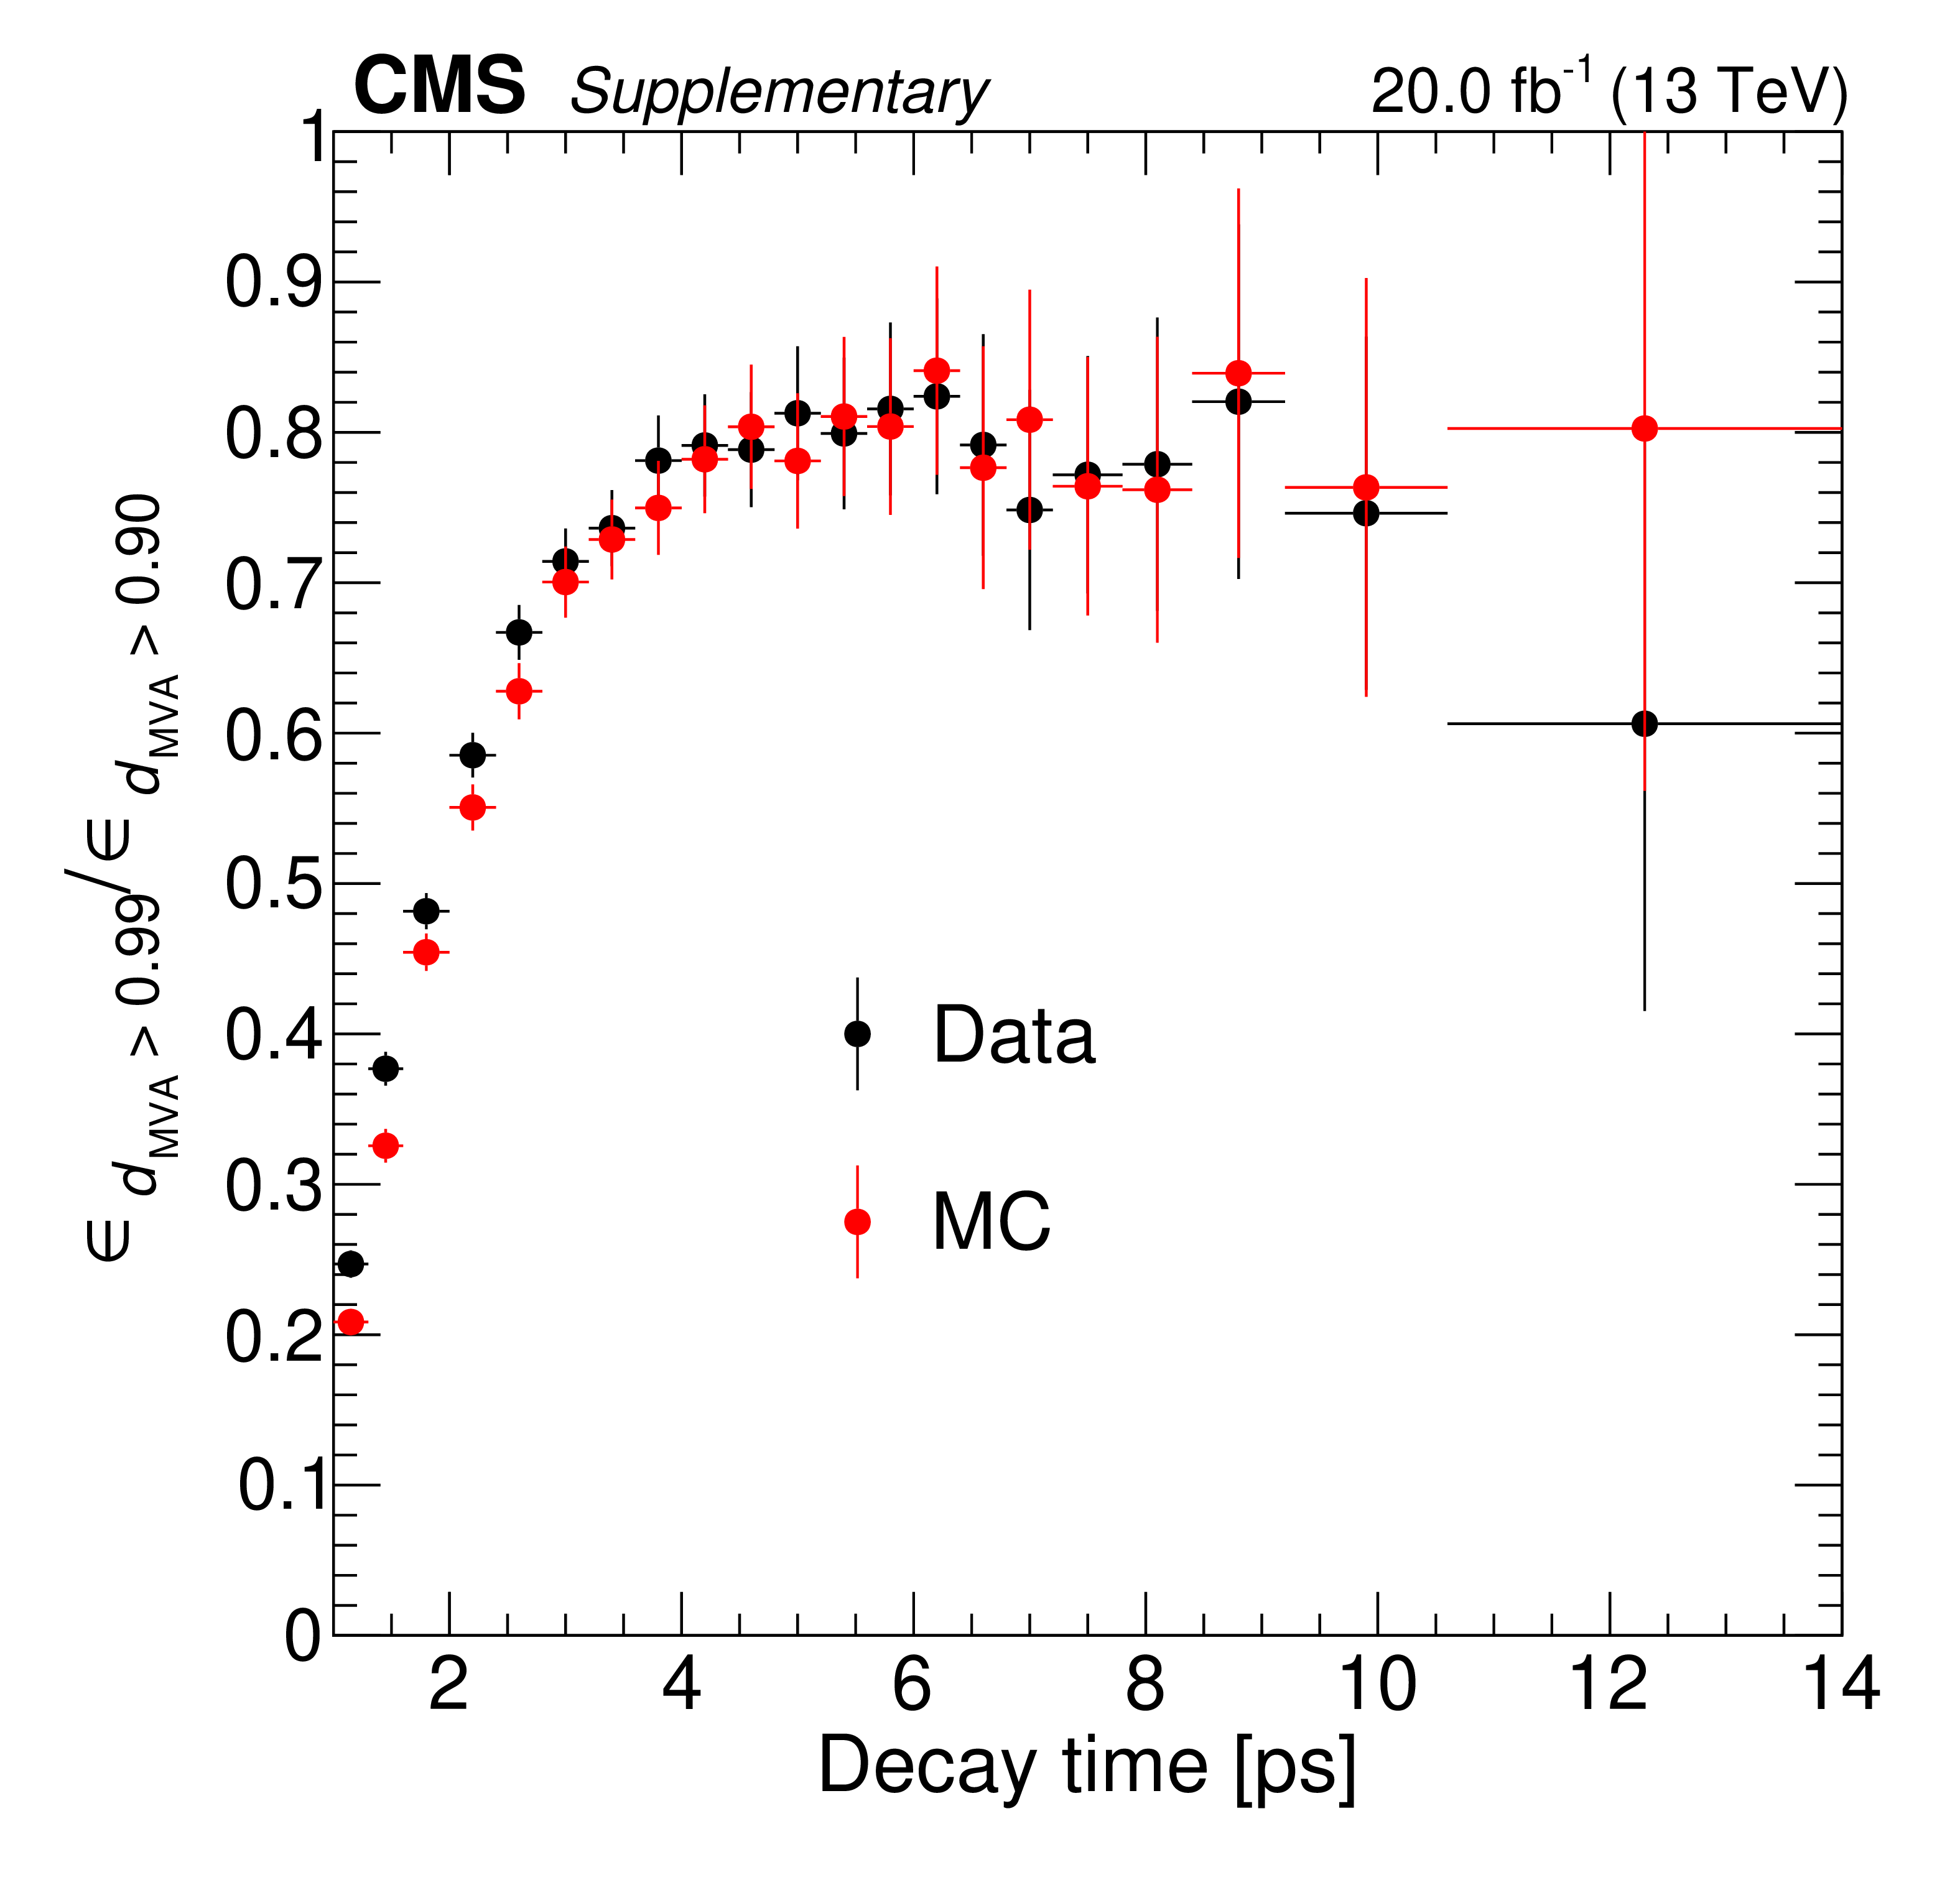
Additional Figure 16:
Ratios of the decay time efficiencies for the tight ($ d_{\text{MVA}} > $ 0.99) and loose ($ d_{\text{MVA}} > $ 0.90) selections observed in Run2018 Data and MC simulations for $ {\mathrm{B}^{+}} \to \mathrm{J}/\psi\mathrm{K^+} $ decays. The difference between the two ratios is used to correct the decay time efficiency for $ \mathrm{B}_{s}^{0} \to\mu^{+}\mu^{-} $ decays. |
png pdf |
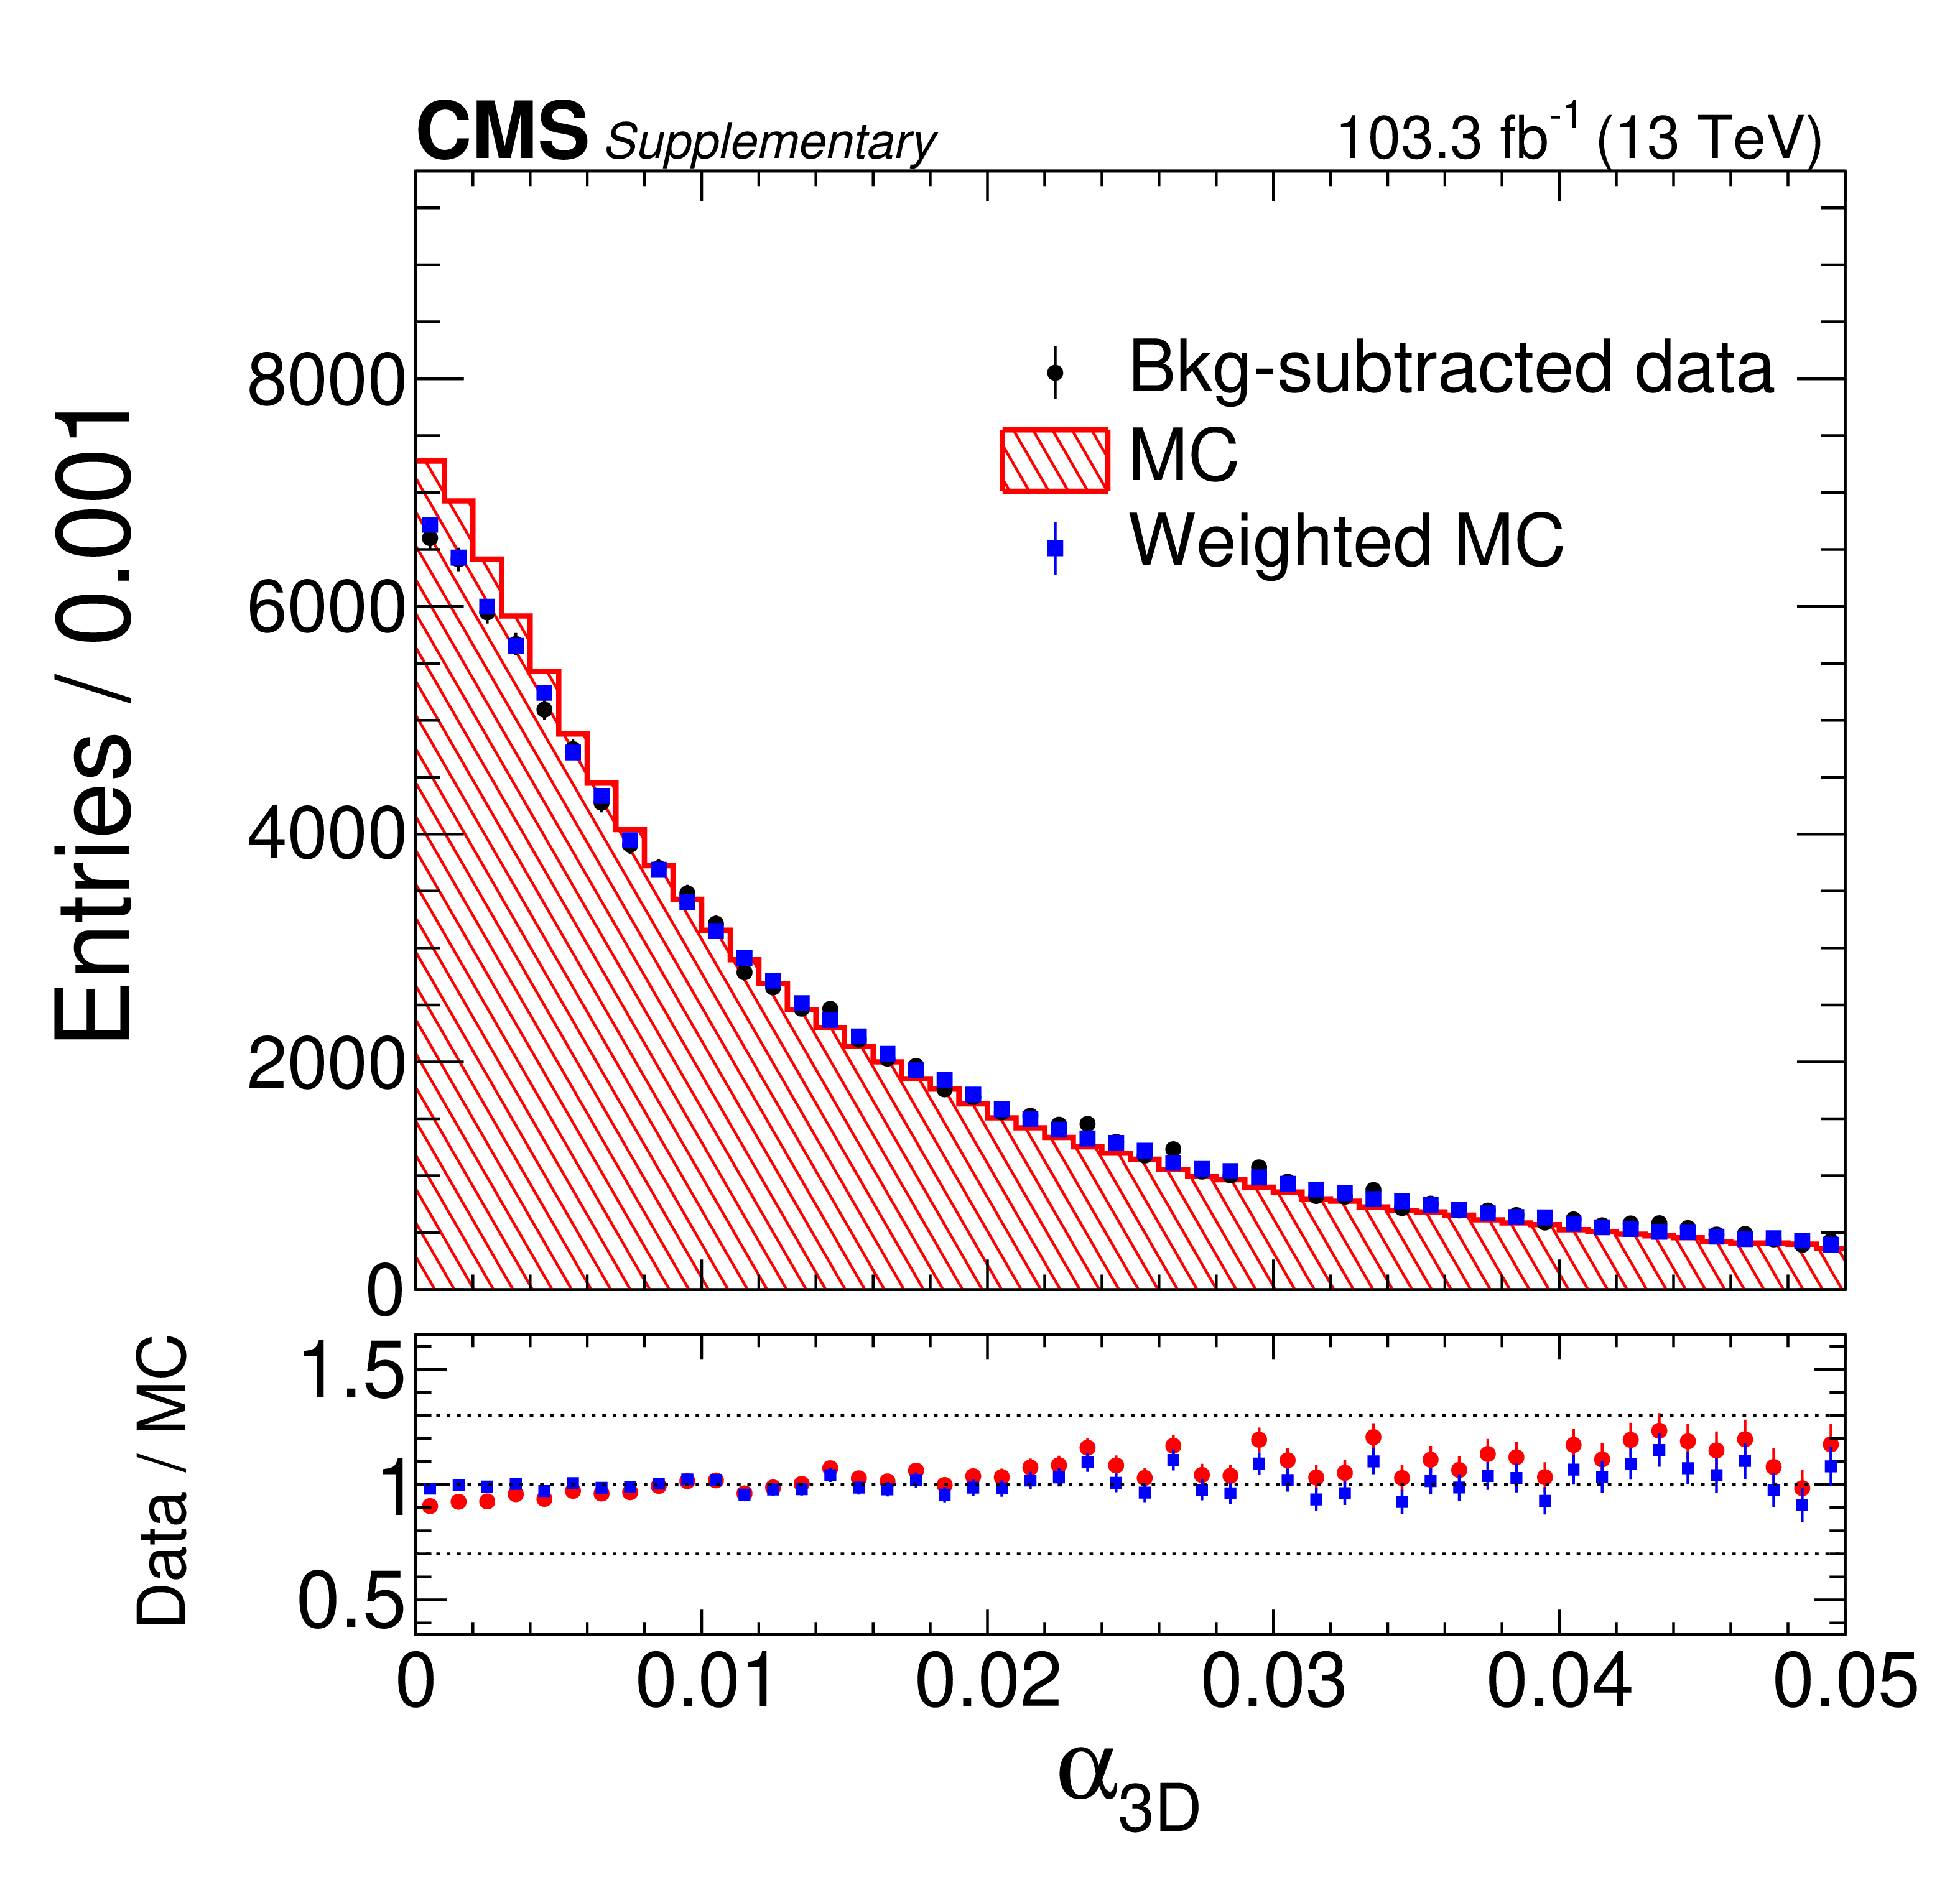
Additional Figure 17:
The pointing angle distribution for 2017--2018 data and corresponding MC simulation. The blue histogram represent the reweighted MC simulation using the XGBoost reweighting method. |
png pdf |
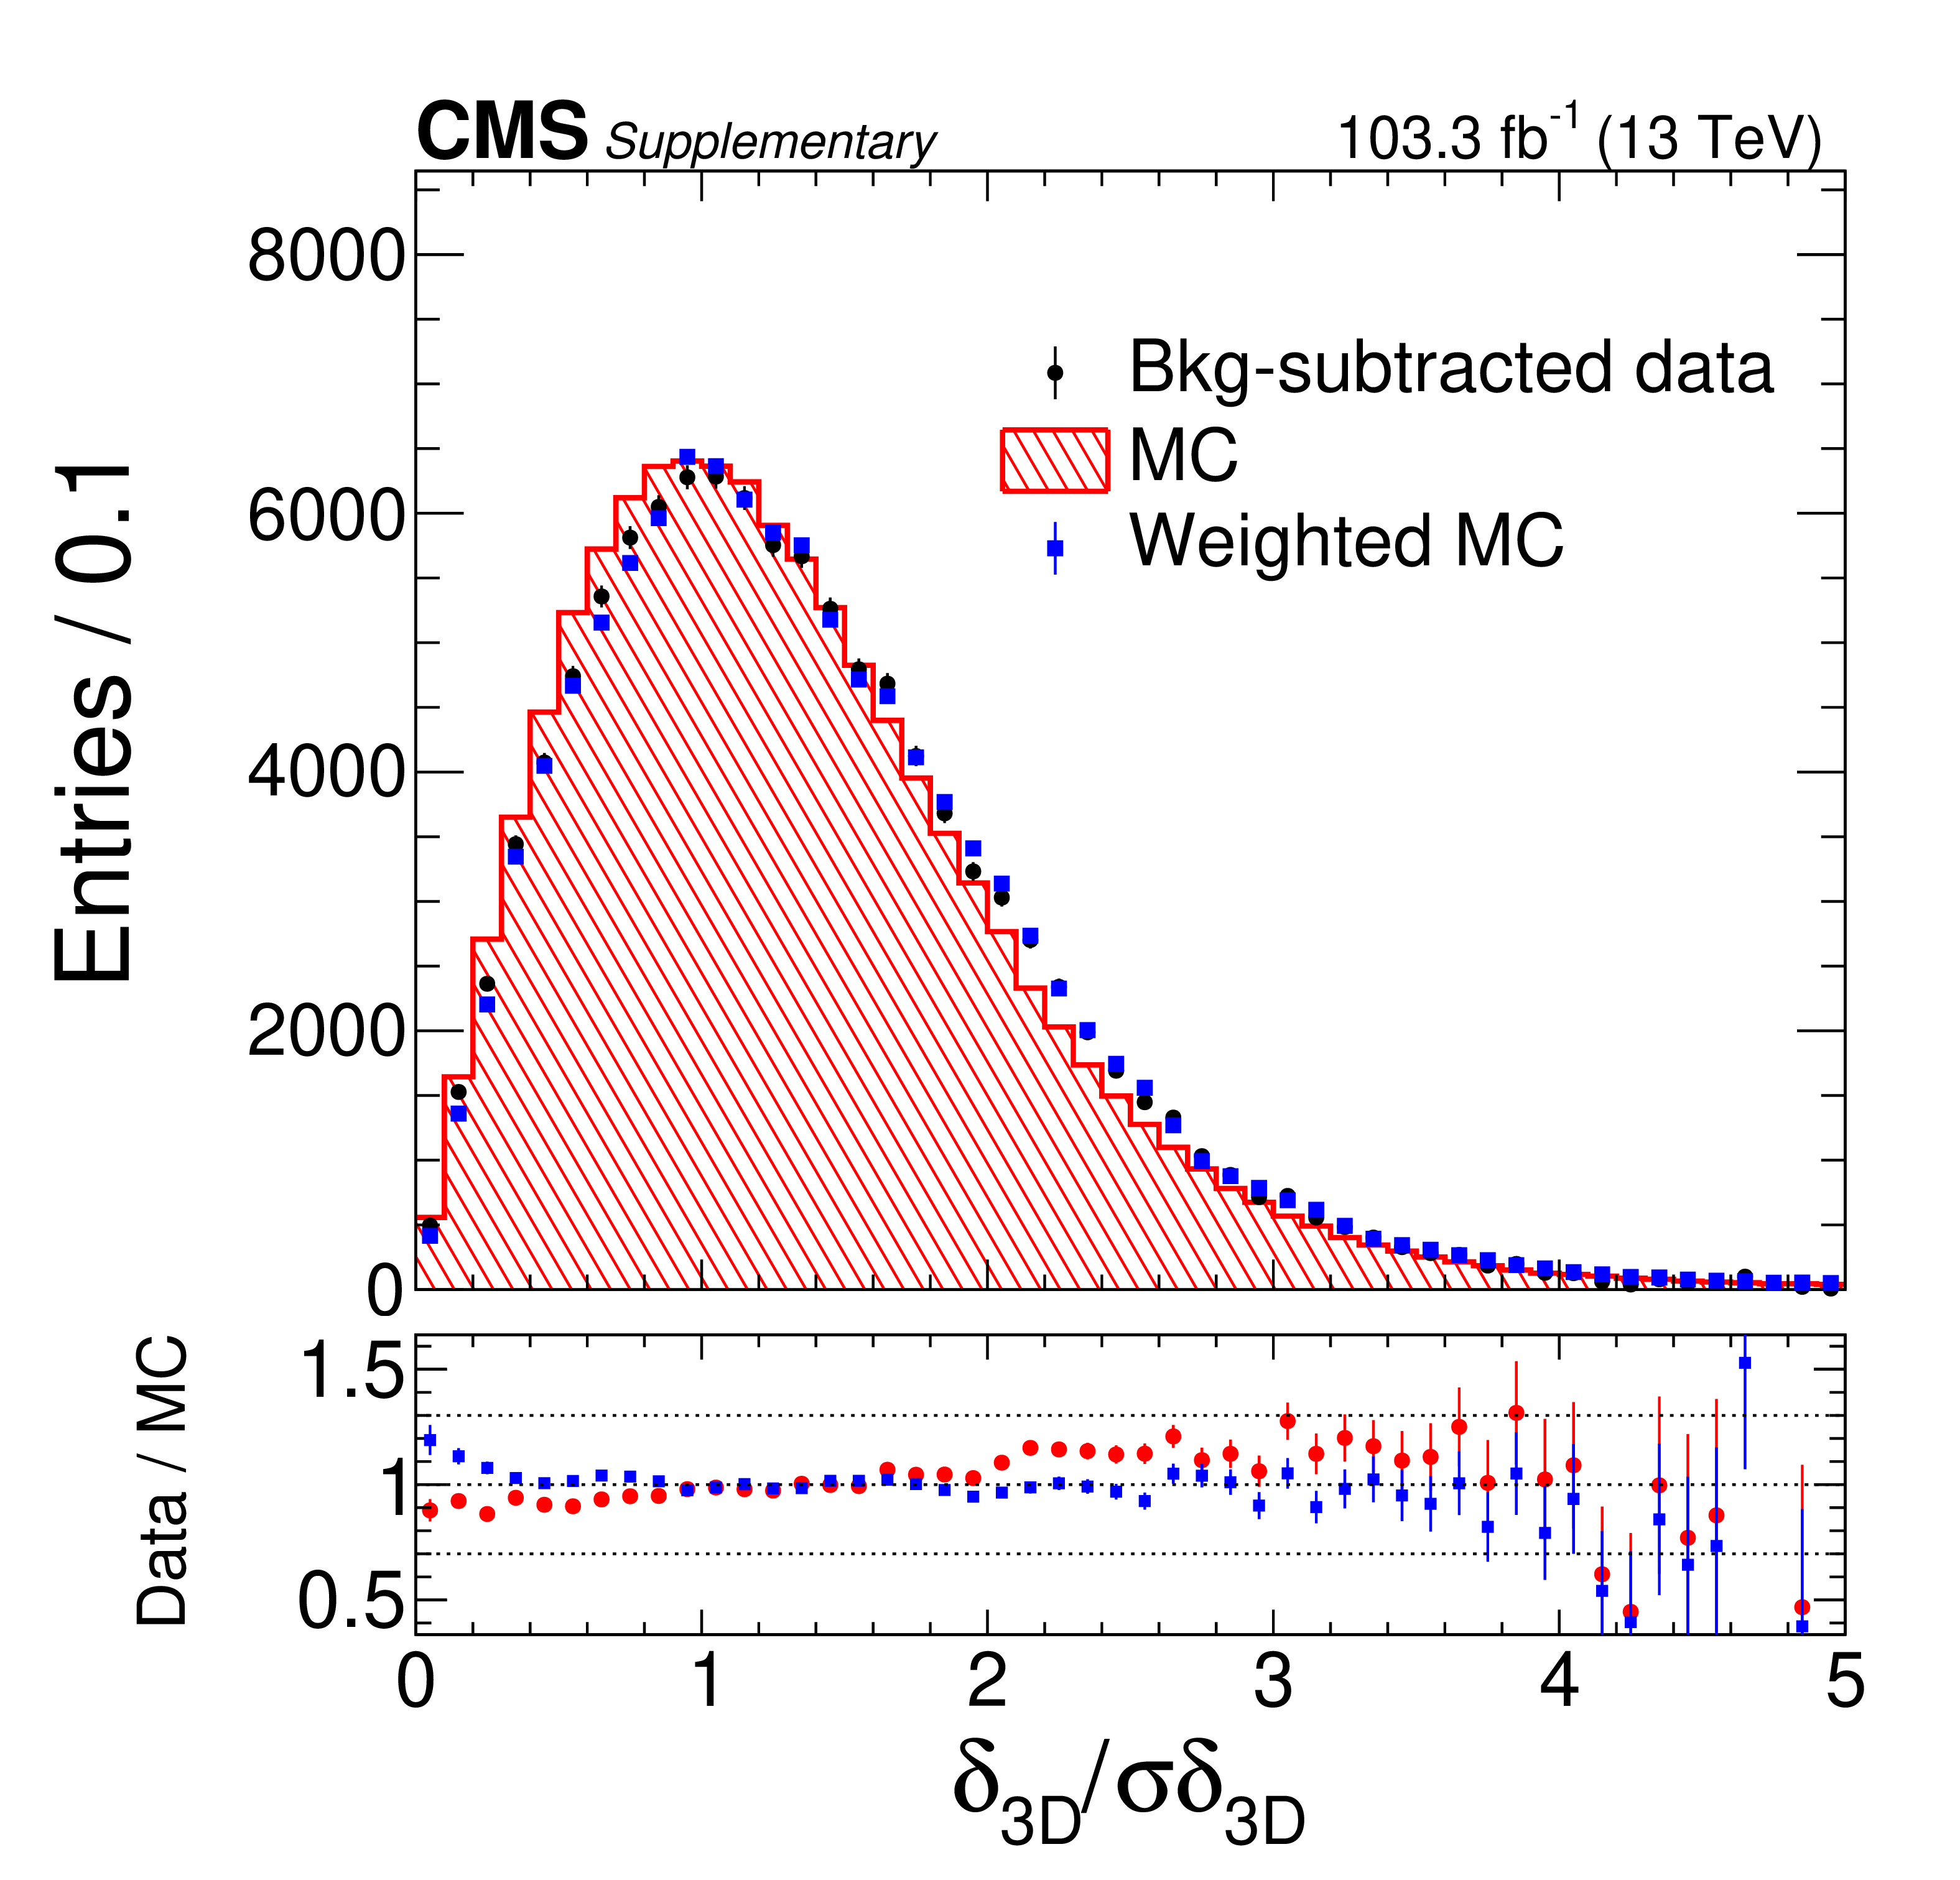
Additional Figure 18:
The impact parameter significance distribution for 2017--2018 data and corresponding MC simulation. The blue histogram represent the reweighted MC simulation using the XGBoost reweighting method. |
png pdf |
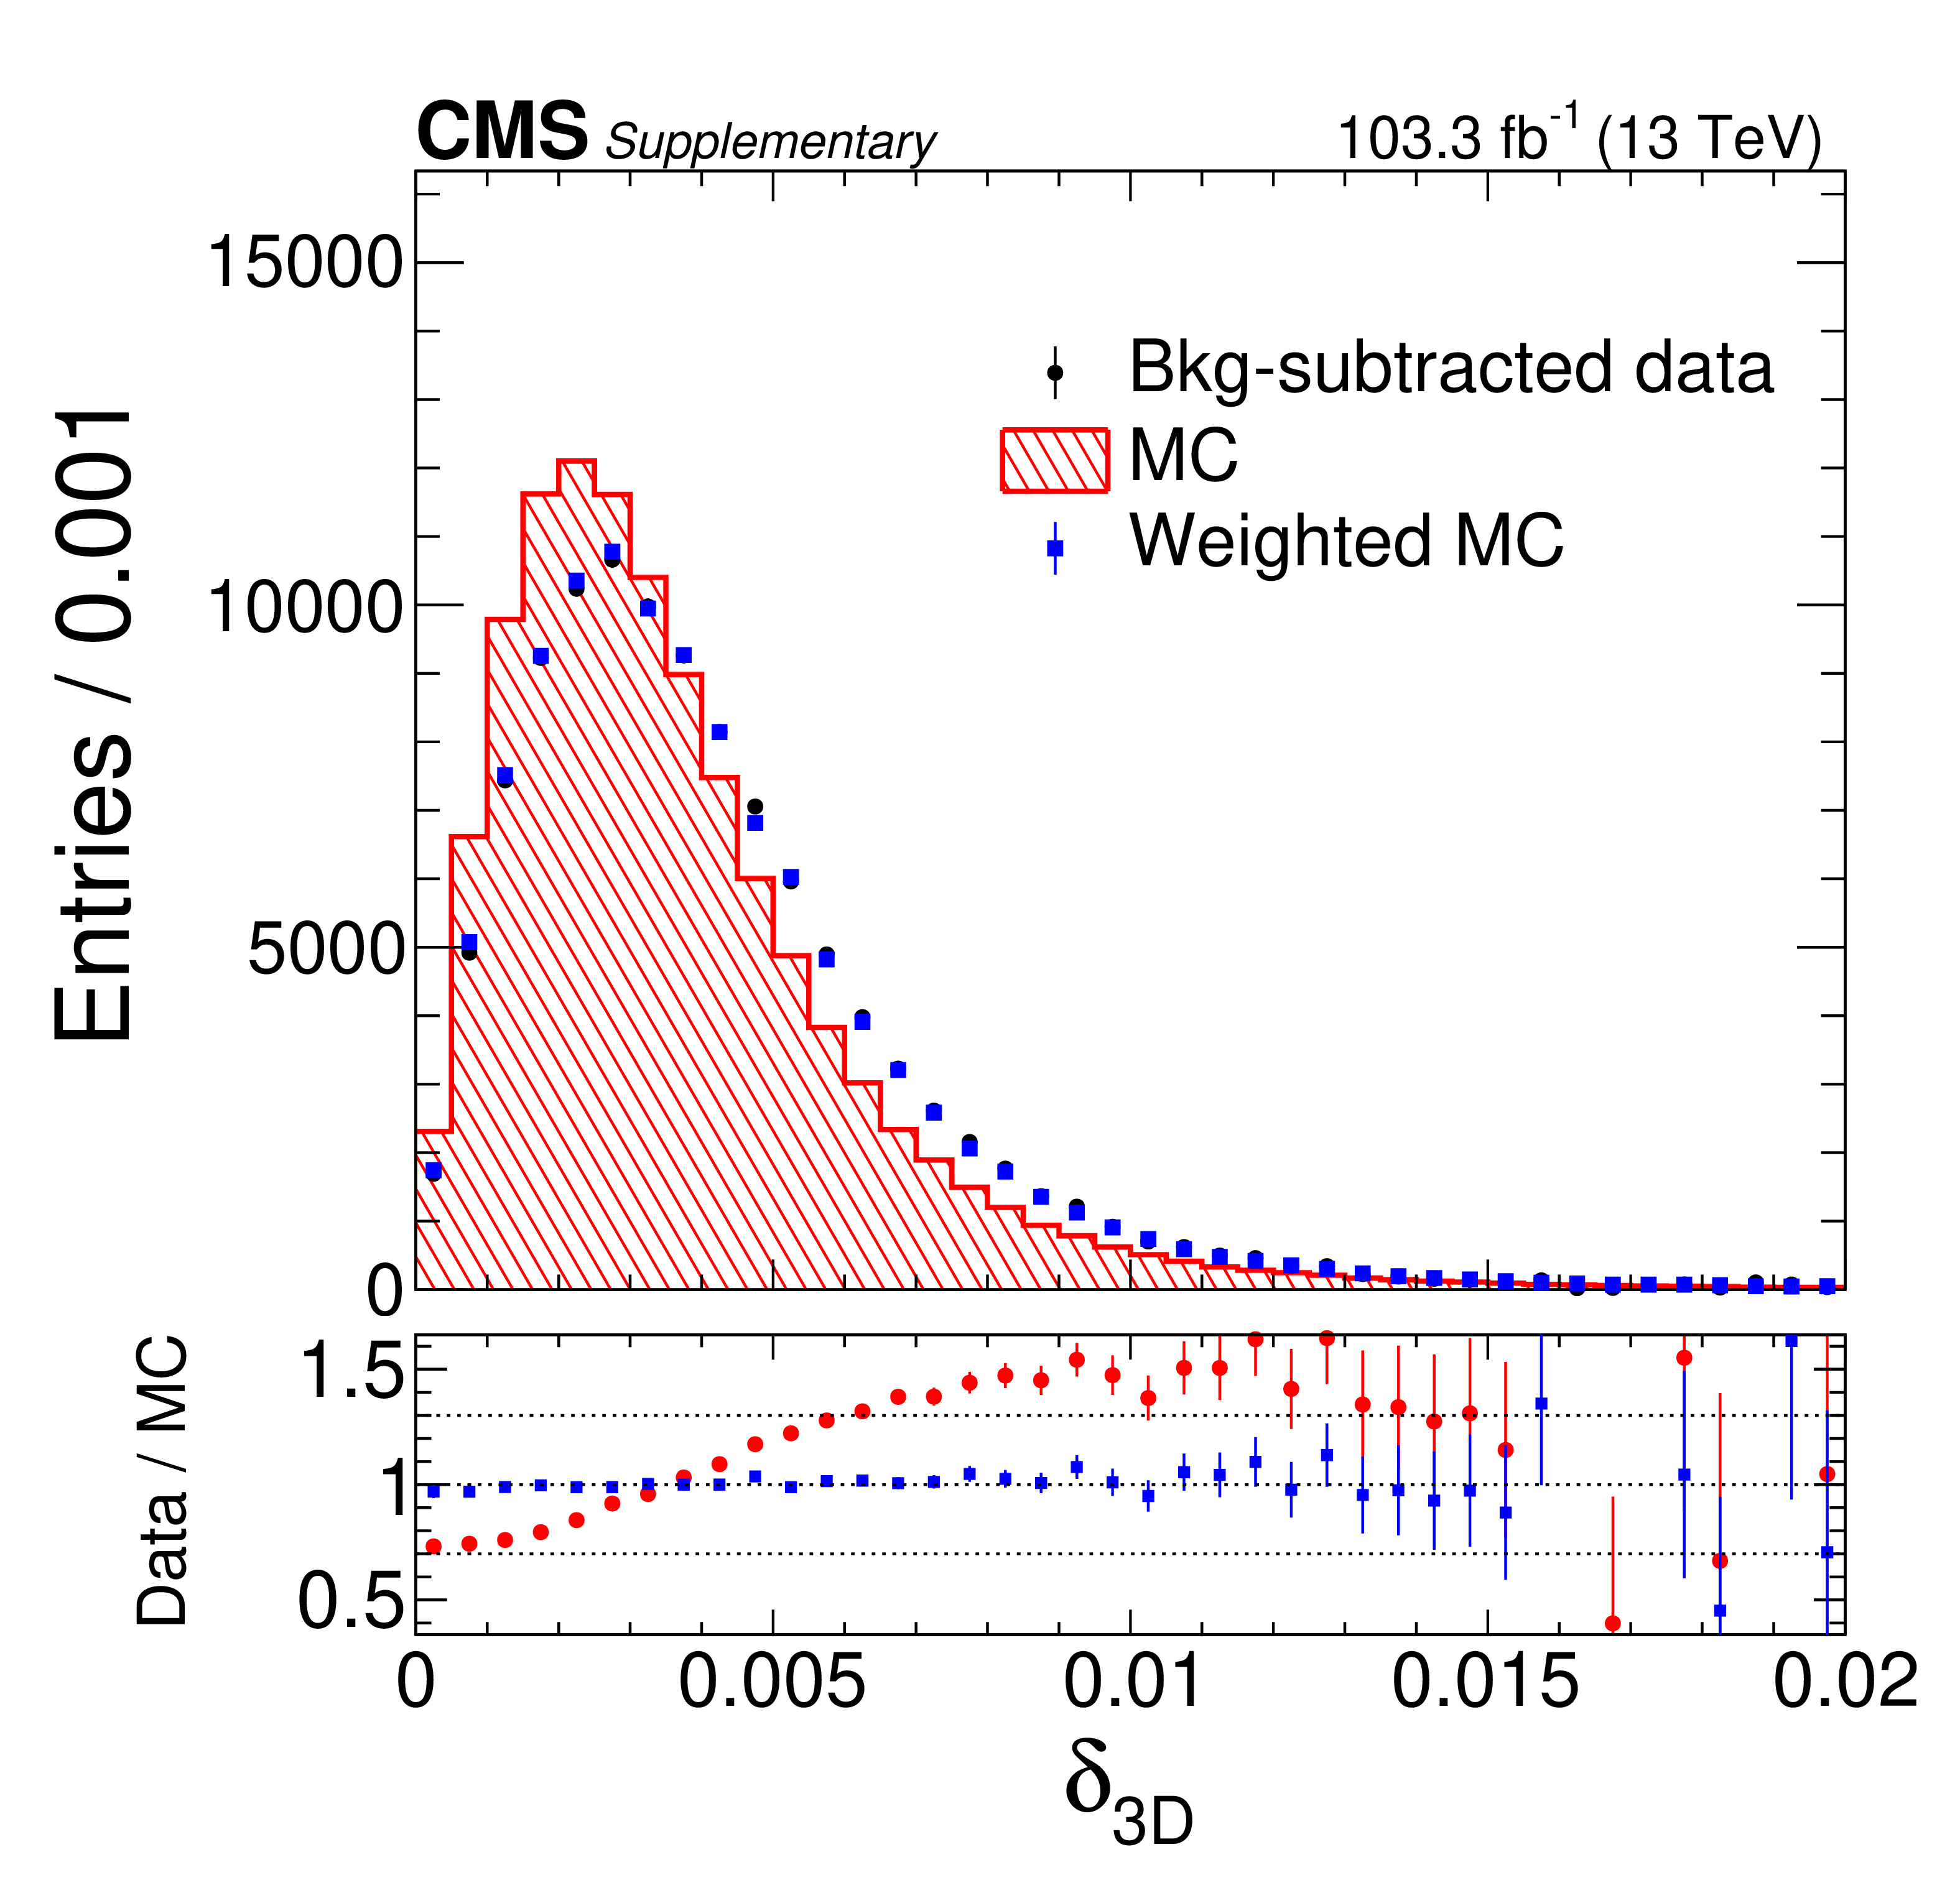
Additional Figure 19:
The impact parameter distribution for 2017--2018 data and corresponding MC simulation. The blue histogram represent the reweighted MC simulation using the XGBoost reweighting method. |
png pdf |
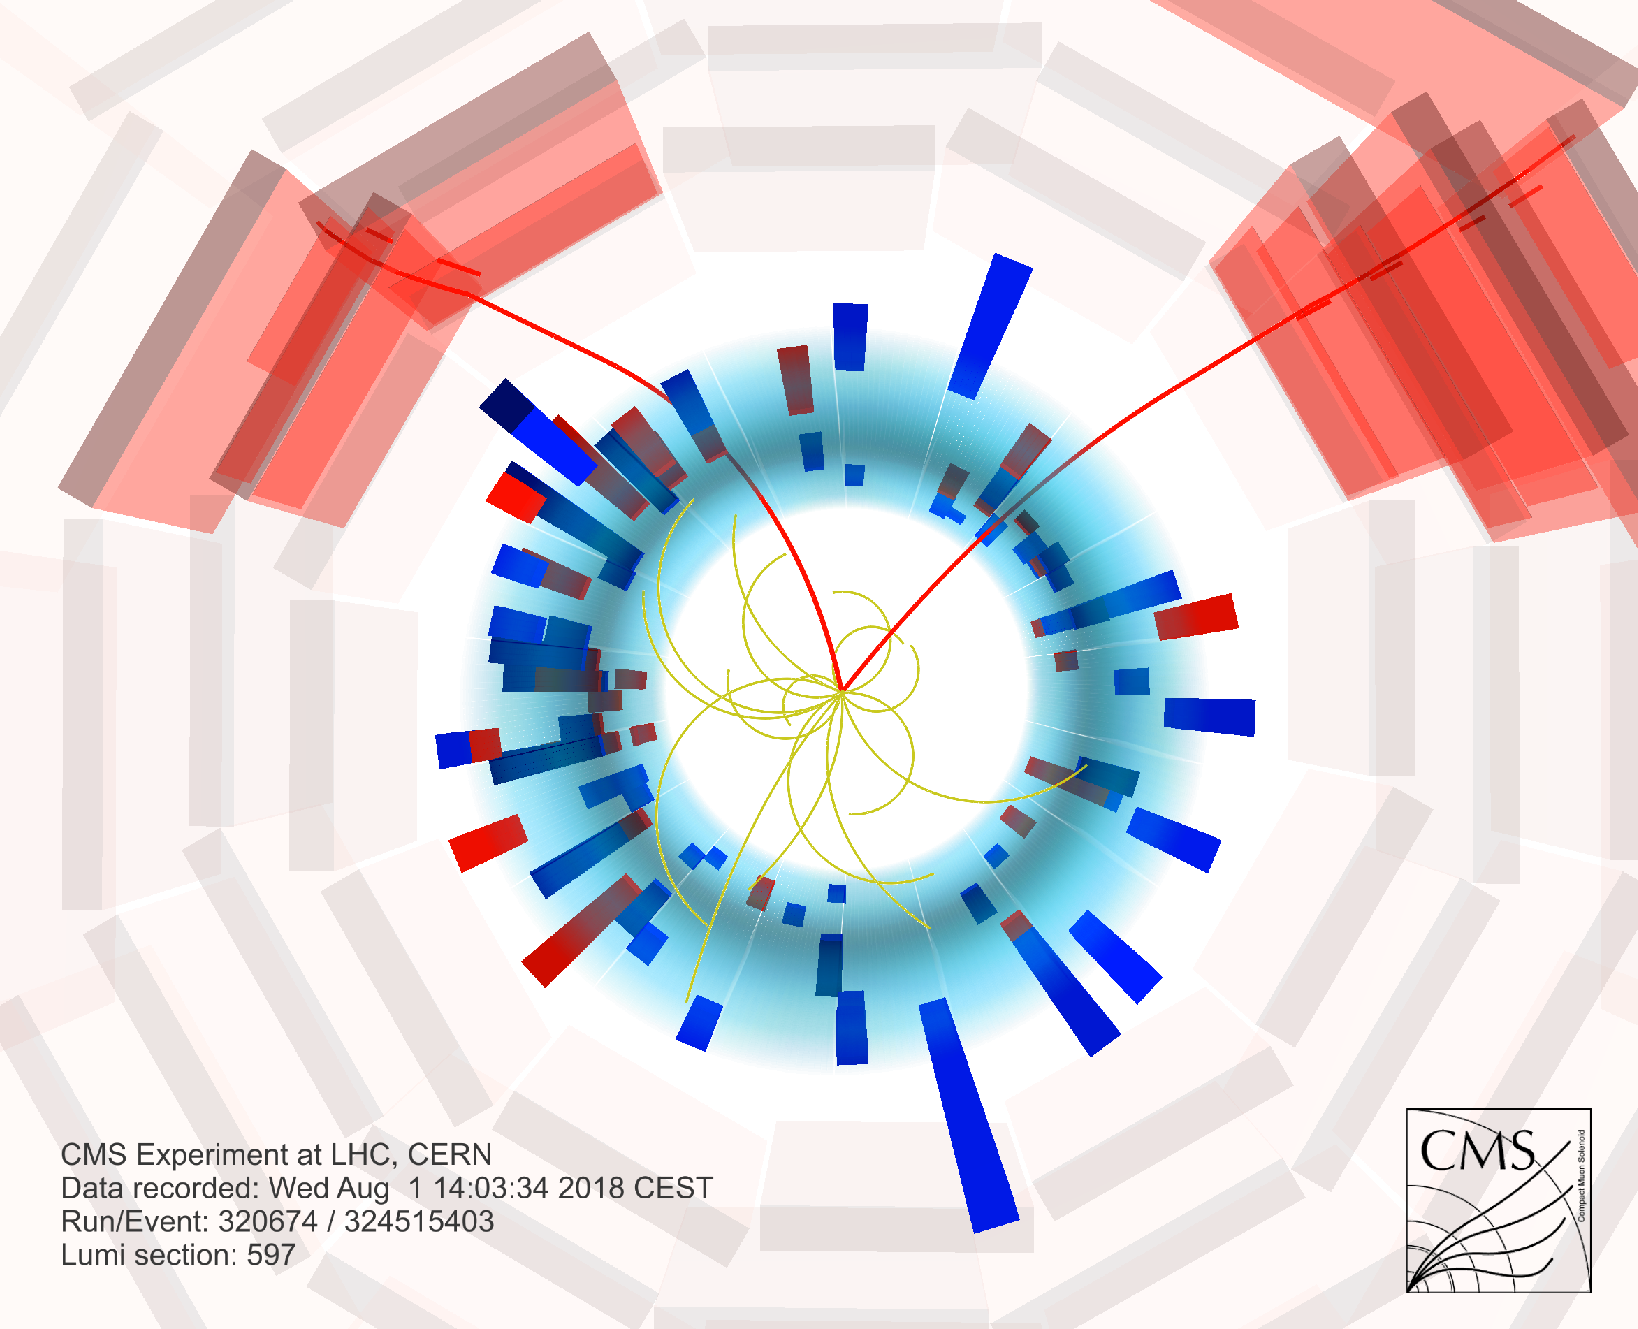
Additional Figure 20:
3D view of a $ \mathrm{B}_{s}^{0} \to\mu^{+}\mu^{-} $ candidate in Run 2 data. The two red lines correspond to the two muons from the decay. Other curved lines represent charged tracks originating from the same primary vertex as the B candidate. Tracks from other interactions in the event have been removed for clarity. |

png pdf |
Additional Figure 21:
The rho-phi projection of a $ \mathrm{B}_{s}^{0} \to\mu^{+}\mu^{-} $ candidate in Run 2 data. The two red lines correspond to the two muons from the decay. Other curved lines represent charged tracks originating from the same primary vertex as the B candidate. Tracks from other interactions in the event have been removed for clarity. |

png pdf |
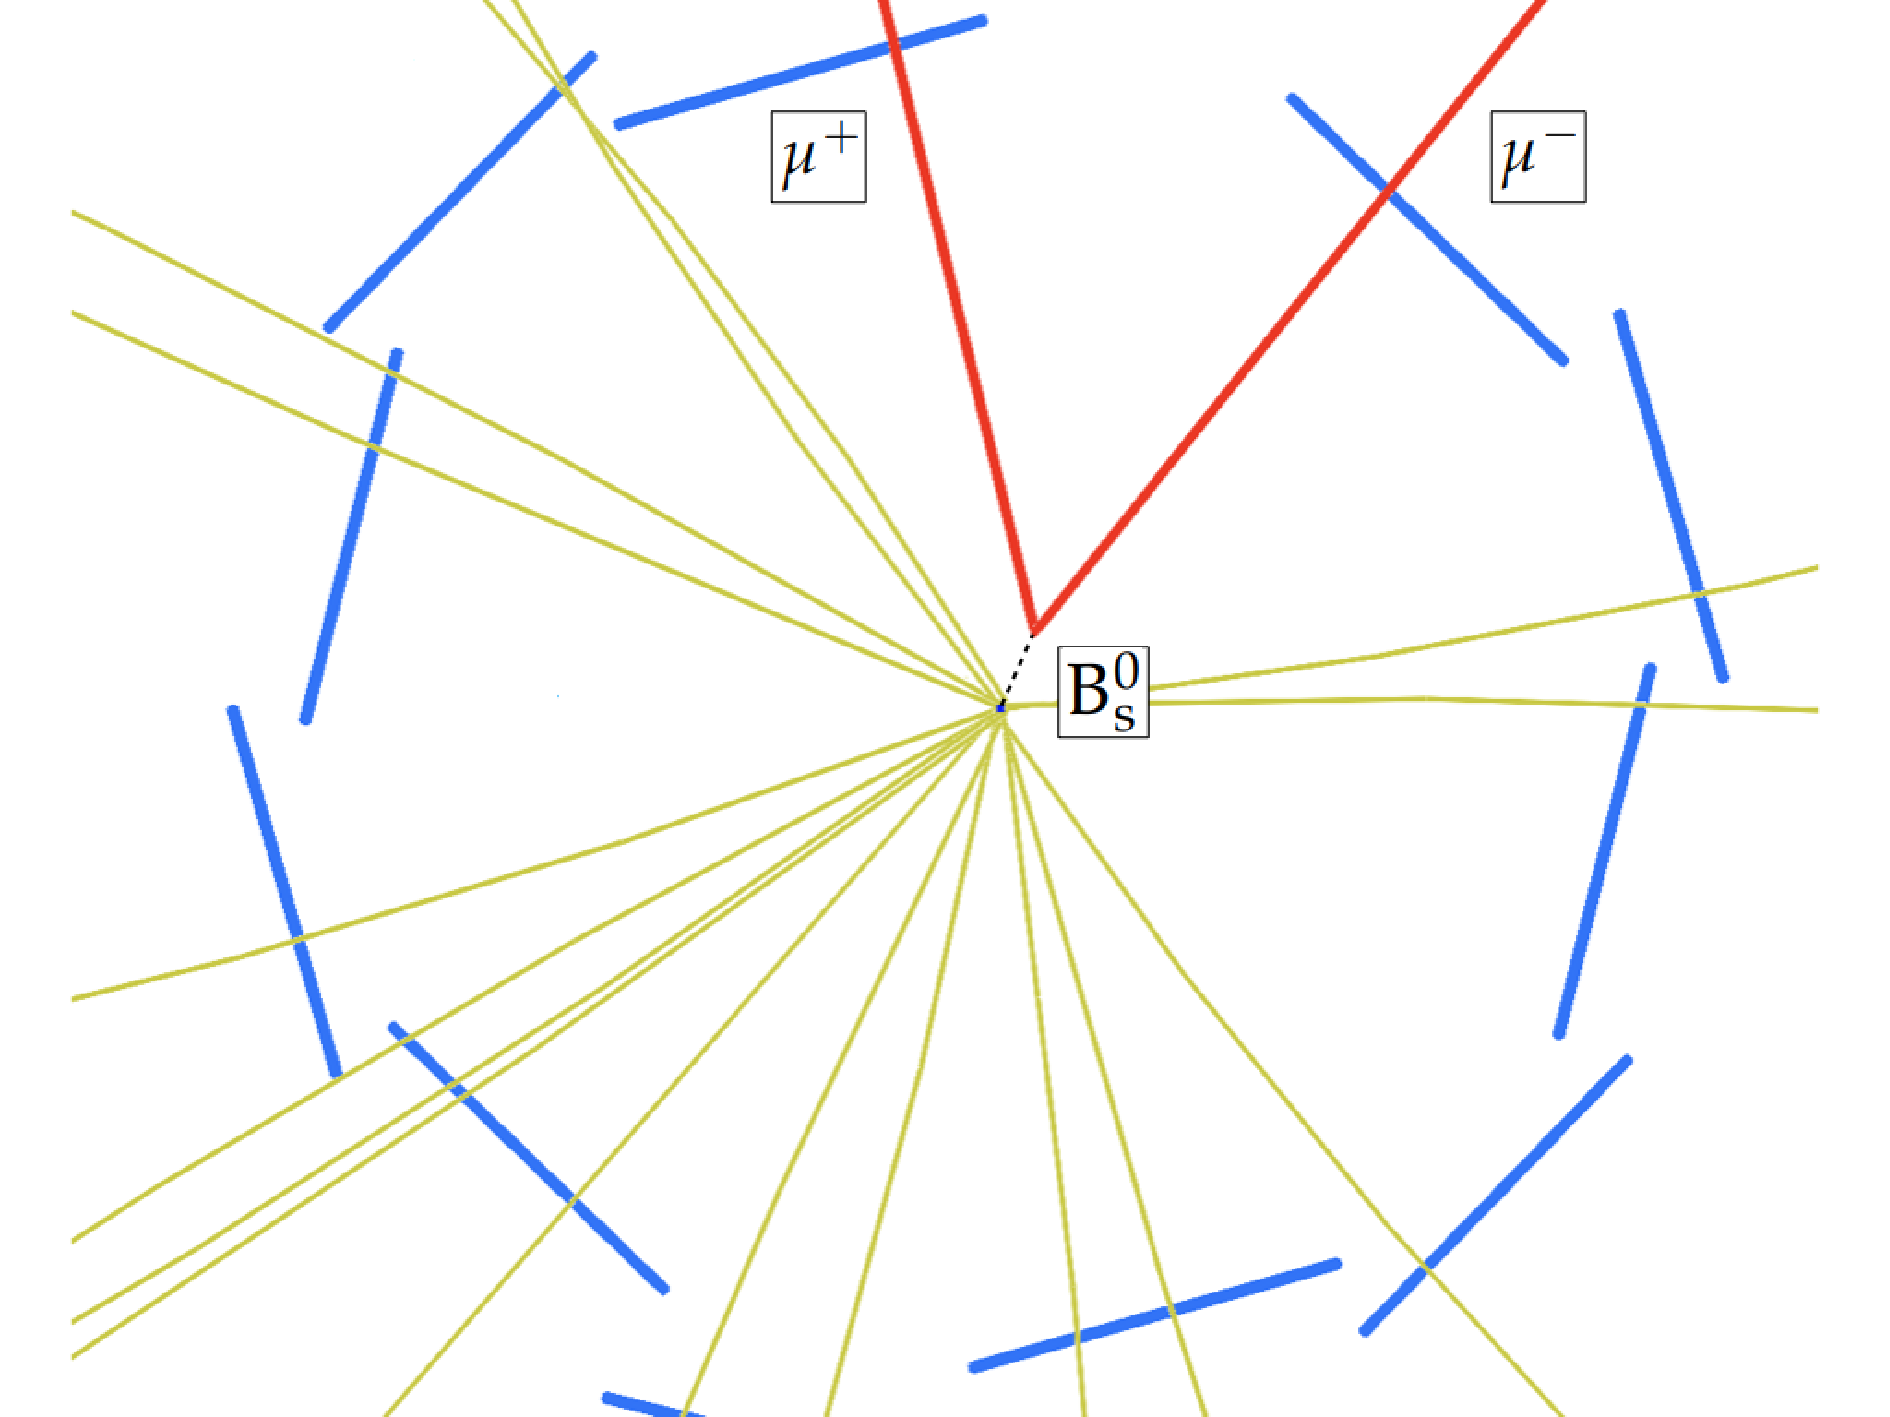
Additional Figure 22:
The rho-phi projection of a $ \mathrm{B}_{s}^{0} \to\mu^{+}\mu^{-} $ candidate in Run 2 data zoomed in on the inner tracker regions. The two red lines correspond to the two muons from the decay. Other curved lines represent charged tracks originating from the same primary vertex as the B candidate. Tracks from other interactions in the event have been removed for clarity. |
png pdf |
Additional Figure 23:
The rho-phi proejction of a $ \mathrm{B}_{s}^{0} \to\mu^{+}\mu^{-} $ candidate in Run 2 data zoomed in on the innermost detector regions. The two red lines correspond to the two muons from the decay. Other curved lines represent charged tracks originating from the same primary vertex as the B candidate. Tracks from other interactions in the event have been removed for clarity. |

png pdf |
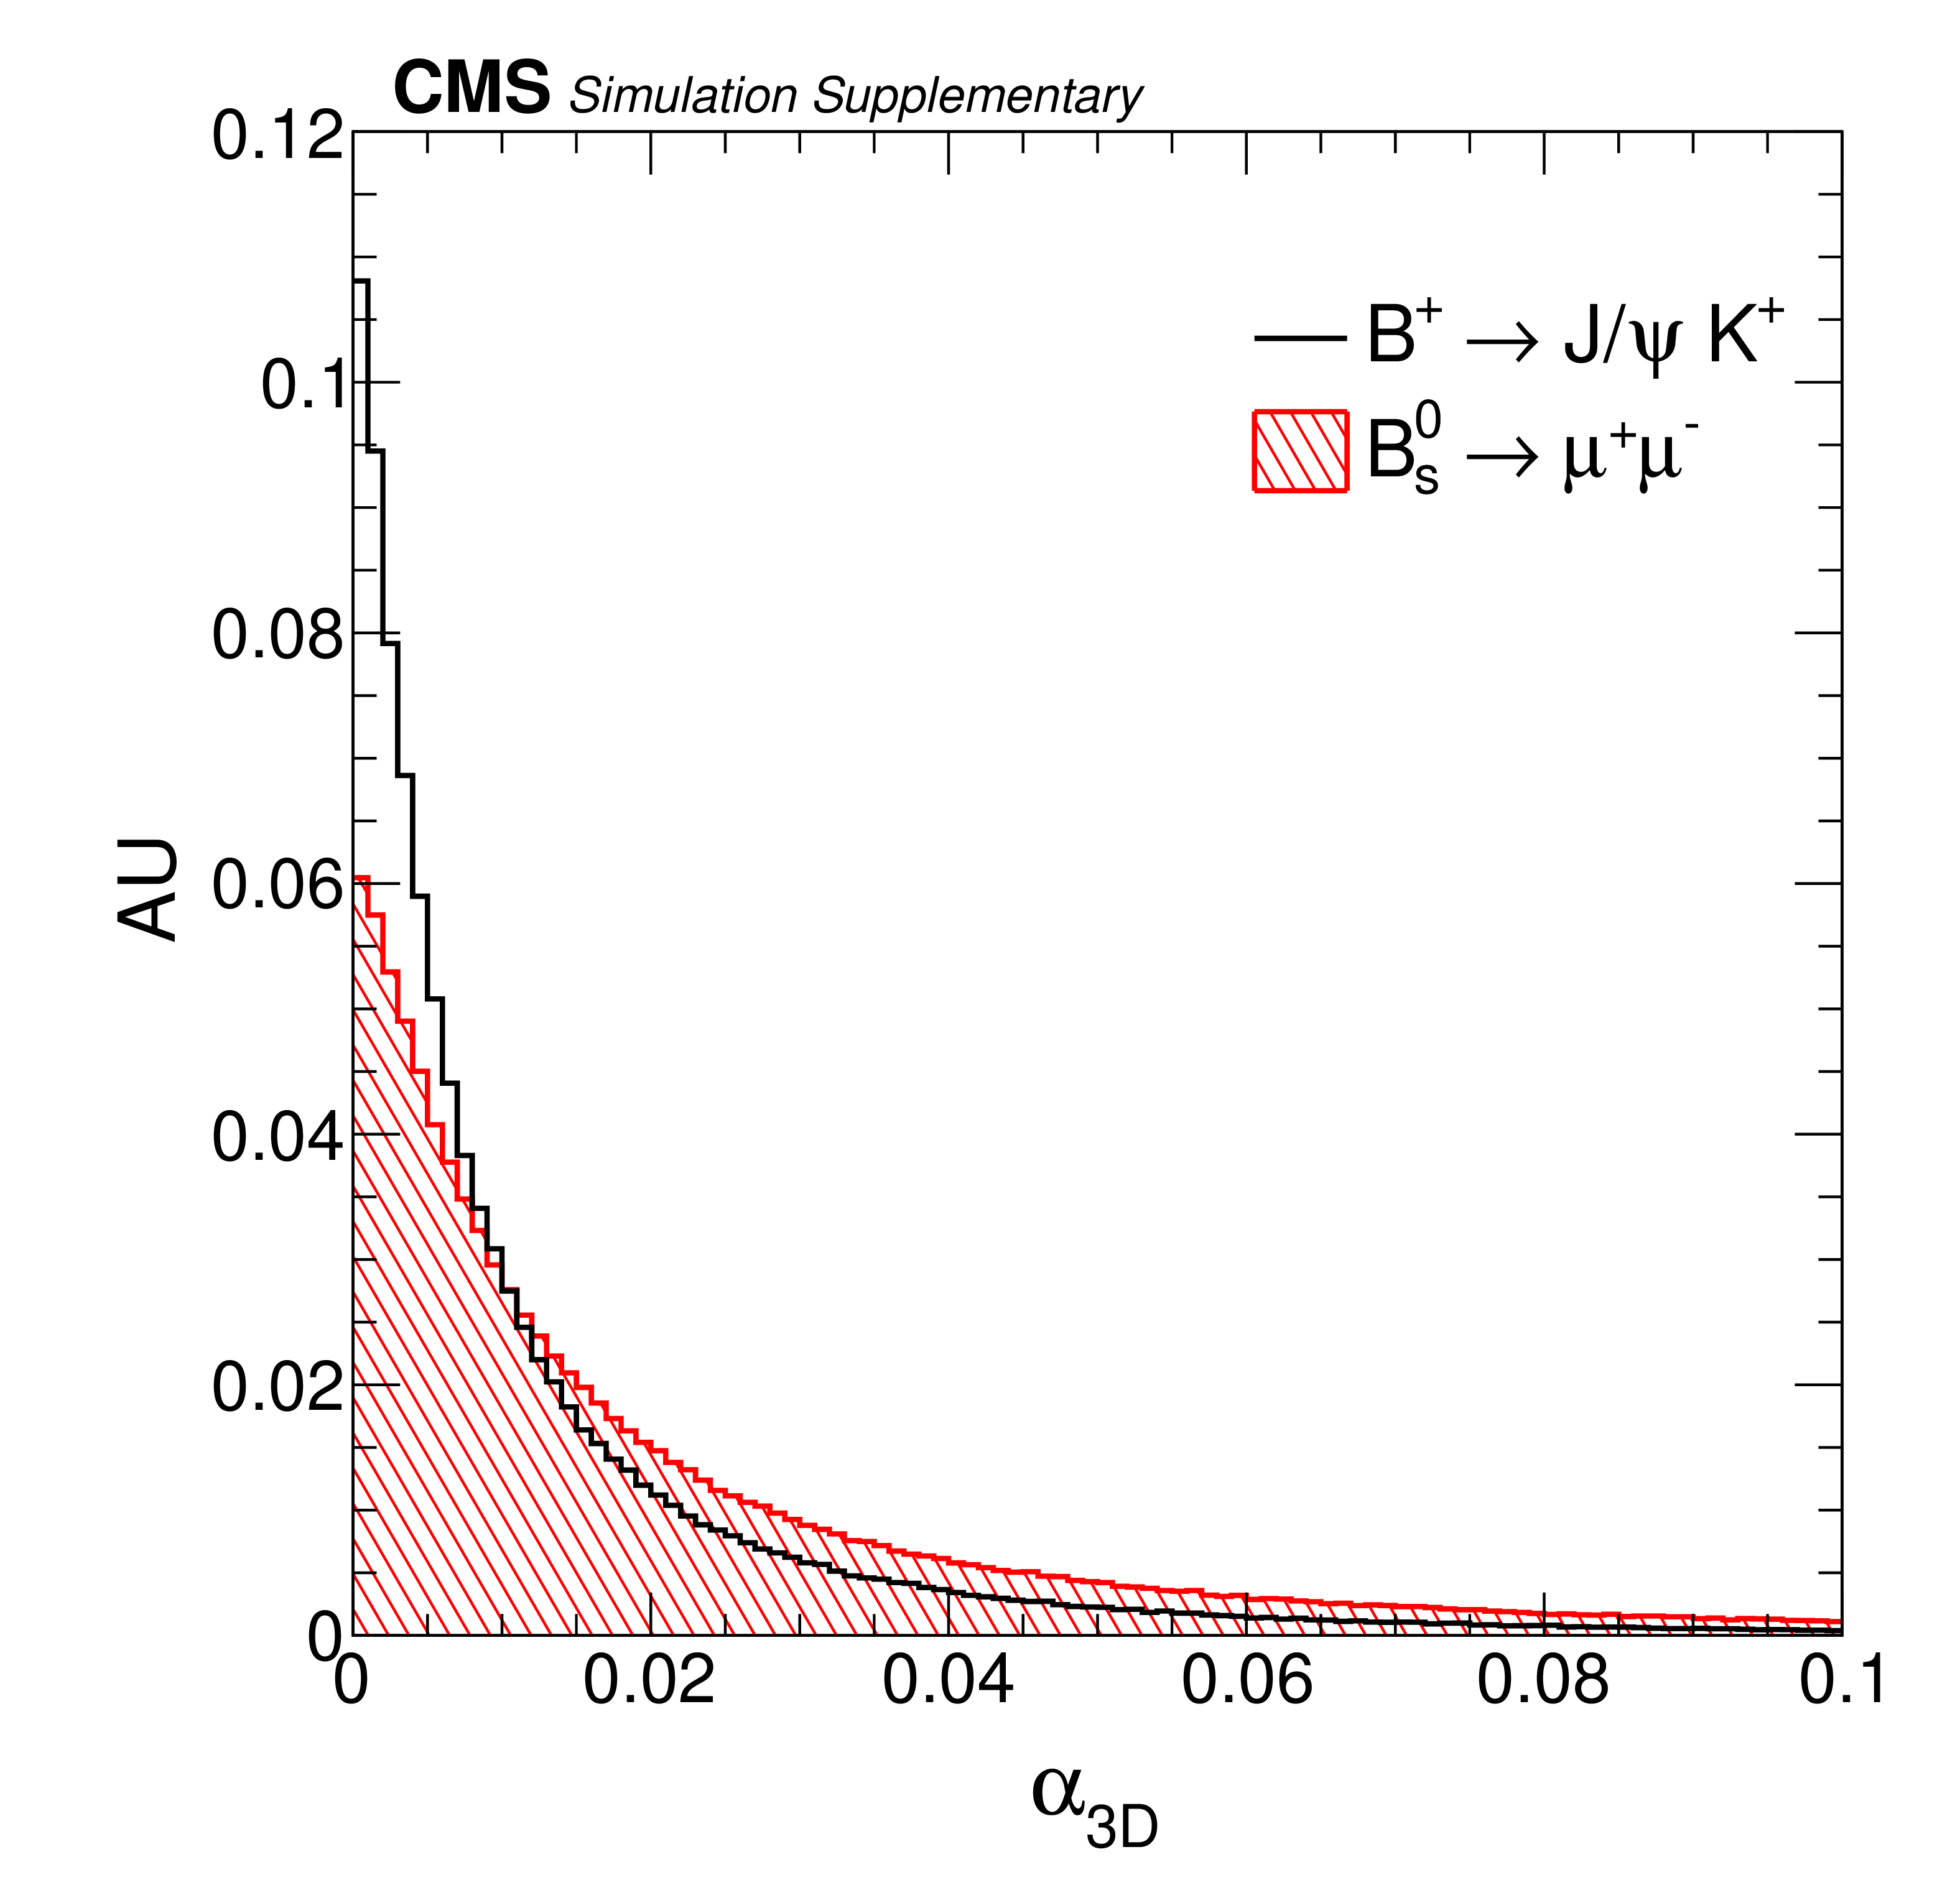
Additional Figure 24:
Comparison of the pointing angle distributions for $ {\mathrm{B}^{+}} \to \mathrm{J}/\psi\mathrm{K^+} $ and $ \mathrm{B}_{s}^{0} \to\mu^{+}\mu^{-} $ decays in MC simulated data using the nominal event selection. |
png pdf |
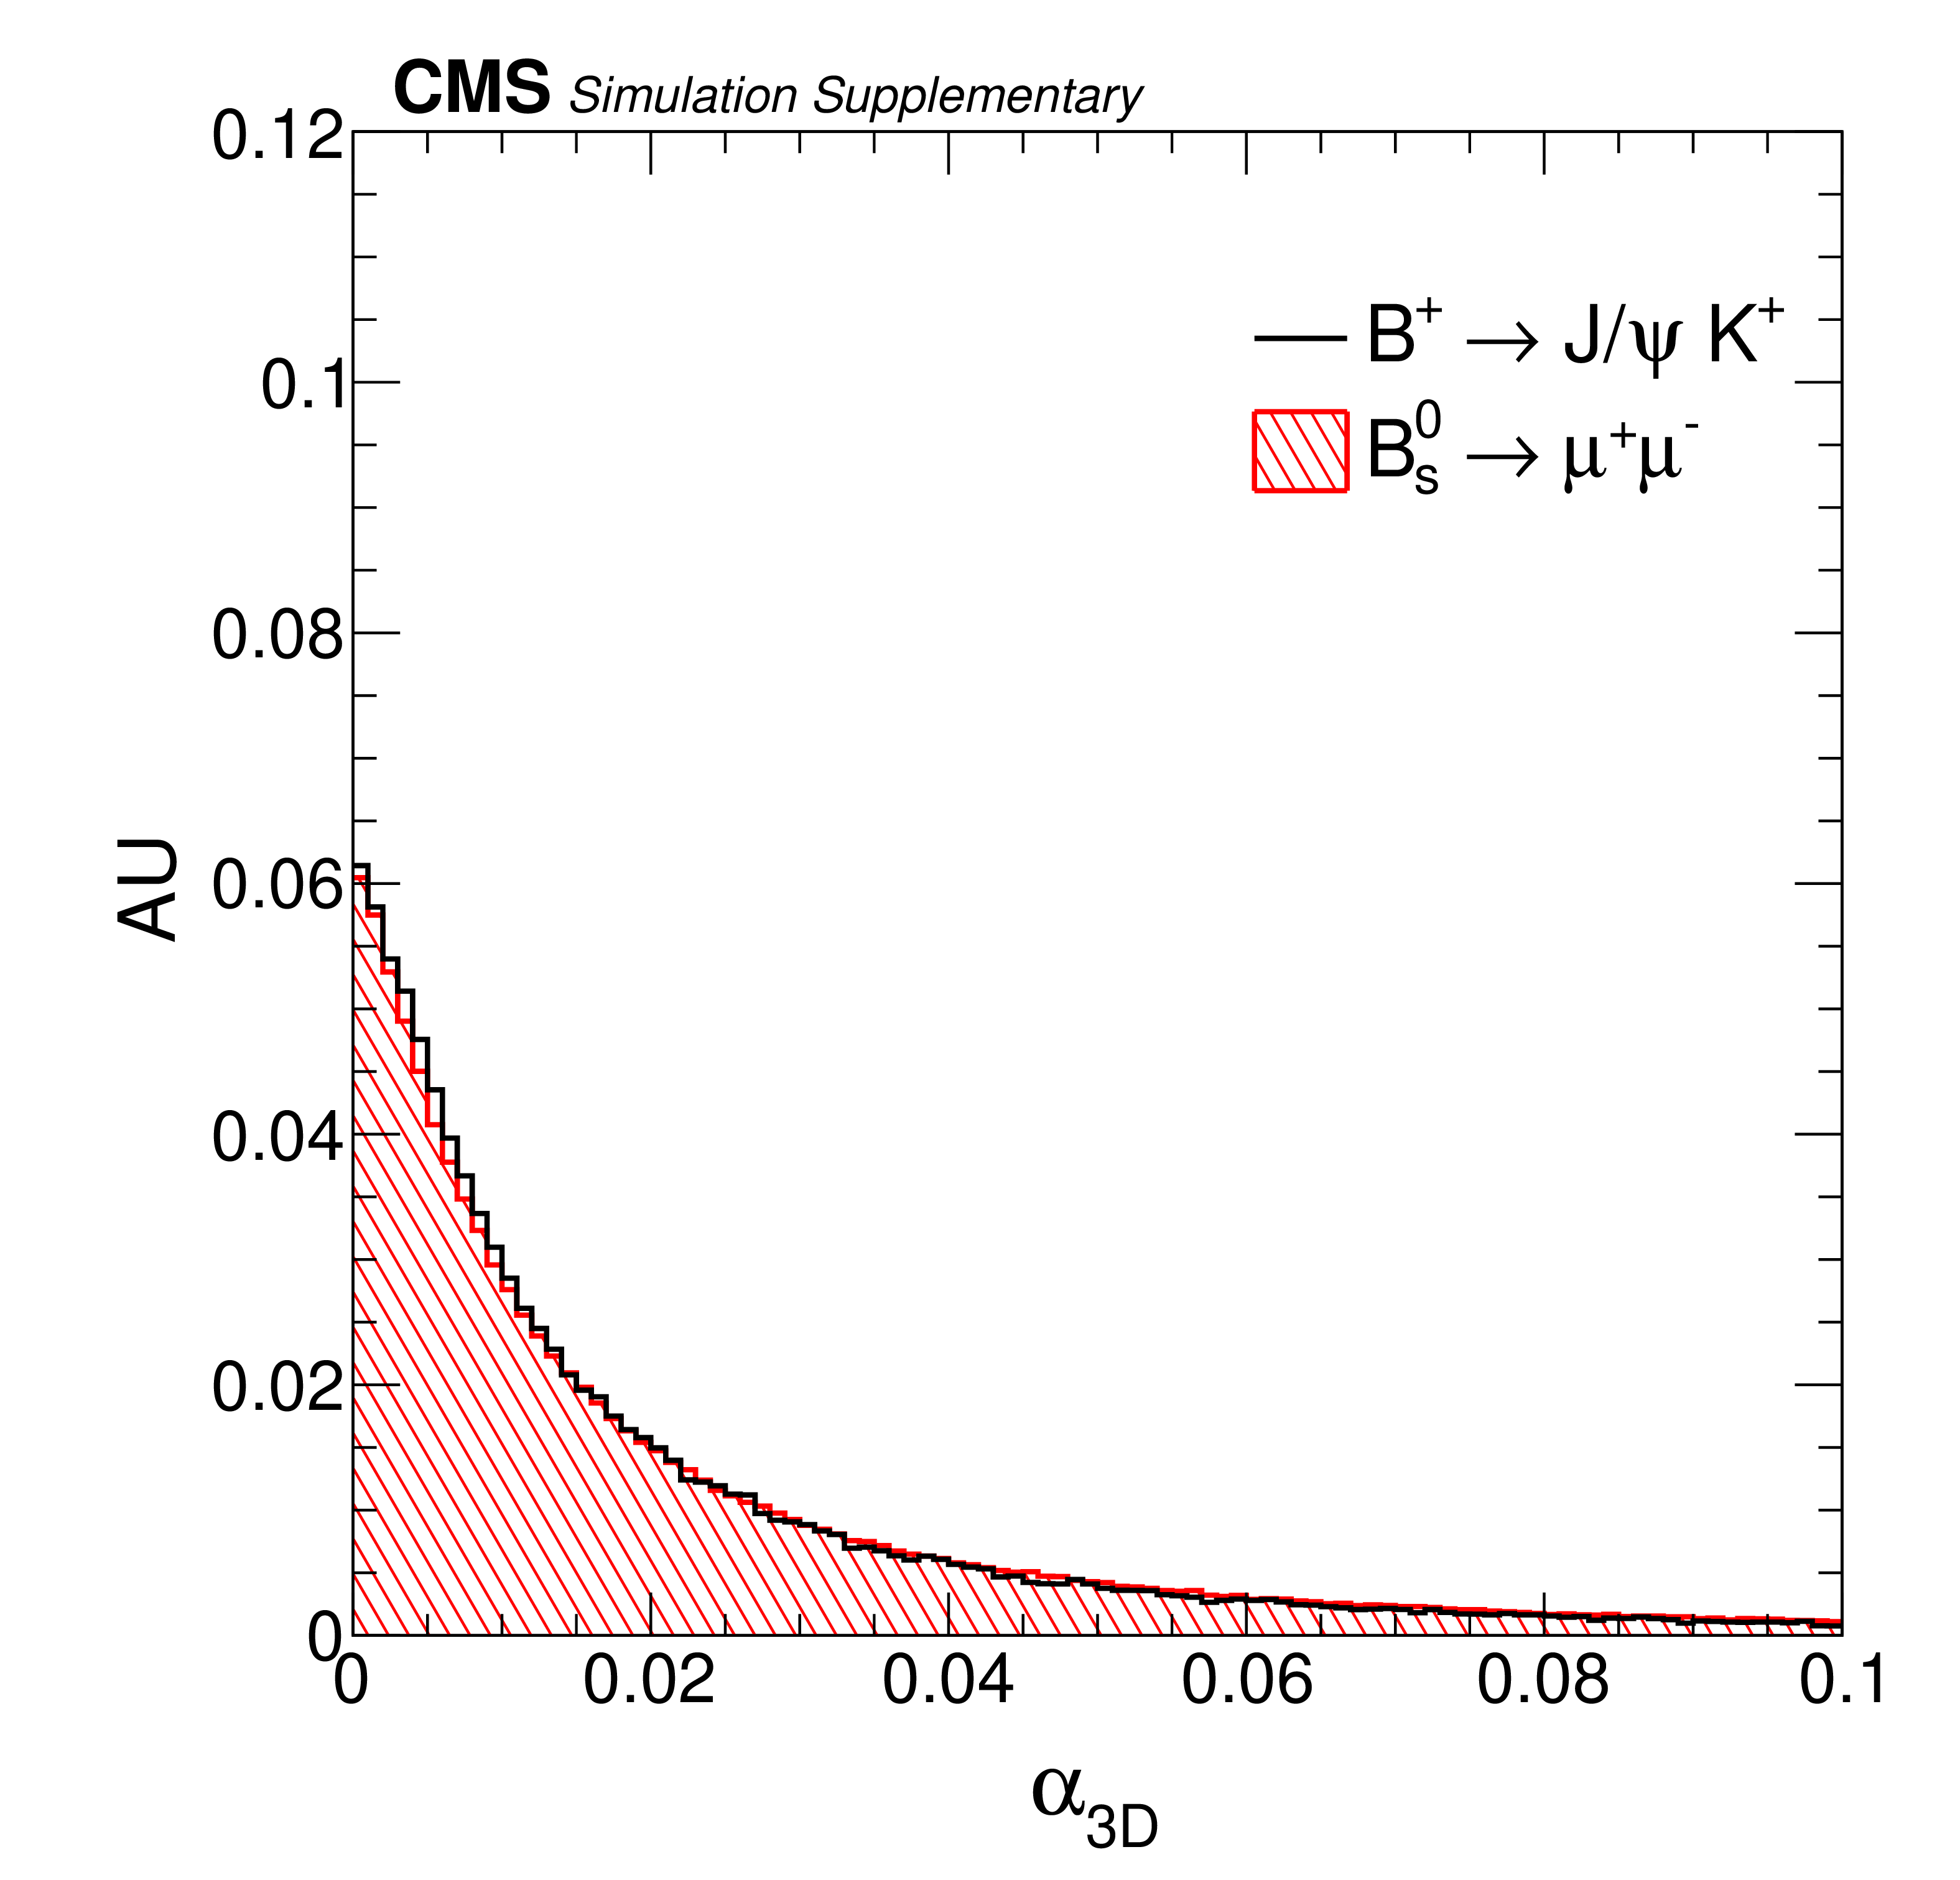
Additional Figure 25:
Comparison of the pointing angle distributions for $ {\mathrm{B}^{+}} \to \mathrm{J}/\psi\mathrm{K^+} $ and $ \mathrm{B}_{s}^{0} \to\mu^{+}\mu^{-} $ decays in MC simulated data with the kaon $ p_{\mathrm{T}} > $ 3.0 GeV. |
png pdf |
Additional Figure 26:
Comparison of the pointing angle distributions for $ {\mathrm{B}^{+}} \to \mathrm{J}/\psi\mathrm{K^+} $ and $ \mathrm{B}_{s}^{0} \to\mu^{+}\mu^{-} $ decays in MC simulated data with the kaon $ p_{\mathrm{T}} < $ 1.5 GeV. |
png pdf |
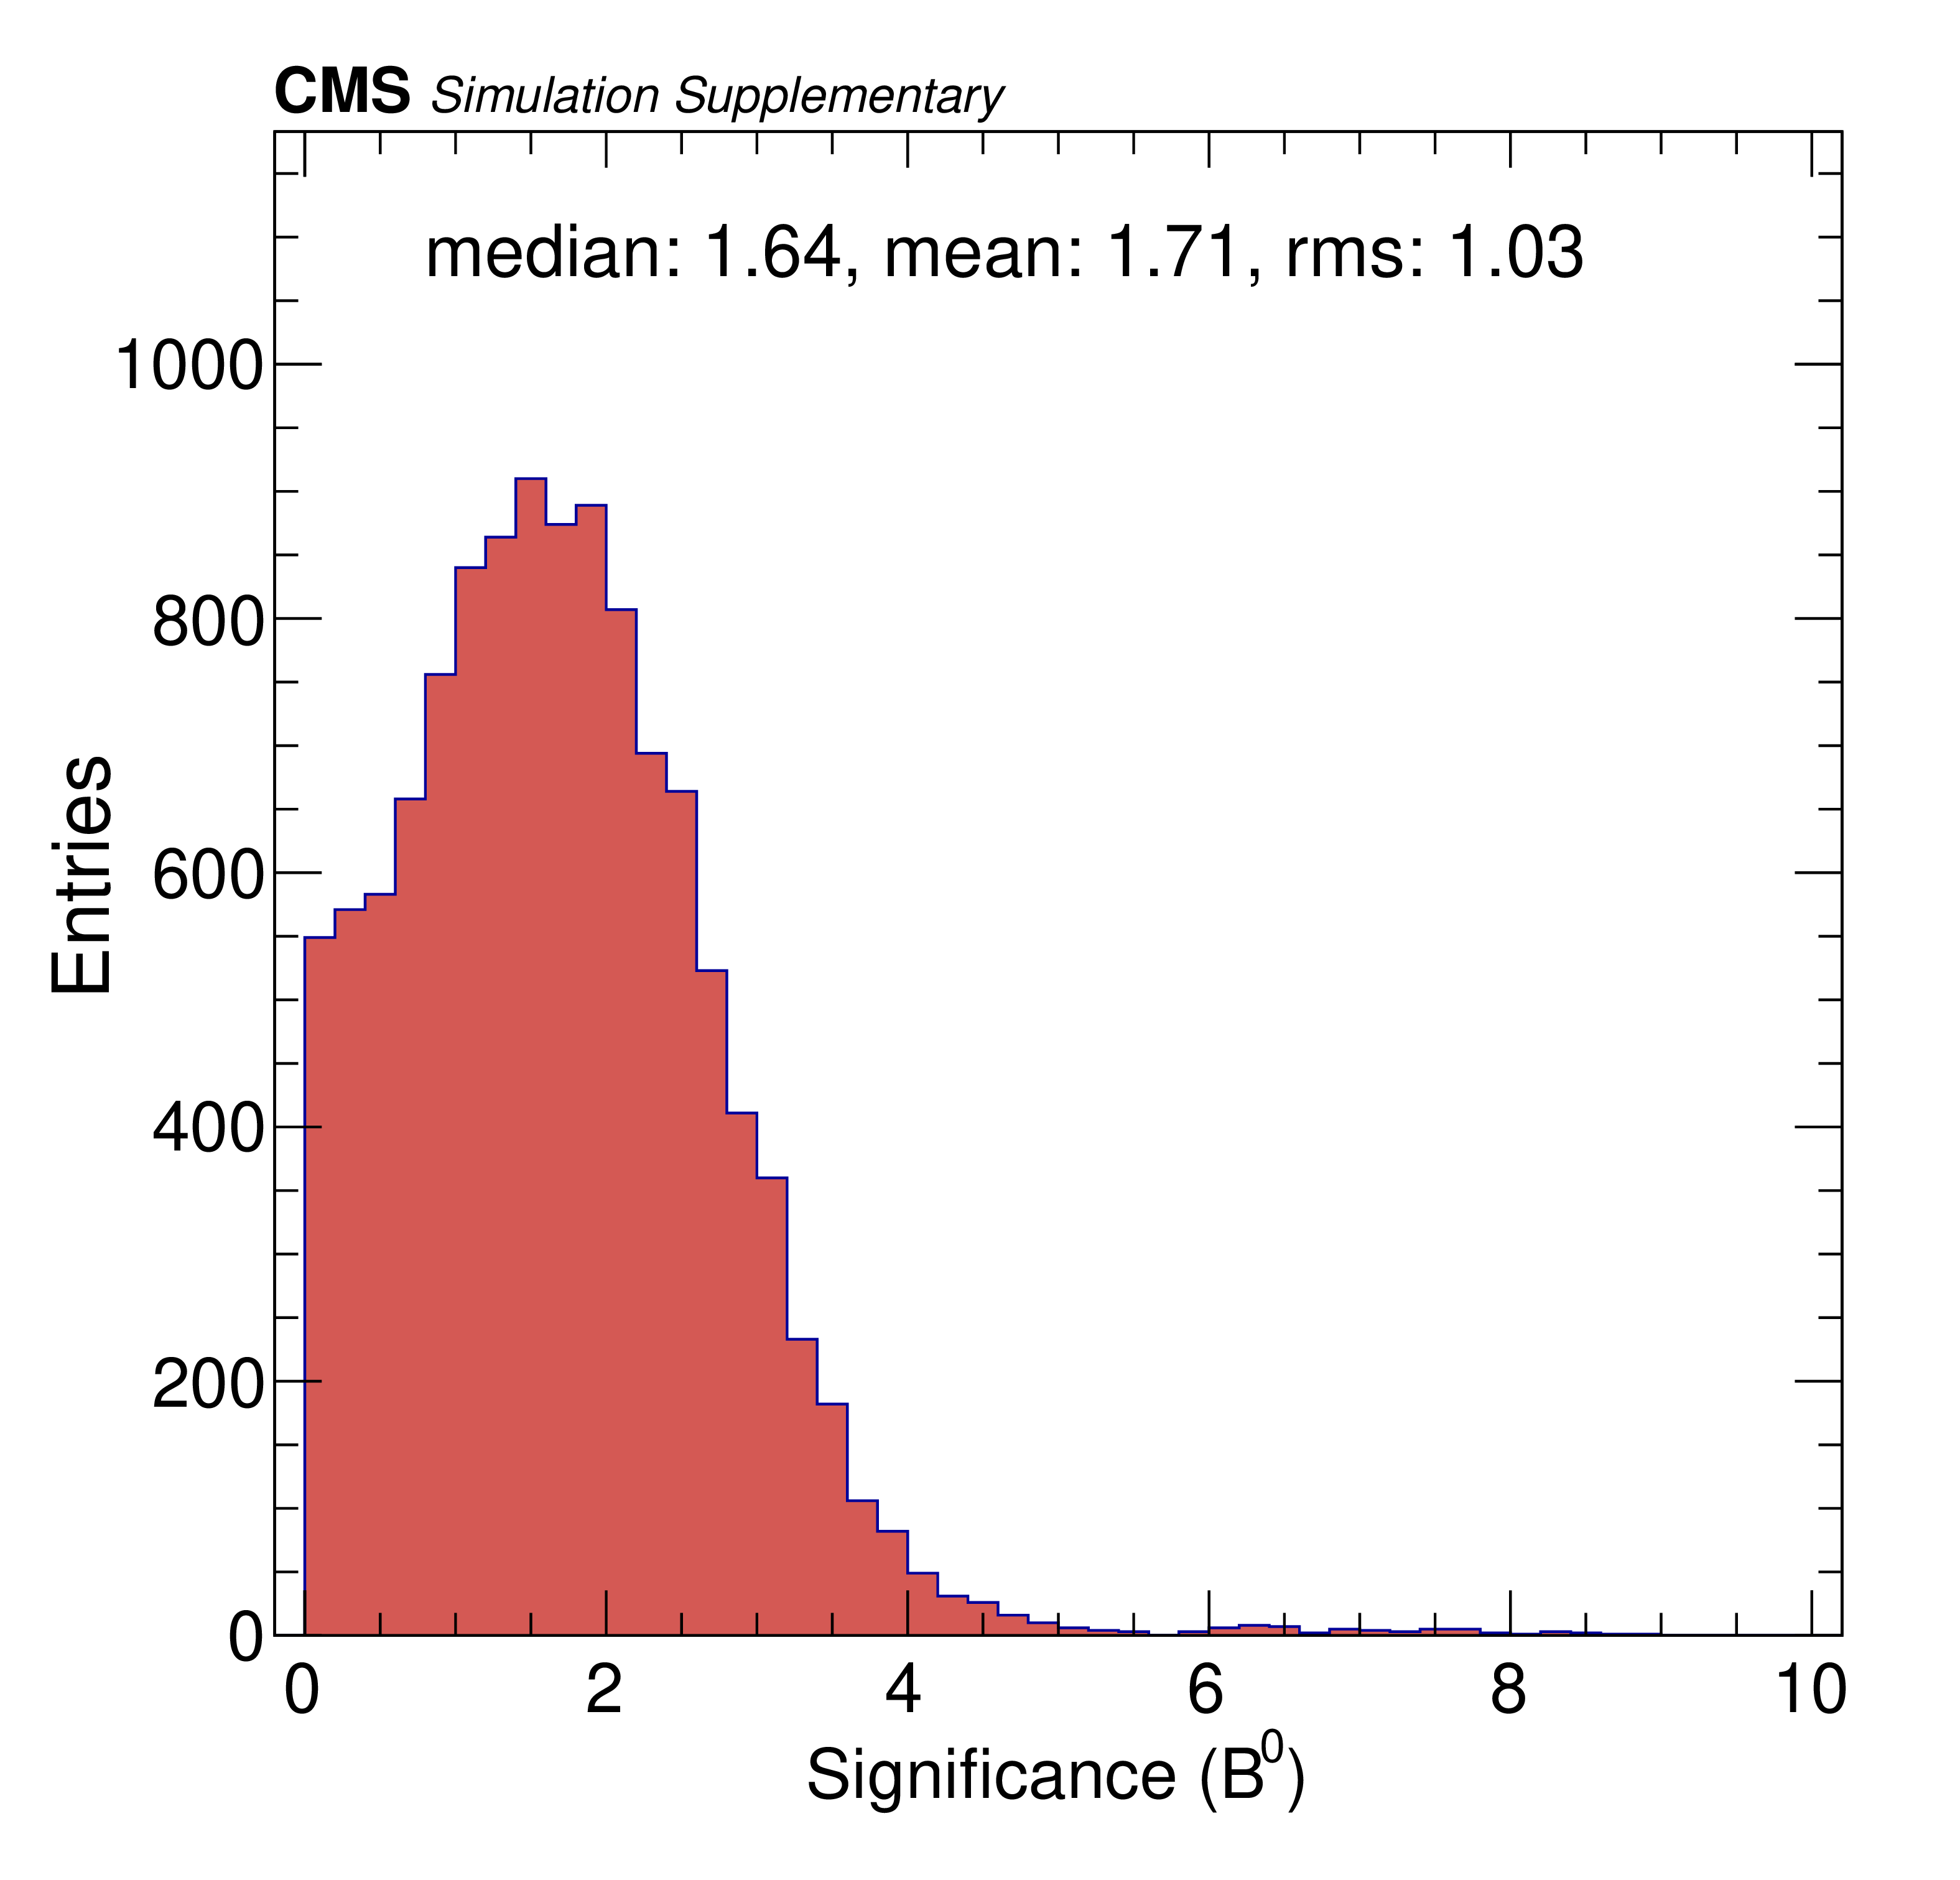
Additional Figure 27:
The $ {\mathrm{B}^0} \to \mu^{+}\mu^{-} $ signal significance distribution for 1000 pseudo data experiments generated with the nominal fit configuration. |
png pdf |
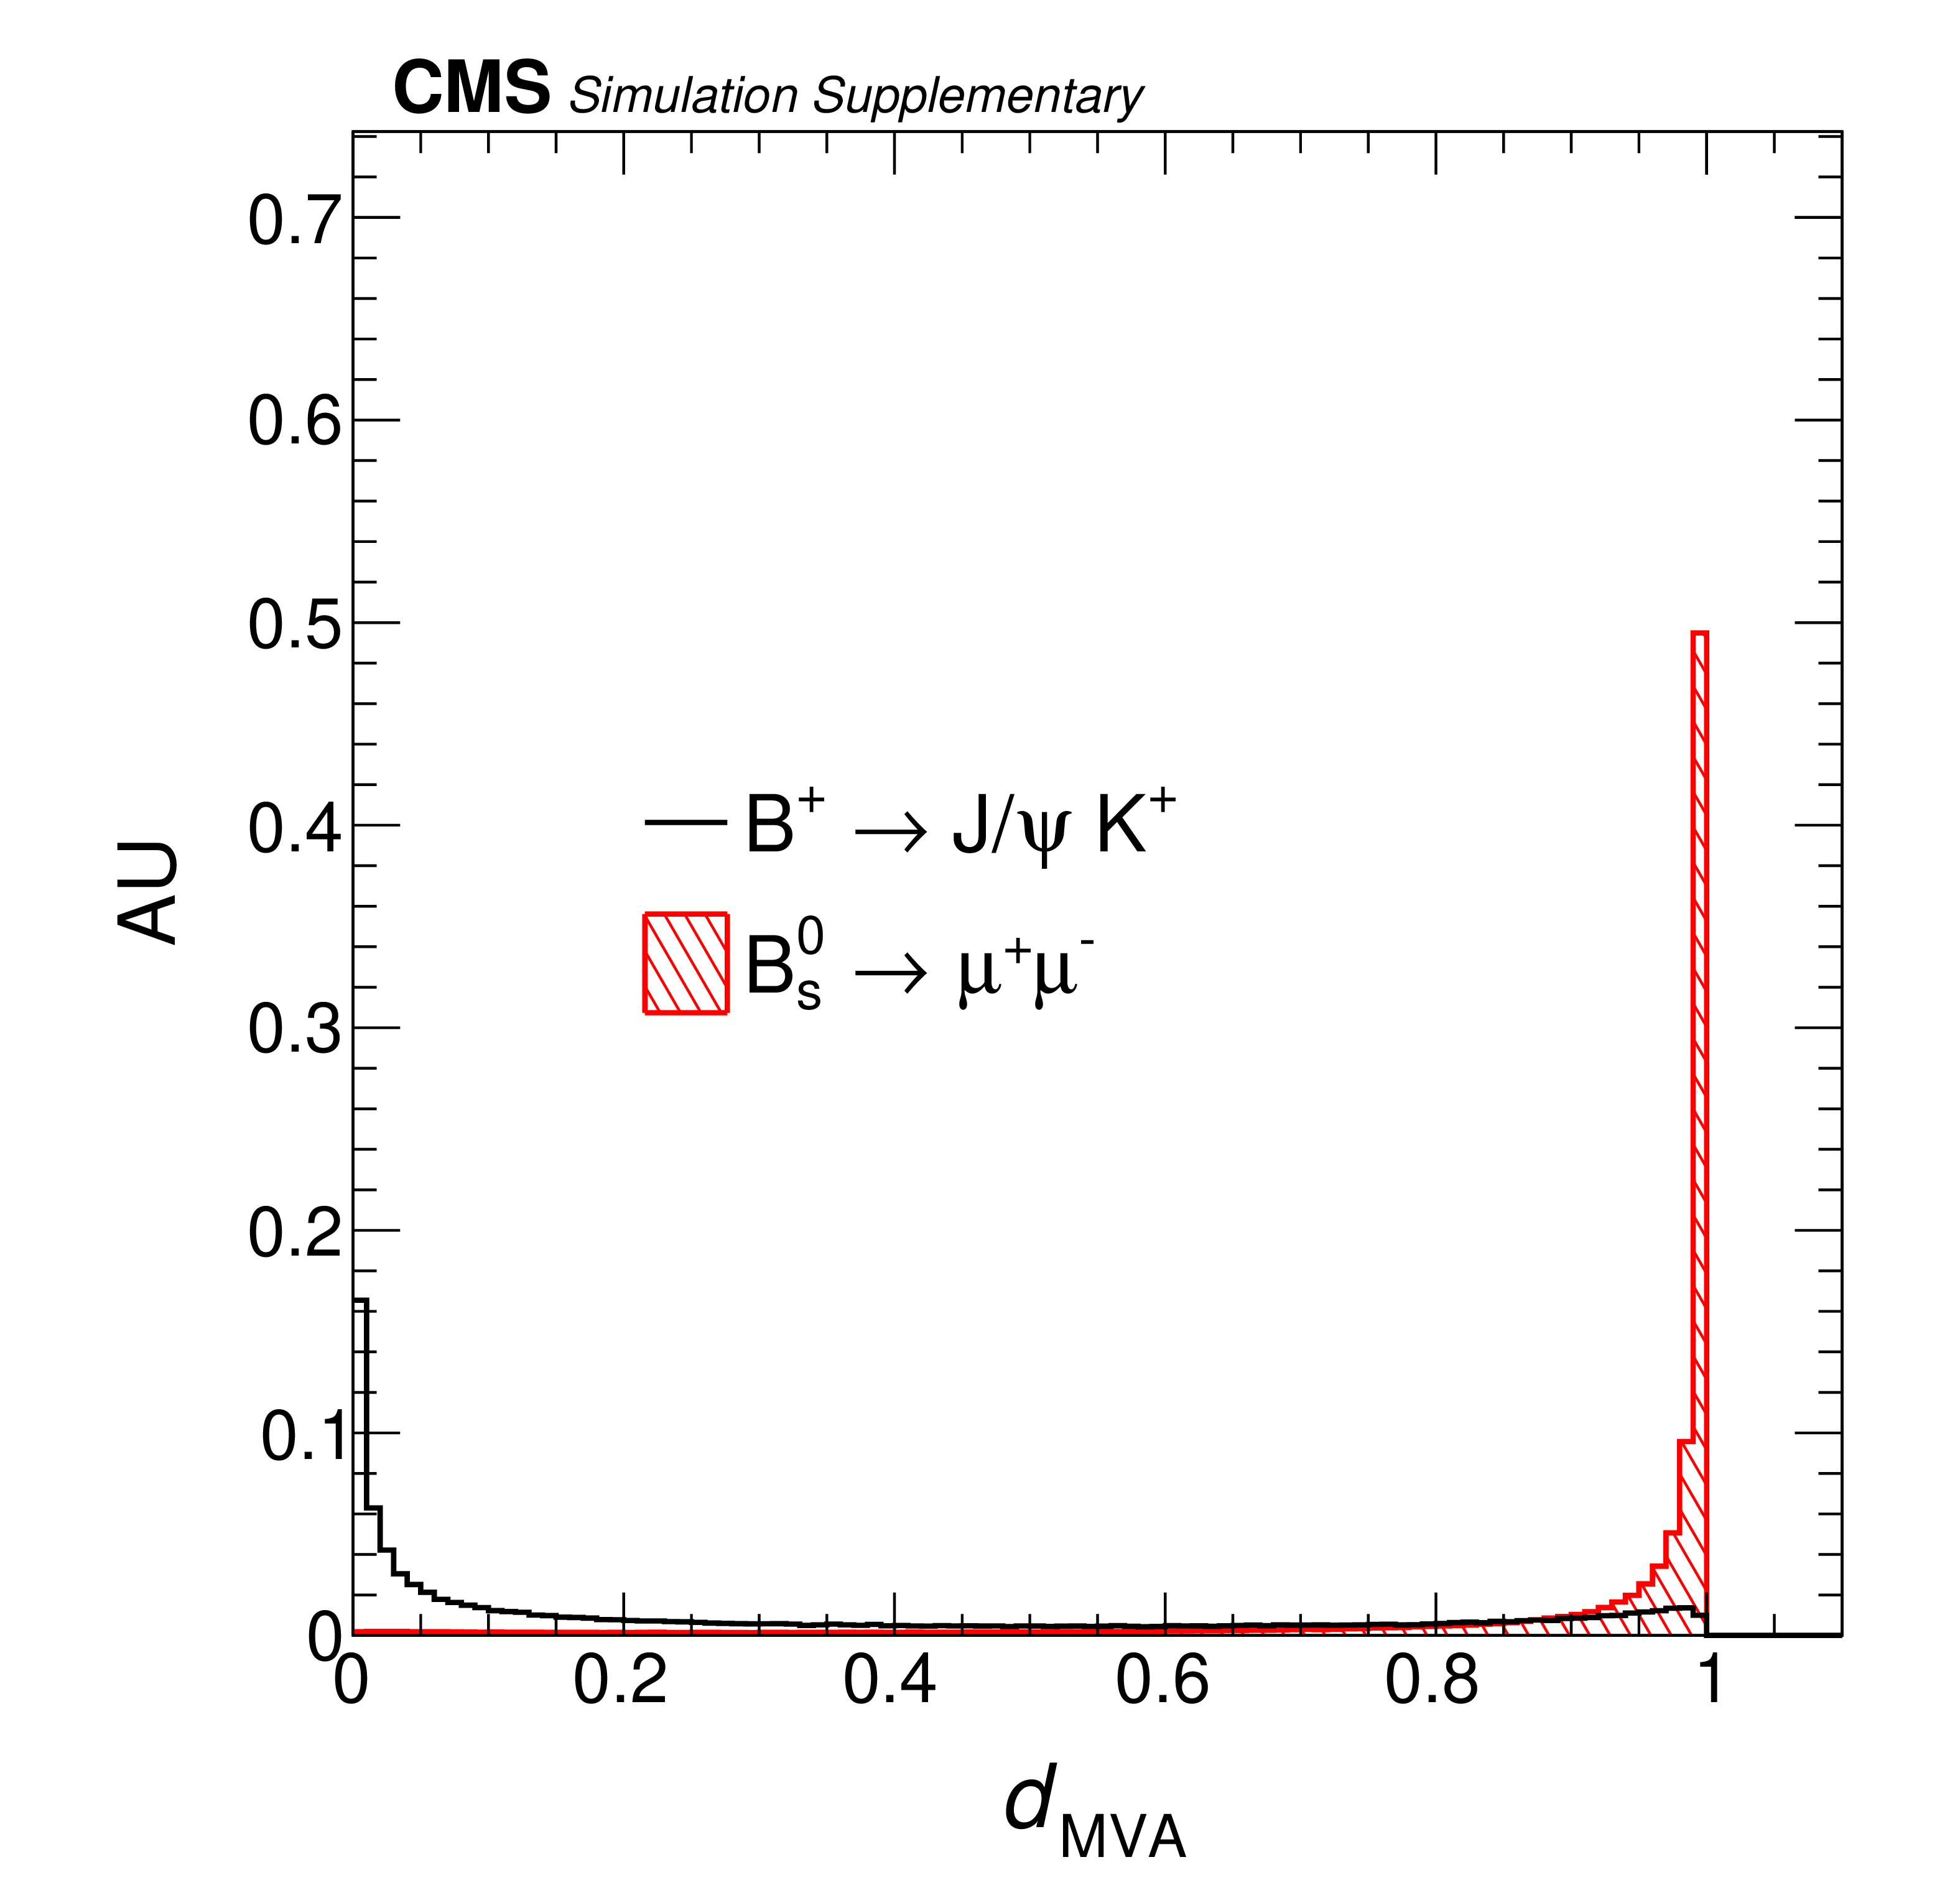
Additional Figure 28:
Comparison of the $ d_{\text{MVA}} $ distributions for $ {\mathrm{B}^{+}} \to \mathrm{J}/\psi\mathrm{K^+} $ and $ \mathrm{B}_{s}^{0} \to\mu^{+}\mu^{-} $ decays in MC simulated data treating $ {\mathrm{B}^{+}} \to \mathrm{J}/\psi\mathrm{K^+} $ as background. |
png pdf |
Additional Figure 29:
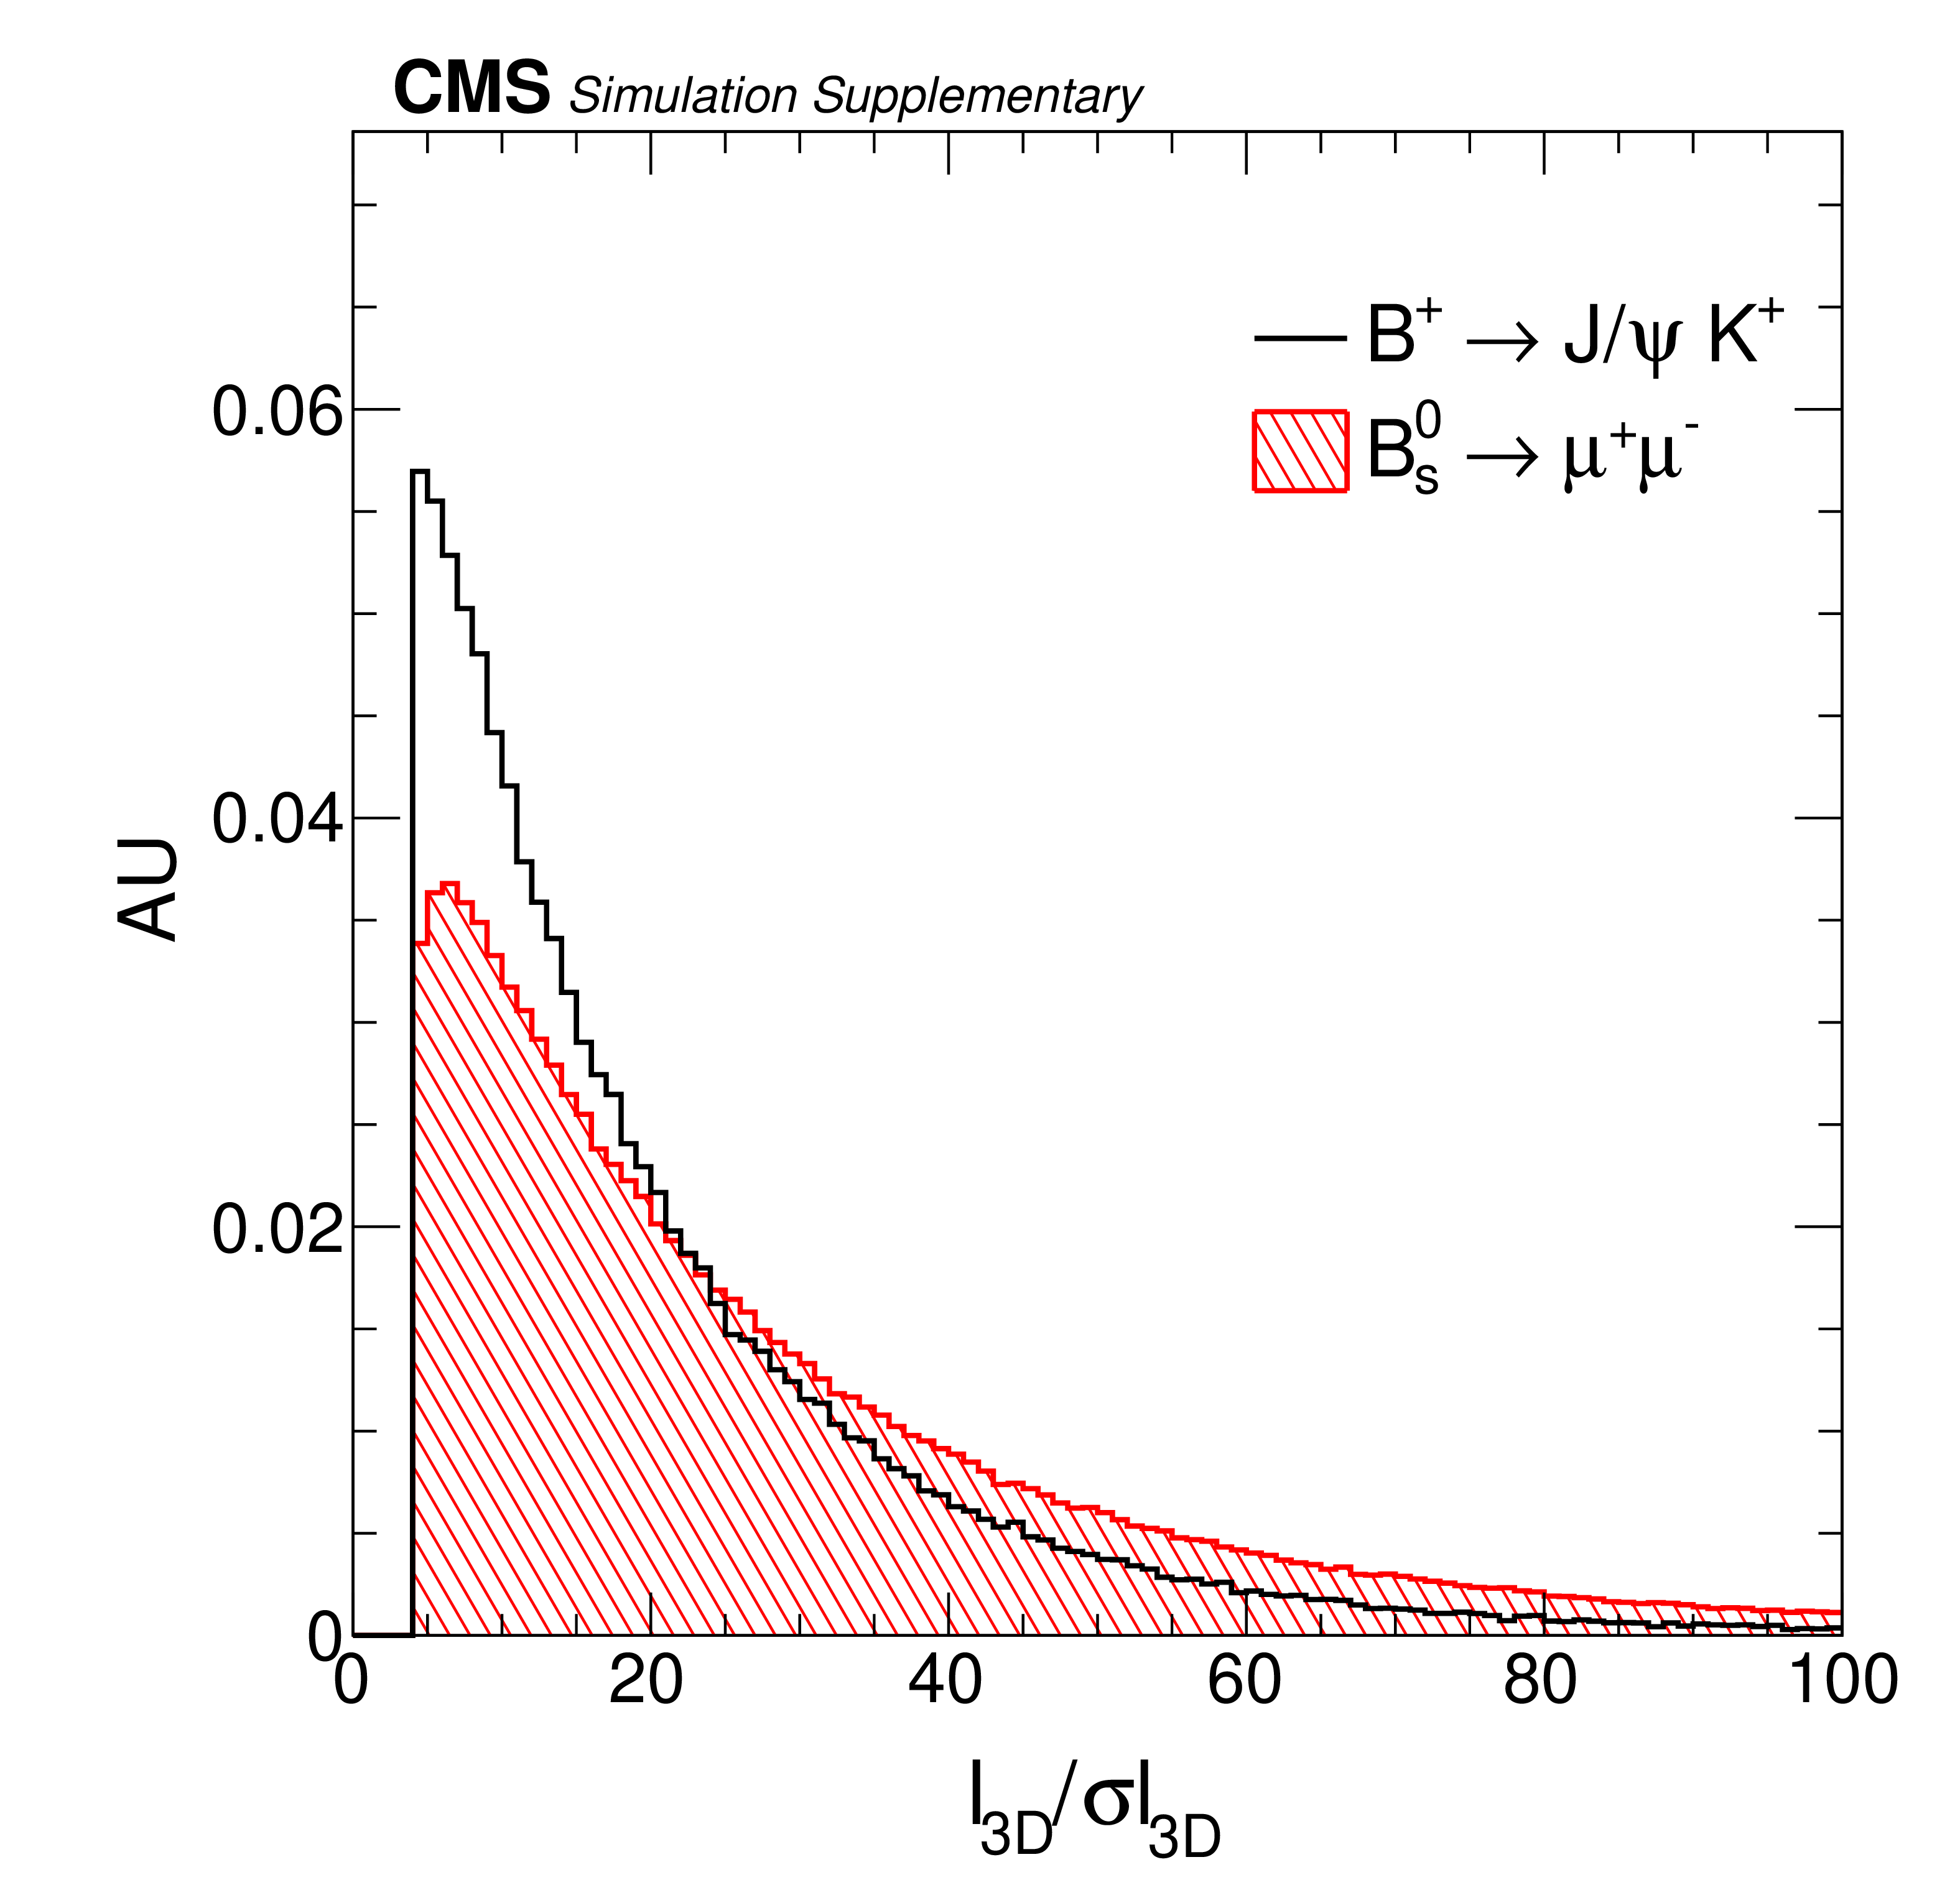
Comparison of the flight length significance distributions for $ {\mathrm{B}^{+}} \to \mathrm{J}/\psi\mathrm{K^+} $ and $ \mathrm{B}_{s}^{0} \to\mu^{+}\mu^{-} $ decays in MC simulated data with the kaon $ p_{\mathrm{T}} < $ 1.5 GeV. |
png pdf |
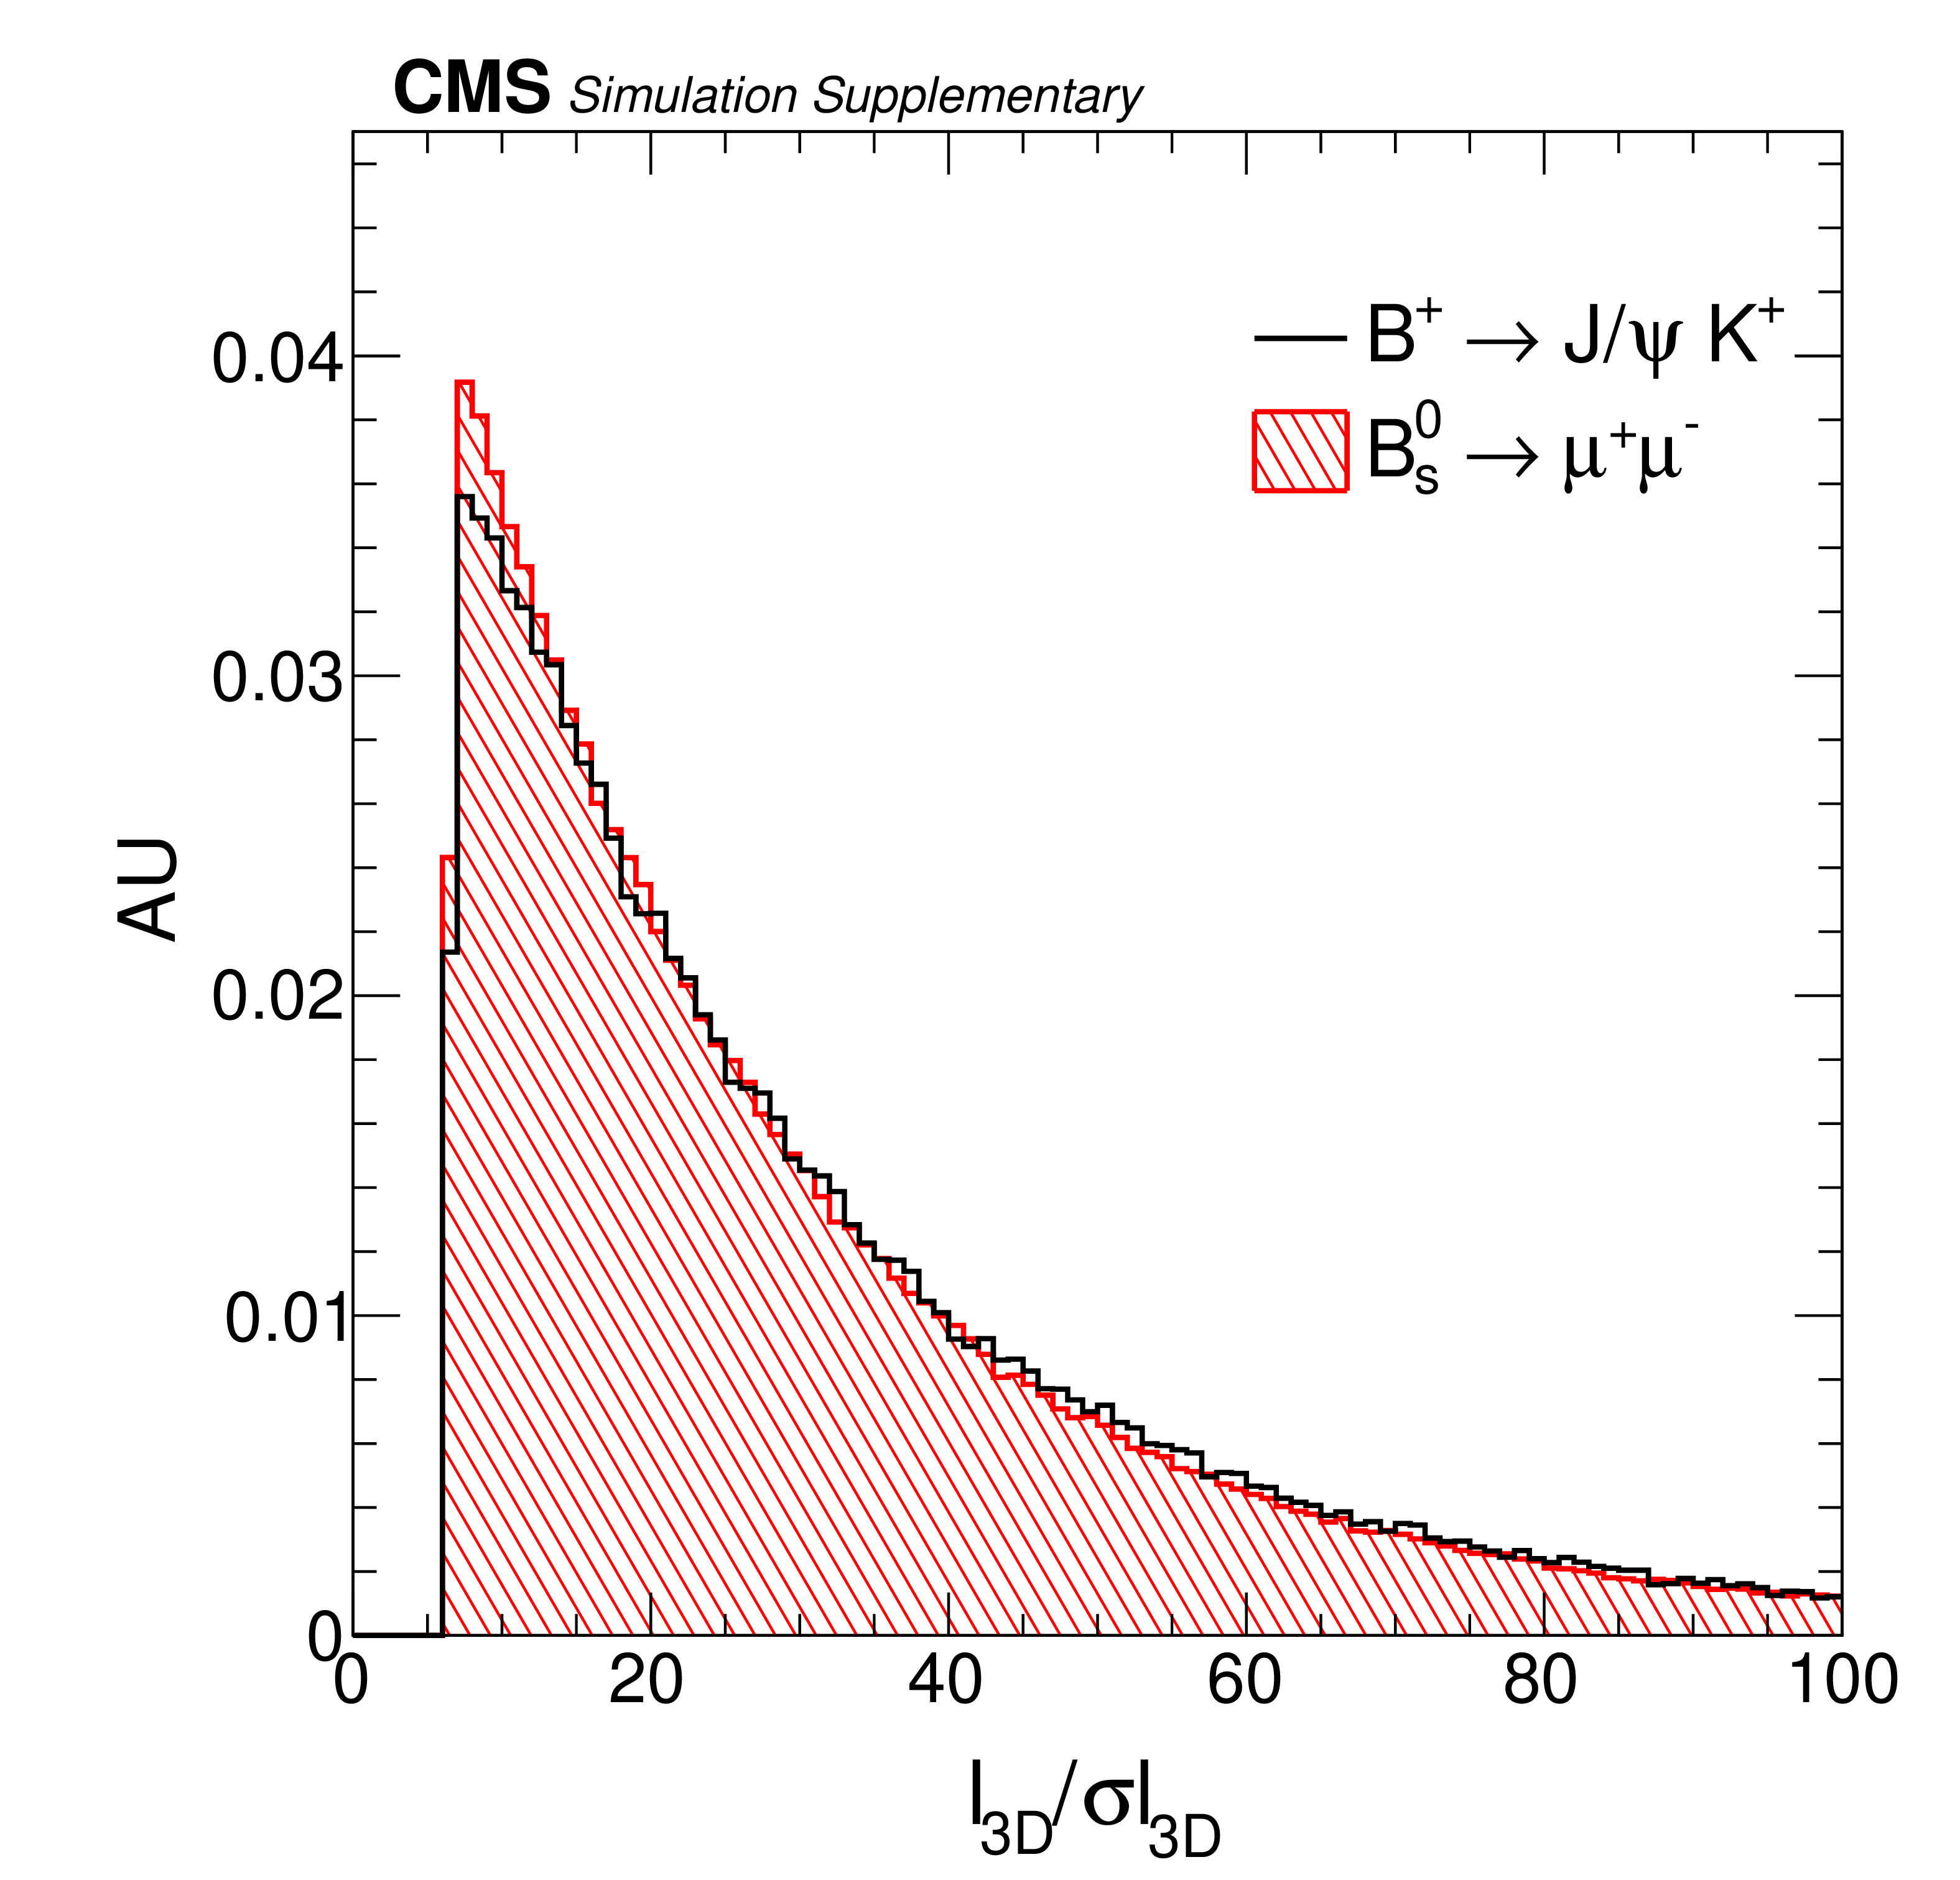
Additional Figure 30:
Comparison of the flight length significance distributions for $ {\mathrm{B}^{+}} \to \mathrm{J}/\psi\mathrm{K^+} $ and $ \mathrm{B}_{s}^{0} \to\mu^{+}\mu^{-} $ decays in MC simulated data with the kaon $ p_{\mathrm{T}} < $ 1.5 GeV scaling the flight length significance by 1.6 for $ {\mathrm{B}^{+}} \to \mathrm{J}/\psi\mathrm{K^+} $ events. |
png pdf |
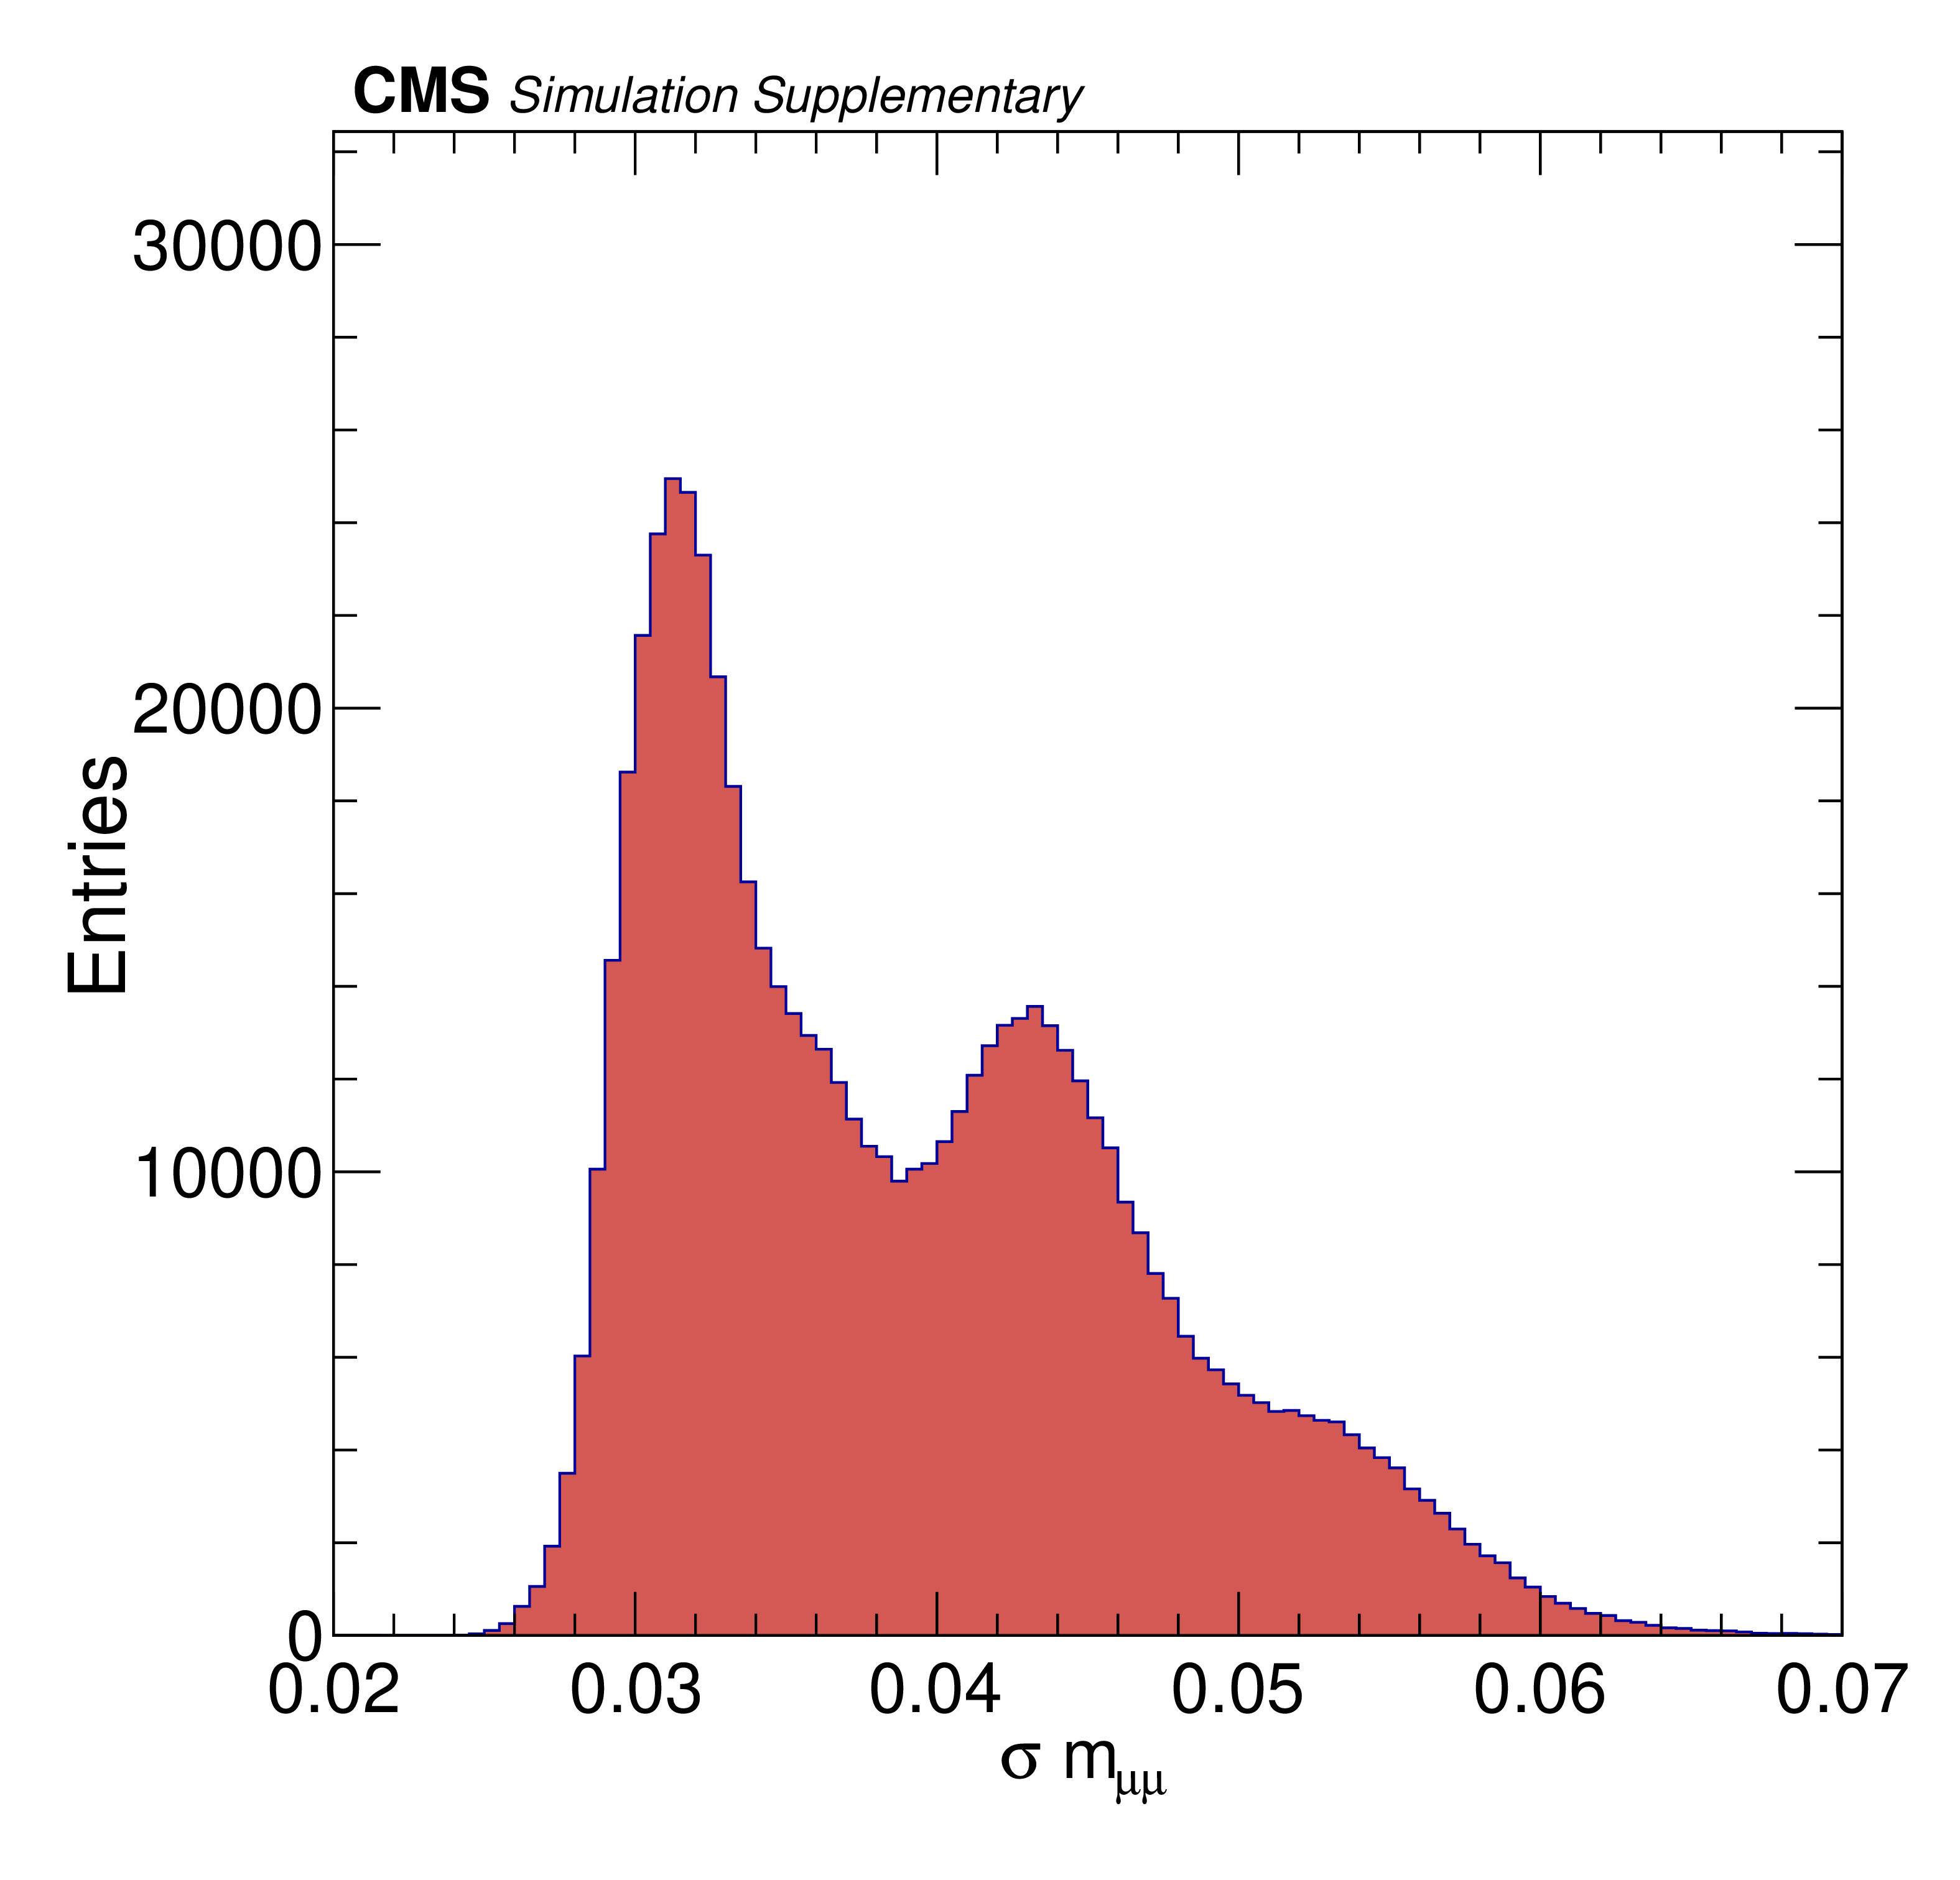
Additional Figure 31:
Distribution of the dimuon mass uncertainty for $ \mathrm{B}_{s}^{0} \to\mu^{+}\mu^{-} $ decays in MC simulated data. The first peak corresponds to events with both muons in the central part of the detector, the second one has one central and one forward muons and the last one corresponds to events where both muons are forward. |
| References | ||||
| 1 | N. Cabibbo | Unitary symmetry and leptonic decays | PRL 10 (1963) 531 | |
| 2 | M. Kobayashi and T. Maskawa | CP-violation in the renormalizable theory of weak interaction | Progress of Theoretical Physics 49 (1973) 652 | |
| 3 | M. Beneke, C. Bobeth, and R. Szafron | Power-enhanced leading-logarithmic QED corrections to $ \mathrm{B_{q}} \to \mu^{+}\mu^{-} $ | JHEP 10 (2019) 232 | 1908.07011 |
| 4 | C. Bobeth and A. J. Buras | Searching for new physics with $ \overline{\mathcal{B}}(\mathrm{B}_{\mathrm{s},\mathrm{d}}\to \mu \overline{\mu})/\Delta M_{\mathrm{s},\mathrm{d}} $ | Acta Phys. Polon. B 52 (2021) 1189 | 2104.09521 |
| 5 | CMS and LHCb Collaborations | Observation of the rare $ \mathrm{B}_{s}^{0} \to\mu^{+}\mu^{-} $ decay from the combined analysis of CMS and LHCb data | Nature 522 (2015) 68 | 1411.4413 |
| 6 | ATLAS Collaboration | Study of the rare decays of $ \mathrm{B}_{s}^{0} $ and $ {\mathrm{B}^0} $ mesons into muon pairs using data collected during 2015 and 2016 with the ATLAS detector | JHEP 04 (2019) 098 | 1812.03017 |
| 7 | CMS Collaboration | Measurement of properties of $ \mathrm{B}_{s}^{0} \to\mu^{+}\mu^{-} $ decays and search for $ {\mathrm{B}^0} \to \mu^{+}\mu^{-} $ with the CMS experiment | JHEP 04 (2020) 188 | CMS-BPH-16-004 1910.12127 |
| 8 | LHCb Collaboration | Measurement of the $ \mathrm{B}_{s}^{0} \to\mu^{+}\mu^{-} $ branching fraction and effective lifetime and search for $ {\mathrm{B}^0} \to \mu^{+}\mu^{-} $ decays | PRL 118 (2017) 191801 | 1703.05747 |
| 9 | LHCb Collaboration | Measurement of the $ \mathrm{B}_{s}^{0} \to\mu^{+}\mu^{-} $ decay properties and search for the $ {\mathrm{B}^0} \to \mu^{+}\mu^{-} $ and $ \mathrm{B}_{s}^{0}\to\mu^{+}\mu^{-}\gamma $ decays | PRD 105 (2022) 012010 | 2108.09283 |
| 10 | LHCb Collaboration | Analysis of neutral $ {\mathrm{B}} $-meson decays into two muons | PRL 128 (2022) 041801 | 2108.09284 |
| 11 | ATLAS, CMS and LHCb Collaborations | Combination of the ATLAS, CMS and LHCb results on the $ \mathrm{B}_{s}^{0} \to \mu^{+}\mu^{-} $ decays | Physics Analysis Summary, LHCb-CONF-2020-002, ATLAS-CONF-2020-049 CMS-PAS-BPH-20-003 |
CMS-PAS-BPH-20-003 |
| 12 | LHCb Collaboration | Differential branching fractions and isospin asymmetries of $ {\mathrm{B}} \to \mathrm{K^{\ast}(892)} \mu^{+}\mu^{-} $ decays | JHEP 06 (2014) 133 | 1403.8044 |
| 13 | LHCb Collaboration | Angular analysis of the rare decay $ \mathrm{B}_{s}^{0}\to\phi\mu^{+}\mu^{-} $ | JHEP 11 (2021) 043 | 2107.13428 |
| 14 | LHCb Collaboration | Measurements of the S-wave fraction in $ {\mathrm{B}^0}\to \mathrm{K^+}\pi^{-}\mu^{+}\mu^{-} $ decays and the $ {\mathrm{B}^0}\to \mathrm{K^{\ast}(892)}(892)^{0}\mu^{+}\mu^{-} $ differential branching fraction | JHEP 11 (2016) 047 | 1606.04731 |
| 15 | LHCb Collaboration | Branching fraction measurements of the rare $ \mathrm{B}_{s}^{0}\to\phi\mu^{+}\mu^{-} $ and $ \mathrm{B}_{s}^{0}\to \mathrm{f}'_2(1525)\mu^{+}\mu^{-} $ decays | PRL 127 (2021) 151801 | 2105.14007 |
| 16 | LHCb Collaboration | Measurement of $ CP $-averaged observables in the $ {\mathrm{B}^0}\to\mathrm{K^{\ast}(892)}^{0}\mu^{+}\mu^{-} $ decay | PRL 125 (2020) 011802 | 2003.04831 |
| 17 | LHCb Collaboration | Angular analysis of the $ {\mathrm{B}^{+}}\to \mathrm{K^{\ast}(892)}^{+}\mu^{+}\mu^{-} $ decay | PRL 126 (2021) 161802 | 2012.13241 |
| 18 | LHCb Collaboration | Test of lepton universality with $ {\mathrm{B}^0} \to \mathrm{K^{\ast}(892)}^{0}\ell^{+}\ell^{-} $ decays | JHEP 08 (2017) 055 | 1705.05802 |
| 19 | LHCb Collaboration | Test of lepton universality in beauty-quark decays | Nature Phys. 18 (2022) 277 | 2103.11769 |
| 20 | Belle Collaboration | Test of lepton-flavor universality in $ {{\mathrm{B}}\to \mathrm{K^{\ast}(892)}\ell^+\ell^-} $ decays at Belle | PRL 126 (2021) 161801 | 1904.02440 |
| 21 | Belle Collaboration | Test of lepton flavor universality and search for lepton flavor violation in $ {\mathrm{B}} \to \mathrm{K}\ell \ell $ decays | JHEP 03 (2021) 105 | 1908.01848 |
| 22 | LHCb Collaboration | Tests of lepton universality using $ {\mathrm{B}^0}\to \mathrm{K^0_S} \ell^+ \ell^- $ and $ {\mathrm{B}^{+}}\to \mathrm{K^{\ast}(892)}^{+} \ell^+ \ell^- $ decays | PRL 128 (2022) 191802 | 2110.09501 |
| 23 | CMS Collaboration | Angular analysis of the decay $ {\mathrm{B}^0} \to \mathrm{K^{\ast}(892)}^{0} \mu^{+}\mu^{-} $ from pp collisions at $ \sqrt{s} = $ 8 TeV | PLB 753 (2016) 424 | CMS-BPH-13-010 1507.08126 |
| 24 | CMS Collaboration | Measurement of angular parameters from the decay $ {\mathrm{B}^0} \to \mathrm{K^{\ast}(892)}^{0} \mu^{+}\mu^{-} $ in proton-proton collisions at $ \sqrt{s} = $ 8 TeV | PLB 781 (2018) 517 | CMS-BPH-15-008 1710.02846 |
| 25 | LHCb Collaboration | Test of lepton universality in $ b \rightarrow s \ell^+ \ell^- $ decays | 2212.09152 | |
| 26 | LHCb Collaboration | Measurement of lepton universality parameters in $ B^+\to K^+\ell^+\ell^- $ and $ B^0\to K^{*0}\ell^+\ell^- $ decays | 12, 2022 | 2212.09153 |
| 27 | Flavour Lattice Averaging Group (FLAG) | FLAG review 2021 | EPJC 82 (2022) 869 | 2111.09849 |
| 28 | HFLAV Collaboration | Averages of b-hadron, c-hadron, and $ \tau $-lepton properties as of 2021 | 2206.07501 | |
| 29 | Particle Data Group, R. L. Workman, and others | Review of Particle Physics | PTEP 2022 (2022) 083C01 | |
| 30 | CMS Collaboration | HEPData record for this analysis | link | |
| 31 | CMS Collaboration | The CMS experiment at the CERN LHC | JINST 3 (2008) S08004 | |
| 32 | CMS Collaboration | Description and performance of track and primary-vertex reconstruction with the CMS tracker | JINST 9 (2014) P10009 | CMS-TRK-11-001 1405.6569 |
| 33 | CMS Tracker Group | The CMS Phase-1 pixel detector upgrade | JINST 16 (2021) P02027 | 2012.14304 |
| 34 | CMS Collaboration | Track impact parameter resolution for the full pseudorapidity coverage in the 2017 dataset with the CMS Phase-1 pixel detector | CMS Detector Performance Report CMS-DP-2020-049, 2020 CDS |
|
| 35 | CMS Collaboration | Performance of the CMS muon detector and muon reconstruction with proton-proton collisions at $ \sqrt{s} = $ 13 TeV | JINST 13 (2018) P06015 | CMS-MUO-16-001 1804.04528 |
| 36 | CMS Collaboration | Performance of the CMS Level-1 trigger in proton-proton collisions at $ \sqrt{s} = $ 13 TeV | JINST 15 (2020) P10017 | CMS-TRG-17-001 2006.10165 |
| 37 | CMS Collaboration | The CMS trigger system | JINST 12 (2017) P01020 | CMS-TRG-12-001 1609.02366 |
| 38 | CMS Collaboration | Precision luminosity measurement in proton-proton collisions at $ \sqrt{s} = $ 13 TeV in 2015 and 2016 at CMS | EPJC 81 (2021) 800 | CMS-LUM-17-003 2104.01927 |
| 39 | CMS Collaboration | CMS luminosity measurements for the 2017 data-taking period at $ \sqrt{s} = $ 13 TeV | CMS Physics Analysis Summary, 2018 CMS-PAS-LUM-17-004 |
CMS-PAS-LUM-17-004 |
| 40 | CMS Collaboration | CMS luminosity measurements for the 2018 data-taking period at $ \sqrt{s} = $ 13 TeV | CMS Physics Analysis Summary, 2018 CMS-PAS-LUM-18-001 |
CMS-PAS-LUM-18-001 |
| 41 | T. Sjöstrand et al. | An introduction to PYTHIA 8.2 | Comput. Phys. Commun. 191 (2015) 159 | 1410.3012 |
| 42 | CMS Collaboration | Extraction and validation of a new set of CMS PYTHIA 8 tunes from underlying-event measurements | EPJC 80 (2020) 4 | CMS-GEN-17-001 1903.12179 |
| 43 | GEANT4 Collaboration | GEANT 4---a simulation toolkit | NIM A 506 (2003) 250 | |
| 44 | D. J. Lange | The EvtGen particle decay simulation package | NIM A 462 (2001) 152 | |
| 45 | N. Davidson, T. Przedzinski, and Z. Was | PHOTOS interface in C++: technical and physics documentation | Comput. Phys. Commun. 199 (2016) 86 | 1011.0937 |
| 46 | K. Prokofiev and T. Speer | A kinematic and a decay chain reconstruction library | in Proc. Int. Conf. on Comput. in High-Energy and Nuc. Physics (CHEP '04) link |
|
| 47 | T. Chen and C. Guestrin | XGBoost: A scalable tree boosting system | in 22nd ACM SIGKDD Int. Conf. on Knowledge Discovery and Data Mining, KDD '16, . ACM, New York Proc. 2 (2016) 785 |
|
| 48 | M. Pivk and F. R. Le Diberder | $ _{s}\mathcal{P}lot $: A statistical tool to unfold data distributions | NIM A 555 (2005) 356 | physics/0402083 |
| 49 | M. J. Oreglia | A study of the reactions $ \psi^\prime \to \gamma \gamma \psi $ | PhD thesis, Stanford University, SLAC Report SLAC-R-236, 1980 link |
|
| 50 | CMS Collaboration | Tracking performances for charged pions with Run2 legacy data | CMS Detector Performance Report CMS-DP-2022-012, 2022 CDS |
|
| 51 | LHCb Collaboration | Precise measurement of the $ f_\mathrm{s}/f_\mathrm{d} $ ratio of fragmentation fractions and of $ \mathrm{B}_{s}^{0} $ decay branching fractions | PRD 104 (2021) 032005 | 2103.06810 |
| 52 | CMS Collaboration | Measurement of the dependence of the hadron production fraction ratio $ f_\mathrm{s}/f_\mathrm{u} $ on $ {\mathrm{B}} $ meson kinematic variables in proton-proton collisions at $ \sqrt{s} $ = 13 TeV | Submitted to PRL | CMS-BPH-21-001 2212.02309 |
| 53 | Belle-II Collaboration | The Belle II physics book | no.~12, 123C01, , . [Erratum: PTEP , 01 ()], 2019 PTEP 2019 (2019) |
1808.10567 |
| 54 | T. Junk | Confidence level computation for combining searches with small statistics | NIM A 434 (1999) 435 | hep-ex/9902006 |
| 55 | A. L. Read | Presentation of search results: The $ \text{CL}_\text{s} $ technique | JPG 28 (2002) 2693 | |
| 56 | W. Altmannshofer and P. Stangl | New physics in rare B decays after Moriond 2021 | EPJC 81 (2021) 952 | 2103.13370 |
|
|
Compact Muon Solenoid LHC, CERN |
|

|

|

|

|

|