

Compact Muon Solenoid
LHC, CERN
| CMS-BPH-23-002 ; CERN-EP-2024-038 | ||
| Observation of the $ \Xi_{b}^{-}\to\psi{(2S)}\Xi^{-} $ decay and studies of the $ \Xi_{b}^{*0} $ baryon in proton-proton collisions at $ \sqrt{s} = $ 13 TeV | ||
| CMS Collaboration | ||
| 27 February 2024 | ||
| Submitted to Phys. Rev. D | ||
| Abstract: The first observation of the decay $ \Xi_{b}^{-}\to\psi{(2S)}\Xi^{-} $ and measurement of the branching ratio of $ \Xi_{b}^{-}\to\psi{(2S)}\Xi^{-} $ to $ \Xi_{b}^{-}\to\mathrm{J}/\psi\Xi^{-} $ are presented. The $ \mathrm{J}/\psi $ and $ \psi{(2S)} $ mesons are reconstructed using their dimuon decay modes. The results are based on proton-proton colliding beam data from the LHC collected by the CMS experiment at $ \sqrt{s} = $ 13 TeV in 2016-2018, corresponding to an integrated luminosity of 140 fb$ ^{-1} $. The branching fraction ratio is measured to be $ \mathcal{B} (\Xi_{b}^{-}\to\psi{(2S)}\Xi^{-}) / \mathcal{B} (\Xi_{b}^{-}\to\mathrm{J}/\psi\Xi^{-}) = $ 0.84 $ ^{+0.21}_{-0.19} $ (stat) $\pm$ 0.10 (syst) $\pm$ 0.02 ($ \mathcal{B} $), where the last uncertainty comes from the uncertainties in the branching fractions of the charmonium states. New measurements of the $ \Xi_{b}^{*0} $ baryon mass and natural width are also presented, using the $ \Xi_{b}^{-}\pi^{+} $ final state, where the $ \Xi_{b}^{-} $ baryon is reconstructed through the decays $ \mathrm{J}/\psi\Xi^{-} $, $ \psi{(2S)}\Xi^{-} $, $ \mathrm{J}/\psi\Lambda\mathrm{K^-} $, and $ \mathrm{J}/\psi\Sigma^{0}\mathrm{K^-} $. Finally, the fraction of the $ \Xi_{b}^{-} $ baryons produced from $ \Xi_{b}^{*0} $ decays is determined. | ||
| Links: e-print arXiv:2402.17738 [hep-ex] (PDF) ; CDS record ; inSPIRE record ; HepData record ; CADI line (restricted) ; | ||
| Figures & Tables | Summary | Additional Figures | References | CMS Publications |
|---|
| Figures | |
png pdf |
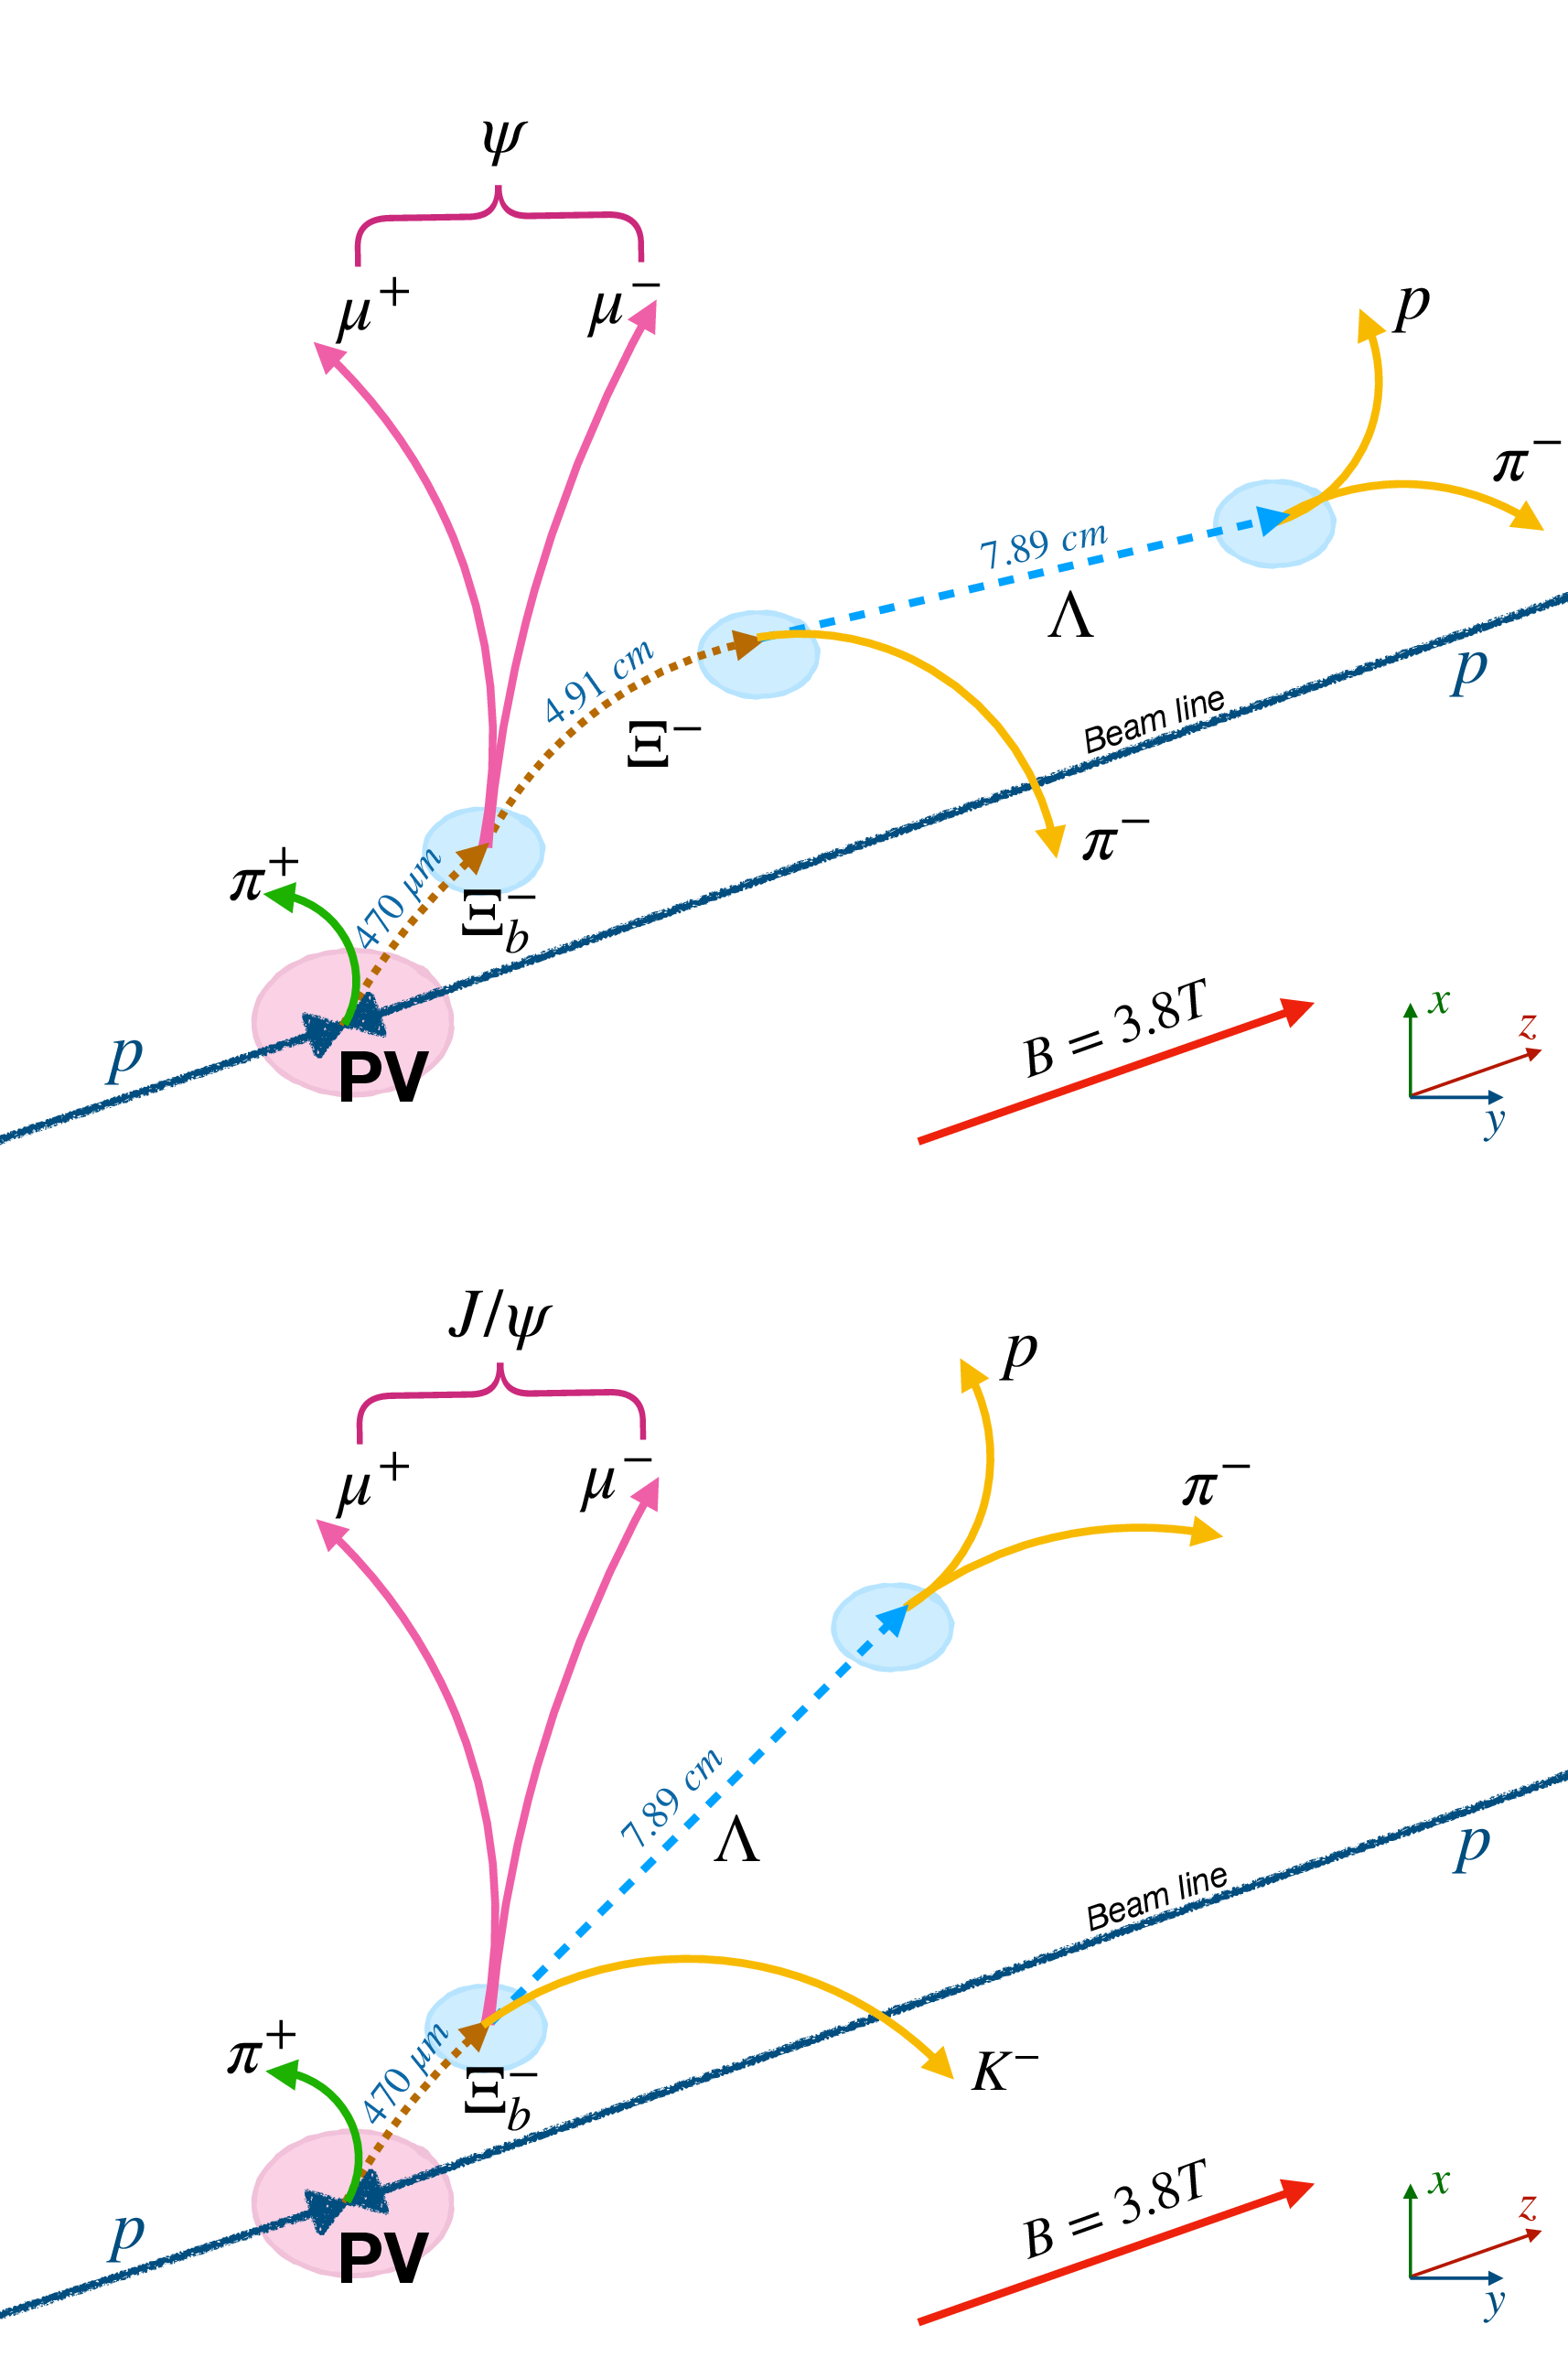
Figure 1:
The $ \Xi_{b}^{*0}\to\Xi_{b}^{-}\pi^{+} $ decay topology, where the $ \Xi_{b}^{-} $ baryon decays to $ \psi\Xi^{-} $ with $ \psi\to\mu^{+}\mu^{-} $ (upper) or $ \mathrm{J}/\psi\Lambda\mathrm{K^-} $ (lower), where $ \psi $ refers to the $ \mathrm{J}/\psi $ and $ \psi{(2S)} $ mesons. The distances given are the average decay lengths, $ c\tau $. |
png pdf |
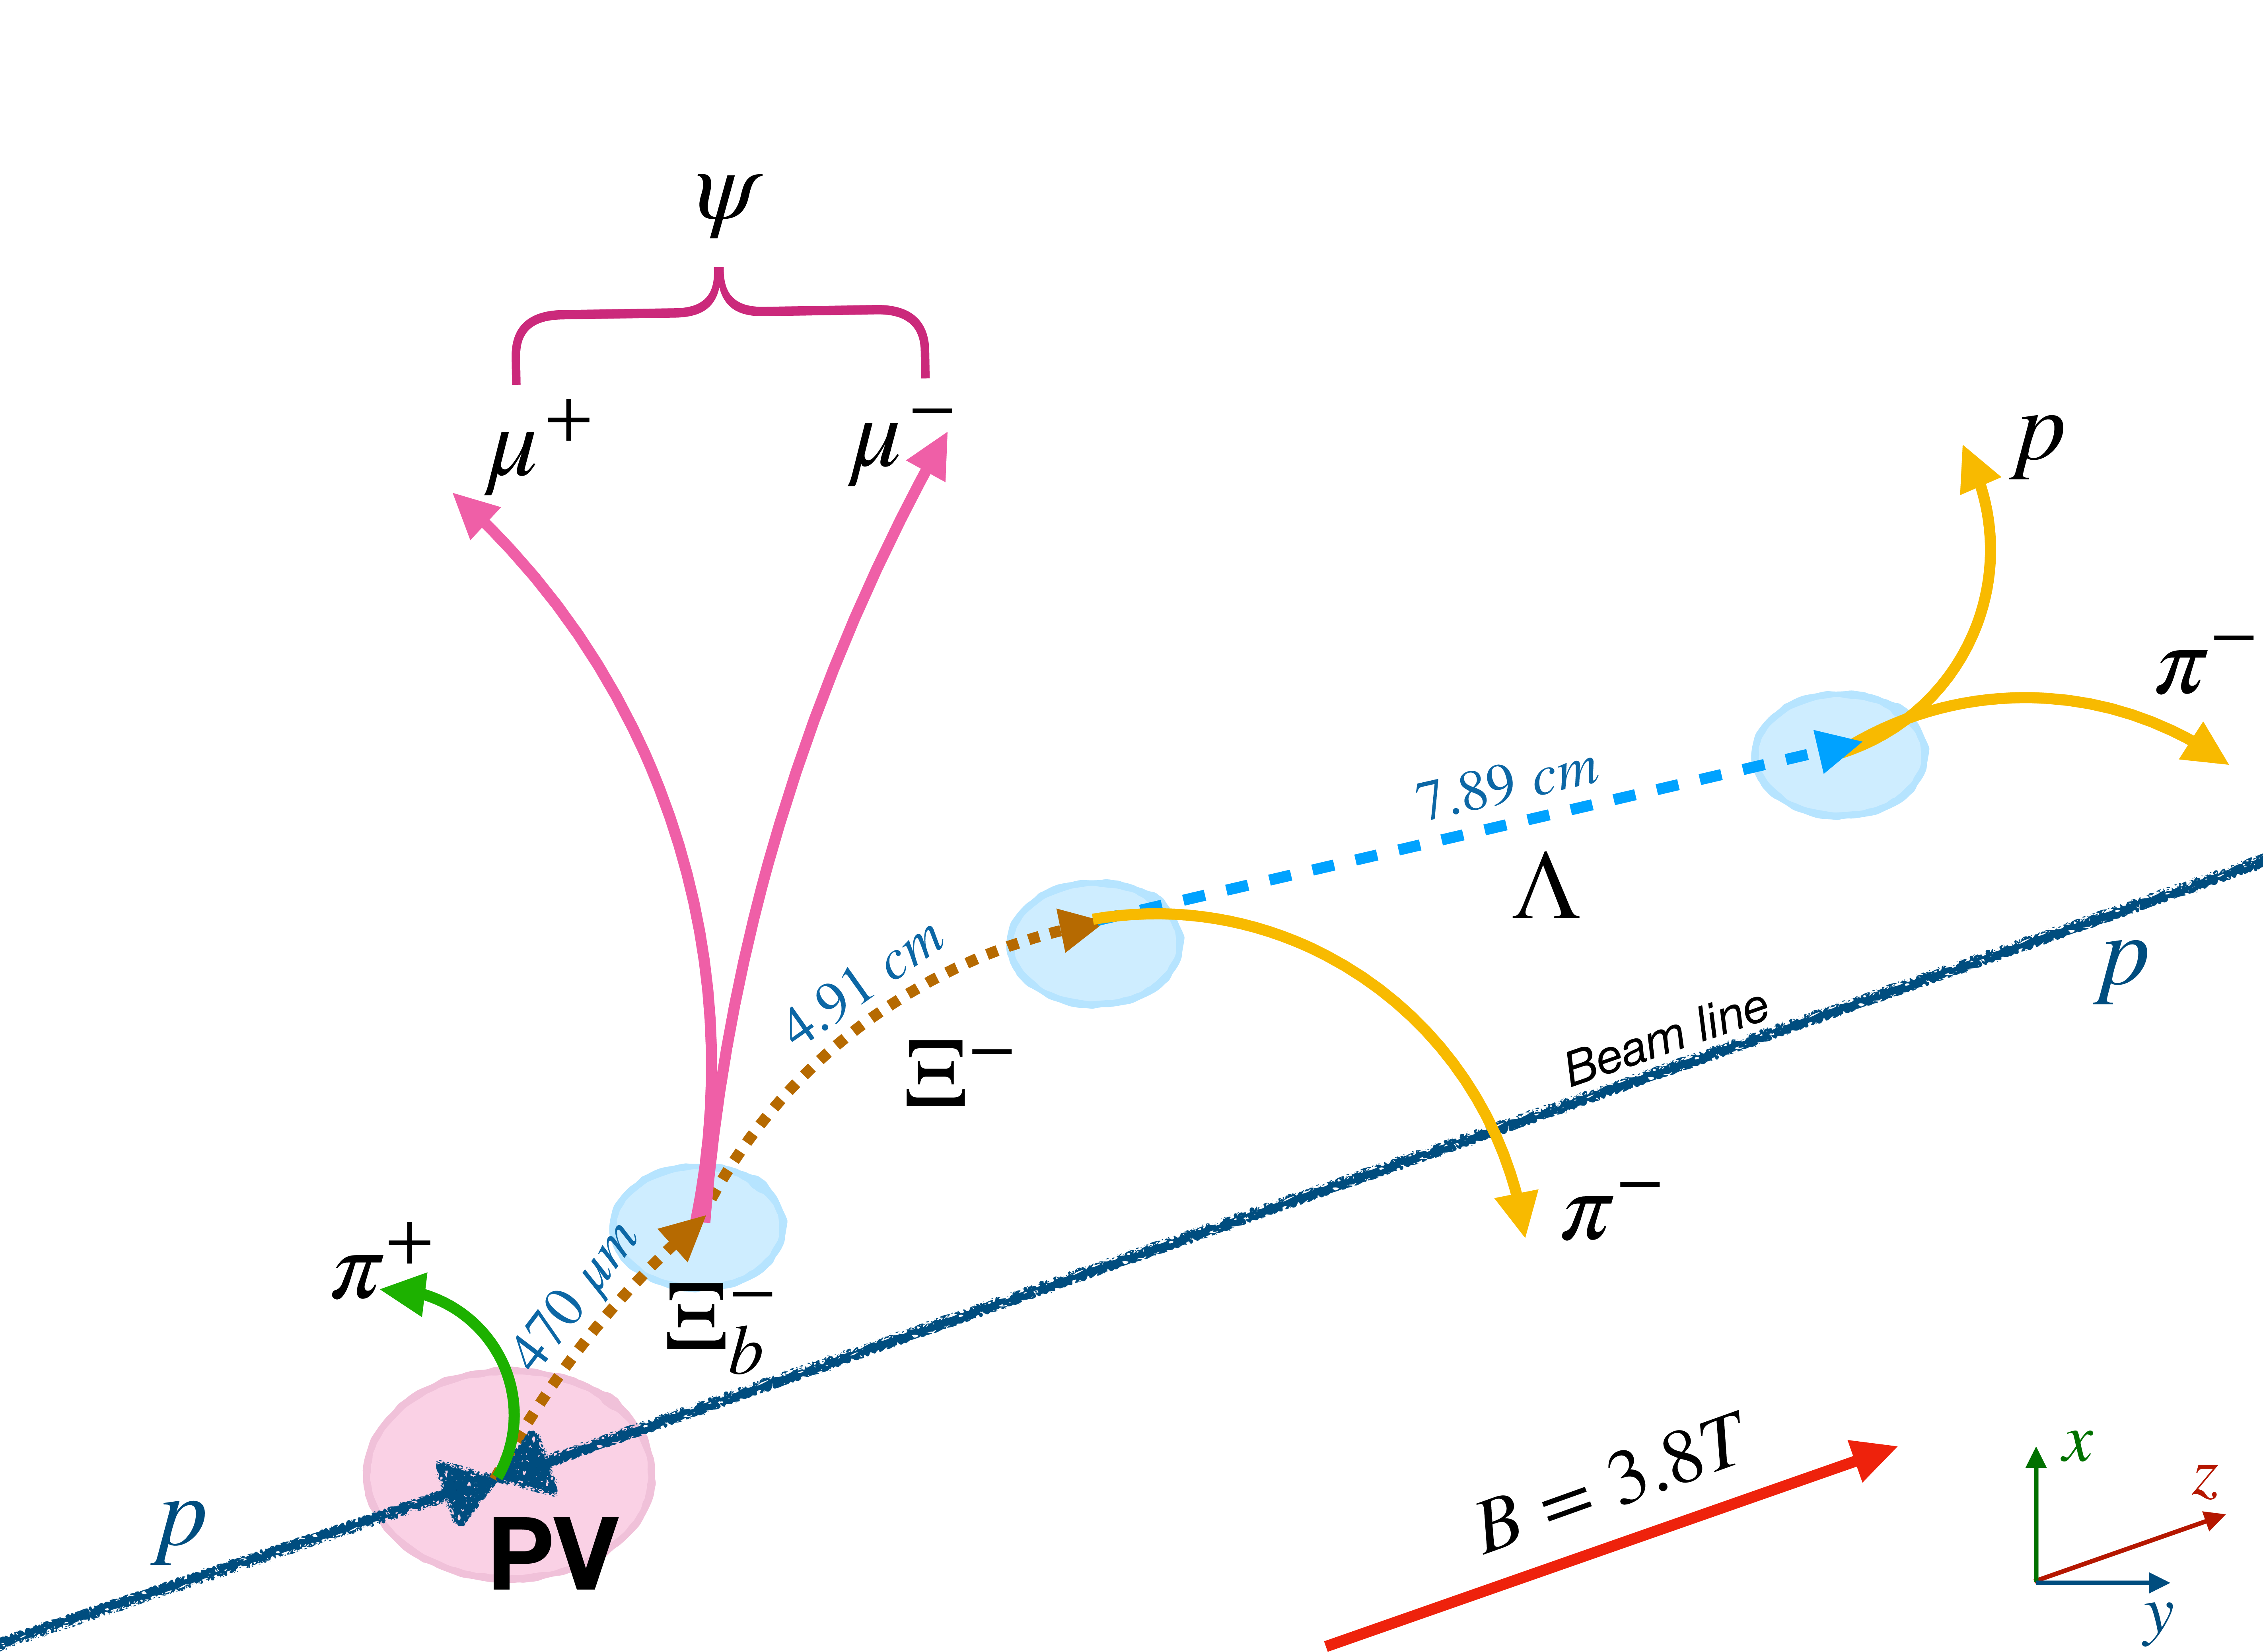
Figure 1-a:
The $ \Xi_{b}^{*0}\to\Xi_{b}^{-}\pi^{+} $ decay topology, where the $ \Xi_{b}^{-} $ baryon decays to $ \psi\Xi^{-} $ with $ \psi\to\mu^{+}\mu^{-} $ (upper) or $ \mathrm{J}/\psi\Lambda\mathrm{K^-} $ (lower), where $ \psi $ refers to the $ \mathrm{J}/\psi $ and $ \psi{(2S)} $ mesons. The distances given are the average decay lengths, $ c\tau $. |
png pdf |
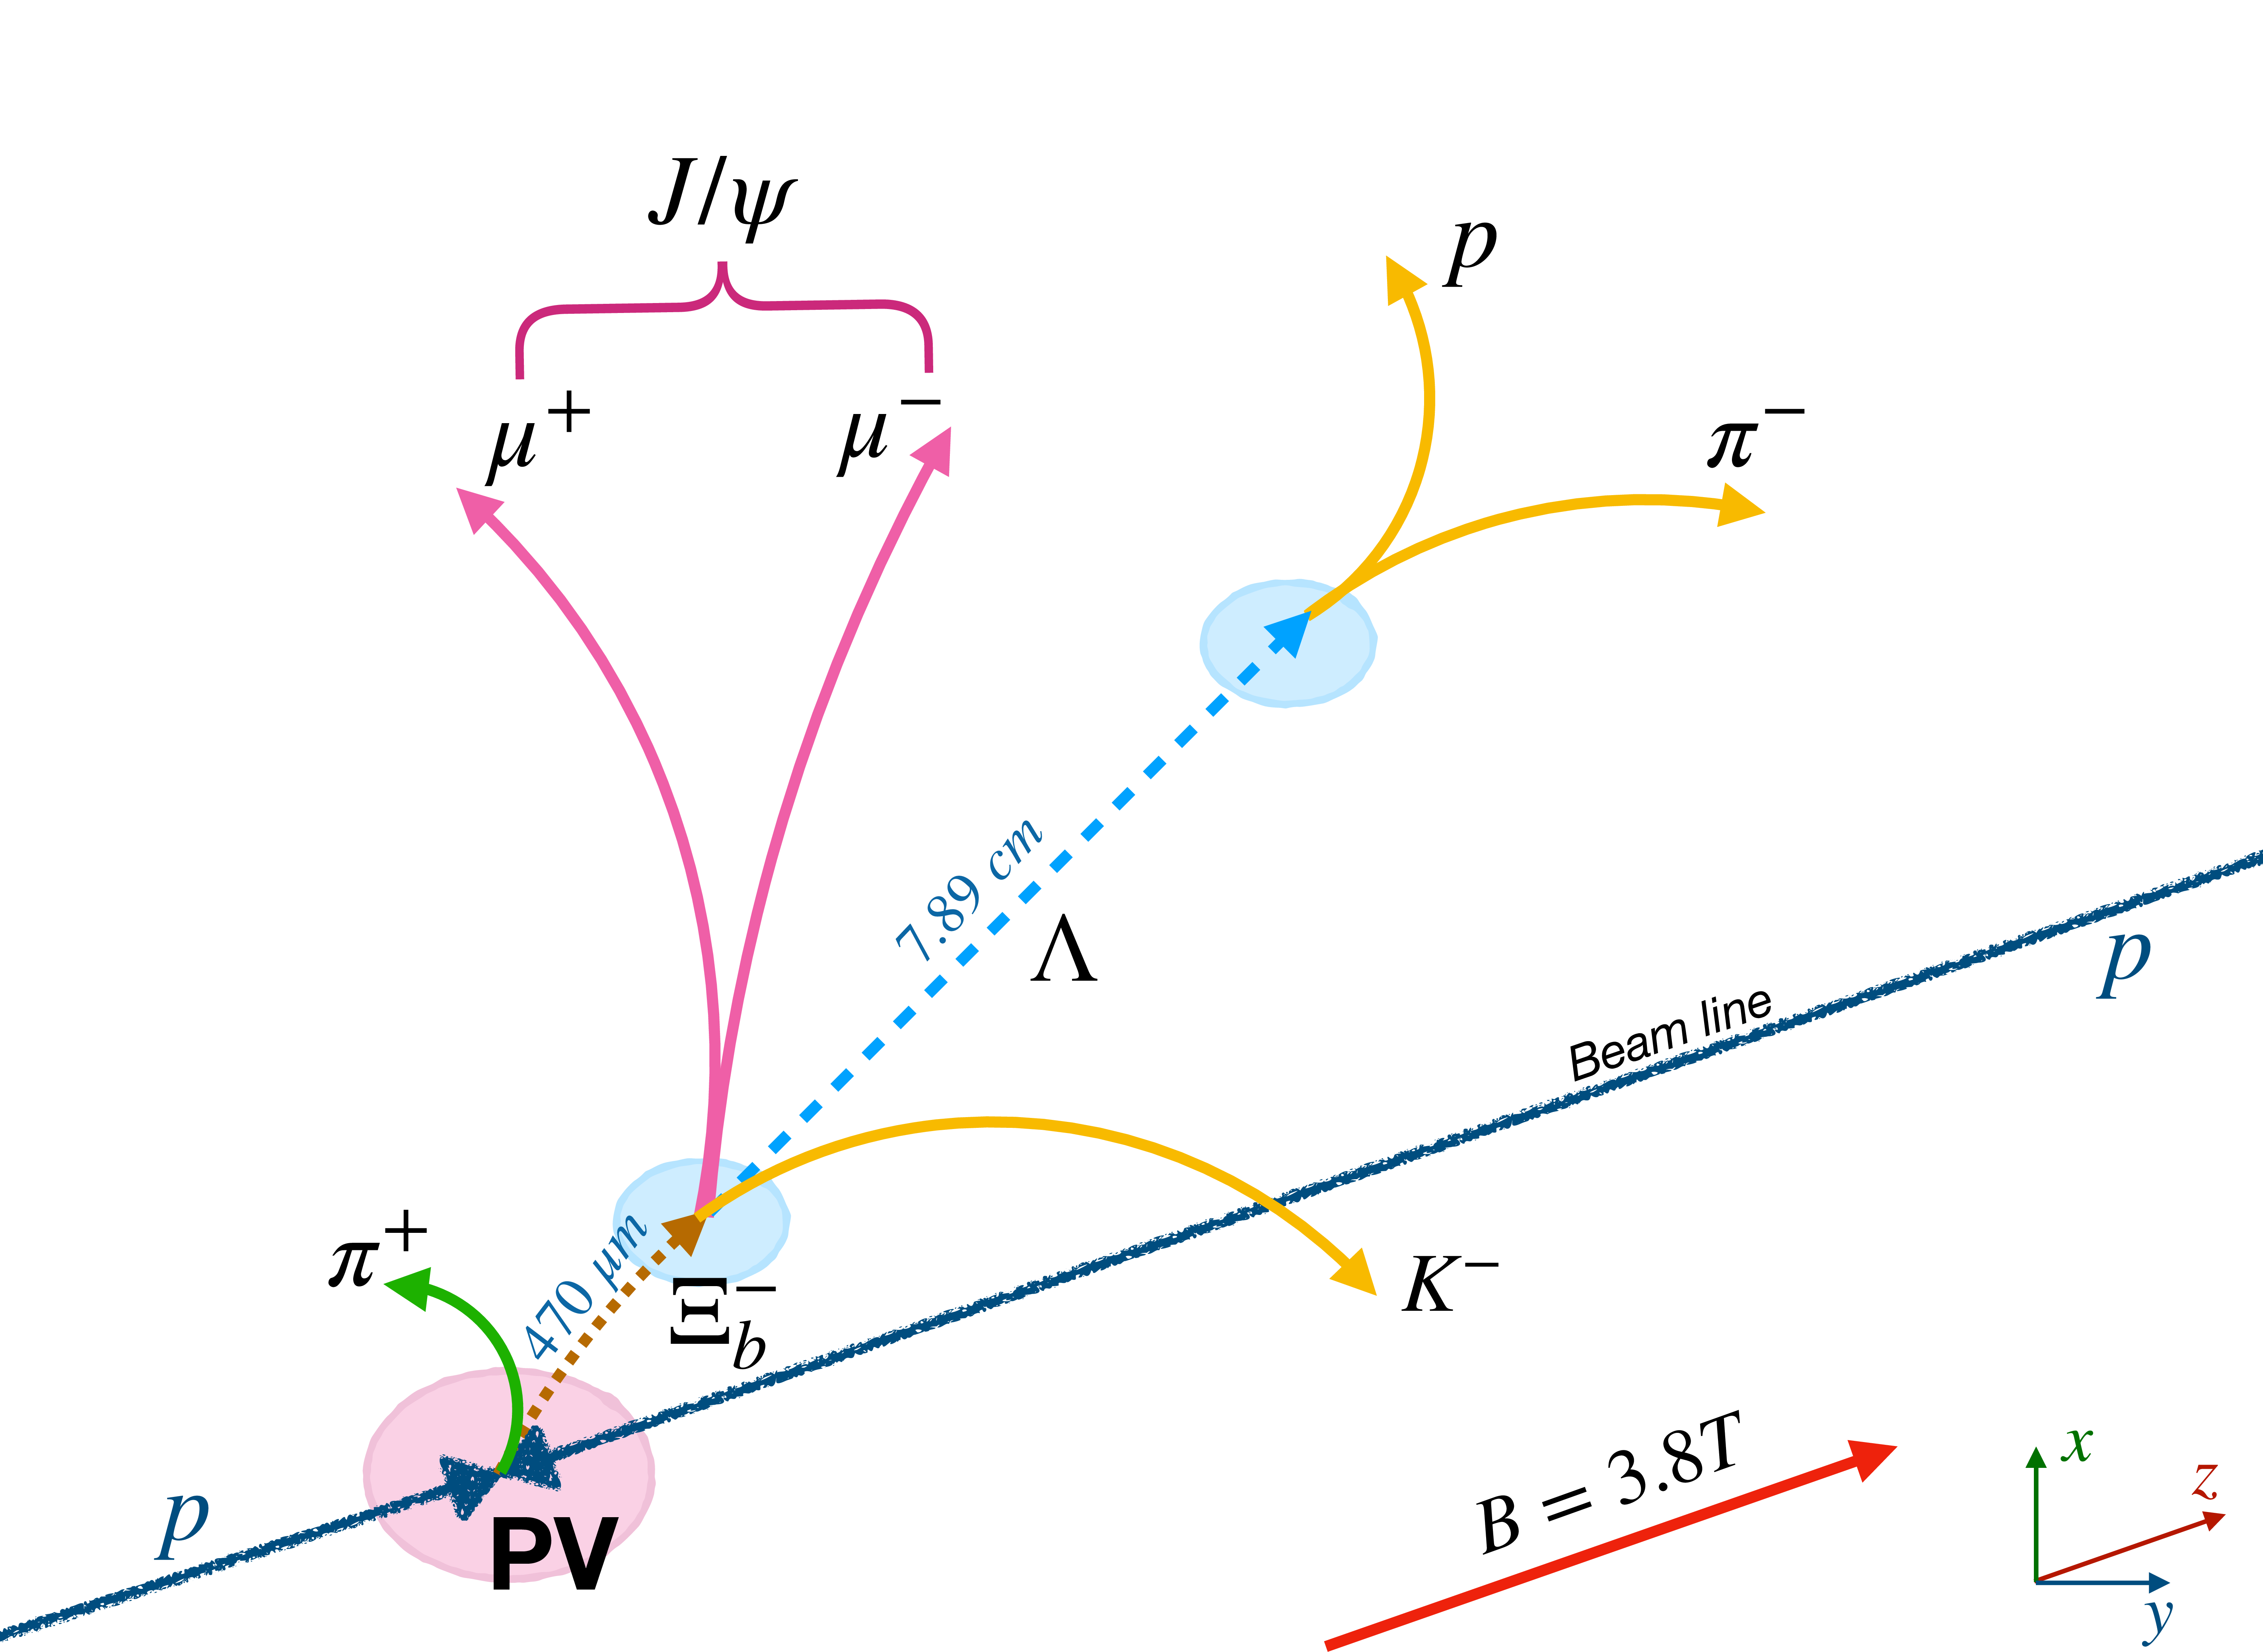
Figure 1-b:
The $ \Xi_{b}^{*0}\to\Xi_{b}^{-}\pi^{+} $ decay topology, where the $ \Xi_{b}^{-} $ baryon decays to $ \psi\Xi^{-} $ with $ \psi\to\mu^{+}\mu^{-} $ (upper) or $ \mathrm{J}/\psi\Lambda\mathrm{K^-} $ (lower), where $ \psi $ refers to the $ \mathrm{J}/\psi $ and $ \psi{(2S)} $ mesons. The distances given are the average decay lengths, $ c\tau $. |

png pdf |
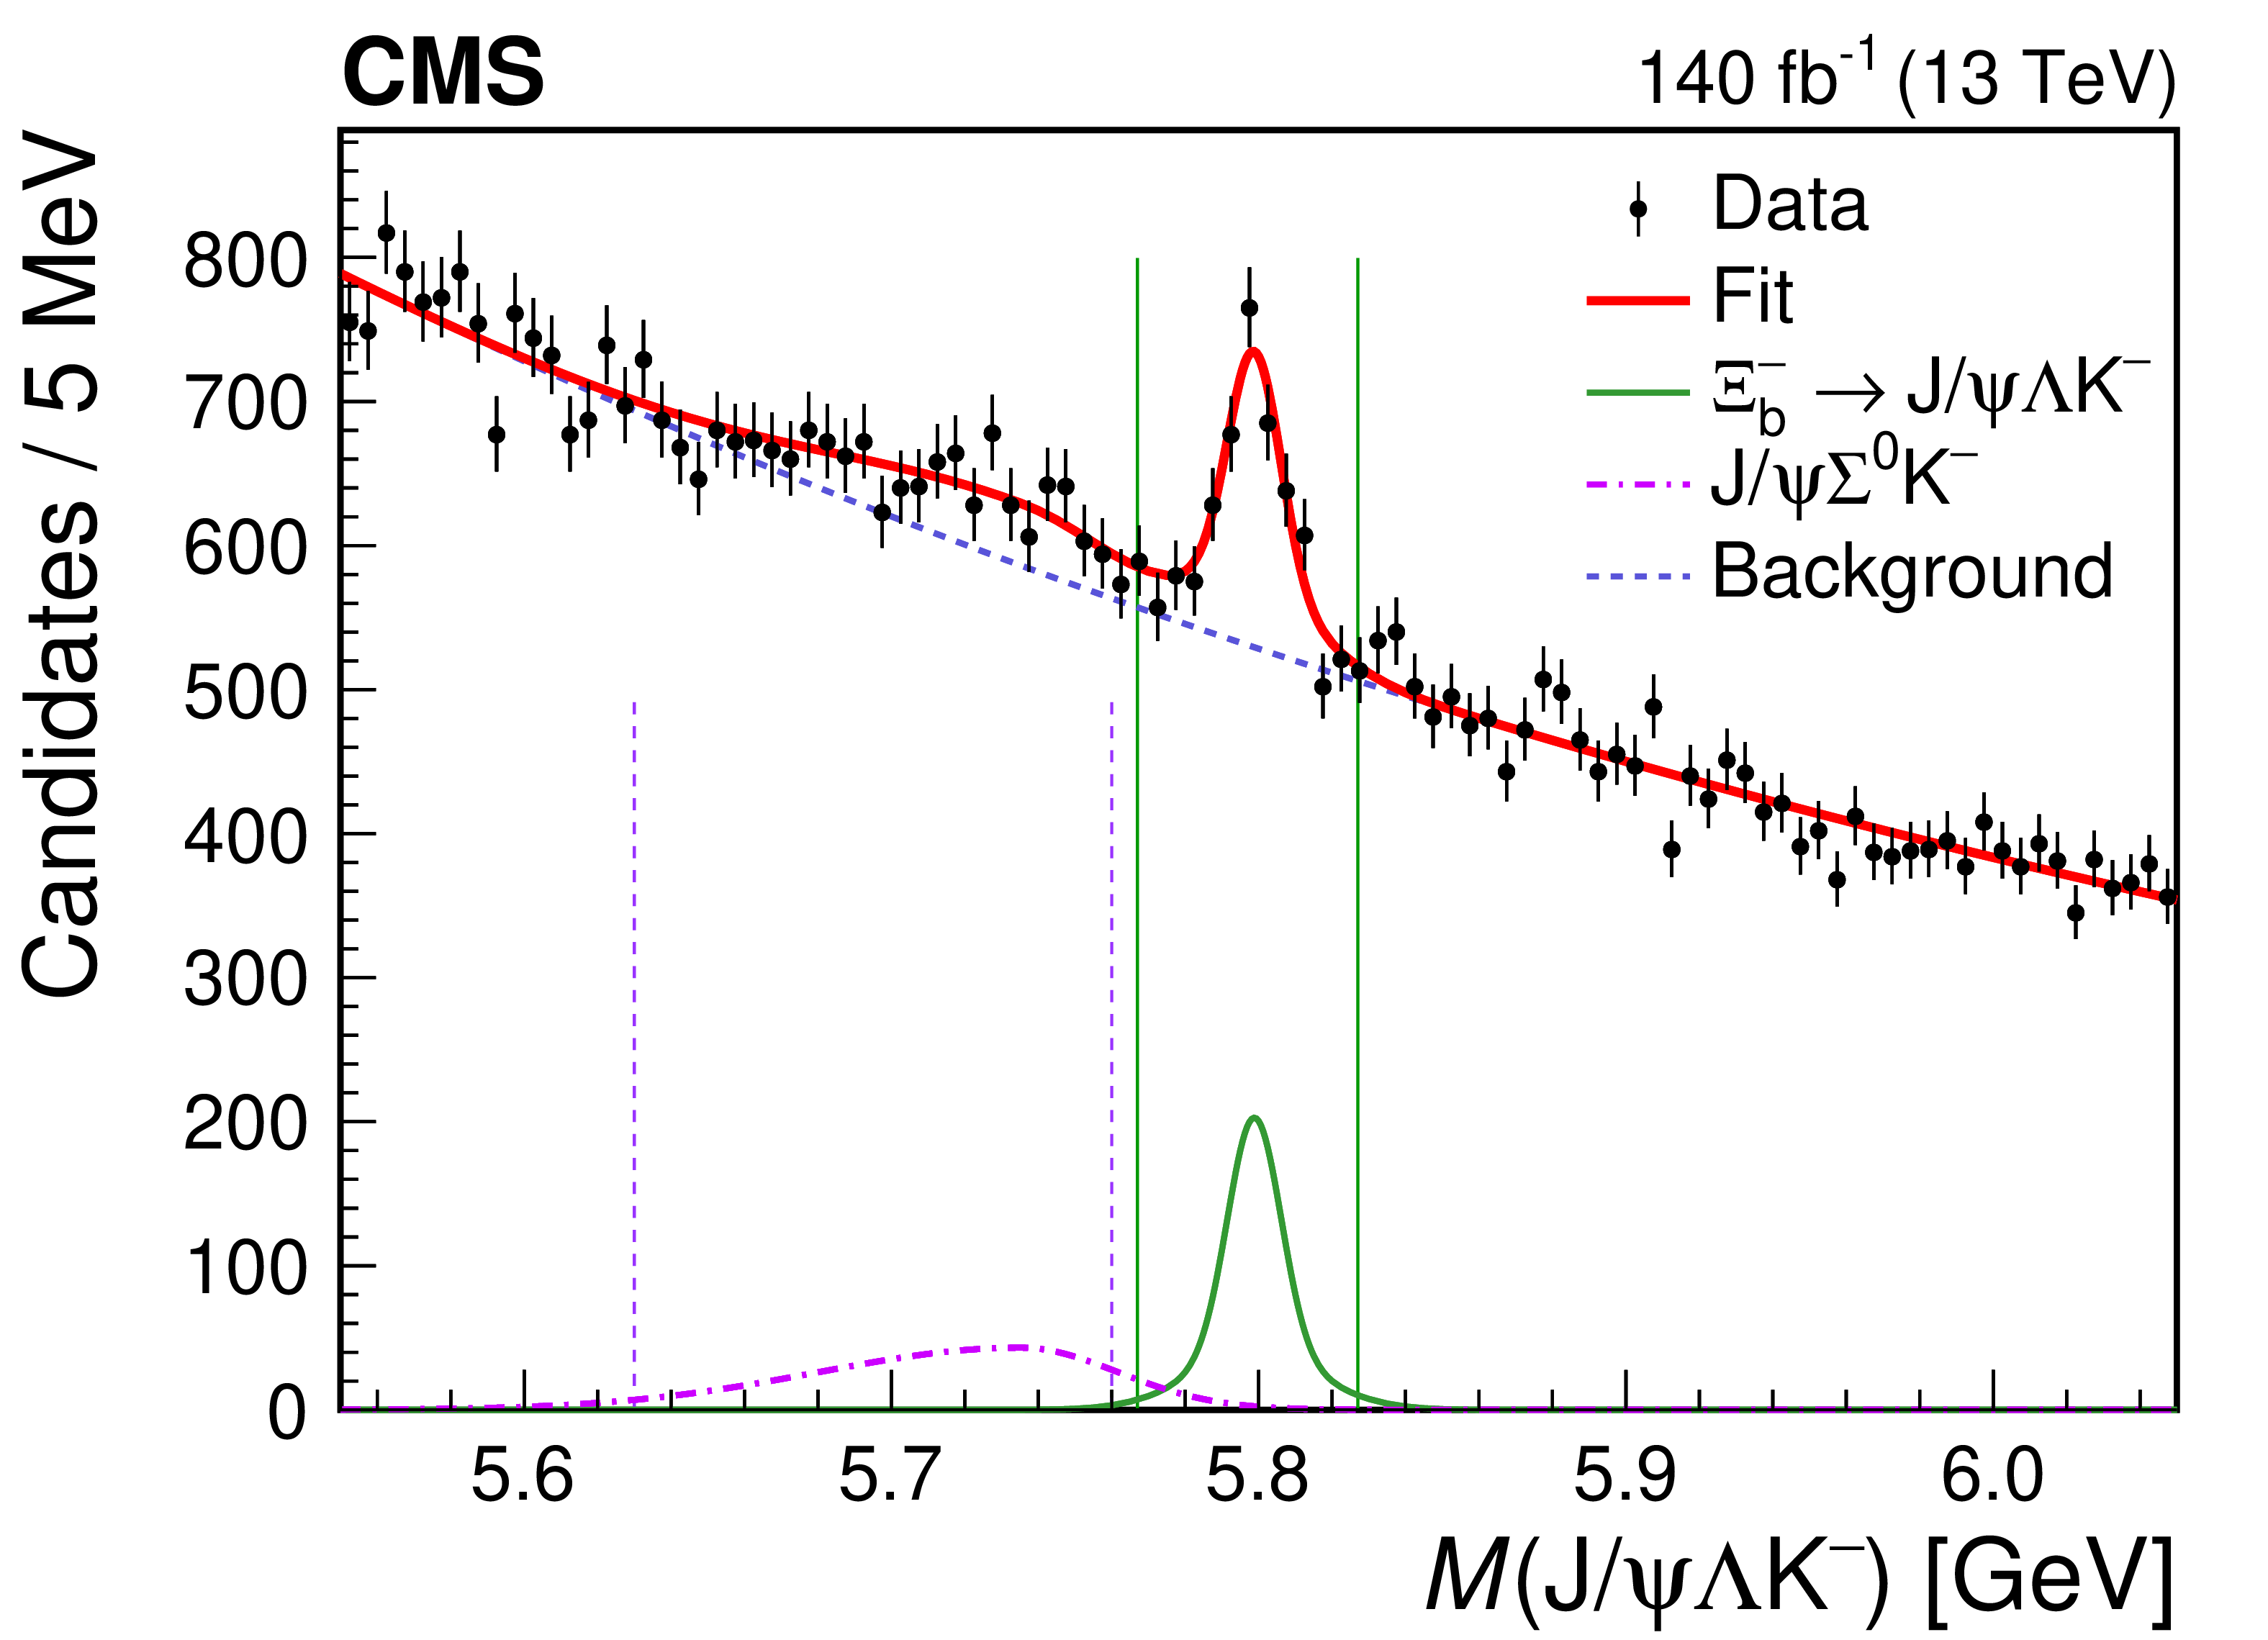
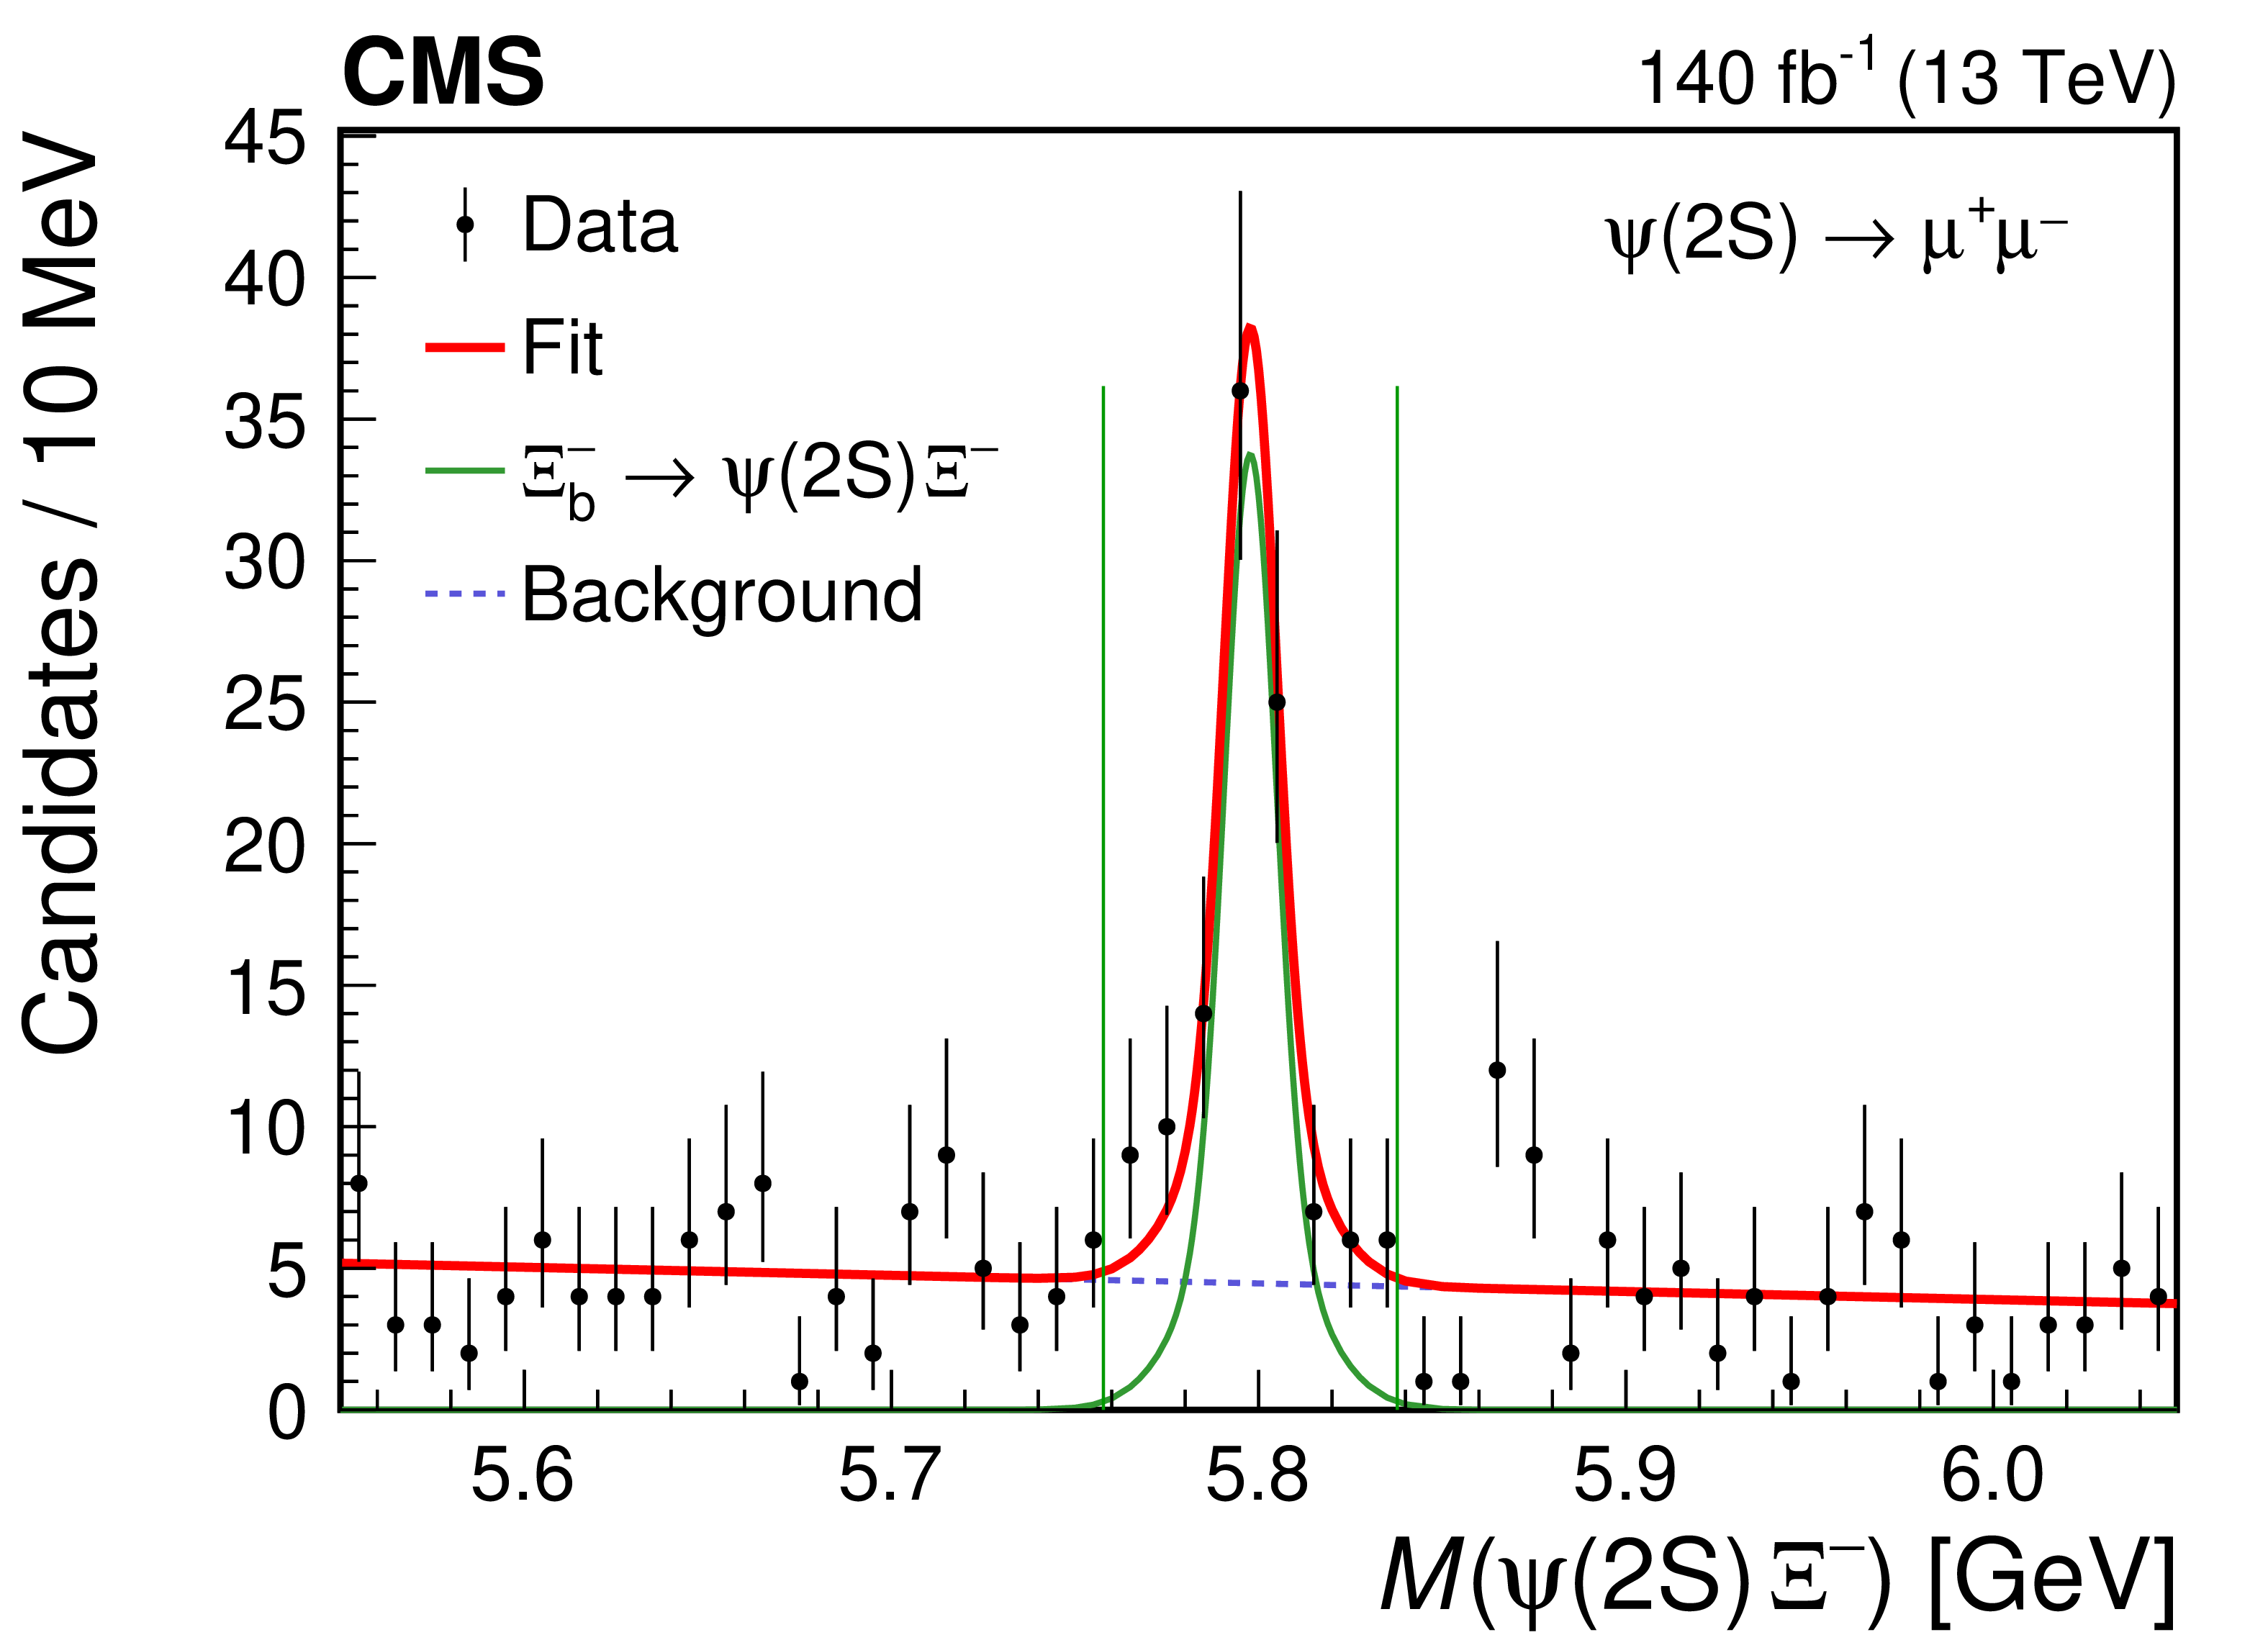
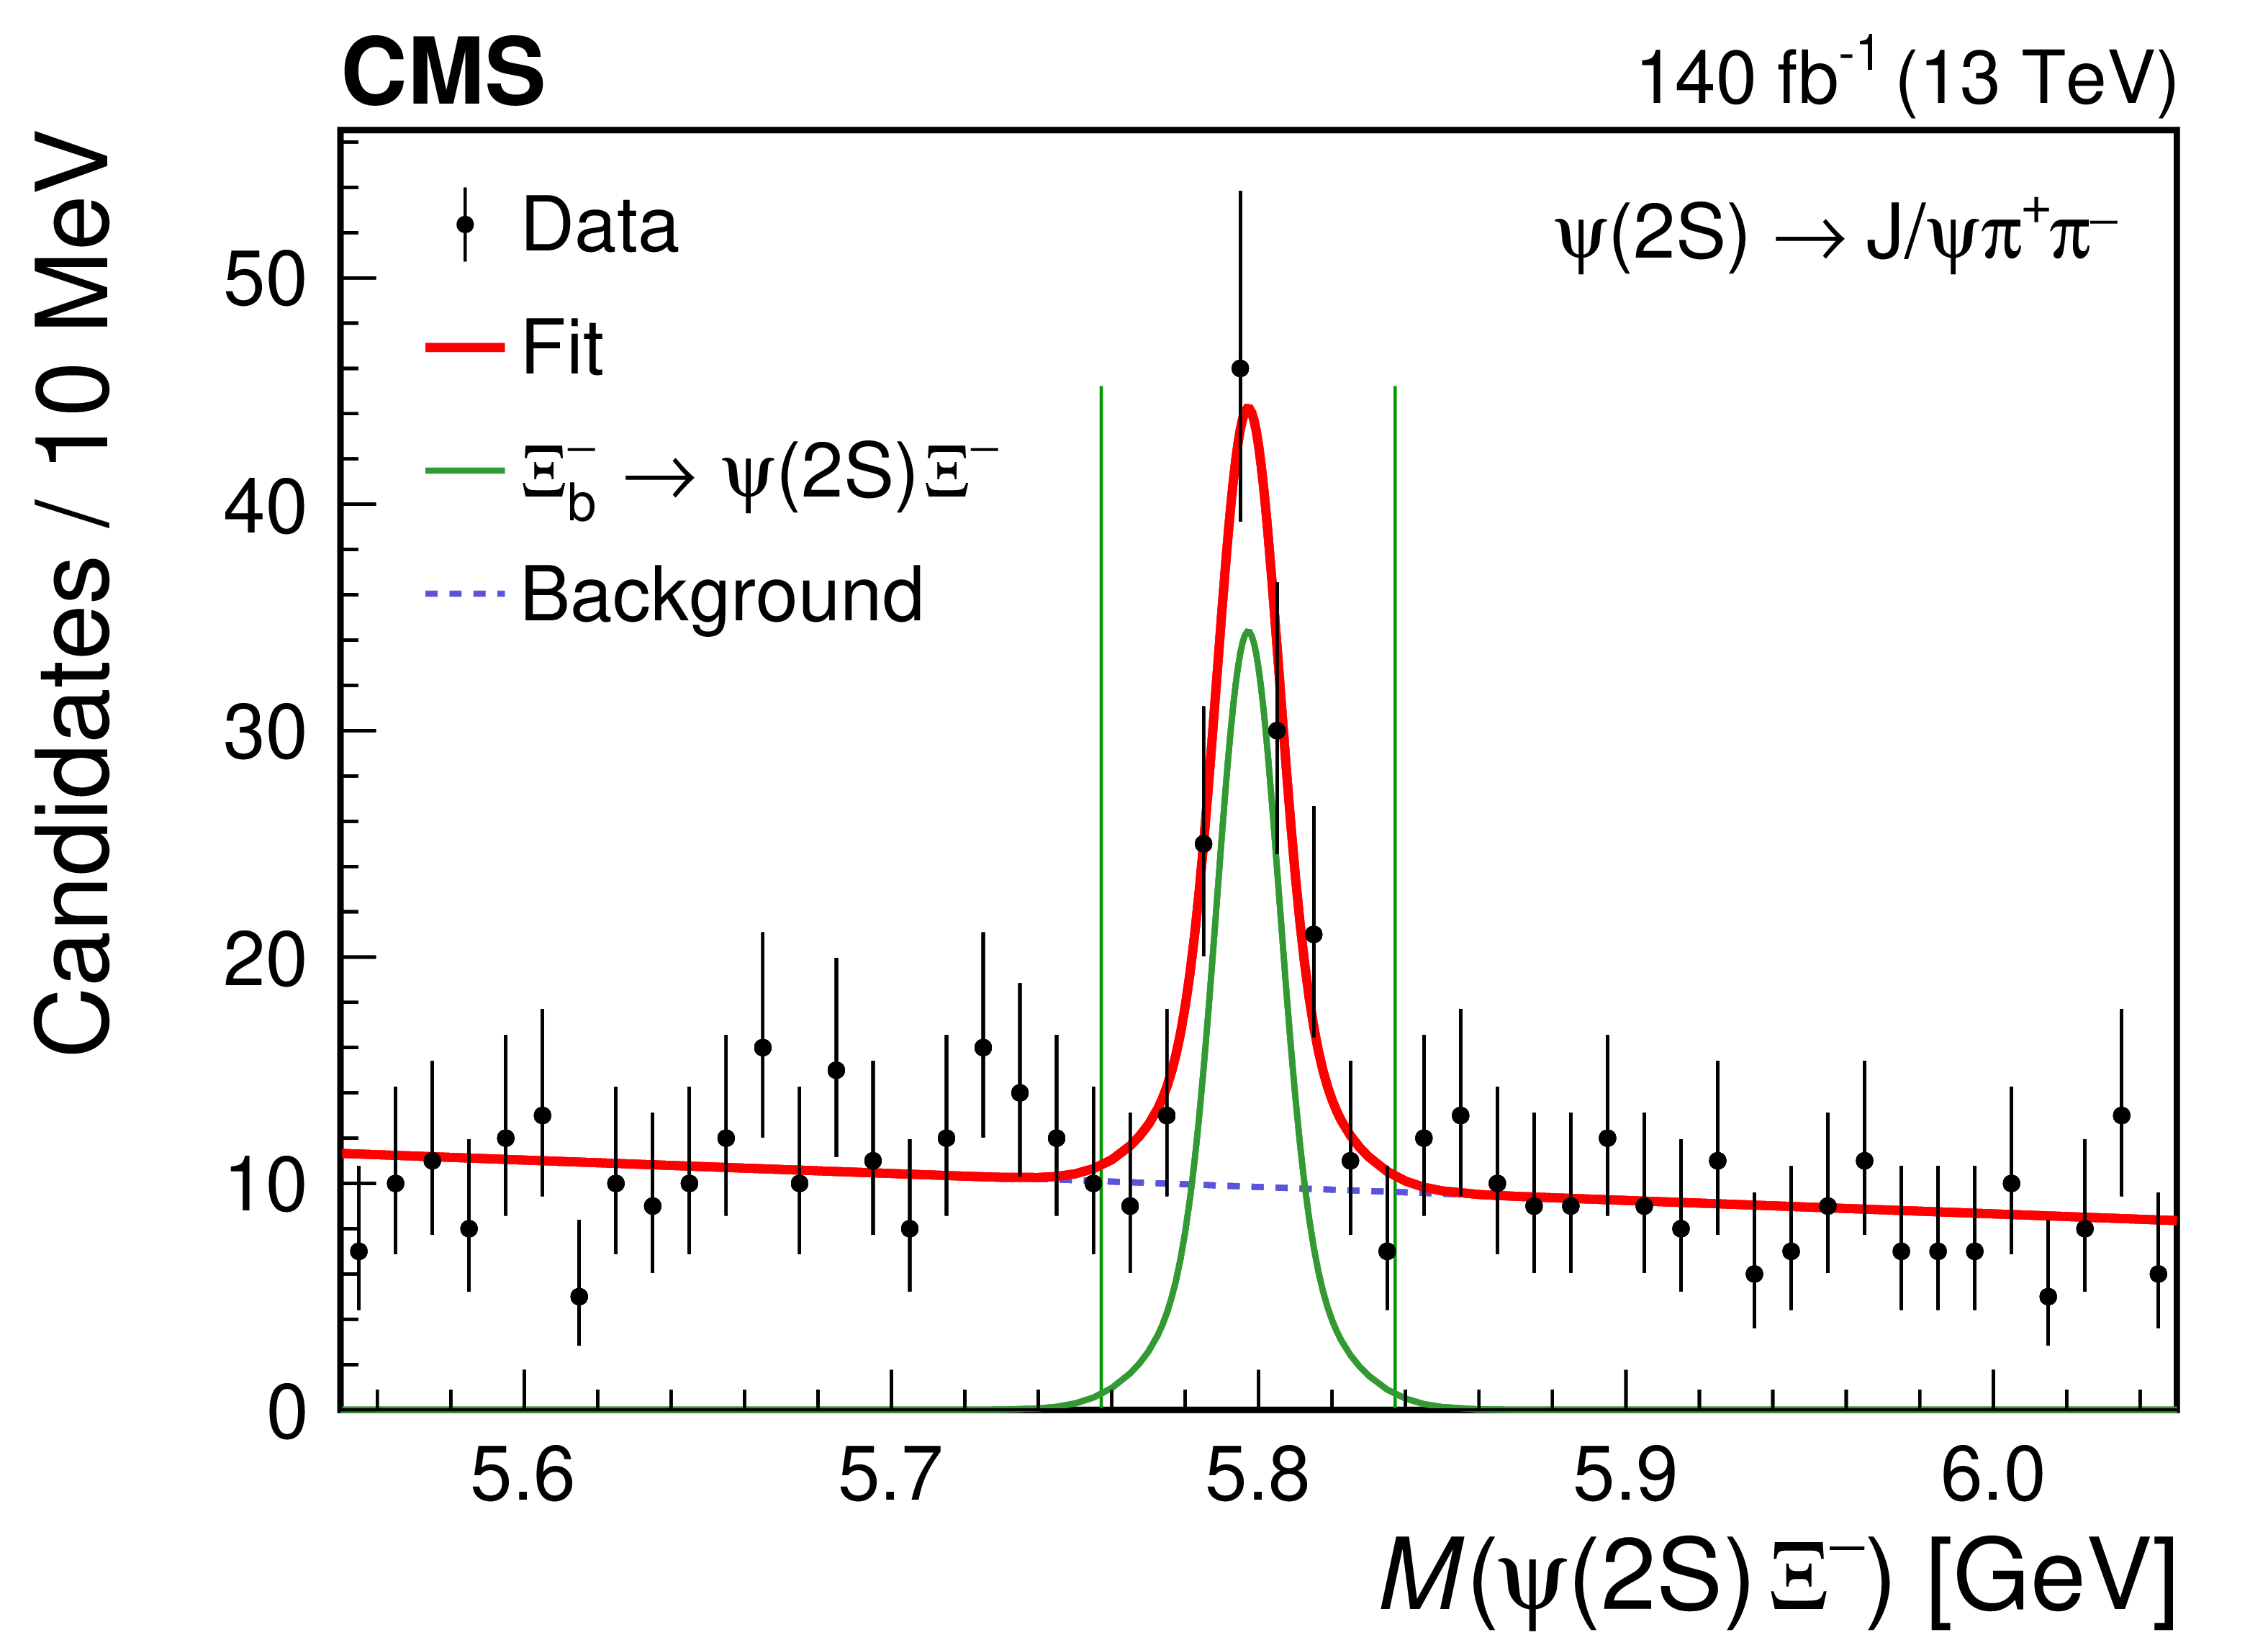
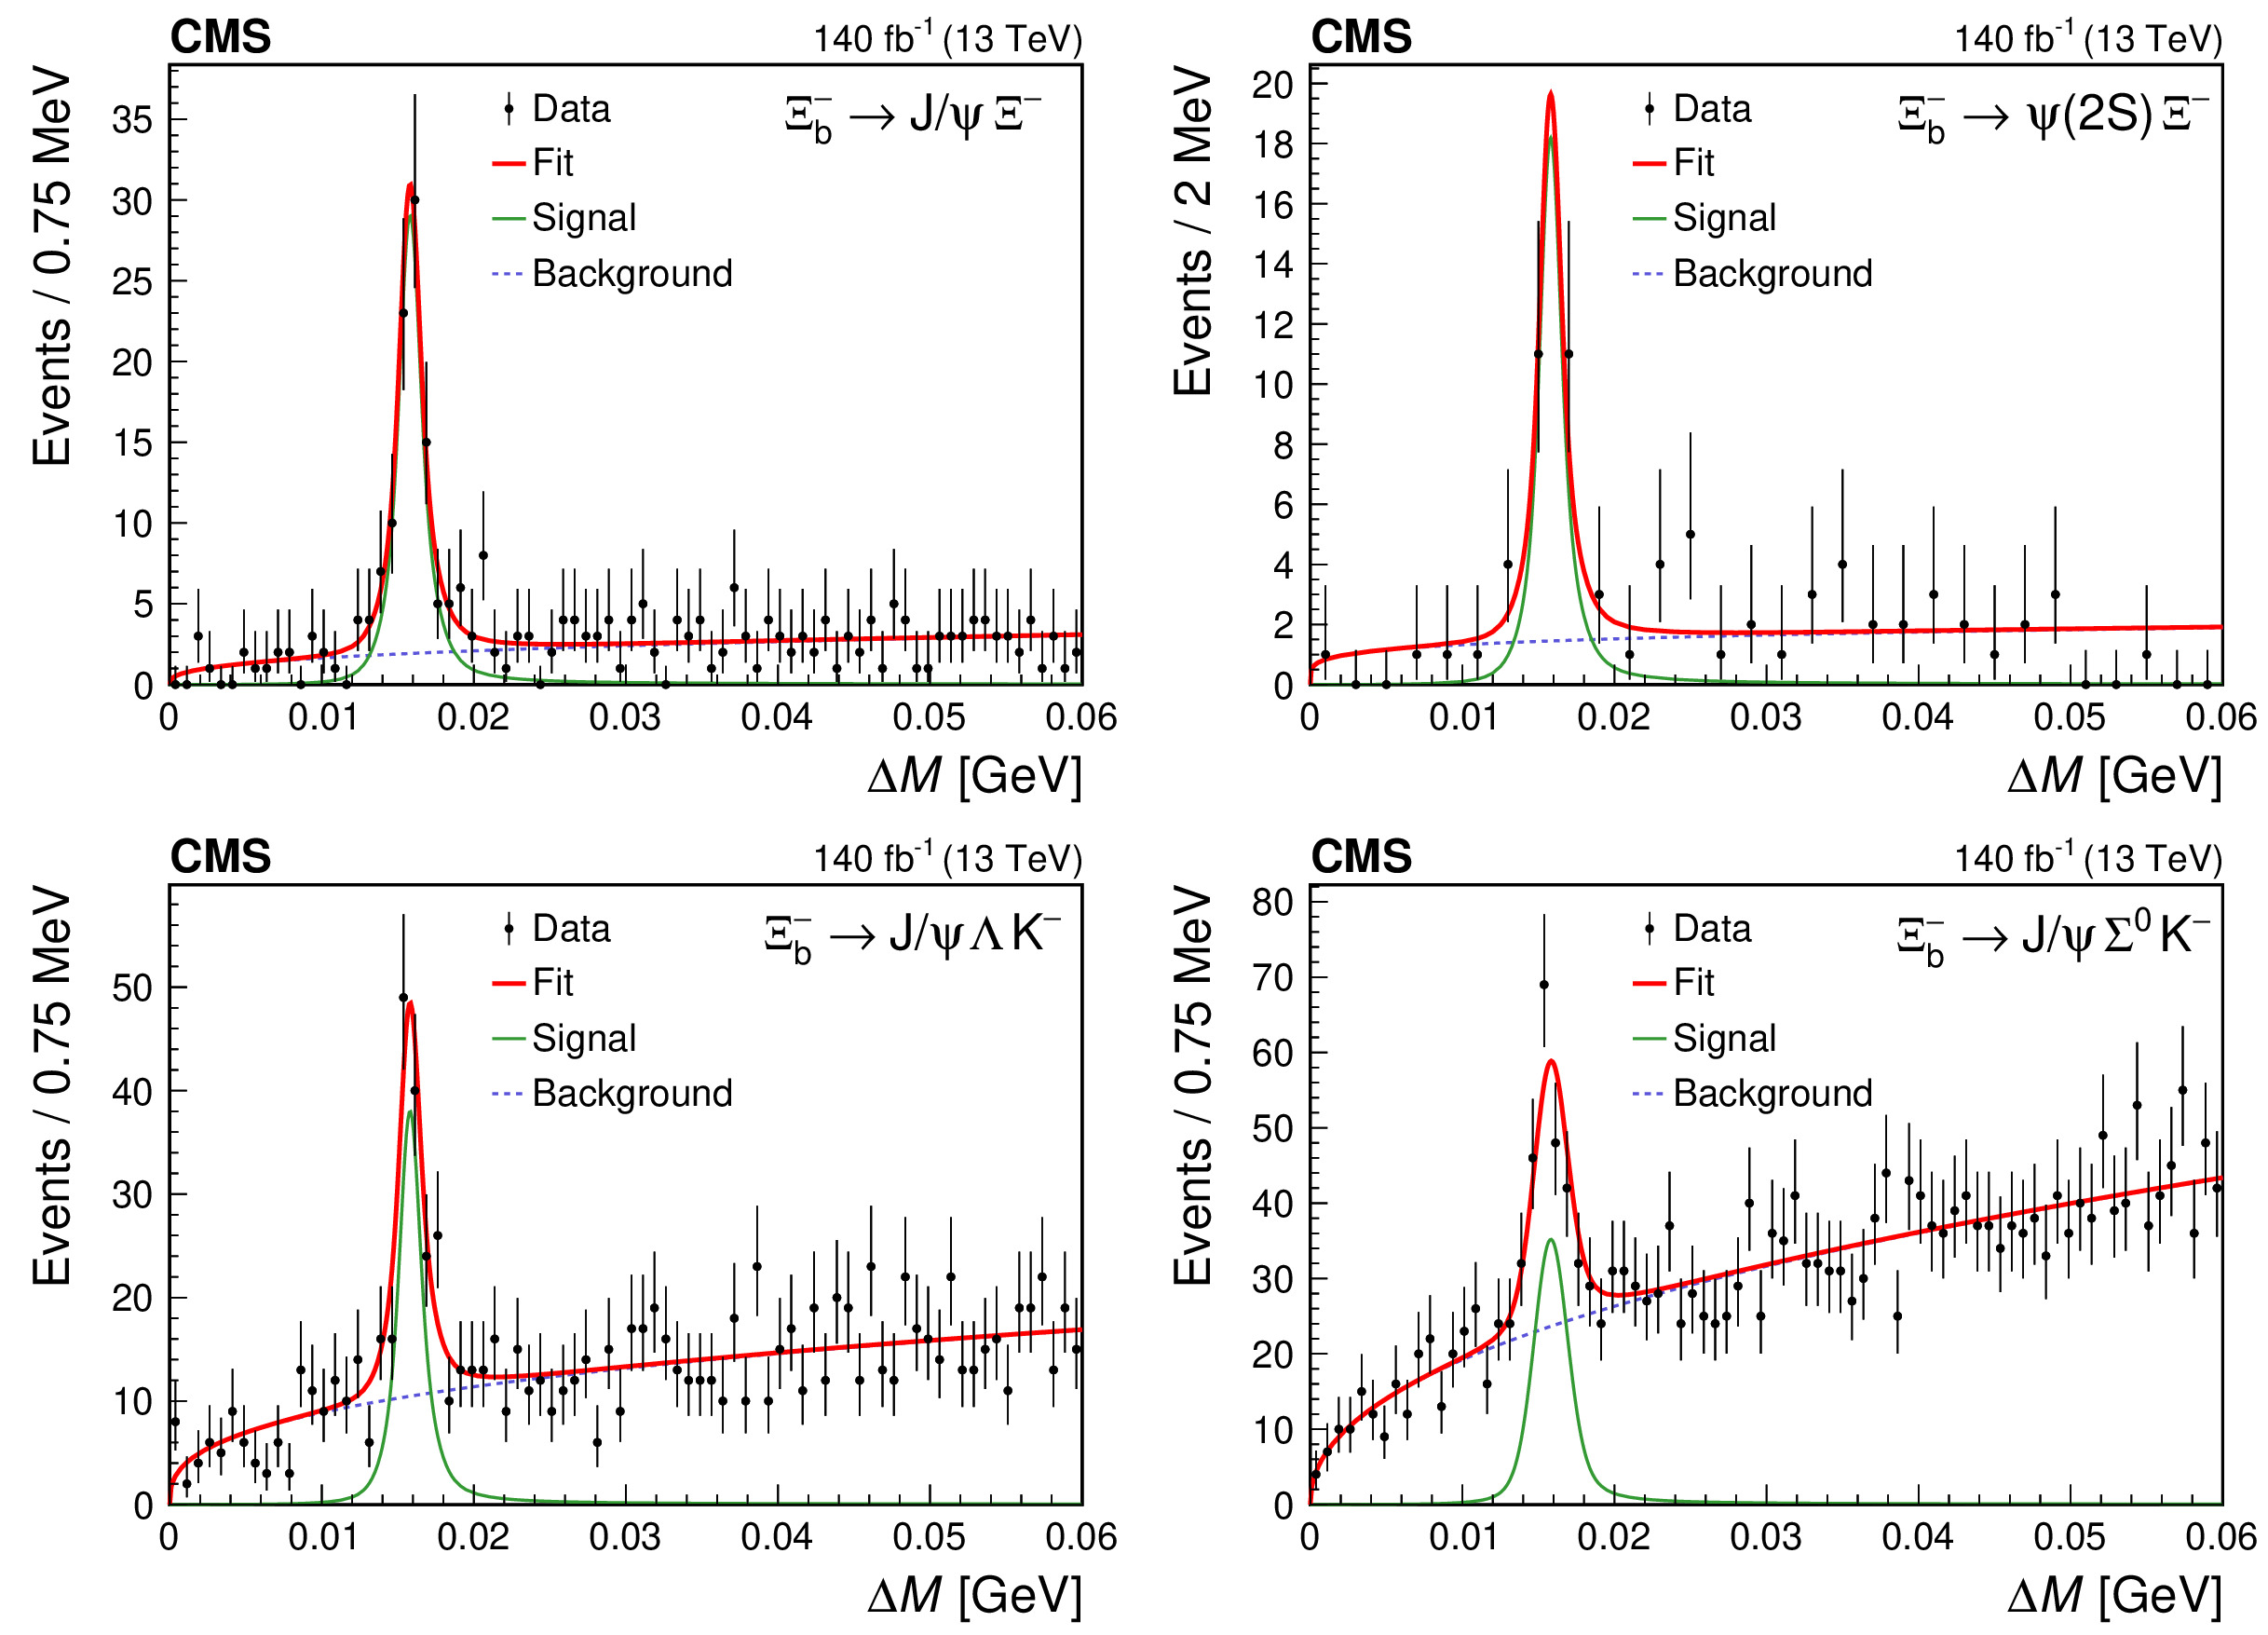
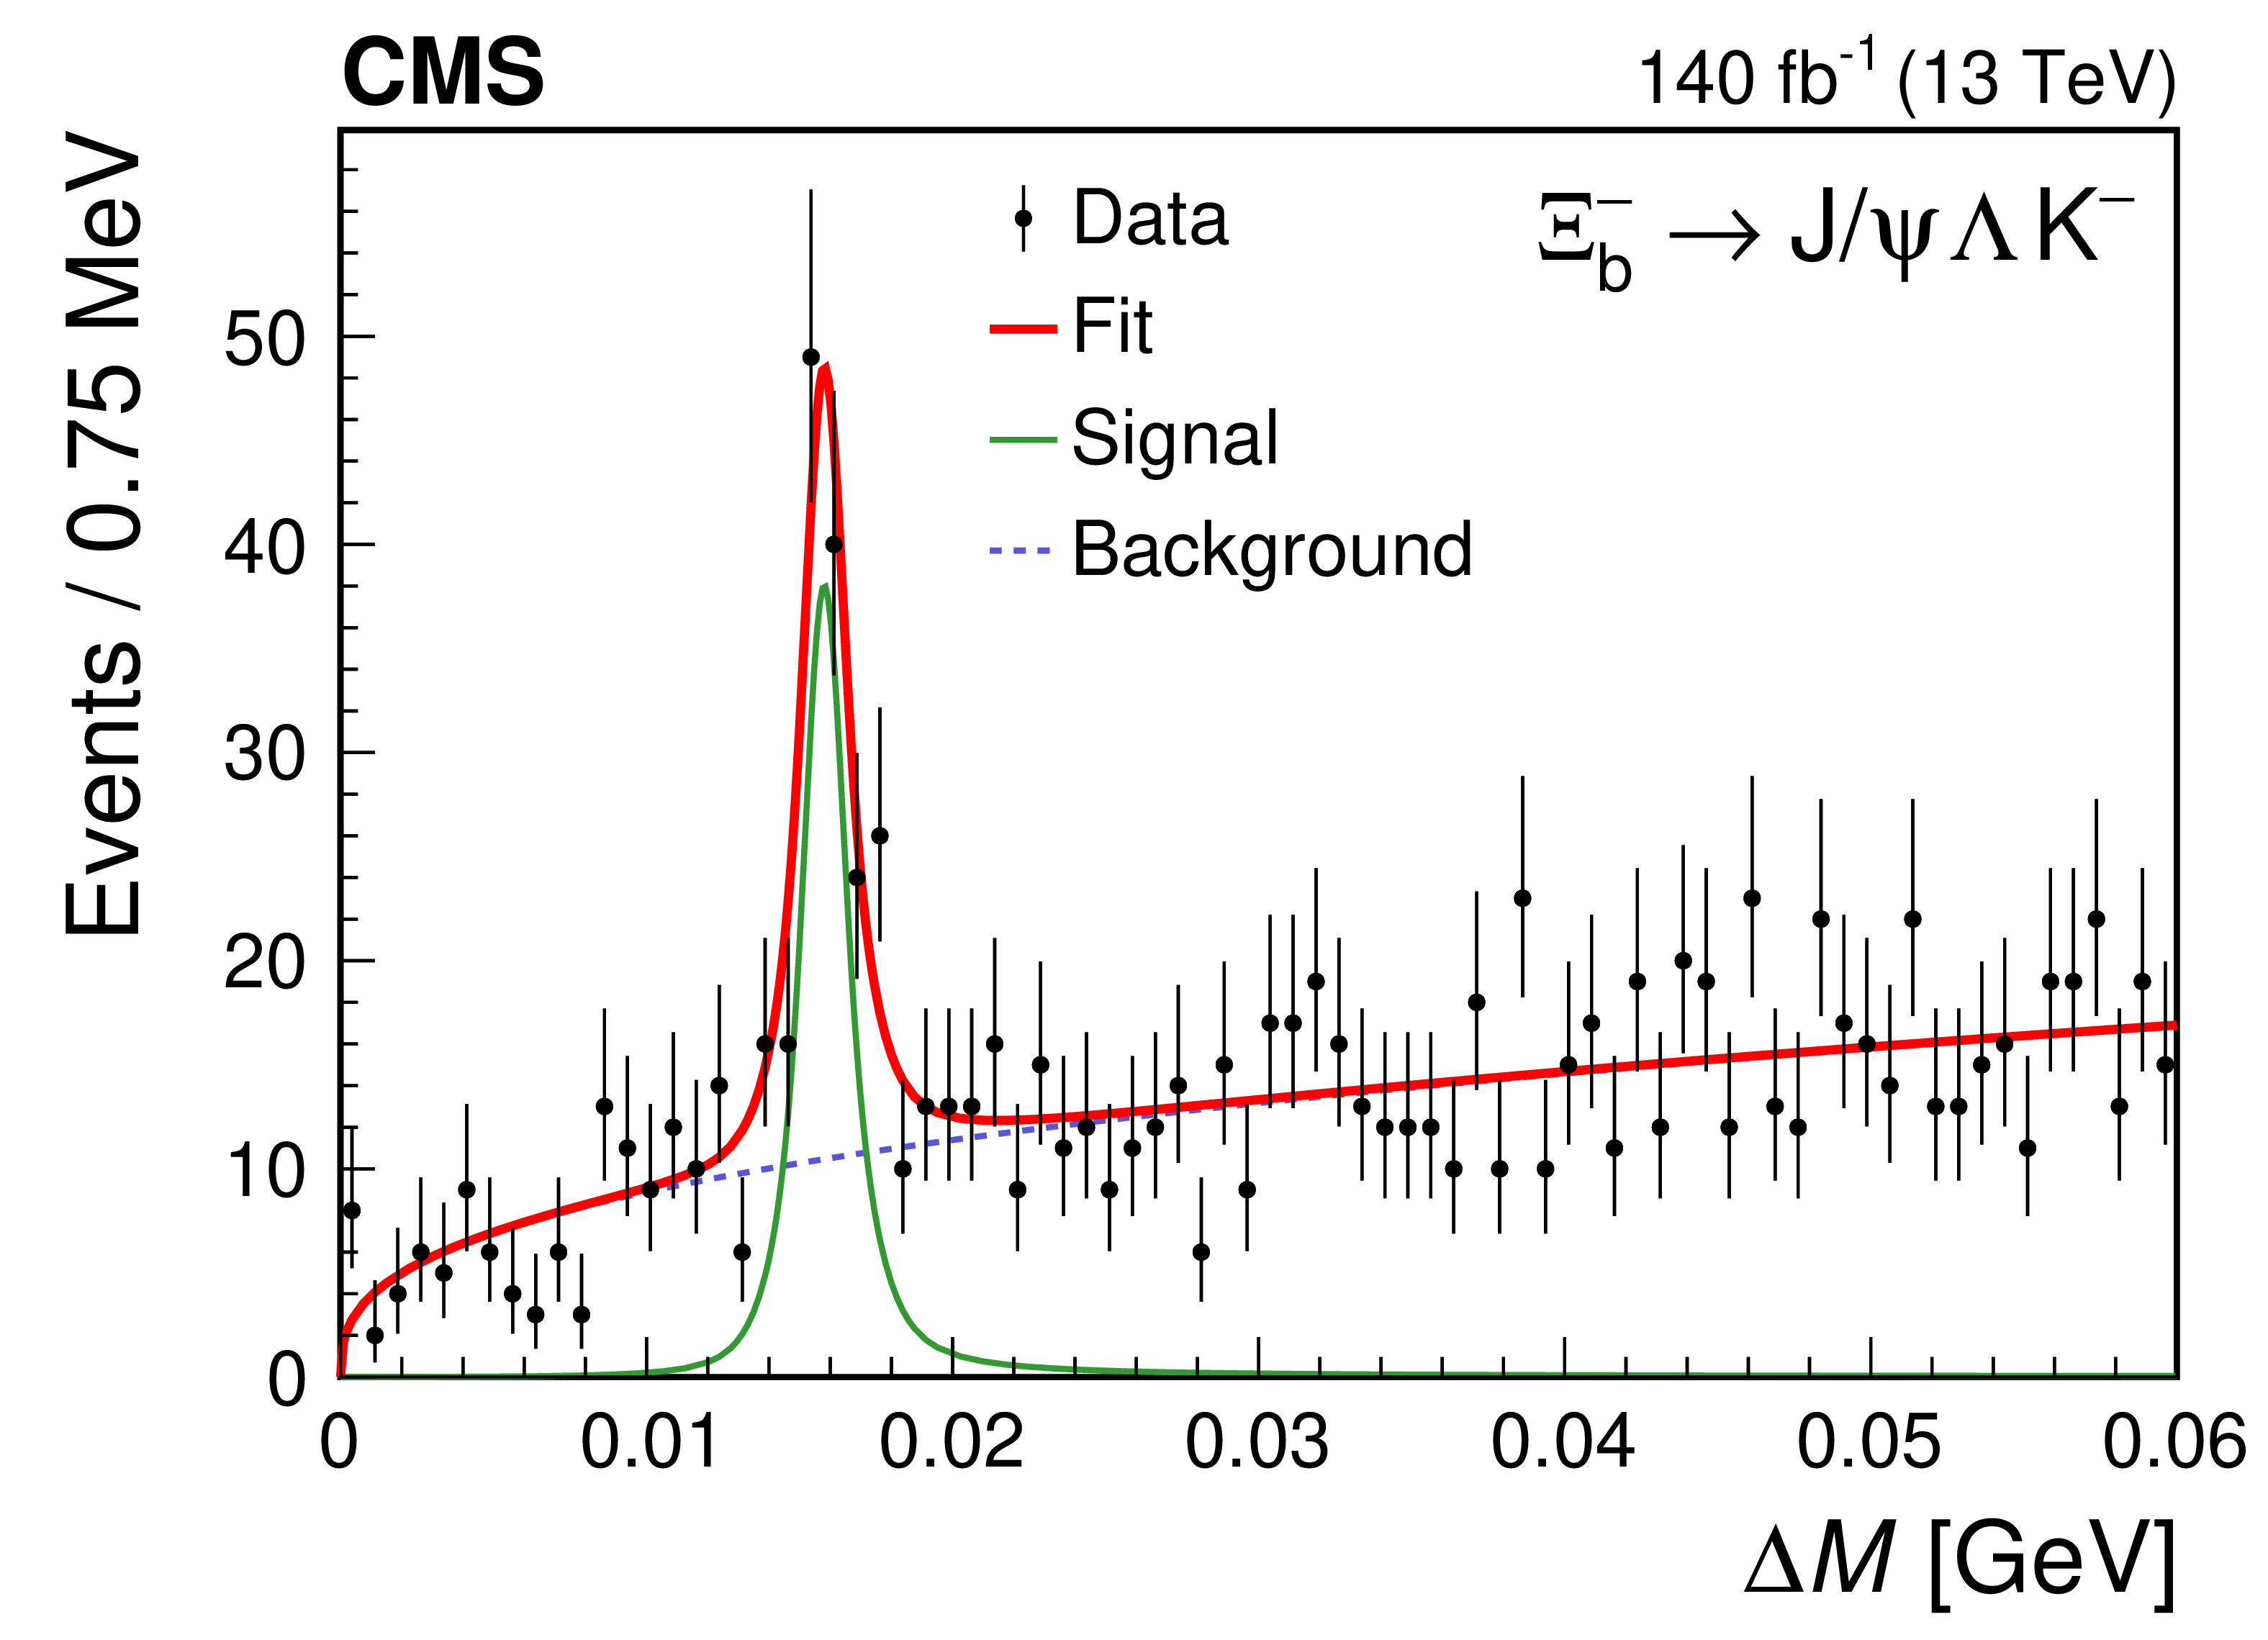
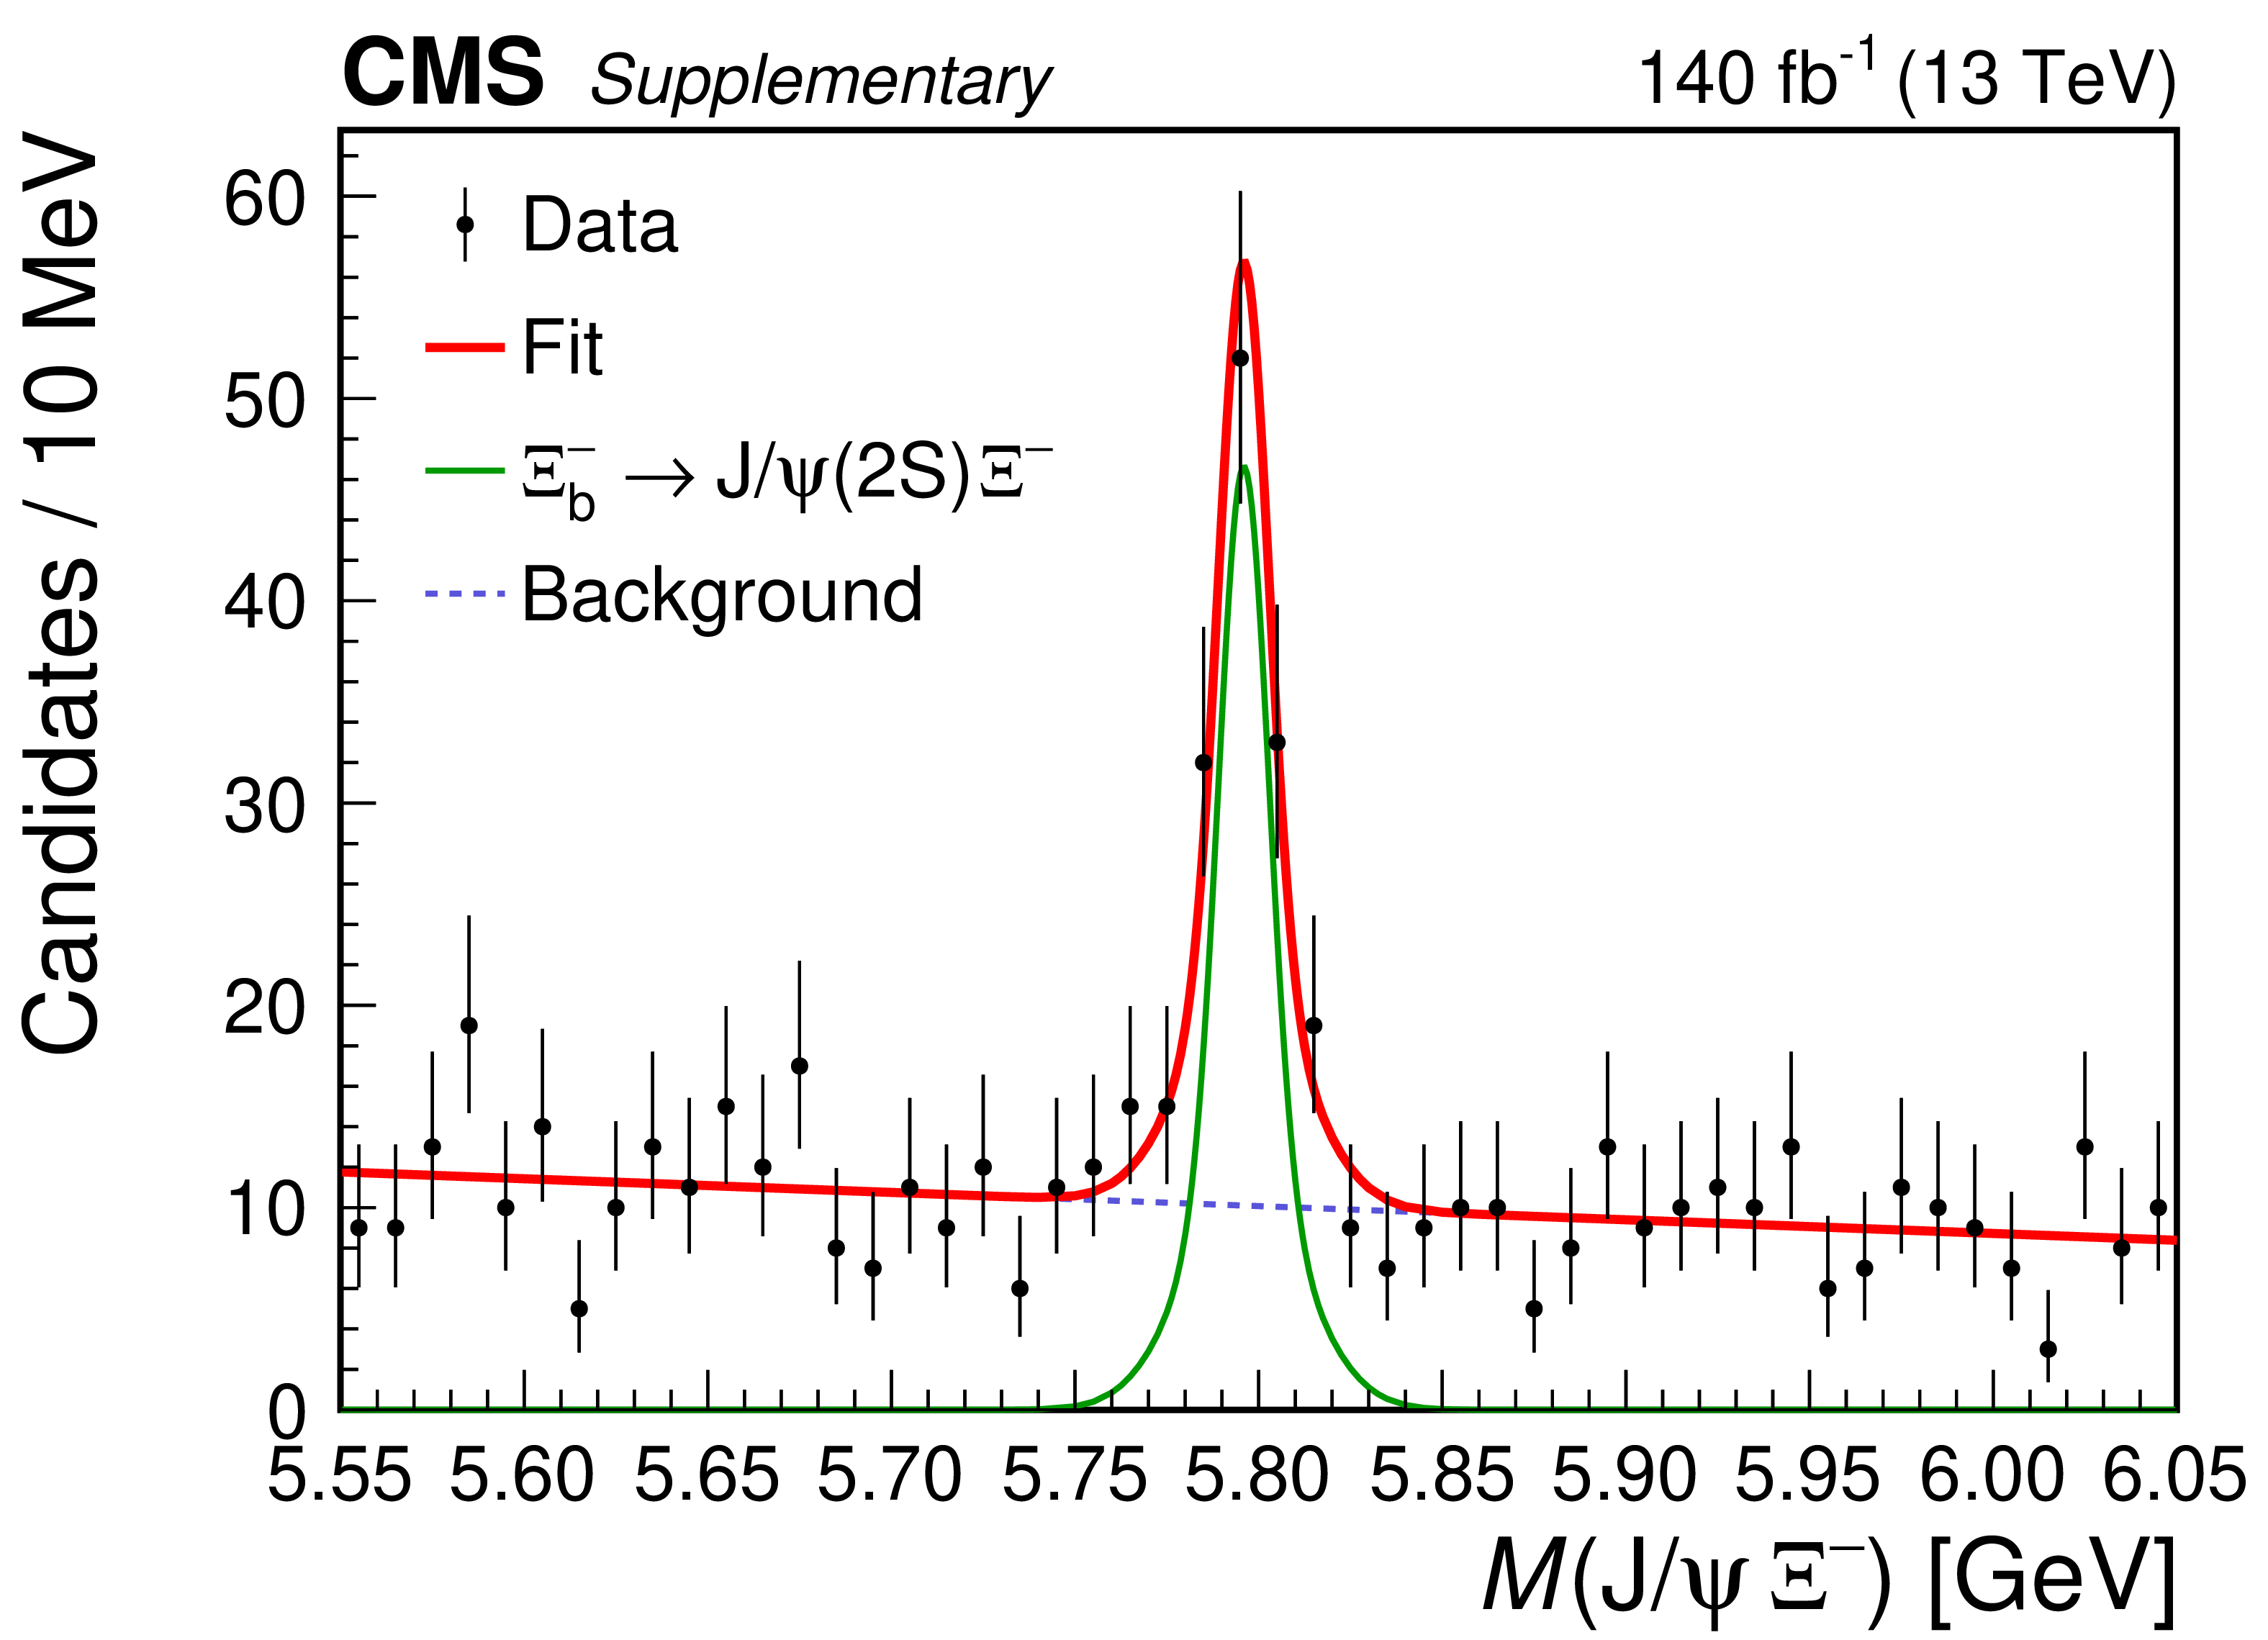
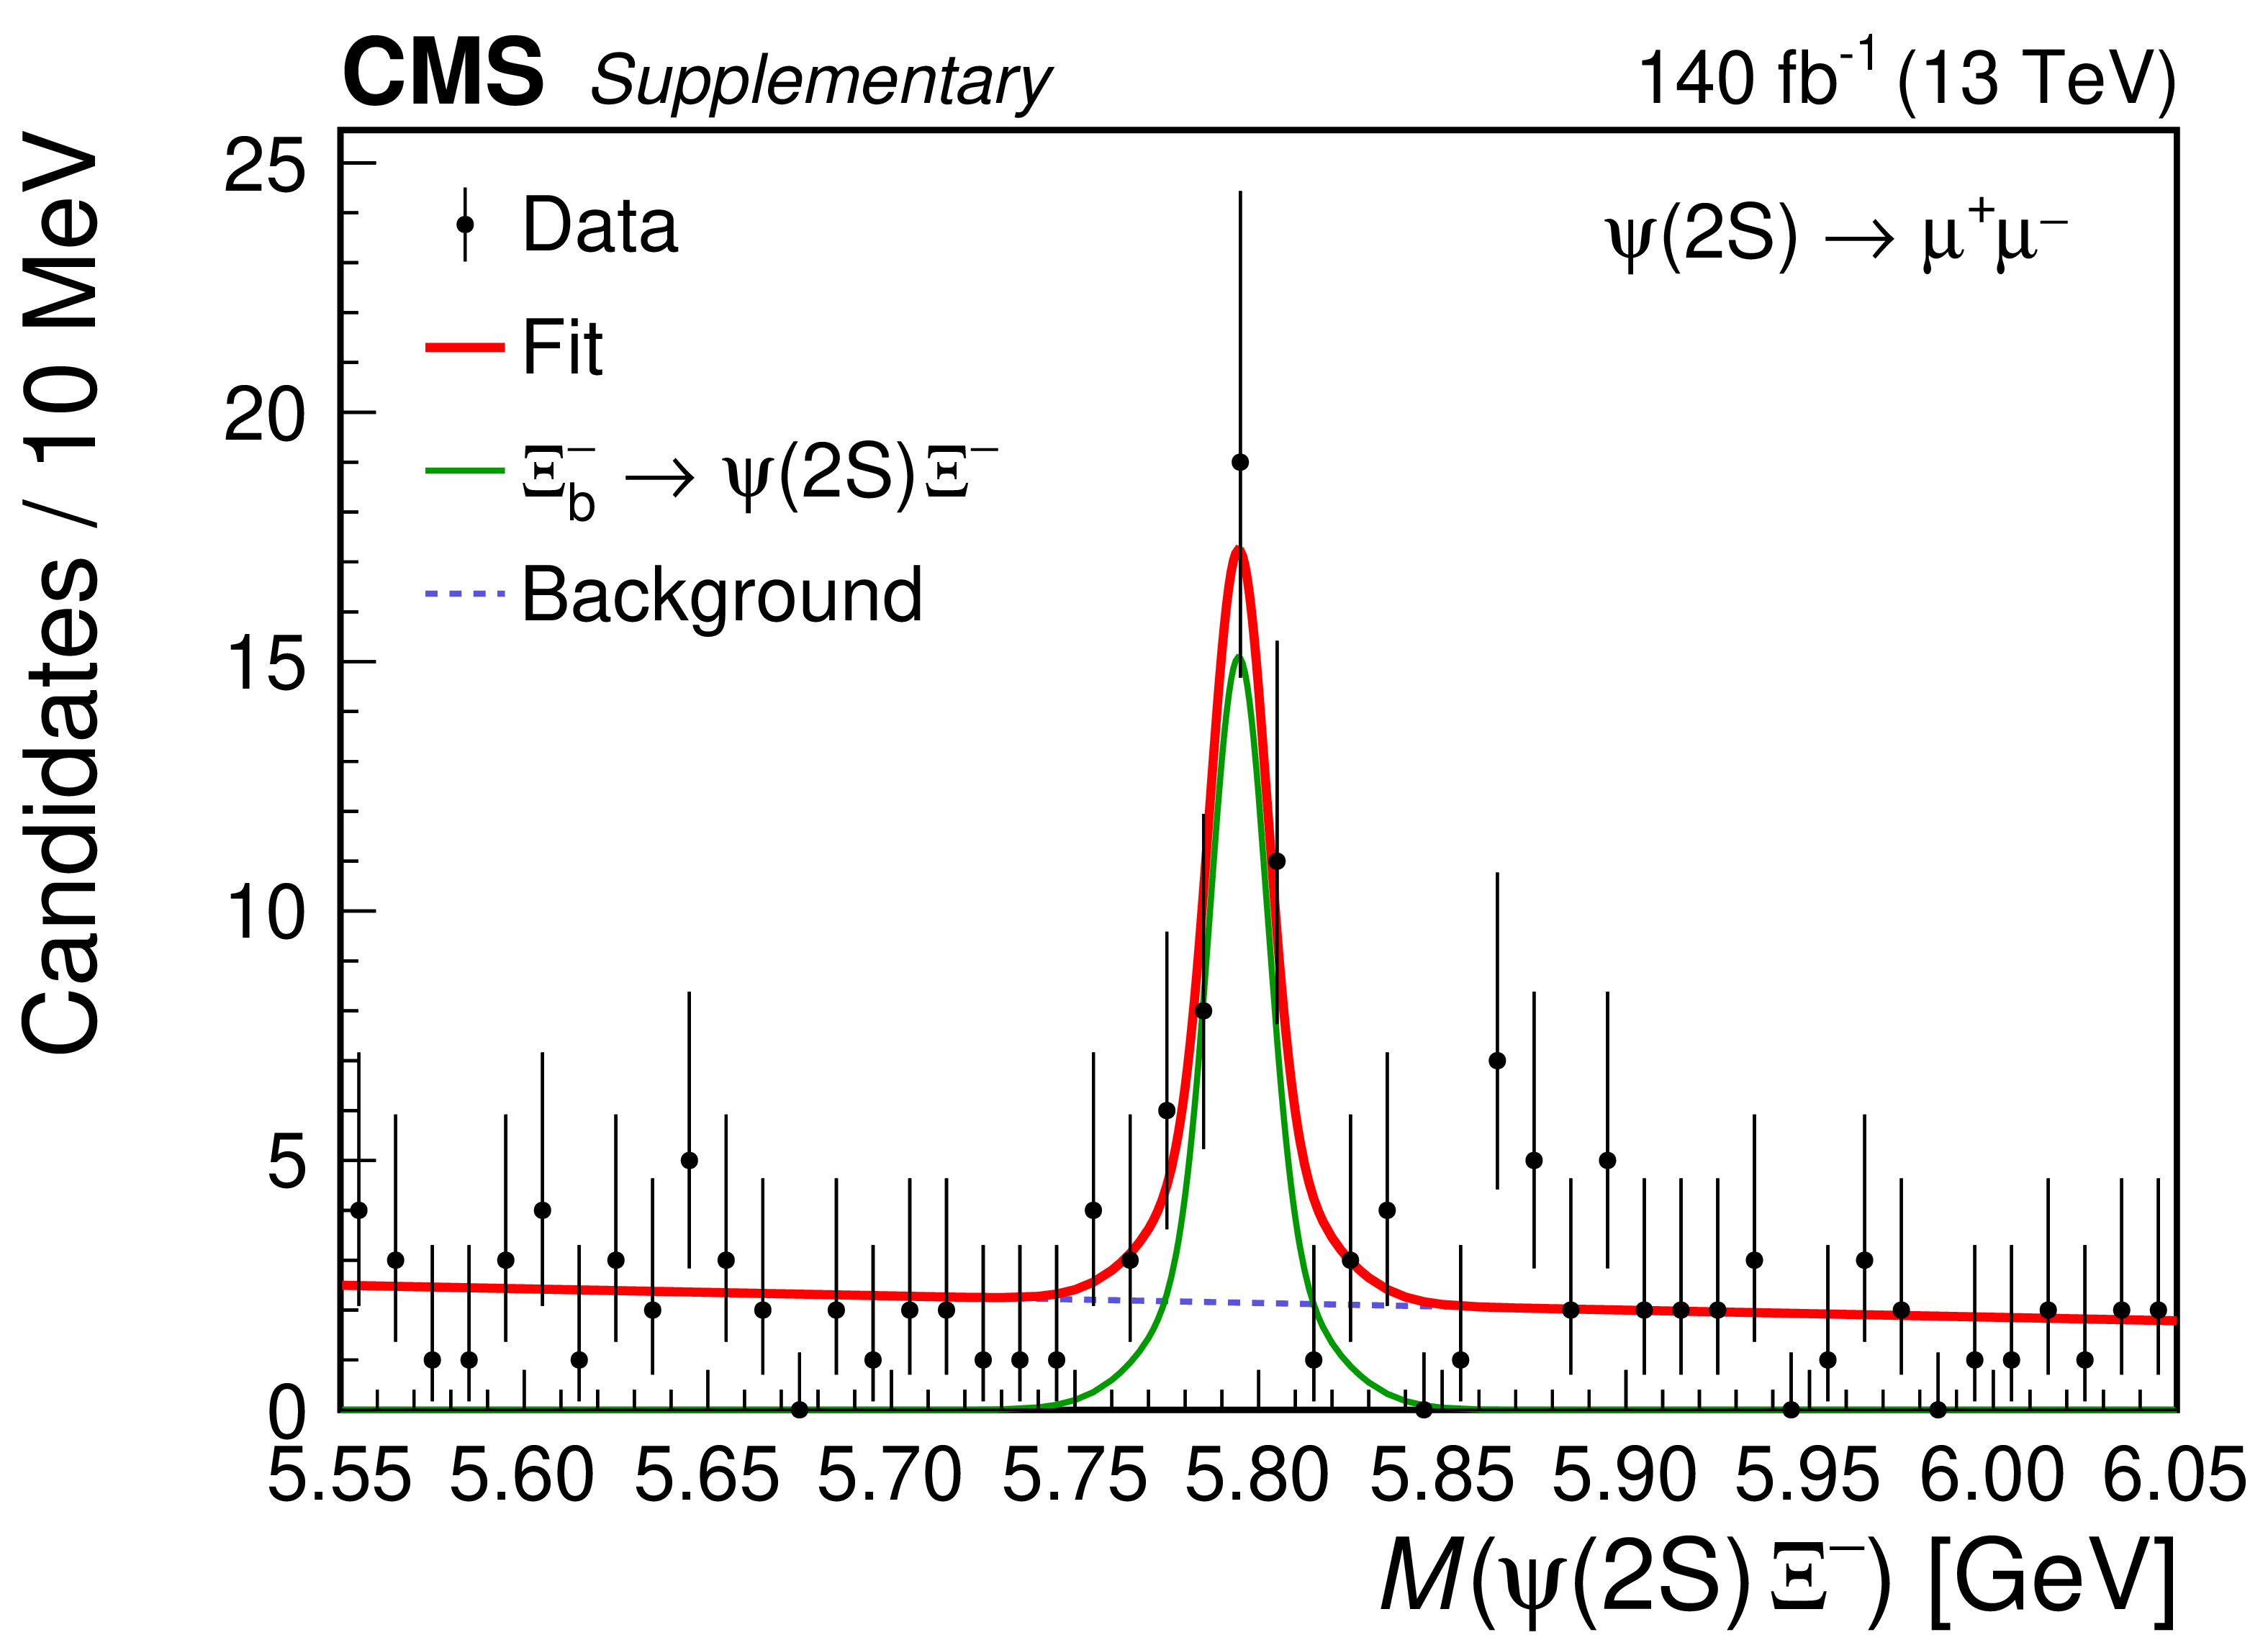
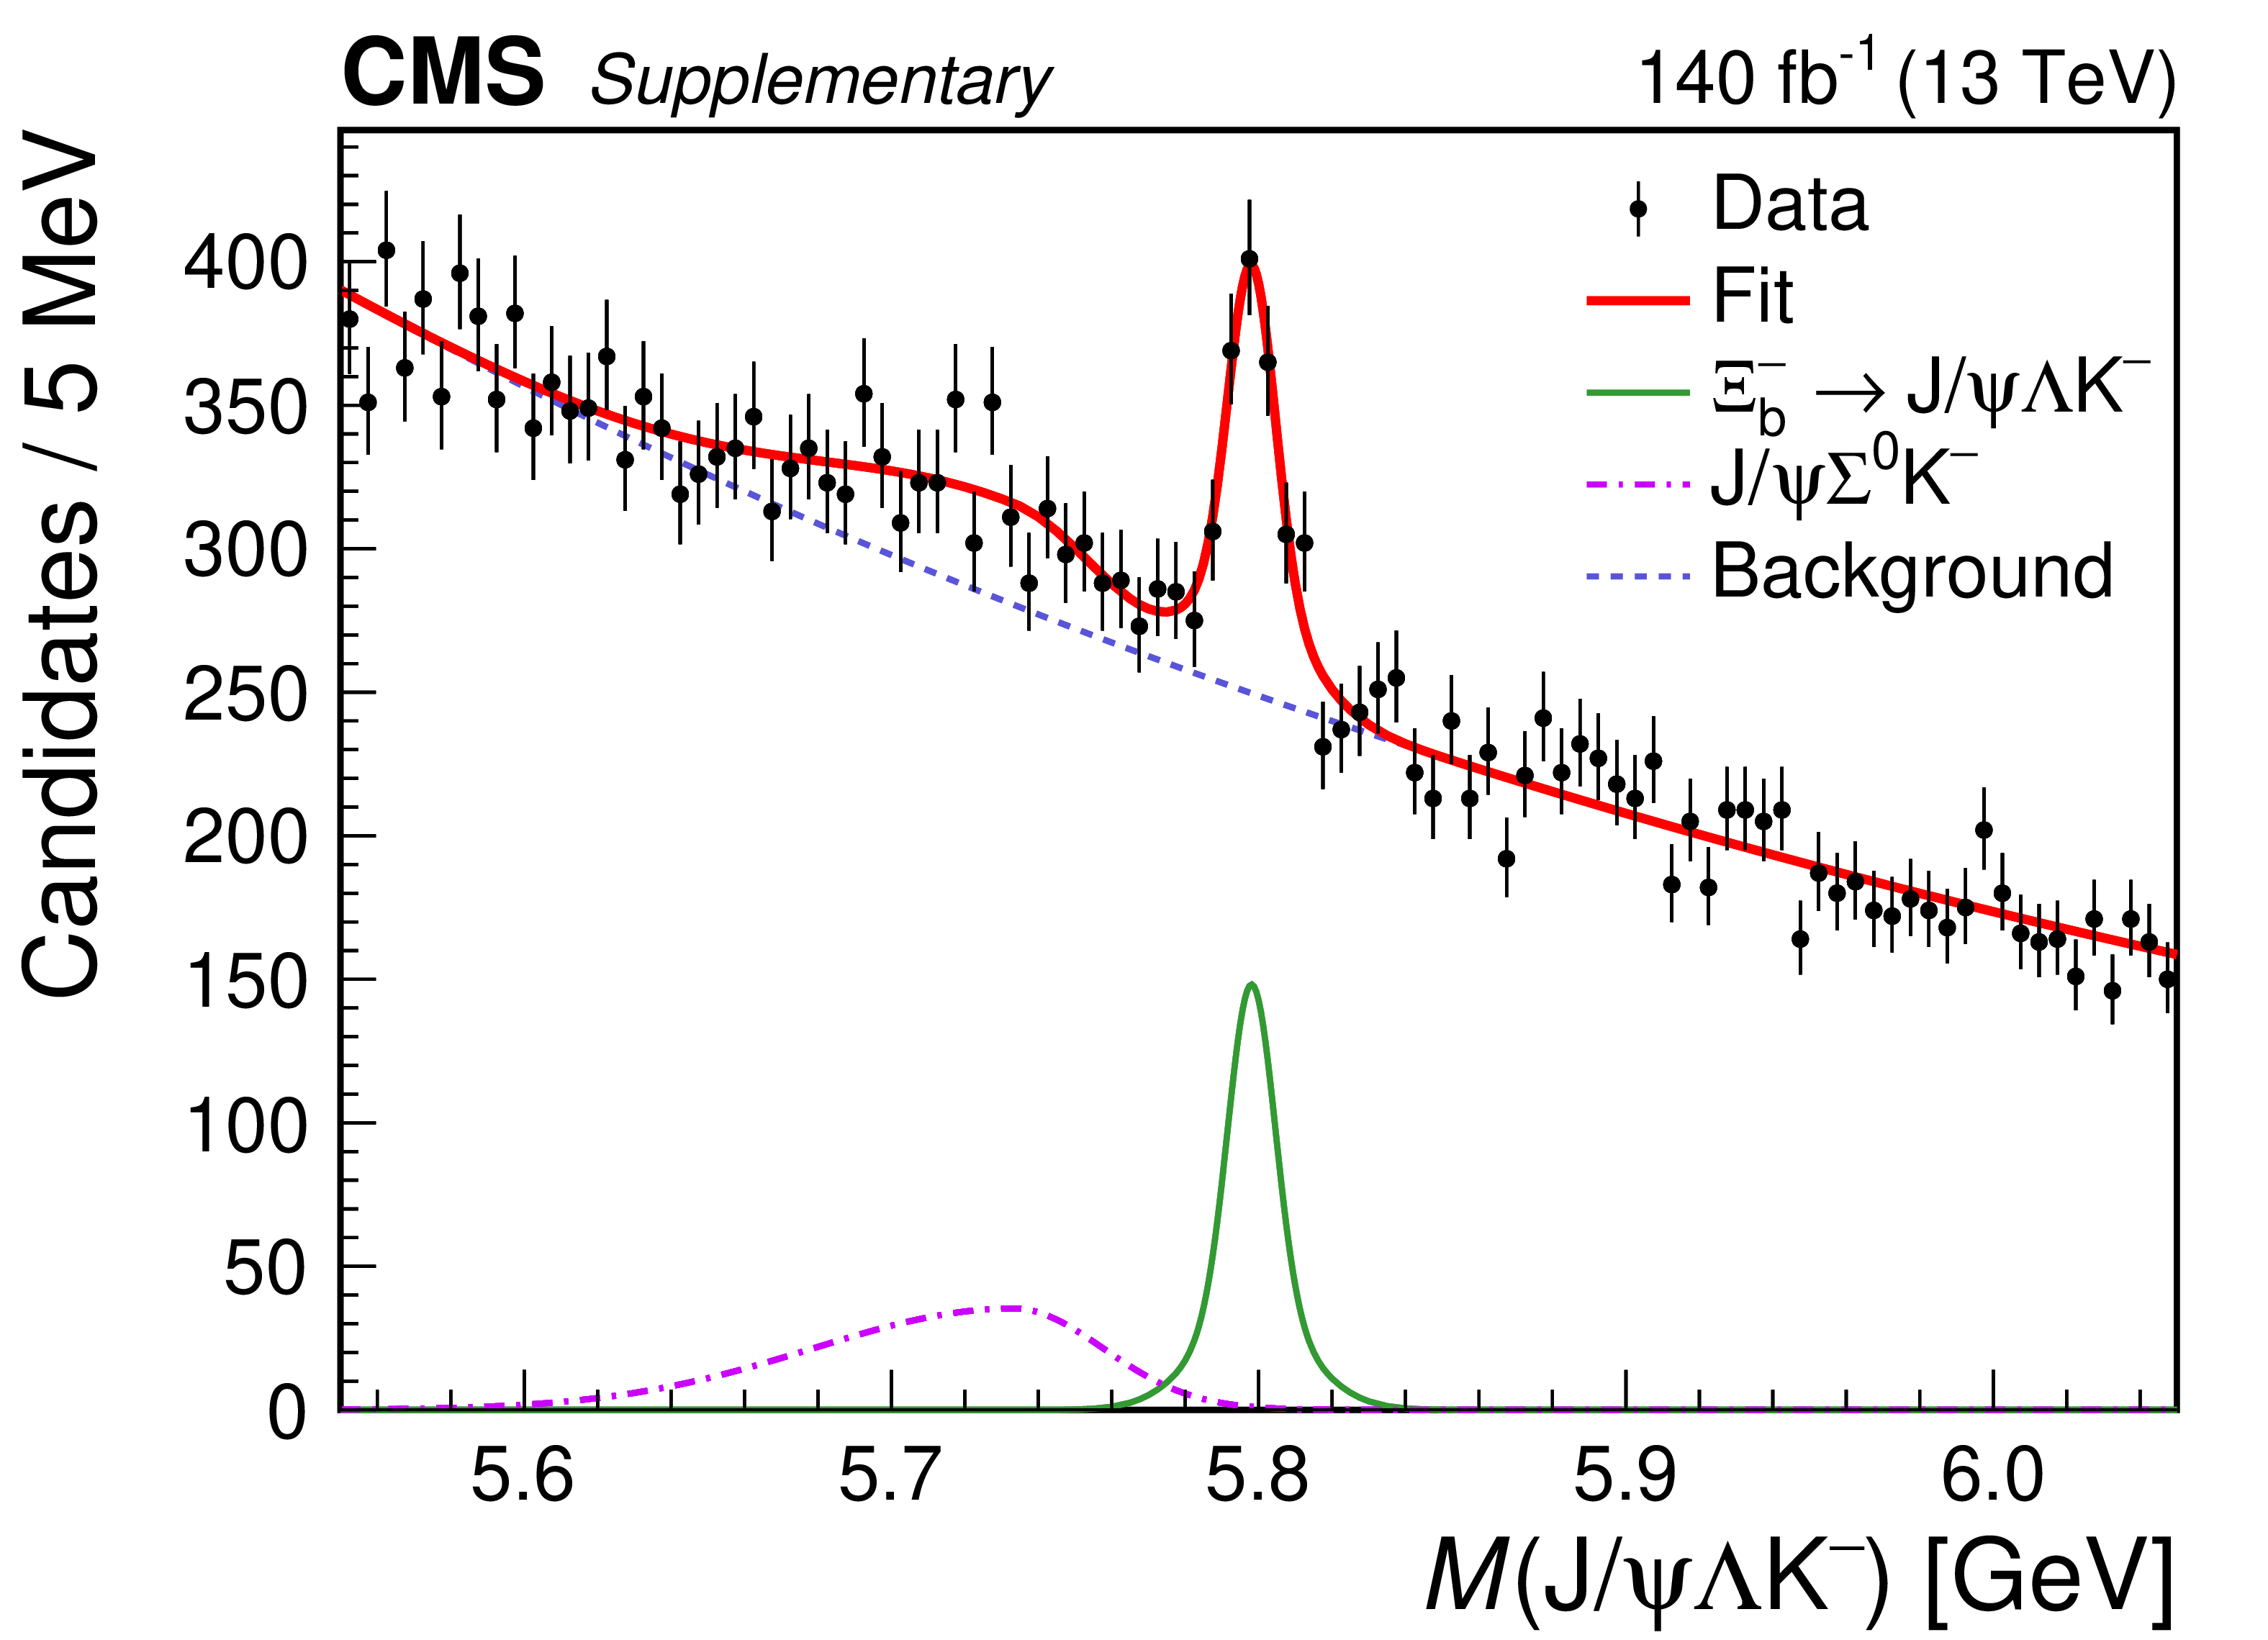
Figure 2:
Invariant mass distributions of the selected $ \mathrm{J}/\psi\Xi^{-} $ (upper left), $ \mathrm{J}/\psi\Lambda\mathrm{K^-} $ (upper right), and $ \psi{(2S)}\Xi^{-} $ [lower row, with $ \psi{(2S)}\to\mu^{+}\mu^{-} $ (left) and $ \psi{(2S)}\to\mathrm{J}/\psi\pi^{+}\pi^{-} $ (right) candidates]. The data are shown by the points, while the vertical bars represent the statistical uncertainties. The overall fit result is shown by the solid red curve, with the signal and background contributions given by the solid green and dashed blue curves, respectively. The vertical lines around each peak display the mass window required for a $ \Xi_{b}^{-} $ candidate to be used in the $ \Xi_{b}^{*0} $ studies. The dotted-dashed curve in the upper right plot shows the fitted contribution from the $ \Xi_{b}^{-}\to\mathrm{J}/\psi\Sigma^{0}\mathrm{K^-} $ decay, with the accompanying vertical dotted lines indicating the mass window for this mode. |

png pdf |
Figure 2-a:
Invariant mass distributions of the selected $ \mathrm{J}/\psi\Xi^{-} $ (upper left), $ \mathrm{J}/\psi\Lambda\mathrm{K^-} $ (upper right), and $ \psi{(2S)}\Xi^{-} $ [lower row, with $ \psi{(2S)}\to\mu^{+}\mu^{-} $ (left) and $ \psi{(2S)}\to\mathrm{J}/\psi\pi^{+}\pi^{-} $ (right) candidates]. The data are shown by the points, while the vertical bars represent the statistical uncertainties. The overall fit result is shown by the solid red curve, with the signal and background contributions given by the solid green and dashed blue curves, respectively. The vertical lines around each peak display the mass window required for a $ \Xi_{b}^{-} $ candidate to be used in the $ \Xi_{b}^{*0} $ studies. The dotted-dashed curve in the upper right plot shows the fitted contribution from the $ \Xi_{b}^{-}\to\mathrm{J}/\psi\Sigma^{0}\mathrm{K^-} $ decay, with the accompanying vertical dotted lines indicating the mass window for this mode. |
png pdf |
Figure 2-b:
Invariant mass distributions of the selected $ \mathrm{J}/\psi\Xi^{-} $ (upper left), $ \mathrm{J}/\psi\Lambda\mathrm{K^-} $ (upper right), and $ \psi{(2S)}\Xi^{-} $ [lower row, with $ \psi{(2S)}\to\mu^{+}\mu^{-} $ (left) and $ \psi{(2S)}\to\mathrm{J}/\psi\pi^{+}\pi^{-} $ (right) candidates]. The data are shown by the points, while the vertical bars represent the statistical uncertainties. The overall fit result is shown by the solid red curve, with the signal and background contributions given by the solid green and dashed blue curves, respectively. The vertical lines around each peak display the mass window required for a $ \Xi_{b}^{-} $ candidate to be used in the $ \Xi_{b}^{*0} $ studies. The dotted-dashed curve in the upper right plot shows the fitted contribution from the $ \Xi_{b}^{-}\to\mathrm{J}/\psi\Sigma^{0}\mathrm{K^-} $ decay, with the accompanying vertical dotted lines indicating the mass window for this mode. |
png pdf |
Figure 2-c:
Invariant mass distributions of the selected $ \mathrm{J}/\psi\Xi^{-} $ (upper left), $ \mathrm{J}/\psi\Lambda\mathrm{K^-} $ (upper right), and $ \psi{(2S)}\Xi^{-} $ [lower row, with $ \psi{(2S)}\to\mu^{+}\mu^{-} $ (left) and $ \psi{(2S)}\to\mathrm{J}/\psi\pi^{+}\pi^{-} $ (right) candidates]. The data are shown by the points, while the vertical bars represent the statistical uncertainties. The overall fit result is shown by the solid red curve, with the signal and background contributions given by the solid green and dashed blue curves, respectively. The vertical lines around each peak display the mass window required for a $ \Xi_{b}^{-} $ candidate to be used in the $ \Xi_{b}^{*0} $ studies. The dotted-dashed curve in the upper right plot shows the fitted contribution from the $ \Xi_{b}^{-}\to\mathrm{J}/\psi\Sigma^{0}\mathrm{K^-} $ decay, with the accompanying vertical dotted lines indicating the mass window for this mode. |
png pdf |
Figure 2-d:
Invariant mass distributions of the selected $ \mathrm{J}/\psi\Xi^{-} $ (upper left), $ \mathrm{J}/\psi\Lambda\mathrm{K^-} $ (upper right), and $ \psi{(2S)}\Xi^{-} $ [lower row, with $ \psi{(2S)}\to\mu^{+}\mu^{-} $ (left) and $ \psi{(2S)}\to\mathrm{J}/\psi\pi^{+}\pi^{-} $ (right) candidates]. The data are shown by the points, while the vertical bars represent the statistical uncertainties. The overall fit result is shown by the solid red curve, with the signal and background contributions given by the solid green and dashed blue curves, respectively. The vertical lines around each peak display the mass window required for a $ \Xi_{b}^{-} $ candidate to be used in the $ \Xi_{b}^{*0} $ studies. The dotted-dashed curve in the upper right plot shows the fitted contribution from the $ \Xi_{b}^{-}\to\mathrm{J}/\psi\Sigma^{0}\mathrm{K^-} $ decay, with the accompanying vertical dotted lines indicating the mass window for this mode. |

png pdf |
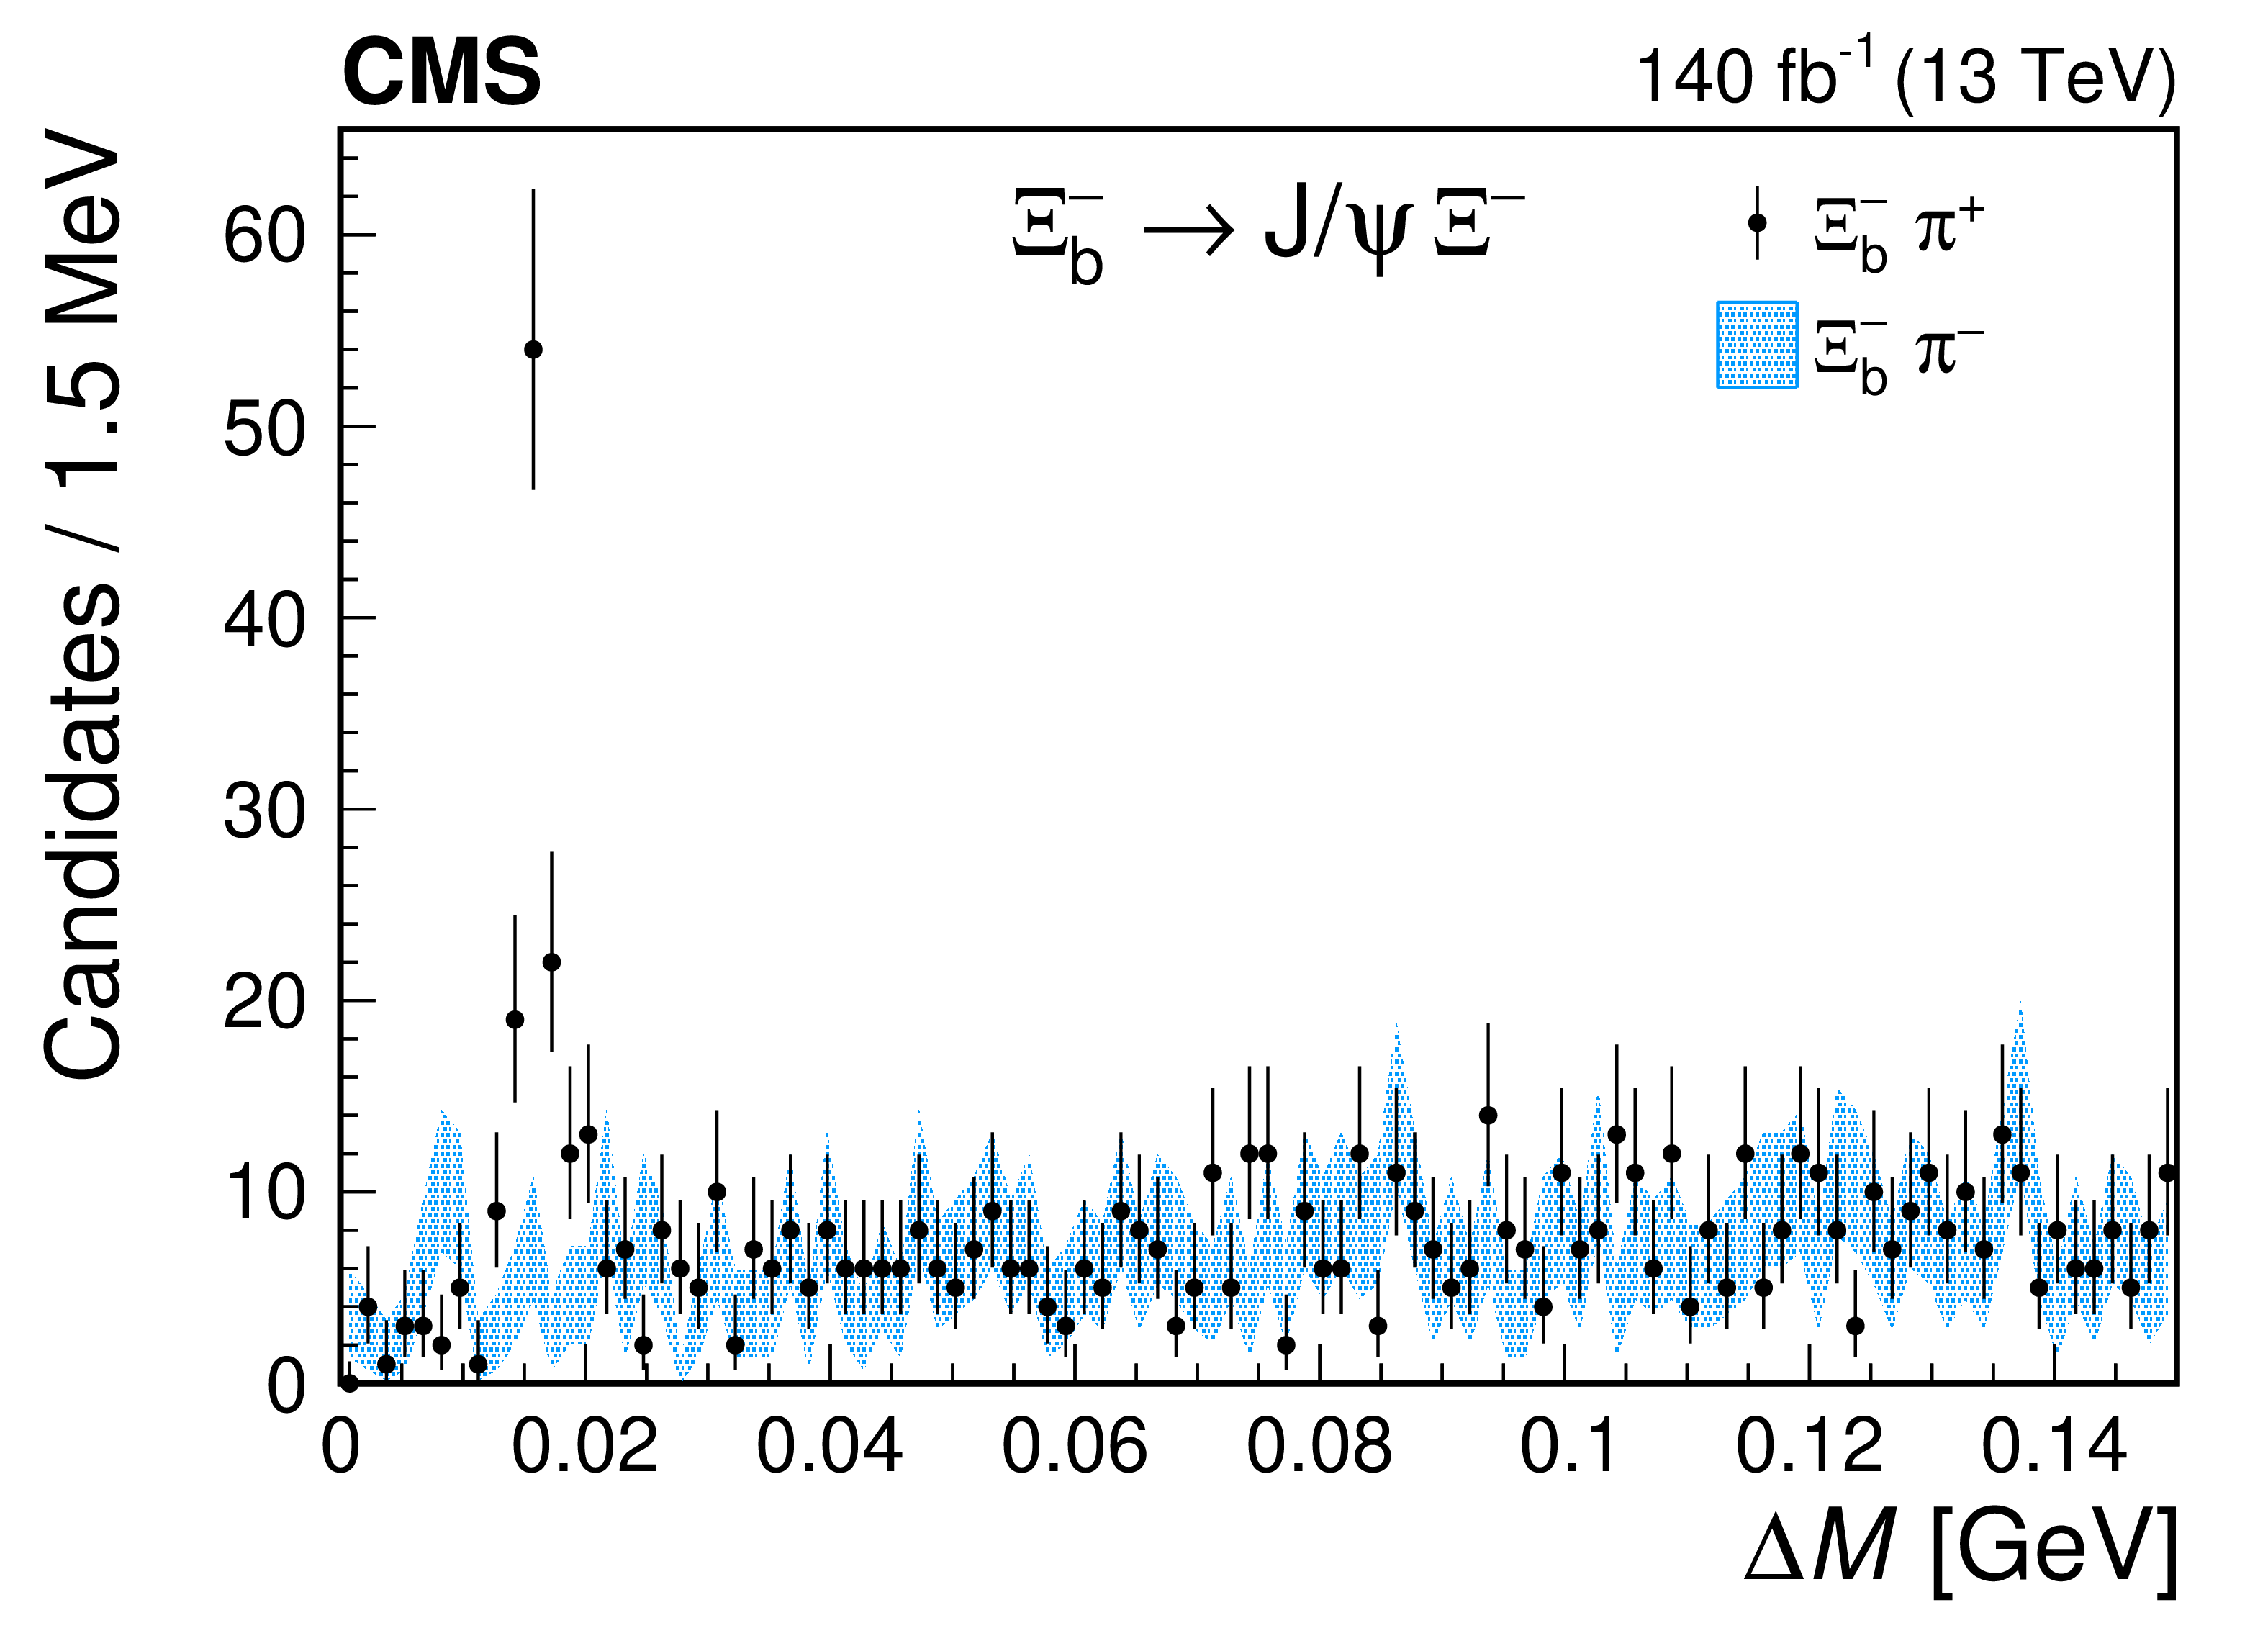
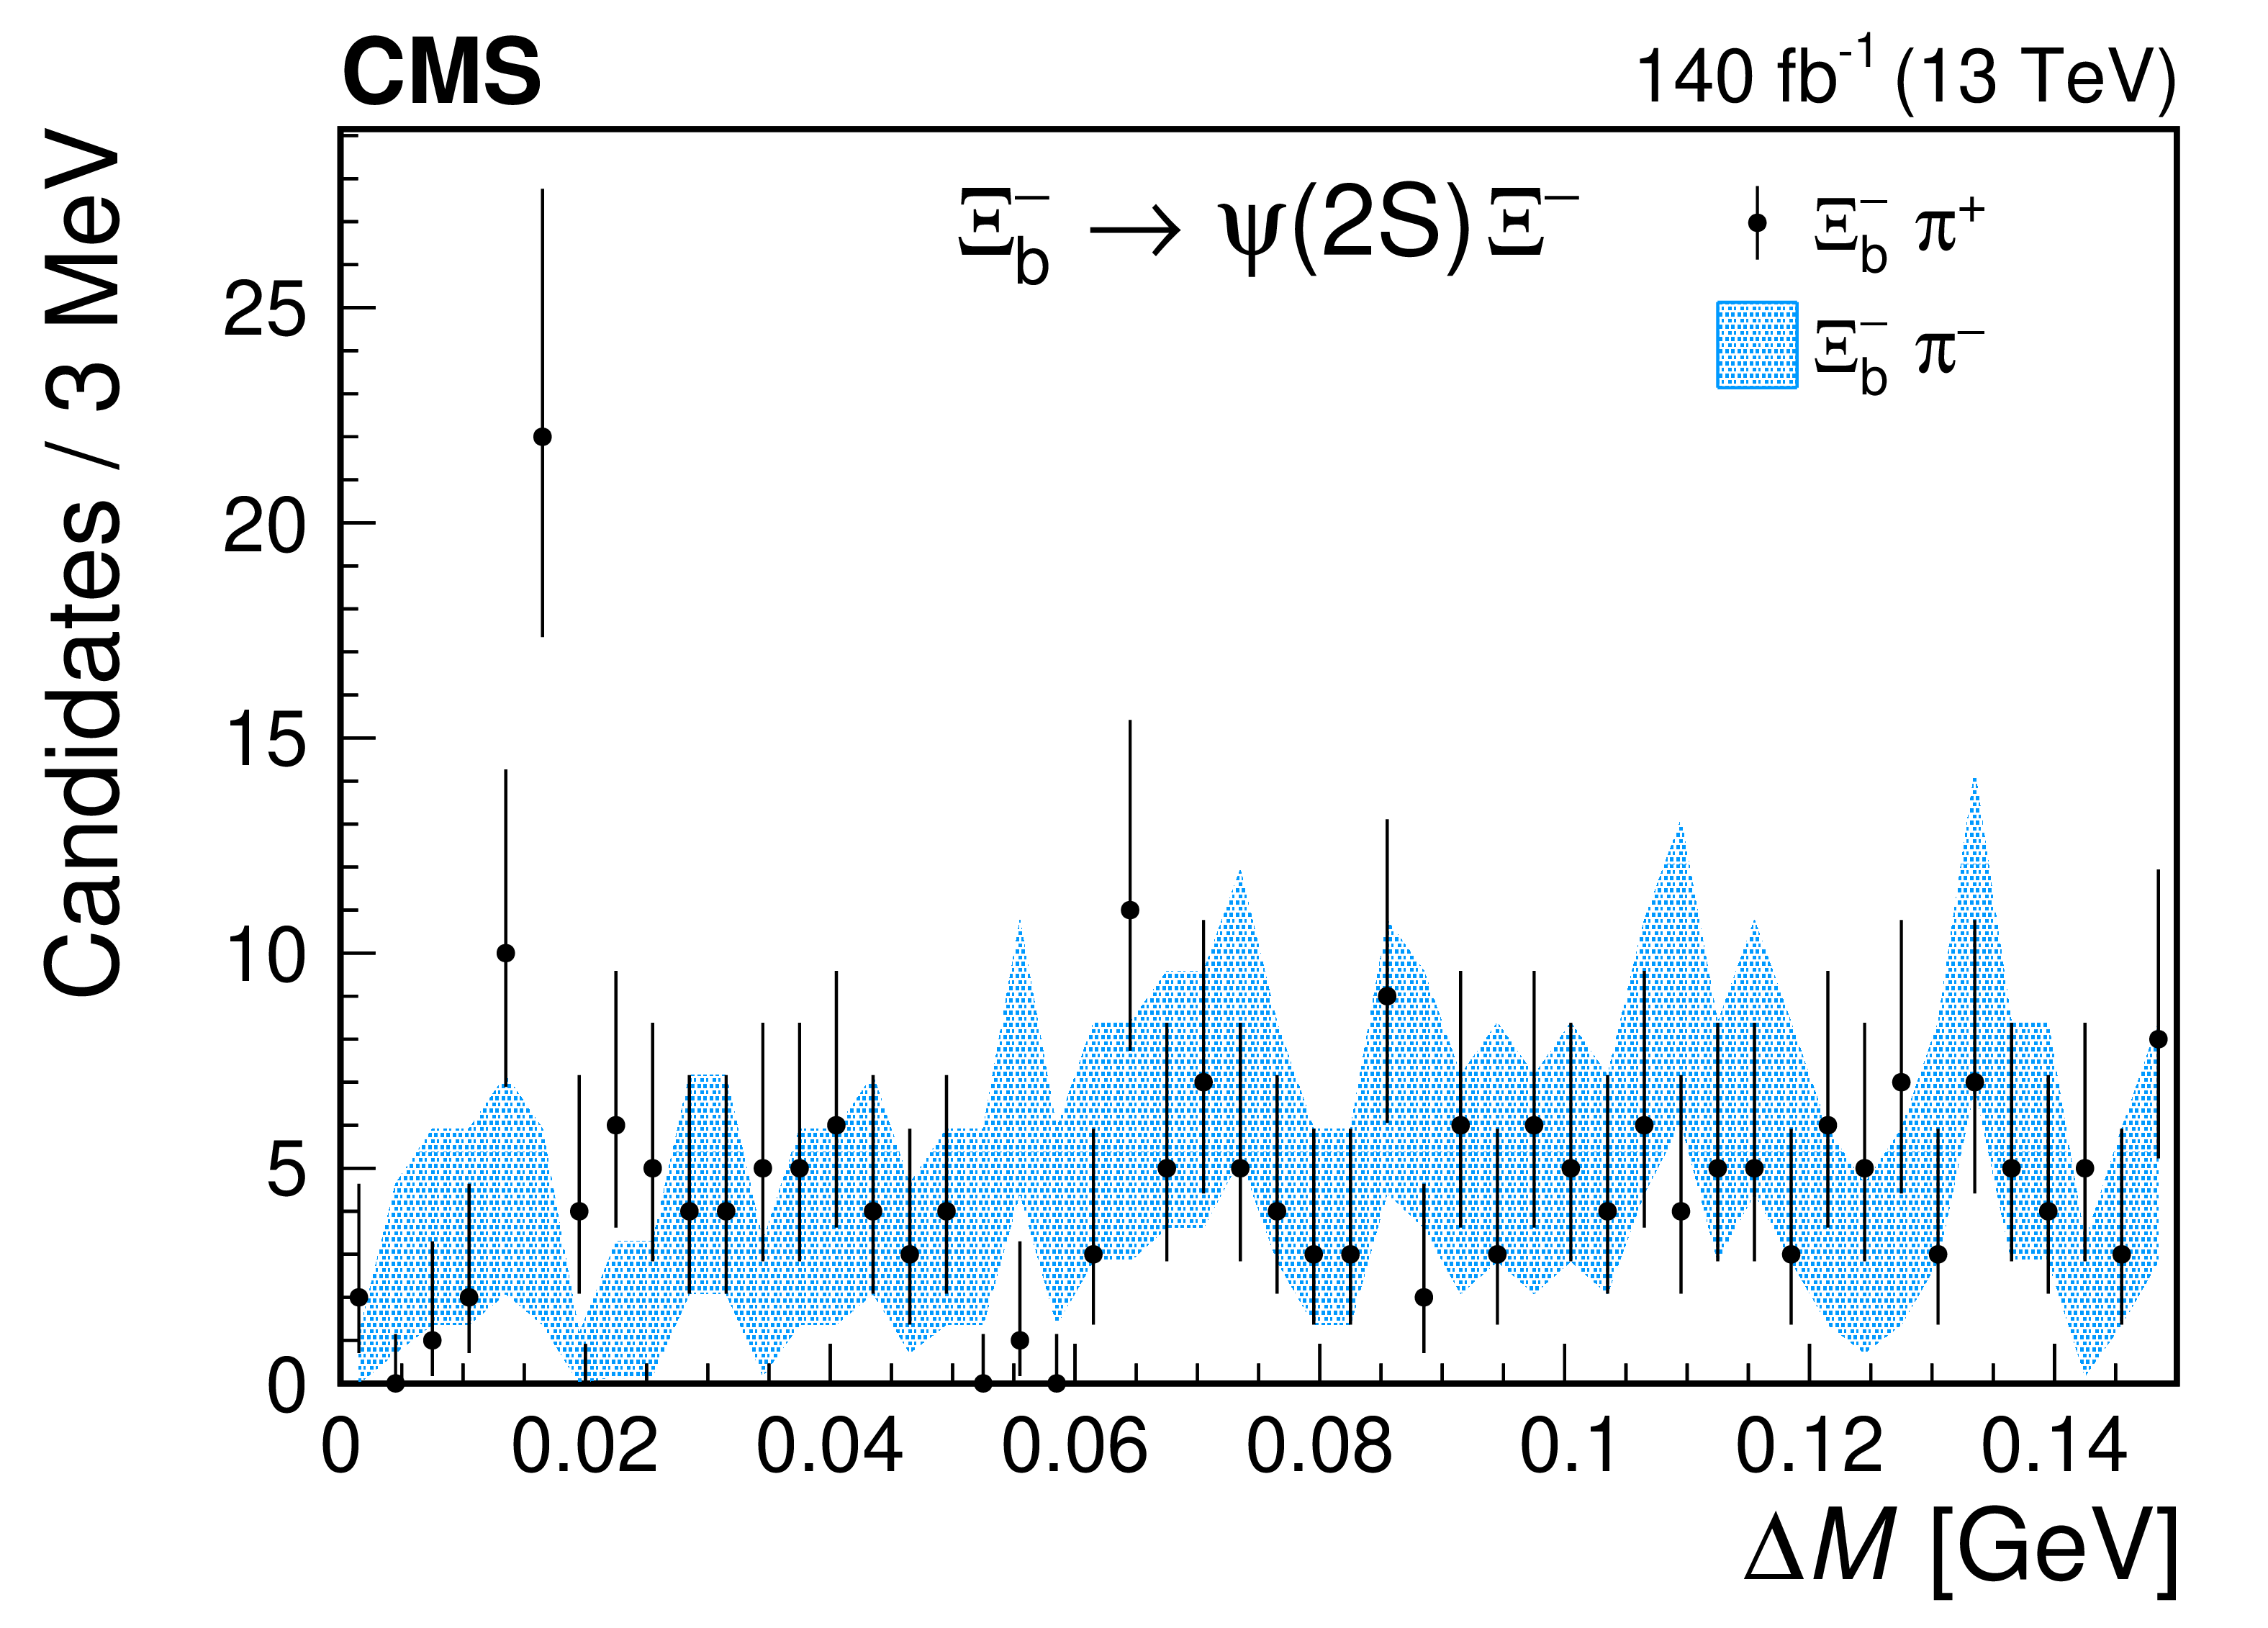
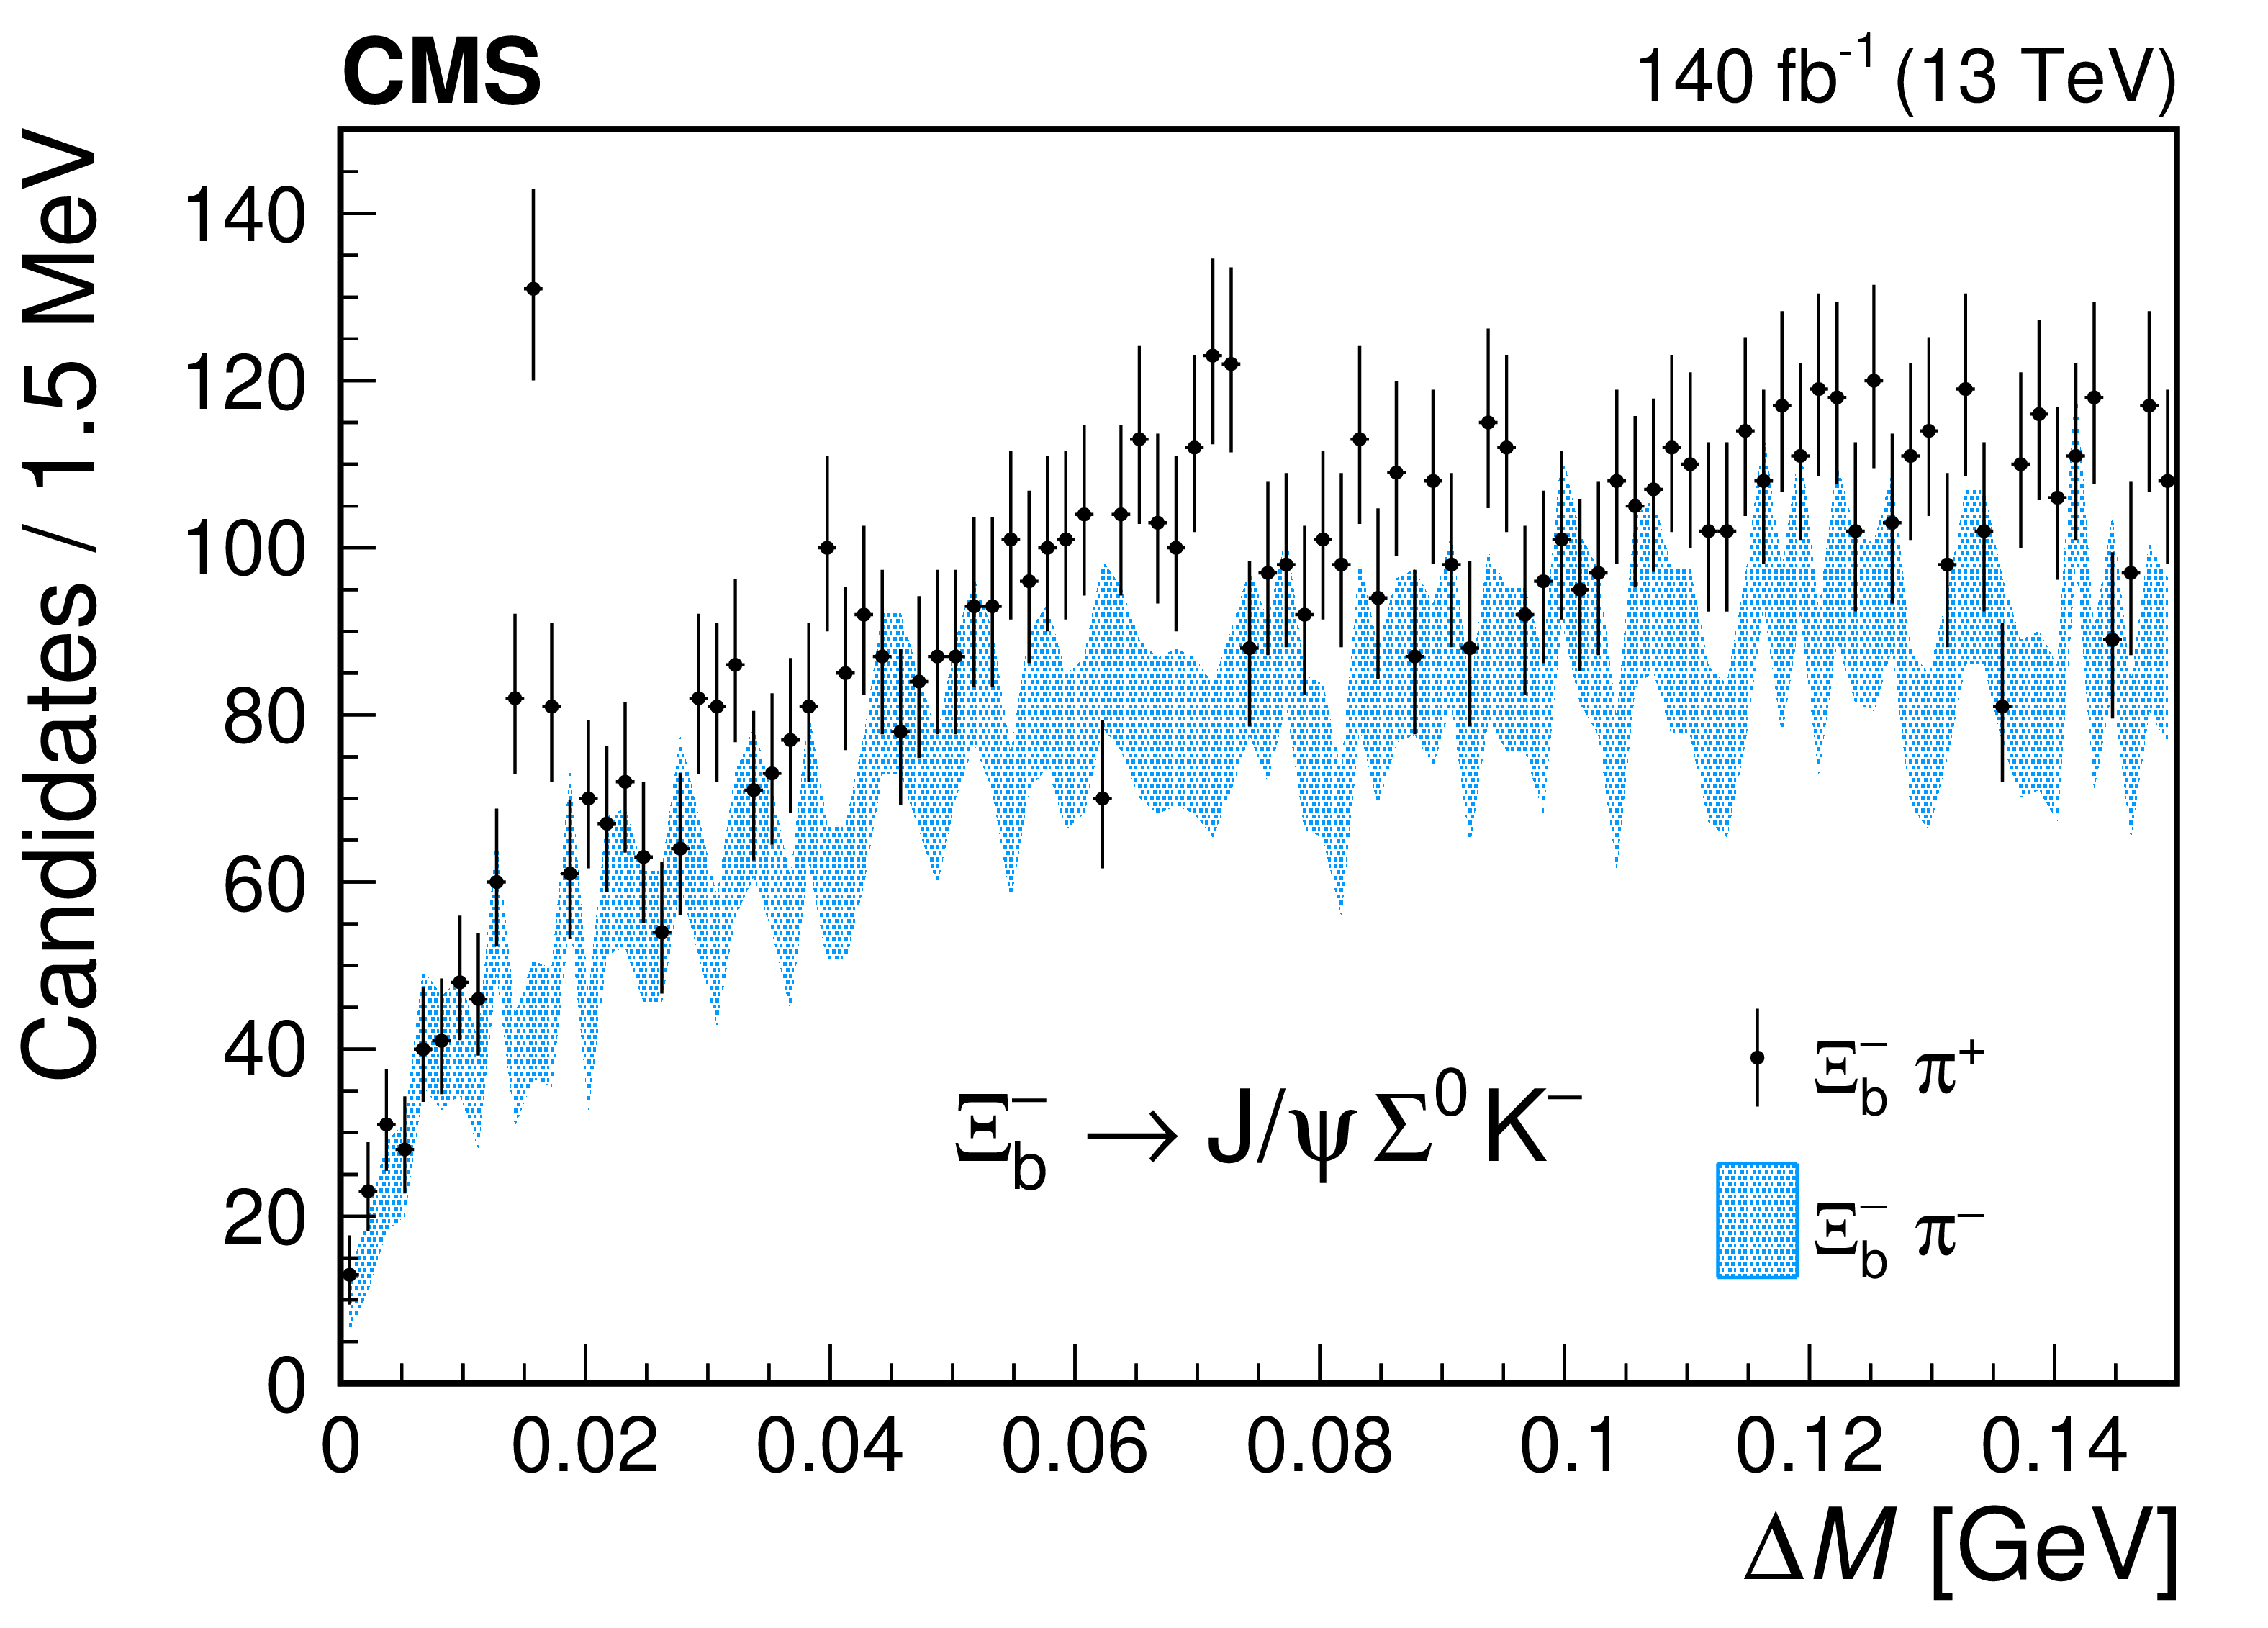
Figure 3:
The mass difference $ \Delta M $ distribution of the selected $ \Xi_{b}^{-}\pi^{\pm} $ candidates for the decay channel labeled on each plot. The points show the correct-sign combinations and the blue bands the wrong-sign. The vertical bars on the points and the length of the bands represent the statistical uncertainties in each distribution, respectively. |
png pdf |
Figure 3-a:
The mass difference $ \Delta M $ distribution of the selected $ \Xi_{b}^{-}\pi^{\pm} $ candidates for the decay channel labeled on each plot. The points show the correct-sign combinations and the blue bands the wrong-sign. The vertical bars on the points and the length of the bands represent the statistical uncertainties in each distribution, respectively. |
png pdf |
Figure 3-b:
The mass difference $ \Delta M $ distribution of the selected $ \Xi_{b}^{-}\pi^{\pm} $ candidates for the decay channel labeled on each plot. The points show the correct-sign combinations and the blue bands the wrong-sign. The vertical bars on the points and the length of the bands represent the statistical uncertainties in each distribution, respectively. |

png pdf |
Figure 3-c:
The mass difference $ \Delta M $ distribution of the selected $ \Xi_{b}^{-}\pi^{\pm} $ candidates for the decay channel labeled on each plot. The points show the correct-sign combinations and the blue bands the wrong-sign. The vertical bars on the points and the length of the bands represent the statistical uncertainties in each distribution, respectively. |
png pdf |
Figure 3-d:
The mass difference $ \Delta M $ distribution of the selected $ \Xi_{b}^{-}\pi^{\pm} $ candidates for the decay channel labeled on each plot. The points show the correct-sign combinations and the blue bands the wrong-sign. The vertical bars on the points and the length of the bands represent the statistical uncertainties in each distribution, respectively. |
png pdf |
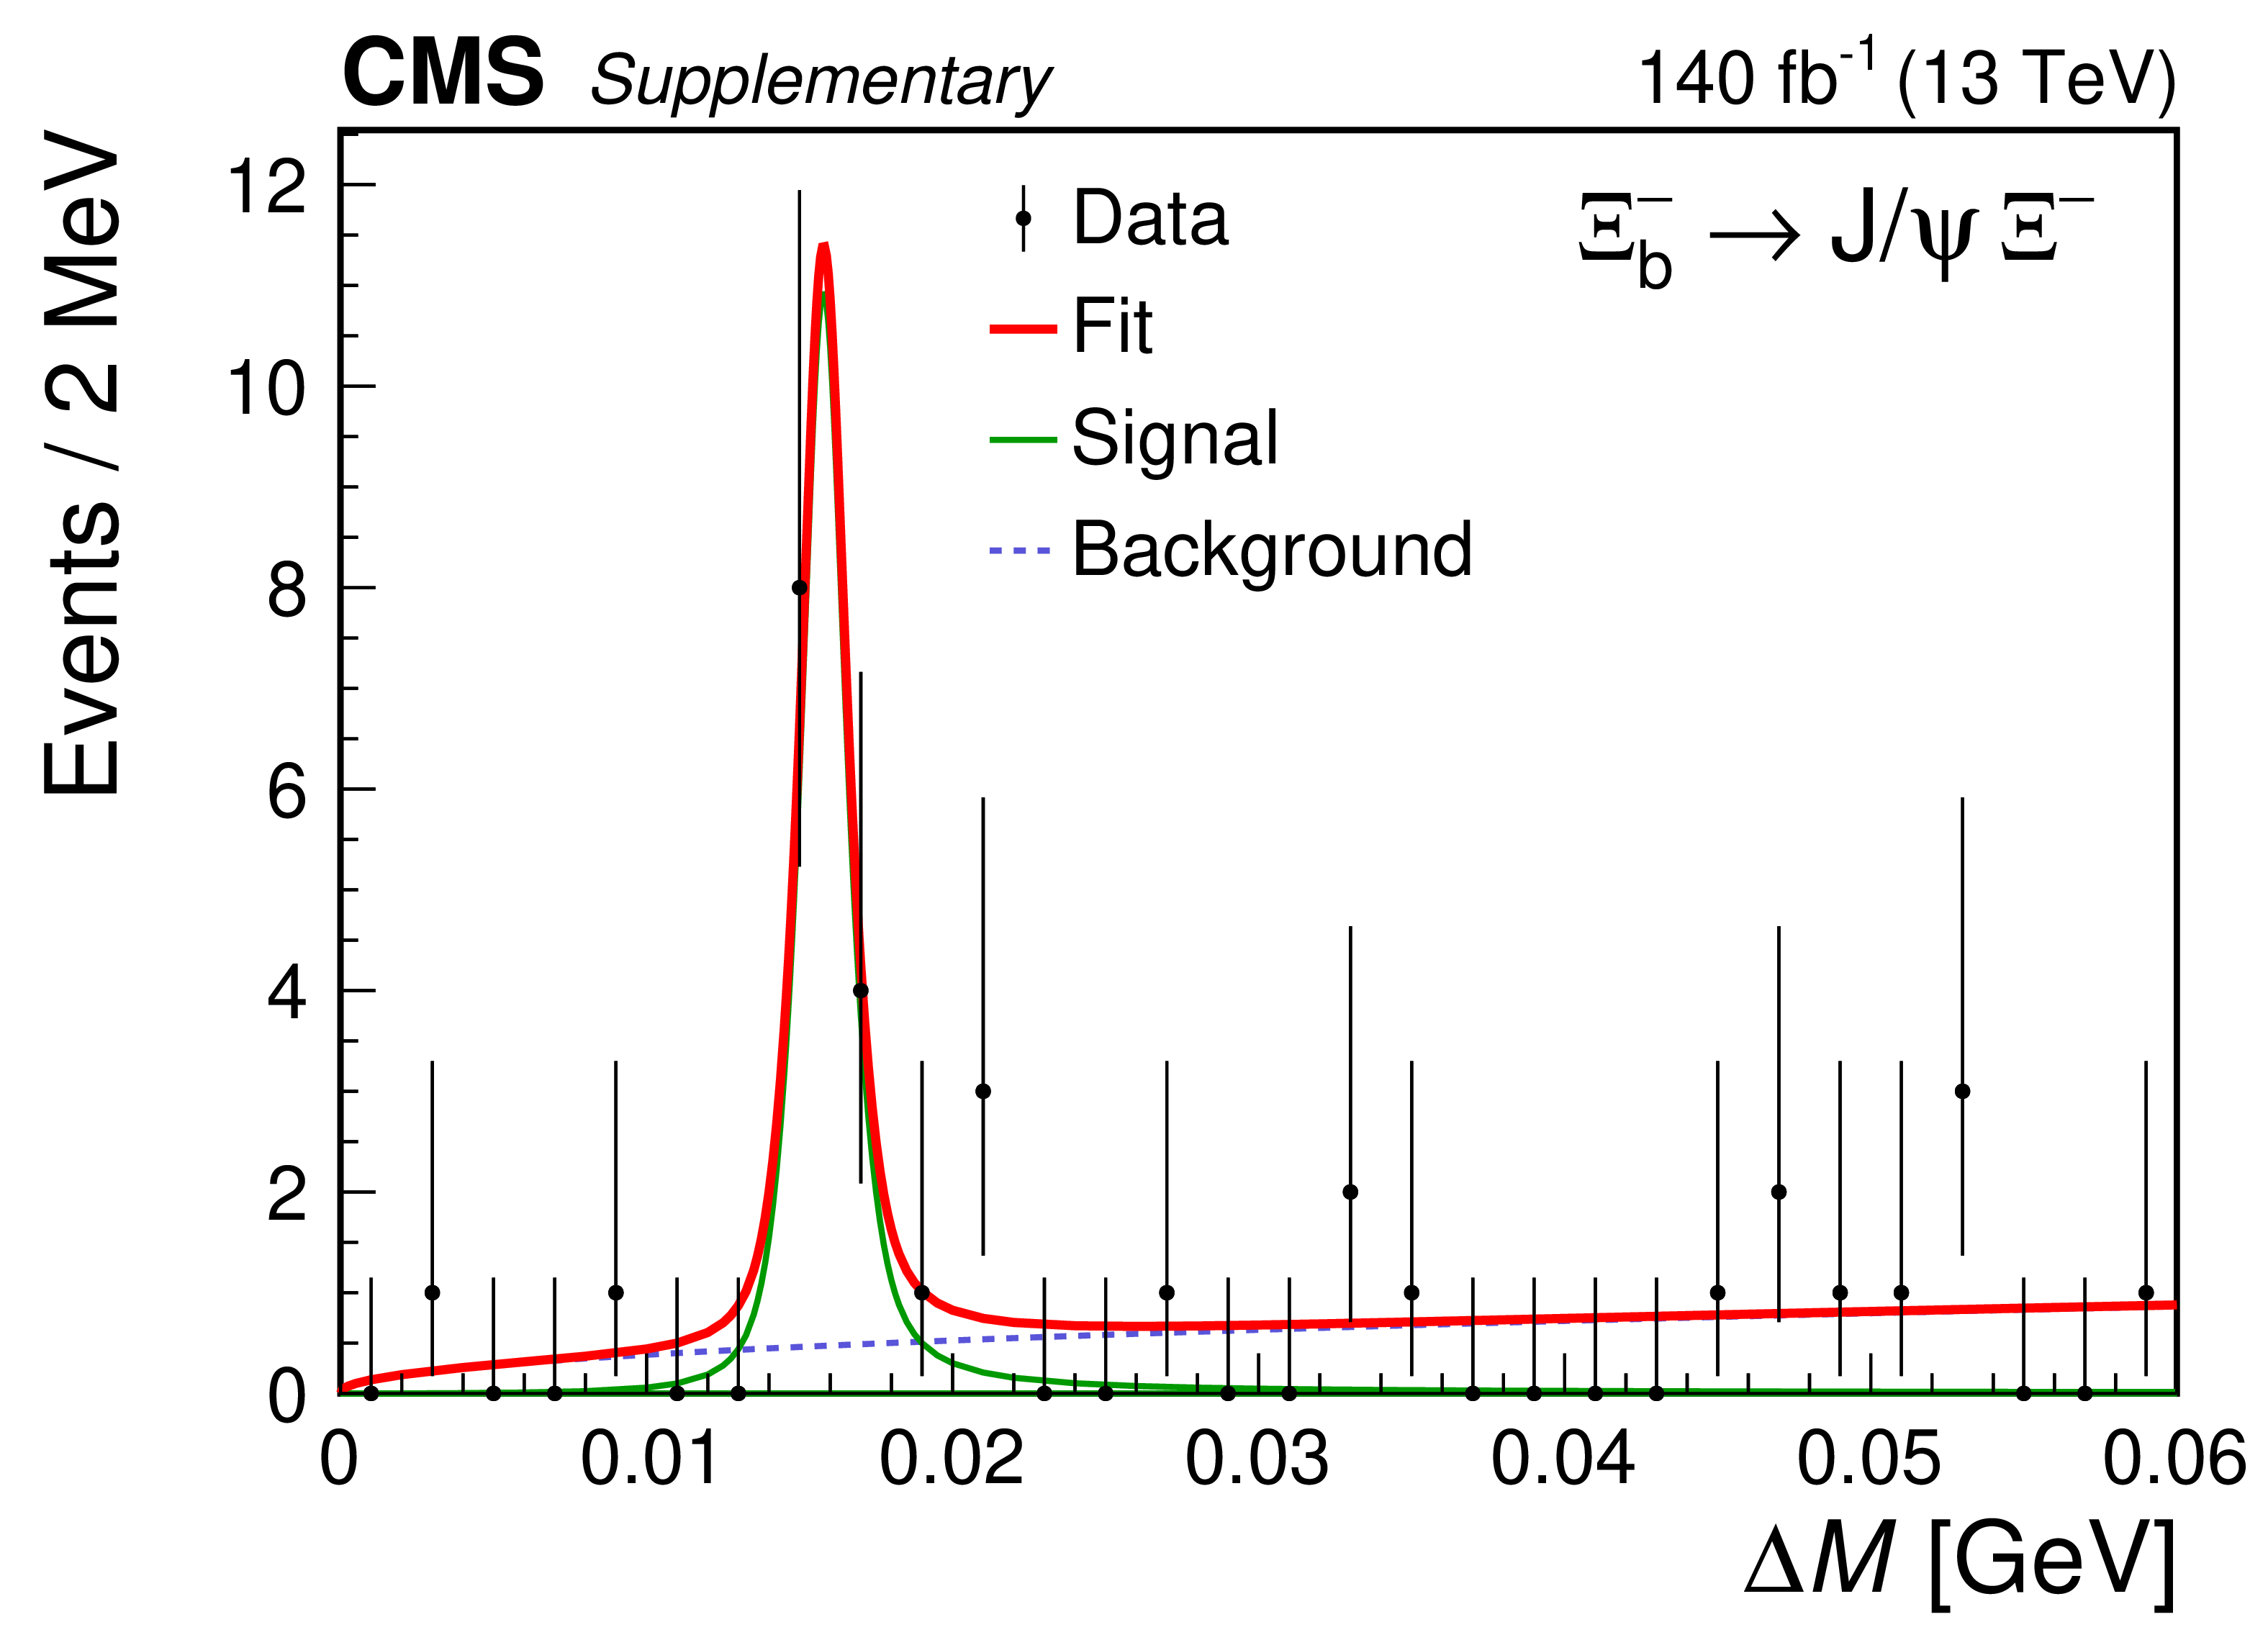
Figure 4:
Results of the simultaneous fits to the $ \Delta M $ invariant mass distributions for the $ \Xi_{b}^{*0} $ candidates in the decay channels given in each plot. The points show the data, with the vertical bars representing the statistical uncertainty. The solid red curve displays the overall fit result, with the solid green and dashed blue curves showing the signal and background contributions, respectively. |

png pdf |
Figure 4-a:
Results of the simultaneous fits to the $ \Delta M $ invariant mass distributions for the $ \Xi_{b}^{*0} $ candidates in the decay channels given in each plot. The points show the data, with the vertical bars representing the statistical uncertainty. The solid red curve displays the overall fit result, with the solid green and dashed blue curves showing the signal and background contributions, respectively. |

png pdf |
Figure 4-b:
Results of the simultaneous fits to the $ \Delta M $ invariant mass distributions for the $ \Xi_{b}^{*0} $ candidates in the decay channels given in each plot. The points show the data, with the vertical bars representing the statistical uncertainty. The solid red curve displays the overall fit result, with the solid green and dashed blue curves showing the signal and background contributions, respectively. |
png pdf |
Figure 4-c:
Results of the simultaneous fits to the $ \Delta M $ invariant mass distributions for the $ \Xi_{b}^{*0} $ candidates in the decay channels given in each plot. The points show the data, with the vertical bars representing the statistical uncertainty. The solid red curve displays the overall fit result, with the solid green and dashed blue curves showing the signal and background contributions, respectively. |

png pdf |
Figure 4-d:
Results of the simultaneous fits to the $ \Delta M $ invariant mass distributions for the $ \Xi_{b}^{*0} $ candidates in the decay channels given in each plot. The points show the data, with the vertical bars representing the statistical uncertainty. The solid red curve displays the overall fit result, with the solid green and dashed blue curves showing the signal and background contributions, respectively. |
| Tables | |
png pdf |
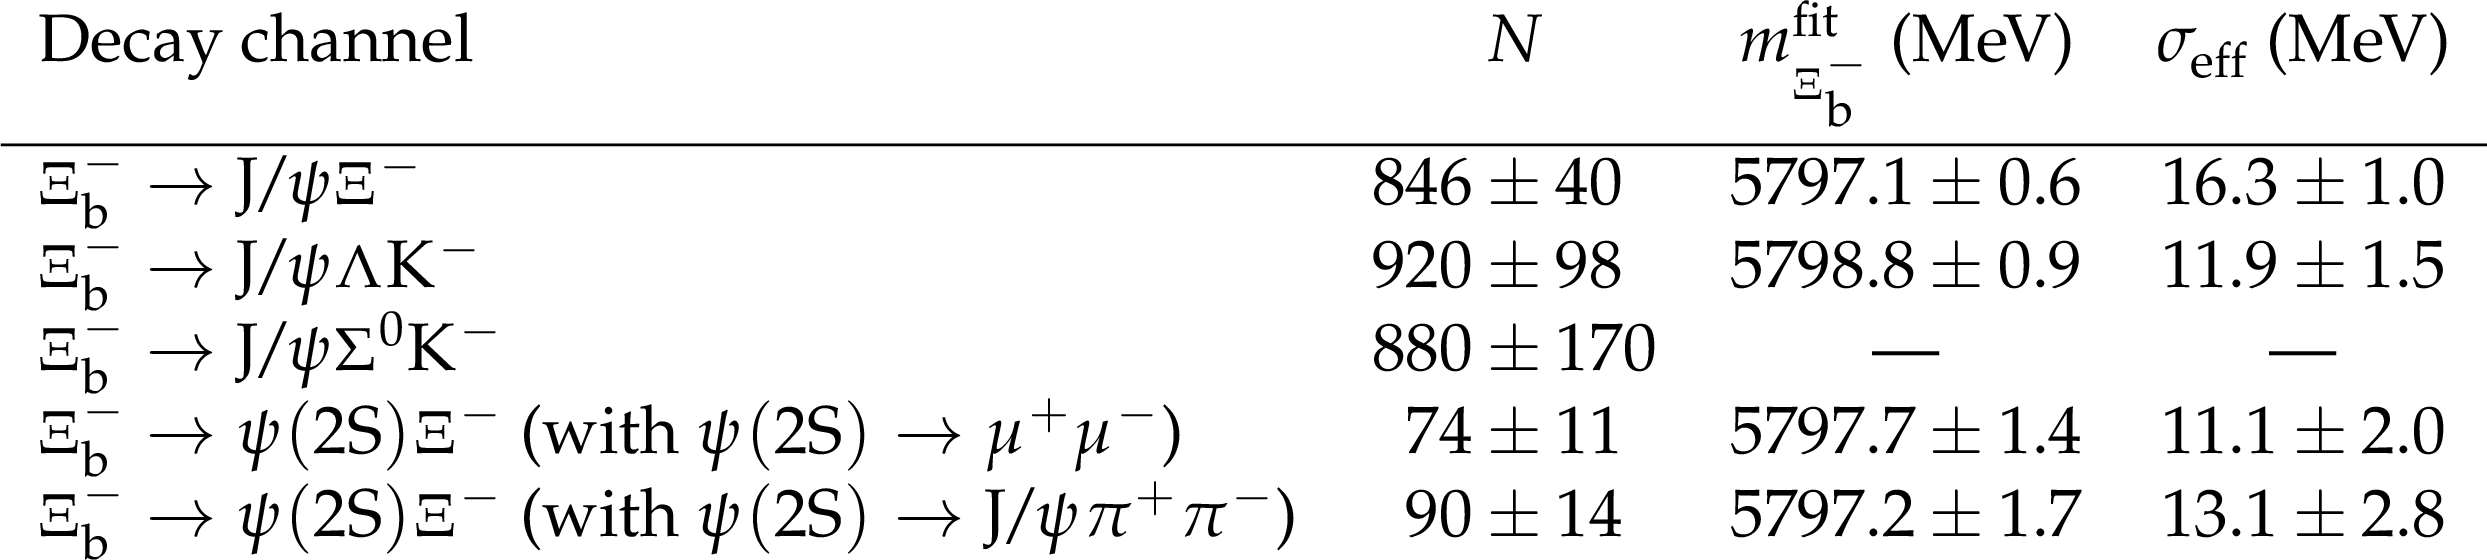
Table 1:
The number of signal events $ N $, the mean $ \Xi_{b}^{-} $ mass $ m_{\Xi_{b}^{-}}^{\text{fit}} $, and the effective $ \Xi_{b}^{-} $ width $ \sigma_{\text{eff}} $ from the fits to the $ \Xi_{b}^{-} $ invariant mass distributions for each of the $ \Xi_{b}^{-} $ decay channels. The uncertainties are statistical only. |

png pdf |
Table 2:
The fitted signal yields of the $ \Xi_{b}^{*0}\to\Xi_{b}^{-}\pi^{+} $ decay for each of the listed $ \Xi_{b}^{-} $ decay channels. Uncertainties are statistical only. |
png pdf |
Table 3:
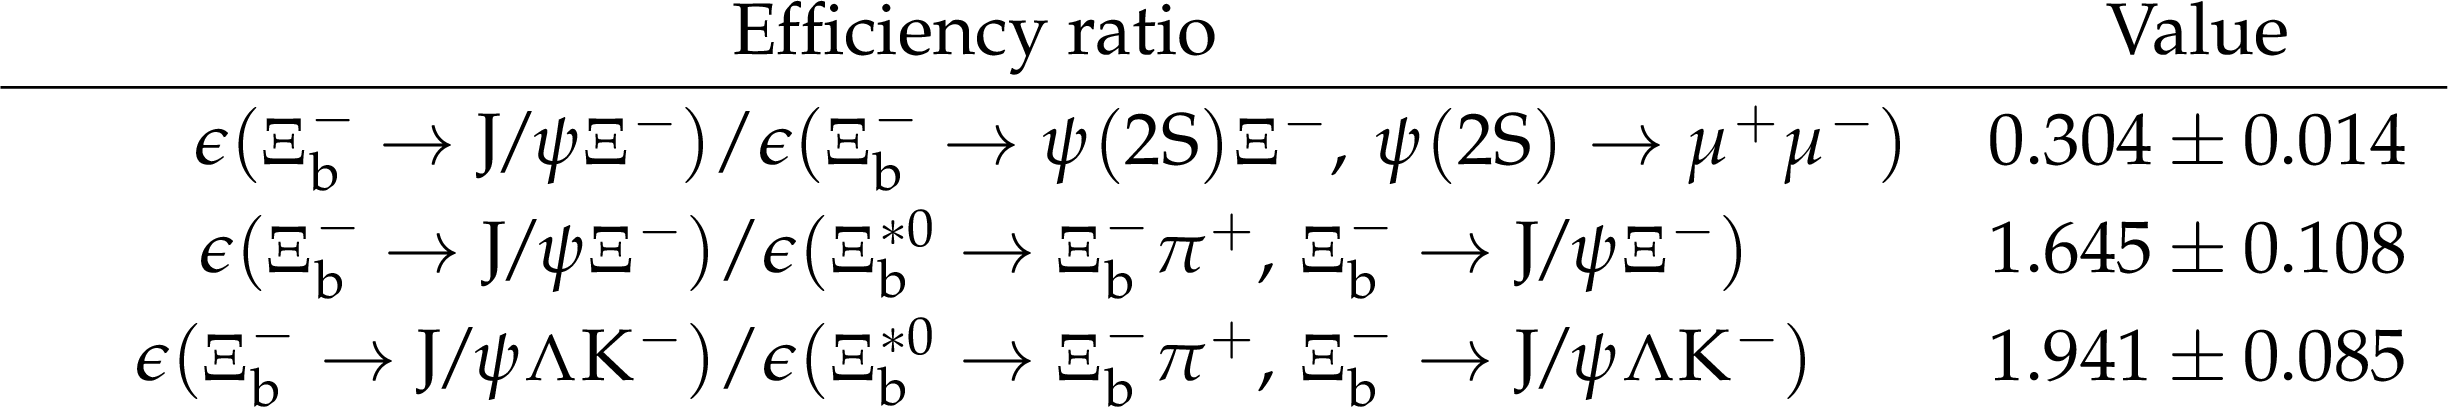
The measured efficiency ratios and their statistical uncertainties. |
png pdf |
Table 4:
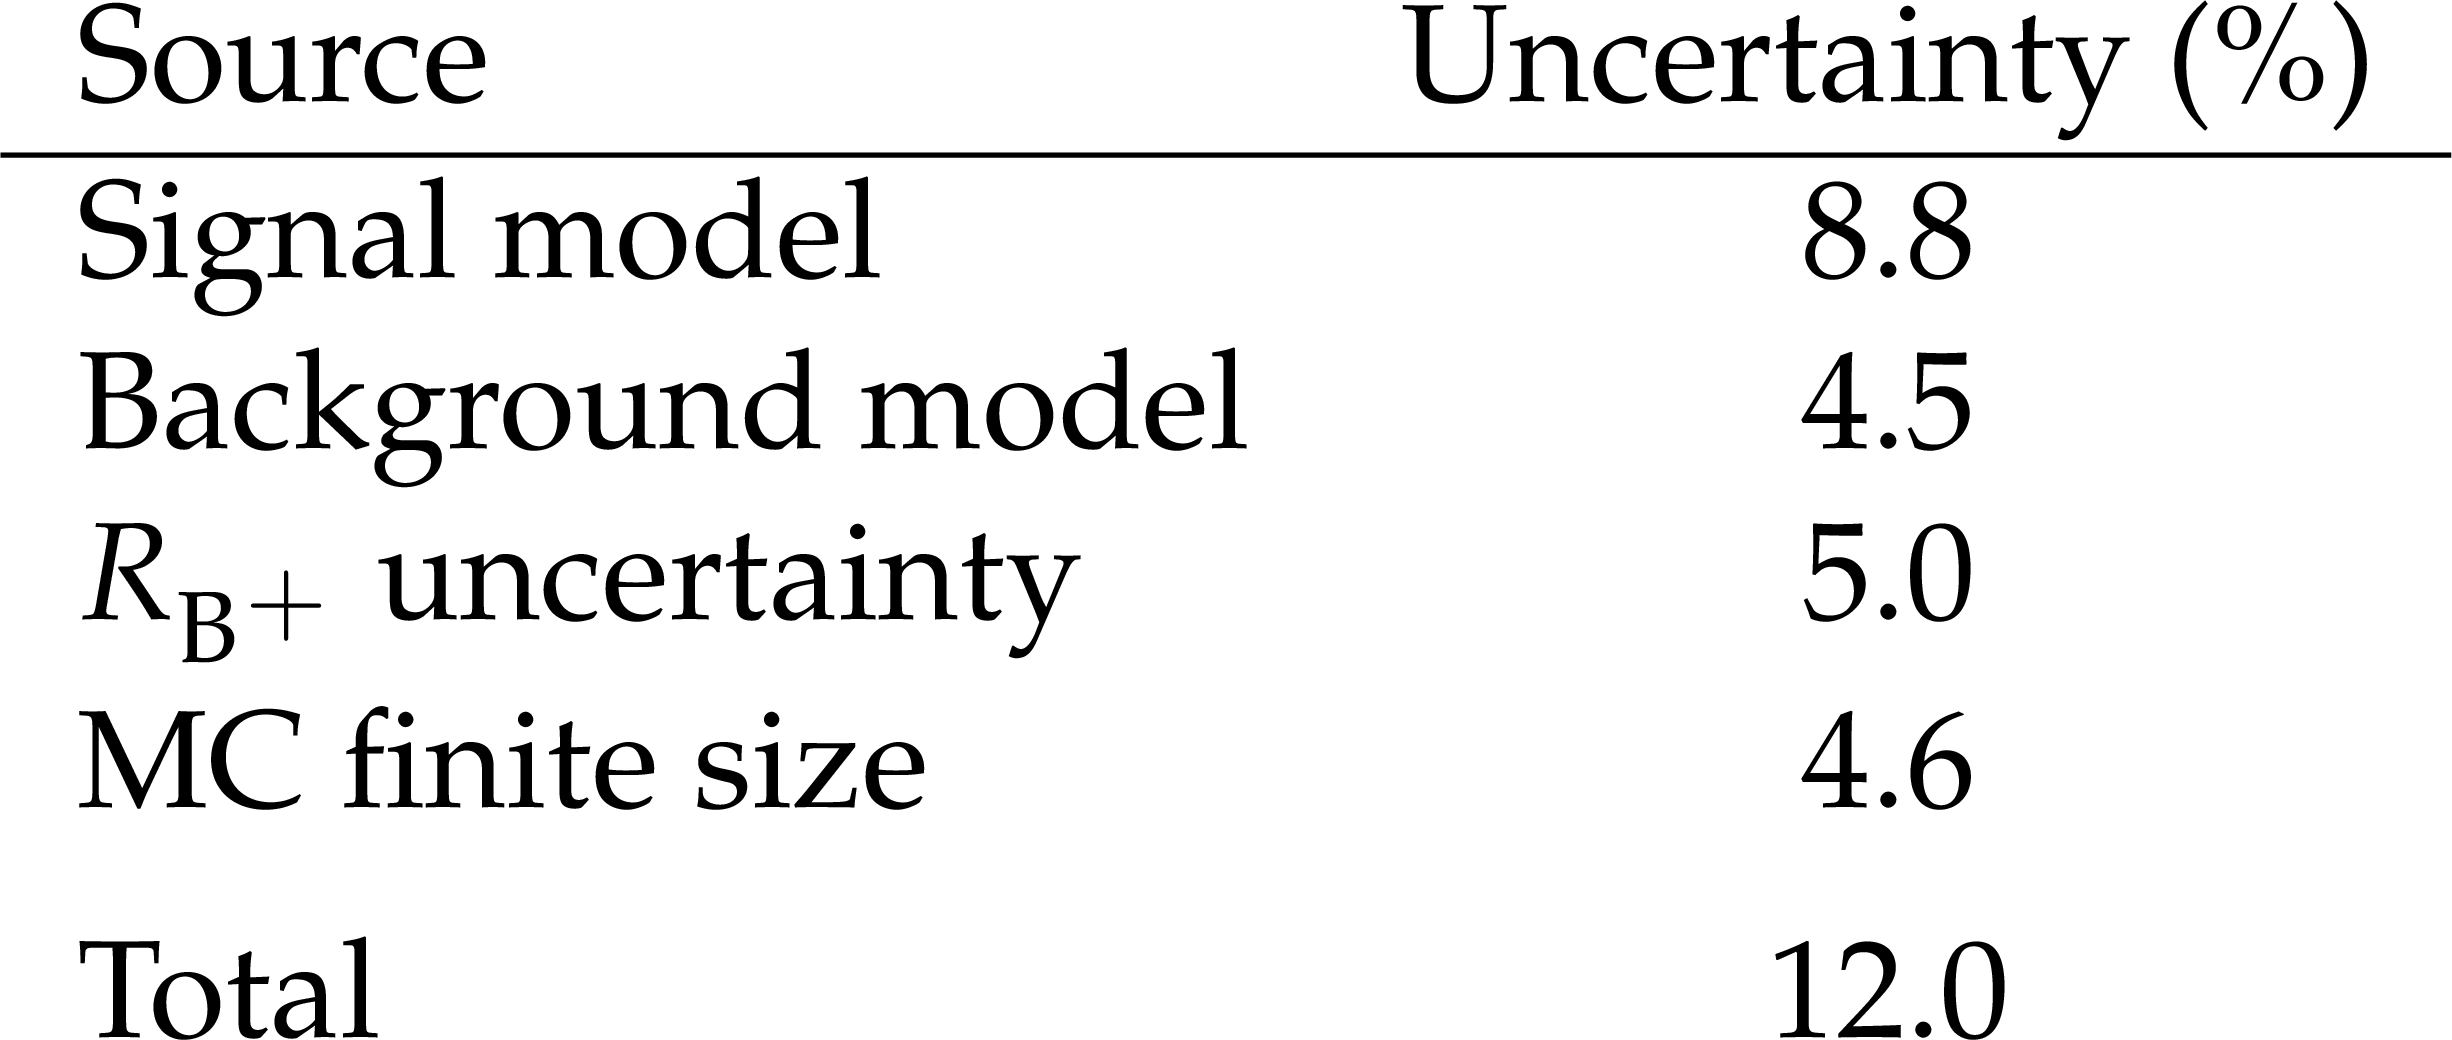
Systematic uncertainties in percent in the ratio $ R $ from the different sources and the total uncertainty. |
png pdf |
Table 5:
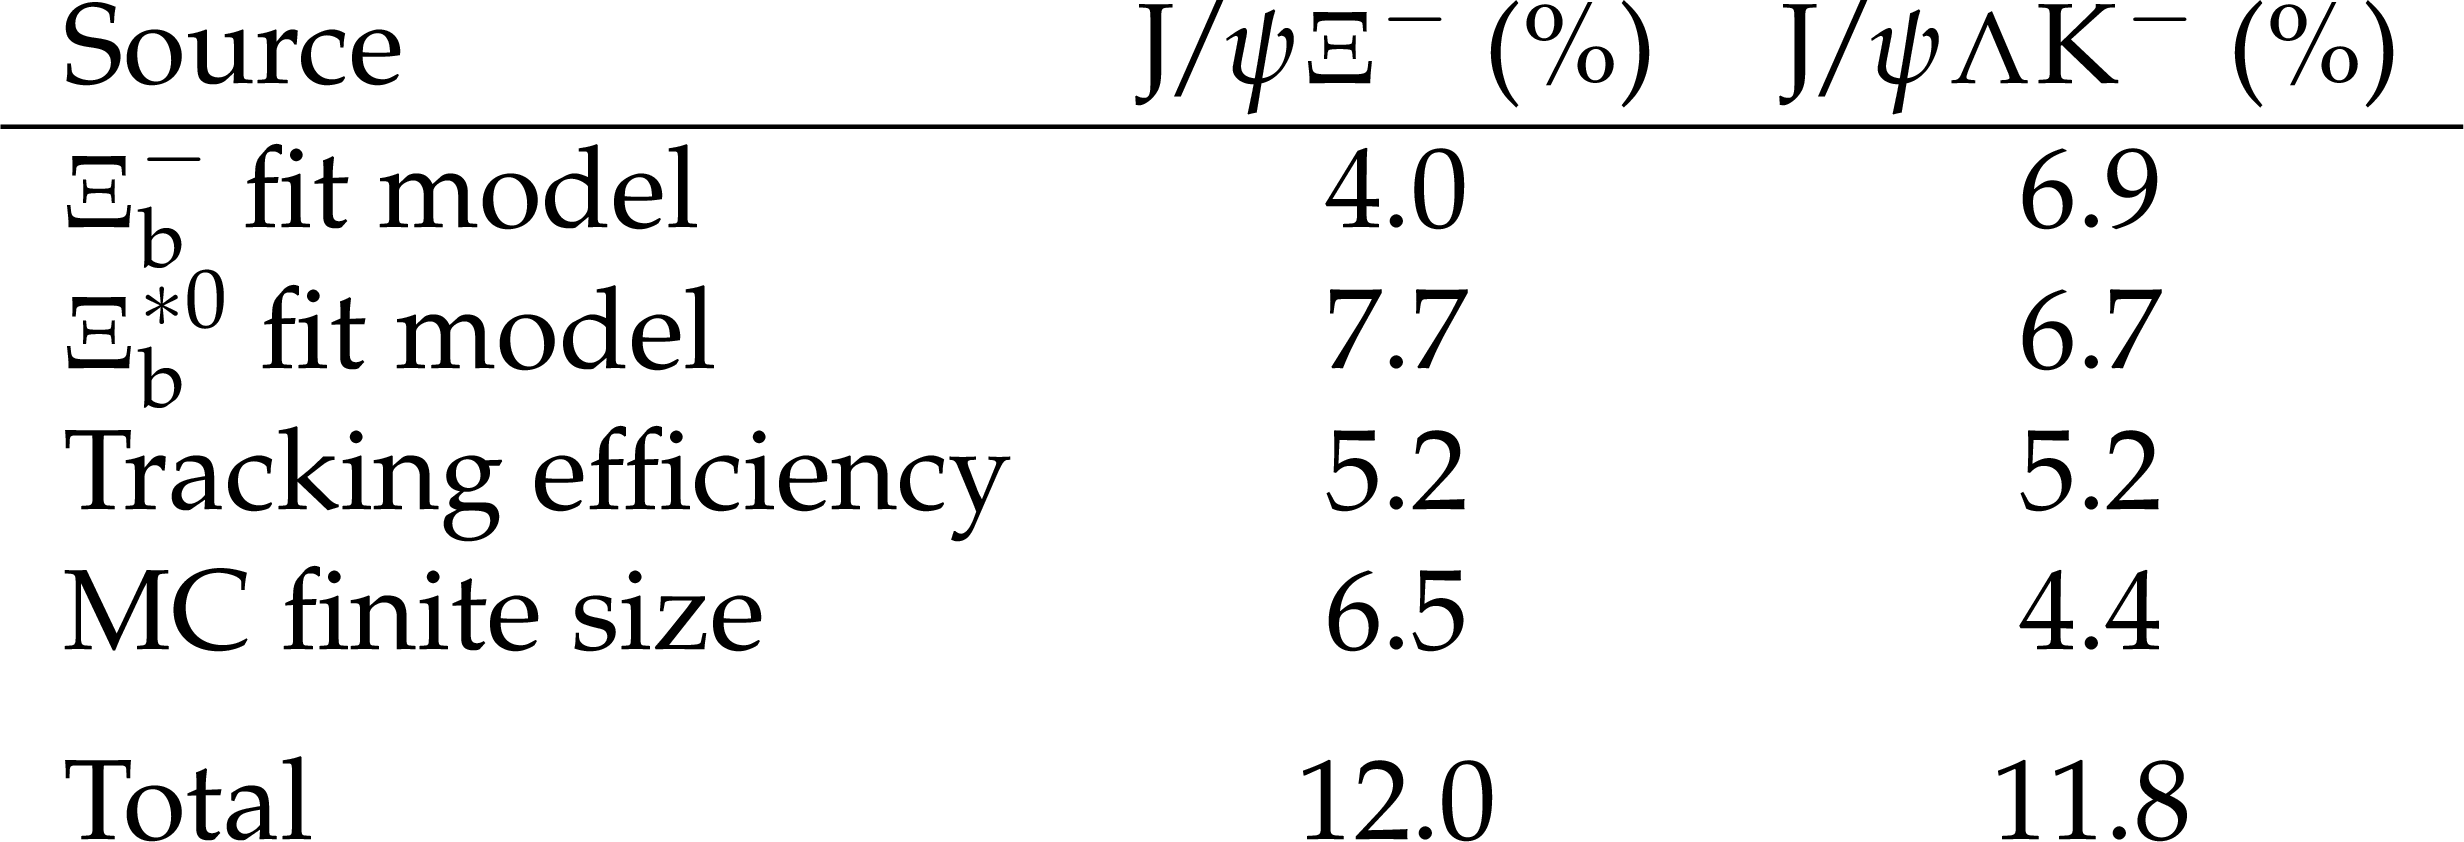
Systematic uncertainties in percent in the ratio $ R_{\Xi_{b}^{*0}} $ from the different sources and the total uncertainty, separately for the $ \mathrm{J}/\psi\Xi^{-} $ and $ \mathrm{J}/\psi\Lambda\mathrm{K^-} $ decay modes. |

png pdf |
Table 6:
The systematic uncertainties in MeVns in the measurement of the $ \Xi_{b}^{*0} $ mass difference and natural width from each of the sources, along with the total uncertainties. |
| Summary |
| In this article, we present the first observation of the $ \Xi_{b}^{-}\to\psi({2S})\Xi^{-} $ decay. We use data from LHC proton-proton (pp) collisions at $ \sqrt{s}= $ 13 TeV, collected by the CMS experiment during 2016--2018, corresponding to an integrated luminosity of 140 fb$ ^{-1} $. We measure the ratio of the branching fraction for the new decay to that for $ \Xi_{b}^{-}\to\mathrm{J}/\psi\Xi^{-} $ to be $R = \mathcal{B} (\Xi_{b}^{-}\to\psi({2S})\Xi^{-} )/ \mathcal{B} ( \Xi_{b}^{-}\to\mathrm{J}/\psi\Xi^{-} ) = $ 0.84 $^{+0.21}_{-0.19}$ (stat) $\pm$ 0.10 (syst) $\pm$ 0.02 ($\mathcal{B}$),where the last uncertainty comes from the uncertainties in the $ \mathrm{J}/\psi $ and $ \psi({2S}) $ branching fractions. This result is consistent with analogous measured ratios from $ {\mathrm{B}}_{(\mathrm{s})} $ and $ \Lambda_{b}^{0} $ decays such as $ {\mathrm{B}^{+}}\to\psi\mathrm{K^+} $, $ {\mathrm{B}^0}\to\psi\mathrm{K^0_S} $, $ \mathrm{B}_{s}^{0}\to\psi\phi $, and $ \Lambda_{b}^{0}\to\psi\Lambda $, whose values are in the range 0.5-0.6 [34] (here $ \psi $ refers to the $ \mathrm{J}/\psi $ and $ \psi({2S}) $ mesons). In general, currently existing results for such ratios do not form any clear and unambiguous pattern. New measurements, such as the one reported here, and corresponding theoretical predictions are required to build a robust model that can reliably describe b hardon decays to charmonium states. We reconstruct $ \Xi_{b}^{*0} $ candidates using the $ \Xi_{b}^{*0}\to\Xi_{b}^{-}\pi^{+} $ decay mode by combining tracks from the proton-proton collision vertex with $ \Xi_{b}^{-} $ candidates from four different decay modes. A simultaneous fit of all decay modes is used to extract the mass difference and natural width, which are consistent with our previous results [5], but with much better precision. They are also in agreement with the LHCb measurements [6,15]. Using the world-average value for the $ \Xi_{b}^{-} $ baryon mass [34], we measure the mass of the $ \Xi_{b}^{*0} $ baryon to be $ M( \Xi_{b}^{*0} ) = $ 5952.4 $\pm$ 0.1 (stat+syst) $\pm$ 0.6 ($m_{ \Xi_{b}^{-} }$) MeV, where the last uncertainty comes from the uncertainty in the $ \Xi_{b}^{-} $ baryon mass. We measure the natural width to be $ \Gamma(\Xi_{b}^{*0}) = $ 0.87 $ ^{+0.22}_{-0.20} $ (stat) $\pm$ 0.16 (syst) MeV. Finally, our determination of the $ \Xi_{b}^{*0} $ / $ \Xi_{b}^{-} $ relative production rate $ R_{\Xi_{b}^{*0}} = $ 0.23 $ \pm $ 0.04 (stat) $ \pm $ 0.02 (syst) is in good agreement with the LHCb result [6] of 0.28 $ \pm $ 0.03 $ \pm $ 0.01 and is of a similar precision. From the measured values of this ratio, we conclude that about 1/4 of $ \Xi_{b}^{-} $ baryons are produced from the $ \Xi_{b}^{*0}\to\Xi_{b}^{-}\pi^{+} $ decay. The other major $ \Xi_{b}^{*0} $ decay is $ \Xi_{b}^{*0}\to\Xi_{b}^{0}\pi^{0} $. Since $ \mathcal{B}(\Xi_{b}^{*}\to\Xi_{b}\pi) $ should be close to 100%, we expect $ \mathcal{B}(\Xi_{b}^{*0}\to\Xi_{b}^{-}\pi^{+}) \approx $ 2 $\mathcal{B}(\Xi_{b}^{*0}\to\Xi_{b}^{0}\pi^{0}) \approx $ 2/3, where the factor of 2 comes from isospin differences and the Clebsch--Gordan coefficients [34]. Incorporating this estimate of $ \mathcal{B}(\Xi_{b}^{*0}\to\Xi_{b}^{-}\pi^{+}) $ into our results for the ratio of production cross sections, we find that $ \sigma(\mathrm{p}\mathrm{p}\to\Xi_{b}^{*0} X) / \sigma(\mathrm{p}\mathrm{p}\to\Xi_{b}^{-} X) \approx $ 1/3. If the relative production rate for $ \Xi_{b}^{*-} $ to $ \Xi_{b}^{-} $ follows the same scheme, the corresponding ratio can be estimated as $ R_{\Xi_{b}^{*-}} = [\sigma(\mathrm{p}\mathrm{p}\to\Xi_{b}^{*-} X) \mathcal{B}(\Xi_{b}^{*-}\to\Xi_{b}^{-}\pi^{0})] / \sigma(\mathrm{p}\mathrm{p}\to\Xi_{b}^{-} X) \approx $ 1/3 $\times$ 1/3 $=$ 1/9. Thus, we can conclude that about a third of the $ \Xi_{b}^{-} $ baryons are produced from $ \Xi_{b}^{*} $ decays. Since decays from higher-mass excited $ \Xi_{b} $ baryons are also possible, such as the $ \Xi_{b}(6227) $ doublet reported by the LHCb experiment [11,12], less than two thirds of the $ \Xi_{b}^{-} $ baryons are expected to be directly produced from pp collisions. It is clear that further studies of different ground- and excited-state $ \Xi_{b} $ baryons are needed to fully understand this family of baryons. |
| Additional Figures | |
png pdf |
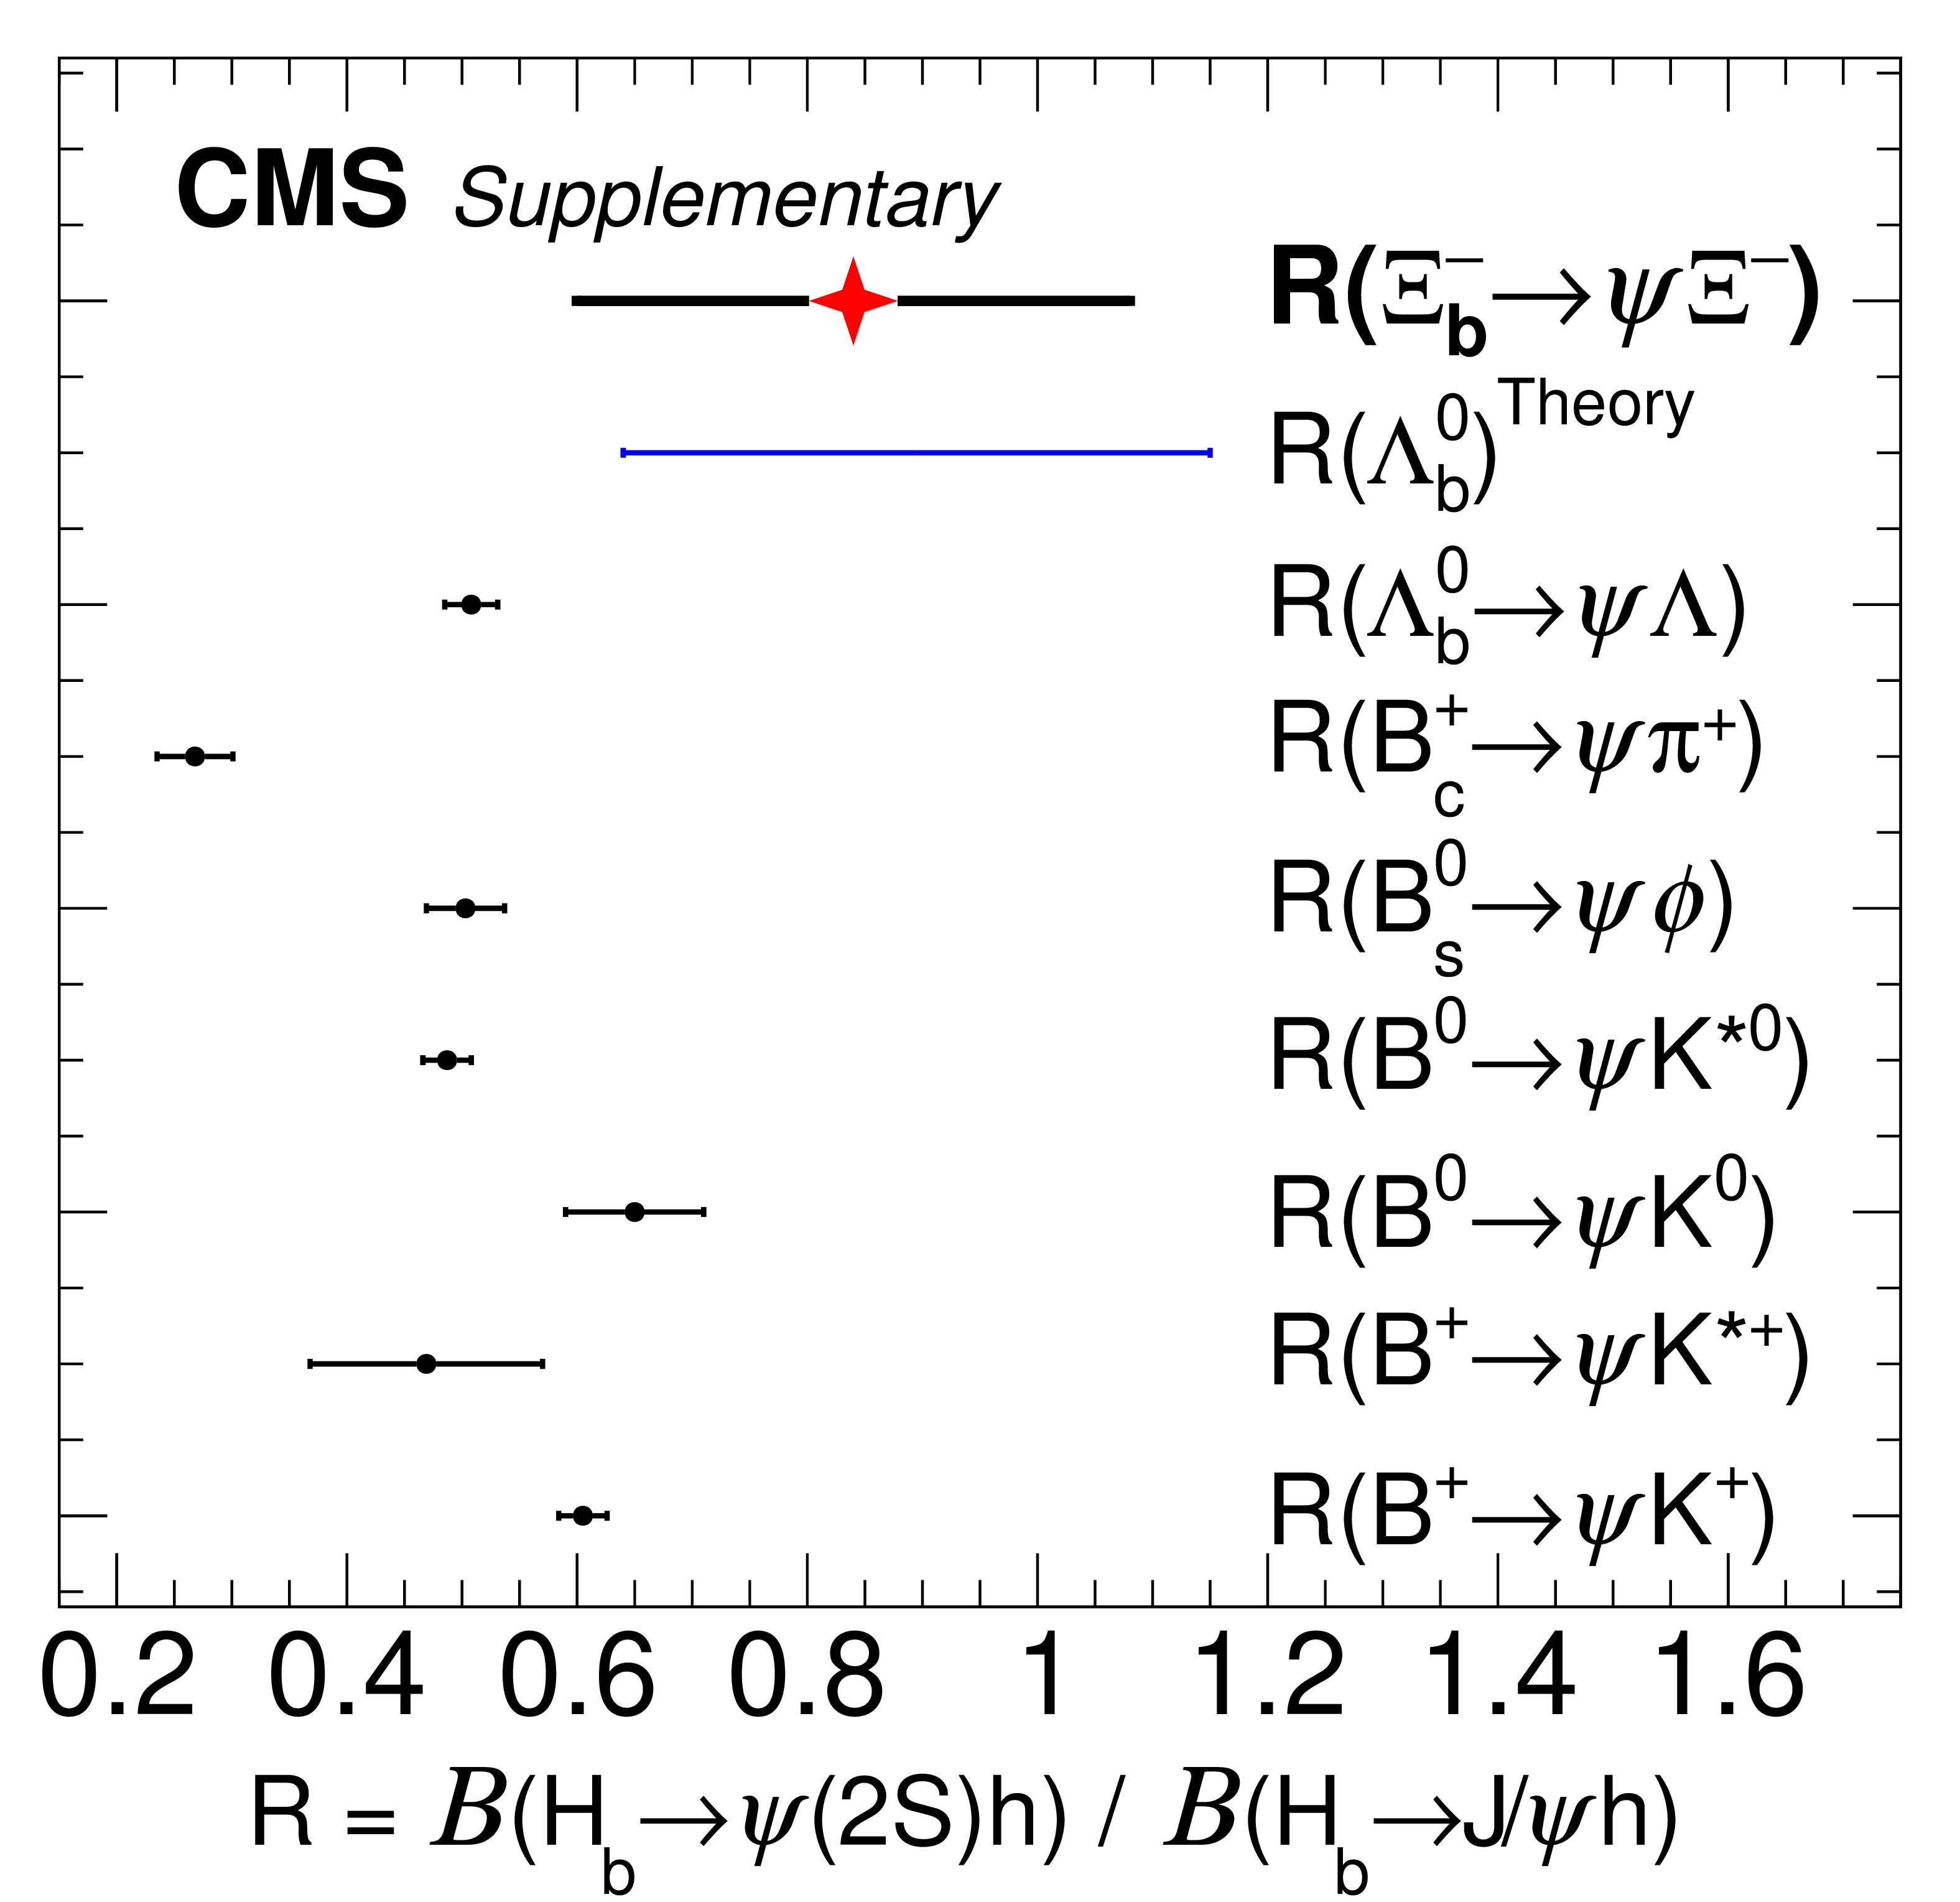
Additional Figure 1:
Comparison of the branching fractions ratios $ \mathcal{B}(\mathrm{H}_\mathrm{b} \to \psi{(2S)} \mathrm{h}) / \mathcal{B}(\mathrm{H}_\mathrm{b} \to \mathrm{J}/\psi \mathrm{h}) $ for $ {\mathrm{B}^{+}} $, $ {\mathrm{B}^0} $, $ \mathrm{B}_{s}^{0} $, $ \mathrm{B}_{c}^{+} $, $ \Lambda_{b}^{0} $, and $ \Xi_{b}^{-} $ decays. The black dotes represents the known values from the PDG [34], blue bar corresponds to the theoretical predictions from Refs [74,75,76,77], and this paper's result by CMS is highlighted in red. |

png pdf |
Additional Figure 2:
Invariant mass distributions of the selected $ \mathrm{J}/\psi\Xi^{-} $ (upper left), $ \psi{(2S)} \Xi^{-} $ with $ \psi{(2S)} \to\mu^{+}\mu^{-} $ (upper right), and $ \mathrm{J}/\psi\Lambda\mathrm{K^-} $ (lower) candidates with a single HLT path required, as described in the paper's text. The fit results are overlaid, and the signal yields are 103 $ \,^{+14}_{-13} $, 38 $ \,^{+8}_{-7} $, and 606 $ \,^{+67}_{-64} $ for the $ \Xi_{b}^{-}\to\mathrm{J}/\psi\Xi^{-} $, $ \Xi_{b}^{-}\to \psi{(2S)} \Xi^{-} $, and $ \Xi_{b}^{-}\to\mathrm{J}/\psi\Lambda\mathrm{K^-} $ modes, respectively. |
png pdf |
Additional Figure 2-a:
Invariant mass distributions of the selected $ \mathrm{J}/\psi\Xi^{-} $ candidates with a single HLT path required, as described in the paper's text. The fit results are overlaid, and the signal yields are 103 $ \,^{+14}_{-13} $, 38 $ \,^{+8}_{-7} $, and 606 $ \,^{+67}_{-64} $ for the $ \Xi_{b}^{-}\to\mathrm{J}/\psi\Xi^{-} $, $ \Xi_{b}^{-}\to \psi{(2S)} \Xi^{-} $, and $ \Xi_{b}^{-}\to\mathrm{J}/\psi\Lambda\mathrm{K^-} $ modes, respectively. |
png pdf |
Additional Figure 2-b:
Invariant mass distributions of the selected $ \psi{(2S)} \Xi^{-} $ with $ \psi{(2S)} \to\mu^{+}\mu^{-} $ candidates with a single HLT path required, as described in the paper's text. The fit results are overlaid, and the signal yields are 103 $ \,^{+14}_{-13} $, 38 $ \,^{+8}_{-7} $, and 606 $ \,^{+67}_{-64} $ for the $ \Xi_{b}^{-}\to\mathrm{J}/\psi\Xi^{-} $, $ \Xi_{b}^{-}\to \psi{(2S)} \Xi^{-} $, and $ \Xi_{b}^{-}\to\mathrm{J}/\psi\Lambda\mathrm{K^-} $ modes, respectively. |
png pdf |
Additional Figure 2-c:
Invariant mass distributions of the selected $ \mathrm{J}/\psi\Lambda\mathrm{K^-} $ candidates with a single HLT path required, as described in the paper's text. The fit results are overlaid, and the signal yields are 103 $ \,^{+14}_{-13} $, 38 $ \,^{+8}_{-7} $, and 606 $ \,^{+67}_{-64} $ for the $ \Xi_{b}^{-}\to\mathrm{J}/\psi\Xi^{-} $, $ \Xi_{b}^{-}\to \psi{(2S)} \Xi^{-} $, and $ \Xi_{b}^{-}\to\mathrm{J}/\psi\Lambda\mathrm{K^-} $ modes, respectively. |

png pdf |
Additional Figure 3:
The mass difference $ \Delta M $ distribution of the selected $ \Xi_{b}^{-}\pi^{+} $ candidates, with the $ \Xi_{b}^{-} $ decays to $ \mathrm{J}/\psi\Xi^{-} $ (left) and $ \mathrm{J}/\psi\Lambda\mathrm{K^-} $ (right), with a single HLT path required, as described in the paper's text. The fit results are overlaid, and the yields of $ \Xi_{b}^{*0} $ signal are 13 $ \pm $ 4 and 74 $ \pm $ 11 for the $ \Xi_{b}^{-}\to\mathrm{J}/\psi\Xi^{-} $ and $ \Xi_{b}^{-}\to\mathrm{J}/\psi\Lambda\mathrm{K^-} $ modes, respectively. |
png pdf |
Additional Figure 3-a:
The mass difference $ \Delta M $ distribution of the selected $ \Xi_{b}^{-}\pi^{+} $ candidates, with the $ \Xi_{b}^{-} $ decays to $ \mathrm{J}/\psi\Xi^{-} $, with a single HLT path required, as described in the paper's text. The fit results are overlaid, and the yields of $ \Xi_{b}^{*0} $ signal are 13 $ \pm $ 4 and 74 $ \pm $ 11 for the $ \Xi_{b}^{-}\to\mathrm{J}/\psi\Xi^{-} $ and $ \Xi_{b}^{-}\to\mathrm{J}/\psi\Lambda\mathrm{K^-} $ modes, respectively. |

png pdf |
Additional Figure 3-b:
The mass difference $ \Delta M $ distribution of the selected $ \Xi_{b}^{-}\pi^{+} $ candidates, with the $ \Xi_{b}^{-} $ decays to $ \mathrm{J}/\psi\Lambda\mathrm{K^-} $, with a single HLT path required, as described in the paper's text. The fit results are overlaid, and the yields of $ \Xi_{b}^{*0} $ signal are 13 $ \pm $ 4 and 74 $ \pm $ 11 for the $ \Xi_{b}^{-}\to\mathrm{J}/\psi\Xi^{-} $ and $ \Xi_{b}^{-}\to\mathrm{J}/\psi\Lambda\mathrm{K^-} $ modes, respectively. |
| References | ||||
| 1 | D. Ebert, T. Feldmann, C. Kettner, and H. Reinhardt | A diquark model for baryons containing one heavy quark | Z. Phys. C 71 (1996) 329 | hep-ph/9506298 |
| 2 | D0 Collaboration | Direct observation of the strange b baryon $ \Xi_{\text{b}}^- $ | PRL 99 (2007) 052001 | 0706.1690 |
| 3 | CDF Collaboration | Observation and mass measurement of the baryon $ \Xi_{\text{b}}^- $ | PRL 99 (2007) 052002 | 0707.0589 |
| 4 | CDF Collaboration | Observation of the $ \Xi_{\text{b}}^0 $ baryon | PRL 107 (2011) 102001 | 1107.4015 |
| 5 | CMS Collaboration | Observation of a new $ \Xi_{\text{b}} $ baryon | PRL 108 (2012) 252002 | CMS-BPH-12-001 1204.5955 |
| 6 | LHCb Collaboration | Measurement of the properties of the $ \Xi_{\text{b}}^{*0} $ baryon | JHEP 05 (2016) 161 | 1604.03896 |
| 7 | LHCb Collaboration | Observation of two new $ \Xi_{\text{b}}^- $ baryon resonances | PRL 114 (2015) 062004 | 1411.4849 |
| 8 | E. E. Jenkins | Model-independent bottom baryon mass predictions in the 1 $ /N_c $ expansion | PRD 77 (2008) 034012 | 0712.0406 |
| 9 | M. Karliner, B. Keren-Zur, H. J. Lipkin, and J. L. Rosner | The quark model and b baryons | Ann. Phys. 324 (2009) 2 | 0804.1575 |
| 10 | D. Ebert, R. N. Faustov, and V. O. Galkin | Masses of excited heavy baryons in the relativistic quark model | PLB 659 (2008) 612 | 0705.2957 |
| 11 | LHCb Collaboration | Observation of a new $ \Xi_{\text{b}}^- $ resonance | PRL 121 (2018) 072002 | 1805.09418 |
| 12 | LHCb Collaboration | Observation of a new $ \Xi_{\text{b}}^0 $ state | PRD 103 (2021) 012004 | 2010.14485 |
| 13 | CMS Collaboration | Observation of a new excited beauty strange baryon decaying to $ \Xi^-_\mathrm{b} \pi^+ \pi^- $ | PRL 126 (2021) 252003 | CMS-BPH-20-004 2102.04524 |
| 14 | LHCb Collaboration | Observation of two new excited $ \Xi_{\text{b}}^0 $ states decaying to $ \Lambda^0_{\text{b}} K^- \pi^+ $ | PRL 128 (2022) 162001 | 2110.04497 |
| 15 | LHCb Collaboration | Observation of new baryons in the $ \Xi^-_\mathrm{b} \pi^+ \pi^- $ and $ \Xi^0_\mathrm{b} \pi^+ \pi^- $ systems | PRL 131 (2023) 171901 | 2307.13399 |
| 16 | W. Roberts and M. Pervin | Heavy baryons in a quark model | Int. J. Mod. Phys. A 23 (2008) 2817 | 0711.2492 |
| 17 | D. Ebert, R. N. Faustov, and V. O. Galkin | Spectroscopy and Regge trajectories of heavy baryons in the relativistic quark-diquark picture | PRD 84 (2011) 014025 | 1105.0583 |
| 18 | H. Garcilazo, J. Vijande, and A. Valcarce | Faddeev study of heavy baryon spectroscopy | JPG 34 (2007) 961 | hep-ph/0703257 |
| 19 | B. Chen, K.-W. Wei, and A. Zhang | Assignments of $ \Lambda_Q $ and $ \Xi_Q $ baryons in the heavy quark-light diquark picture | Eur. Phys. J. A 51 (2015) 82 | 1406.6561 |
| 20 | I. L. Grach, I. M. Narodetskii, M. A. Trusov, and A. I. Veselov | Heavy baryon spectroscopy in the QCD string model | in Particles and Nuclei. Proceedings, 18th International Conference, PANIC08, Eilat, Israel, 2008 | 0811.2184 |
| 21 | Q. Mao et al. | QCD sum rule calculation for P-wave bottom baryons | PRD 92 (2015) 114007 | 1510.05267 |
| 22 | Z.-G. Wang | Analysis of the $ {1/2^-} $ and $ {3/2^-} $ heavy and doubly heavy baryon states with QCD sum rules | Eur. Phys. J. A 47 (2011) 81 | 1003.2838 |
| 23 | K.-L. Wang, Y.-X. Yao, X.-H. Zhong, and Q. Zhao | Strong and radiative decays of the low-lying $ S $- and $ P $-wave singly heavy baryons | PRD 96 (2017) 116016 | 1709.04268 |
| 24 | Y. Kawakami and M. Harada | Singly heavy baryons with chiral partner structure in a three-flavor chiral model | PRD 99 (2019) 094016 | 1902.06774 |
| 25 | Z.-Y. Wang, J.-J. Qi, X.-H. Guo, and K.-W. Wei | Spectra of charmed and bottom baryons with hyperfine interaction | Chin. Phys. C 41 (2017) 093103 | 1701.04524 |
| 26 | K. Thakkar, Z. Shah, A. K. Rai, and P. C. Vinodkumar | Excited state mass spectra and Regge trajectories of bottom baryons | Nucl. Phys. A 965 (2017) 57 | 1610.00411 |
| 27 | K.-W. Wei et al. | Spectroscopy of singly, doubly, and triply bottom baryons | PRD 95 (2017) 116005 | 1609.02512 |
| 28 | LHCb Collaboration | Studies of beauty baryon decays to $ \text{D}^0 \text{p} \text{h}^- $ and $ \Lambda_{\text{c}}^+ \text{h}^- $ final states | PRD 89 (2014) 032001 | 1311.4823 |
| 29 | LHCb Collaboration | Evidence for the strangeness-changing weak decay $ \Xi_{\text{b}}^-\to\Lambda_{\text{b}}^0\pi^- $ | PRL 115 (2015) 241801 | 1510.03829 |
| 30 | LHCb Collaboration | Observation of the decay $ \Xi_{\text{b}}^- \to \text{p} K^-K^- $ | PRL 118 (2017) 071801 | 1612.02244 |
| 31 | LHCb Collaboration | Observation of the $ \Xi_\mathrm{b}^-\to J/\psi\Lambda K^- $ decay | PLB 772 (2017) 265 | 1701.05274 |
| 32 | LHCb Collaboration | Measurement of branching fractions of charmless four-body $ \Lambda_{\text{b}}^0 $ and $ \Xi_{\text{b}}^0 $ decays | JHEP 02 (2018) 098 | 1711.05490 |
| 33 | LHCb Collaboration | Isospin amplitudes in $ \Lambda_{\text{b}}^0\to J/\psi \Lambda(\Sigma^0) $ and $ \Xi_{\text{b}}^0\to J/\psi \Xi^0(\Lambda) $ decays | PRL 124 (2020) 111802 | 1912.02110 |
| 34 | Particle Data Group | Review of particle physics | PTEP 2022 (2022) 083C01 | |
| 35 | LHCb Collaboration | Evidence of a $ J/\psi\Lambda $ structure and observation of excited $ \Xi^- $ states in the $ \Xi^-_{\text{b}} \to J/\psi\Lambda K^- $ decay | Sci. Bull. 66 (2021) 1278 | 2012.10380 |
| 36 | LHCb Collaboration | Search for $ CP $ violation in $ \Xi^-_{\text{b}} \to \text{p} \text{K}^- \text{K}^- $ decays | PRD 104 (2021) 052010 | 2104.15074 |
| 37 | A. G. Grozin | Heavy quark effective theory | Springer Berlin, Heidelberg, 2004 link |
|
| 38 | N. Isgur and M. B. Wise | Spectroscopy with heavy quark symmetry | PRL 66 (1991) 1130 | |
| 39 | M. A. Shifman and M. B. Voloshin | Preasymptotic effects in inclusive weak decays of charmed particles | Sov. J. Nucl. Phys. 41 (1985) 120 | |
| 40 | N. Isgur and M. B. Wise | Weak decays of heavy mesons in the static quark approximation | PLB 232 (1989) 113 | |
| 41 | I. I. Y. Bigi, N. G. Uraltsev, and A. I. Vainshtein | Nonperturbative corrections to inclusive beauty and charm decays: QCD versus phenomenological models | PLB 293 (1992) 430 | hep-ph/9207214 |
| 42 | CMS Collaboration | Precision luminosity measurement in proton-proton collisions at $ \sqrt{s} = $ 13 TeV in 2015 and 2016 at CMS | EPJC 81 (2021) 800 | CMS-LUM-17-003 2104.01927 |
| 43 | CMS Collaboration | CMS luminosity measurement for the 2017 data-taking period at $ \sqrt{s} = $ 13 TeV | CMS Physics Analysis Summary, 2018 CMS-PAS-LUM-17-004 |
CMS-PAS-LUM-17-004 |
| 44 | CMS Collaboration | CMS luminosity measurement for the 2018 data-taking period at $ \sqrt{s} = $ 13 TeV | CMS Physics Analysis Summary, 2019 CMS-PAS-LUM-18-002 |
CMS-PAS-LUM-18-002 |
| 45 | CMS Collaboration | Measurement of B$ _\mathrm{c} $(2S)$ ^+ $ and B$ _\mathrm{c}^* $(2S)$ ^+ $ cross section ratios in proton-proton collisions at $ \sqrt{s}= $ 13 TeV | PRD 102 (2020) 092007 | CMS-BPH-19-001 2008.08629 |
| 46 | CMS Collaboration | HEPData record for this analysis | link | |
| 47 | CMS Collaboration | The CMS experiment at the CERN LHC | JINST 3 (2008) S08004 | |
| 48 | CMS Collaboration | Development of the CMS detector for the CERN LHC Run 3 | Accepted by JINST, 2023 | CMS-PRF-21-001 2309.05466 |
| 49 | CMS Collaboration | Performance of the CMS muon detector and muon reconstruction with proton-proton collisions at $ \sqrt{s}= $ 13 TeV | JINST 13 (2018) P06015 | CMS-MUO-16-001 1804.04528 |
| 50 | CMS Collaboration | Description and performance of track and primary-vertex reconstruction with the CMS tracker | JINST 9 (2014) P10009 | CMS-TRK-11-001 1405.6569 |
| 51 | CMS Tracker Group | The CMS Phase-1 pixel detector upgrade | JINST 16 (2021) P02027 | 2012.14304 |
| 52 | CMS Collaboration | Track impact parameter resolution for the full pseudorapidity coverage in the 2017 dataset with the CMS Phase-1 pixel detector | CMS Detector Performance Note CMS-DP-2020-049, 2020 CDS |
|
| 53 | CMS Collaboration | The CMS trigger system | JINST 12 (2017) P01020 | CMS-TRG-12-001 1609.02366 |
| 54 | CMS Collaboration | Performance of the CMS level-1 trigger in proton-proton collisions at $ \sqrt{s}= $ 13 TeV | JINST 15 (2020) P10017 | CMS-TRG-17-001 2006.10165 |
| 55 | T. Sjöstrand et al. | An introduction to PYTHIA 8.2 | Comput. Phys. Commun. 191 (2015) 159 | 1410.3012 |
| 56 | CMS Collaboration | Extraction and validation of a new set of CMS PYTHIA8 tunes from underlying-event measurements | EPJC 80 (2020) 4 | CMS-GEN-17-001 1903.12179 |
| 57 | D. J. Lange | The EVTGEN particle decay simulation package | NIM A 462 (2001) 152 | |
| 58 | E. Barberio, B. van Eijk, and Z. Was | PHOTOS: A universal Monte Carlo for QED radiative corrections in decays | Comput. Phys. Commun. 66 (1991) 115 | |
| 59 | E. Barberio and Z. Was | PHOTOS: A universal Monte Carlo for QED radiative corrections. version 2.0 | Comput. Phys. Commun. 79 (1994) 291 | |
| 60 | GEANT4 Collaboration | GEANT 4 --- a simulation toolkit | NIM A 506 (2003) 250 | |
| 61 | CMS Collaboration | CMS tracking performance results from early LHC operation | EPJC 70 (2010) 1165 | CMS-TRK-10-001 1007.1988 |
| 62 | CMS Collaboration | Observation of two excited B$ ^+_\mathrm{c} $ states and measurement of the B$ ^+_\mathrm{c} $(2S) mass in pp collisions at $ \sqrt{s}= $ 13 TeV | PRL 122 (2019) 132001 | CMS-BPH-18-007 1902.00571 |
| 63 | CMS Collaboration | Study of excited $ \Lambda_\mathrm{b}^0 $ states decaying to $ \Lambda_\mathrm{b}^0\pi^+\pi^- $ in proton-proton collisions at $ \sqrt{s}= $ 13 TeV | PLB 803 (2020) 135345 | CMS-BPH-19-003 2001.06533 |
| 64 | S. S. Wilks | The large-sample distribution of the likelihood ratio for testing composite hypotheses | Annals Math. Statist. 9 (1938) 60 | |
| 65 | G. Cowan, K. Cranmer, E. Gross, and O. Vitells | Asymptotic formulae for likelihood-based tests of new physics | EPJC 71 (2011) 1554 | 1007.1727 |
| 66 | W. Detmold, C.-J. D. Lin, and S. Meinel | Calculation of the heavy-hadron axial couplings $ g_1 $, $ g_2 $ and $ g_3 $ using lattice QCD | PRD 85 (2012) 114508 | 1203.3378 |
| 67 | C. Chen et al. | Strong decays of charmed baryons | PRD 75 (2007) 094017 | 0704.0075 |
| 68 | S. Jackman | Bayesian analysis for the social sciences | John Wiley \& Sons, New Jersey, USA, 2009 link |
|
| 69 | CMS Collaboration | Measurement of prompt open-charm production cross sections in proton-proton collisions at $ \sqrt{s}= $ 13 TeV | JHEP 11 (2021) 225 | CMS-BPH-18-003 2107.01476 |
| 70 | J. M. Blatt and V. F. Weisskopf | Theoretical nuclear physics | Springer, New York, ISBN~978-0-471-08019-0, 1952 link |
|
| 71 | L. Lyons, D. Gibaut, and P. Clifford | How to combine correlated estimates of a single physical quantity | NIM A 270 (1988) 110 | |
| 72 | R. Nisius | On the combination of correlated estimates of a physics observable | EPJC 74 (2014) 3004 | 1402.4016 |
| 73 | R. Nisius | BLUE: combining correlated estimates of physics observables within ROOT using the best linear unbiased estimate method | SoftwareX 11 (2020) 100468 | 2001.10310 |
| 74 | T. Gutsche et al. | Polarization effects in the cascade decay $ {\Lambda}_{\text{b}}\to\Lambda\mathbf{(}\to\text{p}{\pi}^{\mathbf{-}}\mathbf{)}\mathbf{+}J/\psi\mathbf{(}\to{\ell}^{\mathbf{+}}{\ell}^{\mathbf{-}}\mathbf{)} $ in the covariant confined quark model | PRD 88 (2013) 114018 | 1309.7879 |
| 75 | T. Gutsche et al. | Towards an assessment of the ATLAS data on the branching ratio $ \Gamma(\Lambda_{\text{b}})\to\psi(2S)\Lambda^0 / \Gamma(\Lambda_{\text{b}})\to\text{J}/\psi\Lambda^0 $ | PRD 92 (2015) 114008 | 1510.02266 |
| 76 | Z.-T. Wei, H.-W. Ke, and X.-Q. Li | Evaluating decay rates and asymmetries of $ \Lambda_{\text{b}} $ into light baryons in LFQM | PRD 80 (2009) 094016 | 0909.0100 |
| 77 | L. Mott and W. Roberts | Rare dileptonic decays of $ \Lambda_{\text{b}} $ in a quark model | Int. J. Mod. Phys. A 27 (2012) 1250016 | 1108.6129 |
|
|
Compact Muon Solenoid LHC, CERN |
|

|

|

|

|

|