

Compact Muon Solenoid
LHC, CERN
| CMS-PRF-21-001 ; CERN-EP-2023-136 | ||
| Development of the CMS detector for the CERN LHC Run 3 | ||
| CMS Collaboration | ||
| 8 September 2023 | ||
| Accepted for publication in J. Instrum. | ||
| Abstract: Since the initial data taking of the CERN LHC, the CMS experiment has undergone substantial upgrades and improvements. This paper discusses the CMS detector as it is configured for the third data-taking period of the CERN LHC, Run 3, which started in 2022. The entire silicon pixel tracking detector was replaced. A new powering system for the superconducting solenoid was installed. The electronics of the hadron calorimeter was upgraded. All the muon electronic systems were upgraded, and new muon detector stations were added, including a gas electron multiplier detector. The precision proton spectrometer was upgraded. The dedicated luminosity detectors and the beam loss monitor were refurbished. Substantial improvements to the trigger, data acquisition, software, and computing systems were also implemented, including a new hybrid CPU/GPU farm for the high-level trigger. | ||
| Links: e-print arXiv:2309.05466 [hep-ex] (PDF) ; CDS record ; inSPIRE record ; CADI line (restricted) ; | ||
| Figures | |

png pdf |
Figure 1:
Schematic drawing of the CMS detector. |

png pdf jpg |
Figure 2:
The solenoid magnet cryostat within the open CMS detector. |
png pdf |
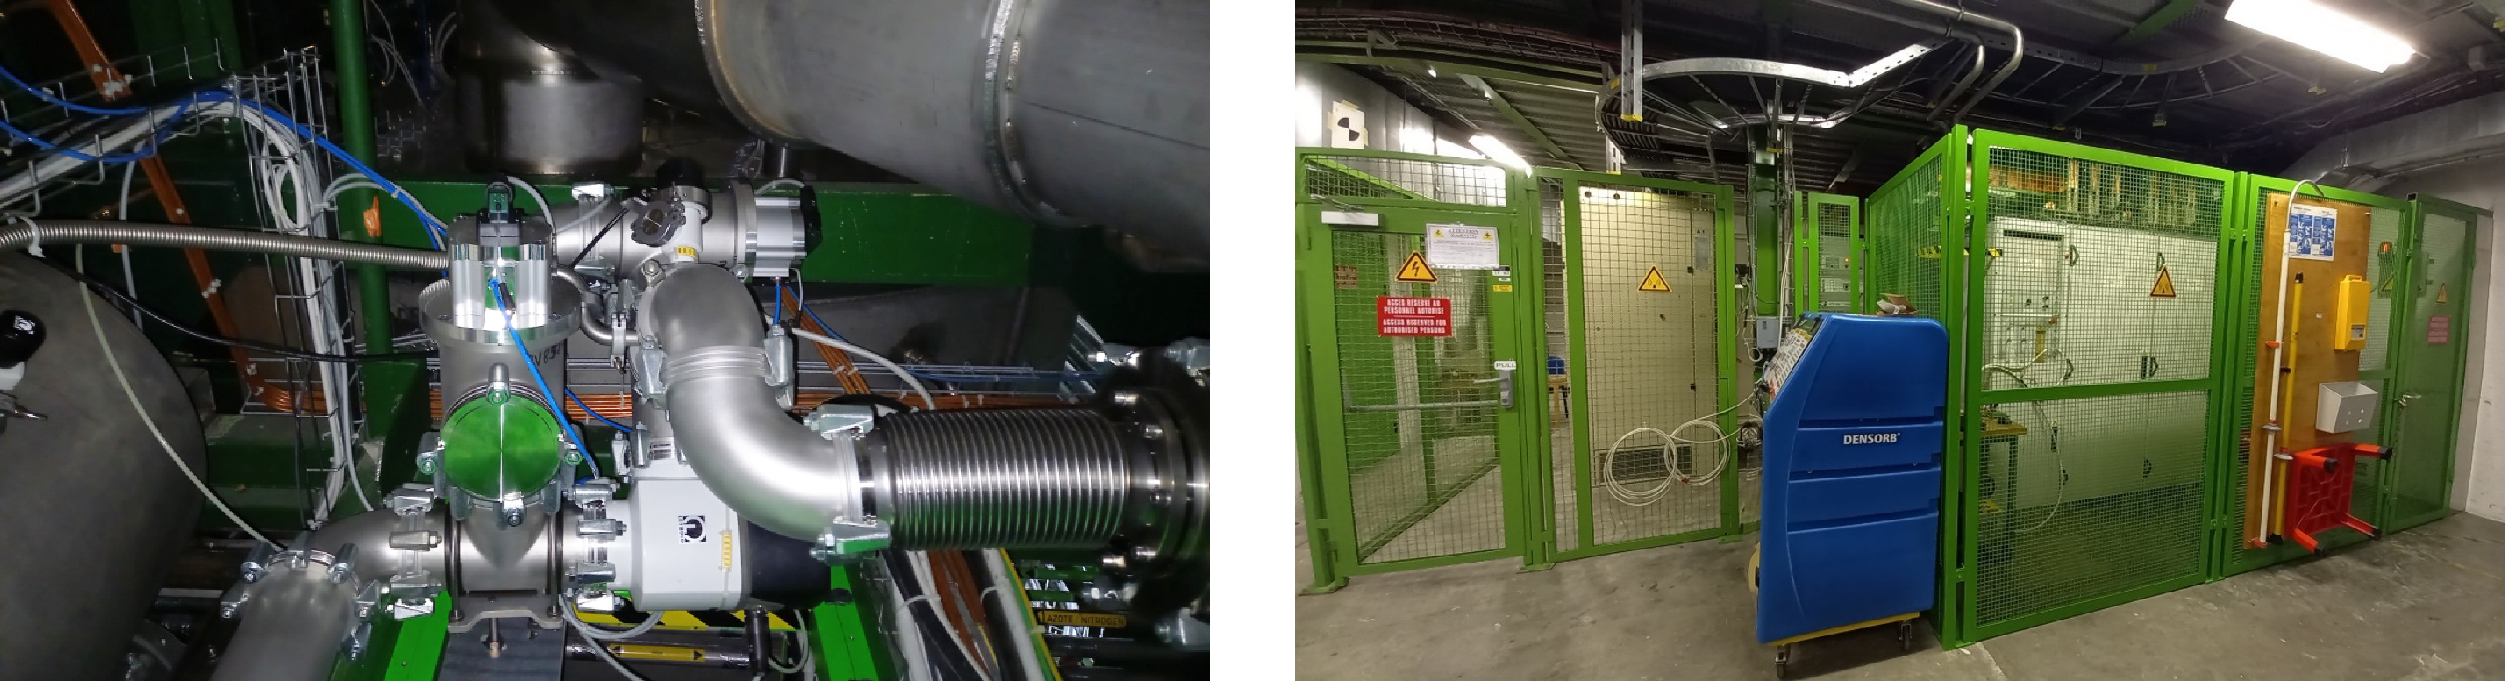
Figure 3:
Photographs of a part of the new vacuum pumping circuit (left) and of the new CMS FWT system installed in the CMS service cavern (right). |

png |
Figure 3-a:
Photograph of a part of the new vacuum pumping circuit. |

png pdf |
Figure 4:
The CMS magnet current ramp and discharge modes representing the various magnet operation procedures and their duration. A current of 18164 A corresponds to a magnetic field of 3.8 T. |
png pdf |
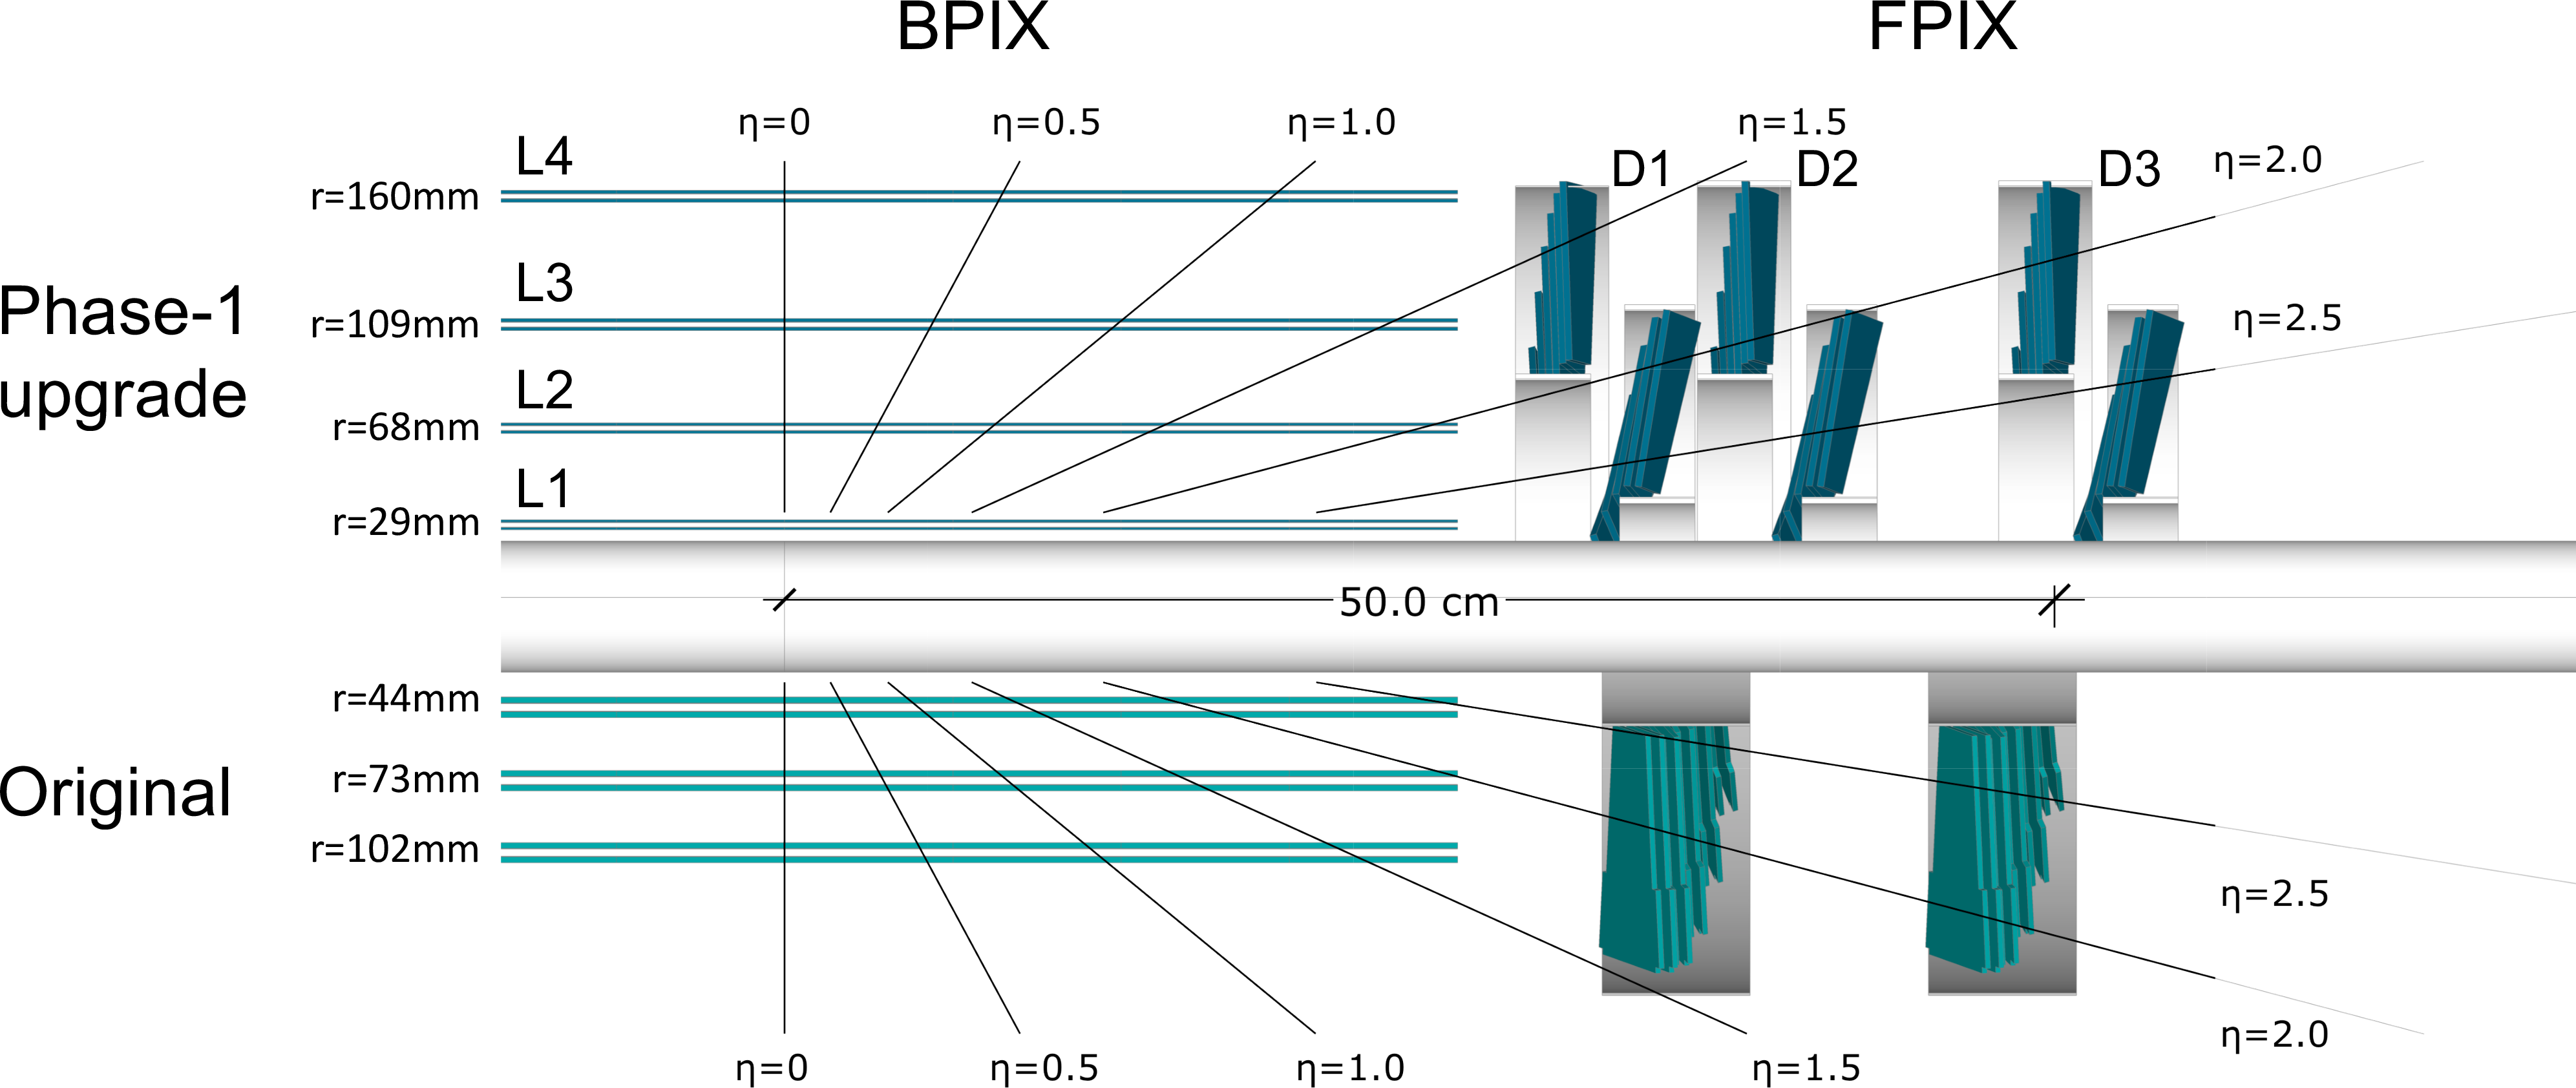
Figure 5:
Longitudinal view of the Phase 1-upgraded pixel detector compared to the original detector layout. |
png pdf |
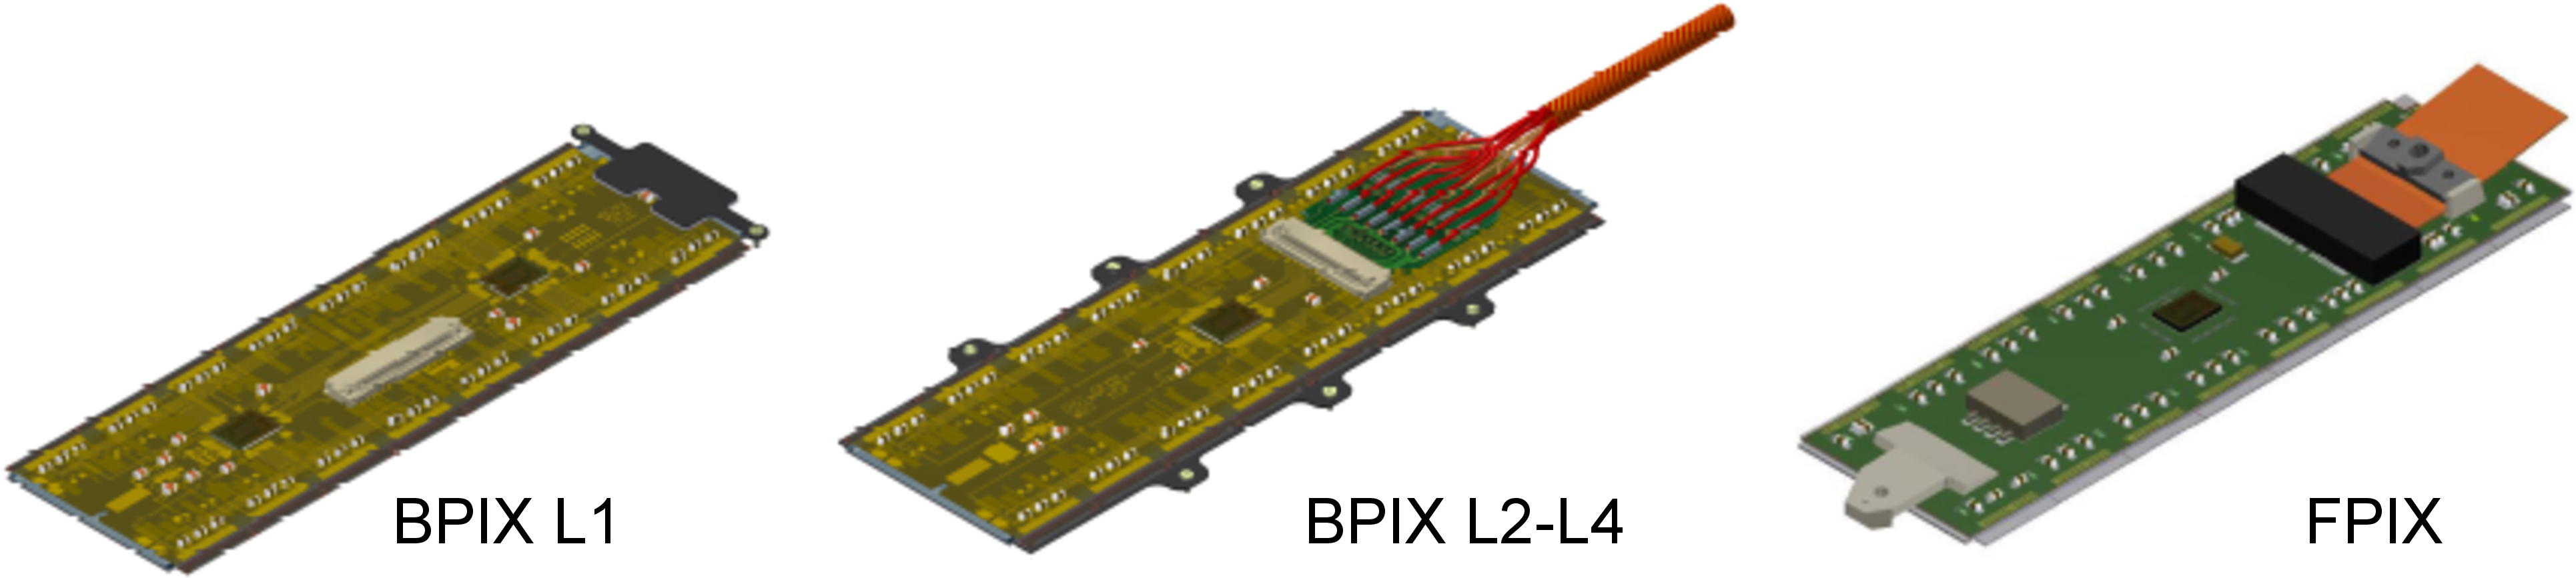
Figure 6:
Drawings of the pixel detector modules for BPIX L1, BPIX L2-4, and the FPIX detector. |

png pdf |
Figure 7:
Cross sectional view of a pixel detector module for BPIX L2-4, cut along the short side of the module. |
png pdf |
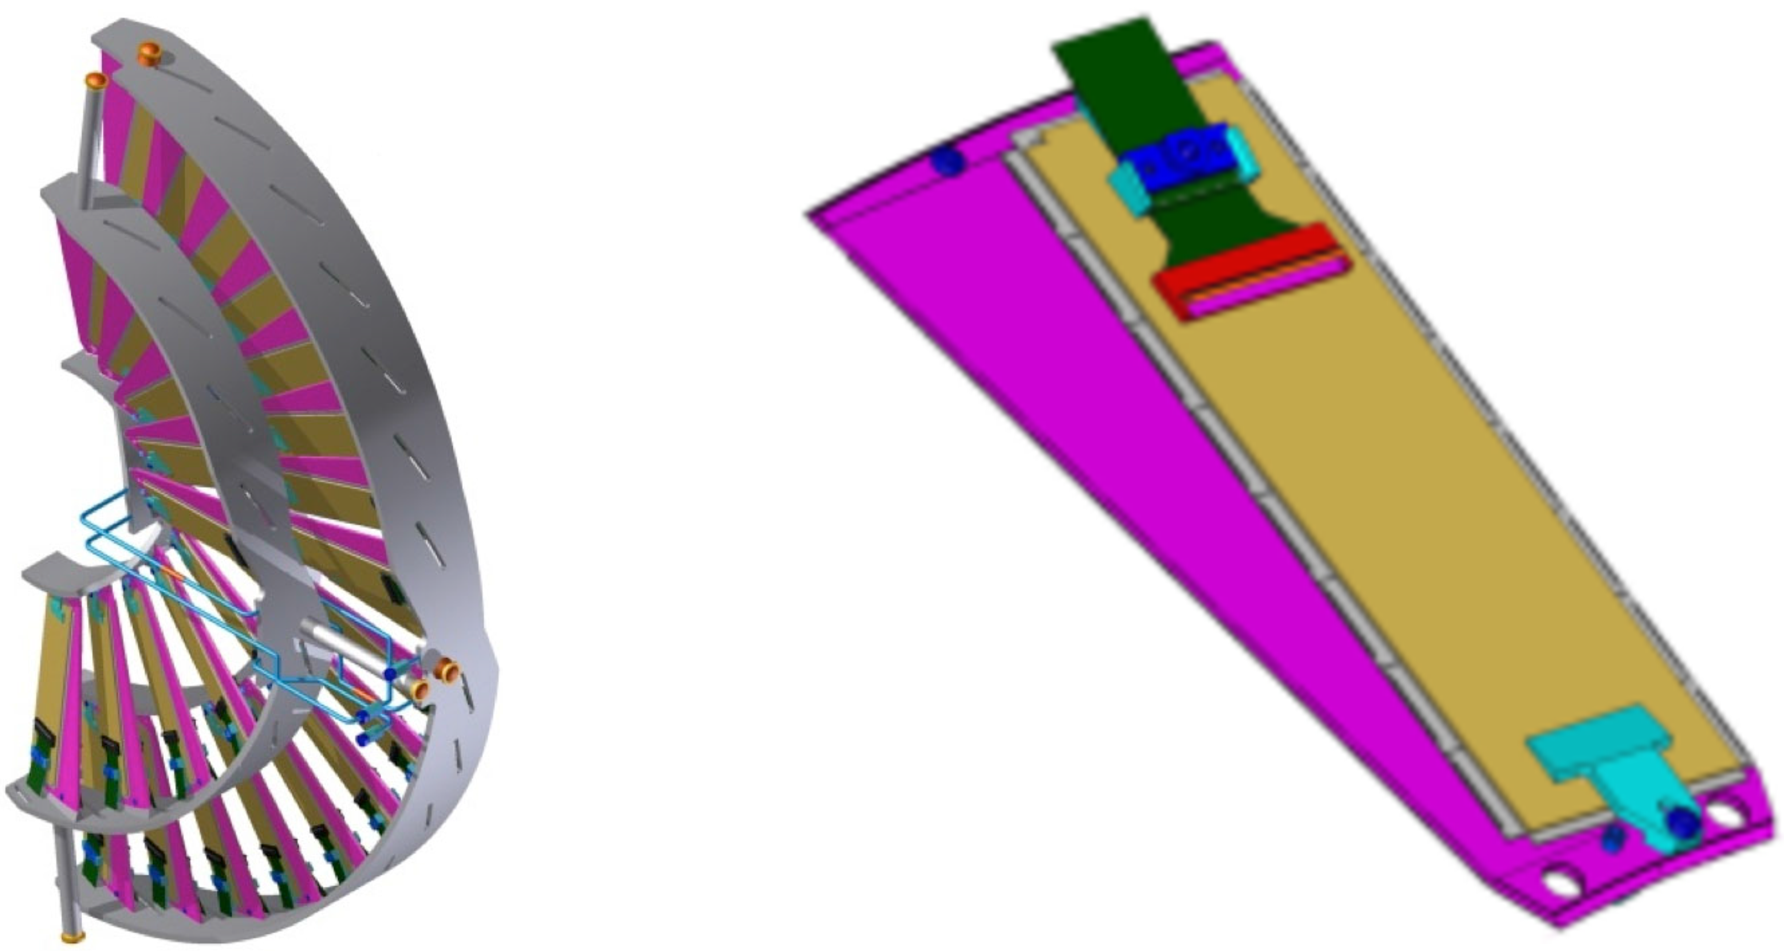
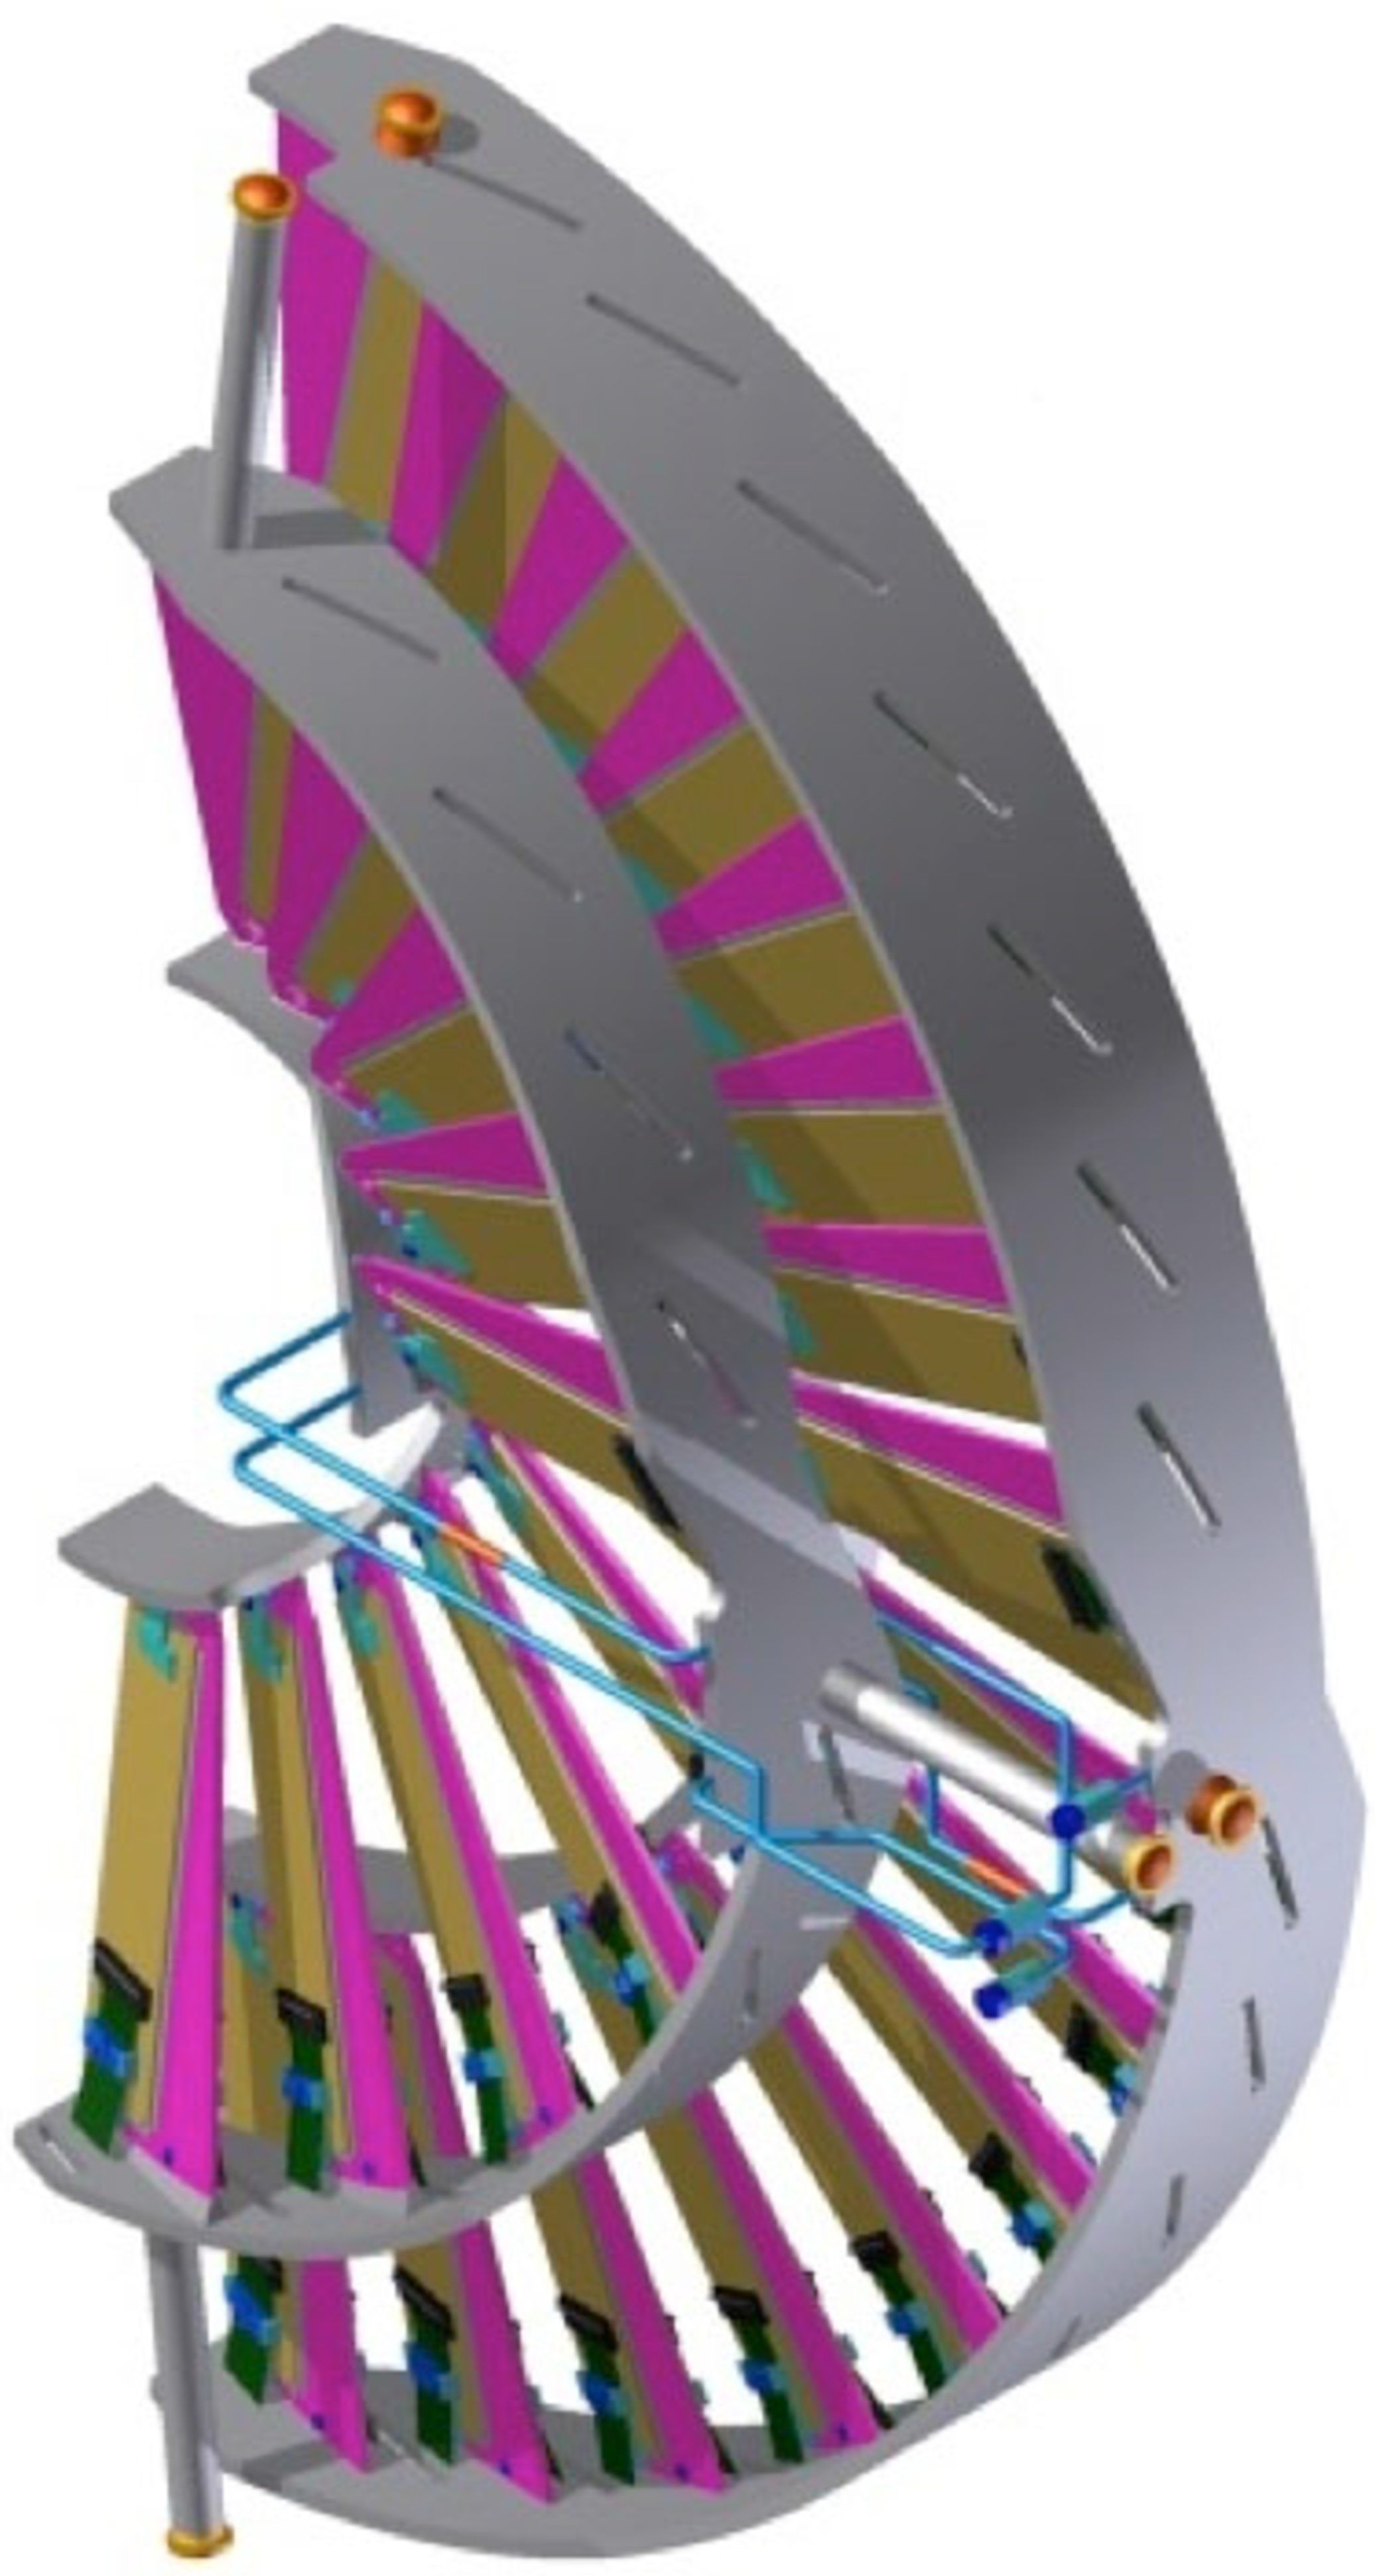
Figure 8:
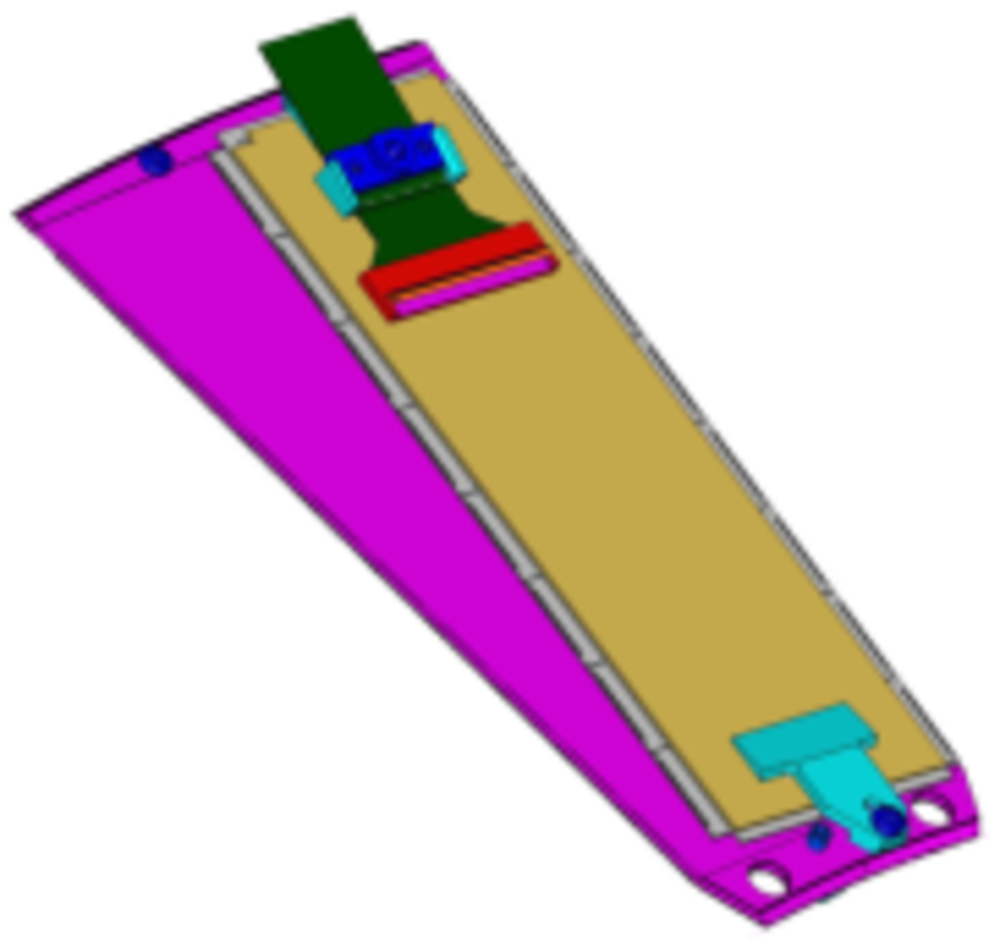
Drawing of an FPIX half-disk made from two half-rings of modules mounted on blades that are suspended between graphite rings (left), and close up view of a module mounted on a blade (right). |
png pdf |
Figure 8-a:
Drawing of an FPIX half-disk made from two half-rings of modules mounted on blades that are suspended between graphite rings. |
png pdf |
Figure 8-b:
Close up view of a module mounted on a blade. |
png pdf |
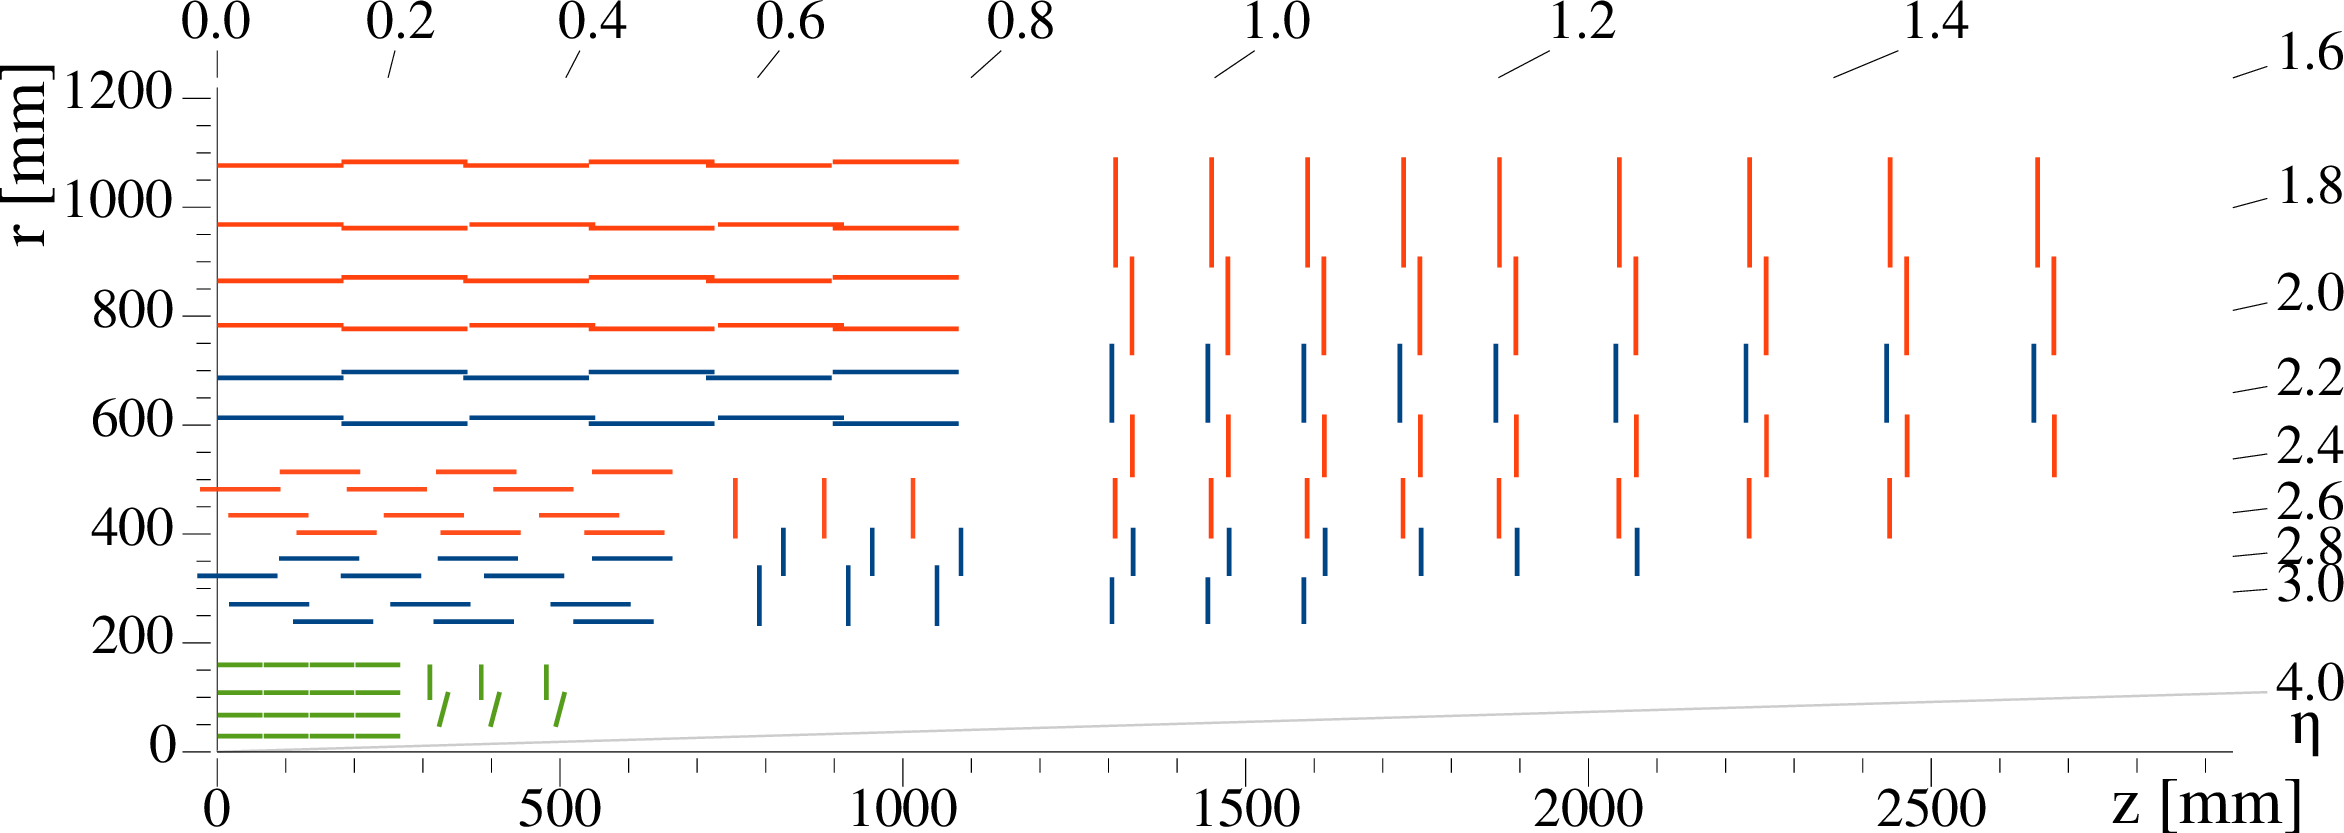
Figure 9:
Schematic view of one quadrant in the $ r $-$ z $ view of the CMS tracker: single-sided and double-sided strip modules are depicted as red and blue segments, respectively. The pixel detector is shown in green. |

png pdf |
Figure 10:
Fraction of bad components for the CMS silicon strip detector as a function of the delivered integrated luminosity [32]. |
png pdf |
Figure 11:
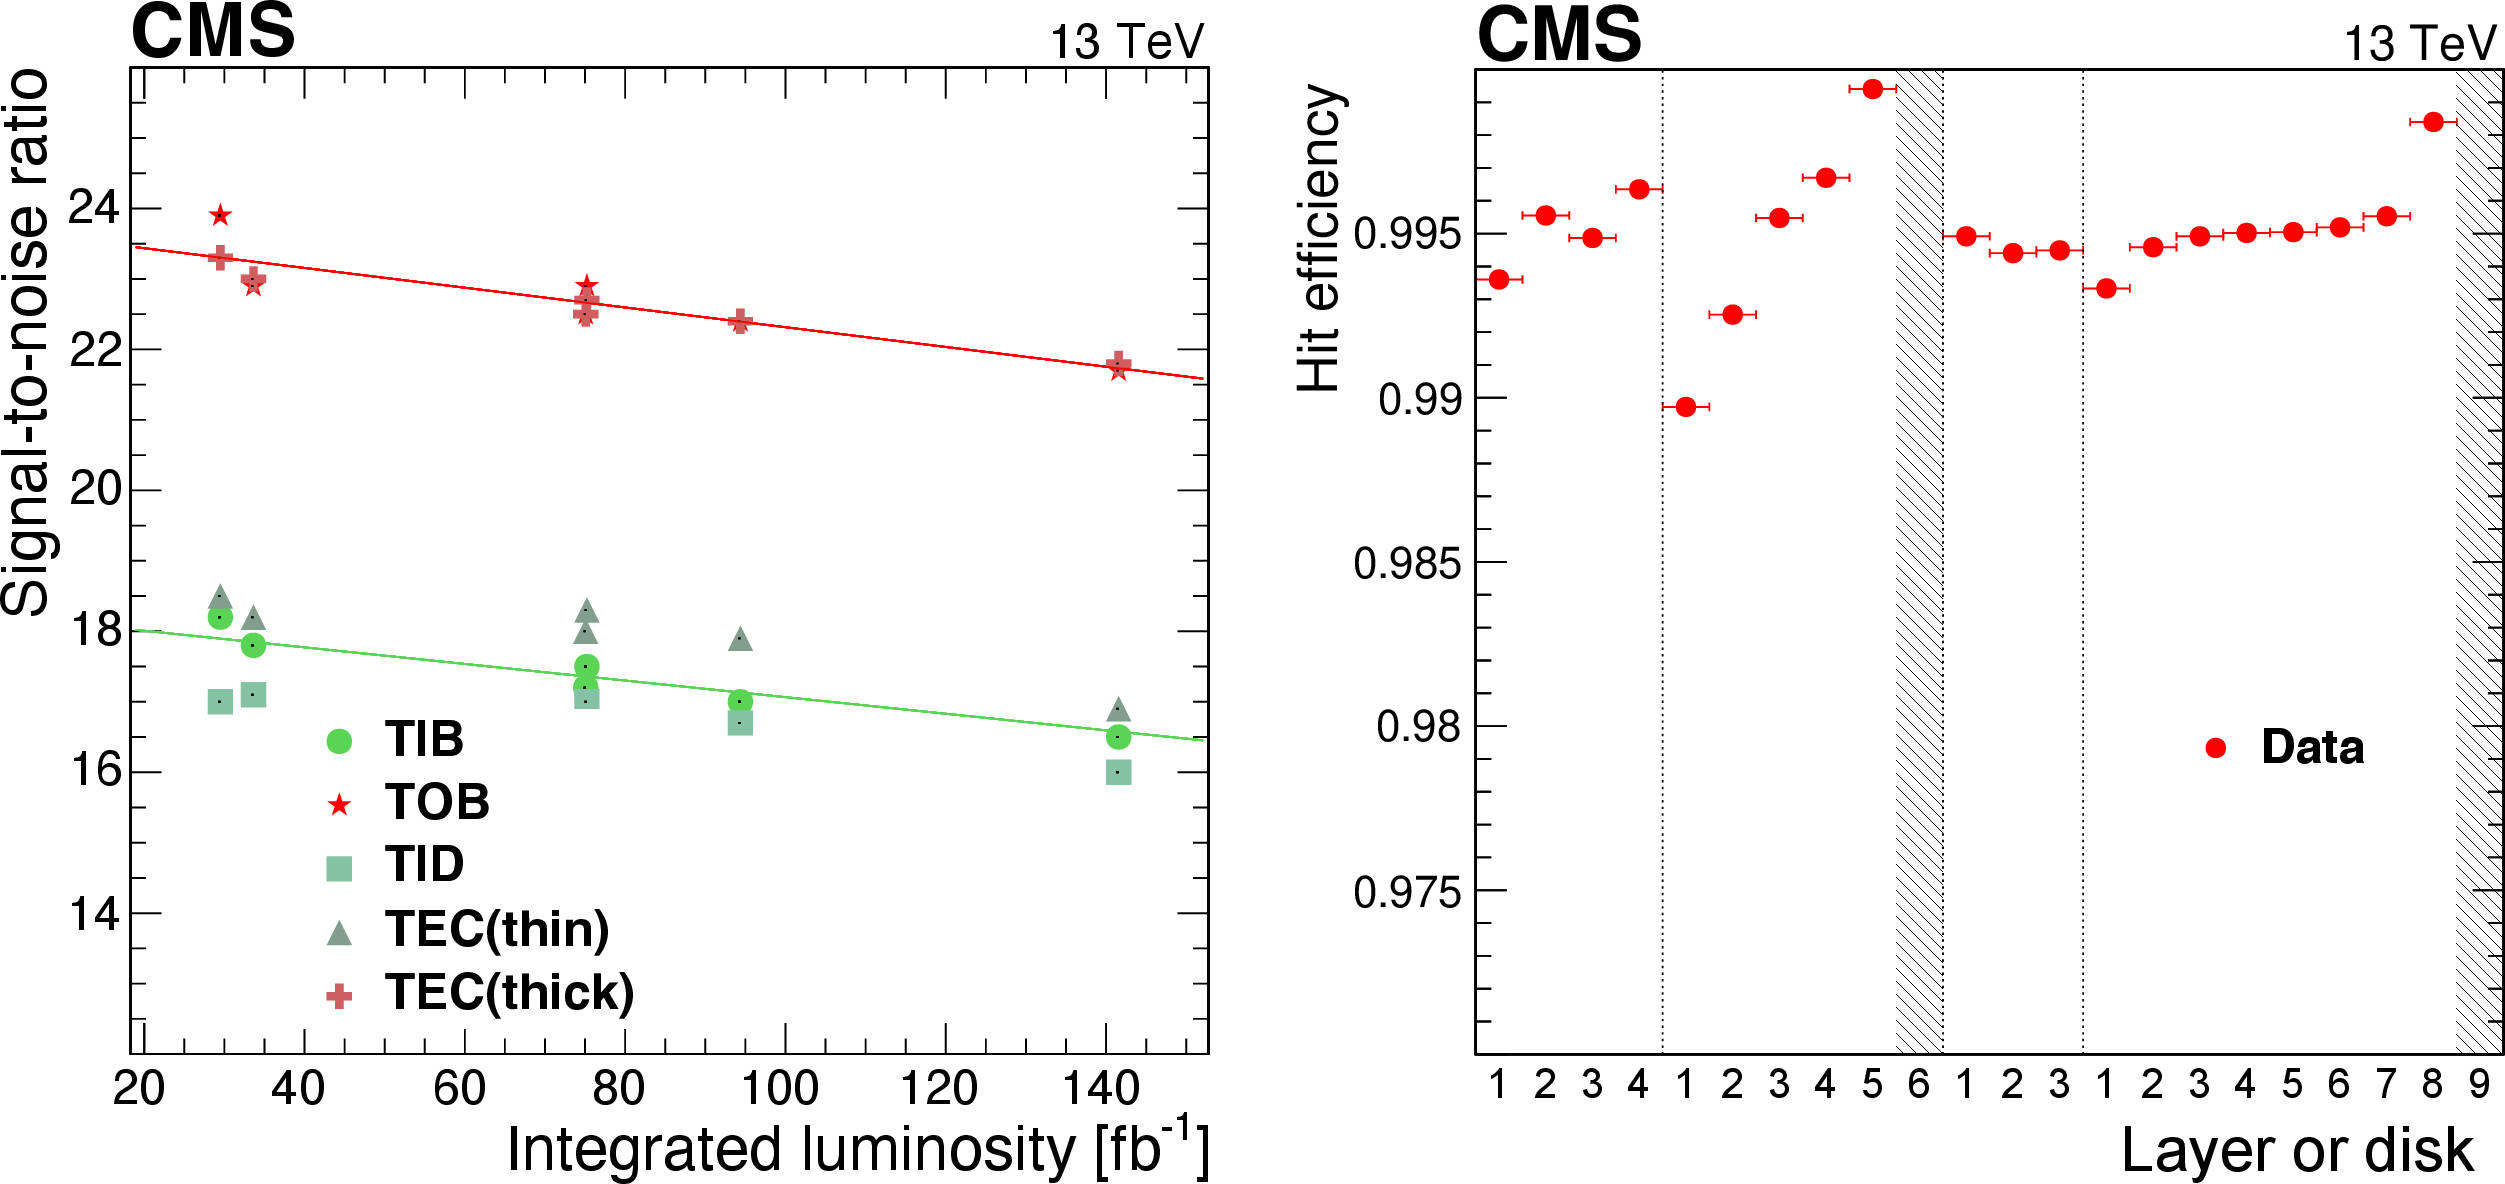
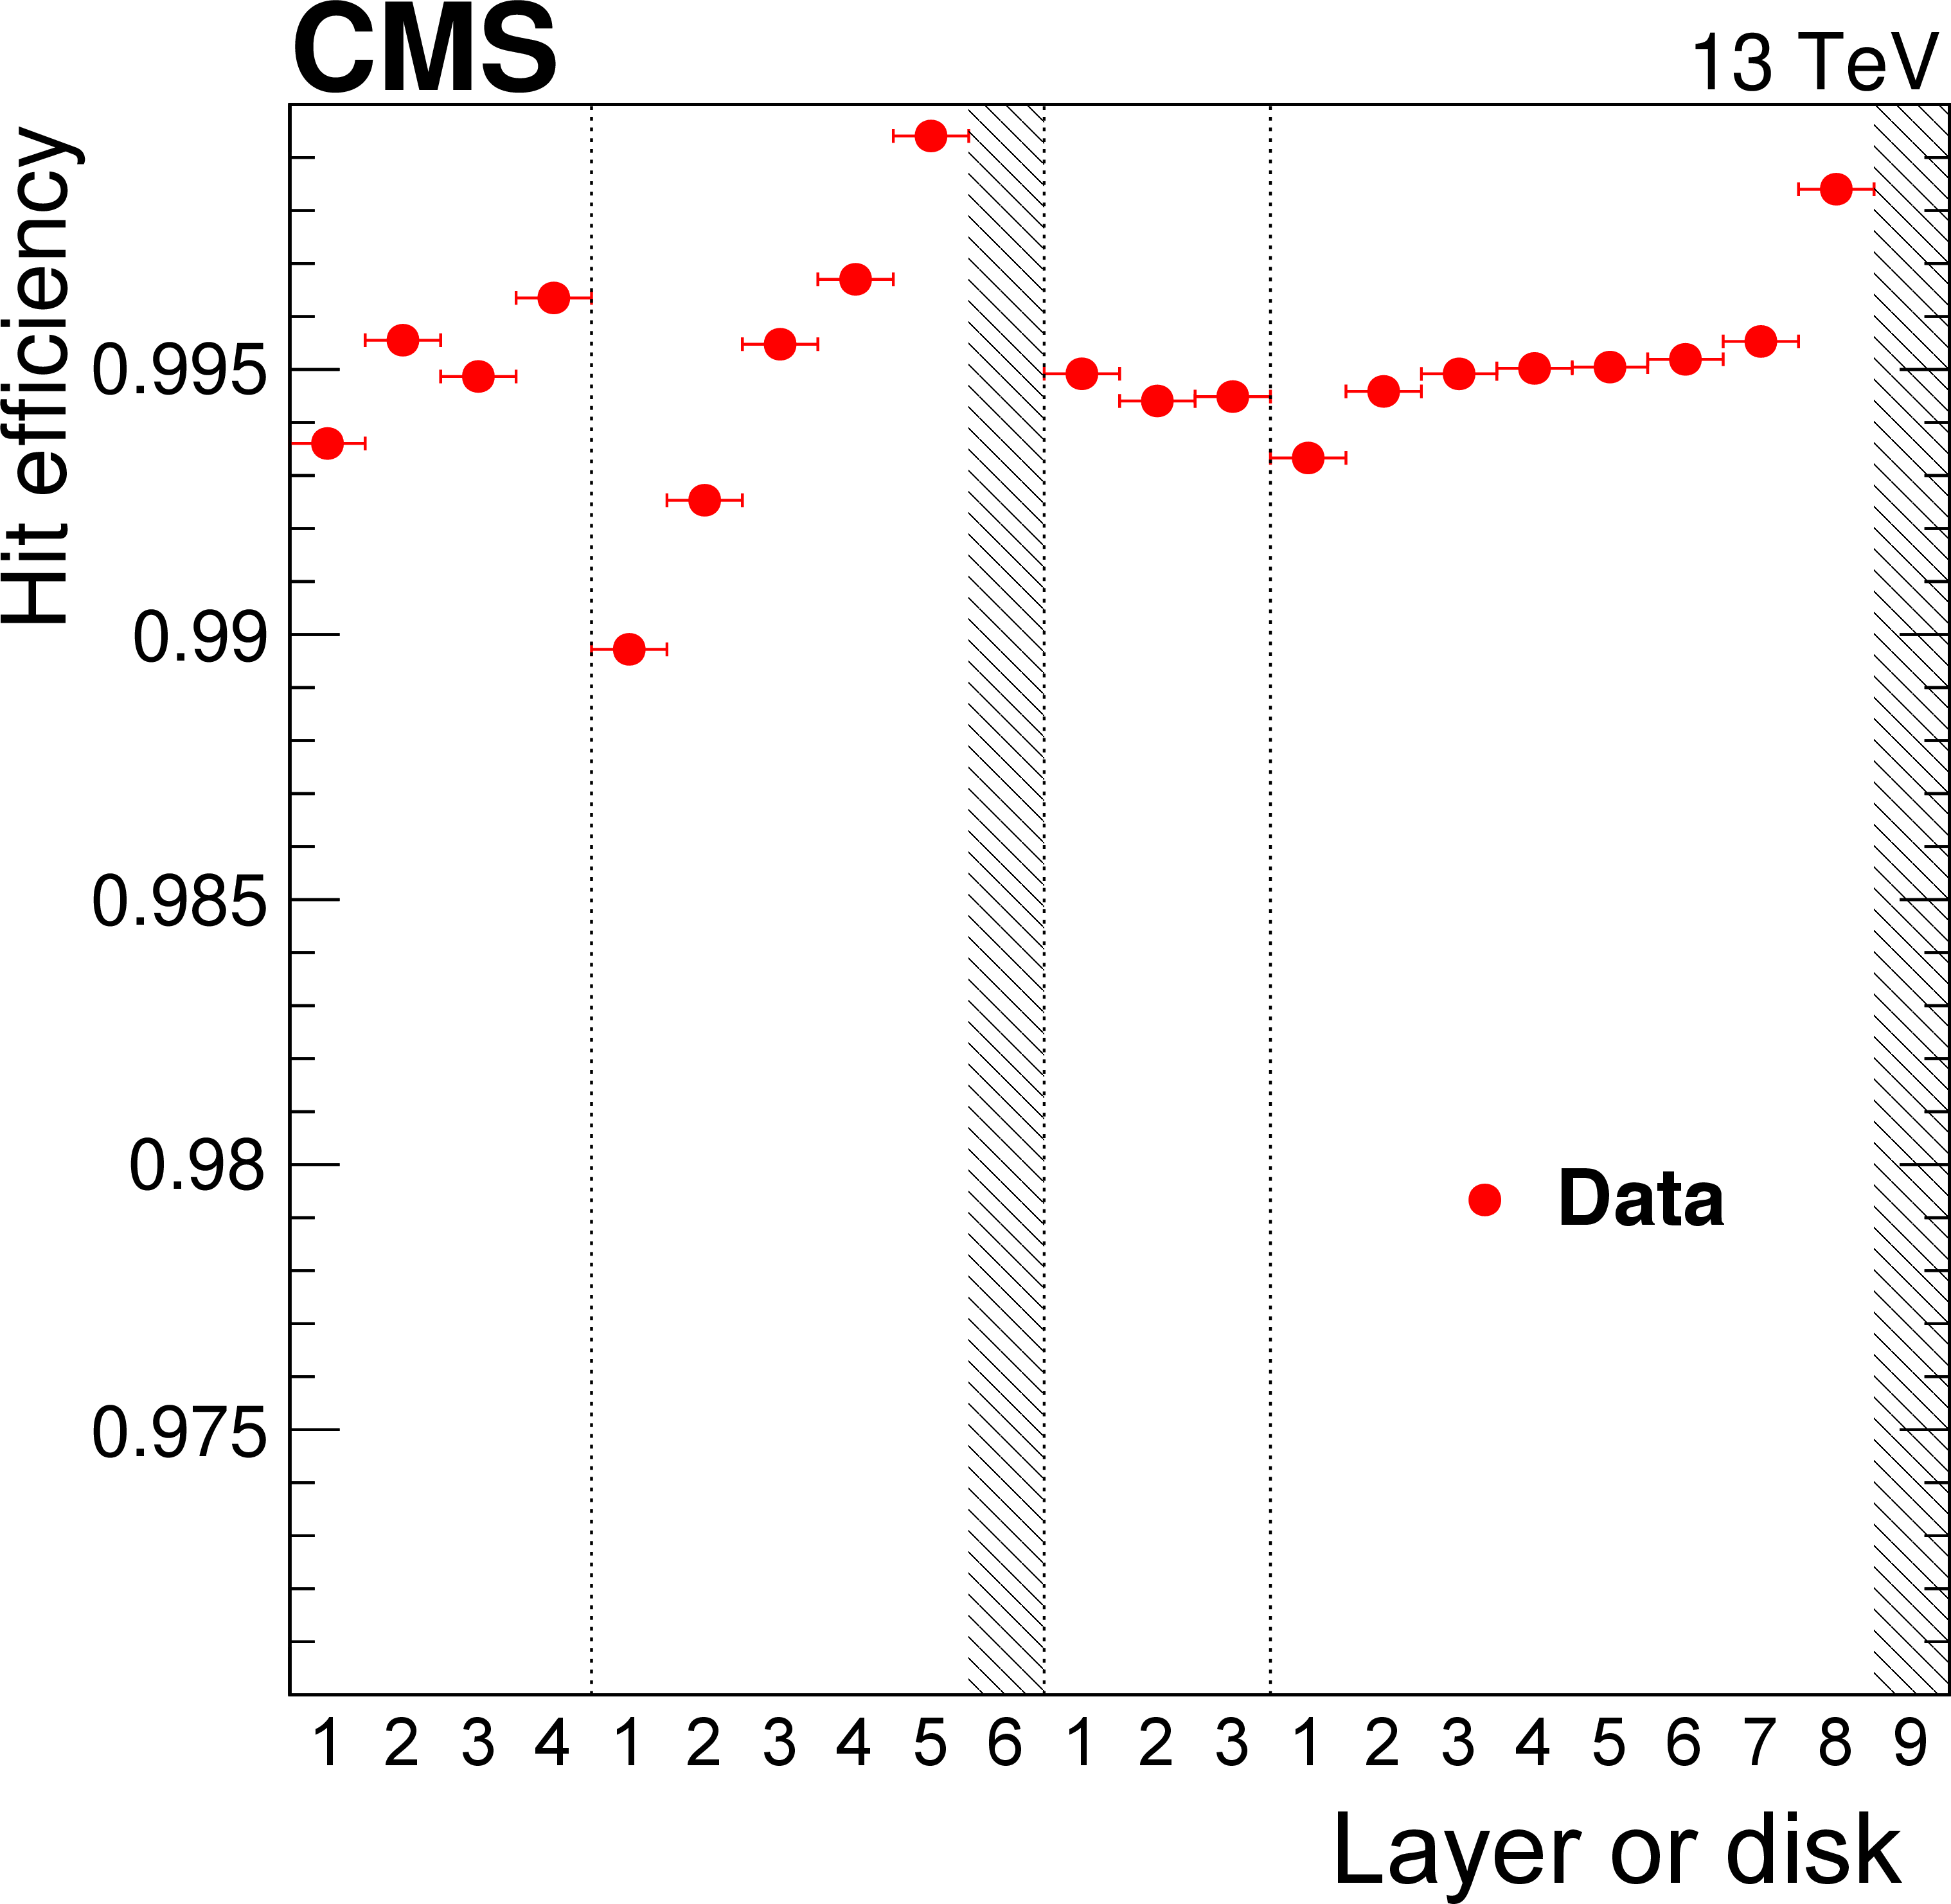
Left: signal-to-noise ratio as a function of integrated luminosity as accumulated in pp collisions during Run 2, separately for the different detector partitions. Triangles and crosses indicate the results for sensors in the TEC of thickness 320 and 500 m, respectively. Right: hit efficiency of the silicon strip detector taken from a representative run recorded in 2018 [32] with an average hit efficiency under typical conditions at an instantaneous luminosity of 1.11 $ \times$ 10$^{34}$ cm$^{2}$s$^{-1}$. The two gray bands represent regions where the hit efficiency is not measured due to the selection criteria of the analysis [32]. |

png pdf |
Figure 11-a:
Signal-to-noise ratio as a function of integrated luminosity as accumulated in pp collisions during Run 2, separately for the different detector partitions. Triangles and crosses indicate the results for sensors in the TEC of thickness 320 and 500 m, respectively. |
png pdf |
Figure 11-b:
Hit efficiency of the silicon strip detector taken from a representative run recorded in 2018 [32] with an average hit efficiency under typical conditions at an instantaneous luminosity of 1.11 $ \times$ 10$^{34}$ cm$^{2}$s$^{-1}$. The two gray bands represent regions where the hit efficiency is not measured due to the selection criteria of the analysis [32]. |
png pdf |
Figure 12:
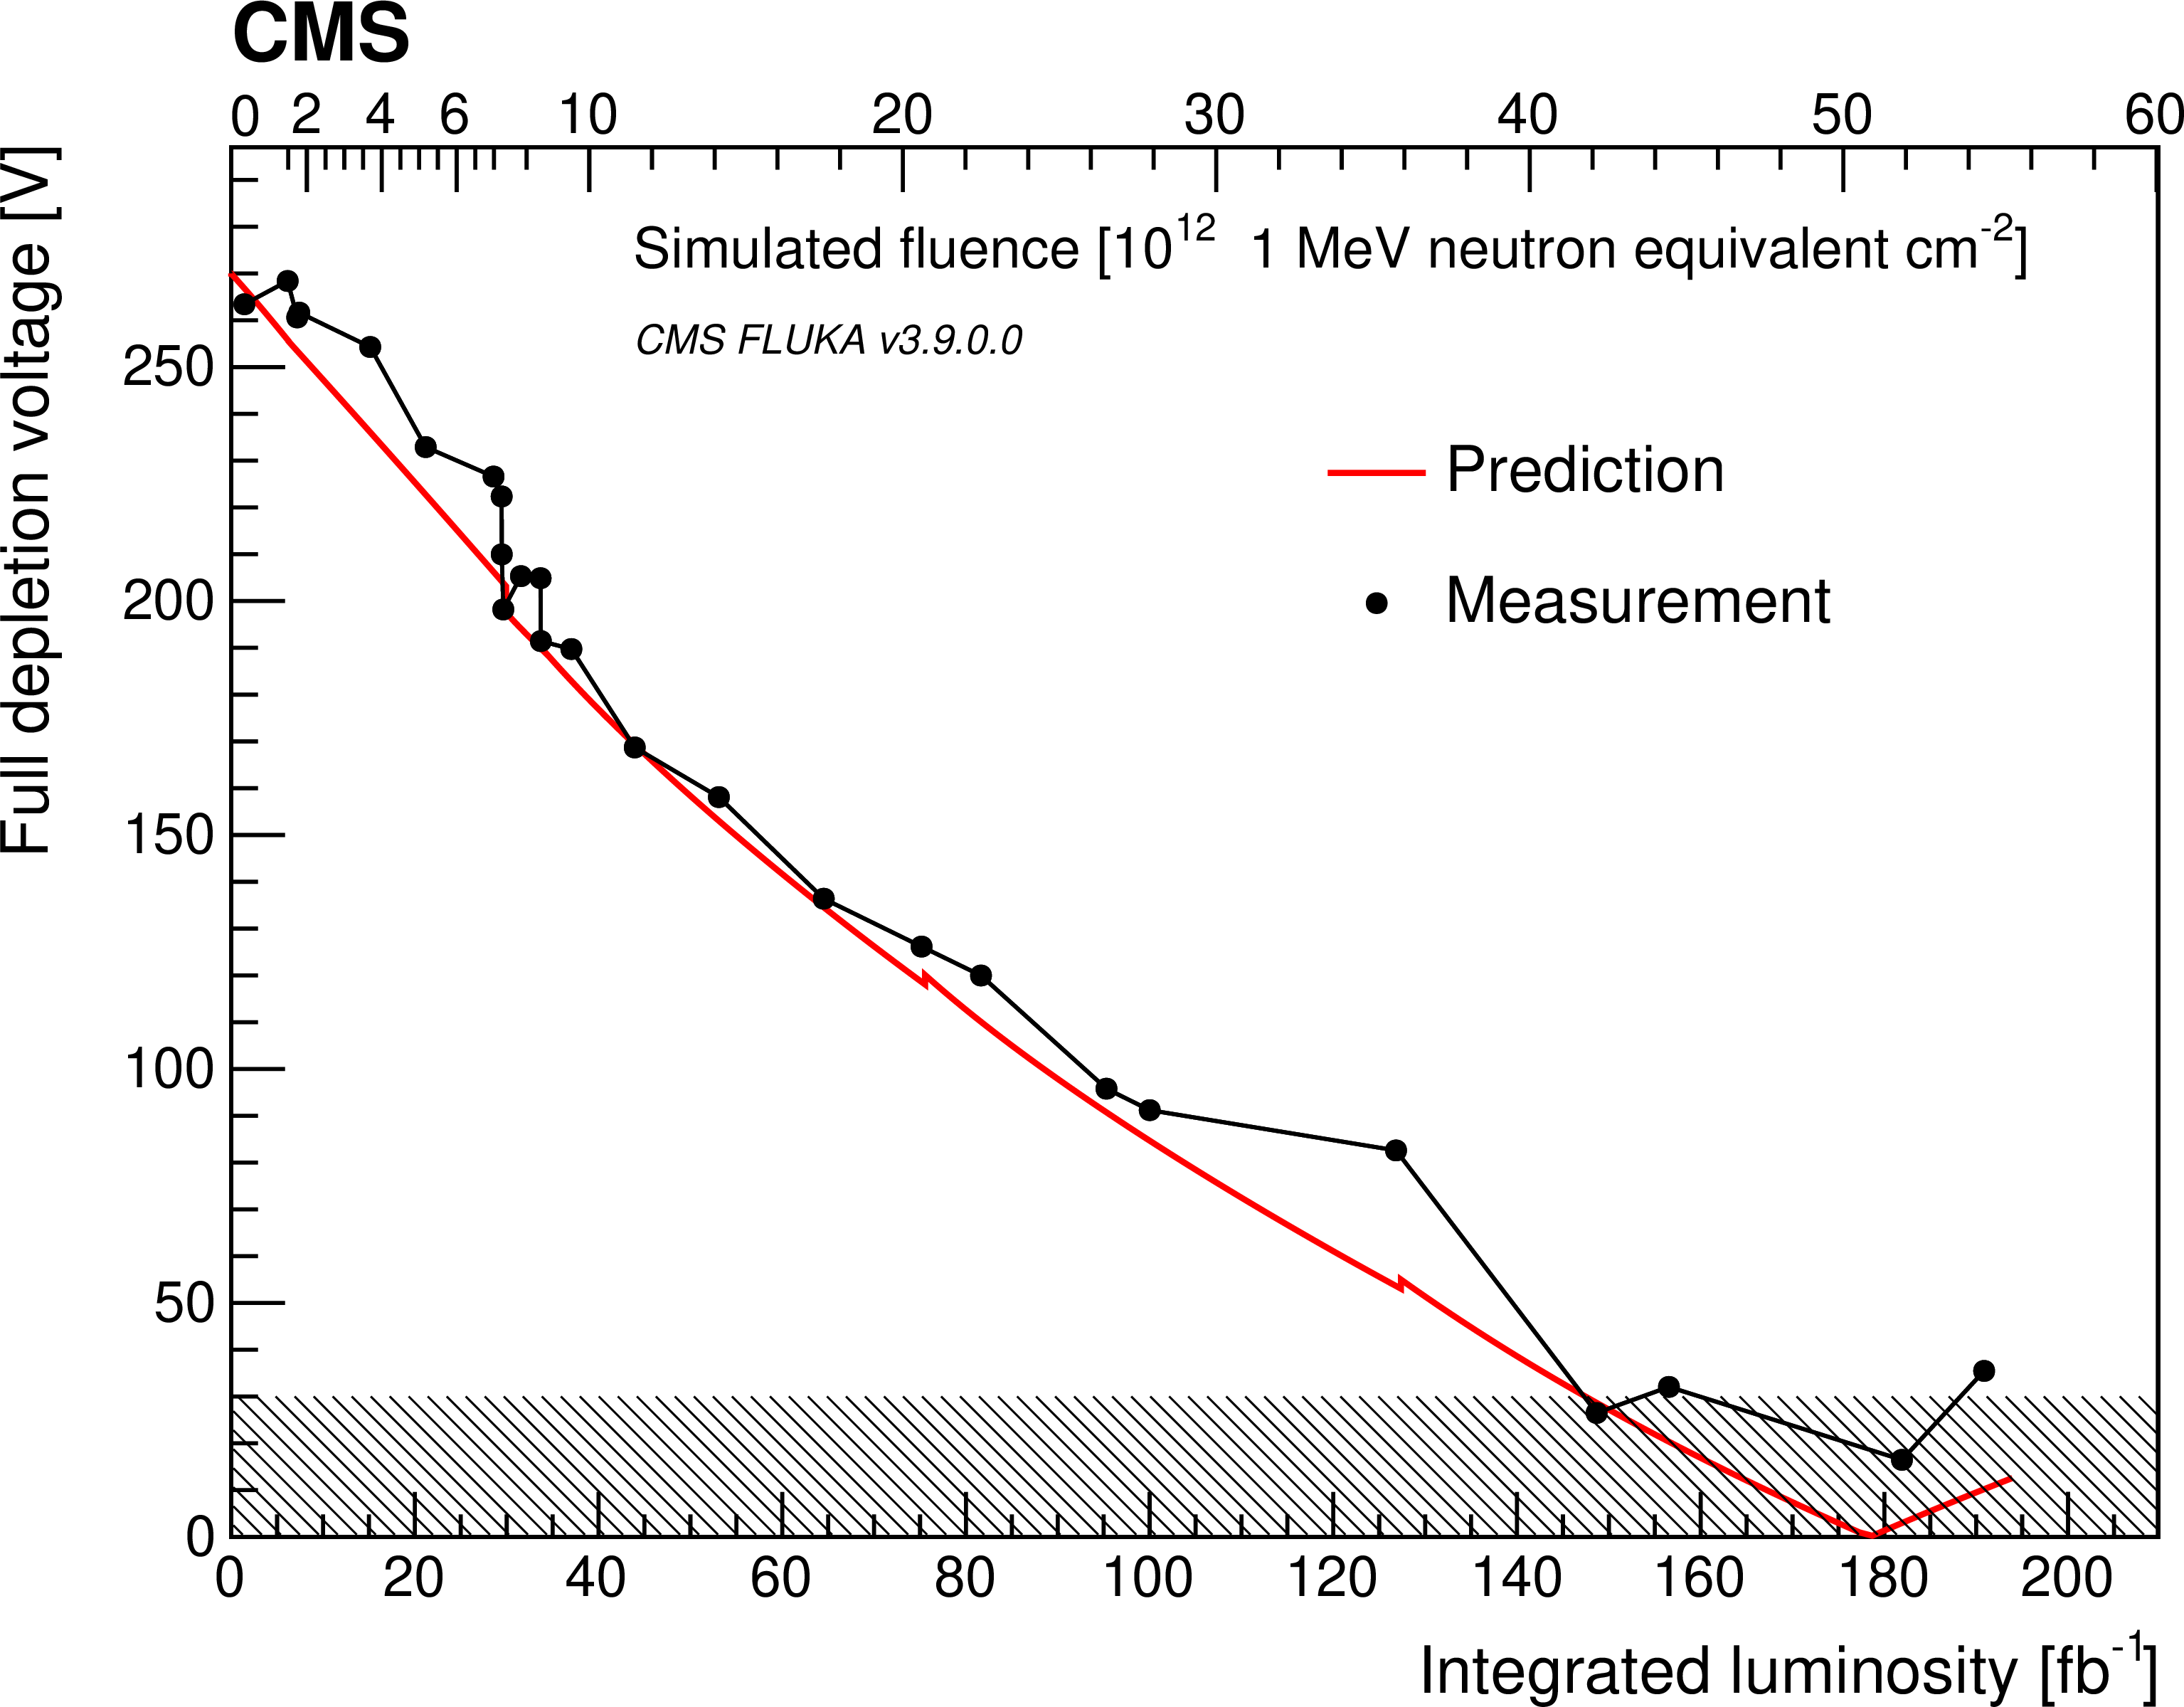
Evolution of the full depletion voltage for one TIB layer-1 sensor as a function of the integrated luminosity and fluence until the end of Run 2. The full depletion voltage is measured from the cluster-width variable, shown as black dots, and the predicted curve is based on a model that uses fluence and temperature history as inputs [34]. The hashed area highlights the region at low values of the full depletion voltage where the analysis loses sensitivity [32]. |
png pdf |
Figure 13:
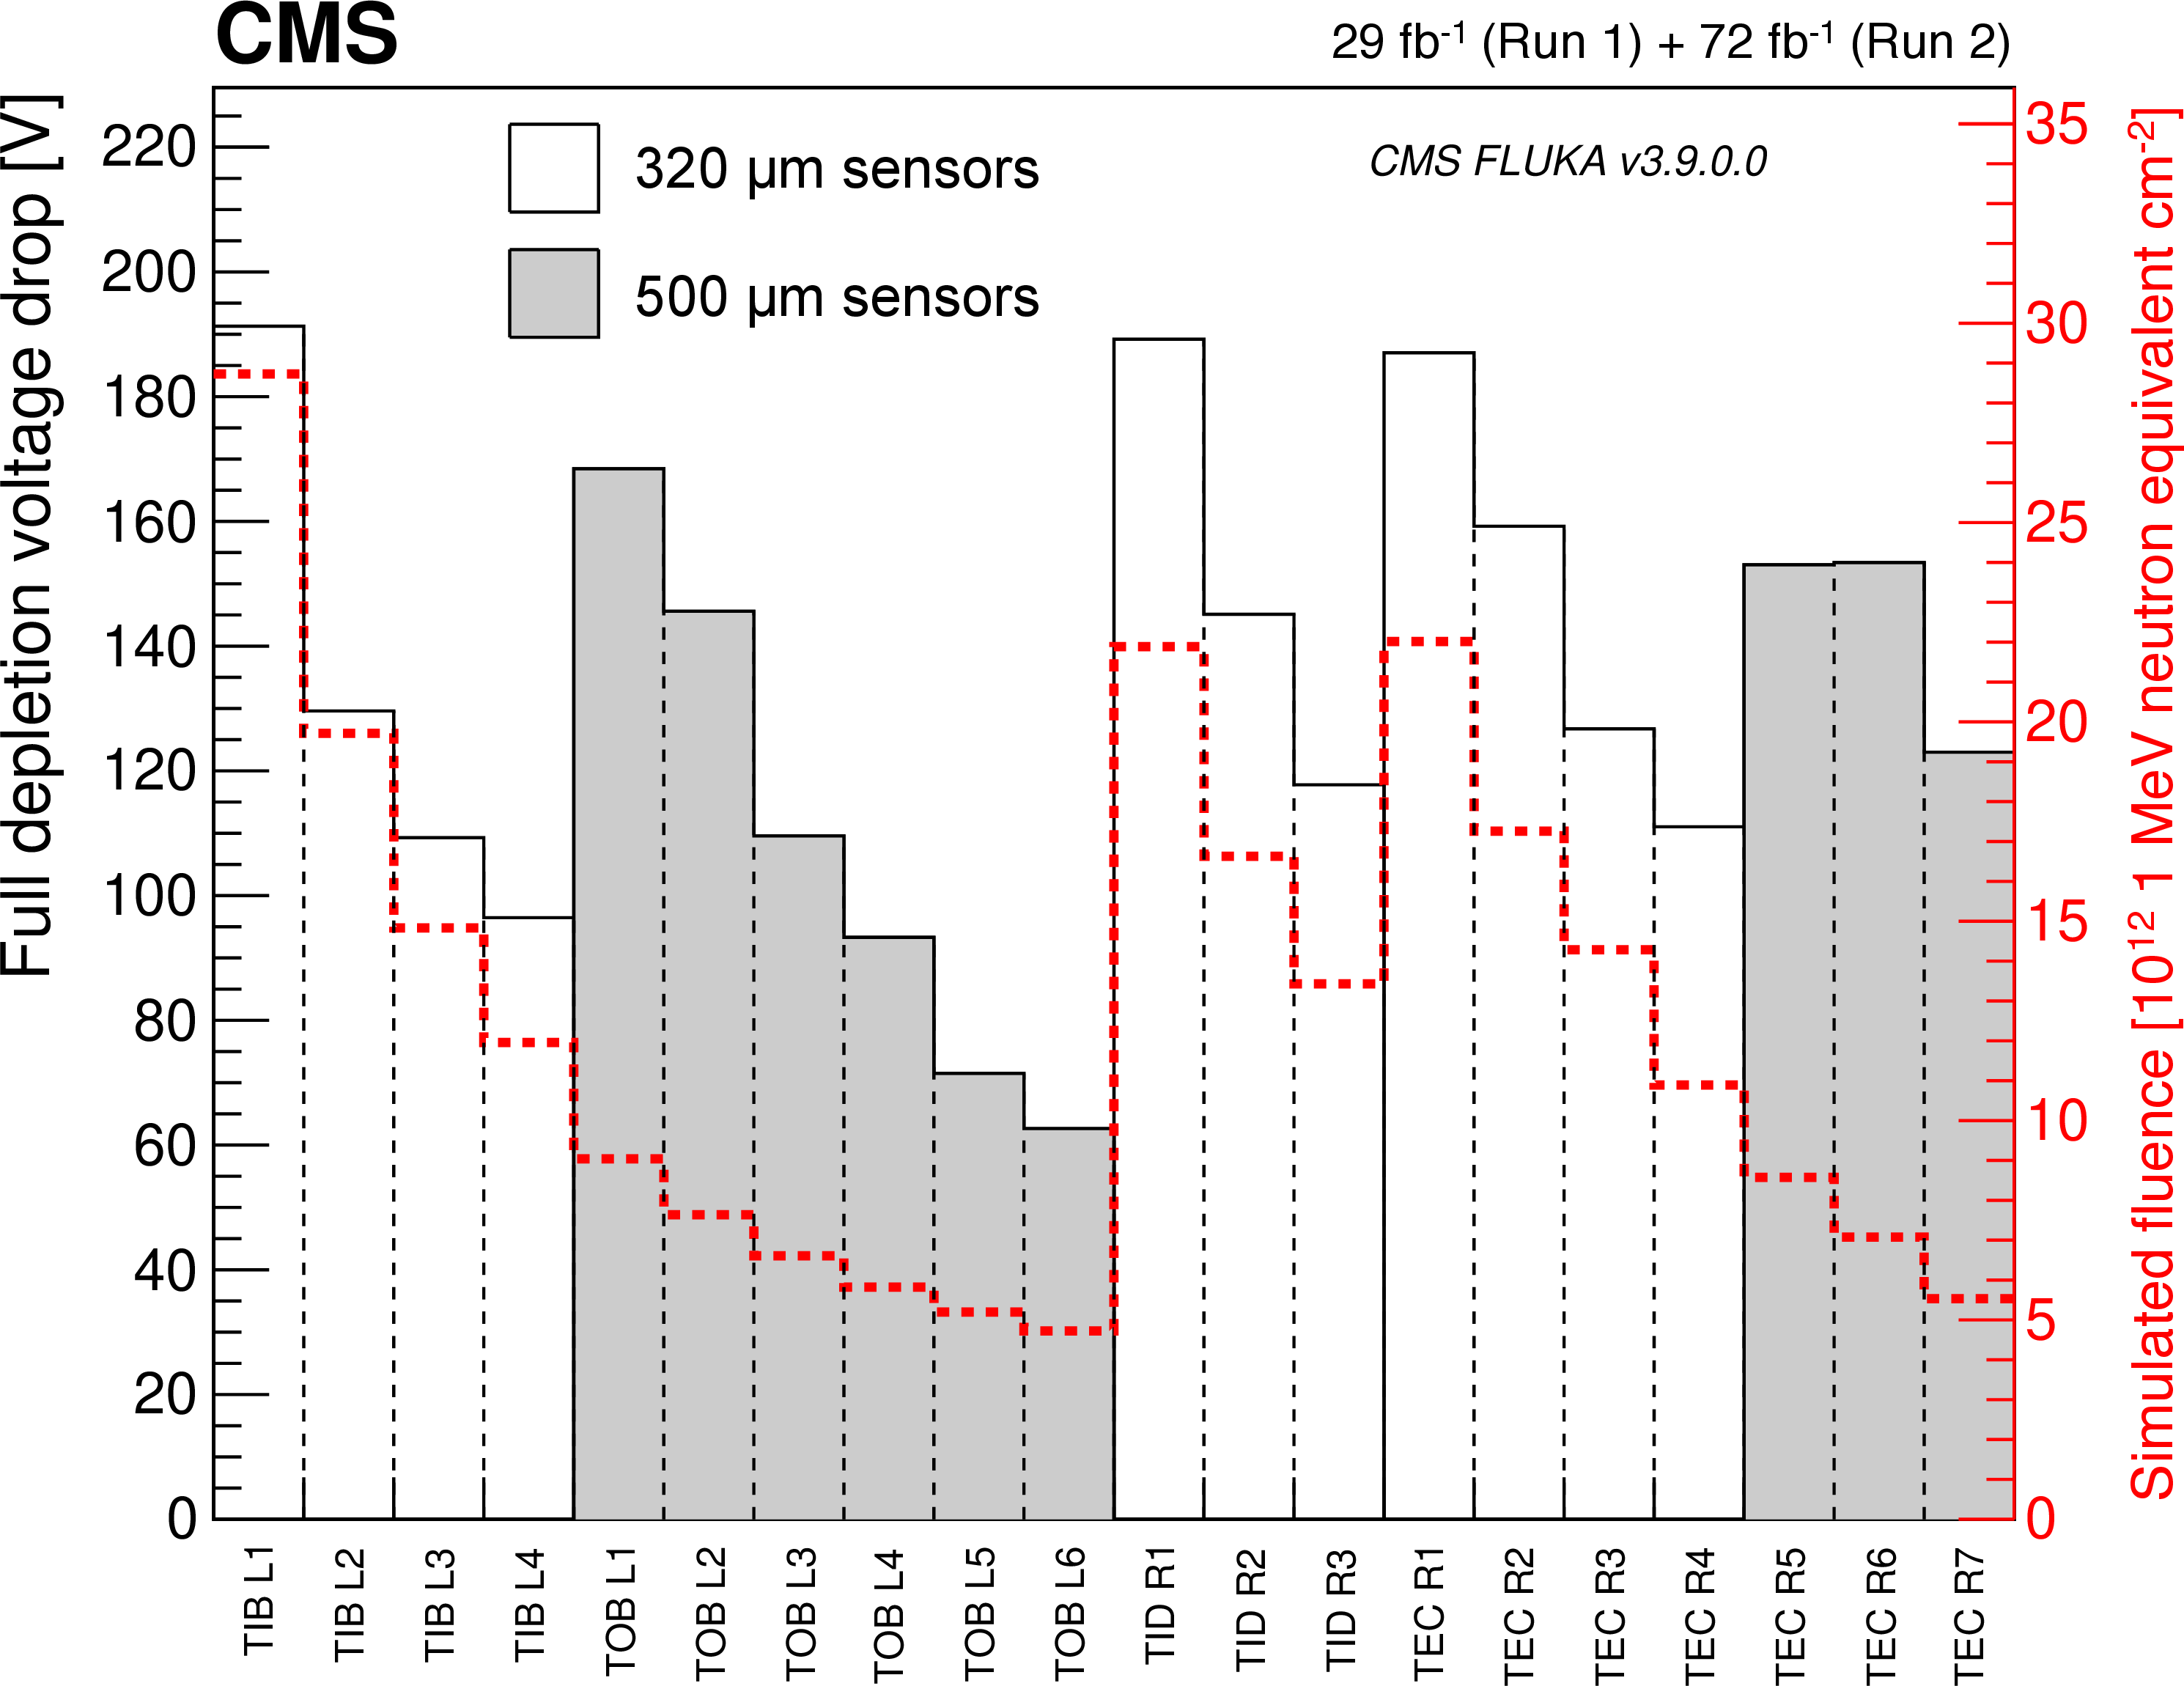
Decrease of the full depletion voltage for each layer, computed as the difference between the values measured at the time of the tracker construction and the values obtained by the analysis of a bias-voltage scan performed in September 2017 on all the tracker modules. The white (gray) histograms represent modules with 320 (500) m thick sensors. The average fluence for each layer is shown by the red line. |

png pdf |
Figure 14:
Relative response to laser light injected into the ECAL crystals, measured by the laser monitoring system, averaged over all crystals in bins of $ |\eta| $. The response change observed in the ECAL channels is up to 13% in the barrel, $ |\eta| < $ 1.5, and reaches up to 62% at $ |\eta|\approx $ 2.5, the limit of the CMS inner tracker acceptance. The response change is up to 96% in the region closest to the beam pipe. The recovery of the crystal response during the periods without collisions is visible. These measurements, performed every 40 minutes, are used to correct the physics data. The lower panel shows the LHC instantaneous luminosity as a function of time. |
png pdf |
Figure 15:
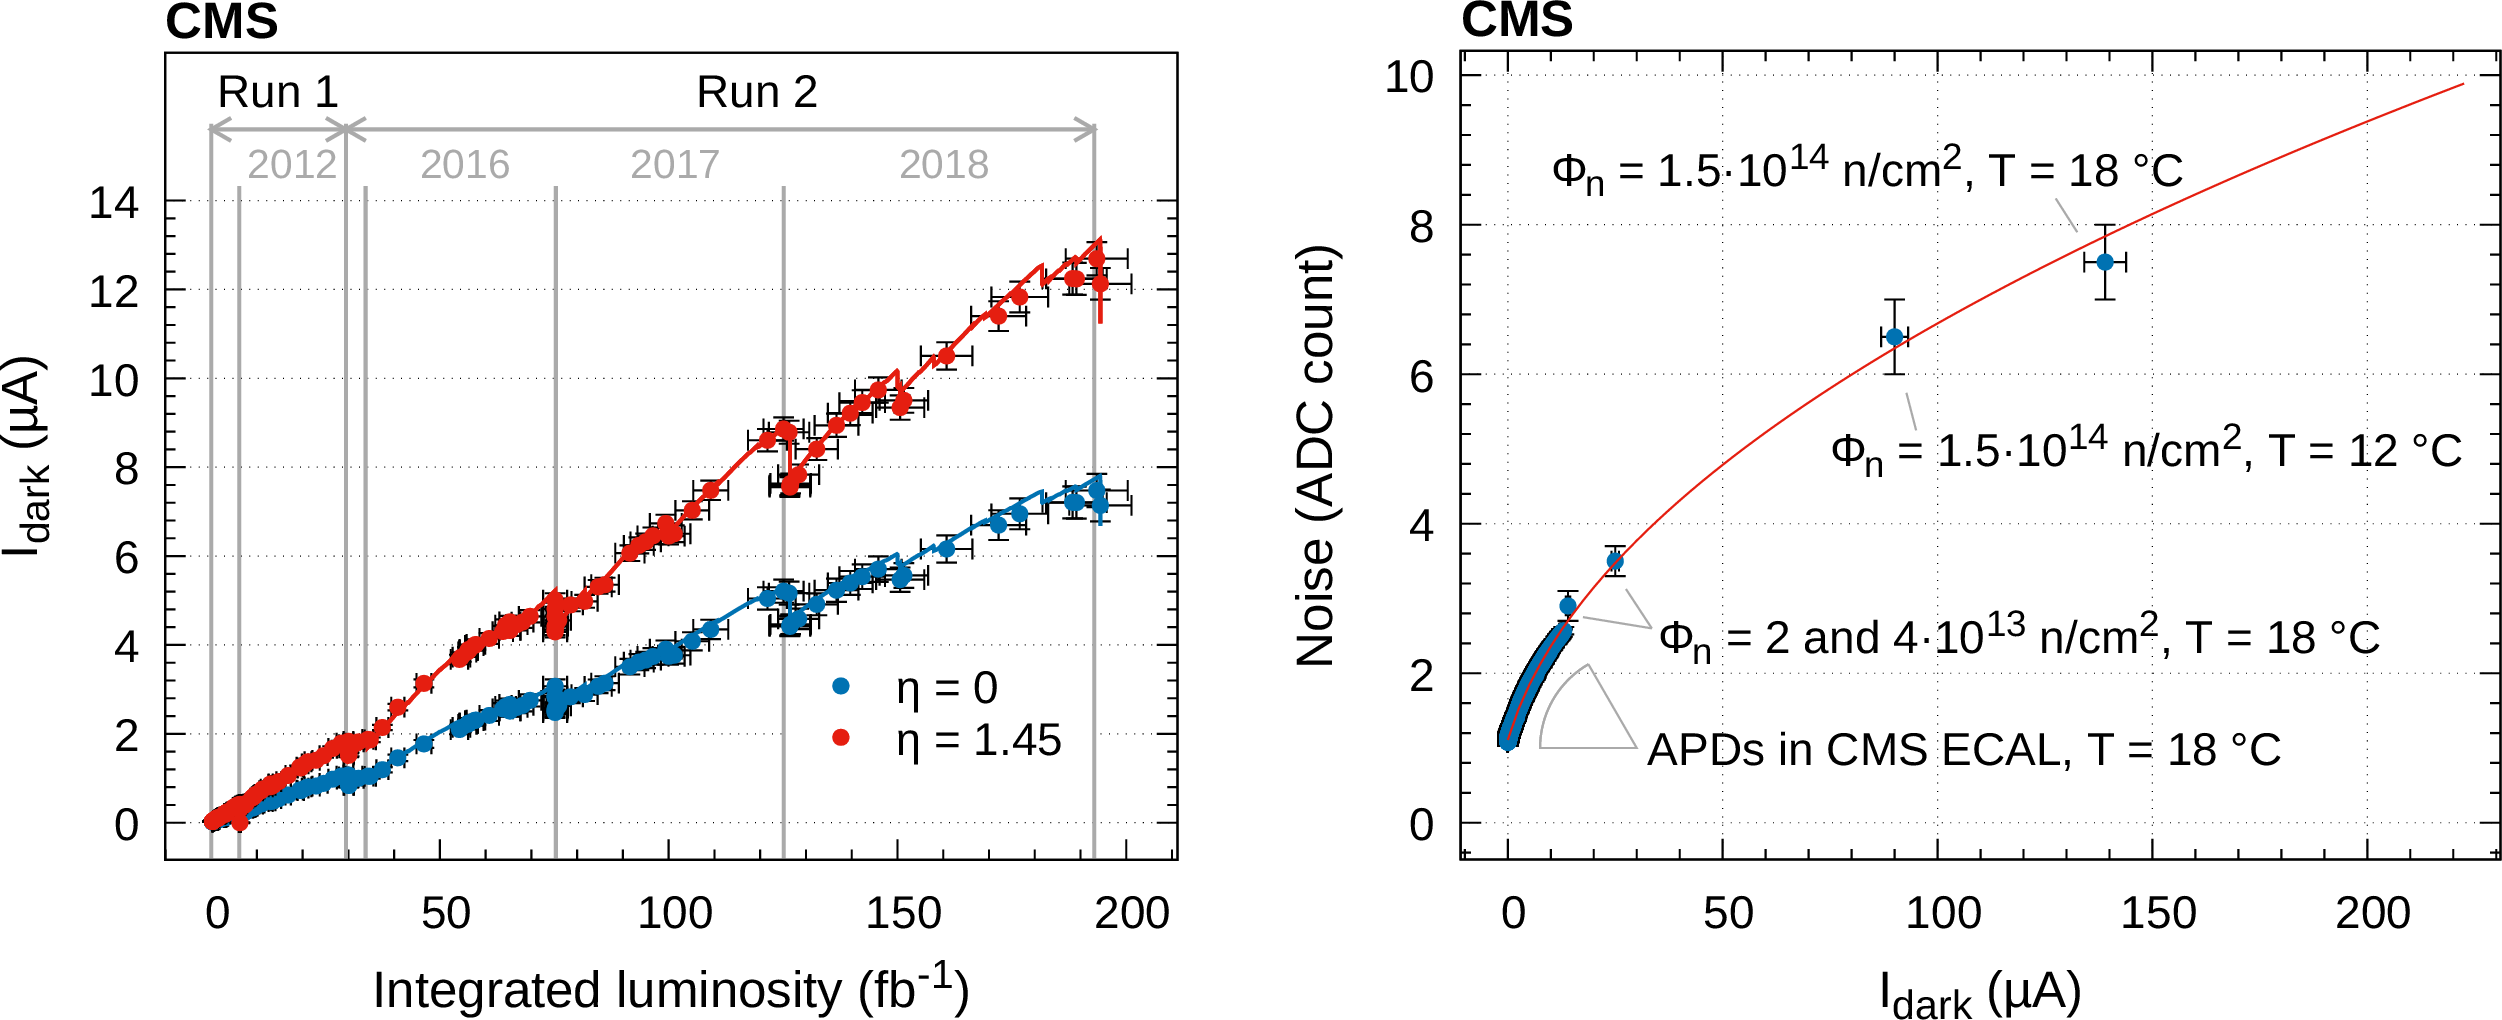
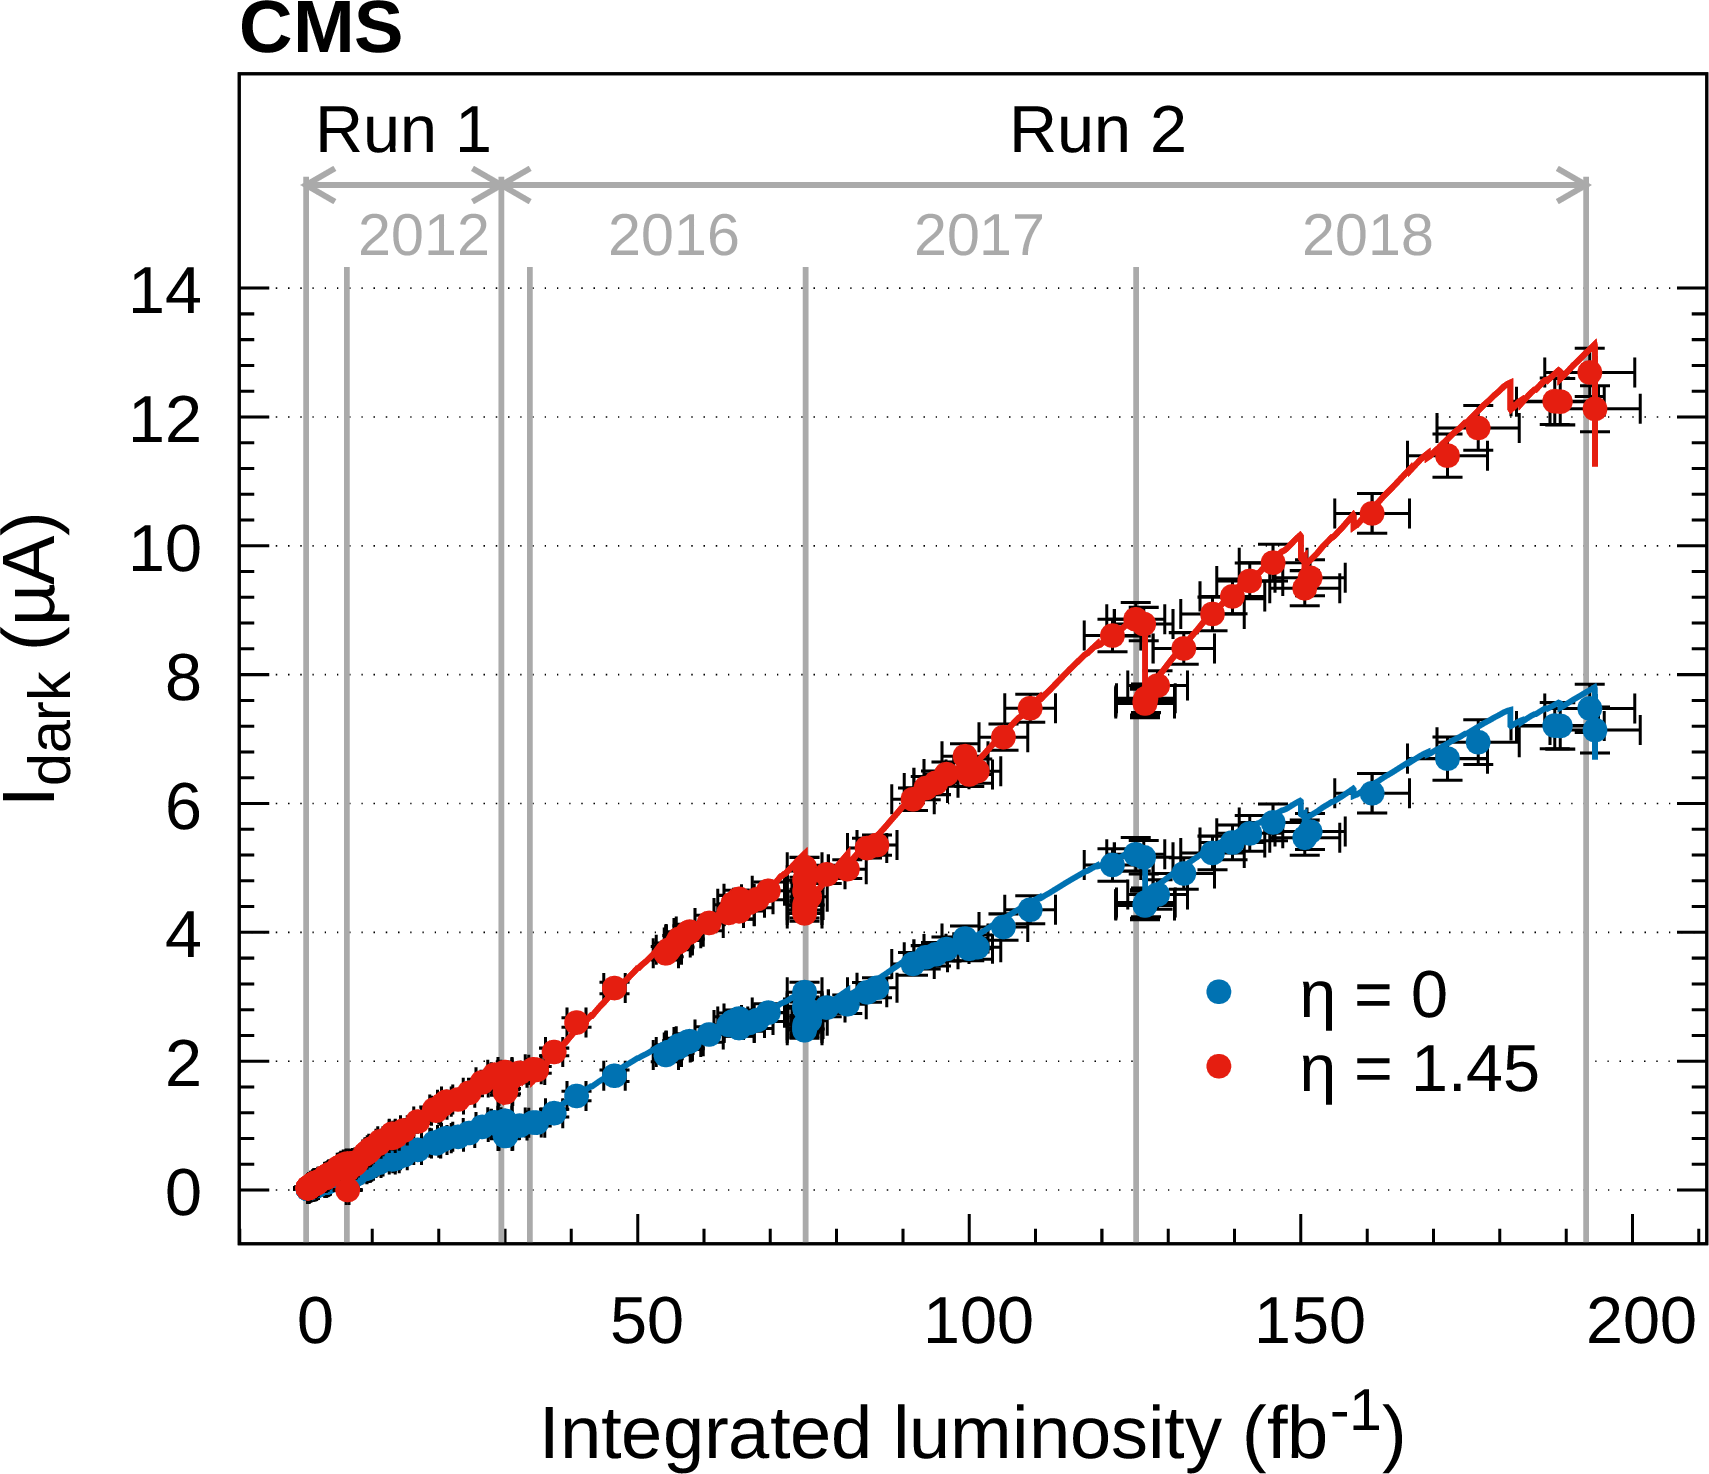
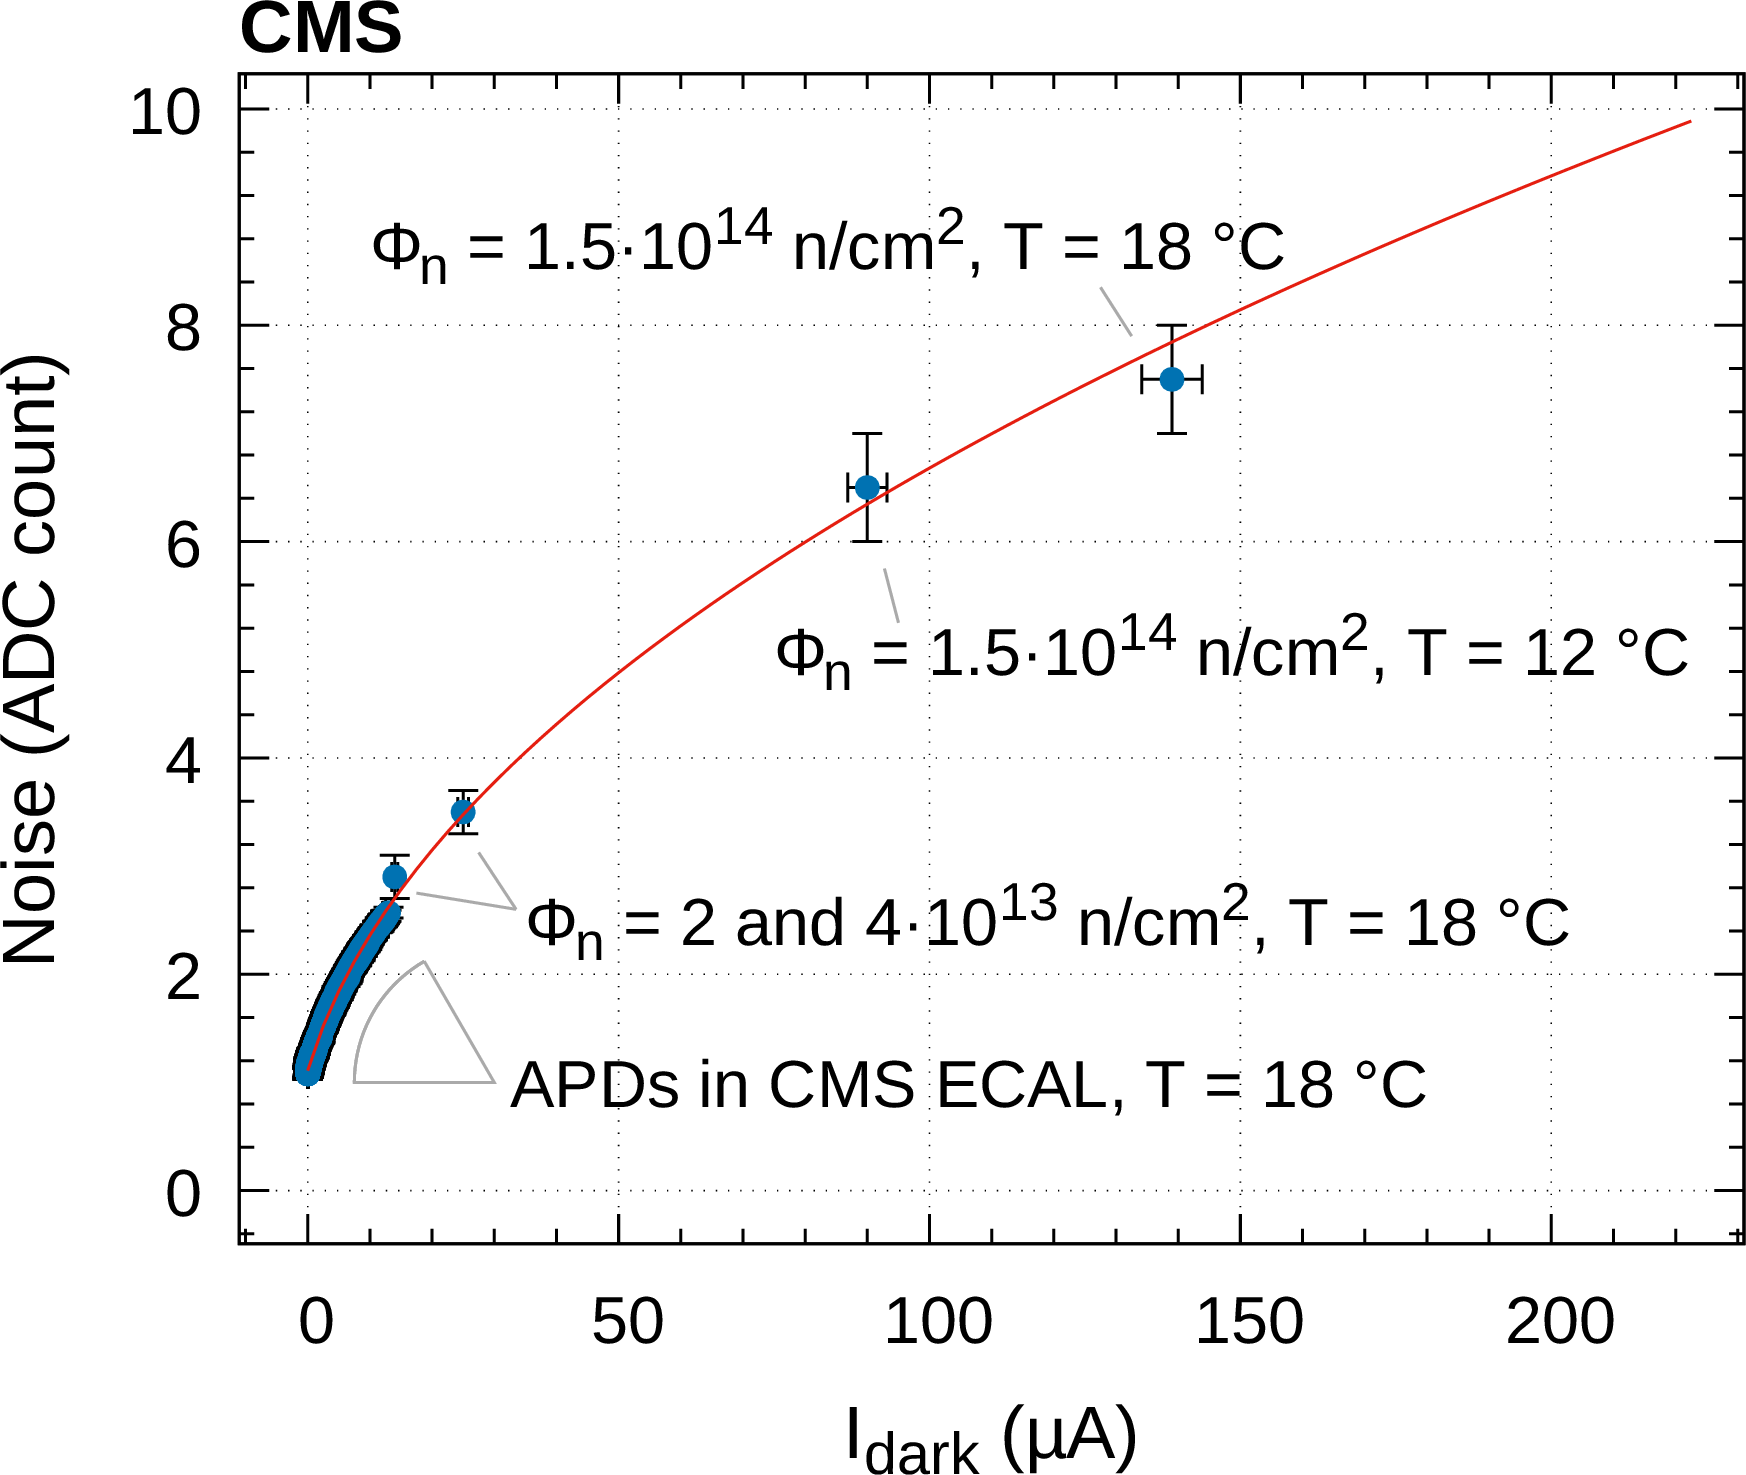
Left: evolution of the APD dark current as a function of the integrated luminosity since the beginning of Run 1. The gray vertical lines represent the ends of the Run 1 and Run 2 data-taking periods. Spontaneous annealing of the radiation-induced defects is visible as vertical steps in the measurements and corresponds to long stops in the data taking, e.g., year-end technical stops. Right: measurement of the electronic noise in the most sensitive amplification range as a function of the measured leakage current of an APD pair. The measurements are explained in the text. The pink line is a fit to the data with a square root function. The maximum expected fluence for Run 3 is 4 $ \times $ 10$ ^{13}$ $\mathrm{n}_{\mathrm{eq} }$/cm$^2 $ at $ |\eta|= $ 1.45. |
png pdf |
Figure 15-a:
Evolution of the APD dark current as a function of the integrated luminosity since the beginning of Run 1. The gray vertical lines represent the ends of the Run 1 and Run 2 data-taking periods. Spontaneous annealing of the radiation-induced defects is visible as vertical steps in the measurements and corresponds to long stops in the data taking, e.g., year-end technical stops. |
png pdf |
Figure 15-b:
Measurement of the electronic noise in the most sensitive amplification range as a function of the measured leakage current of an APD pair. The measurements are explained in the text. The pink line is a fit to the data with a square root function. The maximum expected fluence for Run 3 is 4 $ \times $ 10$ ^{13}$ $\mathrm{n}_{\mathrm{eq} }$/cm$^2 $ at $ |\eta|= $ 1.45. |

png pdf |
Figure 16:
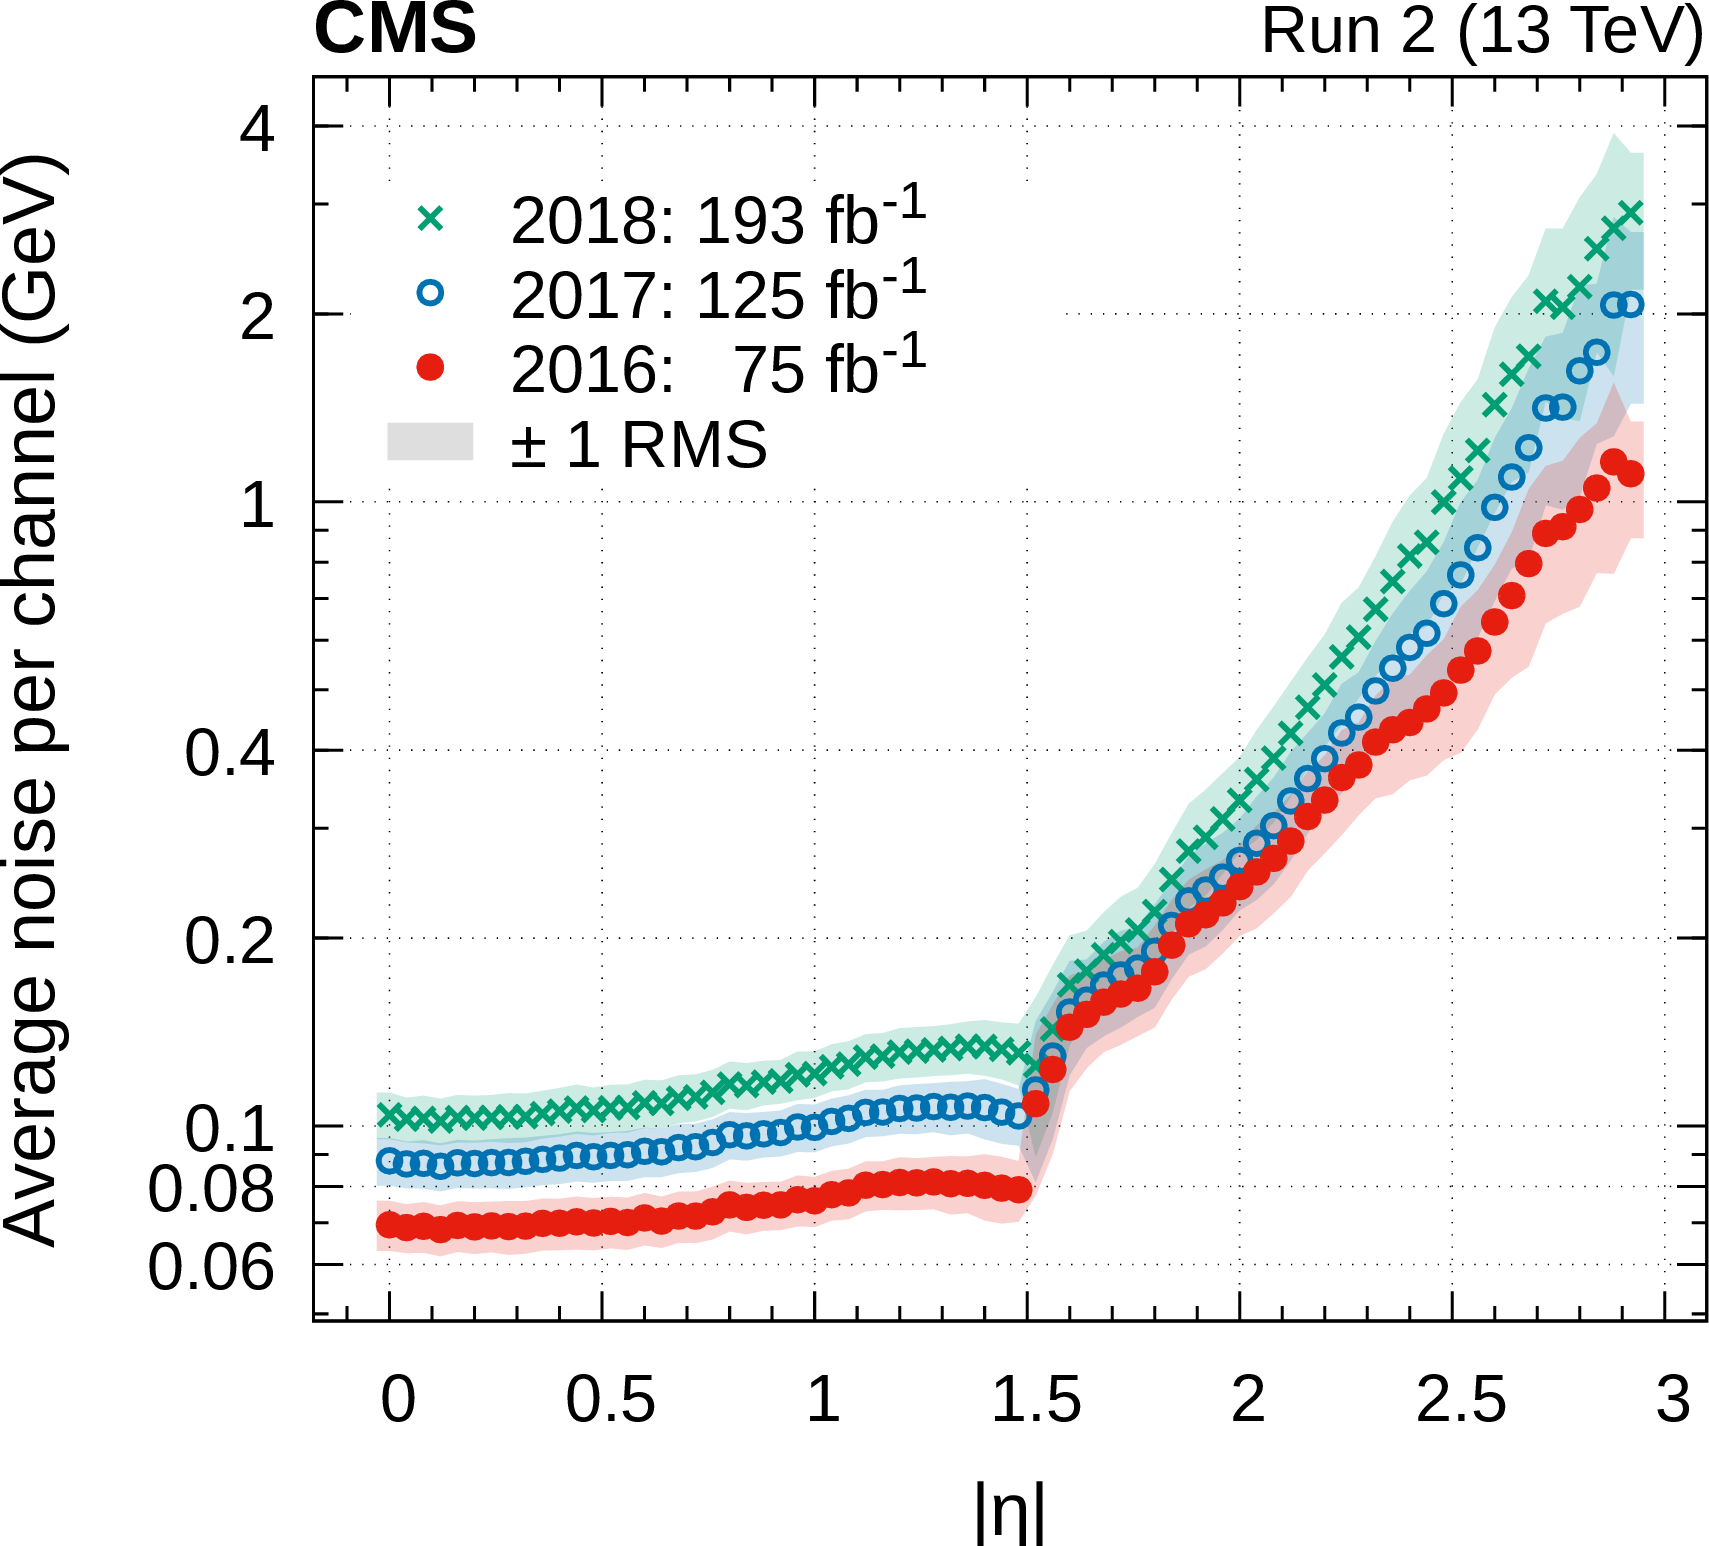
Average noise per channel as extracted from data using variations (RMS) of the signal baseline at the end of each year of Run 2 data taking. The amplitude RMS is converted into an energy equivalent (left) and a transverse-energy equivalent (right). The integrated luminosity accumulated since the start of Run 1 is indicated. The spread of the equivalent noise at a given pseudorapidity is indicated by the light-colored bands. |
png pdf |
Figure 16-a:
Average noise per channel as extracted from data using variations (RMS) of the signal baseline at the end of each year of Run 2 data taking. The amplitude RMS is converted into an energy equivalent. The integrated luminosity accumulated since the start of Run 1 is indicated. The spread of the equivalent noise at a given pseudorapidity is indicated by the light-colored bands. |

png pdf |
Figure 16-b:
Average noise per channel as extracted from data using variations (RMS) of the signal baseline at the end of each year of Run 2 data taking. The amplitude RMS is converted into a transverse-energy equivalent. The integrated luminosity accumulated since the start of Run 1 is indicated. The spread of the equivalent noise at a given pseudorapidity is indicated by the light-colored bands. |
png pdf |
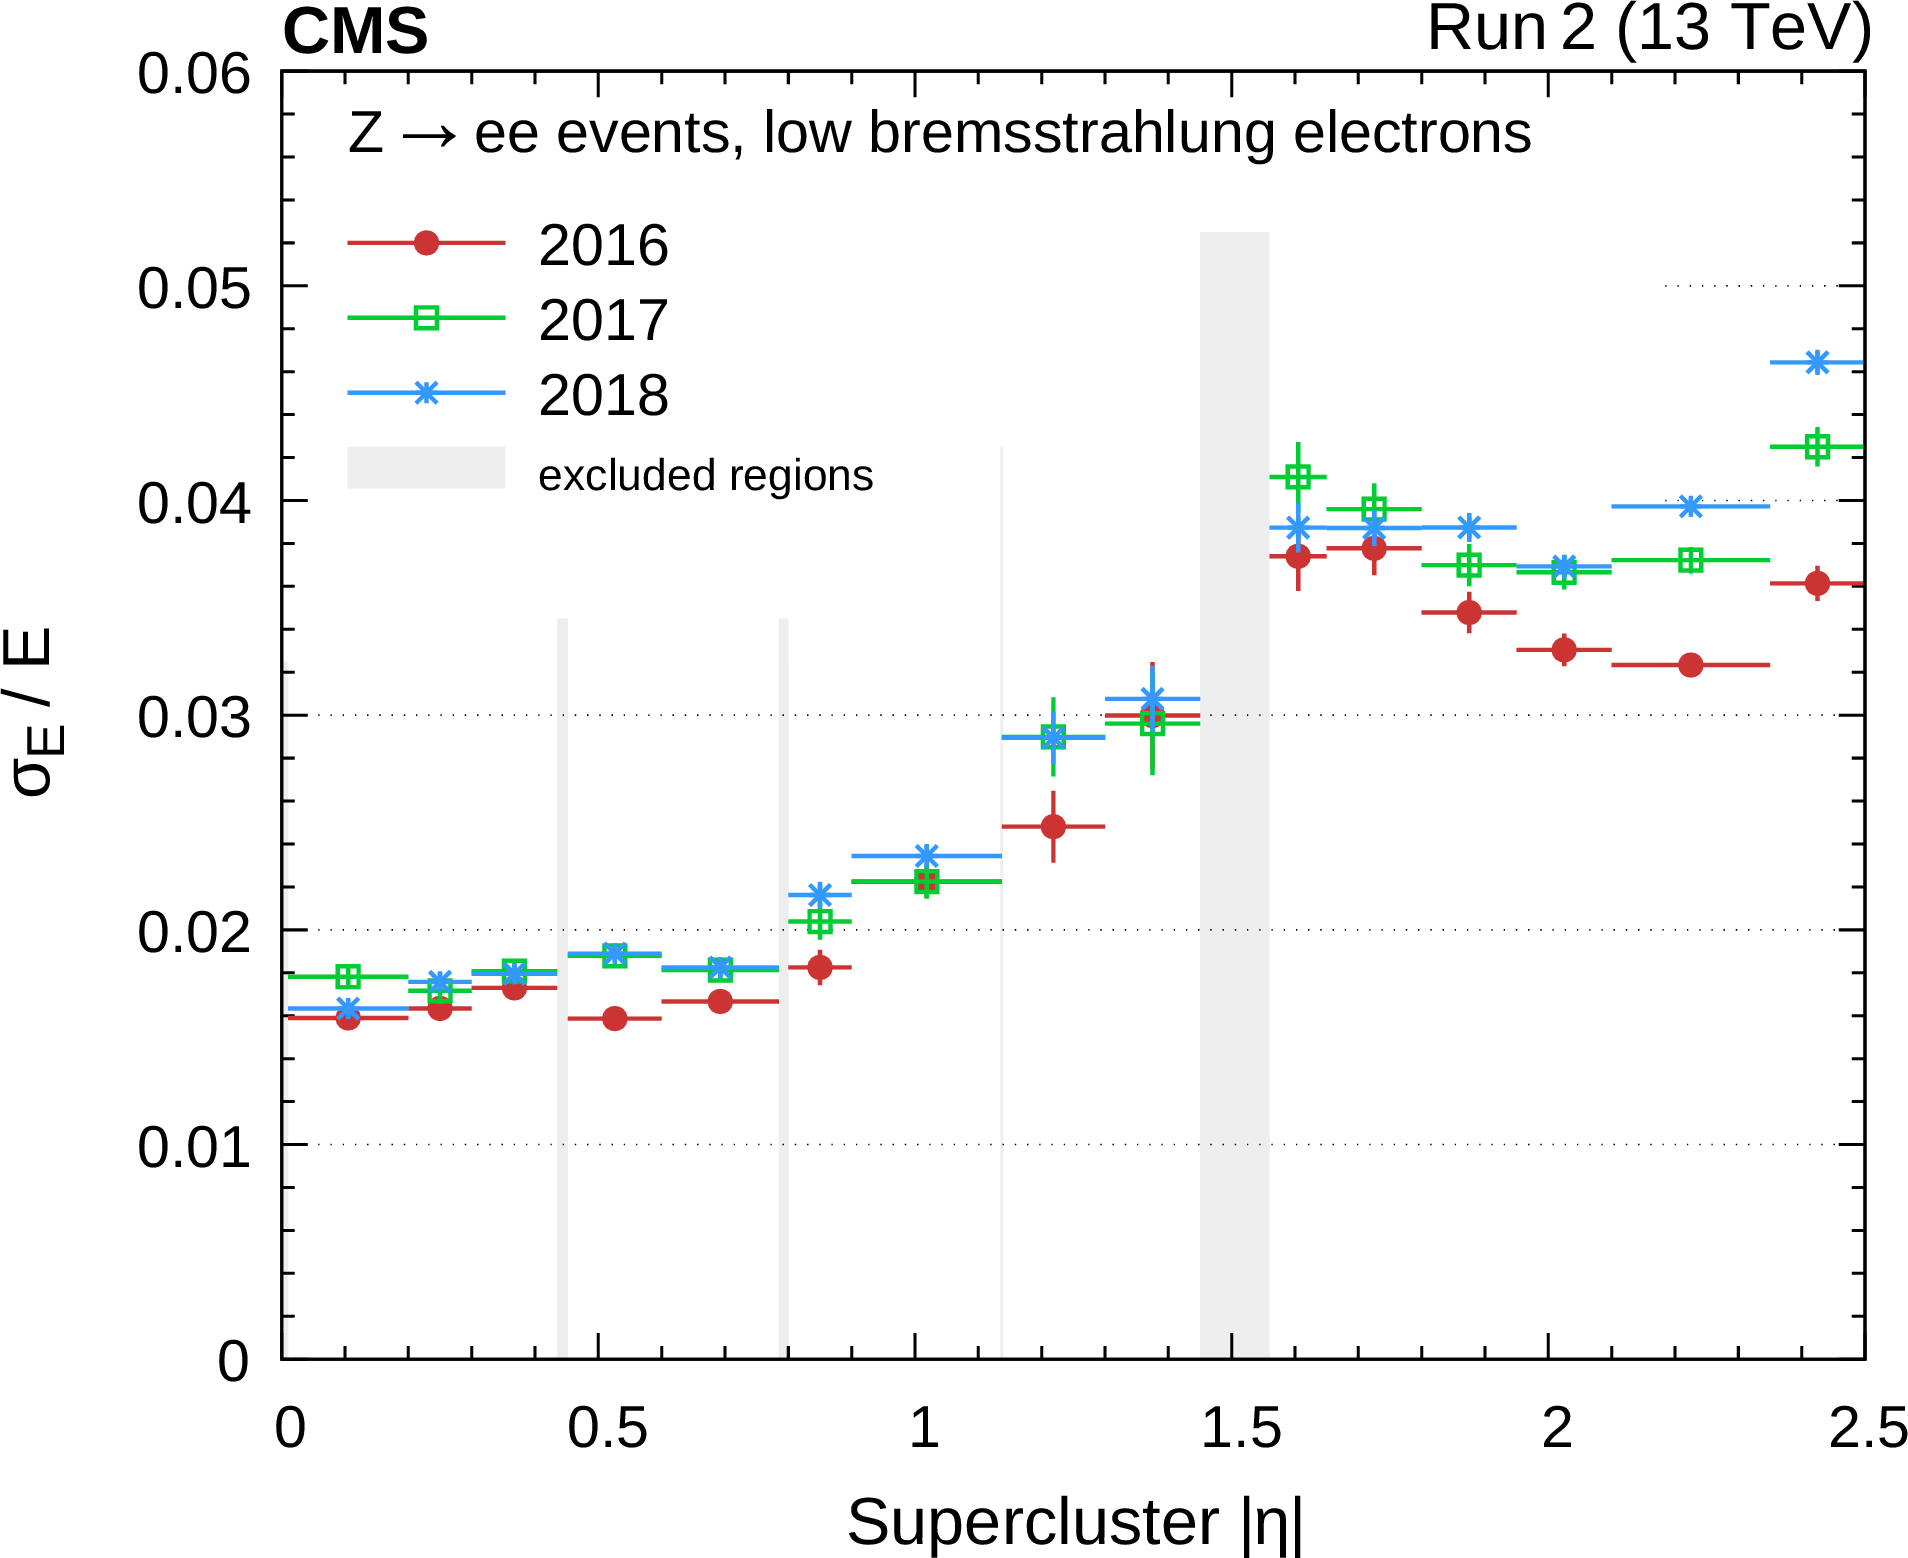
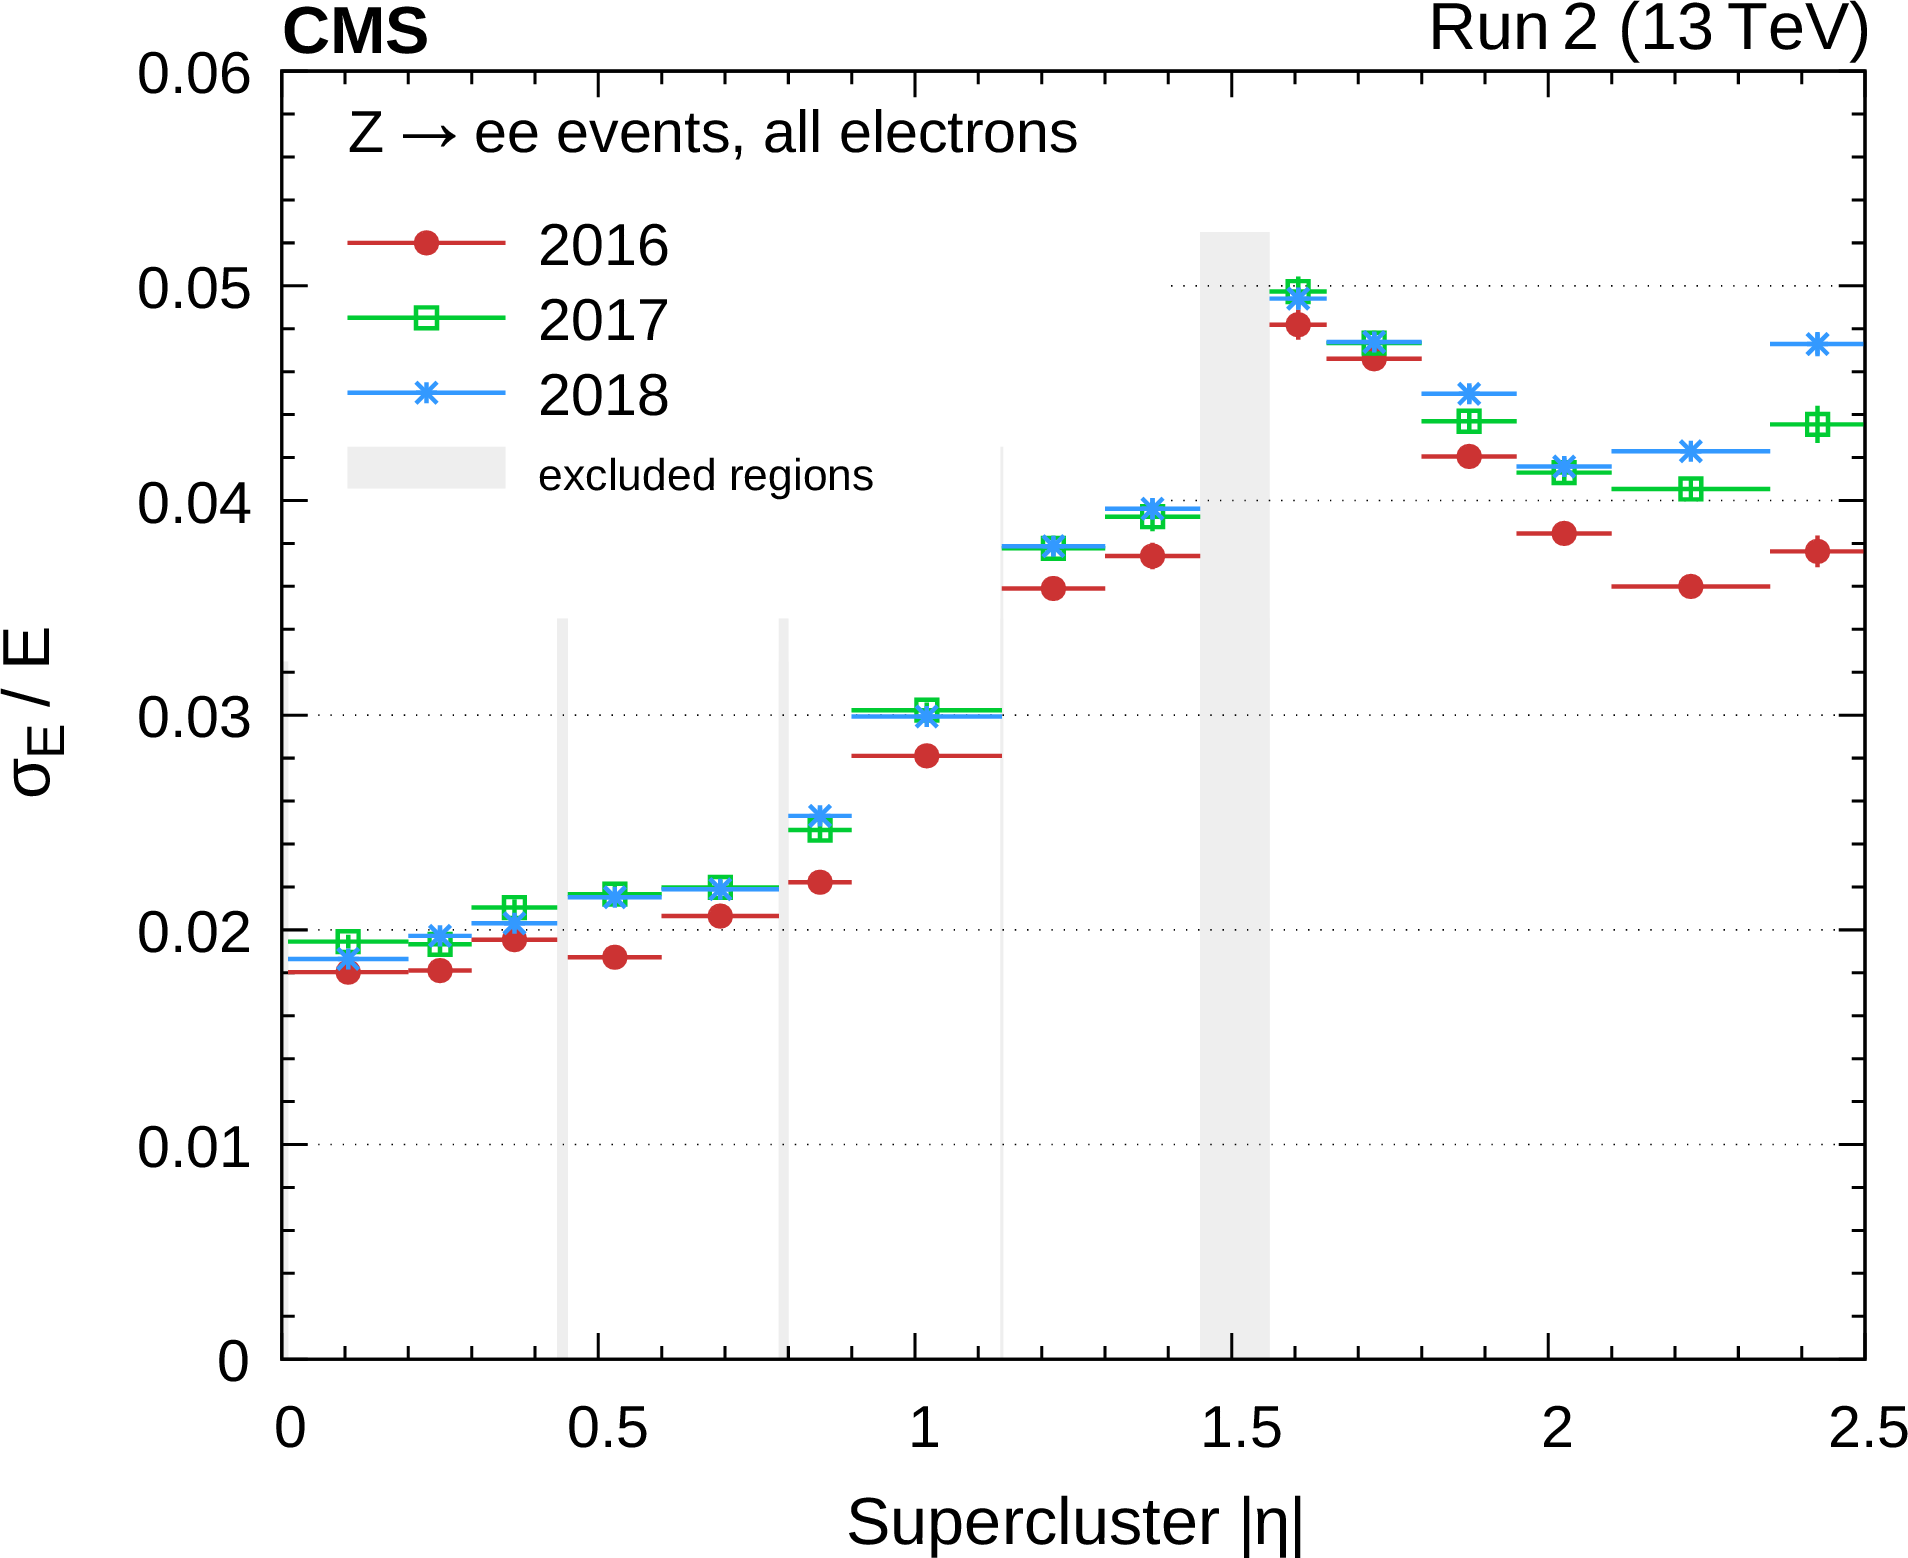
Figure 17:
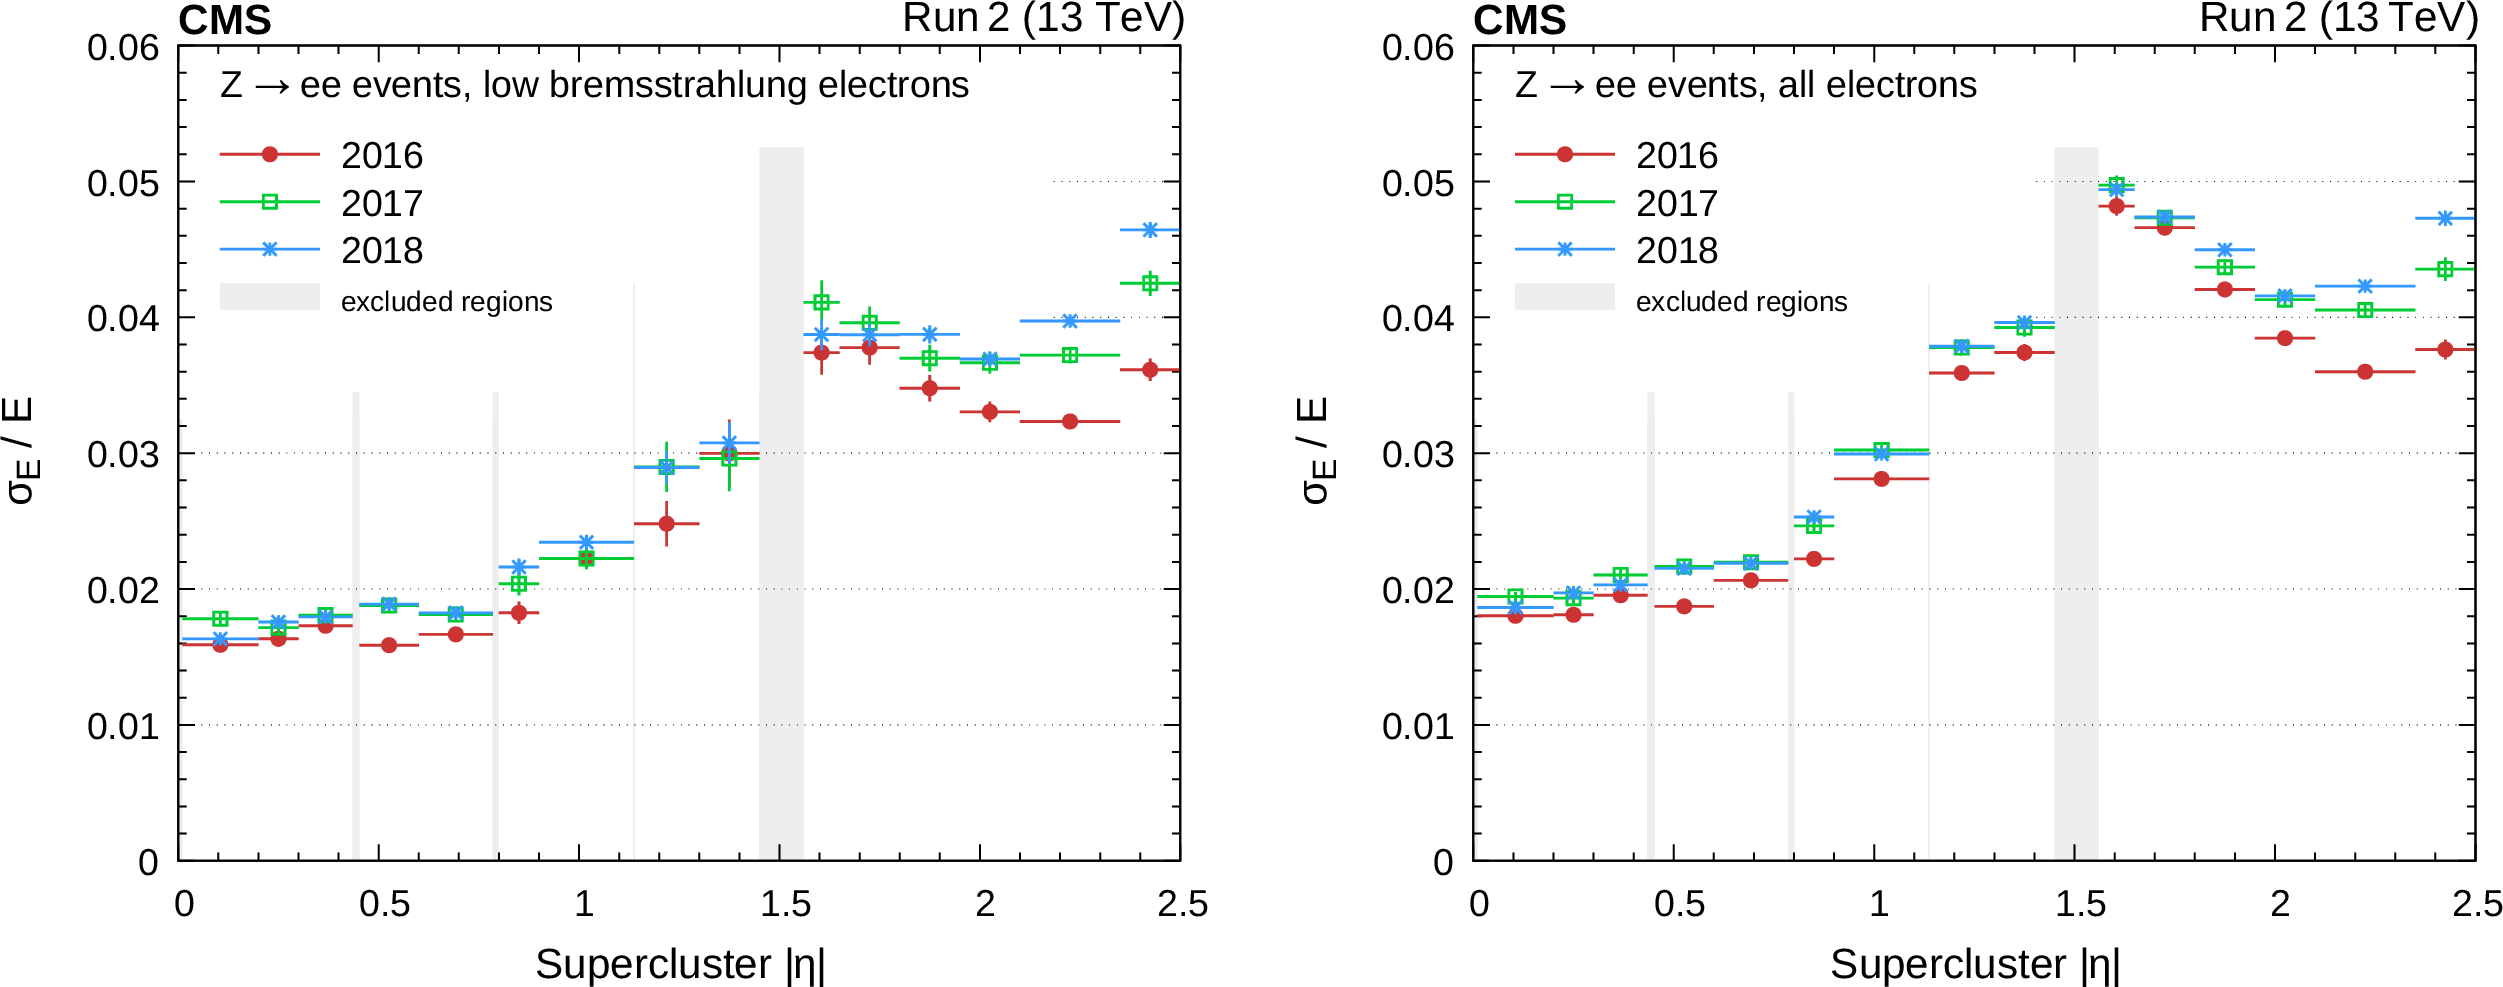
ECAL resolution for electrons having low bremsstrahlung emissions (left) and for an inclusive selection of electrons (right). The horizontal bars show the bin width. |
png pdf |
Figure 17-a:
ECAL resolution for electrons having low bremsstrahlung emissions. The horizontal bars show the bin width. |
png pdf |
Figure 17-b:
ECAL resolution for an inclusive selection of electrons. The horizontal bars show the bin width. |
png pdf |
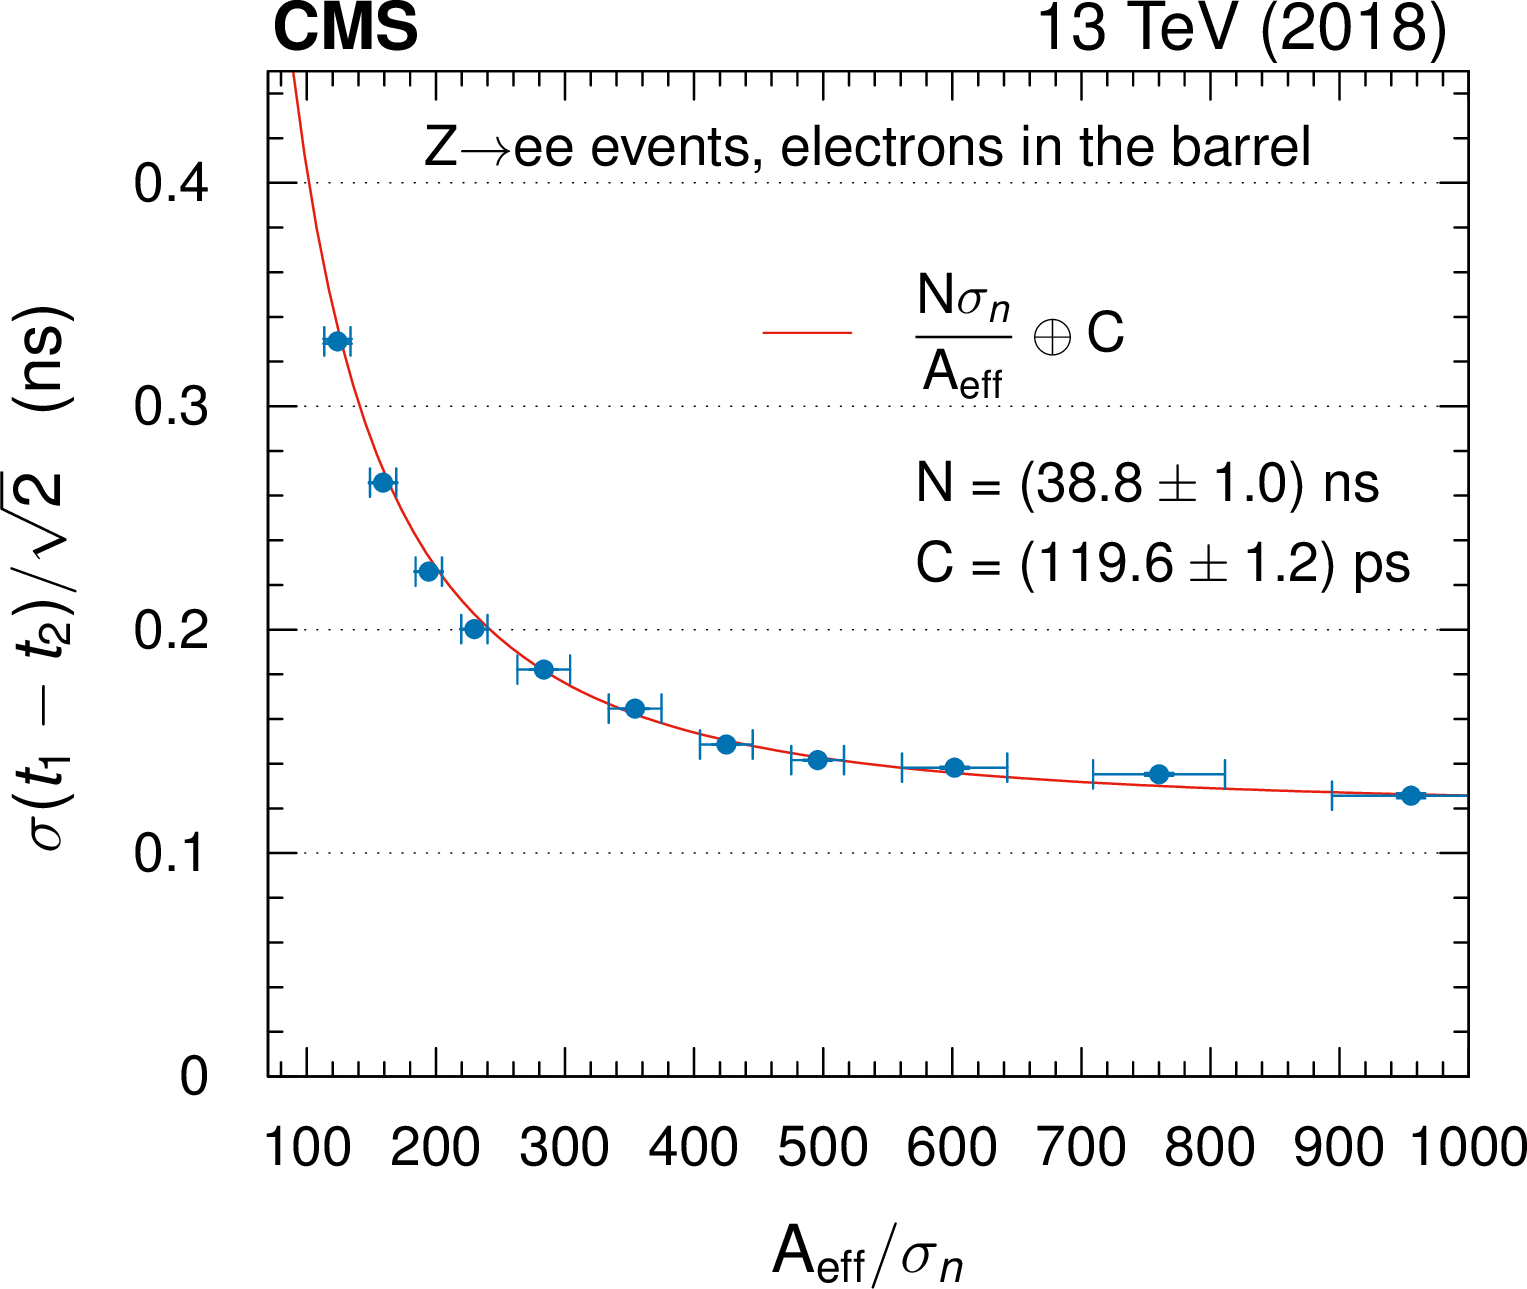
Figure 18:
ECAL timing resolution as measured from $ \mathrm{Z}\to\mathrm{e}\mathrm{e} $ events by comparing the arrival time of the two electrons. The performance has constantly improved over the years due to the frequency at which the synchronization constants have been updated, and is shown for 2018, the last year of Run 2. Updates in the constants are necessary to compensate for pulse shape changes induced by radiation. Vertical bars on the points showing the statistical uncertainties are too small to be seen in the plot. The red line correspond to a fit to the points with the parametrization of the resolution shown in the legend. |
png pdf |
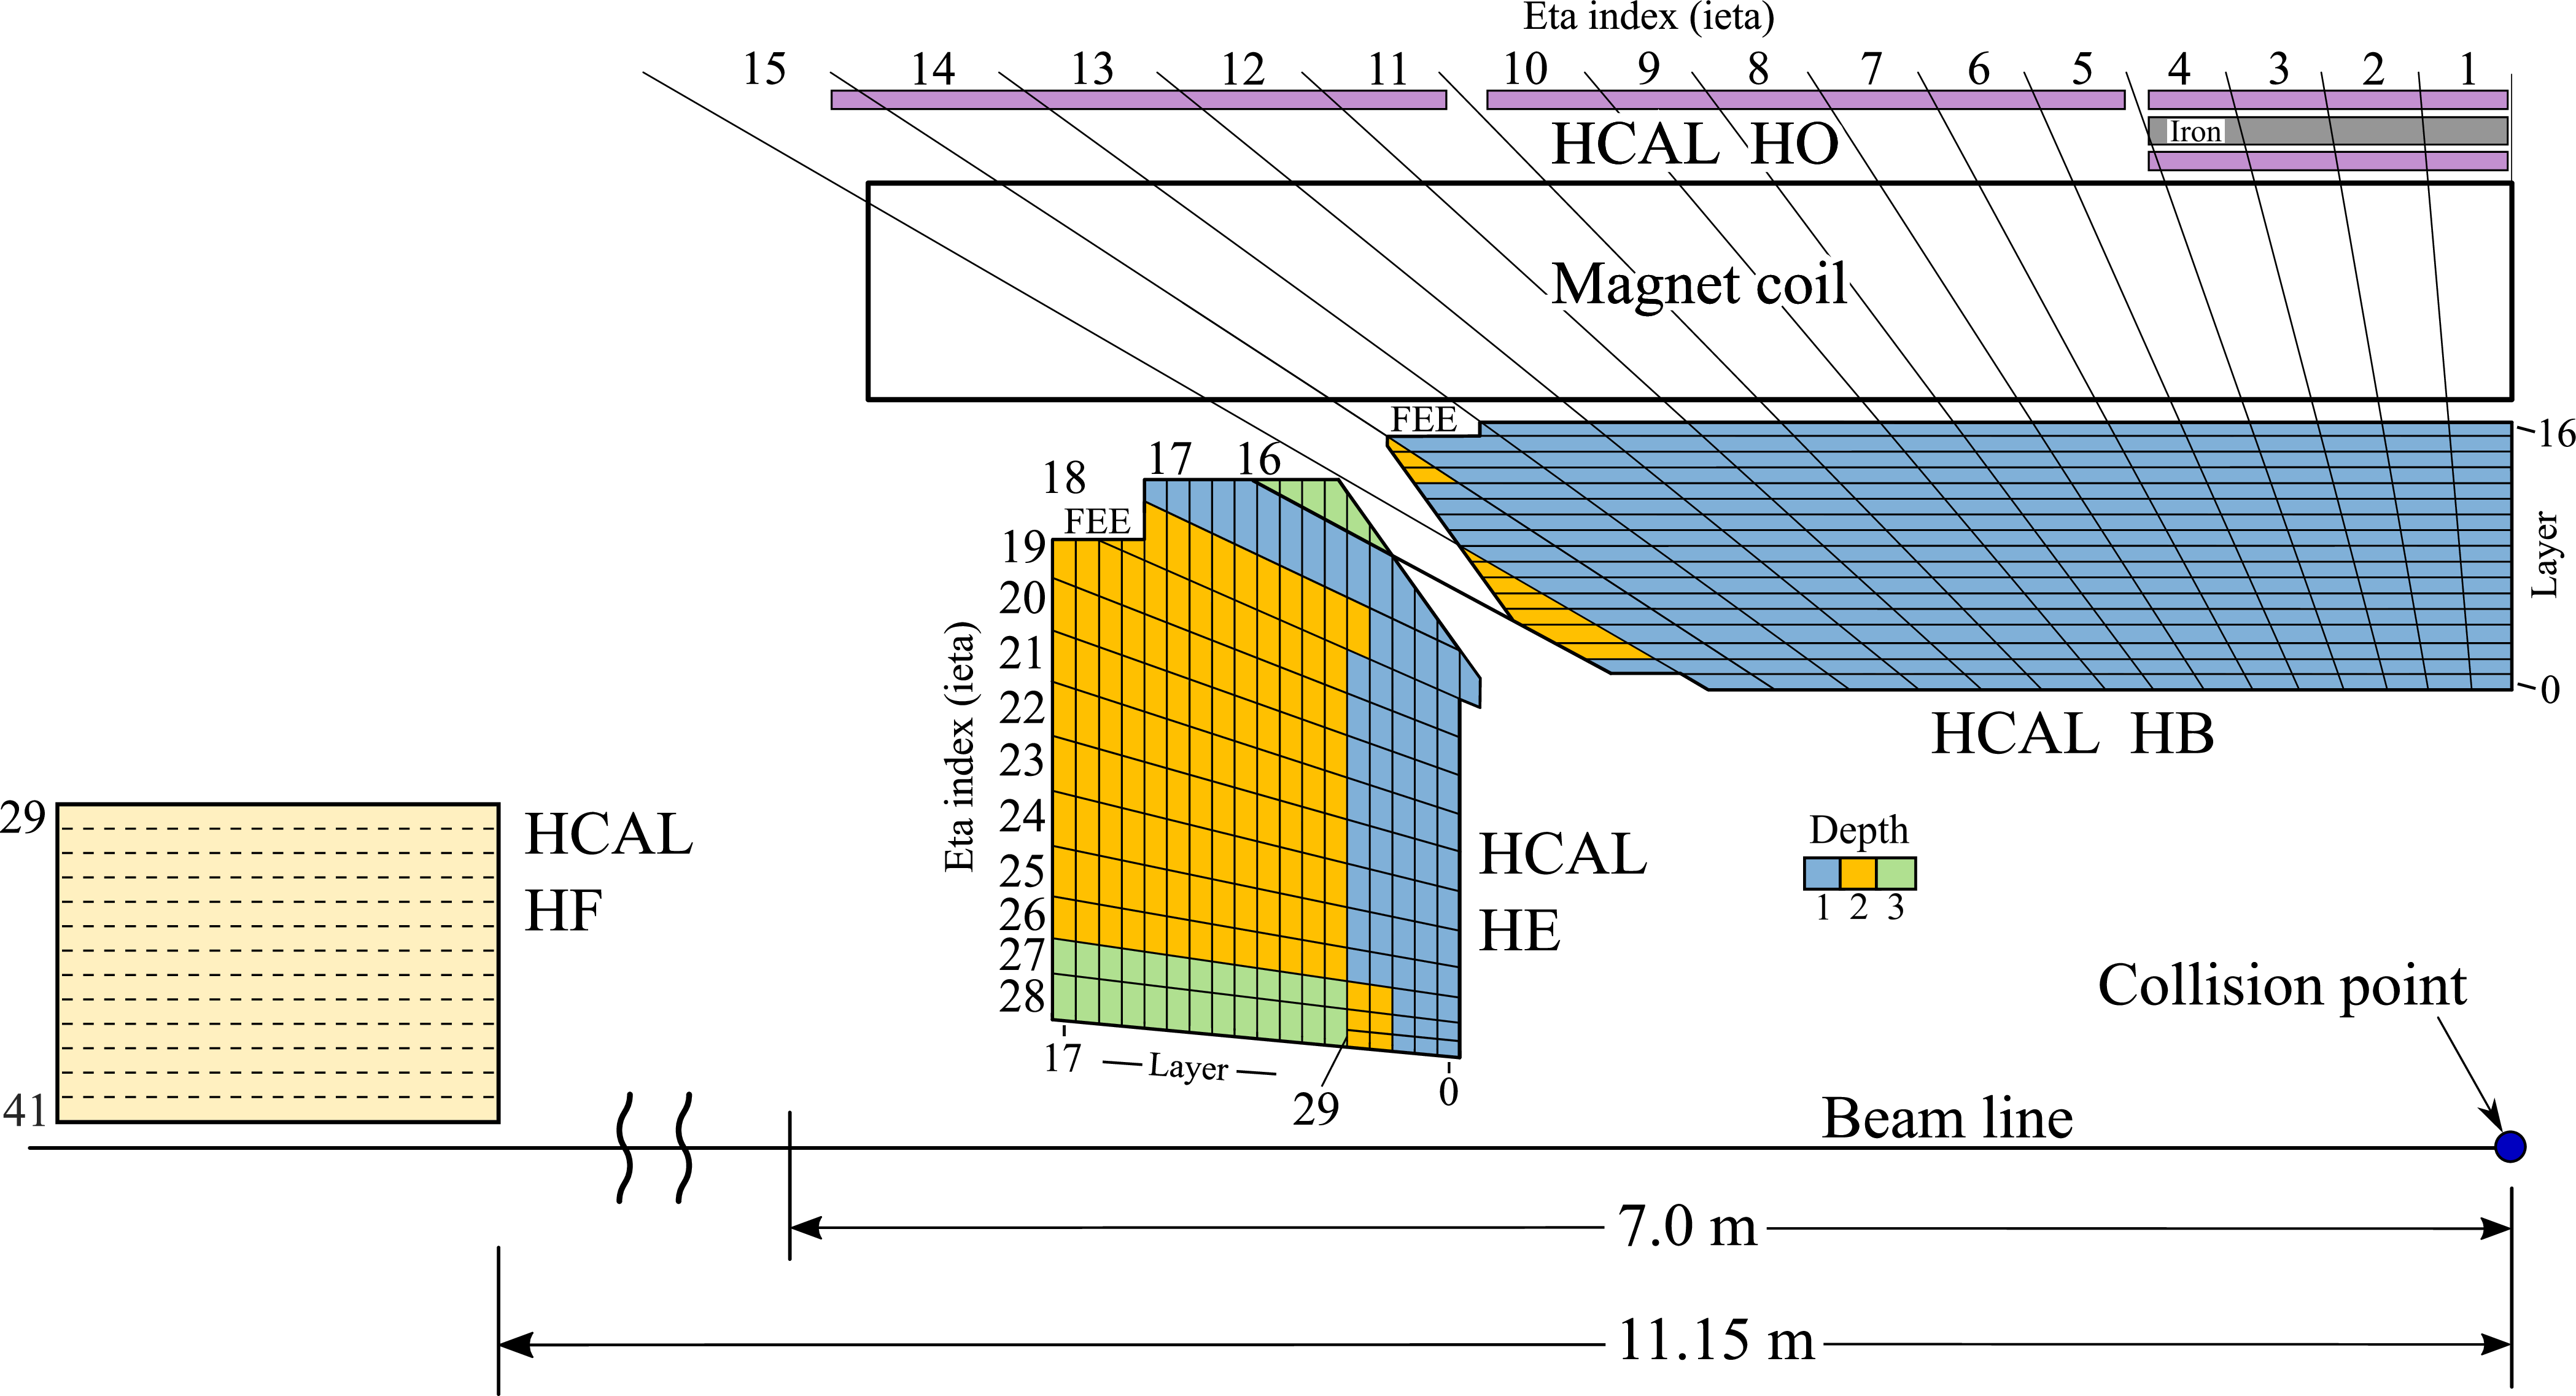
Figure 19:
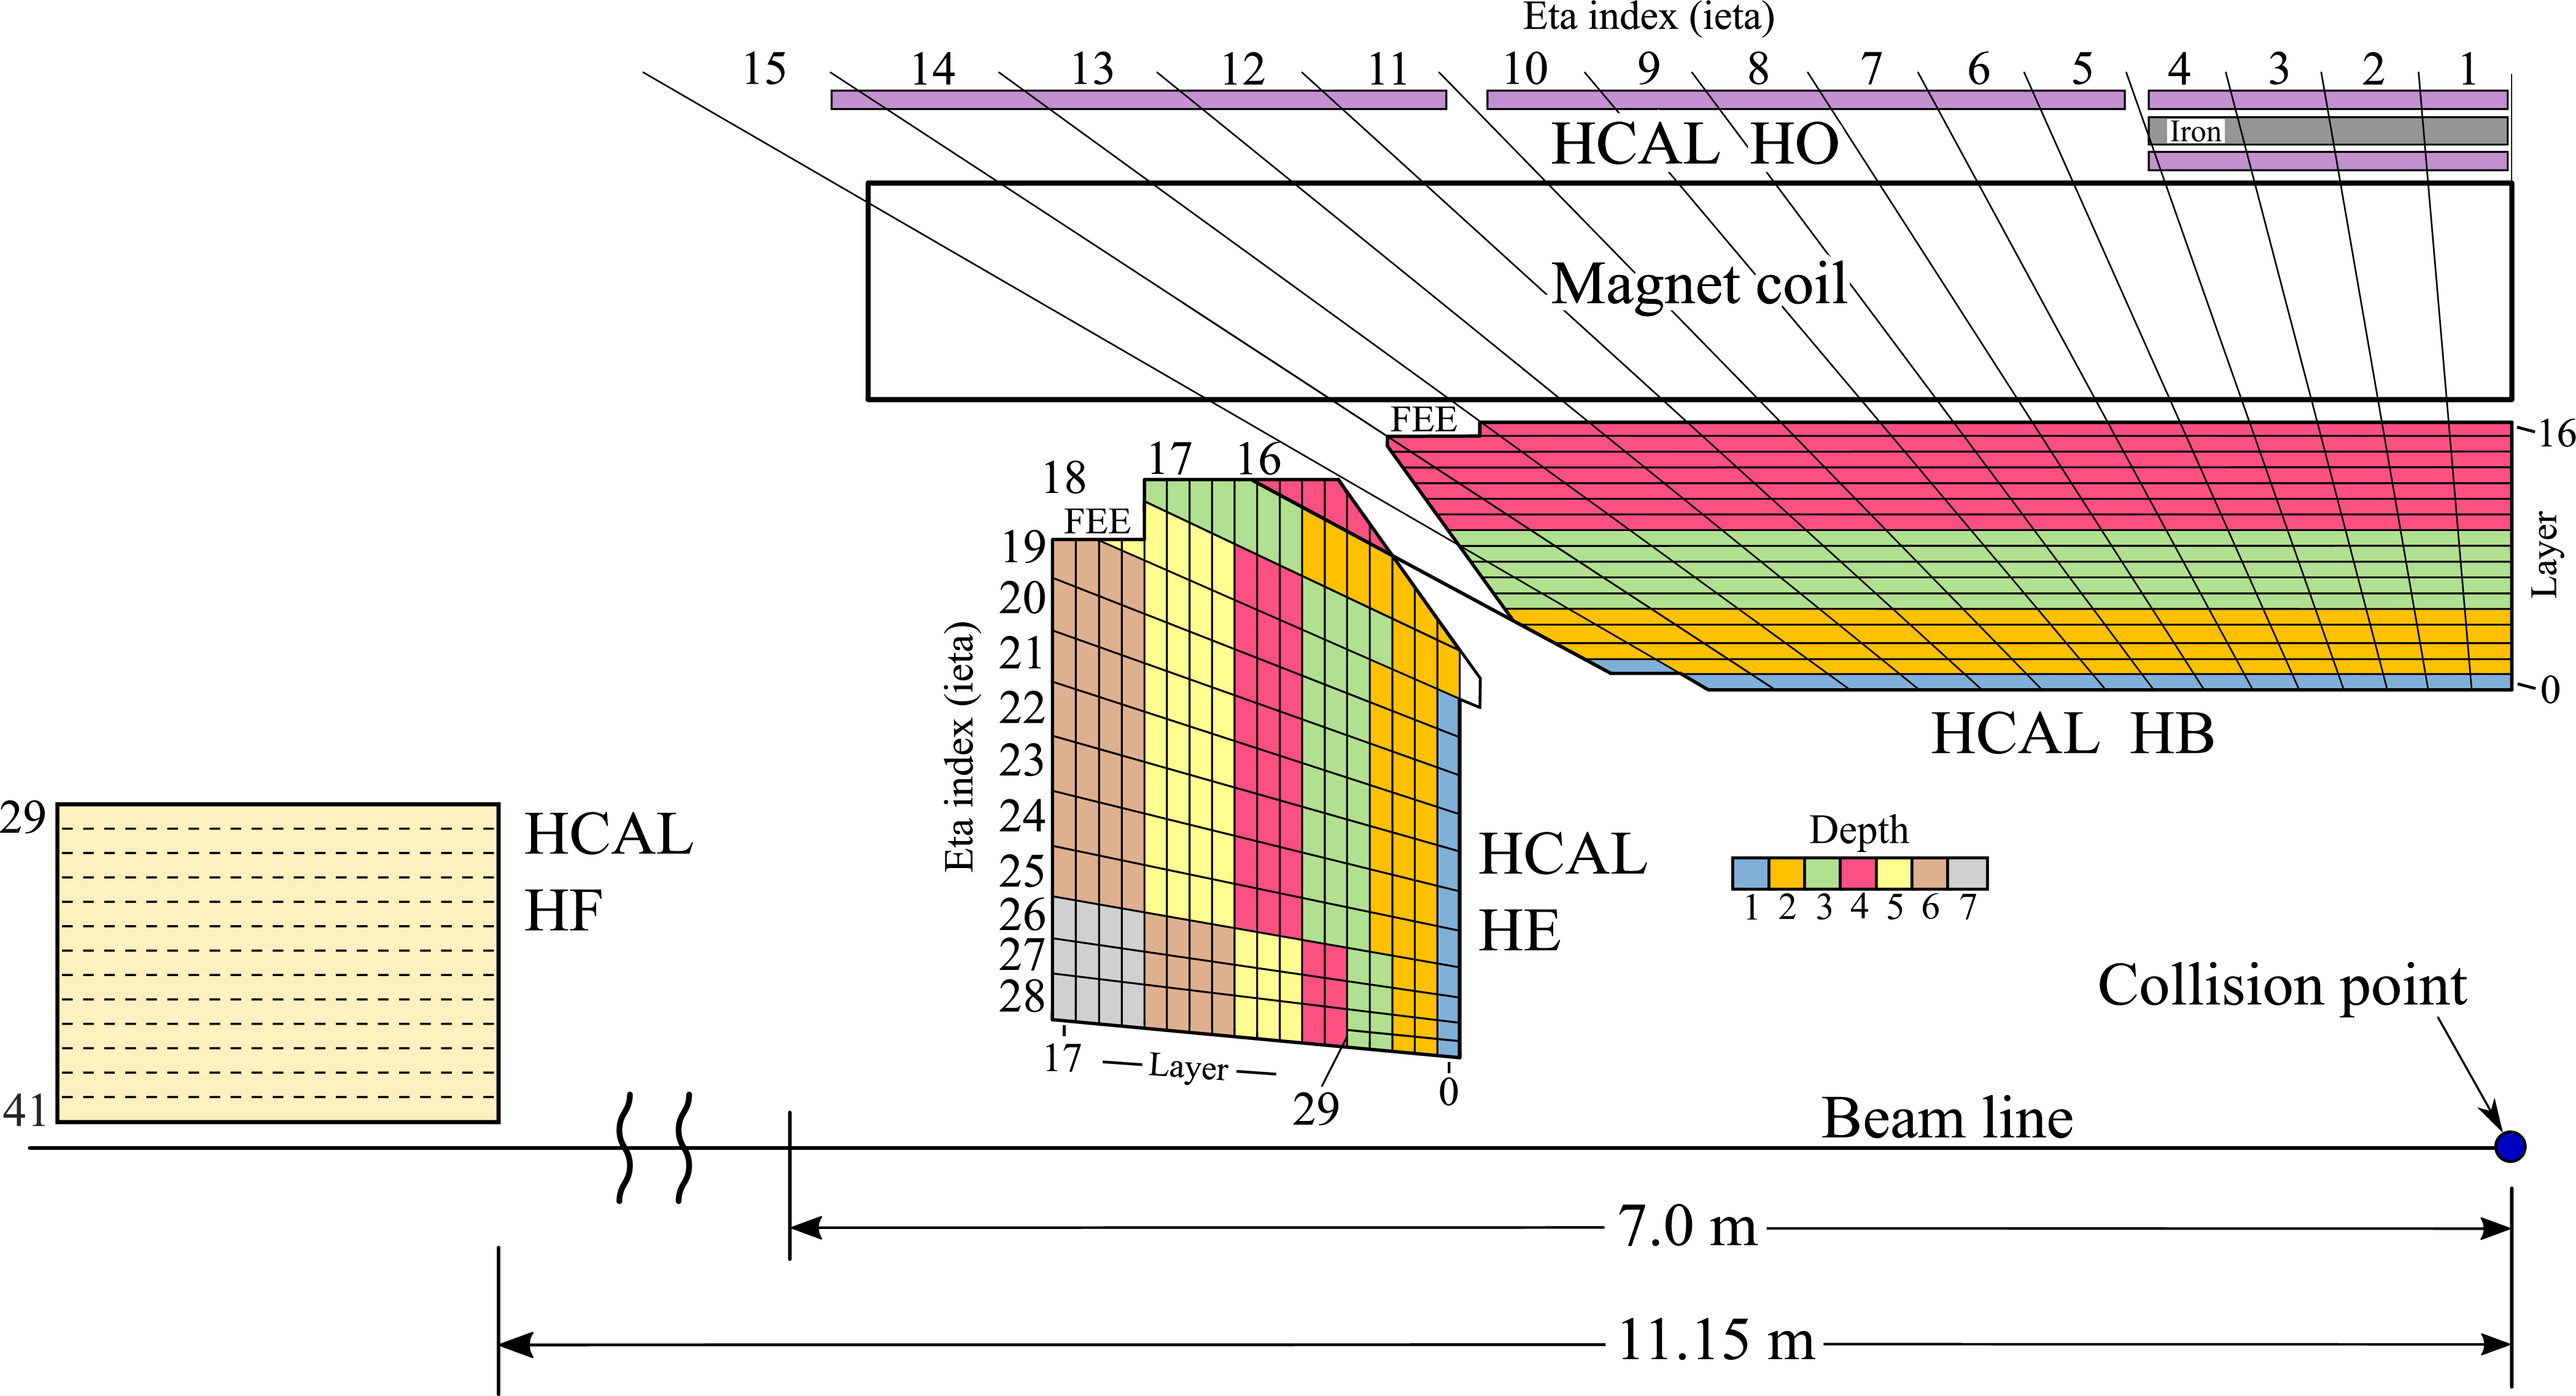
Schematic view of the HCAL as of 2016, showing the positions of its four major components: HB, HE, HO, and HF. The layers marked in blue are grouped together as ``depth 1,'' i.e., the signals from these layers of a given tower are optically summed and read out by a single photodetector. Similarly, the layers shown in yellow and green are combined as depths 2 and 3, respectively, and the layers shown in purple are combined for HO. The notation ``FEE'' denotes the locations of the HB and HE frontend electronics readout boxes. The solid black lines, roughly projective with the interaction point, denote the $ \eta $ divisions in the tower $ \eta $-$ \phi $ segmentation, and the numbers at the edge of the tower denote the ieta index. |
png pdf |
Figure 20:
Left: brass absorber for the hadron barrel calorimeter HB. Right: scintillating tiles with wavelength shifting fibers used as the active media in the barrel, endcap, and outer hadron calorimeters. |
png |
Figure 20-a:
Brass absorber for the hadron barrel calorimeter HB. |

png |
Figure 20-b:
Scintillating tiles with wavelength shifting fibers used as the active media in the barrel, endcap, and outer hadron calorimeters. |
png pdf |
Figure 21:
Physical arrangement of the scintillator and wavelength-shifting fibers into tiles for an HE megatile. |

png pdf |
Figure 22:
Schematic view of the CMS hadron forward calorimeter, HF. The yellow region represents the steel absorber with embedded quartz fibers; the grey shaded area to the left represents fibers which deliver the signals to light guides that penetrate the steel plug shielding; the white rectangle to the left of the light guides represents the frontend readout boxes, which house the photomultiplier tubes. The dimensions shown in the diagram are in millimeters. |
png pdf |
Figure 23:
Schematic diagram of the HCAL readout. The frontend electronics chain begins with analog signals from the HPDs, SiPMs, or PMTs. The HB and HE used HPDs prior to the Phase 1 upgrade and SiPMs after, while the HF uses PMTs. These signals are digitized by the QIE chips in the readout modules (RMs). The ``next-generation clock and control module'' (ngCCM) is part of the frontend control system. The digitized data are sent to the backend $\mu$HTRs ($ \mu $TCA HCAL trigger and readout cards). Data from multiple $\mu$HTRs are concentrated into the AMC13 cards and forwarded to the CMS central data acquisition (DAQ) system. The $ \mu $TCA cards also send data to the trigger system. The AMC13 cards also distribute the fast commands arriving from the CMS timing and control distribution system (TCDS) within each $ \mu $TCA crate. The detector control system (DCS) software communicates with the ``next-generation frontend controller'' (ngFEC). |
png pdf |
Figure 24:
The longitudinal and transverse HCAL segmentation for Run 3. Within a tower, layers with the same color are routed to the same SiPM. The location of the frontend electronics is indicated by the letters FEE. |
png pdf |
Figure 25:
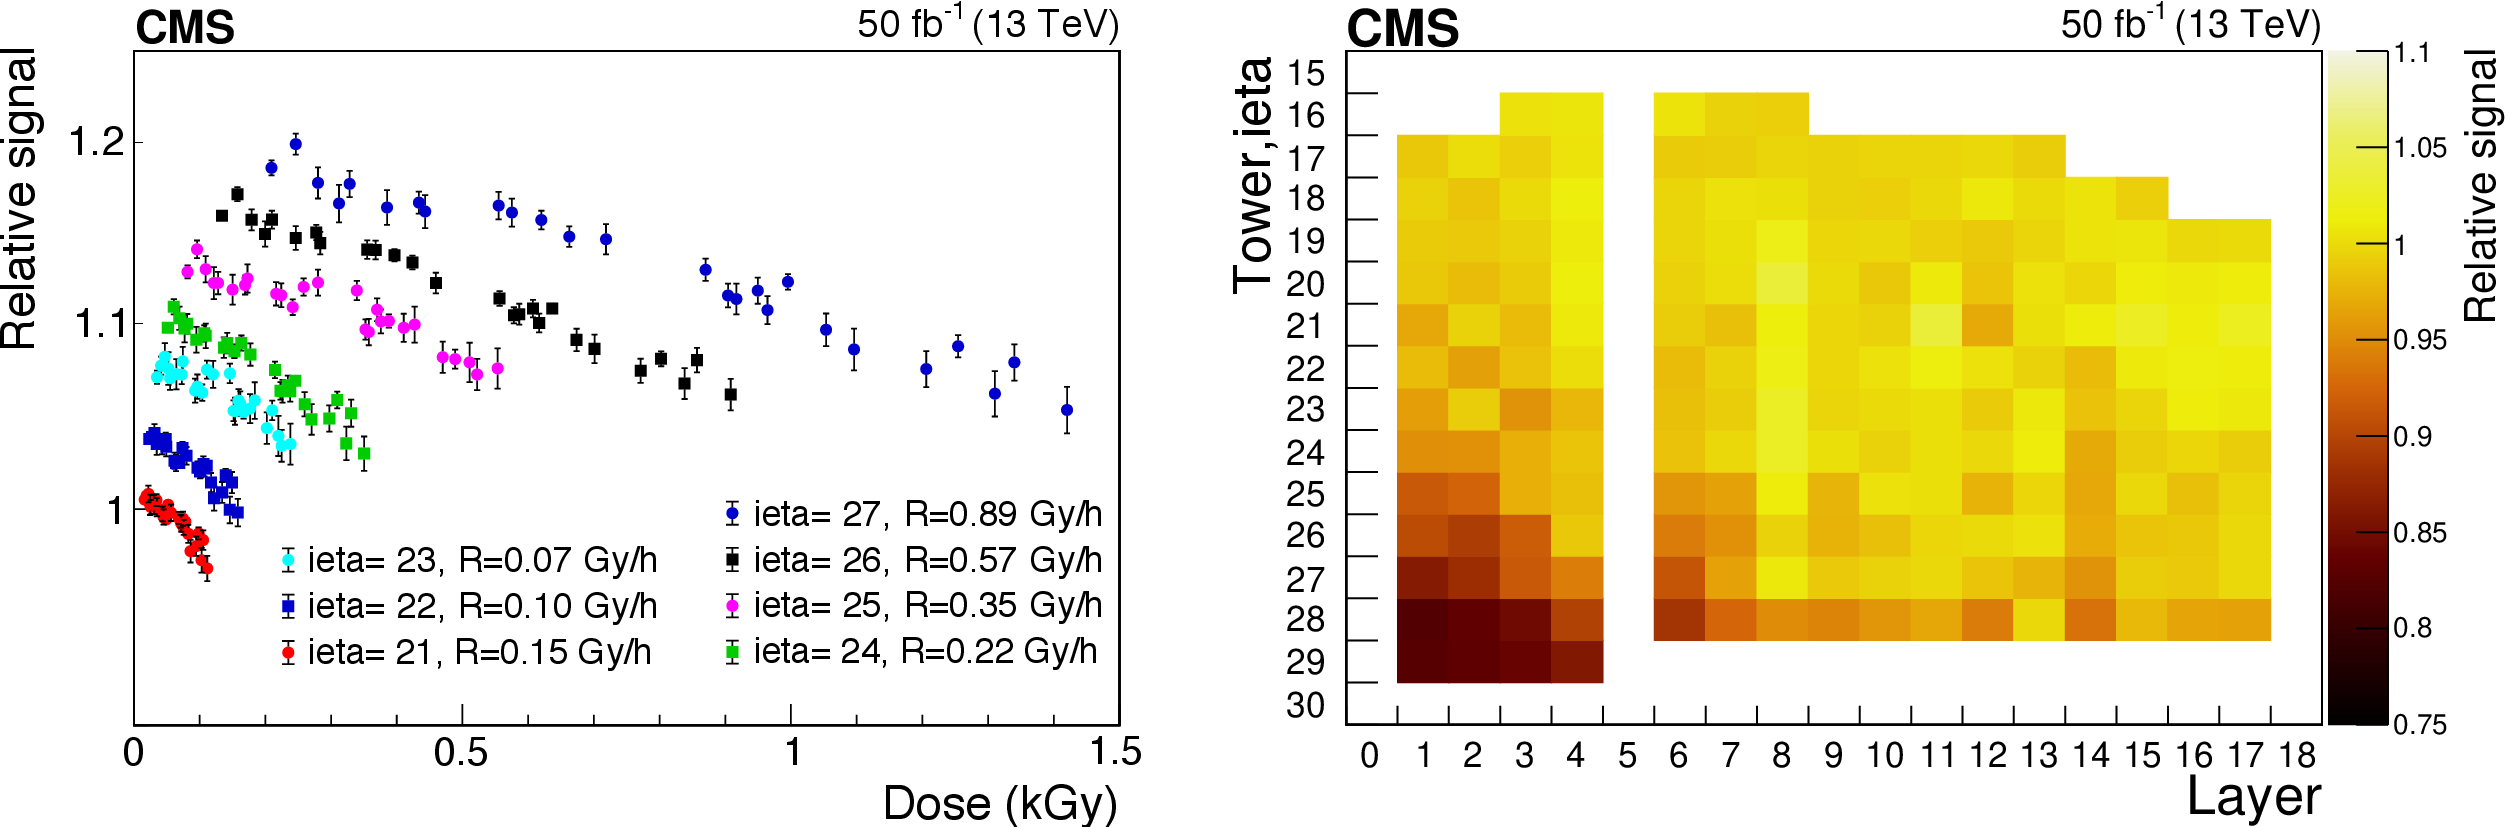
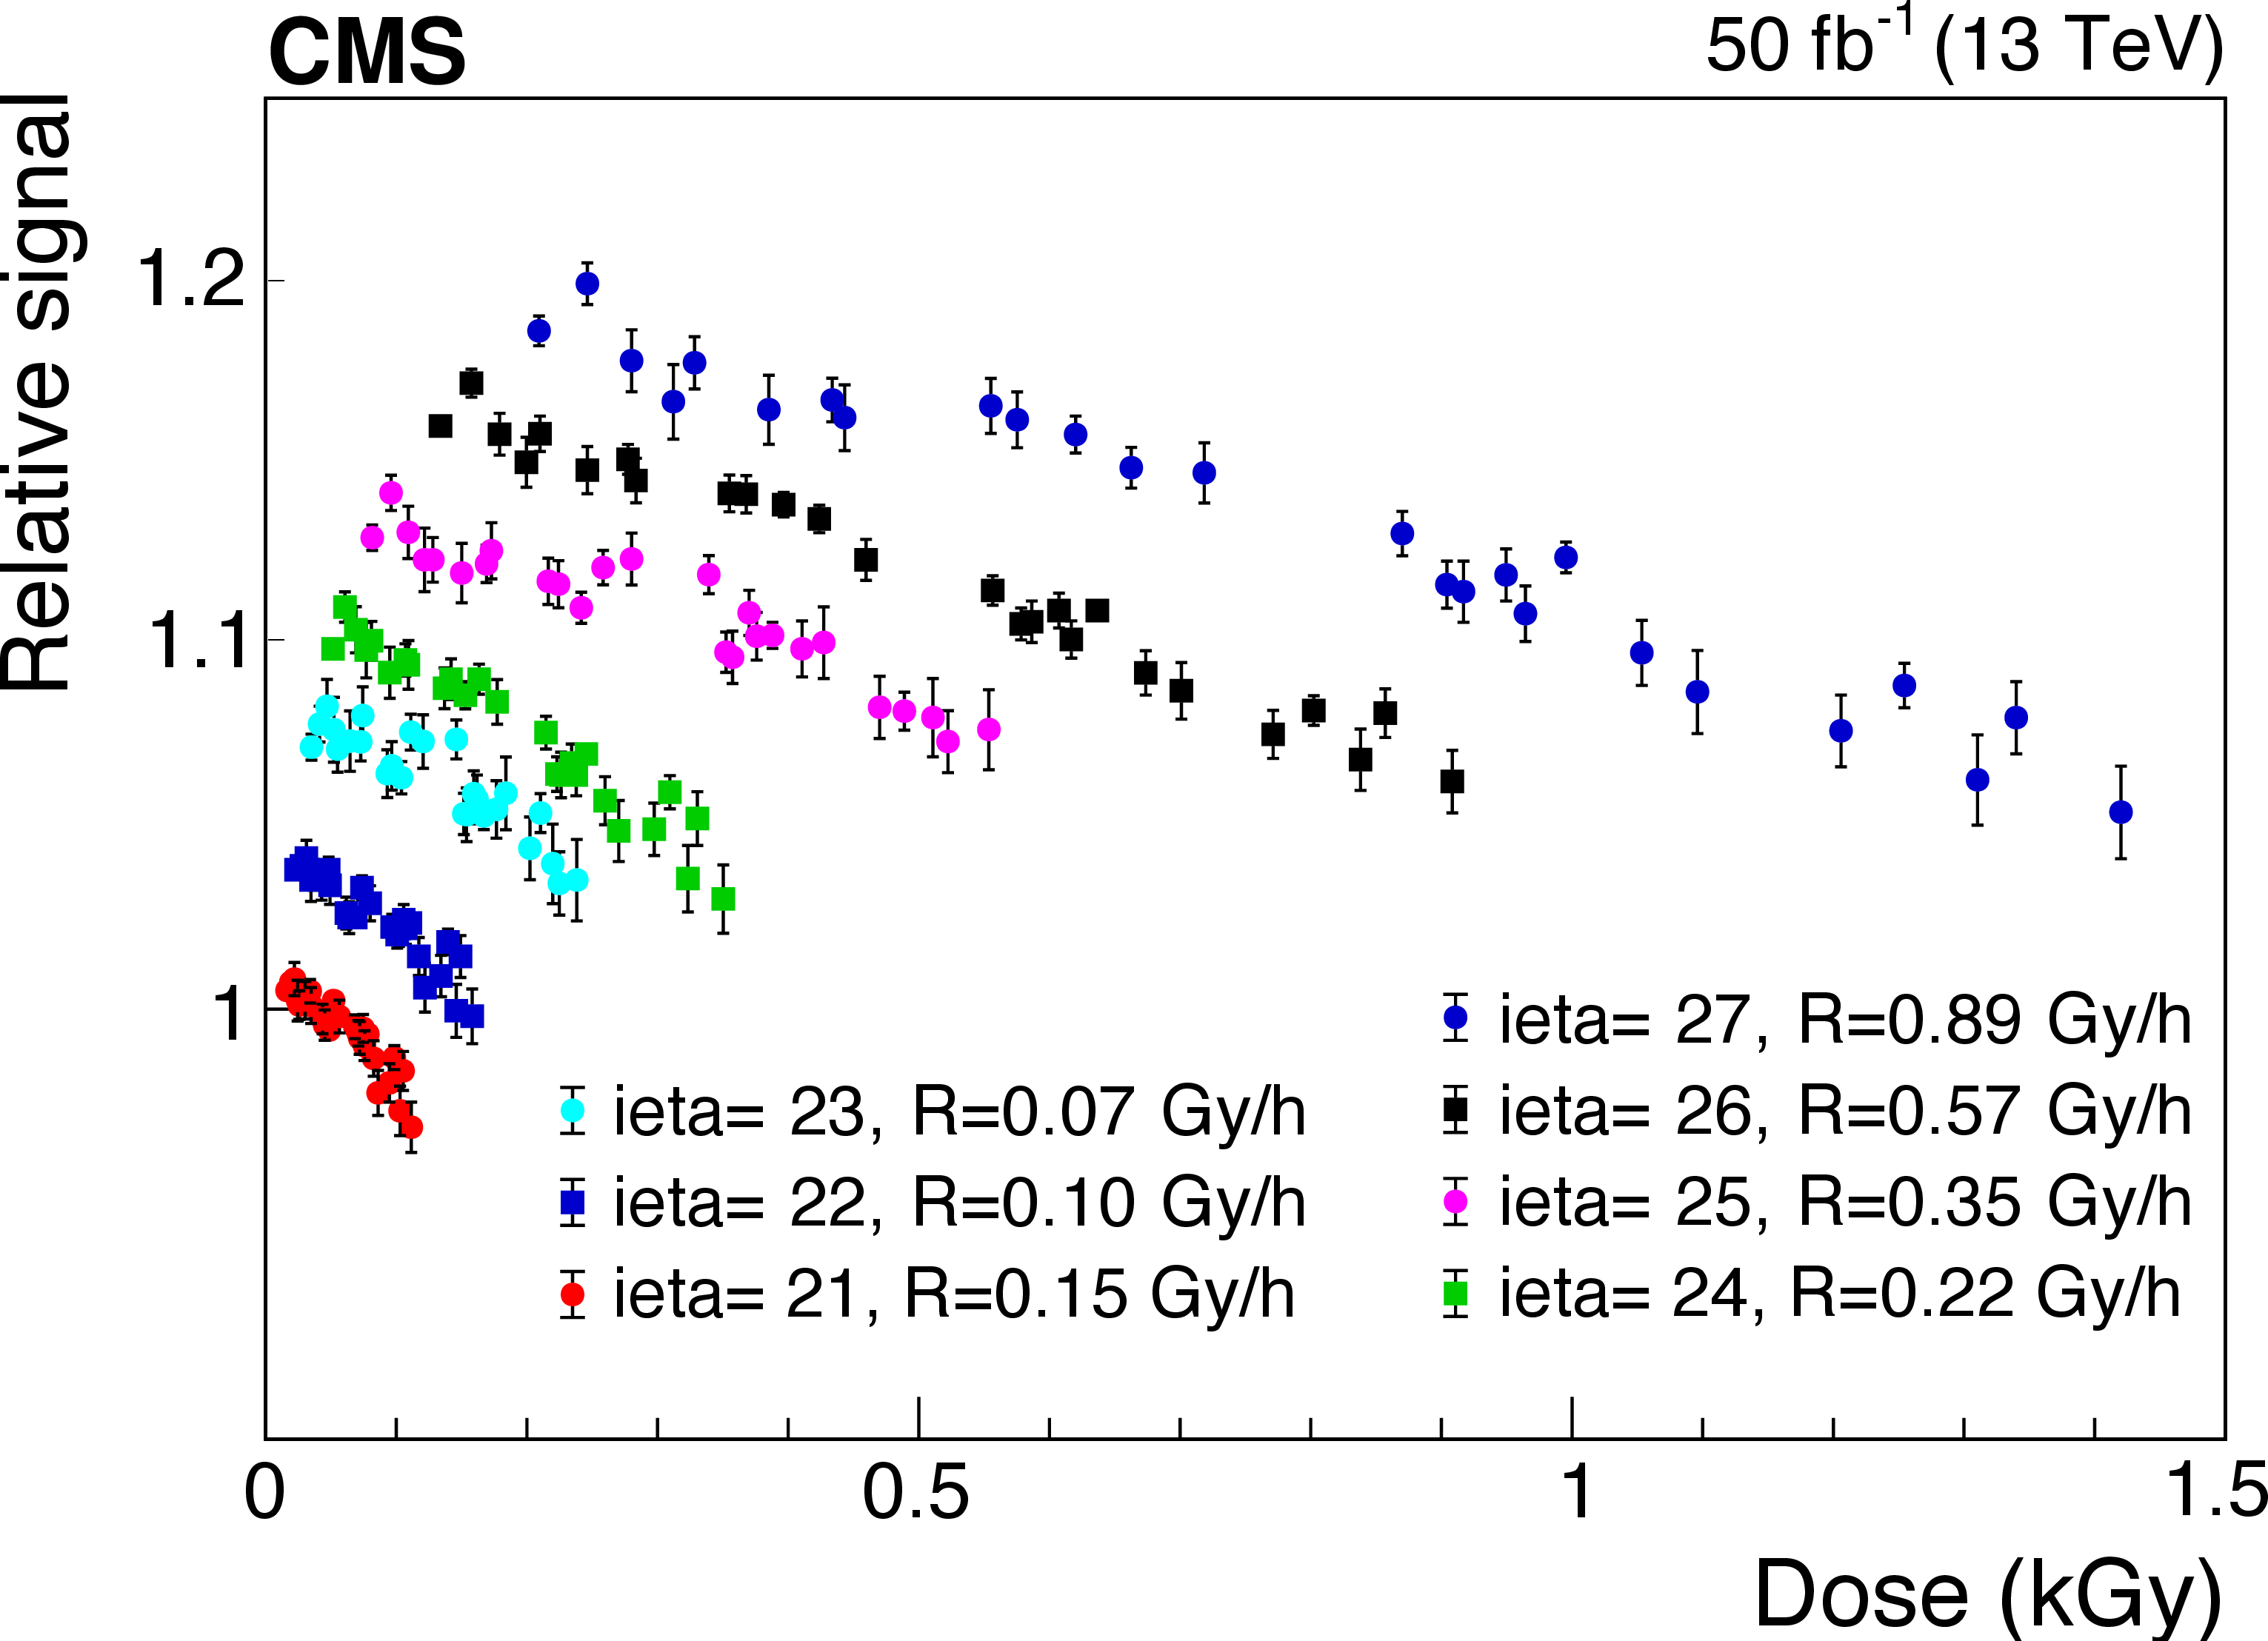
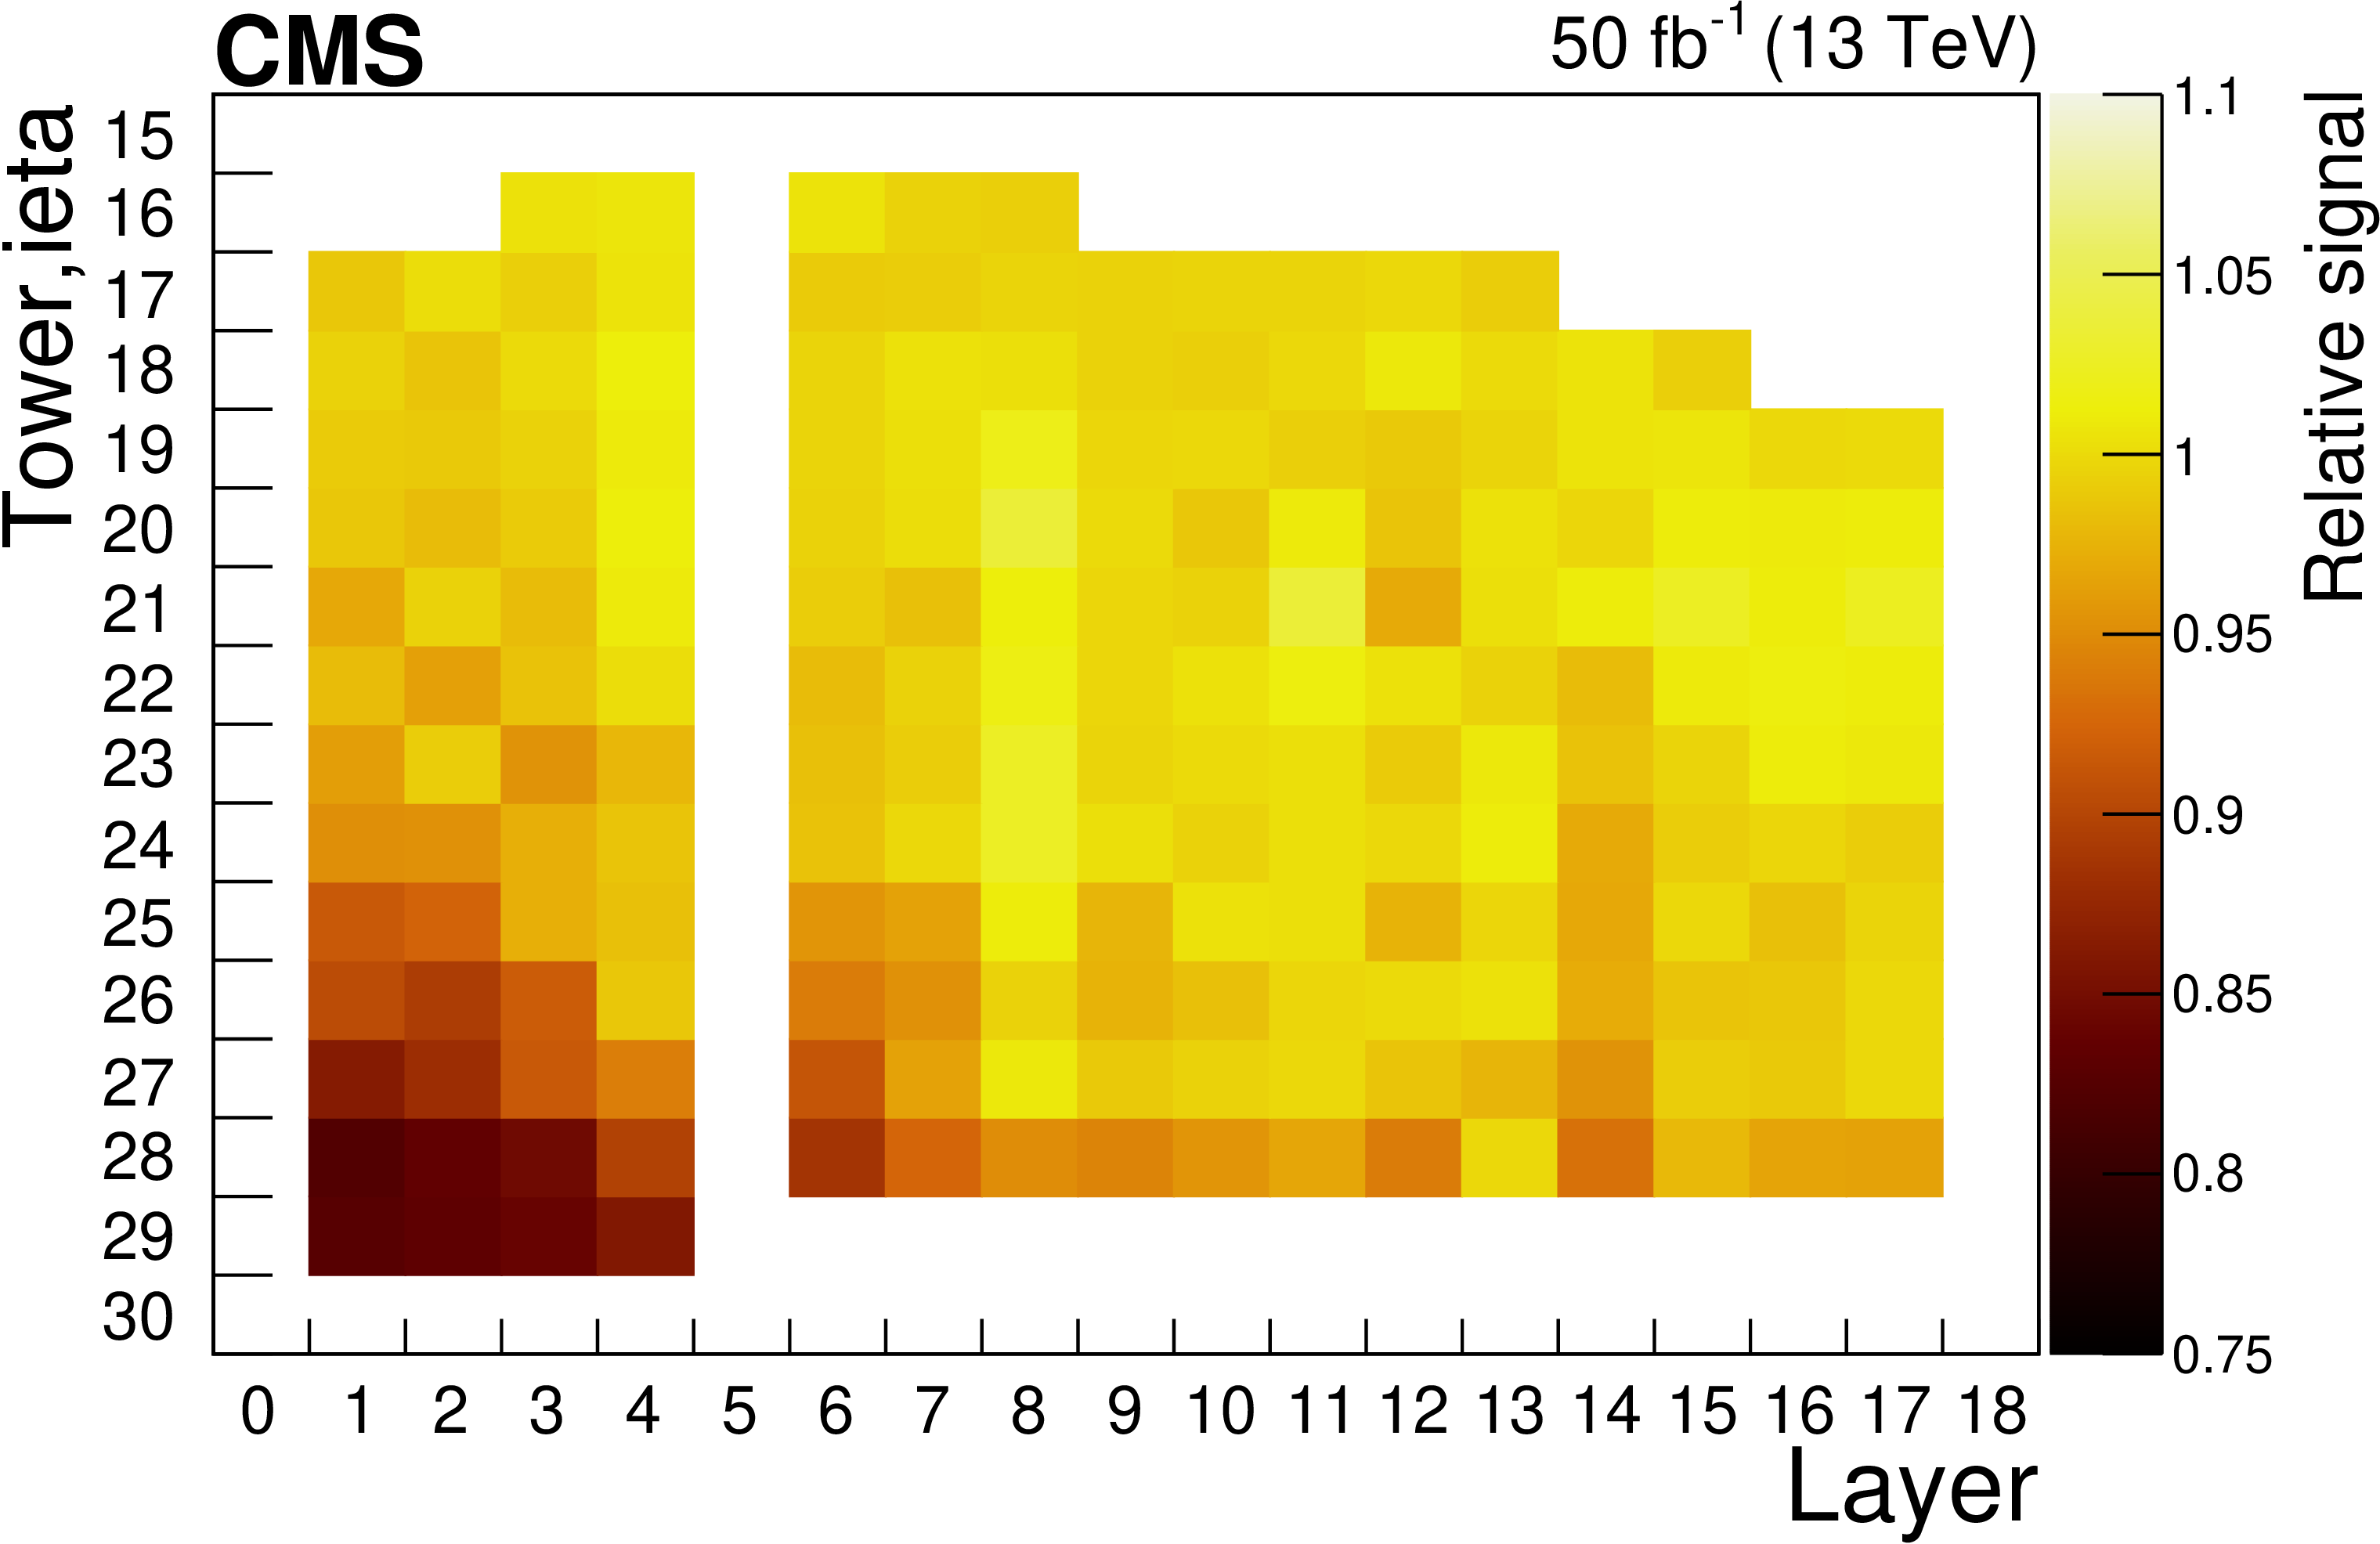
Left: relative laser light signal versus the accumulated dose for scintillator tiles in layer 1 and ieta range 21-27. The average dose rate $ R $ for each set of points is given in the legend. The vertical scale is logarithmic and subsequent sets are shifted up by a factor of 1.03 relative to the previous set for better visibility. Each set starts at a dose corresponding to an integrated luminosity of 7 fb$ ^{-1} $. The vertical bars give the scaled statistical uncertainties. Right: ratio of the signals from the $ ^{60}$Co source observed before and after the 2017 data-taking period for scintillator tiles in the HE as a function of ieta and layer number. Tubes in layers 0 and 5 have obstructions and cannot be accessed. |
png pdf |
Figure 25-a:
Relative laser light signal versus the accumulated dose for scintillator tiles in layer 1 and ieta range 21-27. The average dose rate $ R $ for each set of points is given in the legend. The vertical scale is logarithmic and subsequent sets are shifted up by a factor of 1.03 relative to the previous set for better visibility. Each set starts at a dose corresponding to an integrated luminosity of 7 fb$ ^{-1} $. The vertical bars give the scaled statistical uncertainties. |
png pdf |
Figure 25-b:
Ratio of the signals from the $ ^{60}$Co source observed before and after the 2017 data-taking period for scintillator tiles in the HE as a function of ieta and layer number. Tubes in layers 0 and 5 have obstructions and cannot be accessed. |
png pdf |
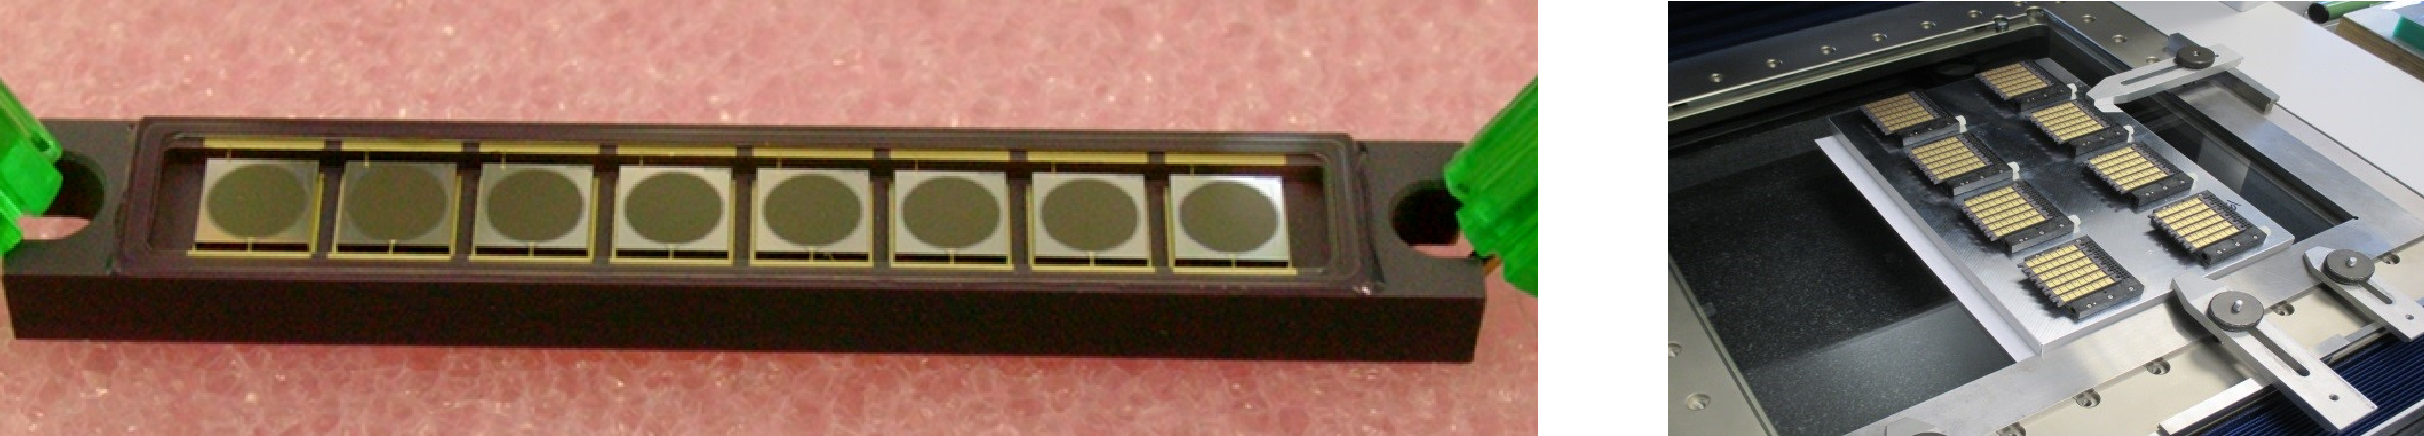
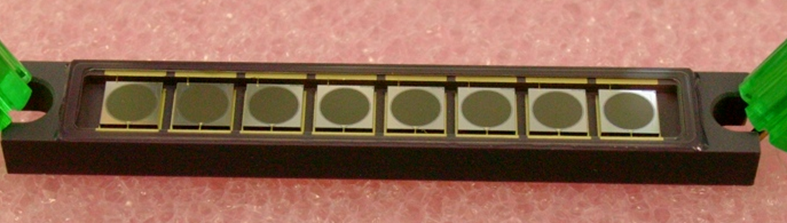
Figure 26:
Left: top and side views of an eight-channel SiPM array in its ceramic package. Right: ceramic packages at the CERN Metrology Laboratory for characterization measurements. |
png |
Figure 26-a:
Top and side views of an eight-channel SiPM array in its ceramic package. |

png pdf |
Figure 27:
Distribution of the signal response (photon detection efficiency times gain) for 3600 HE SiPMs. |
png pdf |
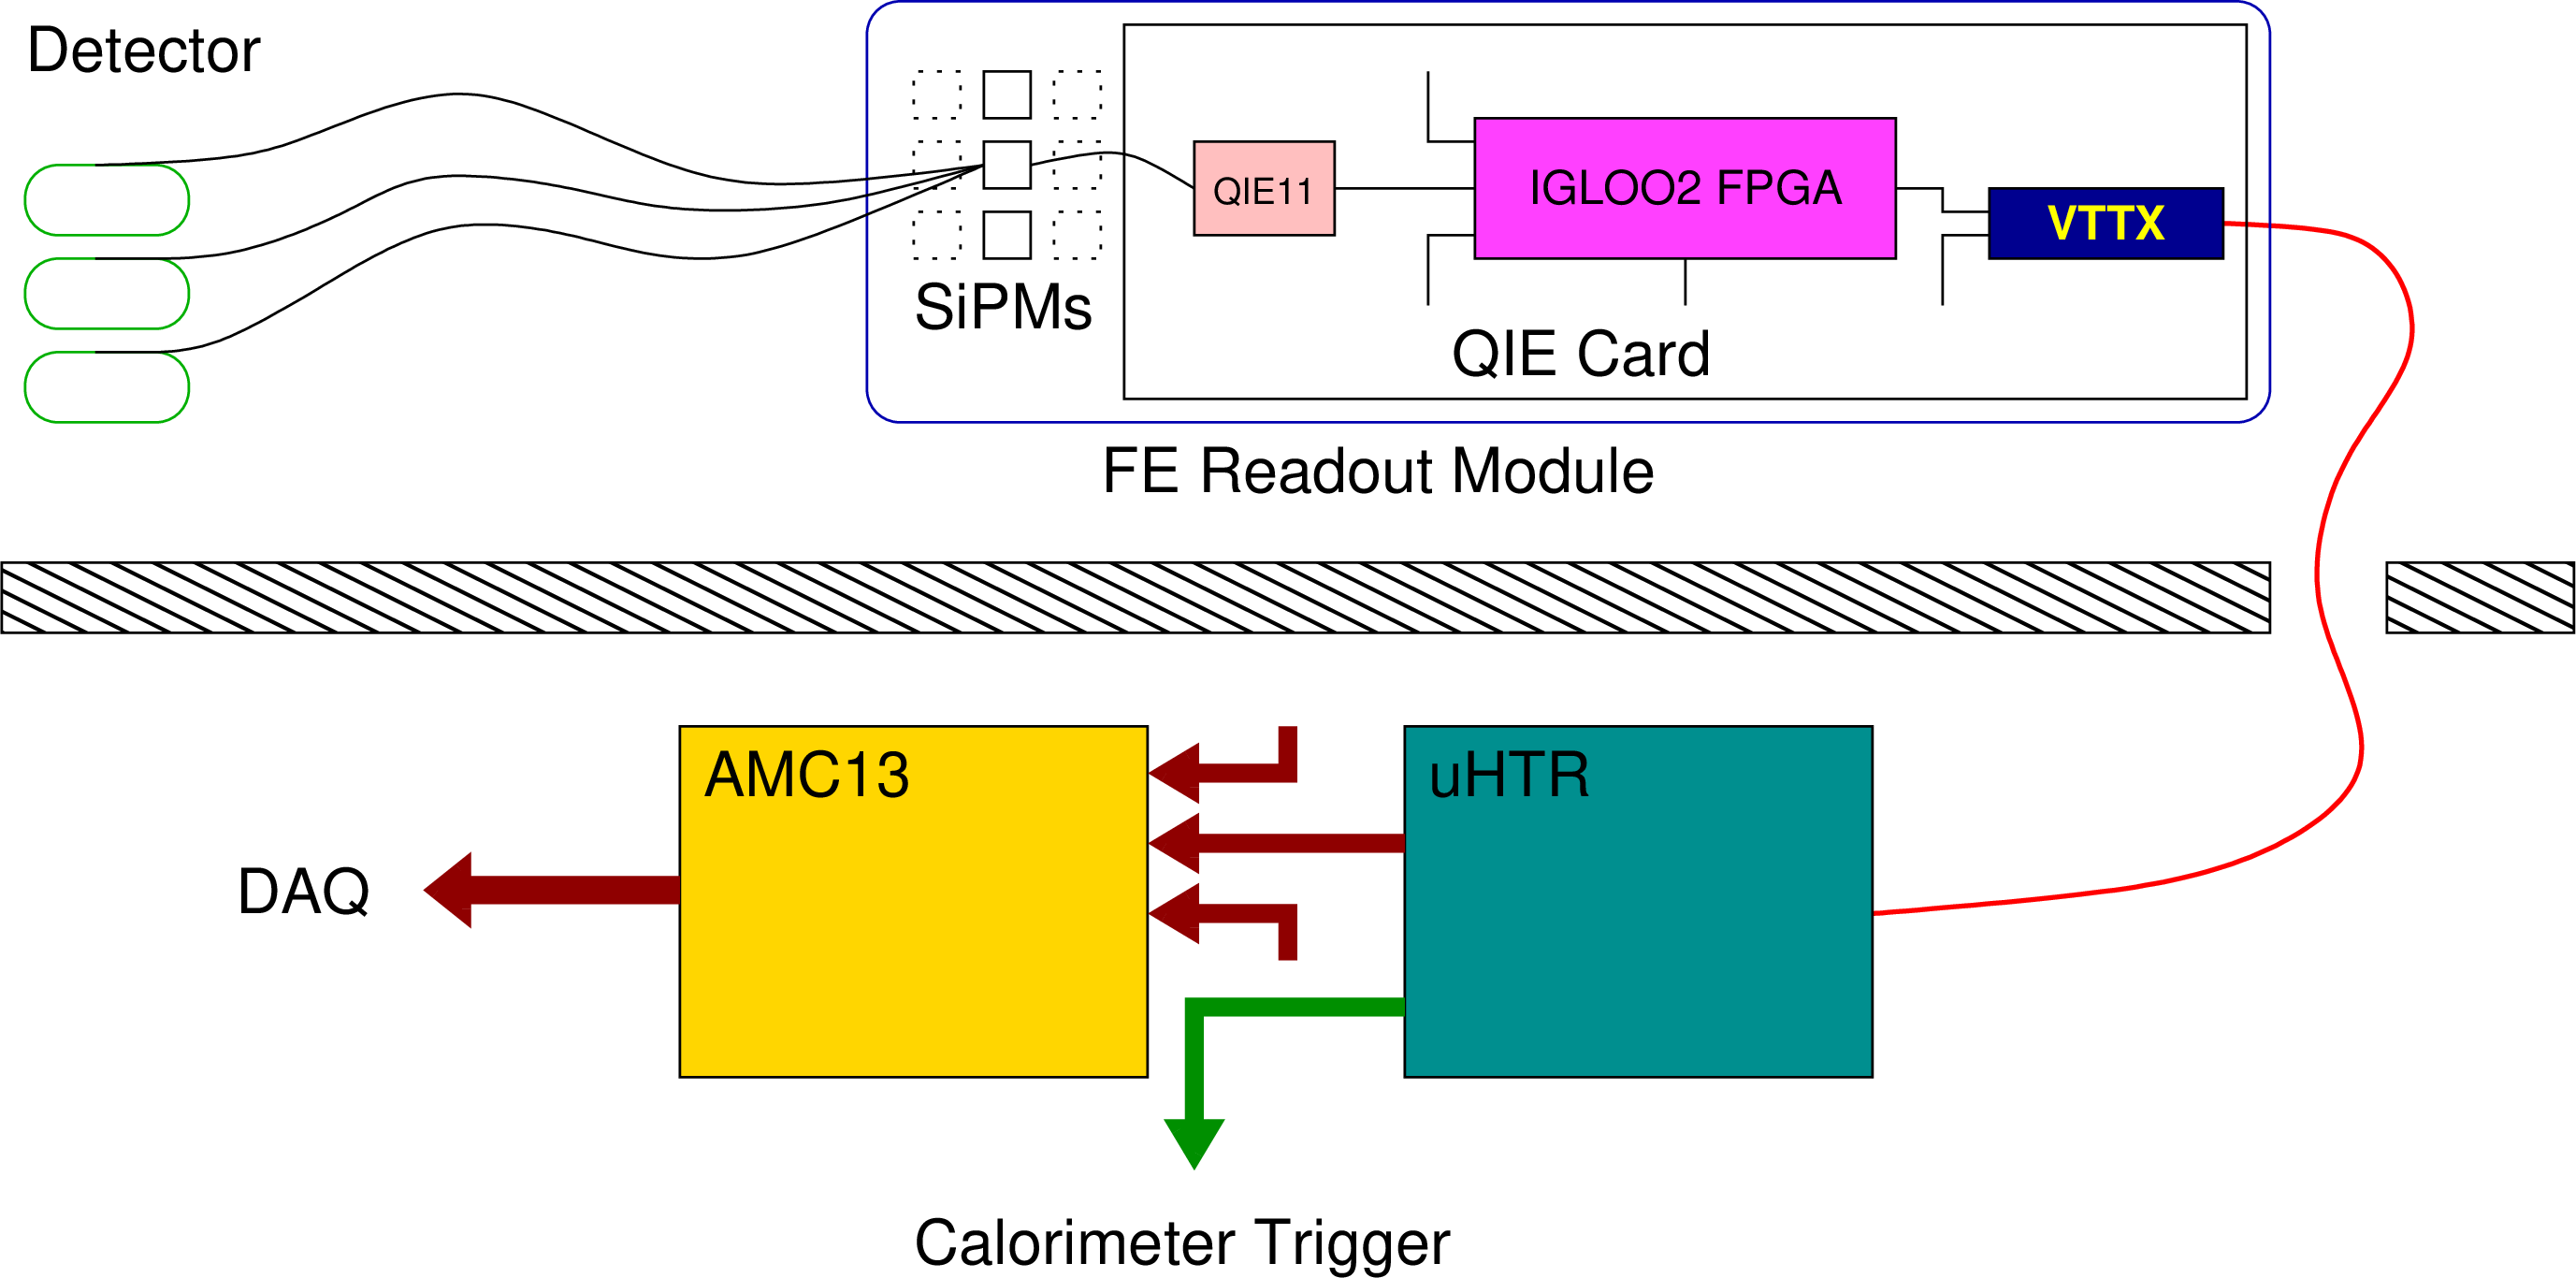
Figure 28:
Upgraded HCAL endcap (HE) and barrel (HB) DAQ readout chain, including the SiPMs, frontend readout electronics, and backend system. |
png pdf |
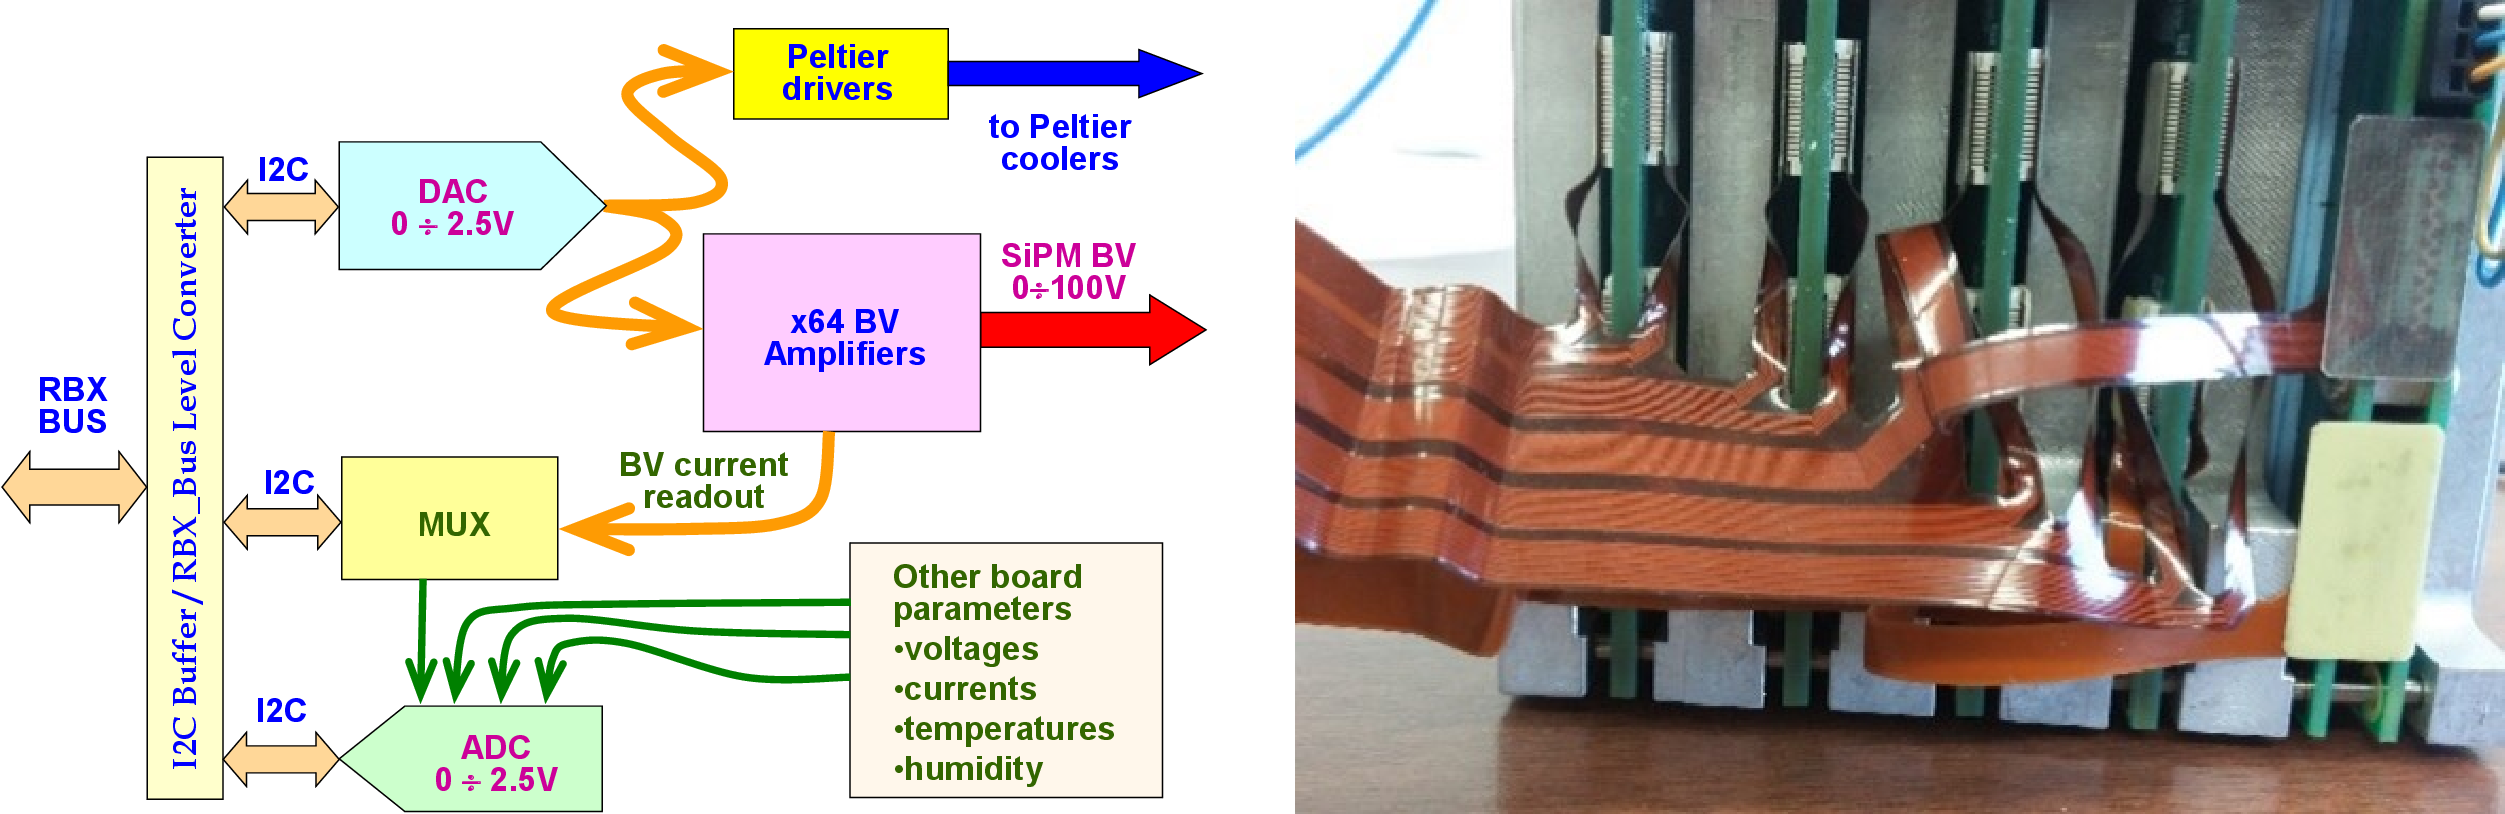
Figure 29:
Left: control board block diagram. Right: HB card pack with one control and four frontend boards. The flex cables provide signal and bias voltage connections to 64 SiPMs. |
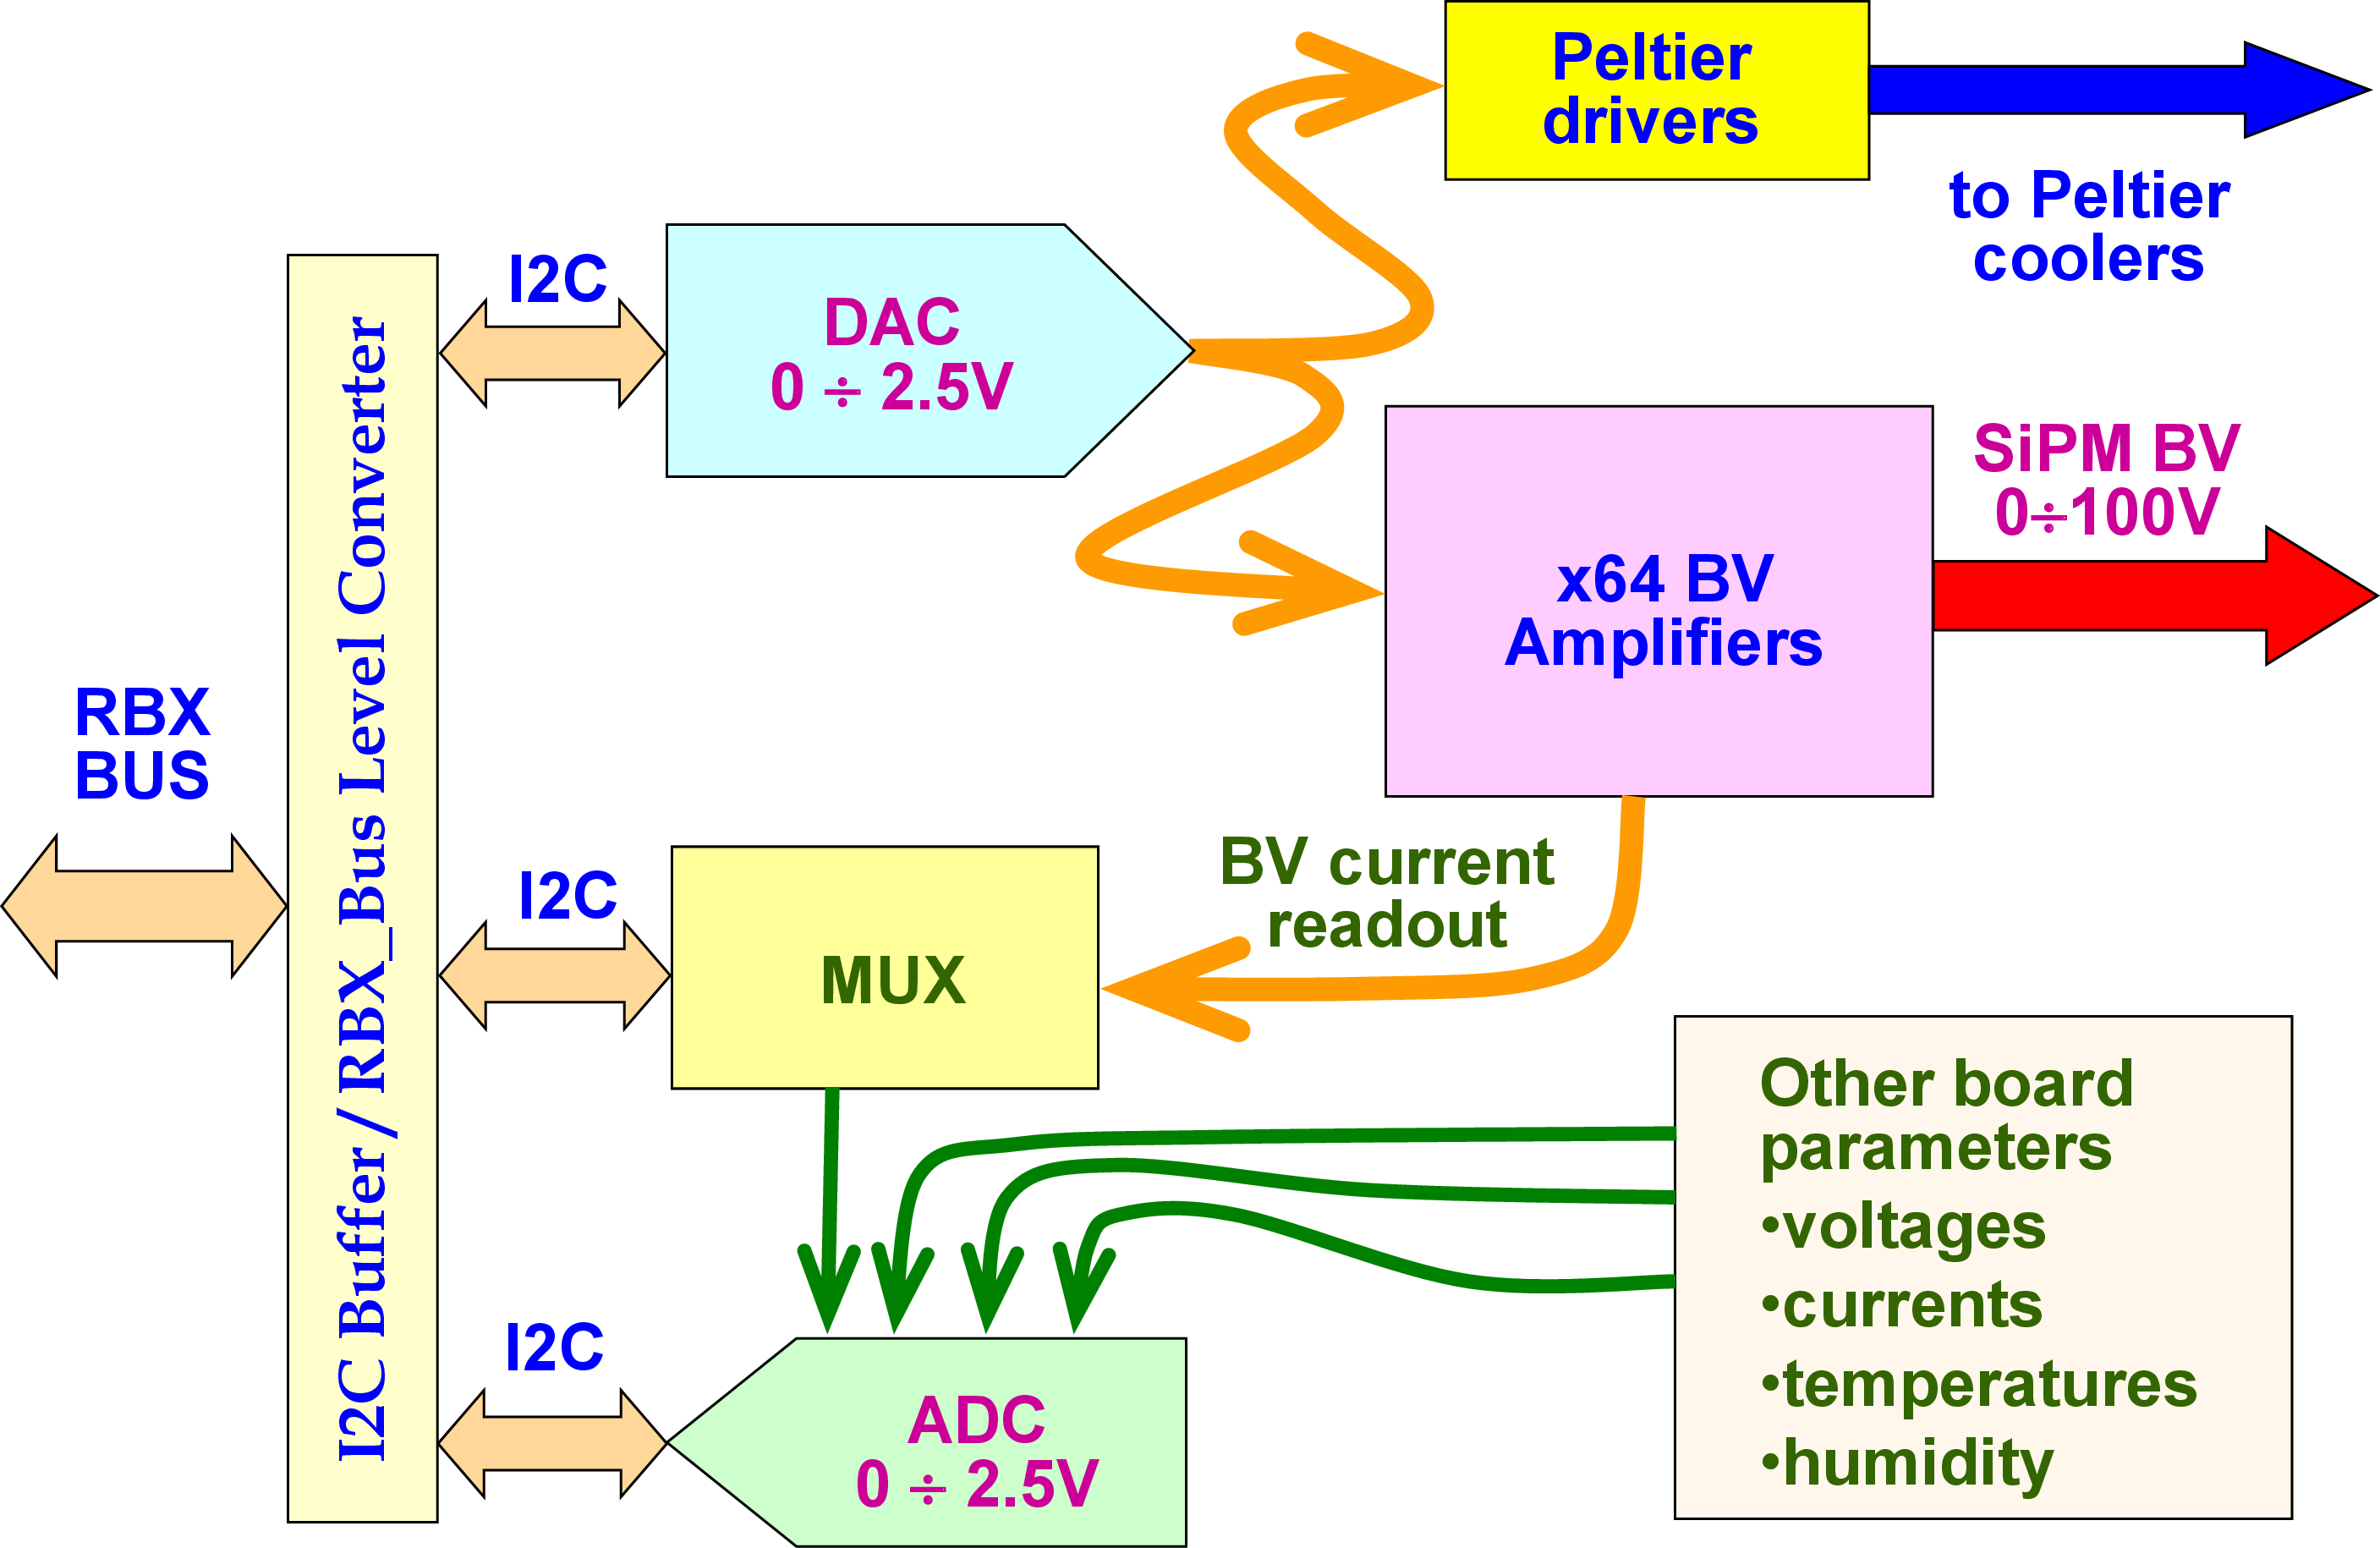
png pdf |
Figure 29-a:
Control board block diagram. |
png pdf |
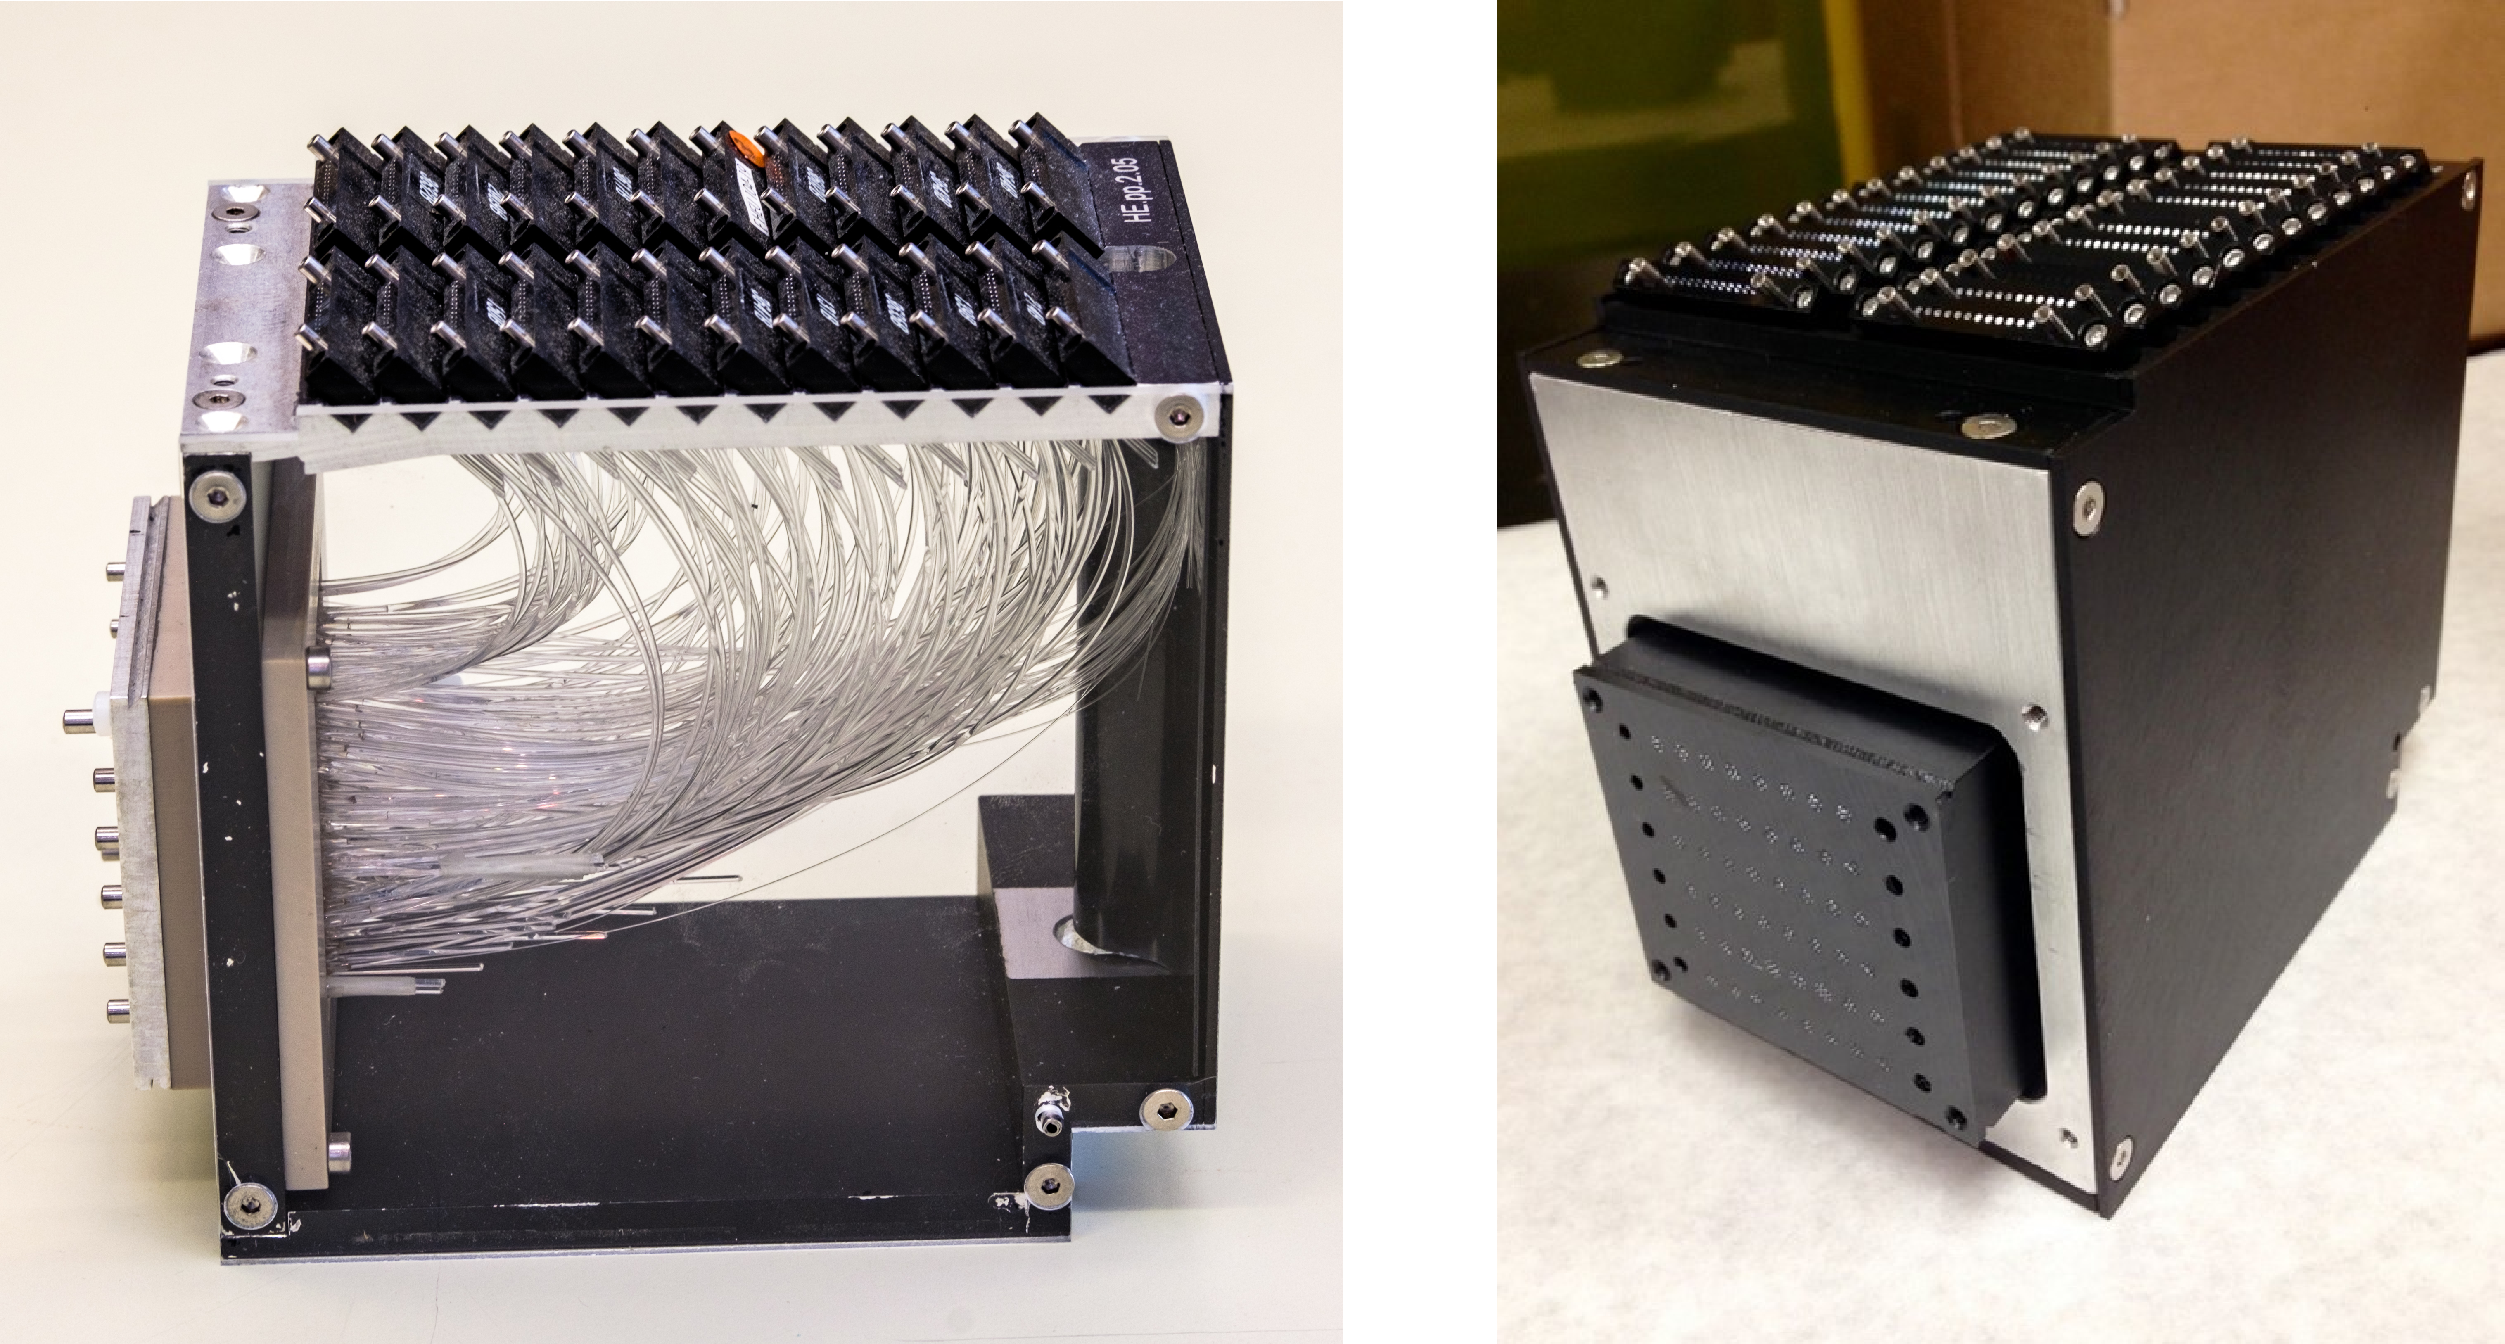
Figure 30:
Left: view of a spare HE optical decoder unit (ODU), showing its light box and fiber mapping. The fibers route from the patch panel at the top to the ``cookie'' at the left. The side panels are clear rather than opaque for display purposes. Right: a production HE ODU. The clear fiber pigtail connectors attached to the patch panel are visible at the top. The plastic ``cookie'' is seen at the front of the ODU. |
png pdf |
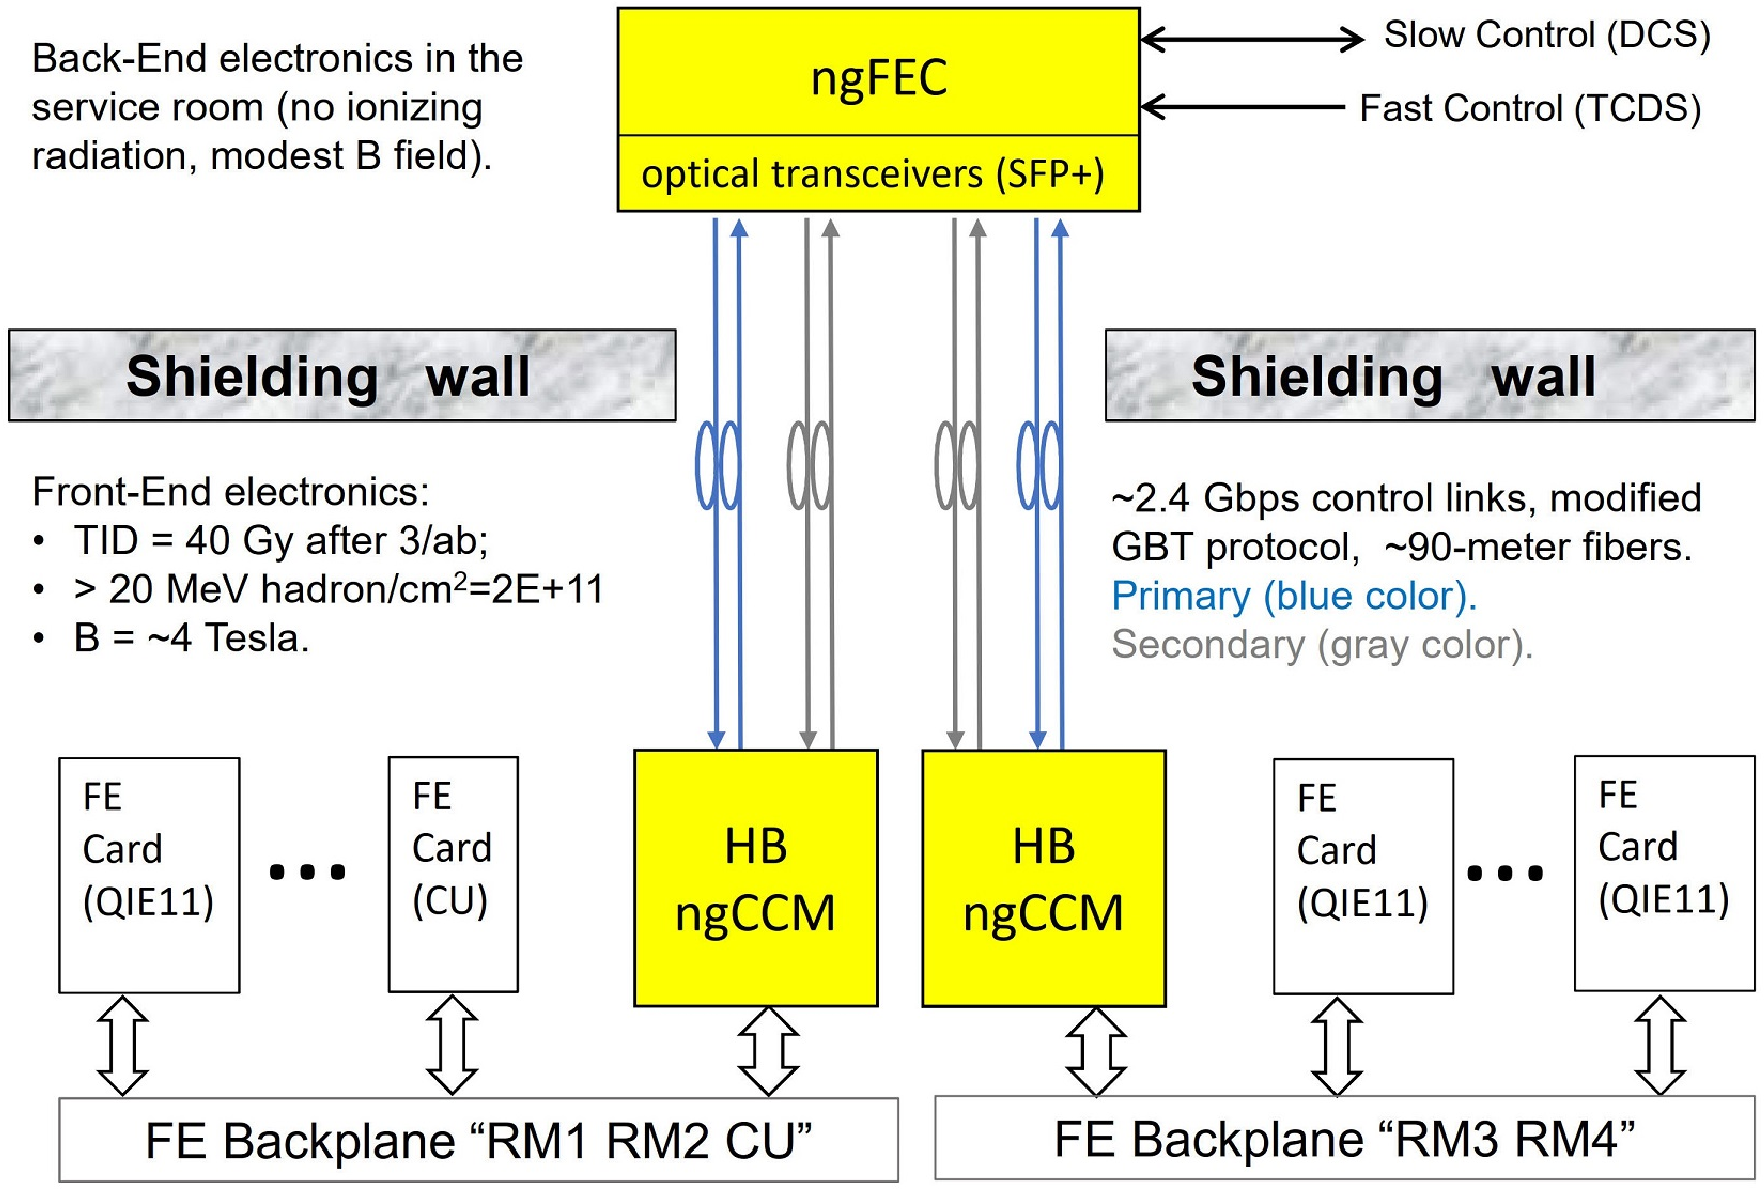
Figure 31:
Block diagram of the HB controls. The ngFEC and ngCCM modules are needed to run and monitor the frontend electronics. All control links connecting the service rooms to the experimental cavern are optical. A secondary link connecting the ngFEC and the ngCCM is available in case of a primary link failure. |
png pdf |
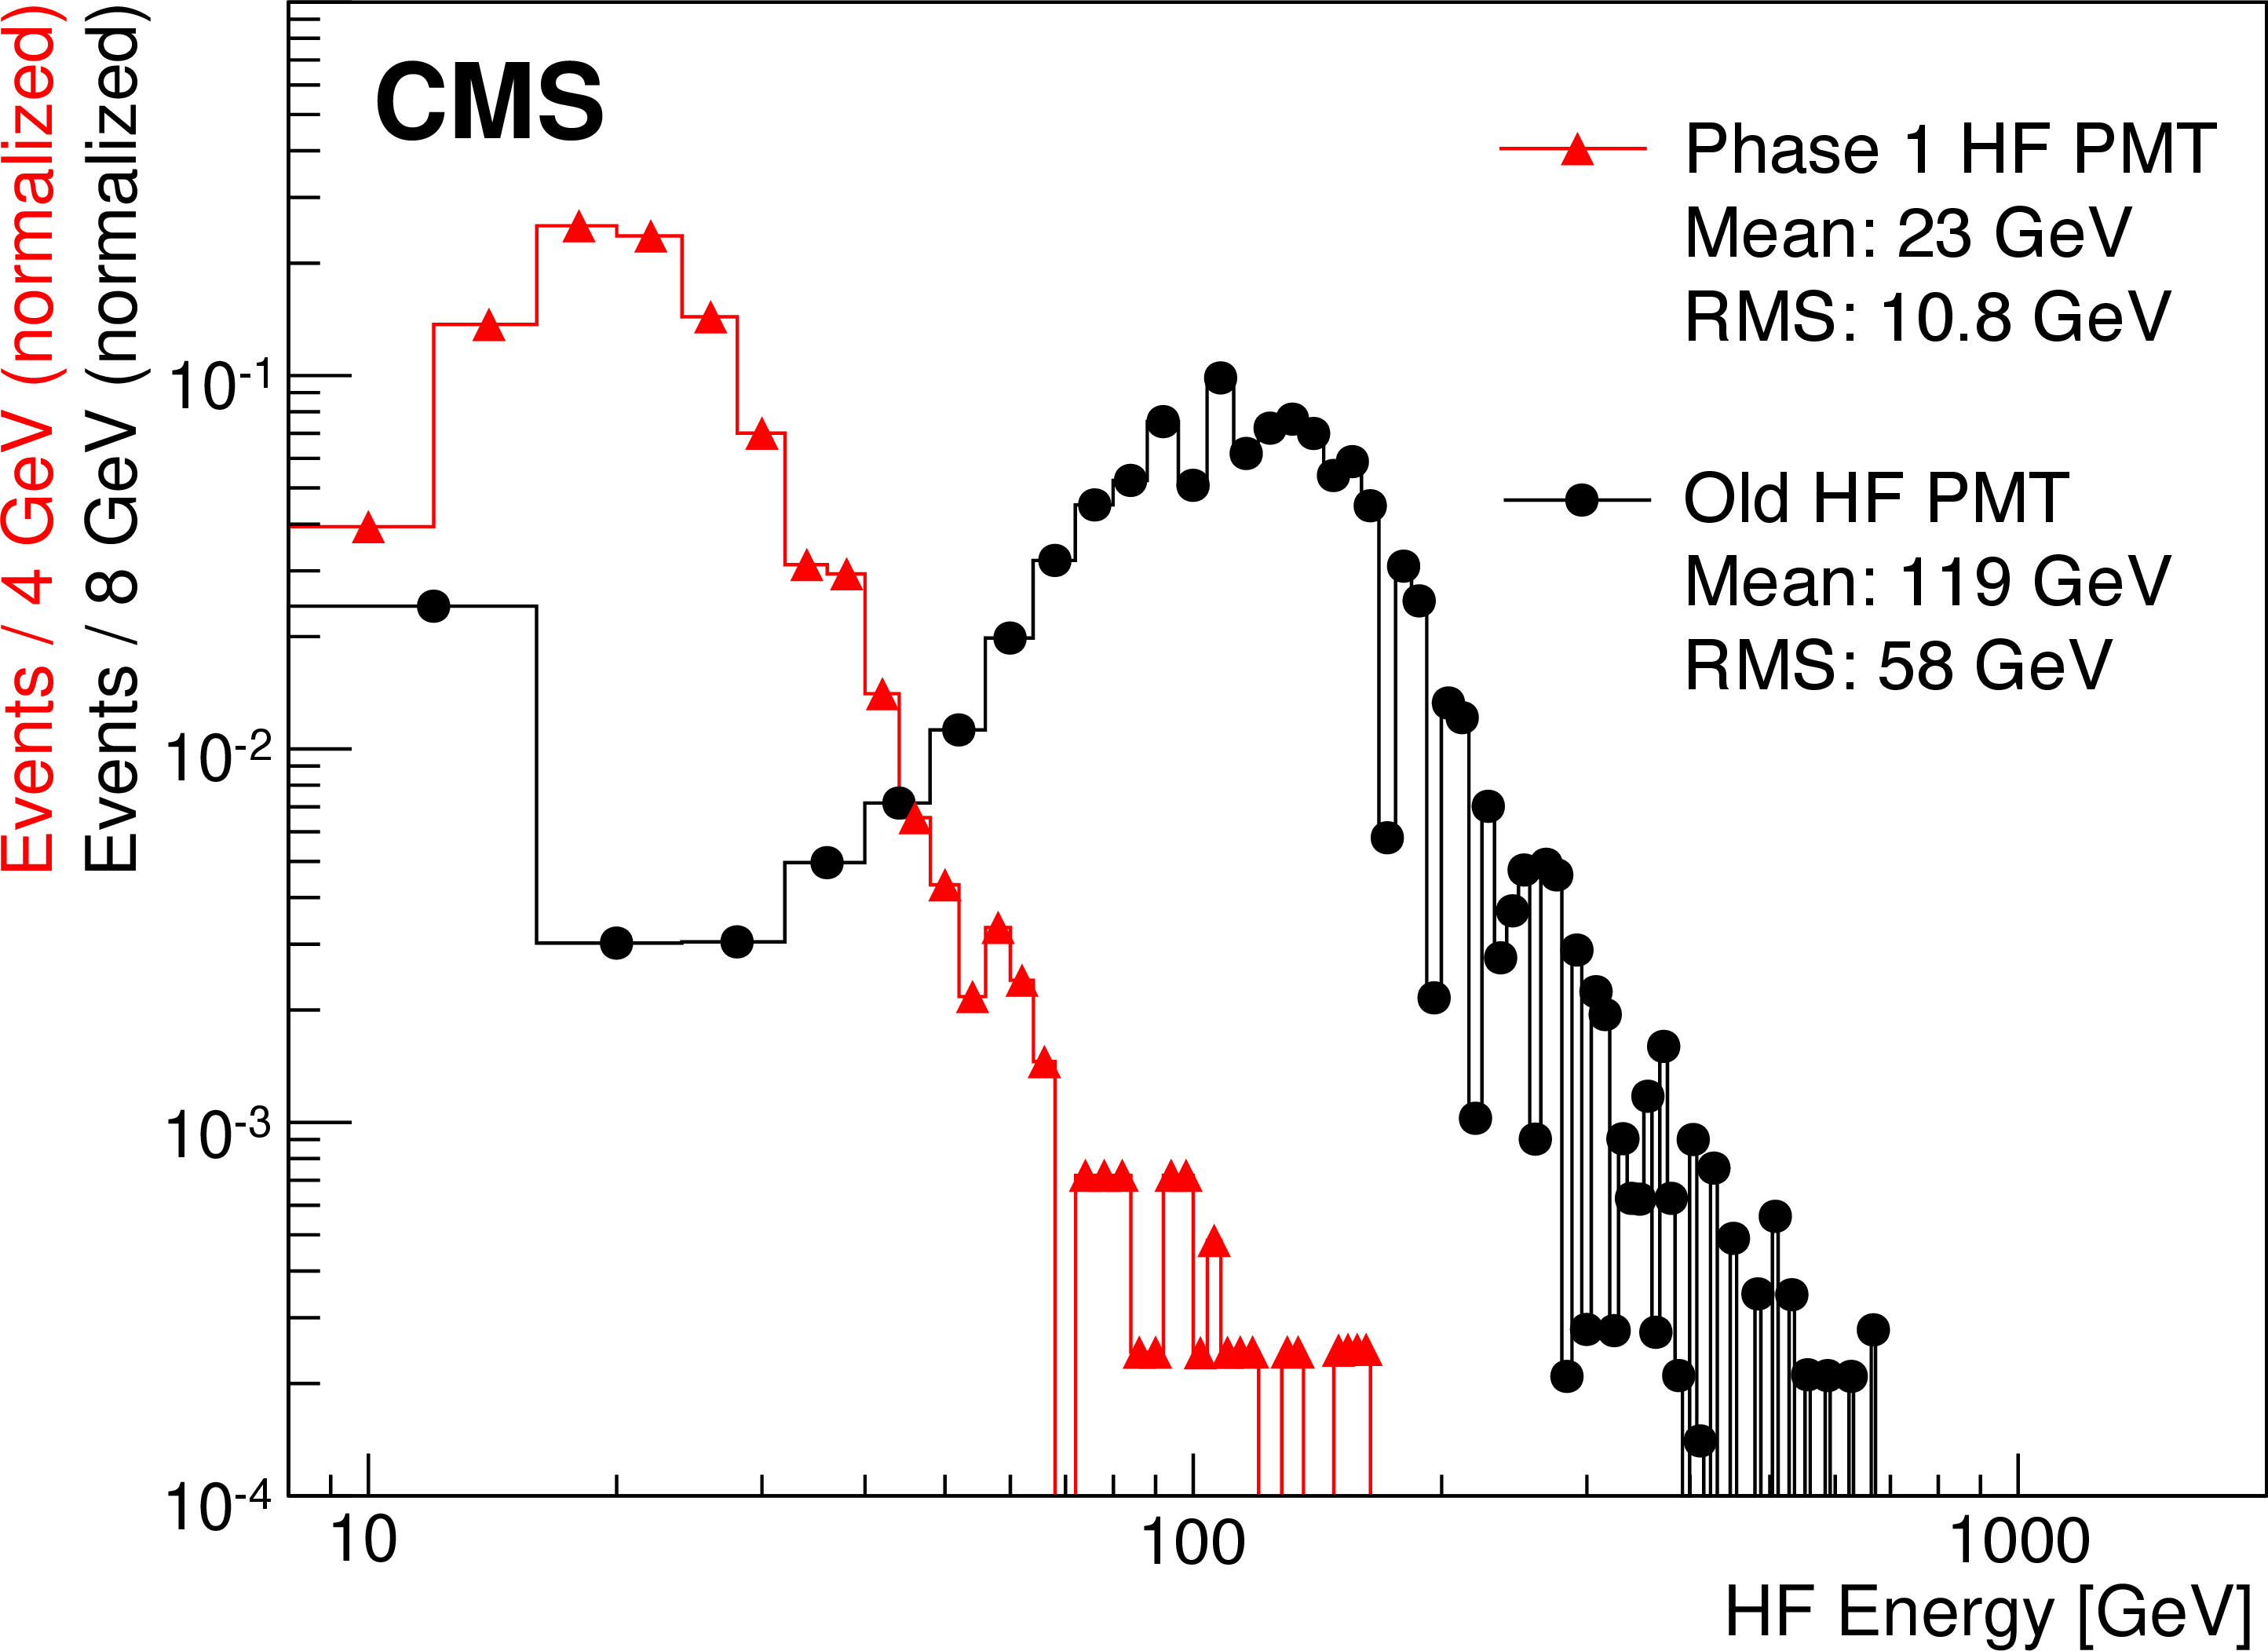
Figure 32:
Cherenkov signals generated in the PMT windows from a muon test beam. Thin windows in the Phase 1 upgrade four-anode PMTs produce smaller signals (red) than those produced in the original PMTs with thick windows (black). |

png pdf |
Figure 33:
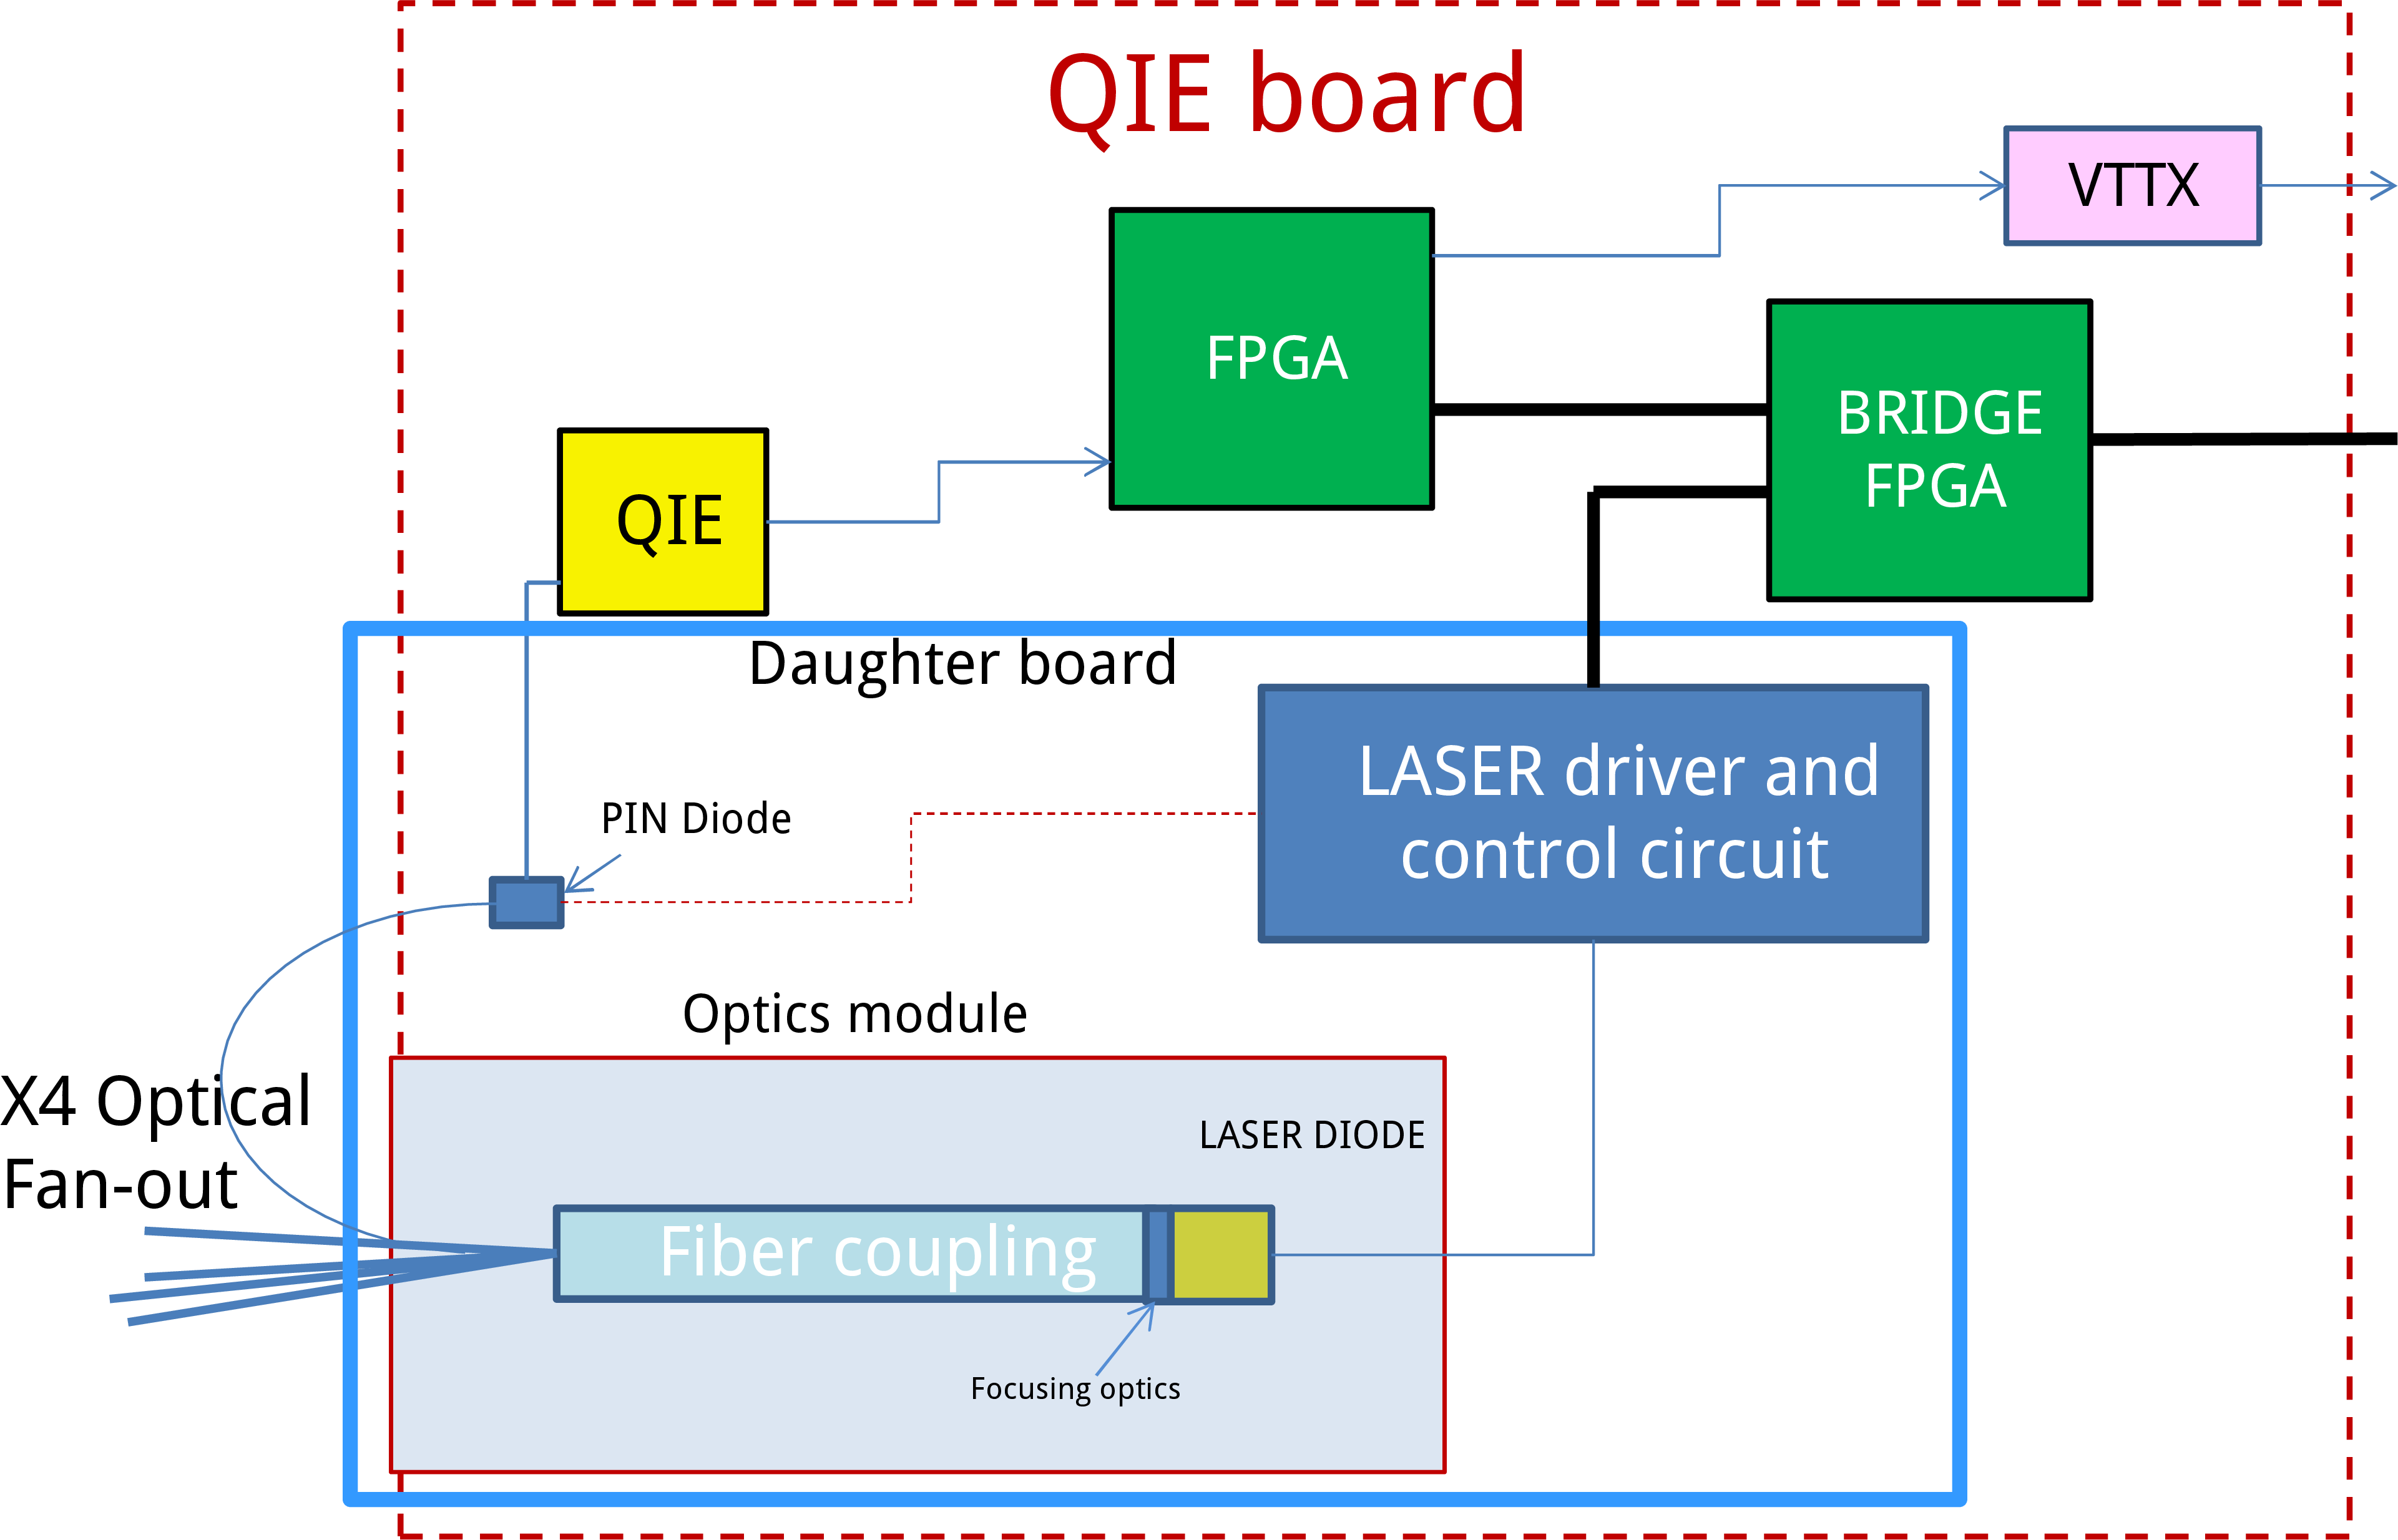
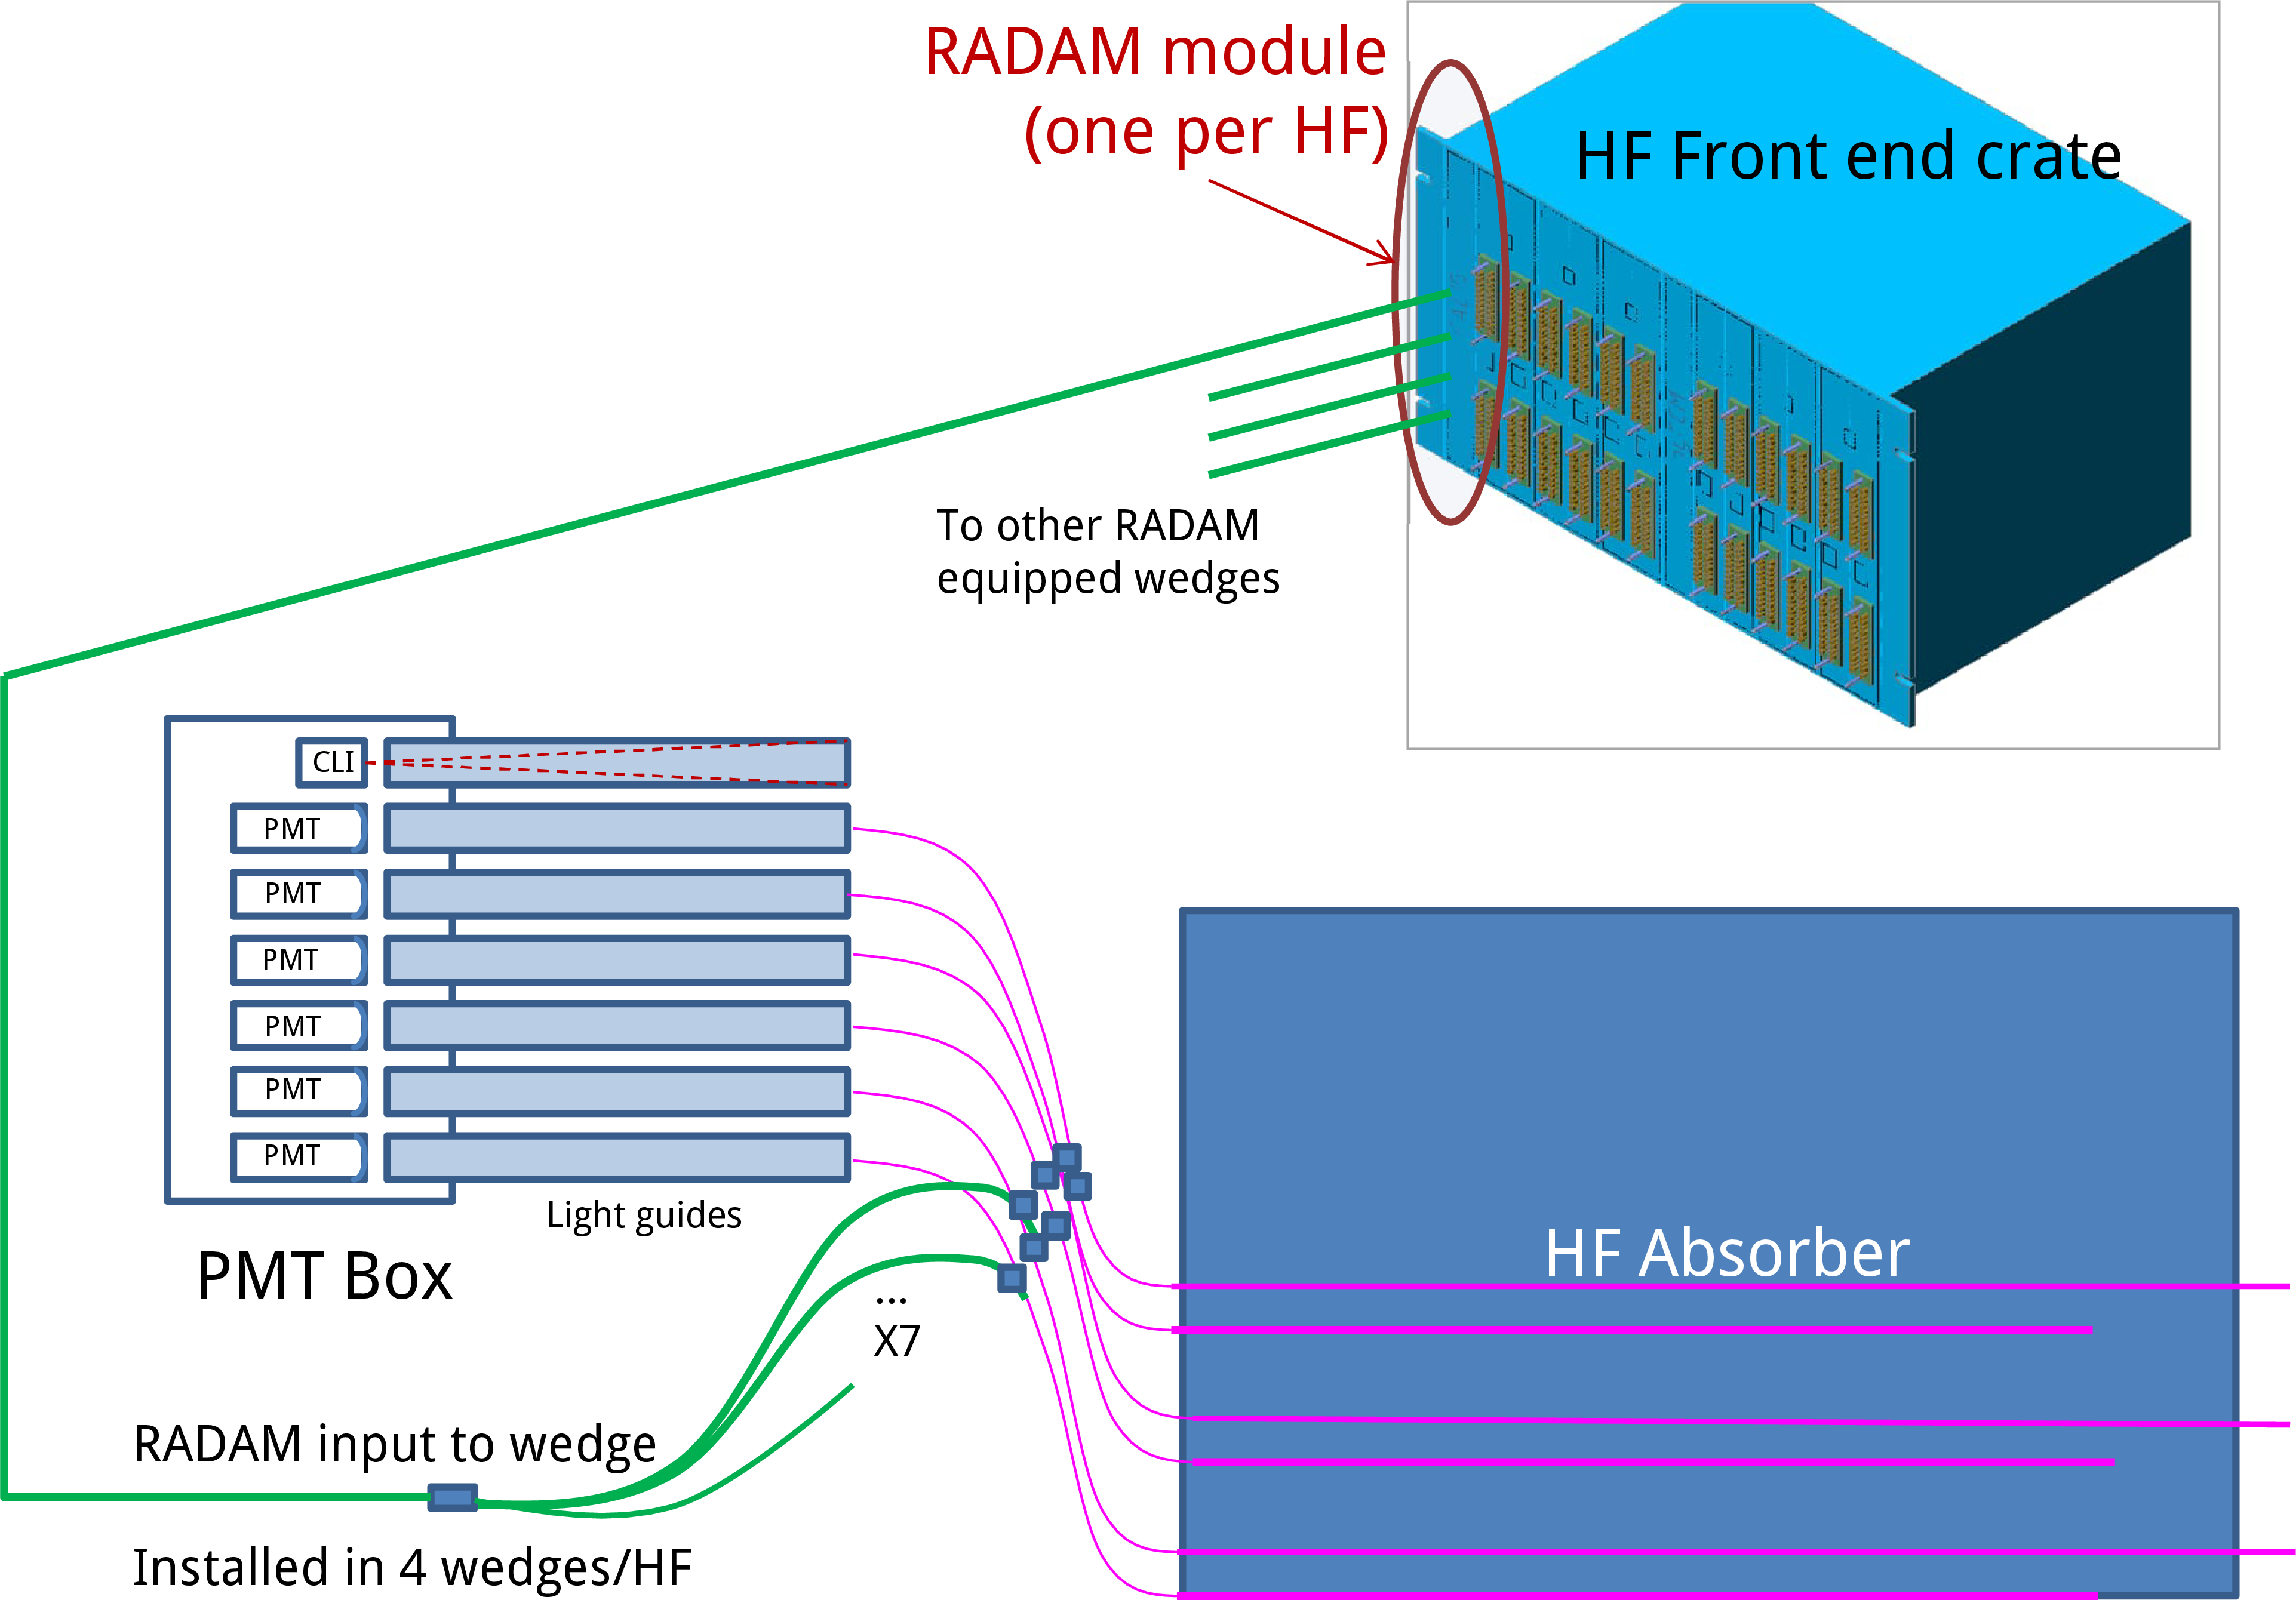
Left: schematic of the new HF QIE laser board, used in the HF radiation monitoring system. Right: sketch of the upgraded HF radiation damage monitoring system light distribution and electronics chain. |
png pdf |
Figure 33-a:
Schematic of the new HF QIE laser board, used in the HF radiation monitoring system. |
png pdf |
Figure 33-b:
Sketch of the upgraded HF radiation damage monitoring system light distribution and electronics chain. |
png pdf |
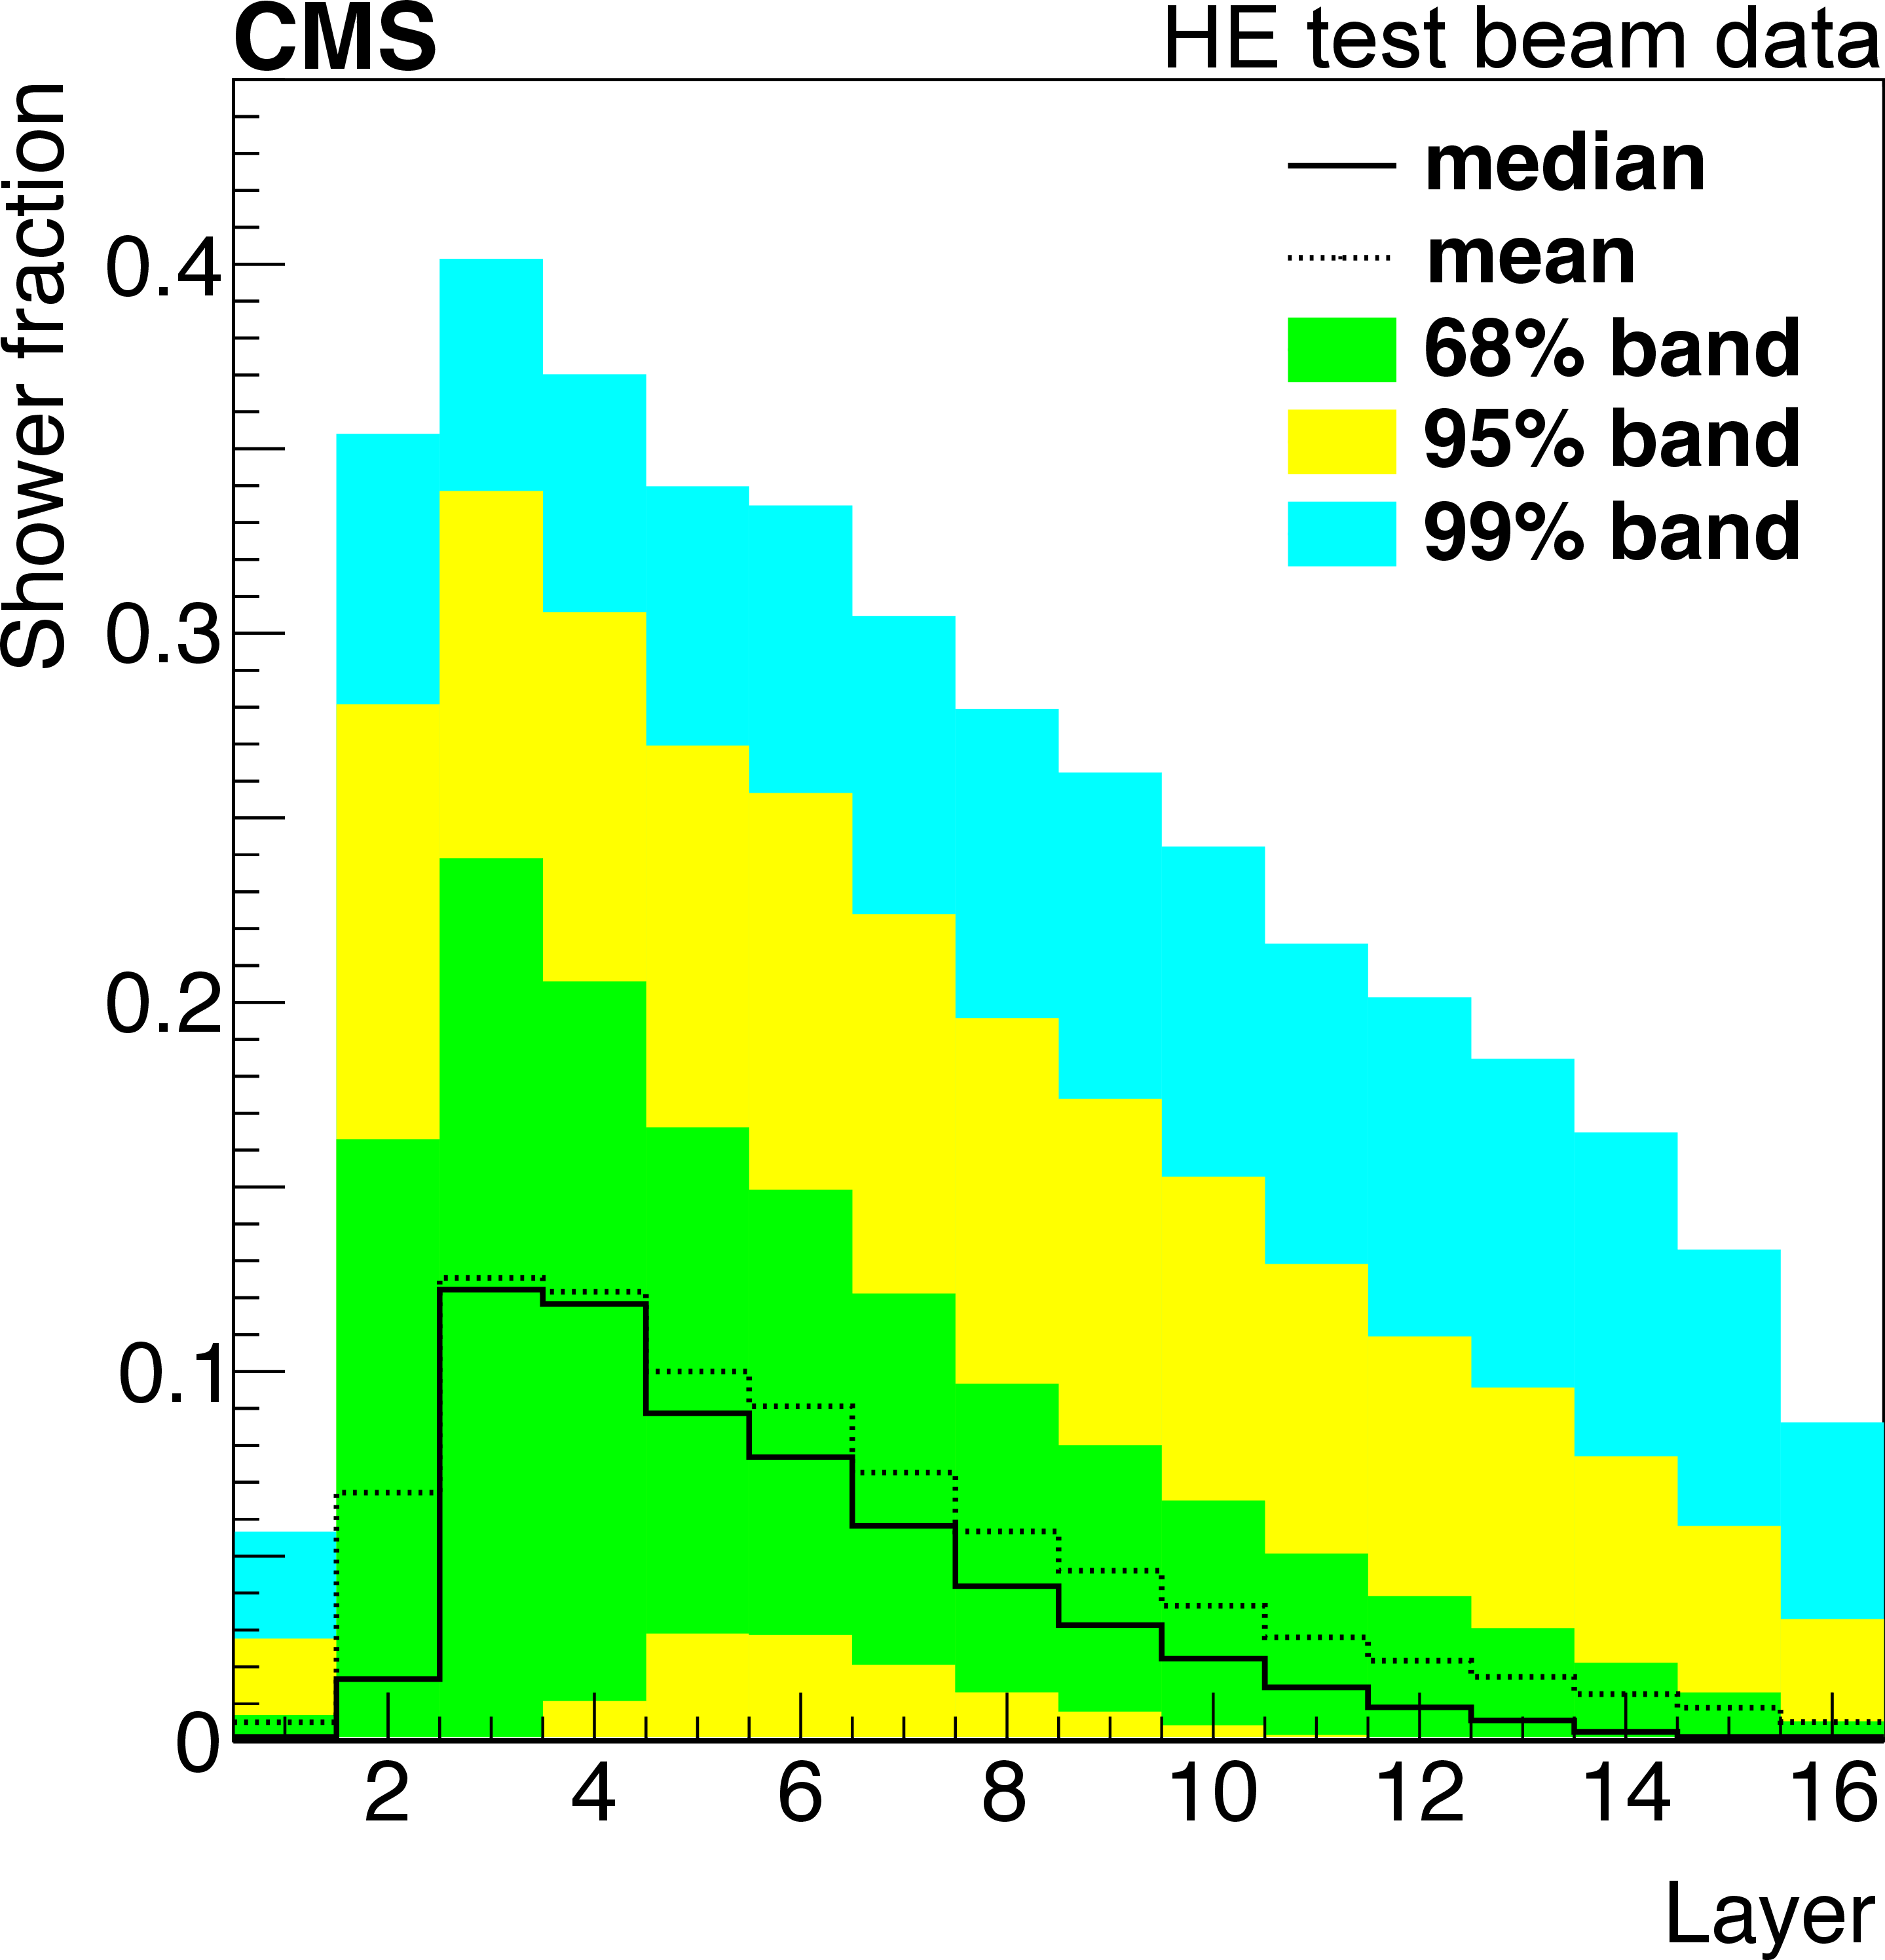
Figure 34:
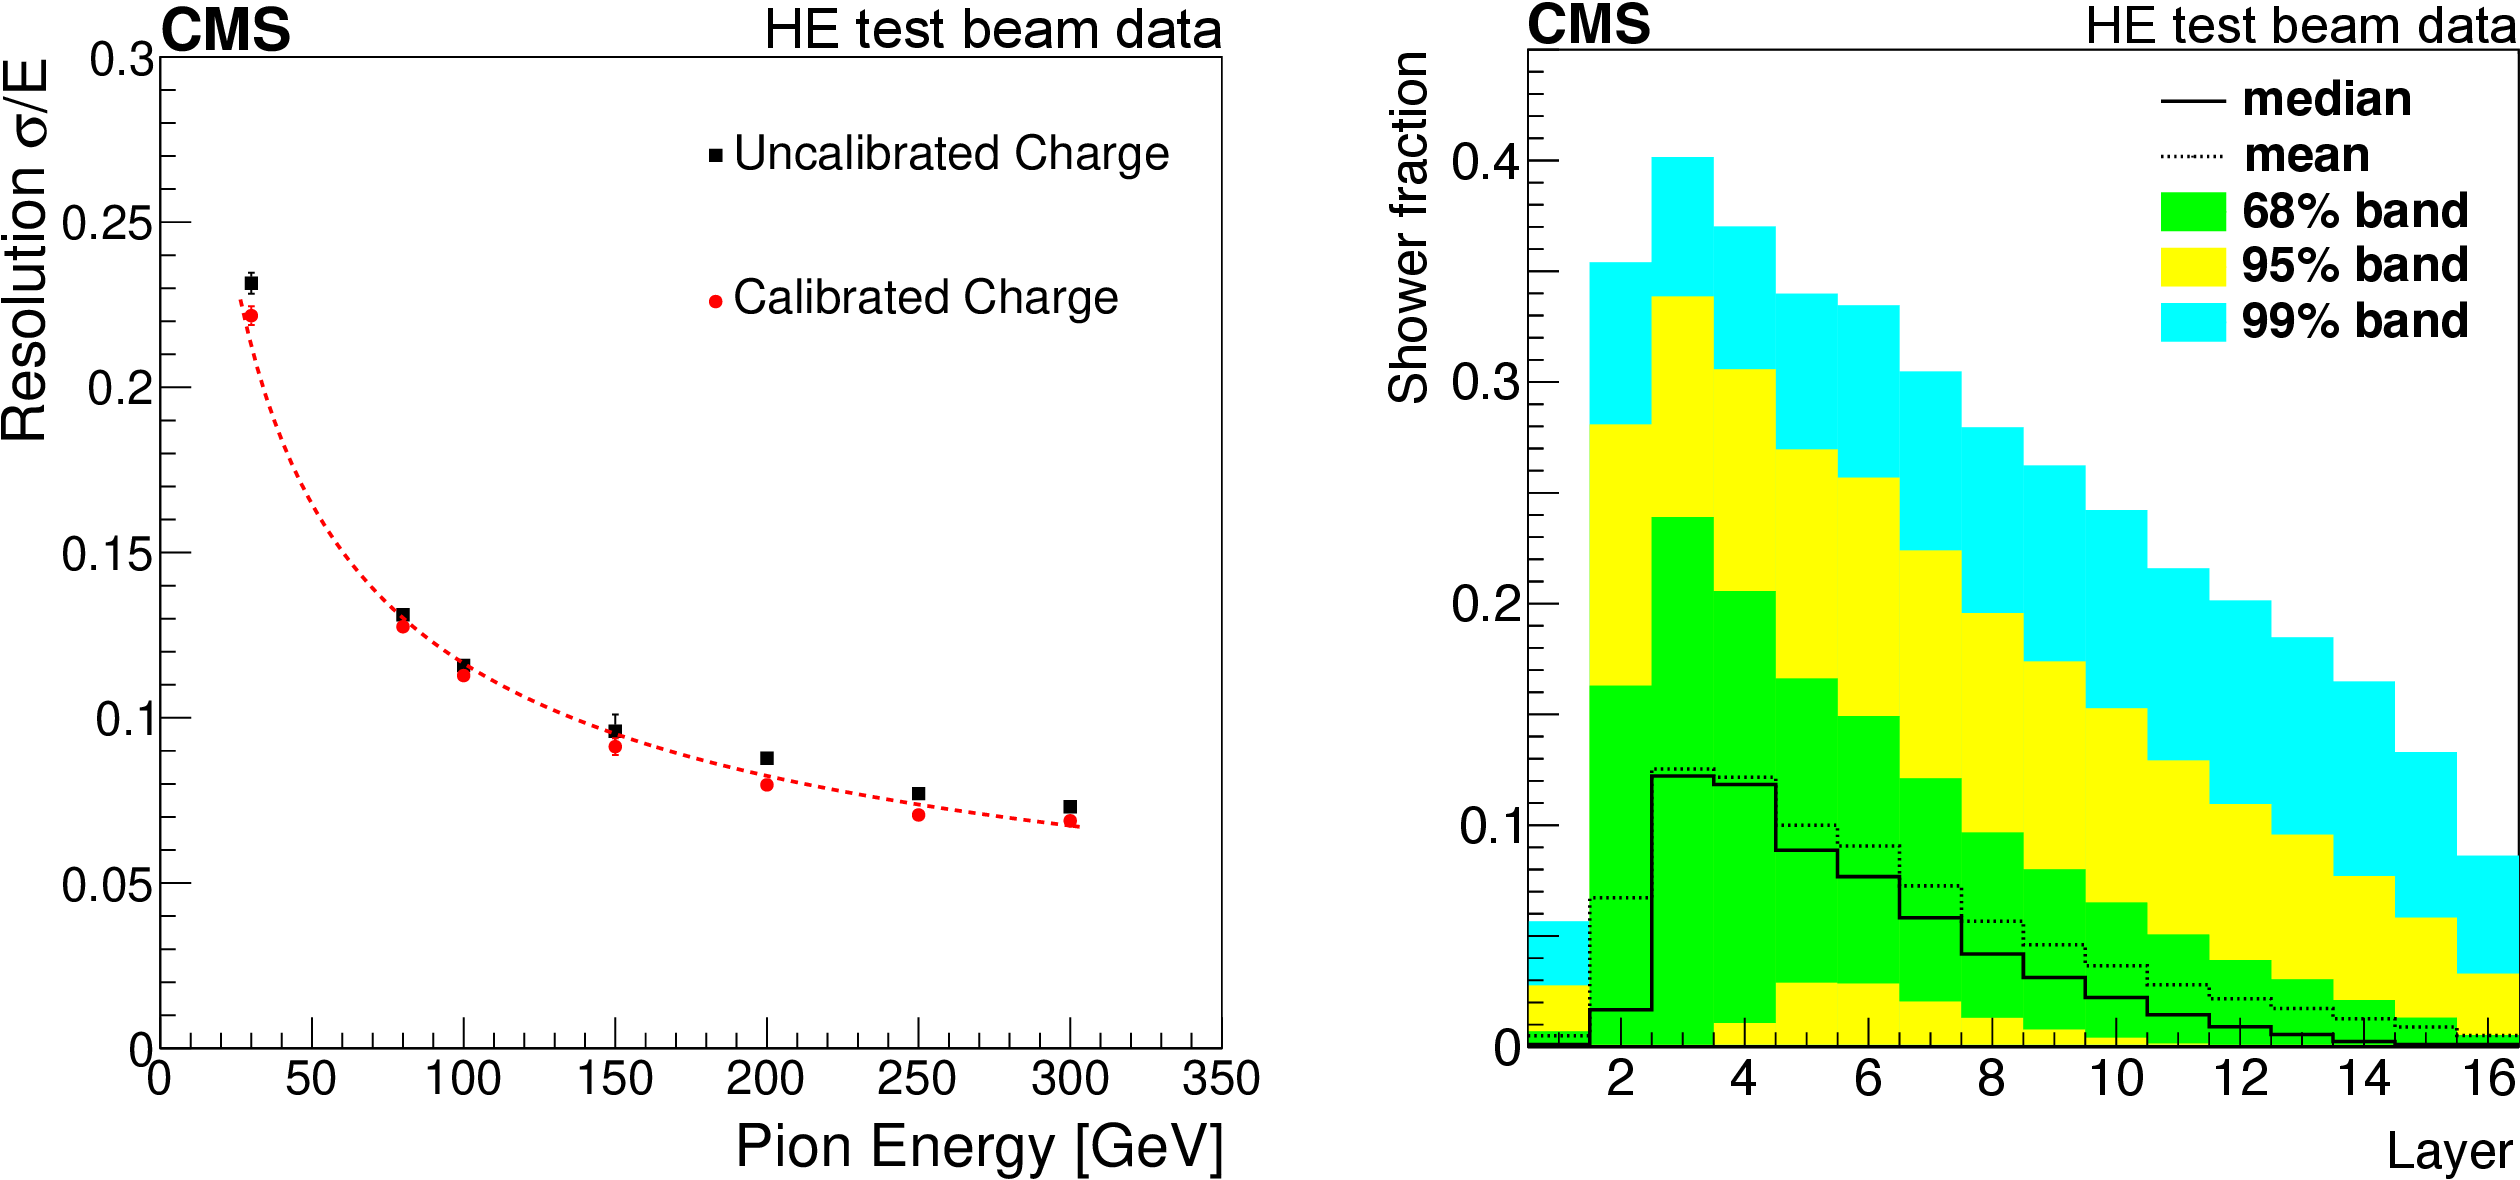
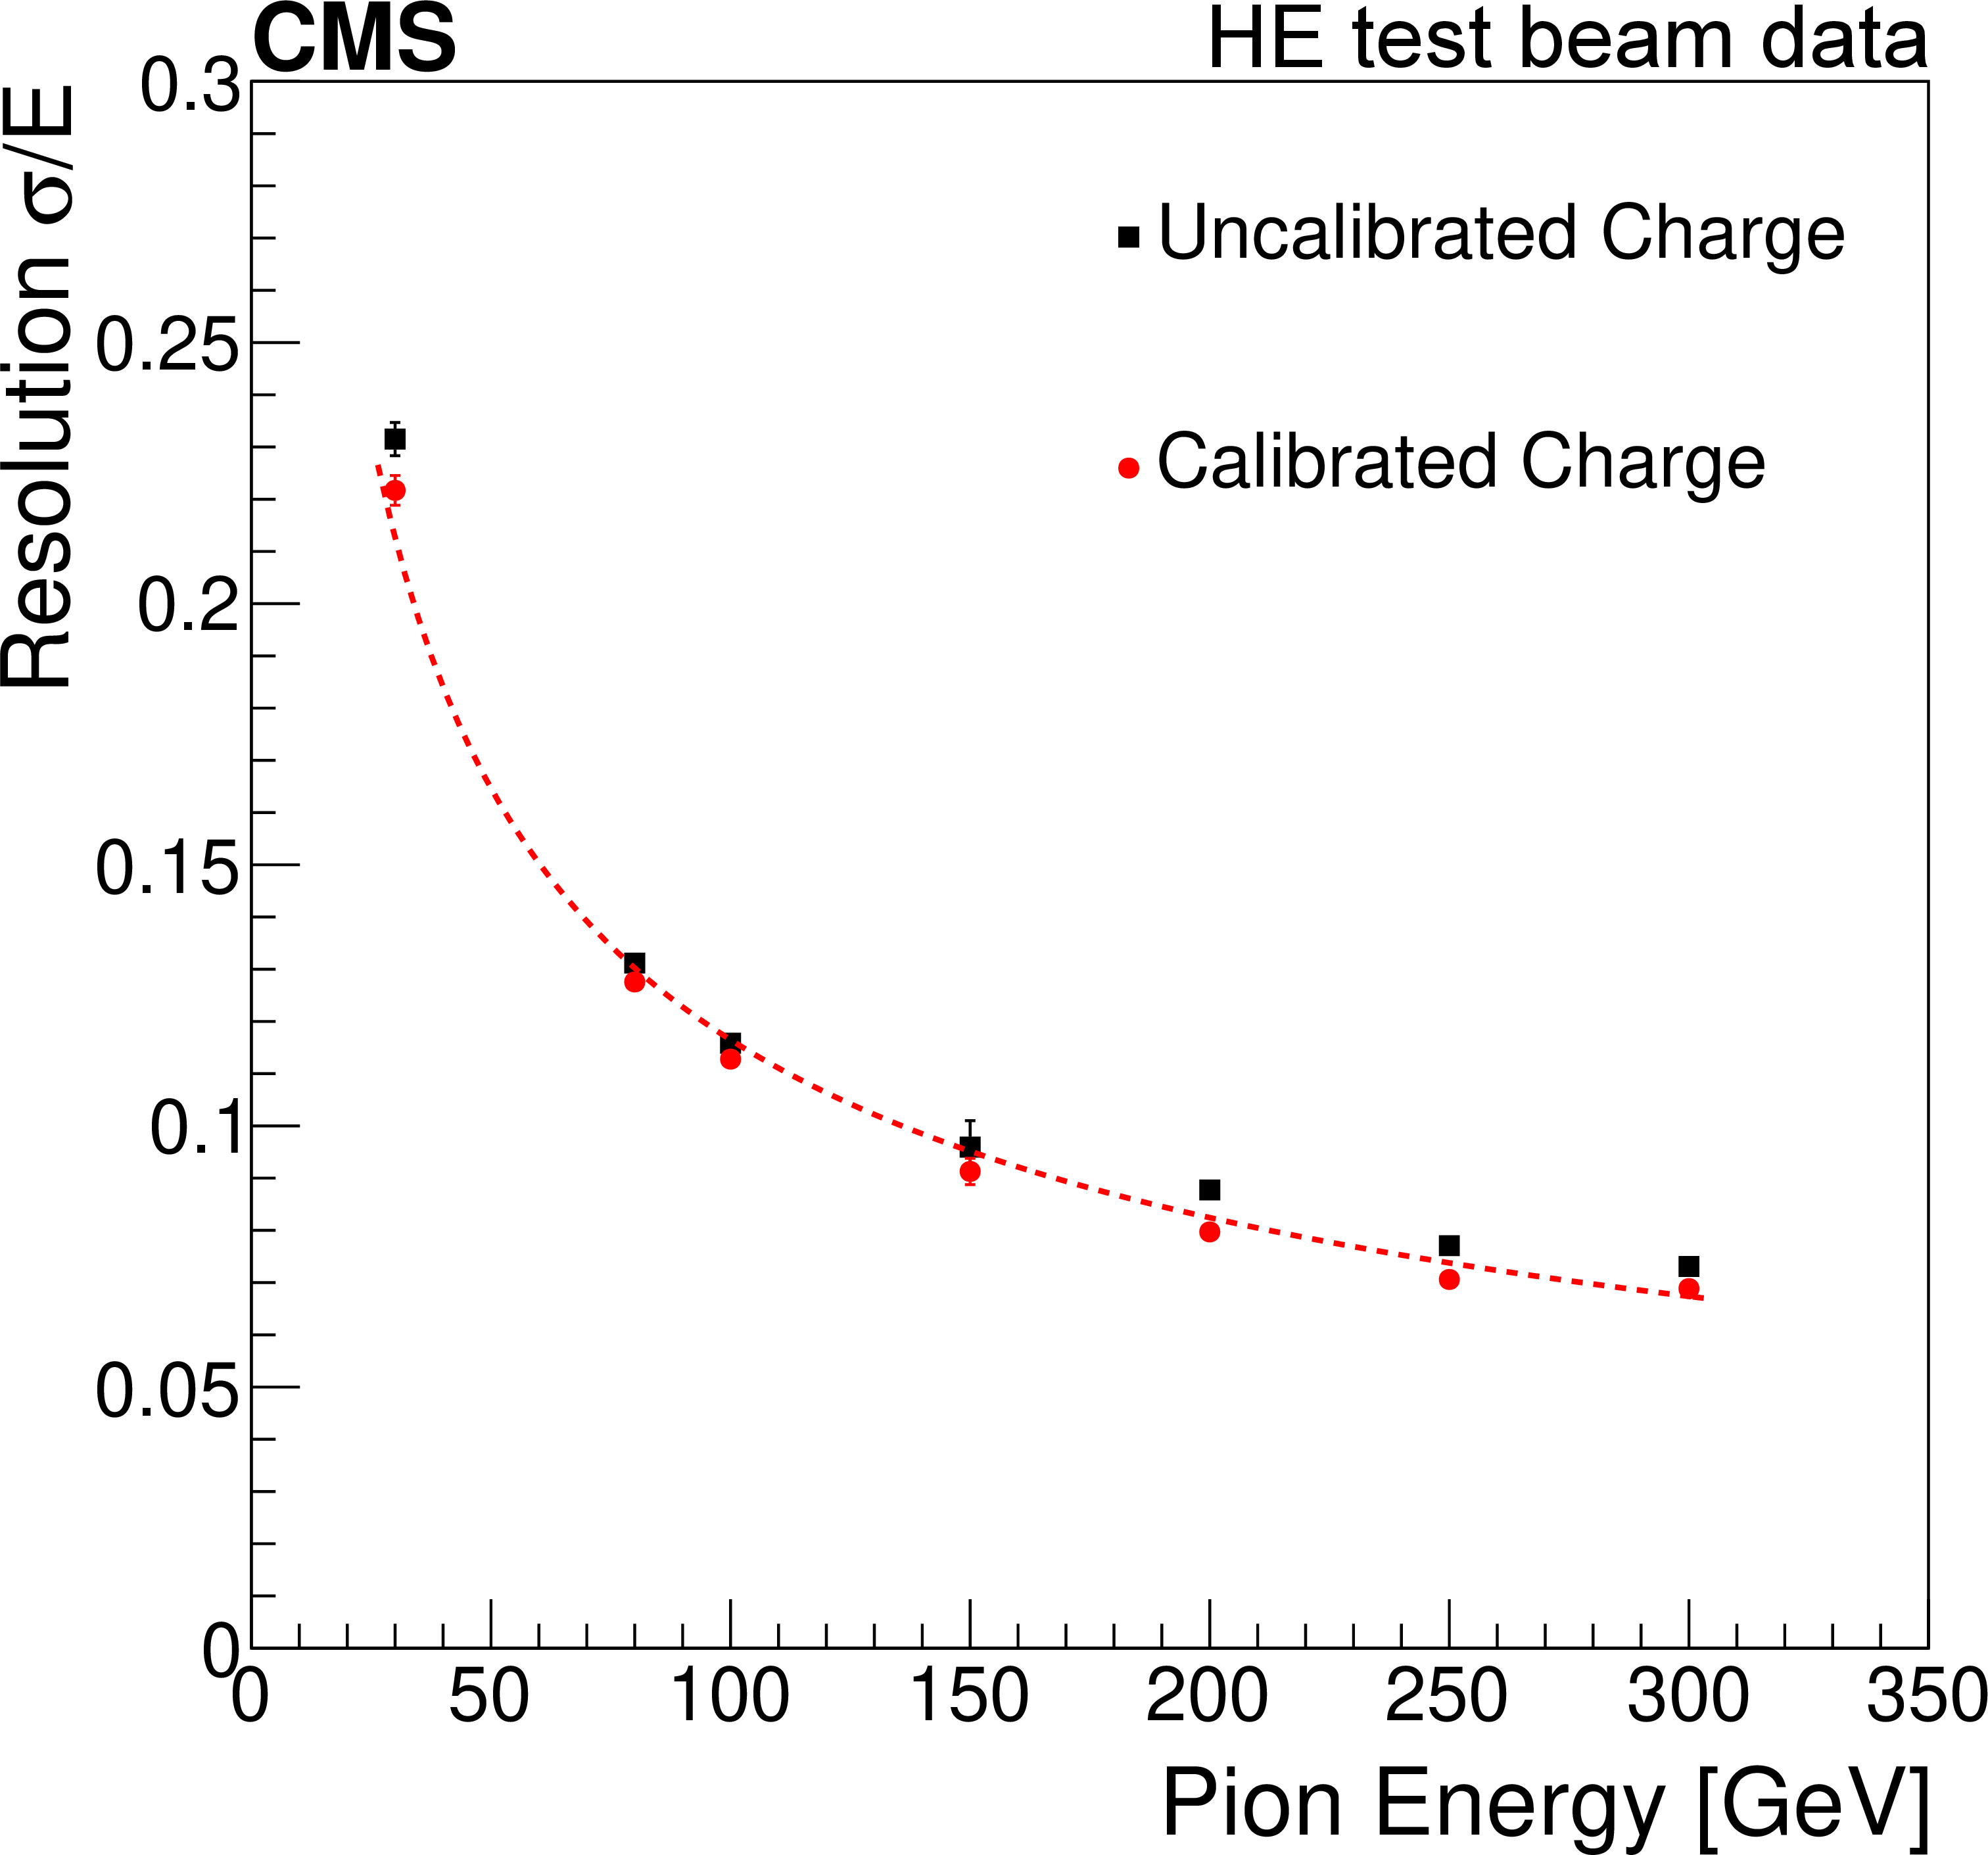
Left: energy resolution of the upgraded prototype detector as a function of the pion beam energy, shown with and without the channel calibrations derived from the response to muons. Right: longitudinal shower profile measured using the special ODU. Bands containing 68, 95, and 99% of all events for each layer are shown. |
png pdf |
Figure 34-a:
Energy resolution of the upgraded prototype detector as a function of the pion beam energy, shown with and without the channel calibrations derived from the response to muons. |
png pdf |
Figure 34-b:
Longitudinal shower profile measured using the special ODU. Bands containing 68, 95, and 99% of all events for each layer are shown. |

png pdf |
Figure 35:
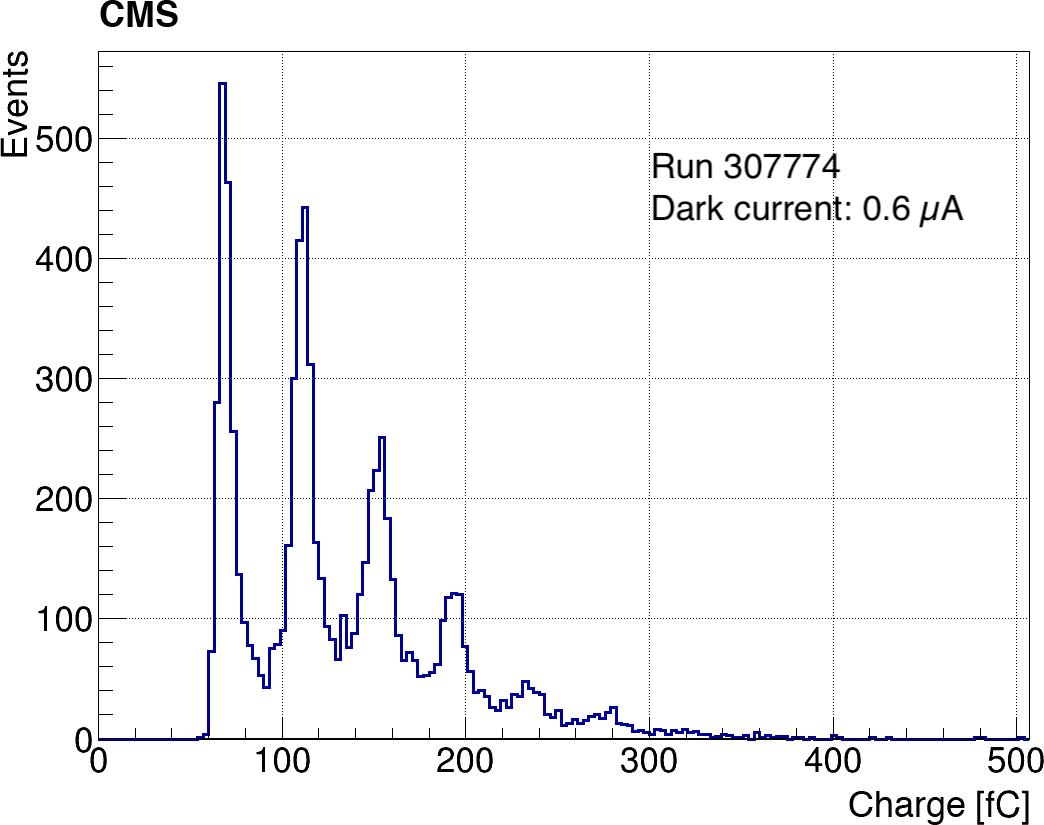
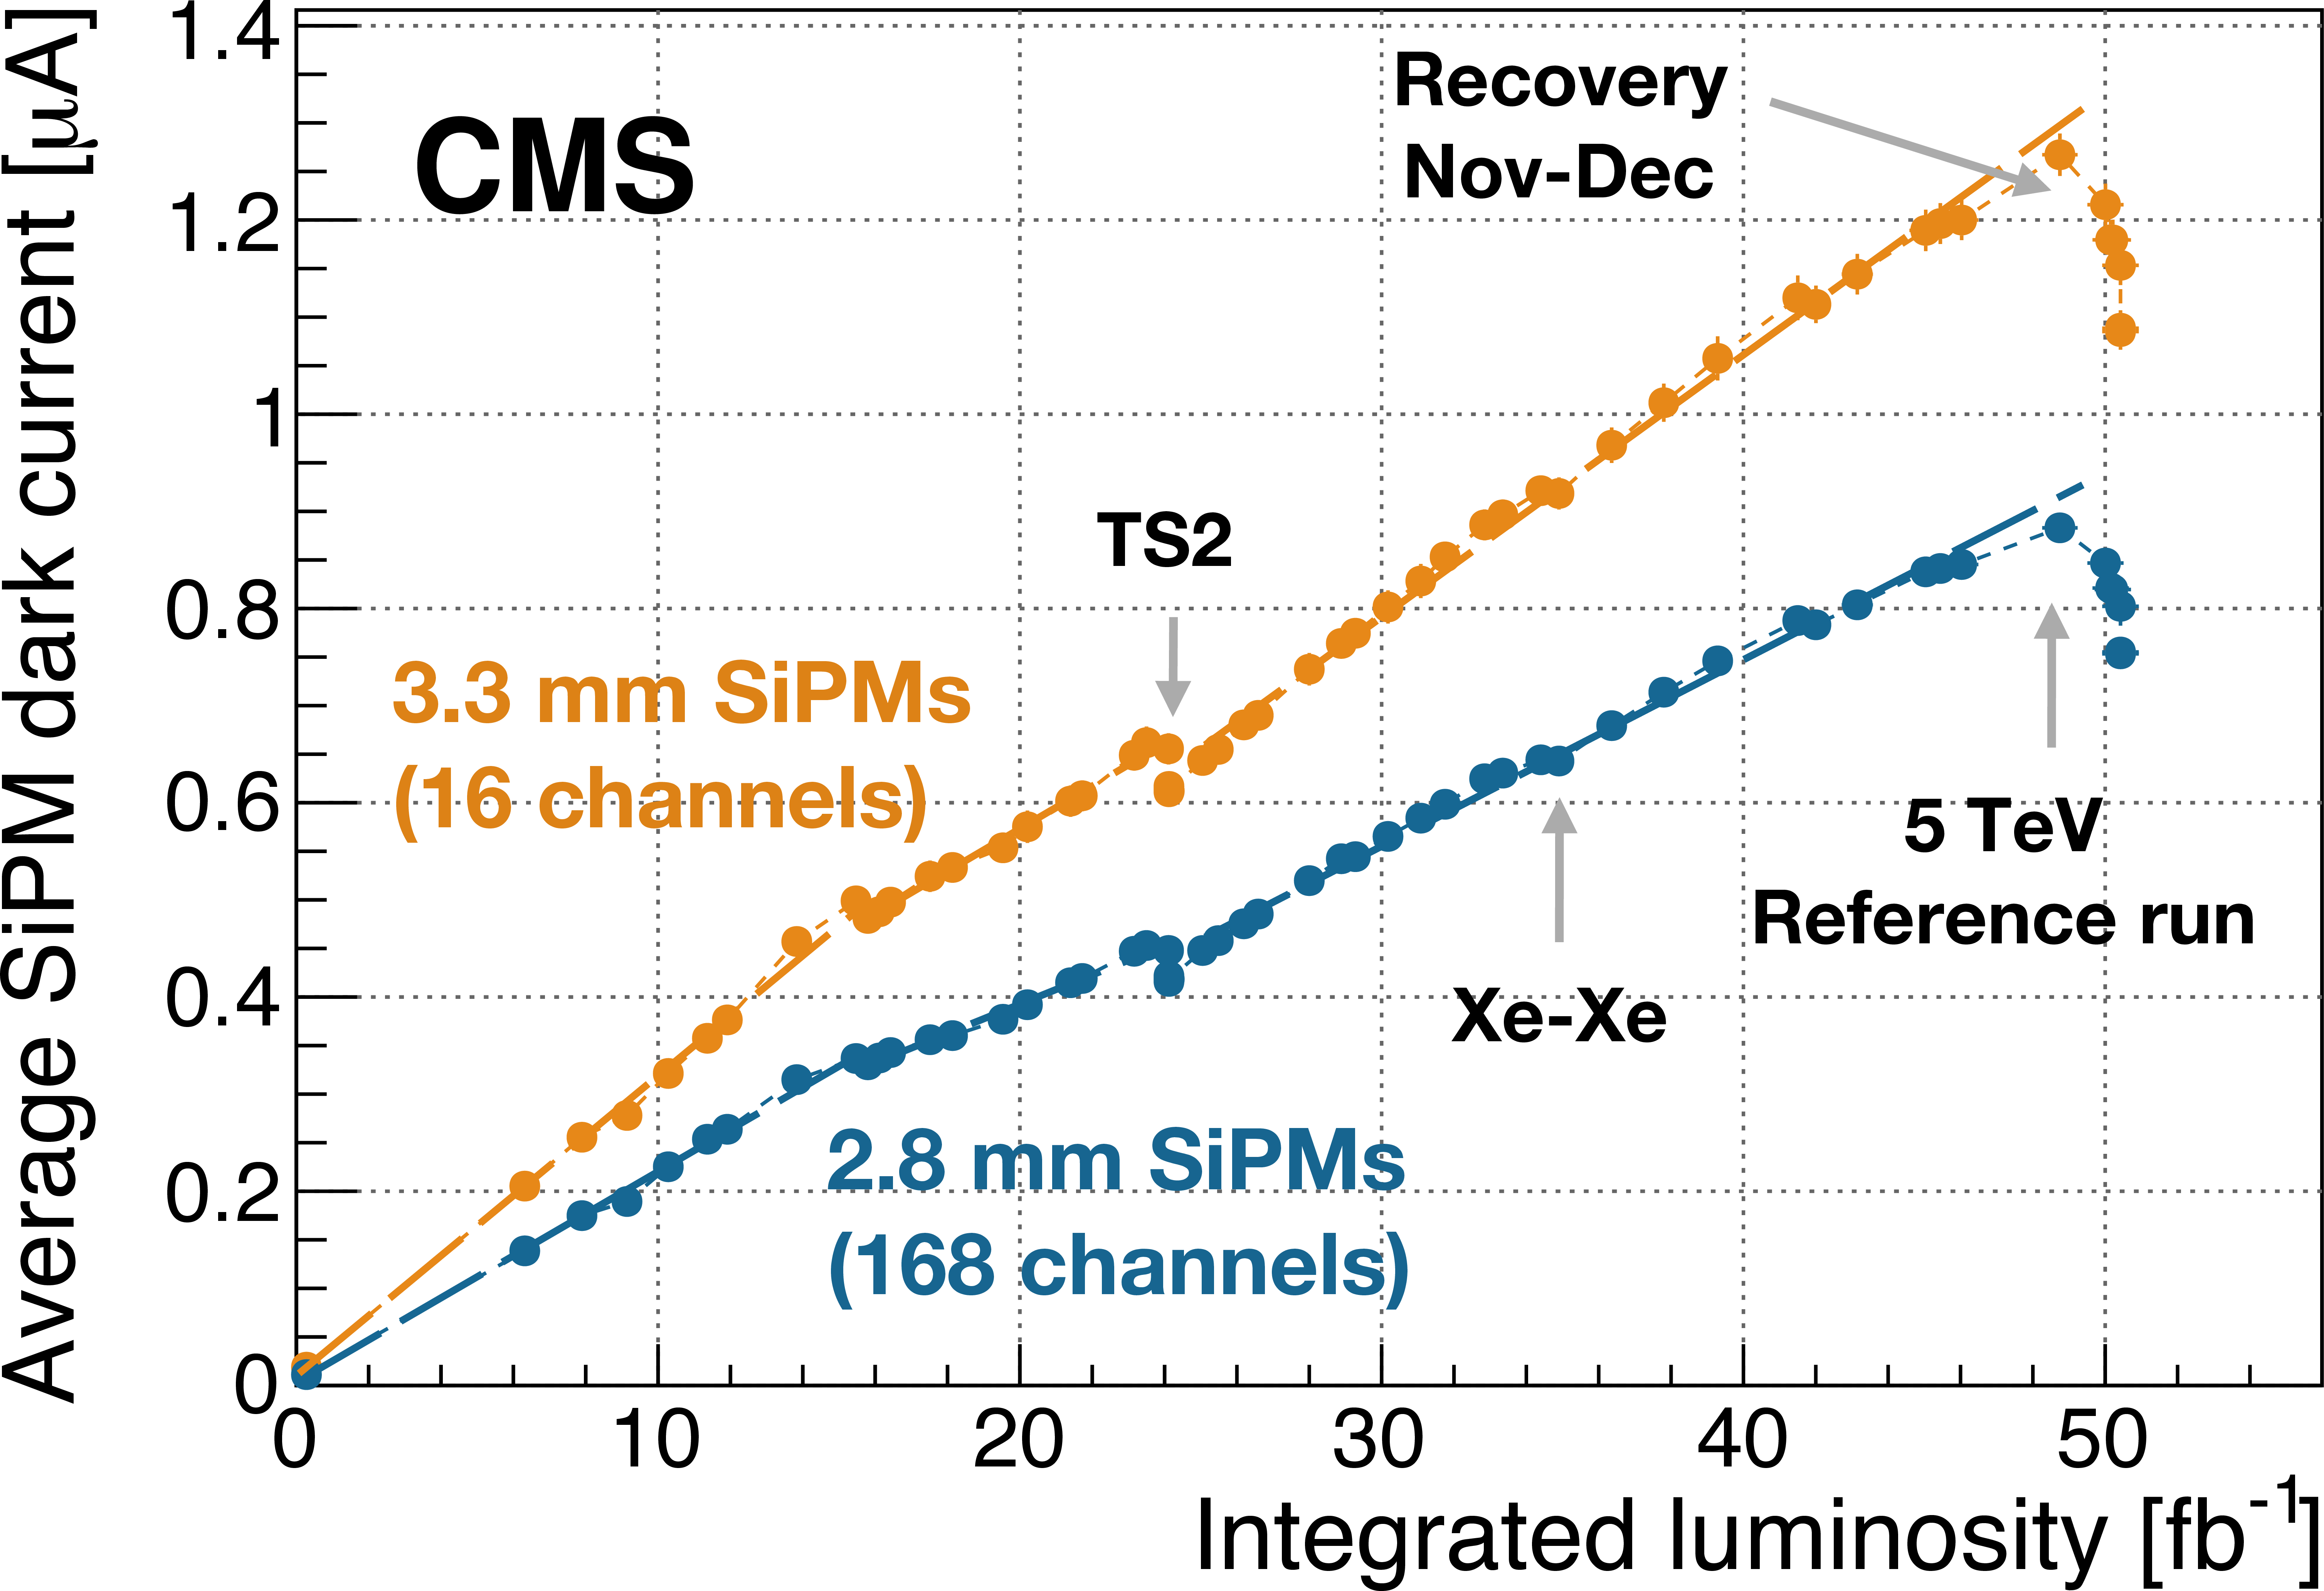
Left: pedestal distribution for a channel with QIE11 + SiPM readout. The charge is integrated in a time window of 100 ns. The QIE pedestal and photoelectron peaks are visible. Right: dark current increase with the integrated luminosity in 2017, where the slope of the fitted line is proportional to the SiPM area. The deviation from linear behavior is due to SiPM annealing in the absence of beam and variation in the instantaneous luminosity. |
png |
Figure 35-a:
Pedestal distribution for a channel with QIE11 + SiPM readout. The charge is integrated in a time window of 100 ns. The QIE pedestal and photoelectron peaks are visible. |
png pdf |
Figure 35-b:
Dark current increase with the integrated luminosity in 2017, where the slope of the fitted line is proportional to the SiPM area. The deviation from linear behavior is due to SiPM annealing in the absence of beam and variation in the instantaneous luminosity. |

png pdf |
Figure 36:
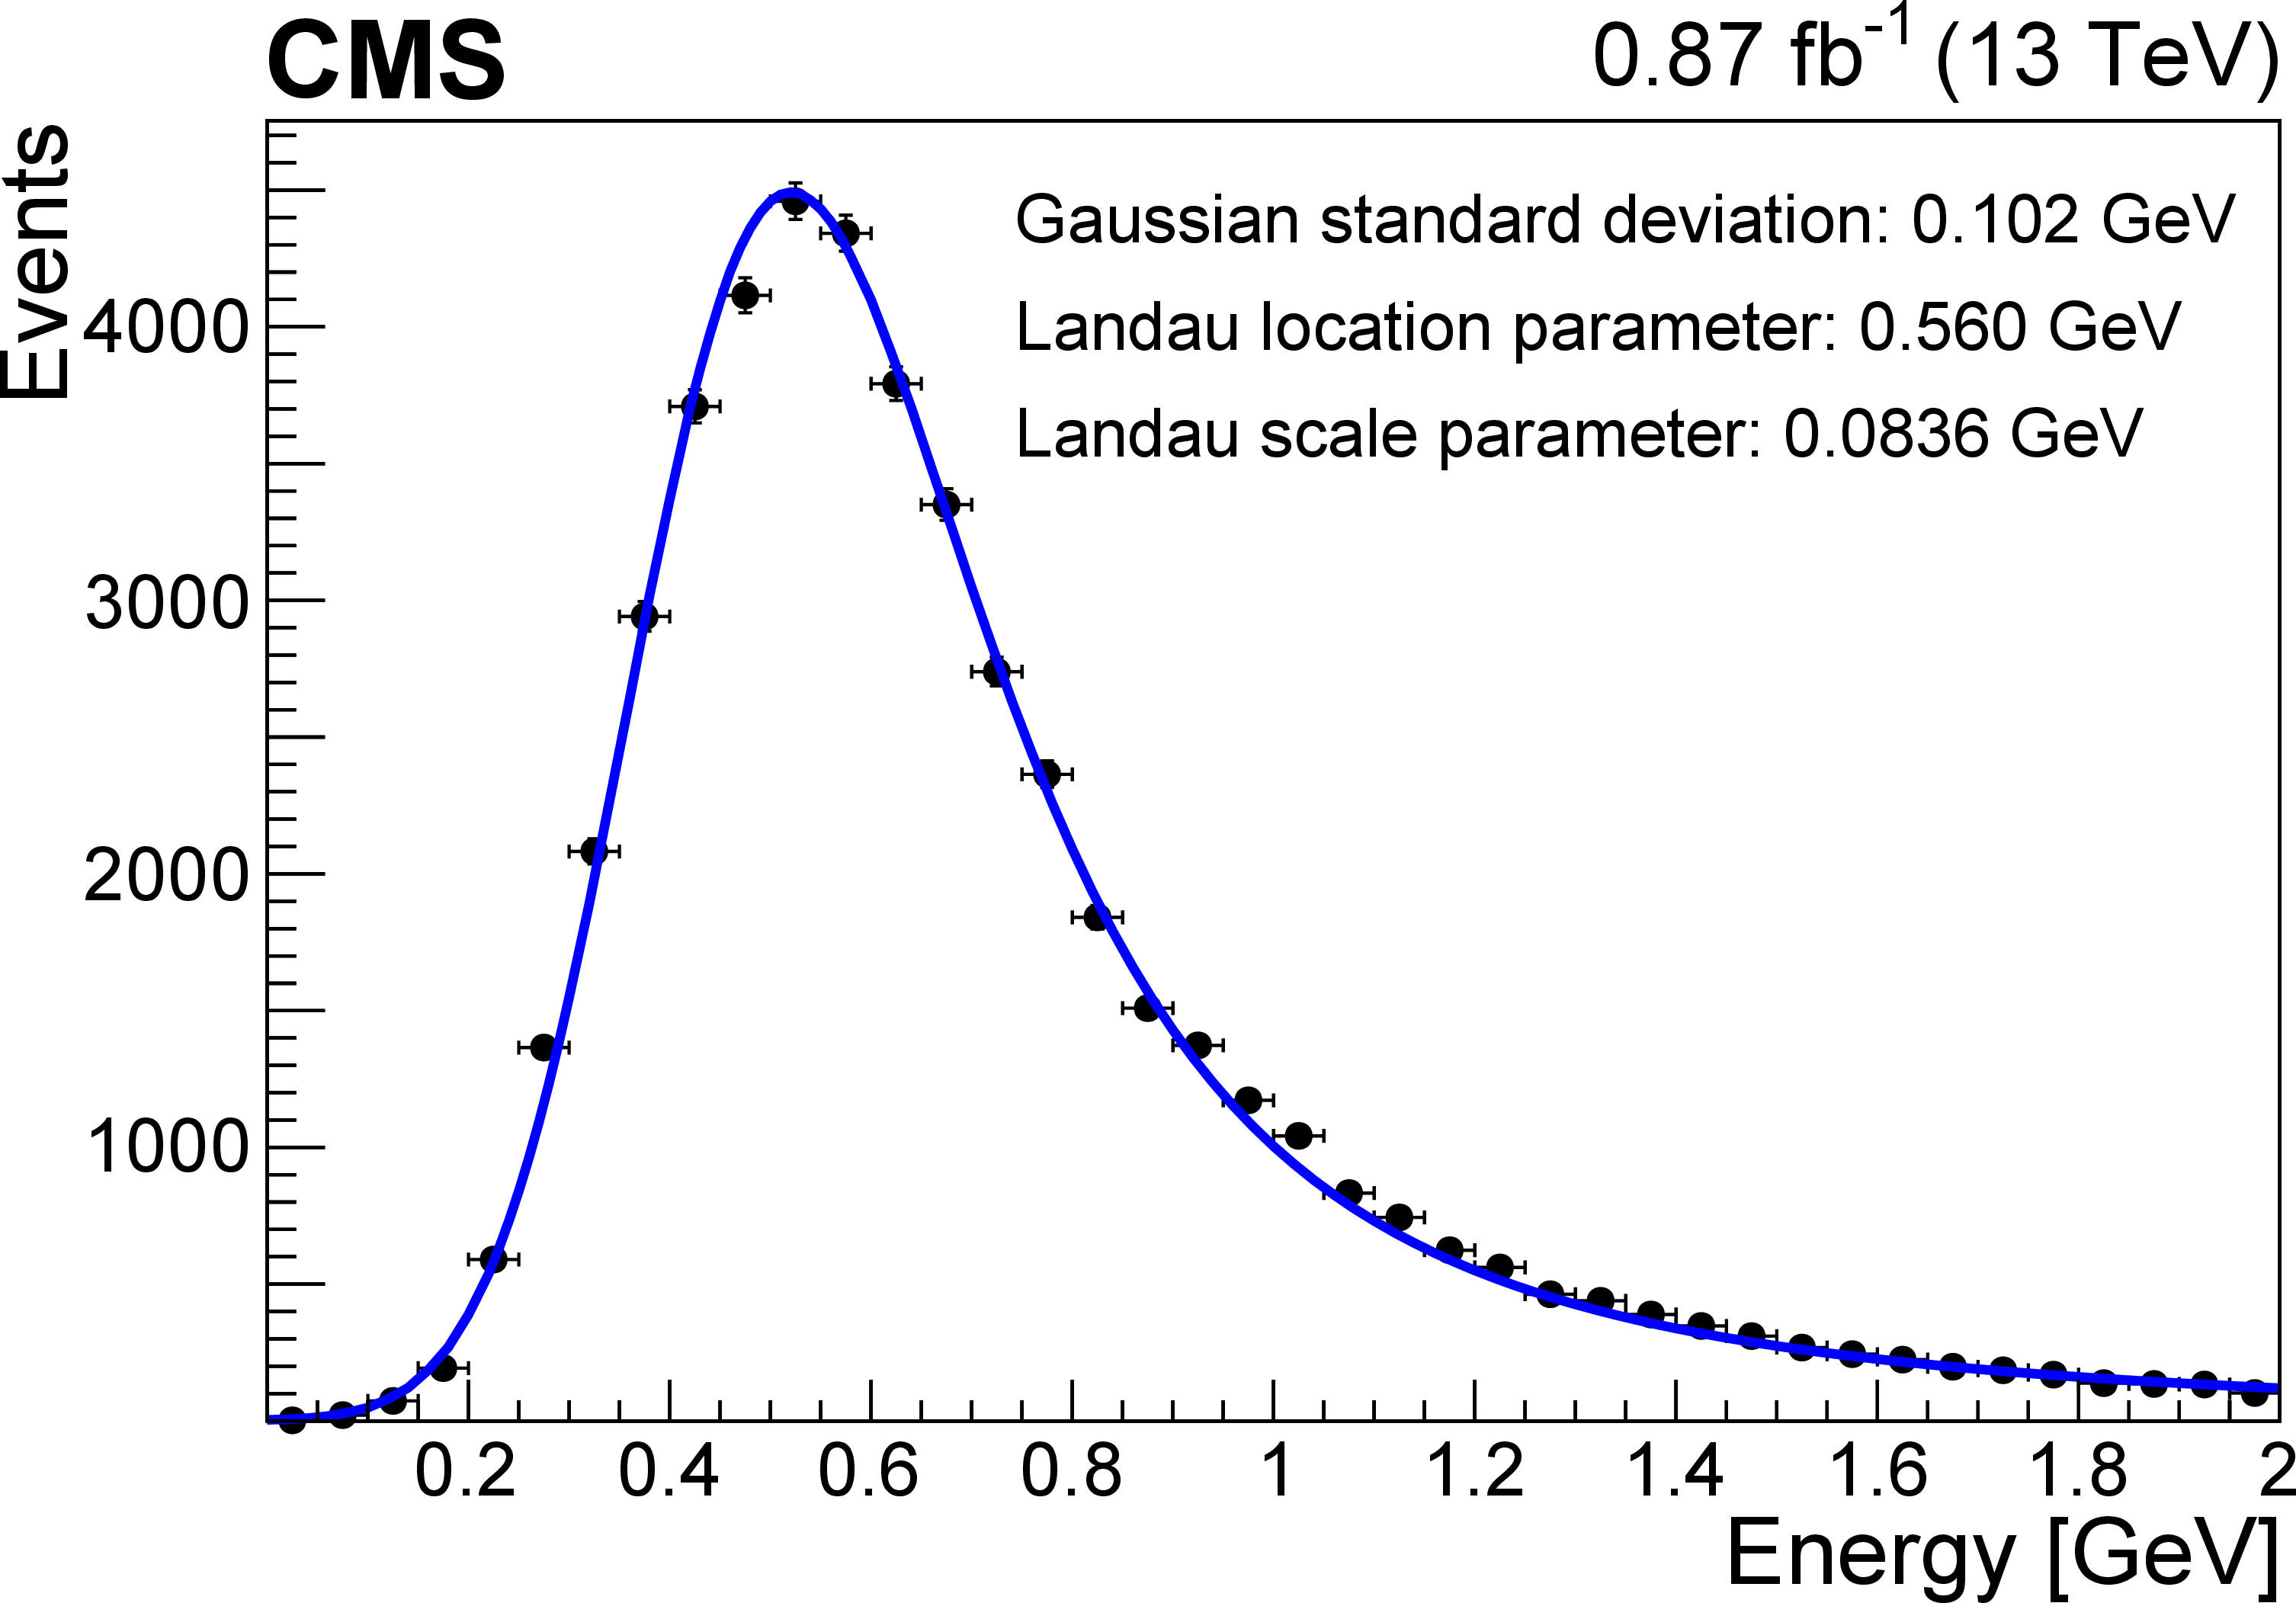
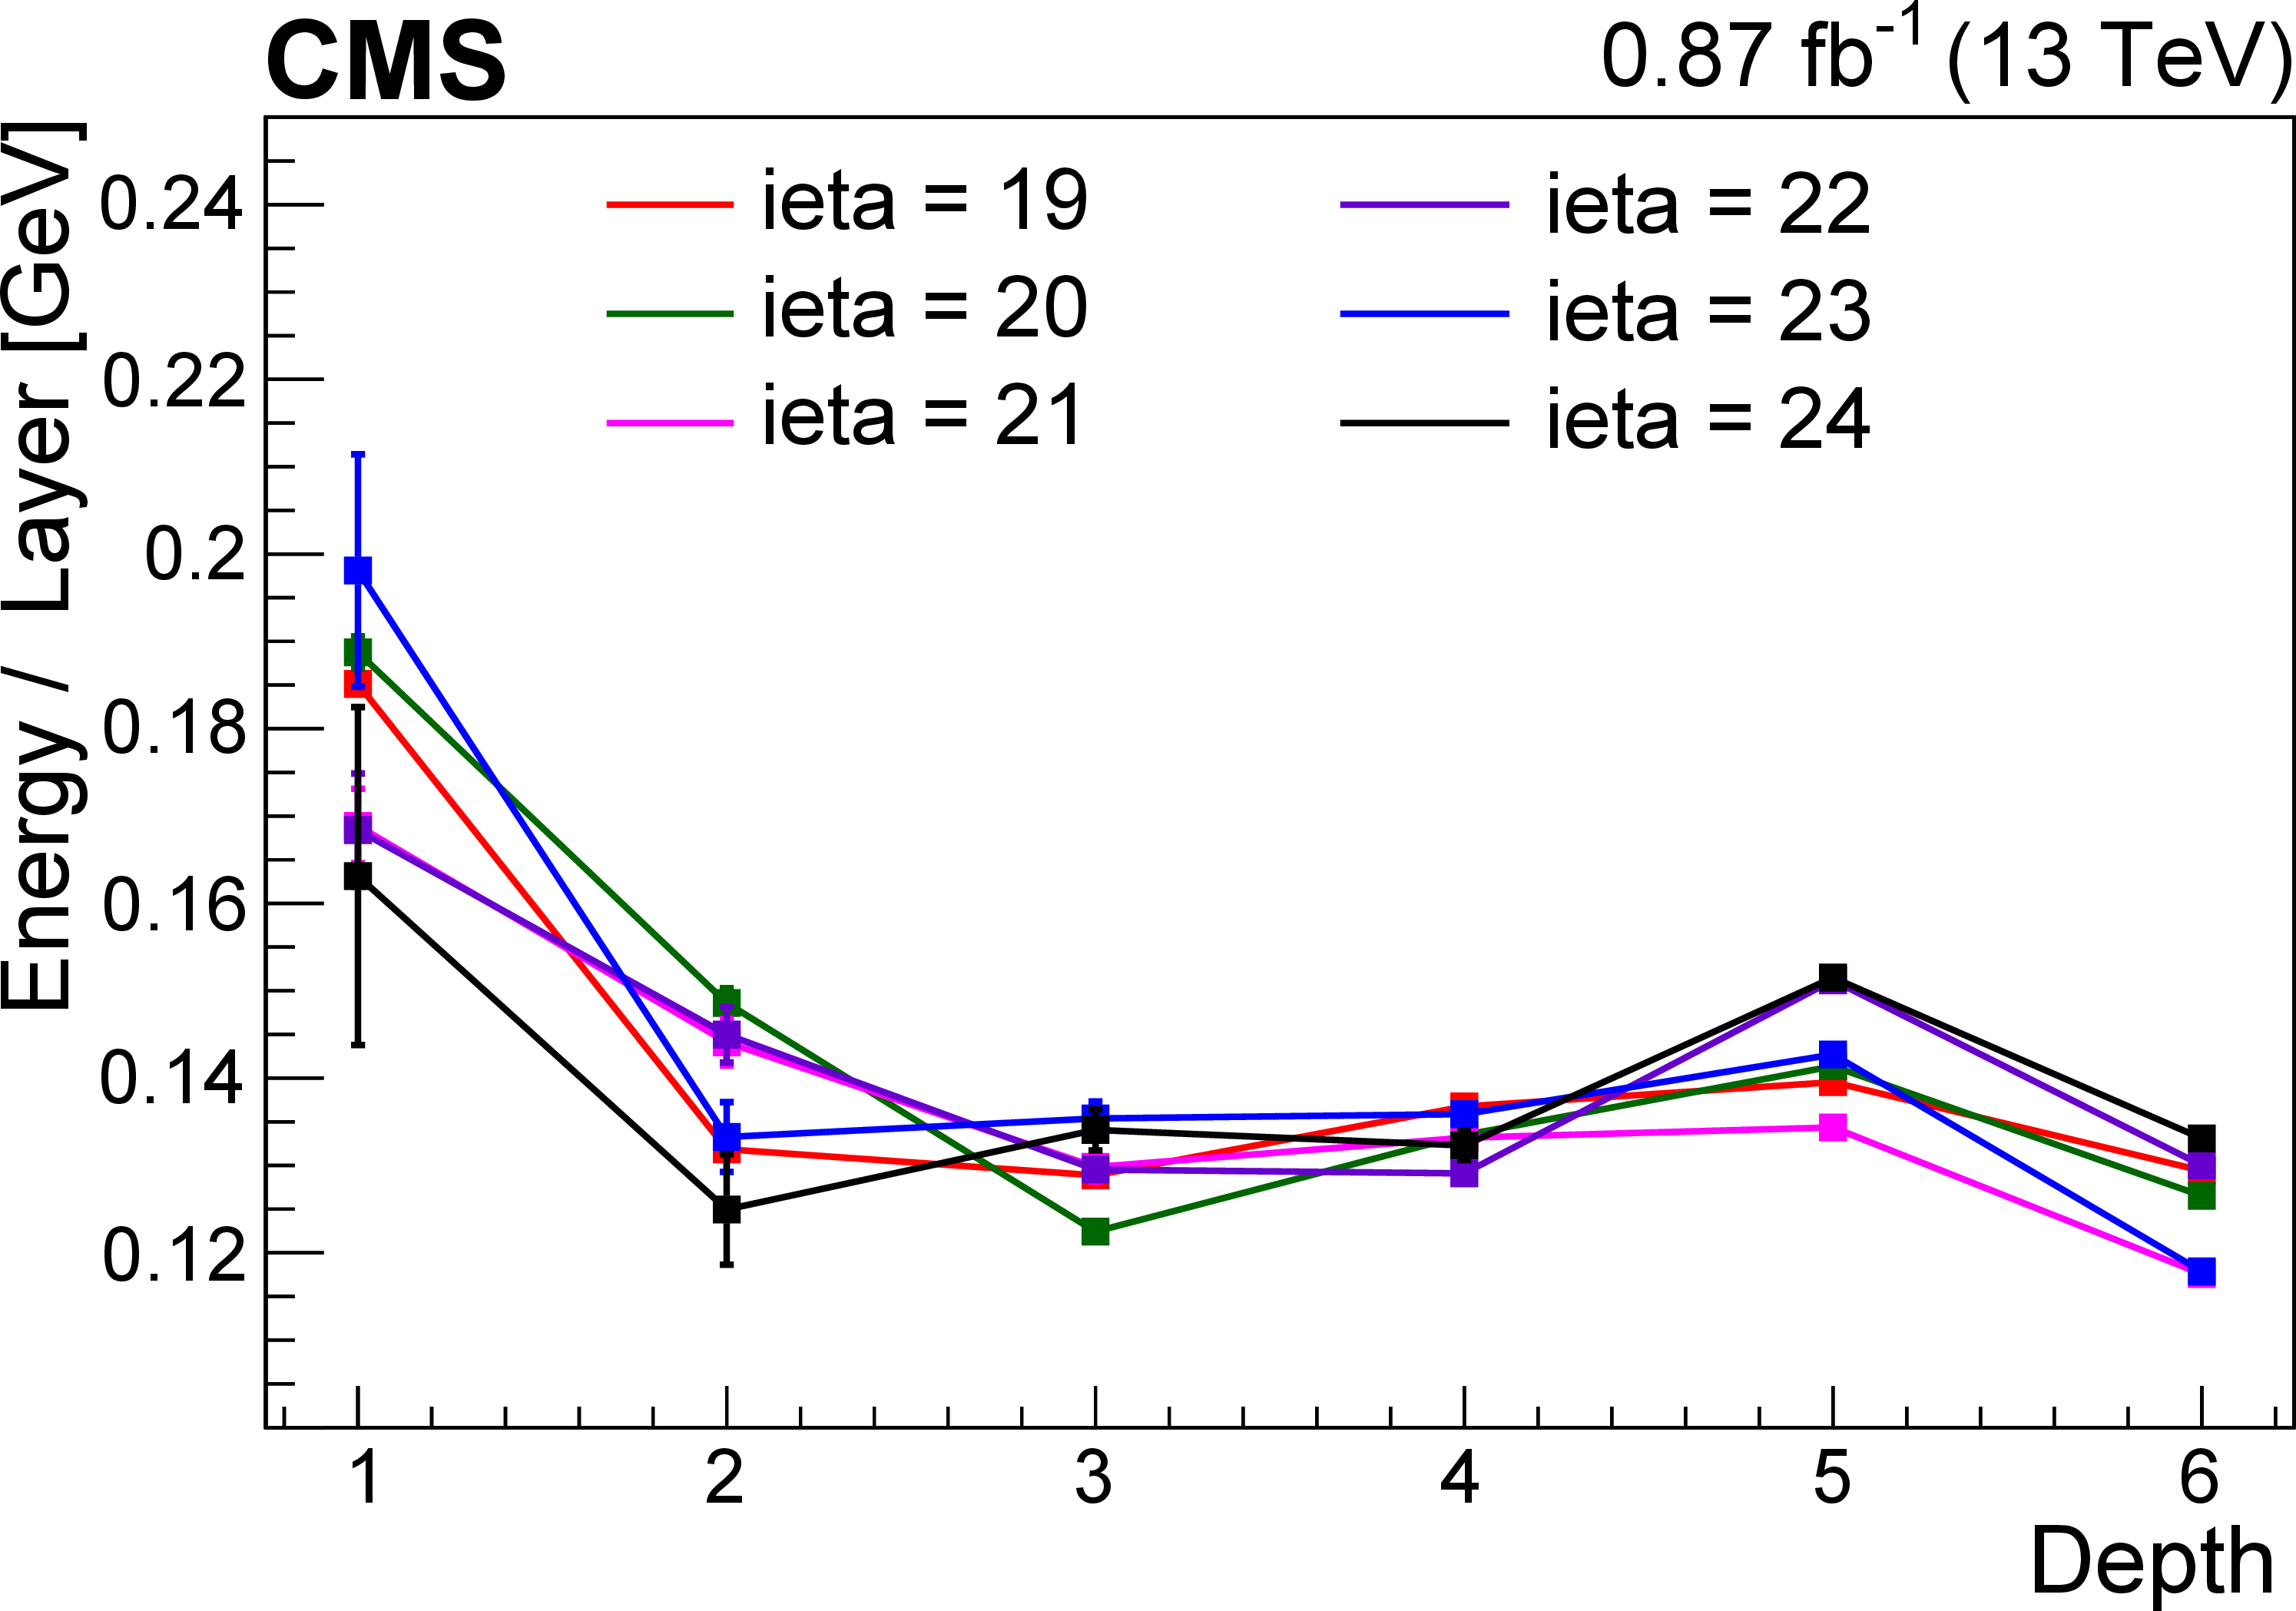
Left: energy deposit from muons in pp collision events in the HE tower corresponding to $ \text{ieta}= $ 20 and $ \text{depth}= $ 5. The energy spectrum is fitted using the convolution of a Gaussian function with a mean of zero and a Landau distribution. The fitting function has three free parameters: the Landau location parameter, the Landau scale parameter, and the width of the Gaussian. Right: the most probable value of the muon energy deposit per layer in HE towers as a function of depth for different $ \eta $ regions. The vertical bars represent the statistical uncertainty. Muons from collision events are considered when their trajectory is contained within a single HCAL tower. The muon signal peak is fitted with the convolution of a Gaussian and Landau functions. The Landau location parameter is divided by the number of scintillator layers in the considered depth. |
png pdf |
Figure 36-a:
Energy deposit from muons in pp collision events in the HE tower corresponding to $ \text{ieta}= $ 20 and $ \text{depth}= $ 5. The energy spectrum is fitted using the convolution of a Gaussian function with a mean of zero and a Landau distribution. The fitting function has three free parameters: the Landau location parameter, the Landau scale parameter, and the width of the Gaussian. |
png pdf |
Figure 36-b:
The most probable value of the muon energy deposit per layer in HE towers as a function of depth for different $ \eta $ regions. The vertical bars represent the statistical uncertainty. Muons from collision events are considered when their trajectory is contained within a single HCAL tower. The muon signal peak is fitted with the convolution of a Gaussian and Landau functions. The Landau location parameter is divided by the number of scintillator layers in the considered depth. |

png pdf |
Figure 37:
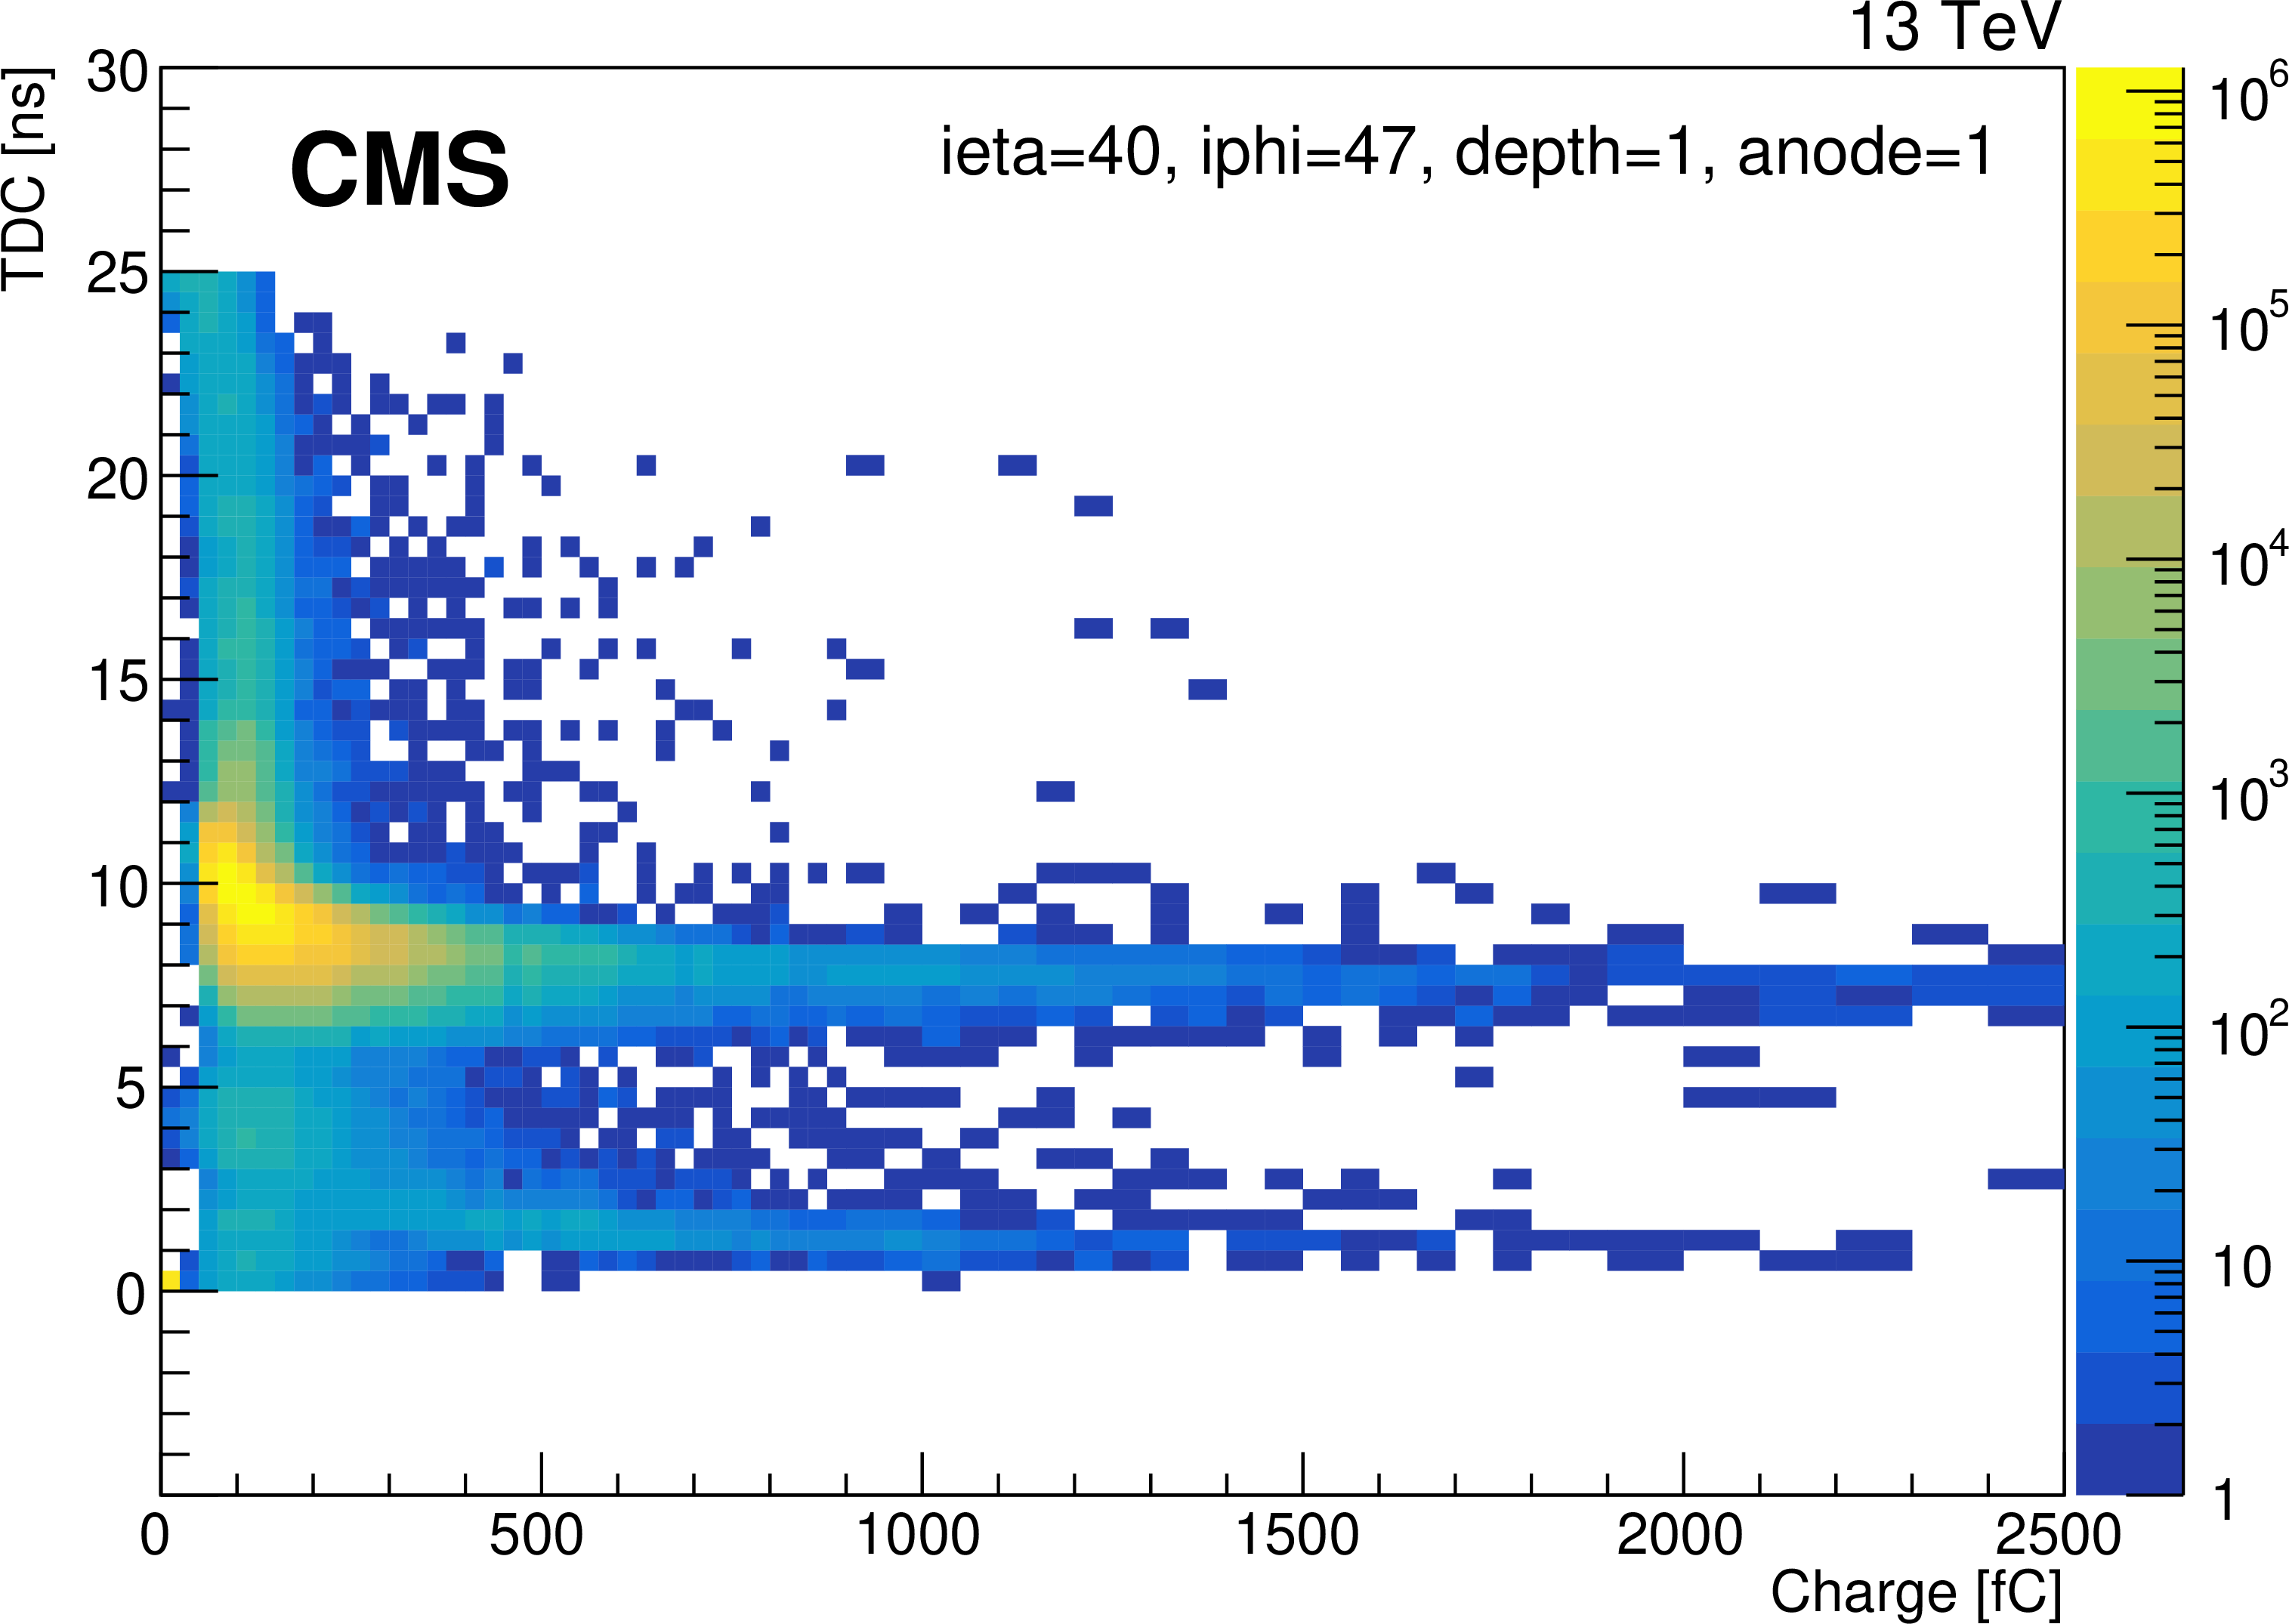
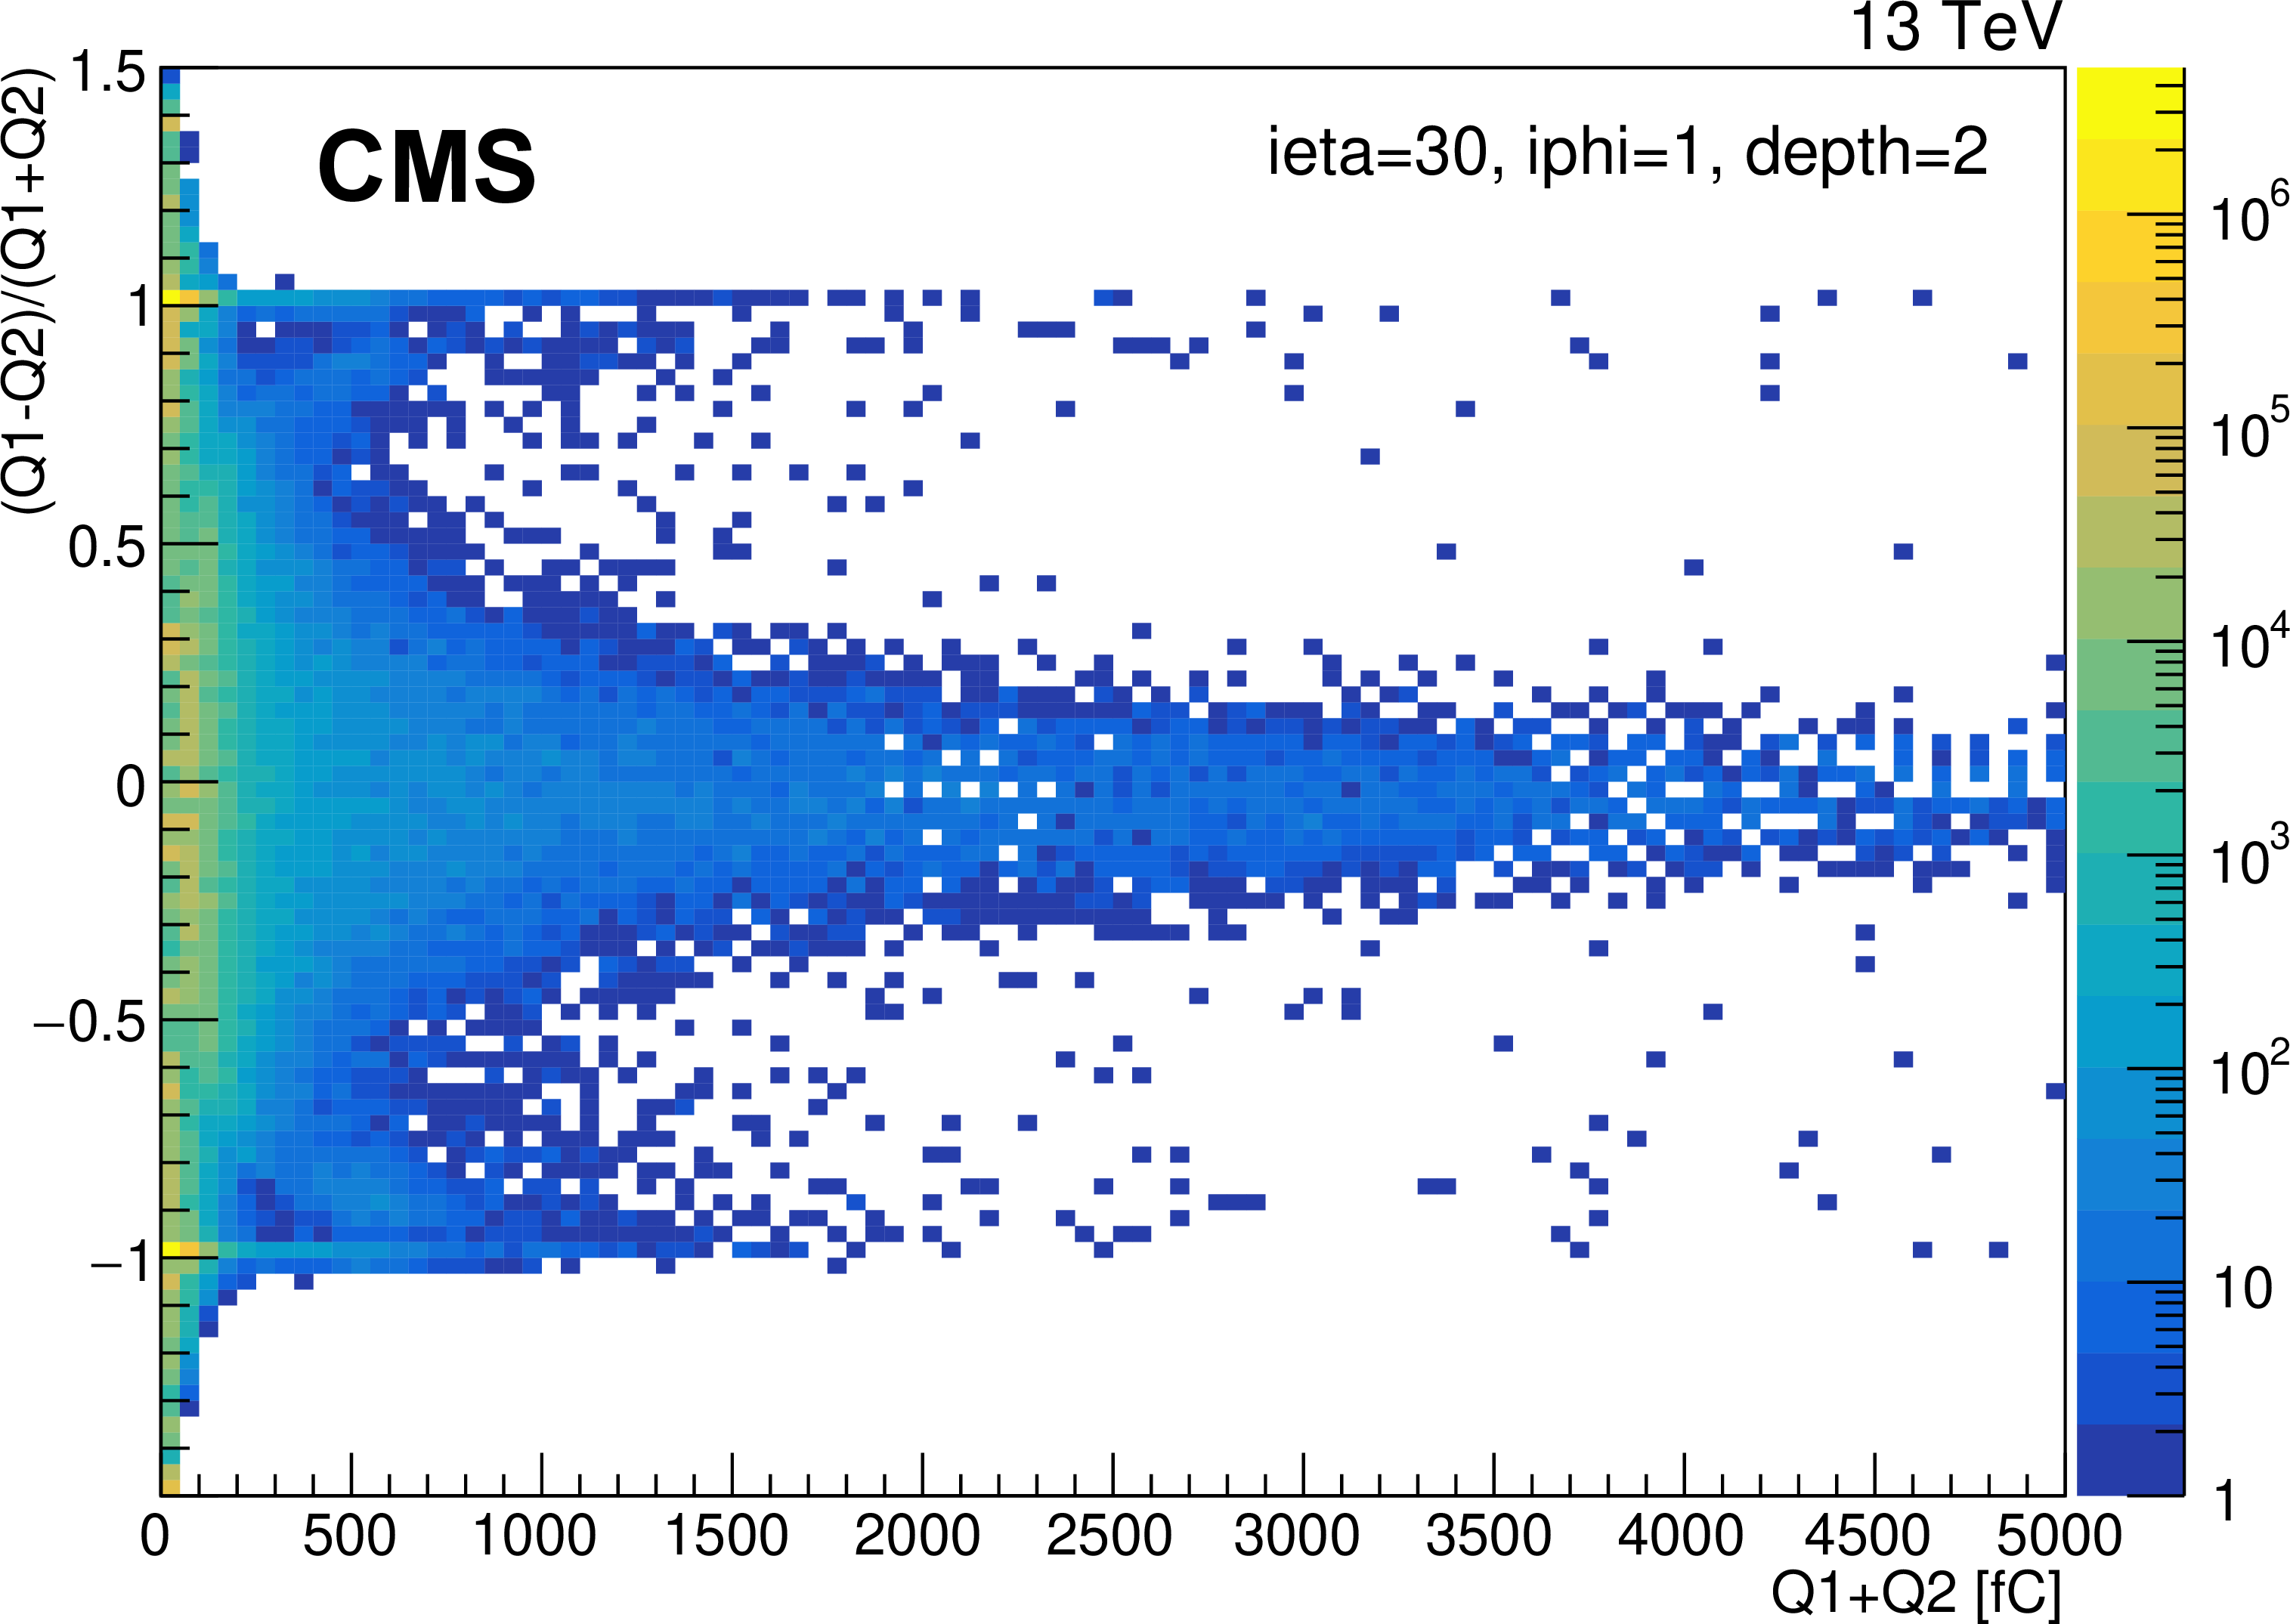
Left: HF signal arrival time, as measured in the TDC, versus the collected signal charge. All signals arriving within less than 5 ns are ``window events''. The color indicates the number of events using the scale to the right of each plot. The data were taken in early 2017. Right: charge asymmetry between the two channels of a PMT versus the total charge in both channels. The light from genuine collision events is well mixed in the light guides before falling on the PMT, hence similar signals are expected in all four anodes, which are grouped into two channels. The so-called ``window events'' due to Cherenkov radiation in the PMT window most likely fall on one or two anodes, producing asymmetric signals. |
png pdf |
Figure 37-a:
HF signal arrival time, as measured in the TDC, versus the collected signal charge. All signals arriving within less than 5 ns are ``window events''. The color indicates the number of events using the scale to the right of each plot. The data were taken in early 2017. |
png pdf |
Figure 37-b:
Charge asymmetry between the two channels of a PMT versus the total charge in both channels. The light from genuine collision events is well mixed in the light guides before falling on the PMT, hence similar signals are expected in all four anodes, which are grouped into two channels. The so-called ``window events'' due to Cherenkov radiation in the PMT window most likely fall on one or two anodes, producing asymmetric signals. |
png pdf |
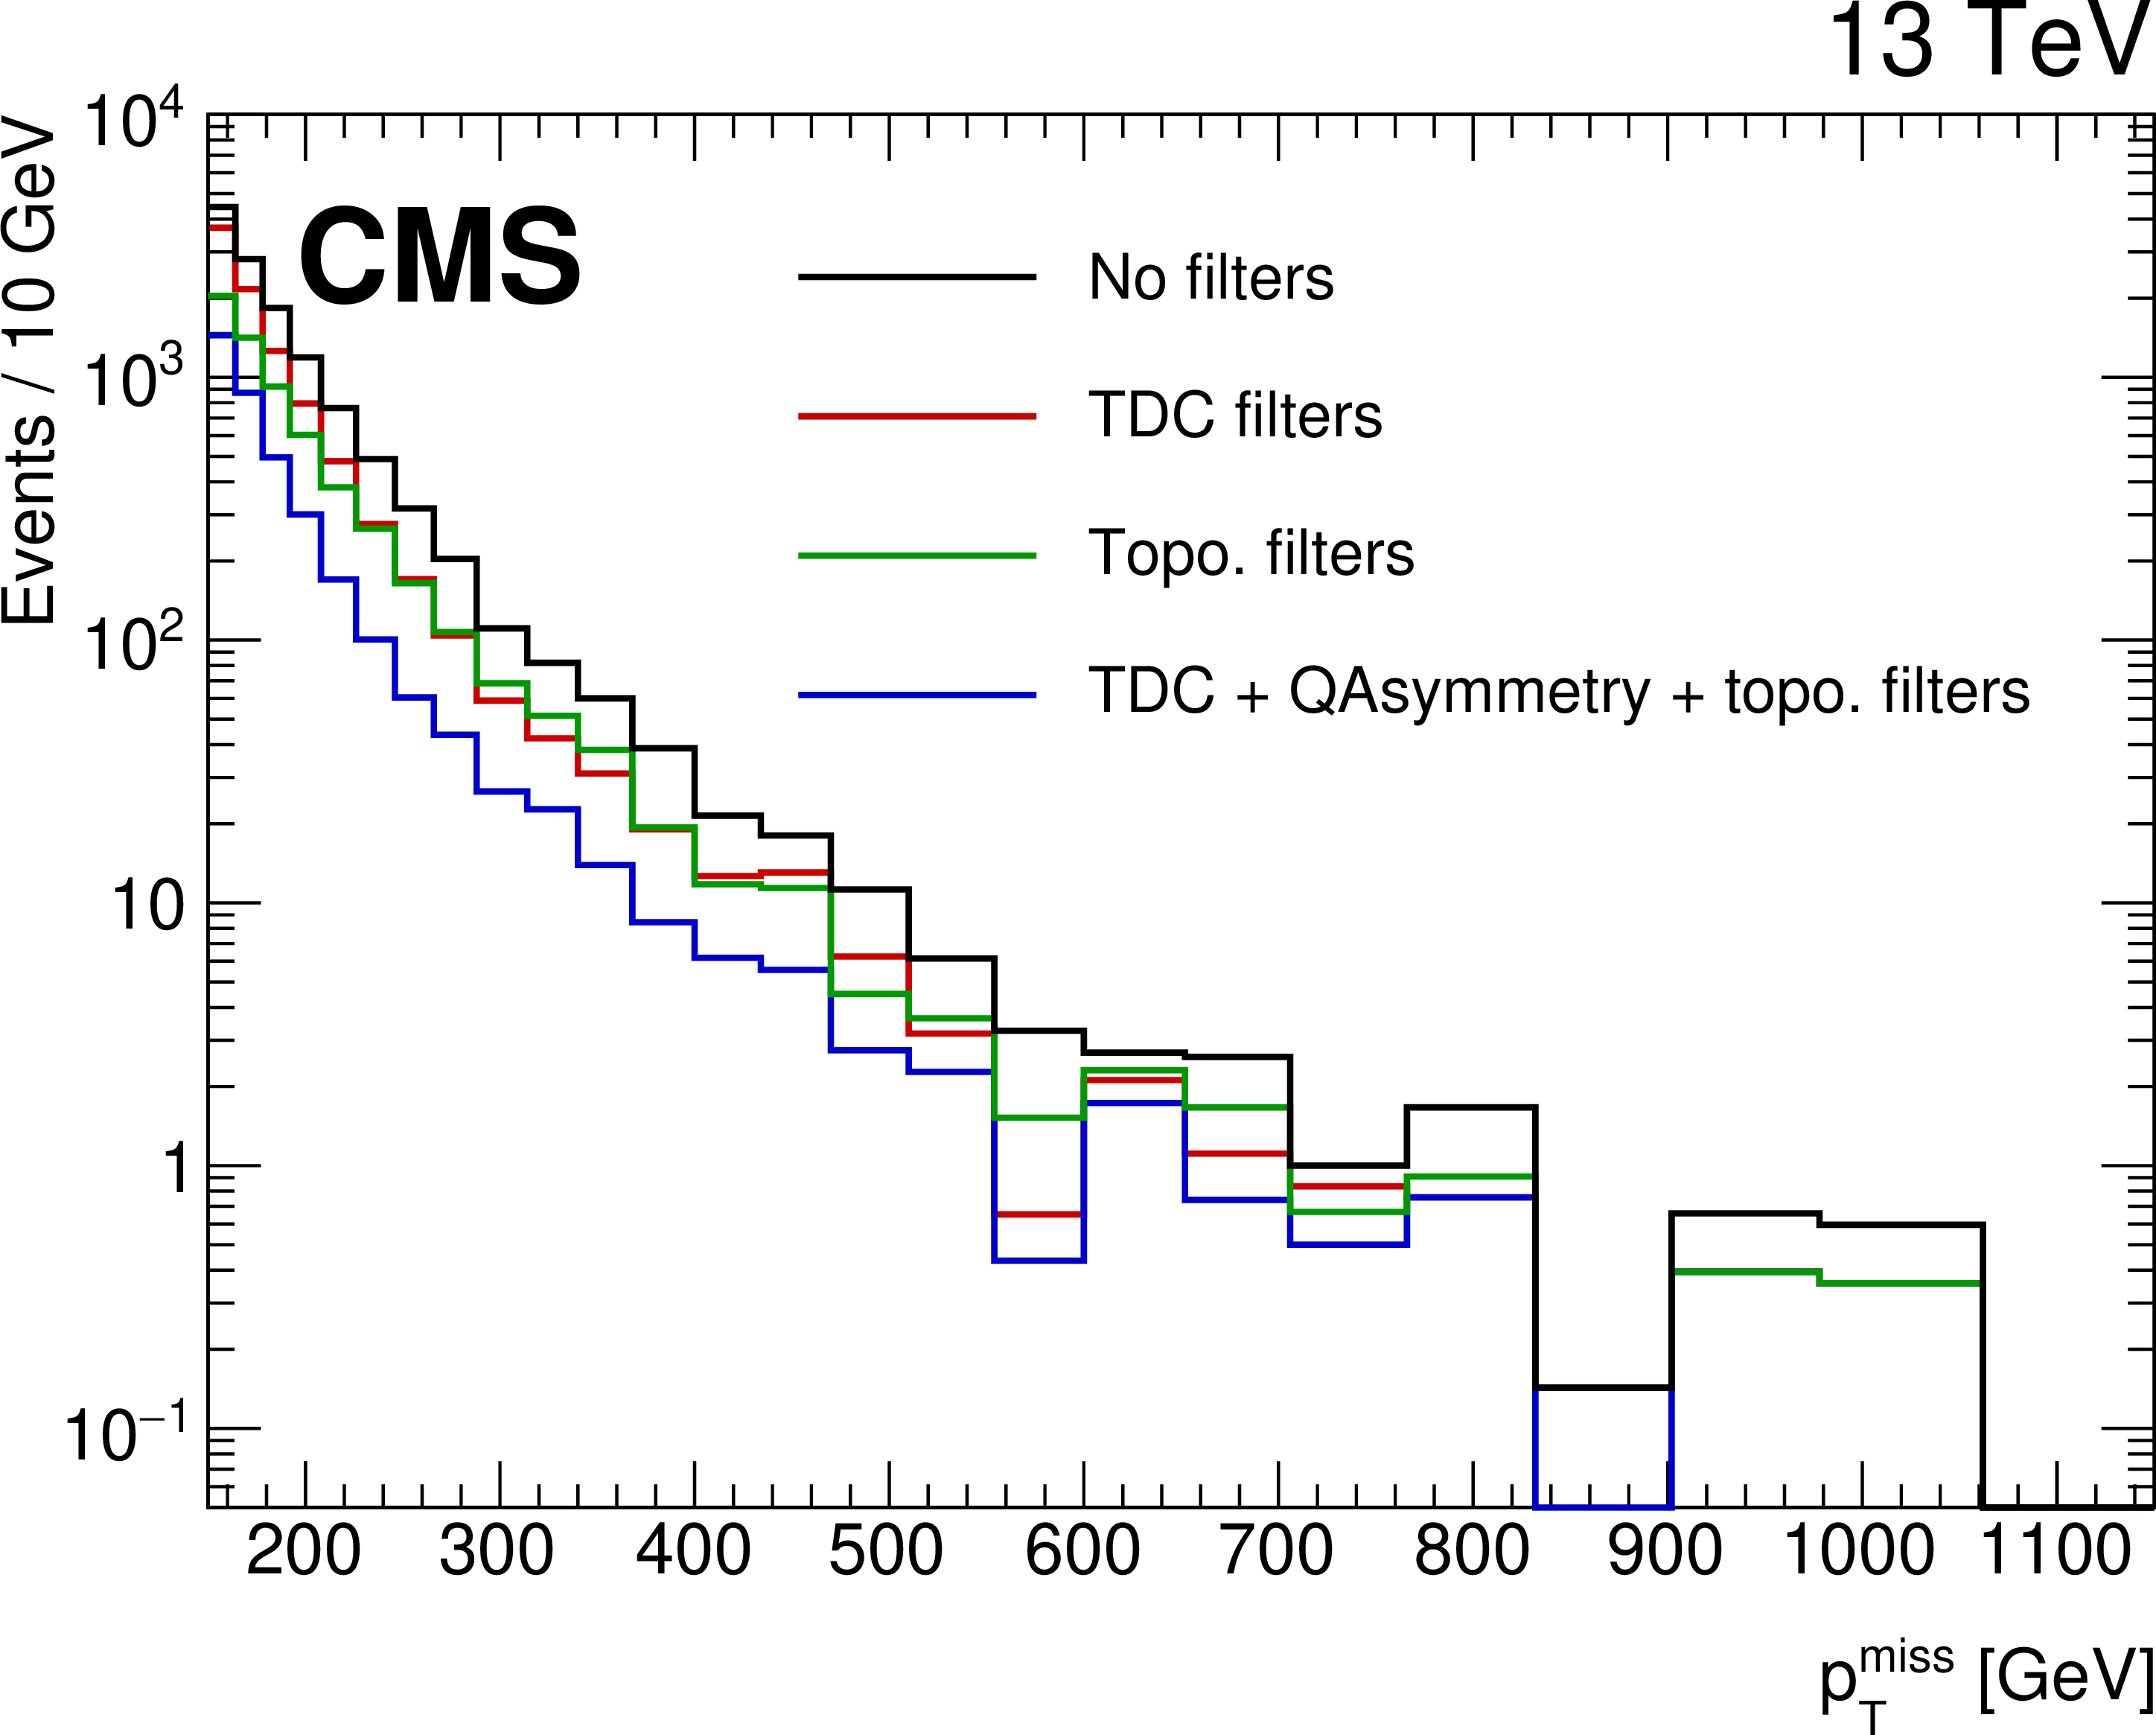
Figure 38:
Effect of filters on the HF anomalous energy contributions to the missing transverse momentum measurement. The methods developed based on hardware improvements installed as part of the Phase 1 upgrade are as effective as the topological selections used previously. Including both the new and old filters further reduces the anomalous missing transverse momentum. |
png pdf |
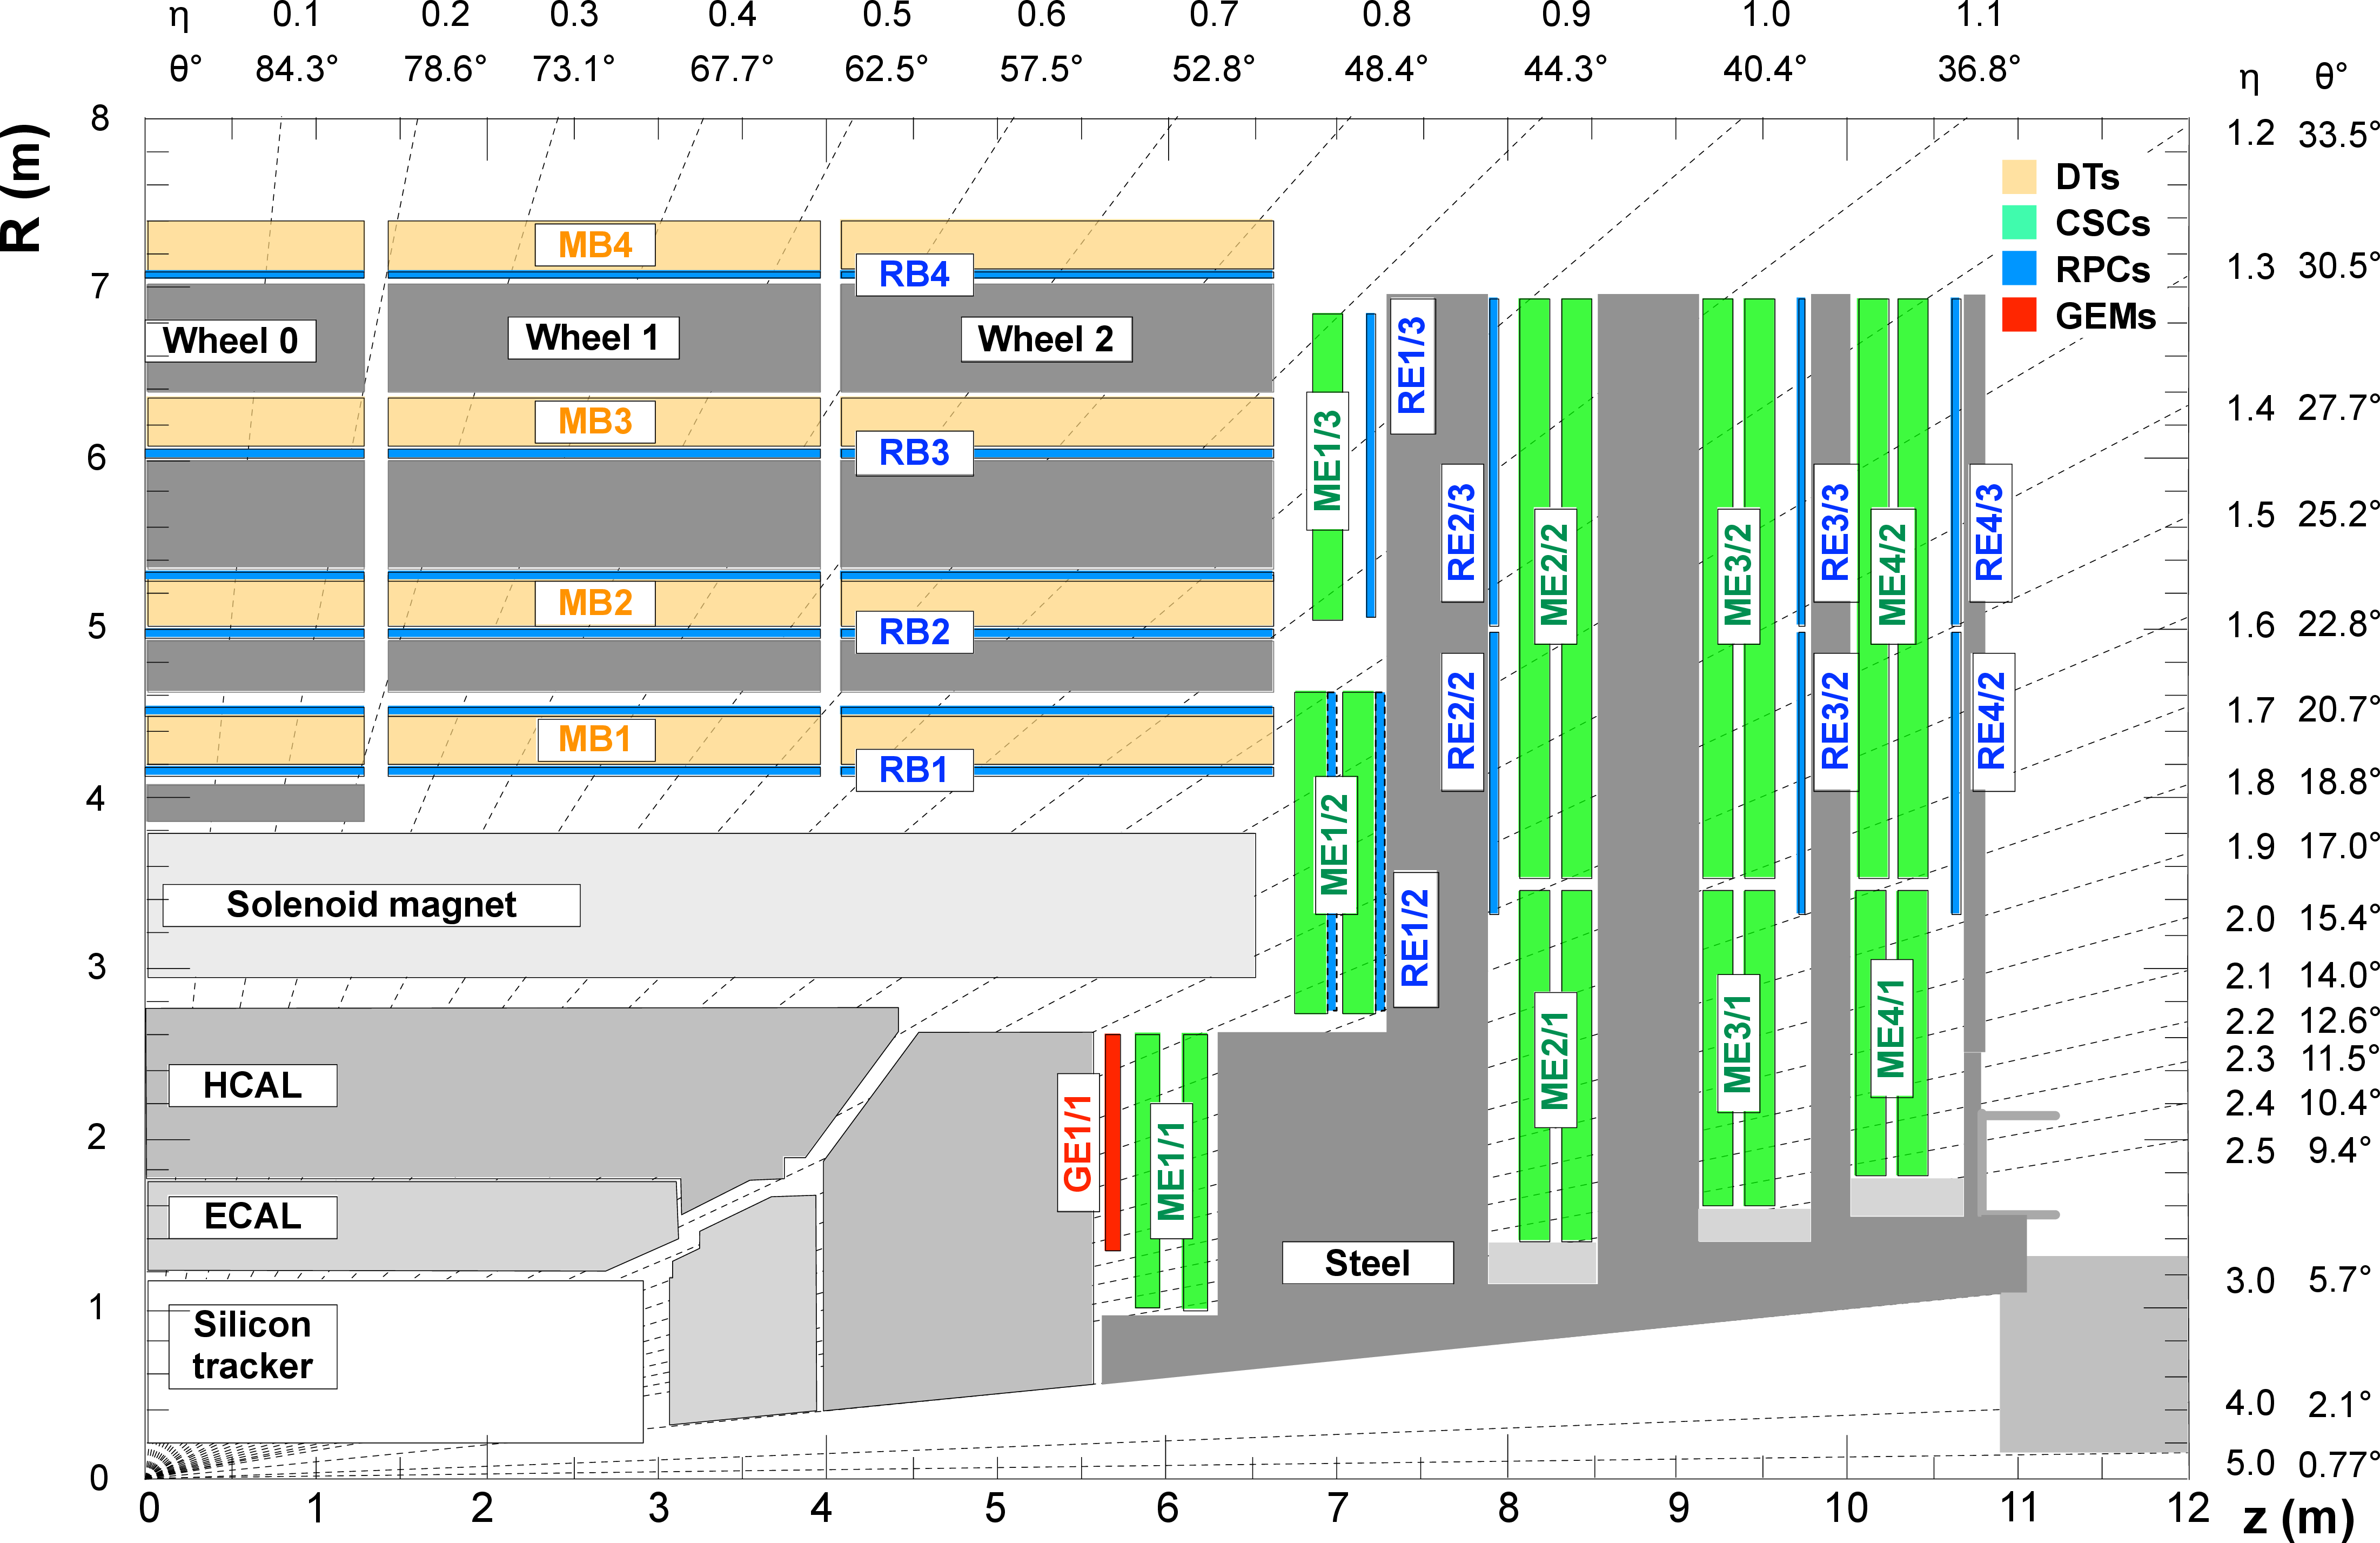
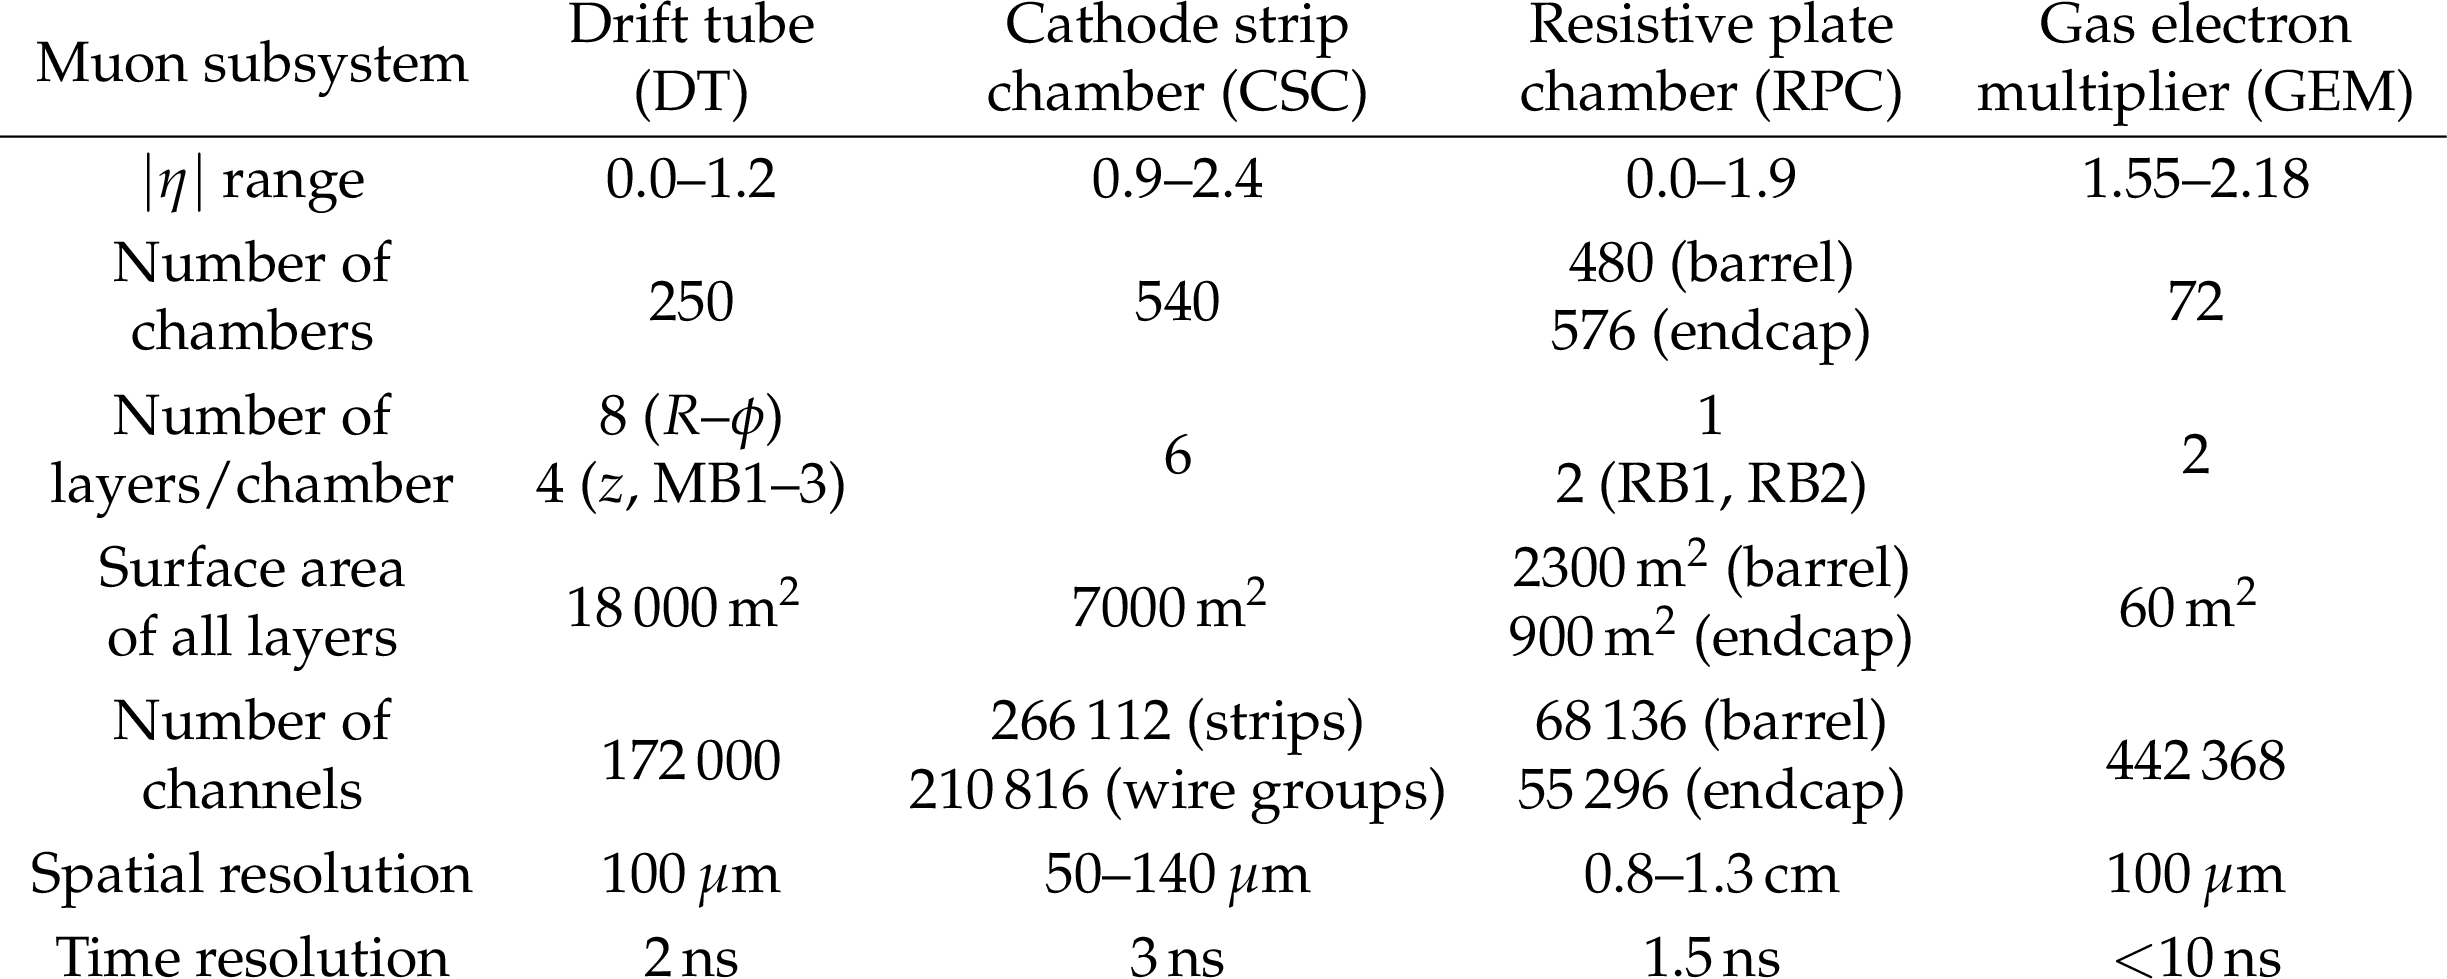
Figure 39:
Schematic view in the $ r $-$ z $ plane of a CMS detector quadrant at the start of Run 3. The interaction point is in the lower left corner. The locations of the various muon stations are shown in color: drift tubes (DTs) with labels MB, cathode strip chambers (CSCs) with labels ME, resistive plate chambers (RPCs) with labels RB and RE, and gas electron multipliers (GEMs) with labels GE. The M denotes muon, B stands for barrel, and E for endcap. The magnet yoke is represented by the dark gray areas. |
png pdf |
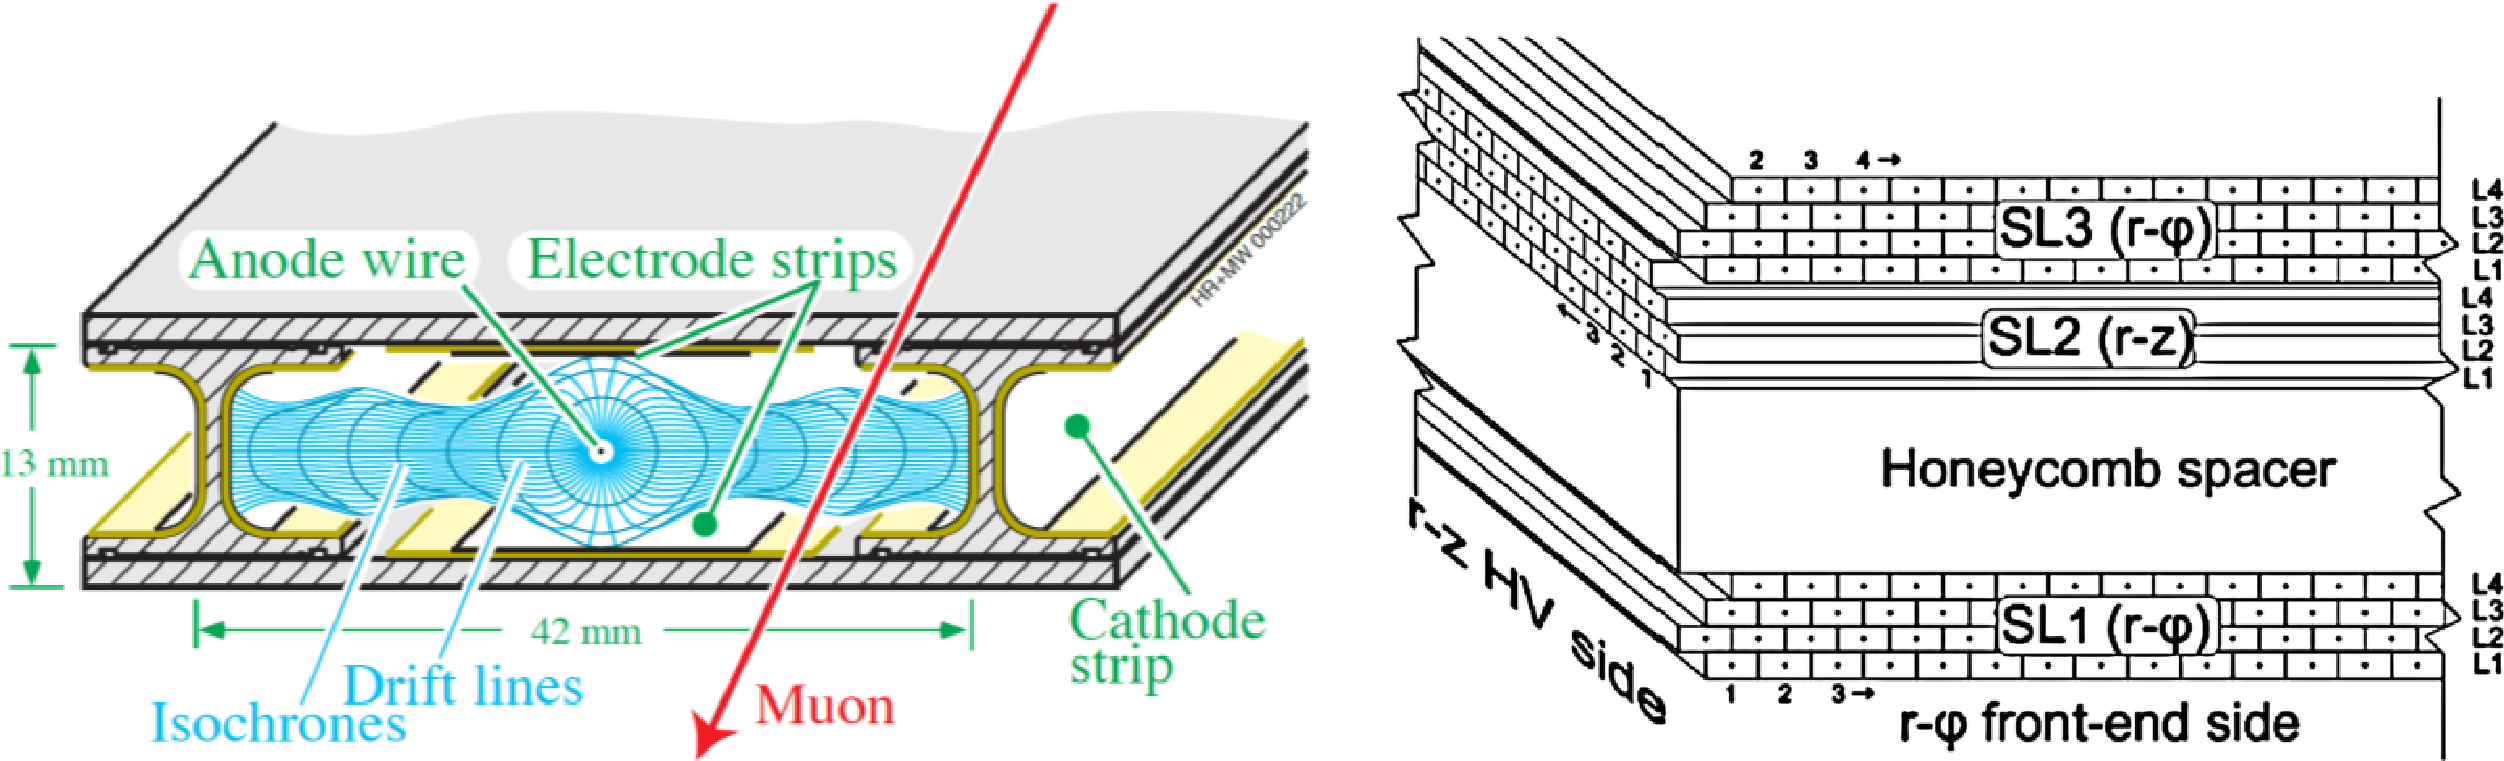
Figure 40:
Left: layout of a CMS DT cell showing the drift lines and isochrones. Right: schematic view of a DT chamber. |
png |
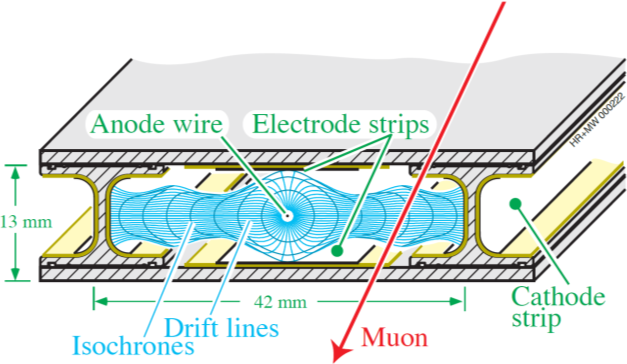
Figure 40-a:
Layout of a CMS DT cell showing the drift lines and isochrones. |
png |
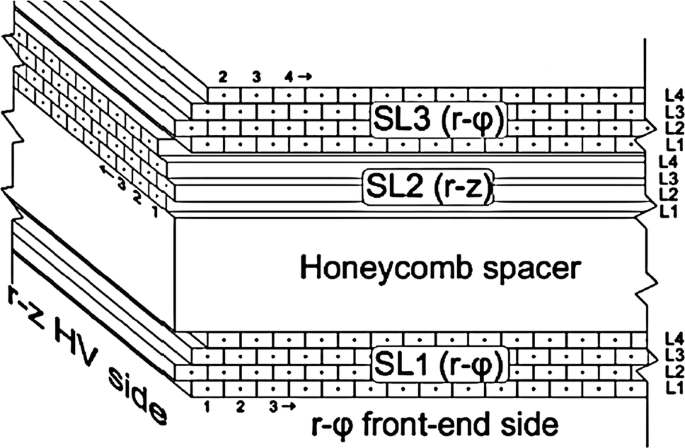
Figure 40-b:
Schematic view of a DT chamber. |
png pdf |
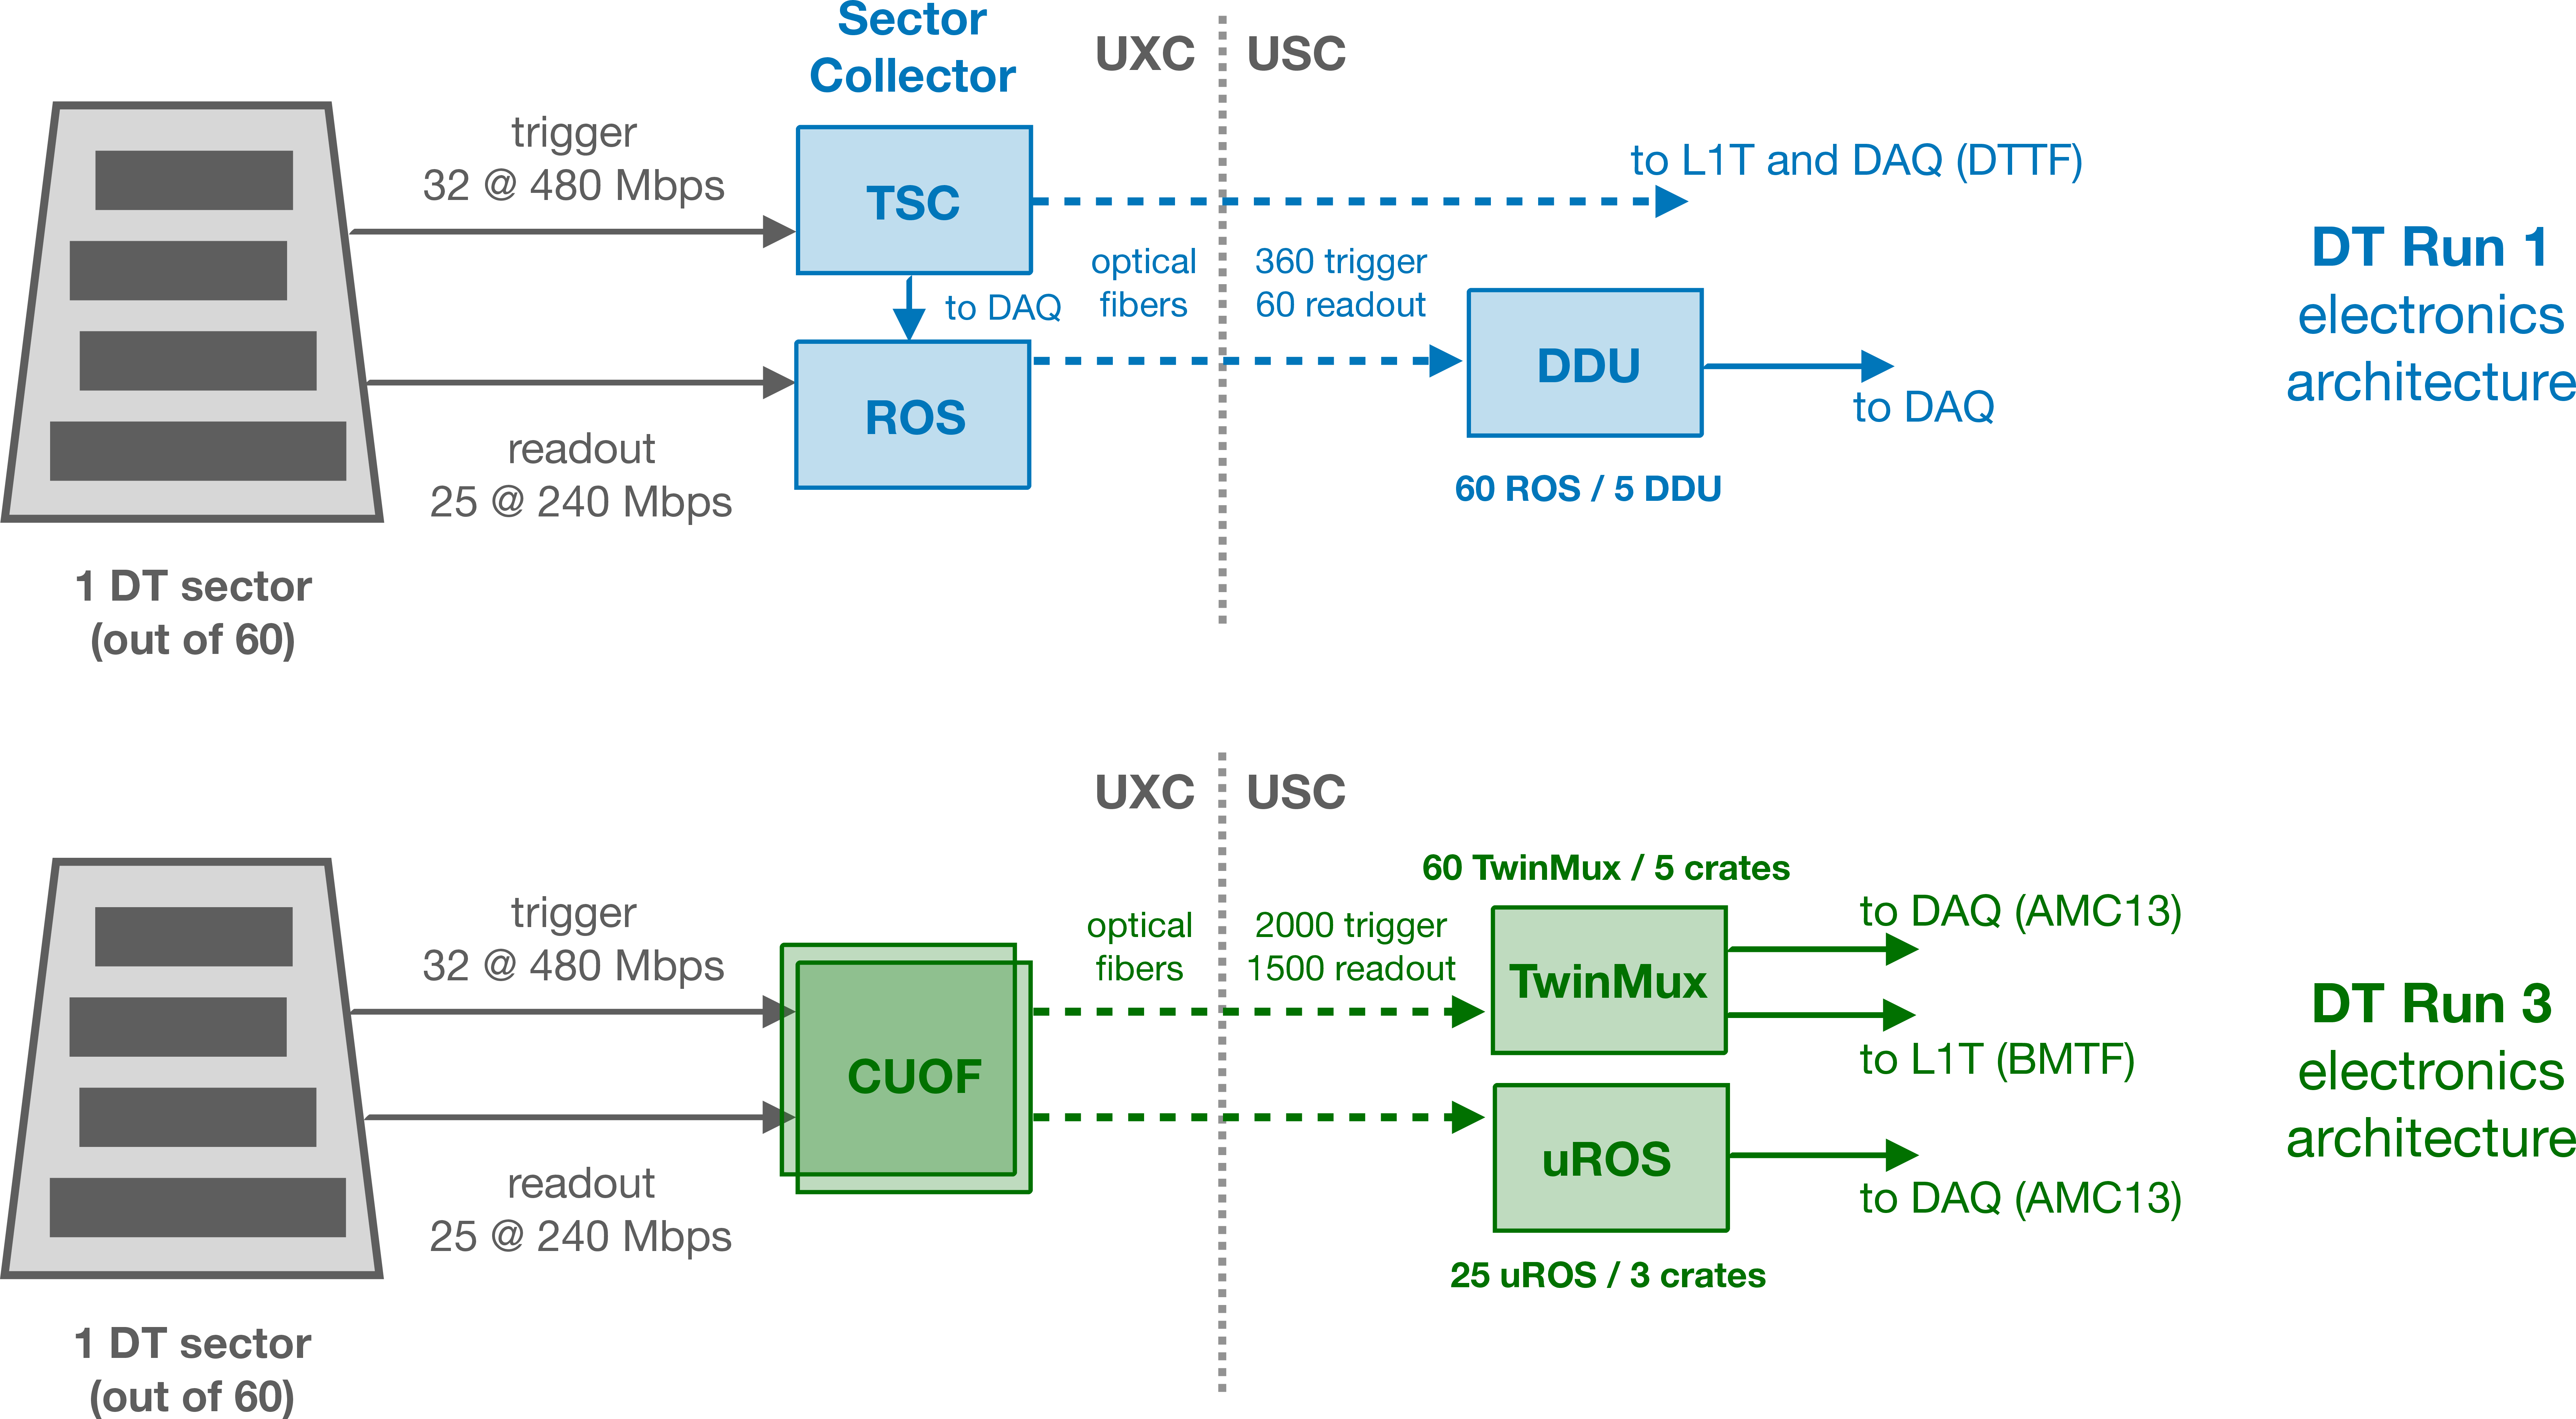
Figure 41:
Schematic views of the Run 1 and Run 3 DT off-detector electronics architectures. |
png pdf |
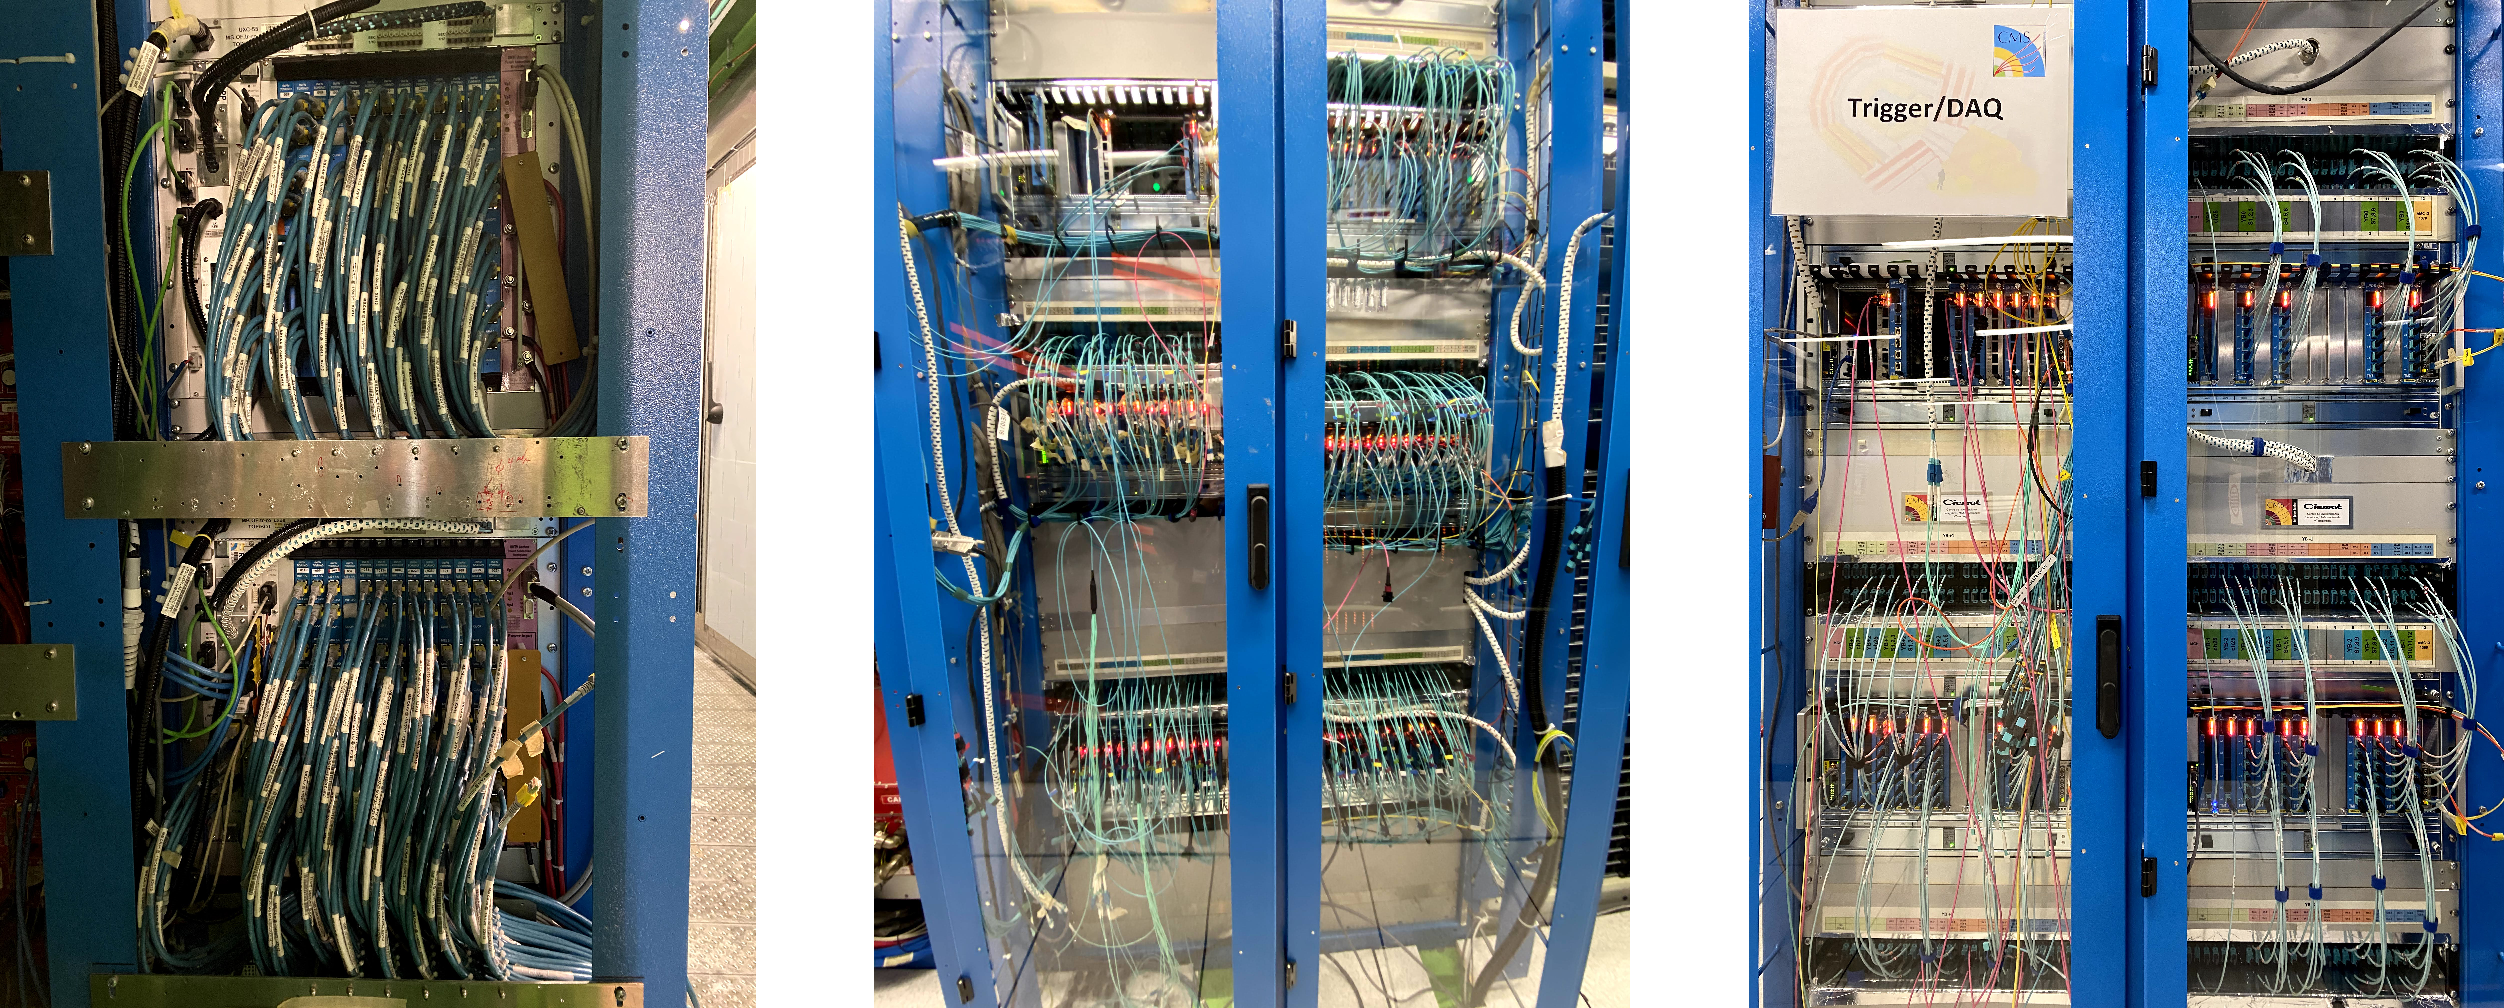
Figure 42:
Left: front view of two out of the ten DT CUOF crates located in the UXC balconies surrounding the muon barrel (W-1). Center: front view of the five $ \mu $TCA crates of the TwinMux in the USC. Right: front view of the three $ \mu $TCA crates of the $ \mu $ROS in the USC. |
png |
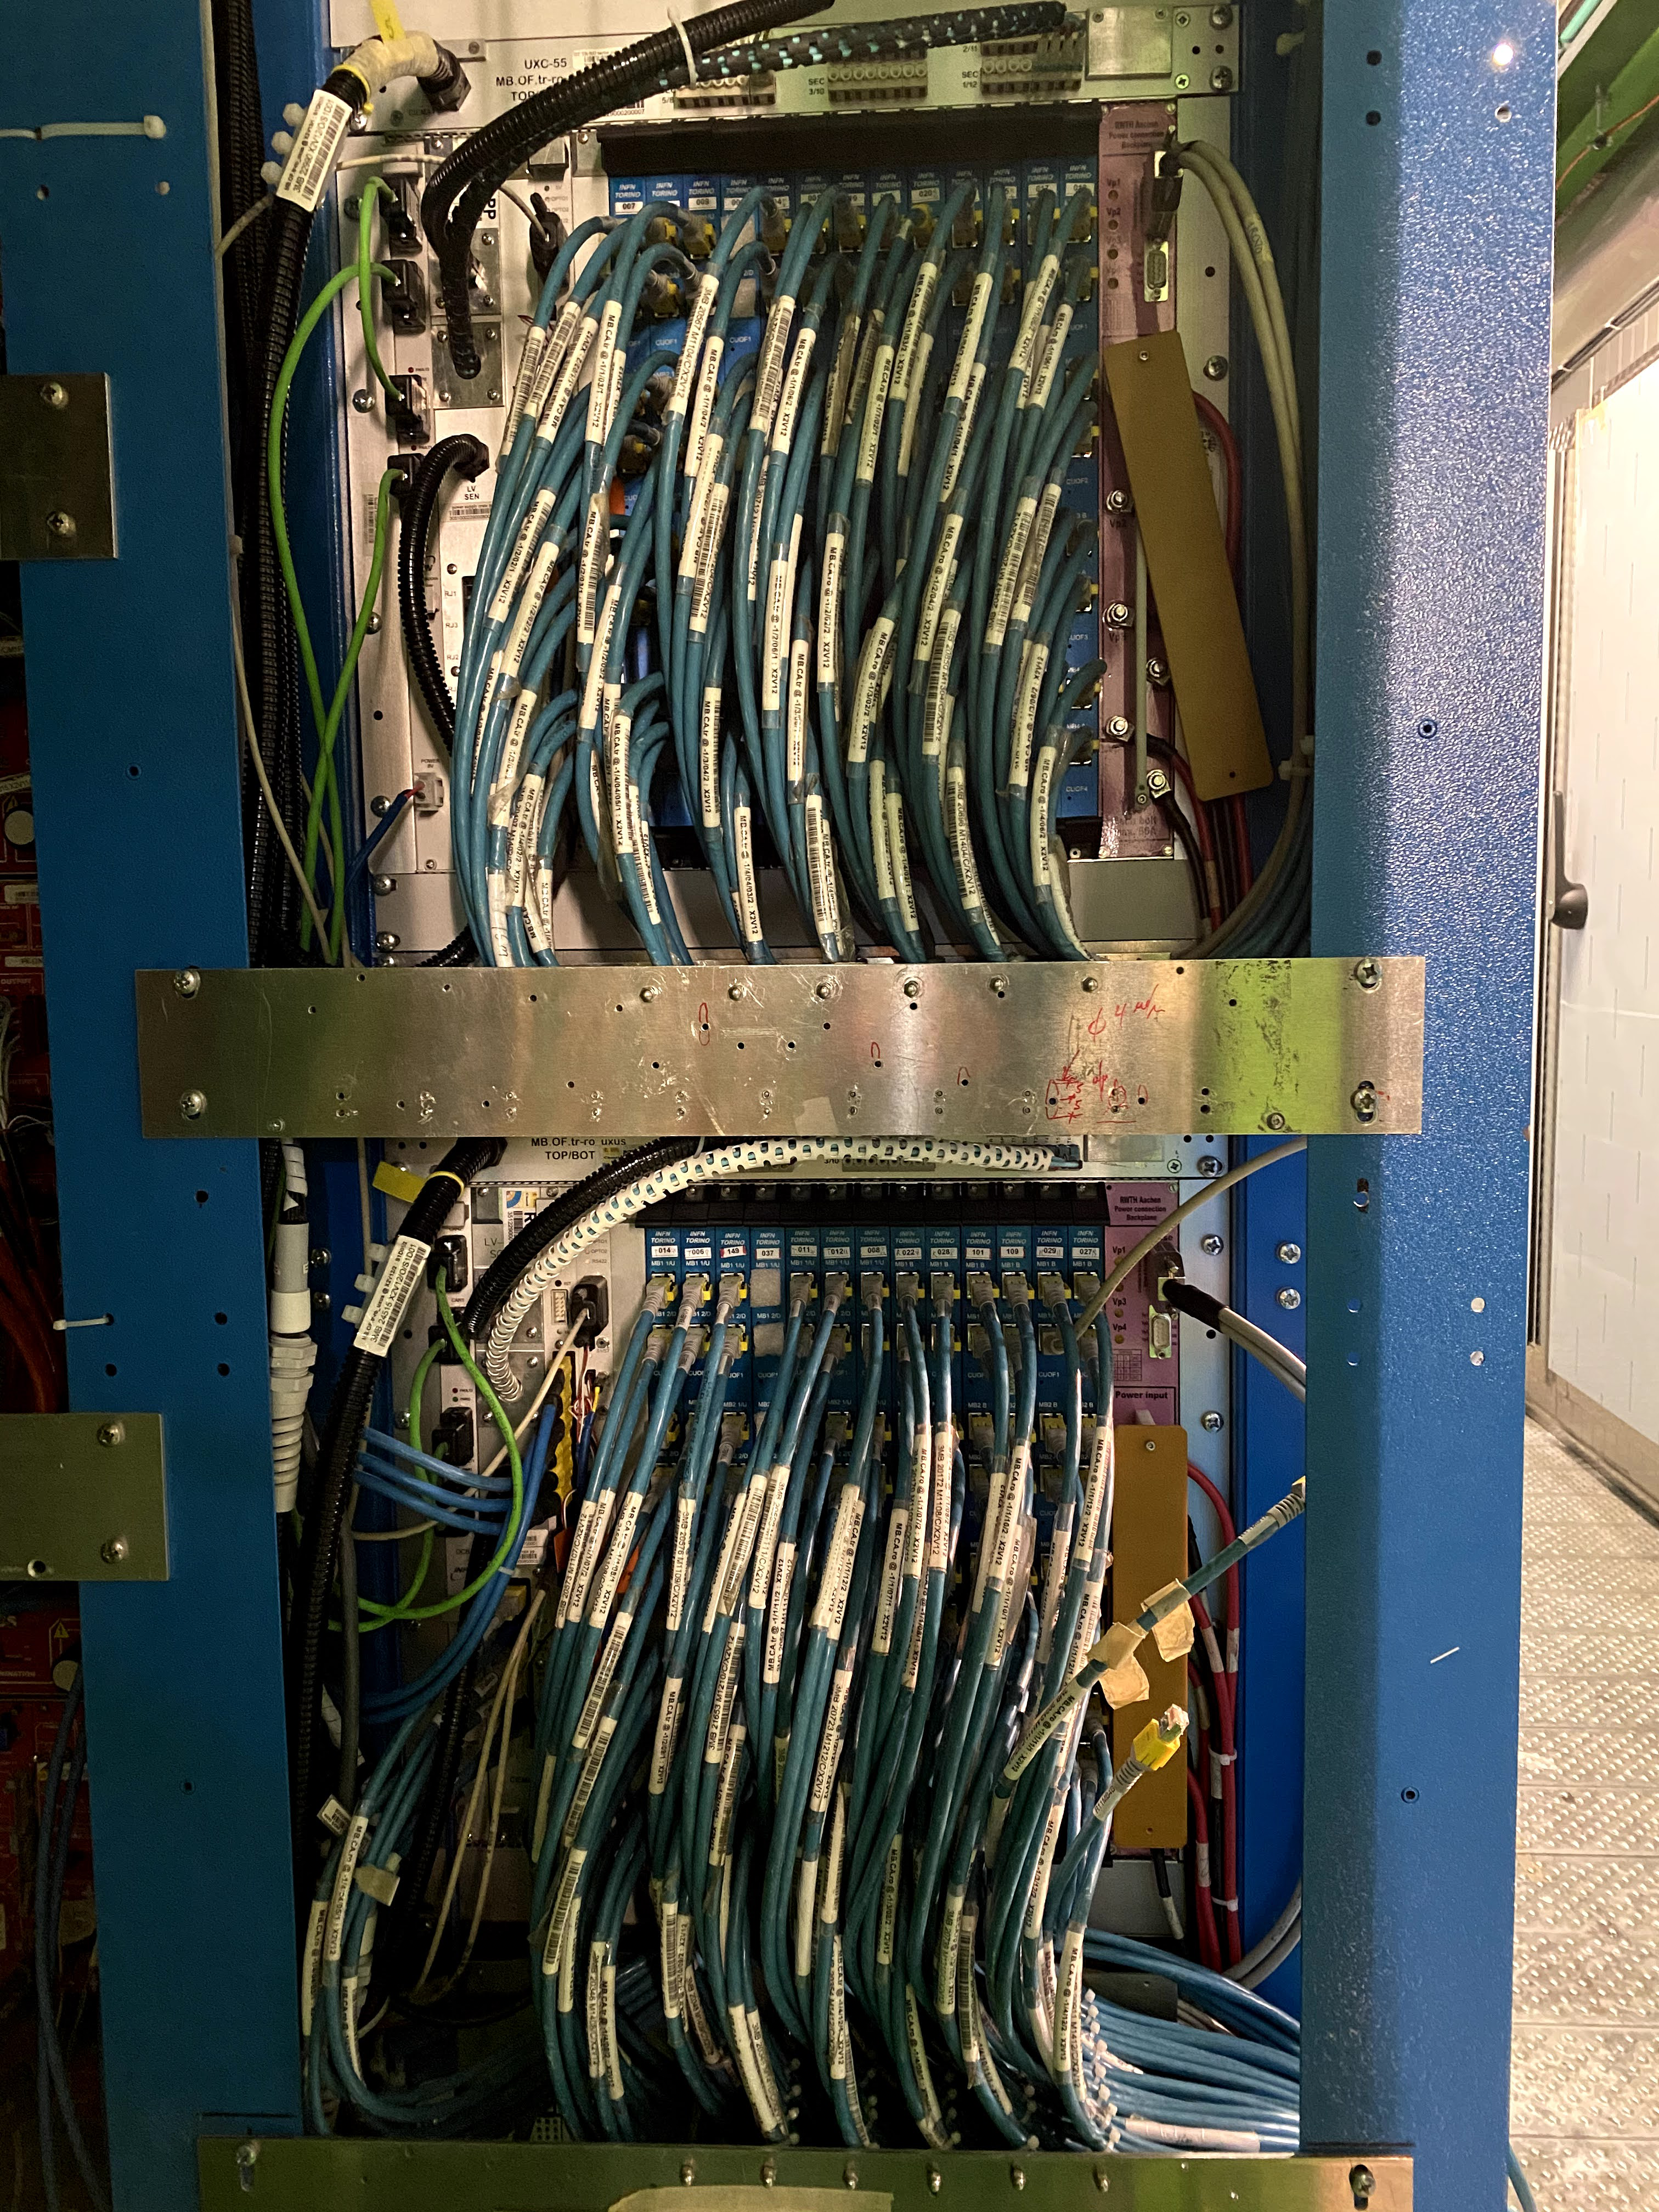
Figure 42-a:
Front view of two out of the ten DT CUOF crates located in the UXC balconies surrounding the muon barrel (W-1). |

png |
Figure 42-b:
Front view of the five $ \mu $TCA crates of the TwinMux in the USC. |

png |
Figure 42-c:
Front view of the three $ \mu $TCA crates of the $ \mu $ROS in the USC. |
png pdf |
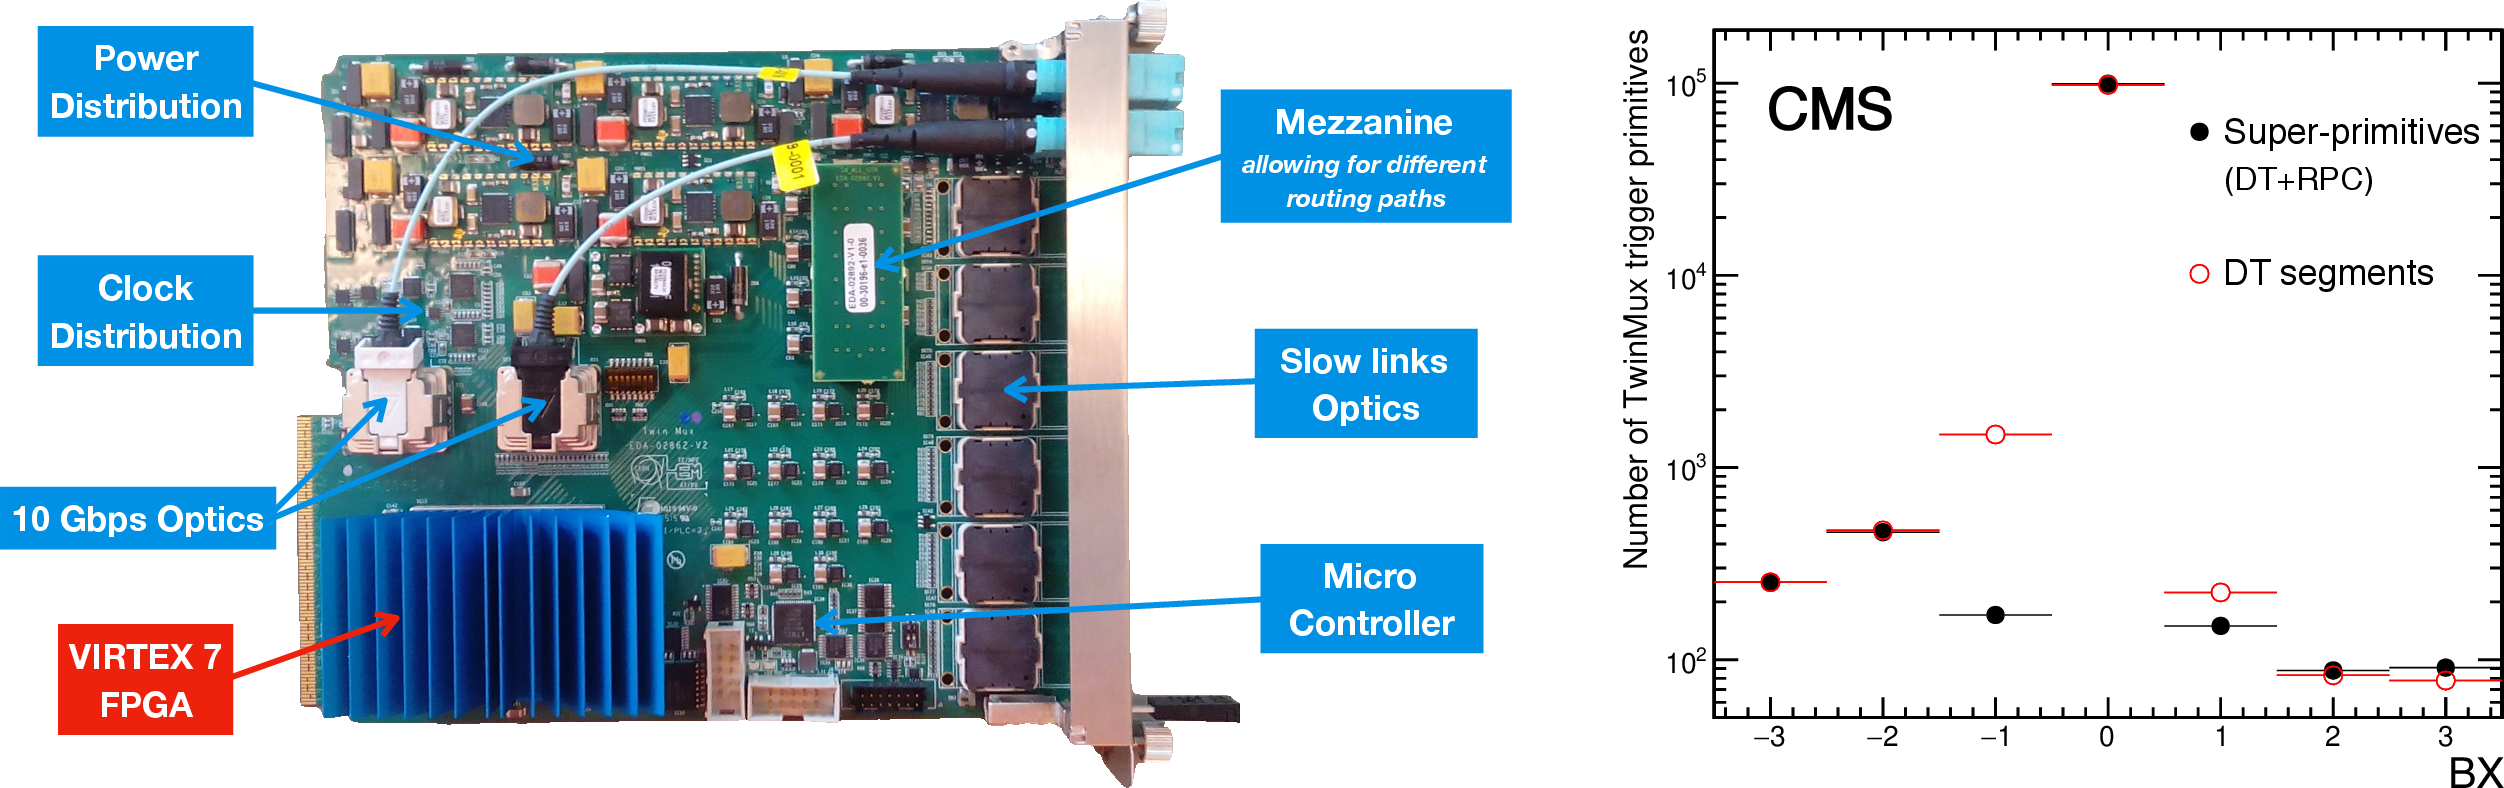
Figure 43:
Left: picture of a TM7 board with the main modules highlighted. Right: BX distribution of L1 trigger primitives reconstructed in the muon barrel [91]. Open (red) circles show the performance of trigger primitives reconstructed using information from the DT detector only. Filled (black) circles show the same performance figure for super-primitives built combining information from the DT and RPC detectors. |

png pdf |
Figure 43-a:
Picture of a TM7 board with the main modules highlighted. |

png pdf |
Figure 43-b:
BX distribution of L1 trigger primitives reconstructed in the muon barrel [91]. Open (red) circles show the performance of trigger primitives reconstructed using information from the DT detector only. Filled (black) circles show the same performance figure for super-primitives built combining information from the DT and RPC detectors. |
png pdf |
Figure 44:
DT segment reconstruction efficiency measured with the tag-and-probe method using data collected by CMS in 2017 (left) [93] and 2018 (right) [94], before and after the transition to the $ \mu $ROS. The efficiency is usually above 99% except for chambers affected by hardware problems, mostly coming from the DT readout. After the deployment of the $ \mu $ROS, the overall efficiency improves. |
png pdf |
Figure 44-a:
DT segment reconstruction efficiency measured with the tag-and-probe method using data collected by CMS in 2017 [93], before and after the transition to the $ \mu $ROS. The efficiency is usually above 99% except for chambers affected by hardware problems, mostly coming from the DT readout. After the deployment of the $ \mu $ROS, the overall efficiency improves. |
png pdf |
Figure 44-b:
DT segment reconstruction efficiency measured with the tag-and-probe method using data collected by CMS in 2018 [94], before and after the transition to the $ \mu $ROS. The efficiency is usually above 99% except for chambers affected by hardware problems, mostly coming from the DT readout. After the deployment of the $ \mu $ROS, the overall efficiency improves. |
png pdf |
Figure 45:
DT hit detection efficiency, computed as a function of the total CMS integrated luminosity, for the $ \phi $-SLs of MB1 chambers [94]. Different colors refer to different DT wheels. The plot summarizes how the efficiency evolved during Run 2, mostly as a consequence of the different updates of the detector HV and FE threshold settings. |
png pdf |
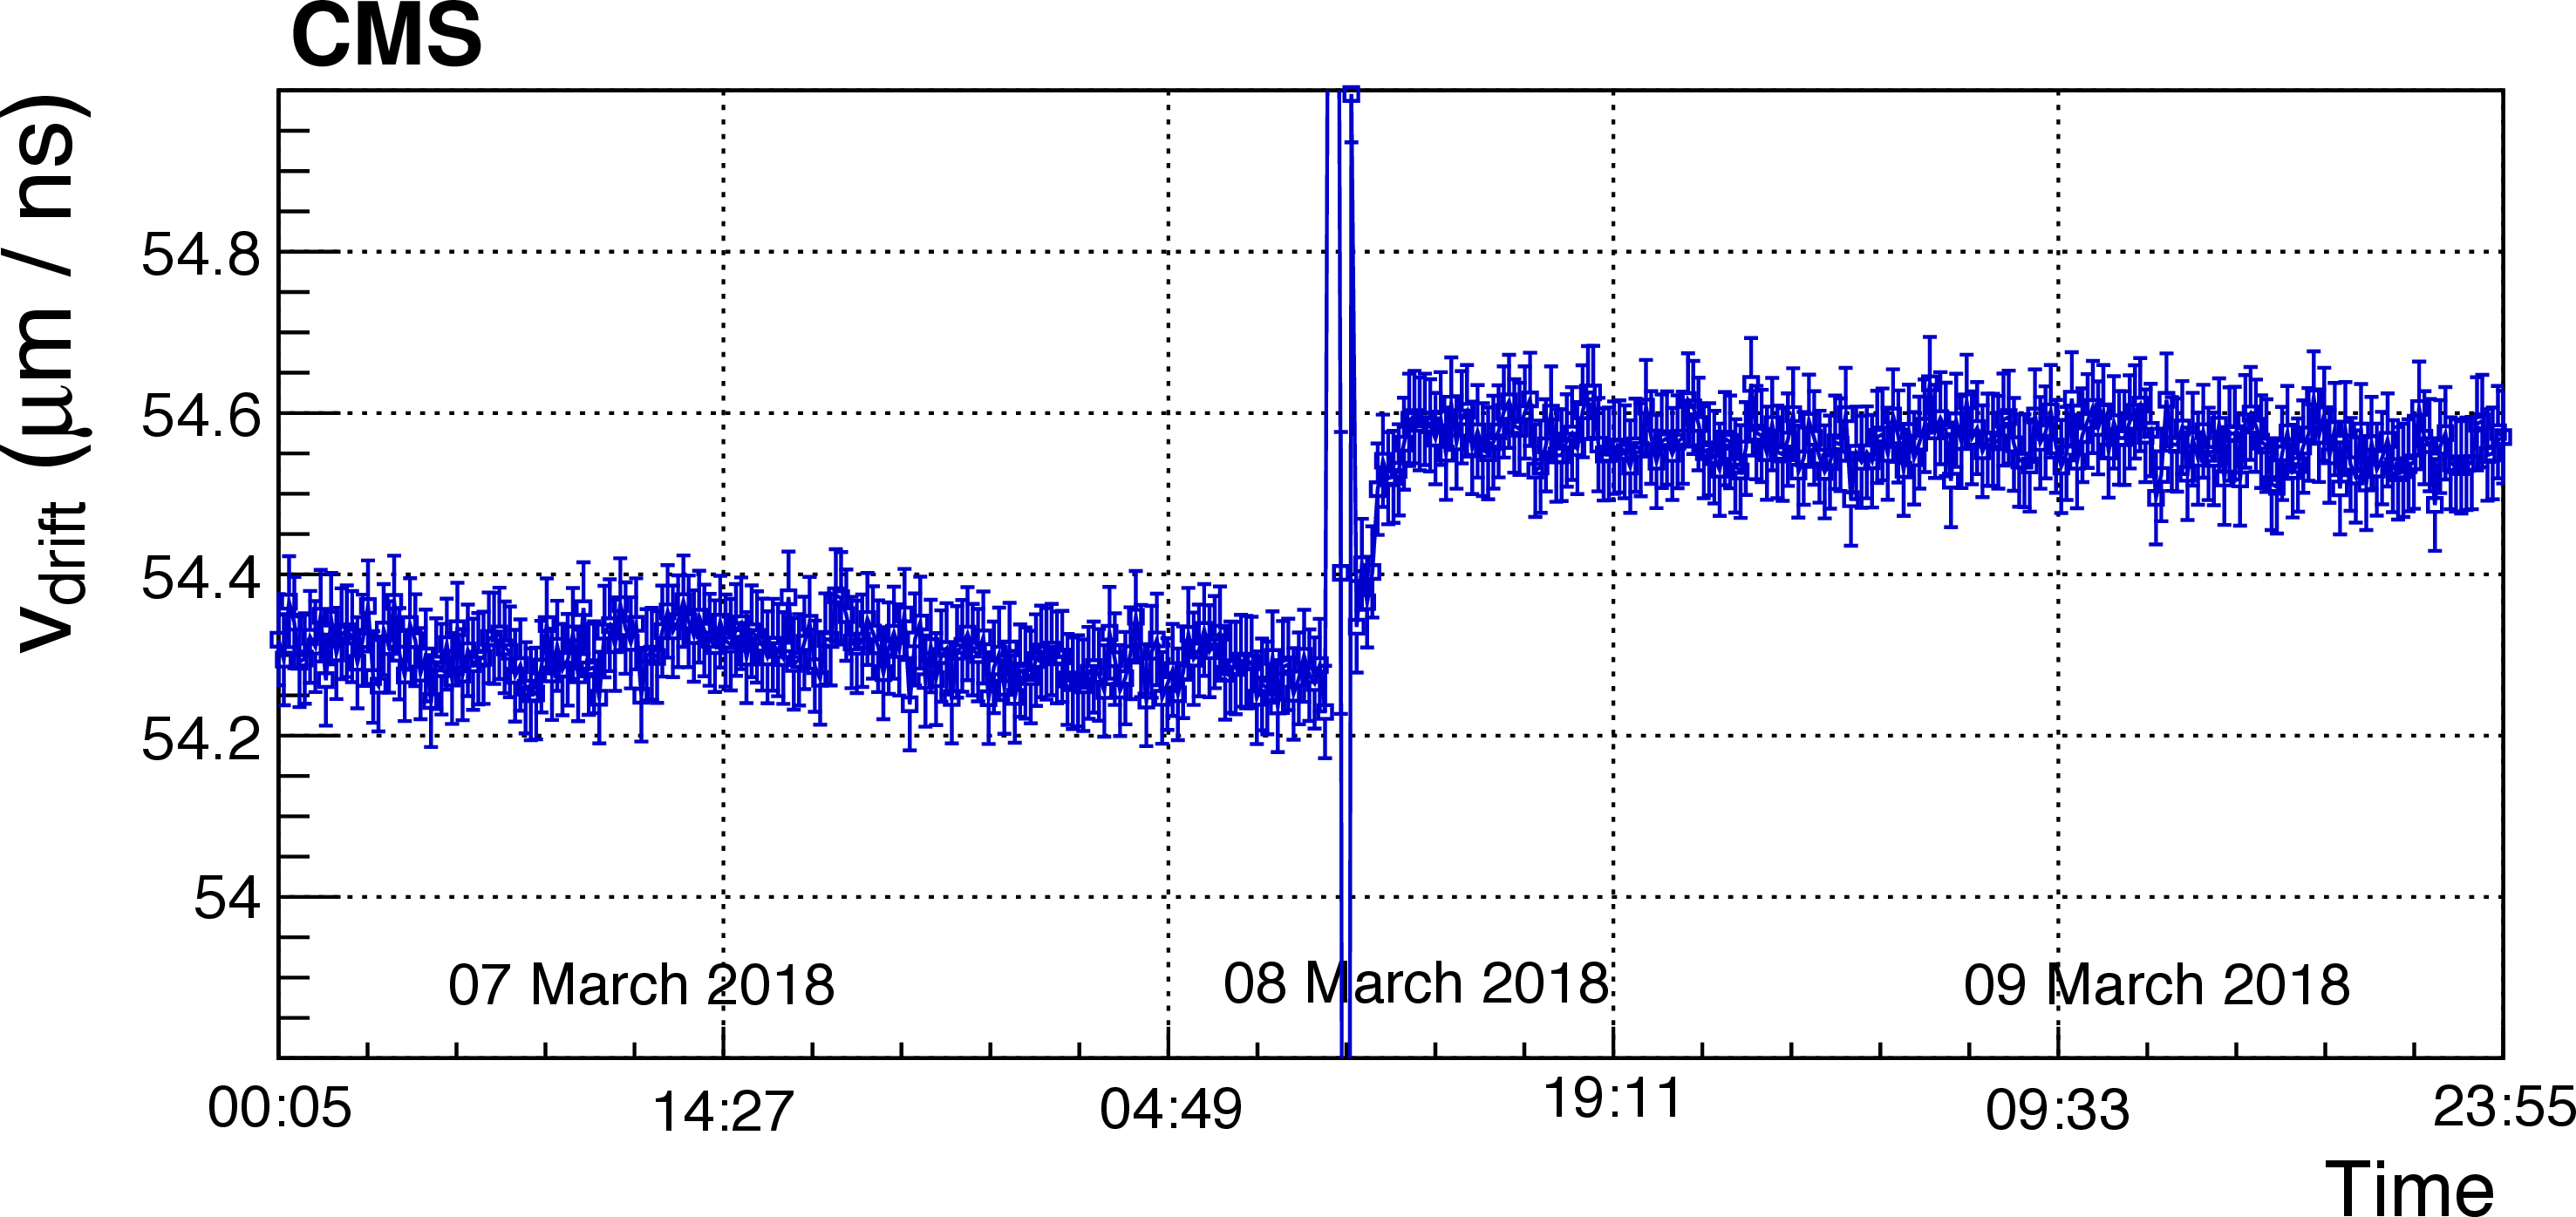
Figure 46:
Drift velocity measurement using the fresh gas analyzed by the VDC system. The variation on 8th March 2018 corresponds to the transition between closed-loop and open-loop operation of the DT gas system. |

png pdf |
Figure 47:
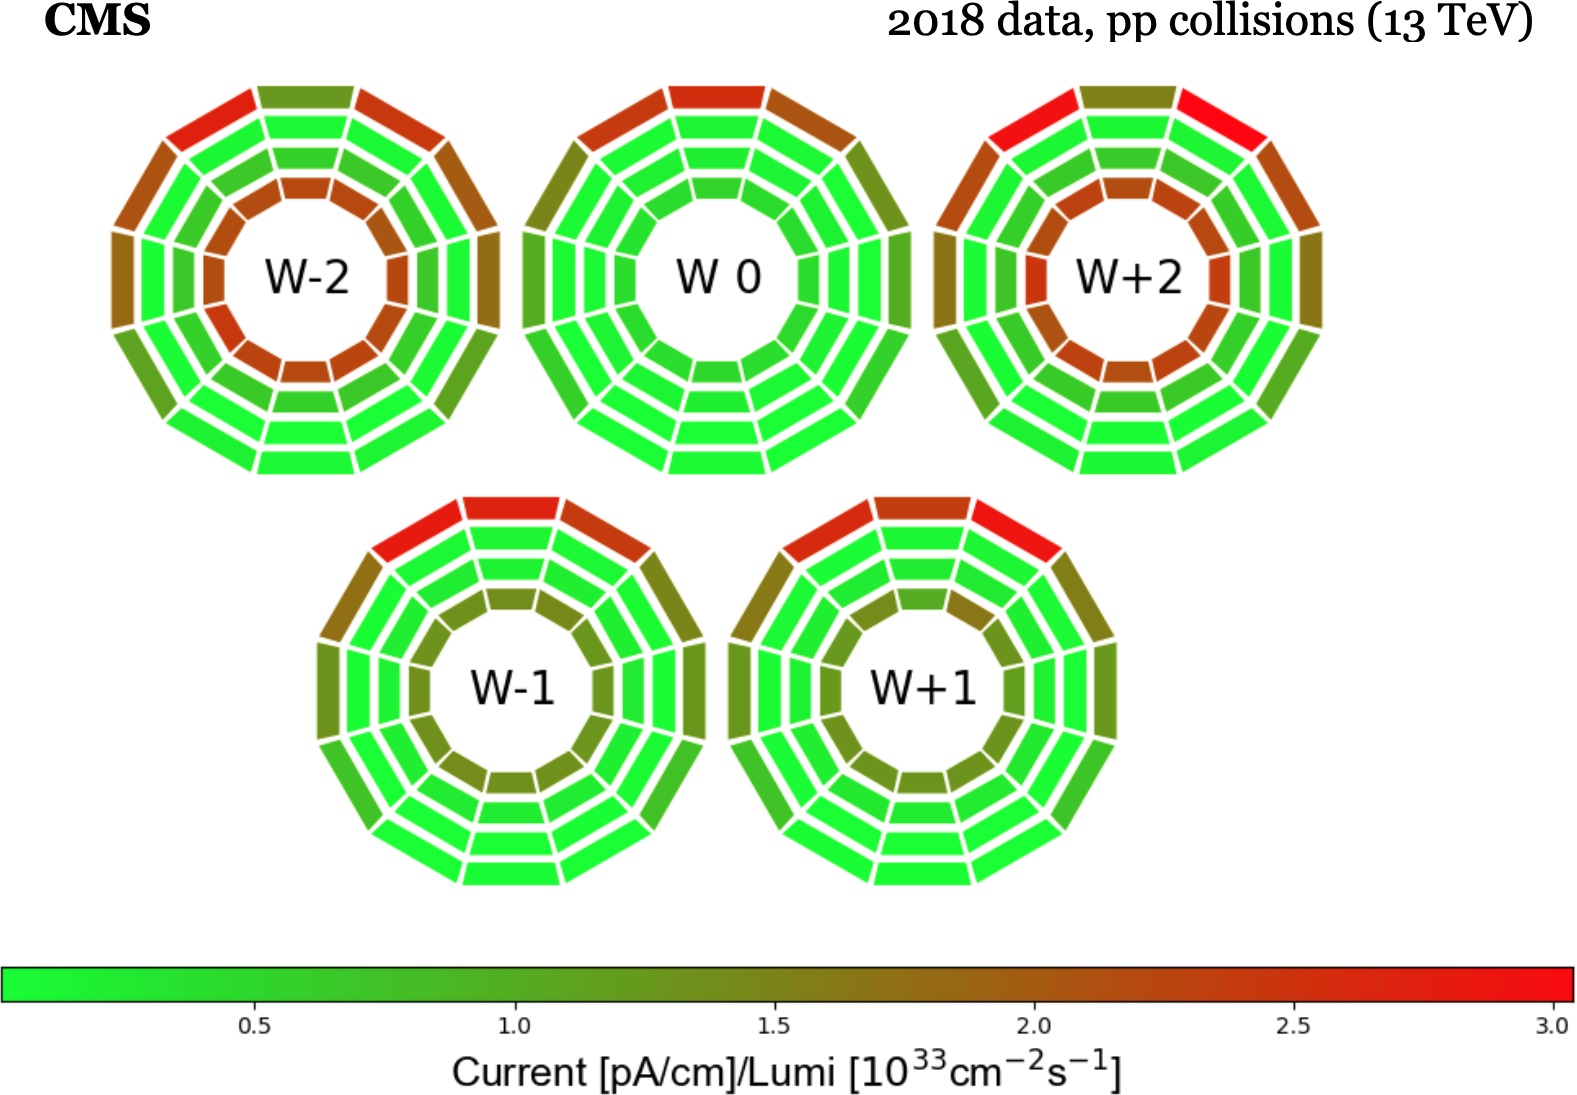
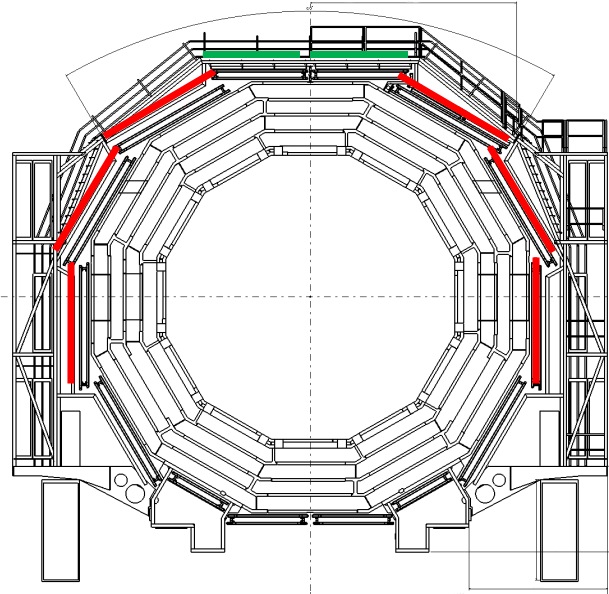
Left: magnitudes of the linear dependence between the currents from each DT chamber of the MB and the LHC instantaneous luminosity [98]. Results are computed after the optimization of the operational working points, described in Section 6.1.3.1. Right: transverse view of an MB wheel highlighting the layout of the MB4 shield, as installed in W$-$2, $-$1, $+$1, and $+$2. Red (green) lines represent shield layers consisting of thin (thick) cassettes. |
png |
Figure 47-a:
Magnitudes of the linear dependence between the currents from each DT chamber of the MB and the LHC instantaneous luminosity [98]. Results are computed after the optimization of the operational working points, described in Section 6.1.3.1. |
png |
Figure 47-b:
Transverse view of an MB wheel highlighting the layout of the MB4 shield, as installed in W$-$2, $-$1, $+$1, and $+$2. Red (green) lines represent shield layers consisting of thin (thick) cassettes. |

png pdf |
Figure 48:
Left: layout of a CSC chamber, with seven trapezoidal panels forming six gas gaps. Only a few wires (lines running from left to right) and strips (gray band running from top to bottom) on the upper right corner are shown for illustration. Right: installation of the outer CSC chambers (ME4/2) during LS1. |

png |
Figure 48-a:
Layout of a CSC chamber, with seven trapezoidal panels forming six gas gaps. Only a few wires (lines running from left to right) and strips (gray band running from top to bottom) on the upper right corner are shown for illustration. |
png pdf |
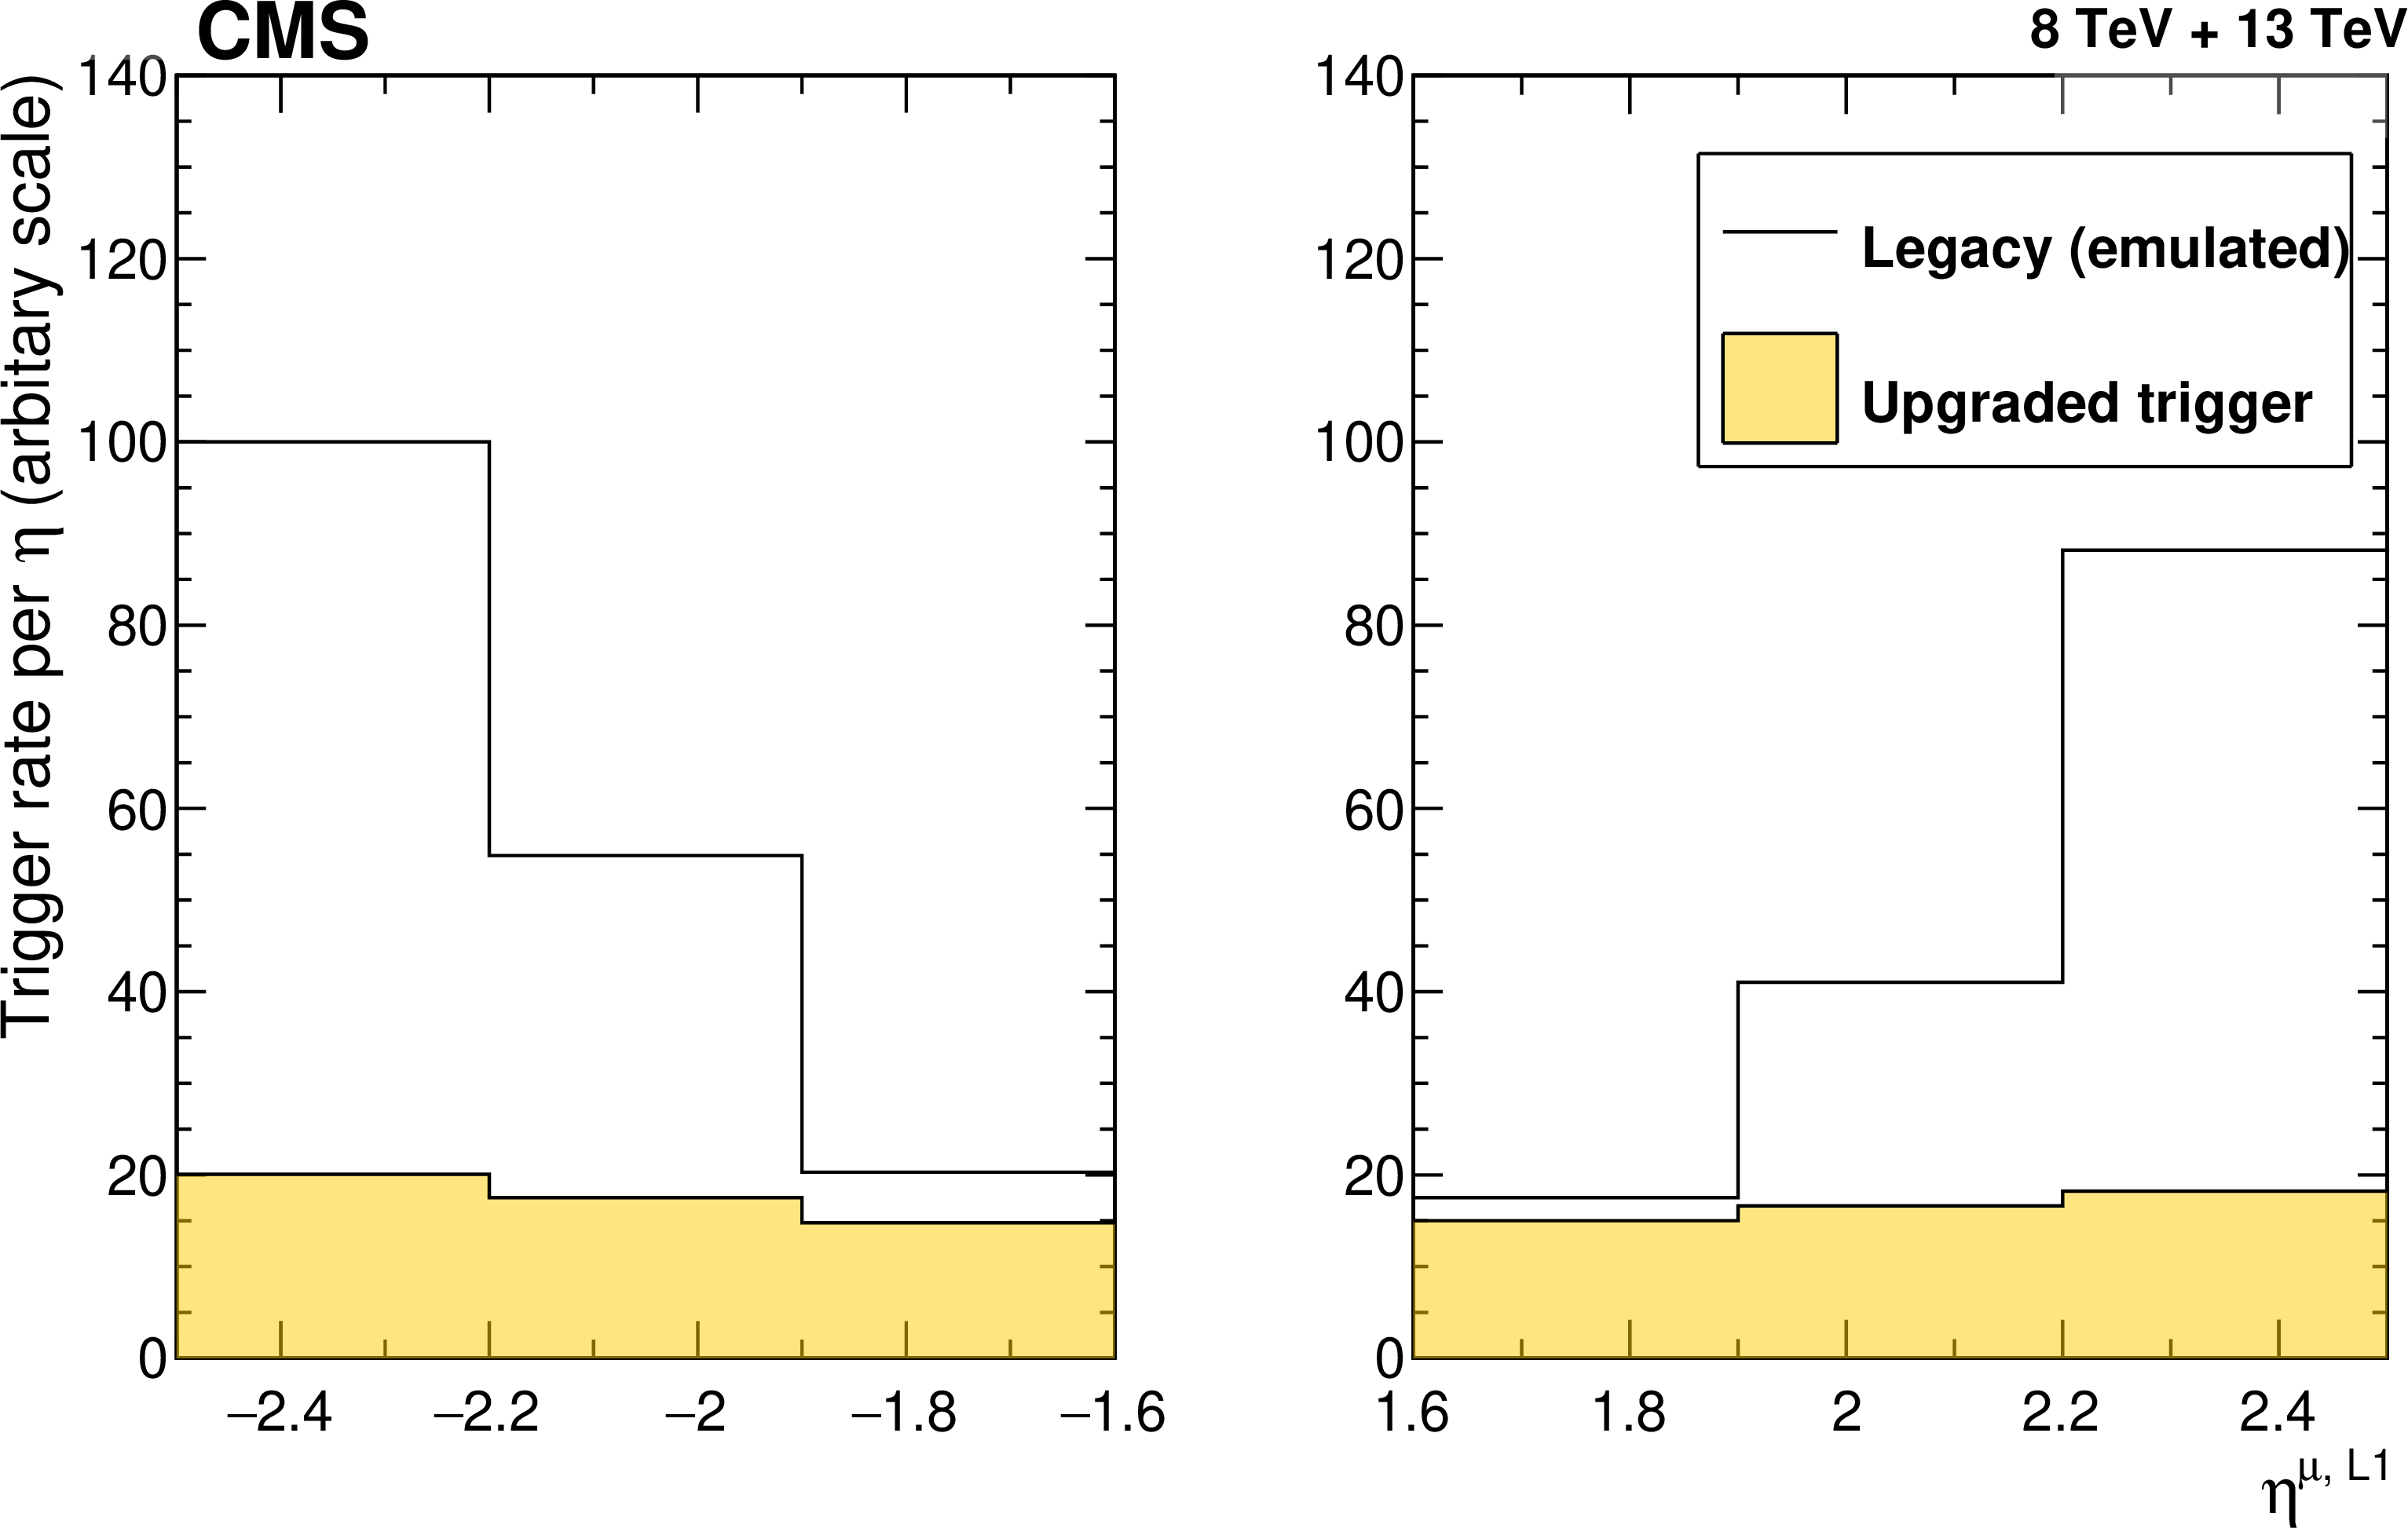
Figure 49:
Emulation of the Run 1 algorithms compared to the upgraded Run 2 algorithms, as a function of the L1 muon $ \eta $. The most common L1 single-muon trigger threshold used in 2017 was $ p_{\mathrm{T}}^{\mu\text{,L1}}\geq $ 25 GeV. |
png pdf |
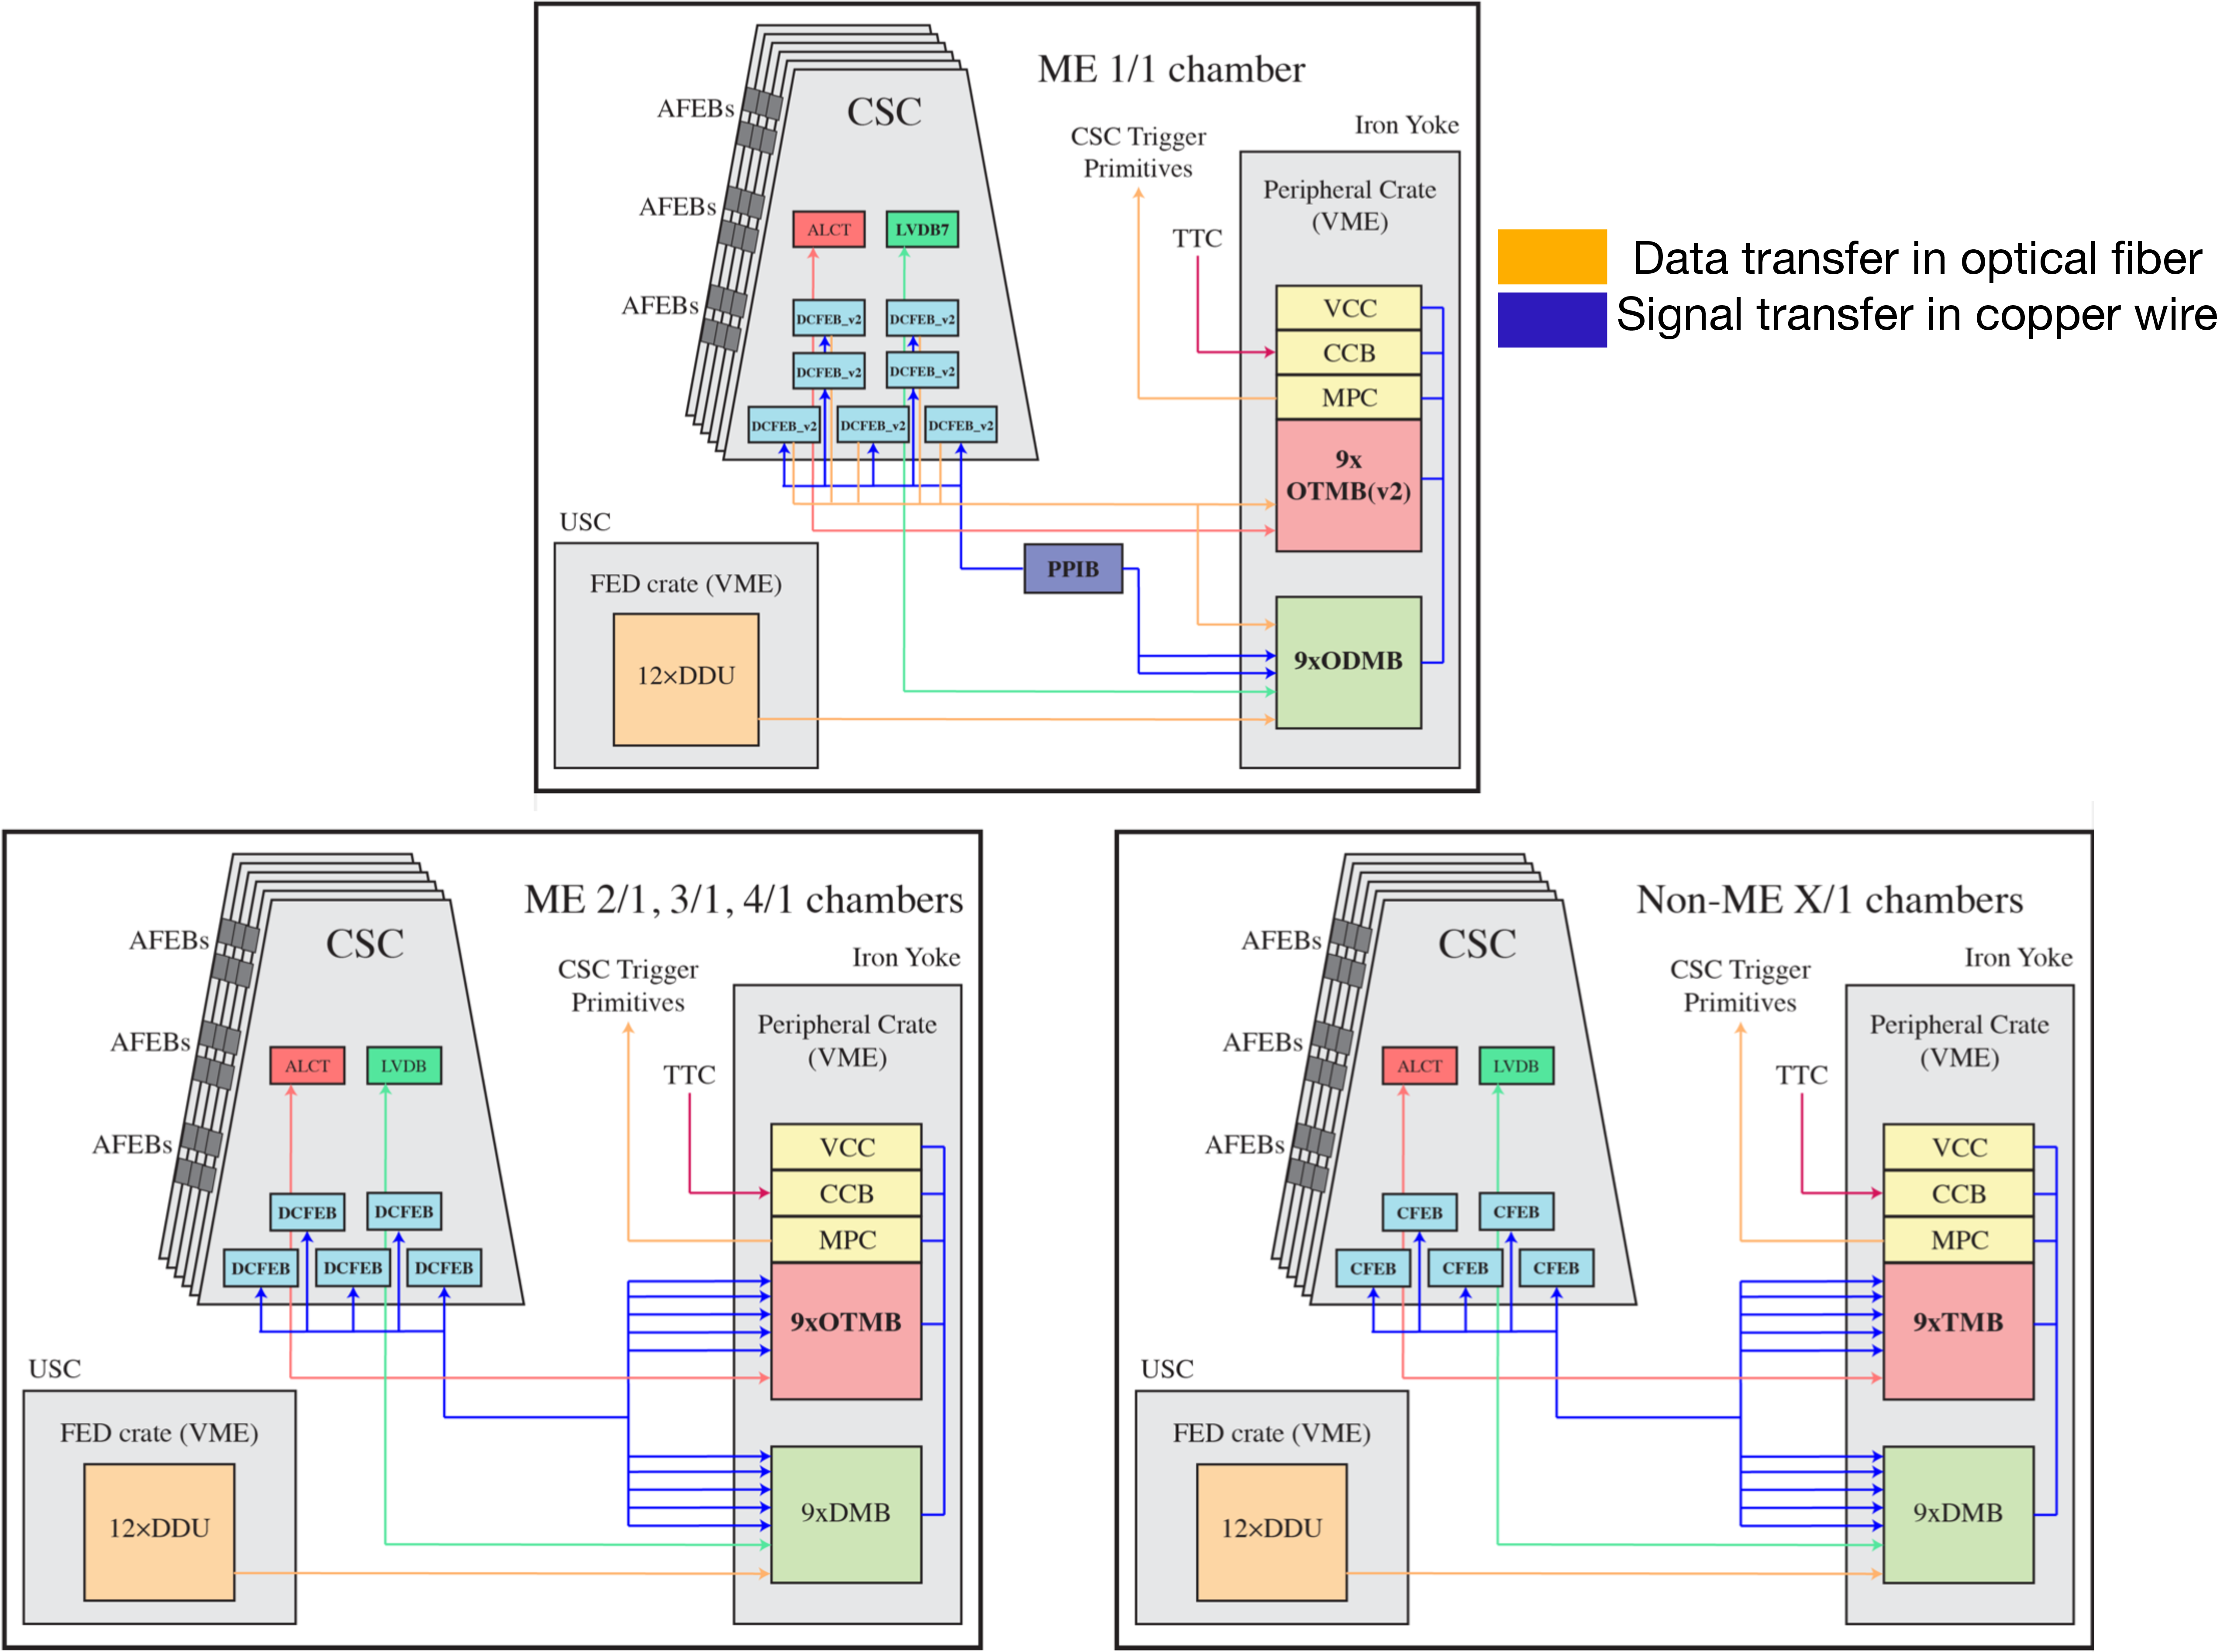
Figure 50:
Schematic of the CSC electronics readout systems for Run 3: ME1/1 (upper), ME234/1 (lower left), all other chambers, ME1234/2 and ME1/3 (lower right). |
png pdf |
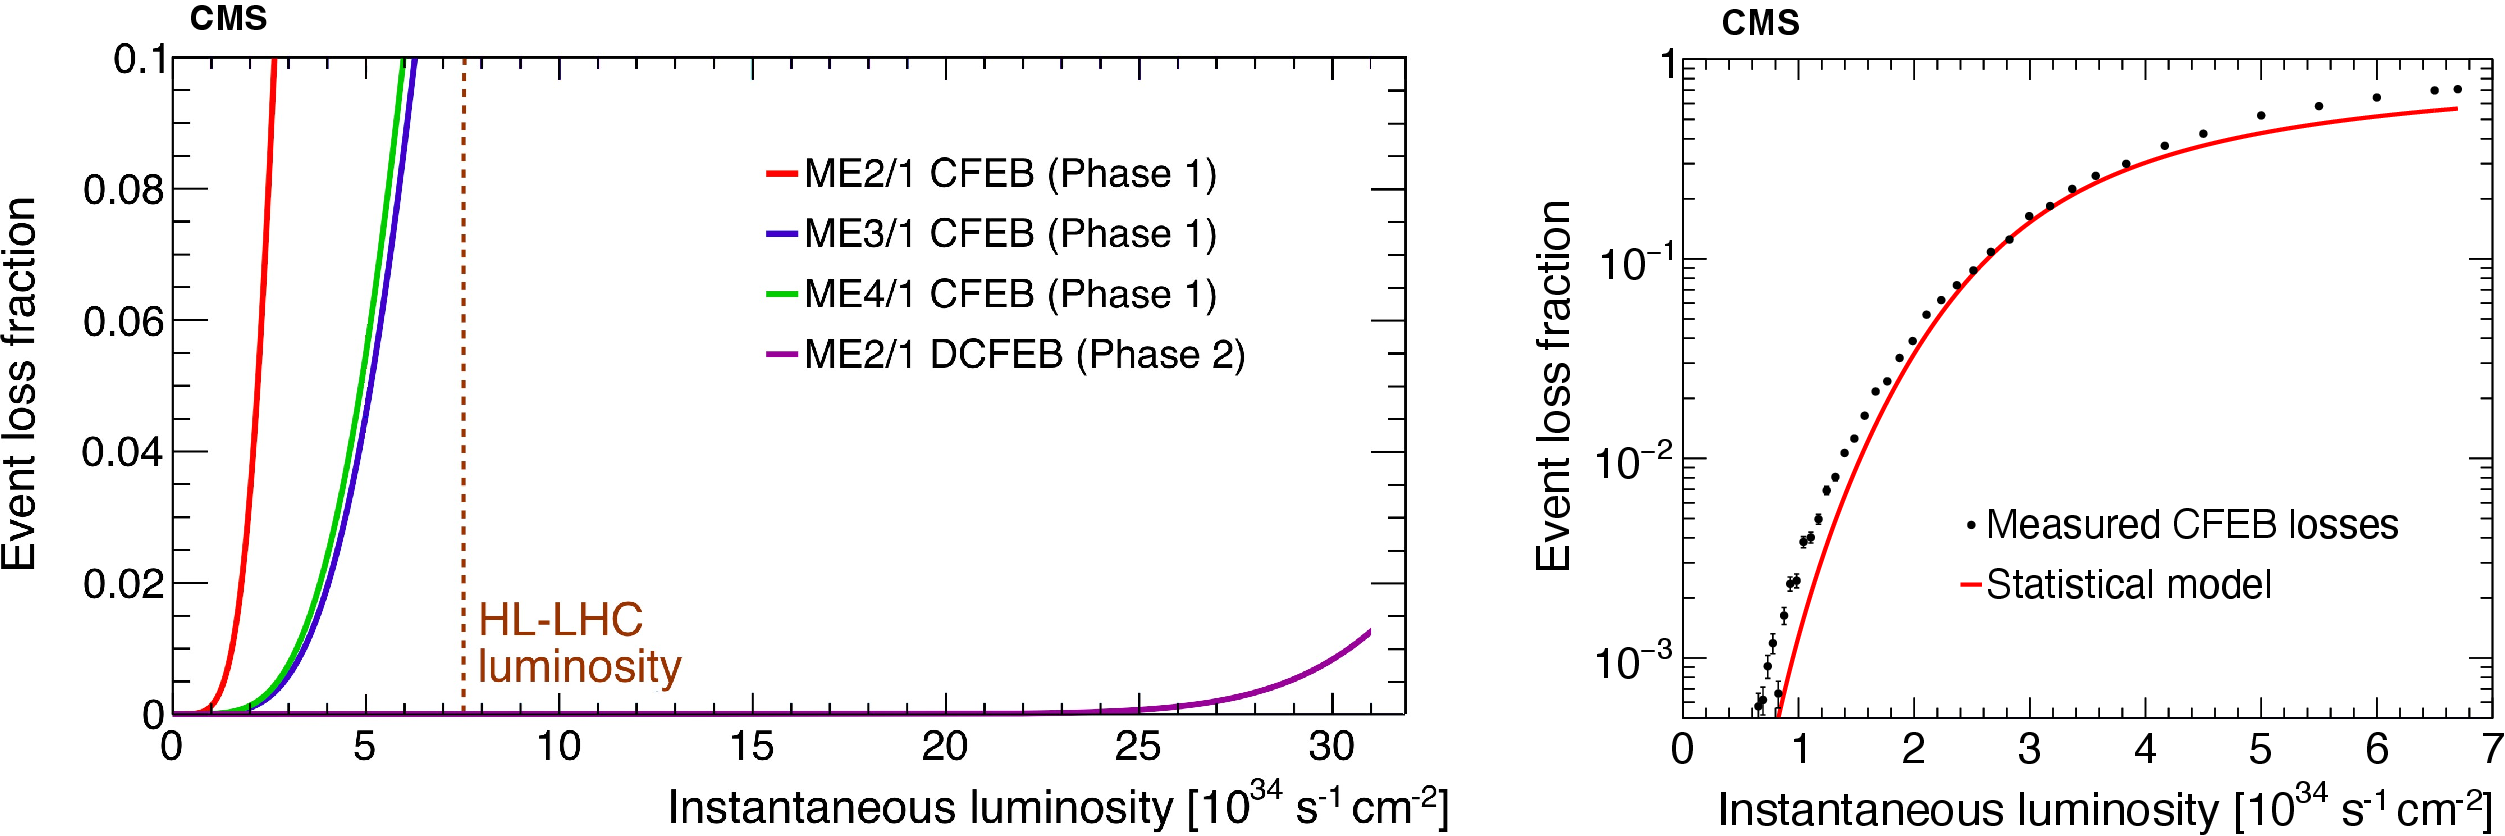
Figure 51:
Left: event loss fraction as a function of instantaneous luminosity for different type chambers after different upgrades. The vertical dashed brown line indicates the design HL-LHC luminosity. Right: event loss rate measured in a CFEB under HL-LHC conditions for an ME2/1 chamber, compared to the statistical model [96]. |
png pdf |
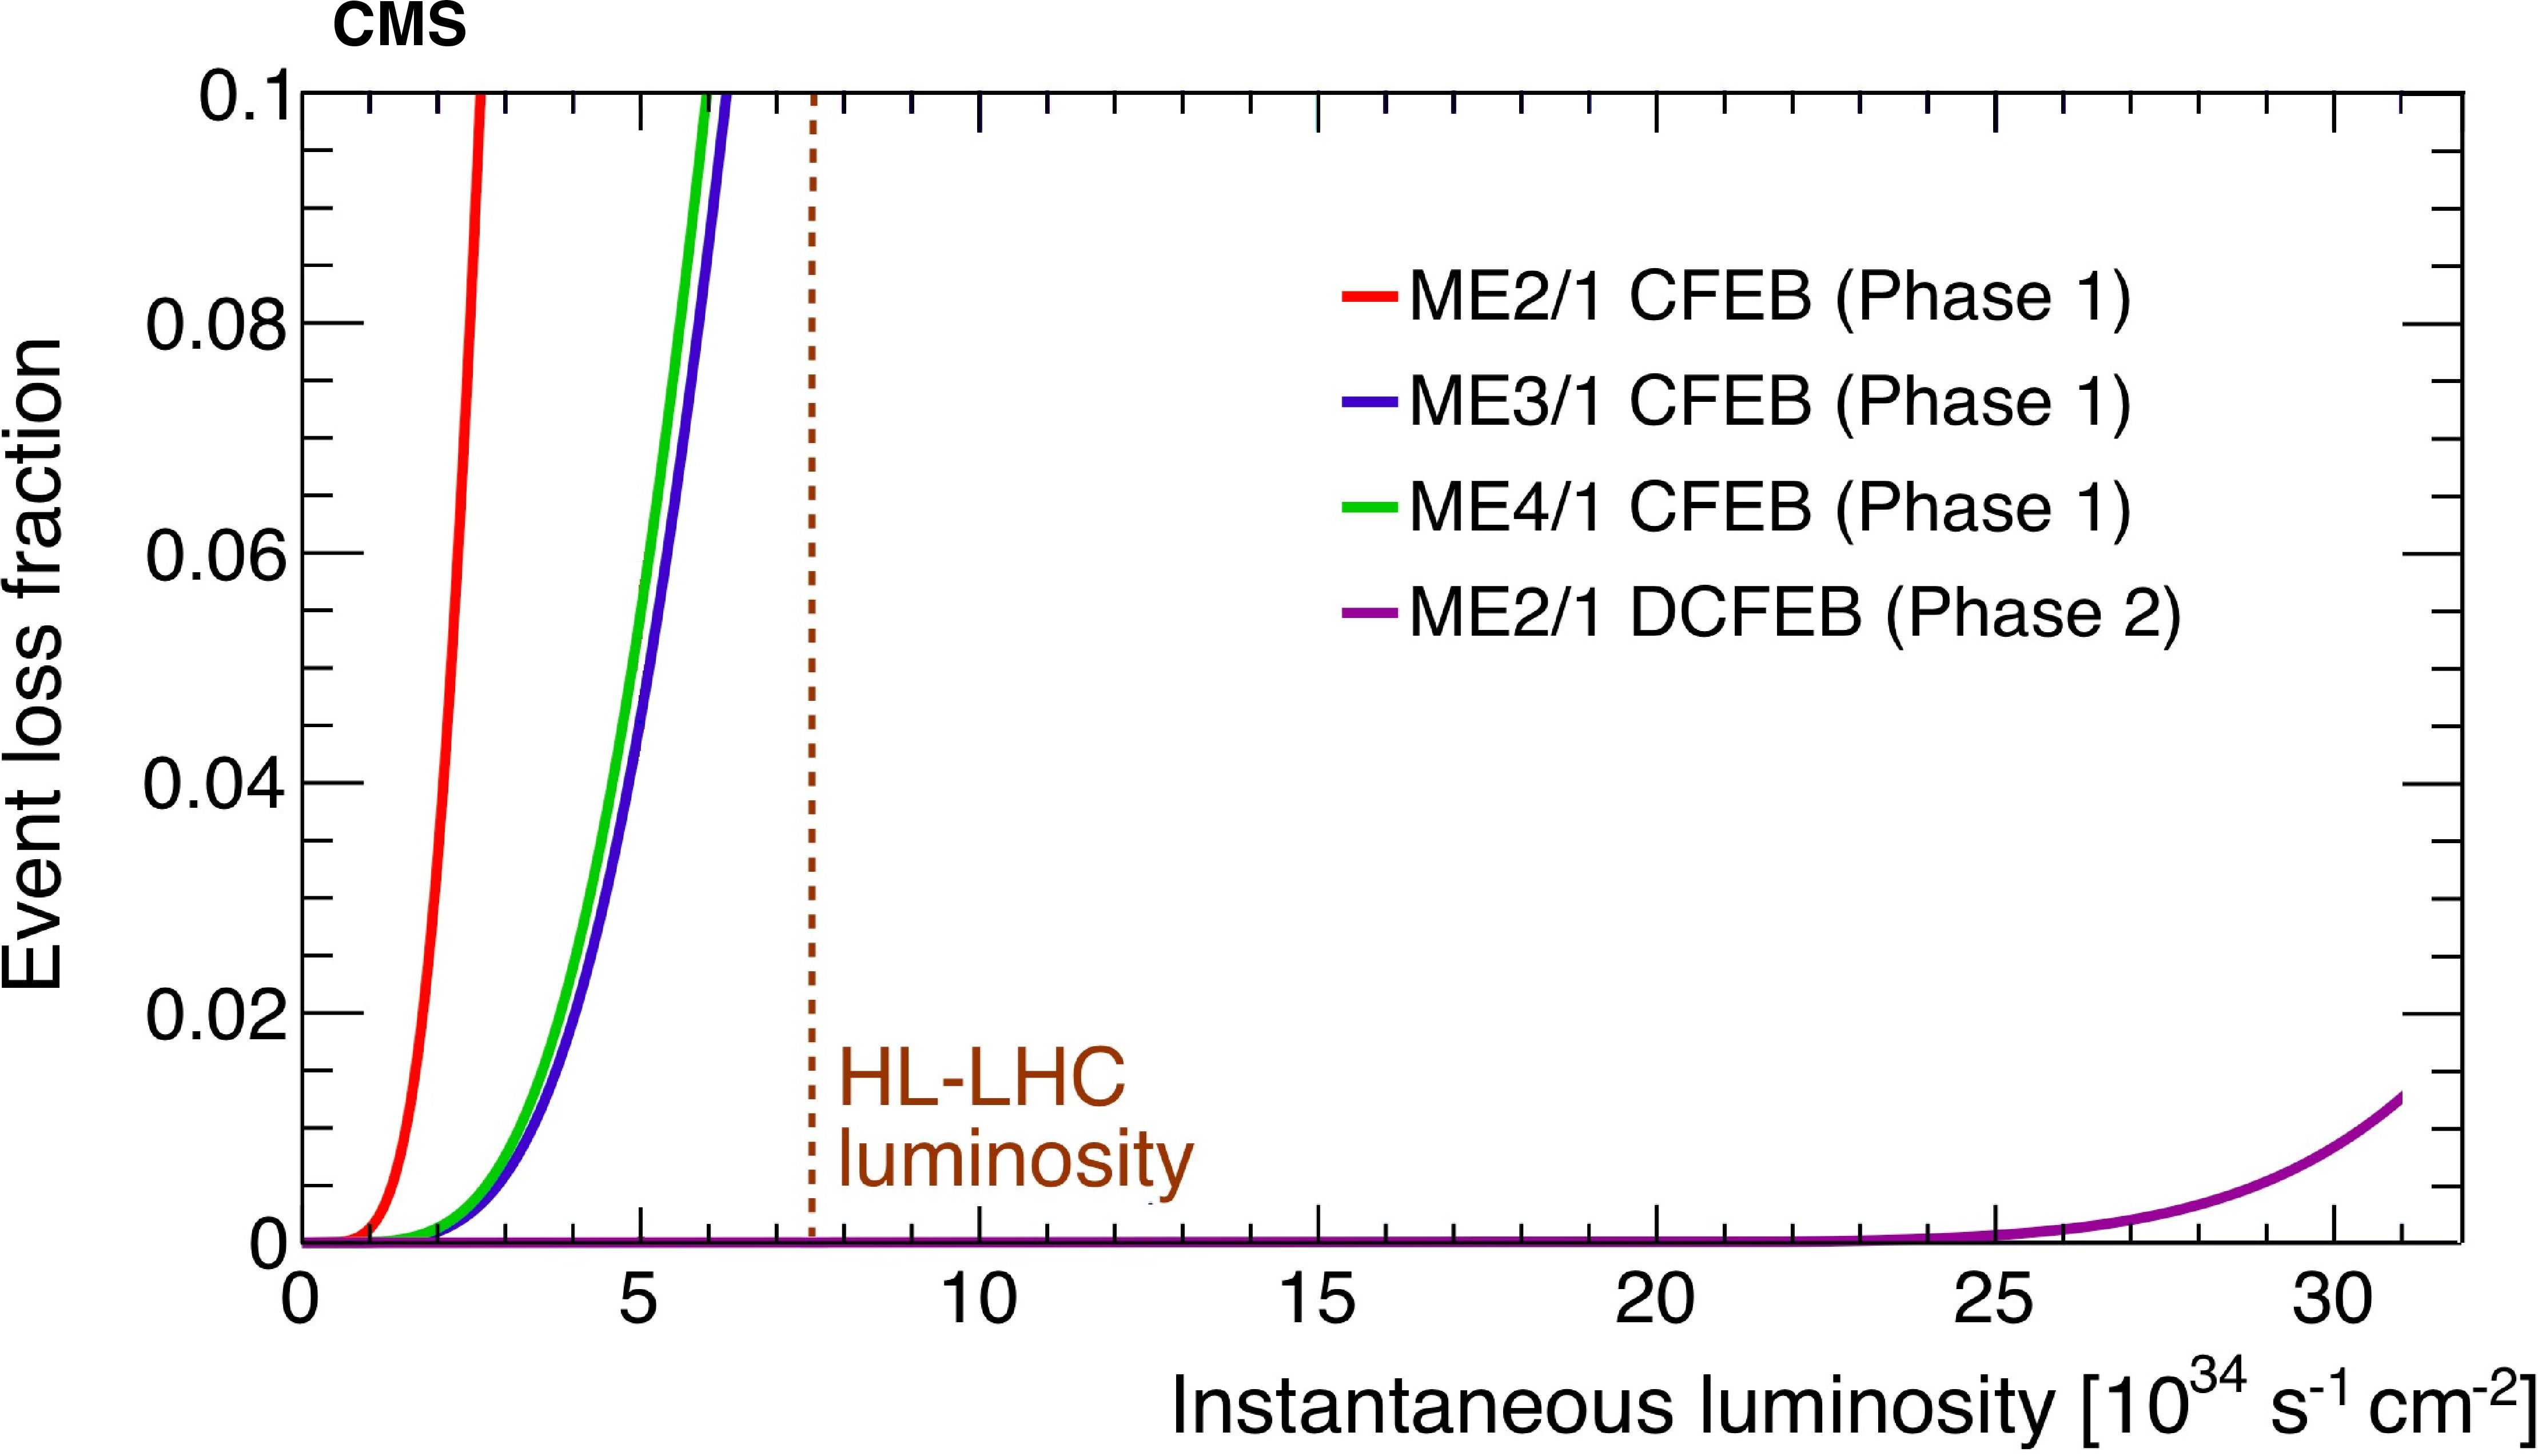
Figure 51-a:
Event loss fraction as a function of instantaneous luminosity for different type chambers after different upgrades. The vertical dashed brown line indicates the design HL-LHC luminosity. |
png pdf |
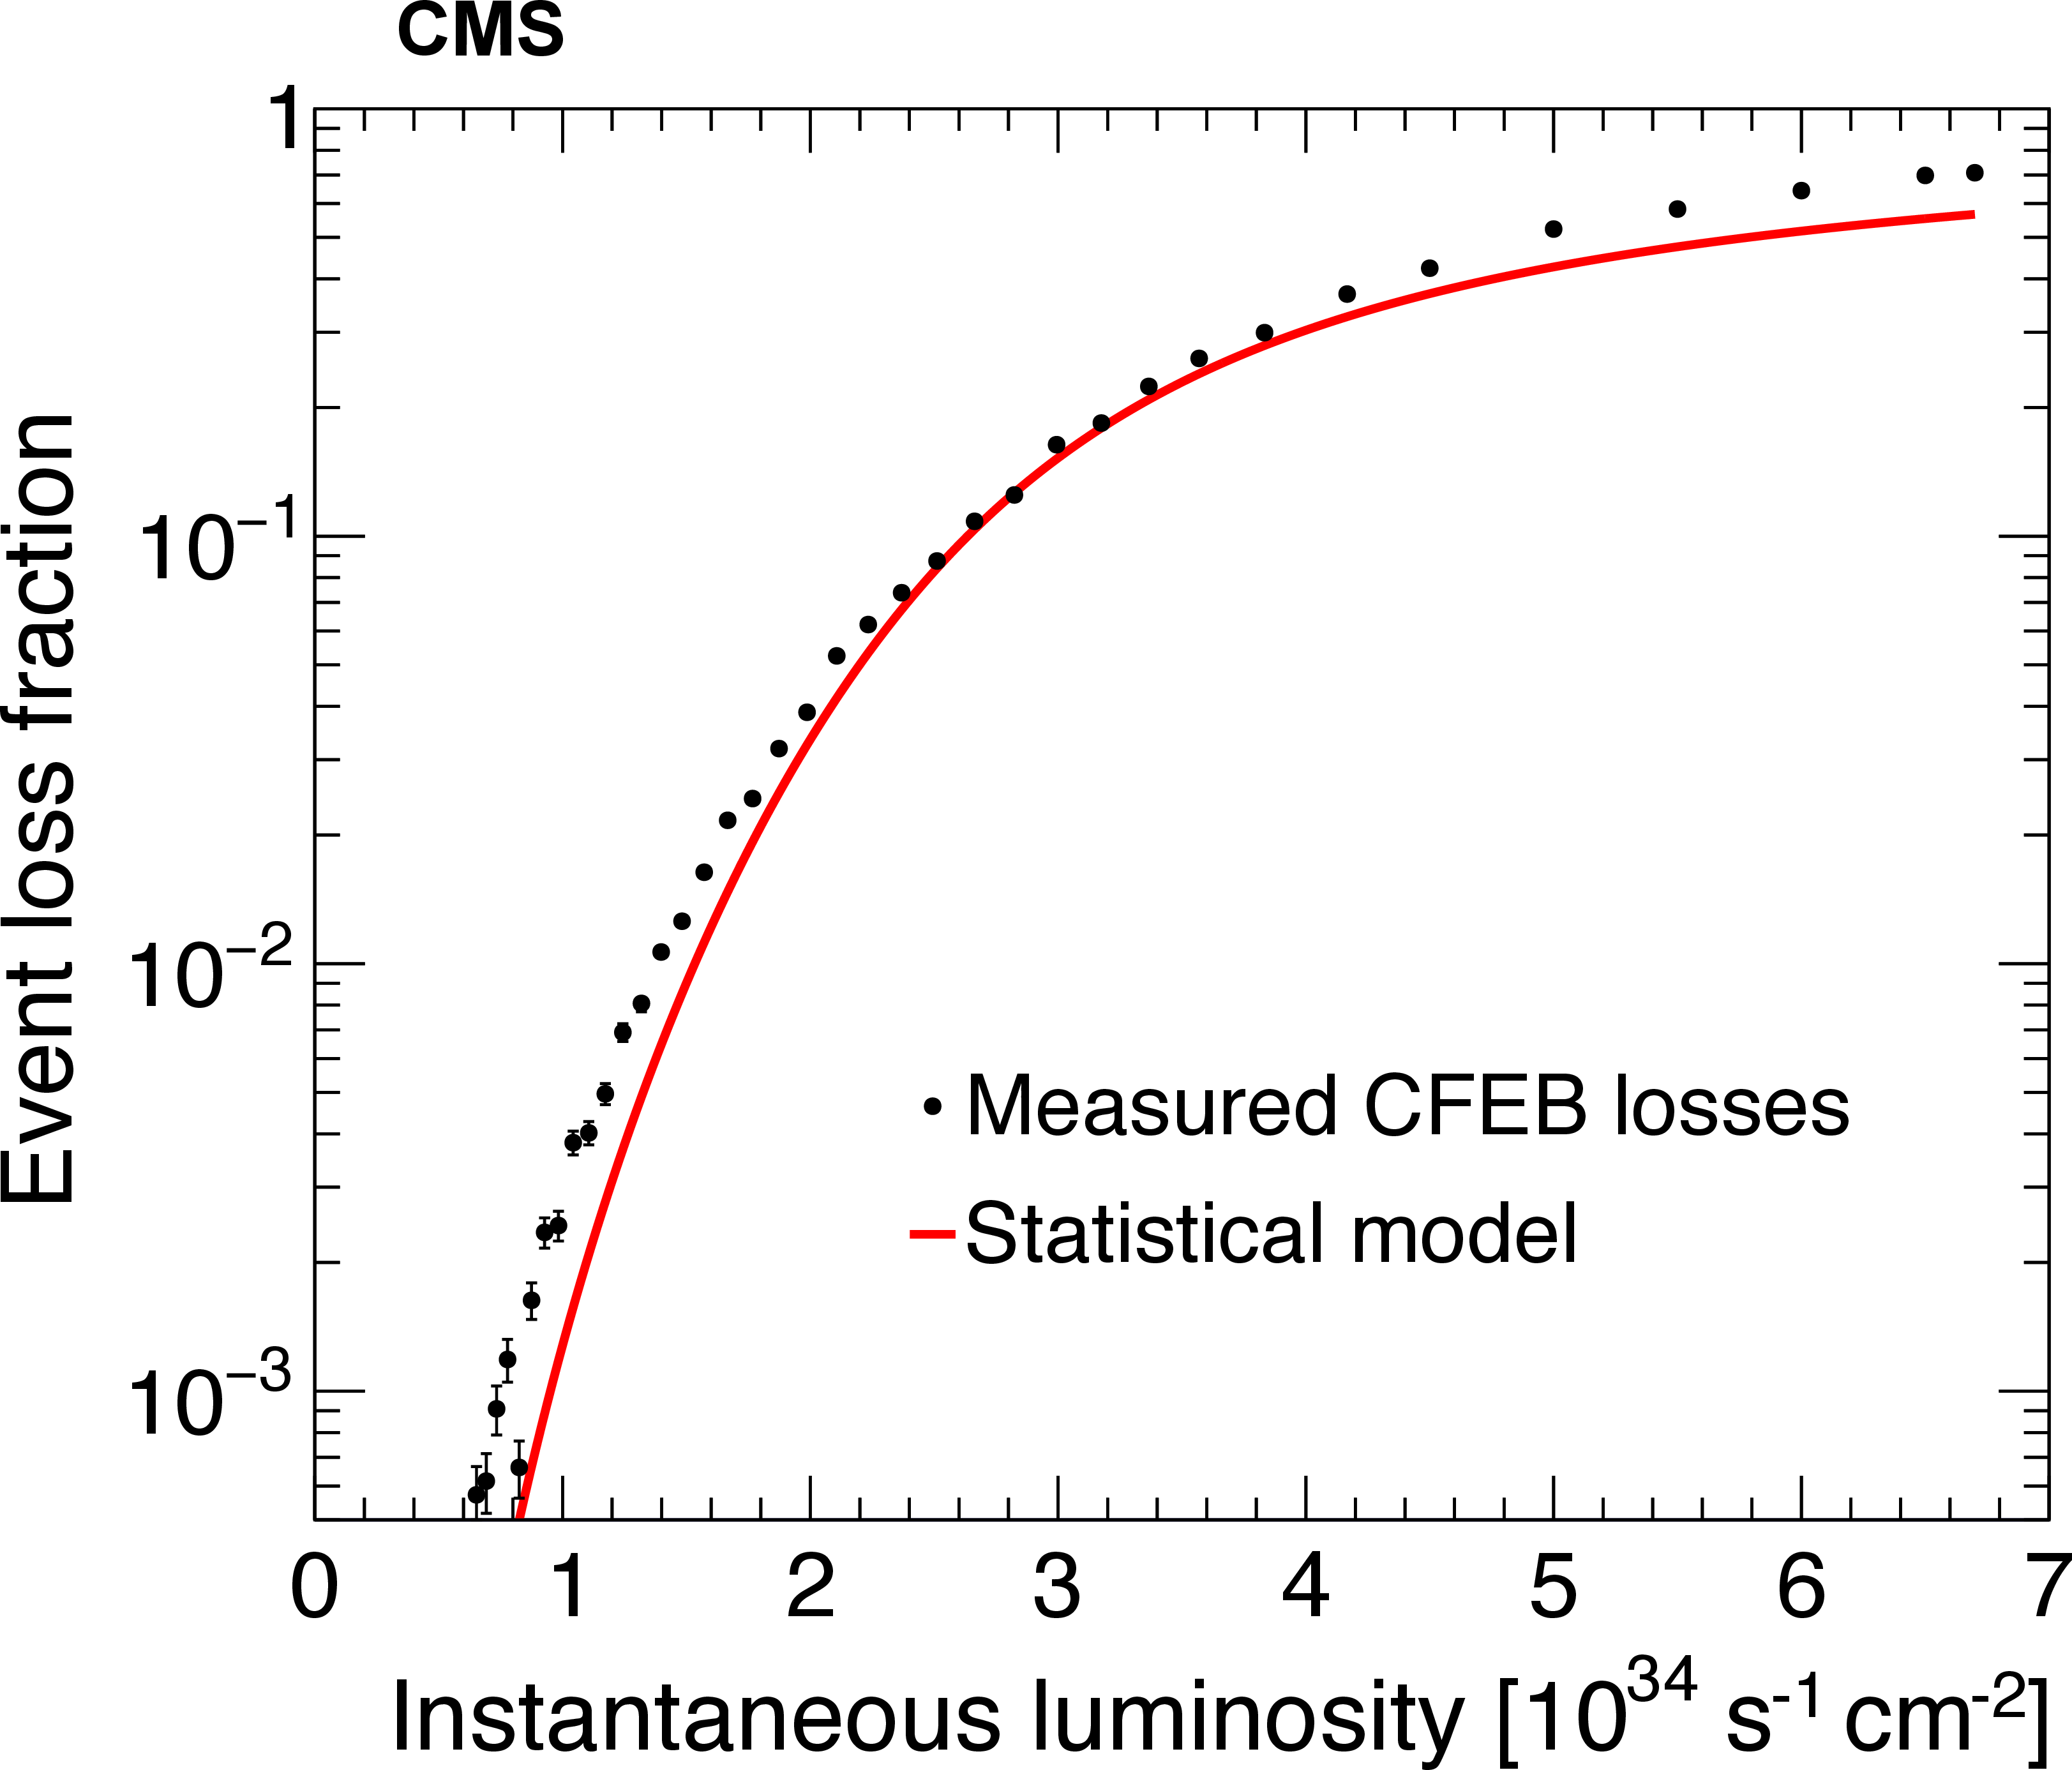
Figure 51-b:
Event loss rate measured in a CFEB under HL-LHC conditions for an ME2/1 chamber, compared to the statistical model [96]. |
png pdf |
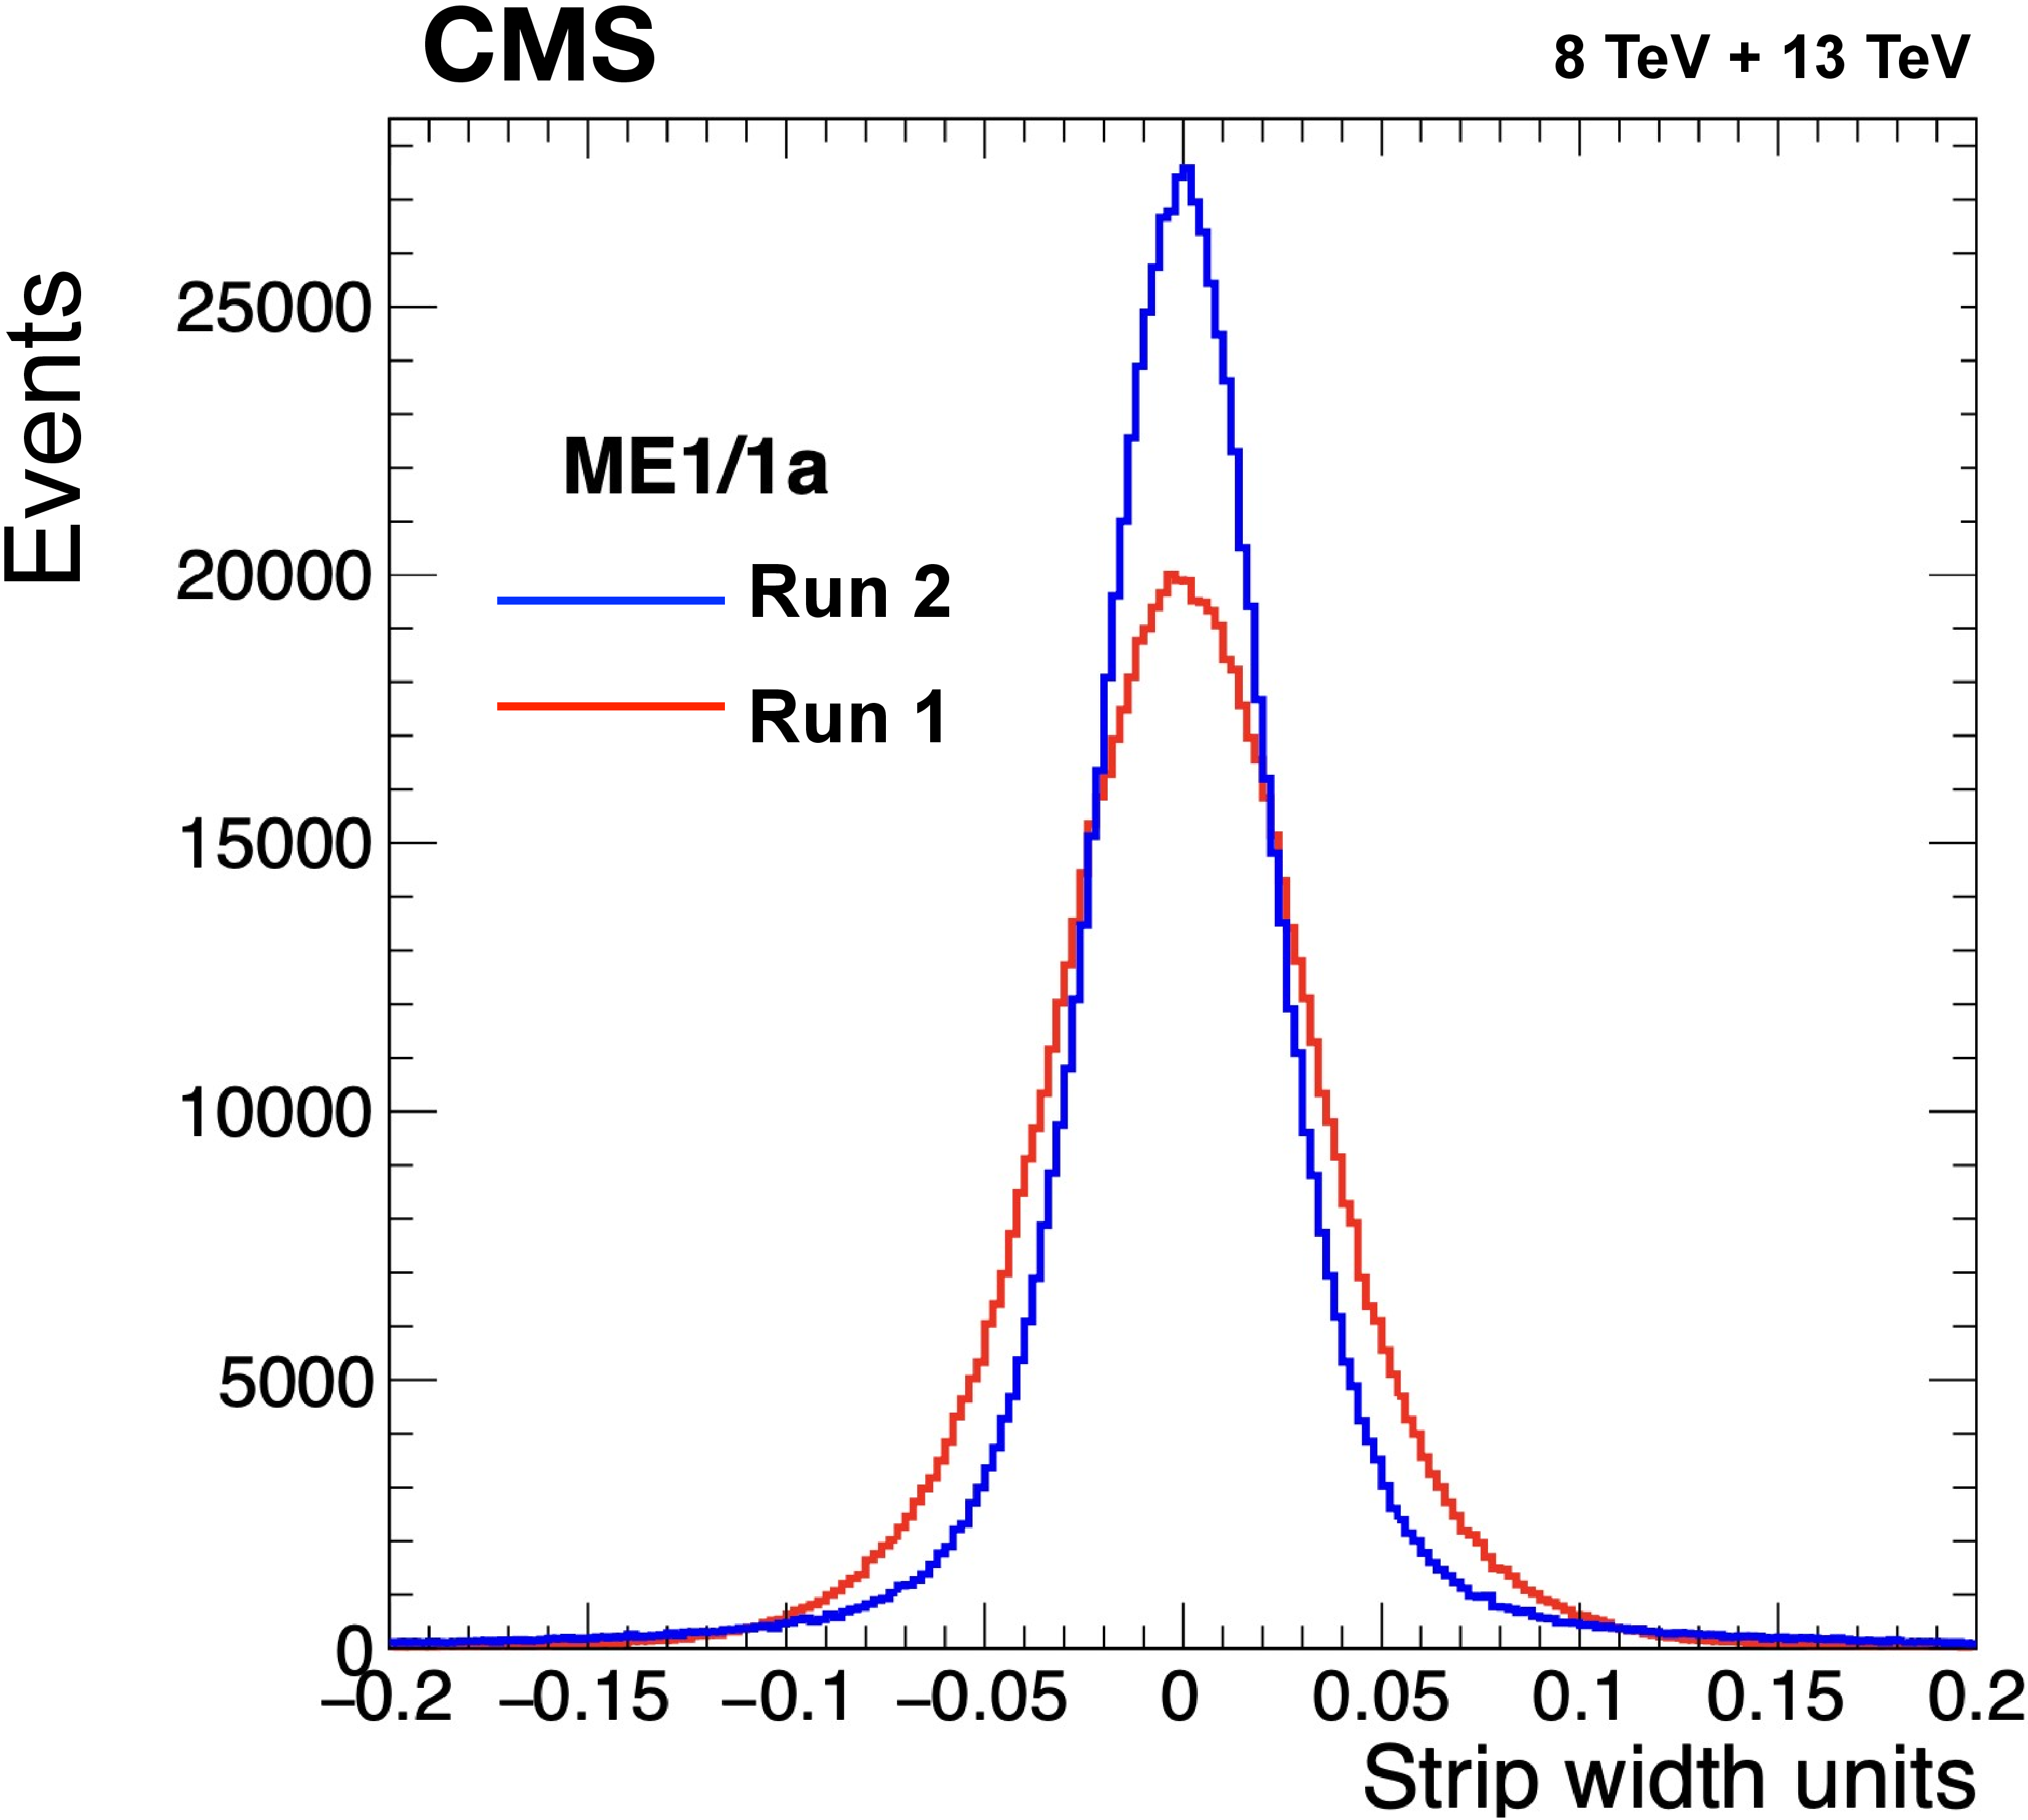
Figure 52:
Difference between the position of a reconstructed hit in layer 3 of an ME1/1a chamber and the position obtained by fitting a segment with hits from the other five layers for Run 1 (red) and Run 2 (blue). The spatial resolution is improved by 27% from $ \sigma=$ 64 $\mu$m$ in Run 1 to 46 m in Run 2. This is due to the removal of the triple-grouping of strips in ME1/1a, which reduces the capacitance and hence the frontend noise. |
png pdf |
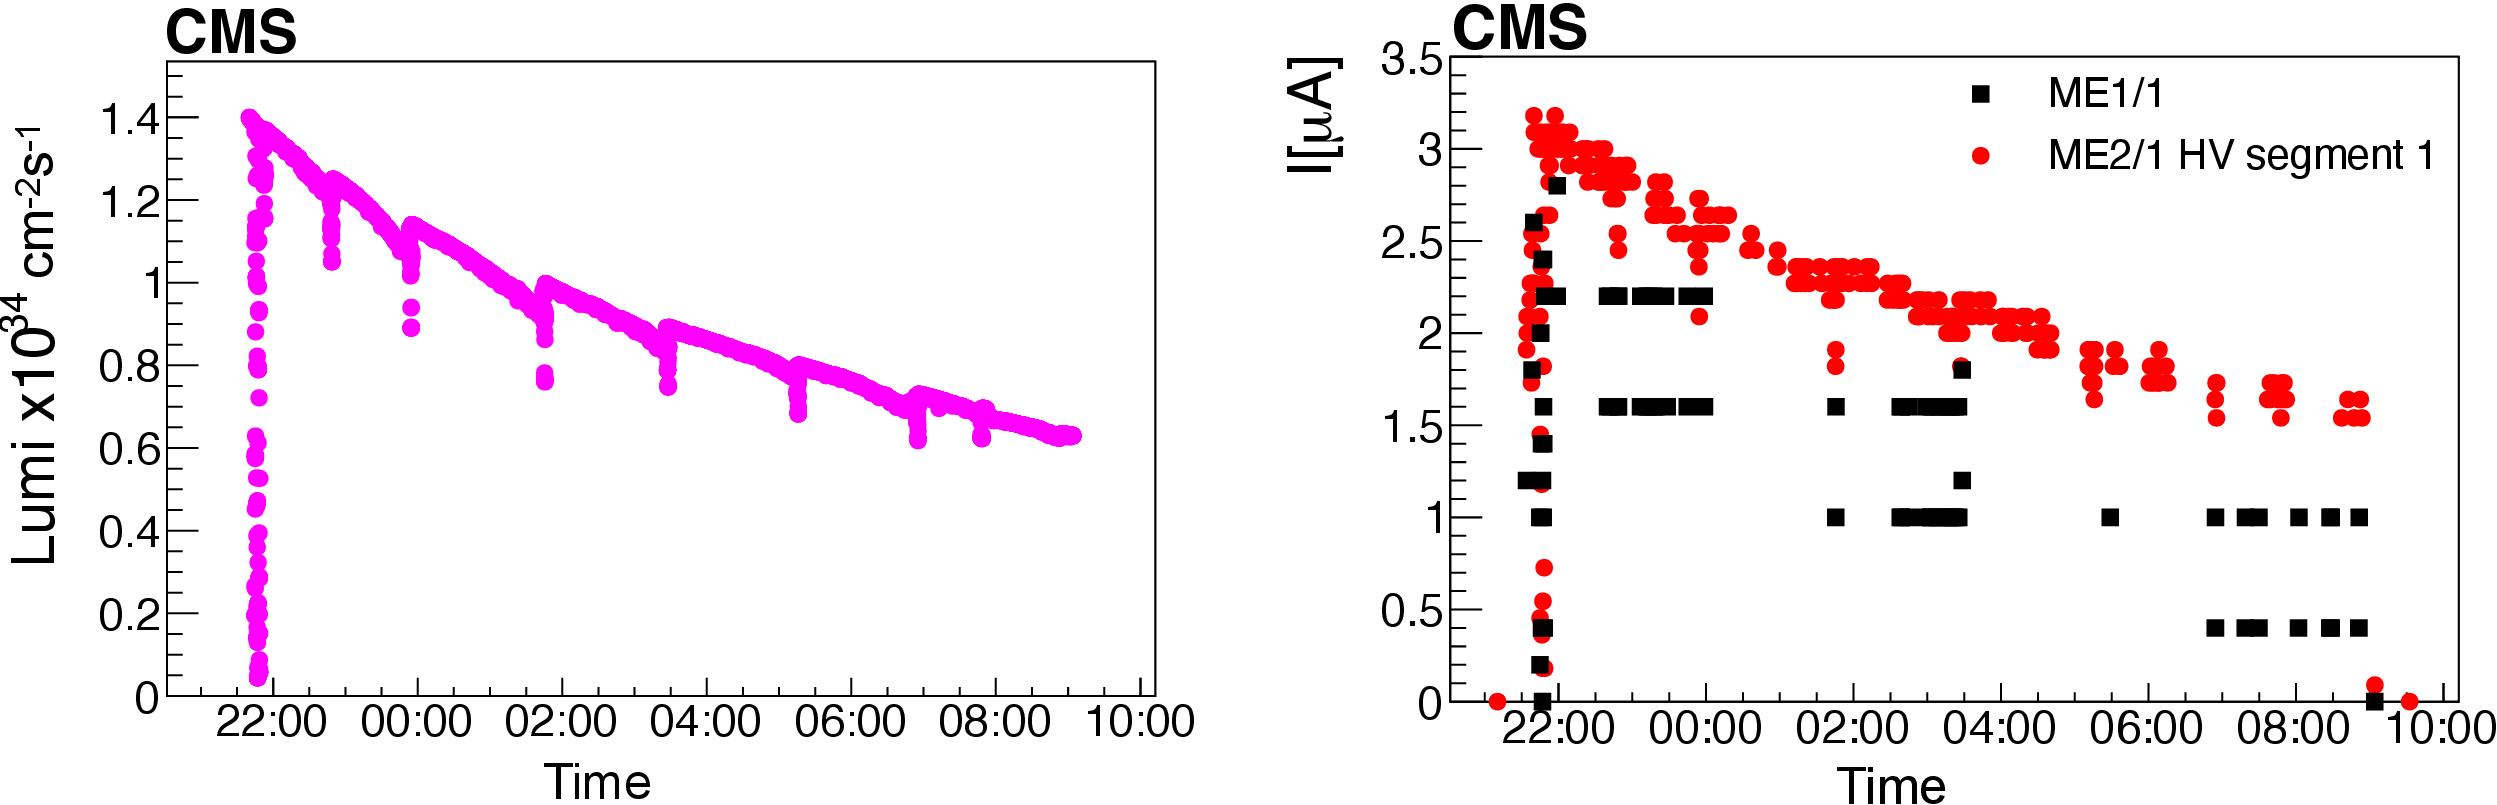
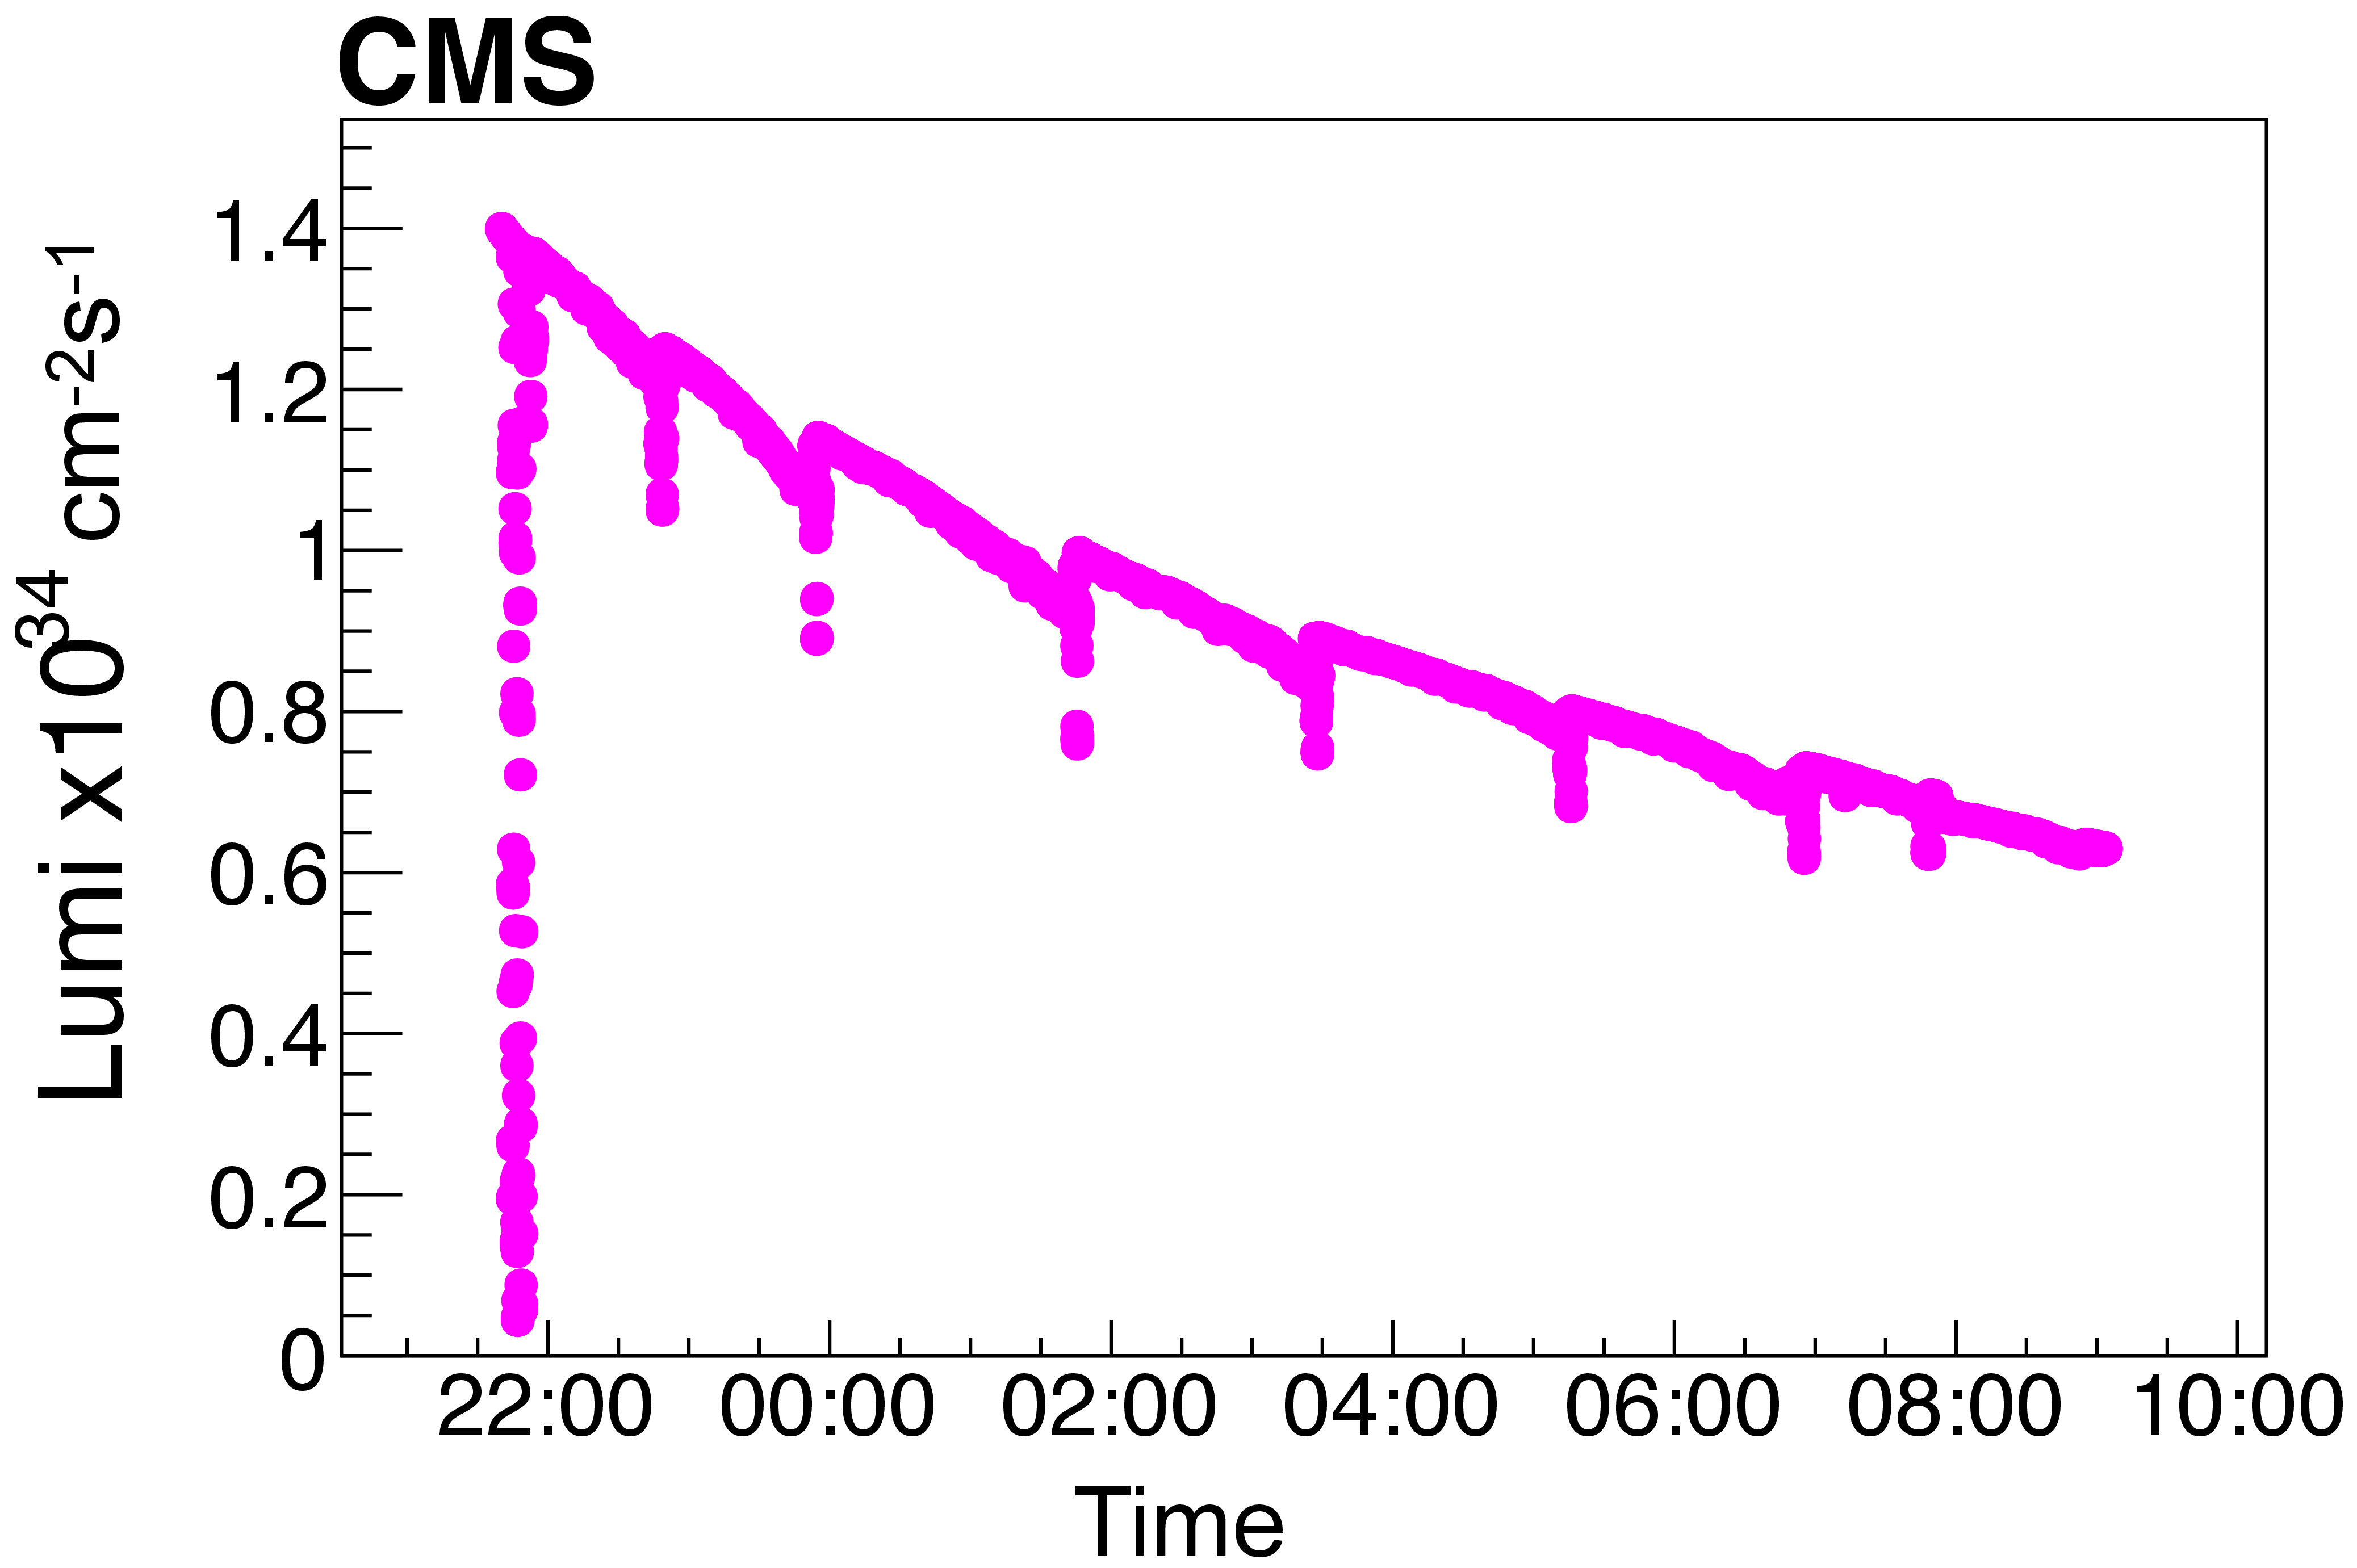
Figure 53:
Left: instantaneous luminosity versus time for one of the LHC fills in 2016. Right: current (in nA) in an ME2/1 chamber (the HV segment closest to the beam) for the same fill, as measured with the custom-made HV subsystem used for non-ME1/1 chambers; current (in $ \mu $A) in an ME1/1 chamber (one plane) for the same fill, as measured with the commercial HV subsystem. |
png pdf |
Figure 53-a:
Instantaneous luminosity versus time for one of the LHC fills in 2016. |

png pdf |
Figure 53-b:
Current (in nA) in an ME2/1 chamber (the HV segment closest to the beam) for the same fill, as measured with the custom-made HV subsystem used for non-ME1/1 chambers; current (in $ \mu $A) in an ME1/1 chamber (one plane) for the same fill, as measured with the commercial HV subsystem. |
png pdf |
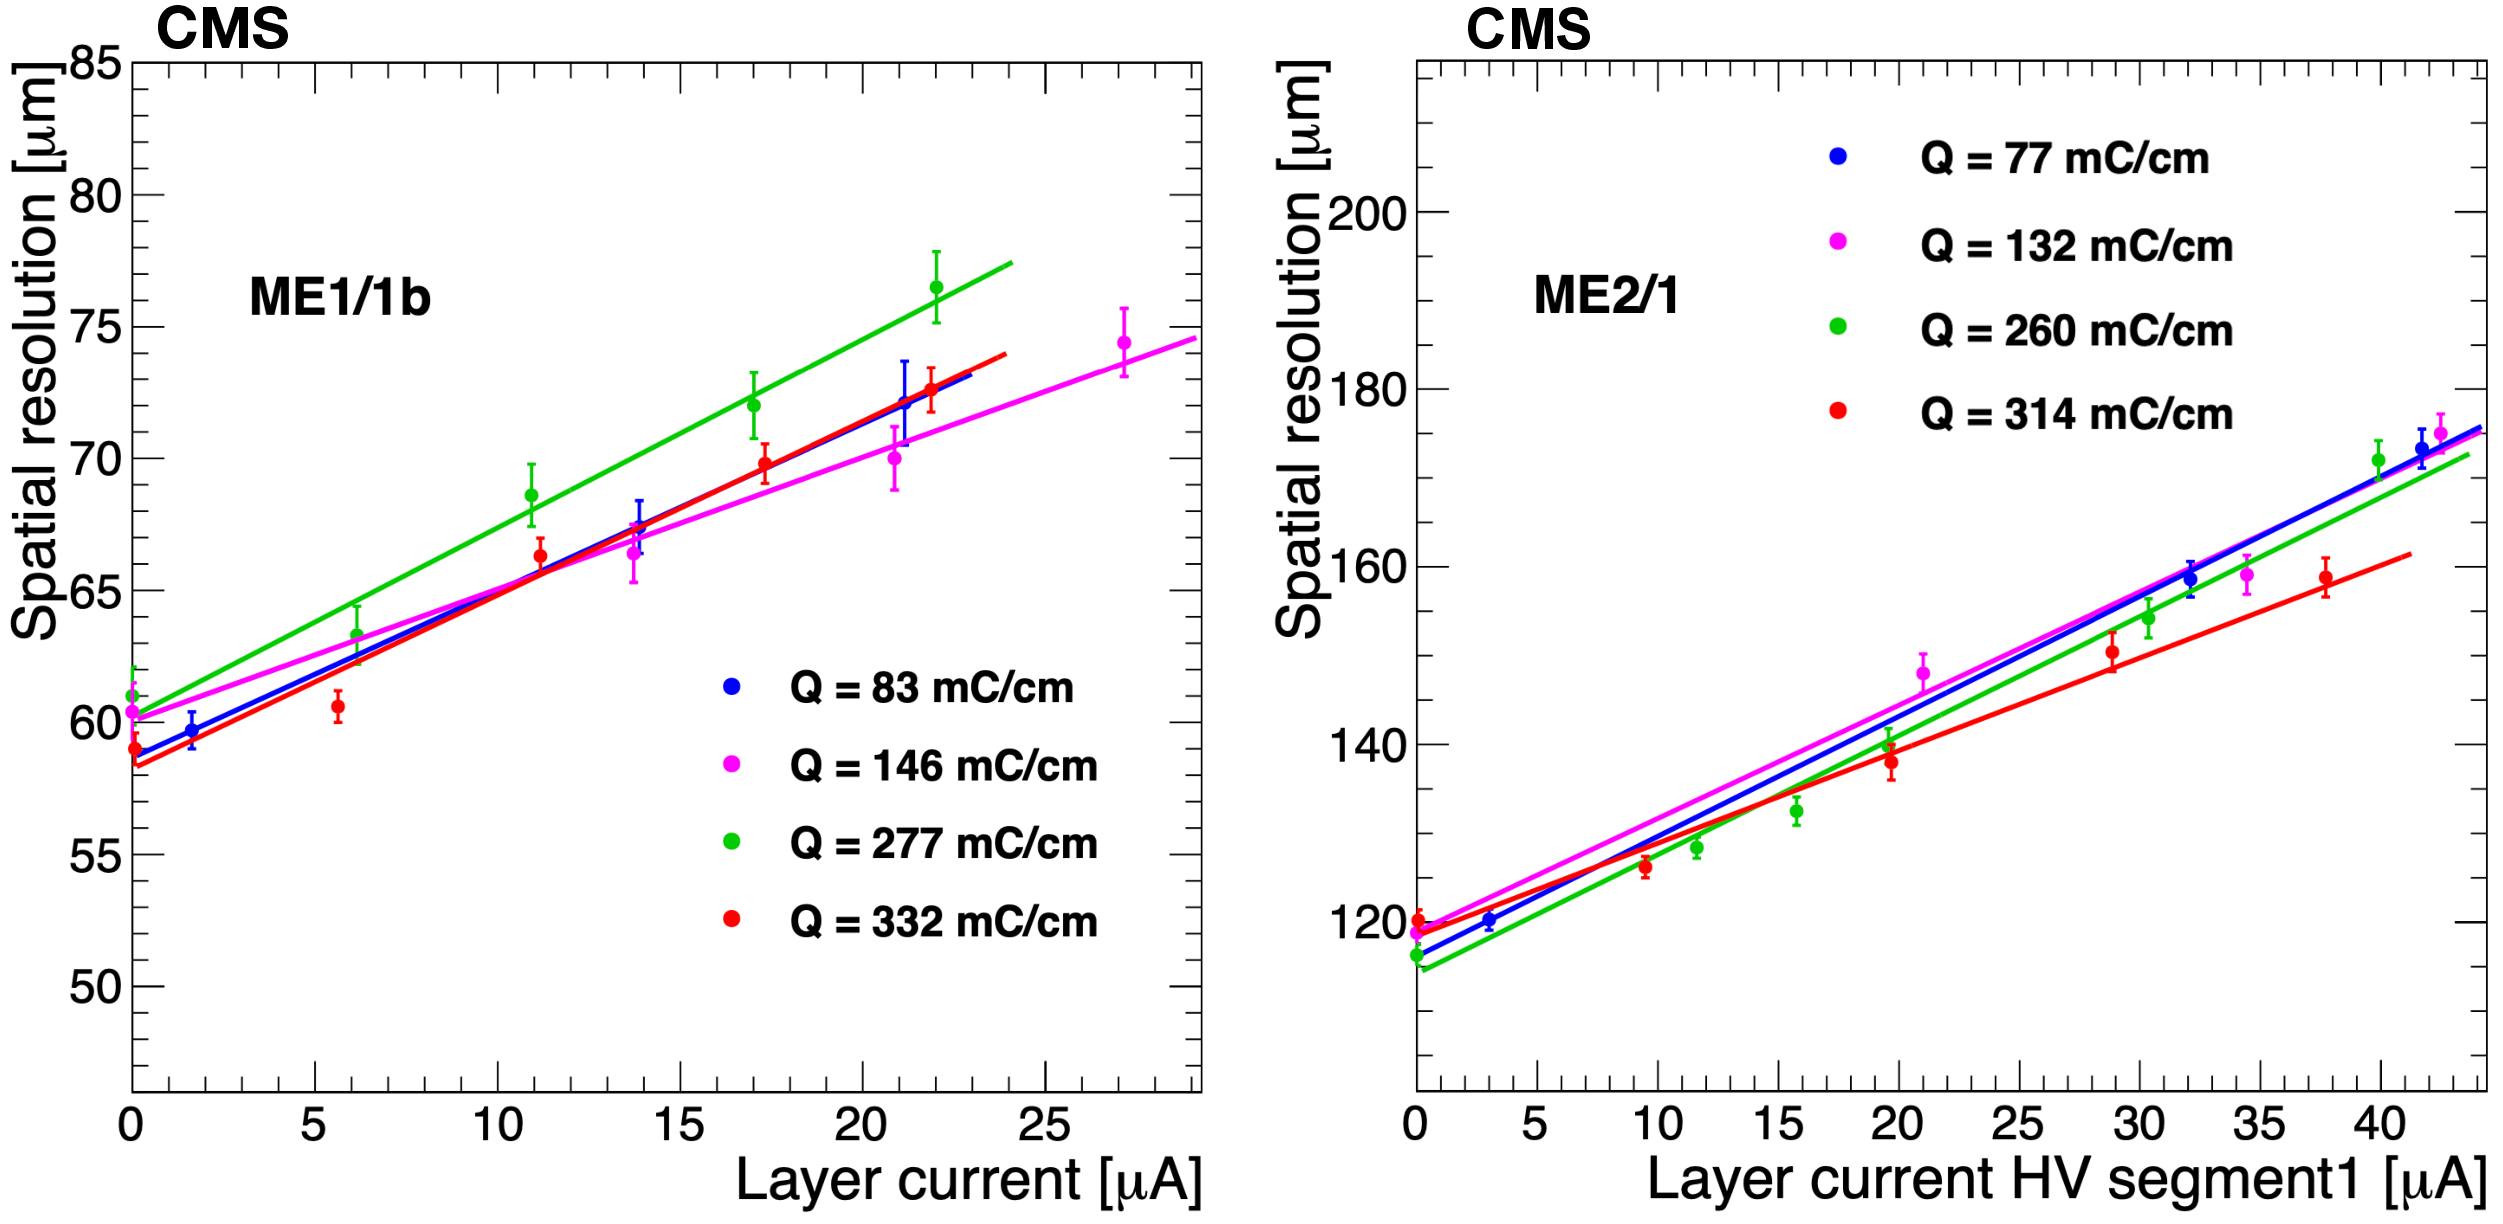
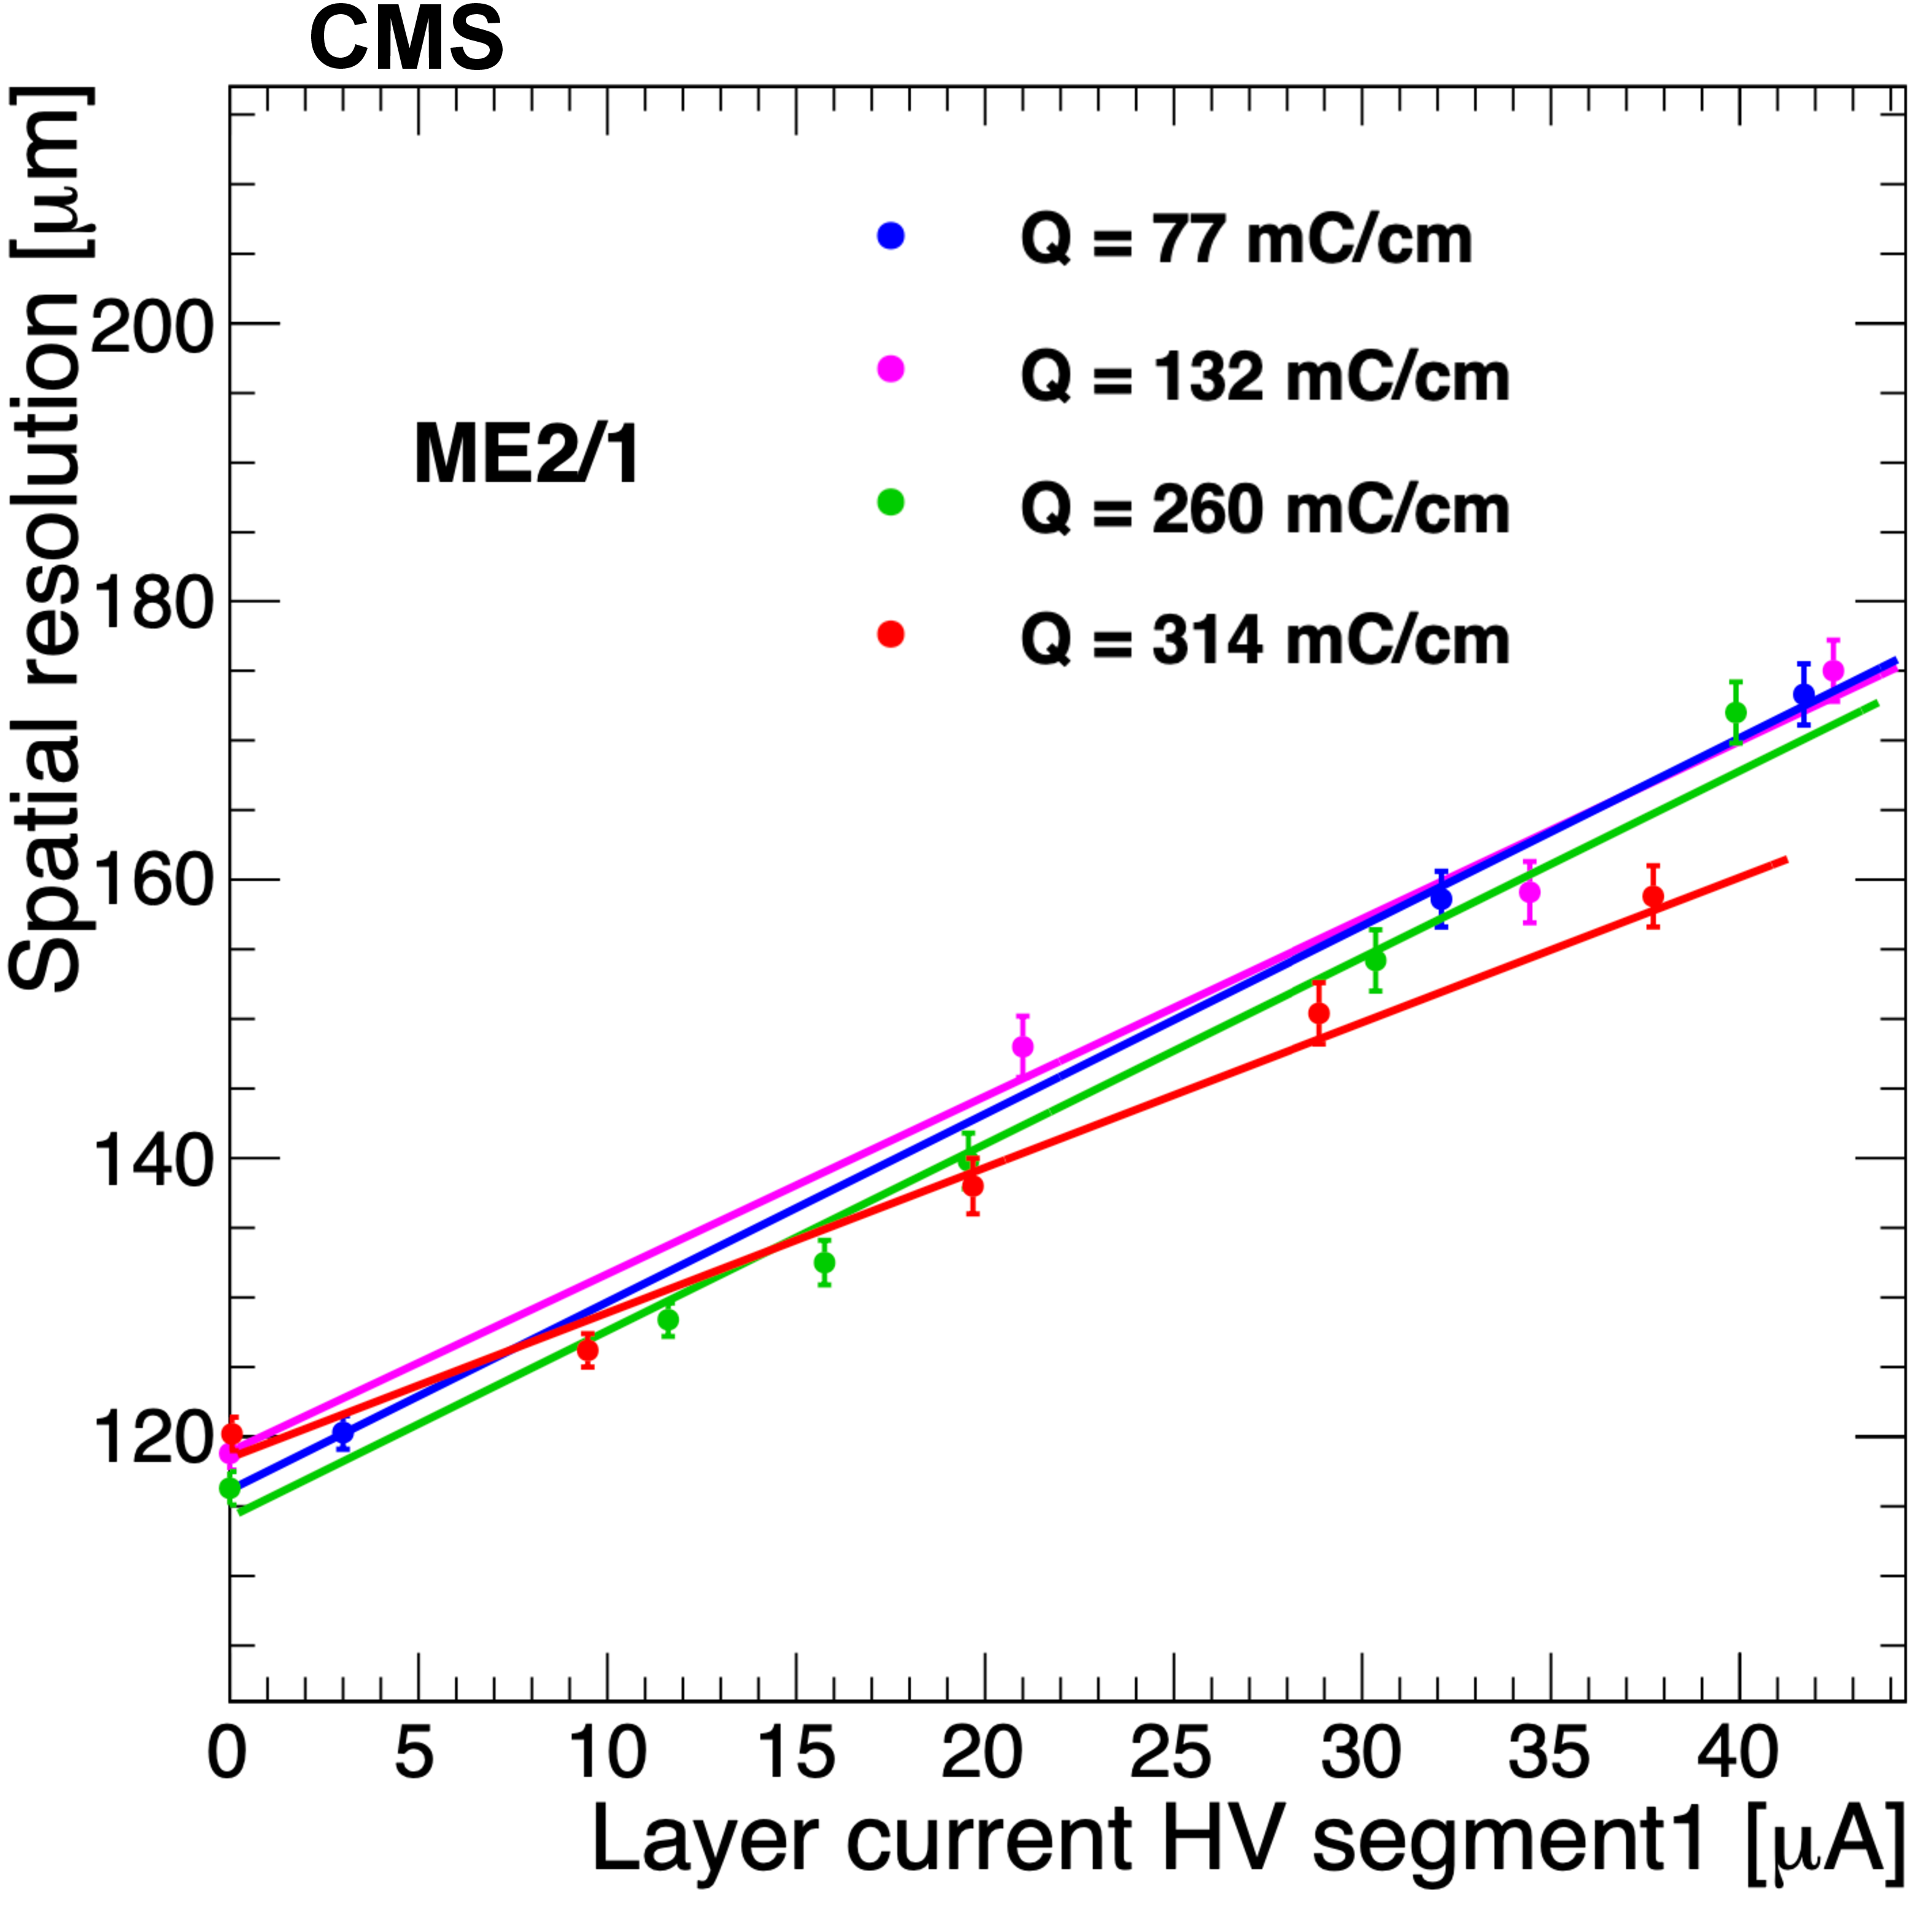
Figure 54:
Spatial resolutions for an ME1/1b (left) and ME2/1 (right) chamber using a muon beam while being uniformly illuminated by a $ ^{137}$Cs photon source to simulate the background from high luminosity pp collisions, as a function of the average current per layer in one HV segment. The results for four different accumulated charges per unit wire length are shown, along with linear fits to each set. |

png pdf |
Figure 54-a:
Spatial resolutions for an ME1/1b ME2/1 chamber using a muon beam while being uniformly illuminated by a $ ^{137}$Cs photon source to simulate the background from high luminosity pp collisions, as a function of the average current per layer in one HV segment. The results for four different accumulated charges per unit wire length are shown, along with linear fits to each set. |
png pdf |
Figure 54-b:
Spatial resolutions for an ME1/1b (left) and ME2/1 (right) chamber using a muon beam while being uniformly illuminated by a $ ^{137}$Cs photon source to simulate the background from high luminosity pp collisions, as a function of the average current per layer in one HV segment. The results for four different accumulated charges per unit wire length are shown, along with linear fits to each set. |
png pdf |
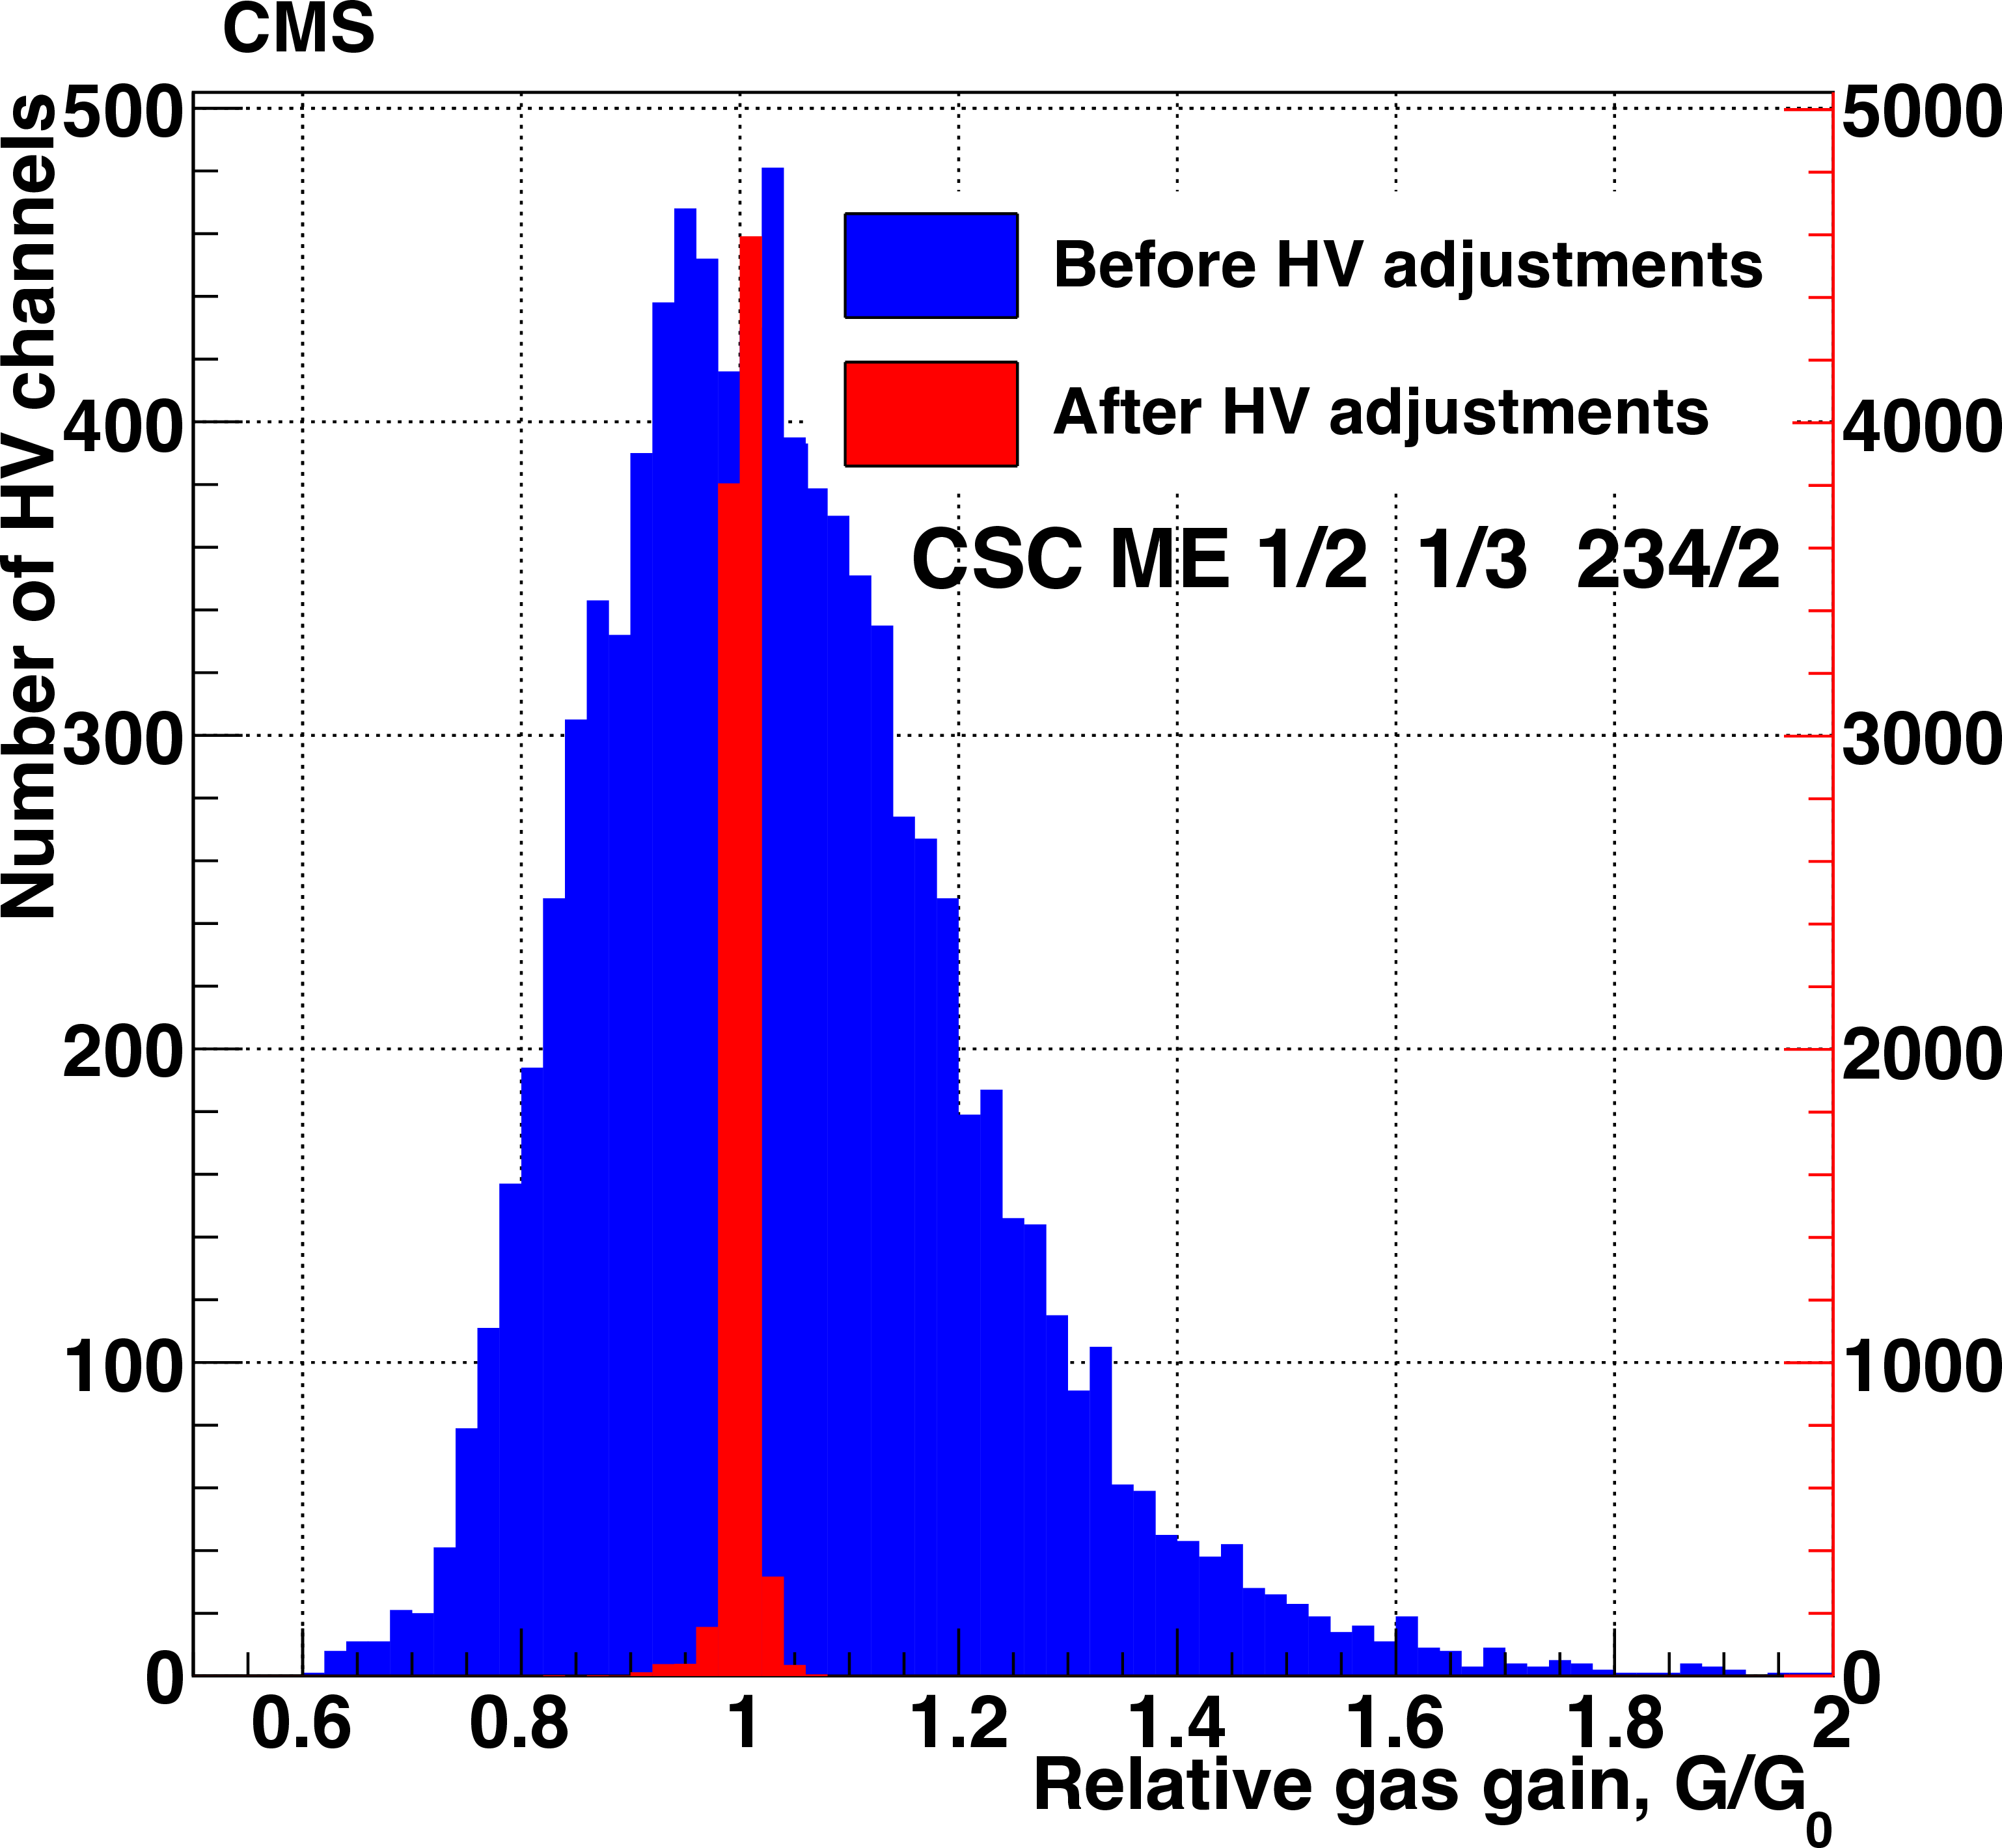
Figure 55:
Relative gas gain distribution in CSCs before and after the gas gain equalization campaign in 2016 [96]. Each entry in the histogram presents the mean value of gas gain in each HV channel. The scale of the blue histogram is on the left while the scale of the red histogram is on the right. |
png pdf |
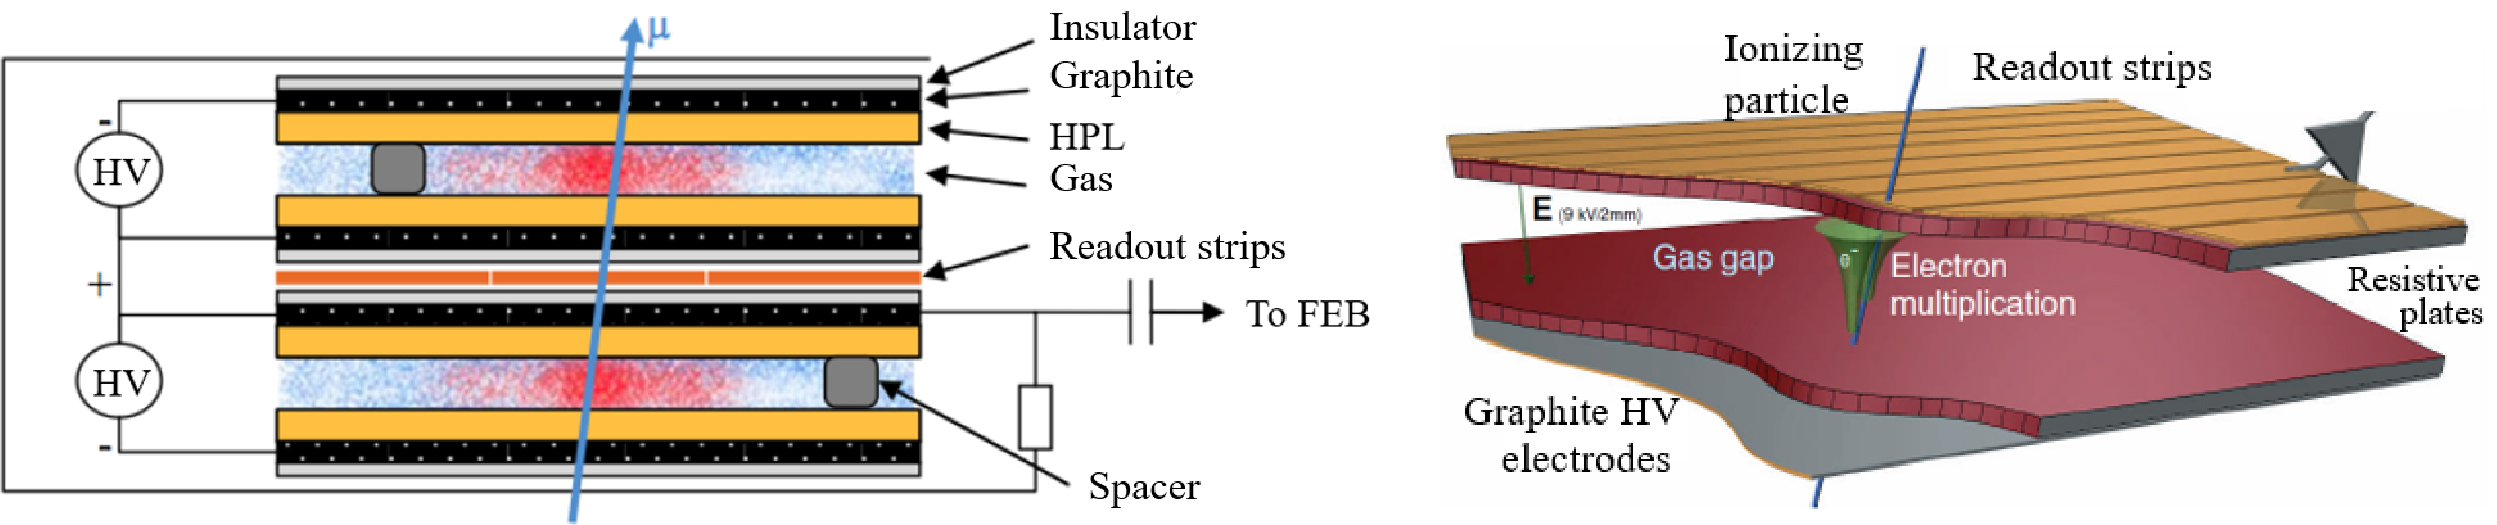
Figure 56:
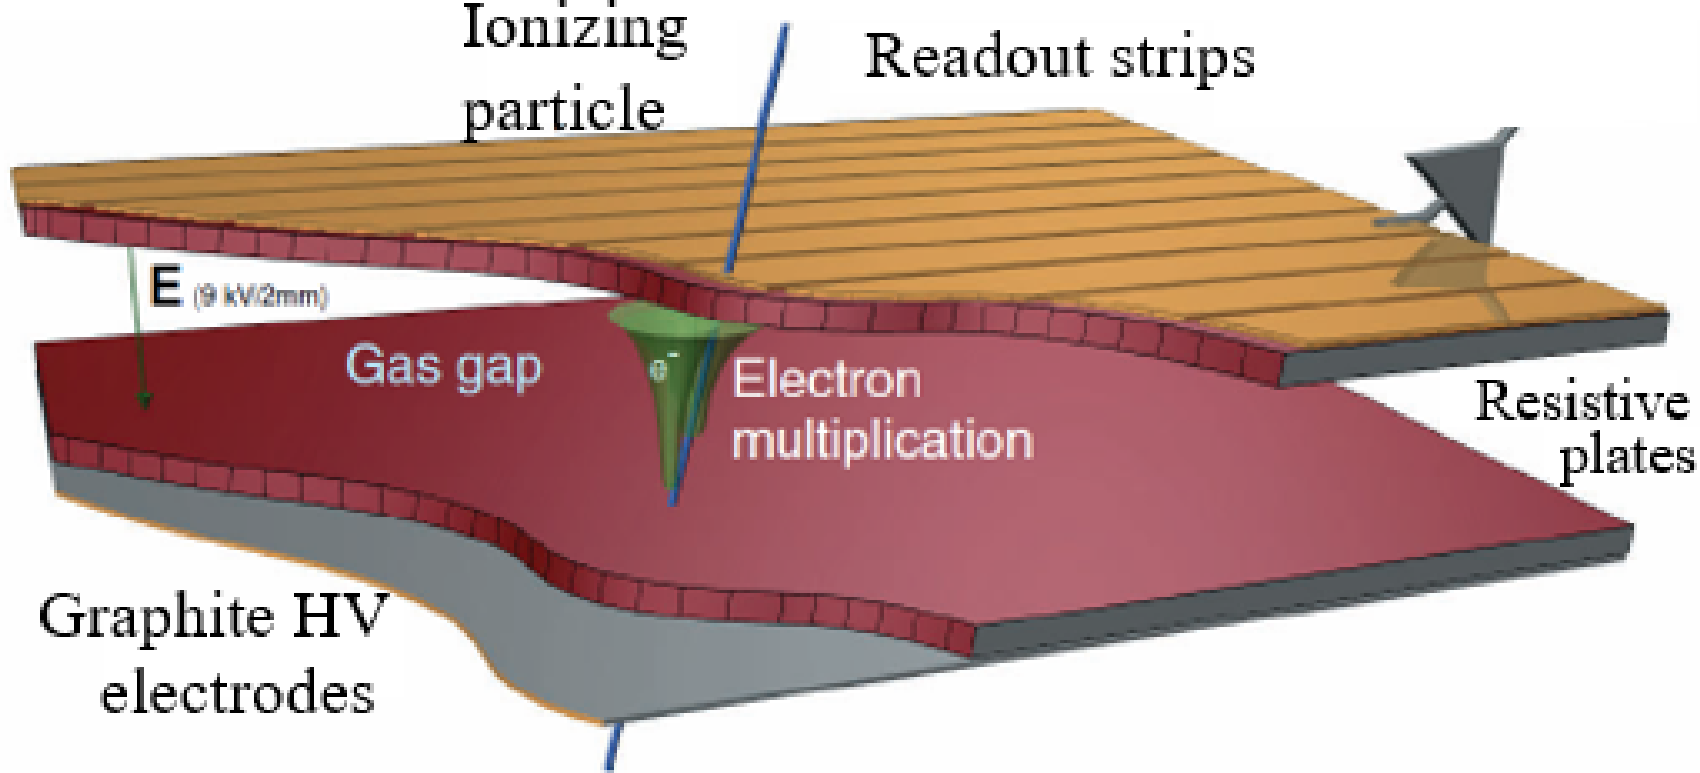
Left: schematic of the double-layer layout of the RPC chambers. Right: illustration of the RPC technology. |
png pdf |
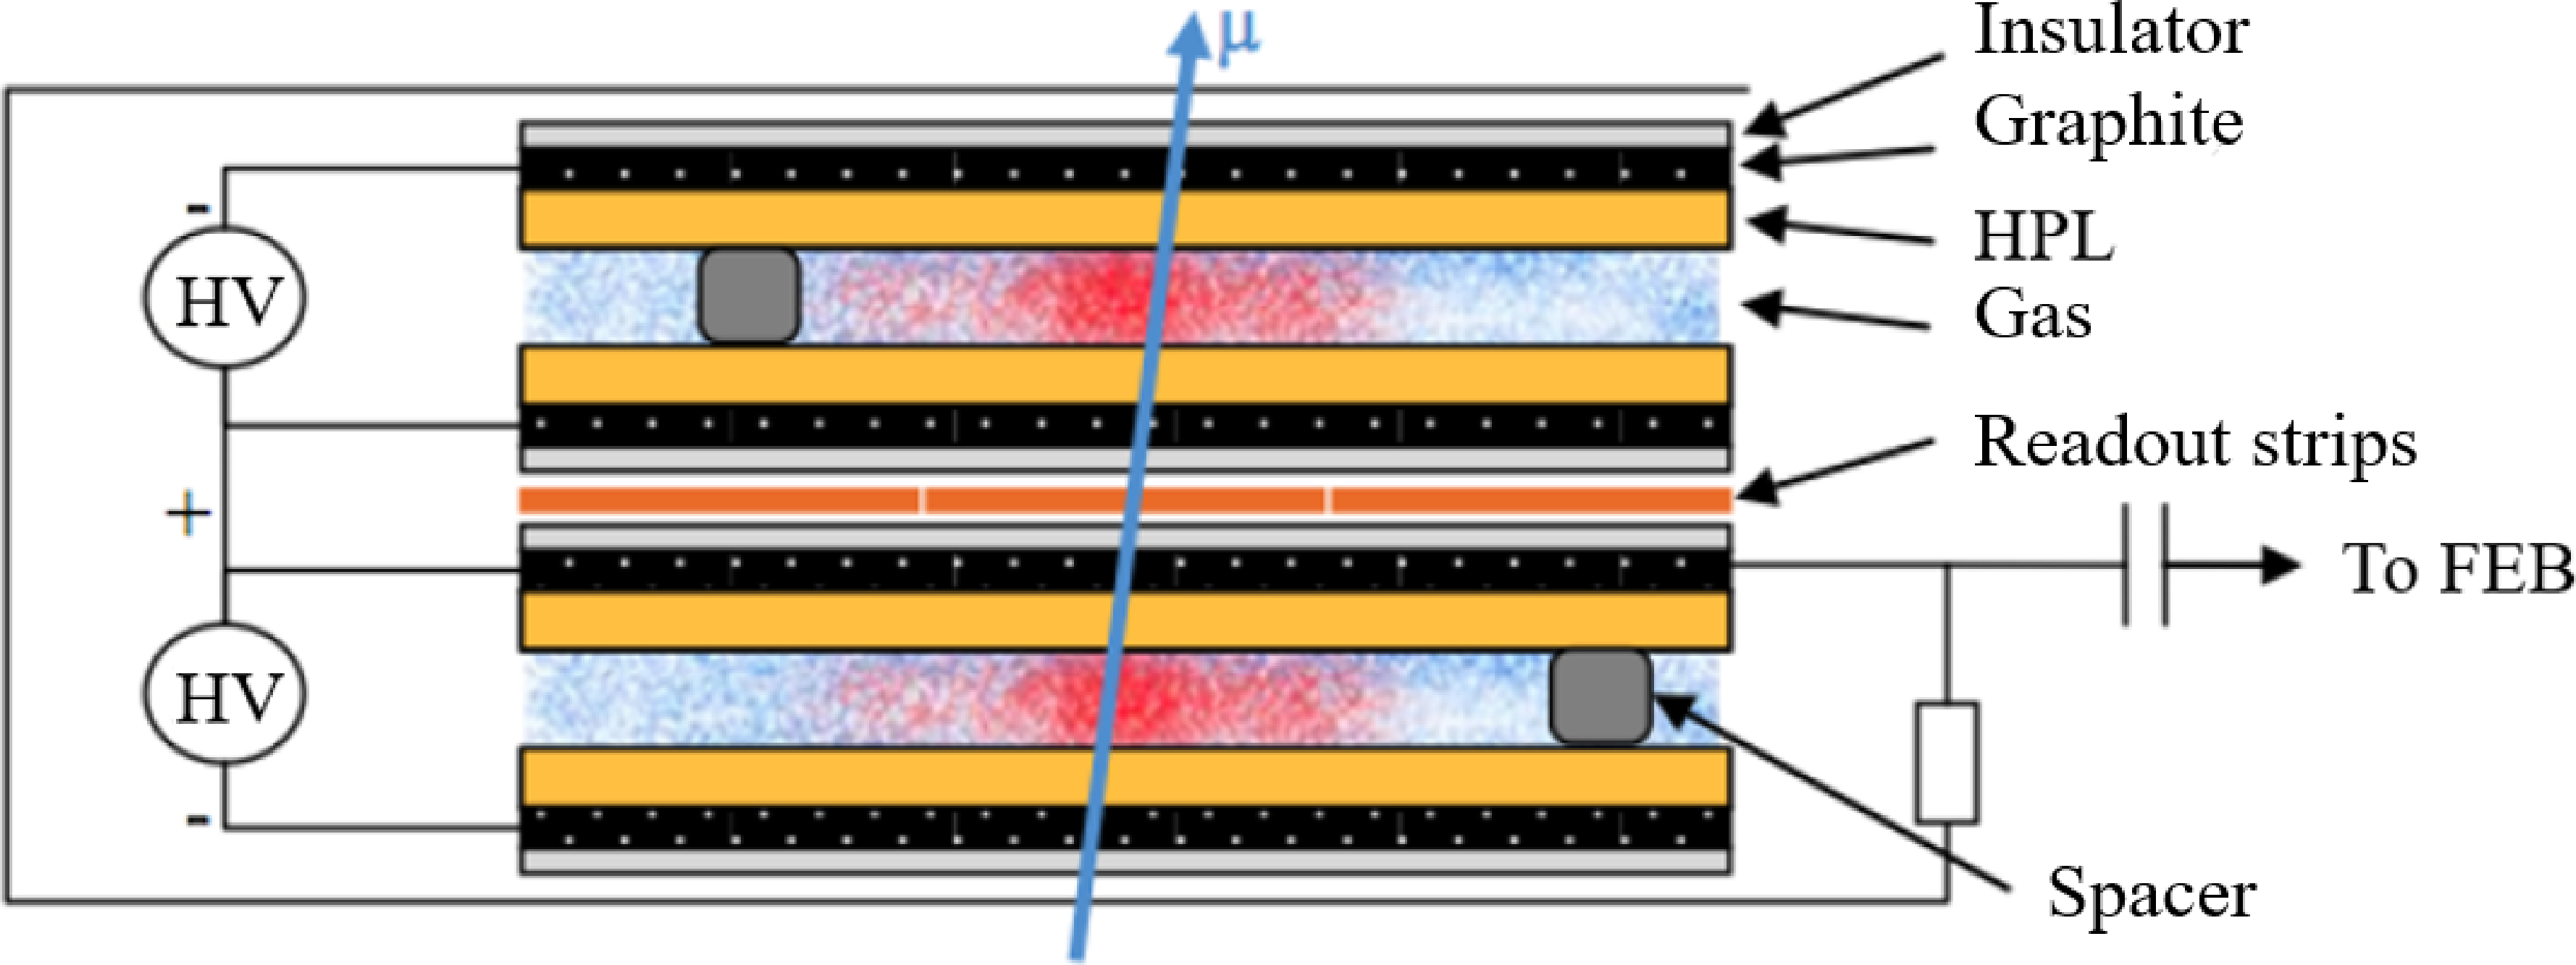
Figure 56-a:
Schematic of the double-layer layout of the RPC chambers. |
png pdf |
Figure 56-b:
Illustration of the RPC technology. |
png pdf |
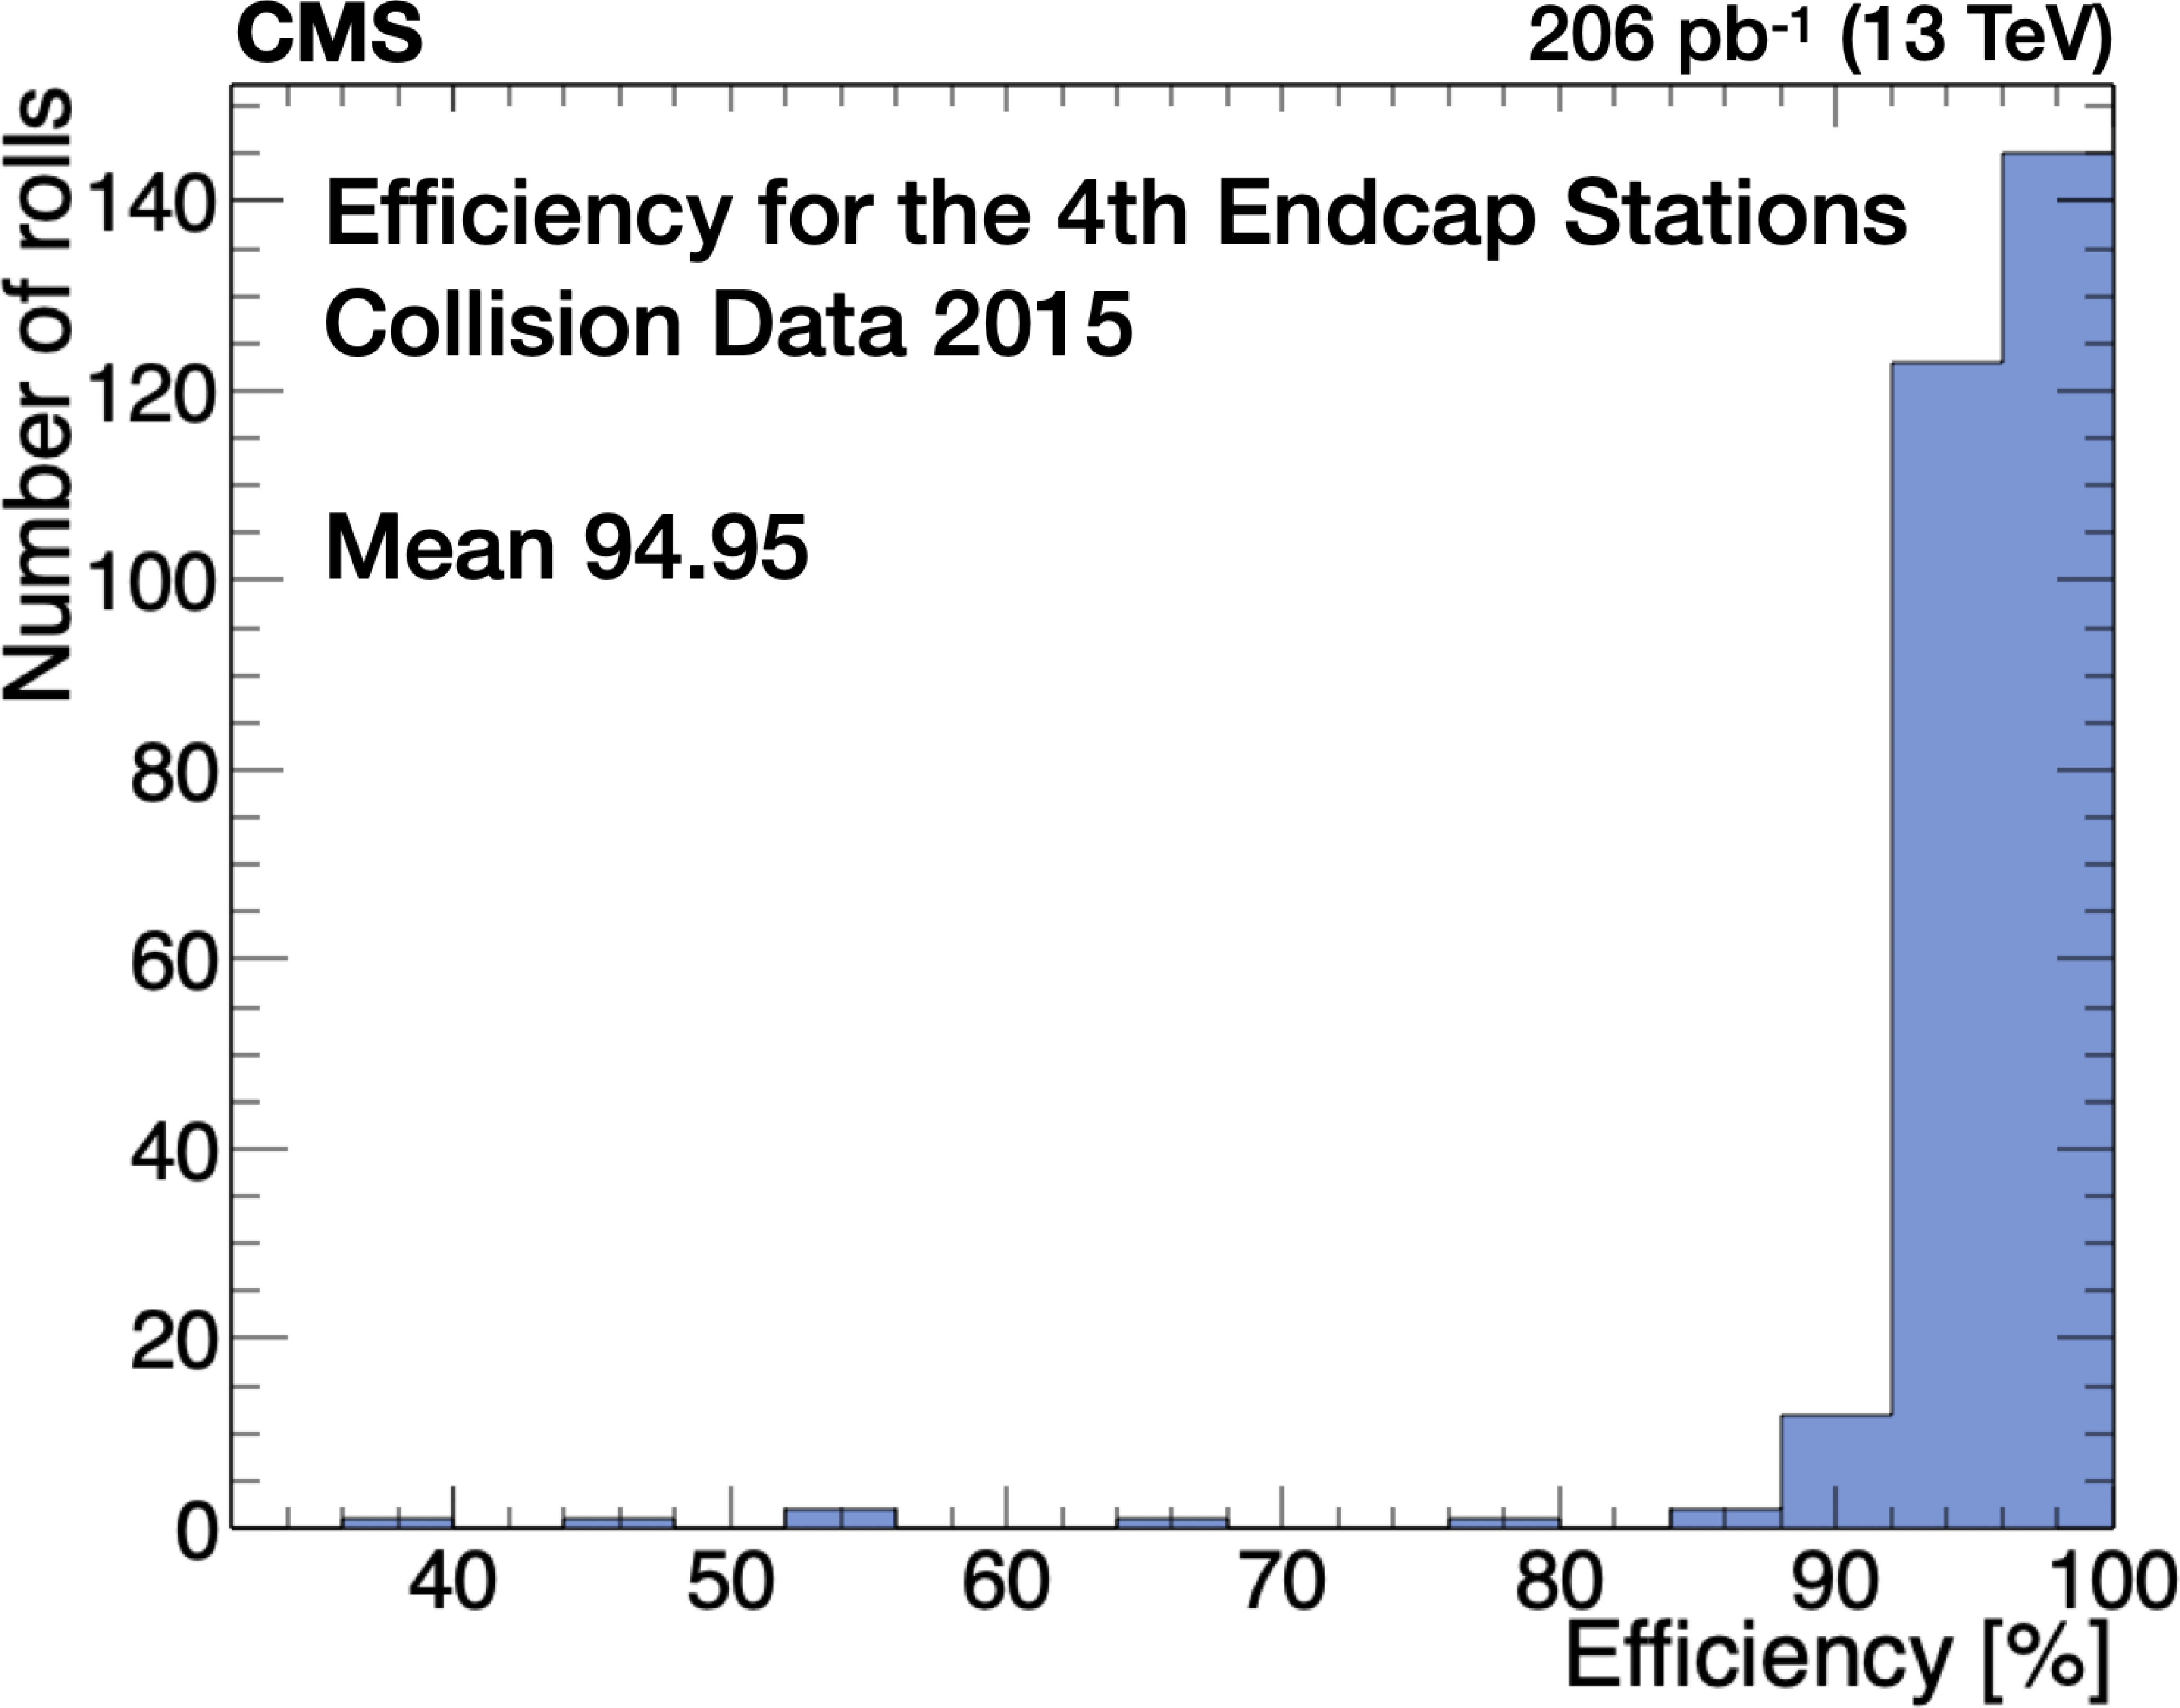
Figure 57:
Efficiency distribution of the RE$ \pm $4 stations in their first year of operation in 2015. |
png pdf |
Figure 58:
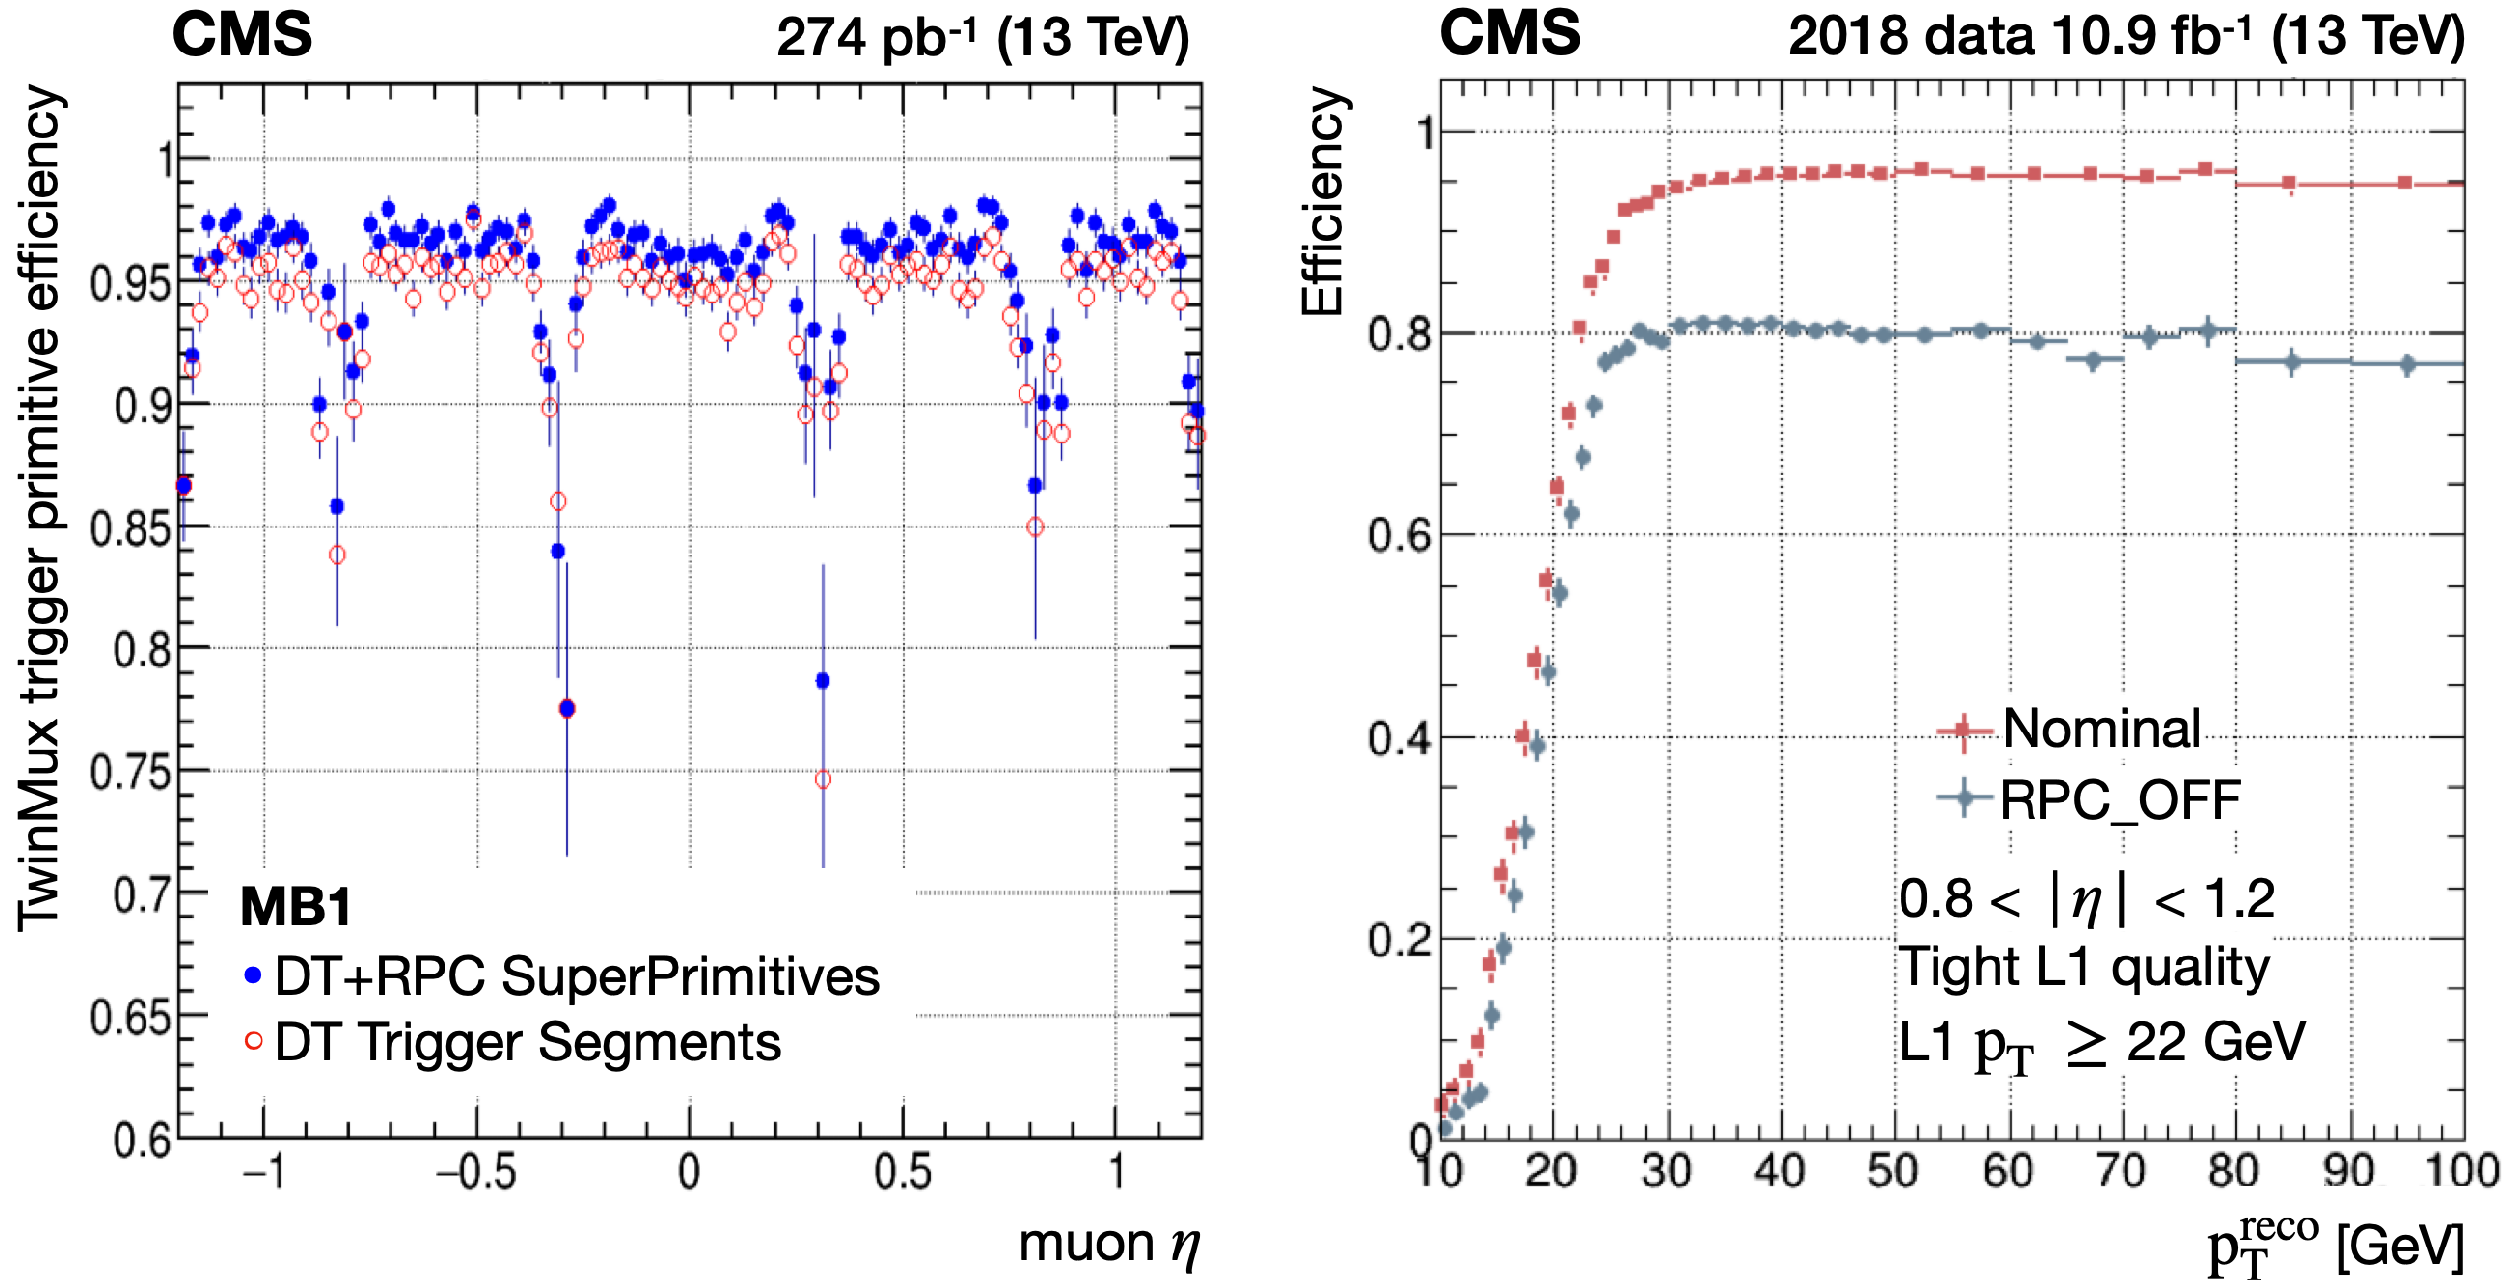
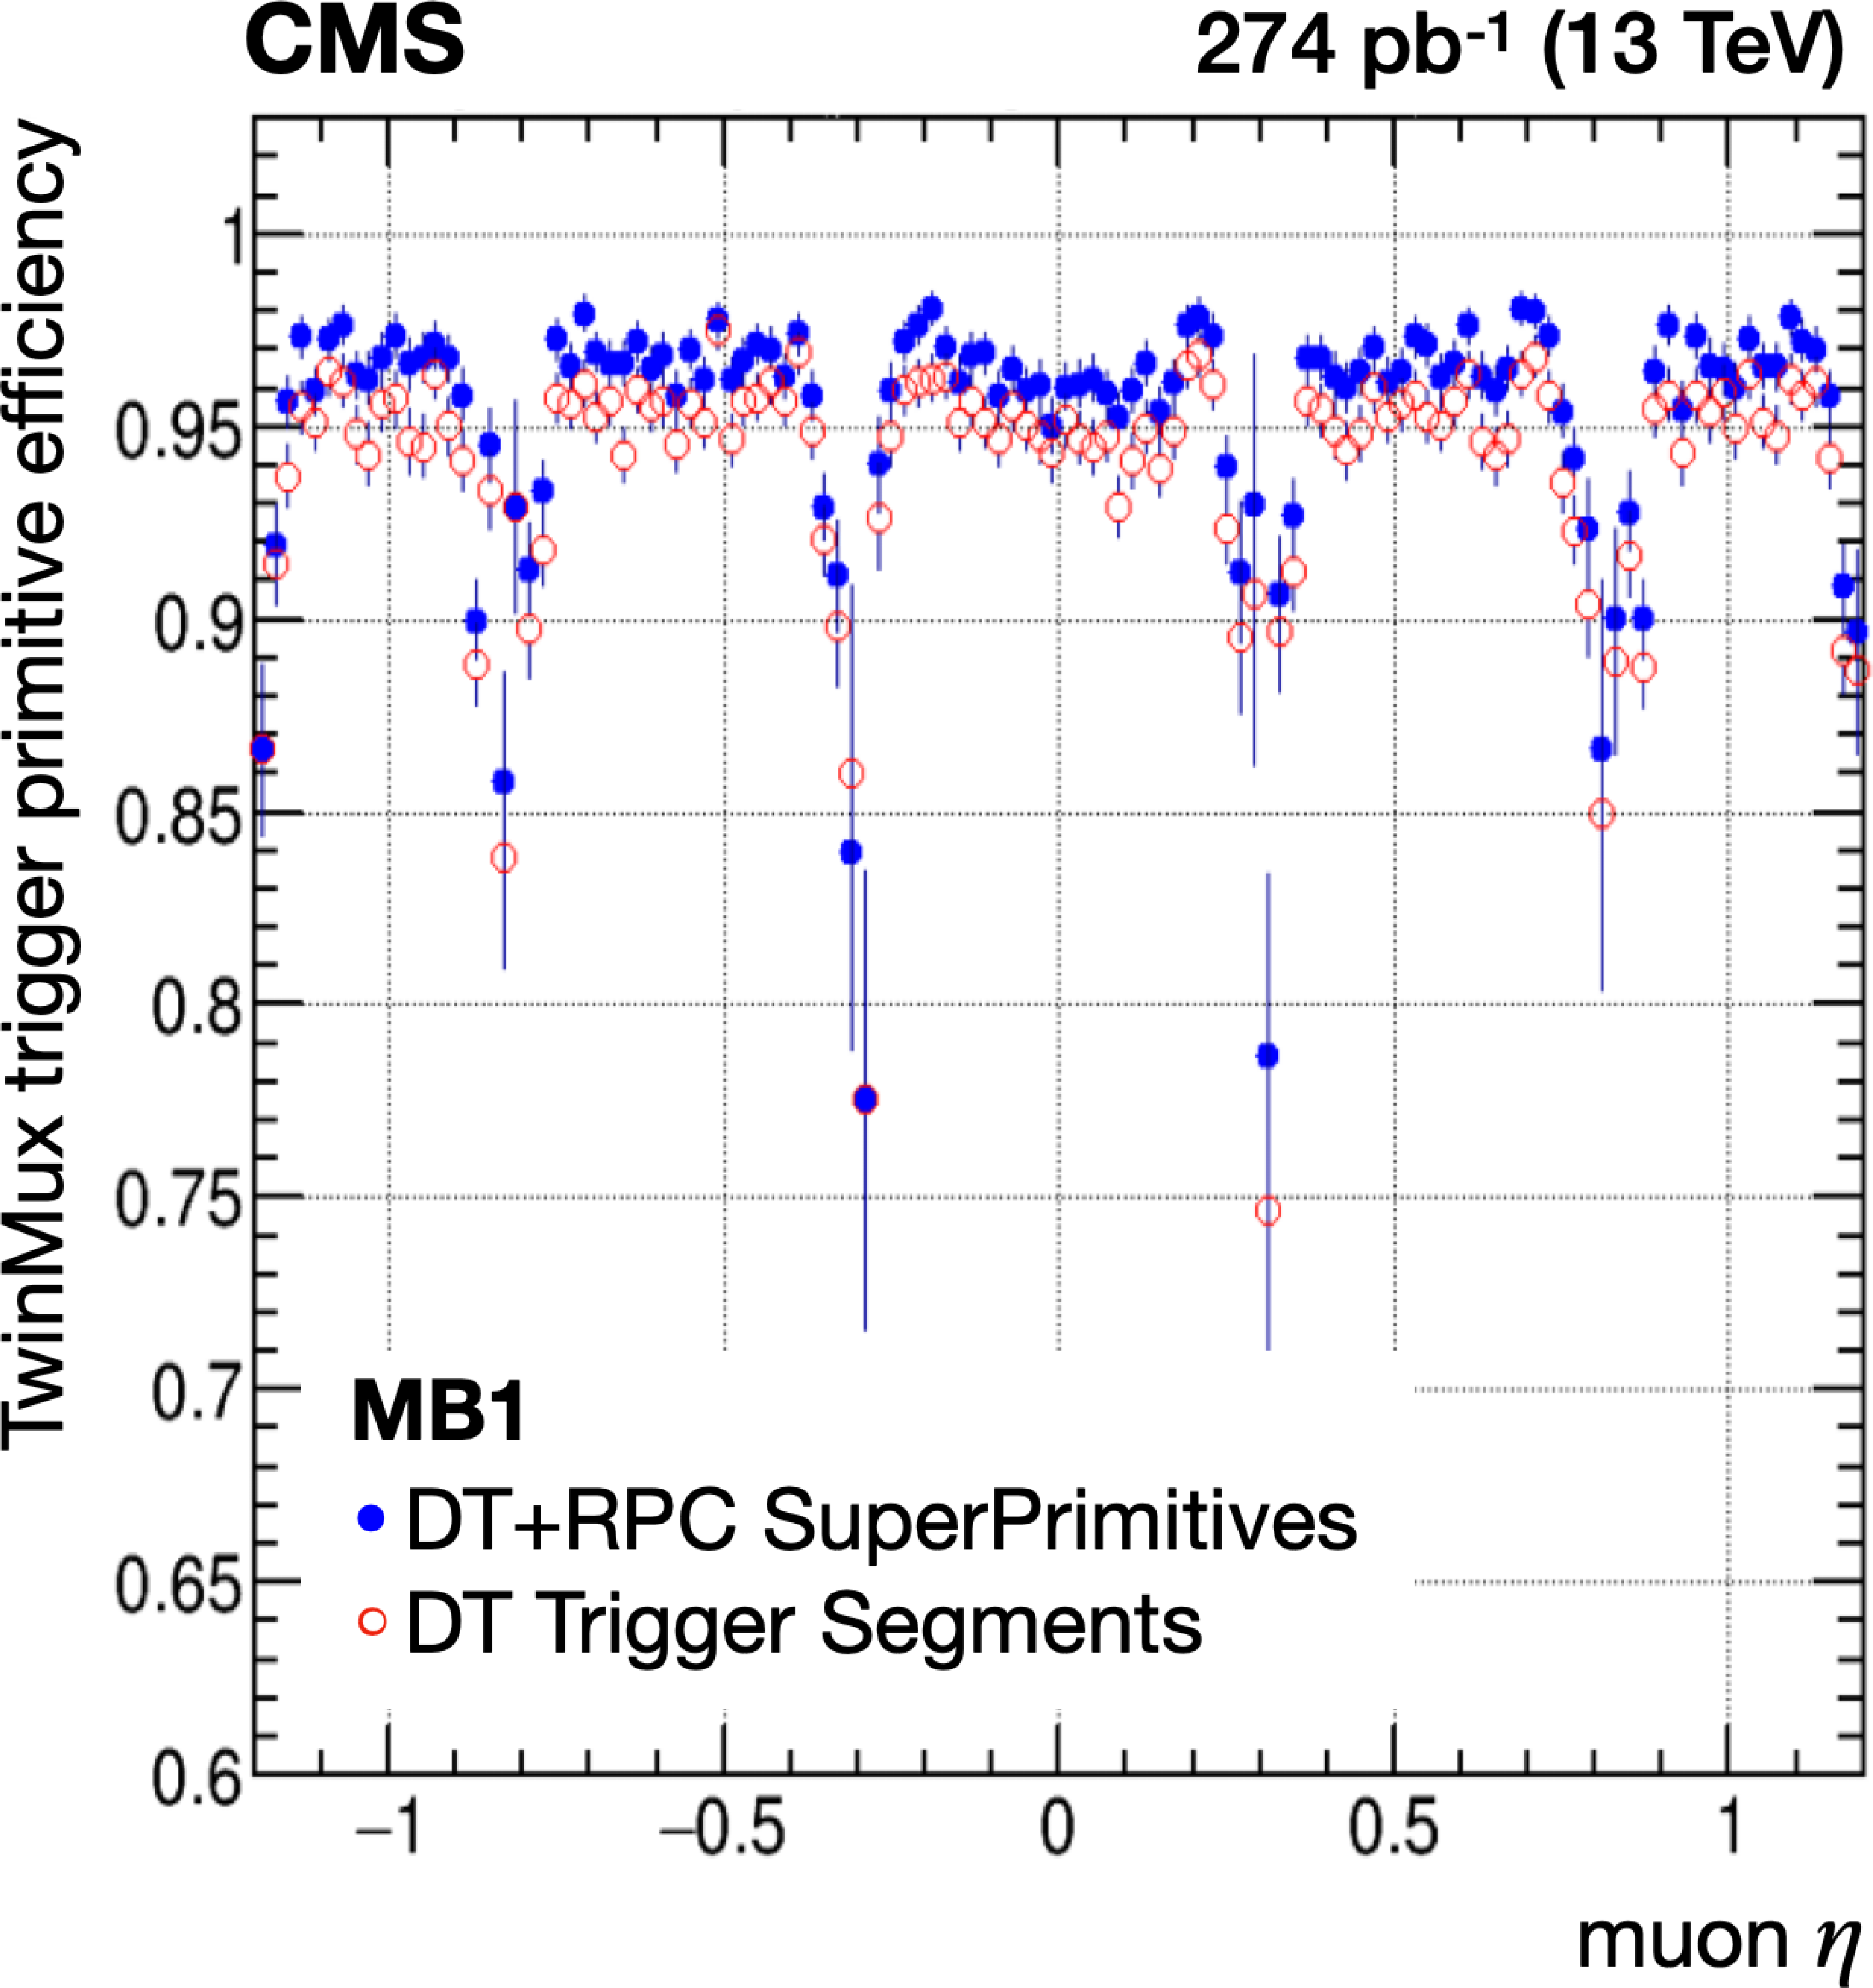
Left: station-1 barrel trigger-primitive efficiency as a function of muon pseudorapidity. Right: trigger efficiency as a function of muon $ p_{\mathrm{T}} $ for the OMTF, derived from a trigger emulation applied to real data, using (red) and not using (blue) RPC information. |
png pdf |
Figure 58-a:
Station-1 barrel trigger-primitive efficiency as a function of muon pseudorapidity. |
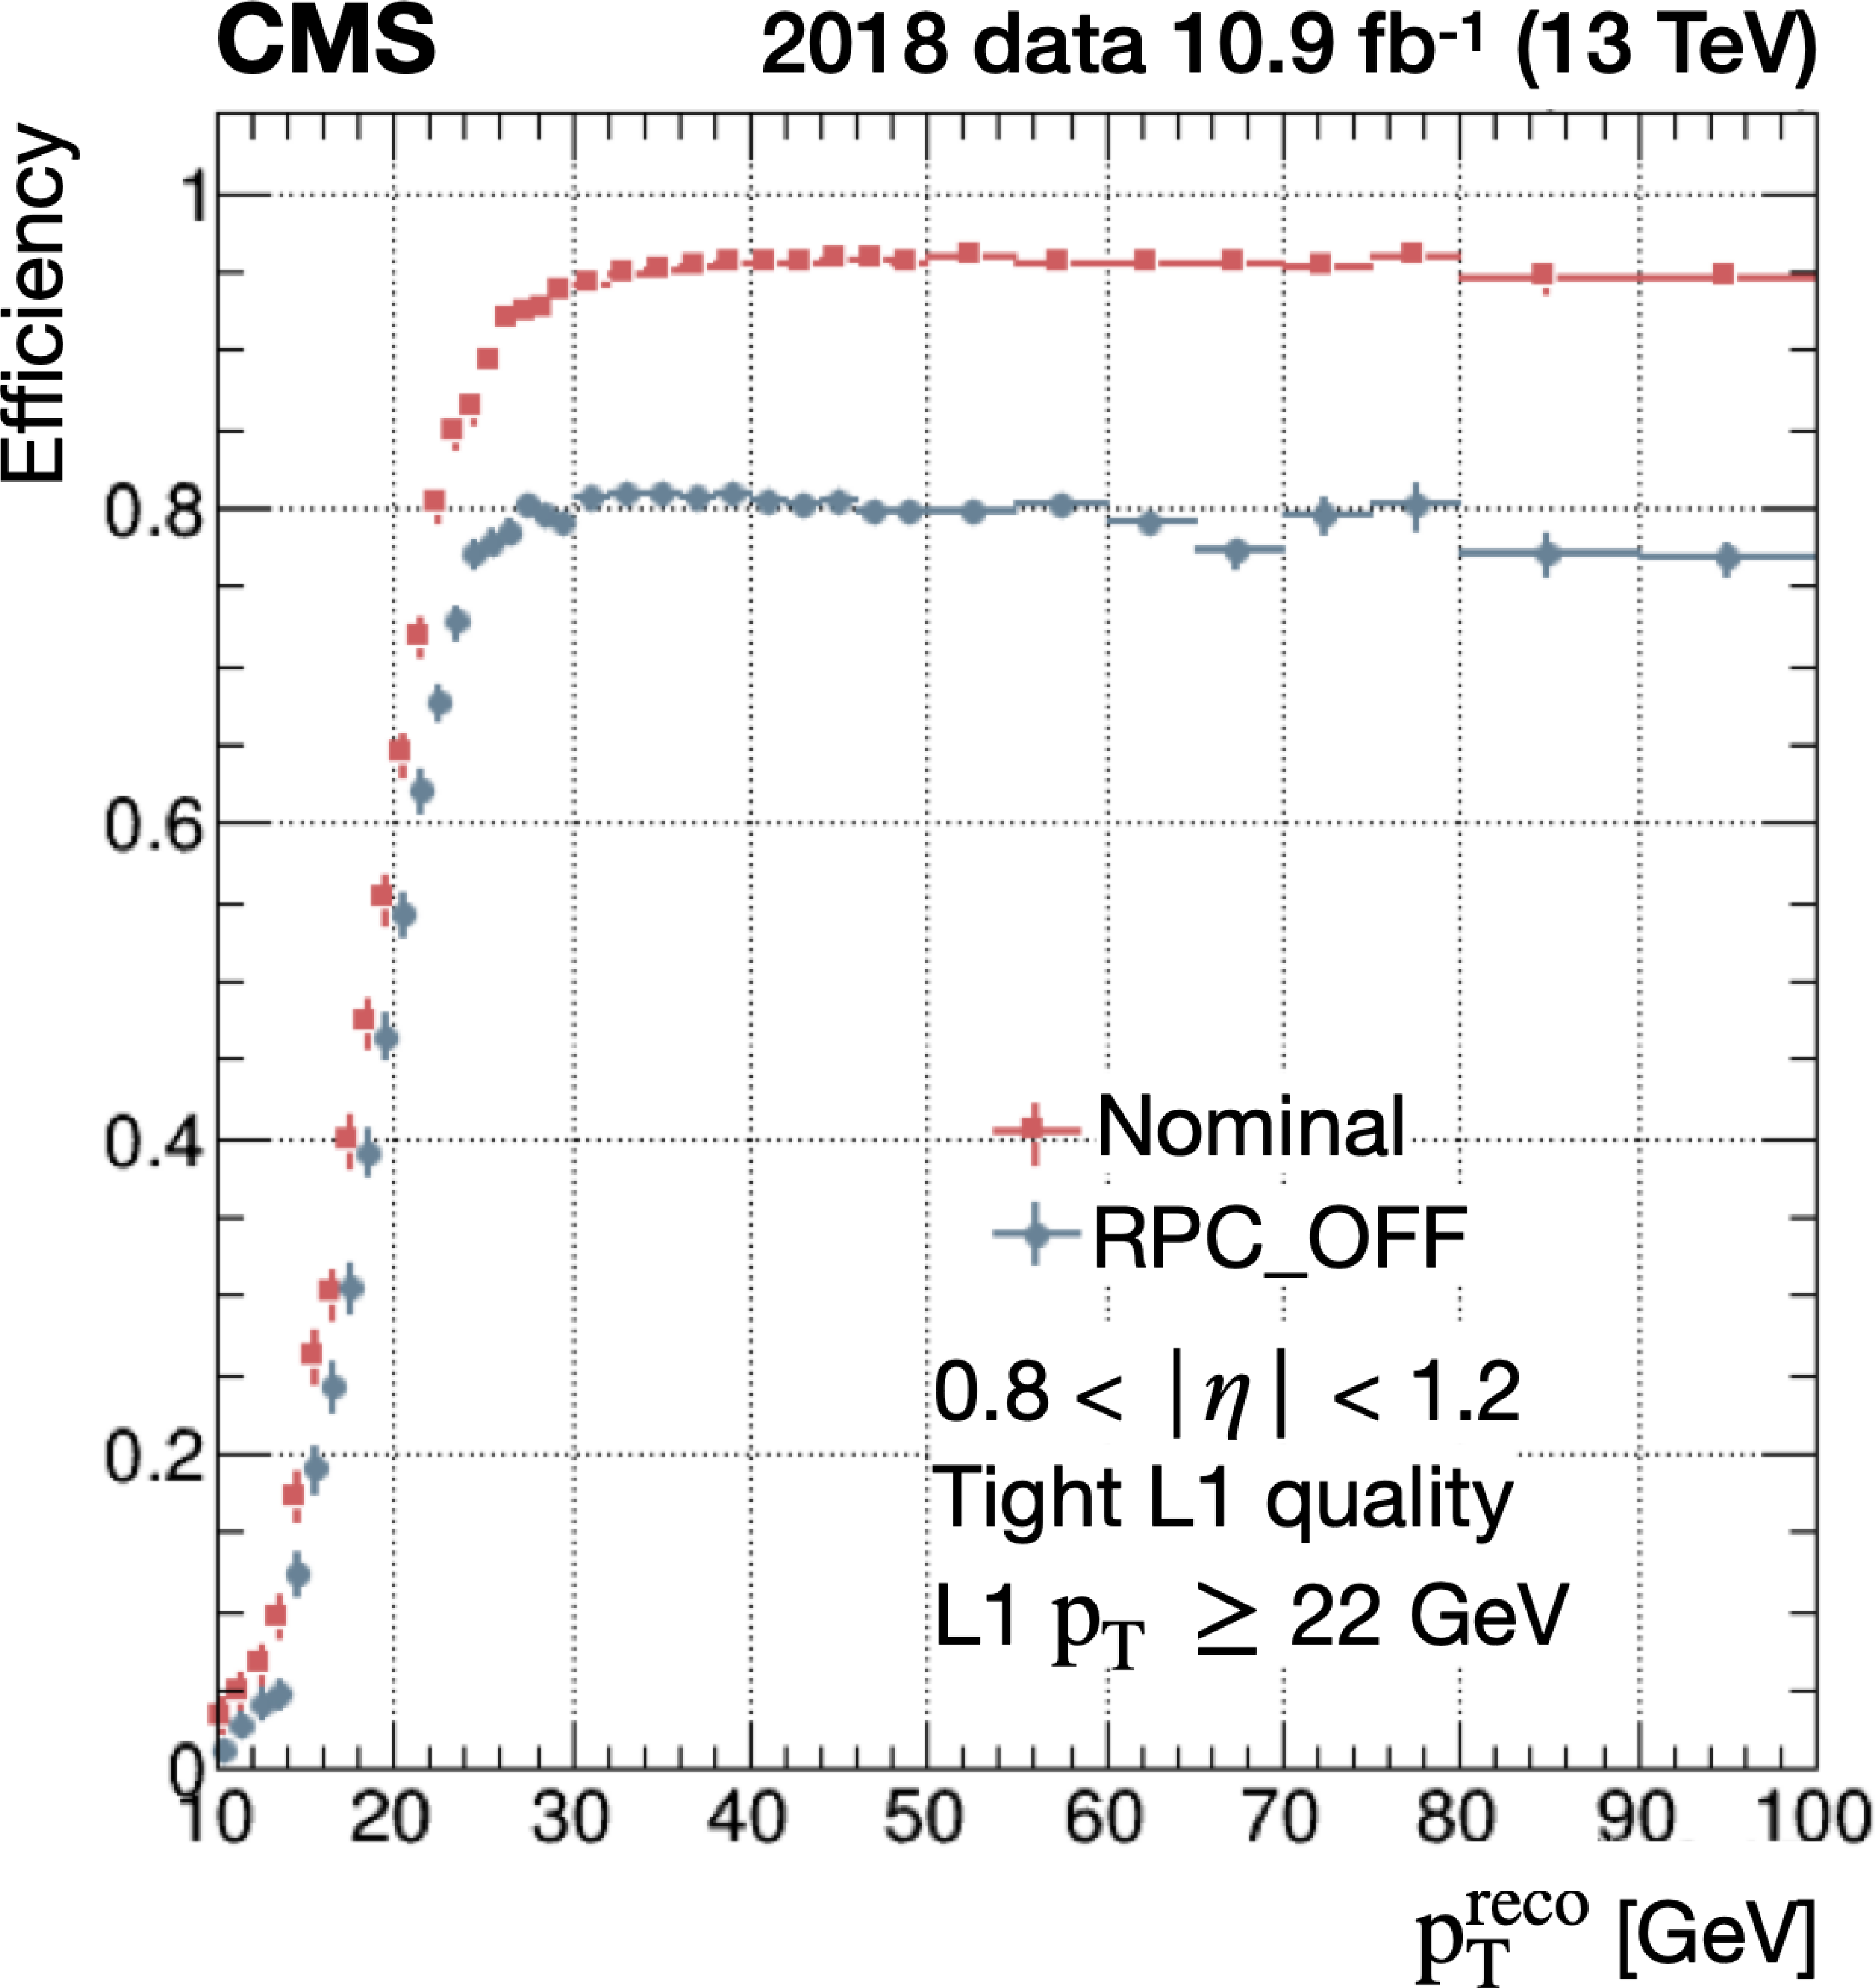
png pdf |
Figure 58-b:
Trigger efficiency as a function of muon $ p_{\mathrm{T}} $ for the OMTF, derived from a trigger emulation applied to real data, using (red) and not using (blue) RPC information. |
png pdf |
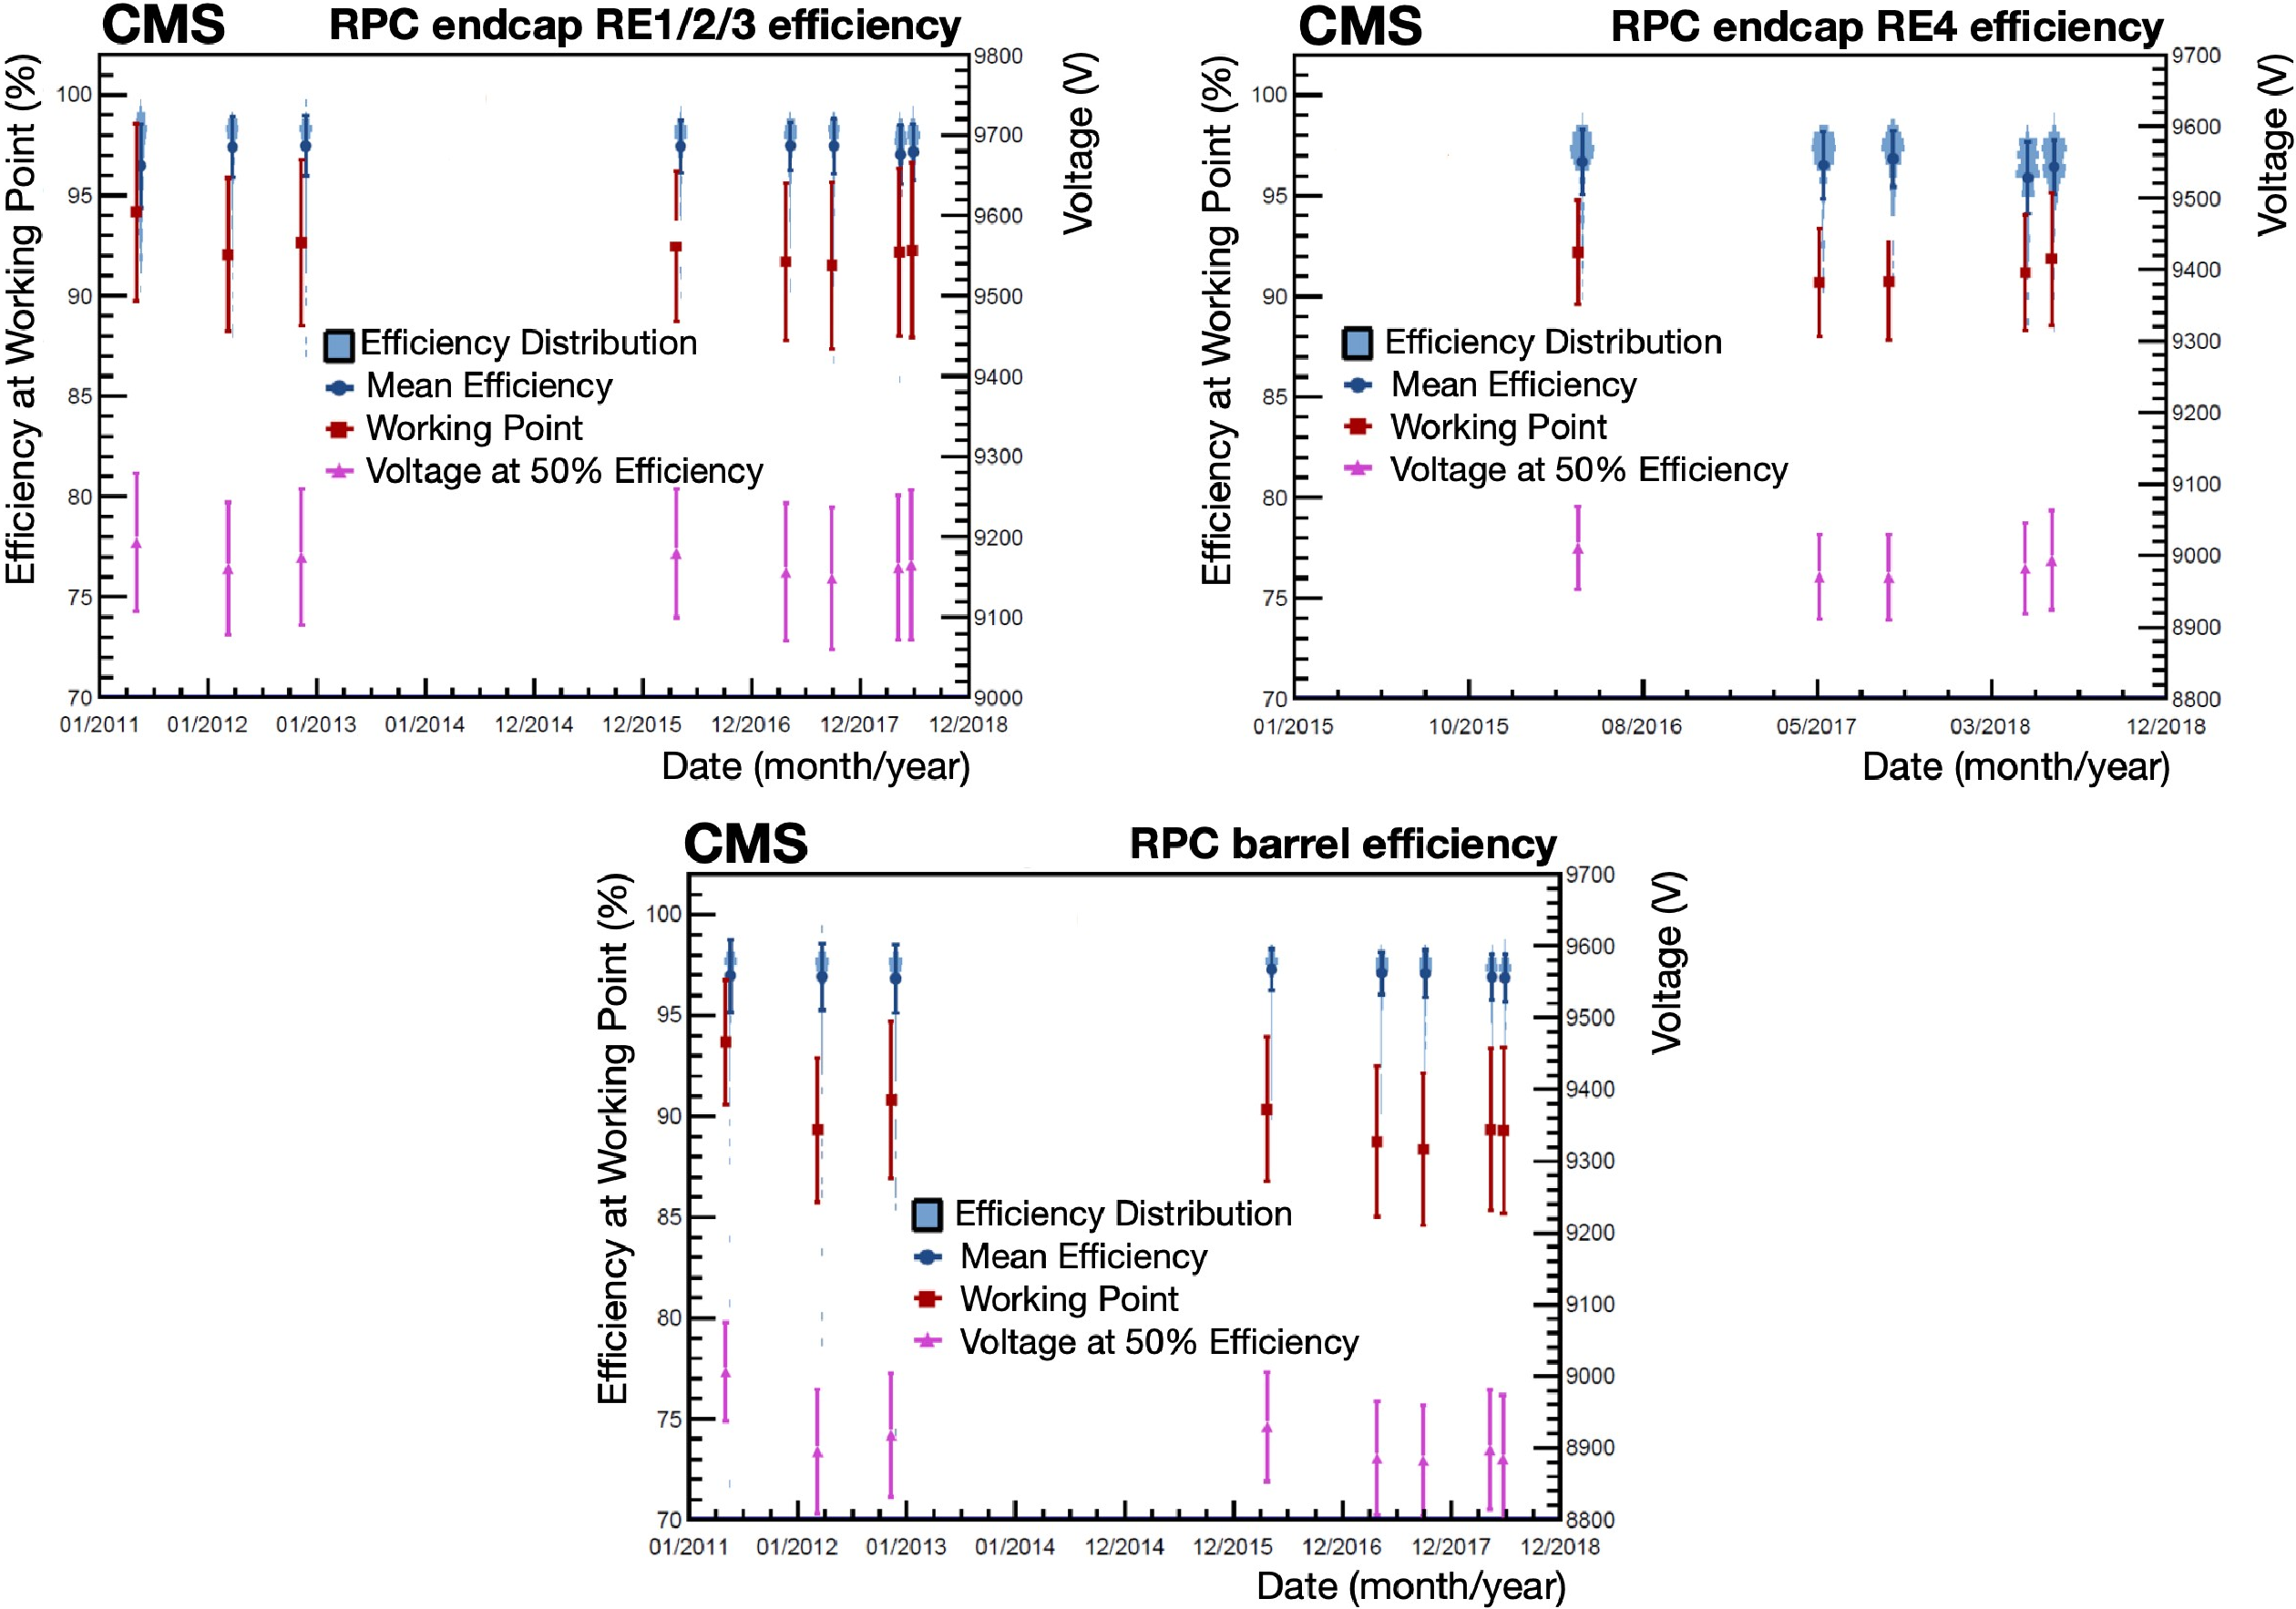
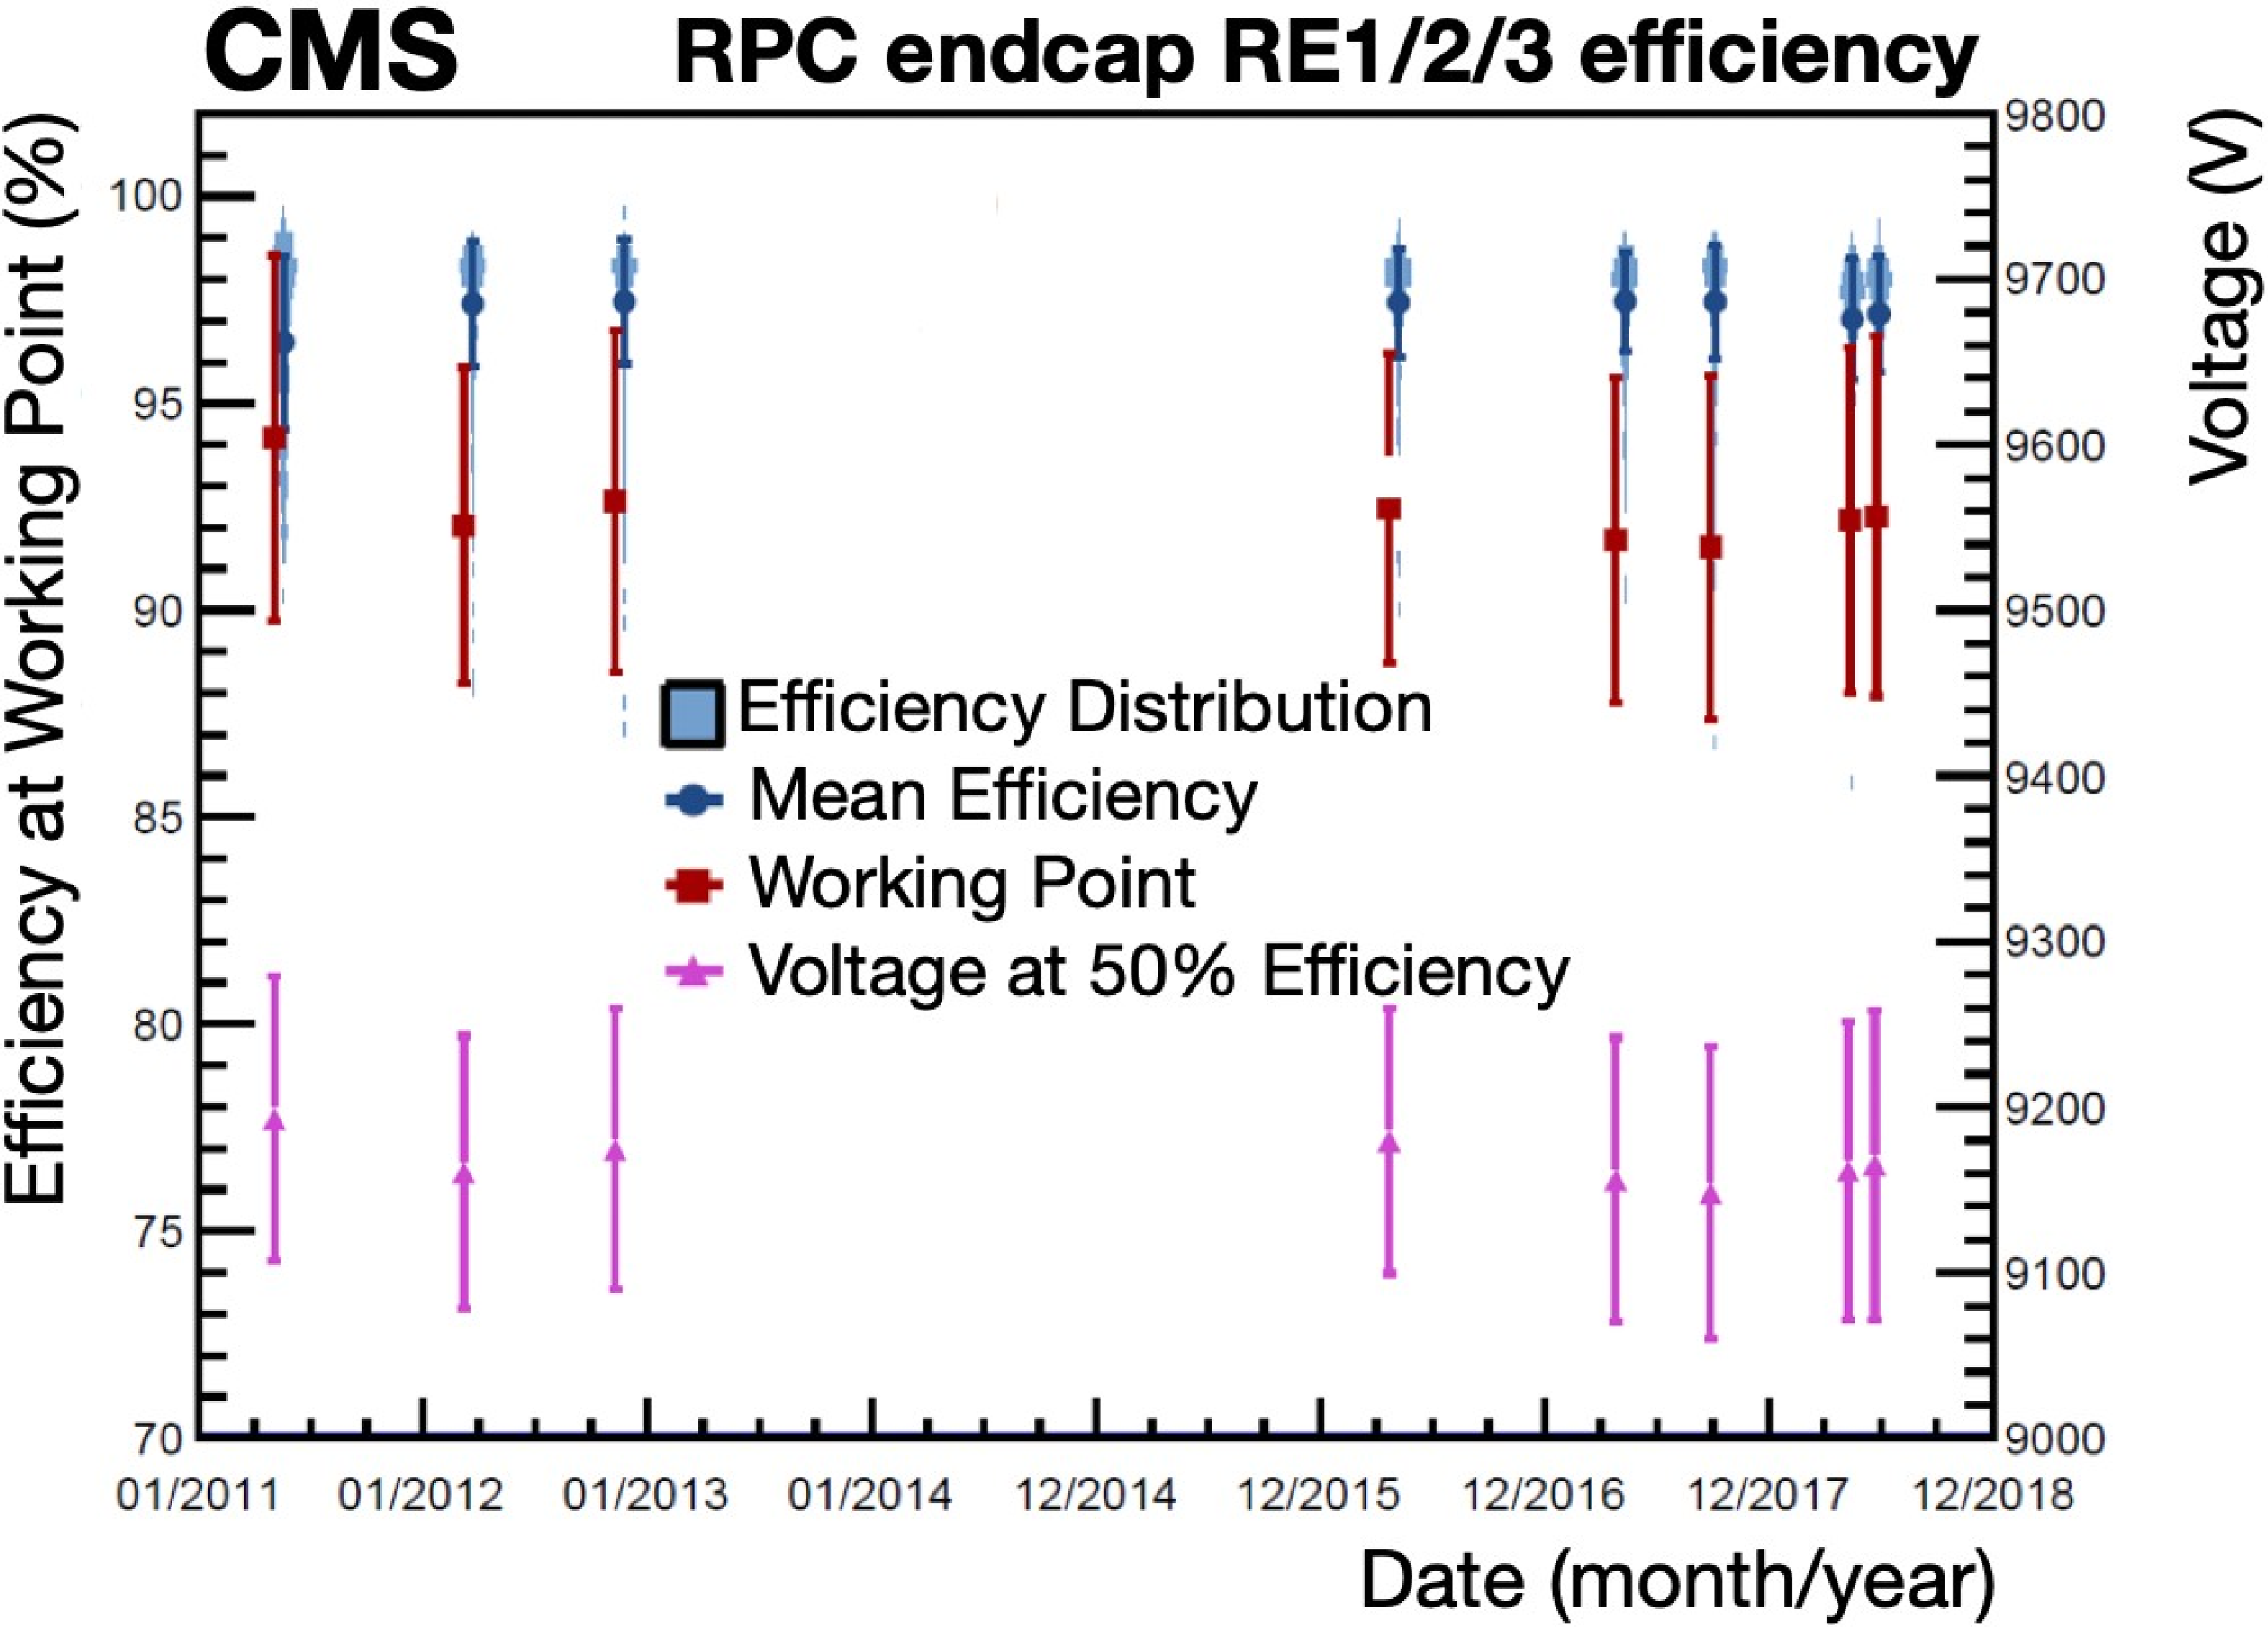
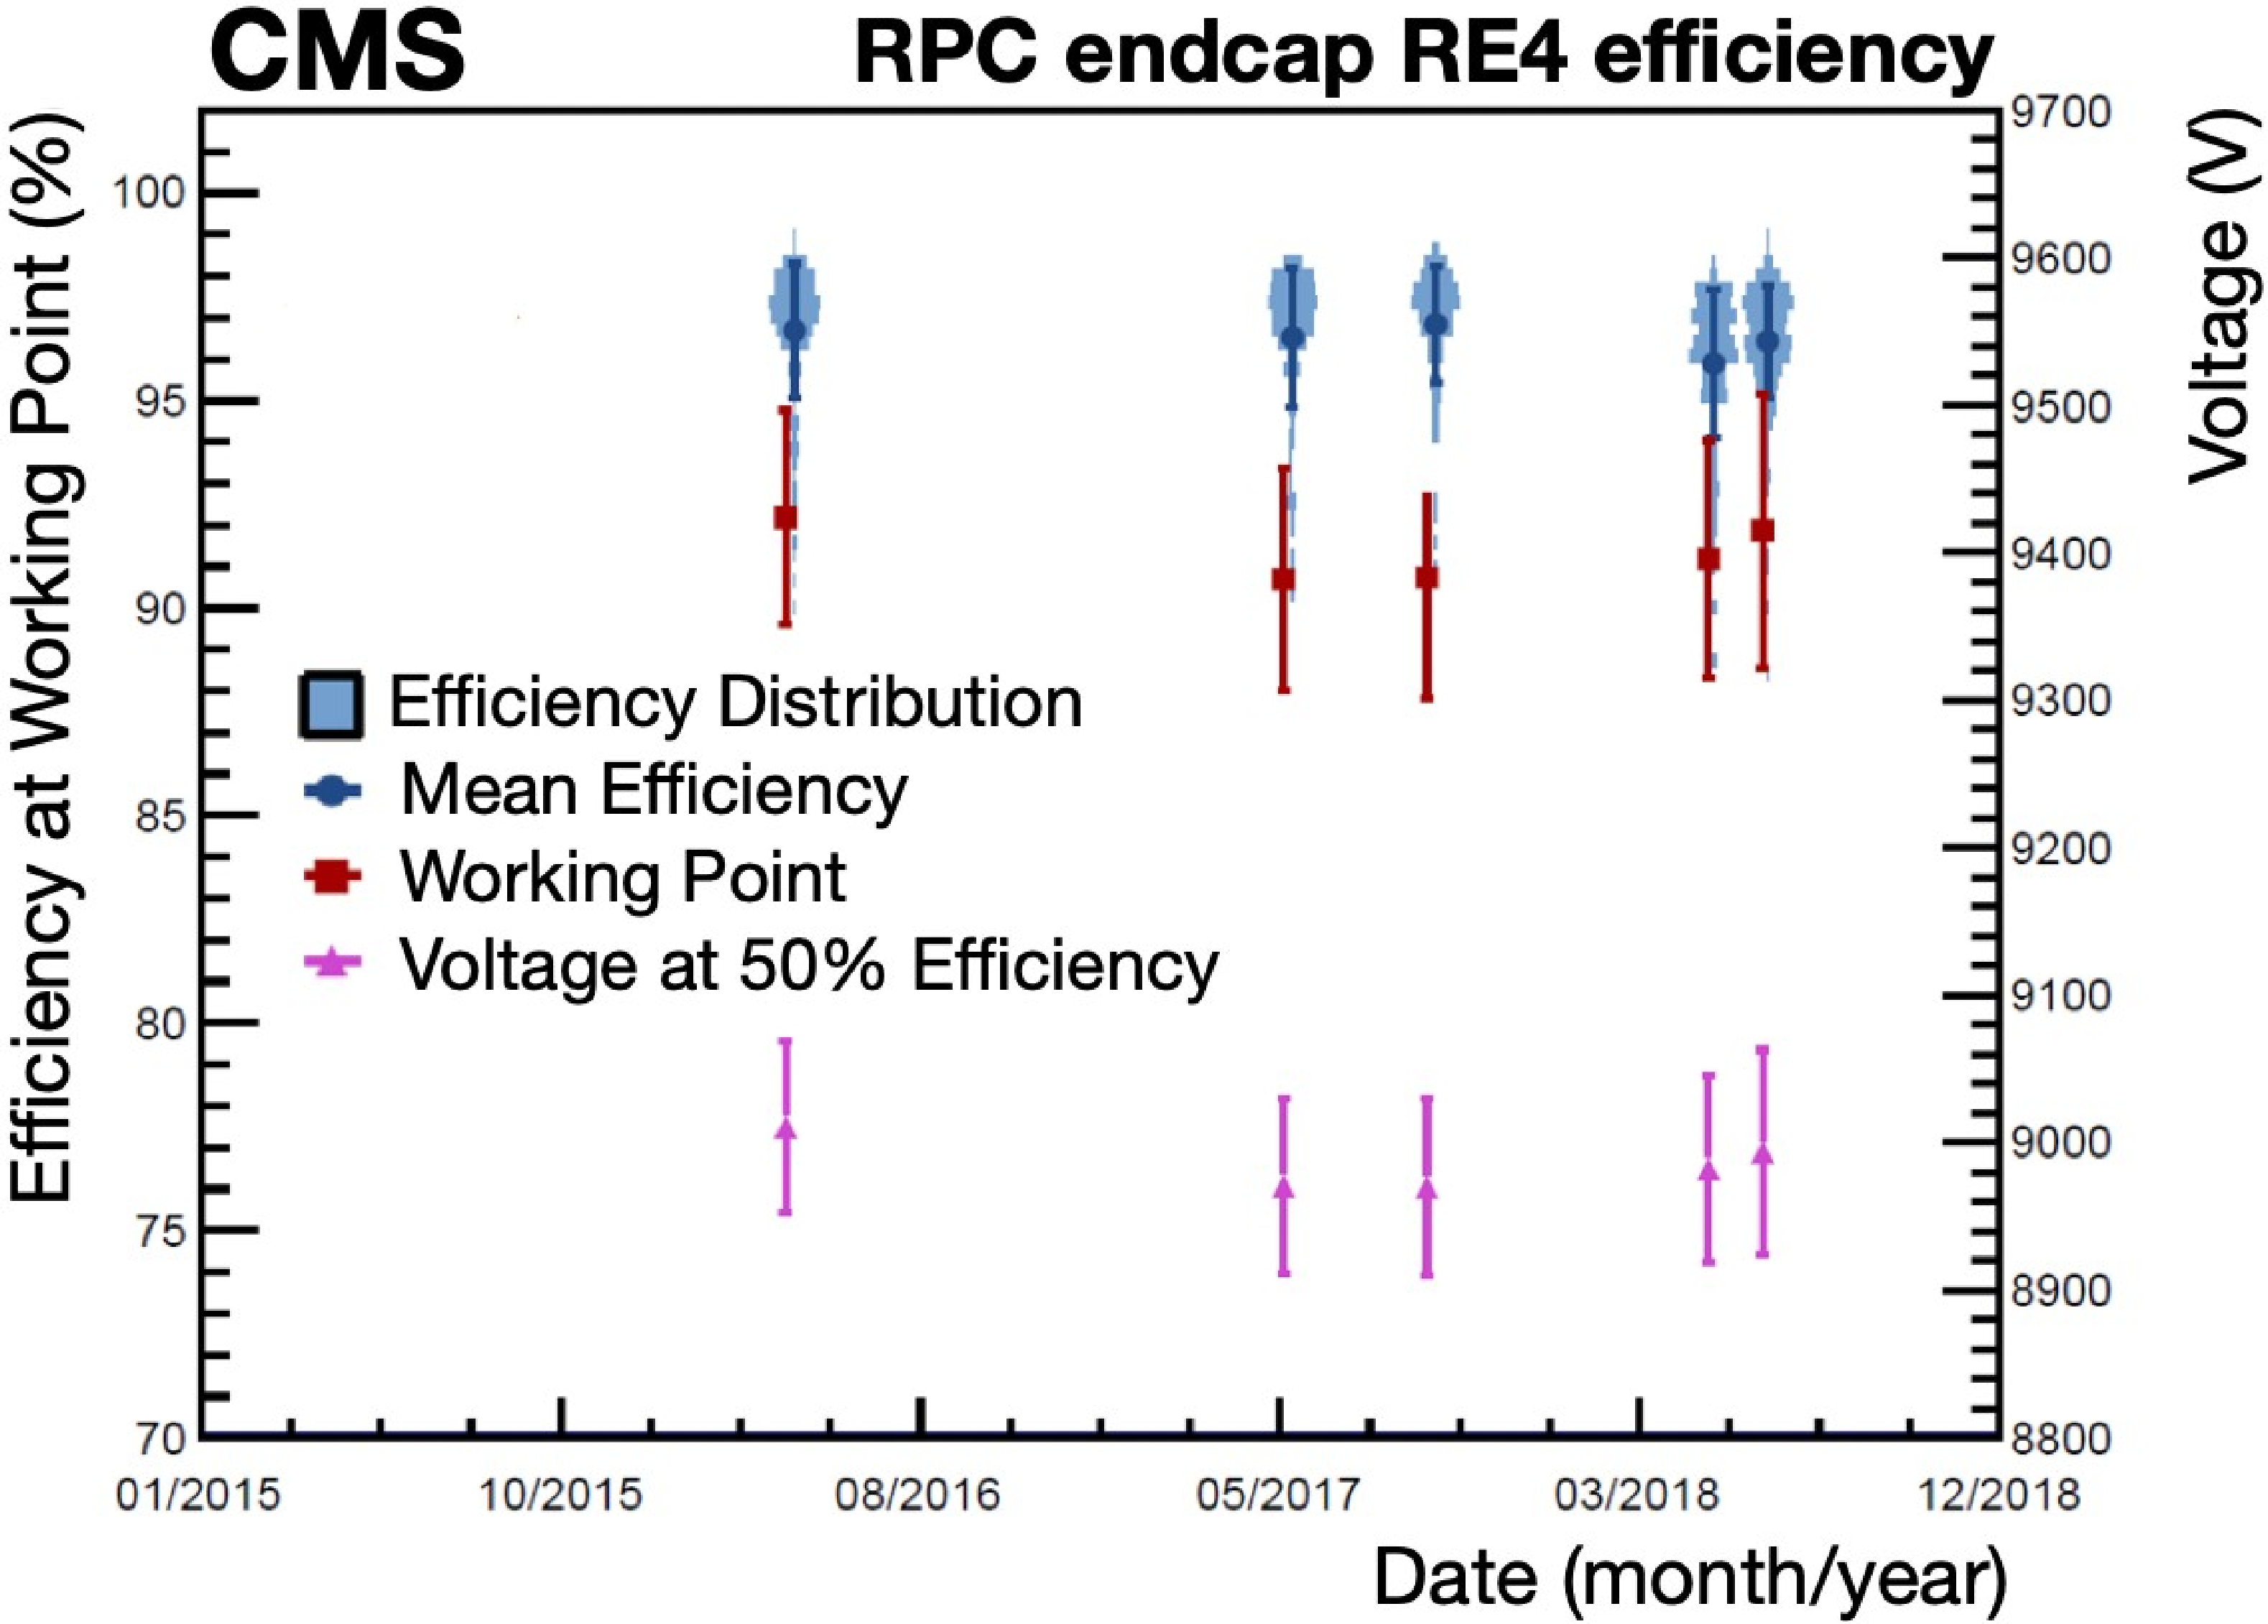
Figure 59:
Temporal evolution of efficiencies determined from HV scan data at the WP and at $ V_{50%} $, for RE1/2/3 (upper left), RE4 (upper right), and the barrel (lower). The light blue bands show the histograms of the distributions, where the width of the band represents the population of channels having the corresponding efficiency value. |
png pdf |
Figure 59-a:
Temporal evolution of efficiencies determined from HV scan data at the WP and at $ V_{50%} $, for RE1/2/3. The light blue bands show the histograms of the distributions, where the width of the band represents the population of channels having the corresponding efficiency value. |
png pdf |
Figure 59-b:
Temporal evolution of efficiencies determined from HV scan data at the WP and at $ V_{50%} $, for RE4. The light blue bands show the histograms of the distributions, where the width of the band represents the population of channels having the corresponding efficiency value. |

png pdf |
Figure 59-c:
Temporal evolution of efficiencies determined from HV scan data at the WP and at $ V_{50%} $, for the barrel. The light blue bands show the histograms of the distributions, where the width of the band represents the population of channels having the corresponding efficiency value. |

png pdf |
Figure 60:
Distributions of the overall RPC efficiencies in the barrel (left) and endcaps (right) during pp data taking in Run 2 [109]. |
png pdf |
Figure 60-a:
Distributions of the overall RPC efficiencies in the barrel during pp data taking in Run 2 [109]. |
png pdf |
Figure 60-b:
Distributions of the overall RPC efficiencies in the endcaps during pp data taking in Run 2 [109]. |
png pdf |
Figure 61:
History of the RPC efficiency (upper) and cluster size (lower) during Run 2. Gray areas correspond to the scheduled technical stops. |

png pdf |
Figure 61-a:
History of the RPC efficiency during Run 2. Gray areas correspond to the scheduled technical stops. |
png pdf |
Figure 61-b:
History of the RPC cluster size during Run 2. Gray areas correspond to the scheduled technical stops. |
png pdf |
Figure 62:
RPC barrel and endcap efficiency (upper) and cluster size (lower) as a function of the LHC instantaneous luminosity for pp collisions in 2016 and 2017. The linear extrapolation to the instantaneous luminosity expected at the HL-LHC of 7.5 $ \times$ 10$^{34}$ cm$^{2}$s$^{-1}$ shows a 1.35% reduction in efficiency for the barrel and 3.5% for the endcap. |
png pdf |
Figure 62-a:
RPC barrel and endcap efficiency as a function of the LHC instantaneous luminosity for pp collisions in 2016 and 2017. The linear extrapolation to the instantaneous luminosity expected at the HL-LHC of 7.5 $ \times$ 10$^{34}$ cm$^{2}$s$^{-1}$ shows a 1.35% reduction in efficiency for the barrel and 3.5% for the endcap. |
png pdf |
Figure 62-b:
RPC barrel and endcap cluster size as a function of the LHC instantaneous luminosity for pp collisions in 2016 and 2017. The linear extrapolation to the instantaneous luminosity expected at the HL-LHC of 7.5 $ \times$ 10$^{34}$ cm$^{2}$s$^{-1}$ shows a 1.35% reduction in efficiency for the barrel and 3.5% for the endcap. |
png pdf |
Figure 63:
Ohmic current history in W$ + $ 0, RE$ + $1, RE$ + $4, and RE$-$4. |
png pdf |
Figure 64:
RPC physics current history in RE$ \pm $1, RE$ \pm $2, RE$ \pm $3 and RE$ \pm $4. |
png pdf |
Figure 65:
Ohmic current as a function of HF concentration. |
png pdf |
Figure 66:
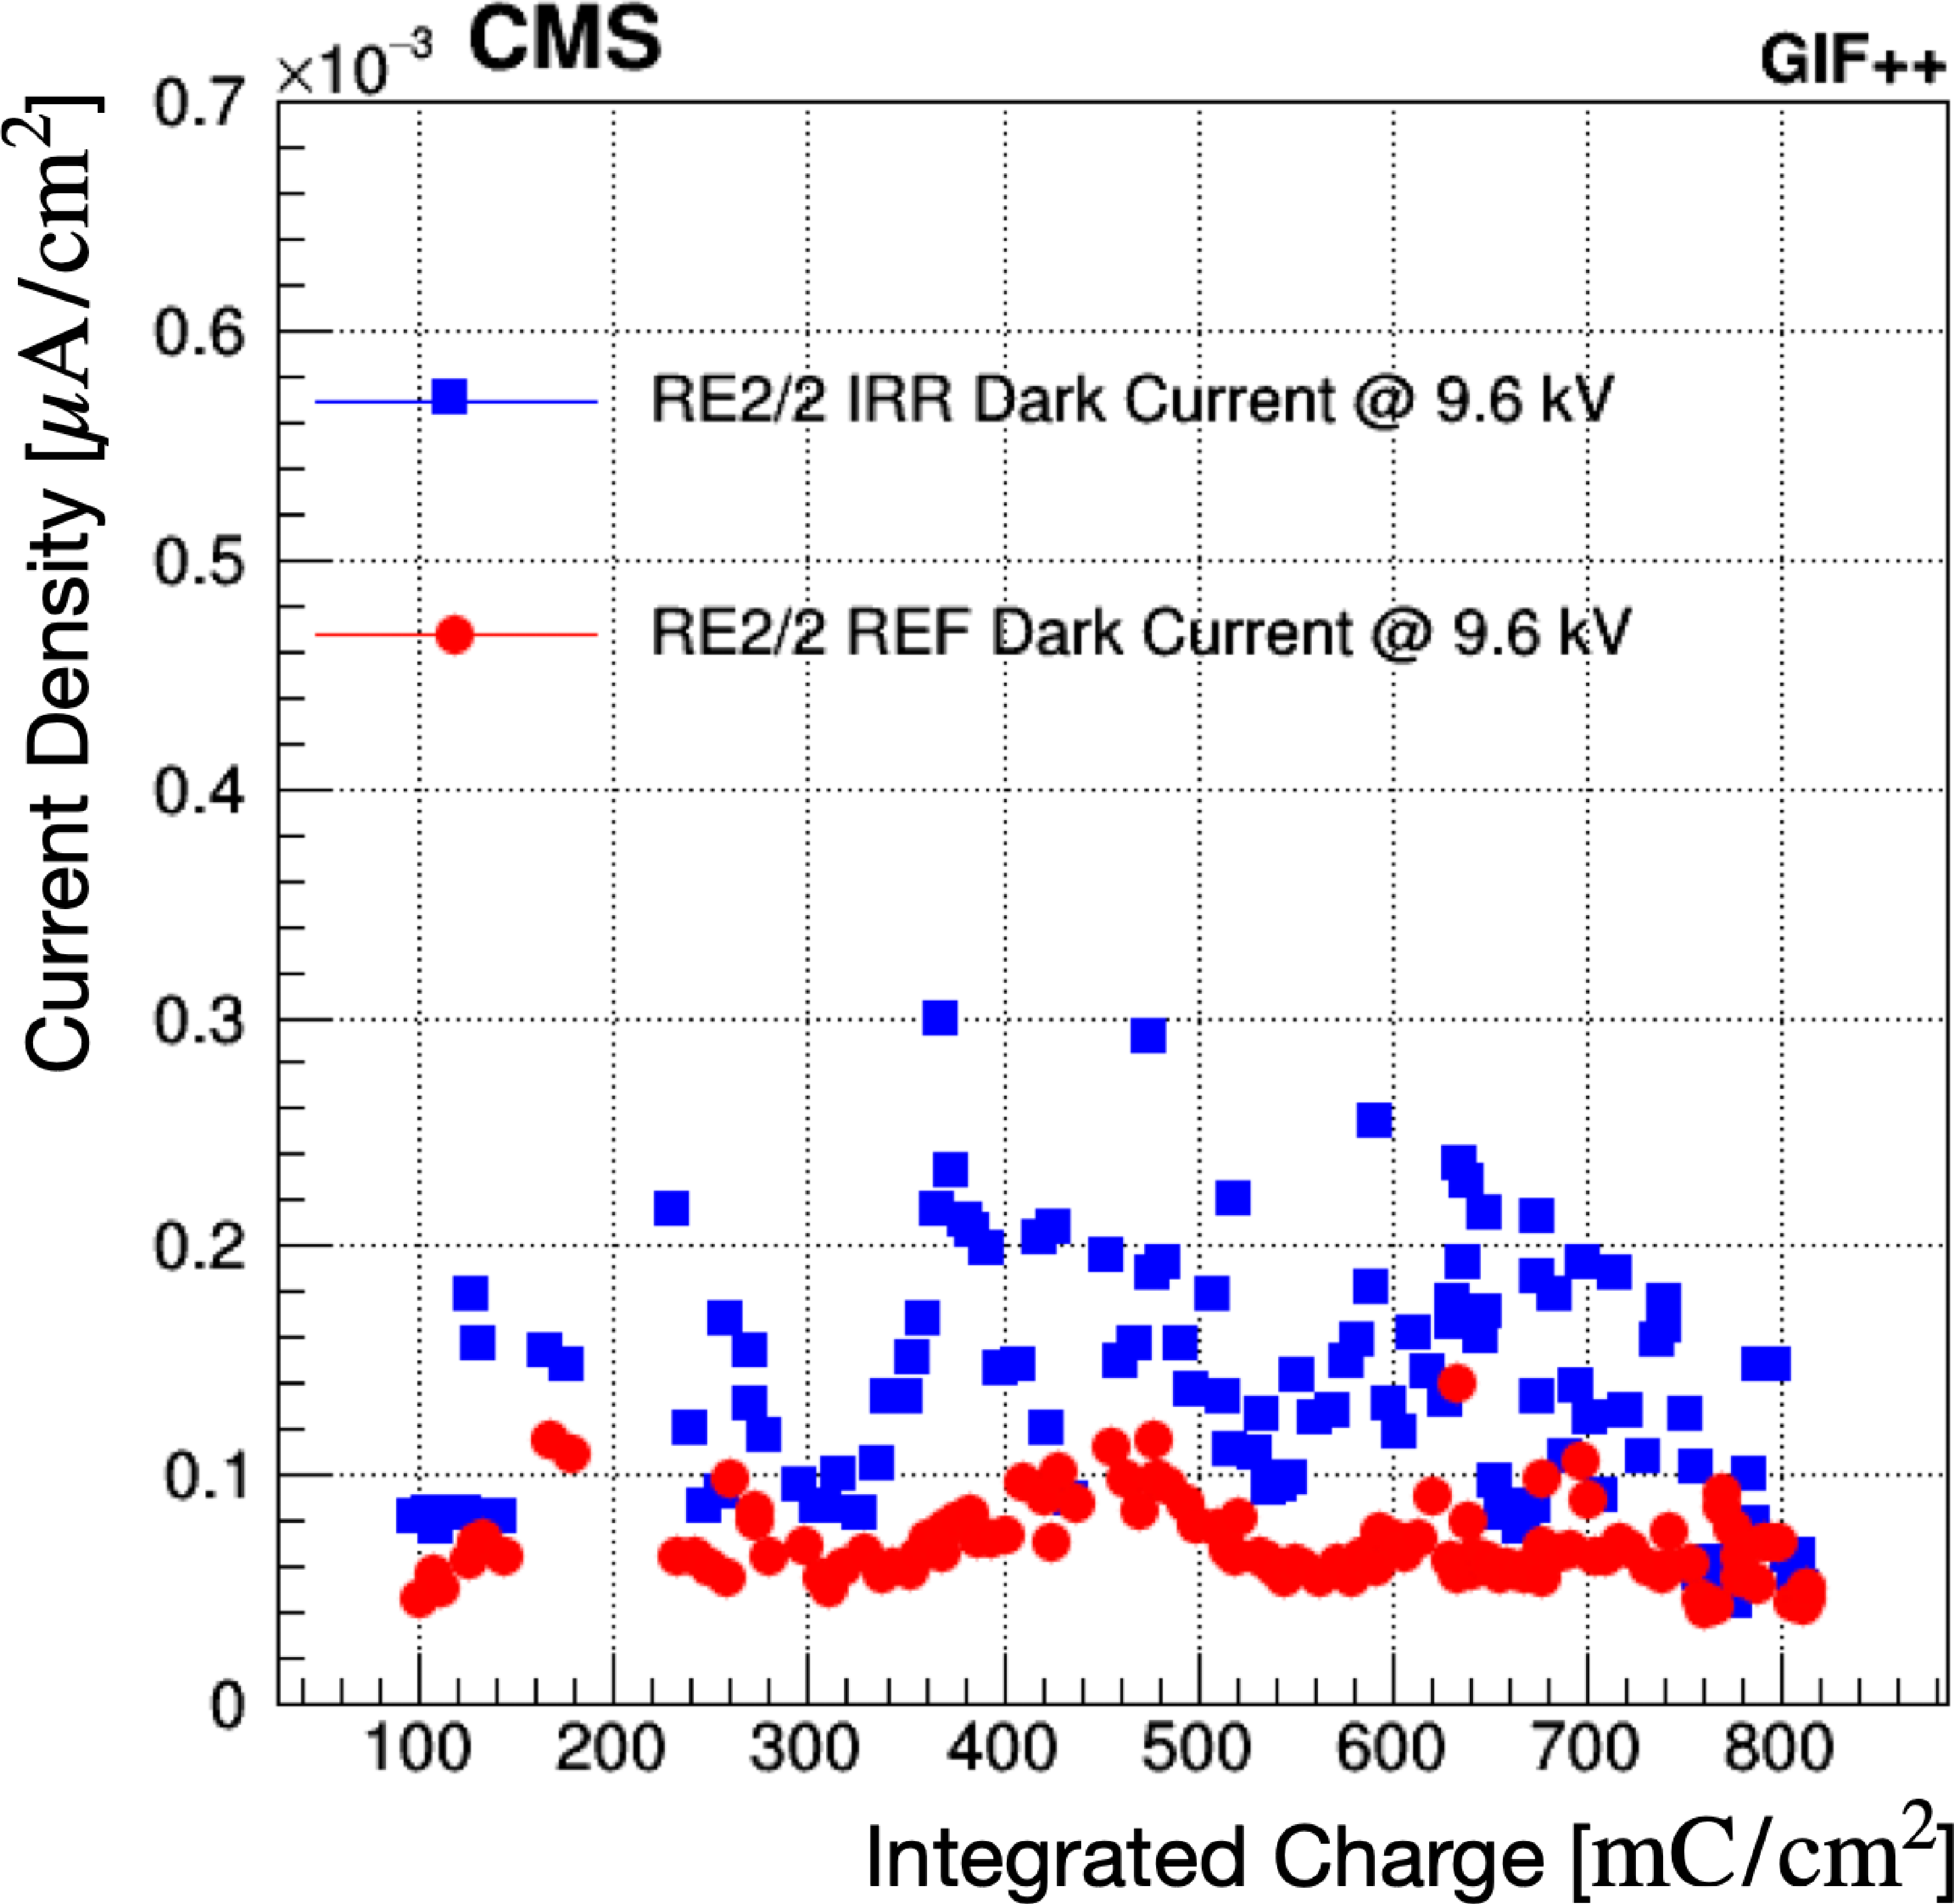
Dark-current density for the irradiated (blue squares) and reference (red circles) RE2 chambers as a function of the collected integrated charge at 6.5 (left) and 9.6 kV (right). |
png pdf |
Figure 66-a:
Dark-current density for the irradiated (blue squares) and reference (red circles) RE2 chambers as a function of the collected integrated charge at 6.5 kV. |
png pdf |
Figure 66-b:
Dark-current density for the irradiated (blue squares) and reference (red circles) RE2 chambers as a function of the collected integrated charge at 9.6 kV. |
png pdf |
Figure 67:
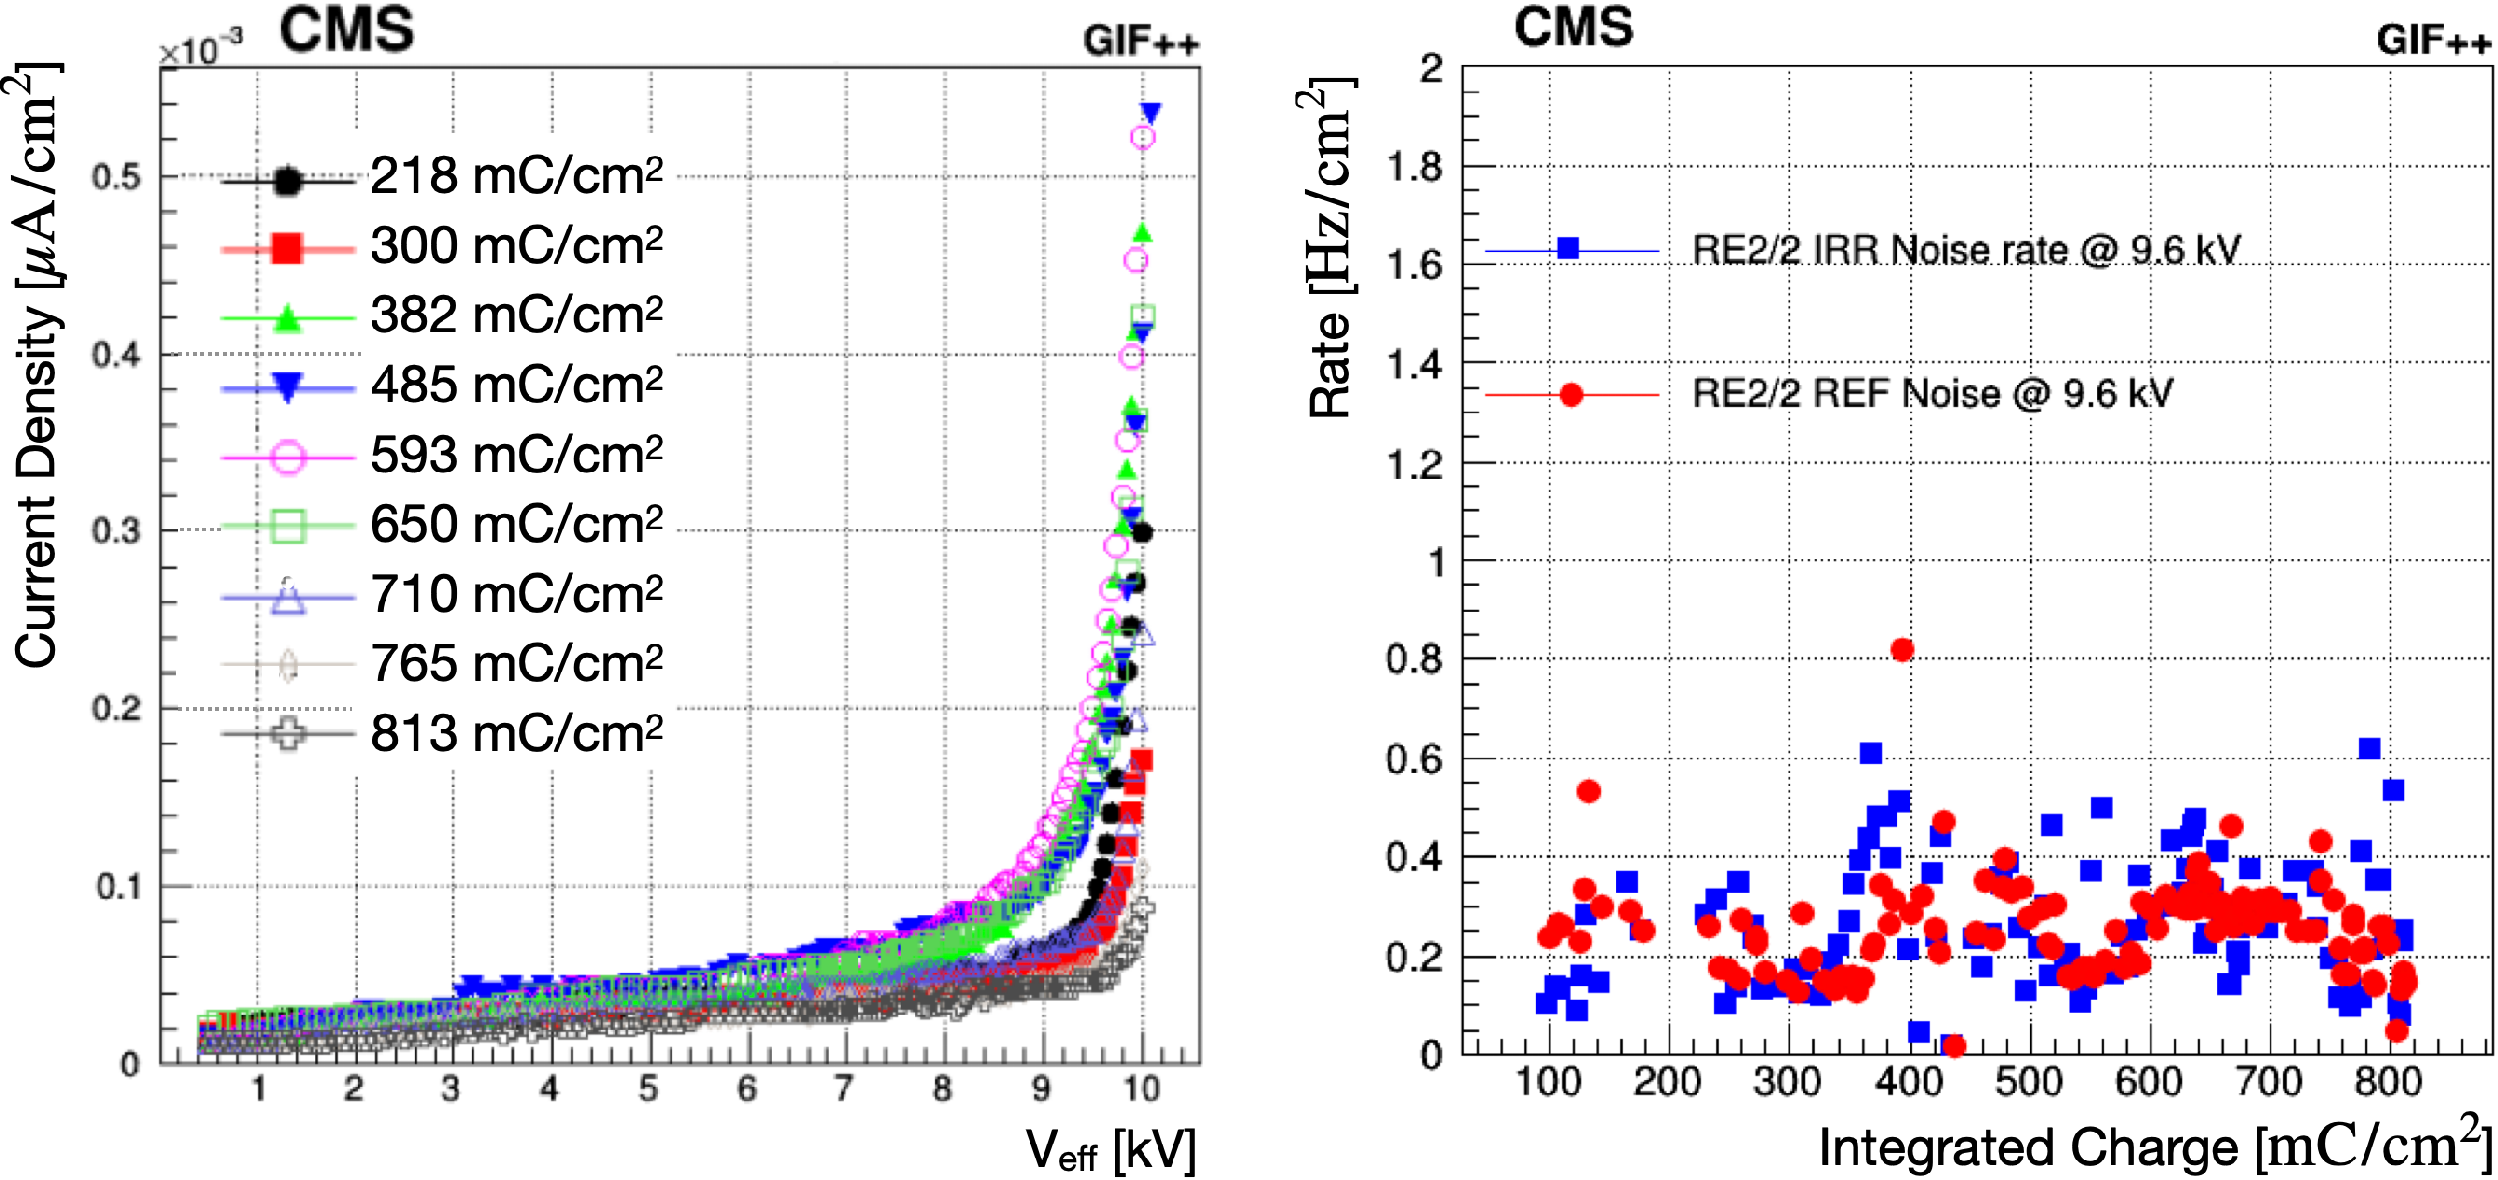
Left: dark-current density monitored as a function of the effective high voltage at different values of the collected integrated charge for the irradiated RE2 chamber. Right: average noise rate as a function of the collected integrated charge for the irradiated (blue squares) and reference (red circles) RE2 chambers. |
png pdf |
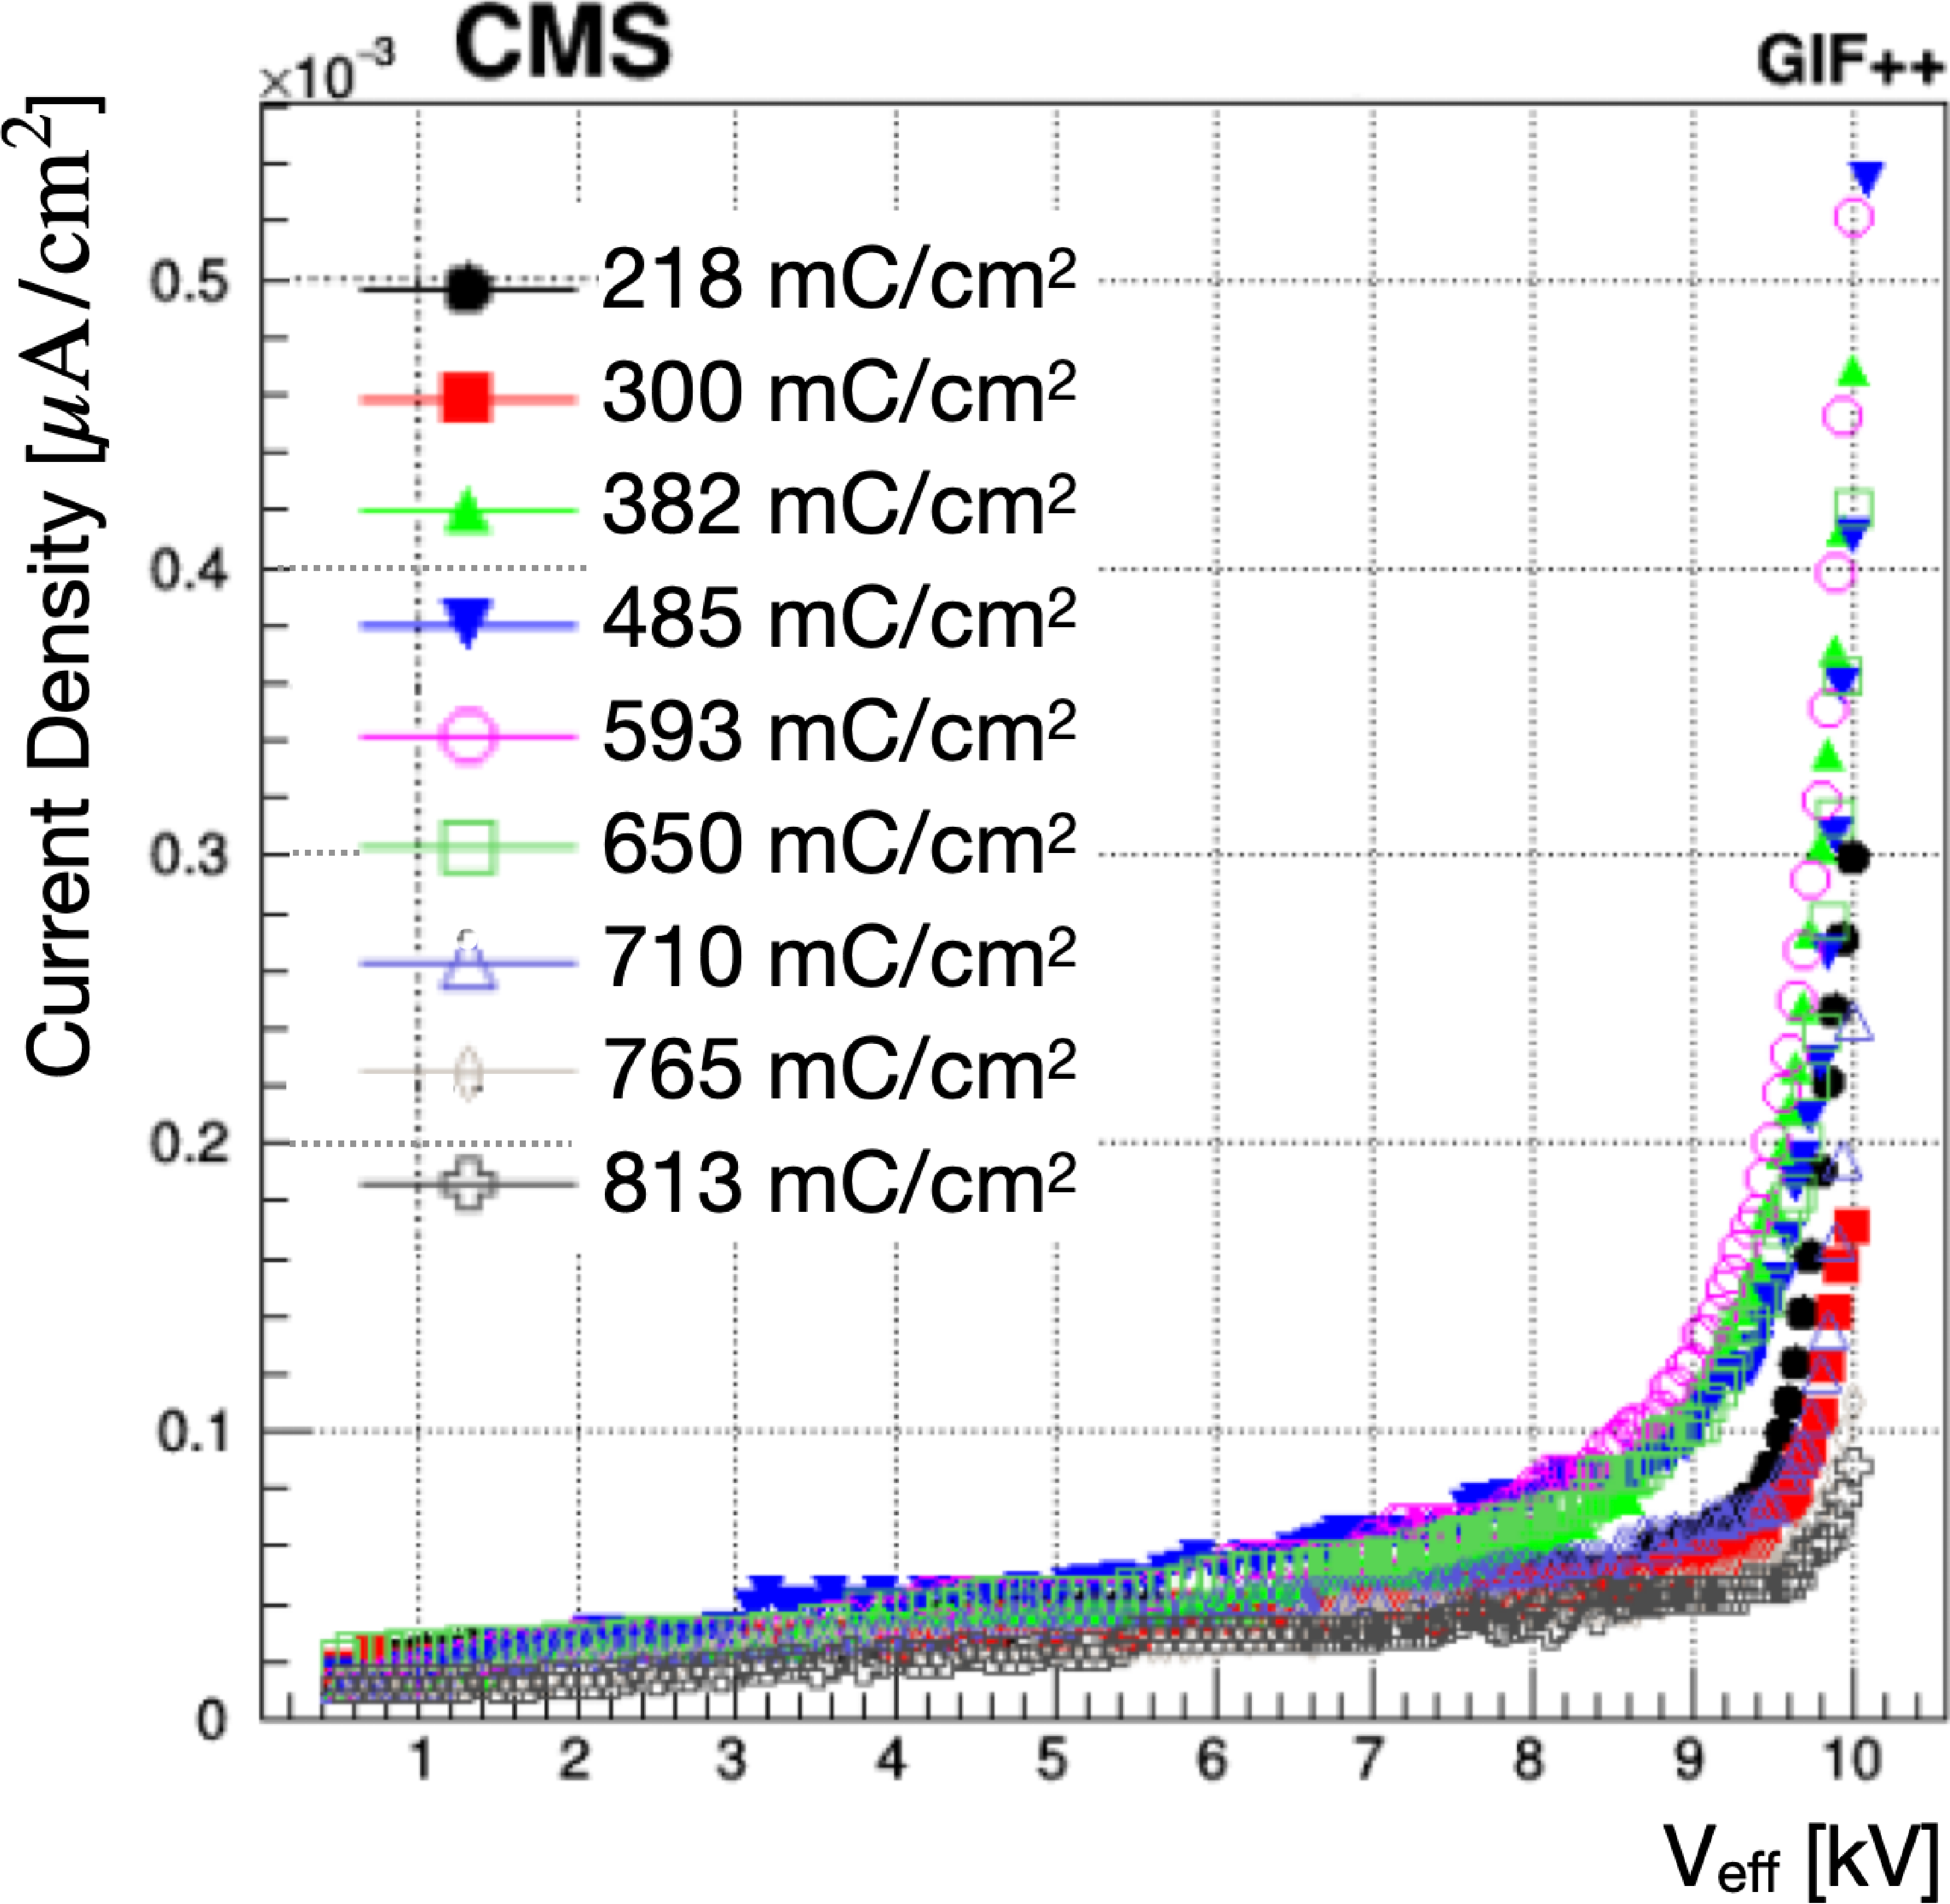
Figure 67-a:
Dark-current density monitored as a function of the effective high voltage at different values of the collected integrated charge for the irradiated RE2 chamber. |
png pdf |
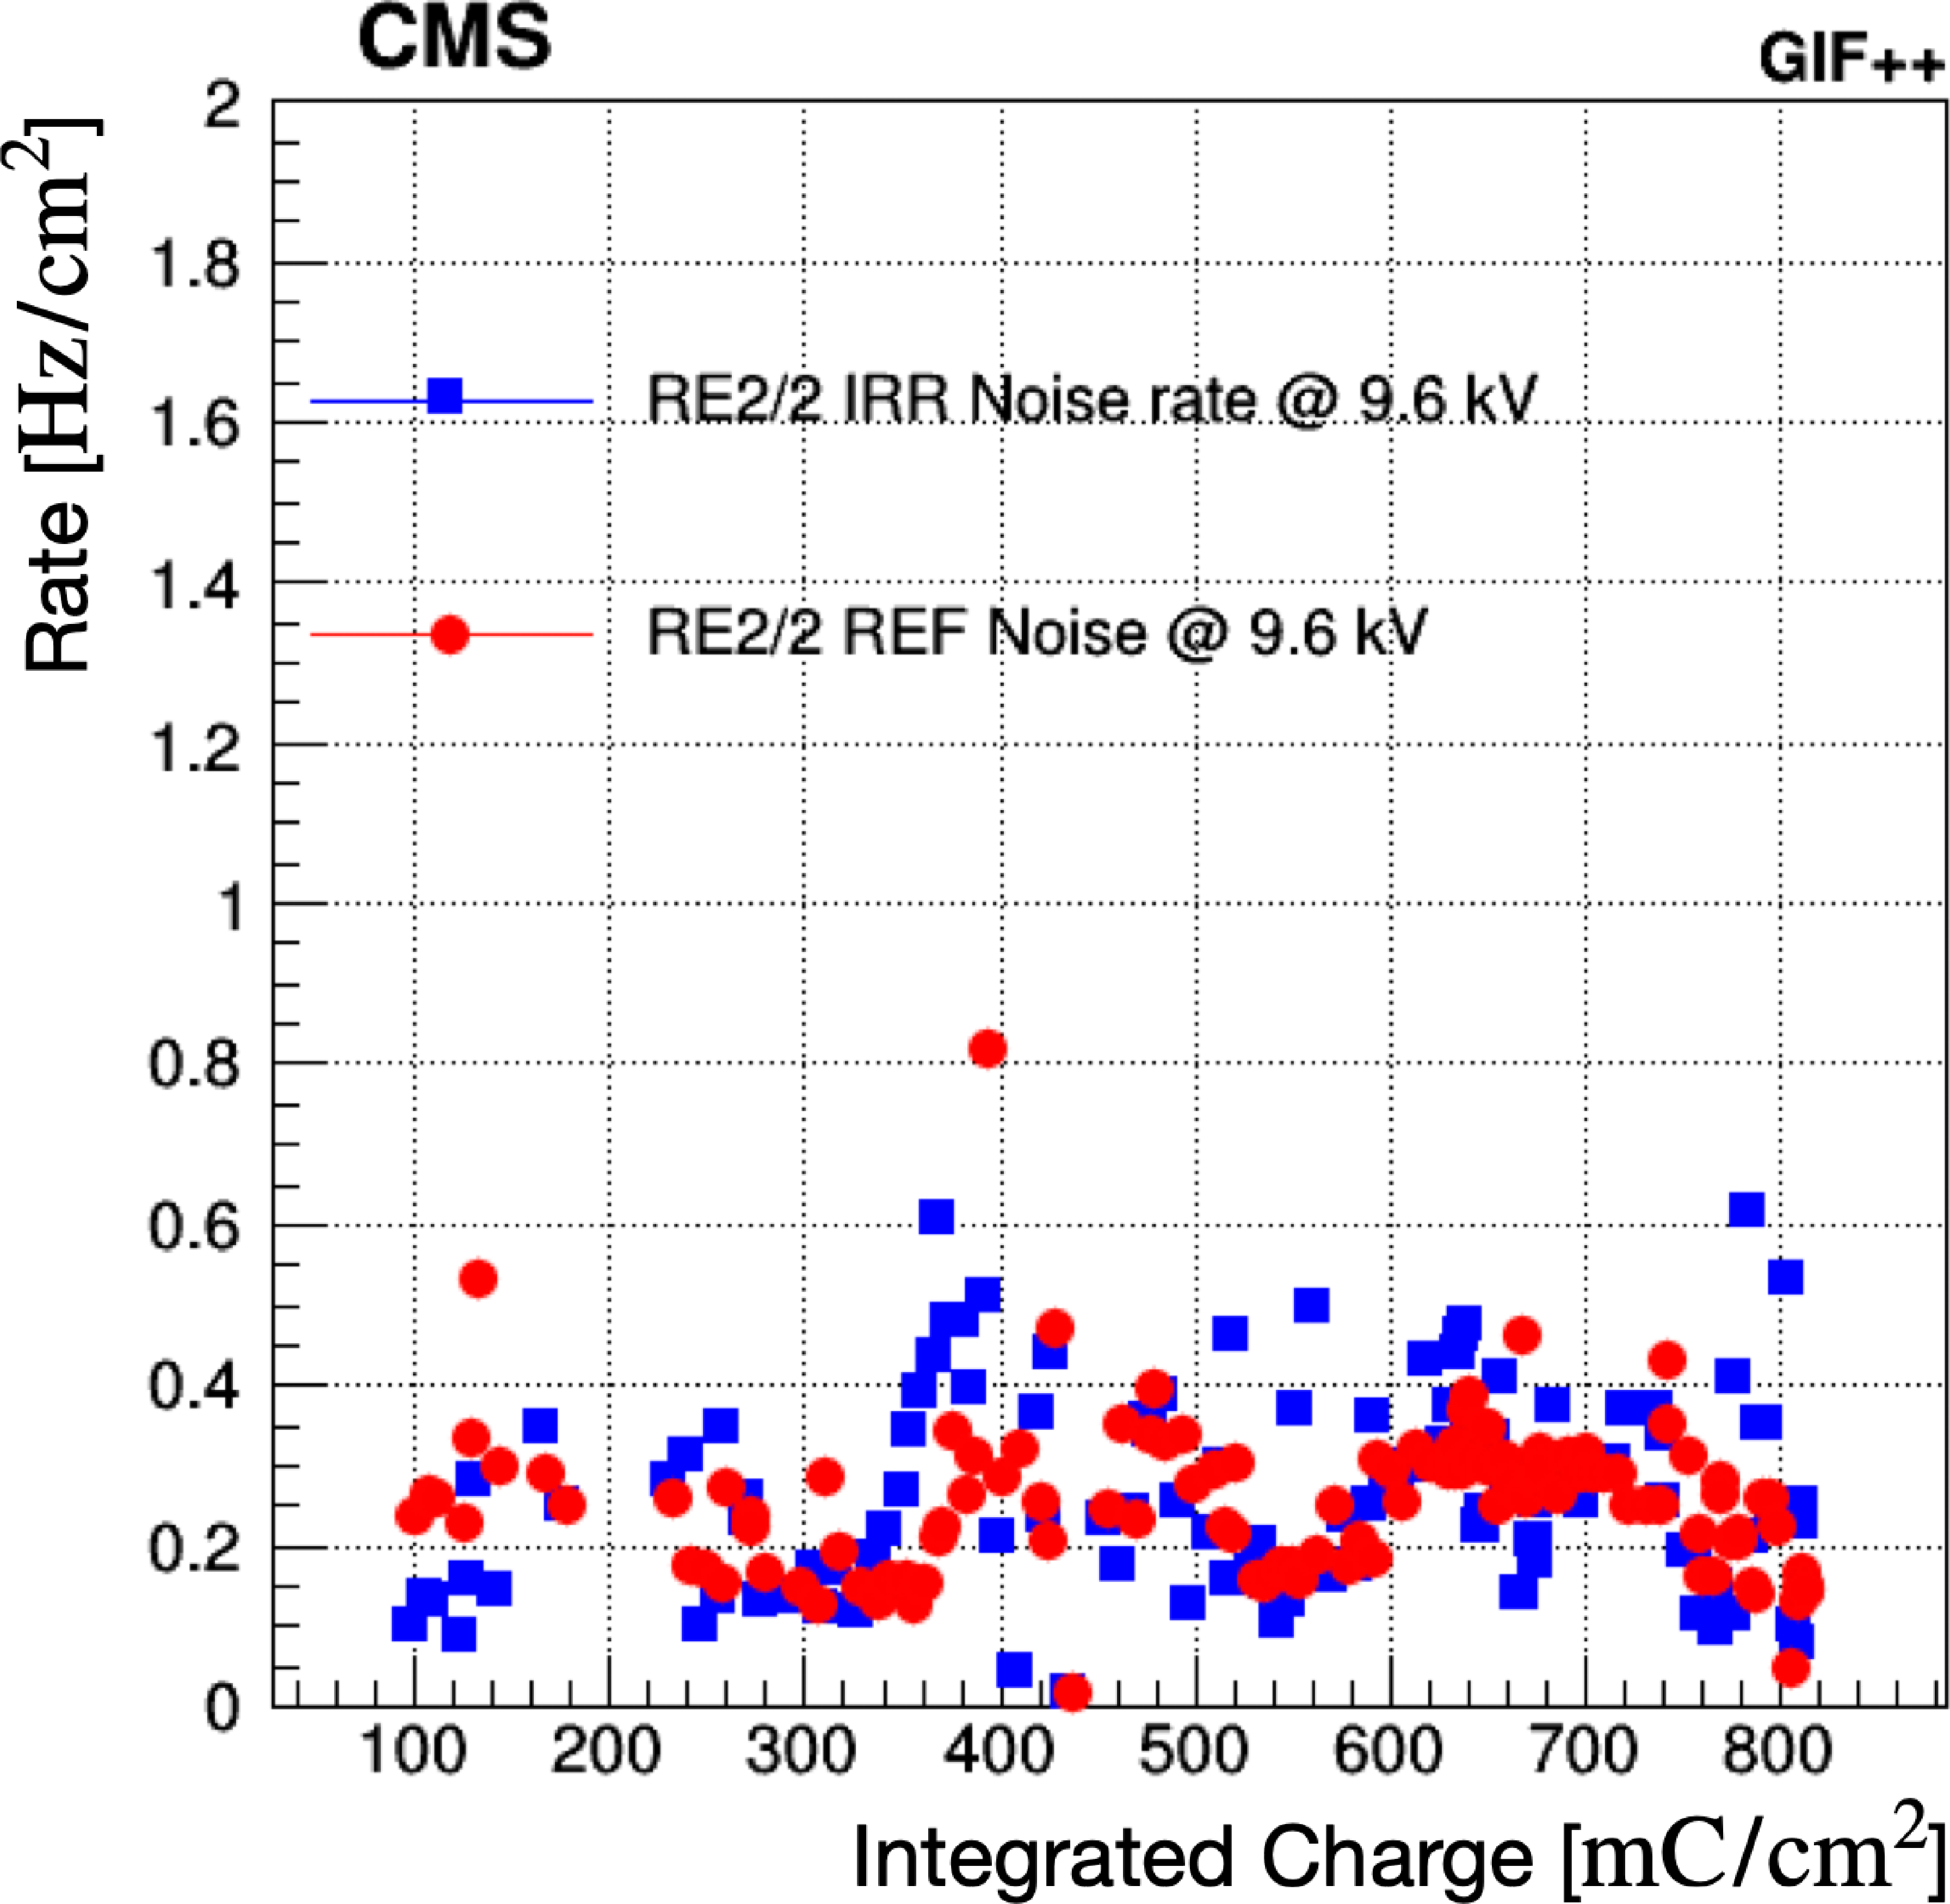
Figure 67-b:
Average noise rate as a function of the collected integrated charge for the irradiated (blue squares) and reference (red circles) RE2 chambers. |

png pdf |
Figure 68:
Resistivity ratio (blue squares) and current ratio (red circles) between the irradiated and reference RE2 chambers as a function of the collected integrated charge. |
png pdf |
Figure 69:
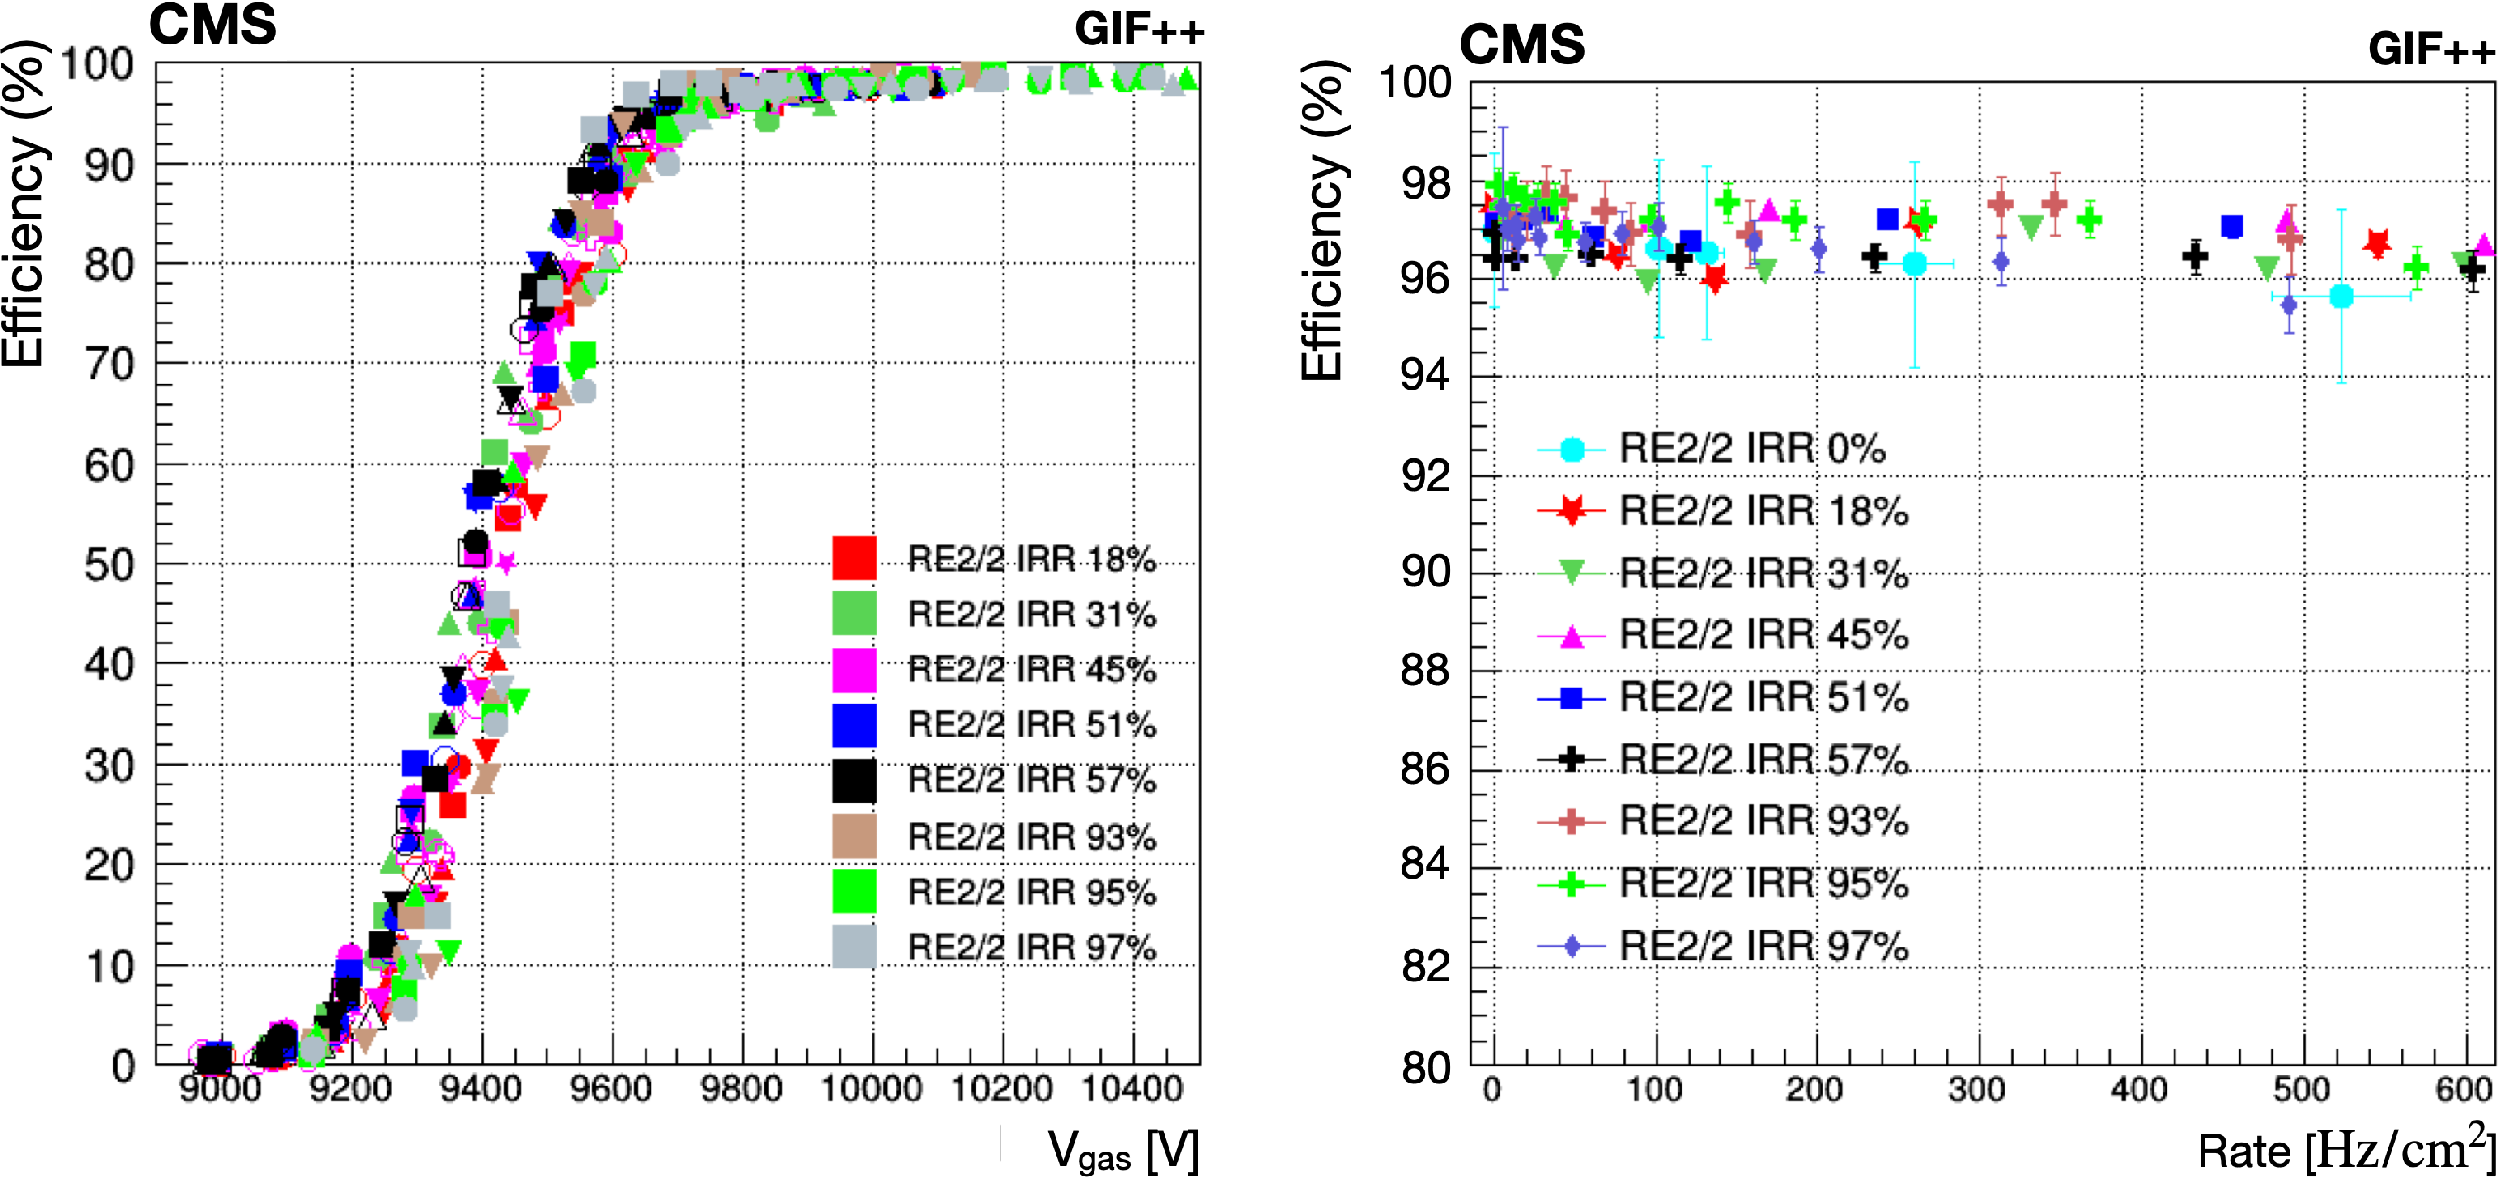
Left: irradiated RE2 $ / $ 2 chamber efficiency as a function of $ V_{\text{gas}} $ for different background irradiation rates, up to 600 Hz/cm$^2 $, and different integrated charge values. Different marker shapes of the same color represent different background rates at the same integrated charge values. Right: irradiated RE2 chamber efficiency at the WP as a function of the background rate at different values of the collected integrated charge. |

png pdf |
Figure 69-a:
Irradiated RE2 $ / $ 2 chamber efficiency as a function of $ V_{\text{gas}} $ for different background irradiation rates, up to 600 Hz/cm$^2 $, and different integrated charge values. Different marker shapes of the same color represent different background rates at the same integrated charge values. |
png pdf |
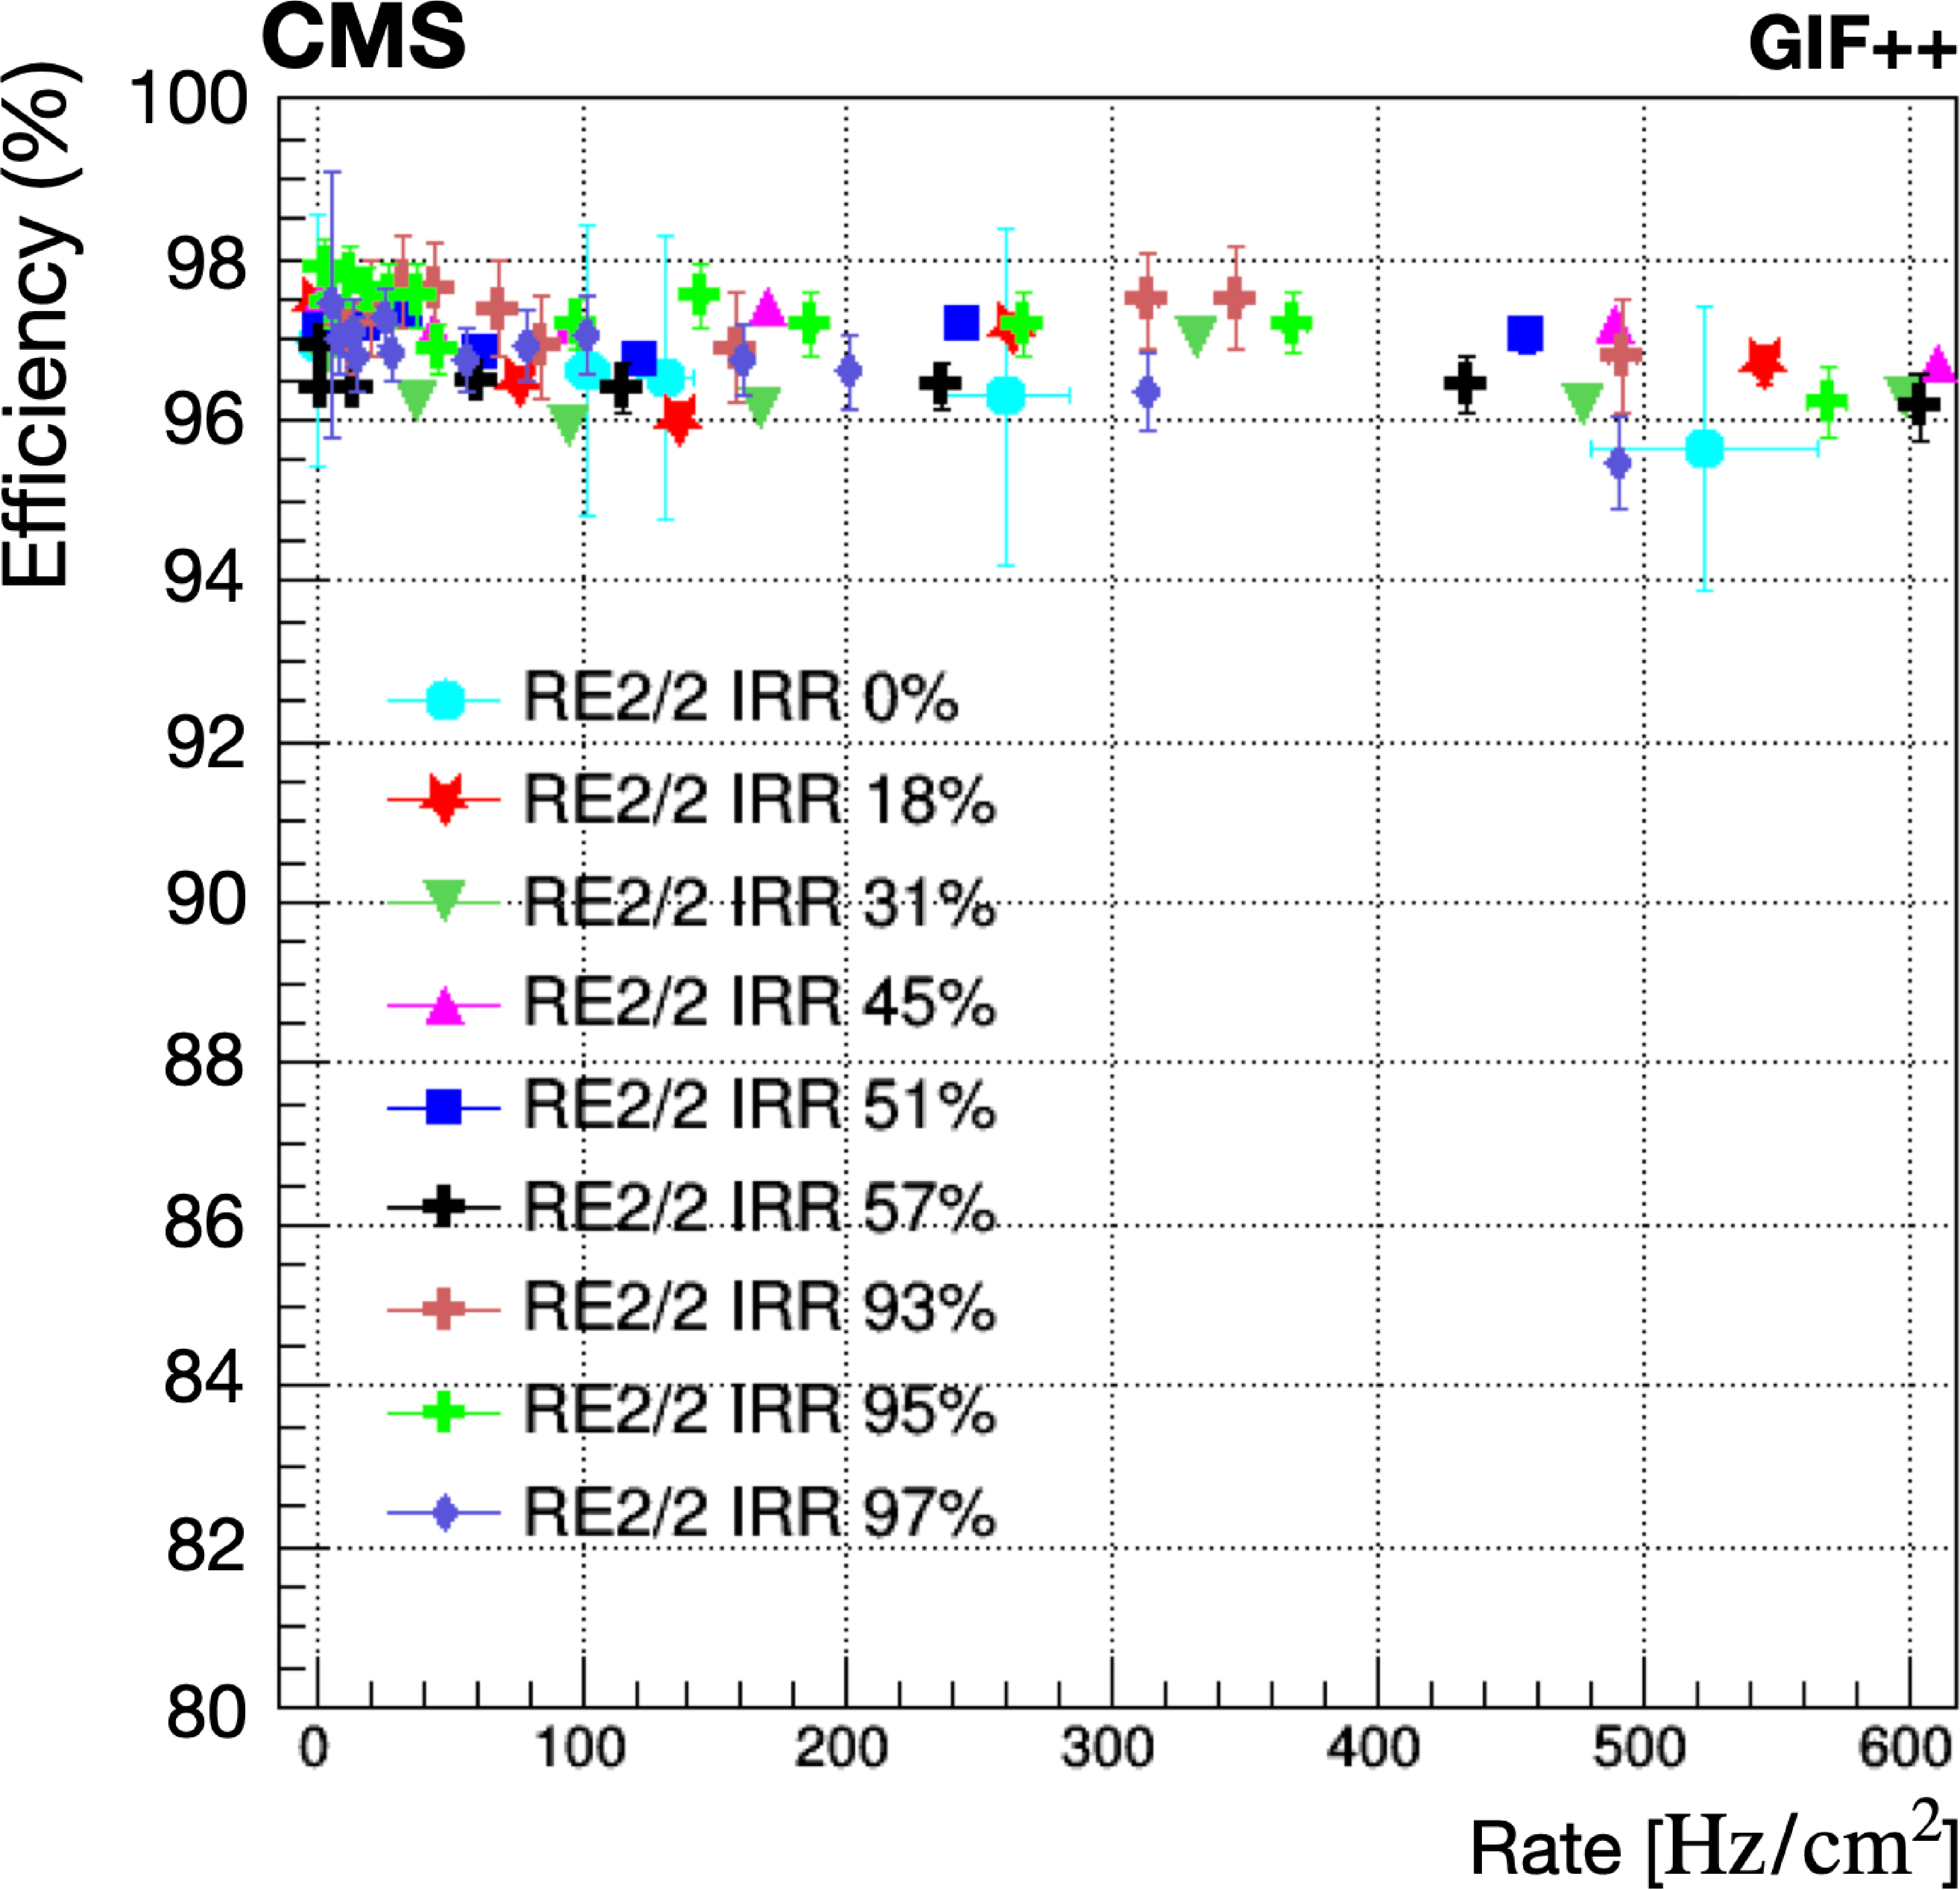
Figure 69-b:
Irradiated RE2 chamber efficiency at the WP as a function of the background rate at different values of the collected integrated charge. |

png pdf |
Figure 70:
Photographs illustrating the gas-leak repair procedures. Left: scientists working on the repair procedure. Middle left: access to broken component. Middle right: repairing of components. Right: closing and validation. |
png pdf |
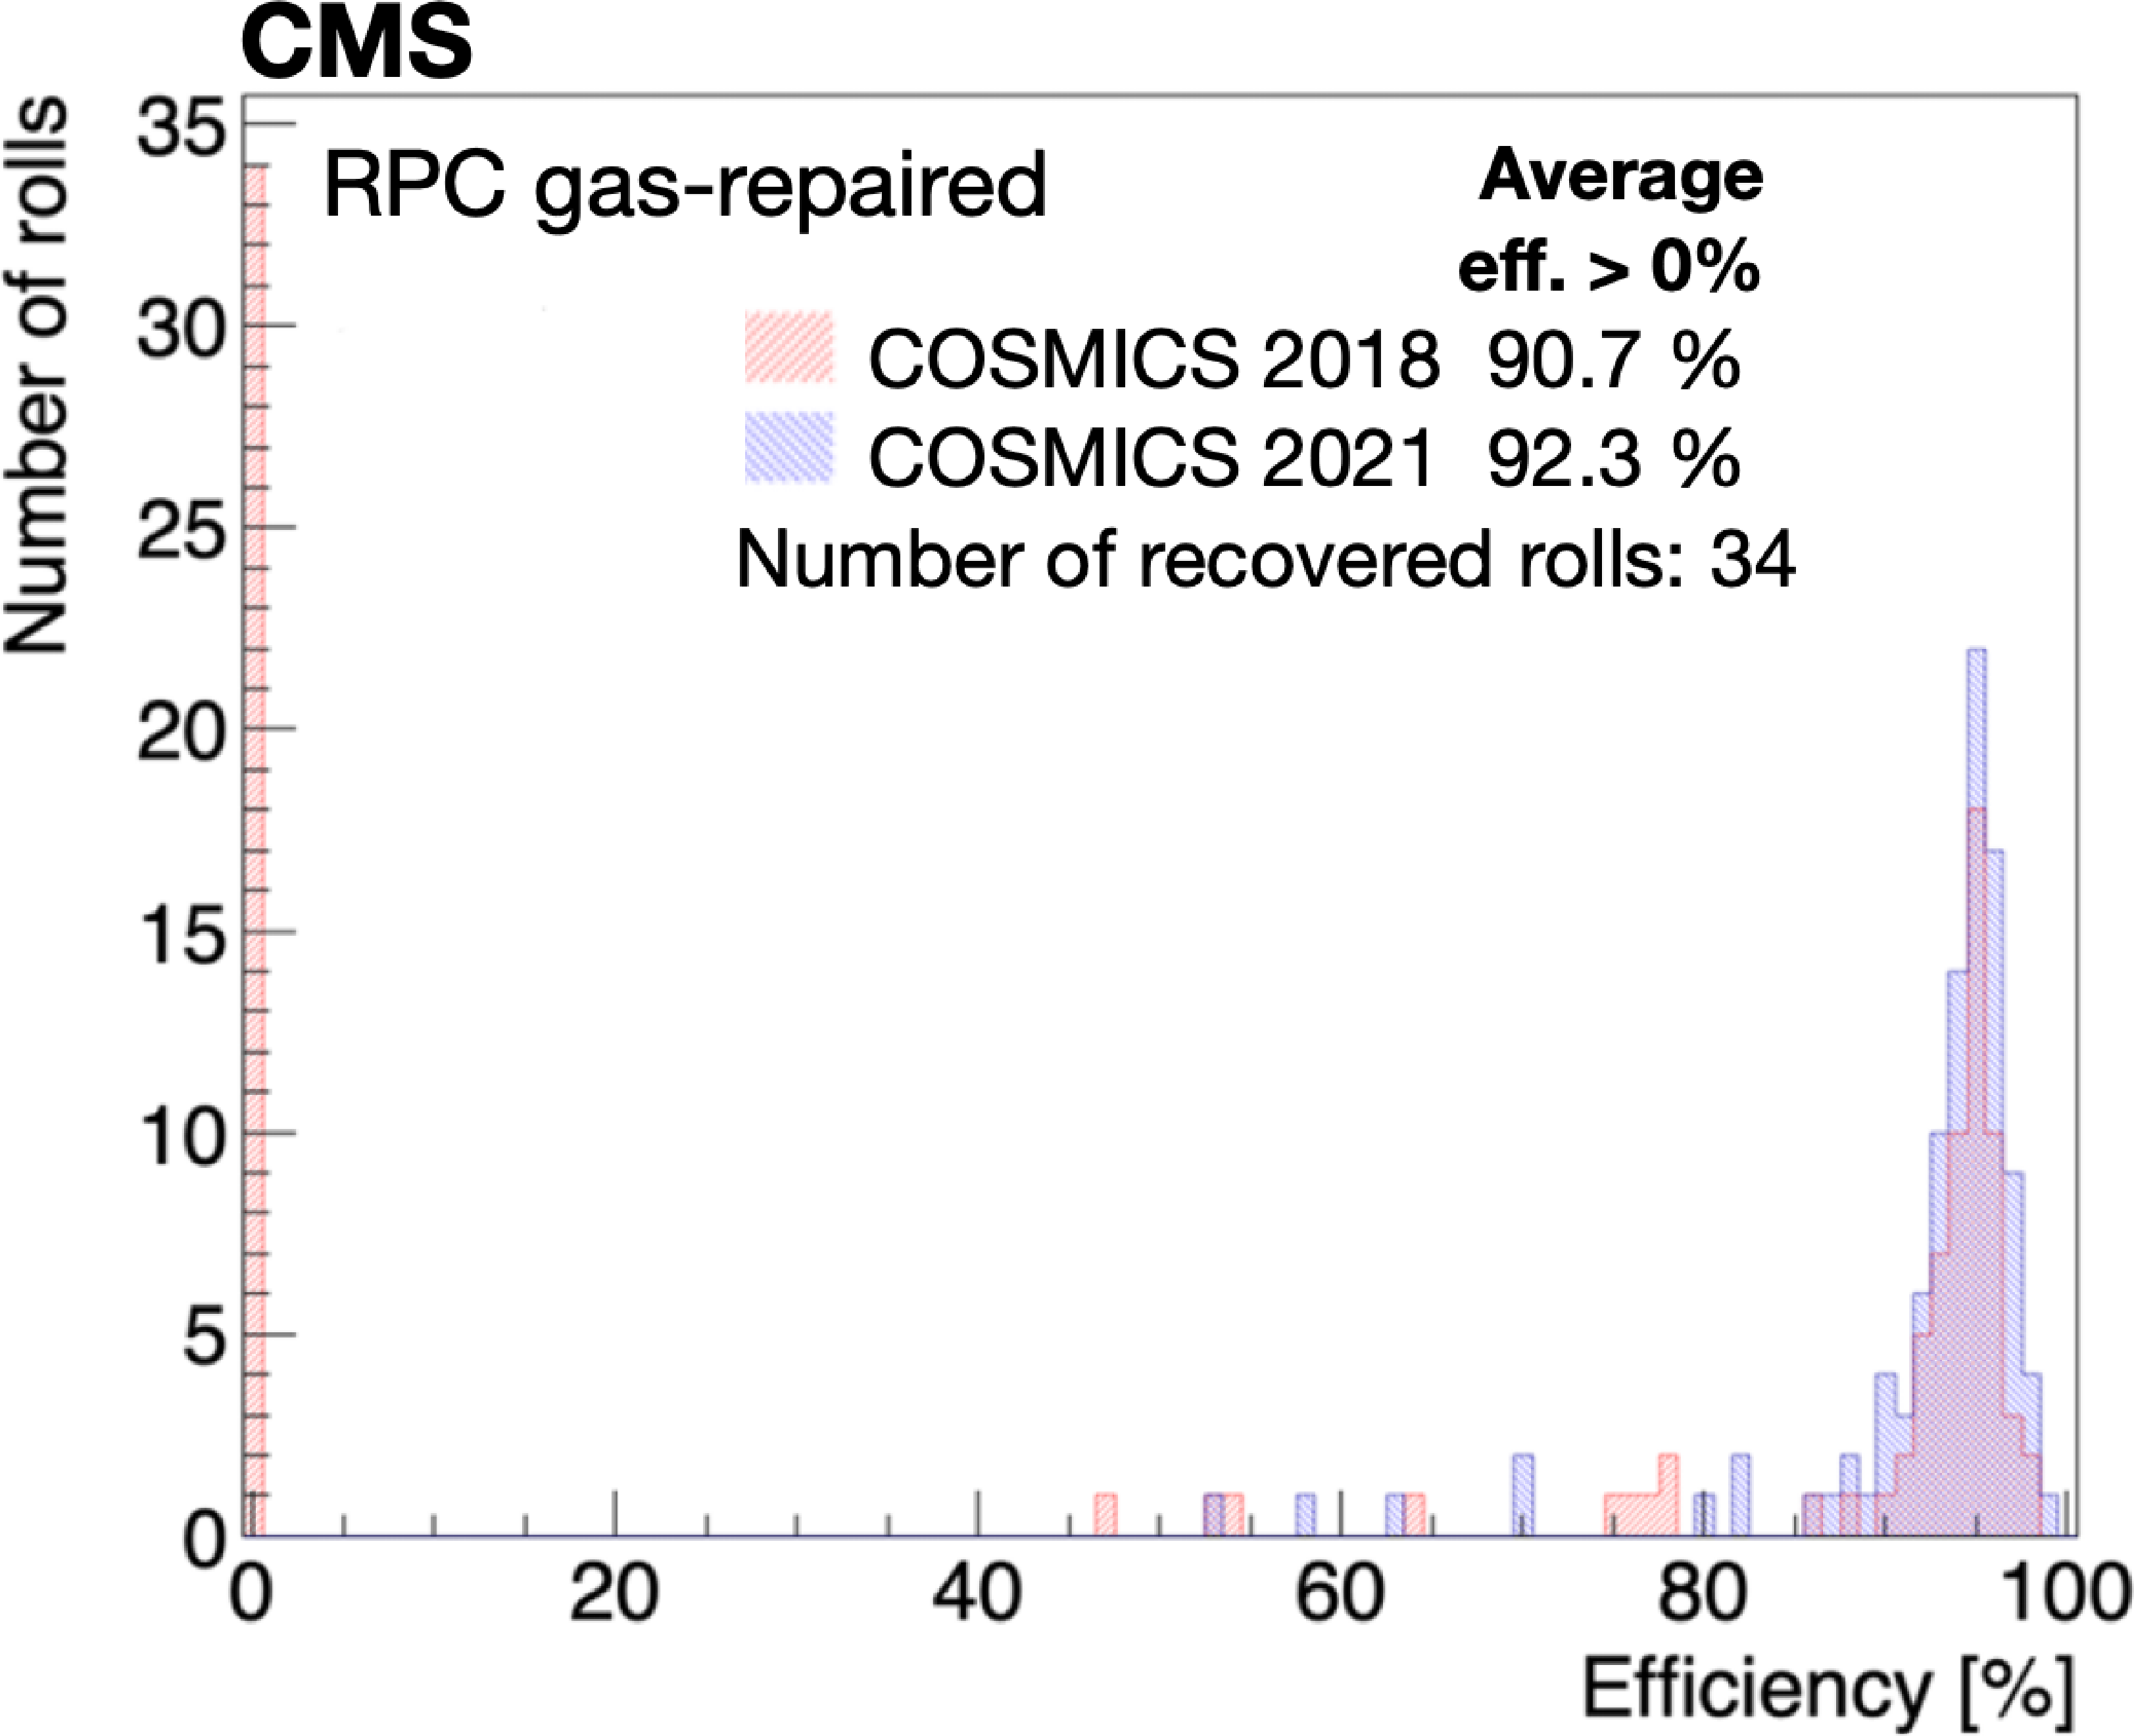
Figure 71:
Efficiency comparison between 2018 (red) and 2021 (blue) cosmic ray data for chambers with repaired gas leaks. |
png pdf |
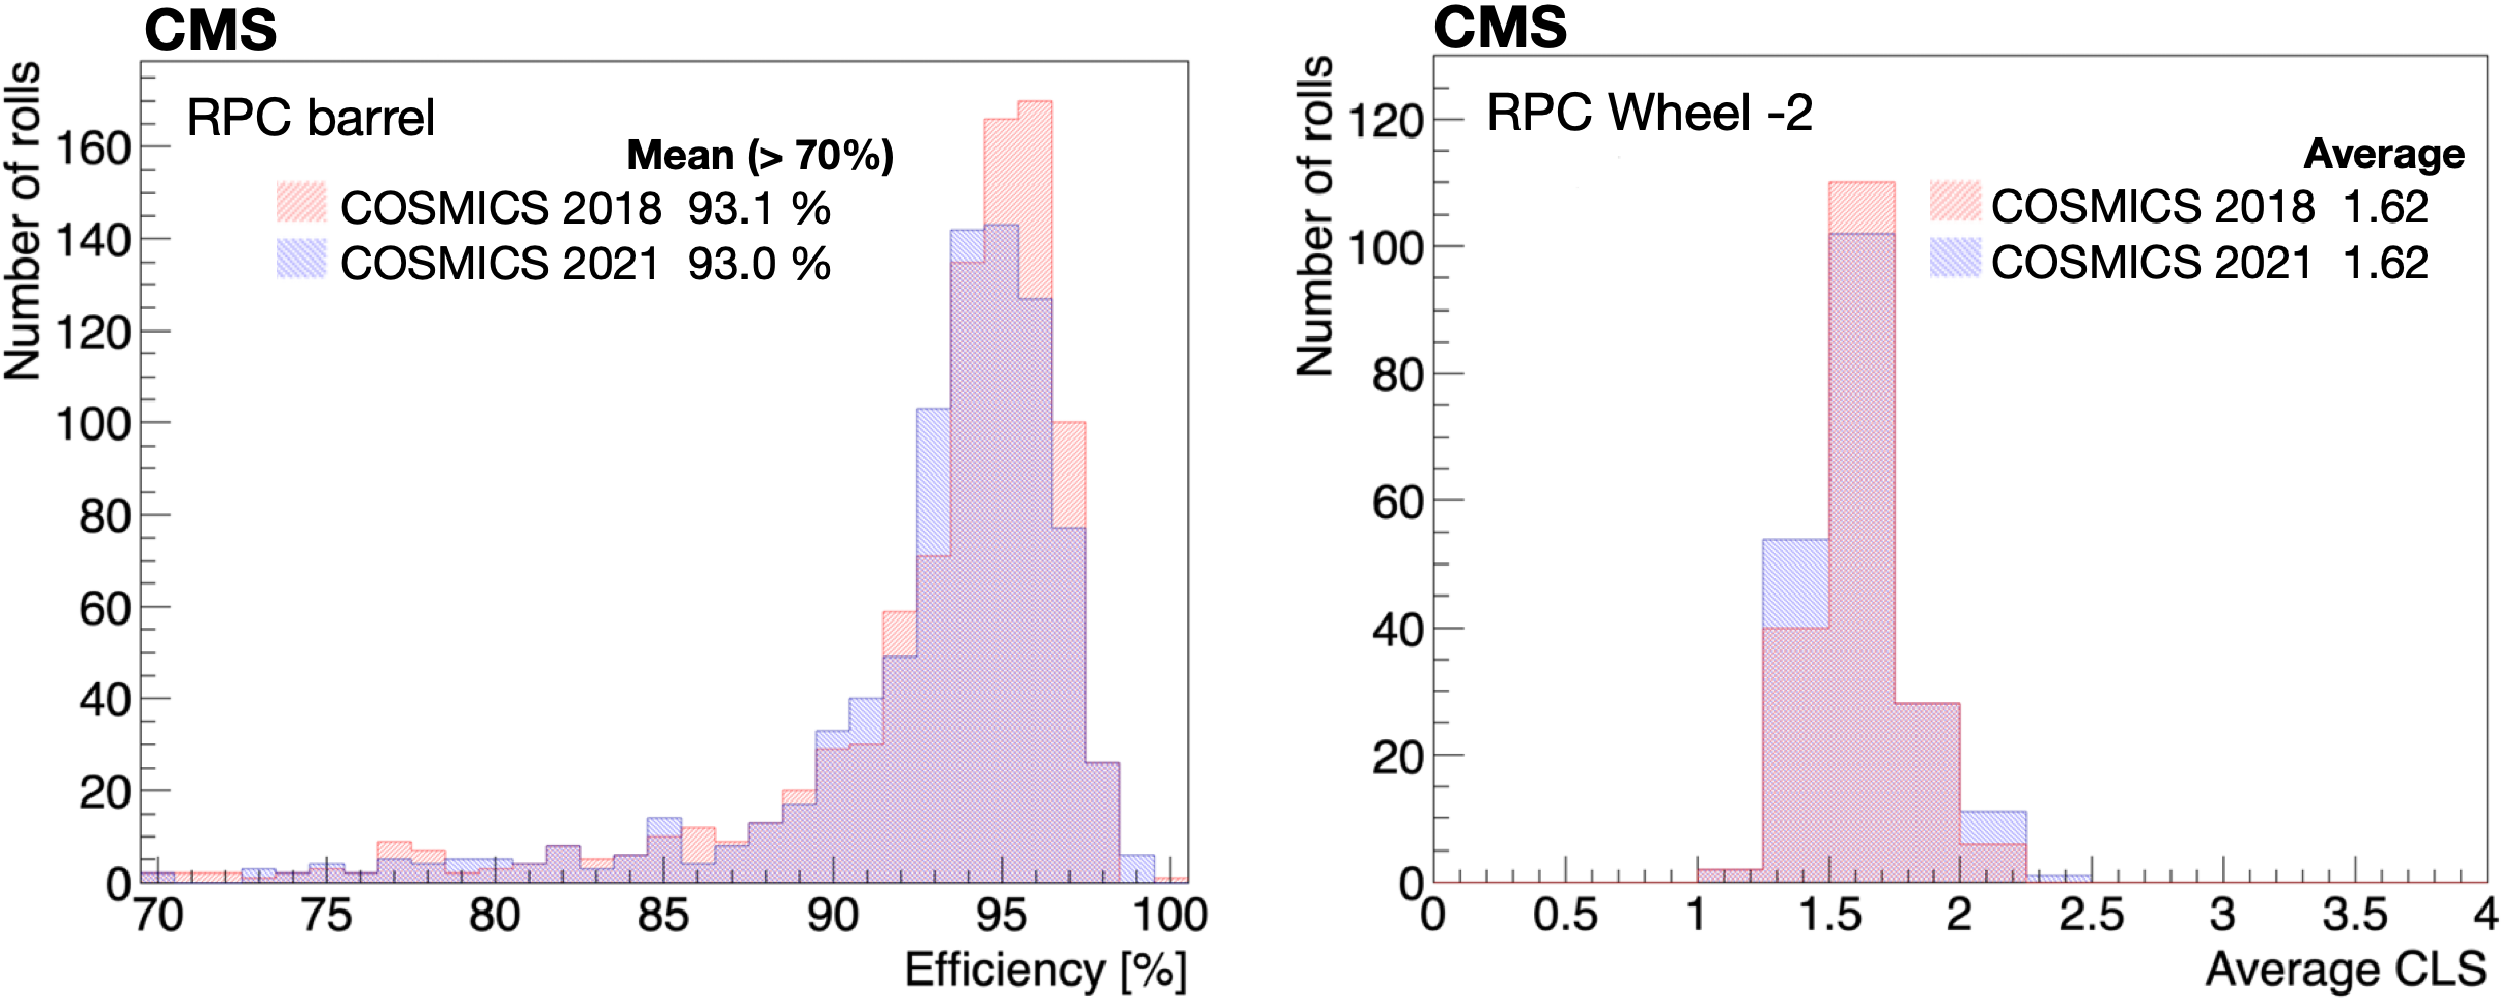
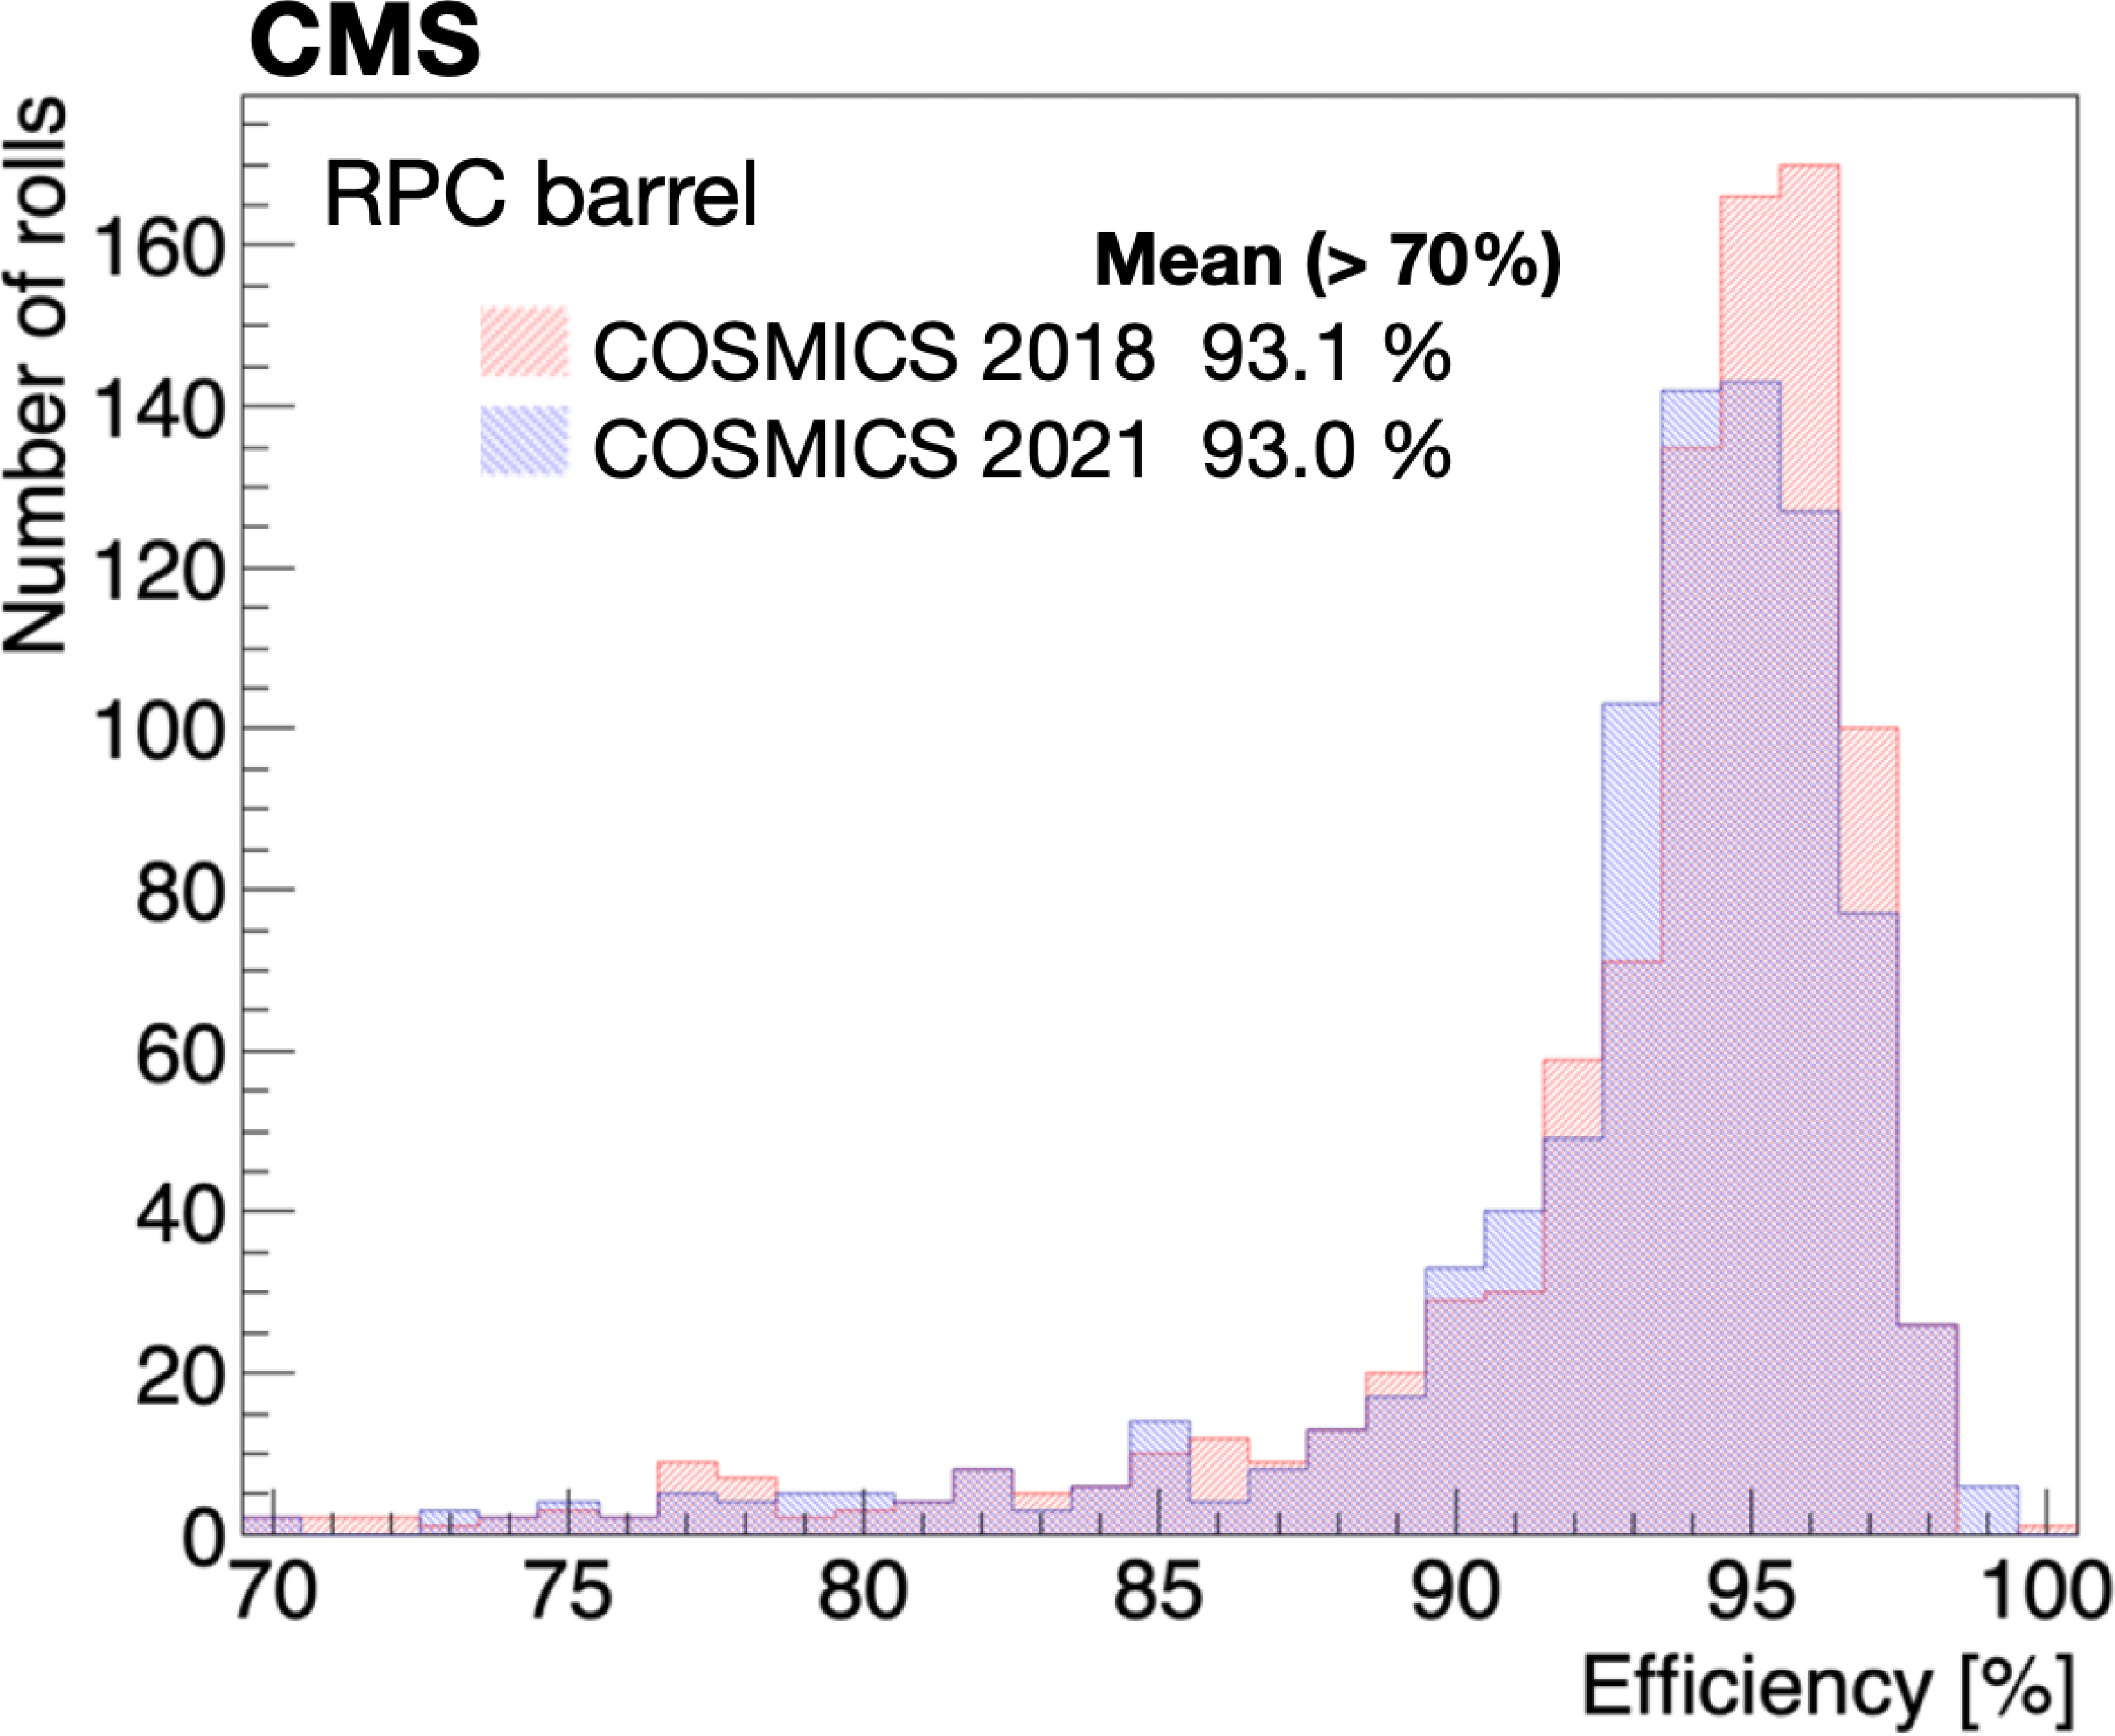
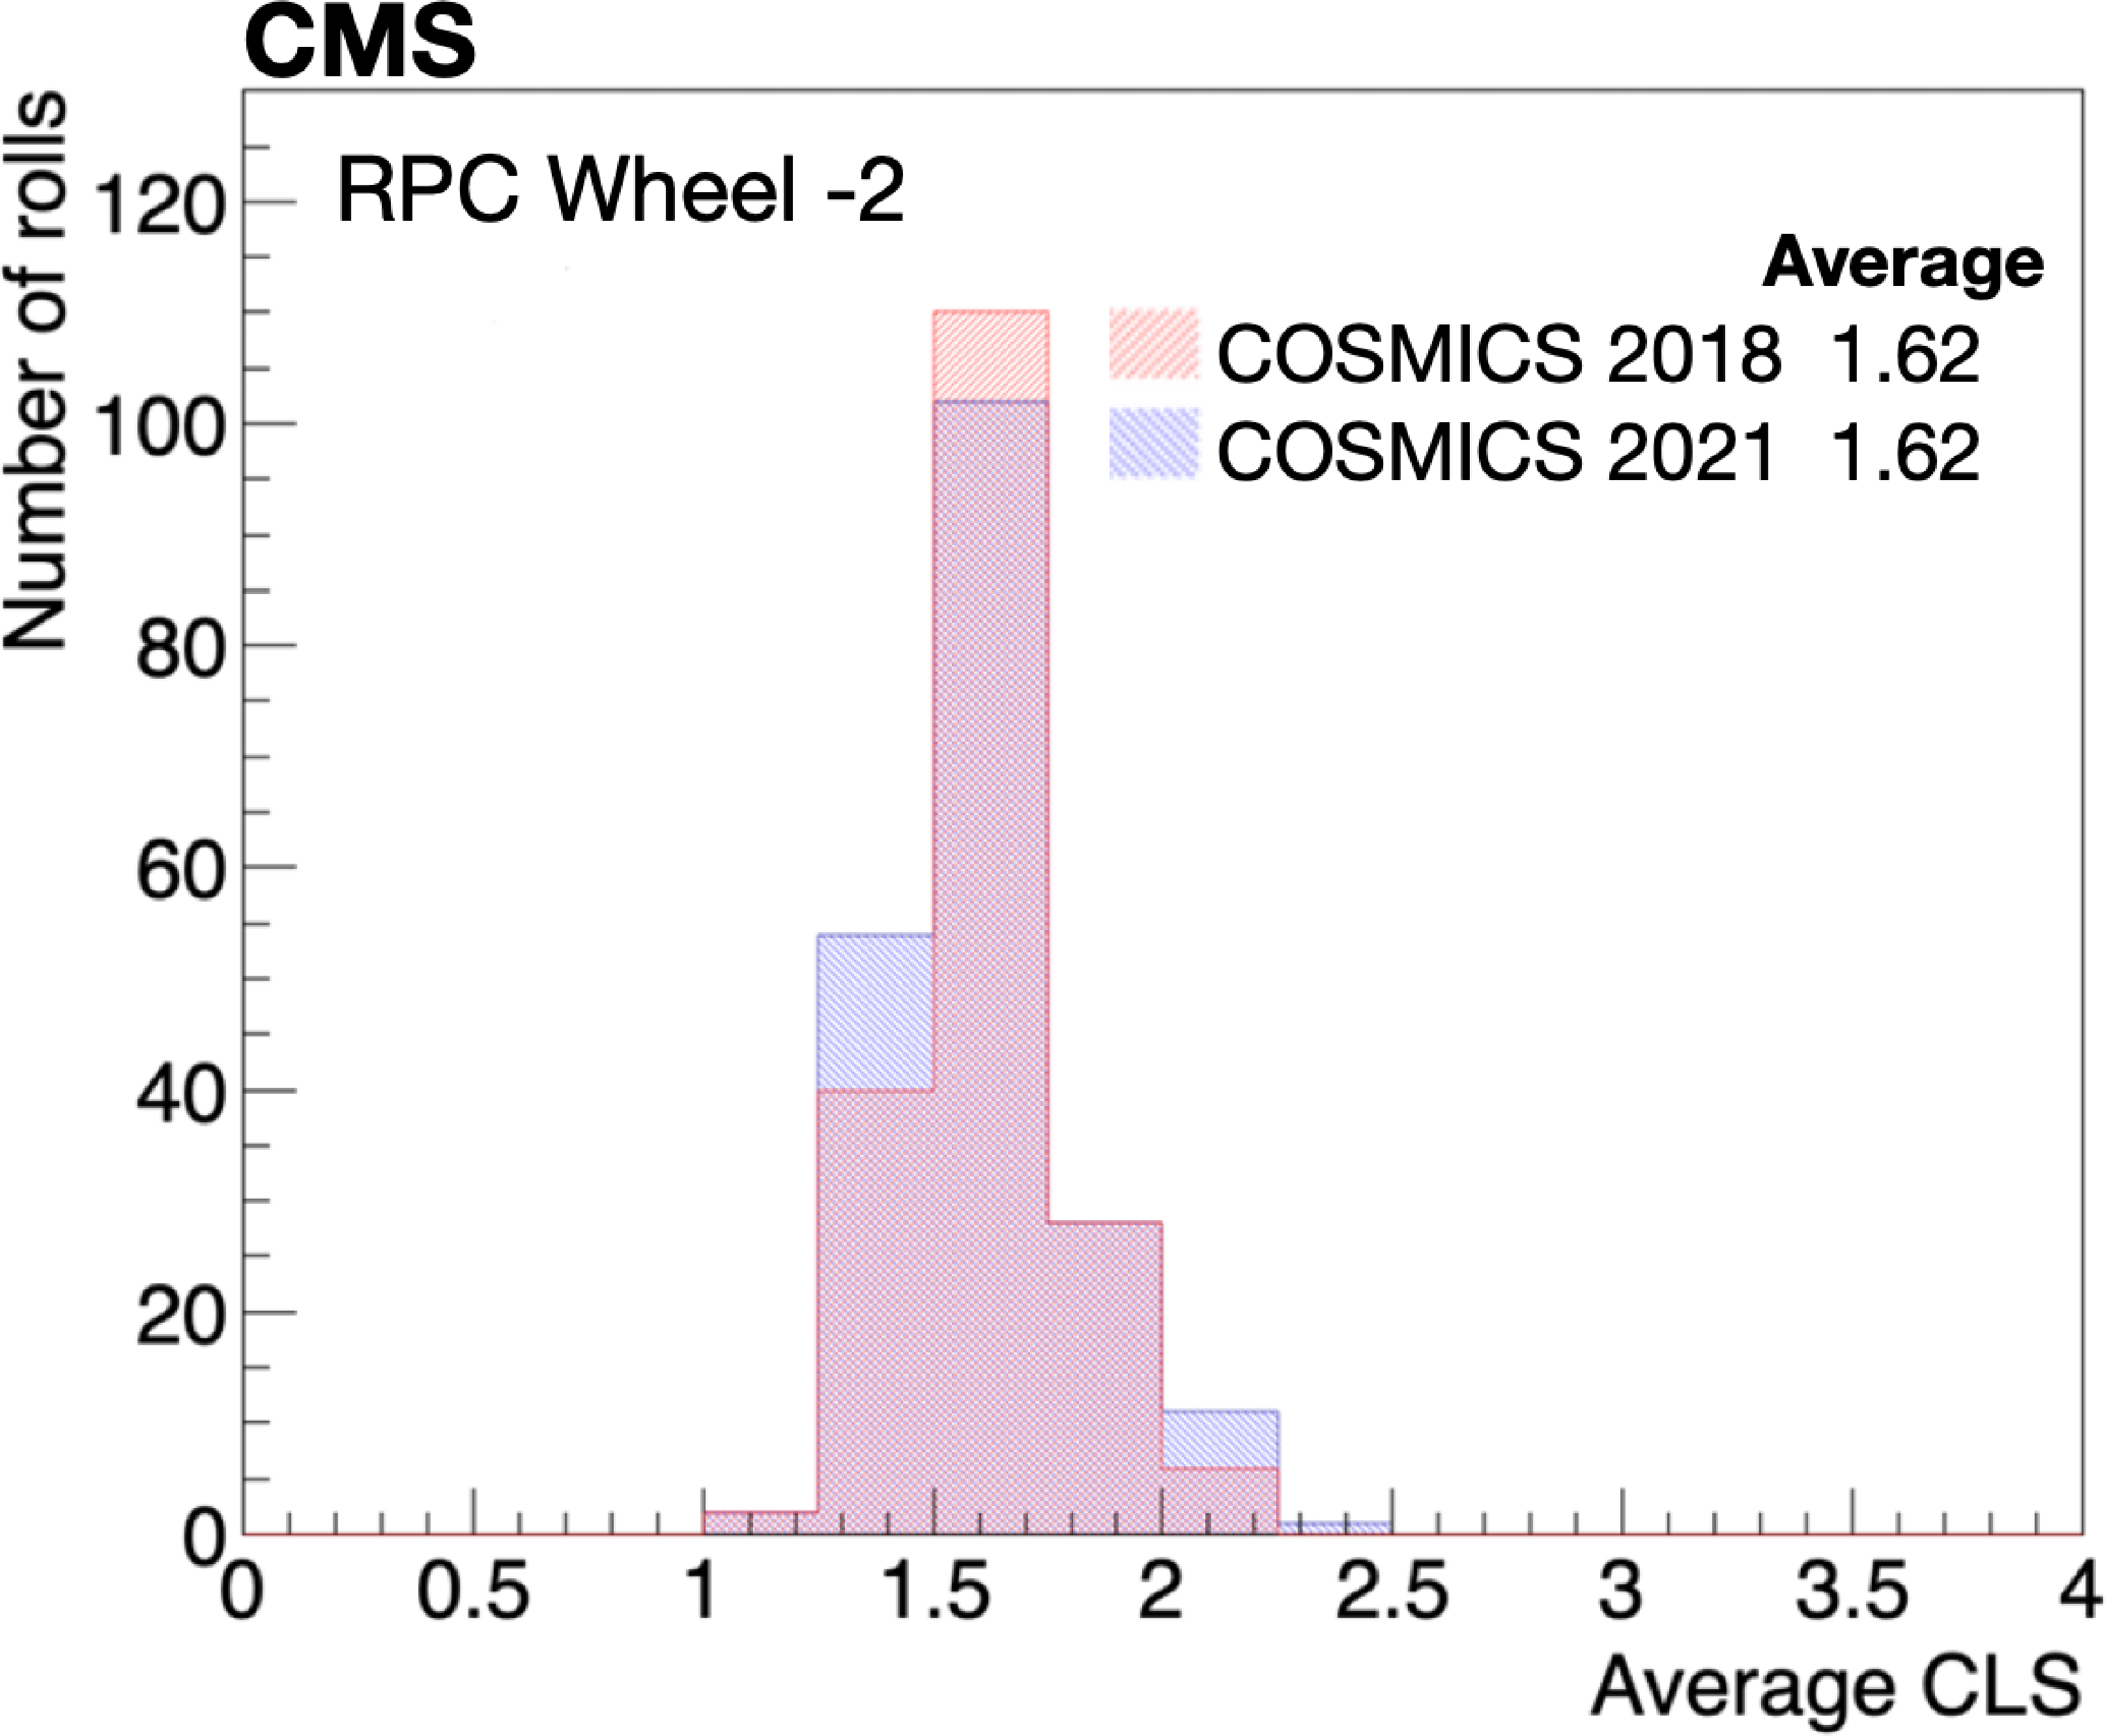
Figure 72:
Left: distribution of the efficiency per roll in the RPC barrel chambers. Only chambers with rolls of efficiency greater than 70% are considered. Right: average cluster size for the RPC barrel chambers in wheel W-2. In both figures, the cosmic ray muon data from 2018 (2021) are indicated in red (blue). |
png pdf |
Figure 72-a:
Distribution of the efficiency per roll in the RPC barrel chambers. Only chambers with rolls of efficiency greater than 70% are considered. |
png pdf |
Figure 72-b:
Average cluster size for the RPC barrel chambers in wheel W-2. In both figures, the cosmic ray muon data from 2018 (2021) are indicated in red (blue). |
png pdf |
Figure 73:
Sketch of GE1/1 system of one endcap indicating its location relative to the full endcap muon system, the endcap calorimeter, and the shielding elements. |
png pdf jpg |
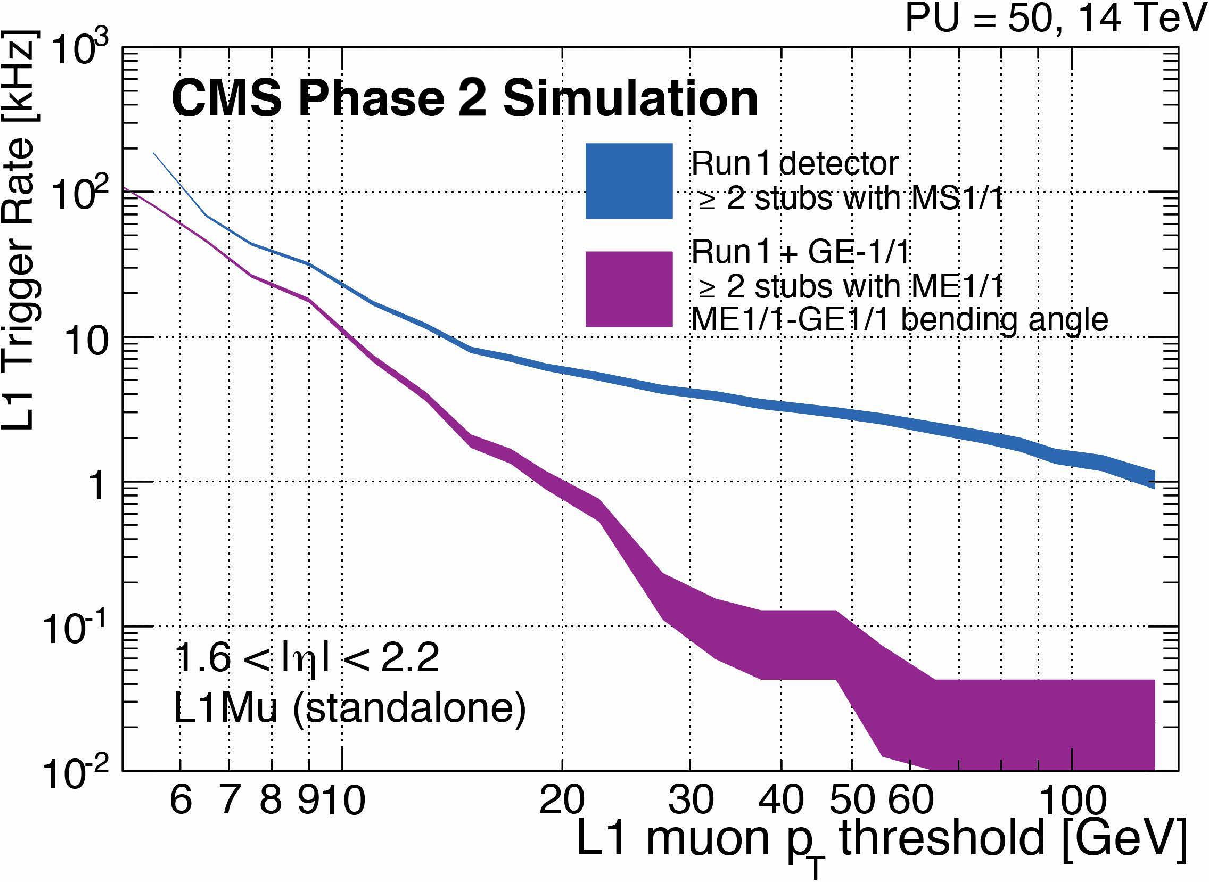
Figure 74:
L1 muon trigger rate with and without the GE1/1 upgrade, assuming an instantaneous luminosity of 2 $ \times$ 10$^{34}$ cm$^{2}$s$^{-1}$, where MS1/1 indicates the first muon station [96]. |

png pdf |
Figure 75:
Left: layout of the GE1/1 chambers along the endcap ring, indicating how the short and long chambers fit in the existing volume. Right: blowup of the trapezoidal detector, GEM foils, and readout planes, indicating the geometry and main elements of the GEM detectors [124]. |
png pdf |
Figure 75-b:
Blowup of the trapezoidal detector, GEM foils, and readout planes, indicating the geometry and main elements of the GEM detectors [124]. |
png pdf |
Figure 76:
Sketch of a triple GEM detector showing the three foils, cathode, readout PCB and amplification [96]. |

png pdf |
Figure 77:
GE1/1 drift board (left) and a magnified view of the drift board (right) showing the HV pins and the resistor and capacitor network connecting to the chamber HV supply. |
png pdf |
Figure 78:
Electron scanning microscope image of a GE1/1 foil (left) and a diagram of the multiplication principle (right) [96]. |
png pdf |
Figure 79:
Left: periphery GE1/1 gas rack. Center: location of the gas lines feeding the GE1/1 chambers. Right: exploded view of a GE1/1 chamber showing the gas plug attached to the readout board. |
png |
Figure 79-a:
Periphery GE1/1 gas rack. Center: location of the gas lines feeding the GE1/1 chambers. |
png pdf |
Figure 80:
GE1/1 electronics overview showing the frontend electronics, VFAT, GEB, and opto-hybrid boards, as well as the optical links and backend readout with connections to the L1 trigger and DAQ. |
png pdf |
Figure 81:
Picture of the VFAT3 ASIC (left) and a high-level schematic (right). |
png pdf jpg |
Figure 82:
Photo of the GE1/1 opto-hybrid board with the Xilinx Virtex-6 FPGA at the center. |
png pdf |
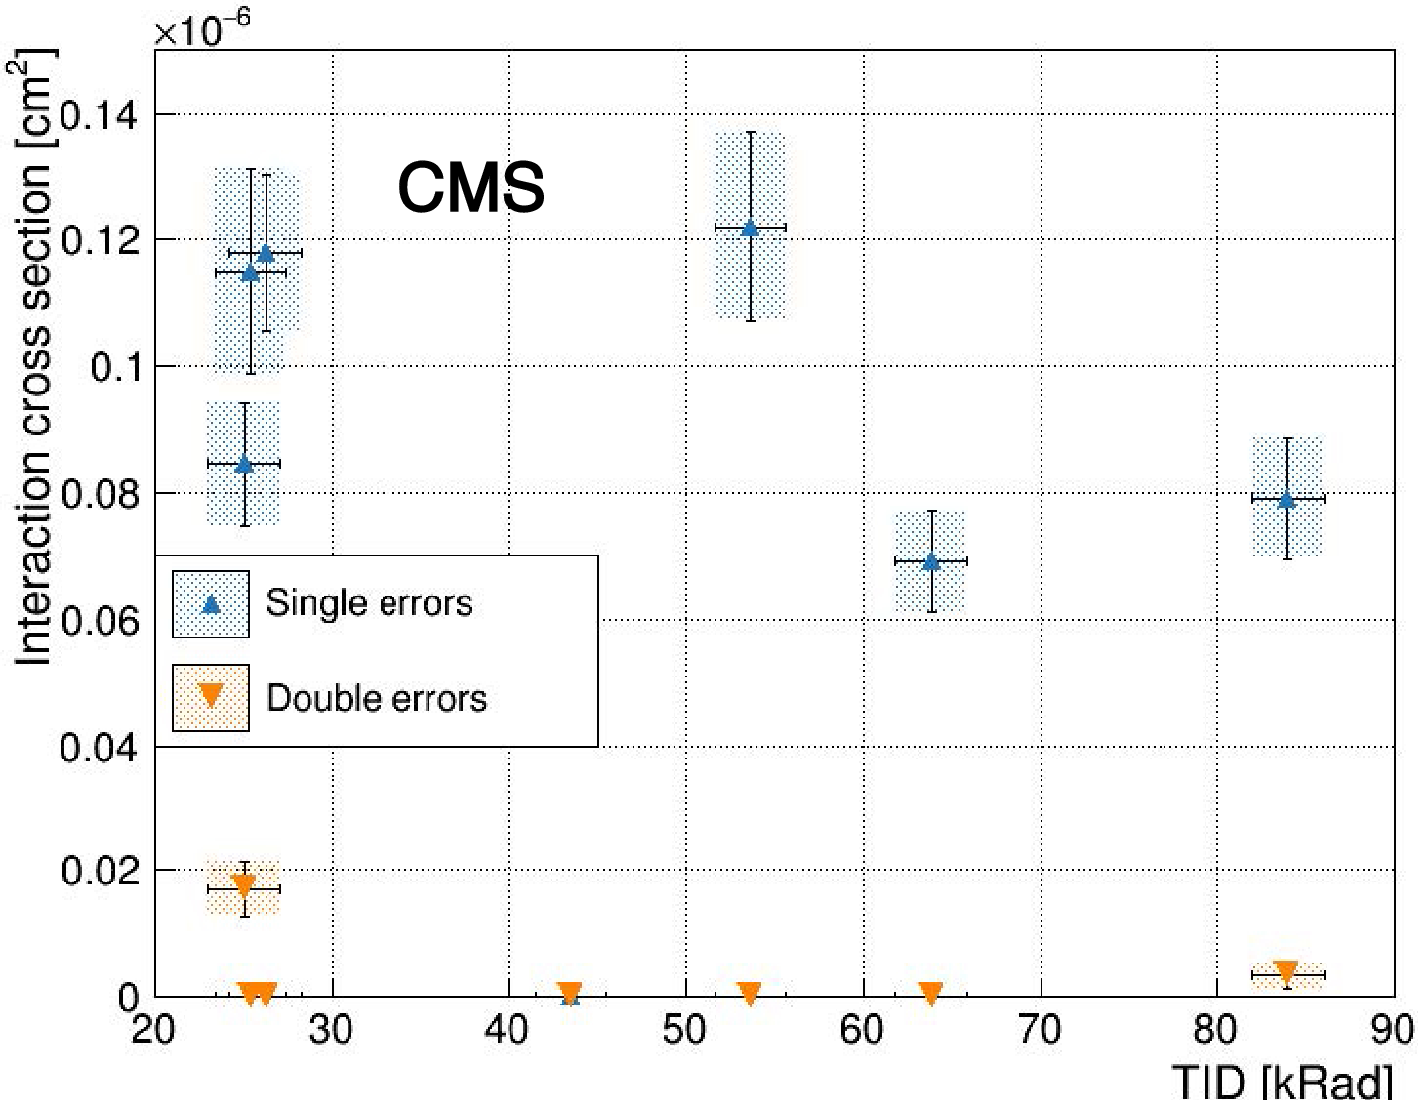
Figure 83:
Single- and double-error cross sections measured in irradiation tests as a function of the TID. |
png pdf |
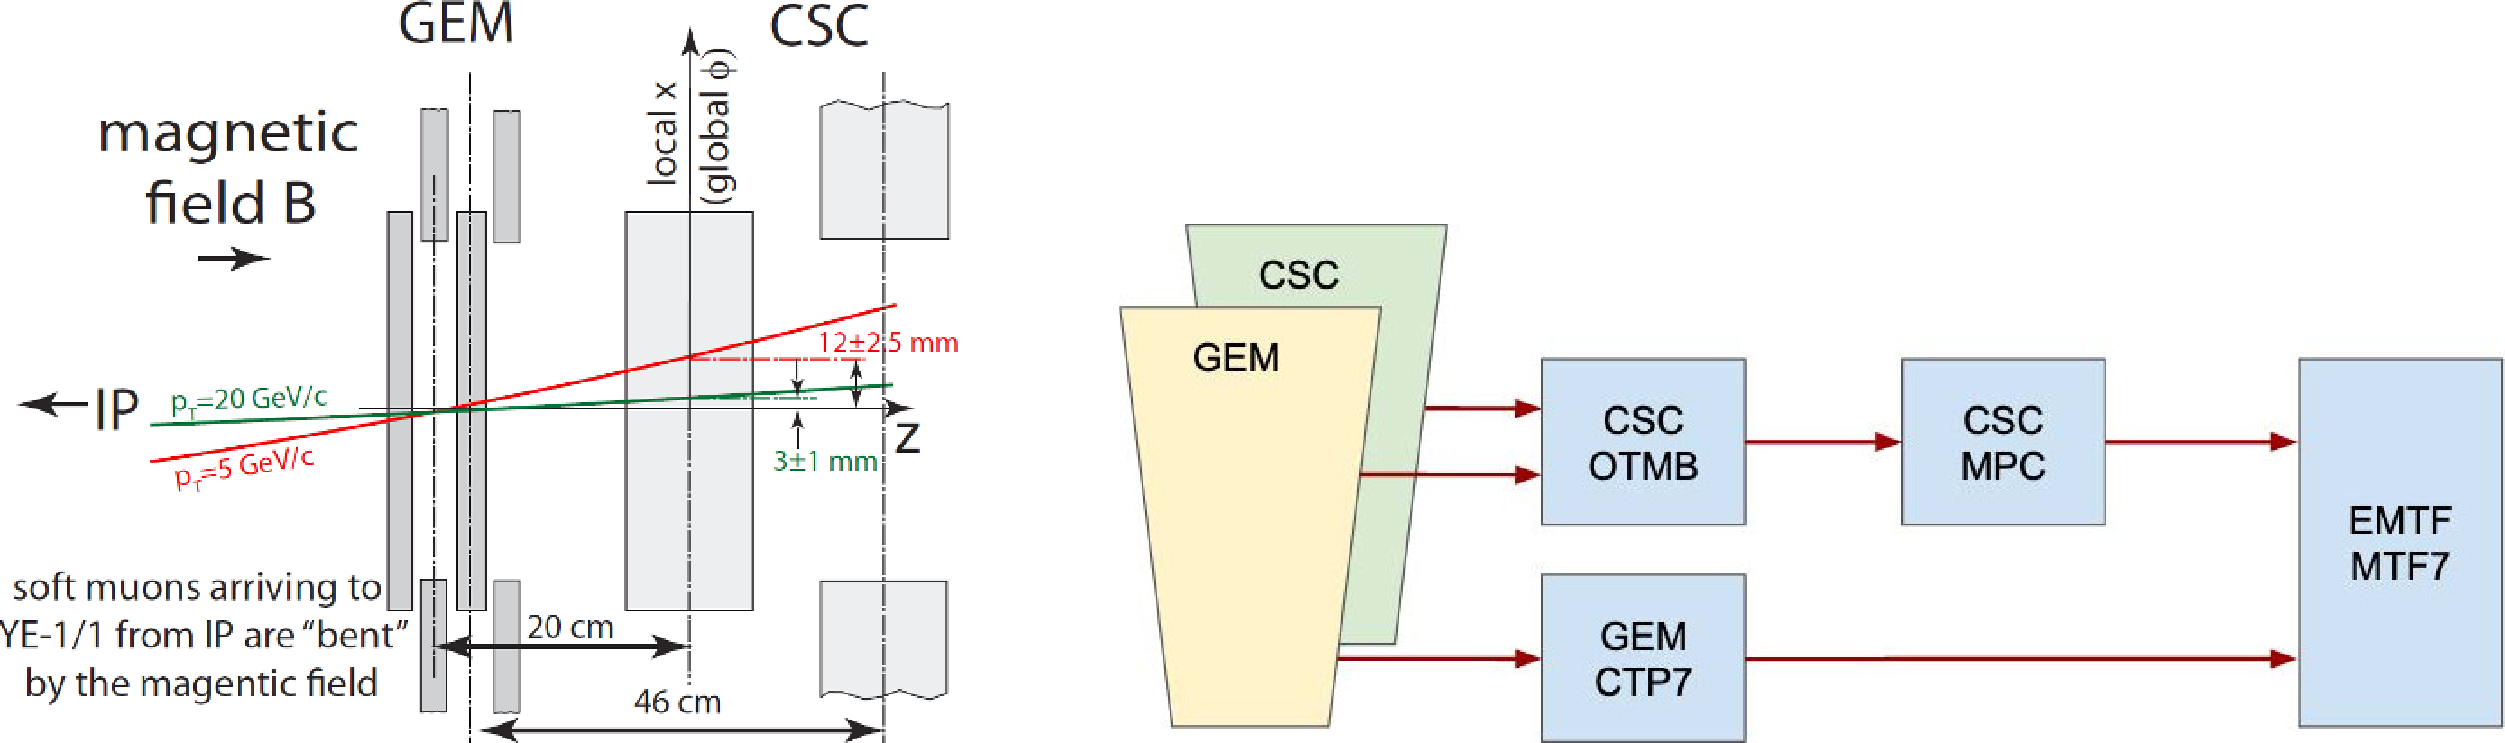
Figure 84:
Side view of the GEM-CSC trigger coincidence (left) and schematic overview of the data flow in the GEM and CSC trigger processor (right). The addition of the GE1/1 station significantly increases (by a factor of 3 to 5) the lever arm of the distance traveled in $ z $ by a muon originating from the interaction point. The bending angle between the entrance of the muon to the GE1/1 station and the exit from the ME1/1 CSC station can be used to estimate the momentum of the muon. |
png |
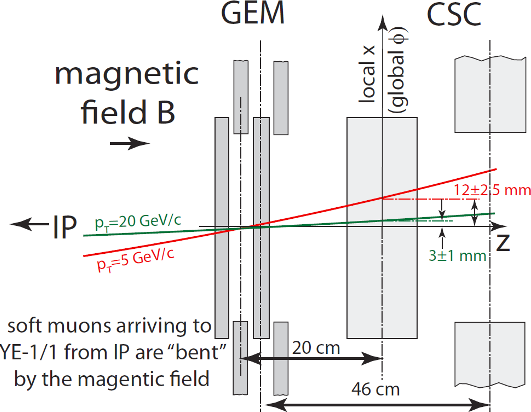
Figure 84-a:
Side view of the GEM-CSC trigger coincidence. |
png pdf |
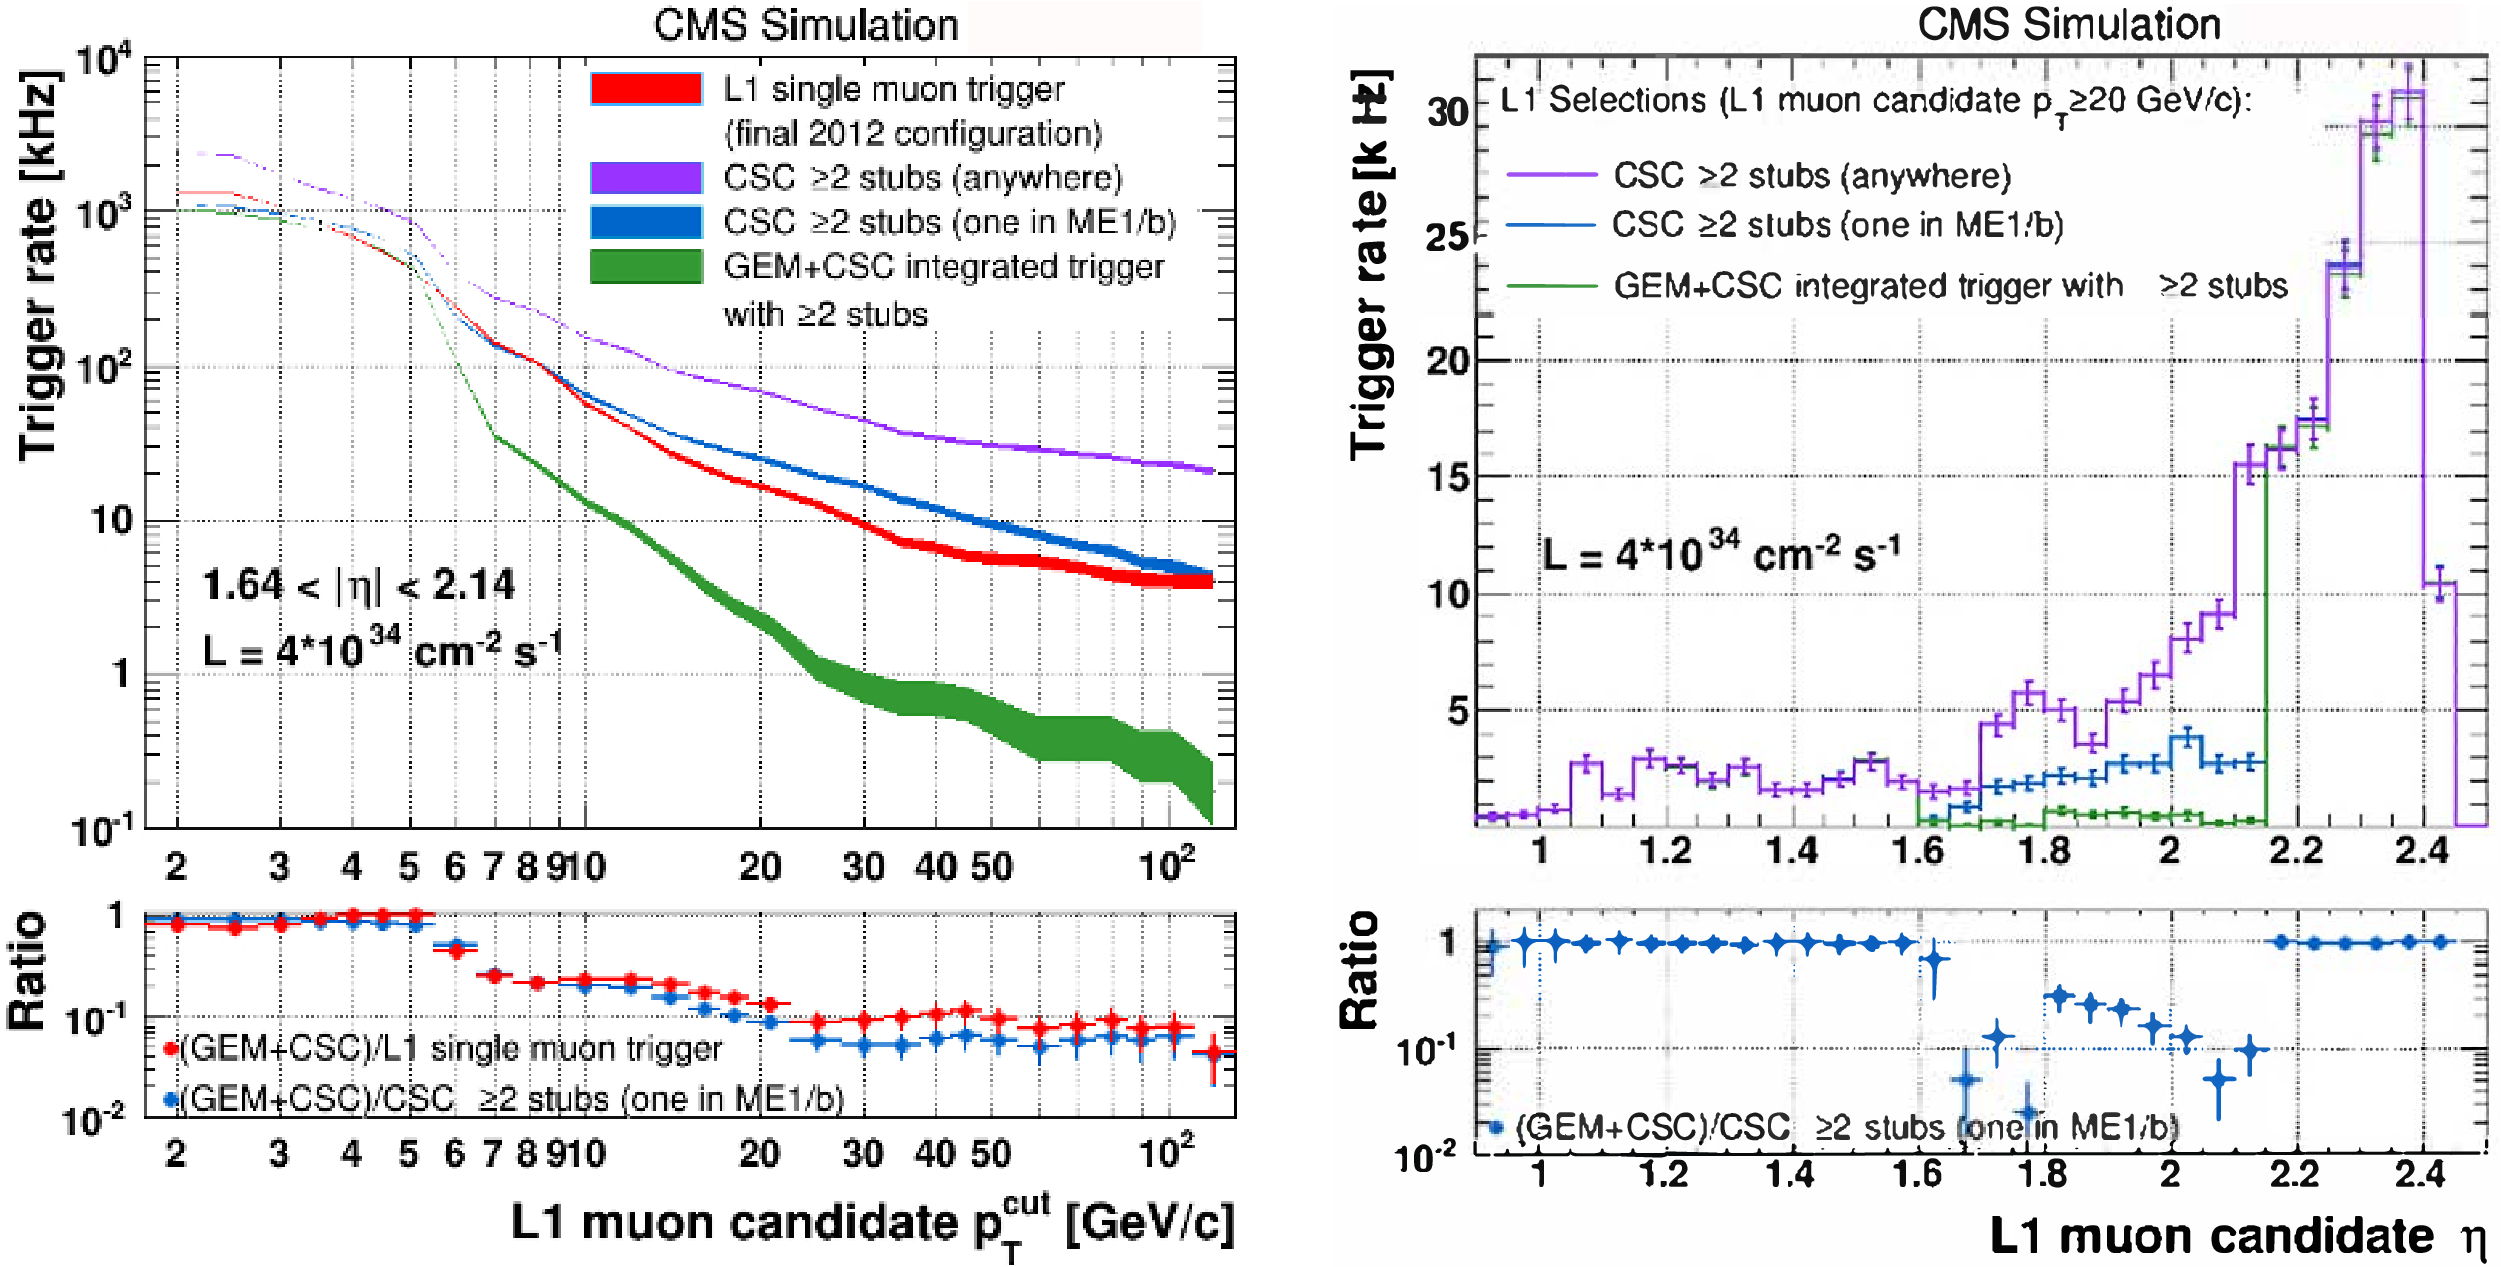
Figure 85:
Muon rate from simulation as a function of $ p_{\mathrm{T}} $ (left) and $ \eta $ (right) with and without the integration of the GEM chambers under various assumptions [96]. |
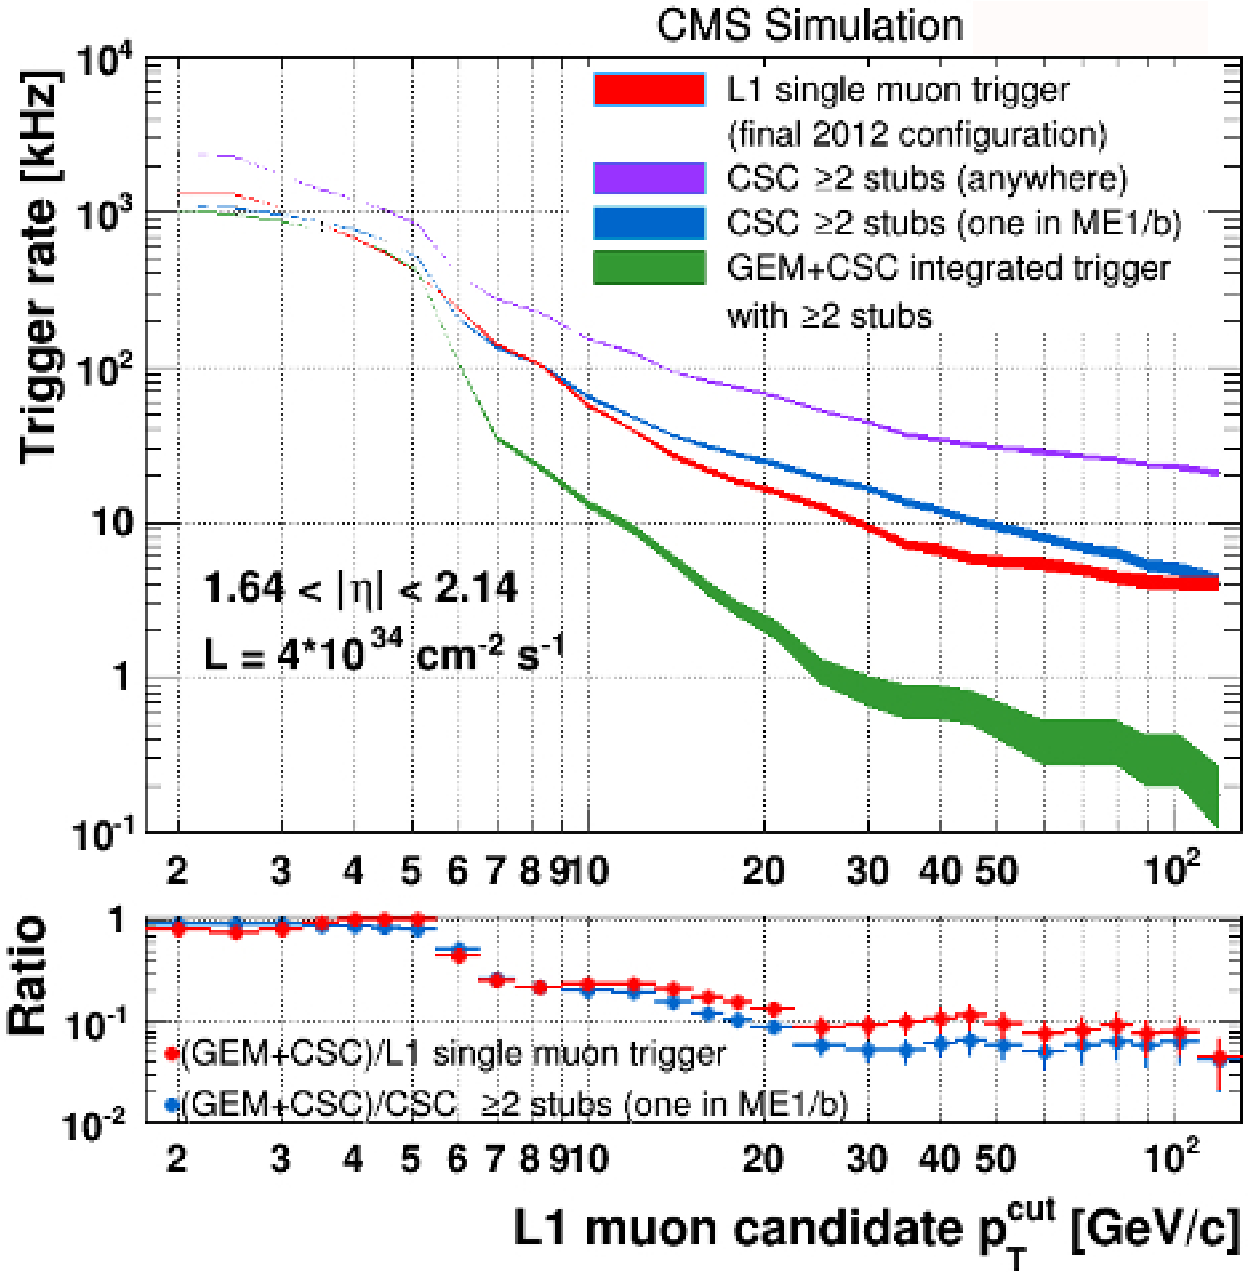
png pdf |
Figure 85-a:
Muon rate from simulation as a function of $ p_{\mathrm{T}} $ with and without the integration of the GEM chambers under various assumptions [96]. |

png pdf |
Figure 85-b:
Muon rate from simulation as a function of $ \eta $ with and without the integration of the GEM chambers under various assumptions [96]. |
png pdf |
Figure 86:
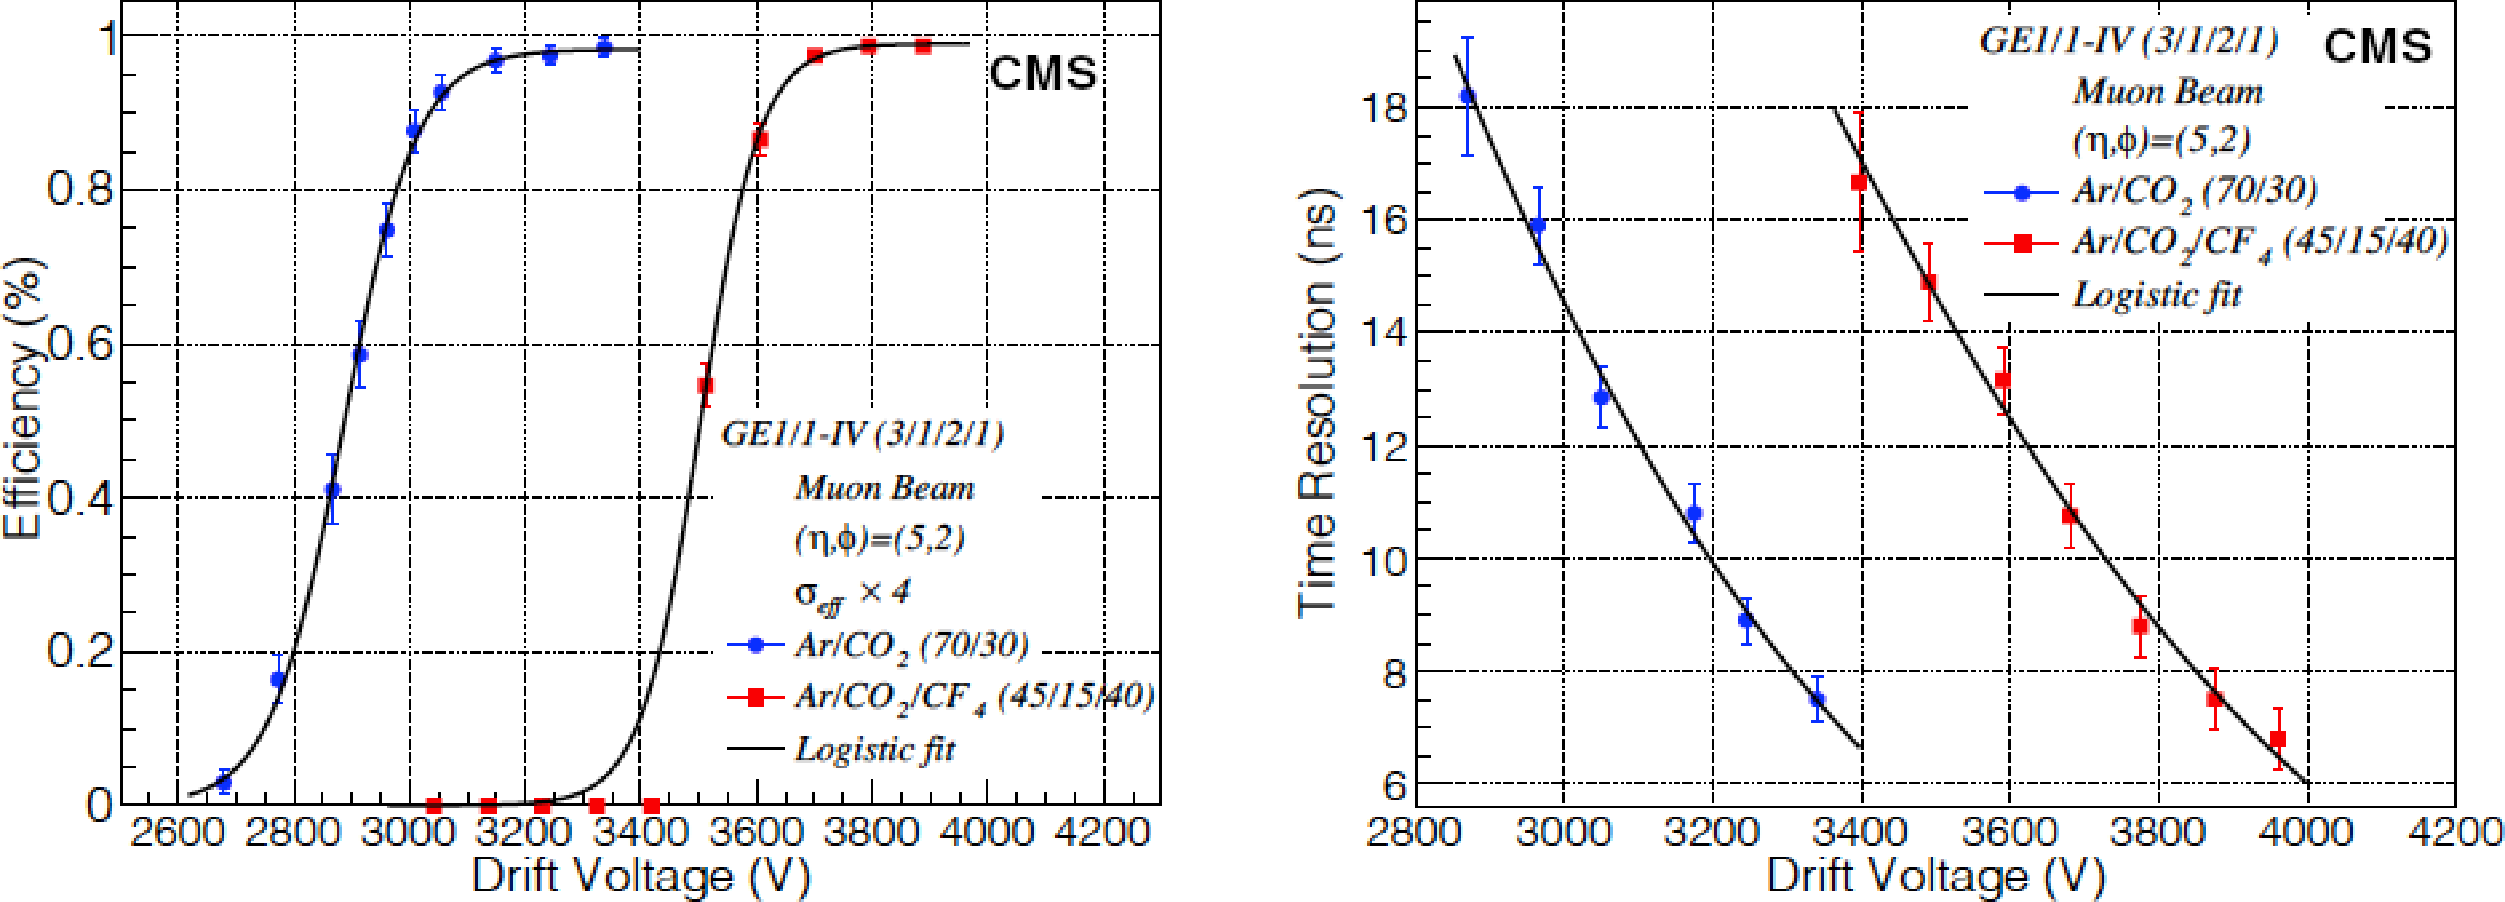
GEM test beam results showing the efficiency (left) and time resolution (right) as a function of the drift voltage placed on the GEM foils. The chosen gas mixture Ar/c (70/30) has very similar properties to Ar/CO$_2$/CF$_4$ (45/15/40) and was selected as CF$_4$, a greenhouse gas, is being phased out of industry. |

png |
Figure 86-a:
GEM test beam results showing the efficiency as a function of the drift voltage placed on the GEM foils. The chosen gas mixture Ar/c (70/30) has very similar properties to Ar/CO$_2$/CF$_4$ (45/15/40) and was selected as CF$_4$, a greenhouse gas, is being phased out of industry. |

png |
Figure 86-b:
GEM test beam results showing the time resolution as a function of the drift voltage placed on the GEM foils. The chosen gas mixture Ar/c (70/30) has very similar properties to Ar/CO$_2$/CF$_4$ (45/15/40) and was selected as CF$_4$, a greenhouse gas, is being phased out of industry. |
png pdf |
Figure 87:
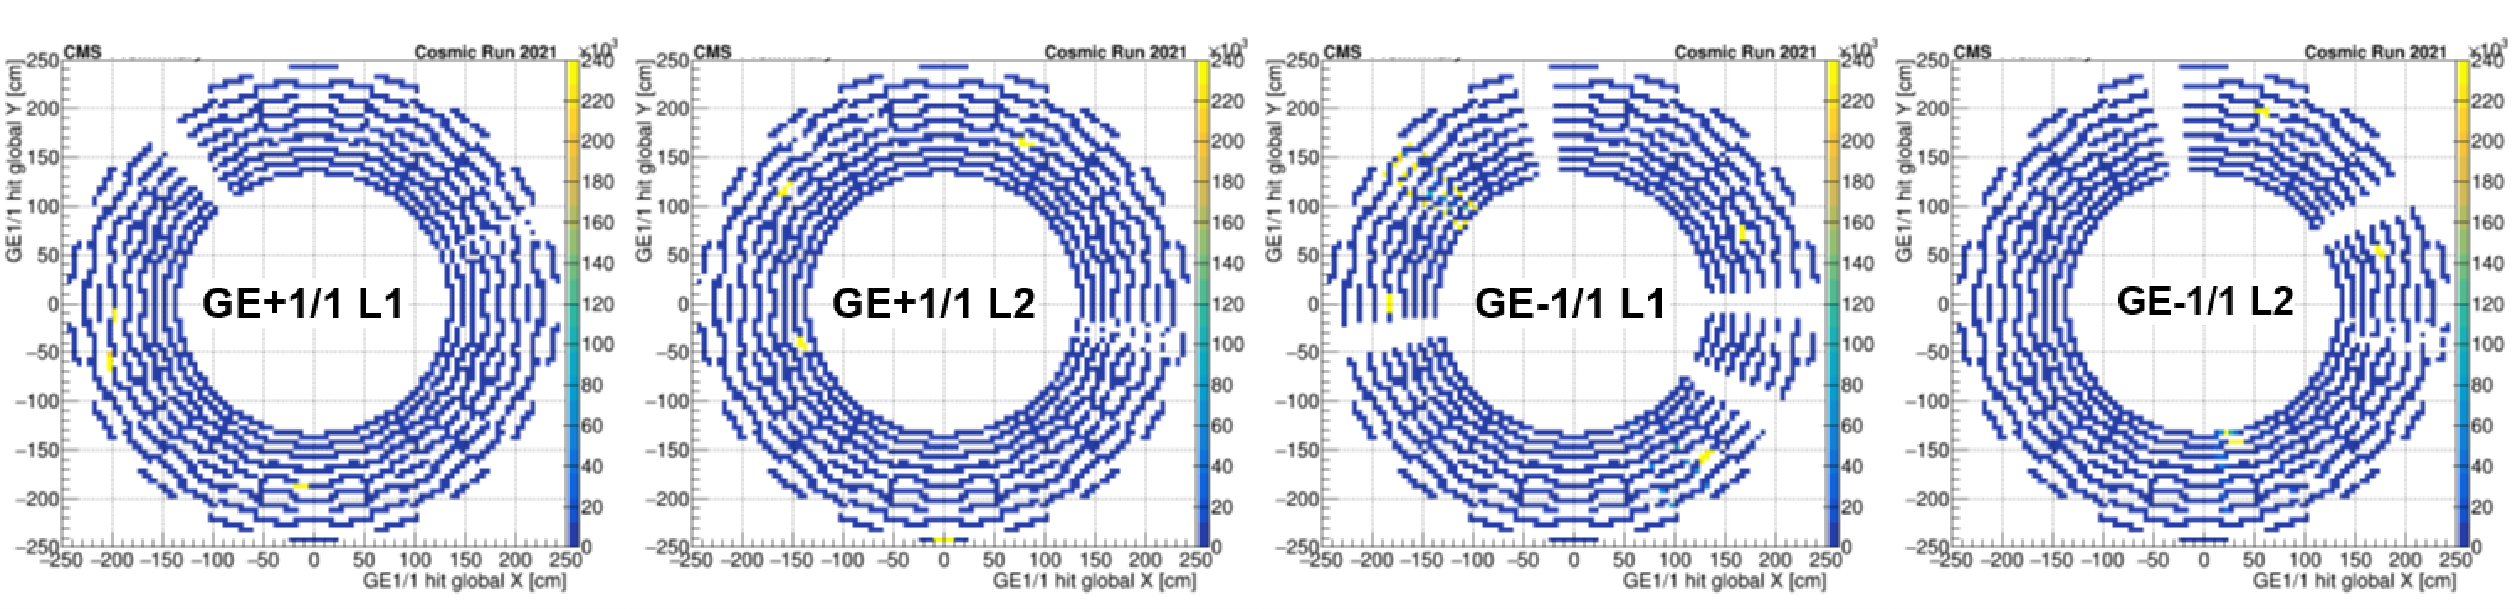
GE1/1 occupancy in cosmic ray muon data recorded in 2021. |
png pdf |
Figure 88:
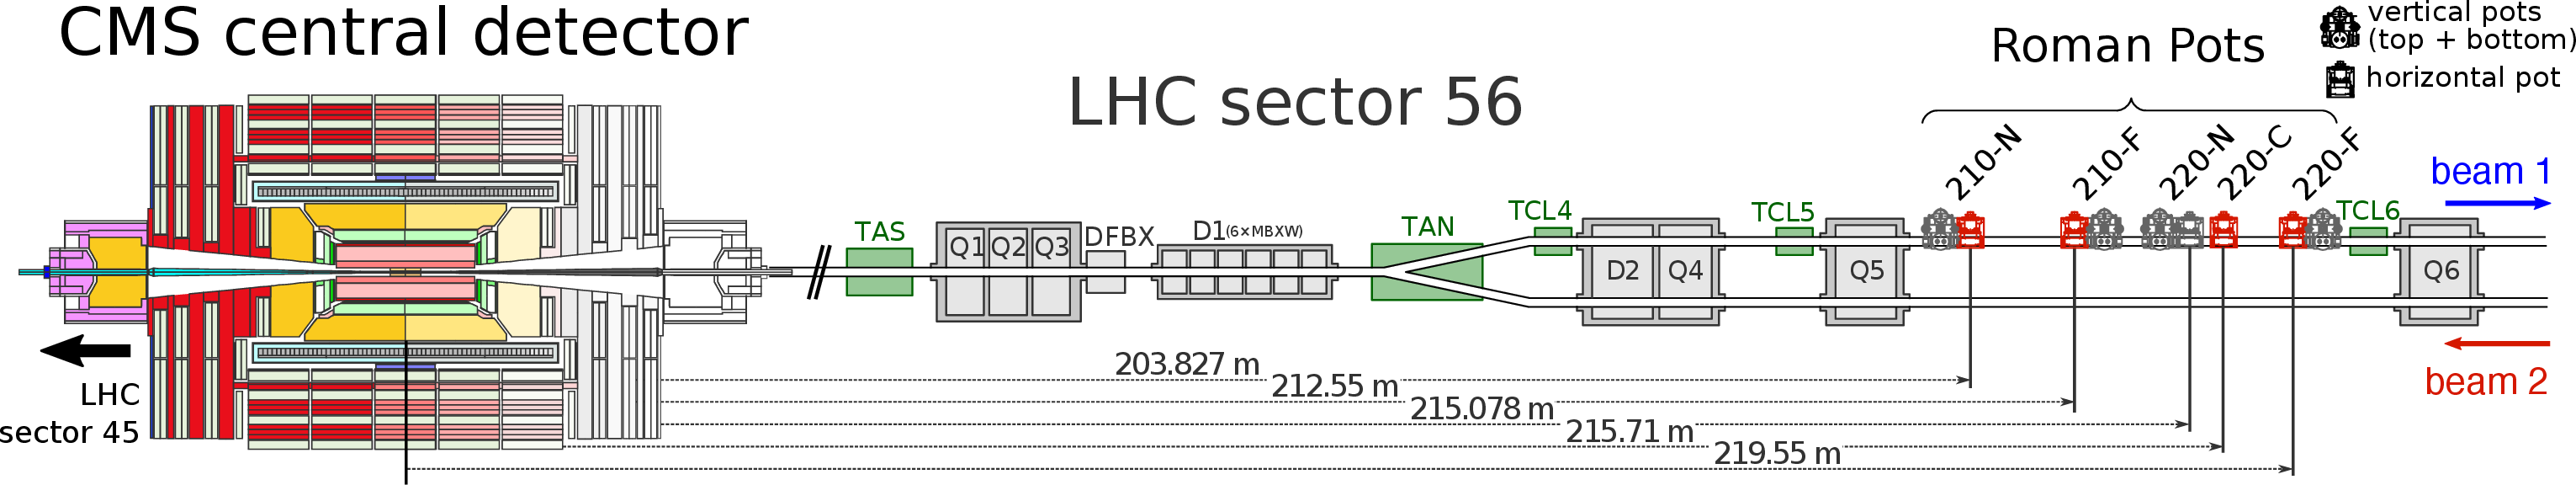
Schematic layout of the beam line between the interaction point and the RP locations in LHC sector 56, corresponding to the negative $ z $ direction in the CMS coordinate system. The accelerator magnets are indicated in gray; the collimator system elements in green. The RP units marked in red are those used by PPS during Run 2; the dark gray ones are part of the TOTEM experiment. In Run 3 the ``220 near'' horizontal unit is used in place of the ``210 near''. |
png pdf |
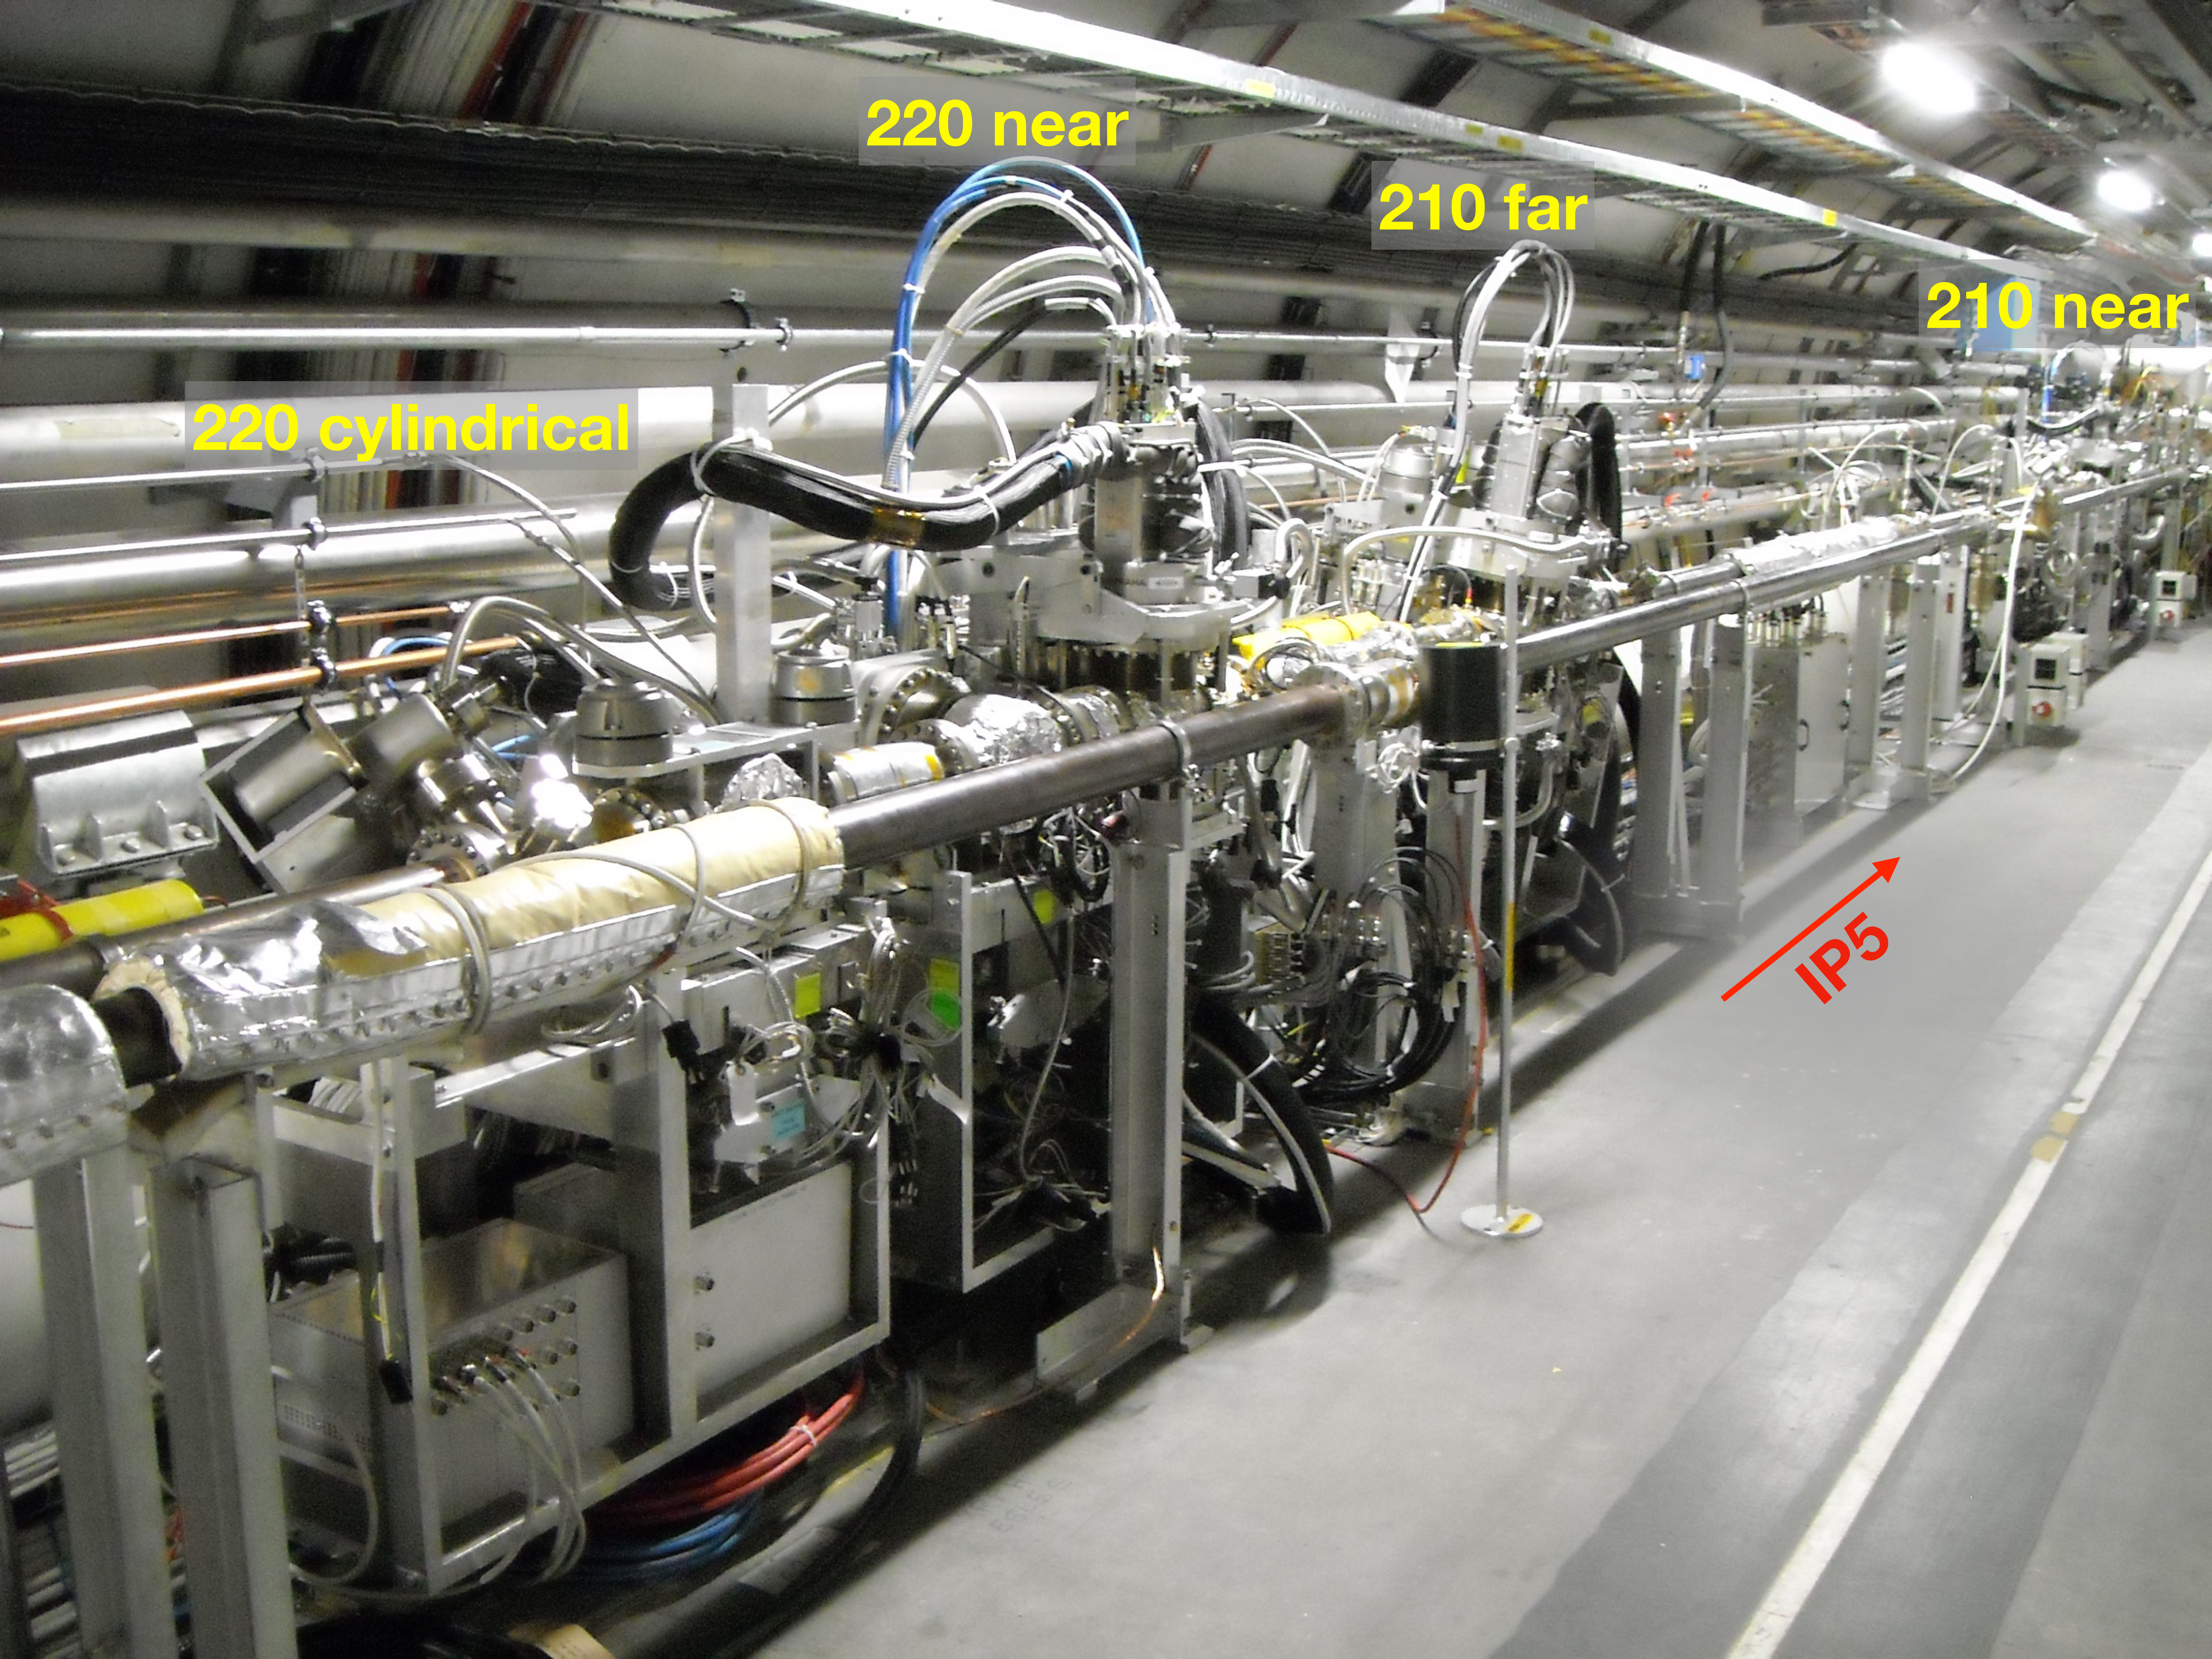
Figure 89:
View of a section of the LHC tunnel in sector 45, with part of the PPS and TOTEM RP stations along the beam line. |
png pdf |
Figure 90:
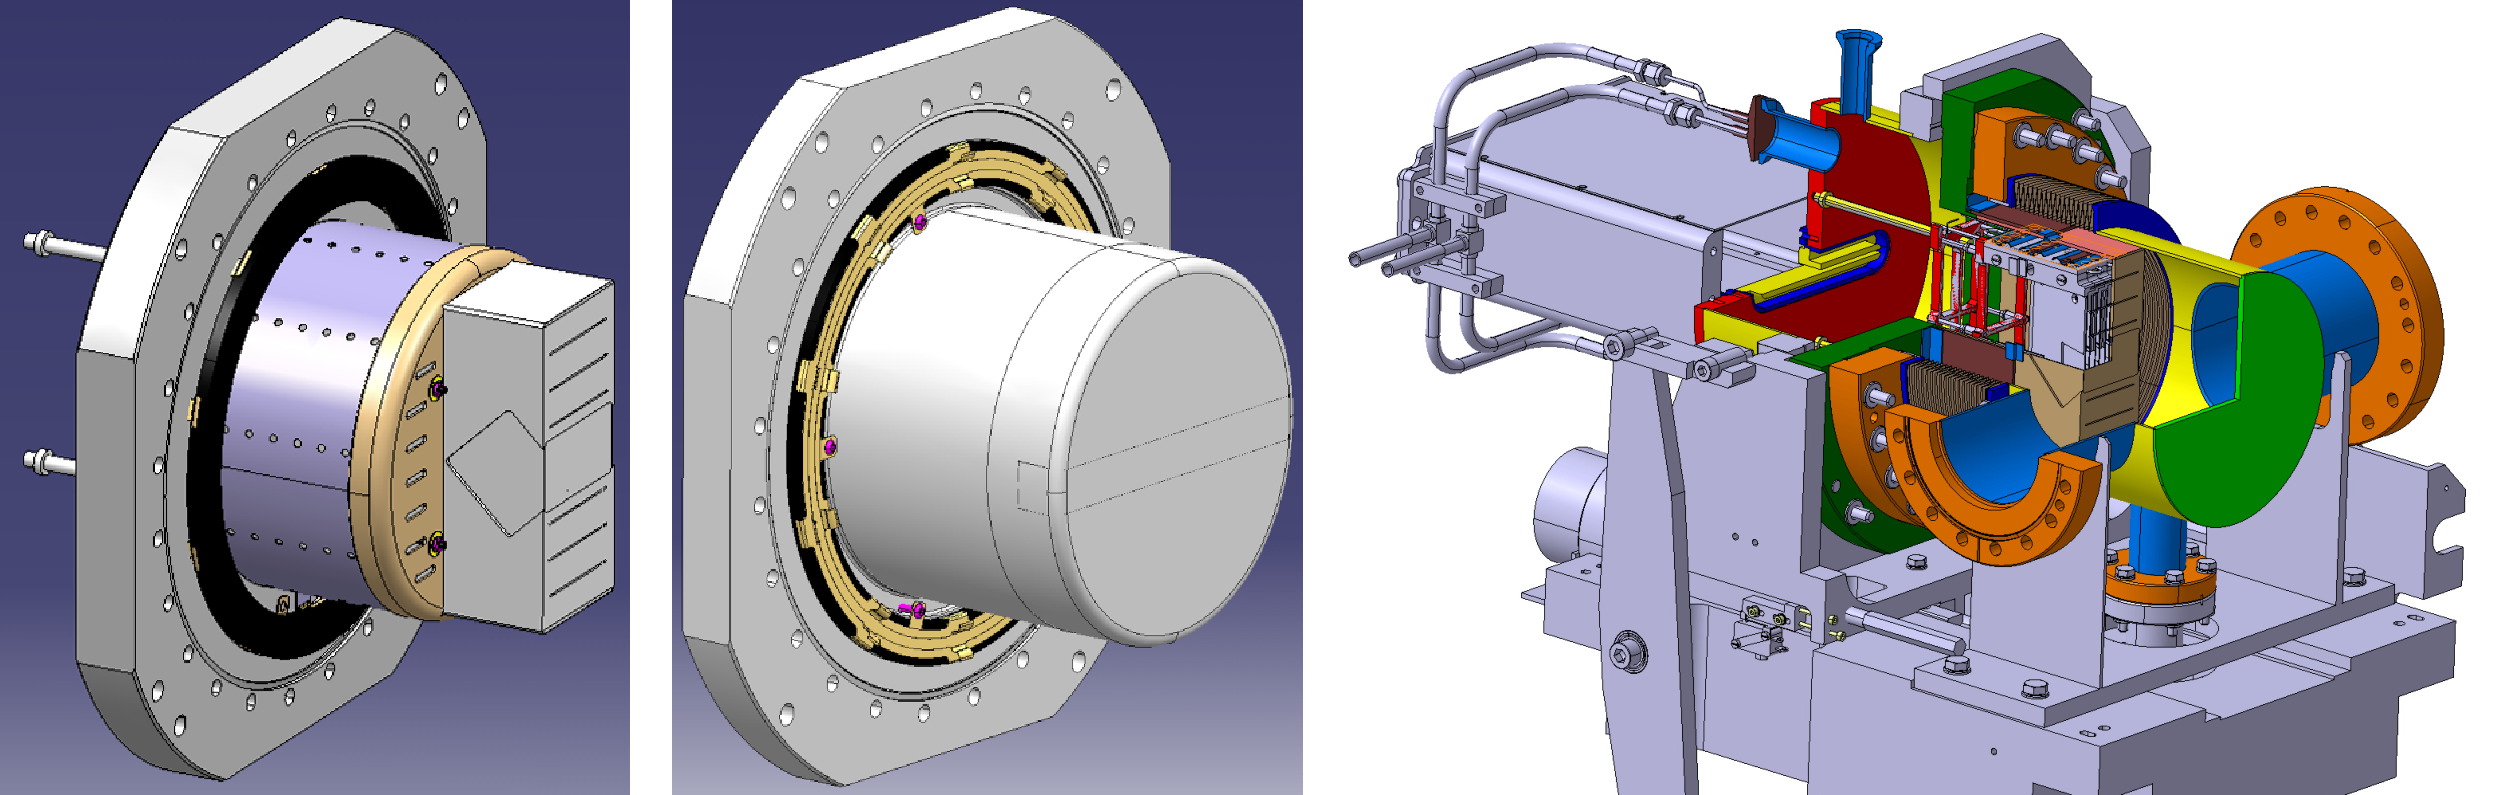
Sketches of the horizontal roman pots. Left: box-shaped pot, with the ferrite RF-shield in place. Center: cylindrical pot where the ferrite RF-shield is integrated as a ring in the flange. The thin window shapes, different for the two cases, are visible in the rightmost, vertically centered part of the pots. Right: overview of the insertion system of a box-shaped pot in a section of the LHC beam pipe. |

png |
Figure 90-a:
Box-shaped pot, with the ferrite RF-shield in place. |
png |
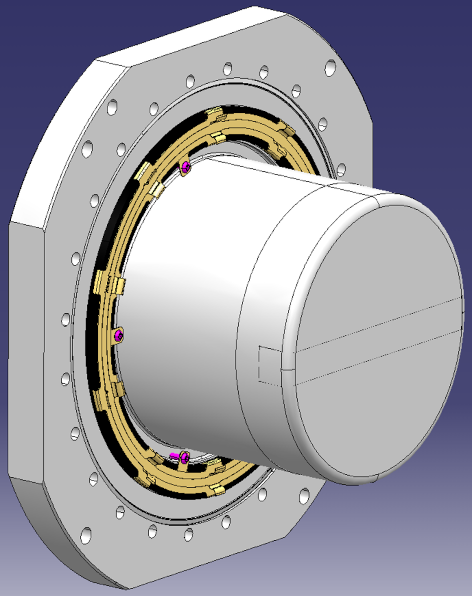
Figure 90-b:
Cylindrical pot where the ferrite RF-shield is integrated as a ring in the flange. The thin window shapes, different for the two cases, are visible in the rightmost, vertically centered part of the pots. |
png pdf |
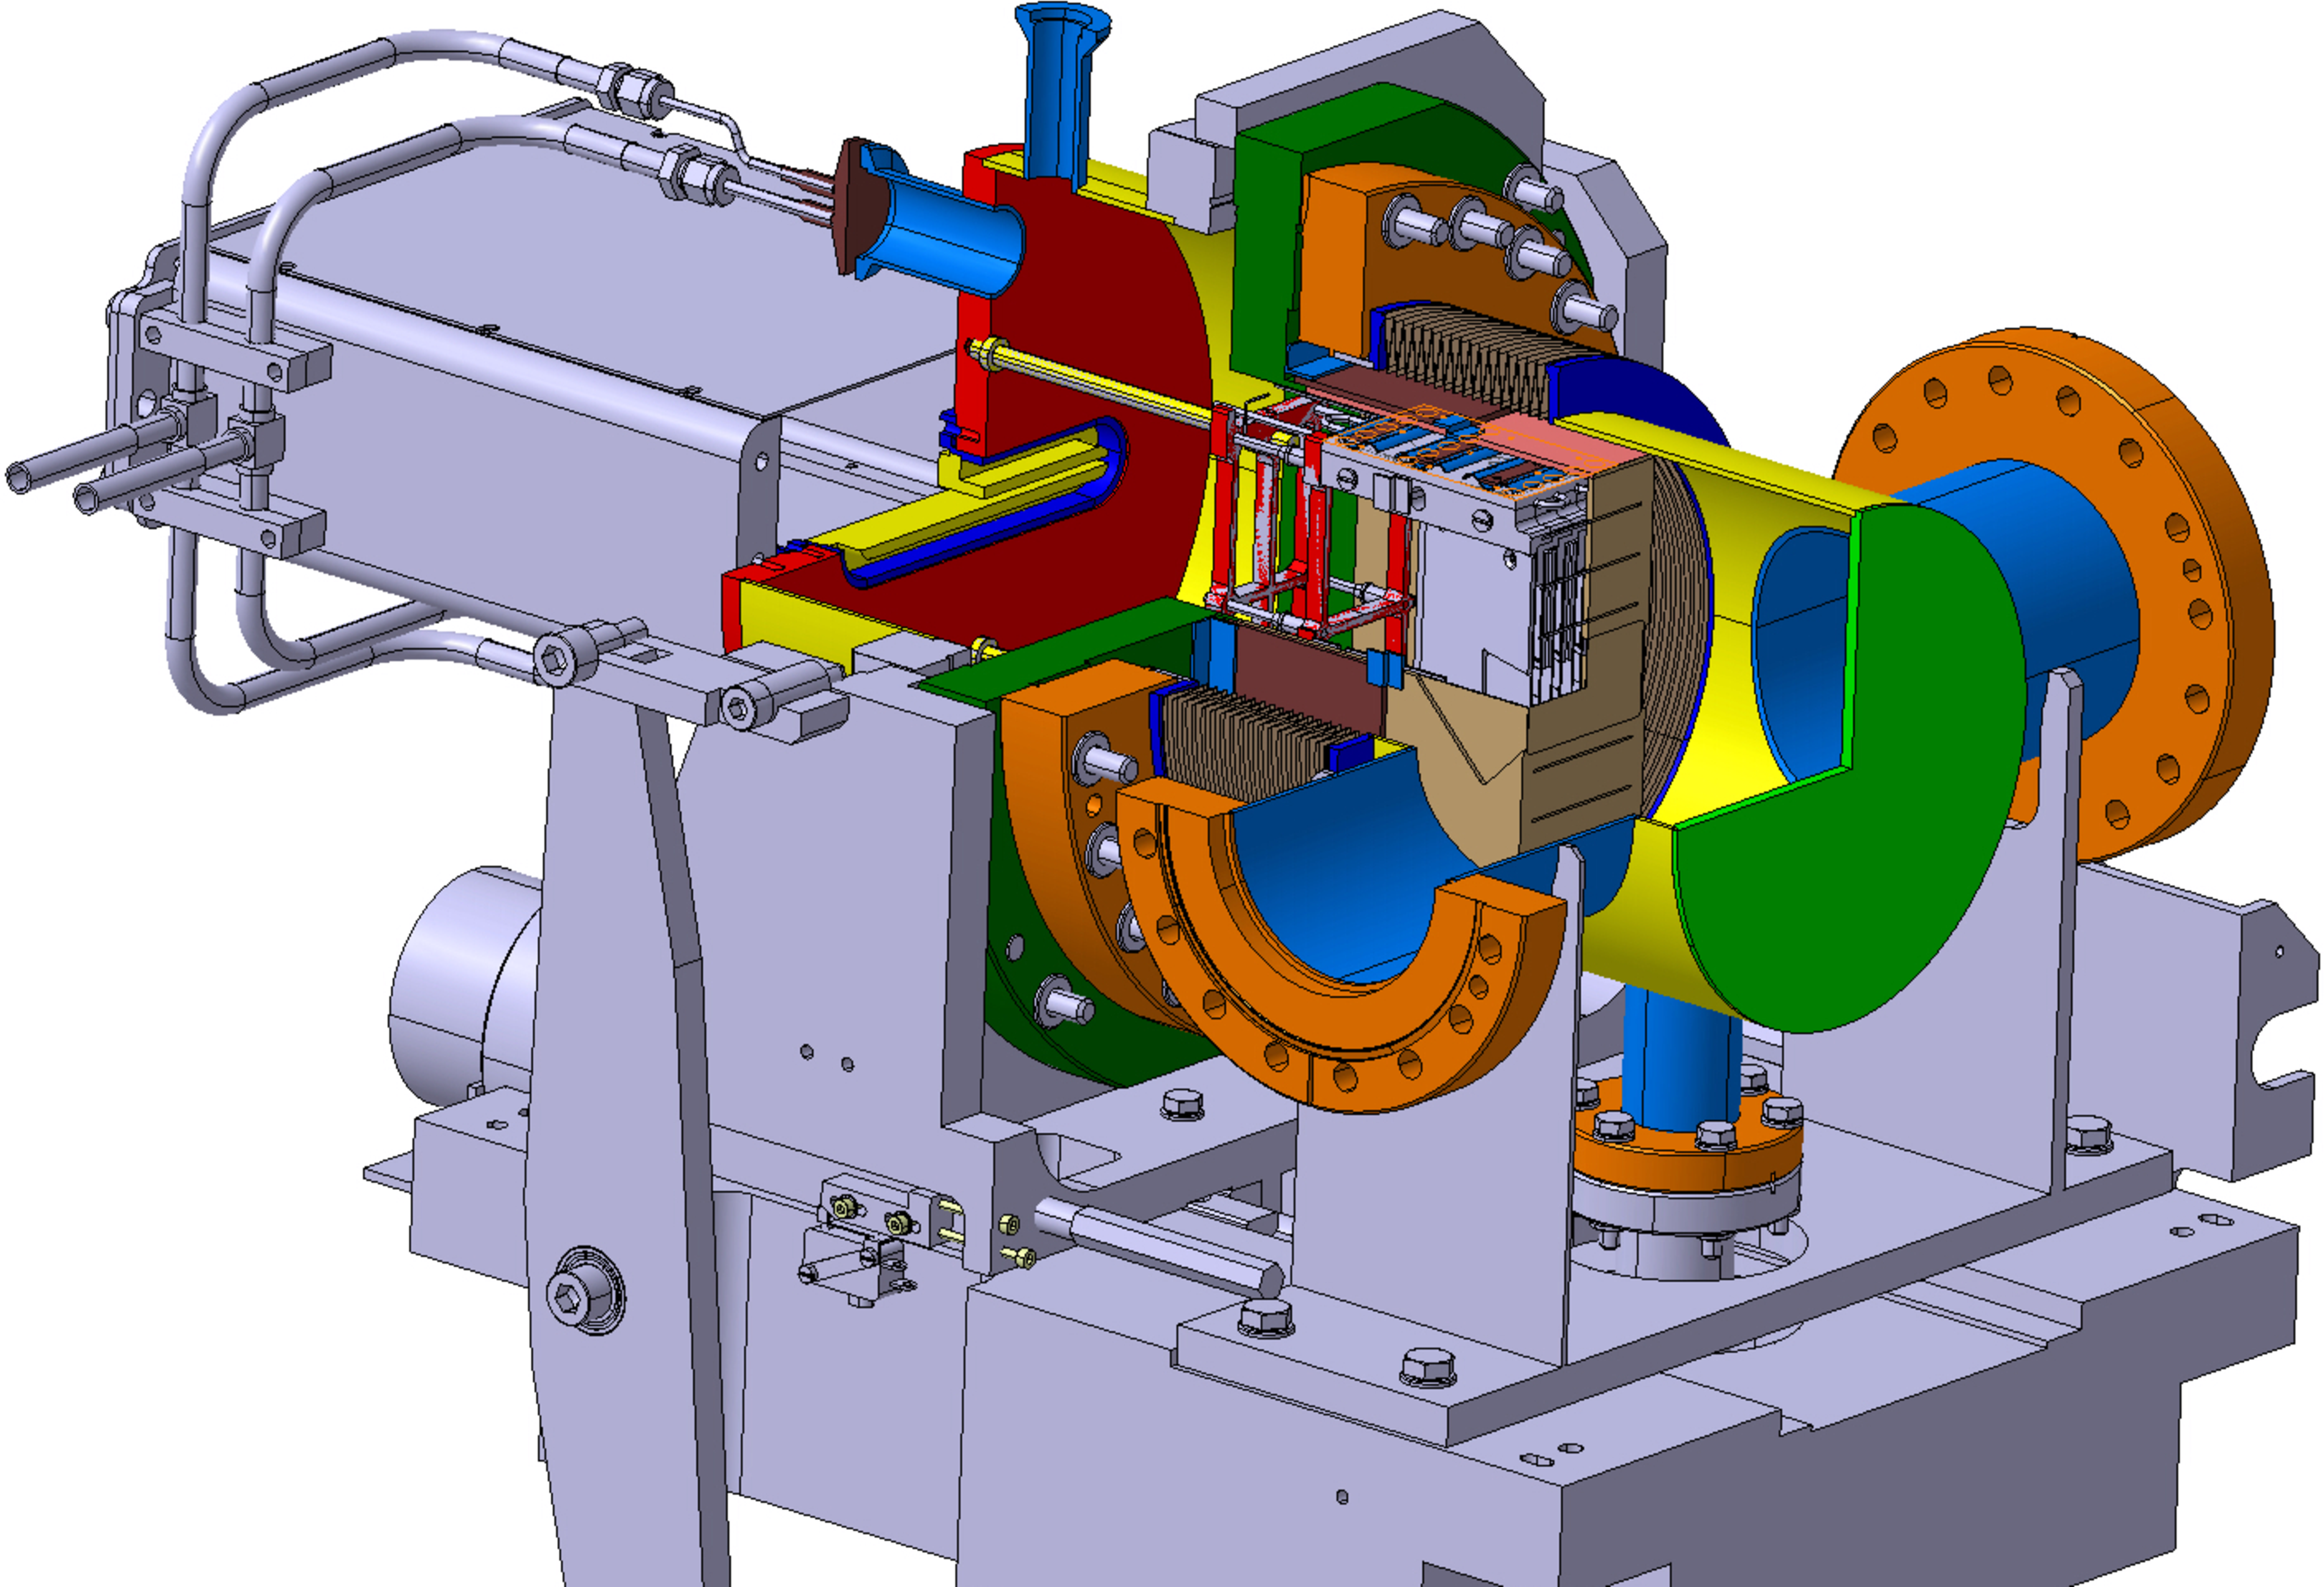
Figure 90-c:
Overview of the insertion system of a box-shaped pot in a section of the LHC beam pipe. |

png pdf |
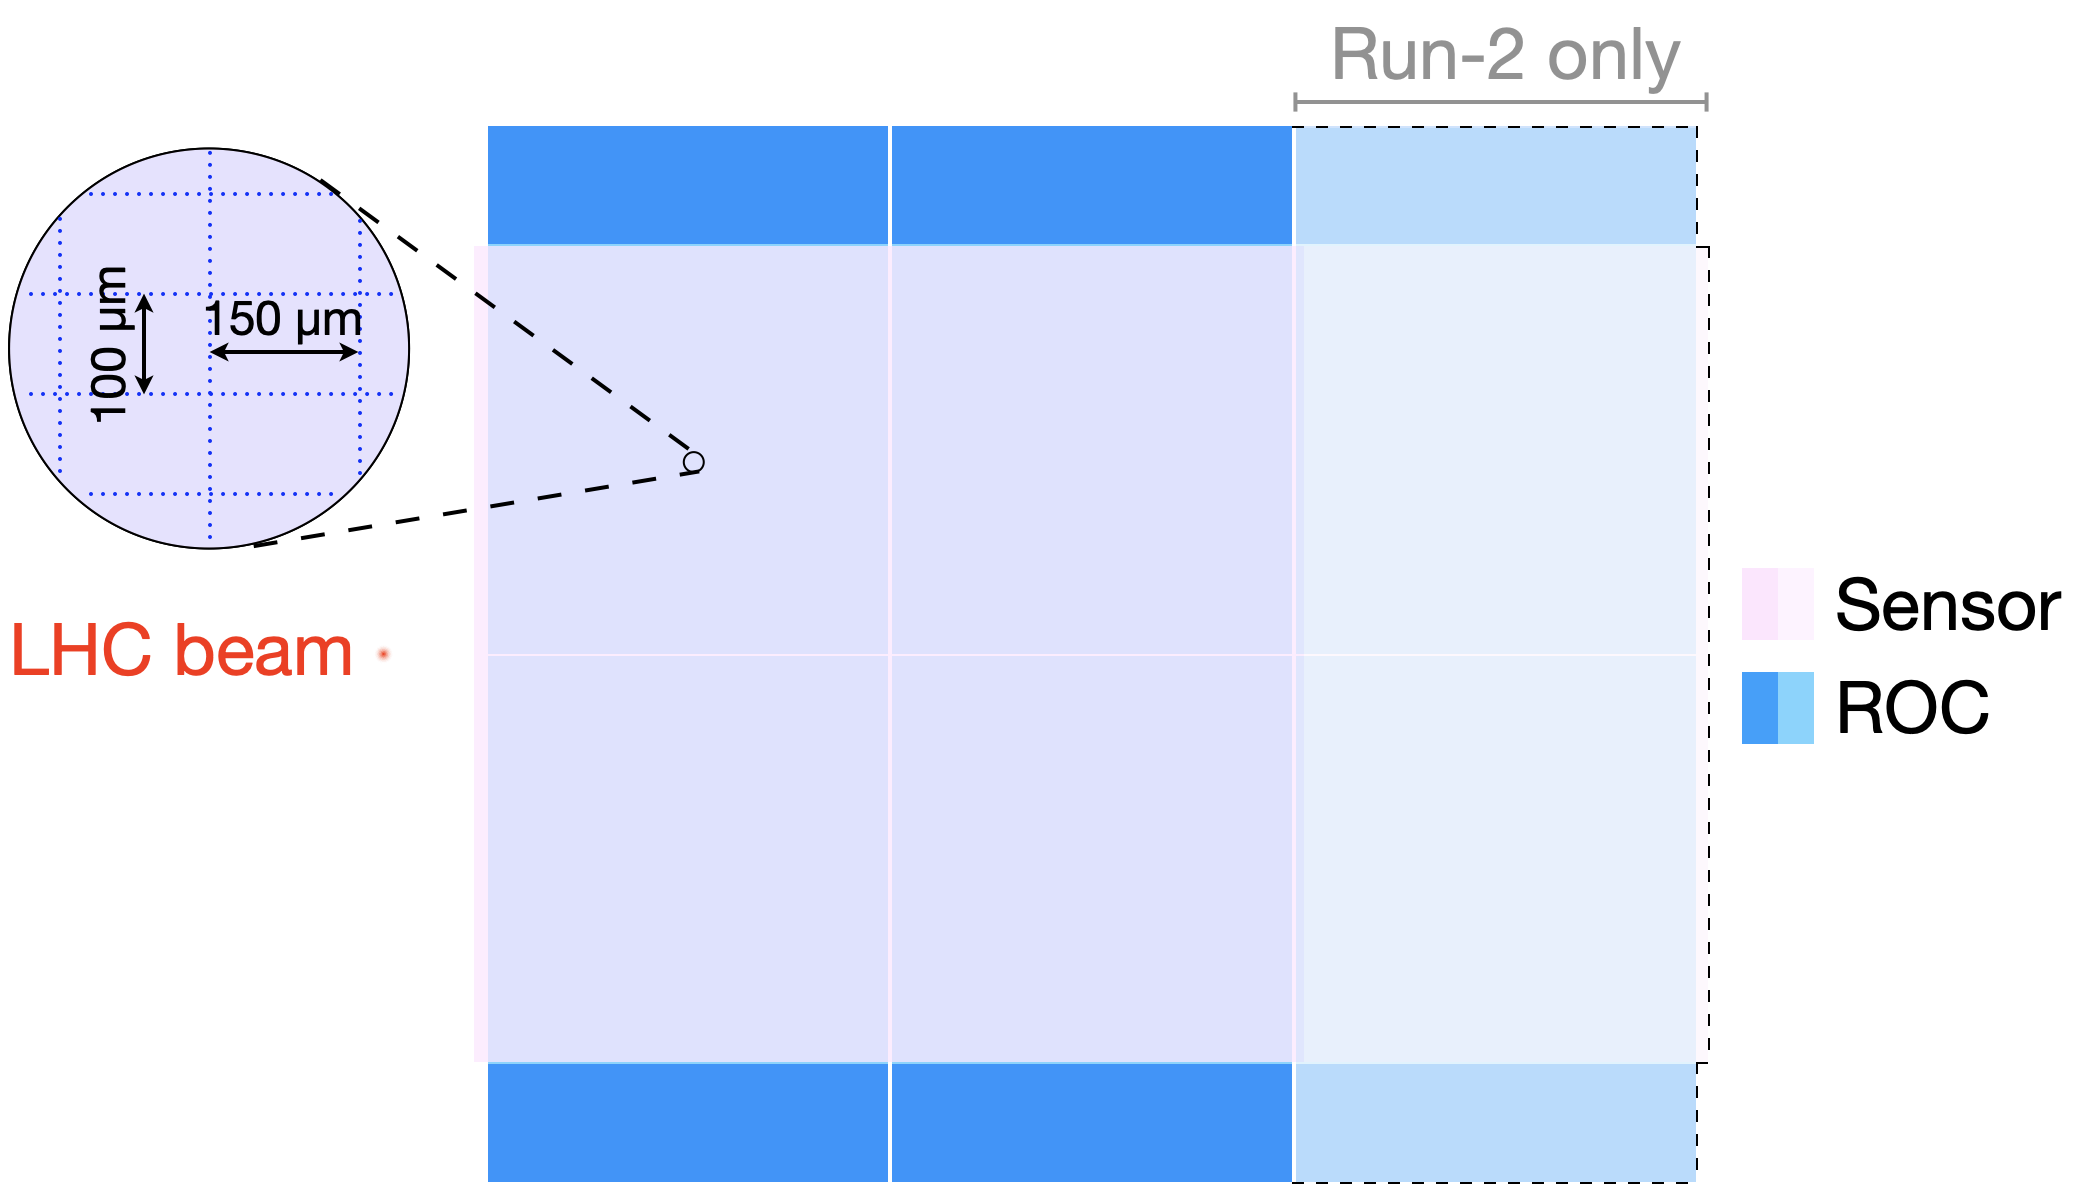
Figure 91:
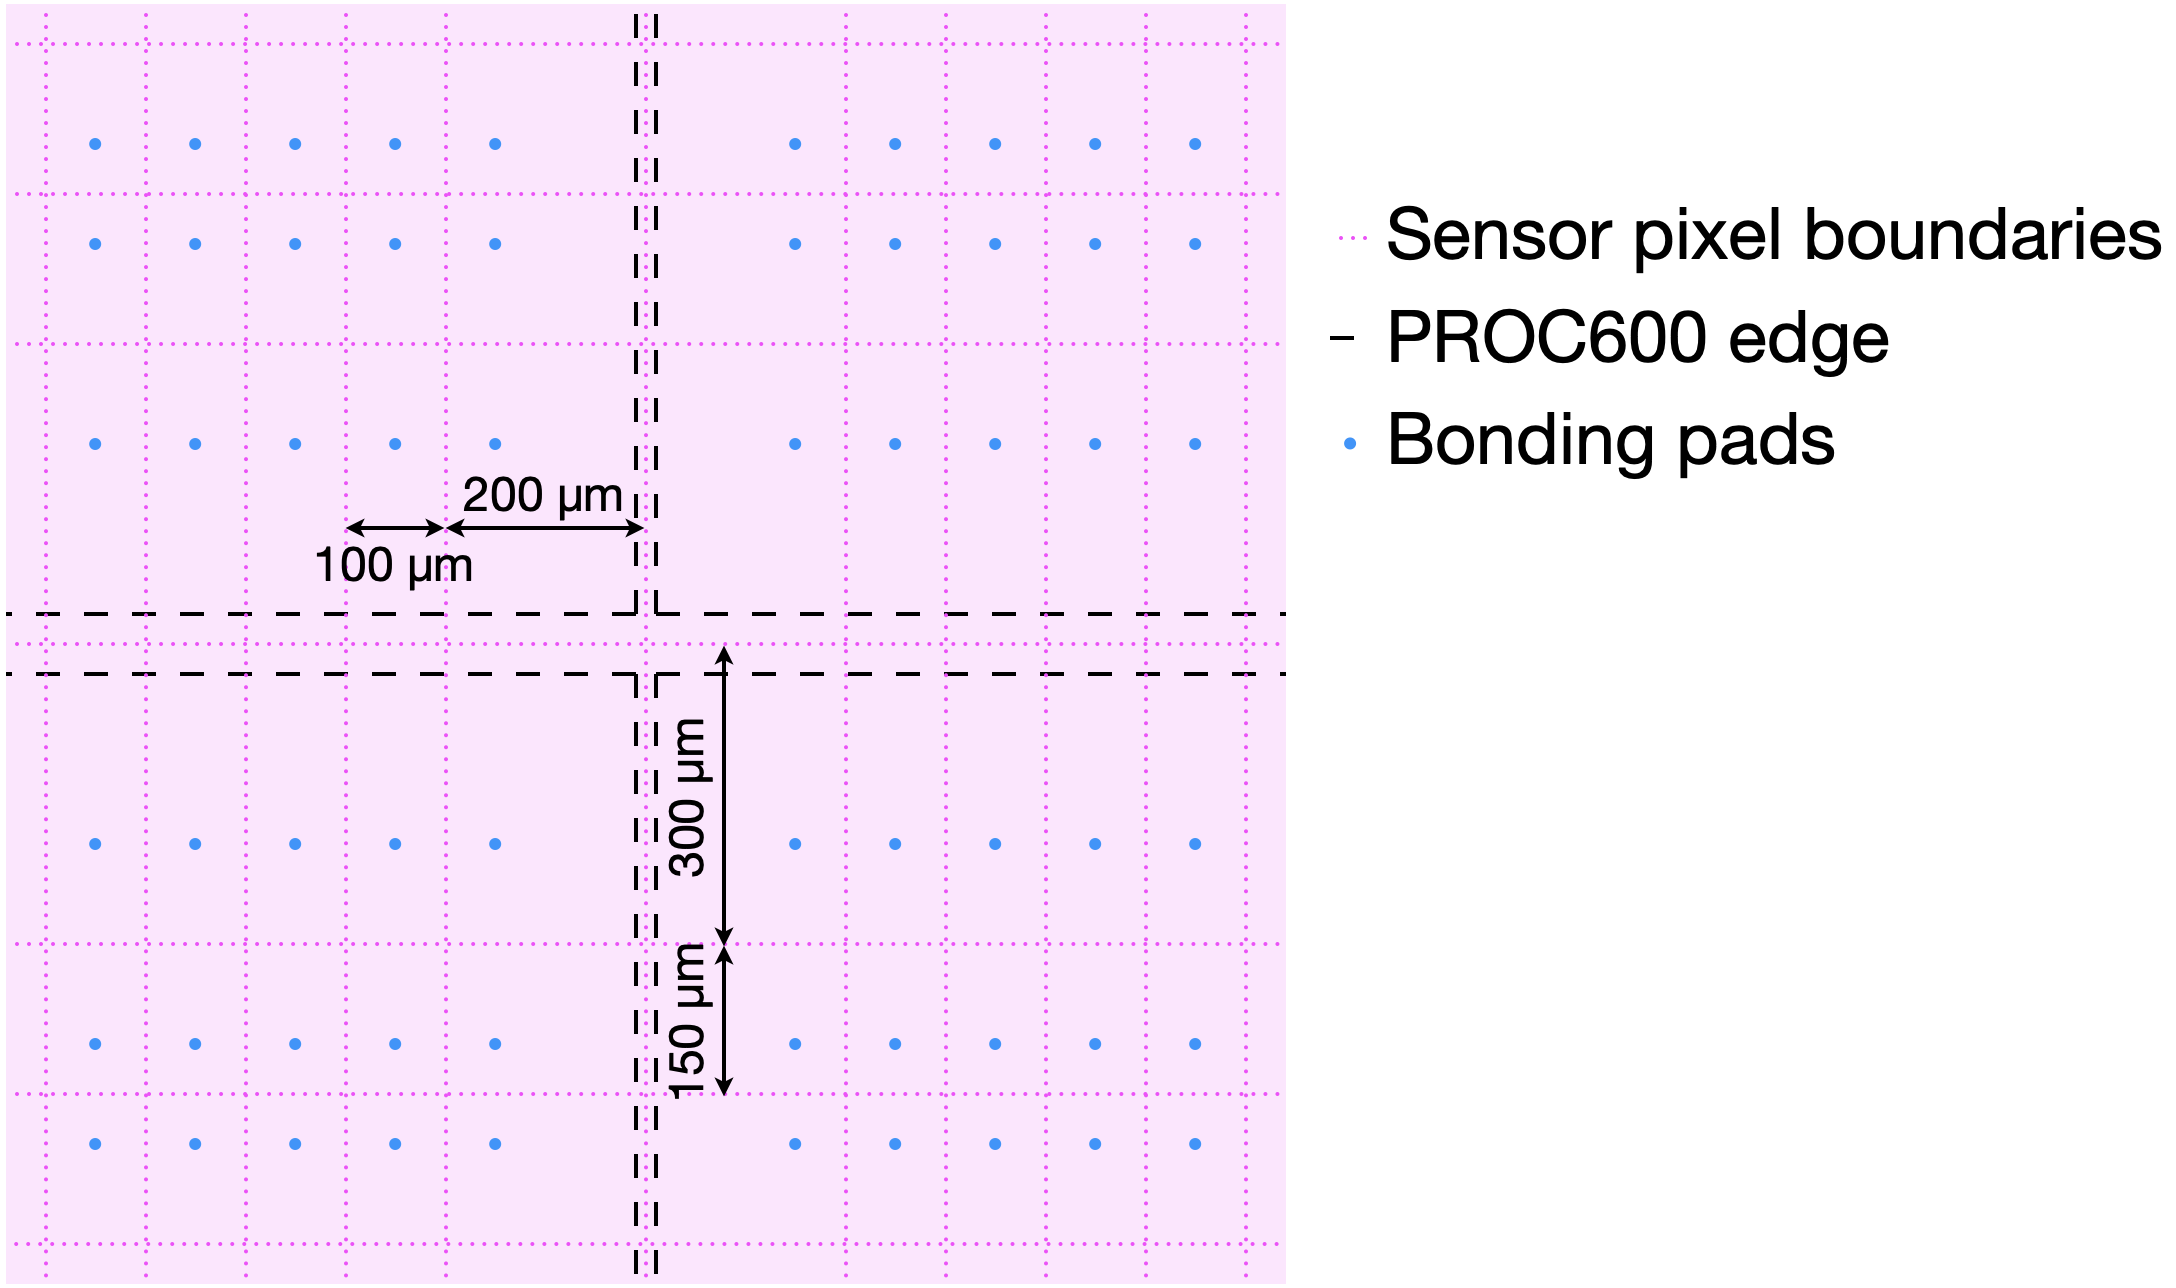
Geometry and arrangement of the pixel sensor modules. Upper left: arrangement of the sensor modules in a tracking station, relative to the LHC beam. Upper right: sensor, ROCs, and pixel geometry. The shaded areas with dashed contours refer to the larger, 3$ \times $2 modules used in Run 2. Lower: detail of pixels at internal ROC edges. |
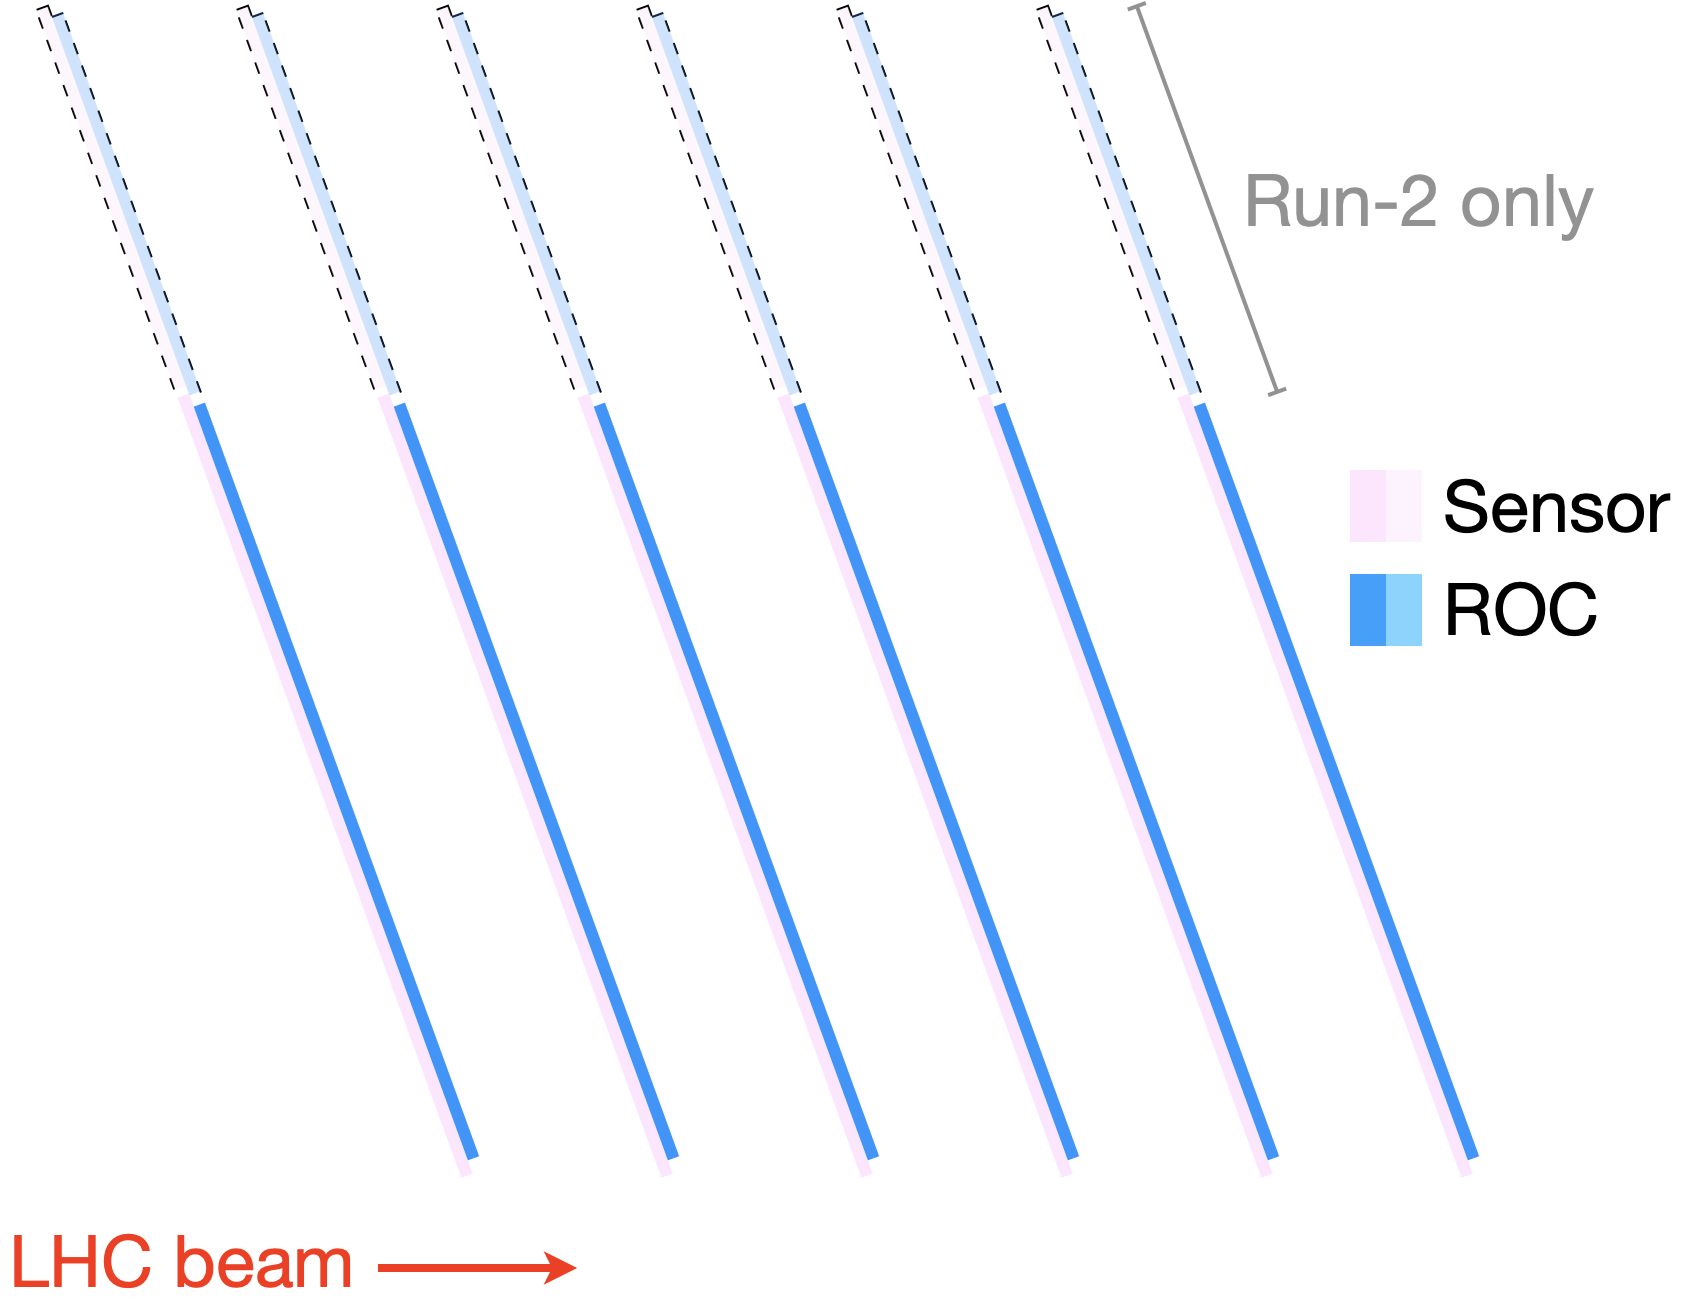
png |
Figure 91-a:
Arrangement of the sensor modules in a tracking station, relative to the LHC beam. |
png |
Figure 91-b:
Sensor, ROCs, and pixel geometry. The shaded areas with dashed contours refer to the larger, 3$ \times $2 modules used in Run 2. |
png |
Figure 91-c:
Detail of pixels at internal ROC edges. |
png pdf |
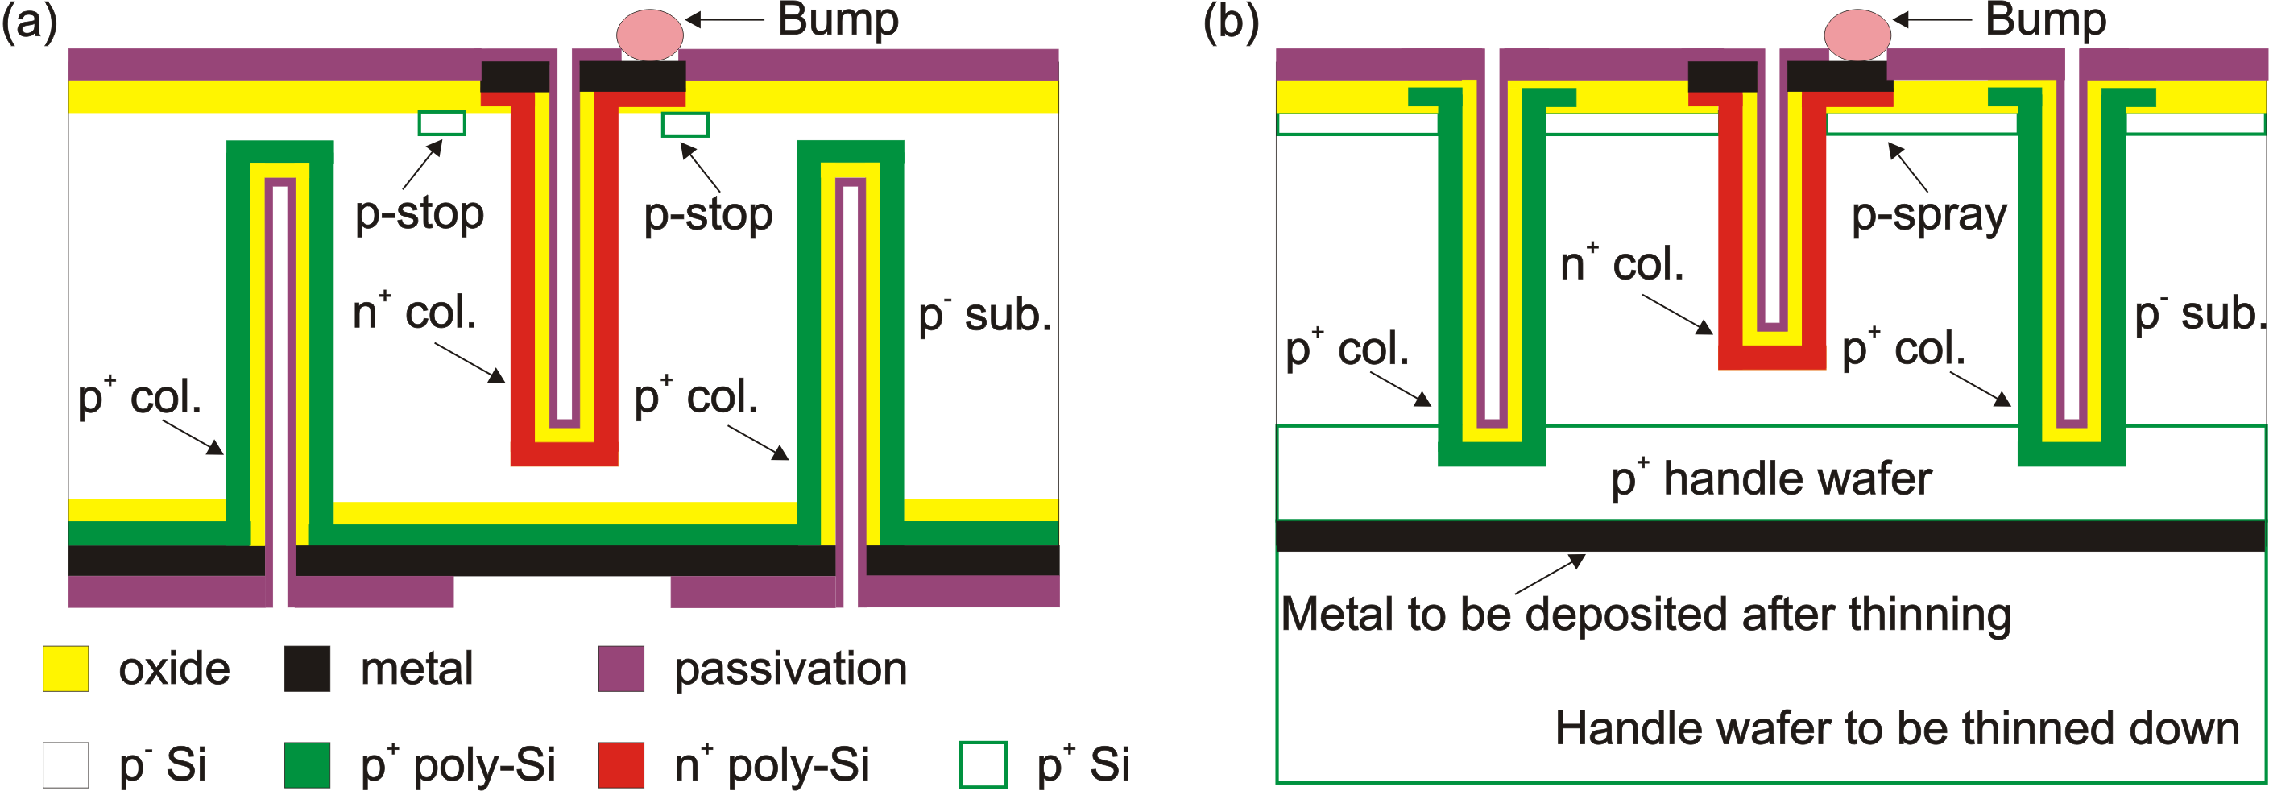
Figure 92:
Schematic layout of the columns of 3D pixels. Left: double-sided technology, used in Run 2. Right: single-sided technology, used in Run 3. Metal bumps on top are used for interconnection with the readout chips; p-type surface implants, such as p-stop or p-spray, provide isolation between contiguous pixels. Reproduced from Ref. [149]. |
png pdf |
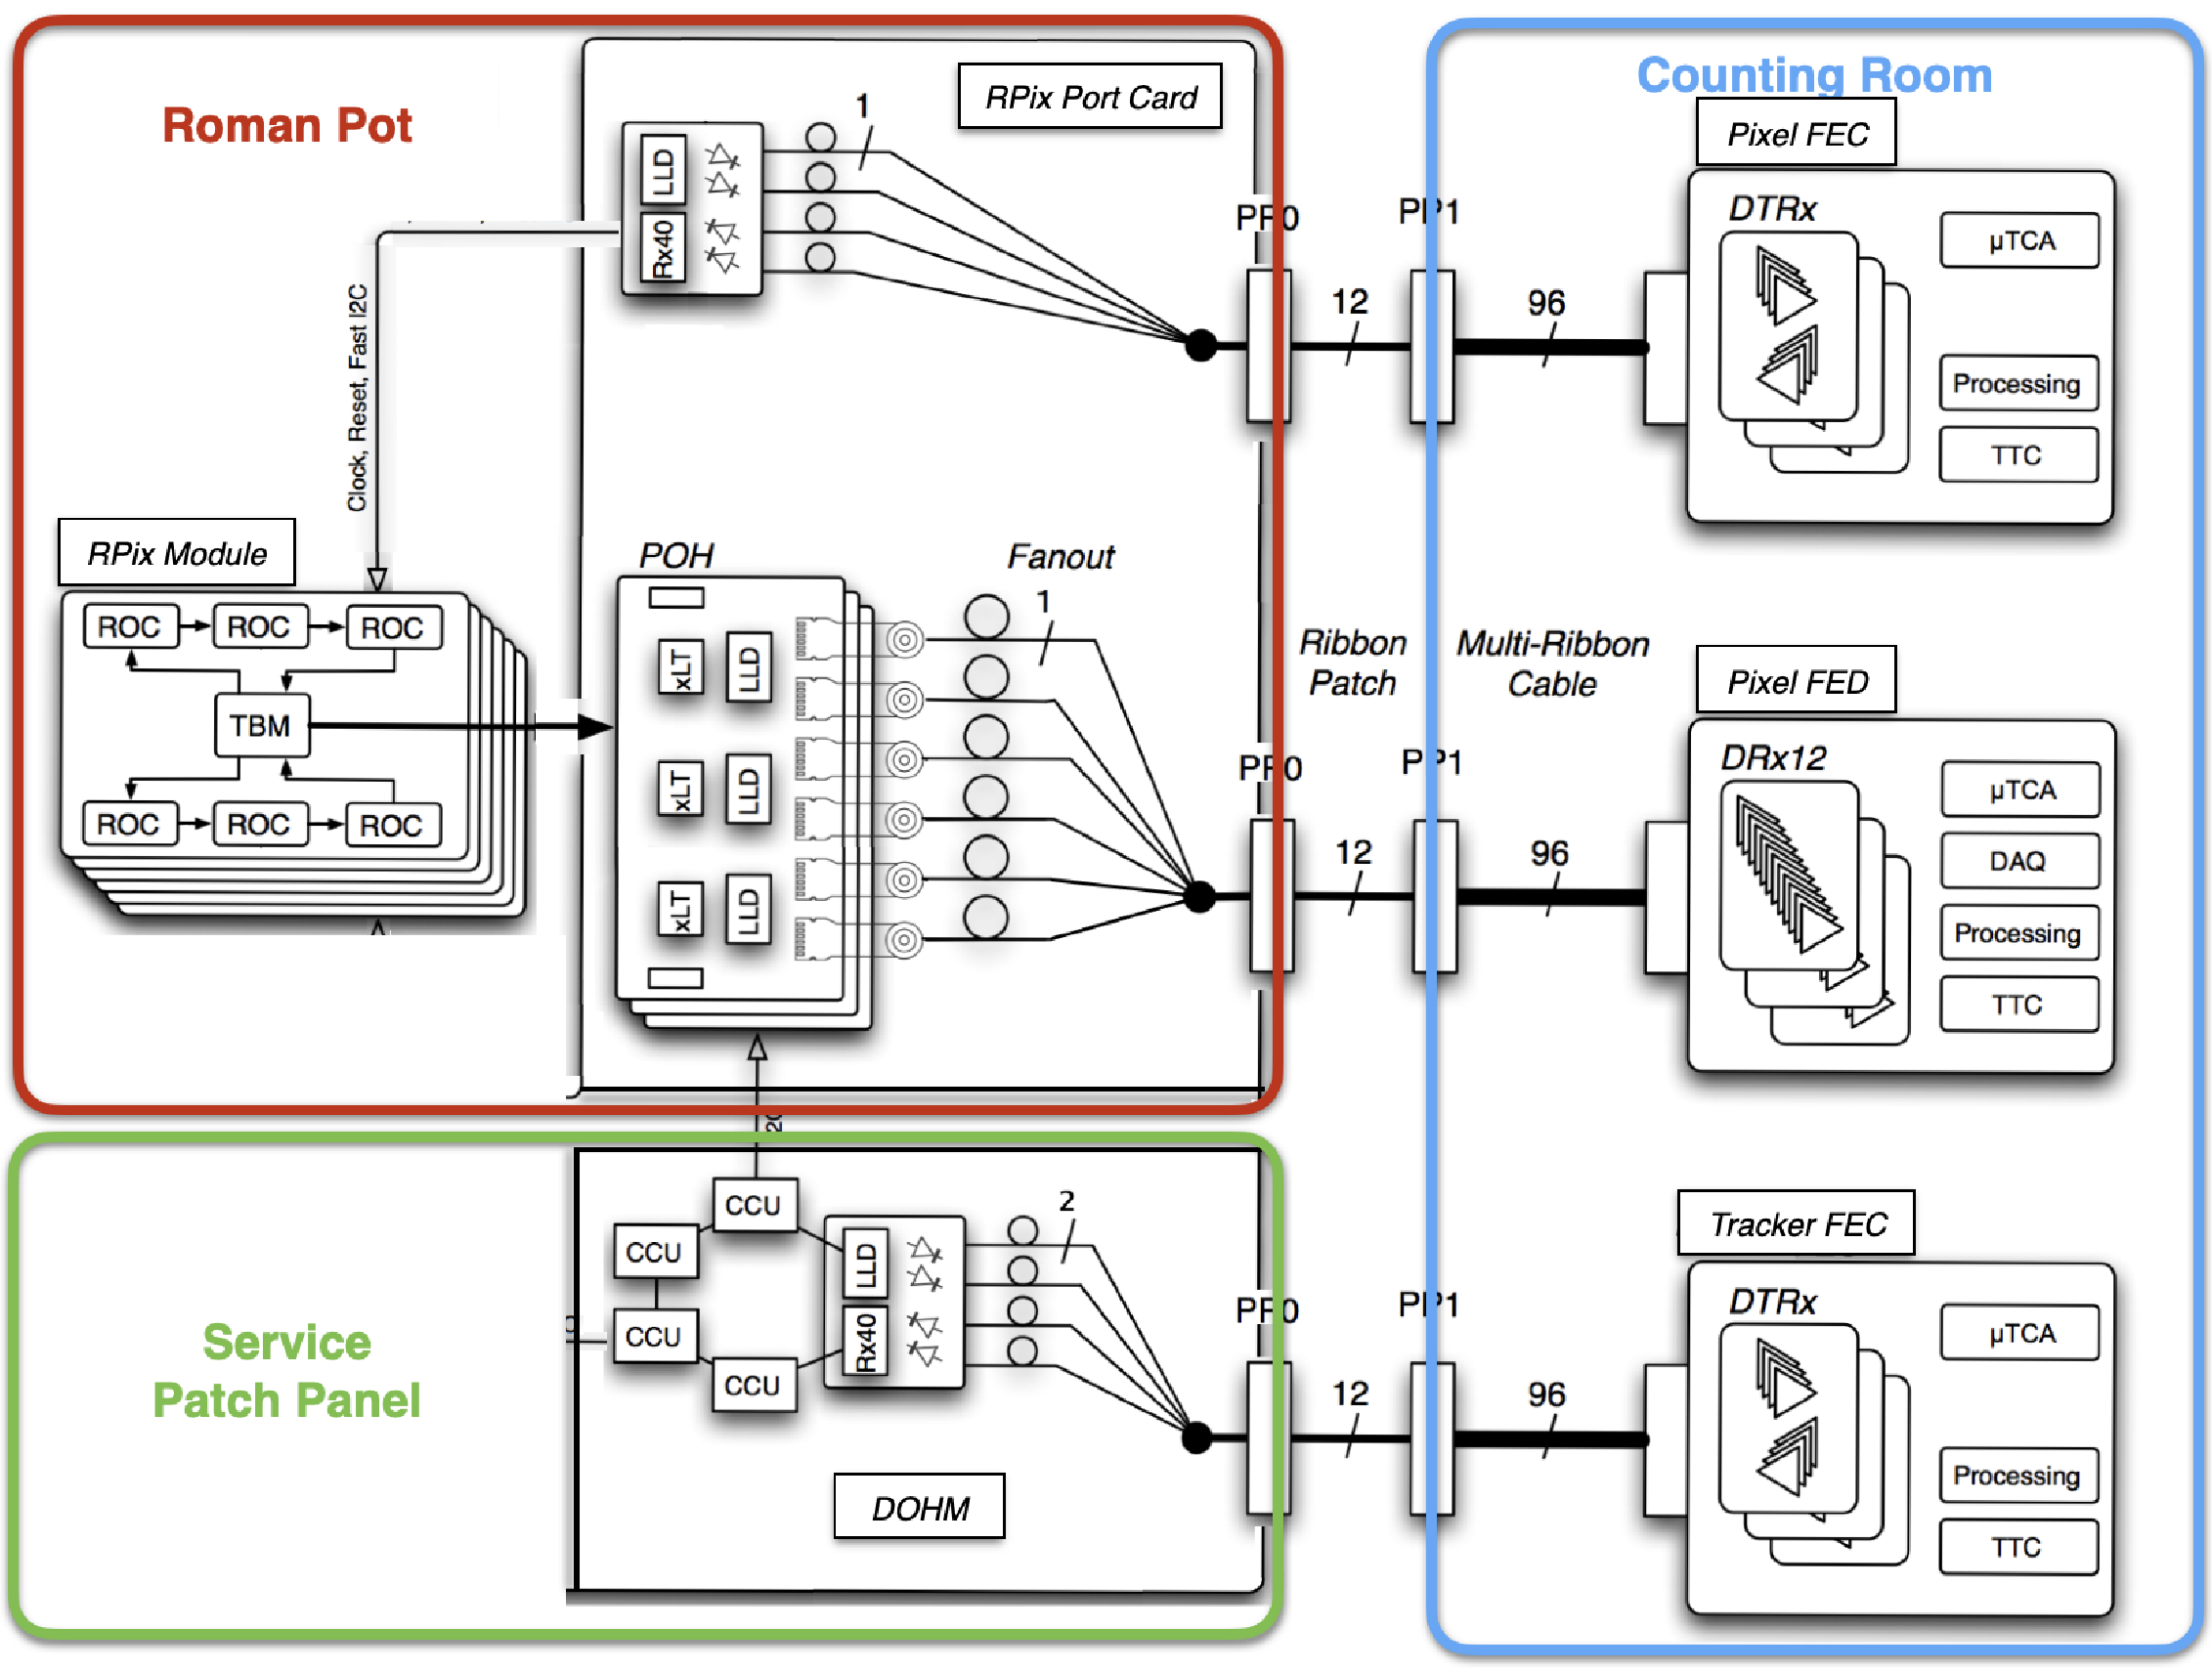
Figure 93:
Schematic diagram of the PPS pixel tracker readout chain. The various components shown are described in Ref. [14]. |
png pdf |
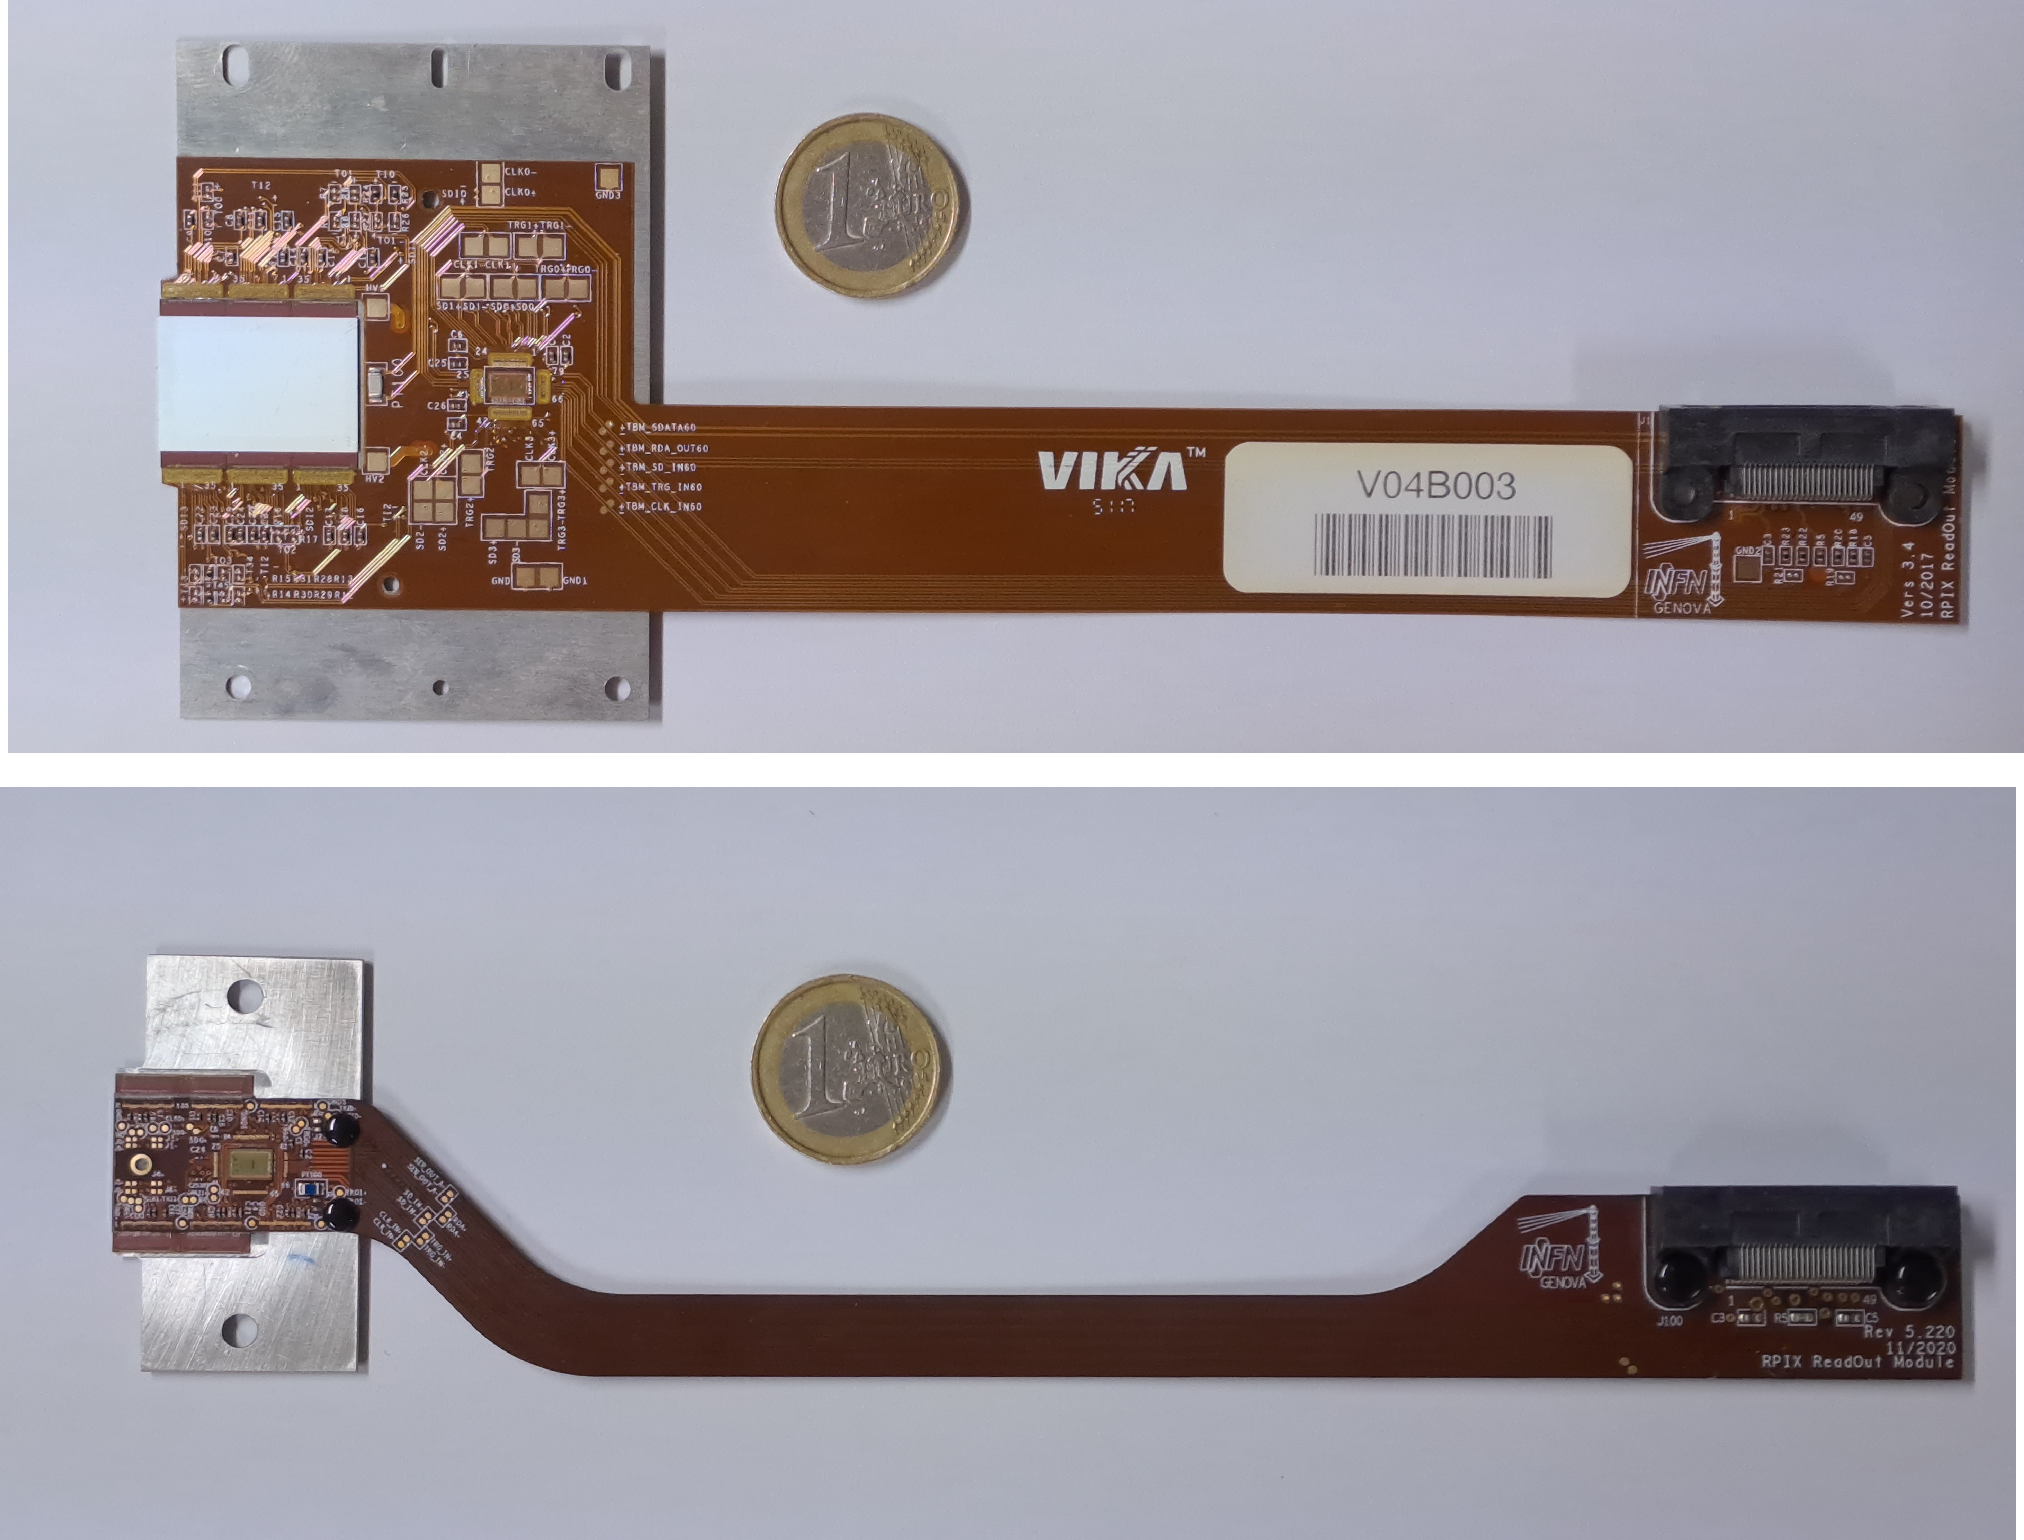
Figure 94:
The detector module of the silicon pixel tracker, in its Run 2 (upper) and Run 3 (lower) versions. |
png pdf jpg |
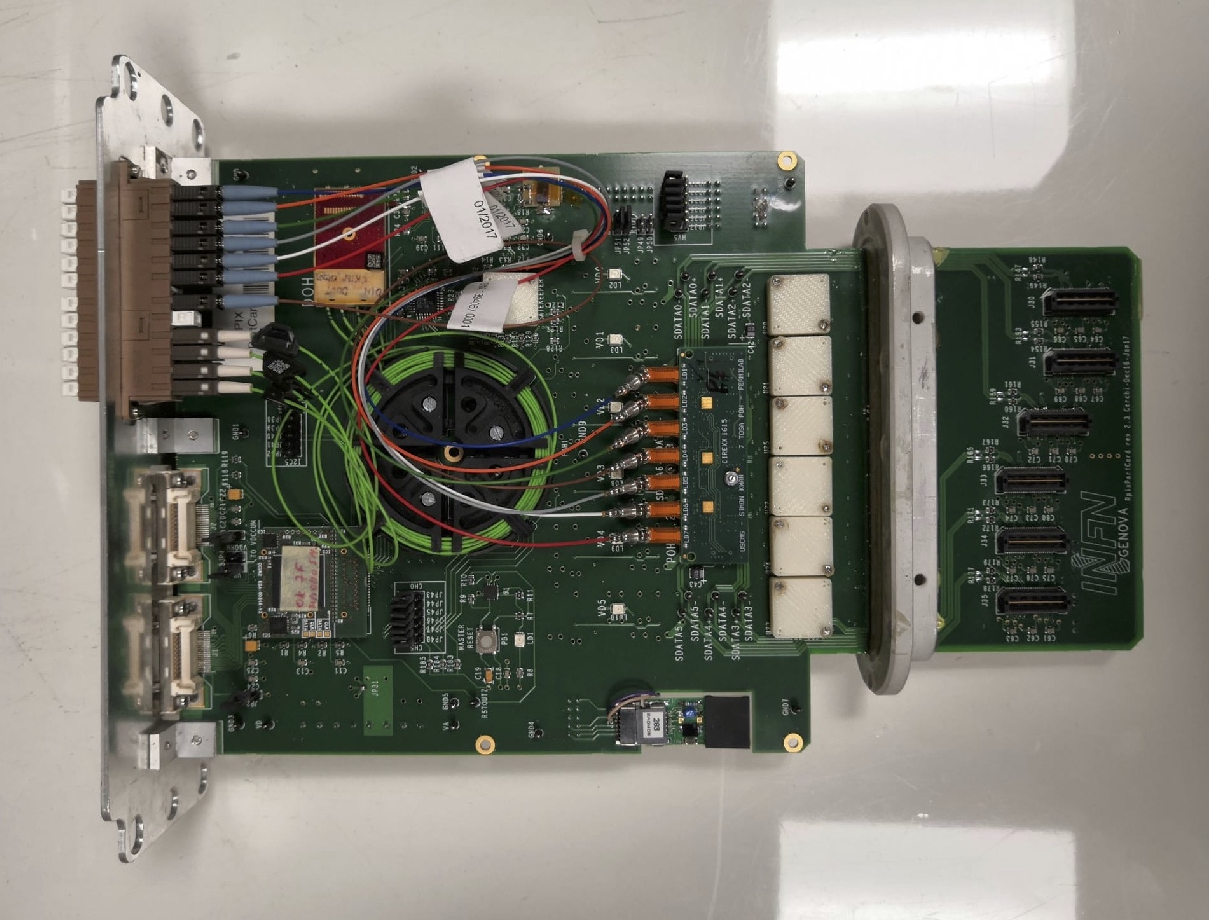
Figure 95:
The pixel PortCard for Run 3; the small flange near the bottom acts as a feed-through for the board. The section below is housed inside the secondary vacuum volume of the pot. |
png pdf |
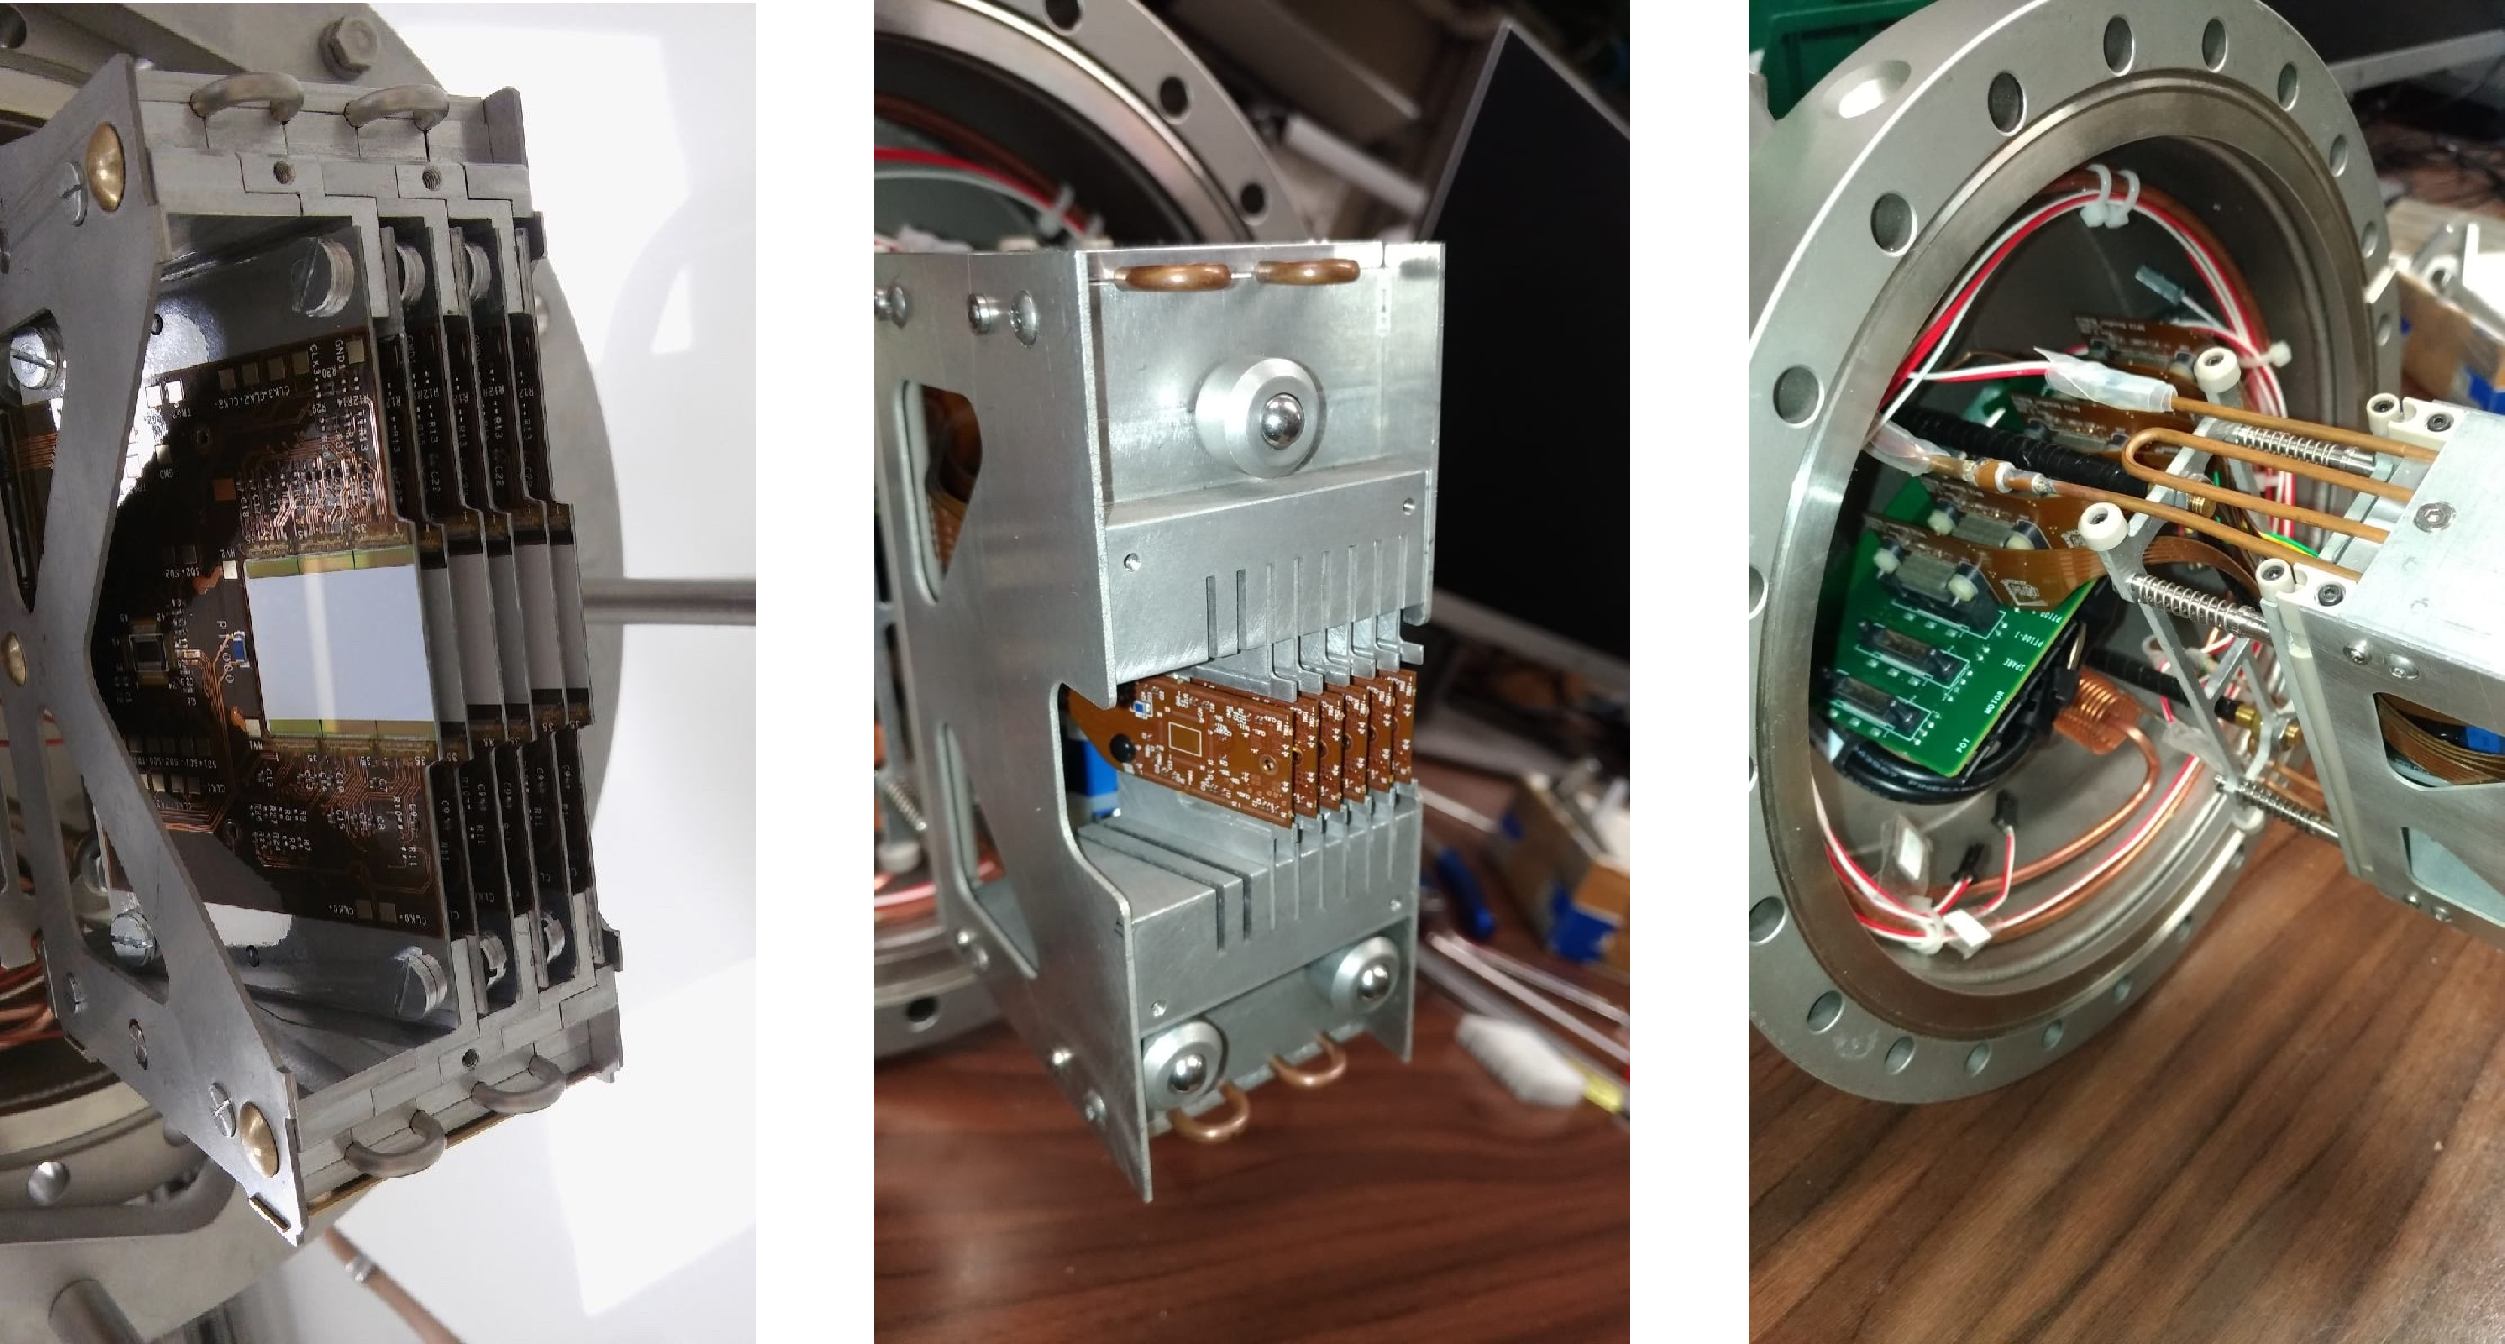
Figure 96:
Details of the pixel detector package. Left: Run 2 version. Center: Run 3 version. Right: mechanical, cooling, and electrical connections to the upper part of the RP in Run 3: the vacuum section of the PortCard is visible, as well as the cooling circuit and the connections to the environmental sensors. |
png pdf |
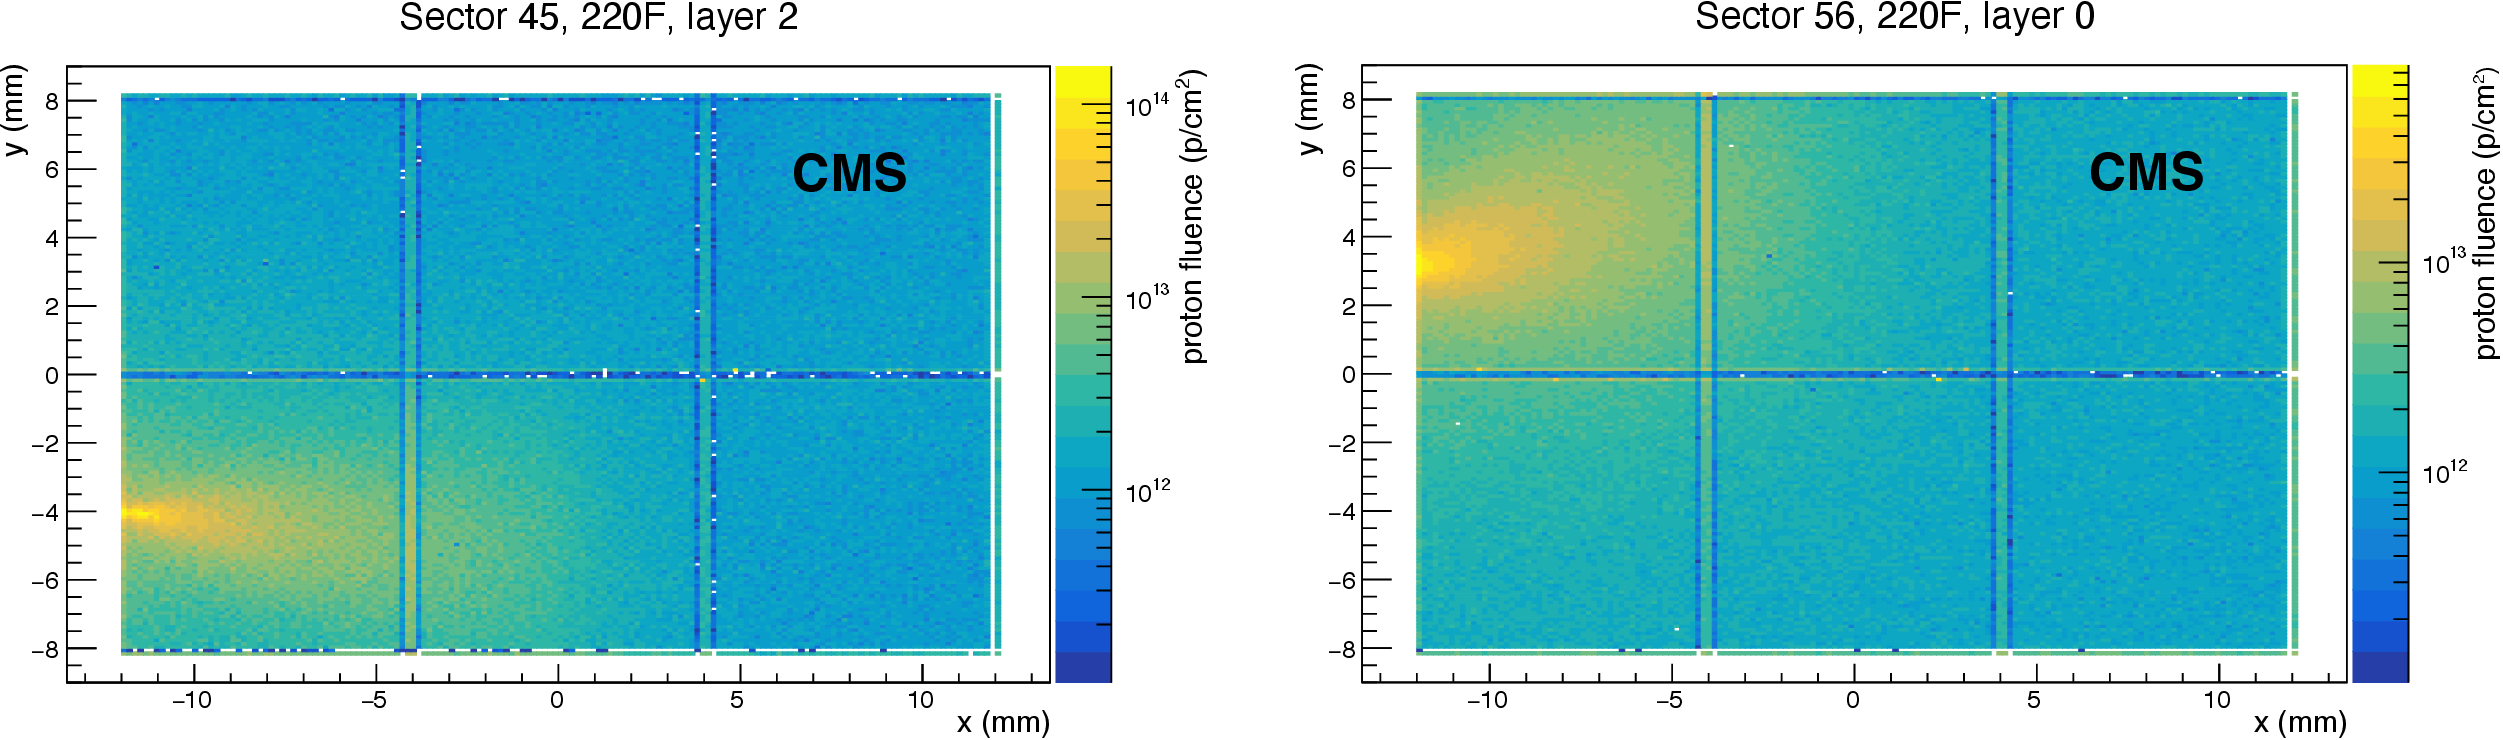
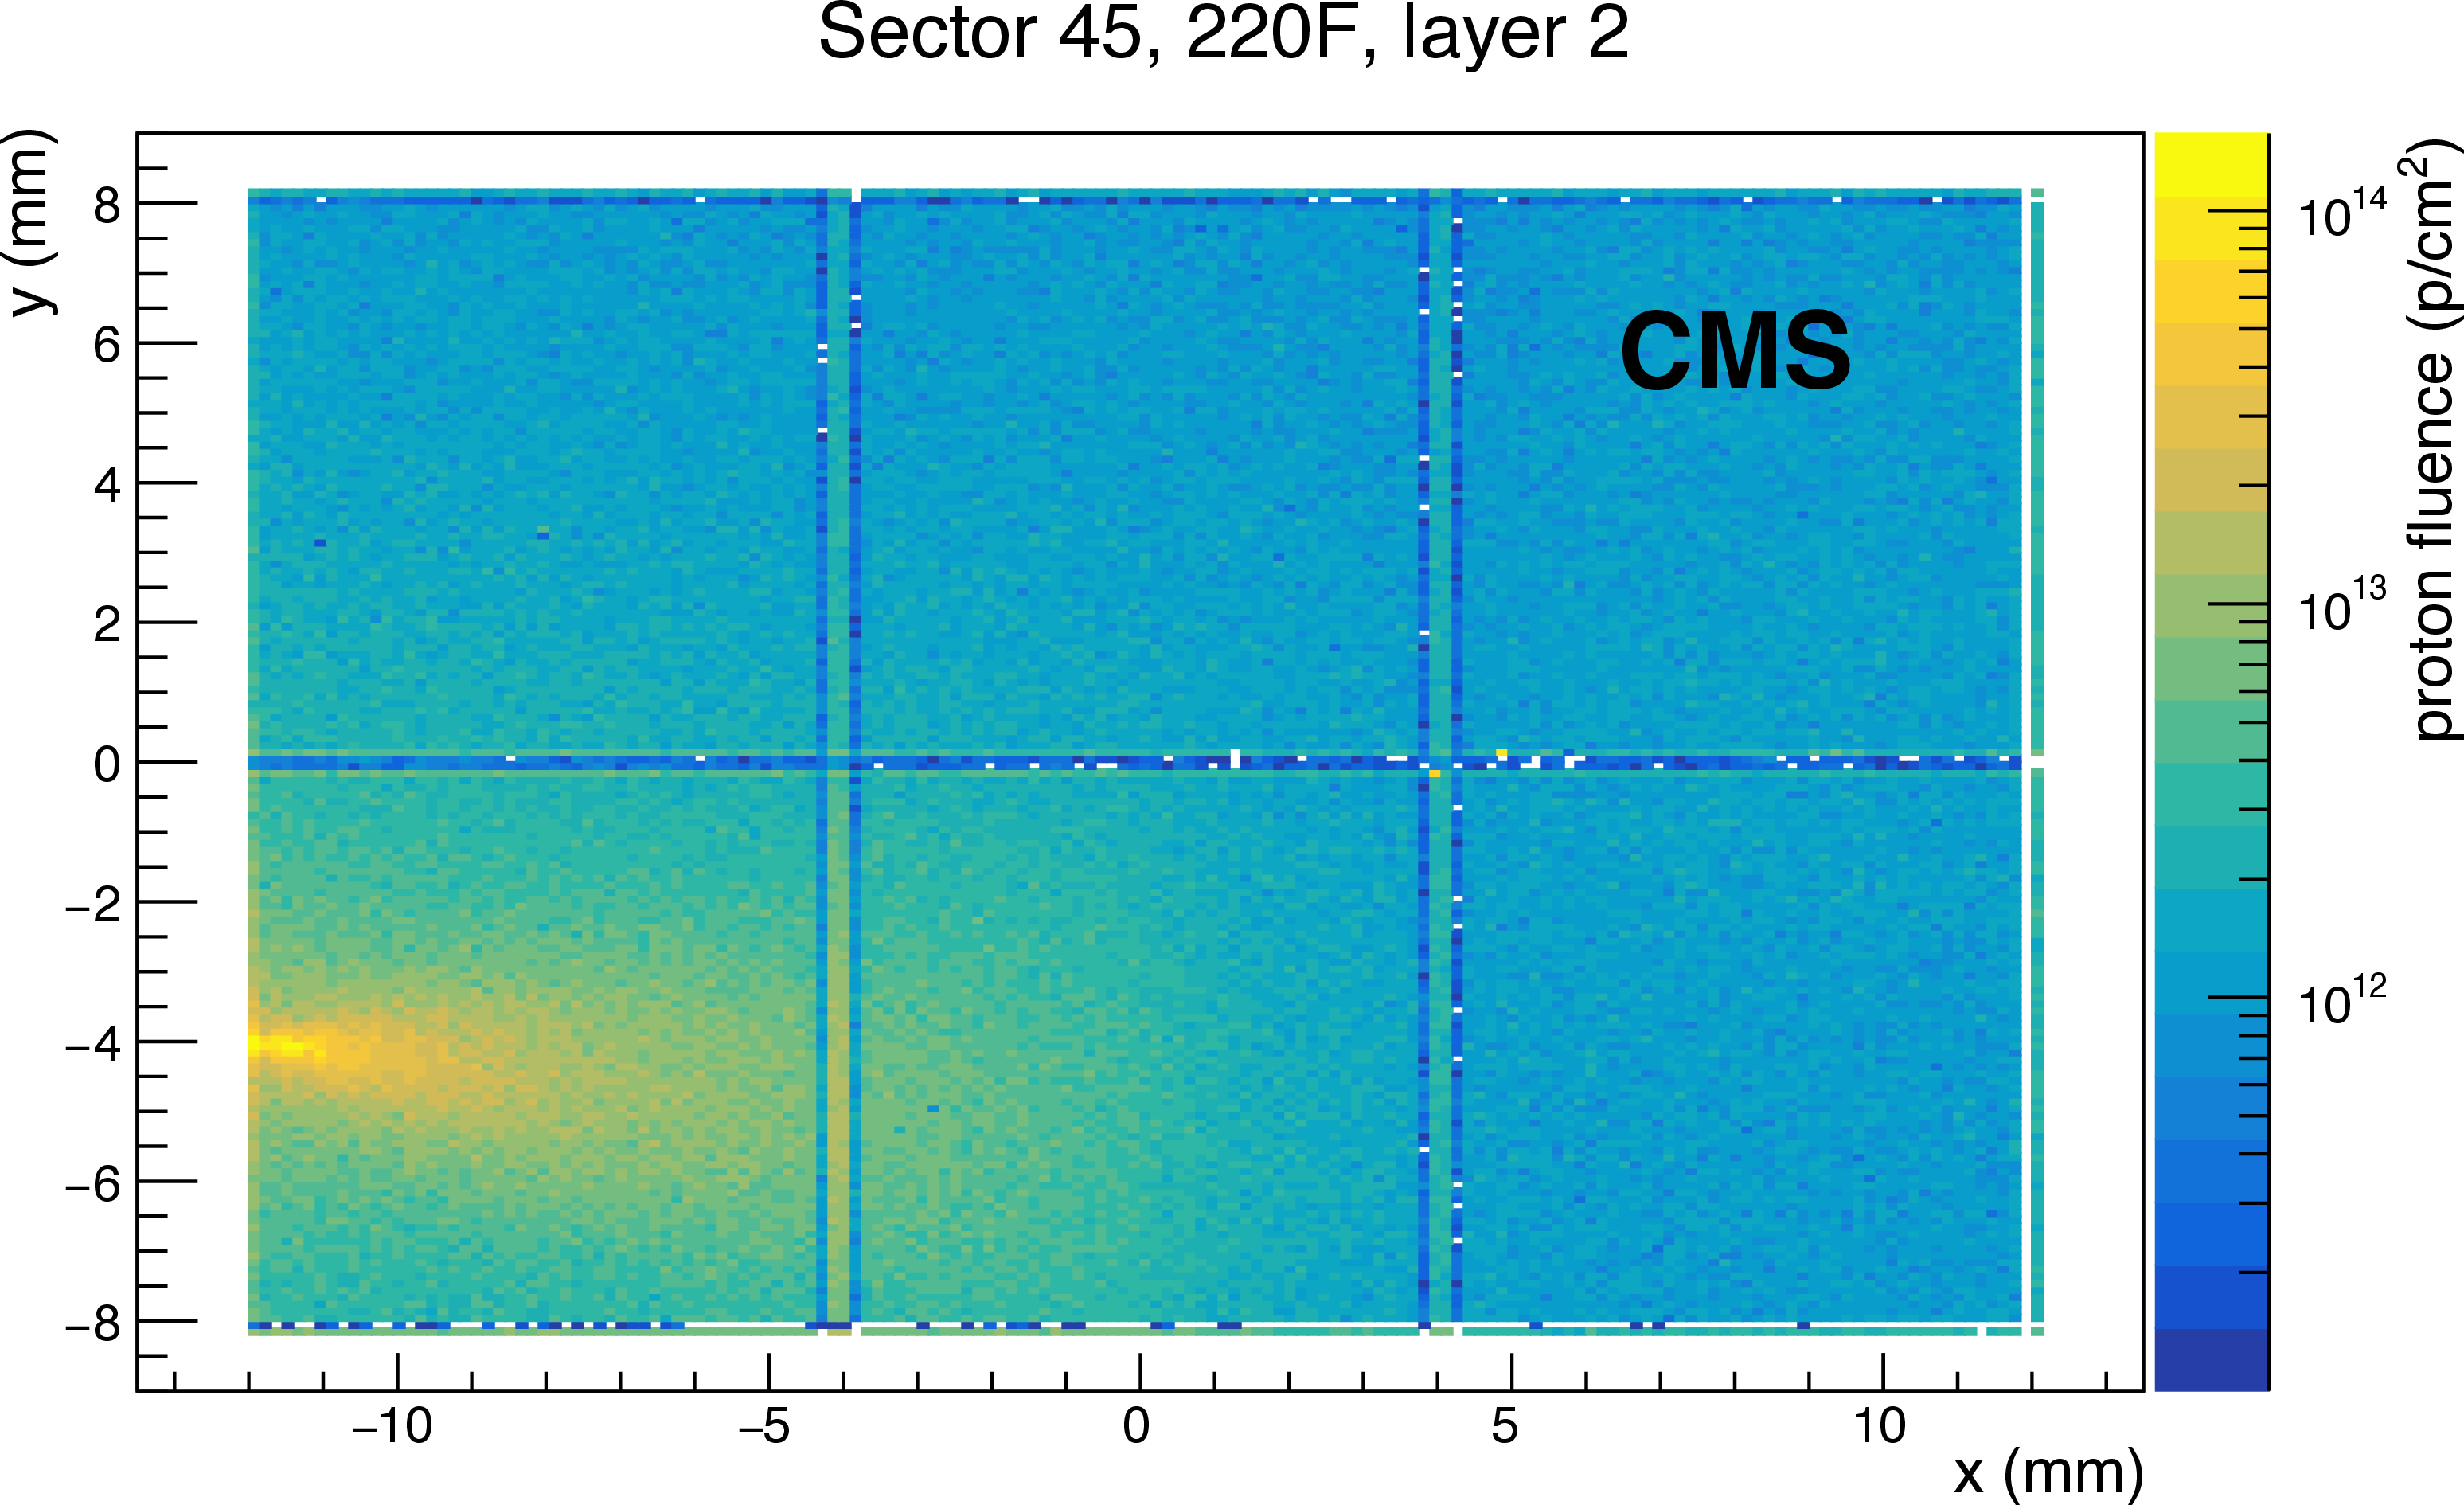
Figure 97:
Proton fluence in two planes (one per arm) of the PPS pixel tracker in a sample run in 2017, normalized to an integrated luminosity of 1 fb$ ^{-1} $. The horizontal and vertical lines in the distributions are an artifact due to the different pixel size of the sensors in those regions. |
png pdf |
Figure 97-a:
Proton fluence in one plane of the PPS pixel tracker in a sample run in 2017, normalized to an integrated luminosity of 1 fb$ ^{-1} $. The horizontal and vertical lines in the distributions are an artifact due to the different pixel size of the sensors in those regions. |

png pdf |
Figure 97-b:
Proton fluence in one plane of the PPS pixel tracker in a sample run in 2017, normalized to an integrated luminosity of 1 fb$ ^{-1} $. The horizontal and vertical lines in the distributions are an artifact due to the different pixel size of the sensors in those regions. |
png pdf |
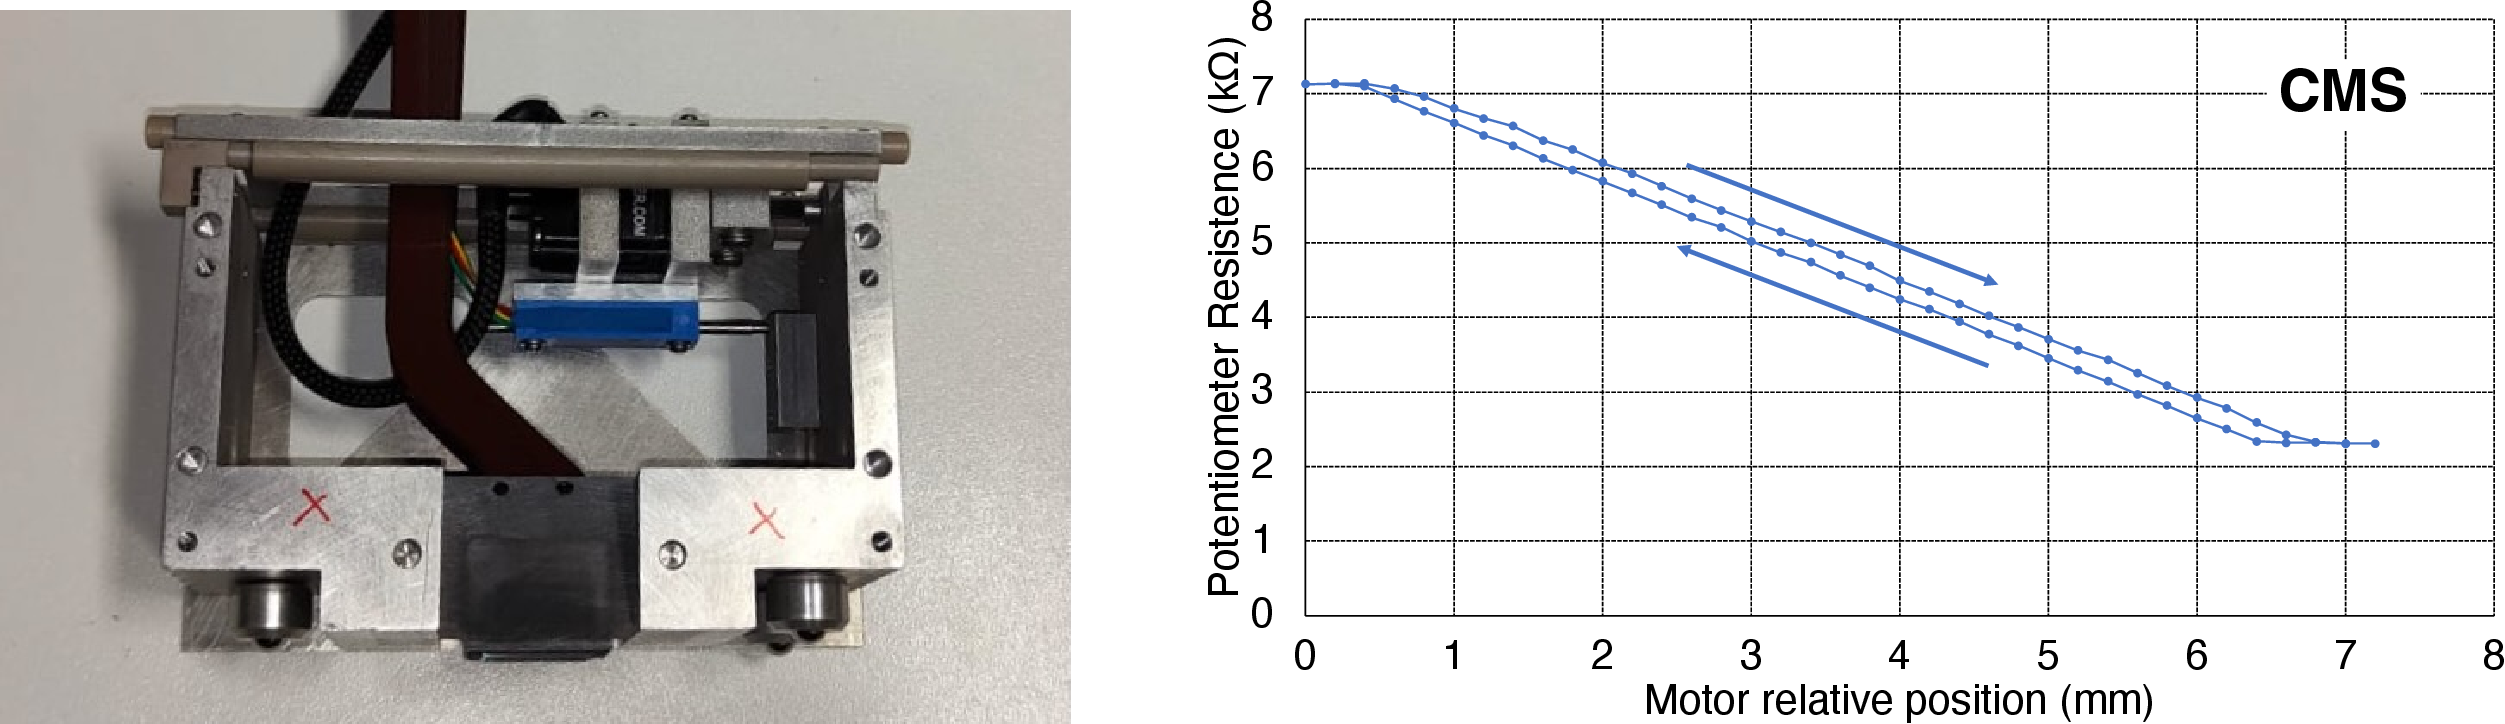
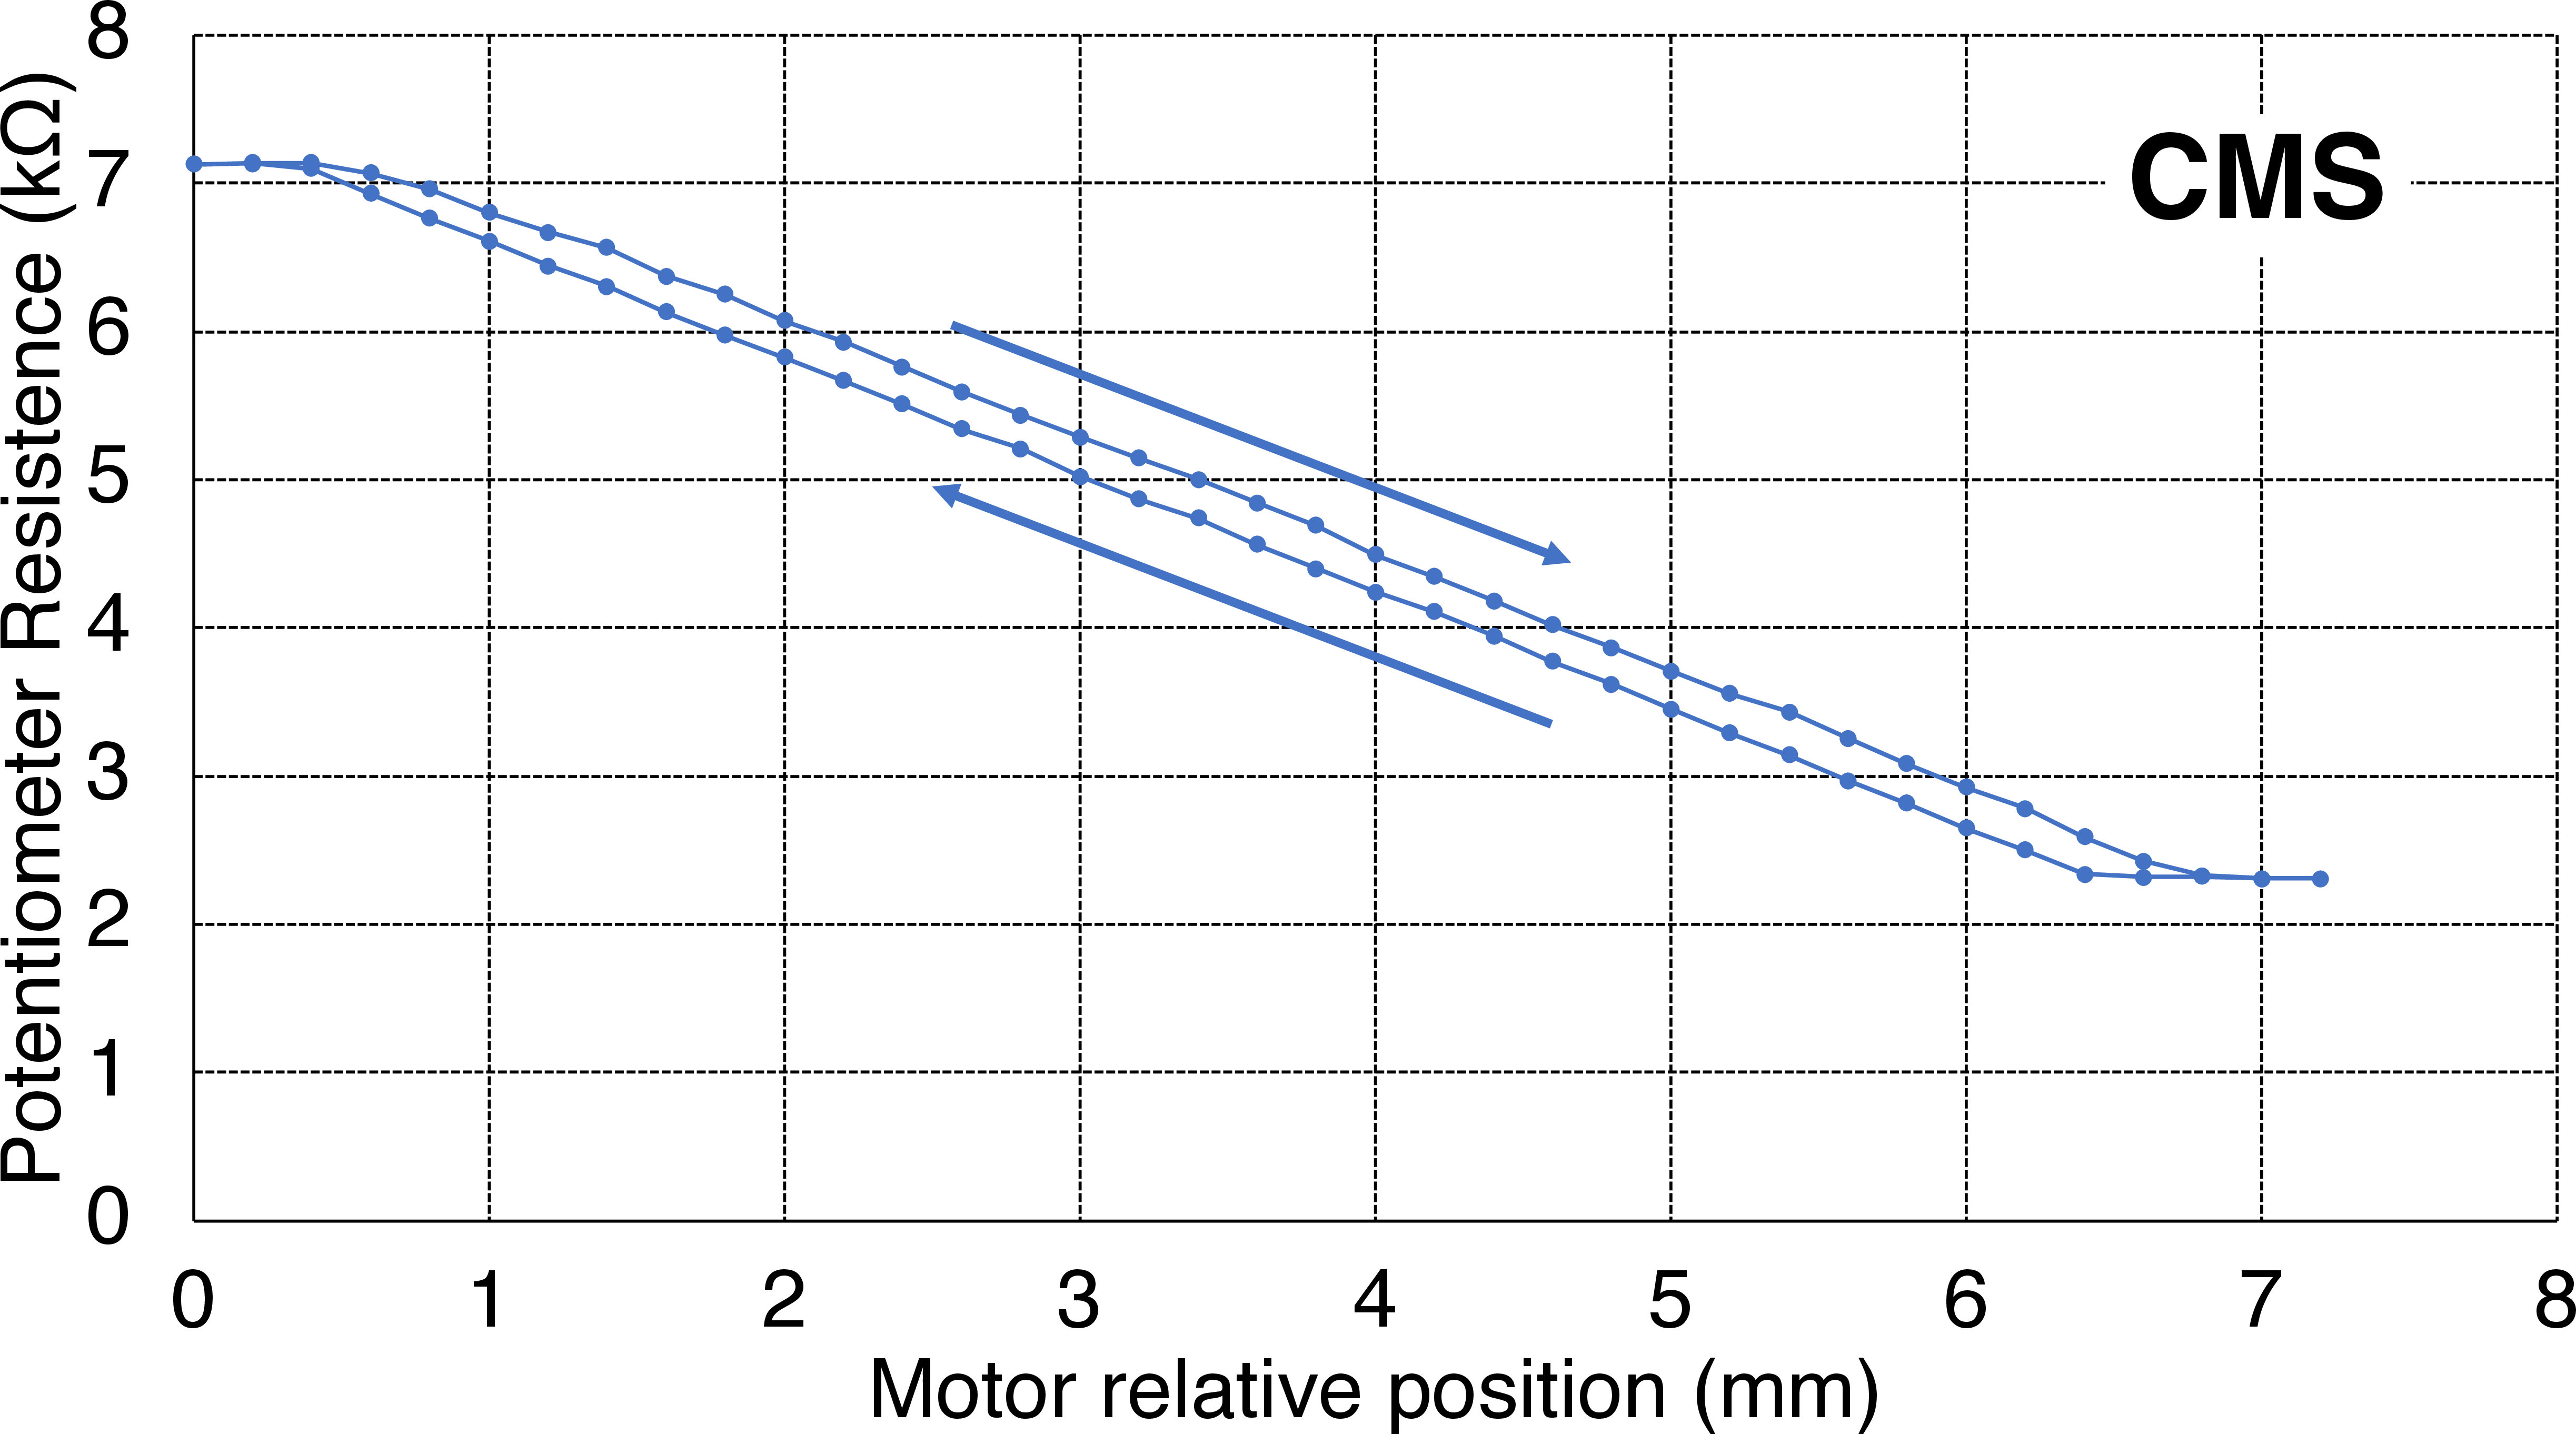
Figure 98:
The system for internal motion of the pixel detector package. Left: detail of a partially assembled detector package: the stepper motor is the black object on top; the blue object below is the potentiometer used to monitor the position; both of them have their body tied up to the sliding slit on top, while their mobile tip is screwed to the support structure for the modules. Right: results of a motion test inside a RP at standard working conditions ($-$20$^{o}$C and about 5 mbar), with measured versus nominal position. Two sets of points can be identified for forward and backward movements, revealing a hysteresis effect. |
png pdf |
Figure 98-b:
Results of a motion test inside a RP at standard working conditions ($-$20$^{o}$C and about 5 mbar), with measured versus nominal position. Two sets of points can be identified for forward and backward movements, revealing a hysteresis effect. |
png pdf |
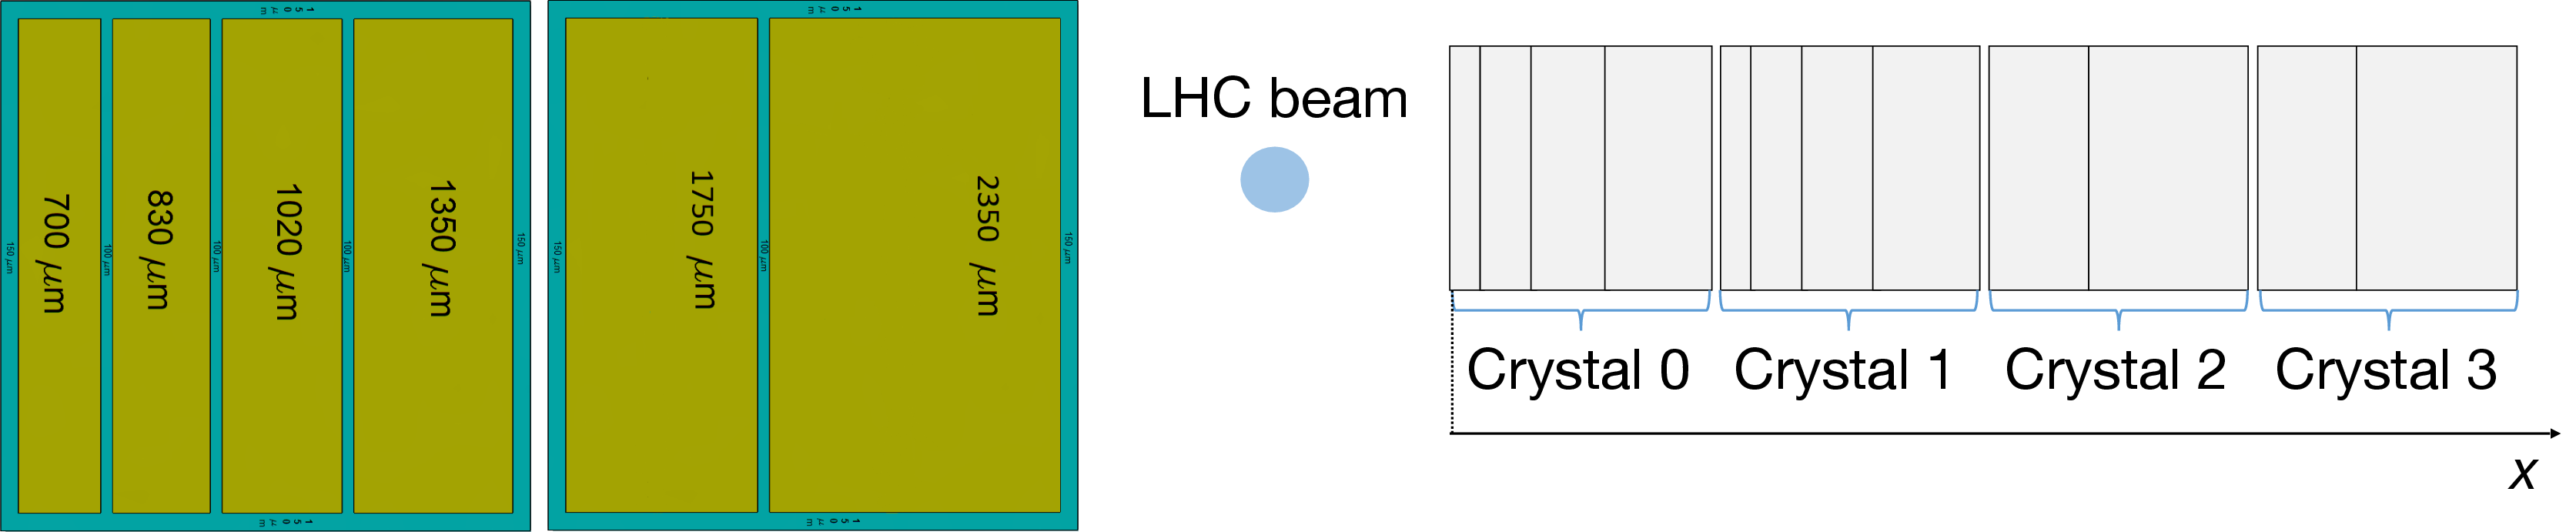
Figure 99:
Left: details of the four-pad and two-pad segmentation of the diamond sensors used in the Run 3 modules. Right: arrangement of the four crystals in a Run 3 module (adapted from Ref. [155]), where the position of the beam is indicated by the spot on the left. |

png pdf |
Figure 100:
Left: the hybrid board for the Run 3 timing detectors' readout; the lower, wider section hosts the sensors and is housed inside the secondary vacuum volume of the pot. Right: detail of the diamond sensors on one side, connected via wire bonds to the frontend electronics. |
png pdf |
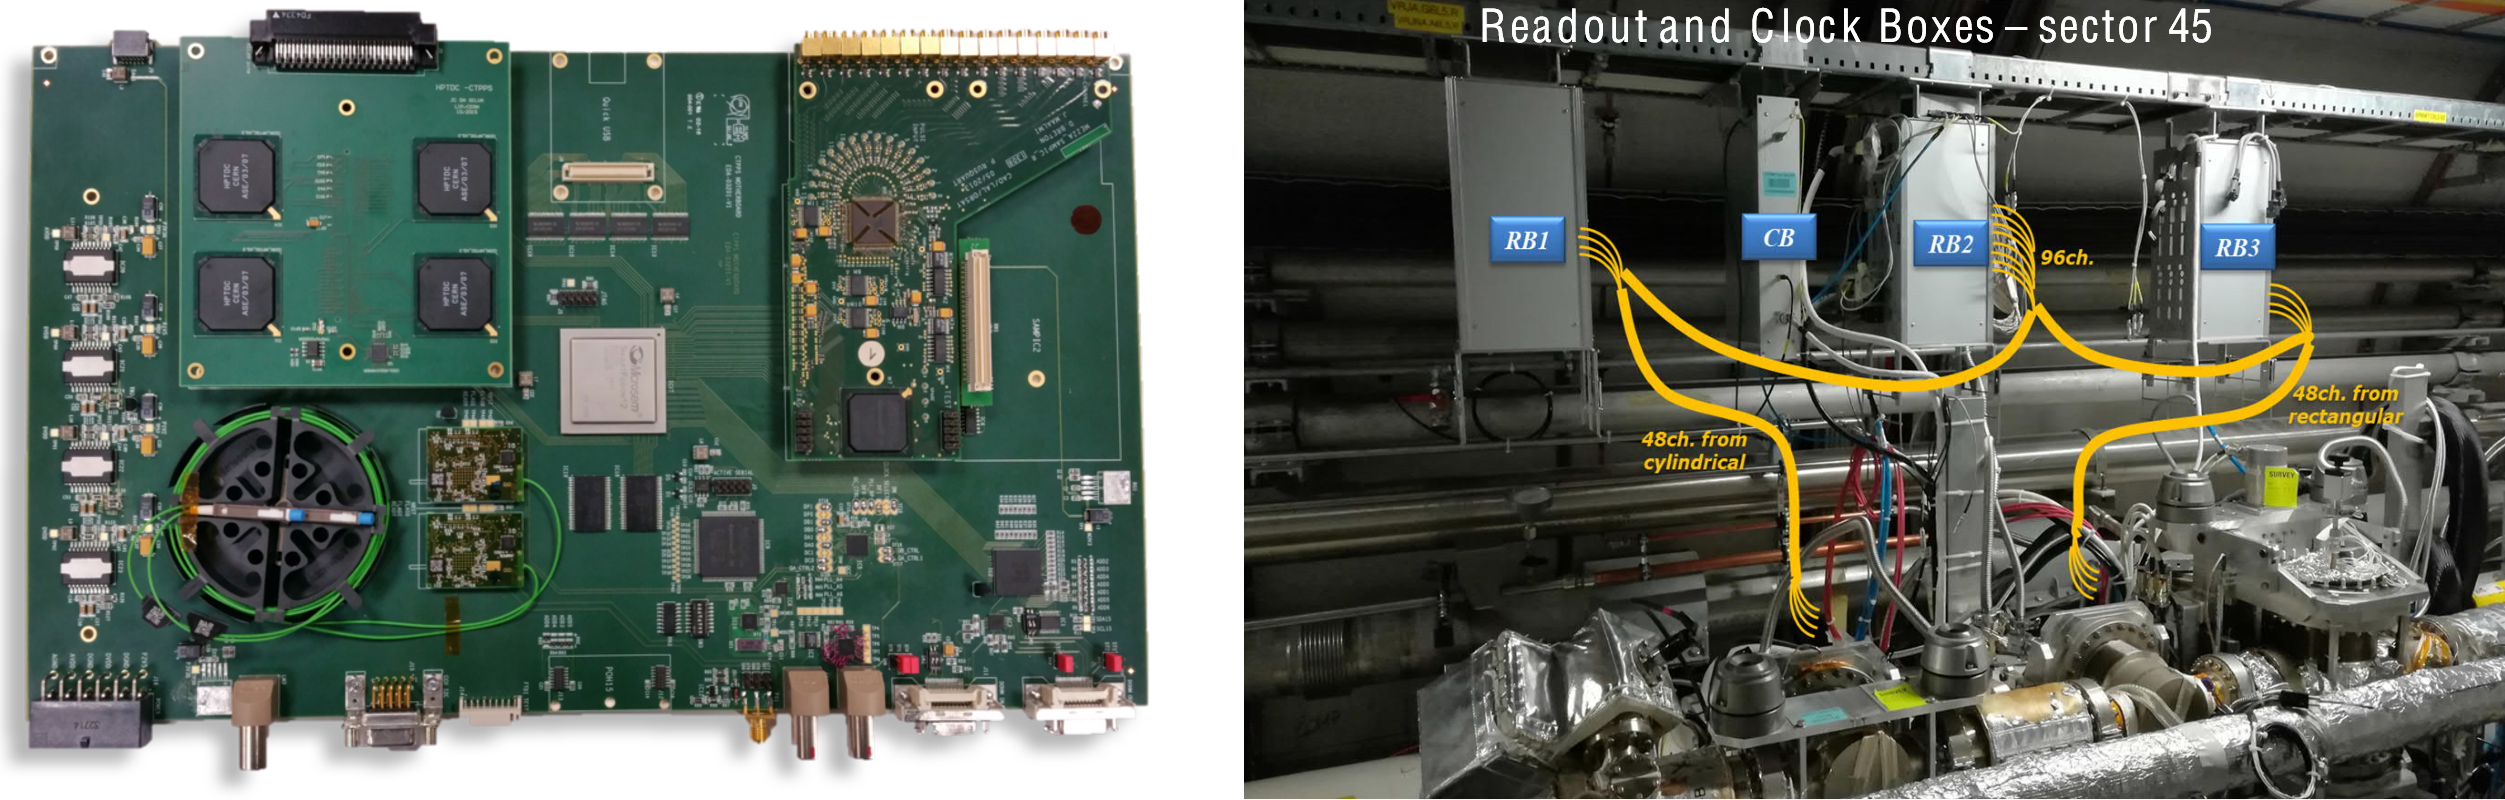
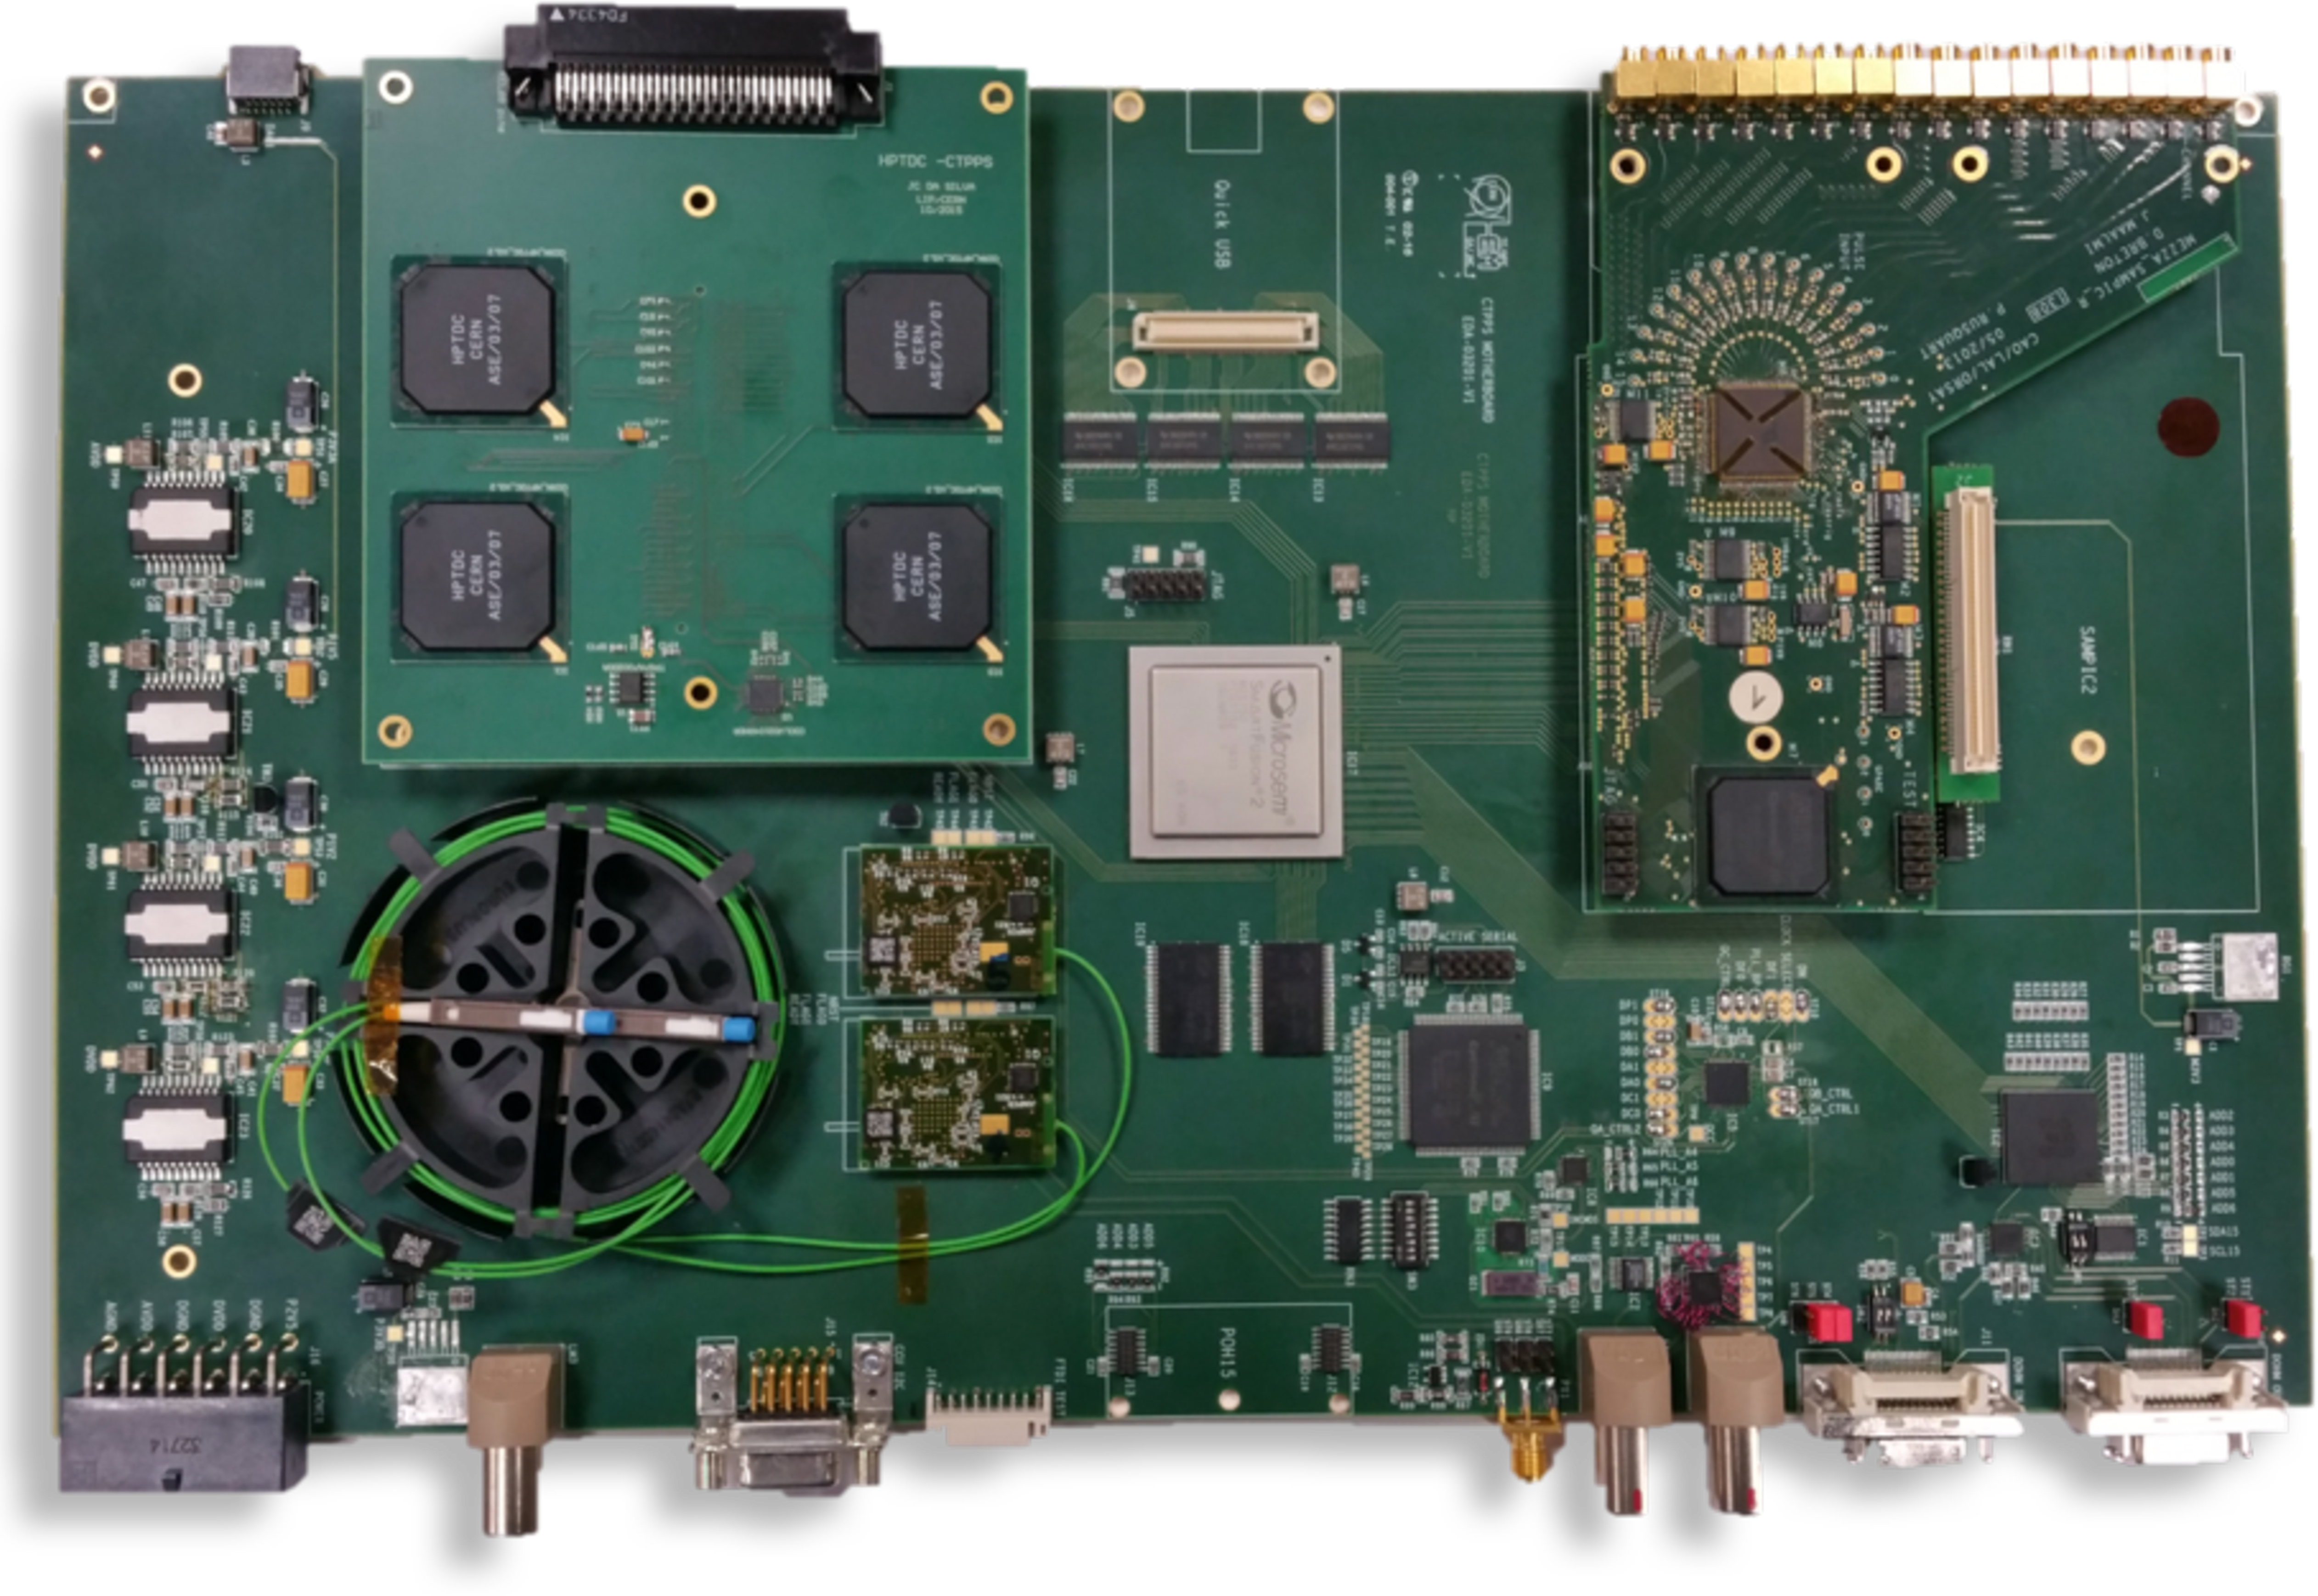
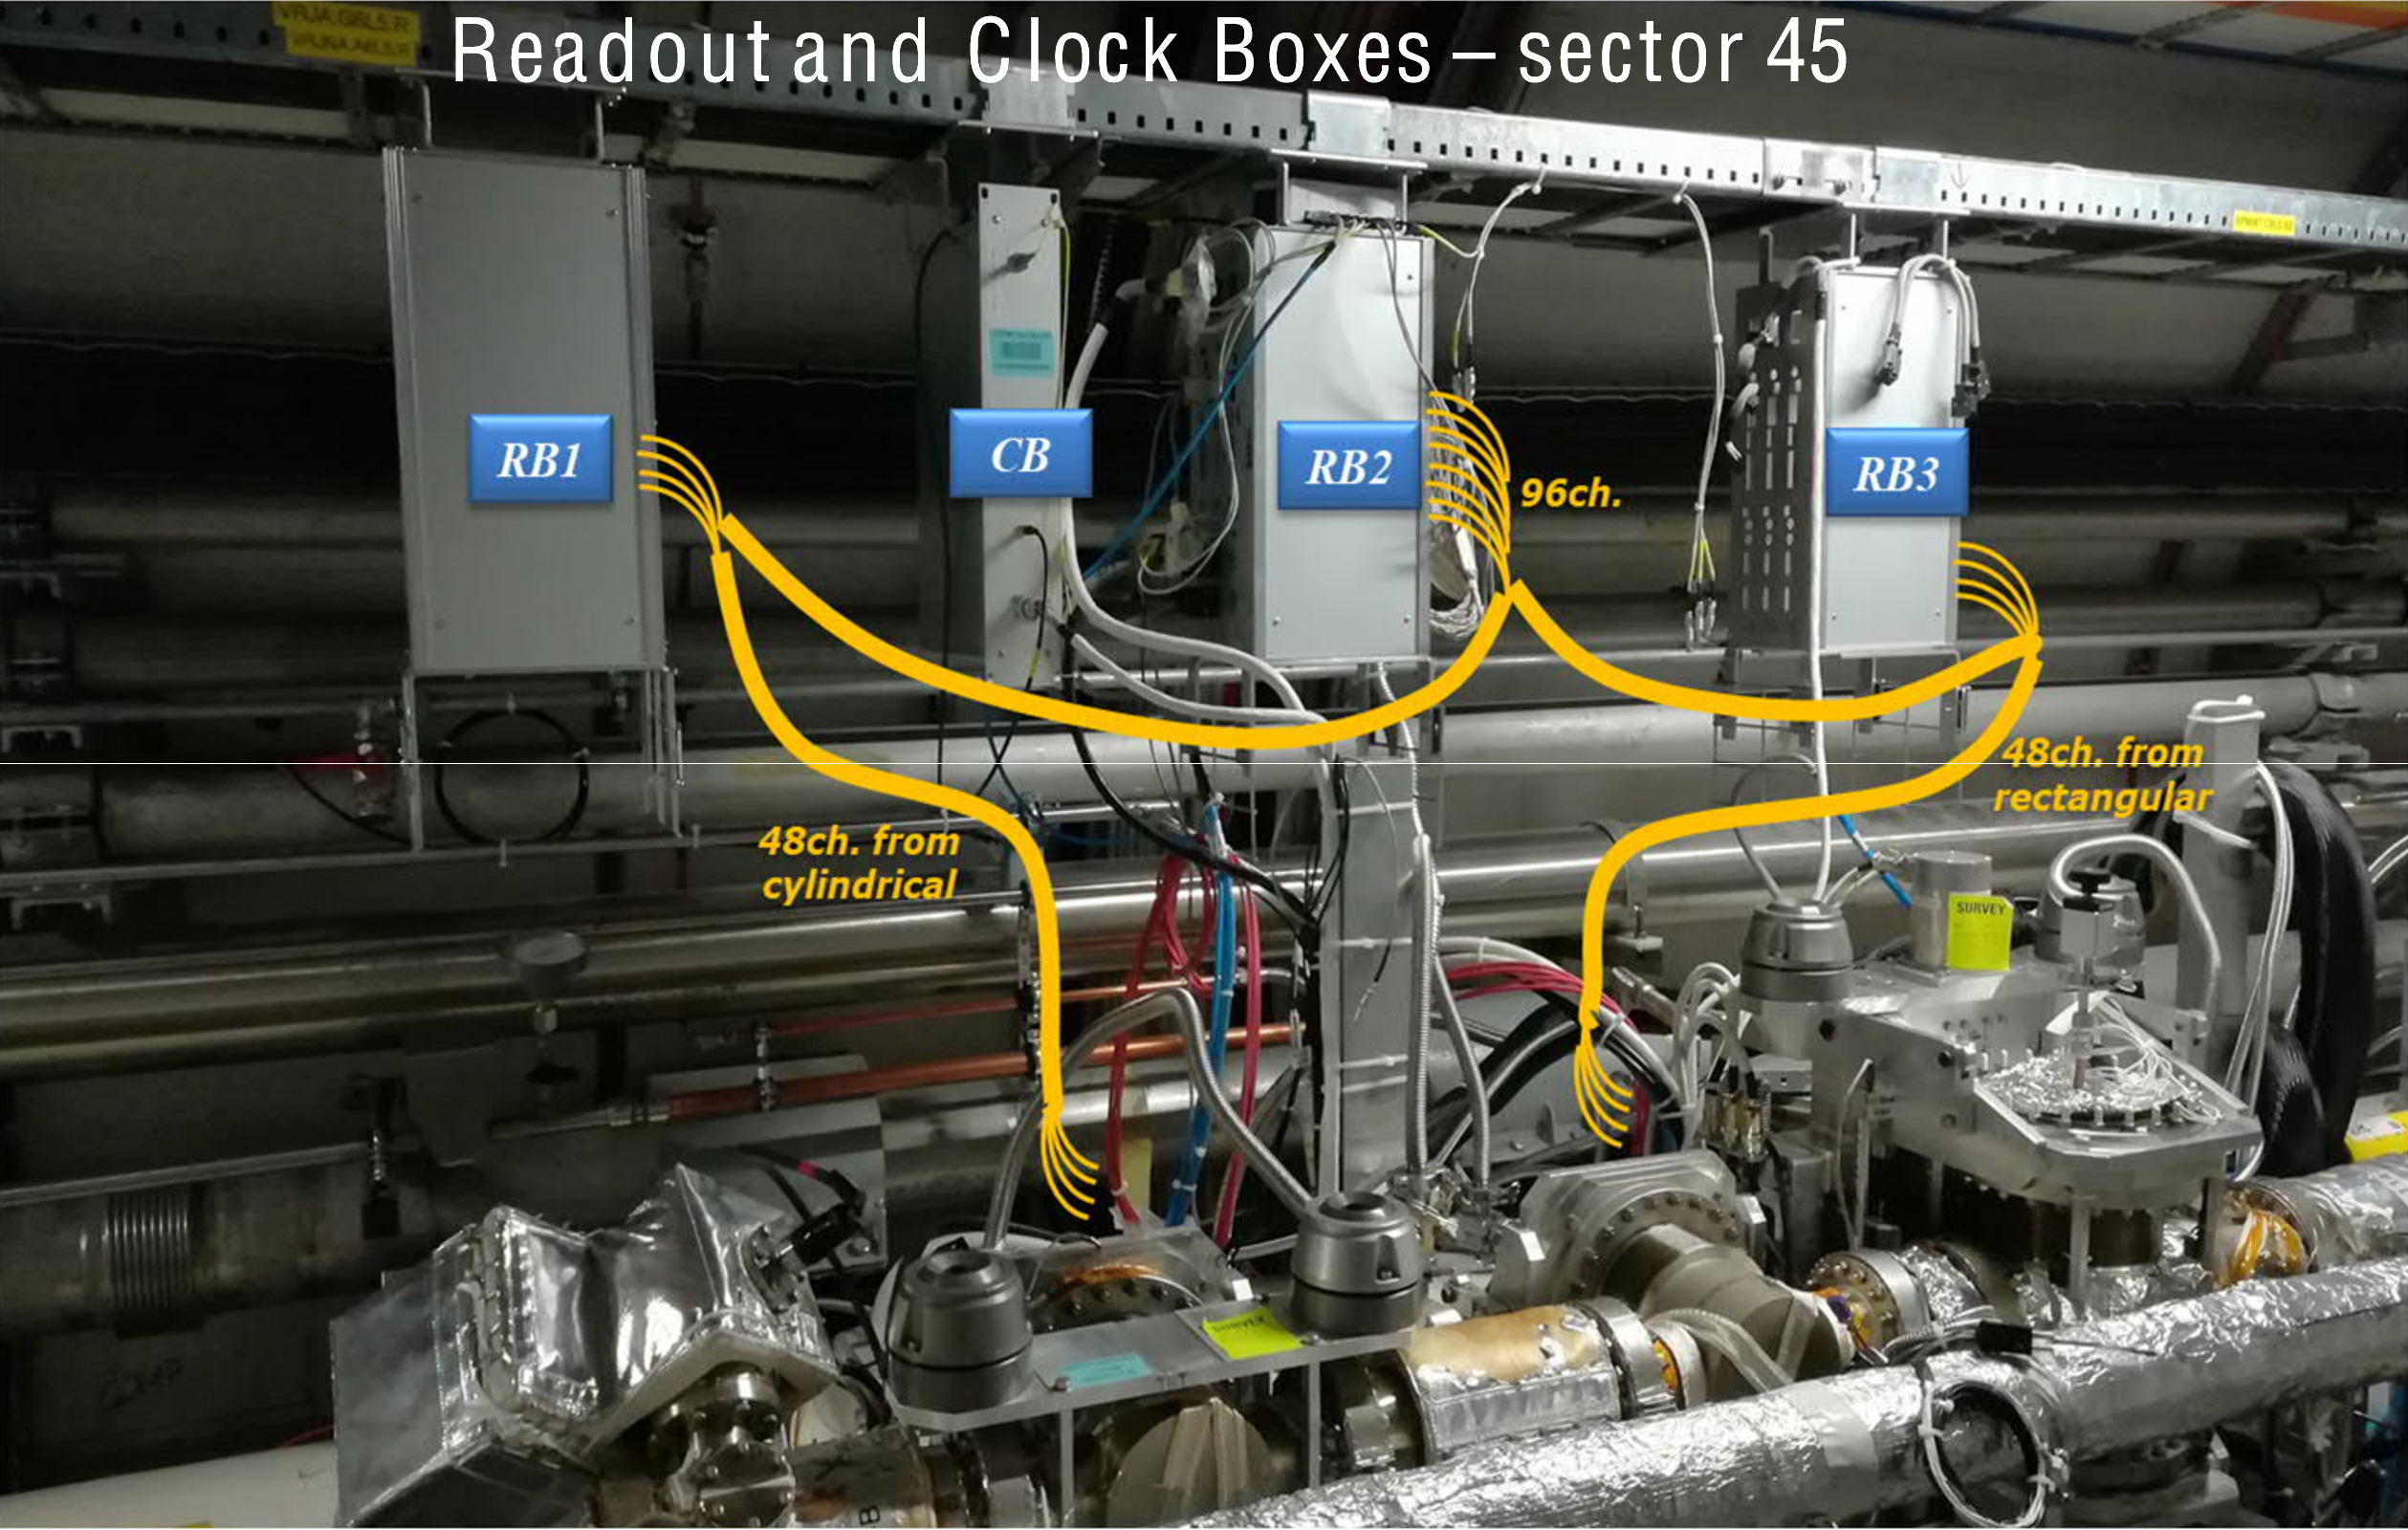
Figure 101:
Left: the digital readout unit. In this example both an HPTDC mezzanine (upper left) and a SAMPIC mezzanine (upper right) are mounted on the motherboard. Right: location of PPS mini-crates installed above the LHC beam pipe, for both the cylindrical timing RP already used in Run 2, and the rectangular 220-N RP newly equipped for timing in Run 3. The readout boxes (labeled ``RB'') contain the NINO boards and DRUs as described in the text. The box labeled ``CB'' holds components for the precise reference clock. |
png pdf |
Figure 101-a:
The digital readout unit. In this example both an HPTDC mezzanine (upper left) and a SAMPIC mezzanine (upper right) are mounted on the motherboard. |
png pdf |
Figure 101-b:
Location of PPS mini-crates installed above the LHC beam pipe, for both the cylindrical timing RP already used in Run 2, and the rectangular 220-N RP newly equipped for timing in Run 3. The readout boxes (labeled ``RB'') contain the NINO boards and DRUs as described in the text. The box labeled ``CB'' holds components for the precise reference clock. |
png pdf |
Figure 102:
Schematic diagram of the full readout chain for the PPS timing detectors in Run 3, also showing the configuration used in Run 2. The arrows on the right represent electrical connections to the slow-control ring and optical connections to components in the underground service cavern of CMS, described in Section 7.4. The central set of DRUs (3 units) was already present in Run 2, but was employed for the diamond detectors equipping the TOTEM experiment at that time, and for one layer of UFSD detectors used in 2017 for the PPS timing. |
png pdf |
Figure 103:
A block scheme of the clock distribution system for the PPS timing detectors. The four receiver units correspond each to a timing station in the tunnel; the remaining elements of the system are all located in the counting room. Different colors of the fiber lines represent the different wavelength carriers used by the system, $ \lambda_1 $, $ \lambda_2 $, $ \lambda_\text{M} $ (black, green, and yellow, respectively), and the multiplexed signals (red). |
png pdf |
Figure 104:
Left: the PPS pixel DAQ crate. On the left are two FC7 FECs, sending clock, trigger and slow-control commands; in the center-right are two FC7 FEDs, receiving data from the two arms of the PPS spectrometer; on the far left is the MCH crate controller, on the far right is the AMC13. Right: the timing and strips DAQ crate. The SLinks are placed in the backplane of the OptoRx boards delivering data to upstream CMS DAQ. |

png pdf |
Figure 104-a:
The PPS pixel DAQ crate. On the left are two FC7 FECs, sending clock, trigger and slow-control commands; in the center-right are two FC7 FEDs, receiving data from the two arms of the PPS spectrometer; on the far left is the MCH crate controller, on the far right is the AMC13. |
png pdf |
Figure 105:
Luminosity-leveling trajectories for typical LHC fills in the $ (\alpha/2, \beta^\ast) $ plane for 2022 (dashed line) and 2023 (continuous line). |
png pdf |
Figure 106:
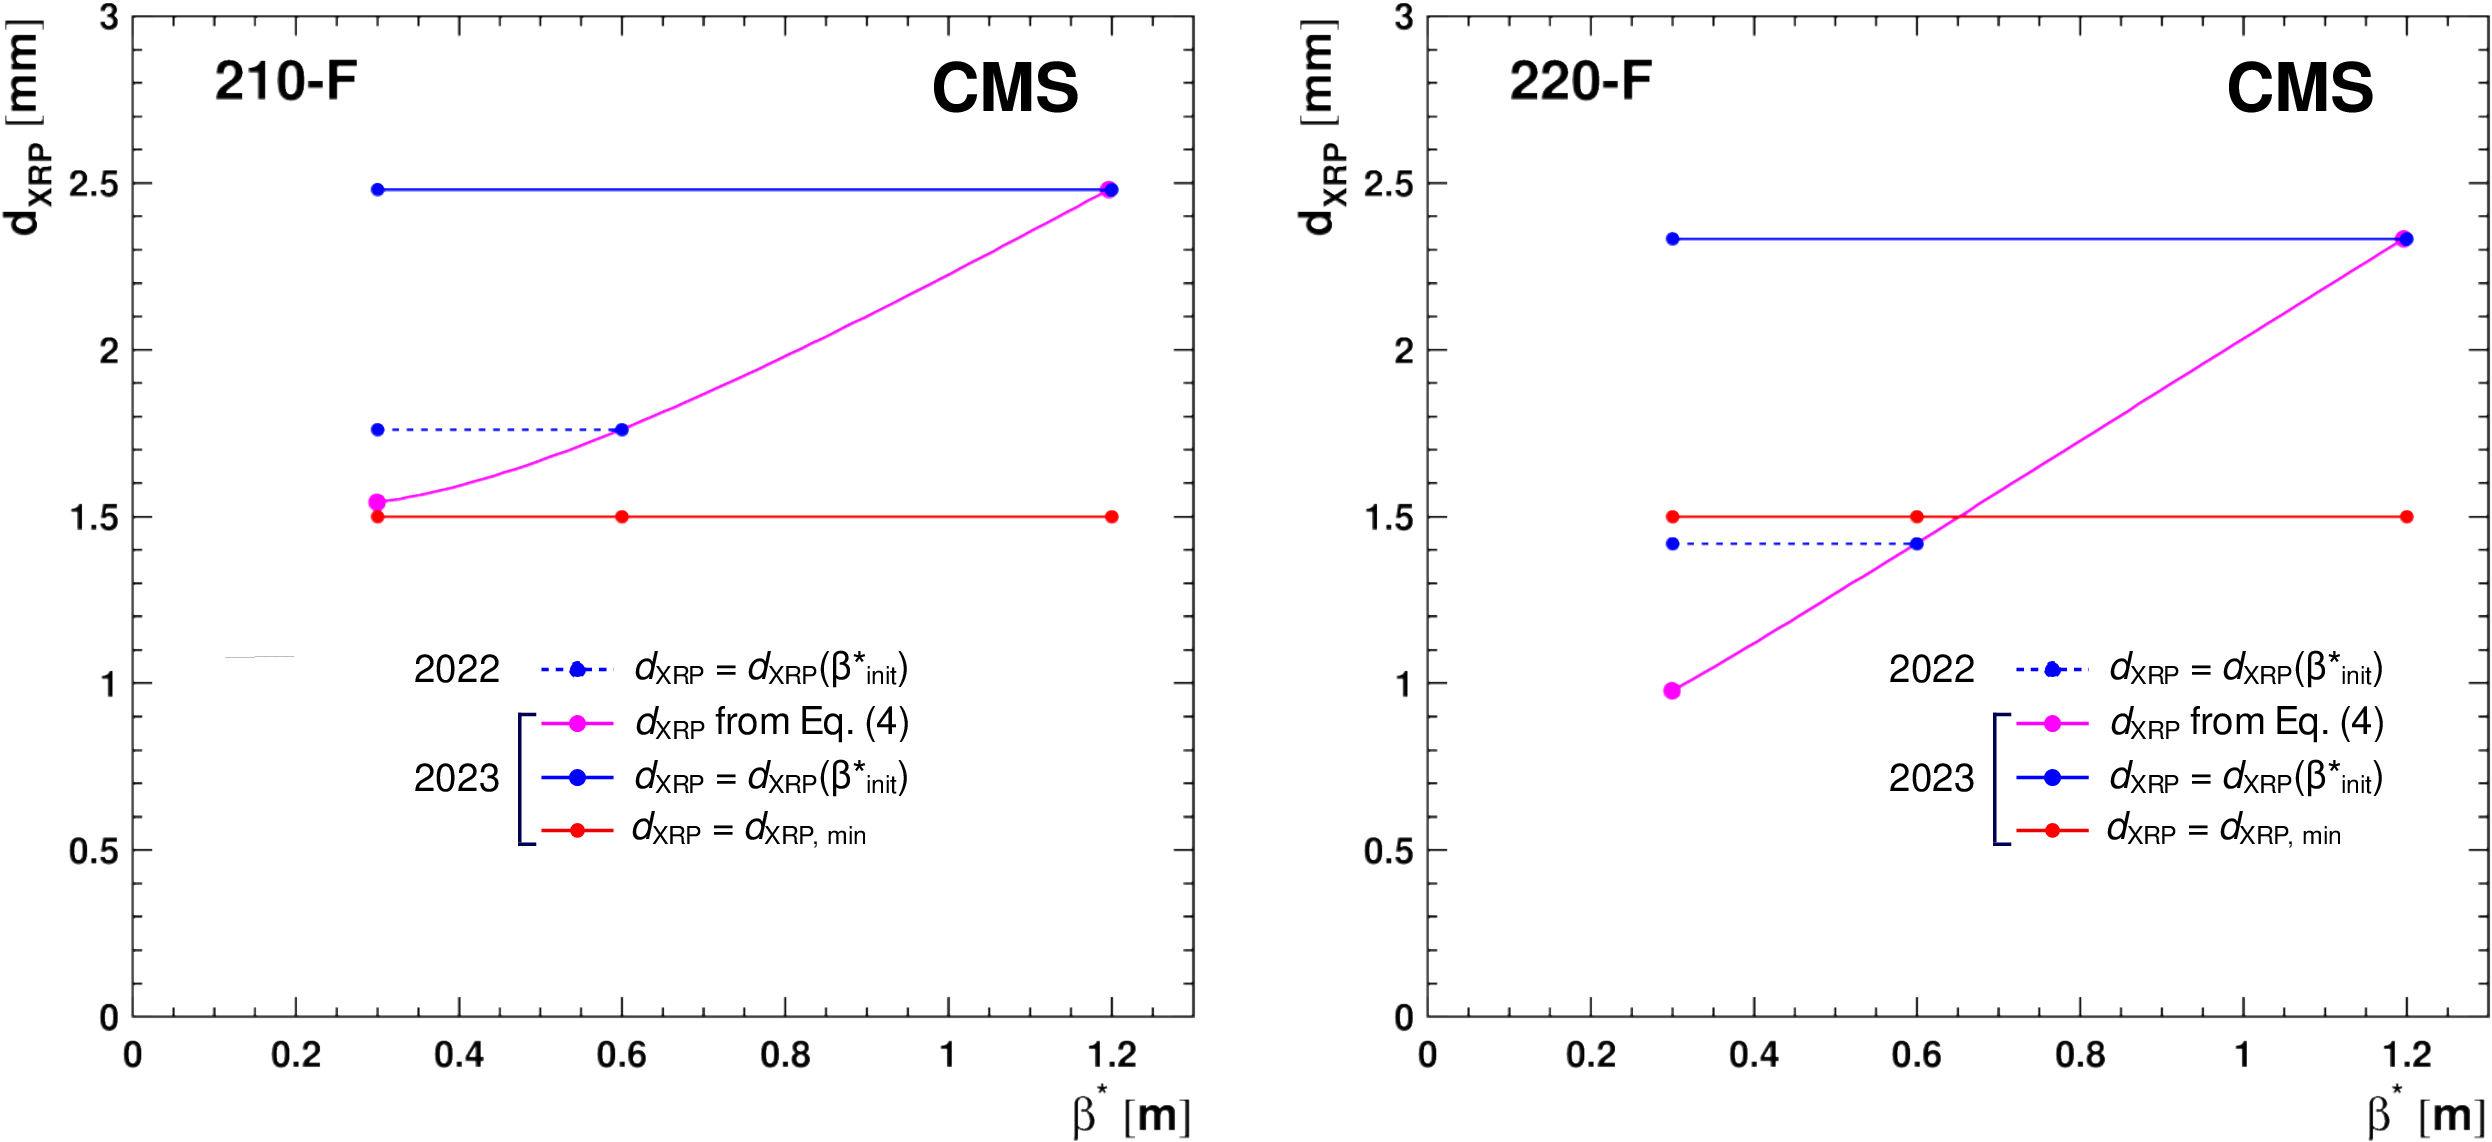
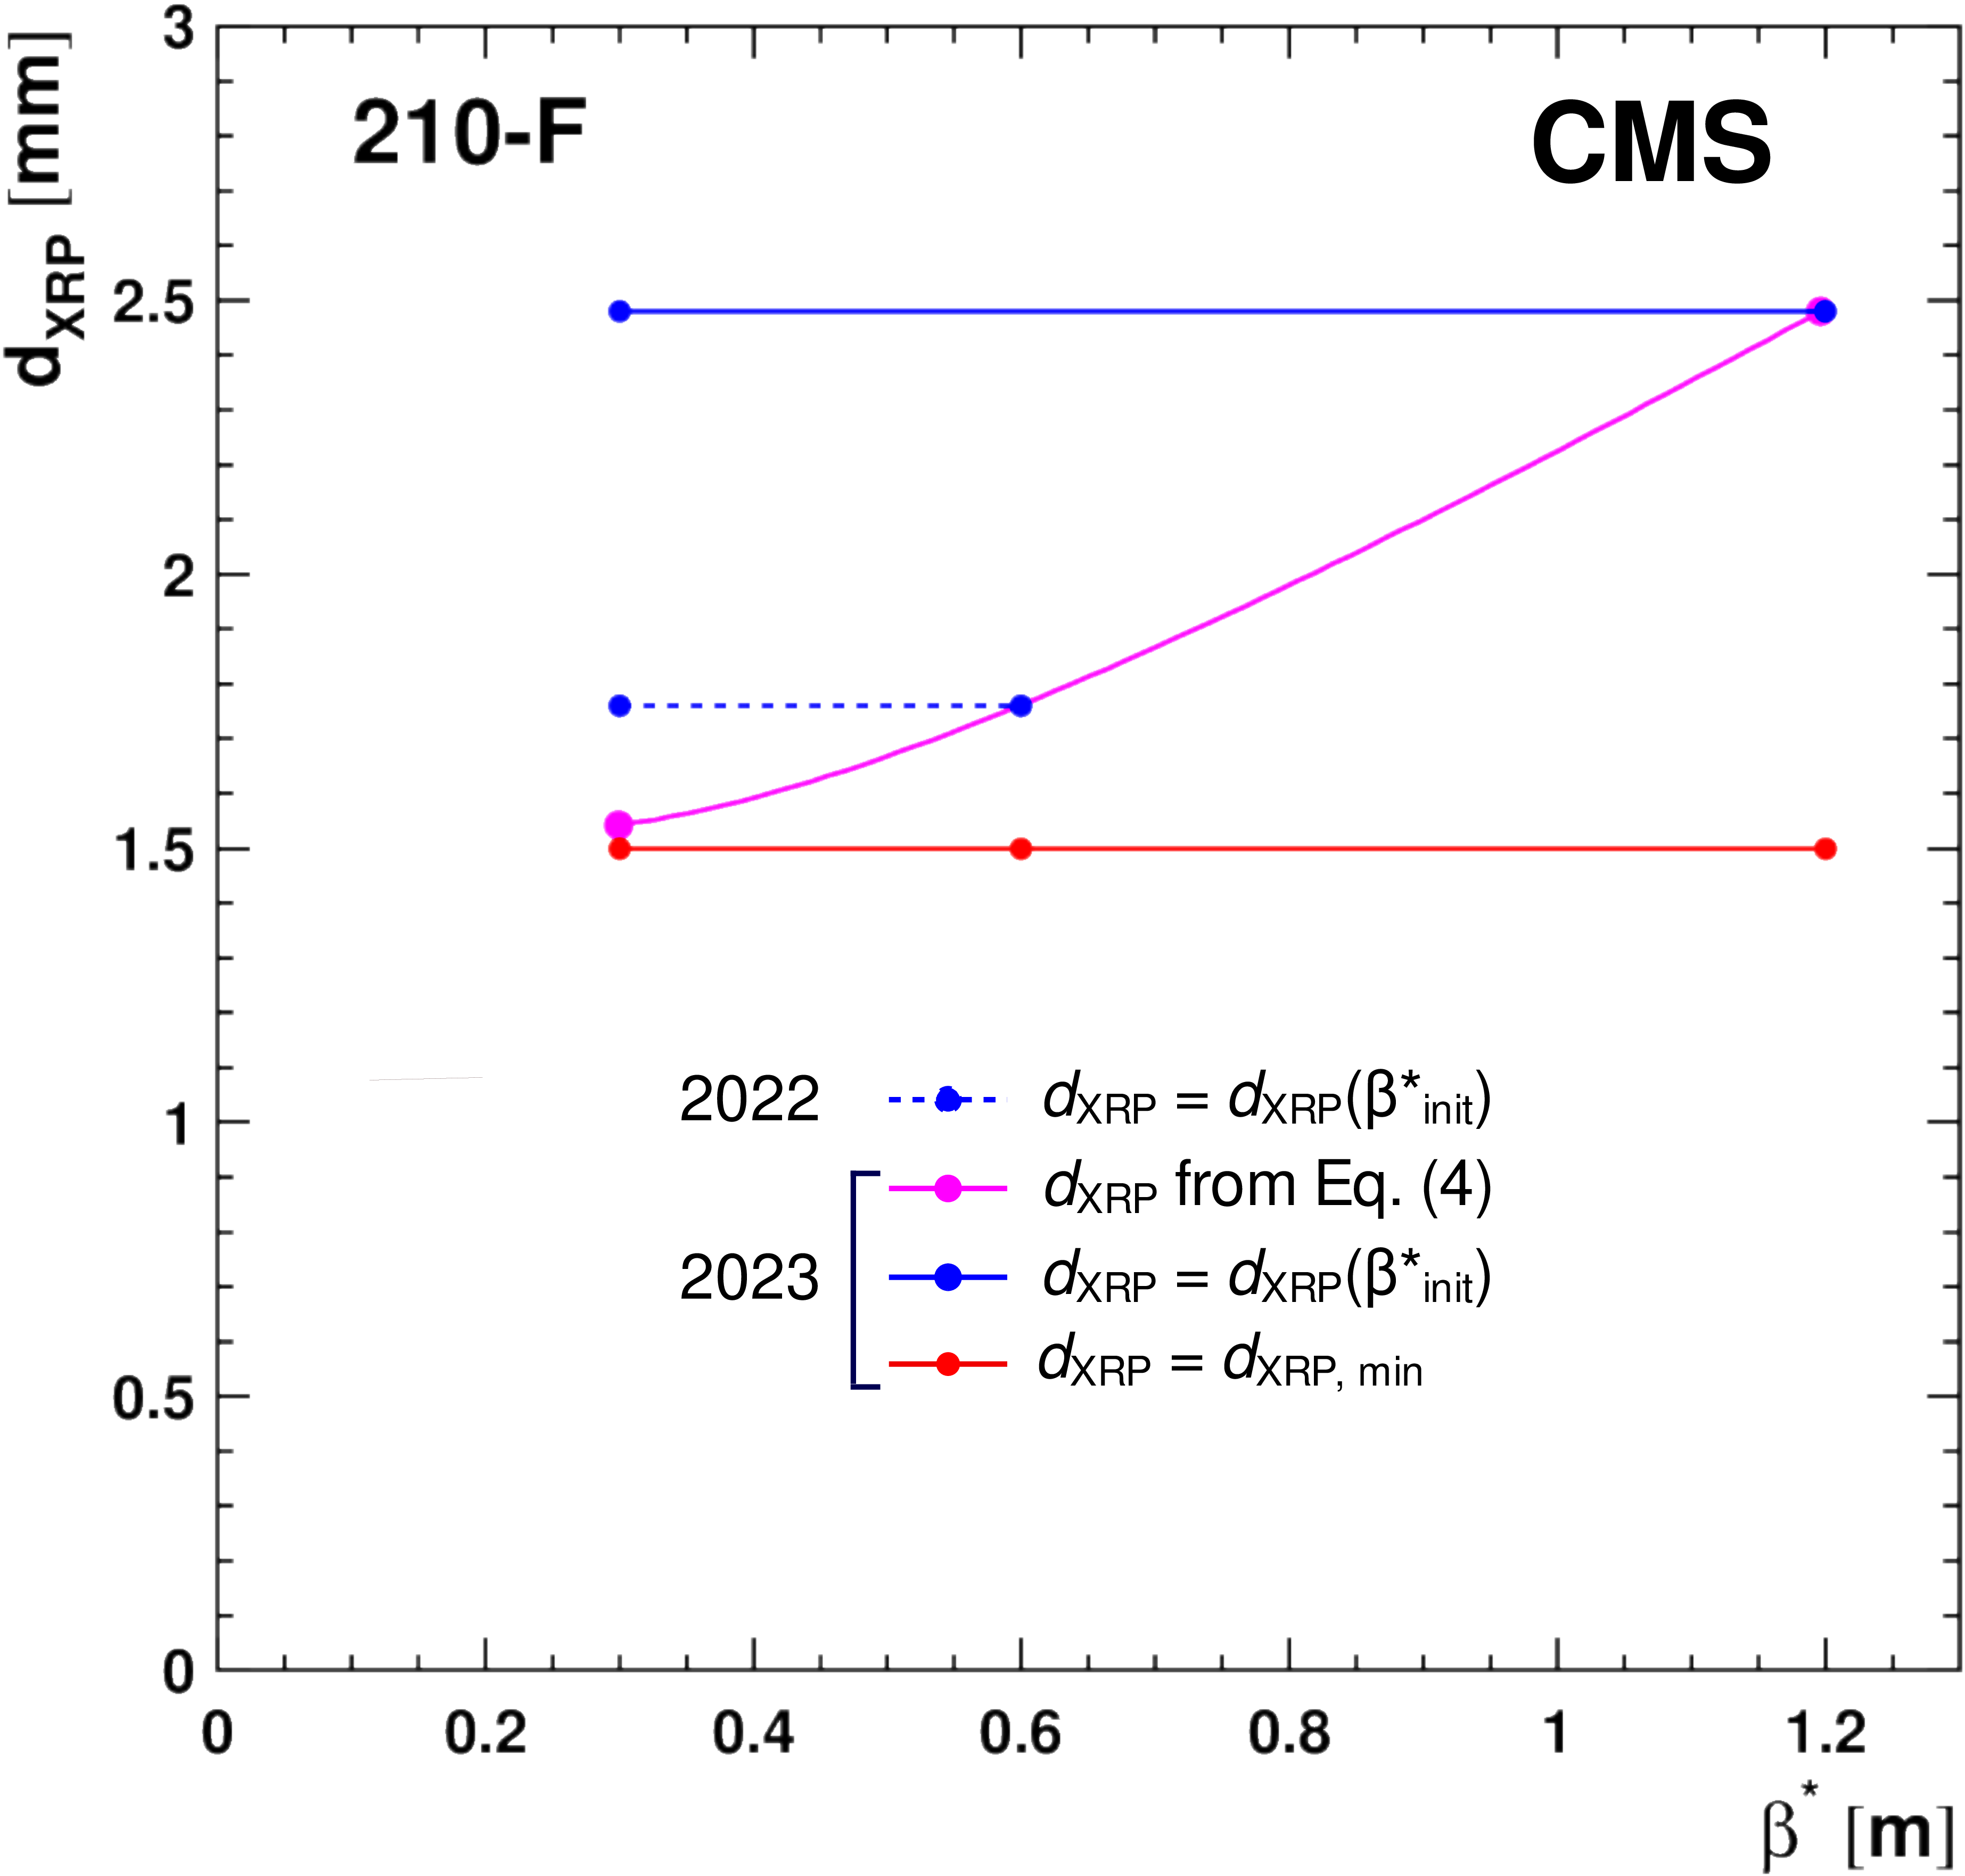
RP insertion distance $ d_{\text{XRP}} $ for the leveling trajectories of 2022 (dashed lines) and 2023 (continuous lines) from Fig. 105, evaluated for the pots 210-F (left) and 220-F (right) in the case of the TCT fixed to $ d_{\text{TCT}} = $ 8.5$\sigma_{x,\text{TCT}}$ ($\beta^\ast=$ 30 cm). The magenta line shows the nominal distance according to Eq. (7). The blue lines show the most conservative constant RP distance, i.e., never closer to the beam than the nominal distance. If this blue distance is smaller than the limit of 1.5 mm (red line), which is the case for 220-F, the pot has to stay at that limit. The fill evolves from the right to the left. |
png pdf |
Figure 106-a:
RP insertion distance $ d_{\text{XRP}} $ for the leveling trajectories of 2022 (dashed lines) and 2023 (continuous lines) from Fig. 105, evaluated for the pots 210-F in the case of the TCT fixed to $ d_{\text{TCT}} = $ 8.5$\sigma_{x,\text{TCT}}$ ($\beta^\ast=$ 30 cm). The magenta line shows the nominal distance according to Eq. (7). The blue lines show the most conservative constant RP distance, i.e., never closer to the beam than the nominal distance. |
png pdf |
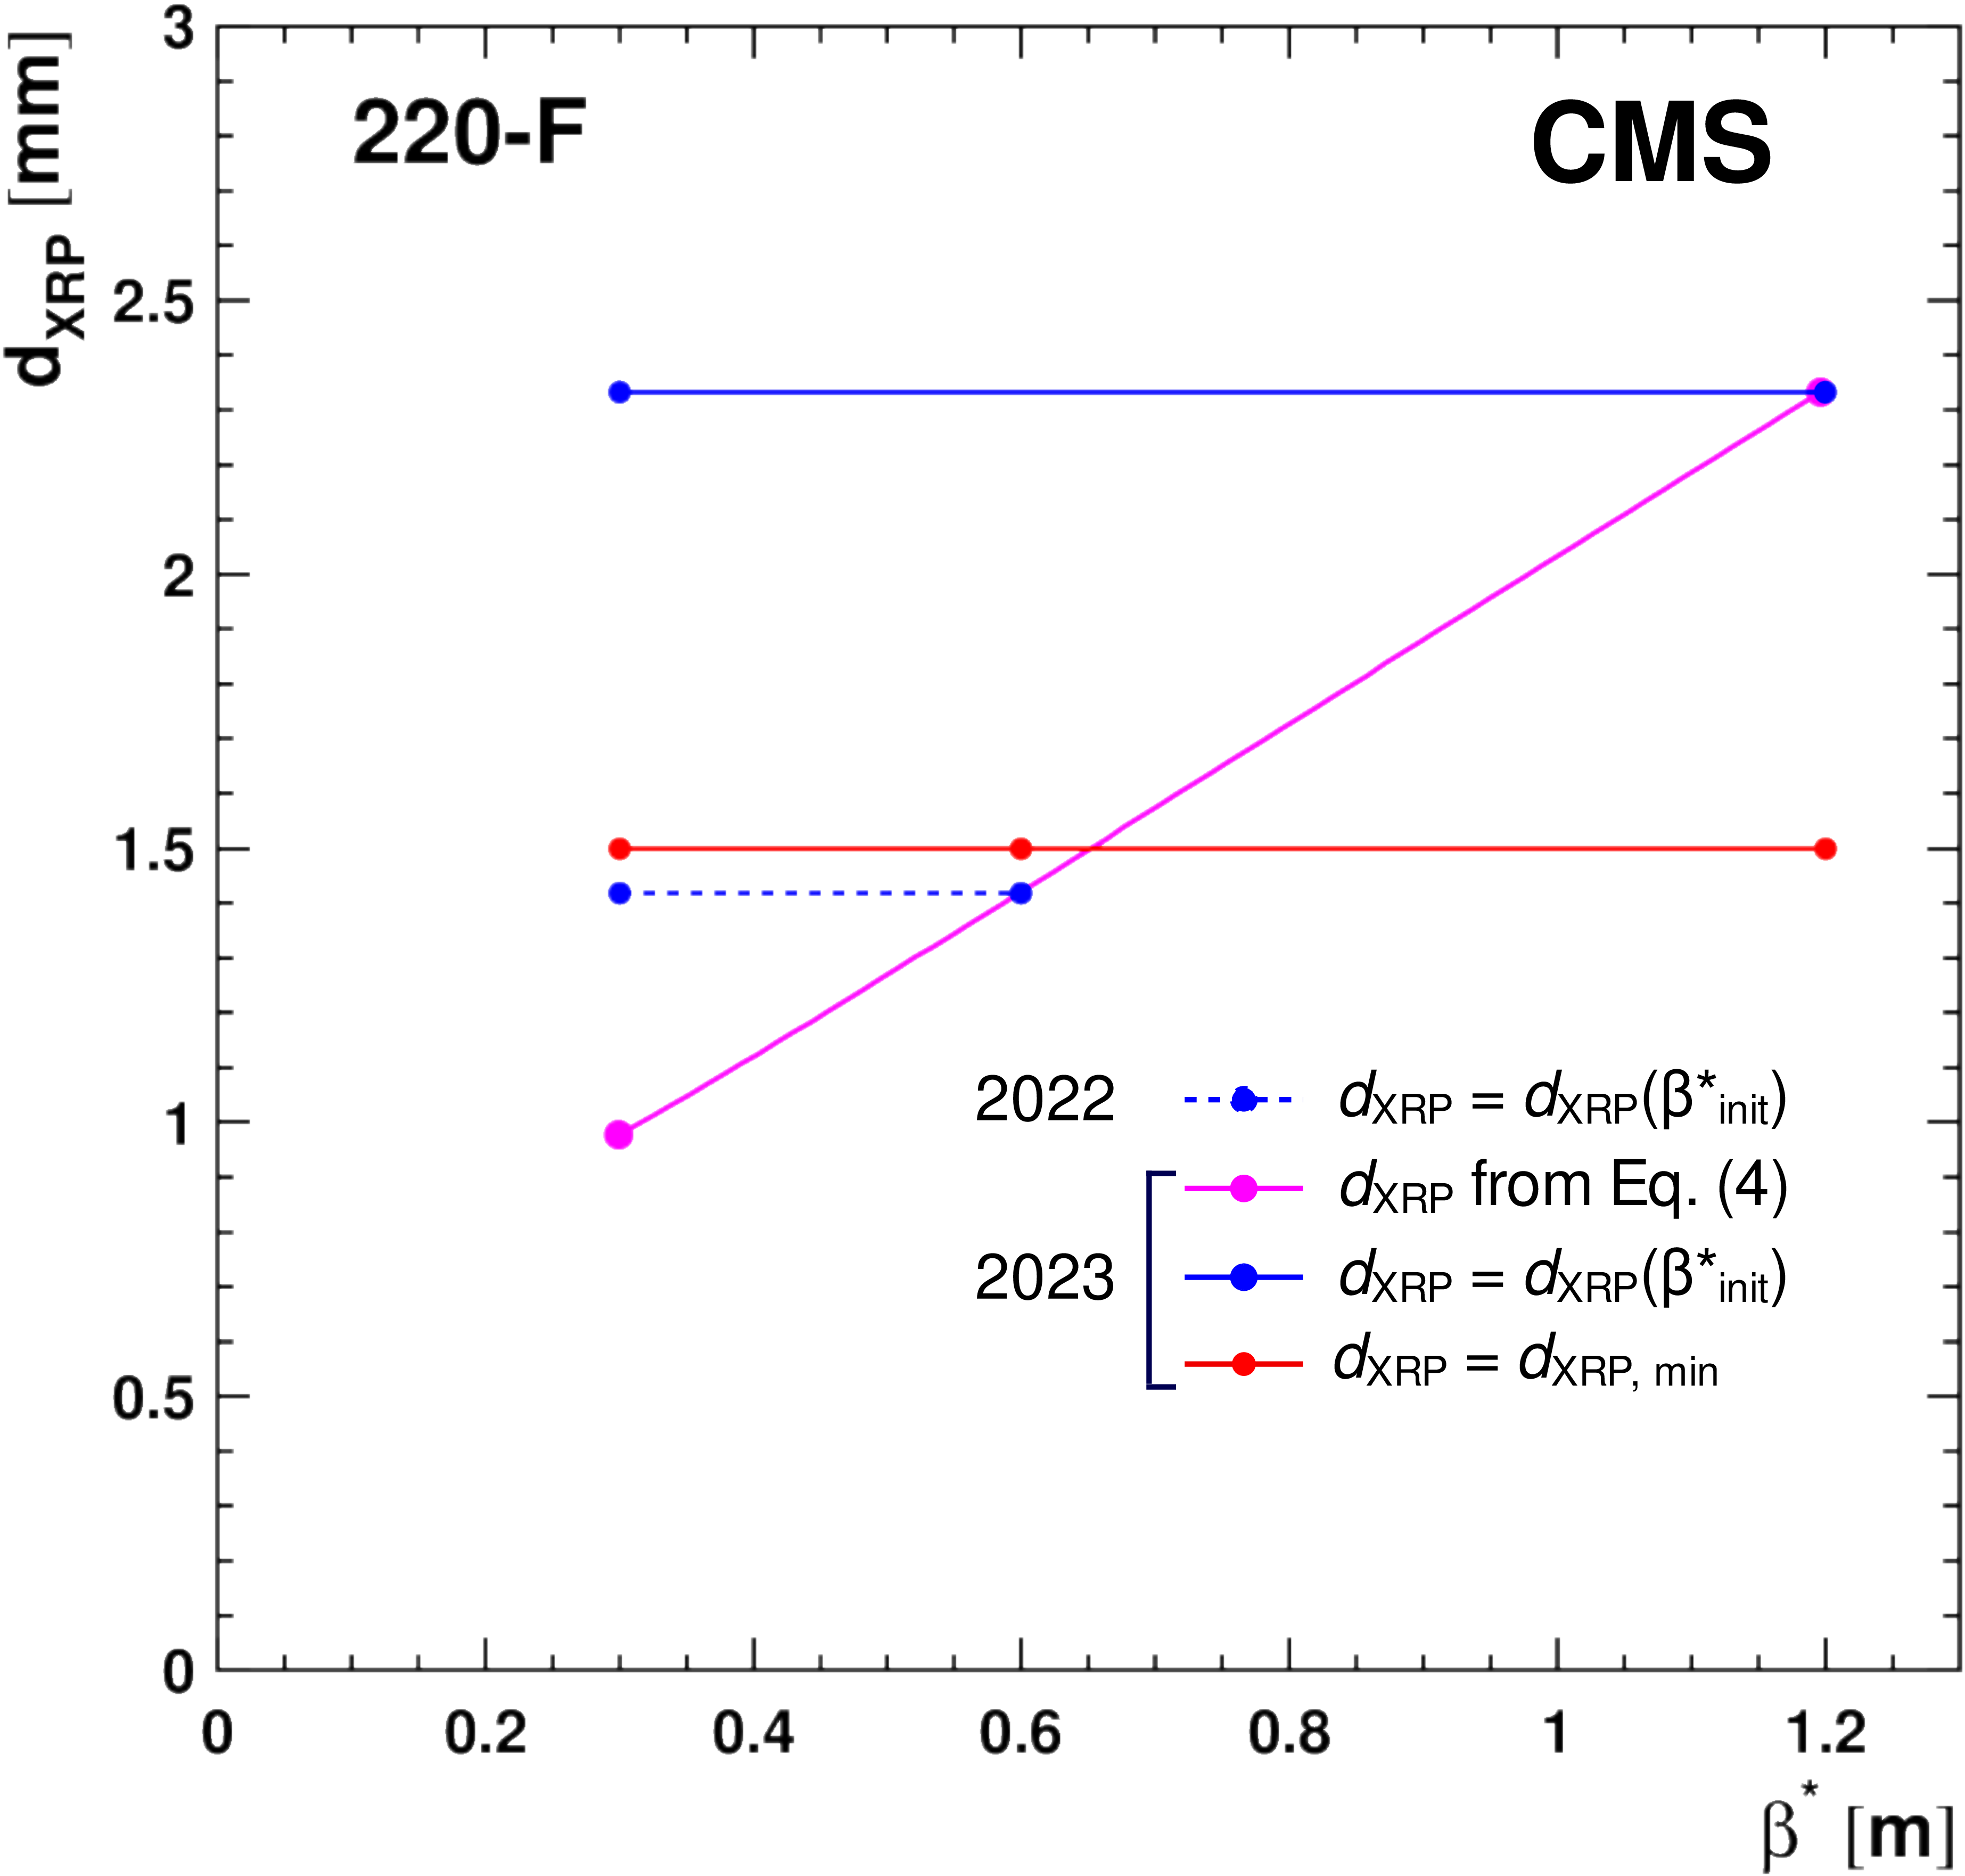
Figure 106-b:
RP insertion distance $ d_{\text{XRP}} $ for the leveling trajectories of 2022 (dashed lines) and 2023 (continuous lines) from Fig. 105, evaluated for the pots 220-F in the case of the TCT fixed to $ d_{\text{TCT}} = $ 8.5$\sigma_{x,\text{TCT}}$ ($\beta^\ast=$ 30 cm). The magenta line shows the nominal distance according to Eq. (7). The blue lines show the most conservative constant RP distance, i.e., never closer to the beam than the nominal distance. If this blue distance is smaller than the limit of 1.5 mm (red line), the pot has to stay at that limit. The fill evolves from the right to the left. |
png pdf |
Figure 107:
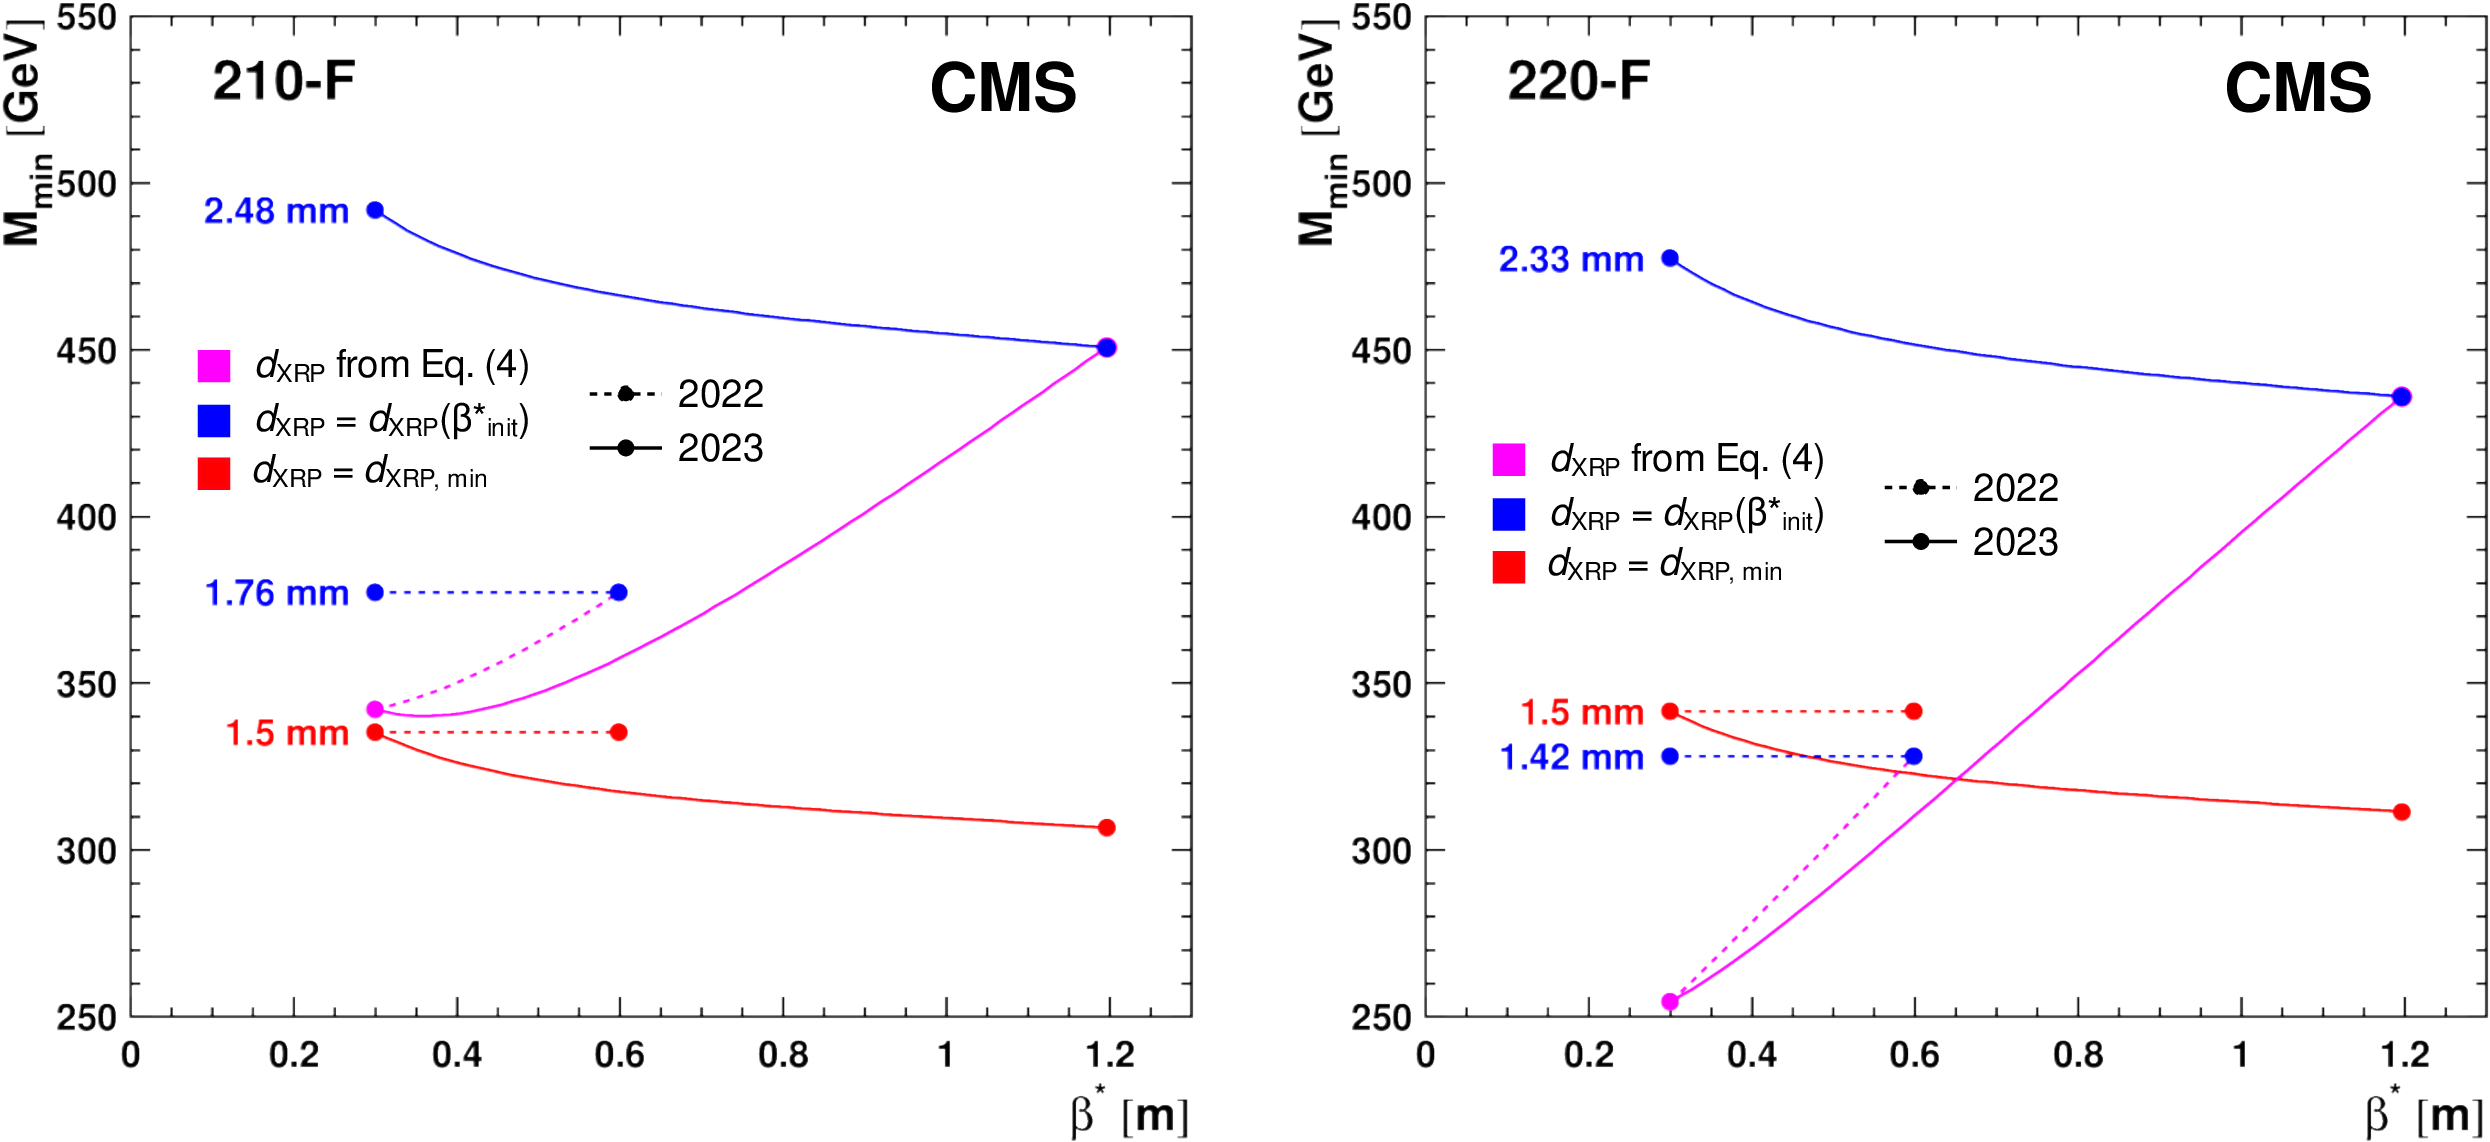
Minimum accepted central mass $ M_{\text{min}} $ in the RPs 210-F (left) and 220-F (right) for the old collimation scheme with the TCTs fixed at $ d_{\text{TCT}}=$ 8.5$\sigma_{x,\text{TCT}}$ ($\beta^\ast=$ 30 cm) and two cases for the RP positions. Magenta lines: RPs moving according to Eq. (7) and Fig. 106. Blue lines: RP positions fixed on the most distant point of the nominal trajectory. The red lines correspond to the 1.5 mm distance limit. The fill evolves from the right to the left. |

png pdf |
Figure 107-a:
Minimum accepted central mass $ M_{\text{min}} $ in the RPs 210-F for the old collimation scheme with the TCTs fixed at $ d_{\text{TCT}}=$ 8.5$\sigma_{x,\text{TCT}}$ ($\beta^\ast=$ 30 cm) and two cases for the RP positions. Magenta lines: RPs moving according to Eq. (7) and Fig. 106. Blue lines: RP positions fixed on the most distant point of the nominal trajectory. The red lines correspond to the 1.5 mm distance limit. The fill evolves from the right to the left. |
png pdf |
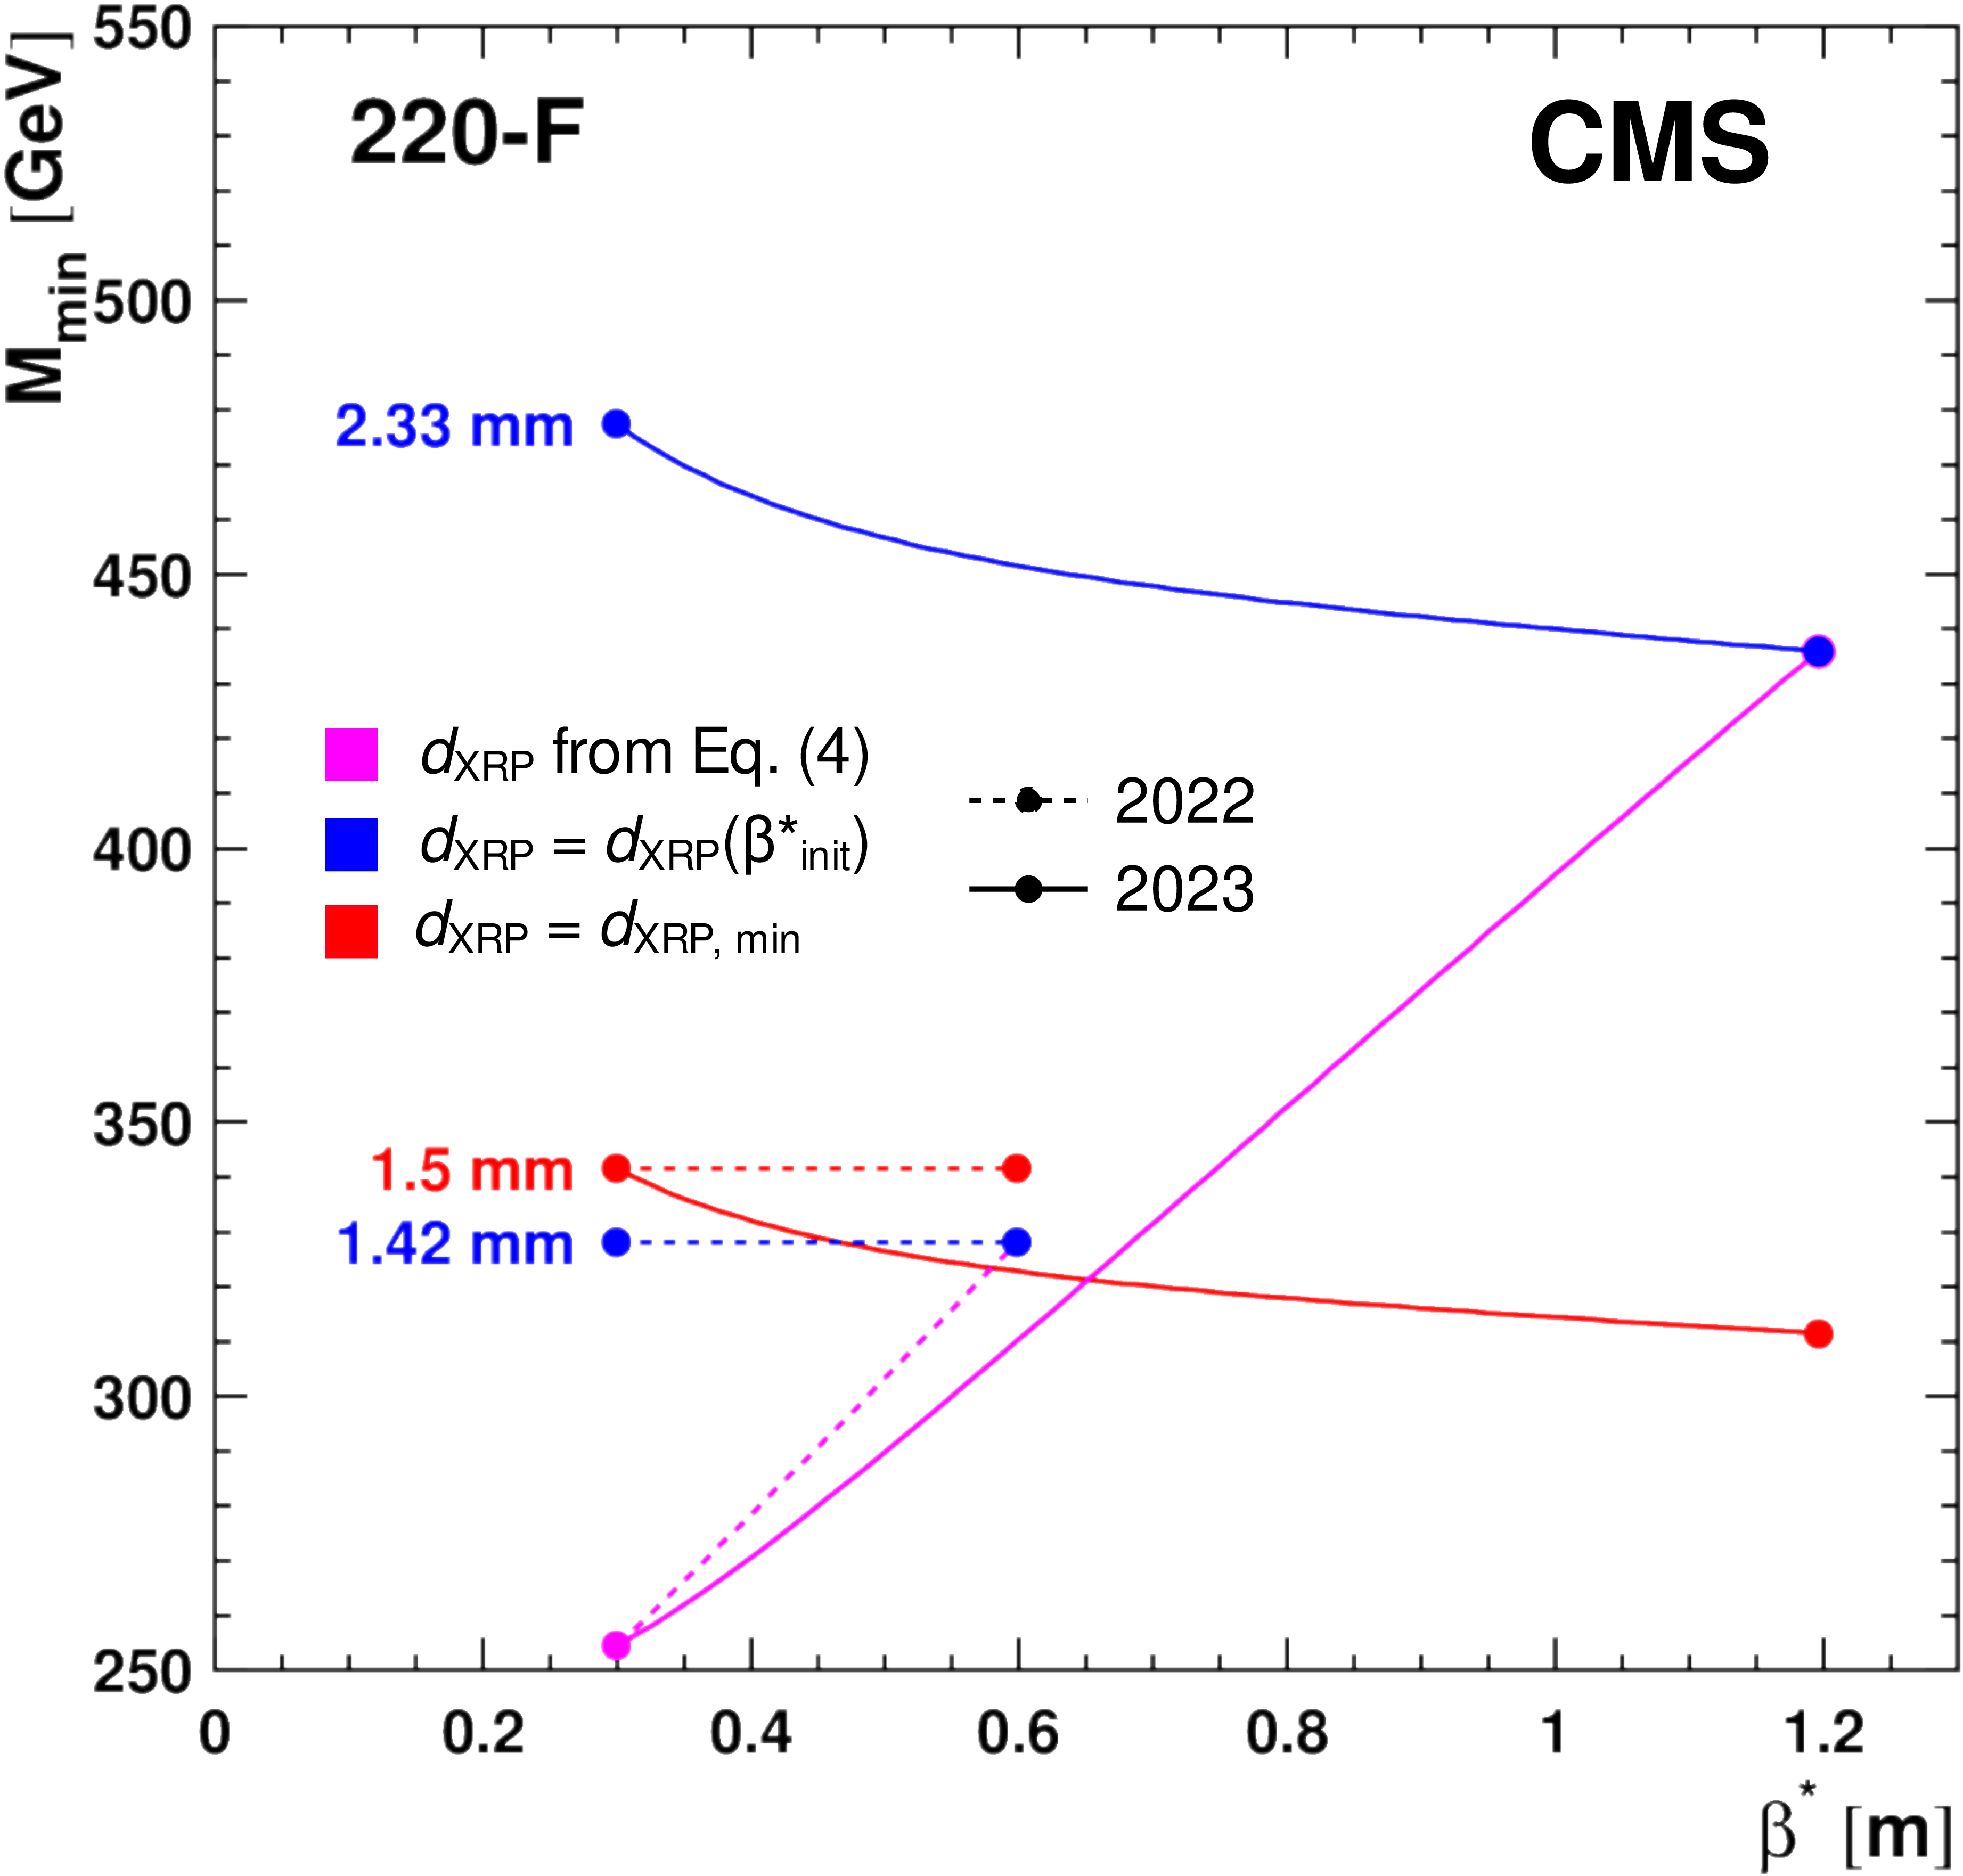
Figure 107-b:
Minimum accepted central mass $ M_{\text{min}} $ in the RPs 220-F for the old collimation scheme with the TCTs fixed at $ d_{\text{TCT}}=$ 8.5$\sigma_{x,\text{TCT}}$ ($\beta^\ast=$ 30 cm) and two cases for the RP positions. Magenta lines: RPs moving according to Eq. (7) and Fig. 106. Blue lines: RP positions fixed on the most distant point of the nominal trajectory. The red lines correspond to the 1.5 mm distance limit. The fill evolves from the right to the left. |
png pdf |
Figure 108:
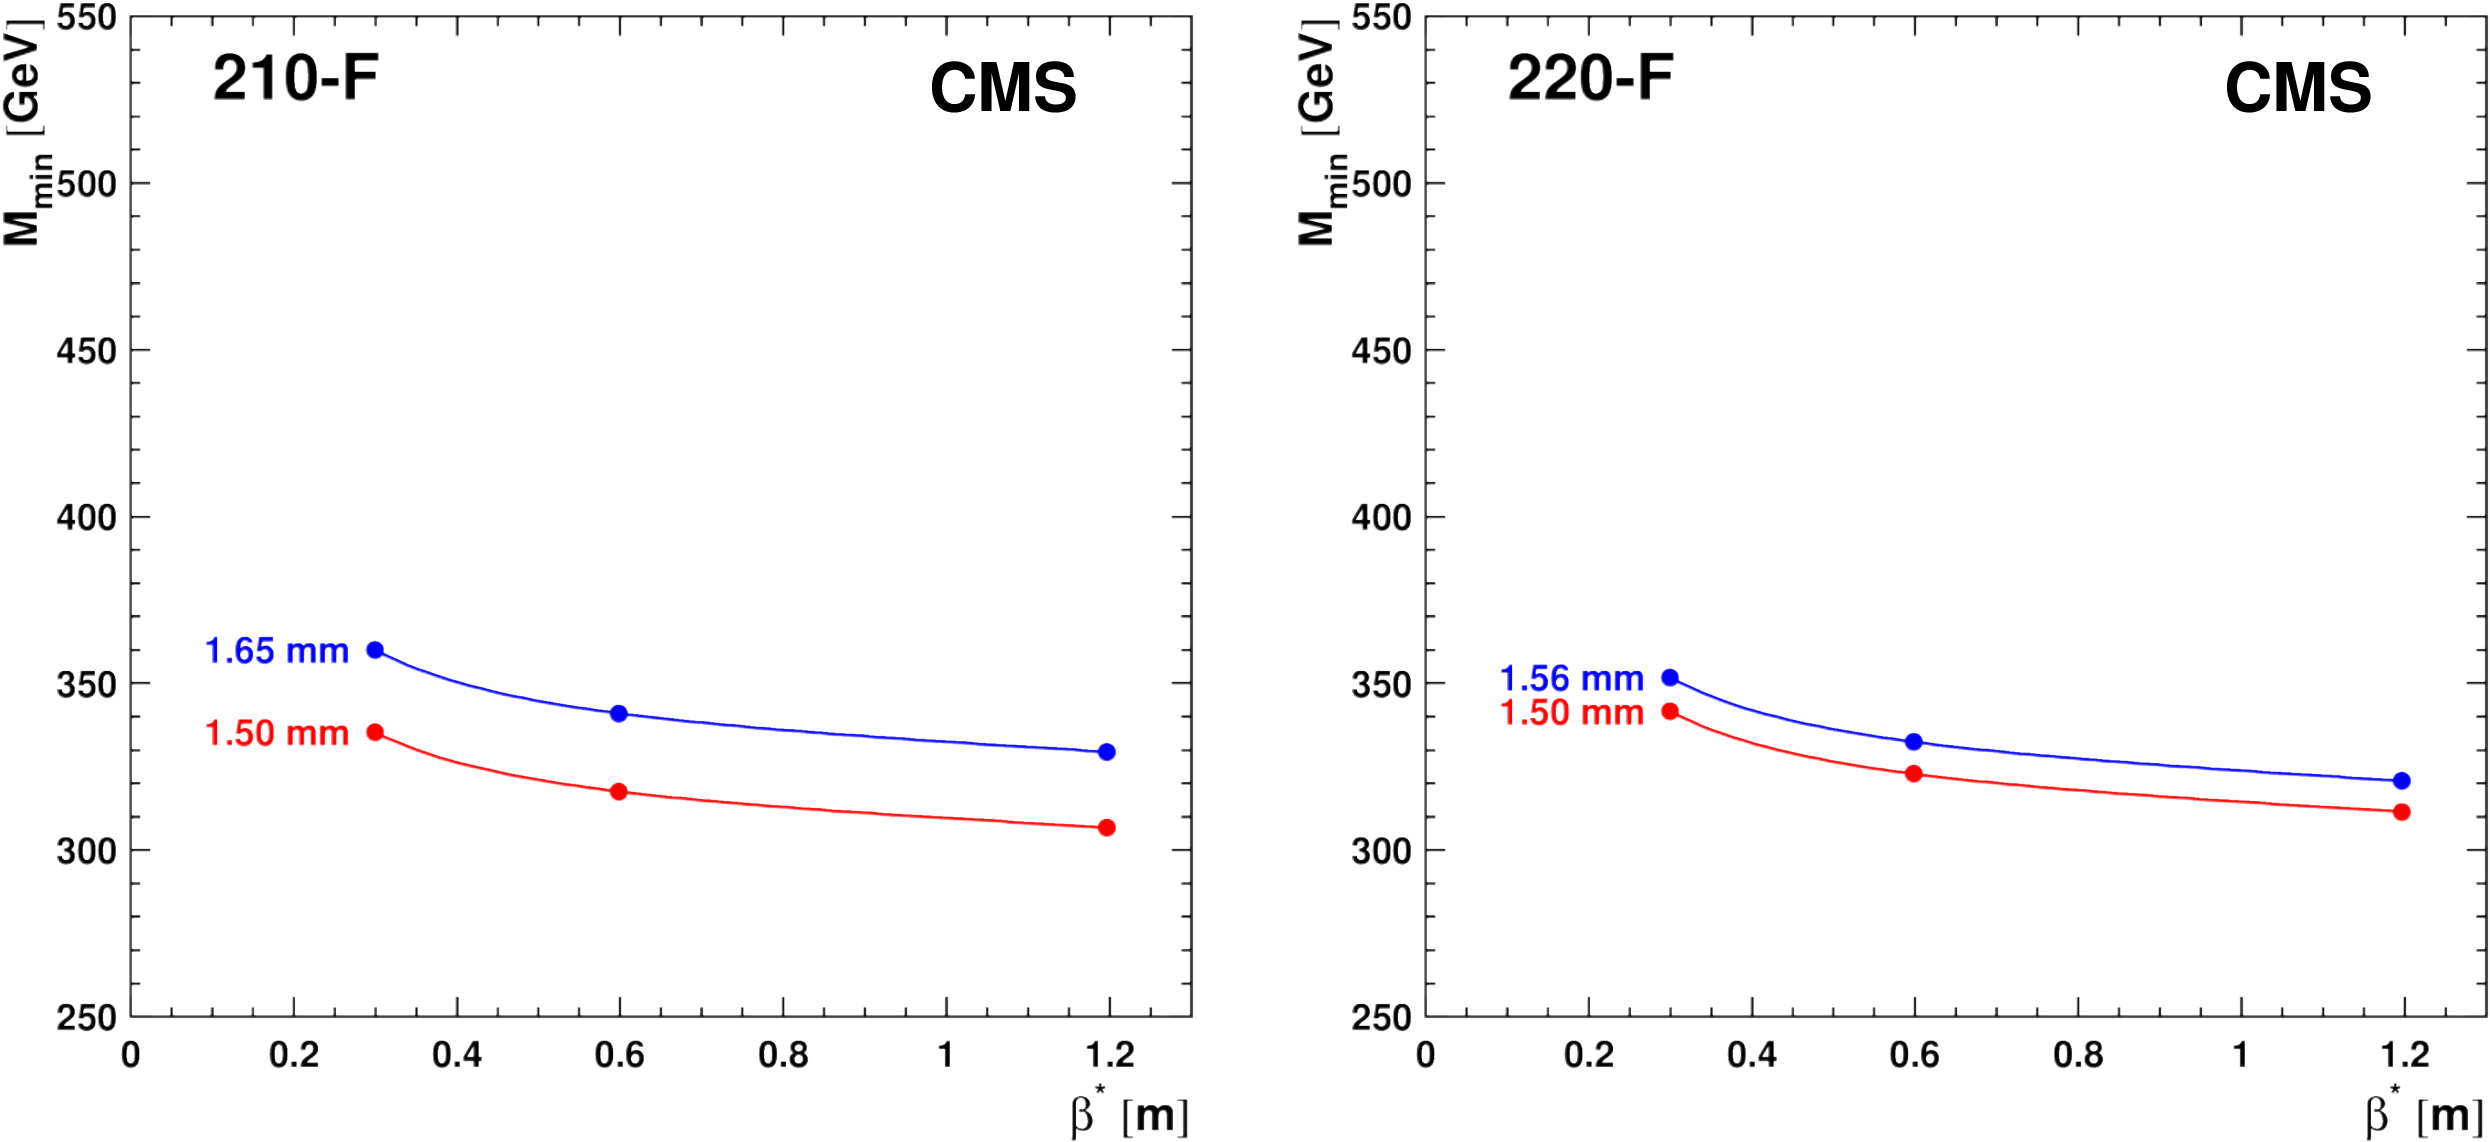
Minimum accepted central mass $ M_{\text{min}} $ in the RPs 210-F (left) and 220-F (right) for the new collimation scheme with moving TCTs and fixed RP positions. The red lines correspond to the 1.5 mm distance limit. The fill evolves from the right to the left. |
png pdf |
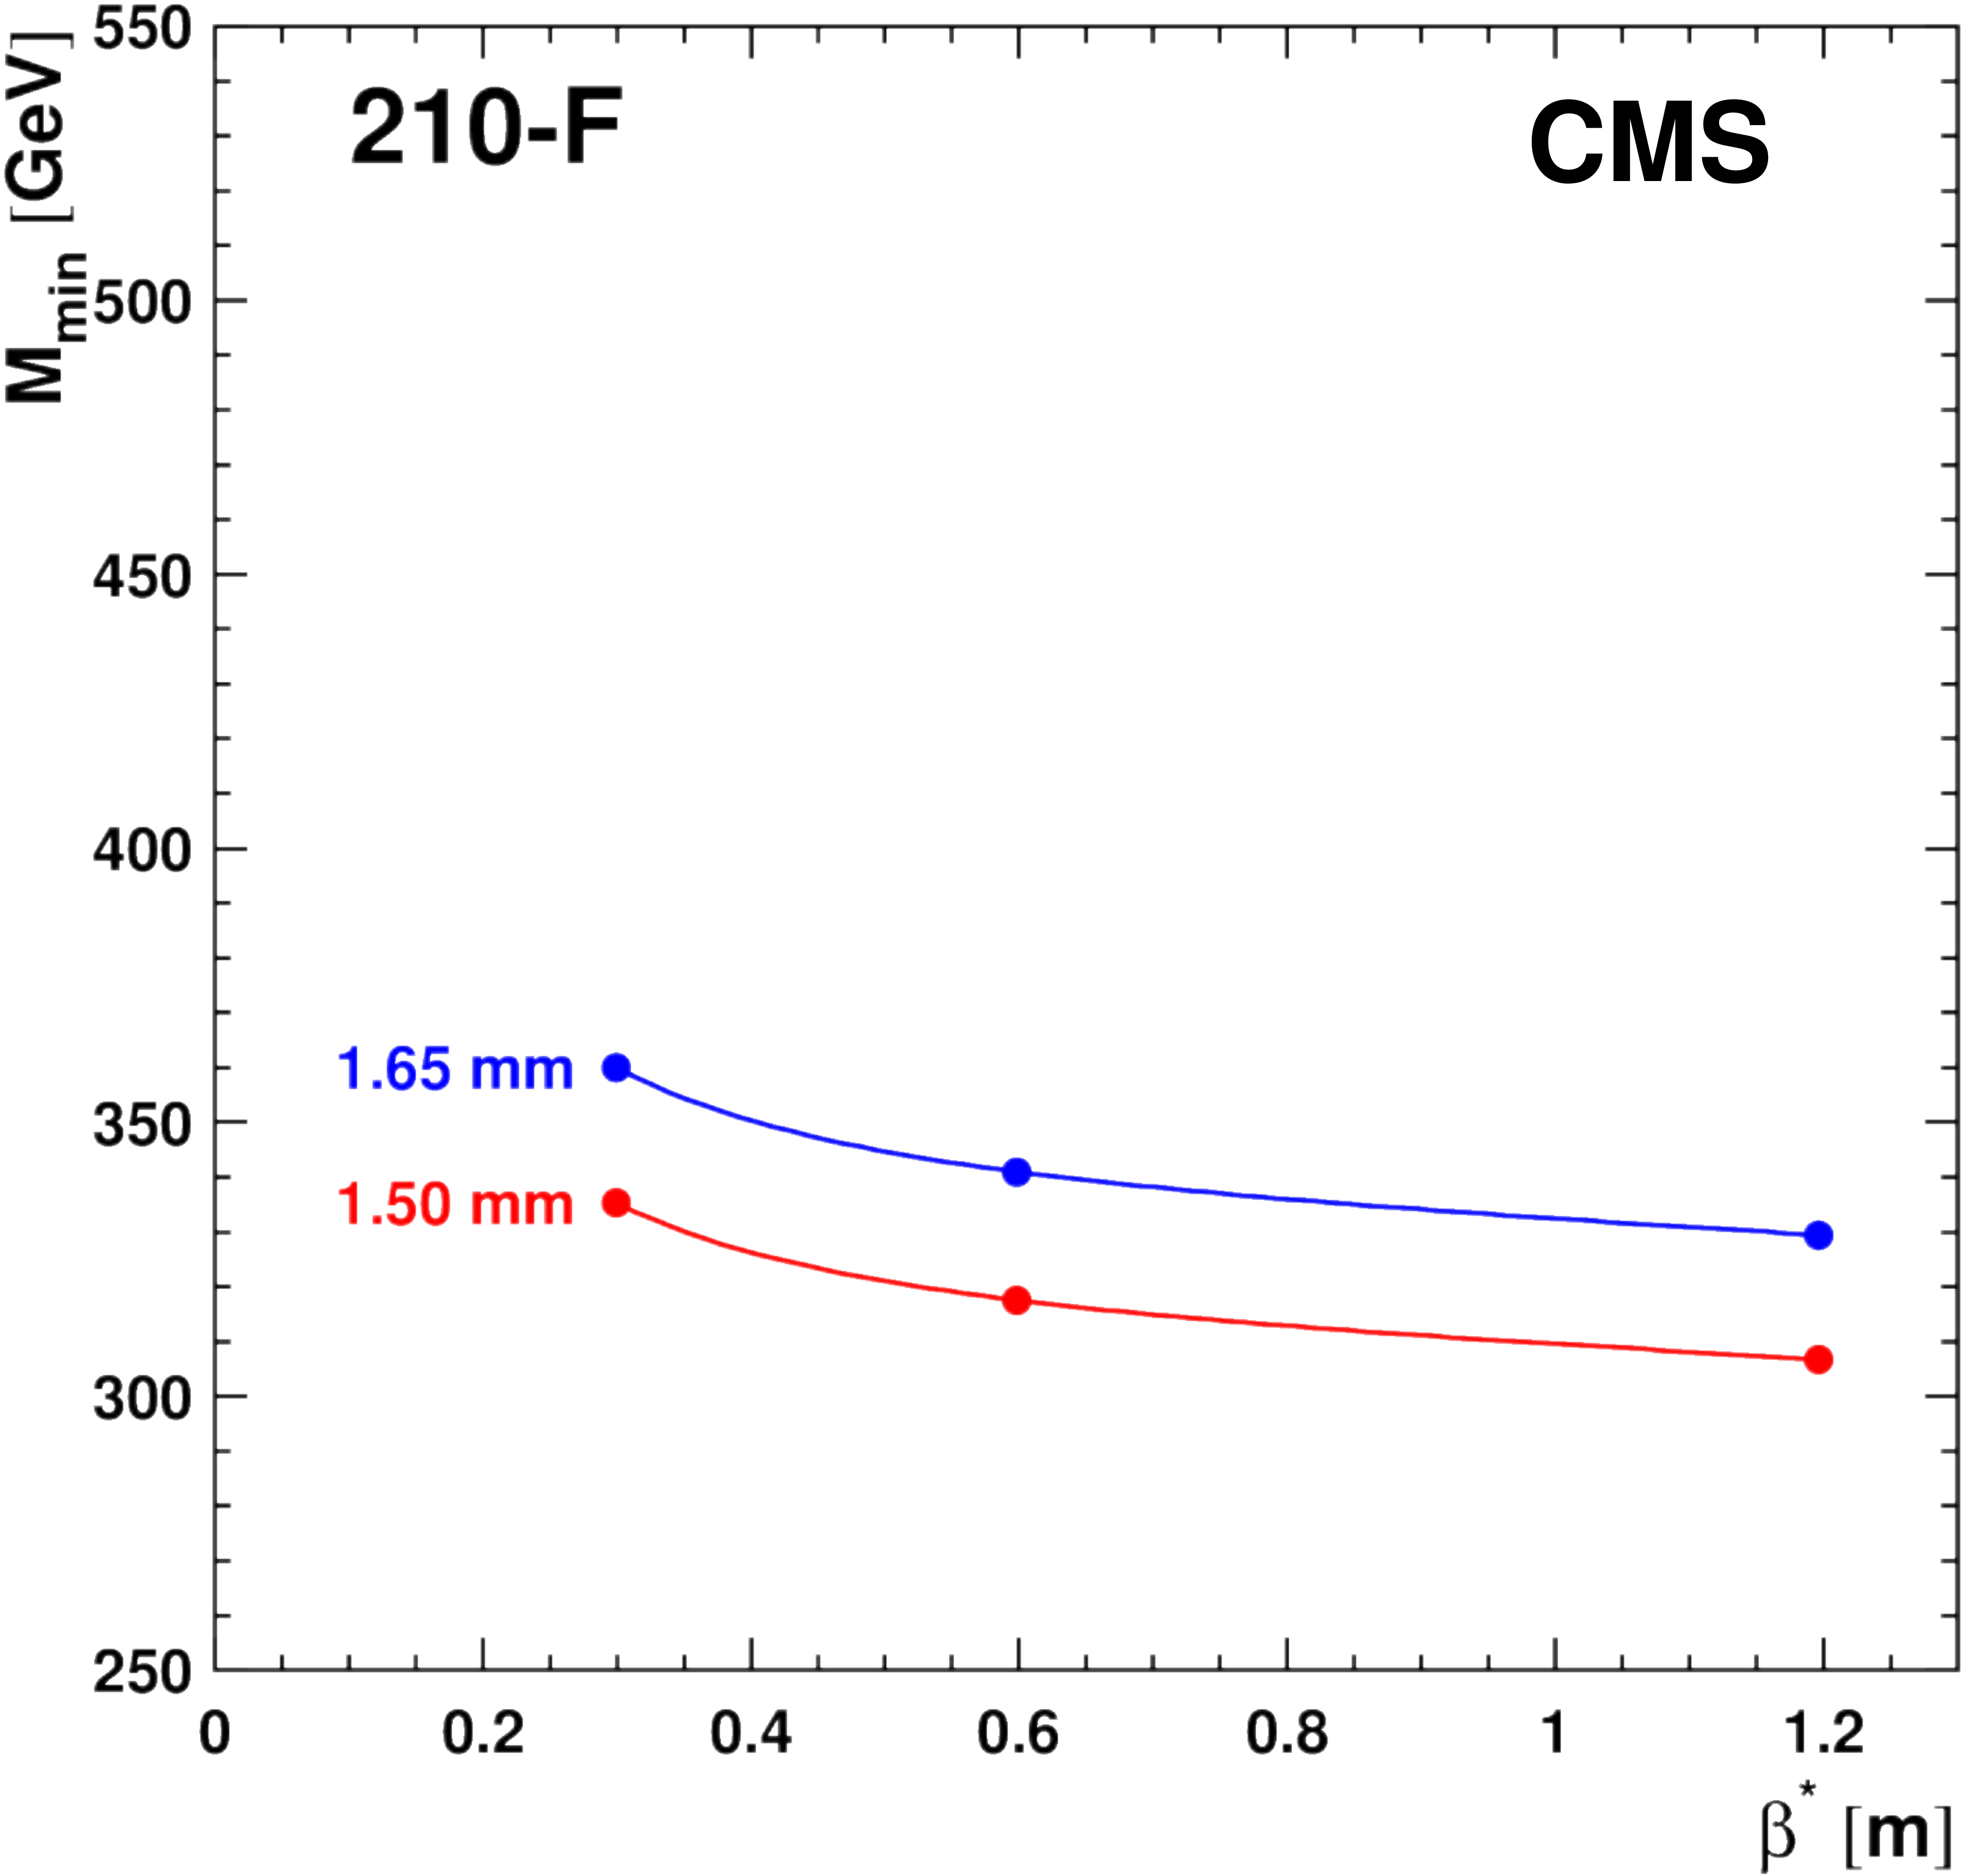
Figure 108-a:
Minimum accepted central mass $ M_{\text{min}} $ in the RPs 210-F for the new collimation scheme with moving TCTs and fixed RP positions. The red lines correspond to the 1.5 mm distance limit. The fill evolves from the right to the left. |
png pdf |
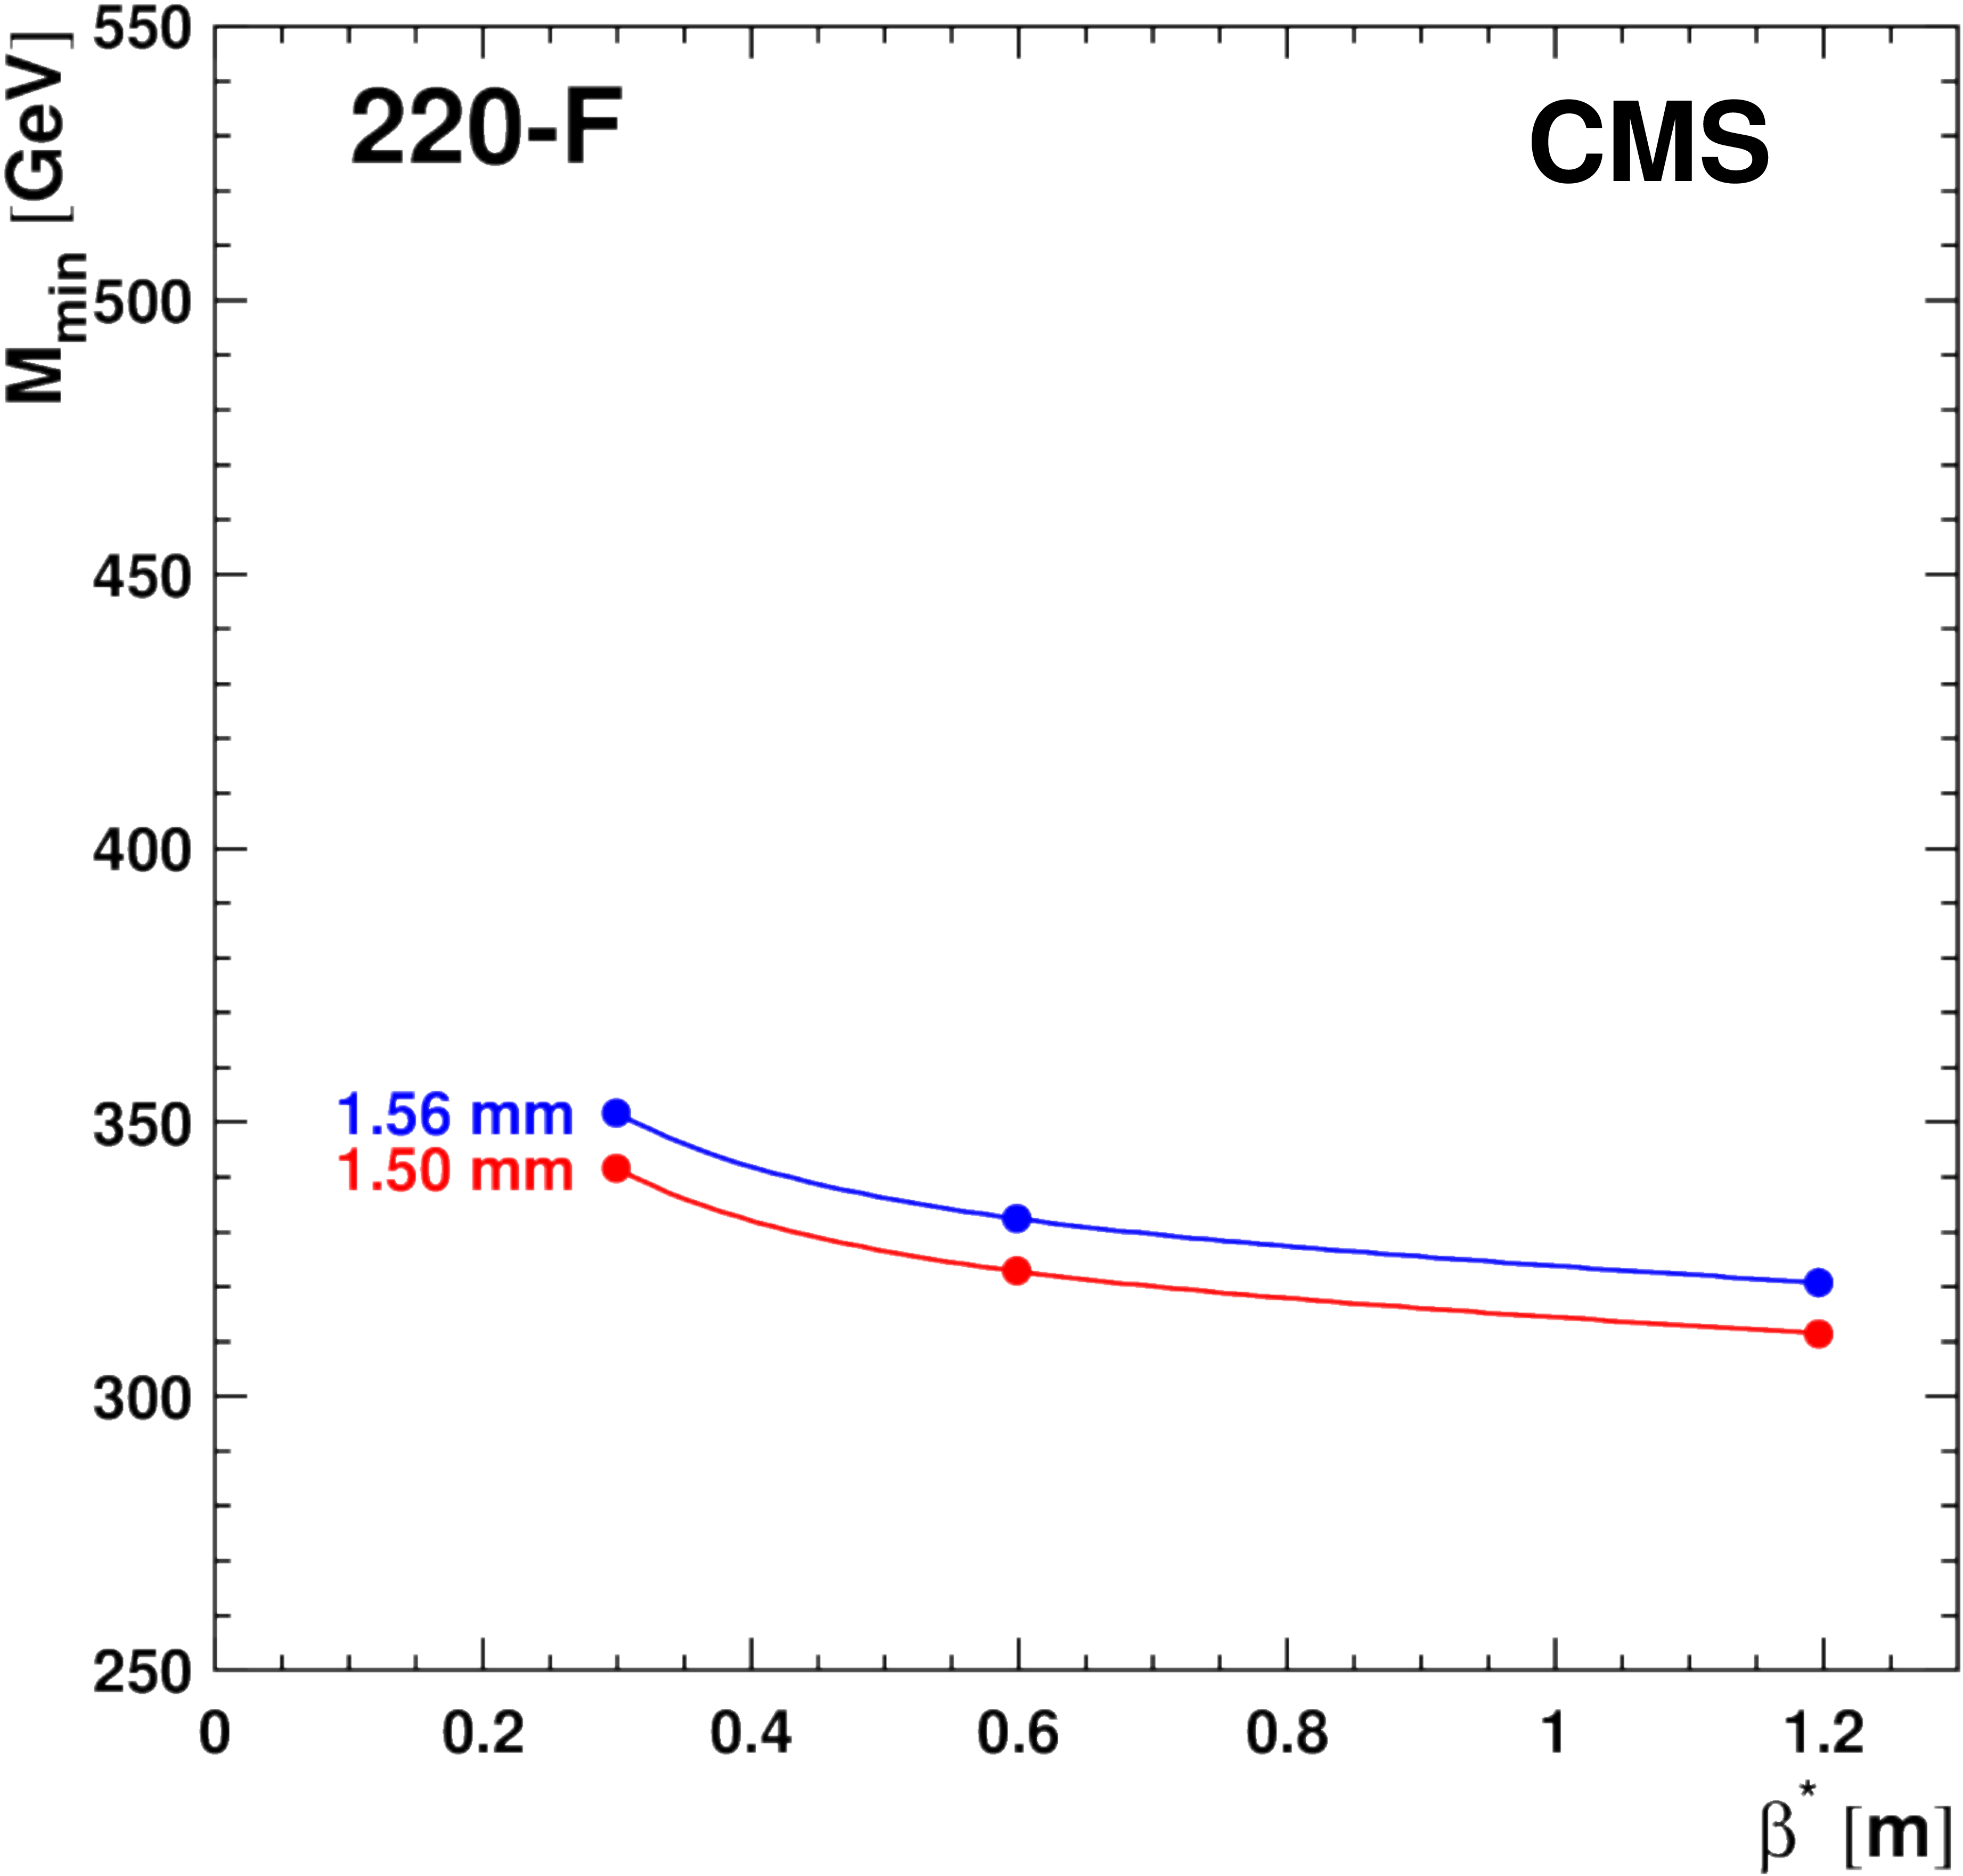
Figure 108-b:
Minimum accepted central mass $ M_{\text{min}} $ in the RPs 220-F for the new collimation scheme with moving TCTs and fixed RP positions. The red lines correspond to the 1.5 mm distance limit. The fill evolves from the right to the left. |
png pdf |
Figure 109:
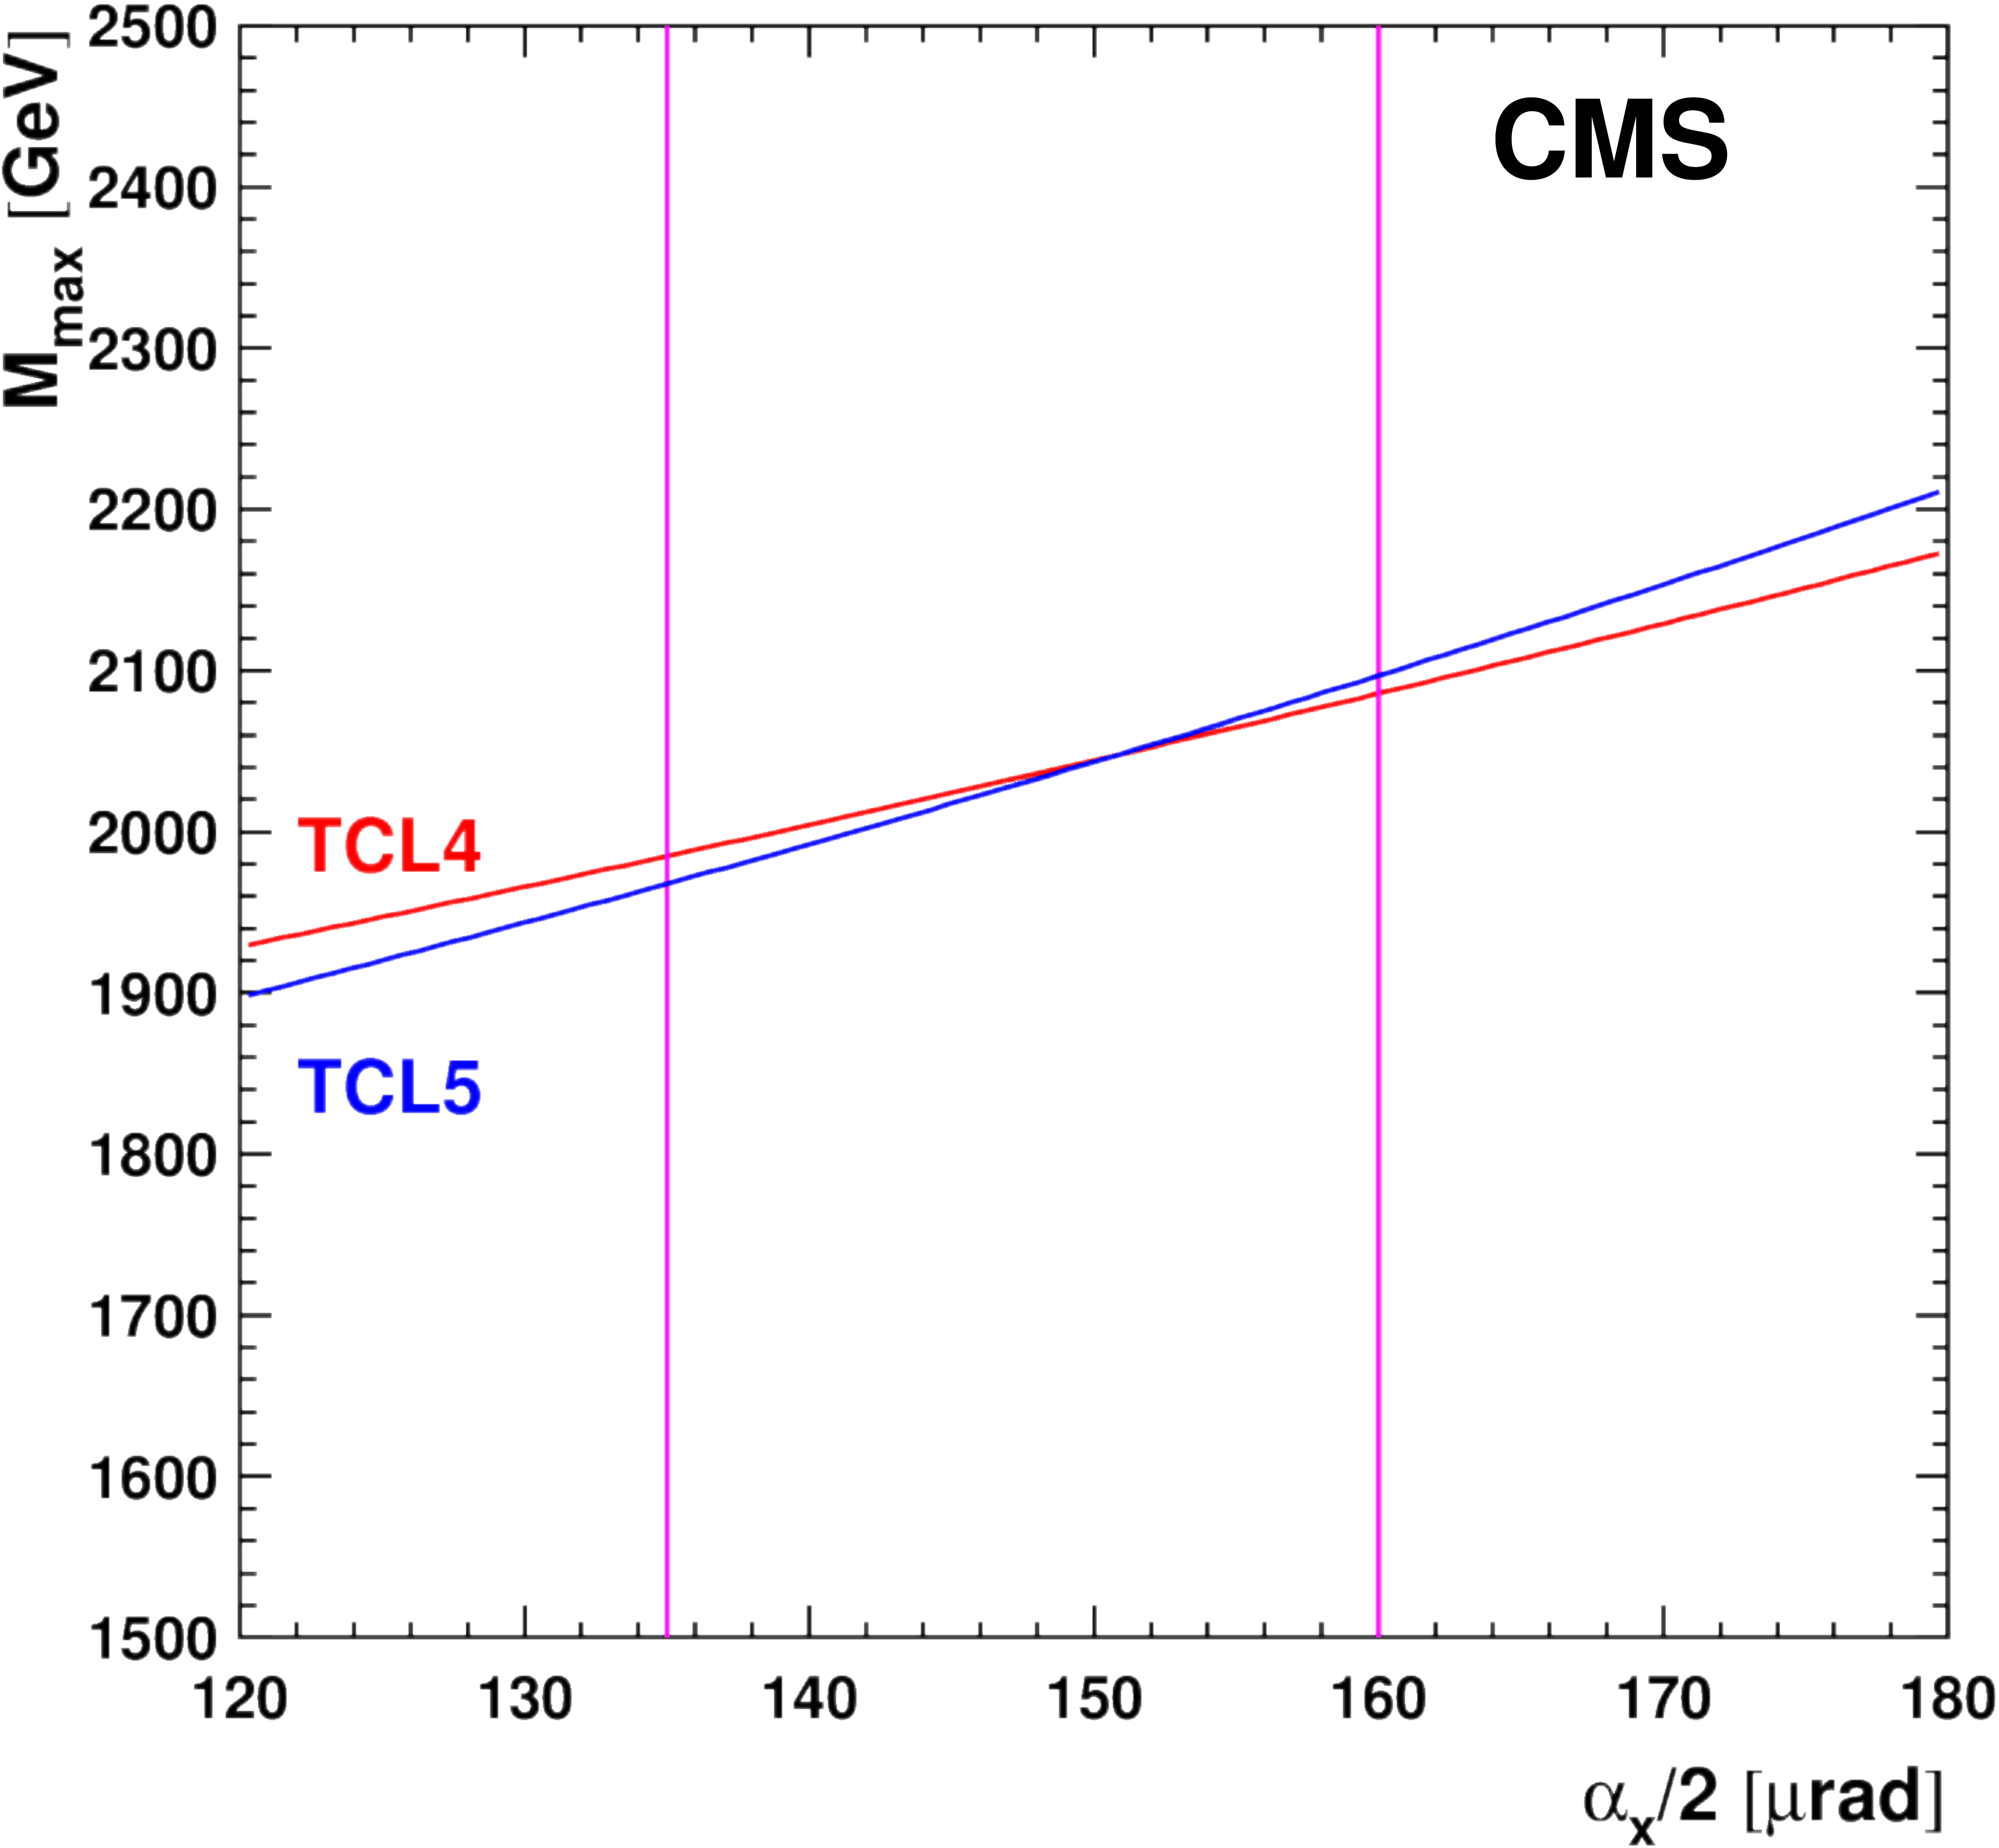
Upper mass cut-off in Run 3 caused by the debris collimators TCL4 and TCL5 for the settings explained in the text as a function of the crossing angle. The fill evolves from the left to the right between the magenta lines. |
png pdf |
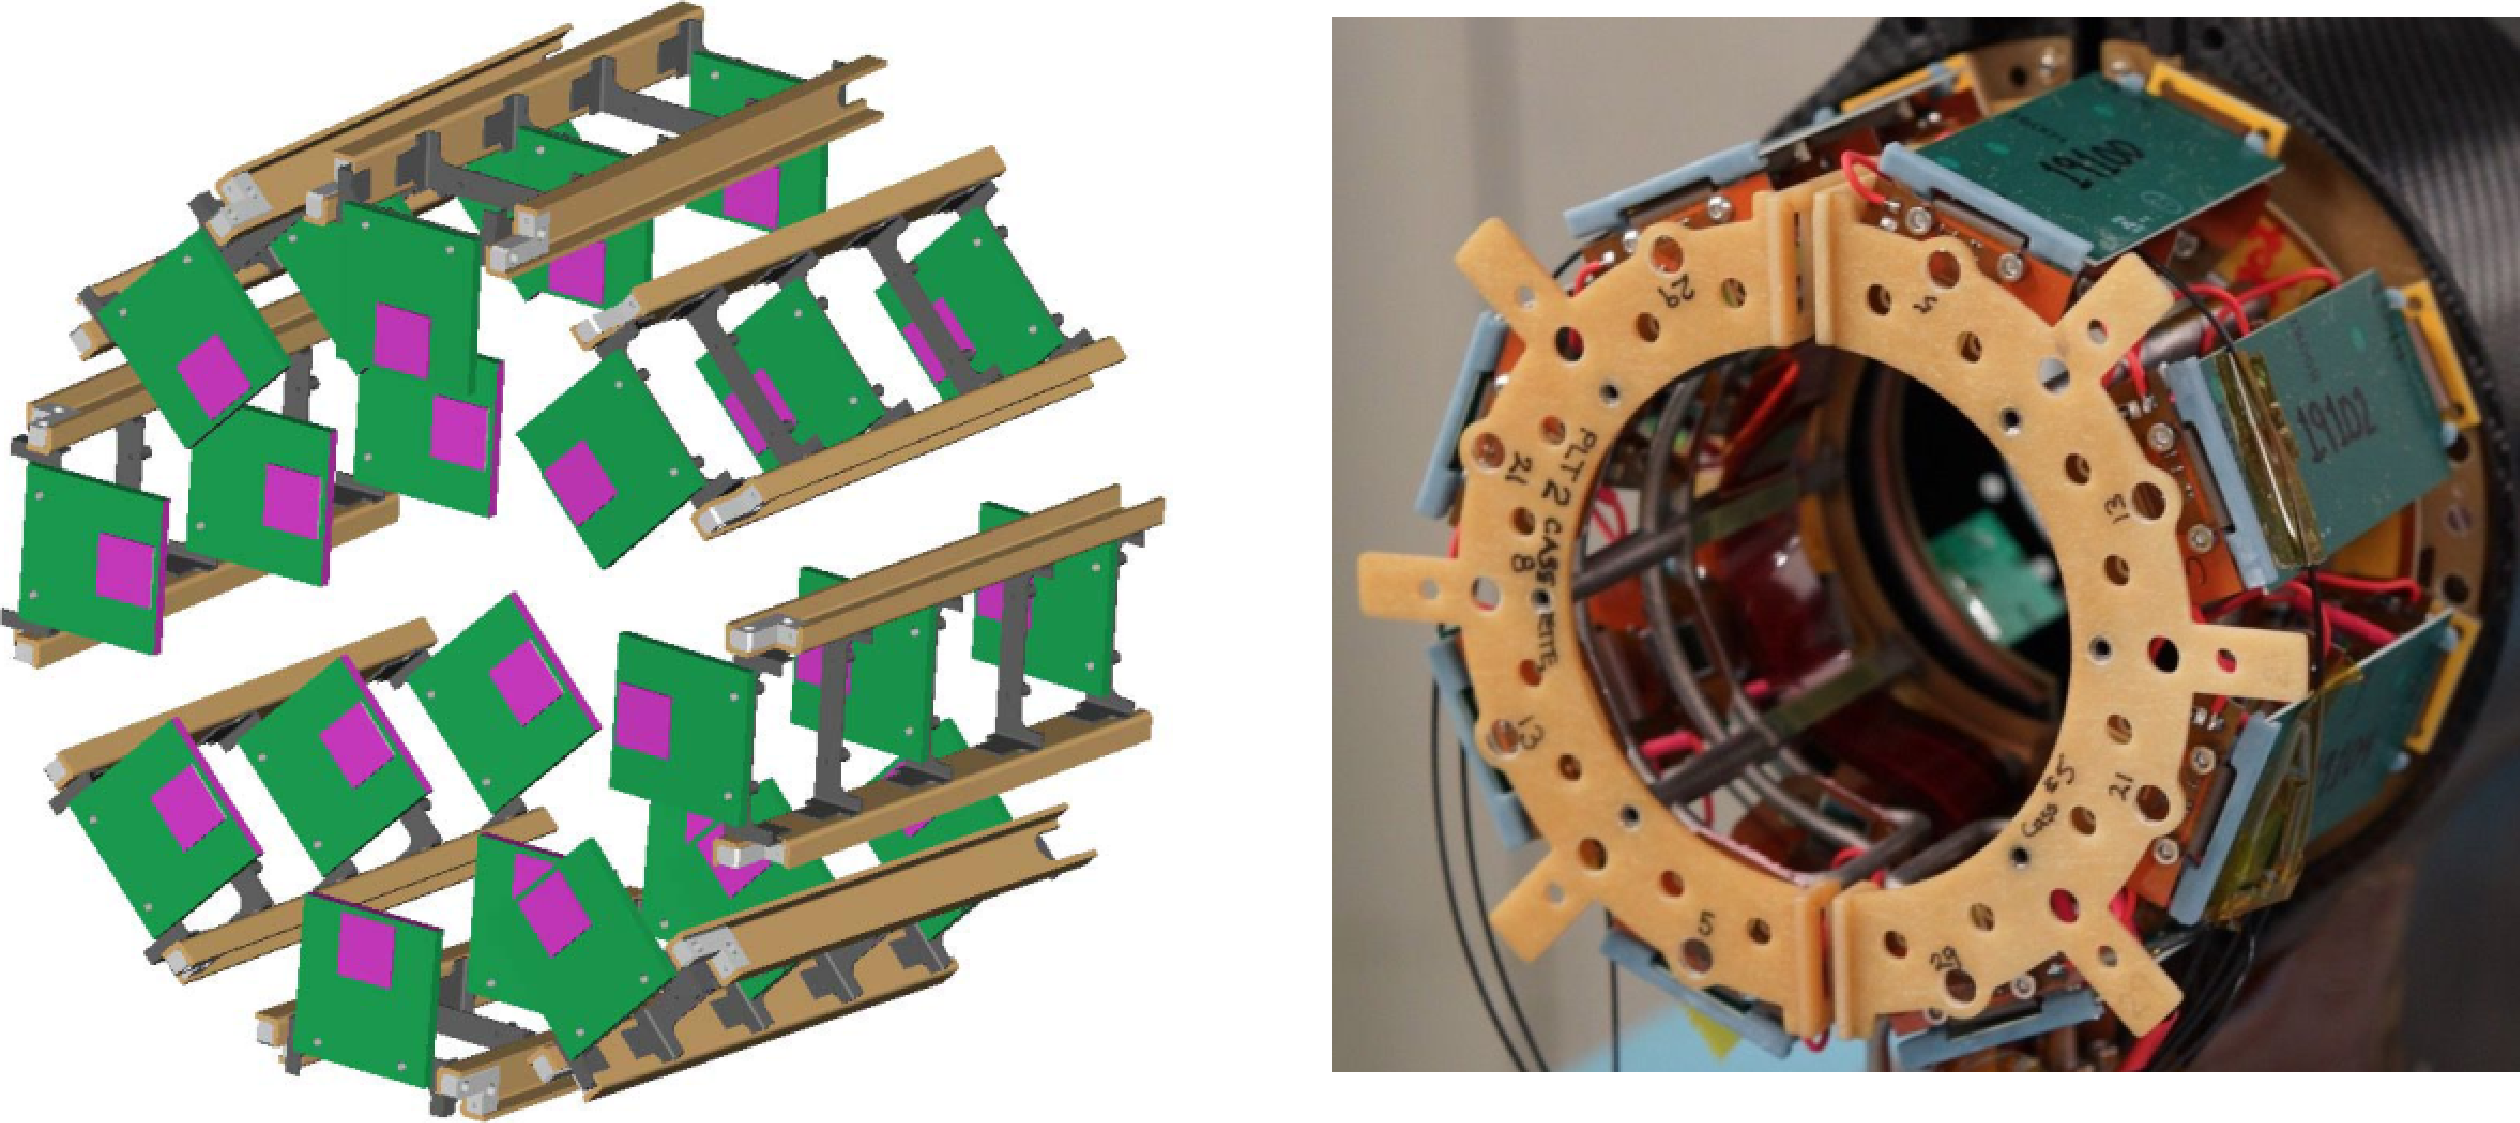
Figure 110:
Left: sketch of the general PLT geometry. The sensors are indicated by the purple squares. Right: the actual PLT detector at one end of CMS, showing the arrangement of the eight telescopes around the beam pipe. |
png pdf |
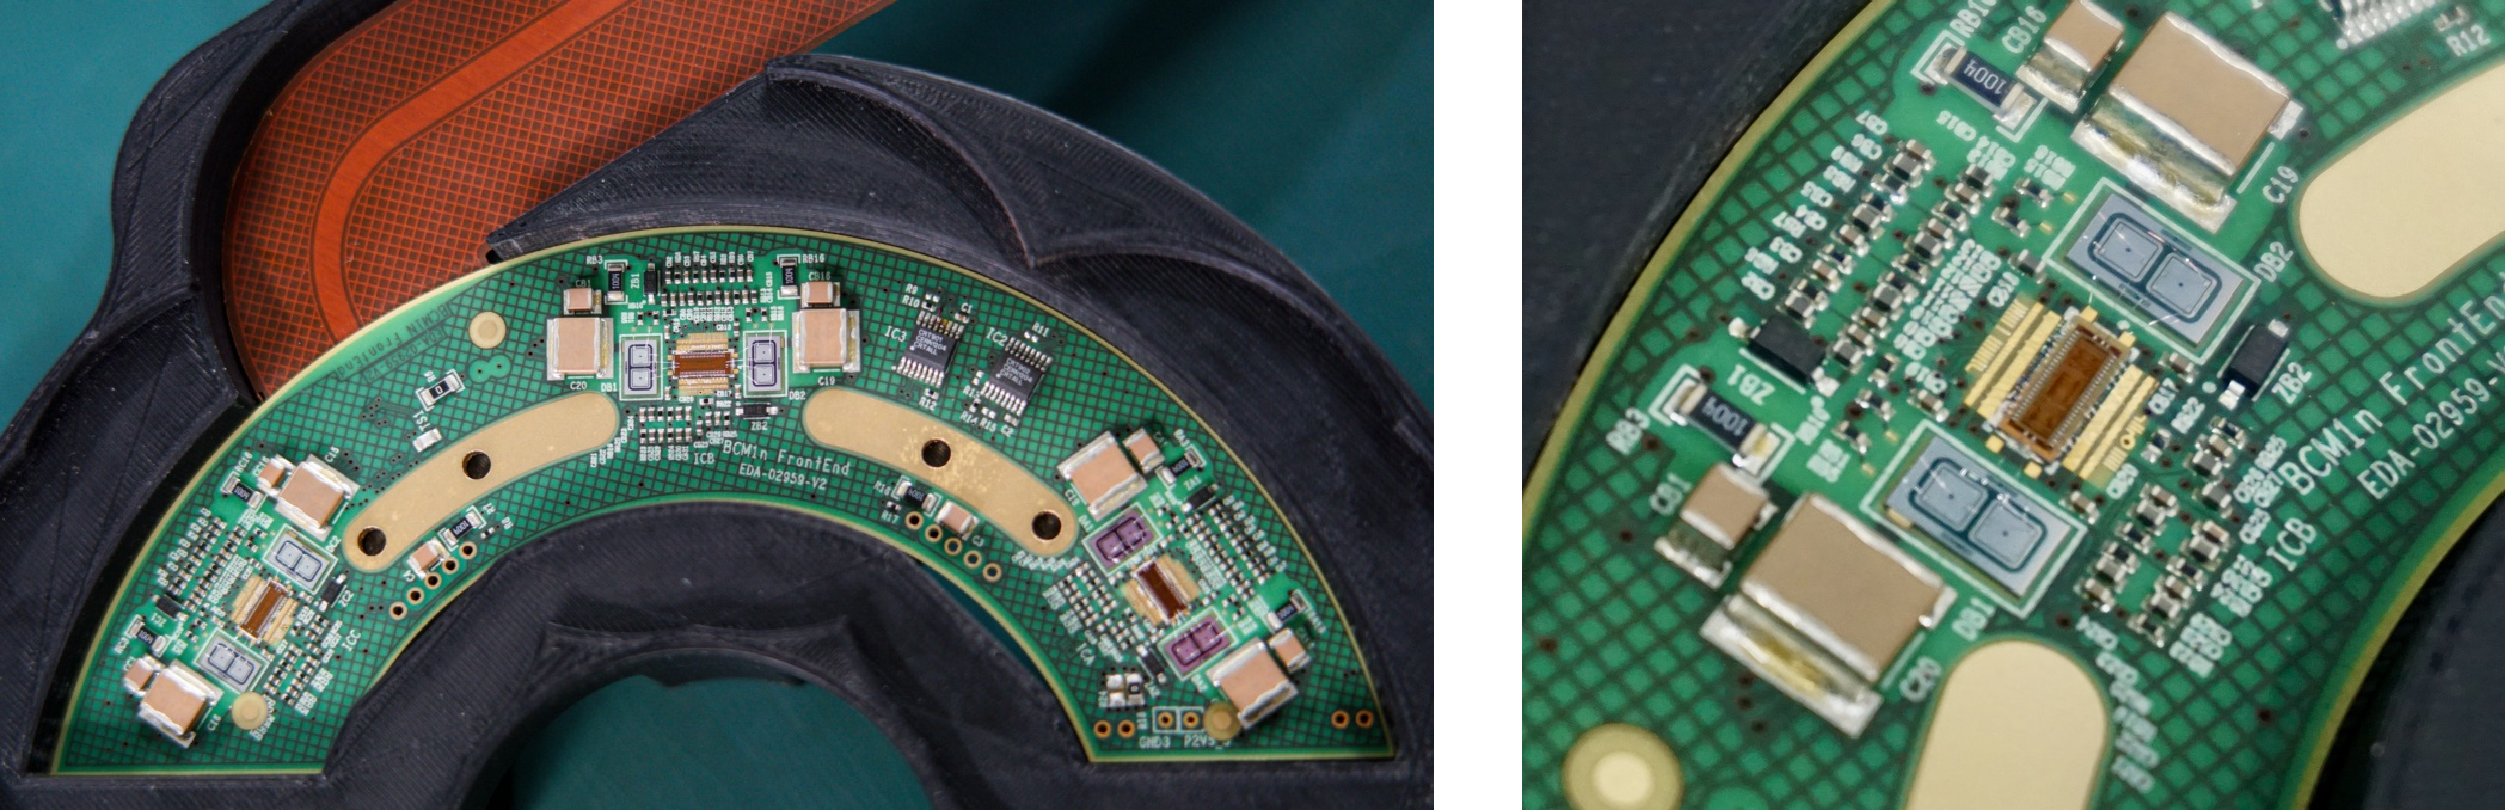
Figure 111:
Photographs of the BCM1F detector used in Run 3. Left: one full BCM1F C-shape printed circuit board. Right: a closeup of the frontend module, which includes the processing chip with two silicon double-diode sensors on each side. |
png pdf |
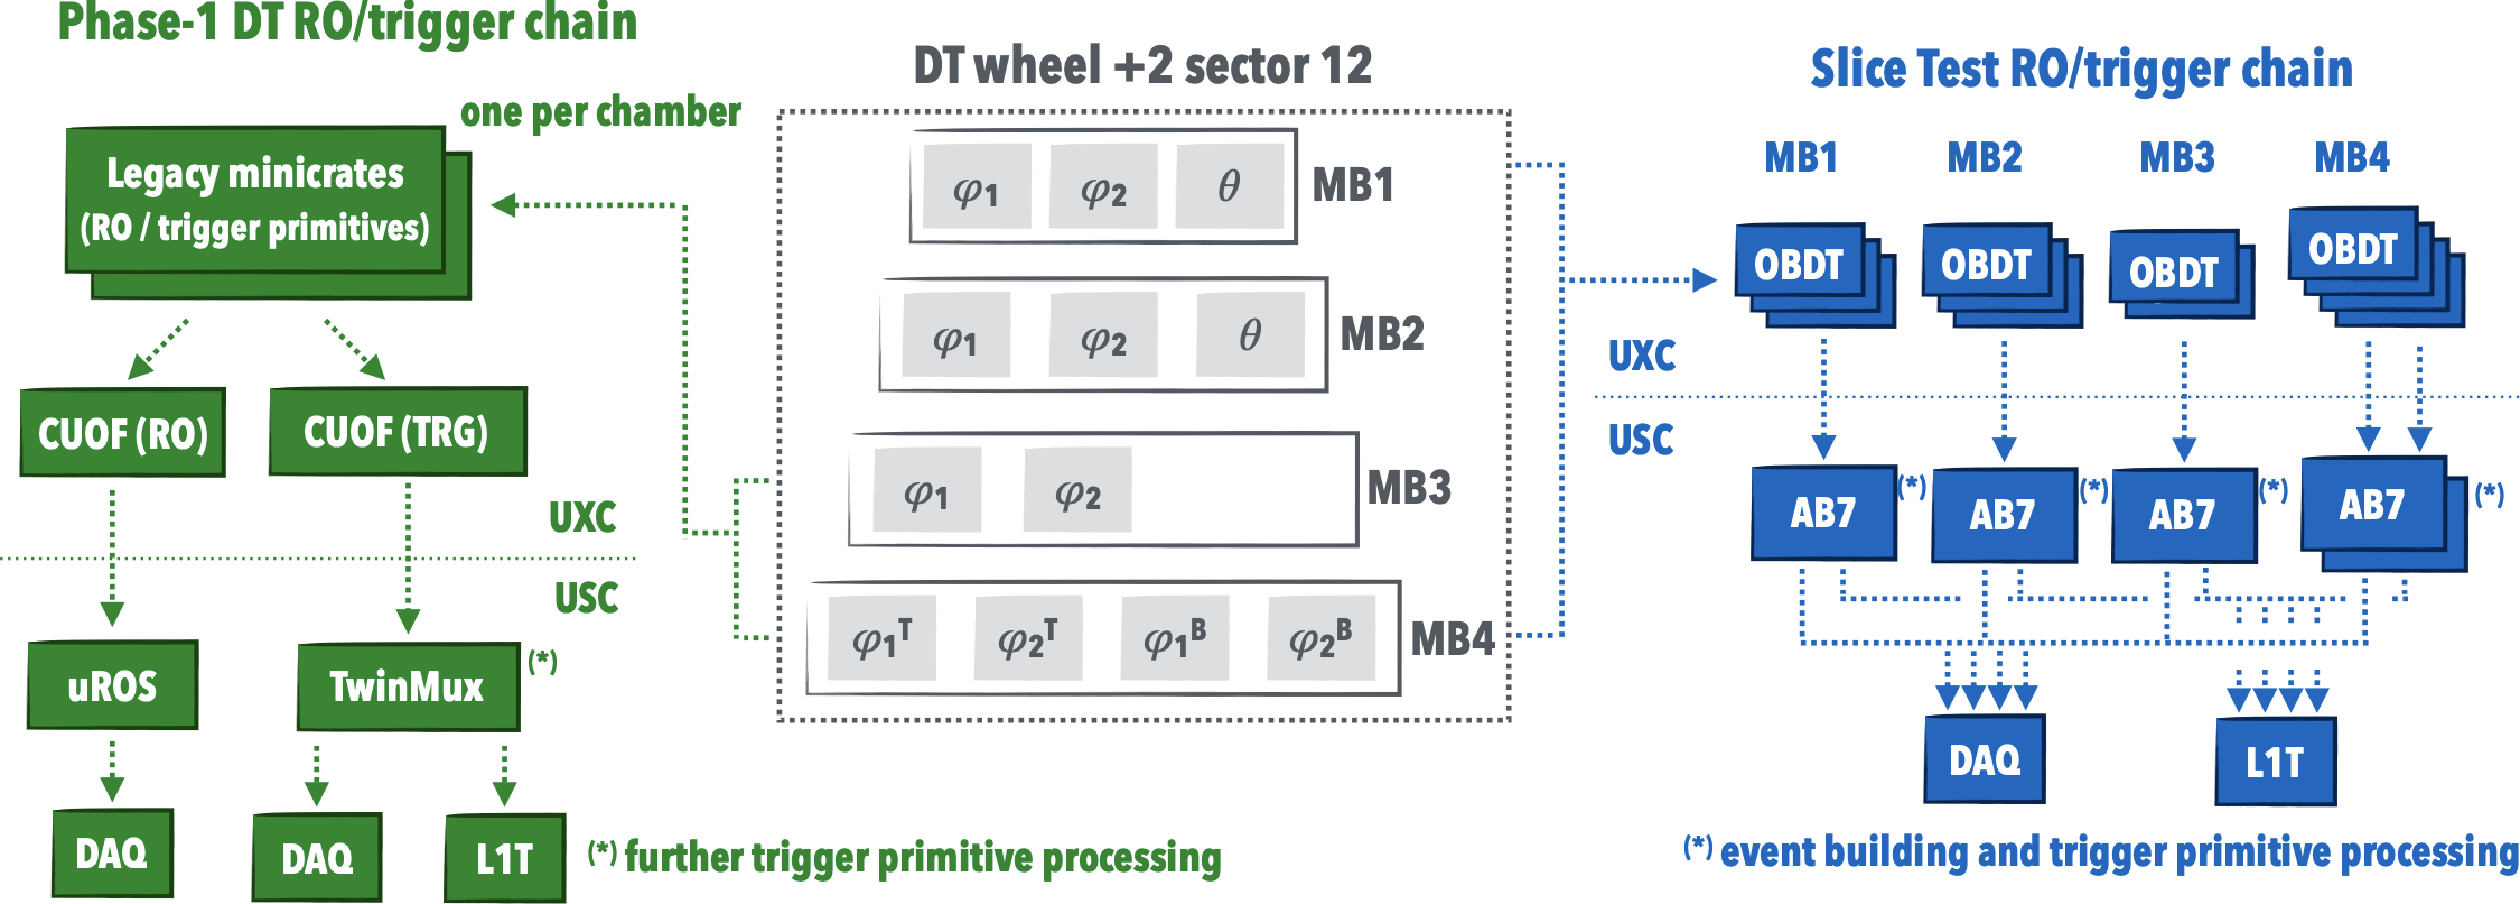
Figure 112:
Diagram comparing the DT readout (RO) and trigger chains in the Phase 1 system used for data taking in Run 3 and in the DT slice test that acts as a demonstrator of the Phase 2 system in Run 3 [84]. The central part of the figure indicates the number of Phase 2 on-board DT (OBDT) boards installed in each DT chamber. The left part of the figure shows how the Phase 1 readout and trigger-primitive generation are performed by the legacy on-board DT electronics (minicrates). Information, transmitted by optical fibers from the detector balconies to the counting room, is further processed independently for the readout ($ \mu $ROS ) and trigger (TwinMux). The right part of the figure illustrates how the slice test TDC data are streamed by each OBDT to AB7 boards hosted in the counting room, which are used for event building and trigger-primitive generation. |
png pdf |
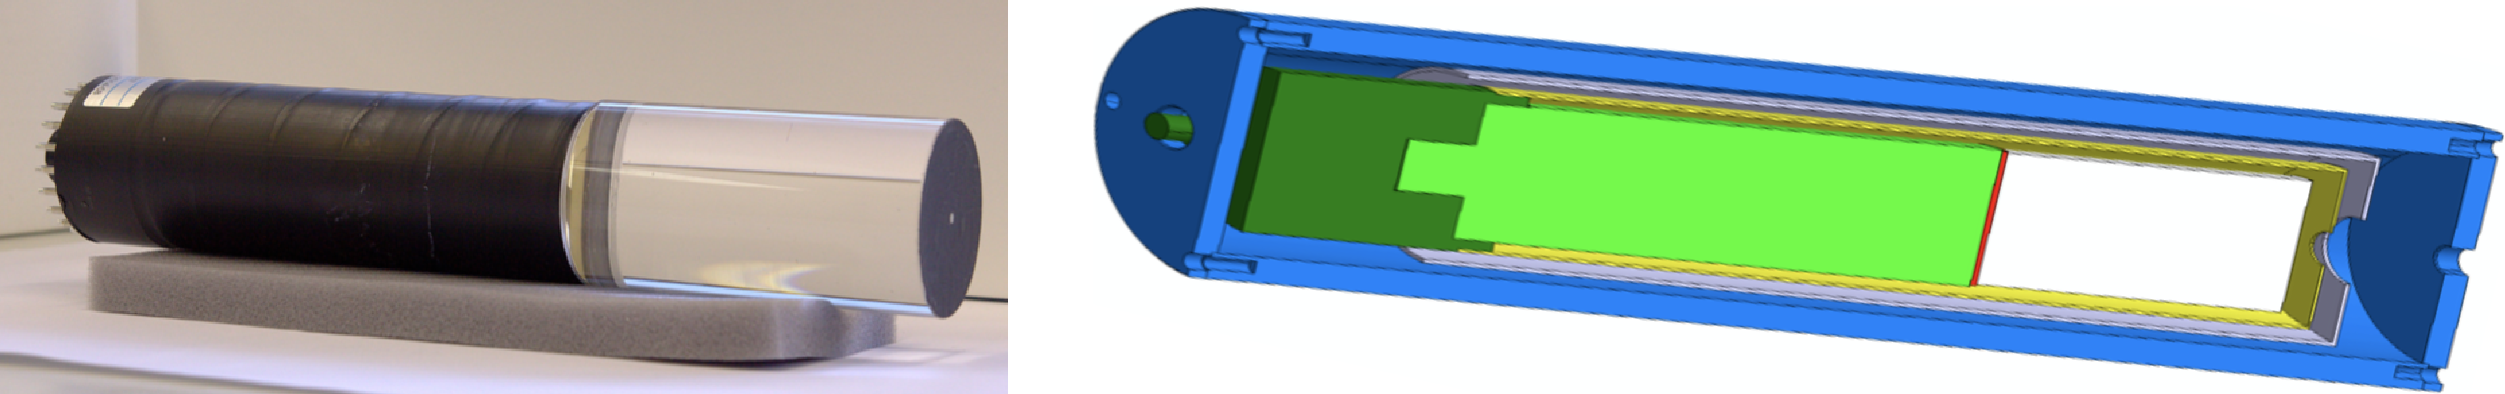
Figure 113:
Left: photograph of the active element of one BHM detector unit, which is a 100 mm-long by 52 mm-diameter cylindrical quartz radiator, connected to a Hamamatsu R2059 photomultiplier. Right: shielding of a BHM detector unit, consisting of a low-carbon steel tube shown in blue, a mu-metal tube in gray, and permalloy in yellow. The quartz radiator, photomultiplier tube, and socket are shown in white, light green, and dark green, respectively [202]. |
png |
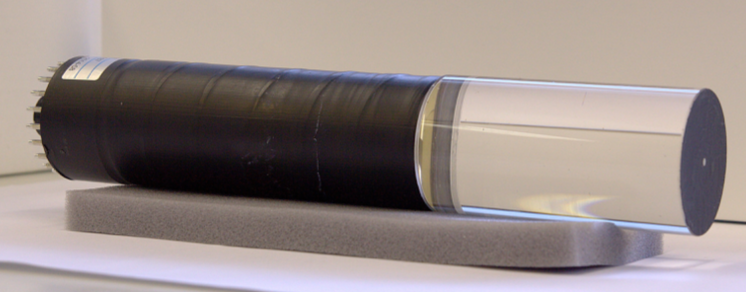
Figure 113-a:
Photograph of the active element of one BHM detector unit, which is a 100 mm-long by 52 mm-diameter cylindrical quartz radiator, connected to a Hamamatsu R2059 photomultiplier. |
png |
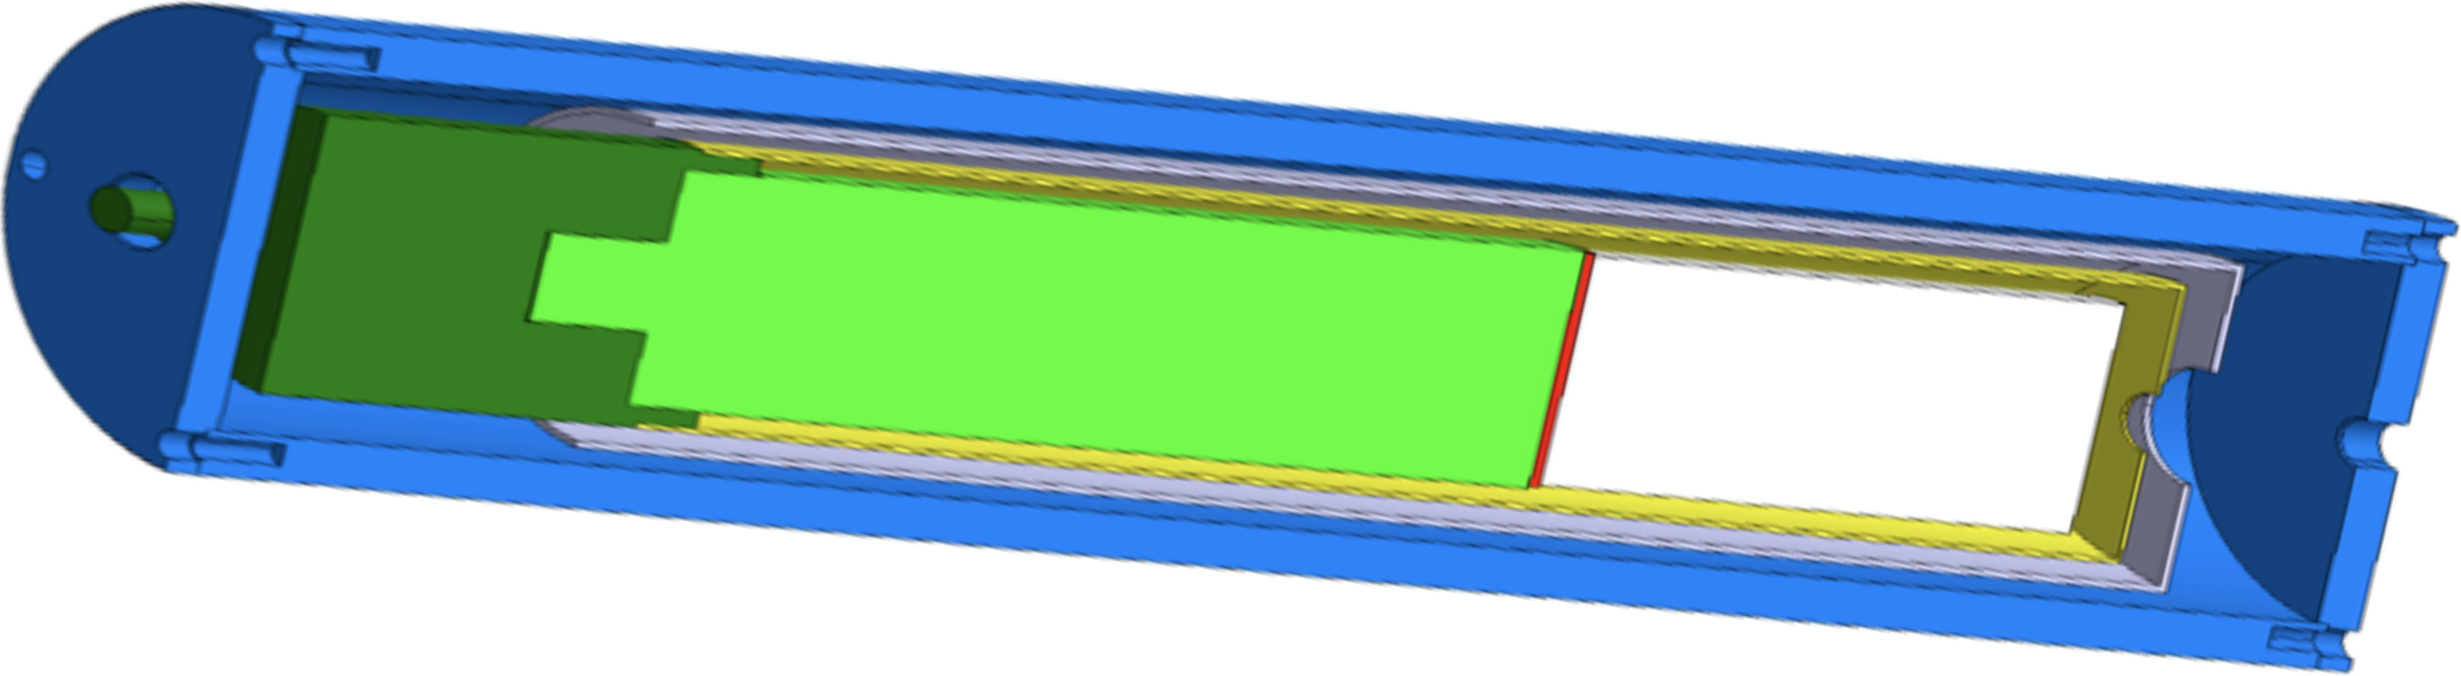
Figure 113-b:
Shielding of a BHM detector unit, consisting of a low-carbon steel tube shown in blue, a mu-metal tube in gray, and permalloy in yellow. The quartz radiator, photomultiplier tube, and socket are shown in white, light green, and dark green, respectively [202]. |
png pdf |
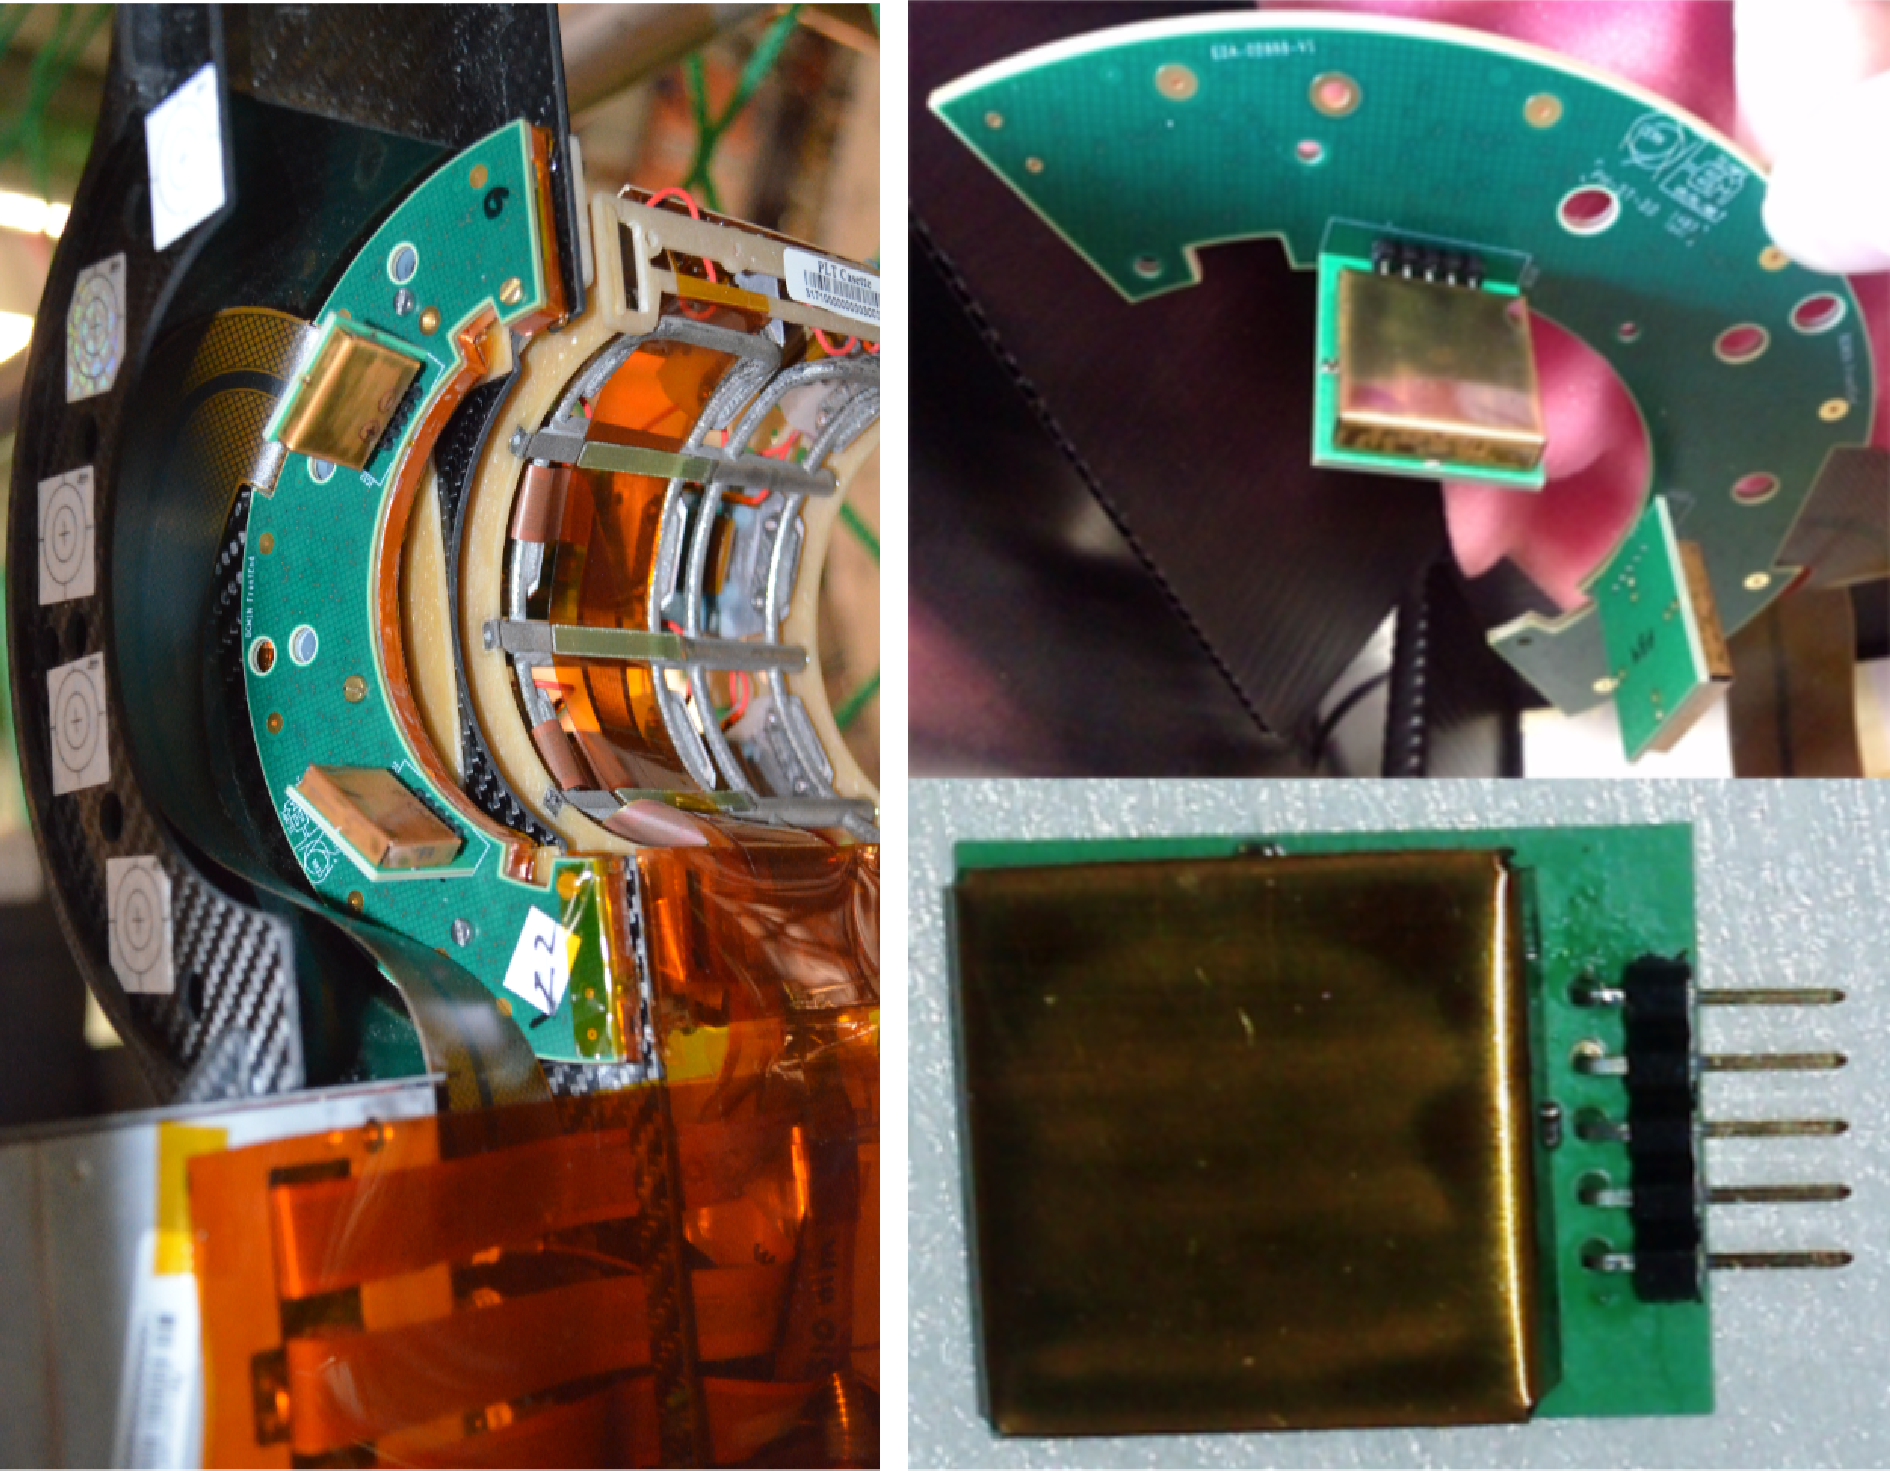
Figure 114:
Mechanics for the BCML1 detector system. Left: a BCML1 mounted on the BCM1F C-shape PCB, attached to the PLT support structure. Right: a BCML1 mounted on a C-shape PCB (upper right), and a single sensor in a Faraday cage (lower right). |
png pdf |
Figure 115:
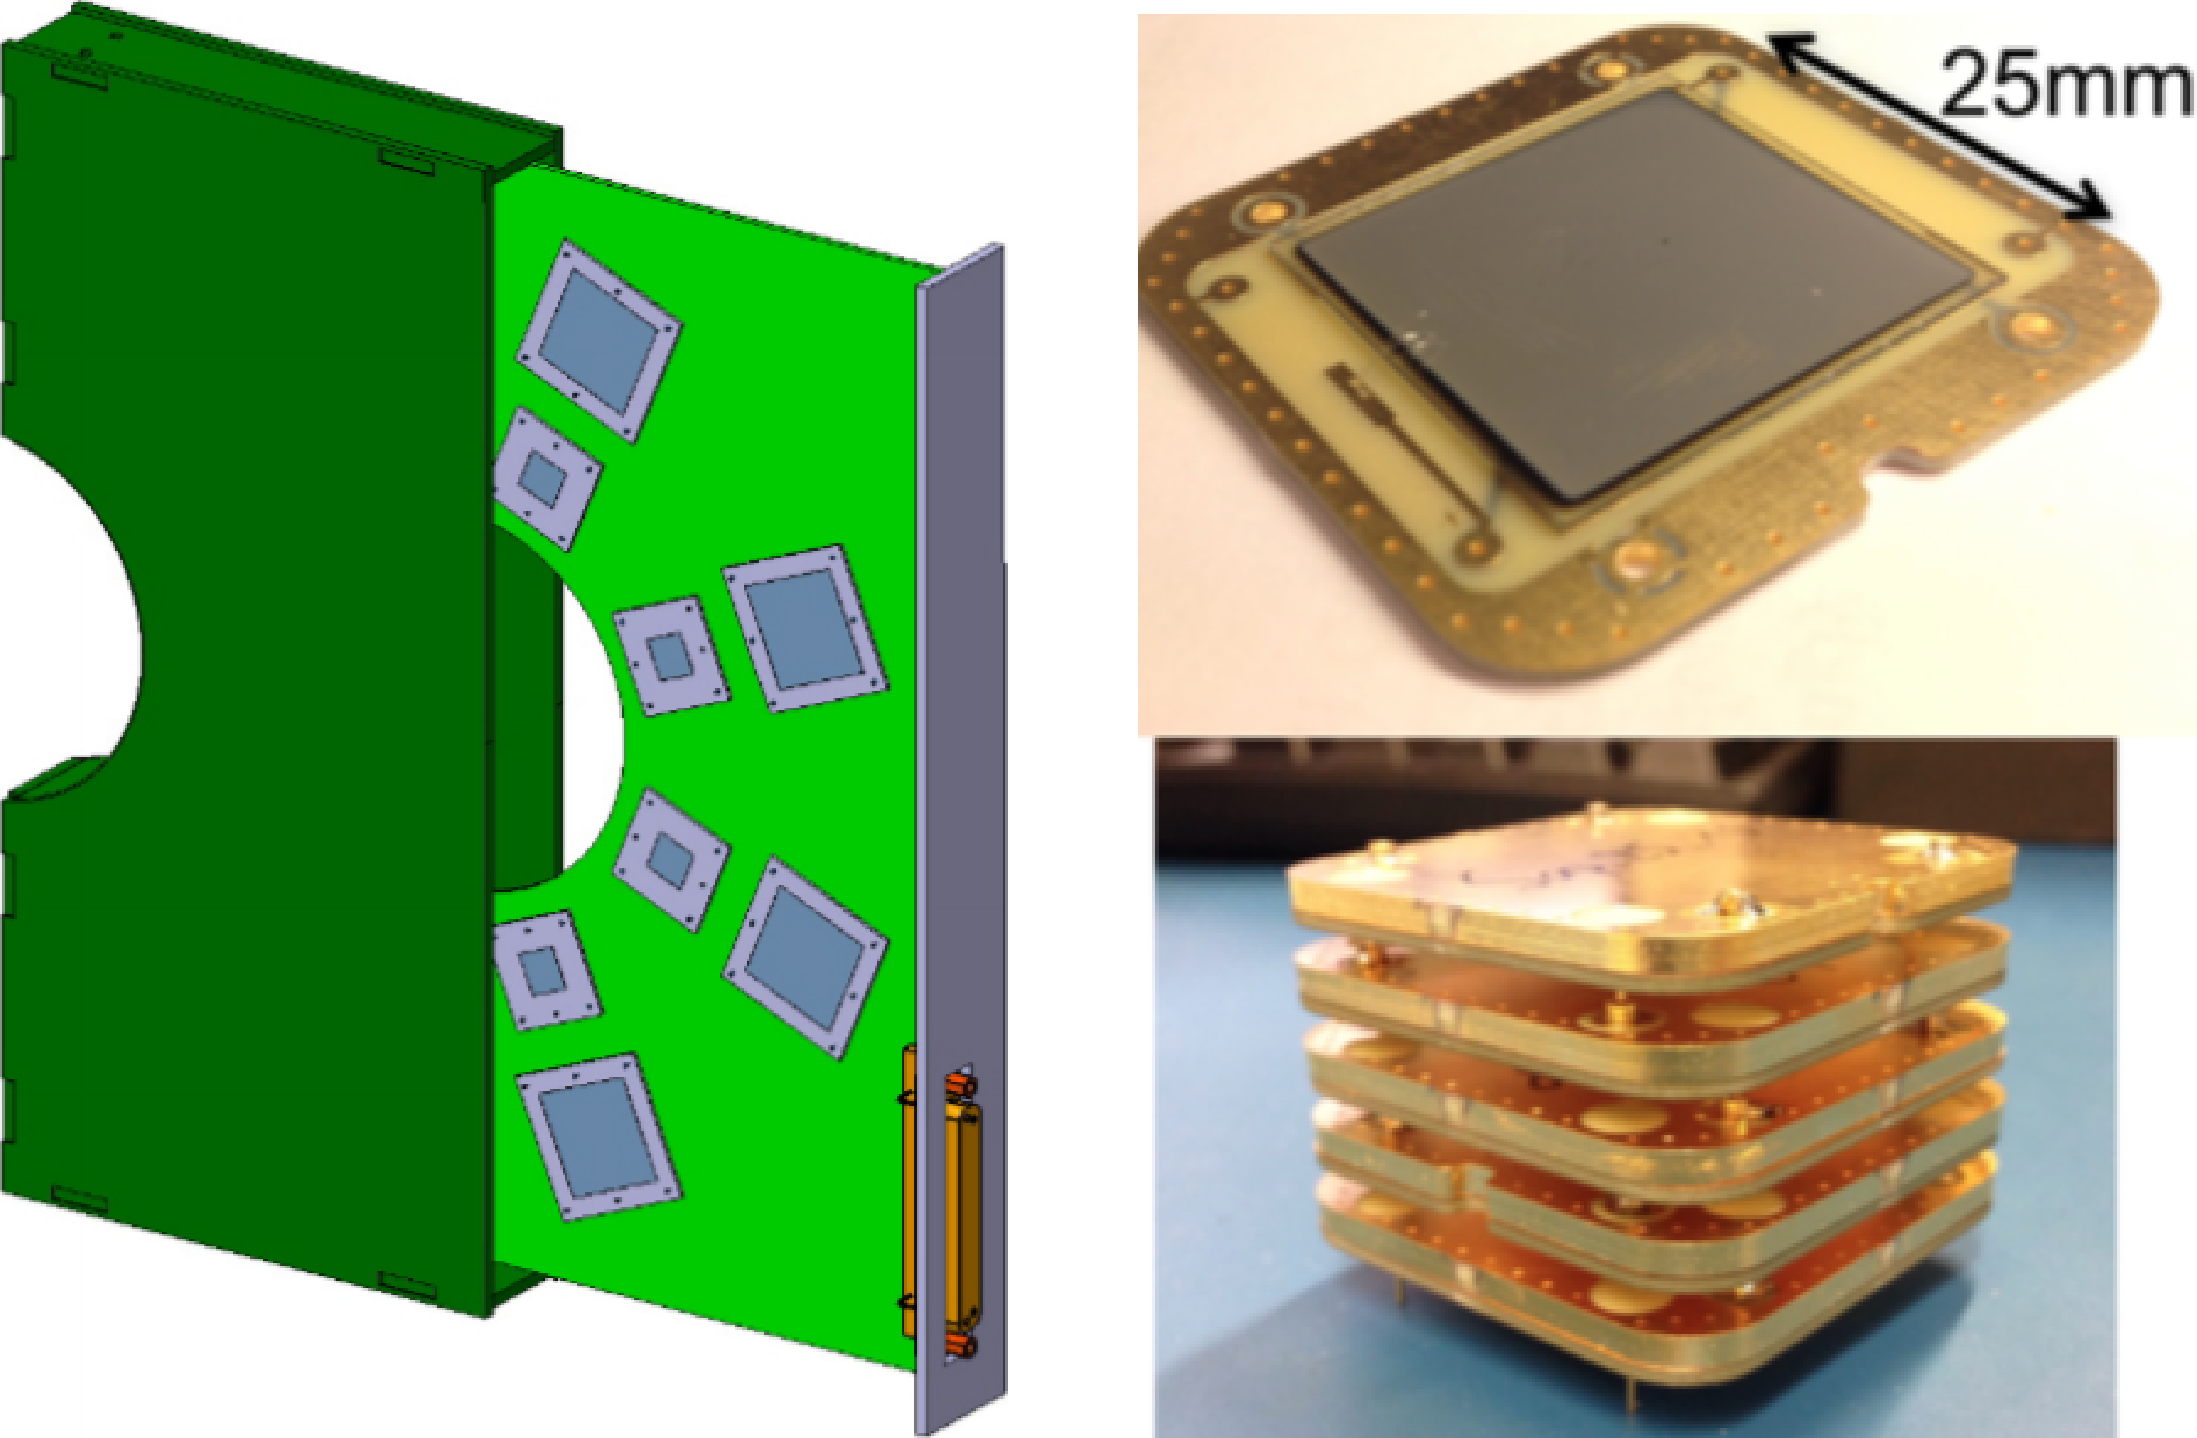
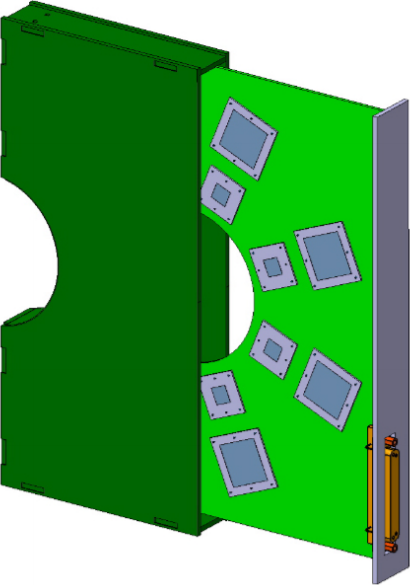
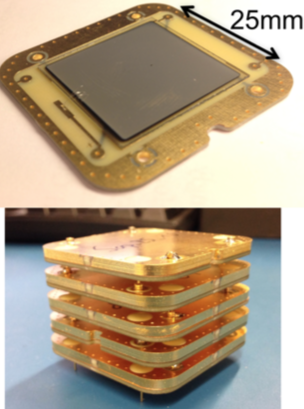
Mechanics for the BCML2 detector system. Left: the support structure of the BCML2 detectors, which also serves as mechanical protection. This structure is compatible with the Phase 2 beam pipe. Right: single-sensor base plate PCB for the large sensors used in BCML2 (upper right), and a complete sensor box assembly, with a stack of five sensors (lower right). |
png |
Figure 115-a:
The support structure of the BCML2 detectors, which also serves as mechanical protection. This structure is compatible with the Phase 2 beam pipe. |
png |
Figure 115-b:
Single-sensor base plate PCB for the large sensors used in BCML2 (upper right), and a complete sensor box assembly, with a stack of five sensors (lower right). |

png pdf |
Figure 116:
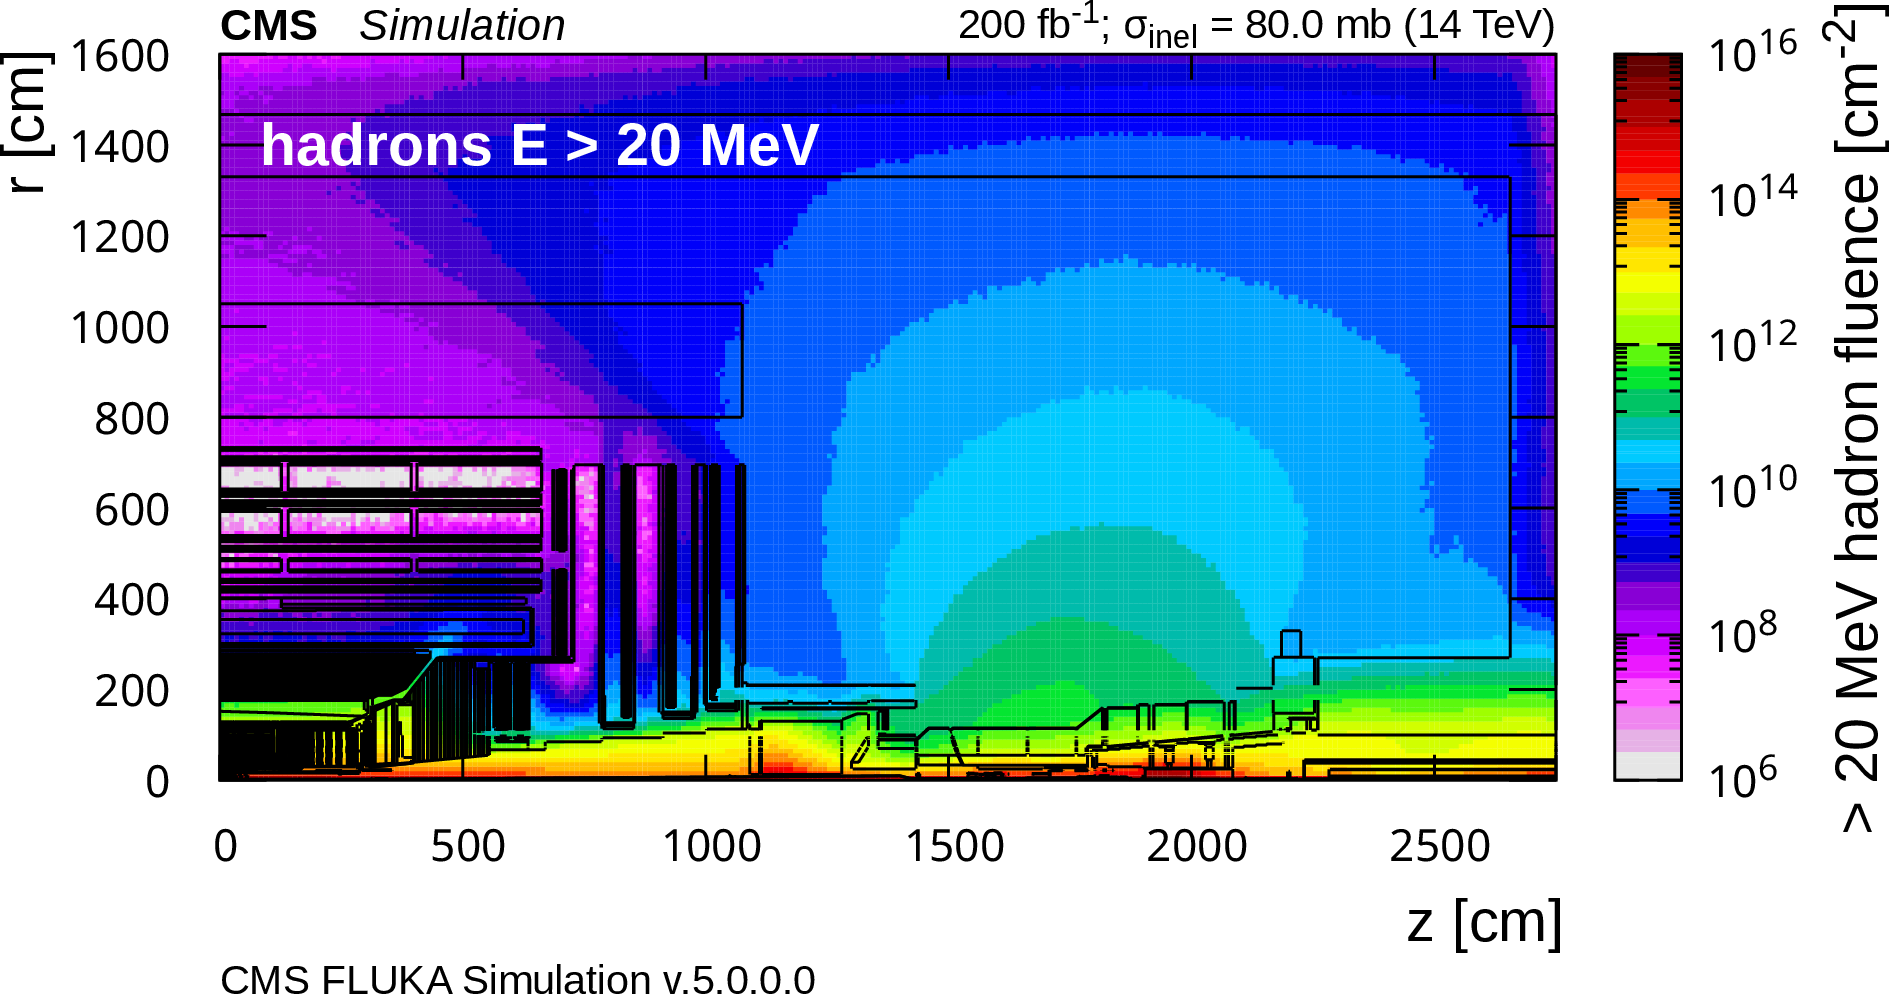
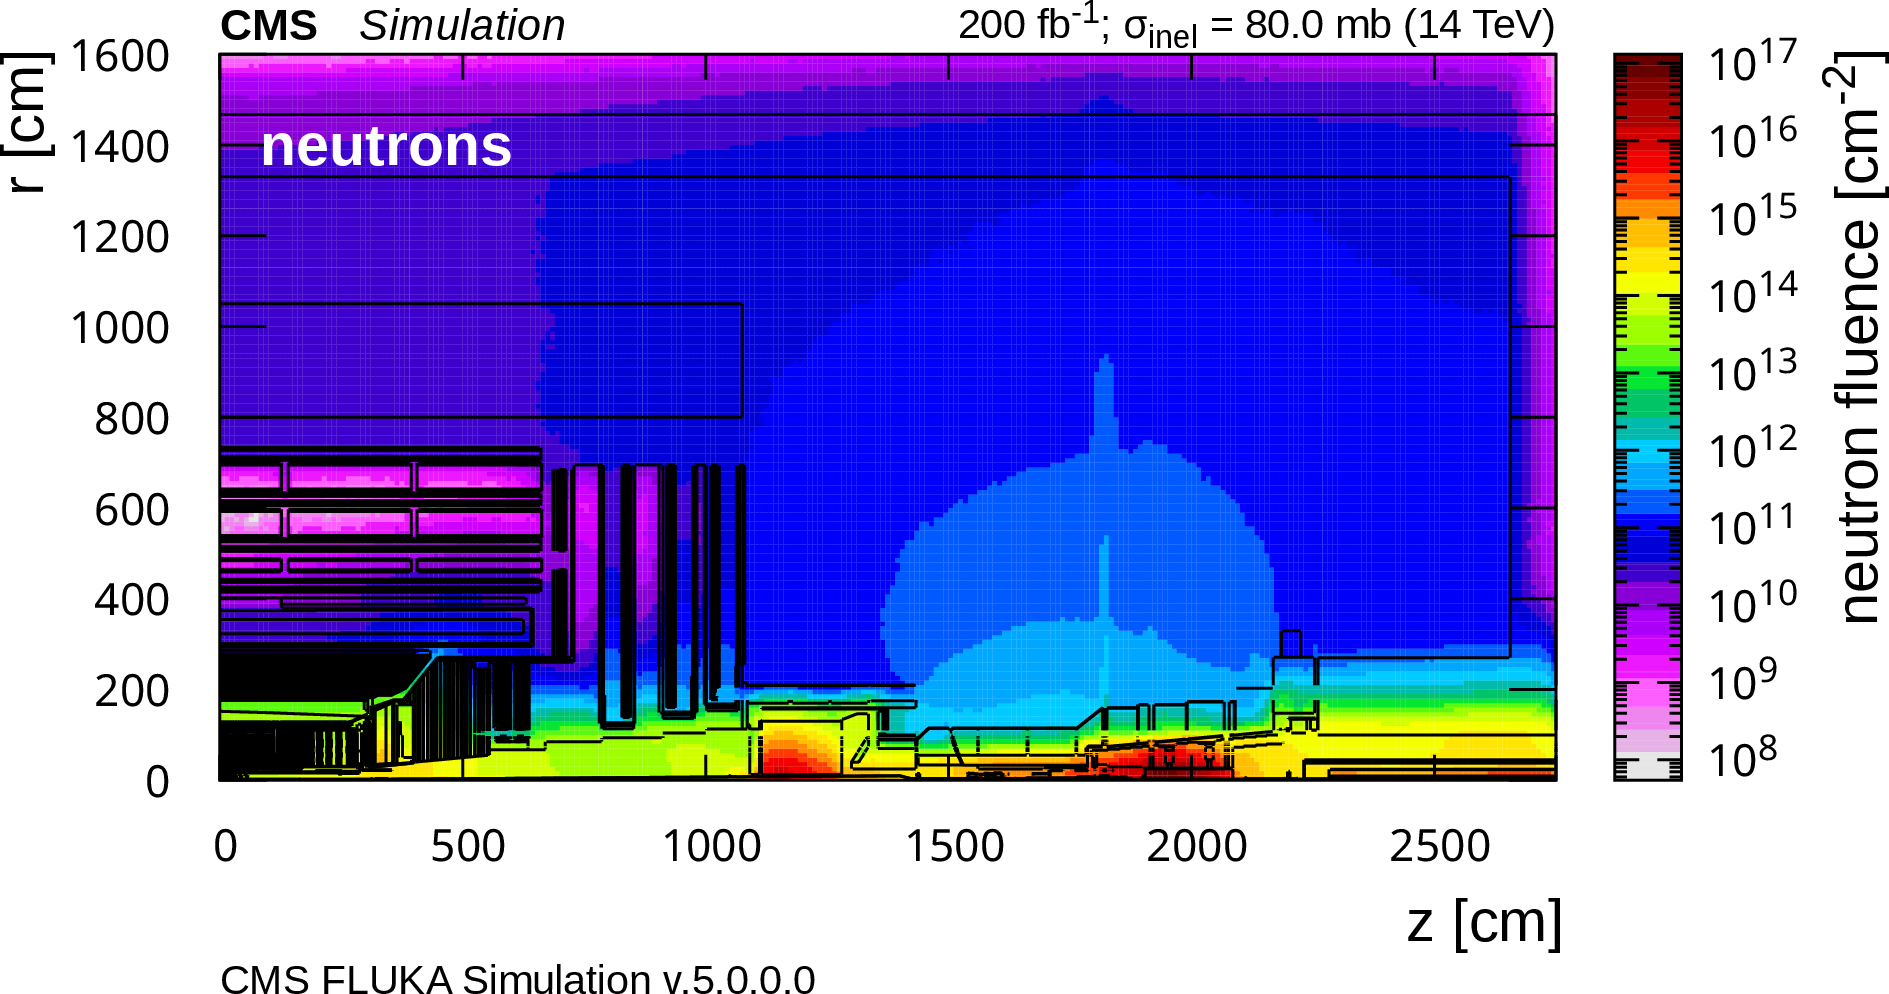
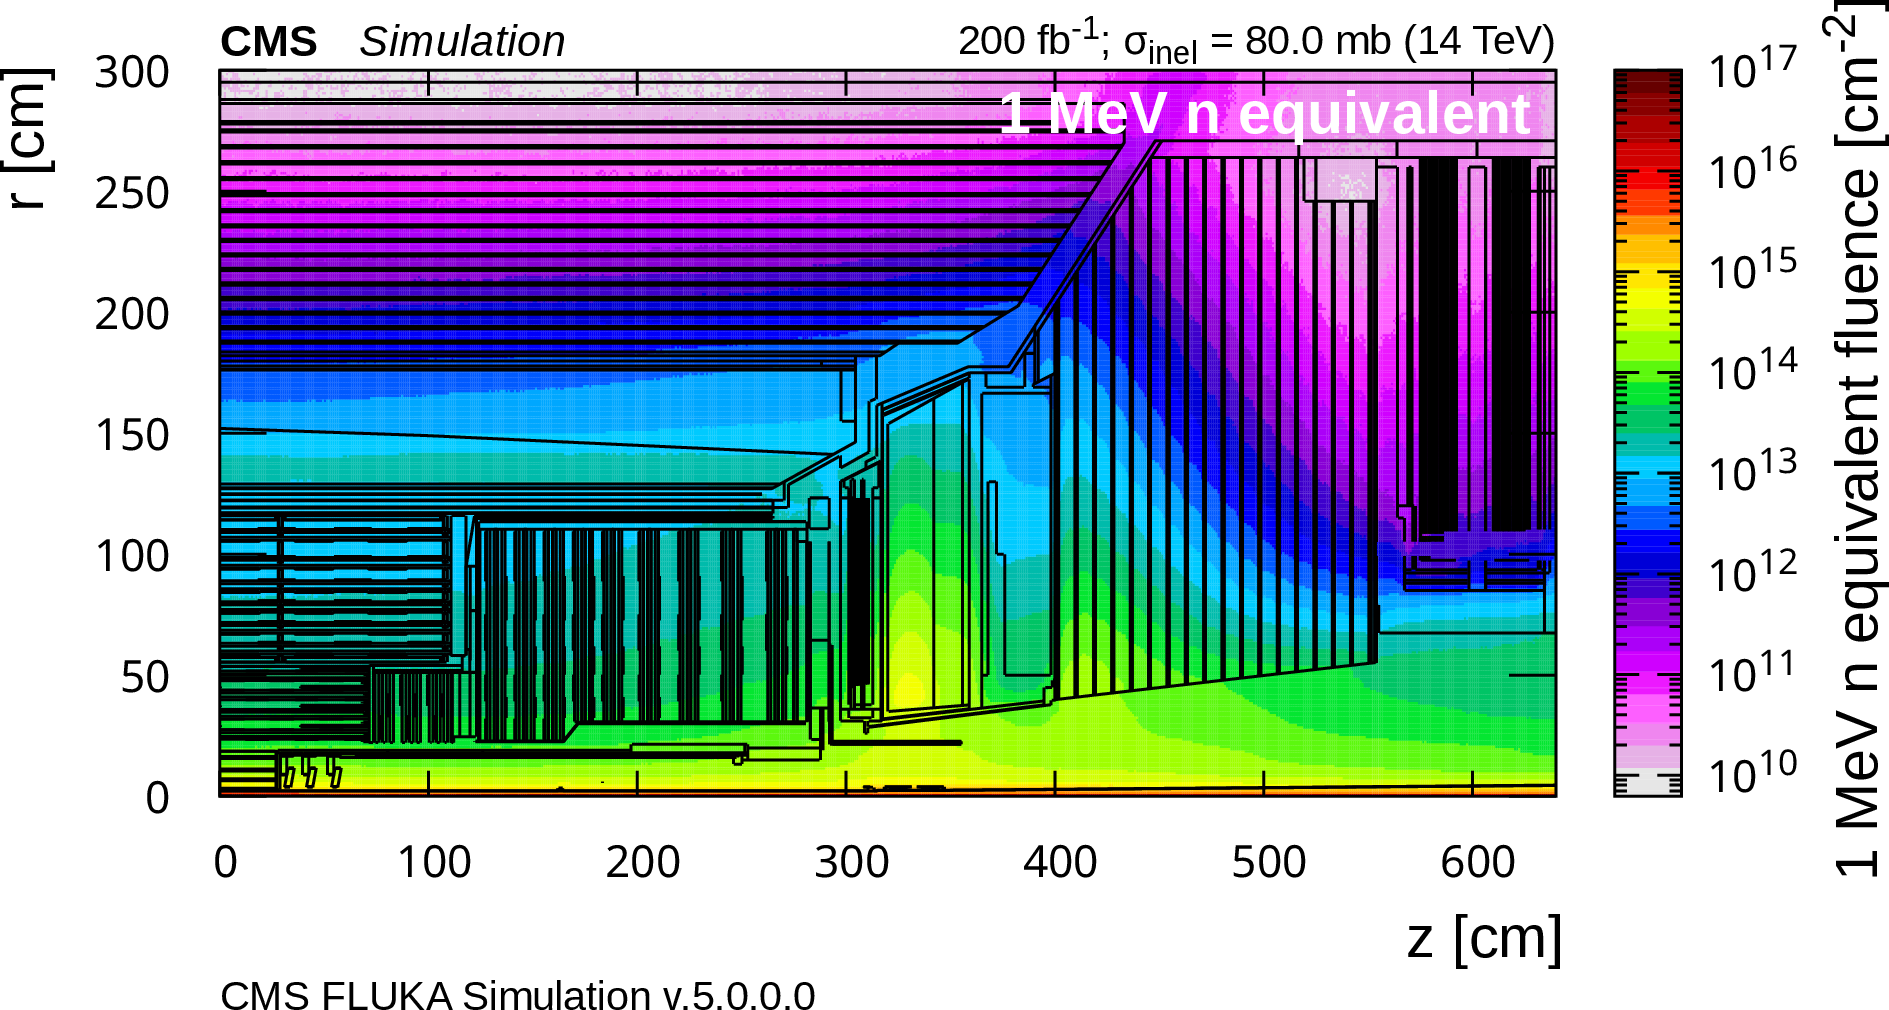
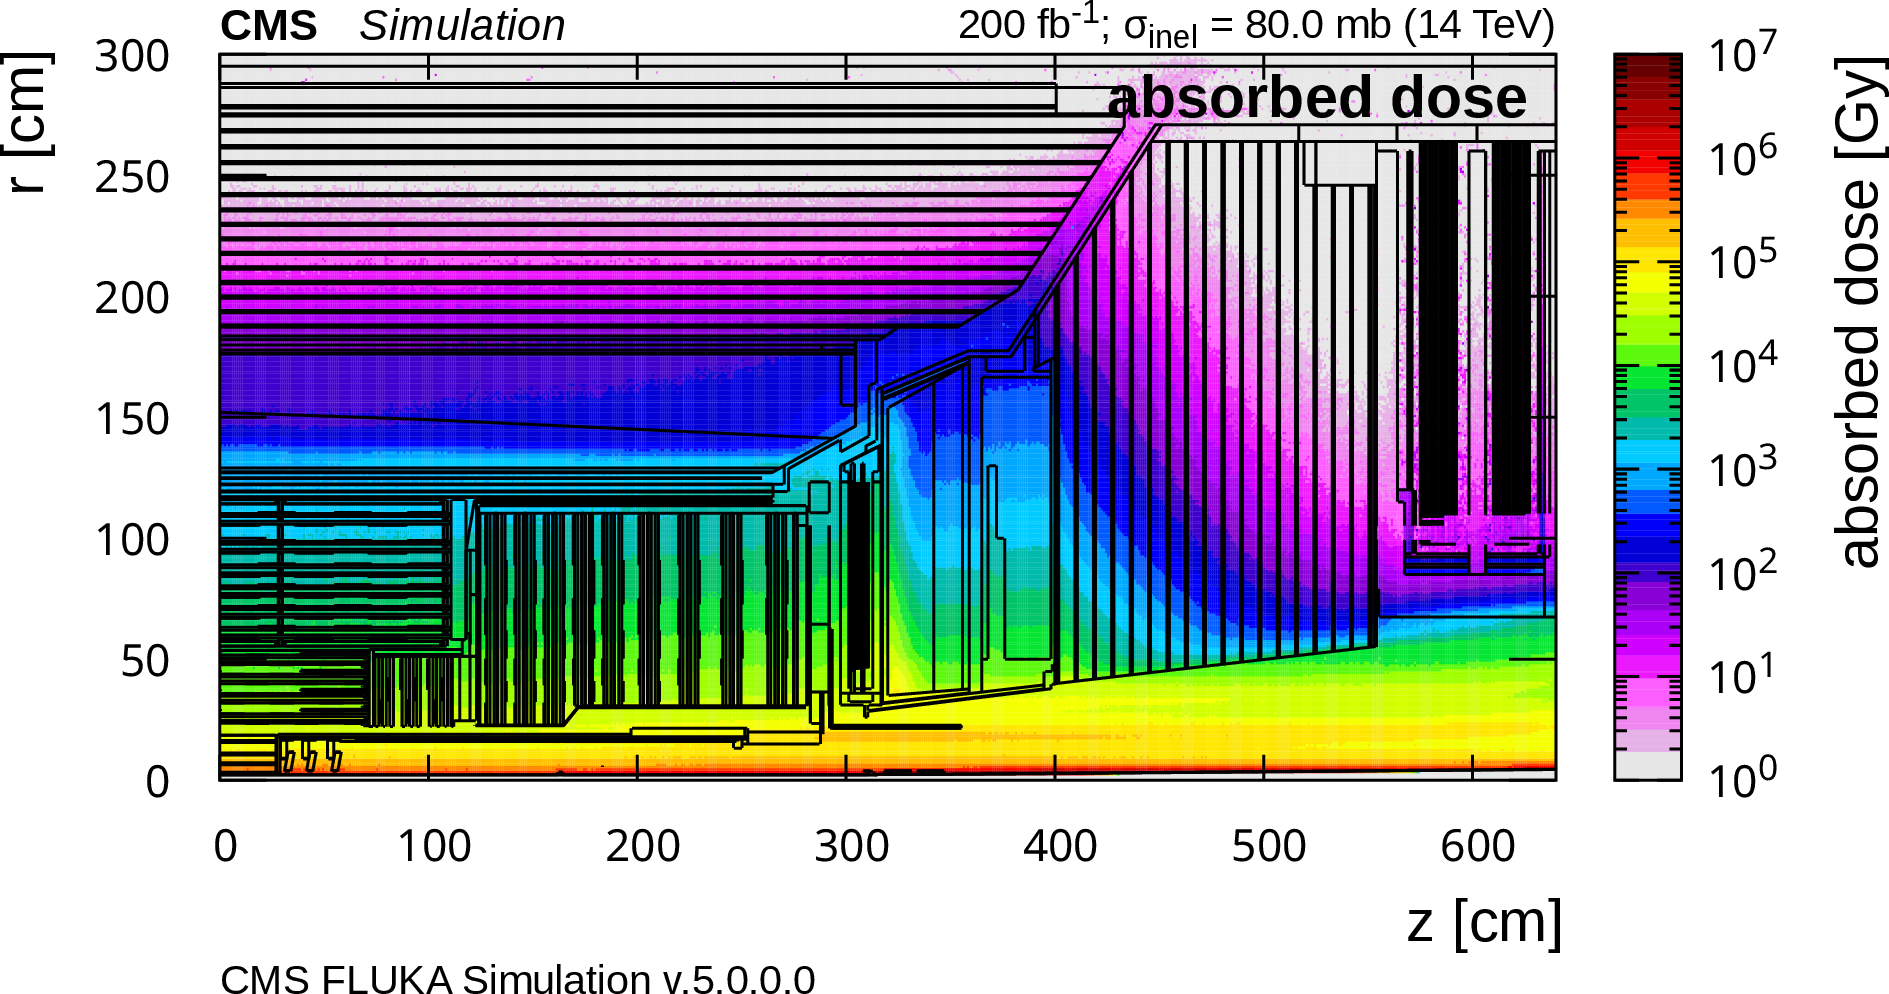
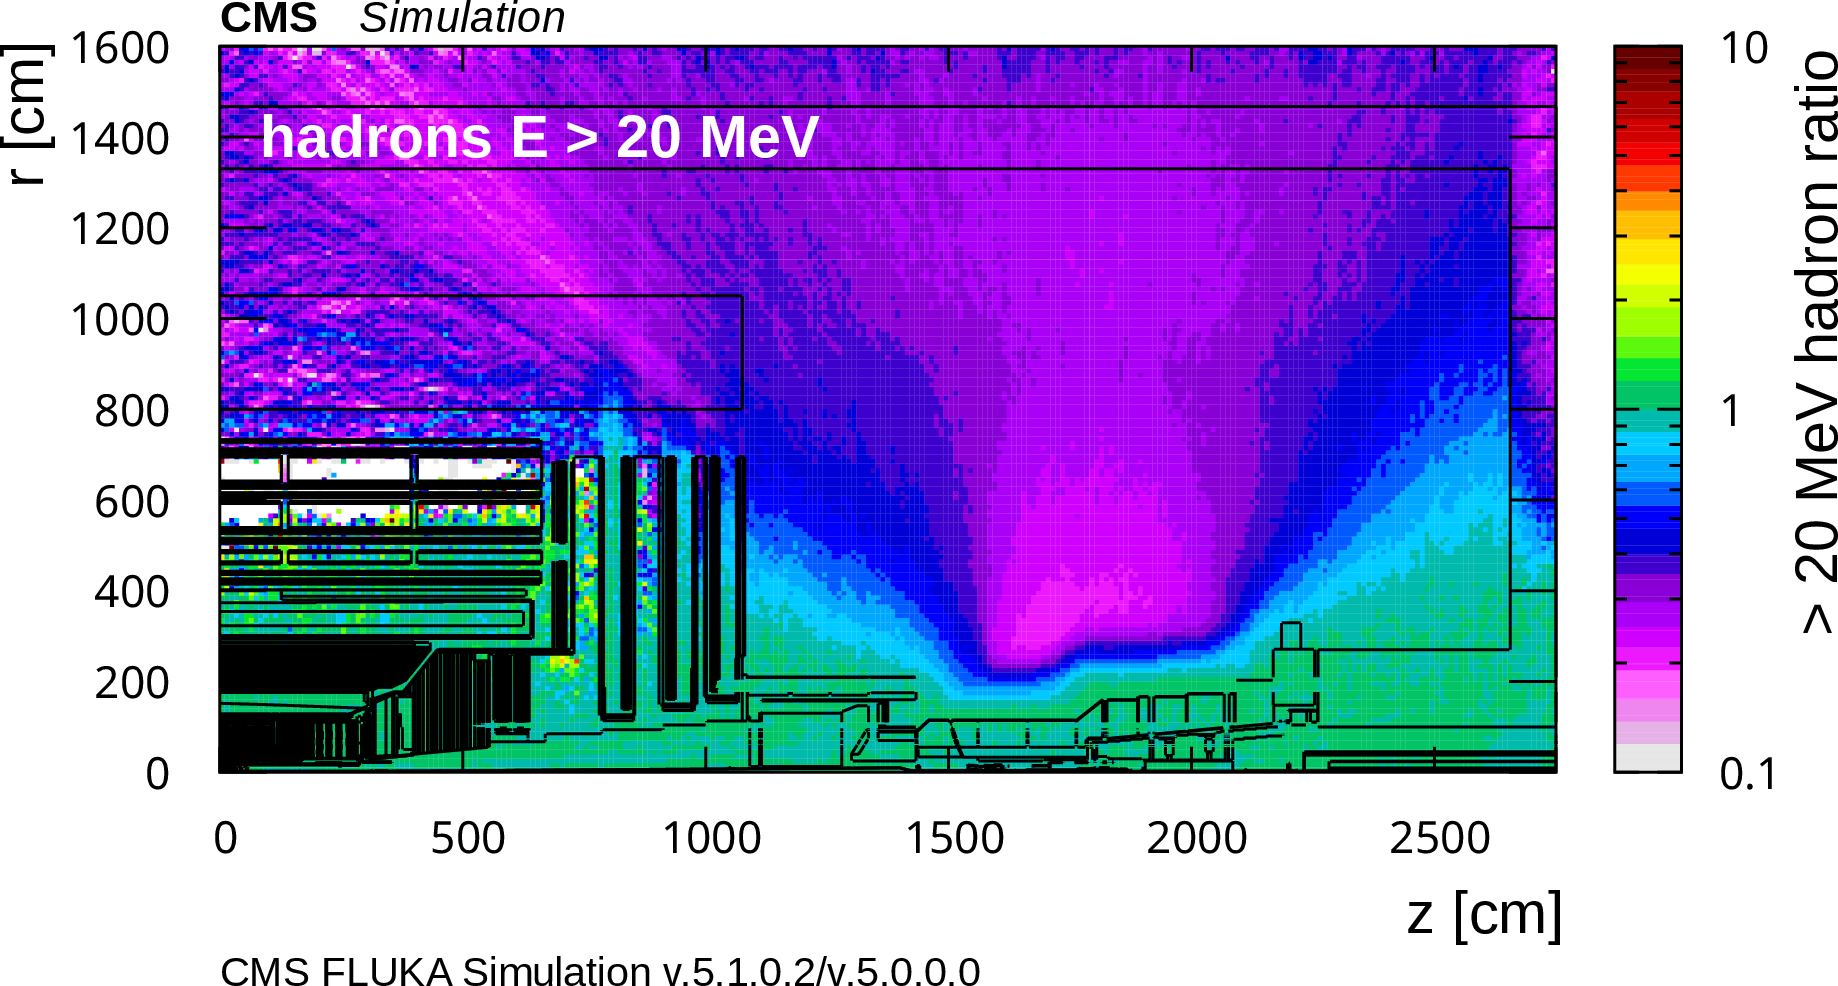
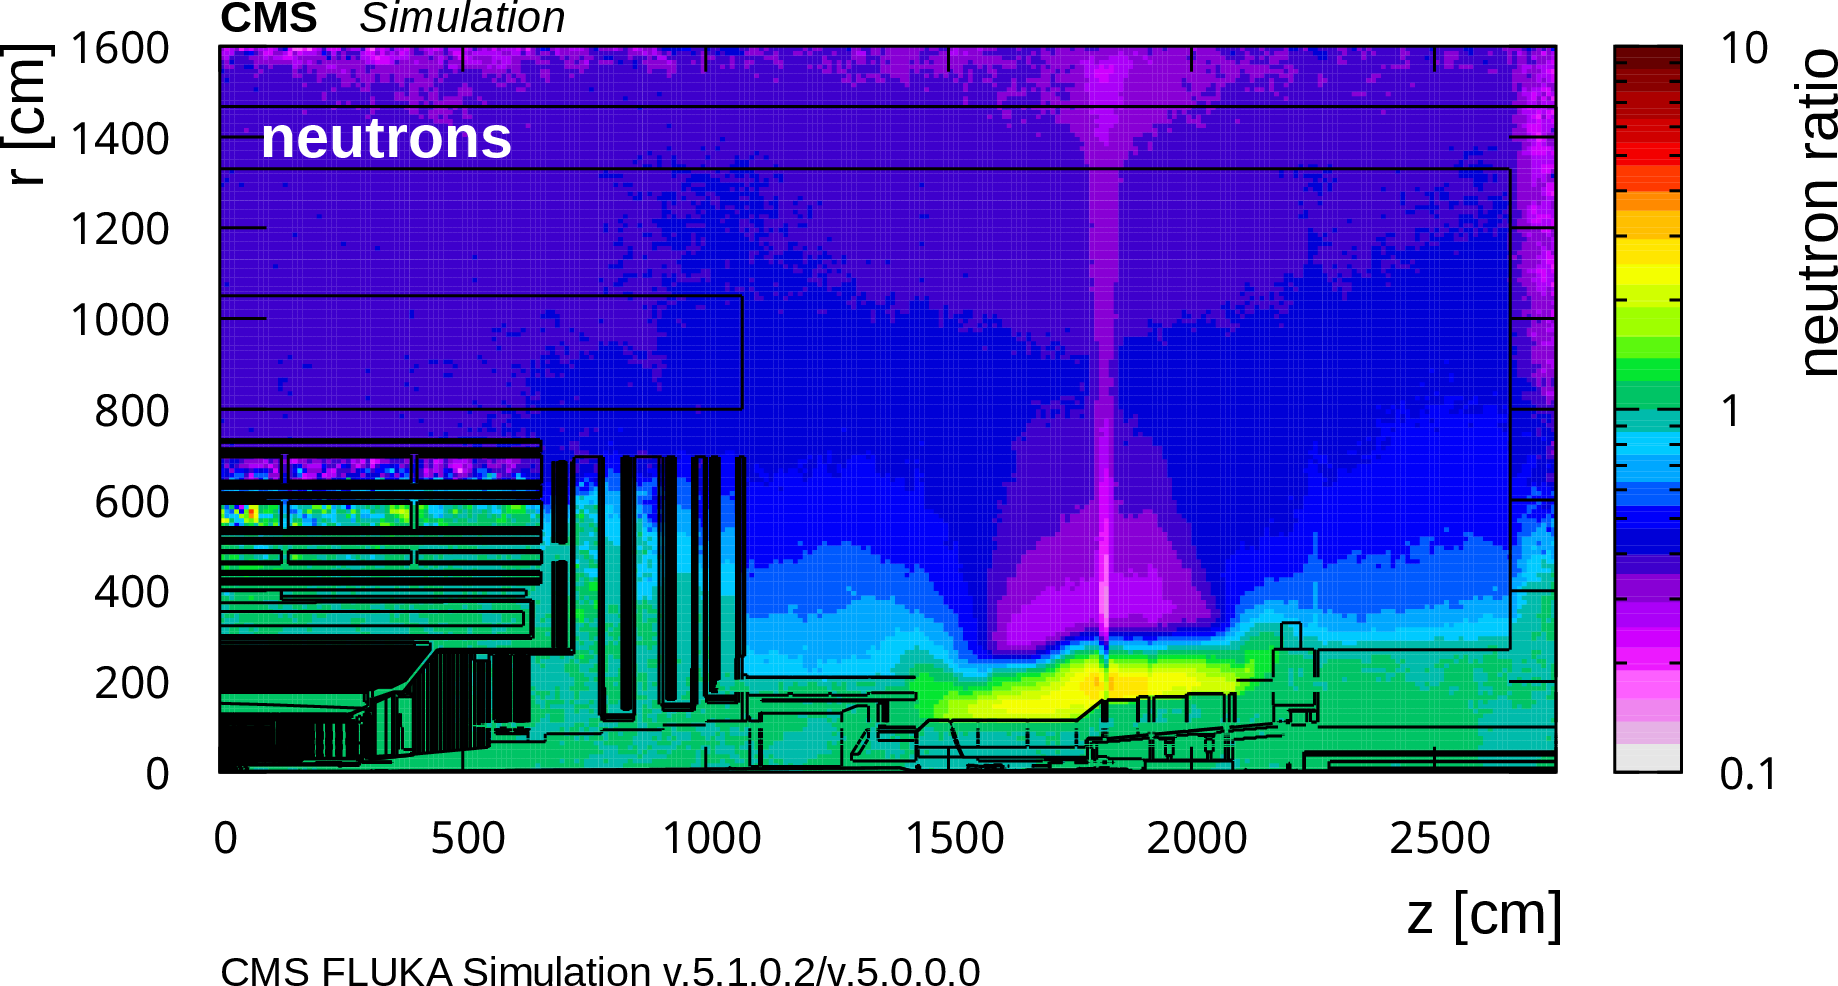
The FLUKA predictions for the expected Run 3 fluence of hadrons with energies greater than 20 MeV (upper left) and neutron fluence (upper right) normalized to an integrated luminosity of 200 fb$ ^{-1} $ at 7 TeV per beam are shown for the CMS cavern and detector. For the central part of CMS, 1 MeV-neutron-equivalent fluence (middle left), and absorbed-dose (middle right) are also presented. The lower two plots show the expected effect of the new forward shield as the ratio of hadron (left) and neutron fluences (right) in the CMS cavern comparing the Run 3 FLUKA simulation results of v5.1.0.2 with the Run 3 baseline of v5.0.0.0. |
png pdf |
Figure 116-a:
The FLUKA predictions for the expected Run 3 fluence of hadrons with energies greater than 20 MeV normalized to an integrated luminosity of 200 fb$ ^{-1} $ at 7 TeV per beam are shown for the CMS cavern and detector. |
png pdf |
Figure 116-b:
The FLUKA predictions for the expected Run 3 neutron fluence normalized to an integrated luminosity of 200 fb$ ^{-1} $ at 7 TeV per beam are shown for the CMS cavern and detector. |
png pdf |
Figure 116-c:
For the central part of CMS, 1 MeV-neutron-equivalent fluence. |
png pdf |
Figure 116-d:
For the central part of CMS, absorbed-dose. |
png pdf |
Figure 116-e:
Expected effect of the new forward shield as the ratio of hadron fluence in the CMS cavern comparing the Run 3 FLUKA simulation results of v5.1.0.2 with the Run 3 baseline of v5.0.0.0. |
png pdf |
Figure 116-f:
Expected effect of the new forward shield as the ratio of neutron fluence in the CMS cavern comparing the Run 3 FLUKA simulation results of v5.1.0.2 with the Run 3 baseline of v5.0.0.0. |

png pdf |
Figure 117:
Diagram of the Run 3 DAQ system. The total numbers of cabled elements are given, including elements used in the MiniDAQ systems described in Section 9.11 and elements installed as hot spares or for contingency. In typical global data-taking configurations, a subset is used, as described in the text. |
png pdf |
Figure 118:
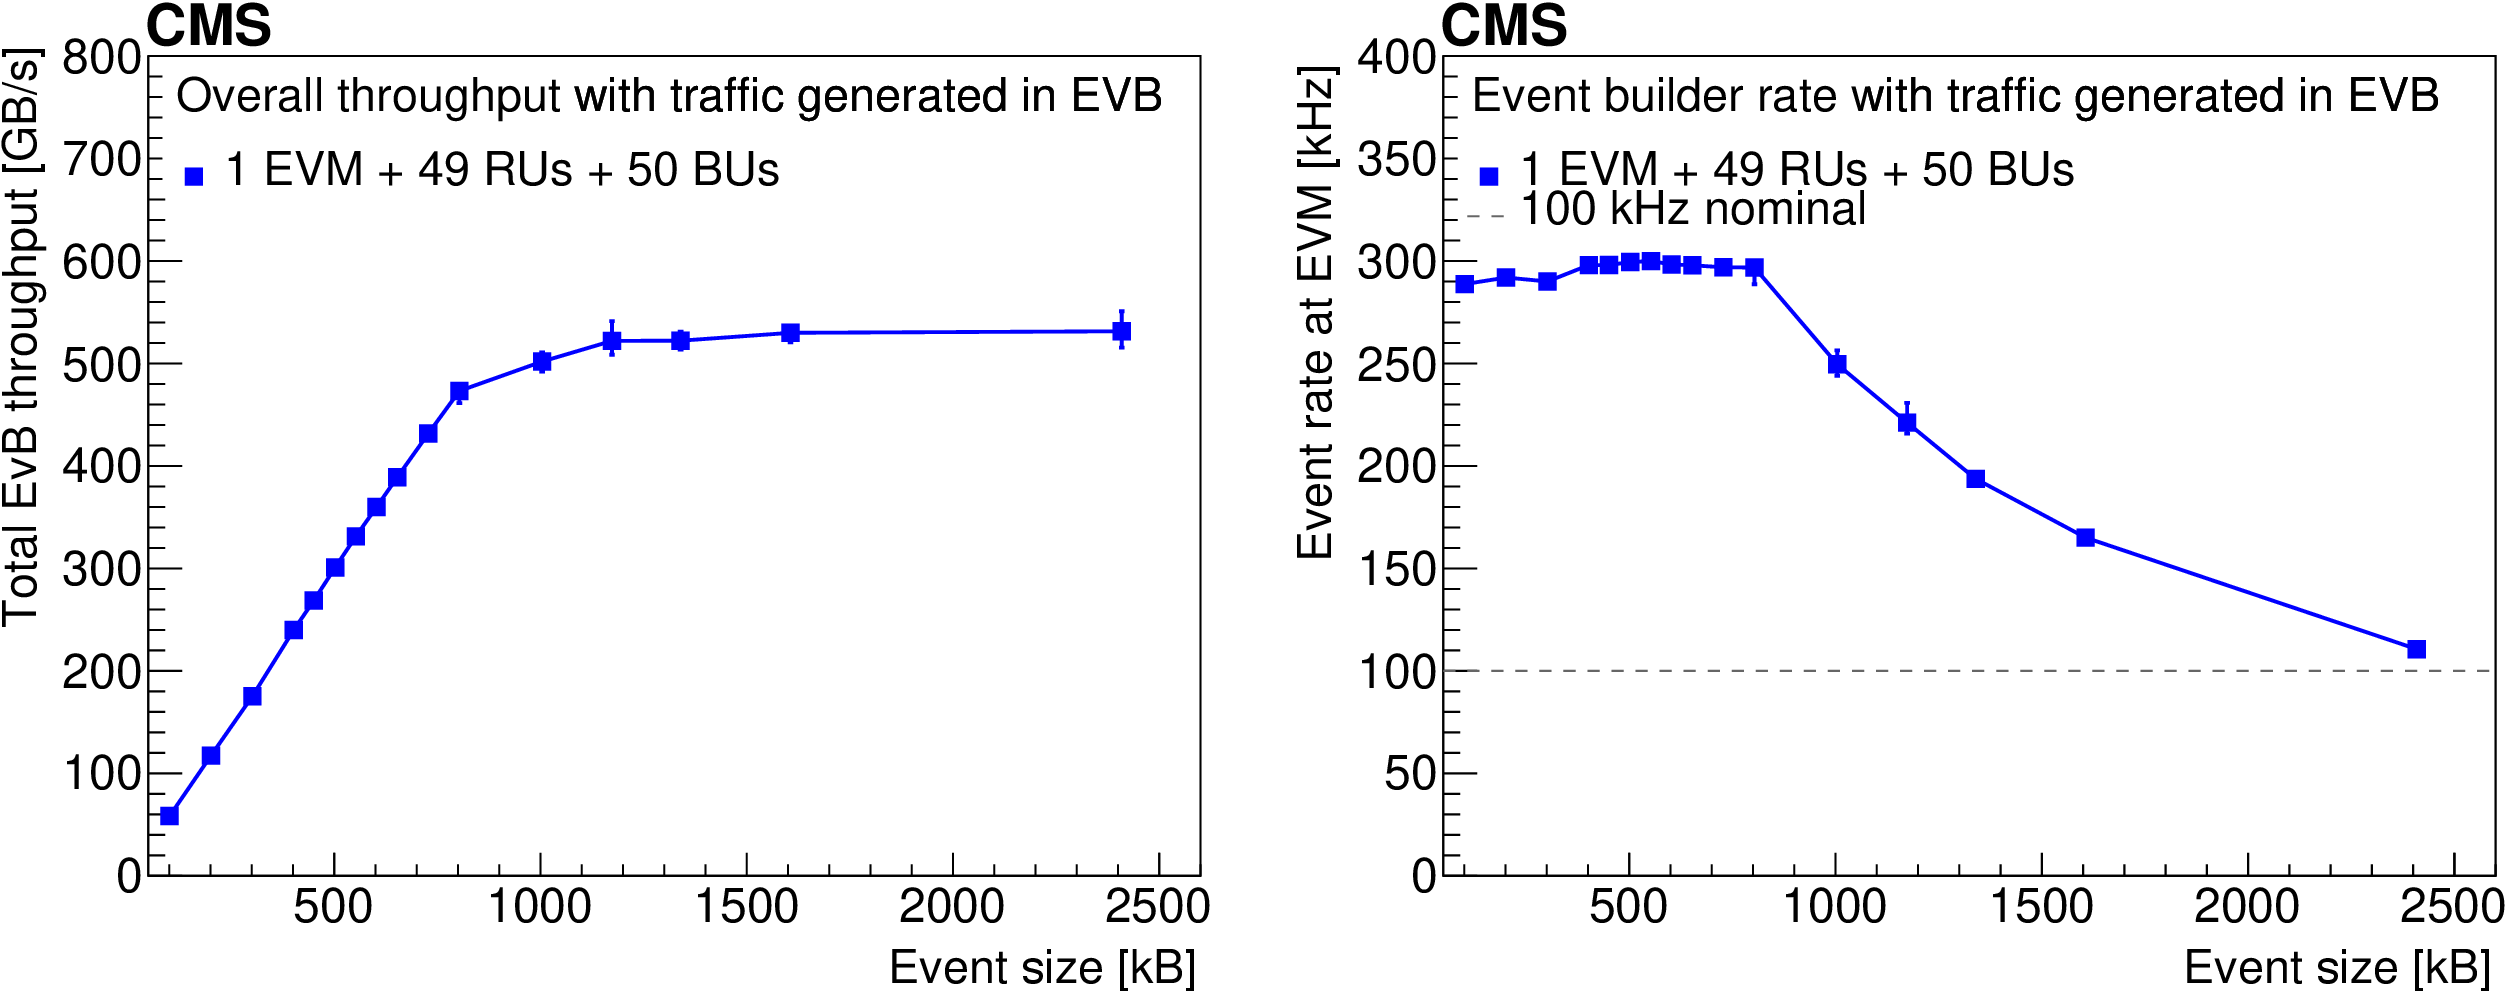
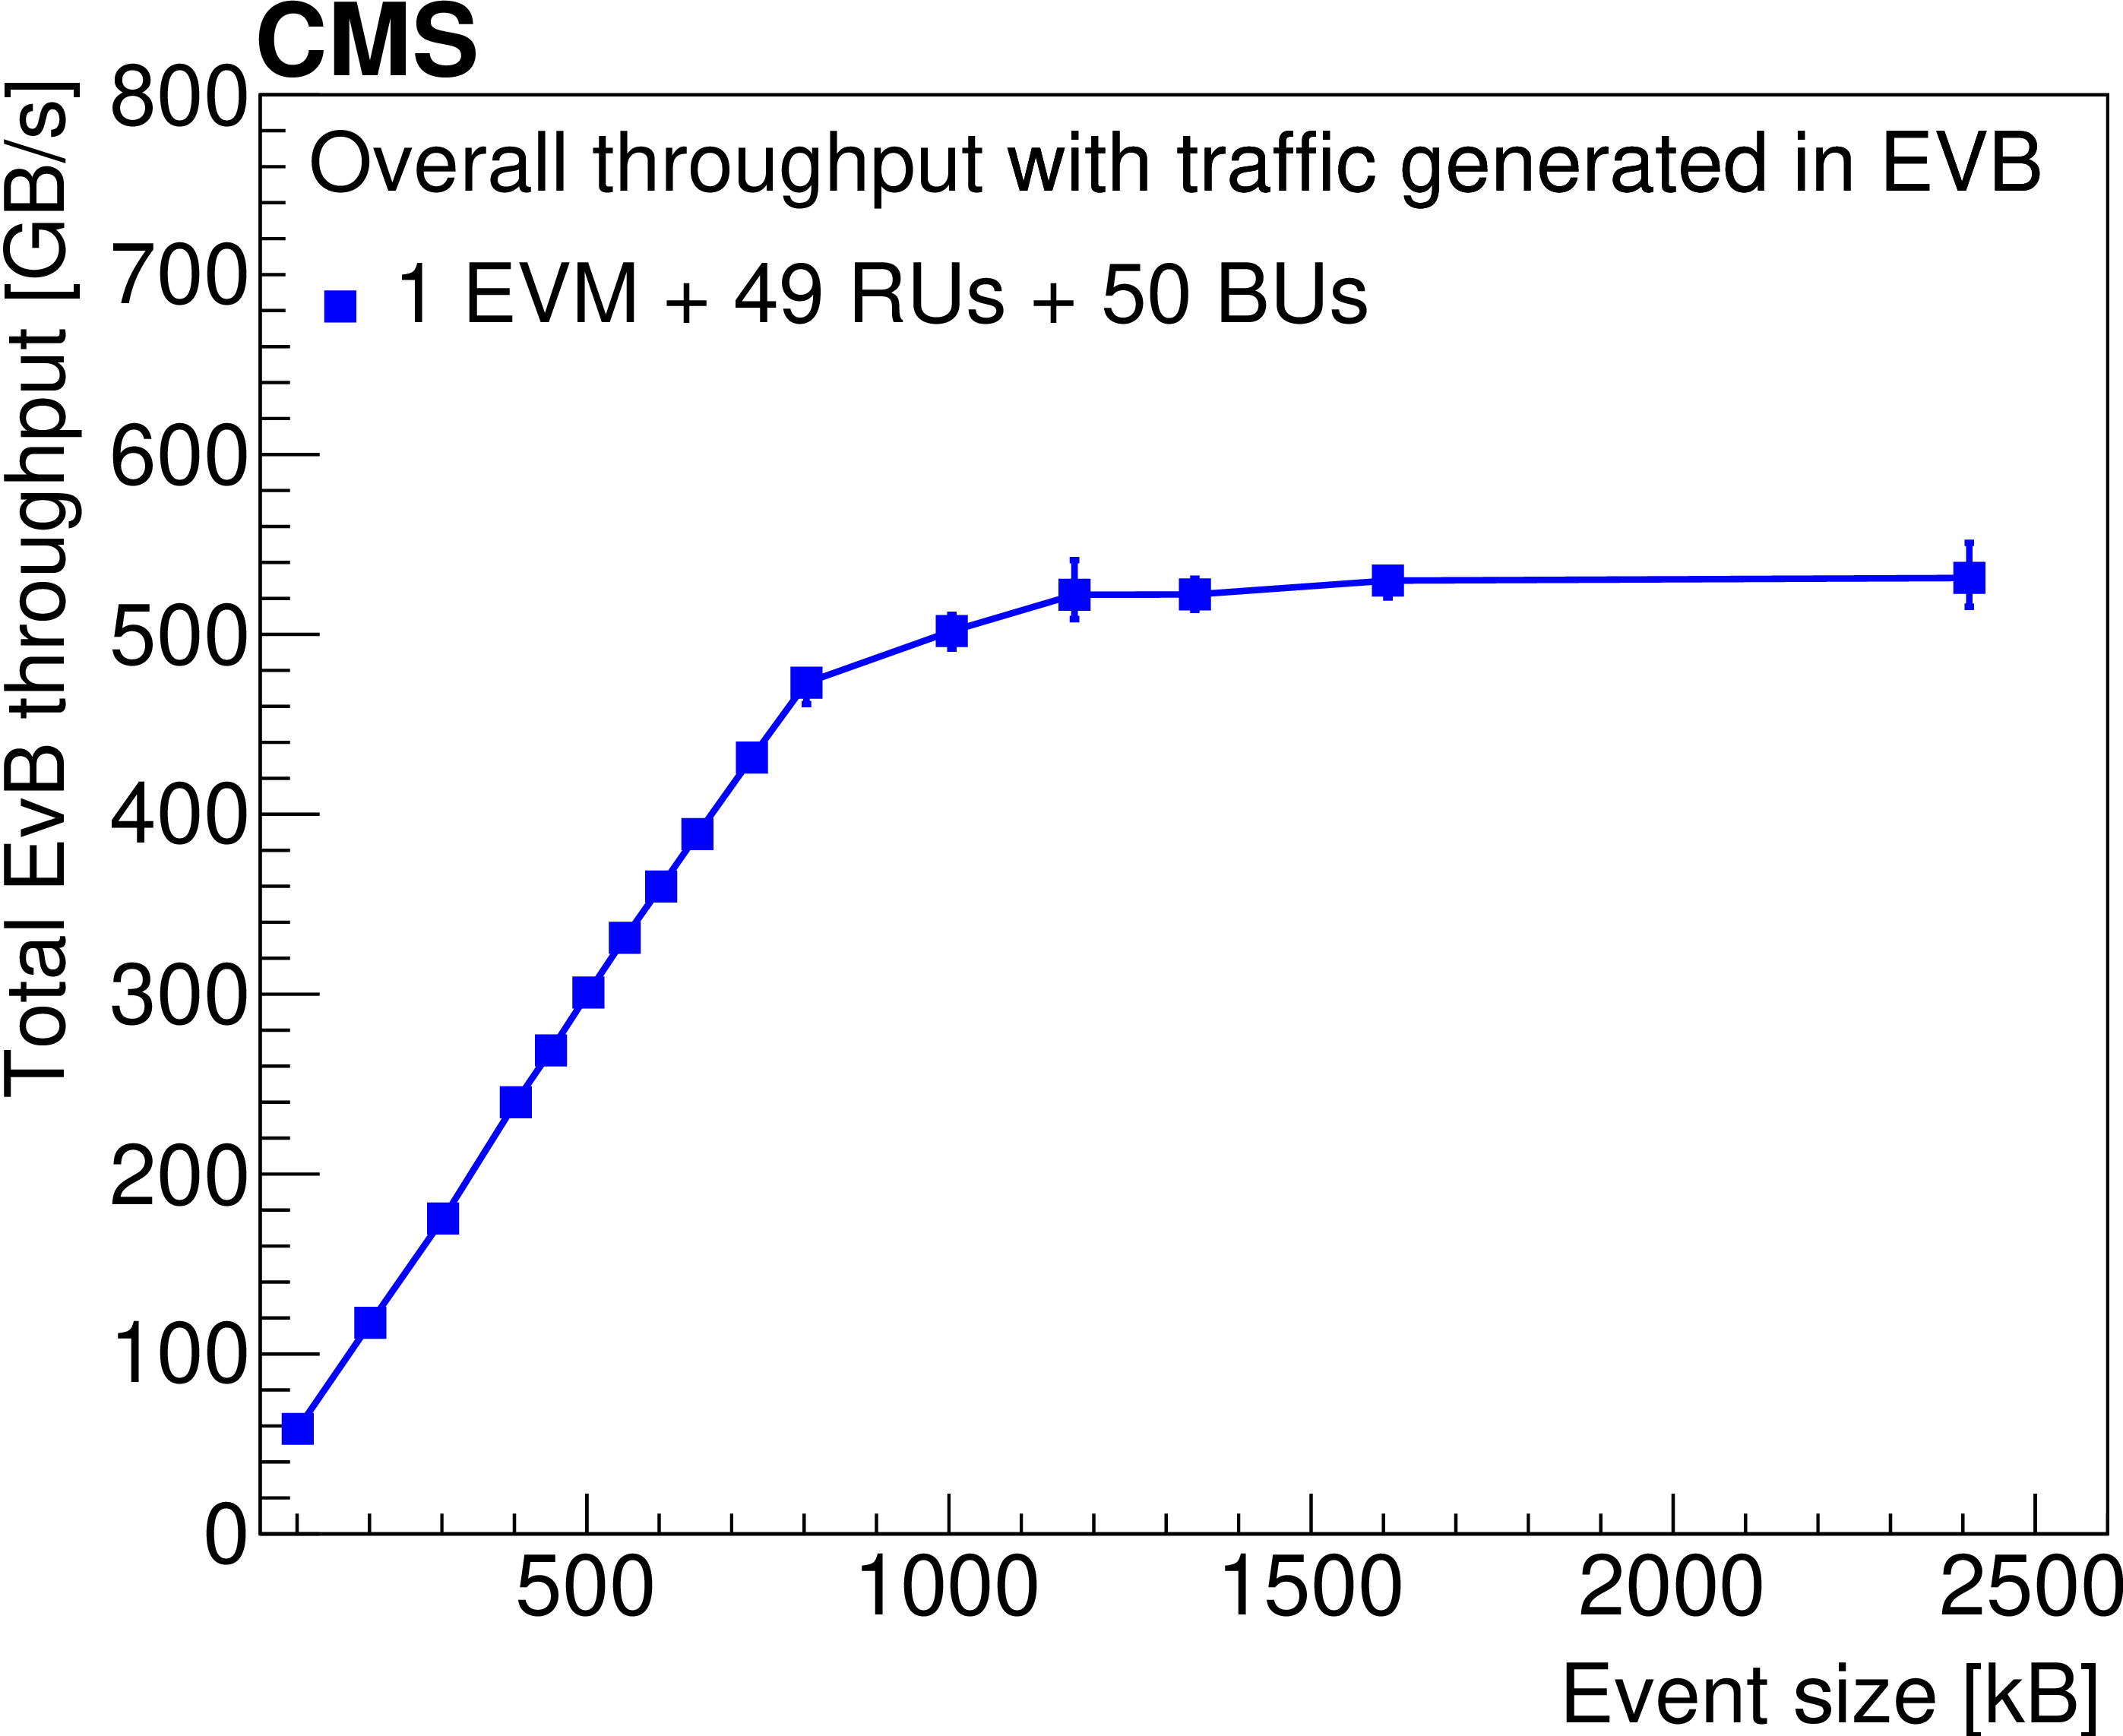
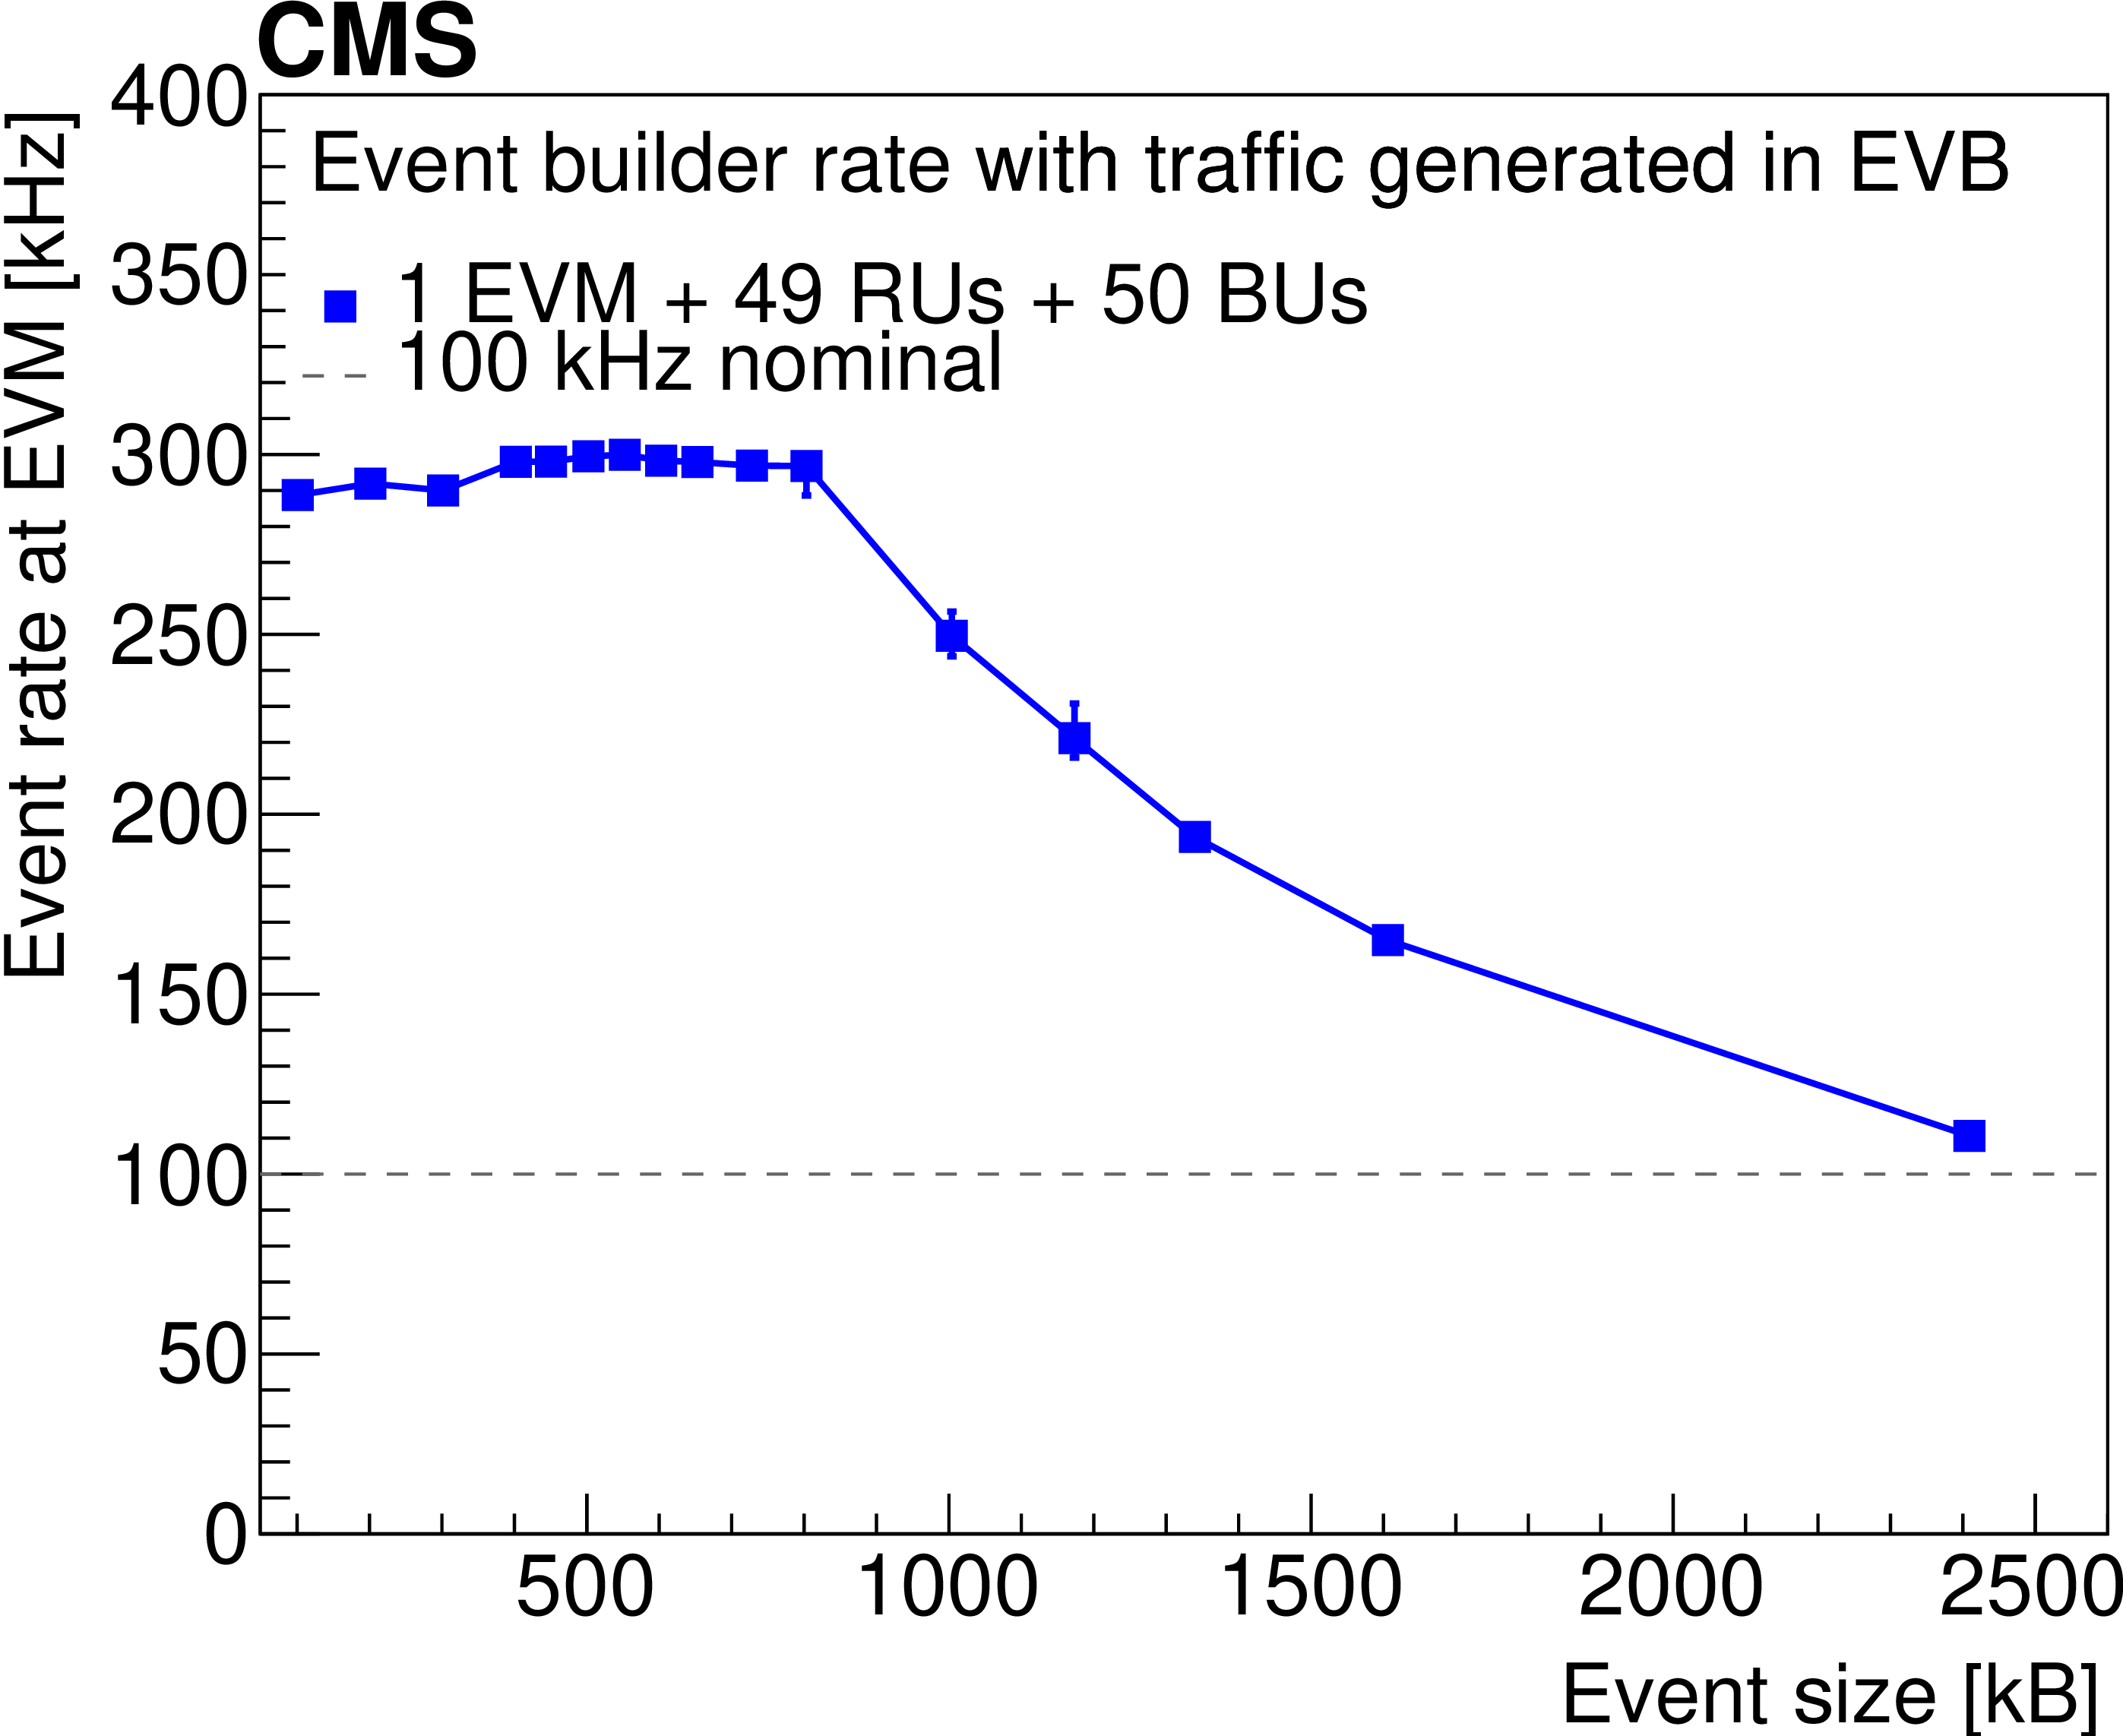
Core event building throughput (left) and event rate (right) of the full-scale RU/BU EVB setup shown for a range of built event sizes. Emulated input data are generated in the RU/BUs and discarded after the event building stage. |
png pdf |
Figure 118-a:
Core event building throughput of the full-scale RU/BU EVB setup shown for a range of built event sizes. Emulated input data are generated in the RU/BUs and discarded after the event building stage. |
png pdf |
Figure 118-b:
Event rate of the full-scale RU/BU EVB setup shown for a range of built event sizes. Emulated input data are generated in the RU/BUs and discarded after the event building stage. |
png pdf |
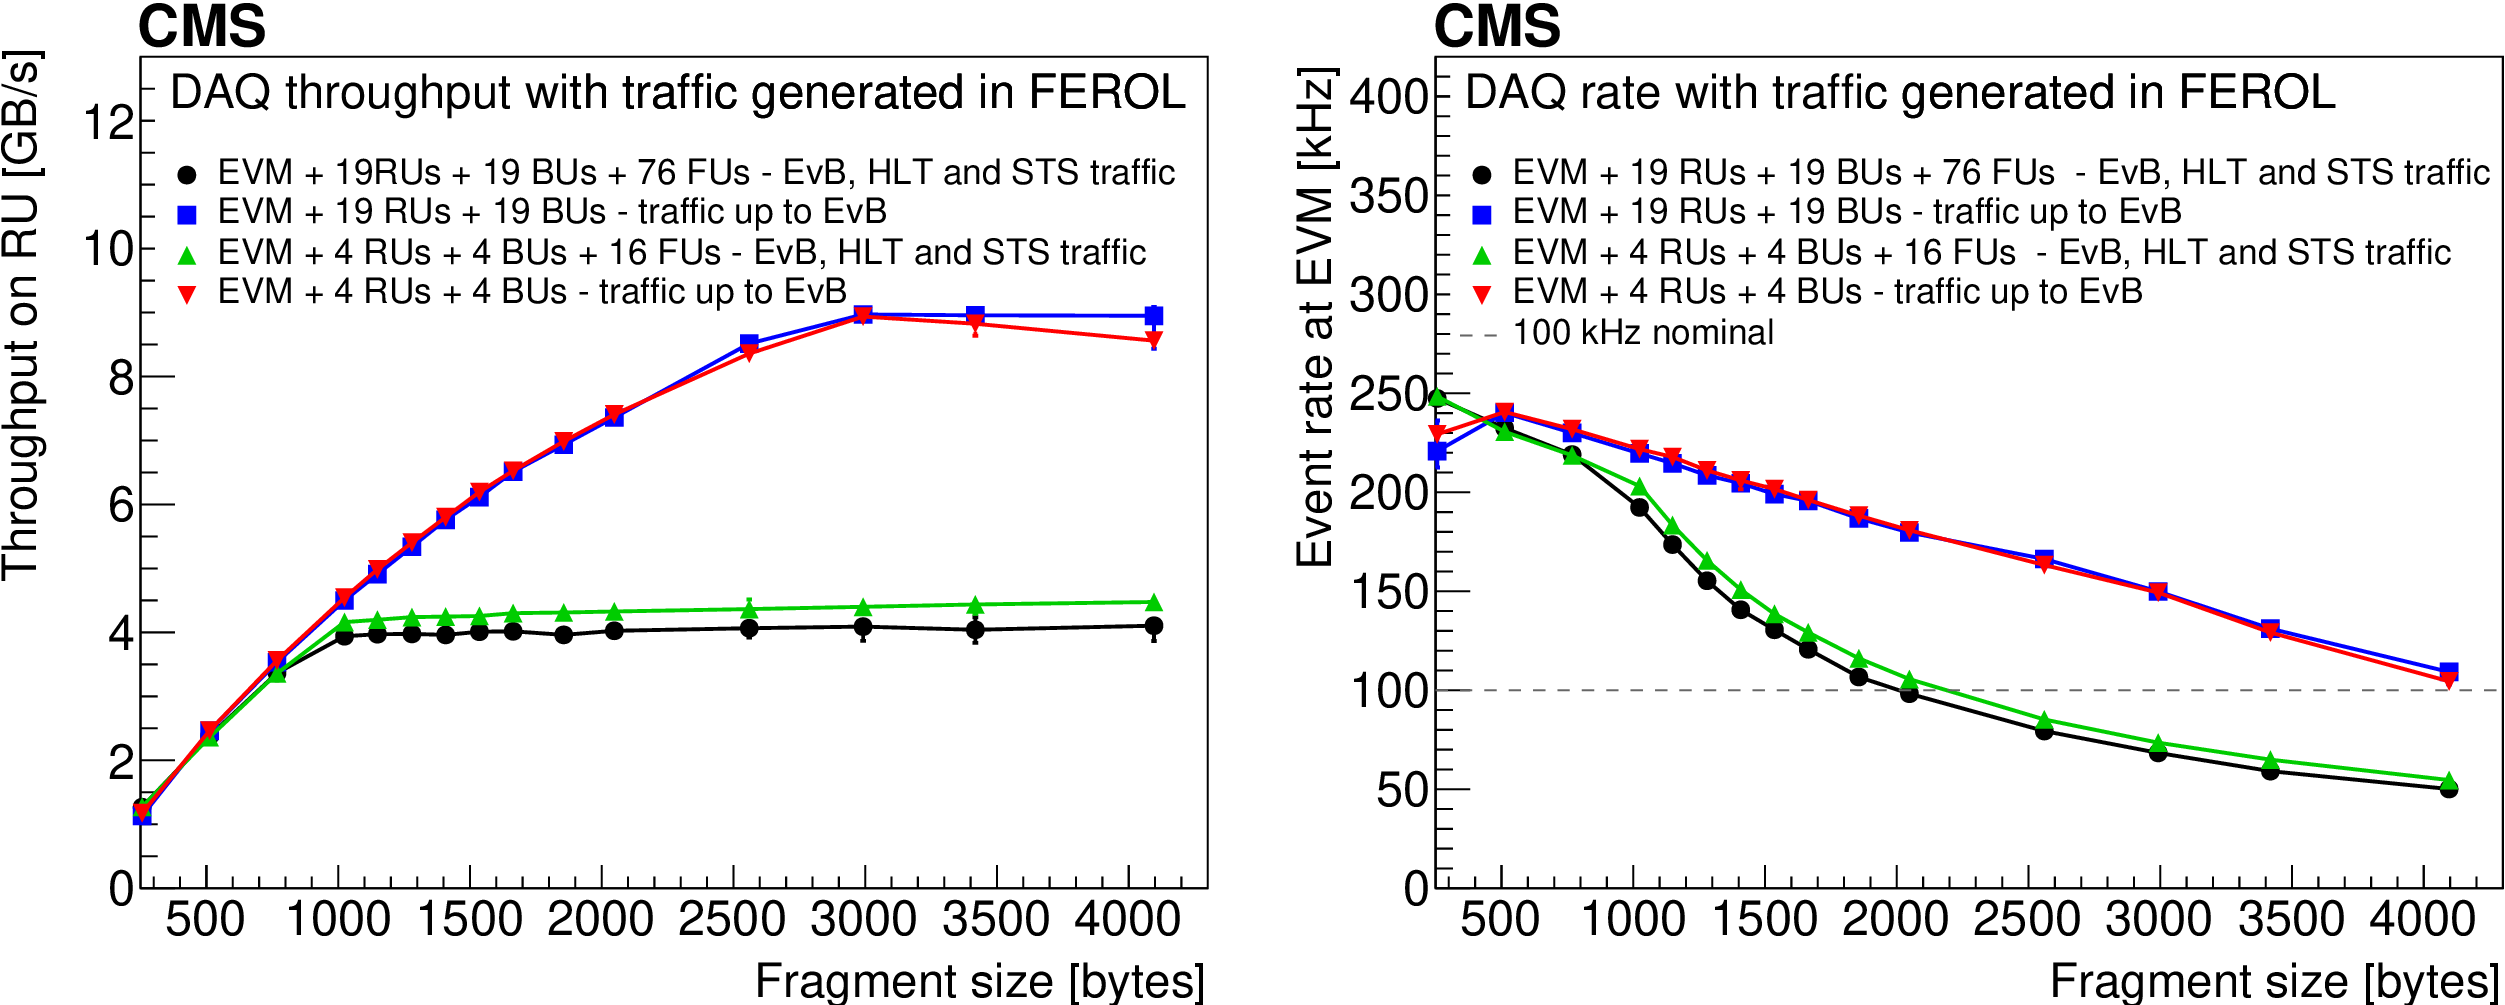
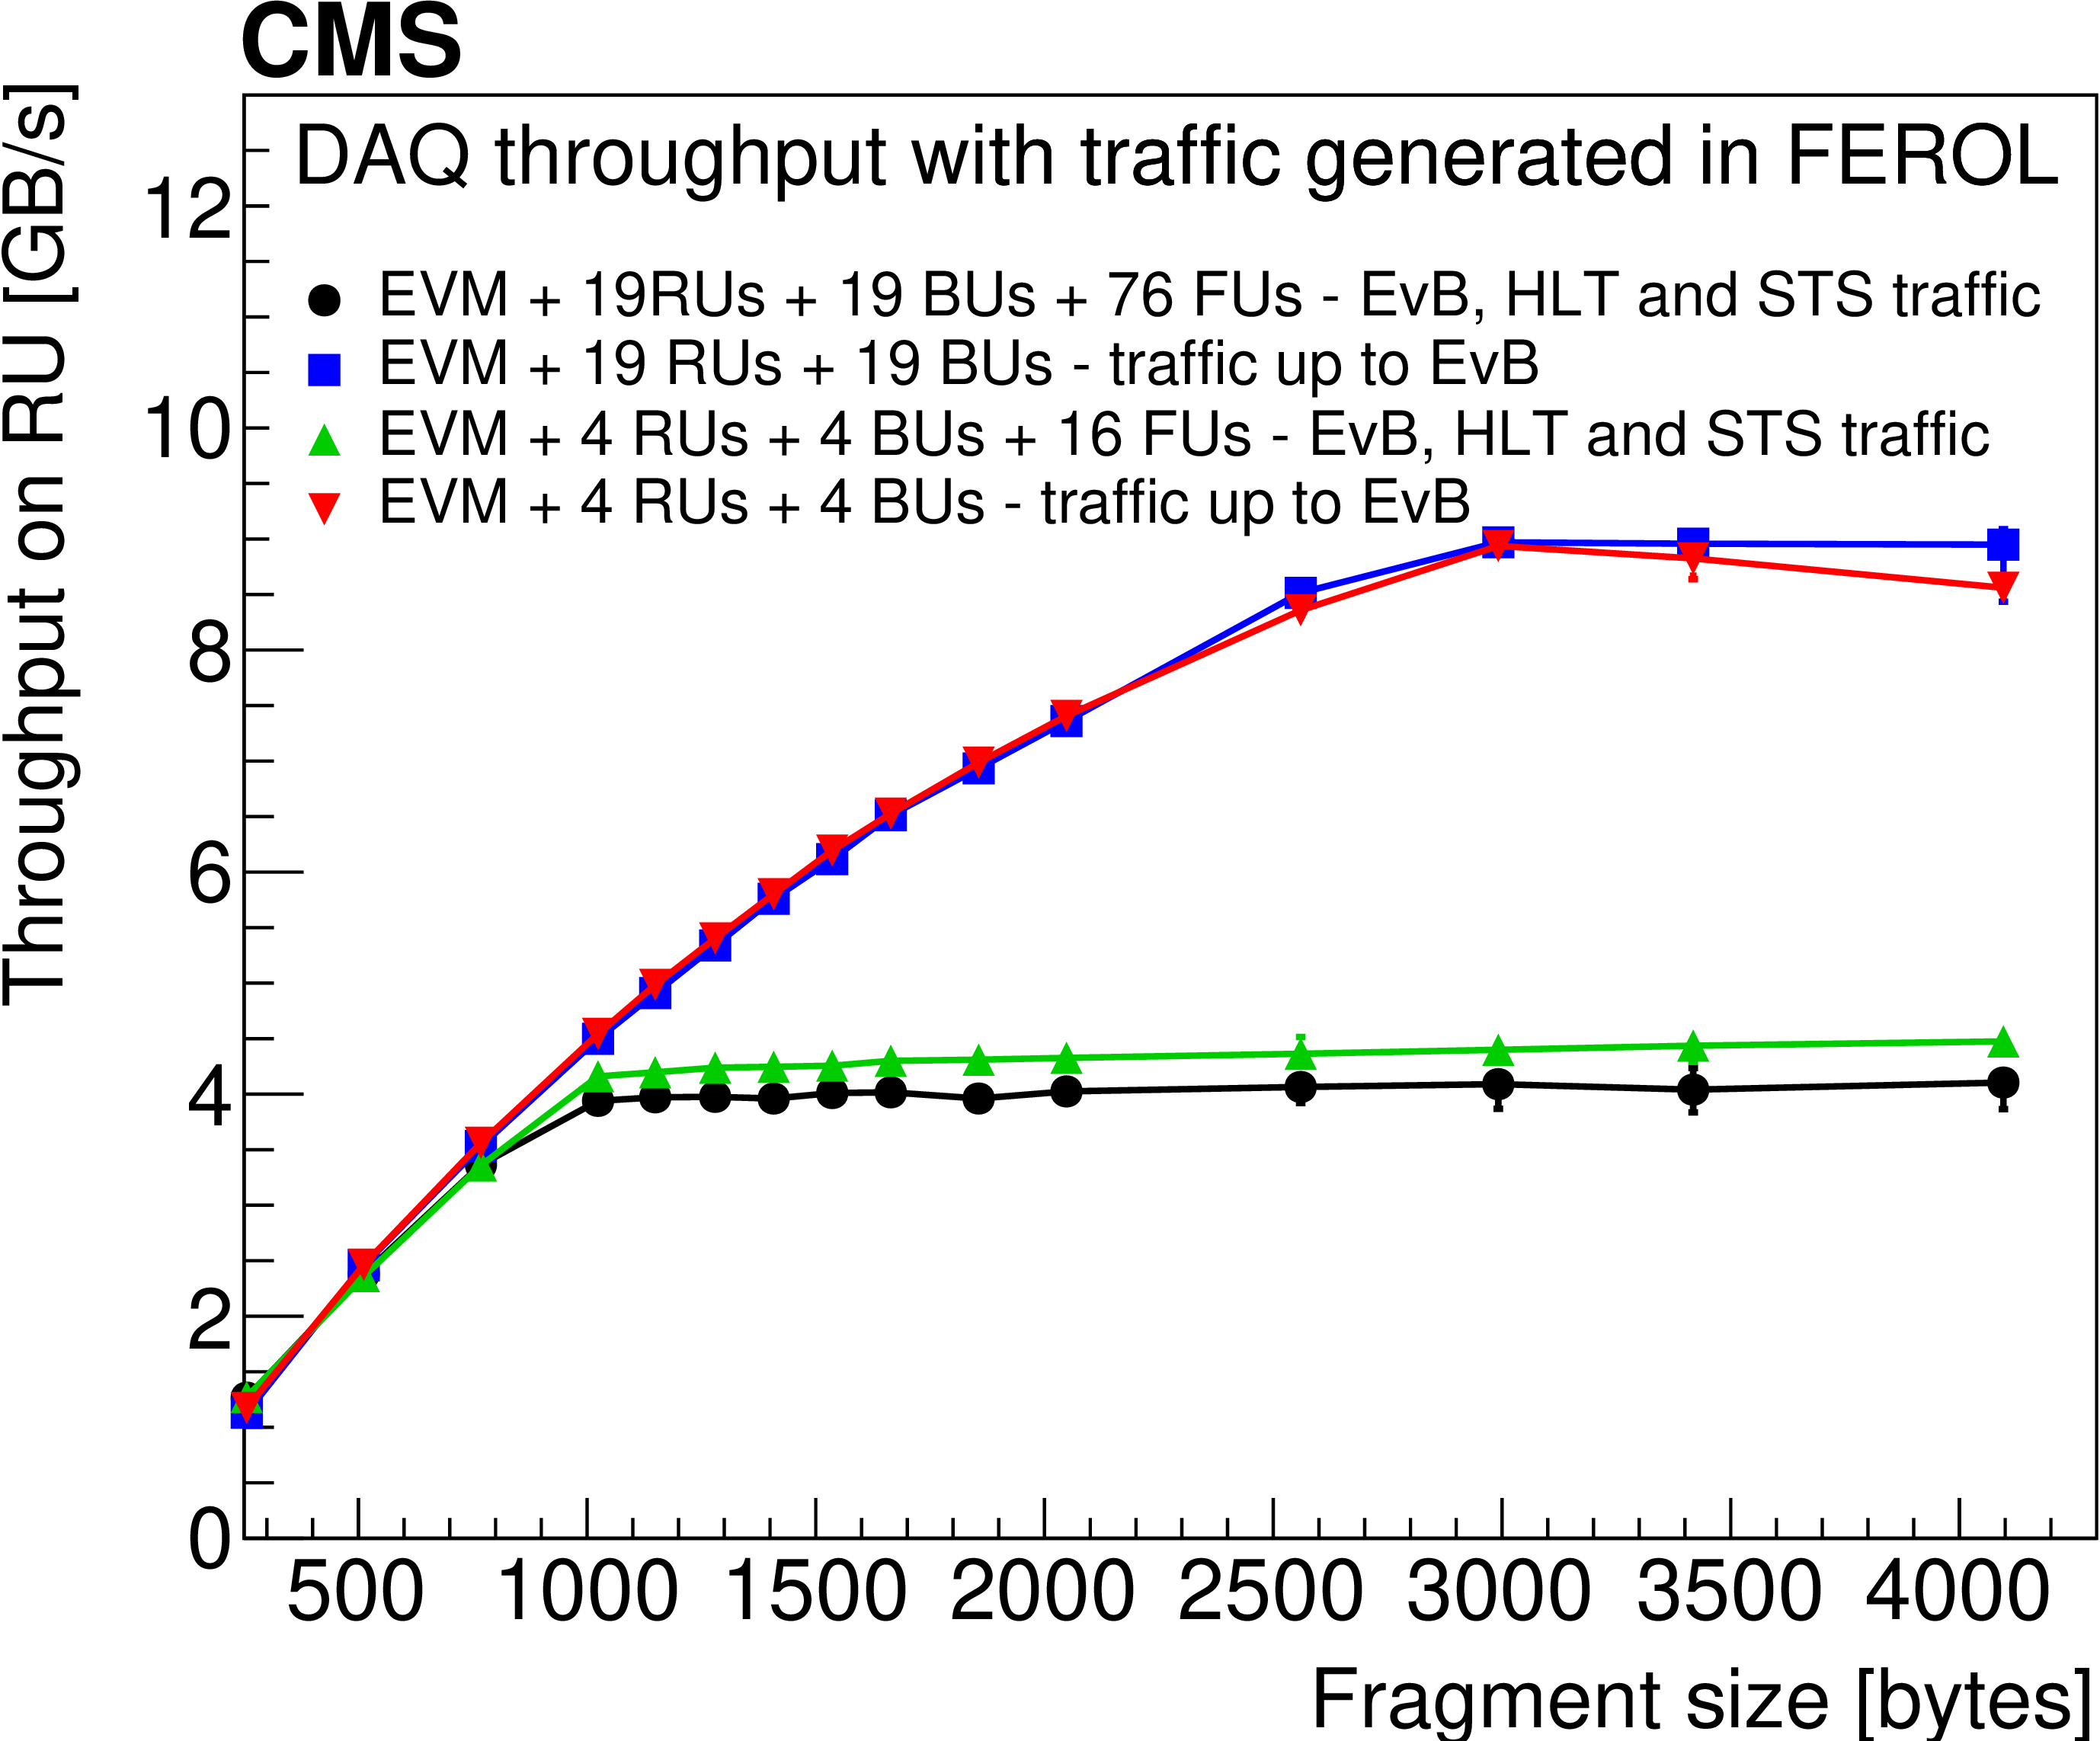
Figure 119:
The DAQ throughput (left) and event rate (right) per RU/BU node for a range of uniform fragment sizes using a mode with the data discarded after the EVB and with the traffic flow through the HLT and STS. Emulated input data are generated at the FEROLs with 20 fragments concentrated per RU/BU. |
png pdf |
Figure 119-a:
The DAQ throughput per RU/BU node for a range of uniform fragment sizes using a mode with the data discarded after the EVB and with the traffic flow through the HLT and STS. Emulated input data are generated at the FEROLs with 20 fragments concentrated per RU/BU. |

png pdf |
Figure 119-b:
Event rate per RU/BU node for a range of uniform fragment sizes using a mode with the data discarded after the EVB and with the traffic flow through the HLT and STS. Emulated input data are generated at the FEROLs with 20 fragments concentrated per RU/BU. |
png pdf |
Figure 120:
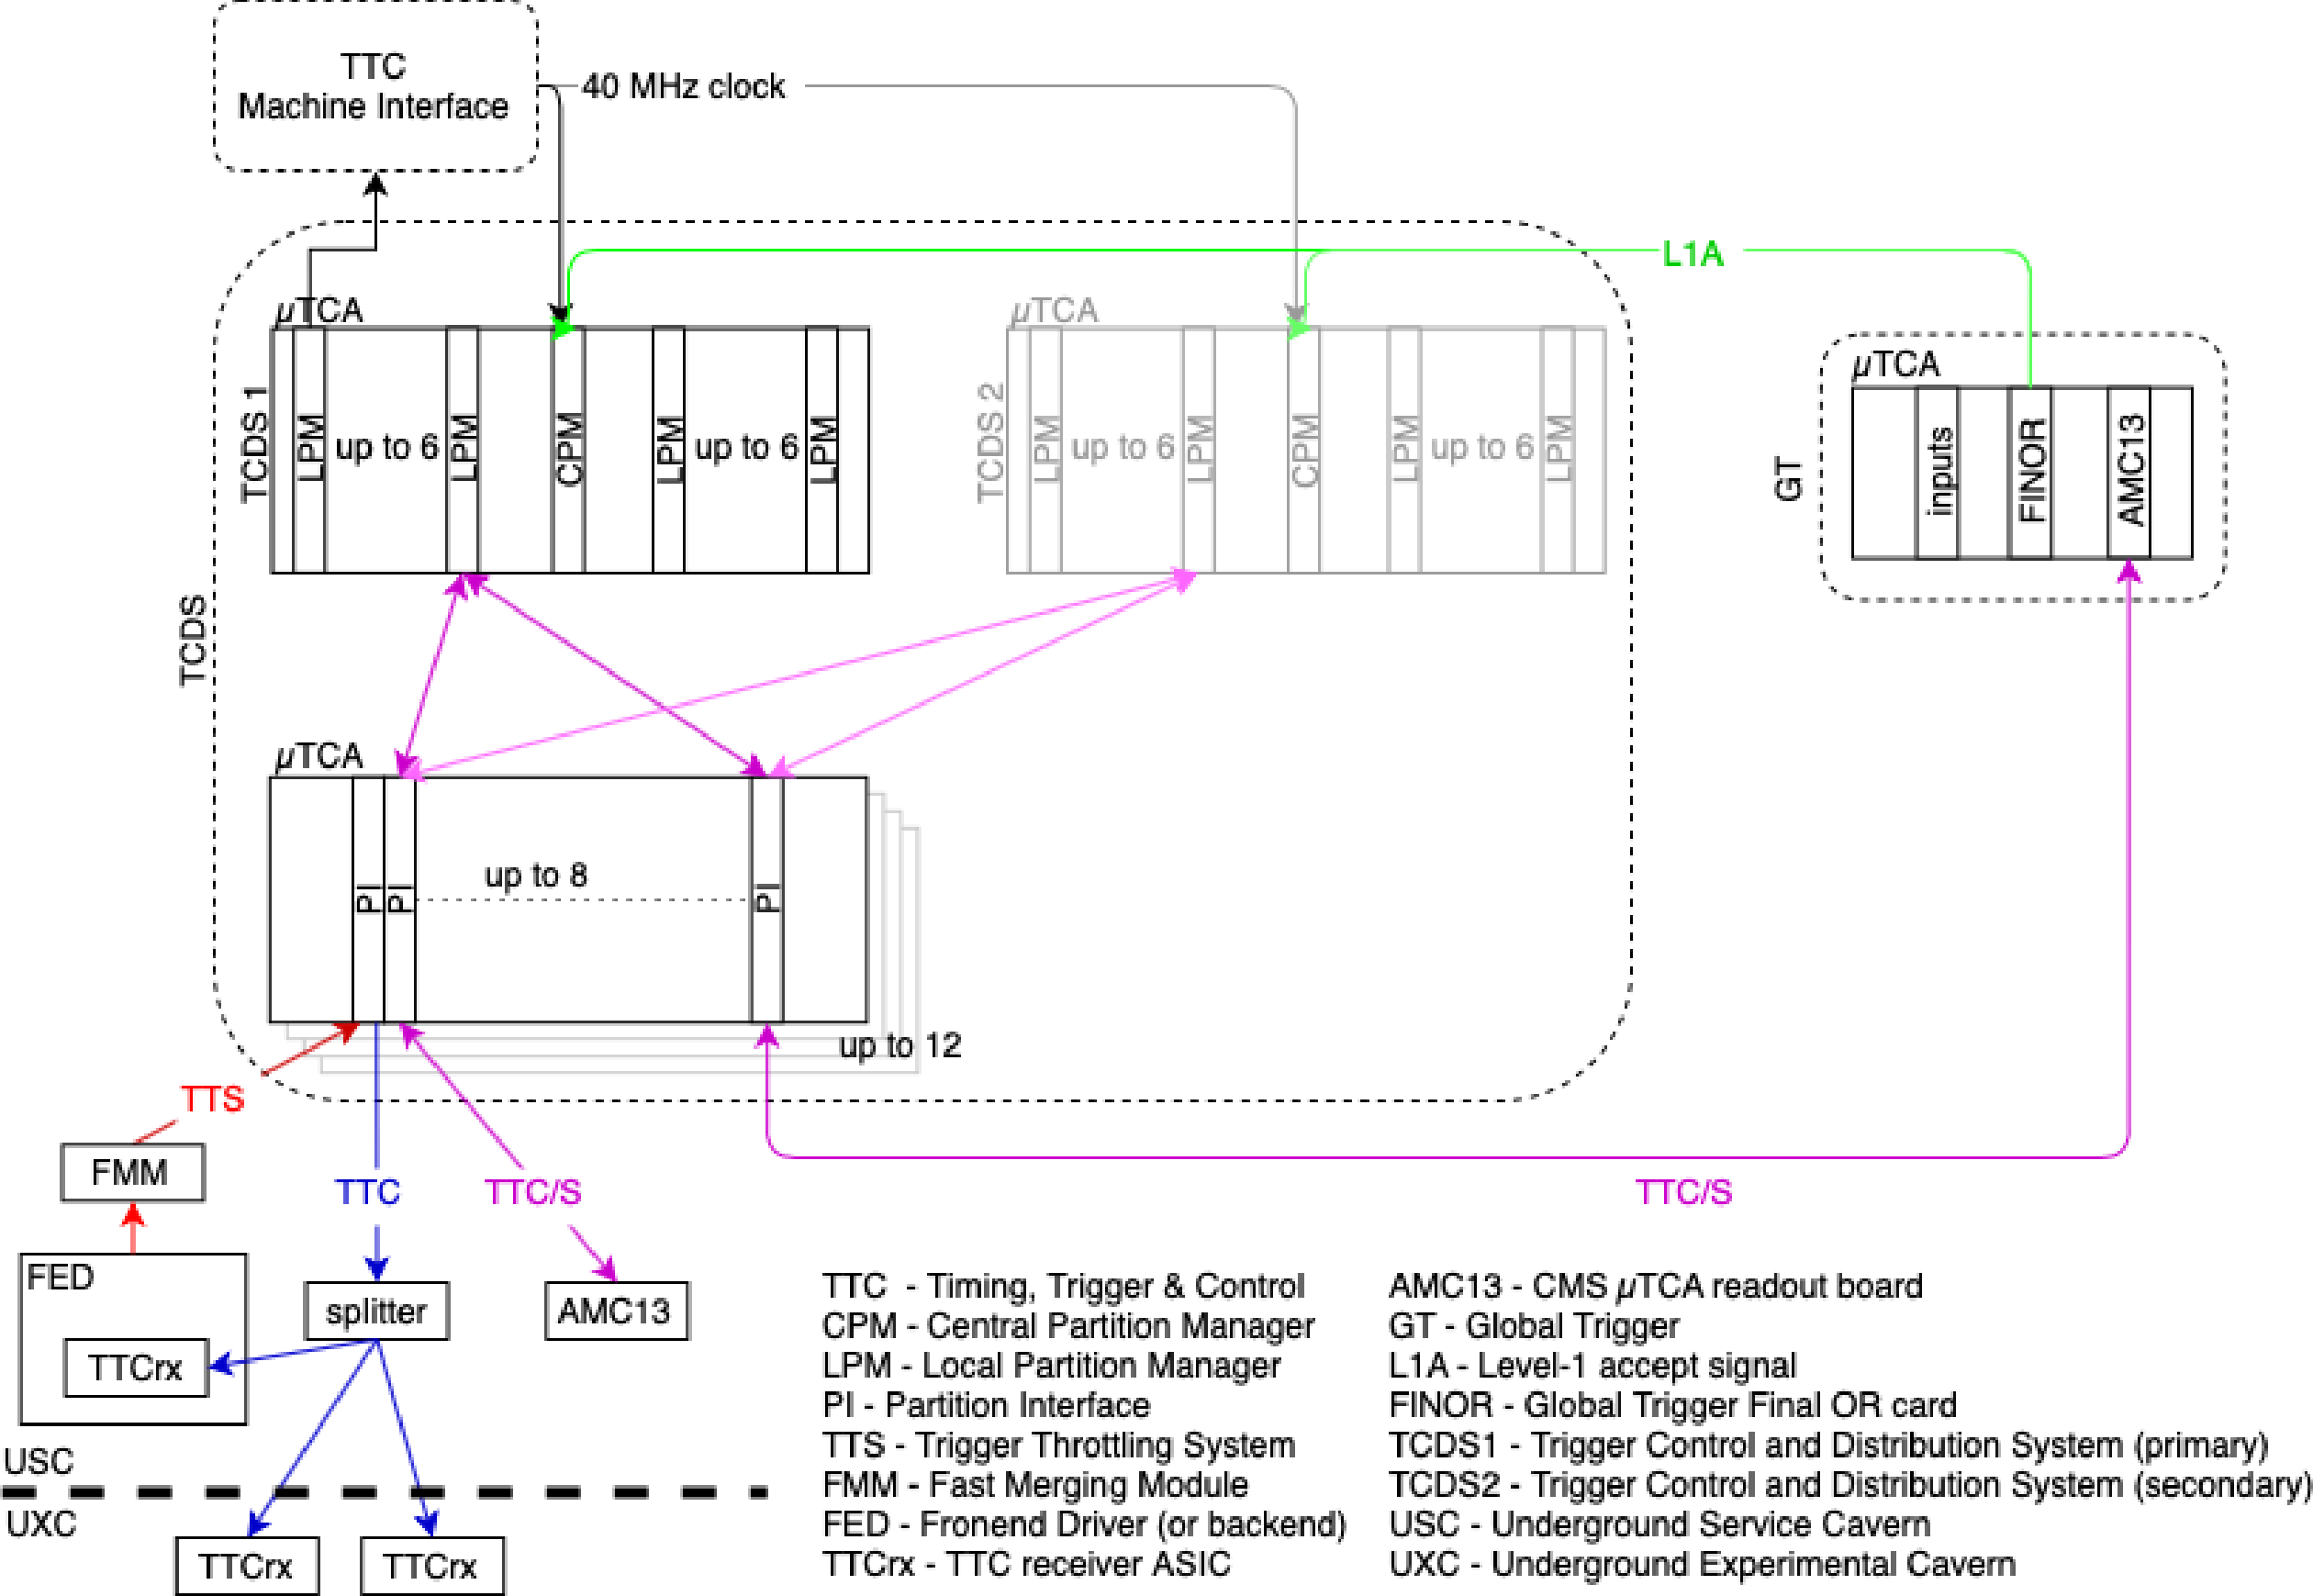
Overview of the CMS trigger control and distribution system (TCDS). |
png pdf |
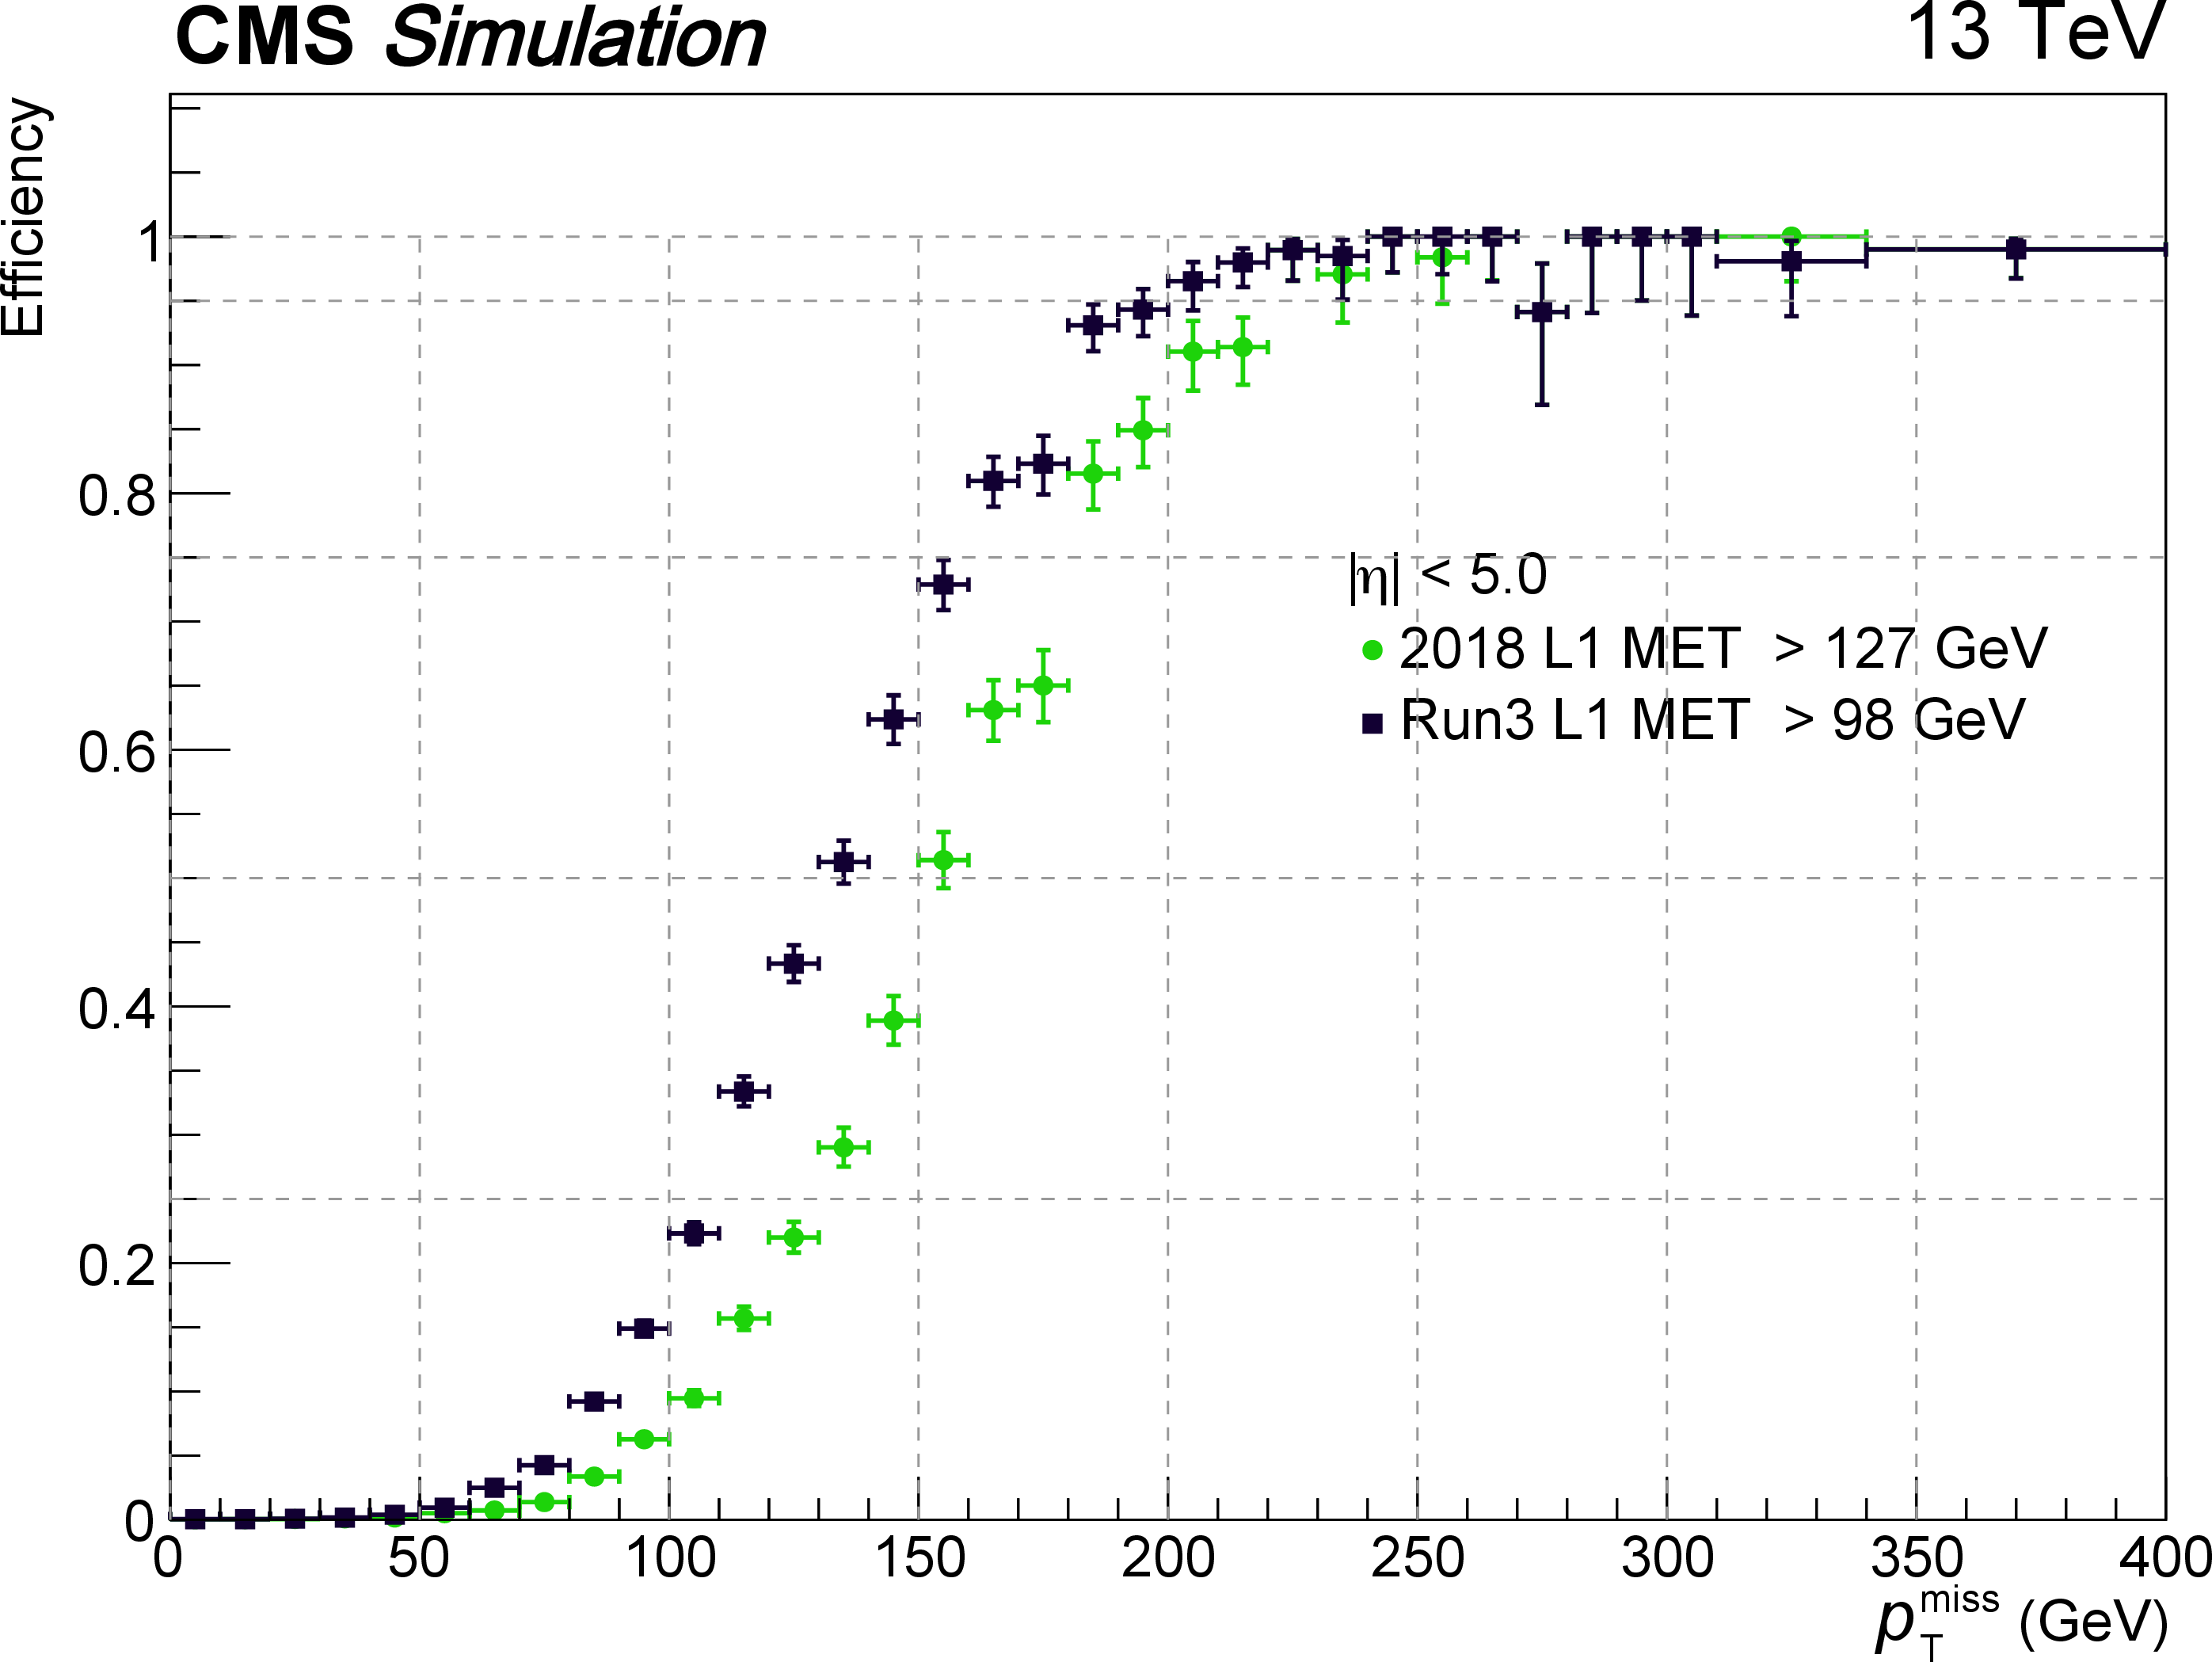
Figure 121:
Comparison of the L1 $ p_{\mathrm{T}}^\text{miss} $ trigger efficiency using pileup mitigation in 2018 (circles) and in Run 3 (squares) for thresholds that provide a rate of 4.3 kHz, for $ \mathrm{Z}\to\mu\mu $ events. |

png pdf |
Figure 122:
Displaced (blue) and prompt (black) kBMTF trigger efficiencies compared to the prompt BMTF (red) trigger efficiency with respect to the muon track $ d_{xy} $, obtained using a sample of cosmic ray muons from 2018 data. The efficiencies are measured using muon candidates with $ p_{\mathrm{T}} > $ 10 GeV. The prompt kBMTF improves BMTF efficiencies up to about 90% for up to 50 cm displacements, while displaced kBMTF retains efficiencies above 80% for up to 90 cm displacements. |
png pdf |
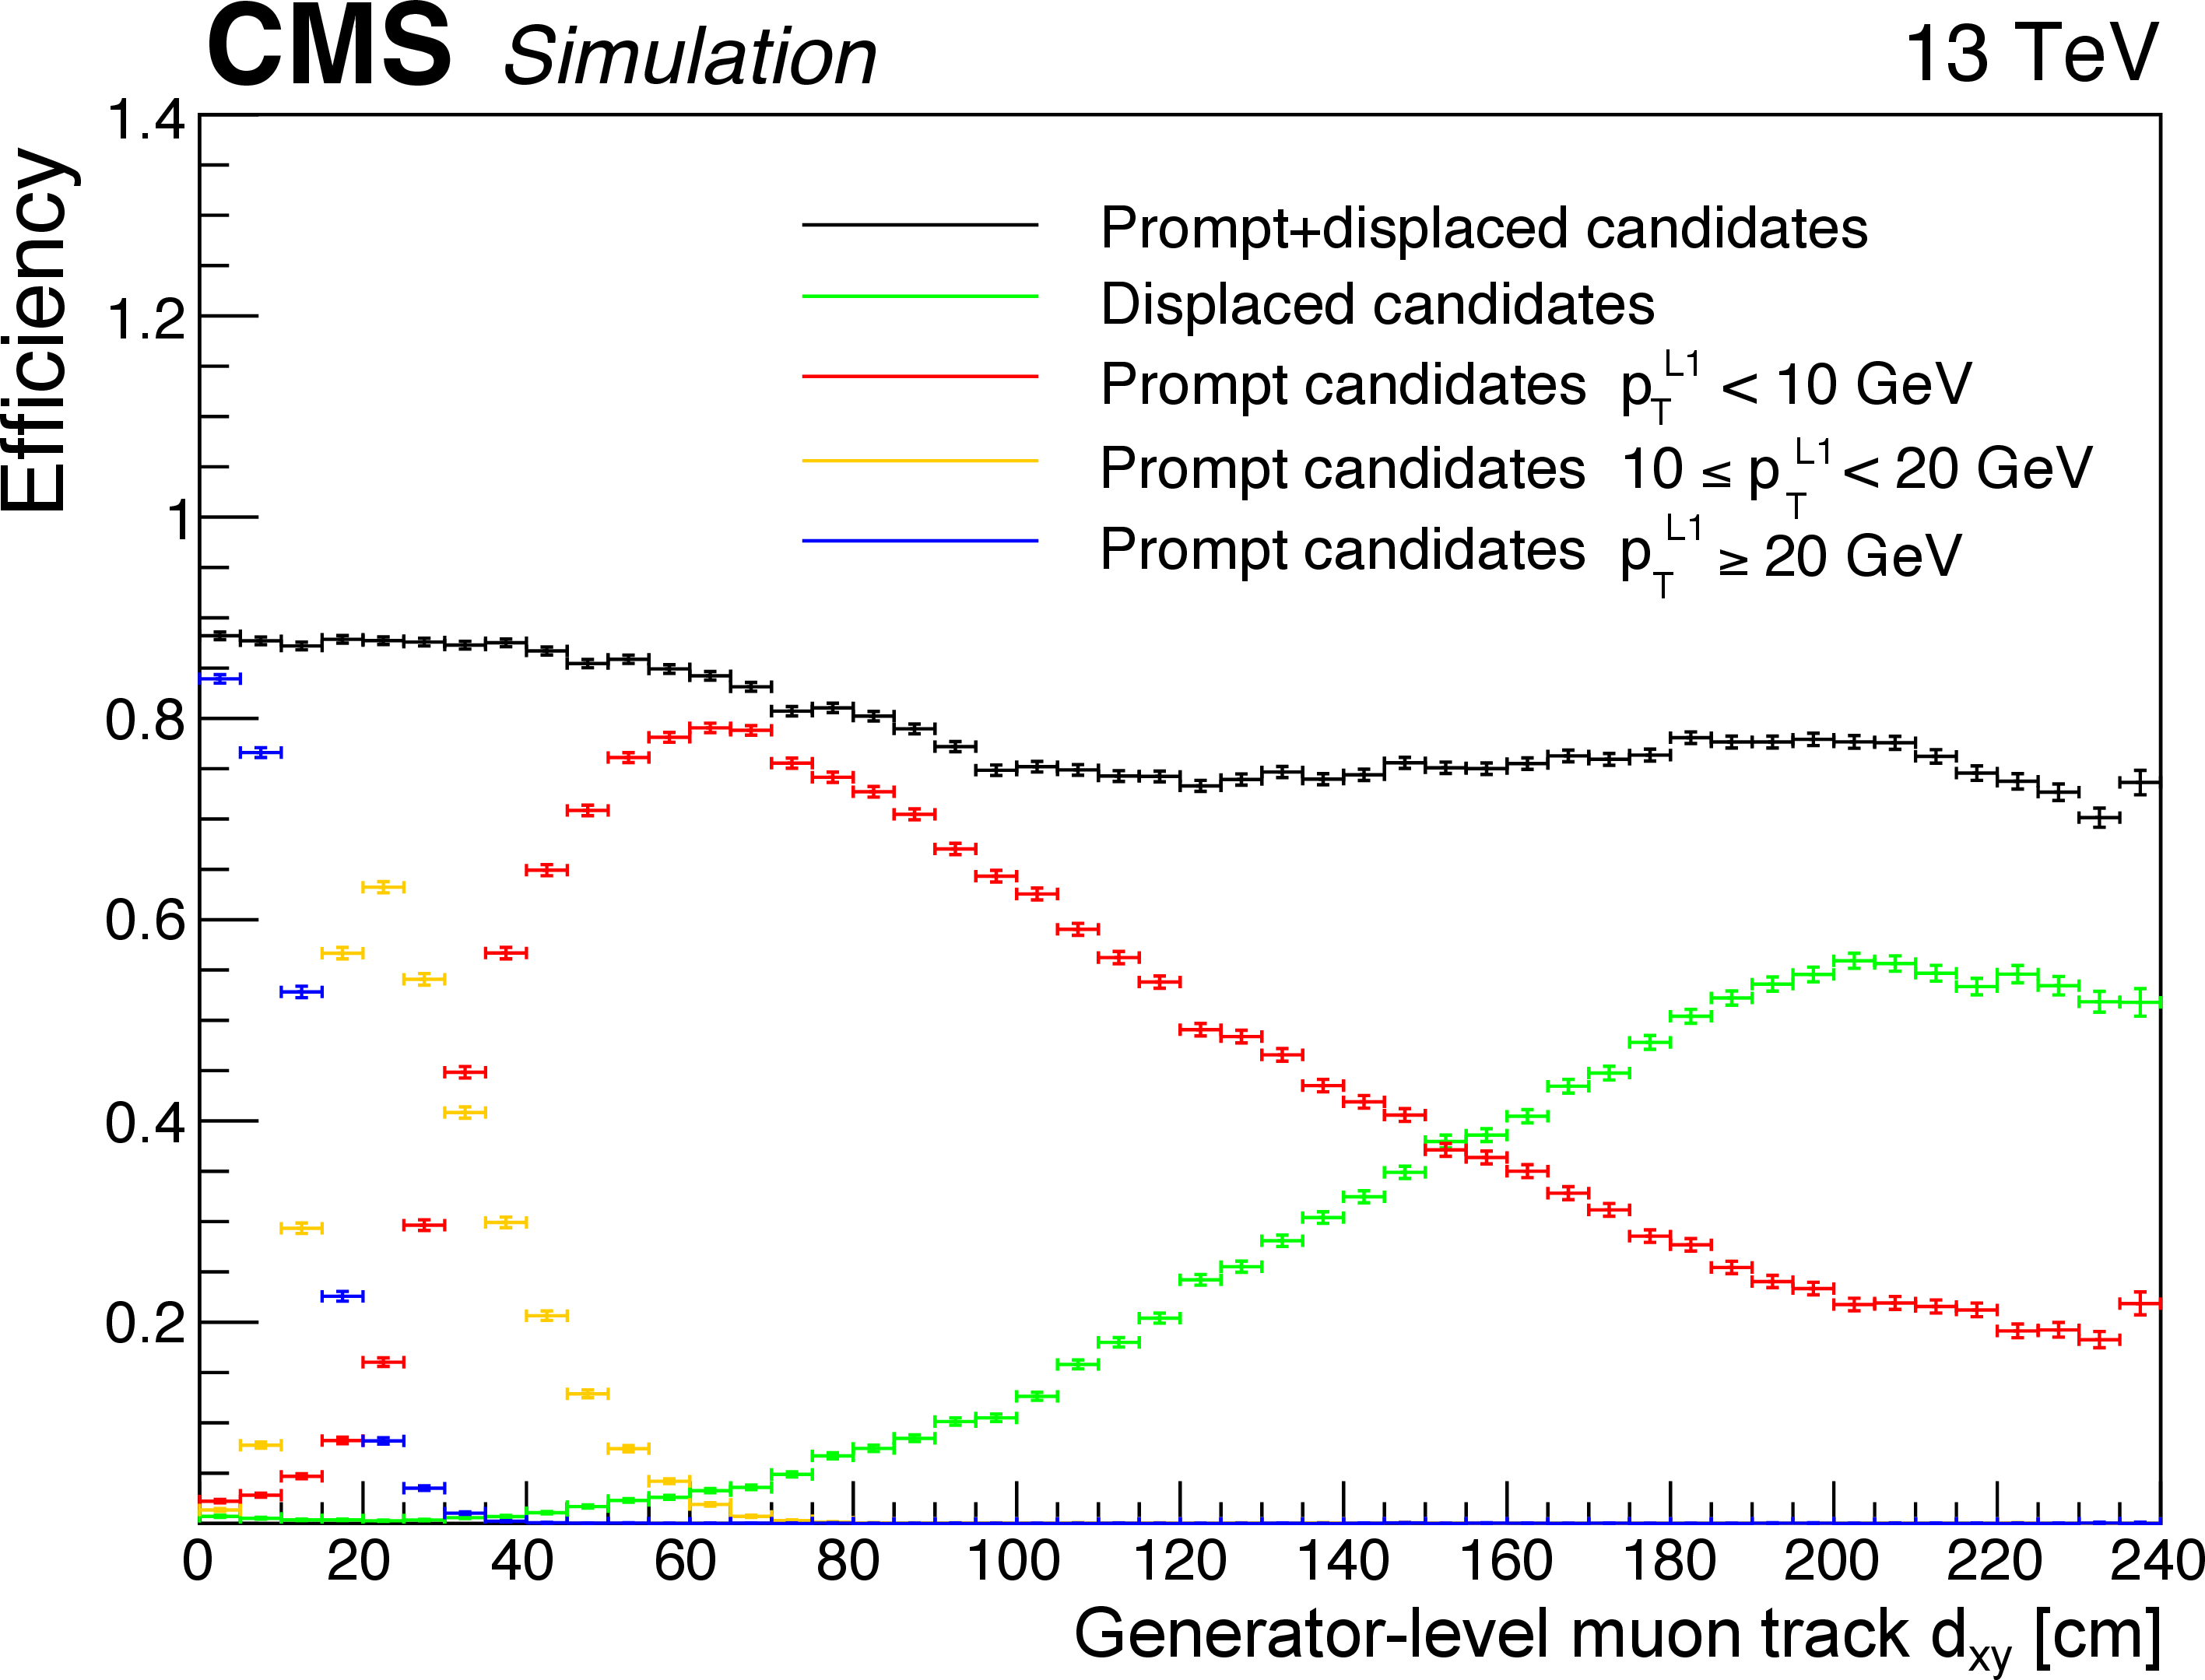
Figure 123:
The OMTF trigger efficiencies for displaced and prompt algorithms with respect to muon track $ d_{xy} $ obtained using a displaced-muon gun sample. The efficiency curves are plotted for different values of the $ p_{\mathrm{T}} $ estimate from the prompt algorithm (red, yellow, and blue), for the displaced algorithm (green), and for the combination (black). The prompt algorithm underestimates the $ p_{\mathrm{T}} $ of displaced tracks, causing most of the tracks to have $ p_{\mathrm{T}} < $ 10 GeV. The displaced algorithm can recover these tracks and improve the efficiencies to be around 80% for up to 200 cm displacements. |

png pdf |
Figure 124:
The EMTF trigger efficiencies for prompt and displaced-muon algorithms for L1 $ p_{\mathrm{T}} > $ 10 GeV with respect to muon track $ d_{xy} $ obtained using a displaced-muon gun sample. The solid stars show displaced NN performance while hollow squares show the prompt BDT performance. The different colors show different $ \eta $ regions: 1.2 $ < |\eta| < $ 1.6 (black), 1.6 $ < |\eta| < $ 2.1 (red), and 2.1 $ < |\eta| < $ 2.5 (blue). |

png pdf jpg |
Figure 125:
Production (upper) and the new test crate (lower) of the $ \mu $GT. |

png pdf |
Figure 126:
Fractions of the 100 kHz rate allocation for single- and multi-object triggers and cross triggers in the baseline Run 3 menu, calculated using Run 3 Monte Carlo simulation samples of inclusive pp events with appropriate pileup. |
png pdf |
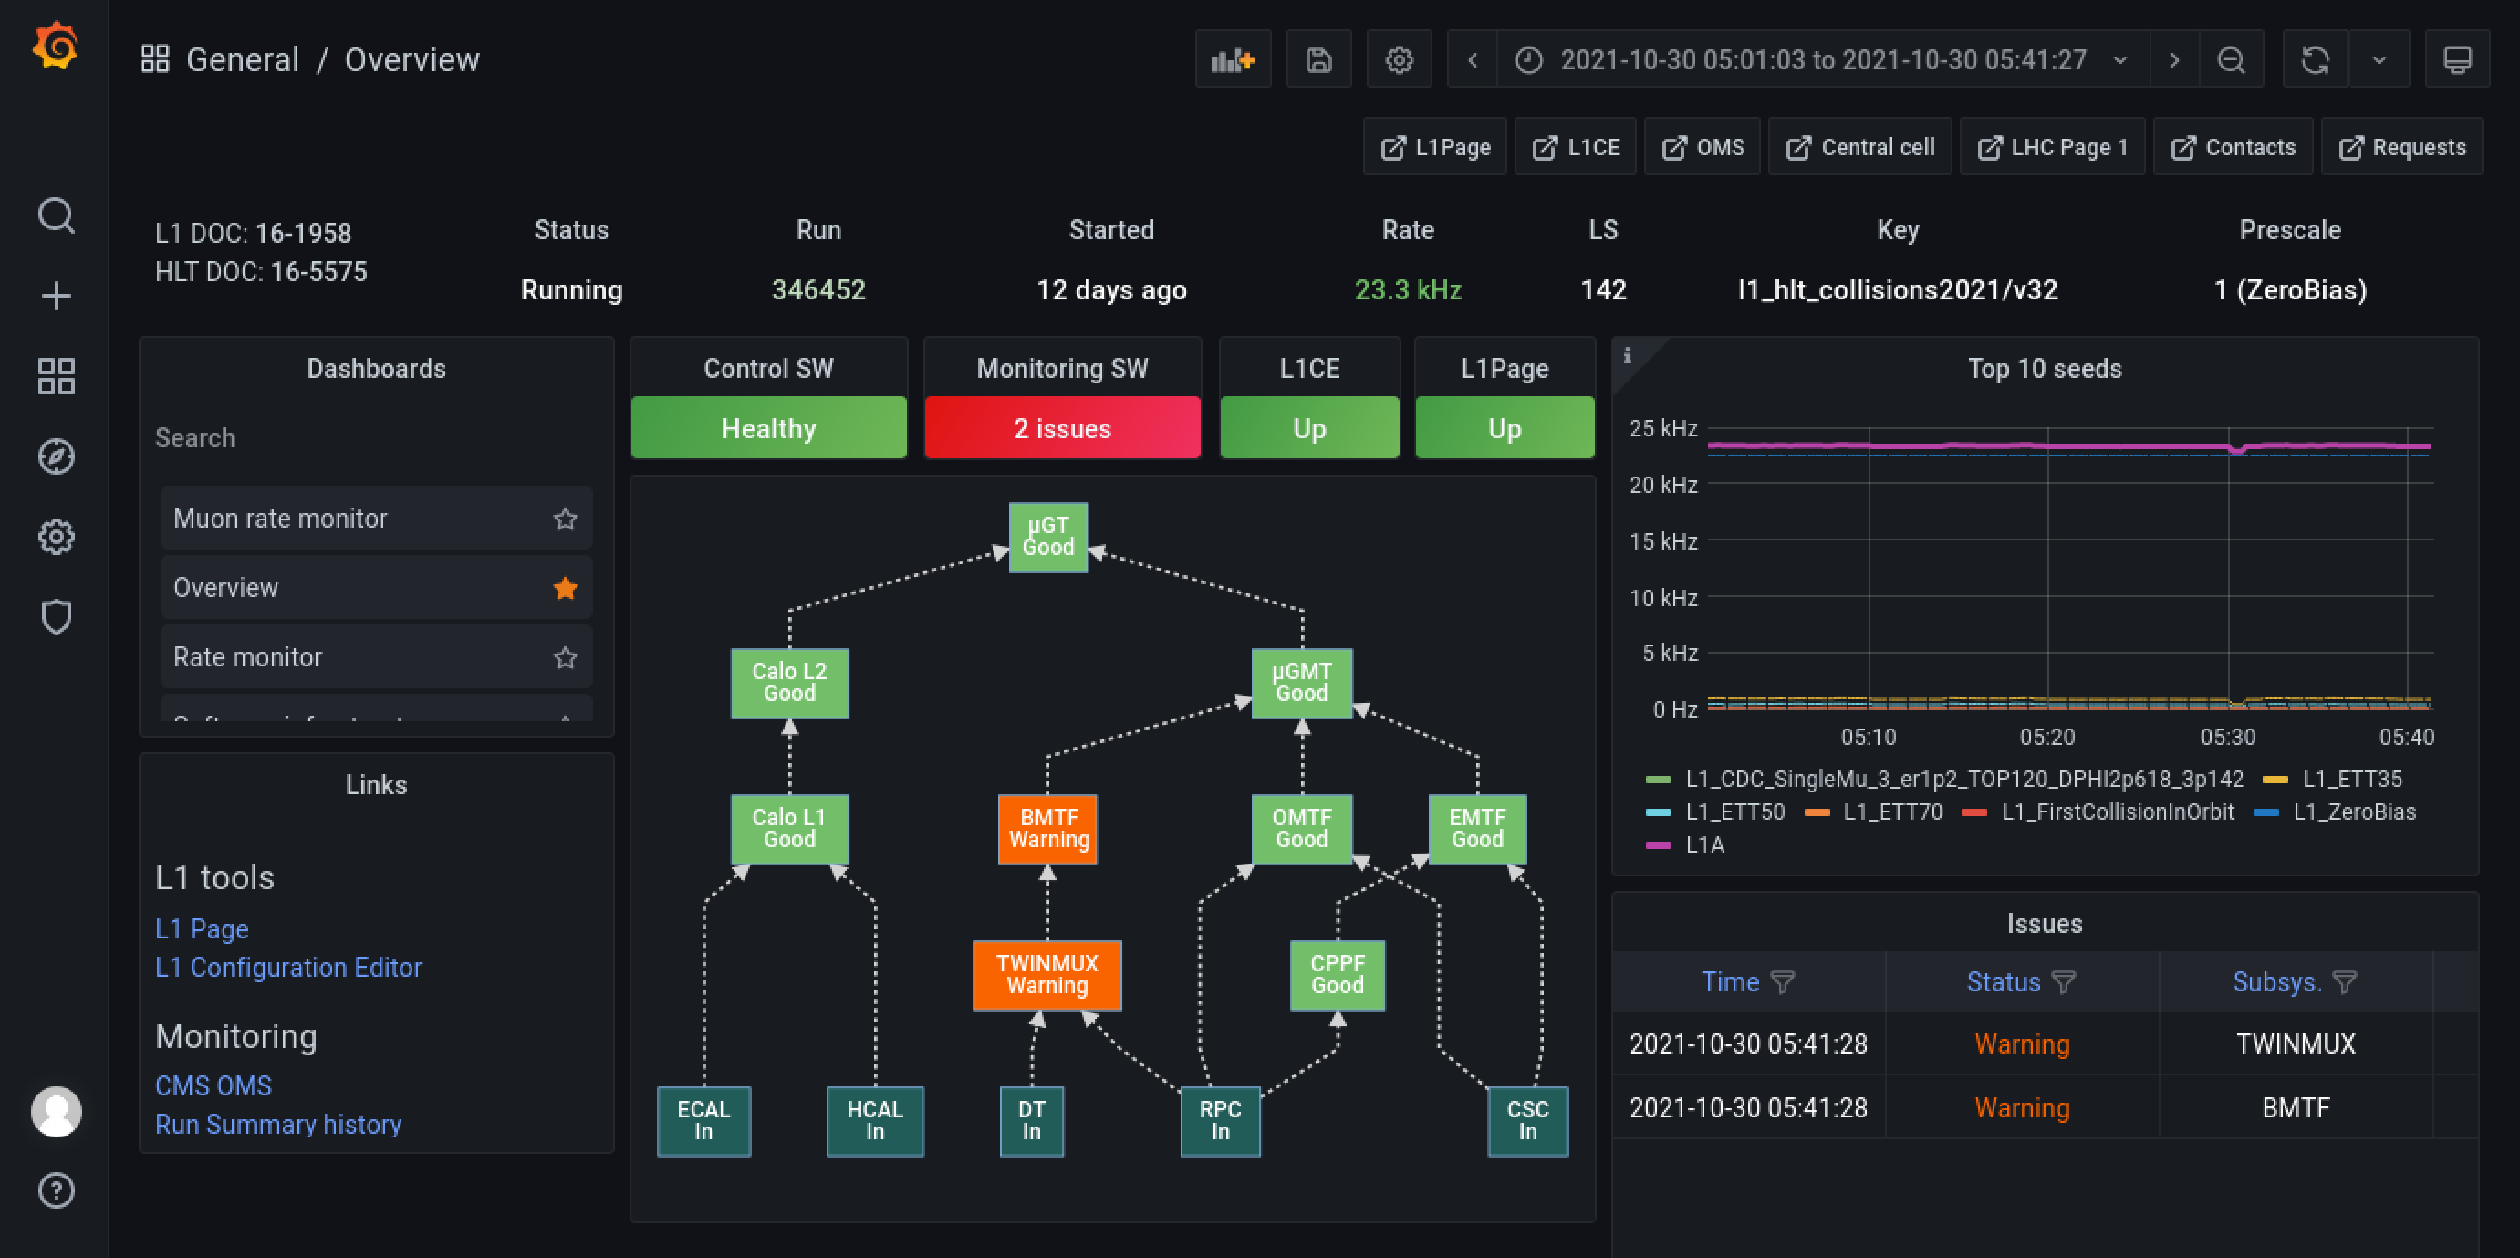
Figure 127:
Screenshot of the Grafana L1 trigger monitoring dashboard. |

png pdf |
Figure 128:
Architecture of the Run 3 L1 scouting prototype system. The input system, located in the experiment service cavern, consists of a combination of different types of FPGA receiver boards, hosted in the PCIe bus of I/O server nodes or extender. The boards receive and pre-process data from the different trigger systems. Two of the boards (KCU1500 and SB852) use DMA to move their data to host memory, from where they are transmitted to the surface data center over 100 Gb/s Ethernet links. The VCU128 implements a TCP/IP core in the FPGA and directly trasmits data to the surface system. In the surface data center, links from the L1 scouting input system are connected to a switched network. Data streams are received through the said network by L1 scouting buffer servers (DSBU) and buffered in files on large RAMdisks. The L1 scouting processing units (DSPU) access buffered data from the DSBUs to perform data reduction and analysis. The processed data are finally moved to a Lustre cluster file system for long-term storage. |
png pdf |
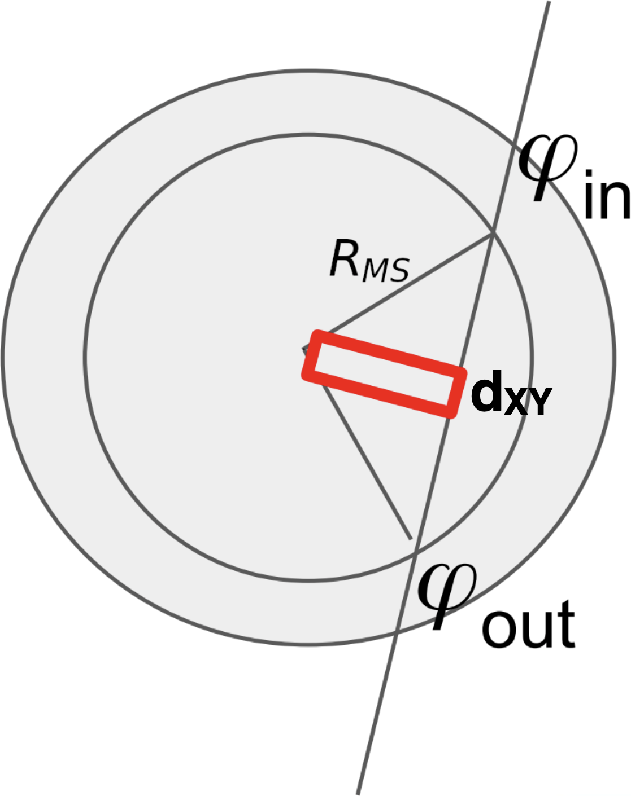
Figure 129:
Illustration of the correlation between the impact parameter $ d_{xy} $, highlighted in red, and the difference between the angles measured for the incoming and outgoing legs of a cosmic muon. |
png pdf |
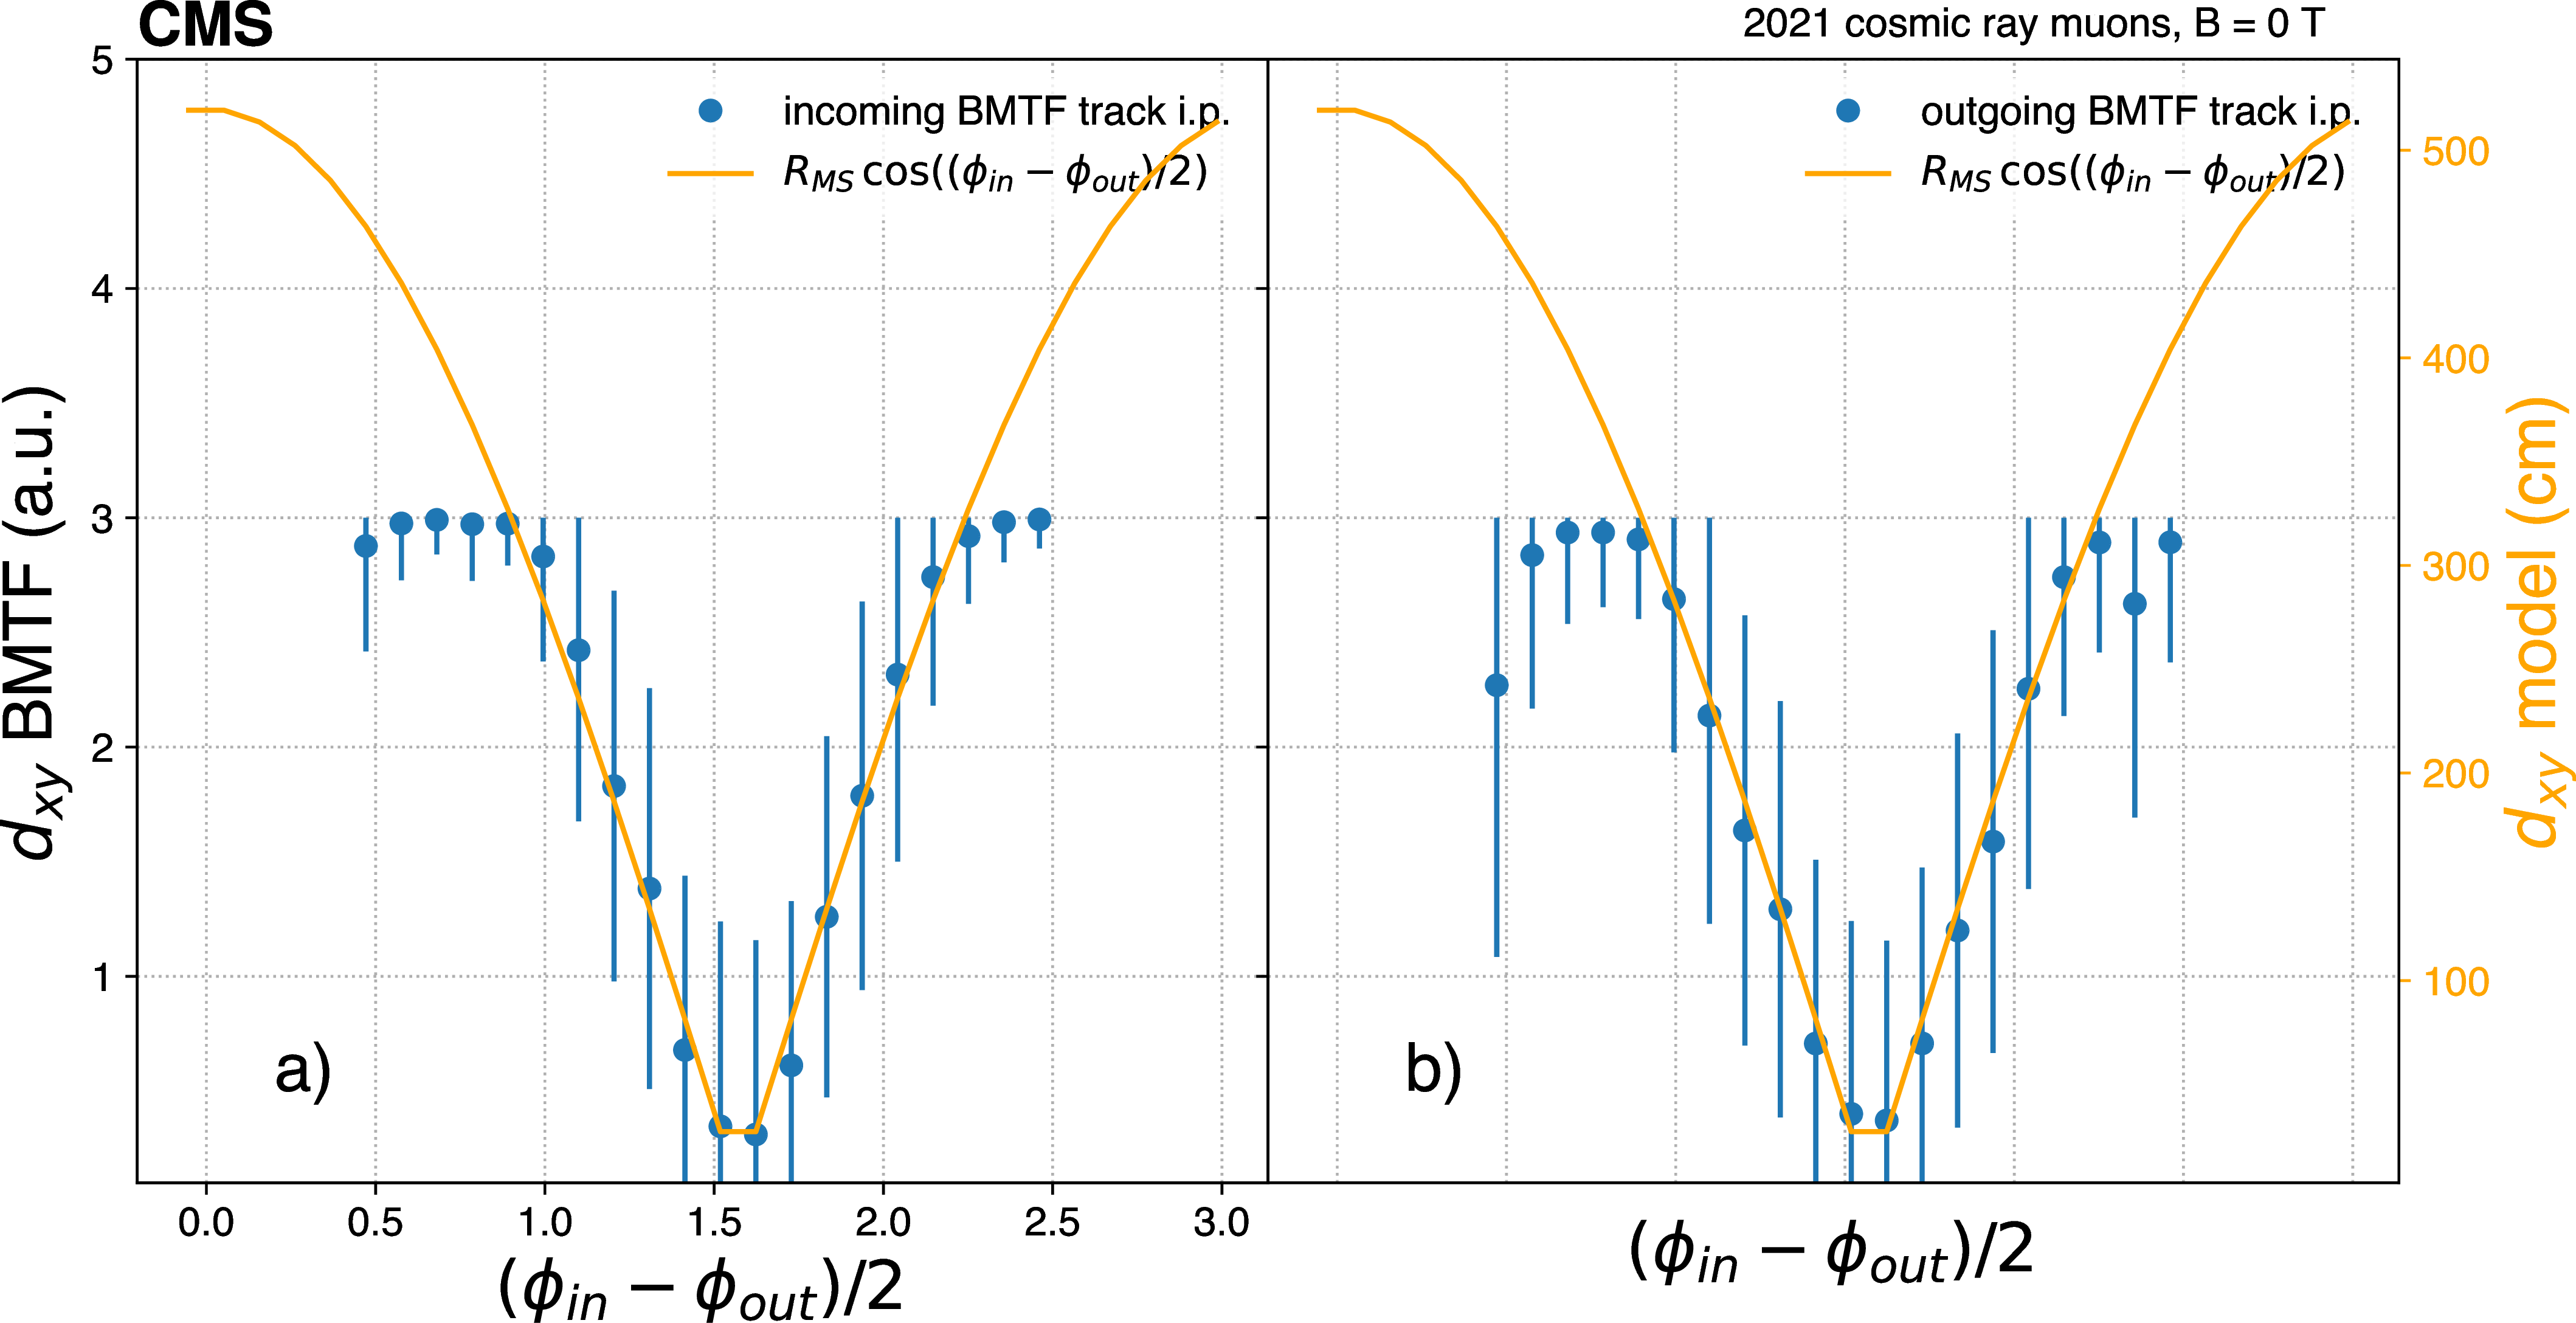
Figure 130:
The impact parameter $ d_{xy} $ of the incoming (left) and outgoing (right) cosmic ray muon tracks as measured by the BMTF as a function of the difference of azimuthal coordinates of the incoming and outgoing legs. The BMTF firmware encodes the impact parameter in two bits, hence the range of values on the left $ y $ axis. The orange curves model this dependence of the actual impact parameter as $ R_{MS}\cos{(\phi_{in}-\phi_{out})/2} $, where $ R_{MS} $ is the radius at which the BMTF measures the $ \phi $ coordinate of the track. The right hand side $ y $ axis shows the $ d_{xy} $ values (in cm) as predicted by this model, which exhibits remarkable consistency with the measurement (for the values within the range), if one assumes one unit of the left axis to correspond to an impact parameter of about 100 cm. |
png pdf |
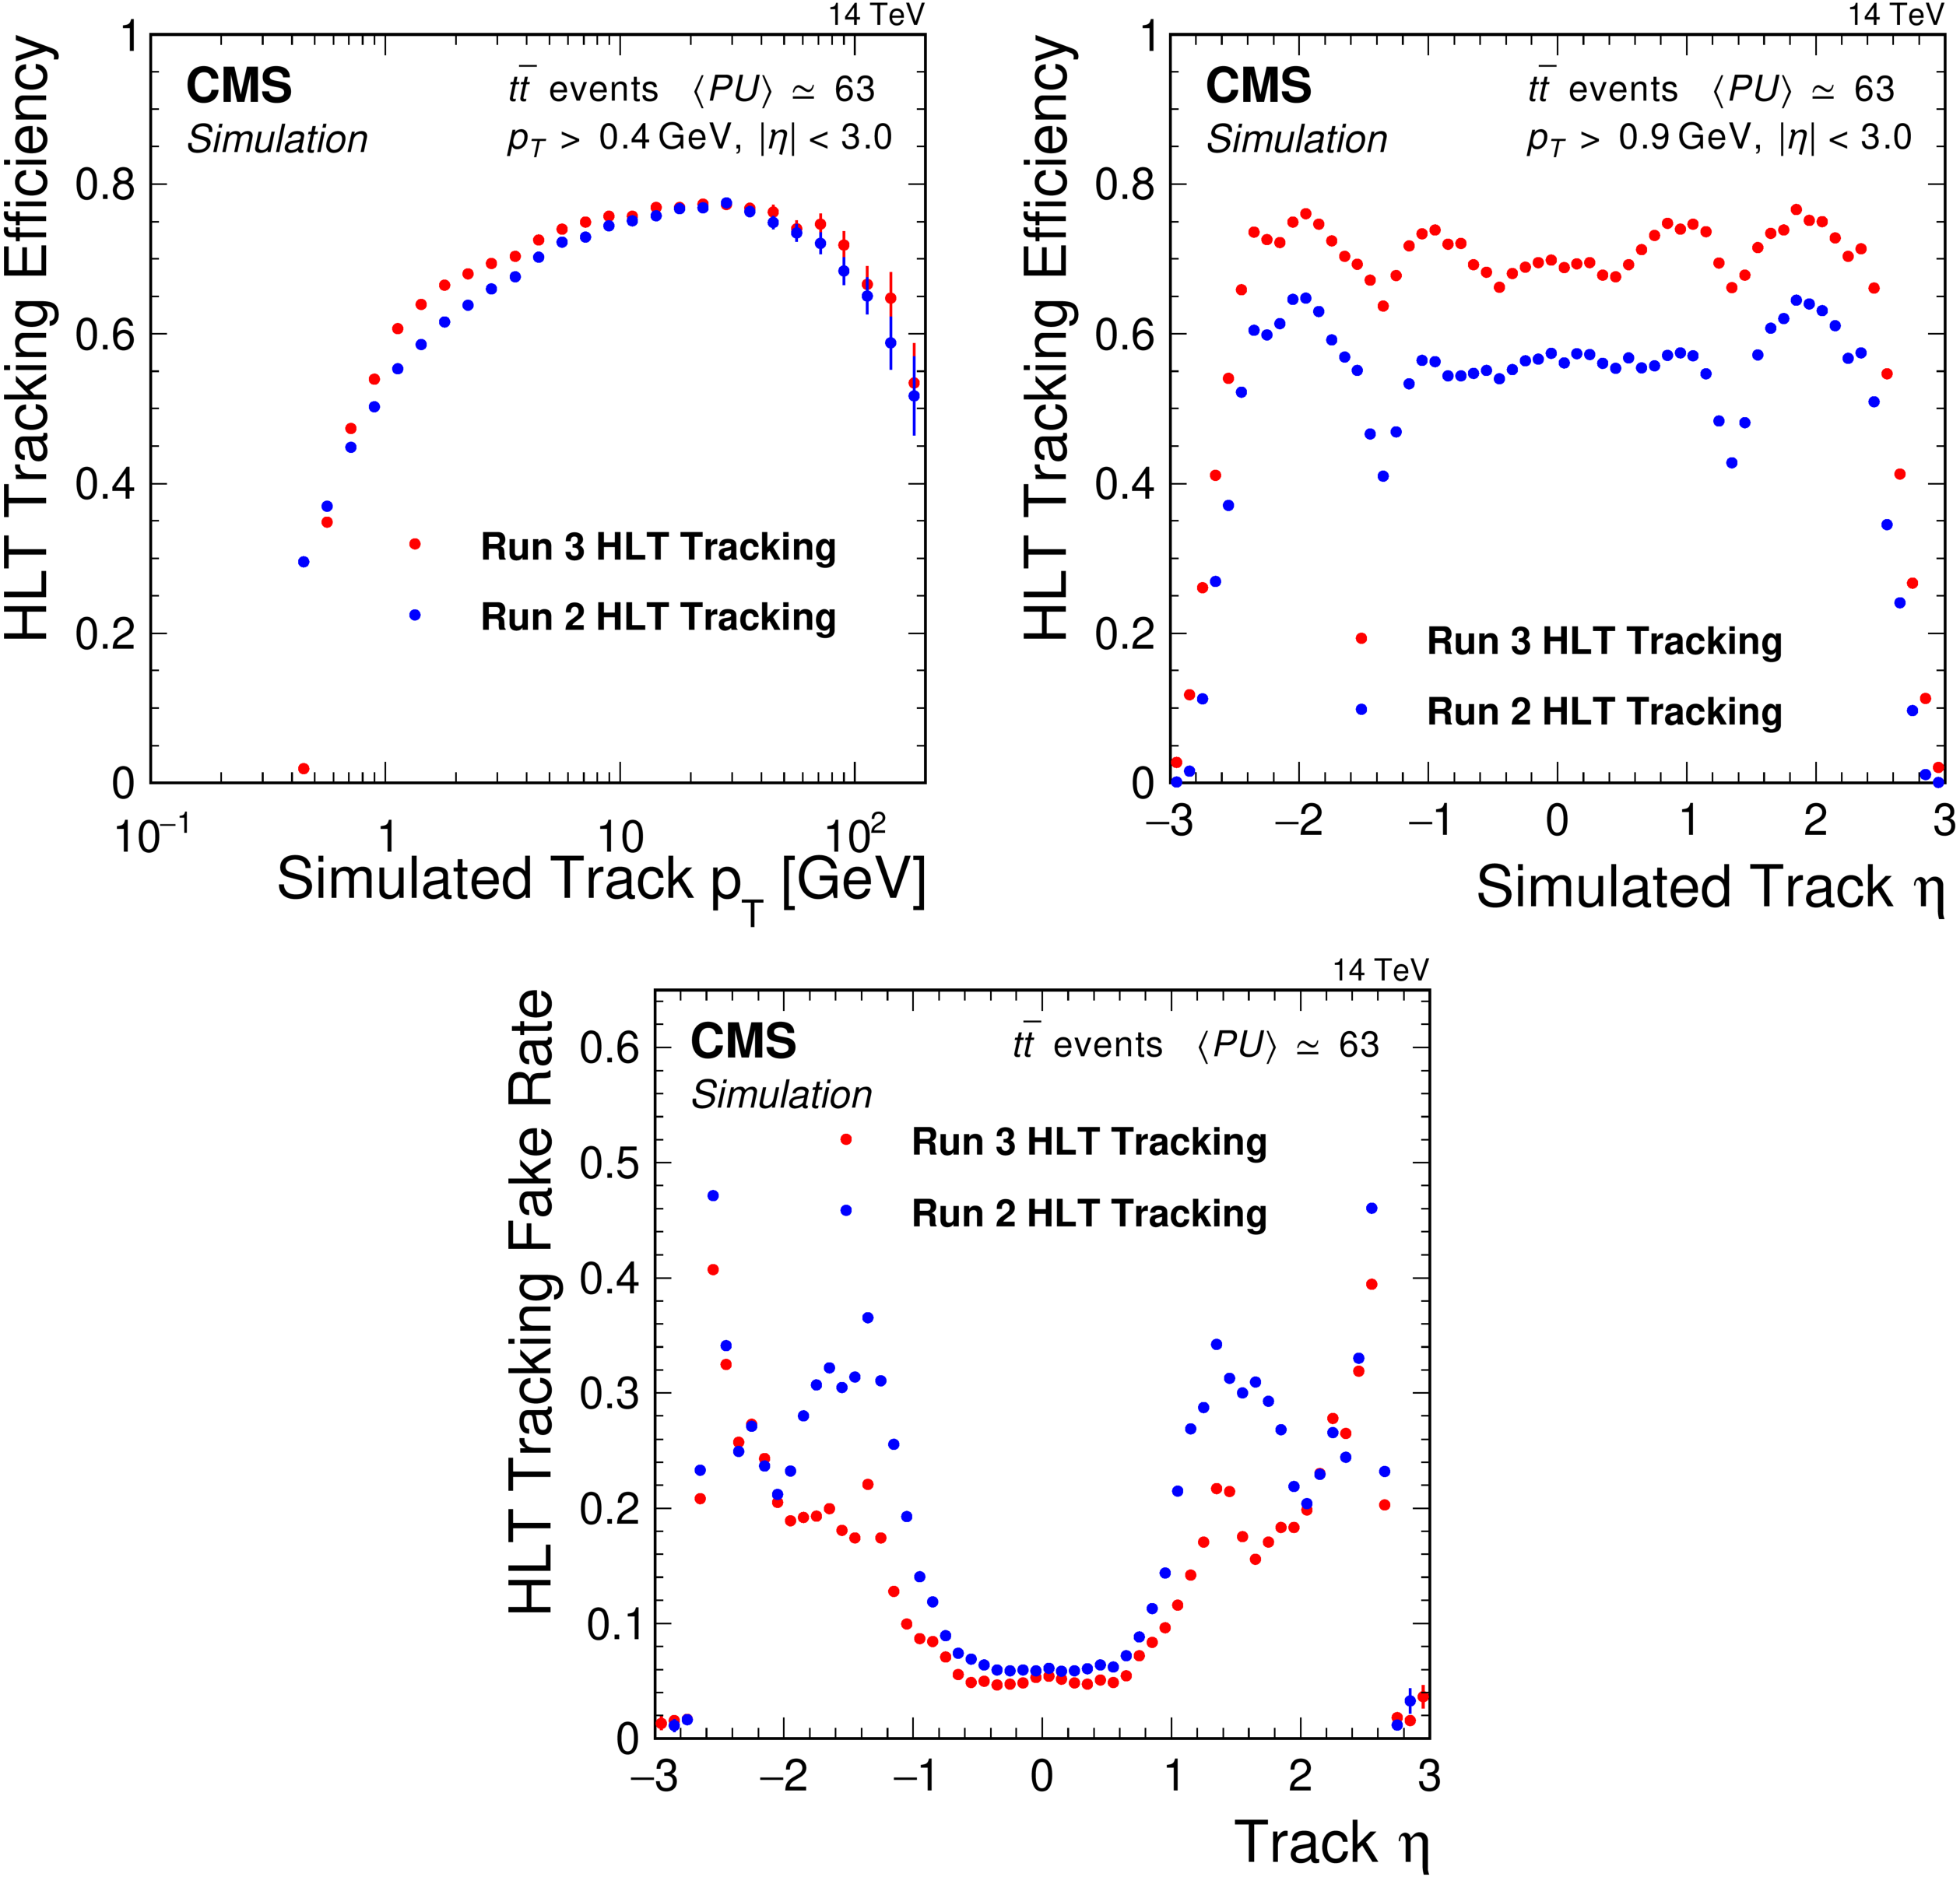
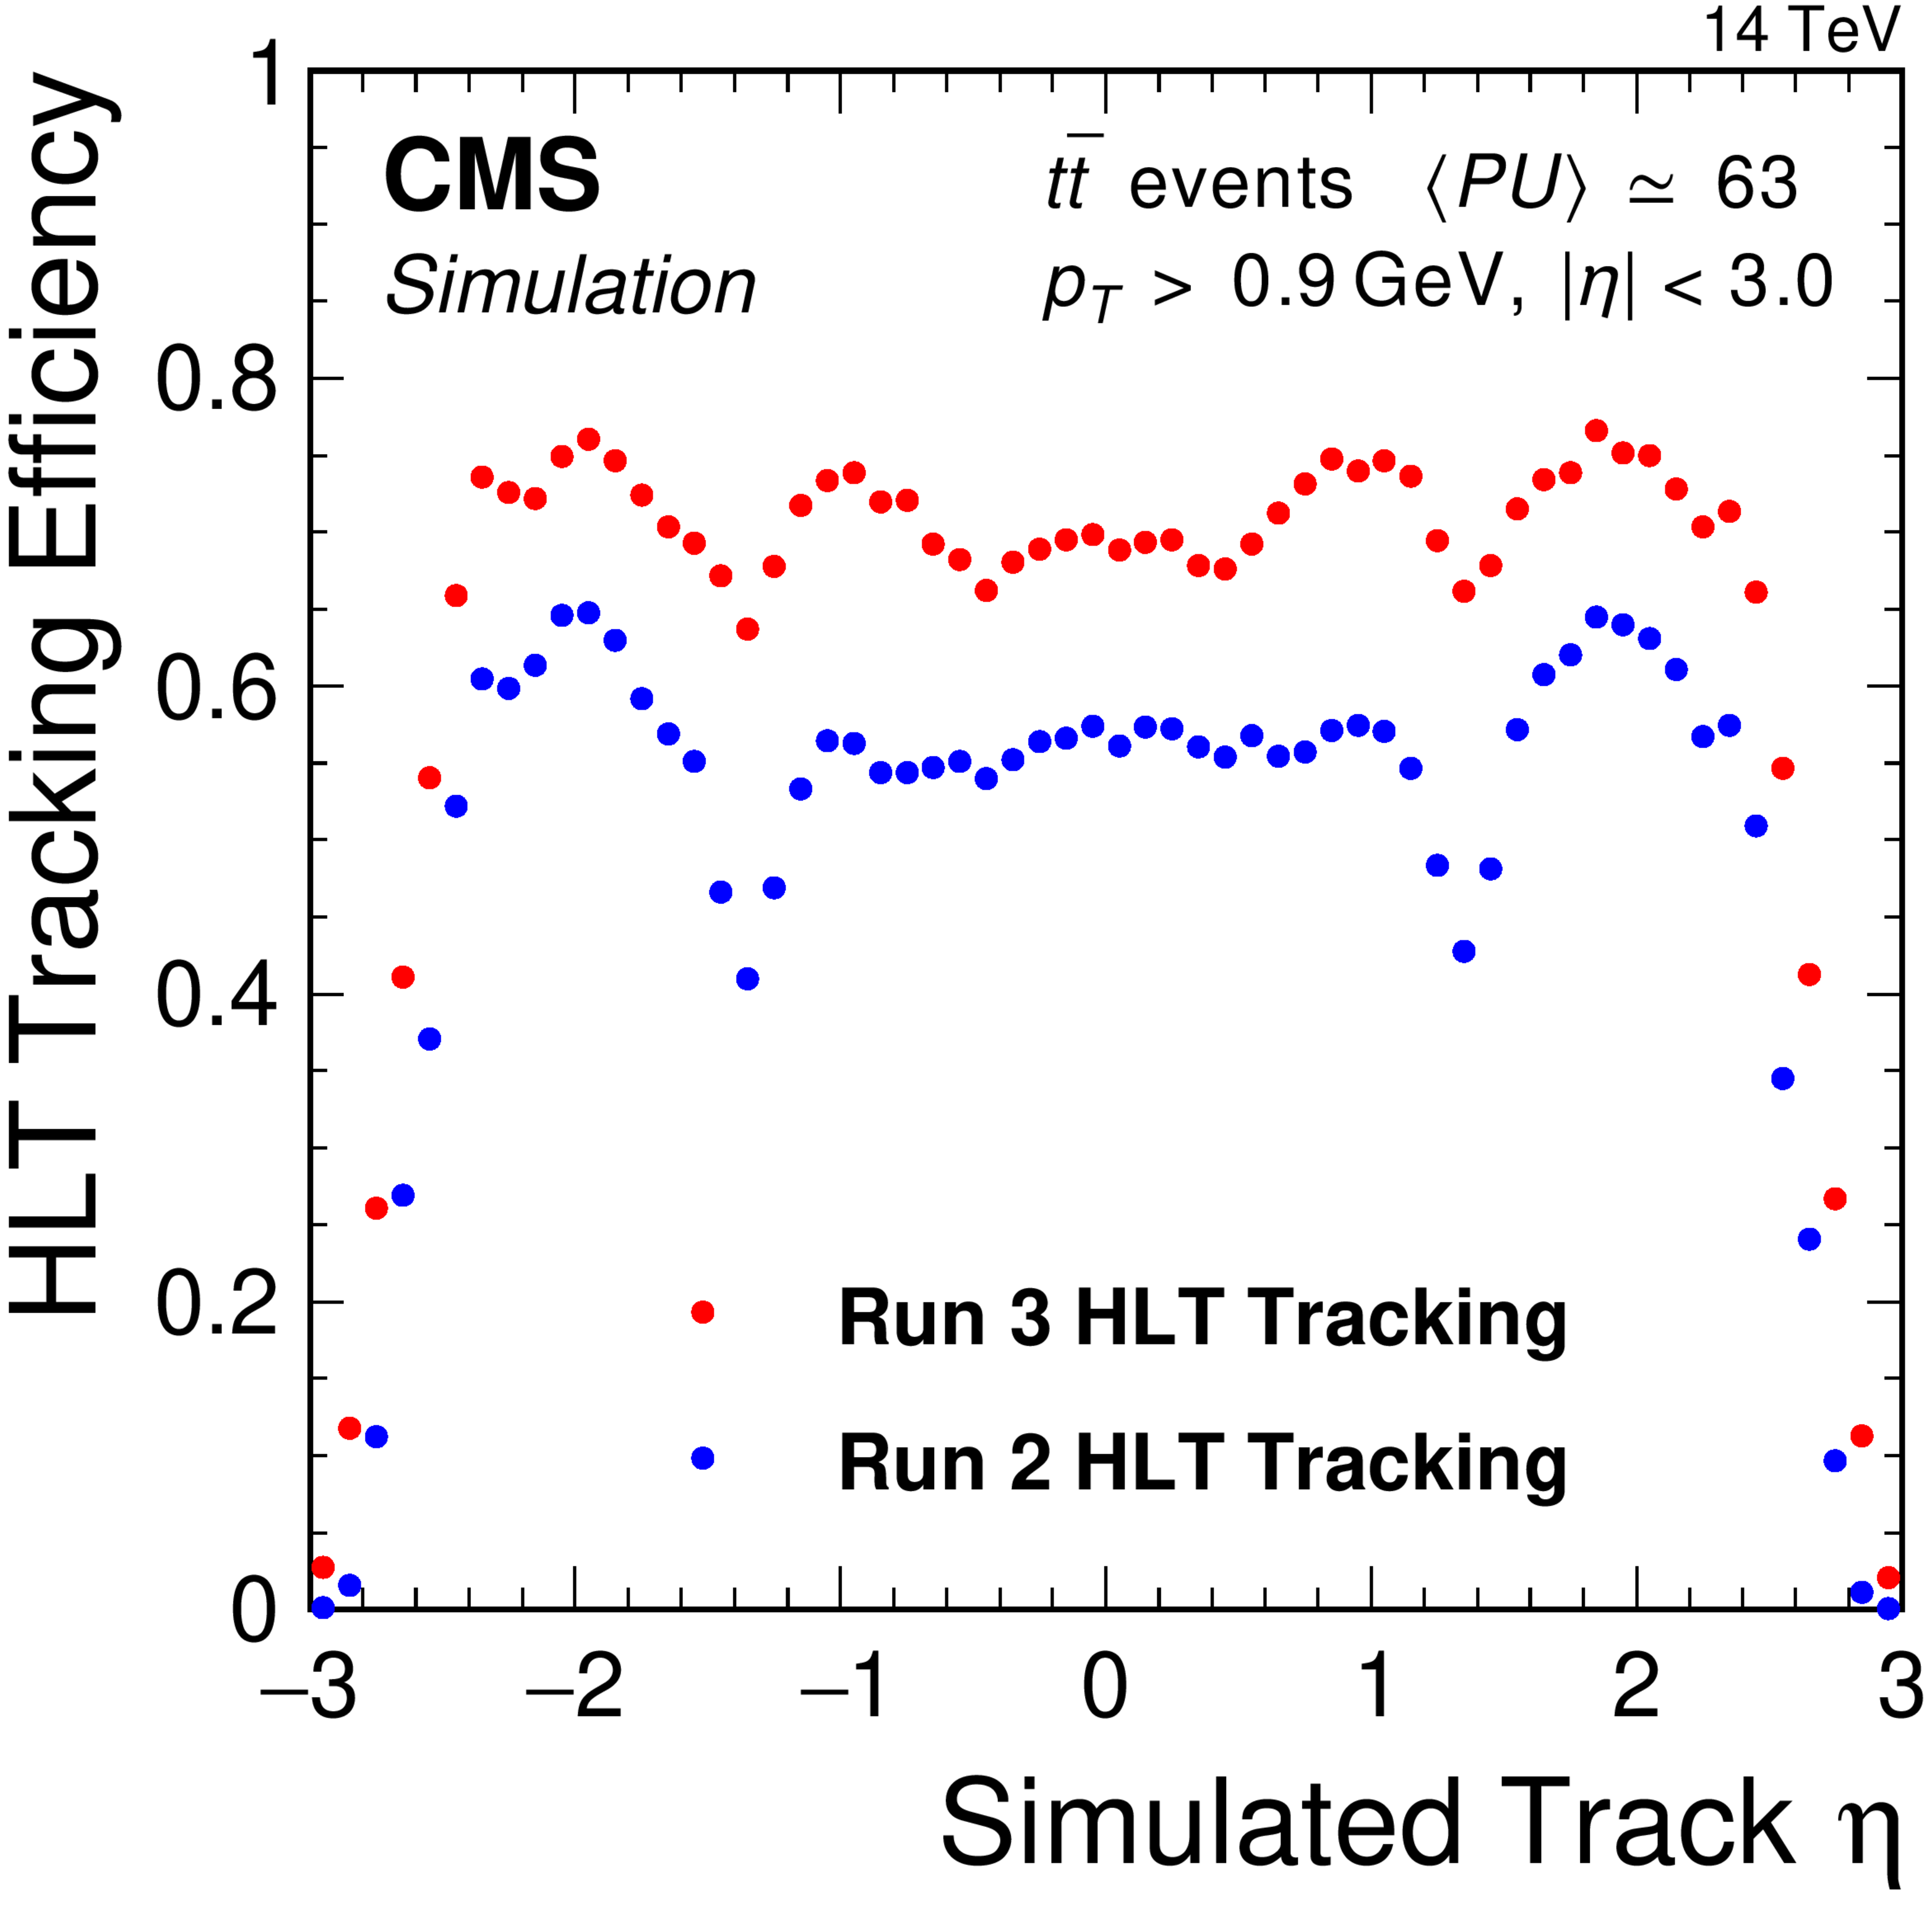
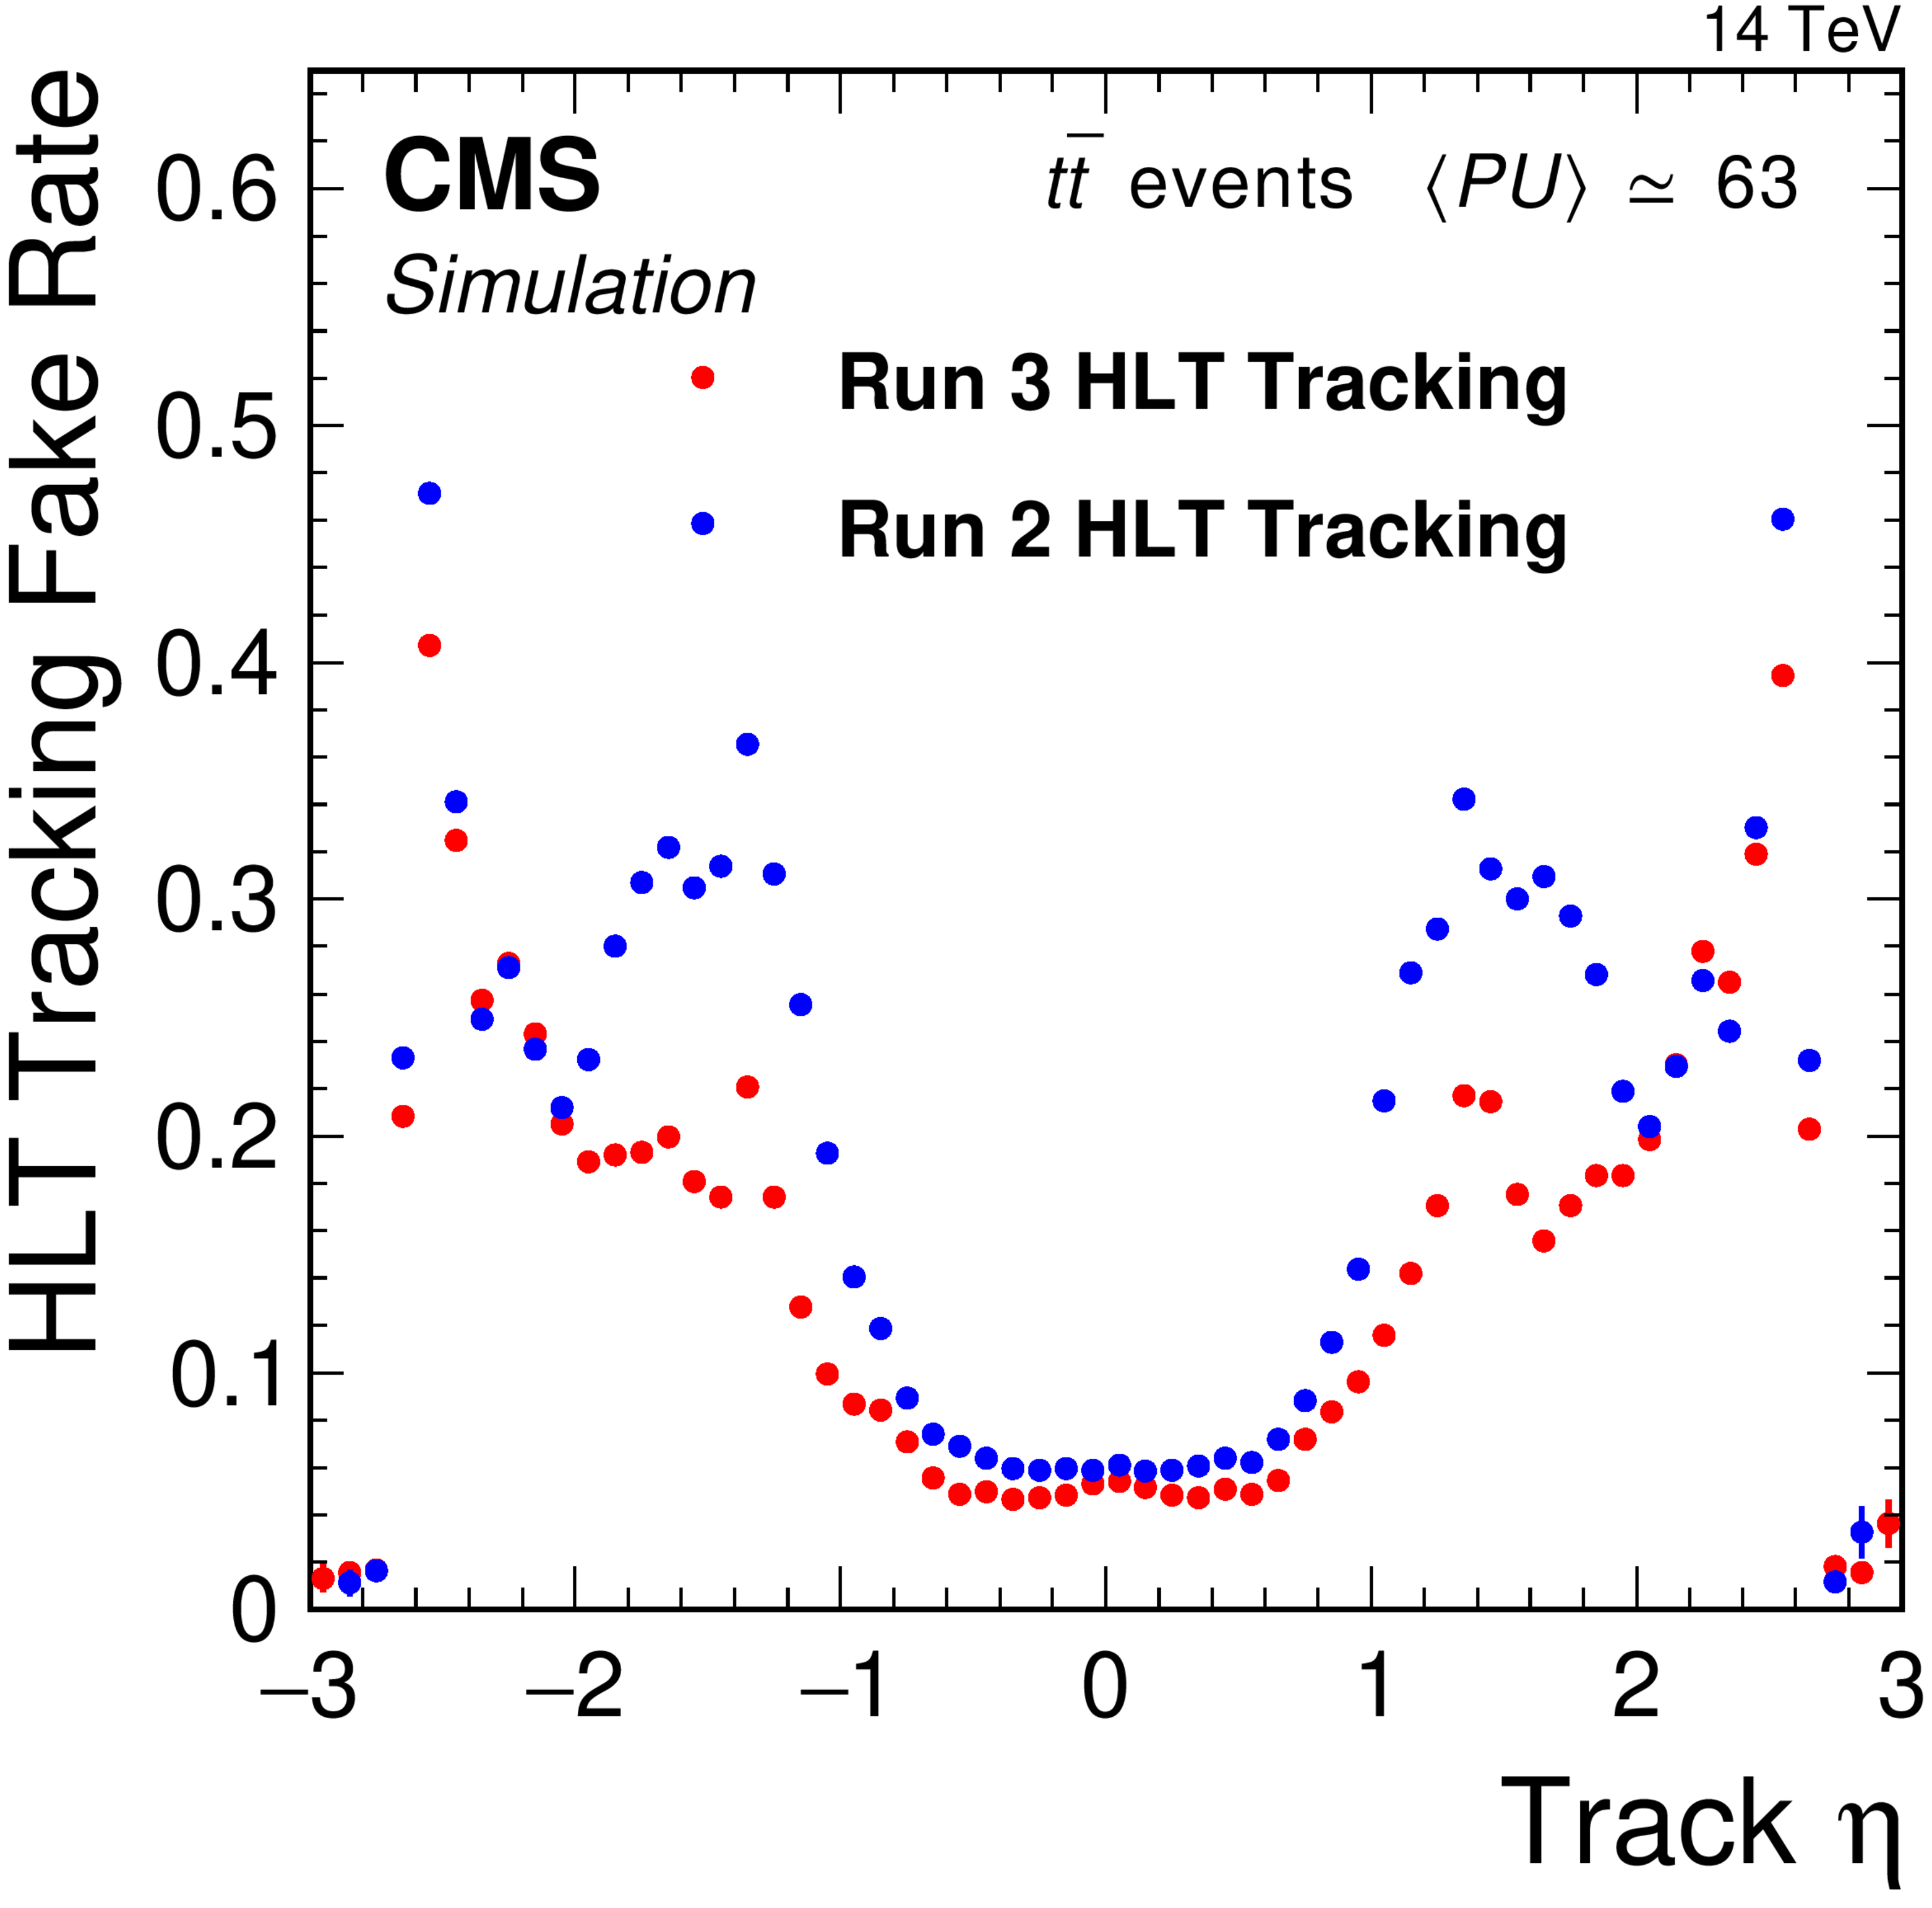
Figure 131:
Tracking efficiency for the Run 2 HLT tracking (blue) and the Run 3 HLT single-iteration tracking (red) as a function of the simulated track $ p_{\mathrm{T}} $ (upper left) and track $ \eta $ (upper right). Only simulated tracks with $ |\eta| < $ 3.0 are considered in the efficiency measurement, with $ p_{\mathrm{T}} > $ 0.4 (0.9) GeV required for the upper left (right) plots. The tracking fake rate (lower) is shown as a function of the reconstructed track $ \eta $ for the Run 2 HLT tracking (blue) and the Run 3 HLT single-iteration tracking (red). |

png pdf |
Figure 131-a:
Tracking efficiency for the Run 2 HLT tracking (blue) and the Run 3 HLT single-iteration tracking (red) as a function of the simulated track $ p_{\mathrm{T}} $. $ \eta $. Only simulated tracks with $ |\eta| < $ 3.0 are considered in the efficiency measurement, with $ p_{\mathrm{T}} > $ 0.4 0.9 GeV required. |
png pdf |
Figure 131-b:
Tracking efficiency for the Run 2 HLT tracking (blue) and the Run 3 HLT single-iteration tracking (red) as a function of the simulated track $ p_{\mathrm{T}} $ (upper left) and track $ \eta $ (upper right). Only simulated tracks with $ |\eta| < $ 3.0 are considered in the efficiency measurement, with $ p_{\mathrm{T}} > $ 0.4 (0.9) GeV required for the upper left (right) plots. The tracking fake rate (lower) is shown as a function of the reconstructed track $ \eta $ for the Run 2 HLT tracking (blue) and the Run 3 HLT single-iteration tracking (red). |
png pdf |
Figure 131-c:
Tracking efficiency for the Run 2 HLT tracking (blue) and the Run 3 HLT single-iteration tracking (red) as a function of the simulated track $ p_{\mathrm{T}} $ (upper left) and track $ \eta $ (upper right). Only simulated tracks with $ |\eta| < $ 3.0 are considered in the efficiency measurement, with $ p_{\mathrm{T}} > $ 0.4 (0.9) GeV required for the upper left (right) plots. The tracking fake rate (lower) is shown as a function of the reconstructed track $ \eta $ for the Run 2 HLT tracking (blue) and the Run 3 HLT single-iteration tracking (red). |

png pdf |
Figure 132:
Light-flavor jet misidentification rate versus the b jet efficiency for the various b tagging algorithms. The solid curves show the performance of the DeepCSV (blue), DeepJet (red), and ParticleNet (magenta) algorithms in the HLT. The dashed curves show the corresponding offline performance for DeepJet (red) and ParticleNet (magenta) taggers using offline reconstruction and training. |
png pdf |
Figure 133:
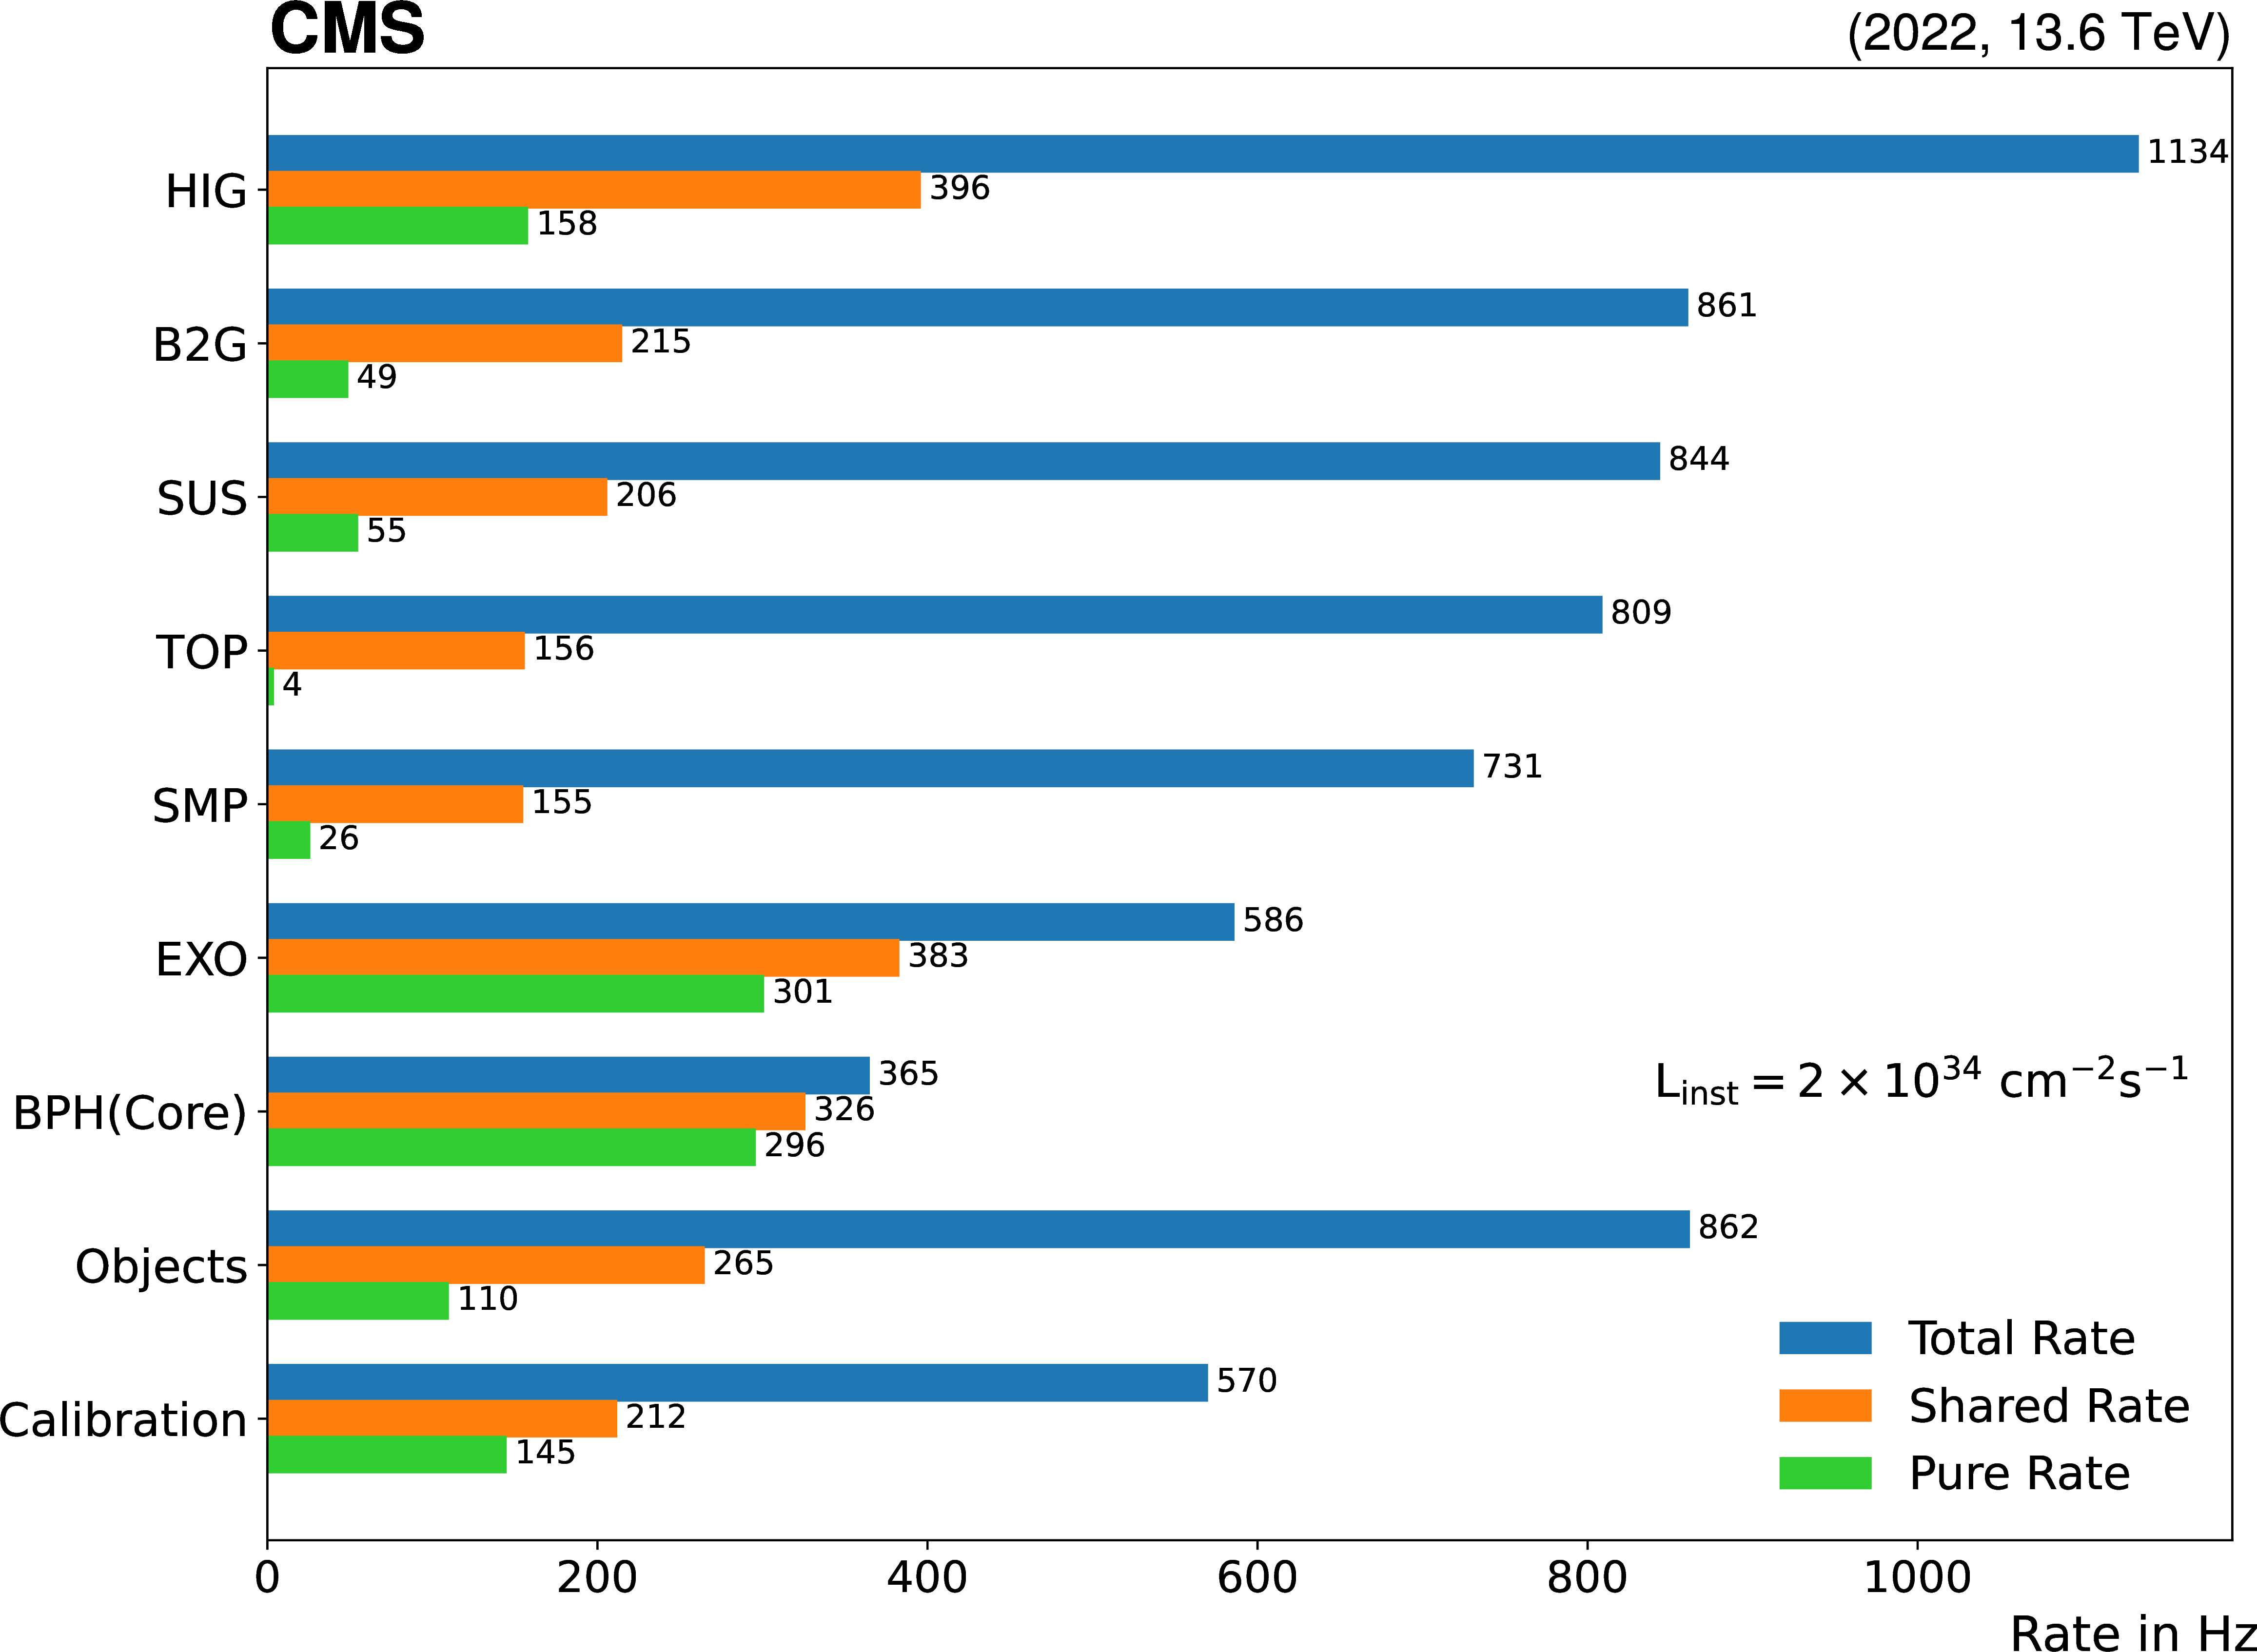
The HLT rate allocation by physics group for the Run 3 menu deployed in November 2022, scaled to a luminosity of 2.0 $ \times$ 10$^{34}$ cm$^{2}$s$^{-1}$. The total rate (blue bar) is the inclusive rate of all triggers used by a physics group and the pure rate (green bar) is the exclusive rate of all triggers unique to that group. The shared rate (orange bar) is the rate calculated by dividing the rate of each trigger equally among all physics groups that use it, before summing the total group rate. |
png pdf |
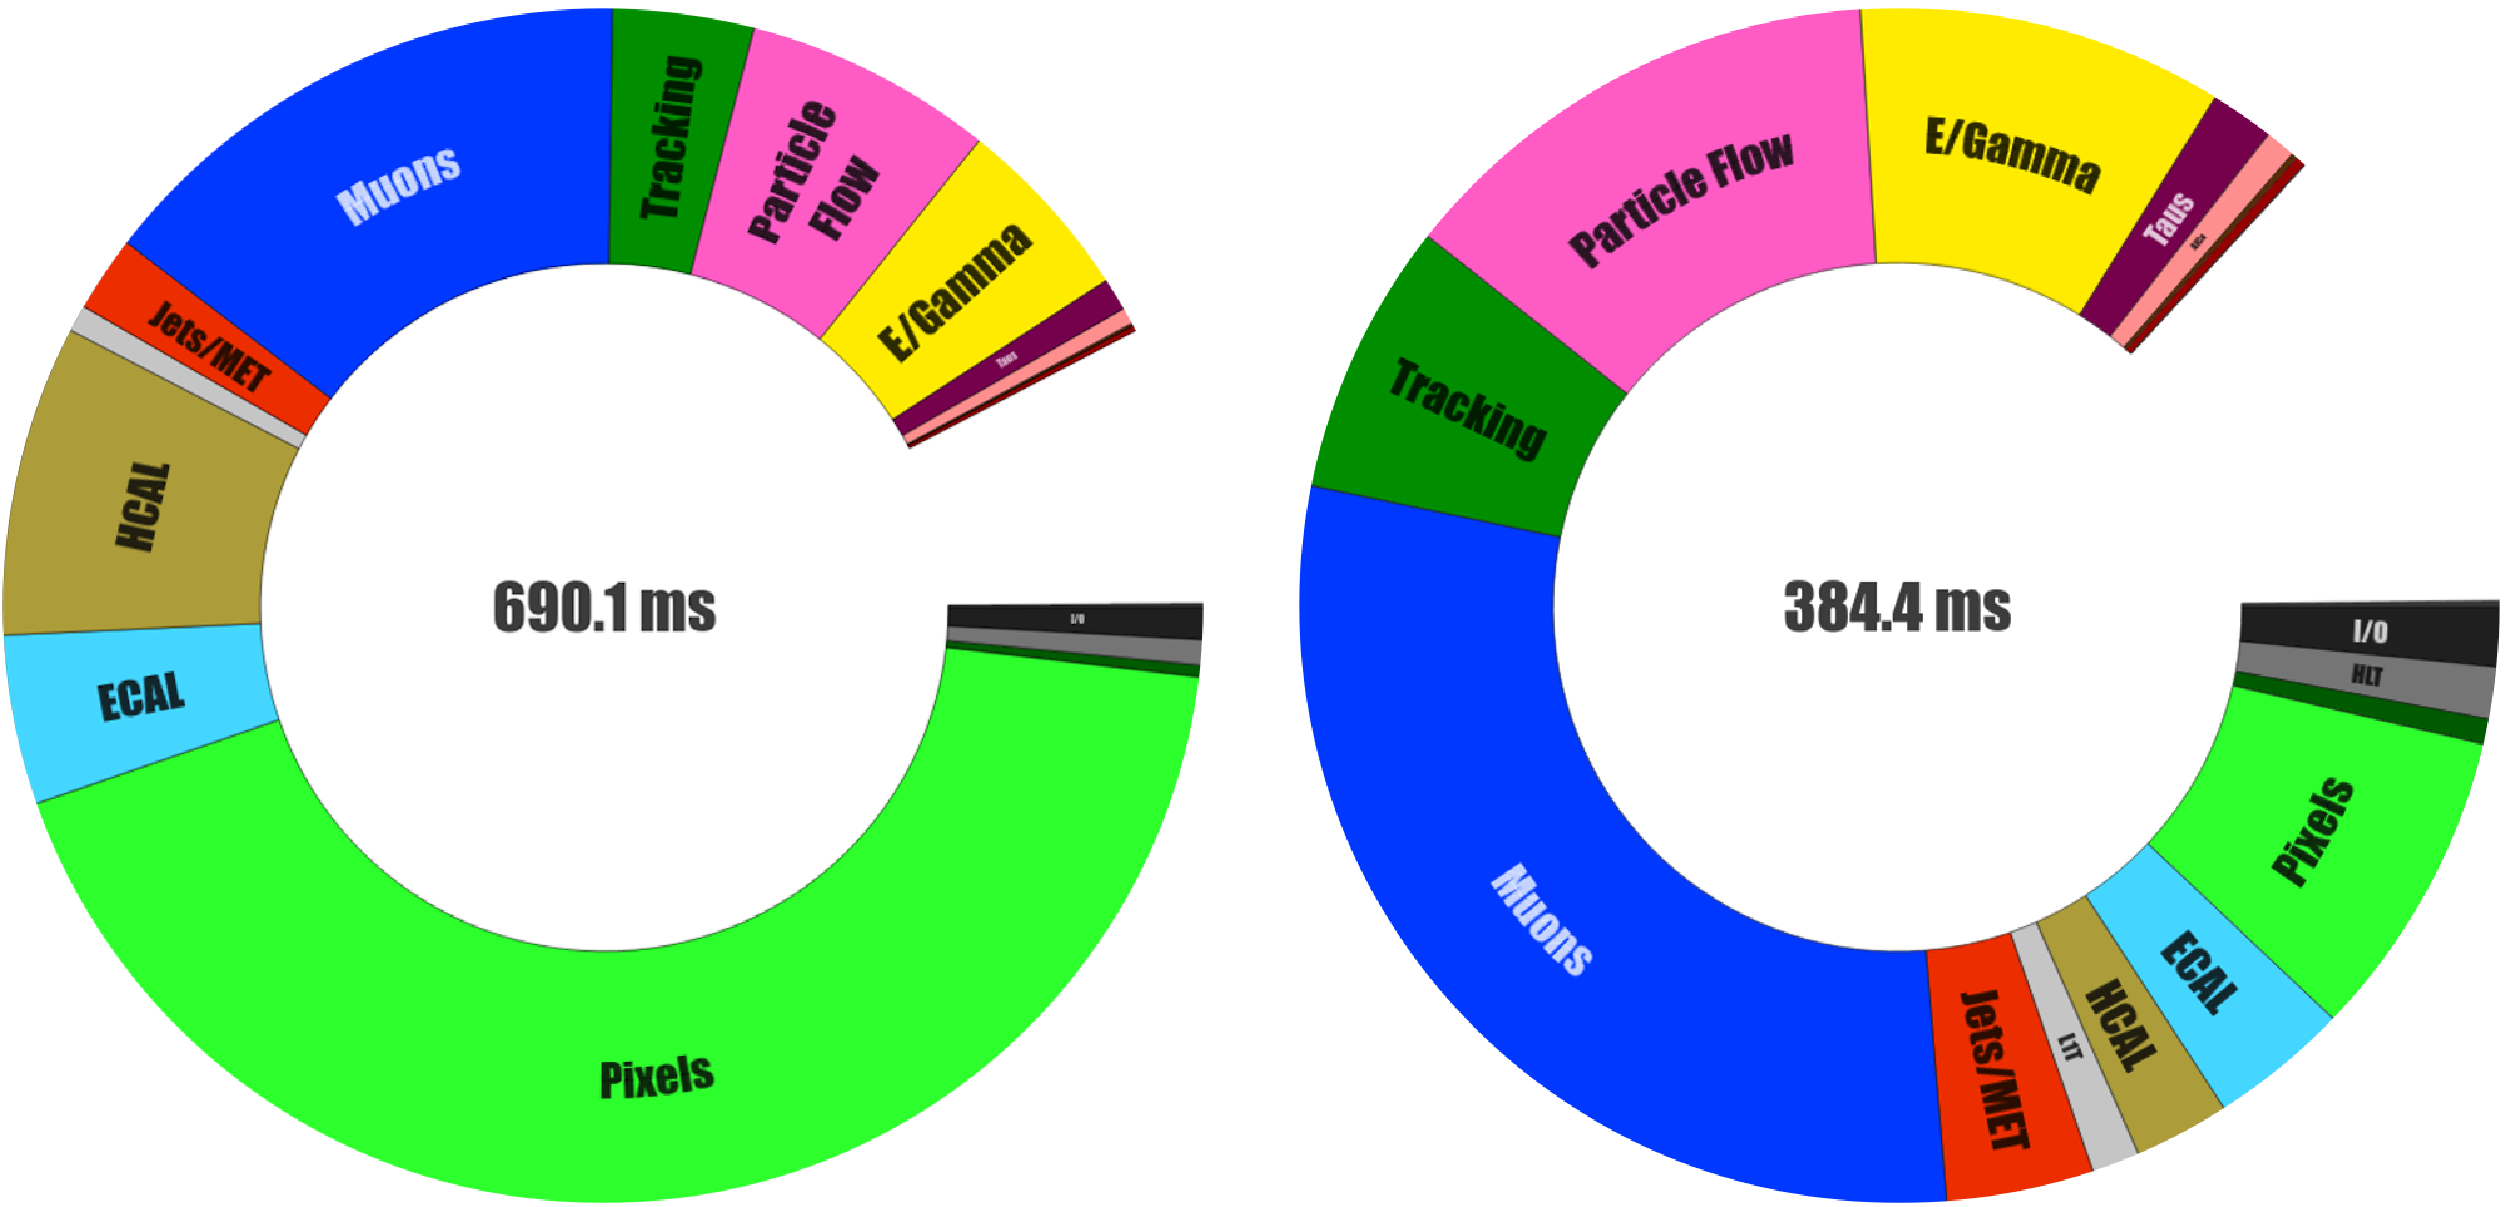
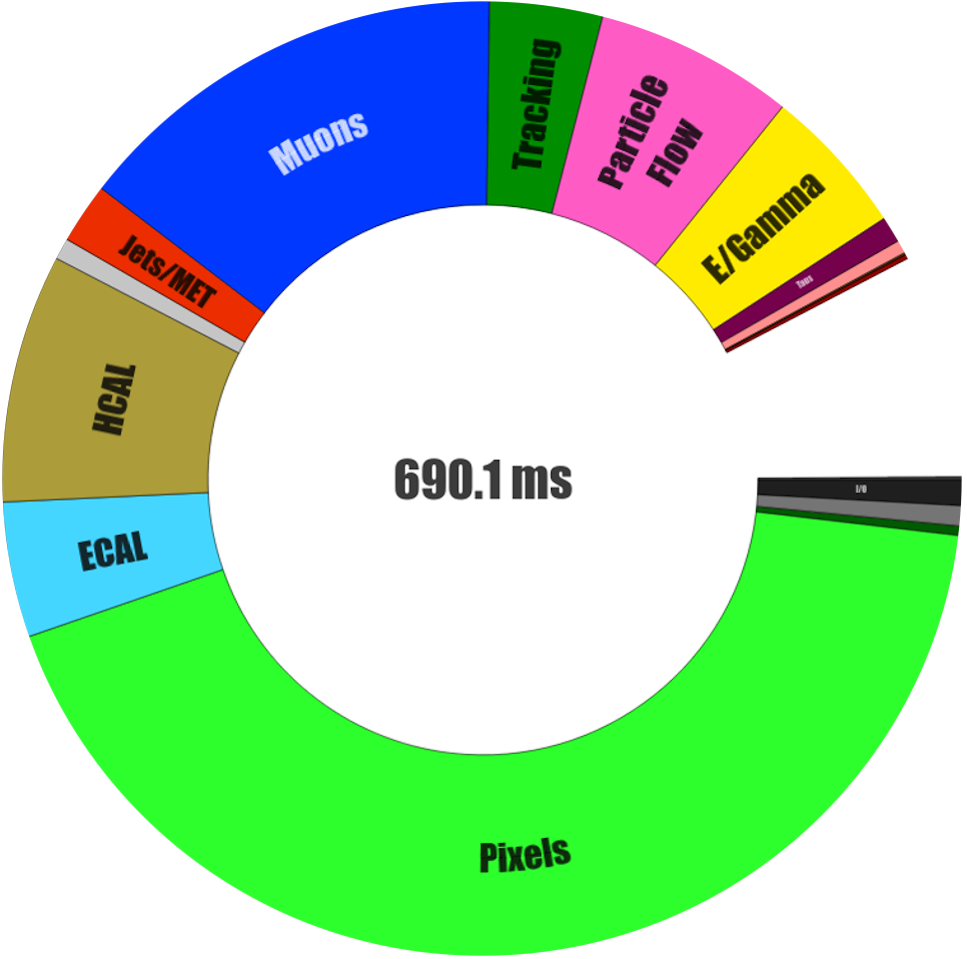
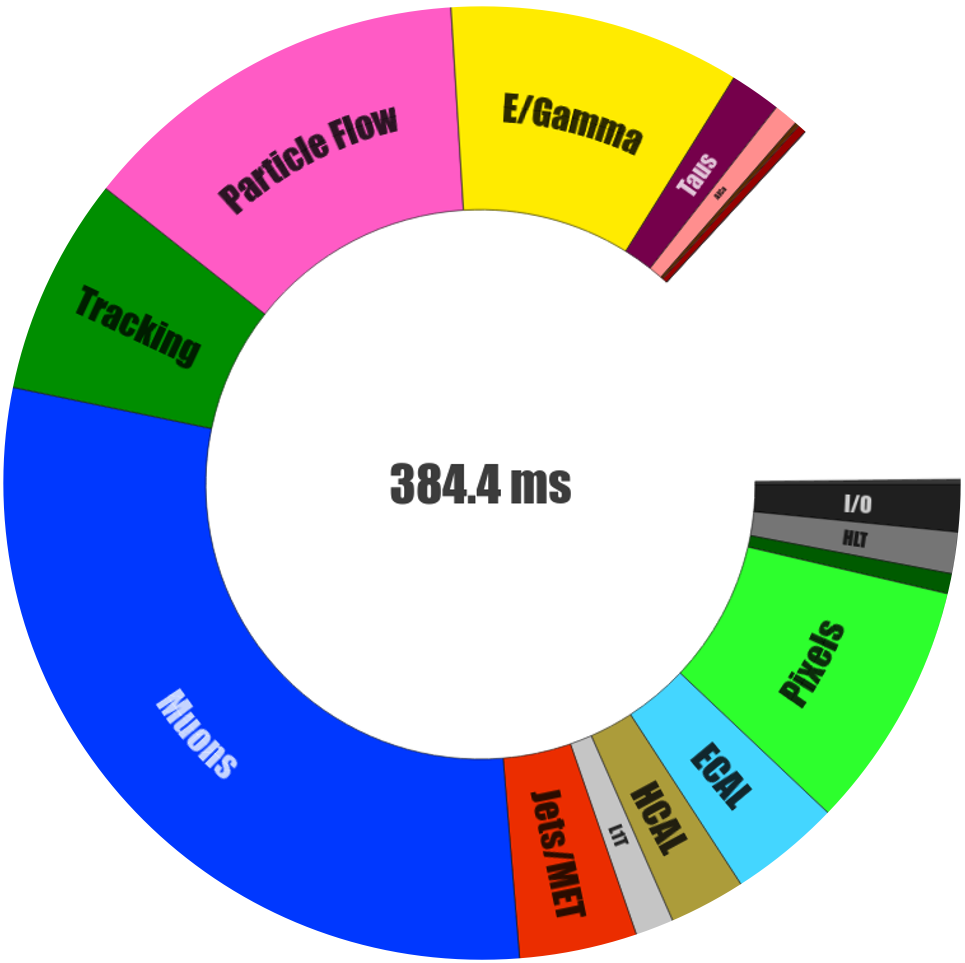
Figure 134:
Pie chart distributions of the processing time for the HLT reconstruction running only on CPUs (left) and offloading part of the reconstruction to GPUs (right). The slices represent the time spent in different physics object or detector reconstruction modules. The empty slice indicates the time spent outside of the individual algorithms. |
png |
Figure 134-a:
Pie chart distribution of the processing time for the HLT reconstruction running only on CPUs. The slices represent the time spent in different physics object or detector reconstruction modules. The empty slice indicates the time spent outside of the individual algorithms. |
png |
Figure 134-b:
Pie chart distribution of offloading part of the reconstruction to GPUs. The slices represent the time spent in different physics object or detector reconstruction modules. The empty slice indicates the time spent outside of the individual algorithms. |

png pdf |
Figure 135:
The HLT rates for promptly reconstructed data streams (blue) and parked data (black) as a function of time during an LHC fill in 2023. |
png pdf |
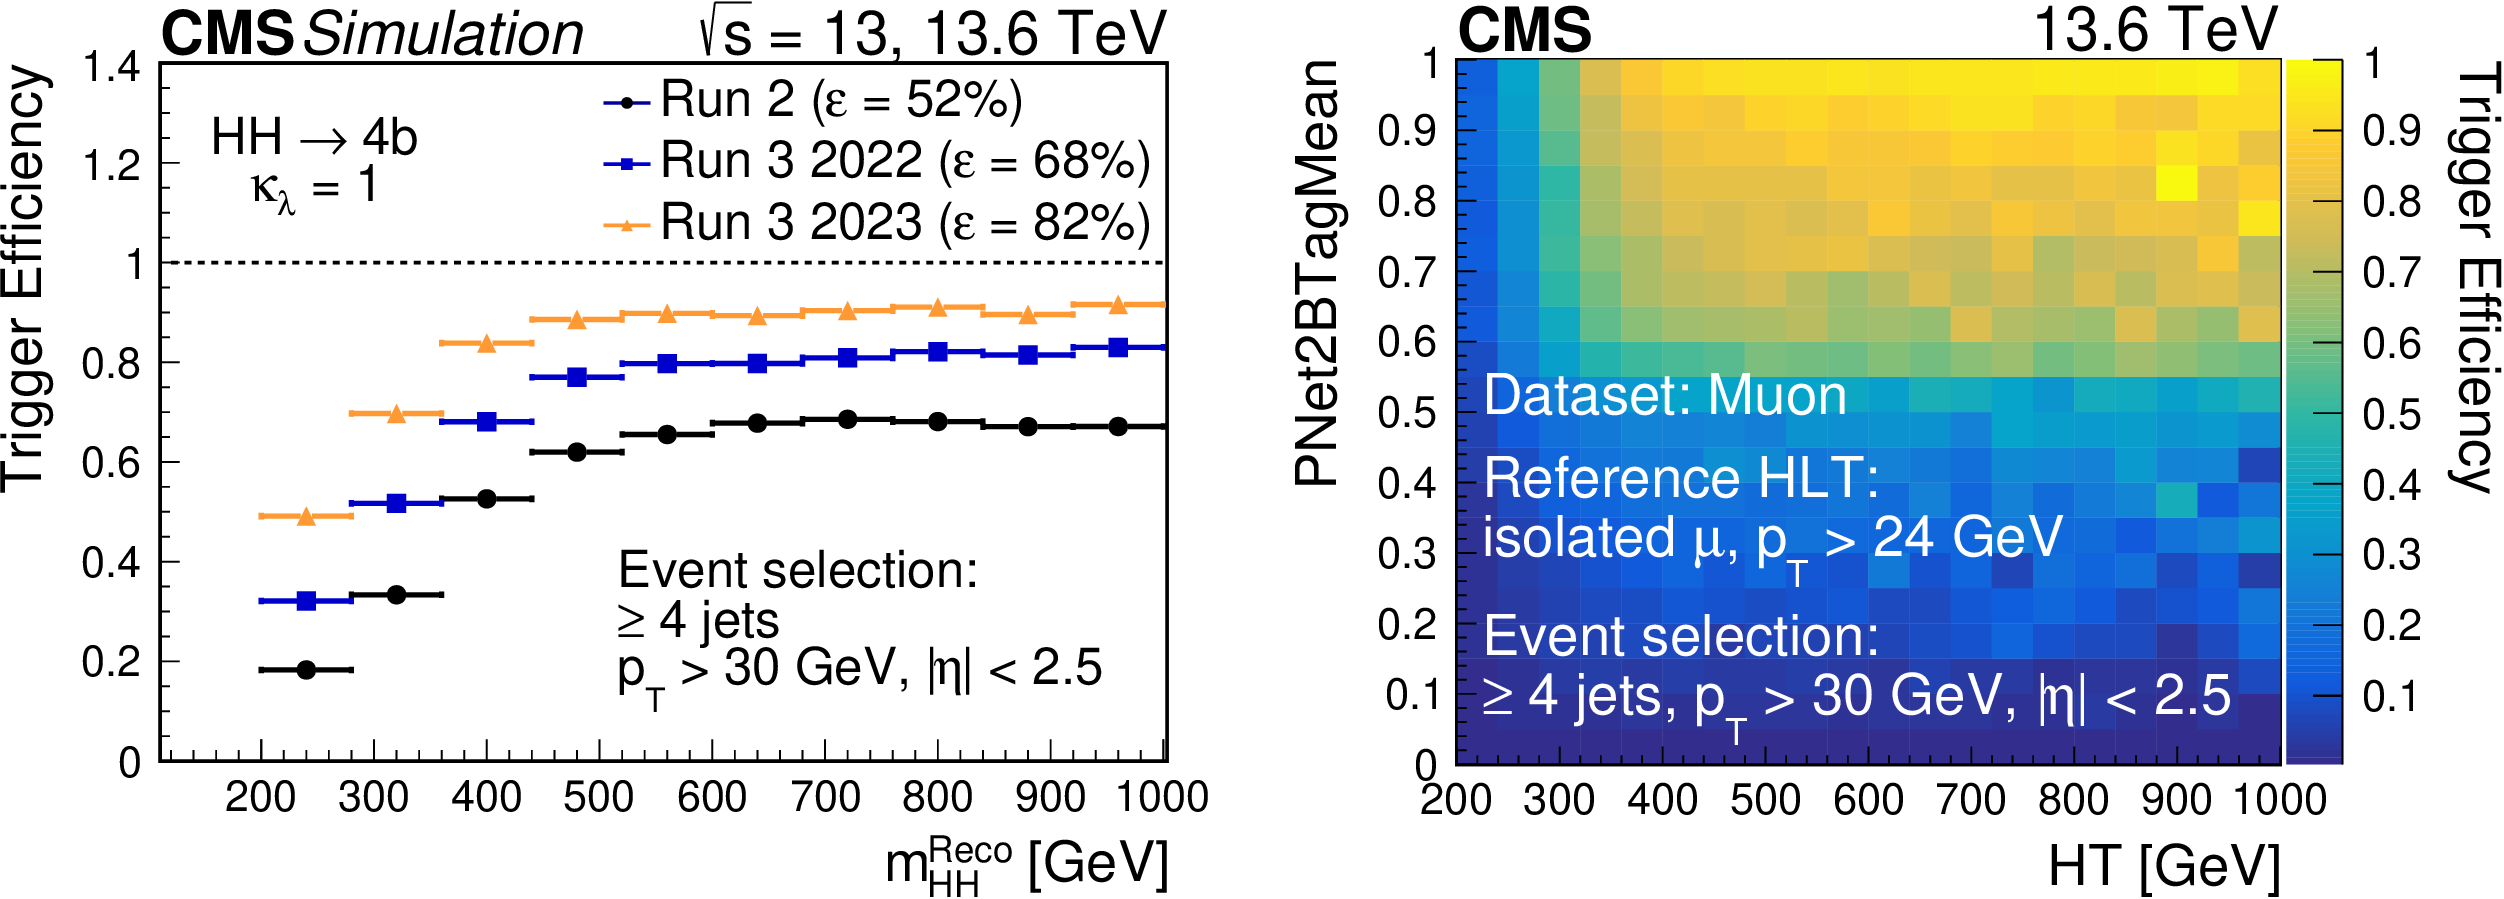
Figure 136:
Left: comparison of the trigger efficiency of the $ \mathrm{H}\mathrm{H}\to\mathrm{b}\overline{\mathrm{b}} $ trigger among the three different strategies used in Run 2 (black), 2022 (blue), and 2023 (orange) using the signal MC sample. Right: trigger efficiency of the $ \mathrm{H}\mathrm{H}\to\mathrm{b}\overline{\mathrm{b}} $ trigger using events collected by the single muon trigger in 2023. |
png pdf |
Figure 136-a:
Comparison of the trigger efficiency of the $ \mathrm{H}\mathrm{H}\to\mathrm{b}\overline{\mathrm{b}} $ trigger among the three different strategies used in Run 2 (black), 2022 (blue), and 2023 (orange) using the signal MC sample. |

png pdf |
Figure 136-b:
Trigger efficiency of the $ \mathrm{H}\mathrm{H}\to\mathrm{b}\overline{\mathrm{b}} $ trigger using events collected by the single muon trigger in 2023. |
png pdf |
Figure 137:
Timeline of the major data processing and computing software improvements put in production since 2010. |
png pdf |
Figure 138:
The evolution of the CMS computing model from a hierarchical (left) to fully connected structure (right). |
png pdf |
Figure 139:
Schematic diagram of the submission infrastructure, including multiple distributed central processing and production (WMAgent) and analysis (CRAB) job submission agents (schedds). Computing resources allocated from diverse origins (green boxes) are grouped into HTCondor pools (gray boxes), federated via workload flocking. The collector and negotiator agents (yellow boxes) keep the state of each pool and perform the workload-to-resource matchmaking. |
| Tables | |
png pdf |
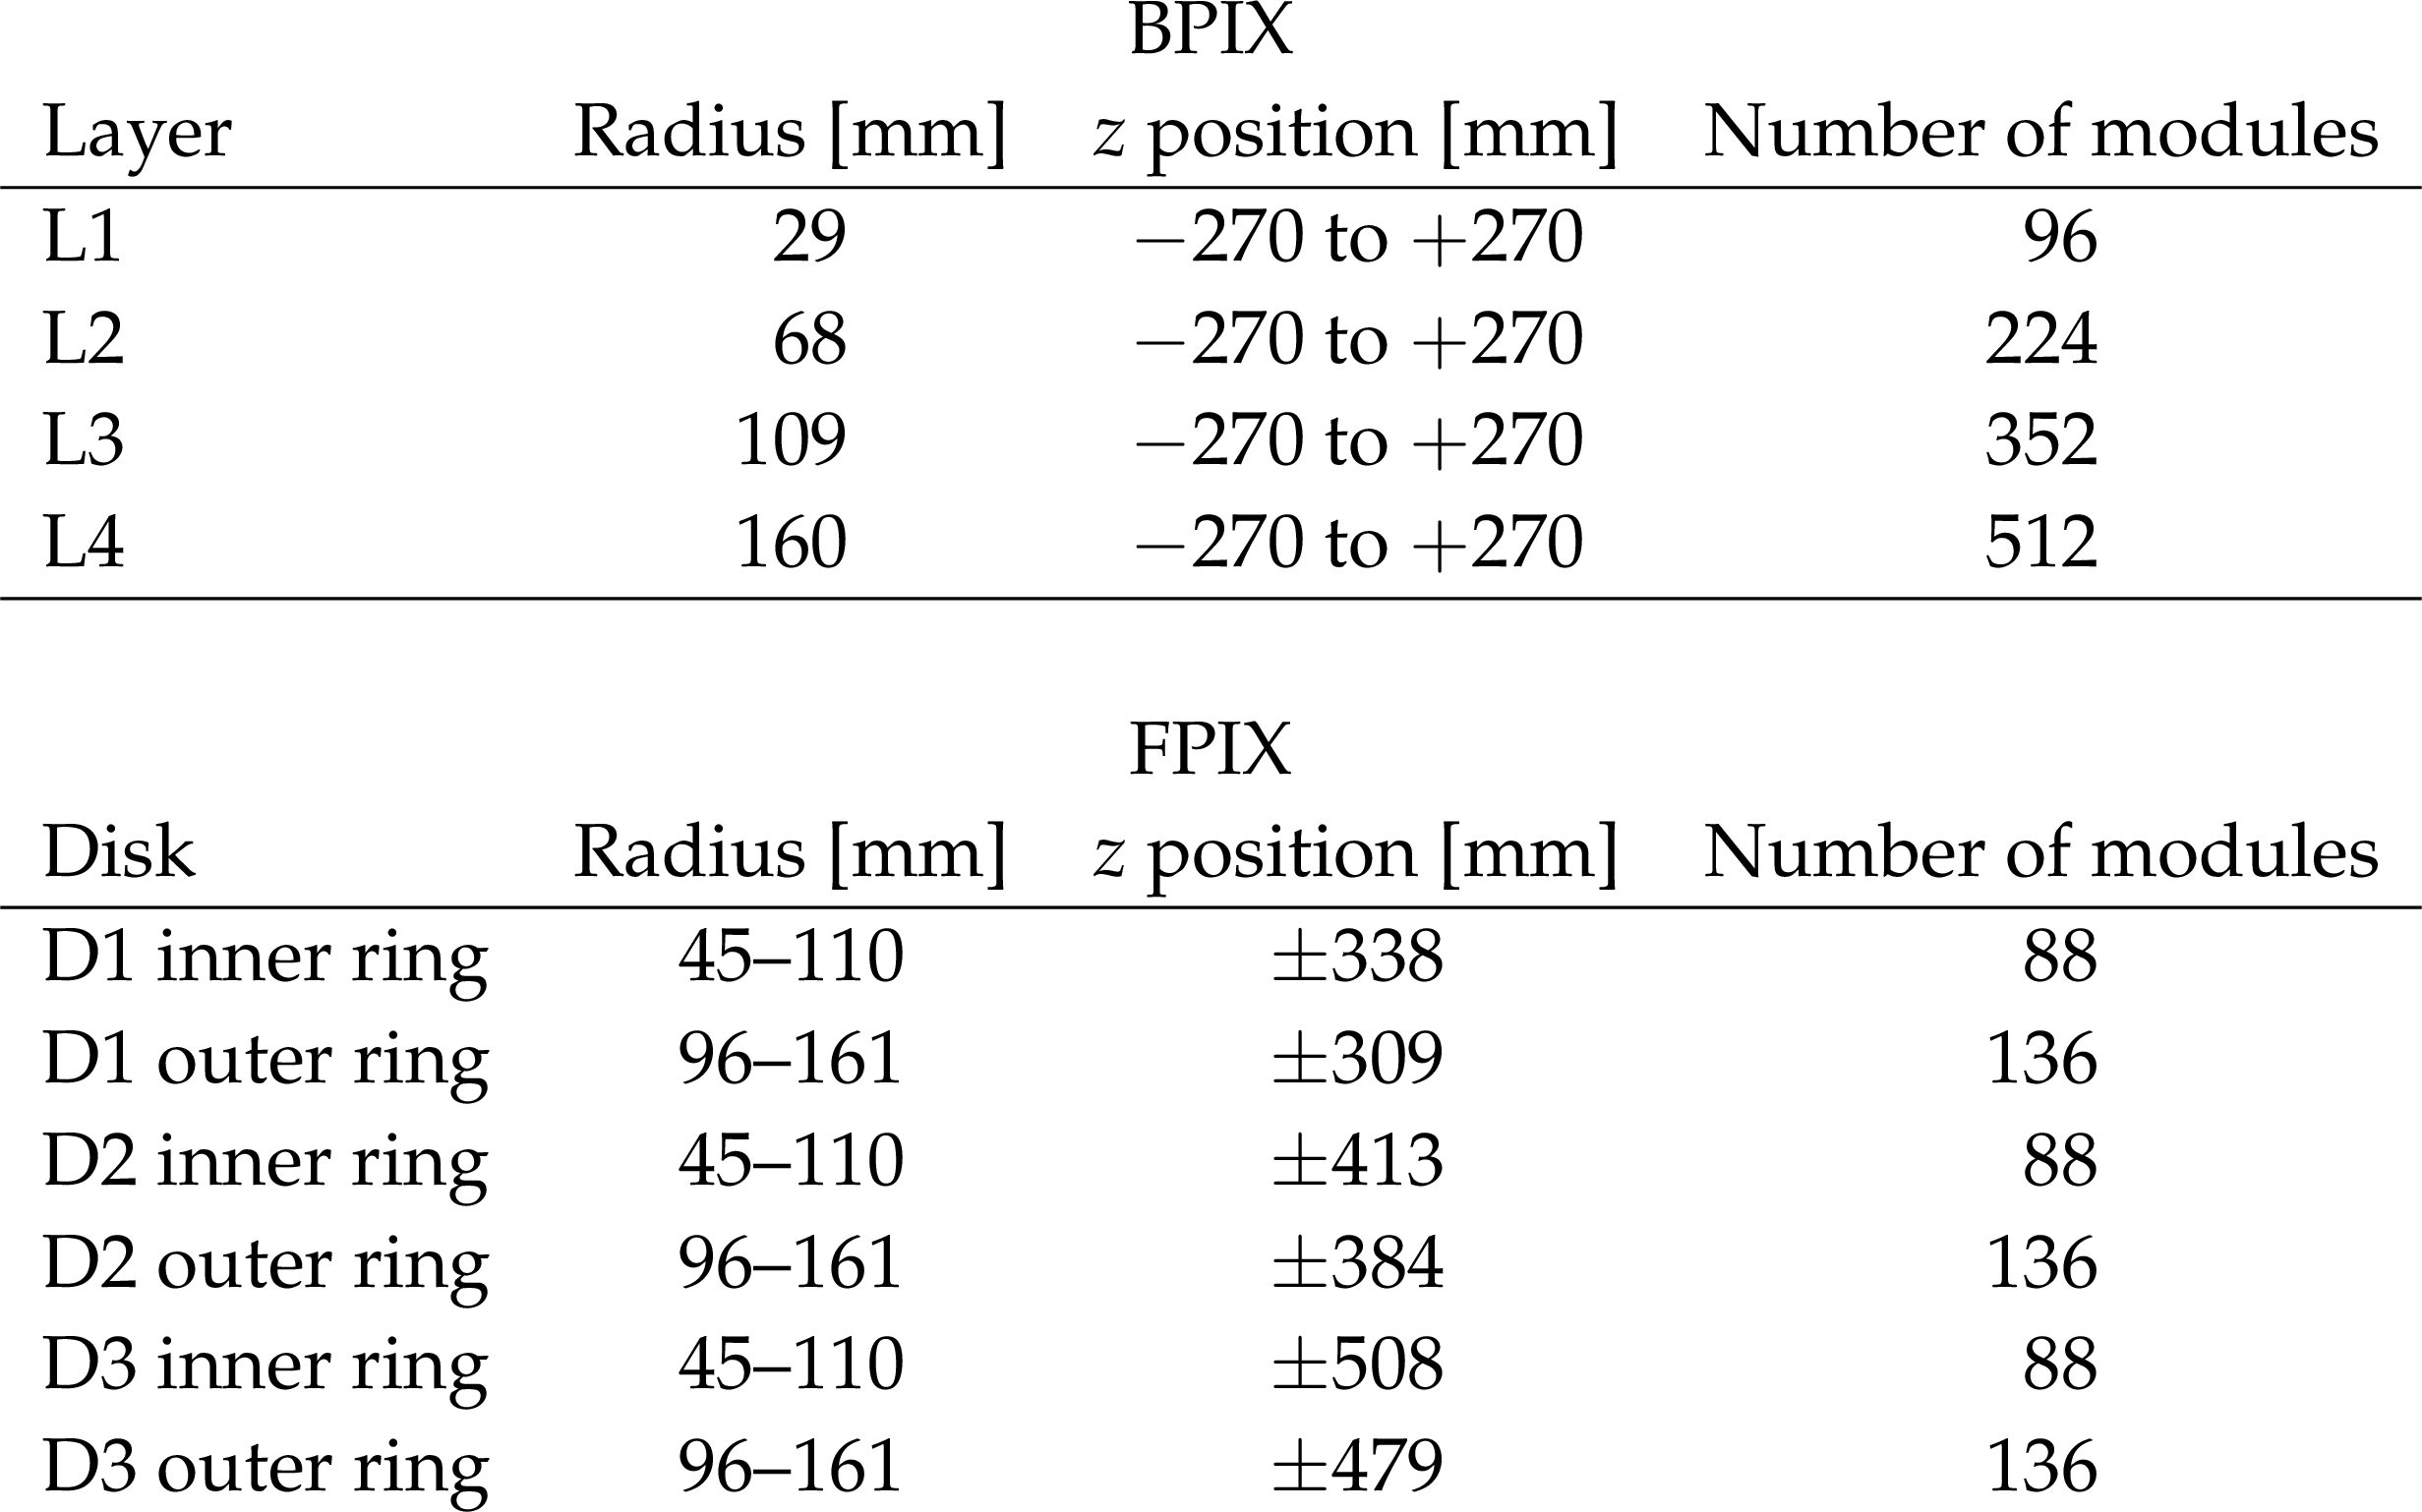
Table 1:
Summary of the average radius and $ z $ position, as well as the number of modules for the four BPIX layers and six FPIX rings for the Phase 1 pixel detector. |
png pdf |
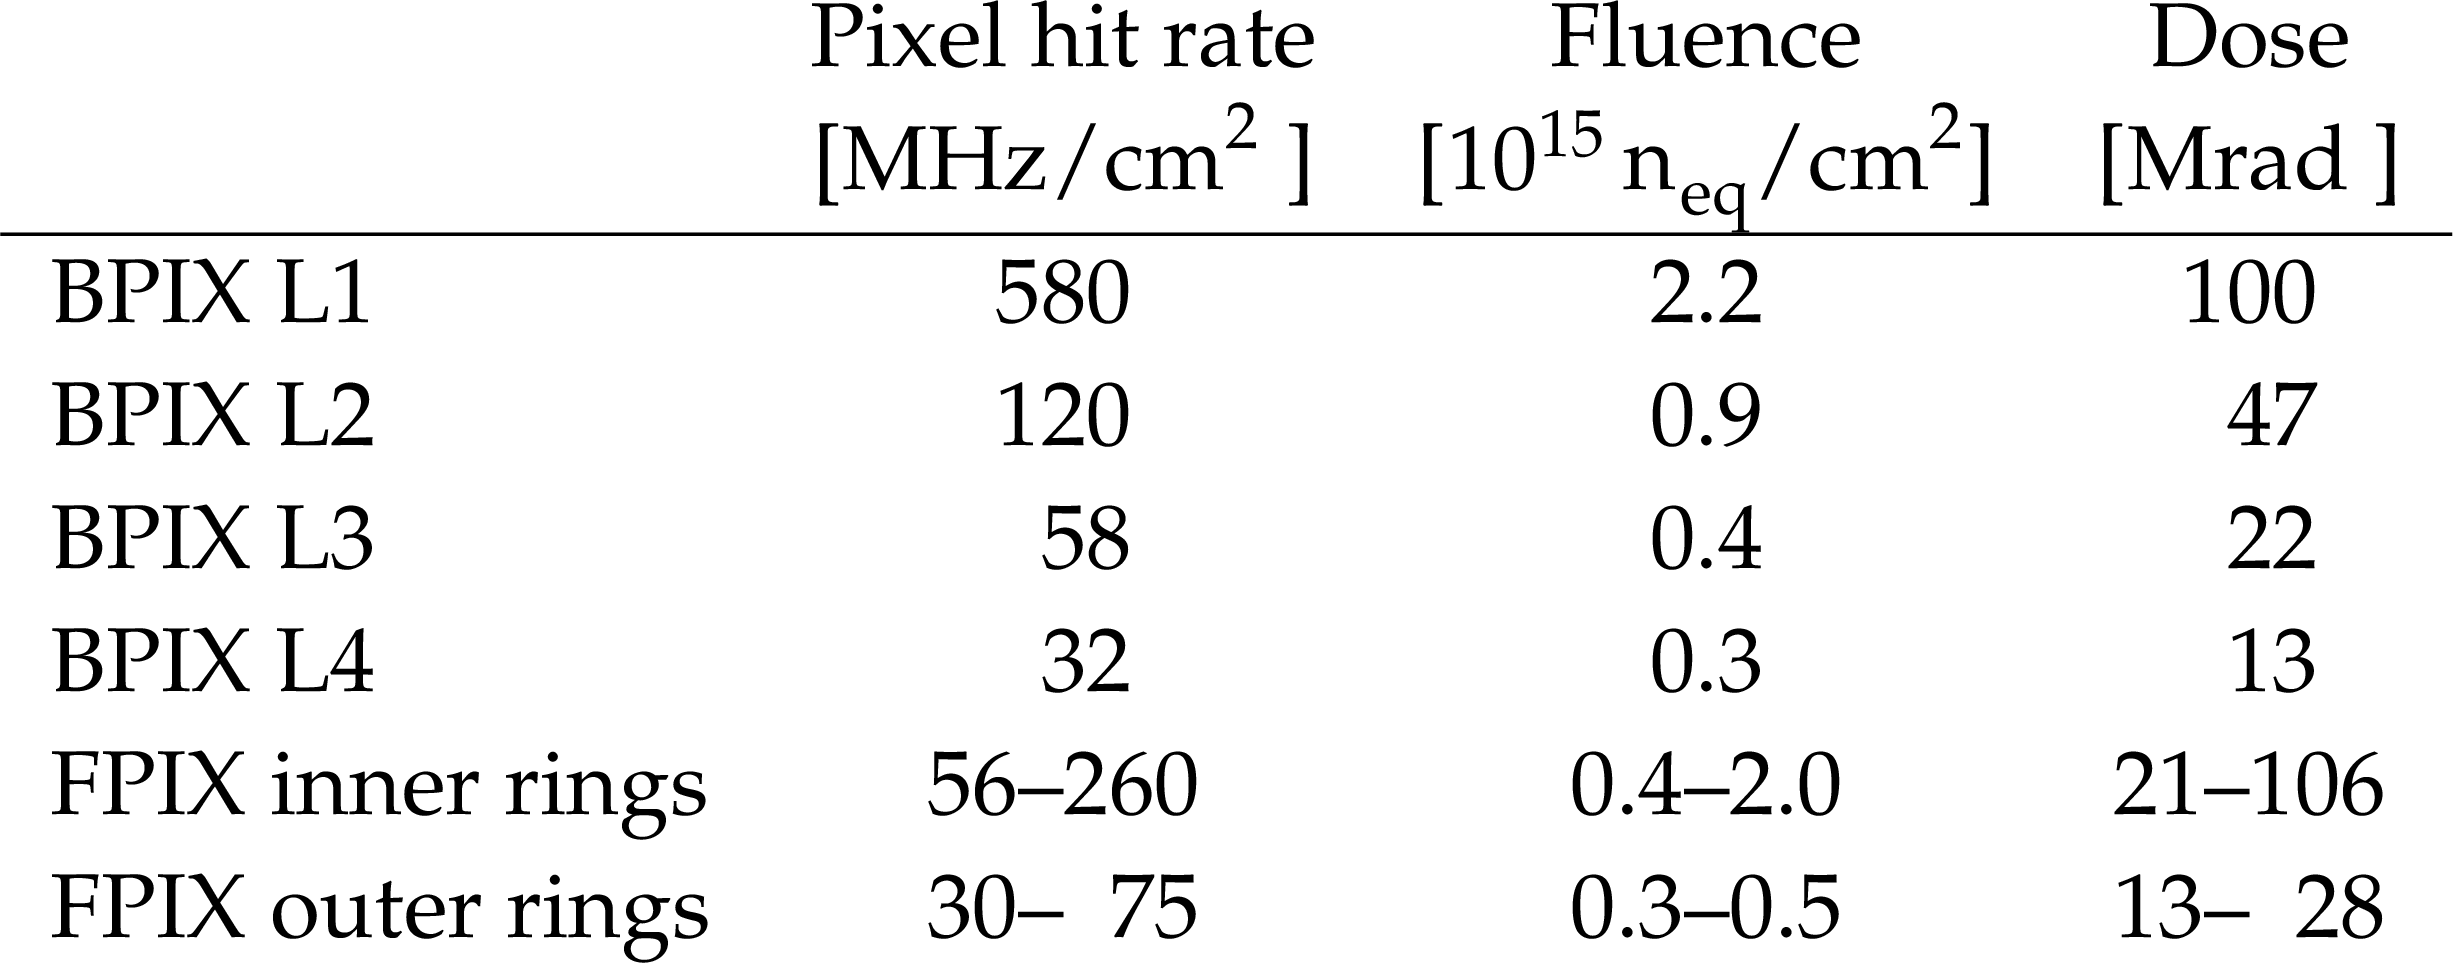
Table 2:
Expected hit rate, fluence, and radiation dose for the BPIX layers and FPIX rings. The hit rate corresponds to an instantaneous luminosity of 2.0 $ \times$ 10$^{34}$ cm$^{2}$s$^{-1}$ [15]. The fluence and radiation dose are shown for integrated luminosities of 300 fb$ ^{-1} $ for the BPIX L1 and 500 fb$ ^{-1} $ for the other BPIX layers and FPIX disks, well beyond the expected integrated luminosities for the detectors at the end of Run 3, of 250 and 370 fb$ ^{-1} $, respectively. |

png pdf |
Table 3:
Parameters and design requirements for the PSI46dig and PROC600. |
png pdf |
Table 4:
Overview of module types used in the Phase 1 pixel detector. |
png pdf |
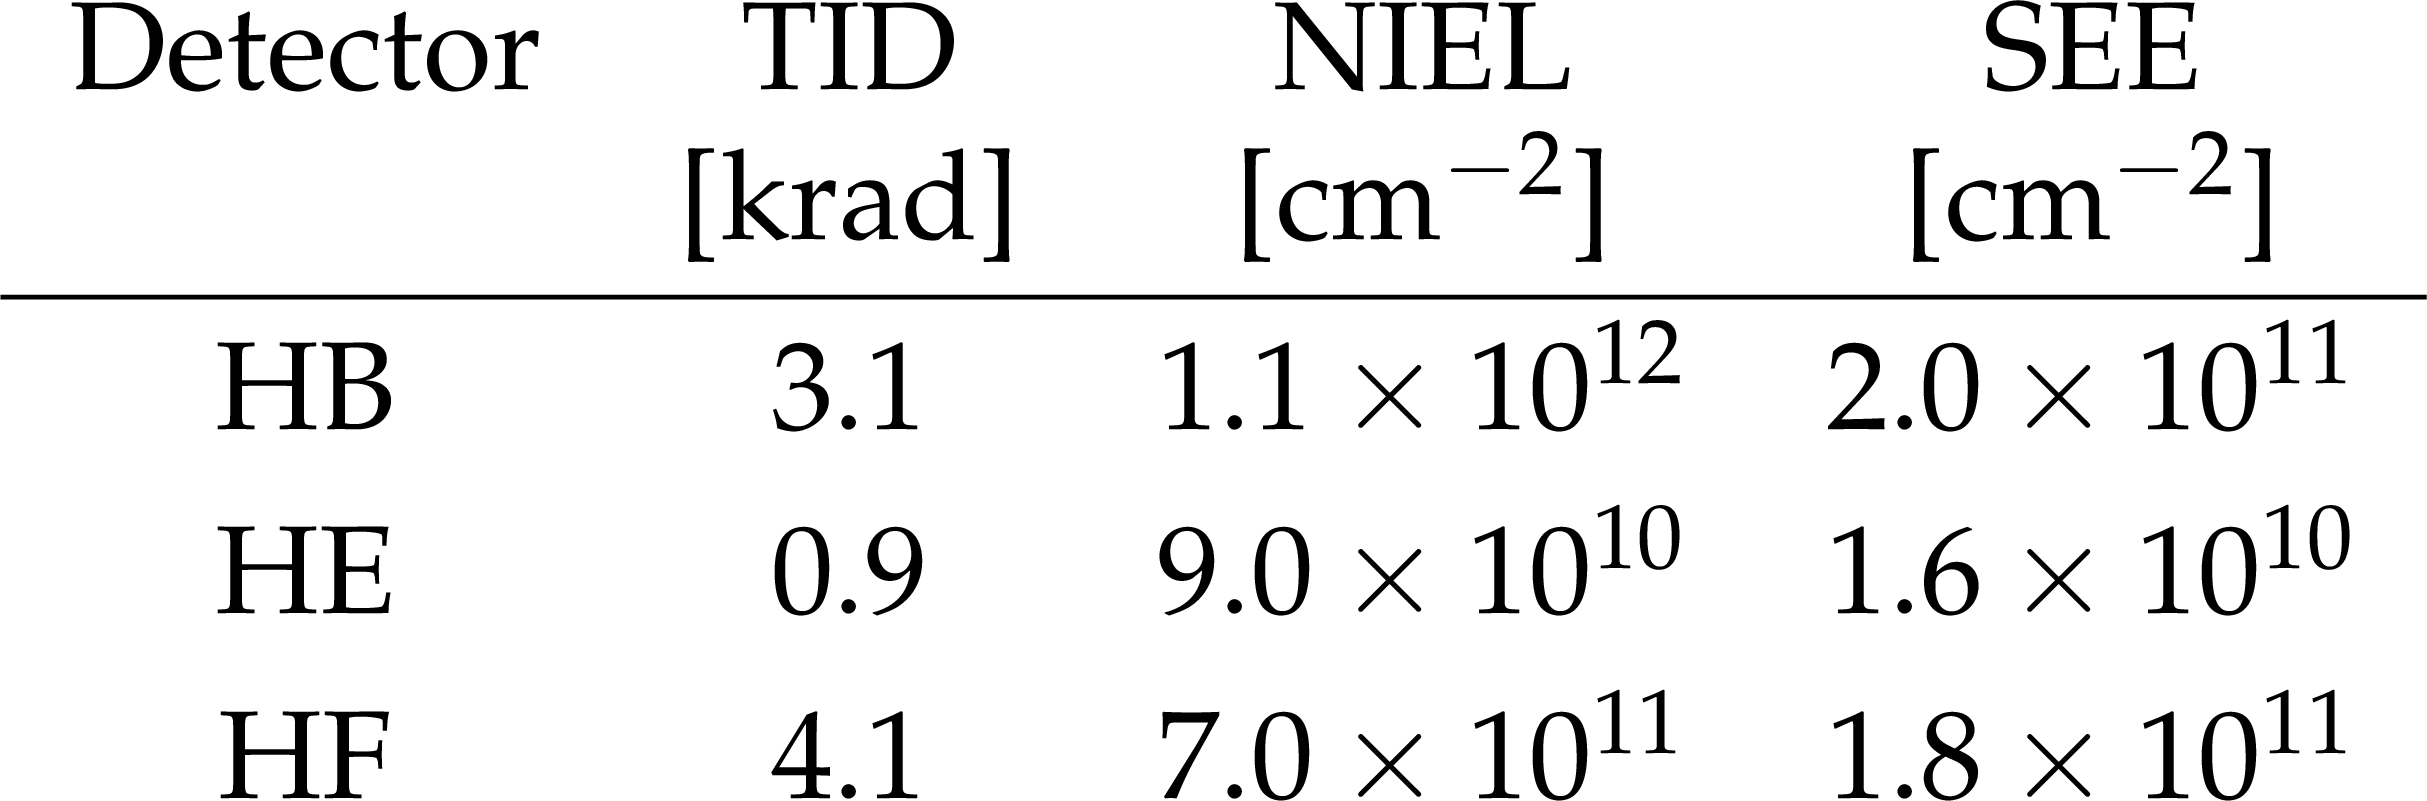
Table 5:
Radiation requirements for the Phase 1 upgrade. The HE numbers are for Run 3, while the HB and HF values correspond to the full HL-LHC duration. |
png pdf |
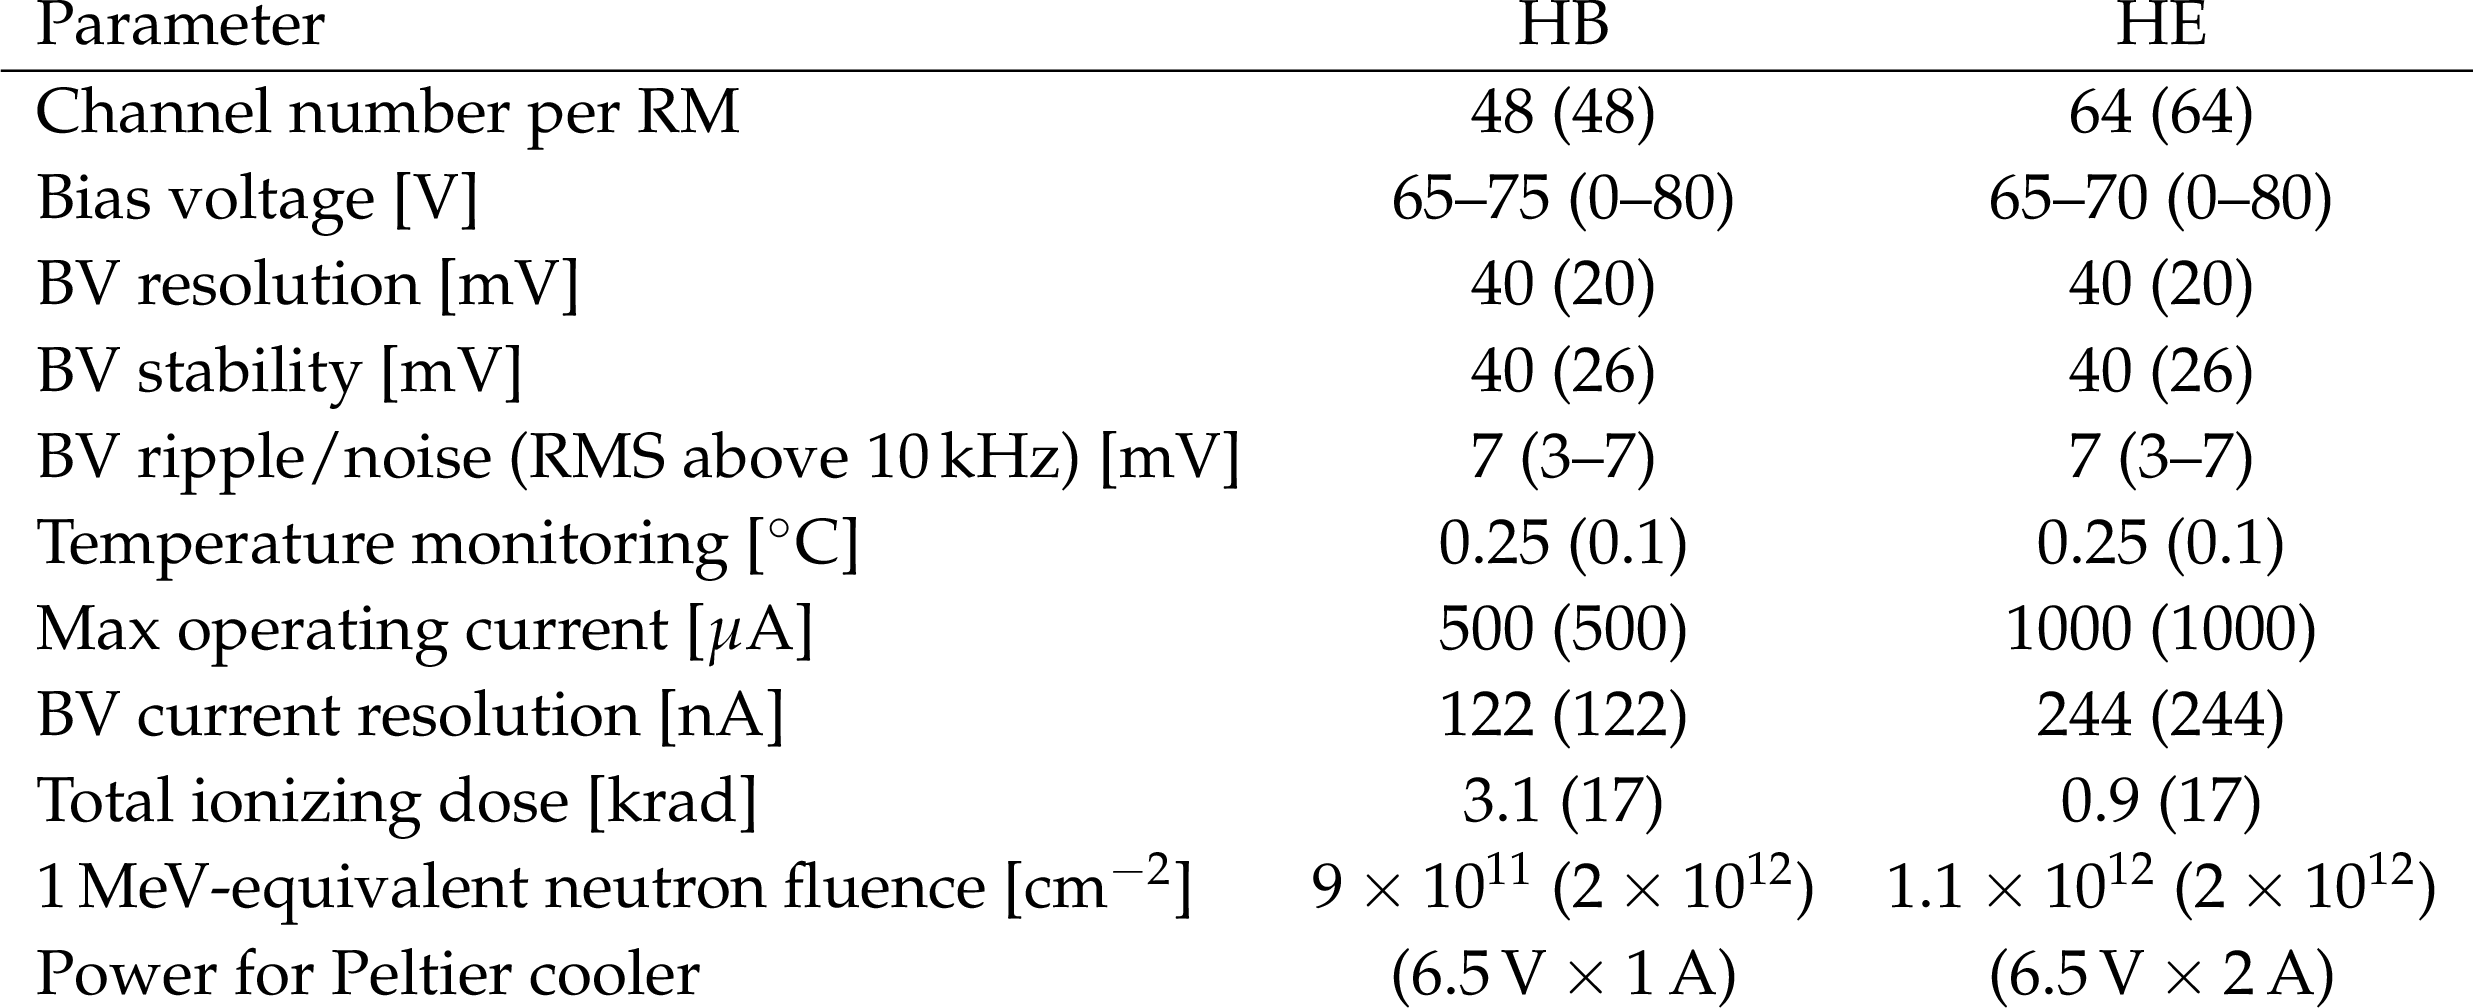
Table 6:
HCAL SiPM requirements for the Phase 1 upgrade. The design (measured) parameter values are shown. For the design (measured) value of the BV stability, the RMS (peak-to-peak) is quoted. |
png pdf |
Table 7:
Properties of the CMS muon system at the beginning of Run 3. The resolutions are quoted for full chambers, and the range indicates the variation over specific chamber types and sizes. The spatial resolution corresponds the precision of the coordinate measurement in bending plane. The time resolution of the RPC of 1.5 ns is currently not fully exploited since the DAQ system records the hit time in steps of 25 ns. |
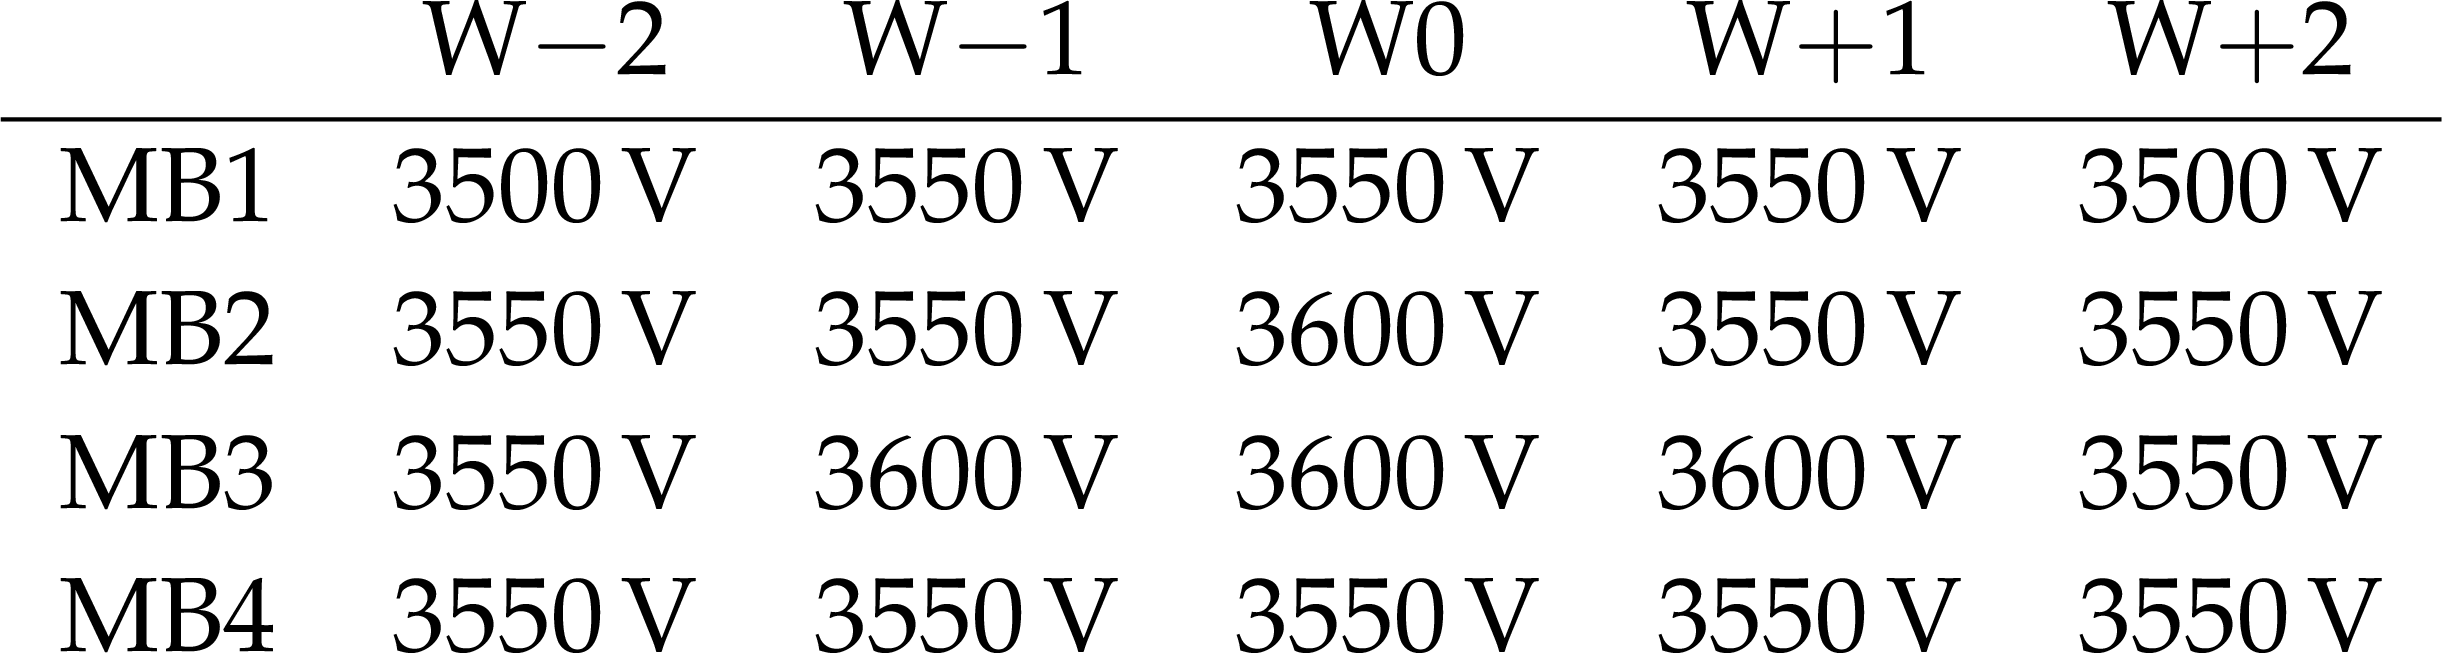
png pdf |
Table 8:
HV settings for the anode wires of the different DT stations and wheels used for the 2018 LHC run. |
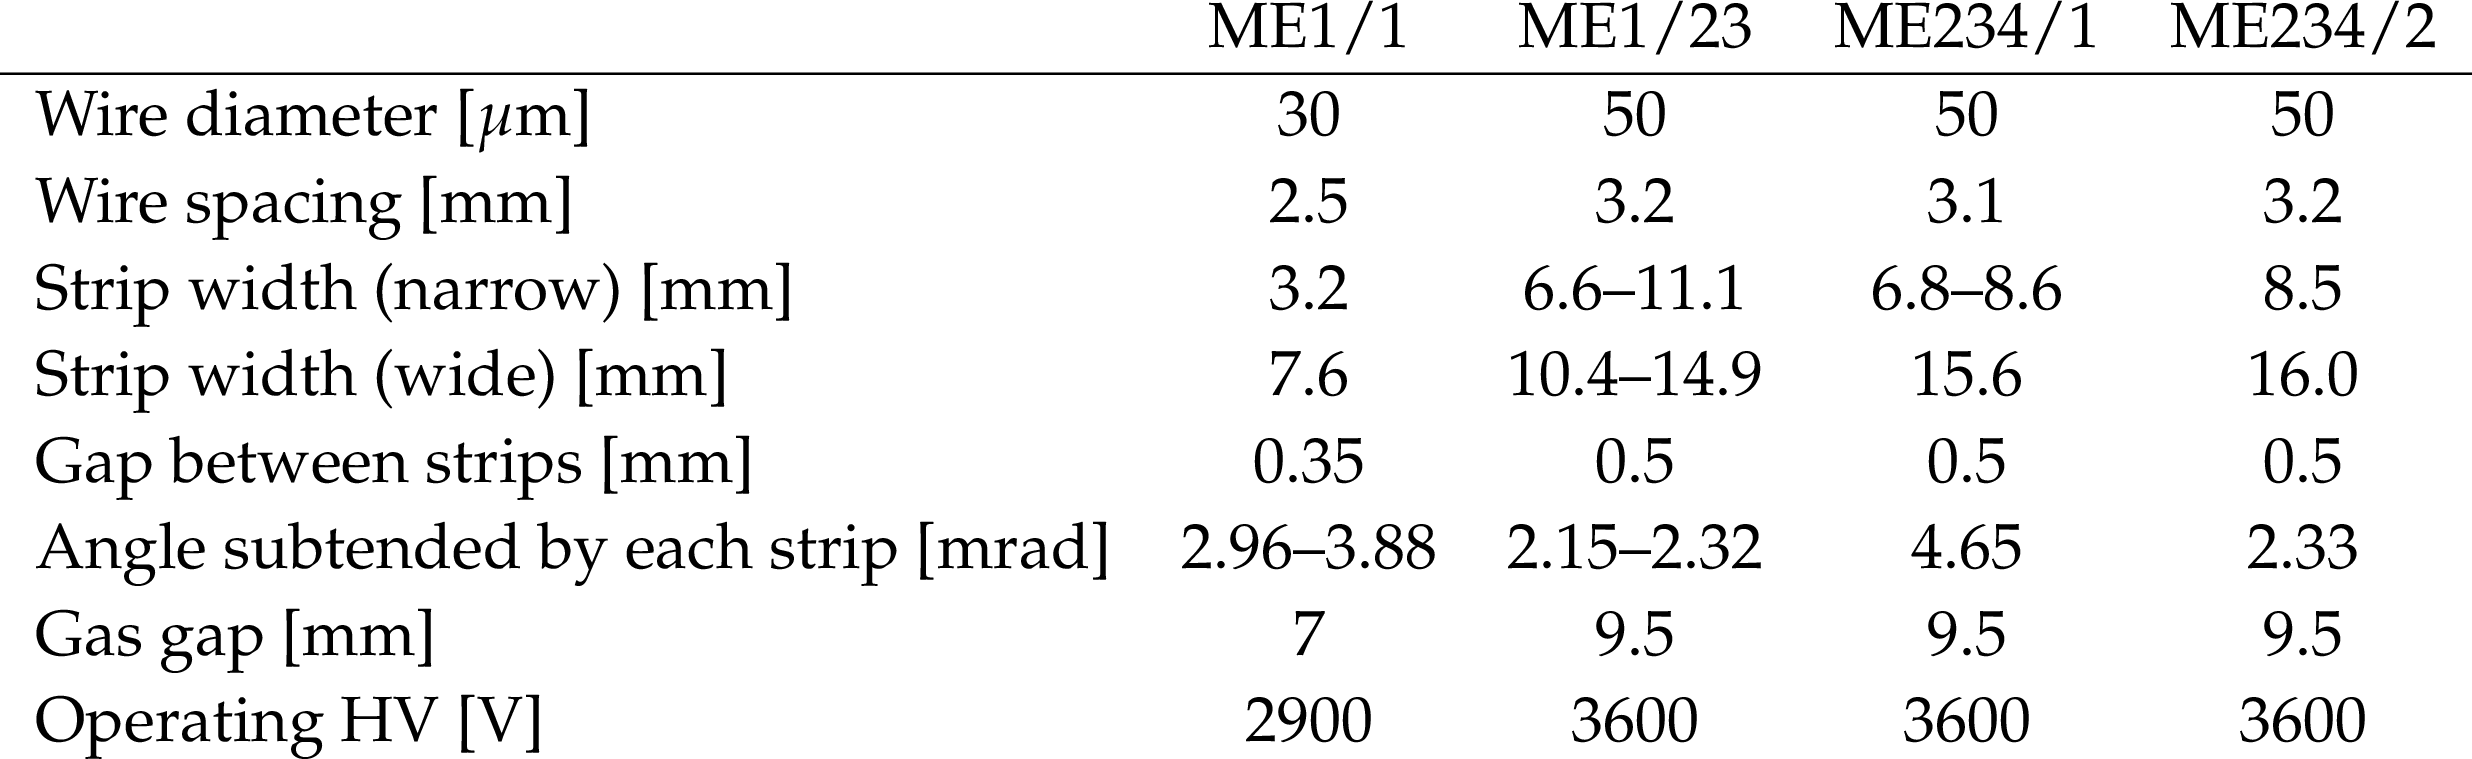
png pdf |
Table 9:
Key parameters for different types of CSCs. |
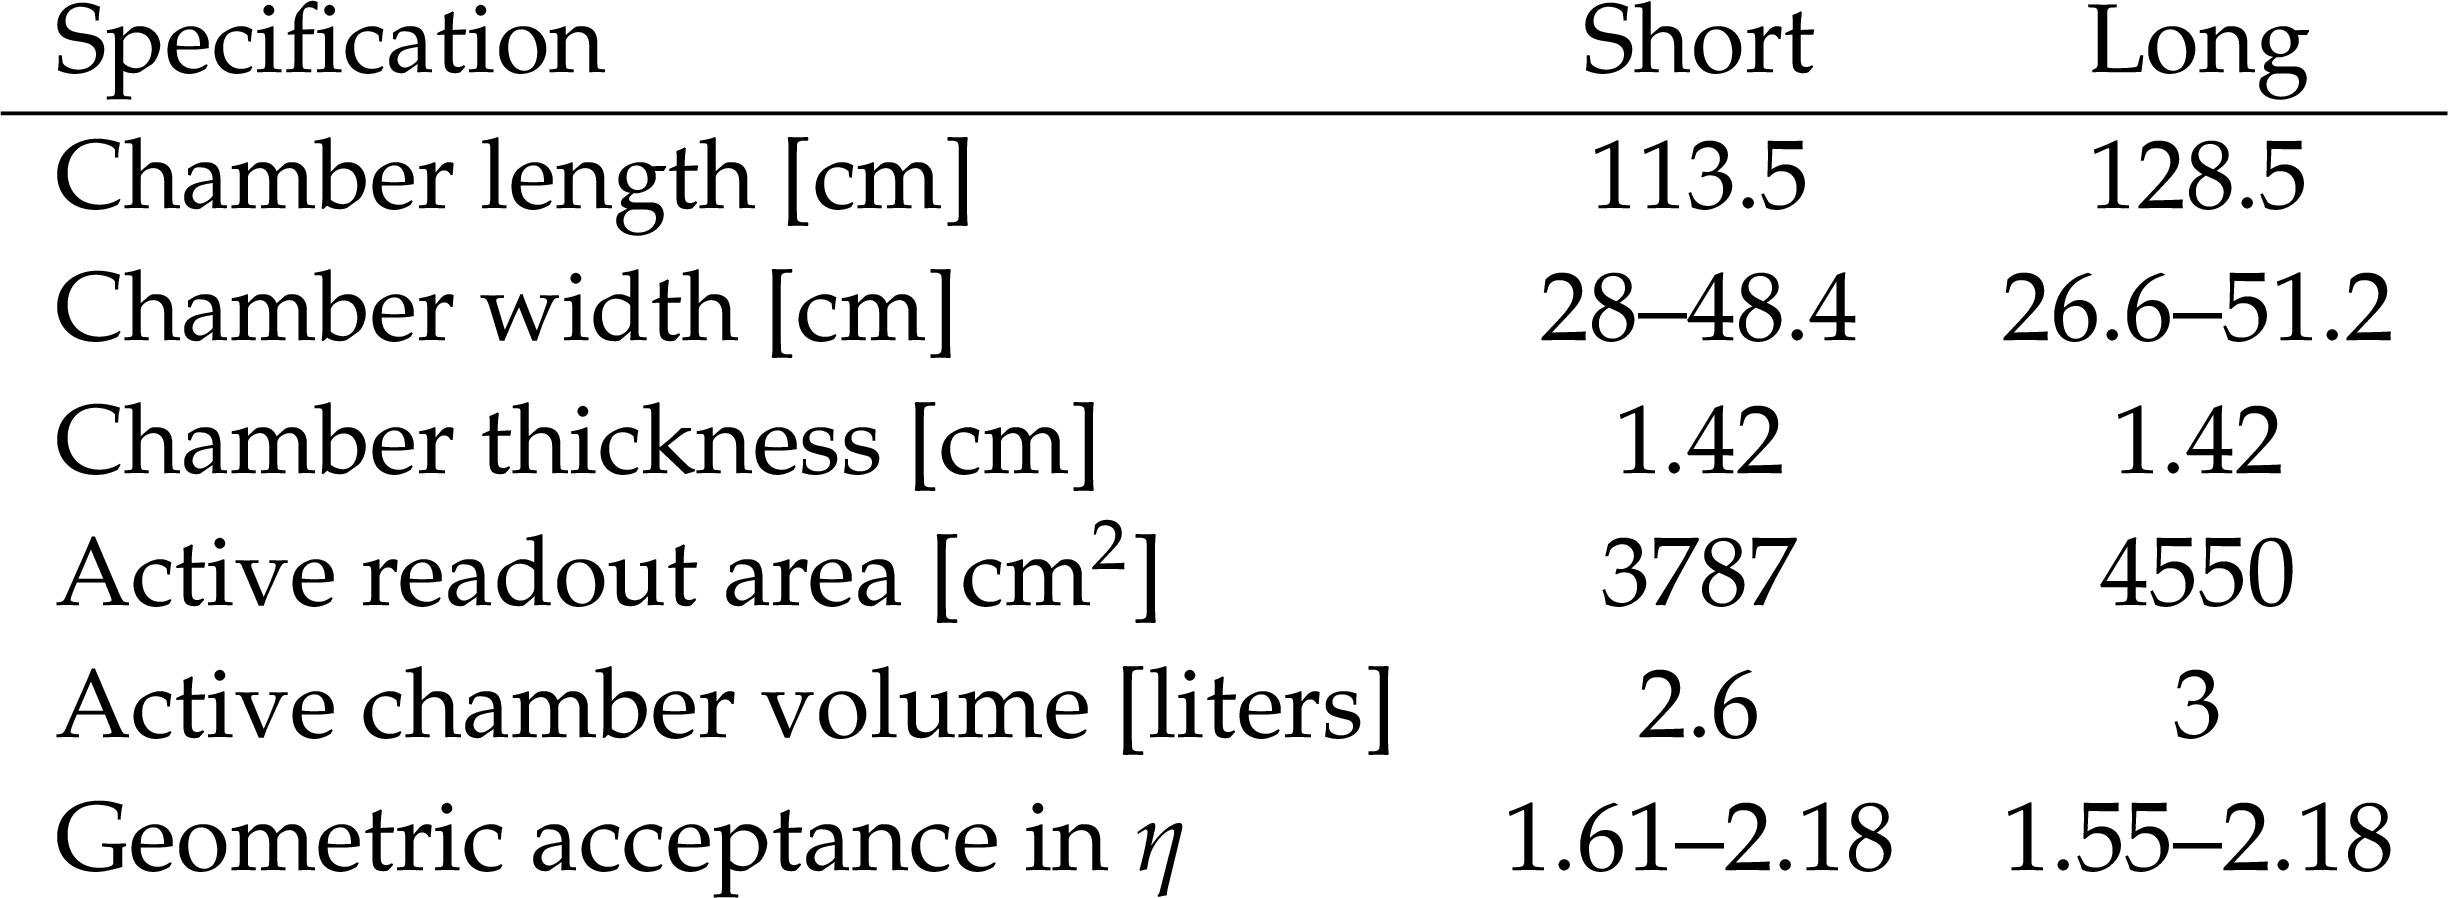
png pdf |
Table 10:
Dimensions and specifications of the GE1/1 short and long chambers, from Ref. [124]. |
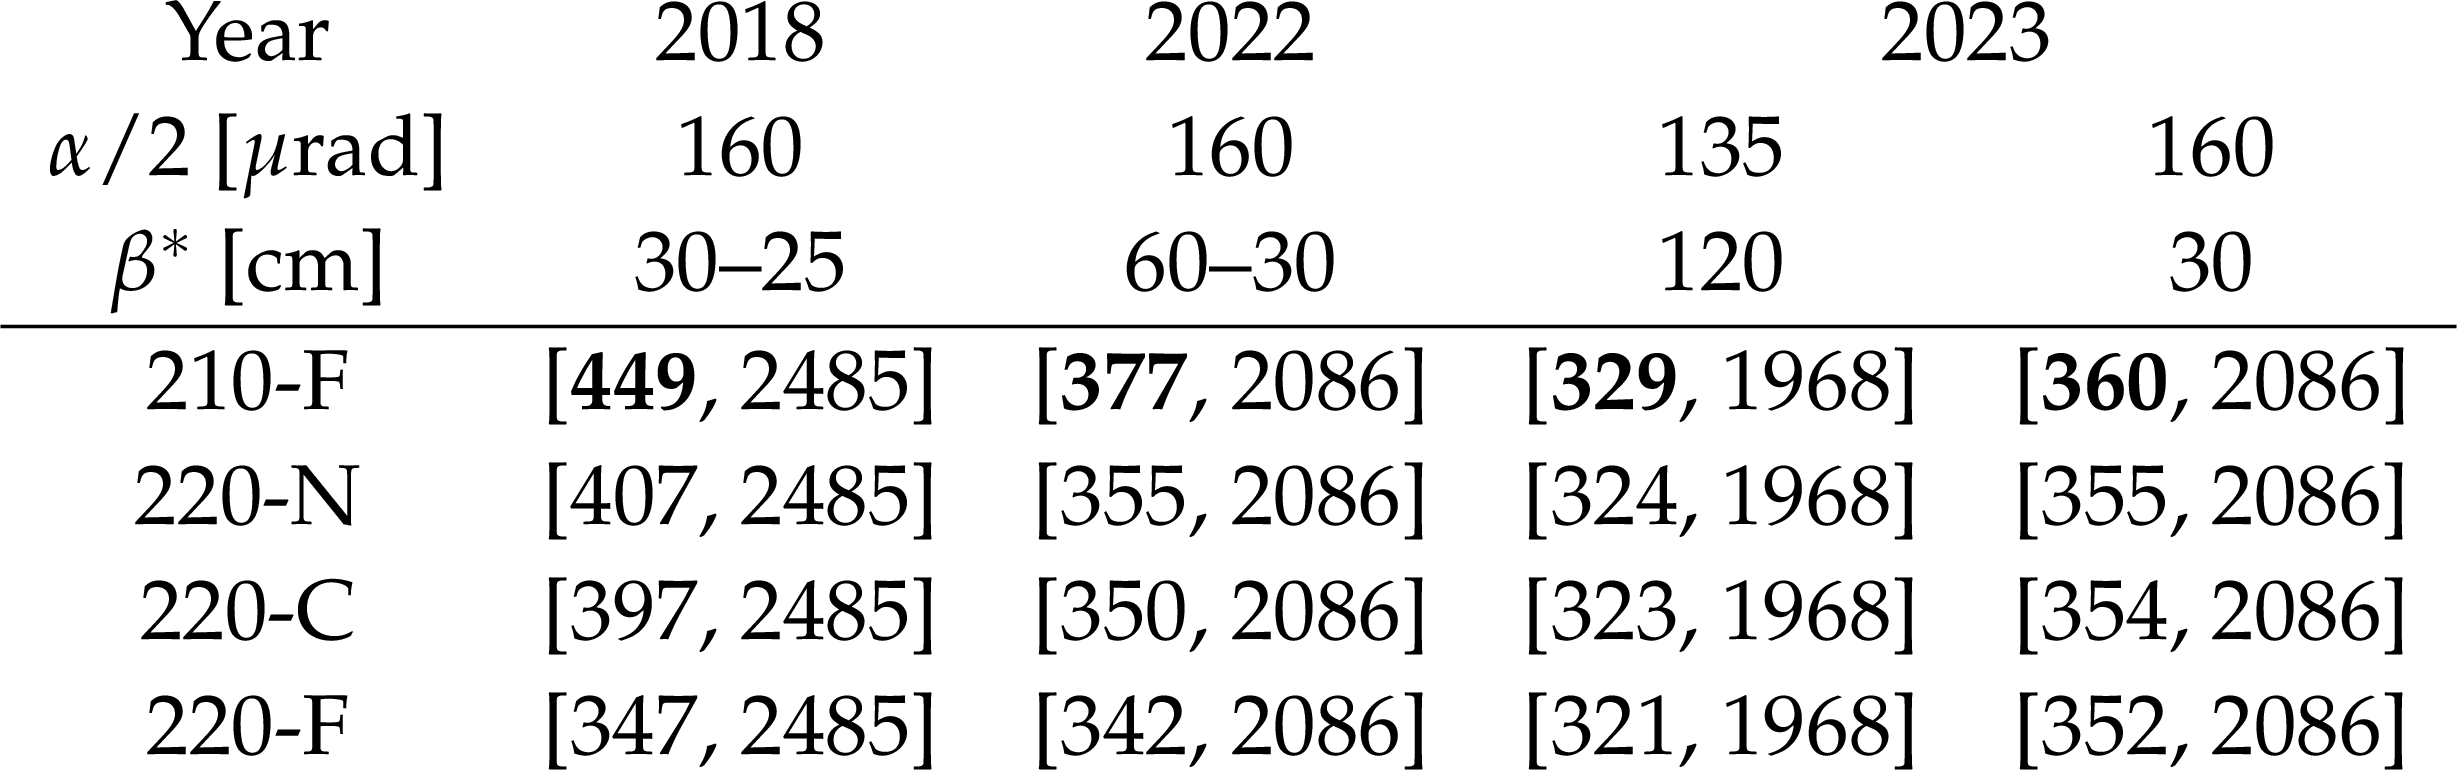
png pdf |
Table 11:
Accepted central mass range, $ [M_{\text{min}}, M_{\text{max}}] $ (in GeVns), for each RP at the beginning and at the end of the levelling trajectory in 2018 ($ \sqrt{s}= $ 13 TeV), and 2022 and 2023 ($ \sqrt{s}= $ 13.6 TeV), for the collimation schemes laid out in the text. Due to the coincidence requirement, the RP with the highest $ M_{\text{min}} $ (typeset in bold face) defines the spectrometer acceptance. |
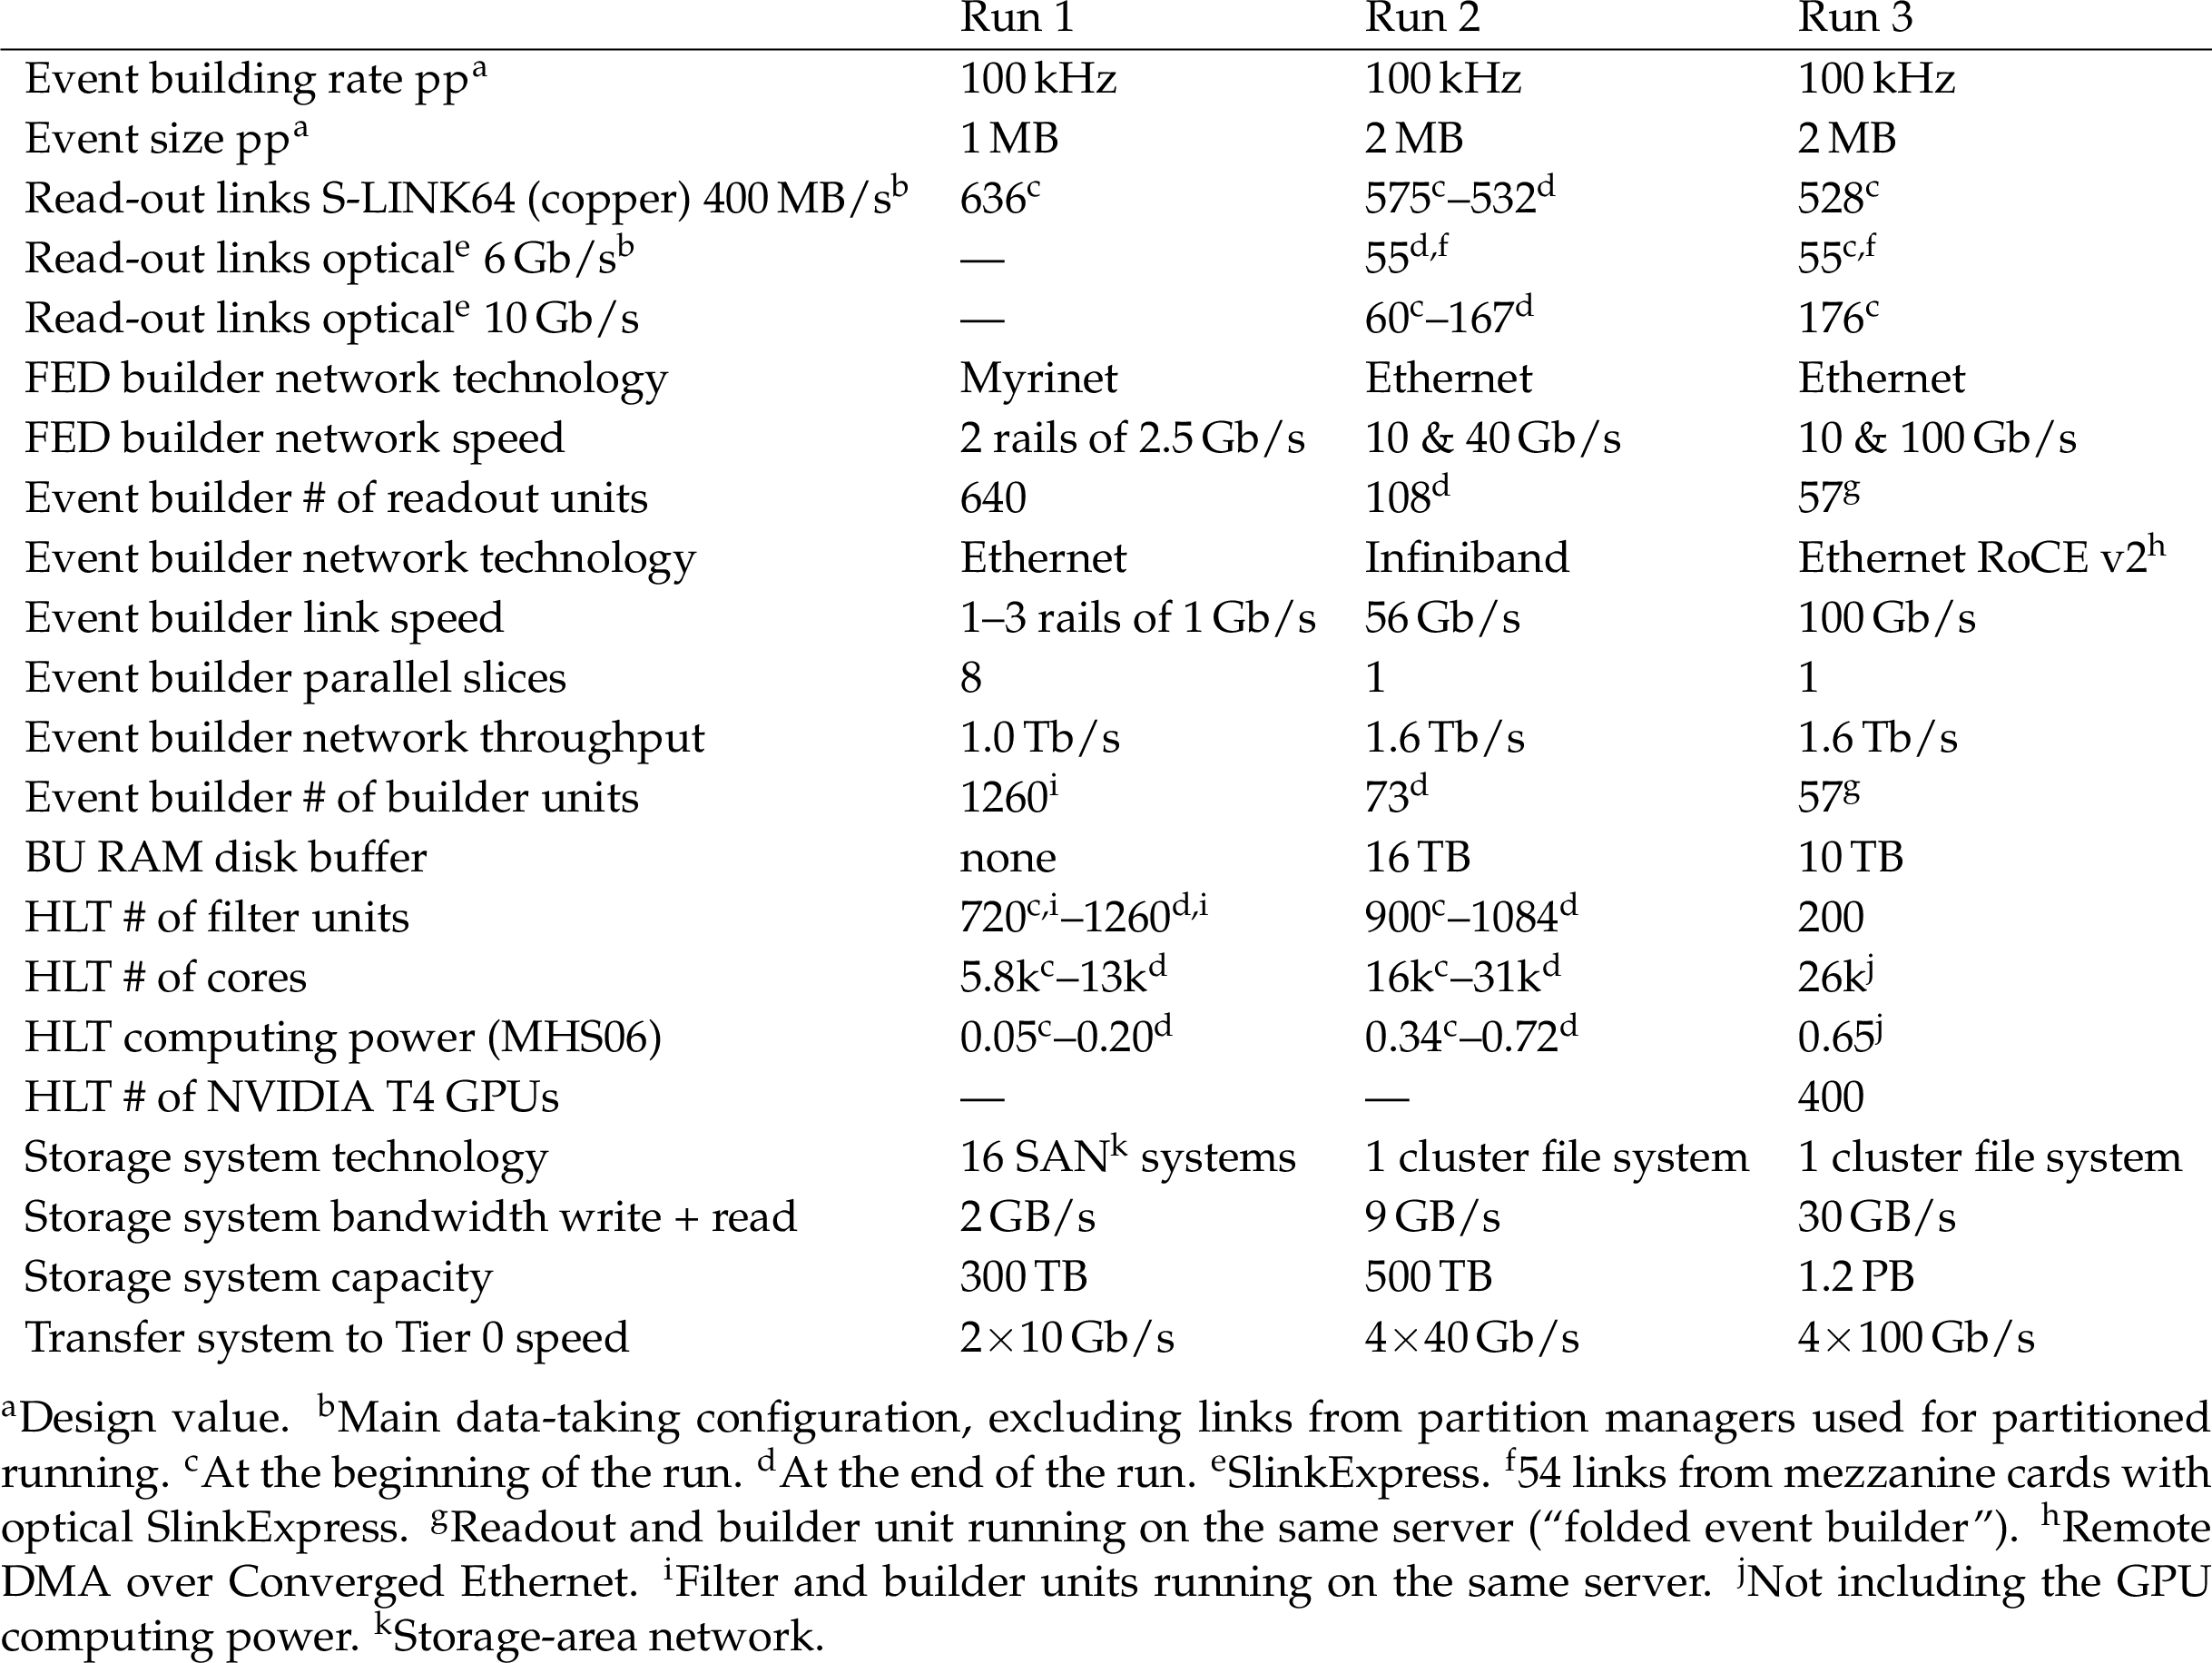
png pdf |
Table 12:
Key parameters of the CMS DAQ system in Run 1 [1, 225], Run 2 [226, 227], and Run 3. |
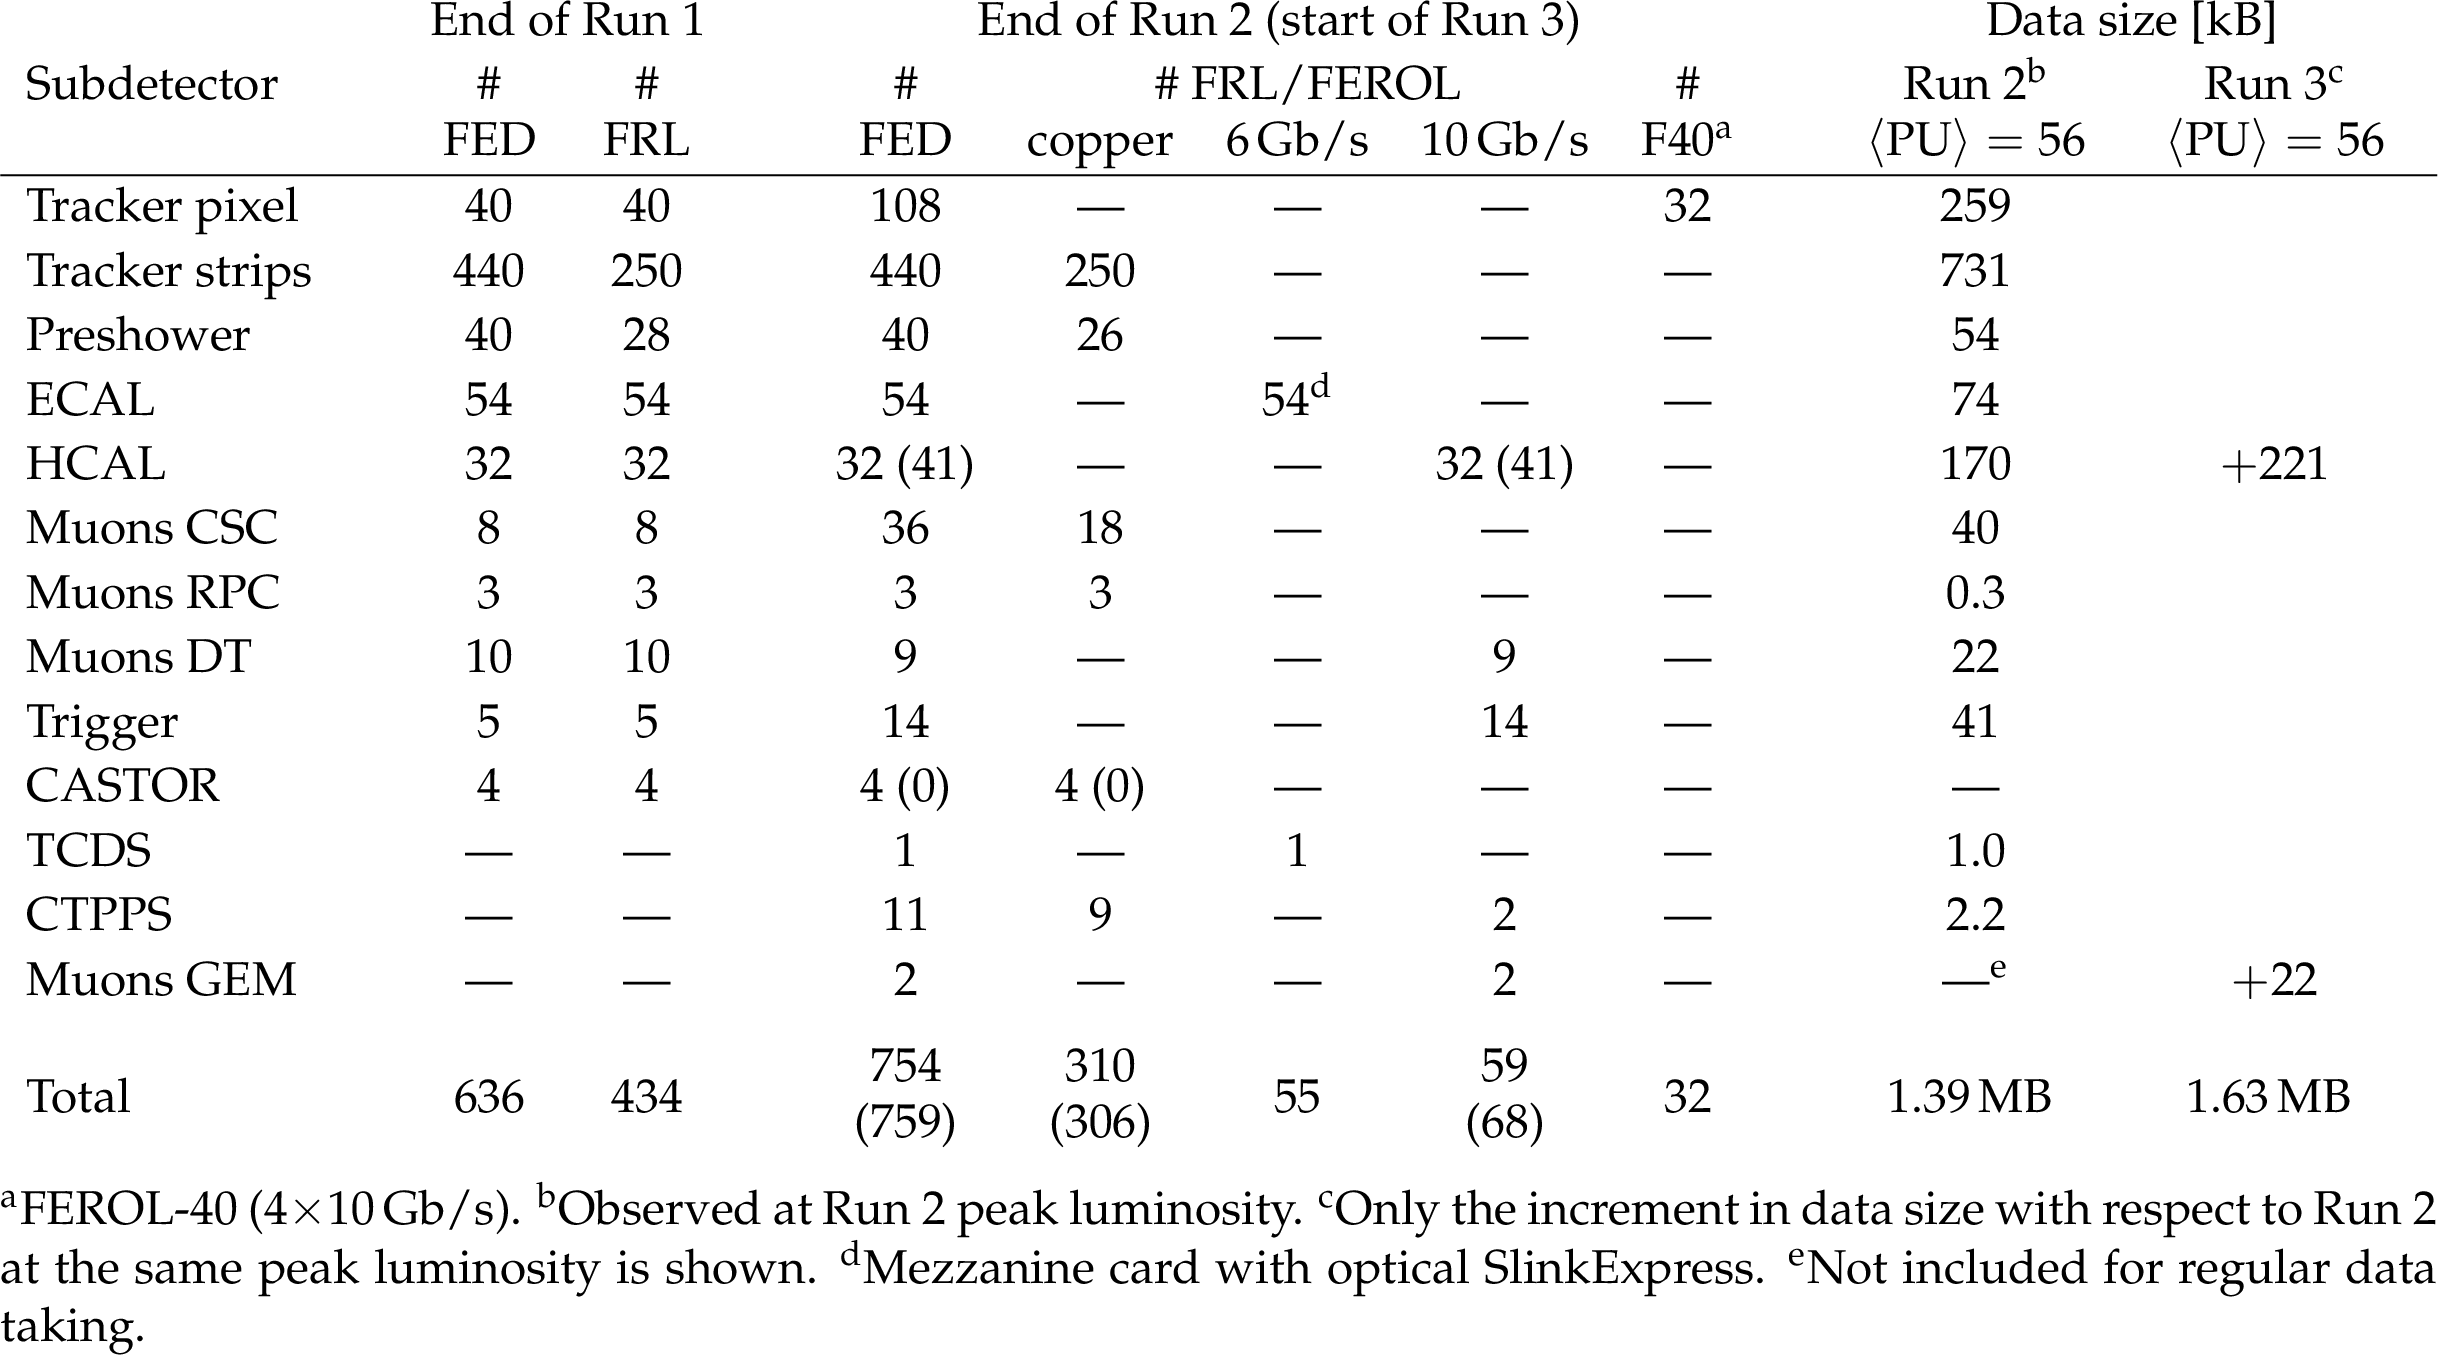
png pdf |
Table 13:
Subdetector readout configuration. |
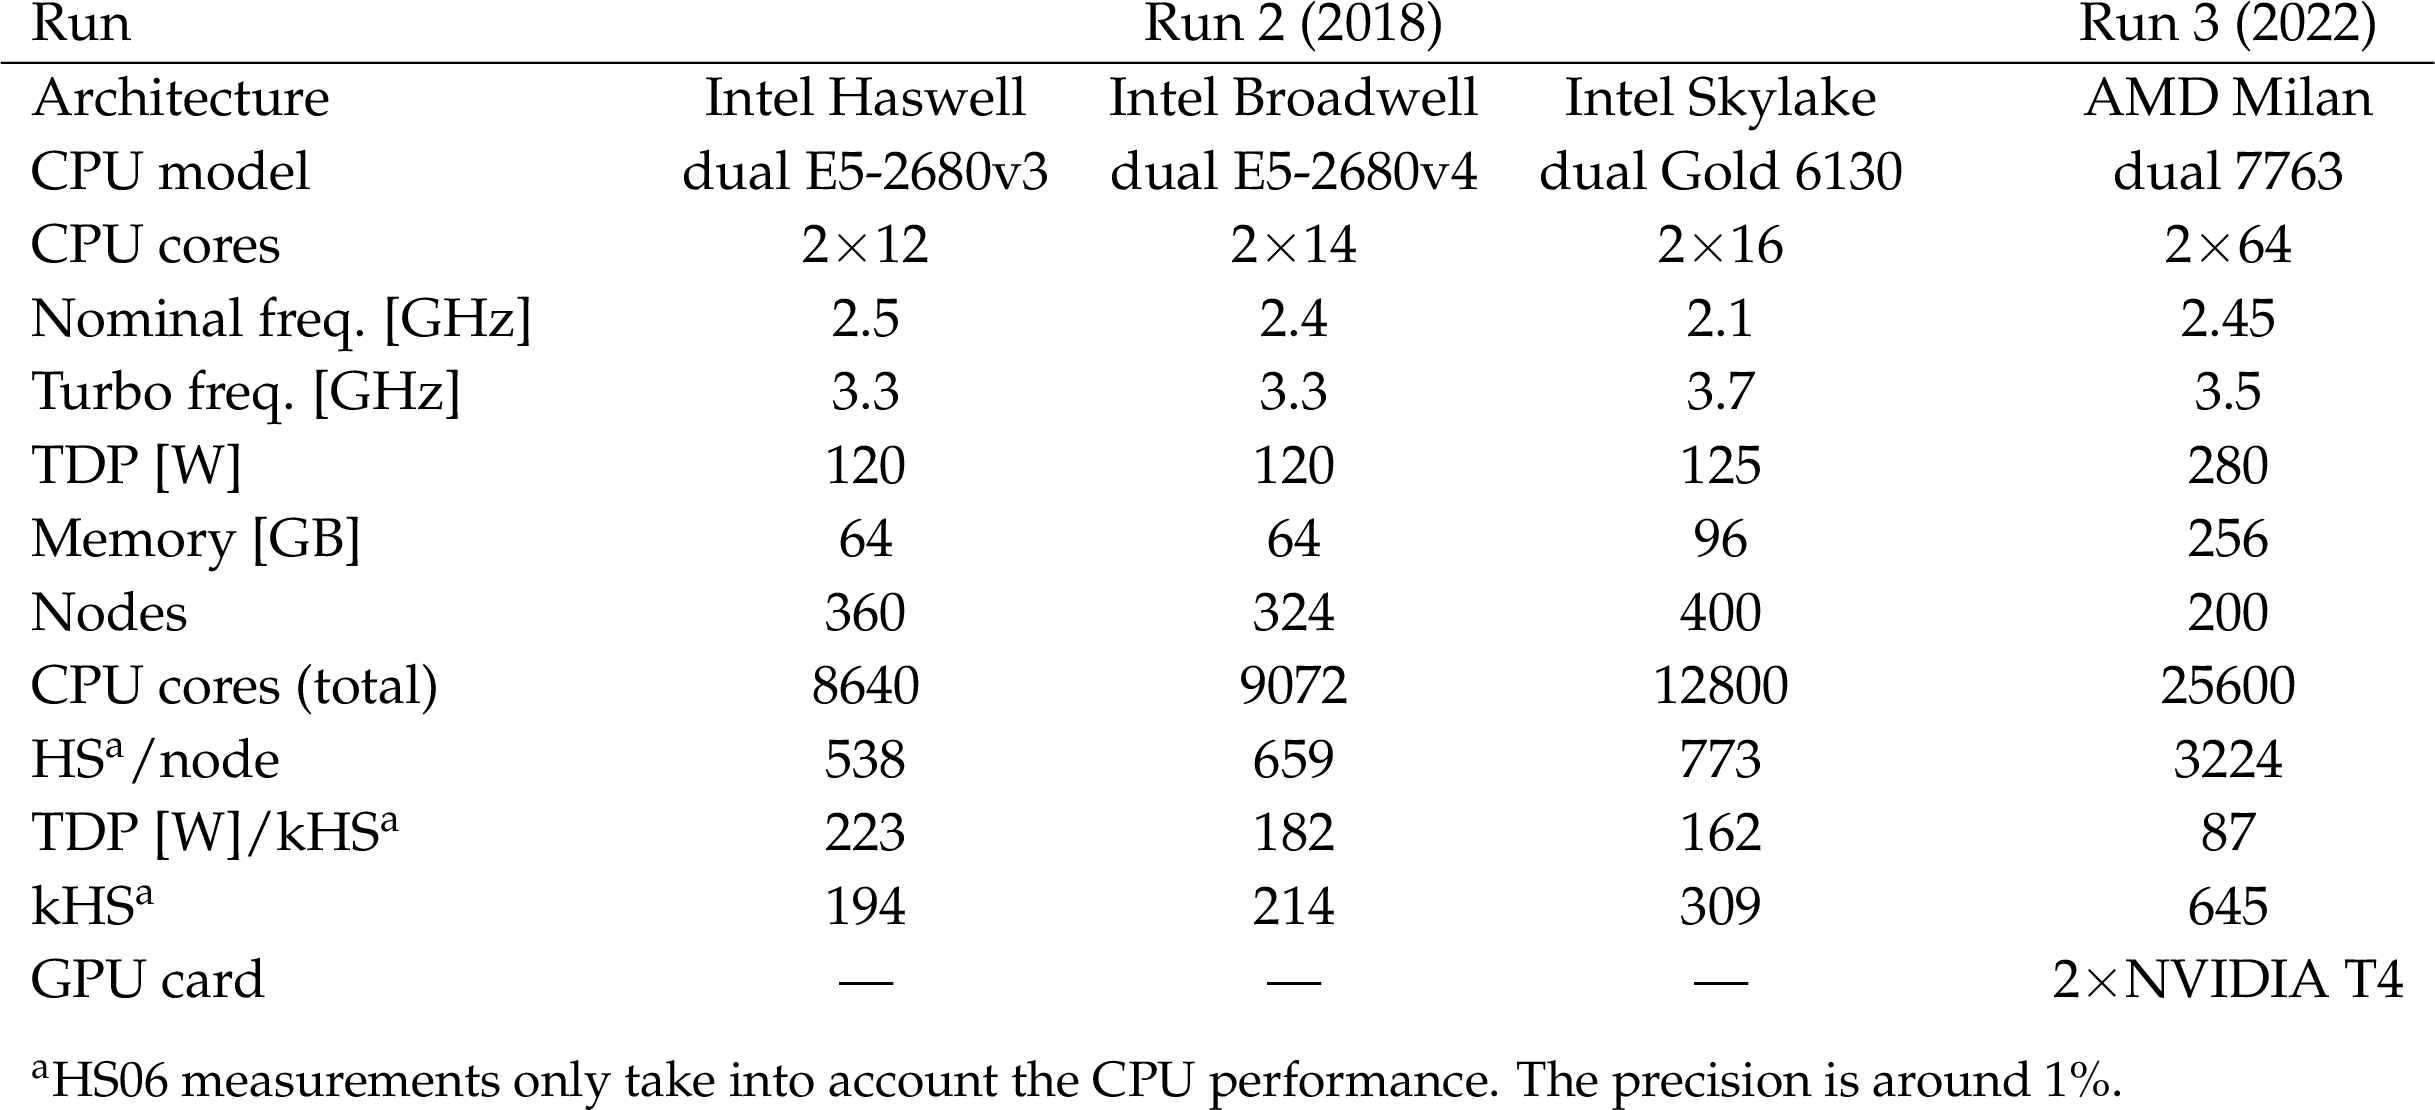
png pdf |
Table 14:
Summary of the HLT filter farm unit specifications, thermal design power, and performance based on HS06 in the final year of Run 2 and first year of Run 3. |

png pdf |
Table 15:
HLT thresholds and rates of some generic triggers in the Run 3 HLT menu. The rates were obtained from measurements during an LHC fill in November 2022 and have been scaled to a luminosity of 2.0 $ \times$ 10$^{34}$ cm$^{2}$s$^{-1}$. |
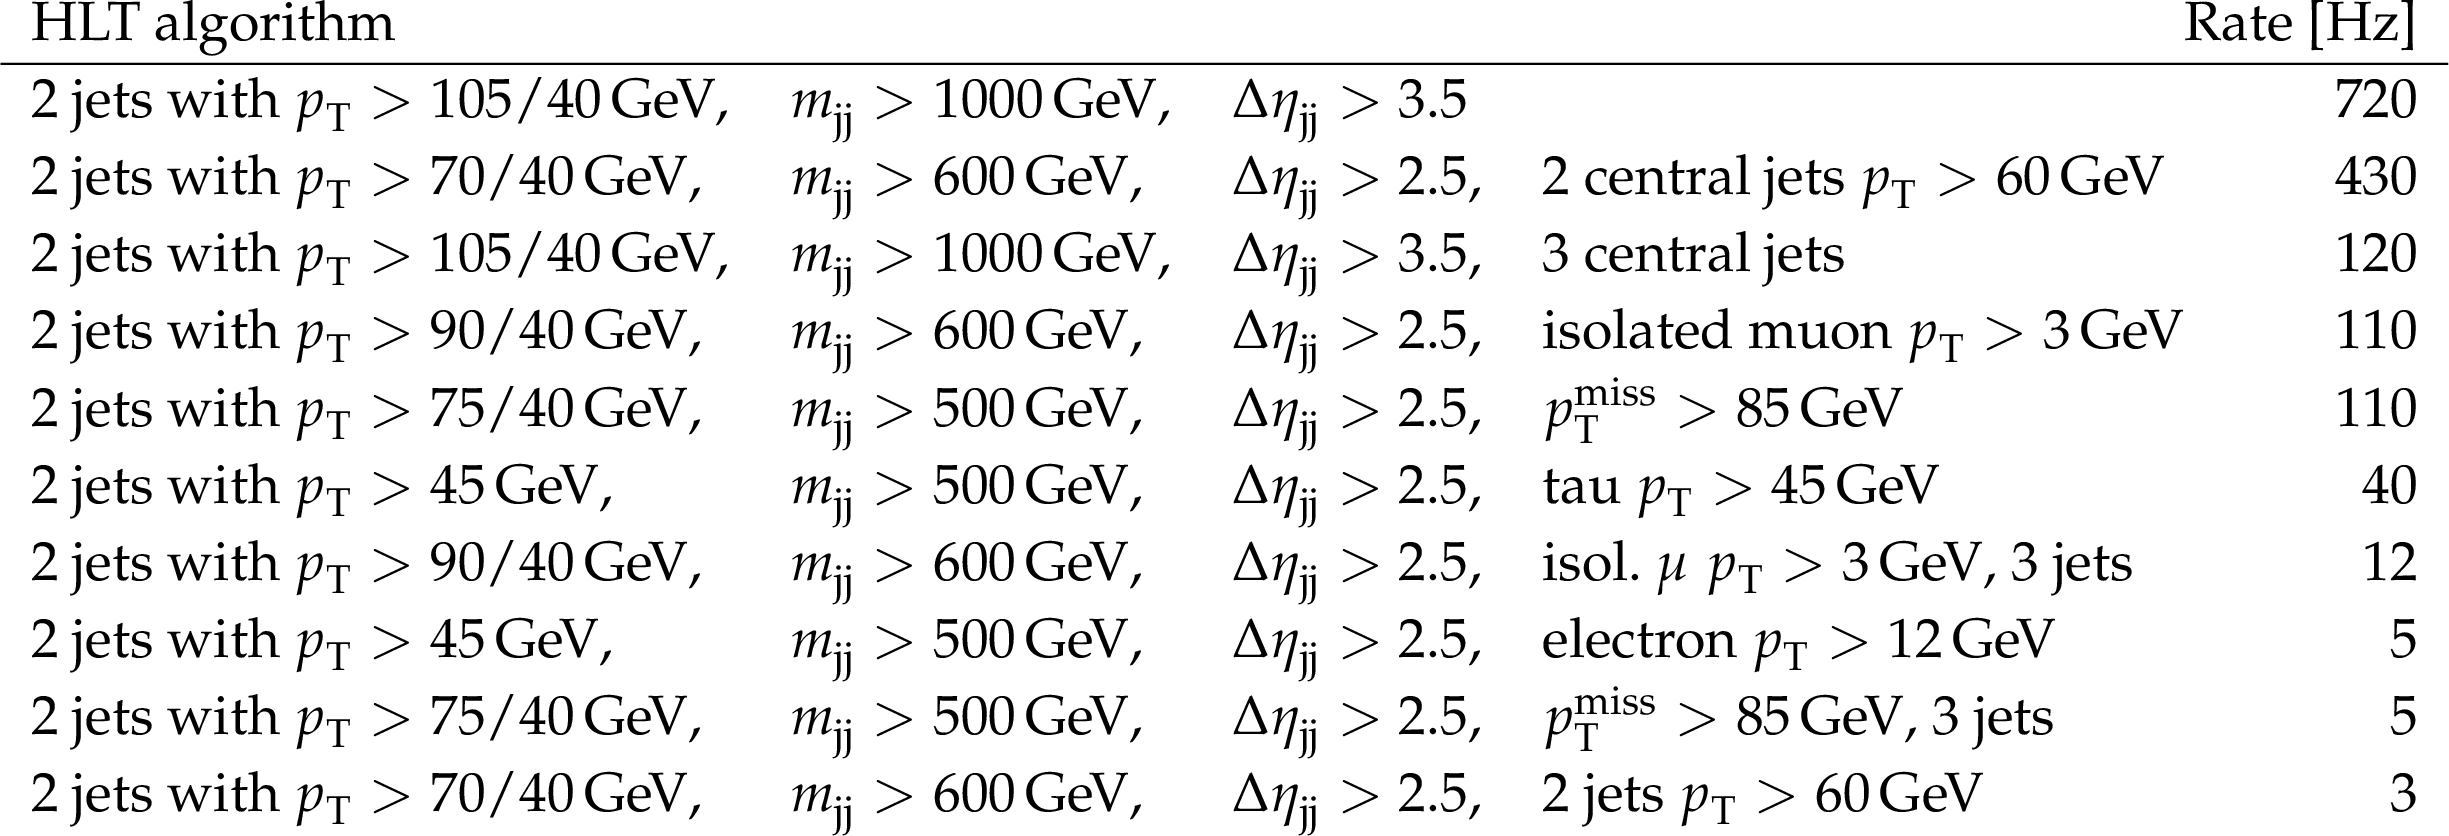
png pdf |
Table 16:
HLT thresholds and rates of the VBF triggers, as obtained from measurements during an LHC fill in June 2023 at an average instantaneous luminosity of 2.0 $ \times$ 10$^{34}$ cm$^{2}$s$^{-1}$, corresponding to a pileup of 61. |

png pdf |
Table 17:
Description of the data tiers regularly produced by centrally managed workflows. The ROOT framework is used to write and read the data. |
| Summary |
| Since the beginning of the LHC operation in 2009, the CMS detector has undergone a number of changes and upgrades, adapting the experiment to operating conditions at luminosities well beyond the original design. In 2022, the LHC Run 3 began and CMS successfully recorded its first 40 fb$ ^{-1} $ of proton-proton data at a center-of-mass energy of 13.6 TeV with an operation efficiency of 92%. This paper describes the modifications, as installed and commissioned for LHC Run 3. The upgraded pixel tracking detector was installed in early 2017. In the new detector, the number of barrel layers was increased from three to four, and the number of disks in each endcap from two to three, whereas the material budget was reduced, leading to a better tracking performance up to an absolute pseudorapidity of 3.0 for pixel tracks. The upgrade also involved a new readout chip enabling increased hit detection efficiencies at higher occupancy. In the electromagnetic calorimeter, measures were taken to improve the monitoring and calibration of effects caused by irradiation, leading to a loss in the PbWO$_4$ crystal transparency and an increase of the leakage current in the avalanche photodiodes. In the second long shutdown (LS2) the calibration algorithms were refined to identify and remove spurious spike signals and to determine time-dependent correction factors for the laser monitoring system. The upgrade of the hadron calorimeter included new readout electronics with finer granularity, leading to an increase in the number of channels and longitudinal segmentation. The previous generation of photosensors was replaced by silicon photomultipliers, which measure the scintillator light output with a better signal-to-noise ratio. In the muon system, a gas electron multiplier (GEM) detector, consisting of four gas gaps separated by three GEM foils, was added in the endcaps. The other subsystems, drift tubes (DT), cathode strip chambers (CSC), and resistive-plate chambers (RPC), underwent several upgrades. In the DT, the muon trigger logic was replaced by a new data concentrator based on $ \mu $TCA architecture. The top of CMS was covered with a neutron shield to reduce the background in the top external DT chambers. An outer ring of CSCs (ME4/2) was added in LS1, and in view of the High-Luminosity LHC, the bulk of the CSC electronics upgrades that required chamber access were performed already during LS2. An outer rings of the RPC chambers in station four (RE4/2 and RE4/3) were added as well. The endcap muon track finder of the L1 trigger was upgraded to utilize GEM-CSC joint track segments to optimize the final track reconstruction and resolution at the trigger level. The precision proton spectrometer was upgraded significantly. Its tracker radiation-damaged sensors and chips were replaced. The mechanics of the detector, as well as the front-end electronics, were completely redesigned to add a novel internal motion system designed to mitigate the effects of radiation damage. In the timing system a second station was installed in each arm. All detector modules were replaced by new double-diamond modules with the aim of further improving the timing resolution. In the beam radiation instrumentation and luminosity system, new versions of the pixel luminosity telescope (PLT), the fast beam conditions monitor (BCM1F), and the beam conditions monitor for losses (BCML) were installed for Run 3. To cope with increasing instantaneous luminosities, the CMS data acquisition (DAQ) system underwent multiple upgrades. The backend technology was gradually moved to the more powerful $ \mu $TCA standard. A new optical readout link with a higher bandwidth of 10 Gb/s was developed. The bulk of the DAQ system downstream from the custom readout benefited from advances in technology to achieve a much more compact design, while doubling the event building bandwidth. The first level (L1) trigger, composed of custom hardware processors, uses information from the calorimeters and muon detectors to select events at a rate of up to 110 kHz within a fixed latency of about 4 $\mu$s. The developments in the L1 trigger mostly focused on the addition of dedicated triggers that became possible due to enhanced capabilities of the global trigger logic and increased trigger information delivered by the calorimeters and muon systems. Among other applications, new triggers for long-lived particle signatures were implemented. The addition of a 40 MHz scouting system that receives data from both the calorimeter and muon systems, further broadens the physics reach of CMS. The high-level trigger (HLT) performs the second stage of event filtering and accepts events at a sustained rate of the order of 5 kHz. Since Run 3 began, an additional 30 kHz of HLT scouting data is recorded. Since 2016, the HLT has been operated using multithreaded event processing software, minimizing memory requirements through reduction of the number of processes concurrently running. For Run 3, GPUs were successfully deployed in the HLT. Substantial improvements were achieved in the physics performance and speed of the software, as well as in the computing infrastructure. Some of the major changes are: support for multithreaded processes and utilization of GPUs; direct remote data access; and usage of high-performance computing centers. New tools such as Rucio for data management were adopted with future data rates in mind. Considerable effort was put into the automation of the workflows and the validation of the software. Physics analyses have been moved to smaller and smaller formats for centrally produced and experiment-wide shared data samples, the most recent of which is the NanoAOD. The development of the CMS detector, as described in this paper, constitutes a solid basis for future data taking. |
| References | ||||
| 1 | CMS Collaboration | The CMS experiment at the CERN LHC | JINST 3 (2008) S08004 | |
| 2 | CMS Collaboration | Observation of a new boson at a mass of 125 GeV with the CMS experiment at the LHC | PLB 716 (2012) 30 | CMS-HIG-12-028 1207.7235 |
| 3 | CMS Collaboration | Observation of a new boson with mass near 125 GeV in pp collisions at $ \sqrt{s}= $ 7 and 8 TeV | JHEP 06 (2013) 081 | CMS-HIG-12-036 1303.4571 |
| 4 | ATLAS Collaboration | Observation of a new particle in the search for the standard model Higgs boson with the ATLAS detector at the LHC | PLB 716 (2012) 1 | 1207.7214 |
| 5 | CMS Collaboration | Performance of the CMS Level-1 trigger in proton-proton collisions at $ \sqrt{s}= $ 13 TeV | JINST 15 (2020) P10017 | CMS-TRG-17-001 2006.10165 |
| 6 | CMS Collaboration | The CMS trigger system | JINST 12 (2017) P01020 | CMS-TRG-12-001 1609.02366 |
| 7 | CMS Collaboration | Performance of the CMS electromagnetic calorimeter in pp collisions at $ \sqrt{s}= $ 13 TeV | To be submitted to JINST, 2023 | |
| 8 | CMS Collaboration | Performance of electron reconstruction and selection with the CMS detector in proton-proton collisions at $ \sqrt{s}= $ 8 TeV | JINST 10 (2015) P06005 | CMS-EGM-13-001 1502.02701 |
| 9 | CMS Collaboration | Performance of the CMS muon detector and muon reconstruction with proton-proton collisions at $ \sqrt{s}= $ 13 TeV | JINST 13 (2018) P06015 | CMS-MUO-16-001 1804.04528 |
| 10 | CMS Collaboration | Performance of photon reconstruction and identification with the CMS detector in proton-proton collisions at $ \sqrt{s}= $ 8 TeV | JINST 10 (2015) P08010 | CMS-EGM-14-001 1502.02702 |
| 11 | CMS Collaboration | Description and performance of track and primary-vertex reconstruction with the CMS tracker | JINST 9 (2014) P10009 | CMS-TRK-11-001 1405.6569 |
| 12 | CMS and TOTEM Collaborations | Proton reconstruction with the CMS-TOTEM precision proton spectrometer | Accepted by JINST, 2022 | 2210.05854 |
| 13 | S. Yammine, G. Le Godec, and H. Thiesen | Study report for the new free wheeling thyristors system for the upgrade of the CMS solenoid power converter | CERN Report, 2021 EDMS Document 184565 (2021) 9 |
|
| 14 | CMS Collaboration | CMS technical design report for the pixel detector upgrade | CMS Technical Proposal CERN-LHCC-2012-016, CMS-TDR-011, 2012 CDS |
|
| 15 | CMS Tracker Group Collaboration | The CMS Phase 1 pixel detector upgrade | JINST 16 (2021) P02027 | 2012.14304 |
| 16 | ROSE Collaboration, G. Lindström et al. | Radiation hard silicon detectors---developments by the RD48 (ROSE) collaboration | in Proc. 4th International Symposium on Development and Application of Semiconductor Tracking Detectors: Hiroshima, Japan, 2001 NIM A 466 (2001) 308 |
|
| 17 | T. Rohe et al. | Fluence dependence of charge collection of irradiated pixel sensors | in Proc. 5th International Conference on Radiation Effects on Semiconductor Materials Detectors and Devices (RESMDD 04): Florence, Italy, 2005 NIM A 552 (2005) 232 |
physics/0411214 |
| 18 | H. C. K ä stli | Frontend electronics development for the CMS pixel detector upgrade | in Proc. 6th International Workshop on Semiconductor Pixel Detectors for Particles and Imaging (PIXEL): Inawashiro, Japan, 2013 NIM A 731 (2013) 88 |
|
| 19 | R. Horisberger | Readout architectures for pixel detectors | in Proc. 1st International Workshop on Seminconductor Pixel Detectors for Particles and X-Rays (PIXEL ): Genoa, Italy, 2000 NIM A 465 (2000) 148 |
|
| 20 | CMS Tracker Group Collaboration | The DAQ and control system for the CMS Phase 1 pixel detector upgrade | JINST 14 (2019) P10017 | |
| 21 | P. Moreira and A. Marchioro | QPLL: a quartz crystal based PLL for jitter filtering applications in LHC | in Proc. 9th Workshop on Electronics for LHC Experiments: Amsterdam, Netherlands, 2003 September 2 (2003) 9 |
|
| 22 | C. Nägeli | Analysis of the rare decay $ {\mathrm{B}_{s}^{0}\to\mu^{+}\mu^{-}} $ using the Compact Muon Solenoid experiment at CERN's Large Hadron Collider | PhD thesis, Eidgenössische Technische Hochschule, Zürich, 2013 link |
|
| 23 | M. Pesaresi et al. | The FC7 AMC for generic DAQ & control applications in CMS | in Proc. Topical Workshop on Electronics for Particle Physics (TWEPP14): Aix en Provence, France, 2015 JINST 10 (2015) C03036 |
|
| 24 | E. Hazen et al. | The AMC13XG: a new generation clock/timing/DAQ module for CMS MicroTCA | in Proc. Topical Workshop on Electronics for Particle Physics (TWEPP13): Perugia, Italy, 2013 JINST 8 (2013) C12036 |
|
| 25 | S. Michelis et al. | DC-DC converters in 0.35 $\mu$m CMOS technology | in Proc. Topical Workshop on Electronics for Particle Physics (TWEPP11): Vienna, Austria, 2012 JINST 7 (2012) C01072 |
|
| 26 | L. Feld et al. | The DC-DC conversion power system of the CMS Phase 1 pixel upgrade | in Proc. Topical Workshop on Electronics for Particle Physics (TWEPP14): Aix en Provence, France, 2015 JINST 10 (2015) C01052 |
|
| 27 | L. Feld et al., on behalf of the CMS Collaboration | Experience from design, prototyping and production of a DC-DC conversion powering scheme for the CMS Phase 1 pixel upgrade | in Proc. Topical Workshop on Electronics for Particle Physics (TWEPP15): Lisbon, Portugal, 2016 JINST 11 (2016) C02033 |
|
| 28 | C. Paillard, C. Ljuslin, and A. Marchioro | The CCU25: a network oriented communication and control unit integrated circuit in a 0.25 $\mu$m CMOS technology | in Proc. 8th Workshop on Electronics for LHC Experiments: Colmar, France, 2002 link |
|
| 29 | F. Faccio, S. Michelis, and G. Ripamonti | Summary of measurements on FEAST2 modules to understand the failures observed in the CMS pixel system | CERN Technical Report, 2018 link |
|
| 30 | P. Tropea et al. | Advancements and plans for the LHC upgrade detector thermal management with CO$_2$ evaporative cooling | in Proc. 14th Pisa Meeting on Advanced Detectors: Frontier Detectors for Frontier Physics (Pisameet): La Biodola, Italy, 2019 NIM A 936 (2019) 644 |
|
| 31 | M. J. French et al. | Design and results from the APV25, a deep sub-micron CMOS front-end chip for the CMS tracker | in Proc. 4th International Symposium on Development and Application of Semiconductor Tracking Detectors: Hiroshima, Japan, 2001 NIM A 466 (2001) 359 |
|
| 32 | CMS Collaboration | Operation and performance of the CMS silicon strip tracker with proton-proton collisions at the CERN LHC | To be submitted to JINST, 2023 | |
| 33 | CMS Collaboration | Silicon strip tracker performance results 2018 | CMS Detector Performance Note CMS-DP-2018-052, 2018 CDS |
|
| 34 | C.~Barth | Performance of the CMS tracker under irradiation | PhD thesis, Karlsruher Institut für Technologie, CERN-THESIS-2013-410, IEKP-KA-2013-01, 2013 link |
|
| 35 | K. Deiters et al. | Properties of the most recent avalanche photodiodes for the CMS electromagnetic calorimeter | in Proc. 2nd International Conference on New Developments in Photodetection (NDIP99): Beaune, France, 2000 NIM A 442 (2000) 193 |
|
| 36 | F. Addesa and F. Cavallari | Performance prospects for the CMS electromagnetic calorimeter barrel avalanche photodiodes for LHC Phase 1 and Phase 2: Radiation hardness and longevity | in Proc. 7th International Conference on New Developments in Photodetection (NDIP14): Tours, France, 2015 NIM A 787 (2015) 114 |
|
| 37 | CMS ECAL Collaboration | Radiation hardness qualification of PbWO$_4$ scintillation crystals for the CMS electromagnetic calorimeter | JINST 5 (2010) P03010 | 0912.4300 |
| 38 | R. Benetta et al. | The CMS ECAL readout architecture and the clock and control system | in 11th International Conference on Calorimetry in High-Energy Physics (CALOR ): Perugia, Italy, 2004 Proc. 1 (2004) 1 |
|
| 39 | CMS Collaboration | Reconstruction of signal amplitudes in the CMS electromagnetic calorimeter in the presence of overlapping proton-proton interactions | JINST 15 (2020) P10002 | CMS-EGM-18-001 2006.14359 |
| 40 | CMS ECAL Collaboration | Reconstruction of the signal amplitude of the CMS electromagnetic calorimeter | EPJC 46 (2006) 23 | |
| 41 | CMS Collaboration | Time reconstruction and performance of the CMS electromagnetic calorimeter | JINST 5 (2010) T03011 | CMS-CFT-09-006 0911.4044 |
| 42 | P. Paganini on behalf of the CMS Collaboration | CMS electromagnetic trigger commissioning and first operation experiences | in Proc. 13th International Conference on Calorimetry in High Energy Physics (CALOR08): Pavia, Italy, 2009 J. Ph. Conf. Ser. 160 (2009) 012062 |
|
| 43 | M. Hansen | The new readout architecture for the CMS ECAL | in Proc. 9th Workshop on Electronics for LHC Experiments: Amsterdam, Netherlands, 2003 CERN-2003-006 |
|
| 44 | D. A. Petyt on behalf of the CMS Collaboration | Anomalous APD signals in the CMS electromagnetic calorimeter | in Proc. 6th International Conference on New Developments in Photodetection (NDIP11): Lyon, France, 2013 NIM A 695 (2013) 293 |
|
| 45 | CMS Collaboration | Energy calibration and resolution of the CMS electromagnetic calorimeter in pp collisions at $ \sqrt{s}= $ 7 TeV | JINST 8 (2013) P09009 | CMS-EGM-11-001 1306.2016 |
| 46 | F. Thiant et al., on behalf of the CMS Collaboration | New development in the CMS ECAL Level-1 trigger system to meet the challenges of LHC Run 2 | in Proc. Topical Workshop on Electronics for Particle Physics (TWEPP18): Antwerp, Belgium, 2018 link |
|
| 47 | CMS Collaboration | Search for long-lived particles using delayed photons in proton-proton collisions at $ \sqrt{s}= $ 13 TeV | PRD 100 (2019) 112003 | CMS-EXO-19-005 1909.06166 |
| 48 | CMS Collaboration | The hadron calorimeter | CMS Technical Proposal CERN-LHCC-97-31, CMS-TDR-2, 1997 CDS |
|
| 49 | CMS HCAL Collaboration | Design, performance, and calibration of CMS hadron-barrel calorimeter wedges | EPJC 55 (2008) 159 | |
| 50 | CMS HCAL Collaboration | Design, performance, and calibration of CMS forward calorimeter wedges | EPJC 53 (2008) 139 | |
| 51 | CMS HCAL Collaboration | Design, performance, and calibration of the CMS hadron-outer calorimeter | EPJC 57 (2008) 653 | |
| 52 | T. Zimmerman and J. R. Hoff | The design of a charge integrating, modified floating point ADC chip | IEEE J. Sol. State Circ. 39 (2004) 895 | |
| 53 | A. Baumbaugh et al. | QIE10: a new front-end custom integrated circuit for high-rate experiments | in Proc. Topical Workshop on Electronics for Particle Physics (TWEPP13): Perugia, Italy, 2014 JINST 9 (2014) C01062 |
|
| 54 | T. Roy et al. | QIE: performance studies of the next generation charge integrator | in Proc. Topical Workshop on Electronics for Particle Physics (TWEPP14): Aix en Provence, France, 2015 JINST 10 (2015) C02009 |
|
| 55 | D. Hare et al. | First large volume characterization of the QIE10/11 custom front-end integrated circuits | in Proc. Topical Workshop on Electronics for Particle Physics (TWEPP15): Lisbon, Portugal, 2016 JINST 11 (2016) C02052 |
|
| 56 | CMS Collaboration | CMS technical design report for the Phase 1 upgrade of the hadron calorimeter | CMS Technical Proposal CERN-LHCC-2012-015, CMS-TDR-010, 2012 CDS |
|
| 57 | CMS Collaboration | The Phase 2 upgrade of the CMS barrel calorimeters | CMS Technical Proposal CERN-LHCC-2017-011, CMS-TDR-015, 2017 CDS |
|
| 58 | CMS Collaboration | Identification and filtering of uncharacteristic noise in the CMS hadron calorimeter | JINST 5 (2010) T03014 | CMS-CFT-09-019 0911.4881 |
| 59 | R. A. Shukla et al. | Microscopic characterisation of photodetectors used in the hadron calorimeter of the Compact Muon Solenoid experiment | in Proc. 6th International Workshop on X-ray Optics and Metrology (IWXM ): Hsinchu, Taiwan, 2019 Rev. Sci. Instrum. 90 (2019) 023303 |
|
| 60 | CMS Collaboration | Measurements of dose-rate effects in the radiation damage of plastic scintillator tiles using silicon photomultipliers | JINST 15 (2020) P06009 | CMS-PRF-18-003 2001.06553 |
| 61 | P. Cushman, A. Heering, and A. Ronzhin | Custom HPD readout for the CMS HCAL | in Proc. 2nd International Conference on New Developments in Photodetection (NDIP99): Beaune, France, 2000 NIM A 442 (2000) 289 |
|
| 62 | A. Heering et al. | Parameters of the preproduction series SiPMs for the CMS HCAL Phase 1 upgrade | in Proc. 13th Pisa Meeting on Advanced Detectors: Frontier Detectors for Frontier Physics (FDFP ): La Biodola, Italy, 2016 NIM A 824 (2016) 115 |
|
| 63 | Y. Musienko et al. | Radiation damage studies of silicon photomultipliers for the CMS HCAL Phase 1 upgrade | in Proc. 7th International Conference on New Developments in Photodetection (NDIP14): Tours, France, 2015 NIM A 787 (2015) 319 |
|
| 64 | F. Vasey et al. | The versatile link common project: feasibility report | in Proc. Topical Workshop on Electronics for Particle Physics (TWEPP11): Vienna, Austria, 2012 JINST 7 (2012) C01075 |
|
| 65 | G. Cummings on behalf of the CMS Collaboration | CMS HCAL VTRx-induced communication loss and mitigation | in Proc. Topical Workshop on Electronics for Particle Physics (TWEPP21): Online, 2022 JINST 17 (2022) C05020 |
|
| 66 | P. Moreira et al. | The GBT-SerDes ASIC prototype | in Proc. Topical Workshop on Electronics for Particle Physics (TWEPP10): Aachen, Germany, 2010 JINST 5 (2010) C11022 |
|
| 67 | J. Gutleber and L. Orsini | Software architecture for processing clusters based on I$_2$O | Cluster Comput. 5 (2002) 55 | |
| 68 | T. Williams on behalf of the CMS Collaboration | IPbus: A flexible Ethernet-based control system for xTCA hardware | in Proc. Topical Workshop on Electronics for Particle Physics (TWEPP14): Aix en Provence, France, 2014 September 2 (2014) 2 |
|
| 69 | V. Brigljevic et al. | Run control and monitor system for the CMS experiment | in th International Conference on Computing in High-Enery and Nuclear Physics (CHEP ): La Jolla CA, USA, 2003 Proc. 1 (2003) 3 |
cs/0306110 |
| 70 | D. Charousset, R. Hiesgen, and T. C. Schmidt | Revisiting actor programming in C++ | Comp. Lang. Syst. Struct. 45 (2016) 105 | 1505.07368 |
| 71 | JSON-RPC Working Group | JSON-RPC 2.0 | Specification, 2013 link |
|
| 72 | I. Fette and A. Melnikov | The WebSocket protocol | RFC Proposed Standard 645 (2011) 5 | |
| 73 | B. Bilki | Review of scalar meson production at $ \sqrt{s}= $ 7 TeV, $ U(1)^\prime $ gauge extensions of the MSSM and calorimetry for future colliders | PhD thesis, University of Iowa, CERN-THESIS-2011-229, 2011 link |
|
| 74 | CMS HCAL Collaboration | Study of various photomultiplier tubes with muon beams and Cherenkov light produced in electron showers | JINST 5 (2010) P06002 | |
| 75 | CMS Collaboration | Calibration of the CMS hadron calorimeters using proton-proton collision data at $ \sqrt{s}= $ 13 TeV | JINST 15 (2020) P05002 | CMS-PRF-18-001 1910.00079 |
| 76 | CMS HCAL/ECAL Collaborations | The CMS barrel calorimeter response to particle beams from 2 to 350 GeVc | EPJC 60 (2009) 359 | |
| 77 | CMS Collaboration | Performance of CMS hadron calorimeter timing and synchronization using test beam, cosmic ray, and LHC beam data | JINST 5 (2010) T03013 | CMS-CFT-09-018 0911.4877 |
| 78 | J. Lawhorn on behalf of the CMS HCAL Collaboration | New method of out-of-time energy subtraction for the CMS hadronic calorimeter | in Proc. 18th International Conference on Calorimetry in Particle Physics (CALOR ): Eugene OR, USA, 2019 J. Ph. Conf. Ser. 1162 (2019) 012036 |
|
| 79 | CMS Collaboration | Performance of the local reconstruction algorithms for the CMS hadron calorimeter with Run 2 data | Submitted to JINST, 2023 | CMS-PRF-22-001 2306.10355 |
| 80 | CMS Collaboration | Noise in Phase 1 HF detector in 2017 | CMS Detector Performance Note CMS-DP-2017-034, 2017 CDS |
|
| 81 | CMS Collaboration | Search for invisible decays of the Higgs boson produced via vector boson fusion in proton-proton collisions at $ \sqrt{s}= $ 13 TeV | PRD 105 (2022) 092007 | CMS-HIG-20-003 2201.11585 |
| 82 | CMS Collaboration | The performance of the CMS muon detector in proton-proton collisions at $ \sqrt{s}= $ 7 TeV at the LHC | JINST 8 (2013) P11002 | CMS-MUO-11-001 1306.6905 |
| 83 | CMS Collaboration | Technical proposal for the upgrade of the CMS detector through 2020 | CMS Technical Proposal CERN-LHCC-2011-006, CMS-UG-TP-1, 2011 CDS |
|
| 84 | CMS Collaboration | The Phase 2 upgrade of the CMS Level-1 trigger | CMS Technical Proposal CERN-LHCC-2020-004, CMS-TDR-021, 2020 CDS |
|
| 85 | Á. Navarro-Tobar and C. Fernández-Bedoya on behalf of the CMS Collaboration | CMS DT upgrade: the sector collector relocation | in Proc. Topical Workshop on Electronics for Particle Physics (TWEPP15): Lisbon, Portugal, 2016 JINST 11 (2016) C02046 |
|
| 86 | Á. Navarro-Tobar, C. Fernández-Bedoya, and I. Redondo | Low-cost, high-precision propagation delay measurement of 12-fibre MPO cables for the CMS DT electronics upgrade | in Proc. Topical Workshop on Electronics for Particle Physics (TWEPP12): Oxford, UK, 2013 JINST 8 (2013) C02001 |
|
| 87 | CMS Collaboration | CMS technical design report for the Level-1 trigger upgrade | CMS Technical Proposal CERN-LHCC-2013-011, CMS-TDR-012, 2013 CDS |
|
| 88 | A. Triossi et al. | A new data concentrator for the CMS muon barrel track finder | in Proc. 3rd International Conference on Technology and Instrumentation in Particle Physics (): Amsterdam, Netherlands, 2014 TIPP 201 (2014) 4 |
|
| 89 | Xilinx Inc. | 7 series FPGAs GTX/GTH transceivers | User Guide UG476 v1.12.1 link |
|
| 90 | P. Moreira et al. | A radiation tolerant gigabit serializer for LHC data transmission | in Proc. 7th Workshop on Electronics for LHC Experiments: Stockholm, Sweden, 2001 September 1 (2001) 0 |
|
| 91 | CMS Collaboration | Performance of the CMS TwinMux algorithm in late 2016 pp collision runs | CMS Detector Performance Note CMS-DP-2016-074, 2016 CDS |
|
| 92 | A. Navarro-Tobar et al., on behalf of the CMS Collaboration | Phase 1 upgrade of the CMS drift tubes read-out system | in Proc. Topical Workshop on Electronics for Particle Physics (TWEPP ): Karlsruhe, Germany, 2017 JINST 12 (2017) C03070 |
|
| 93 | CMS Collaboration | Efficiency of the CMS drift tubes at LHC in 2017 | CMS Detector Performance Note CMS-DP-2018-016, 2018 CDS |
|
| 94 | CMS Collaboration | Performance of the CMS drift tubes at the end of LHC Run 2 | CMS Detector Performance Note CMS-DP-2019-008, 2019 CDS |
|
| 95 | E. Conti and F. Gasparini | Test of the wire ageing induced by radiation for the CMS barrel muon chambers | NIM A 465 (2001) 472 | |
| 96 | CMS Collaboration | The Phase 2 upgrade of the CMS muon detectors | CMS Technical Proposal CERN-LHCC-2017-012, CMS-TDR-016, 2017 CDS |
|
| 97 | G. Altenhöfer et al. | The drift velocity monitoring system of the CMS barrel muon chambers | NIM A 888 (2018) 1 | |
| 98 | CMS Collaboration | Background measurements in the CMS DT chambers during LHC Run 2 | CMS Detector Performance Note CMS-DP-2020-011, 2020 CDS |
|
| 99 | CAEN S.p.A. | Mod. A1733-A1833-A1733B-A1833B HV boards | Technical Information Manual rev. 1 (2013) 0 link |
|
| 100 | D. Pfeiffer et al. | The radiation field in the Gamma Irradiation Facility GIF++ at CERN | NIM A 866 (2017) 91 | 1611.00299 |
| 101 | B. Bylsma et al. | Radiation testing of electronics for the CMS endcap muon system | NIM A 698 (2013) 242 | 1208.4051 |
| 102 | F. Ferrarese | Statistical analysis of total ionizing dose response in 25-nm NAND flash memory | PhD thesis, Università degli Studi di Padova, 2014 link |
|
| 103 | S. Colafranceschi et al. | Resistive plate chambers for 2013--2014 muon upgrade in CMS at LHC | in Proc. 12th Workshop on Resistive Plate Chambers and Related Detectors (RPC): Beijing, China, 2014 JINST 9 (2014) C10033 |
|
| 104 | CMS Collaboration | CMS physics technical design report, volume II: Physics performance | JPG 34 (2007) 995 | |
| 105 | L.-B. Cheng, P.-C. Cao, J.-Z. Zhao, and Z.-A. Liu | Design of online control and monitoring software for the CPPF system in the CMS Level-1 trigger upgrade | Nucl. Sci. Tech. 29 (2018) 166 | |
| 106 | M. Abbrescia et al. | Resistive plate chambers performances at cosmic rays fluxes | NIM A 359 (1995) 603 | |
| 107 | S. Colafranceschi et al. | Performance of the gas gain monitoring system of the CMS RPC muon detector and effective working point fine tuning | JINST 7 (2012) P12004 | 1209.3893 |
| 108 | J. Goh et al., on behalf of the CMS Collaboration | CMS RPC tracker muon reconstruction | in Proc. 12th Workshop on Resistive Plate Chambers and Related Detectors (RPC): Beijing, China, 2014 JINST 9 (2014) C10027 |
|
| 109 | M. I. Pedraza-Morales, M. A. Shah, and M. Shopova on behalf of the CMS Collaboration | First results of CMS RPC performance at 13 TeV | in Proc. 13th Workshop on Resistive Plate Chambers and Related Detectors (RPC): Ghent, Belgium, February 22--26, . . . [], 2016 JINST 11 (2016) C12003 |
1605.09521 |
| 110 | M. A. Shah et al., on behalf of the CMS Collaboration | The CMS RPC detector performance and stability during LHC Run 2 | in Proc. 14th Workshop on Resistive Plate Chambers and Related Detectors (RCP): Puerto Vallarta, Mexico, February 19--23, . . . [], 2019 JINST 14 (2019) C11012 |
1808.10488 |
| 111 | A. Gelmi, R. Guida, and B. Mandelli on behalf of the CMS Muon Group | Gas mixture quality studies for the CMS RPC detectors during LHC Run 2 | in Proc. 15th Workshop on Resistive Plate Chambers and Related Detectors (RPC): Rome, Italy, February 10--14, . . [], 2021 JINST 16 (2021) C04004 |
|
| 112 | M. Abbrescia et al. | HF production in CMS-resistive plate chambers | in Proc. 8th International Workshop on Resistive Plate Chambers and Related Detectors (RPC): Seoul, Korea, October 10--12, . . [], 2006 NPB Proc. Suppl. 158 (2006) 30 |
|
| 113 | CMS Collaboration | The muon project | CMS Technical Proposal CERN-LHCC-97-32, CMS-TDR-3, 1997 CDS |
|
| 114 | A. Gelmi et al. | Longevity studies on the CMS-RPC system | in Proc. 14th Workshop on Resistive Plate Chambers and Related Detectors (RCP): Puerto Vallarta, Mexico, 2019 JINST 14 (2019) C05012 |
|
| 115 | R. Guida on behalf of the EN, EP, and AIDA GIF++ Collaborations | GIF++: The new CERN irradiation facility to test large-area detectors for the HL-LHC program | in 38th International Conference on High Energy Physics (ICHEP ): Chicago IL, USA, 2016 Proc. 3 (2016) 8 |
|
| 116 | R. Aly et al., on behalf of the CMS Muon Group | Aging study on resistive plate chambers of the CMS muon detector for HL-LHC | in Proc. 15th Workshop on Resistive Plate Chambers and Related Detectors (RPC): Rome, Italy, 2020 JINST 15 (2020) C11002 |
2005.11397 |
| 117 | S. Costantini et al., on behalf of the CMS Collaboration | Radiation background with the CMS RPCs at the LHC | in Proc. 12th Workshop on Resistive Plate Chambers and Related Detectors (RPC): Beijing, China, 2015 JINST 10 (2015) C05031 |
1406.2859 |
| 118 | G. Carboni et al. | An extensive aging study of bakelite resistive plate chambers | in Proc. 9th Pisa Meeting on Advanced Detectors: Frontier Detectors for Frontier Physics (Pisameet): La Biodola, Italy, 2004 NIM A 518 (2004) 82 |
|
| 119 | F. Thyssen on behalf of the CMS Collaboration | Performance of the resistive plate chambers in the CMS experiment | in Proc. 9th International Conference on Position Sensitive Detectors (PSD9): Aberystwyth, UK, 2012 JINST 7 (2012) C01104 |
|
| 120 | G. Pugliese et al. | Aging studies for resistive plate chambers of the CMS muon trigger detector | in Proc. International Workshop on Aging Phenomena in Gaseous Detectors: Hamburg, Germany, 2013 NIM A 515 (2013) 342 |
|
| 121 | R. Guida and B. Mandelli | R&D strategies for optimizing greenhouse gases usage in the LHC particle detection systems | in 15th Vienna Conference on Instrumentation (VCI): Vienna, Austria, 2020 NIM A 958 (2020) 162135 |
|
| 122 | R. Guida, B. Mandelli, and G. Rigoletti | Studies on alternative eco-friendly gas mixtures and development of gas recuperation plant for RPC detectors | in Proc. 16th Vienna Conference on Instrumentation (VCI): Vienna, Austria, 2022 NIM A 1039 (2022) 167045 |
|
| 123 | F. Sauli | GEM: A new concept for electron amplification in gas detectors | NIM A 386 (1997) 531 | |
| 124 | CMS Muon Collaboration | Layout and assembly technique of the GEM chambers for the upgrade of the CMS first muon endcap station | NIM A 918 (2019) 67 | 1812.00411 |
| 125 | P. Aspell et al. | VFAT3: A trigger and tracking front-end ASIC for the binary readout of gaseous and silicon sensors | in Proc. Nuclear Science Symposium and Medical Imaging Conference (NSS/MIC ): Sydney, Australia, 2018 Proc. 2018 (2018) IEEE |
|
| 126 | P. Aspell et al. | Development of a GEM electronic board (GEB) for triple-GEM detectors | in Proc. Topical Workshop on Electronics for Particle Physics (TWEPP14): Aix en Provence, France, 2014 JINST 9 (2014) C12030 |
|
| 127 | D. Abbaneo | CMS muon system Phase 2 upgrade with triple-GEM detectors | in Proc. Nuclear Science Symposium and Medical Imaging Conference (NSS/MIC ): San Diego CA, USA, 2015 Proc. 2015 (2015) IEEE |
|
| 128 | T. Lenzi on behalf of the CMS Collaboration | A micro-TCA based data acquisition system for the Triple-GEM detectors for the upgrade of the CMS forward muon spectrometer | in Proc. Topical Workshop on Electronics for Particle Physics (TWEPP ): Karlsruhe, Germany, 2017 JINST 12 (2017) C01058 |
|
| 129 | A. Svetek et al. | The calorimeter trigger processor card: the next generation of high speed algorithmic data processing at CMS | in Proc. Topical Workshop on Electronics for Particle Physics (TWEPP15): Lisbon, Portugal, 2016 JINST 11 (2016) C02011 |
|
| 130 | R. K. Mommsen et al. | The CMS event-builder system for LHC Run 3 (2021--23) | in Proc. 23rd International Conference on Computing in High Energy and Nuclear Physics (CHEP ): Sofia, Bulgaria, 2019 EPJ Web Conf. 214 (2019) 01006 |
|
| 131 | P. Aspell et al. | VFAT2: A front-end ``system on chip'' providing fast trigger information and digitized data storage for the charge sensitive readout of multi-channel silicon and gas particle detectors | in Proc. Nuclear Science Symposium and Medical Imaging Conference (NSS/MIC ) : Dresden, Germany, 2008 Proc. 2008 (2008) 1489 |
|
| 132 | P. Moreira et al. | The GBT project | in Proc. Topical Workshop on Electronics for Particle Physics (TWEPP09): Paris, France, 2009 CERN-2009-006 |
|
| 133 | P. Alfke | Xilinx Virtex-6 and Spartan-6 FPGA families | in Hot Chips 21 Symposium (HCS ): Stanford CA, USA, 2009 Proc. 2009 (2009) IEEE |
|
| 134 | K. Ecklund et al. | Upgrade of the cathode strip chamber level 1 trigger optical links at CMS | in Proc. Topical Workshop on Electronics for Particle Physics (TWEPP12): Oxford, UK, 2012 JINST 7 (2012) C11011 |
|
| 135 | D. Acosta on behalf of the CMS Collaboration | Boosted decision trees in the Level-1 muon endcap trigger at CMS | in Proc. 18th International Workshop on Advanced Computing and Analysis Techniques in Physics Research (ACAT ): Seattle WA, USA, 2018 J. Ph. Conf. Ser. 1085 (2018) 042042 |
|
| 136 | P. Golonka et al. | FwWebViewPlus: integration of web technologies into WinCC OA based human-machine interfaces at CERN | in Proc. 20th International Conference on Computing in High Energy and Nuclear Physics (CHEP ): Amsterdam, Netherlands, 2014 J. Ph. Conf. Ser. 513 (2014) 012009 |
|
| 137 | M. Abbas et al. | Detector control system for the GE1/1 slice test | JINST 15 (2020) P05023 | |
| 138 | R. Venditti on behalf of the CMS Muon Group | Production, quality control and performance of GE1/1 detectors for the CMS upgrade | in Proc. 6th International Conference on Micro Pattern Gaseous Detectors (MPGD): La Rochelle, France, 2020 J. Ph. Conf. Ser. 1498 (2020) 012055 |
|
| 139 | CMS Muon Collaboration | Performance of prototype GE1/1 chambers for the CMS muon spectrometer upgrade | NIM A 972 (2020) 164104 | 1903.02186 |
| 140 | CMS and TOTEM Collaborations | CMS-TOTEM precision proton spectrometer | TOTEM Technical Proposal CERN-LHCC-2014-021, TOTEM-TDR-003, CMS-TDR-013, 2014 | |
| 141 | TOTEM Collaboration | Total cross section, elastic scattering and diffraction dissociation at the Large Hadron Collider at CERN | TOTEM Technical Proposal CERN-LHCC-2004-002, TOTEM-TDR-001, 2004 | |
| 142 | V. Vacek, G. D. Hallewell, S. Ilie, and S. Lindsay | Perfluorocarbons and their use in cooling systems for semiconductor particle detectors | Fluid Phase Equilib. 174 (2000) 191 | |
| 143 | G. Ruggiero et al. | Characteristics of edgeless silicon detectors for the roman pots of the TOTEM experiment at the LHC | in Proc. 8th International Conference on Position Sensitive Detectors (PSD8): Glasgow, UK, 2009 NIM A 604 (2009) 242 |
|
| 144 | TOTEM Collaboration | Performance of the TOTEM detectors at the LHC | Int. J. Mod. Ph. A 28 (2013) 1330046 | 1310.2908 |
| 145 | F. Ravera on behalf of the CMS and TOTEM Collaborations | The CT-PPS tracking system with 3D pixel detectors | in Proc. 8th International Workshop on Semiconductor Pixel Detectors for Particles and Imaging (PIXEL ): Sestri Levante, Italy, 2016 JINST 11 (2016) C11027 |
|
| 146 | F. Ravera | 3D silicon pixel detectors for the CT-PPS tracking system | PhD thesis, Università degli Studi di Torino, CERN-THESIS-2017-473, 2017 link |
|
| 147 | D. M. S. Sultan et al. | First production of new thin 3D sensors for HL-LHC at FBK | in Proc. 18th International Workshop on Radiation Imaging Detectors (IWORID ): Barcelona, Spain, 2017 JINST 12 (2017) C01022 |
1612.00638 |
| 148 | G. Pellegrini et al. | 3D double sided detector fabrication at IMB-CNM | in Proc. 8th International Hiroshima Symposium on Development and Application of Semiconductor Tracking Detectors (HSTS8): Taipei, Taiwan, 2013 NIM A 699 (2013) 27 |
|
| 149 | G.-F. Dalla Betta et al. | Small pitch 3D devices | in th International Workshop on Vertex Detectors (Vertex ): La Biodola, Italy, 2016 Proc. 2 (2016) 5 |
|
| 150 | D. Hits and A. Starodumov on behalf of the CMS Collaboration | The CMS pixel readout chip for the Phase 1 upgrade | in Proc. 7th International Workshop on Semiconductor Pixel Detectors for Particles and Imaging (PIXEL ): Niagara Falls, Canada, 2015 JINST 10 (2015) C05029 |
|
| 151 | J. Hoss et al., on behalf of the CMS Collaboration | Radiation tolerance of the readout chip for the Phase 1 upgrade of the CMS pixel detector | in Proc. Topical Workshop on Electronics for Particle Physics (TWEPP15): Lisbon, Portugal, 2016 JINST 11 (2016) C01003 |
|
| 152 | TOTEM Collaboration | Diamond detectors for the TOTEM timing upgrade | JINST 12 (2017) P03007 | 1701.05227 |
| 153 | E. Bossini on behalf of the CMS and TOTEM Collaborations | The CMS precision proton spectrometer timing system: performance in Run 2, future upgrades and sensor radiation hardness studies | in Proc. 15th Topical Seminar on Innovative Particle and Radiation Detectors (IPRD19): Siena, Italy, 2020 JINST 15 (2020) C05054 |
2004.11068 |
| 154 | E. Bossini and N. Minafra | Diamond detectors for timing measurements in high energy physics | Front. in Phys. 8 (2020) 248 | |
| 155 | CMS Collaboration | Time resolution of the diamond sensors used in the precision proton spectrometer | CMS Detector Performance Note CMS-DP-2019-034, 2019 CDS |
|
| 156 | E. Bossini, D. M. Figueiredo, L. Forthomme, and F. I. Garcia Fuentes | Test beam results of irradiated single-crystal CVD diamond detectors at DESY-II | CMS Note CMS-NOTE-2020-007, 2020 | |
| 157 | F. Anghinolfi et al. | NINO: An ultra-fast and low-power front-end amplifier/discriminator ASIC designed for the multigap resistive plate chamber | in Proc. 7th International Workshop on Resistive Plate Chambers and Related Detectors (RPC): Clermont-Ferrand, France, 2004 NIM A 533 (2004) 183 |
|
| 158 | J. Christiansen | HPTDC: High performance time to digital converter. version 2.2 for HPTDC version 1.3 | CERN Report, 2000 link |
|
| 159 | C. Royon | SAMPIC: a readout chip for fast timing detectors in particle physics and medical imaging | in Proc. 1st Workshop on Applications of Novel Scintillators for Research and Industry (ANSRI ): Dublin, Ireland, 2015 J. Ph. Conf. Ser. 620 (2015) 012008 |
1503.04625 |
| 160 | TOTEM Collaboration | Timing measurements in the vertical roman pots of the TOTEM experiment | TOTEM Technical Proposal CERN-LHCC-2014-020, TOTEM-TDR-002, 2014 | |
| 161 | M. Bousonville and J. Rausch | Universal picosecond timing system for the Facility for Antiproton and Ion Research | Phys. Rev. ST Accel. Beams 12 (2009) 042801 link |
|
| 162 | P. Moritz and B. Zipfel | Recent progress on the technical realization of the bunch phase timing system BuTiS | in Proc. 2nd International Particle Accelerator Conference (IPAC ): San Sebastian, Spain, 2011 Conf. Proc. C 110904 (2011) MOPC145 |
|
| 163 | M. Quinto, F. Cafagna, A. Fiergolski, and E. Radicioni | Upgrade of the TOTEM DAQ using the scalable readout system (SRS) | in Proc. 3rd International Conference on Micro Pattern Gaseous Detectors (MPGD): Zaragoza, Spain, 2013 JINST 8 (2013) C11006 |
|
| 164 | CMS Collaboration | Precision luminosity measurement in proton-proton collisions at $ \sqrt{s}= $ 13 TeV in 2015 and 2016 at CMS | EPJC 81 (2021) 800 | CMS-LUM-17-003 2104.01927 |
| 165 | CMS Collaboration | CMS luminosity measurement for the 2017 data-taking period at $ \sqrt{s}= $ 13 TeV | CMS Physics Analysis Summary, 2018 CMS-PAS-LUM-17-004 |
CMS-PAS-LUM-17-004 |
| 166 | CMS Collaboration | CMS luminosity measurement for the 2018 data-taking period at $ \sqrt{s}= $ 13 TeV | CMS Physics Analysis Summary, 2019 CMS-PAS-LUM-18-002 |
CMS-PAS-LUM-18-002 |
| 167 | CMS Collaboration | CMS luminosity measurement using nucleus-nucleus collisions at $ {\sqrt{\smash[b]{s_{_{\mathrm{NN}}}}}= $ 5.02 TeV in 2018 | CMS Physics Analysis Summary, 2022 CMS-PAS-LUM-18-001 |
CMS-PAS-LUM-18-001 |
| 168 | CMS Collaboration | CMS luminosity calibration for the pp reference run at $ {\sqrt{s}= $ 5.02 TeV | CMS Physics Analysis Summary, 2016 CMS-PAS-LUM-16-001 |
CMS-PAS-LUM-16-001 |
| 169 | CMS Collaboration | Luminosity measurement in proton-proton collisions at 5.02 TeV in 2017 at CMS | CMS Physics Analysis Summary, 2021 CMS-PAS-LUM-19-001 |
CMS-PAS-LUM-19-001 |
| 170 | CMS Collaboration | CMS luminosity measurement using 2016 proton-nucleus collisions at $ {\sqrt{\smash[b]{s_{_{\mathrm{NN}}}}}= $ 8.16 TeV | CMS Physics Analysis Summary, 2018 CMS-PAS-LUM-17-002 |
CMS-PAS-LUM-17-002 |
| 171 | A. Kornmayer on behalf of the CMS Collaboration | The CMS pixel luminosity telescope | in Proc. 13th Pisa Meeting on Advanced Detectors: Frontier Detectors for Frontier Physics (FDFP ): La Biodola, Italy, 2016 NIM A 824 (2016) 304 |
|
| 172 | K. Rose on behalf of the CMS Collaboration | The new pixel luminosity telescope of CMS at the LHC | in Proc. Nuclear Science Symposium and Medical Imaging Conference (NSS/MIC ): San Diego CA, USA, 2015 Proc. 2015 (2015) IEEE |
|
| 173 | P. Lujan on behalf of the CMS Collaboration | Performance of the pixel luminosity telescope for luminosity measurement at CMS during Run 2 | in uropean Physical Society Conference on High Energy Physics (EPS-HEP ): Venice, Italy, July 5--12, . . [PoS (EPS-HEP) 504], 2017 Proc. 2017 (2017) E |
|
| 174 | CMS BRIL Collaboration | The pixel luminosity telescope: a detector for luminosity measurement at CMS using silicon pixel sensors | EPJC 83 (2023) 673 | 2206.08870 |
| 175 | N. Karunarathna on behalf of the CMS Collaboration | Run 3 luminosity measurements with the pixel luminosity telescope | in st International Conference on High Energy Physics (ICHEP ): Bologna, Italy, 2022 PoS (ICHEP2022) 936 |
|
| 176 | G. Bolla et al. | Sensor development for the CMS pixel detector | in Proc. 5th International Conference on Large Scale Applications and Radiation Hardness of Semiconductor Detectors: Florence, Italy, 2002 NIM A 485 (2002) 89 |
|
| 177 | Y. Allkofer et al. | Design and performance of the silicon sensors for the CMS barrel pixel detector | NIM A 584 (2008) 25 | physics/0702092 |
| 178 | H. C. Kastli et al. | Design and performance of the CMS pixel detector readout chip | in Proc. 3rd International Workshop on Semiconductor Pixel Detectors for Particles and Imaging (PIXEL ): Bonn, Germany, 2001 NIM A 565 (2001) 188 |
physics/0511166 |
| 179 | M. Barbero | Development of a radiation-hard pixel read out chip with trigger capability | PhD thesis, Universität Basel, 2003 link |
|
| 180 | E. Bartz | The 0.25 $\mu$m token bit manager chip for the CMS pixel readout | in th Workshop on Electronics for LHC and Future Experiments: Heidelberg, Germany, 2005 Proc. 1 (2005) 1 |
|
| 181 | M. Pernicka et al. | The CMS pixel FED | in Proc. Topical Workshop on Electronics for Particle Physics (TWEPP07): Prague, Czech Republic, 2007 link |
|
| 182 | E. van der Bij, R. A. McLaren, O. Boyle, and G. Rubin | S-LINK, a data link interface specification for the LHC era | IEEE Trans. Nucl. Sci. 44 (1997) 398 | |
| 183 | A. A. Zagozdzinska et al., on behalf of the CMS Collaboration | New fast beam conditions monitoring (BCM1F) system for CMS | in Proc. Topical Workshop on Electronics for Particle Physics (TWEPP15): Lisbon, Portugal, 2016 JINST 11 (2016) C01088 |
|
| 184 | M. Guthoff on behalf of the CMS Collaboration | The new fast beam condition monitor using poly-crystalline diamond sensors for luminosity measurement at CMS | in Proc. 14th Pisa Meeting on Advanced Detectors: Frontier Detectors for Frontier Physics (Pisameet): La Biodola, Italy, 2019 NIM A 936 (2019) 717 |
|
| 185 | J. Wańczyk on behalf of the CMS Collaboration | Upgraded CMS fast beam condition monitor for LHC Run 3 online luminosity and beam induced background measurements | in 11th International Beam Instrumentation Conference (IBIC ): Cracow, Poland, 2018 Proc. 1 (2018) 1 |
|
| 186 | CMS Collaboration | The Phase 2 upgrade of the CMS tracker | CMS Technical Proposal CERN-LHCC-2017-009, CMS-TDR-014, 2017 CDS |
|
| 187 | D. Przyborowski, J. Kaplon, and P. Rymaszewski | Design and performance of the BCM1F front end ASIC for the beam condition monitoring system at the CMS experiment | IEEE Trans. Nucl. Sci. 63 (2016) 2300 | |
| 188 | M. Friedl | Analog optohybrids, CMS tracker TOB/TEC | CMS Technical Specification CMS-TK-CS-0002, . v1.11, 2004 EDMS Document 37136 (2004) 4 |
|
| 189 | et al. | A real-time histogramming unit for luminosity measurements of each bunch crossing at CMS | in Proc. Topical Workshop on Electronics for Particle Physics (TWEPP13): Perugia, Italy, 2013 DESY-2013-00940 |
|
| 190 | A. A. Zagozdzinska et al. | The fast beam condition monitor BCM1F backend electronics upgraded MicroTCA based architecture | in Proc. Photonics Applications in Astronomy, Communications, Industry, and High-Energy Physics Experiments : Wilga, Poland, 2014 link |
|
| 191 | A. A. Zagozdzinska on behalf of the CMS Collaboration | The CMS fast beams condition monitor back-end electronics based on MicroTCA technology | in Proc. Nuclear Science Symposium and Medical Imaging Conference (NSS/MIC ): San Diego CA, USA, 2015 Proc. 2015 (2015) IEEE |
|
| 192 | A. J. Rüde | New peak finding algorithm for the BCM1F detector of the CMS experiment at CERN | Master's thesis, Ernst-Abbe-Hochschule Jena, CERN-THESIS-2018-021, 2018 | |
| 193 | CMS Collaboration | BRIL luminosity performance plots: Cross-detector stability in early Run 3 data | CMS Detector Performance Note CMS-DP-2022-038, 2022 CDS |
|
| 194 | CMS Collaboration | The Phase 2 upgrade of the CMS beam radiation, instrumentation, and luminosity detectors: Conceptual design | CMS Technical Proposal CERN-NOTE-2019-008, 2020 CDS |
|
| 195 | A. Triossi et al., on behalf of the CMS Collaboration | The CMS barrel muon trigger upgrade | in Proc. Topical Workshop on Electronics for Particle Physics (TWEPP ): Karlsruhe, Germany, 2017 JINST 12 (2017) C01095 |
|
| 196 | J. Salfeld-Nebgen and D. Marlow | Data-driven precision luminosity measurements with Z bosons at the LHC and HL-LHC | JINST 13 (2018) P12016 | 1806.02184 |
| 197 | CMS Collaboration | Luminosity determination using Z boson production at the CMS experiment | CMS Physics Analysis Summary, 2023 CMS-PAS-LUM-21-001 |
CMS-PAS-LUM-21-001 |
| 198 | CMS Collaboration | Luminosity monitoring with Z counting in early 2022 data | CMS Detector Performance Note CMS-DP-2023-003, 2023 CDS |
|
| 199 | CMS Collaboration | First measurement of the top quark pair production cross section in proton-proton collisions at $ \sqrt{s}= $ 13.6 TeV | Accepted by JHEP, 2023 | CMS-TOP-22-012 2303.10680 |
| 200 | CMS Collaboration | CMS $ {\mathrm{Z}(\mu\mu)} $ yields for comparisons with ATLAS | CMS Detector Performance Note CMS-DP-2012-014, 2012 CDS |
|
| 201 | C. Schwick and B. Petersen | LPC's view on Run 2 | in Proc. 9th Evian Workshop on LHC beam operation: Evian Les Bains, France, 2019 CERN-ACC-2019-059 27 |
|
| 202 | S. Orfanelli et al. | A novel beam halo monitor for the CMS experiment at the LHC | JINST 10 (2015) P11011 | |
| 203 | N. Tosi et al. | Electronics and calibration system for the CMS beam halo monitor | in Proc. 3rd International Conference on Technology and Instrumentation in Particle Physics (): Amsterdam, Netherlands, 2014 TIPP 201 (2014) 4 |
|
| 204 | N. Tosi | The new beam halo monitor for the CMS experiment at the LHC | PhD thesis, Università di Bologna, CERN-THESIS-2015-283, 2015 link |
|
| 205 | S. Müller | The beam condition monitor 2 and the radiation environment of the CMS detector at the LHC | PhD thesis, Karlsruher Institut für Technologie, IEKP-KA-2011-01, 2011 CERN-THESIS-2011-085 |
|
| 206 | M. Guthoff | Radiation damage to the diamond-based beam condition monitor of the CMS detector at the LHC | PhD thesis, Karlsruher Institut für Technologie, IEKP-KA-2014-01, 2014 CERN-THESIS-2014-216 |
|
| 207 | R. Kassel | The rate dependent radiation induced signal degradation of diamond detectors | PhD thesis, Karlsruher Institut für Technologie, IEKP-KA-2017-19, 2017 CERN-THESIS-2017-071 |
|
| 208 | B. Dehning et al. | LHC beam loss monitor system design | in Proc. 10th Beam Instrumentation Workshop (BIW ): Upton NY, USA, 2002 AIP Conf. Proc. 648 (2002) 229 |
|
| 209 | J. Emery et al. | Functional and linearity test system for the LHC beam loss monitoring data acquisition card | in 12th Workshop on Electronics for LHC and Future Experiments: Valencia, Spain, 2007 CERN-2007-001.447 |
|
| 210 | C. Zamantzas | The real-time data analysis and decision system for particle flux detection in the LHC accelerator at CERN | PhD thesis, Brunel University, 2006 CERN-THESIS-2006-037 |
|
| 211 | B. Todd, A. Dinius, C. Martin, and B. Puccio | User interface to the beam interlock system | CERN Technical Note, 2011 EDMS Document 63658 |
|
| 212 | V. N. Kurlov | Sapphire: Properties, growth, and applications | in Reference module: Material science and materials engineering. Elsevier, Amsterdam, Netherlands,2016 SBN 978-0128035818 |
|
| 213 | O. Karacheban et al. | Investigation of a direction sensitive sapphire detector stack at the 5 GeV electron beam at DESY-II | JINST 10 (2015) P08008 | 1504.04023 |
| 214 | CMS Collaboration | FLUKA Run 2 simulation benchmark with beam loss monitors in the CMS forward region | CMS Detector Performance Note CMS-DP-2021-008, 2021 CDS |
|
| 215 | A. M. Gribushin et al. | A neutron field monitoring system for collider experiments | Instrum. Exp. Tech. 60 (2017) 167 | |
| 216 | G. Segura Millan, D. Perrin, and L. Scibile | RAMSES: The LHC radiation monitoring system for the environment and safety | in Proc. 10th International Conference on Accelerator and Large Experimental Physics Control Systems (ICALEPCS): Geneva, Switzerland, October 10--15, . . [.1-3O], 2005 Conf. Proc. C 051010 (2005) TH3B |
|
| 217 | A. Ledeul et al. | CERN supervision, control and data acquisition system for radiation and environmental protection | in Proc. 12th International Workshop on Personal Computers and Particle Accelerator Controls (PCaPAC ): Hsinchu, Taiwan, 2019 link |
|
| 218 | G. Spiezia et al. | The LHC radiation monitoring system: RadMon | in Proc. 10th International Conference on Large Scale Applications and Radiation Hardness of Semiconductor Detectors (RD11): Florence, Italy, 2011 PoS (RD11) 024 |
|
| 219 | C. Martinella | High energy hadrons fluence measurements in the LHC during 2015, 2016 and 2017 proton physics operations | CERN Internal Note CERN-ACC-NOTE-2018-088, 2018 | |
| 220 | T. T. Böhlen et al. | The FLUKA code: Developments and challenges for high energy and medical applications | Nucl. Data Sheets 120 (2014) 211 | |
| 221 | J. Gutleber, S. Murray, and L. Orsini | Towards a homogeneous architecture for high-energy physics data acquisition systems | Comput. Phys. Commun. 153 (2003) 155 | |
| 222 | B. Copy, E. Mandilara, I. Prieto Barreiro, and F. Varela Rodriguez | Monitoring of CERN's data interchange protocol (DIP) system | in Proc. 16th International Conference on Accelerator and Large Experimental Physics Control Systems (ICALEPCS): Barcelona, Spain, 2018 JACoW ICALEPCS2017 (2018) THPHA162 |
|
| 223 | Y. Fain and A. Moiseev | Angular 2 development with TypeScript | Manning Publications, Shelter Island NY, USA, 2016 | |
| 224 | J.-M. Andre et al. | A scalable monitoring for the CMS filter farm based on Elasticsearch | in Proc. 21st International Conference on Computing in High Energy and Nuclear Physics (CHEP ): Okinawa, Japan, 2015 J. Ph. Conf. Ser. 664 (2015) 082036 |
|
| 225 | G. Bauer et al. | The CMS event builder and storage system | in Proc. 17th International Conference on Computing in High Energy and Nuclear Physics (CHEP): Prague, Czech Republic, 2015 J. Ph. Conf. Ser. 219 (2015) 022038 |
|
| 226 | G. Bauer et al. | The new CMS DAQ system for LHC operation after 2014 (DAQ2) | in Proc. 20th International Conference on Computing in High Energy and Nuclear Physics (CHEP ): Amsterdam, Netherlands, 2015 J. Ph. Conf. Ser. 513 (2015) 012014 |
|
| 227 | T. Bawej et al. | The new CMS DAQ system for Run 2 of the LHC | IEEE Trans. Nucl. Sci. 62 (2015) 1099 | |
| 228 | G. Bauer et al. | The Terabit/s super-fragment builder and trigger throttling system for the Compact Muon Solenoid experiment at CERN | IEEE Trans. Nucl. Sci. 55 (2008) 190 | |
| 229 | G. Bauer et al. | 10\unitGbps TCP/IP streams from the FPGA for the CMS DAQ eventbuilder network | in Proc. Topical Workshop on Electronics for Particle Physics (TWEPP13): Perugia, Italy, 2013 JINST 8 (2013) C12039 |
|
| 230 | G. Bauer et al. | 10\unitGbps TCP/IP streams from the FPGA for high energy physics | in Proc. 20th International Conference on Computing in High Energy and Nuclear Physics (CHEP ): Amsterdam, Netherlands, 2014 J. Ph. Conf. Ser. 513 (2014) 012042 |
|
| 231 | D. Gigi et al. | The FEROL40, a microTCA card interfacing custom point-to-point links and standard TCP/IP | in Proc. Topical Workshop on Electronics for Particle Physics (TWEPP17): Santa Cruz CA, USA, 2017 link |
|
| 232 | G. Bauer et al. | Upgrade of the CMS event builder | in Proc. 19th International Conference on Computing in High Energy and Nuclear Physics (CHEP ): New York NY, USA, 2012 J. Ph. Conf. Ser. 396 (2012) 012039 |
|
| 233 | J.-M. Andréet al. | Performance of the new DAQ system of the CMS experiment for Run 2 | in Proc. 20th IEEE-NPSS Real Time Conference (RT ): Padua, Italy, June 5--10, 2016 link |
|
| 234 | J.-M. Andre et al. | Performance of the CMS event builder | in Proc. 22nd International Conference on Computing in High Energy and Nuclear Physics (CHEP): San Francisco CA, 2017 J. Ph. Conf. Ser. 898 (2017) 032020 |
|
| 235 | Juniper Networks, Inc. | QFX10000 modular Ethernet switches | datasheet (2021) link |
|
| 236 | IEEE Standards Association | IEEE 802.3-2012 | Standard for Ethernet, 2012 link |
|
| 237 | Linux developers | tmpfs | Software available in the Linux kernel link |
|
| 238 | C. D. Jones et al., on behalf of the CMS Collaboration | Using the CMS threaded framework in a production environment | in Proc. 21st International Conference on Computing in High Energy and Nuclear Physics (CHEP ): Okinawa, Japan, 2015 J. Ph. Conf. Ser. 664 (2015) 072026 |
|
| 239 | J.-M. Andre et al. | File-based data flow in the CMS filter farm | in Proc. 21st International Conference on Computing in High Energy and Nuclear Physics (CHEP ): Okinawa, Japan, 2015 J. Ph. Conf. Ser. 664 (2015) 082033 |
|
| 240 | Linux developers | inotify | Software available in the Linux kernel, 2021 link |
|
| 241 | R. Brun and F. Rademakers | ROOT: An object oriented data analysis framework | in Proc. 5th International Workshop on New Computing Techniques in Physics Research (AIHENP 96): Lausanne, Switzerland, 1997 NIM A 389 (1997) 81 |
|
| 242 | P. Deutsch and J.-L. Gailly | ZLIB compressed data format specification version 3.3 | RFC Informational 1950, 1996 link |
|
| 243 | tukaani.org | XZ Utils | link | |
| 244 | Y. Collet and M. Kucherawy | Zstandard compression and the `application/zstd' media type | RFC Informational 8878, 2021 link |
|
| 245 | elasticsearch | Elasticsearch | Software, 2023 link |
|
| 246 | T. Bray | The JavaScript object notation (JSON) data interchange format | RFC Proposed Standard 7159 (2014) link |
|
| 247 | M. Michelottod et al. | A comparison of HEP code with SPEC benchmarks on multi-core worker nodes | in Proc. 17th International Conference on Computing in High Energy and Nuclear Physics (CHEP): Prague, Czech Republic, 2010 J. Ph. Conf. Ser. 219 (2010) 052009 |
|
| 248 | Nvidia Corporation | NVIDIA T4 tensor core GPU | Datasheet, 2019 link |
|
| 249 | A. J. Peters, E. A. Sindrilaru, and G. Adde | EOS as the present and future solution for data storage at CERN | in Proc. 21st International Conference on Computing in High Energy and Nuclear Physics (CHEP ): Okinawa, Japan, 2015 J. Ph. Conf. Ser. 664 (2015) 042042 |
|
| 250 | J.-M. Andre et al. | Online data handling and storage at the CMS experiment | in Proc. 21st International Conference on Computing in High Energy and Nuclear Physics (CHEP ): Okinawa, Japan, 2015 J. Ph. Conf. Ser. 664 (2015) 082009 |
|
| 251 | DataDirect Networks | EXAScaler product family | DDN Data Sheet, 2023 link |
|
| 252 | J. Hegeman et al. | The CMS timing and control distribution system | in Proc. Nuclear Science Symposium and Medical Imaging Conference (NSS/MIC ): San Diego CA, USA, 2015 Proc. 2015 (2015) IEEE |
|
| 253 | CentOS Project | CentOS-7 (2009) | Release Notes, 2020 link |
|
| 254 | Red Hat, Inc. | Red Hat Enterprise Linux 8.8 | Release Notes, 2023 link |
|
| 255 | R. García Leiva et al. | Quattor: Tools and techniques for the configuration, installation and management of large-scale grid computing fabrics | J. Grid Comput. 2 (2004) 313 | |
| 256 | Puppet | Puppet | \href. Software available at \urlhttps://github.com/puppetlabs/puppet, . More information at \urlhttps://www.puppet.com/ (last accessed \LastAccessed), 2023 link |
|
| 257 | oVirt | oVirt | \href. Software available at \urlhttps://github.com/ovirt/, . More information at \urlhttps://www.ovirt.org/ (last accessed \LastAccessed), 2023 link |
|
| 258 | J.-M. Andre et al. | Experience with dynamic resource provisioning of the CMS online cluster using a cloud overlay | in Proc. 23rd International Conference on Computing in High Energy and Nuclear Physics (CHEP ): Sofia, Bulgaria, 2019 EPJ Web Conf. 214 (2019) 07017 |
|
| 259 | G. Bauer et al. | First operational experience with a high-energy physics run control system based on web technologies | IEEE Trans. Nucl. Sci. 59 (2012) 1597 | |
| 260 | G. Bauer et al. | A comprehensive zero-copy architecture for high performance distributed data acquisition over advanced network technologies for the CMS experiment | in Proc. 18th IEEE-NPSS Real Time Conference (RT ): Berkeley CA, USA, 2012 link |
|
| 261 | T. Bawej et al. | Achieving high performance with TCP over 40 GbE on NUMA architectures for CMS data acquisition | IEEE Trans. Nucl. Sci. 62 (2015) 1091 | |
| 262 | G. Bauer et al. | Distributed error and alarm processing in the CMS data acquisition system | in Proc. 19th International Conference on Computing in High Energy and Nuclear Physics (CHEP ): New York NY, USA, 2012 J. Ph. Conf. Ser. 396 (2012) 01 |
|
| 263 | G. Bauer et al. | Automating the CMS DAQ | in Proc. 20th International Conference on Computing in High Energy and Nuclear Physics (CHEP ): Amsterdam, Netherlands, 2014 J. Ph. Conf. Ser. 513 (2014) 012031 |
|
| 264 | J. M. Andre et al. | New operator assistance features in the CMS run control system | in Proc. 22nd International Conference on Computing in High Energy and Nuclear Physics (CHEP): San Francisco CA, 2017 J. Ph. Conf. Ser. 898 (2017) 032028 |
|
| 265 | J.-M. Andre et al. | DAQExpert---an expert system to increase CMS data-taking efficiency | in Proc. 18th International Workshop on Advanced Computing and Analysis Techniques in Physics Research (ACAT ): Seattle WA, USA, 2018 J. Ph. Conf. Ser. 1085 (2018) 032021 |
|
| 266 | J.-M. Andre et al. | Operational experience with the new CMS DAQ-Expert | in Proc. 23rd International Conference on Computing in High Energy and Nuclear Physics (CHEP ): Sofia, Bulgaria, 2019 EPJ Web Conf. 214 (2019) 01015 |
|
| 267 | G. Badaro et al. | DAQExpert---the service to increase CMS data-taking efficiency | in Proc. 24th International Conference on Computing in High Energy and Nuclear Physics (CHEP ): Adelaide, Australia, 2020 EPJ Web Conf. 245 (2020) 01028 |
|
| 268 | J. A. Lopez-Perez et al. | The web based monitoring project at the CMS experiment | in Proc. 22nd International Conference on Computing in High Energy and Nuclear Physics (CHEP): San Francisco CA, 2017 J. Ph. Conf. Ser. 898 (2017) 092040 |
|
| 269 | J. Duarte et al. | Fast inference of deep neural networks in FPGAs for particle physics | JINST 13 (2018) P07027 | 1804.06913 |
| 270 | R. Bainbridge on behalf of the CMS Collaboration | Recording and reconstructing 10 billion unbiased b hadron decays in CMS | in Proc. 24th International Conference on Computing in High Energy and Nuclear Physics (CHEP ): Adelaide, Australia, 2020 EPJ Web Conf. 245 (2020) 01025 |
|
| 271 | F. M. A. Erich, C. Amrit, and M. Daneva | A qualitative study of DevOps usage in practice | JSEP 29 (2017) e1885 | |
| 272 | T. Dingsoyr, S. Nerur, V. Balijepally, and N. B. Moe | A decade of agile methodologies: Towards explaining agile software development | J. Syst. Softw. 85 (2012) 1213 | |
| 273 | Prometheus | Prometheus | \href. Software available at \urlhttps://github.com/prometheus/prometheus, . More information at \urlhttps://prometheus.io/ (last accessed \LastAccessed), 2023 link |
|
| 274 | S. H. Sunil Kumar and C. Saravanan | A comprehensive study on data visualization tool: Grafana | JETIR 8 (2021) f908 | |
| 275 | A. X. Ming Chang et al. | Deep neural networks compiler for a trace-based accelerator | J. Syst. Archit. 102 (2020) 101659 | |
| 276 | Xilinx Inc. | VCU128 evaluation board | User Guide UG1302 v1.2, 2022 link |
|
| 277 | CMS Collaboration | The Phase 2 upgrade of the CMS data acquisition and high level trigger | CMS Technical Proposal CERN-LHCC-2021-007, CMS-TDR-022, 2021 CDS |
|
| 278 | D. Golubovic et al., on behalf of the CMS Collaboration | 40 MHz scouting with deep learning in CMS | in Proc. 6th Internation Workshop Connecting the Dots (CTD): Princeton NJ, USA, 2020 link |
|
| 279 | CMS Collaboration | 40 MHz scouting with deep learning in CMS | CMS Detector Performance Note CMS-DP-2022-066, 2022 CDS |
|
| 280 | A. Bocci et al. | Heterogeneous reconstruction of tracks and primary vertices with the CMS pixel tracker | Front. Big Data 3 (2020) 601728 | 2008.13461 |
| 281 | CMS Collaboration | Particle-flow reconstruction and global event description with the CMS detector | JINST 12 (2017) P10003 | CMS-PRF-14-001 1706.04965 |
| 282 | CMS Collaboration | Performance of the CMS muon trigger system in proton-proton collisions at $ \sqrt{s}= $ 13 TeV | JINST 16 (2021) P07001 | CMS-MUO-19-001 2102.04790 |
| 283 | W. Adam, R. Frühwirth, A. Strandlie, and T. Todorov | Reconstruction of electrons with the Gaussian-sum filter in the CMS tracker at the LHC | JPG 31 (2005) N9 | physics/0306087 |
| 284 | M. Cacciari, G. P. Salam, and G. Soyez | The anti-$ k_{\mathrm{T}} $ jet clustering algorithm | JHEP 04 (2008) 063 | 0802.1189 |
| 285 | M. Cacciari, G. P. Salam, and G. Soyez | FASTJET user manual | EPJC 72 (2012) 1896 | 1111.6097 |
| 286 | CMS Collaboration | Reconstruction and identification of $ \tau $ lepton decays to hadrons and $ \nu_{\!\tau} $ at CMS | JINST 7 (2012) P01001 | CMS-TAU-11-001 1109.6034 |
| 287 | CMS Collaboration | Identification of hadronic tau lepton decays using a deep neural network | JINST 17 (2022) P07023 | CMS-TAU-20-001 2201.08458 |
| 288 | A. J. Larkoski, S. Marzani, G. Soyez, and J. Thaler | Soft drop | JHEP 05 (2014) 146 | 1402.2657 |
| 289 | CMS Collaboration | Identification of heavy-flavour jets with the CMS detector in pp collisions at 13 TeV | JINST 13 (2018) P05011 | CMS-BTV-16-002 1712.07158 |
| 290 | E. Bols et al. | Jet flavour classification using DeepJet | JINST 15 (2020) P12012 | 2008.10519 |
| 291 | H. Qu and L. Gouskos | Jet tagging via particle clouds | PRD 101 (2020) 056019 | 1902.08570 |
| 292 | Y. L. Dokshitzer, G. D. Leder, S. Moretti, and B. R. Webber | Better jet clustering algorithms | JHEP 08 (1997) 1 | hep-ph/9707323 |
| 293 | M. Wobisch and T. Wengler | Hadronization corrections to jet cross sections in deep-inelastic scattering | in Proc. Workshop on Monte Carlo Generators for HERA Physics: Hamburg, Germany, 1999 | hep-ph/9907280 |
| 294 | CMS Collaboration | Search for narrow resonances and quantum black holes in inclusive and b-tagged dijet mass spectra from pp collisions at $ \sqrt{s}= $ 7 TeV | JHEP 01 (2013) 013 | CMS-EXO-11-094 1210.2387 |
| 295 | CMS Collaboration | Search for narrow resonances in dijet final states at $ \sqrt{s}= $ 8 TeV with the novel CMS technique of data scouting | PRL 117 (2016) 031802 | CMS-EXO-14-005 1604.08907 |
| 296 | CMS Collaboration | Search for a narrow resonance lighter than 200 GeV decaying to a pair of muons in proton-proton collisions at $ \sqrt{s}= $ 13 TeV | PRL 124 (2020) 131802 | CMS-EXO-19-018 1912.04776 |
| 297 | CMS Collaboration | Search for pair-produced three-jet resonances in proton-proton collisions at $ \sqrt{s}= $ 13 TeV | PRD 99 (2019) 012010 | CMS-EXO-17-030 1810.10092 |
| 298 | GEANT4 Collaboration | GEANT 4---a simulation toolkit | NIM A 506 (2003) 250 | |
| 299 | D. J. Lange, M. Hildreth, V. N. Ivantchenko, and I. Osborne on behalf of the CMS Collaboration | Upgrades for the CMS simulation | in Proc. 16th International Workshop on Advanced Computing and Analysis Techniques in Physics (ACAT ): Prague, Czech Republic, 2015 J. Ph. Conf. Ser. 608 (2015) 012056 |
|
| 300 | S. Sekmen on behalf of the CMS Collaboration | Recent developments in CMS fast simulation | in Proc. 38th International Conference on High Energy Physics (ICHEP ): Chicago IL, USA, 2016 link |
1701.03850 |
| 301 | K. Pedro on behalf of the CMS Collaboration | Current and future performance of the CMS simulation | in Proc. 23rd International Conference on Computing in High Energy and Nuclear Physics (CHEP ): Sofia, Bulgaria, July 9--13, , volume 214, . . [], 2019 EPJ Web Conf. 214 (2019) 0 |
|
| 302 | C. Caputo on behalf of the CMS Collaboration | Enabling continuous speedup of CMS event reconstruction through continuous benchmarking | in Proc. 21th International Workshop on Advanced Computing and Analysis Techniques in Physics Research (ACAT ): Bari, Italy, October 24--28, . . [CMS-CR-2023-038], 2022 CMS-CR-2023-038 |
|
| 303 | D. Piparo | Automated quality monitoring and validation of the CMS reconstruction software | in Proc. 11th International Workshop on Advanced Computing and Analysis Techniques in Physics Research (ACAT ): Uxbridge, UK, 2012 J. Ph. Conf. Ser. 368 (2012) 012008 |
|
| 304 | N. Rodozov and D. Lange on behalf of the CMS Collaboration | Modernizing the CMS software stack | Zenodo, 2019 link |
|
| 305 | J. Blomer, C. Aguado-Sánchez, P. Buncic, and A. Harutyunyan | Distributing LHC application software and conditions databases using the CernVM file system | in Proc. 18th International Conference on Computing in High Energy and Nuclear Physics (CHEP ): Taipei, Taiwan, 2011 J. Ph. Conf. Ser. 331 (2011) 042003 |
|
| 306 | J.~Blomer et al. | The CernVM file system: v2.7.5 | Zenodo, 2020 link |
|
| 307 | C. D. Jones and E. Sexton-Kennedy | Stitched together: Transitioning CMS to a hierarchical threaded framework | in Proc. 20th International Conference on Computing in High Energy and Nuclear Physics (CHEP ): Amsterdam, Netherlands, 2014 J. Ph. Conf. Ser. 513 (2014) 022034 |
|
| 308 | oneapi-src | oneAPI Threading Building Blocks (oneTBB) | link | |
| 309 | I. Bird et al. | LHC computing grid: Technical design report | CERN Technical Proposal CERN-LHCC-2005-024, 2005 | |
| 310 | C. D. Jones on behalf of the CMS Collaboration | CMS event processing multi-core efficiency status | in Proc. 22nd International Conference on Computing in High Energy and Nuclear Physics (CHEP): San Francisco CA, 2017 J. Ph. Conf. Ser. 898 (2017) 042008 |
|
| 311 | A. Bocci et al. | Bringing heterogeneity to the CMS software framework | in Proc. 24th International Conference on Computing in High Energy and Nuclear Physics (CHEP ): Adelaide, Australia, 2020 EPJ Web Conf. 245 (2020) 05009 |
2004.04334 |
| 312 | E. Zenker et al. | Alpaka---an abstraction library for parallel kernel acceleration | in IEEE International Parallel and Distributed Processing Symposium Workshops (IPDPSW): Chicago IL, USA, 2016 link |
1602.08477 |
| 313 | H. C. Edwards, C. R. Trott, and D. Sunderland | Kokkos: Enabling manycore performance portability through polymorphic memory access patterns | JPDC 74 (2014) 3202 | |
| 314 | M. J. Kortelainen et al., on behalf of the CMS Collaboration | Porting CMS heterogeneous pixel reconstruction to Kokkos | in Proc. 25th International Conference on Computing in High-Energy and Nuclear Physics (vCHEP): Online, 2021 EPJ Web Conf. 251 (2021) 03034 |
2104.06573 |
| 315 | A. Bocci et al., on behalf of the CMS Collaboration | Performance portability for the CMS reconstruction with Alpaka | in Proc. 20th International Workshop on Advanced Computing and Analysis Techniques in Physics Research (ACAT ): Daejeon, Korea, 2023 J. Ph. Conf. Ser. 2438 (2023) 012058 |
|
| 316 | J. Duarte et al. | FPGA-accelerated machine learning inference as a service for particle physics computing | Comput. Softw. Big Sci. 3 (2019) 13 | 1904.08986 |
| 317 | D. S. Rankin et al. | FPGAs-as-a-service toolkit (FaaST) | in /ACM International Workshop on Heterogeneous High-Performance Reconfigurable Computing (H2RC ): Atlanta GA, USA, 2020 Proc. 2020 (2020) IEEE |
2010.08556 |
| 318 | J. Krupa et al. | GPU coprocessors as a service for deep learning inference in high energy physics | ML Sci. Tech. 2 (2021) 035005 | 2007.10359 |
| 319 | Nvidia Corporation | Triton inference server | Release Notes, 2023 link |
|
| 320 | M. Case, M. Liendl, A. T. M. Aerts, and A. Muhammad | CMS detector description: New developments | in Proc. 14th International Conference on Computing in High-Energy and Nuclear Physics (CHEP ): Interlaken, Switzerland, 2005 link |
|
| 321 | M. Frank, F. Gaede, C. Grefe, and P. Mato | DD4hep: A detector description toolkit for high energy physics experiments | in Proc. 20th International Conference on Computing in High Energy and Nuclear Physics (CHEP ): Amsterdam, Netherlands, 2014 J. Ph. Conf. Ser. 513 (2014) 022010 |
|
| 322 | G. Petrucciani, A. Rizzi, and C. Vuosalo on behalf of the CMS Collaboration | Mini-AOD: A new analysis data format for CMS | in Proc. 21st International Conference on Computing in High Energy and Nuclear Physics (CHEP ): Okinawa, Japan, 2015 J. Ph. Conf. Ser. 664 (2015) 072052 |
1702.04685 |
| 323 | A. Rizzi, G. Petrucciani, and M. Peruzzi on behalf of the CMS Collaboration | A further reduction in CMS event data for analysis: the NANOAOD format | in Proc. 23rd International Conference on Computing in High Energy and Nuclear Physics (CHEP ): Sofia, Bulgaria, 2019 EPJ Web Conf. 214 (2019) 06021 |
|
| 324 | M. Hildreth, V. N. Ivanchenko, and D. J. Lange on behalf of the CMS Collaboration | Upgrades for the CMS simulation | in Proc. 22nd International Conference on Computing in High Energy and Nuclear Physics (CHEP): San Francisco CA, 2017 J. Ph. Conf. Ser. 898 (2017) 042040 |
|
| 325 | M. Aderholz et al. | Models of networked analysis at regional centres for LHC experiments (MONARC): Phase 2 report | CERN Report CERN-LCB-2000-001, 2000 | |
| 326 | D. Futyan on behalf of the CMS Collaboration | Commissioning the CMS alignment and calibration framework | in Proc. 17th International Conference on Computing in High Energy and Nuclear Physics (CHEP): Prague, Czech Republic, 2010 J. Ph. Conf. Ser. 219 (2010) 032041 |
|
| 327 | K. Bloom et al. | Any data, any time, anywhere: Global data access for science | in /ACM 2nd International Symposium on Big Data Computing (BDC ): Limassol, Cyprus, 2015 Proc. 2015 (2015) IEEE |
|
| 328 | L. Bauerdick et al. | Using Xrootd to federate regional storage | in Proc. 19th International Conference on Computing in High Energy and Nuclear Physics (CHEP ): New York NY, USA, 2012 J. Ph. Conf. Ser. 396 (2012) 042009 |
|
| 329 | L. A. T. Bauerdick et al., on behalf of the CMS Collaboration | XRootd, disk-based, caching proxy for optimization of data access, data placement and data replication | in Proc. 20th International Conference on Computing in High Energy and Nuclear Physics (CHEP ): Amsterdam, Netherlands, 2014 J. Ph. Conf. Ser. 513 (2014) 042044 |
|
| 330 | G. M. Kurtzer, V. Sochat, and M. W. Bauer | Singularity: Scientific containers for mobility of compute | link | |
| 331 | T. Boccali et al. | Dynamic distribution of high-rate data processing from CERN to remote HPC data centers | Comput. Softw. Big Sci. 5 (2021) 7 | |
| 332 | T. Boccali et al. | Extension of the INFN \Tier1 on a HPC system | in Proc. 24th International Conference on Computing in High Energy and Nuclear Physics (CHEP ): Adelaide, Australia, 2020 EPJ Web Conf. 245 (2020) 09009 |
2006.14603 |
| 333 | C. Acosta-Silva et al. | Exploitation of network-segregated CPU resources in CMS | in Proc. 25th International Conference on Computing in High-Energy and Nuclear Physics (vCHEP): Online, 2021 EPJ Web Conf. 251 (2021) 0 |
|
| 334 | M. Fischer et al. | Effective dynamic integration and utilization of heterogenous compute resources | in Proc. 24th International Conference on Computing in High Energy and Nuclear Physics (CHEP ): Adelaide, Australia, 2020 EPJ Web Conf. 245 (2020) 07038 |
|
| 335 | T. Boccali et al. | Enabling CMS experiment to the utilization of multiple hardware architectures: a Power9 testbed at CINECA | in Proc. 20th International Workshop on Advanced Computing and Analysis Techniques in Physics Research (ACAT ): Daejeon, Korea, 2023 J. Ph. Conf. Ser. 2438 (2023) 012031 |
|
| 336 | D. Hufnagel et al. | HPC resource integration into CMS computing via HEPCloud | in Proc. 23rd International Conference on Computing in High Energy and Nuclear Physics (CHEP ): Sofia, Bulgaria, 2019 EPJ Web Conf. 214 (2019) 03031 |
|
| 337 | M. C. Davis et al. | CERN tape archive---from development to production deployment | in Proc. 23rd International Conference on Computing in High Energy and Nuclear Physics (CHEP ): Sofia, Bulgaria, 2019 EPJ Web Conf. 214 (2019) 04015 |
|
| 338 | J. Rehn et al. | PhEDEx high-throughput data transfer management system | in Proc. 15th International Conference on Computing in High Energy and Nuclear Physics (CHEP ): Mumbai, India, 2006 link |
|
| 339 | Y. Iiyama et al. | Dynamo: Handling scientific data across sites and storage media | Comput. Softw. Big Sci. 5 (2021) 11 | 2003.11409 |
| 340 | I. Béjar Alonso et al. | High-luminosity Large Hadron Collider (HL-LHC): Technical design report | CERN Technical Proposal CERN-2020-010, 2020 link |
|
| 341 | E. Karavakis et al. | FTS improvements for LHC Run 3 and beyond | in Proc. 24th International Conference on Computing in High Energy and Nuclear Physics (CHEP ): Adelaide, Australia, 2020 EPJ Web Conf. 245 (2020) 04016 |
|
| 342 | M. Barisits et al. | Rucio: Scientific data management | Comput. Softw. Big Sci. 3 (2019) 11 | 1902.09857 |
| 343 | Helm | Helm: the package manager for Kubernetes | \href. Software available at \urlhttps://github.com/helm/helm, . More information at \urlhttps://helm.sh/ (last accessed \LastAccessed), 2023 | |
| 344 | Kubernetes | Kubernetes (K8s) | \href. Software available at \urlhttps://github.com/kubernetes/kubernetes, . More information at \urlhttps://kubernetes.io/ (last accessed \LastAccessed), 2023 link |
|
| 345 | Docker | Docker | \href. Software available at \urlhttps://github.com/docker, . More information at \urlhttps://www.docker.com/ (last accessed \LastAccessed), 2023 link |
|
| 346 | I. Foster, C. Kesselman, G. Tsudik, and S. Tuecke | A security architecture for computational grids | in Proc. 5th ACM conference on Computer and Communications Security (CCS98): San Francisco CA, USA, 1998 link |
|
| 347 | R. Butler et al. | A national-scale authentication infrastructure | Computer 33 (2000) 60 | |
| 348 | L. Dusseault | HTTP extensions for web distributed authoring and versioning (WebDAV) | RFC Proposed Standard 4918 (2007) | |
| 349 | X. Espinal et al. | The quest to solve the HL-LHC data access puzzle | in Proc. 24th International Conference on Computing in High Energy and Nuclear Physics (CHEP ): Adelaide, Australia, 2020 EPJ Web Conf. 245 (2020) 04027 |
|
| 350 | I. Sfiligoi et al. | The pilot way to grid resources using glideinWMS | in World Congress on Computer Science and Information Engineering: Los Angeles CA, USA, 2009 link |
|
| 351 | D. Thain, T. Tannenbaum, and M. Livny | Distributed computing in practice: the Condor experience | Concurr. Comput. 17 (2005) 323 | |
| 352 | J. Balcas et al. | Using the glideinWMS system as a common resource provisioning layer in CMS | in Proc. 21st International Conference on Computing in High Energy and Nuclear Physics (CHEP ): Okinawa, Japan, 2015 J. Ph. Conf. Ser. 664 (2015) 062031 |
|
| 353 | A. Pérez-Calero Yzquierdo et al., on behalf of the CMS Collaboration | Evolution of the CMS global submission infrastructure for the HL-LHC era | in Proc. 24th International Conference on Computing in High Energy and Nuclear Physics (CHEP ): Adelaide, Australia, 2020 EPJ Web Conf. 245 (2020) 03016 |
|
| 354 | D. Spiga et al. | Exploiting private and commercial clouds to generate on-demand CMS computing facilities with DODAS | in Proc. 23rd International Conference on Computing in High Energy and Nuclear Physics (CHEP ): Sofia, Bulgaria, 2019 EPJ Web Conf. 214 (2019) 07027 |
|
| 355 | D. P. Anderson | BOINC: A platform for volunteer computing | J. Grid Comput. 18 (2020) 99 | |
| 356 | D. Smith et al. | Sharing server nodes for storage and compute | in Proc. 23rd International Conference on Computing in High Energy and Nuclear Physics (CHEP ): Sofia, Bulgaria, 2019 EPJ Web Conf. 214 (2019) 08025 |
|
| 357 | D. Giordano et al. | CERN-IT evaluation of Microsoft Azure cloud IaaS | Zenodo, 2016 link |
|
| 358 | C. Cordeiro et al. | CERN computing in commercial clouds | in Proc. 22nd International Conference on Computing in High Energy and Nuclear Physics (CHEP): San Francisco CA, 2017 J. Ph. Conf. Ser. 898 (2017) 082030 |
|
| 359 | A. Perez-Calero Yzquierdo et al. | CMS readiness for multi-core workload scheduling | in Proc. 22nd International Conference on Computing in High Energy and Nuclear Physics (CHEP): San Francisco CA, 2017 J. Ph. Conf. Ser. 898 (2017) 052030 |
|
| 360 | B. P. Bockelman et al., on behalf of the CMS Collaboration | Improving the scheduling efficiency of a global multi-core HTCondor pool in CMS | in Proc. 23rd International Conference on Computing in High Energy and Nuclear Physics (CHEP ): Sofia, Bulgaria, 2019 EPJ Web Conf. 214 (2019) 03056 |
|
| 361 | A. Pérez-Calero Yzquierdo et al., on behalf of the CMS Collaboration | Reaching new peaks for the future of the CMS HTCondor global pool | in Proc. 25th International Conference on Computing in High-Energy and Nuclear Physics (vCHEP): Online, 2021 EPJ Web Conf. 251 (2021) 02055 |
|
| 362 | P. Couvares et al. | Workflow management in Condor | in Workflows for e-Science, Springer Nature, London, UK, 2007 link |
|
| 363 | J. Balcas et al. | CMS Connect | in Proc. 22nd International Conference on Computing in High Energy and Nuclear Physics (CHEP): San Francisco CA, 2017 J. Ph. Conf. Ser. 898 (2017) 082032 |
|
| 364 | V. Kuznetsov, D. Evans, and S. Metson | The CMS data aggregation system | in Proc. 10th International Conference on Computational Science (ICCS ): Amsterdam, Netherlands, 2010 Proc. Comp. Sci. 1 (2010) 1535 |
|
| 365 | M. Imran et al. | Migration of CMSWEB cluster at CERN to Kubernetes: a comprehensive study | Clust. Comput. 24 (2021) 3085 | |
| 366 | WLCG | WLCG token transition timeline | Zenodo, 2022 link |
|
| 367 | C. Ariza-Porras, V. Kuznetsov, and F. Legger | The CMS monitoring infrastructure and applications | Comput. Softw. Big Sci. 5 (2021) 5 | 2007.03630 |
| 368 | A. Aimar et al. | Unified monitoring architecture for IT and grid services | in Proc. 22nd International Conference on Computing in High Energy and Nuclear Physics (CHEP): San Francisco CA, 2017 J. Ph. Conf. Ser. 898 (2017) 092033 |
|
|
|
Compact Muon Solenoid LHC, CERN |
|

|

|

|

|

|