

Compact Muon Solenoid
LHC, CERN
| CMS-EXO-17-003 ; CERN-EP-2018-218 | ||
| Search for pair production of second-generation leptoquarks at $\sqrt{s} = $ 13 TeV | ||
| CMS Collaboration | ||
| 15 August 2018 | ||
| Phys. Rev. D 99 (2019) 032014 | ||
| Abstract: A search for pair production of second-generation leptoquarks is performed using proton-proton collision data collected at $\sqrt{s} = $ 13 TeV in 2016 with the CMS detector at the CERN LHC, corresponding to an integrated luminosity of 35.9 fb$^{-1}$. Final states with two muons and two jets, or with one muon, two jets, and missing transverse momentum are considered. Second-generation scalar leptoquarks with masses less than 1530 (1285) GeV are excluded for $\beta = $ 1.0 (0.5), where $\beta$ is the branching fraction for the decay of a leptoquark to a charged lepton and a quark. The results of the search are also interpreted as limits on the pair production of long-lived top squarks in an $R$-parity violating supersymmetry model that has a final state with two muons and two jets. These limits represent the most stringent limits to date on these models. | ||
| Links: e-print arXiv:1808.05082 [hep-ex] (PDF) ; CDS record ; inSPIRE record ; CADI line (restricted) ; | ||
| Figures | |
png pdf |
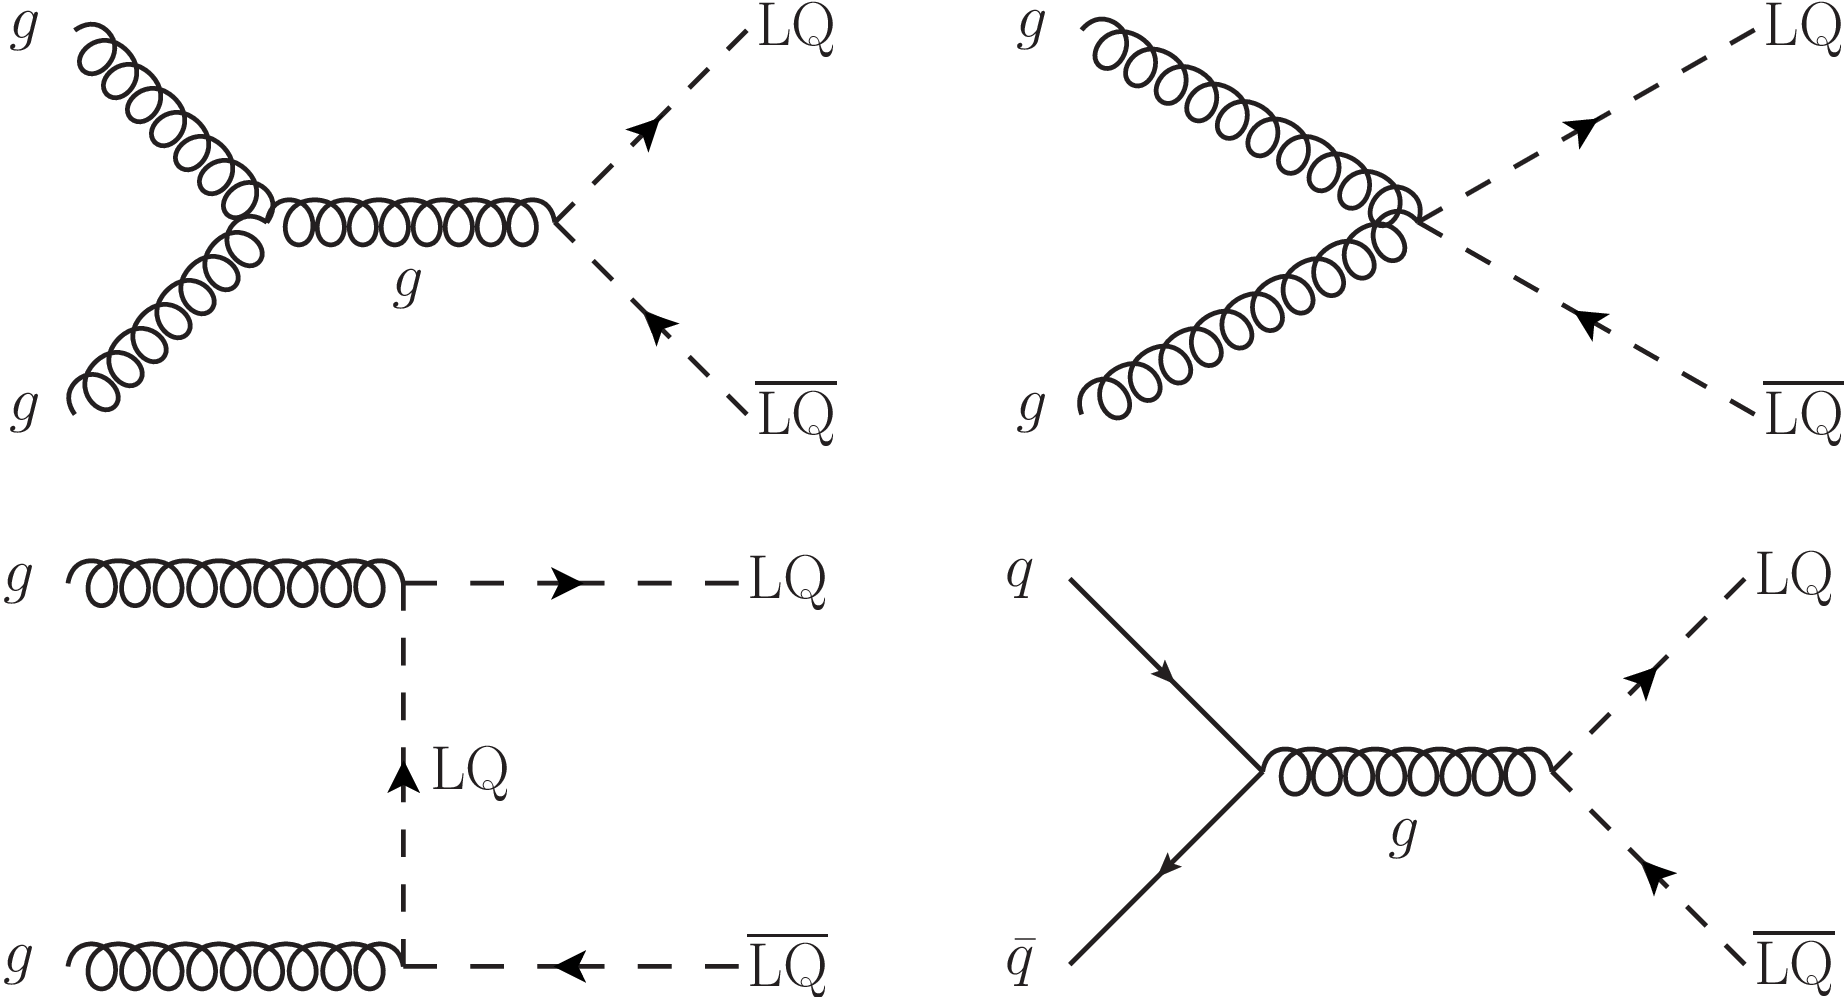
Figure 1:
Dominant leading-order Feynman diagrams for the pair production of LQs at the LHC. |
png pdf |
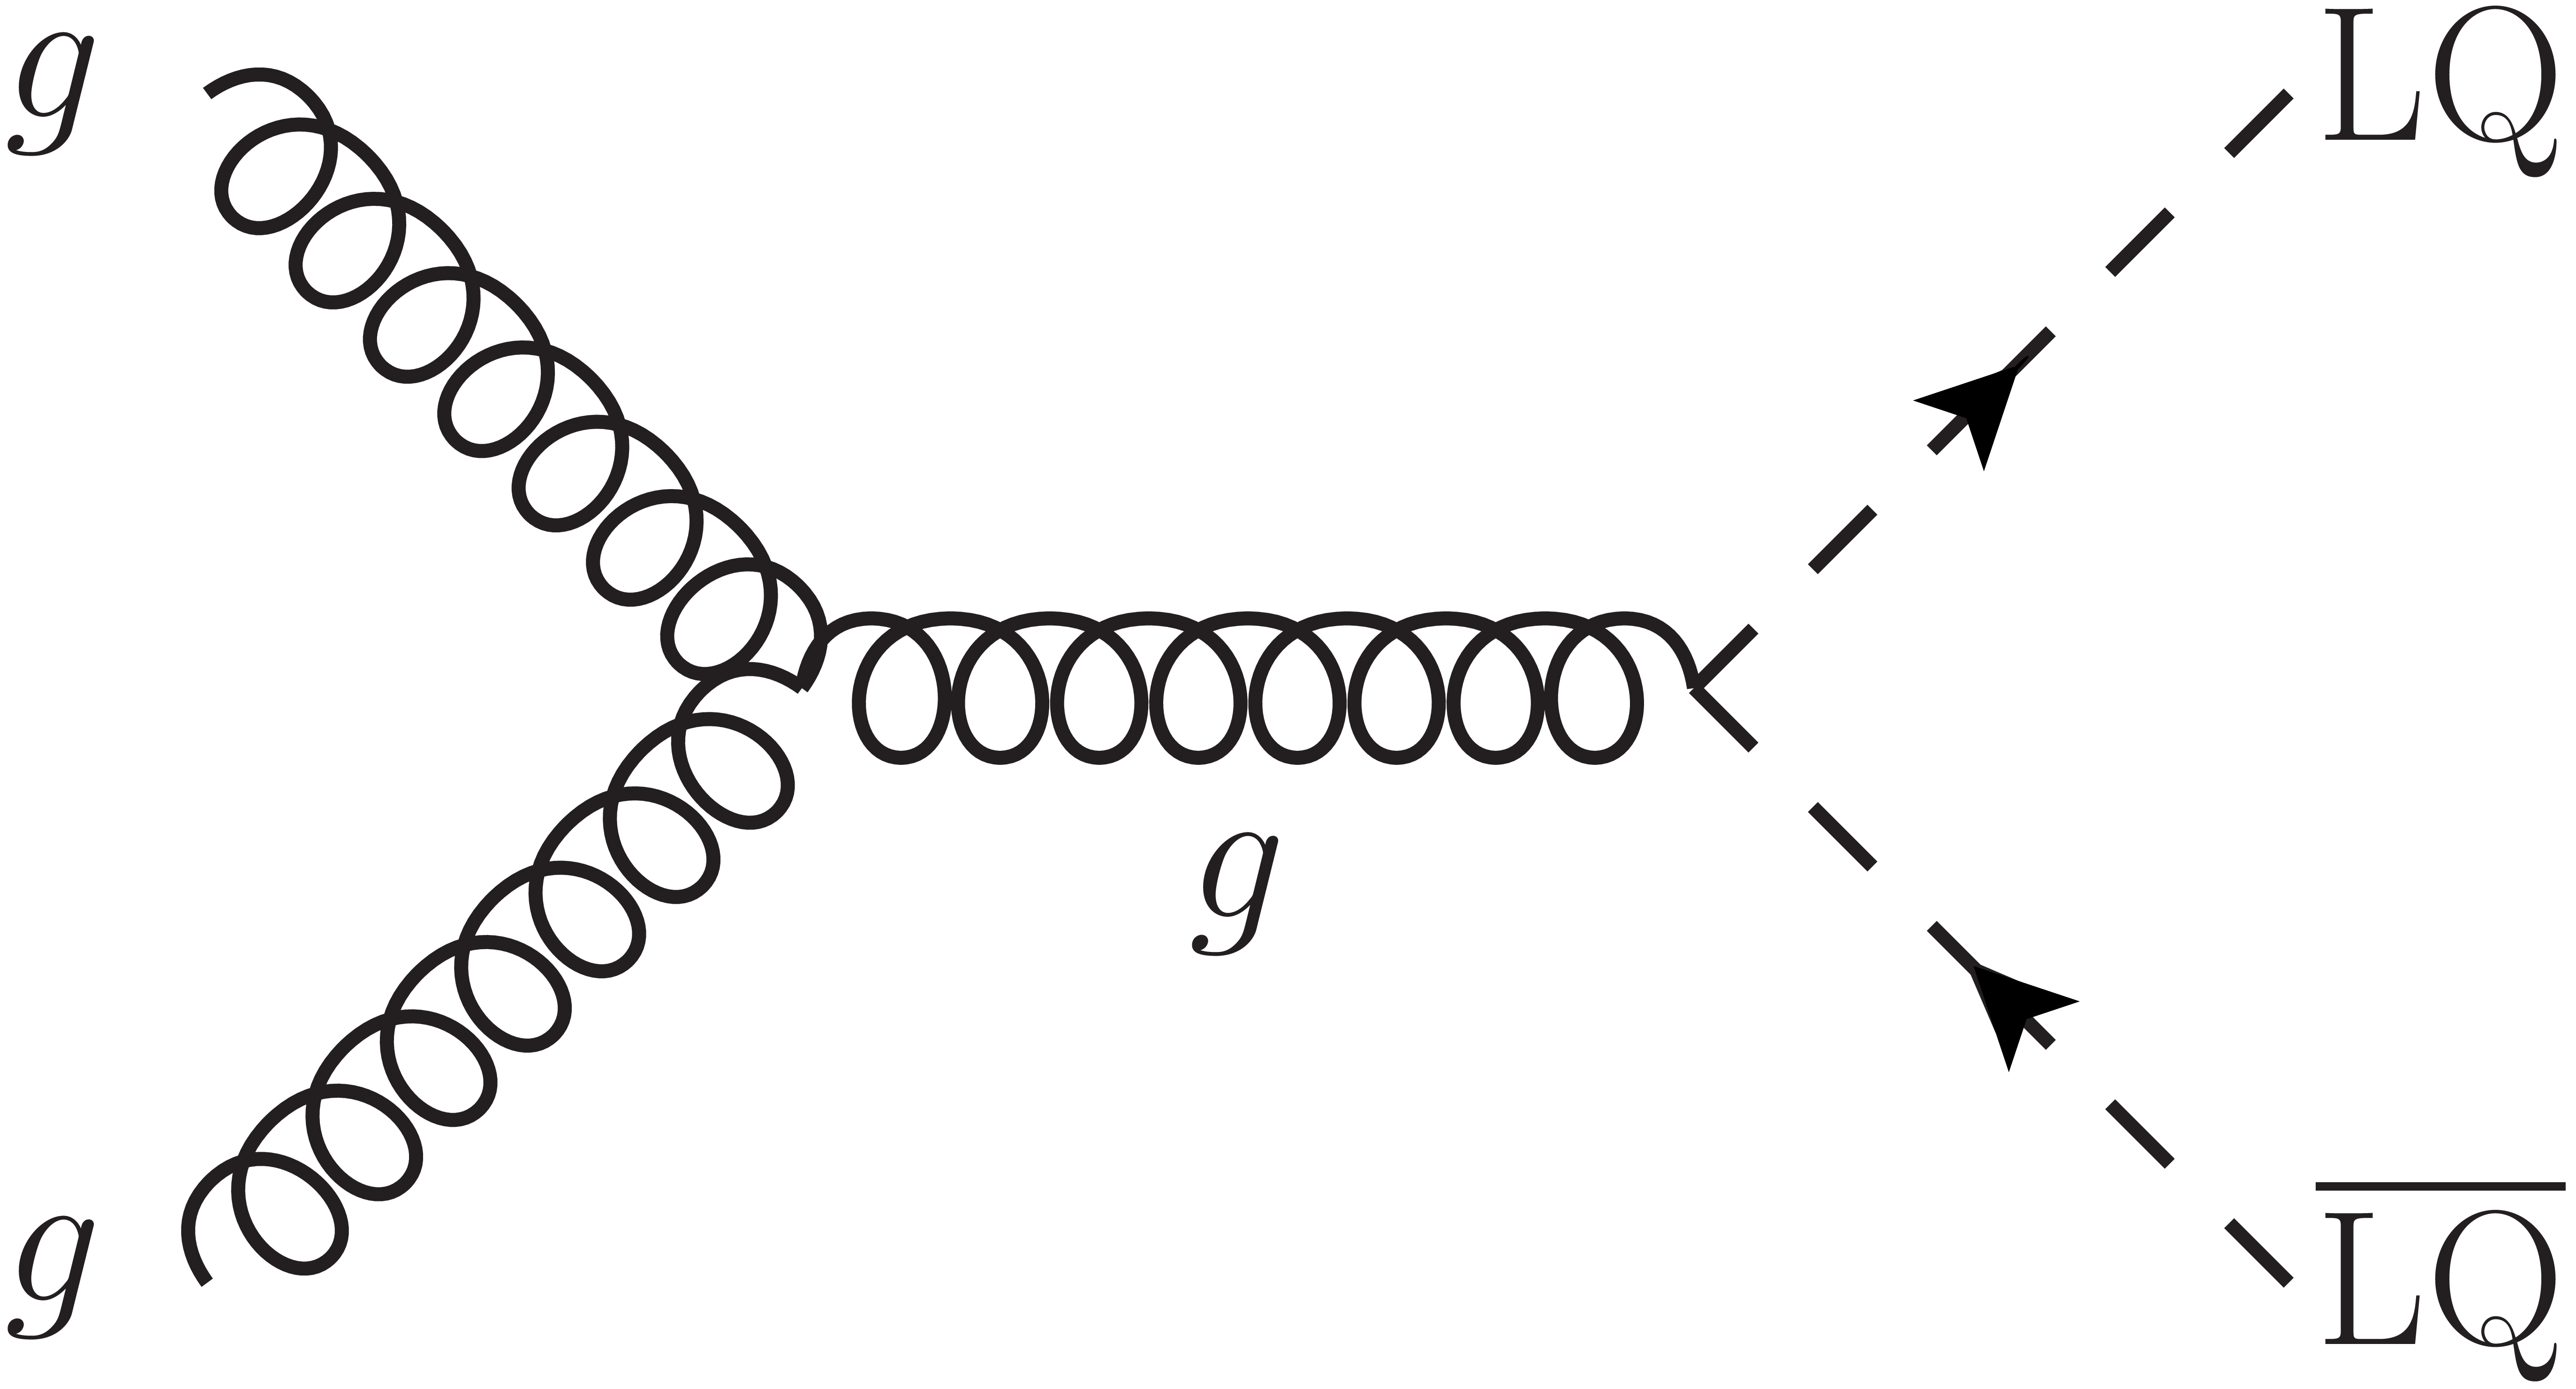
Figure 1-a:
A leading-order Feynman diagram for the pair production of LQs at the LHC. |

png pdf |
Figure 1-b:
A leading-order Feynman diagram for the pair production of LQs at the LHC. |
png pdf |
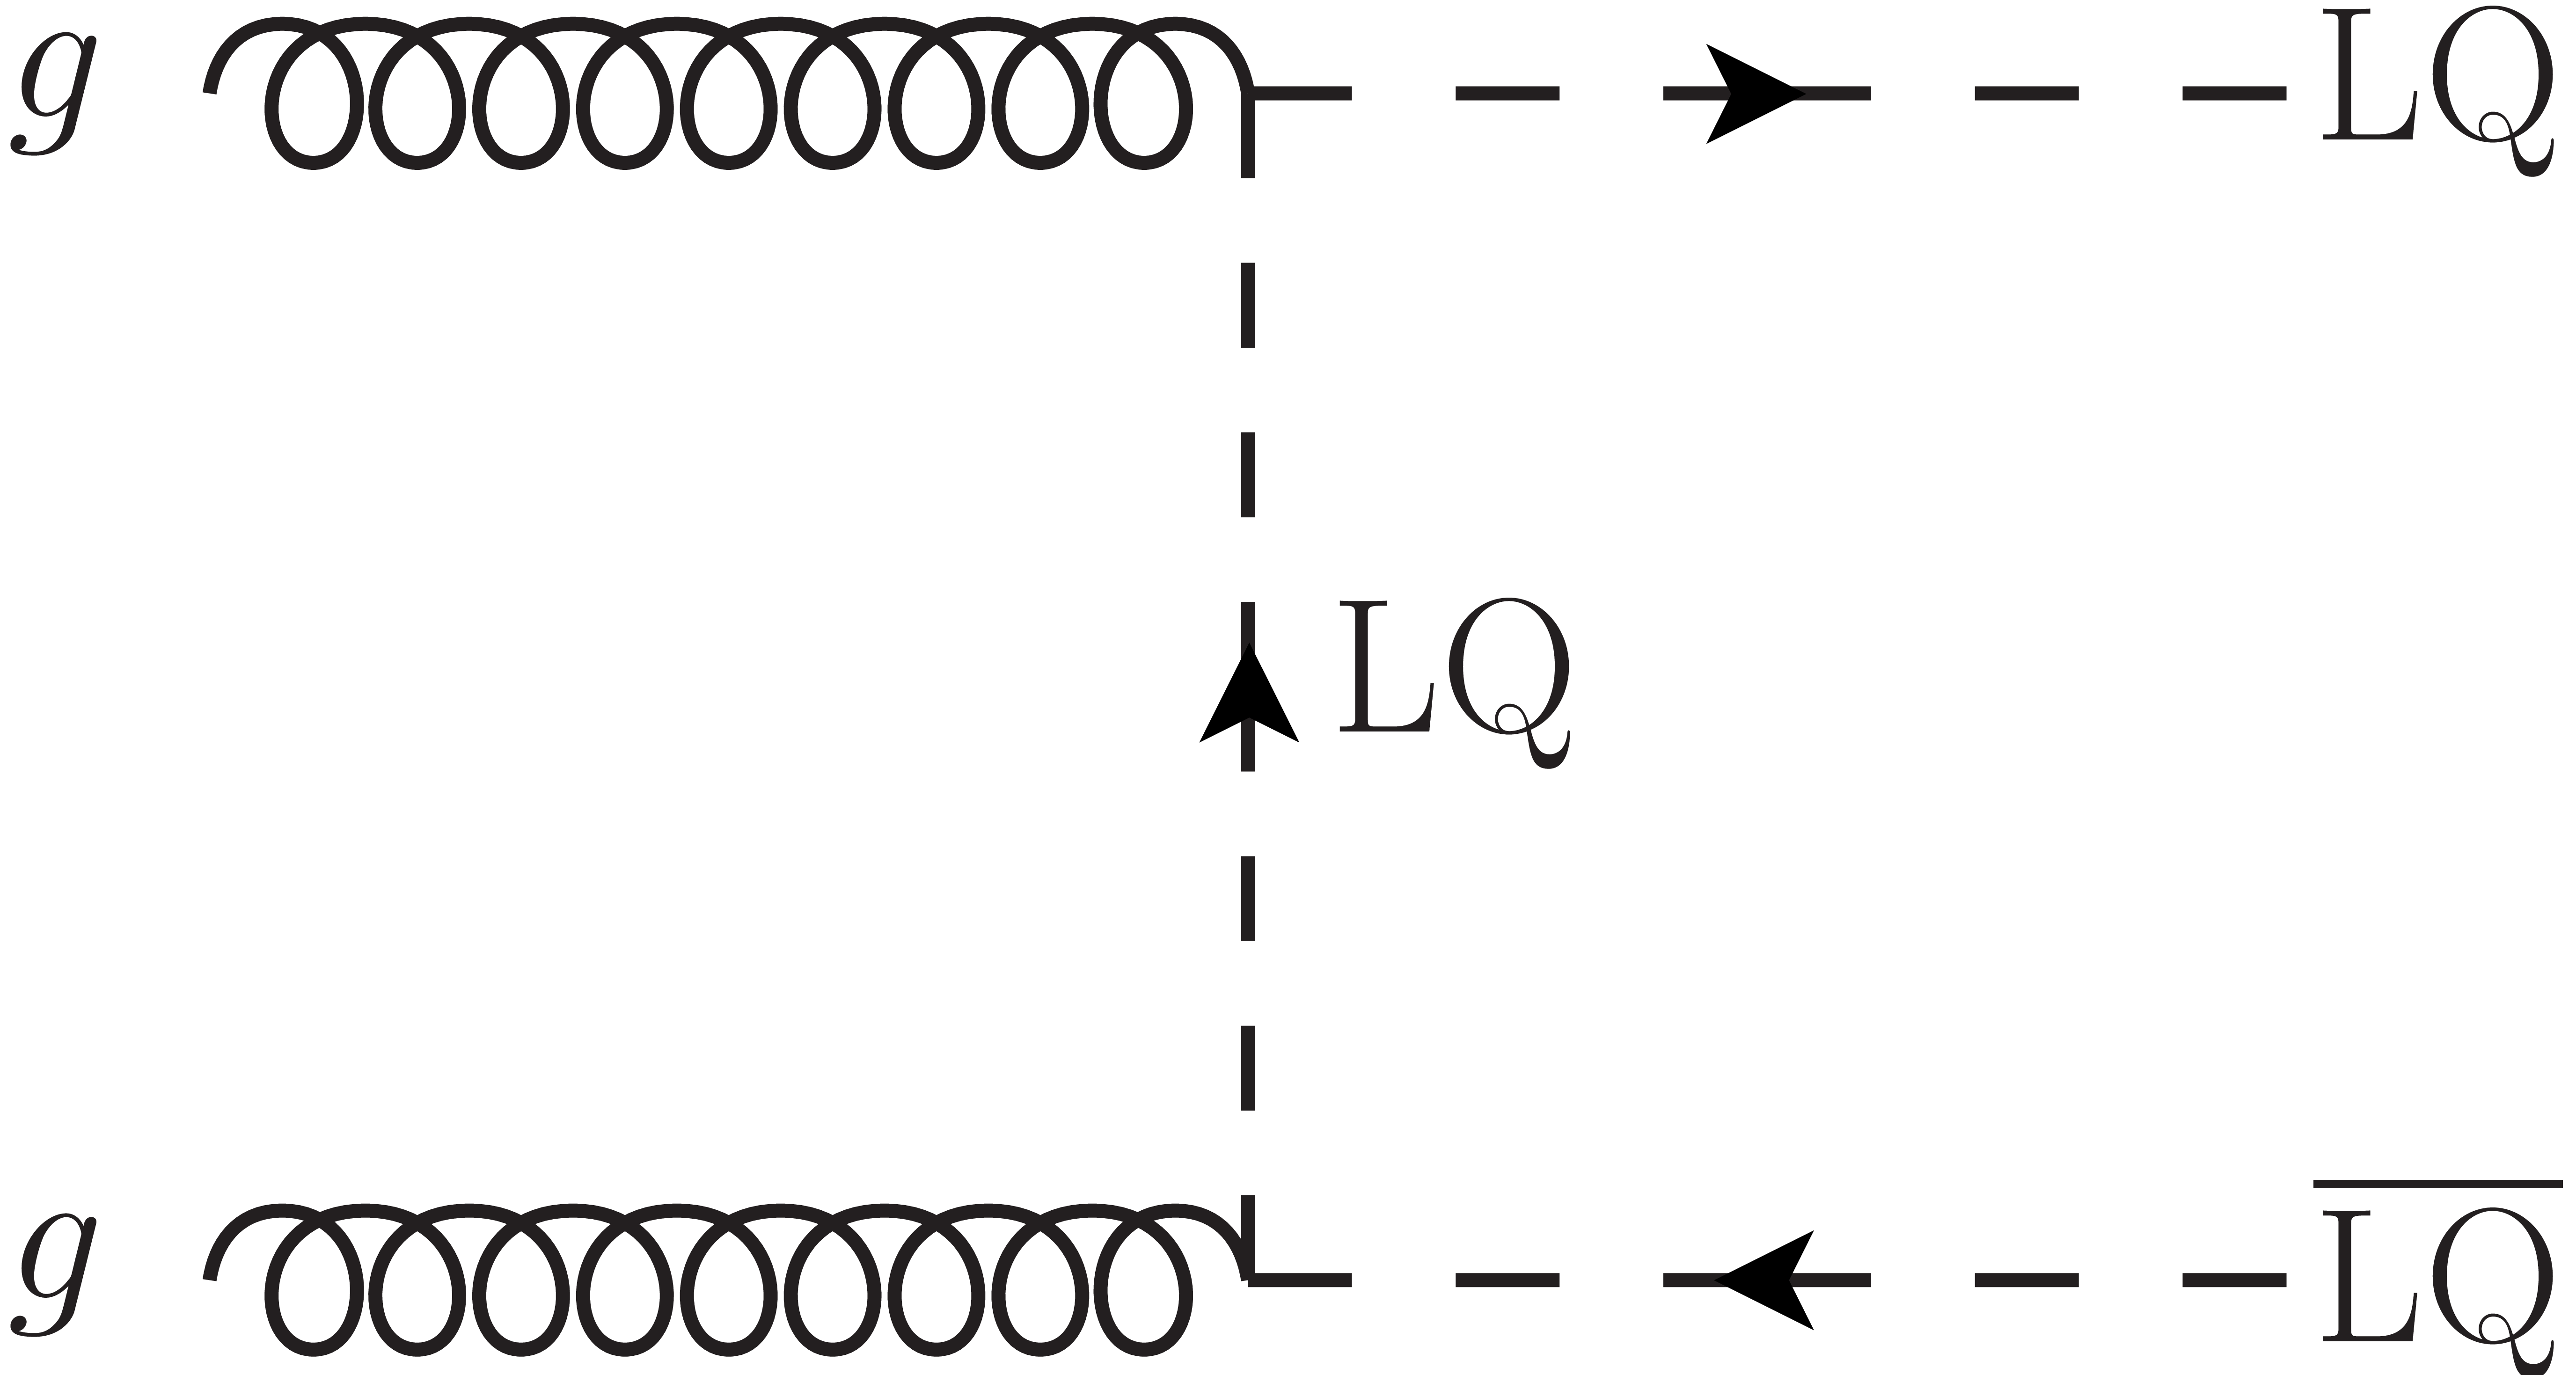
Figure 1-c:
A leading-order Feynman diagram for the pair production of LQs at the LHC. |

png pdf |
Figure 1-d:
A leading-order Feynman diagram for the pair production of LQs at the LHC. |

png pdf |
Figure 2:
Comparison of data and background at the preselection level for the ${{{\mu} {\mu} \mathrm {jj}}}$ channel, for the variables used for final the selection optimization: ${{m_{{\mu} {\mu}}}}$ (upper), ${{m_{{\mu} \mathrm {j}}^{\mathrm {min}}}}$ (lower left), and ${{S_{\mathrm {T}}^{{\mu} {\mu} \mathrm {jj}}}}$ (lower right). `Other background' includes W+jets, single top quark, and diboson backgrounds. The hashed band represents the combined statistical and systematic uncertainty in the full background estimate. |

png pdf |
Figure 2-a:
Comparison of data and background for the ${{m_{{\mu} {\mu}}}}$ variable, at the preselection level for the ${{{\mu} {\mu} \mathrm {jj}}}$ channel. `Other background' includes W+jets, single top quark, and diboson backgrounds. The hashed band represents the combined statistical and systematic uncertainty in the full background estimate. |
png pdf |
Figure 2-b:
Comparison of data and background for the ${{m_{{\mu} \mathrm {j}}^{\mathrm {min}}}}$ variable, at the preselection level for the ${{{\mu} {\mu} \mathrm {jj}}}$ channel. `Other background' includes W+jets, single top quark, and diboson backgrounds. The hashed band represents the combined statistical and systematic uncertainty in the full background estimate. |

png pdf |
Figure 2-c:
Comparison of data and background for the ${{S_{\mathrm {T}}^{{\mu} {\mu} \mathrm {jj}}}}$ variable, at the preselection level for the ${{{\mu} {\mu} \mathrm {jj}}}$ channel. `Other background' includes W+jets, single top quark, and diboson backgrounds. The hashed band represents the combined statistical and systematic uncertainty in the full background estimate. |

png pdf |
Figure 3:
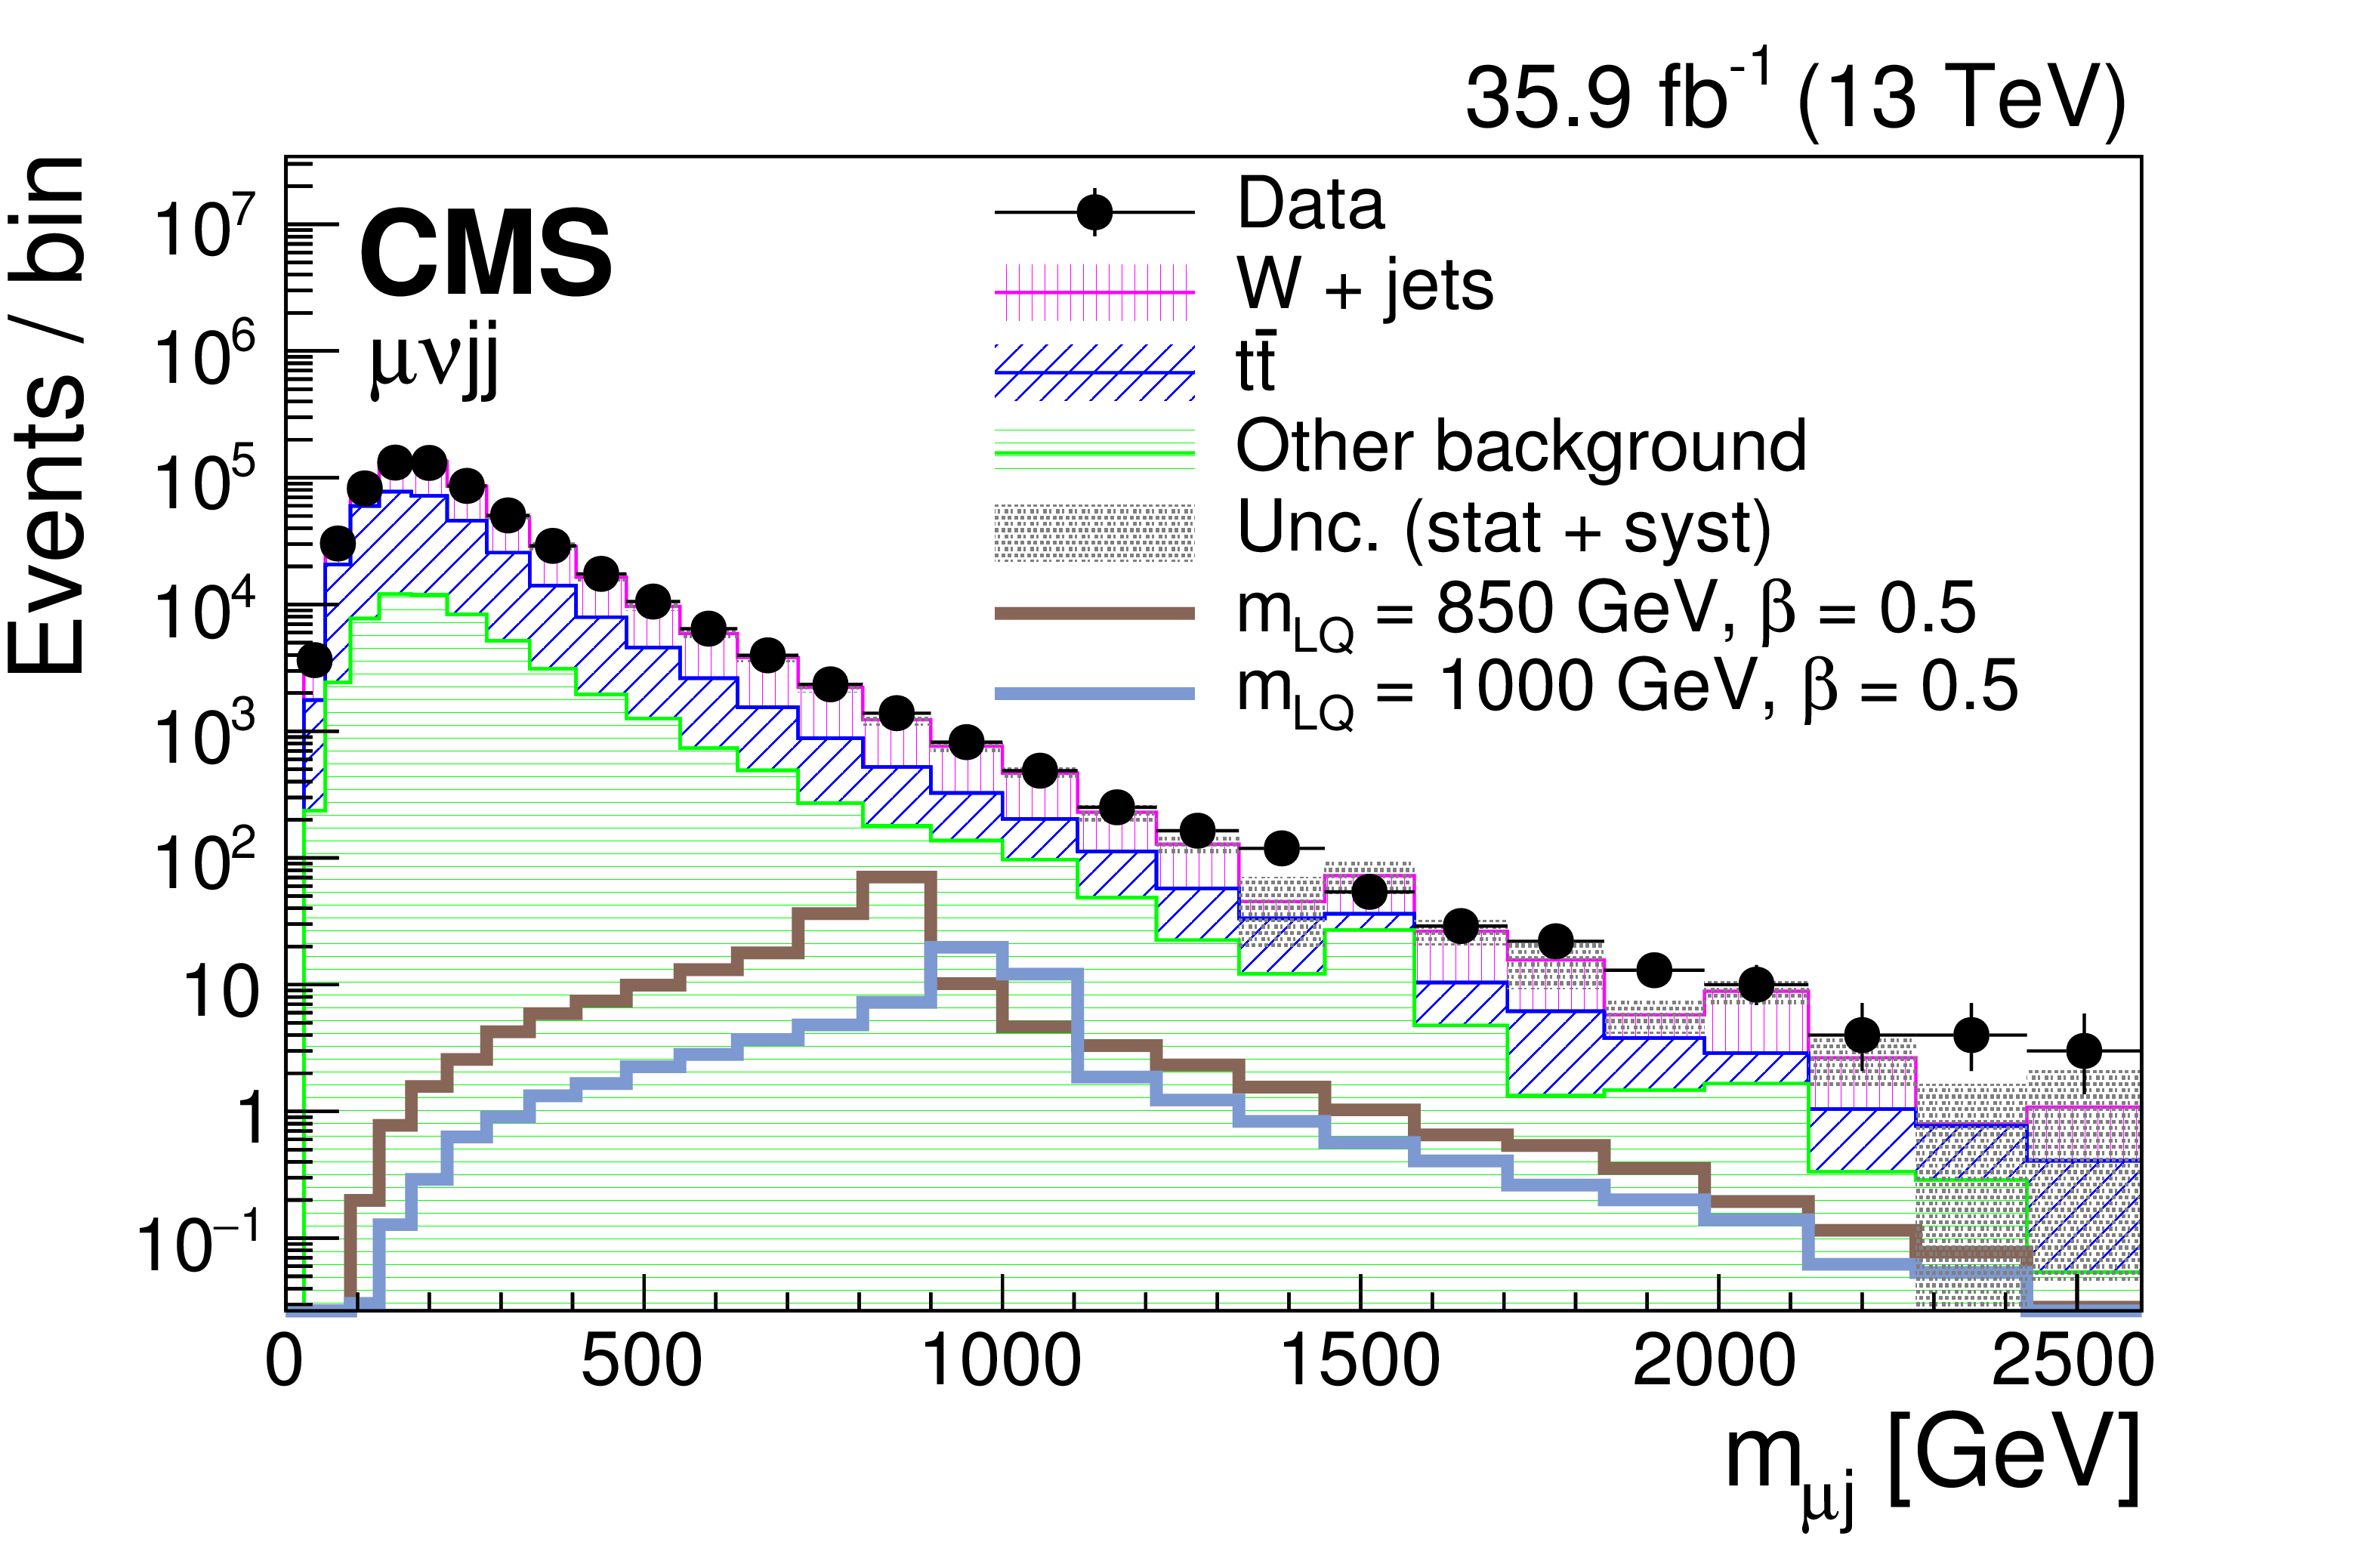
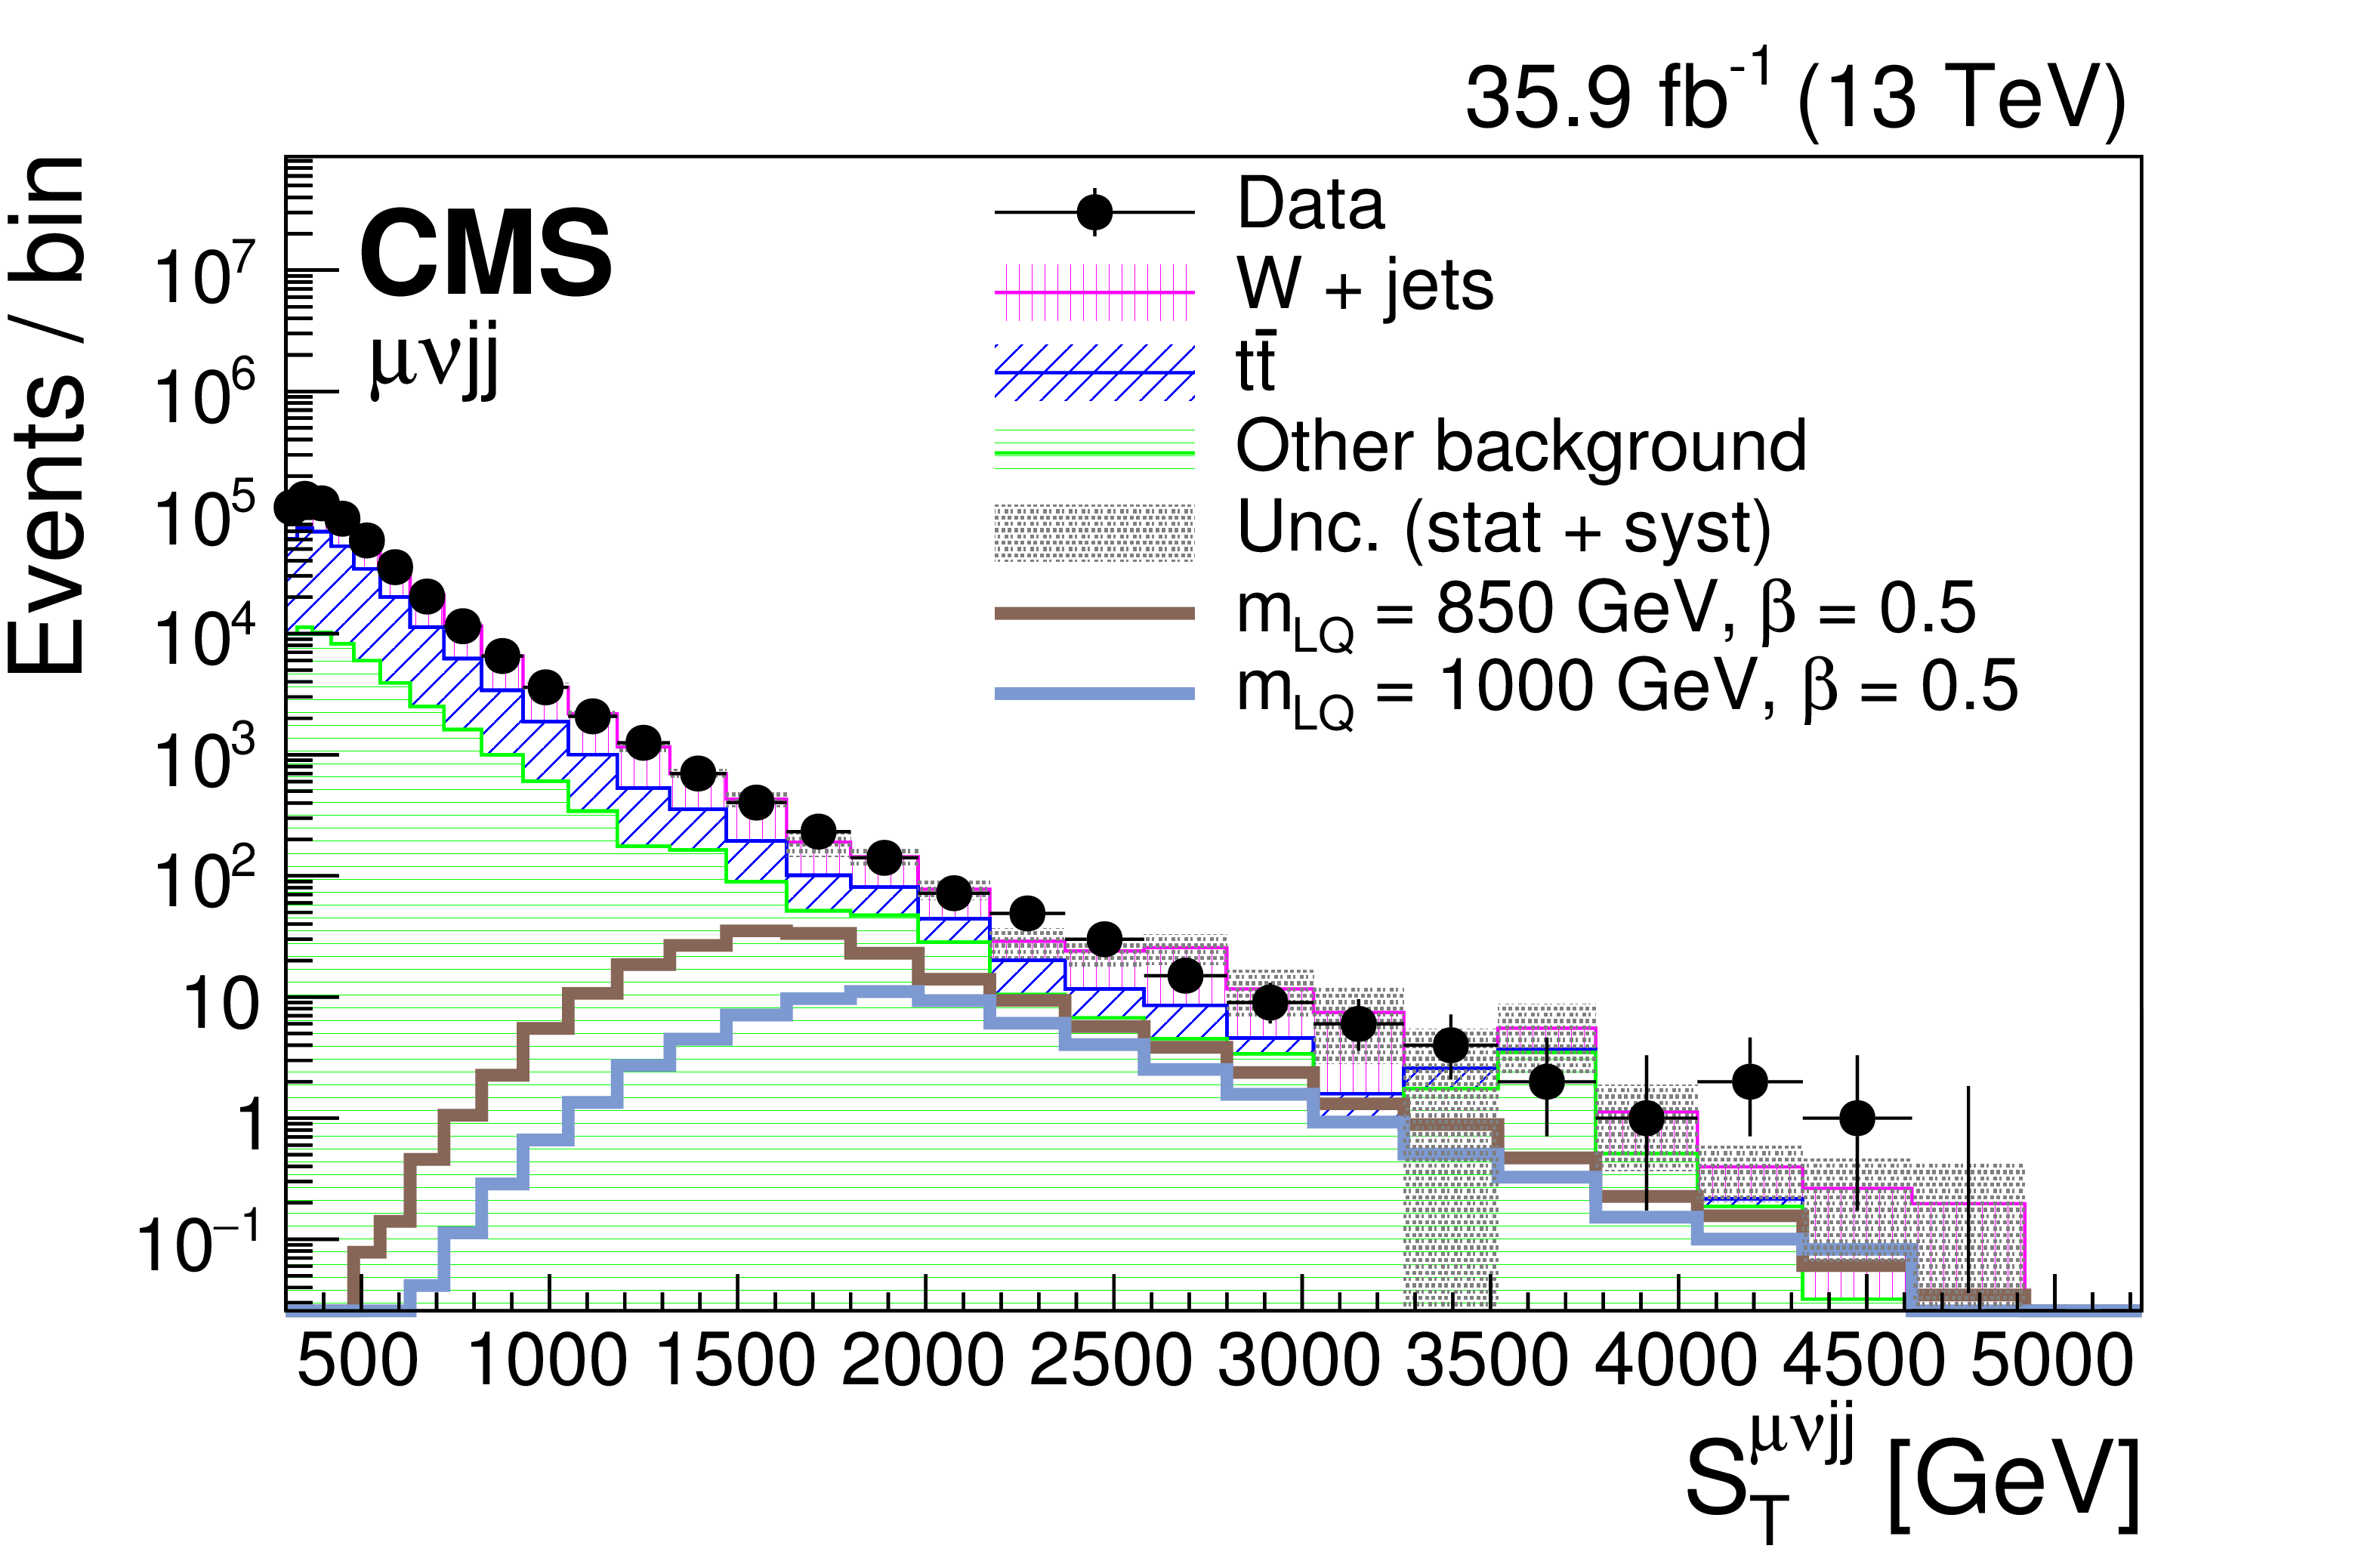
Comparison of data and background at the preselection level for the ${{{\mu} {\nu}\mathrm {jj}}}$ channel, for the variables used for final selection criteria optimization: ${{m_{\mathrm {T}}^{{\mu} {\nu}}}}$ (upper), ${{m_{{\mu} \mathrm {j}}}}$ (lower left), and ${{S_{\mathrm {T}}^{{\mu} {\nu}\mathrm {jj}}}}$ (lower right). `Other background' includes $ {\mathrm {Z}}/\gamma ^*$+jets, single top quark, and diboson backgrounds. The hashed band represents the combined statistical and systematic uncertainty in the full background estimate. |

png pdf |
Figure 3-a:
Comparison of data and background for the ${{m_{\mathrm {T}}^{{\mu} {\nu}}}}$ variable, at the preselection level for the ${{{\mu} {\nu}\mathrm {jj}}}$ channel. `Other background' includes $ {\mathrm {Z}}/\gamma ^*$+jets, single top quark, and diboson backgrounds. The hashed band represents the combined statistical and systematic uncertainty in the full background estimate. |
png pdf |
Figure 3-b:
Comparison of data and background for the ${{m_{{\mu} \mathrm {j}}}}$ variable, at the preselection level for the ${{{\mu} {\nu}\mathrm {jj}}}$ channel. `Other background' includes $ {\mathrm {Z}}/\gamma ^*$+jets, single top quark, and diboson backgrounds. The hashed band represents the combined statistical and systematic uncertainty in the full background estimate. |
png pdf |
Figure 3-c:
Comparison of data and background for the ${{S_{\mathrm {T}}^{{\mu} {\nu}\mathrm {jj}}}}$ variable, at the preselection level for the ${{{\mu} {\nu}\mathrm {jj}}}$ channel. `Other background' includes $ {\mathrm {Z}}/\gamma ^*$+jets, single top quark, and diboson backgrounds. The hashed band represents the combined statistical and systematic uncertainty in the full background estimate. |
png pdf |
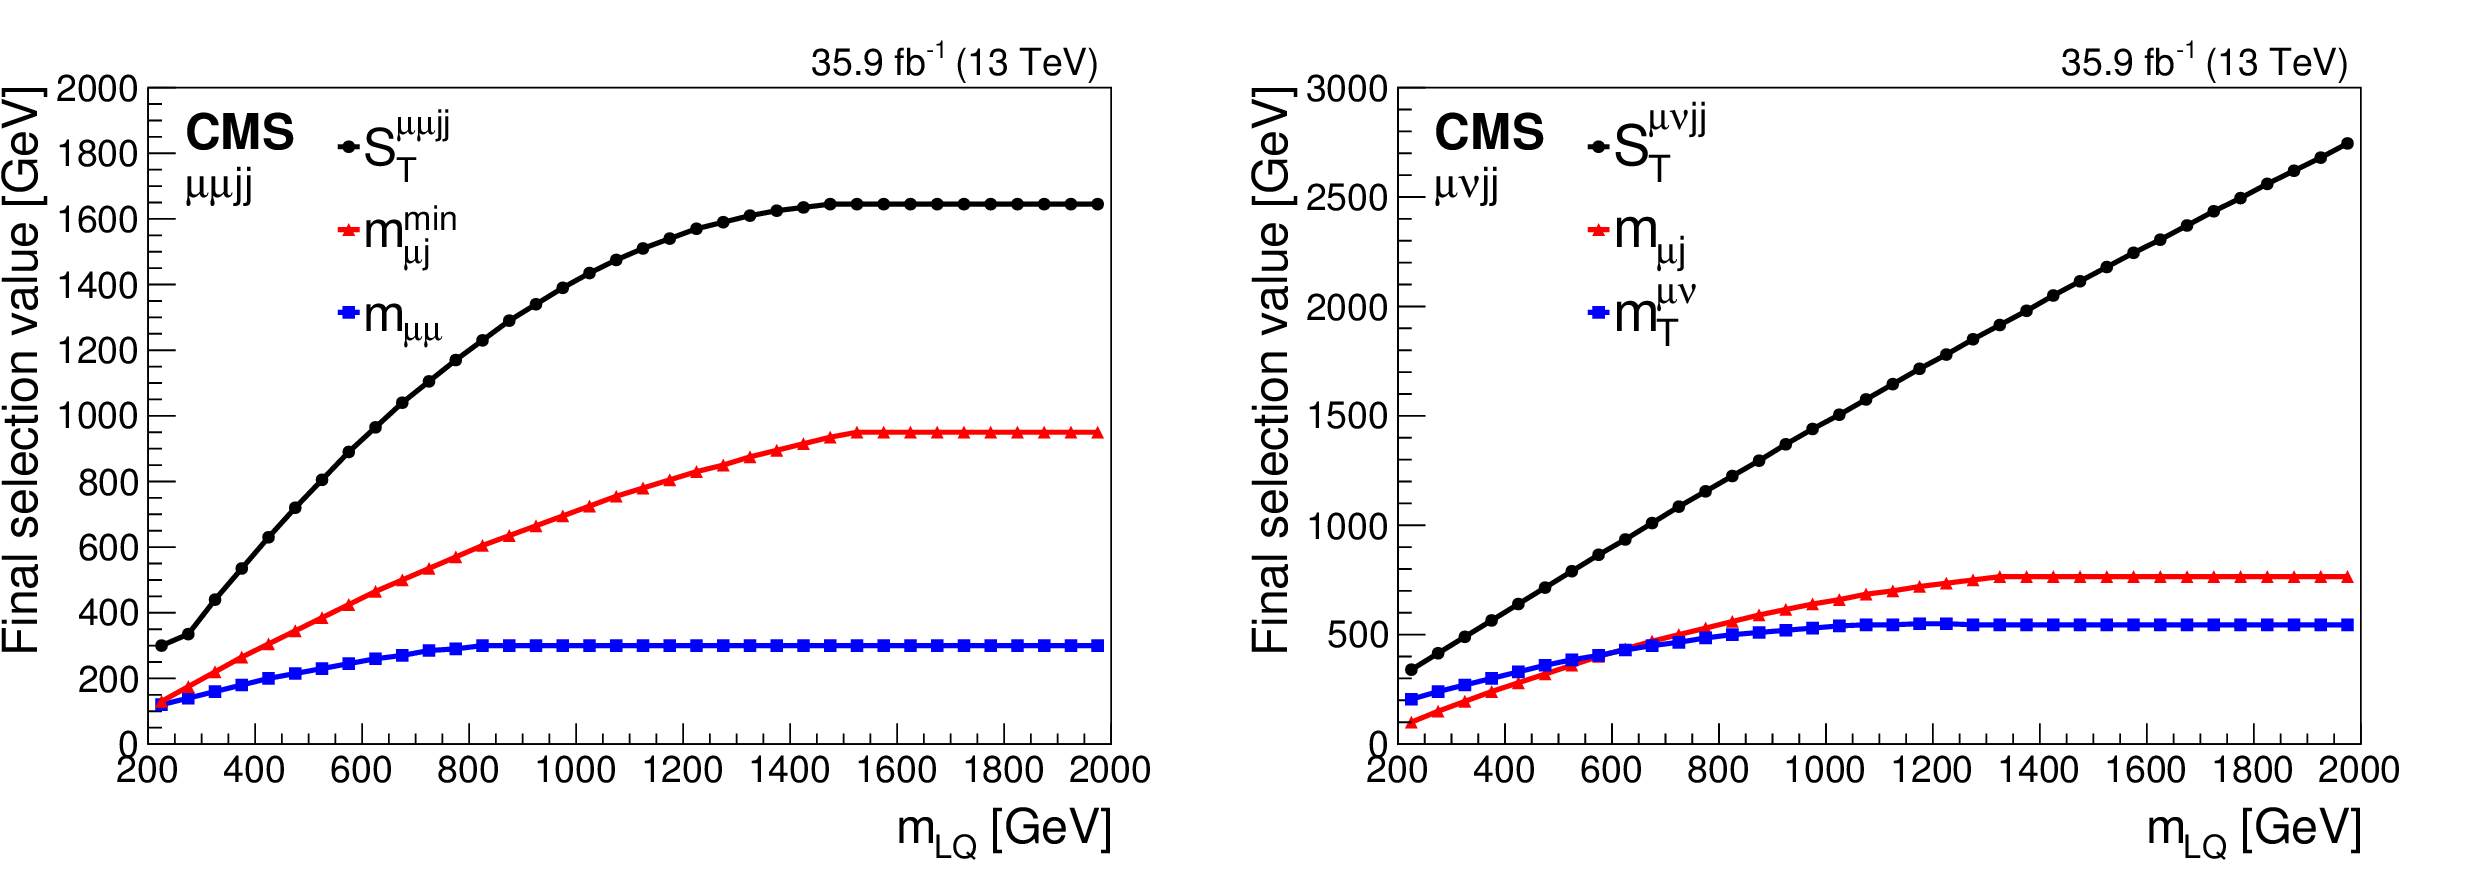
Figure 4:
Lower bounds of the final selection criteria for the three variables for the ${{{\mu} {\mu} \mathrm {jj}}}$ (left) and ${{{\mu} {\nu}\mathrm {jj}}}$ (right) channels as a function of scalar ${{m_{\mathrm {LQ}}}}$. |

png pdf |
Figure 4-a:
Lower bounds of the final selection criteria for the three variables for the ${{{\mu} {\mu} \mathrm {jj}}}$ channel as a function of scalar ${{m_{\mathrm {LQ}}}}$. |

png pdf |
Figure 4-b:
Lower bounds of the final selection criteria for the three variables for the ${{{\mu} {\nu}\mathrm {jj}}}$ channel as a function of scalar ${{m_{\mathrm {LQ}}}}$. |

png pdf |
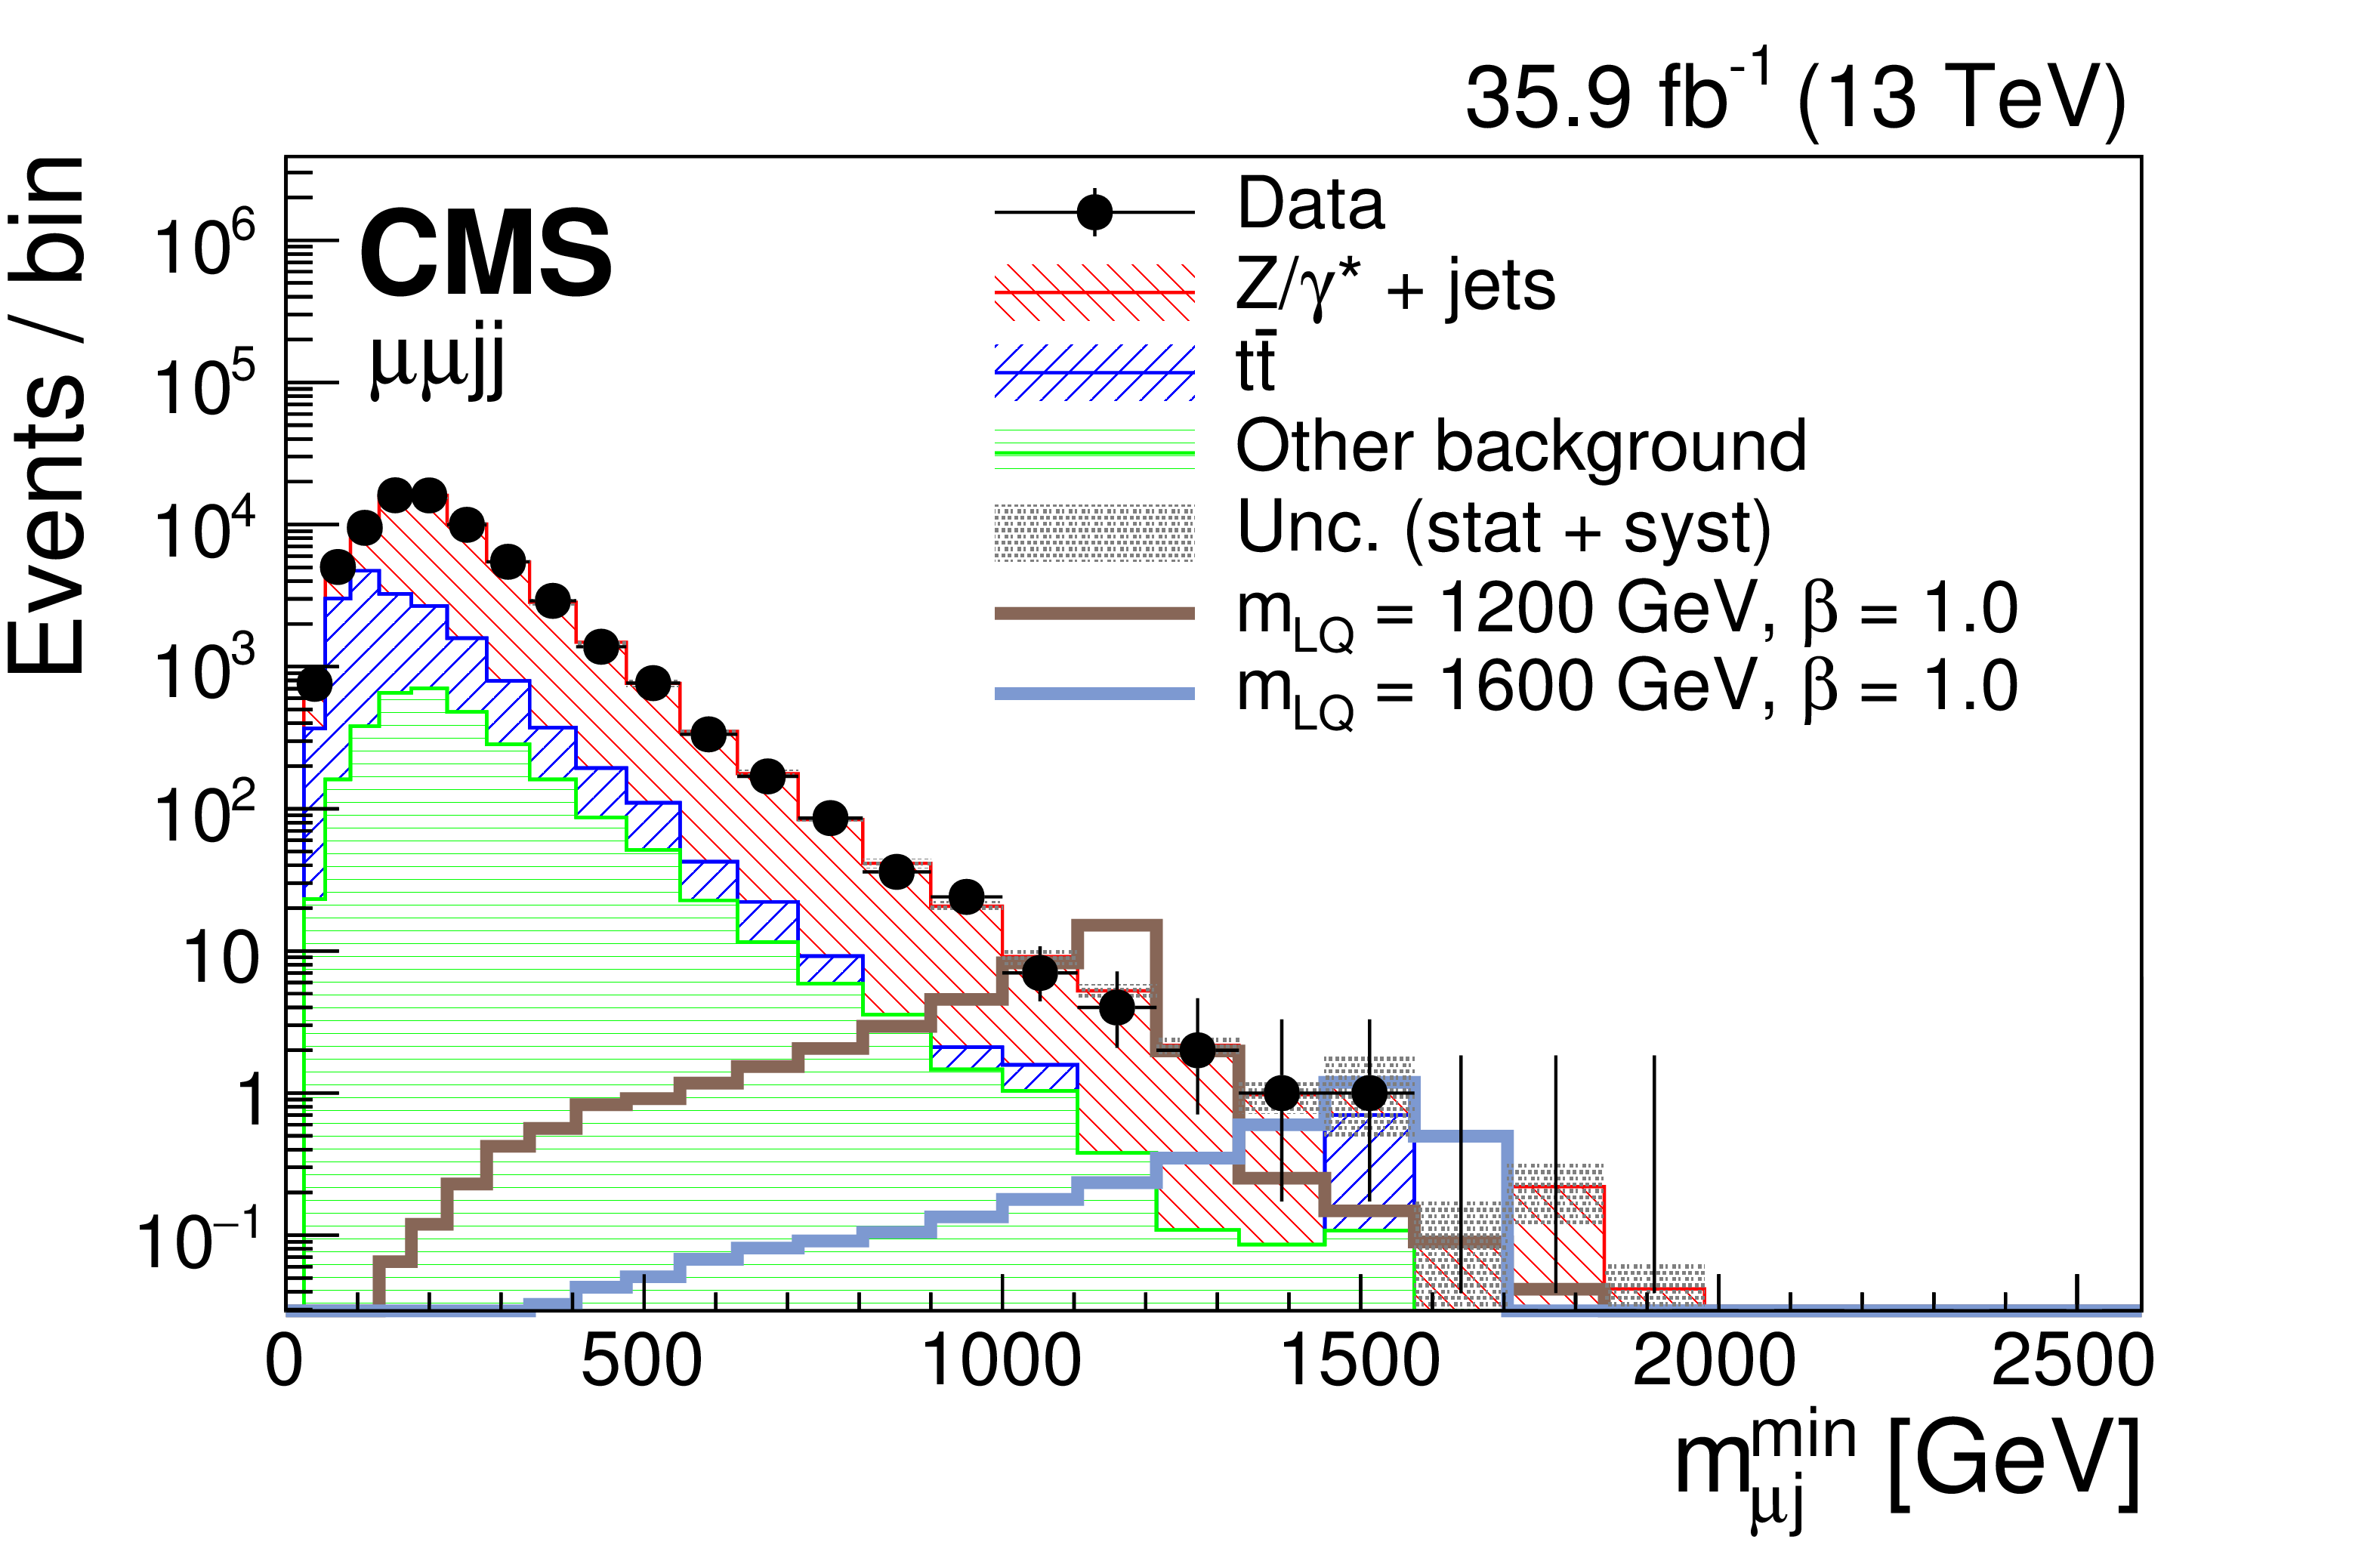
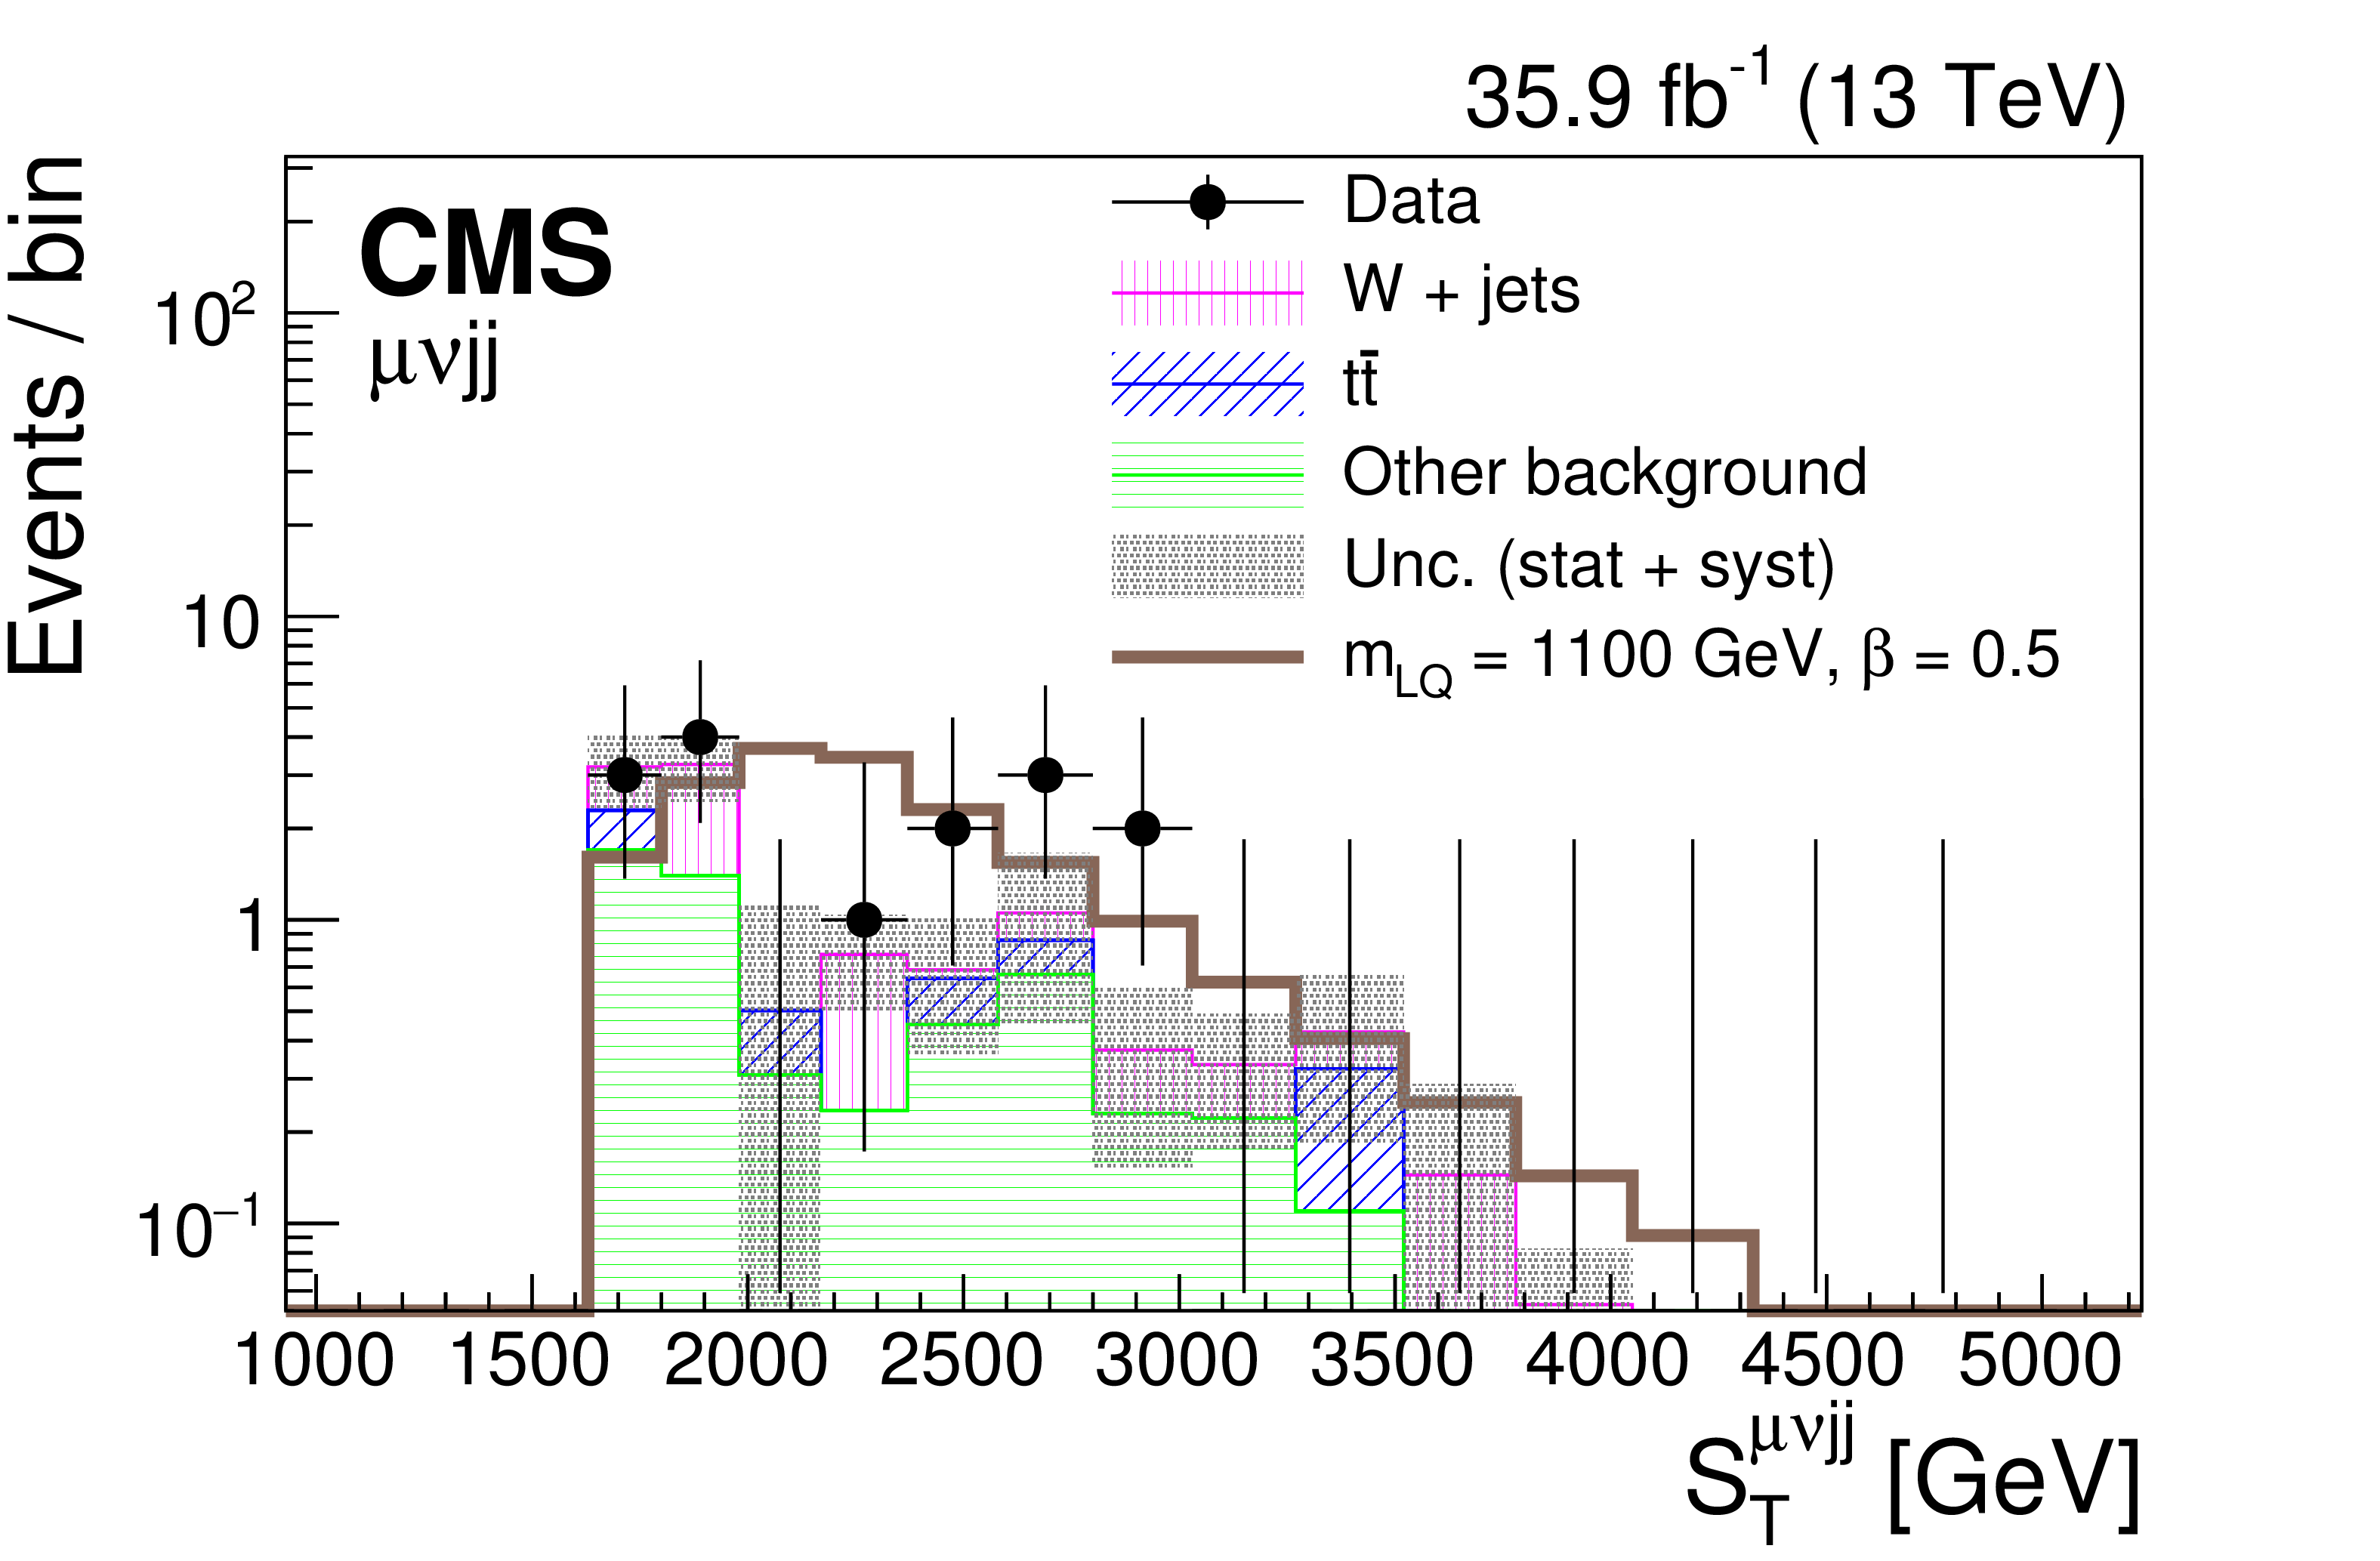
Figure 5:
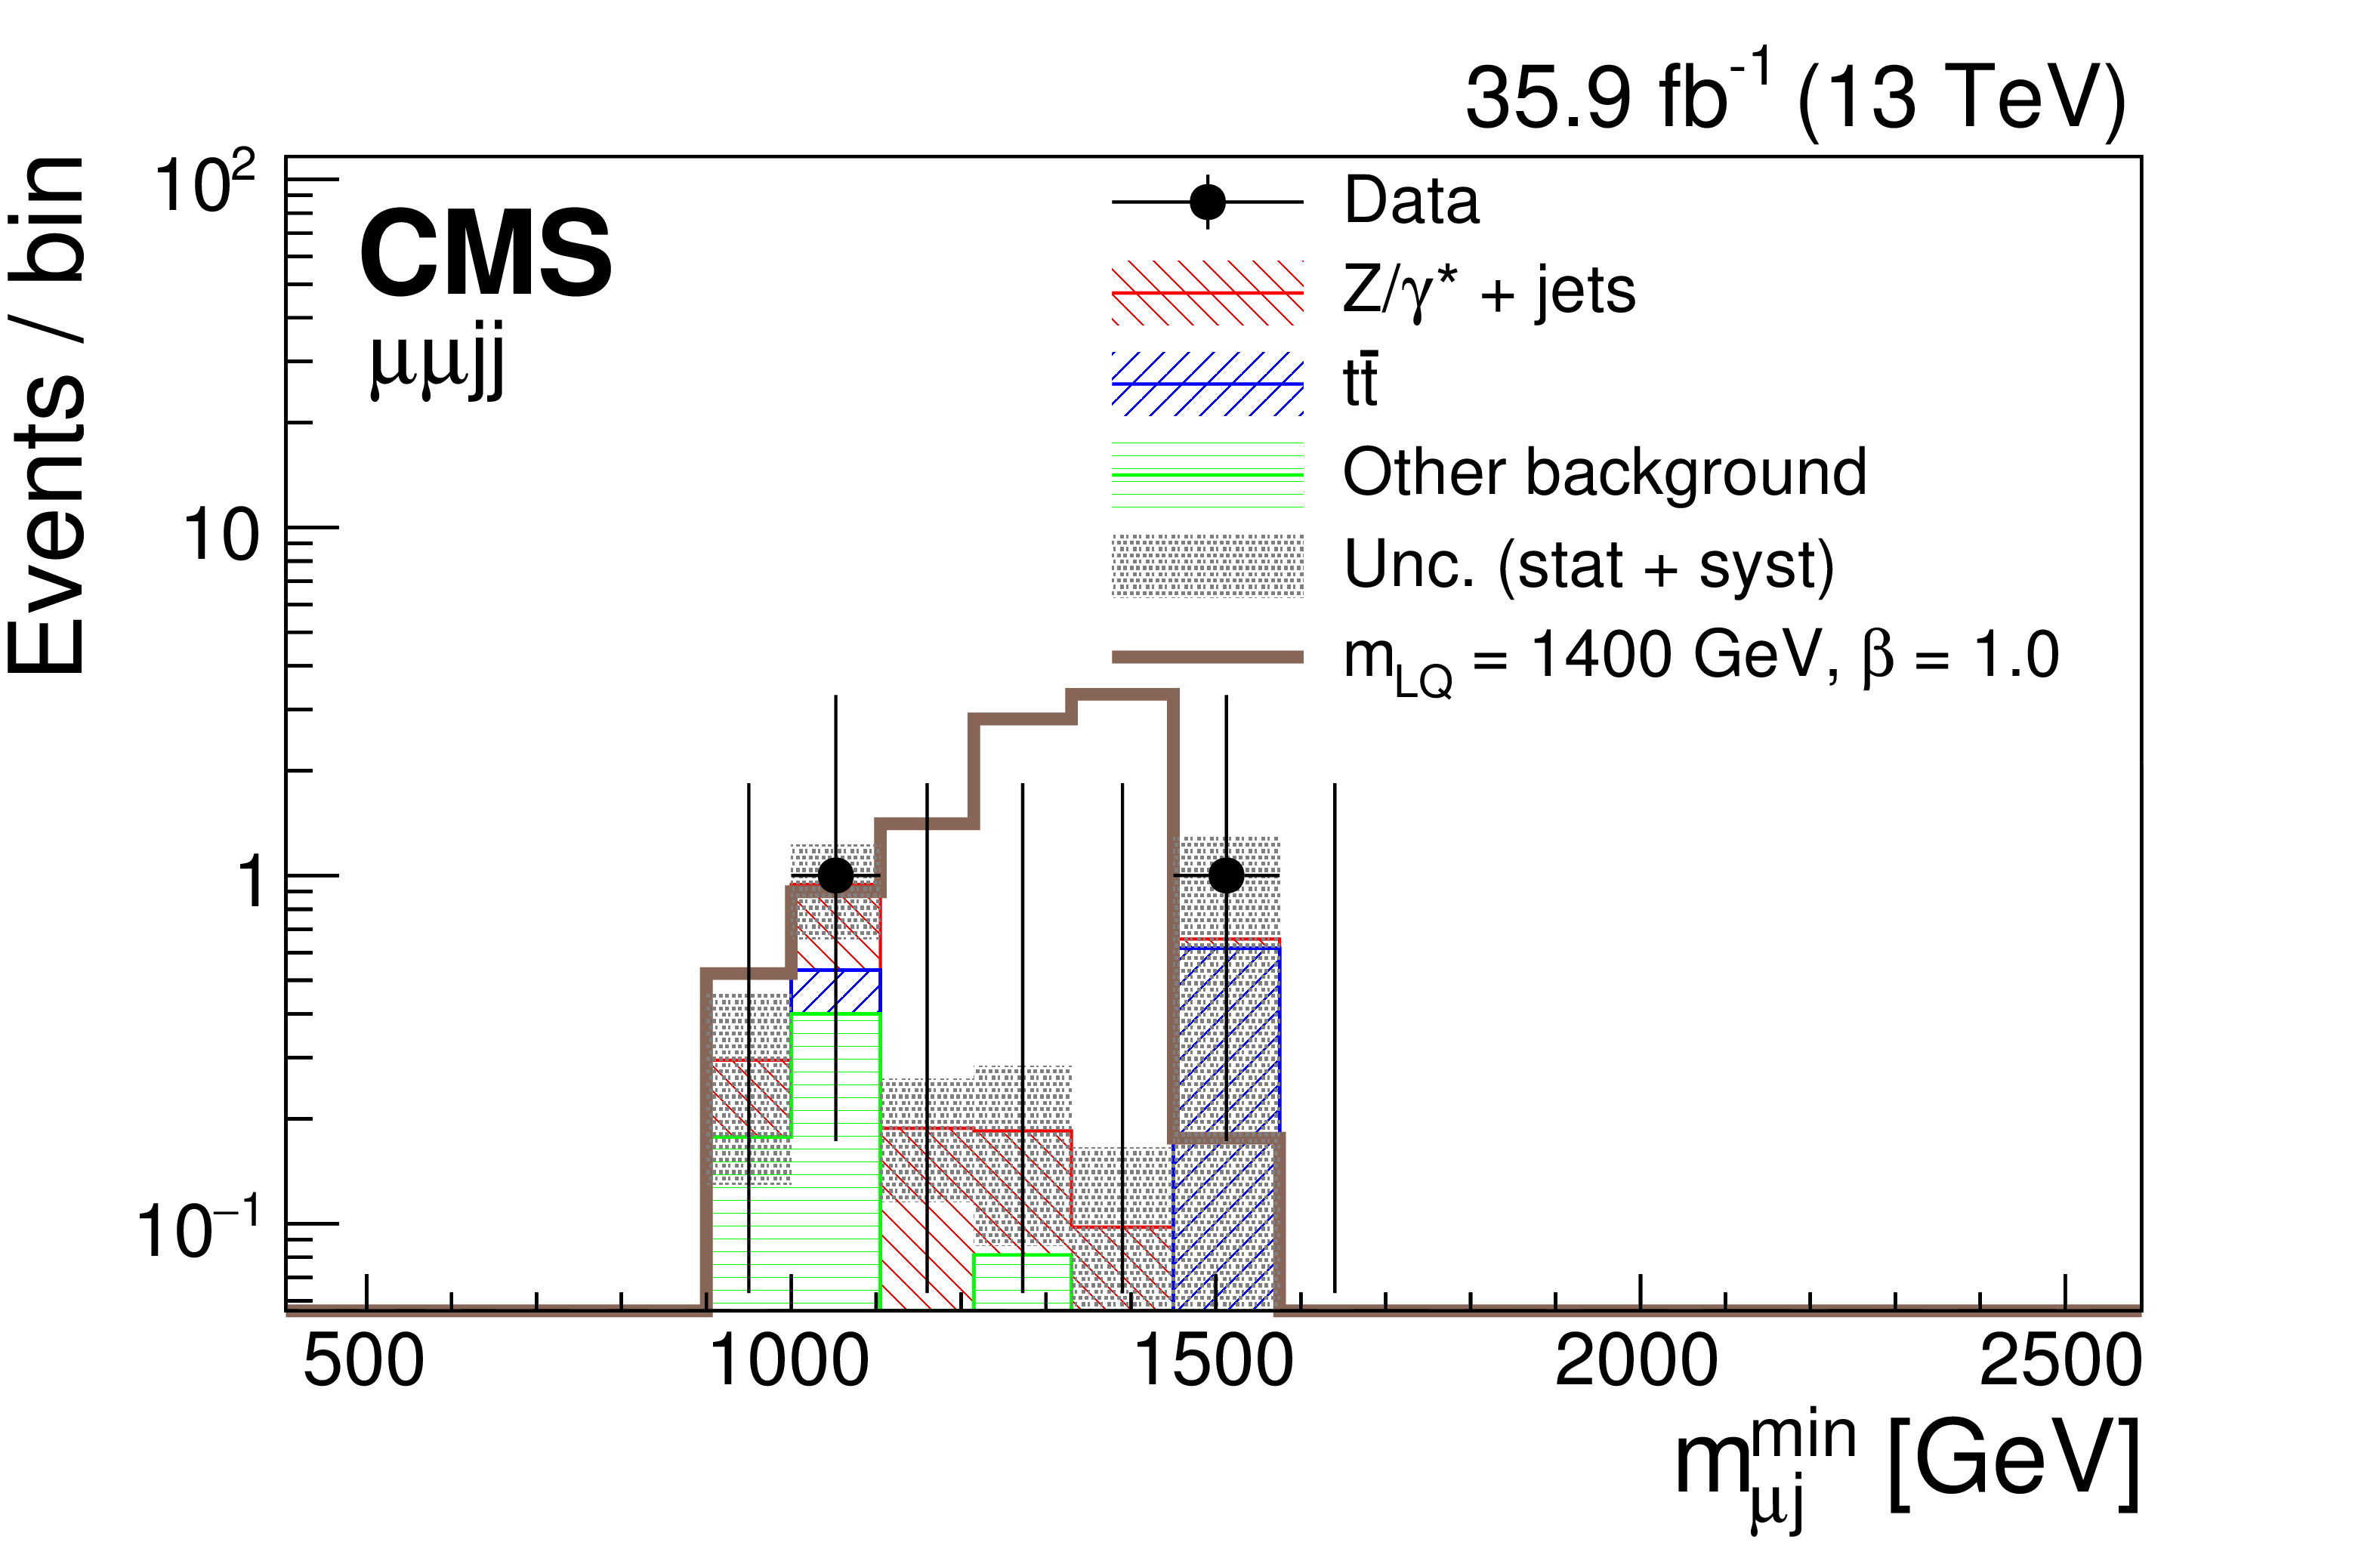
Comparison of data and background distributions of ${{S_{\mathrm {T}}^{{\mu} {\mu} \mathrm {jj}}}}$ (left) and ${{m_{{\mu} \mathrm {j}}^{\mathrm {min}}}}$ (upper right) and ${{m_{{\mu} \mathrm {j}}}}$ (lower right), for the ${{{\mu} {\mu} \mathrm {jj}}}$ channel (upper plots) and the ${{{\mu} {\nu}\mathrm {jj}}}$ channel (lower plots). Events after final selections with $ {m_{\mathrm {LQ}}} = $ 1400 GeV are shown in the upper plots, and with $ {m_{\mathrm {LQ}}} = $ 1100 GeV in the lower plots. The hashed band represents the combined statistical and systematic uncertainty in the full background estimate. `Other background' includes W+jets, single top quark, and diboson backgrounds in the ${{{\mu} {\mu} \mathrm {jj}}}$ channel, and $ {\mathrm {Z}}/\gamma ^*$+jets, single top quark, and diboson backgrounds in the ${{{\mu} {\nu}\mathrm {jj}}}$ channel. |

png pdf |
Figure 5-a:
Comparison of data and background distribution of ${{S_{\mathrm {T}}^{{\mu} {\mu} \mathrm {jj}}}}$. Events after final selections with $ {m_{\mathrm {LQ}}} = $ 1400 GeV are shown. The hashed band represents the combined statistical and systematic uncertainty in the full background estimate. `Other background' includes W+jets, single top quark, and diboson backgrounds in the ${{{\mu} {\mu} \mathrm {jj}}}$ channel, and $ {\mathrm {Z}}/\gamma ^*$+jets, single top quark, and diboson backgrounds in the ${{{\mu} {\nu}\mathrm {jj}}}$ channel. |
png pdf |
Figure 5-b:
Comparison of data and background distribution of ${{m_{{\mu} \mathrm {j}}^{\mathrm {min}}}}$ for the ${{{\mu} {\mu} \mathrm {jj}}}$ channel. Events after final selections with $ {m_{\mathrm {LQ}}} = $ 1400 GeV are shown. The hashed band represents the combined statistical and systematic uncertainty in the full background estimate. `Other background' includes W+jets, single top quark, and diboson backgrounds in the ${{{\mu} {\mu} \mathrm {jj}}}$ channel, and $ {\mathrm {Z}}/\gamma ^*$+jets, single top quark, and diboson backgrounds in the ${{{\mu} {\nu}\mathrm {jj}}}$ channel. |
png pdf |
Figure 5-c:
Comparison of data and background distribution of ${{S_{\mathrm {T}}^{{\nu} {\mu} \mathrm {jj}}}}$. Events after final selections with $ {m_{\mathrm {LQ}}} = $ 1100 GeV are shown. The hashed band represents the combined statistical and systematic uncertainty in the full background estimate. `Other background' includes W+jets, single top quark, and diboson backgrounds in the ${{{\mu} {\mu} \mathrm {jj}}}$ channel, and $ {\mathrm {Z}}/\gamma ^*$+jets, single top quark, and diboson backgrounds in the ${{{\mu} {\nu}\mathrm {jj}}}$ channel. |

png pdf |
Figure 5-d:
Comparison of data and background distribution of ${{m_{{\mu} \mathrm {j}}}}$ for the ${{{\mu} {\nu}\mathrm {jj}}}$ channel. Events after final selections with $ {m_{\mathrm {LQ}}} = $ 1100 GeV are shown. The hashed band represents the combined statistical and systematic uncertainty in the full background estimate. `Other background' includes W+jets, single top quark, and diboson backgrounds in the ${{{\mu} {\mu} \mathrm {jj}}}$ channel, and $ {\mathrm {Z}}/\gamma ^*$+jets, single top quark, and diboson backgrounds in the ${{{\mu} {\nu}\mathrm {jj}}}$ channel. |

png pdf |
Figure 6:
Data and background event yields after final selections for the ${{{\mu} {\mu} \mathrm {jj}}}$ analysis, as a function of scalar ${m_{\mathrm {LQ}}}$. `Other background' includes W+jets and single top quark. The selection criteria for each bin are detailed in Table 1. All the bins are correlated, as the events selected for each ${{m_{\mathrm {LQ}}}}$ are a strict subset of the events selected for the lower mass LQ. The hashed band represents the combined statistical and systematic uncertainty in the full background estimate. |

png pdf |
Figure 7:
Data and background event yields after final selections for the ${{{\mu} {\nu}\mathrm {jj}}}$ analysis, as a function of ${m_{\mathrm {LQ}}}$. `Other background' includes $ {\mathrm {Z}}/\gamma ^*$+jets and single top quark. The selection criteria for each bin are detailed in Table 2. All the bins are correlated, as the events selected for each ${m_{\mathrm {LQ}}}$ are a strict subset of the events selected for the lower mass LQ. The hashed band represents the combined statistical and systematic uncertainty in the full background estimate. |
png pdf |
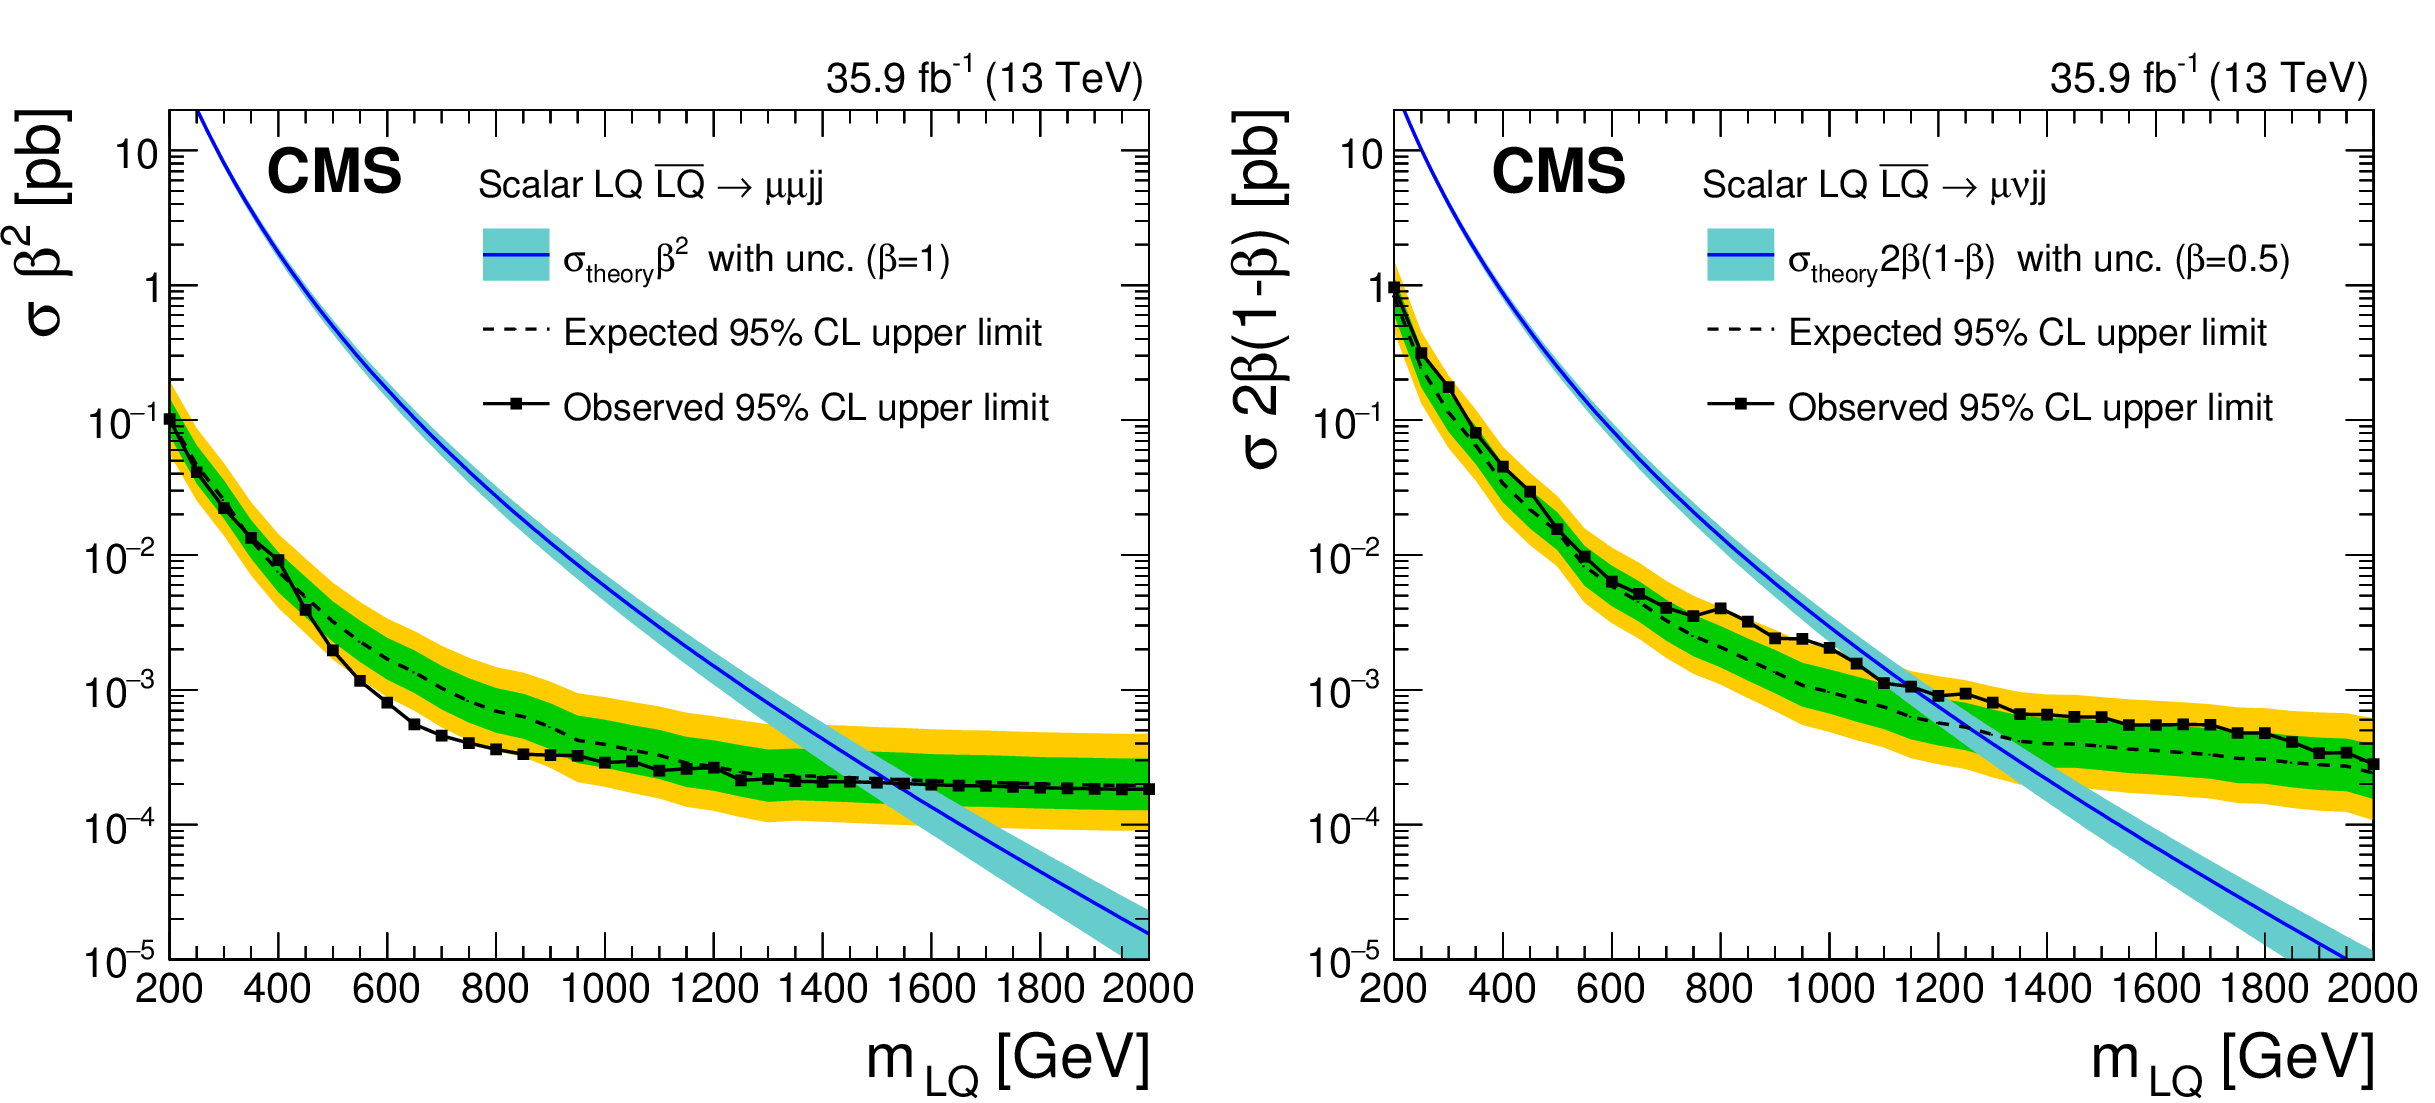
Figure 8:
The expected and observed upper limits at 95% CL on the product of the scalar LQ pair production cross section and the branching fractions $\beta ^2$ or $2\beta (1-\beta)$ as a function of the second-generation ${m_{\mathrm {LQ}}}$ obtained with the ${{{\mu} {\mu} \mathrm {jj}}}$ (left) and ${{{\mu} {\nu}\mathrm {jj}}}$ (right) analysis. The solid lines represent the observed limits, the dashed lines represent the median expected limits, and the inner dark-green and outer light-yellow bands represent the 68% and 95% confidence intervals. The $\sigma _{\text {theory}}$ curves and their blue bands represent the theoretical scalar LQ pair production cross sections and the uncertainties on the cross sections due to the choice of PDF and renormalization and factorization scales, respectively. |

png pdf |
Figure 8-a:
The expected and observed upper limits at 95% CL on the product of the scalar LQ pair production cross section and the branching fractions $\beta ^2$ or $2\beta (1-\beta)$ as a function of the second-generation ${m_{\mathrm {LQ}}}$ obtained with the ${{{\mu} {\mu} \mathrm {jj}}}$ analysis. The solid line represents the observed limit, the dashed line represent the median expected limit, and the inner dark-green and outer light-yellow bands represent the 68% and 95% confidence intervals. The $\sigma _{\text {theory}}$ curve and its blue bands represent the theoretical scalar LQ pair production cross sections and the uncertainties on the cross sections due to the choice of PDF and renormalization and factorization scales, respectively. |
png pdf |
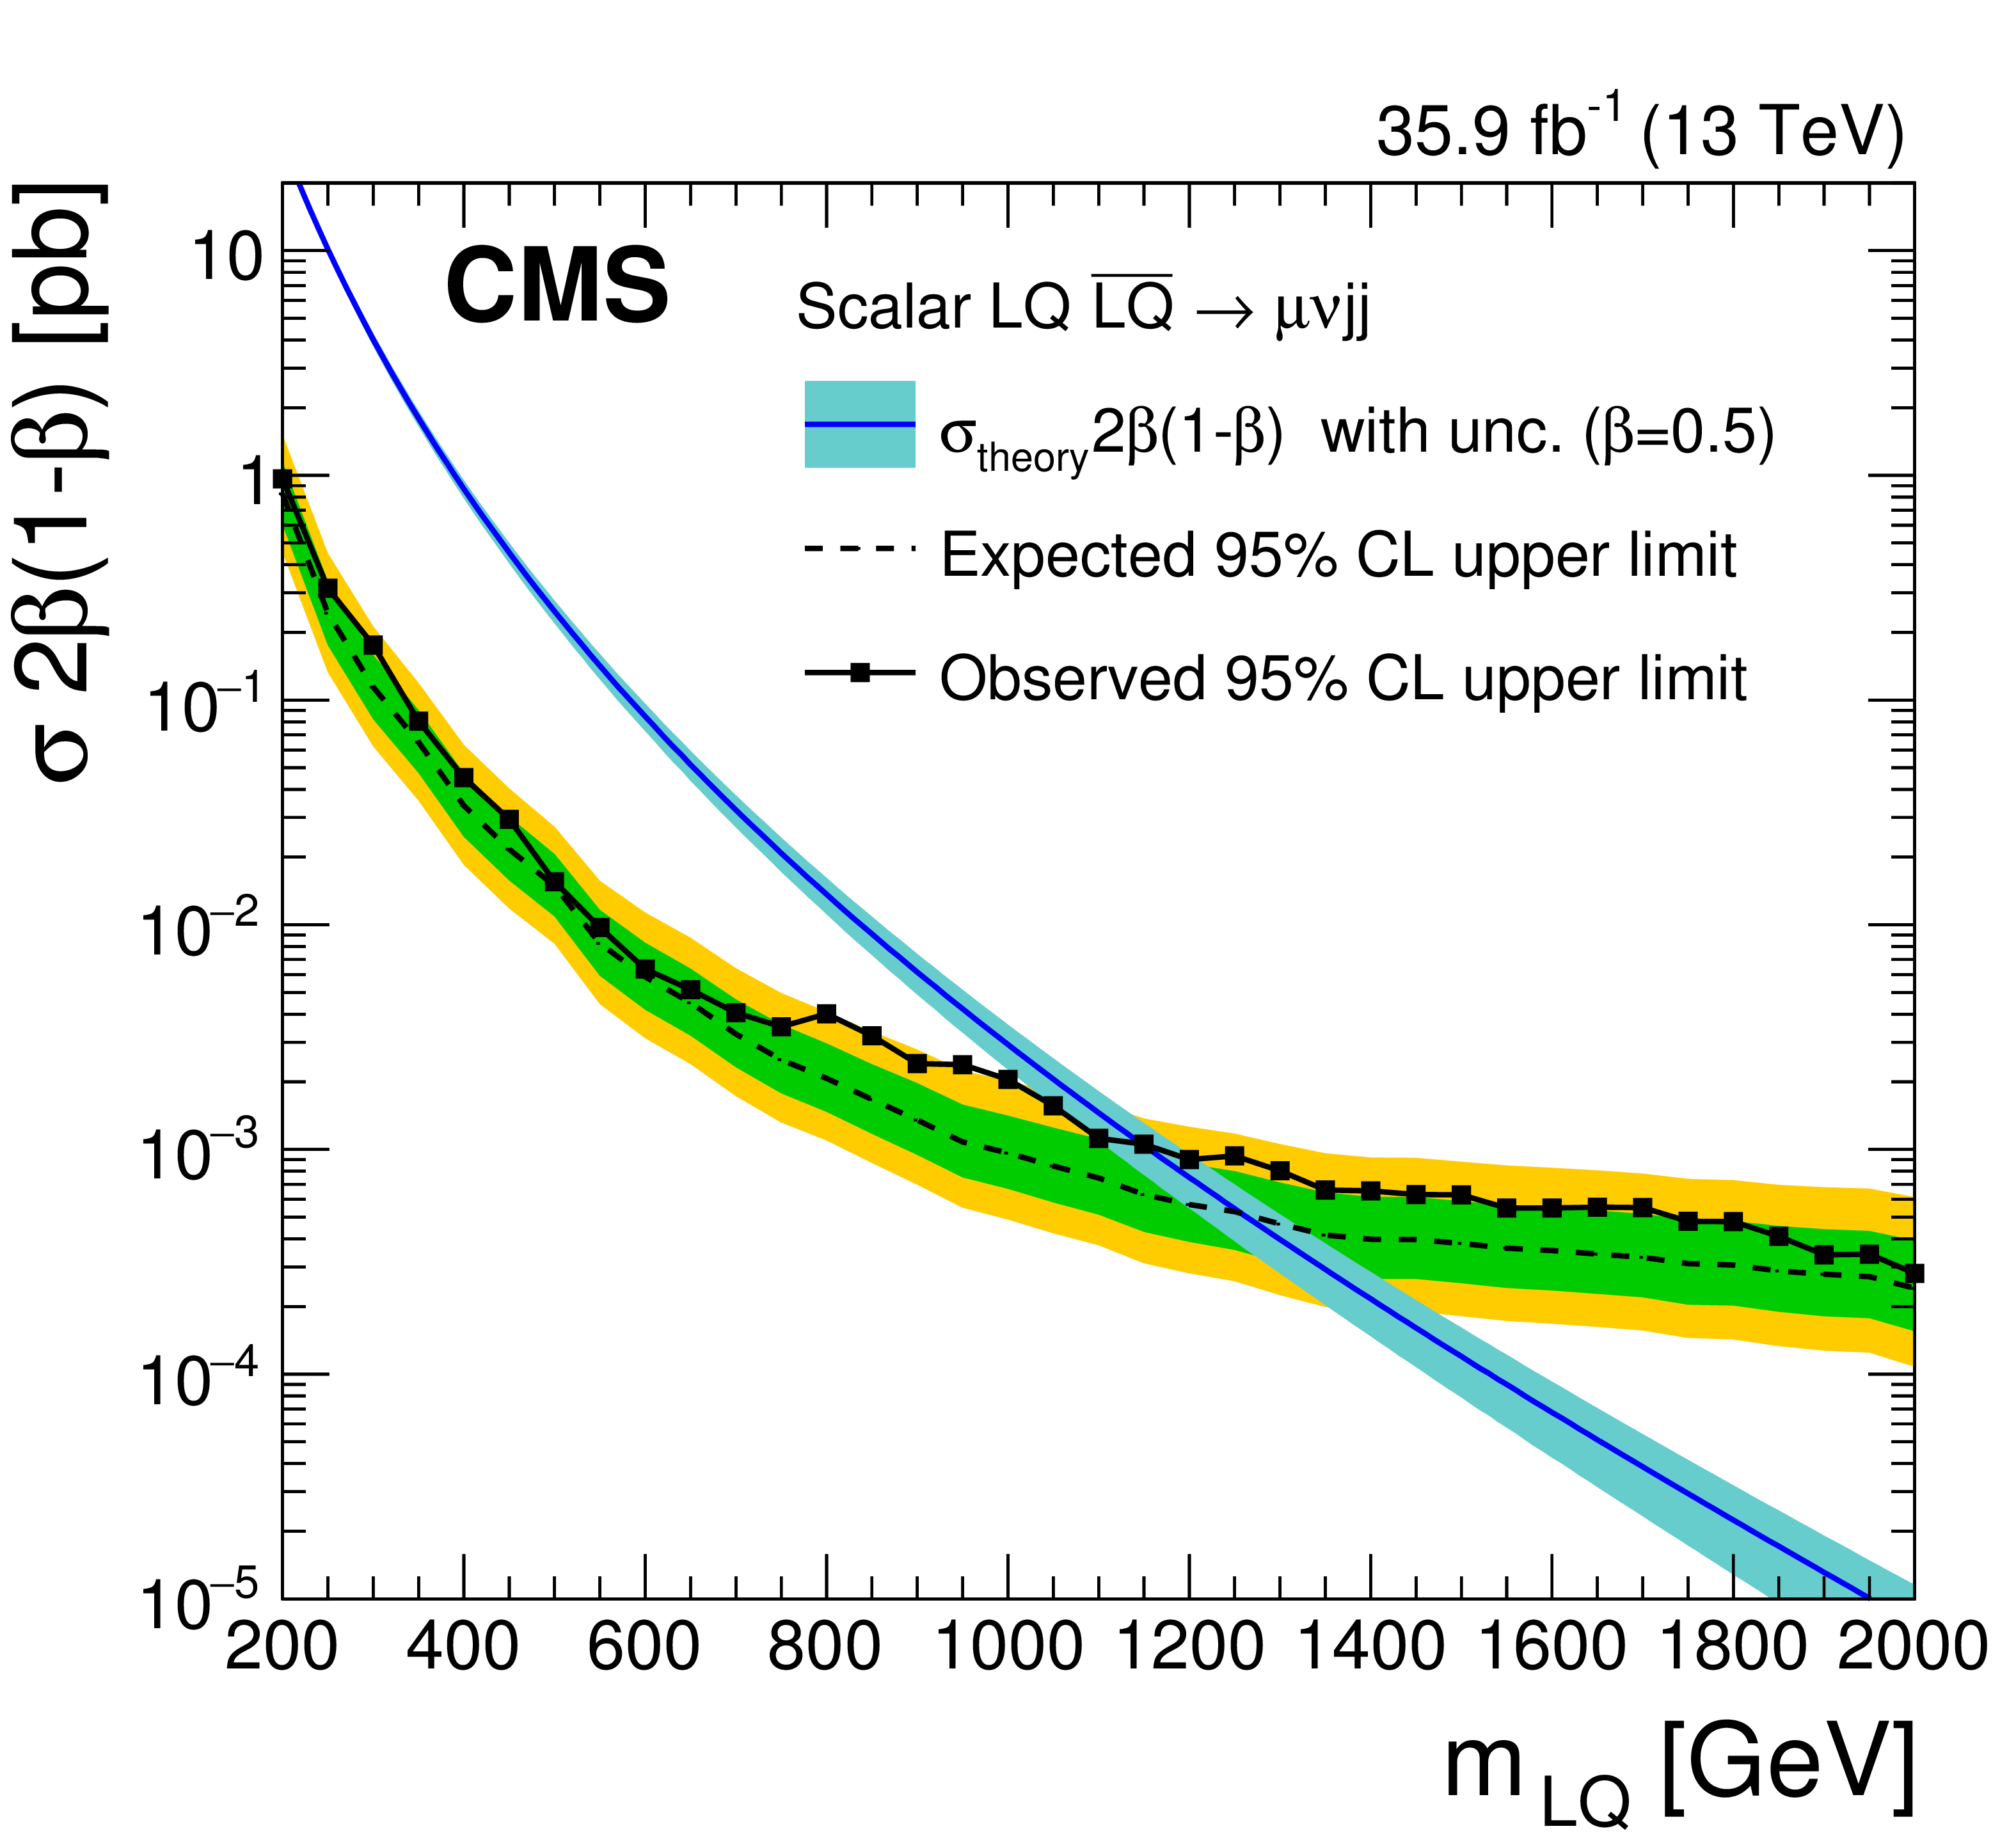
Figure 8-b:
The expected and observed upper limits at 95% CL on the product of the scalar LQ pair production cross section and the branching fractions $\beta ^2$ or $2\beta (1-\beta)$ as a function of the second-generation ${m_{\mathrm {LQ}}}$ obtained with the ${{{\mu} {\nu}\mathrm {jj}}}$ analysis. The solid line represents the observed limit, the dashed line represent the median expected limit, and the inner dark-green and outer light-yellow bands represent the 68% and 95% confidence intervals. The $\sigma _{\text {theory}}$ curve and its blue bands represent the theoretical scalar LQ pair production cross sections and the uncertainties on the cross sections due to the choice of PDF and renormalization and factorization scales, respectively. |

png pdf |
Figure 9:
The expected and observed exclusion limits at 95% CL for second-generation ${m_{\mathrm {LQ}}}$ as a function of the branching fraction $\beta $ vs. ${m_{\mathrm {LQ}}}$. The inner dark-green and outer light-yellow expected limit uncertainty bands represent the 68% and 95% confidence intervals on the combination. Limits for the individual ${{{\mu} {\mu} \mathrm {jj}}}$ and ${{{\mu} {\nu}\mathrm {jj}}}$ channels are also drawn. The solid lines represent the observed limits in each channel, and the dashed lines represent the expected limits. |

png pdf |
Figure 10:
Expected and observed upper limits at 95% CL on the long-lived RPV SUSY $\tilde{\mathrm{t}}$ pair production cross section as a function of $\tilde{\mathrm{t}}$ mass ($x$ axis) and lifetime ($y$ axis). The dashed line and the inner dark-green and outer light-yellow uncertainty bands represent the median expected limits, and the 68% and 95% confidence intervals, respectively. Extrapolation has been performed to produce a limit plot extending down to the prompt kinematic range. |

png pdf |
Figure 11:
The product of signal acceptance and efficiency for optimized final selections as a function of ${m_{\mathrm {LQ}}}$ in the ${{{\mu} {\mu} \mathrm {jj}}}$ (left) and ${{{\mu} {\nu}\mathrm {jj}}}$ (right) channels. |

png pdf |
Figure 11-a:
The product of signal acceptance and efficiency for optimized final selections as a function of ${m_{\mathrm {LQ}}}$ in the ${{{\mu} {\mu} \mathrm {jj}}}$ channel. |

png pdf |
Figure 11-b:
The product of signal acceptance and efficiency for optimized final selections as a function of ${m_{\mathrm {LQ}}}$ in the ${{{\mu} {\nu}\mathrm {jj}}}$ channel. |
| Tables | |
png pdf |
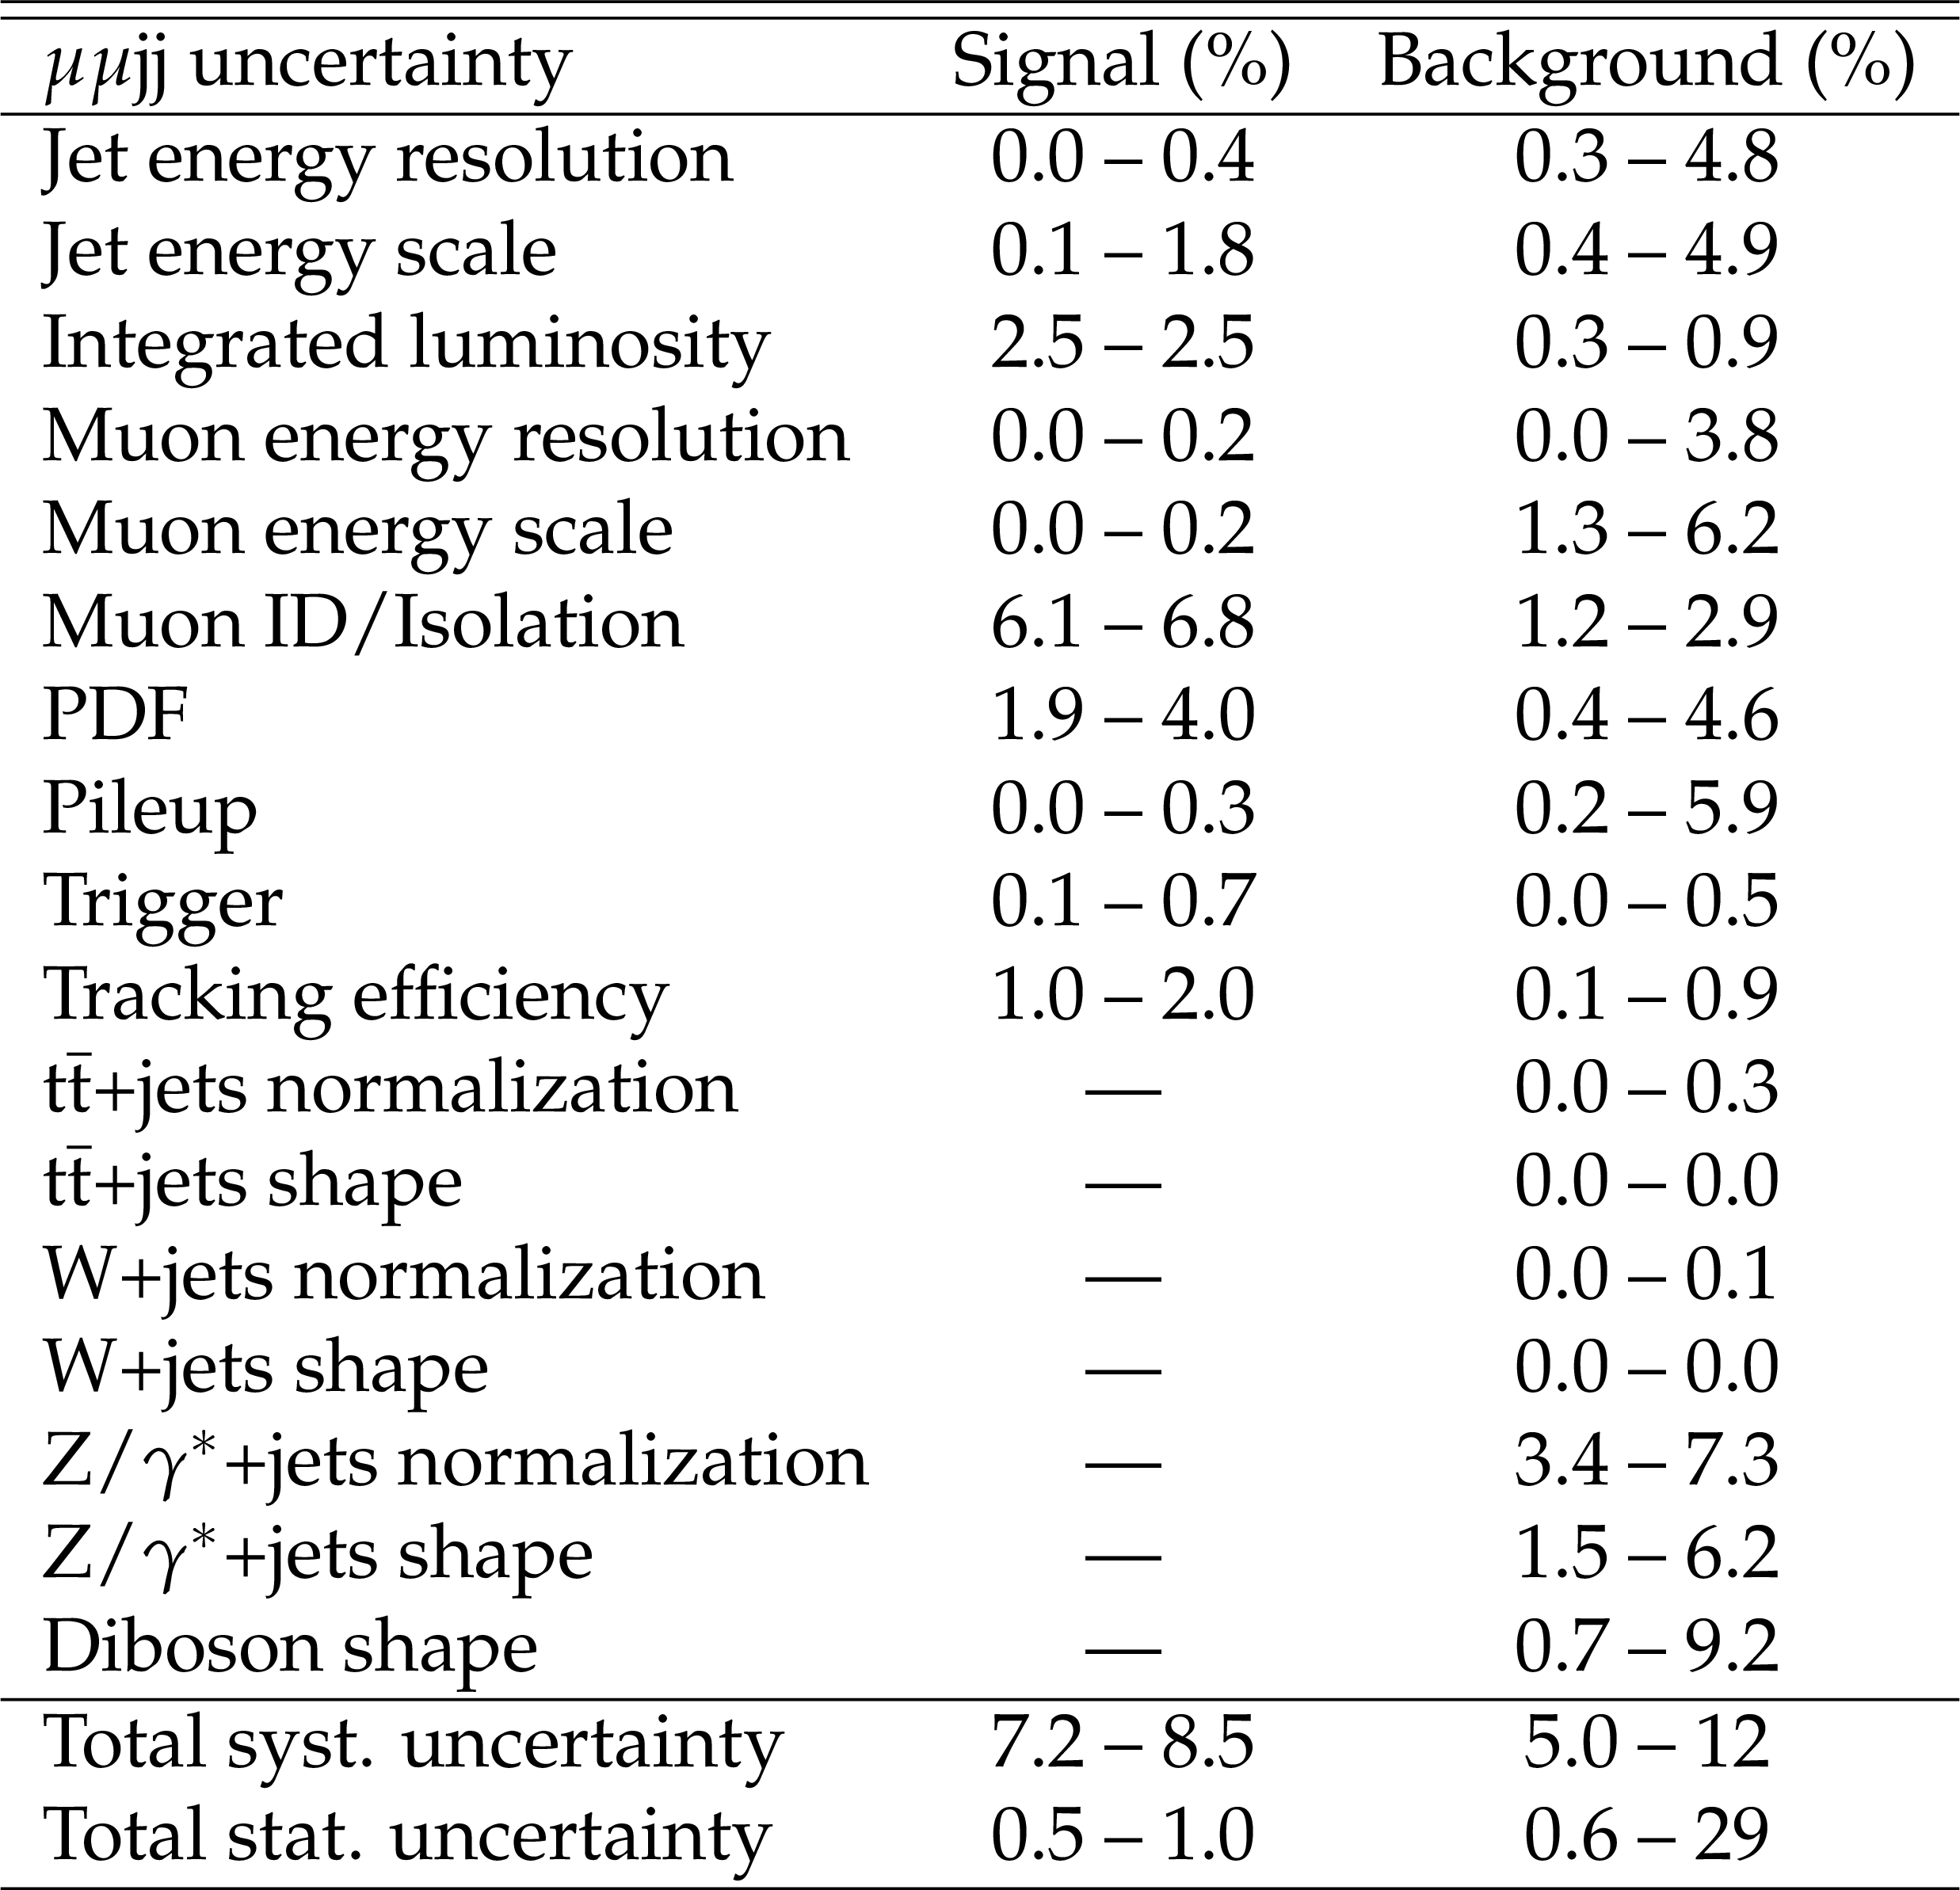
Table 1:
Range of systematic uncertainties in the signal acceptance and background yields for the ${{{\mu} {\mu} \mathrm {jj}}}$ analysis. The last two lines show the total systematic uncertainty and the total statistical uncertainty in the simulated samples, respectively. |

png pdf |
Table 2:
Range of systematic uncertainties in the signal acceptance and background yields for the ${{{\mu} {\nu}\mathrm {jj}}}$ analysis. The last two lines show the total systematic uncertainty and the total statistical uncertainty in the simulated samples, respectively. |
png pdf |
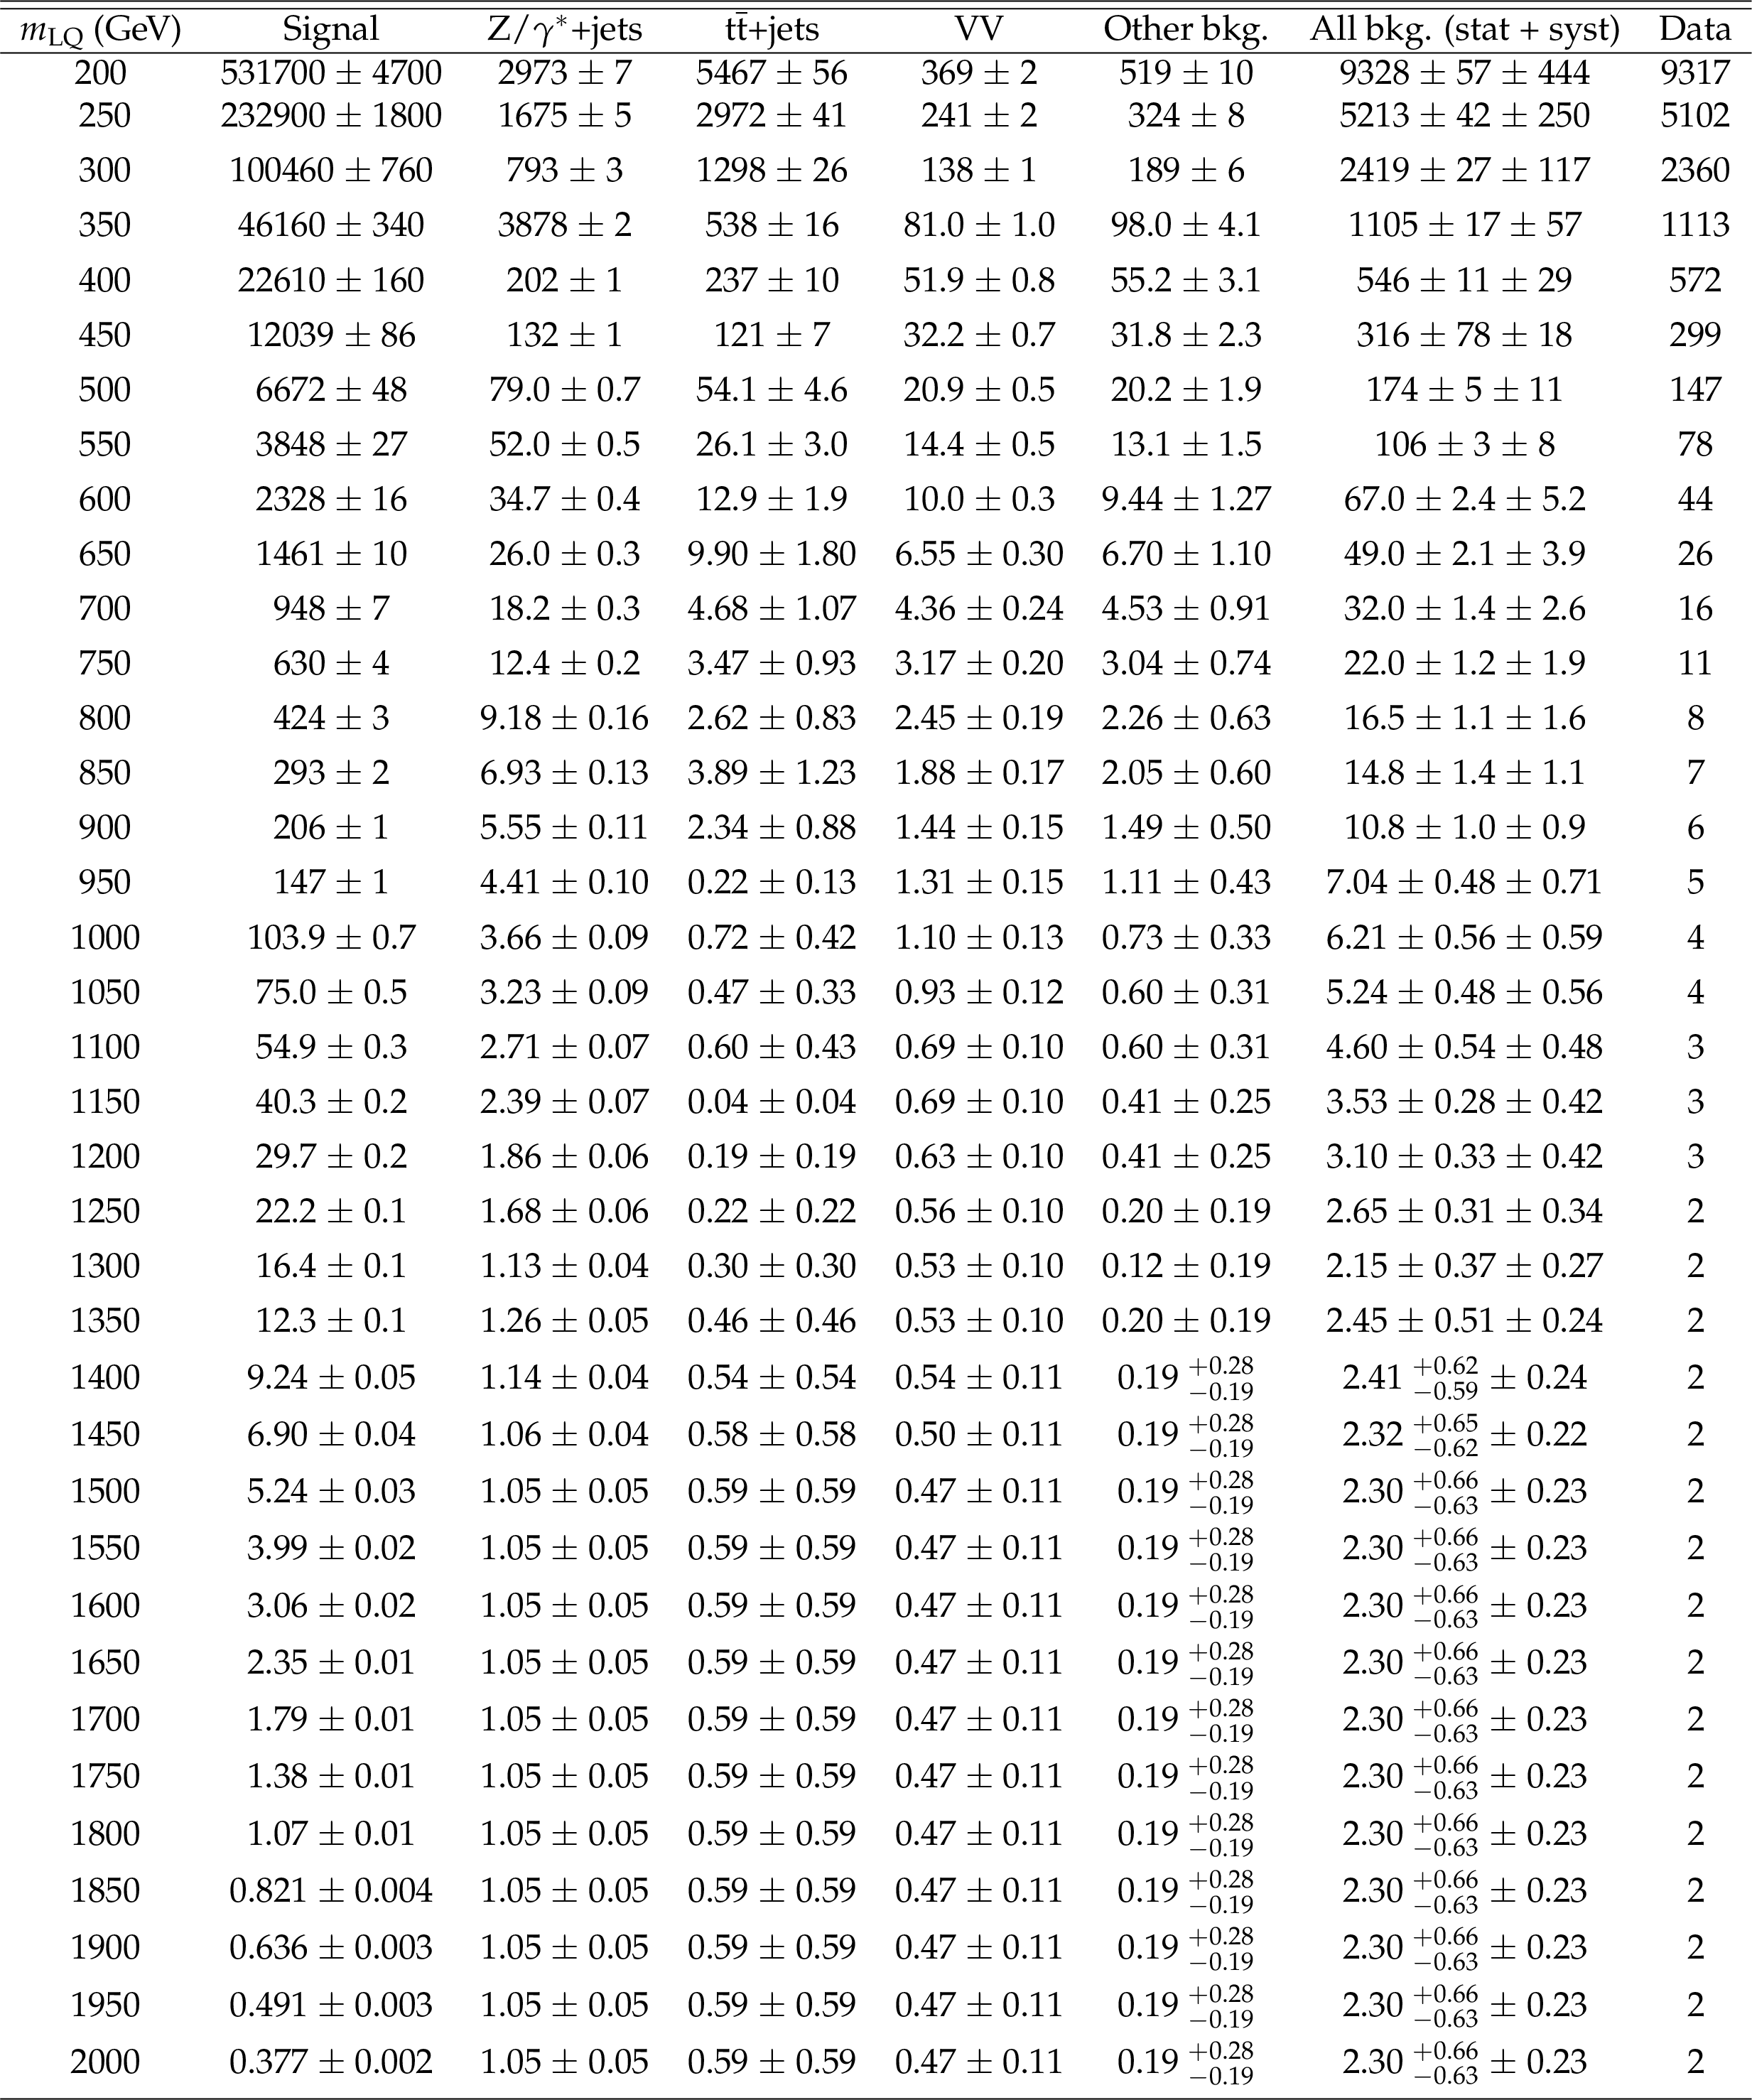
Table 3:
Event yields after final selections for the ${{{\mu} {\mu} \mathrm {jj}}}$ analysis. `Other bkg.' includes W+jets and single top quark. Uncertainties are statistical unless otherwise indicated. |
png pdf |
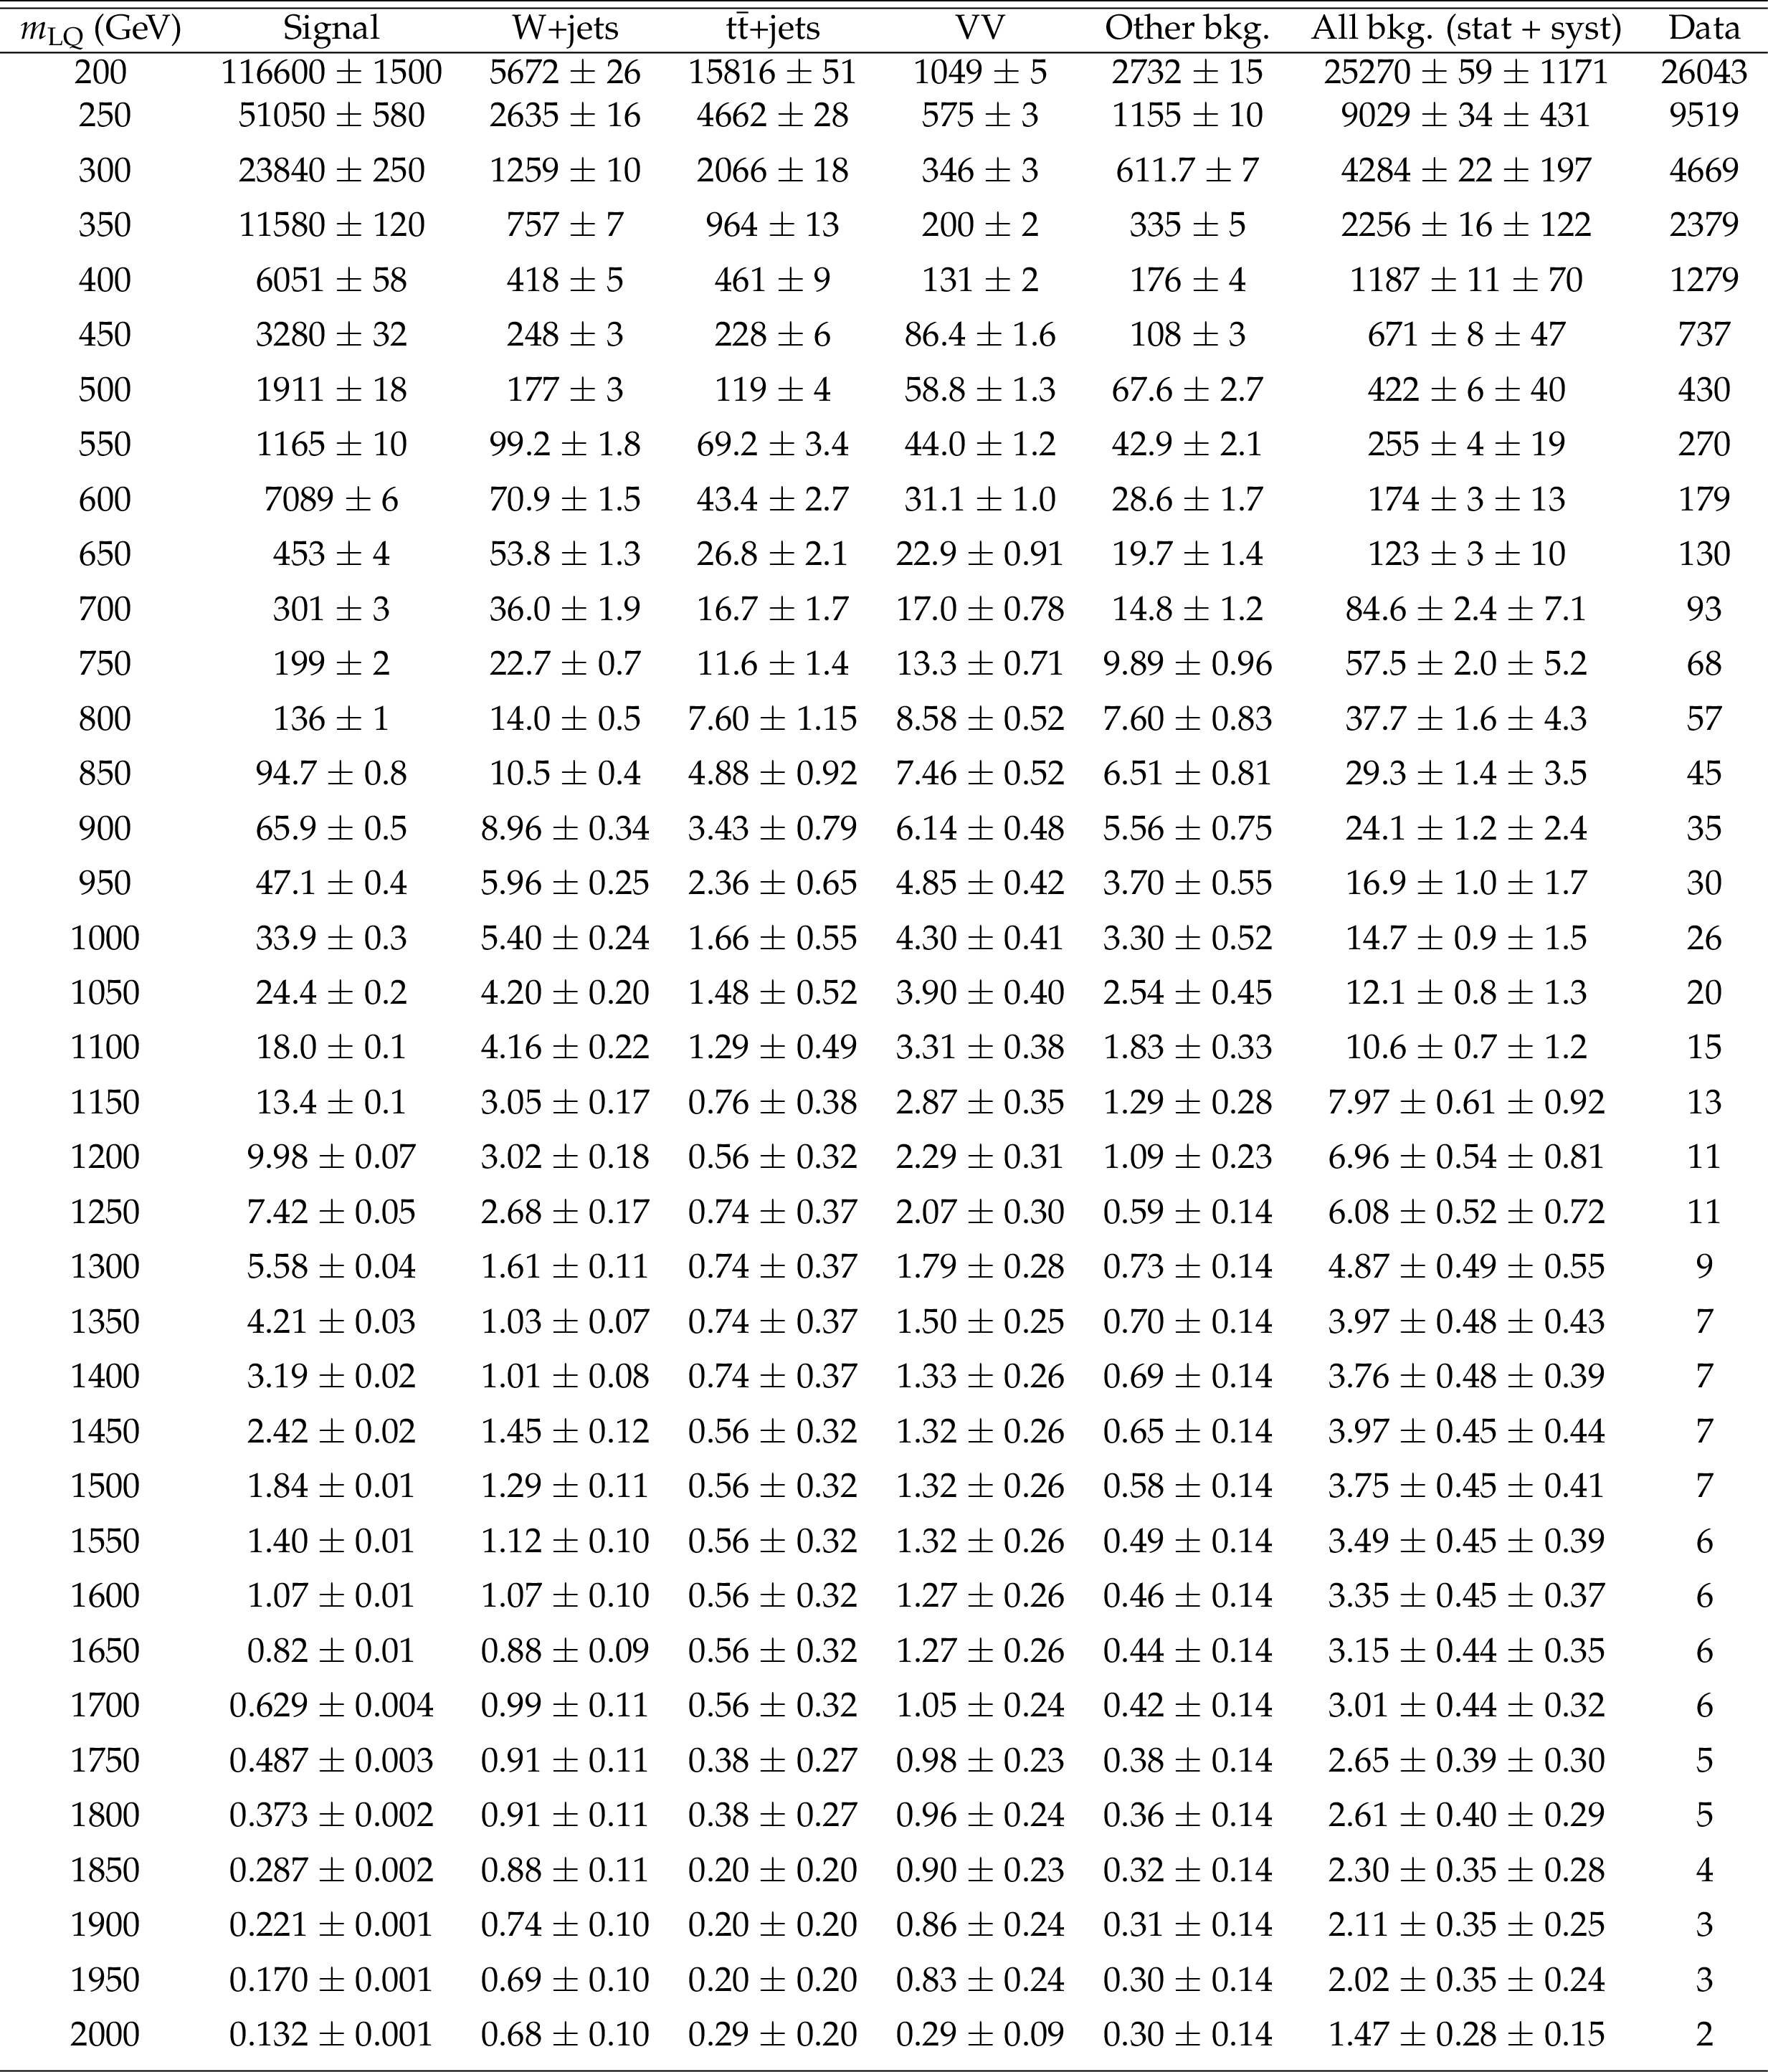
Table 4:
Event yields after final selections for the ${{{\mu} {\nu}\mathrm {jj}}}$ analysis. `Other bkg.' includes $ {\mathrm {Z}}/\gamma ^*$+jets and single top quark. Uncertainties are statistical unless otherwise indicated. |
| Summary |
| A search has been presented for pair production of second-generation leptoquarks using proton-proton collision data collected at $\sqrt{s} = $ 13 TeV in 2016 with the CMS detector at the LHC, corresponding to an integrated luminosity of 35.9 fb$^{-1}$. Limits are set at 95% confidence level on the product of the scalar leptoquark pair production cross section and $\beta^2$ ($2\beta(1-\beta)$) in the $\mu\mu\mathrm{jj}$ ($\mu\nu\mathrm{jj}$) channels, for the branching fraction $\beta = $ 1.0 (0.5) as a function of the leptoquark mass ${m_{\mathrm{LQ}}}$. Second-generation leptoquarks with masses less than 1530 (1285) GeV are excluded for $\beta= $ 1.0 (0.5), an improvement of 370 (525) GeV compared to previously published results. Two-dimensional limits are set in the $\beta$-${{m_{\mathrm{LQ}}}}$ plane. The results in the $\mu\mu\mathrm{jj}$ search are interpreted in the context of an $R$-parity violating supersymmetry model with long-lived top squarks. These limits represent the most stringent limits to date on these models. |
| References | ||||
| 1 | J. C. Pati and A. Salam | Unified lepton-hadron symmetry and a gauge theory of the basic interactions | PRD 8 (1973) 1240 | |
| 2 | J. C. Pati and A. Salam | Lepton number as the fourth color | PRD 10 (1974) 275 | |
| 3 | H. Georgi and S. Glashow | Unity of all elementary-particle forces | PRL 32 (1974) 438 | |
| 4 | H. Murayama and T. Yanagida | A viable SU(5) GUT with light leptoquark bosons | MPLA 7 (1992) 147 | |
| 5 | H. Fritzsch and P. Minkowski | United interactions of leptons and hadrons | Annals Phys. 93 (1975) 193 | |
| 6 | G. Senjanovi\'c and A. Sokorac | Light lepto-quarks in SO(10) | Z. Phys. C 20 (1983) 255 | |
| 7 | P. H. Frampton and B.-H. Lee | SU(15) grand unification | PRL 64 (1990) 619 | |
| 8 | P. H. Frampton and T. W. Kephart | Higgs sector and proton decay in SU(15q) grand unification | PRD 42 (1990) 3892 | |
| 9 | B. Schrempp and F. Schrempp | Light leptoquarks | PLB 153 (1985) 101 | |
| 10 | S. Dimopoulos and L. Susskind | Mass without scalars | NPB 155 (1979) 237 | |
| 11 | S. Dimopoulos | Technicolored signatures | NPB 168 (1980) 69 | |
| 12 | E. Eichten and K. Lane | Dynamical breaking of the weak interaction symmetries | PLB 90 (1980) 85 | |
| 13 | J. L. Hewett and T. G. Rizzo | Low-energy phenomenology of superstring-inspired E$ _{6} $ models | PL183 (1989) 193 | |
| 14 | W. Buchmuller, R. Ruckl, and D. Wyler | Leptoquarks in lepton-quark collisions | PLB 191 (1987) 442 | |
| 15 | Belle Collaboration | Observation of B$ ^0\rightarrow $D*$ ^{-} \tau^{+}\nu_\tau $ decay at Belle | PRL 99 (2007) 191807 | 0706.4429 |
| 16 | Belle Collaboration | Observation of B$ ^{+}\rightarrow \overline{D} $*$ ^{0}\tau^{+}\nu_\tau $ and evidence for B$ ^{+}\rightarrow\overline{D}^0\tau^+\nu_\tau $ at Belle | PRD 82 (2010) 072005 | 1005.2302 |
| 17 | Belle Collaboration | Measurement of the branching ratio of $ \bar{B} \to D^{(\ast)} \tau^- \bar{\nu}_\tau $ relative to $ \bar{B} \to D^{(\ast)} \ell^- \bar{\nu}_\ell $ decays with hadronic tagging at Belle | PRD 92 (2015) 072014 | 1507.03233 |
| 18 | BaBar Collaboration | Evidence for an excess of $ \bar{B} \to D^{(*)} \tau^-\bar{\nu}_\tau $ decays | PRL 109 (2012) 101802 | 1205.5442 |
| 19 | BaBar Collaboration | Measurement of an excess of $ \bar{B} \to D^{(*)}\tau^- \bar{\nu}_\tau $ decays and implications for charged higgs bosons | PRD 88 (2013) 072012 | 1303.0571 |
| 20 | LHCb Collaboration | Measurement of the ratio of branching fractions $ \mathcal{B}(\bar{B}^0 \to D^{*+}\tau^{-}\bar{\nu}_{\tau})/\mathcal{B}(\bar{B}^0 \to D^{*+}\mu^{-}\bar{\nu}_{\mu}) $ | PRL 115 (2015) 111803 | 1506.08614 |
| 21 | LHCb Collaboration | Measurement of form-factor-independent observables in the decay $ B^{0} \to K^{*0} \mu^+ \mu^- $ | PRL 111 (2013) 191801 | 1308.1707 |
| 22 | LHCb Collaboration | Test of lepton universality using $ B^{+}\rightarrow K^{+}\ell^{+}\ell^{-} $ decays | PRL 113 (2014) 151601 | 1406.6482 |
| 23 | LHCb Collaboration | Test of lepton universality with $ B^{0} \rightarrow K^{*0}\ell^{+}\ell^{-} $ decays | JHEP 08 (2017) 055 | 1705.05802 |
| 24 | W. Buchmuller, R. Ruckl, and D. Wyler | Leptoquarks in lepton-quark collisions | PLB 191 (1987) 442, .[Erratum: \DOI10.1016/S0370-2693(99)00014-3] | |
| 25 | B. Diaz, M. Schmaltz, and Y.-M. Zhong | The leptoquark hunter's guide: pair production | JHEP 10 (2017) 097 | 1706.05033 |
| 26 | W. Buchmuller and D. Wyler | Constraints on SU(5)-type leptoquarks | PLB 177 (1986) 377 | |
| 27 | O. Shanker | $ \pi\ell $2, $ \mathrm{K}\ell $3, and $ \mathrm{K}^0 $-$ \overline{\mathrm{K}}^0 $ constraints on leptoquarks and supersymmetric particles | NPB 204 (1982) 375 | |
| 28 | CMS Collaboration | Search for pair production of first and second generation leptoquarks in proton-proton collisions at $ \sqrt{s} = $ 8 TeV | PRD 93 (2016) 032004 | CMS-EXO-12-041 1509.03744 |
| 29 | ATLAS Collaboration | Search for scalar leptoquarks in pp collisions at $ \sqrt{s} = $ 13 TeV with the ATLAS experiment | New J. Phys. 18 (2016) 093016 | 1605.06035 |
| 30 | H. K. Dreiner | An introduction to explicit $ R $-parity violation | Pramana 51 (1998) 123 | |
| 31 | P. W. Graham, D. E. Kaplan, S. Rajendran, and P. Saraswat | Displaced supersymmetry | JHEP 07 (2012) 149 | 1204.6038 |
| 32 | CMS Collaboration | Search for displaced supersymmetry in events with an electron and a muon with large impact parameters | PRL 114 (2015) 061801 | CMS-B2G-12-024 1409.4789 |
| 33 | CMS Collaboration | The CMS experiment at the CERN LHC | JINST 3 (2008) S08004 | CMS-00-001 |
| 34 | CMS Collaboration | The CMS trigger system | JINST 12 (2017) P01020 | CMS-TRG-12-001 1609.02366 |
| 35 | CMS Collaboration | CMS luminosity measurements for the 2016 data-taking period | CMS-PAS-LUM-17-001 | CMS-PAS-LUM-17-001 |
| 36 | T. Sjostrand et al. | An Introduction to PYTHIA 8.2 | CPC 191 (2015) 159 | 1410.3012 |
| 37 | M. Kramer, T. Plehn, M. Spira, and P. M. Zerwas | Pair production of scalar leptoquarks at the CERN LHC | PRD 71 (2005) 057503 | |
| 38 | J. Pumplin et al. | New generation of parton distributions with uncertainties from global QCD analysis | JHEP 07 (2002) 012 | |
| 39 | B. C. Allanach et al. | The Snowmass points and slopes: Benchmarks for SUSY searches | EPJC 25 (2002) 113 | hep-ph/0202233 |
| 40 | W. Beenakker et al. | Stop production at hadron colliders | NPB 515 (1998) 3 | hep-ph/9710451 |
| 41 | W. Beenakker et al. | Supersymmetric top and bottom squark production at hadron colliders | JHEP 08 (2010) 098 | 1006.4771 |
| 42 | W. Beenakker et al. | Squark and gluino hadroproduction | Int. J. Mod. Phys. A 26 (2011) 2637 | 1105.1110 |
| 43 | J. Alwall et al. | The automated computation of tree-level and next-to-leading order differential cross sections, and their matching to parton shower simulations | JHEP 07 (2014) 079 | 1405.0301 |
| 44 | S. Frixione and B. R. Webber | Matching NLO QCD computations and parton shower simulations | JHEP 06 (2002) 029 | hep-ph/0204244 |
| 45 | S. Frixione, P. Nason, and C. Oleari | Matching NLO QCD computations with parton shower simulations: the POWHEG method | JHEP 11 (2007) 070 | 0709.2092 |
| 46 | S. Alioli, P. Nason, C. Oleari, and E. Re | A general framework for implementing NLO calculations in shower Monte Carlo programs: the POWHEG BOX | JHEP 06 (2010) 043 | 1002.2581 |
| 47 | S. Alioli, P. Nason, C. Oleari, and E. Re | NLO vector-boson production matched with shower in POWHEG | JHEP 07 (2008) 060 | 0805.4802 |
| 48 | S. Alioli, P. Nason, C. Oleari, and E. Re | NLO single-top production matched with shower in POWHEG: $ s $- and $ t $-channel contributions | JHEP 09 (2009) 111 | 0907.4076 |
| 49 | S. Frixione, E. Laenen, P. Motylinski, and B. R. Webber | Single-top production in MC@NLO | JHEP 03 (2006) 092 | hep-ph/0512250 |
| 50 | Y. Li and F. Petriello | Combining QCD and electroweak corrections to dilepton production in FEWZ | PRD 86 (2012) 094034 | 1208.5967 |
| 51 | J. Campbell, R. K. Ellis, and F. Tramontano | Single top-quark production and decay at next-to-leading order | PRD 70 (2004) 094012 | hep-ph/0408158 |
| 52 | J. Campbell and F. Tramontano | Next-to-leading order corrections to Wt production and decay | NPB 726 (2005) 109 | hep-ph/0506289 |
| 53 | J. M. Campbell, R. Frederix, F. Maltoni, and F. Tramontano | Next-to-leading-order predictions for $ t $-channel single-top production at hadron colliders | PRL 102 (2009) 182003 | 0903.0005 |
| 54 | J. M. Campbell, R. K. Ellis, and C. Williams | Vector boson pair production at the LHC | JHEP 07 (2011) 018 | 1105.0020 |
| 55 | M. Botje et al. | The PDF4LHC Working Group Interim Recommendations | 1101.0538 | |
| 56 | D. Bourilkov, R. C. Group, and M. R. Whalley | LHAPDF: PDF use from the Tevatron to the LHC | hep-ph/0605240 | |
| 57 | M. Czakon, P. Fiedler, and A. Mitov | The total top quark pair production cross-section at hadron colliders through O($ \alpha_S^4 $) | PRL 110 (2013) 252004 | 1303.6254 |
| 58 | M. Czakon, M. L. Mangano, A. Mitov, and J. Rojo | Constraints on the gluon PDF from top quark pair production at hadron colliders | JHEP 07 (2013) 167 | 1303.7215 |
| 59 | J. Gao et al. | CT10 next-to-next-to-leading order global analysis of QCD | PRD 89 (2014) 033009 | 1302.6246 |
| 60 | NNPDF Collaboration | Parton distributions for the LHC Run II | JHEP 04 (2015) 040 | 1410.8849 |
| 61 | GEANT4 Collaboration | GEANT4--A simulation toolkit | NIMA 506 (2003) 250 | |
| 62 | J. Allison et al. | GEANT4 developments and applications | IEEE Trans. Nucl. Sci. 53 (2006) 270 | |
| 63 | CMS Collaboration | Event generator tunes obtained from underlying event and multiparton scattering measurements | EPJC 76 (2016) 155 | CMS-GEN-14-001 1512.00815 |
| 64 | CMS Collaboration | Particle-flow reconstruction and global event description with the cms detector | JINST 12 (2017) P10003 | CMS-PRF-14-001 1706.04965 |
| 65 | M. Cacciari, G. P. Salam, and G. Soyez | The anti-$ {k_{\mathrm{T}}} $ jet clustering algorithm | JHEP 08 (2008) 063 | |
| 66 | M. Cacciari, G. P. Salam, and G. Soyez | FastJet user manual | EPJC 72 (2012) 1896 | 1111.6097 |
| 67 | CMS Collaboration | Jet energy scale and resolution in the CMS experiment in pp collisions at 8 TeV | JINST 12 (2017) P02014 | CMS-JME-13-004 1607.03663 |
| 68 | CMS Collaboration | Identification of heavy-flavour jets with the CMS detector in pp collisions at 13 TeV | JINST 13 (2018) P05011 | CMS-BTV-16-002 1712.07158 |
| 69 | CMS Collaboration | Performance of the CMS muon detector and muon reconstruction with proton-proton collisions at $ \sqrt{s}= $ 13 TeV | JINST 13 (2018) P06015 | CMS-MUO-16-001 1804.04528 |
| 70 | CMS Collaboration | Performance of electron reconstruction and selection with the CMS detector in proton-proton collisions at $ \sqrt{s} = $ 8 TeV | JINST 10 (2015) P06005 | CMS-EGM-13-001 1502.02701 |
| 71 | G. Punzi | Sensitivity of searches for new signals and its optimization | in Statistical problems in particle physics, astrophysics and cosmology. PHYSTAT 2003, Stanford | physics/0308063 |
| 72 | CMS Collaboration | Search for high-mass resonances in dilepton final states in proton-proton collisions at $ \sqrt{s}= $ 13 TeV | CMS-EXO-16-047 1803.06292 |
|
| 73 | CMS Collaboration | Measurement of the inelastic proton-proton cross section at $ \sqrt{s}= $ 13 TeV | JHEP 07 (2018) 161 | CMS-FSQ-15-005 1802.02613 |
| 74 | G. Cowan, K. Cranmer, E. Gross, and O. Vitells | Asymptotic formulae for likelihood-based tests of new physics | EPJC 71 (2011) 1554 | 1007.1727 |
| 75 | T. Junk | Confidence level computation for combining searches with small statistics | NIMA 434 (1999) 435 | hep-ex/9902006 |
| 76 | A. L. Read | Presentation of search results: The CL$ _{\rm{s}} $ technique | JPG 28 (2002) 2693 | |
| 77 | ATLAS and CMS Collaborations | Procedure for the LHC Higgs boson search combination in summer 2011 | CMS-NOTE-2011-005 | |
| 78 | P. Richardson | Simulations of R-parity violating SUSY models | PhD thesis, Oxford University | hep-ph/0101105 |
|
|
Compact Muon Solenoid LHC, CERN |
|

|

|

|

|

|