

Compact Muon Solenoid
LHC, CERN
| CMS-EXO-17-028 ; CERN-EP-2018-159 | ||
| Search for heavy Majorana neutrinos in same-sign dilepton channels in proton-proton collisions at $\sqrt{s} = $ 13 TeV | ||
| CMS Collaboration | ||
| 28 June 2018 | ||
| JHEP 01 (2019) 122 | ||
| Abstract: A search is performed for a heavy Majorana neutrino (N ), produced by leptonic decay of a $\mathrm{W}$ boson propagator and decaying into a $\mathrm{W}$ boson and a lepton, with the CMS detector at the LHC. The signature used in this search consists of two same-sign leptons, in any flavor combination of electrons and muons, and at least one jet. The data were collected during 2016 in proton-proton collisions at a center-of-mass energy of 13 TeV, corresponding to an integrated luminosity of 35.9 fb$^{-1}$. The results are found to be consistent with the expected standard model backgrounds. Upper limits are set in the mass range between 20 and 1600 GeV in the context of a Type-I seesaw mechanism, on ${|{{V_{\mathrm{e} \mathrm{N}}} }|^2} $, ${|{{V_{\mu \mathrm{N}}} }|^2} $, and ${|{V_{\mathrm{e} {\mathrm{N}} } V^{*}_{\mu {\mathrm{N}} }}|^2 / ({|{{V_{\mathrm{e} \mathrm{N}}} }|^2} + {|{{V_{\mu \mathrm{N}}} }|^2} )} $, where ${V_{\ell \mathrm{N}}}$ is the matrix element describing the mixing of N with the standard model neutrino of flavor $\ell = \mathrm{e}$, $\mu$. For N masses between 20 and 1600 GeV, the upper limits on $ {|{{V_{\ell \mathrm{N}}} }|^2}$ range between $ 2.3 \times 10^{-5} $ and unity. These are the most restrictive direct limits for heavy Majorana neutrino masses above 430 GeV. | ||
| Links: e-print arXiv:1806.10905 [hep-ex] (PDF) ; CDS record ; inSPIRE record ; CADI line (restricted) ; | ||
| Figures | |
png pdf |
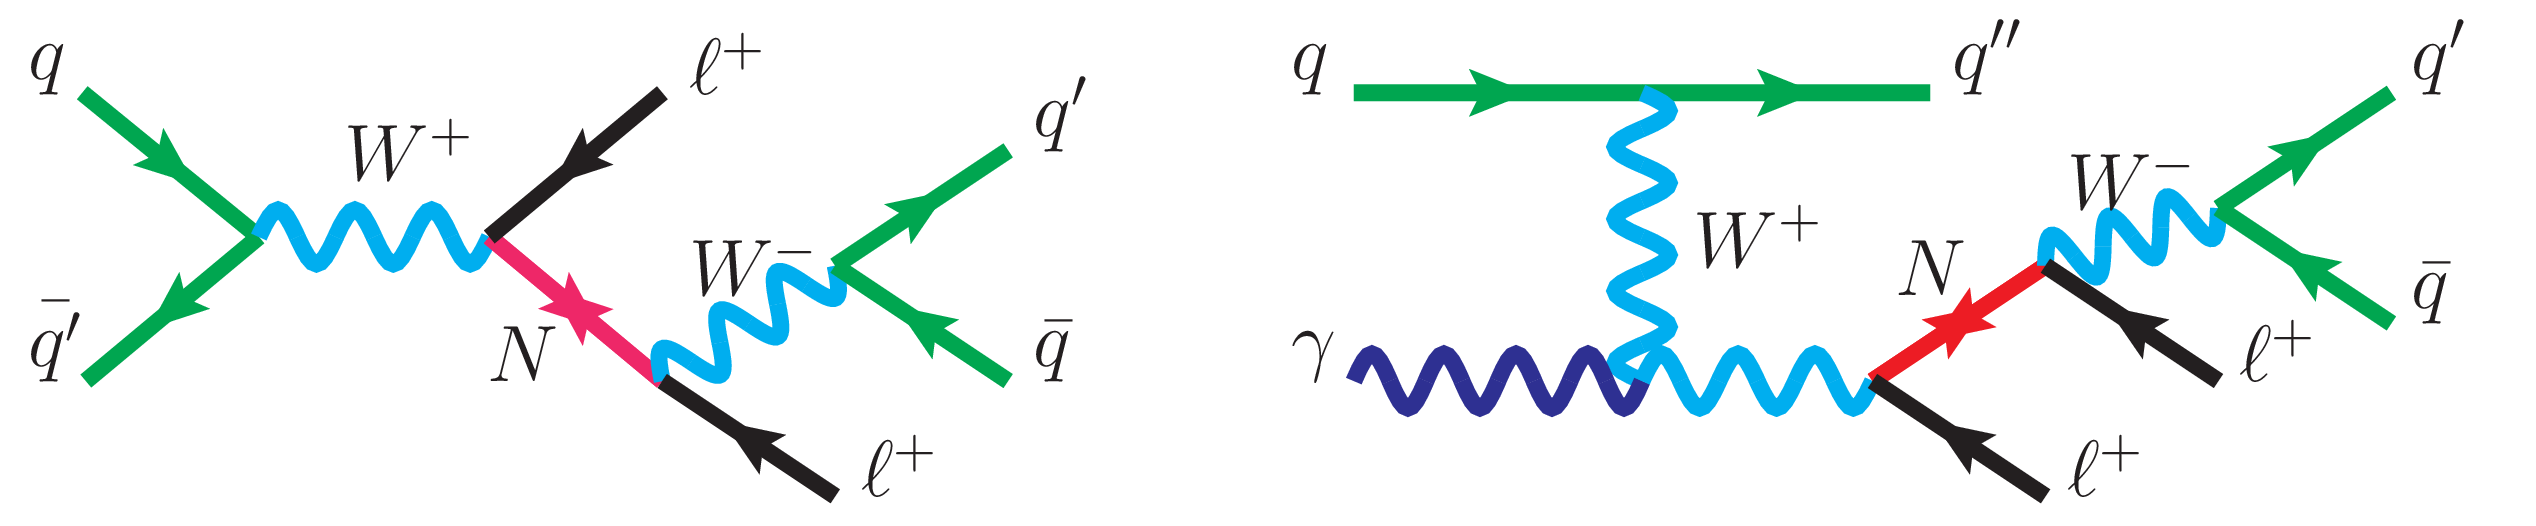
Figure 1:
Feynman diagram representing a resonant production of a Majorana neutrino (N), via the $s$-channel Drell-Yan process (left) and its decay into a lepton and two quarks, resulting in a final state with two same-sign leptons and two quarks from a W boson decay. Feynman diagram for the photon-initiated process (right). |
png pdf |
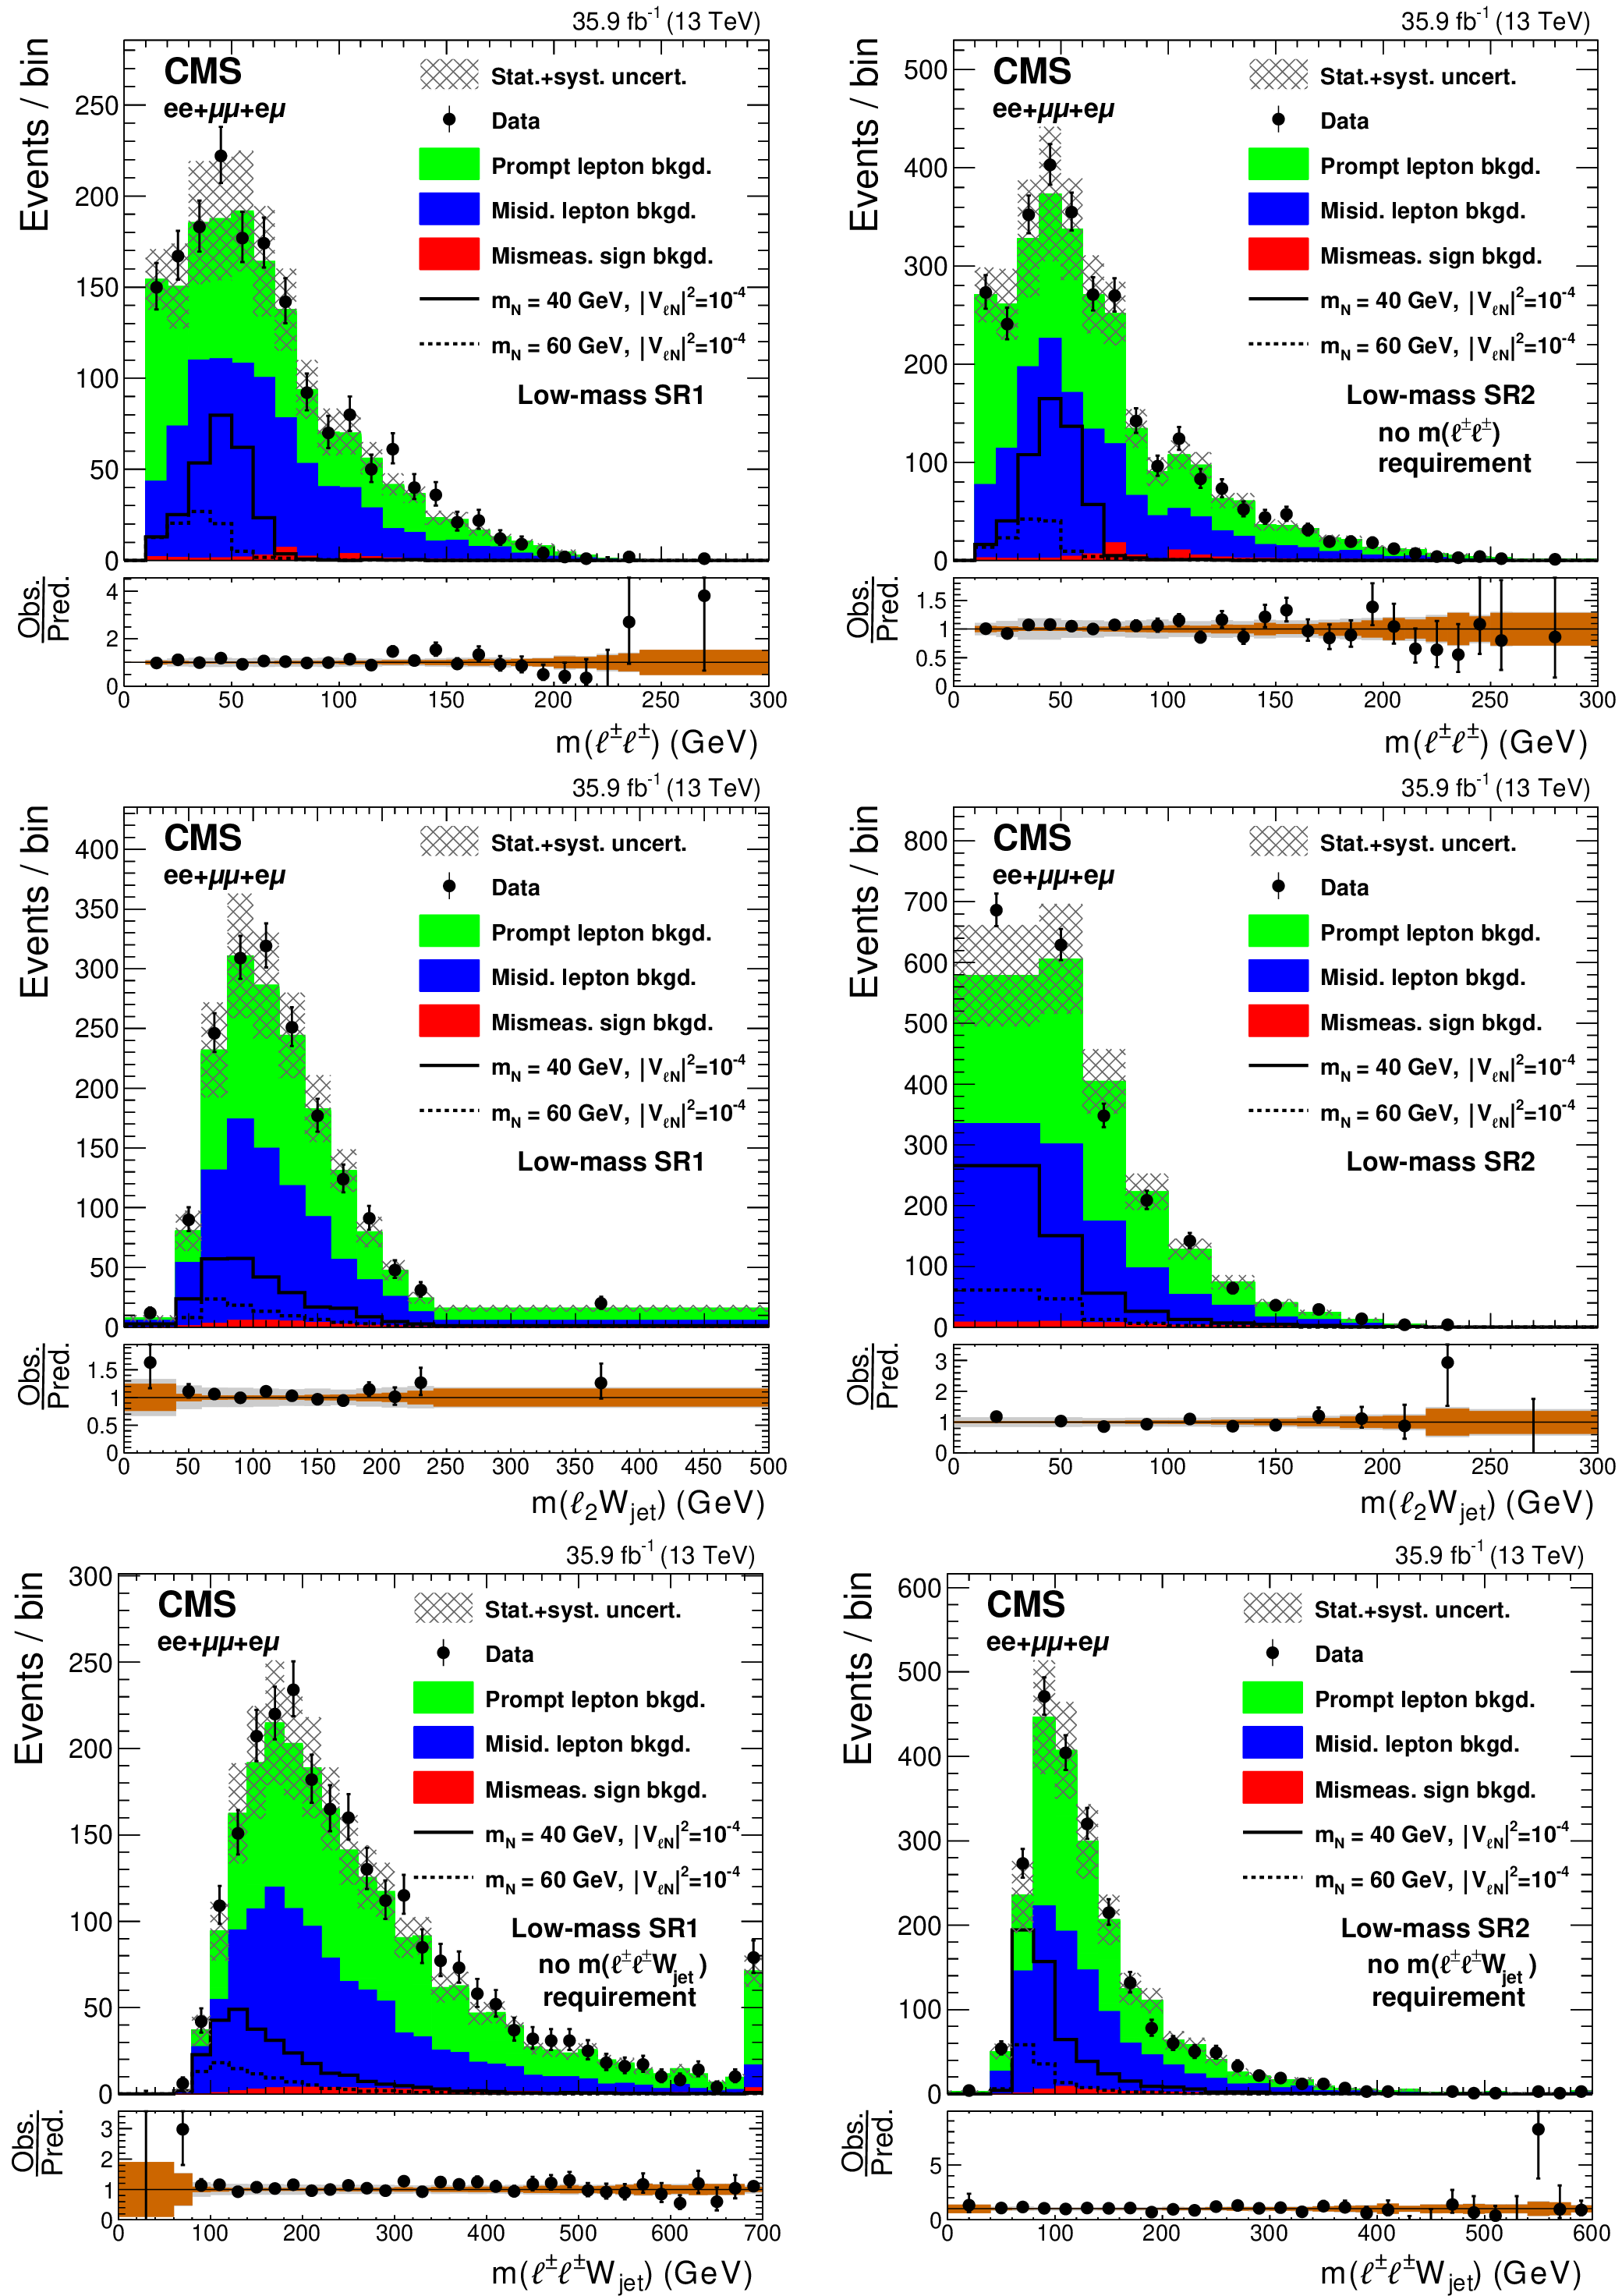
Figure 2:
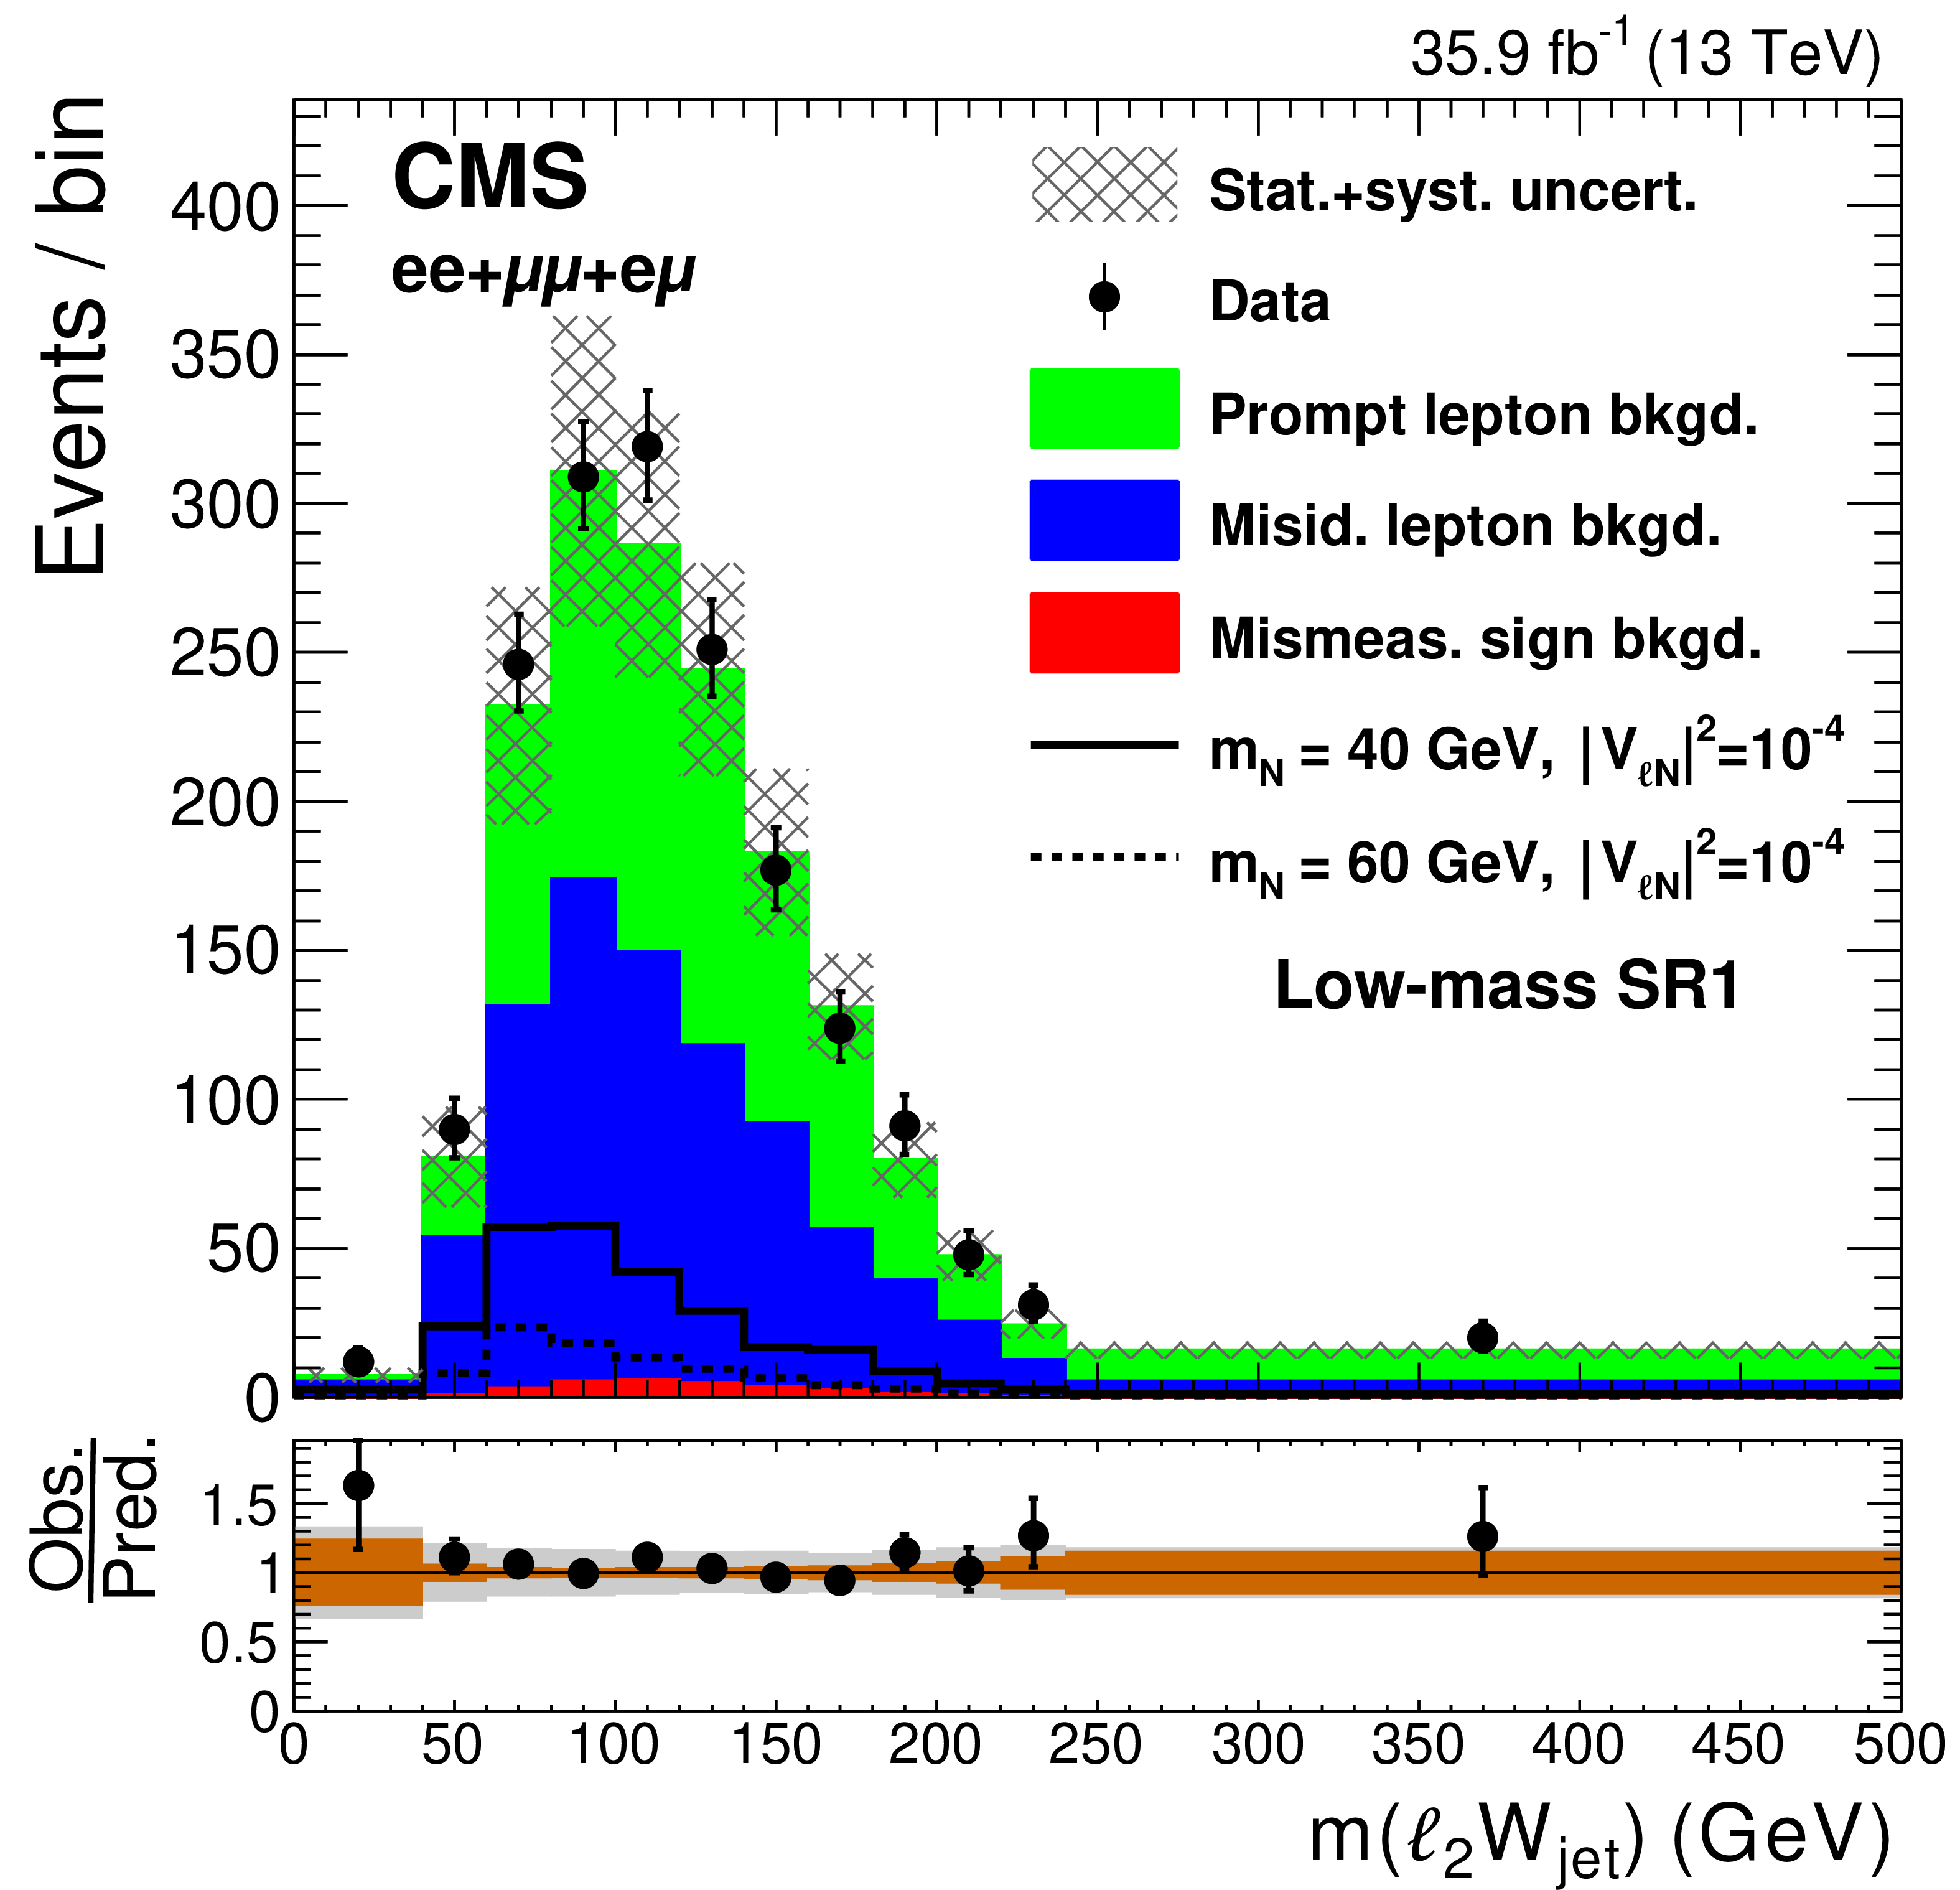
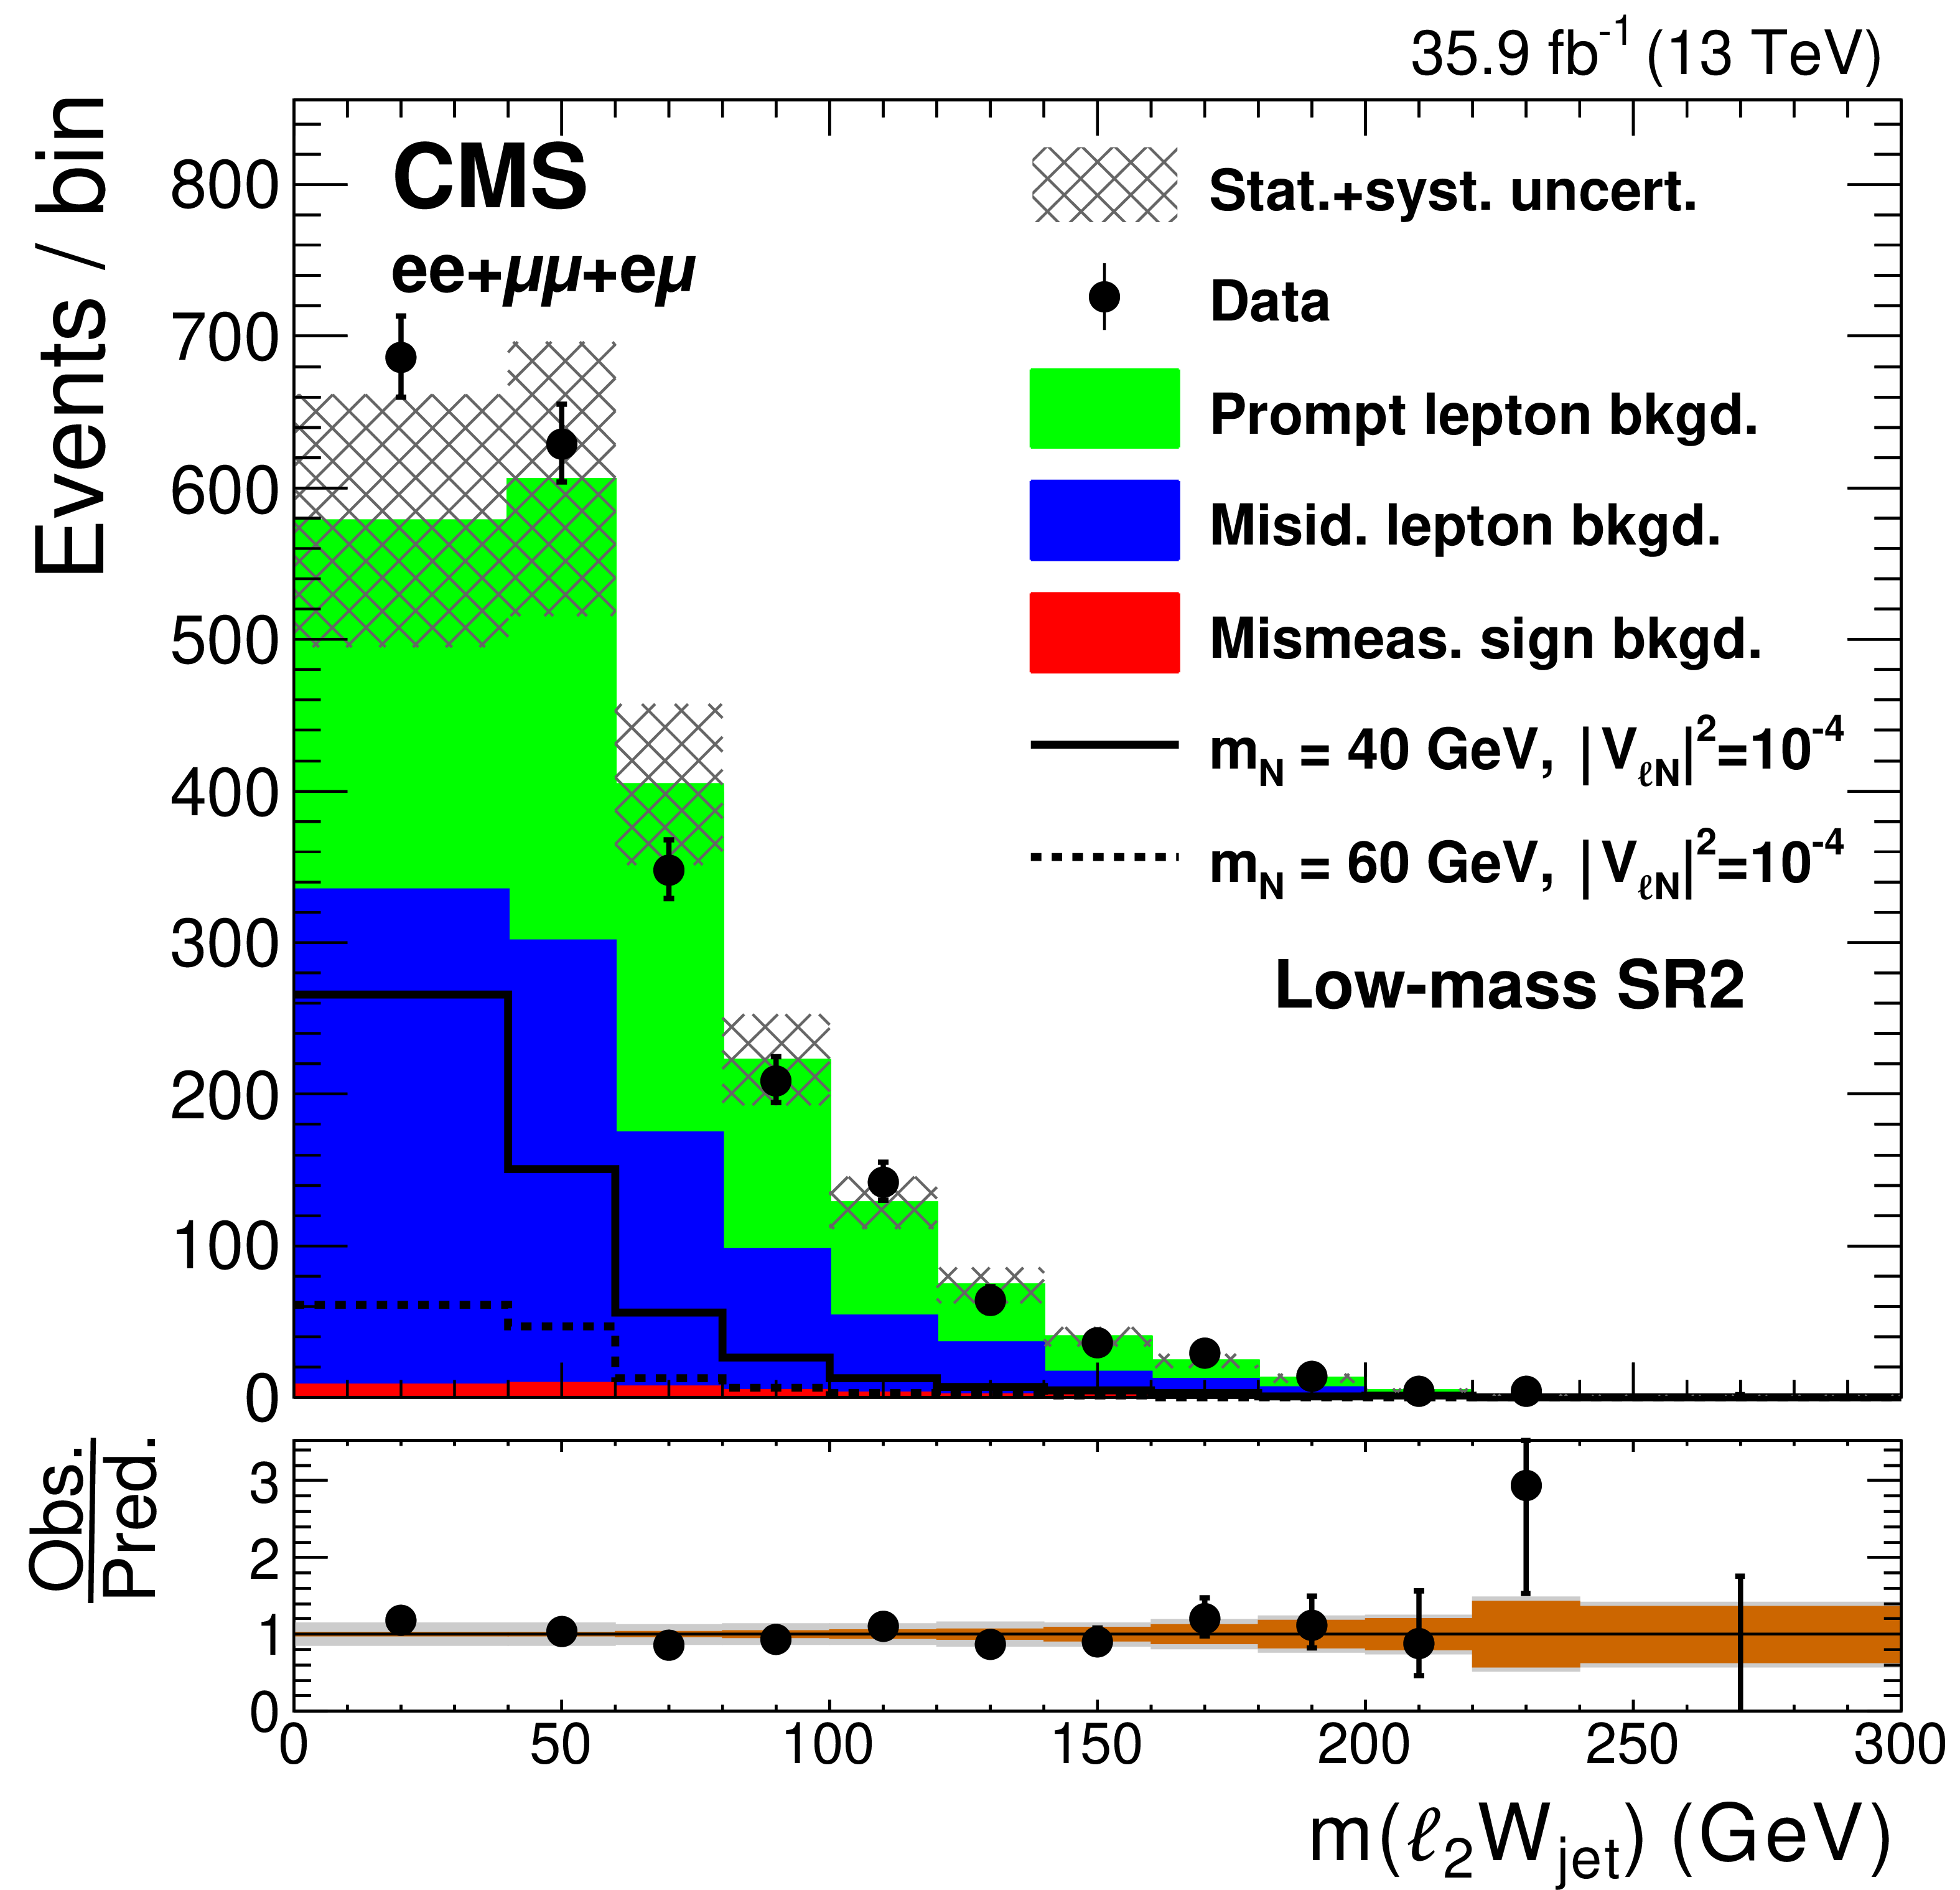
Observed distributions of the invariant mass of the two leptons (upper), invariant mass of the subleading lepton and jets (middle), and the invariant mass of the reconstructed W propagator (lower), compared to the expected SM background contributions, for the low-mass SR1 (left) and SR2 (right), after combining the events in the $ {\mathrm {e}} {\mathrm {e}}$, $\mu \mu $, and $ {\mathrm {e}}\mu $ channels. The hatched bands represent the sums in quadrature of the statistical and systematic uncertainties. The solid and dashed lines show the kinematic distributions of two possible signal hypotheses. The lower panels show the ratio between the observed and expected events in each bin, including the uncertainty bands that represent the statistical (brown) and total uncertainties (gray). |
png pdf |
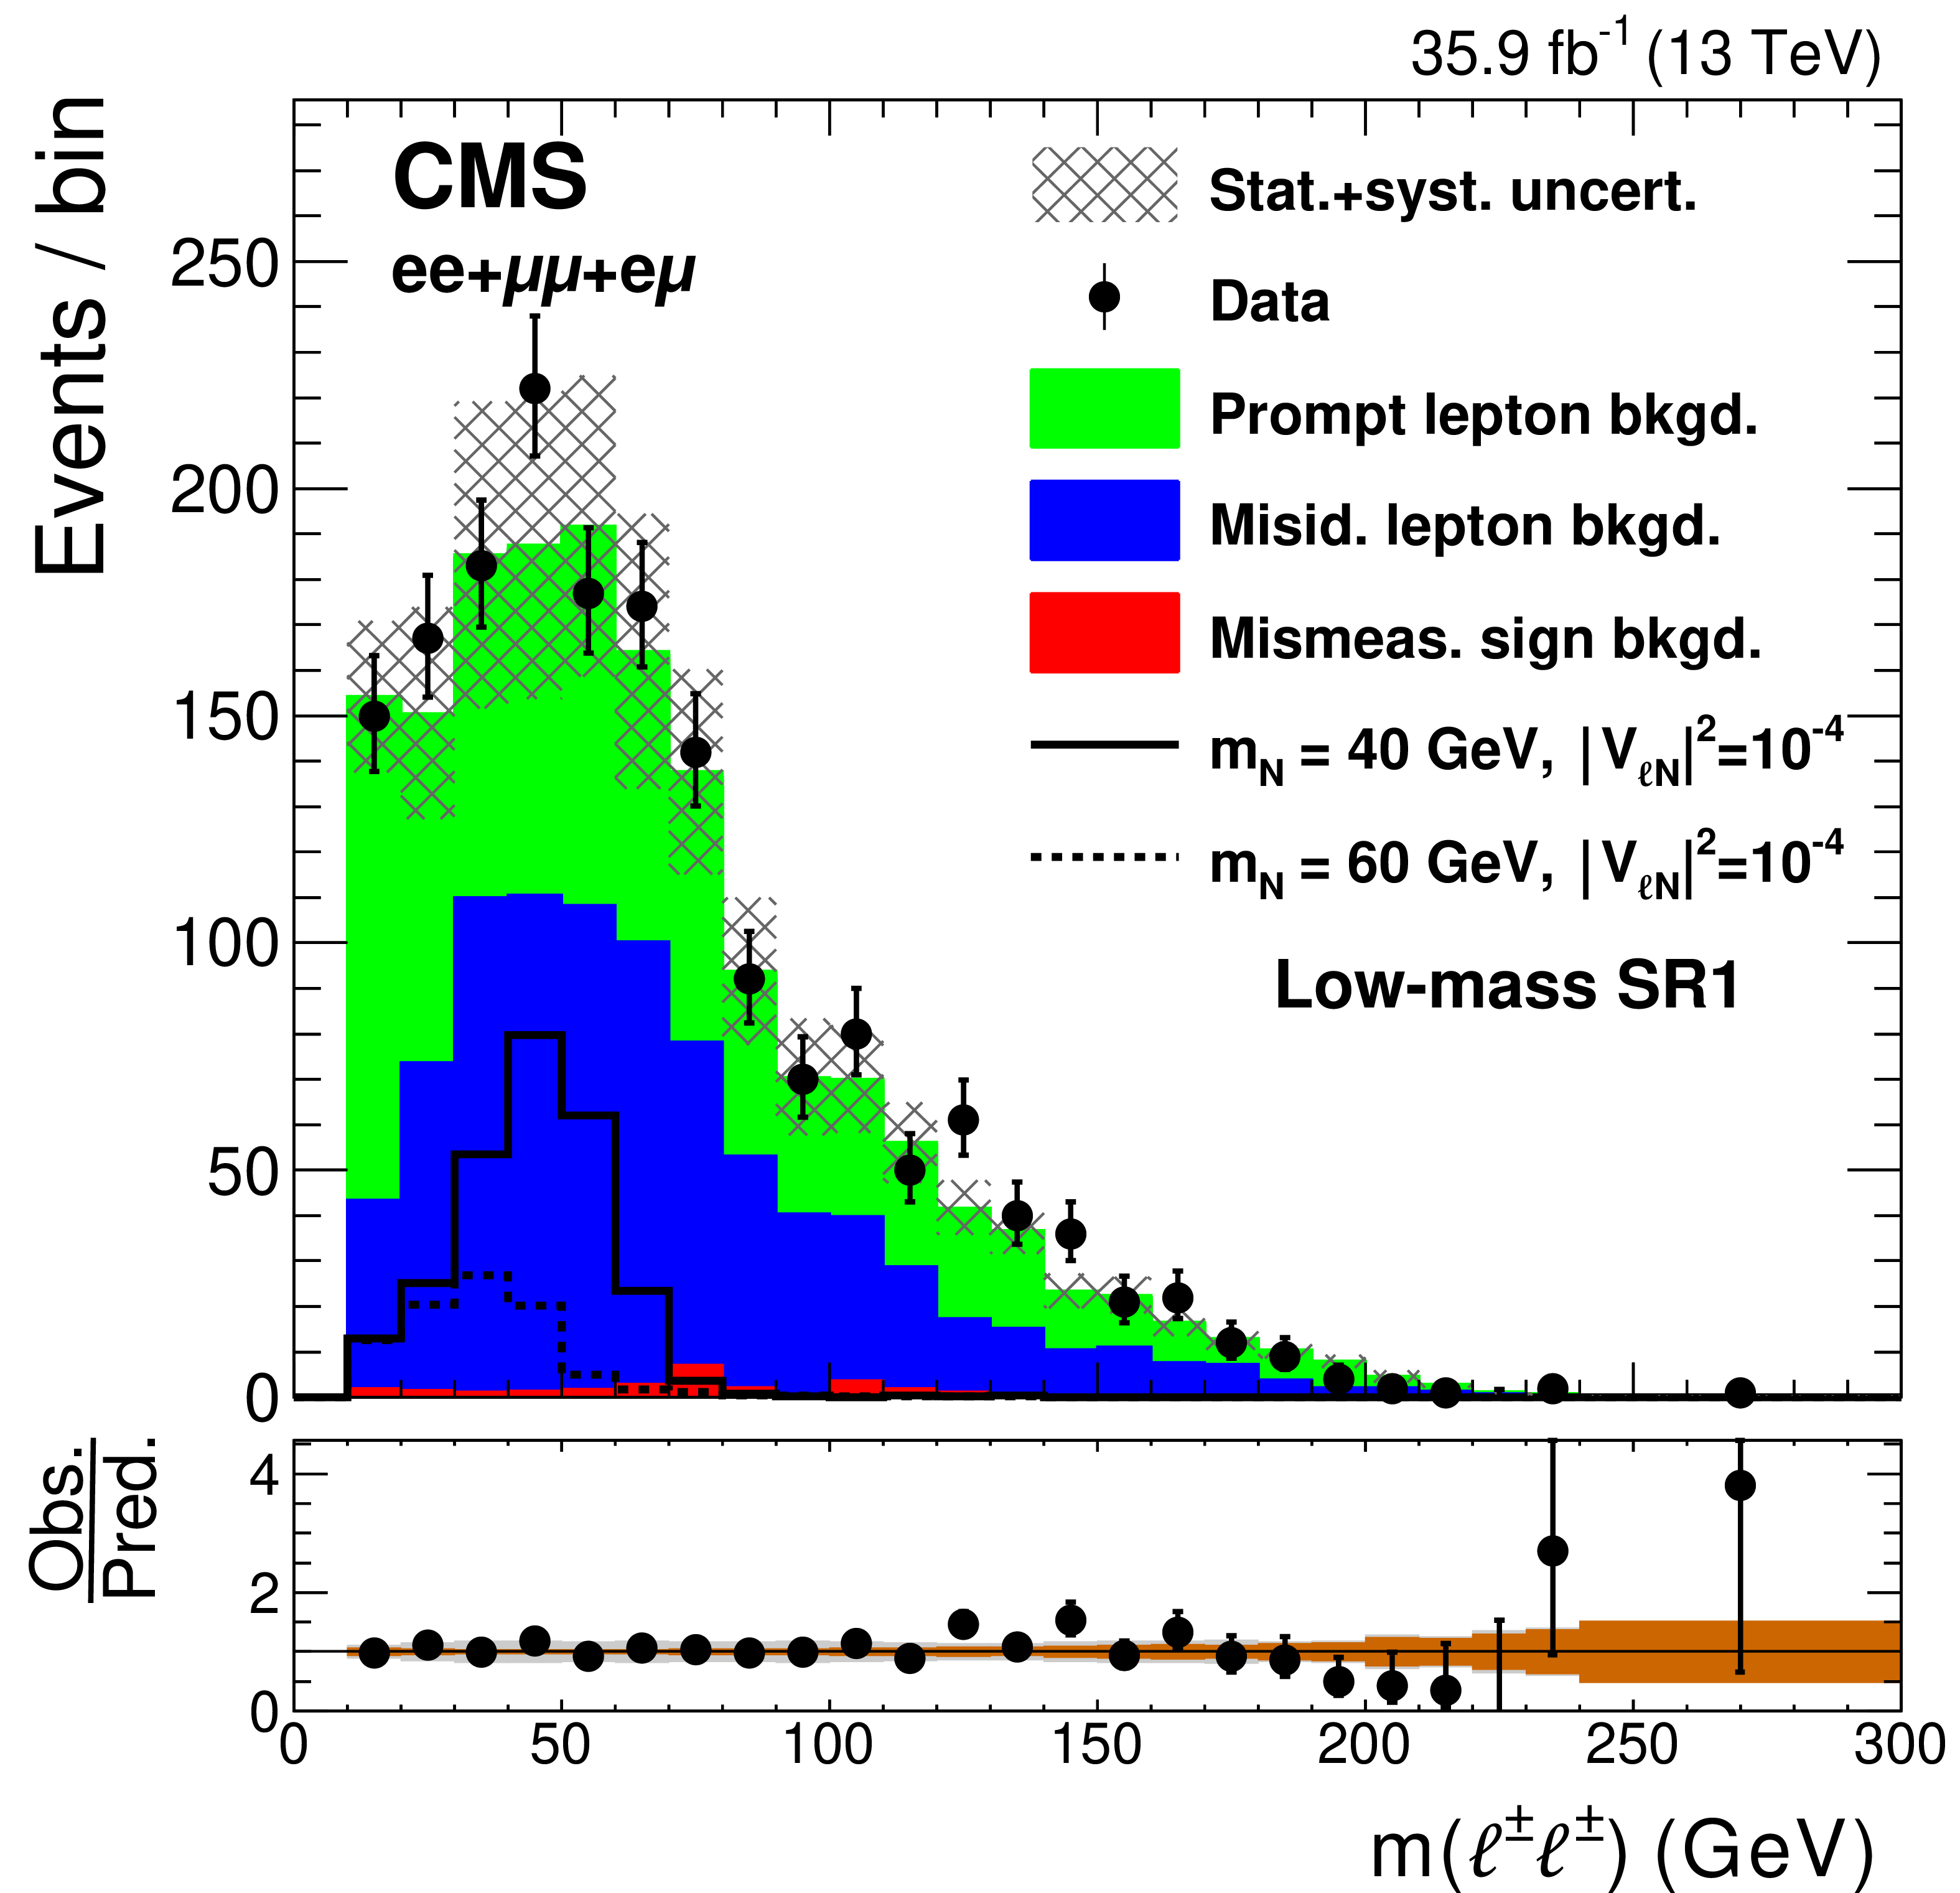
Figure 2-a:
Observed distribution of the invariant mass of the two leptons invariant mass, compared to the expected SM background contributions, for the low-mass SR1, after combining the events in the $ {\mathrm {e}} {\mathrm {e}}$, $\mu \mu $, and $ {\mathrm {e}}\mu $ channels. The hatched bands represent the sums in quadrature of the statistical and systematic uncertainties. The solid and dashed lines show the kinematic distributions of two possible signal hypotheses. The lower panel shows the ratio between the observed and expected events in each bin, including the uncertainty bands that represent the statistical (brown) and total uncertainties (gray). |
png pdf |
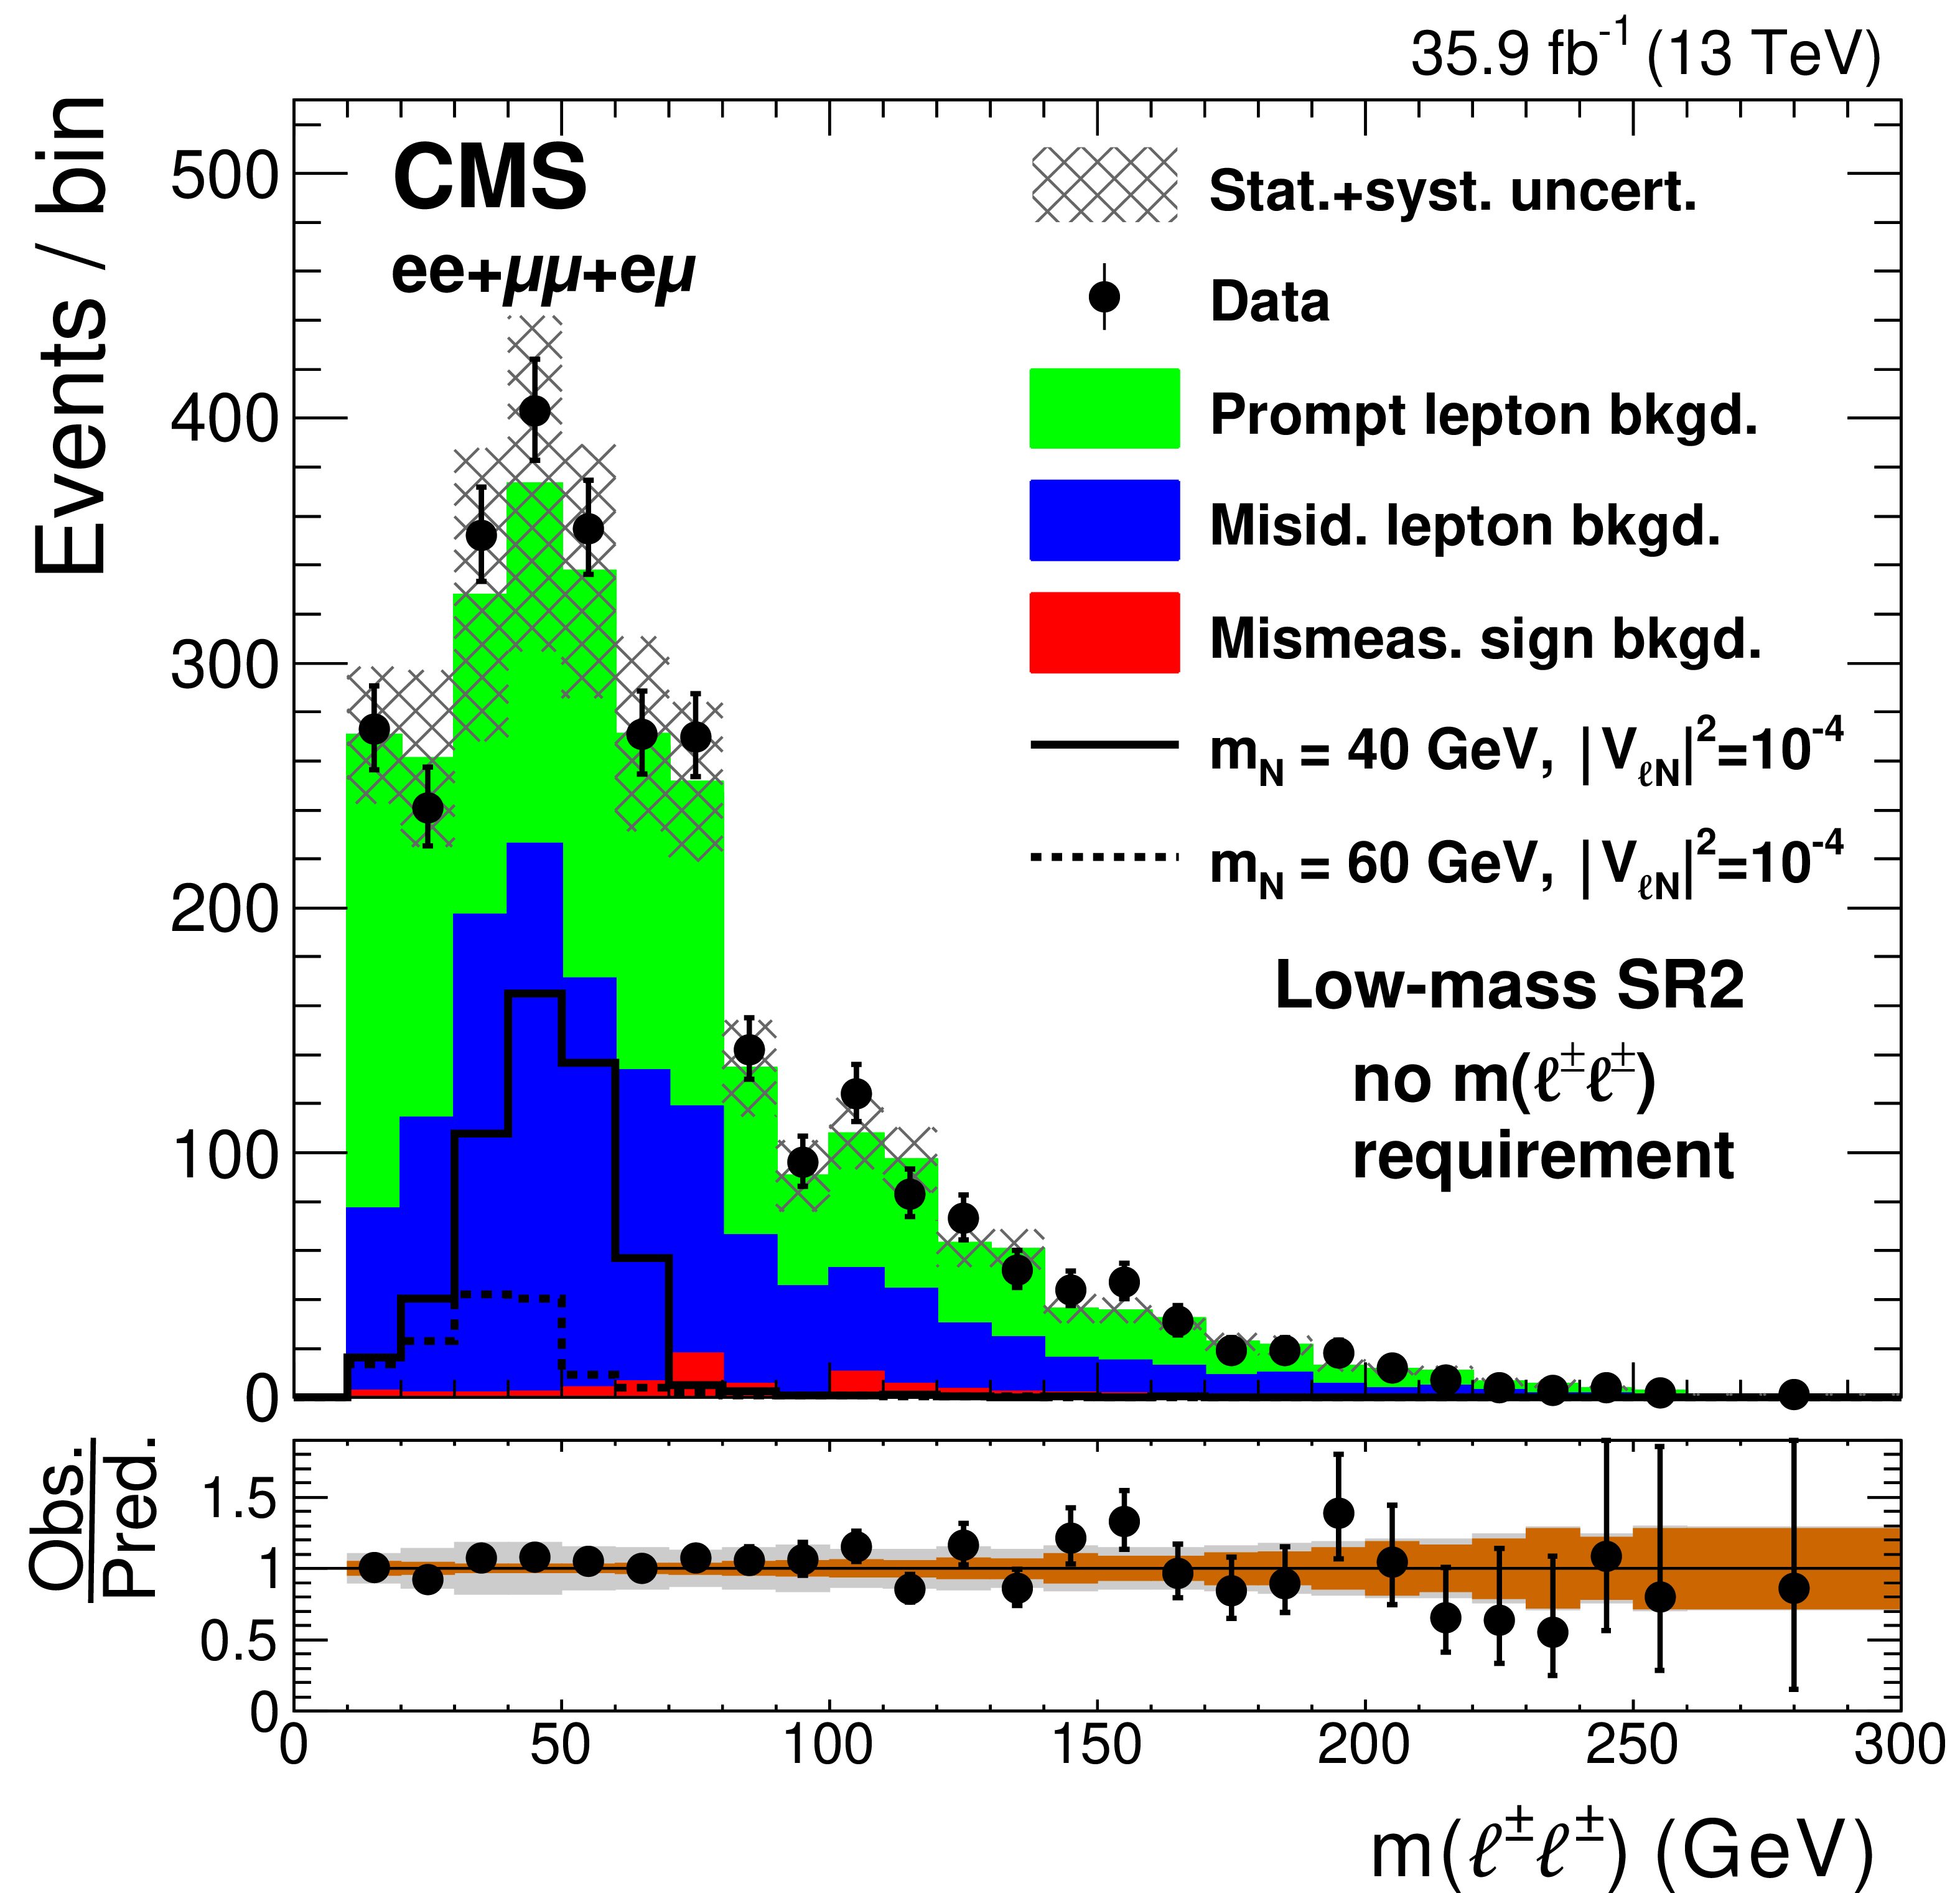
Figure 2-b:
Observed distribution of the invariant mass of the two leptons invariant mass, compared to the expected SM background contributions, for the low-mass SR2, after combining the events in the $ {\mathrm {e}} {\mathrm {e}}$, $\mu \mu $, and $ {\mathrm {e}}\mu $ channels. The hatched bands represent the sums in quadrature of the statistical and systematic uncertainties. The solid and dashed lines show the kinematic distributions of two possible signal hypotheses. The lower panel shows the ratio between the observed and expected events in each bin, including the uncertainty bands that represent the statistical (brown) and total uncertainties (gray). |
png pdf |
Figure 2-c:
Observed distribution of the invariant mass of the subleading lepton and jets, compared to the expected SM background contributions, for the low-mass SR1, after combining the events in the $ {\mathrm {e}} {\mathrm {e}}$, $\mu \mu $, and $ {\mathrm {e}}\mu $ channels. The hatched bands represent the sums in quadrature of the statistical and systematic uncertainties. The solid and dashed lines show the kinematic distributions of two possible signal hypotheses. The lower panel shows the ratio between the observed and expected events in each bin, including the uncertainty bands that represent the statistical (brown) and total uncertainties (gray). |
png pdf |
Figure 2-d:
Observed distribution of the invariant mass of the subleading lepton and jets, compared to the expected SM background contributions, for the low-mass SR2, after combining the events in the $ {\mathrm {e}} {\mathrm {e}}$, $\mu \mu $, and $ {\mathrm {e}}\mu $ channels. The hatched bands represent the sums in quadrature of the statistical and systematic uncertainties. The solid and dashed lines show the kinematic distributions of two possible signal hypotheses. The lower panel shows the ratio between the observed and expected events in each bin, including the uncertainty bands that represent the statistical (brown) and total uncertainties (gray). |
png pdf |
Figure 2-e:
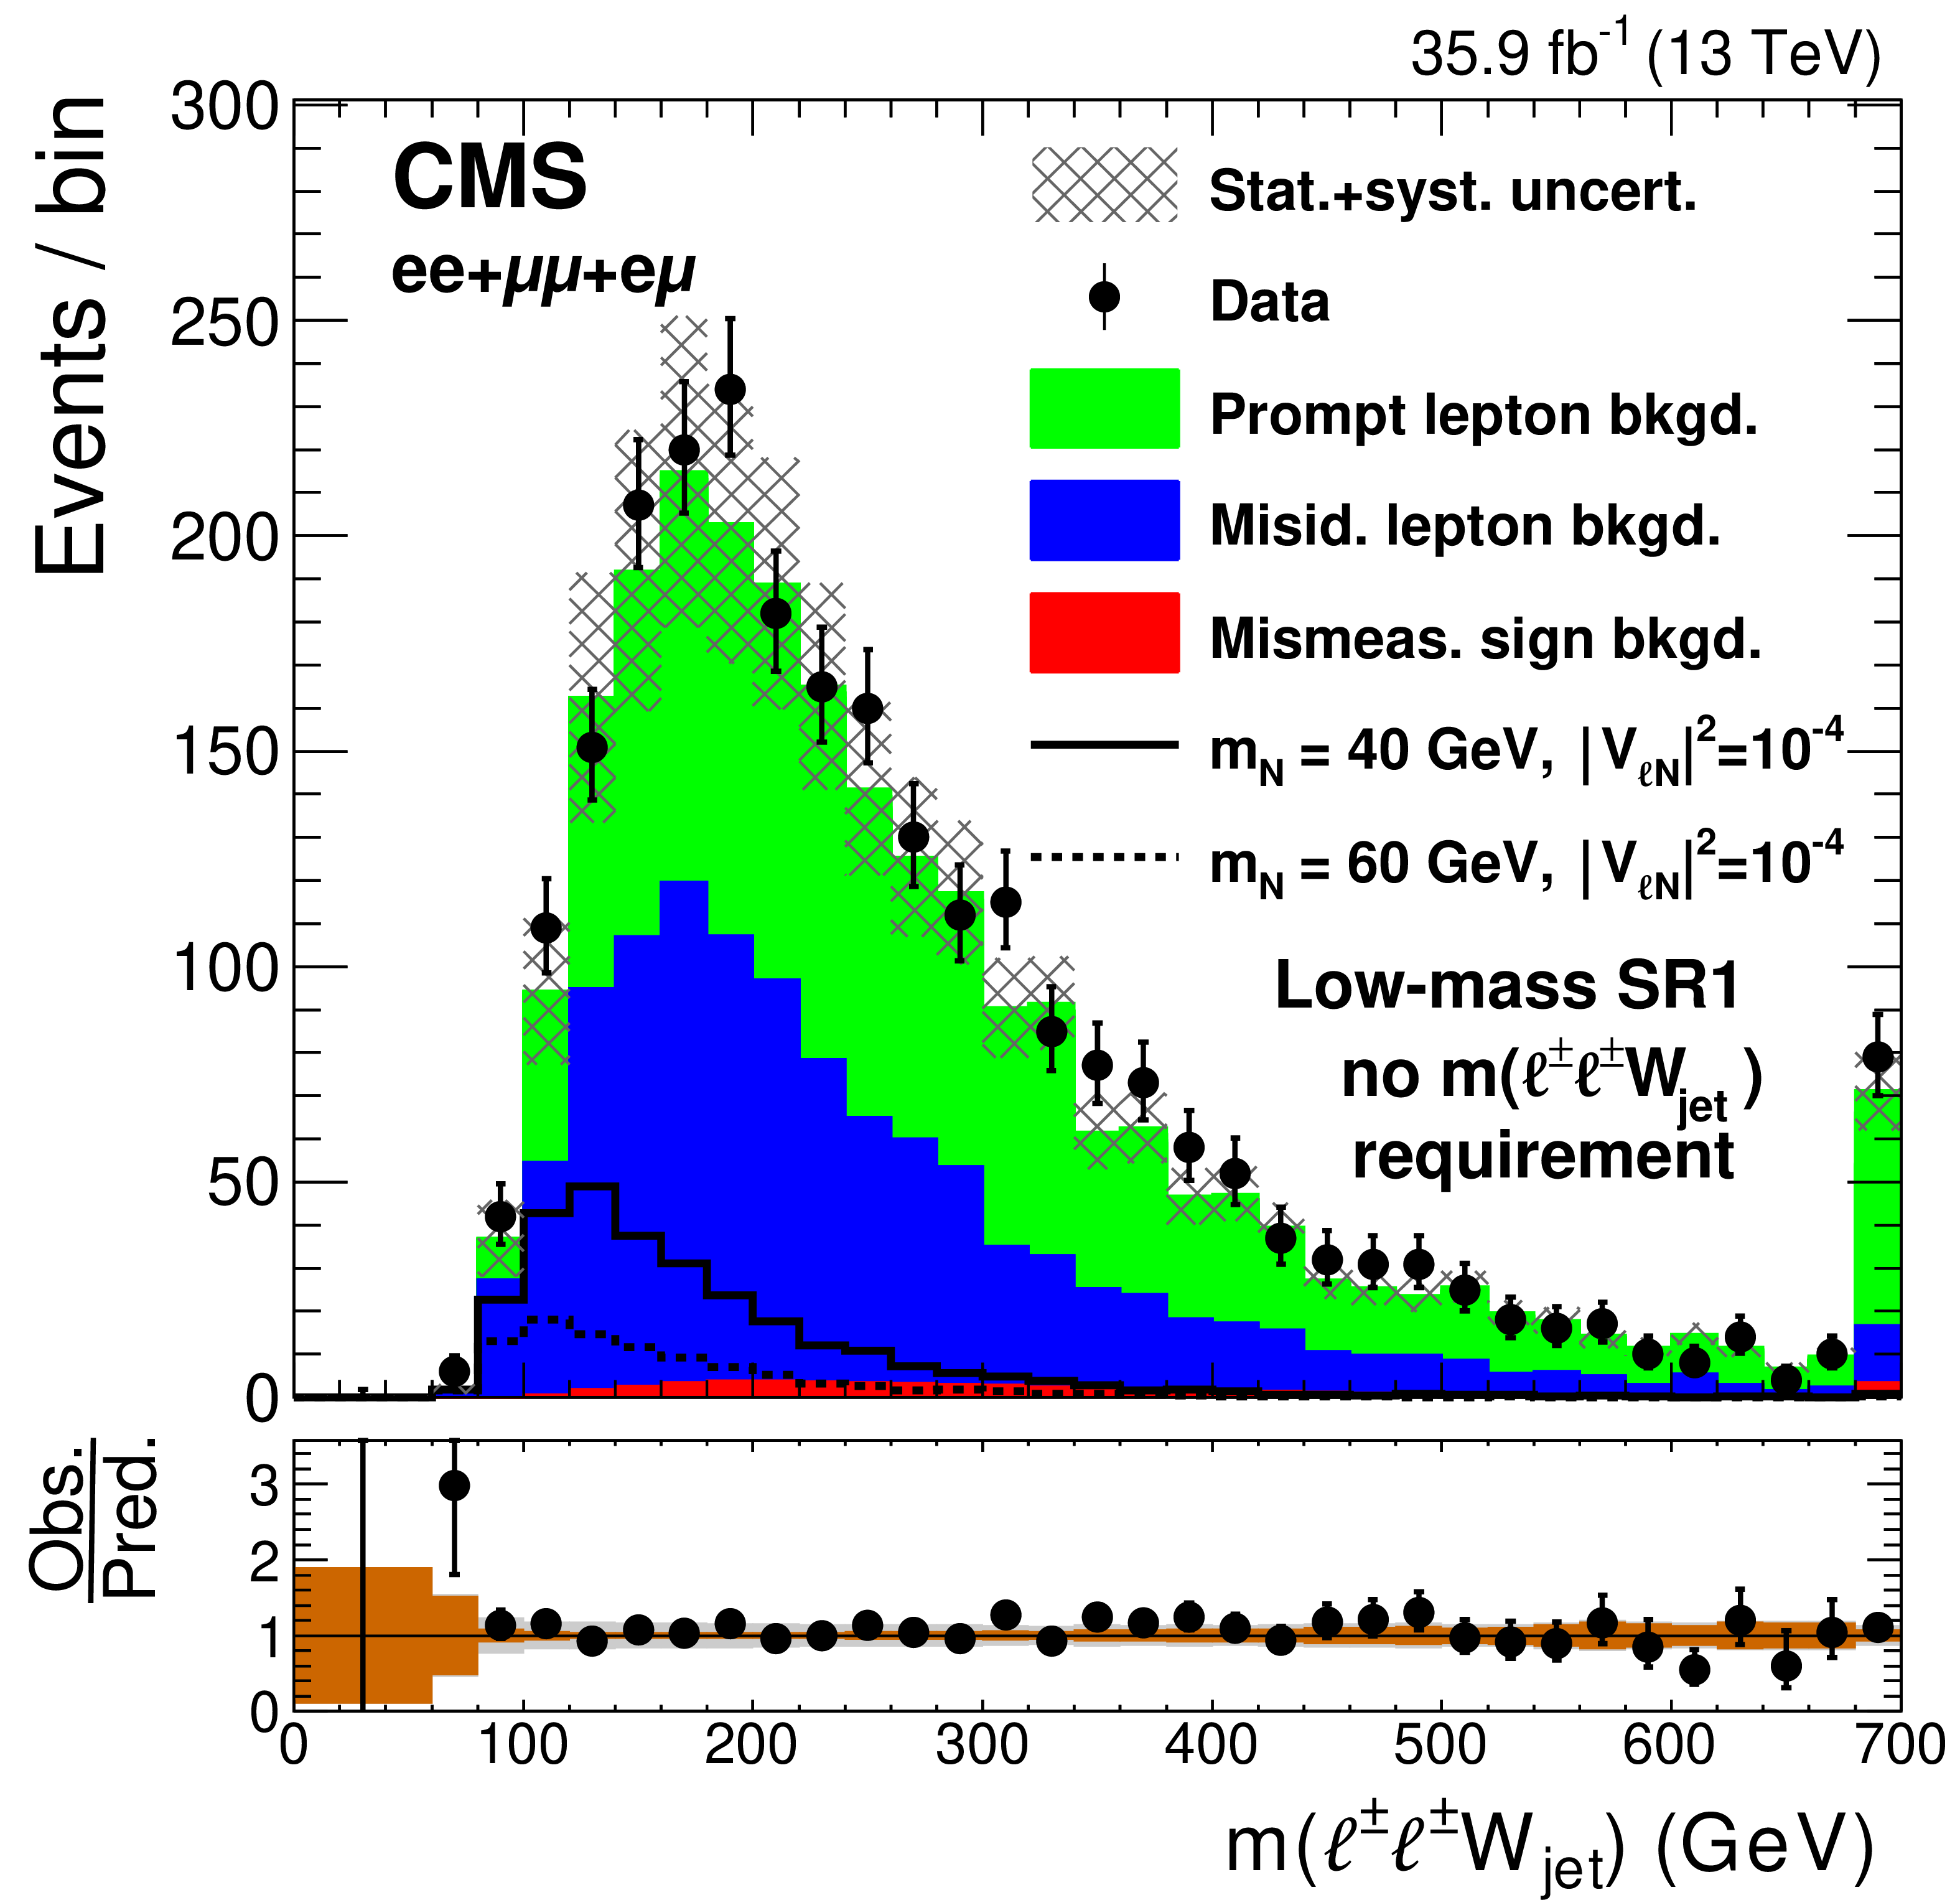
Observed distribution of the invariant mass of the reconstructed W propagator, compared to the expected SM background contributions, for the low-mass SR1, after combining the events in the $ {\mathrm {e}} {\mathrm {e}}$, $\mu \mu $, and $ {\mathrm {e}}\mu $ channels. The hatched bands represent the sums in quadrature of the statistical and systematic uncertainties. The solid and dashed lines show the kinematic distributions of two possible signal hypotheses. The lower panel shows the ratio between the observed and expected events in each bin, including the uncertainty bands that represent the statistical (brown) and total uncertainties (gray). |
png pdf |
Figure 2-f:
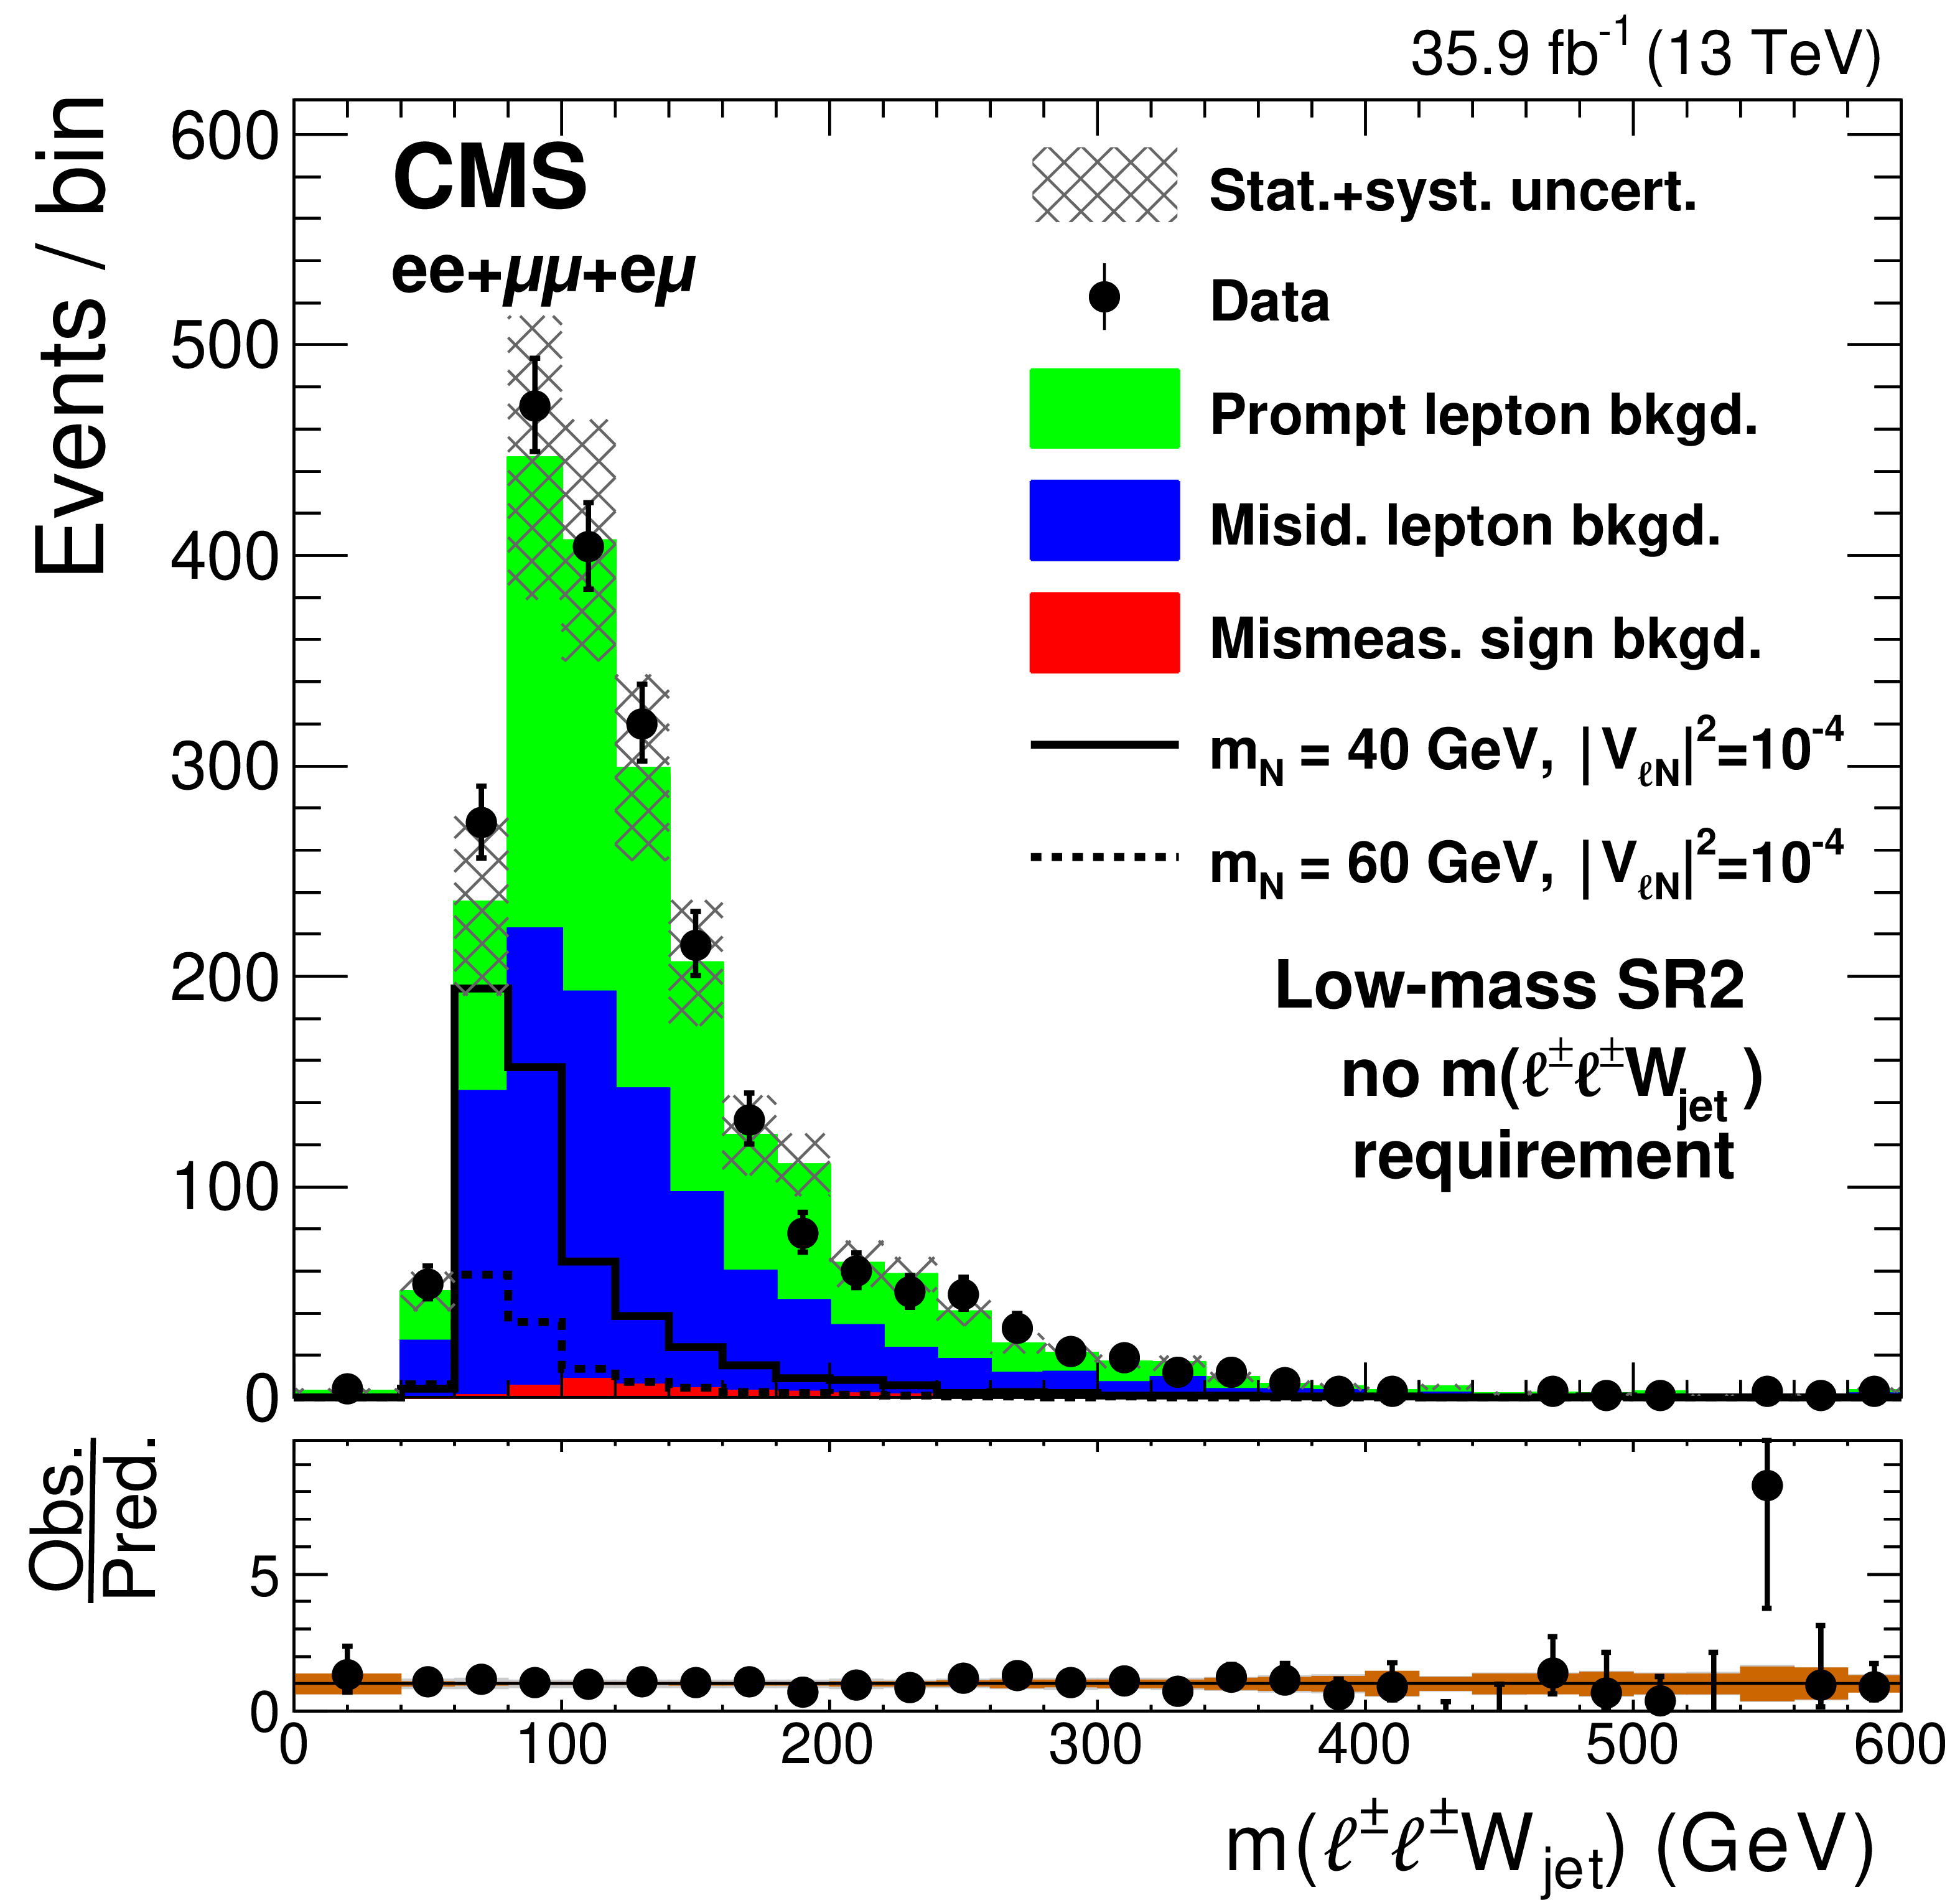
Observed distribution of the invariant mass of the reconstructed W propagator, compared to the expected SM background contributions, for the low-mass SR2, after combining the events in the $ {\mathrm {e}} {\mathrm {e}}$, $\mu \mu $, and $ {\mathrm {e}}\mu $ channels. The hatched bands represent the sums in quadrature of the statistical and systematic uncertainties. The solid and dashed lines show the kinematic distributions of two possible signal hypotheses. The lower panel shows the ratio between the observed and expected events in each bin, including the uncertainty bands that represent the statistical (brown) and total uncertainties (gray). |

png pdf |
Figure 3:
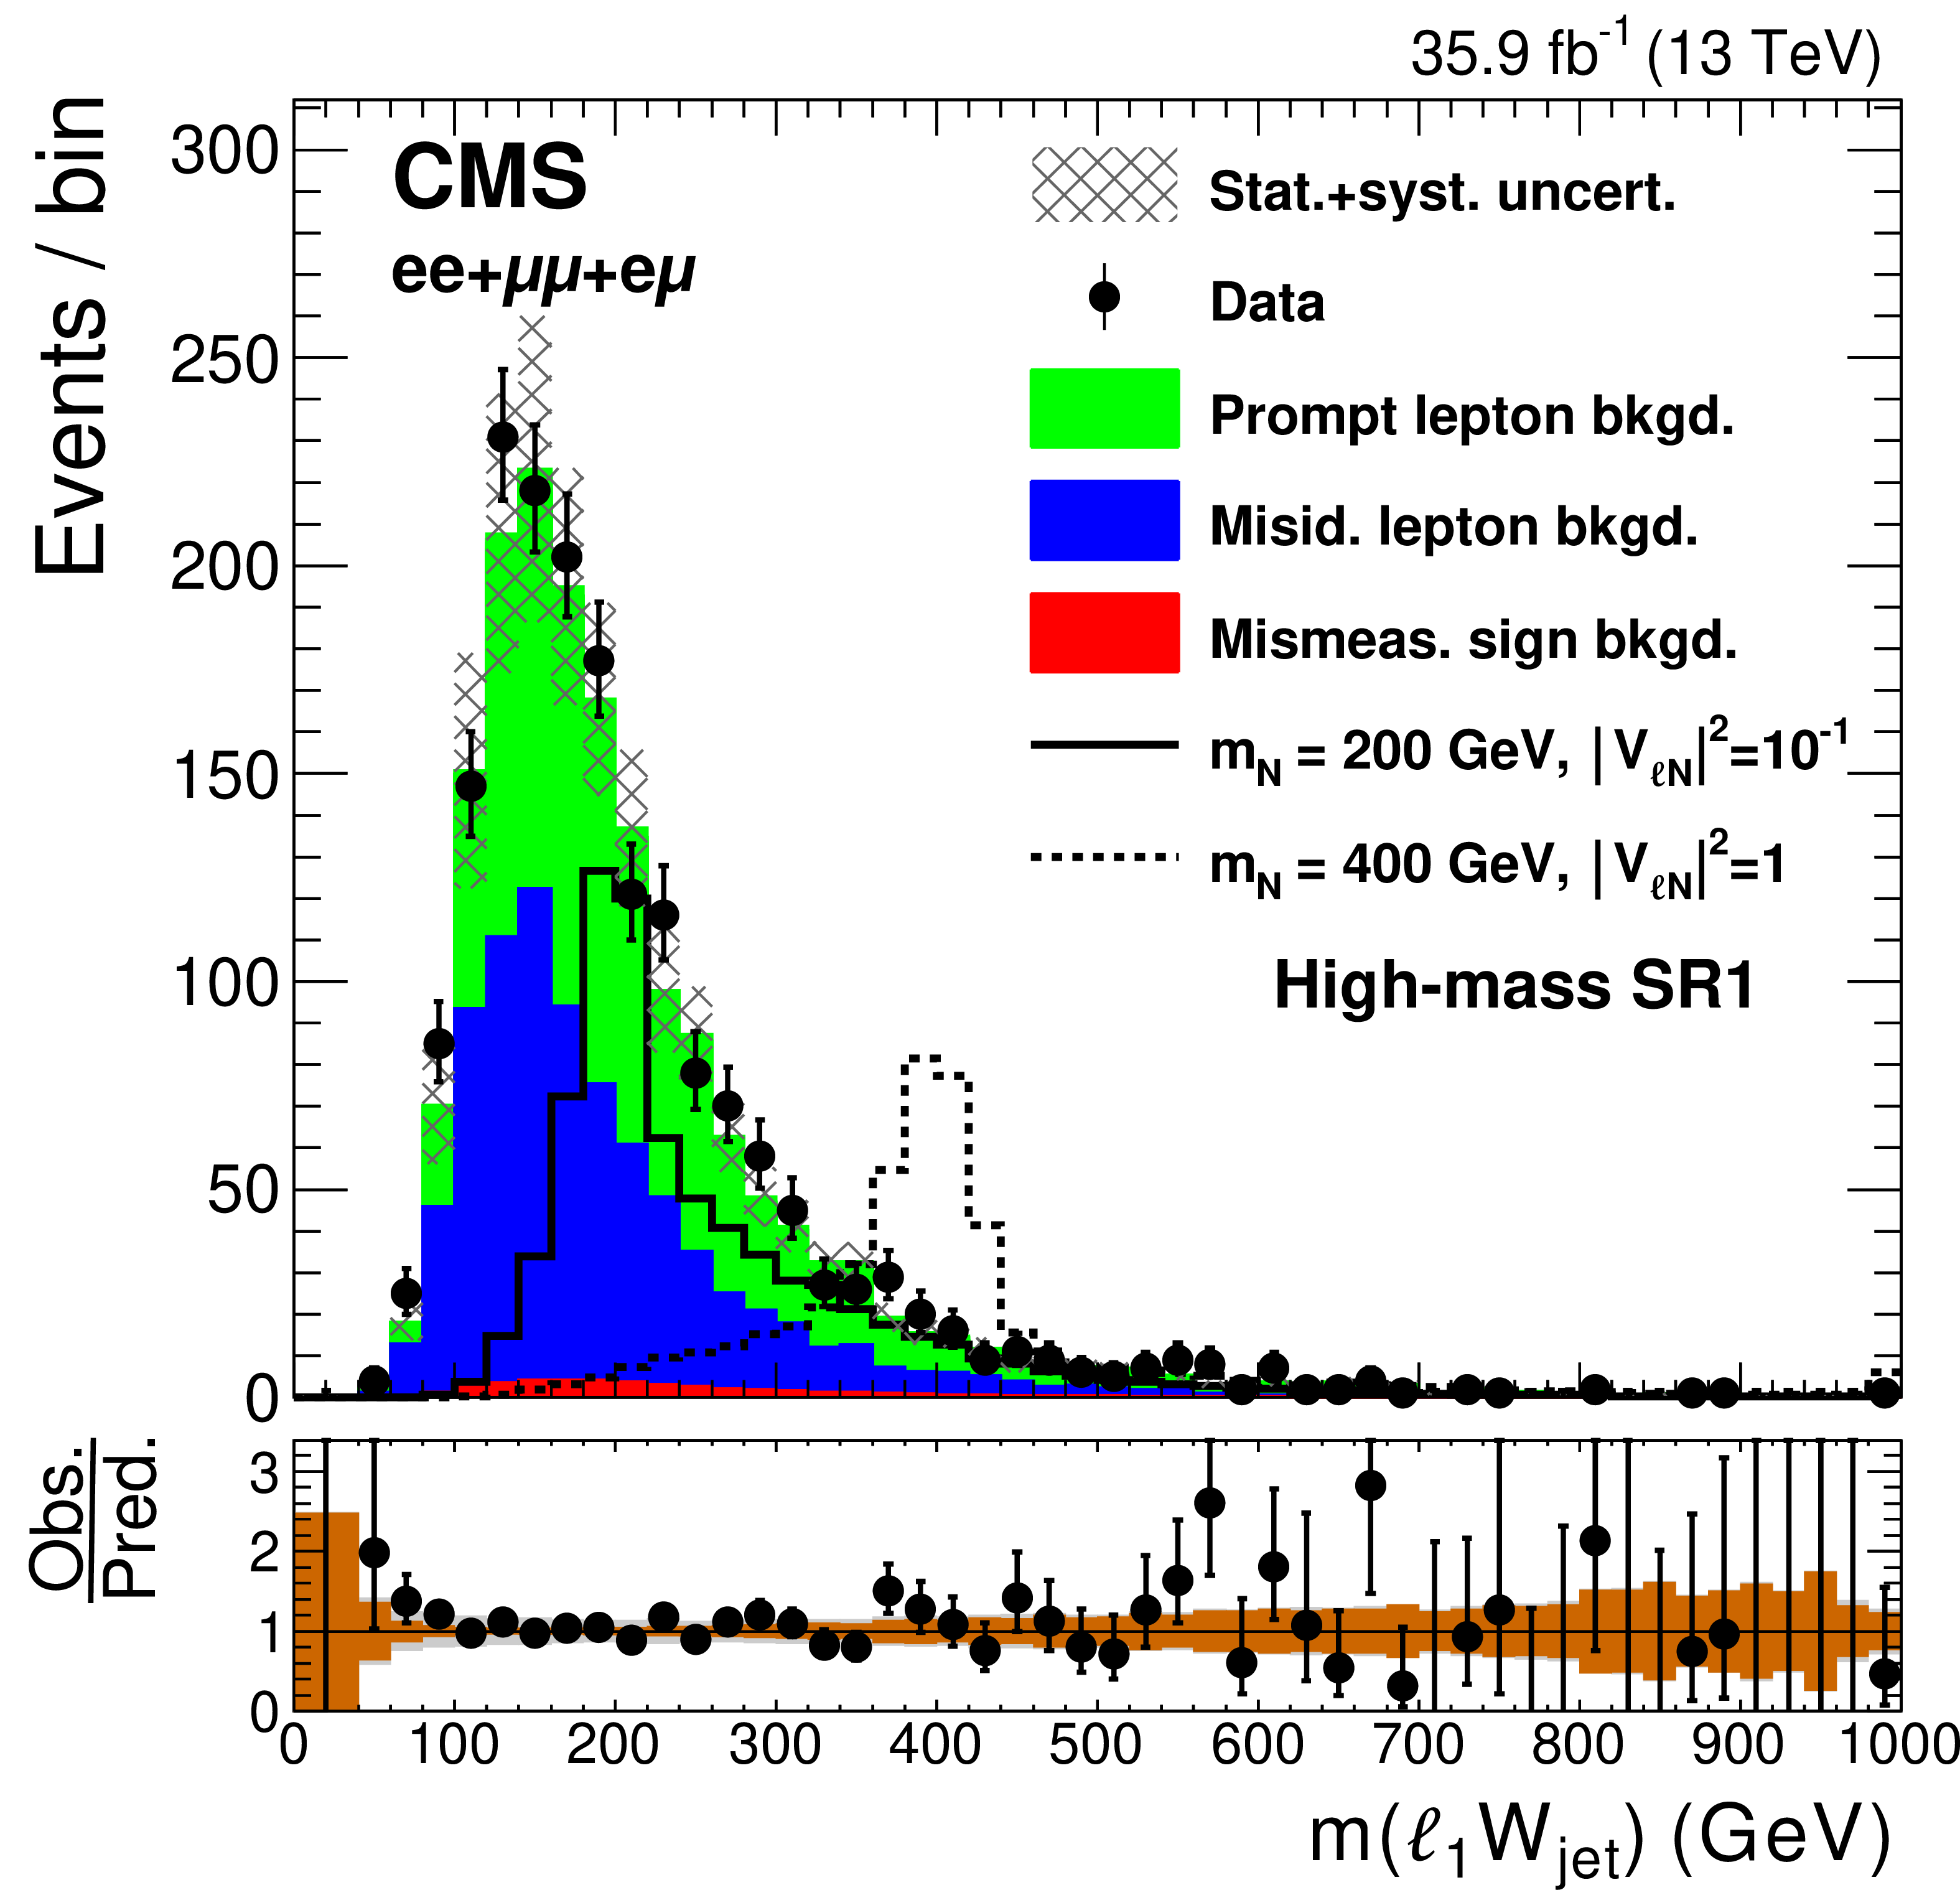
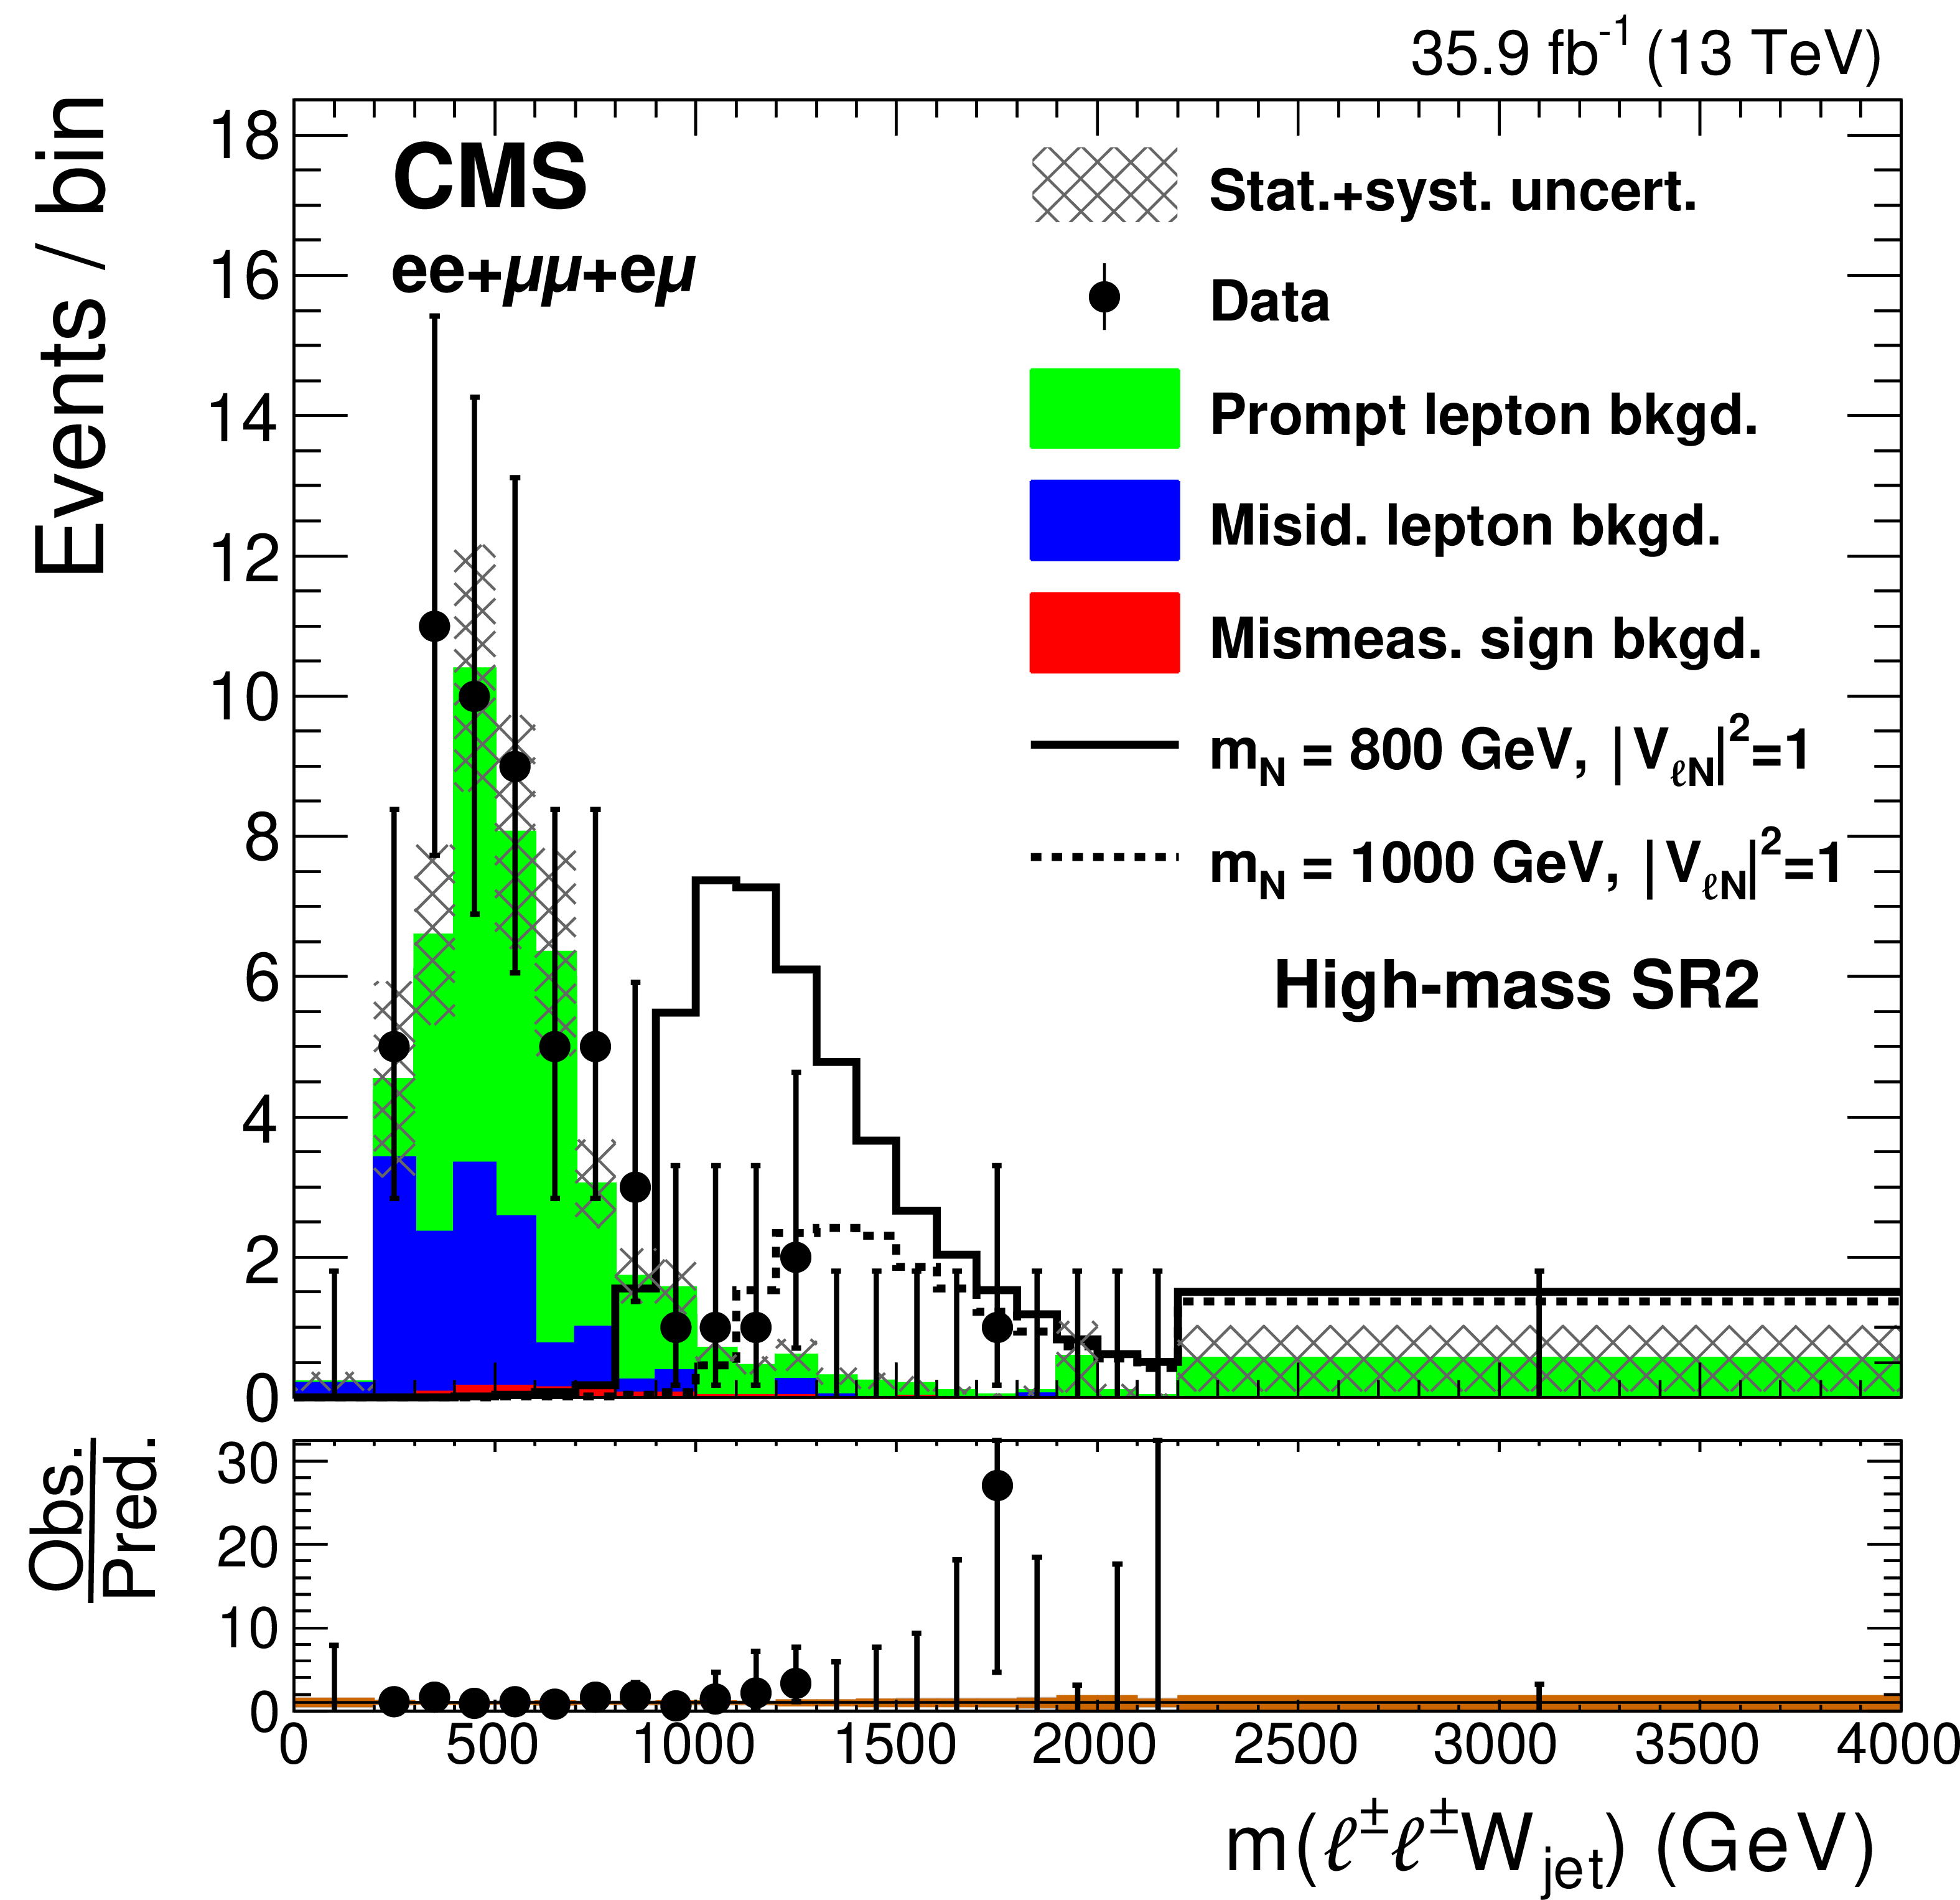
Observed distributions of the invariant mass of the leading lepton and jets (upper), invariant mass of the subleading lepton and jets (middle), and the invariant mass of the reconstructed $ {\mathrm {W}}$ propagator (lower), compared to the expected SM background contributions, for the high-mass SR1 (left) and SR2 (right), after combining the events in the $ {\mathrm {e}} {\mathrm {e}}$, $\mu \mu $, and $ {\mathrm {e}}\mu $ channels. The hatched bands represent the sums in quadrature of the statistical and systematic uncertainties. The solid and dashed lines show the kinematic distributions of two possible signal hypotheses. The lower panels show the ratio between the observed and expected events in each bin, including the uncertainty bands that represent the statistical (brown) and total uncertainties (gray). |
png pdf |
Figure 3-a:
Observed distribution of the invariant mass of the leading lepton and jets, compared to the expected SM background contributions, for the high-mass SR1, after combining the events in the $ {\mathrm {e}} {\mathrm {e}}$, $\mu \mu $, and $ {\mathrm {e}}\mu $ channels. The hatched bands represent the sums in quadrature of the statistical and systematic uncertainties. The solid and dashed lines show the kinematic distributions of two possible signal hypotheses. The lower panel shows the ratio between the observed and expected events in each bin, including the uncertainty bands that represent the statistical (brown) and total uncertainties (gray). |
png pdf |
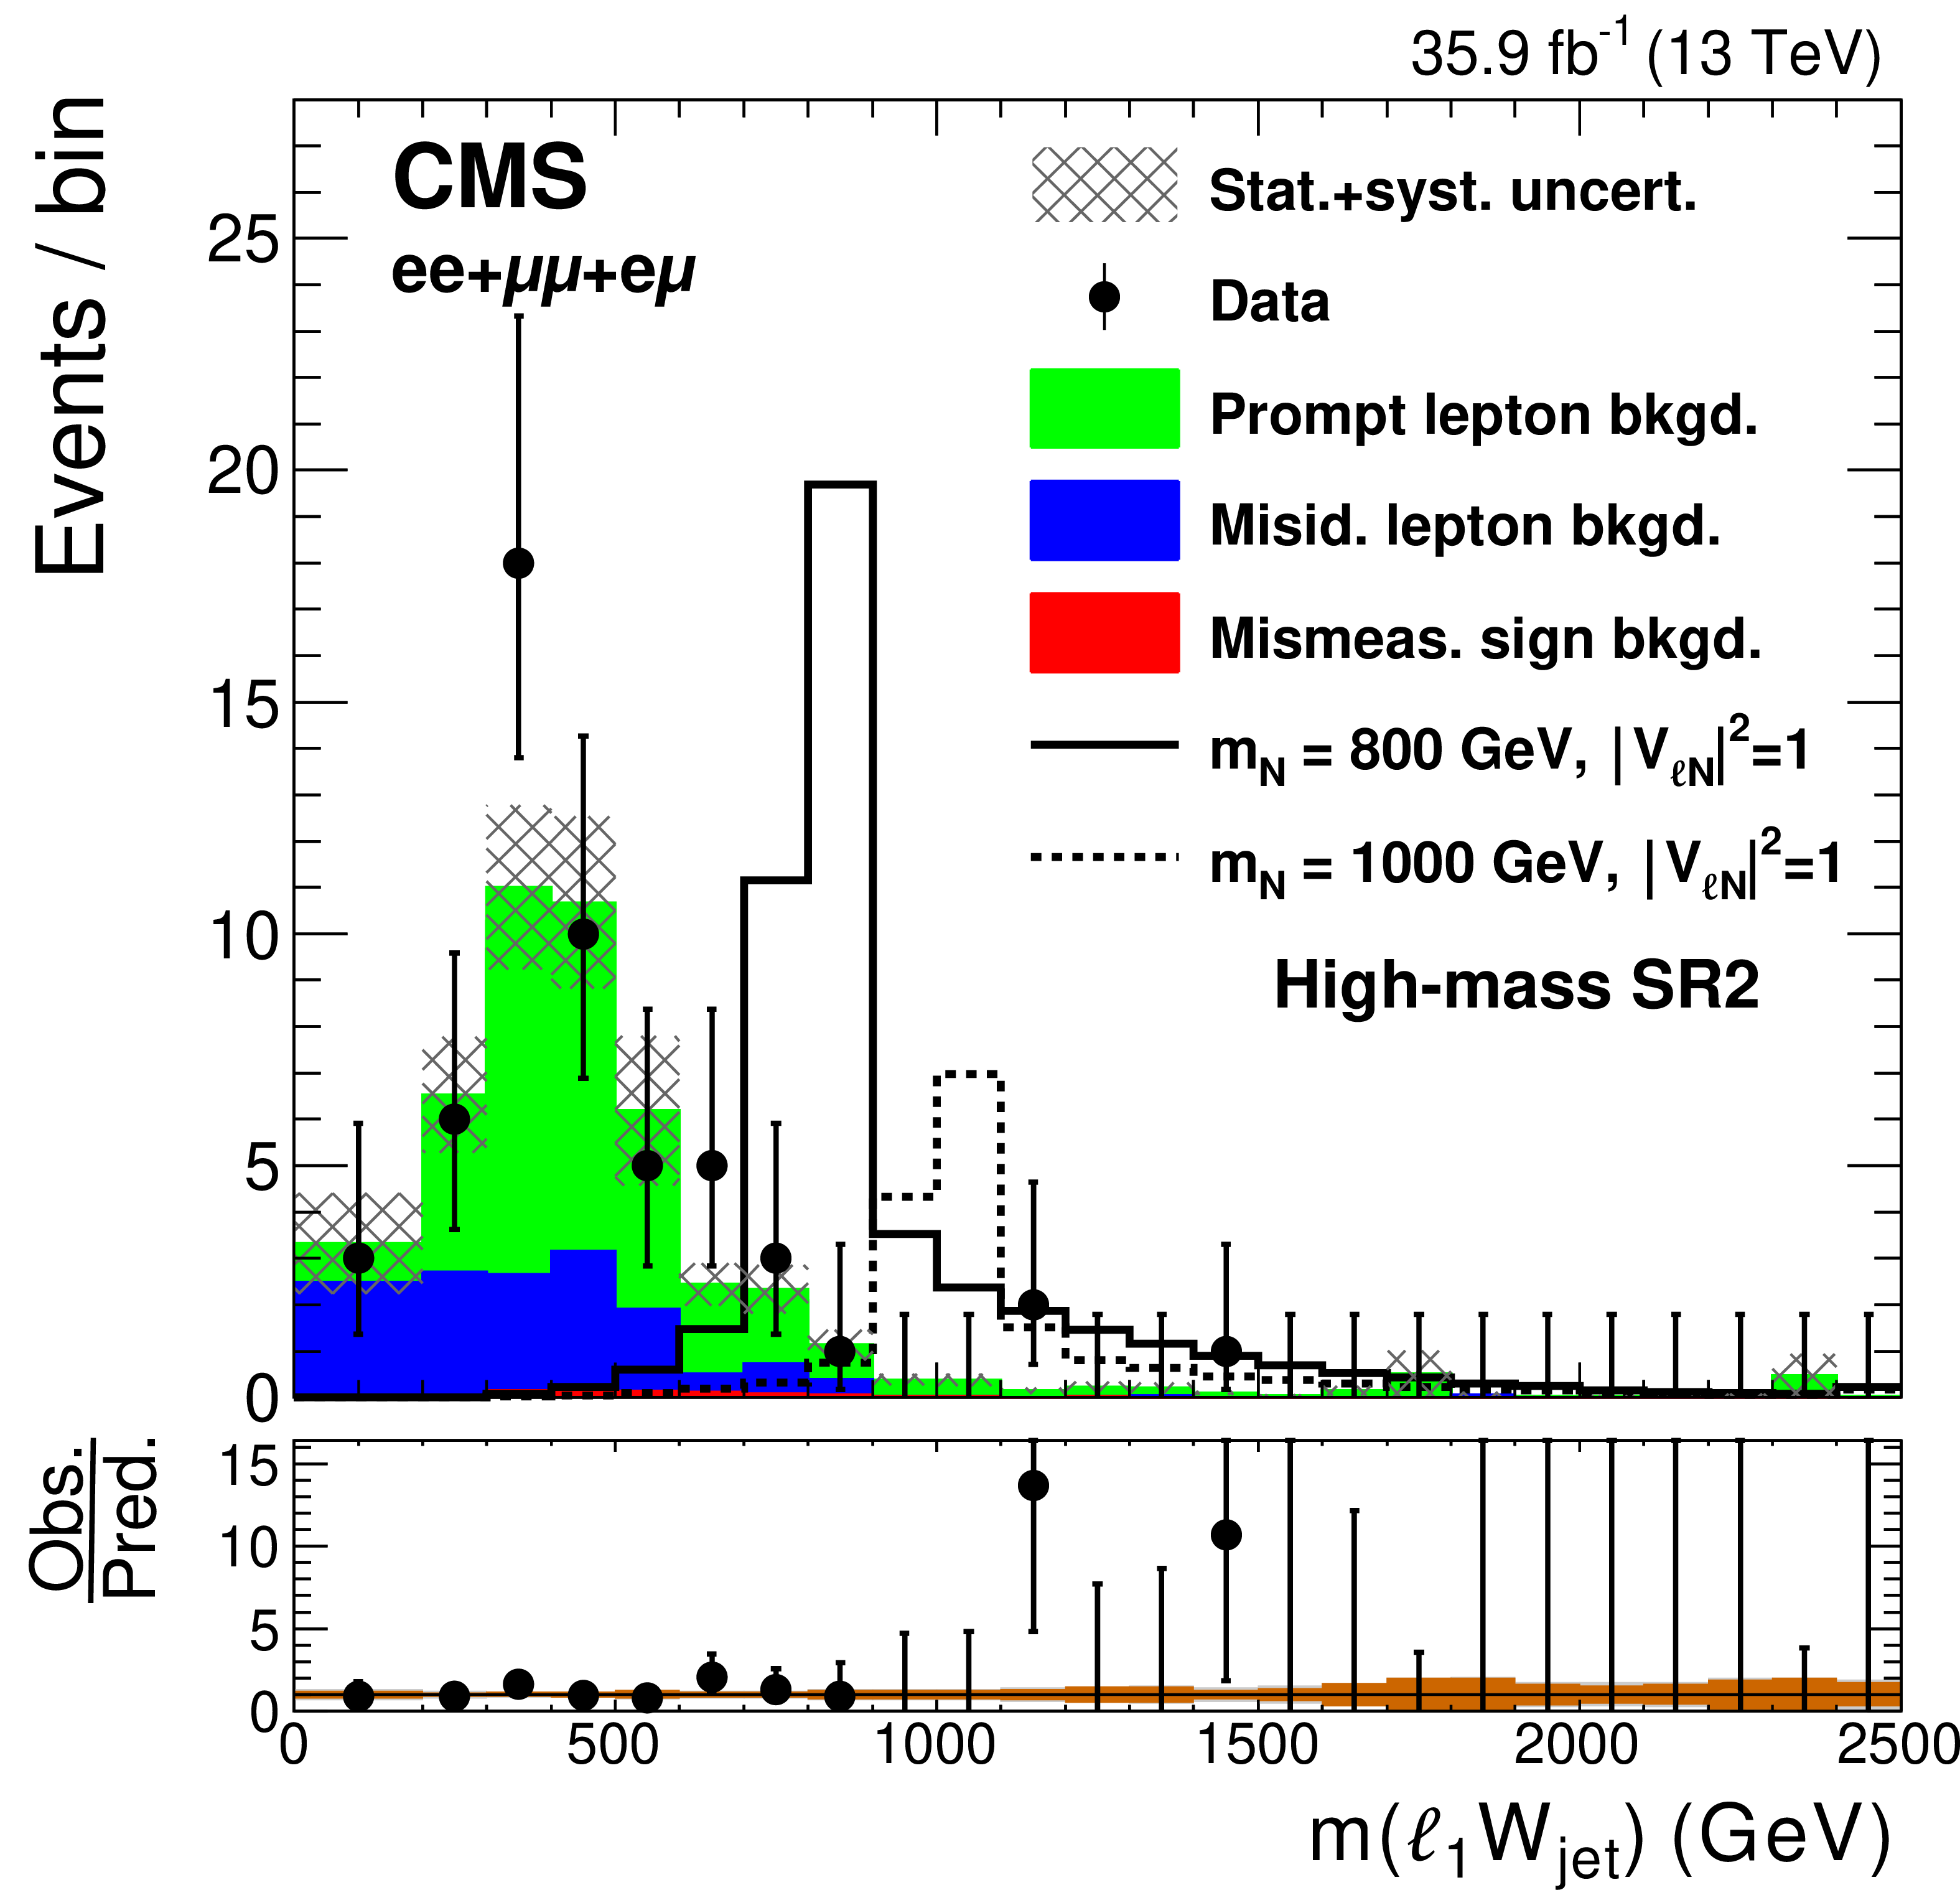
Figure 3-b:
Observed distribution of the invariant mass of the leading lepton and jets, compared to the expected SM background contributions, for the high-mass SR2, after combining the events in the $ {\mathrm {e}} {\mathrm {e}}$, $\mu \mu $, and $ {\mathrm {e}}\mu $ channels. The hatched bands represent the sums in quadrature of the statistical and systematic uncertainties. The solid and dashed lines show the kinematic distributions of two possible signal hypotheses. The lower panel shows the ratio between the observed and expected events in each bin, including the uncertainty bands that represent the statistical (brown) and total uncertainties (gray). |
png pdf |
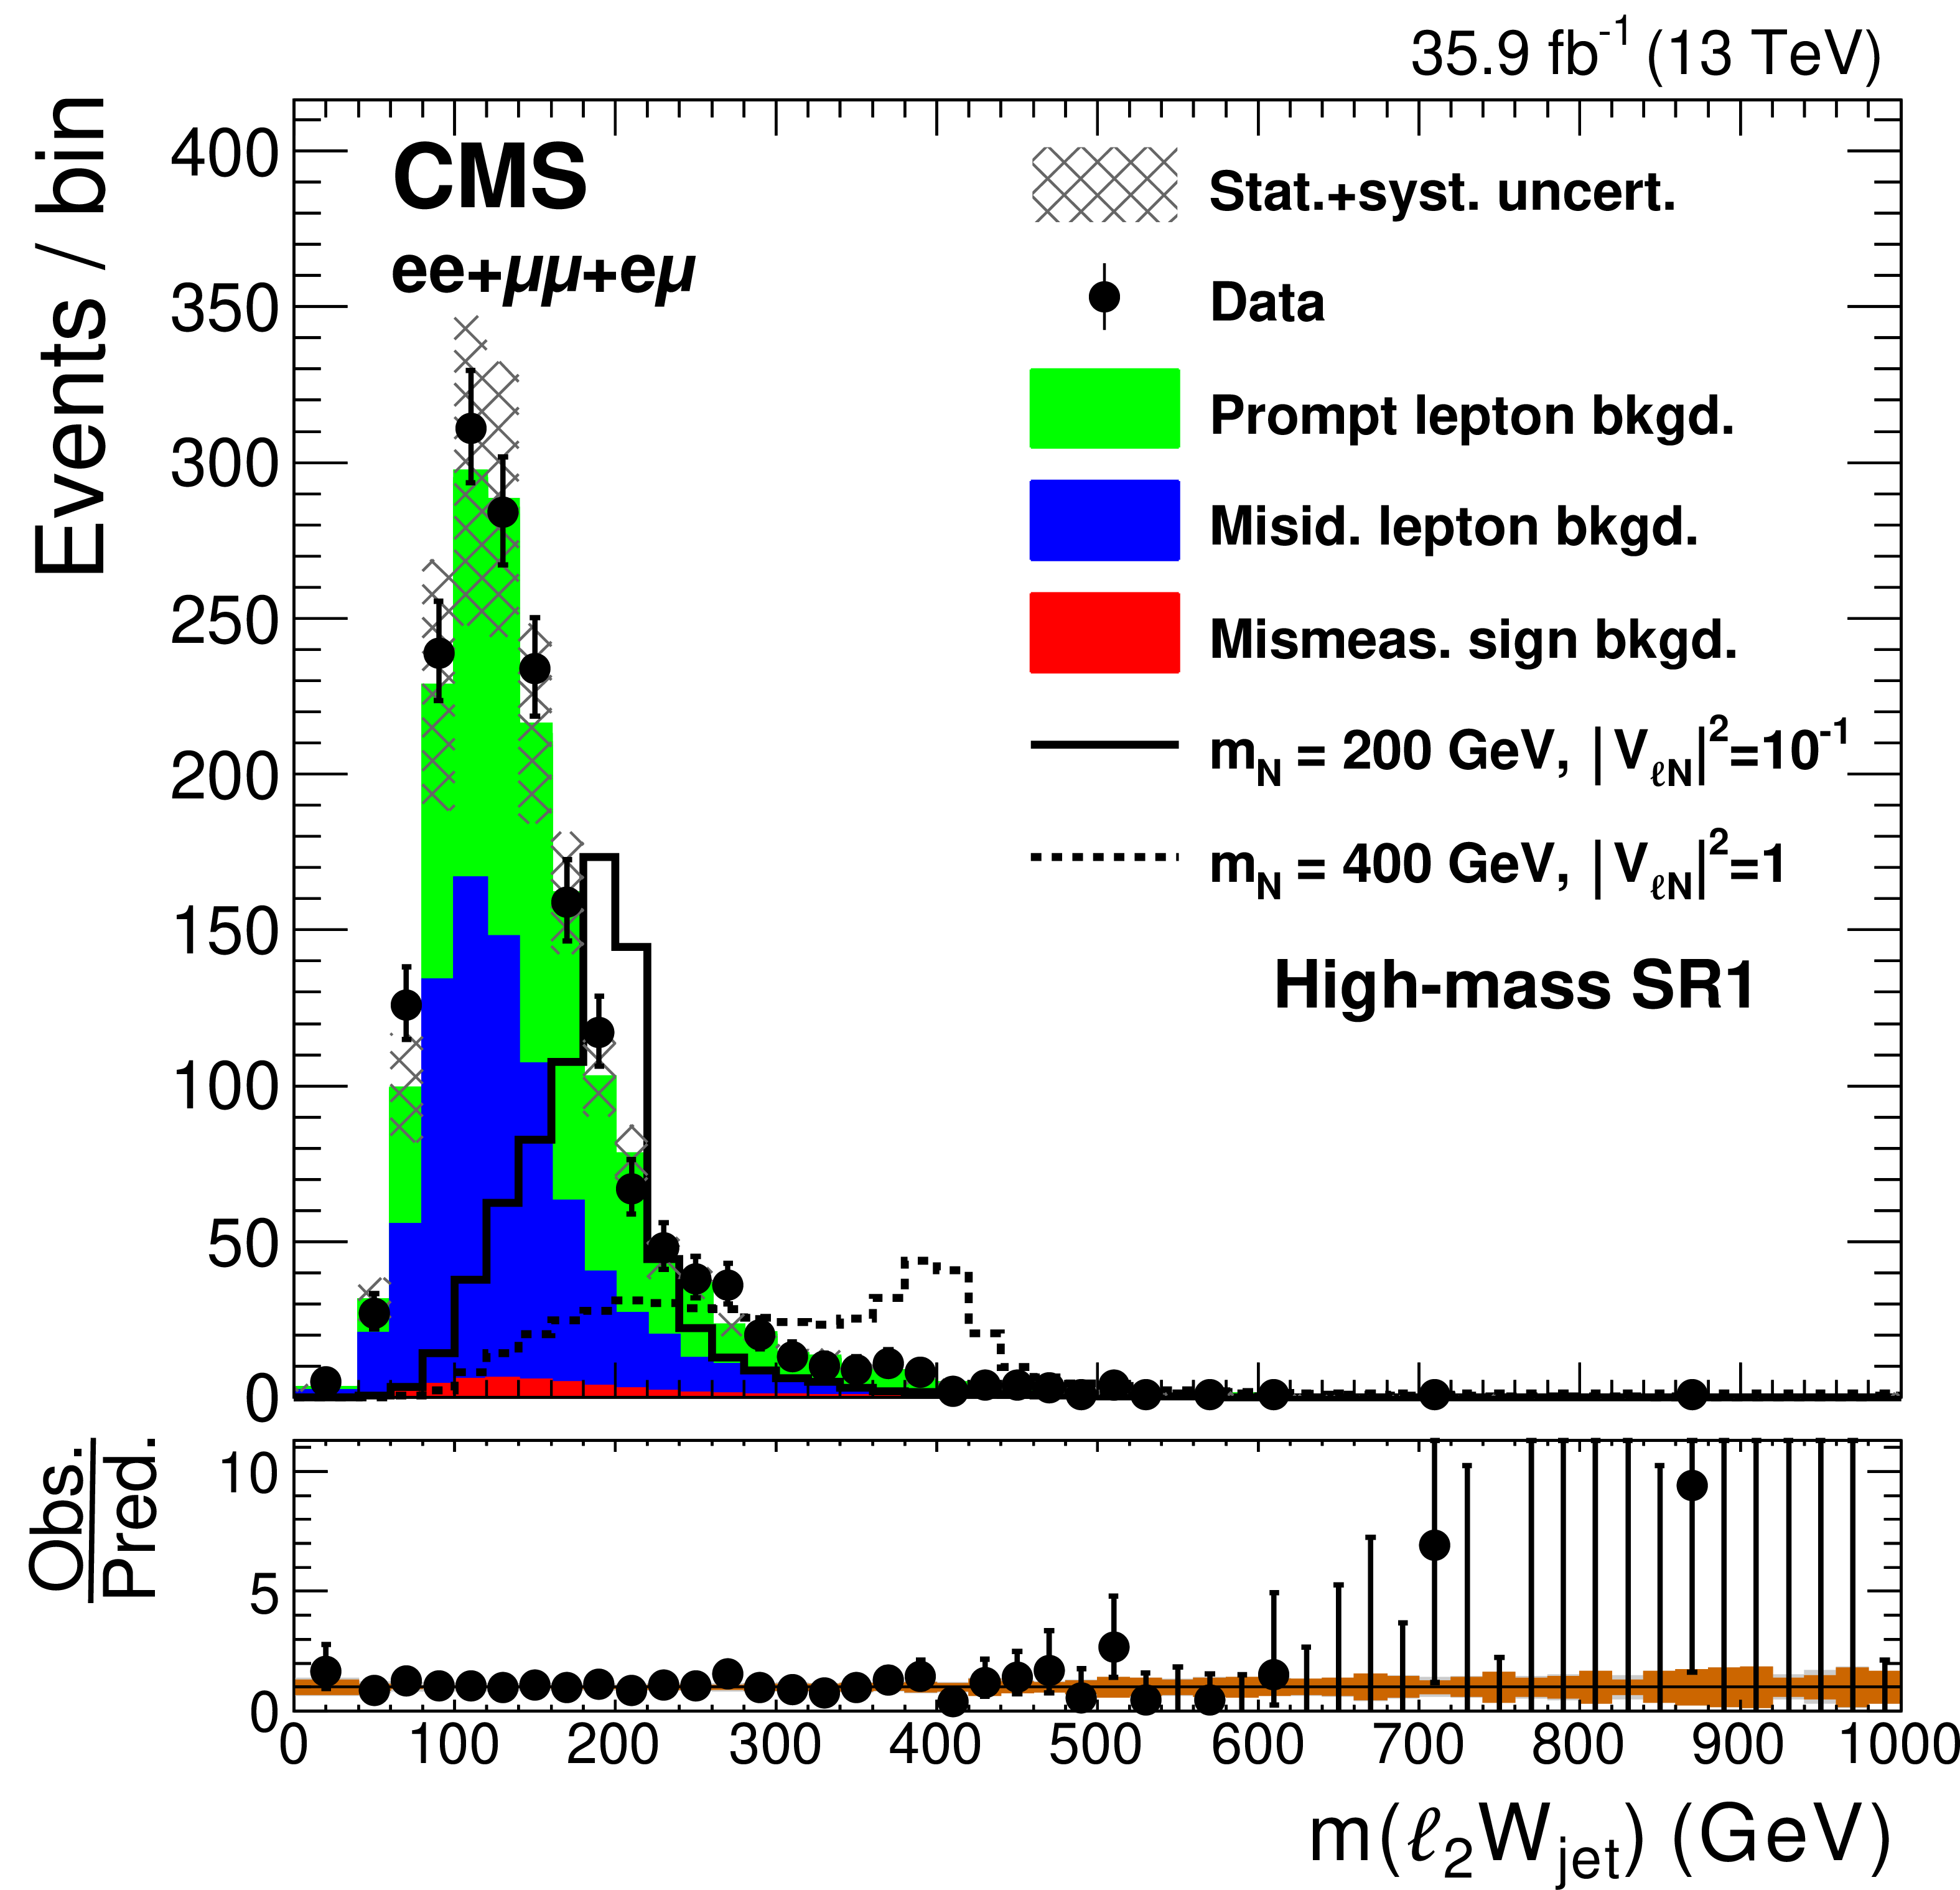
Figure 3-c:
Observed distribution of the invariant mass of the subleading lepton and jets, compared to the expected SM background contributions, for the high-mass SR1, after combining the events in the $ {\mathrm {e}} {\mathrm {e}}$, $\mu \mu $, and $ {\mathrm {e}}\mu $ channels. The hatched bands represent the sums in quadrature of the statistical and systematic uncertainties. The solid and dashed lines show the kinematic distributions of two possible signal hypotheses. The lower panel shows the ratio between the observed and expected events in each bin, including the uncertainty bands that represent the statistical (brown) and total uncertainties (gray). |

png pdf |
Figure 3-d:
Observed distribution of the invariant mass of the subleading lepton and jets, compared to the expected SM background contributions, for the high-mass SR2, after combining the events in the $ {\mathrm {e}} {\mathrm {e}}$, $\mu \mu $, and $ {\mathrm {e}}\mu $ channels. The hatched bands represent the sums in quadrature of the statistical and systematic uncertainties. The solid and dashed lines show the kinematic distributions of two possible signal hypotheses. The lower panel shows the ratio between the observed and expected events in each bin, including the uncertainty bands that represent the statistical (brown) and total uncertainties (gray). |
png pdf |
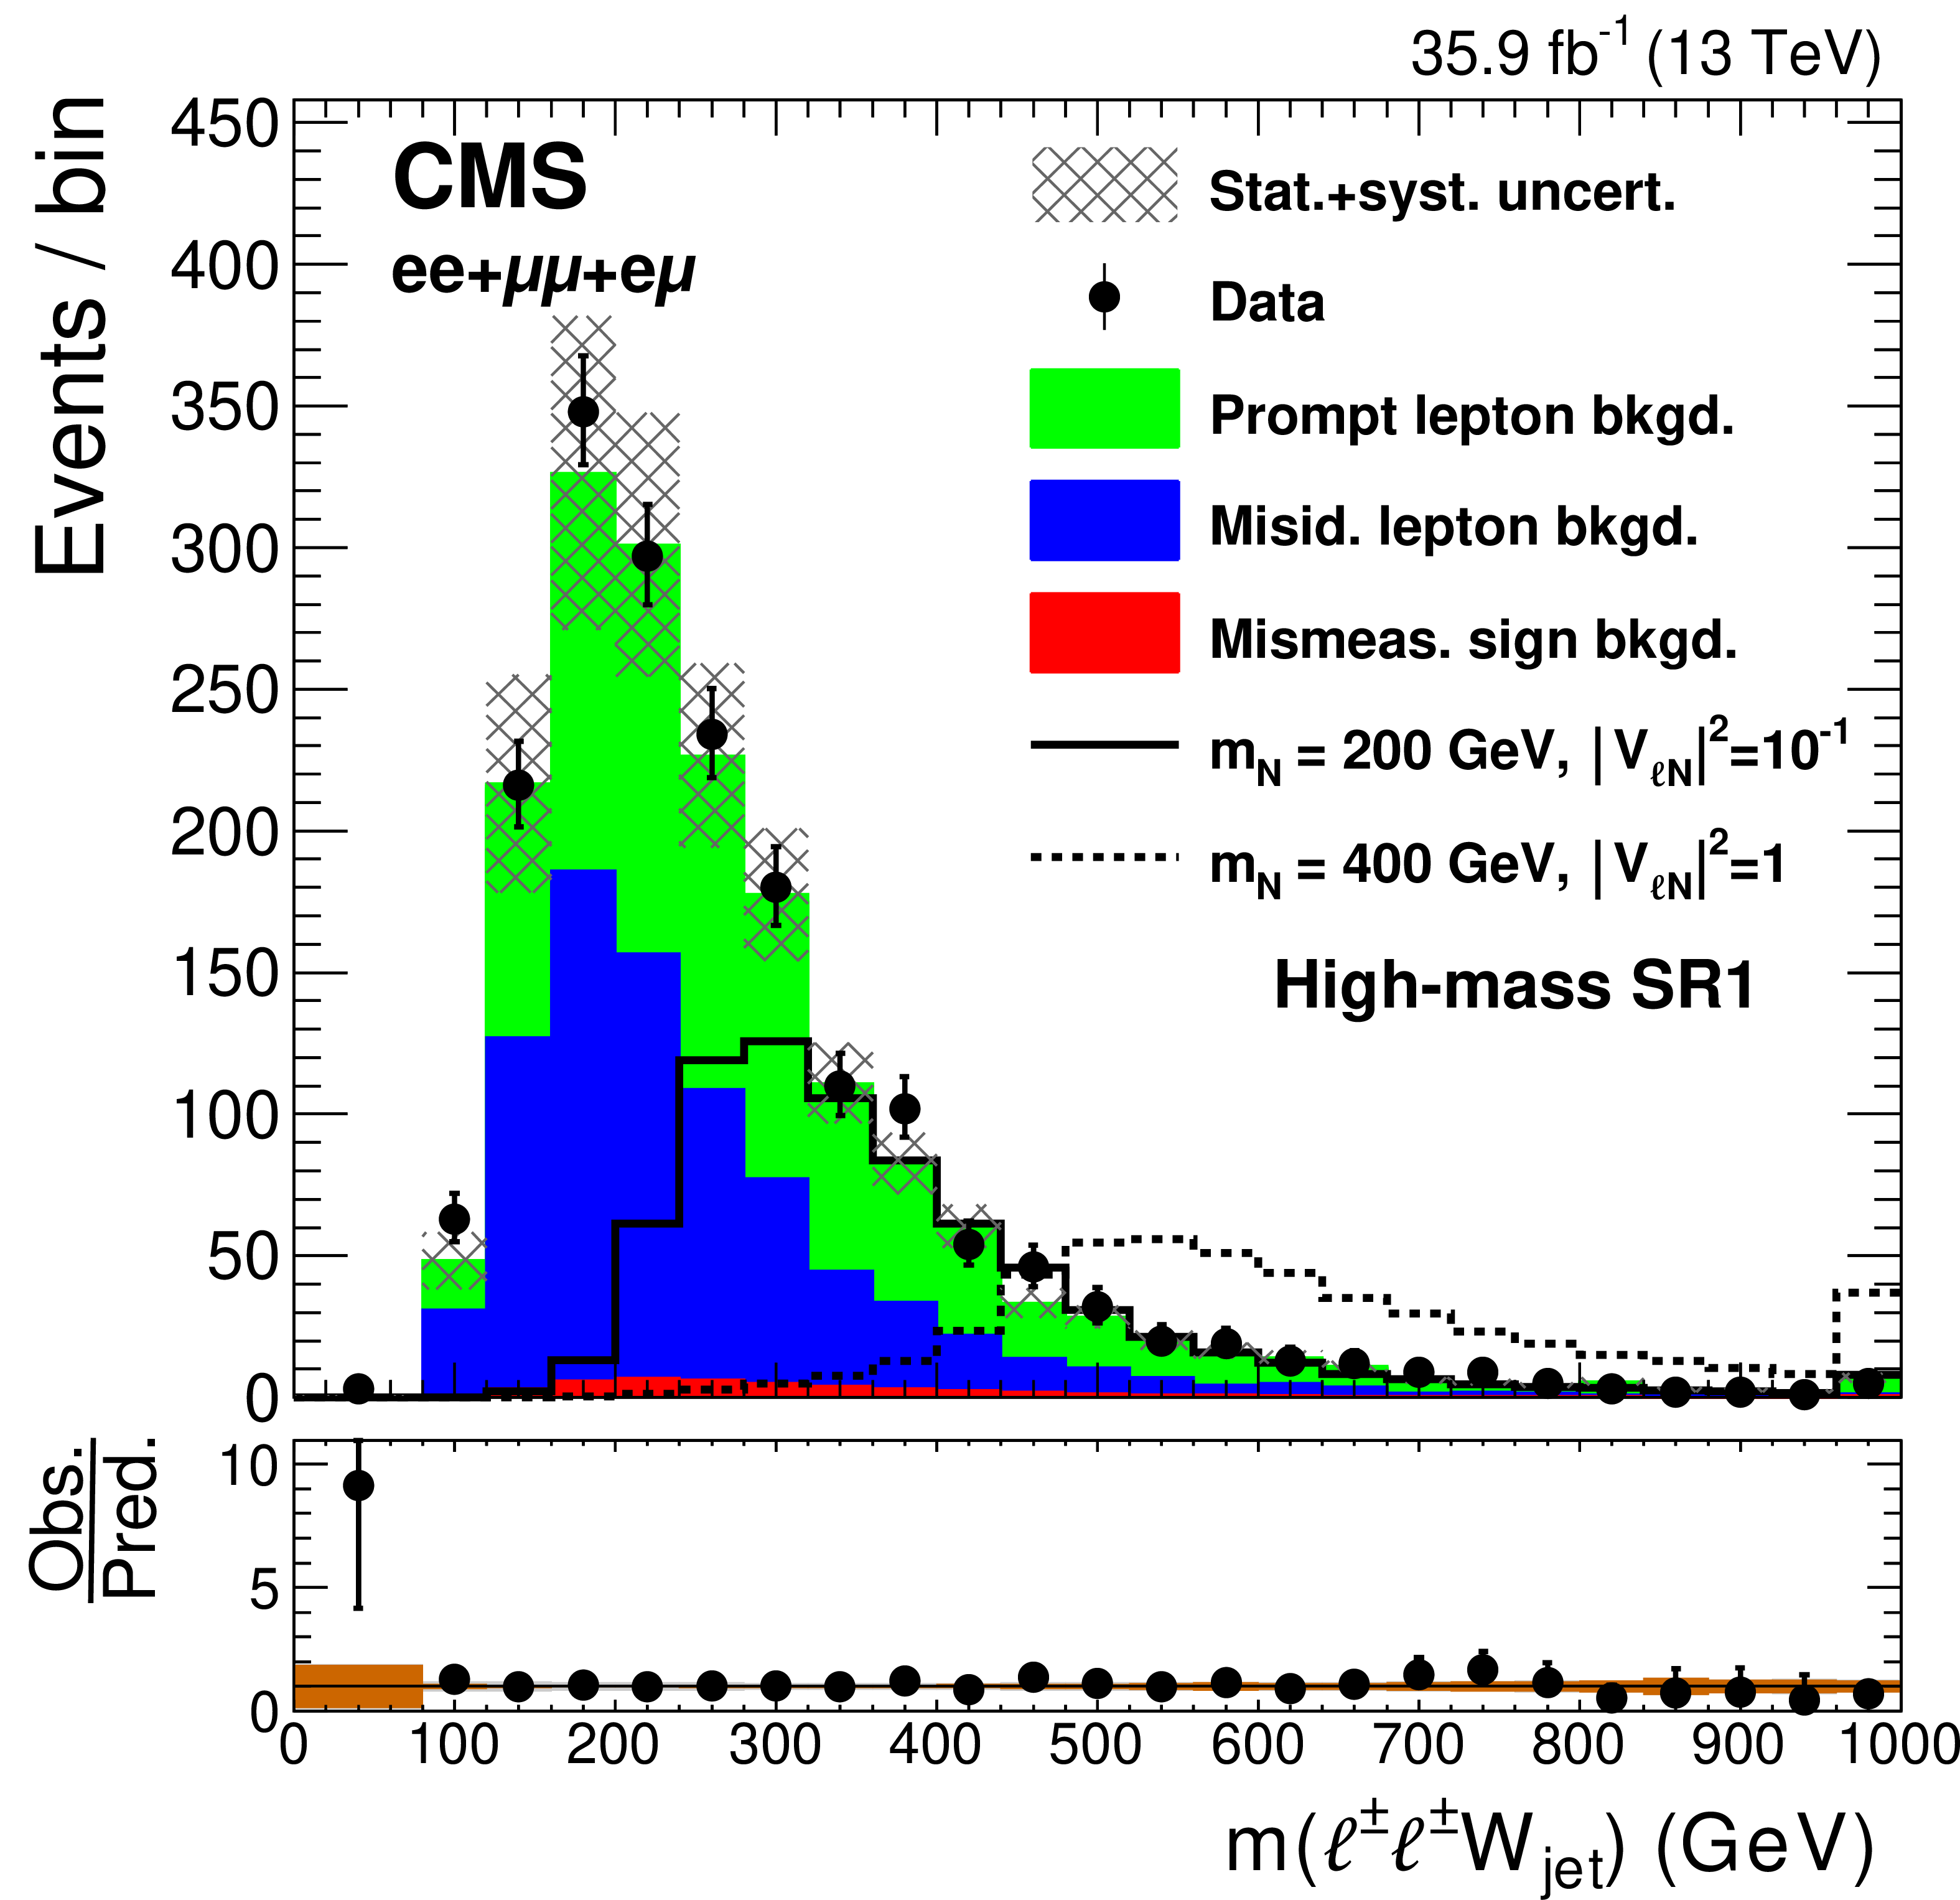
Figure 3-e:
Observed distribution of the invariant mass of the reconstructed $ {\mathrm {W}}$ propagator, compared to the expected SM background contributions, for the high-mass SR1, after combining the events in the $ {\mathrm {e}} {\mathrm {e}}$, $\mu \mu $, and $ {\mathrm {e}}\mu $ channels. The hatched bands represent the sums in quadrature of the statistical and systematic uncertainties. The solid and dashed lines show the kinematic distributions of two possible signal hypotheses. The lower panel shows the ratio between the observed and expected events in each bin, including the uncertainty bands that represent the statistical (brown) and total uncertainties (gray). |
png pdf |
Figure 3-f:
Observed distribution of the invariant mass of the reconstructed $ {\mathrm {W}}$ propagator, compared to the expected SM background contributions, for the high-mass SR2, after combining the events in the $ {\mathrm {e}} {\mathrm {e}}$, $\mu \mu $, and $ {\mathrm {e}}\mu $ channels. The hatched bands represent the sums in quadrature of the statistical and systematic uncertainties. The solid and dashed lines show the kinematic distributions of two possible signal hypotheses. The lower panel shows the ratio between the observed and expected events in each bin, including the uncertainty bands that represent the statistical (brown) and total uncertainties (gray). |
png pdf |
Figure 4:
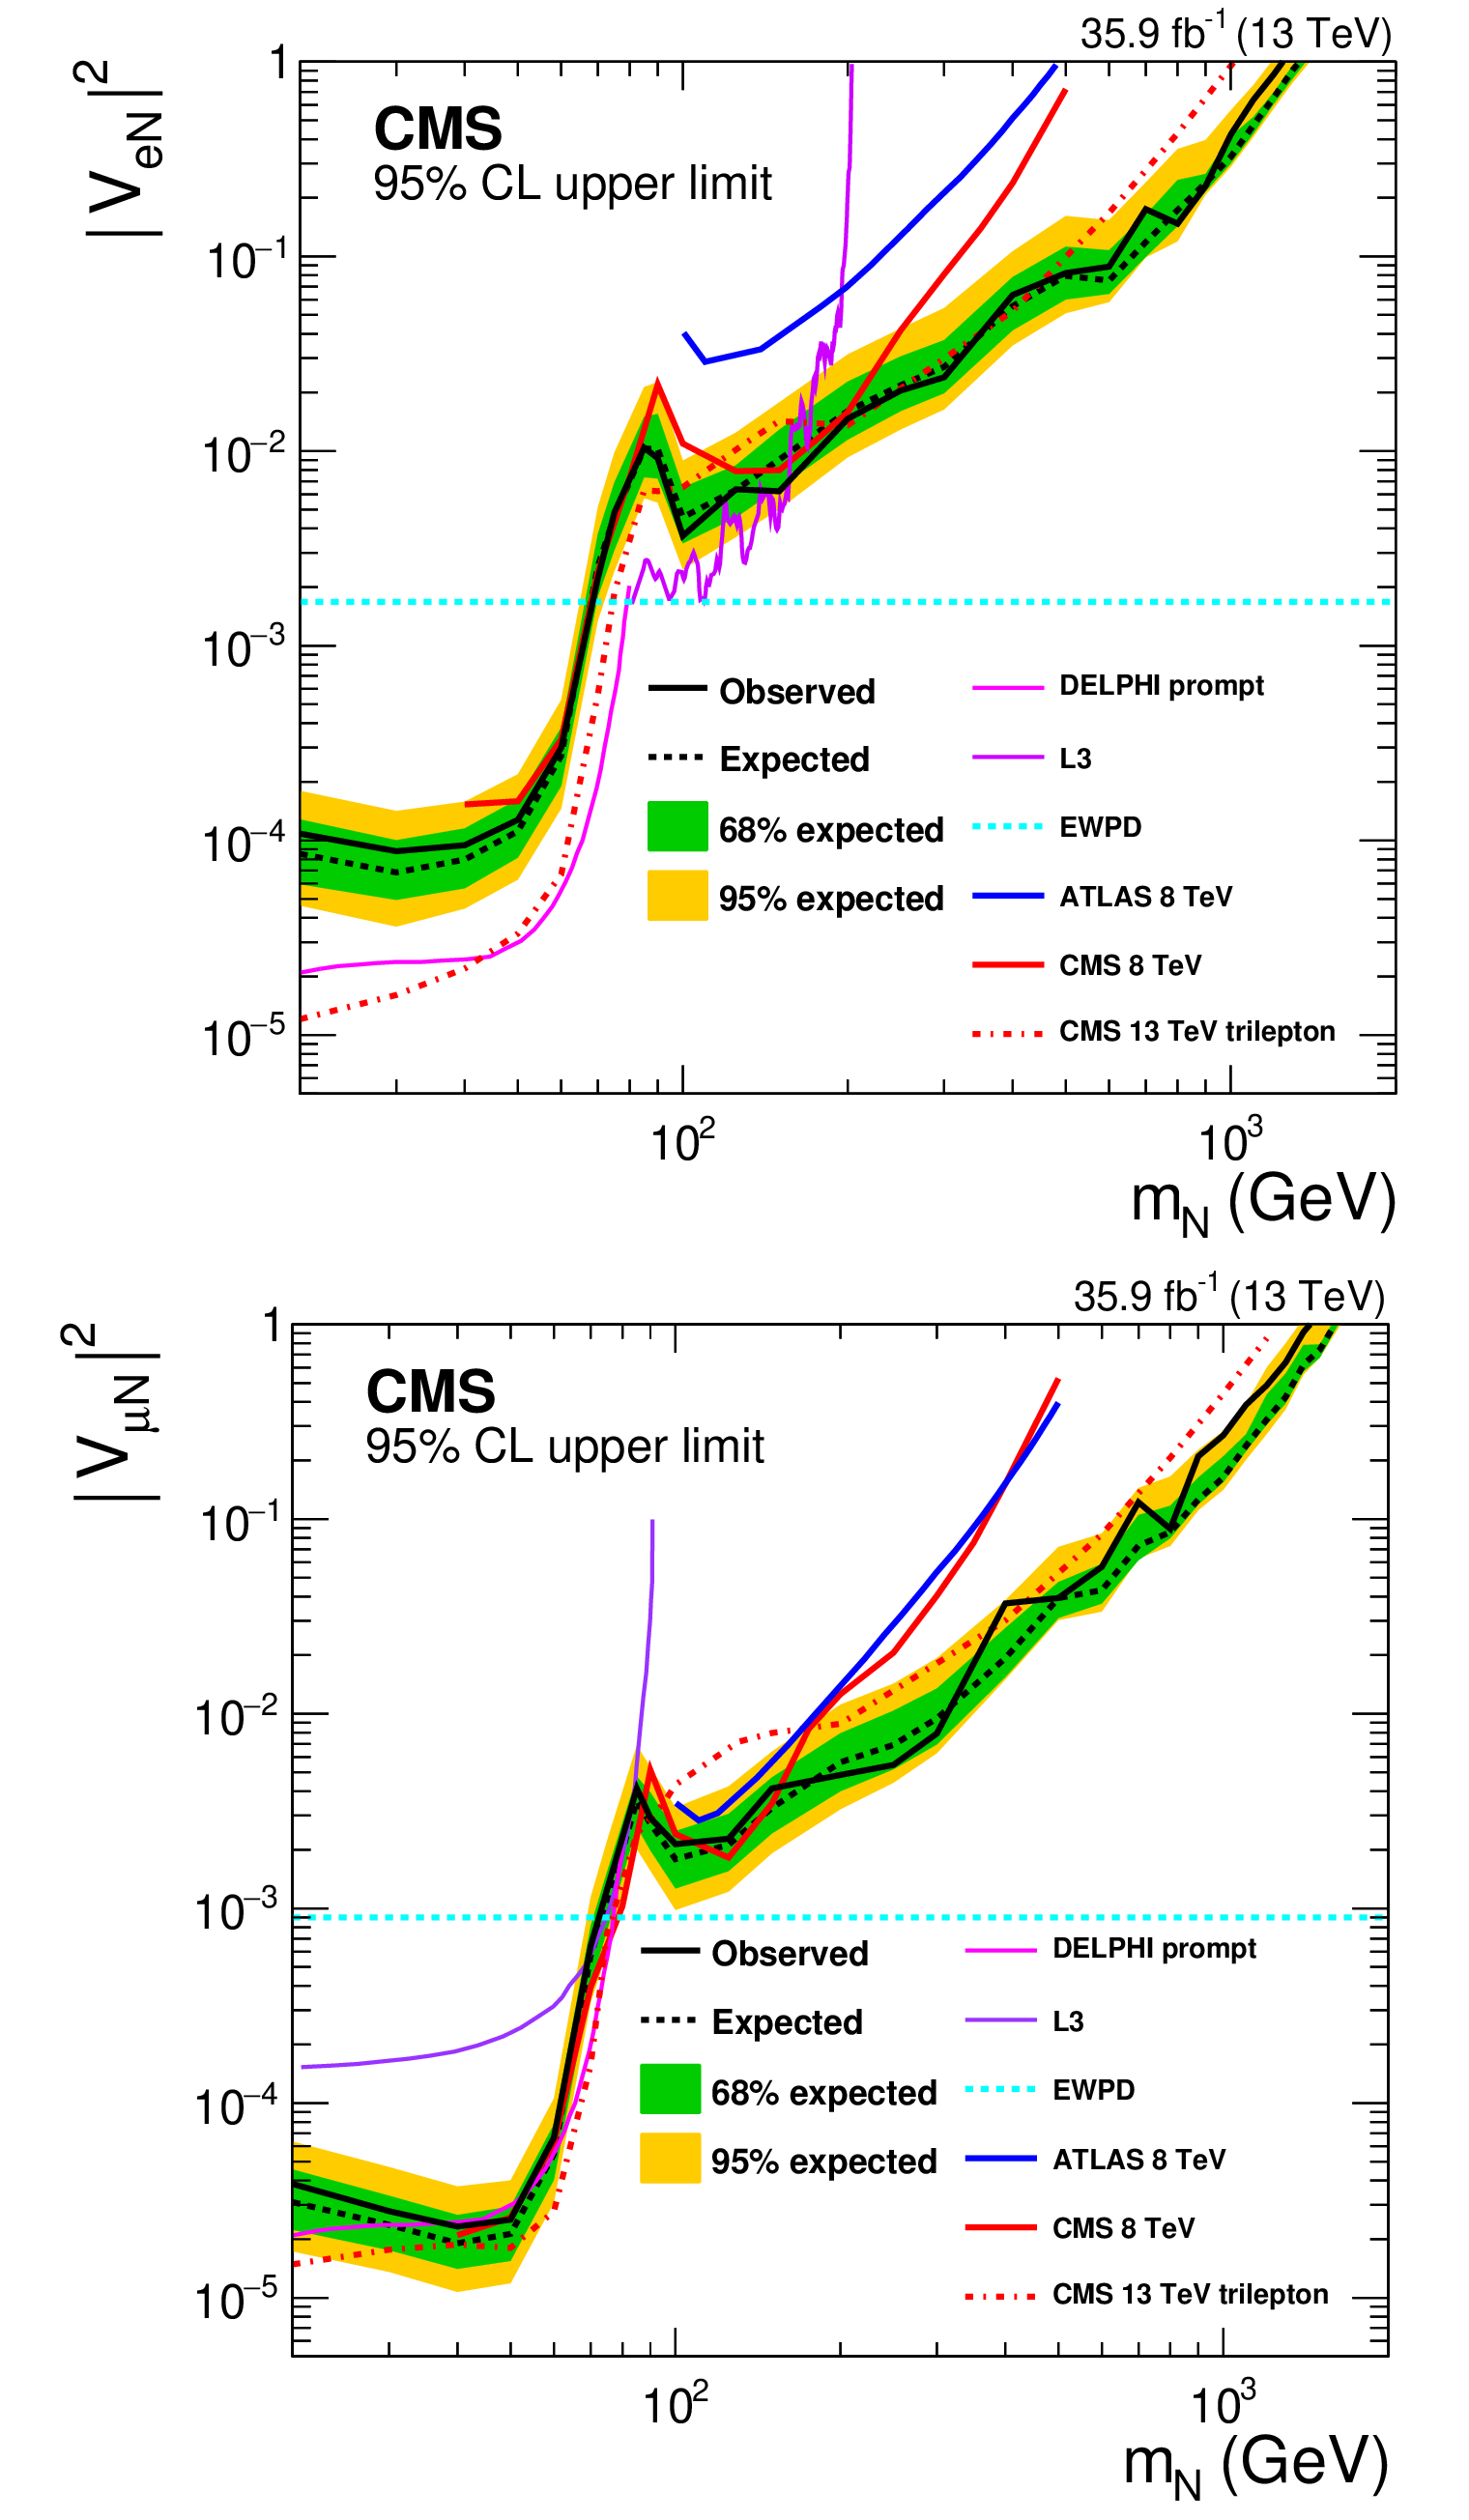
Exclusion region at 95% CL in the $ {{| {V_{{\mathrm {e}} {\mathrm {N}}}} |}^2} $ (upper) and ${{| {V_{\mu {\mathrm {N}}}} |}^2}$ (lower) vs. ${m_\mathrm {N}}$ plane. The dashed black curve is the expected upper limit, with one and two standard-deviation bands shown in green and yellow, respectively. The solid black curve is the observed upper limit. The dashed cyan line shows constraints from EWPD [83]. Also shown are the upper limits from other direct searches: DELPHI [30], L3 [31,32], ATLAS [36], and the upper limits from the CMS $\sqrt {s} = $ 8 TeV 2012 data [35] and the trilepton analysis [37] based on the same 2016 data set as used in this analysis. |

png pdf |
Figure 4-a:
Exclusion region at 95% CL in the $ {{| {V_{{\mathrm {e}} {\mathrm {N}}}} |}^2} $ vs. ${m_\mathrm {N}}$ plane. The dashed black curve is the expected upper limit, with one and two standard-deviation bands shown in green and yellow, respectively. The solid black curve is the observed upper limit. The dashed cyan line shows constraints from EWPD [83]. Also shown are the upper limits from other direct searches: DELPHI [30], L3 [31,32], ATLAS [36], and the upper limits from the CMS $\sqrt {s} = $ 8 TeV 2012 data [35] and the trilepton analysis [37] based on the same 2016 data set as used in this analysis. |
png pdf |
Figure 4-b:
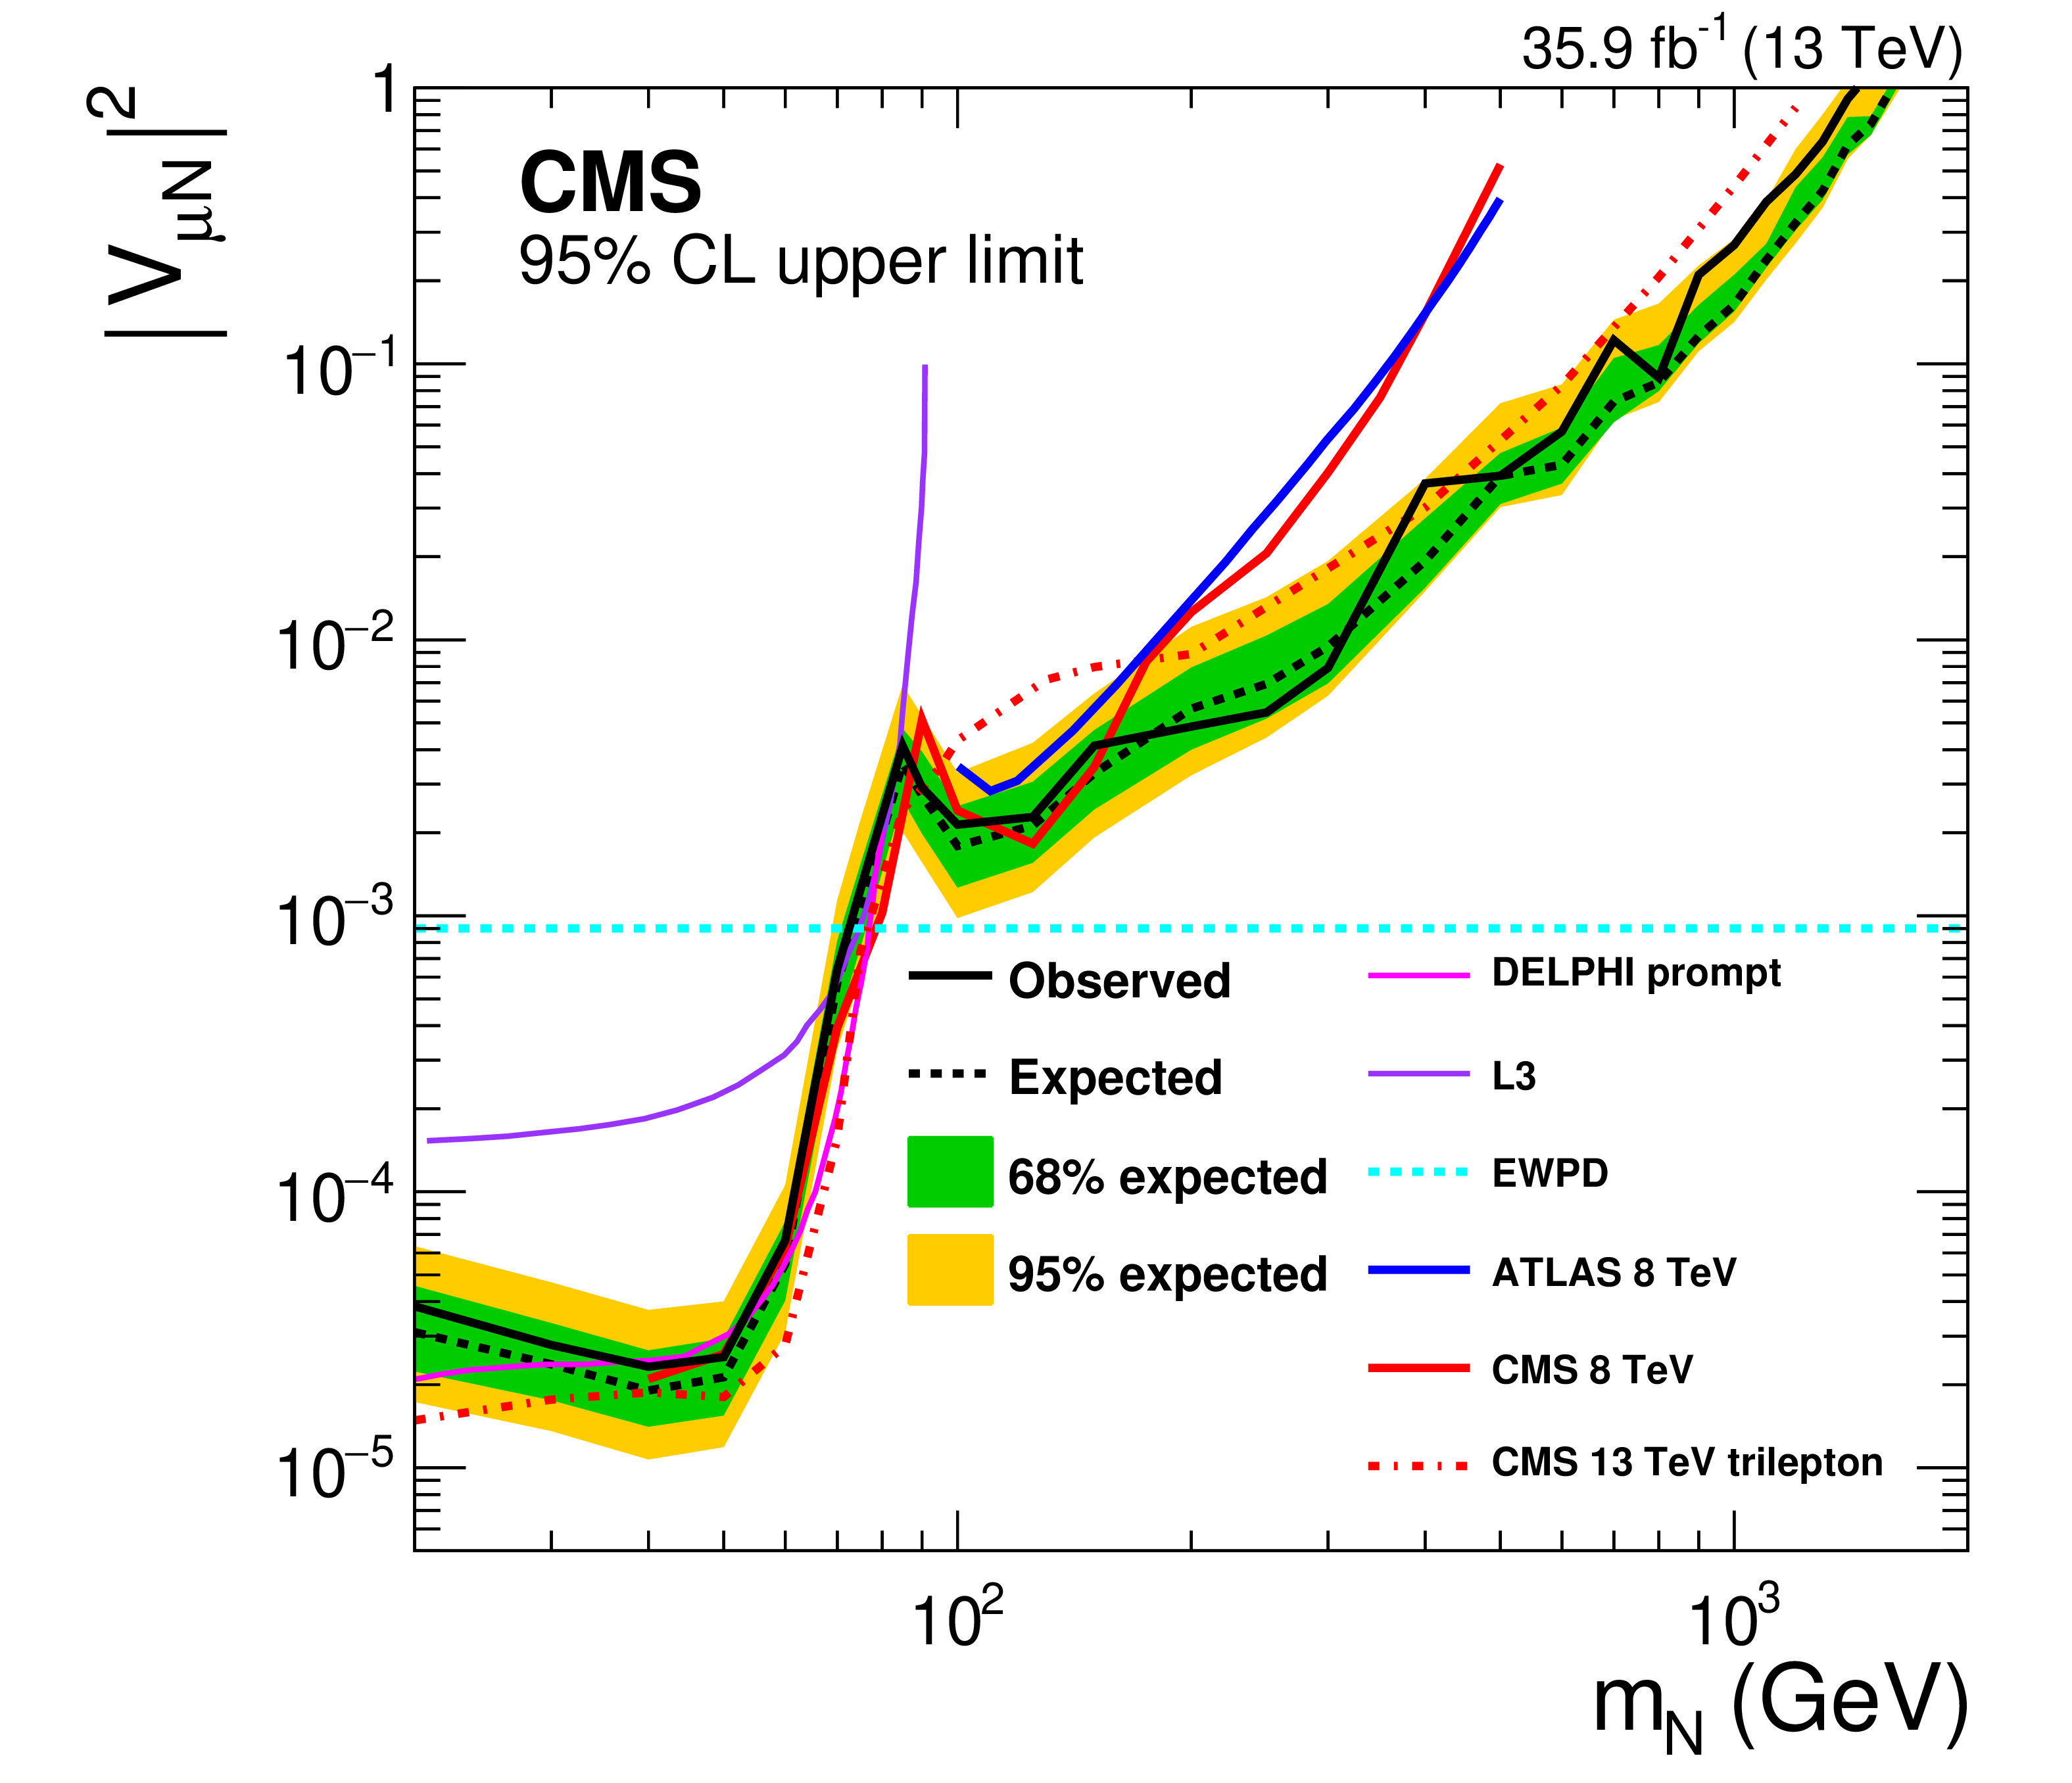
Exclusion region at 95% CL in the ${{| {V_{\mu {\mathrm {N}}}} |}^2}$ vs. ${m_\mathrm {N}}$ plane. The dashed black curve is the expected upper limit, with one and two standard-deviation bands shown in green and yellow, respectively. The solid black curve is the observed upper limit. The dashed cyan line shows constraints from EWPD [83]. Also shown are the upper limits from other direct searches: DELPHI [30], L3 [31,32], ATLAS [36], and the upper limits from the CMS $\sqrt {s} = $ 8 TeV 2012 data [35] and the trilepton analysis [37] based on the same 2016 data set as used in this analysis. |
png pdf |
Figure 5:
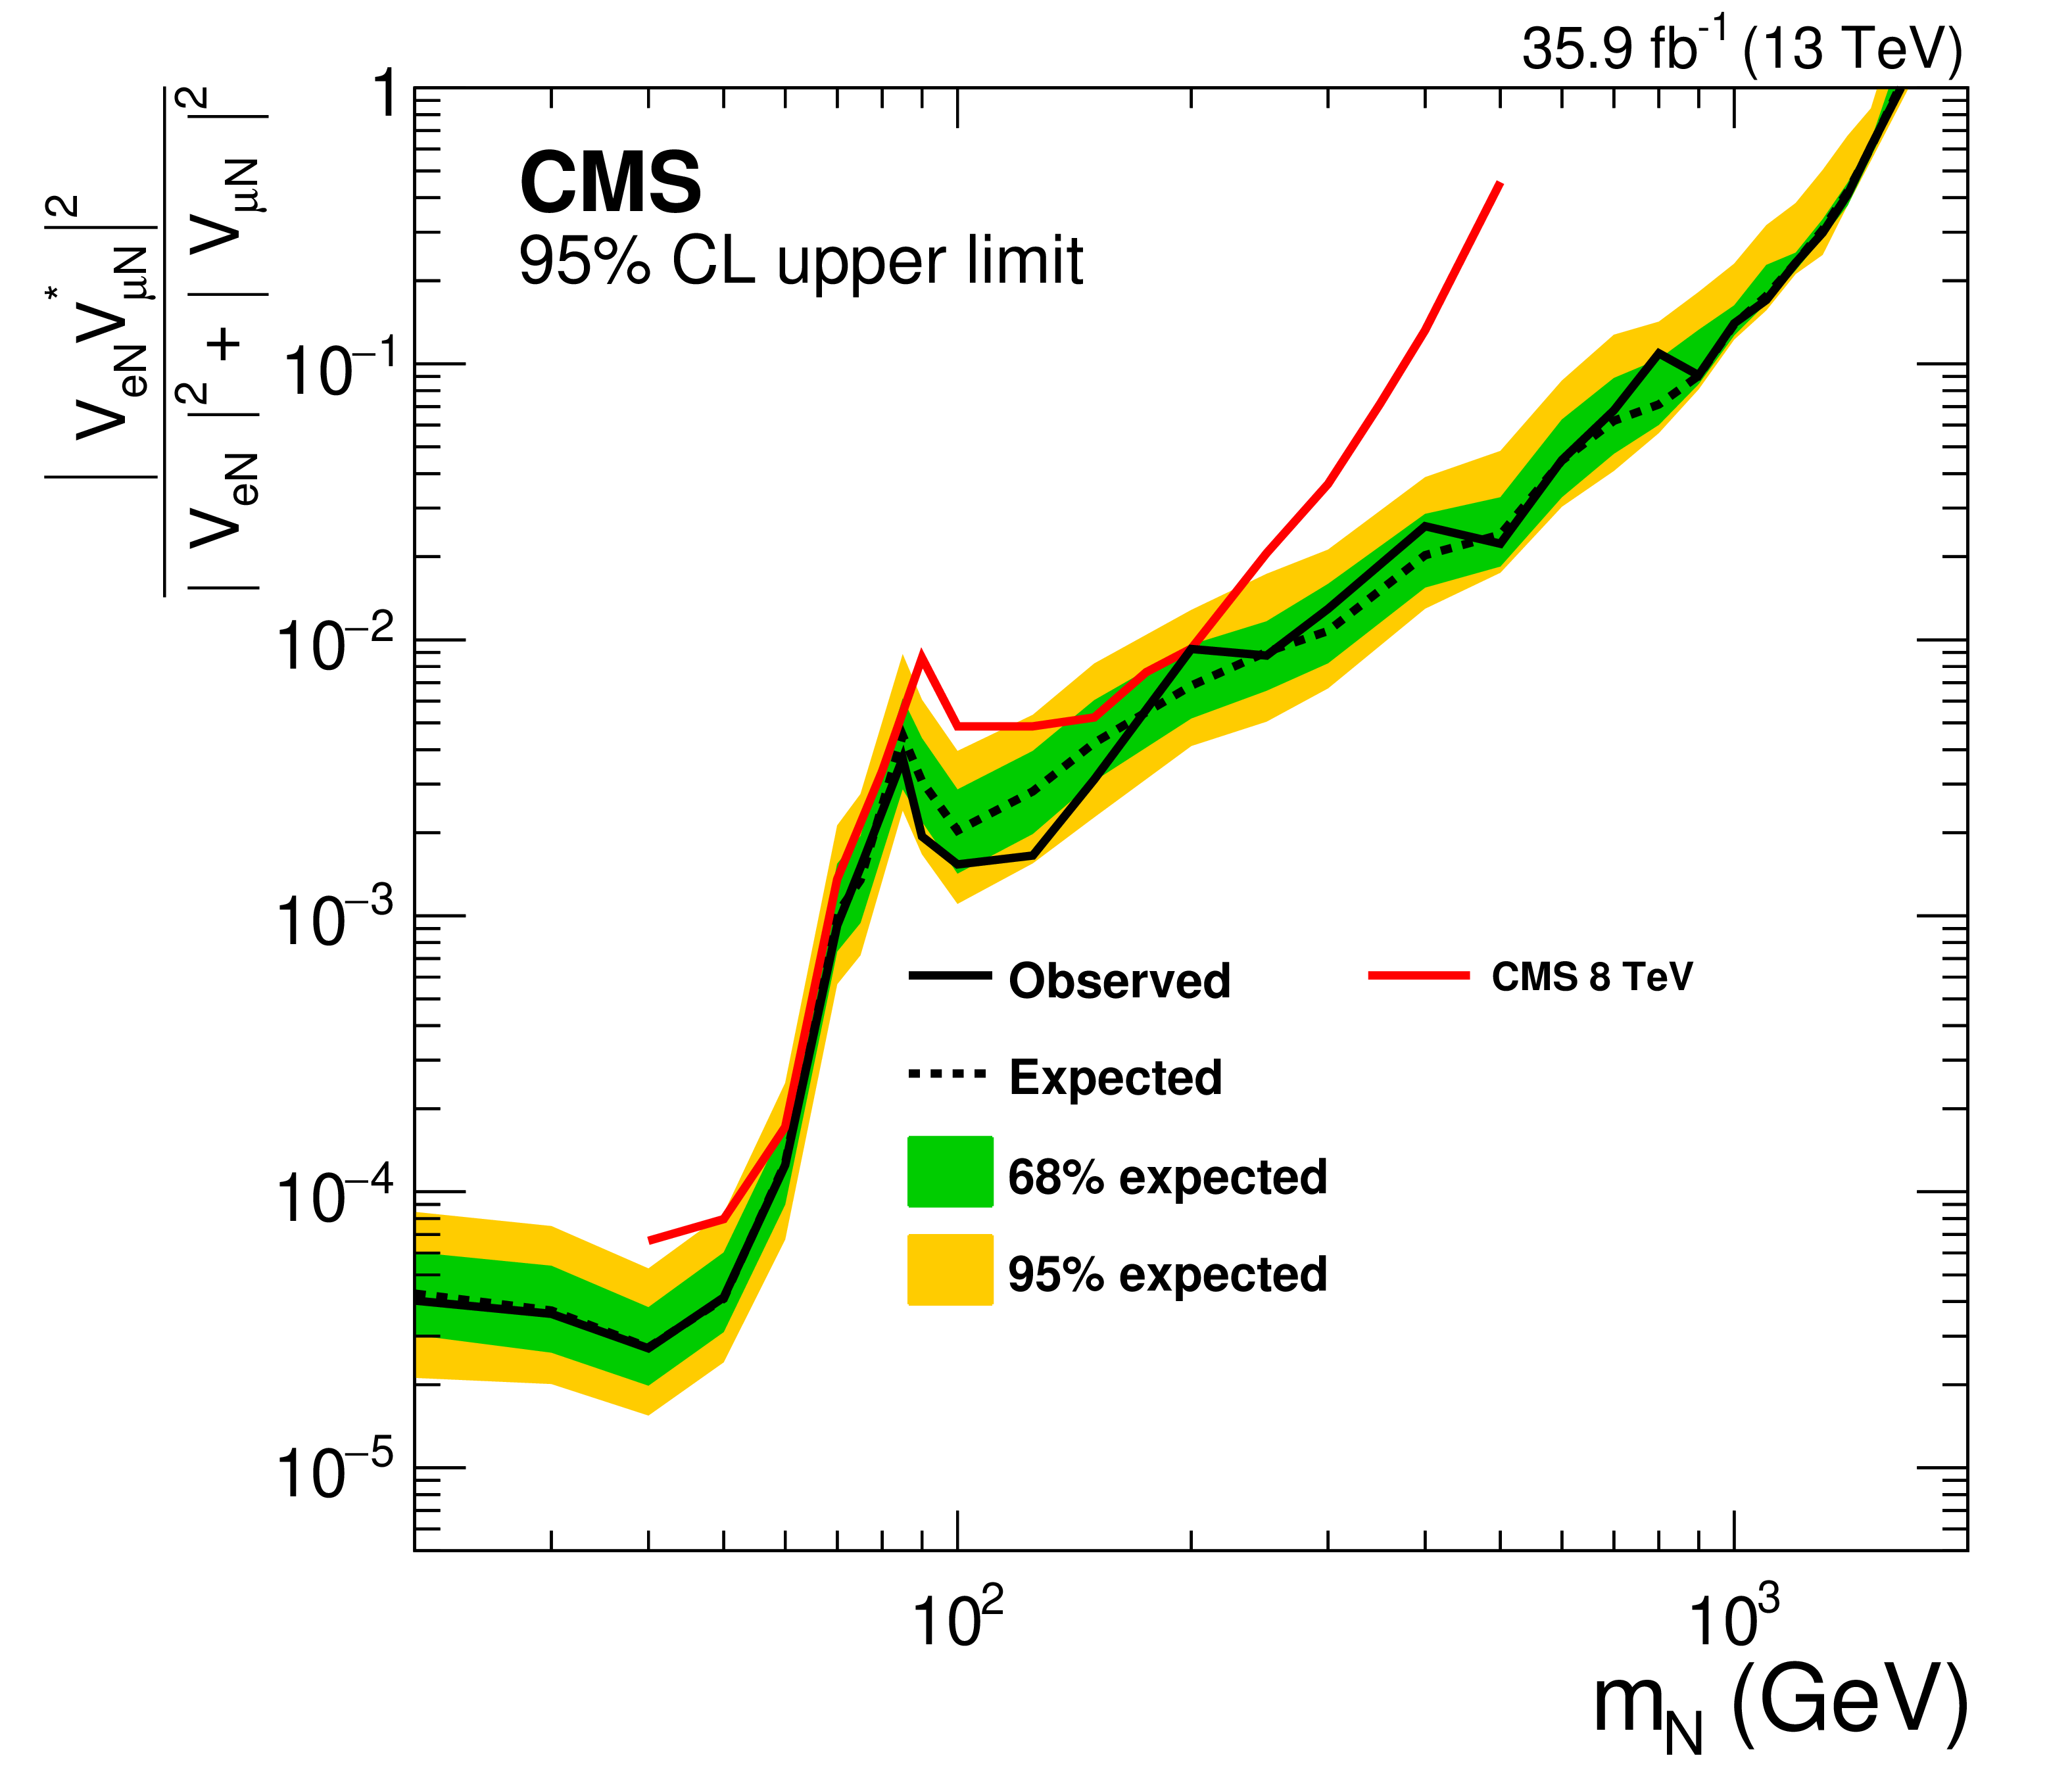
Exclusion region at 95% CL in the ${{| V_{{\mathrm {e}} {\mathrm {N}}} V^{*}_{\mu {\mathrm {N}}} |}^2 / ({{| {V_{{\mathrm {e}} {\mathrm {N}}}} |}^2} + {{| {V_{\mu {\mathrm {N}}}} |}^2})}$ vs. ${m_\mathrm {N}}$ plane. The dashed black curve is the expected upper limit, with one and two standard-deviation bands shown in green and yellow, respectively. The solid black curve is the observed upper limit. Also shown are the upper limits from the CMS $\sqrt {s} = $ 8 TeV 2012 data [35]. |
| Tables | |
png pdf |
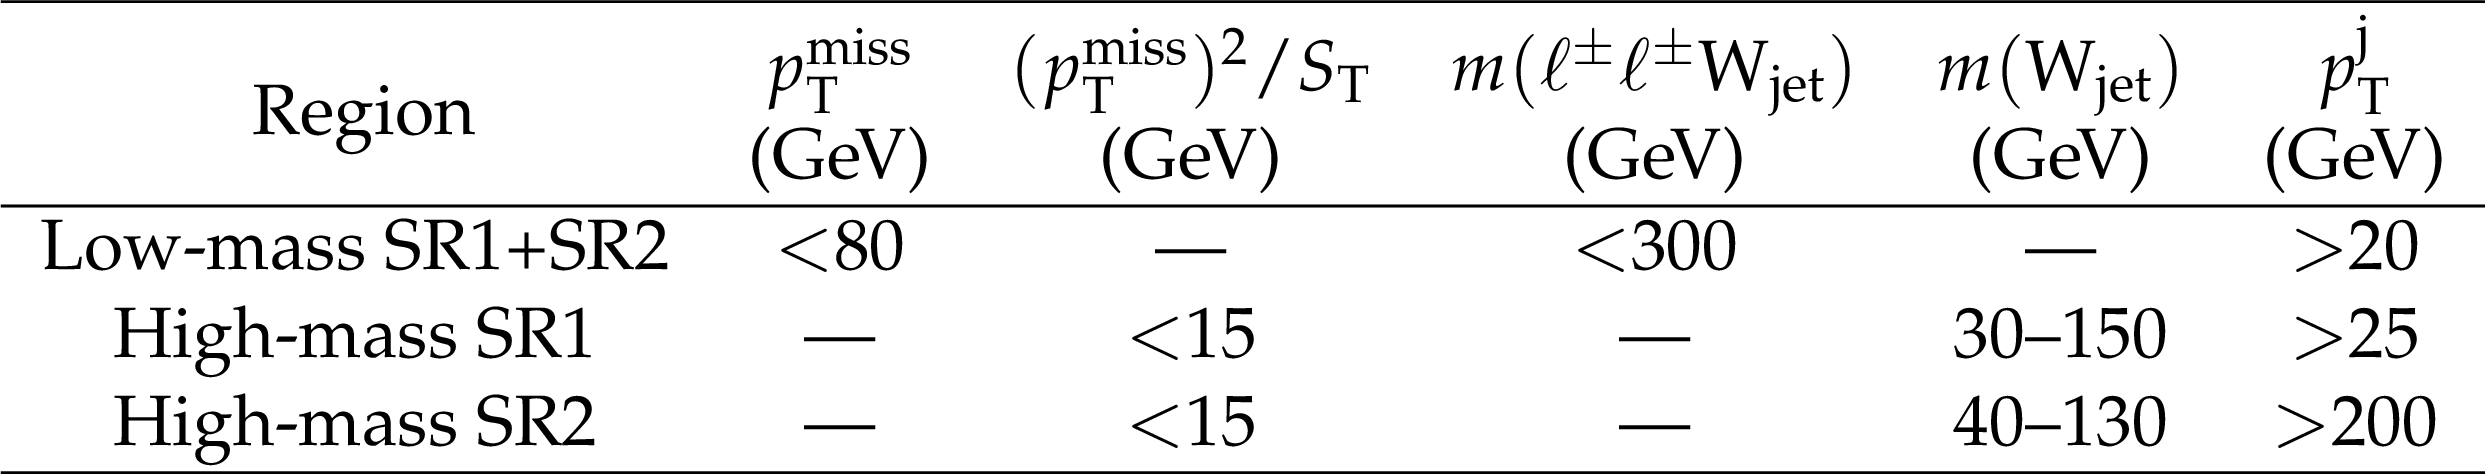
Table 1:
Selection requirements, after applying the preselection criteria, for the low- and high-mass signal regions. A dash indicates that the variable is not used in the selection. |
png pdf |
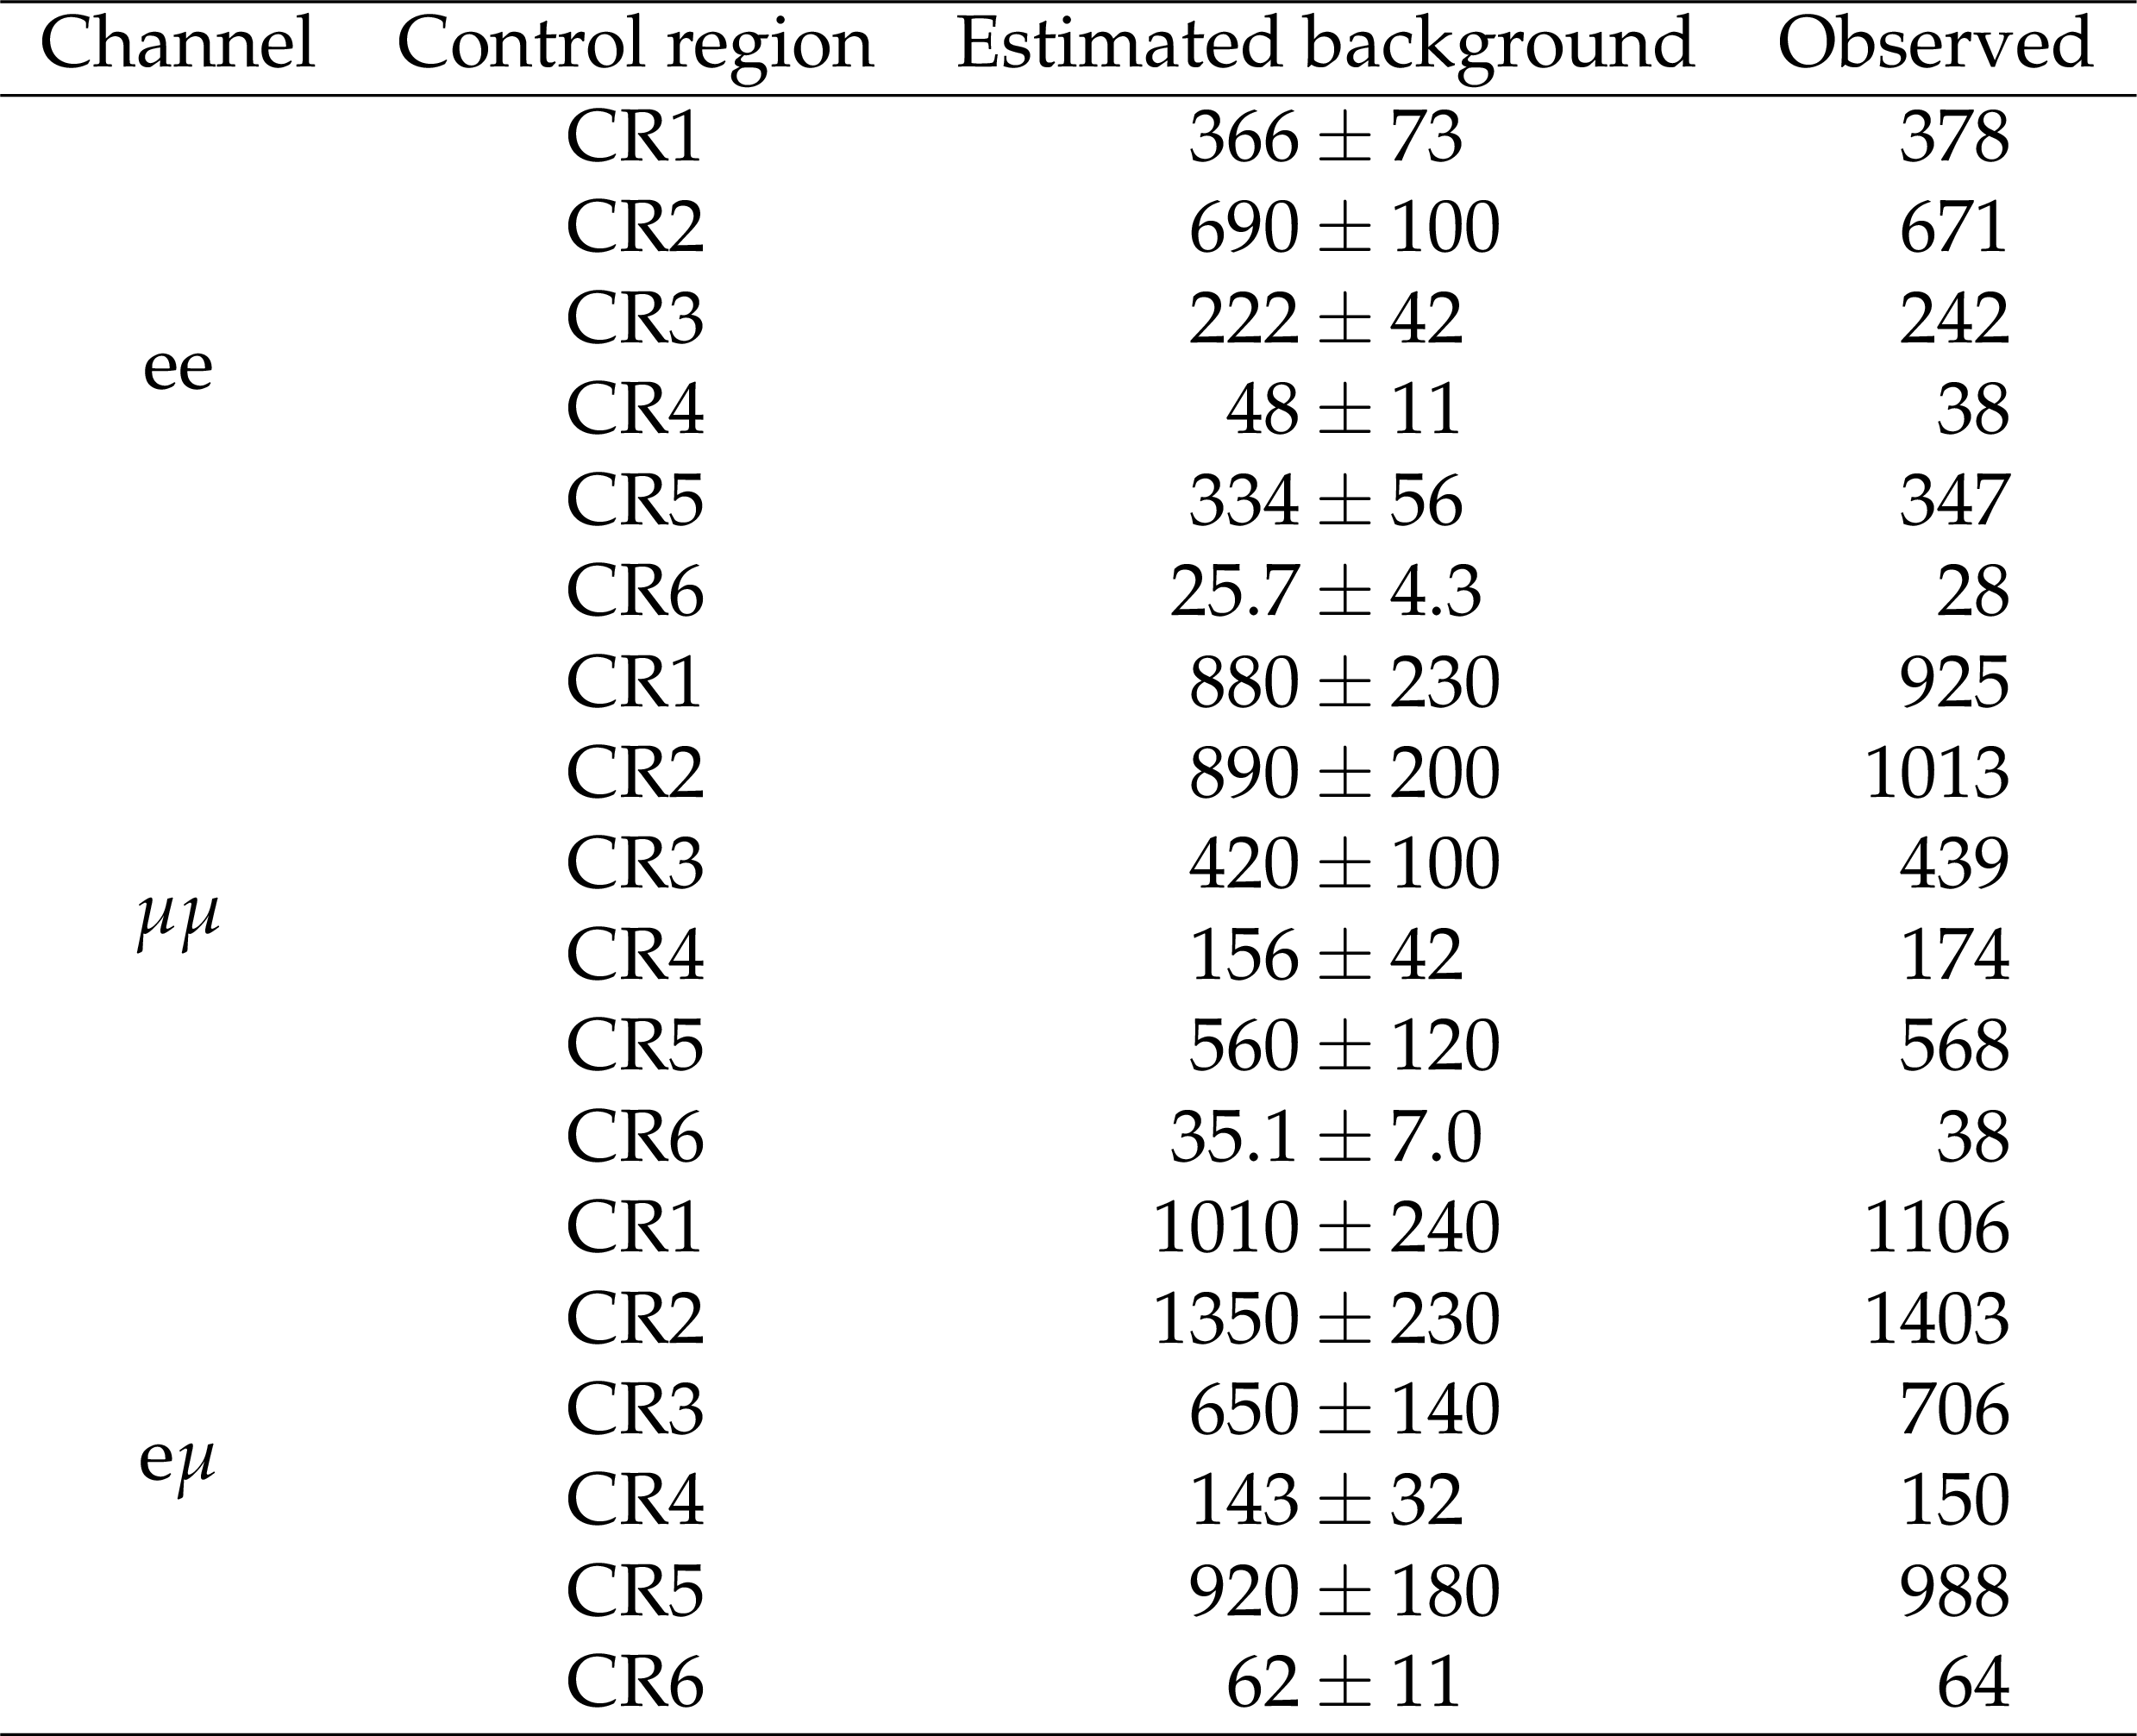
Table 2:
Observed event yields and estimated backgrounds in the control regions. The uncertainties in the background yields are the sums in quadrature of the statistical and systematic components. |
png pdf |
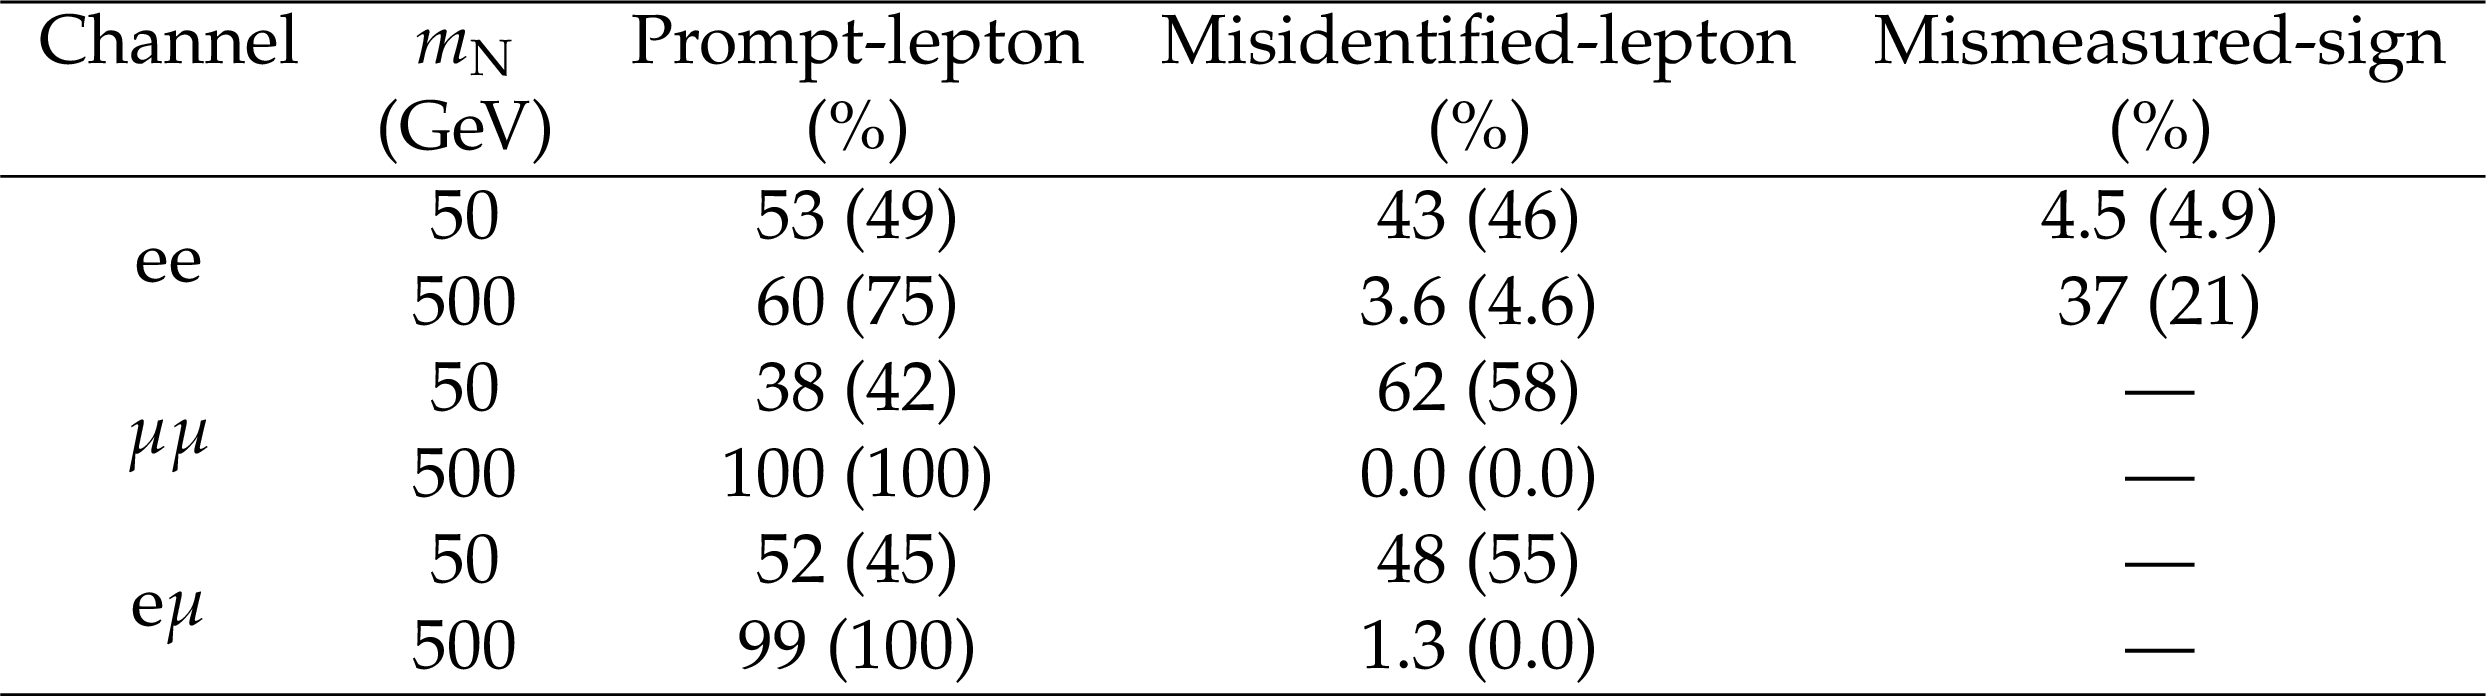
Table 3:
Fractional contributions to the total background systematic uncertainties related to the uncertainties in the prompt SS lepton, misidentified-lepton, and mismeasured-sign background. The numbers are for the SR1 (SR2) in the case of ${m_{\mathrm {N}}} = $ 50 and 500 GeV. |
png pdf |
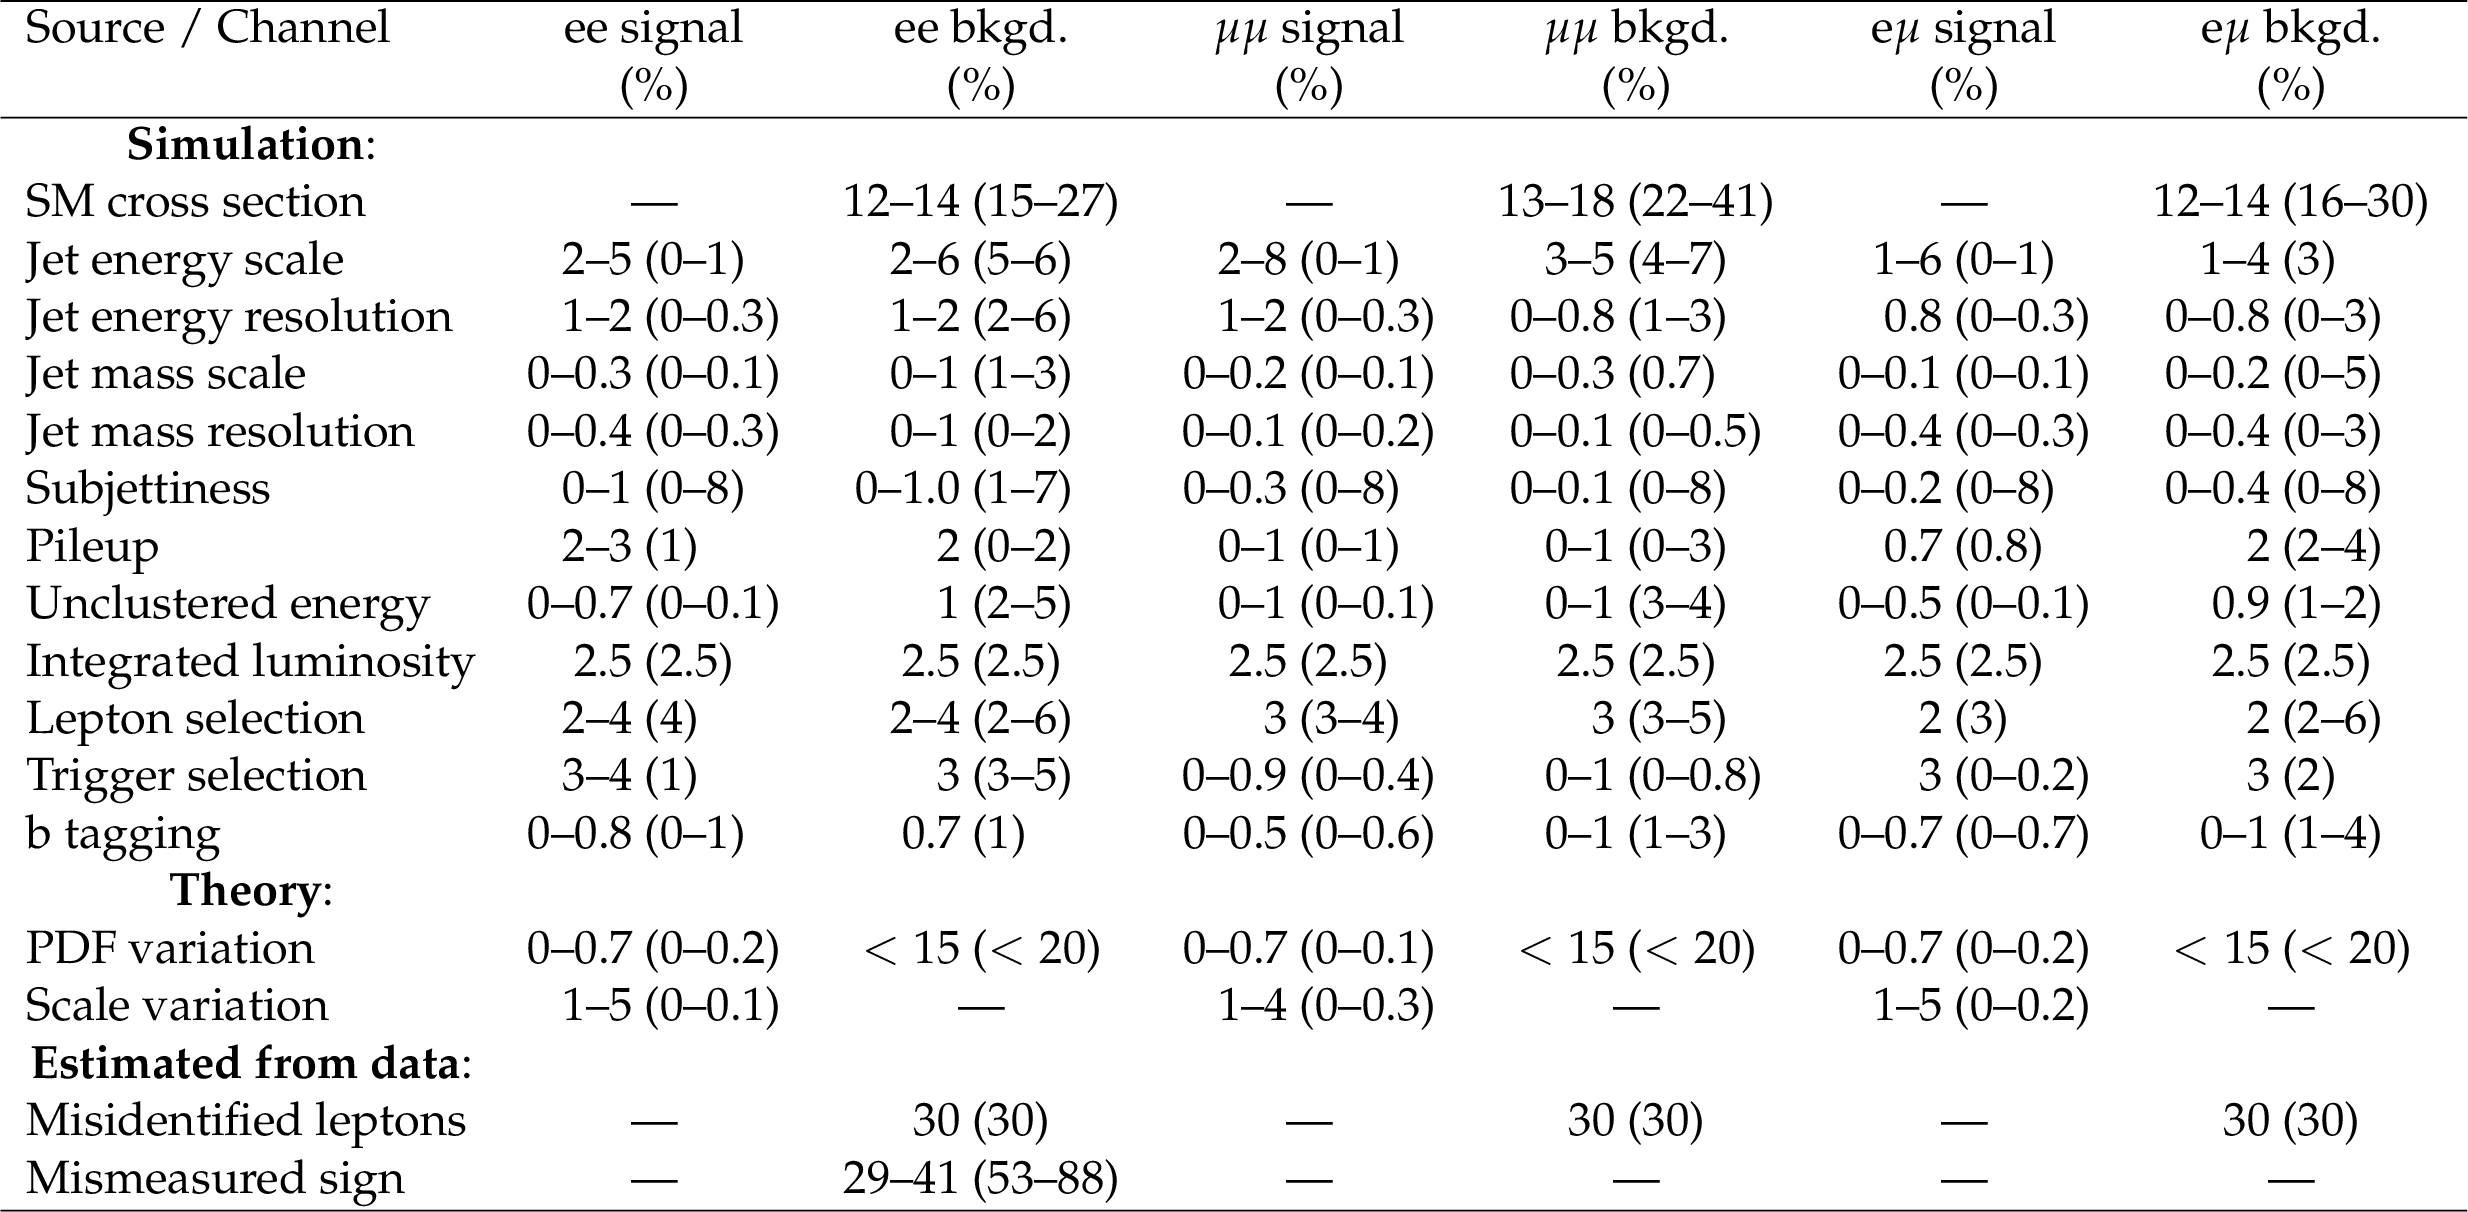
Table 4:
Summary of the relative systematic uncertainties in heavy Majorana neutrino signal yields and in the background from prompt SS leptons, both estimated from simulation. The relative systematic uncertainties assigned to the misidentified-lepton and mismeasured-sign background estimated from control regions in data and simulation are also shown. The uncertainties are given for the low- (high-)mass selections. The range given for each systematic uncertainty source covers the variation across the mass range. Upper limits are presented for the uncertainty related to the PDF choice in the background estimates, however this source of uncertainty is considered to be accounted for via the normalization uncertainty and was not applied explicitly as an uncertainty in the background. |
png pdf |
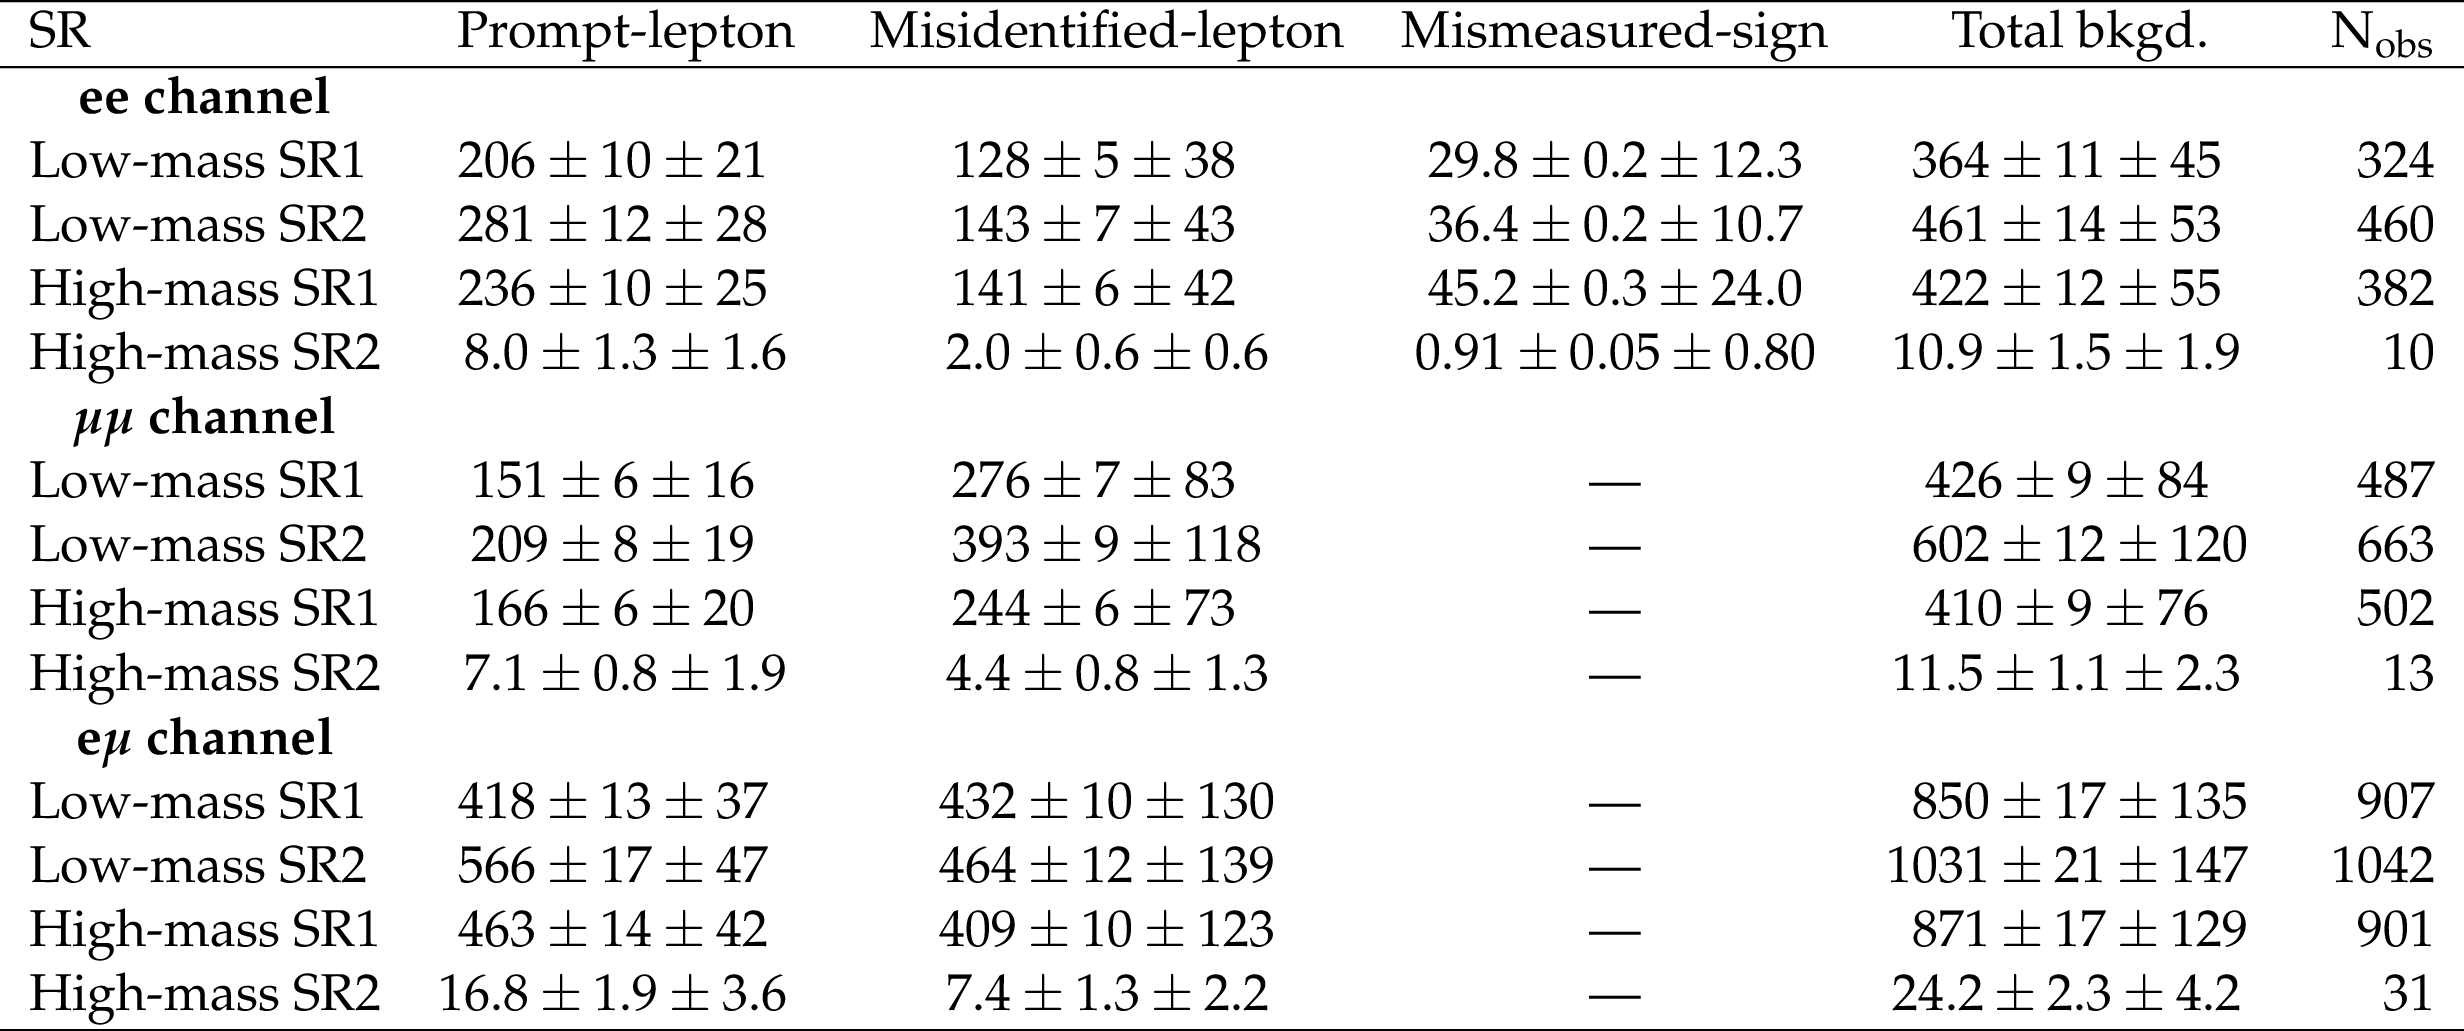
Table 5:
Observed event yields and estimated backgrounds for the signal region selections. The background predictions from prompt SS leptons, misidentified leptons, leptons with mismeasured sign, and the total background are shown together with the number of events observed in data. The uncertainties shown are the statistical and systematic components, respectively. A dash indicates that the background is considered negligible. |
png pdf |
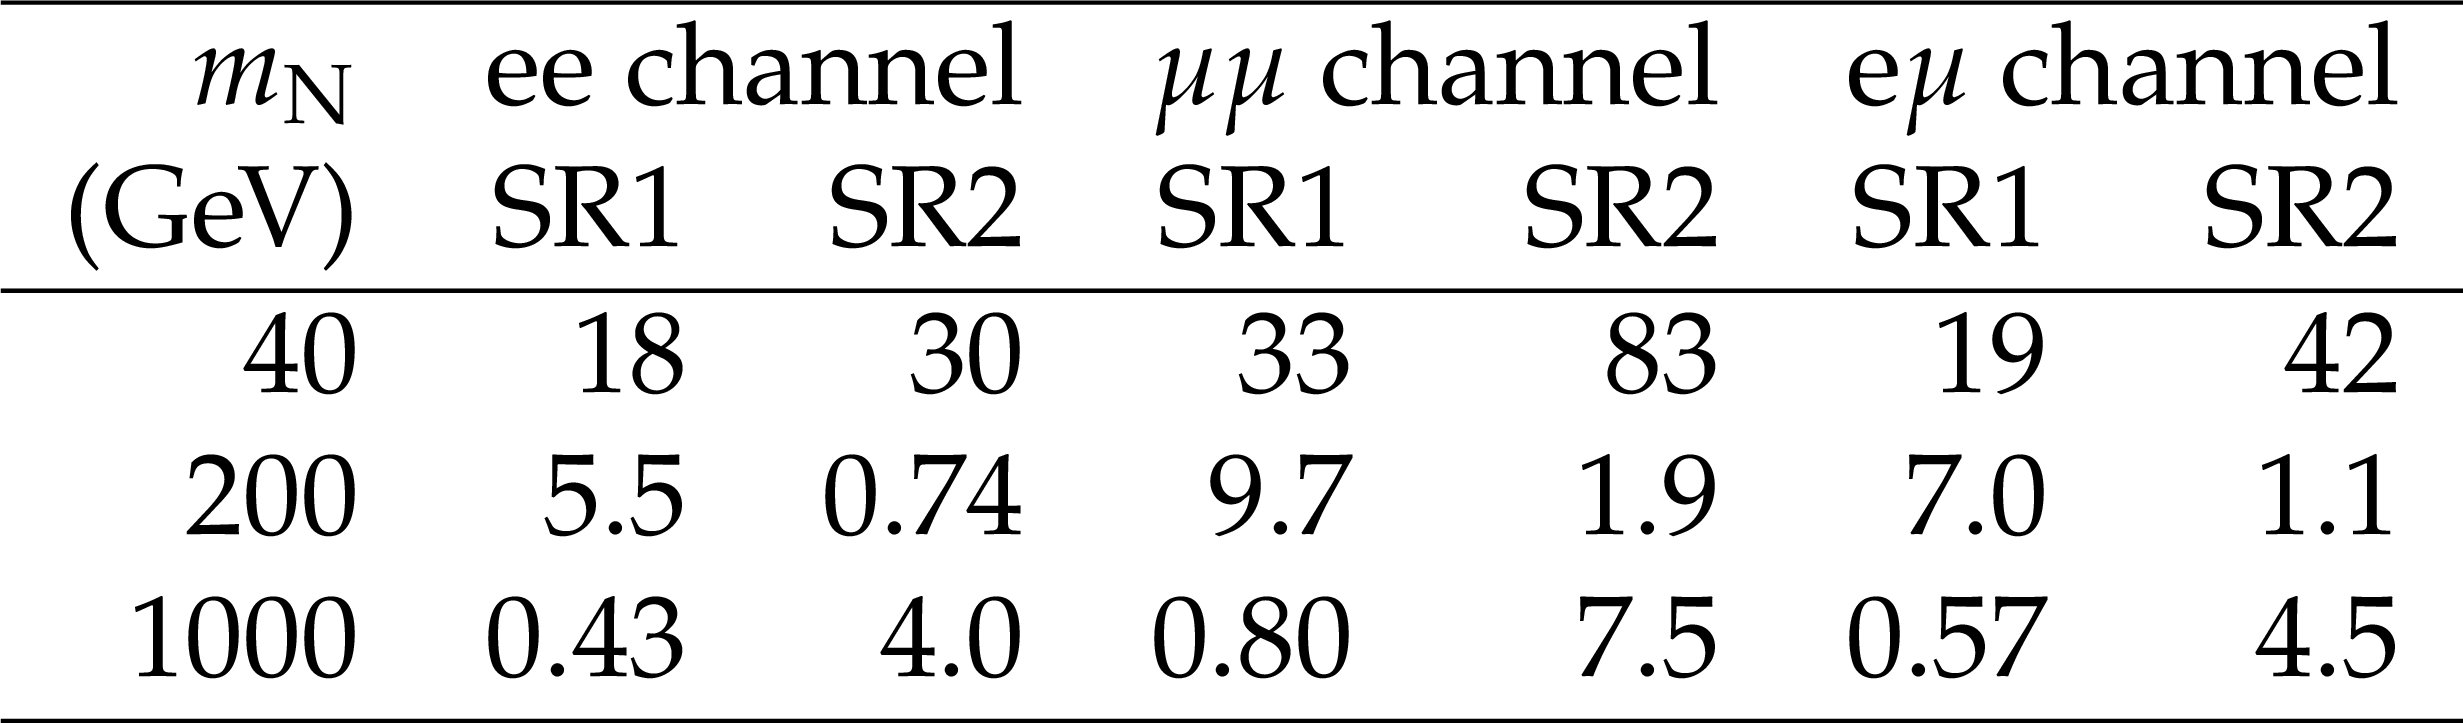
Table 6:
Numbers of expected signal events passing the selection requirements. The matrix element squared is assumed to be $1 \times 10^{-4}$, $1 \times 10^{-2}$, and 1 for $ {m_\mathrm {N}} = $ 40, 200, and 1000 GeV, respectively. |
png pdf |
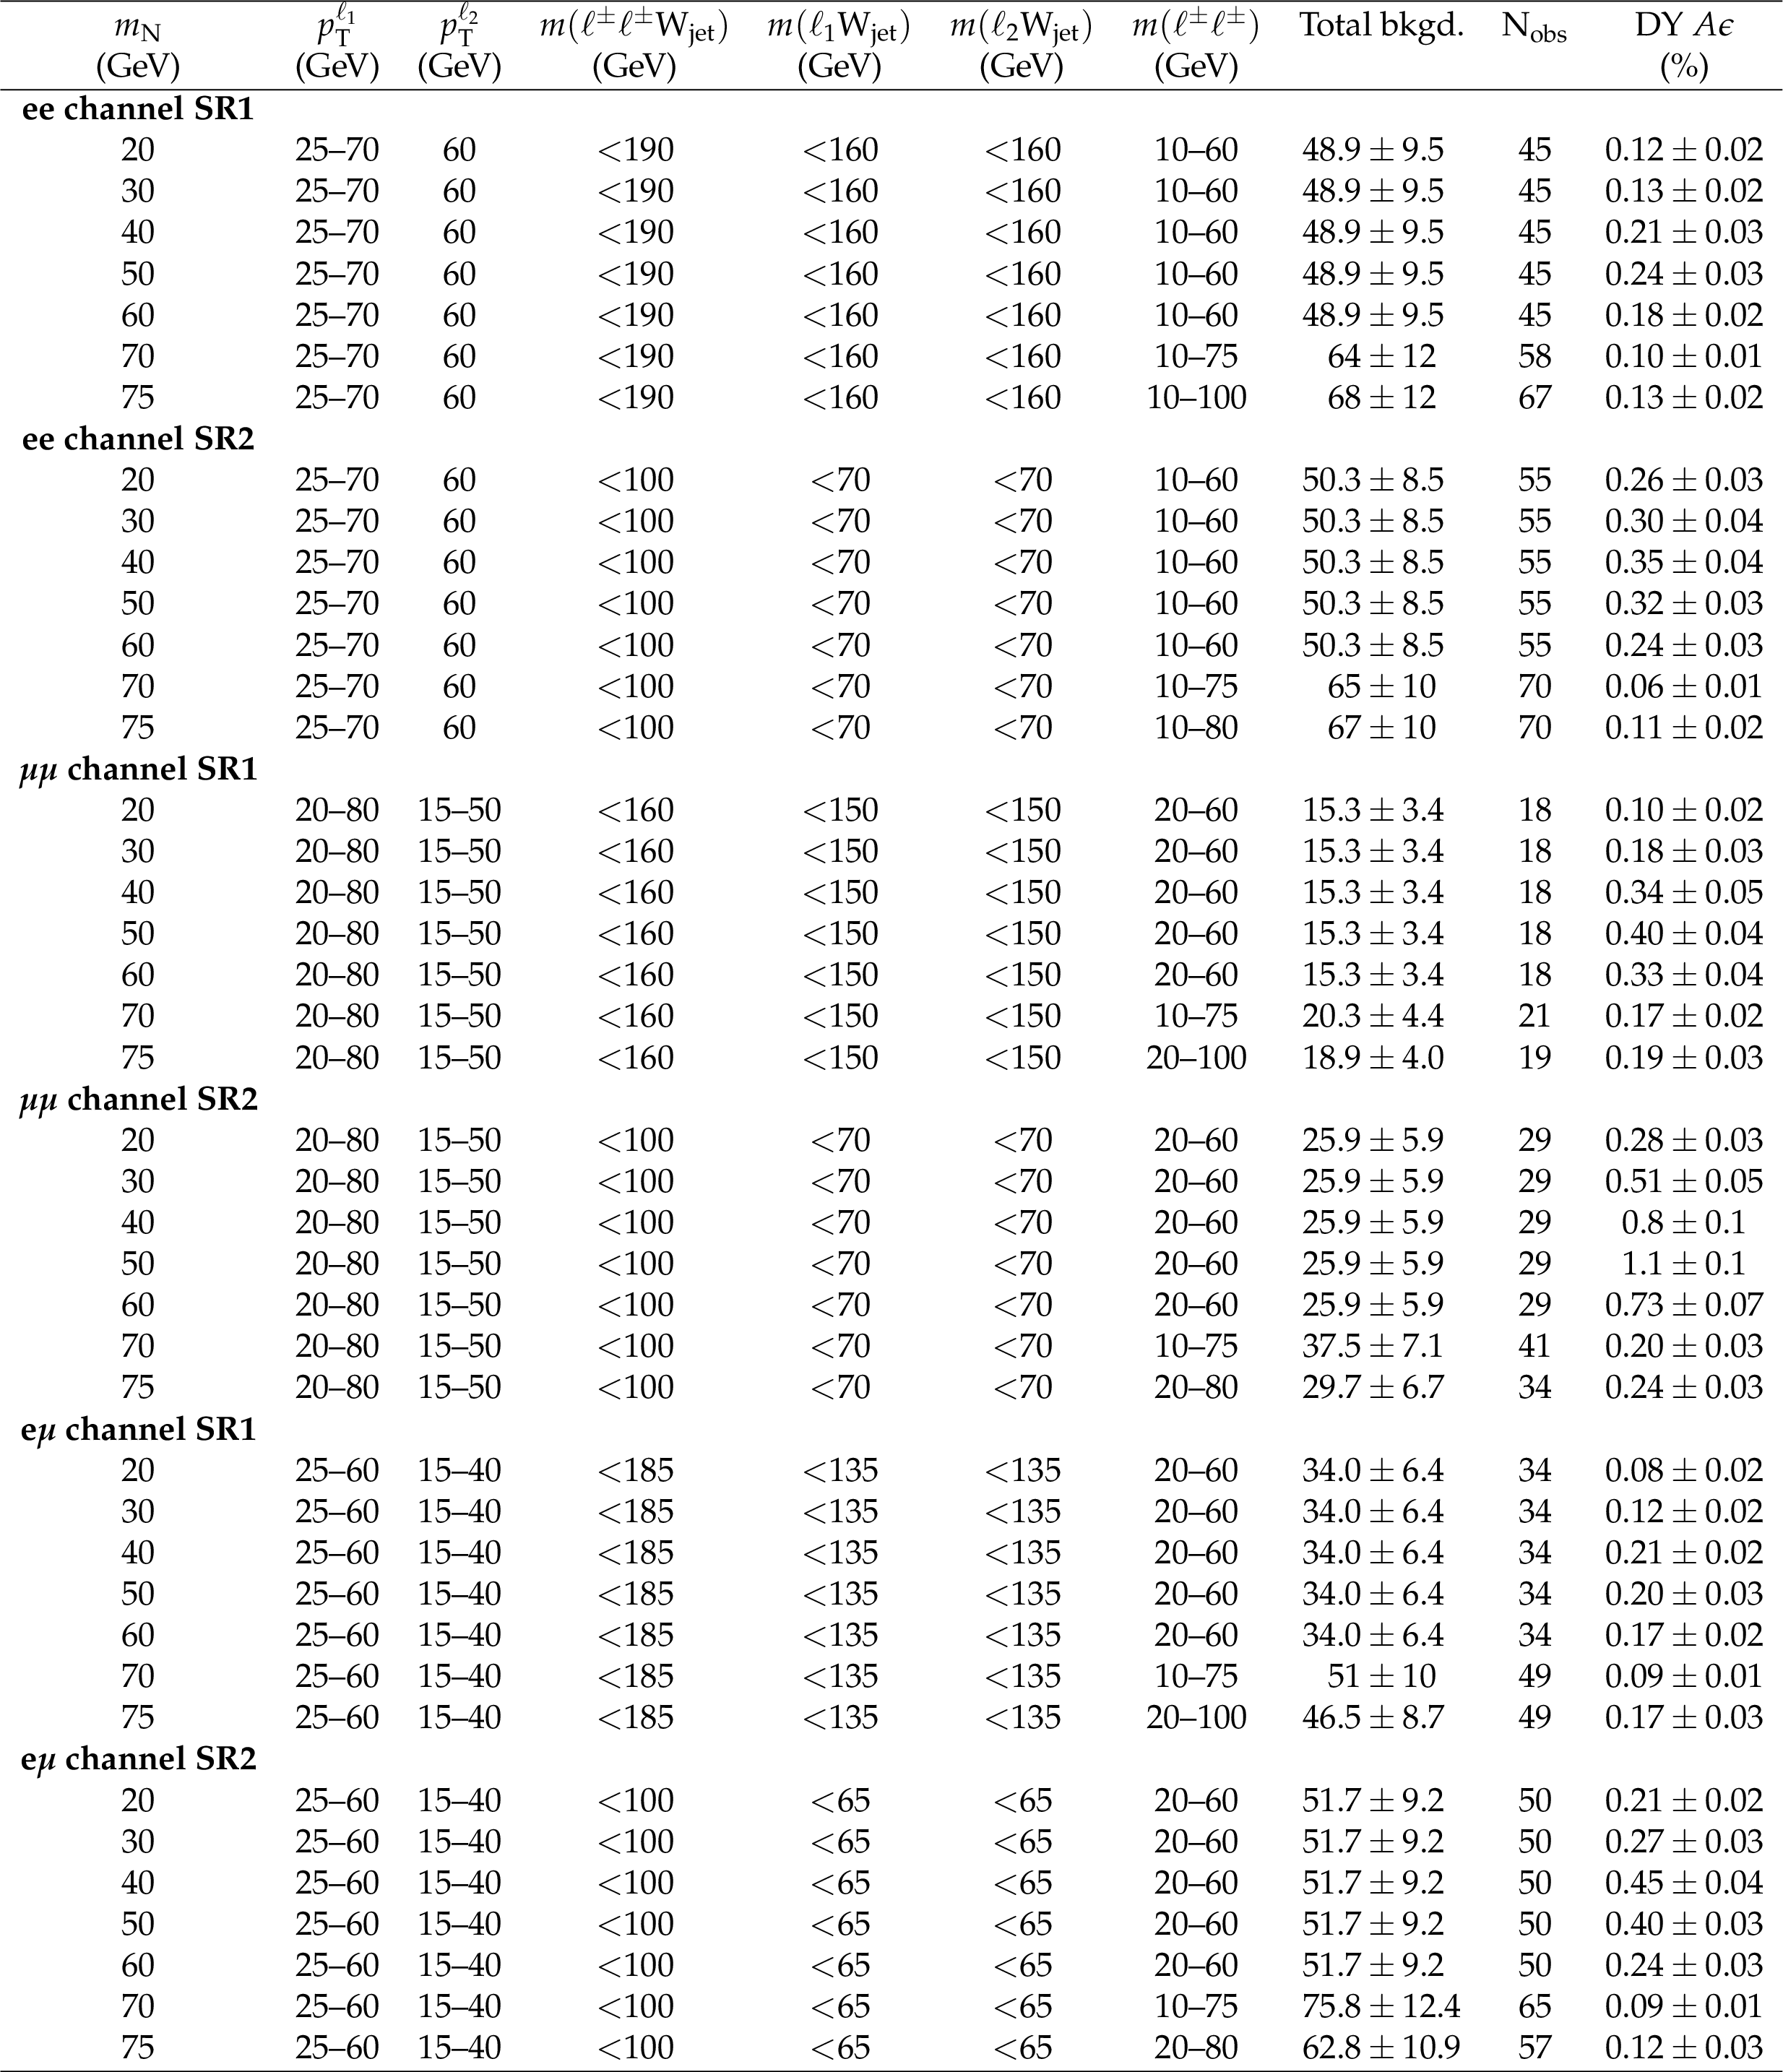
Table 7:
Selection requirements on discriminating variables determined by the optimization for each Majorana neutrino mass point in the low-mass signal regions. Columns 8 and 9 show the total background yields (Total bkgd.) and the number of observed data (${\mathrm {N}_{\text {obs}}}$), respectively. The last column shows the overall signal acceptances for the DY channel. The quoted uncertainties include both the statistical and systematic contributions. |
png pdf |
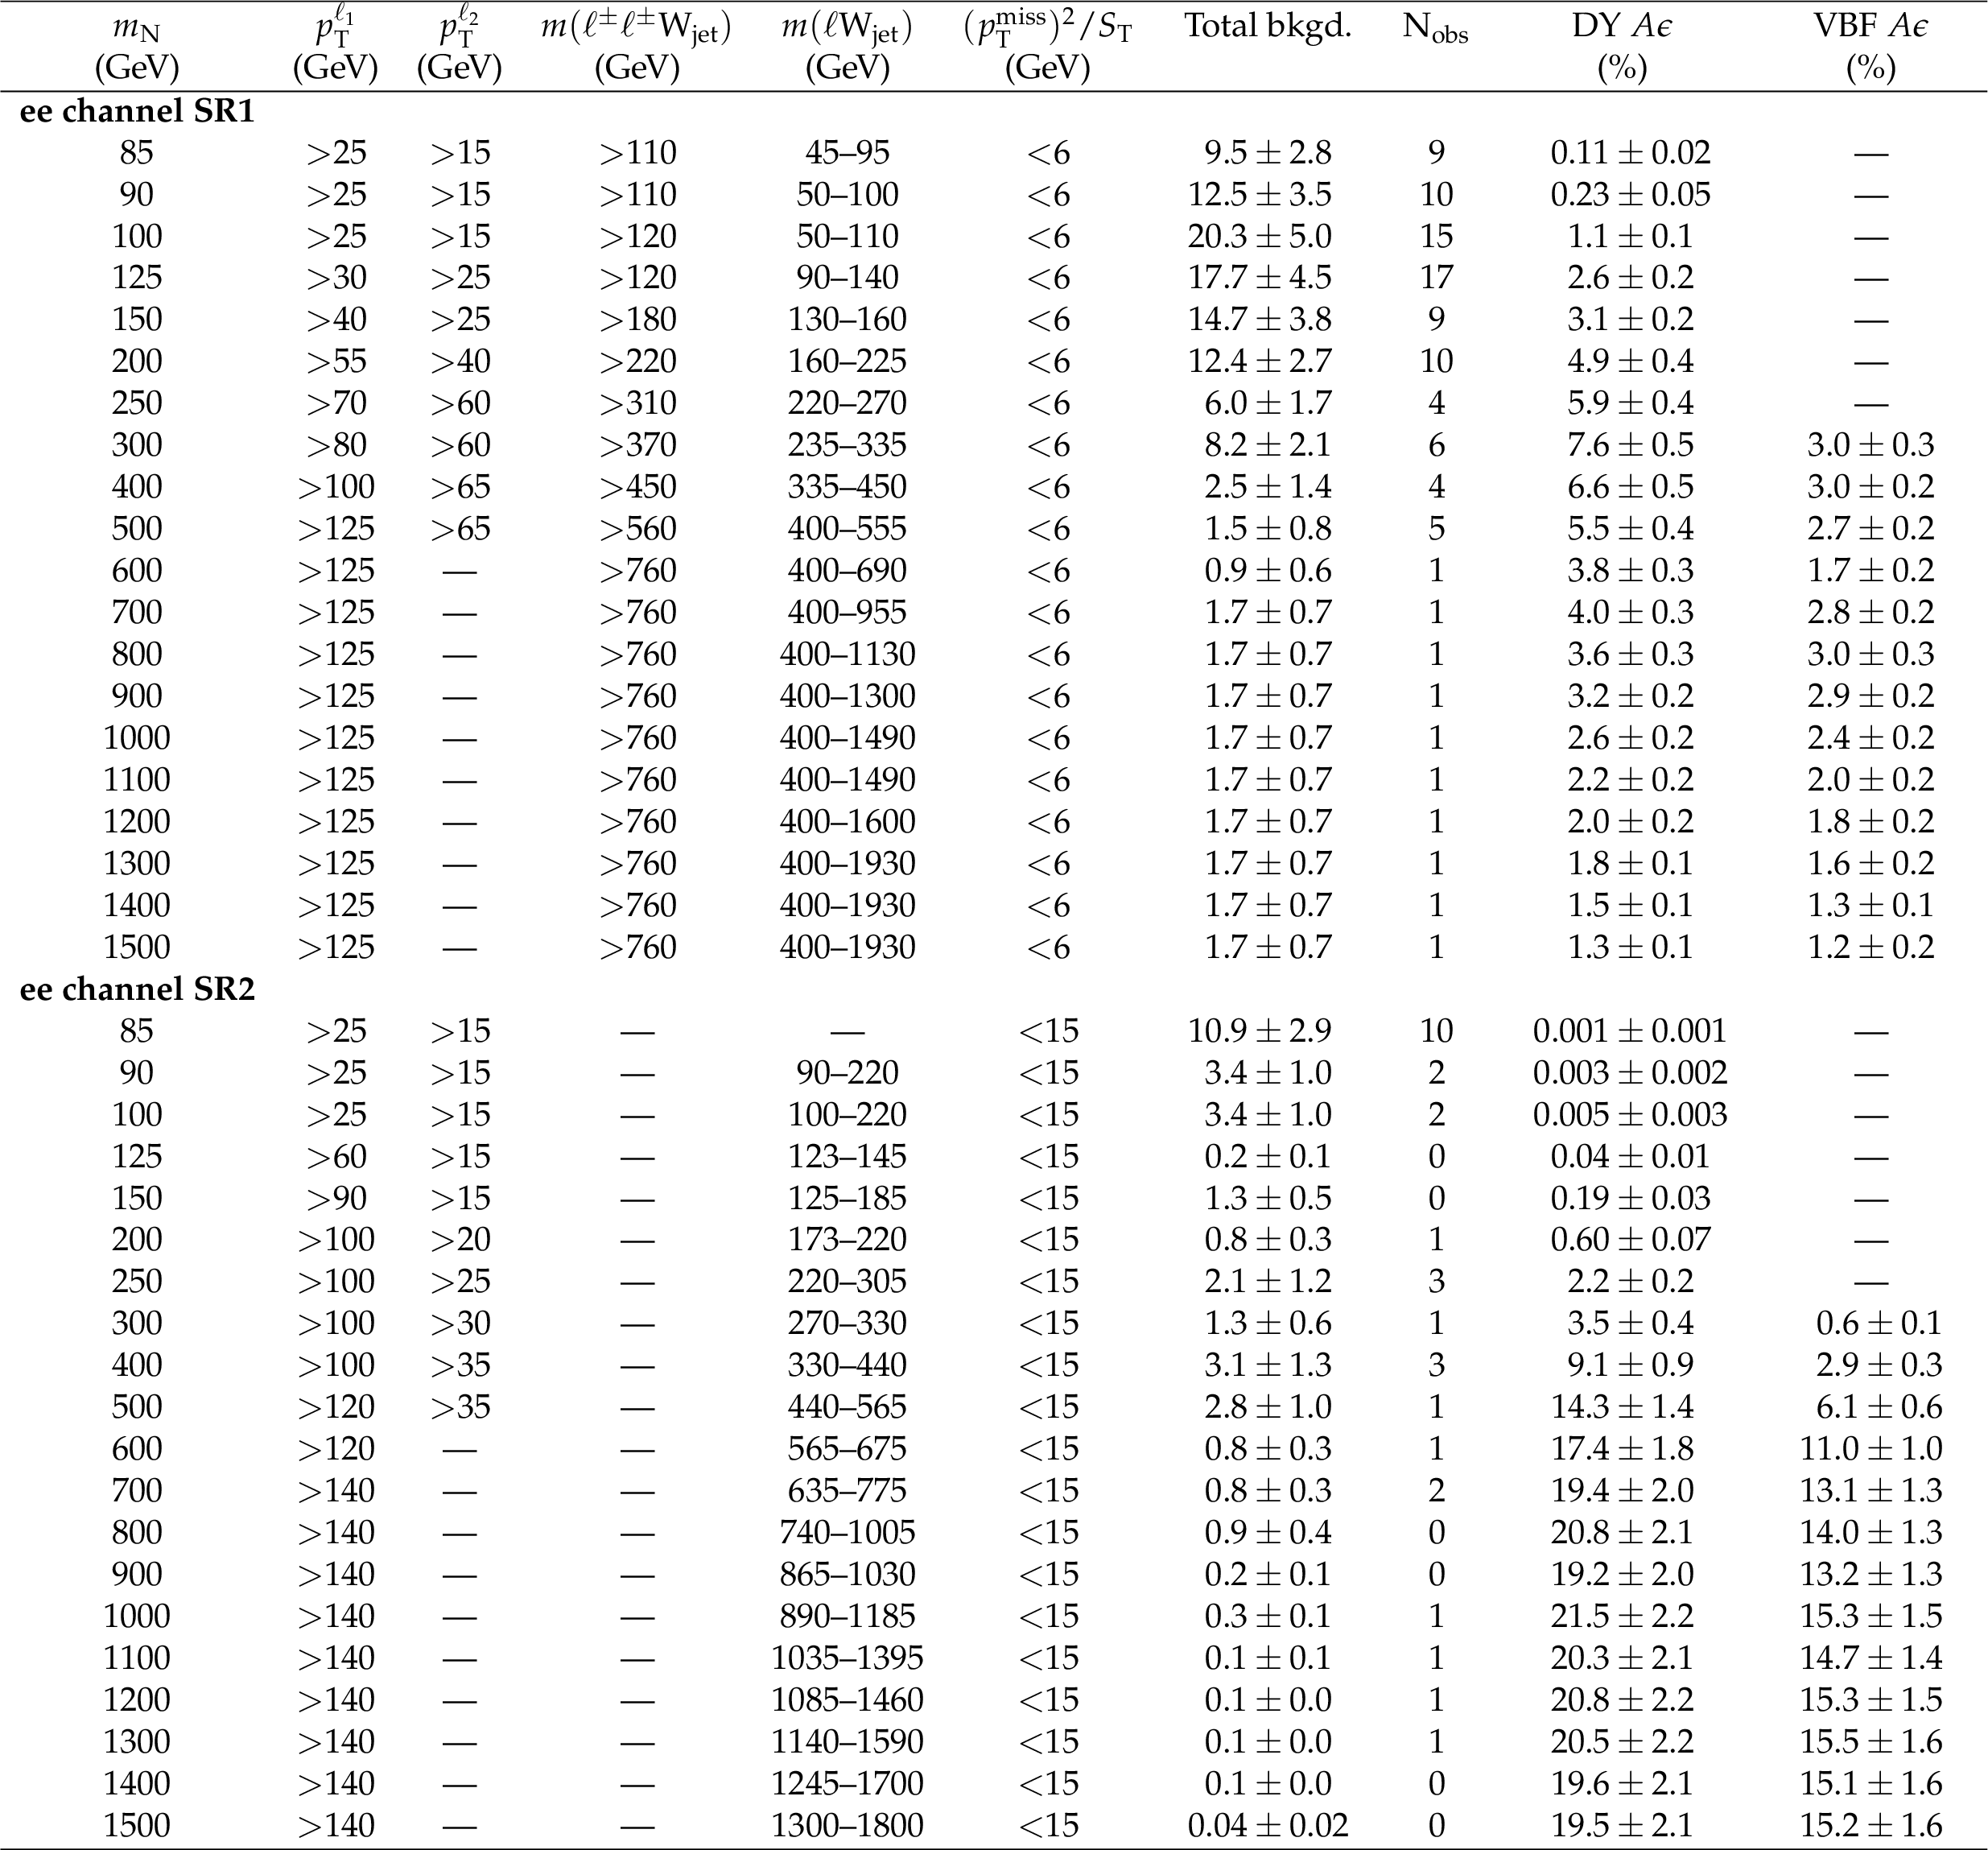
Table 8:
Selection requirements on discriminating variables determined by the optimization for each Majorana neutrino mass point in the $ {\mathrm {e}} {\mathrm {e}}$ channel high-mass SRs. Columns 7 and 8 show the total background yields (Total bkgd.) and the number of observed data (${\mathrm {N}_{\text {obs}}}$), respectively. The last columns show the overall signal acceptance for the DY and VBF channels. The quoted uncertainties include both the statistical and systematic contributions. The dash indicates that no selection requirement is made. |
png pdf |
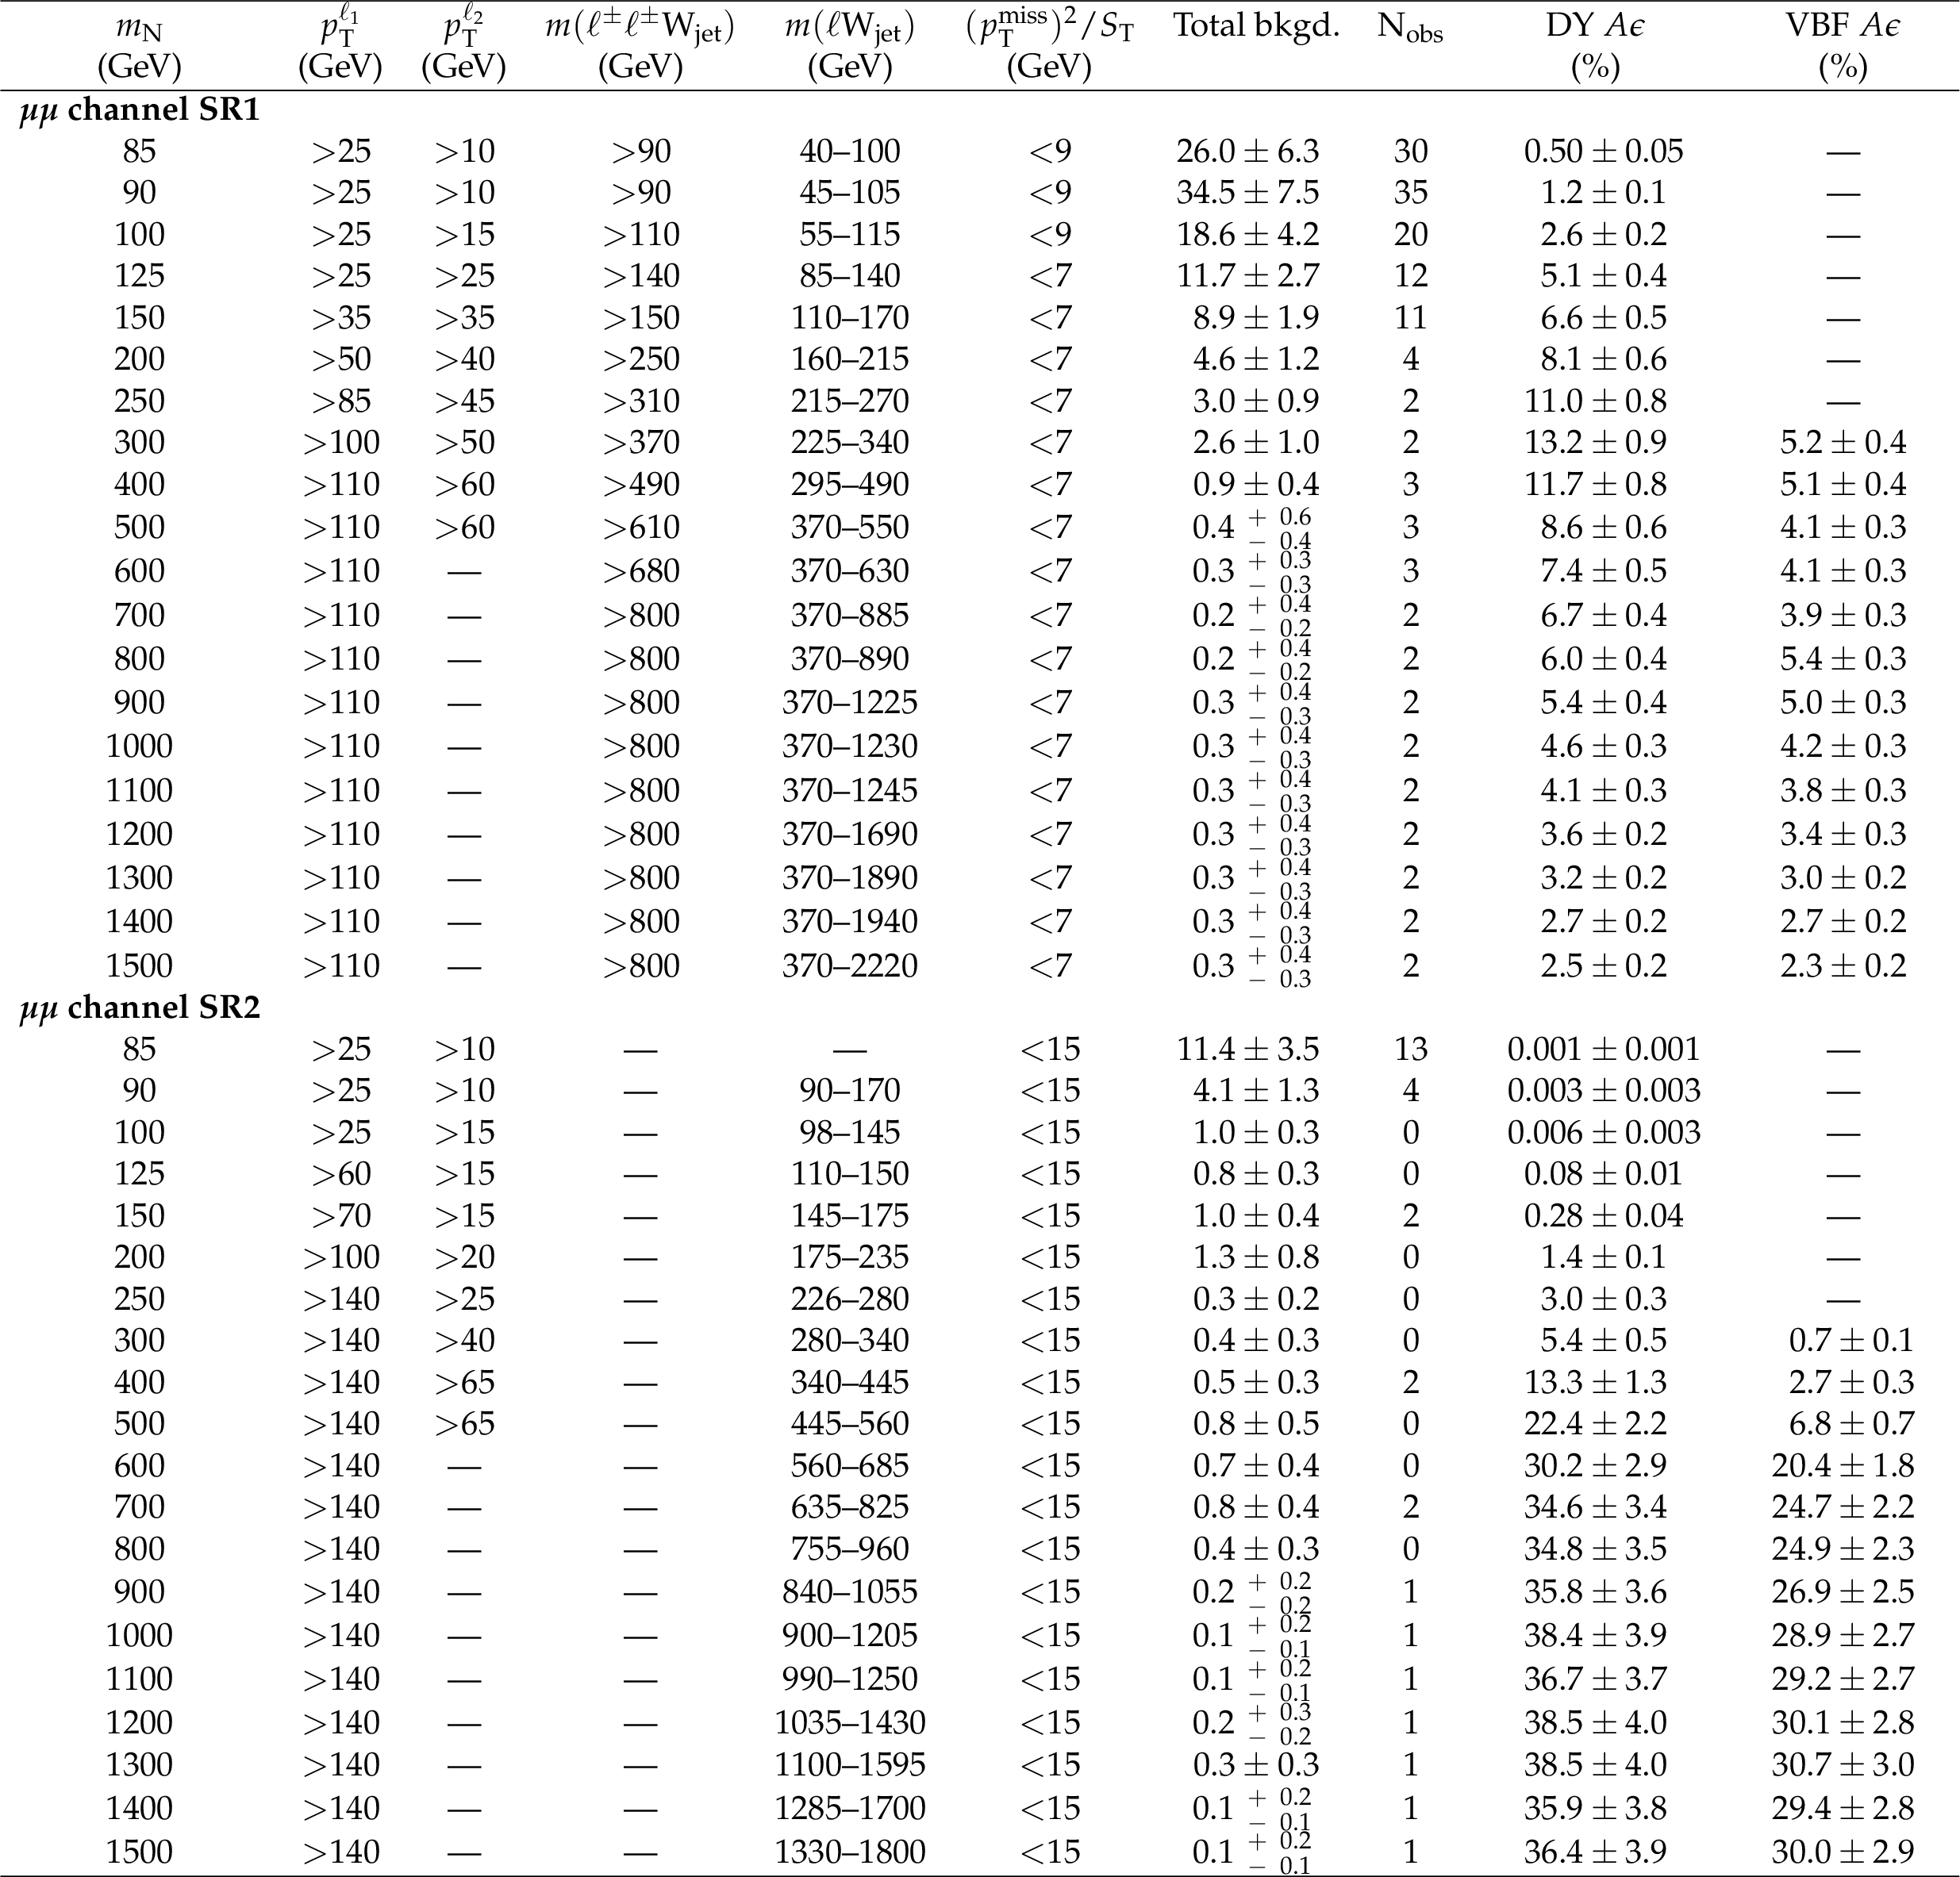
Table 9:
Selection requirements on discriminating variables determined by the optimization for each Majorana neutrino mass point in the $\mu \mu $ channel high-mass SRs. Columns 7 and 8 show the total background yields (Total bkgd.) and the number of observed data $({\mathrm {N}_{\text {obs}}}$), respectively. The last columns show the overall signal acceptance for the DY and VBF channels. The quoted uncertainties include both the statistical and systematic contributions. The dash indicates that no selection requirement is made. |
png pdf |
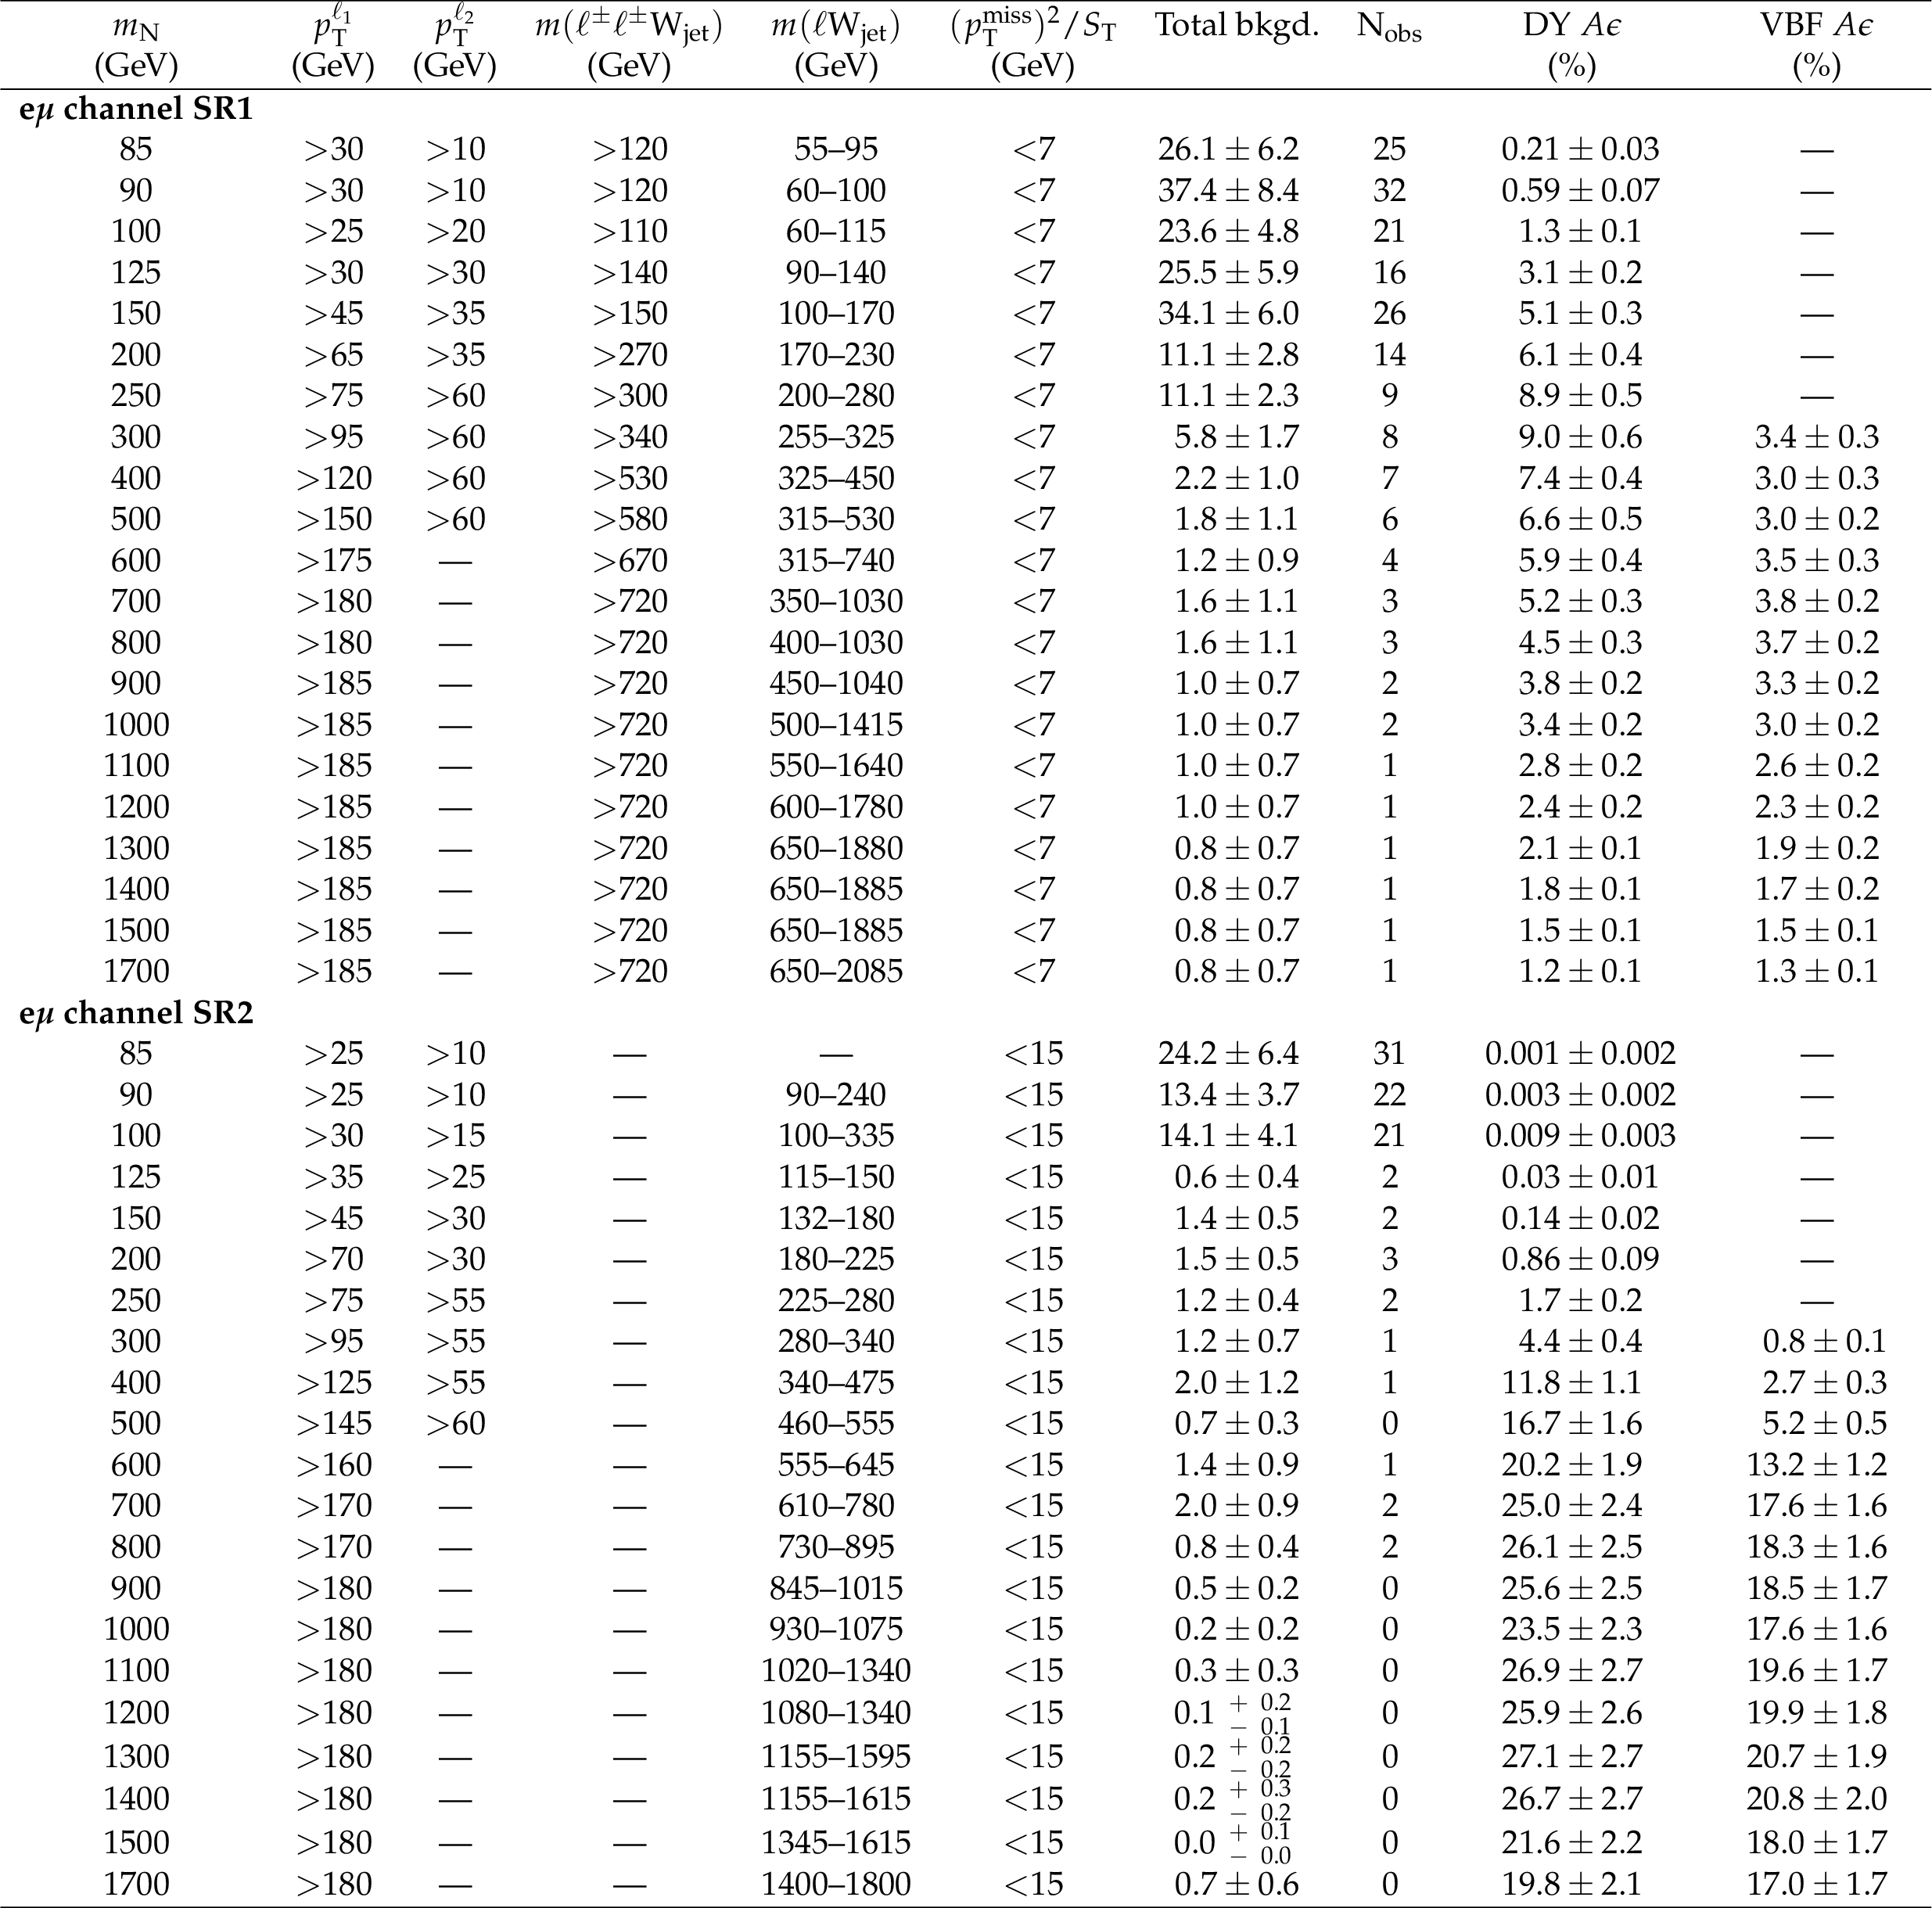
Table 10:
Selection requirements on discriminating variables determined by the optimization for each Majorana neutrino mass point in the $ {\mathrm {e}}\mu $ channel high-mass SRs. Columns 7 and 8 show the total background yields (Total bkgd.) and the number of observed data (${\mathrm {N}_{\text {obs}}}$), respectively. The last columns show the overall signal acceptance for the DY and VBF channels. The quoted uncertainties include both the statistical and systematic contributions. The dash indicates that no selection requirement is made. |
| Summary |
| A search for heavy Majorana neutrinos, N , in final states with same-sign dileptons and jets has been performed in proton-proton collisions at a center-of-mass energy of 13 TeV, using a data set corresponding to an integrated luminosity of 35.9 fb$^{-1}$. No significant excess of events compared to the expected standard model background prediction is observed. Upper limits at 95% confidence level are set on the mixing matrix element between standard model neutrinos and N ($|{{V_{\ell \mathrm{N}}} }$) in the context of a Type-I seesaw model, as a function of N mass. The analysis improves on previous 8 TeV searches by including single-jet events into the signal region, which increases sensitivities. For an N mass of 40 GeV the observed (expected) limits are ${|{{V_{\mathrm{e} \mathrm{N}}} }|^2} < 9.5\,(8.0) \times 10^{-5}$, ${|{{V_{\mu \mathrm{N}}} }|^2} < 2.3\,(1.9) \times 10^{-5}$, and ${|{V_{\mathrm{e} {\mathrm{N}} } V^{*}_{\mu {\mathrm{N}} }}|^2 / ({|{{V_{\mathrm{e} \mathrm{N}}} }|^2} + {|{{V_{\mu \mathrm{N}}} }|^2} )} < 2.7\,(2.7) \times 10^{-5}$, and for an N mass of 1000 GeV the limits are ${|{{V_{\mathrm{e} \mathrm{N}}} }|^2} < 0.42\,(0.32)$, ${|{{V_{\mu \mathrm{N}}} }|^2} < 0.27\,(0.16)$, and ${|{V_{\mathrm{e} {\mathrm{N}} } V^{*}_{\mu {\mathrm{N}} }}|^2 / ({|{{V_{\mathrm{e} \mathrm{N}}} }|^2} + {|{{V_{\mu \mathrm{N}}} }|^2} )} < 0.14\,(0.14)$. The search is sensitive to masses of N from 20 to 1600 GeV. The limits on the mixing matrix elements are placed up to 1240 GeV for ${|{{V_{\mathrm{e} \mathrm{N}}} }|^2} $, 1430 GeV for the ${|{{V_{\mu \mathrm{N}}} }|^2} $, and 1600 GeV for ${|{V_{\mathrm{e} {\mathrm{N}} } V^{*}_{\mu {\mathrm{N}} }}|^2 / ({|{{V_{\mathrm{e} \mathrm{N}}} }|^2} + {|{{V_{\mu \mathrm{N}}} }|^2} )} $. These are the most restrictive direct limits on the N mixing parameters for heavy Majorana neutrino masses greater than 430 GeV, and are the first for masses greater than 1200 GeV. |
| References | ||||
| 1 | Particle Data Group, C. Patrignani et al. | Review of particle physics | CPC 40 (2016) 100001 | |
| 2 | J. A. McCarthy | Search for double beta decay in Ca$ ^{48} $ | PR97 (1955) 1234 | |
| 3 | V. R. Lazarenko and S. Y. Luk'yanov | An attempt to detect double beta decay in Ca$ ^{48} $ | Sov. Phys. JETP 22 (1966) 521 | |
| 4 | E. Ma | Pathways to naturally small neutrino masses | PRL 81 (1998) 1171 | hep-ph/9805219 |
| 5 | Y. Cai, T. Han, T. Li, and R. Ruiz | Lepton-number violation: Seesaw models and their collider tests | Front. in Phys. 6 (2018) 40 | 1711.02180 |
| 6 | P. Minkowski | $ \mu \to \mathrm{e} \gamma $ at a rate of one out of 1-billion muon decays? | PLB 67 (1977) 421 | |
| 7 | M. Gell-Mann, P. Ramond, and R. Slansky | Complex spinors and unified theories | in Supergravity: proceedings of the Supergravity Workshop at Stony Brook, p. 341 North-Holland, Amsterdam, Netherlands | |
| 8 | T. Yanagida | Horizontal gauge symmetry and masses of neutrinos | in Proceedings of the Workshop on the Unified Theory and the Baryon Number in the Universe, p. 95 National Laboratory for High Energy Physics (KEK) | |
| 9 | R. N. Mohapatra and G. Senjanovi\ifmmode \acutec\else \'c\fi | Neutrino mass and spontaneous parity violation | PRL 44 (1980) 912 | |
| 10 | J. Schechter and J. W. F. Valle | Neutrino masses in SU(2) $ \bigotimes $ U(1) theories | PRD 22 (1980) 2227 | |
| 11 | R. E. Shrock | General theory of weak processes involving neutrinos. I. leptonic pseudoscalar-meson decays, with associated tests for, and bounds on, neutrino masses and lepton mixing | PRD 24 (1981) 1232 | |
| 12 | J. Schechter and J. W. F. Valle | Neutrino decay and spontaneous violation of lepton number | PRD 25 (1982) 774 | |
| 13 | M. Magg and C. Wetterich | Neutrino mass problem and gauge hierarchy | PLB 94 (1980) 61 | |
| 14 | R. N. Mohapatra and G. Senjanovi\ifmmode \acutec\else \'c\fi | Neutrino masses and mixings in gauge models with spontaneous parity violation | PRD 23 (1981) 165 | |
| 15 | R. Foot, H. Lew, X.-G. He, and G. C. Joshi | See-saw neutrino masses induced by a triplet of leptons | Z. Phys. C 44 (1989) 441 | |
| 16 | R. N. Mohapatra | Mechanism for understanding small neutrino mass in superstring theories | PRL 56 (1986) 561 | |
| 17 | R. N. Mohapatra and J. W. F. Valle | Neutrino mass and baryon-number nonconservation in superstring models | PRD 34 (1986) 1642 | |
| 18 | J. Bernab\'eu et al. | Lepton flavour non-conservation at high energies in a superstring inspired standard model | PLB 187 (1987) 303 | |
| 19 | M. Lindner and M. Weiser | Gauge coupling unification in left-right symmetric models | PLB 383 (1996) 405 | hep-ph/9605353 |
| 20 | T. Appelquist and R. Shrock | Neutrino masses in theories with dynamical electroweak symmetry breaking | PLB 548 (2002) 204 | hep-ph/0204141 |
| 21 | T. Appelquist and R. Shrock | Dynamical symmetry breaking of extended gauge symmetries | PRL 90 (2003) 201801 | hep-ph/0301108 |
| 22 | T. Asaka, S. Blanchet, and M. Shaposhnikov | The nuMSM, dark matter and neutrino masses | PLB 631 (2005) 151 | hep-ph/0503065 |
| 23 | T. Asaka and M. Shaposhnikov | The nuMSM, dark matter and baryon asymmetry of the universe | PLB 620 (2005) 17 | hep-ph/0505013 |
| 24 | W.-Y. Keung and G. Senjanovic | Majorana neutrinos and the production of the right-handed charged gauge boson | PRL 50 (1983) 1427 | |
| 25 | D. A. Dicus, D. D. Karatas, and P. Roy | Lepton nonconservation at supercollider energies | PRD 44 (1991) 2033 | |
| 26 | A. Datta, M. Guchait, and A. Pilaftsis | Probing lepton number violation via Majorana neutrinos at hadron supercolliders | PRD 50 (1994) 3195 | hep-ph/9311257 |
| 27 | F. M. L. Almeida, Y. A. Coutinho, J. A. M. Sim\ oes, and M. A. B. d. Vale | Signature for heavy Majorana neutrinos in hadronic collisions | PRD 62 (2000) 075004 | hep-ph/0002024 |
| 28 | O. Panella, M. Cannoni, C. Carimalo, and Y. N. Srivastava | Signals of heavy Majorana neutrinos at hadron colliders | PRD 65 (2002) 035005 | hep-ph/0107308 |
| 29 | F. F. Deppisch, P. S. Bhupal Dev, and A. Pilaftsis | Neutrinos and collider physics | New J. Phys. 17 (2015) 075019 | 1502.06541 |
| 30 | DELPHI Collaboration | Search for neutral heavy leptons produced in Z decays | Z. Phys. C 74 (1997) 57 | |
| 31 | L3 Collaboration | Search for isosinglet neutral heavy leptons in Z$ ^0 $ decays | PLB 295 (1992) 371 | |
| 32 | L3 Collaboration | Search for heavy isosinglet neutrino in $ \mathrm{e}^{+} \mathrm{e}^{-} $ annihilation at LEP | PLB 517 (2001) 67 | hep-ex/0107014 |
| 33 | LHCb Collaboration | Search for Majorana neutrinos in $ B^- \to \pi^+\mu^-\mu^- $ decays | PRL 112 (2014) 131802 | 1401.5361 |
| 34 | CMS Collaboration | Search for heavy Majorana neutrinos in $ \mu^\pm \mu^\pm+ $ jets events in proton-proton collisions at $ \sqrt{s} = $ 8 TeV | PLB 748 (2015) 144 | CMS-EXO-12-057 1501.05566 |
| 35 | CMS Collaboration | Search for heavy Majorana neutrinos in ee + jets and e$ \mu $ + jets events in proton-proton collisions at $ \sqrt{s} = $ 8 TeV | JHEP 04 (2016) 169 | CMS-EXO-14-014 1603.02248 |
| 36 | ATLAS Collaboration | Search for heavy Majorana neutrinos with the ATLAS detector in pp collisions at $ \sqrt{s} = $ 8 TeV | JHEP 07 (2015) 162 | 1506.06020 |
| 37 | CMS Collaboration | Search for heavy neutral leptons in events with three charged leptons in proton-proton collisions at $ \sqrt{s}= $ 13 TeV | PRL 120 (2018) 221801 | CMS-EXO-17-012 1802.02965 |
| 38 | A. Atre, T. Han, S. Pascoli, and B. Zhang | The search for heavy Majorana neutrinos | JHEP 05 (2009) 030 | 0901.3589 |
| 39 | P. S. B. Dev, A. Pilaftsis, and U.-k. Yang | New production mechanism for heavy neutrinos at the LHC | PRL 112 (2014) 081801 | 1308.2209 |
| 40 | D. Alva, T. Han, and R. Ruiz | Heavy Majorana neutrinos from W$ \gamma $ fusion at hadron colliders | JHEP 02 (2015) 072 | 1411.7305 |
| 41 | A. Das, P. Konar, and A. Thalapillil | Jet substructure shedding light on heavy Majorana neutrinos at the LHC | JHEP 02 (2018) 083 | 1709.09712 |
| 42 | CMS Collaboration | The CMS trigger system | JINST 12 (2017) P01020 | CMS-TRG-12-001 1609.02366 |
| 43 | CMS Collaboration | The CMS experiment at the CERN LHC | JINST 3 (2008) S08004 | CMS-00-001 |
| 44 | J. Alwall et al. | The automated computation of tree-level and next-to-leading order differential cross sections, and their matching to parton shower simulations | JHEP 07 (2014) 079 | 1405.0301 |
| 45 | J. M. Campbell and R. K. Ellis | MCFM for the Tevatron and the LHC | NPPS 205-206 (2010) 10 | 1007.3492 |
| 46 | P. Nason | A New method for combining NLO QCD with shower Monte Carlo algorithms | JHEP 11 (2004) 040 | hep-ph/0409146 |
| 47 | S. Frixione, P. Nason, and C. Oleari | Matching NLO QCD computations with parton shower simulations: the POWHEG method | JHEP 11 (2007) 070 | 0709.2092 |
| 48 | S. Alioli, P. Nason, C. Oleari, and E. Re | A general framework for implementing NLO calculations in shower Monte Carlo programs: the POWHEG BOX | JHEP 06 (2010) 043 | 1002.2581 |
| 49 | P. Nason and G. Zanderighi | $ W^+ W^- $ , $ W Z $ and $ Z Z $ production in the POWHEG-BOX-V2 | EPJC 74 (2014) 2702 | 1311.1365 |
| 50 | R. D. Ball et al. | Parton distributions for the LHC run II | JHEP 04 (2015) 040 | 1410.8849 |
| 51 | T. Sj$\ddot\mathrmo$strand et al. | An introduction to PYTHIA 8.2 | CPC 191 (2015) 159 | 1410.3012 |
| 52 | CMS Collaboration | Event generator tunes obtained from underlying event and multiparton scattering measurements | EPJC 76 (2016) 155 | CMS-GEN-14-001 1512.00815 |
| 53 | GEANT4 Collaboration | GEANT4--a simulation toolkit | NIMA 506 (2003) 250 | |
| 54 | J. Alwall et al. | Comparative study of various algorithms for the merging of parton showers and matrix elements in hadronic collisions | EPJC 53 (2008) 473 | 0706.2569 |
| 55 | R. Frederix and S. Frixione | Merging meets matching in MC@NLO | JHEP 12 (2012) 061 | 1209.6215 |
| 56 | P. Artoisenet, R. Frederix, O. Mattelaer, and R. Rietkerk | Automatic spin-entangled decays of heavy resonances in Monte Carlo simulations | JHEP 03 (2013) 15 | 1212.3460 |
| 57 | C. Degrande, O. Mattelaer, R. Ruiz, and J. Turner | Fully automated precision predictions for heavy neutrino production mechanisms at hadron colliders | PRD 94 (2016) 053002 | 1602.06957 |
| 58 | A. Das, P. Konar, and S. Majhi | Production of heavy neutrino in next-to-leading order QCD at the LHC and beyond | JHEP 06 (2016) 019 | 1604.00608 |
| 59 | A. Manohar, P. Nason, G. P. Salam, and G. Zanderighi | How bright is the proton? A precise determination of the photon parton distribution function | PRL 117 (2016) 242002 | 1607.04266 |
| 60 | M. Cacciari, G. P. Salam, and G. Soyez | The anti-$ k_{\mathrm{T}} $ jet clustering algorithm | JHEP 04 (2008) 063 | 0802.1189 |
| 61 | M. Cacciari, G. P. Salam, and G. Soyez | FastJet user manual | EPJC 72 (2012) 1896 | 1111.6097 |
| 62 | CMS Collaboration | Particle-flow reconstruction and global event description with the CMS detector | JINST 12 (2017) P10003 | CMS-PRF-14-001 1706.04965 |
| 63 | CMS Collaboration | Performance of electron reconstruction and selection with the CMS detector in proton-proton collisions at $ \sqrt{s} = $ 8 TeV | JINST 10 (2015) P06005 | CMS-EGM-13-001 1502.02701 |
| 64 | CMS Collaboration | Performance of CMS muon reconstruction in pp collision events at $ \sqrt{s} $~= 7 TeV | JINST 7 (2012) P10002 | CMS-MUO-10-004 1206.4071 |
| 65 | E. Akhmedov et al. | Improving electro-weak fits with TeV-scale sterile neutrinos | JHEP 05 (2013) 081 | 1302.1872 |
| 66 | CMS Collaboration | Jet energy scale and resolution in the CMS experiment in pp collisions at 8 TeV | JINST 12 (2017) P02014 | CMS-JME-13-004 1607.03663 |
| 67 | CMS Collaboration | Jet algorithms performance in 13 TeV data | CMS-PAS-JME-16-003 | CMS-PAS-JME-16-003 |
| 68 | S. D. Ellis, C. K. Vermilion, and J. R. Walsh | Techniques for improved heavy particle searches with jet substructure | PRD 80 (2009) 051501 | 0903.5081 |
| 69 | S. D. Ellis, C. K. Vermilion, and J. R. Walsh | Recombination algorithms and jet substructure: Pruning as a tool for heavy particle searches | PRD 81 (2010) 094023 | 0912.0033 |
| 70 | Y. L. Dokshitzer, G. D. Leder, S. Moretti, and B. R. Webber | Better jet clustering algorithms | JHEP 08 (1997) 001 | hep-ph/9707323 |
| 71 | M. Wobisch and T. Wengler | Hadronization corrections to jet cross-sections in deep inelastic scattering | in Monte Carlo generators for HERA physics. Proceedings, Workshop, Hamburg, Germany, 1998-1999, p. 270 1998 | hep-ph/9907280 |
| 72 | J. Thaler and K. Van Tilburg | Maximizing boosted top identification by minimizing $ N $-subjettiness | JHEP 02 (2012) 093 | 1108.2701 |
| 73 | CMS Collaboration | Identification of heavy-flavour jets with the CMS detector in pp collisions at 13 TeV | JINST 13 (2018) P05011 | CMS-BTV-16-002 1712.07158 |
| 74 | G. Punzi | Sensitivity of searches for new signals and its optimization | in Statistical Problems in Particle Physics, Astrophysics, and Cosmology, p. 79 2003 | physics/0308063 |
| 75 | CMS Collaboration | Performance of CMS muon reconstruction in cosmic-ray events | JINST 5 (2010) T03022 | CMS-CFT-09-014 0911.4994 |
| 76 | A. Bierweiler, T. Kasprzik, and J. H. Kuhn | Vector-boson pair production at the LHC to $ \mathcal{O} $($ \alpha^{3} $) accuracy | JHEP 12 (2013) 071 | 1305.5402 |
| 77 | S. Gieseke, T. Kasprzik, and J. H. Kuhn | Vector-boson pair production and electroweak corrections in HERWIG++ | EPJC 74 (2014) 2988 | 1401.3964 |
| 78 | J. Baglio, L. D. Ninh, and M. M. Weber | Massive gauge boson pair production at the LHC: A next-to-leading order story | PRD 88 (2013) 113005 | 1307.4331 |
| 79 | CMS Collaboration | CMS luminosity measurements for the 2016 data taking period | CMS-PAS-LUM-17-001 | CMS-PAS-LUM-17-001 |
| 80 | J. Butterworth et al. | PDF4LHC recommendations for LHC run II | JPG 43 (2016) 023001 | 1510.03865 |
| 81 | T. Junk | Confidence level computation for combining searches with small statistics | NIMA 434 (1999) 435 | hep-ex/9902006 |
| 82 | A. L. Read | Presentation of search results: the CL$ _{\mathrm{s}} $ technique | JPG 28 (2002) 2693 | |
| 83 | J. de Blas | Electroweak limits on physics beyond the Standard Model | in European Physical Journal Web of Conferences, volume 60 of European Physical Journal Web of Conferences, p. 19008 November | 1307.6173 |
|
|
Compact Muon Solenoid LHC, CERN |
|

|

|

|

|

|