

Compact Muon Solenoid
LHC, CERN
| CMS-HIG-15-010 ; CERN-EP-2016-125 | ||
| Measurement of the transverse momentum spectrum of the Higgs boson produced in pp collisions at $ \sqrt{s} = $ 8 TeV using $\mathrm{ H }\to\mathrm{ W }\mathrm{ W }$ decays | ||
| CMS Collaboration | ||
| 5 June 2016 | ||
| JHEP 03 (2017) 032 | ||
| Abstract: The cross section for Higgs boson production in pp collisions is studied using the $\mathrm{ H } \to \mathrm{ W }^+ \mathrm{ W }^-$ decay mode, followed by leptonic decays of the W bosons to an oppositely charged electron-muon pair in the final state. The measurements are performed using data collected by the CMS experiment at the LHC at a centre-of-mass energy of 8 TeV, corresponding to an integrated luminosity of 19.4 fb$^{-1}$. The Higgs boson transverse momentum ($p_{\mathrm{T}}$) is reconstructed using the lepton pair $p_{\mathrm{T}}$ and missing $p_{\mathrm{T}}$. The differential cross section times branching fraction is measured as a function of the Higgs boson $p_{\mathrm{T}}$ in a fiducial phase space defined to match the experimental acceptance in terms of the lepton kinematics and event topology. The production cross section times branching fraction in the fiducial phase space is measured to be 39 $\pm$ 8 (stat) $\pm$ 9 (syst) fb. The measurements are found to agree, within experimental uncertainties, with theoretical calculations based on the standard model. | ||
| Links: e-print arXiv:1606.01522 [hep-ex] (PDF) ; CDS record ; inSPIRE record ; HepData record ; CADI line (restricted) ; | ||
| Figures | |
png pdf |
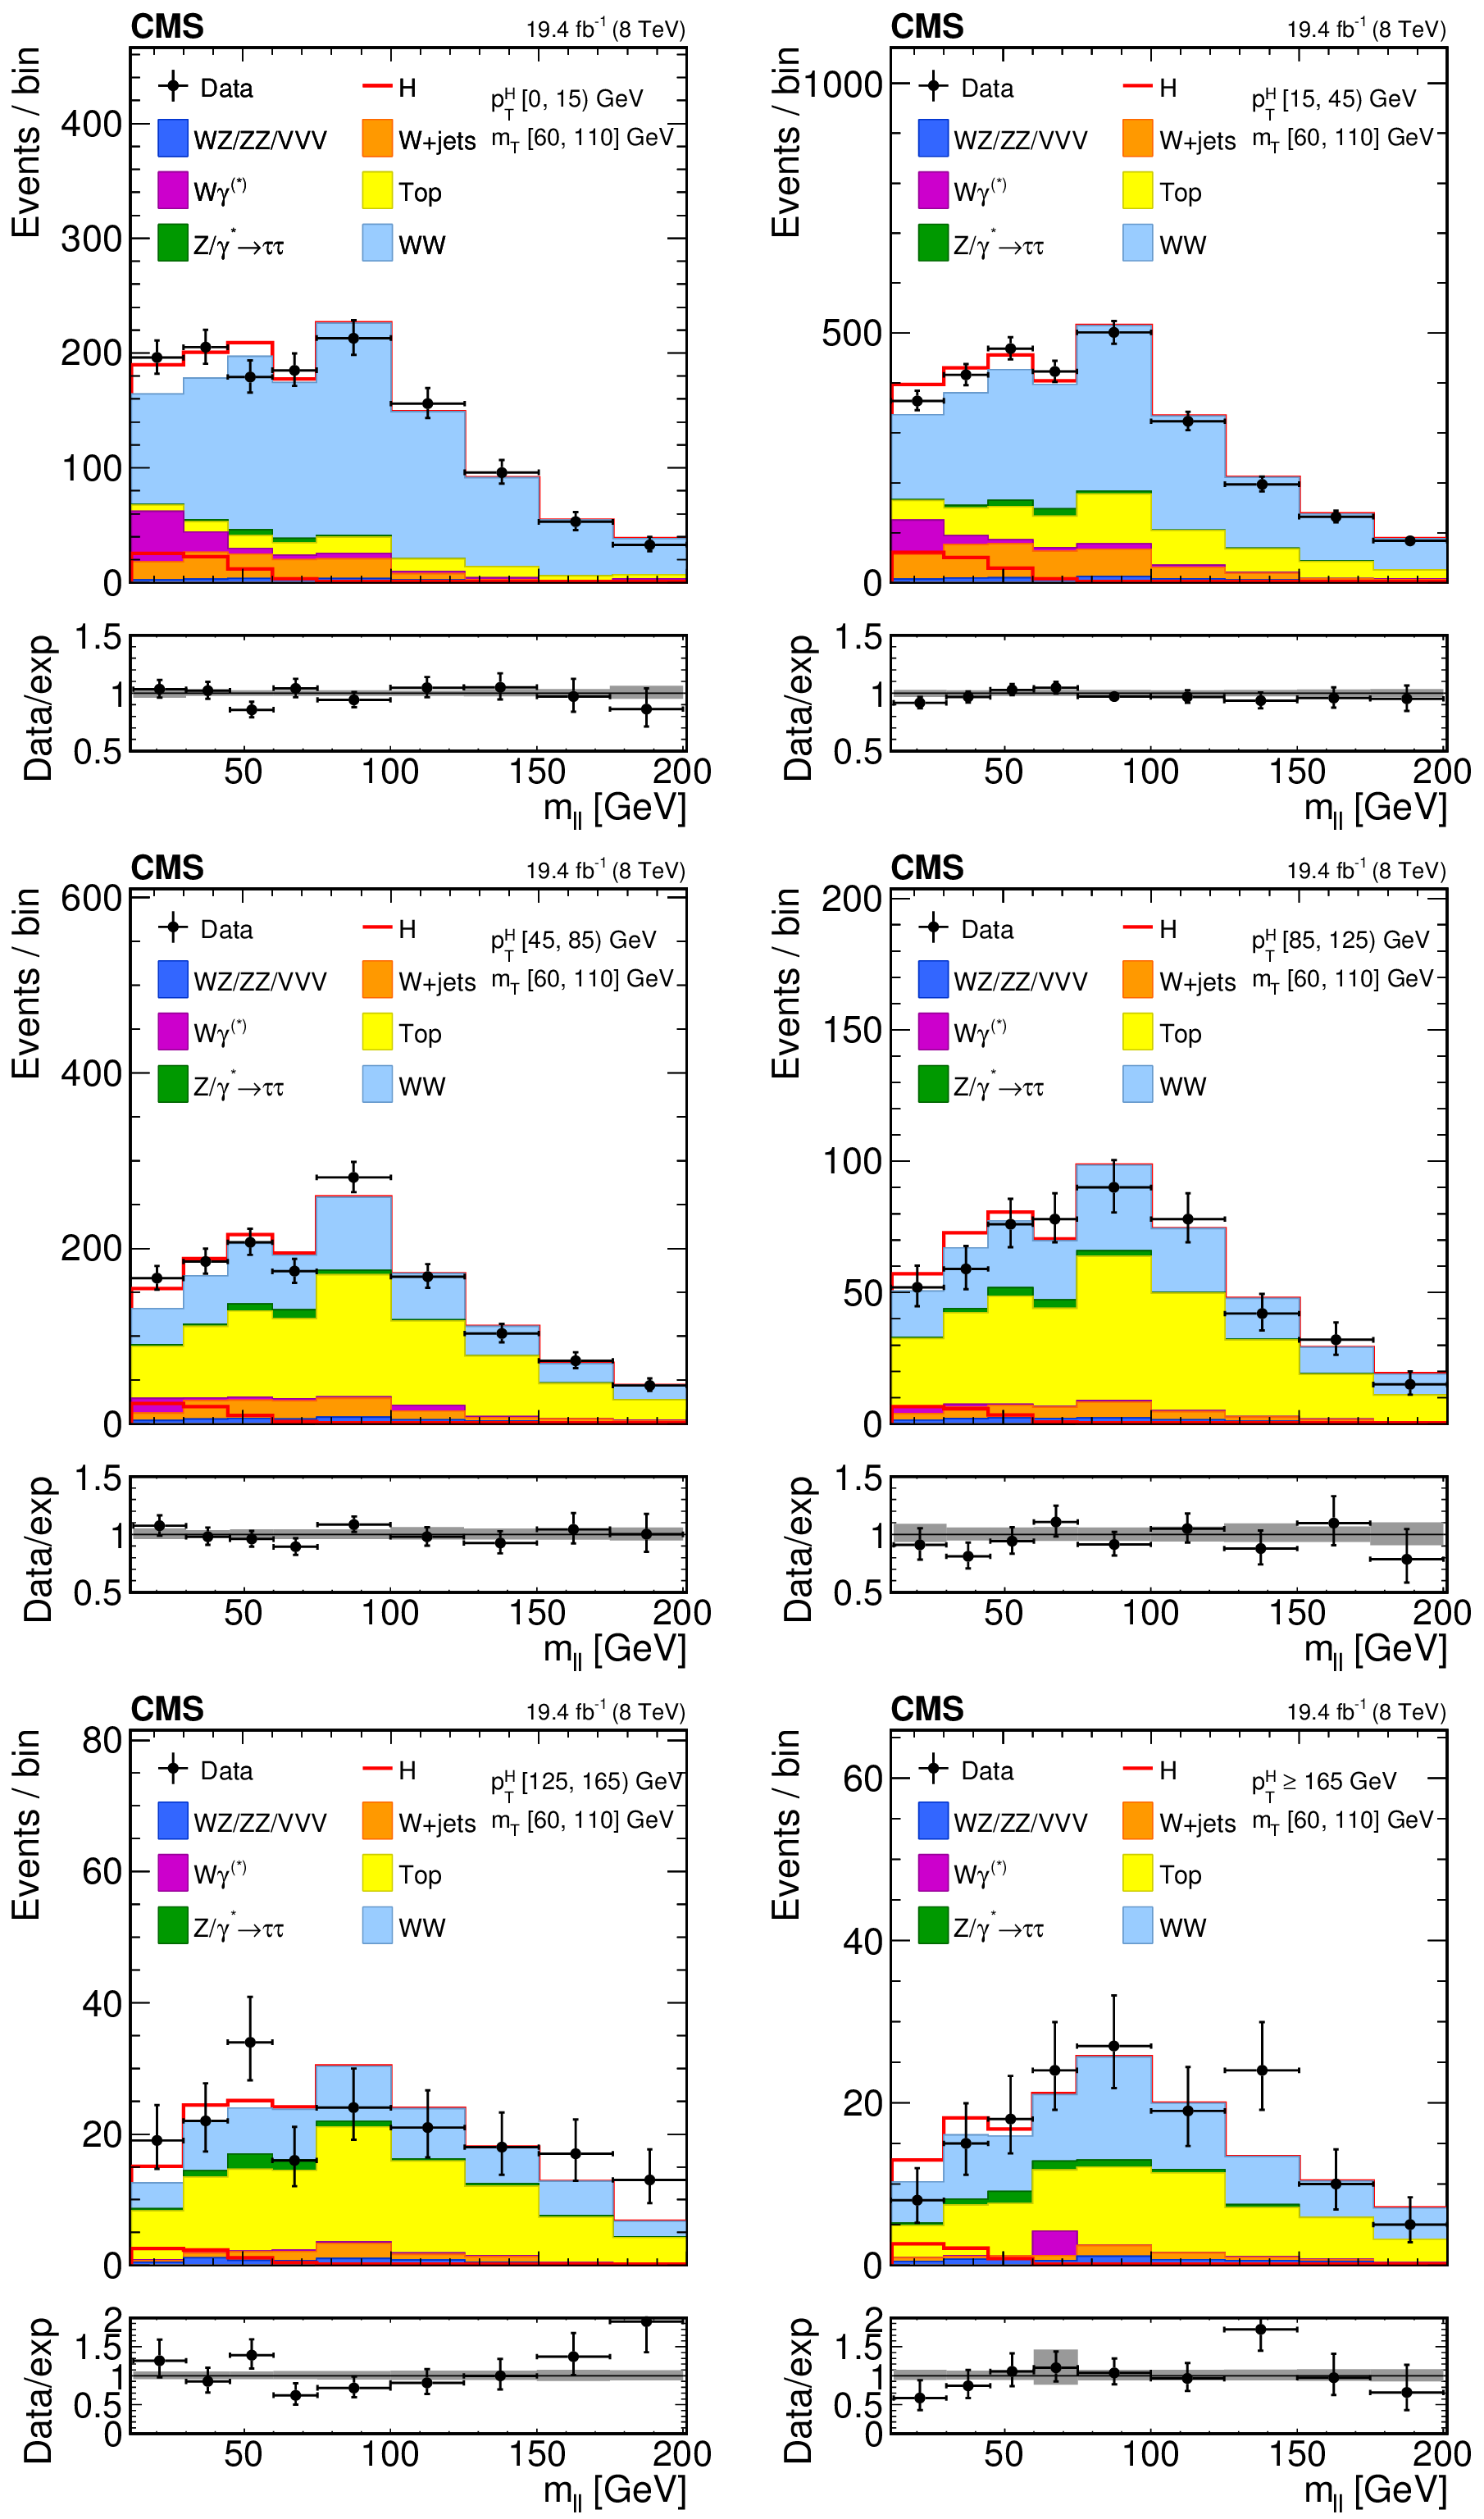
Figure 1:
Distributions of the ${m_{\ell \ell }}$ variable in each of the six ${p_{\mathrm {T}}^{\mathrm {H}}}$ bins. Background normalizations correspond to the values obtained from the fit. Signal normalization is fixed to the SM expectation. The distributions are shown in an ${m_\mathrm {T}}$ window of [60,110] GeV in order to emphasize the Higgs boson (H) signal. The signal contribution is shown both stacked on top of the background and superimposed to it. Ratios of the expected and observed event yields in individual bins are shown in the panels below the plots. The uncertainty band shown in the ratio plot corresponds to the envelope of systematic uncertainties after performing the fit to the data. |
png pdf |
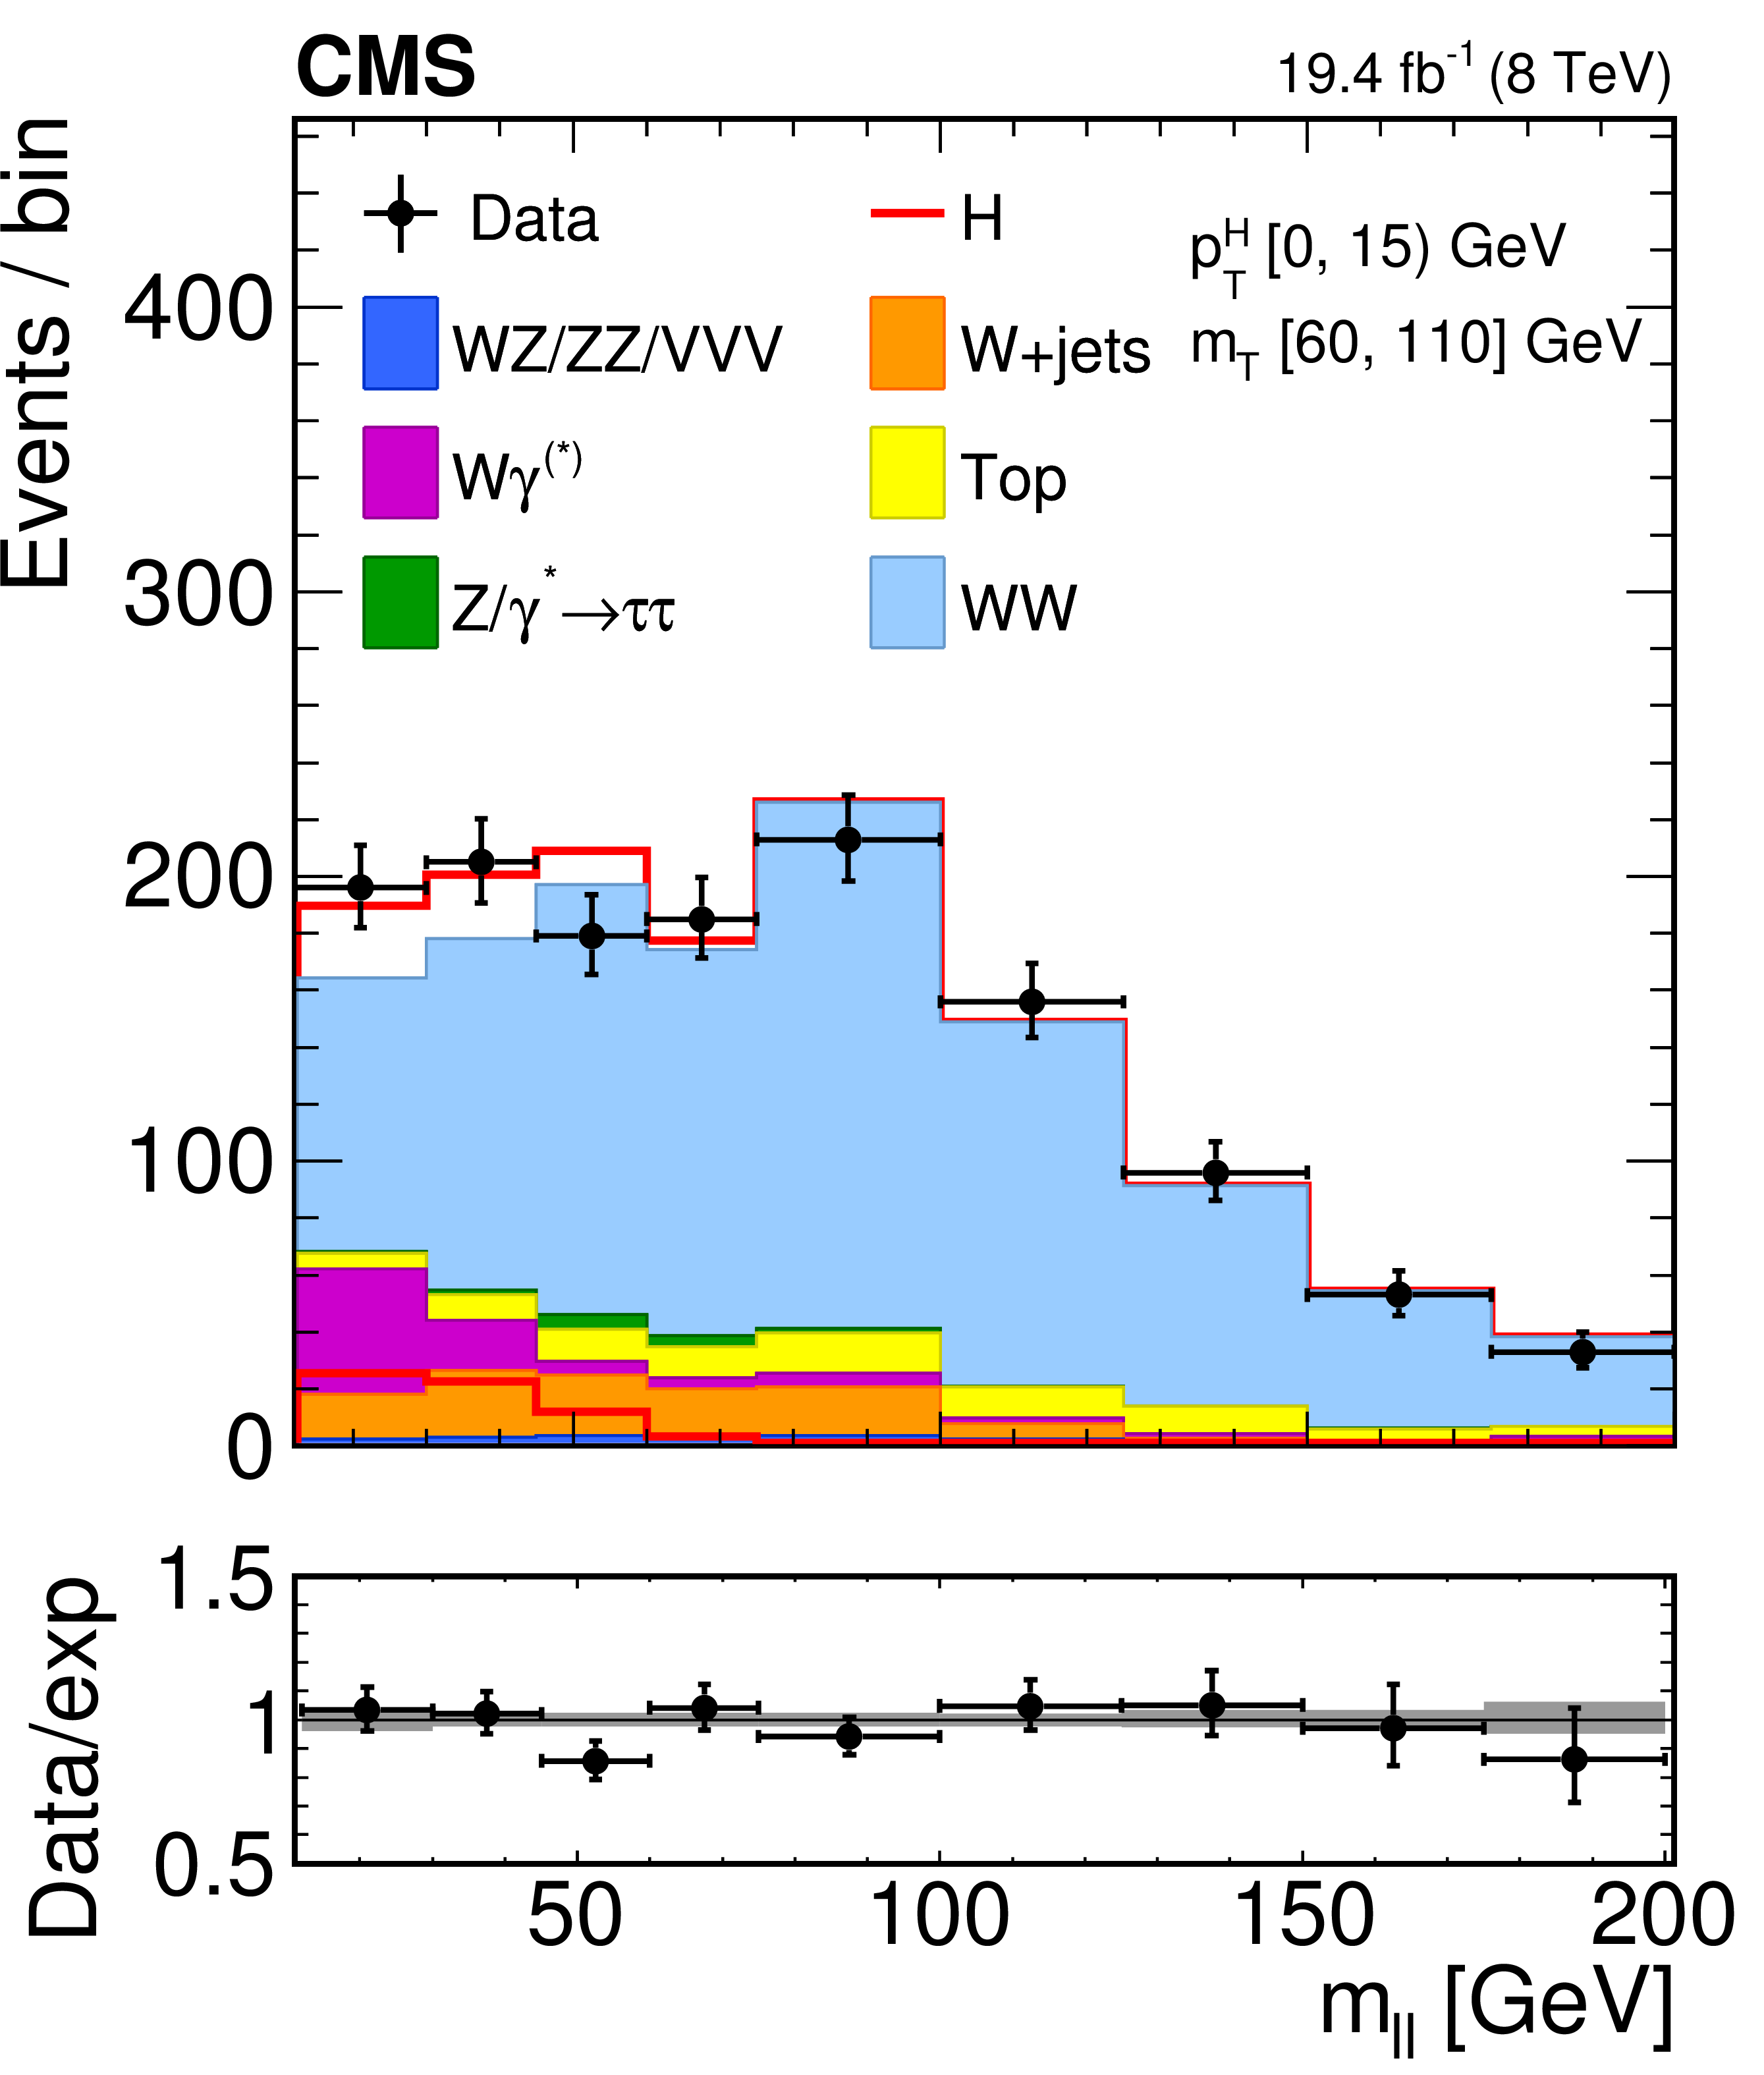
Figure 1-a:
Distribution of the ${m_{\ell \ell }}$ variable in the [0,15] GeV ${p_{\mathrm {T}}^{\mathrm {H}}}$ bin. Background normalizations correspond to the values obtained from the fit. Signal normalization is fixed to the SM expectation. The distributions are shown in an ${m_\mathrm {T}}$ window of [60,110] GeV in order to emphasize the Higgs boson (H) signal. The signal contribution is shown both stacked on top of the background and superimposed to it. Ratios of the expected and observed event yields in individual bins are shown in the panels below the plots. The uncertainty band shown in the ratio plot corresponds to the envelope of systematic uncertainties after performing the fit to the data. |
png pdf |
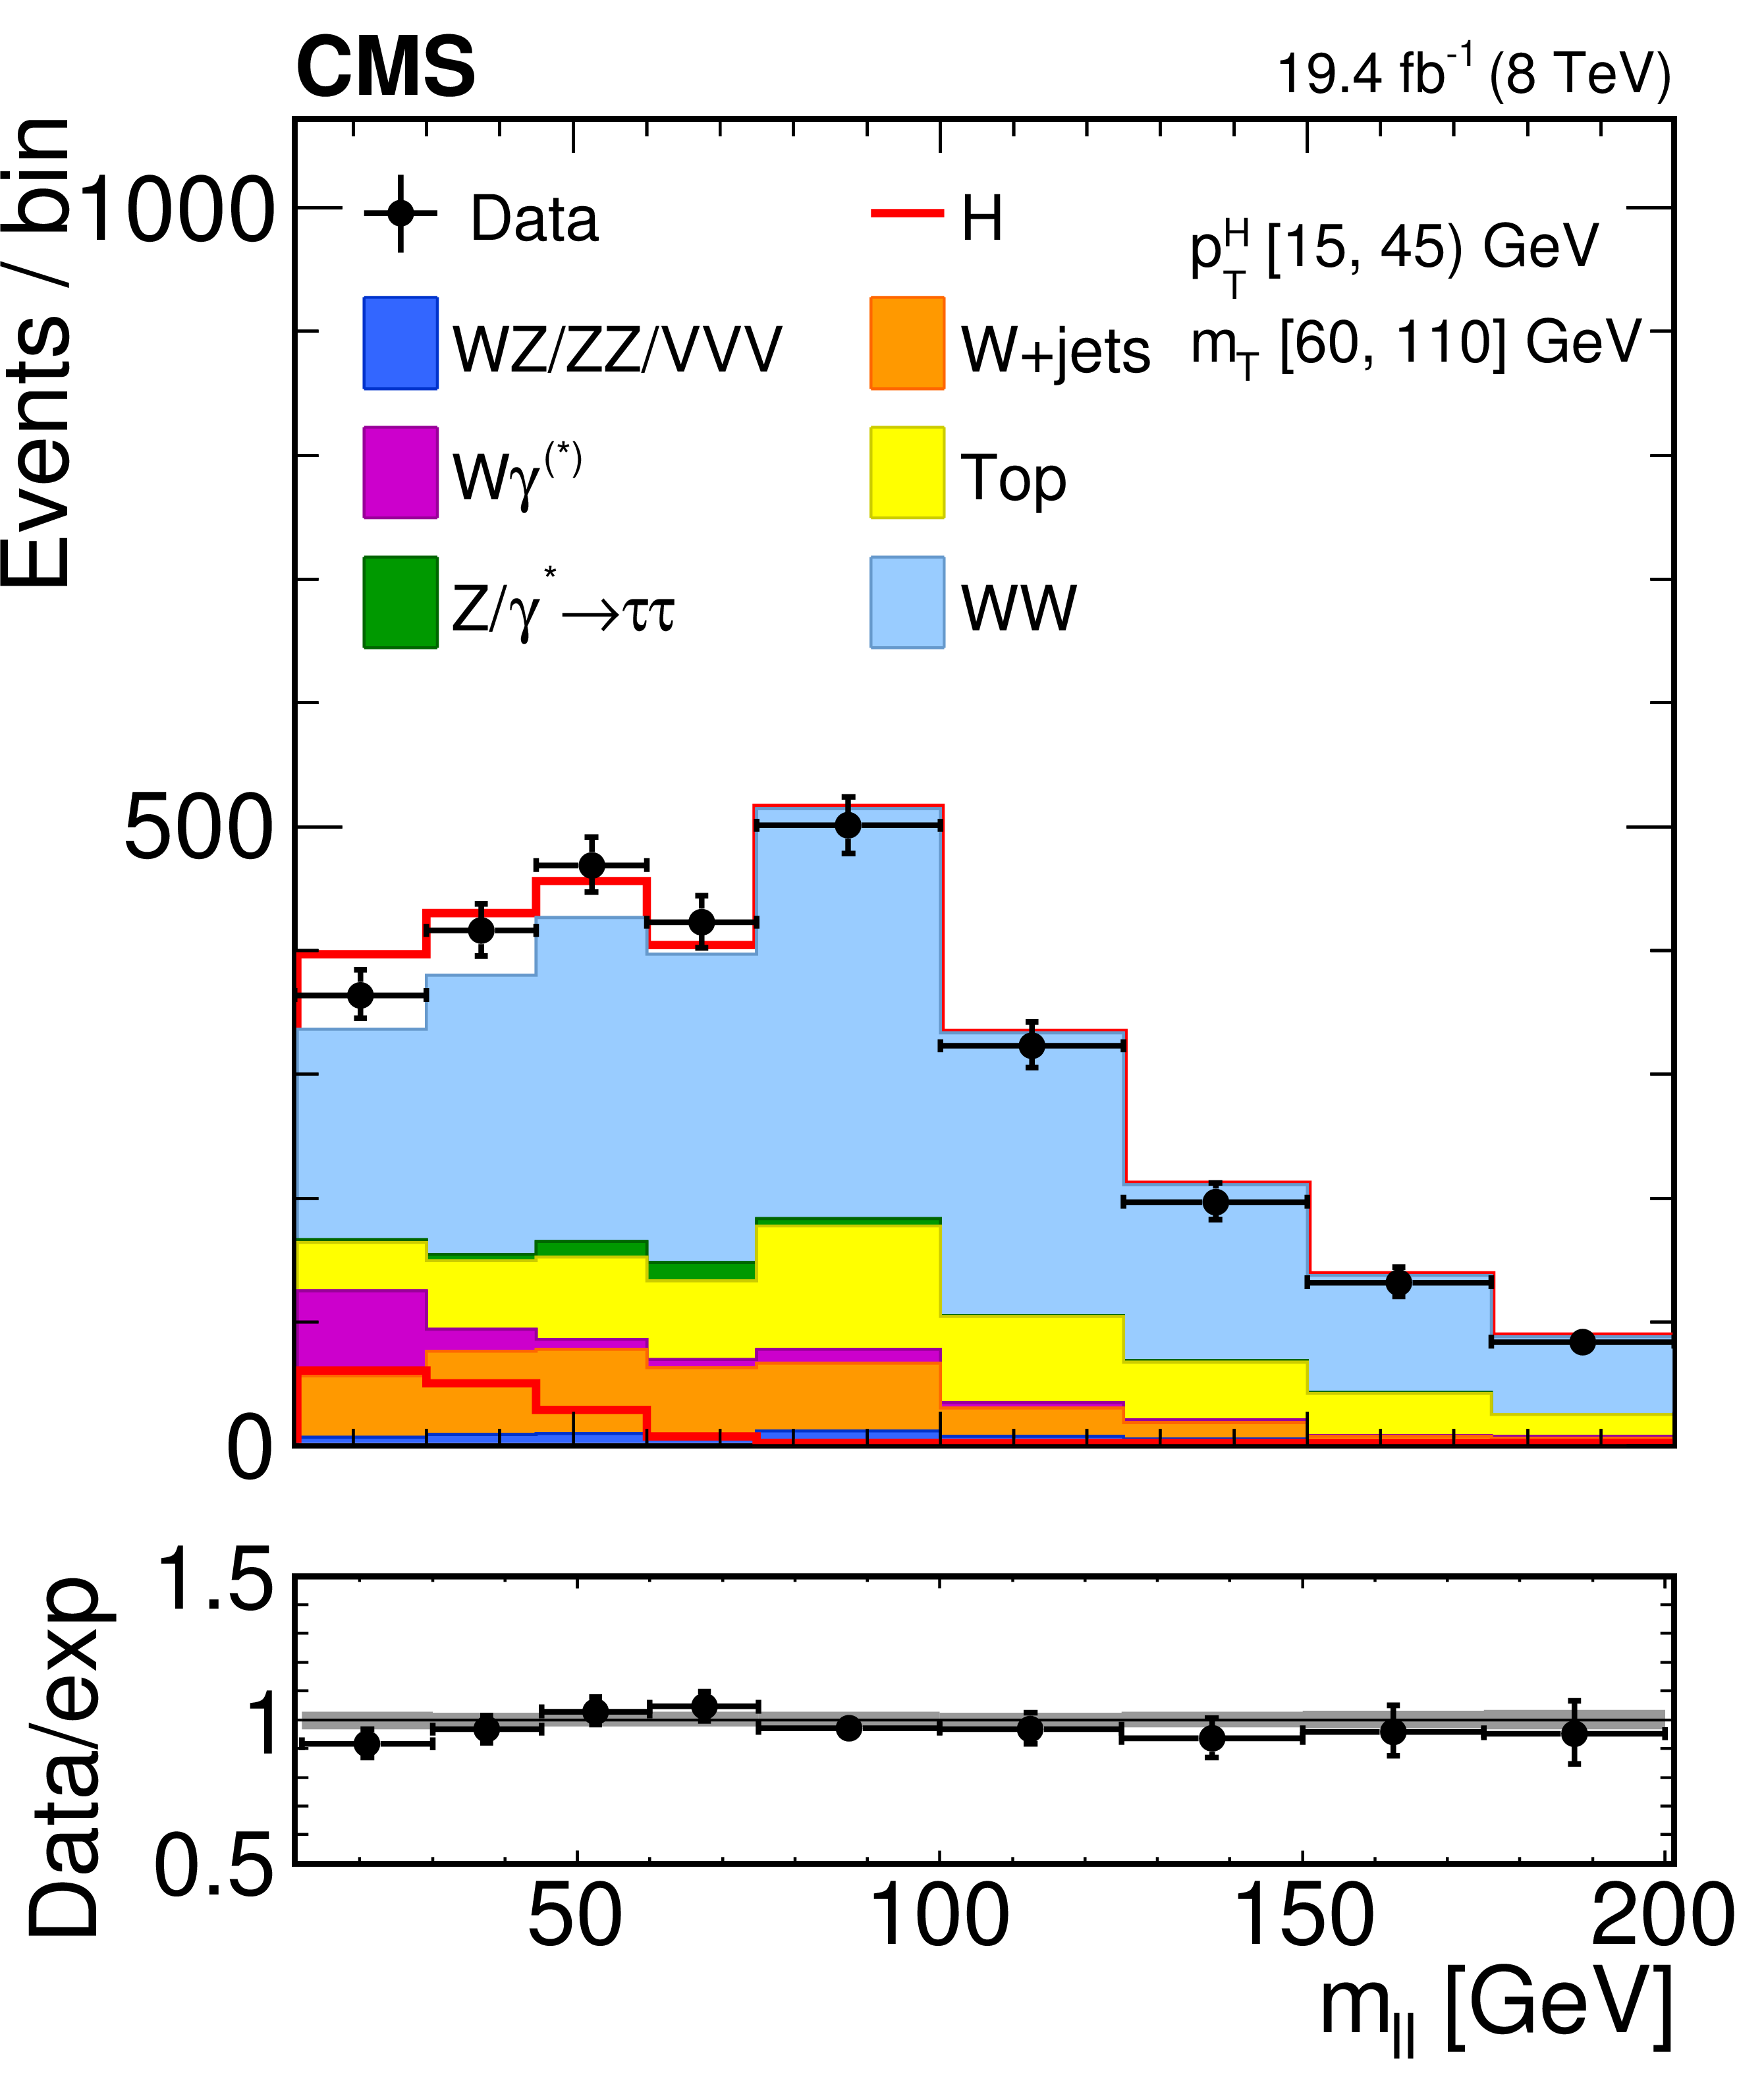
Figure 1-b:
Distribution of the ${m_{\ell \ell }}$ variable in the [15,45] GeV ${p_{\mathrm {T}}^{\mathrm {H}}}$ bin. Background normalizations correspond to the values obtained from the fit. Signal normalization is fixed to the SM expectation. The distributions are shown in an ${m_\mathrm {T}}$ window of [60,110] GeV in order to emphasize the Higgs boson (H) signal. The signal contribution is shown both stacked on top of the background and superimposed to it. Ratios of the expected and observed event yields in individual bins are shown in the panels below the plots. The uncertainty band shown in the ratio plot corresponds to the envelope of systematic uncertainties after performing the fit to the data. |
png pdf |
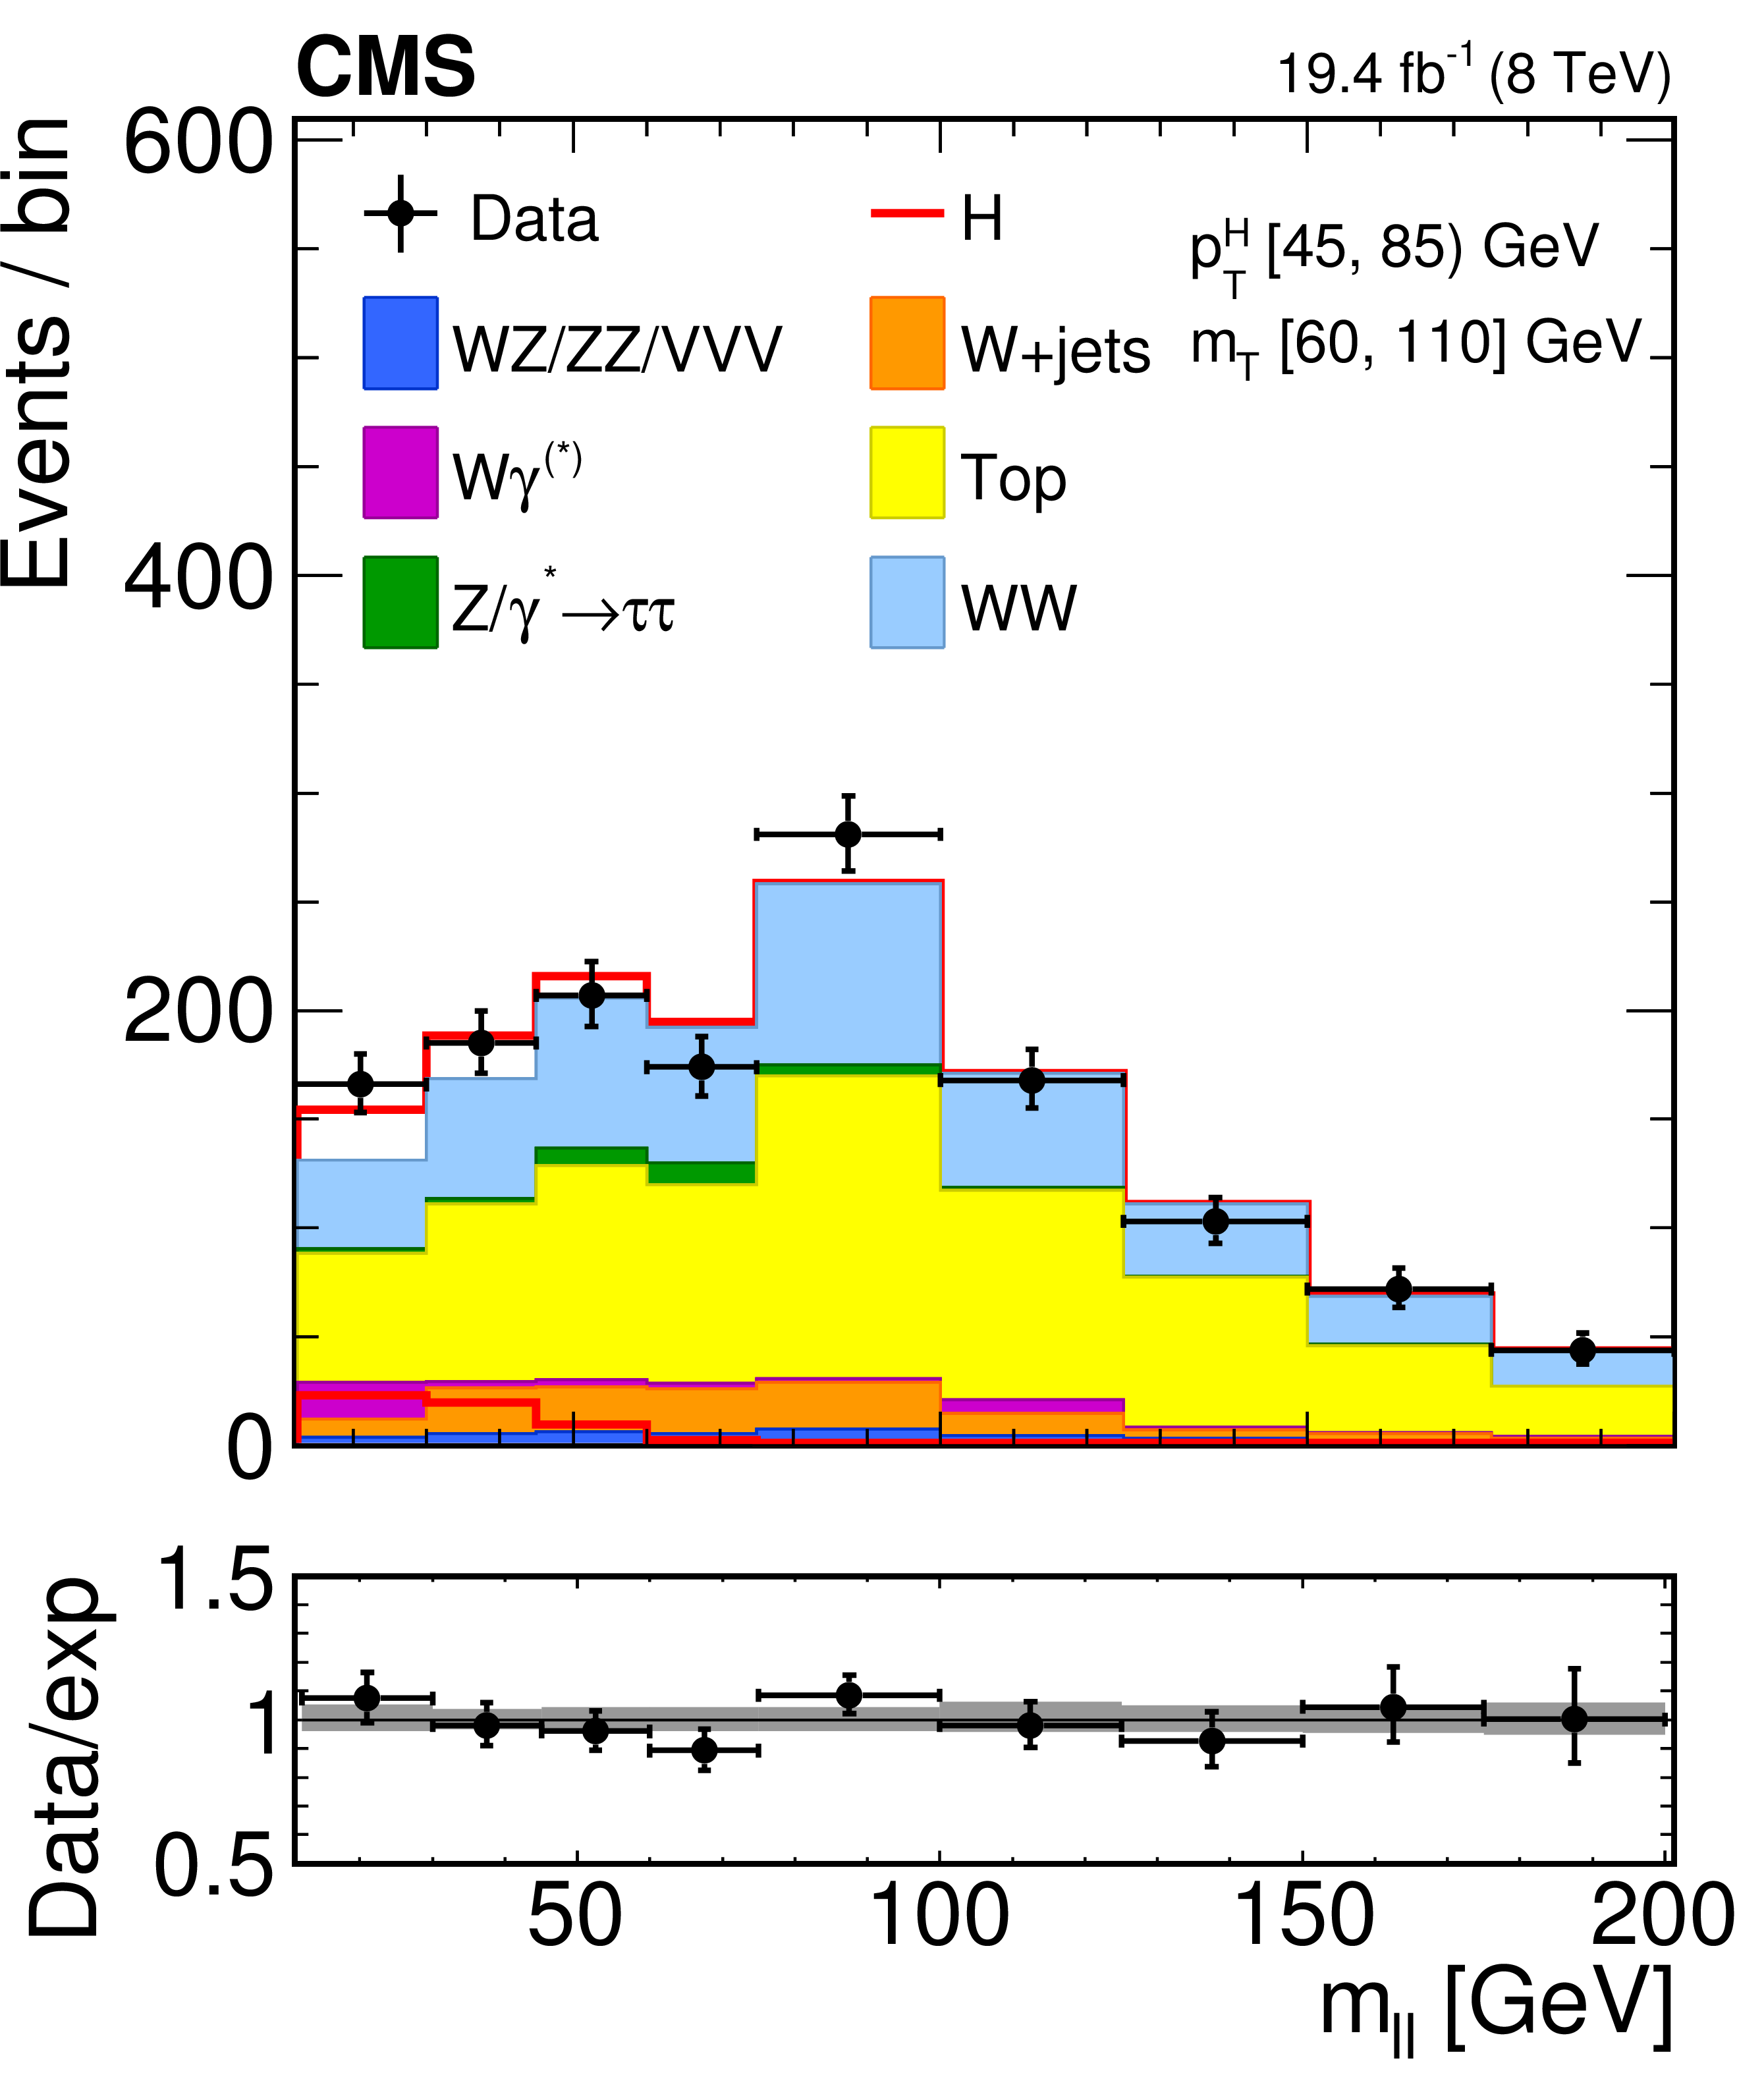
Figure 1-c:
Distribution of the ${m_{\ell \ell }}$ variable in the [45,85] GeV ${p_{\mathrm {T}}^{\mathrm {H}}}$ bin. Background normalizations correspond to the values obtained from the fit. Signal normalization is fixed to the SM expectation. The distributions are shown in an ${m_\mathrm {T}}$ window of [60,110] GeV in order to emphasize the Higgs boson (H) signal. The signal contribution is shown both stacked on top of the background and superimposed to it. Ratios of the expected and observed event yields in individual bins are shown in the panels below the plots. The uncertainty band shown in the ratio plot corresponds to the envelope of systematic uncertainties after performing the fit to the data. |
png pdf |
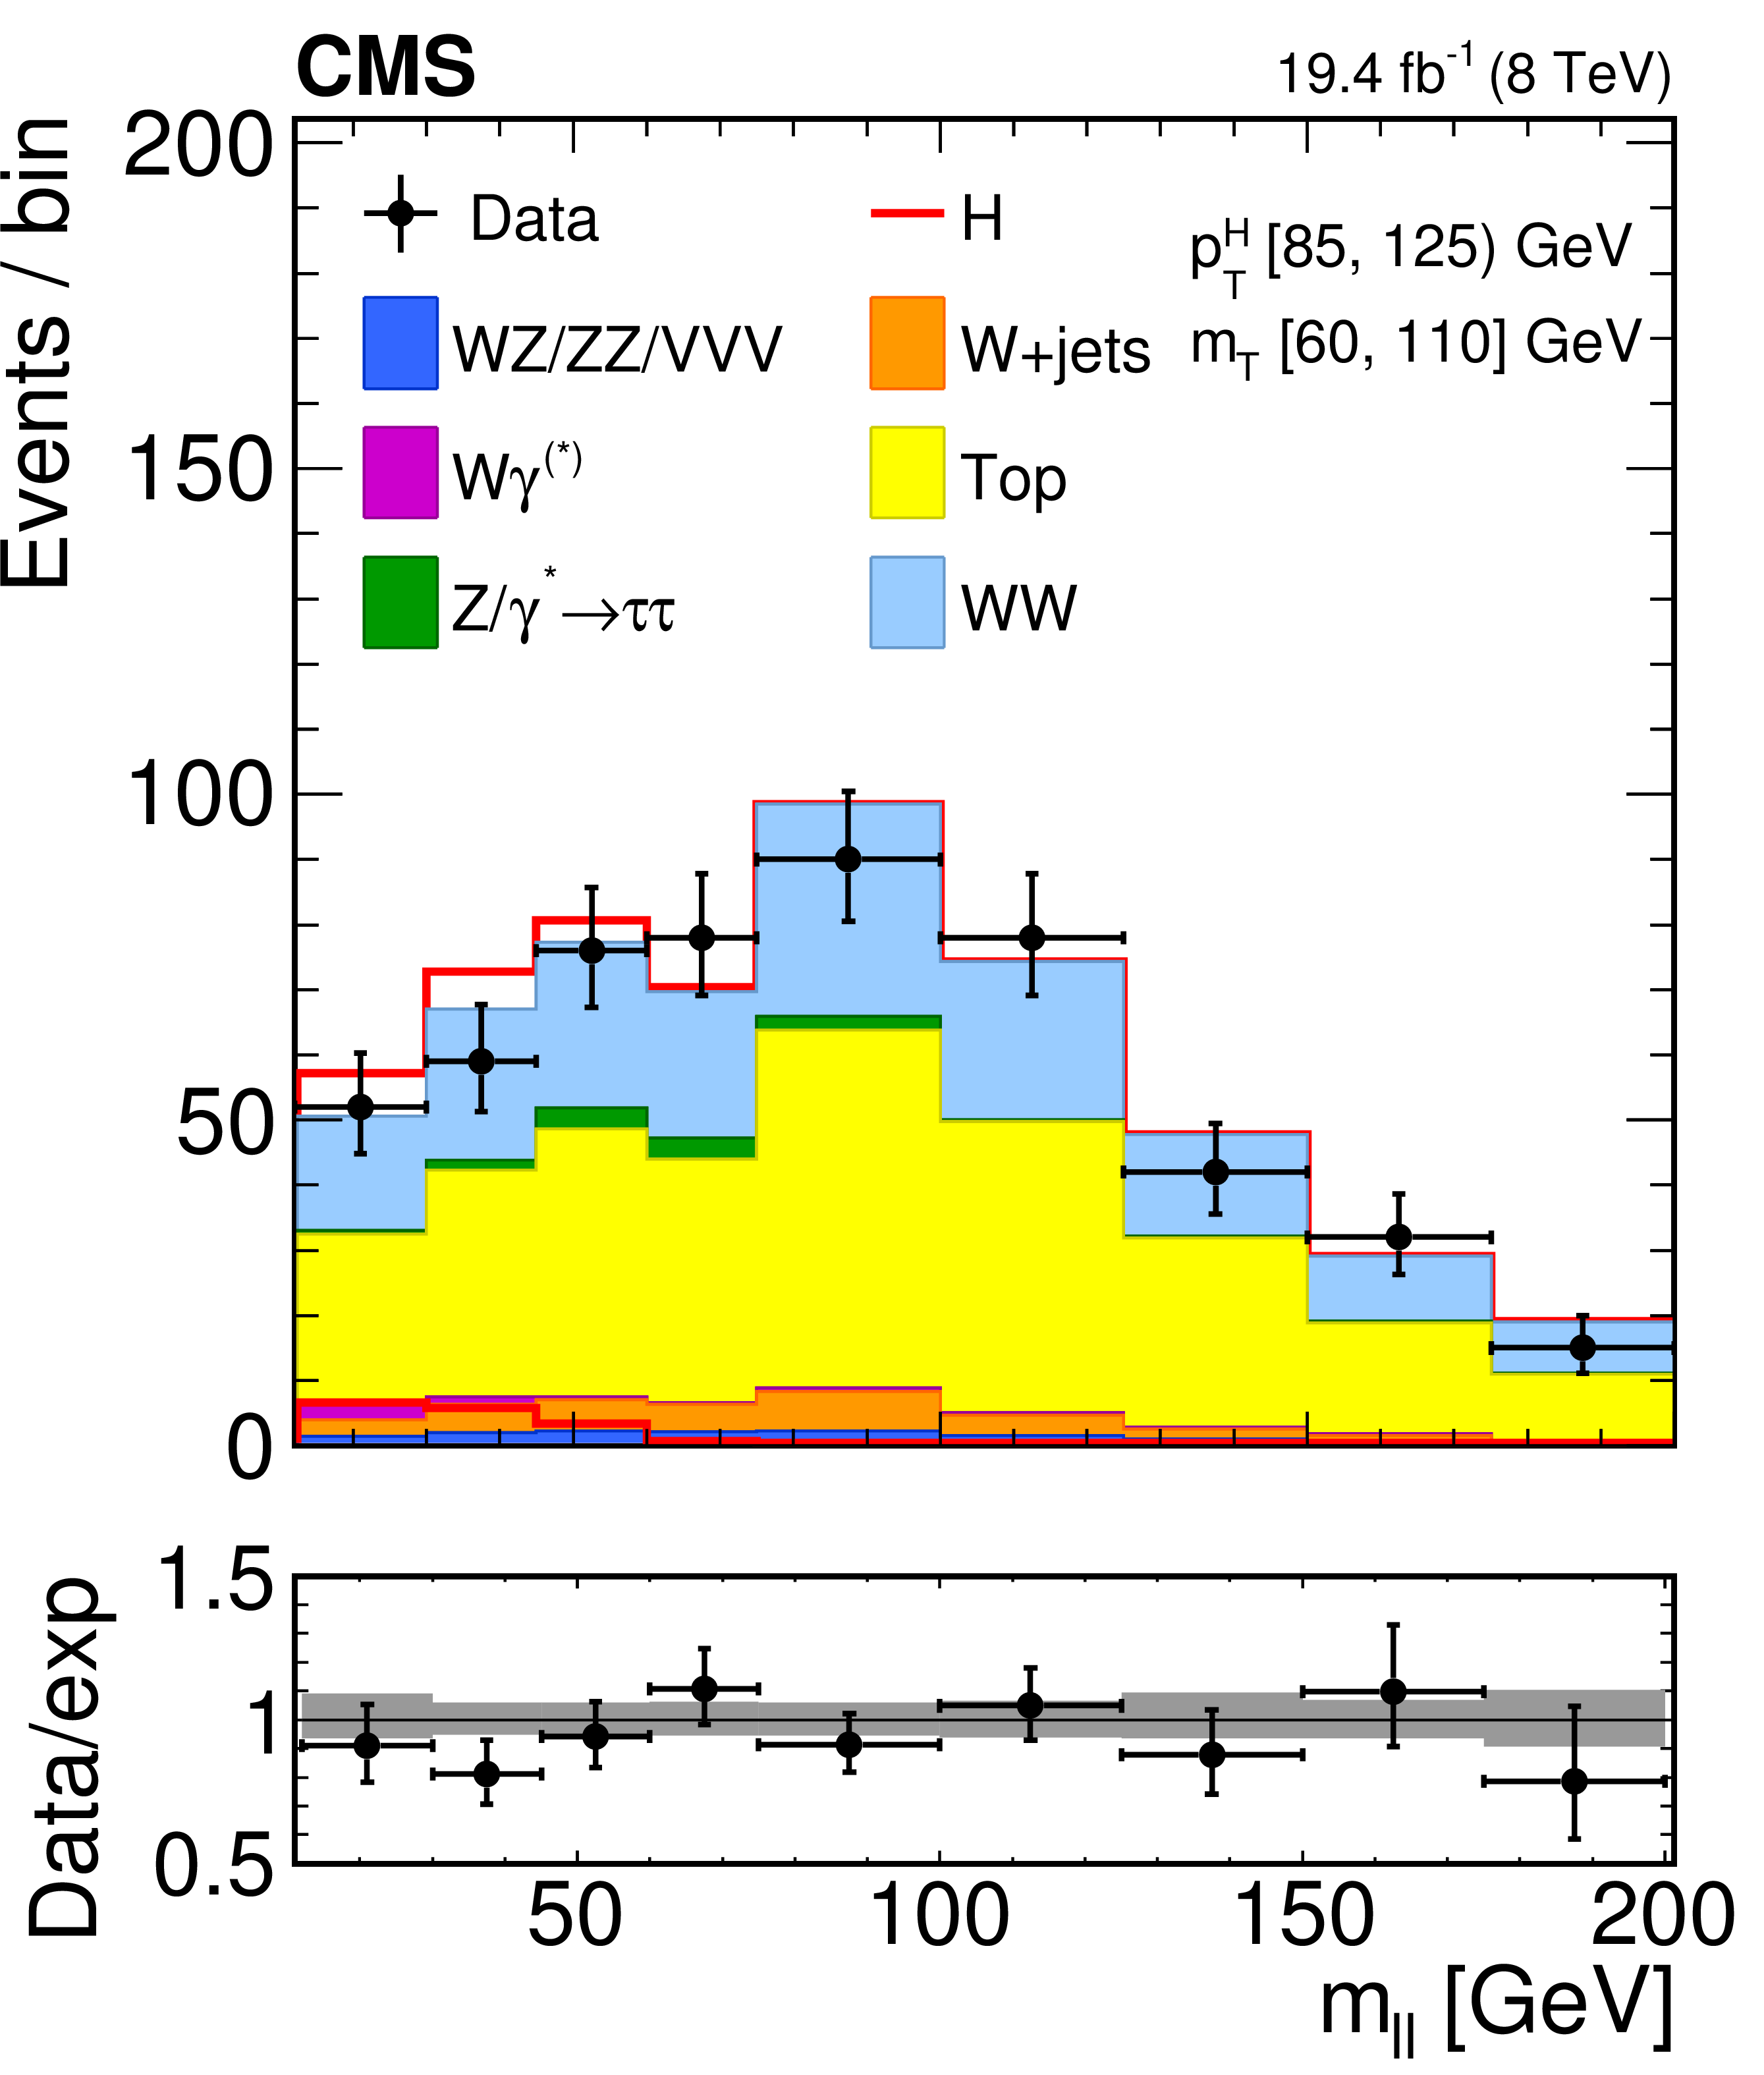
Figure 1-d:
Distribution of the ${m_{\ell \ell }}$ variable in the [85,125] GeV ${p_{\mathrm {T}}^{\mathrm {H}}}$ bin. Background normalizations correspond to the values obtained from the fit. Signal normalization is fixed to the SM expectation. The distributions are shown in an ${m_\mathrm {T}}$ window of [60,110] GeV in order to emphasize the Higgs boson (H) signal. The signal contribution is shown both stacked on top of the background and superimposed to it. Ratios of the expected and observed event yields in individual bins are shown in the panels below the plots. The uncertainty band shown in the ratio plot corresponds to the envelope of systematic uncertainties after performing the fit to the data. |

png pdf |
Figure 1-e:
Distribution of the ${m_{\ell \ell }}$ variable in the [125,165] GeV ${p_{\mathrm {T}}^{\mathrm {H}}}$ bin. Background normalizations correspond to the values obtained from the fit. Signal normalization is fixed to the SM expectation. The distributions are shown in an ${m_\mathrm {T}}$ window of [60,110] GeV in order to emphasize the Higgs boson (H) signal. The signal contribution is shown both stacked on top of the background and superimposed to it. Ratios of the expected and observed event yields in individual bins are shown in the panels below the plots. The uncertainty band shown in the ratio plot corresponds to the envelope of systematic uncertainties after performing the fit to the data. |

png pdf |
Figure 1-f:
Distribution of the ${m_{\ell \ell }}$ variable in the $>$165 GeV ${p_{\mathrm {T}}^{\mathrm {H}}}$ bin. Background normalizations correspond to the values obtained from the fit. Signal normalization is fixed to the SM expectation. The distributions are shown in an ${m_\mathrm {T}}$ window of [60,110] GeV in order to emphasize the Higgs boson (H) signal. The signal contribution is shown both stacked on top of the background and superimposed to it. Ratios of the expected and observed event yields in individual bins are shown in the panels below the plots. The uncertainty band shown in the ratio plot corresponds to the envelope of systematic uncertainties after performing the fit to the data. |

png pdf |
Figure 2:
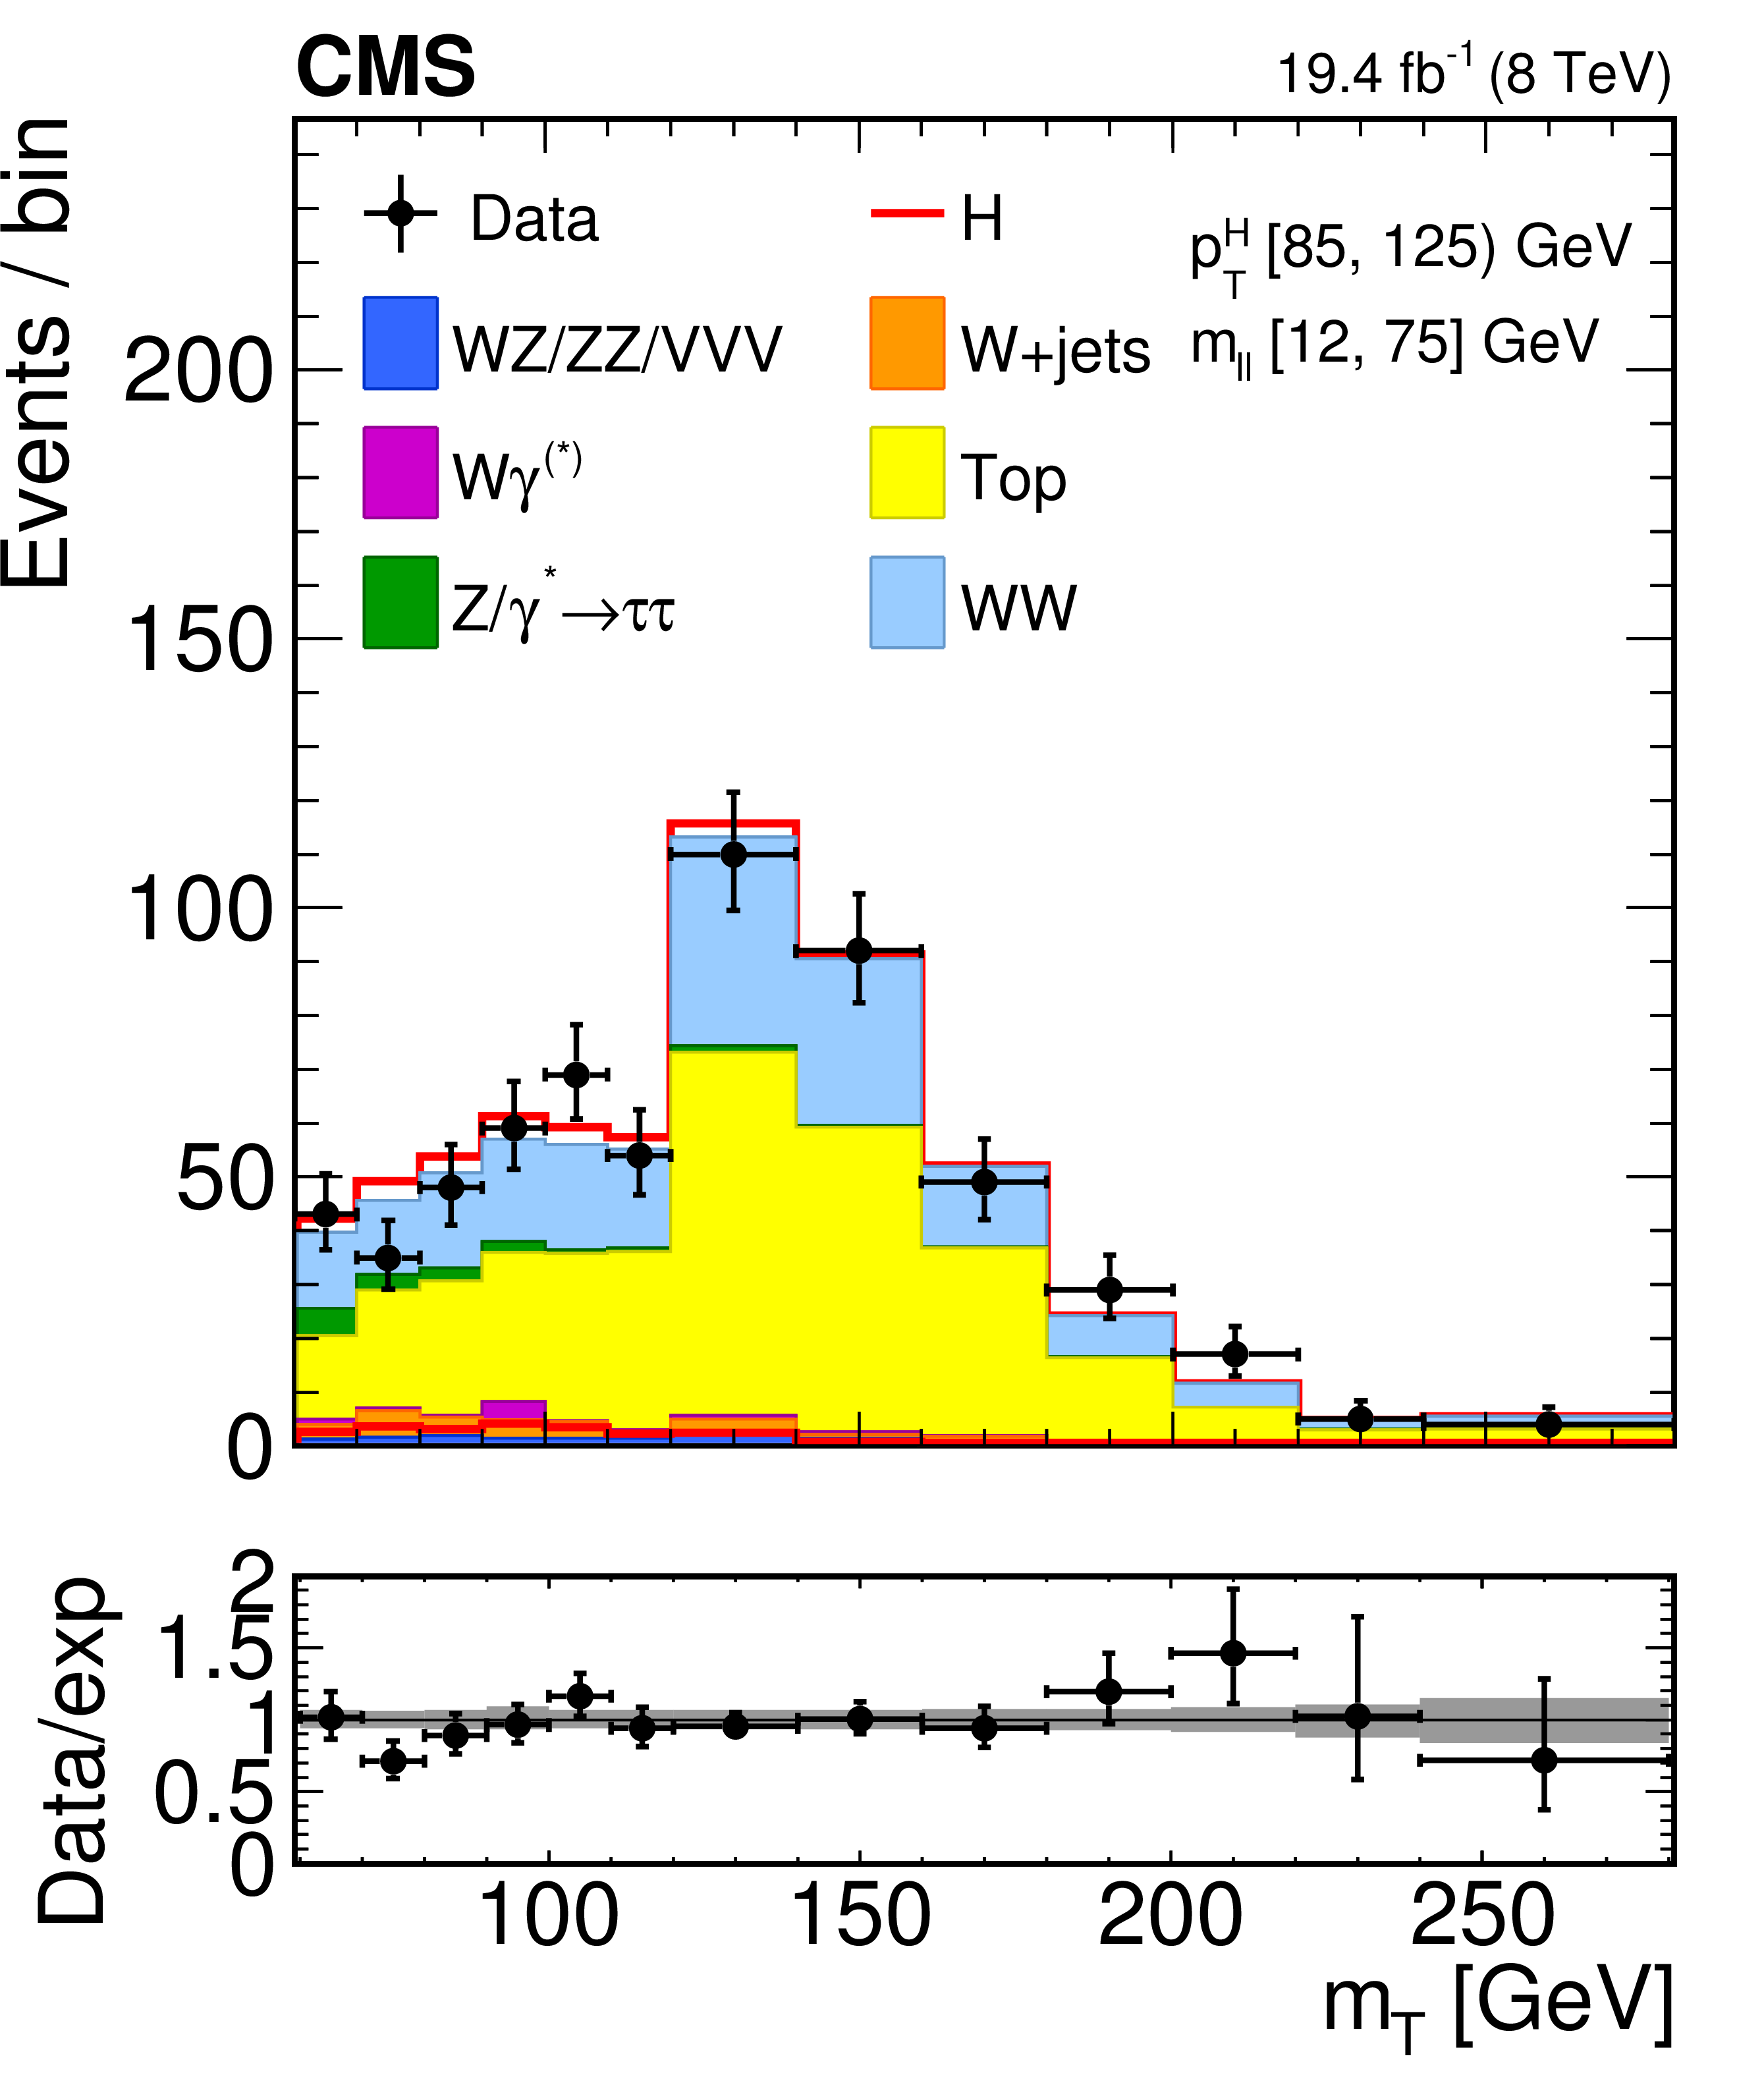
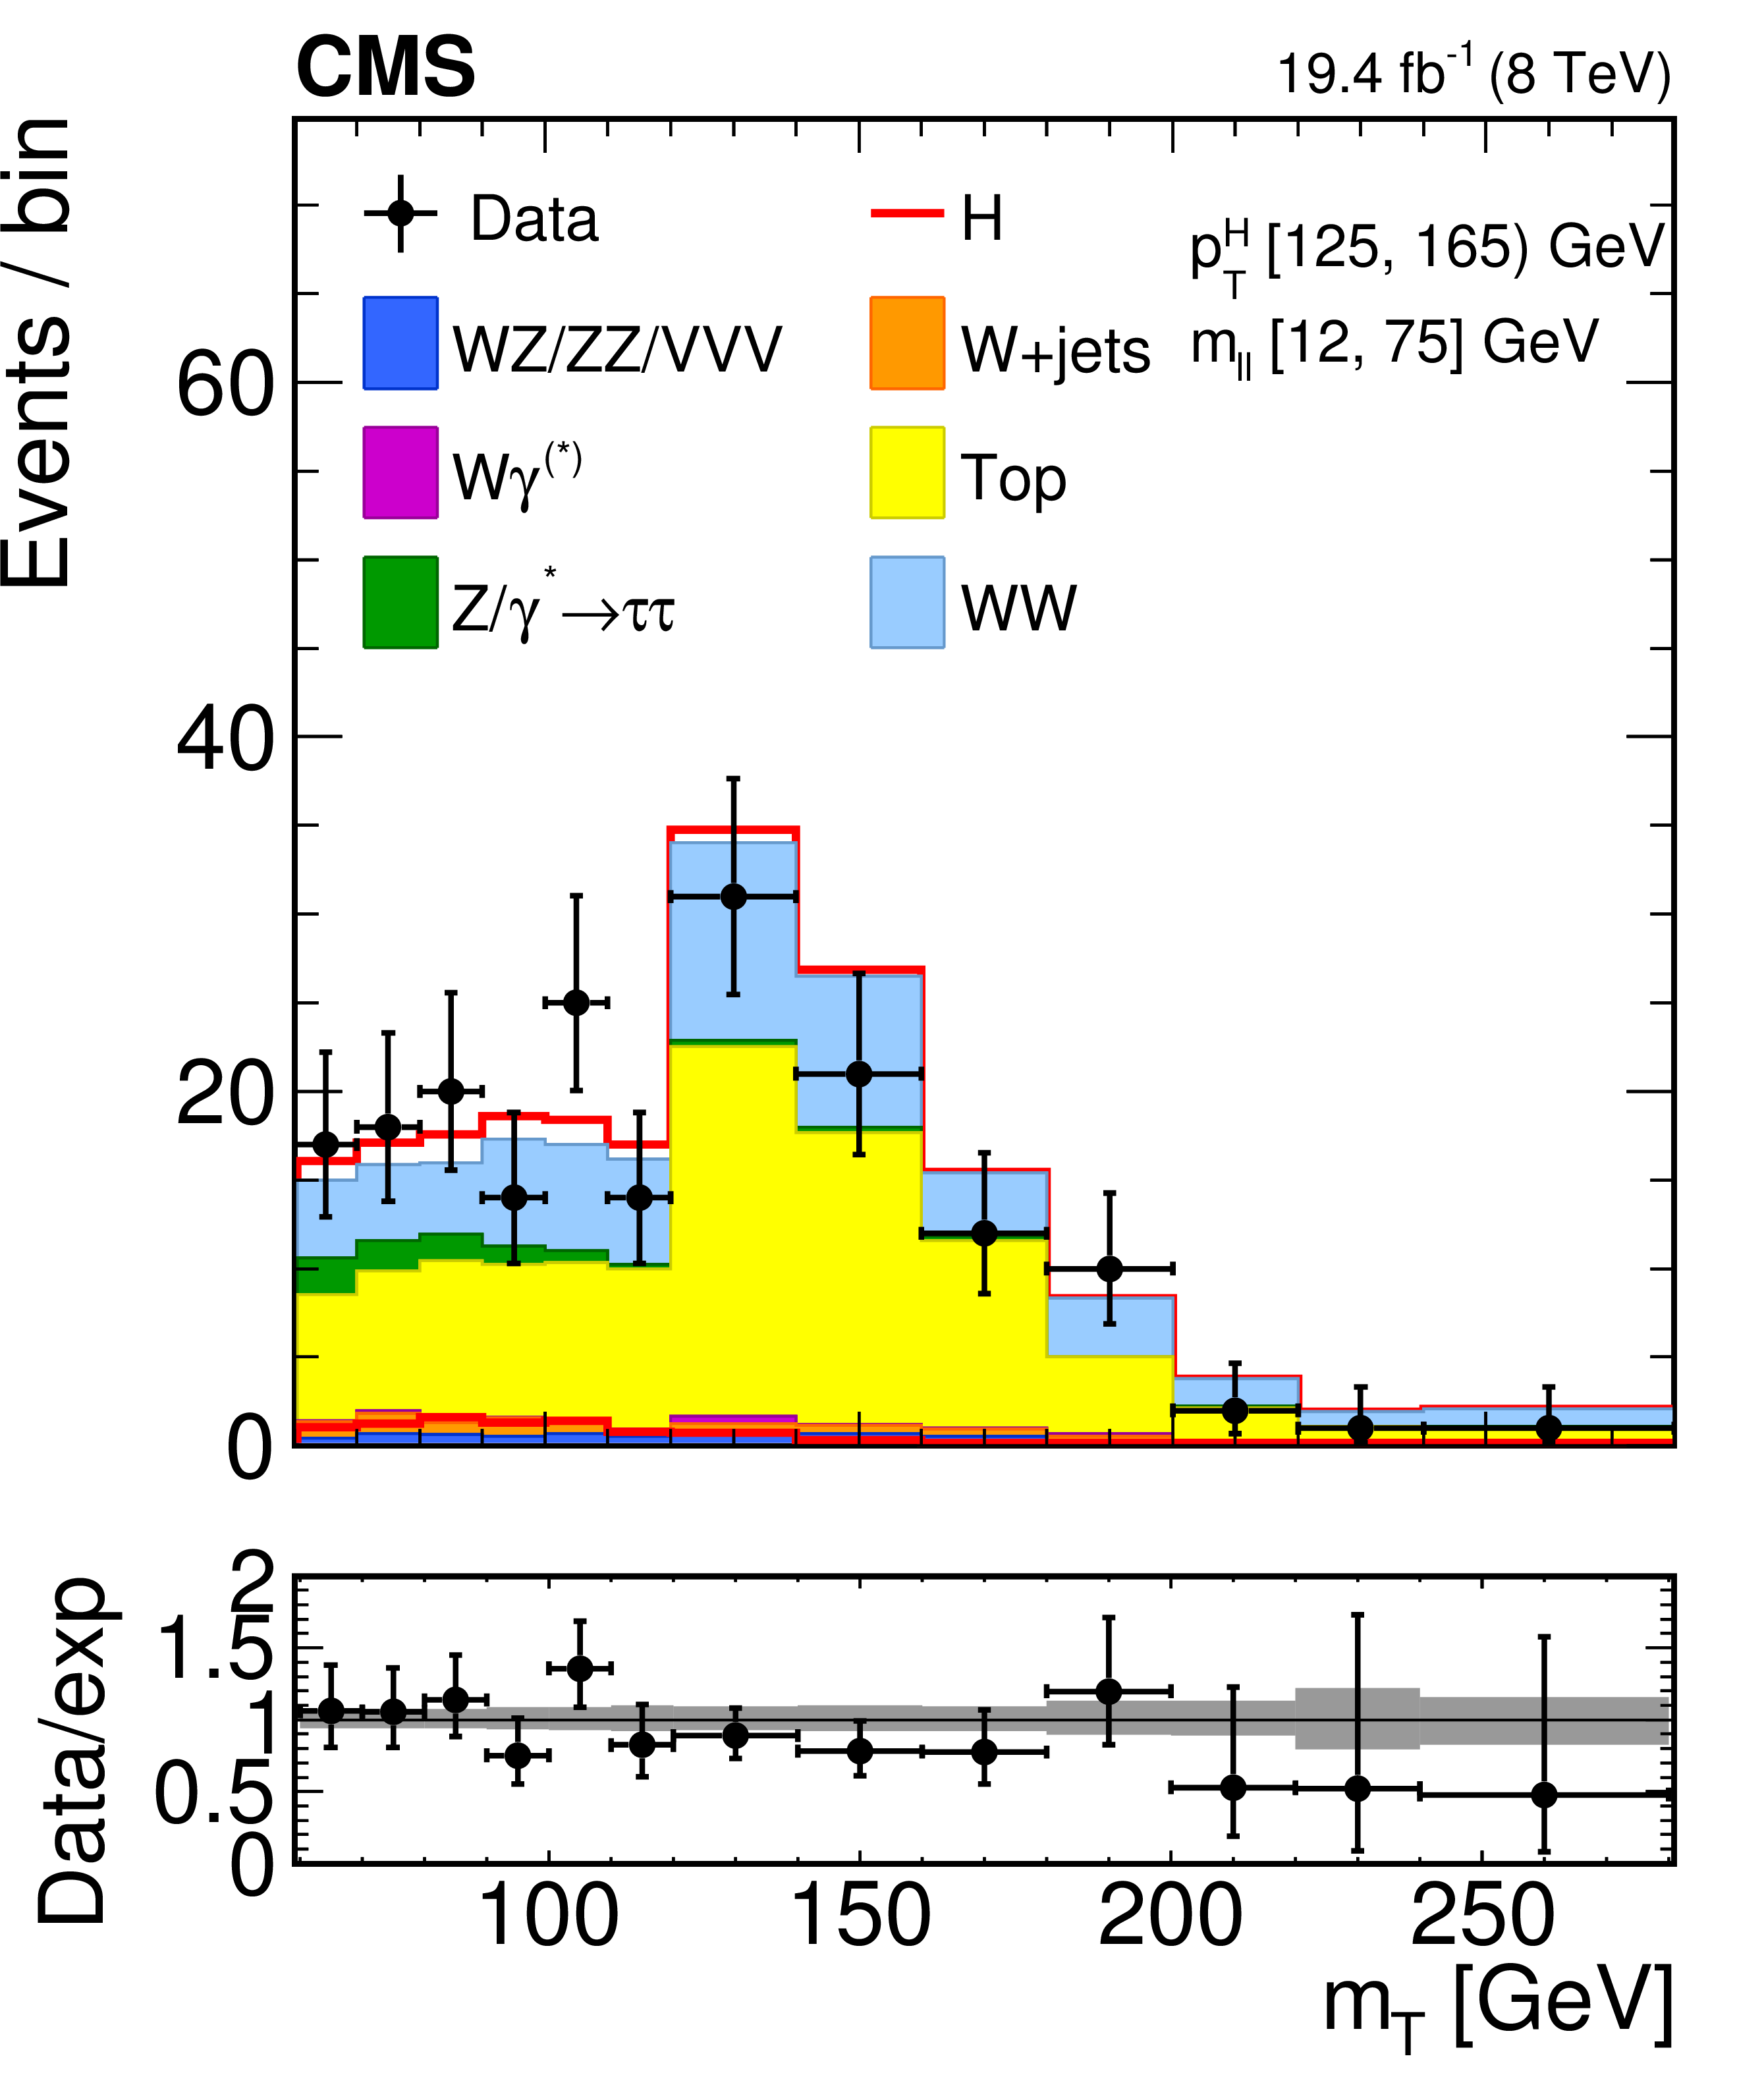
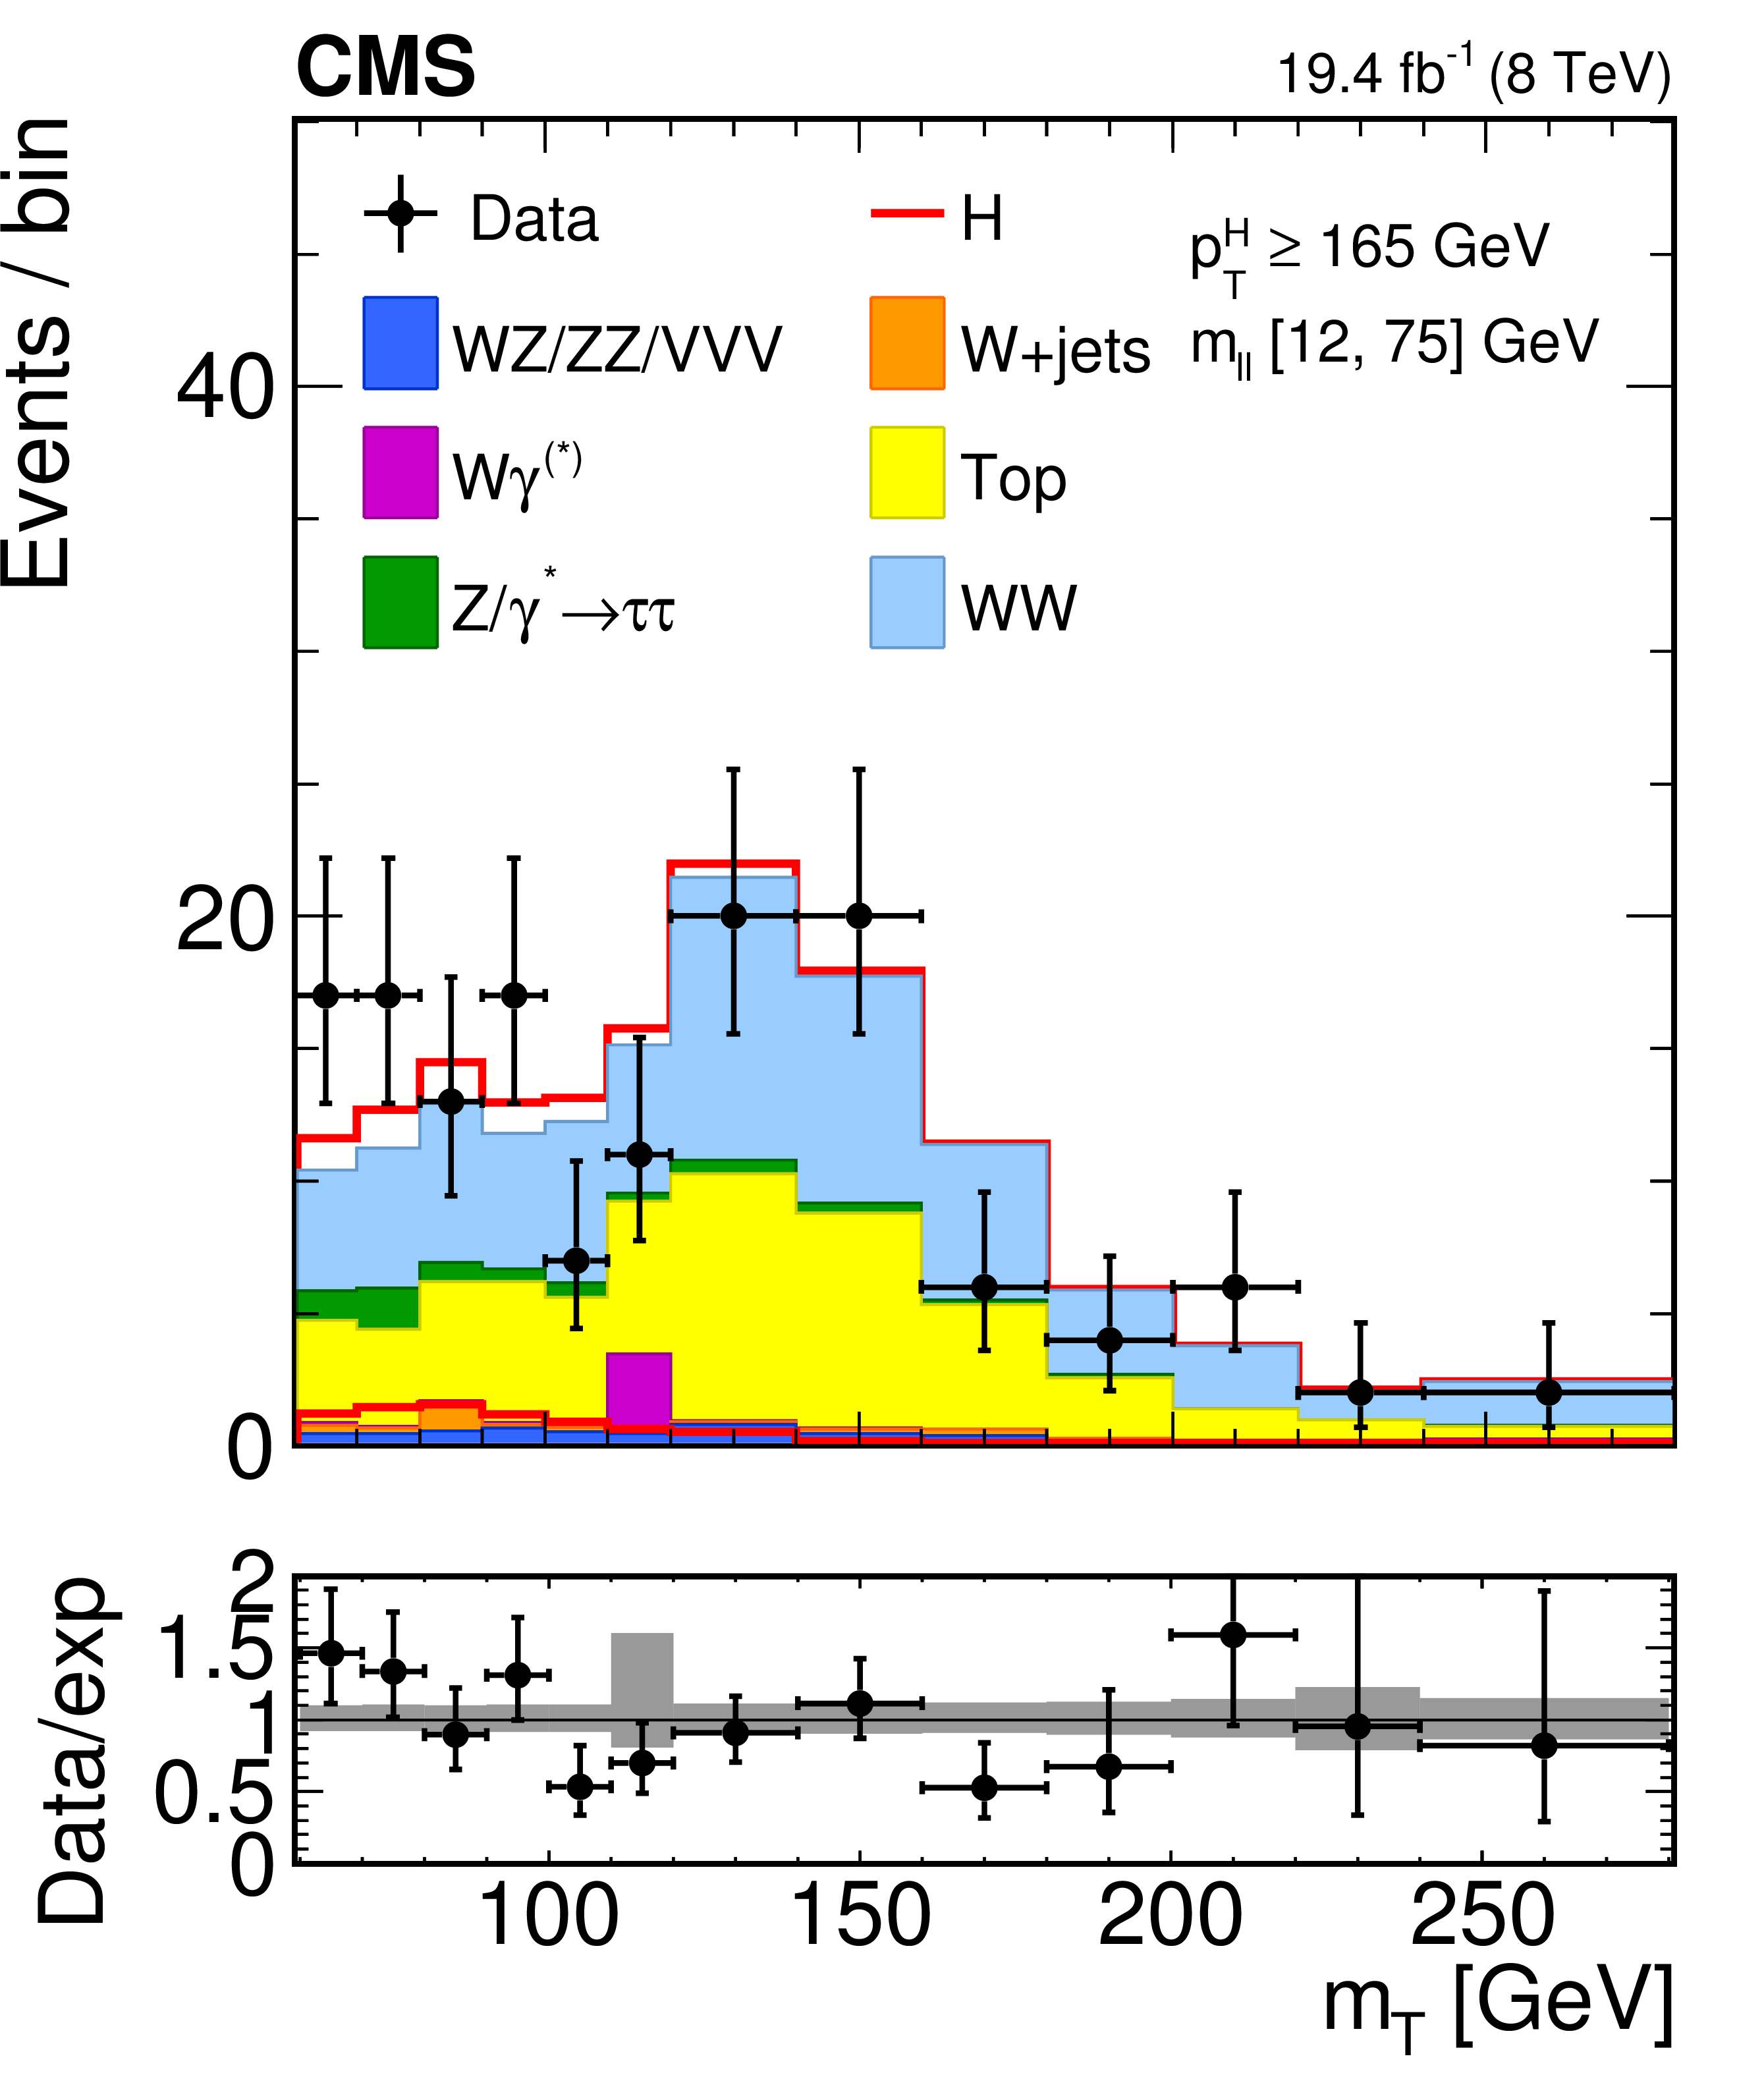
Distributions of the ${m_\mathrm {T}}$ variable in each of the six ${p_{\mathrm {T}}^{\mathrm {H}}} {}$ bins. Background normalizations correspond to the values obtained from the fit. Signal normalization is fixed to the SM expectation. The distributions are shown in an ${m_{\ell \ell }} {}$ window of [12,75] GeV in order to emphasize the Higgs boson (H) signal. The signal contribution is shown both stacked on top of the background and superimposed on it. Ratios of the expected and observed event yields in individual bins are shown in the panels below the plots. The uncertainty band shown in the ratio plot corresponds to the envelope of systematic uncertainties after performing the fit to the data. |
png pdf |
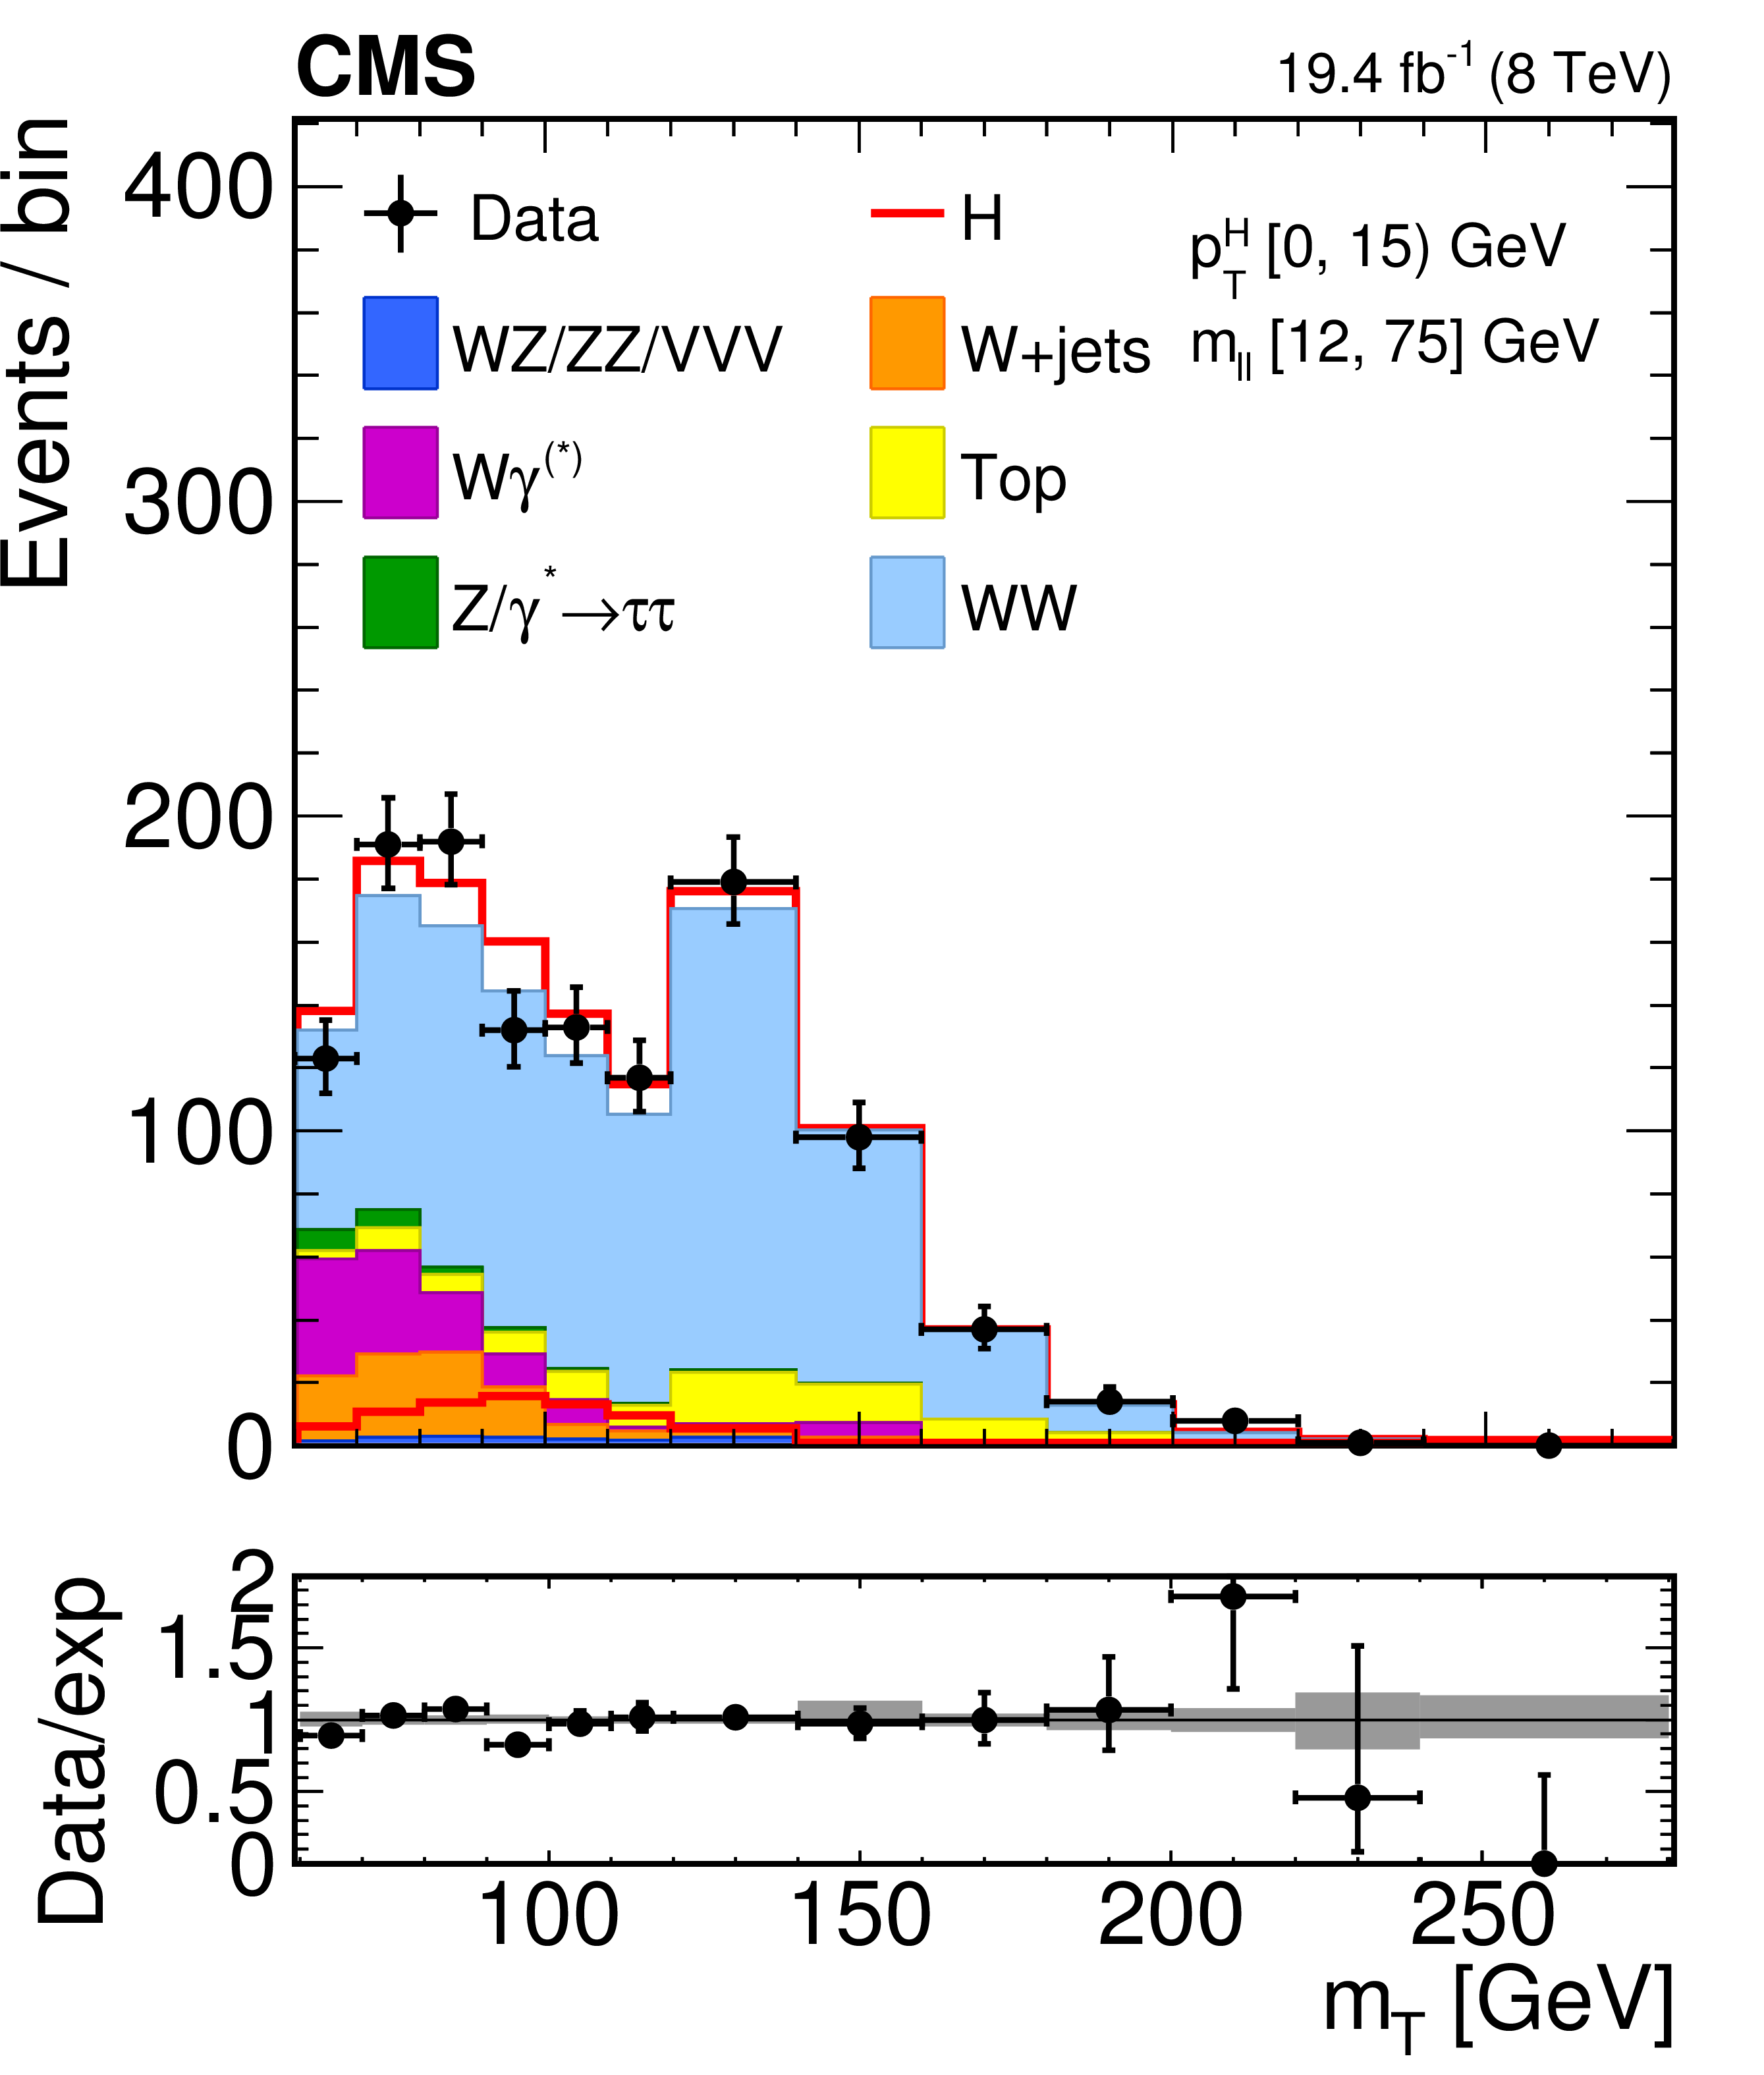
Figure 2-a:
Distribution of the ${m_\mathrm {T}}$ variable in the [0,15] GeV ${p_{\mathrm {T}}^{\mathrm {H}}} {}$ bins. Background normalizations correspond to the values obtained from the fit. Signal normalization is fixed to the SM expectation. The distributions are shown in an ${m_{\ell \ell }} {}$ window of [12,75] GeV in order to emphasize the Higgs boson (H) signal. The signal contribution is shown both stacked on top of the background and superimposed on it. Ratios of the expected and observed event yields in individual bins are shown in the panels below the plots. The uncertainty band shown in the ratio plot corresponds to the envelope of systematic uncertainties after performing the fit to the data. |
png pdf |
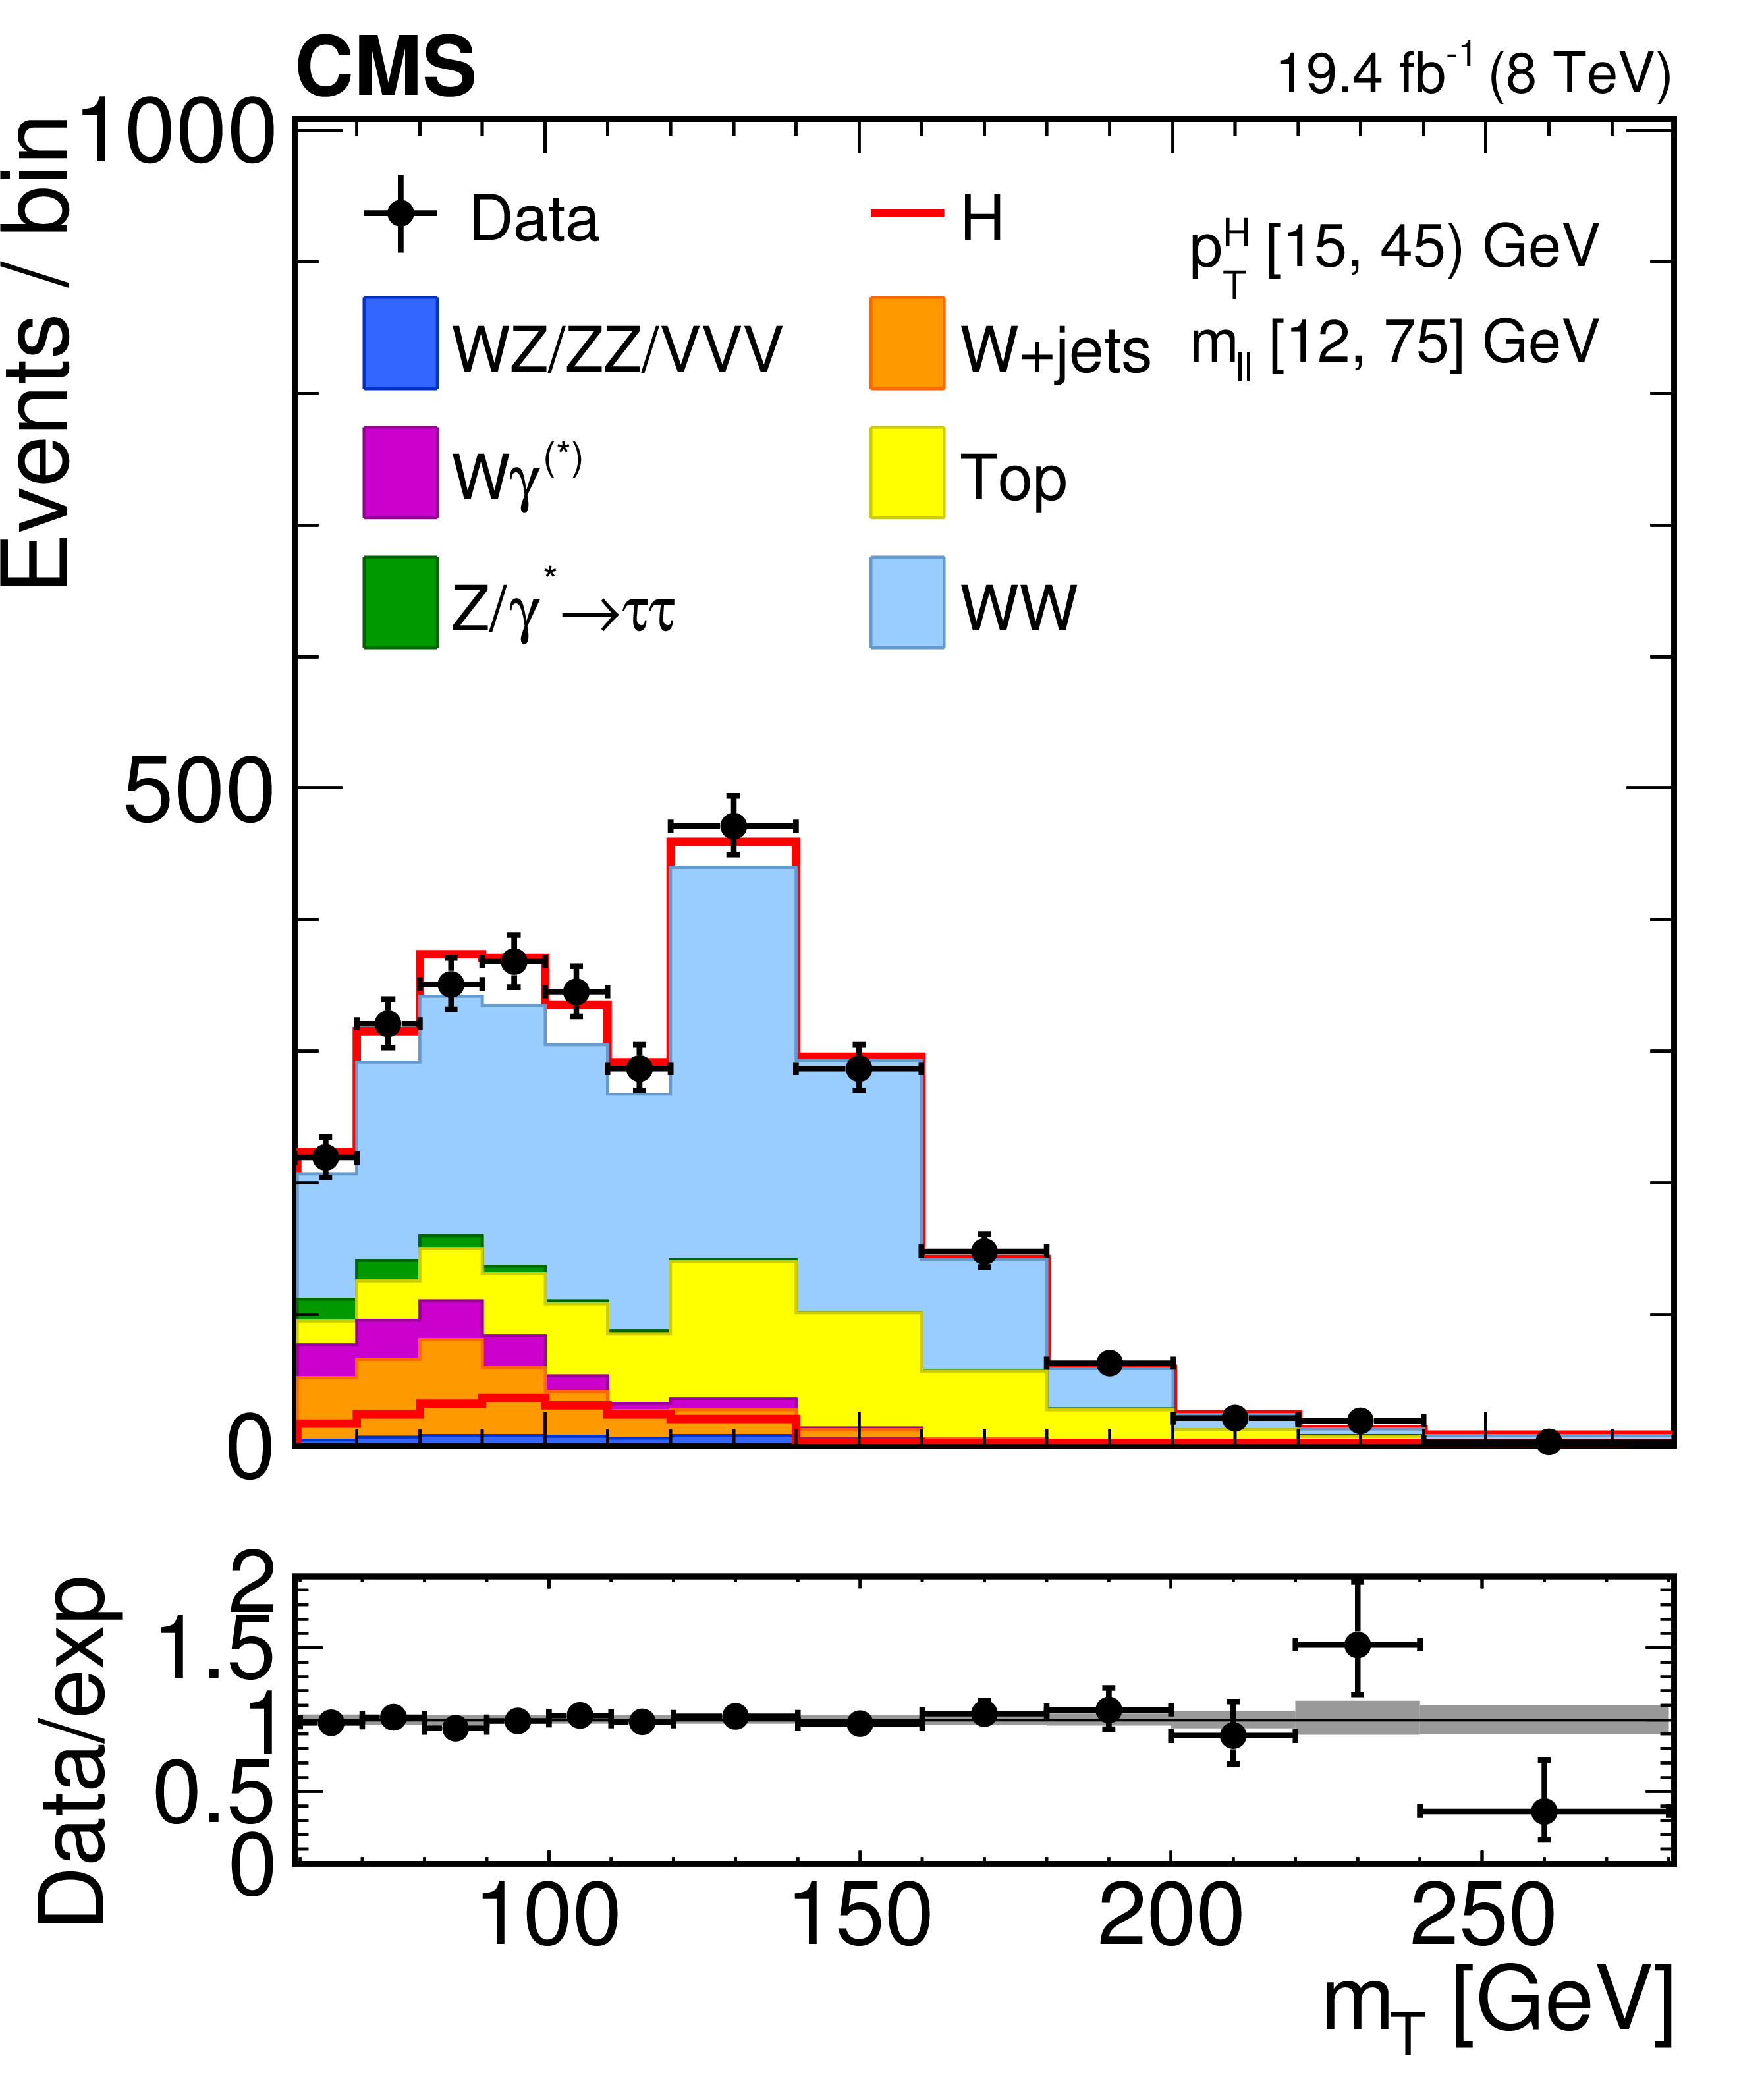
Figure 2-b:
Distribution of the ${m_\mathrm {T}}$ variable in the [15,45] GeV ${p_{\mathrm {T}}^{\mathrm {H}}} {}$ bins. Background normalizations correspond to the values obtained from the fit. Signal normalization is fixed to the SM expectation. The distributions are shown in an ${m_{\ell \ell }} {}$ window of [12,75] GeV in order to emphasize the Higgs boson (H) signal. The signal contribution is shown both stacked on top of the background and superimposed on it. Ratios of the expected and observed event yields in individual bins are shown in the panels below the plots. The uncertainty band shown in the ratio plot corresponds to the envelope of systematic uncertainties after performing the fit to the data. |
png pdf |
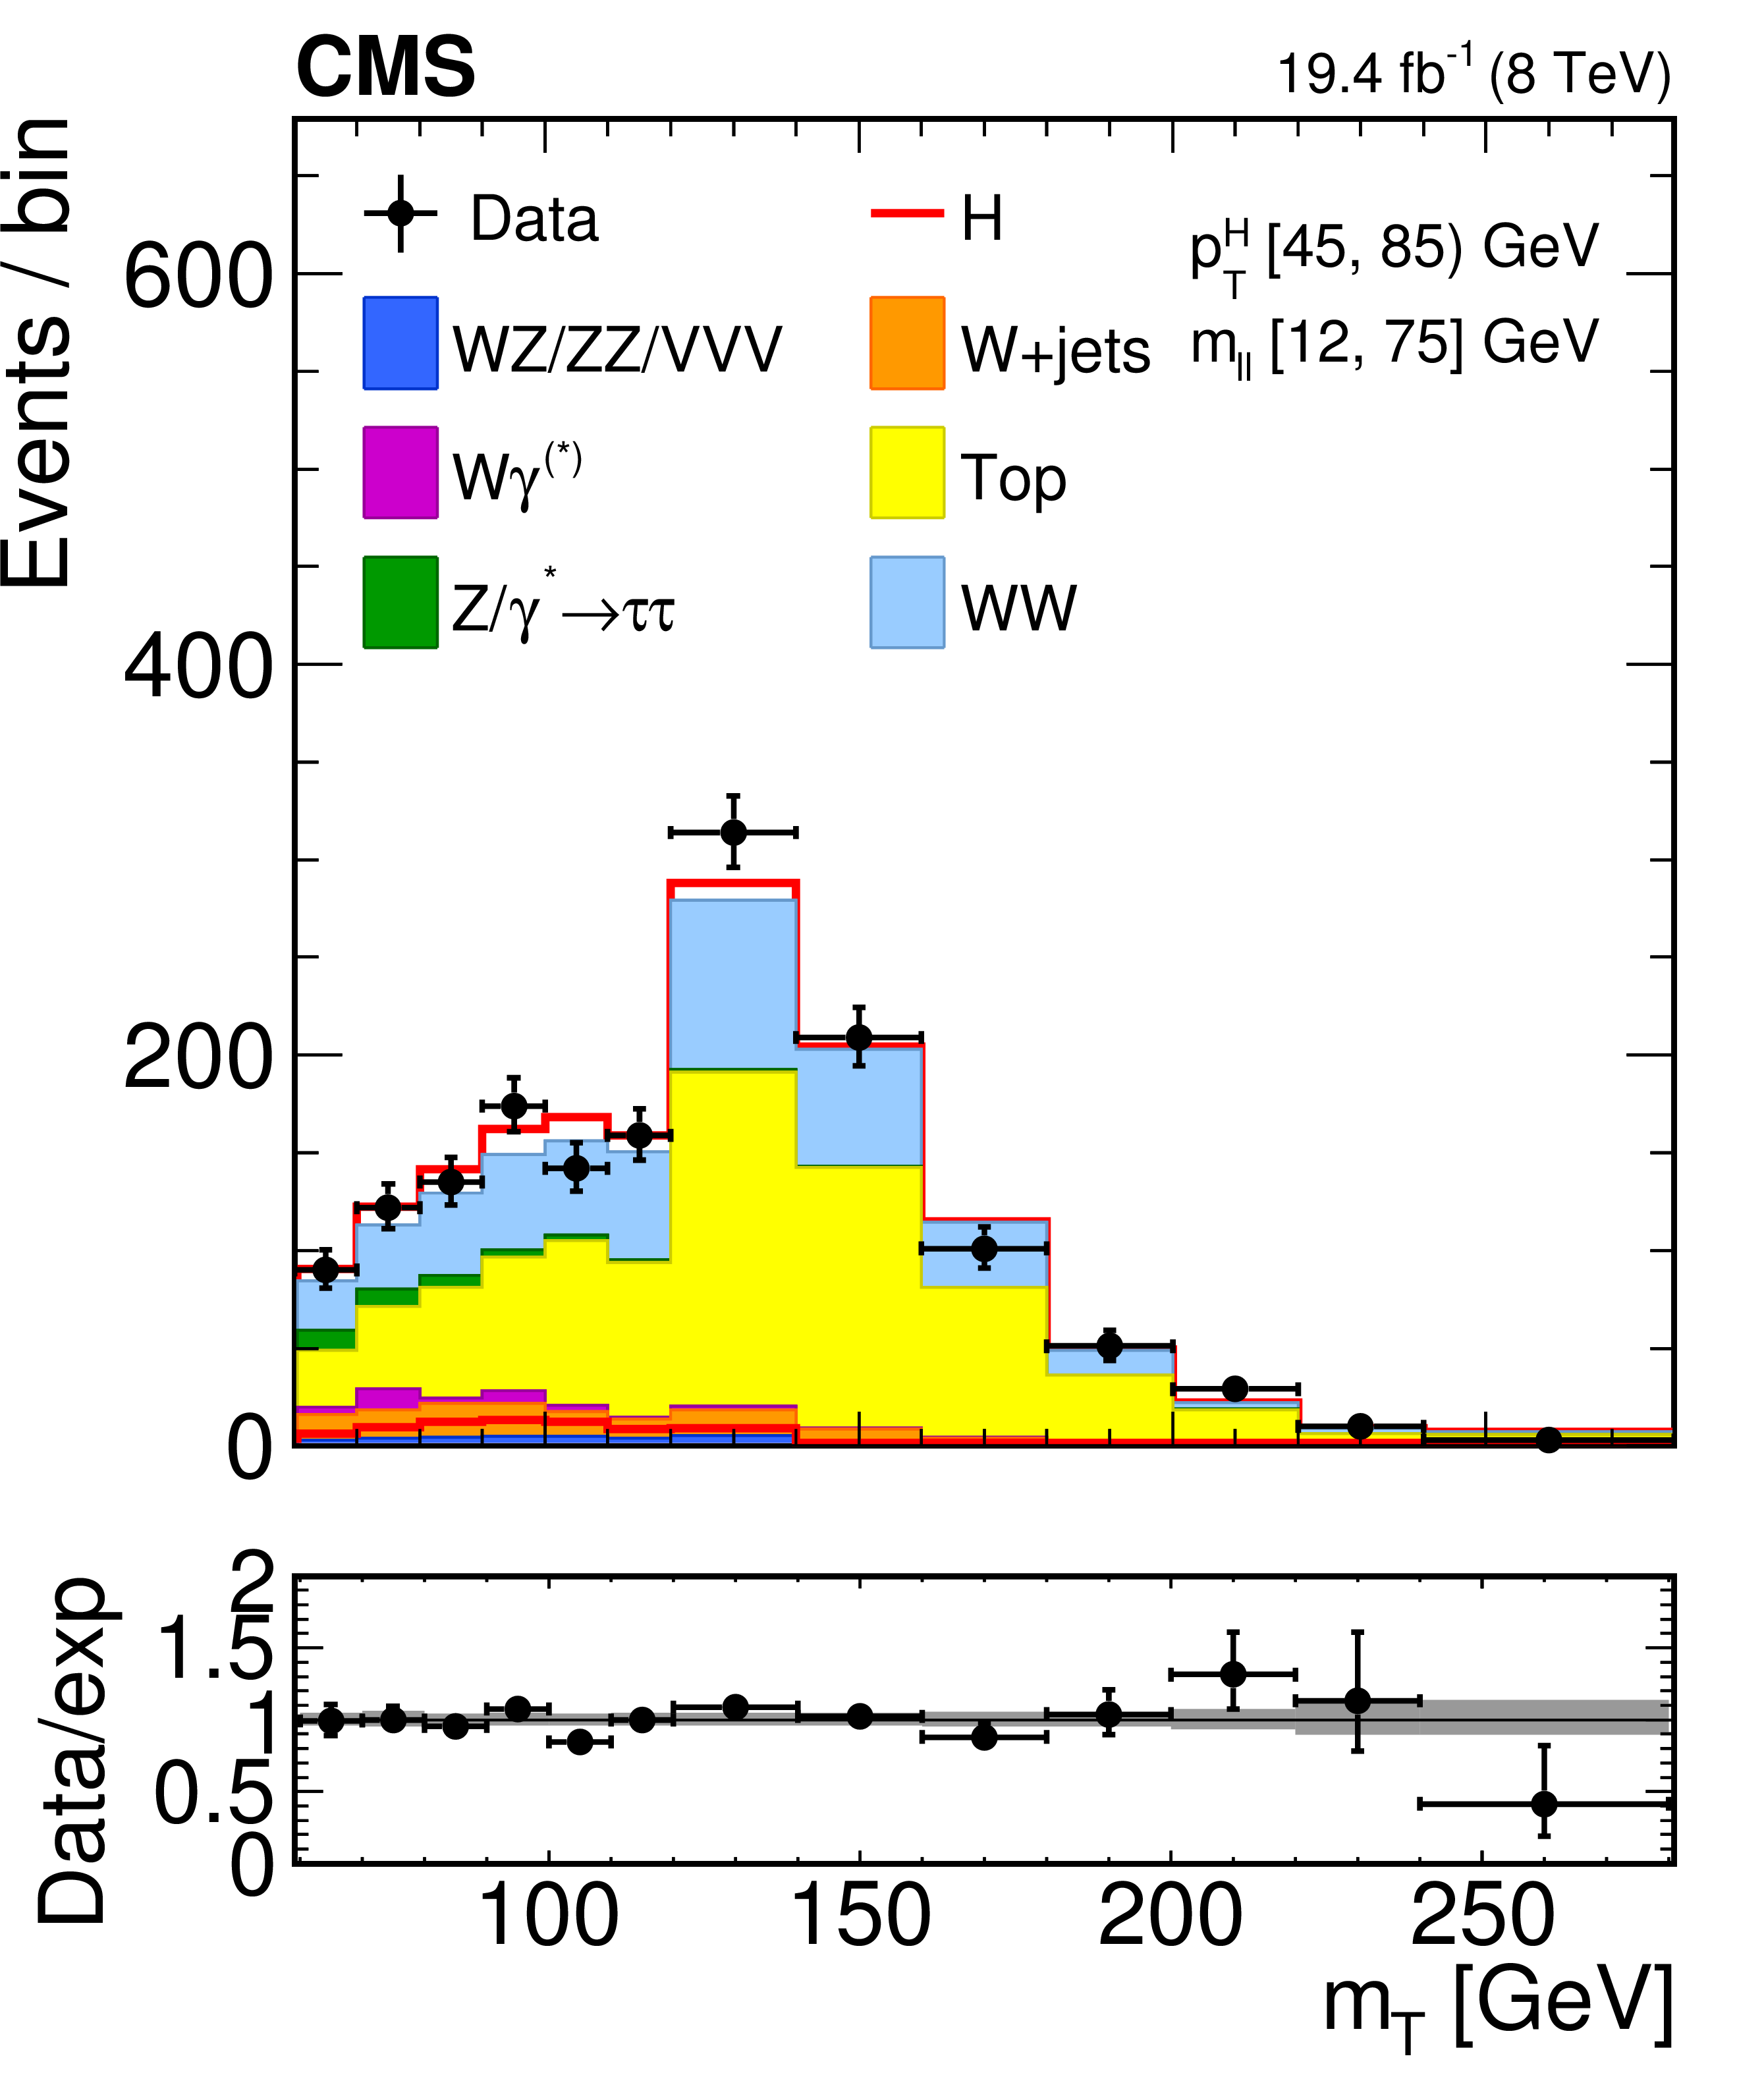
Figure 2-c:
Distribution of the ${m_\mathrm {T}}$ variable in the [45,85] GeV ${p_{\mathrm {T}}^{\mathrm {H}}} {}$ bins. Background normalizations correspond to the values obtained from the fit. Signal normalization is fixed to the SM expectation. The distributions are shown in an ${m_{\ell \ell }} {}$ window of [12,75] GeV in order to emphasize the Higgs boson (H) signal. The signal contribution is shown both stacked on top of the background and superimposed on it. Ratios of the expected and observed event yields in individual bins are shown in the panels below the plots. The uncertainty band shown in the ratio plot corresponds to the envelope of systematic uncertainties after performing the fit to the data. |
png pdf |
Figure 2-d:
Distribution of the ${m_\mathrm {T}}$ variable in the [85,125] GeV ${p_{\mathrm {T}}^{\mathrm {H}}} {}$ bins. Background normalizations correspond to the values obtained from the fit. Signal normalization is fixed to the SM expectation. The distributions are shown in an ${m_{\ell \ell }} {}$ window of [12,75] GeV in order to emphasize the Higgs boson (H) signal. The signal contribution is shown both stacked on top of the background and superimposed on it. Ratios of the expected and observed event yields in individual bins are shown in the panels below the plots. The uncertainty band shown in the ratio plot corresponds to the envelope of systematic uncertainties after performing the fit to the data. |
png pdf |
Figure 2-e:
Distribution of the ${m_\mathrm {T}}$ variable in the [125,165] GeV ${p_{\mathrm {T}}^{\mathrm {H}}} {}$ bins. Background normalizations correspond to the values obtained from the fit. Signal normalization is fixed to the SM expectation. The distributions are shown in an ${m_{\ell \ell }} {}$ window of [12,75] GeV in order to emphasize the Higgs boson (H) signal. The signal contribution is shown both stacked on top of the background and superimposed on it. Ratios of the expected and observed event yields in individual bins are shown in the panels below the plots. The uncertainty band shown in the ratio plot corresponds to the envelope of systematic uncertainties after performing the fit to the data. |
png pdf |
Figure 2-f:
Distribution of the ${m_\mathrm {T}}$ variable in the $>$165 GeV ${p_{\mathrm {T}}^{\mathrm {H}}} {}$ bins. Background normalizations correspond to the values obtained from the fit. Signal normalization is fixed to the SM expectation. The distributions are shown in an ${m_{\ell \ell }} {}$ window of [12,75] GeV in order to emphasize the Higgs boson (H) signal. The signal contribution is shown both stacked on top of the background and superimposed on it. Ratios of the expected and observed event yields in individual bins are shown in the panels below the plots. The uncertainty band shown in the ratio plot corresponds to the envelope of systematic uncertainties after performing the fit to the data. |
png pdf |
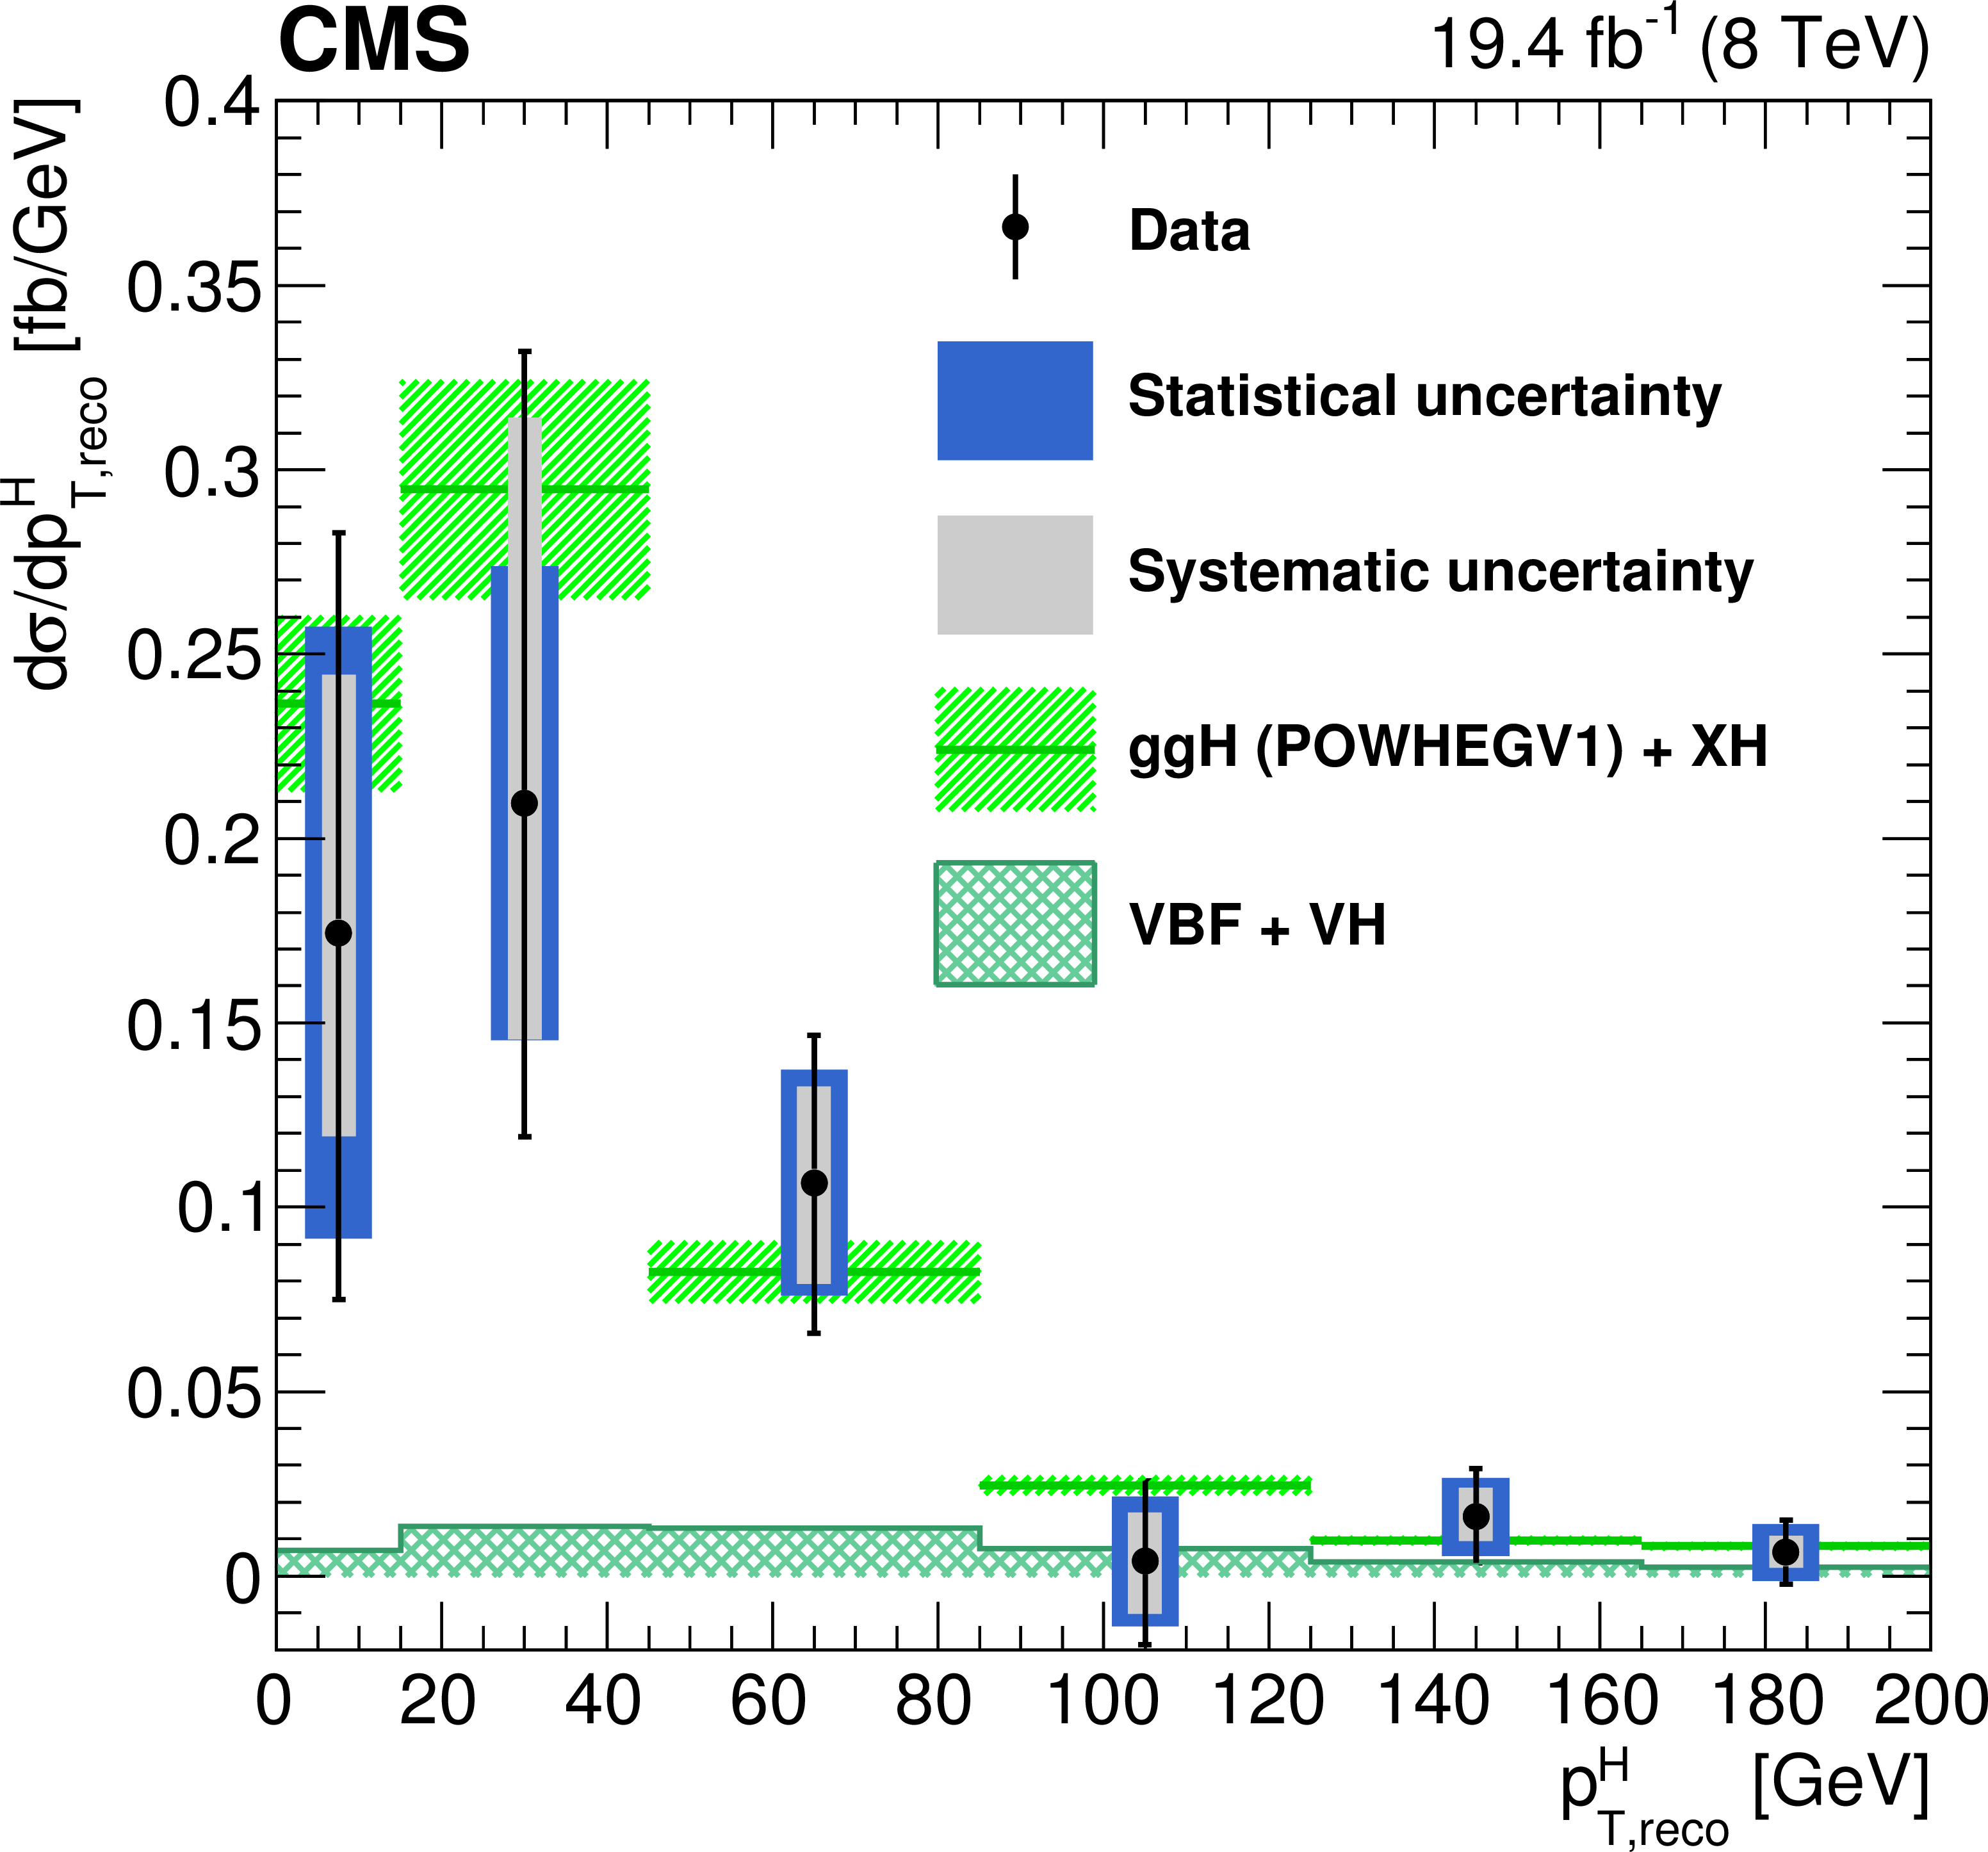
Figure 3:
Differential Higgs boson production cross section as a function of the reconstructed ${p_{\mathrm {T}}^{\mathrm {H}}}$, before applying the unfolding procedure. Data values after the background subtraction are shown together with the statistical and the systematic uncertainties, determined propagating the sources of uncertainty through the fit procedure. The line and dashed area represent the SM theoretical estimates in which the acceptance of the dominant ggH contribution is modelled by Powheg V1. The sub-dominant component of the signal is denoted as XH=VBF+VH, and is shown with the cross filled area separately. |
png pdf |
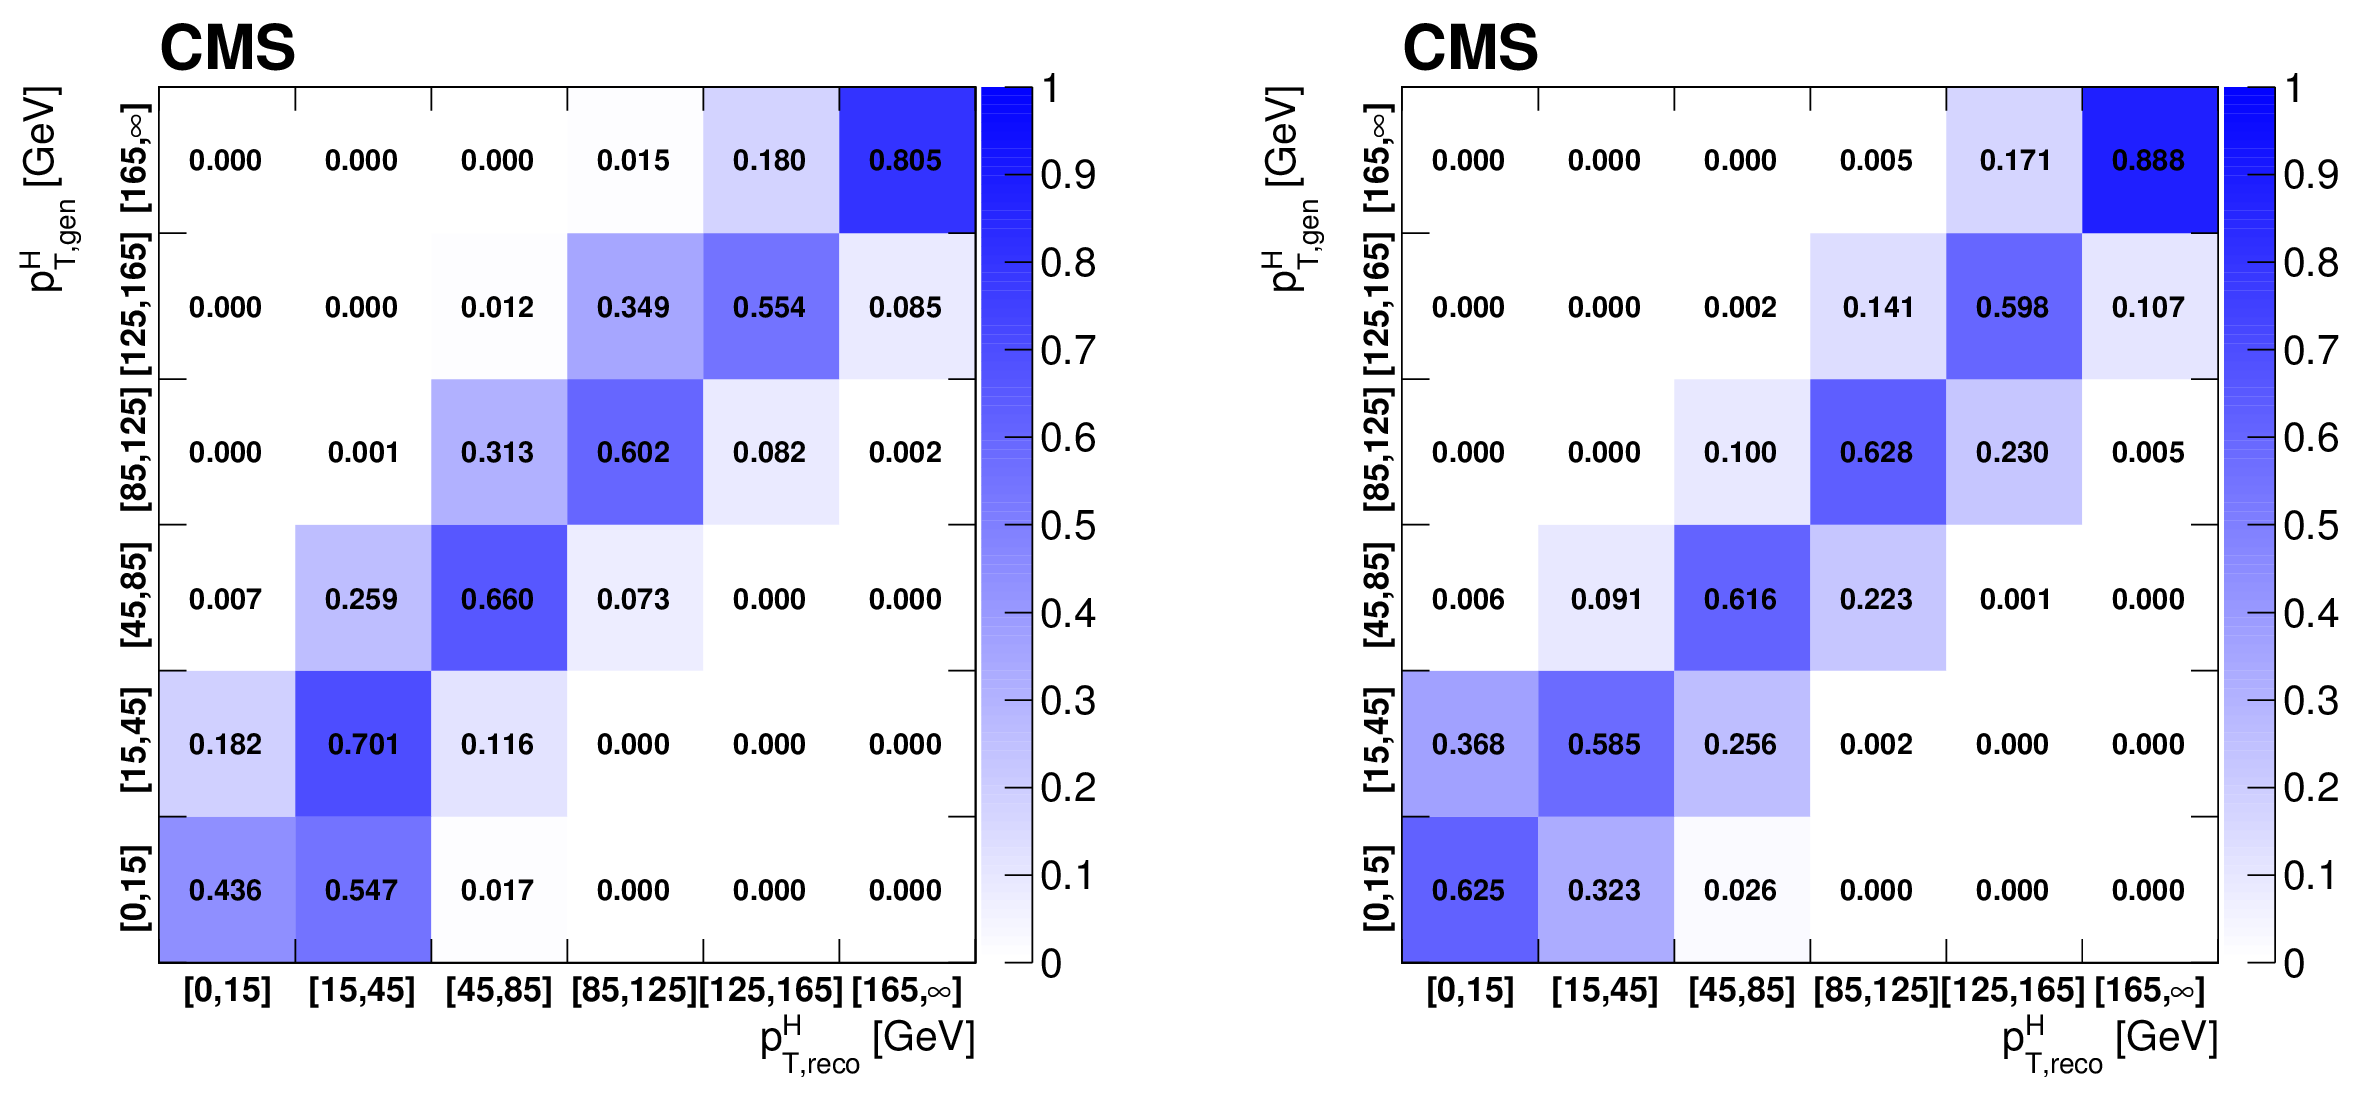
Figure 4:
Response matrix (a) and deconvolution matrix (b) including all signal processes. The matrices are normalized either by row (a) or by column (b) in order to show the purity or stability respectively in diagonal bins. |
png pdf |
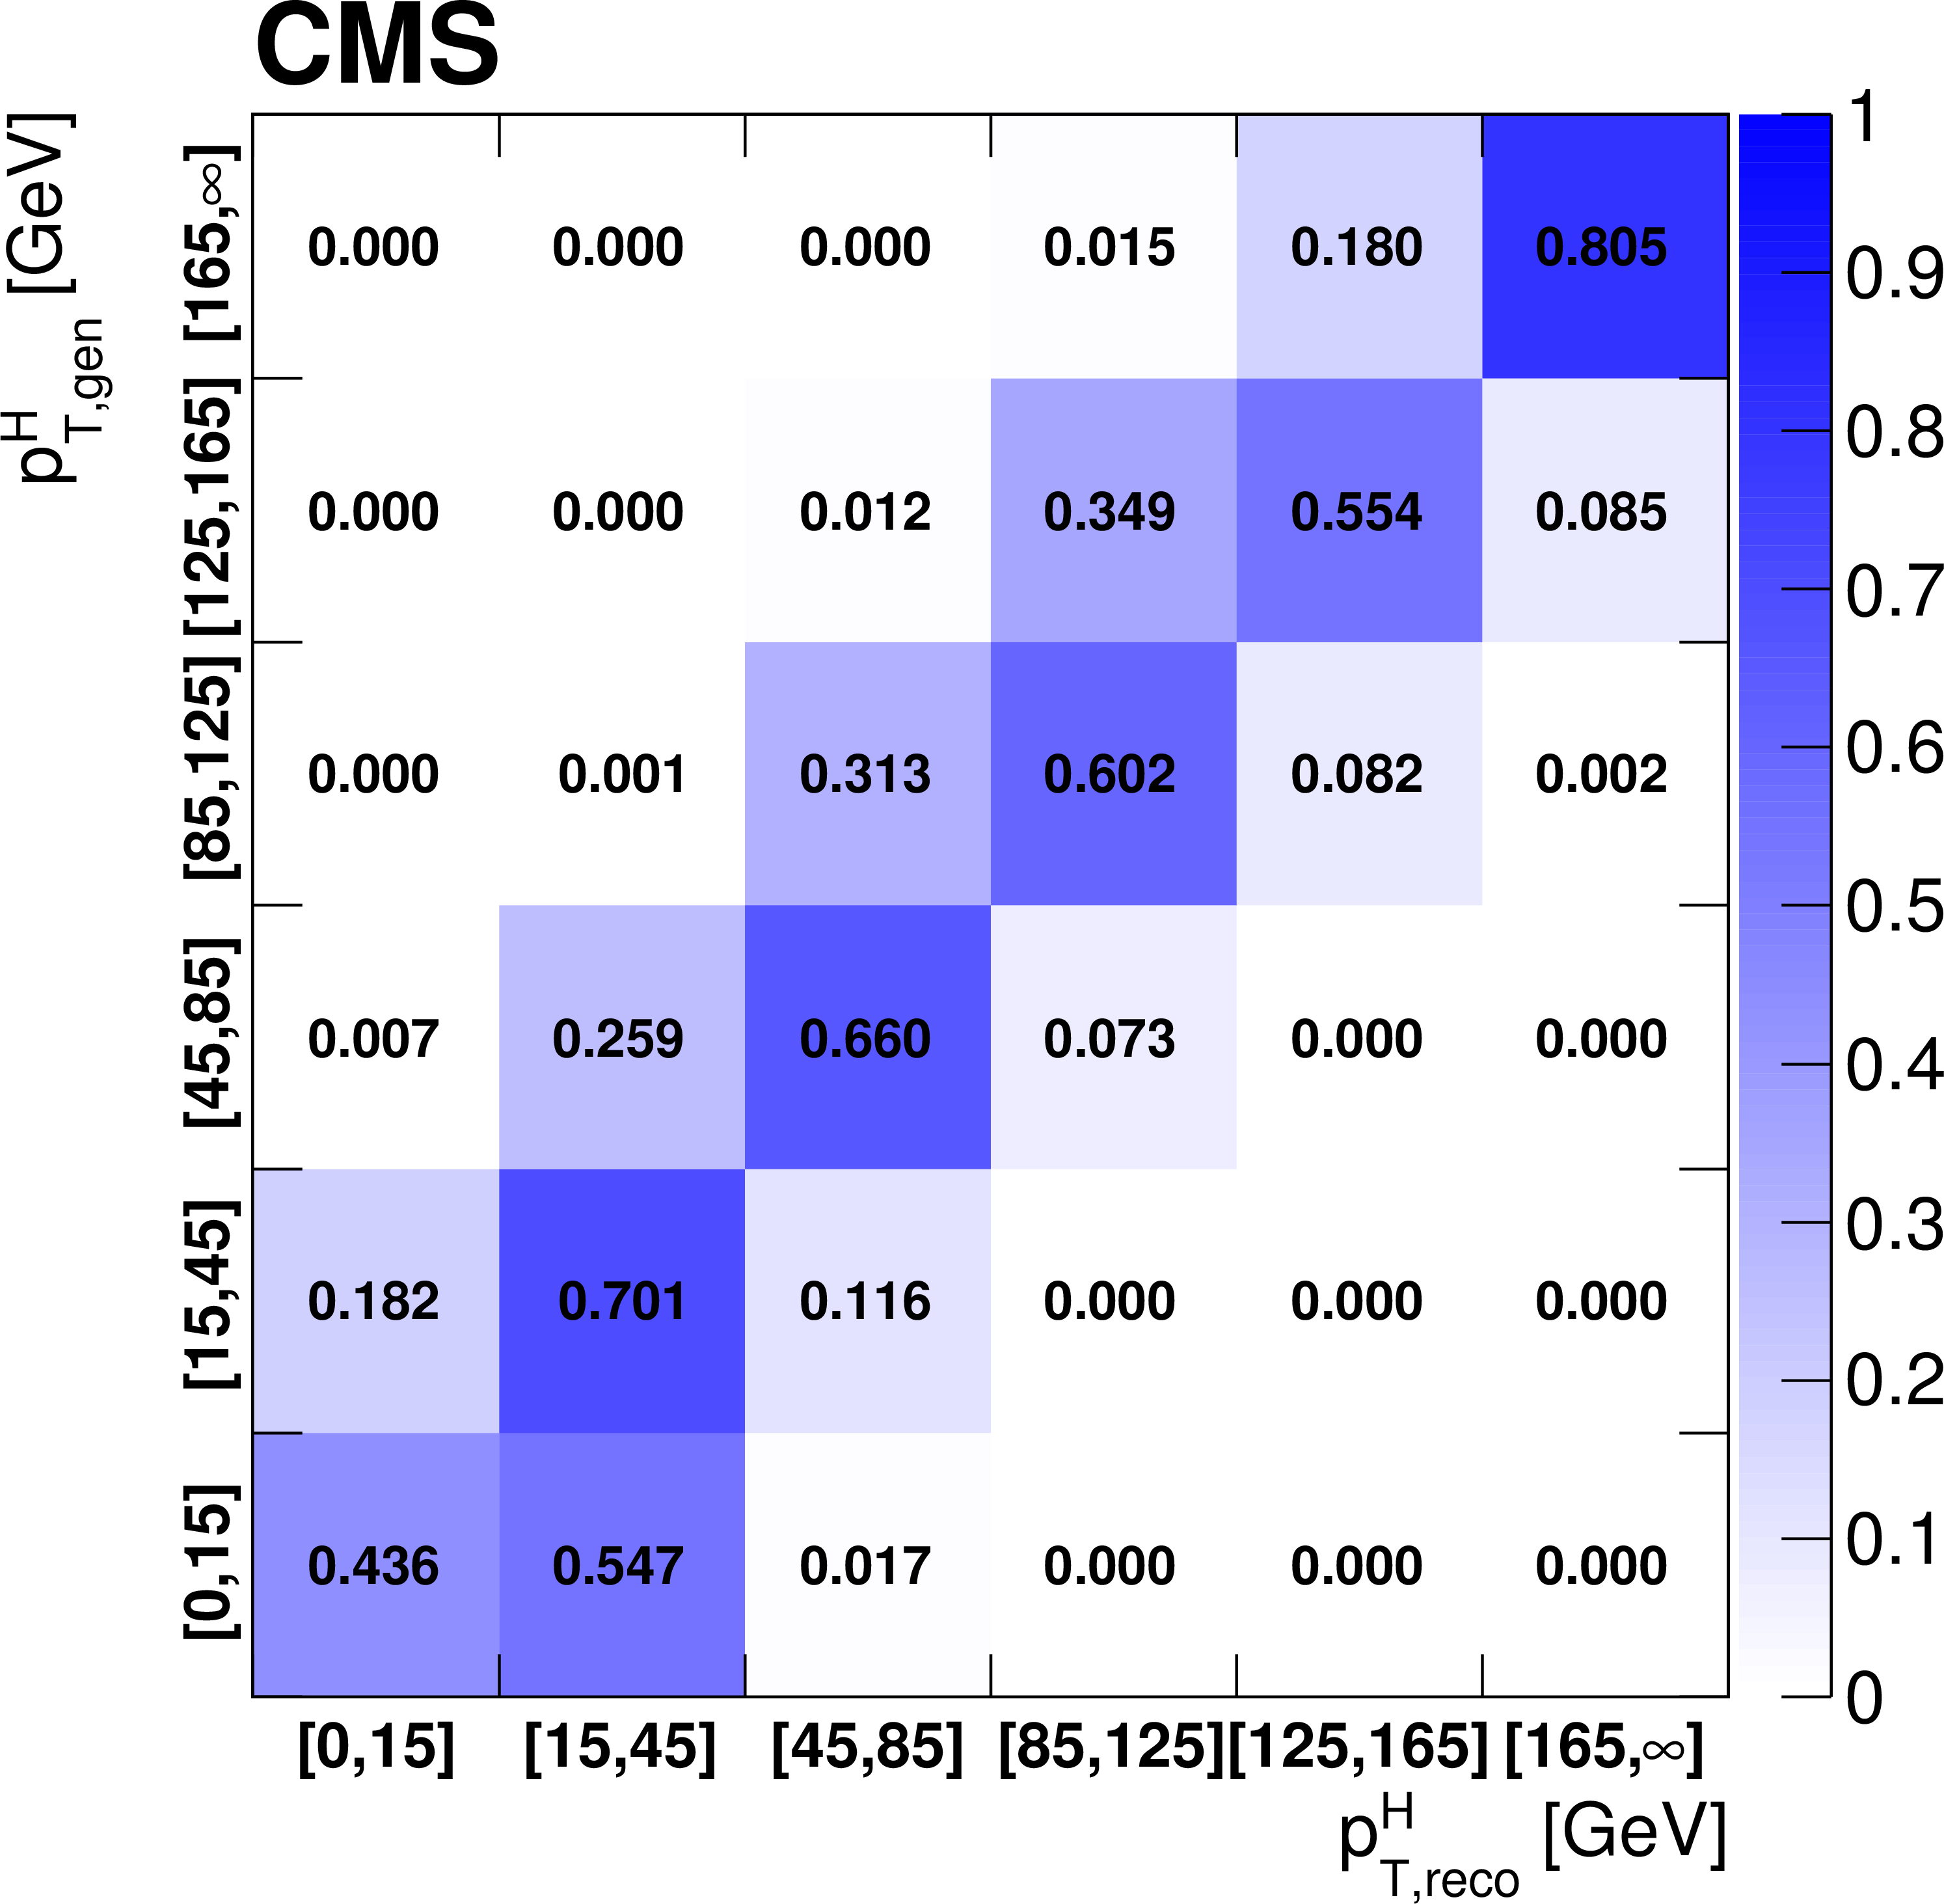
Figure 4-a:
Response matrix including all signal processes. The matrix is normalized by row in order to show the purity in diagonal bins. |
png pdf |
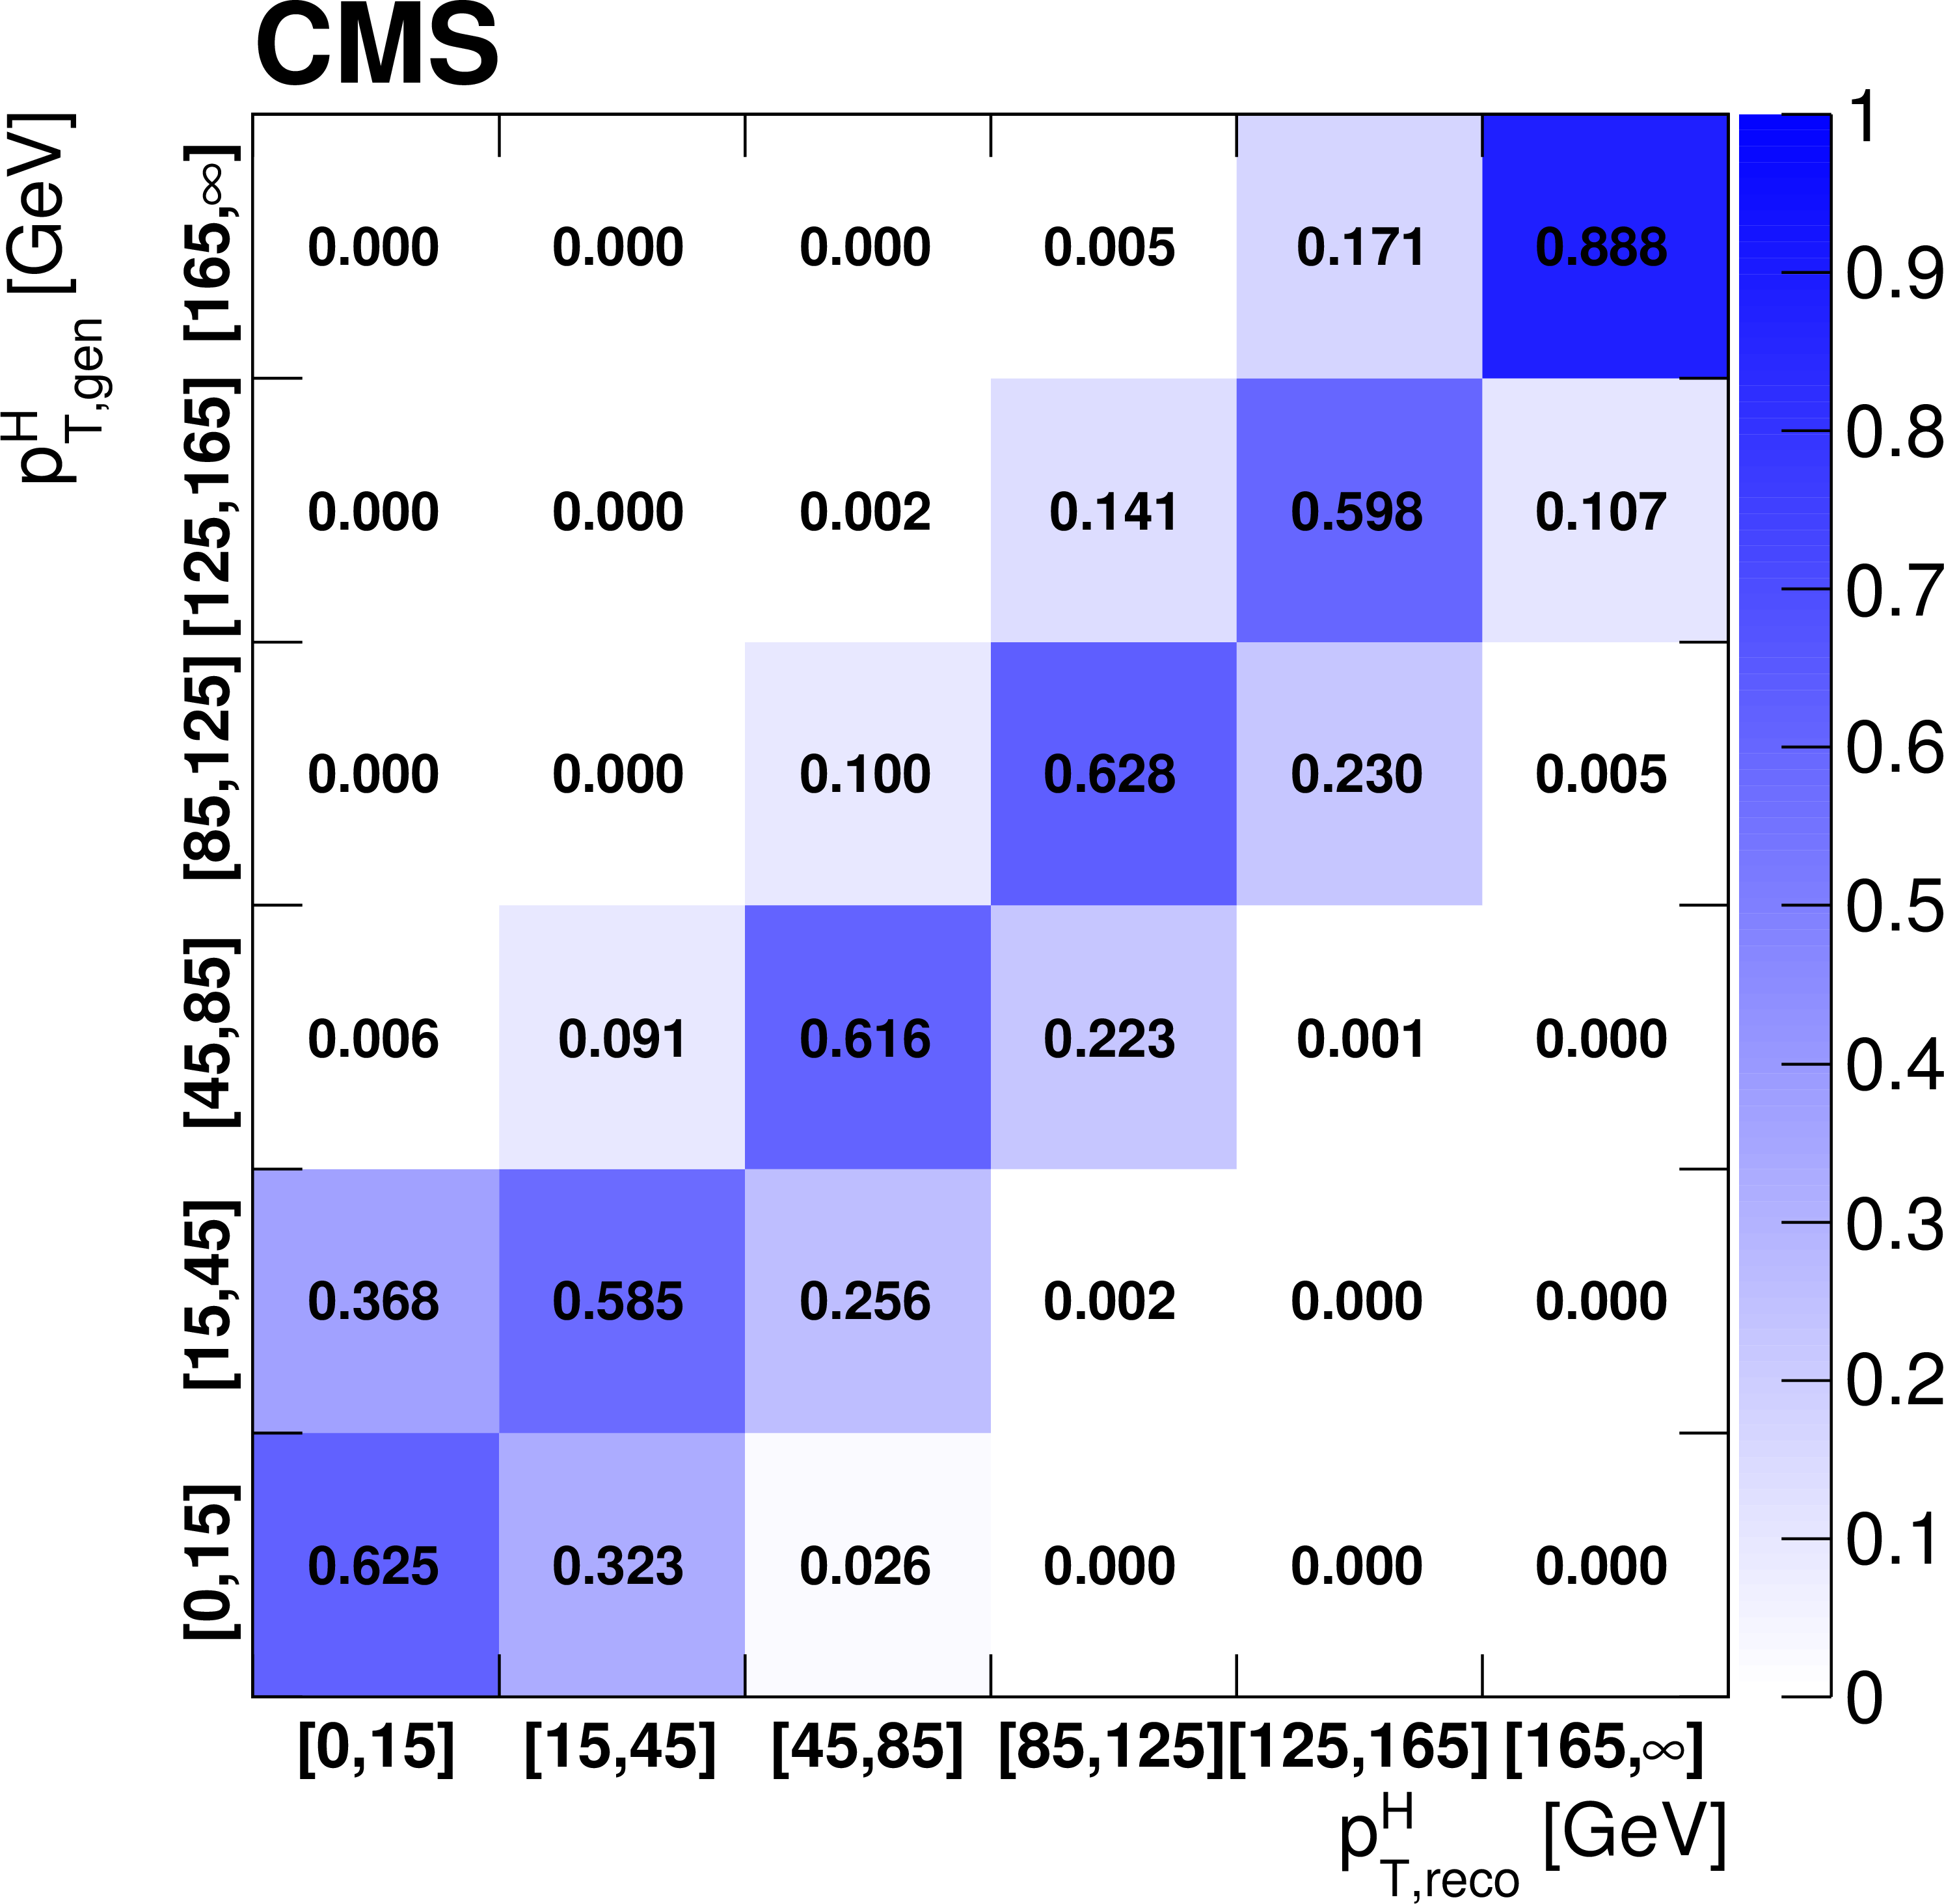
Figure 4-b:
Deconvolution matrix including all signal processes. The matrix is normalized by column in order to show the stability in diagonal bins. |
png pdf |
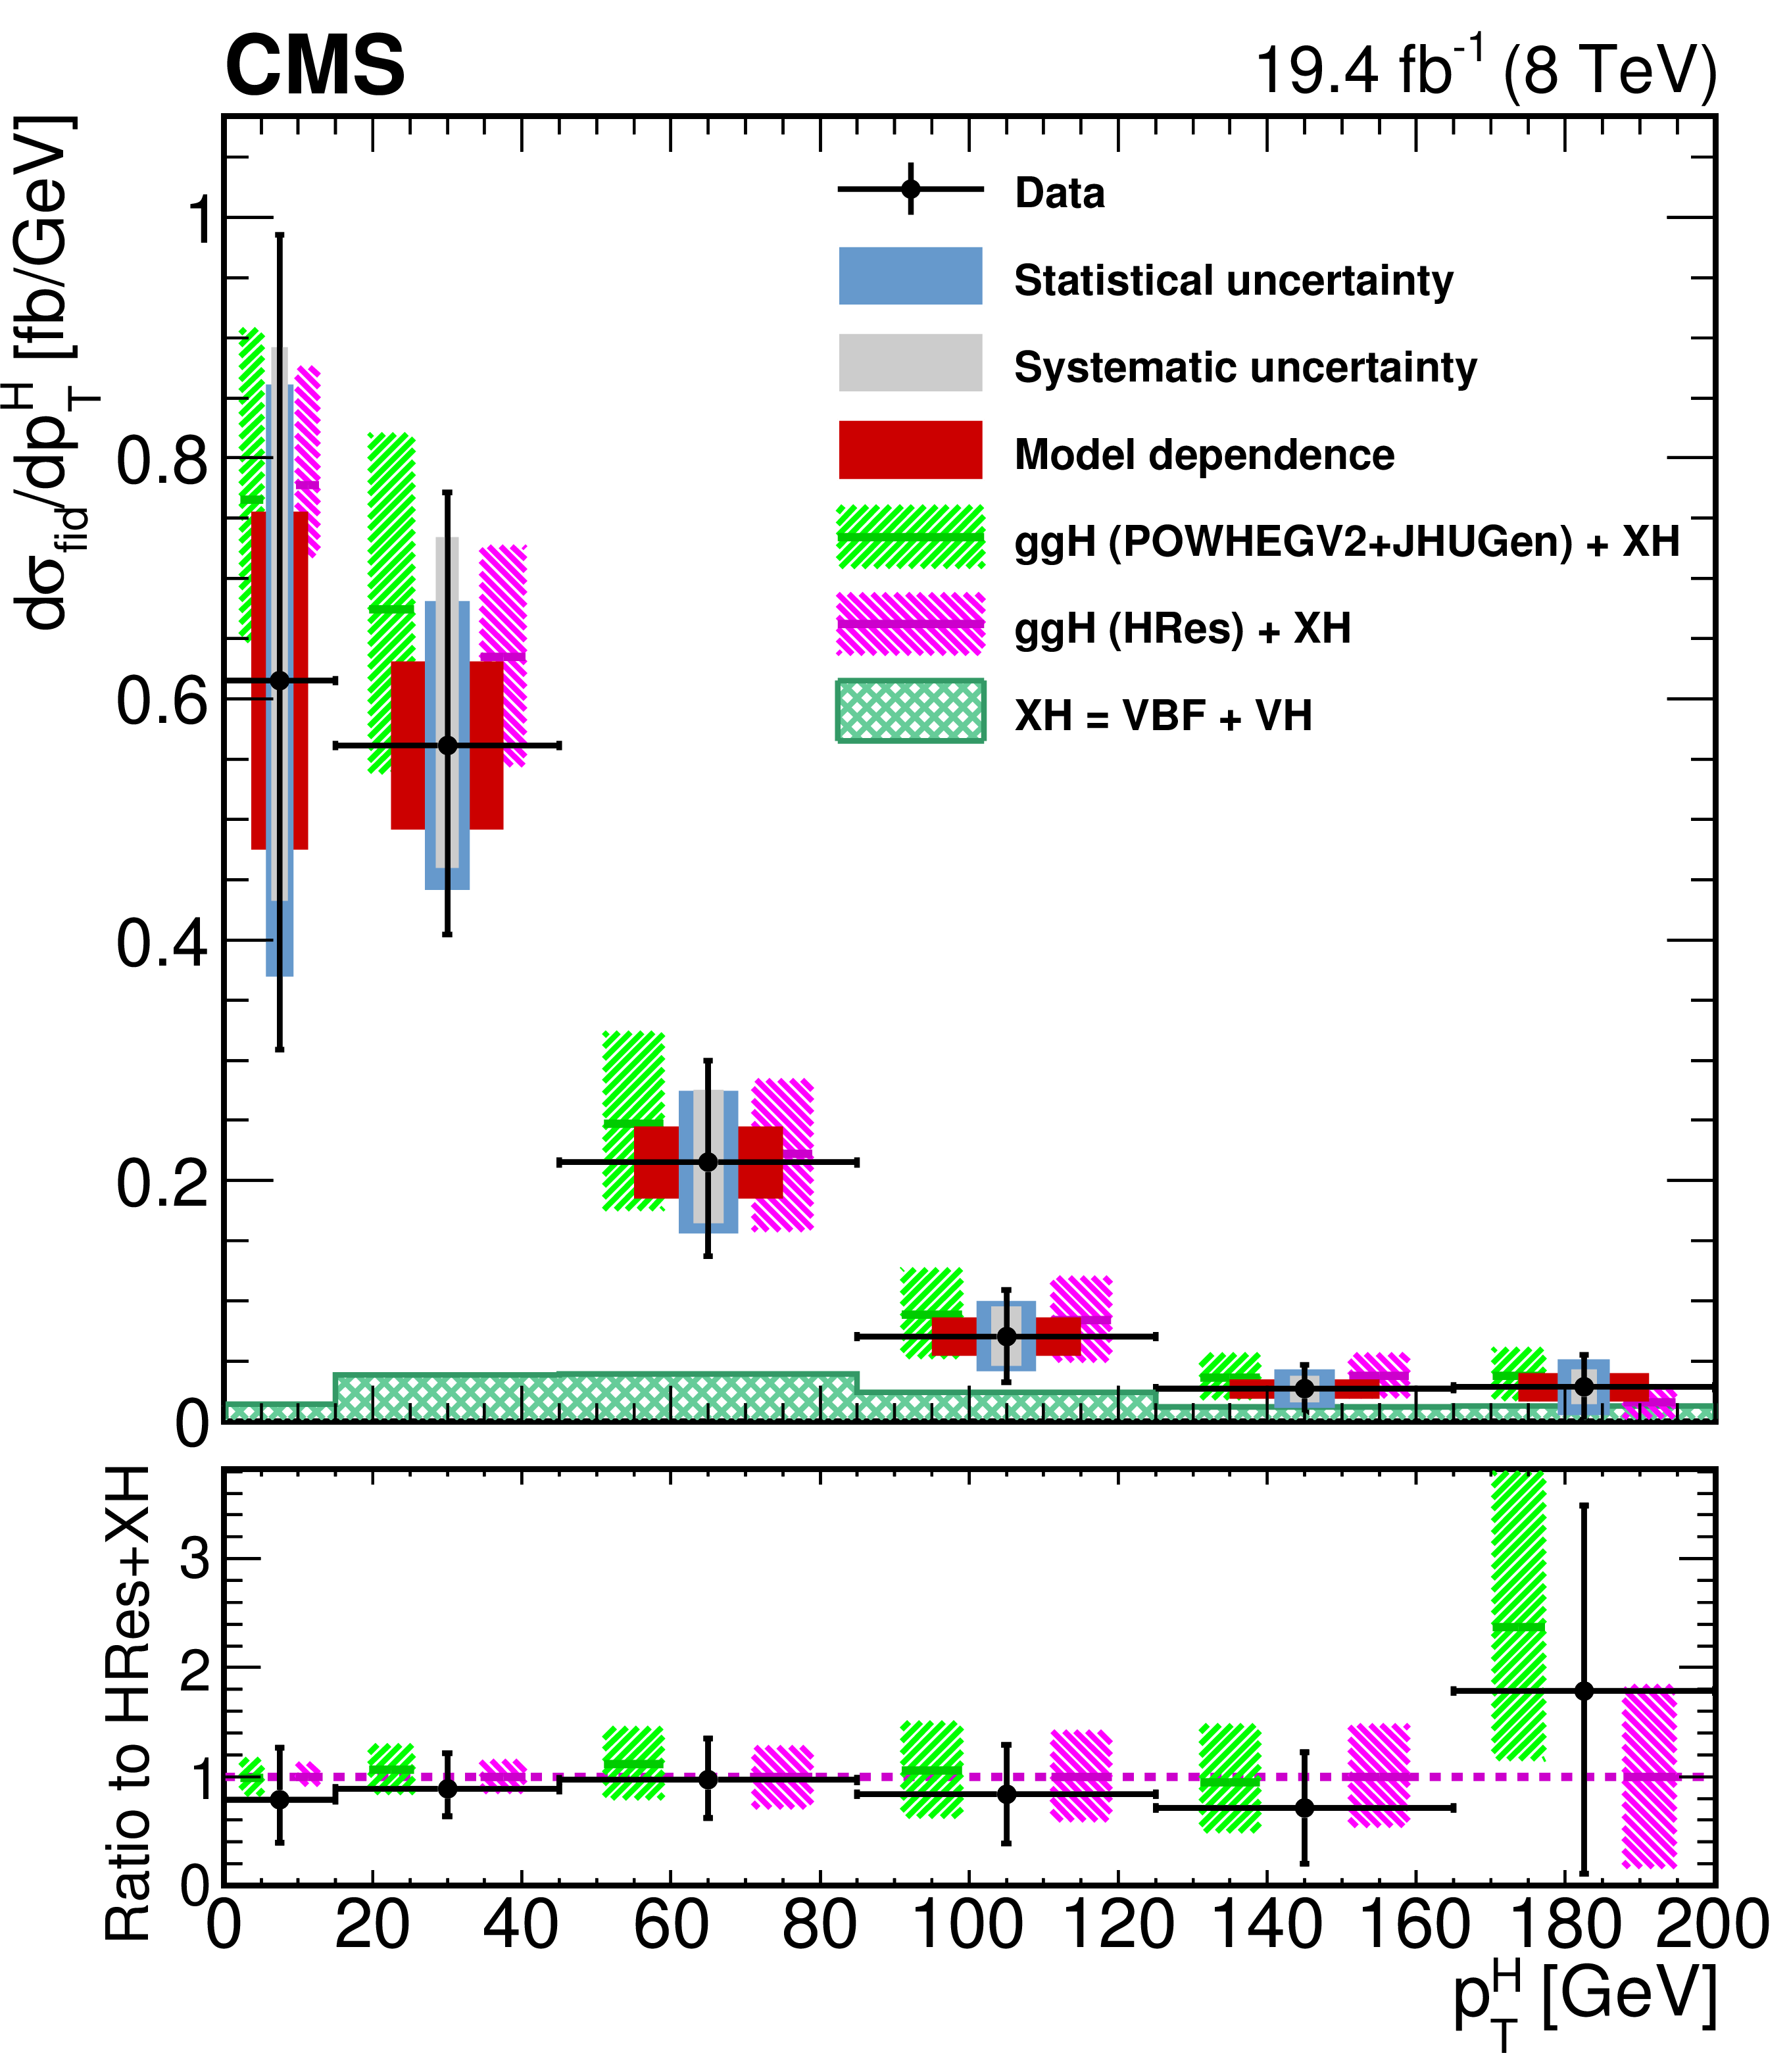
Figure 5:
Higgs boson production cross section as a function of ${p_{\mathrm {T}}^{\mathrm {H}}}$, after applying the unfolding procedure. Data points are shown, together with statistical and systematic uncertainties. The vertical bars on the data points correspond to the sum in quadrature of the statistical and systematic uncertainties. The model dependence uncertainty is also shown. The pink (and back-slashed filling) and green (and slashed filling) lines and areas represent the SM theoretical estimates in which the acceptance of the dominant ggH contribution is modelled by HRes and Powheg V2, respectively. The subdominant component of the signal is denoted as XH=VBF+VH and it is shown with the cross filled area separately. The bottom panel shows the ratio of data and Powheg V2 theoretical estimate to the HRes theoretical prediction. |
png pdf |
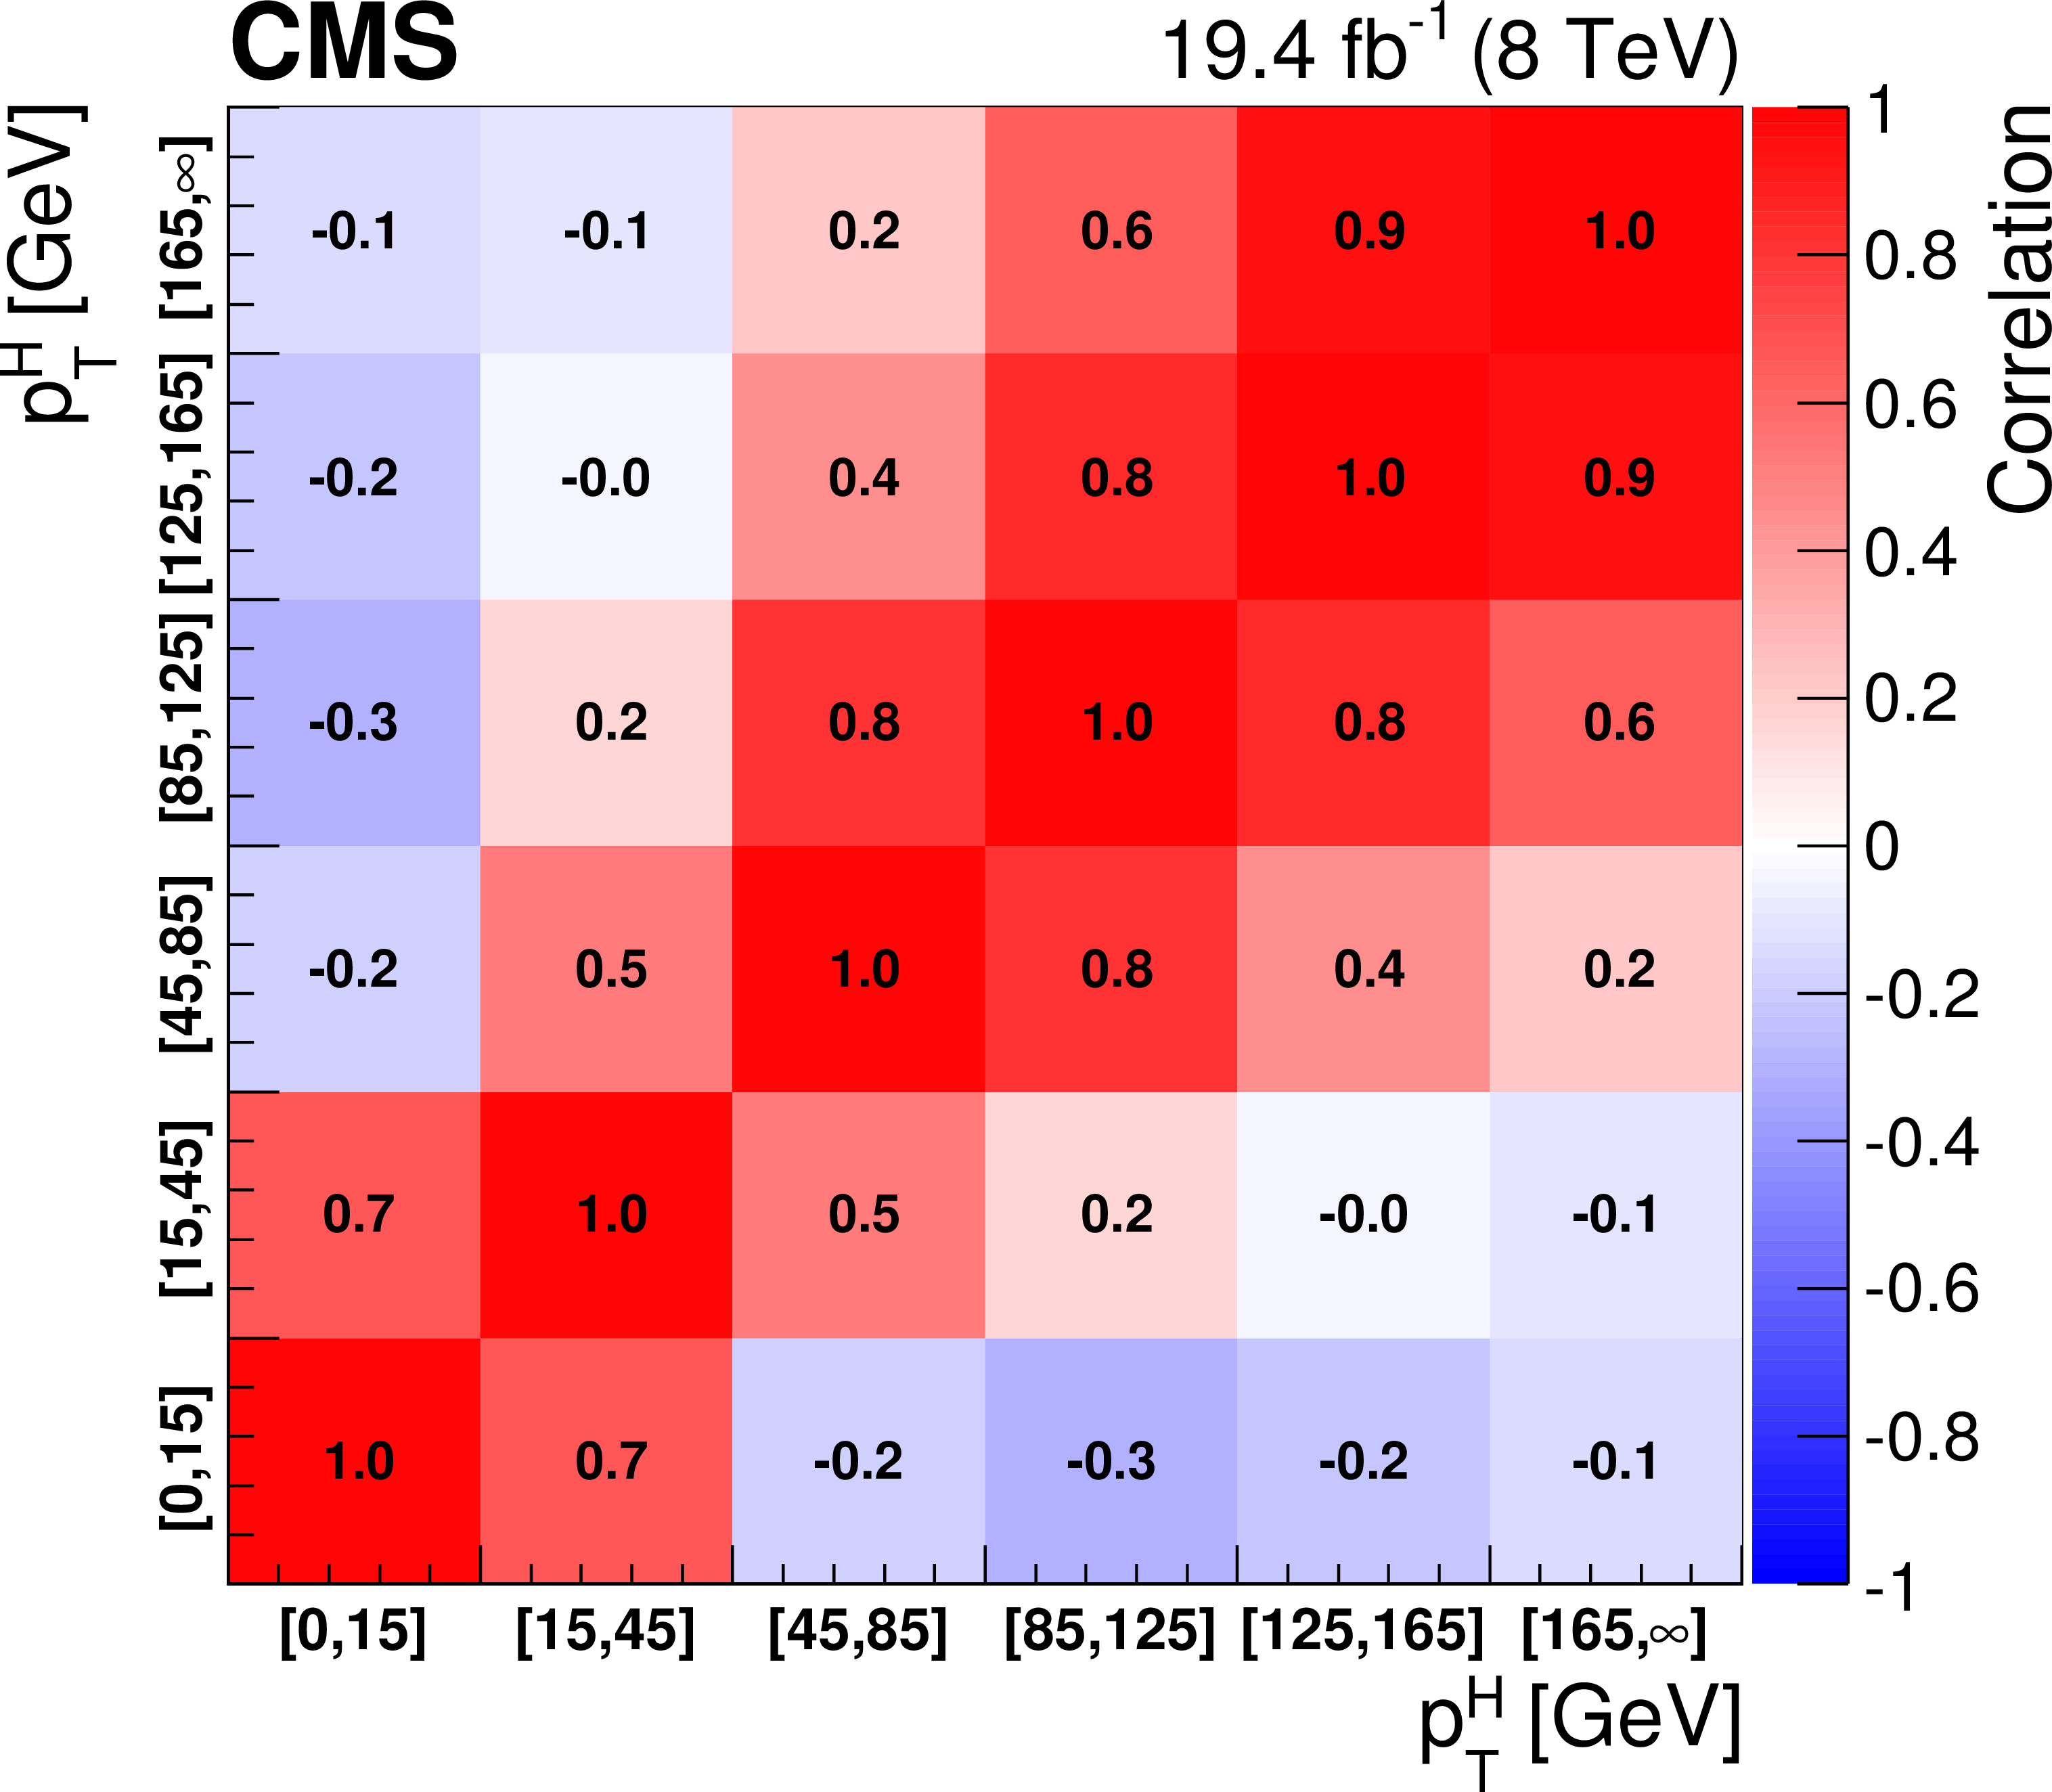
Figure 6:
Correlation matrix among the ${p_{\mathrm {T}}^{\mathrm {H}}}$ bins of the differential spectrum. |
| Tables | |
png pdf |
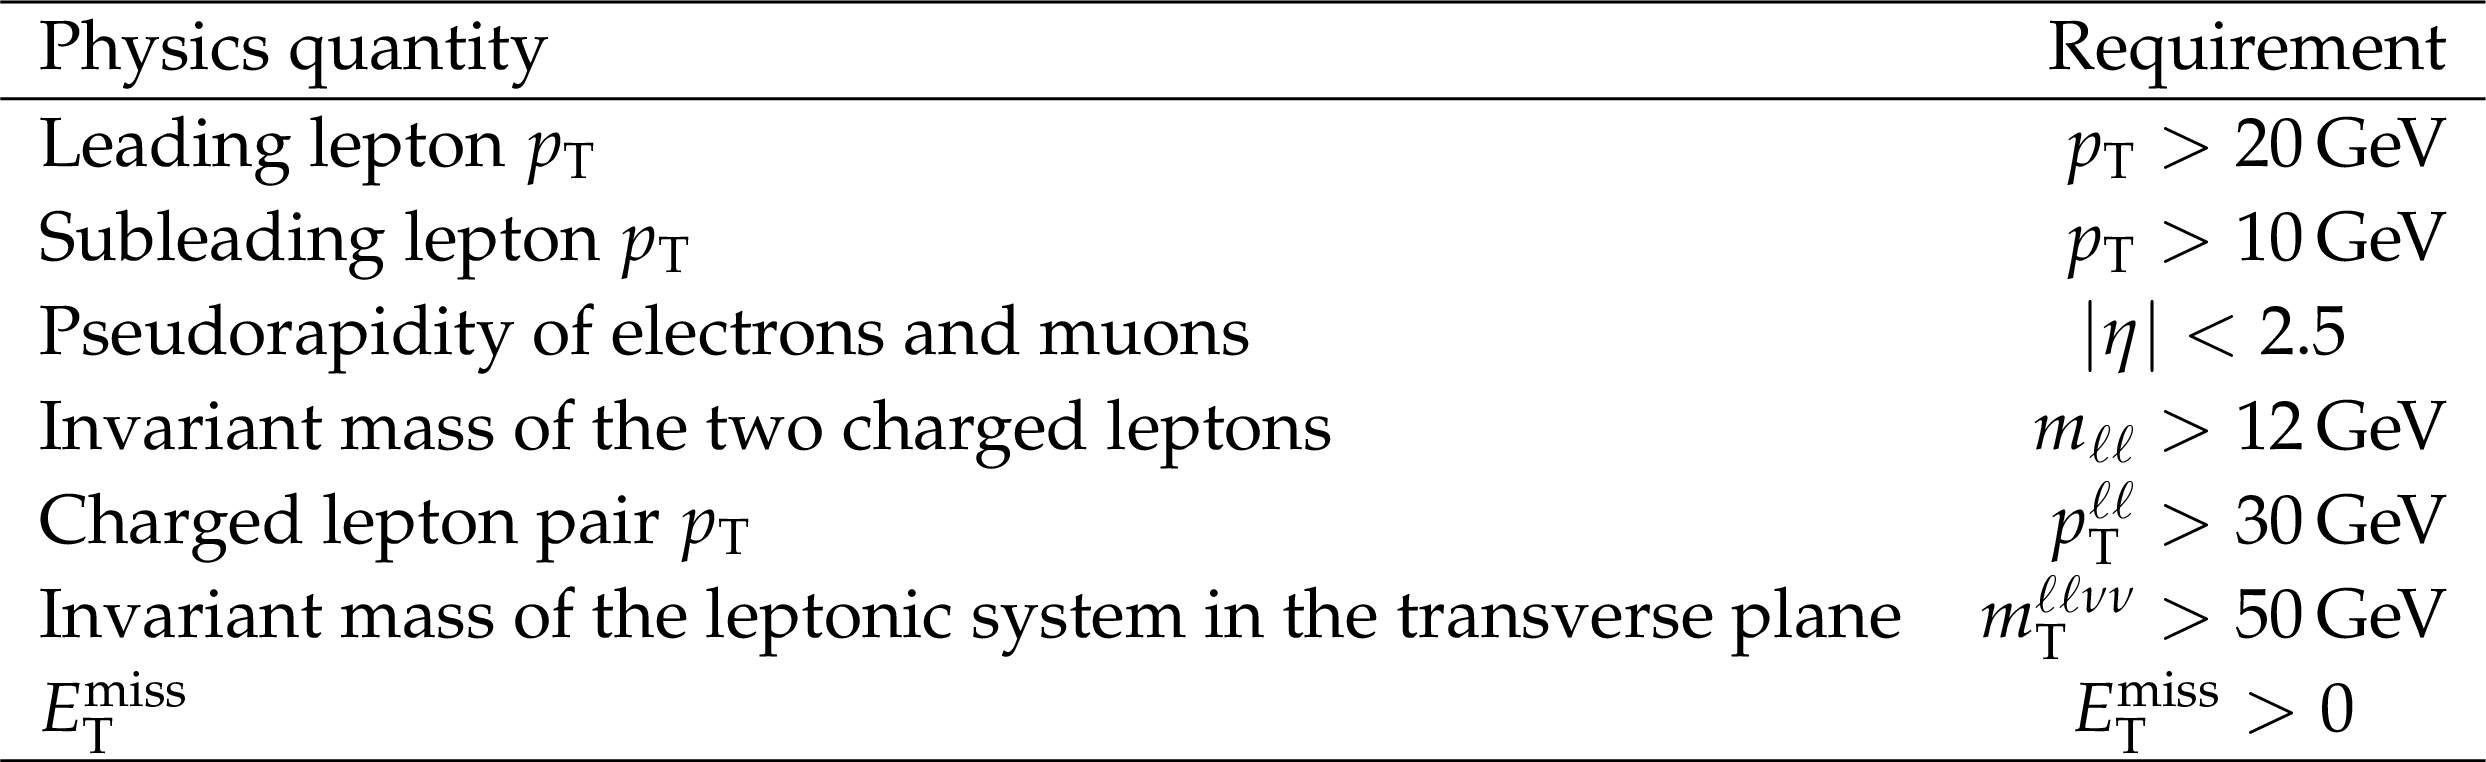
Table 1:
Summary of requirements used in the definition of the fiducial phase space. |
png pdf |
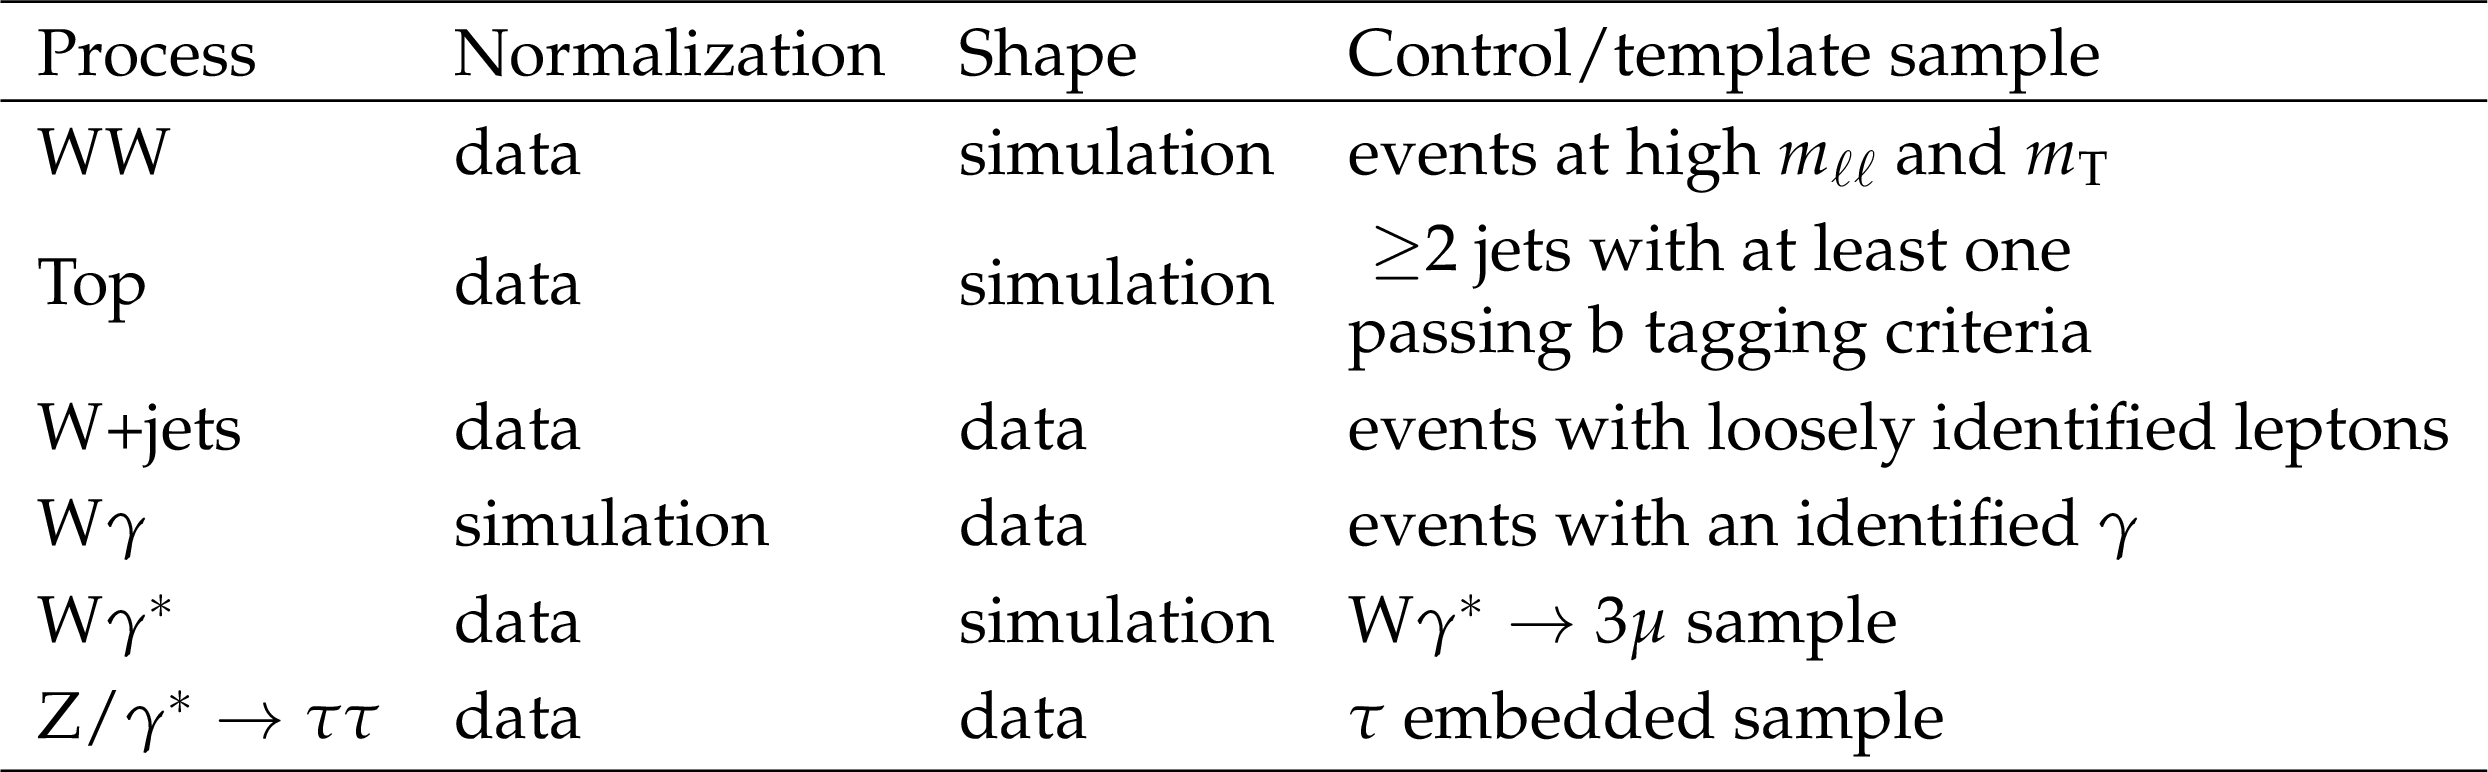
Table 2:
Summary of the processes used to estimate backgrounds in cases where data events are used to estimate either the normalization or the shape of the discriminant variable. A brief description of the control/template samples is given. |
png pdf |
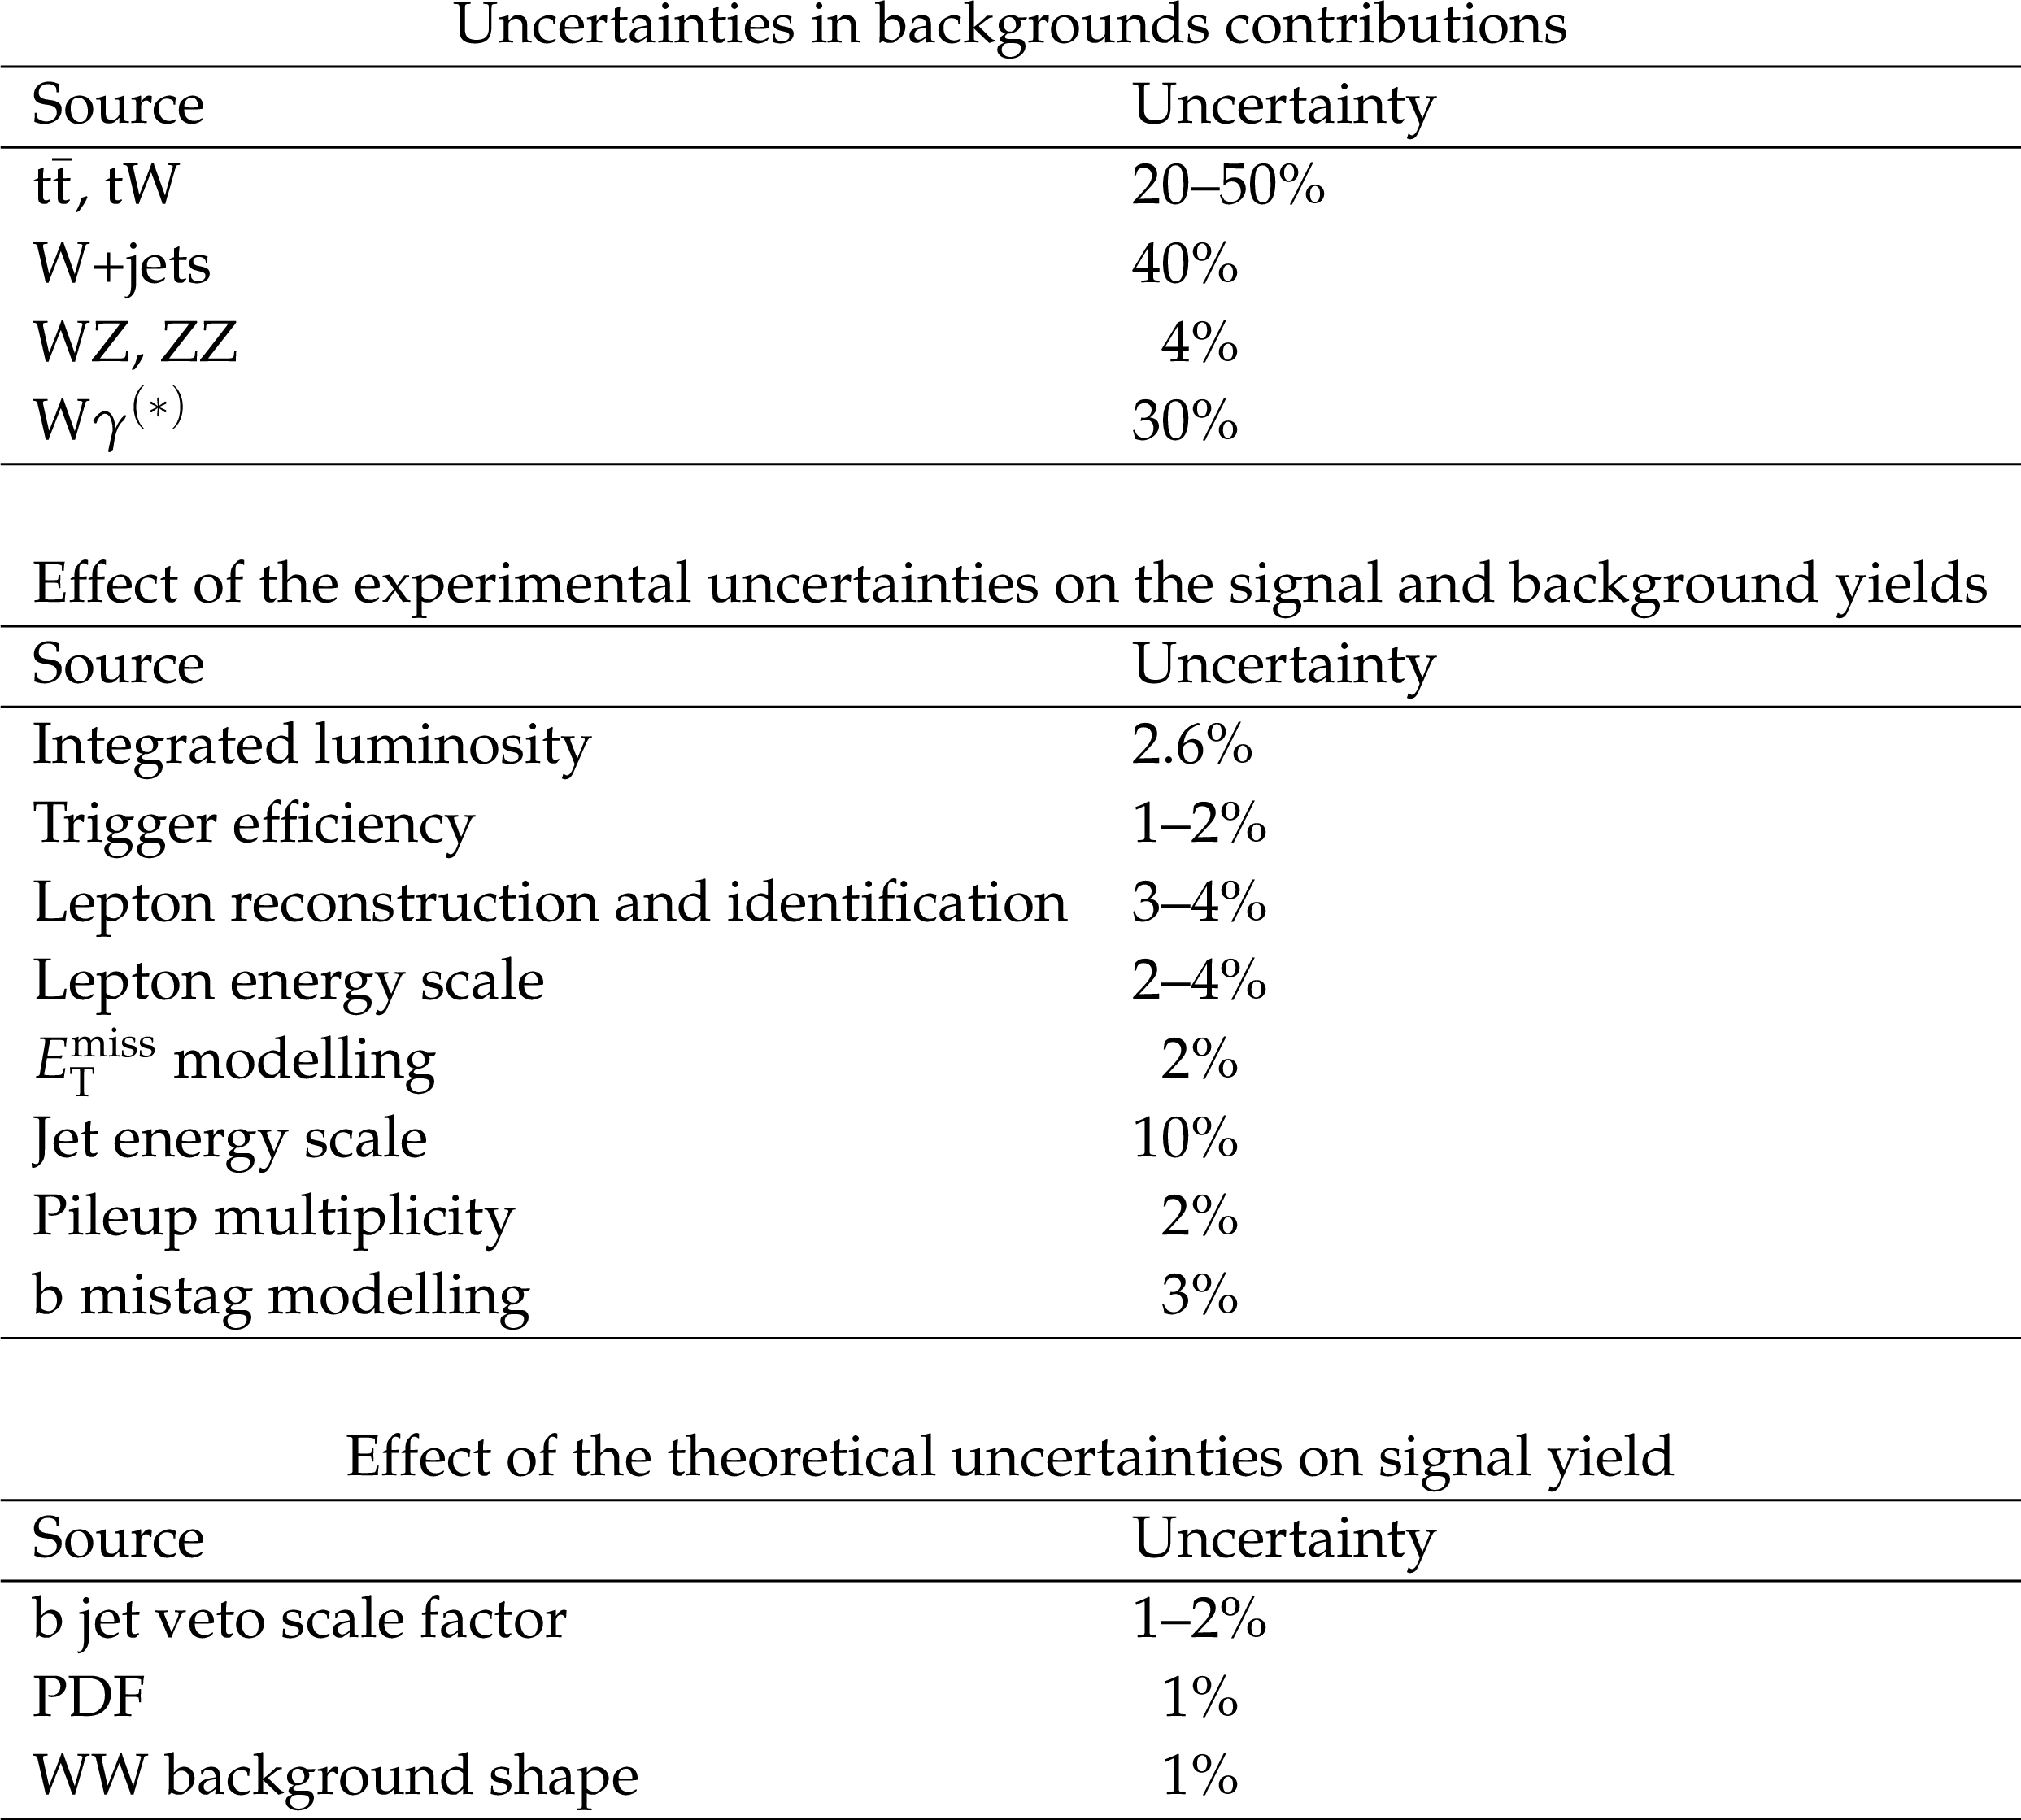
Table 3:
Main sources of systematic uncertainties and their estimate. The first category reports the uncertainties in the normalization of background contributions. The experimental and theoretical uncertainties refer to the effect on signal yields. A range is specified if the uncertainty varies across the $ {p_{\mathrm {T}}^{\mathrm {H}}}$ bins. |
png pdf |
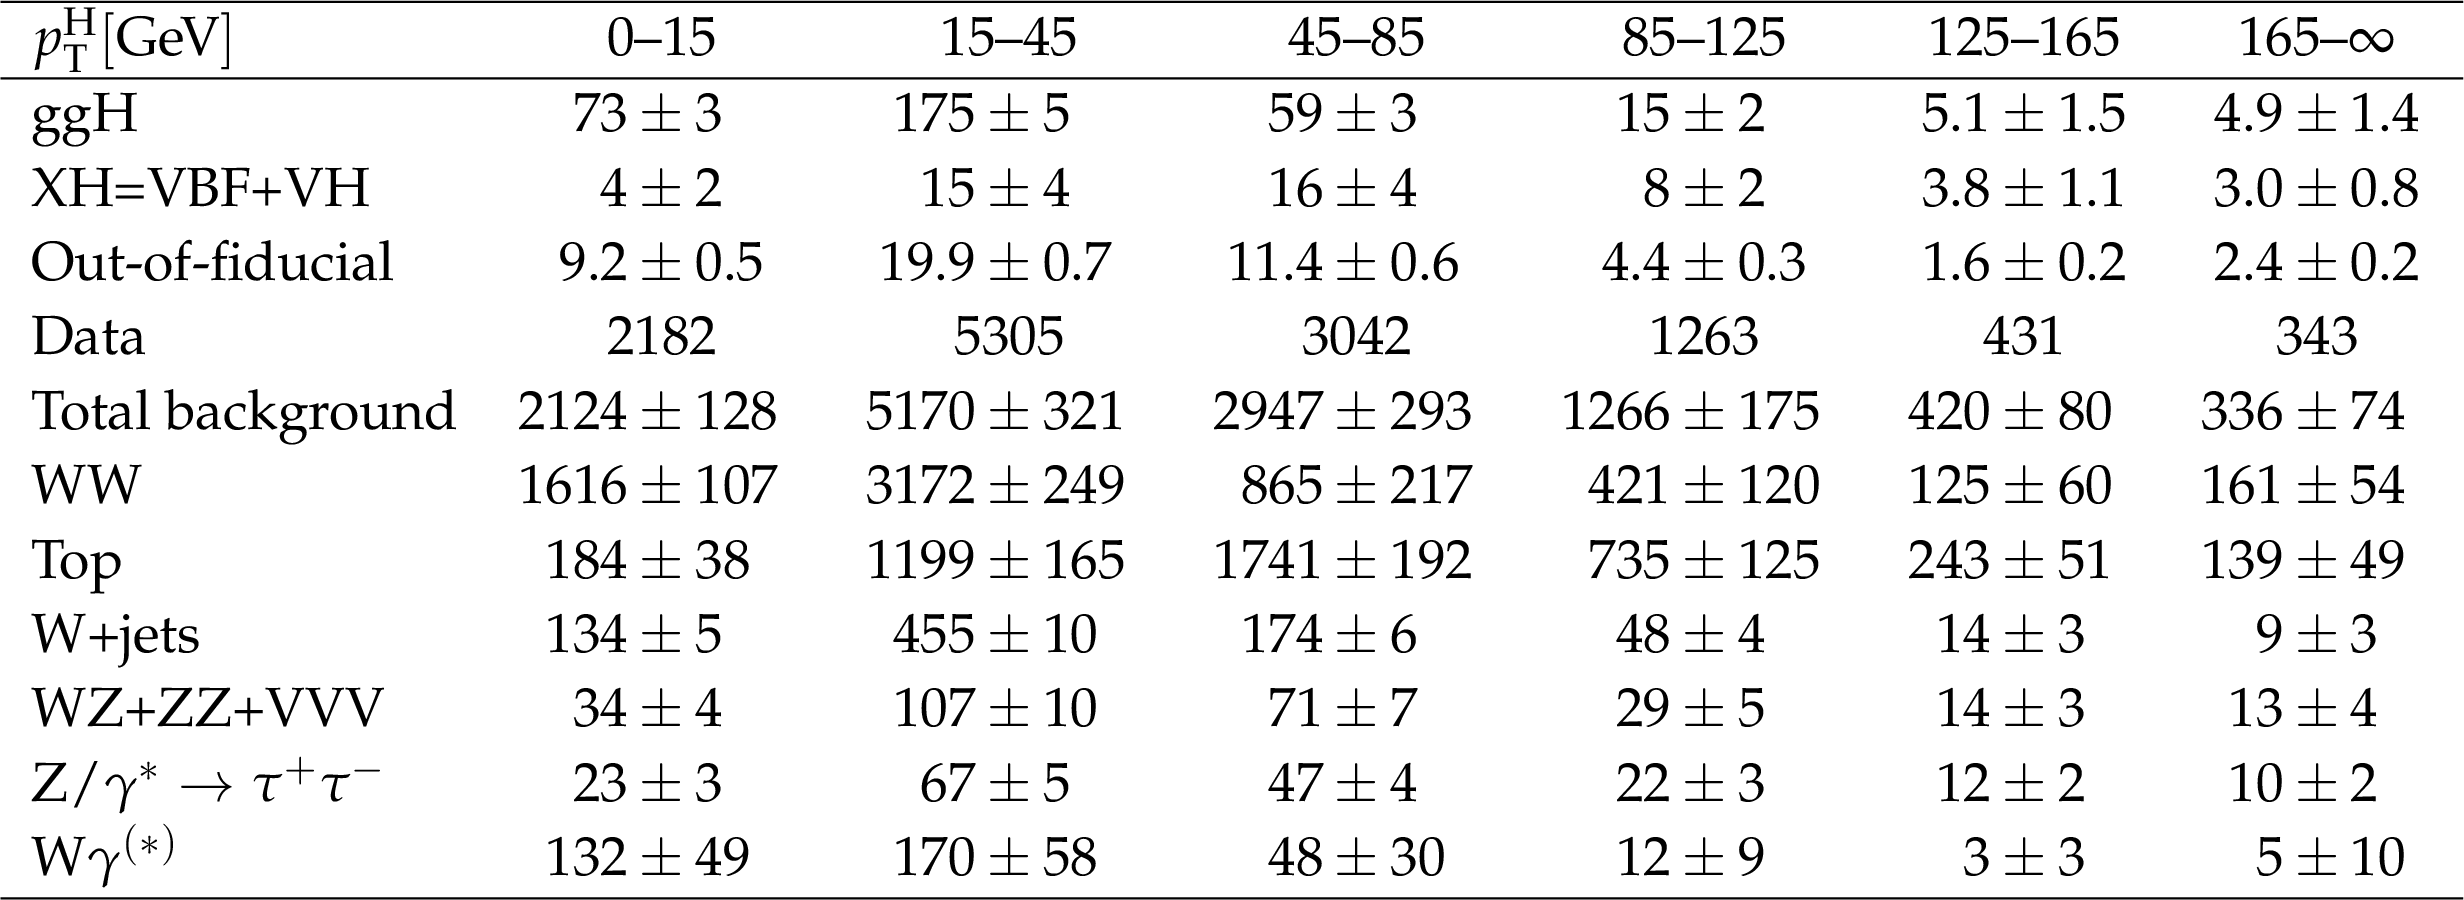
Table 4:
Signal prediction, background estimates and observed number of events in data are shown in each ${p_{\mathrm {T}}^{\mathrm {H}}}$ bin for the signal after applying the analysis selection requirements. The total uncertainty on the number of events is reported. For signal processes, the yield related to the ggH are shown, separated with respect to the contribution of the other production mechanisms (XH=VBF+VH). The WW process includes both quark and gluon induced contribution, while the Top process takes into account both $ {\mathrm{ t \bar{t} } } $ and tW. |
png pdf |
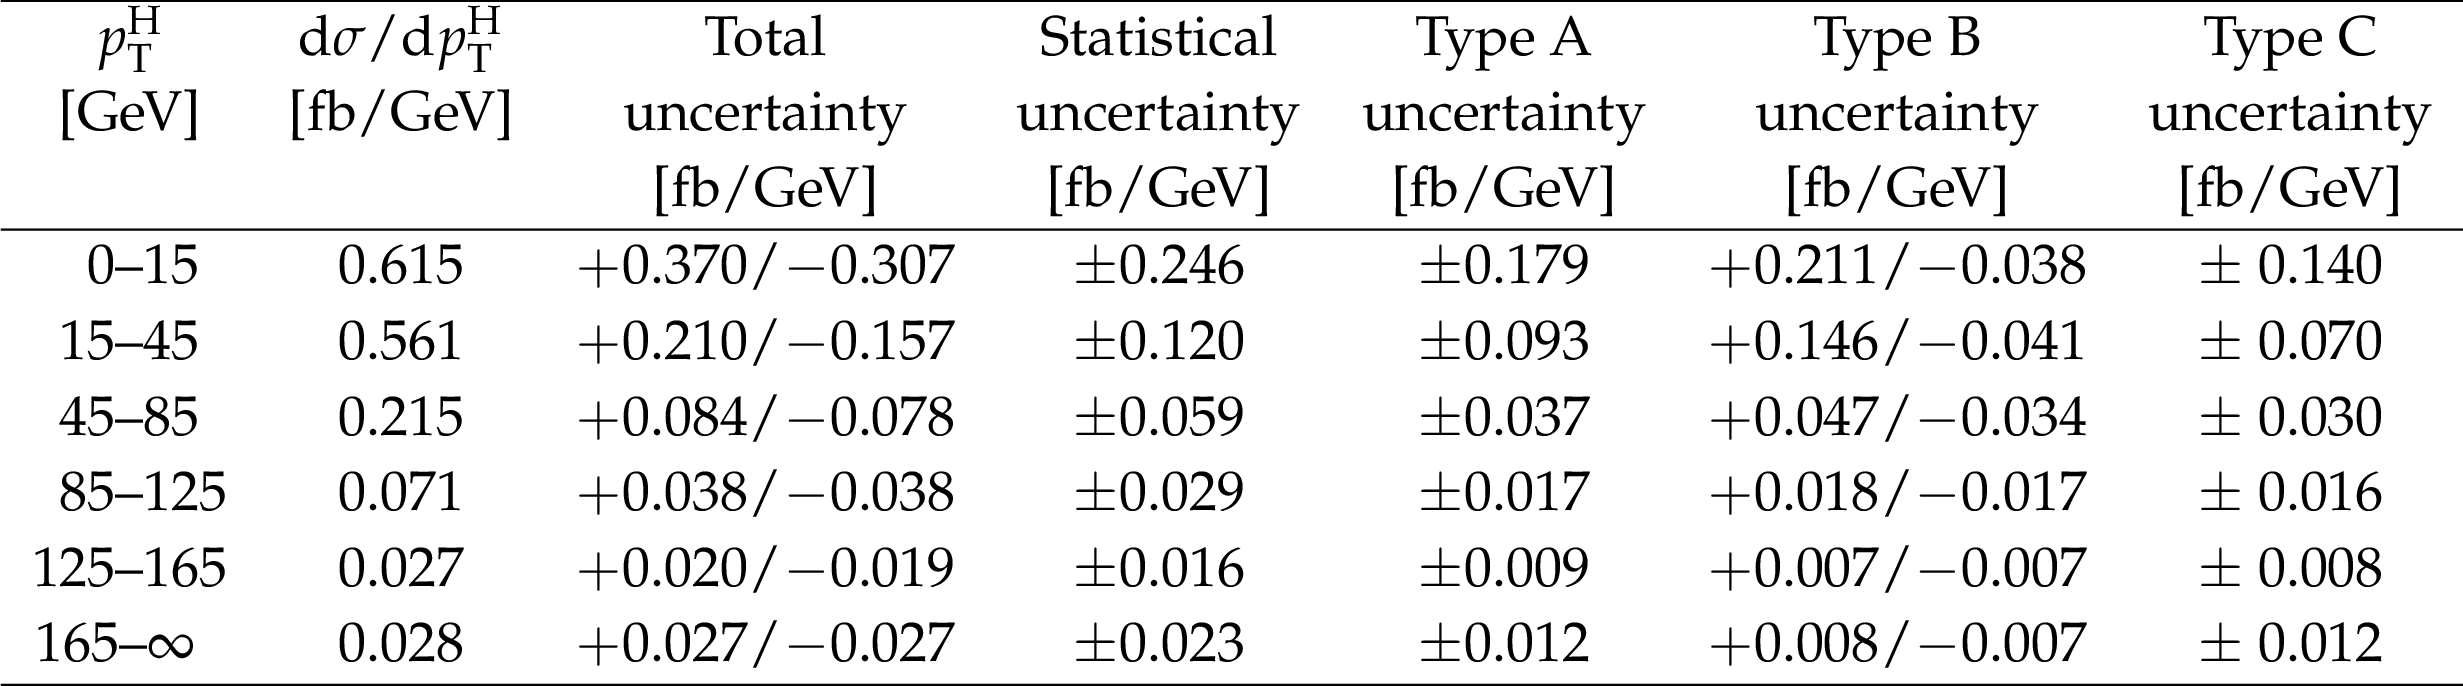
Table 5:
Differential cross section in each ${p_{\mathrm {T}}^{\mathrm {H}}}$ bin, together with the total uncertainty and the separate components of the various sources of uncertainty. |
| Summary |
| The cross section for Higgs boson production in pp collisions has been studied using the ${\mathrm{ H } \to \mathrm{ W }^+ \mathrm{ W }^-}$ decay mode, followed by leptonic decays of the W bosons to an oppositely charged electron-muon pair in the final state. Measurements have been performed using data from pp collisions at a centre-of-mass energy of 8 TeV collected by the CMS experiment at the LHC and corresponding to an integrated luminosity of 19.4 fb$^{-1}$. The differential cross section has been measured as a function of the Higgs boson transverse momentum in a fiducial phase space, defined to match the experimental kinematic acceptance. An unfolding procedure has been used to extrapolate the measured results to the fiducial phase space and to correct for the detector effects. The measurements have been compared to SM theoretical estimations provided by the HRes and Powheg V2 generators, showing good agreement within the experimental uncertainties. The inclusive production $\sigma B$ in the fiducial phase space has been measured to be 39 $\pm$ 8 (stat) $\pm$ 9 (syst) fb, consistent with the SM expectation. |
| References | ||||
| 1 | ATLAS Collaboration | Observation of a new particle in the search for the Standard Model Higgs boson with the ATLAS detector at the LHC | PLB 716 (2012) 1 | 1207.7214 |
| 2 | CMS Collaboration | Observation of a new boson at a mass of 125 GeV with the CMS experiment at the LHC | PLB 716 (2012) 30 | CMS-HIG-12-028 1207.7235 |
| 3 | CMS Collaboration | Observation of a new boson with mass near 125 GeV in pp collisions at $ \sqrt{s} = $ 7 and 8 TeV | JHEP 06 (2013) 081 | CMS-HIG-12-036 1303.4571 |
| 4 | ATLAS Collaboration | Measurements of Higgs boson production and couplings in diboson final states with the ATLAS detector at the LHC | PLB 726 (2013) 88 | 1307.1427 |
| 5 | ATLAS Collaboration | Evidence for the spin-0 nature of the Higgs boson using ATLAS data | PLB 726 (2013) 120 | 1307.1432 |
| 6 | CMS Collaboration | Search for the standard model Higgs boson produced in association with a W or a Z boson and decaying to bottom quarks | PRD 89 (2014) 012003 | CMS-HIG-13-012 1310.3687 |
| 7 | CMS Collaboration | Measurement of Higgs boson production and properties in the WW decay channel with leptonic final states | JHEP 01 (2014) 096 | CMS-HIG-13-023 1312.1129 |
| 8 | CMS Collaboration | Measurement of the properties of a Higgs boson in the four-lepton final state | PRD 89 (2014) 092007 | CMS-HIG-13-002 1312.5353 |
| 9 | CMS Collaboration | Evidence for the 125 GeV Higgs boson decaying to a pair of $ \tau $ leptons | JHEP 05 (2014) 104 | CMS-HIG-13-004 1401.5041 |
| 10 | CMS Collaboration | Evidence for the direct decay of the 125 GeV Higgs boson to fermions | NP 10 (2014) 557 | CMS-HIG-13-033 1401.6527 |
| 11 | CMS Collaboration | Observation of the diphoton decay of the Higgs boson and measurement of its properties | EPJC 74 (2014) 3076 | CMS-HIG-13-001 1407.0558 |
| 12 | ATLAS Collaboration | Measurement of Higgs boson production in the diphoton decay channel in pp collisions at center-of-mass energies of 7 and 8 TeV with the ATLAS detector | PRD 90 (2014) 112015 | 1408.7084 |
| 13 | ATLAS Collaboration | Measurements of Higgs boson production and couplings in the four-lepton channel in pp collisions at center-of-mass energies of 7 and 8 TeV with the ATLAS detector | PRD 91 (2015) 012006 | 1408.5191 |
| 14 | ATLAS Collaboration | Search for the $ \mathrm{ b }\mathrm{ \bar{b} } $ decay of the Standard Model Higgs boson in associated $ (\mathrm{ W }/\mathrm{ Z })\mathrm{ H } $ production with the ATLAS detector | JHEP 01 (2015) 069 | 1409.6212 |
| 15 | CMS Collaboration | Constraints on the spin-parity and anomalous HVV couplings of the Higgs boson in proton collisions at 7 and 8 TeV | PRD 92 (2015) 012004 | CMS-HIG-14-018 1411.3441 |
| 16 | ATLAS Collaboration | Observation and measurement of Higgs boson decays to $ \mathrm{ W }\mathrm{ W }^* $ with the ATLAS detector | PRD 92 (2015) 012006 | 1412.2641 |
| 17 | CMS Collaboration | Precise determination of the mass of the Higgs boson and tests of compatibility of its couplings with the standard model predictions using proton collisions at 7 and 8 TeV | EPJC 75 (2015) 212 | CMS-HIG-14-009 1412.8662 |
| 18 | ATLAS Collaboration | Evidence for the Higgs-boson Yukawa coupling to tau leptons with the ATLAS detector | JHEP 04 (2015) 117 | 1501.04943 |
| 19 | ATLAS Collaboration | Determination of spin and parity of the Higgs boson in the $ \mathrm{ W }\mathrm{ W }^*\rightarrow \mathrm{ e } \nu \mu \nu $ decay channel with the ATLAS detector | EPJC 75 (2015) 231 | 1503.03643 |
| 20 | ATLAS and CMS Collaborations | Combined measurement of the Higgs boson mass in pp collisions at $ \sqrt{s}= $ 7 and 8 TeV with the ATLAS and CMS experiments | PRL 114 (2015) 191803 | 1503.07589 |
| 21 | ATLAS Collaboration | Measurements of the Higgs boson production and decay rates and coupling strengths using pp collision data at $ \sqrt{s}= $ 7 and 8 TeV in the ATLAS experiment | EPJC 76 (2016) 6 | 1507.04548 |
| 22 | CMS Collaboration | Search for Higgs boson off-shell production in proton-proton collisions at 7 and 8 TeV and derivation of constraints on its total decay width | Submitted to JHEP | CMS-HIG-14-032 1605.02329 |
| 23 | R. V. Harlander and T. Neumann | Probing the nature of the Higgs-gluon coupling | PRD 88 (2013) 074015 | 1308.2225 |
| 24 | A. Banfi, A. Martin, and V. Sanz | Probing top-partners in Higgs+jets | JHEP 08 (2014) 053 | 1308.4771 |
| 25 | A. Azatov and A. Paul | Probing Higgs couplings with high $ p_{\mathrm{T}} $ Higgs production | JHEP 01 (2014) 014 | 1309.5273 |
| 26 | C. Grojean, E. Salvioni, M. Schlaffer, and A. Weiler | Very boosted Higgs in gluon fusion | JHEP 05 (2014) 022 | 1312.3317 |
| 27 | S. Dawson, I. M. Lewis, and M. Zeng | Effective field theory for Higgs boson plus jet production | PRD 90 (2014) 093007 | 1409.6299 |
| 28 | G. Bozzi, S. Catani, D. de Florian, and M. Grazzini | Transverse-momentum resummation and the spectrum of the Higgs boson at the LHC | NPB 737 (2006) 73 | hep-ph/0508068 |
| 29 | D. de Florian, G. Ferrera, M. Grazzini, and D. Tommasini | Higgs boson production at the LHC: transverse momentum resummation effects in the $ \mathrm{ H } \to 2 \gamma $, $ \mathrm{ H } \to \mathrm{ W } \mathrm{ W } \to \ell \nu \ell \nu $ and $ \mathrm{ H } \to \mathrm{ Z } \mathrm{ Z } \to 4 \ell $ decay modes | JHEP 06 (2012) 132 | 1203.6321 |
| 30 | M. Grazzini and H. Sargsyan | Heavy-quark mass effects in Higgs boson production at the LHC | JHEP 09 (2013) 129 | 1306.4581 |
| 31 | ATLAS Collaboration | Fiducial and differential cross sections of Higgs boson production measured in the four-lepton decay channel in pp collisions at $ \sqrt{s} = $ 8 TeV with the ATLAS detector | PLB 738 (2014) 234 | 1408.3226 |
| 32 | ATLAS Collaboration | Measurements of fiducial and differential cross sections for Higgs boson production in the diphoton decay channel at $ \sqrt{s} = $ 8 TeV with ATLAS | JHEP 09 (2014) 112 | 1407.4222 |
| 33 | ATLAS Collaboration | Measurements of the total and differential Higgs boson production cross sections combining the $ \mathrm{ H } \rightarrow \gamma\gamma $ and $ \mathrm{ H } \rightarrow \mathrm{ Z } \mathrm{ Z }^{*} \rightarrow 4 \ell $ decay channels at $ \sqrt{s} = $ 8 TeV with the ATLAS detector | PRL 115 (2015) 091801 | 1504.05833 |
| 34 | CMS Collaboration | Measurement of differential cross sections for Higgs boson production in the diphoton decay channel in pp collisions at $ \sqrt{s} = $ 8 TeV | EPJC 76 (2016) 13 | CMS-HIG-14-016 1508.07819 |
| 35 | CMS Collaboration | Measurement of differential and integrated fiducial cross sections for Higgs boson production in the four-lepton decay channel in pp collisions at $ \sqrt{s}= $ 7 and 8 TeV | JHEP 04 (2016) 005 | CMS-HIG-14-028 1512.08377 |
| 36 | ATLAS Collaboration | Measurement of fiducial differential cross sections of gluon-fusion production of Higgs bosons decaying to $ WW^{\ast}{\rightarrow\,}e\nu\mu\nu $ with the ATLAS detector at $ \sqrt{s}= $ 8 TeV | JHEP 08 (2016) 104 | 1604.02997 |
| 37 | S. Heinemeyer et al. | Handbook of LHC Higgs cross sections: 3. Higgs properties | CERN-2013-004 | 1307.1347 |
| 38 | G. Cowan | A survey of unfolding methods for particle physics | in Proceedings of the conference on advanced statistical techniques in particle physics, University of Durham, 2002 | |
| 39 | CMS Collaboration | The CMS experiment at the CERN LHC | JINST 3 (2008) S08004 | CMS-00-001 |
| 40 | CMS Collaboration | Particle--flow event reconstruction in CMS and performance for jets, taus, and $ E_{\mathrm{T}}^{\text{miss}} $ | CMS-PAS-PFT-09-001 | |
| 41 | CMS Collaboration | Commissioning of the particle-flow event reconstruction with the first LHC collisions recorded in the CMS detector | CMS-PAS-PFT-10-001 | |
| 42 | CMS Collaboration | Commissioning of the particle-flow reconstruction in minimum-bias and jet events from pp collisions at 7 TeV | CMS-PAS-PFT-10-002 | |
| 43 | CMS Collaboration | Particle-flow commissioning with muons and electrons from $ \mathrm{J}/\psi $ and W events at 7 TeV | CMS-PAS-PFT-10-003 | |
| 44 | CMS Collaboration | Determination of jet energy calibration and transverse momentum resolution in CMS | JINST 6 (2011) P11002 | CMS-JME-10-011 1107.4277 |
| 45 | CMS Collaboration | Performance of electron reconstruction and selection with the CMS detector in proton-proton collisions at $ \sqrt{s} = $ 8 TeV | JINST 10 (2015), no06, P06005 | CMS-EGM-13-001 1502.02701 |
| 46 | M. Cacciari, G. P. Salam, and G. Soyez | The anti-$ k_t $ jet clustering algorithm | JHEP 04 (2008) 063 | 0802.1189 |
| 47 | M. Cacciari, G. P. Salam, and G. Soyez | FastJet user manual | EPJC 72 (2012) 1896 | 1111.6097 |
| 48 | CMS Collaboration | Measurement of the inclusive W and Z production cross sections in pp collisions at $ \sqrt{s} = $ 7 TeV | JHEP 10 (2011) 132 | CMS-EWK-10-005 1107.4789 |
| 49 | CMS Collaboration | Performance of CMS muon reconstruction in pp collision events at $ \sqrt{s} = $ 7 TeV | JINST 7 (2012) P10002 | CMS-MUO-10-004 1206.4071 |
| 50 | CMS Collaboration | The performance of the CMS muon detector in proton-proton collisions at sqrt(s) = 7 TeV at the LHC | JINST 8 (2013) P11002 | CMS-MUO-11-001 1306.6905 |
| 51 | CMS Collaboration | Performance of photon reconstruction and identification with the CMS detector in proton-proton collisions at $ \sqrt{s} = $ 8 TeV | JINST 10 (2015) P08010 | CMS-EGM-14-001 1502.02702 |
| 52 | CMS Collaboration | Performance of the CMS missing transverse momentum reconstruction in pp data at $ \sqrt{s} = $ 8 TeV | JINST 10 (2015), no02, P02006 | CMS-JME-13-003 1411.0511 |
| 53 | M. Kramer, S. Mrenna, and D. E. Soper | Next-to-leading order QCD jet production with parton showers and hadronization | PRD 73 (2006) 014022 | hep-ph/0509127 |
| 54 | S. Frixione, P. Nason, and C. Oleari | Matching NLO QCD computations with Parton Shower simulations: the POWHEG method | JHEP 11 (2007) 070 | 0709.2092 |
| 55 | N. Lavesson and L. Lonnblad | Extending CKKW-merging to one-loop matrix elements | JHEP 12 (2008) 070 | 0811.2912 |
| 56 | S. Alioli, P. Nason, C. Oleari, and E. Re | NLO Higgs boson production via gluon fusion matched with shower in POWHEG | JHEP 04 (2009) 002 | 0812.0578 |
| 57 | P. Nason and C. Oleari | NLO Higgs boson production via vector-boson fusion matched with shower in POWHEG | JHEP 02 (2010) 037 | 0911.5299 |
| 58 | T. Sjostrand, S. Mrenna, and P. Skands | PYTHIA 6.4 physics and manual | JHEP 05 (2006) 026 | hep-ph/0603175 |
| 59 | J. Alwall et al. | The automated computation of tree-level and next-to-leading order differential cross sections, and their matching to parton shower simulations | JHEP 07 (2014) 079 | 1405.0301 |
| 60 | S. Alioli, S.-O. Moch, and P. Uwer | Hadronic top-quark pair-production with one jet and parton showering | JHEP 01 (2012) 137 | 1110.5251 |
| 61 | T. Binoth, M. Ciccolini, N. Kauer, and M. Kramer | Gluon-induced W-boson pair production at the LHC | JHEP 12 (2006) 046 | hep-ph/0611170 |
| 62 | M. Bonvini et al. | Signal-background interference effects for $ \gamma\gamma \rightarrow \mathrm{ H } \rightarrow \mathrm{ W }^+ \mathrm{ W }^- $ beyond leading order | PRD 88 (2013) 034032 | 1304.3053 |
| 63 | G. Passarino | Higgs CAT | EPJC 74 (2014) 2866 | 1312.2397 |
| 64 | H.-L. Lai et al. | Uncertainty induced by QCD coupling in the CTEQ global analysis of parton distributions | PRD 82 (2010) 054021 | 1004.4624 |
| 65 | H.-L. Lai et al. | New parton distributions for collider physics | PRD 82 (2010) 074024 | 1007.2241 |
| 66 | S. Alioli, P. Nason, C. Oleari, and E. Re | A general framework for implementing NLO calculations in shower Monte Carlo programs: the POWHEG BOX | JHEP 06 (2010) 043 | 1002.2581 |
| 67 | GEANT4 Collaboration | GEANT4---a simulation toolkit | NIMA 506 (2003) 250 | |
| 68 | E. Bagnaschi, G. Degrassi, P. Slavich, and A. Vicini | Higgs production via gluon fusion in the POWHEG approach in the SM and in the MSSM | JHEP 02 (2012) 088 | 1111.2854 |
| 69 | S. Actis, G. Passarino, C. Sturm, and S. Uccirati | NLO electroweak corrections to Higgs boson production at hadron colliders | PLB 670 (2008) 12 | 0809.1301 |
| 70 | S. Catani, D. de Florian, M. Grazzini, and P. Nason | Soft gluon resummation for Higgs boson production at hadron colliders | JHEP 07 (2003) 028 | hep-ph/0306211 |
| 71 | Y. Gao et al. | Spin determination of single-produced resonances at hadron colliders | PRD 81 (2010) 075022 | 1001.3396 |
| 72 | S. Bolognesi et al. | Spin and parity of a single-produced resonance at the LHC | PRD 86 (2012) 095031 | 1208.4018 |
| 73 | I. Anderson et al. | Constraining anomalous HVV interactions at proton and lepton colliders | PRD 89 (2014) 035007 | 1309.4819 |
| 74 | T. Sjostrand, S. Mrenna, and P. Z. Skands | A brief introduction to PYTHIA 8.1 | CPC 178 (2008) 852 | 0710.3820 |
| 75 | CMS Collaboration | Identification of $ \mathrm{ b } $-quark jets with the CMS experiment | JINST 8 (2013) P04013 | CMS-BTV-12-001 1211.4462 |
| 76 | CMS Collaboration | Performance of $ \mathrm{ b } $ tagging at $ \sqrt{s} = $ 8 TeV in multijet, $ \mathrm{ t \bar{t} } $ and boosted topology events | CMS-PAS-BTV-13-001 | CMS-PAS-BTV-13-001 |
| 77 | S. Jadach, J. H. Kuhn, and Z. Was | TAUOLA: a library of Monte Carlo programs to simulate decays of polarized tau leptons | CPC 64 (1990) 275 | |
| 78 | S. Alekhin et al. | The PDF4LHC Working Group interim report | 1101.0536 | |
| 79 | M. Botje et al. | The PDF4LHC Working Group interim recommendations | 1101.0538 | |
| 80 | R. D. Ball et al. | Impact of heavy quark masses on parton distributions and LHC phenomenology | NPB 849 (2011) 296 | 1101.1300 |
| 81 | A. D. Martin, W. J. Stirling, R. S. Thorne, and G. Watt | Parton distributions for the LHC | EPJC 63 (2009) 189 | 0901.0002 |
| 82 | I. W. Stewart and F. J. Tackmann | Theory uncertainties for Higgs and other searches using jet bins | PRD 85 (2012) 034011 | 1107.2117 |
| 83 | S. Frixione et al. | The MC@NLO 4.0 event generator | 1010.0819 | |
| 84 | T. Adye | Unfolding algorithms and tests using RooUnfold | in PHYSTAT 2011 Workshop on Statistical Issues Related to Discovery Claims in Search Experiments and Unfolding, H. Prosper and L. Lyons | 1105.1160 |
| 85 | A. Hocker and V. Kartvelishvili | SVD approach to data unfolding | NIMA 372 (1996) 469 | hep-ph/9509307 |
|
|
Compact Muon Solenoid LHC, CERN |
|

|

|

|

|

|