

Compact Muon Solenoid
LHC, CERN
| CMS-HIG-17-025 ; CERN-EP-2018-166 | ||
| Measurement of inclusive and differential Higgs boson production cross sections in the diphoton decay channel in proton-proton collisions at $\sqrt{s}=$ 13 TeV | ||
| CMS Collaboration | ||
| 11 July 2018 | ||
| JHEP 01 (2019) 183 | ||
| Abstract: Measurements of the inclusive and differential production cross sections for the Higgs boson in the diphoton decay channel are performed using the data set of proton-proton collisions at $\sqrt{s} = $ 13 TeV collected by the CMS experiment at the LHC in 2016 and corresponding to an integrated luminosity of 35.9 fb$^{-1}$ . The cross sections are measured in a fiducial phase space defined by a set of requirements on the isolation and kinematic variables of the photons. Differential cross sections are measured as functions of the kinematic properties of the diphoton system and the event. A subset of the measurements is performed in subregions of the fiducial phase space, where relative contributions of specific Higgs boson production mechanisms are enhanced. The total cross section in the chosen fiducial phase space is measured to be 84 $\pm$ 11 (stat) $\pm$ 7 (syst) fb = 84 $\pm$ 13 fb, to be compared with a theoretical prediction of 73 $\pm$ 4 fb. All measurements are found to be in agreement with the theoretical predictions for the standard model Higgs boson with a mass of 125.09 GeV within the experimental and theoretical uncertainties. | ||
| Links: e-print arXiv:1807.03825 [hep-ex] (PDF) ; CDS record ; inSPIRE record ; CADI line (restricted) ; | ||
| Figures | |

png pdf |
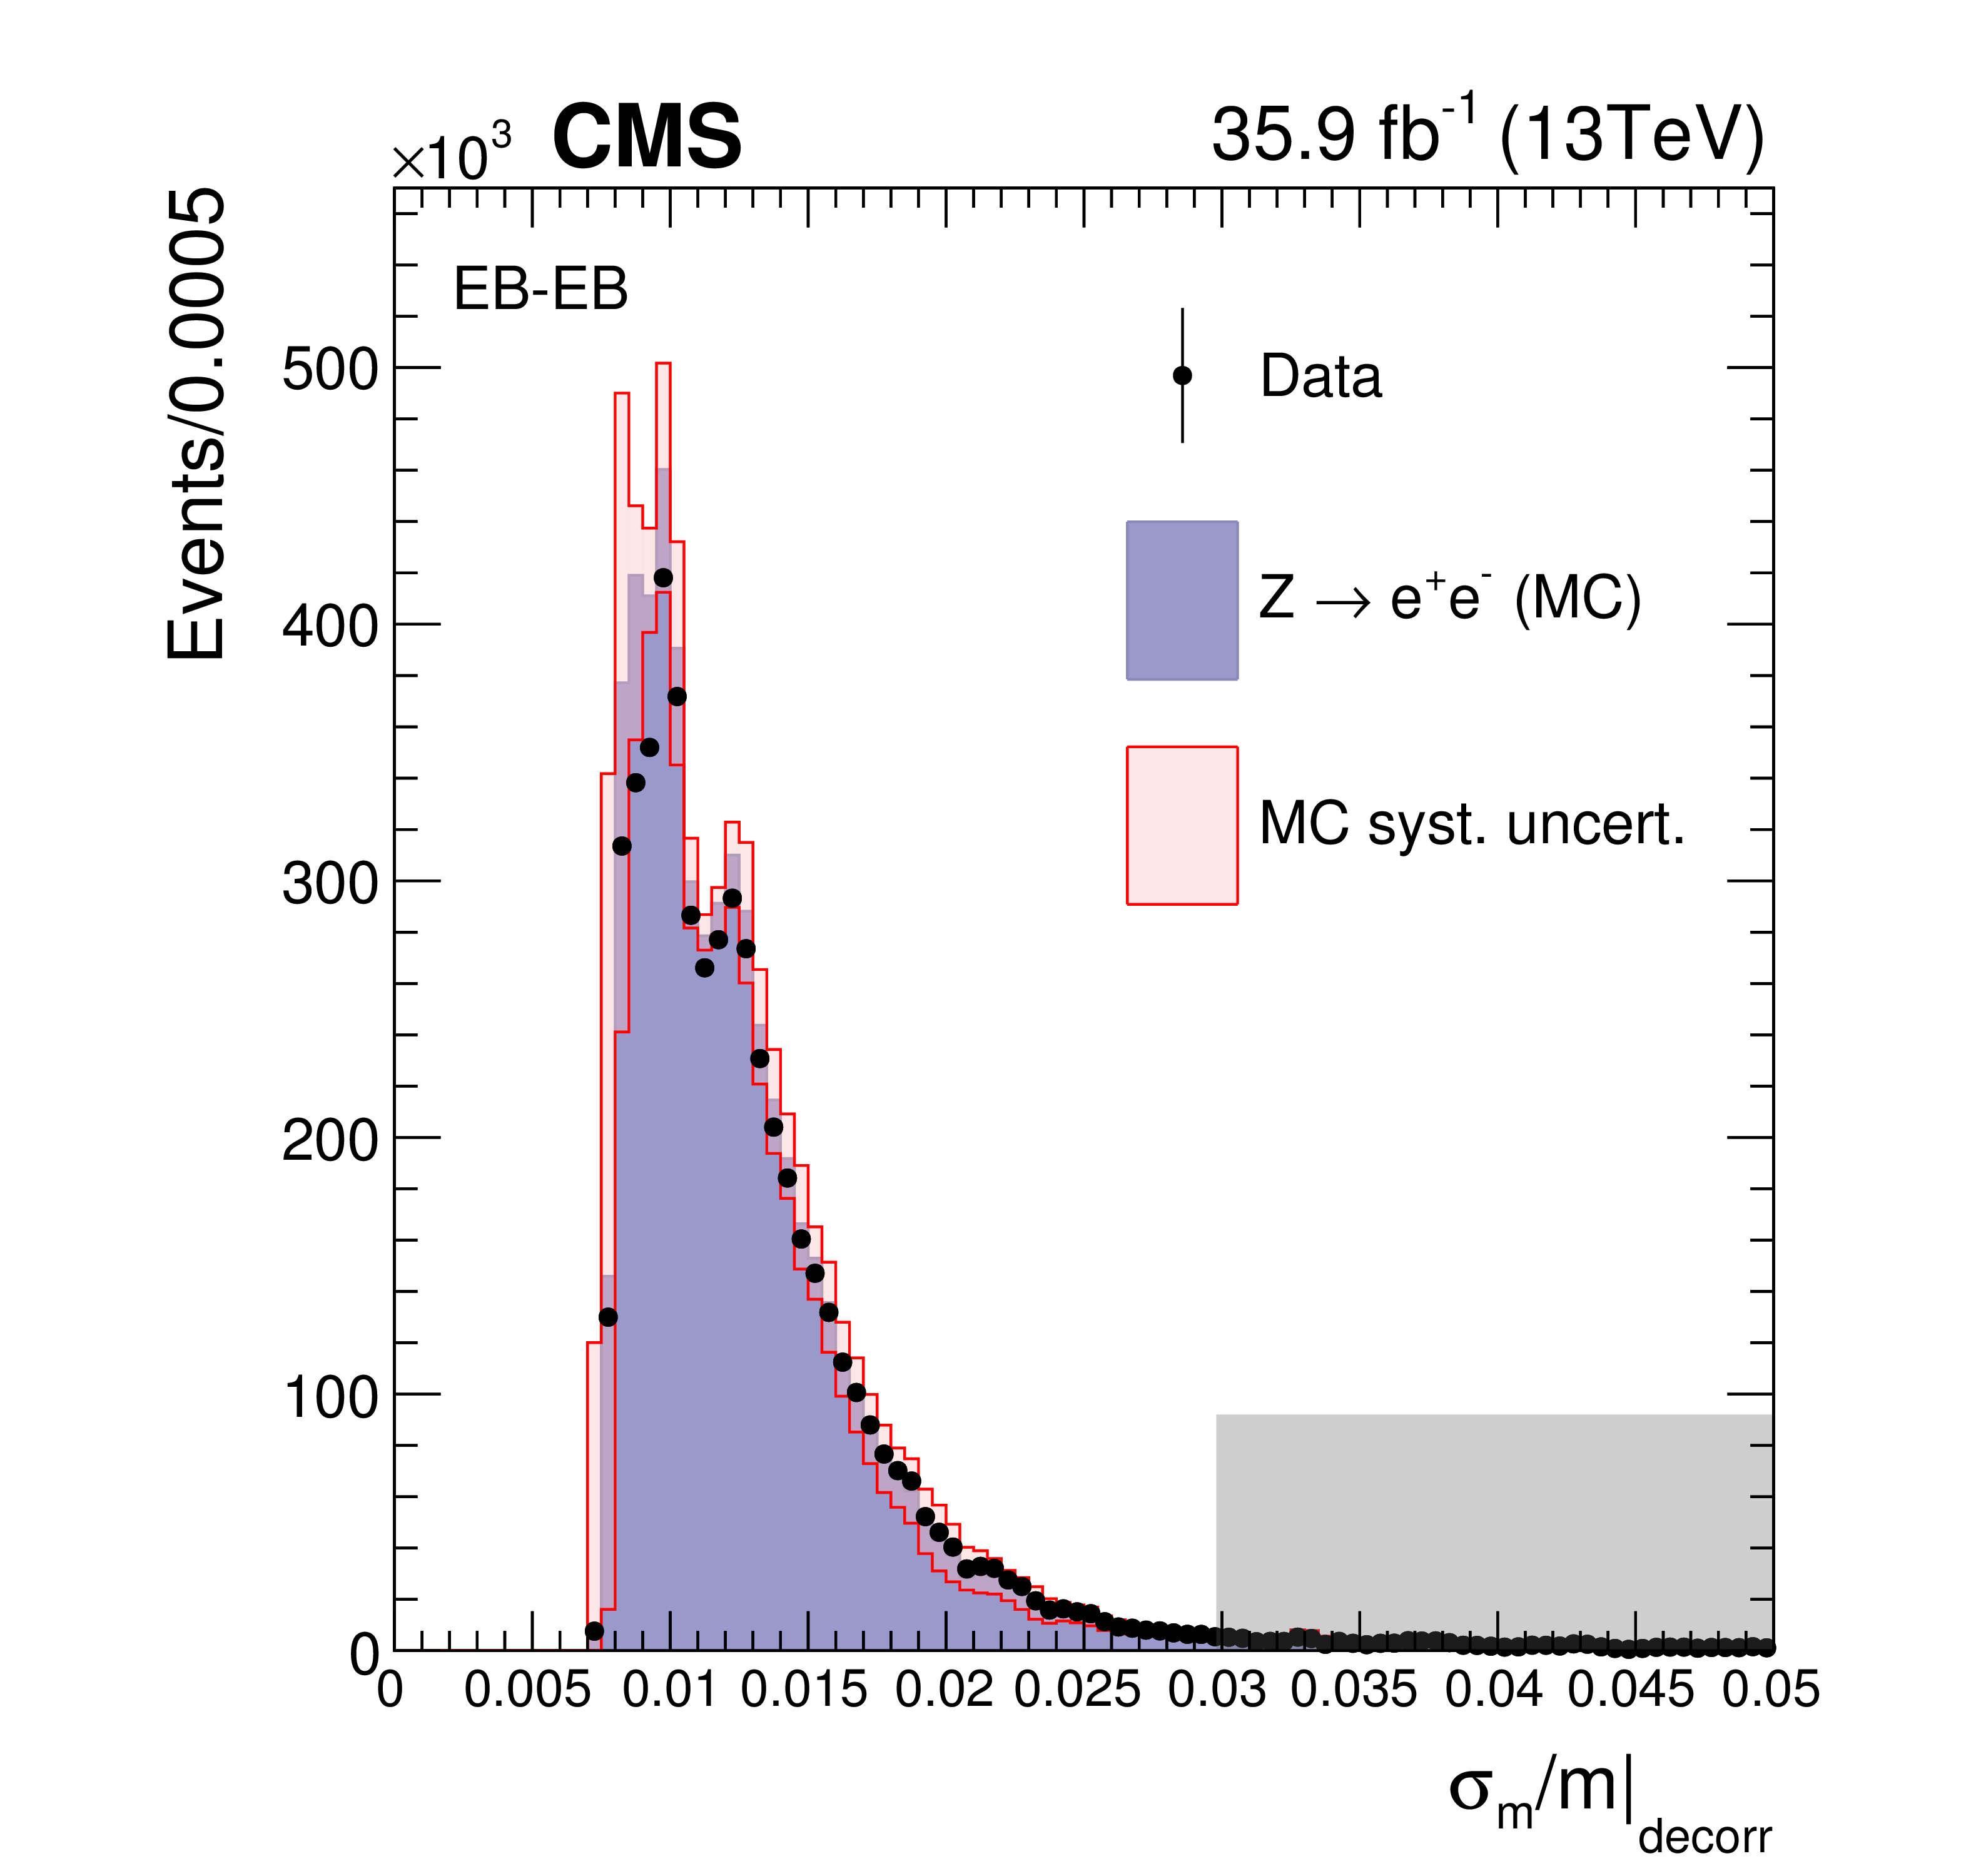
Figure 1:
Comparison of the decorrelated mass resolution estimator ${\sigma _{m}/m |_\text {decorr}}$ distributions in data and simulation for ${{\mathrm {Z}}\to {\mathrm {e}^+} {\mathrm {e}^-}}$ events where both electrons are reconstructed as photons, passing the selection defined in Section 5. The impact of the systematic uncertainty in the $\sigma _E/E$ is indicated by the red band. The distributions are shown separately for events with both electrons in the EB (left) and the remainder of the events, i.e., events with at least one photon in the EE (right). Events in the shaded gray region are discarded from the final analysis. |
png pdf |
Figure 1-a:
Comparison of the decorrelated mass resolution estimator ${\sigma _{m}/m |_\text {decorr}}$ distribution in data and simulation for ${{\mathrm {Z}}\to {\mathrm {e}^+} {\mathrm {e}^-}}$ events where both electrons are reconstructed as photons, passing the selection defined in Section 5. The impact of the systematic uncertainty in the $\sigma _E/E$ is indicated by the red band. The distribution is shown for events with both electrons in the EB. Events in the shaded gray region are discarded from the final analysis. |
png pdf |
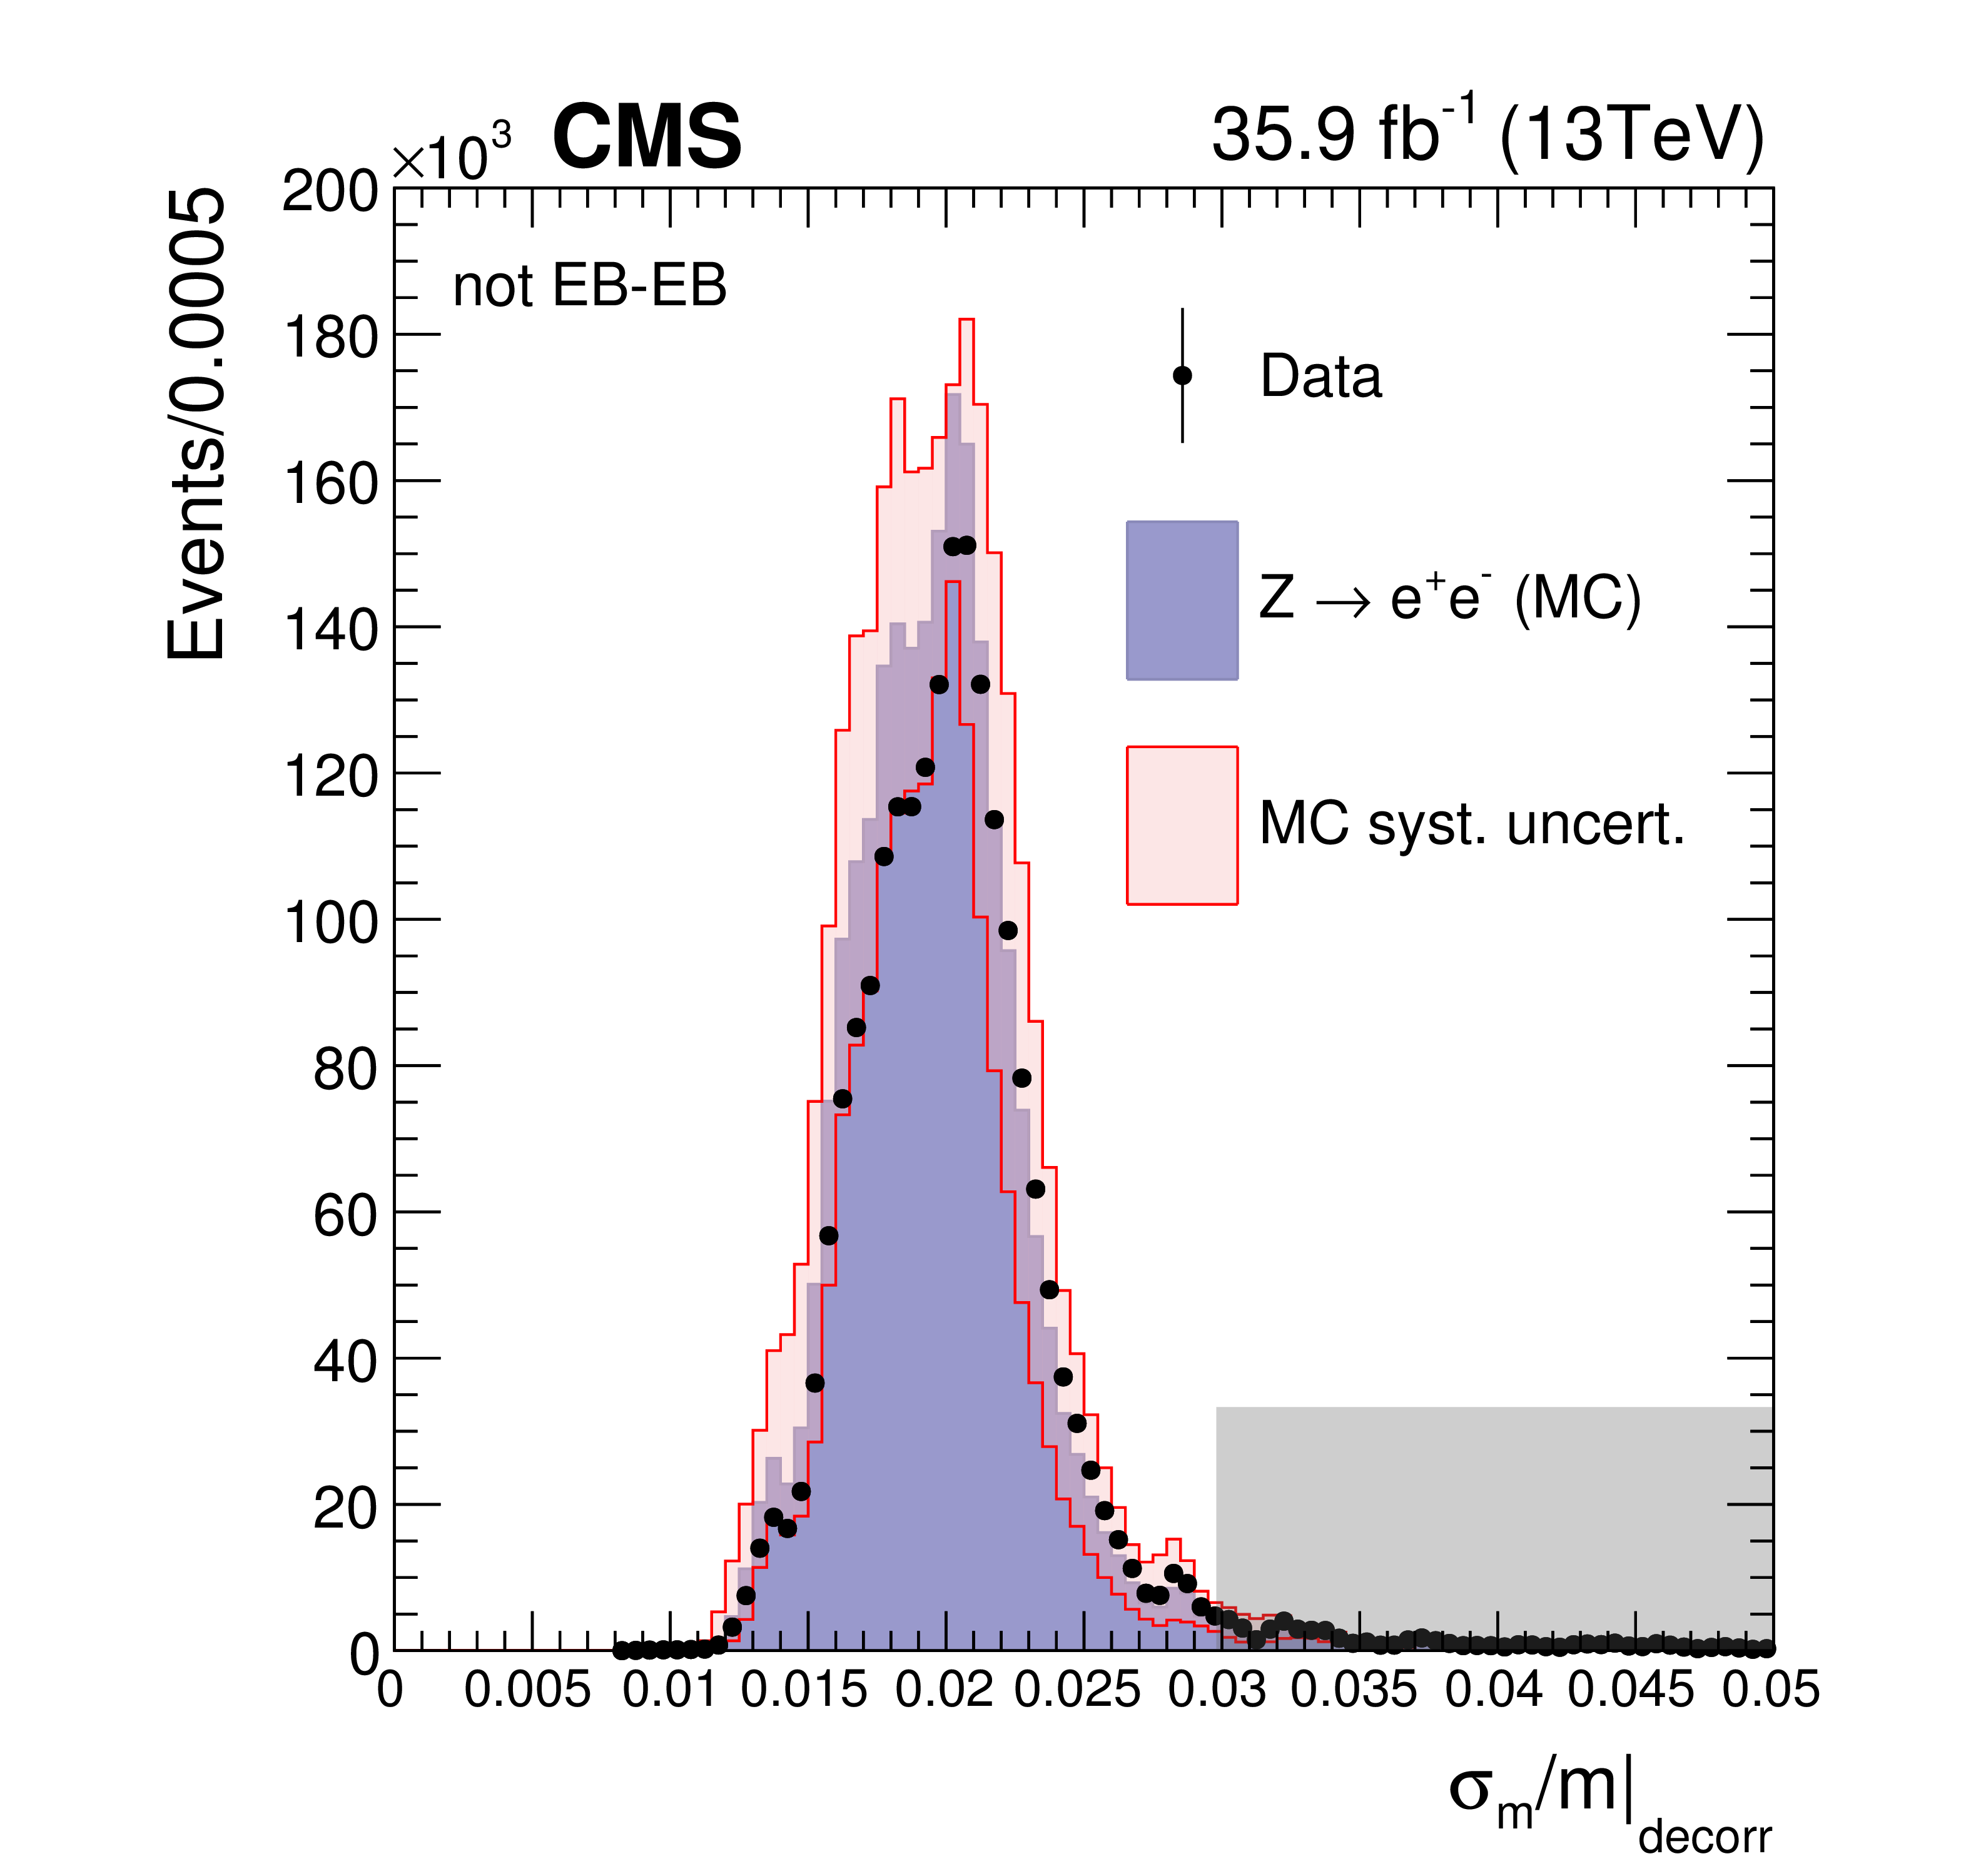
Figure 1-b:
Comparison of the decorrelated mass resolution estimator ${\sigma _{m}/m |_\text {decorr}}$ distribution in data and simulation for ${{\mathrm {Z}}\to {\mathrm {e}^+} {\mathrm {e}^-}}$ events where both electrons are reconstructed as photons, passing the selection defined in Section 5. The impact of the systematic uncertainty in the $\sigma _E/E$ is indicated by the red band. The distribution is shown for events with at least one photon in the EE. Events in the shaded gray region are discarded from the final analysis. |
png pdf |
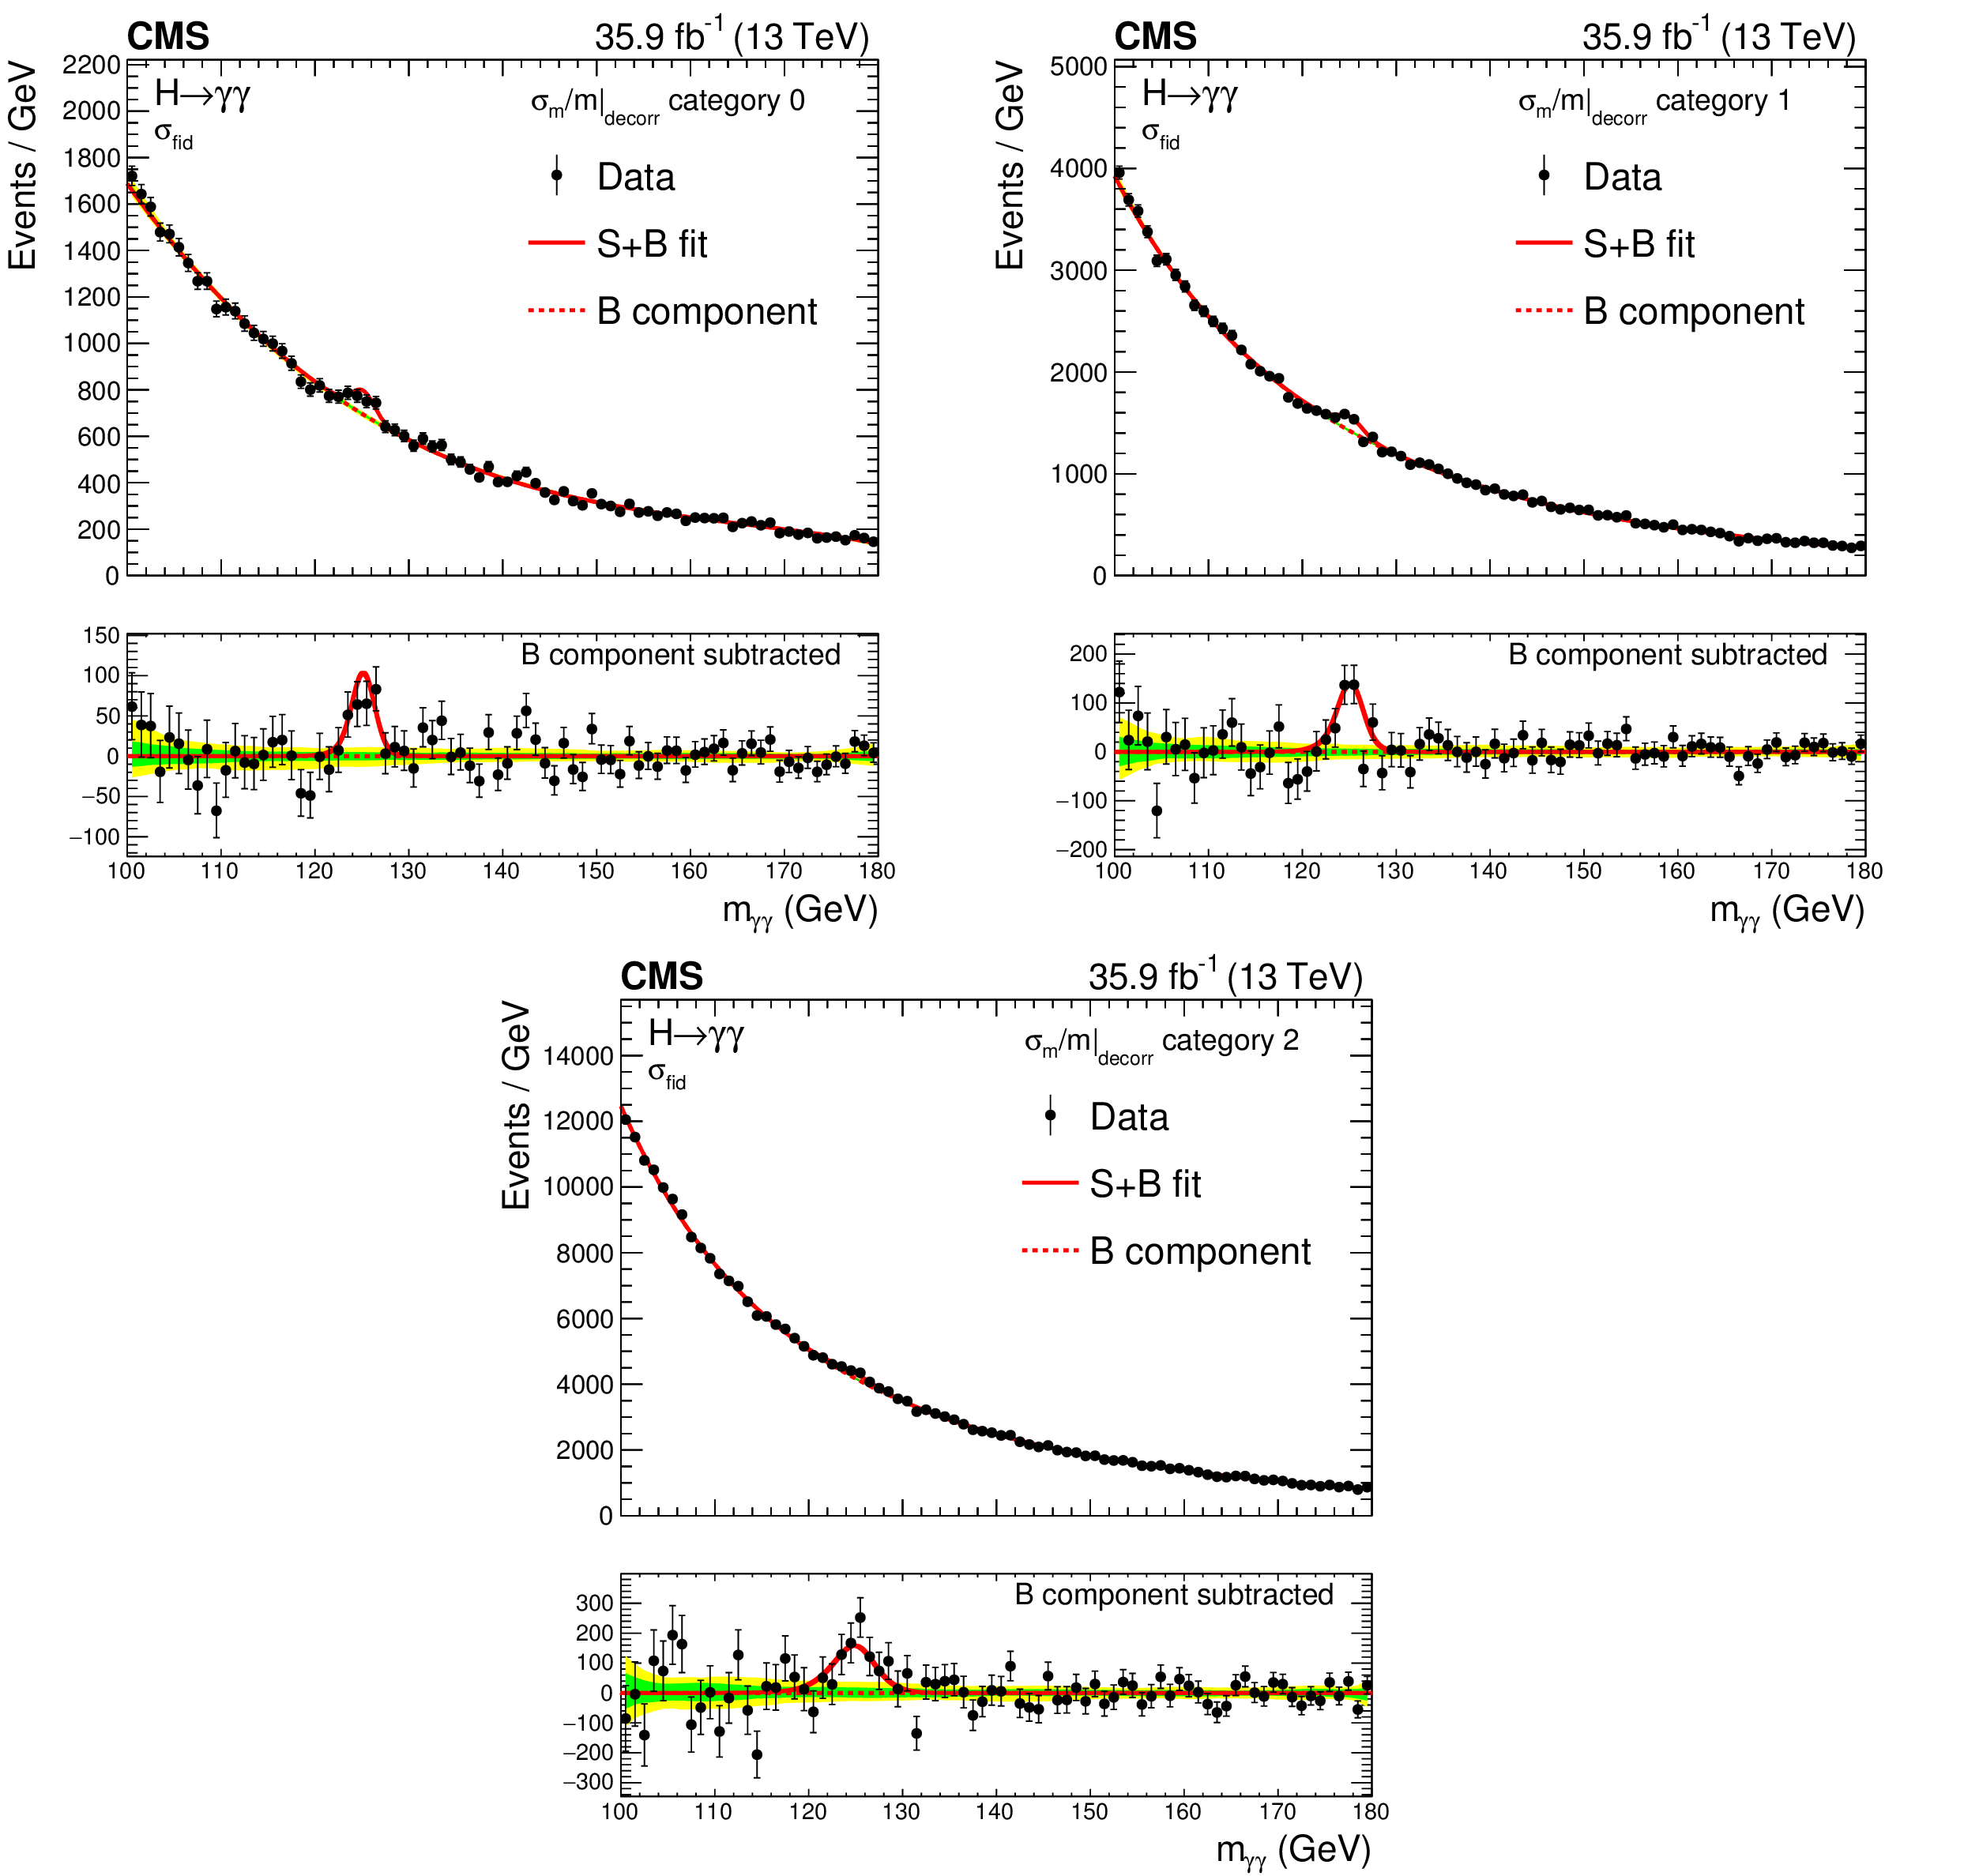
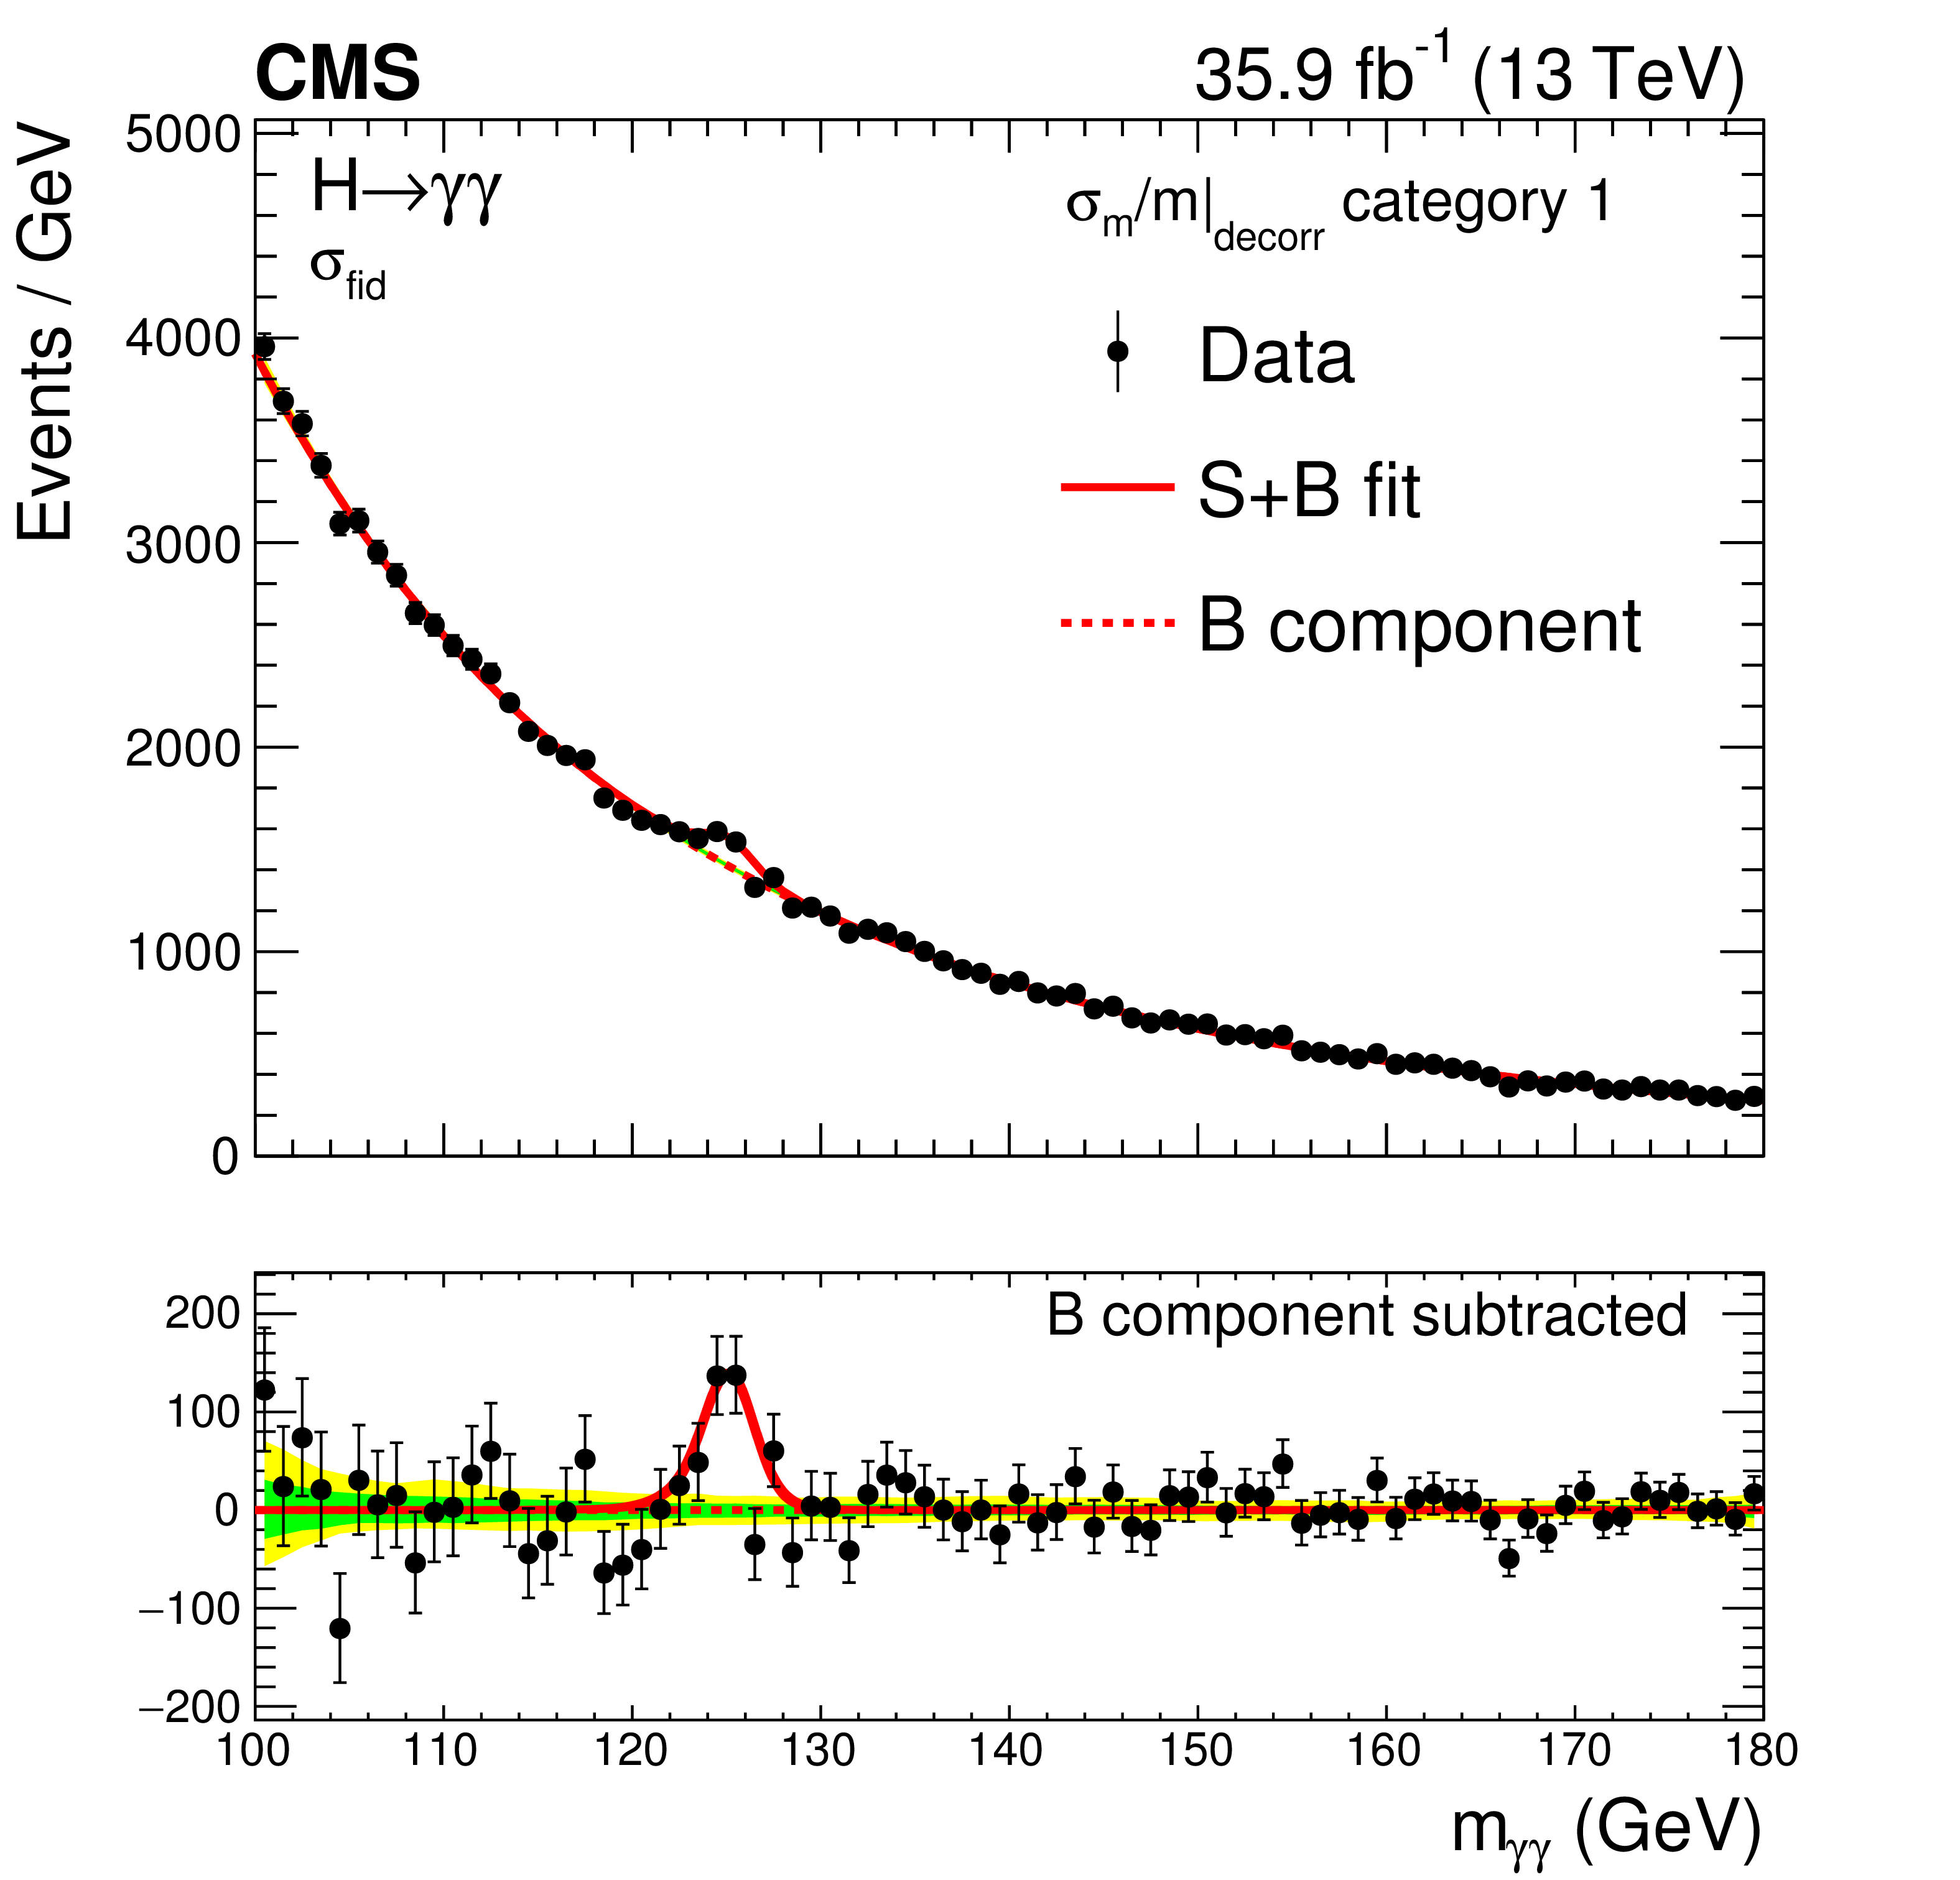
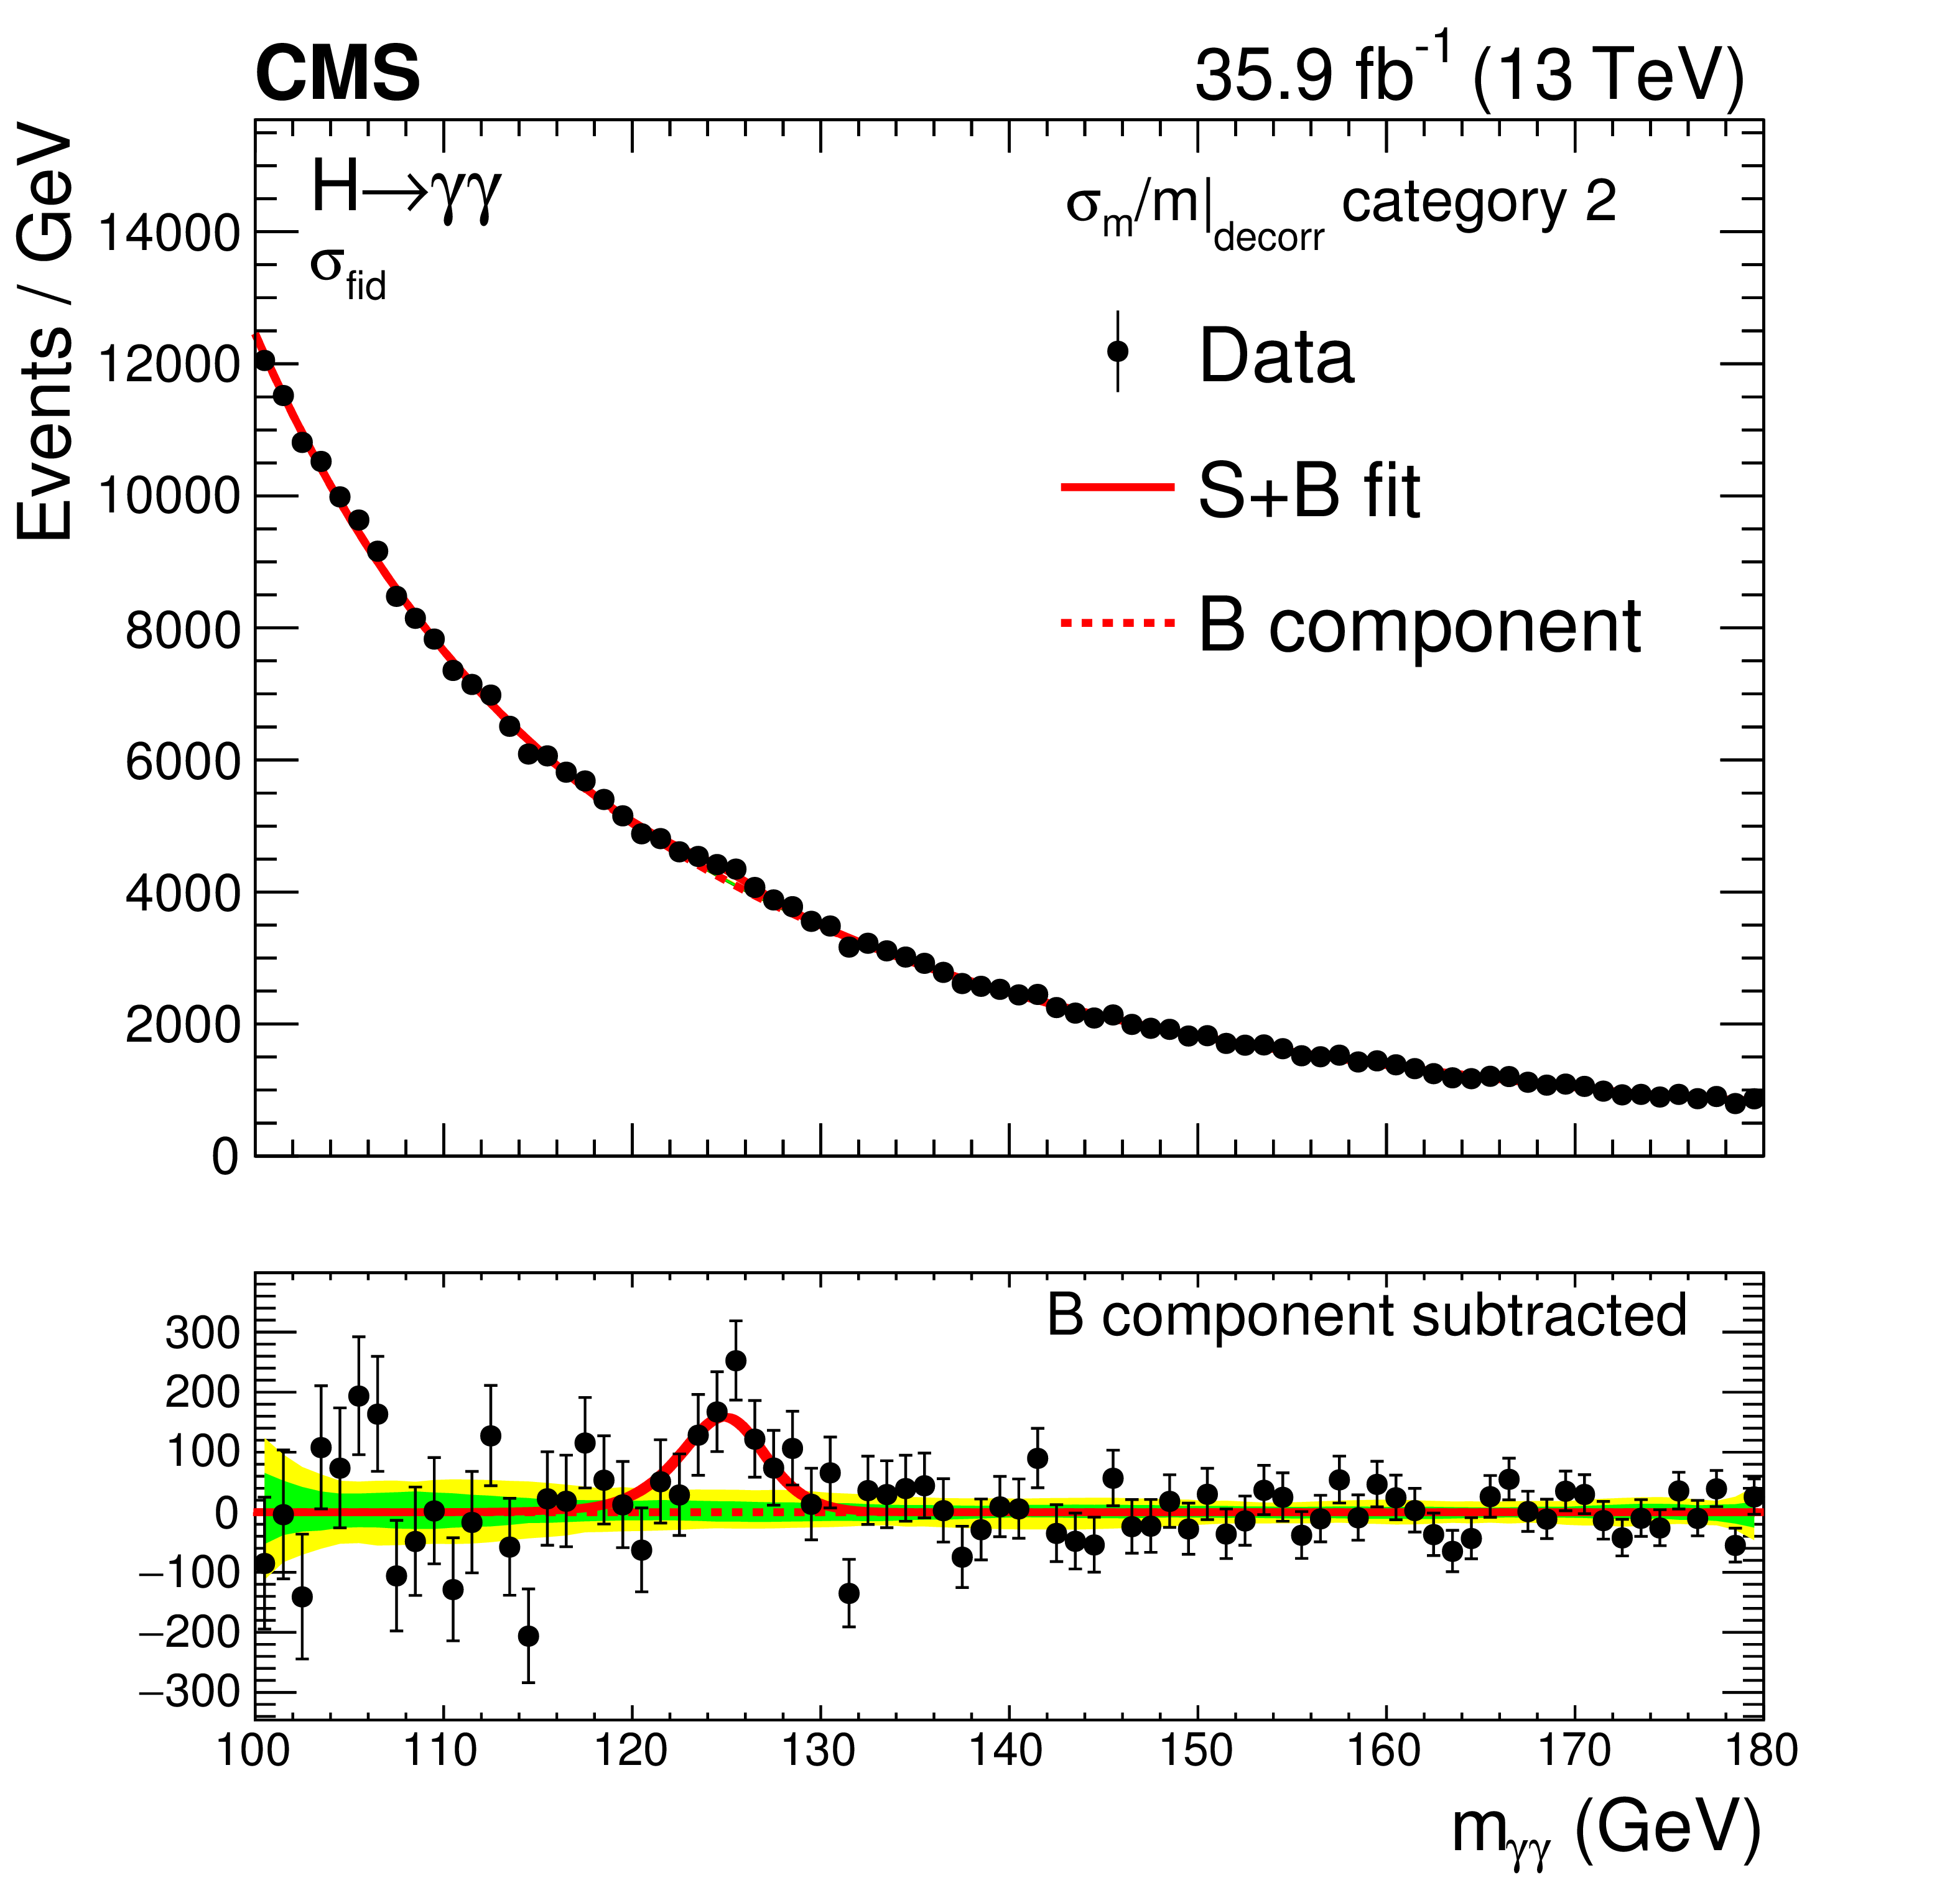
Figure 2:
The diphoton mass spectrum in data (black points), together with the best signal-plus-background fit (red lines), for each ${\sigma _{m}/m |_\text {decorr}}$ category employed for the measurement of the inclusive fiducial cross section, as defined in Section 7. The two bands indicate the one and two standard deviation uncertainty in the background component. |
png pdf |
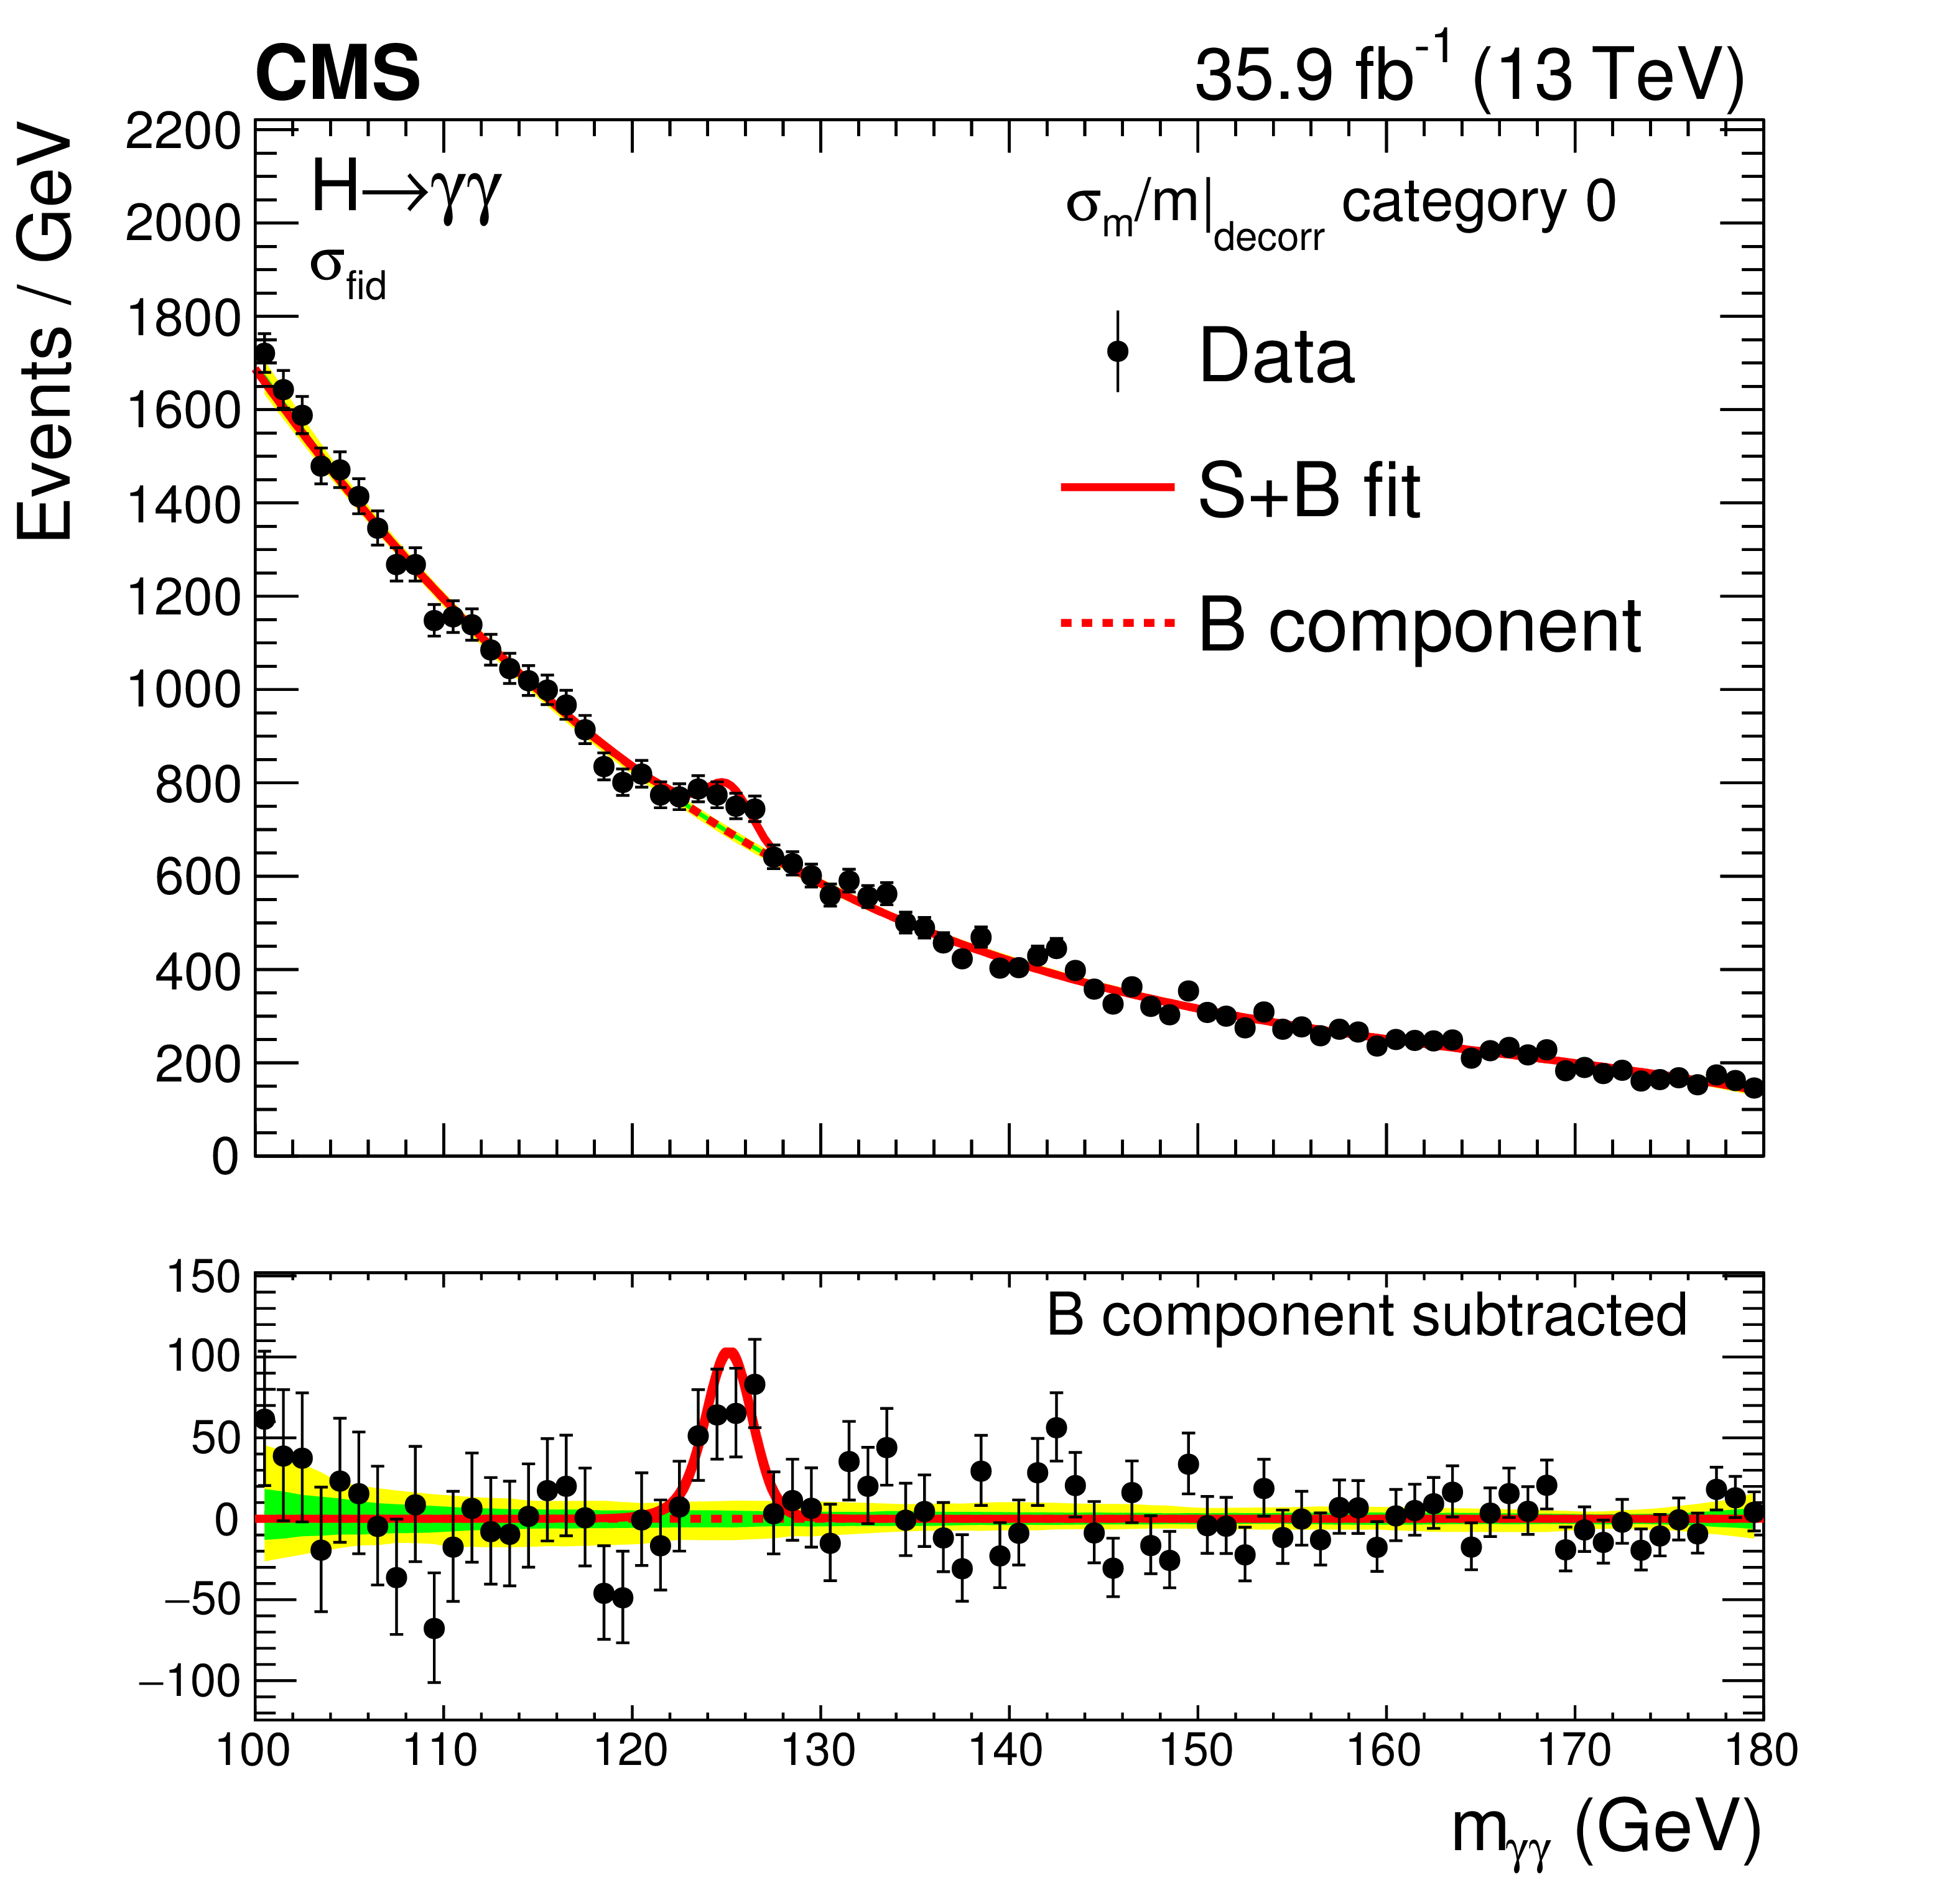
Figure 2-a:
The diphoton mass spectrum in data (black points), together with the best signal-plus-background fit (red lines), |
png pdf |
Figure 2-b:
The diphoton mass spectrum in data (black points), together with the best signal-plus-background fit (red lines), |
png pdf |
Figure 2-c:
The diphoton mass spectrum in data (black points), together with the best signal-plus-background fit (red lines), |
png pdf |
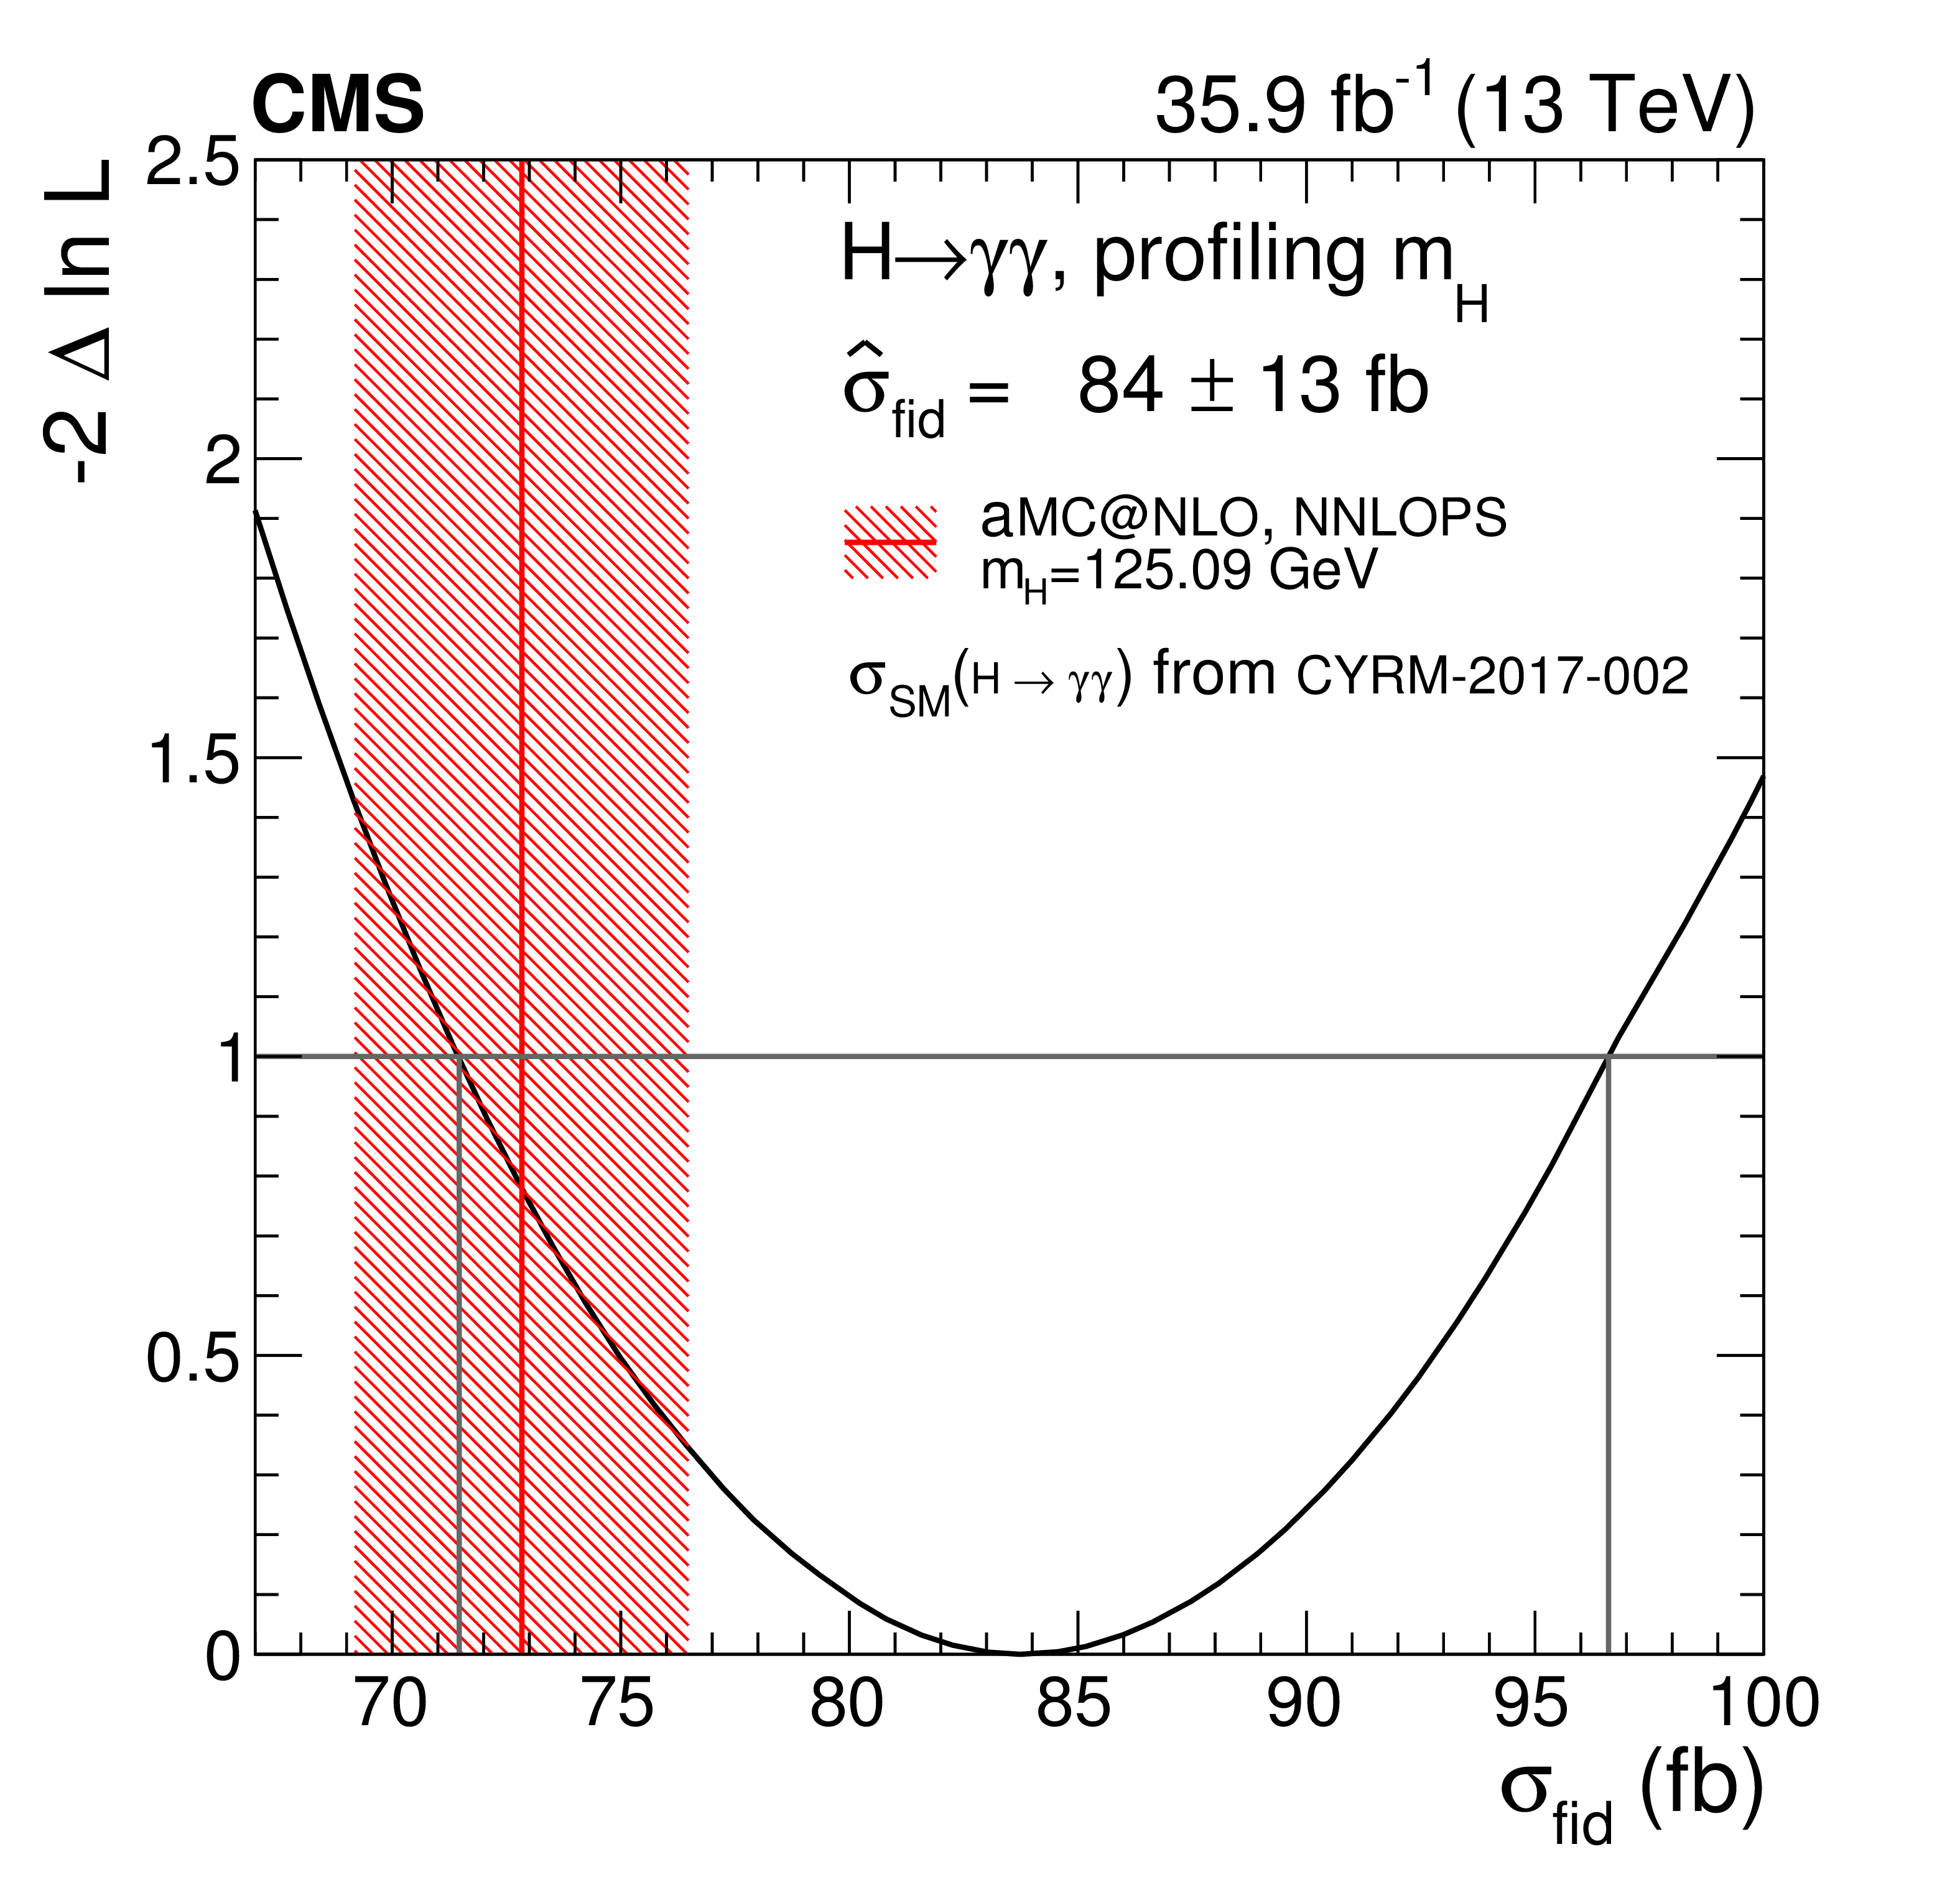
Figure 3:
Likelihood scan (black curve) for the fiducial cross section measurement, where the value of the SM Higgs boson mass is profiled in the fit. The measurement is compared to the theoretical prediction (vertical red line), shown with its uncertainty (red hatched area), and it is found in agreement within the uncertainties. |
png pdf |
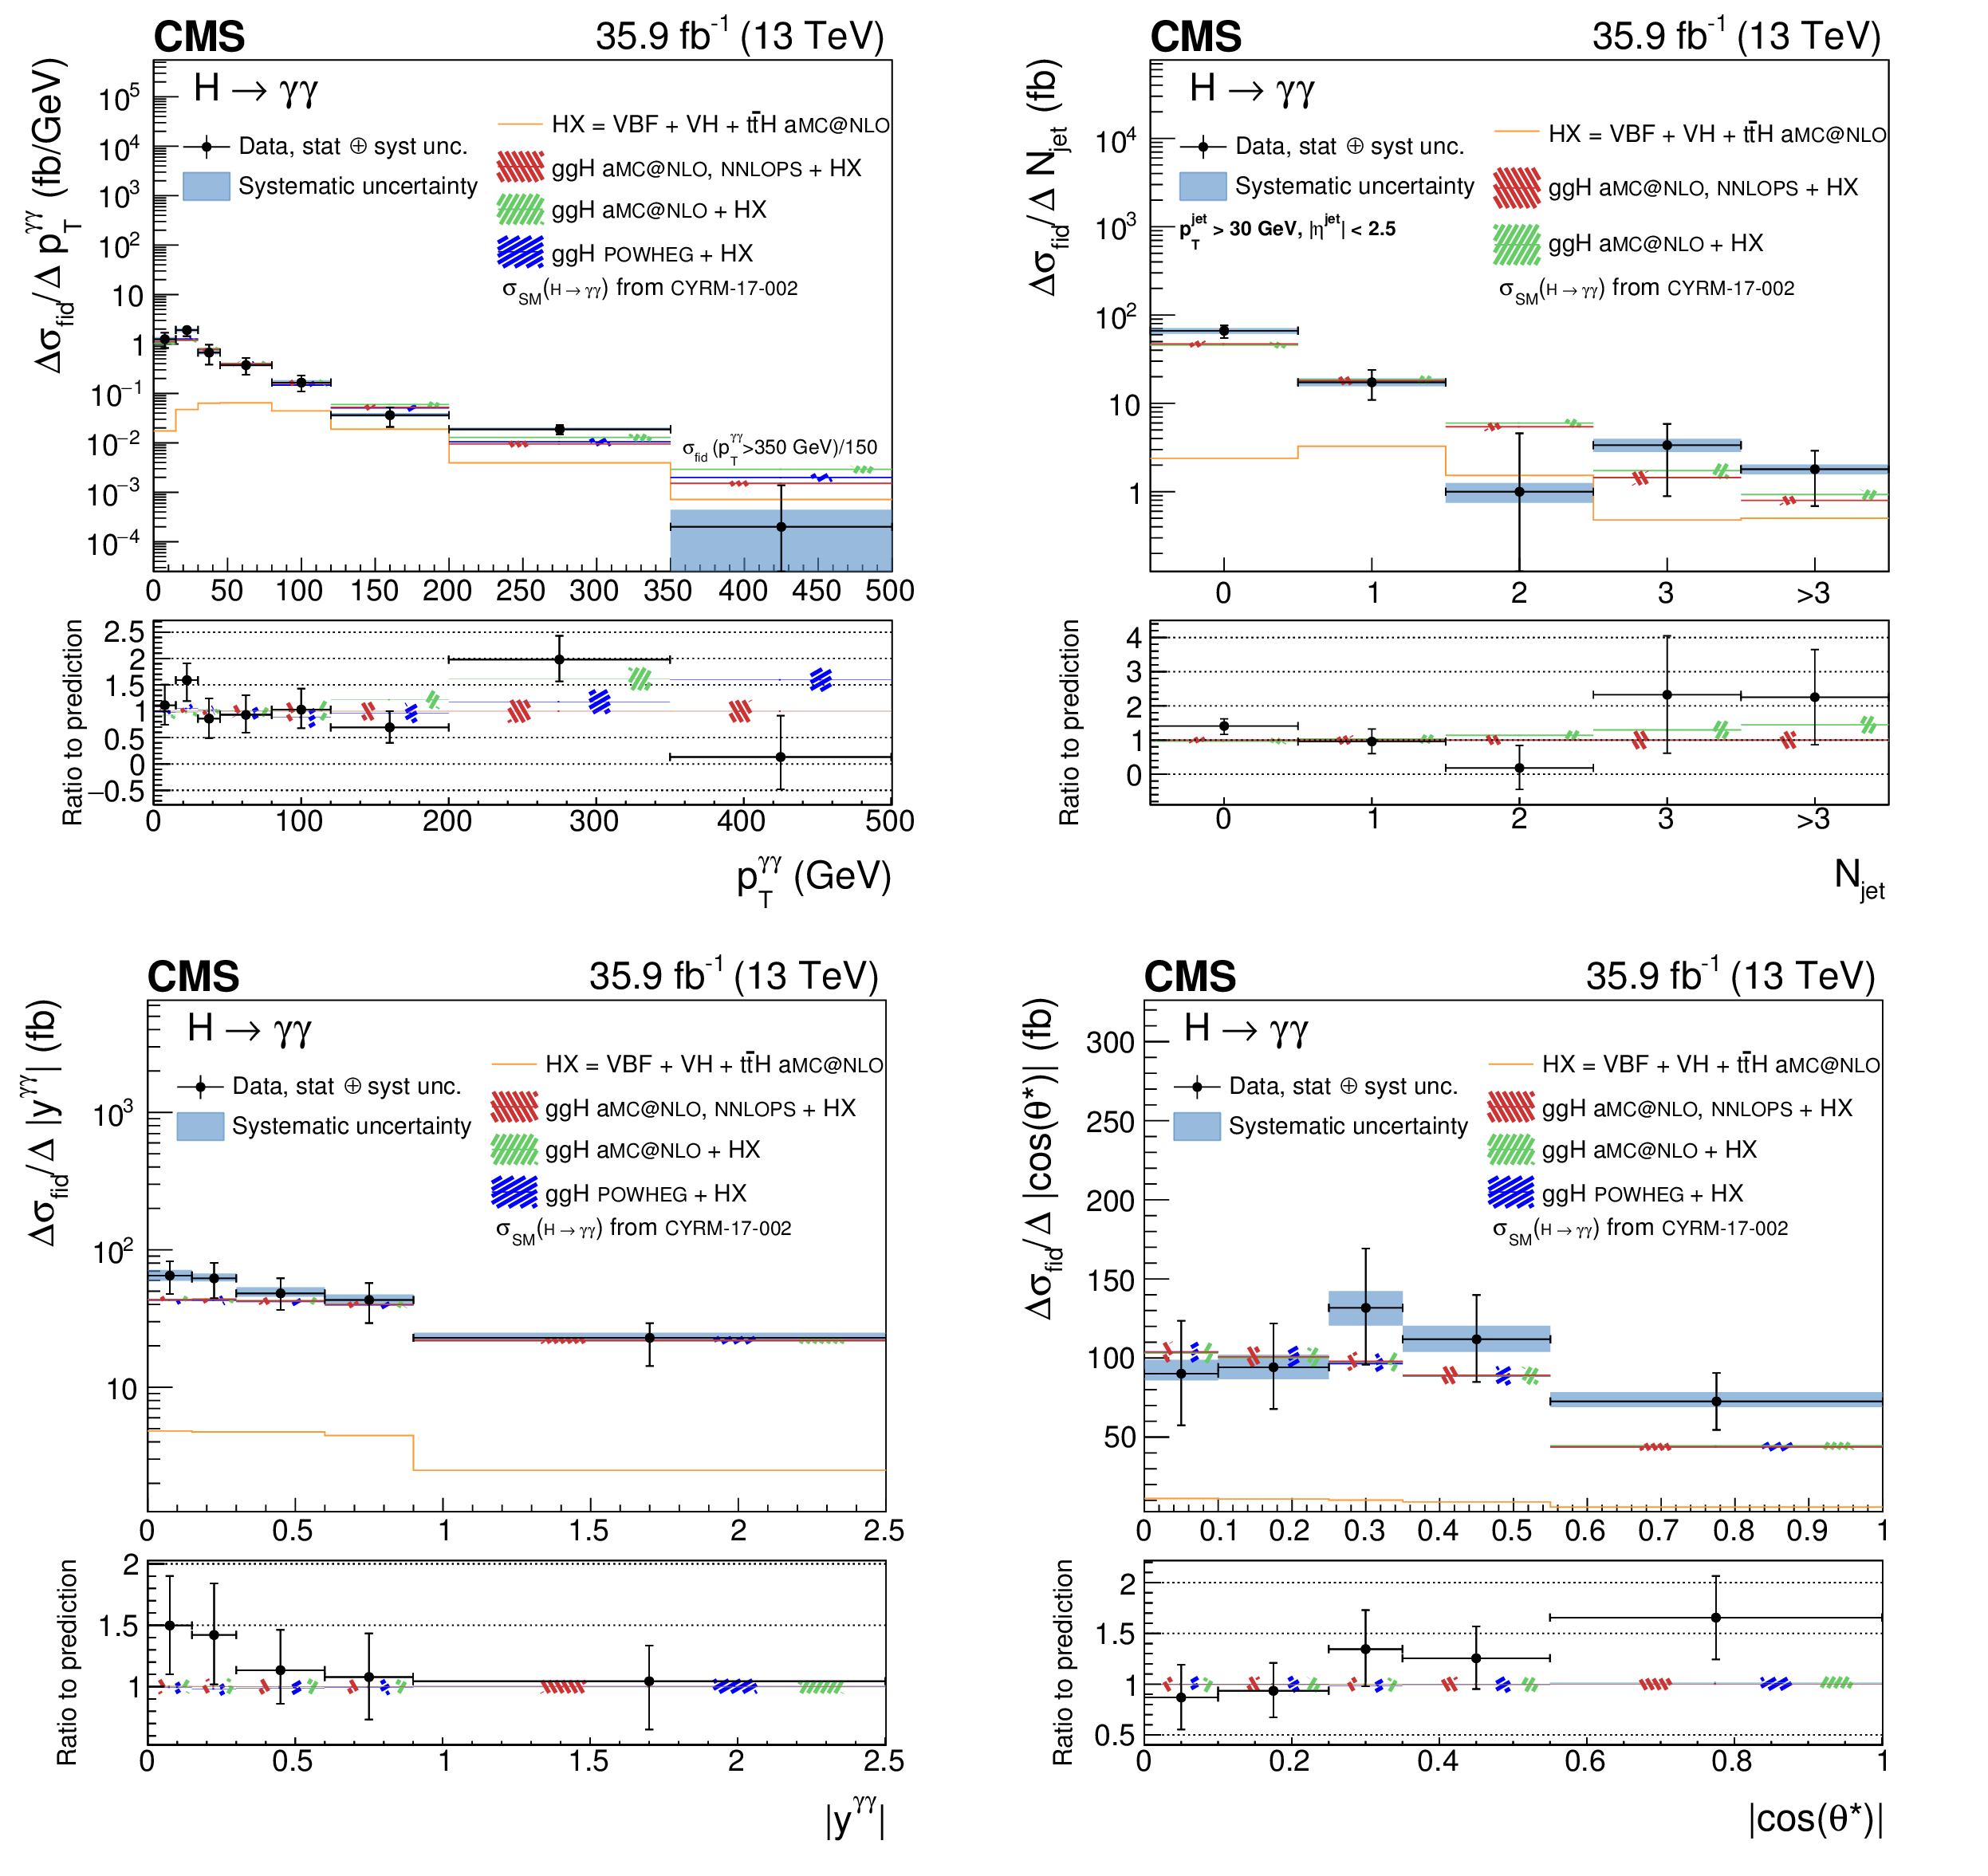
Figure 4:
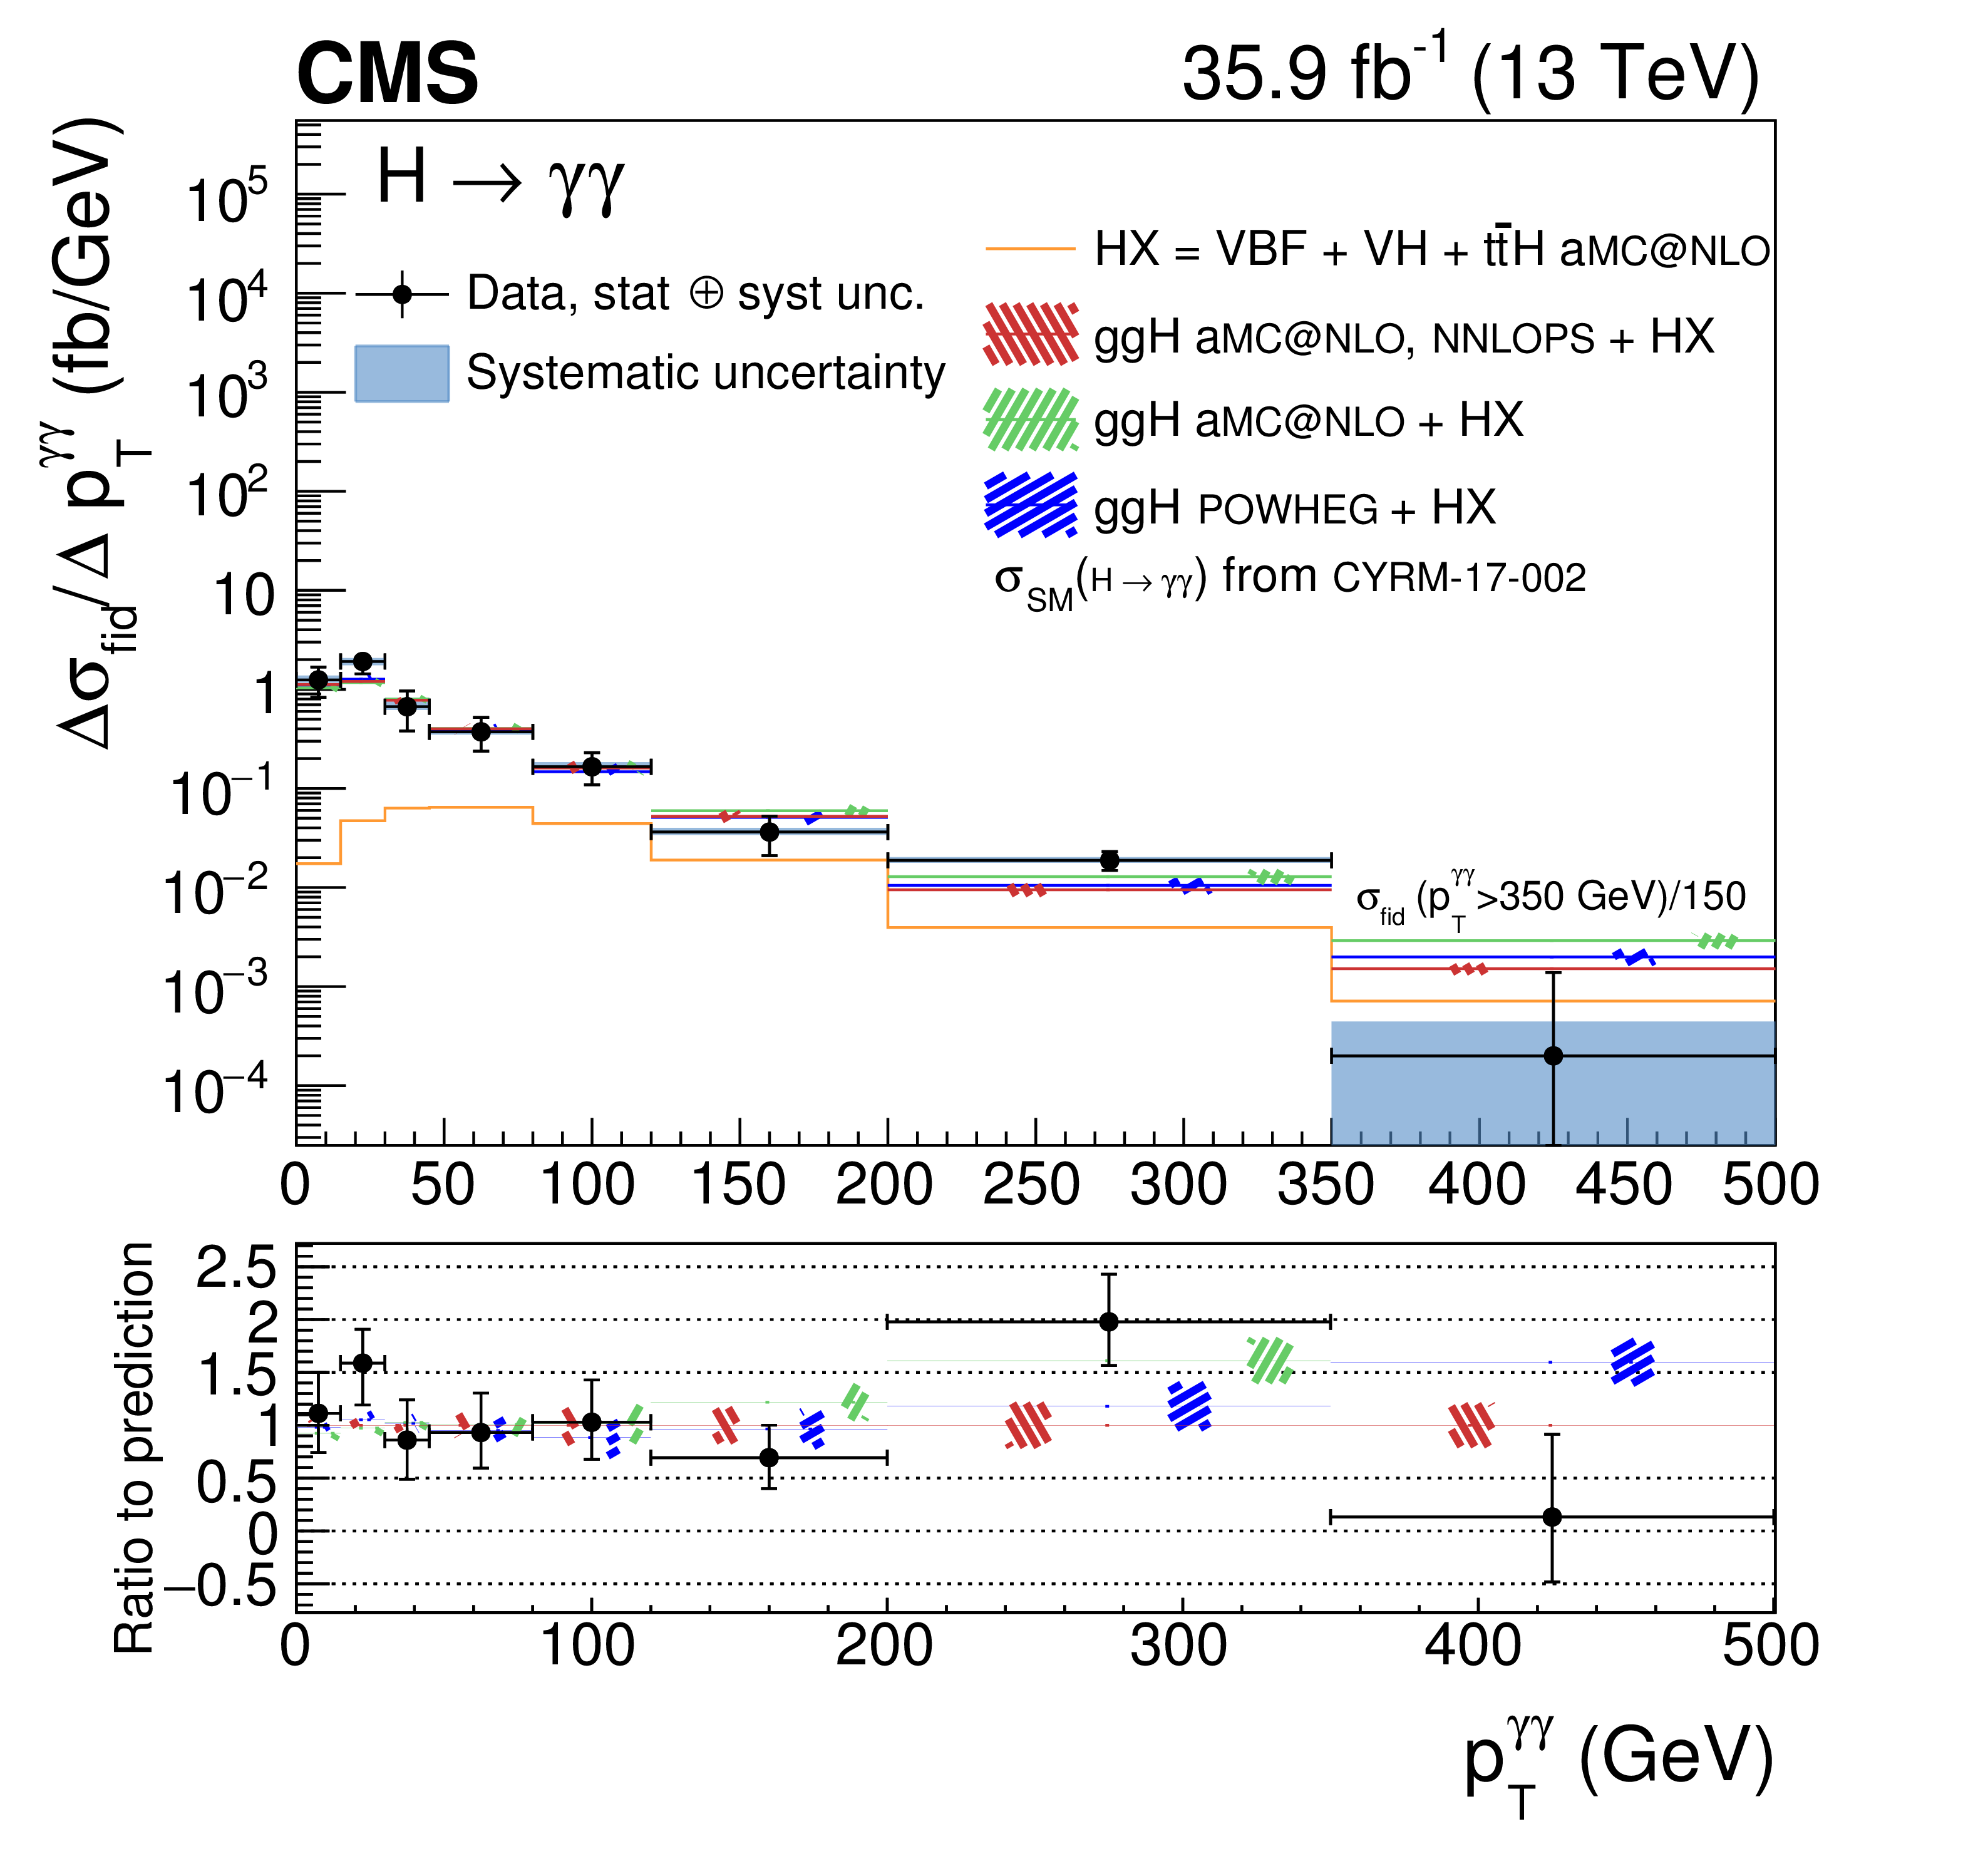
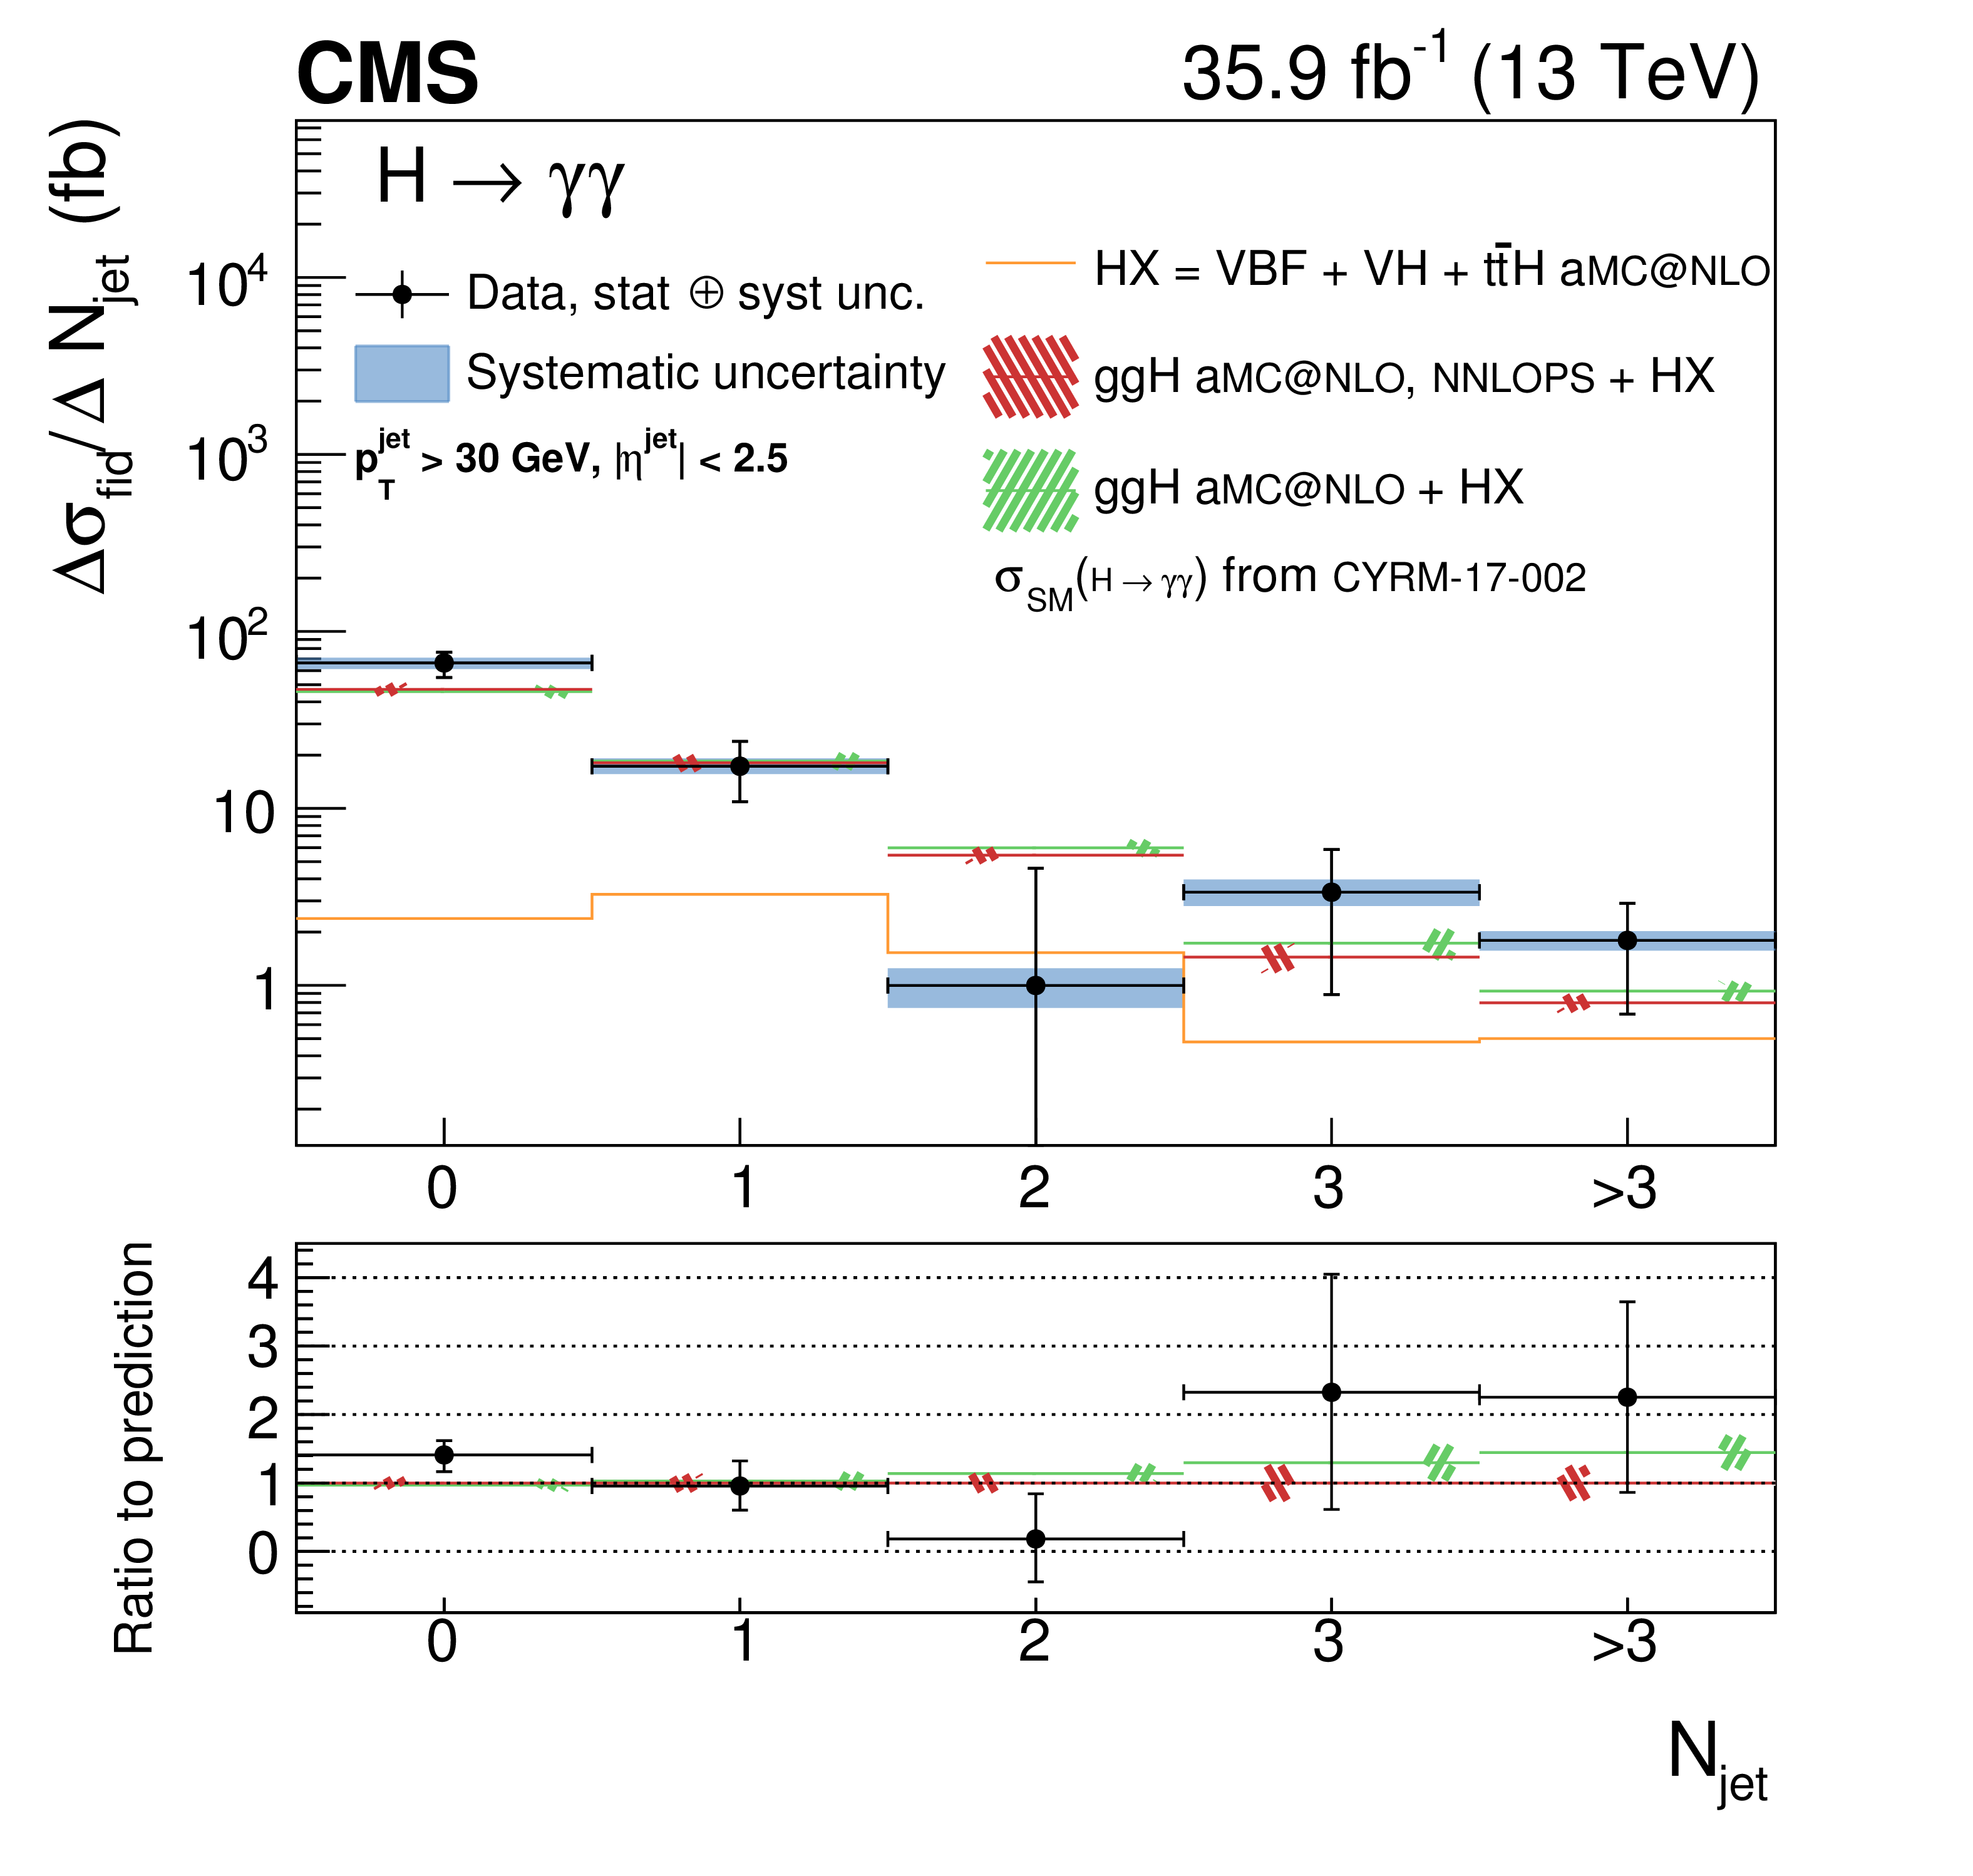
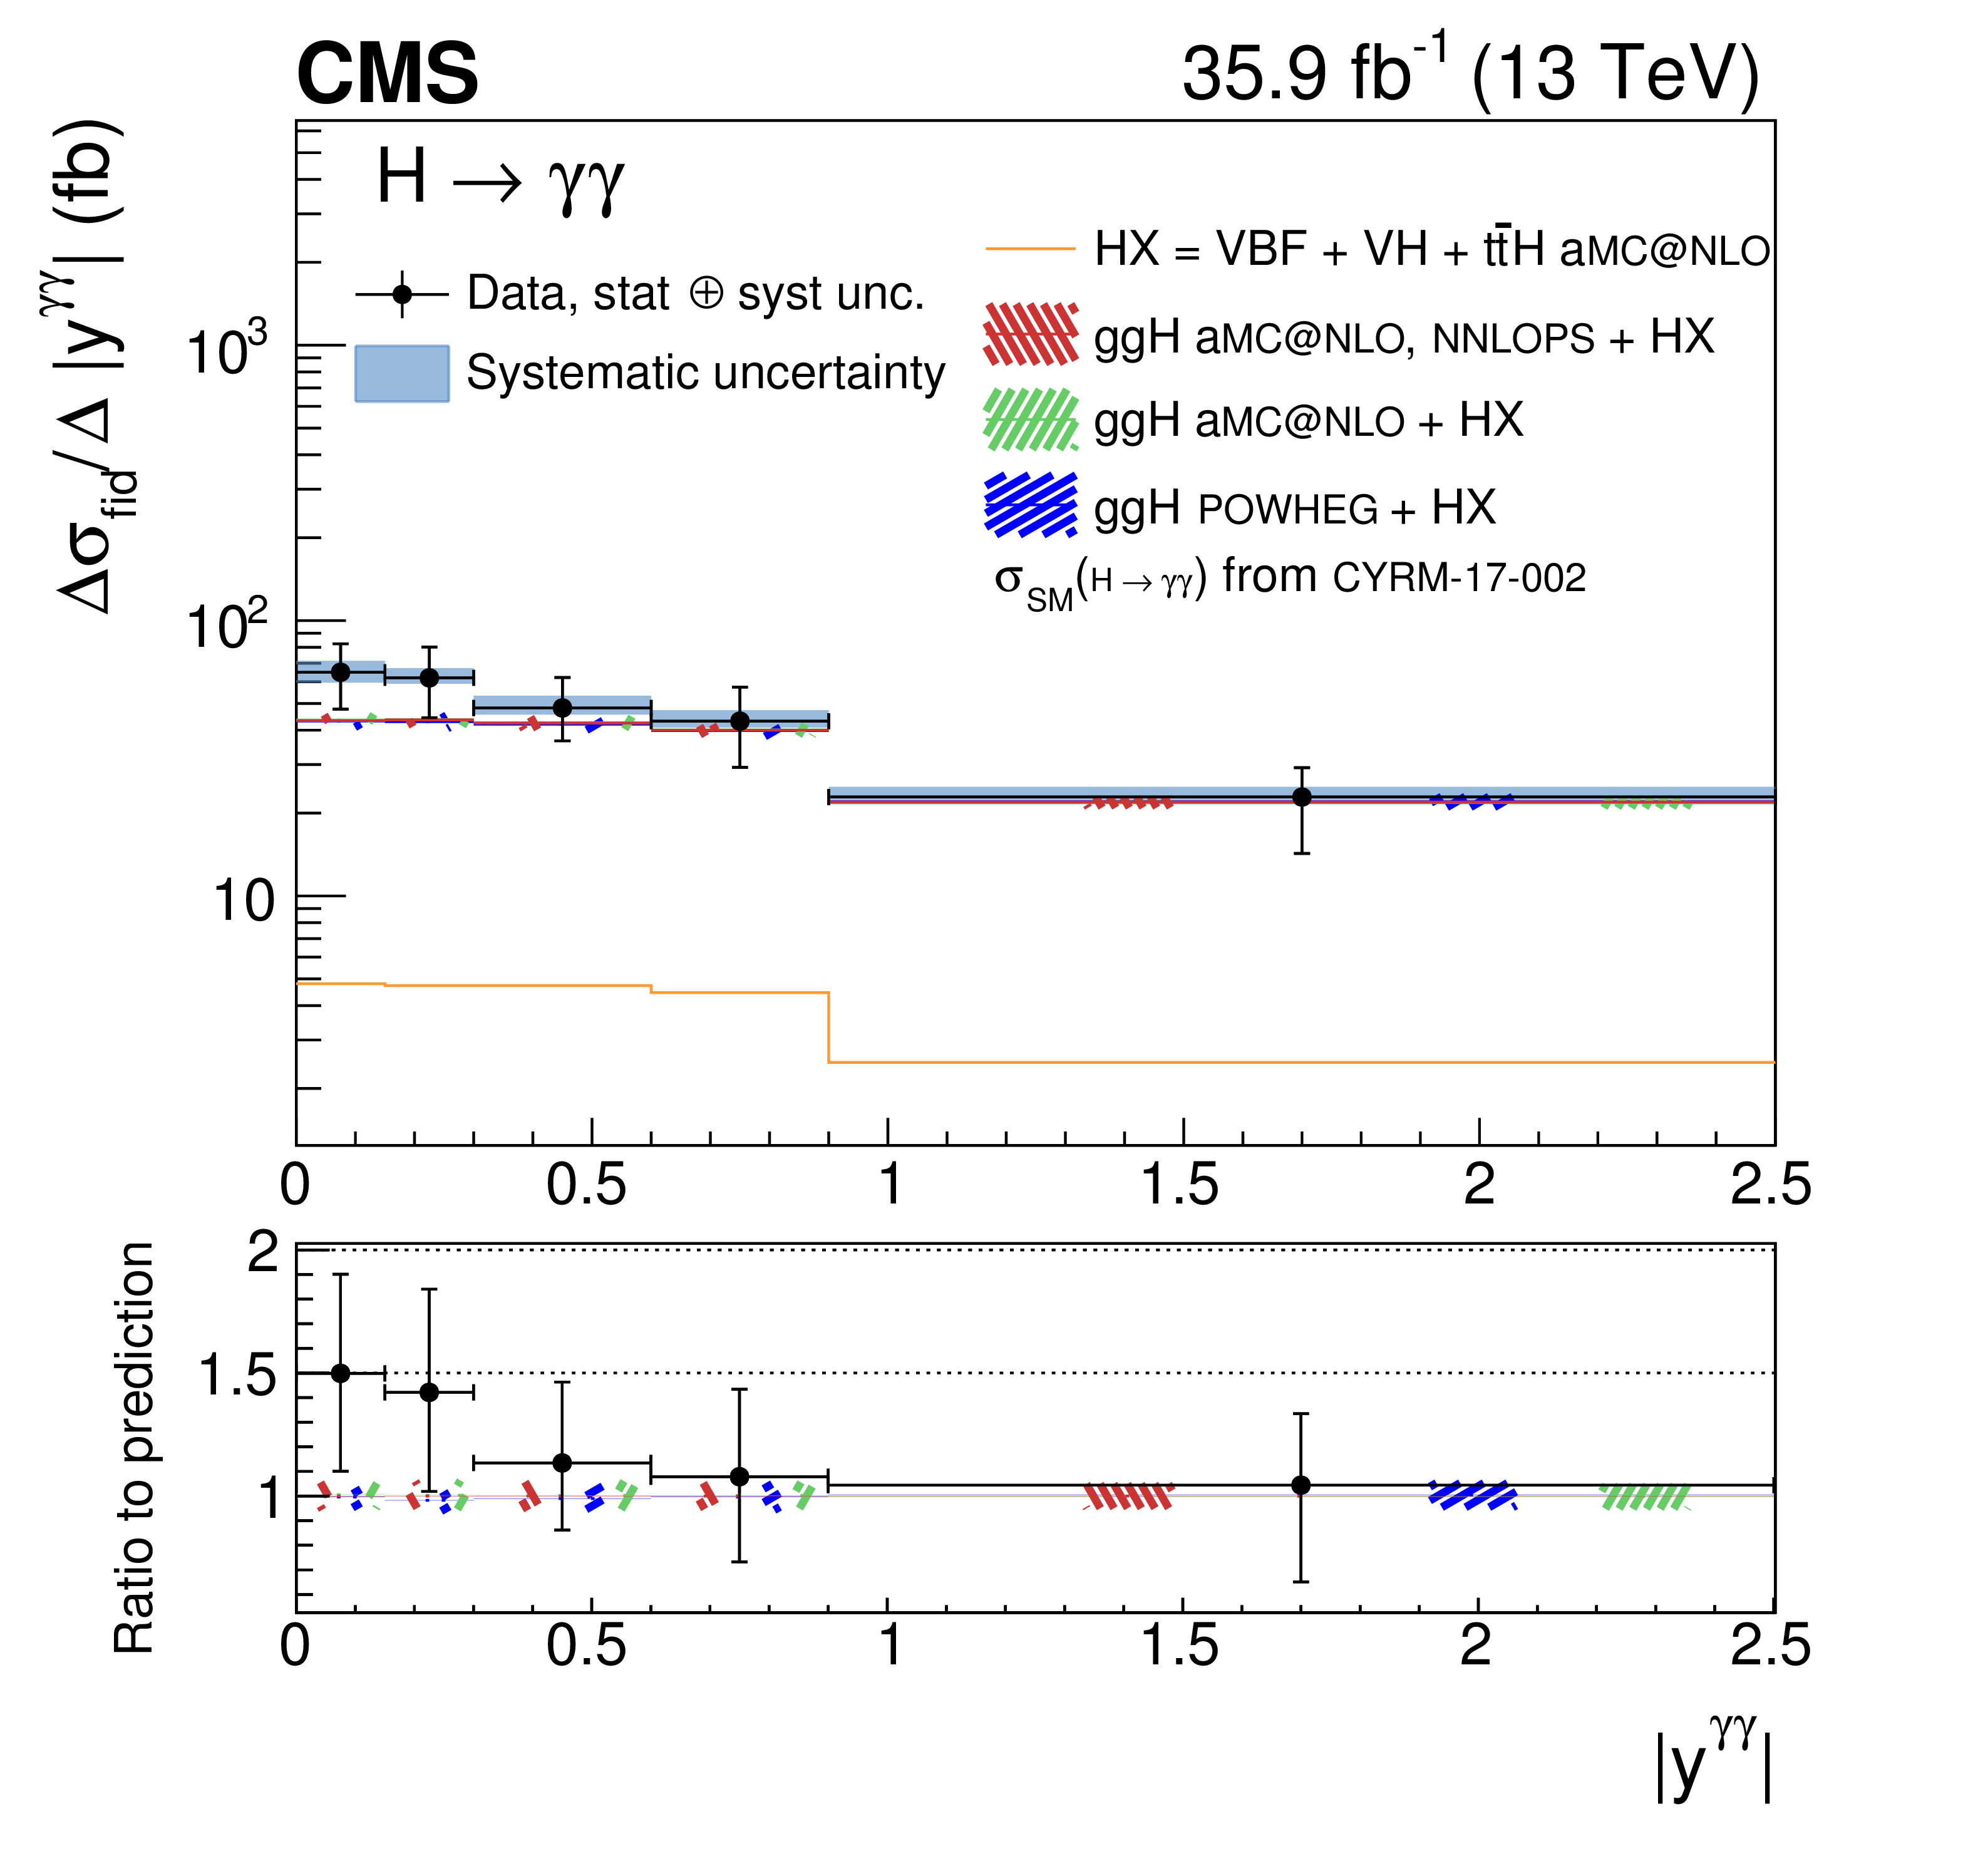
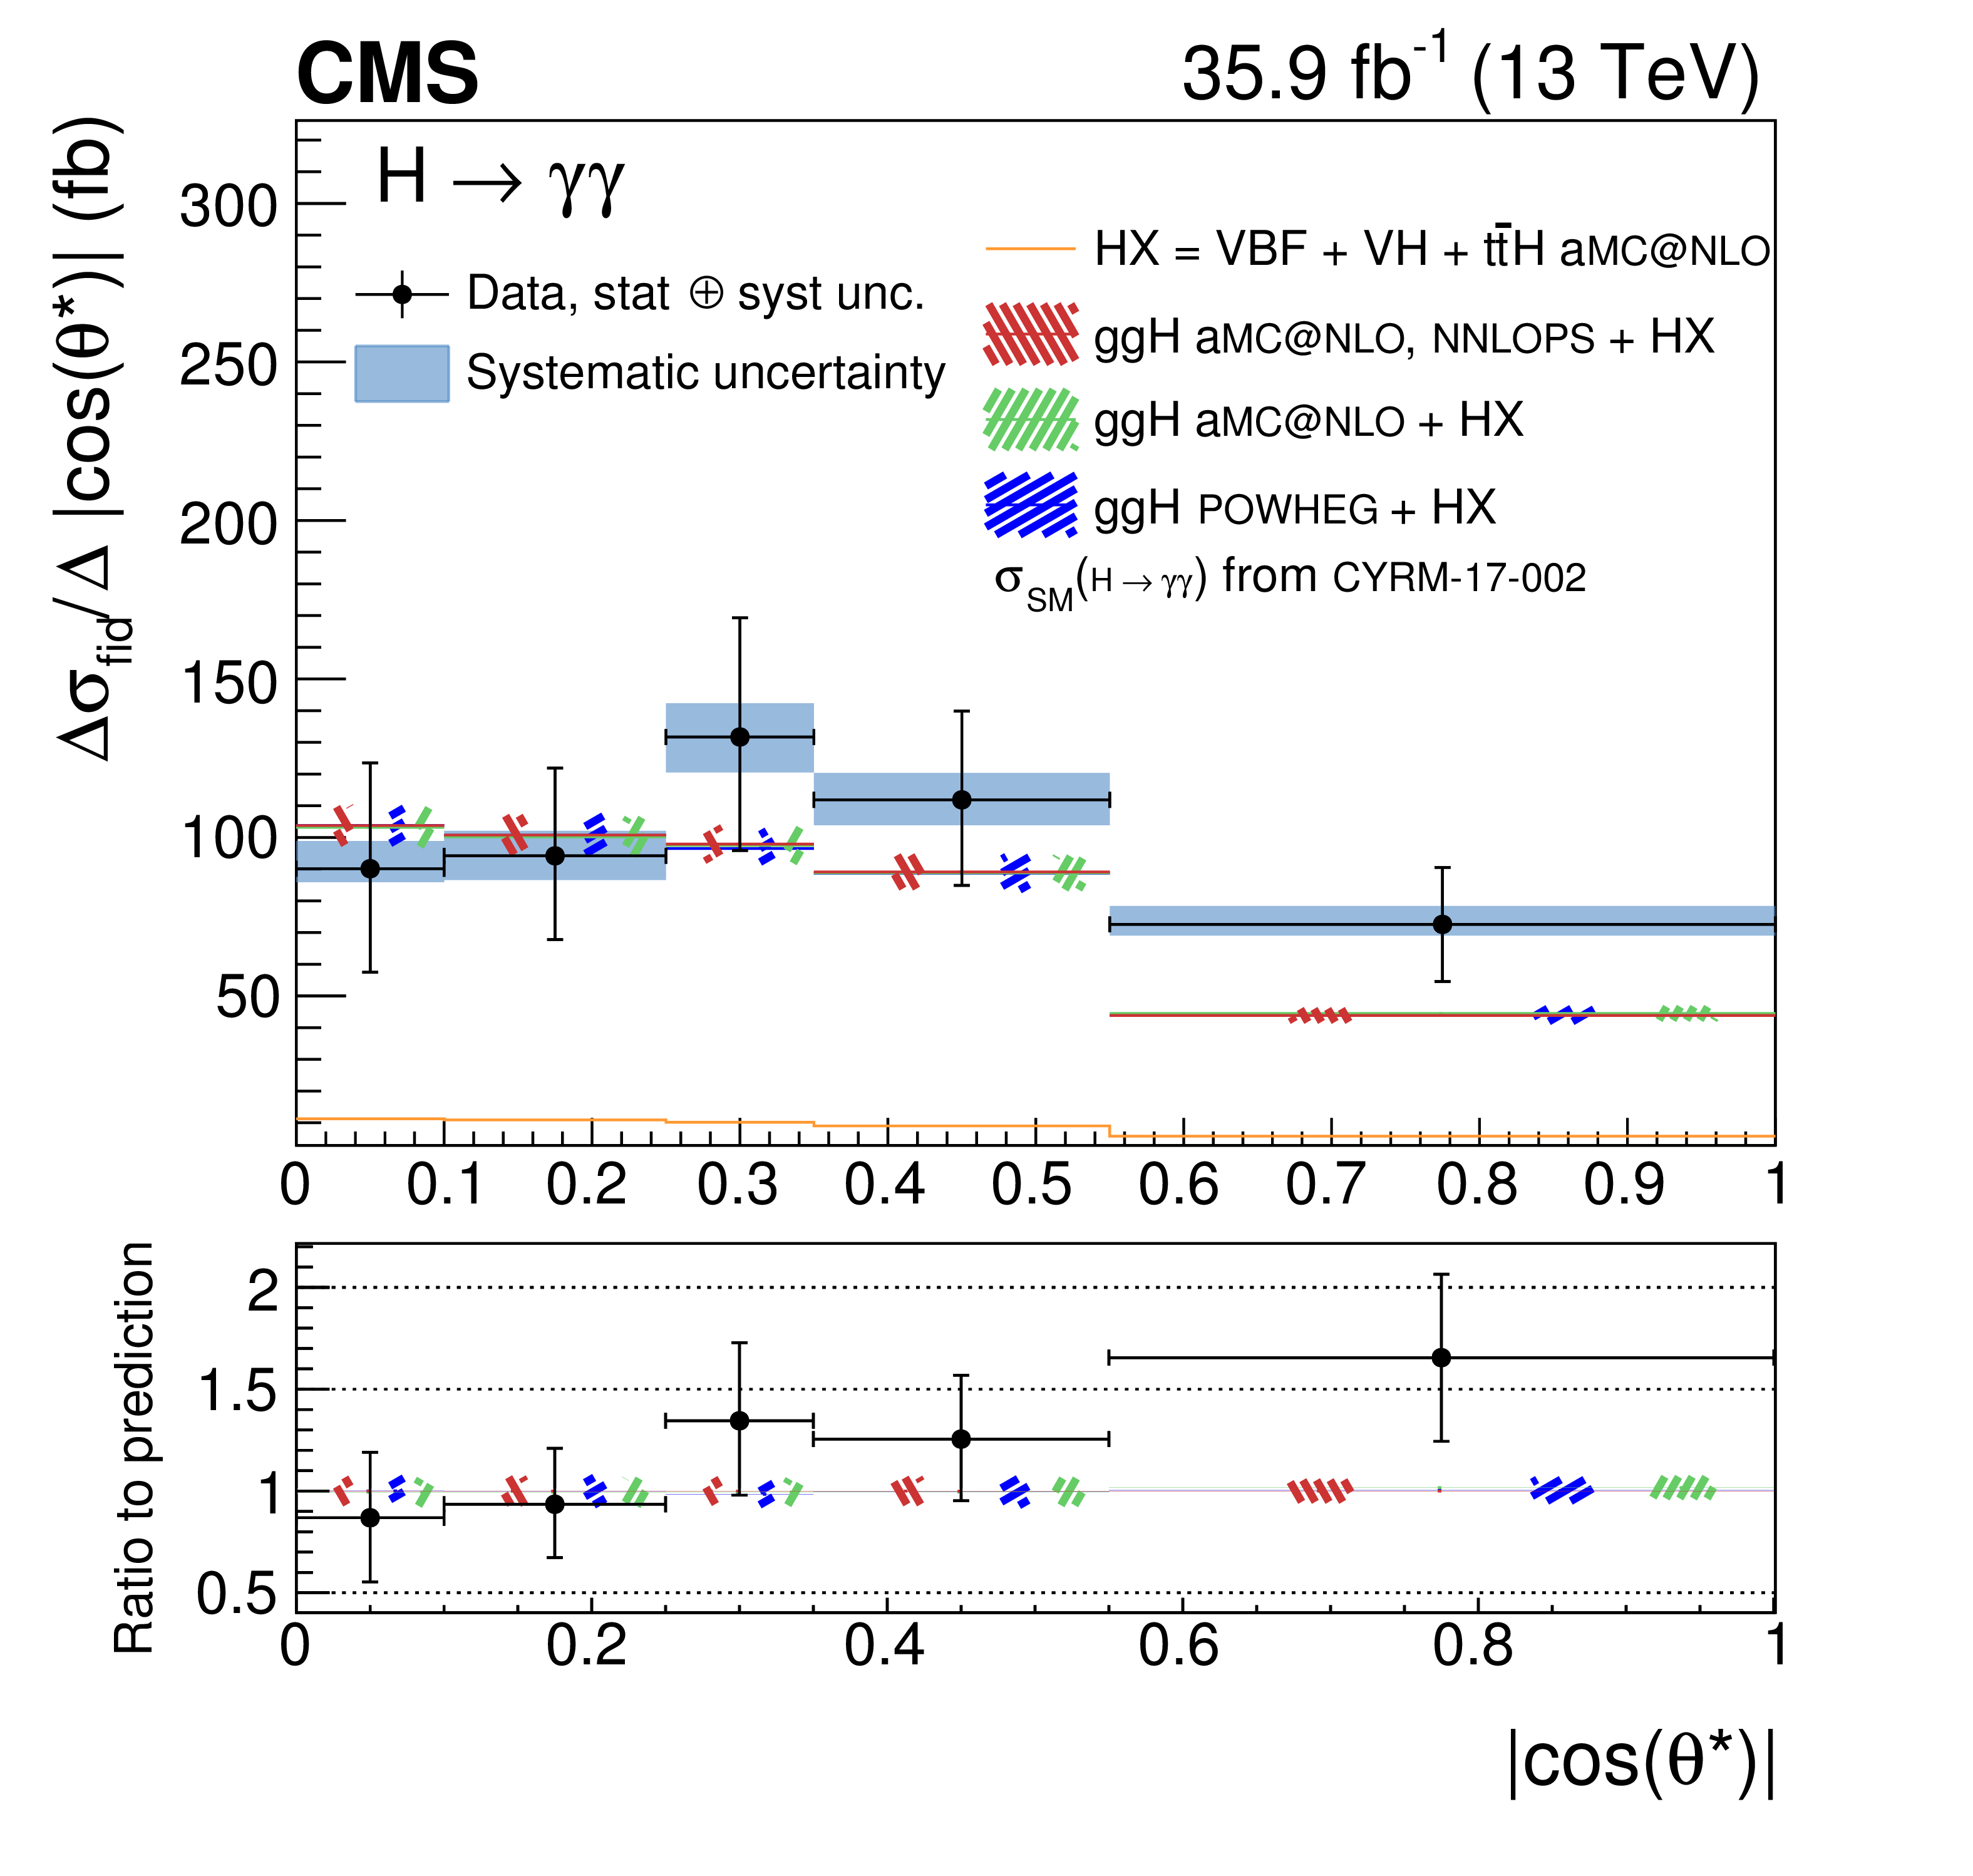
Measurement of the differential cross section (black points) as functions of $ {{p_{\mathrm {T}}} ^{\gamma \gamma}} $, $ {N_{\text {jet}}} $, $ {{| y^{\gamma \gamma} |}} $, and $ {{| \cos(\theta ^*) |}} $. The error bars indicate 1 standard deviation uncertainty. The systematic component of the uncertainty is shown by the blue band. The measurements are compared to different simulation programs (histograms) with their uncertainties (hatched areas), all normalized to the same theoretical predictions from Ref. [13]. When the last bin of the distribution is an overflow bin, the normalization of the cross section in that bin is indicated in the figure. |
png pdf |
Figure 4-a:
Measurement of the differential cross section (black points) as a function of $ {{p_{\mathrm {T}}} ^{\gamma \gamma}} $. The error bars indicate 1 standard deviation uncertainty. The systematic component of the uncertainty is shown by the blue band. The measurements are compared to different simulation programs (histograms) with their uncertainties (hatched areas), all normalized to the same theoretical predictions from Ref. [13]. The normalization of the cross section in last, overflow bin is indicated in the figure. |
png pdf |
Figure 4-b:
Measurement of the differential cross section (black points) as a function of $ {N_{\text {jet}}} $. The error bars indicate 1 standard deviation uncertainty. The systematic component of the uncertainty is shown by the blue band. The measurements are compared to different simulation programs (histograms) with their uncertainties (hatched areas), all normalized to the same theoretical predictions from Ref. [13]. |
png pdf |
Figure 4-c:
Measurement of the differential cross section (black points) as a function of $ {{| y^{\gamma \gamma} |}} $. The error bars indicate 1 standard deviation uncertainty. The systematic component of the uncertainty is shown by the blue band. The measurements are compared to different simulation programs (histograms) with their uncertainties (hatched areas), all normalized to the same theoretical predictions from Ref. [13]. |
png pdf |
Figure 4-d:
Measurement of the differential cross section (black points) as a function of $ {{| \cos(\theta ^*) |}} $. The error bars indicate 1 standard deviation uncertainty. The systematic component of the uncertainty is shown by the blue band. The measurements are compared to different simulation programs (histograms) with their uncertainties (hatched areas), all normalized to the same theoretical predictions from Ref. [13]. |
png pdf |
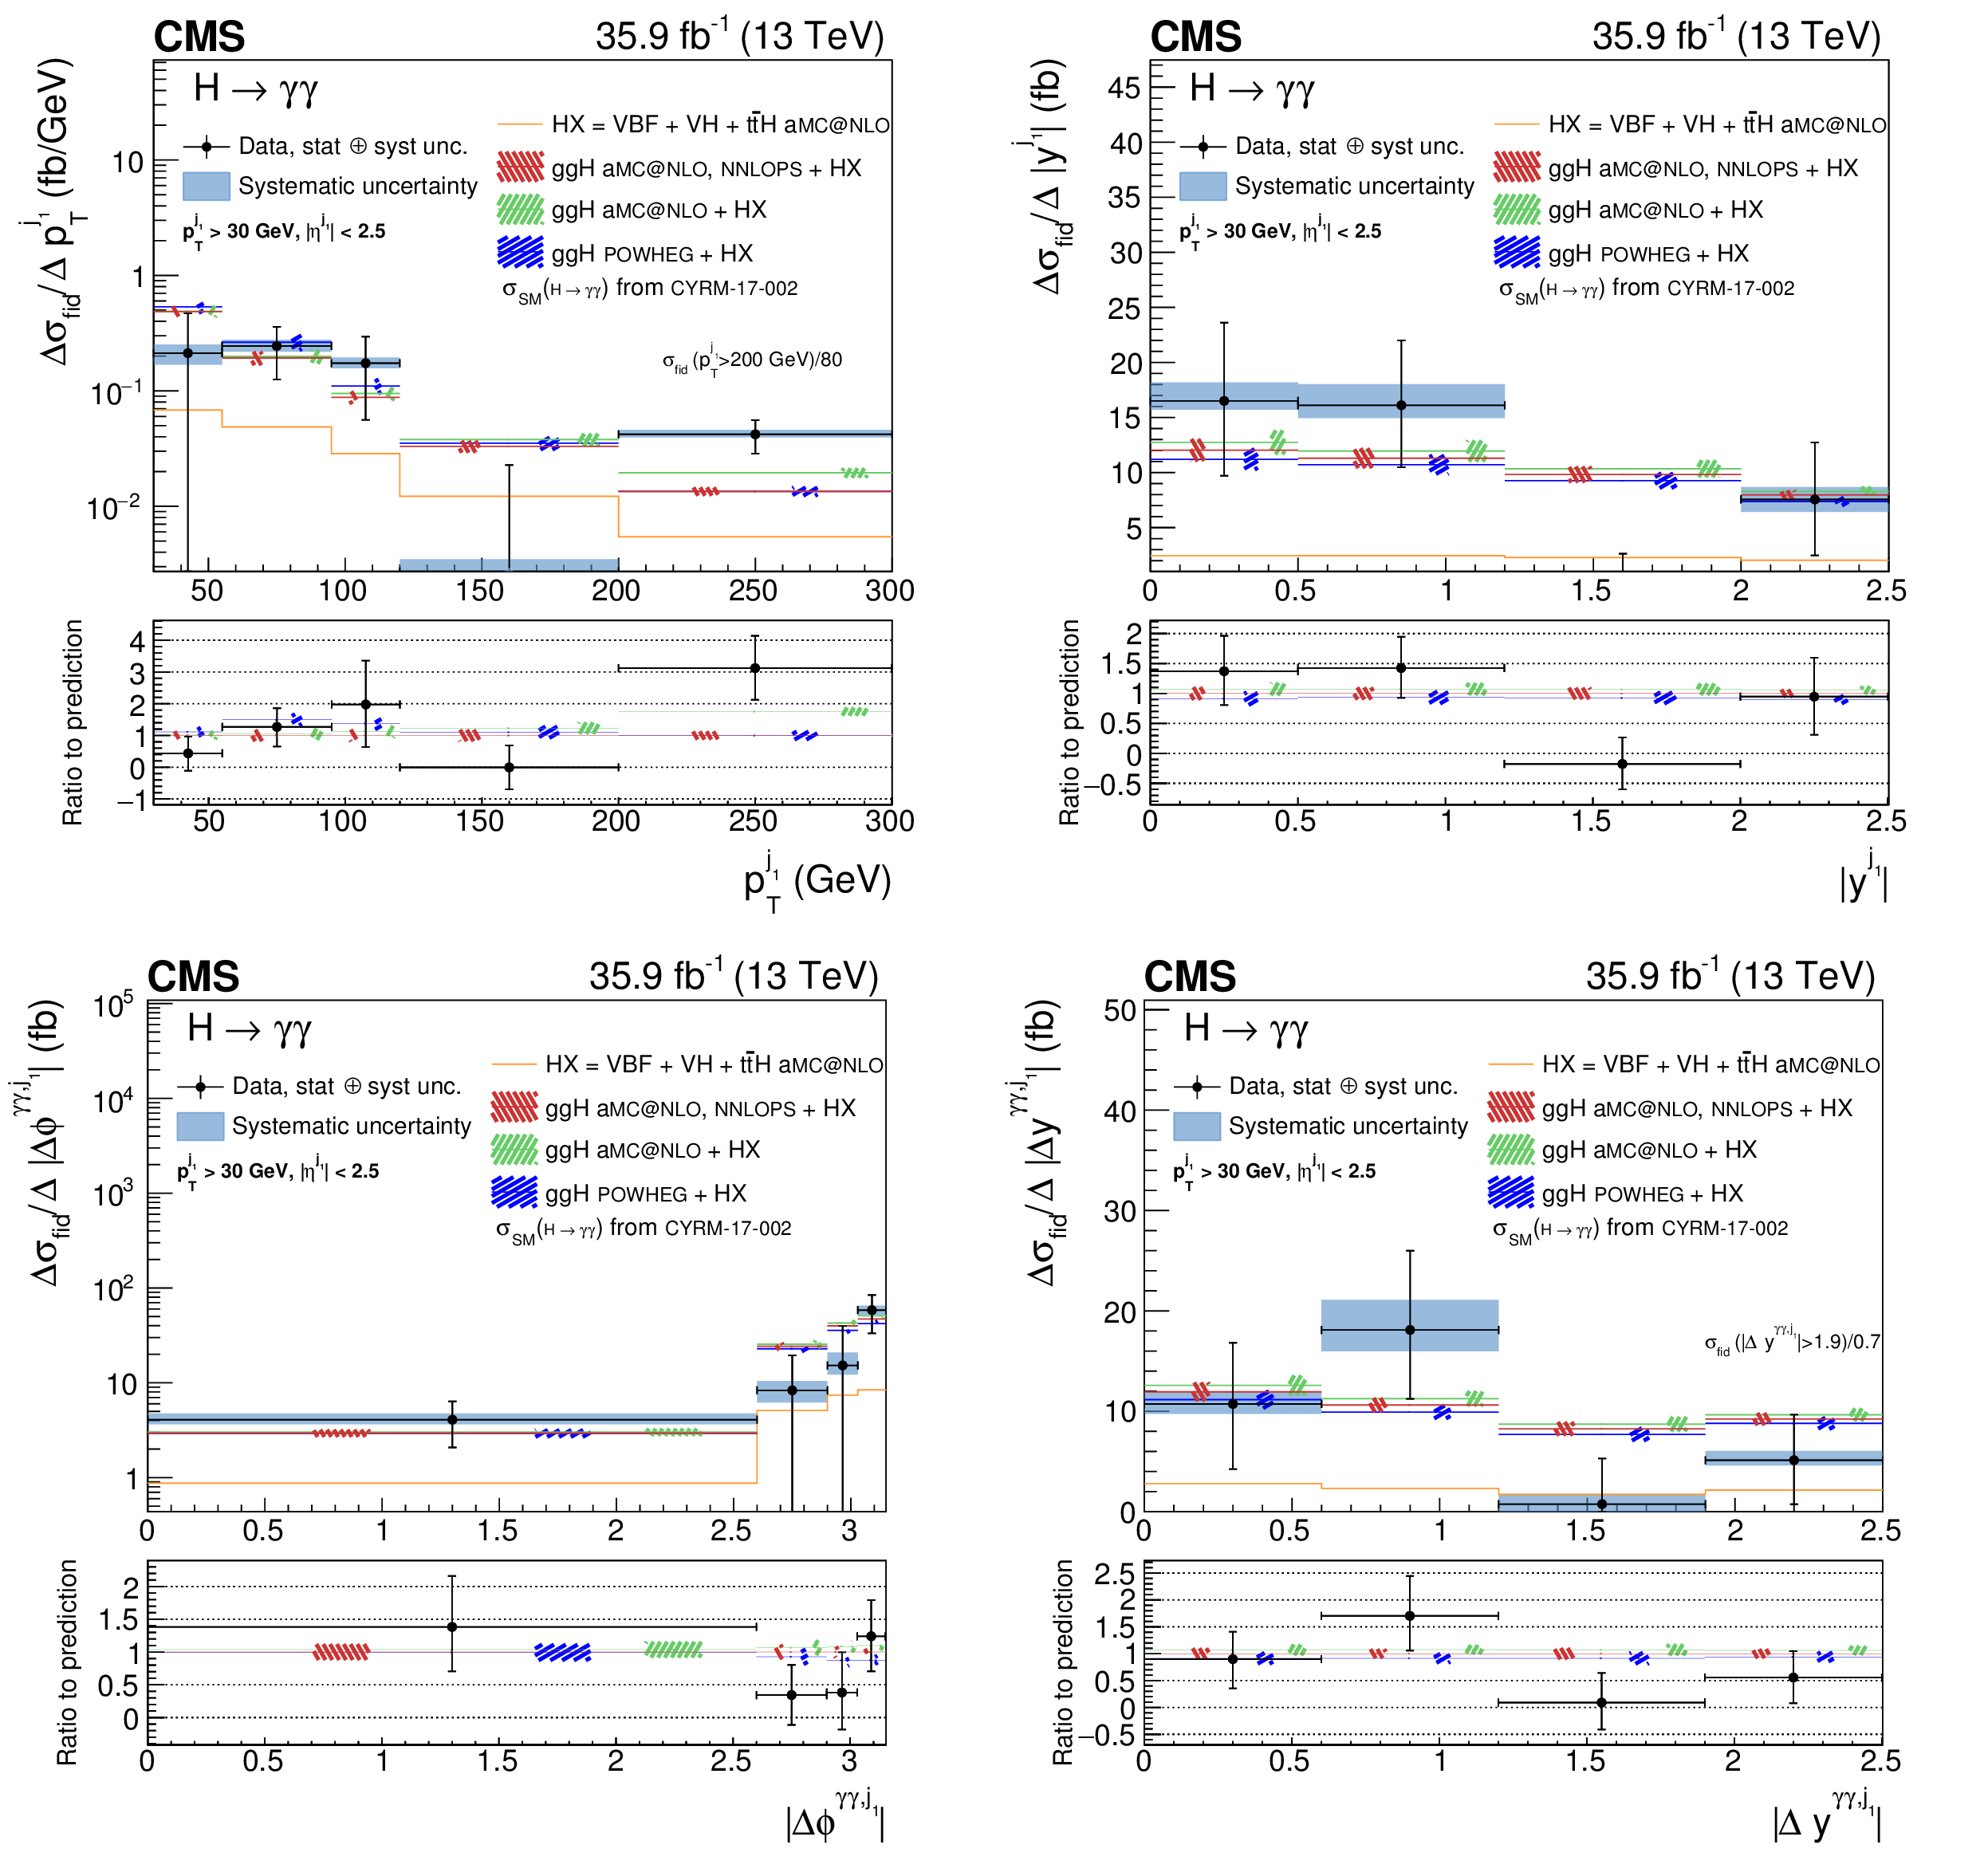
Figure 5:
Measurement of the differential cross section (black points) as functions of $ {{p_{\mathrm {T}}} ^{{j_{\text {1}}}}} $, $ {{| y^{{j_{\text {1}}}} |}} $, $ {{| \Delta \phi ^{\gamma \gamma, {j_{\text {1}}}} |}} $, and $ {{| \Delta y^{\gamma \gamma, {j_{\text {1}}}} |}} $. The error bars indicate 1 standard deviation uncertainty. The systematic component of the uncertainty is shown by the blue band. The measurements are compared to different simulation programs (histograms) with their uncertainties (hatched areas), all normalized to the same theoretical predictions from Ref. [13]. When the last bin of the distribution is an overflow bin, the normalization of the cross section in that bin is indicated in the figure. |
png pdf |
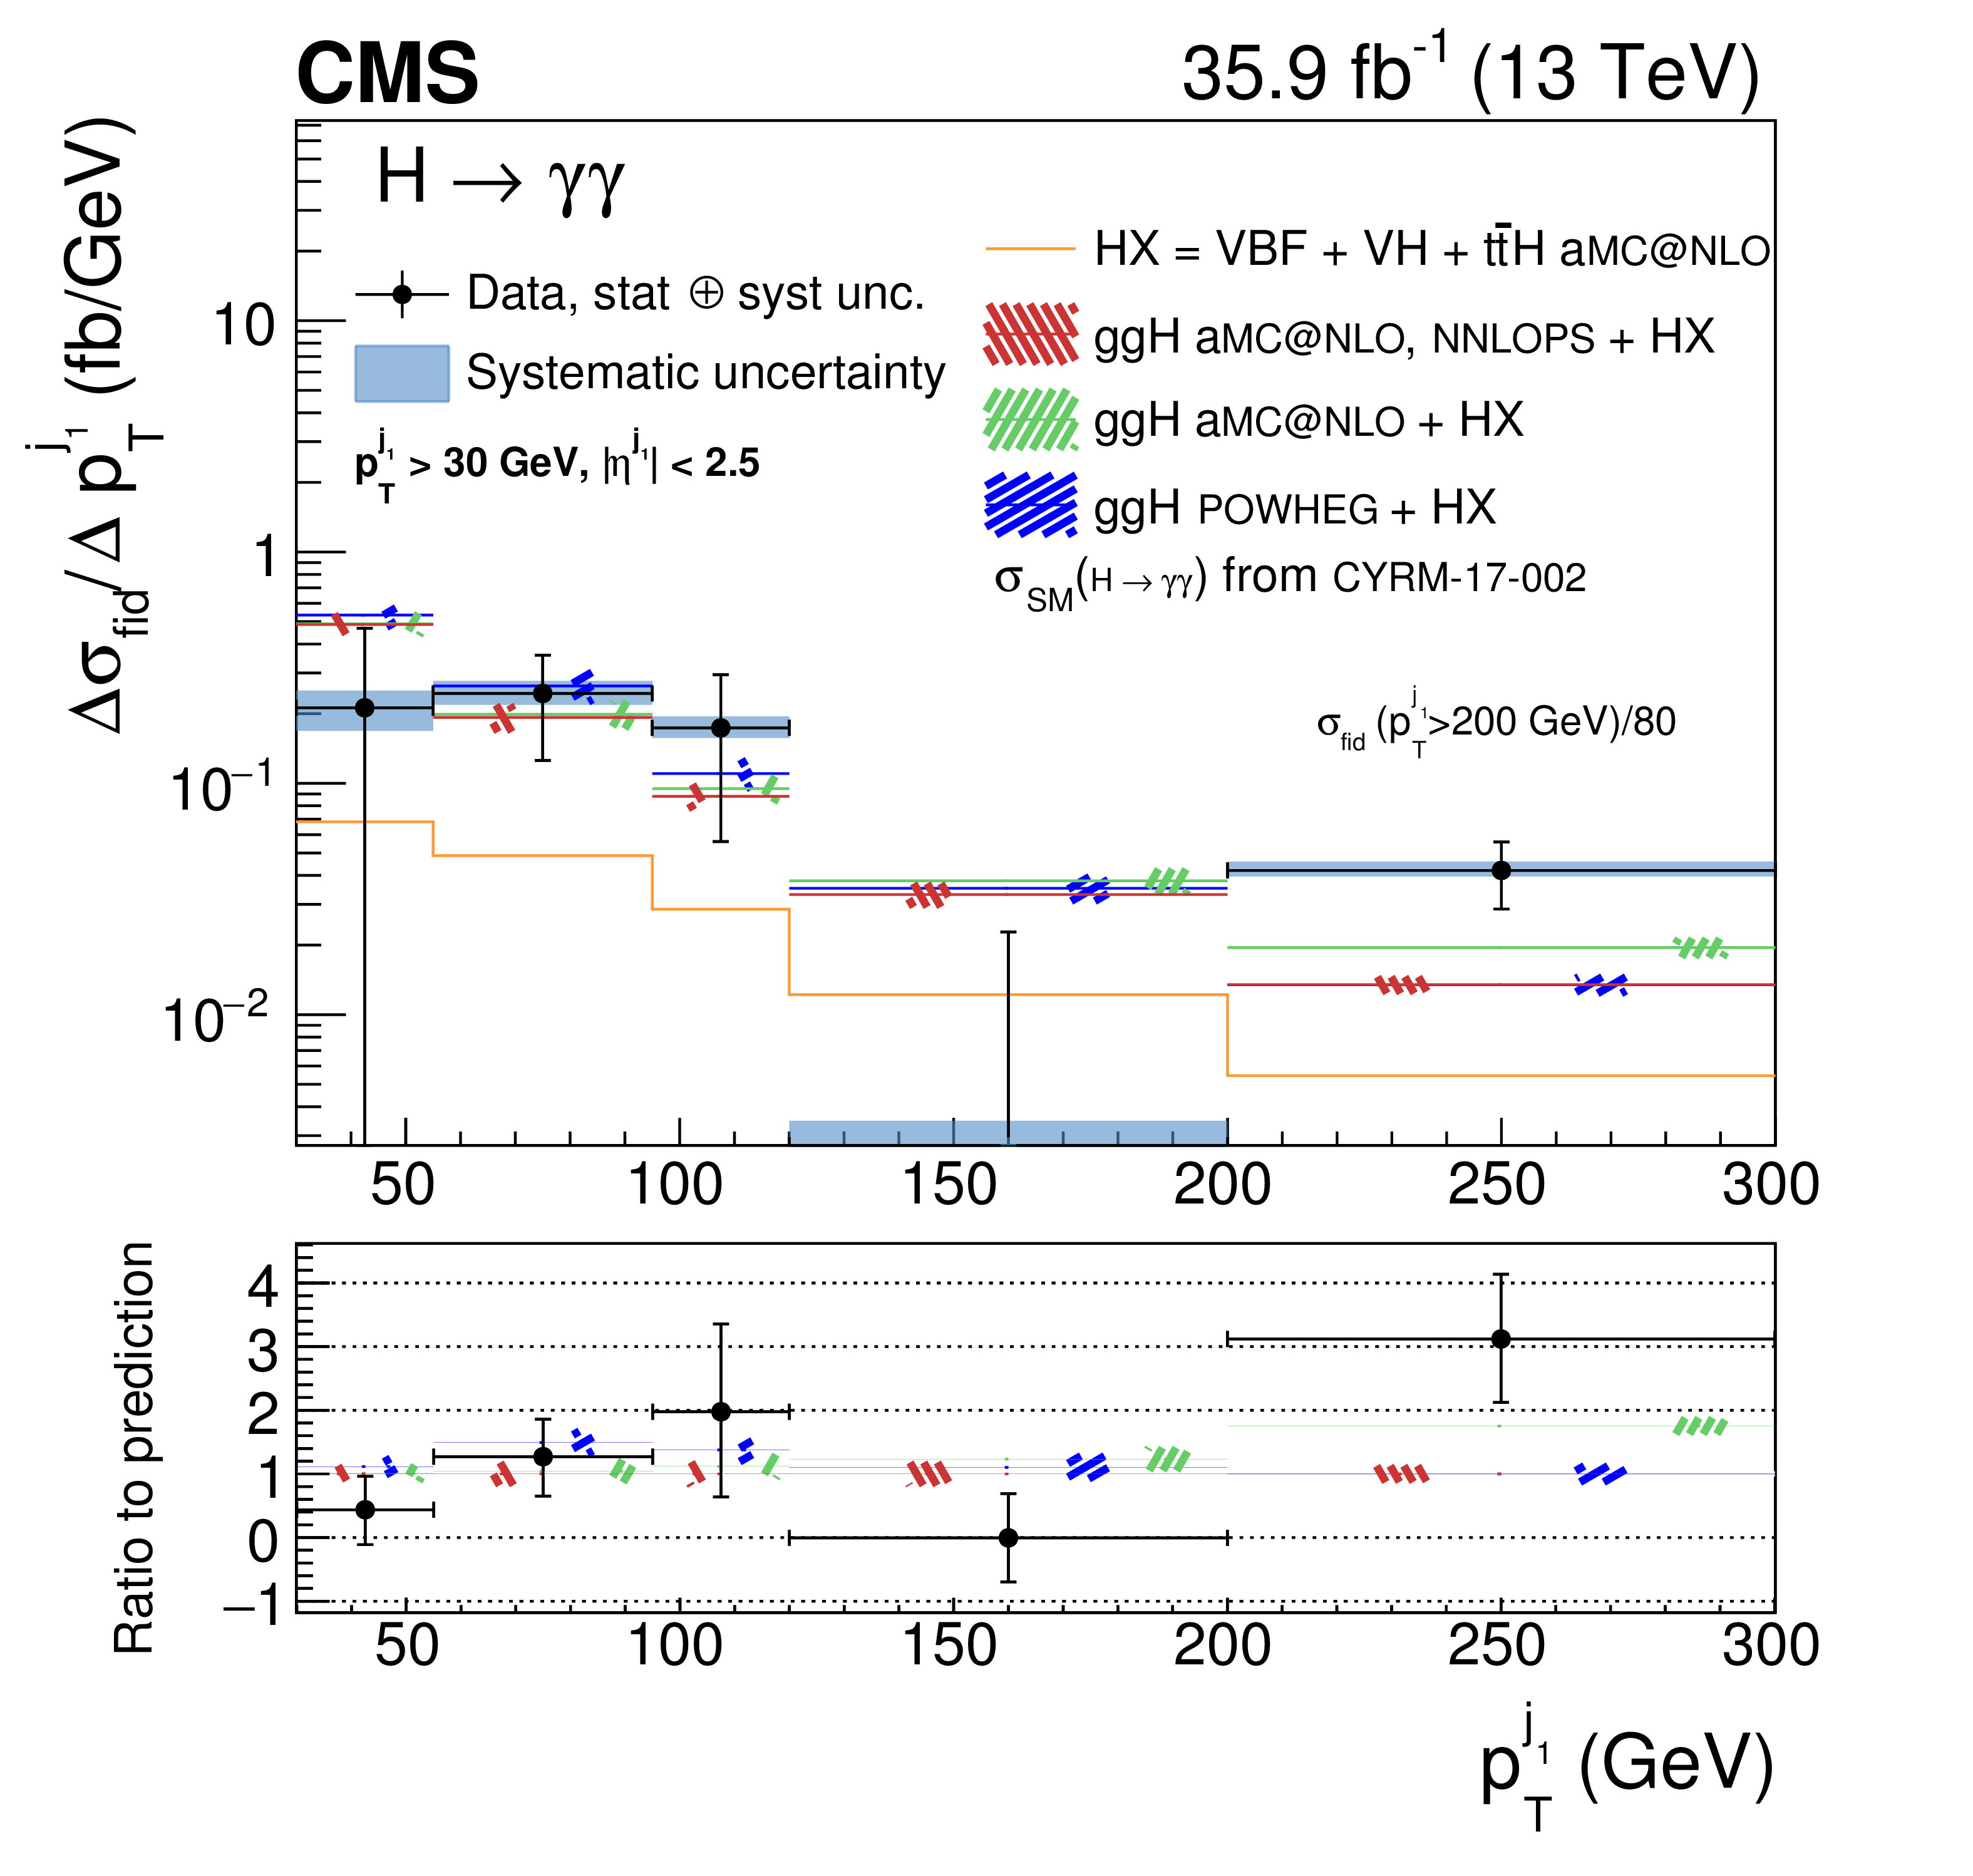
Figure 5-a:
Measurement of the differential cross section (black points) as a function of $ {{p_{\mathrm {T}}} ^{{j_{\text {1}}}}} $. The error bars indicate 1 standard deviation uncertainty. The systematic component of the uncertainty is shown by the blue band. The measurements are compared to different simulation programs (histograms) with their uncertainties (hatched areas), all normalized to the same theoretical predictions from Ref. [13]. The normalization of the cross section in last, overflow bin is indicated in the figure. |
png pdf |
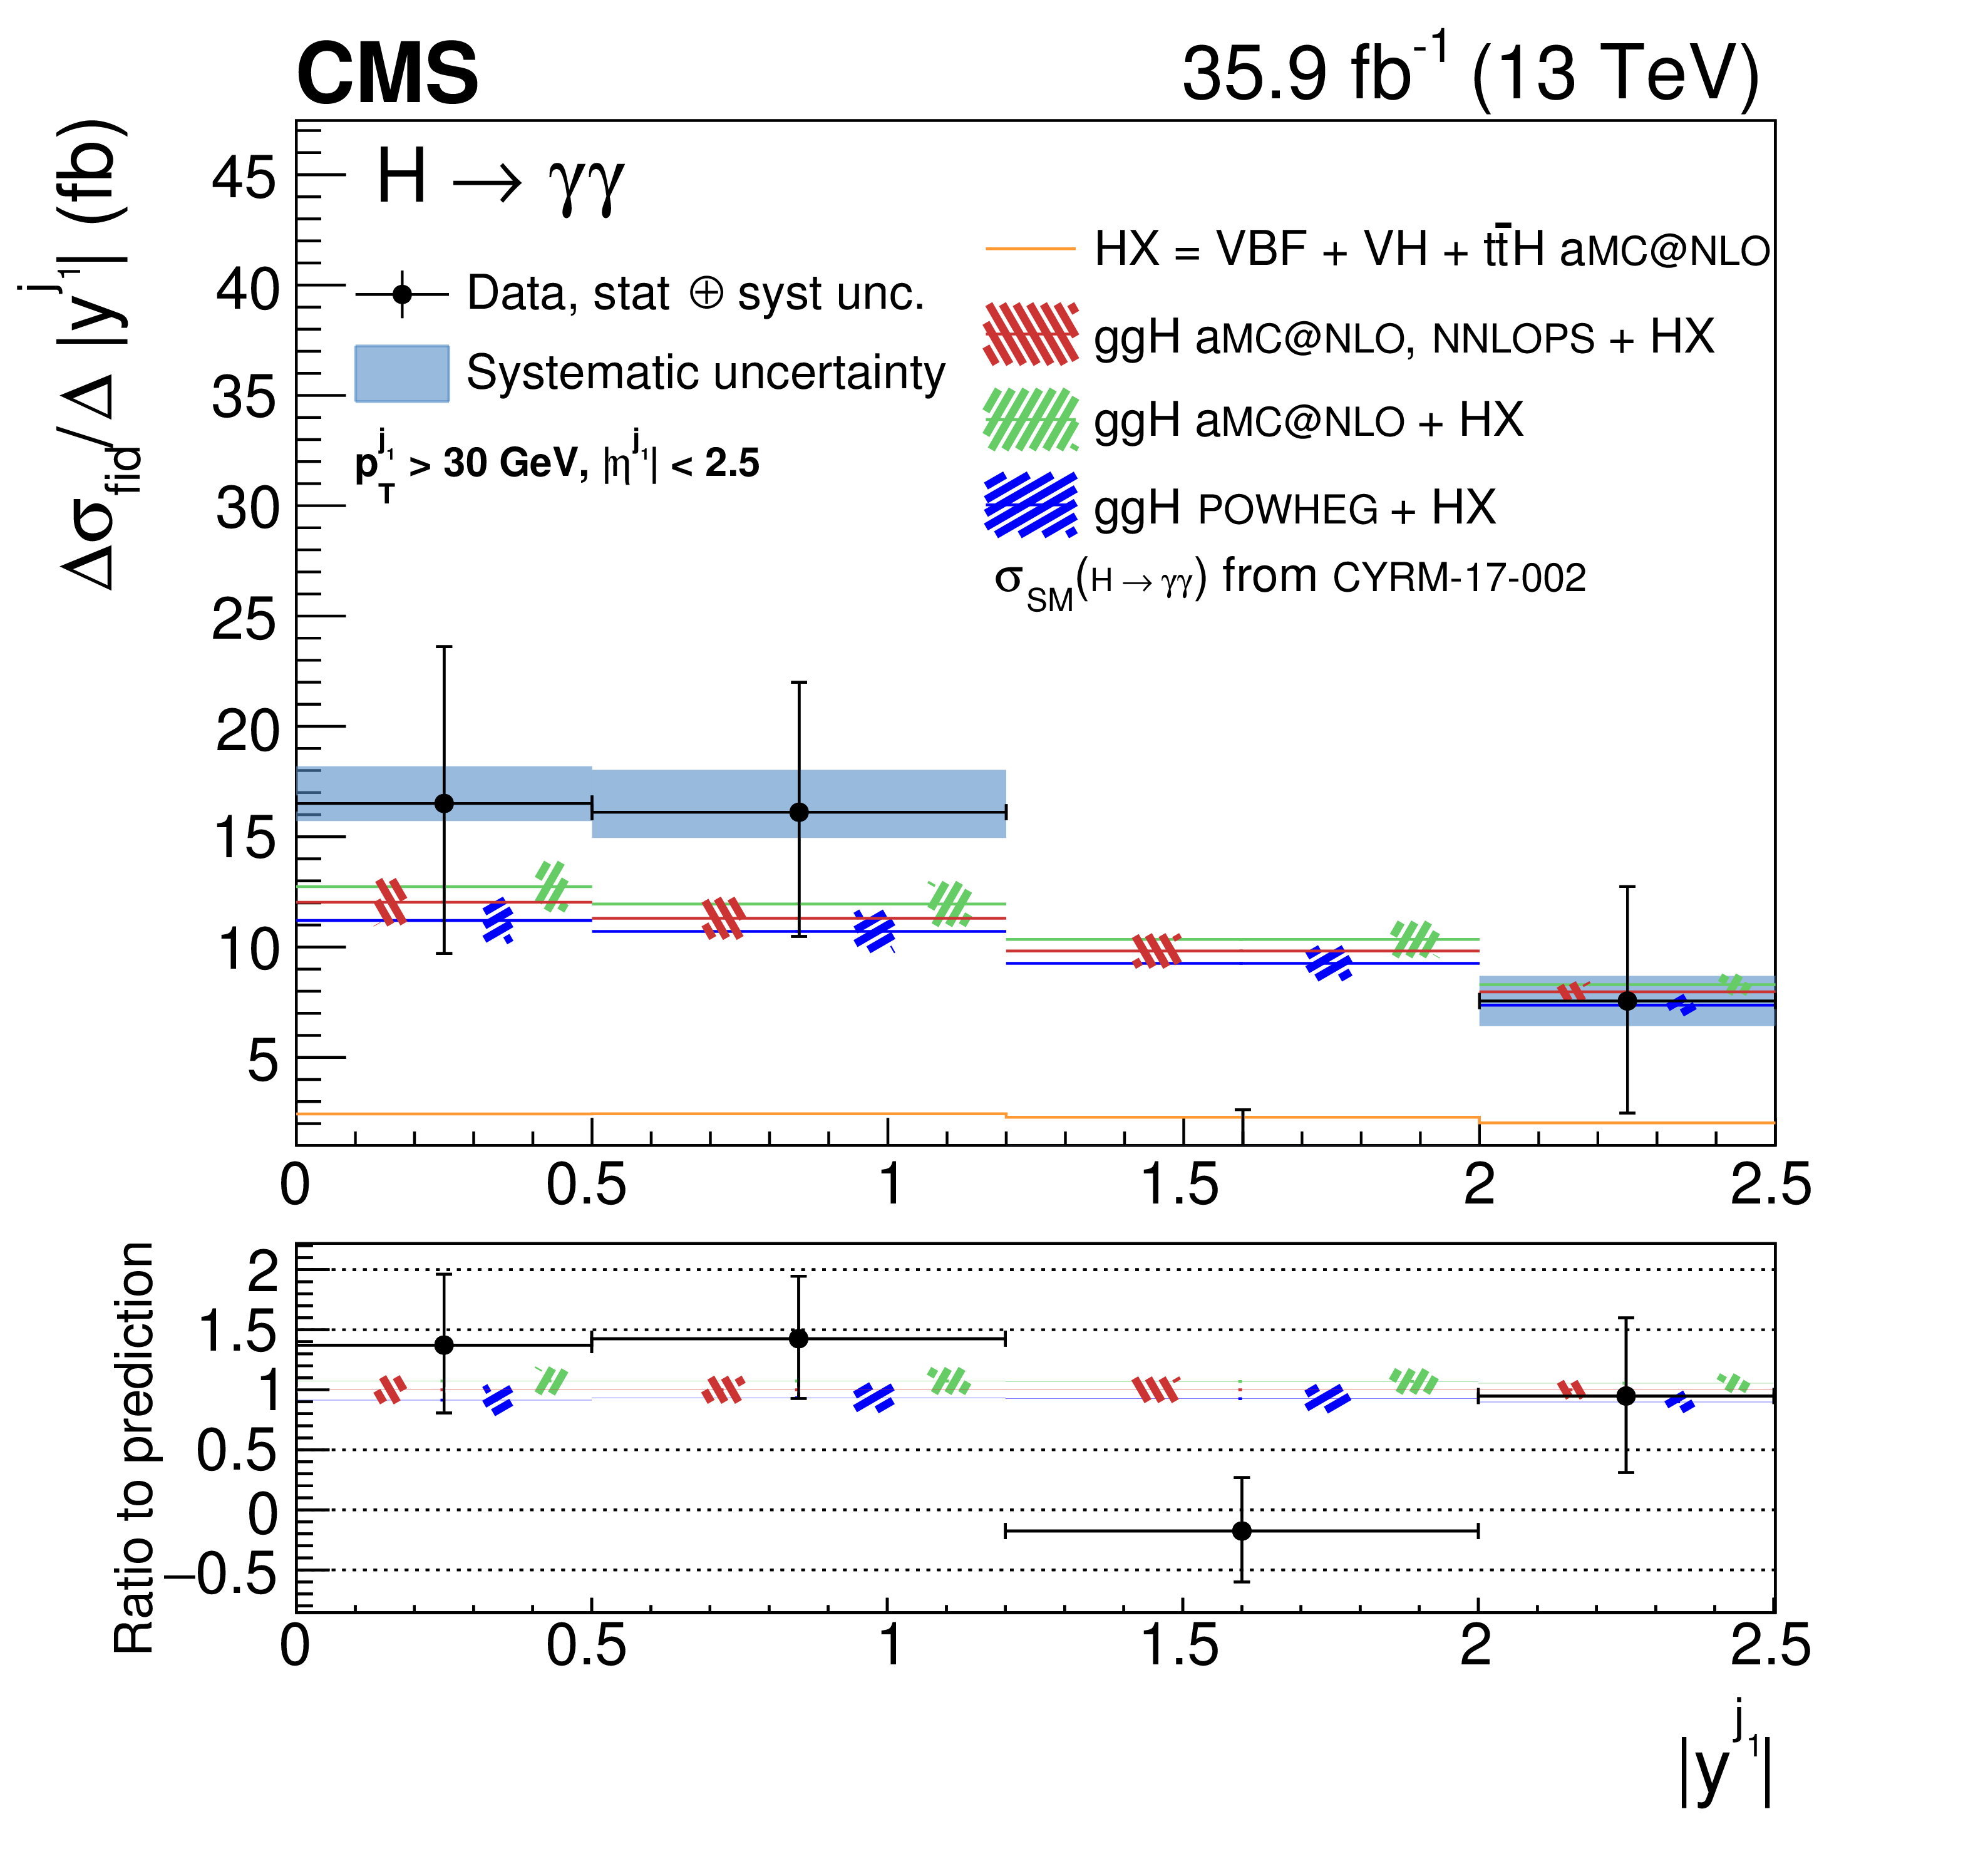
Figure 5-b:
Measurement of the differential cross section (black points) as a function of $ {{| y^{{j_{\text {1}}}} |}} $. The error bars indicate 1 standard deviation uncertainty. The systematic component of the uncertainty is shown by the blue band. The measurements are compared to different simulation programs (histograms) with their uncertainties (hatched areas), all normalized to the same theoretical predictions from Ref. [13]. |
png pdf |
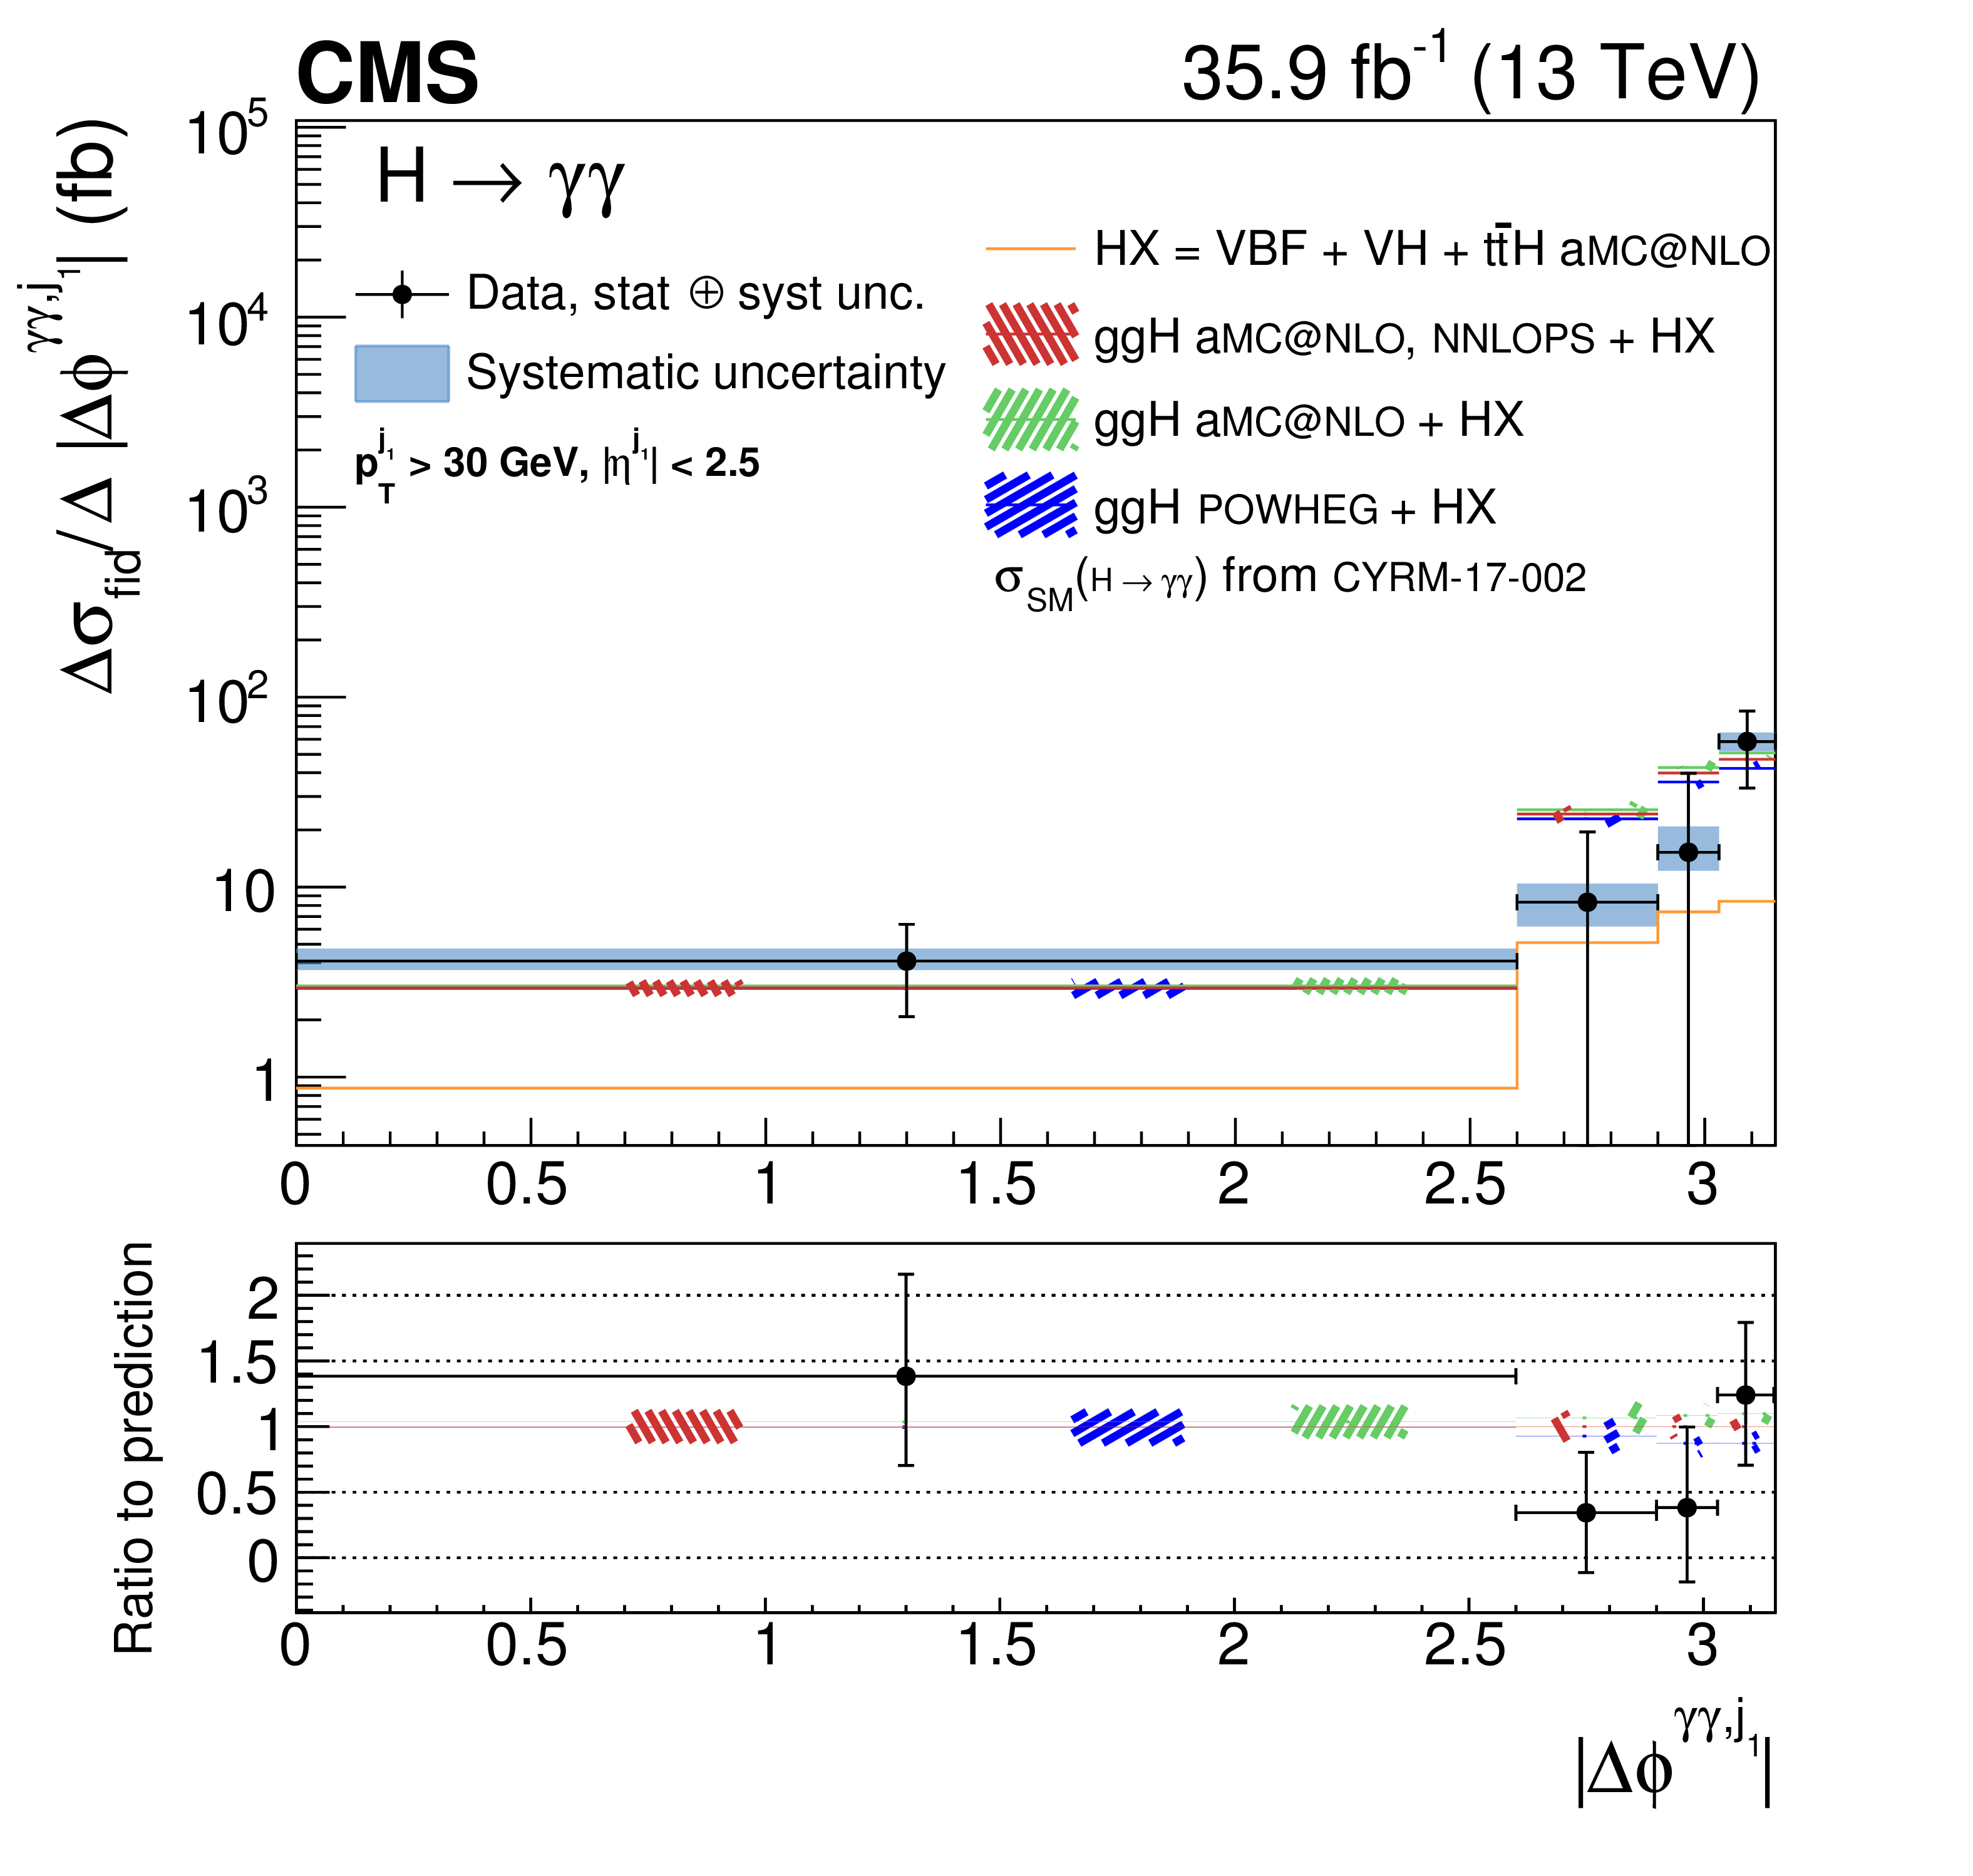
Figure 5-c:
Measurement of the differential cross section (black points) as a function of $ {{| \Delta \phi ^{\gamma \gamma, {j_{\text {1}}}} |}} $. The error bars indicate 1 standard deviation uncertainty. The systematic component of the uncertainty is shown by the blue band. The measurements are compared to different simulation programs (histograms) with their uncertainties (hatched areas), all normalized to the same theoretical predictions from Ref. [13]. The normalization of the cross section in last, overflow bin is indicated in the figure. |
png pdf |
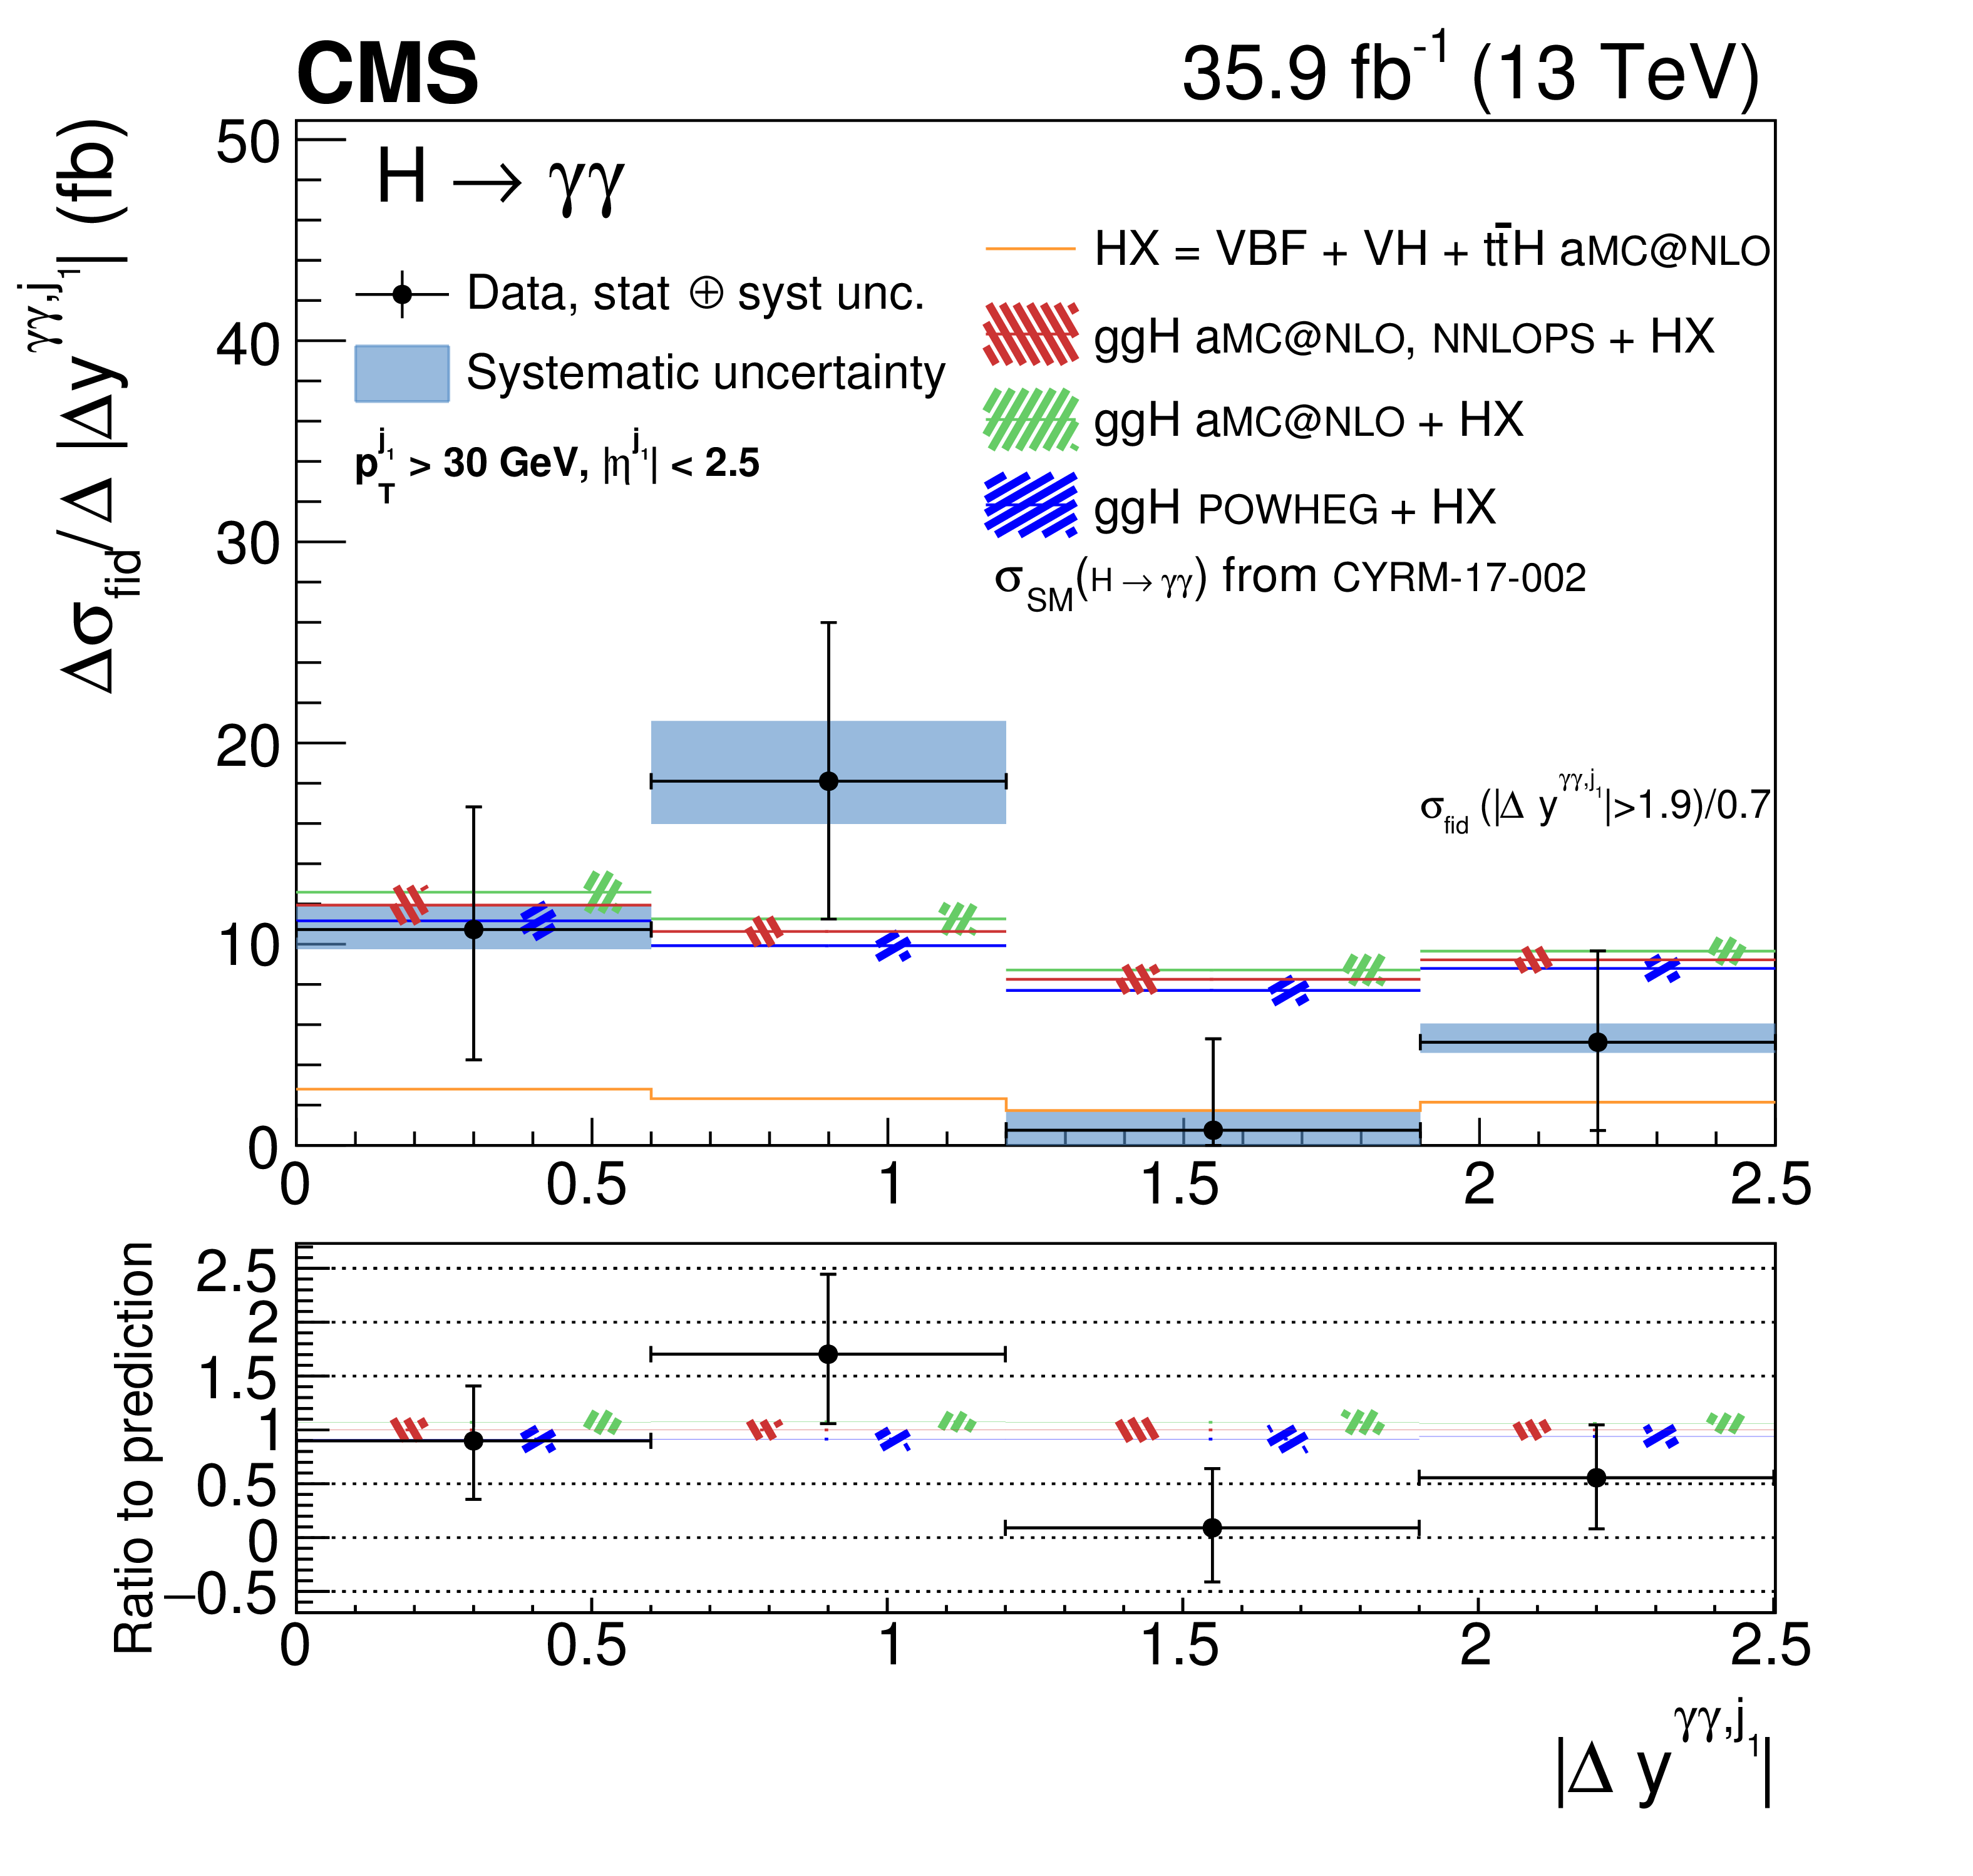
Figure 5-d:
Measurement of the differential cross section (black points) as a function of $ {{| \Delta y^{\gamma \gamma, {j_{\text {1}}}} |}} $. The error bars indicate 1 standard deviation uncertainty. The systematic component of the uncertainty is shown by the blue band. The measurements are compared to different simulation programs (histograms) with their uncertainties (hatched areas), all normalized to the same theoretical predictions from Ref. [13]. |
png pdf |
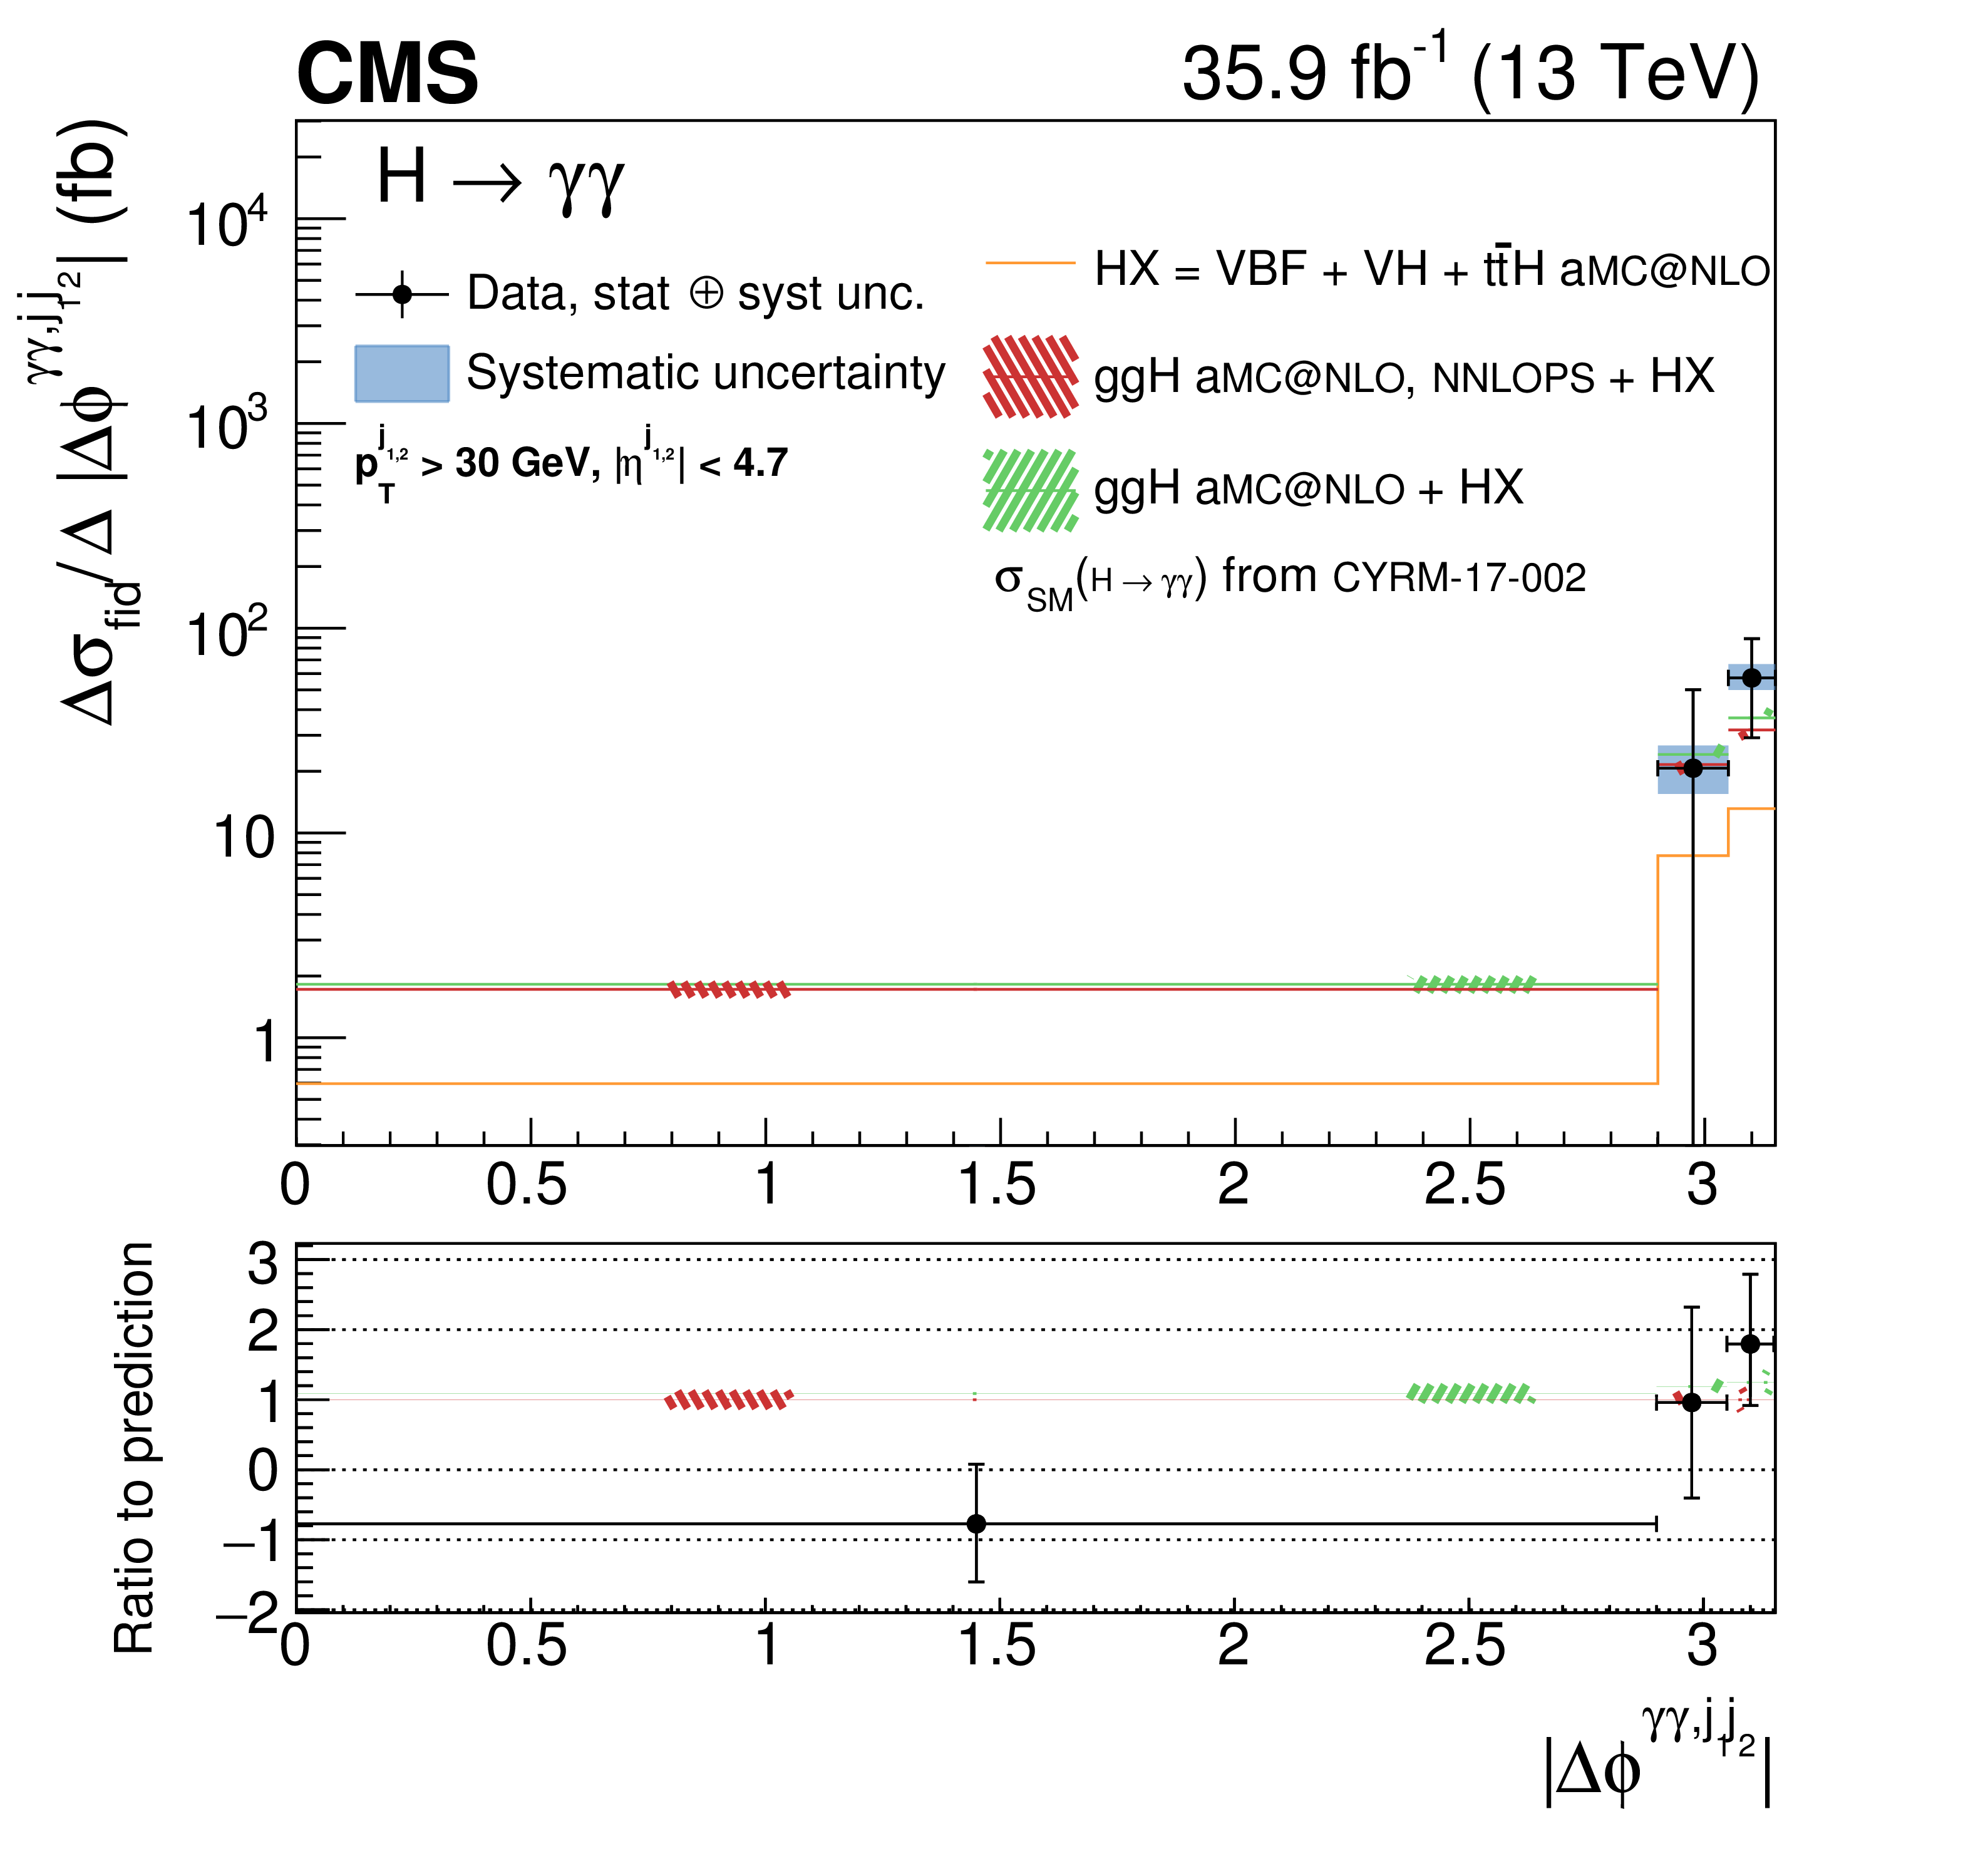
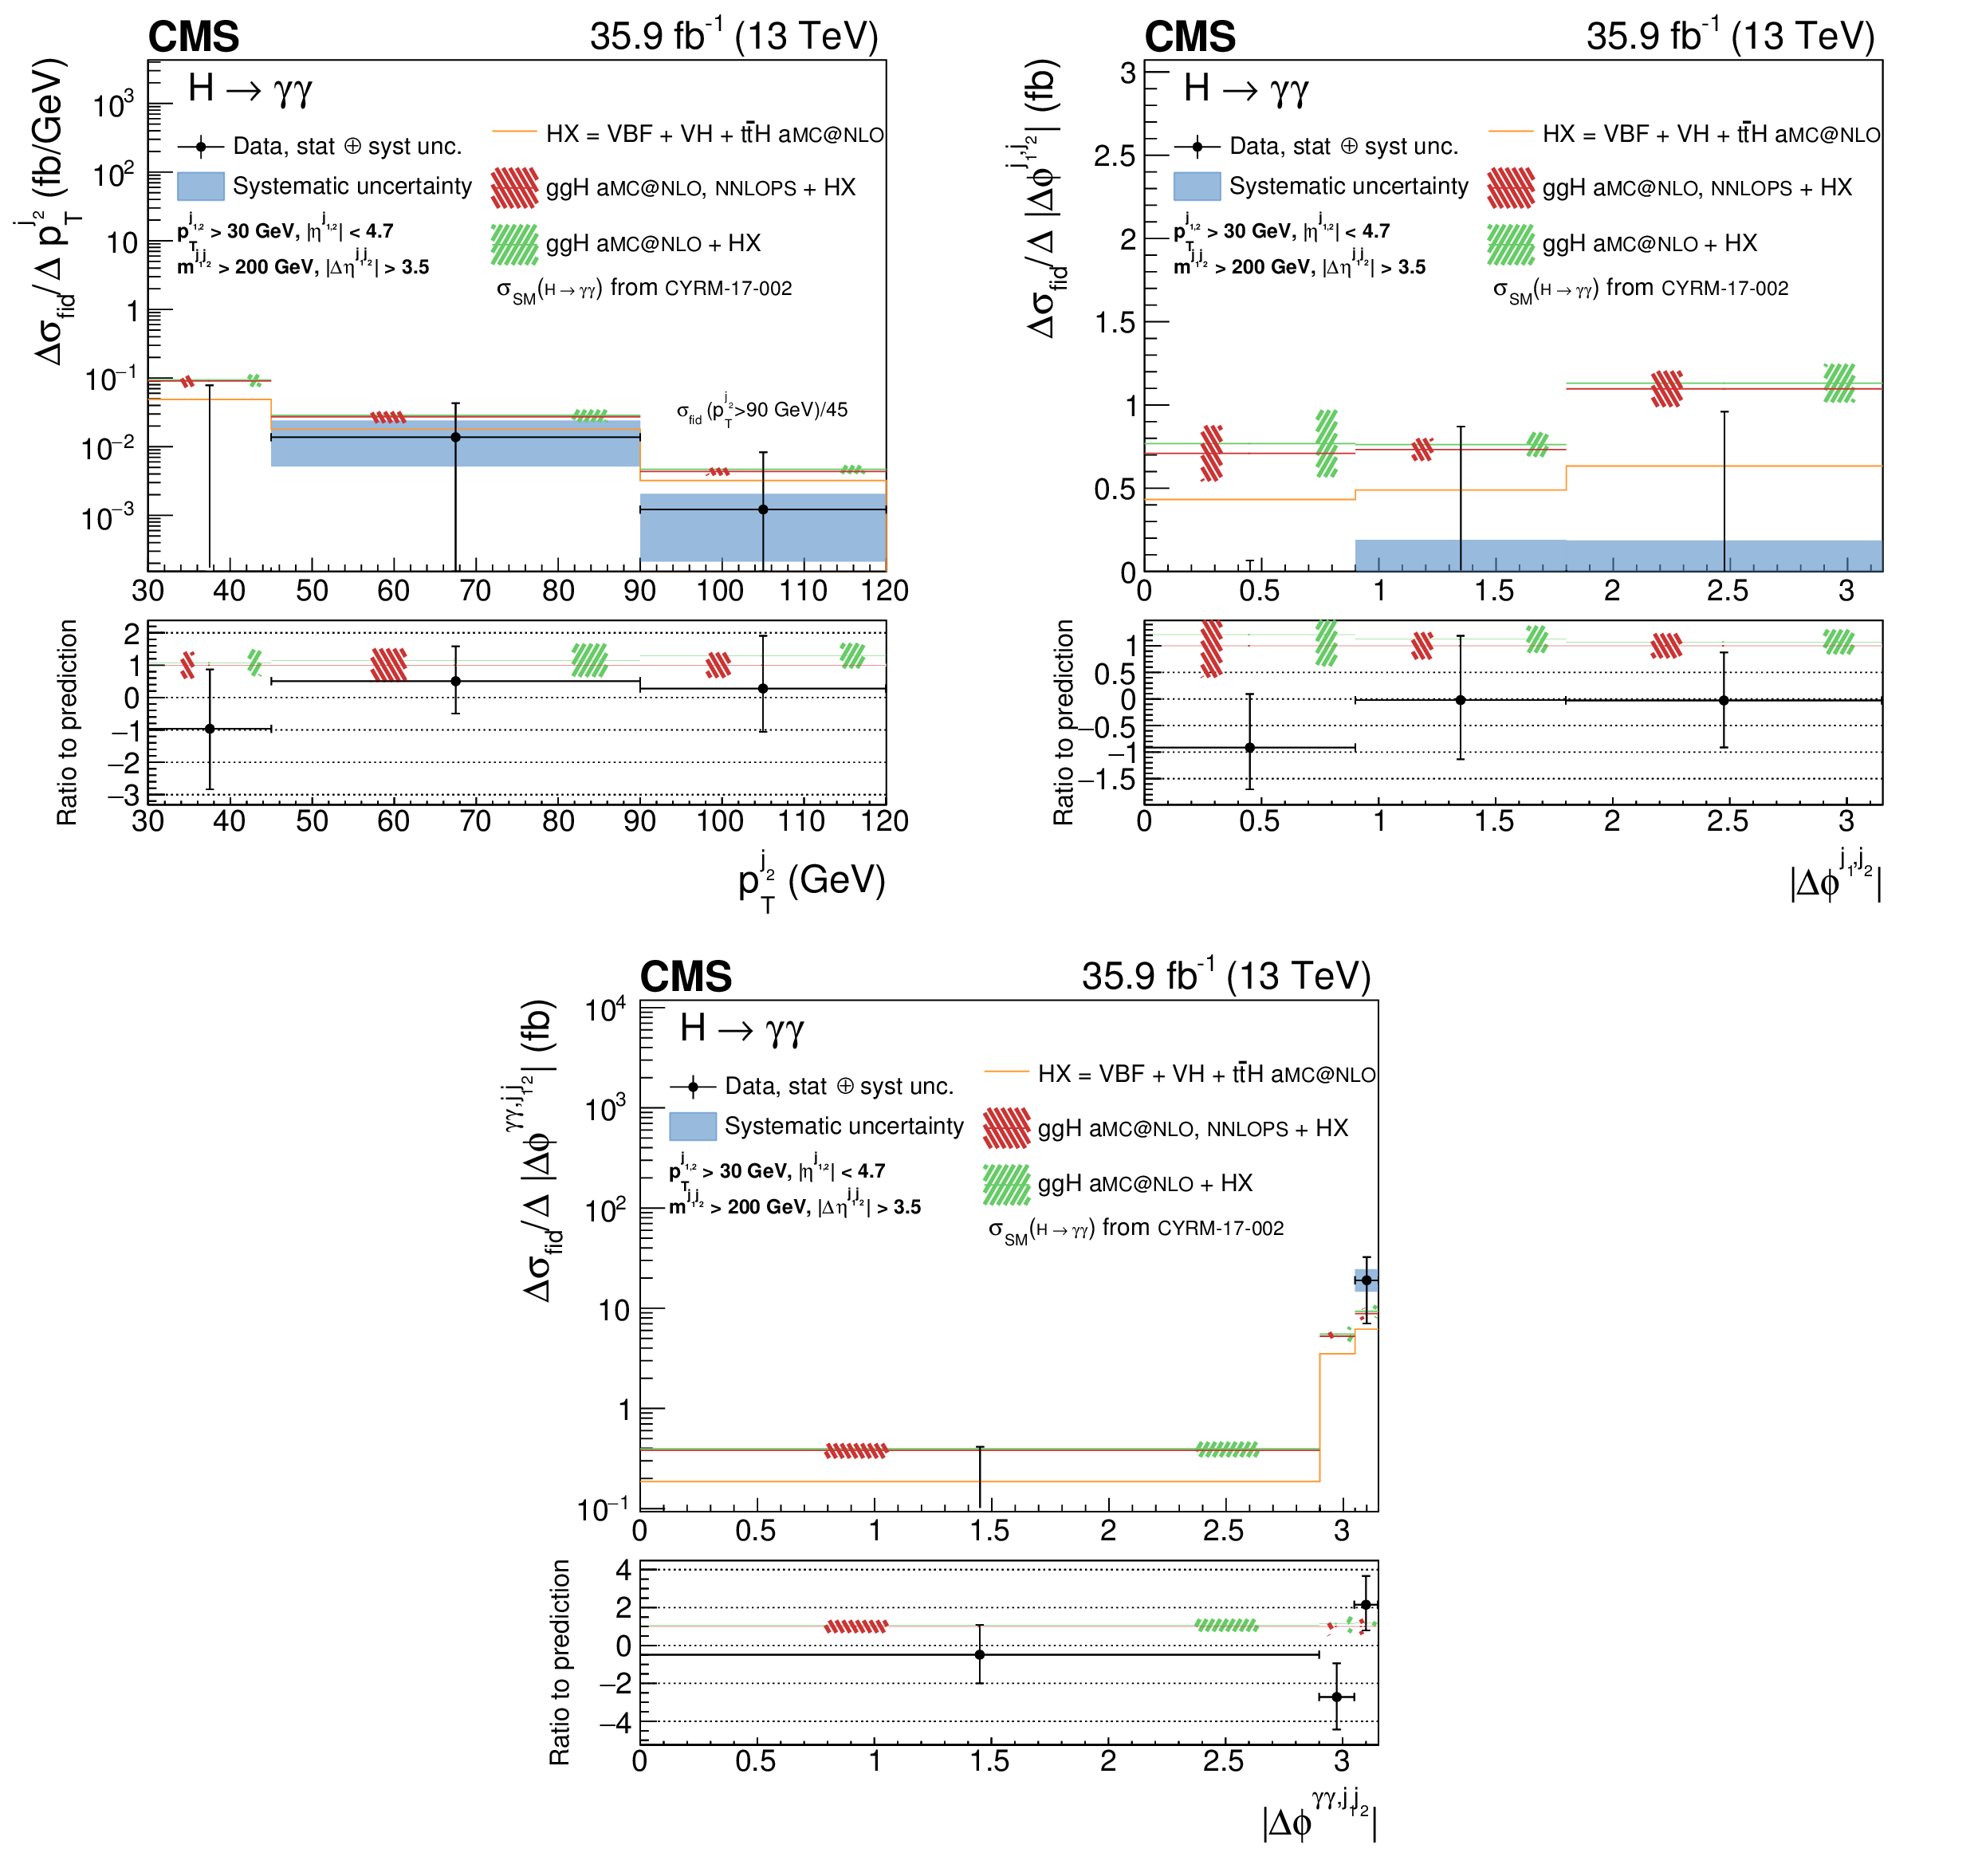
Figure 6:
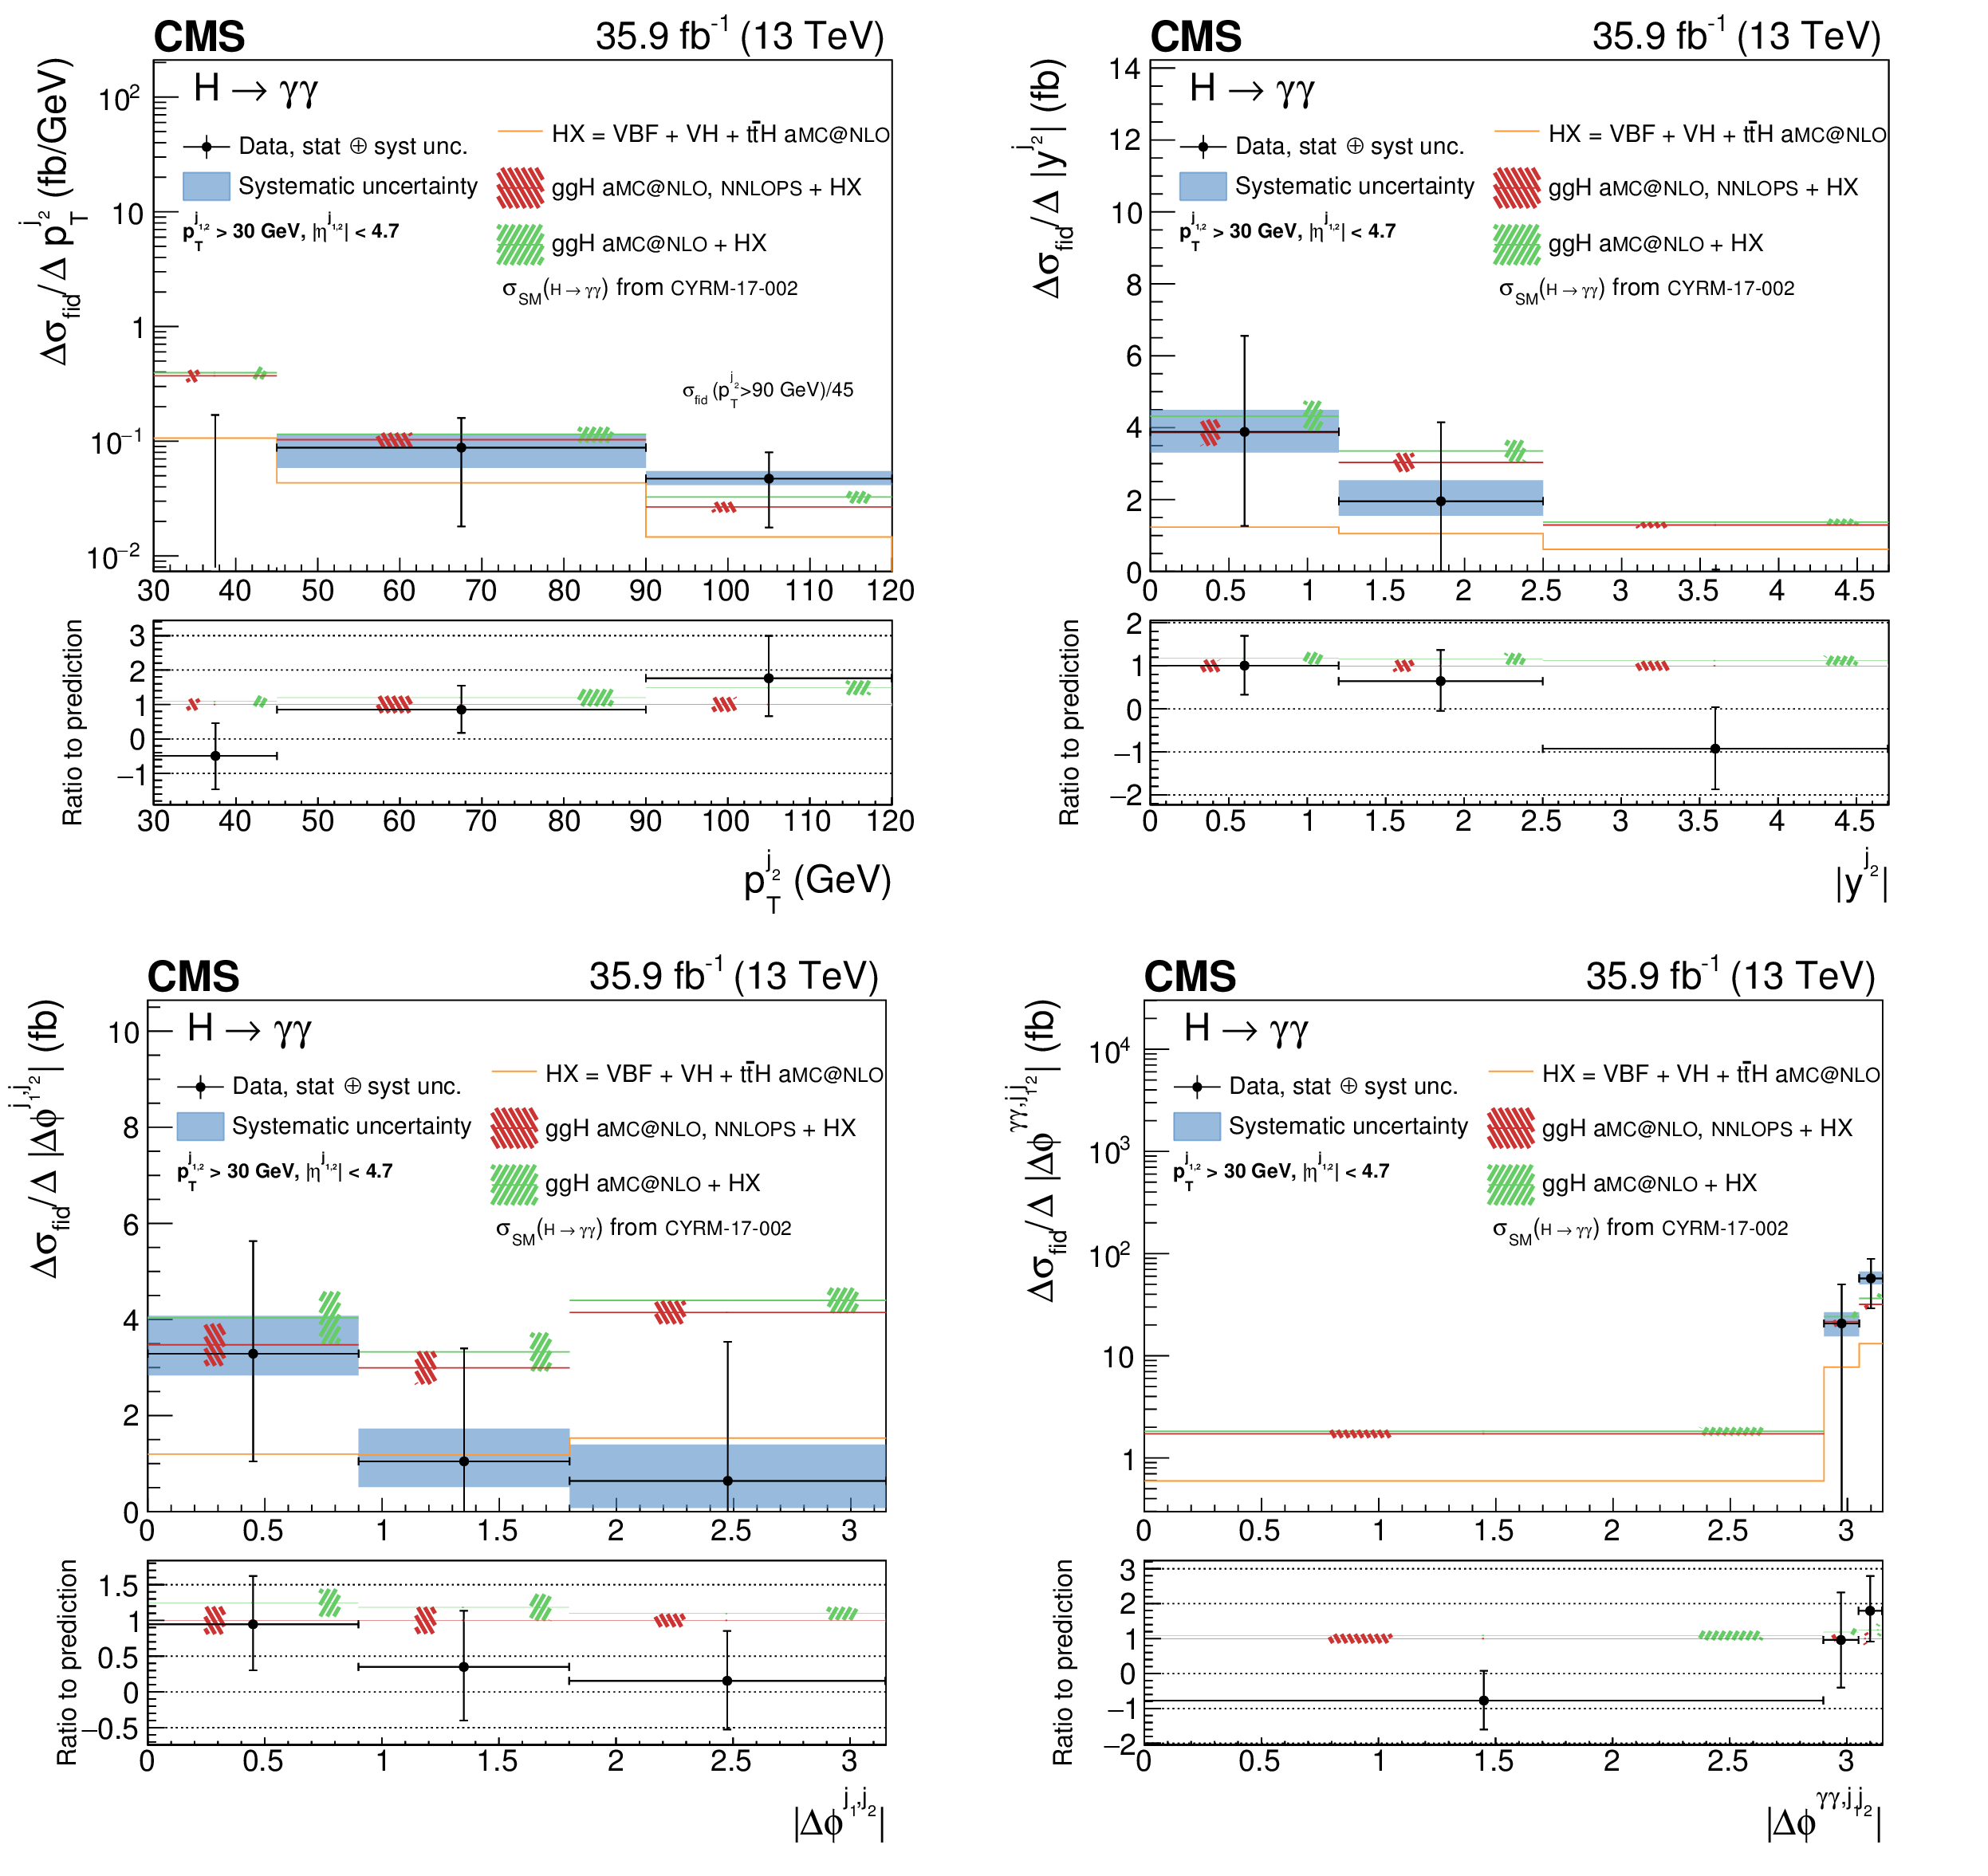
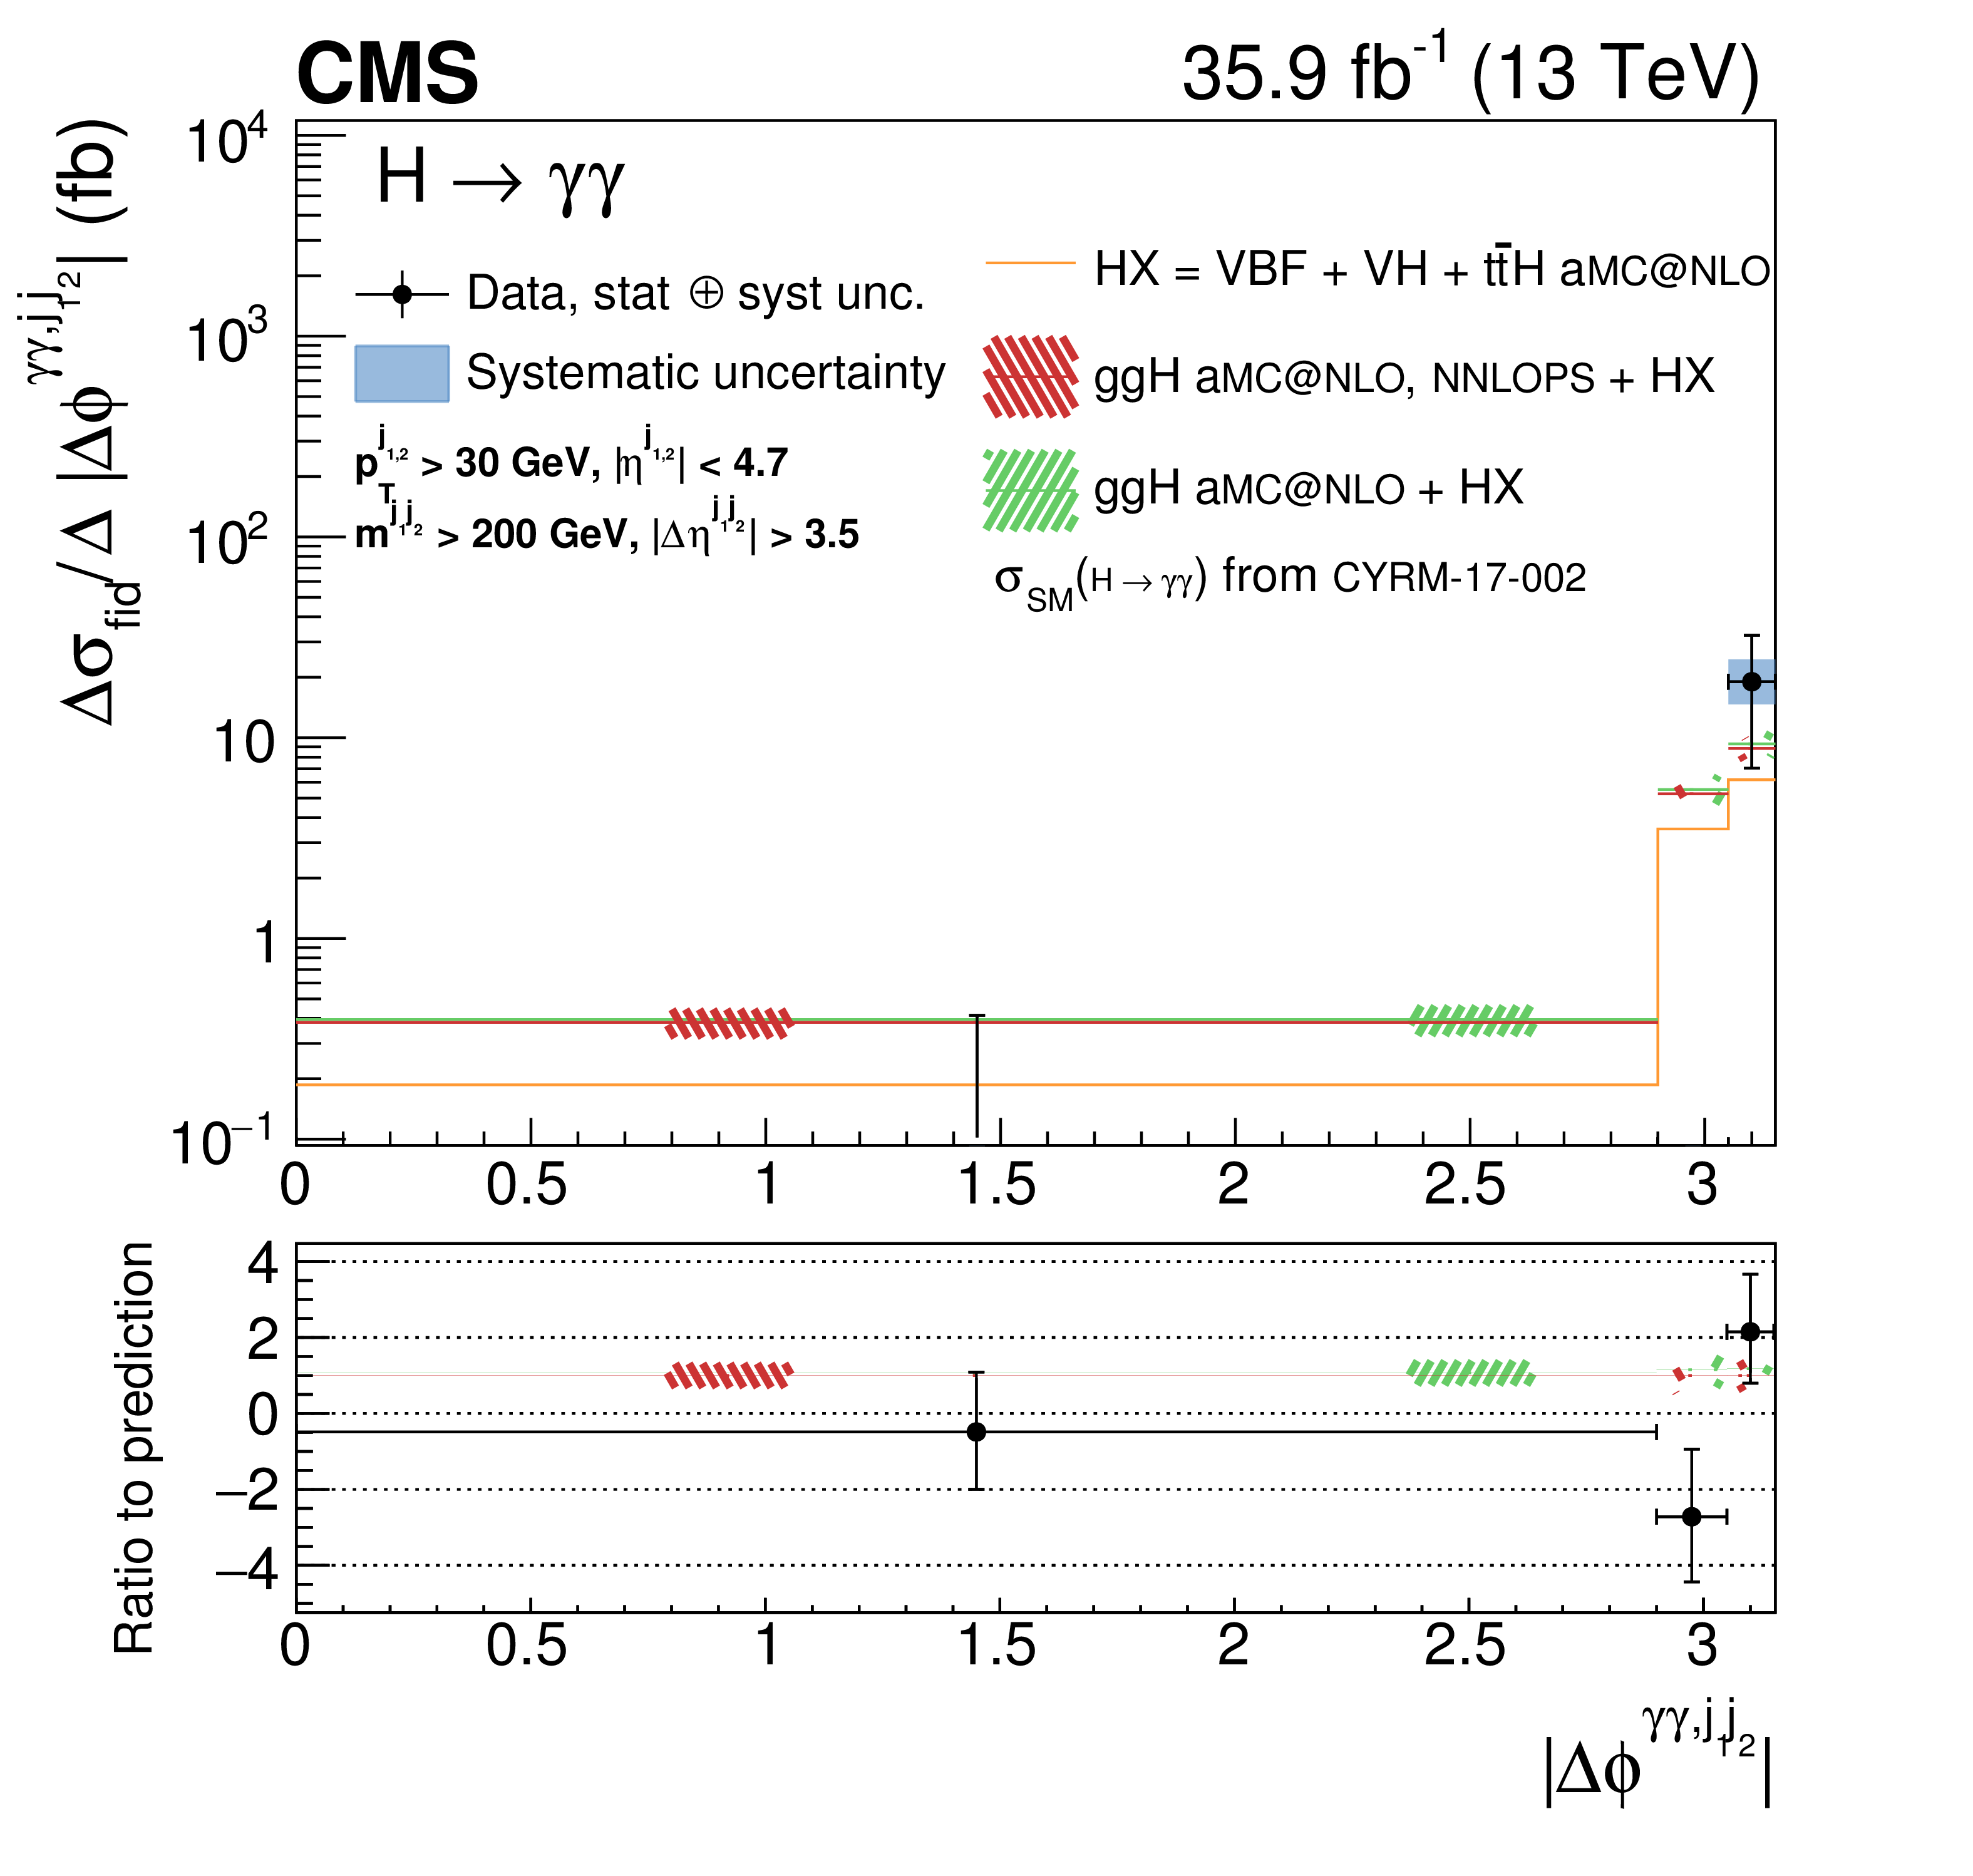
Measurement of the differential cross section (black points) as functions of $ {{p_{\mathrm {T}}} ^{{j_{\text {2}}}}} $, $ {{| y^{{j_{\text {2}}}} |}} $, $ {{| \Delta \phi ^{{j_{\text {1}}}, {j_{\text {2}}}} |}} $, and $ {{| \Delta \phi ^{\gamma \gamma, {j_{\text {1}}} {j_{\text {2}}}} |}} $. The error bars indicate 1 standard deviation uncertainty. The systematic component of the uncertainty is shown by the blue band. The measurements are compared to two different simulation programs (histograms) with their uncertainties (hatched areas), both normalized to the same theoretical predictions from Ref. [13]. When the last bin of the distribution is an overflow bin, the normalization of the cross section in that bin is indicated in the figure. |
png pdf |
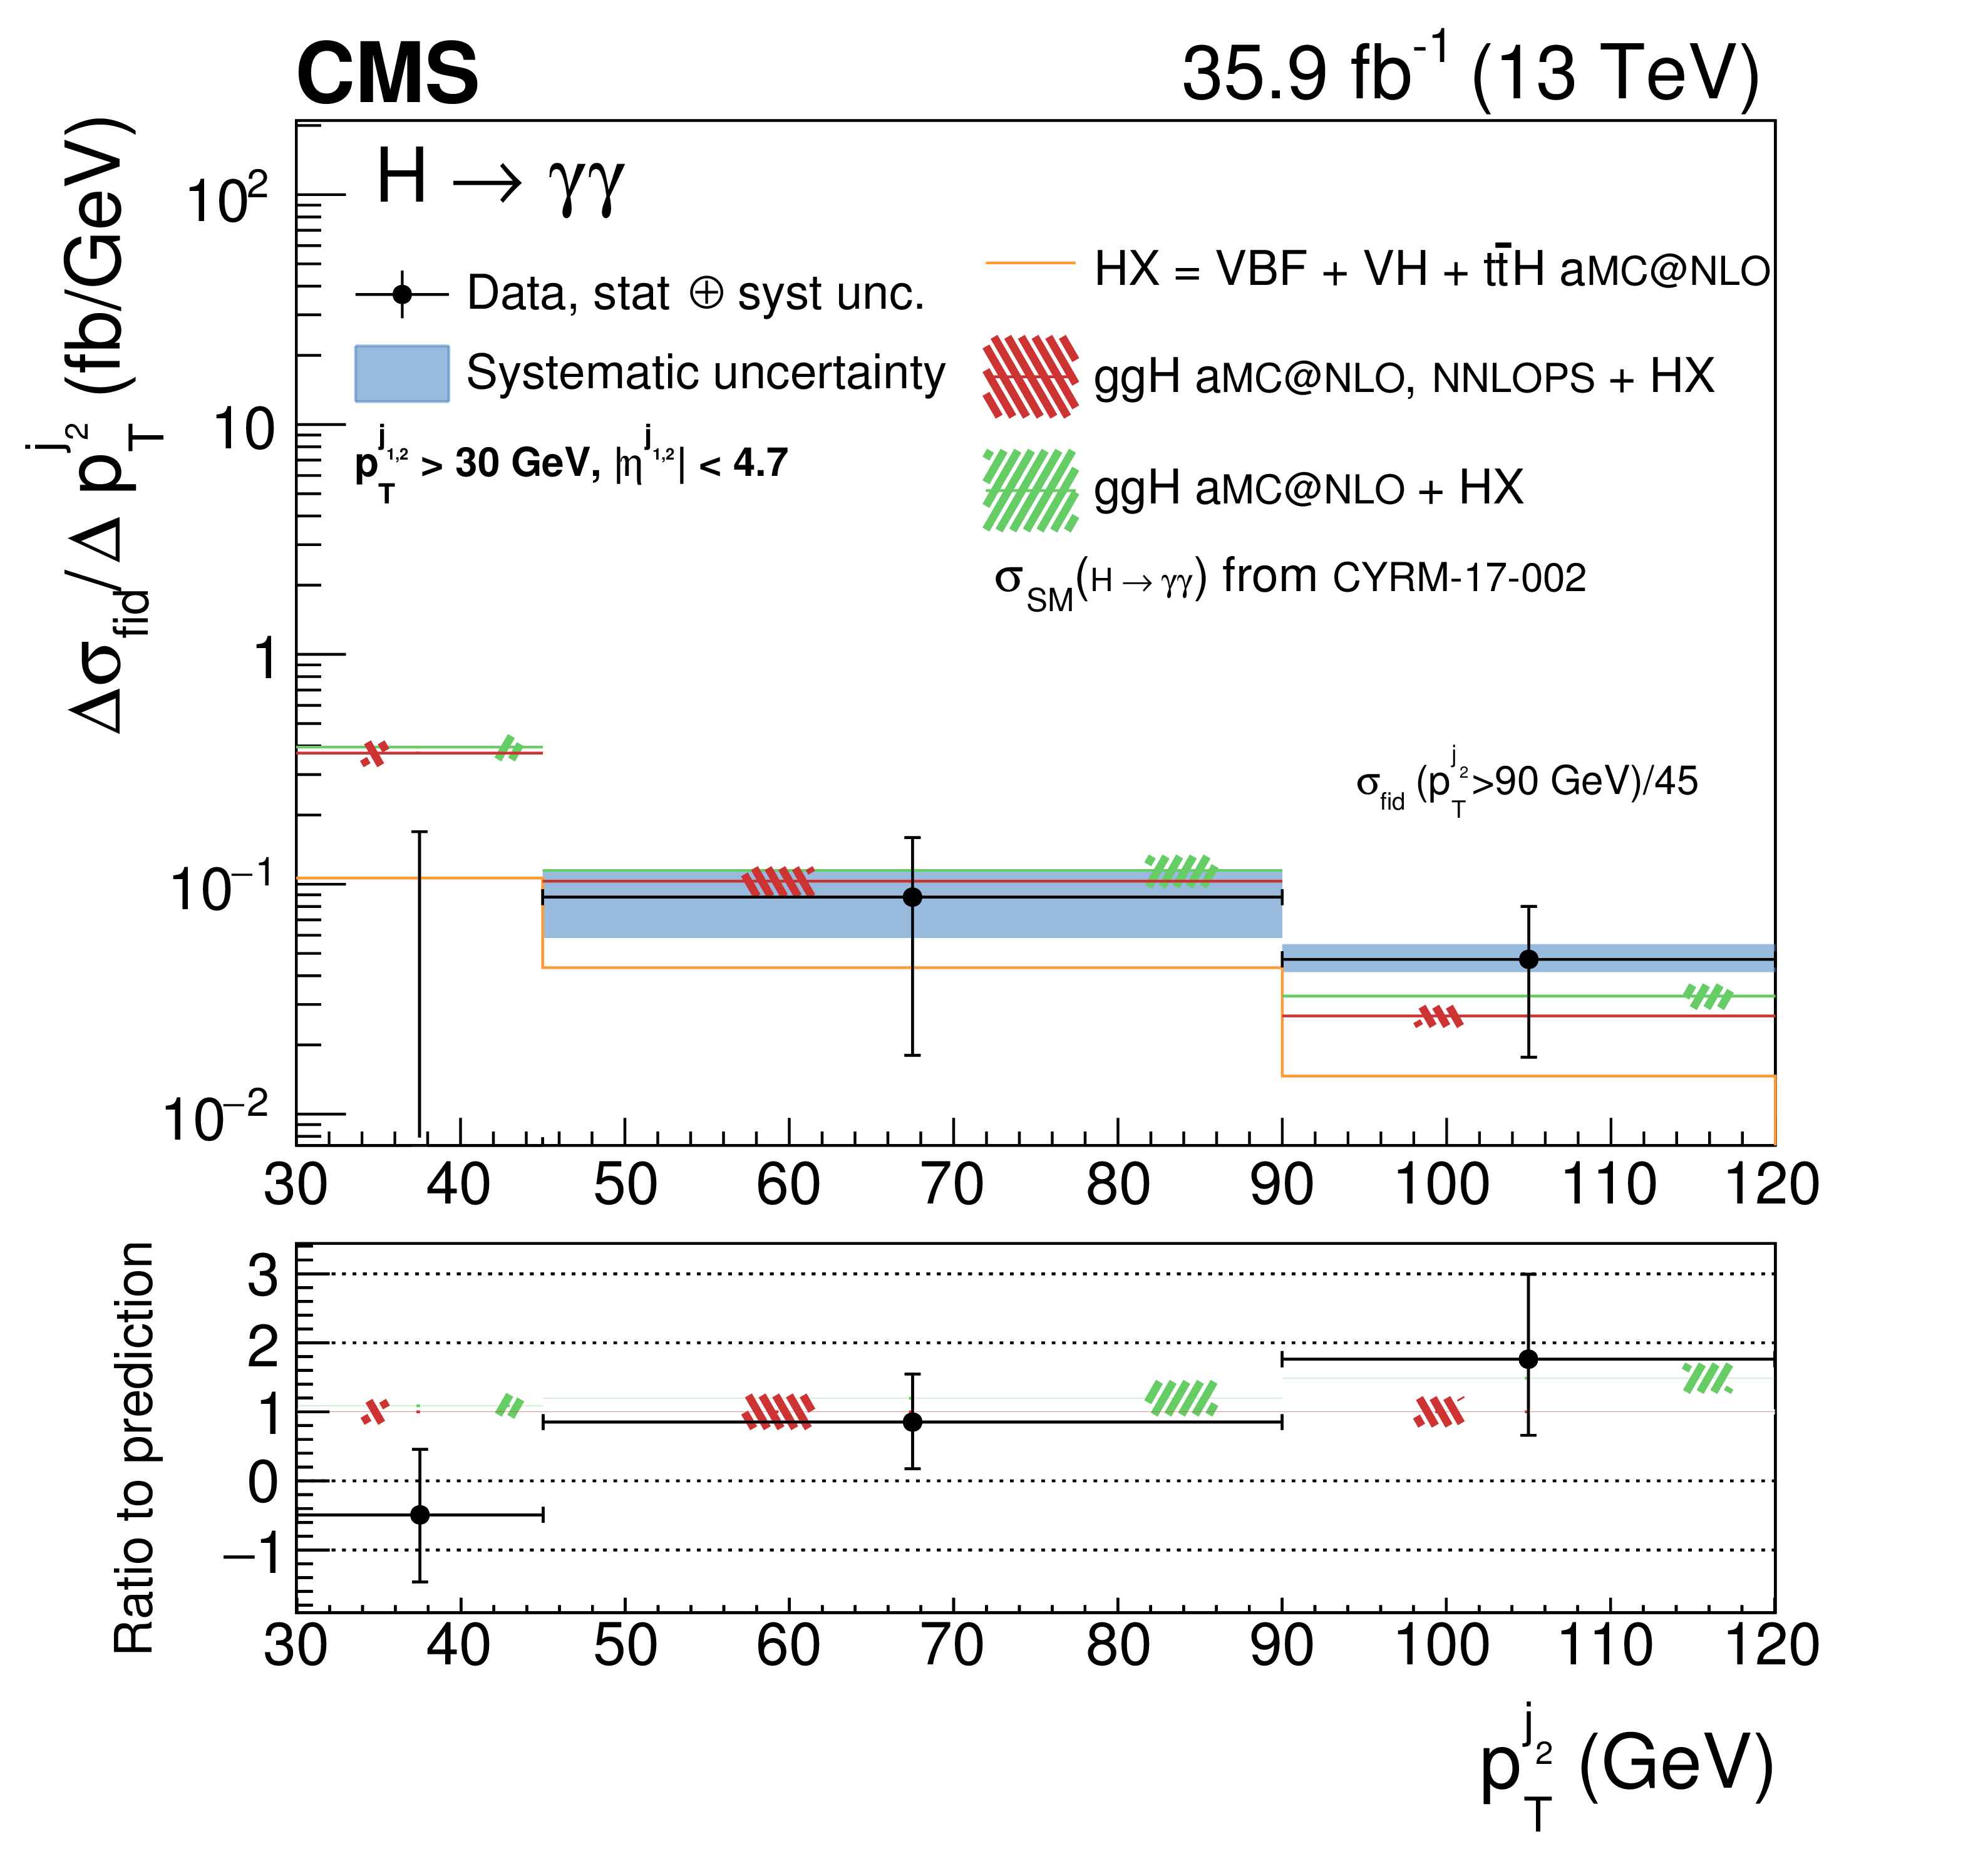
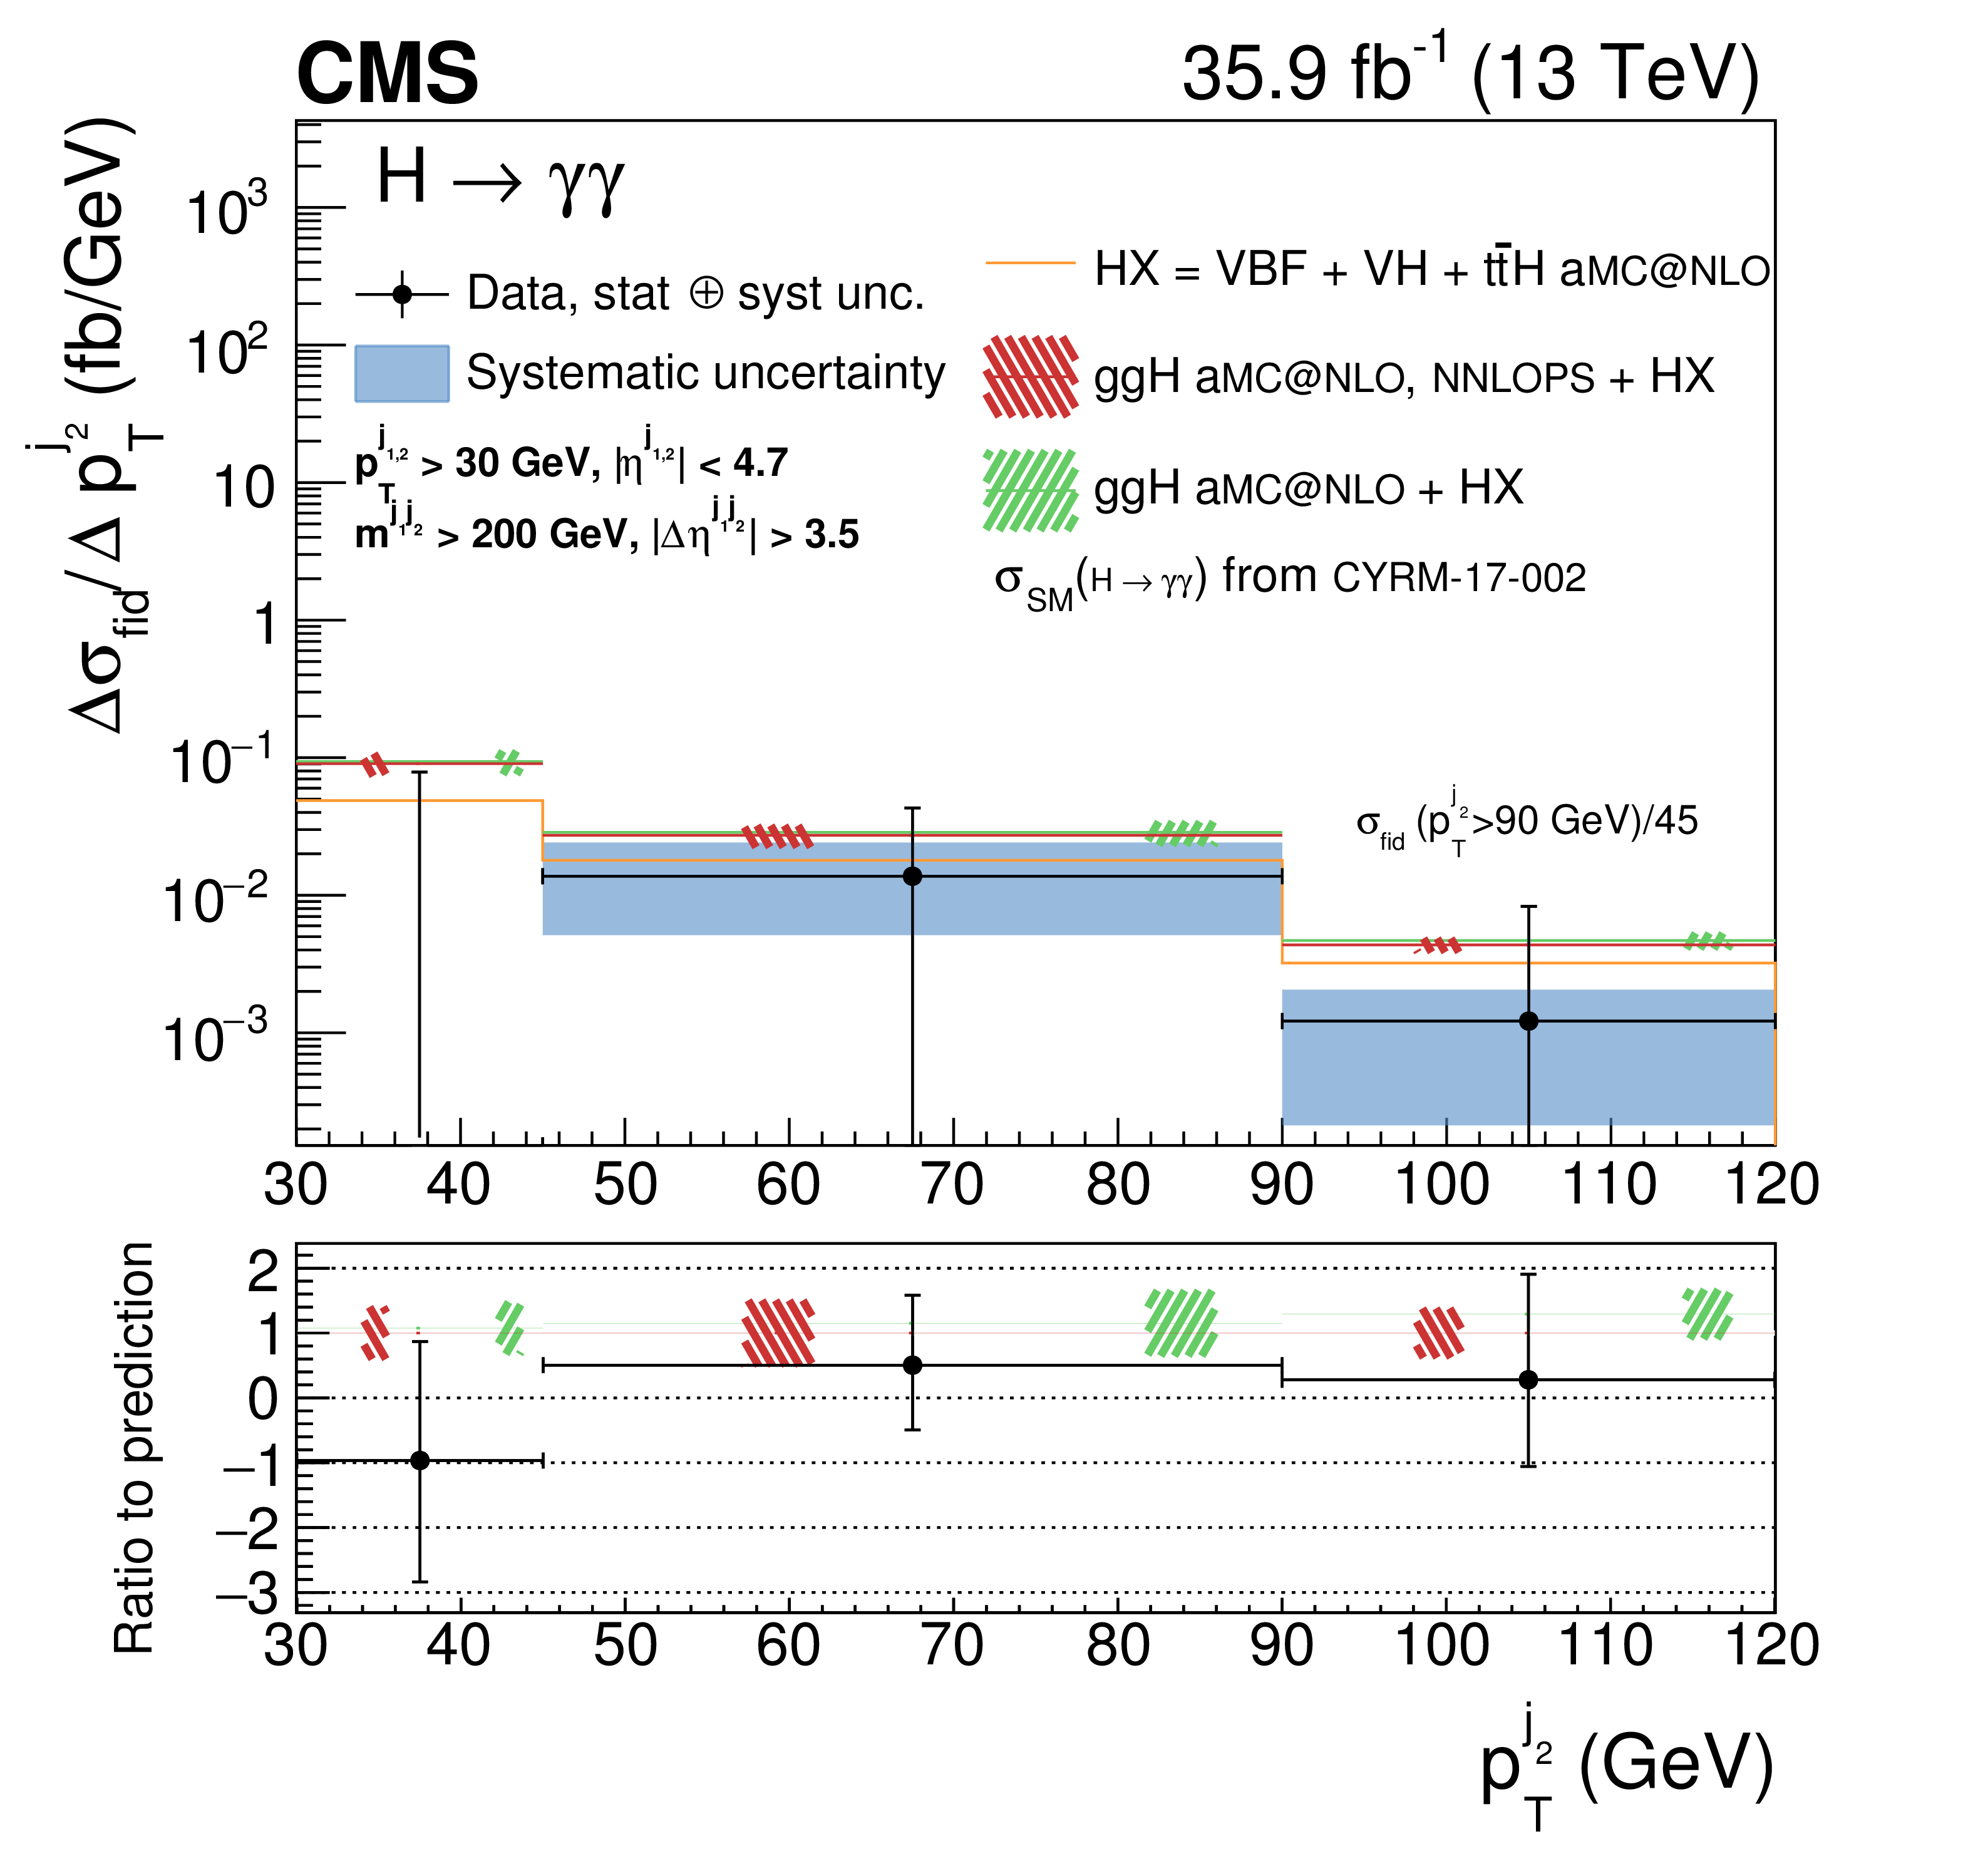
Figure 6-a:
Measurement of the differential cross section (black points) as a function of $ {{p_{\mathrm {T}}} ^{{j_{\text {2}}}}} $. The error bars indicate 1 standard deviation uncertainty. The systematic component of the uncertainty is shown by the blue band. The measurements are compared to two different simulation programs (histograms) with their uncertainties (hatched areas), both normalized to the same theoretical predictions from Ref. [13]. The normalization of the cross section in last, overflow bin is indicated in the figure. |
png pdf |
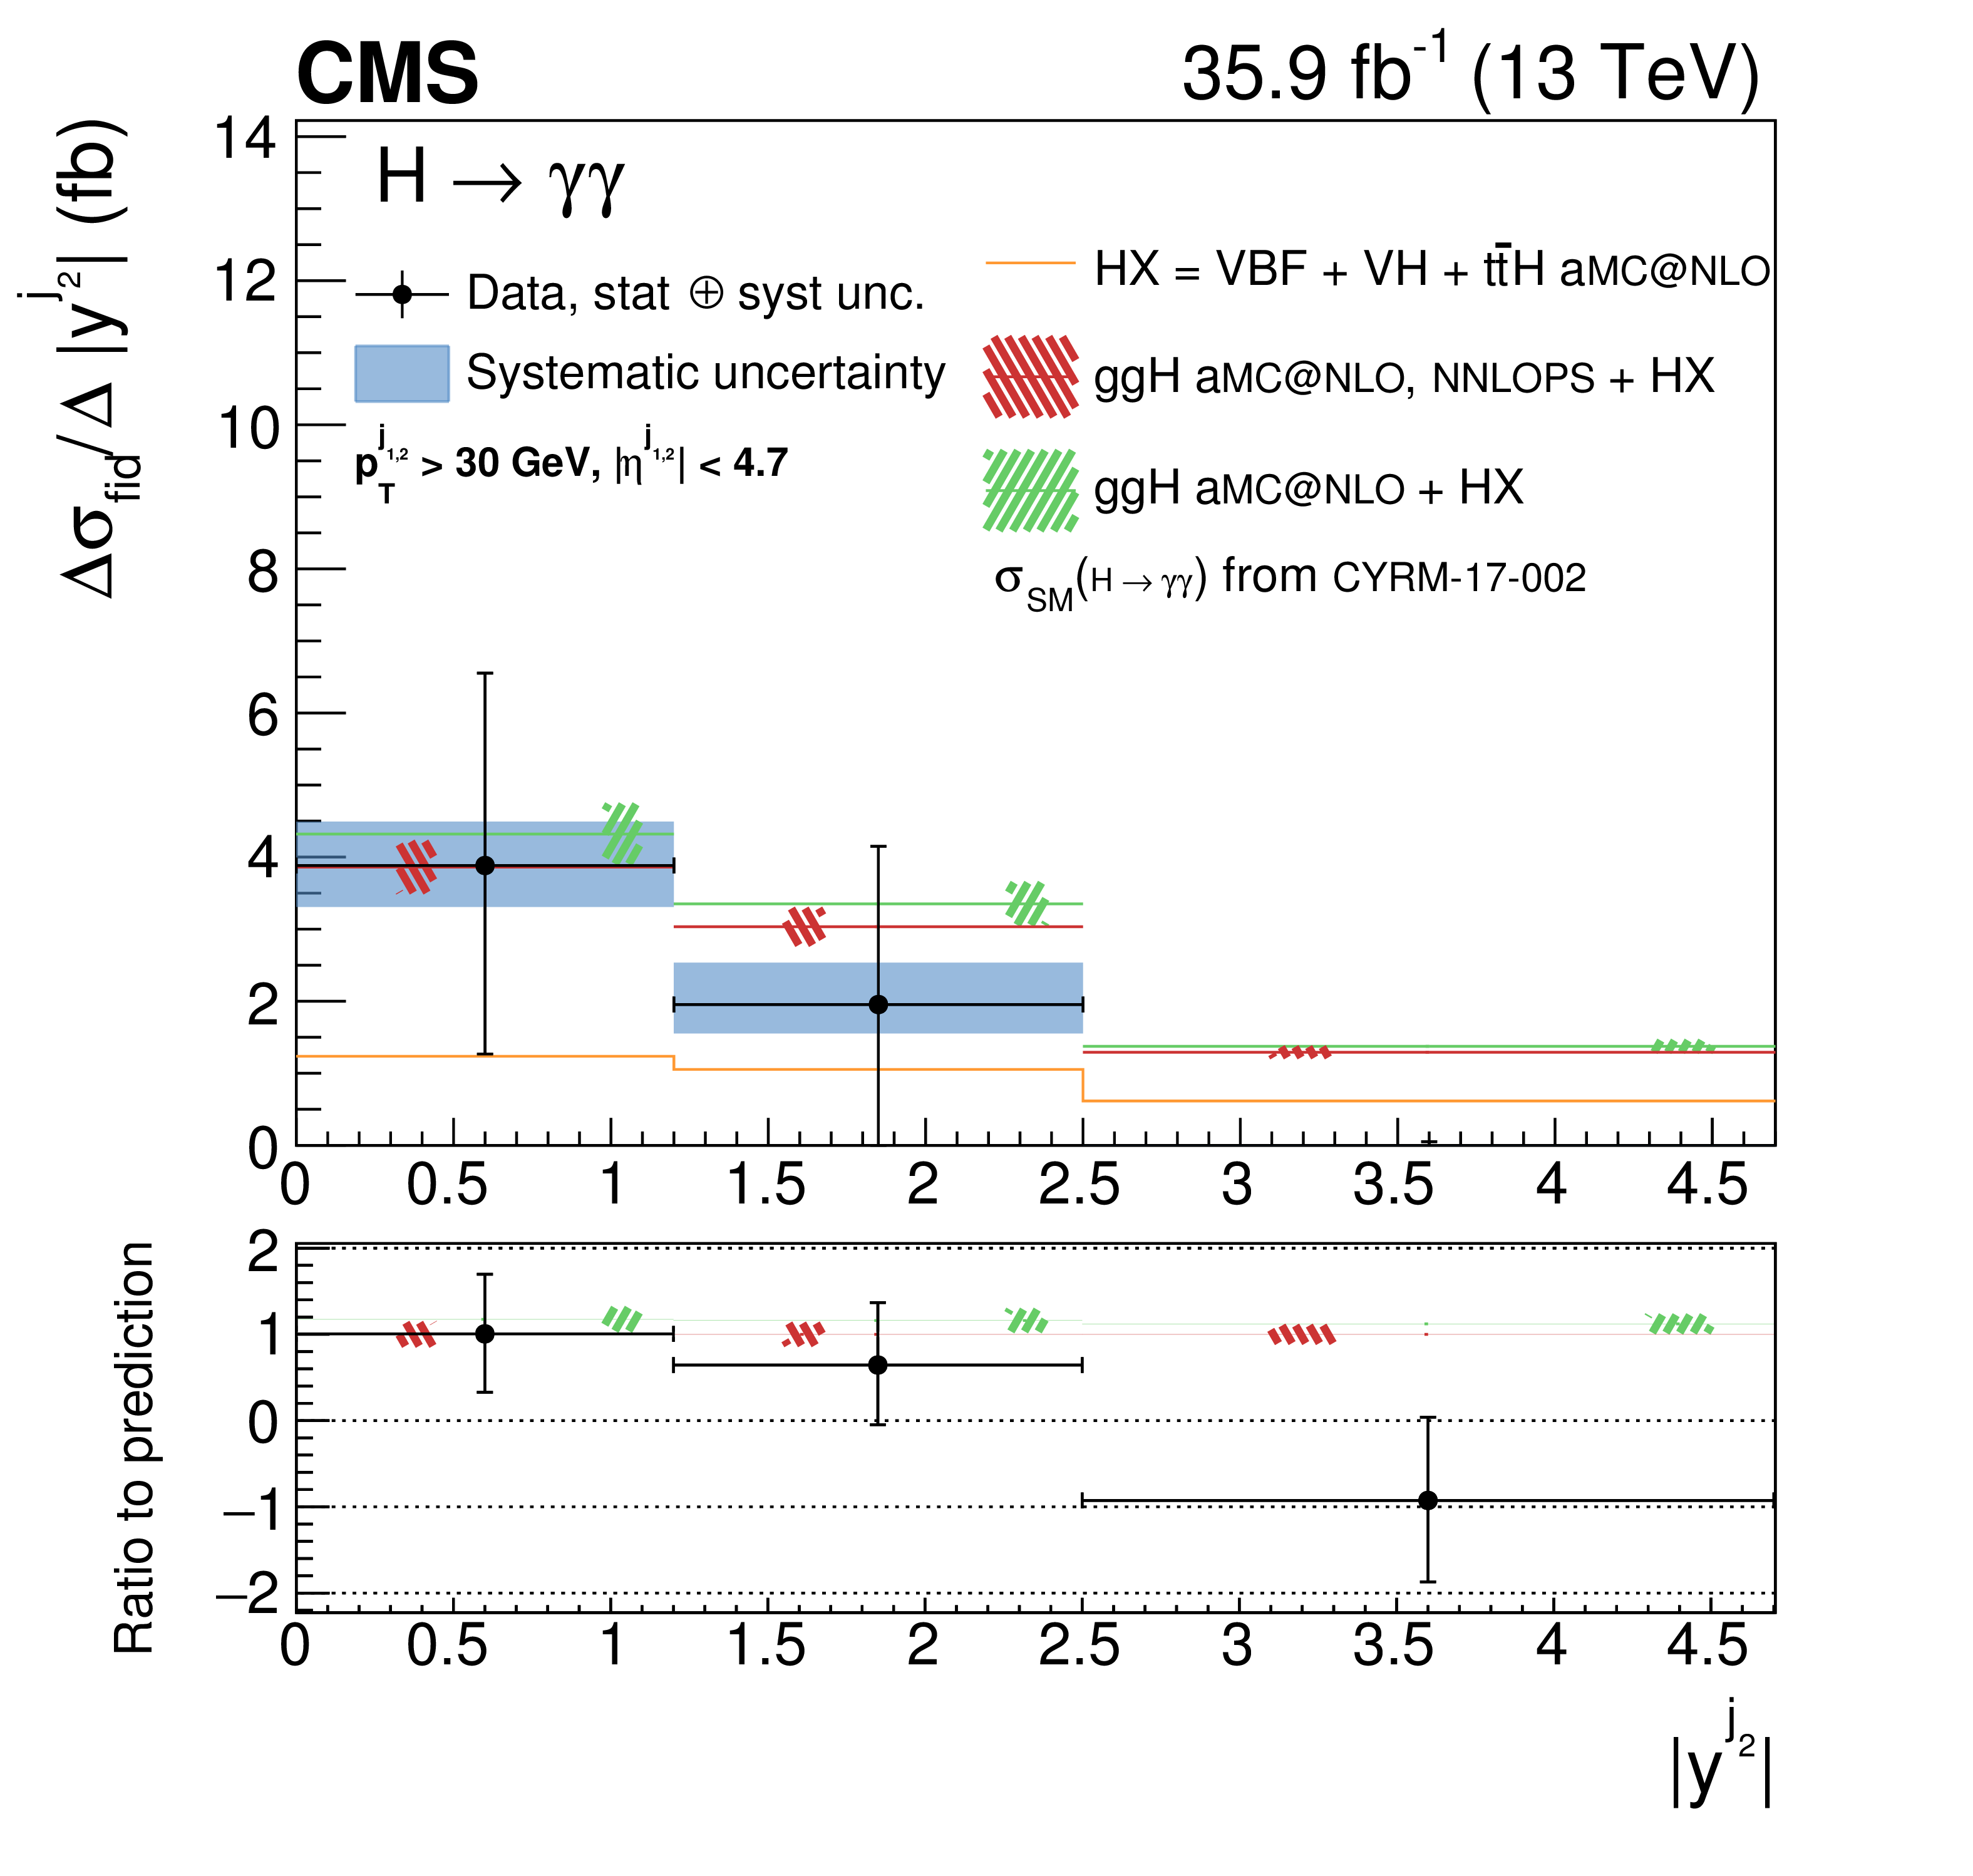
Figure 6-b:
Measurement of the differential cross section (black points) as functions of $ {{p_{\mathrm {T}}} ^{{j_{\text {2}}}}} $, $ {{| y^{{j_{\text {2}}}} |}} $, $ {{| \Delta \phi ^{{j_{\text {1}}}, {j_{\text {2}}}} |}} $, and $ {{| \Delta \phi ^{\gamma \gamma, {j_{\text {1}}} {j_{\text {2}}}} |}} $. The error bars indicate 1 standard deviation uncertainty. The systematic component of the uncertainty is shown by the blue band. The measurements are compared to two different simulation programs (histograms) with their uncertainties (hatched areas), both normalized to the same theoretical predictions from Ref. [13]. When the last bin of the distribution is an overflow bin, the normalization of the cross section in that bin is indicated in the figure. |

png pdf |
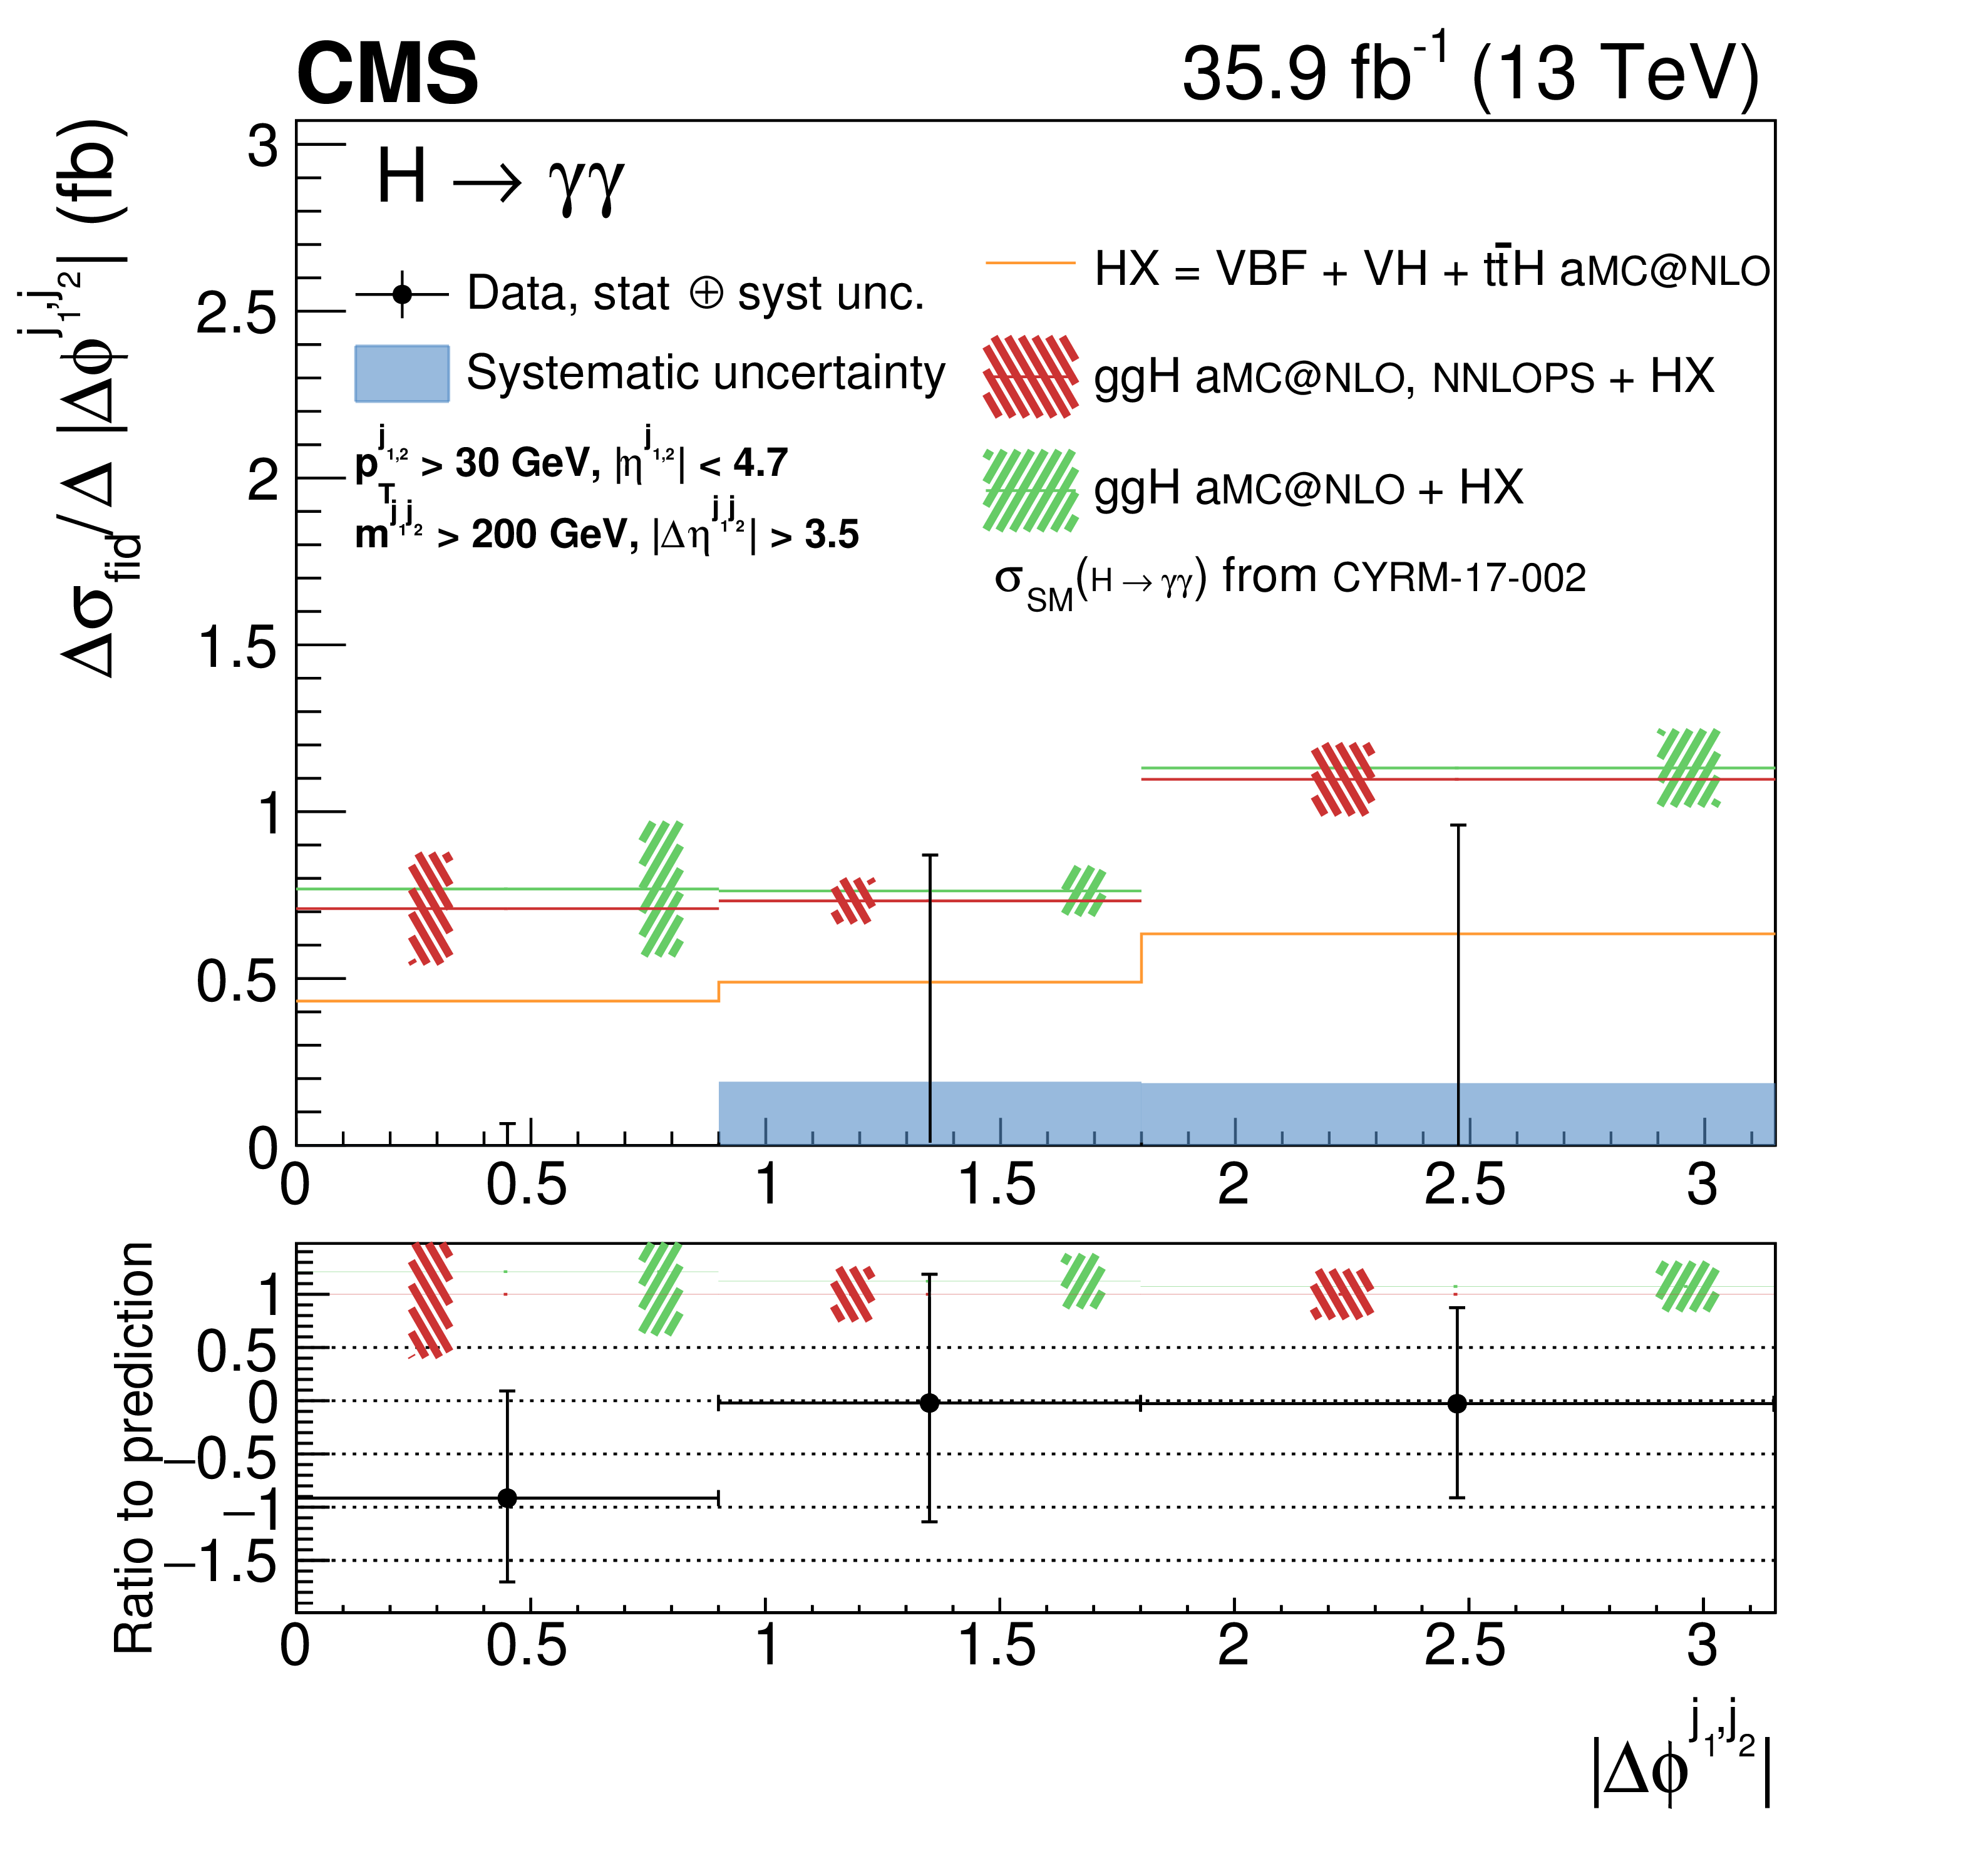
Figure 6-c:
Measurement of the differential cross section (black points) as a function of $ {{| \Delta \phi ^{{j_{\text {1}}}, {j_{\text {2}}}} |}} $. The error bars indicate 1 standard deviation uncertainty. The systematic component of the uncertainty is shown by the blue band. The measurements are compared to two different simulation programs (histograms) with their uncertainties (hatched areas), both normalized to the same theoretical predictions from Ref. [13]. |
png pdf |
Figure 6-d:
Measurement of the differential cross section (black points) as a function of $ {{| \Delta \phi ^{\gamma \gamma, {j_{\text {1}}} {j_{\text {2}}}} |}} $. The error bars indicate 1 standard deviation uncertainty. The systematic component of the uncertainty is shown by the blue band. The measurements are compared to two different simulation programs (histograms) with their uncertainties (hatched areas), both normalized to the same theoretical predictions from Ref. [13]. |
png pdf |
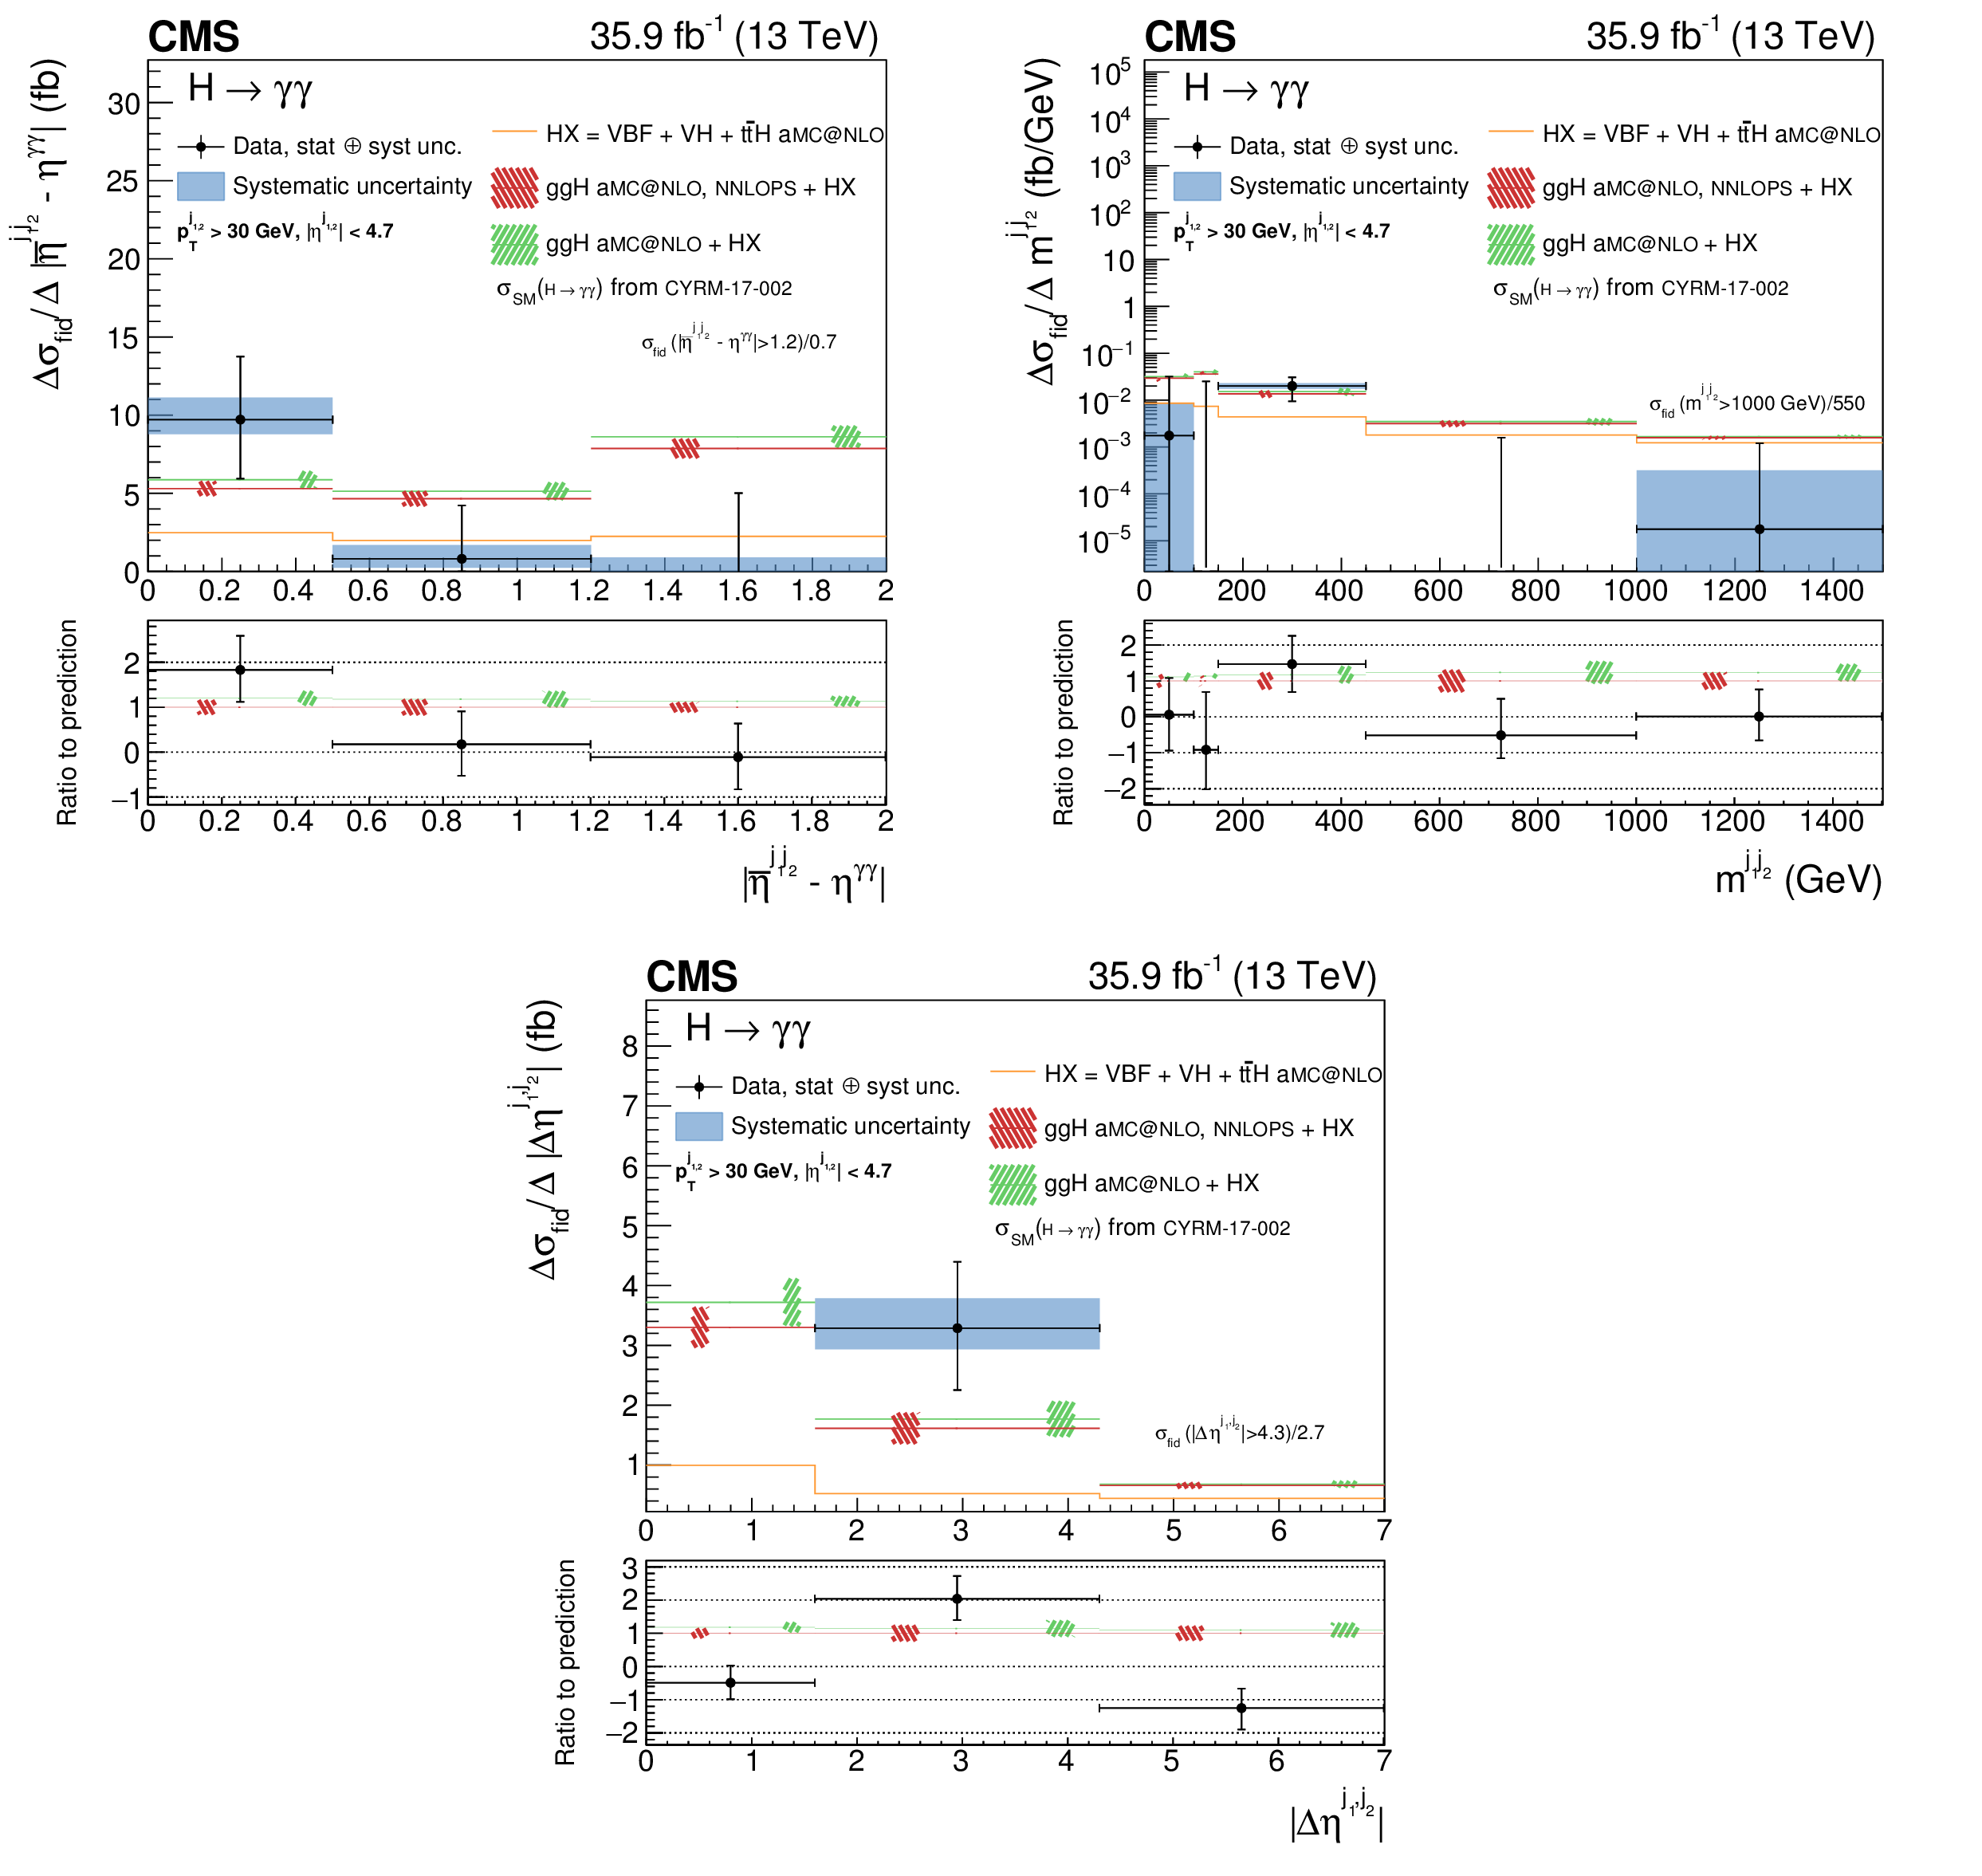
Figure 7:
Measurement of the differential cross section (black points) as functions of $ {{| \overline {\eta}_{{j_{\text {1}}} {j_{\text {2}}}} - \eta _{\gamma \gamma} |}} $, $ {m^{{j_{\text {1}}} {j_{\text {2}}}}} $, and $ {{| \Delta \eta ^{{j_{\text {1}}}, {j_{\text {2}}}} |}} $. The error bars indicate 1 standard deviation uncertainty. The systematic component of the uncertainty is shown by the blue band. The measurements are compared to two different simulation programs (histograms) with their uncertainties (hatched areas), both normalized to the same theoretical predictions from Ref. [13]. When the last bin of the distribution is an overflow bin, the normalization of the cross section in that bin is indicated in the figure. |
png pdf |
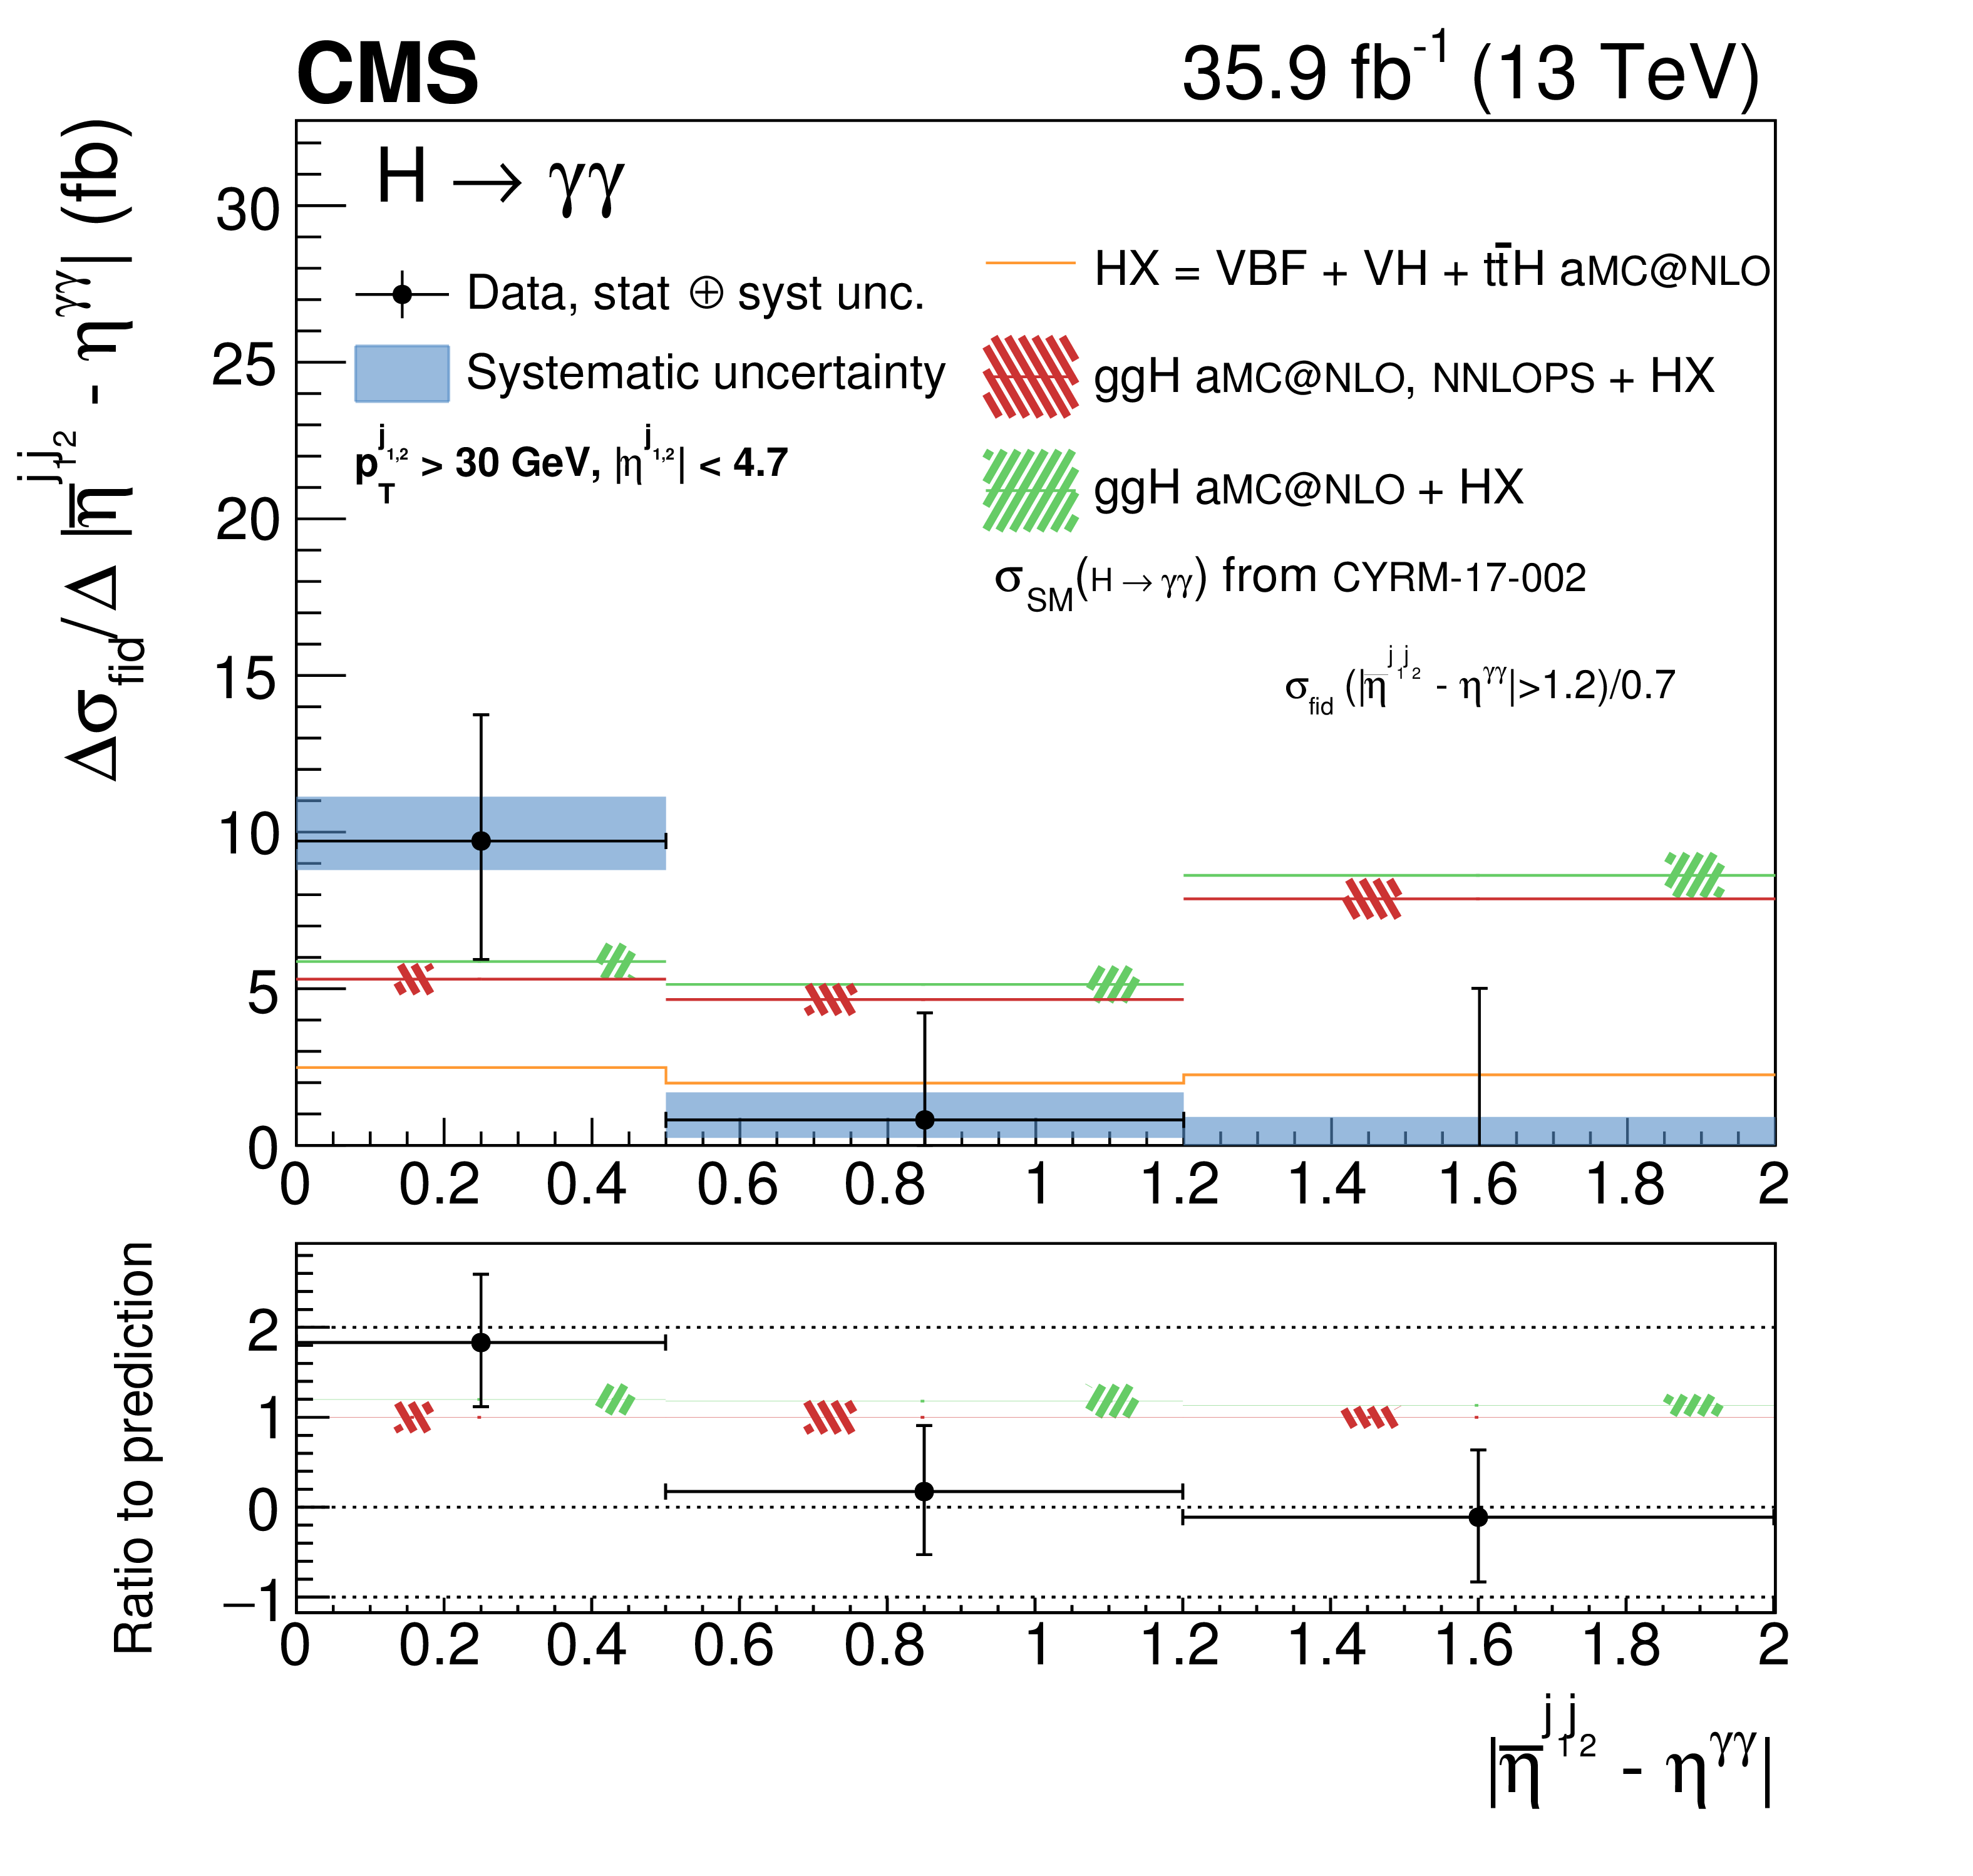
Figure 7-a:
Measurement of the differential cross section (black points) as a function of $ {{| \overline {\eta}_{{j_{\text {1}}} {j_{\text {2}}}} - \eta _{\gamma \gamma} |}} $. The error bars indicate 1 standard deviation uncertainty. The systematic component of the uncertainty is shown by the blue band. The measurements are compared to two different simulation programs (histograms) with their uncertainties (hatched areas), both normalized to the same theoretical predictions from Ref. [13]. |
png pdf |
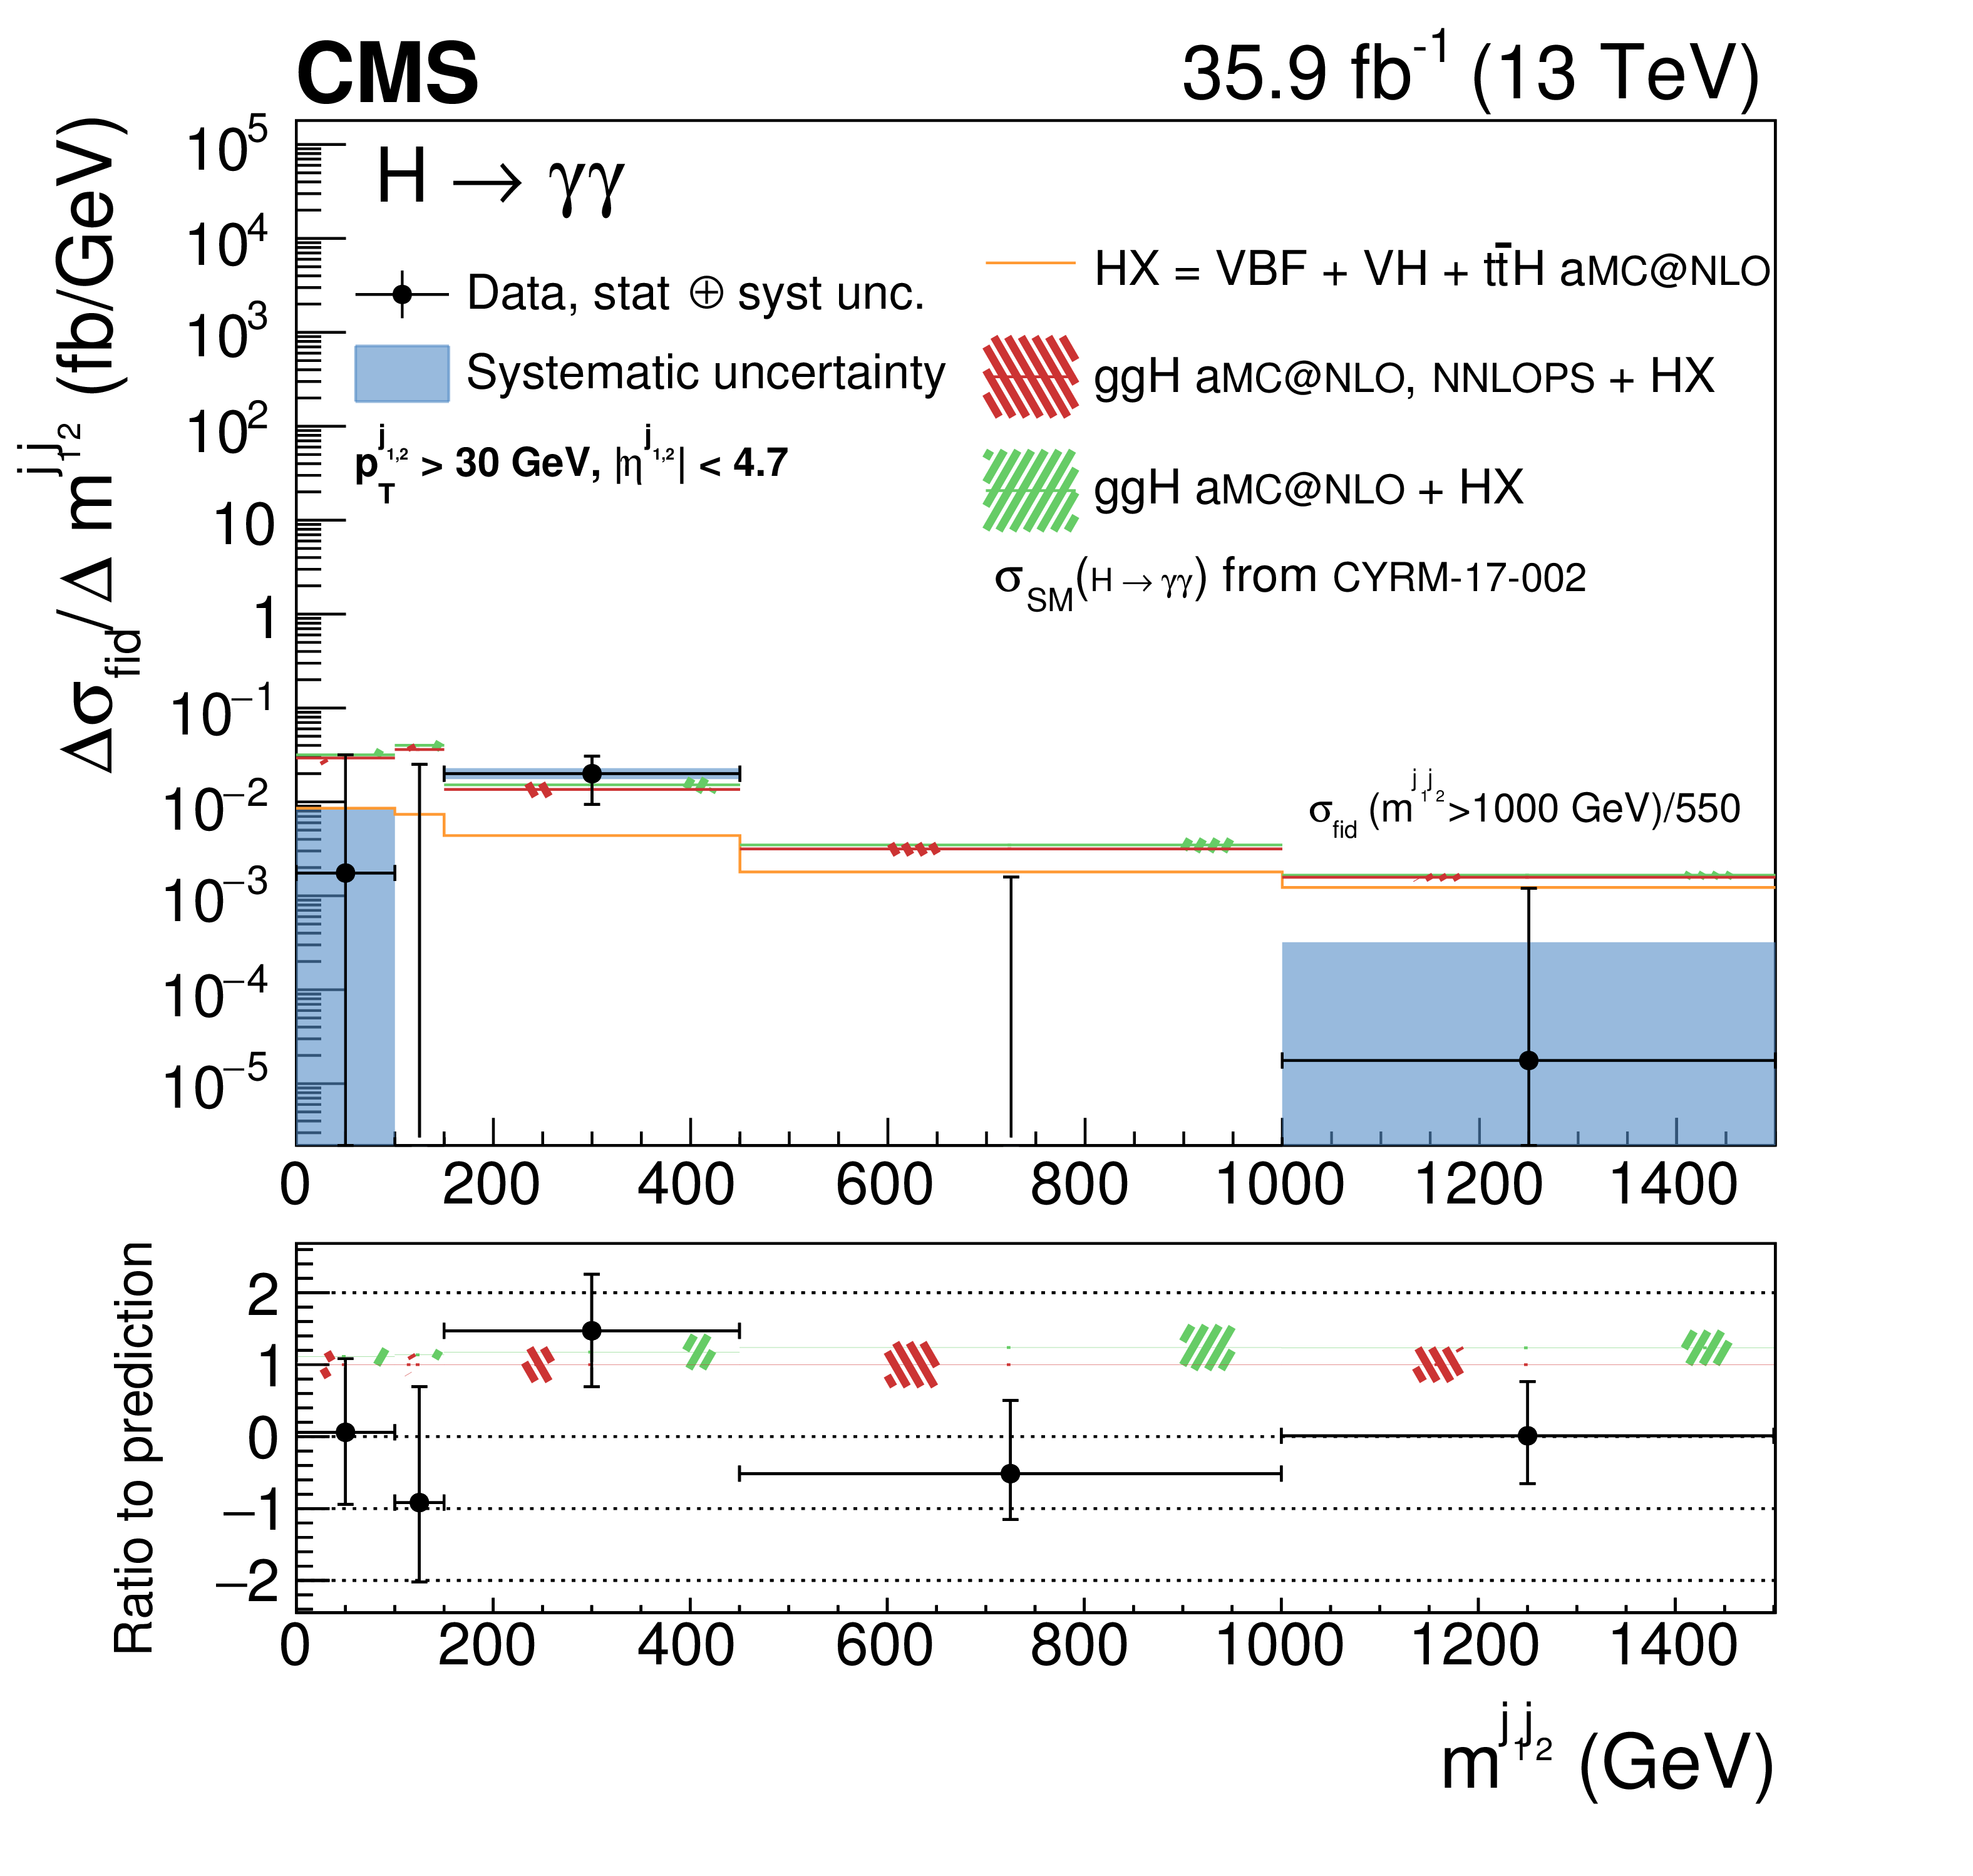
Figure 7-b:
Measurement of the differential cross section (black points) as a function of $ {m^{{j_{\text {1}}} {j_{\text {2}}}}} $. The error bars indicate 1 standard deviation uncertainty. The systematic component of the uncertainty is shown by the blue band. The measurements are compared to two different simulation programs (histograms) with their uncertainties (hatched areas), both normalized to the same theoretical predictions from Ref. [13]. The normalization of the cross section in last, overflow bin is indicated in the figure. |
png pdf |
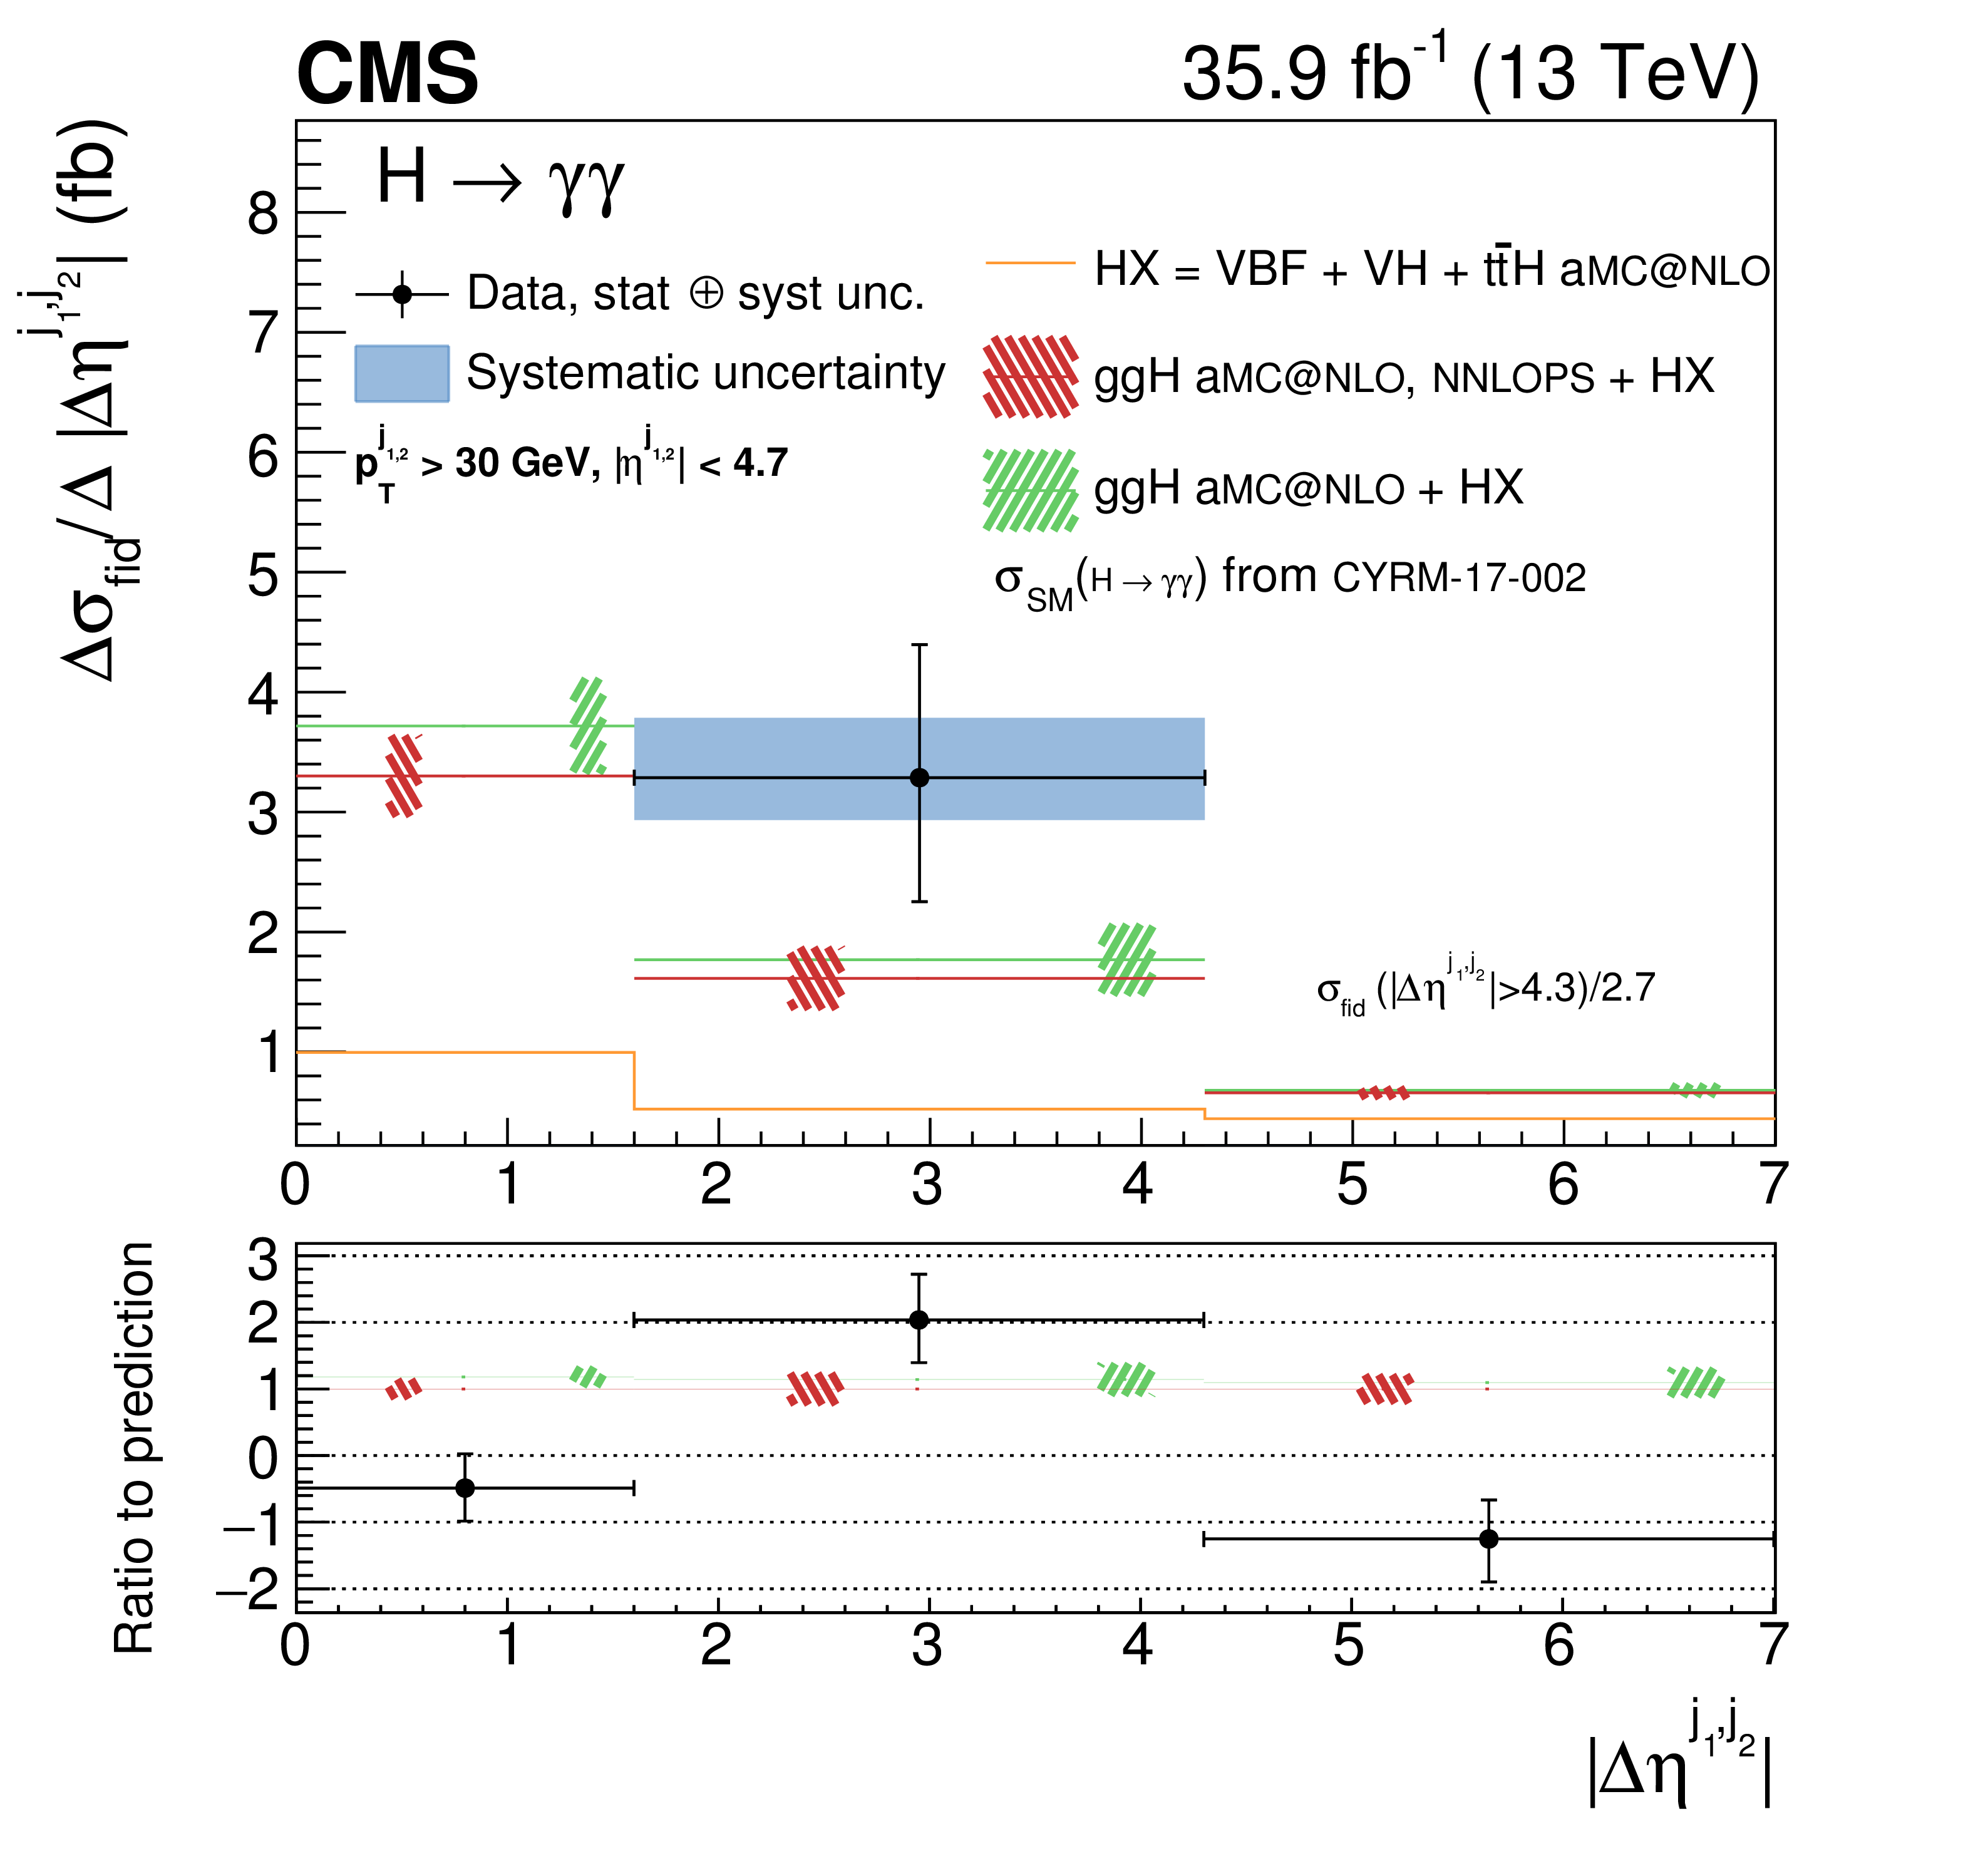
Figure 7-c:
Measurement of the differential cross section (black points) as a function of $ {{| \Delta \eta ^{{j_{\text {1}}}, {j_{\text {2}}}} |}} $. The error bars indicate 1 standard deviation uncertainty. The systematic component of the uncertainty is shown by the blue band. The measurements are compared to two different simulation programs (histograms) with their uncertainties (hatched areas), both normalized to the same theoretical predictions from Ref. [13]. The normalization of the cross section in last, overflow bin is indicated in the figure. |
png pdf |
Figure 8:
Measurement in a VBF-enriched sub-region of the fiducial phase space of the differential cross section (black points) as functions of $ {{p_{\mathrm {T}}} ^{{j_{\text {2}}}}} $, $ {{| \Delta \phi ^{{j_{\text {1}}}, {j_{\text {2}}}} |}} $, and $ {{| \Delta \phi ^{\gamma \gamma, {j_{\text {1}}} {j_{\text {2}}}} |}} $. The error bars indicate 1 standard deviation uncertainty. The systematic component of the uncertainty is shown by the blue band. The measurements are compared to two different simulation programs (histograms) with their uncertainties (hatched areas), both normalized to the same theoretical predictions from Ref. [13]. When the last bin of the distribution is an overflow bin, the normalization of the cross section in that bin is indicated in the figure. |
png pdf |
Figure 8-a:
Measurement in a VBF-enriched sub-region of the fiducial phase space of the differential cross section (black points) as a function of $ {{p_{\mathrm {T}}} ^{{j_{\text {2}}}}} $. The error bars indicate 1 standard deviation uncertainty. The systematic component of the uncertainty is shown by the blue band. The measurements are compared to two different simulation programs (histograms) with their uncertainties (hatched areas), both normalized to the same theoretical predictions from Ref. [13]. The normalization of the cross section in last, overflow bin is indicated in the figure. |
png pdf |
Figure 8-b:
Measurement in a VBF-enriched sub-region of the fiducial phase space of the differential cross section (black points) as a function of $ {{| \Delta \phi ^{{j_{\text {1}}}, {j_{\text {2}}}} |}} $. The error bars indicate 1 standard deviation uncertainty. The systematic component of the uncertainty is shown by the blue band. The measurements are compared to two different simulation programs (histograms) with their uncertainties (hatched areas), both normalized to the same theoretical predictions from Ref. [13]. |
png pdf |
Figure 8-c:
Measurement in a VBF-enriched sub-region of the fiducial phase space of the differential cross section (black points) as a function of $ {{| \Delta \phi ^{\gamma \gamma, {j_{\text {1}}} {j_{\text {2}}}} |}} $. The error bars indicate 1 standard deviation uncertainty. The systematic component of the uncertainty is shown by the blue band. The measurements are compared to two different simulation programs (histograms) with their uncertainties (hatched areas), both normalized to the same theoretical predictions from Ref. [13]. |
png pdf |
Figure 9:
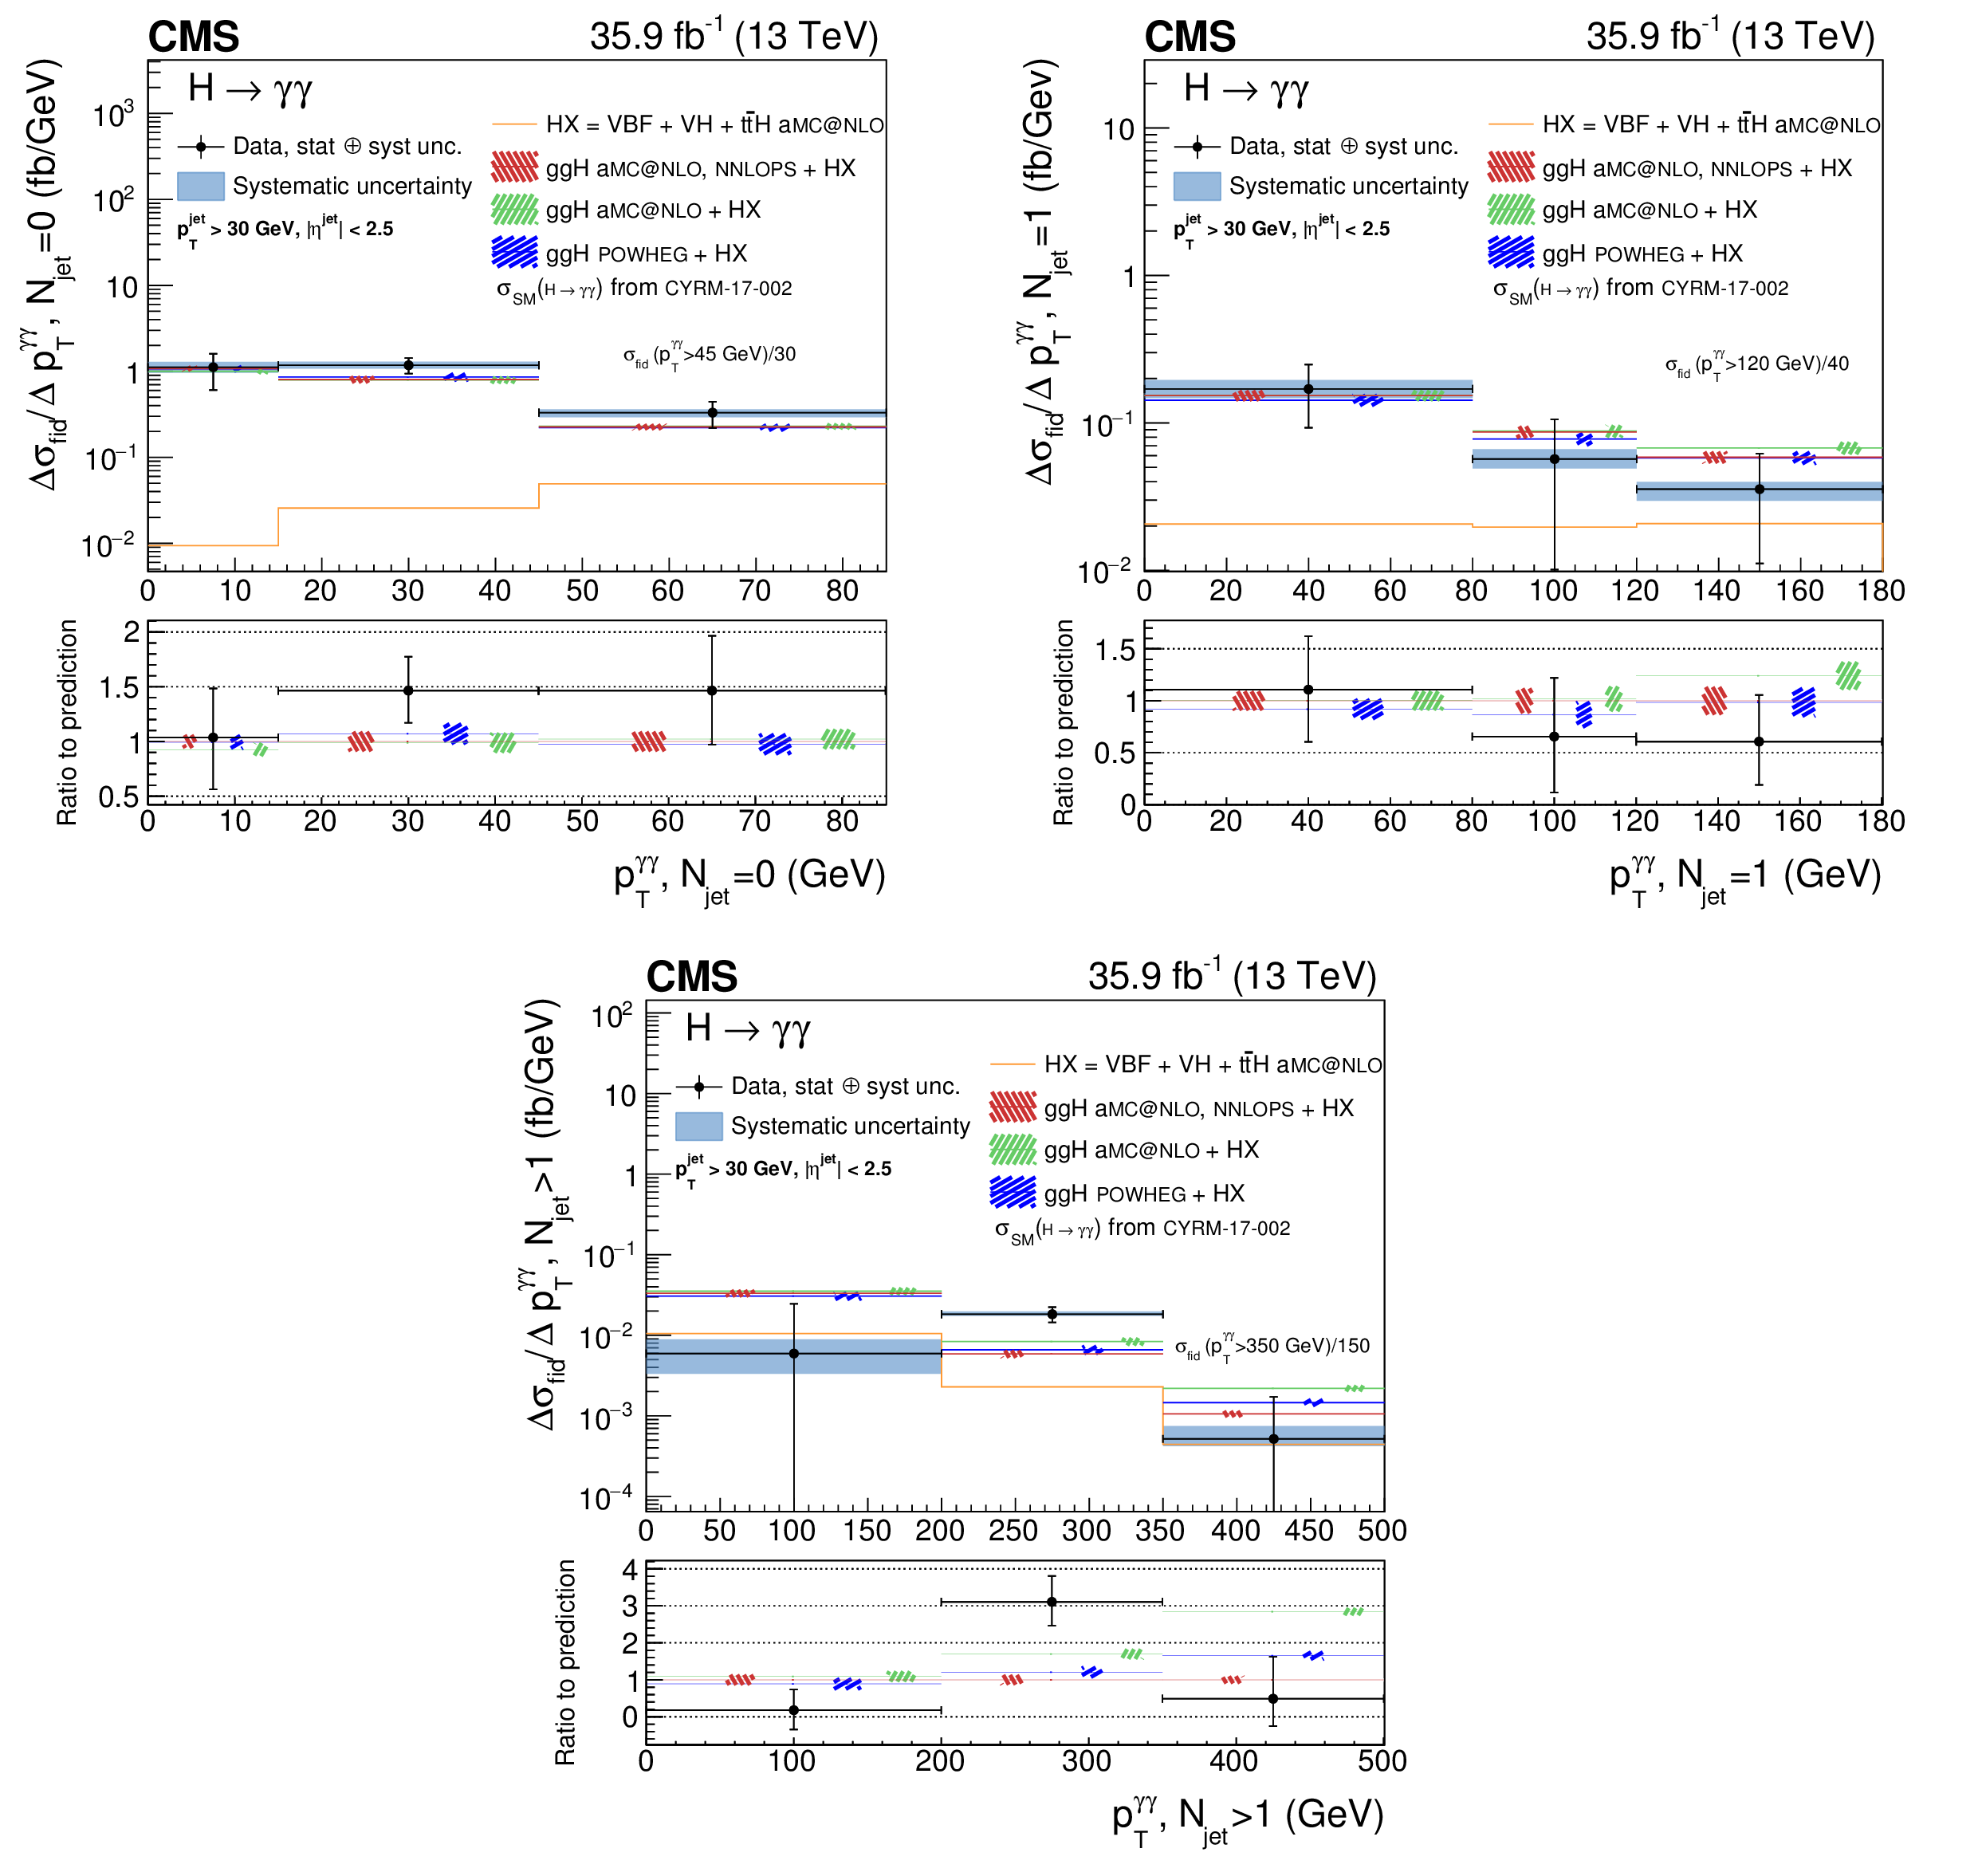
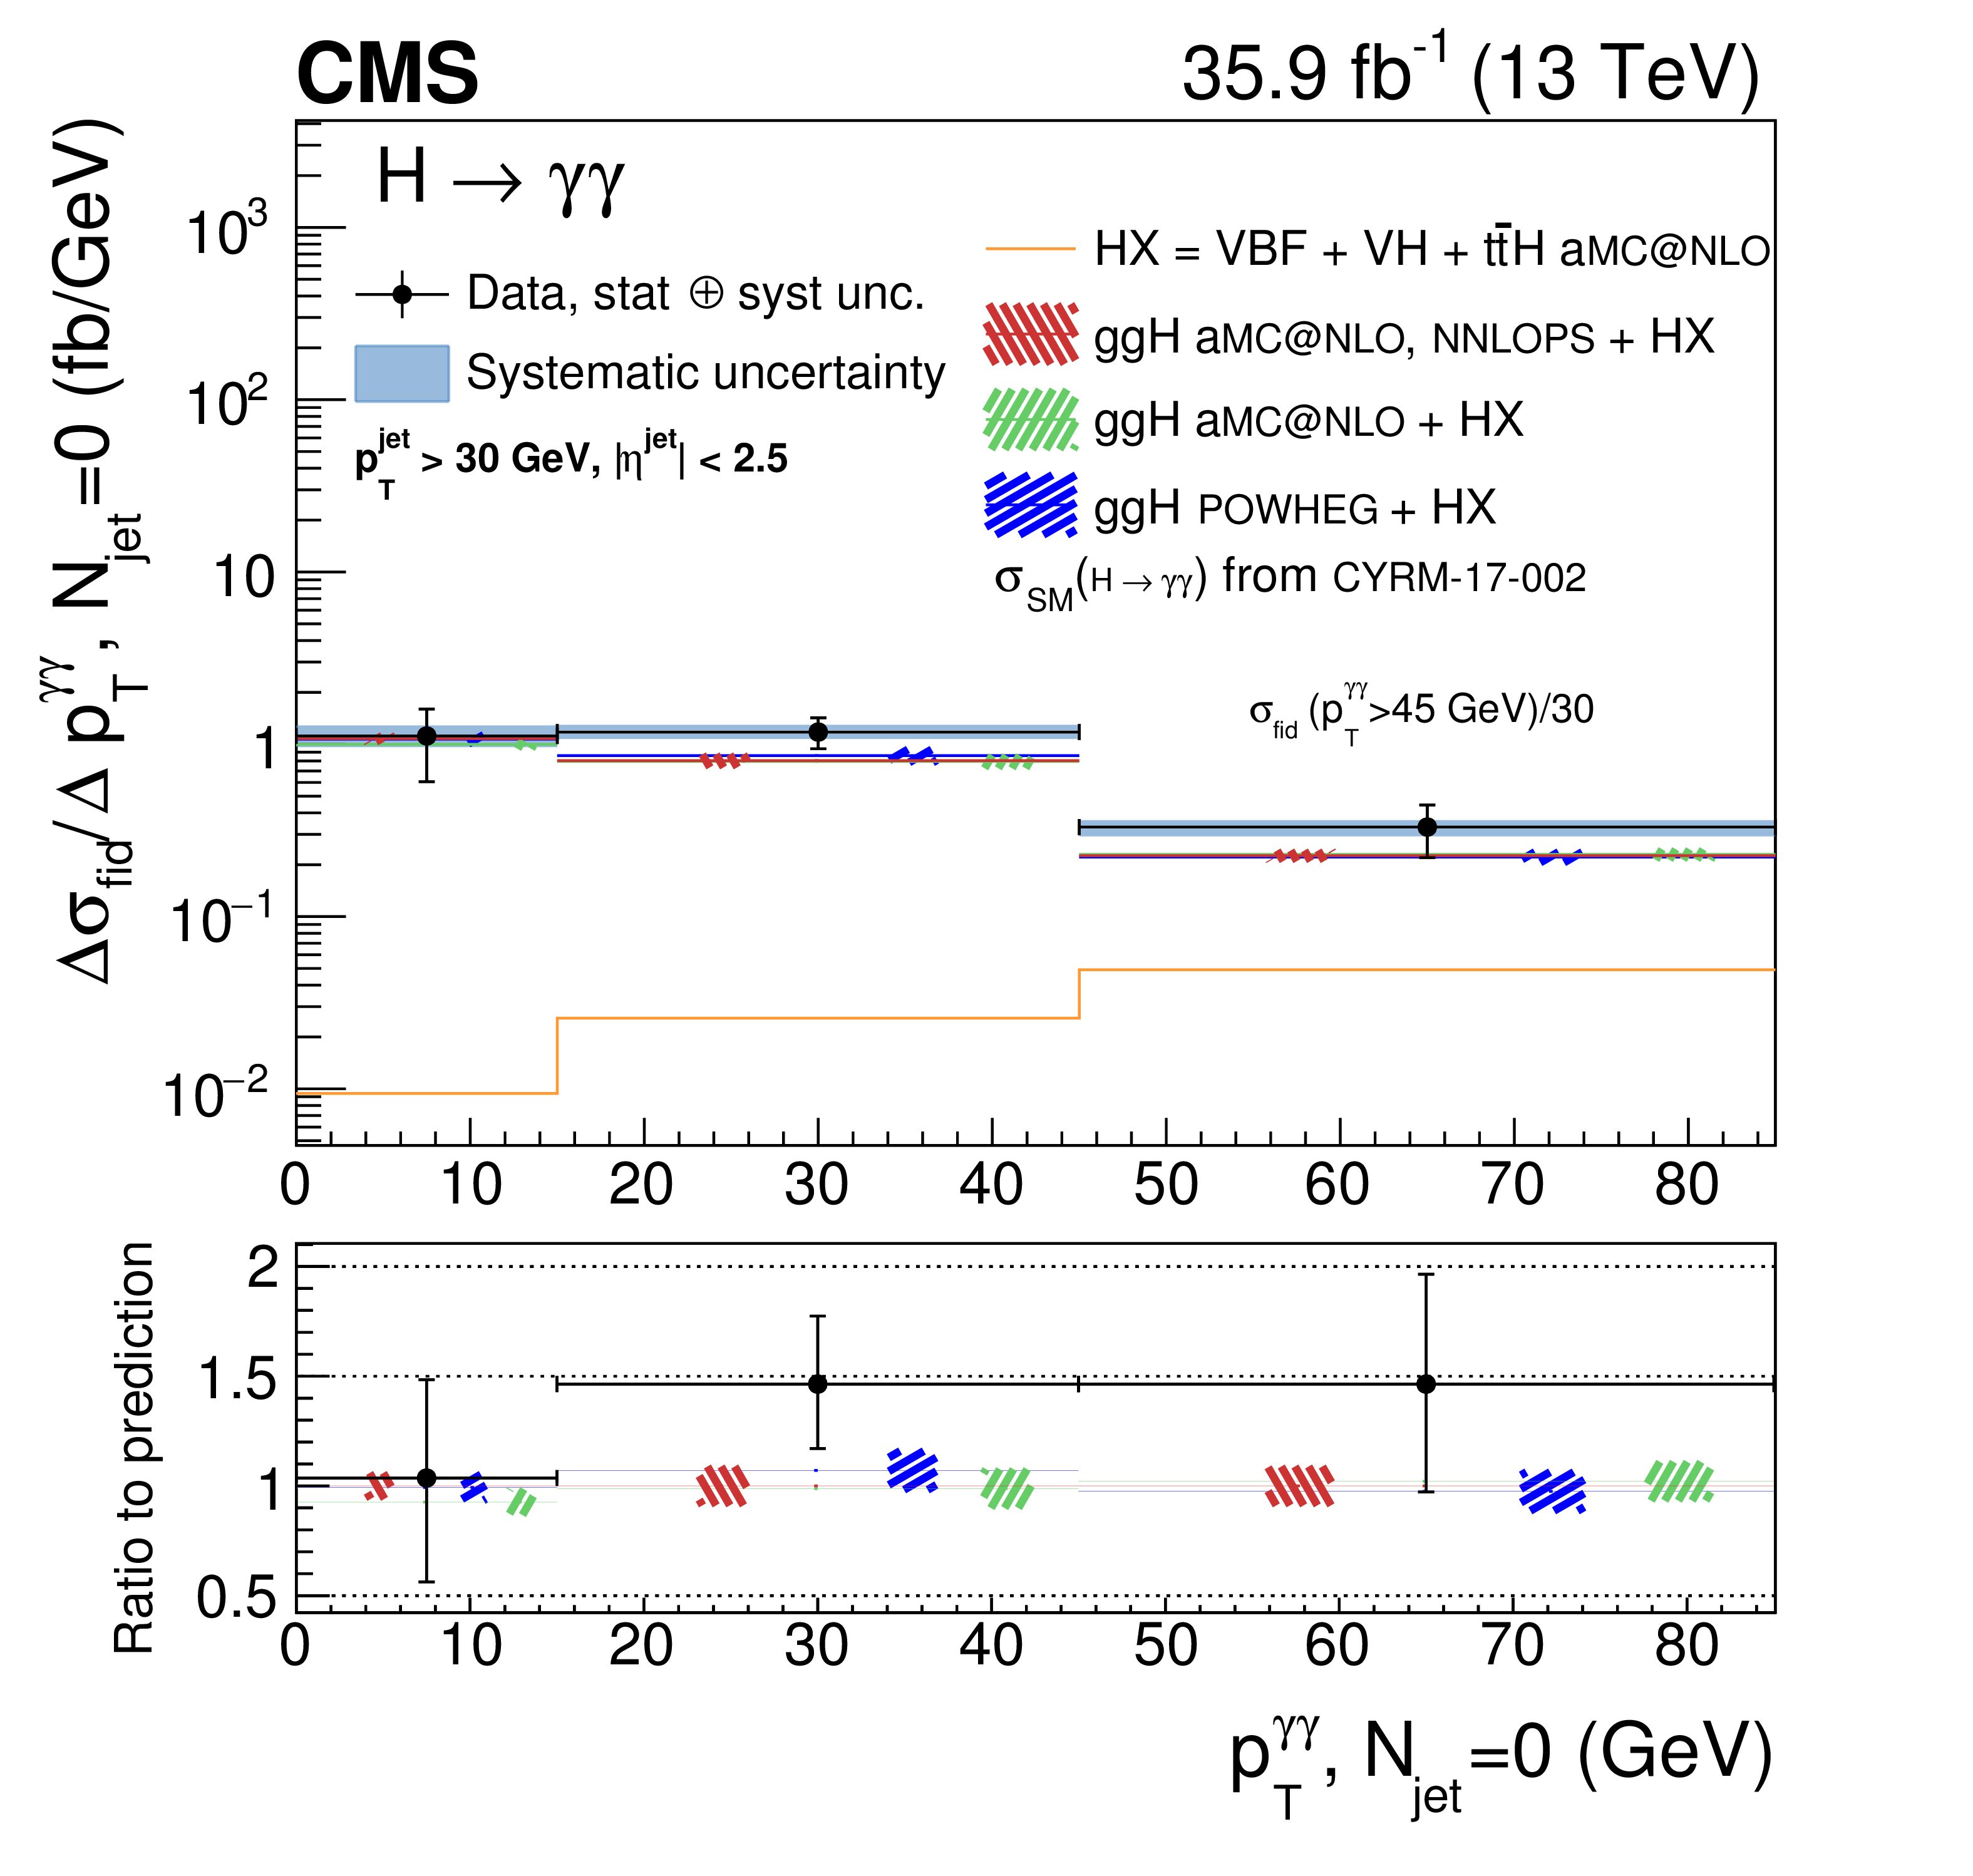
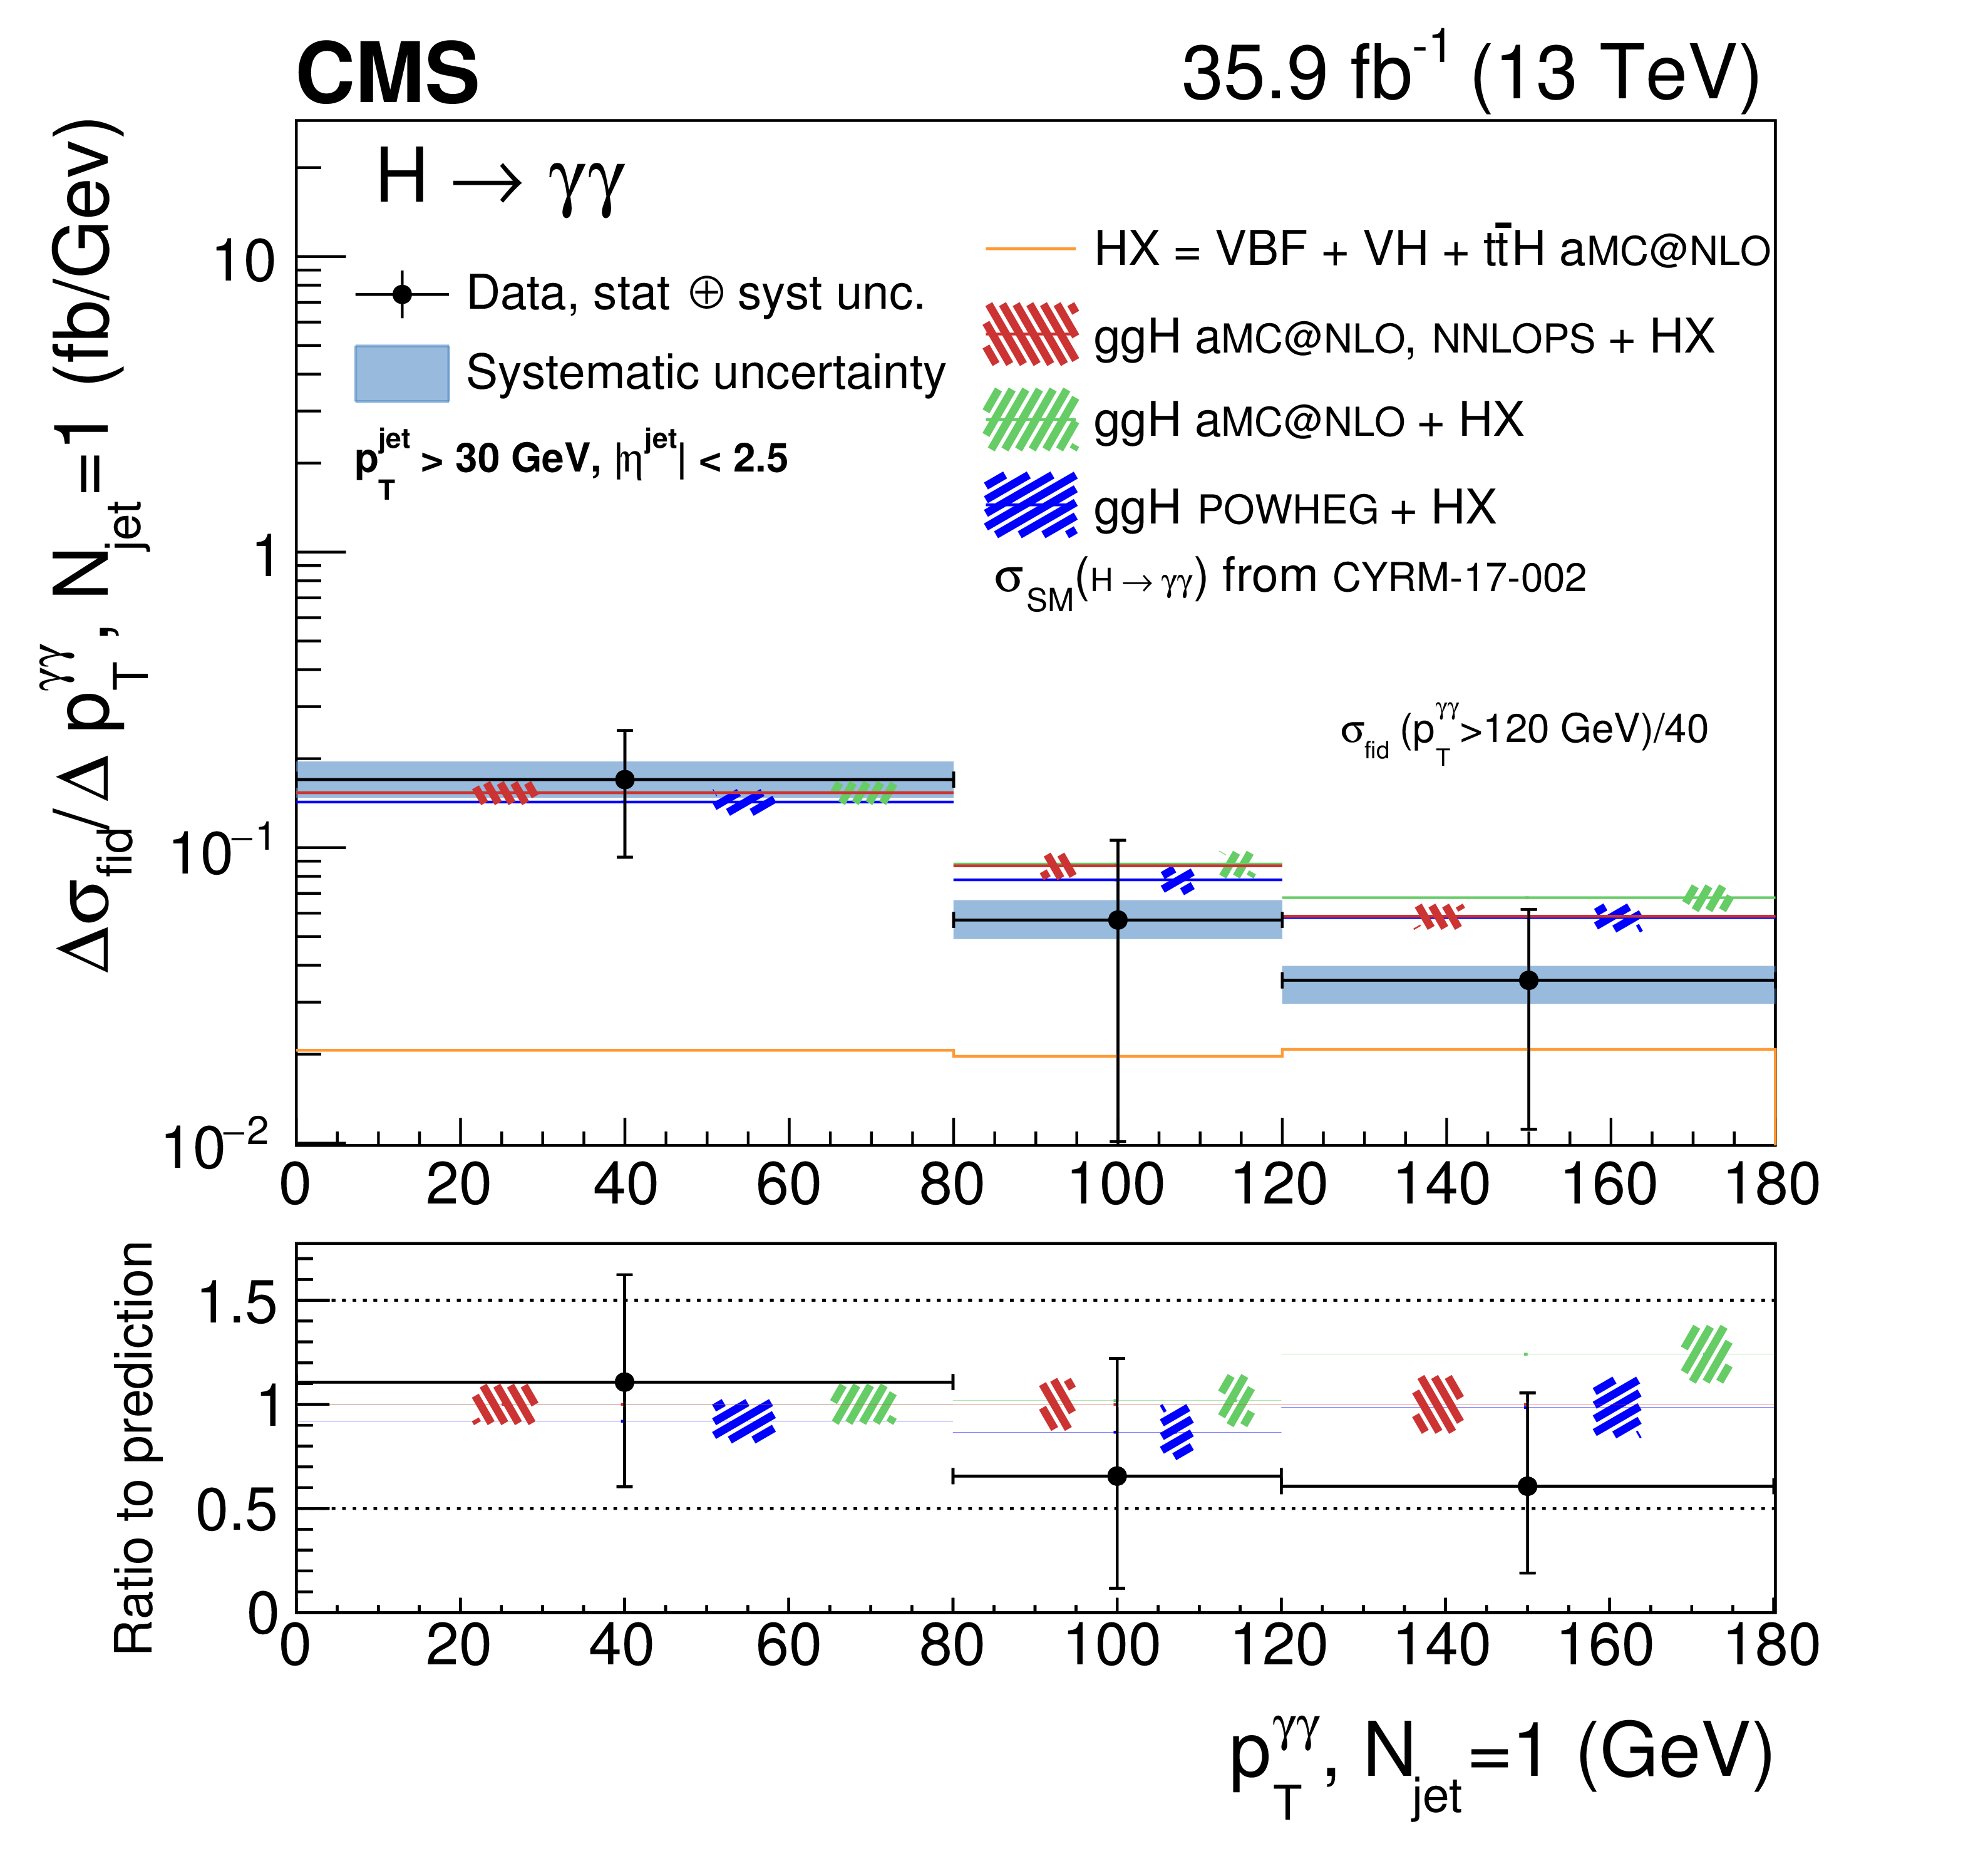
Measurement of the differential cross section (black points) as function of $ {{p_{\mathrm {T}}} ^{\gamma \gamma}} $ and $ {N_{\text {jet}}} $ simultaneously. The error bars indicate 1 standard deviation uncertainty. The systematic component of the uncertainty is shown by the blue band. The measurements are compared to different simulation programs (histograms) with their uncertainties (hatched areas), all normalized to the same theoretical predictions from Ref. [13]. The normalization of the cross section in last, overflow bin is indicated in the figure. |
png pdf |
Figure 9-a:
Measurement of the differential cross section (black points) as function of $ {{p_{\mathrm {T}}} ^{\gamma \gamma}} $ for $ {N_{\text {jet}}} = $ 0. The error bars indicate 1 standard deviation uncertainty. The systematic component of the uncertainty is shown by the blue band. The measurements are compared to different simulation programs (histograms) with their uncertainties (hatched areas), all normalized to the same theoretical predictions from Ref. [13]. The normalization of the cross section in last, overflow bin is indicated in the figure. |
png pdf |
Figure 9-b:
Measurement of the differential cross section (black points) as function of $ {{p_{\mathrm {T}}} ^{\gamma \gamma}} $ for $ {N_{\text {jet}}} = $ 1. The error bars indicate 1 standard deviation uncertainty. The systematic component of the uncertainty is shown by the blue band. The measurements are compared to different simulation programs (histograms) with their uncertainties (hatched areas), all normalized to the same theoretical predictions from Ref. [13]. The normalization of the cross section in last, overflow bin is indicated in the figure. |
png pdf |
Figure 9-c:
Measurement of the differential cross section (black points) as function of $ {{p_{\mathrm {T}}} ^{\gamma \gamma}} $ for $ {N_{\text {jet}}} > $ 1. The error bars indicate 1 standard deviation uncertainty. The systematic component of the uncertainty is shown by the blue band. The measurements are compared to different simulation programs (histograms) with their uncertainties (hatched areas), all normalized to the same theoretical predictions from Ref. [13]. The normalization of the cross section in last, overflow bin is indicated in the figure. |

png pdf |
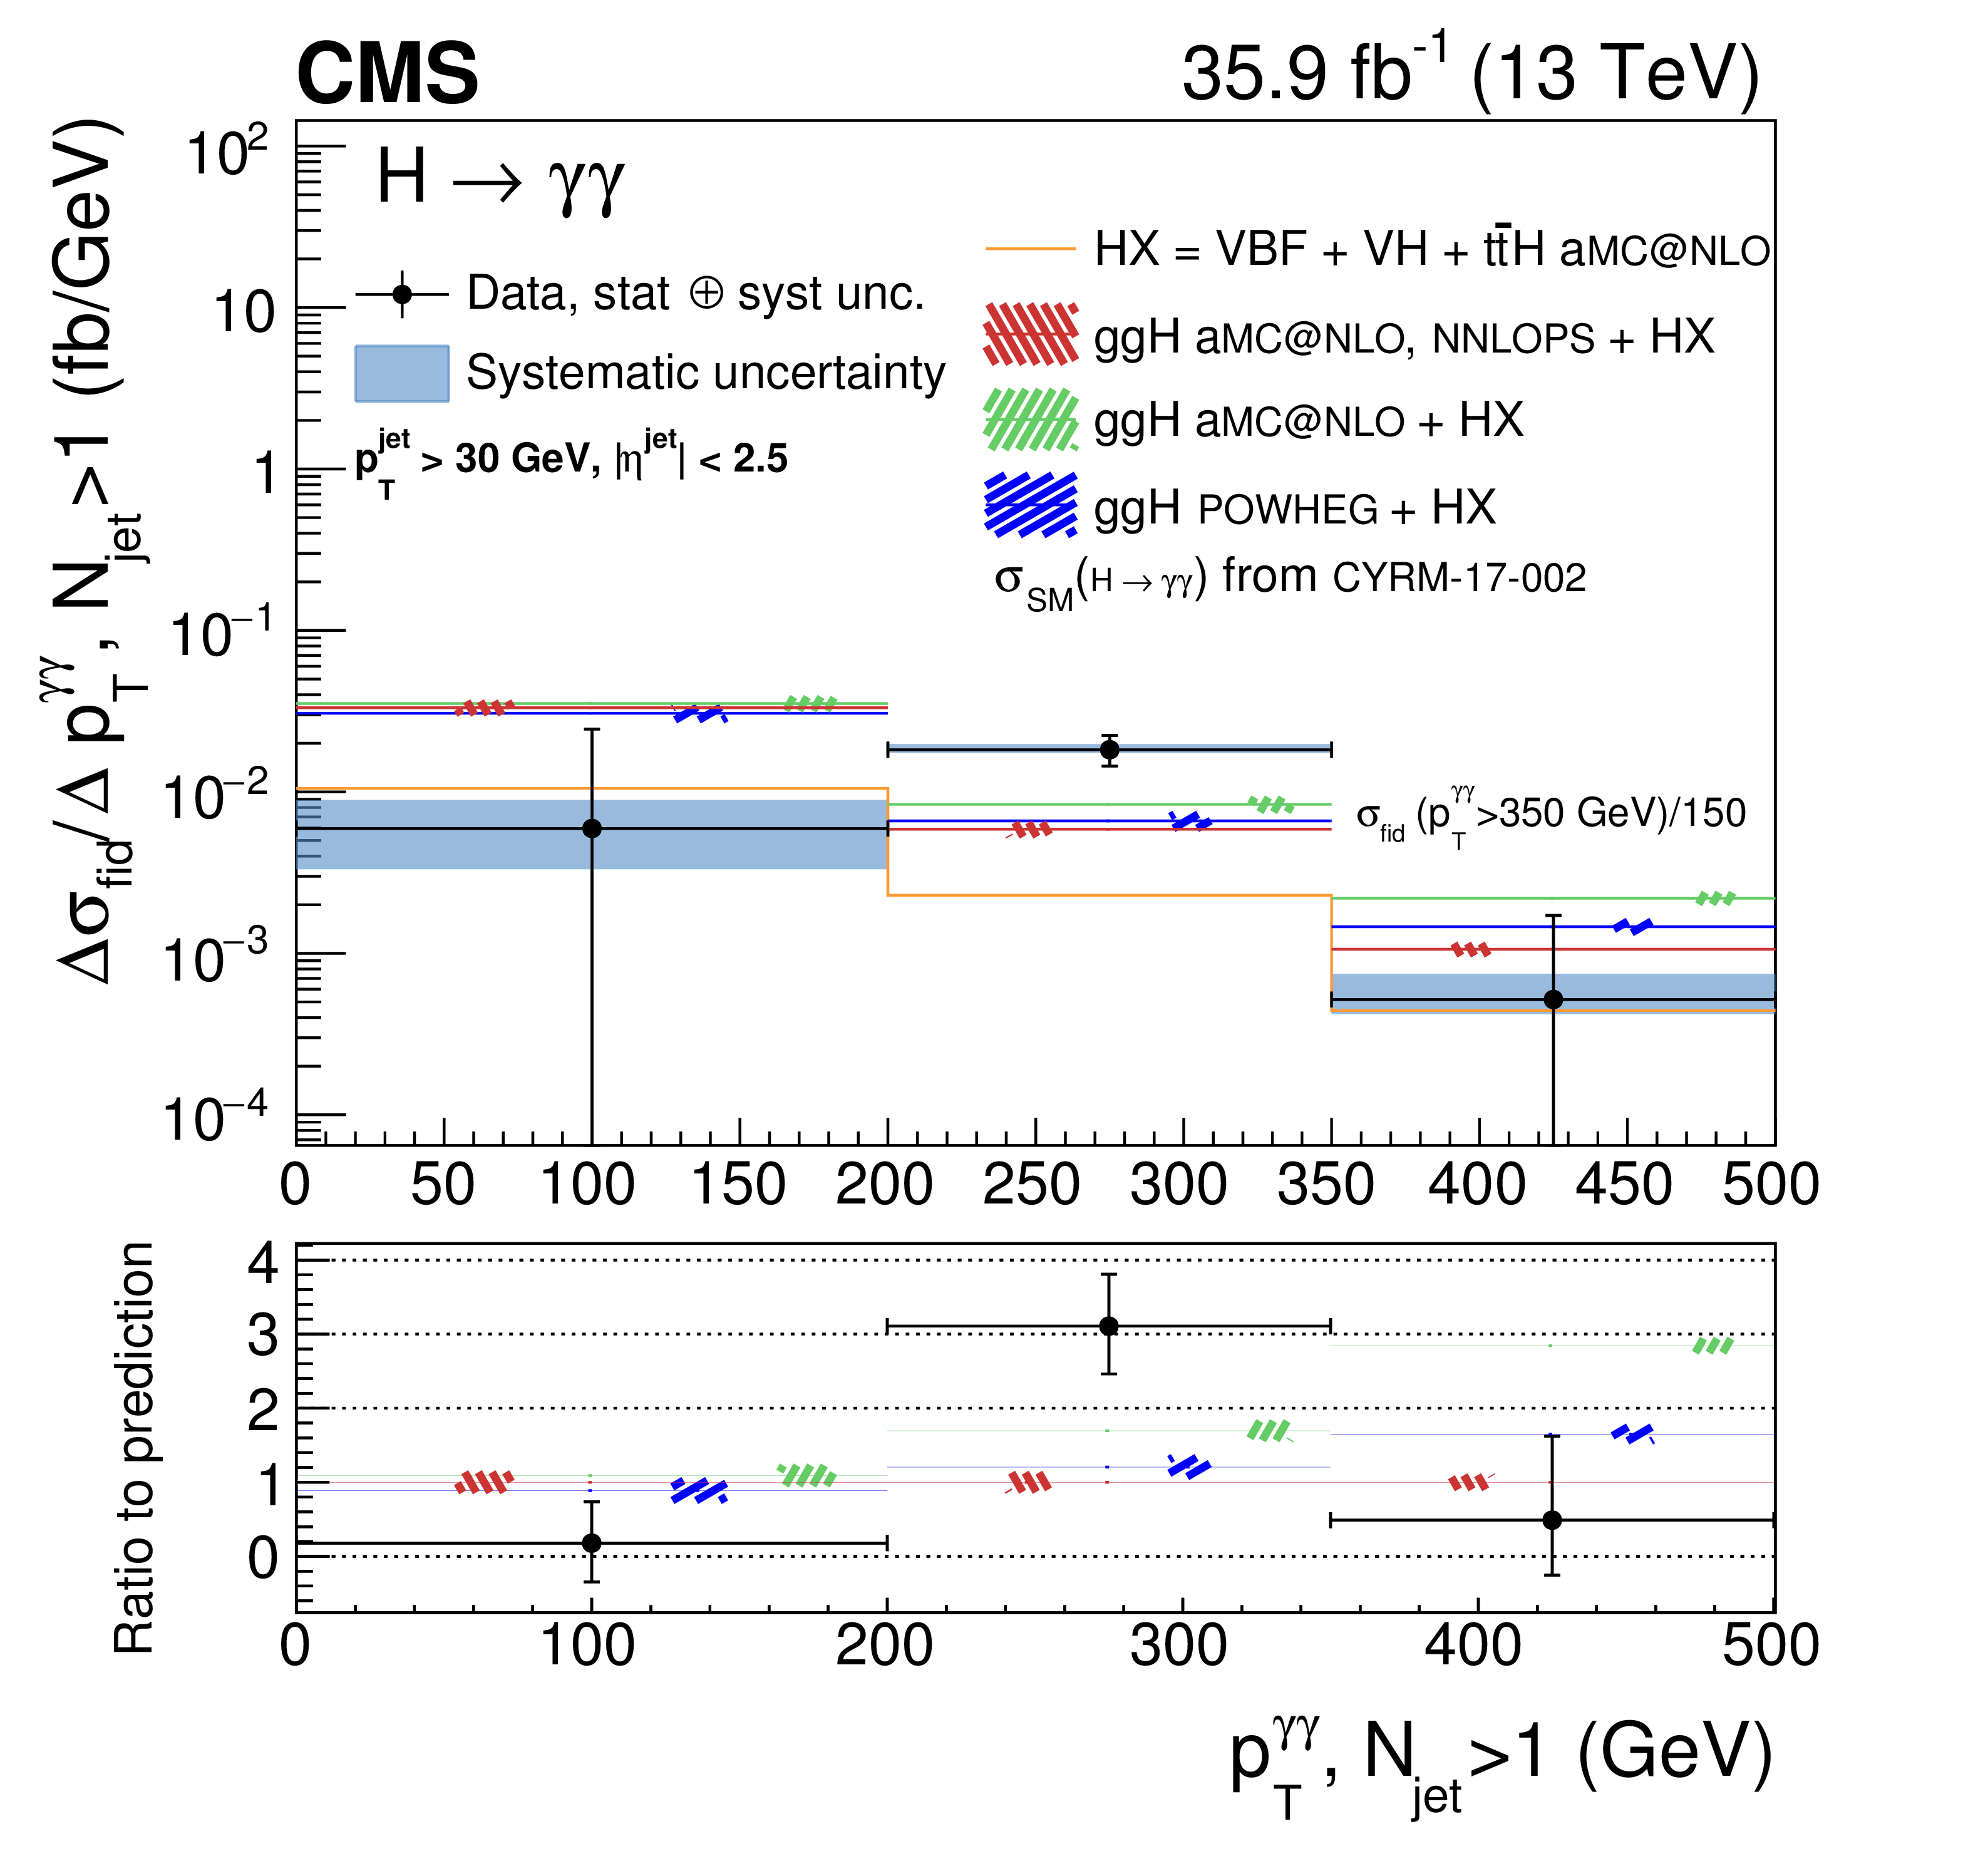
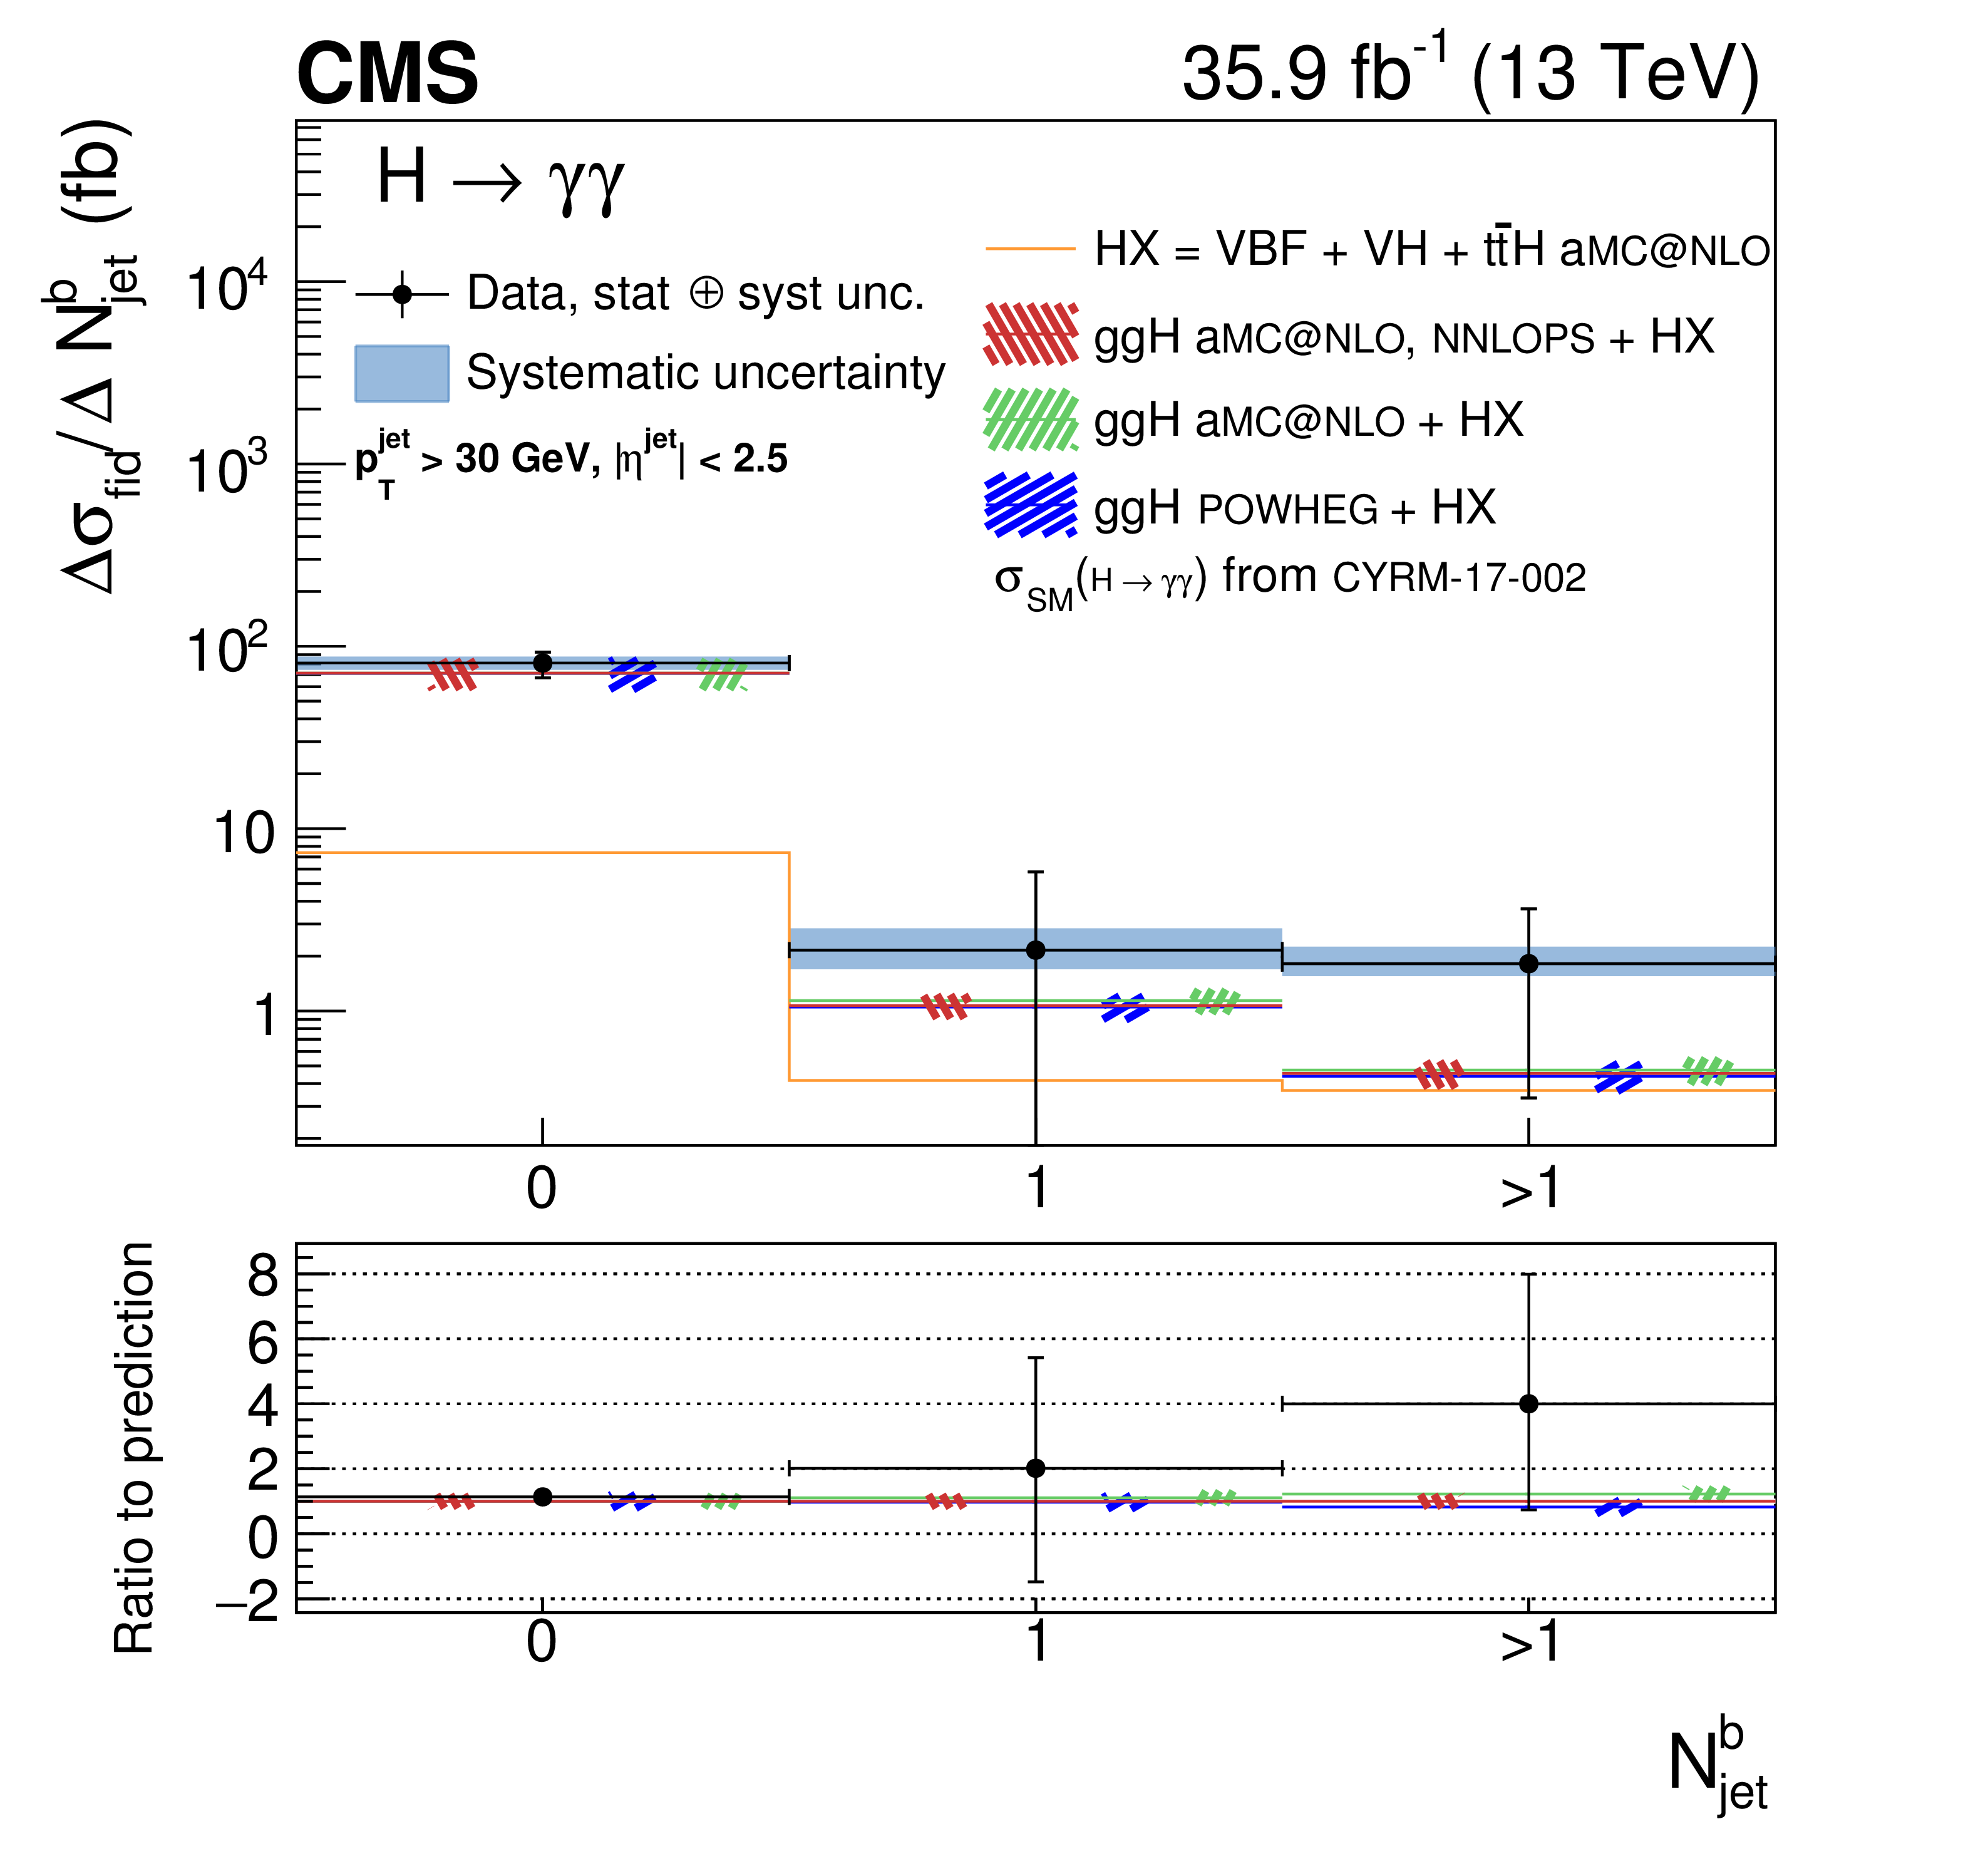
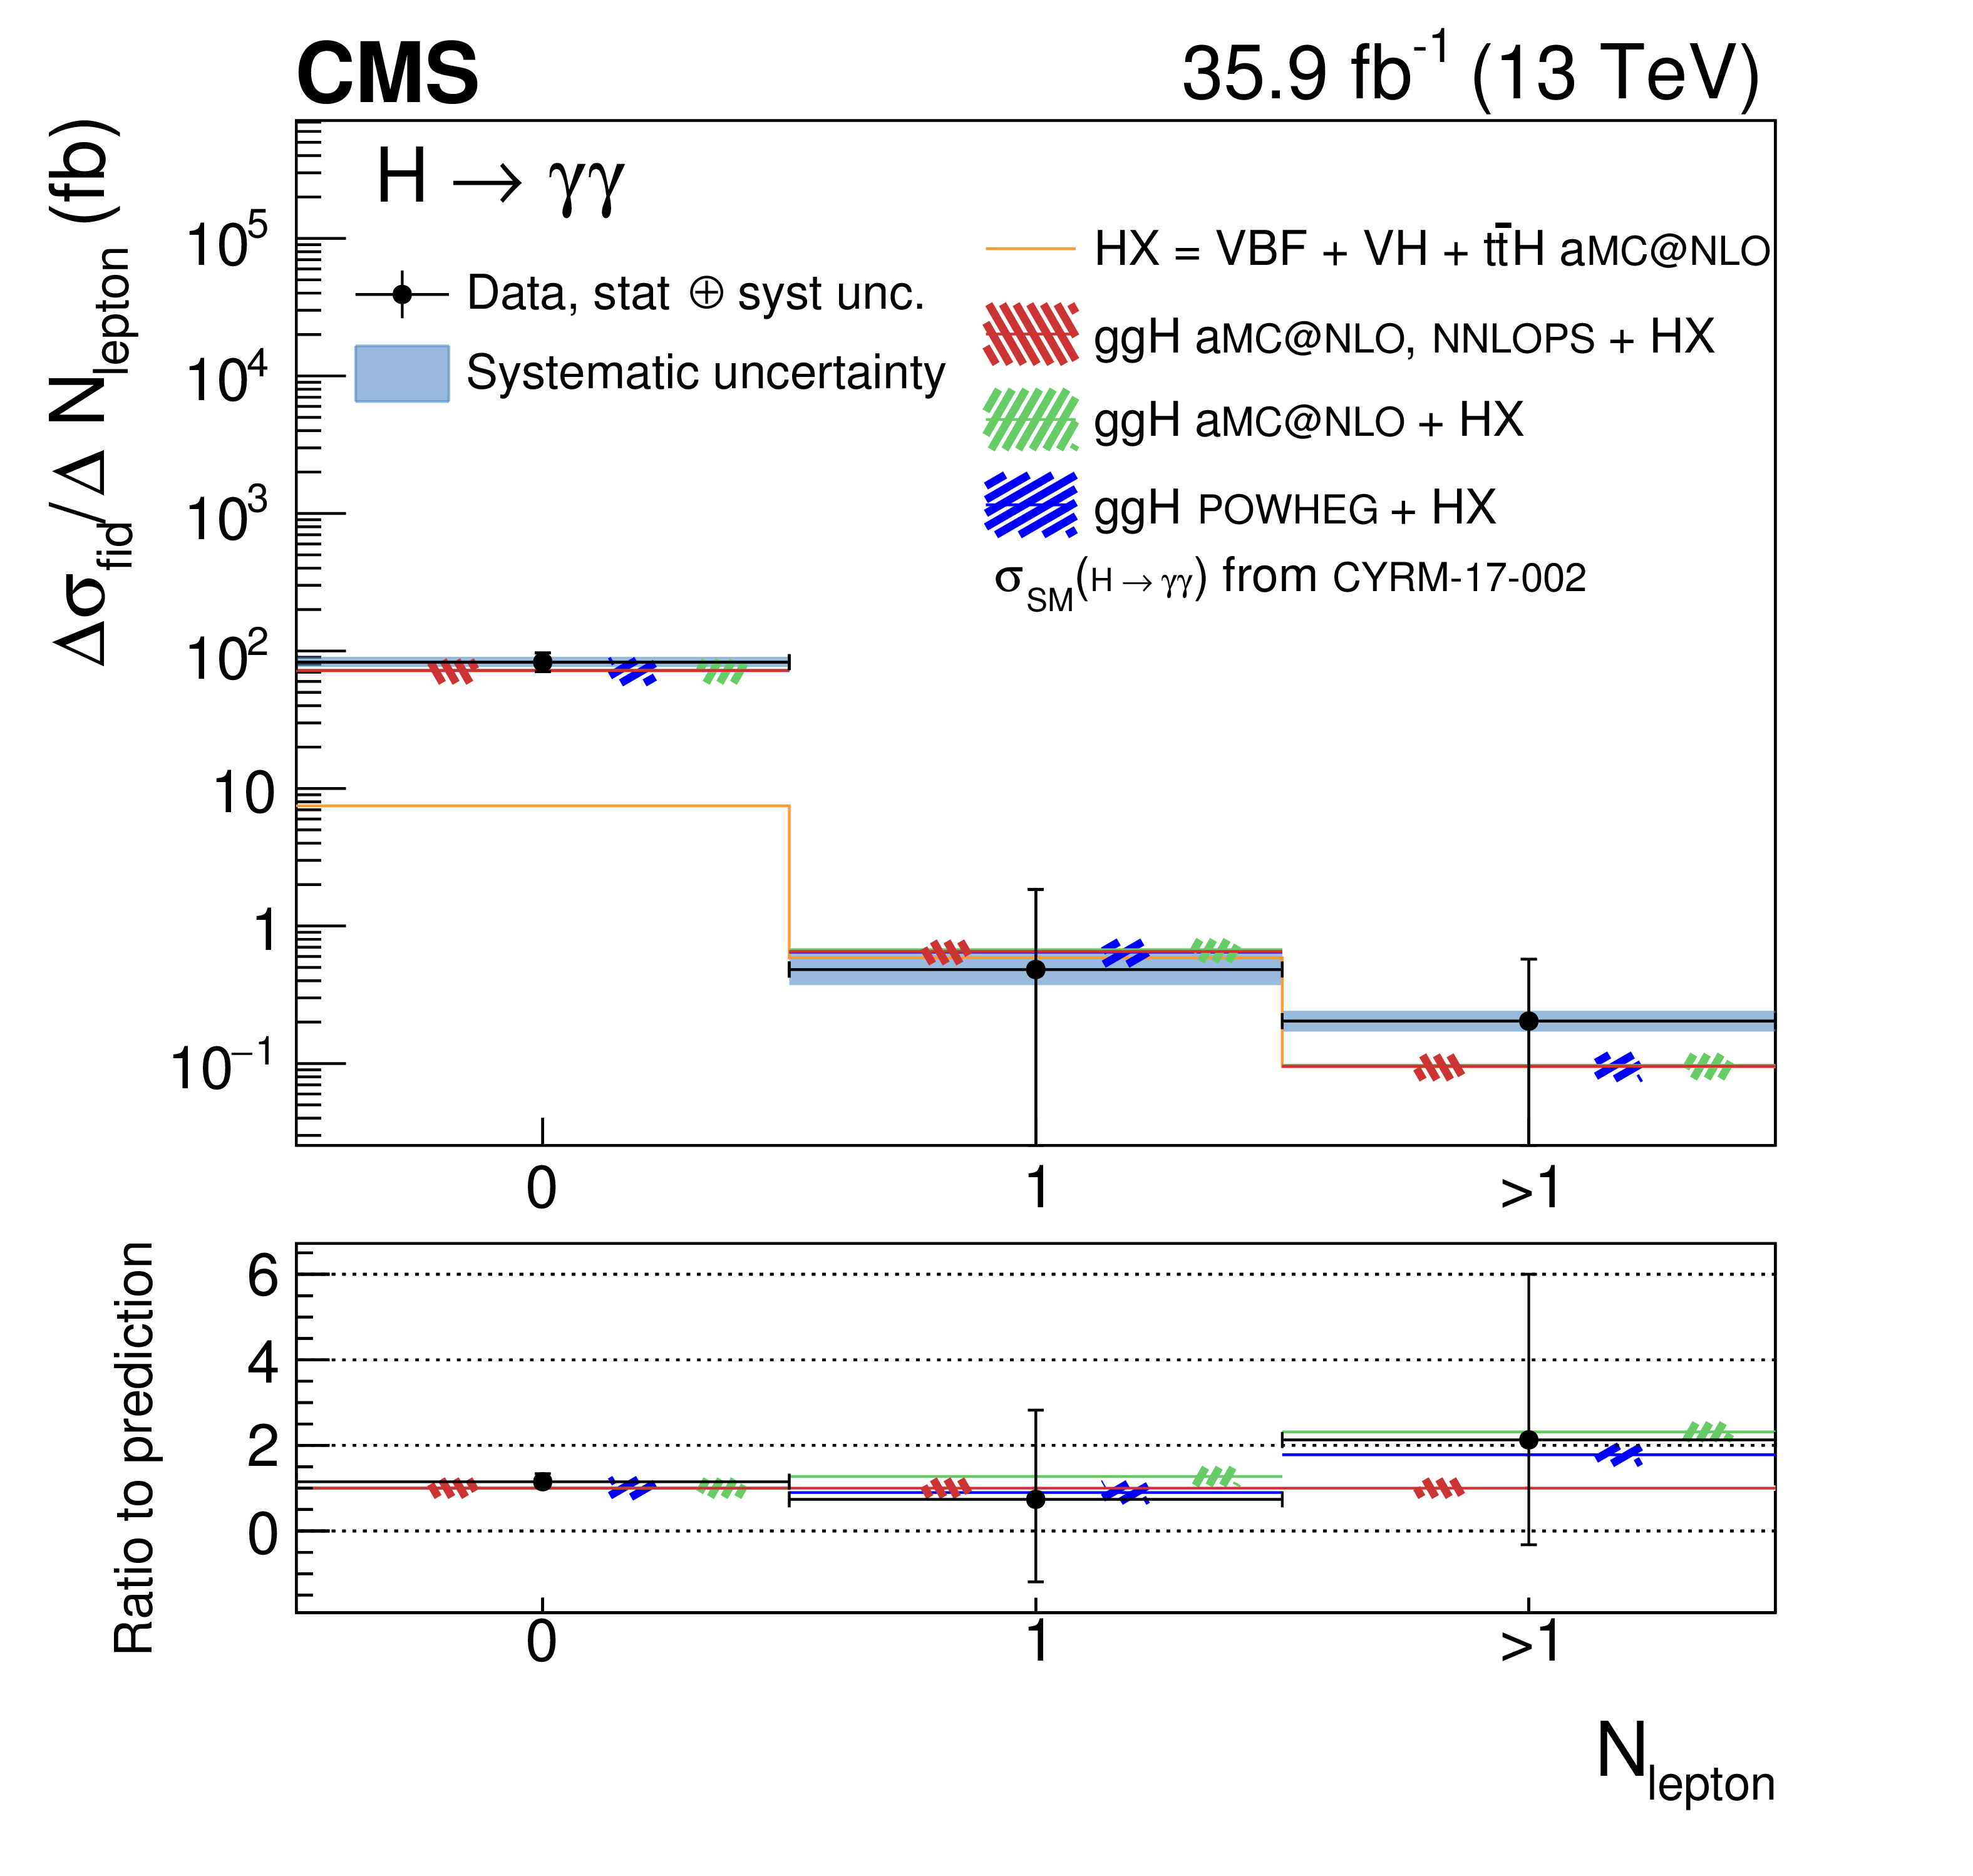
Figure 10:
Measurement of the differential cross section (black points) as functions of $ {{p_{\mathrm {T}}} ^\text {miss}} $, $ {N_{\text {jet}}^{{\mathrm {b}}}} $, and $ {N_{\text {lepton}}} $. The error bars indicate 1 standard deviation uncertainty. The systematic component of the uncertainty is shown by the blue band. The measurements are compared to different simulation programs (histograms) with their uncertainties (hatched areas), all normalized to the same theoretical predictions from Ref. [13]. When the last bin of the distribution is an overflow bin, the normalization of the cross section in that bin is indicated in the figure. |

png pdf |
Figure 10-a:
Measurement of the differential cross section (black points) as a function of $ {{p_{\mathrm {T}}} ^\text {miss}} $. The error bars indicate 1 standard deviation uncertainty. The systematic component of the uncertainty is shown by the blue band. The measurements are compared to different simulation programs (histograms) with their uncertainties (hatched areas), all normalized to the same theoretical predictions from Ref. [13]. The normalization of the cross section in last, overflow bin is indicated in the figure. |
png pdf |
Figure 10-b:
Measurement of the differential cross section (black points) as a function of $ {N_{\text {jet}}^{{\mathrm {b}}}} $. The error bars indicate 1 standard deviation uncertainty. The systematic component of the uncertainty is shown by the blue band. The measurements are compared to different simulation programs (histograms) with their uncertainties (hatched areas), all normalized to the same theoretical predictions from Ref. [13]. |
png pdf |
Figure 10-c:
Measurement of the differential cross section (black points) as a function of $ {N_{\text {lepton}}} $. The error bars indicate 1 standard deviation uncertainty. The systematic component of the uncertainty is shown by the blue band. The measurements are compared to different simulation programs (histograms) with their uncertainties (hatched areas), all normalized to the same theoretical predictions from Ref. [13]. |
png pdf |
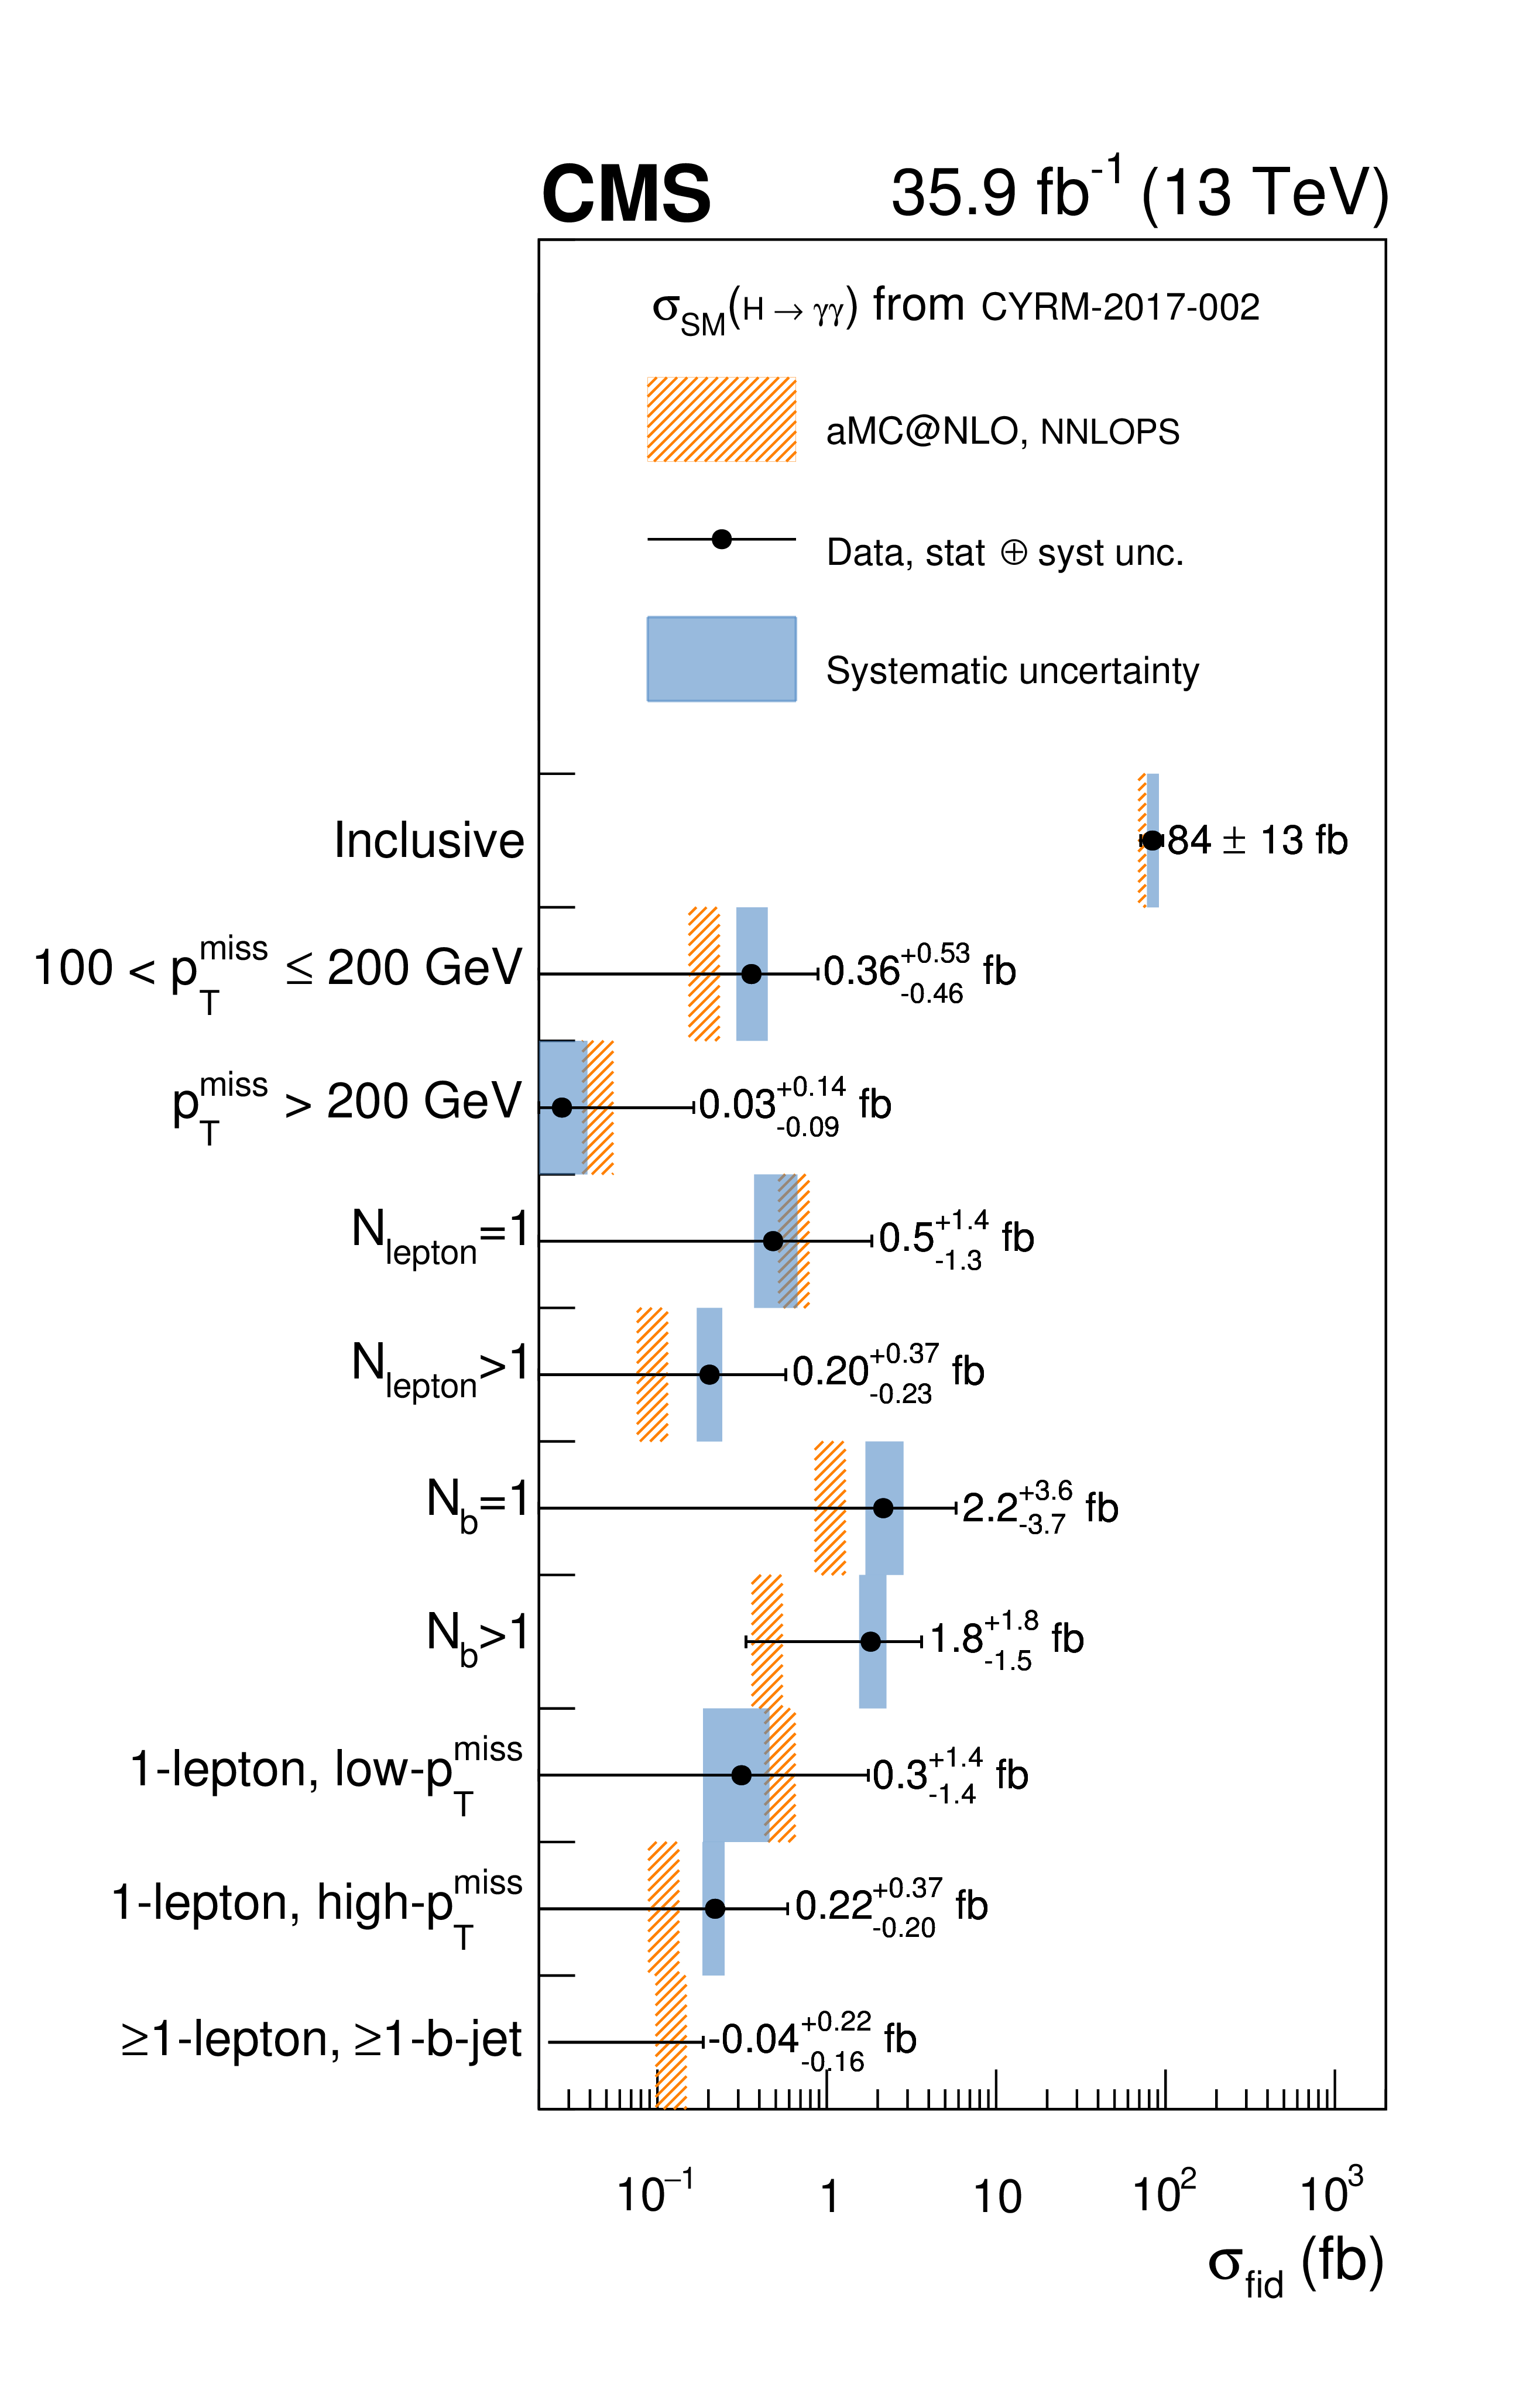
Figure 11:
The measurement of the differential cross section (black points) for different regions of the phase space, listed on the vertical axis. The black error bars indicate the 1 standard deviation uncertainty and its systematic component is shown by the blue band. The measurements are compared to the theoretical predictions (orange hatched area), normalized to the predictions from Ref. [13]. |
| Tables | |
png pdf |
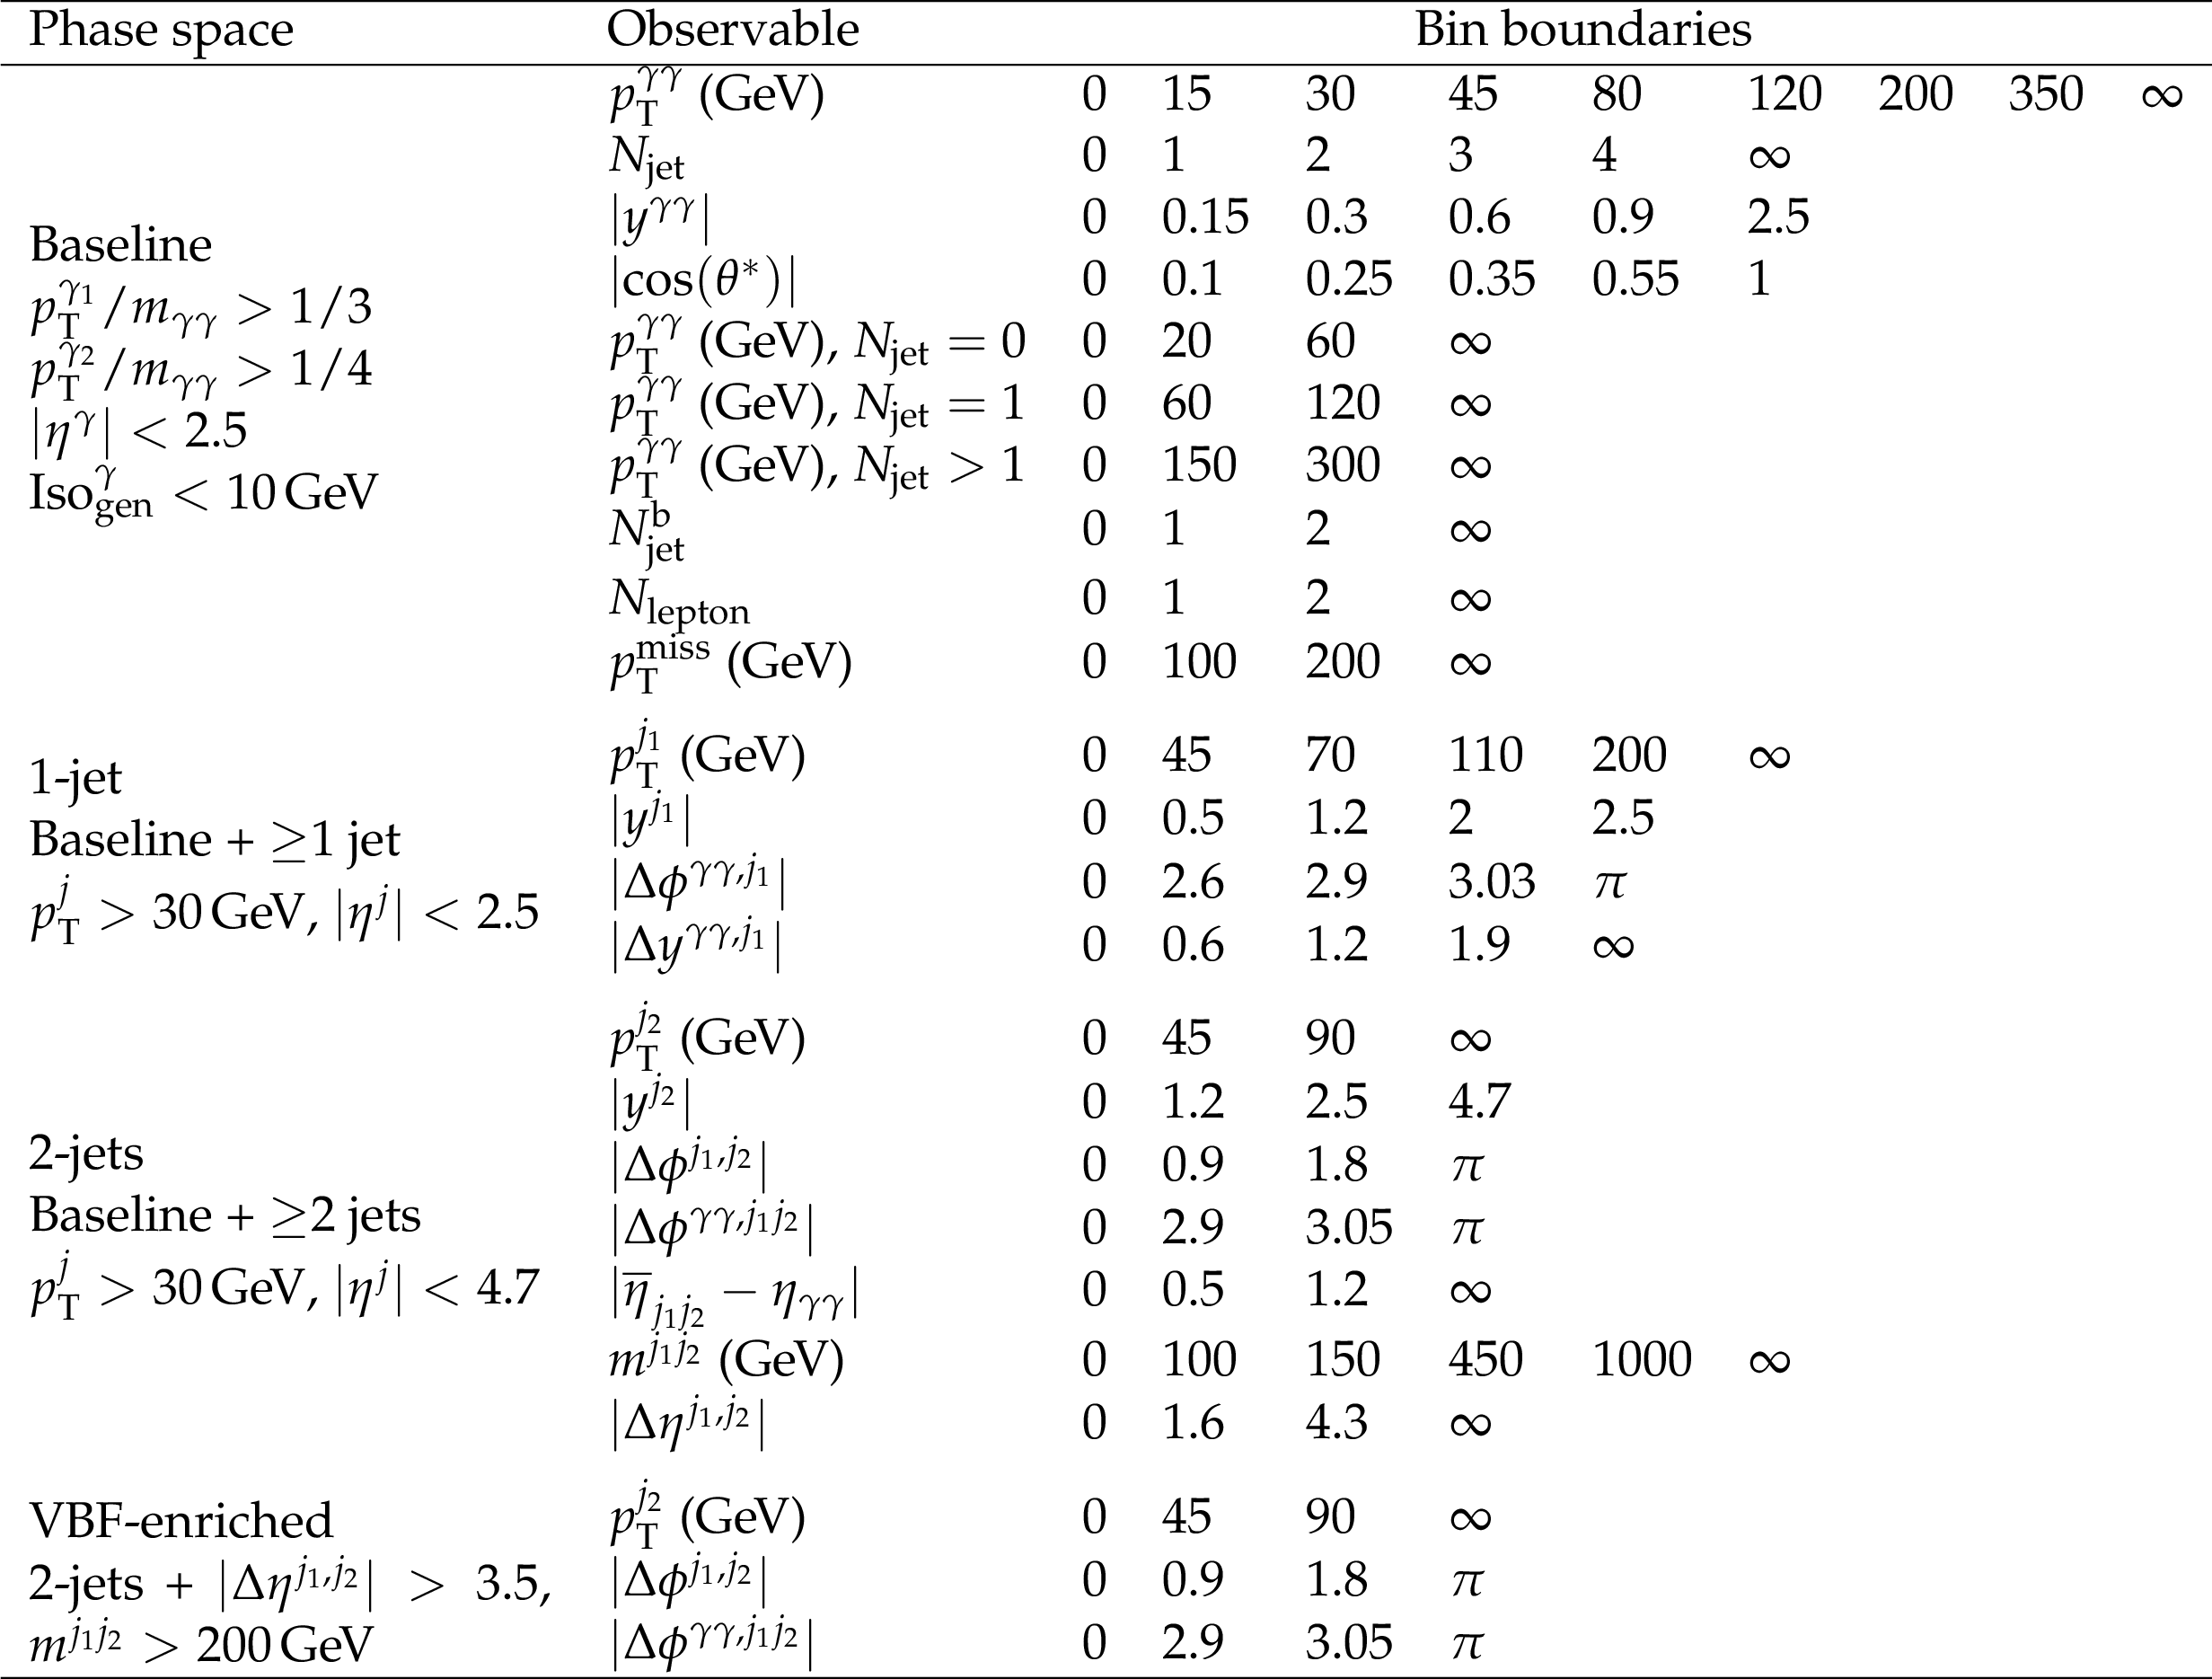
Table 1:
The differential observables studied with the corresponding bins chosen, grouped by the region of the fiducial phase space where the measurements are performed. |
| Summary |
|
Measurements of the inclusive and differential fiducial cross sections for production of the Higgs boson in the diphoton decay channel have been performed using an integrated luminosity of 35.9 fb$^{-1}$ of proton-proton collision data collected by the CMS experiment at a center-of-mass energy of 13 TeV. The measurements of the differential cross sections are reported as functions of a set of observables characterizing the diphoton system and particles produced in association with the Higgs boson. The measurements are performed for isolated photons in the fiducial region defined by requiring that both photons are isolated and within the pseudorapidity $|\eta^{\gamma}| < $ 2.5 and ${p_{\mathrm{T}}}/m_{\gamma\gamma} > $ 1/3 (1/4) for the leading (subleading) photon. In this fiducial region, the cross section is measured to be 84 $\pm$ 13 fb, compared with a theoretical prediction of 73 $\pm$ 4 fb. The double-differential measurement is performed as a function of the transverse momentum of the diphoton system and the jet multiplicity in the event. A subset of the differential observables describing the kinematics of the system of two additional jets is studied in a vector-boson-fusion enriched fiducial phase space. The inclusive cross section is also measured in three subregions of the fiducial phase space, additionally requiring the presence of one selected lepton and missing transverse momentum ${p_{\mathrm{T}}^{\text{miss}}} < $ 100 GeV, or one selected lepton and ${p_{\mathrm{T}}^{\text{miss}}}\geq$ 100 GeV, or at least one selected lepton and at least one b-tagged jet, respectively. The measurements are in agreement within the uncertainties with the predictions for the production of a standard model Higgs boson. |
| References | ||||
| 1 | ATLAS Collaboration | Observation of a new particle in the search for the standard model Higgs boson with the ATLAS detector at the LHC | PLB 716 (2012) 1 | 1207.7214 |
| 2 | CMS Collaboration | Observation of a new boson at a mass of 125 GeV with the CMS experiment at the LHC | PLB 716 (2012) 30 | |
| 3 | CMS Collaboration | Observation of a new boson with mass near 125 GeV in pp collisions at $ \sqrt{s} = $ 7 and 8 TeV | JHEP 06 (2013) 081 | CMS-HIG-12-036 1303.4571 |
| 4 | ATLAS and CMS Collaborations | Measurements of the Higgs boson production and decay rates and constraints on its couplings from a combined ATLAS and CMS analysis of the LHC pp collision data at $ \sqrt{s}= $ 7 and 8 TeV | JHEP 08 (2016) 045 | 1606.02266 |
| 5 | ATLAS Collaboration | Measurements of fiducial and differential cross sections for Higgs boson production in the diphoton decay channel at $ \sqrt{s}= $ 8 TeV with ATLAS | JHEP 09 (2014) 112 | 1407.4222 |
| 6 | CMS Collaboration | Measurement of differential cross sections for Higgs boson production in the diphoton decay channel in pp collisions at $ \sqrt{s} = $ 8 TeV | EPJC 76 (2016) 13 | CMS-HIG-14-016 1508.07819 |
| 7 | ATLAS Collaboration | Fiducial and differential cross sections of Higgs boson production measured in the four-lepton decay channel in pp collisions at $ \sqrt{s} = $ 8 TeV with the ATLAS detector | PLB 738 (2014) 234 | 1408.3226 |
| 8 | CMS Collaboration | Measurement of differential and integrated fiducial cross sections for Higgs boson production in the four-lepton decay channel in pp collisions at $ \sqrt{s} = $ 7 and 8 TeV | JHEP 04 (2015) 005 | CMS-HIG-14-028 1512.08377 |
| 9 | ATLAS Collaboration | Measurement of fiducial differential cross sections of gluon-fusion production of Higgs bosons decaying to $ WW^{\ast}{\rightarrow }e\nu\mu\nu $ with the ATLAS detector at $ \sqrt{s}= $ 8 TeV. | JHEP 08 (2016) 104 | 1604.02997 |
| 10 | CMS Collaboration | Measurement of the transverse momentum spectrum of the Higgs boson produced in pp collisions at $ \sqrt{s} = $ 8 TeV using $ \mathrm{H}\to\mathrm{W}\mathrm{W} $ decays | JHEP 03 (2016) 032 | CMS-HIG-15-010 1606.01522 |
| 11 | ATLAS Collaboration | Measurement of inclusive and differential cross sections in the $ H \rightarrow ZZ^* \rightarrow 4\ell $ decay channel in $ pp $ collisions at $ \sqrt{s} = $ 13 TeV with the ATLAS detector. | JHEP 10 (2017) 132 | 1708.02810 |
| 12 | CMS Collaboration | Measurements of properties of the Higgs boson decaying into the four-lepton final state in pp collisions at $ \sqrt{s} = $ 13 TeV. | JHEP 11 (2017) 047 | CMS-HIG-16-041 1706.09936 |
| 13 | LHC Higgs Cross Section Working Group | Handbook of LHC Higgs cross sections: 4. Deciphering the nature of the Higgs sector | CERN (2016) | 1610.07922 |
| 14 | CMS Collaboration | Measurements of Higgs boson properties in the diphoton decay channel in proton-proton collisions at $ \sqrt{s} = $ 13 TeV | Submitted to JHEP | CMS-HIG-16-040 1804.02716 |
| 15 | CMS Collaboration | The CMS trigger system | JINST 12 (2017) P01020 | CMS-TRG-12-001 1609.02366 |
| 16 | CMS Collaboration | The CMS experiment at the CERN LHC | JINST 3 (2008) S08004 | CMS-00-001 |
| 17 | GEANT4 Collaboration | GEANT4 --- a simulation toolkit | NIMA 506 (2003) 250 | |
| 18 | J. Alwall et al. | The automated computation of tree-level and next-to-leading order differential cross sections, and their matching to parton shower simulations | JHEP 07 (2014) 079 | 1405.0301 |
| 19 | R. Frederix and S. Frixione | Merging meets matching in MC@NLO | JHEP 12 (2012) 061 | 1209.6215 |
| 20 | T. Sjostrand et al. | An Introduction to PYTHIA 8.2 | CPC 191 (2015) 159 | 1410.3012 |
| 21 | P. Skands, S. Carrazza, and J. Rojo | Tuning PYTHIA 8.1: the Monash 2013 Tune | EPJC 74 (2014) 3024 | 1404.5630 |
| 22 | K. Hamilton, P. Nason, E. Re, and G. Zanderighi | NNLOPS simulation of Higgs boson production | JHEP 10 (2013) 222 | 1309.0017 |
| 23 | K. Hamilton, P. Nason, and G. Zanderighi | MINLO: multi-scale improved NLO | JHEP 10 (2012) 155 | 1206.3572 |
| 24 | A. Kardos, P. Nason, and C. Oleari | Three-jet production in POWHEG | JHEP 04 (2014) 043 | 1402.4001 |
| 25 | P. Nason | A new method for combining NLO QCD with shower Monte Carlo algorithms | JHEP 11 (2004) 040 | hep-ph/0409146 |
| 26 | S. Frixione, P. Nason, and C. Oleari | Matching NLO QCD computations with parton shower simulations: the POWHEG method | JHEP 11 (2007) 070 | 0709.2092 |
| 27 | S. Alioli, P. Nason, C. Oleari, and E. Re | A general framework for implementing NLO calculations in shower Monte Carlo programs: the POWHEG BOX | JHEP 06 (2010) 043 | 1002.2581 |
| 28 | S. Alioli, P. Nason, C. Oleari, and E. Re | NLO Higgs boson production via gluon fusion matched with shower in POWHEG | JHEP 04 (2009) 002 | 0812.0578 |
| 29 | E. Bagnaschi, G. Degrassi, P. Slavich, and A. Vicini | Higgs production via gluon fusion in the POWHEG approach in the SM and in the MSSM | JHEP 02 (2012) 088 | 1111.2854 |
| 30 | NNPDF Collaboration | Parton distributions for the LHC Run II | JHEP 04 (2015) 040 | 1410.8849 |
| 31 | T. Gleisberg et al. | Event generation with SHERPA 1.1 | JHEP 02 (2009) 007 | 0811.4622 |
| 32 | CMS Collaboration | Performance of photon reconstruction and identification with the CMS detector in proton-proton collisions at $ \sqrt{s} = $ 8 TeV | JINST 10 (2015) P08010 | CMS-EGM-14-001 1502.02702 |
| 33 | CMS Collaboration | Performance of electron reconstruction and selection with the CMS detector in proton-proton collisions at $ \sqrt{s} = $ 8 TeV | JINST 10 (2015) P06005 | CMS-EGM-13-001 1502.02701 |
| 34 | CMS Collaboration | Energy calibration and resolution of the CMS electromagnetic calorimeter in pp collisions at $ \sqrt{s} = $ 7 TeV | JINST 8 (2013) P09009 | CMS-EGM-11-001 1306.2016 |
| 35 | M. J. Oreglia | A study of the reactions $\psi' \to \gamma\gamma \psi$ | PhD thesis, Stanford University, 1980 SLAC Report SLAC-R-236, see A | |
| 36 | CMS Collaboration | Particle-flow reconstruction and global event description with the CMS detector | JINST 12 (2017) P10003 | CMS-PRF-14-001 1706.04965 |
| 37 | M. Cacciari, G. P. Salam, and G. Soyez | The anti-$ {k_{\mathrm{T}}} $ jet clustering algorithm | JHEP 04 (2008) 063 | 0802.1189 |
| 38 | M. Cacciari, G. P. Salam, and G. Soyez | FastJet user manual | EPJC 72 (2012) 1896 | 1111.6097 |
| 39 | CMS Collaboration | Jet algorithms performance in 13 TeV data | CMS-PAS-JME-16-003 | CMS-PAS-JME-16-003 |
| 40 | CMS Collaboration | Jet energy scale and resolution in the CMS experiment in pp collisions at 8 TeV | JINST 12 (2017) P02014 | CMS-JME-13-004 1607.03663 |
| 41 | CMS Collaboration | Identification of heavy-flavour jets with the CMS detector in pp collisions at 13 TeV | JINST 13 (2018), no. 05, P05011 | CMS-BTV-16-002 1712.07158 |
| 42 | CMS Collaboration | Observation of the diphoton decay of the Higgs boson and measurement of its properties | EPJC 74 (2014) 3076 | CMS-HIG-13-001 1407.0558 |
| 43 | CMS Collaboration | Pileup jet identification | CMS-PAS-JME-13-005 | CMS-PAS-JME-13-005 |
| 44 | CMS Collaboration | Electron and photon performance using data collected by CMS at $ \sqrt{s} = $ 13 TeV and 25 ns | CDS | |
| 45 | CMS Collaboration | Electron and photon performance in CMS with the full 2016 data sample | CDS | |
| 46 | J. C. Collins and D. E. Soper | Angular distribution of dileptons in high-energy hadron collisions | PRD 16 (1977) 2219 | |
| 47 | D. L. Rainwater, R. Szalapski, and D. Zeppenfeld | Probing color singlet exchange in $ Z $ + two jet events at the CERN LHC | PRD 54 (1996) 6680 | hep-ph/9605444 |
| 48 | G. Cowan, K. Cranmer, E. Gross, and O. Vitells | Asymptotic formulae for likelihood-based tests of new physics | EPJC 71 (2011) 1 | 1007.1727 |
| 49 | P. D. Dauncey, M. Kenzie, N. Wardle, and G. J. Davies | Handling uncertainties in background shapes: the discrete profiling method | JINST 10 (2015) P04015 | 1408.6865 |
| 50 | CMS Collaboration | CMS luminosity measurements for the 2016 data taking period | CMS-PAS-LUM-17-001 | CMS-PAS-LUM-17-001 |
| 51 | CMS Collaboration | Measurement of the inclusive $ W $ and $ Z $ production cross sections in pp collisions at $ \sqrt{s}= $ 7 TeV | JHEP 10 (2011) 132 | CMS-EWK-10-005 1107.4789 |
| 52 | CMS Collaboration | Identification of b-quark jets with the CMS experiment | JINST 8 (2013) P04013 | CMS-BTV-12-001 1211.4462 |
| 53 | CMS Collaboration | Performance of missing energy reconstruction in 13 TeV pp collision data using the CMS detector | CMS-PAS-JME-16-004 | CMS-PAS-JME-16-004 |
| 54 | F. Demartin et al. | The impact of PDF and $ \alpha_S $ uncertainties on Higgs production in gluon fusion at hadron colliders | PRD 82 (2010) 014002 | 1004.0962 |
| 55 | S. Carrazza et al. | An unbiased Hessian representation for Monte Carlo PDFs | EPJC 75 (2015) 369 | 1505.06736 |
| 56 | ATLAS and CMS Collaborations | Combined measurement of the Higgs boson mass in $ pp $ collisions at $ \sqrt{s}= $ 7 and 8 TeV with the ATLAS and CMS experiments | PRL 114 (2015) 191803 | 1503.07589 |
| 57 | LHC Higgs Cross Section Working Group | Handbook of LHC Higgs cross sections: 3. Higgs Properties | CERN (2013) | 1307.1347 |
|
|
Compact Muon Solenoid LHC, CERN |
|

|

|

|

|

|