

Compact Muon Solenoid
LHC, CERN
| CMS-HIG-18-024 ; CERN-EP-2020-061 | ||
| Search for a light pseudoscalar Higgs boson in the boosted $\mu\mu\tau\tau$ final state in proton-proton collisions at $\sqrt{s} = $ 13 TeV | ||
| CMS Collaboration | ||
| 18 May 2020 | ||
| JHEP 08 (2020) 139 | ||
| Abstract: A search for a light pseudoscalar Higgs boson (a) decaying from the 125 GeV (or a heavier) scalar Higgs boson (H) is performed using the 2016 LHC proton-proton collision data at $\sqrt{s} = $ 13 TeV, corresponding to an integrated luminosity of 35.9 fb$^{-1}$, collected by the CMS experiment. The analysis considers gluon fusion and vector boson fusion production of the H, followed by the decay $\mathrm{H}\to\mathrm{a}\mathrm{a}\to\mu\mu\tau\tau$, and considers pseudoscalar masses in the range 3.6 $ < {m_{\mathrm{a}}} < $ 21 GeV. Because of the large mass difference between the H and the a bosons and the small masses of the a boson decay products, both the $\mu\mu$ and the $\tau\tau$ pairs have high Lorentz boost and are collimated. The $\tau\tau$ reconstruction efficiency is increased by modifying the standard technique for hadronic $\tau$ lepton decay reconstruction to account for a nearby muon. No significant signal is observed. Model-independent limits are set at 95% confidence level, as a function of ${m_{\mathrm{a}}}$, on the branching fraction (${\mathcal{B}}$) for $\mathrm{H}\to\mathrm{a}\mathrm{a}\to\mu\mu\tau\tau$, down to 1.5 (2.0) $\times$ 10$^{-4}$ for ${m_{\mathrm{H}}} =$ 125 (300) GeV. Model-dependent limits on ${\mathcal{B}}(\mathrm{H}\to\mathrm{a}\mathrm{a})$ are set within the context of two Higgs doublets plus singlet models, with the most stringent results obtained for Type-III models. These results extend current LHC searches for heavier a bosons that decay to resolved lepton pairs and provide the first such bounds for an H boson with a mass above 125 GeV. | ||
| Links: e-print arXiv:2005.08694 [hep-ex] (PDF) ; CDS record ; inSPIRE record ; CADI line (restricted) ; | ||
| Figures | |
png pdf |
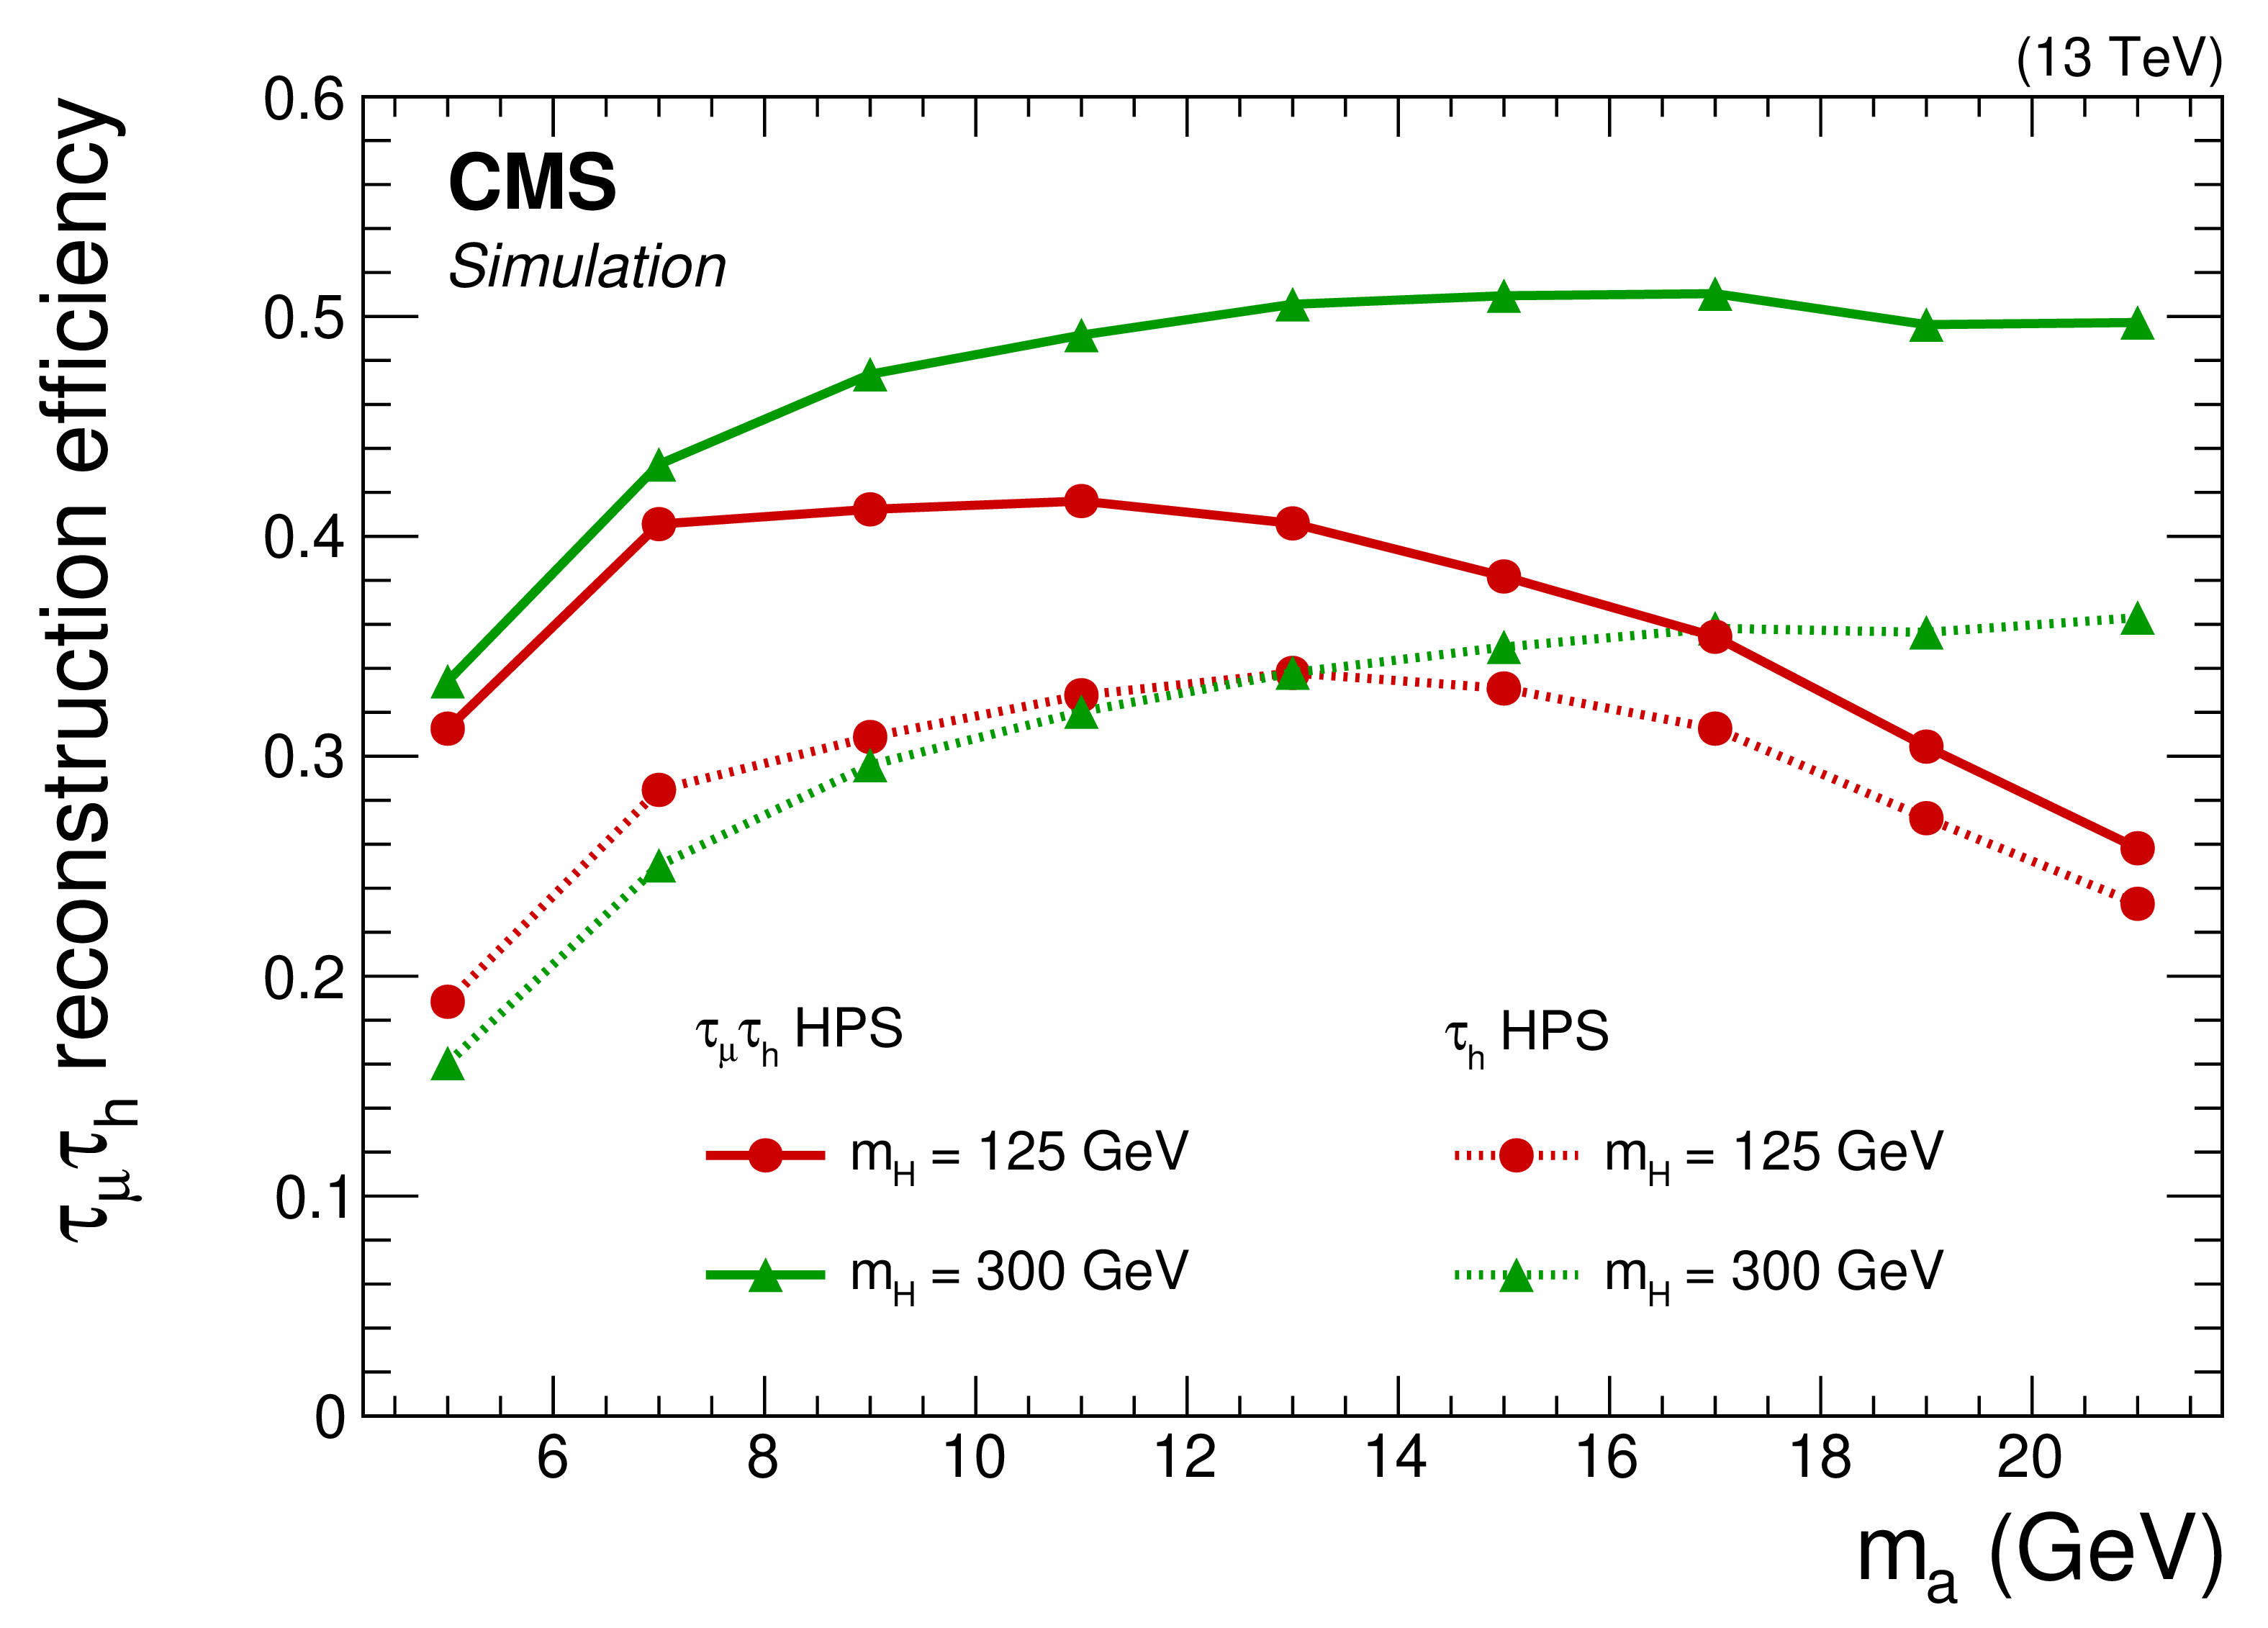
Figure 1:
The efficiency of the standard HPS (dashed lines) and $ {\tau _{\mu}} {\tau _{\mathrm{h}}} $ HPS reconstruction used in this search (solid lines) as a function of pseudoscalar boson mass for $ {m_{\mathrm{H}}} =$ 125 (red) and 300 GeV (green). The events are required to have two reconstructed muons passing identification and isolation criteria. The efficiency is measured by additionally requiring a third muon passing identification requirements and a ${\tau _{\mathrm{h}}}$ candidate reconstructed using either the standard HPS algorithm or the $ {\tau _{\mu}} {\tau _{\mathrm{h}}} $ HPS algorithm and passing isolation requirements. |
png pdf |
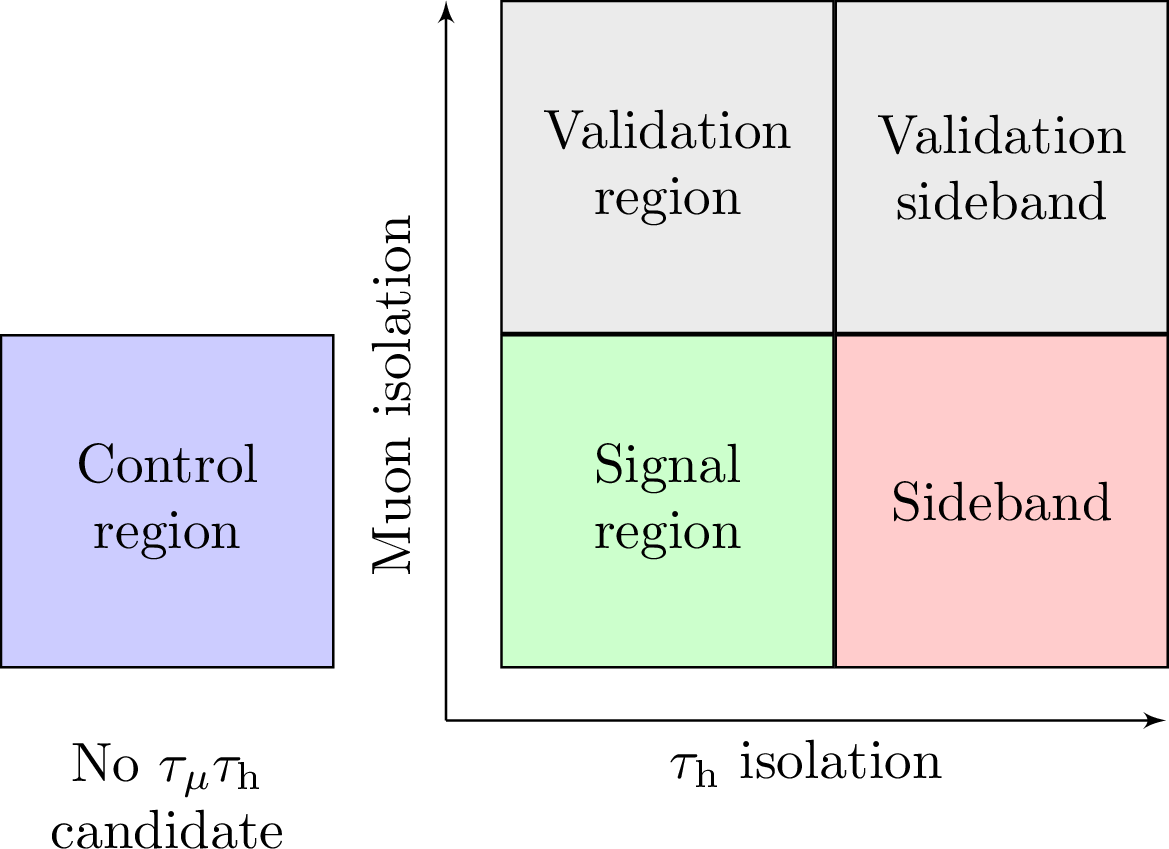
Figure 2:
Schematic of the fit regions in the analysis. Events with two isolated muons and no $ {\tau _{\mu}} {\tau _{\mathrm{h}}} $ candidates constitute the control region (blue). Events that have a $ {\tau _{\mu}} {\tau _{\mathrm{h}}} $ candidate are further divided based on the isolation of the ${\tau _{\mathrm{h}}}$ candidate with isolated $ {\tau _{\mu}} {\tau _{\mathrm{h}}} $ candidates forming the signal region (green) and the remaining $ {\tau _{\mu}} {\tau _{\mathrm{h}}} $ candidates forming the sideband (red). Additionally, the $\mu \mu $ candidates that fail the muon isolation selection form two analogous regions for the validation of the background fit model (gray). |
png pdf |
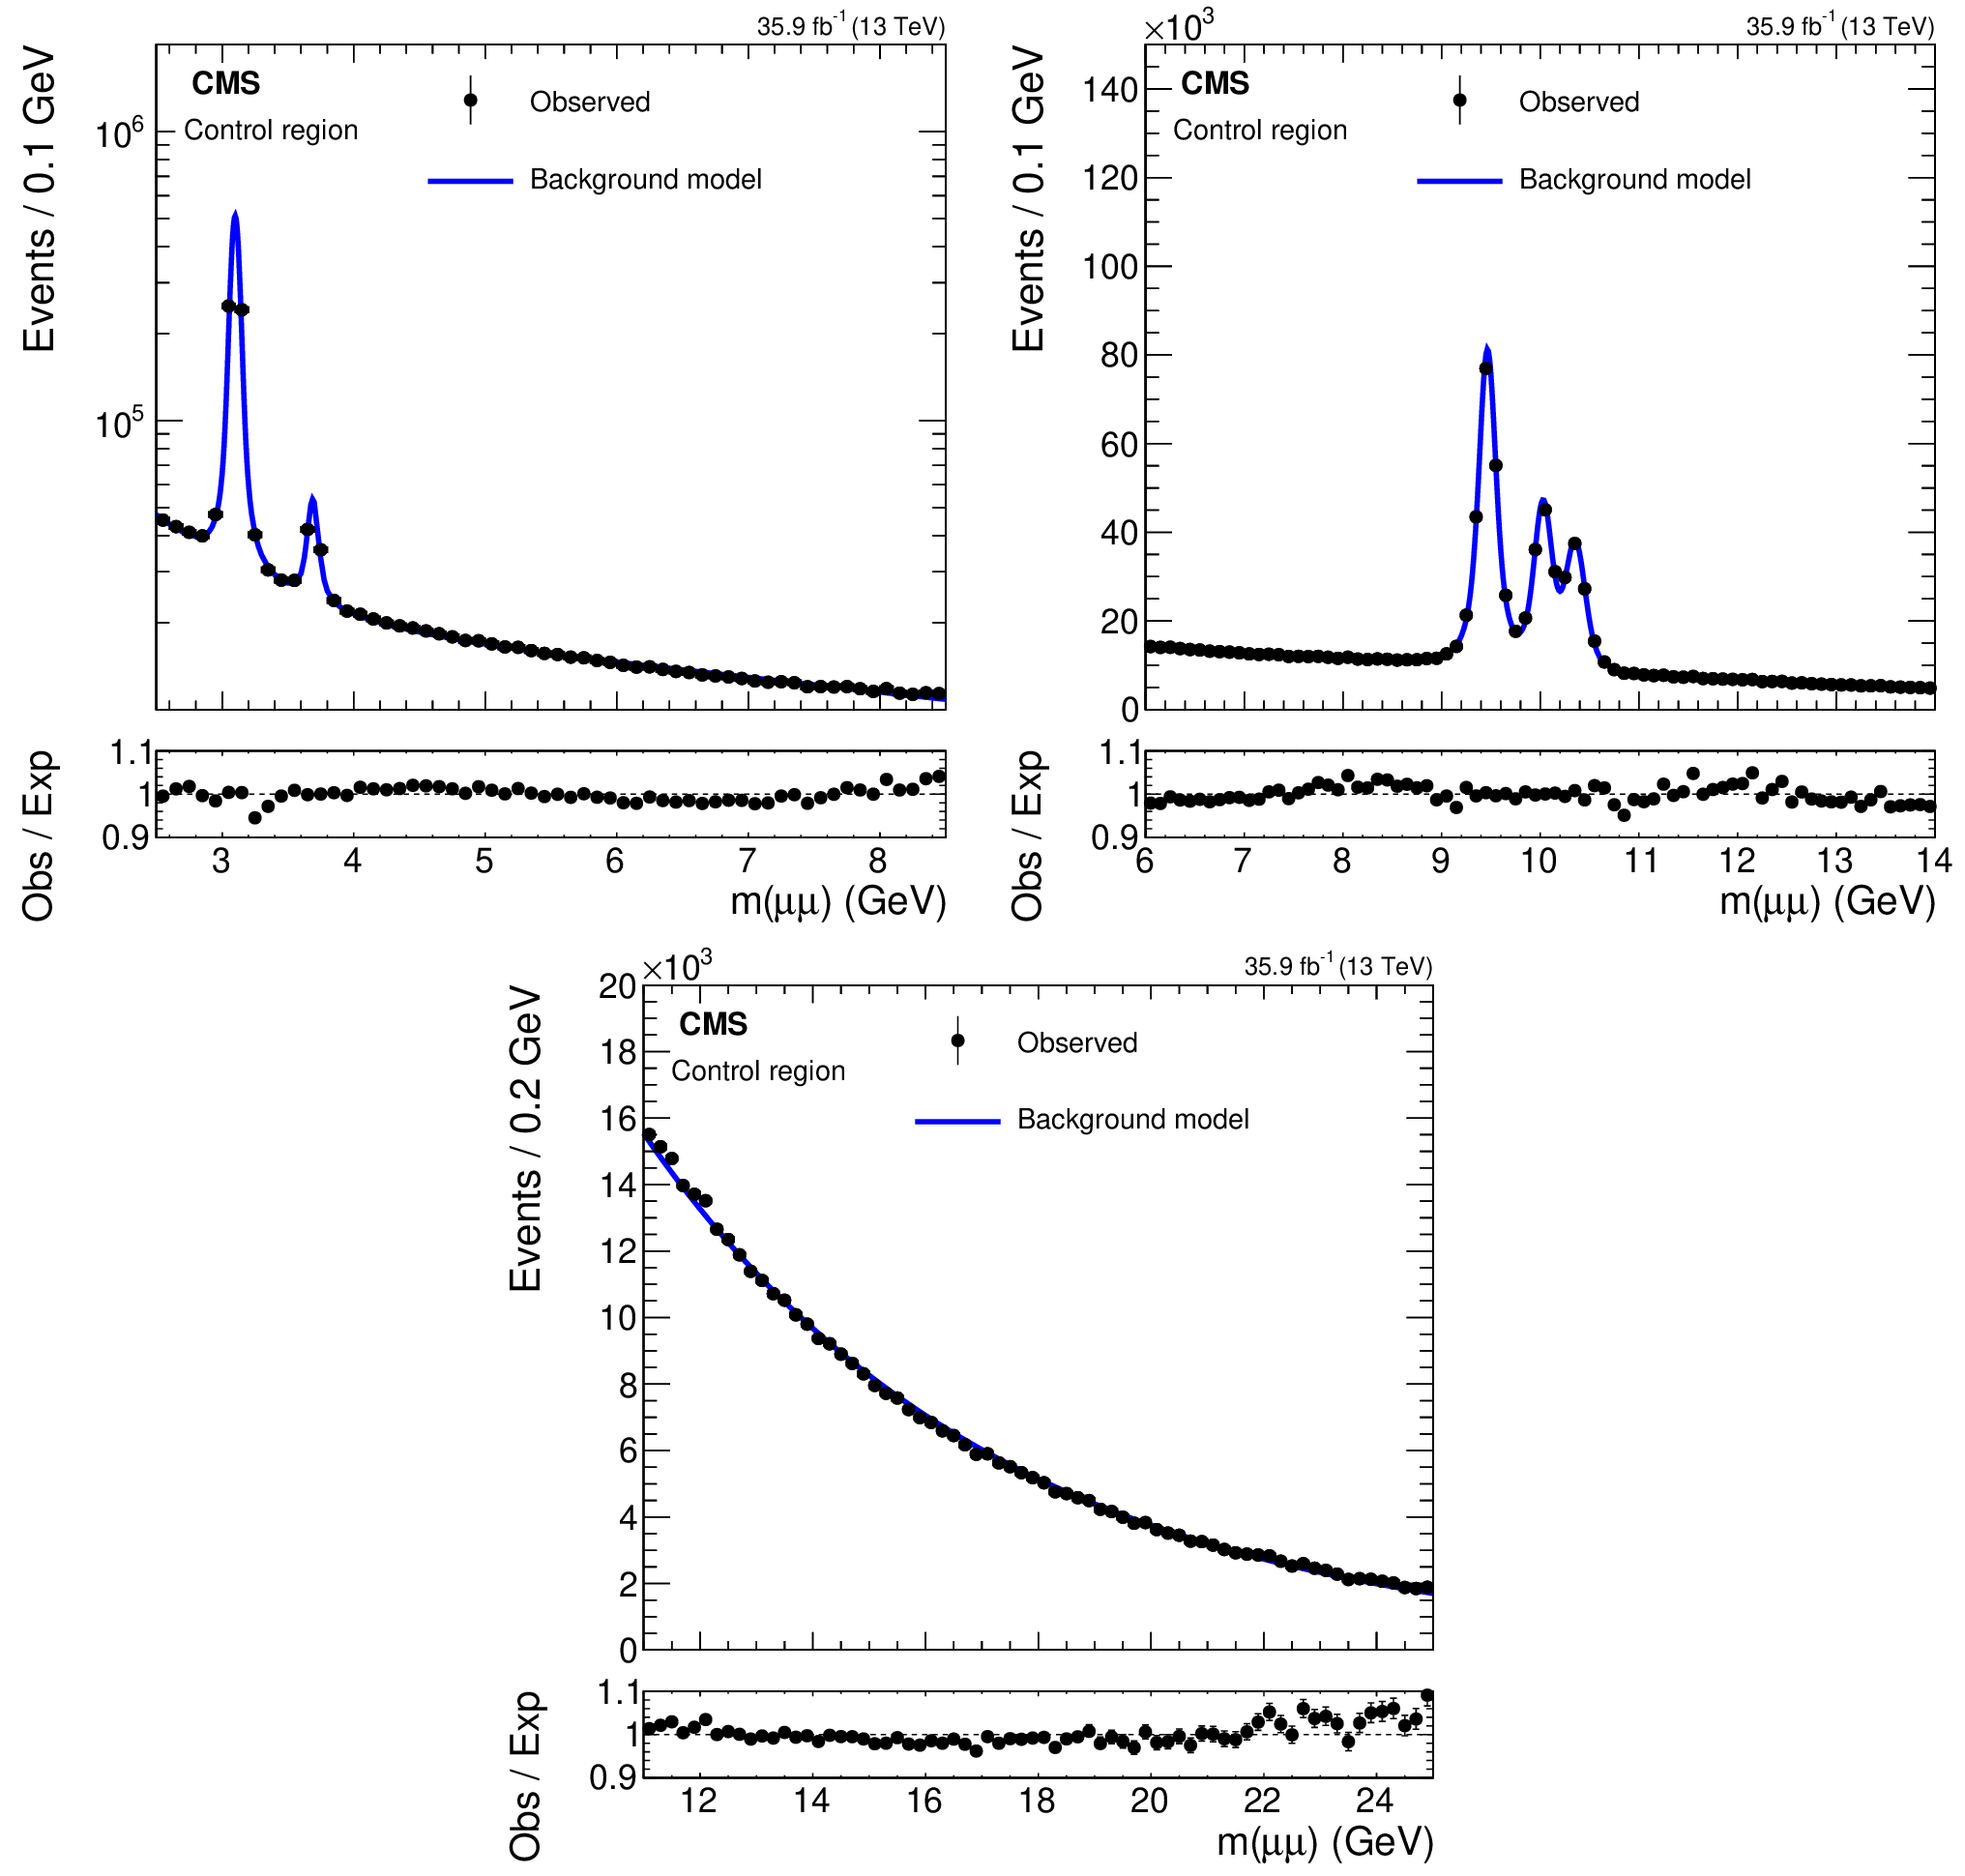
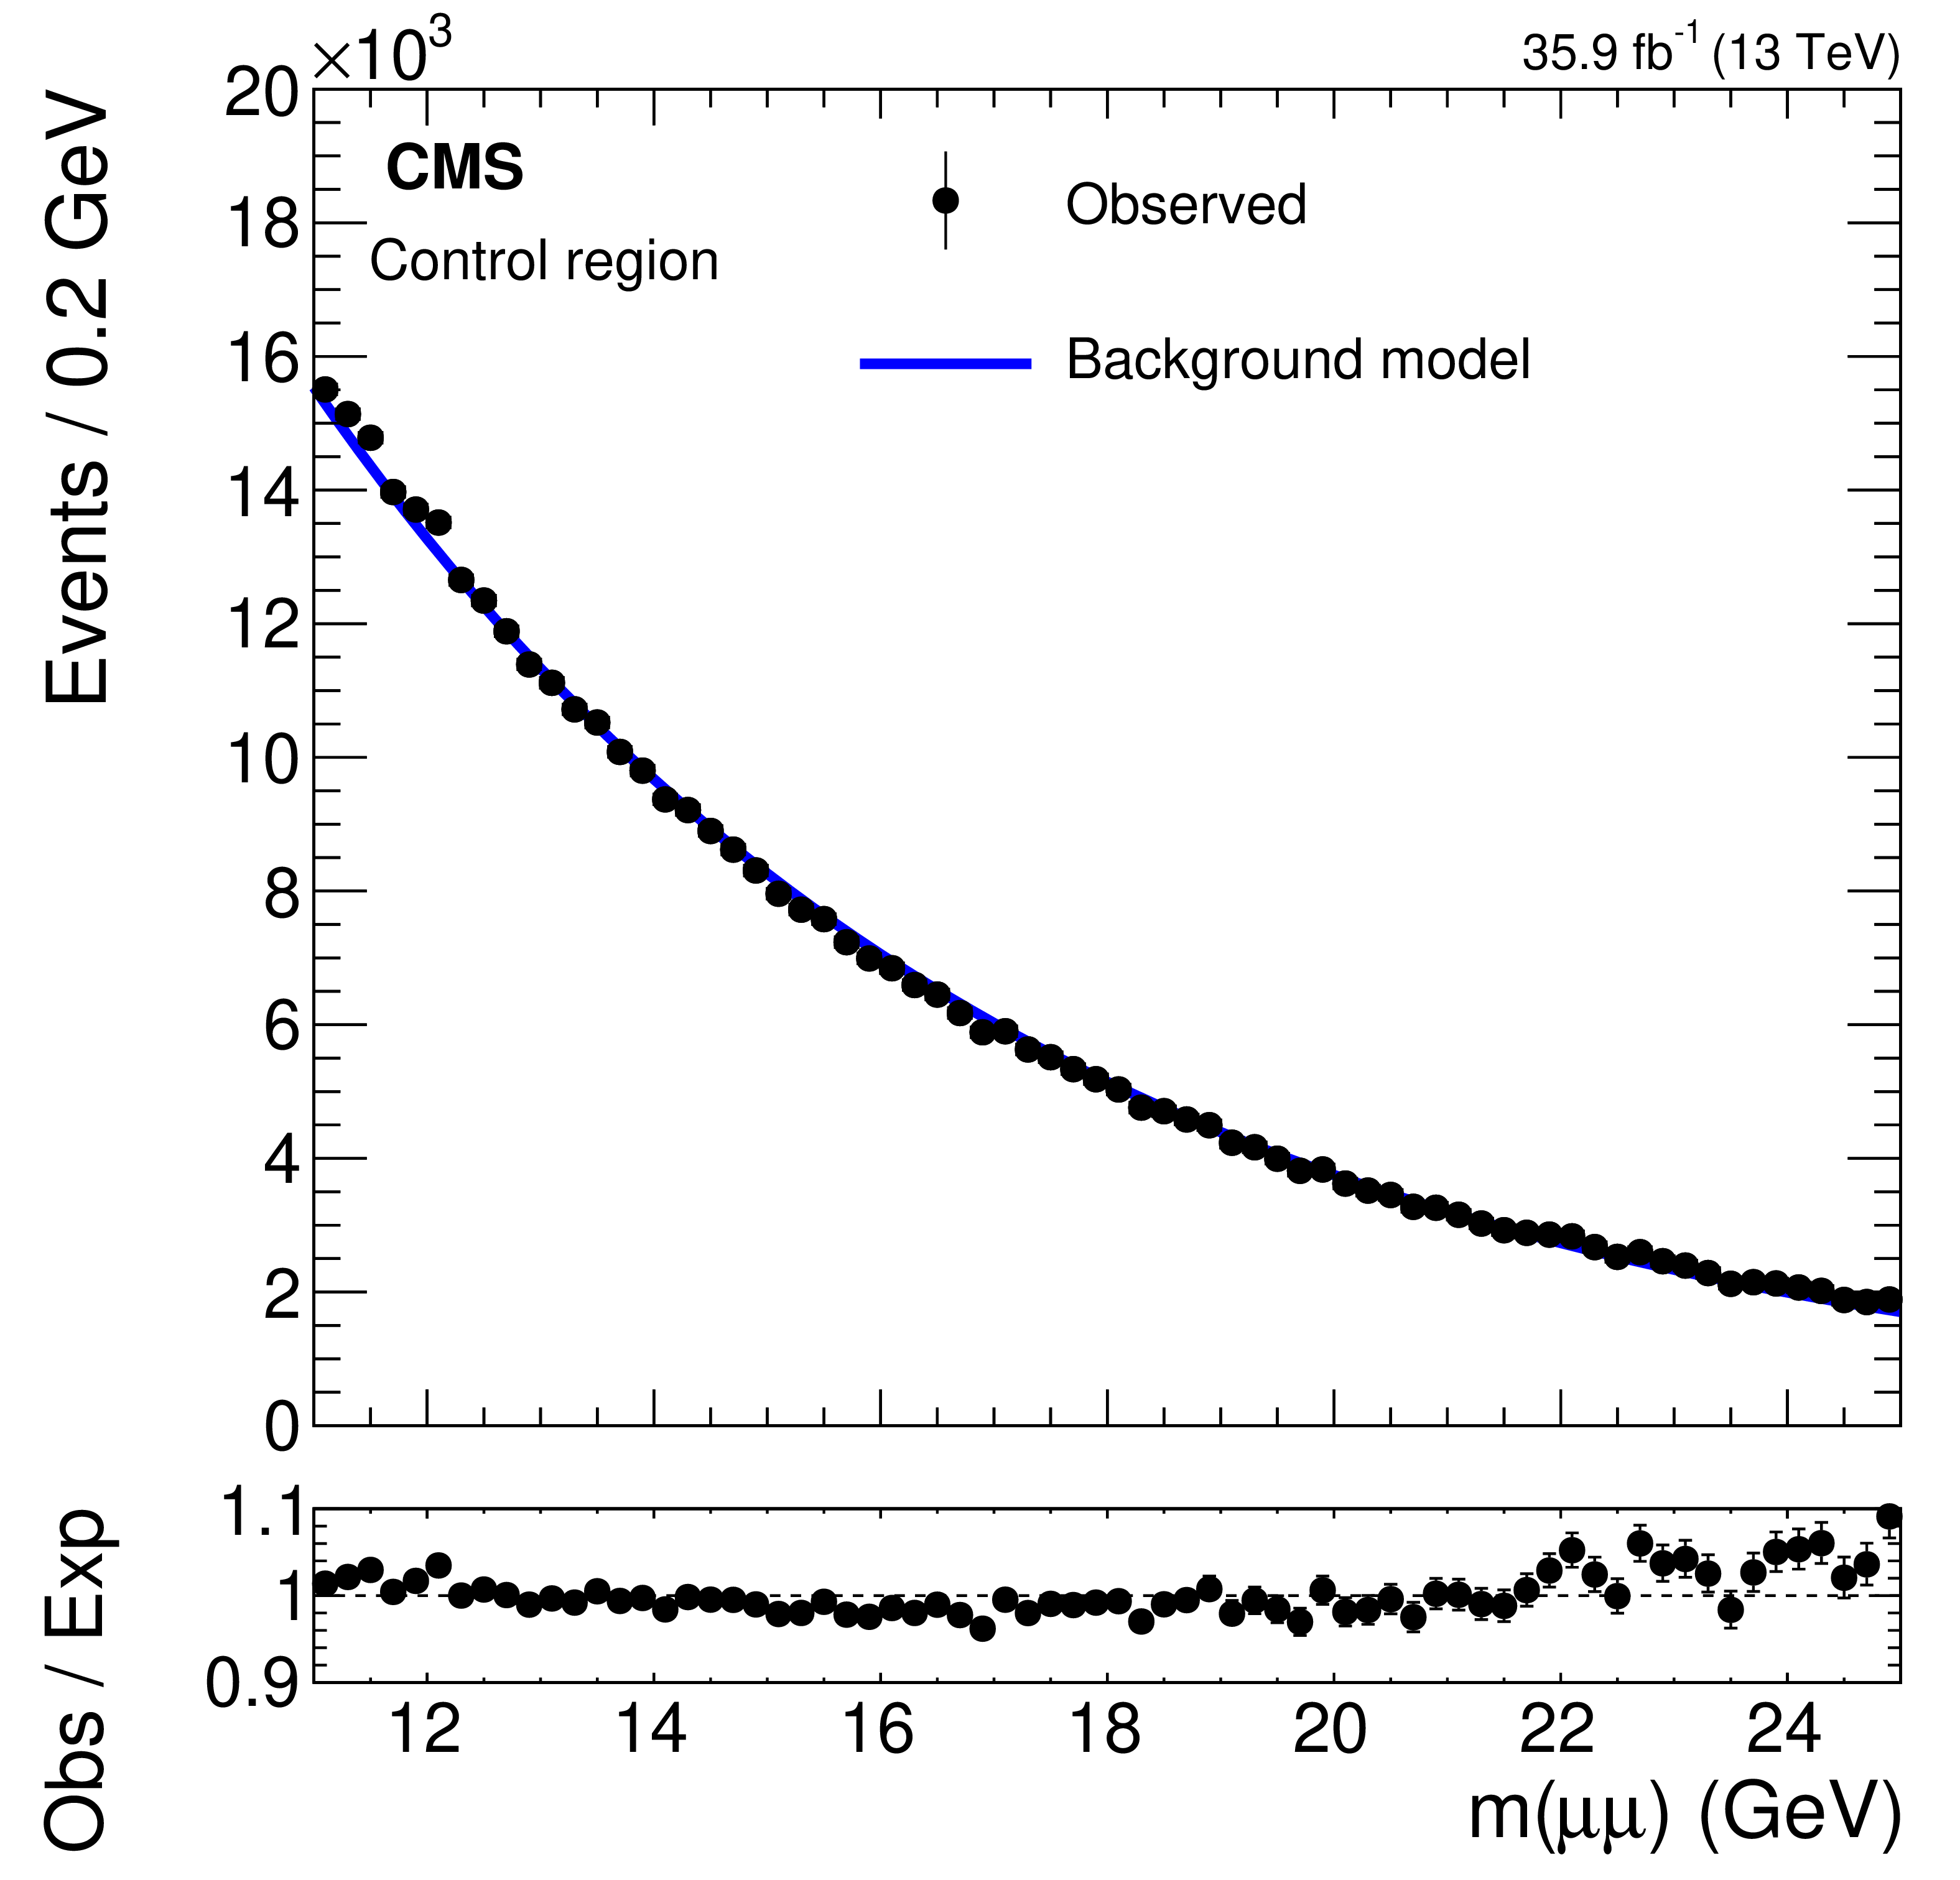
Figure 3:
Background model fits and observed data in the control region ${m(\mu \mu)}$ distribution. The figures are divided into three fit ranges: 2.5 $ < {m(\mu \mu)} < $ 8.5 GeV (left), 6 $ < {m(\mu \mu)} < $ 14 GeV (middle), and 11 $ < {m(\mu \mu)} < $ 25 GeV (right). |
png pdf |
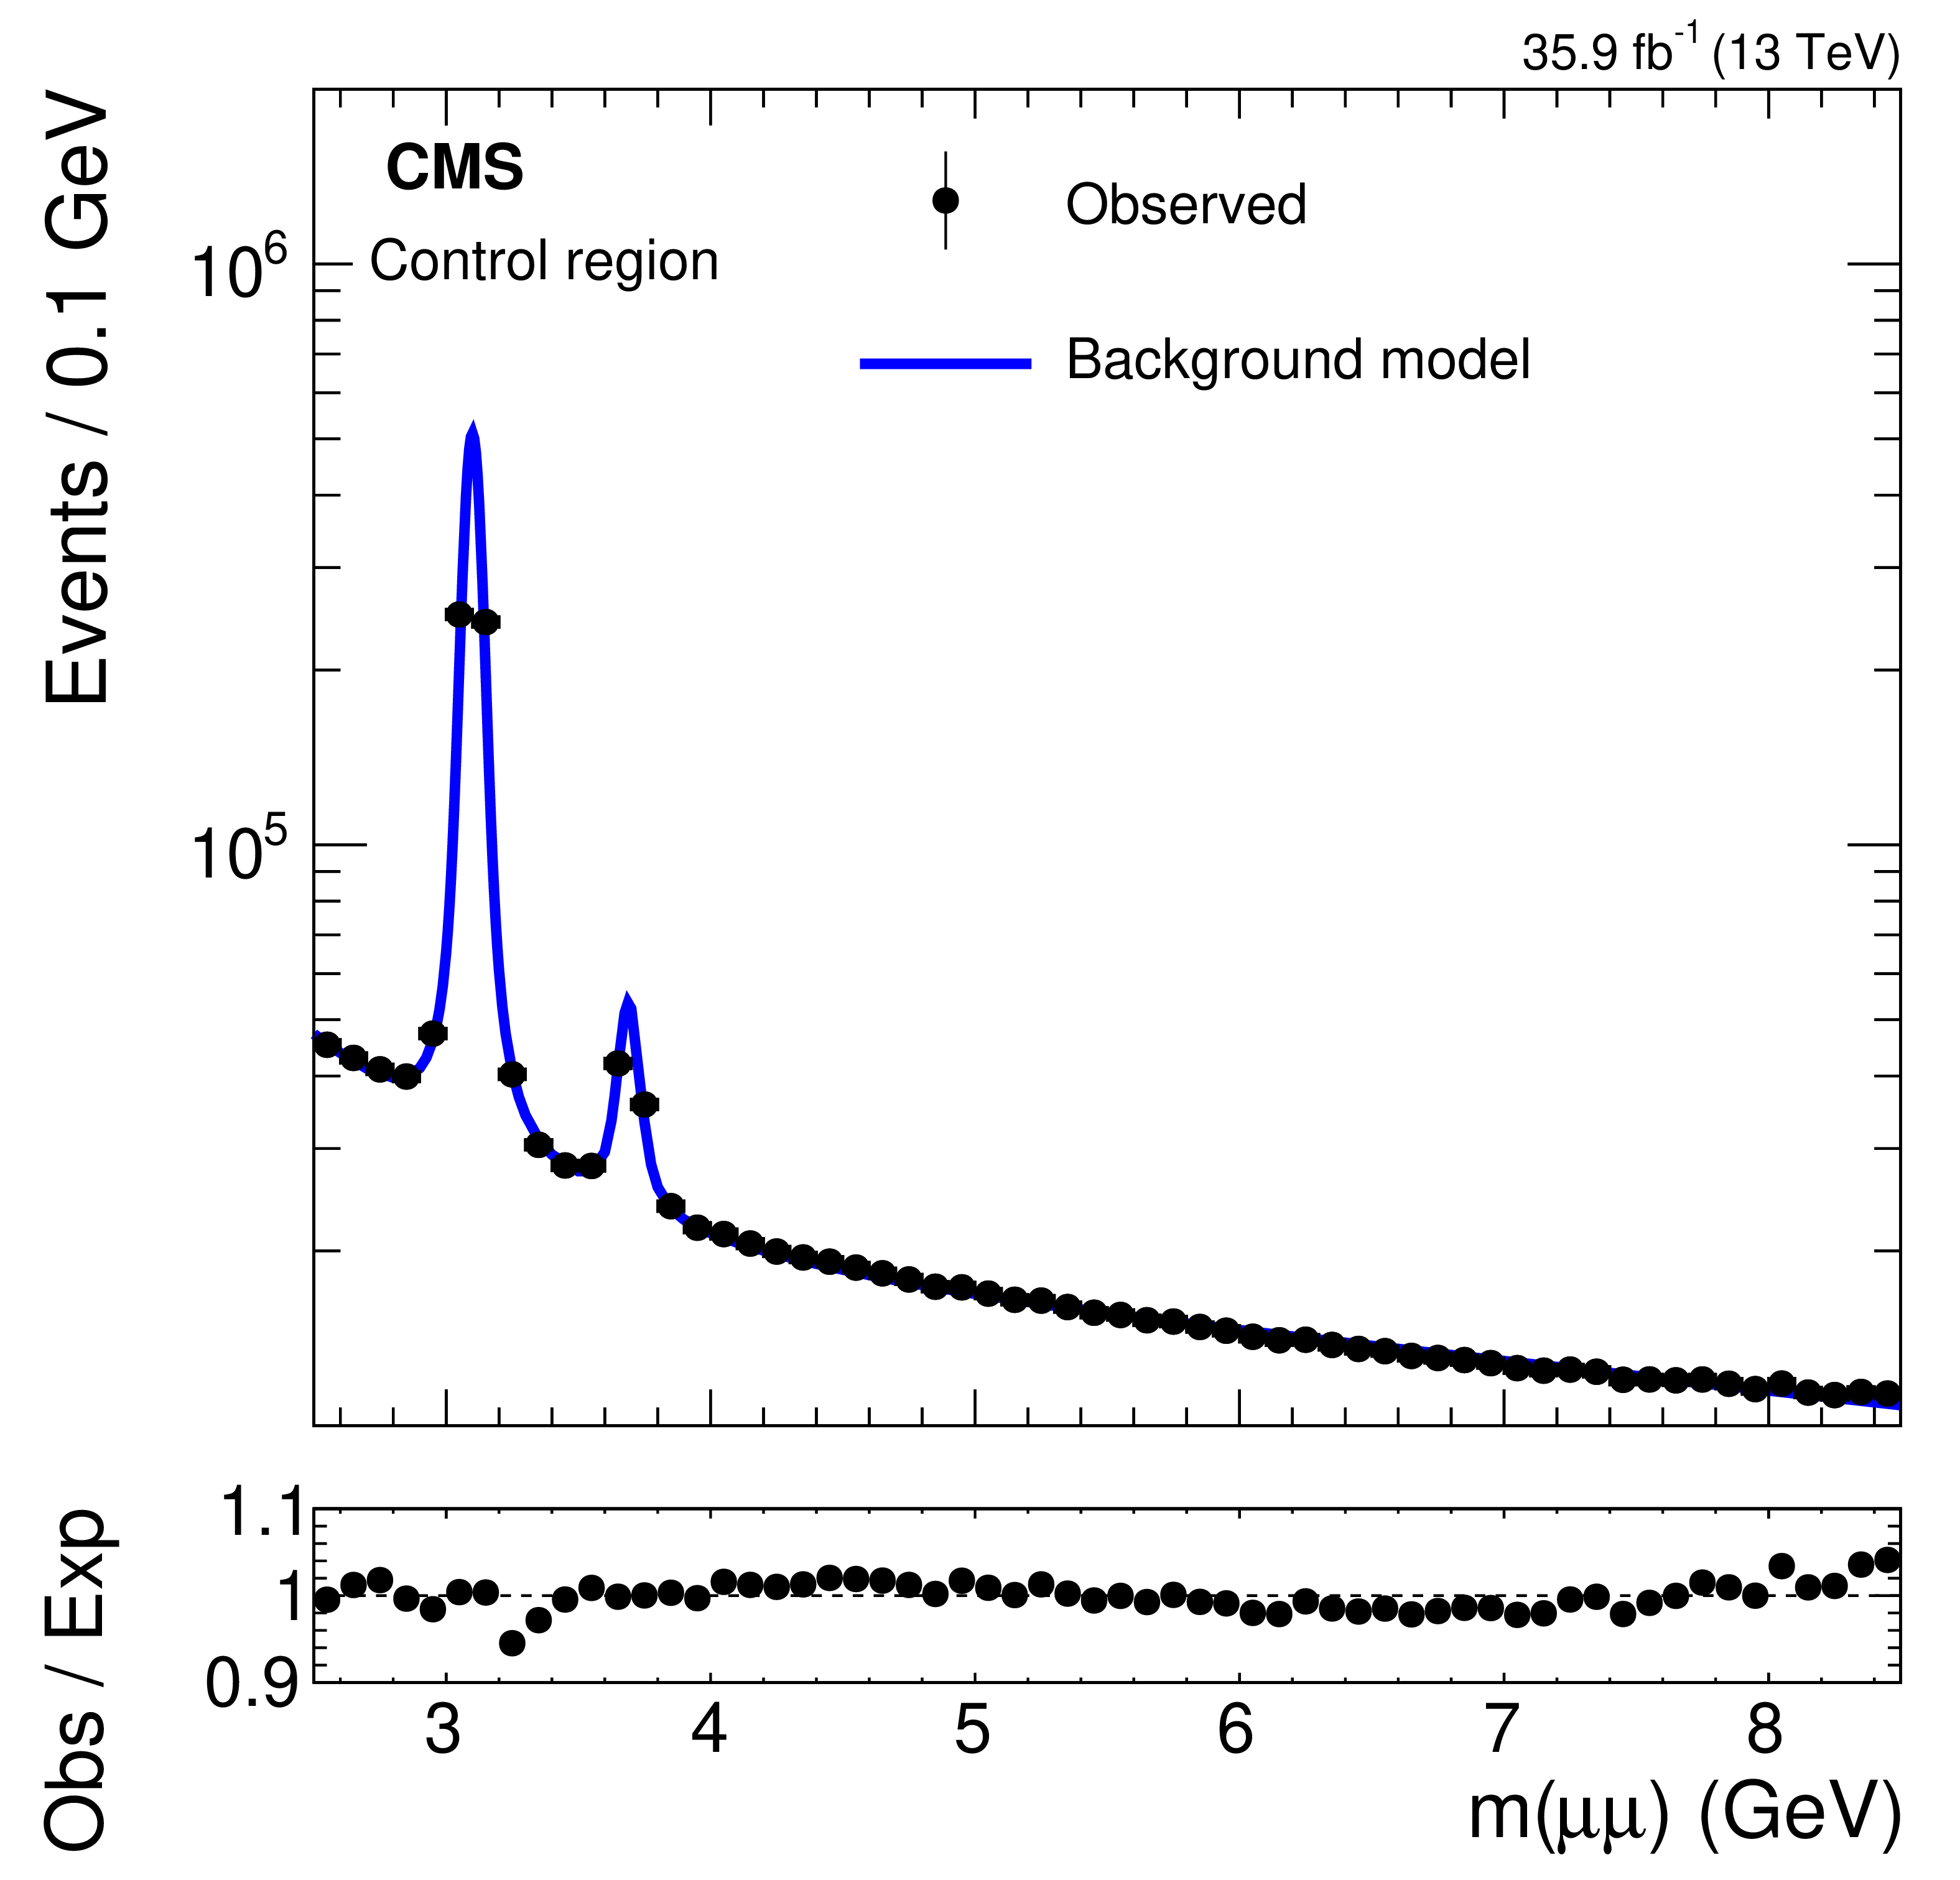
Figure 3-a:
Background model fit and observed data in the control region ${m(\mu \mu)}$ distribution, in the fit range 2.5 $ < {m(\mu \mu)} < $ 8.5 GeV. |

png pdf |
Figure 3-b:
Background model fit and observed data in the control region ${m(\mu \mu)}$ distribution, in the fit range 6 $ < {m(\mu \mu)} < $ 14 GeV. |
png pdf |
Figure 3-c:
Background model fit and observed data in the control region ${m(\mu \mu)}$ distribution, in the fit range 11 $ < {m(\mu \mu)} < $ 25 GeV. |

png pdf |
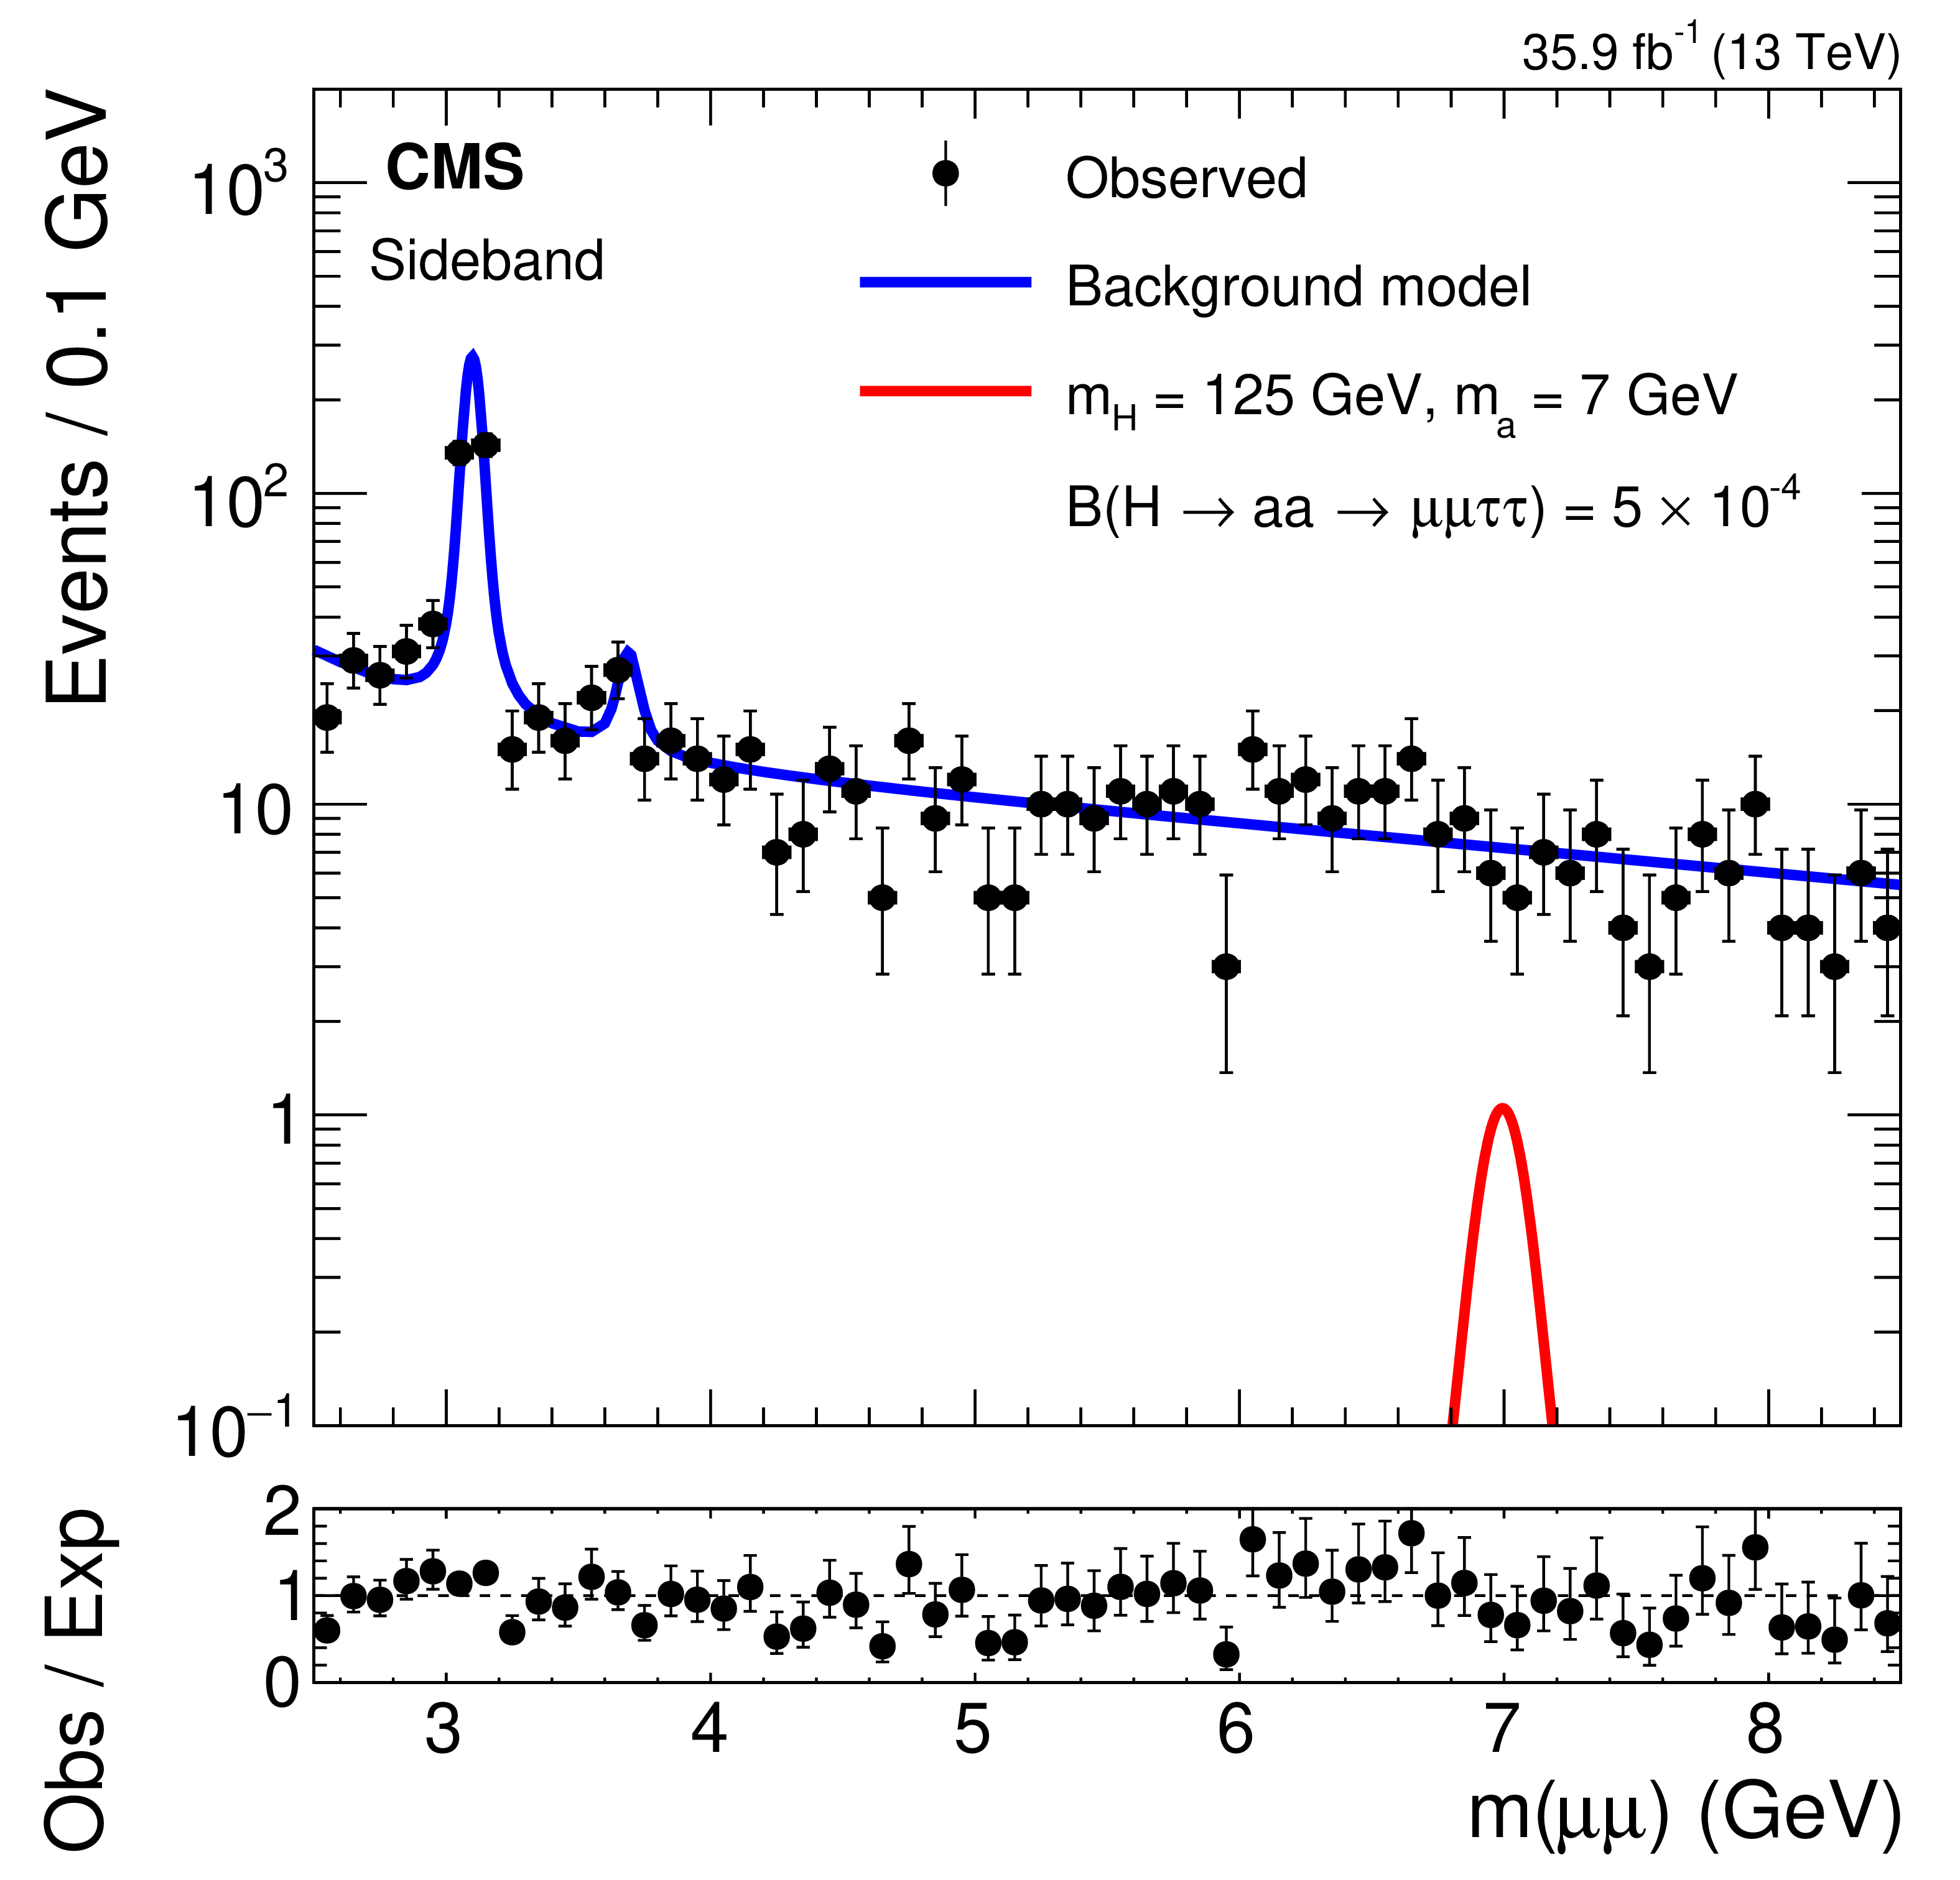
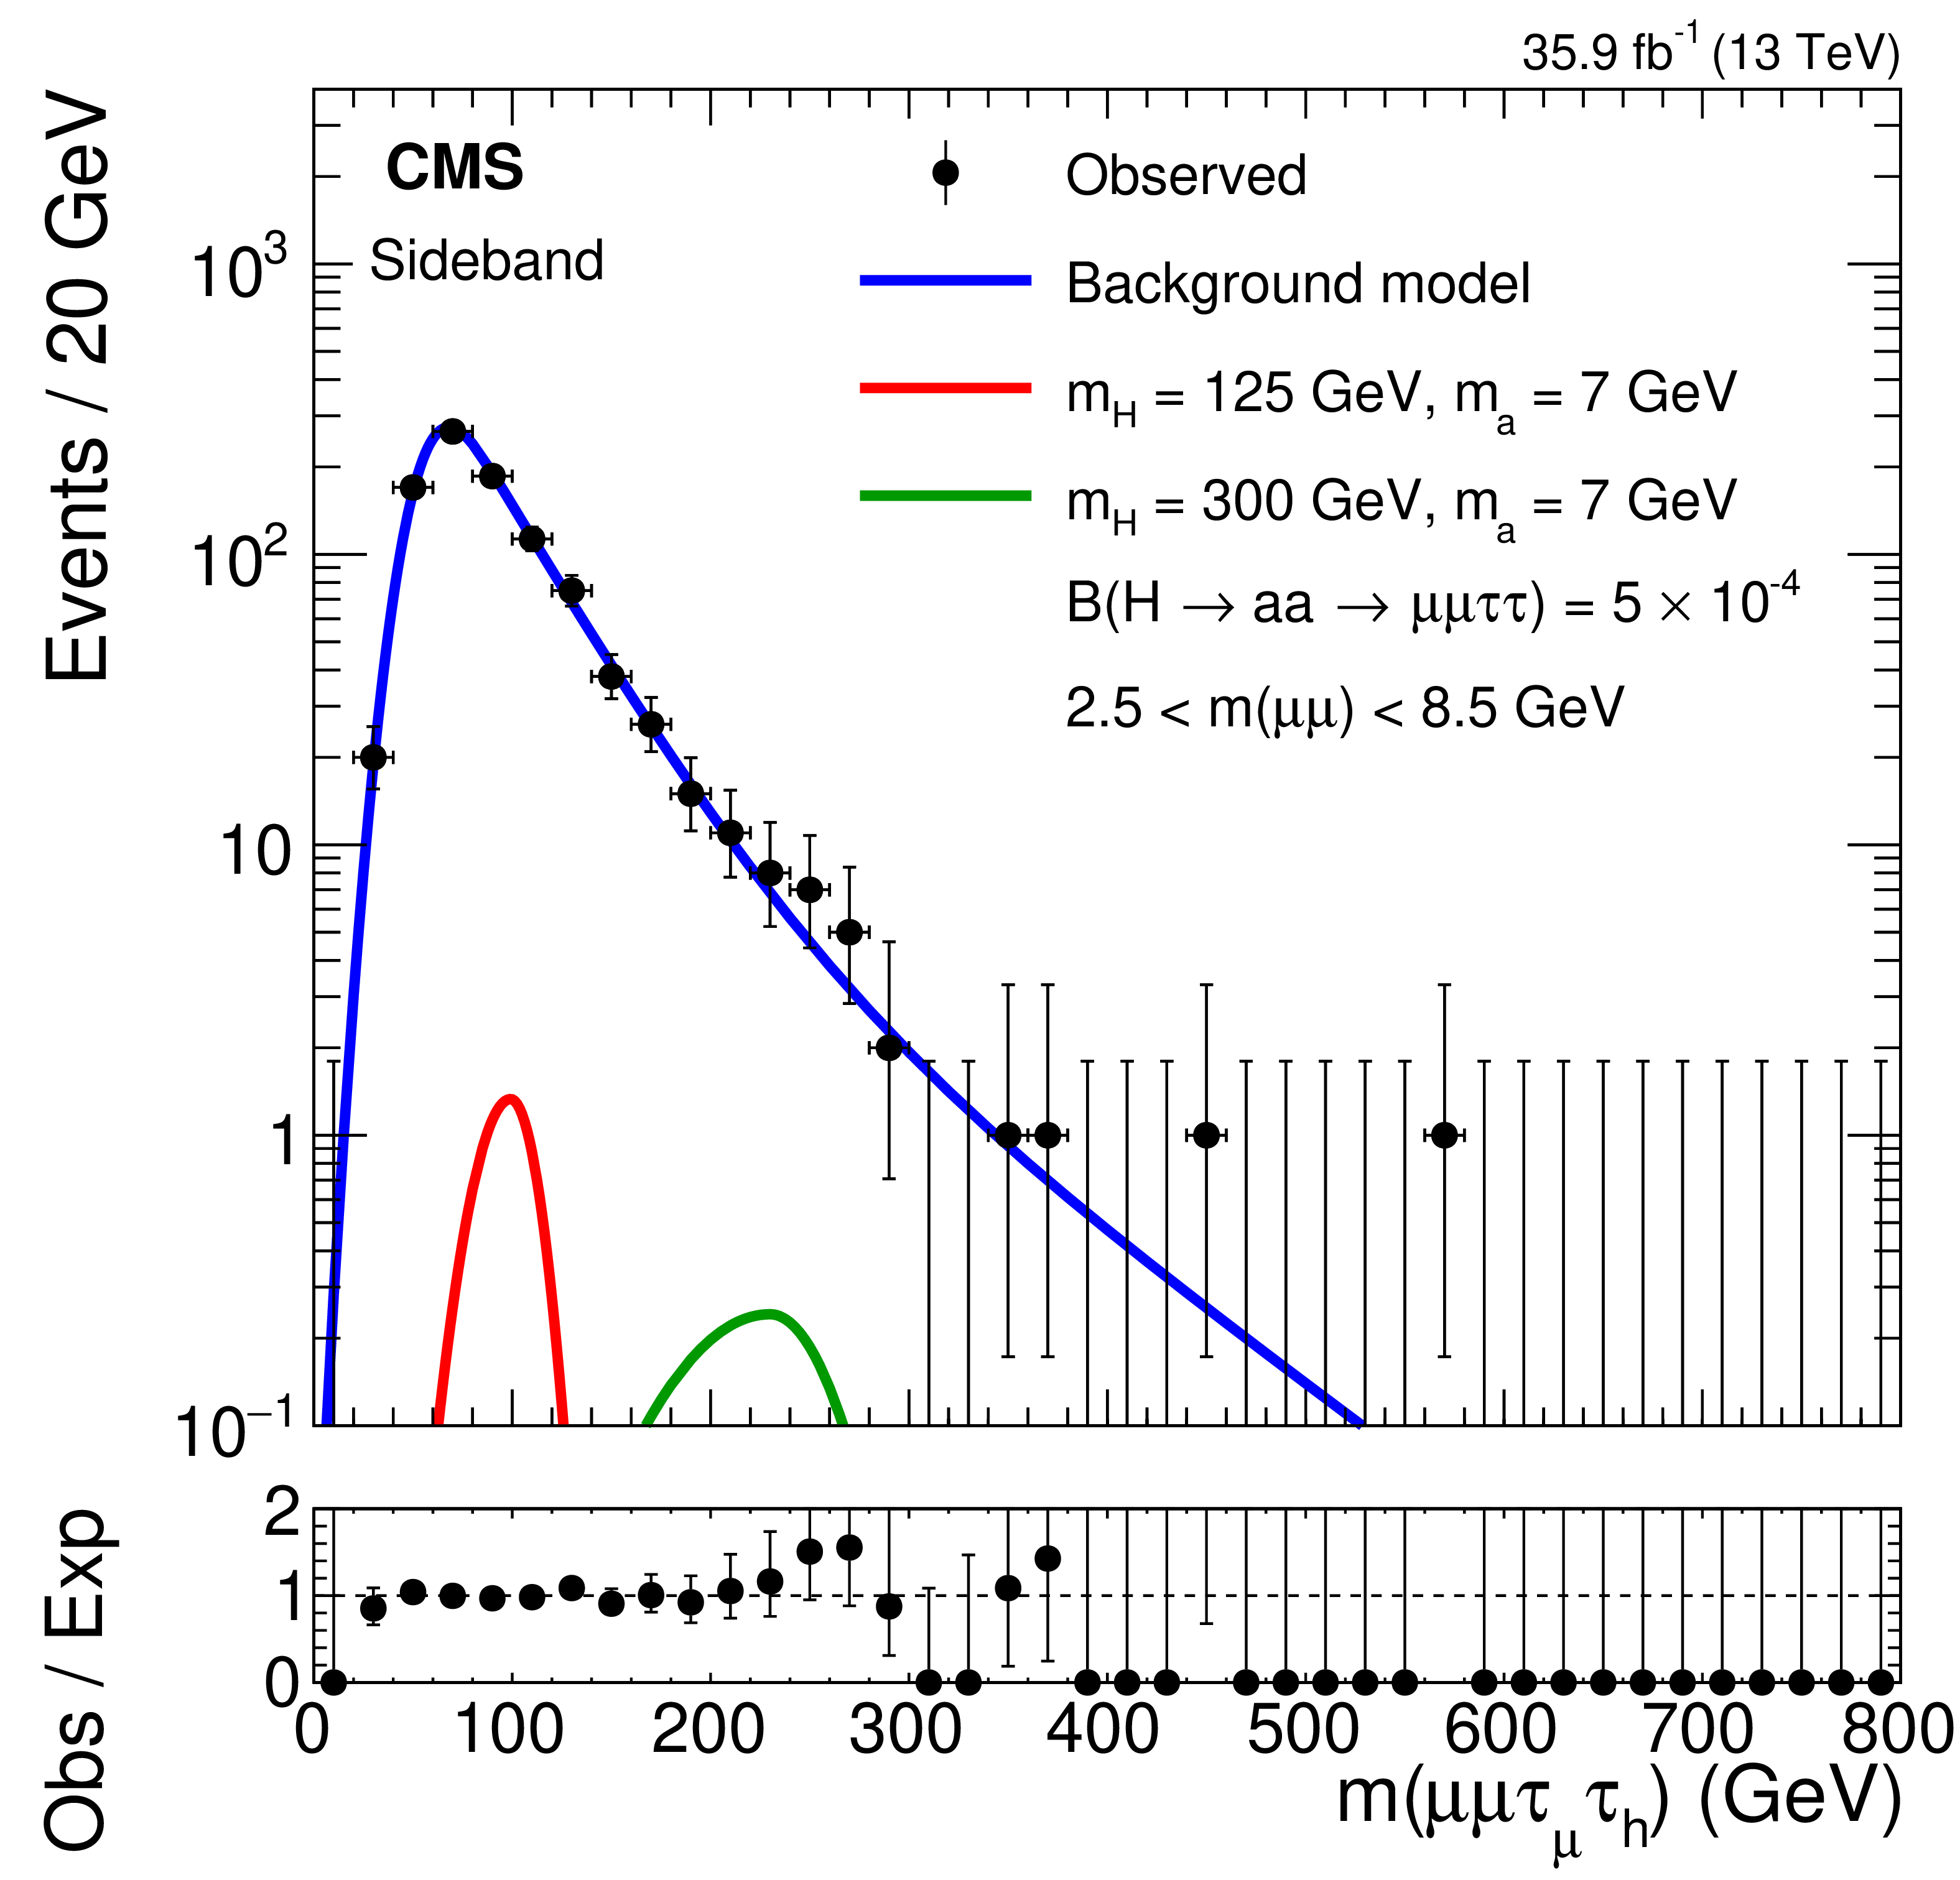
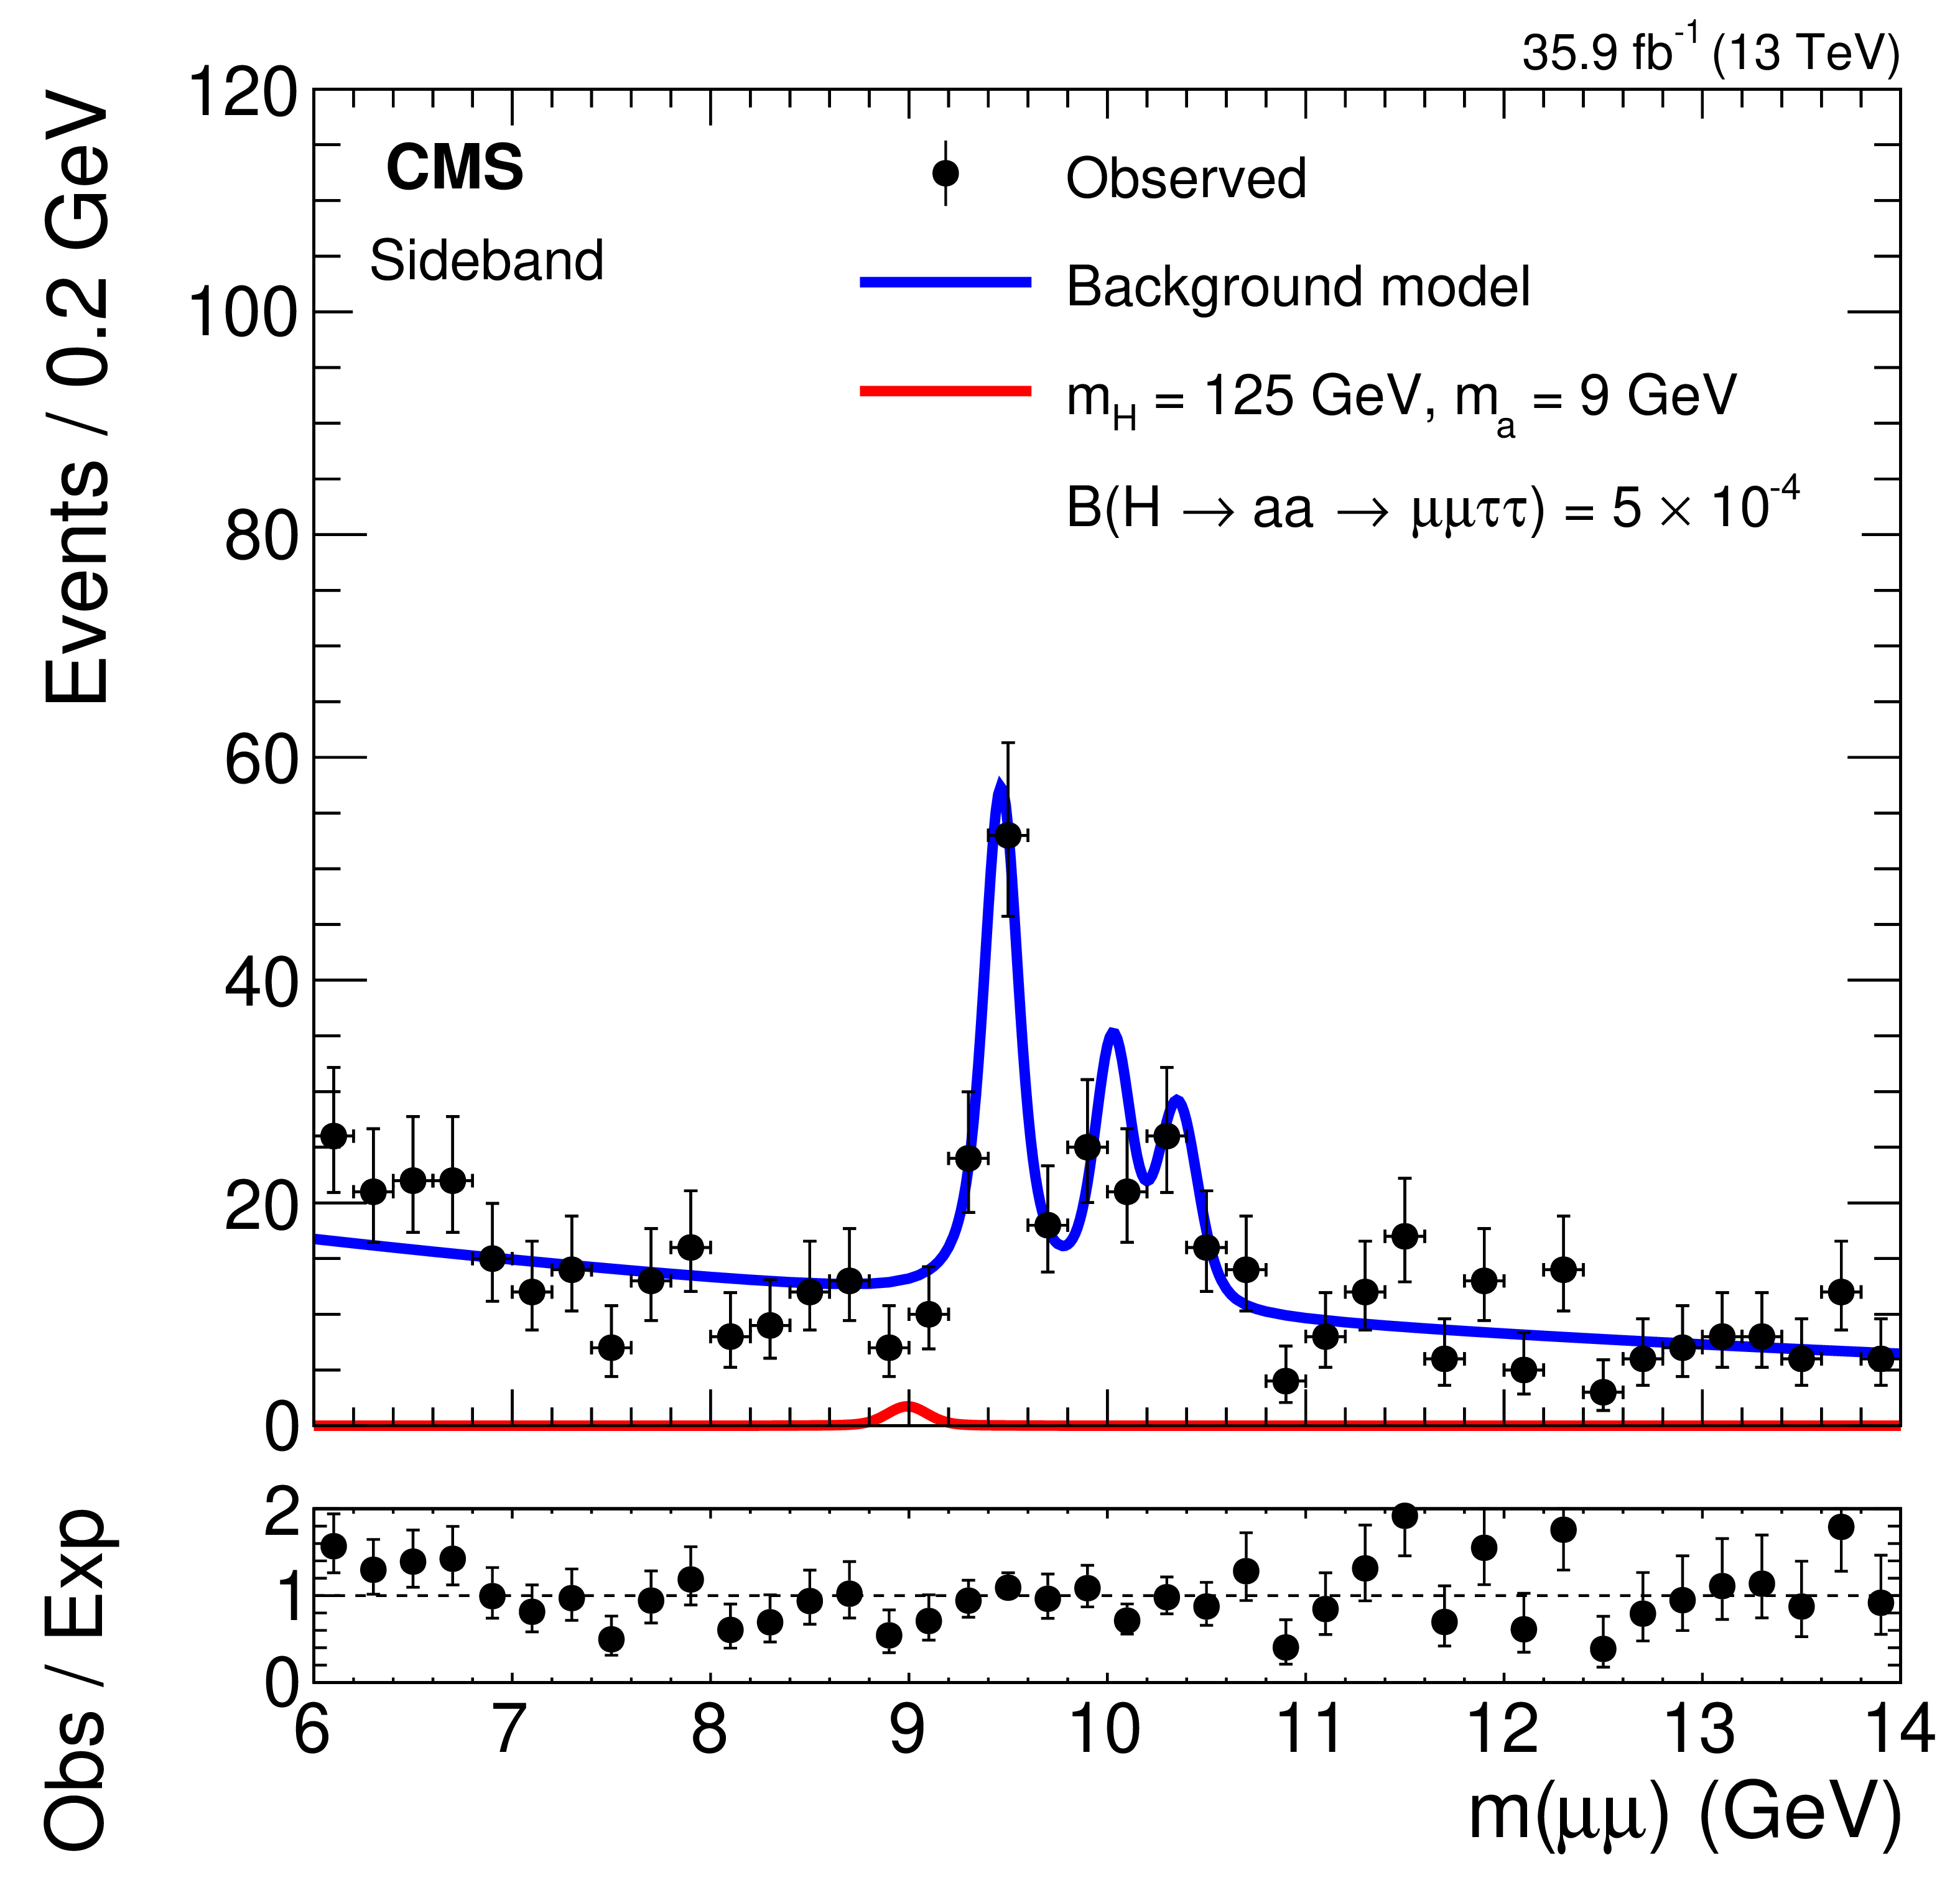
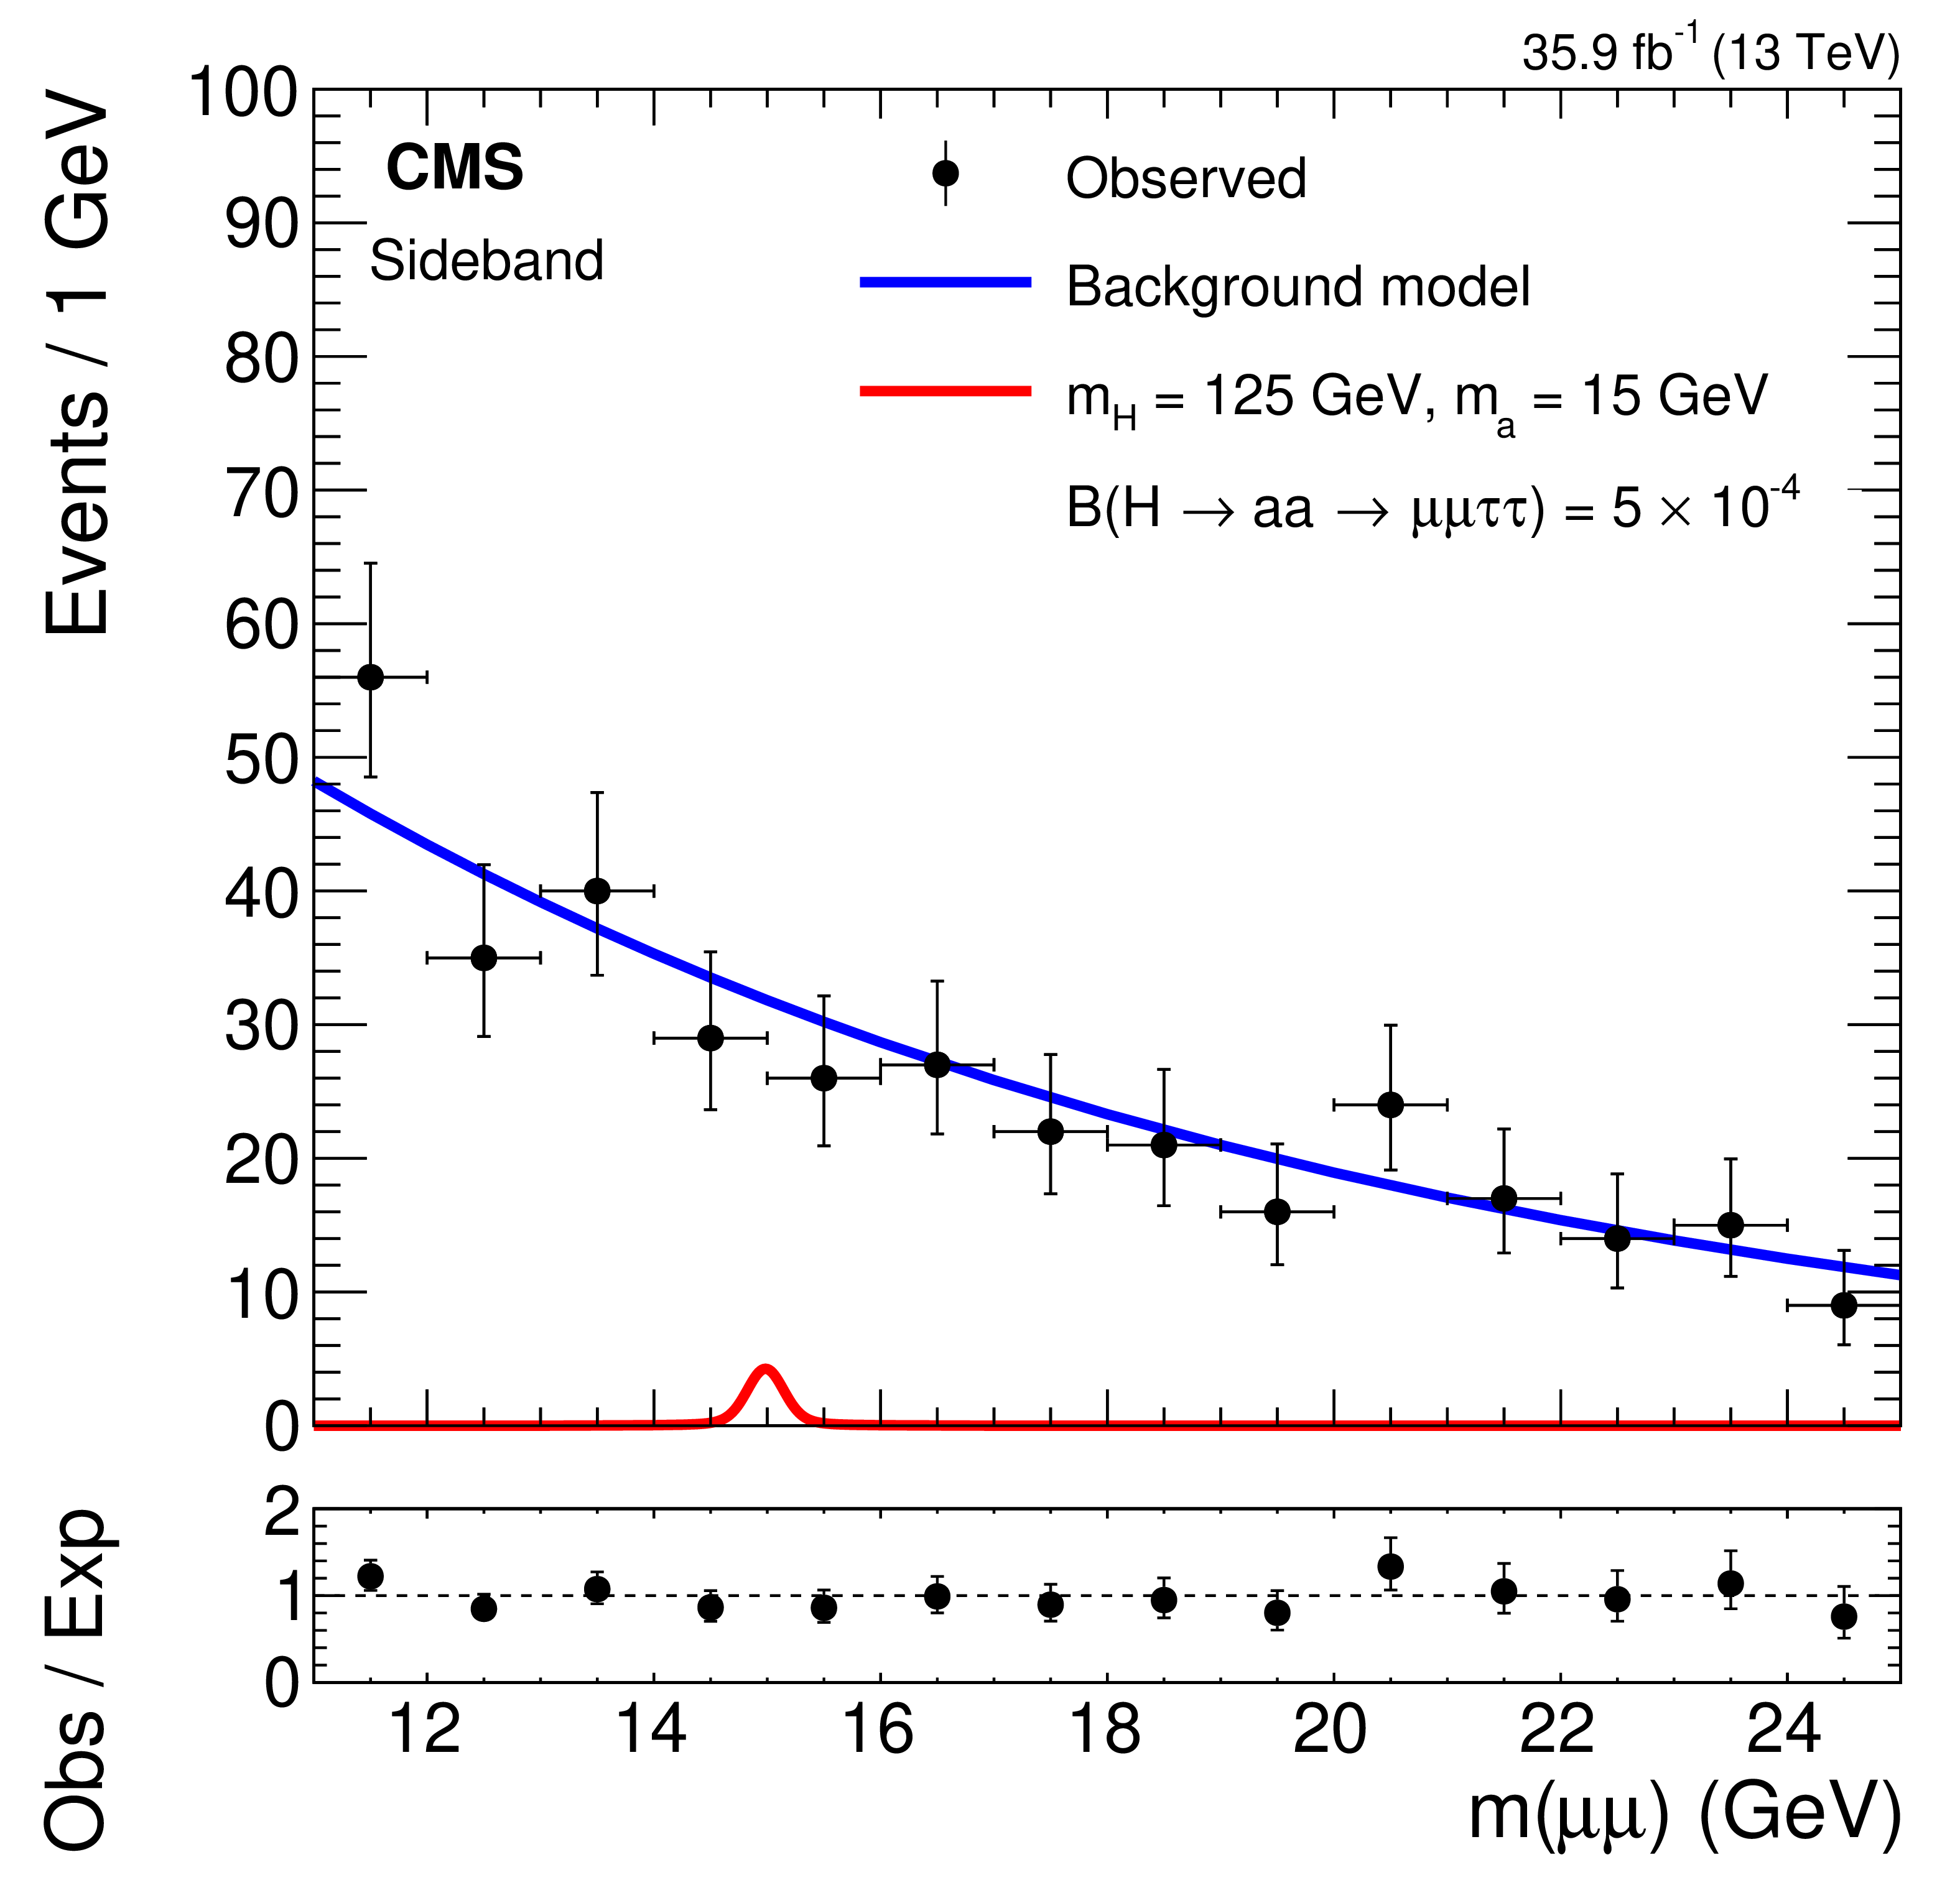
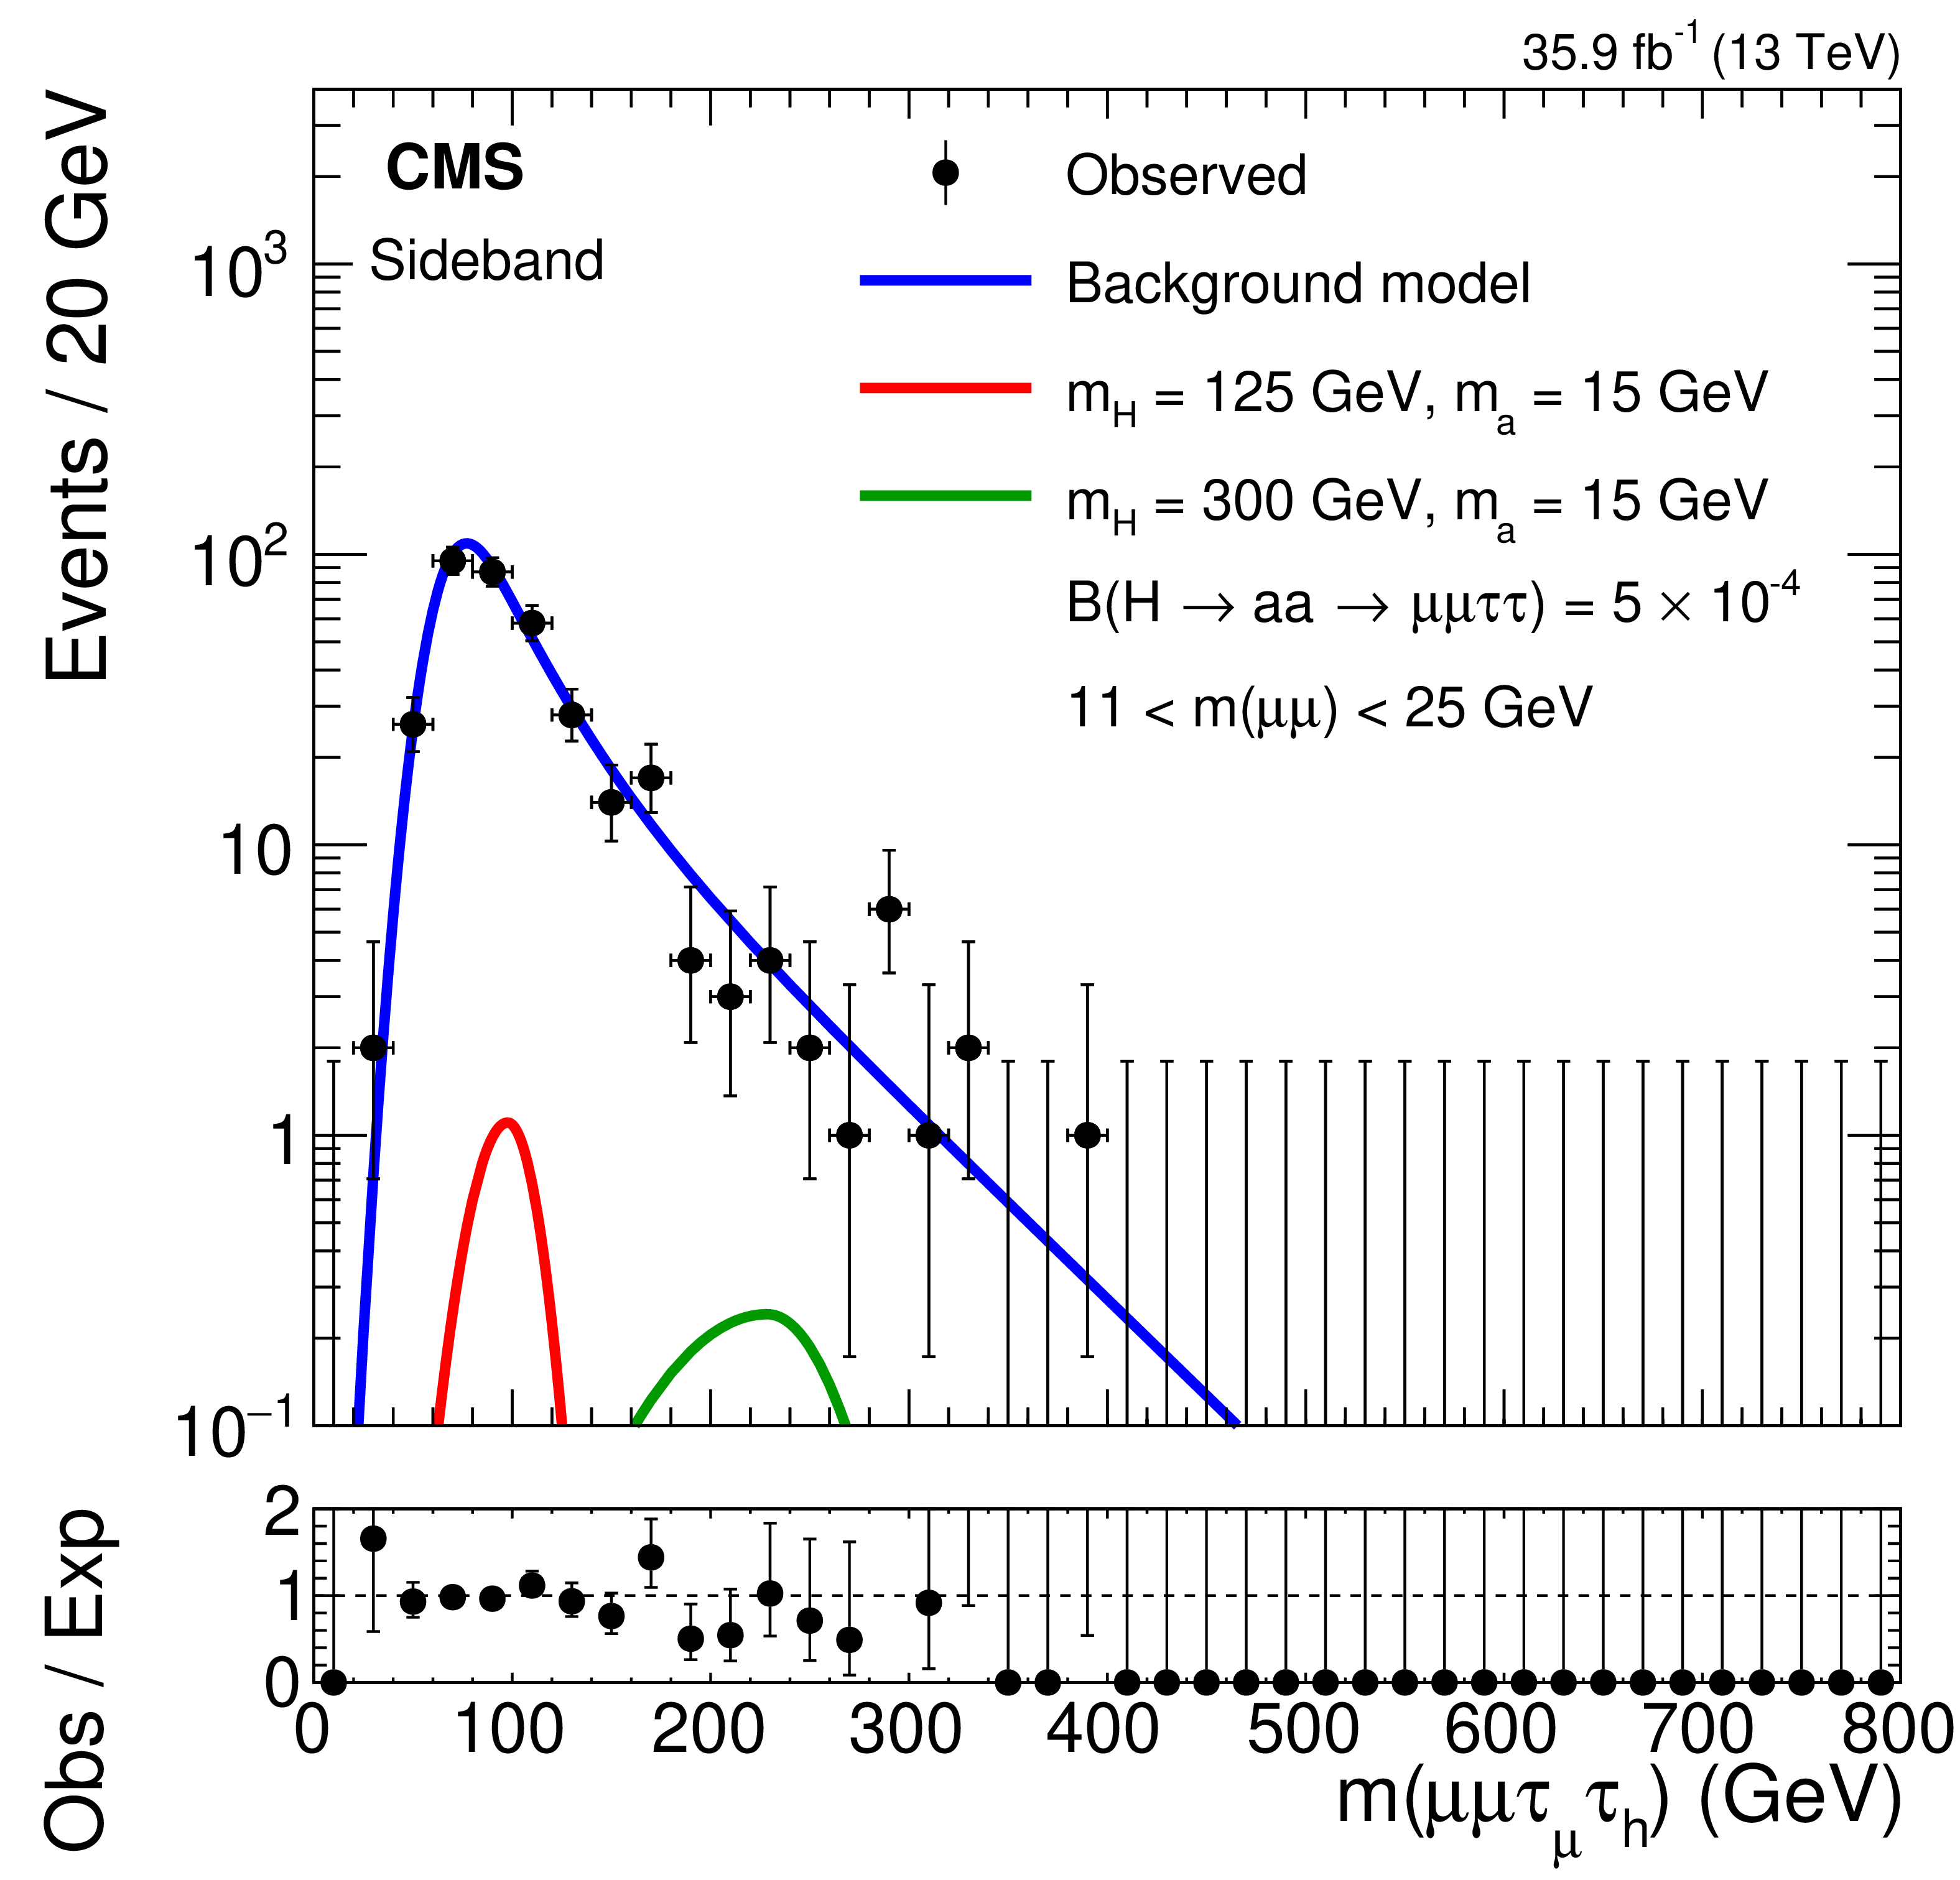
Figure 4:
Projections of 2D background model fits and observed data in the sideband on the ${m(\mu \mu)}$ (left), and ${m(\mu \mu {\tau _{\mu}} {\tau _{\mathrm{h}}})}$ (right) axes with sample signal distributions that assume H boson masses of $ {m_{\mathrm{H}}} =$ 125 and 300 GeV. The figures are divided into three fit ranges: 2.5 $ < {m(\mu \mu)} < $ 8.5 GeV (upper), 6 $ < {m(\mu \mu)} < $ 14 GeV (middle), and 11 $ < {m(\mu \mu)} < $ 25 GeV (lower). |
png pdf |
Figure 4-a:
Projection of the 2D background model fit and observed data in the sideband on the ${m(\mu \mu)}$ axis with sample signal distributions that assume H boson masses of $ {m_{\mathrm{H}}} =$ 125 and 300 GeV, in the fit range 2.5 $ < {m(\mu \mu)} < $ 8.5 GeV. |
png pdf |
Figure 4-b:
Projection of the 2D background model fit and observed data in the sideband on the ${m(\mu \mu {\tau _{\mu}} {\tau _{\mathrm{h}}})}$ axis with sample signal distributions that assume H boson masses of $ {m_{\mathrm{H}}} =$ 125 and 300 GeV, in the fit range 2.5 $ < {m(\mu \mu)} < $ 8.5 GeV. |
png pdf |
Figure 4-c:
Projection of the 2D background model fit and observed data in the sideband on the ${m(\mu \mu)}$ axis with sample signal distributions that assume H boson masses of $ {m_{\mathrm{H}}} =$ 125 and 300 GeV, in the fit range 6 $ < {m(\mu \mu)} < $ 14 GeV. |
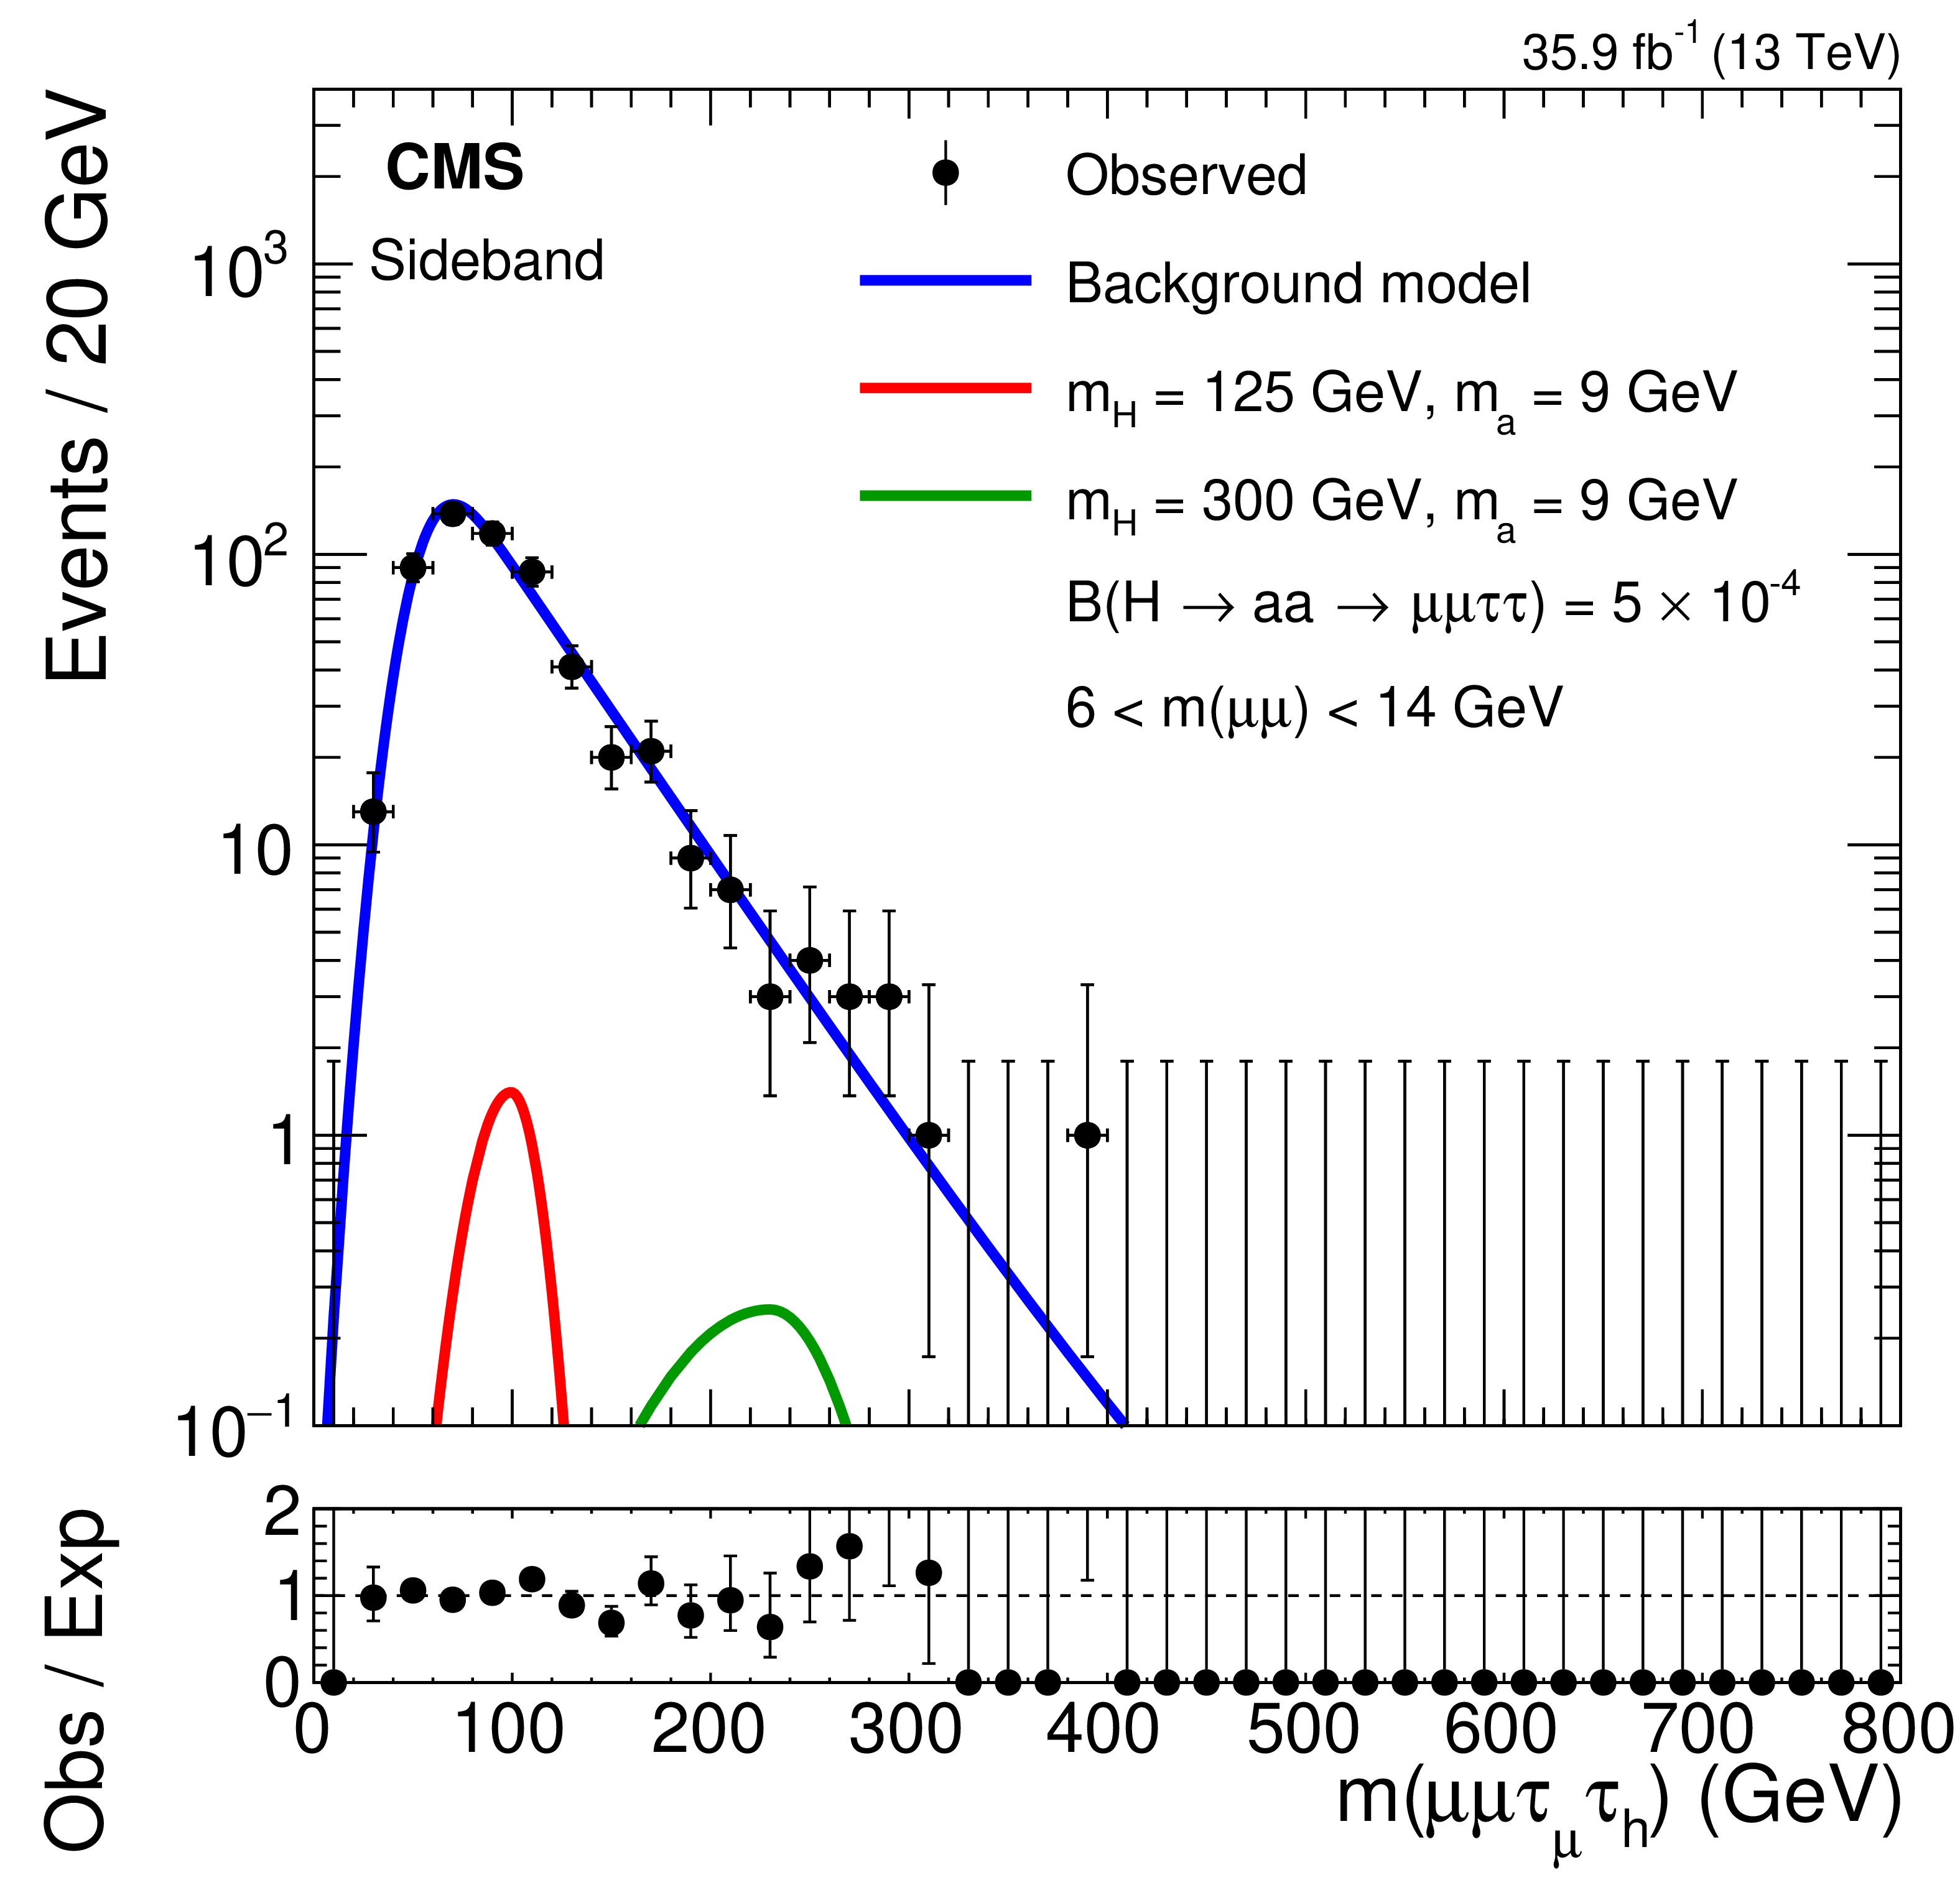
png pdf |
Figure 4-d:
Projection of the 2D background model fit and observed data in the sideband on the ${m(\mu \mu {\tau _{\mu}} {\tau _{\mathrm{h}}})}$ axis with sample signal distributions that assume H boson masses of $ {m_{\mathrm{H}}} =$ 125 and 300 GeV, in the fit range 6 $ < {m(\mu \mu)} < $ 14 GeV. |
png pdf |
Figure 4-e:
Projection of the 2D background model fit and observed data in the sideband on the ${m(\mu \mu)}$ axis with sample signal distributions that assume H boson masses of $ {m_{\mathrm{H}}} =$ 125 and 300 GeV, in the fit range 11 $ < {m(\mu \mu)} < $ 25 GeV. |
png pdf |
Figure 4-f:
Projection of the 2D background model fit and observed data in the sideband on the ${m(\mu \mu {\tau _{\mu}} {\tau _{\mathrm{h}}})}$ axis with sample signal distributions that assume H boson masses of $ {m_{\mathrm{H}}} =$ 125 and 300 GeV, in the fit range 11 $ < {m(\mu \mu)} < $ 25 GeV. |

png pdf |
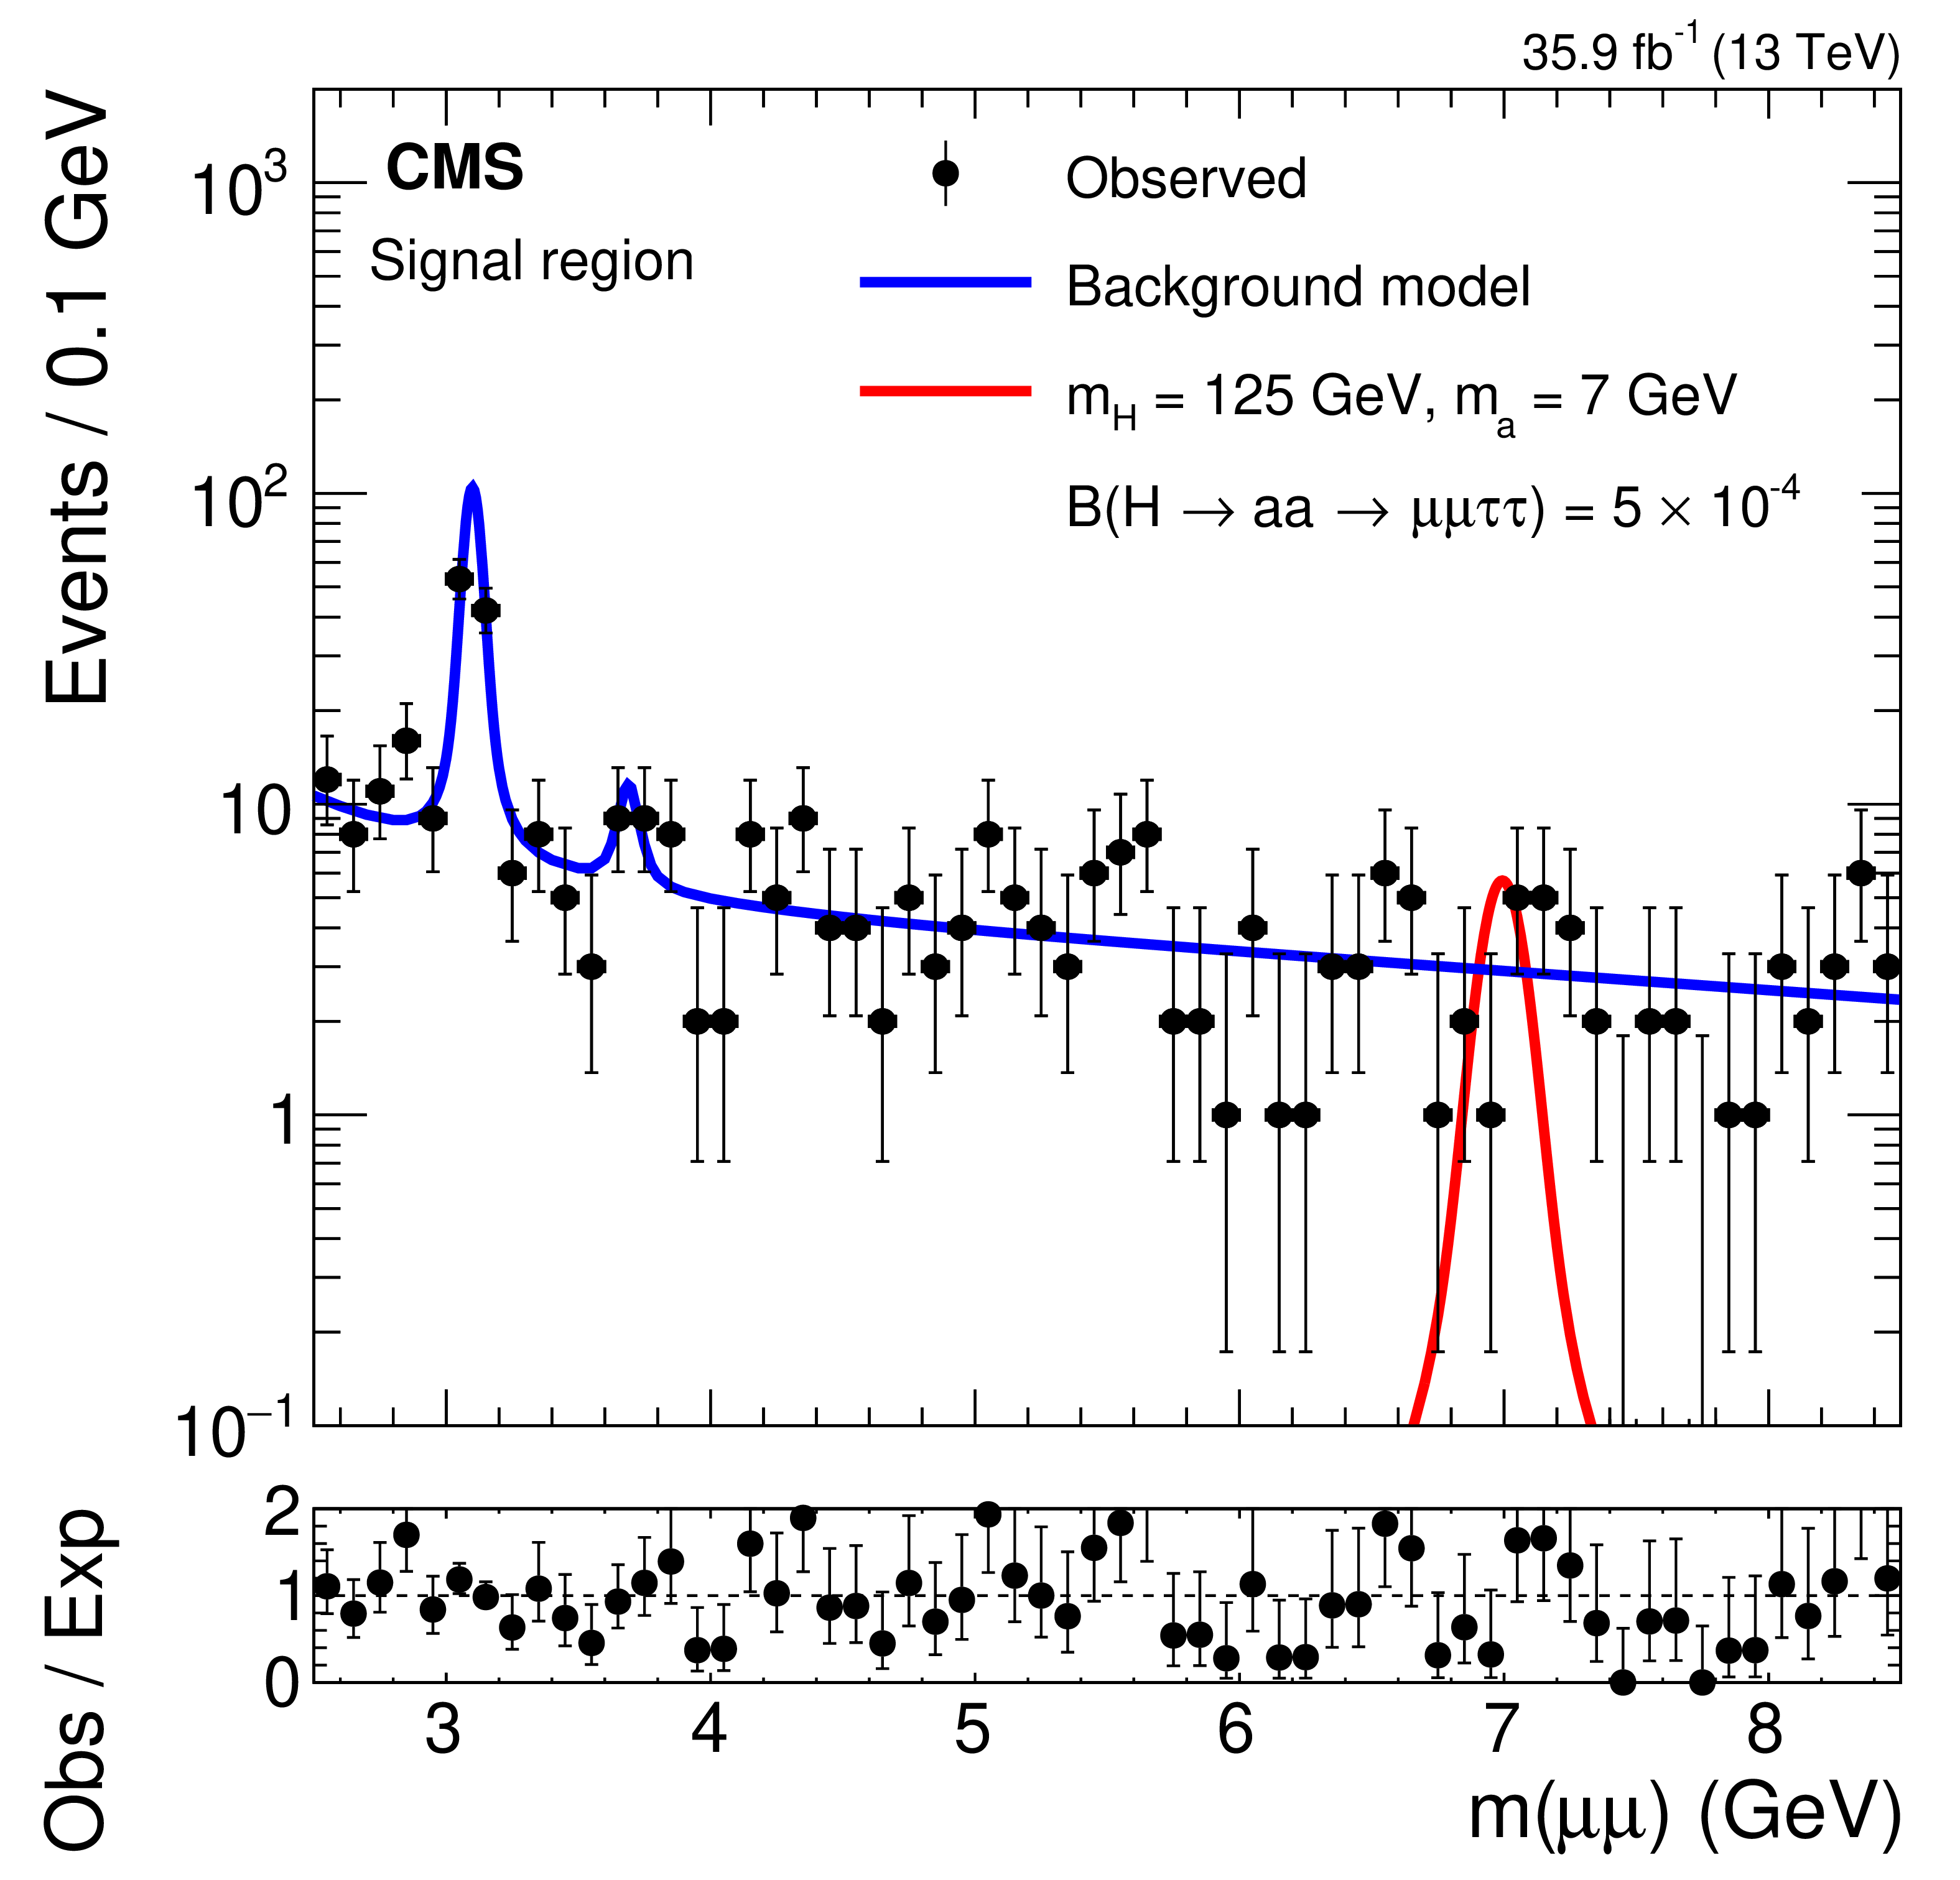
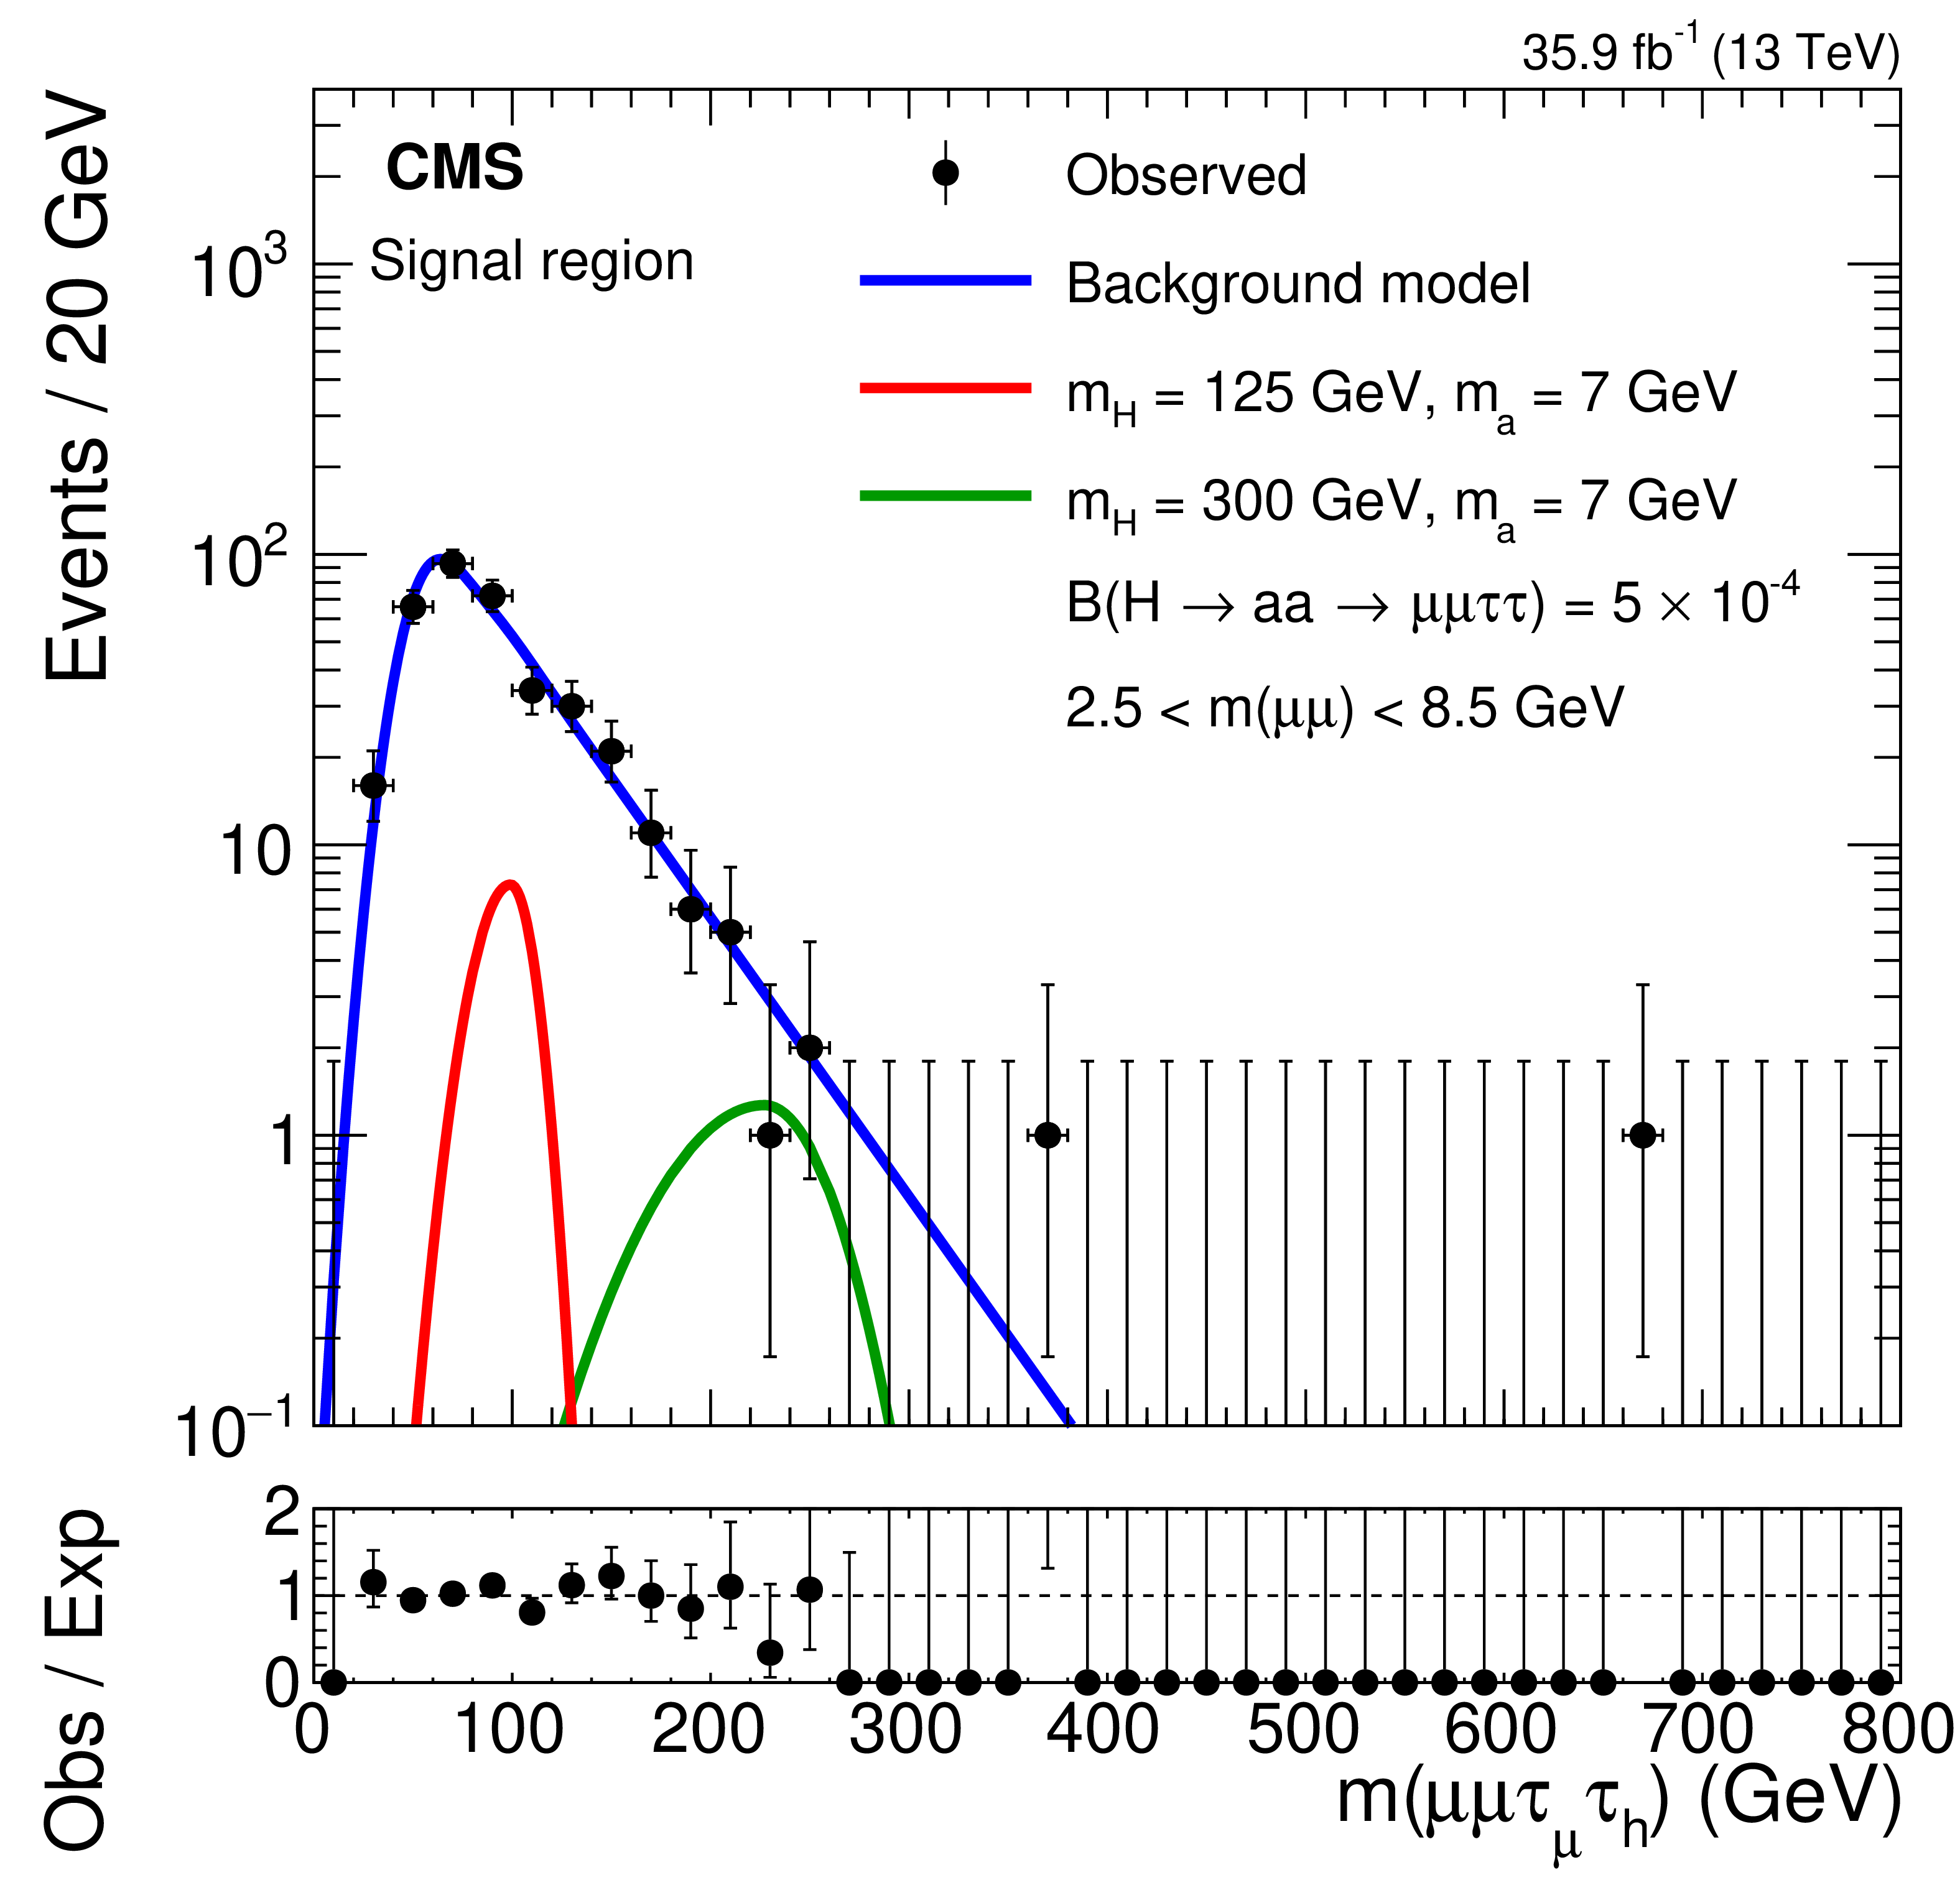
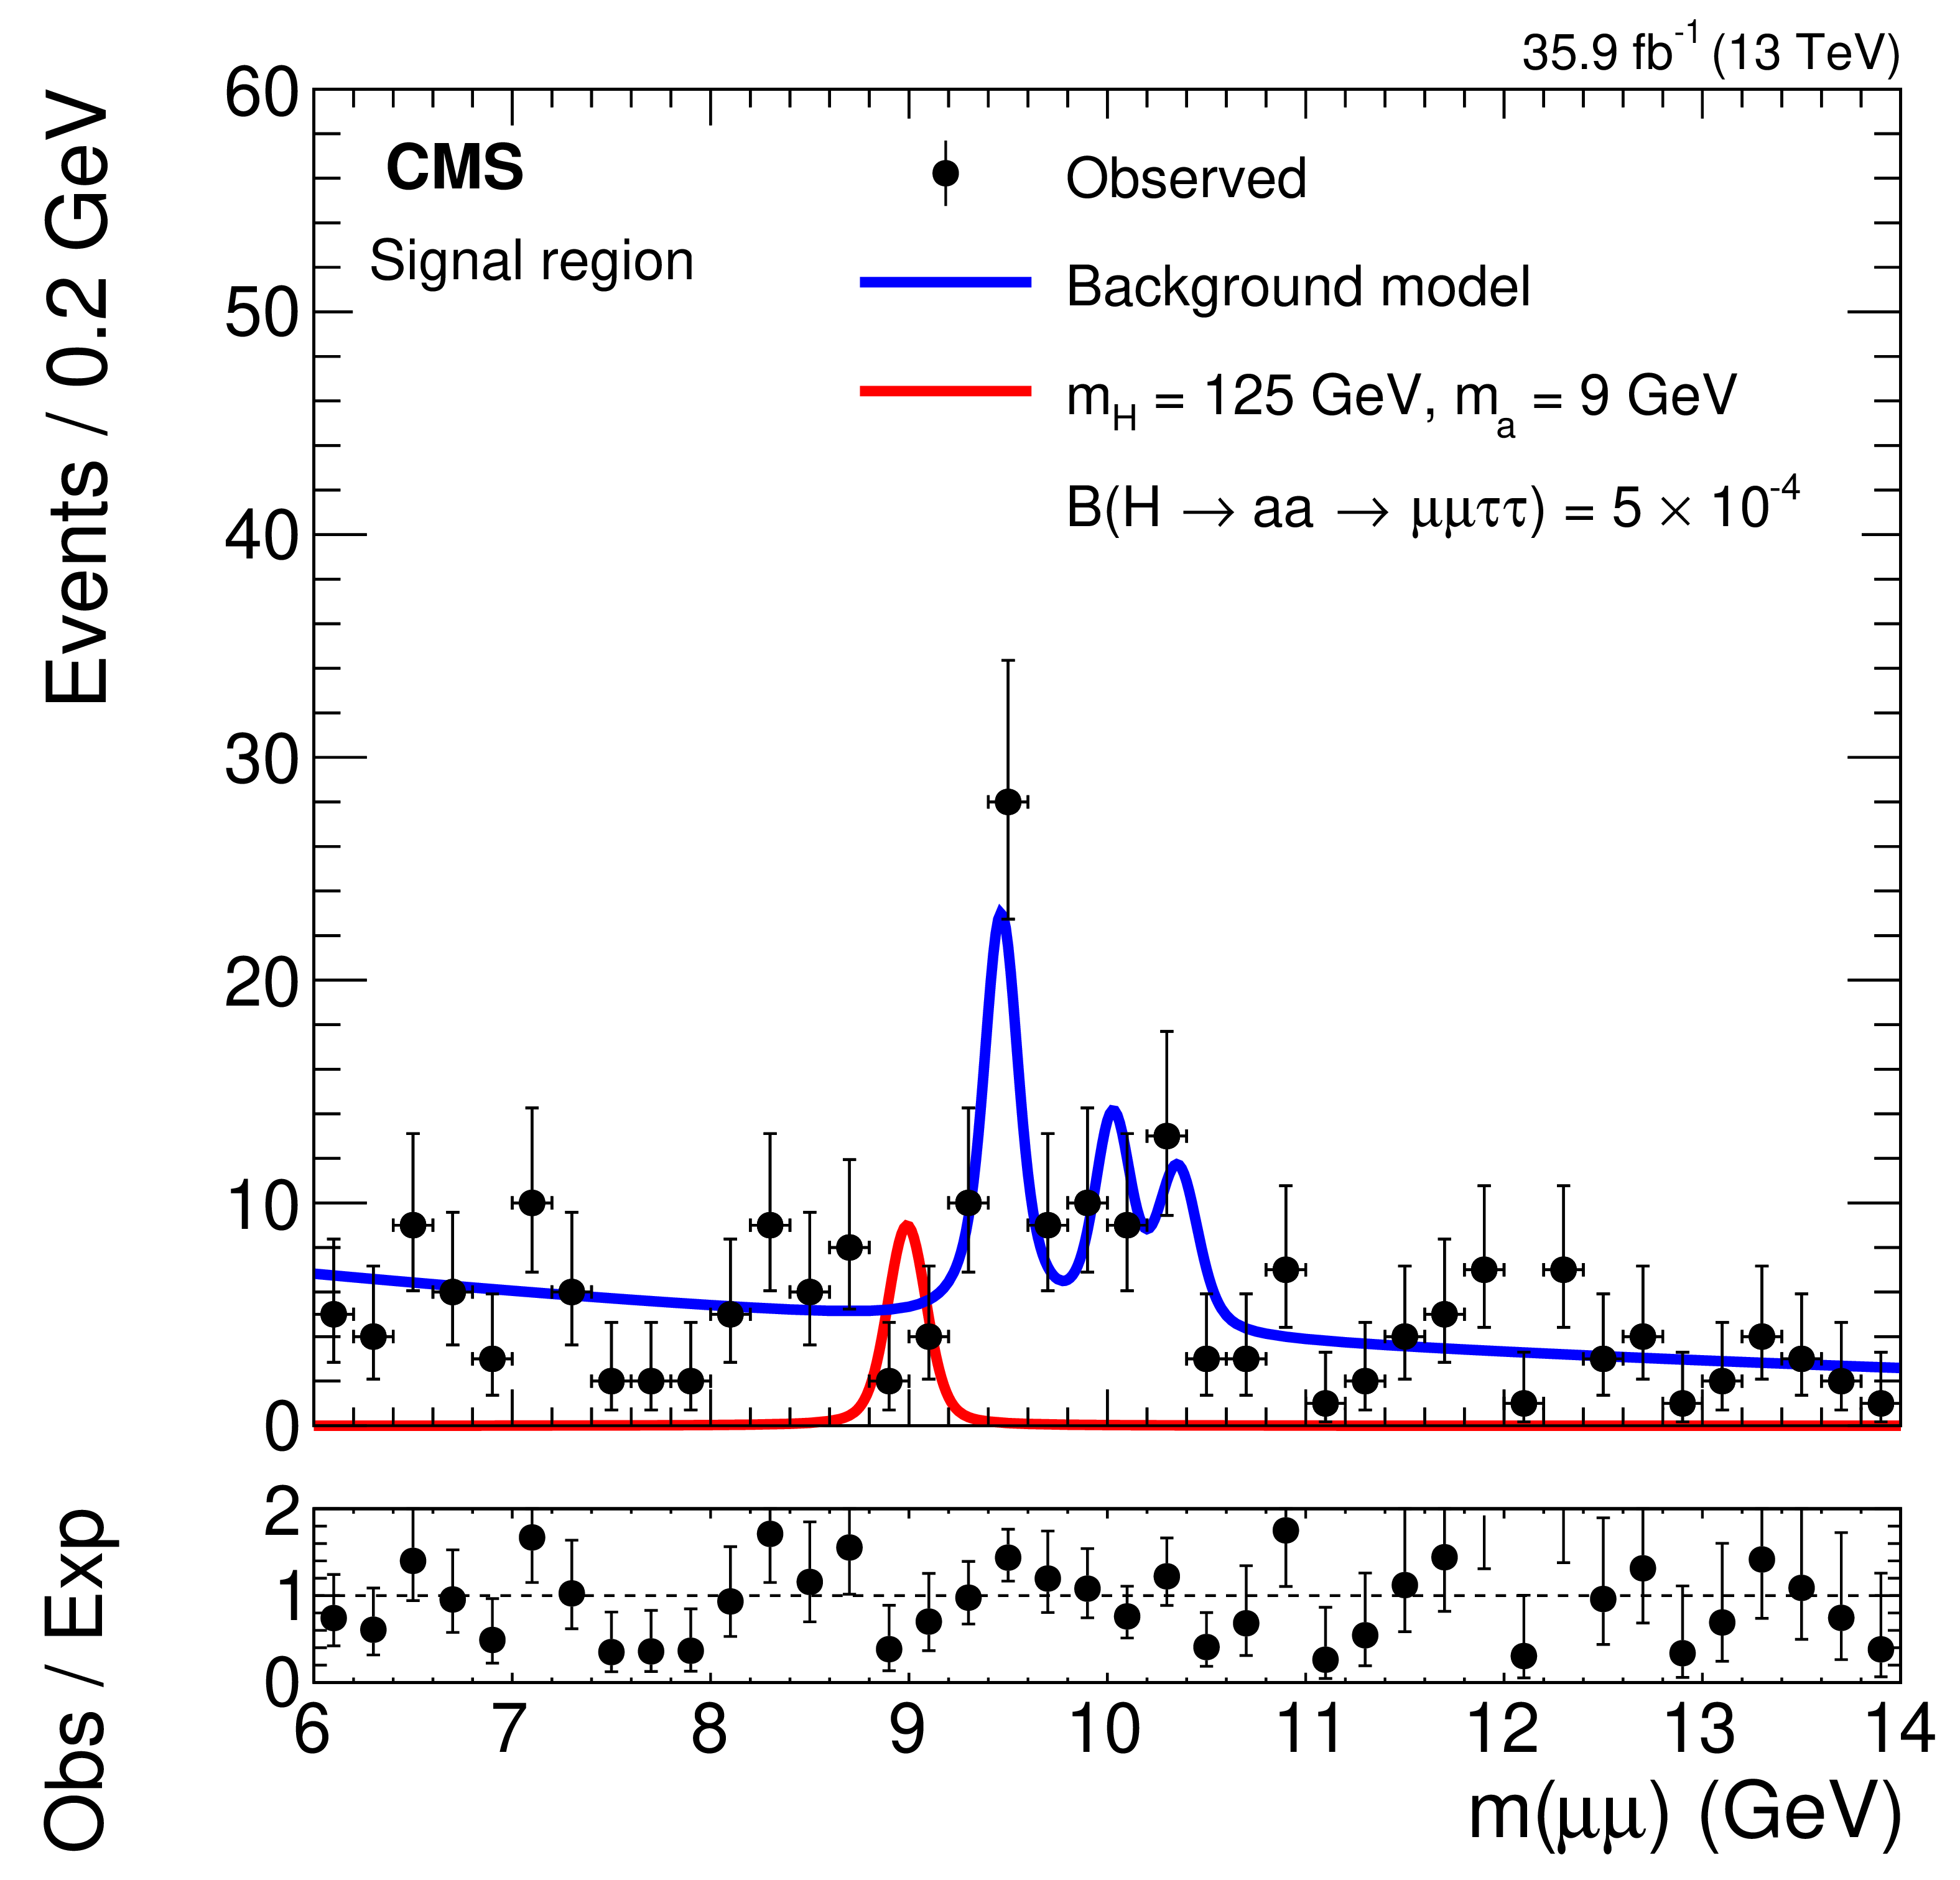
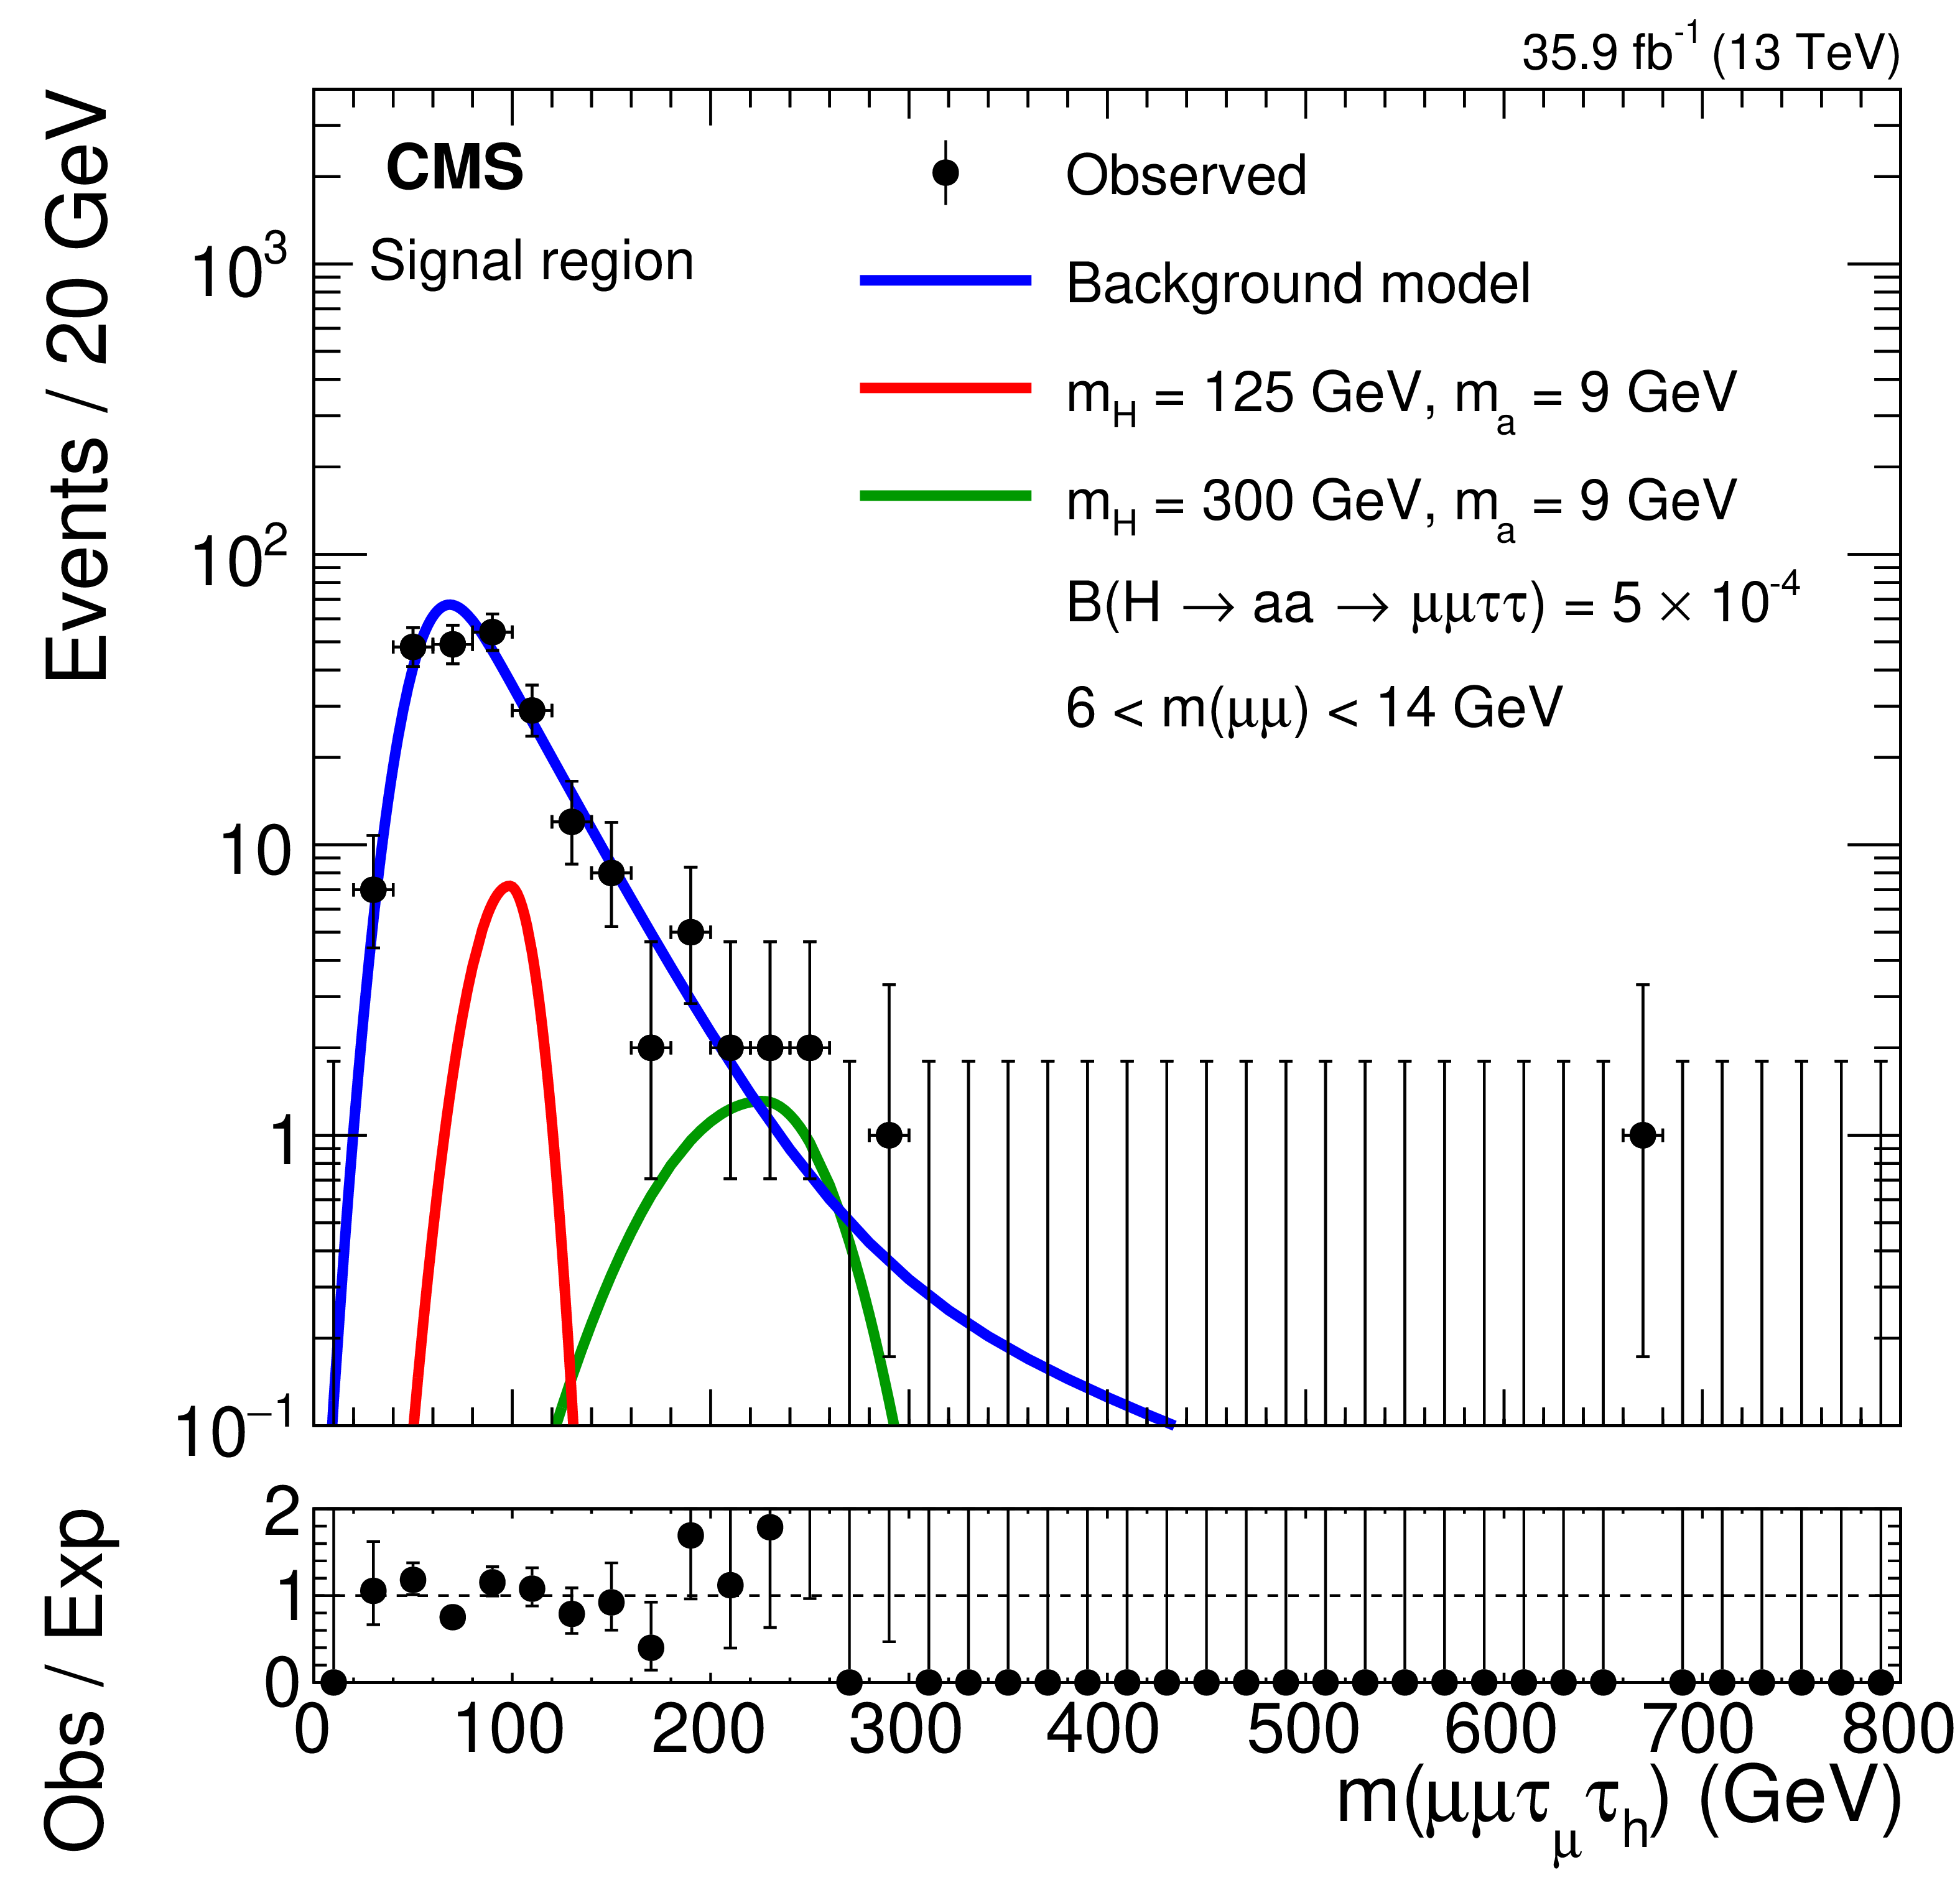
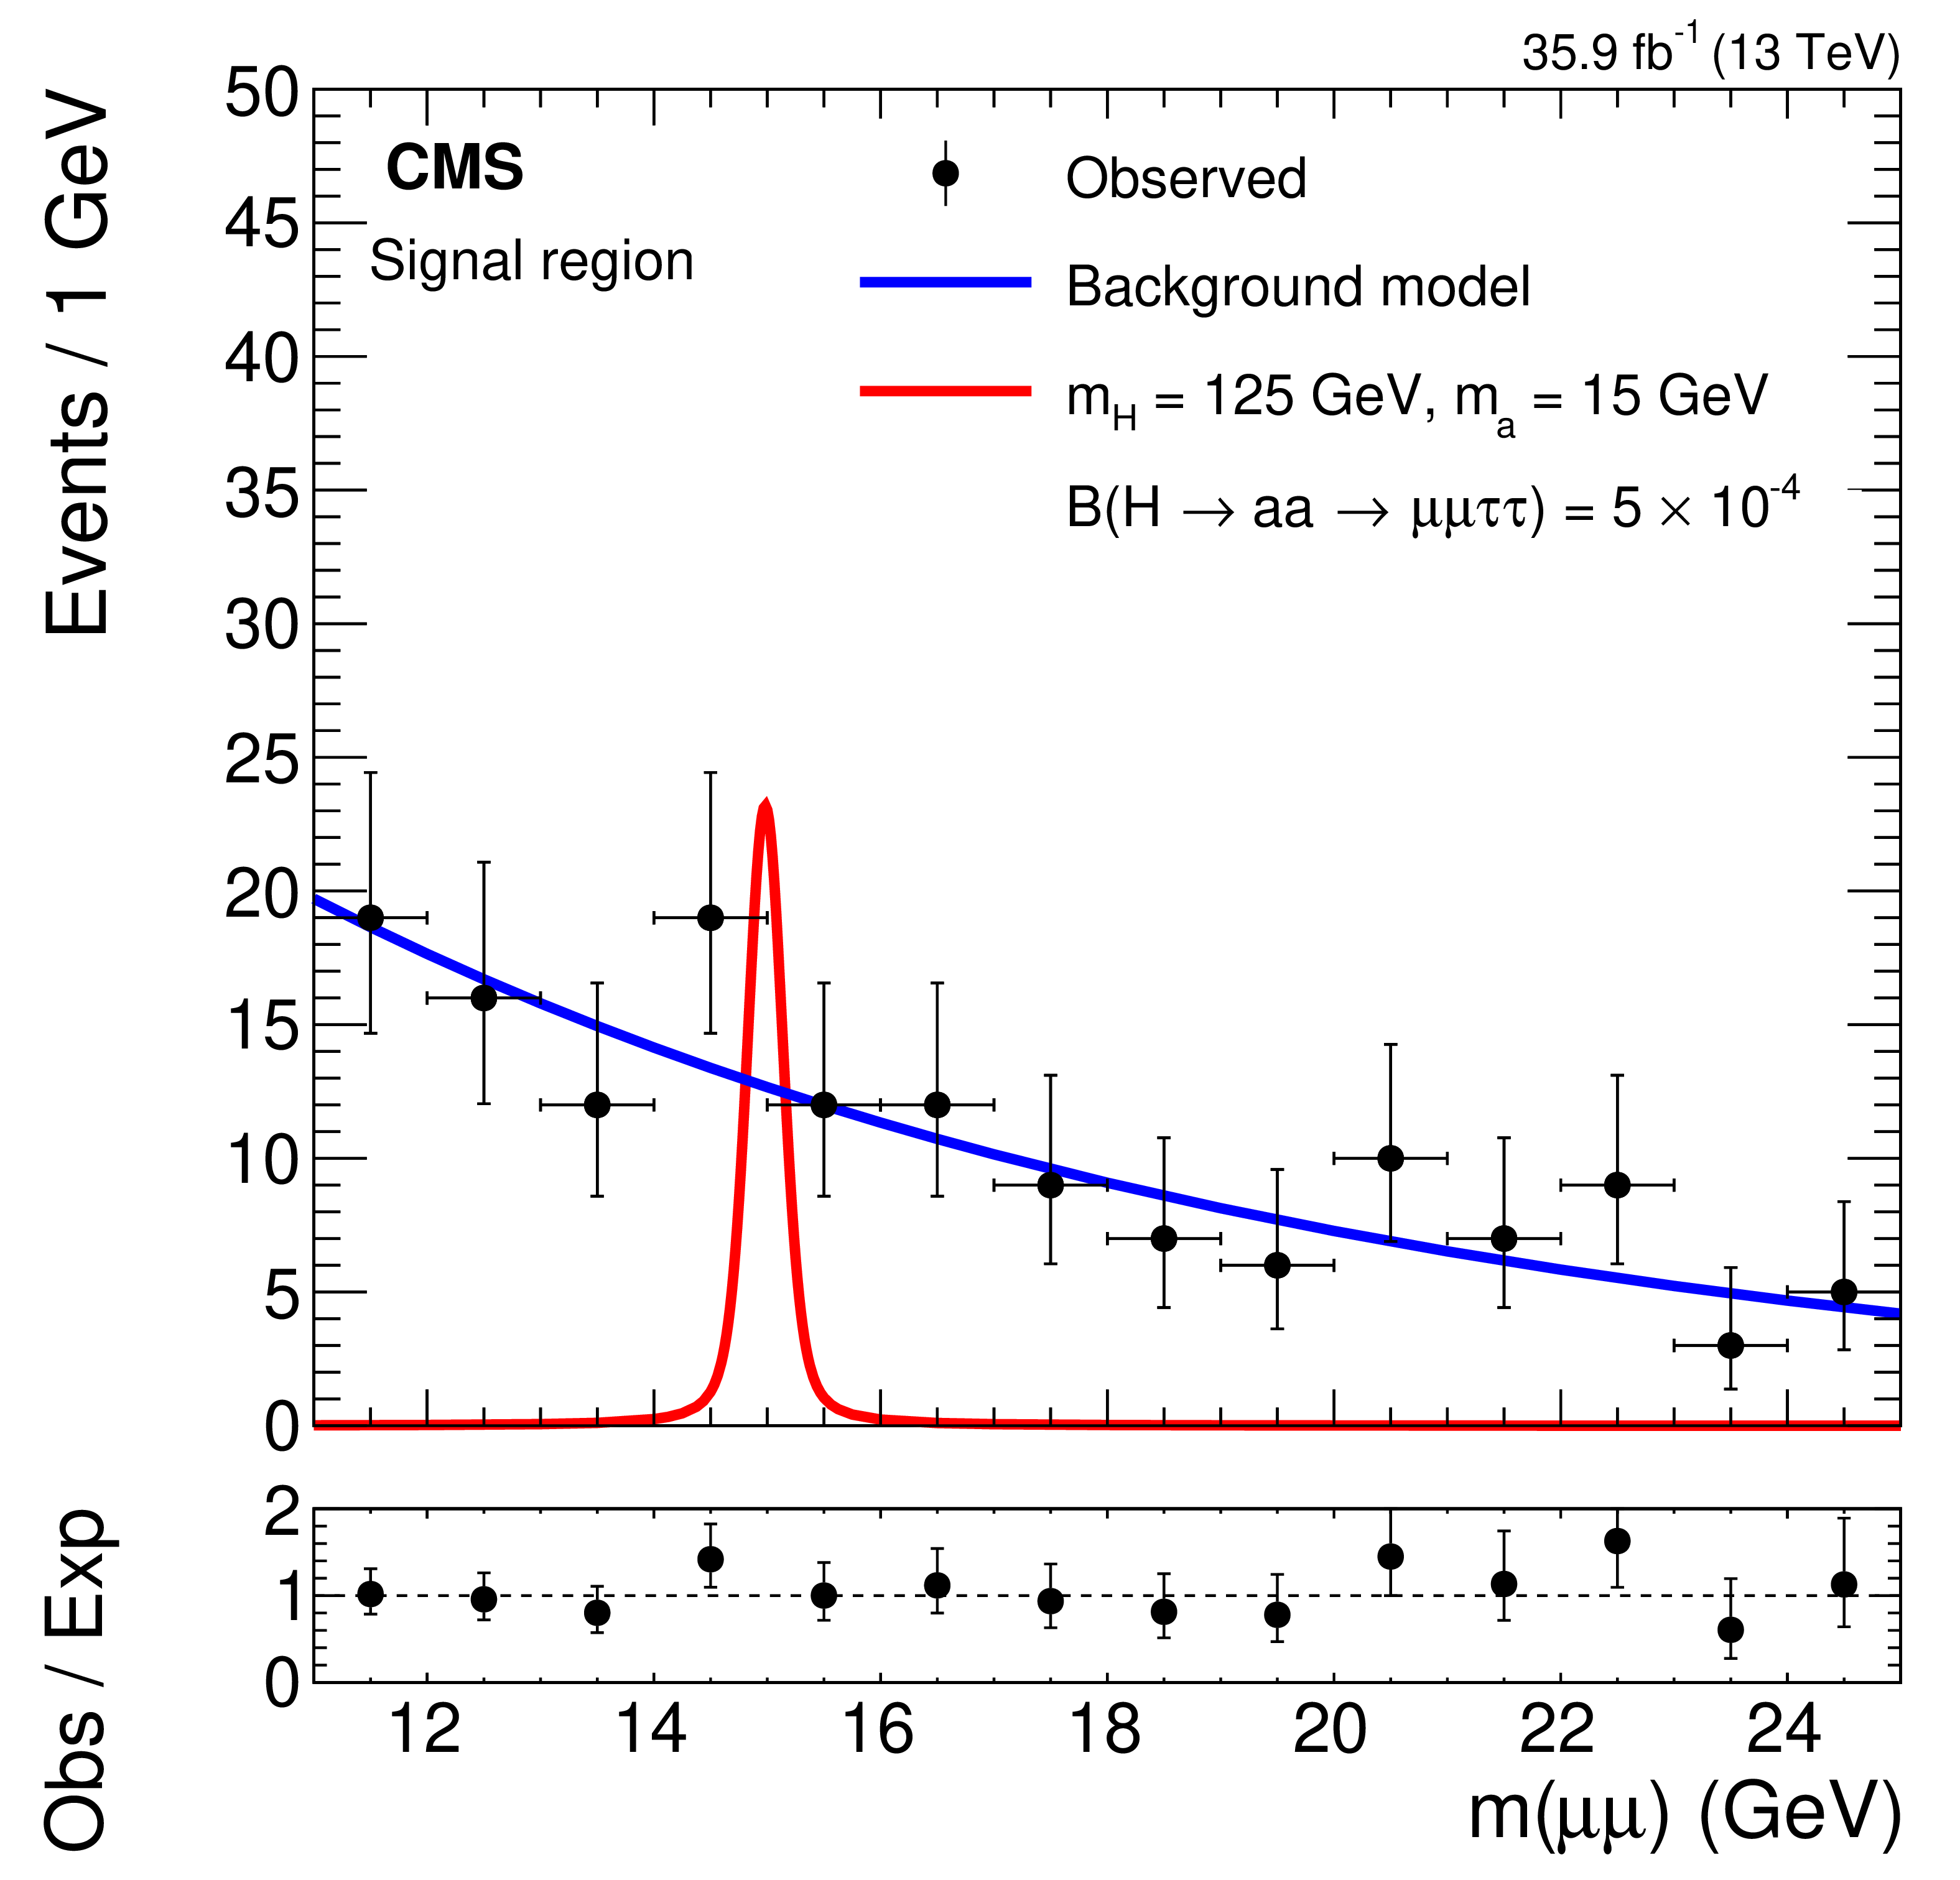
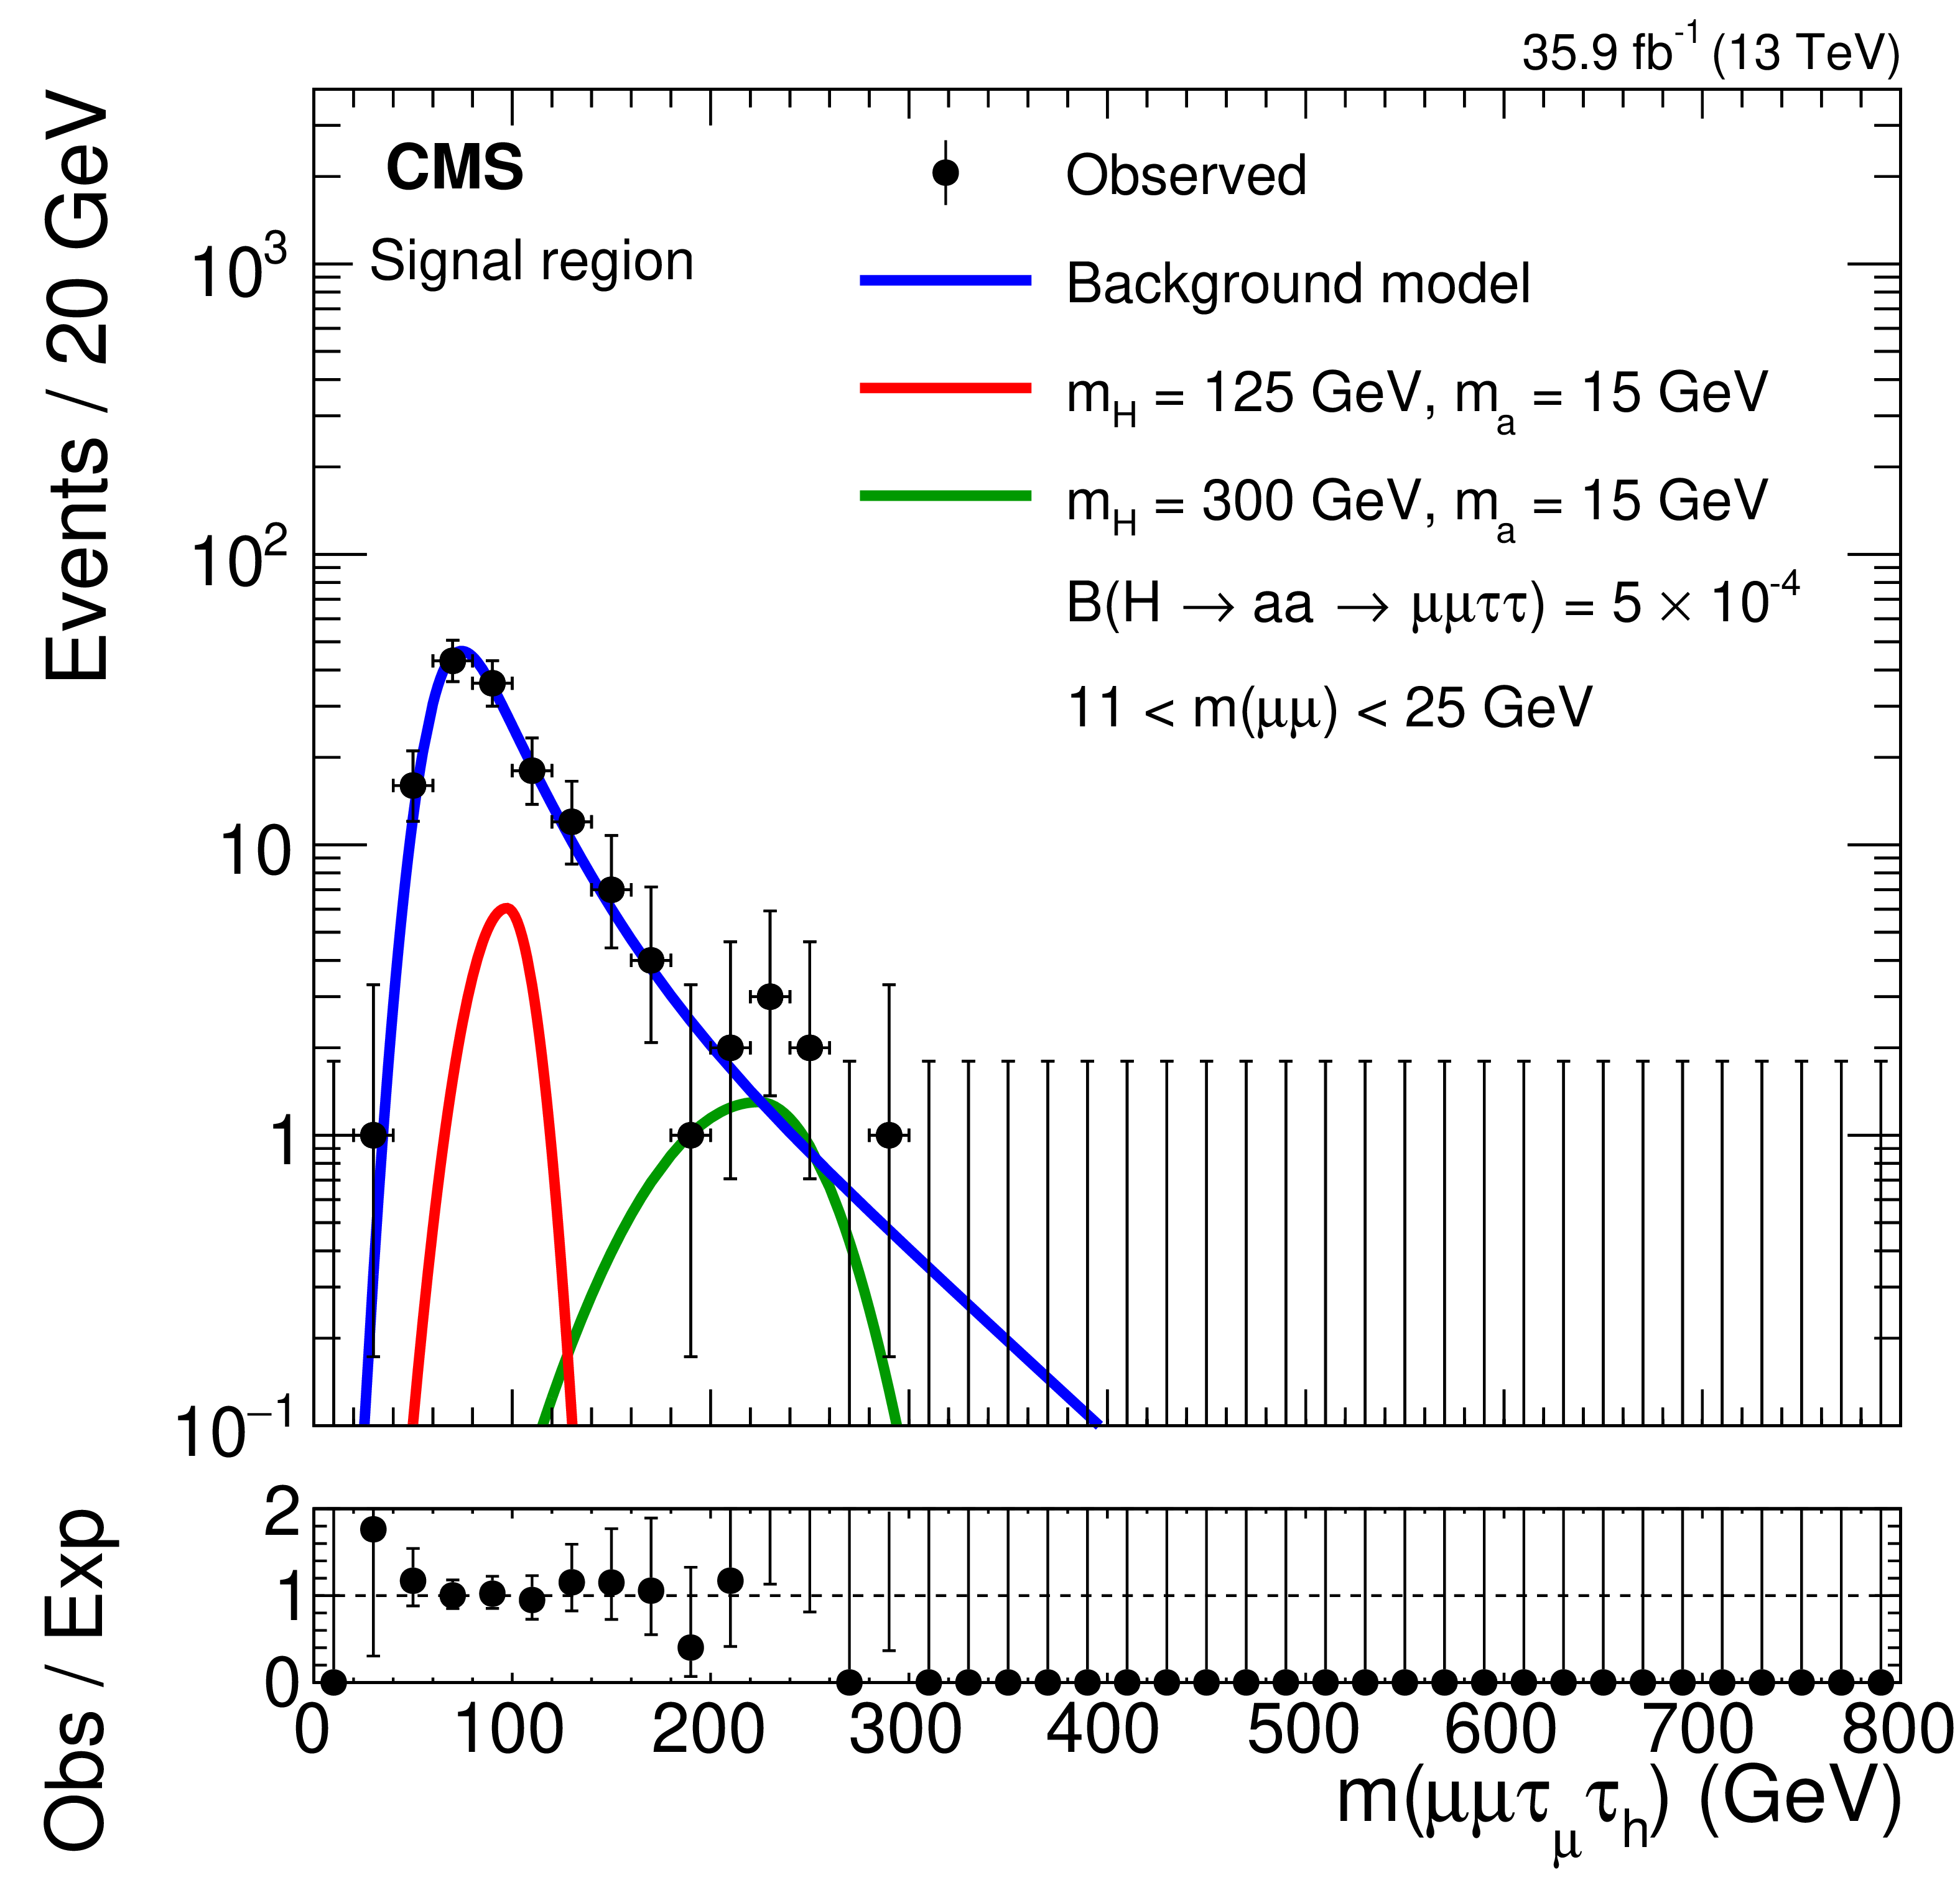
Figure 5:
Projections of 2D background model fits and observed data in the signal region on the ${m(\mu \mu)}$ (left), and ${m(\mu \mu {\tau _{\mu}} {\tau _{\mathrm{h}}})}$ (right) axes with sample signal distributions that assume H boson masses of $ {m_{\mathrm{H}}} =$ 125 and 300 GeV. The figures are divided into three fit ranges: 2.5 $ < {m(\mu \mu)} < $ 8.5 GeV (upper), 6 $ < {m(\mu \mu)} < $ 14 GeV (middle), and 11 $ < {m(\mu \mu)} < $ 25 GeV (lower). |
png pdf |
Figure 5-a:
Projection of the 2D background model fit and observed data in the signal region on the ${m(\mu \mu)}$ axis with sample signal distributions that assume H boson masses of $ {m_{\mathrm{H}}} =$ 125 and 300 GeV in the fit range 2.5 $ < {m(\mu \mu)} < $ 8.5 GeV. |
png pdf |
Figure 5-b:
Projection of the 2D background model fit and observed data in the signal region on the ${m(\mu \mu {\tau _{\mu}} {\tau _{\mathrm{h}}})}$ axis with sample signal distributions that assume H boson masses of $ {m_{\mathrm{H}}} =$ 125 and 300 GeV in the fit range 2.5 $ < {m(\mu \mu)} < $ 8.5 GeV. |
png pdf |
Figure 5-c:
Projection of the 2D background model fit and observed data in the signal region on the ${m(\mu \mu)}$ axis with sample signal distributions that assume H boson masses of $ {m_{\mathrm{H}}} =$ 125 and 300 GeV in the fit range 6 $ < {m(\mu \mu)} < $ 14 GeV. |
png pdf |
Figure 5-d:
Projection of the 2D background model fit and observed data in the signal region on the ${m(\mu \mu {\tau _{\mu}} {\tau _{\mathrm{h}}})}$ axis with sample signal distributions that assume H boson masses of $ {m_{\mathrm{H}}} =$ 125 and 300 GeV in the fit range 6 $ < {m(\mu \mu)} < $ 14 GeV. |
png pdf |
Figure 5-e:
Projection of the 2D background model fit and observed data in the signal region on the ${m(\mu \mu)}$ axis with sample signal distributions that assume H boson masses of $ {m_{\mathrm{H}}} =$ 125 and 300 GeV in the fit range 11 $ < {m(\mu \mu)} < $ 25 GeV. |
png pdf |
Figure 5-f:
Projection of the 2D background model fit and observed data in the signal region on the ${m(\mu \mu {\tau _{\mu}} {\tau _{\mathrm{h}}})}$ axis with sample signal distributions that assume H boson masses of $ {m_{\mathrm{H}}} =$ 125 and 300 GeV in the fit range 11 $ < {m(\mu \mu)} < $ 25 GeV. |
png pdf |
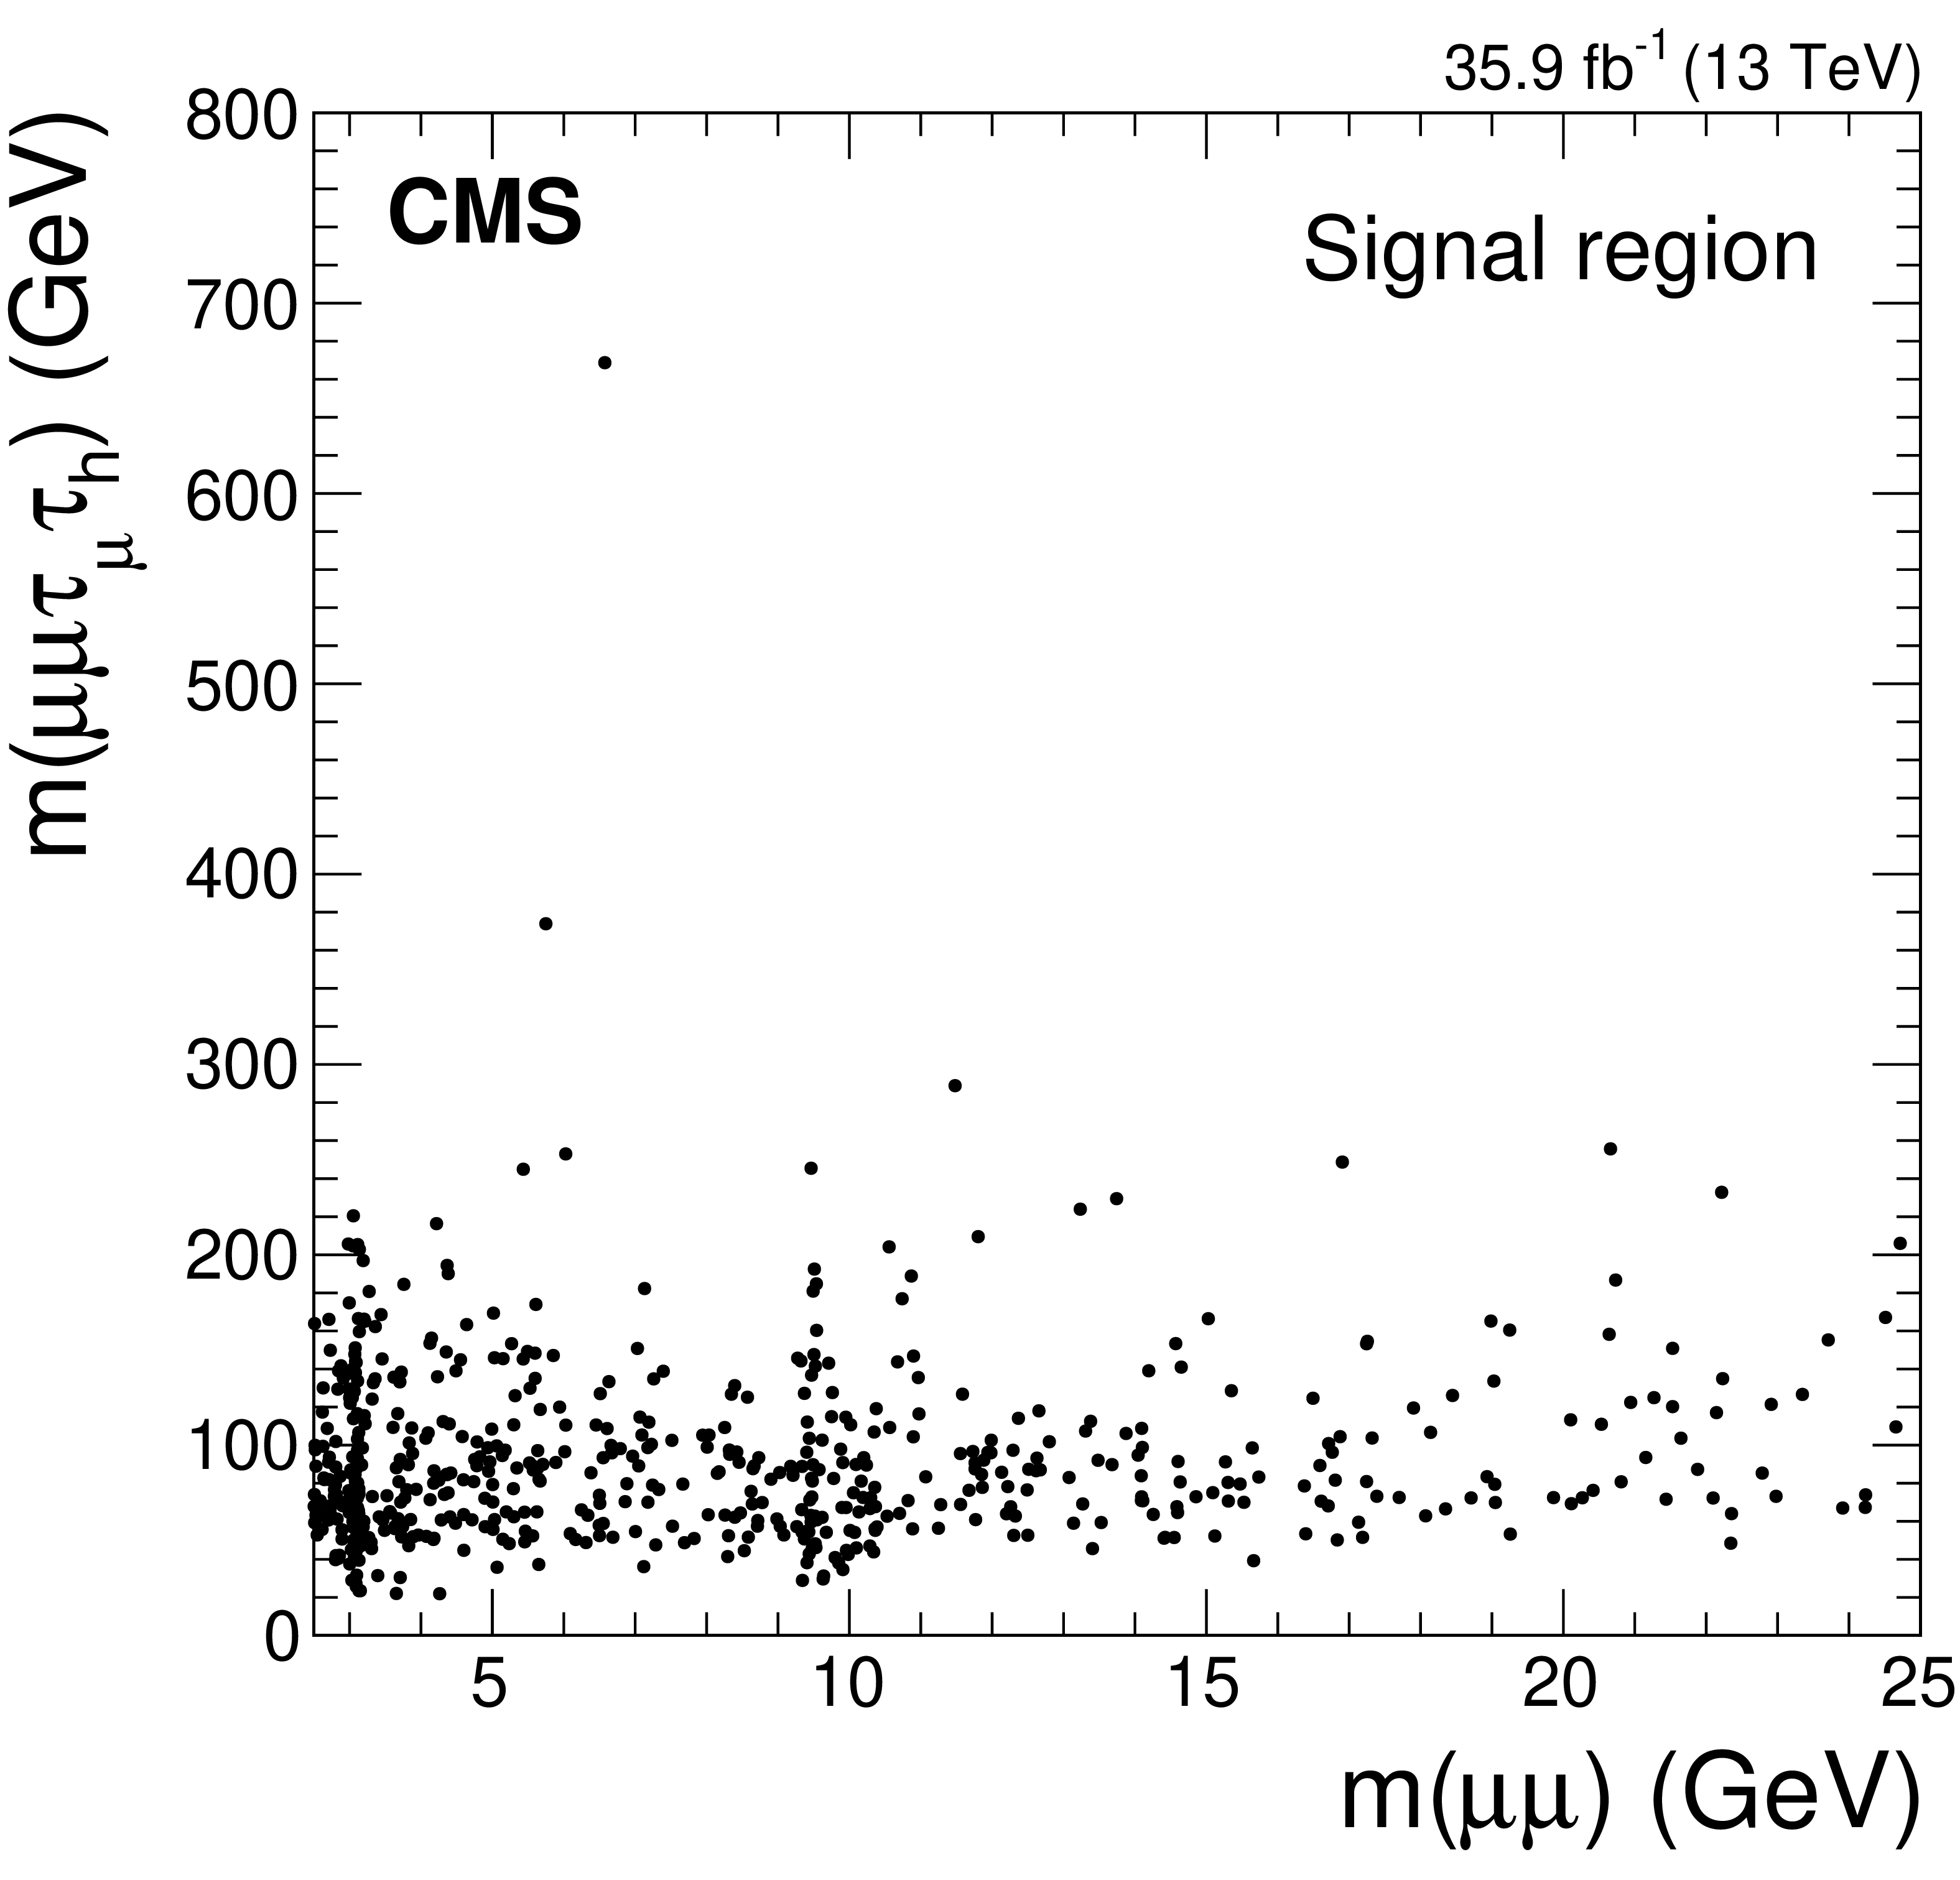
Figure 6:
Observed data distribution, as a function of the 4-body visible mass and $\mu \mu $ invariant mass for the signal region; 614 events are observed. |
png pdf |
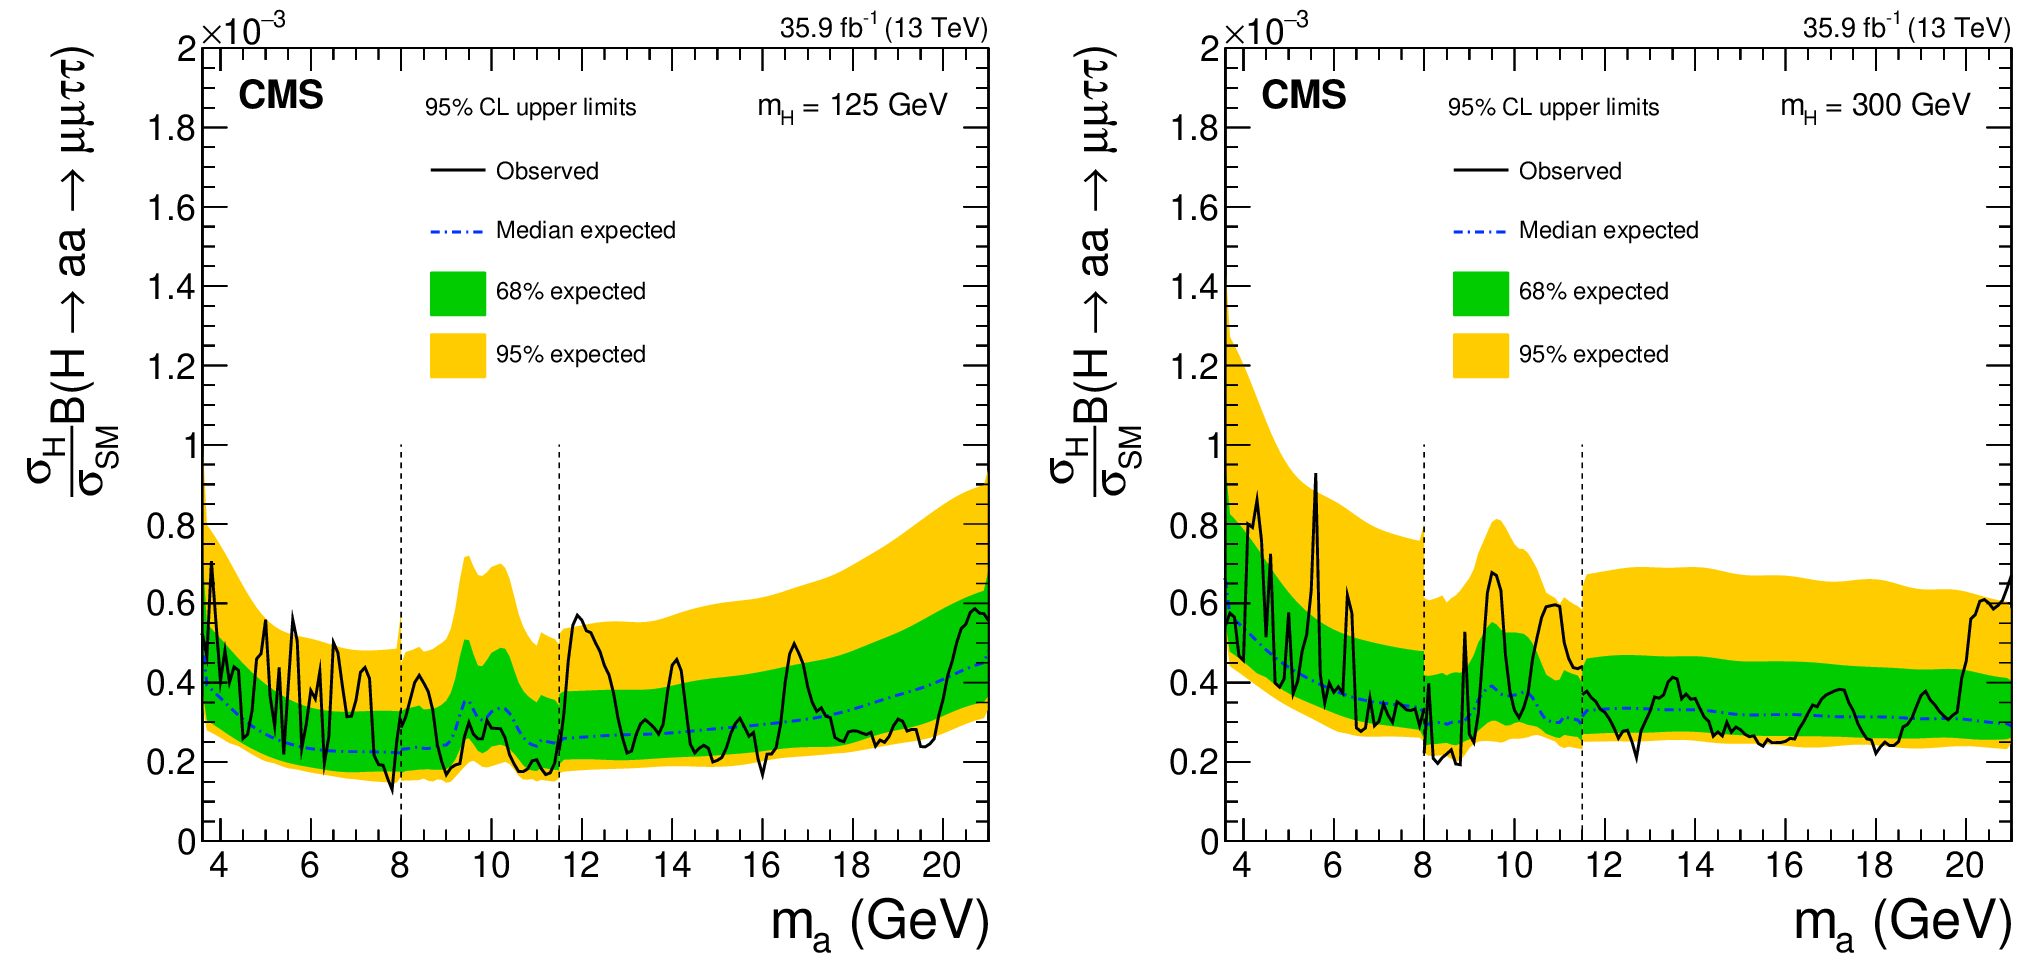
Figure 7:
Model-independent 95% CL upper limits on $ {\sigma _{\mathrm{H}}} {\mathcal {B}}(\mathrm{H} \to \mathrm{a} \mathrm{a} \to \mu \mu \tau \tau)/ {\sigma _{\text {SM}}} $ as a function of pseudoscalar boson mass for a Higgs boson with $ {m_{\mathrm{H}}} = $ 125 GeV (left), and 300 GeV (right). The vertical dashed lines indicate the transition between the $\mu \mu $ mass fit ranges for a given mass hypothesis, occurring at $ {m_{\mathrm{a}}} =$ 8 and 11.5 GeV. The inner (green) band and the outer (yellow) band indicate the regions containing 68 and 95%, respectively, of the distribution of limits expected under the background-only hypothesis. |
png pdf |
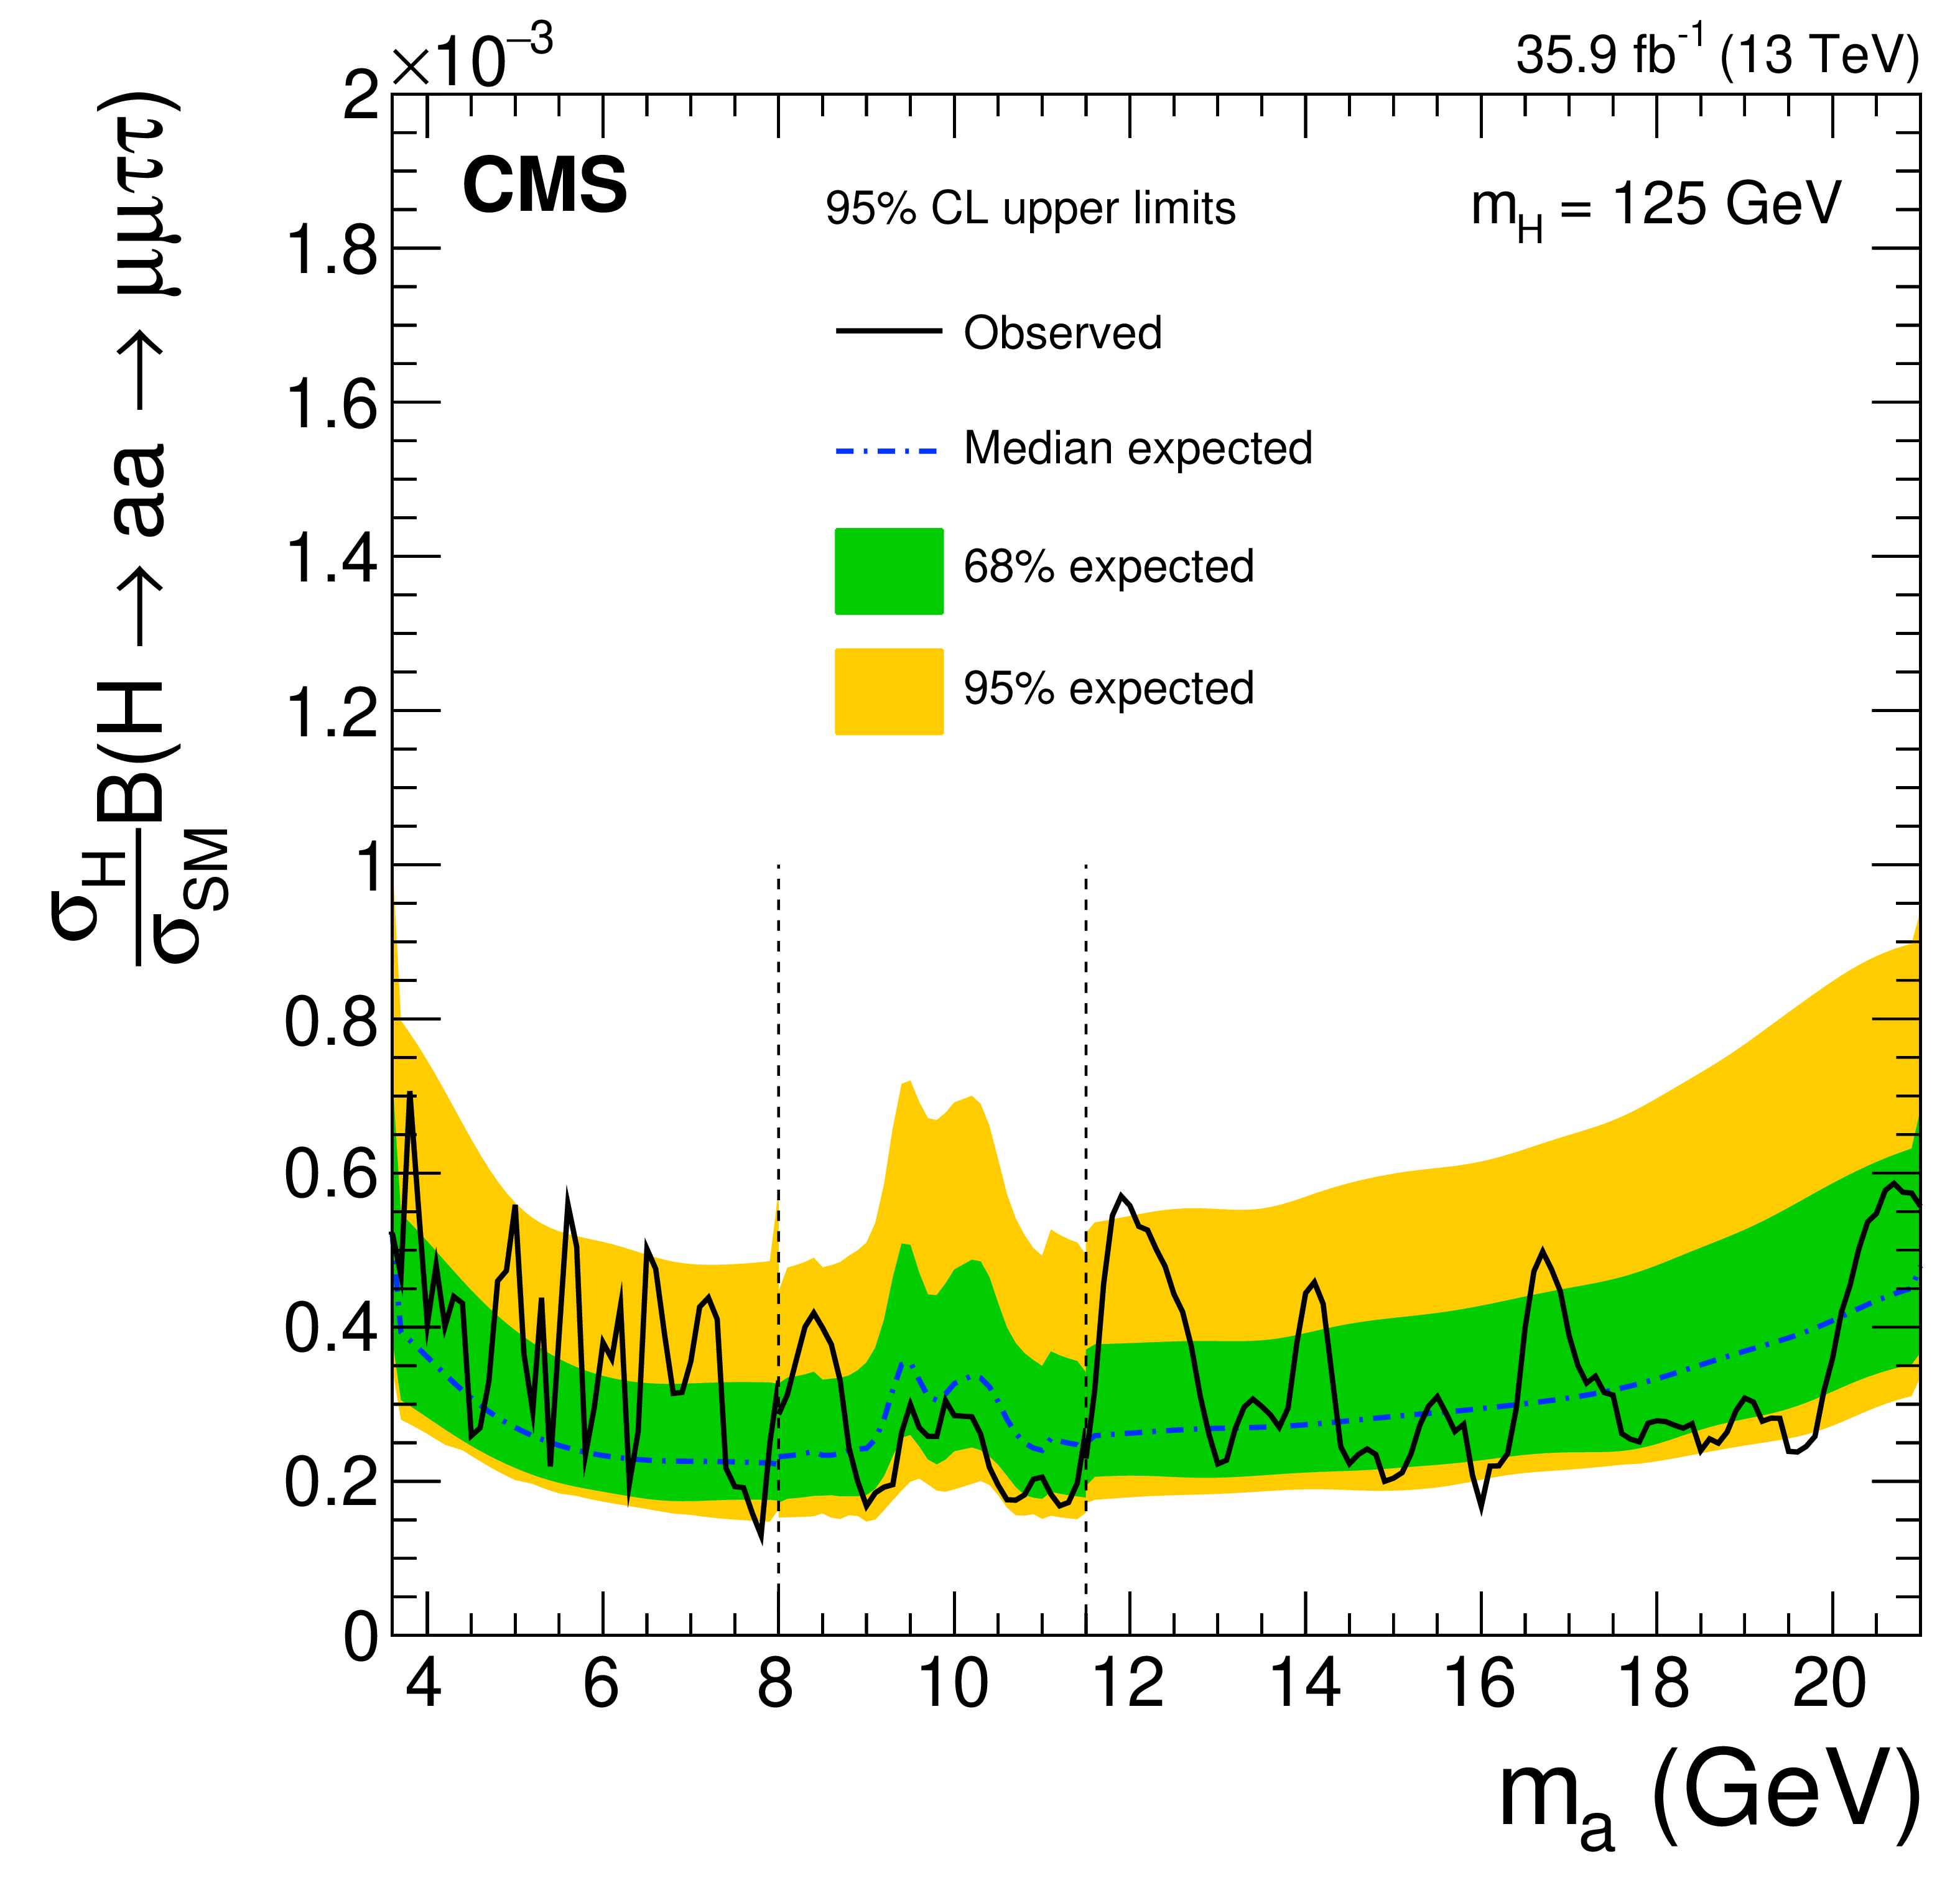
Figure 7-a:
Model-independent 95% CL upper limits on $ {\sigma _{\mathrm{H}}} {\mathcal {B}}(\mathrm{H} \to \mathrm{a} \mathrm{a} \to \mu \mu \tau \tau)/ {\sigma _{\text {SM}}} $ as a function of pseudoscalar boson mass for a Higgs boson with $ {m_{\mathrm{H}}} = $ 125 GeV. The vertical dashed lines indicate the transition between the $\mu \mu $ mass fit ranges for a given mass hypothesis, occurring at $ {m_{\mathrm{a}}} =$ 8 and 11.5 GeV. The inner (green) band and the outer (yellow) band indicate the regions containing 68 and 95%, respectively, of the distribution of limits expected under the background-only hypothesis. |

png pdf |
Figure 7-b:
Model-independent 95% CL upper limits on $ {\sigma _{\mathrm{H}}} {\mathcal {B}}(\mathrm{H} \to \mathrm{a} \mathrm{a} \to \mu \mu \tau \tau)/ {\sigma _{\text {SM}}} $ as a function of pseudoscalar boson mass for a Higgs boson with $ {m_{\mathrm{H}}} = $ 300 GeV. The vertical dashed lines indicate the transition between the $\mu \mu $ mass fit ranges for a given mass hypothesis, occurring at $ {m_{\mathrm{a}}} =$ 8 and 11.5 GeV. The inner (green) band and the outer (yellow) band indicate the regions containing 68 and 95%, respectively, of the distribution of limits expected under the background-only hypothesis. |
png pdf |
Figure 8:
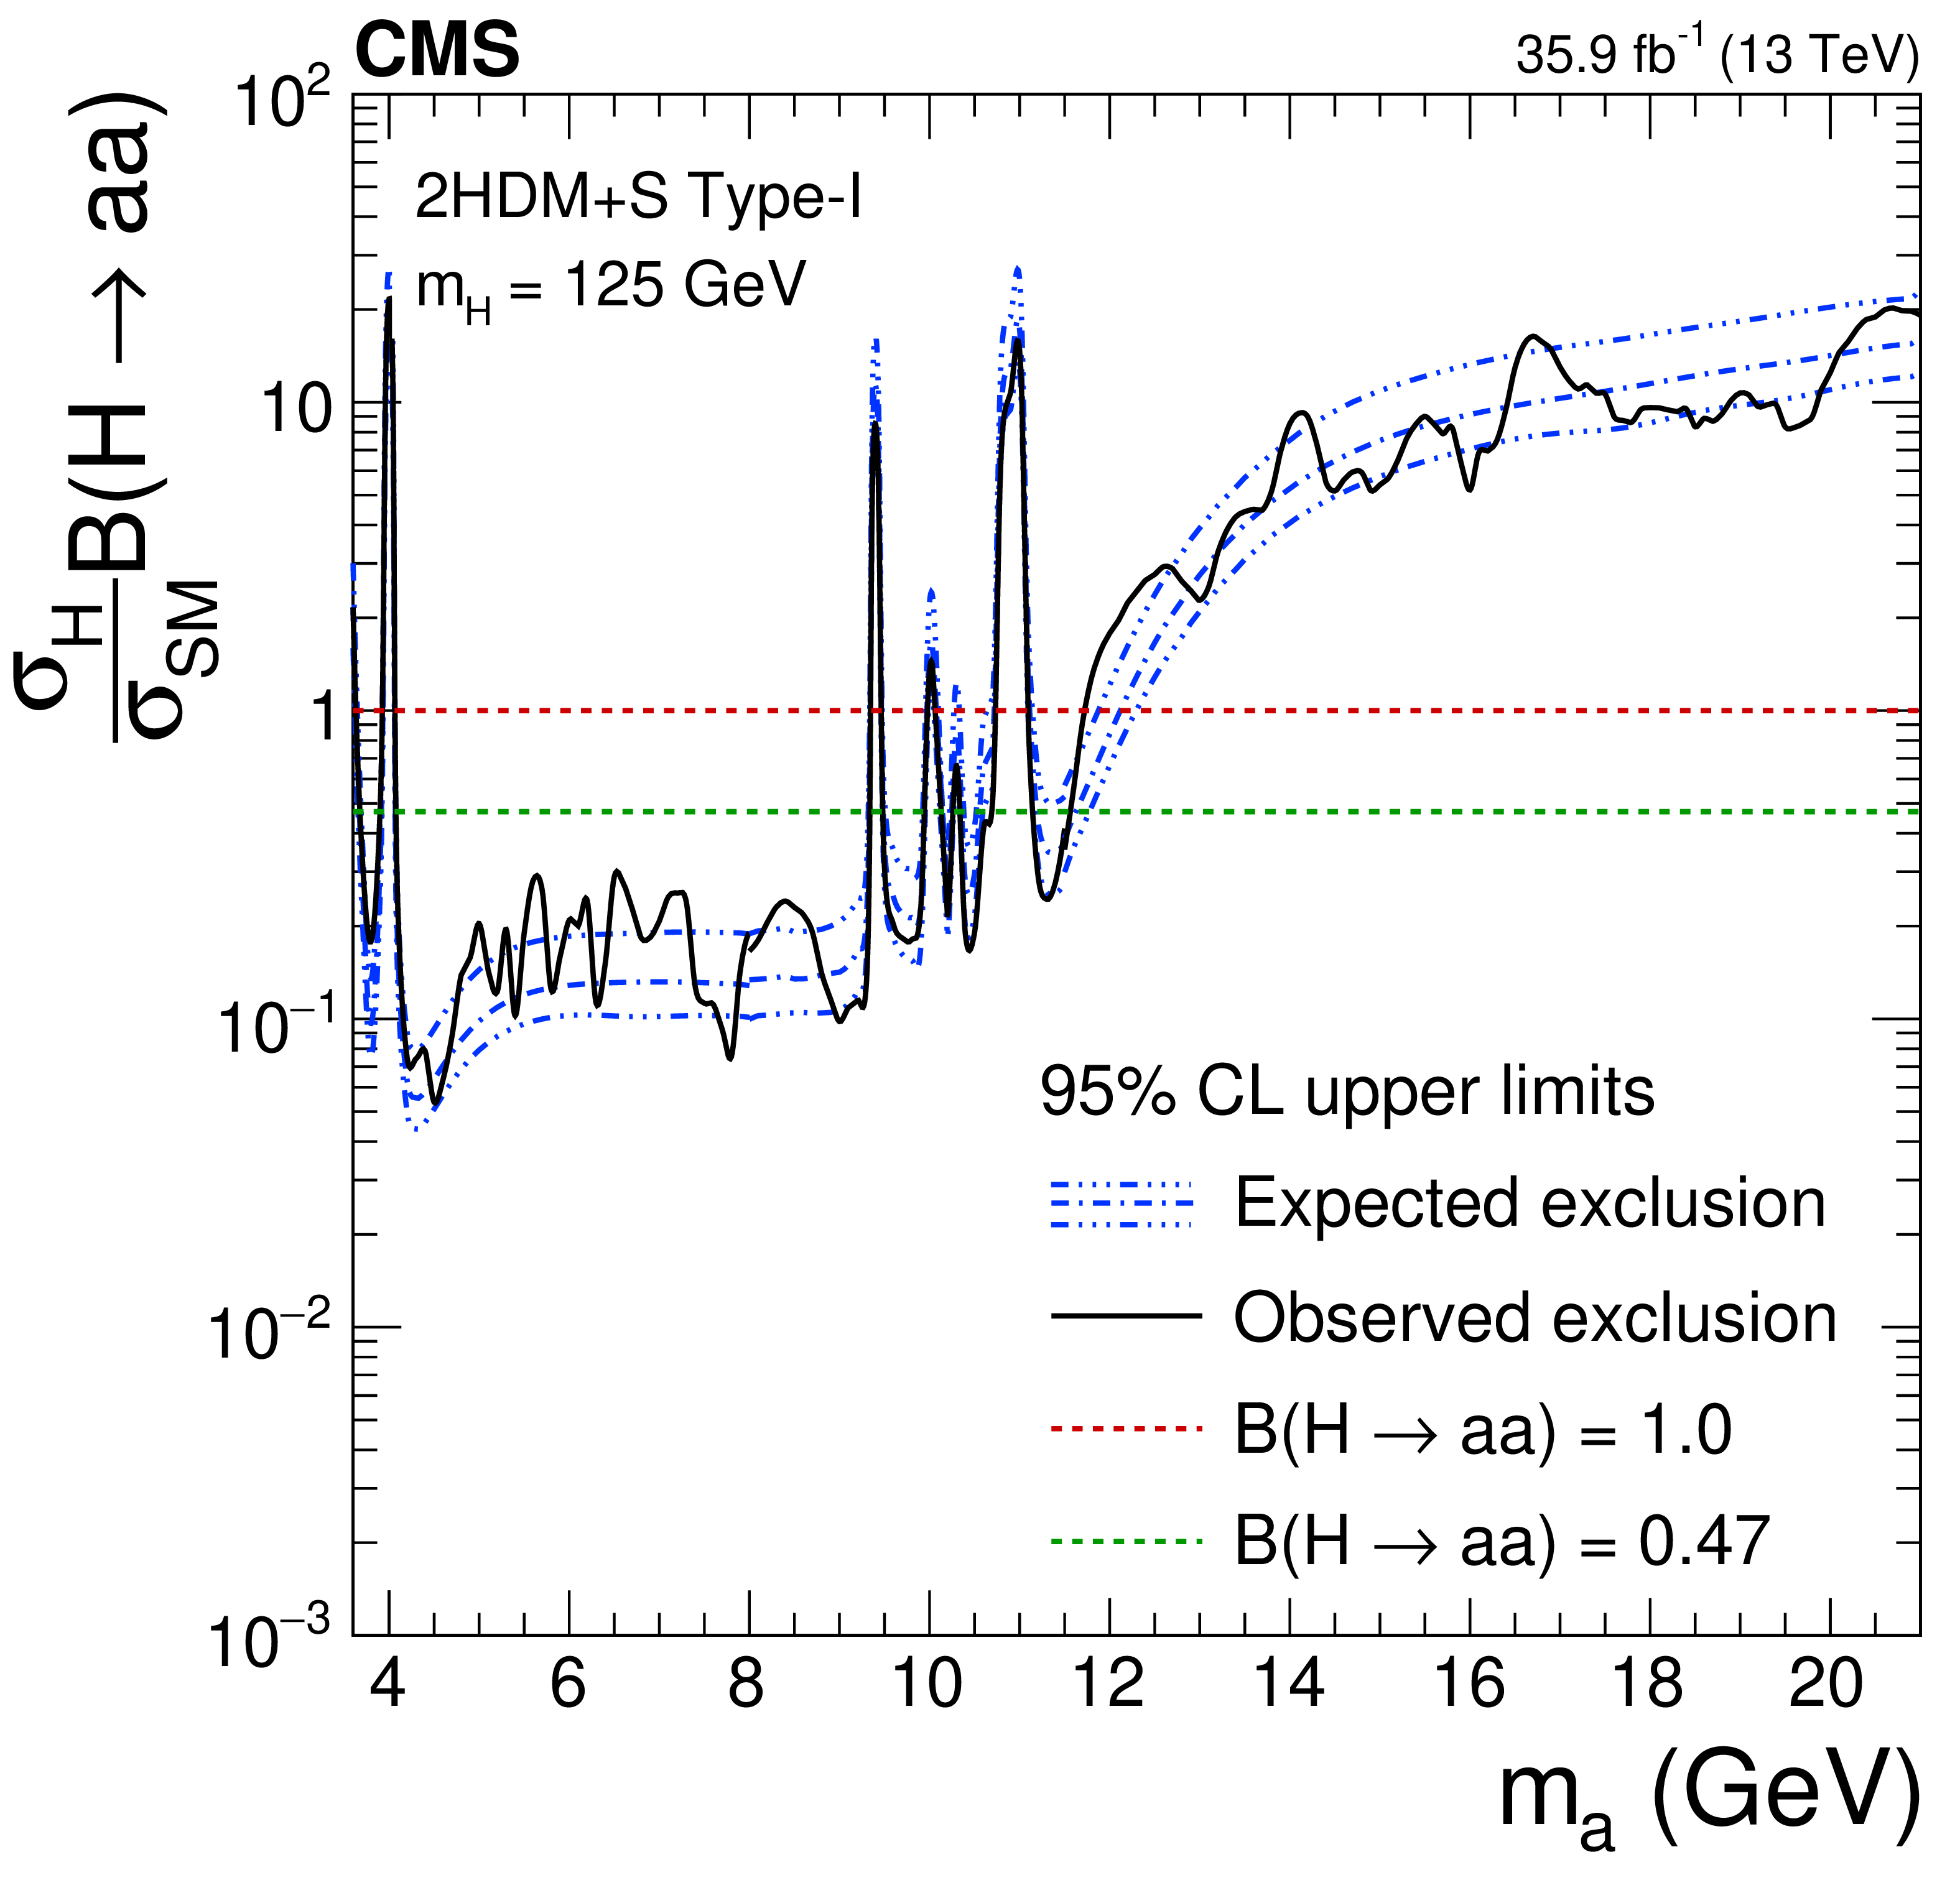
Observed (black) and expected (blue, median and 68%) model-specific 95% CL upper limits on $ {\sigma _{\mathrm{H}}} {\mathcal {B}}(\mathrm{H} \to \mathrm{a} \mathrm{a})/ {\sigma _{\text {SM}}} $ as a function of ${m_{\mathrm{a}}}$ for the Type-I 2HDM+S at $ {\tan\beta} = $ 1.5 and $ {m_{\mathrm{H}}} = $ 125 GeV. The assumed model branching fractions for pseudoscalar Higgs boson decay to $\mu \mu $ and $\tau \tau $ are taken from Ref. [71] and are approximately independent of ${\tan\beta}$. |

png pdf |
Figure 9:
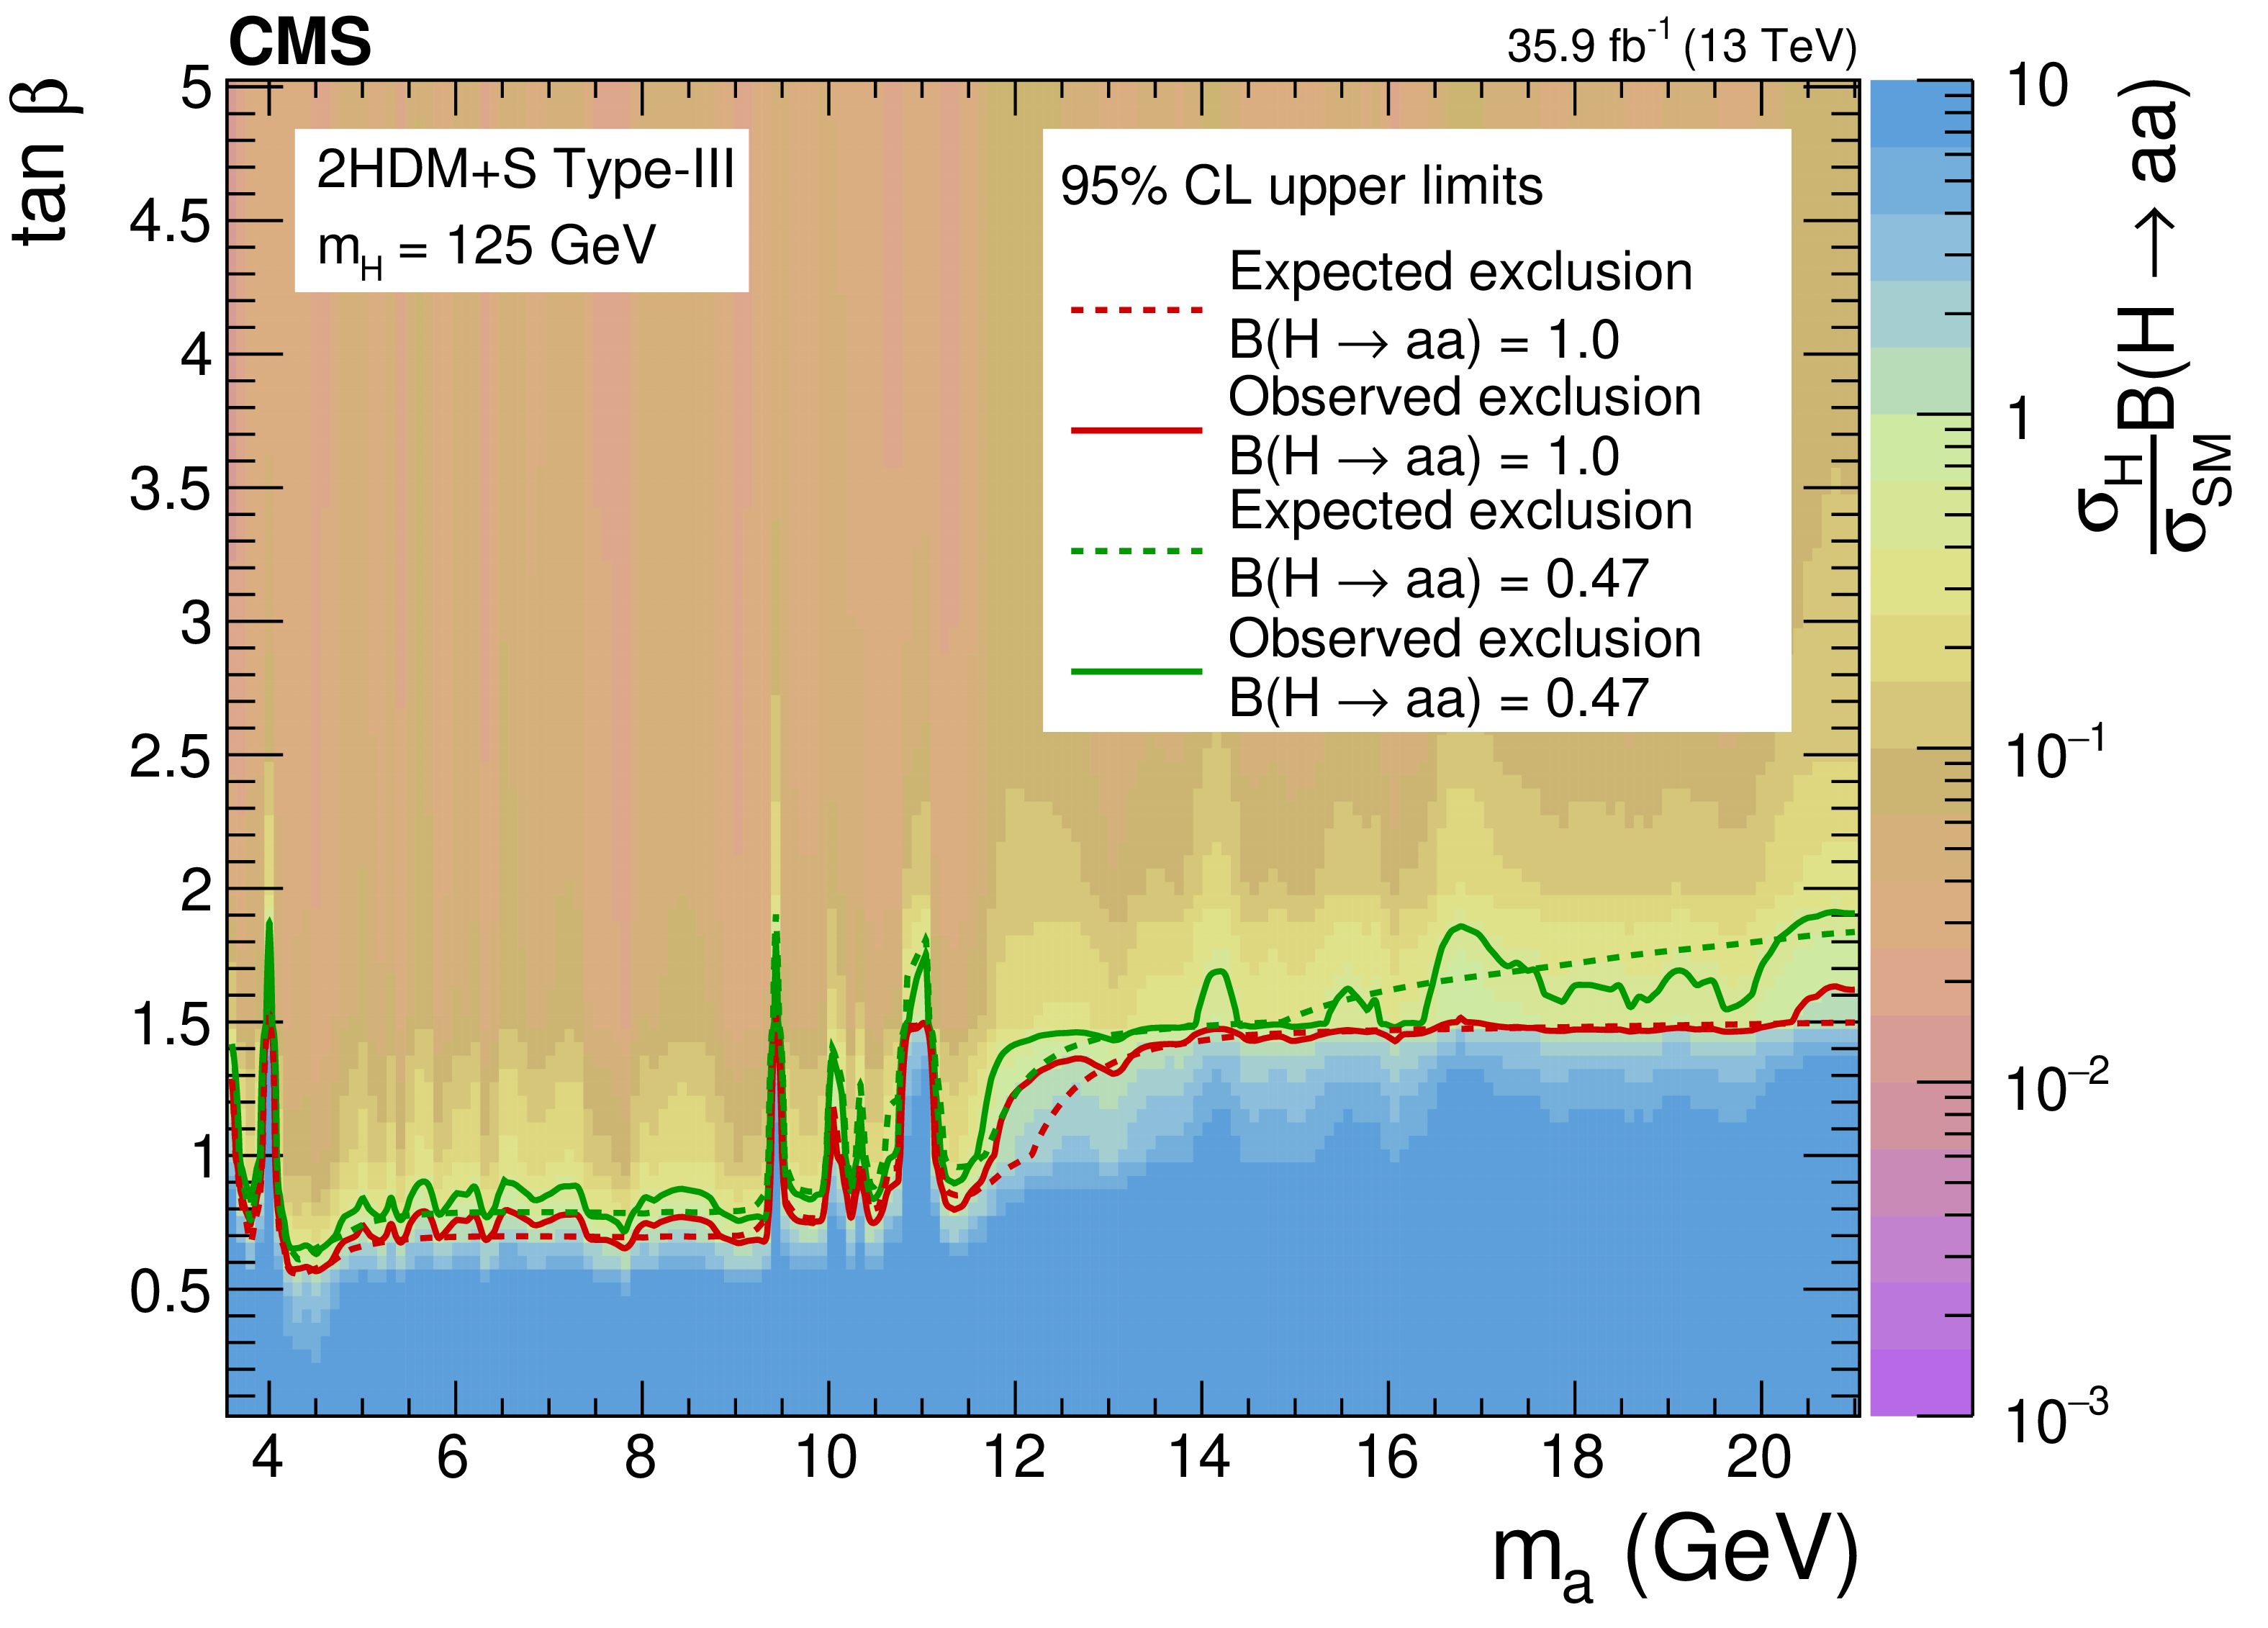
Model-specific 95% CL upper limits on $ {\sigma _{\mathrm{H}}} {\mathcal {B}}(\mathrm{H} \to \mathrm{a} \mathrm{a})/ {\sigma _{\text {SM}}} $ for three model types of the 2HDM+S as a function of ${\tan\beta}$ and ${m_{\mathrm{a}}}$, for $ {m_{\mathrm{H}}} = $ 125 GeV. Contours for two values of $ {\mathcal {B}}(\mathrm{H} \to \mathrm{a} \mathrm{a})$ are shown for reference. The assumed model branching fractions for pseudoscalar Higgs boson decay to $\mu \mu $ and $\tau \tau $ are taken from Ref. [71]. |

png pdf |
Figure 9-a:
Model-specific 95% CL upper limits on $ {\sigma _{\mathrm{H}}} {\mathcal {B}}(\mathrm{H} \to \mathrm{a} \mathrm{a})/ {\sigma _{\text {SM}}} $ for model 2HDM+S Type II as a function of ${\tan\beta}$ and ${m_{\mathrm{a}}}$, for $ {m_{\mathrm{H}}} = $ 125 GeV. Contours for two values of $ {\mathcal {B}}(\mathrm{H} \to \mathrm{a} \mathrm{a})$ are shown for reference. The assumed model branching fractions for pseudoscalar Higgs boson decay to $\mu \mu $ and $\tau \tau $ are taken from Ref. [71]. |
png pdf |
Figure 9-b:
Model-specific 95% CL upper limits on $ {\sigma _{\mathrm{H}}} {\mathcal {B}}(\mathrm{H} \to \mathrm{a} \mathrm{a})/ {\sigma _{\text {SM}}} $ for model 2HDM+S Type III as a function of ${\tan\beta}$ and ${m_{\mathrm{a}}}$, for $ {m_{\mathrm{H}}} = $ 125 GeV. Contours for two values of $ {\mathcal {B}}(\mathrm{H} \to \mathrm{a} \mathrm{a})$ are shown for reference. The assumed model branching fractions for pseudoscalar Higgs boson decay to $\mu \mu $ and $\tau \tau $ are taken from Ref. [71]. |

png pdf |
Figure 9-c:
Model-specific 95% CL upper limits on $ {\sigma _{\mathrm{H}}} {\mathcal {B}}(\mathrm{H} \to \mathrm{a} \mathrm{a})/ {\sigma _{\text {SM}}} $ for model 2HDM+S Type IV as a function of ${\tan\beta}$ and ${m_{\mathrm{a}}}$, for $ {m_{\mathrm{H}}} = $ 125 GeV. Contours for two values of $ {\mathcal {B}}(\mathrm{H} \to \mathrm{a} \mathrm{a})$ are shown for reference. The assumed model branching fractions for pseudoscalar Higgs boson decay to $\mu \mu $ and $\tau \tau $ are taken from Ref. [71]. |
| Tables | |
png pdf |
Table 1:
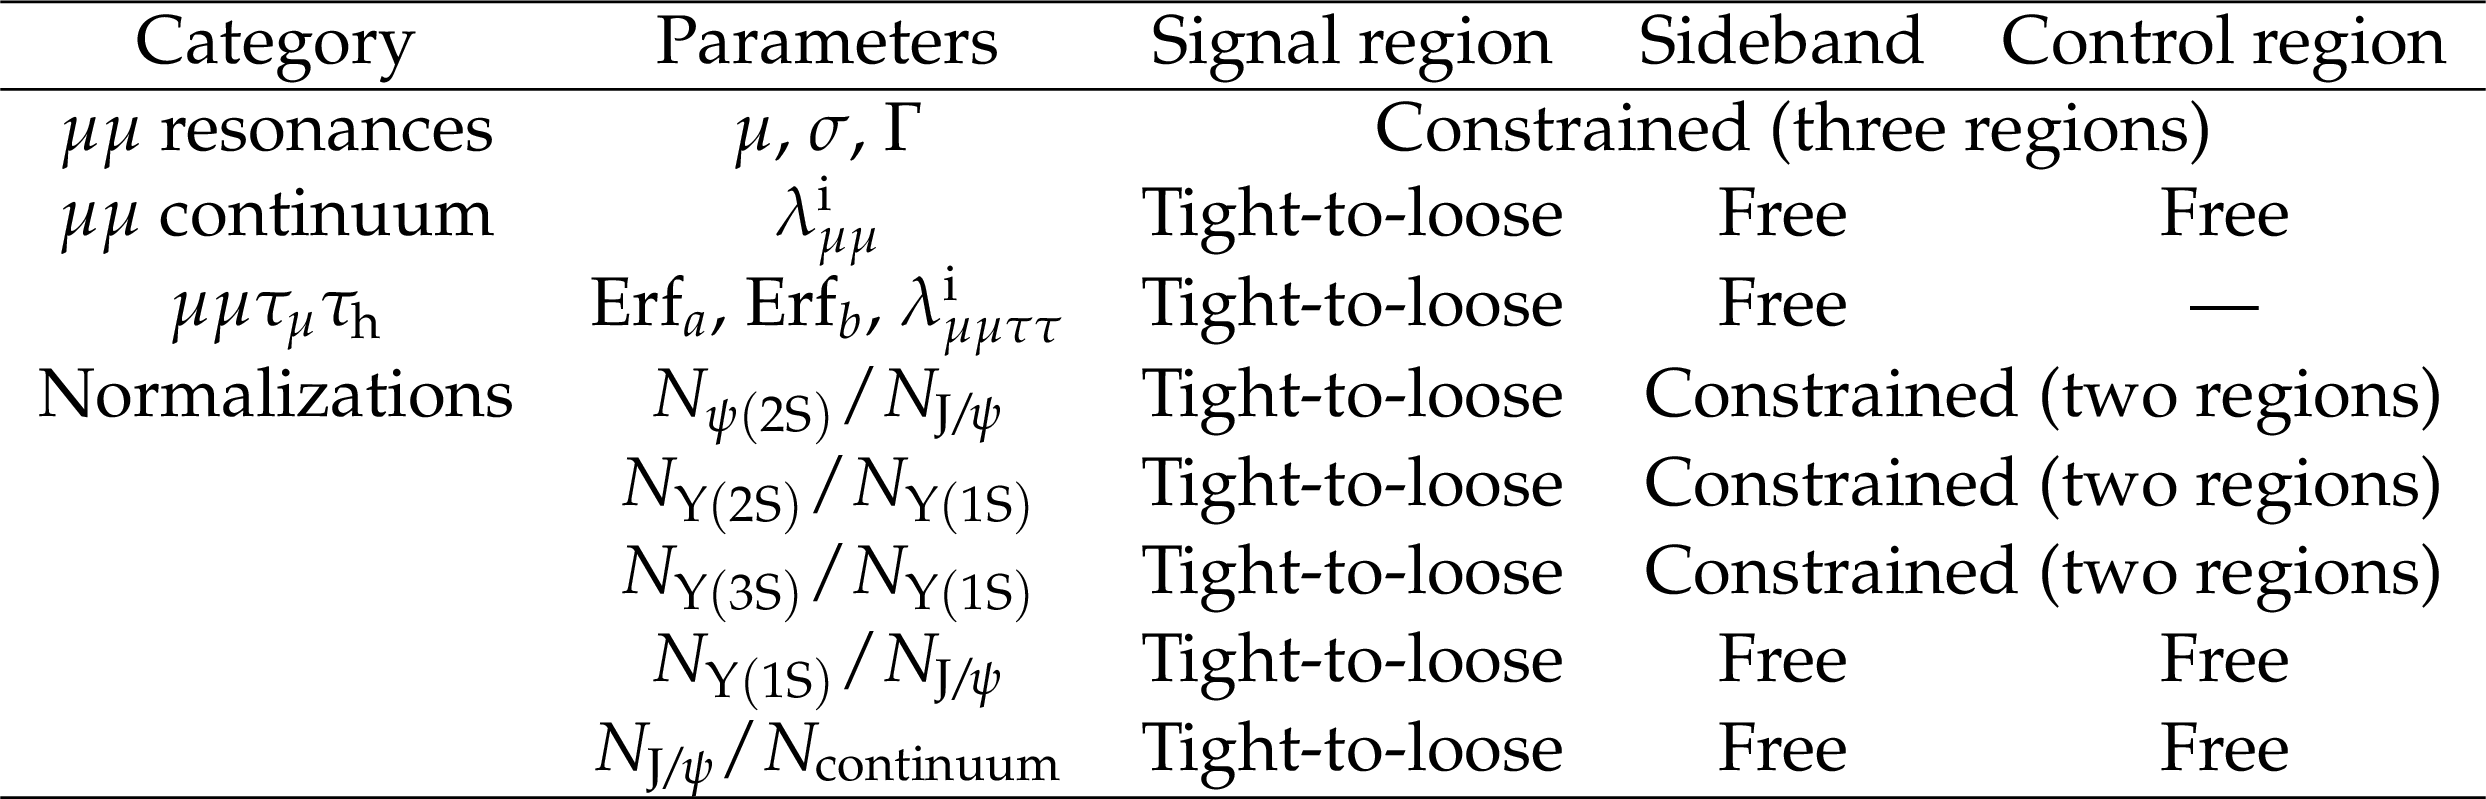
Background model parameters and their relations among the three fit regions in the analysis. The ${\mu \mu}$ background model includes the five meson resonances modeled using a Voigt function over an exponential continuum. The 4-body background model includes an error function multiplied with the sum of two exponential distributions. Three types of fit region relations are used: (a) constrained, in which the parameters are the same in the indicated regions, (b) free, in which the parameter is not related to those in any other region, and (c) related via the $ {\tau _{\mu}} {\tau _{\mathrm{h}}} $ tight-to-loose ratio, in which the indicated parameter in the signal region is constrained to the corresponding parameter in the sideband via a linear transformation. |
| Summary |
| A search for Higgs boson (H) decays to a pair of light pseudoscalar bosons (a) is presented, including the first such LHC results for an H with mass above 125 GeV. The light pseudoscalars decay to $\mu\mu$ and $\tau\tau$ with substantial overlap between the leptons because of the Lorentz boost. This difficult topology motivates the development of a dedicated $\tau_{\mu}\tau_{\mathrm{h}}$ reconstruction method to increase the acceptance. Data collected by the CMS Collaboration at $\sqrt{s} = $ 13 TeV, corresponding to an integrated luminosity of 35.9 fb$^{-1}$, are examined and no significant excess over standard model (SM) processes is observed. This analysis obtains model-independent upper limits at 95% confidence level on the branching fraction (${\mathcal{B}}$) of a SM-like Higgs boson (H), decaying to a pair of pseudoscalar bosons (a) in the $\mu\mu\tau\tau$ final state, ${\sigma_{\mathrm{H}}} {\mathcal{B}}(\mathrm{H}\to\mathrm{a}\mathrm{a}\to\mu\mu\tau\tau)/{\sigma_{\text{SM}}} $, as well as model-specific upper limits on ${\sigma_{\mathrm{H}}} {\mathcal{B}}(\mathrm{H}\to\mathrm{a}\mathrm{a})/{\sigma_{\text{SM}}} $ for Type-I, -II, -III, and -IV two Higgs doublets plus singlet models. In the Type-I model, the upper limit on the allowed branching fraction is approximately independent of ${\tan\beta}$, with the most stringent limit of 5% set for ${m_{\mathrm{a}}} \approx $ 4.5 GeV. For the Type-II and -III models with ${m_{\mathrm{a}}} $ below the $\mathrm{b\bar{b}}$ threshold, upper limits on ${\mathcal{B}}(\mathrm{H}\to\mathrm{a}\mathrm{a})$ are stronger than the 0.47 inferred from combined measurements of SM Higgs couplings for ${\tan\beta}\gtrsim $ 0.8-0.9, becoming as strong as 10% for ${\tan\beta}\gtrsim $ 1.5. In the Type-III models, the predicted branching fraction to leptons increases with ${\tan\beta}$, leading to strong upper limits for all pseudoscalar boson masses tested when ${\tan\beta}\gtrsim $ 1.5. In contrast, the strongest upper limits for Type-IV models are set when ${\tan\beta} < $ 1. These results significantly extend upper limits obtained by earlier searches by the CMS and ATLAS Collaborations, such as those obtained by CMS with 8 TeV data [39], and are complementary to present searches (e.g. Ref. [40]) at higher ${m_{\mathrm{a}}} $ that lead to resolved $\mu\mu$ and $\tau\tau$ final states. |
| References | ||||
| 1 | ATLAS Collaboration | Measurements of Higgs boson production and couplings in diboson final states with the ATLAS detector at the LHC | PLB 726 (2013) 88 | 1307.1427 |
| 2 | ATLAS and CMS Collaborations | Measurements of the Higgs boson production and decay rates and constraints on its couplings from a combined ATLAS and CMS analysis of the LHC pp collision data at $ \sqrt{s}= $ 7 and 8 TeV | JHEP 08 (2016) 045 | 1606.02266 |
| 3 | CMS Collaboration | Measurements of properties of the Higgs boson decaying into the four-lepton final state in pp collisions at $ \sqrt{s}= $ 13 TeV | JHEP 11 (2017) 047 | CMS-HIG-16-041 1706.09936 |
| 4 | ATLAS Collaboration | Measurement of the Higgs boson mass from the $ H\rightarrow \gamma\gamma $ and $ H \rightarrow ZZ^{*} \rightarrow 4\ell $ channels with the ATLAS detector using 25 fb$ ^{-1} $ of pp collision data | PRD 90 (2014) 052004 | 1406.3827 |
| 5 | ATLAS and CMS Collaborations | Combined measurement of the Higgs boson mass in pp collisions at $ \sqrt{s}= $ 7 and 8 TeV with the ATLAS and CMS experiments | PRL 114 (2015) 191803 | 1503.07589 |
| 6 | G. C. Branco et al. | Theory and phenomenology of two-Higgs-doublet models | PR 516 (2012) 1 | 1106.0034 |
| 7 | D. Curtin et al. | Exotic decays of the 125 GeV Higgs boson | PRD 90 (2014) 075004 | 1312.4992 |
| 8 | U. Ellwanger, C. Hugonie, and A. M. Teixeira | The next-to-minimal supersymmetric standard model | PR 496 (2010) 1 | 0910.1785 |
| 9 | CMS Collaboration | Combined measurements of Higgs boson couplings in proton-proton collisions at $ \sqrt{s}= $ 13 TeV | EPJC 79 (2019) 421 | CMS-HIG-17-031 1809.10733 |
| 10 | R. Dermisek and J. F. Gunion | Escaping the large fine tuning and little hierarchy problems in the next to minimal supersymmetric model and $ h\rightarrow aa $ decays | PRL 95 (2005) 041801 | hep-ph/0502105 |
| 11 | R. Dermisek and J. F. Gunion | The NMSSM close to the R-symmetry limit and naturalness in $ h\rightarrow aa $ decays for $ m(a) < 2m(b) $ | PRD 75 (2007) 075019 | hep-ph/0611142 |
| 12 | S. Chang, R. Dermisek, J. F. Gunion, and N. Weiner | Nonstandard Higgs boson decays | Ann. Rev. Nucl. Part. Sci. 58 (2008) 75 | 0801.4554 |
| 13 | J. F. Gunion, H. E. Haber, G. L. Kane, and S. Dawson | The Higgs Hunter's Guide | volume 80 of Frontiers in Physics Perseus Books | |
| 14 | S. F. King, M. Muhlleitner, R. Nevzorov, and K. Walz | Natural NMSSM Higgs bosons | NPB 870 (2013) 323 | 1211.5074 |
| 15 | A. Celis, V. Ilisie, and A. Pich | LHC constraints on two-Higgs doublet models | JHEP 07 (2013) 053 | 1302.4022 |
| 16 | B. Grinstein and P. Uttayarat | Carving out parameter space in Type-II two Higgs doublets model | JHEP 06 (2013) 094 | 1304.0028 |
| 17 | B. Coleppa, F. Kling, and S. Su | Constraining Type II 2HDM in light of LHC Higgs searches | JHEP 01 (2014) 161 | 1305.0002 |
| 18 | C.-Y. Chen, S. Dawson, and M. Sher | Heavy Higgs searches and constraints on two Higgs doublet models | PRD 88 (2013) 015018 | 1305.1624 |
| 19 | N. Craig, J. Galloway, and S. Thomas | Searching for signs of the second Higgs doublet | 1305.2424 | |
| 20 | L. Wang and X.-F. Han | Status of the aligned two-Higgs-doublet model confronted with the Higgs data | JHEP 04 (2014) 128 | 1312.4759 |
| 21 | J. Cao et al. | A light Higgs scalar in the NMSSM confronted with the latest LHC Higgs data | JHEP 11 (2013) 018 | 1309.4939 |
| 22 | N. D. Christensen, T. Han, Z. Liu, and S. Su | Low-mass Higgs bosons in the NMSSM and their LHC implications | JHEP 08 (2013) 019 | 1303.2113 |
| 23 | D. G. Cerdeno, P. Ghosh, and C. B. Park | Probing the two light Higgs scenario in the NMSSM with a low-mass pseudoscalar | JHEP 06 (2013) 031 | 1301.1325 |
| 24 | G. Chalons and F. Domingo | Analysis of the Higgs potentials for two doublets and a singlet | PRD 86 (2012) 115024 | 1209.6235 |
| 25 | A. Ahriche, A. Arhrib, and S. Nasri | Higgs phenomenology in the two-singlet model | JHEP 02 (2014) 042 | 1309.5615 |
| 26 | J. Baglio, O. Eberhardt, U. Nierste, and M. Wiebusch | Benchmarks for Higgs pair production and heavy Higgs boson searches in the two-Higgs-doublet model of Type II | PRD 90 (2014) 015008 | 1403.1264 |
| 27 | B. Dumont, J. F. Gunion, Y. Jiang, and S. Kraml | Constraints on and future prospects for two-Higgs-doublet models in light of the LHC Higgs signal | PRD 90 (2014) 035021 | 1405.3584 |
| 28 | J. Bernon et al. | Scrutinizing the alignment limit in two-Higgs-doublet models: m$ _h = $ 125 GeV | PRD 92 (2015) 075004 | 1507.00933 |
| 29 | ALEPH Collaboration | Search for a nonminimal Higgs boson produced in the reaction $ e^{+} e^{-} \to \mathrm{h} {Z}^{*} $ | PLB 313 (1993) 312 | |
| 30 | L3 Collaboration | Search for neutral Higgs boson production through the process $ e^{+} e^{-} \to {Z}^{*} \mathrm{H}^{0}$ | PLB 385 (1996) 454 | |
| 31 | OPAL Collaboration | Decay mode independent searches for new scalar bosons with the OPAL detector at LEP | EPJC 27 (2003) 311 | hep-ex/0206022 |
| 32 | S. F. King, M. Muhlleitner, R. Nevzorov, and K. Walz | Discovery prospects for NMSSM Higgs bosons at the high-energy large hadron collider | PRD 90 (2014) 095014 | 1408.1120 |
| 33 | ALEPH Collaboration | Search for neutral Higgs bosons decaying into four taus at LEP2 | JHEP 05 (2010) 049 | 1003.0705 |
| 34 | CMS Collaboration | Search for a light pseudoscalar Higgs boson in the dimuon decay channel in pp collisions at $ \sqrt{s}= $ 7 TeV | PRL 109 (2012) 121801 | CMS-HIG-12-004 1206.6326 |
| 35 | R. Dermisek and J. F. Gunion | Direct production of a light CP-odd Higgs boson at the Tevatron and LHC | PRD 81 (2010) 055001 | 0911.2460 |
| 36 | LHCb Collaboration | Search for a dimuon resonance in the $ \upsilon $ mass region | JHEP 09 (2018) 147 | 1805.09820 |
| 37 | CMS Collaboration | A search for pair production of new light bosons decaying into muons in proton-proton collisions at 13 TeV | PLB 796 (2019) 131 | CMS-HIG-18-003 1812.00380 |
| 38 | ATLAS Collaboration | Search for Higgs boson decays to beyond-the-standard-model light bosons in four-lepton events with the ATLAS detector at $ \sqrt{s}= $ 13 TeV | JHEP 06 (2018) 166 | 1802.03388 |
| 39 | CMS Collaboration | Search for light bosons in decays of the 125 GeV Higgs boson in proton-proton collisions at $ \sqrt{s}= $ 8 TeV | JHEP 10 (2017) 076 | CMS-HIG-16-015 1701.02032 |
| 40 | CMS Collaboration | Search for an exotic decay of the Higgs boson to a pair of light pseudoscalars in the final state of two muons and two $ \tau $ leptons in proton-proton collisions at $ \sqrt{s}= $ 13 TeV | JHEP 11 (2018) 018 | CMS-HIG-17-029 1805.04865 |
| 41 | CMS Collaboration | Search for an exotic decay of the Higgs boson to a pair of light pseudoscalars in the final state with two b quarks and two $ \tau $ leptons in proton-proton collisions at $ \sqrt{s}= $ 13 TeV | PLB 785 (2018) 462 | CMS-HIG-17-024 1805.10191 |
| 42 | CMS Collaboration | Search for light pseudoscalar boson pairs produced from decays of the 125 GeV Higgs boson in final states with two muons and two nearby tracks in pp collisions at $ \sqrt{s}= $ 13 TeV | PLB 800 (2020) 135087 | CMS-HIG-18-006 1907.07235 |
| 43 | ATLAS Collaboration | Search for Higgs bosons decaying to $ aa $ in the $ \mu\mu\tau\tau $ final state in pp collisions at $ \sqrt{s} = $ 8 TeV with the ATLAS experiment | PRD 92 (2015) 052002 | 1505.01609 |
| 44 | ATLAS Collaboration | Search for Higgs boson decays into a pair of light bosons in the $ bb\mu\mu $ final state in pp collision at $ \sqrt{s} = $ 13 TeV with the ATLAS detector | PLB 790 (2019) 1 | 1807.00539 |
| 45 | ATLAS Collaboration | Search for the Higgs boson produced in association with a vector boson and decaying into two spin-zero particles in the $ h \rightarrow aa \rightarrow 4b $ channel in pp collisions at $ \sqrt{s} = $ 13 TeV with the ATLAS detector | JHEP 10 (2018) 031 | 1806.07355 |
| 46 | LHC Higgs Cross Section Working Group | Handbook of LHC Higgs cross sections: 4. deciphering the nature of the Higgs sector | CERN (2016) | 1610.07922 |
| 47 | J. Bernon, J. F. Gunion, Y. Jiang, and S. Kraml | Light Higgs bosons in two-Higgs-doublet models | PRD 91 (2015) 075019 | 1412.3385 |
| 48 | CMS Collaboration | The CMS trigger system | JINST 12 (2017) P01020 | CMS-TRG-12-001 1609.02366 |
| 49 | CMS Collaboration | The CMS experiment at the CERN LHC | JINST 3 (2008) S08004 | CMS-00-001 |
| 50 | J. Alwall et al. | The automated computation of tree-level and next-to-leading order differential cross sections, and their matching to parton shower simulations | JHEP 07 (2014) 079 | 1405.0301 |
| 51 | T. Sjostrand et al. | An introduction to PYTHIA 8.2 | CPC 191 (2015) 159 | 1410.3012 |
| 52 | CMS Collaboration | Event generator tunes obtained from underlying event and multiparton scattering measurements | EPJC 76 (2016) 155 | CMS-GEN-14-001 1512.00815 |
| 53 | NNPDF Collaboration | Parton distributions from high-precision collider data | EPJC 77 (2017) 663 | 1706.00428 |
| 54 | GEANT4 Collaboration | GEANT4--a simulation toolkit | NIMA 506 (2003) 250 | |
| 55 | CMS Collaboration | Particle-flow reconstruction and global event description with the CMS detector | JINST 12 (2017) P10003 | CMS-PRF-14-001 1706.04965 |
| 56 | M. Cacciari, G. P. Salam, and G. Soyez | The anti-$ {k_{\mathrm{T}}} $ jet clustering algorithm | JHEP 04 (2008) 063 | 0802.1189 |
| 57 | M. Cacciari, G. P. Salam, and G. Soyez | FastJet user manual | EPJC 72 (2012) 1896 | 1111.6097 |
| 58 | CMS Collaboration | Performance of the CMS muon detector and muon reconstruction with proton-proton collisions at $ \sqrt{s}= $ 13 TeV | JINST 13 (2018) P06015 | CMS-MUO-16-001 1804.04528 |
| 59 | CMS Collaboration | Determination of jet energy calibration and transverse momentum resolution in CMS | JINST 6 (2011) P11002 | CMS-JME-10-011 1107.4277 |
| 60 | CMS Collaboration | Pileup mitigation at CMS in 13 TeV data | CMS-PAS-JME-18-001 | CMS-PAS-JME-18-001 |
| 61 | CMS Collaboration | Identification of b quark jets with the CMS experiment | JINST 8 (2013) P04013 | CMS-BTV-12-001 1211.4462 |
| 62 | CMS Collaboration | Identification of heavy-flavour jets with the CMS detector in pp collisions at 13 TeV | JINST 13 (2018) P05011 | CMS-BTV-16-002 1712.07158 |
| 63 | CMS Collaboration | Performance of reconstruction and identification of $ \tau $ leptons decaying to hadrons and $ \nu_\tau $ in pp collisions at $ \sqrt{s}= $ 13 TeV | JINST 13 (2018) P10005 | CMS-TAU-16-003 1809.02816 |
| 64 | CMS Collaboration | Measurement of the inclusive $ \mathrm{W} $ and $ \mathrm{Z} $ production cross sections in pp collisions at $ \sqrt{s}= $ 7 TeV with the CMS experiment | JHEP 10 (2011) 132 | CMS-EWK-10-005 1107.4789 |
| 65 | Particle Data Group, M. Tanabashi et al. | Review of particle physics | PRD 98 (2018) 030001 | |
| 66 | CMS Collaboration | CMS luminosity measurements for the 2016 data taking period | CMS-PAS-LUM-17-001 | CMS-PAS-LUM-17-001 |
| 67 | CMS Collaboration | Measurement of the inelastic proton-proton cross section at $ \sqrt{s}= $ 13 TeV | JHEP 07 (2018) 161 | CMS-FSQ-15-005 1802.02613 |
| 68 | T. Junk | Confidence level computation for combining searches with small statistics | NIMA 434 (1999) 435 | hep-ex/9902006 |
| 69 | A. L. Read | Presentation of search results: The CL$ _{\rm{s}} $ technique | JPG 28 (2002) 2693 | |
| 70 | ATLAS and CMS Collaborations, and The LHC Higgs Combination Group | Procedure for the LHC Higgs boson search combination in Summer 2011 | CMS-NOTE-2011-005 | |
| 71 | U. Haisch, J. F. Kamenik, A. Malinauskas, and M. Spira | Collider constraints on light pseudoscalars | JHEP 03 (2018) 178 | 1802.02156 |
|
|
Compact Muon Solenoid LHC, CERN |
|

|

|

|

|

|