

Compact Muon Solenoid
LHC, CERN
| CMS-PRF-18-002 ; CERN-EP-2020-180 | ||
| The very forward CASTOR calorimeter of the CMS experiment | ||
| CMS Collaboration | ||
| 2 November 2020 | ||
| JINST 16 (2021) P02010 | ||
| Abstract: The physics motivation, detector design, triggers, calibration, alignment, simulation, and overall performance of the very forward CASTOR calorimeter of the CMS experiment are reviewed. The CASTOR Cherenkov sampling calorimeter is located very close to the LHC beam line, at a radial distance of about 1 cm from the beam pipe, and at 14.4 m from the CMS interaction point, covering the pseudorapidity range of $-6.6 < \eta < -5.2$. It was designed to withstand high ambient radiation and strong magnetic fields. The performance of the detector in measurements of forward energy density, jets, and processes characterized by rapidity gaps, is reviewed using data collected in proton and nuclear collisions at the LHC. | ||
| Links: e-print arXiv:2011.01185 [hep-ex] (PDF) ; CDS record ; inSPIRE record ; CADI line (restricted) ; | ||
| Figures | |

png pdf |
Figure 1:
Picture of the forward region of the CMS experiment with the two half-cylinders of the CASTOR calorimeter (indicated by an arrow) visible in the zone where the collar shielding (orange) structures are open. The green cylindrical structure in the foreground belongs to the target absorber region. The massive shielding around the calorimeter is in the open position. The two half-cylinders of CASTOR are not yet closed around the LHC beam pipe that is visible emerging from the target absorber region in the foreground and disappearing towards the IP inside the CMS detector. |
png pdf |
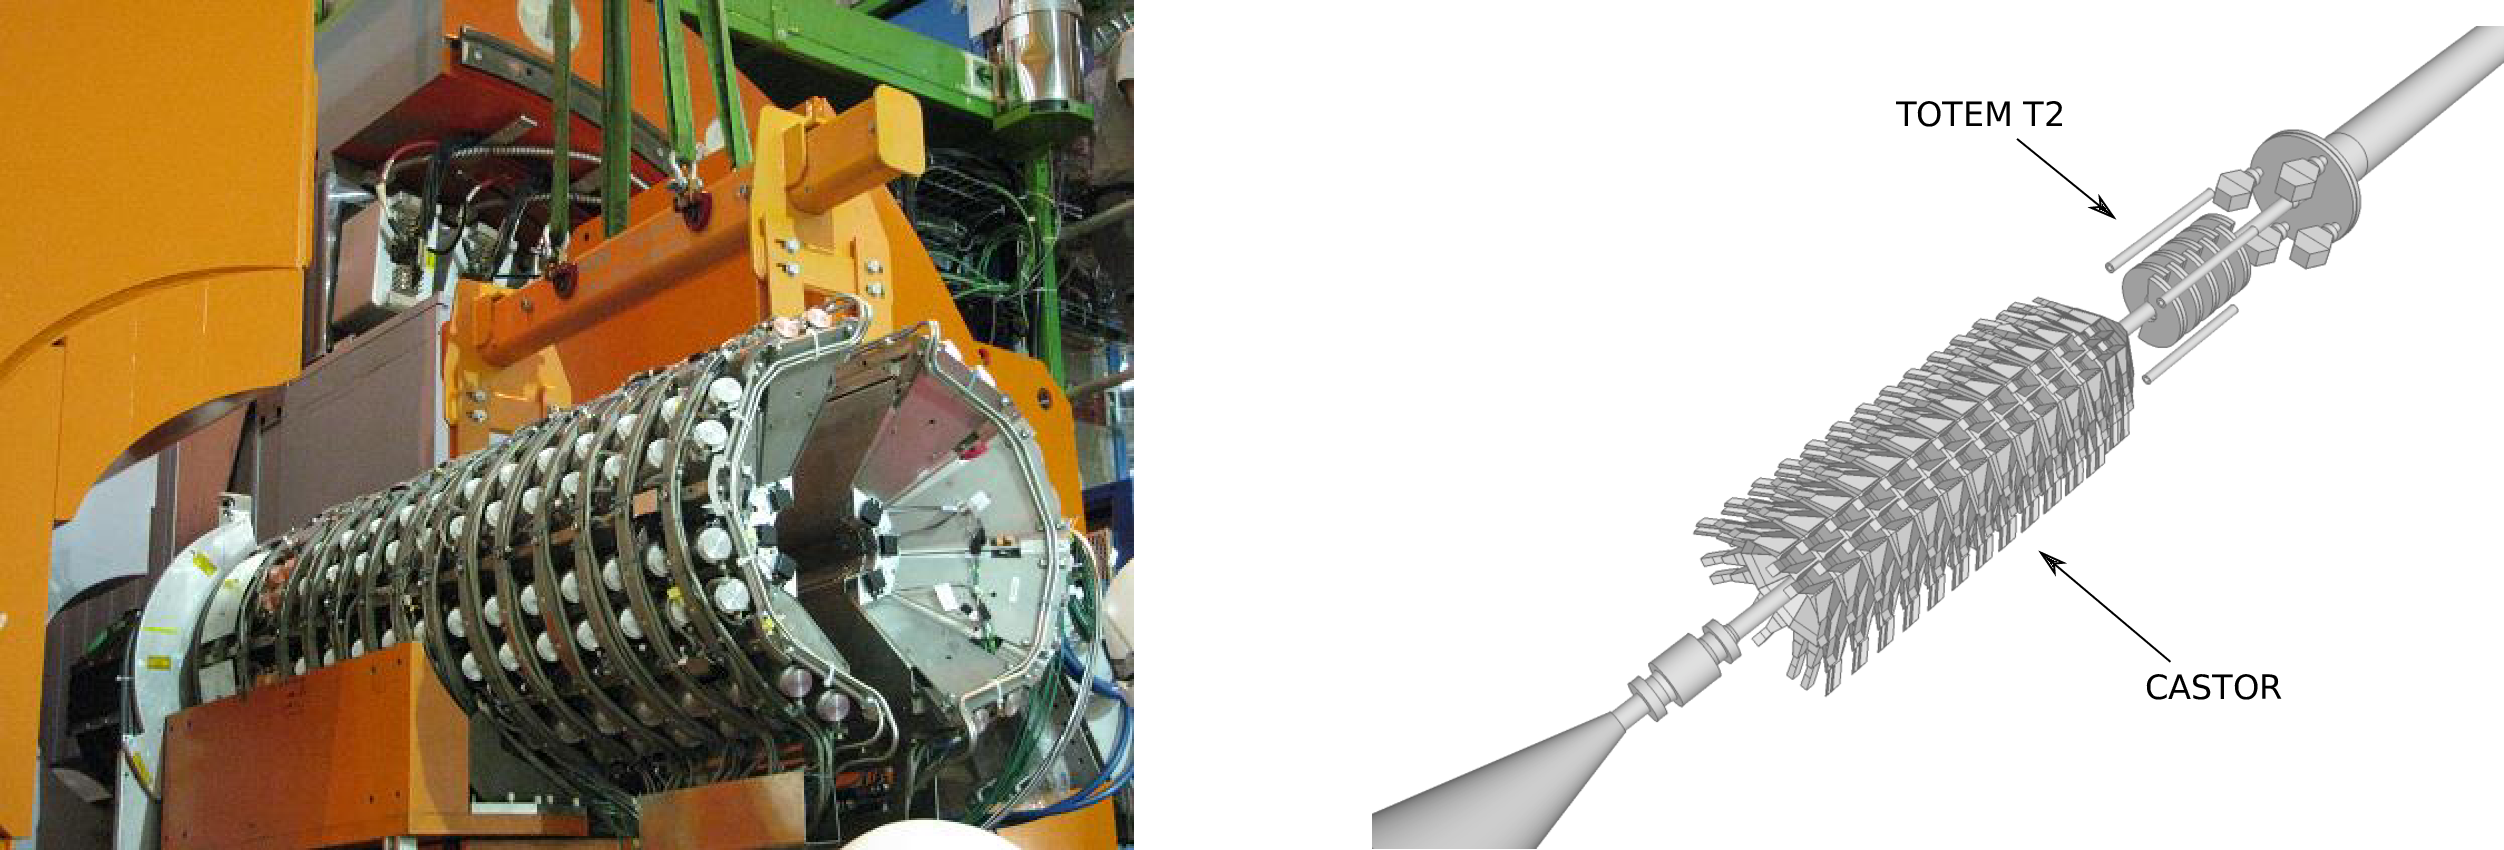
Figure 2:
Left: Closeup image of the CASTOR calorimeter surrounded by the CMS collar shielding in the open position during an integration test, about 5 m below the beam pipe. Right: Visualization of the CASTOR detector integrated around the beam pipe. The CMS interaction point is at 14.4 m upstream (towards the upper right). The TOTEM T2 tracking station, and several pieces of LHC/CMS infrastructure, are visible along this direction. |

png |
Figure 2-a:
Closeup image of the CASTOR calorimeter surrounded by the CMS collar shielding in the open position during an integration test, about 5 m below the beam pipe. |
png pdf |
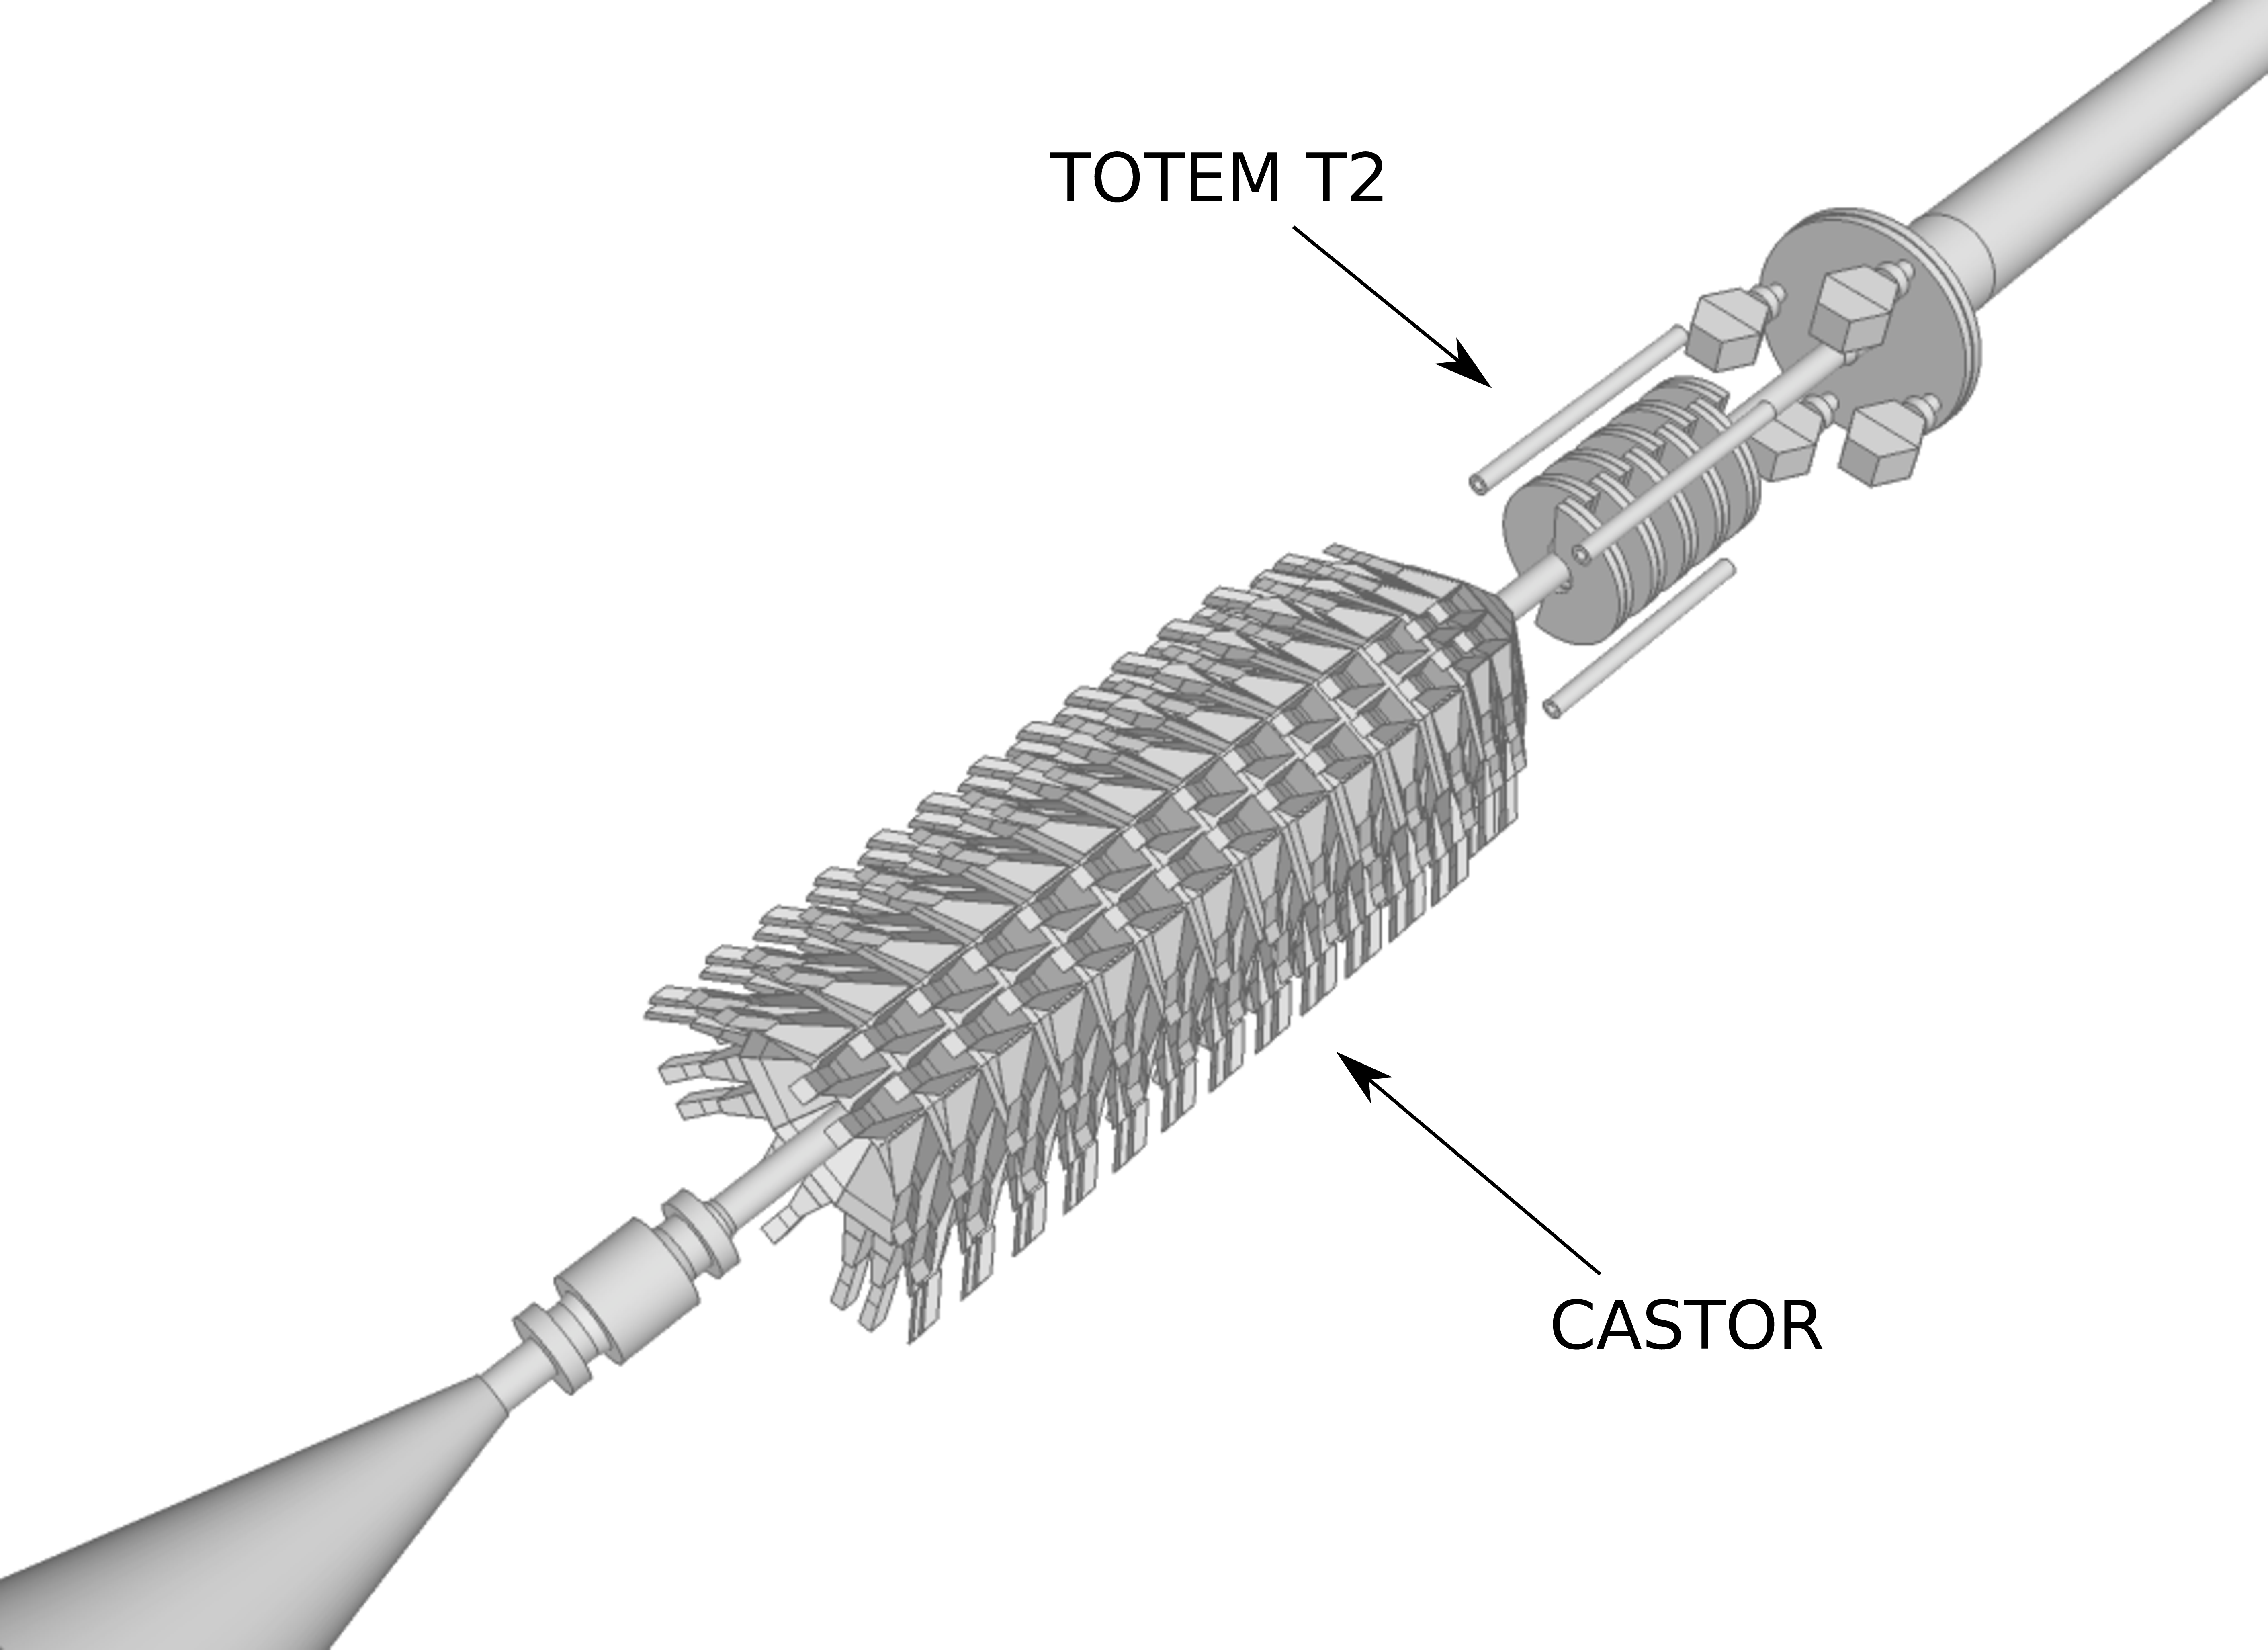
Figure 2-b:
Visualization of the CASTOR detector integrated around the beam pipe. The CMS interaction point is at 14.4 m upstream (towards the upper right). The TOTEM T2 tracking station, and several pieces of LHC/CMS infrastructure, are visible along this direction. |
png pdf |
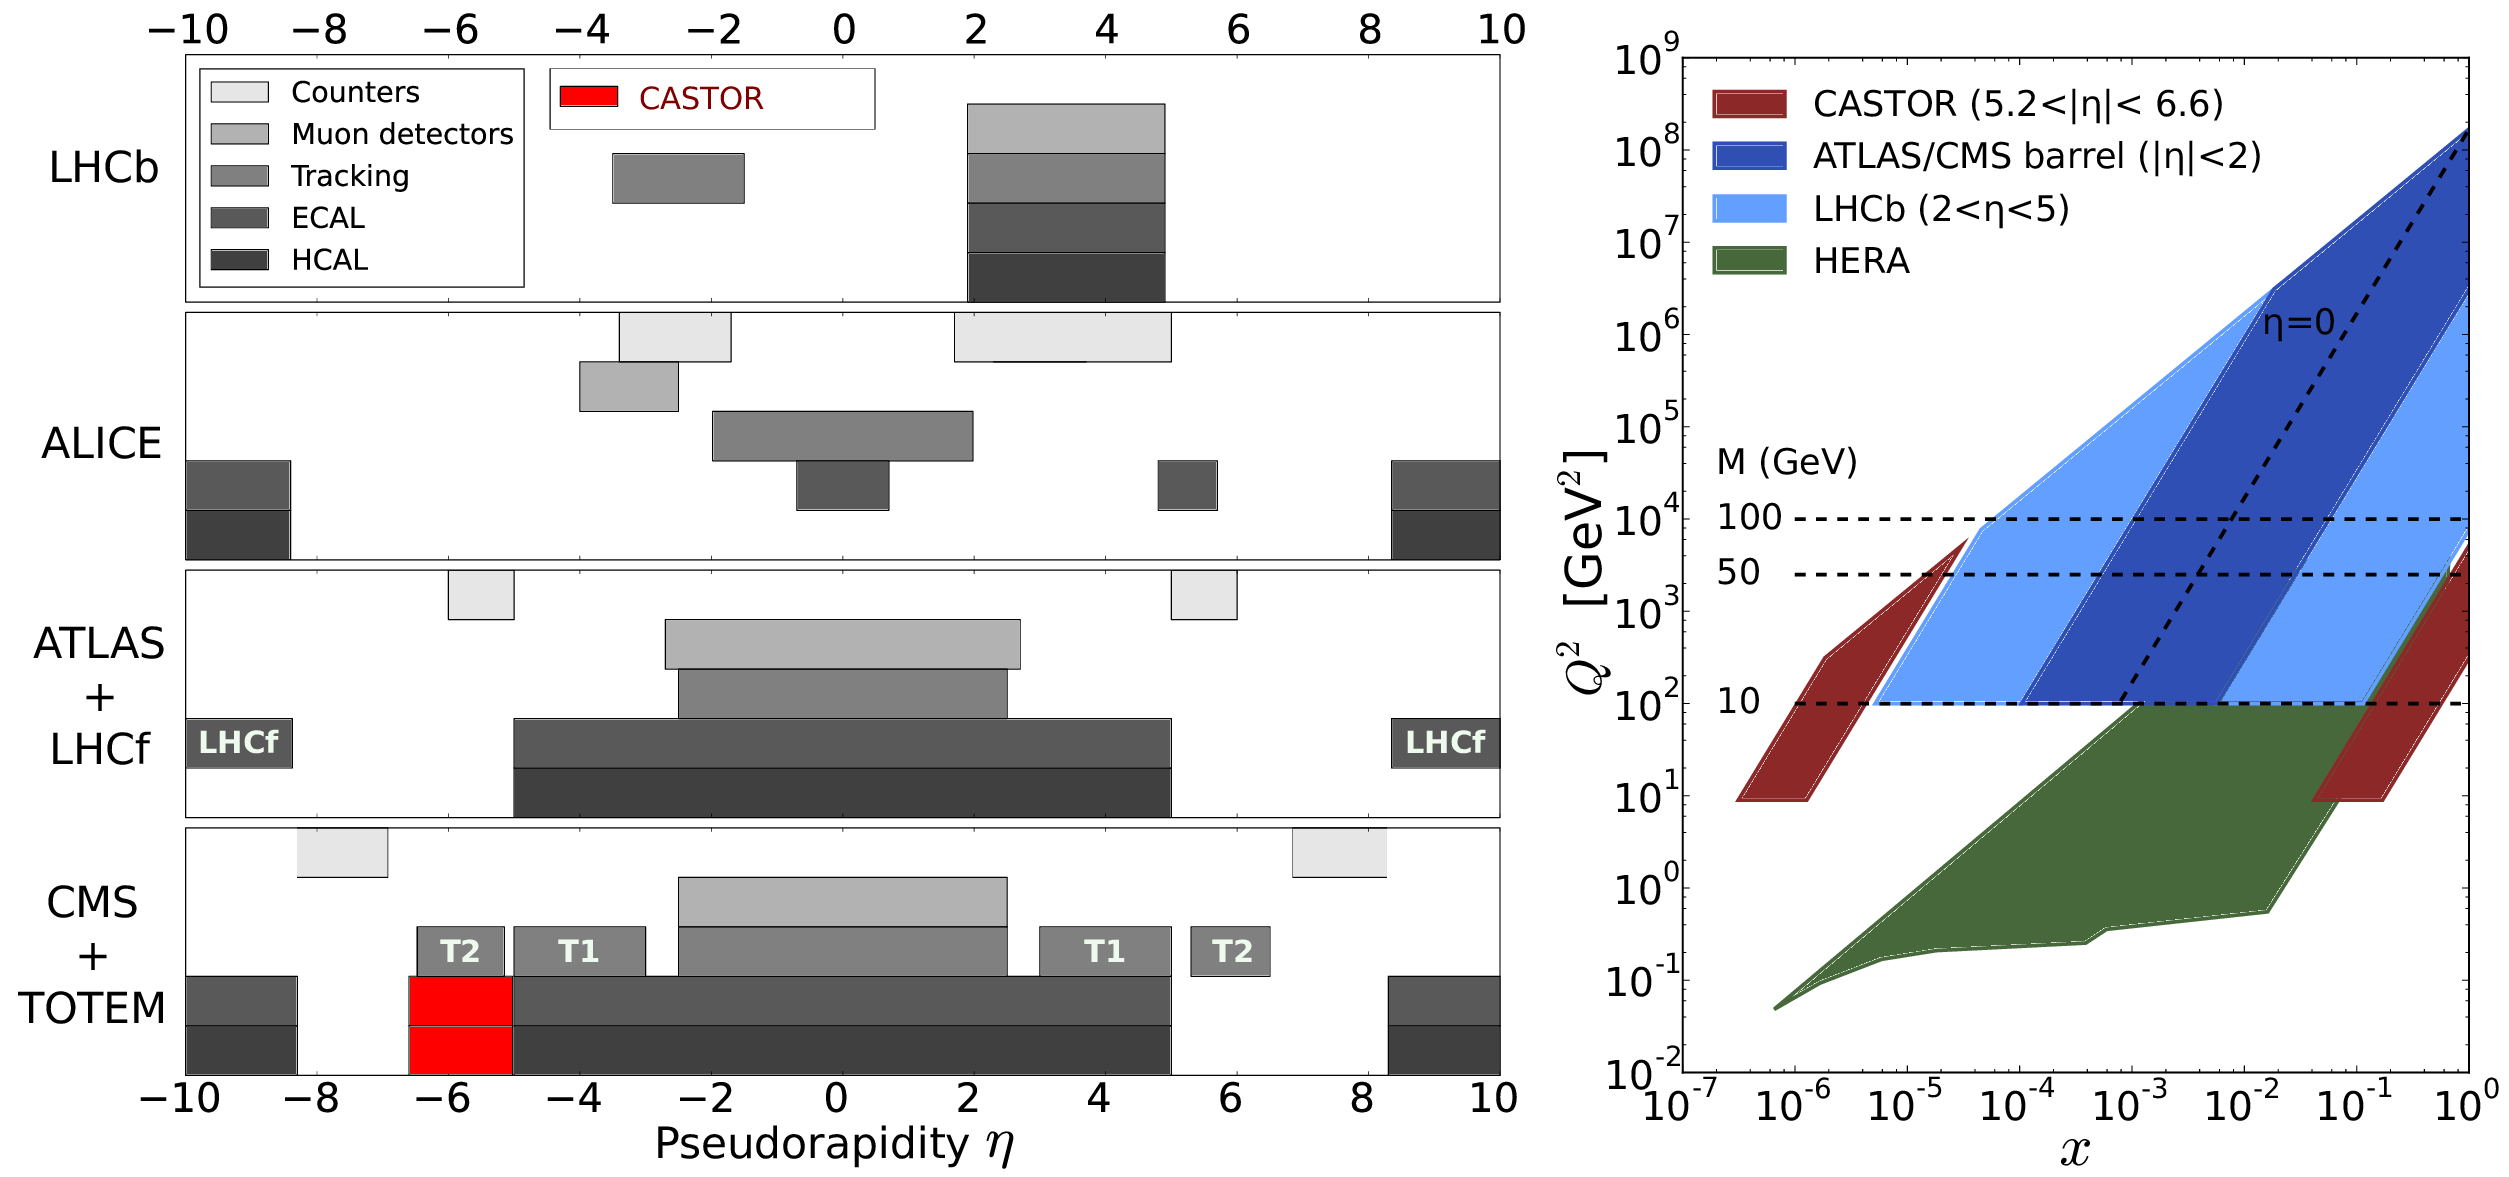
Figure 3:
Left: Comparison of the pseudorapidity acceptances of all the LHC experiments [30,31,32,33,34]. The ATLAS ALFA and CMS TOTEM proton spectrometers ("Roman pots'') installed inside the beam tunnel at $\approx $200 m around IPs 1 and 5 are not plotted. The TOTEM forward tracking T1 and T2 telescopes [34] are individually identified. Right: Kinematic coverage in the parton fractional momentum $x$ and momentum transfer $Q^2$ plane corresponding to the CASTOR detector, the central CMS/ATLAS [30,31], the LHCb [33], and the DESY HERA [35,36] experiments. |

png pdf |
Figure 3-a:
Comparison of the pseudorapidity acceptances of all the LHC experiments [30,31,32,33,34]. The ATLAS ALFA and CMS TOTEM proton spectrometers ("Roman pots'') installed inside the beam tunnel at $\approx $200 m around IPs 1 and 5 are not plotted. The TOTEM forward tracking T1 and T2 telescopes [34] are individually identified. |
png pdf |
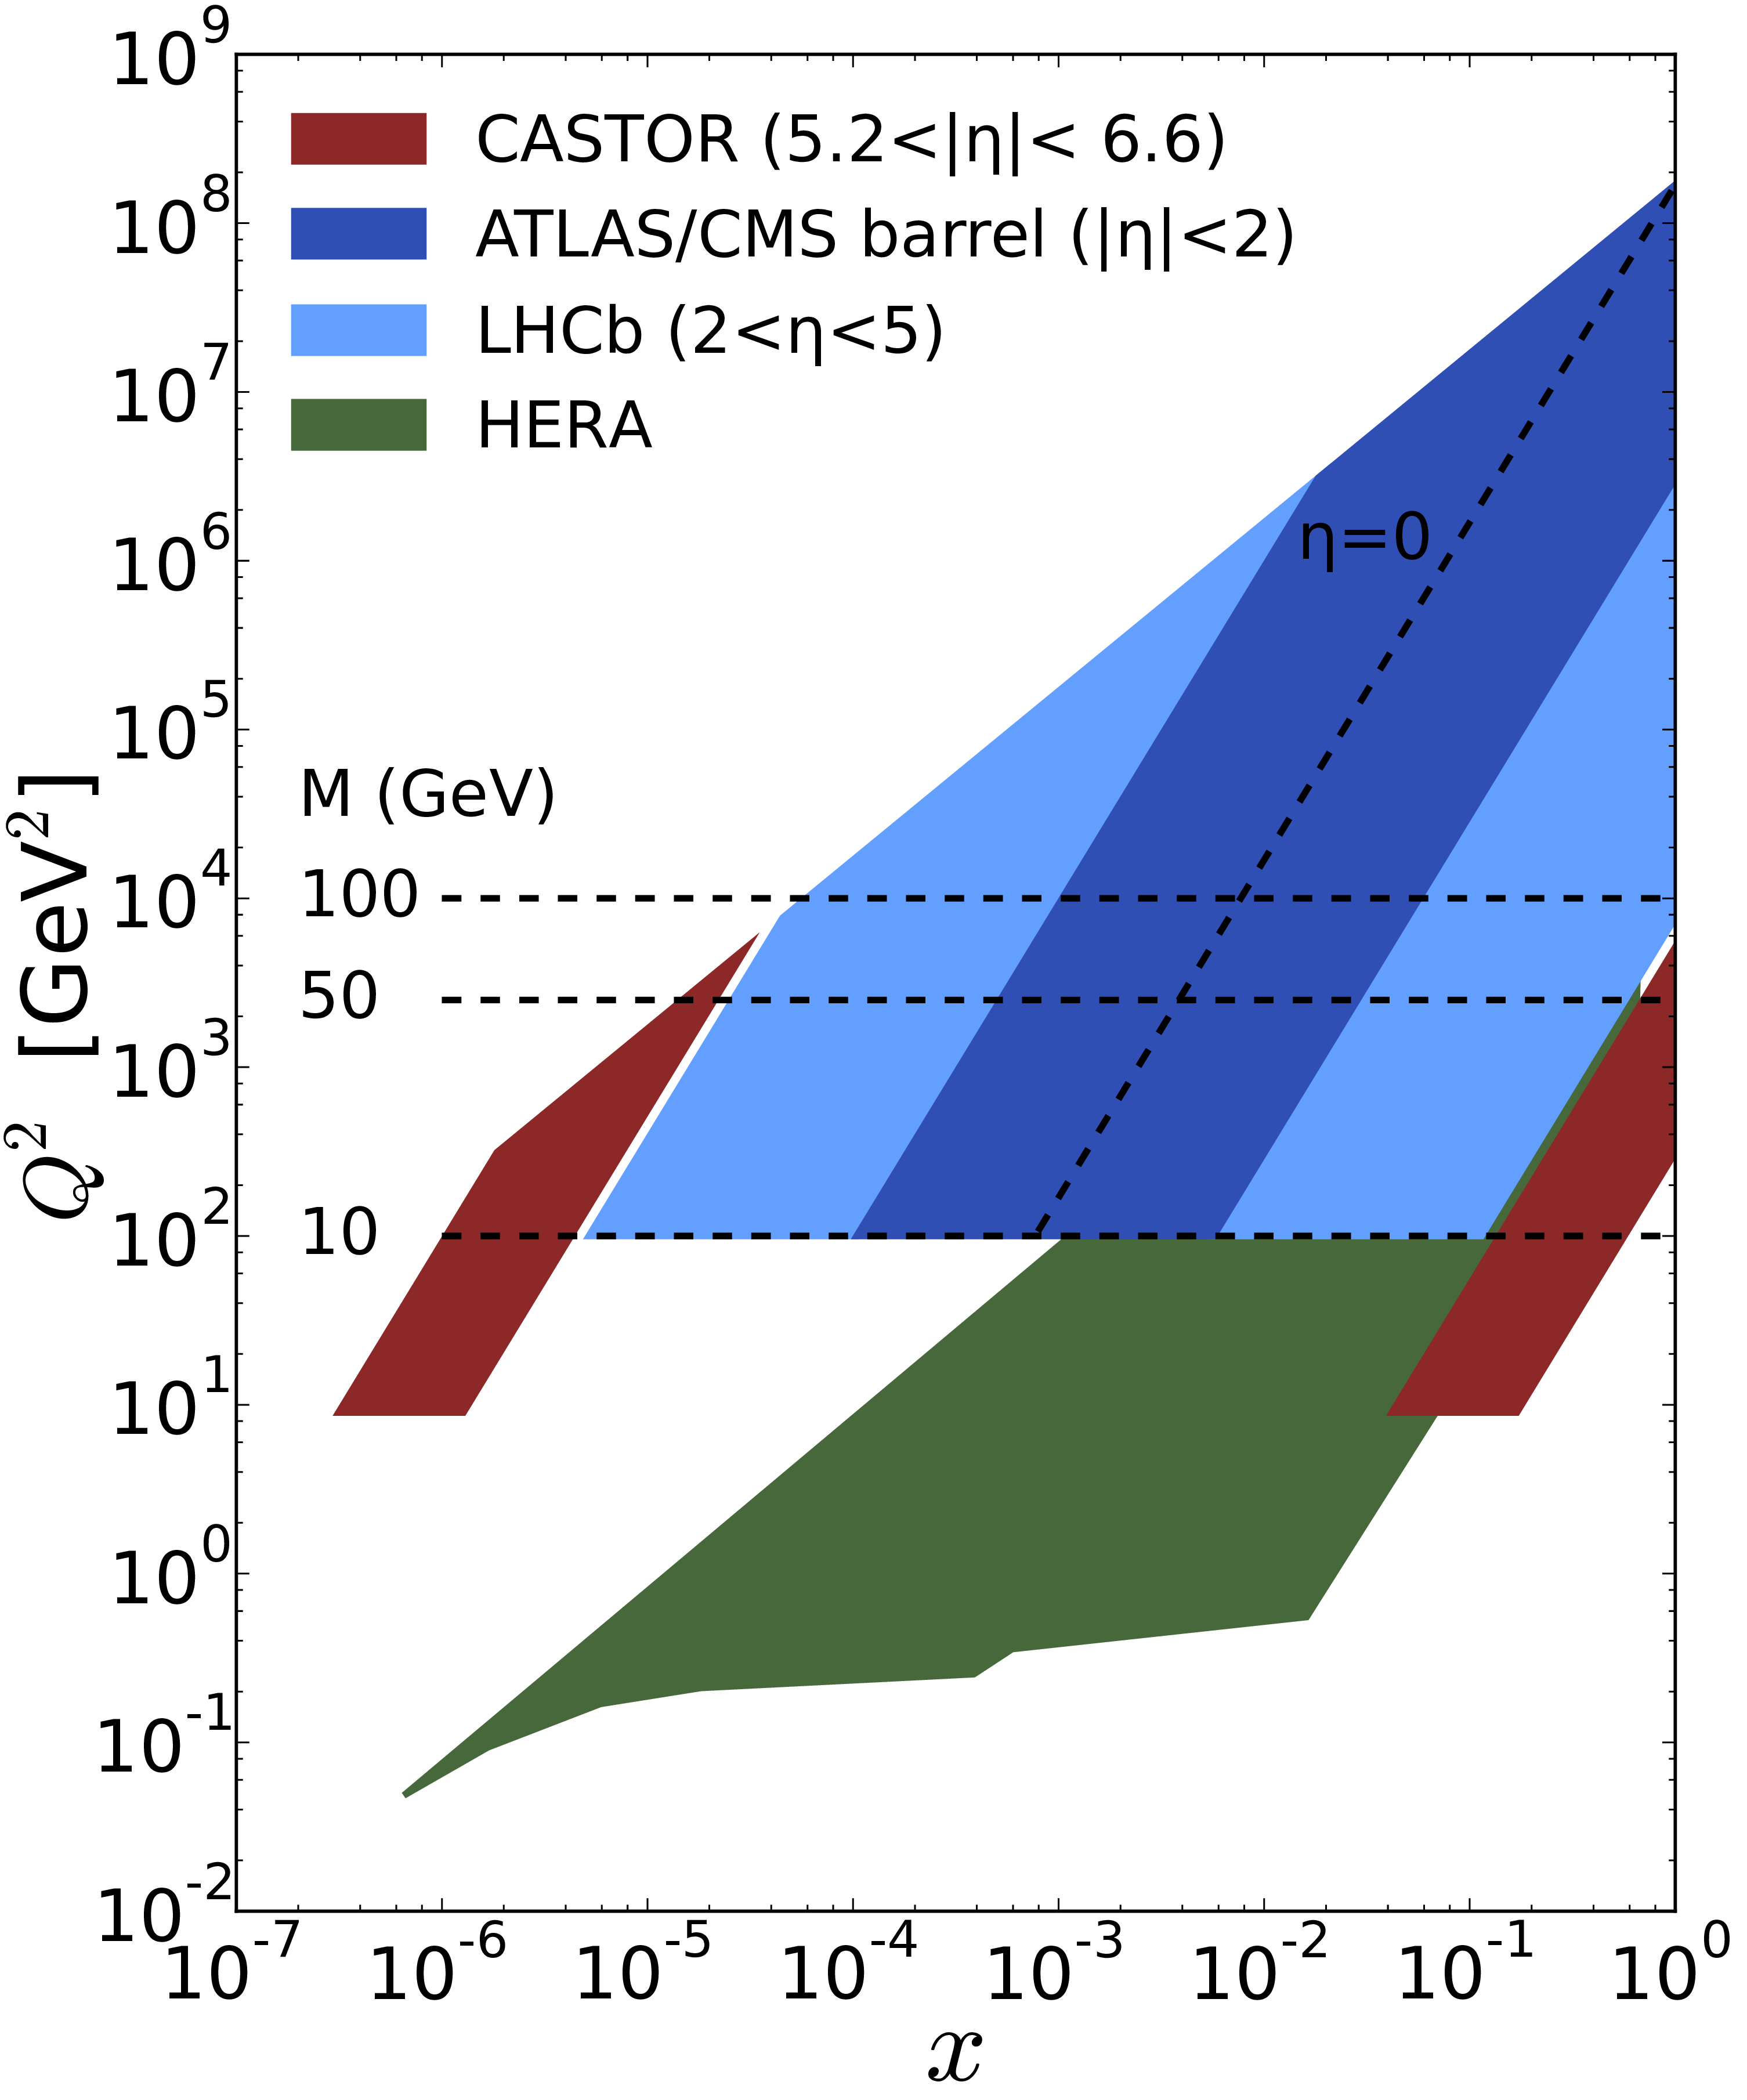
Figure 3-b:
Kinematic coverage in the parton fractional momentum $x$ and momentum transfer $Q^2$ plane corresponding to the CASTOR detector, the central CMS/ATLAS [30,31], the LHCb [33], and the DESY HERA [35,36] experiments. |
png pdf |
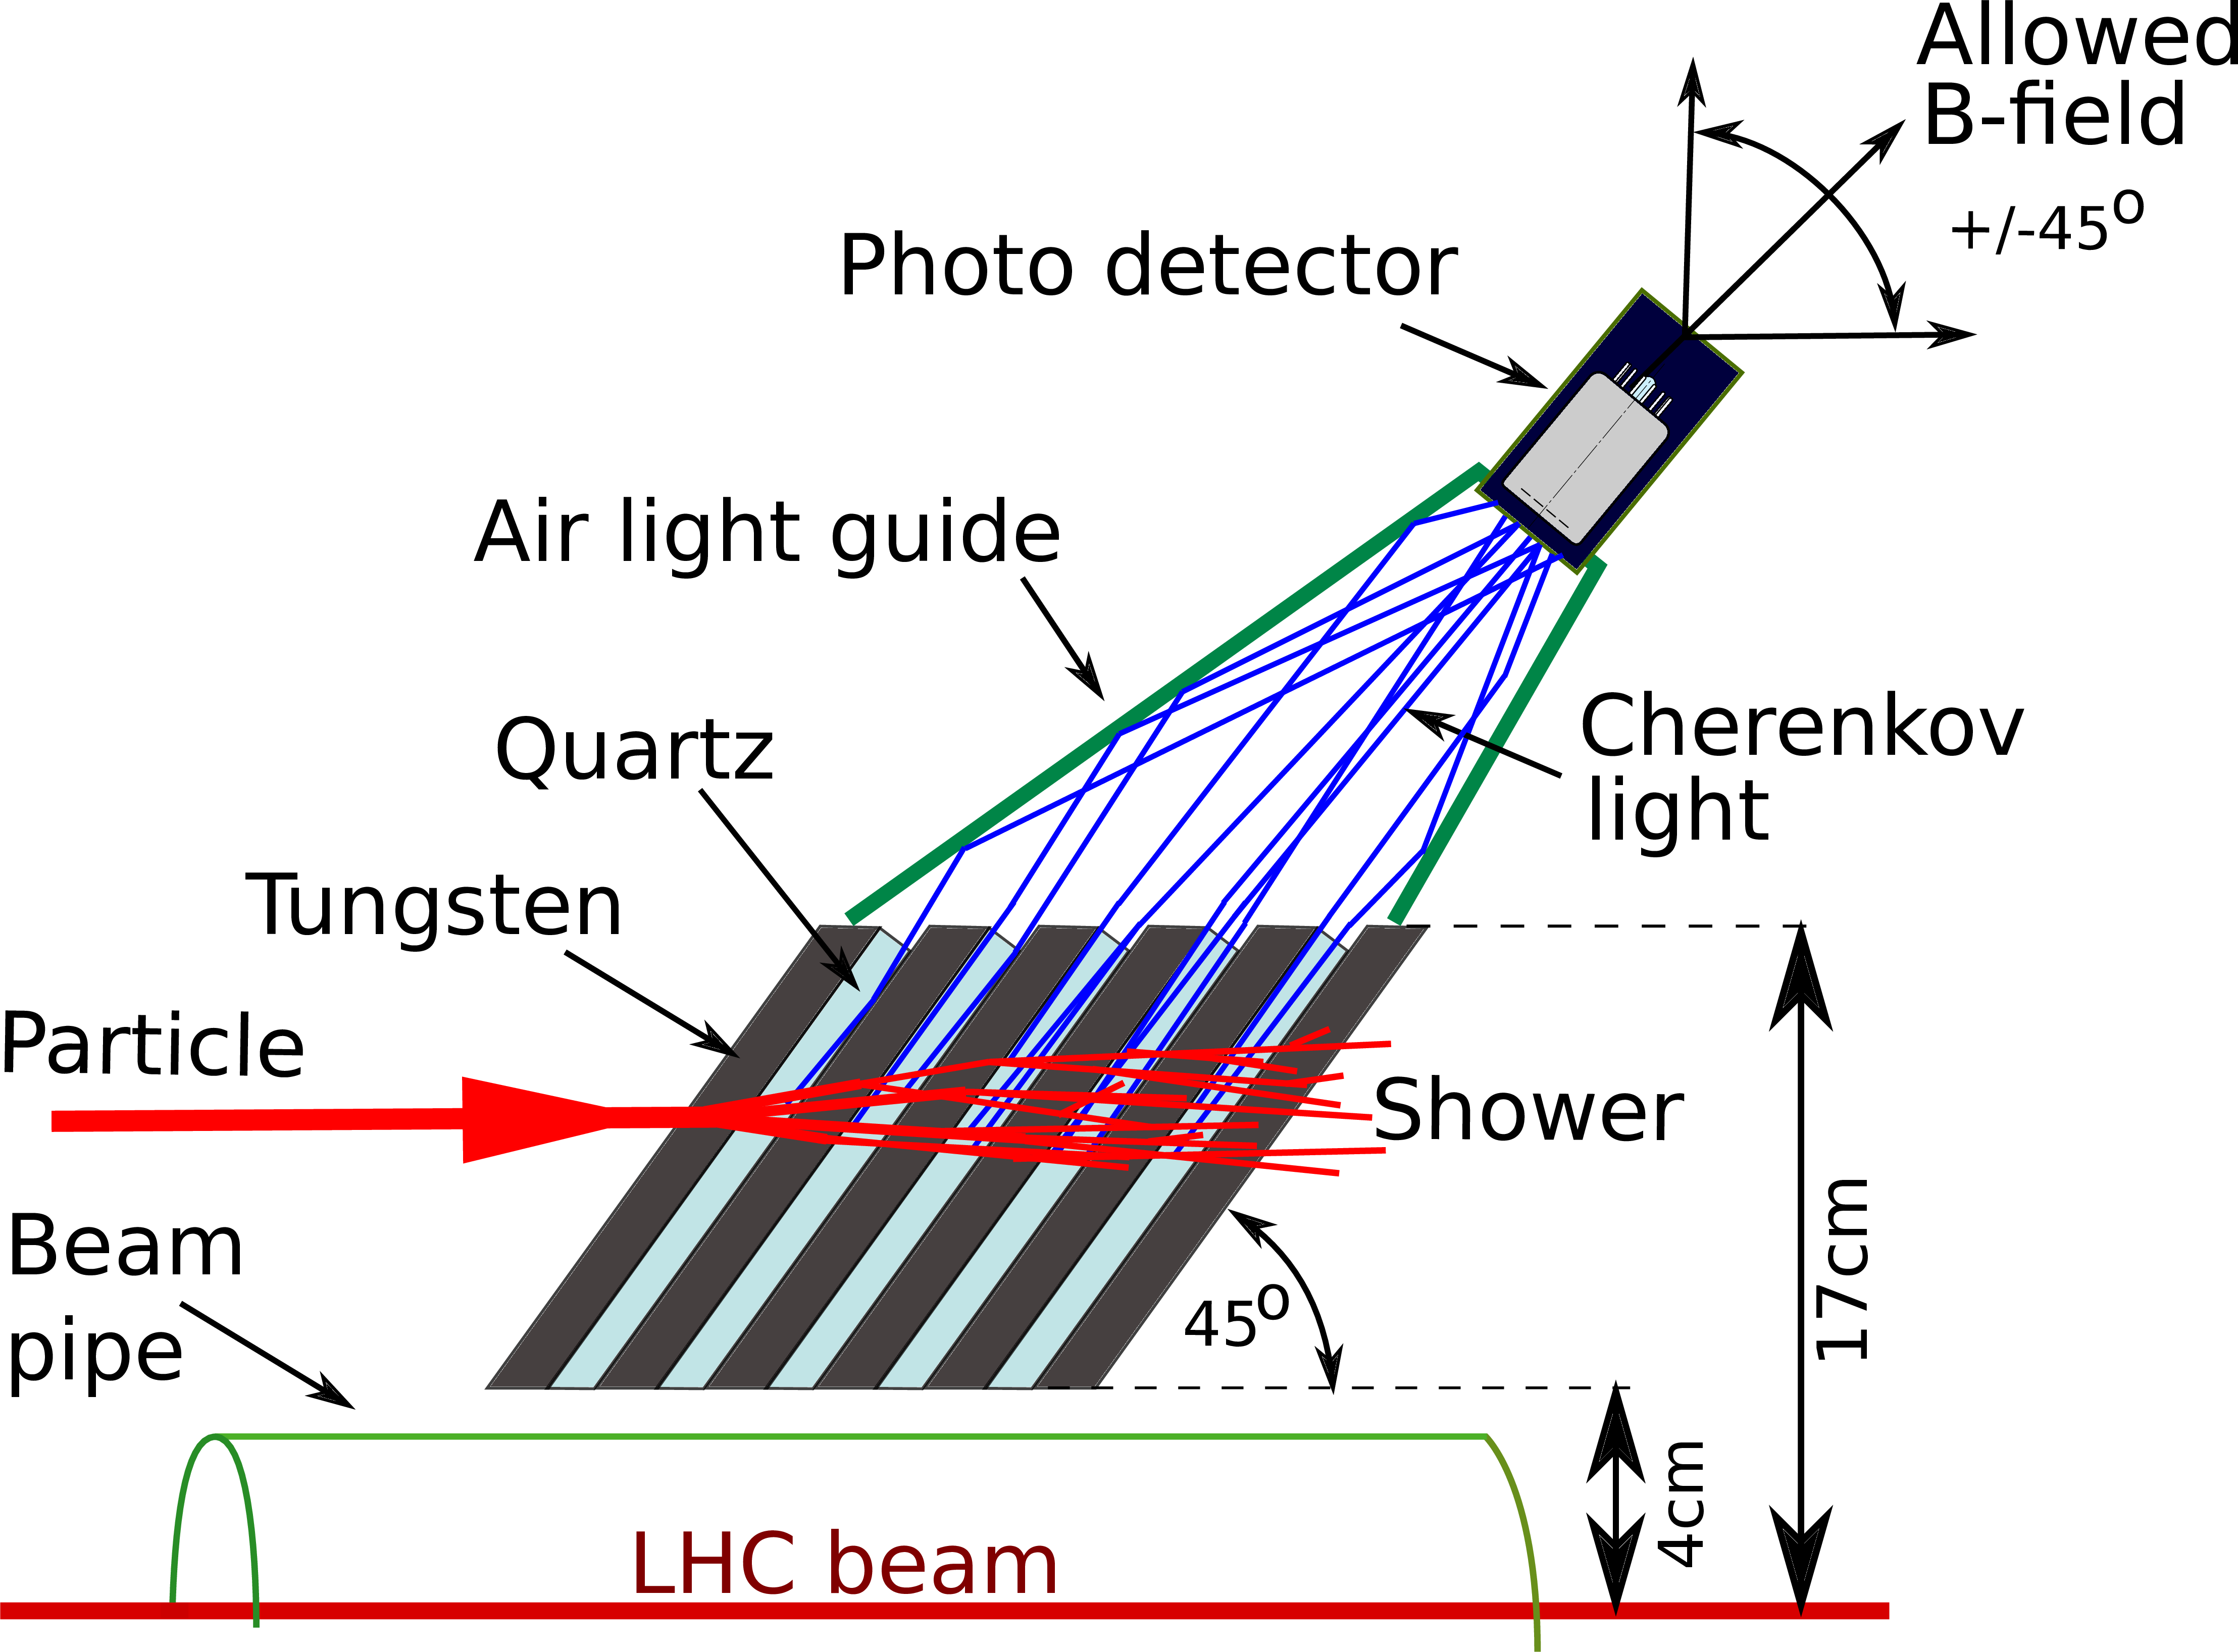
Figure 4:
Schematics of one CASTOR readout module, illustrating the signal production mechanism. Each module consists of five quartz and five tungsten absorber plates, an air-core light guide, and a PMT photosensor. Incident particles develop a shower in the tungsten absorber, and Cherenkov light is produced in the interleaved quartz plates. Total internal reflection transports very efficiently the Cherenkov photons through the quartz and the air light-guide to the PMT. One tower consists of 14 such modules. Note that six tungsten plates are visible here since the air light-guides are attached on top of the tungsten plates between neighboring modules. |
png pdf |
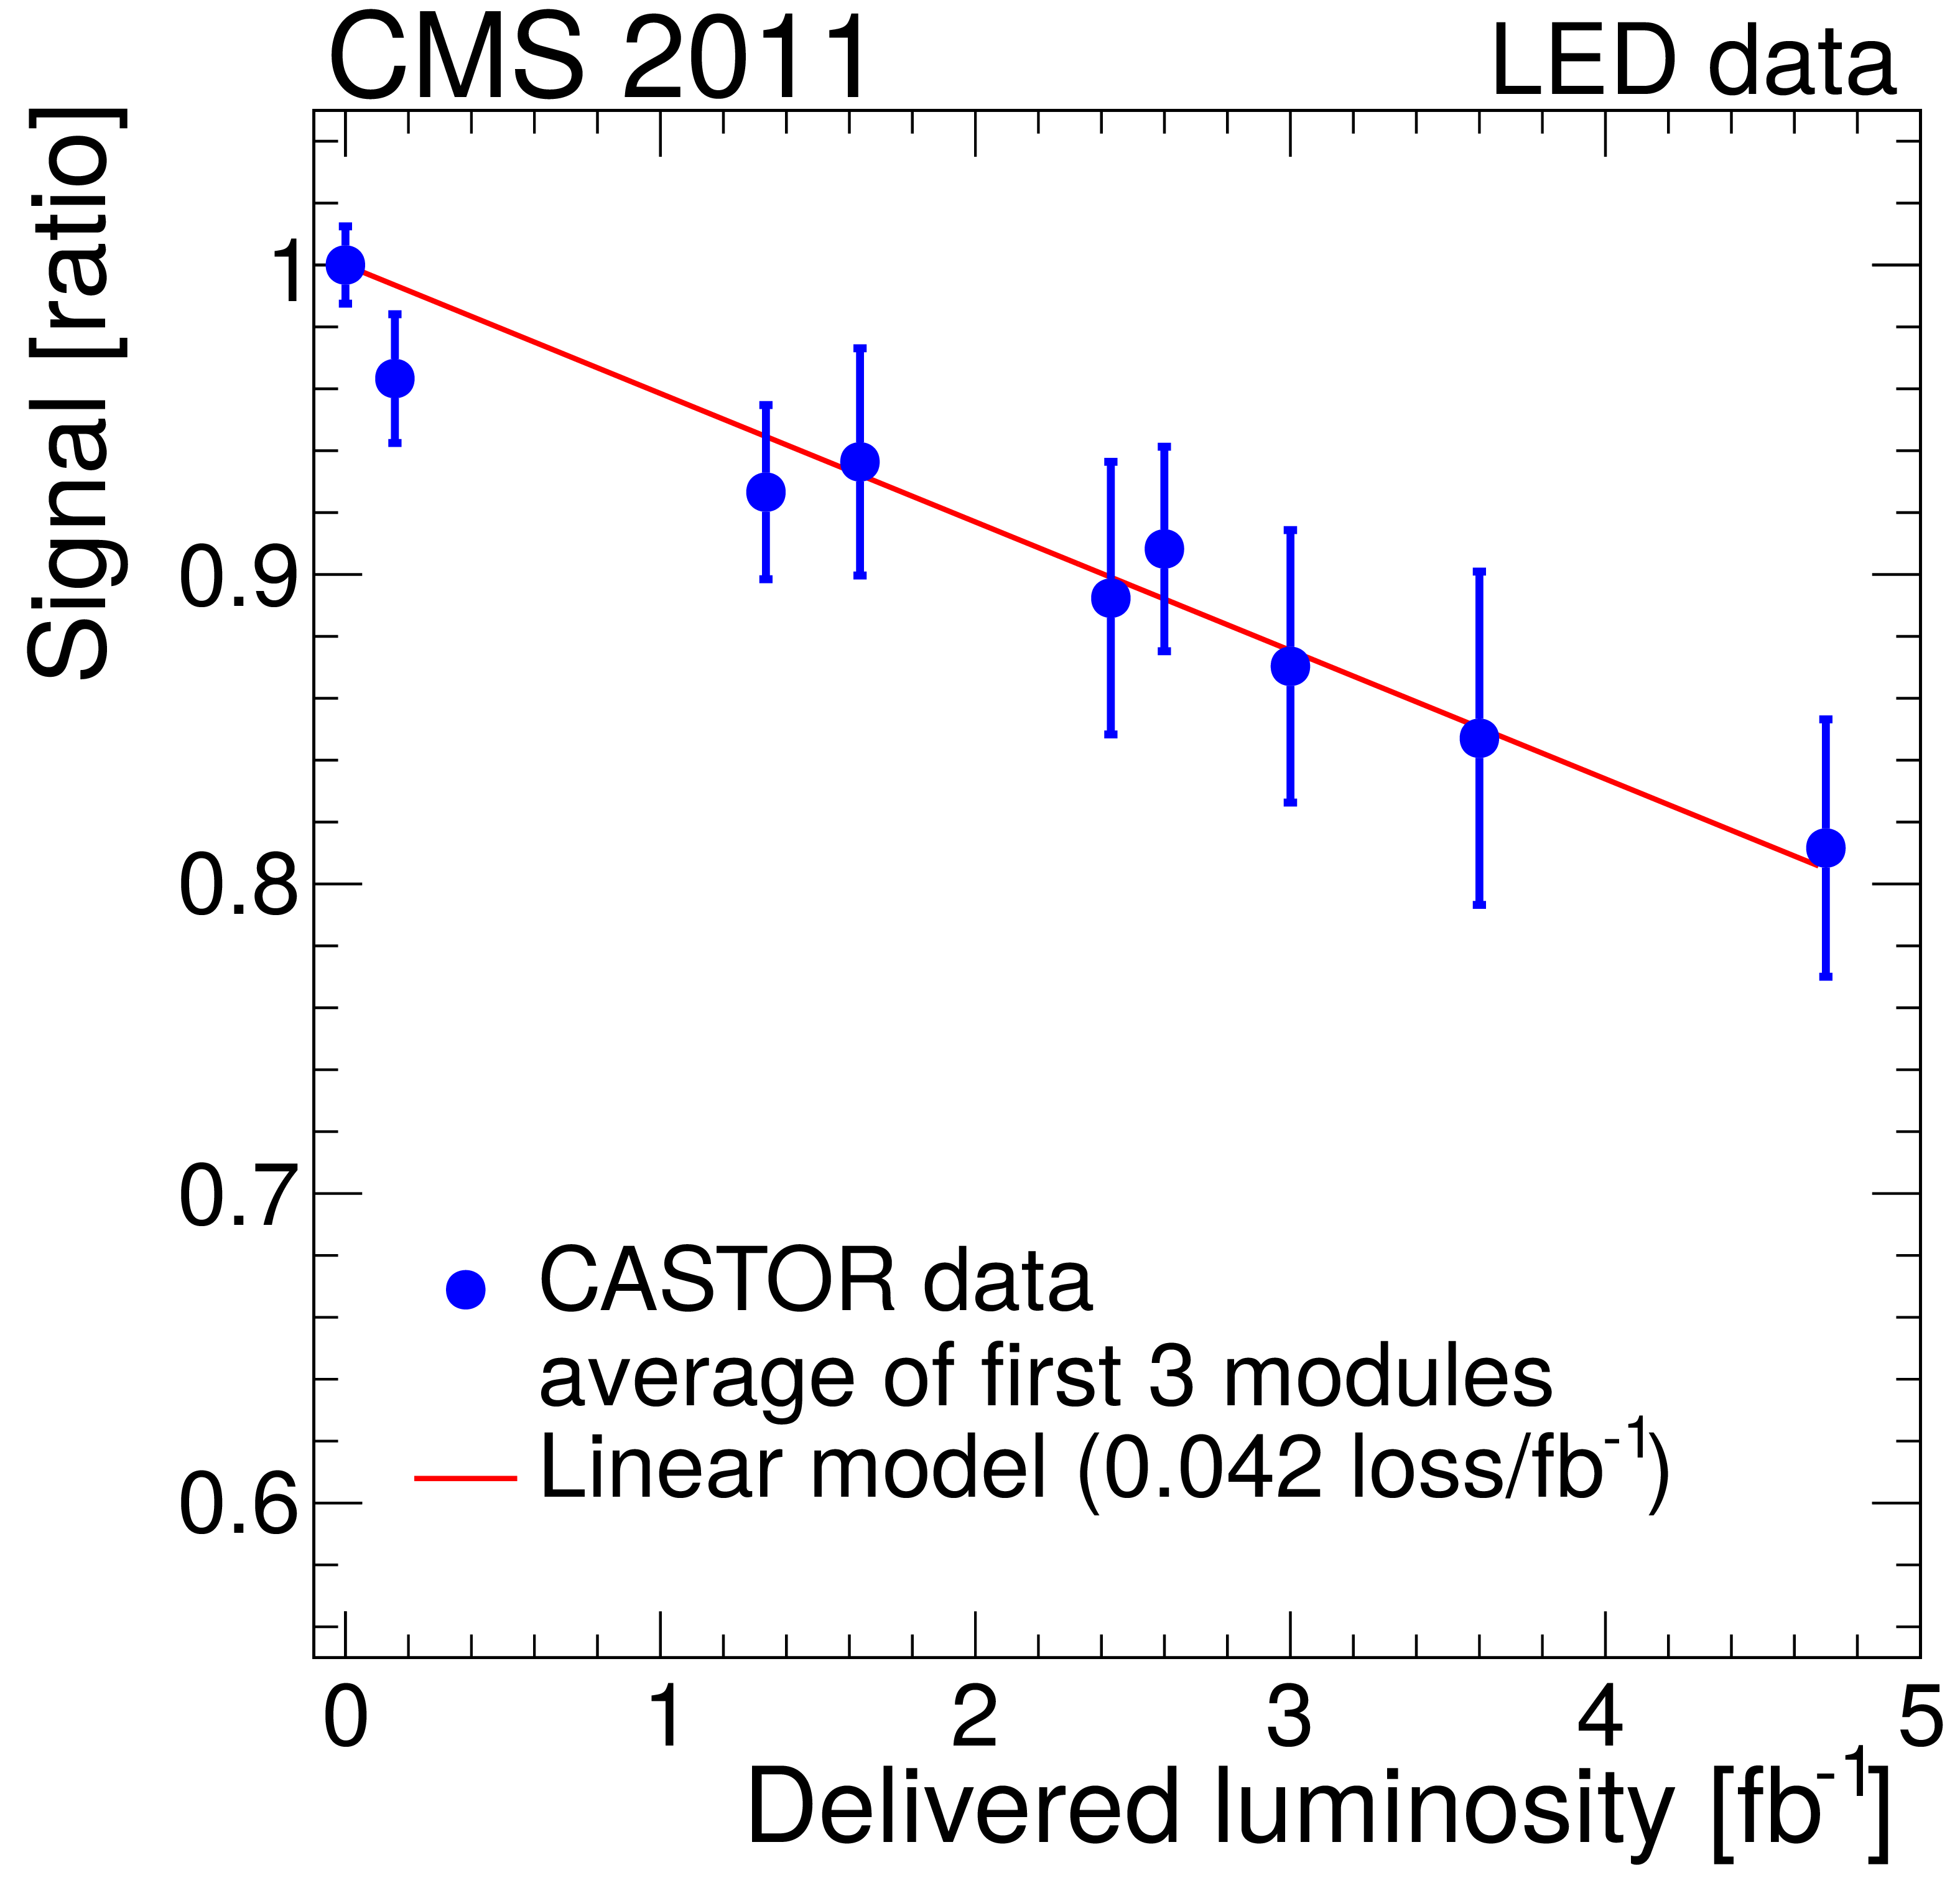
Figure 5:
Observed loss of sensitivity of the CASTOR photocathodes, attributed to the aging of the borosilicate PMT windows, during the 2011 high-intensity proton-proton LHC operation. The relative loss of the signal (normalized to its original strength) is plotted as a function of integrated luminosity. The uncertainties indicate the RMS of the respective 48 PMTs involved in the measurement (3 modules times 16 towers). |
png pdf |
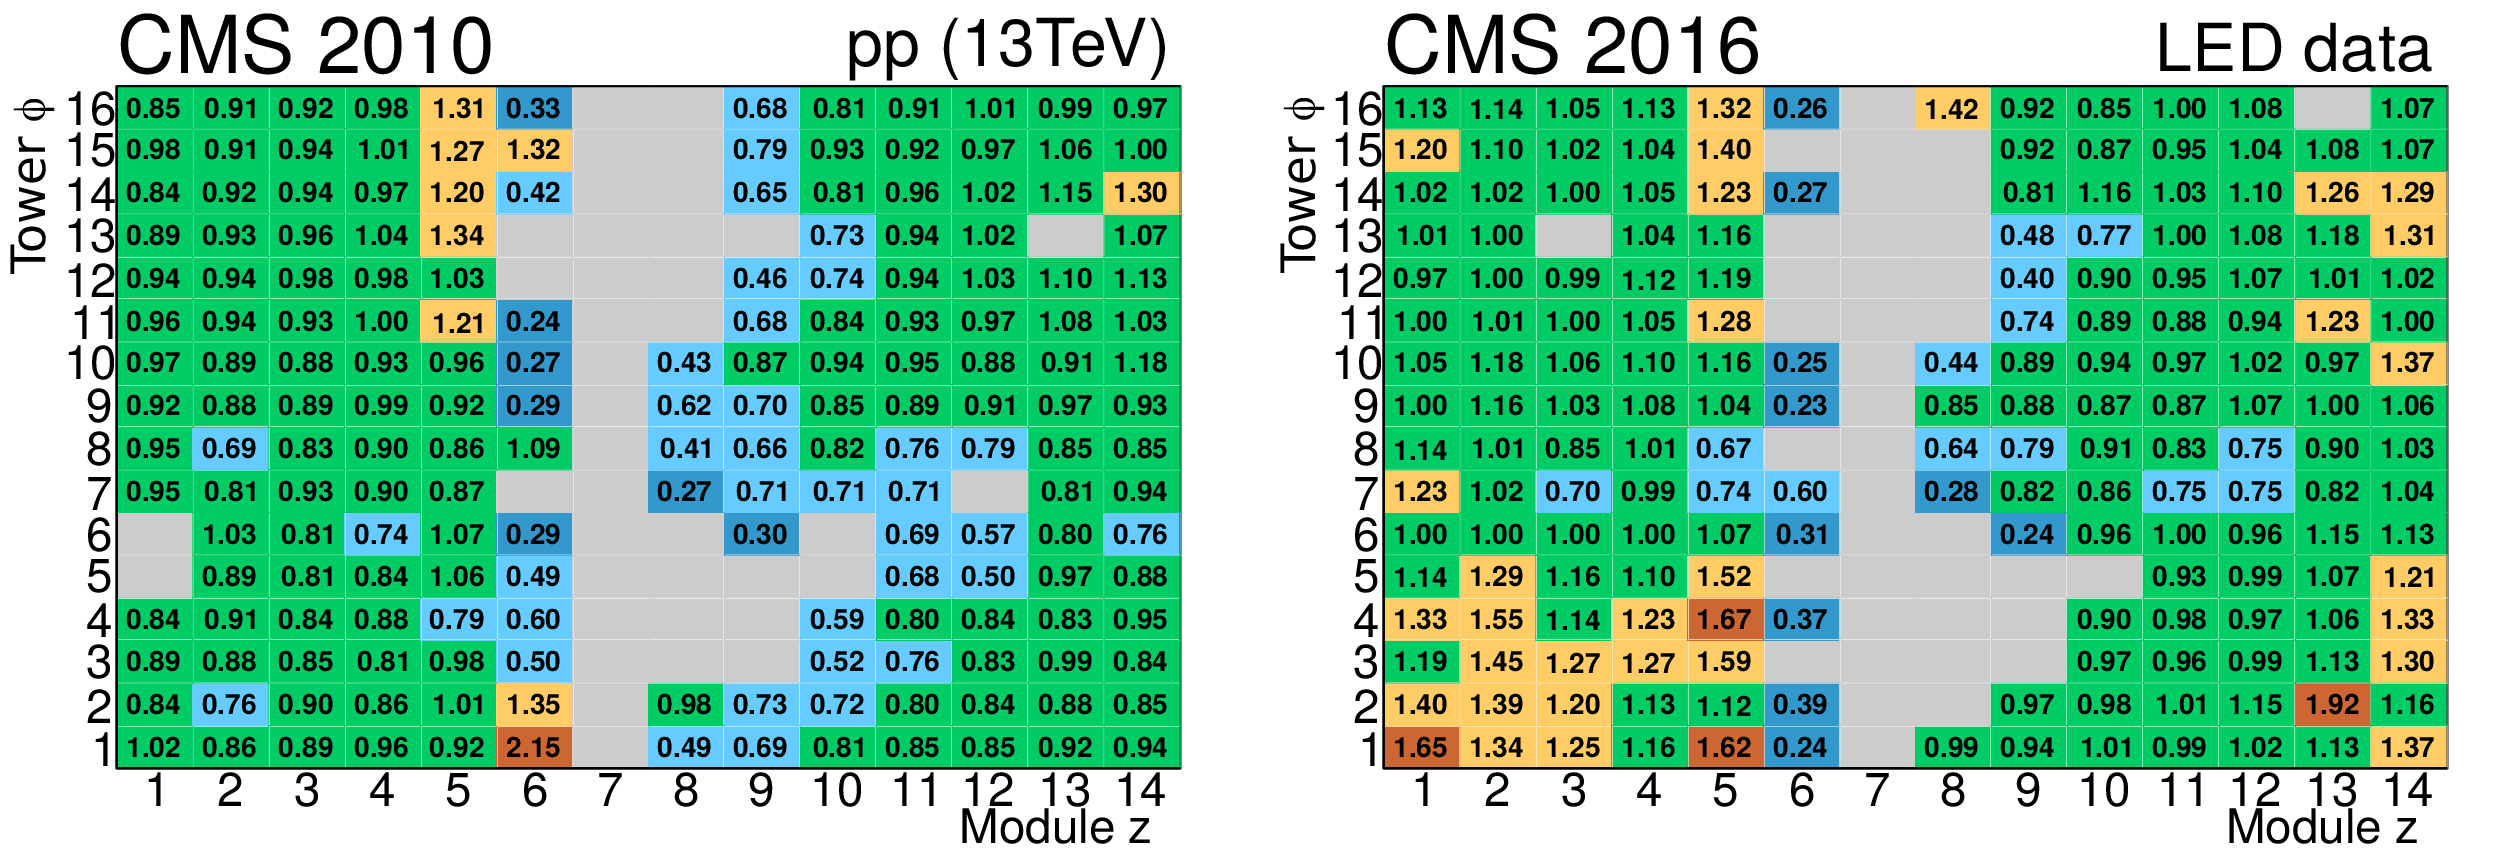
Figure 6:
Impact of the CMS magnet on the signals observed in the CASTOR calorimeter in the $(z,\phi)$ plane for 2010 pp minimum-bias (left) and 2016 LED pulser (right) data. The numerical values at each bin correspond to the ratio of signals measured at 3.8 T over those at 0 T. The channels in gray have normalized signals below 0.2, or are excluded for technical reasons. |

png pdf |
Figure 6-a:
Impact of the CMS magnet on the signals observed in the CASTOR calorimeter in the $(z,\phi)$ plane for 2010 pp minimum-bias data. The numerical values at each bin correspond to the ratio of signals measured at 3.8 T over those at 0 T. The channels in gray have normalized signals below 0.2, or are excluded for technical reasons. |
png pdf |
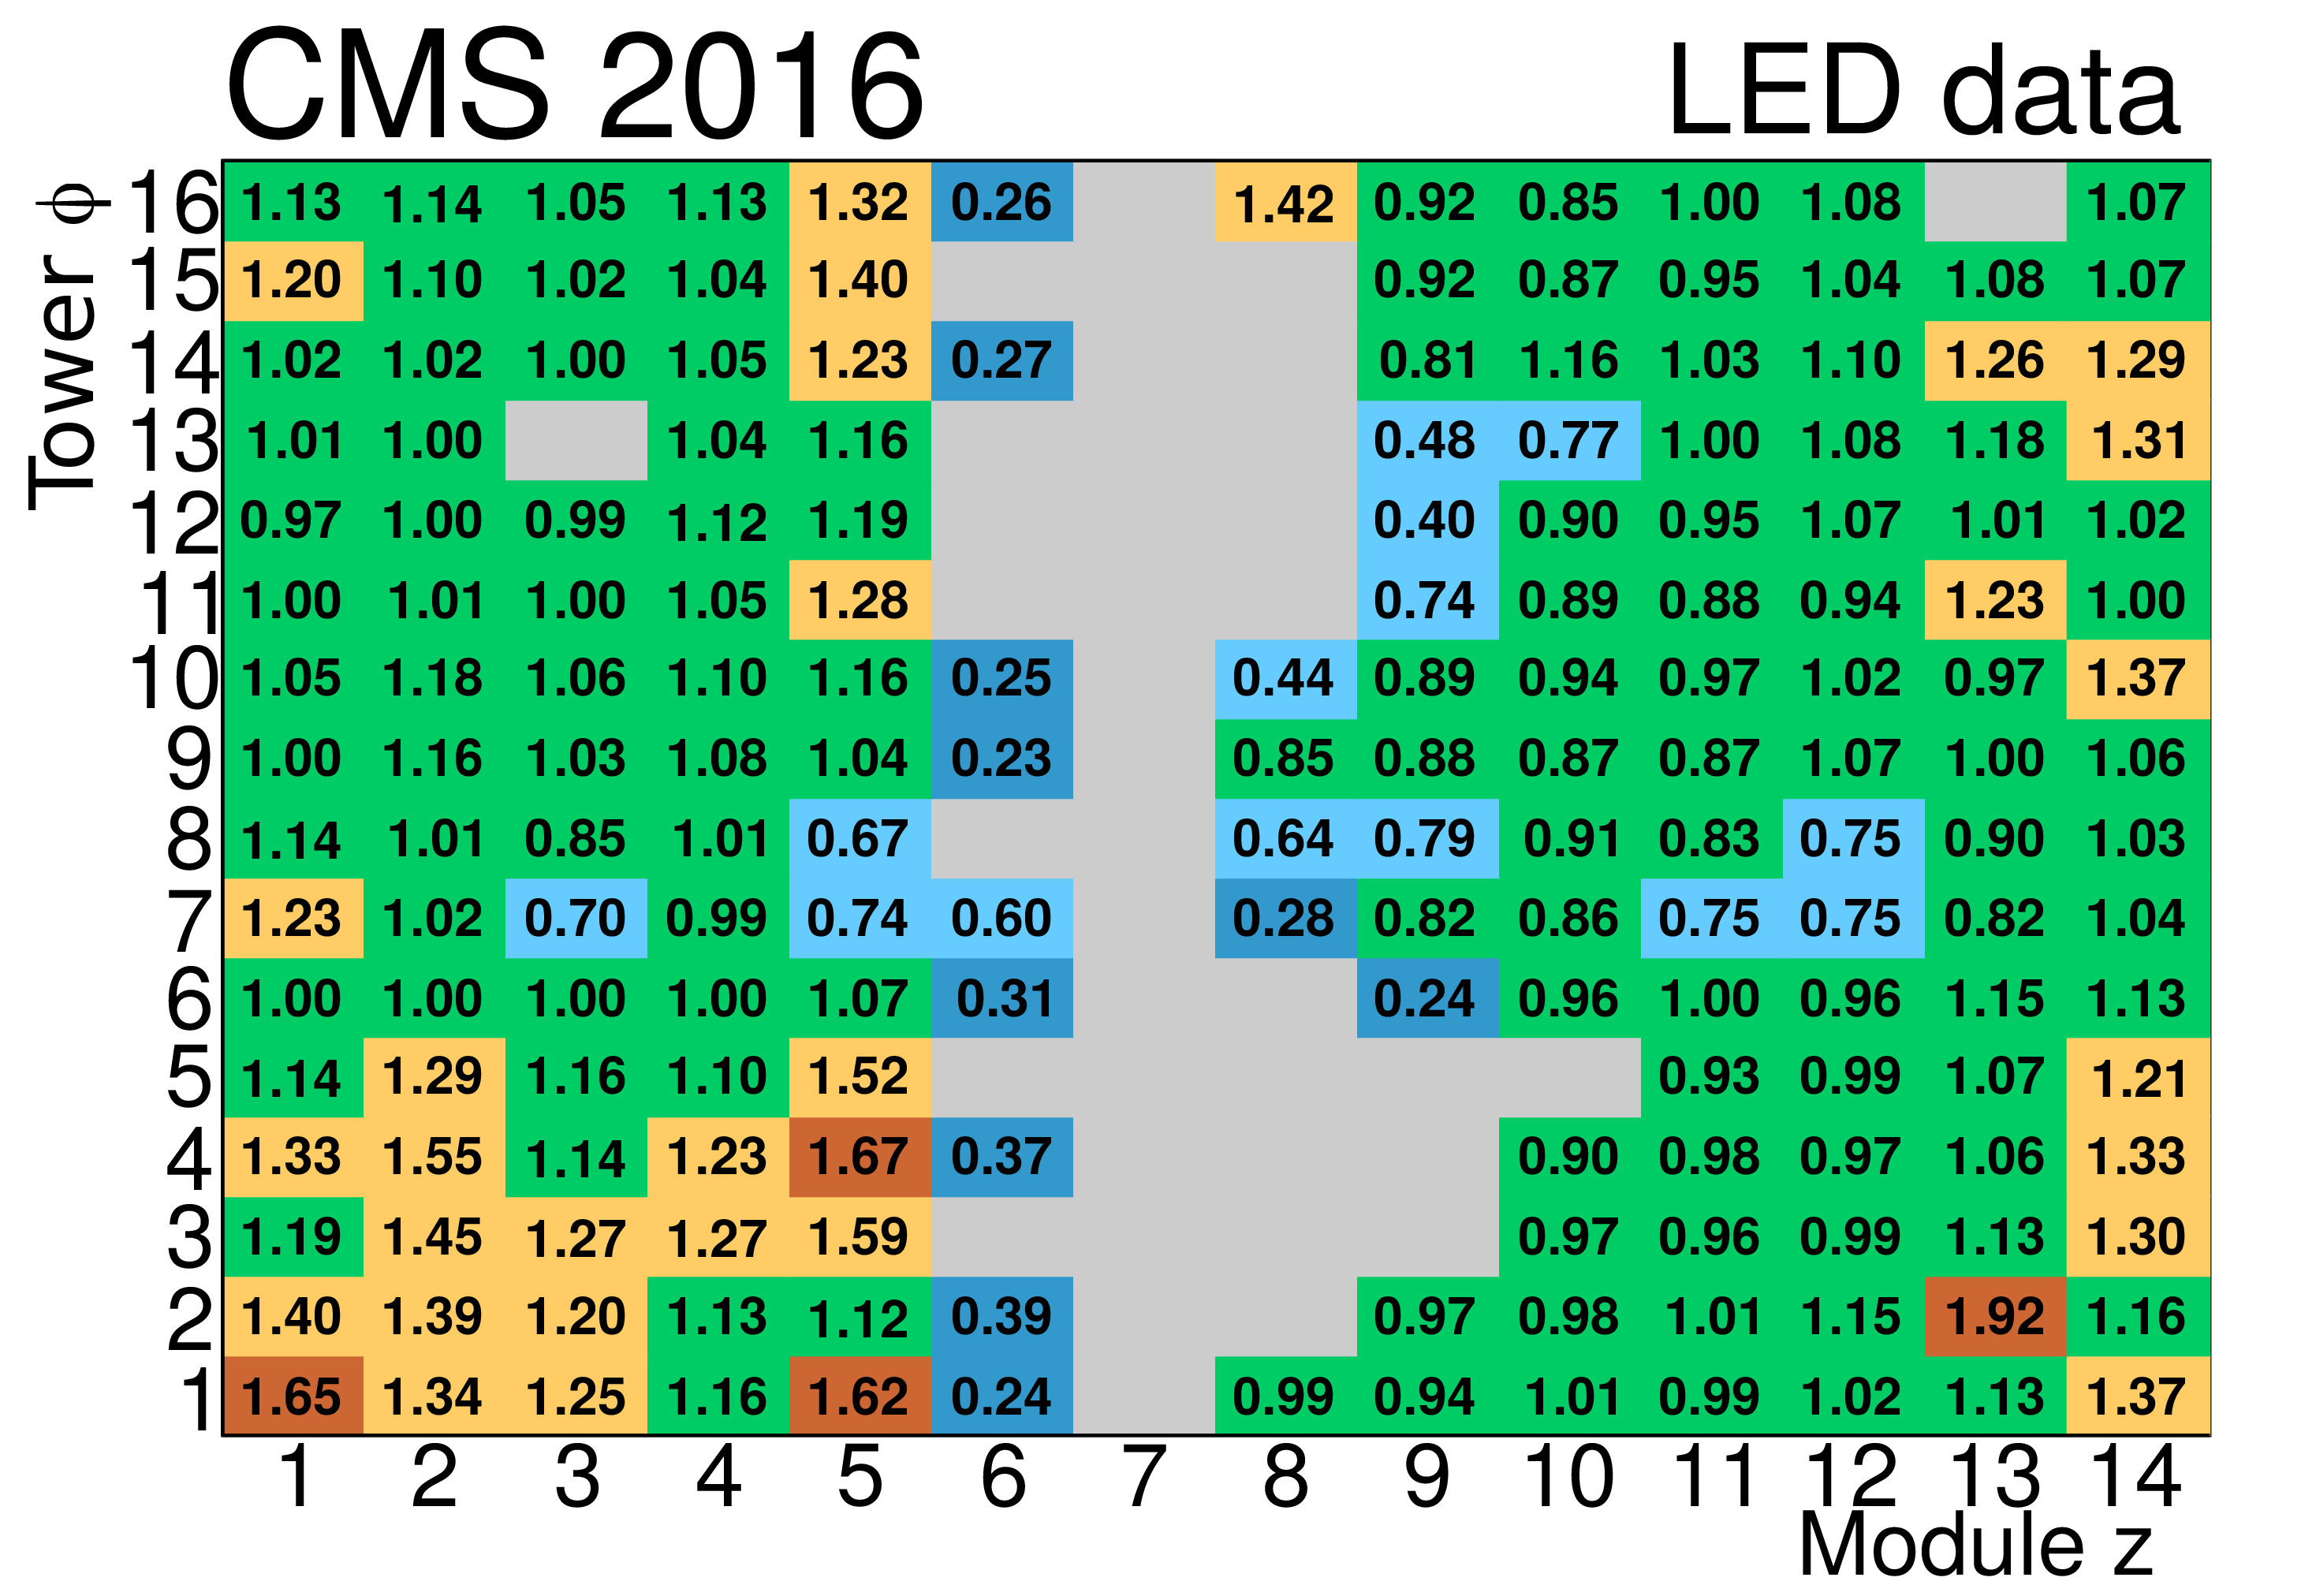
Figure 6-b:
Impact of the CMS magnet on the signals observed in the CASTOR calorimeter in the $(z,\phi)$ plane for 2016 LED pulser data. The numerical values at each bin correspond to the ratio of signals measured at 3.8 T over those at 0 T. The channels in gray have normalized signals below 0.2, or are excluded for technical reasons. |
png pdf |
Figure 7:
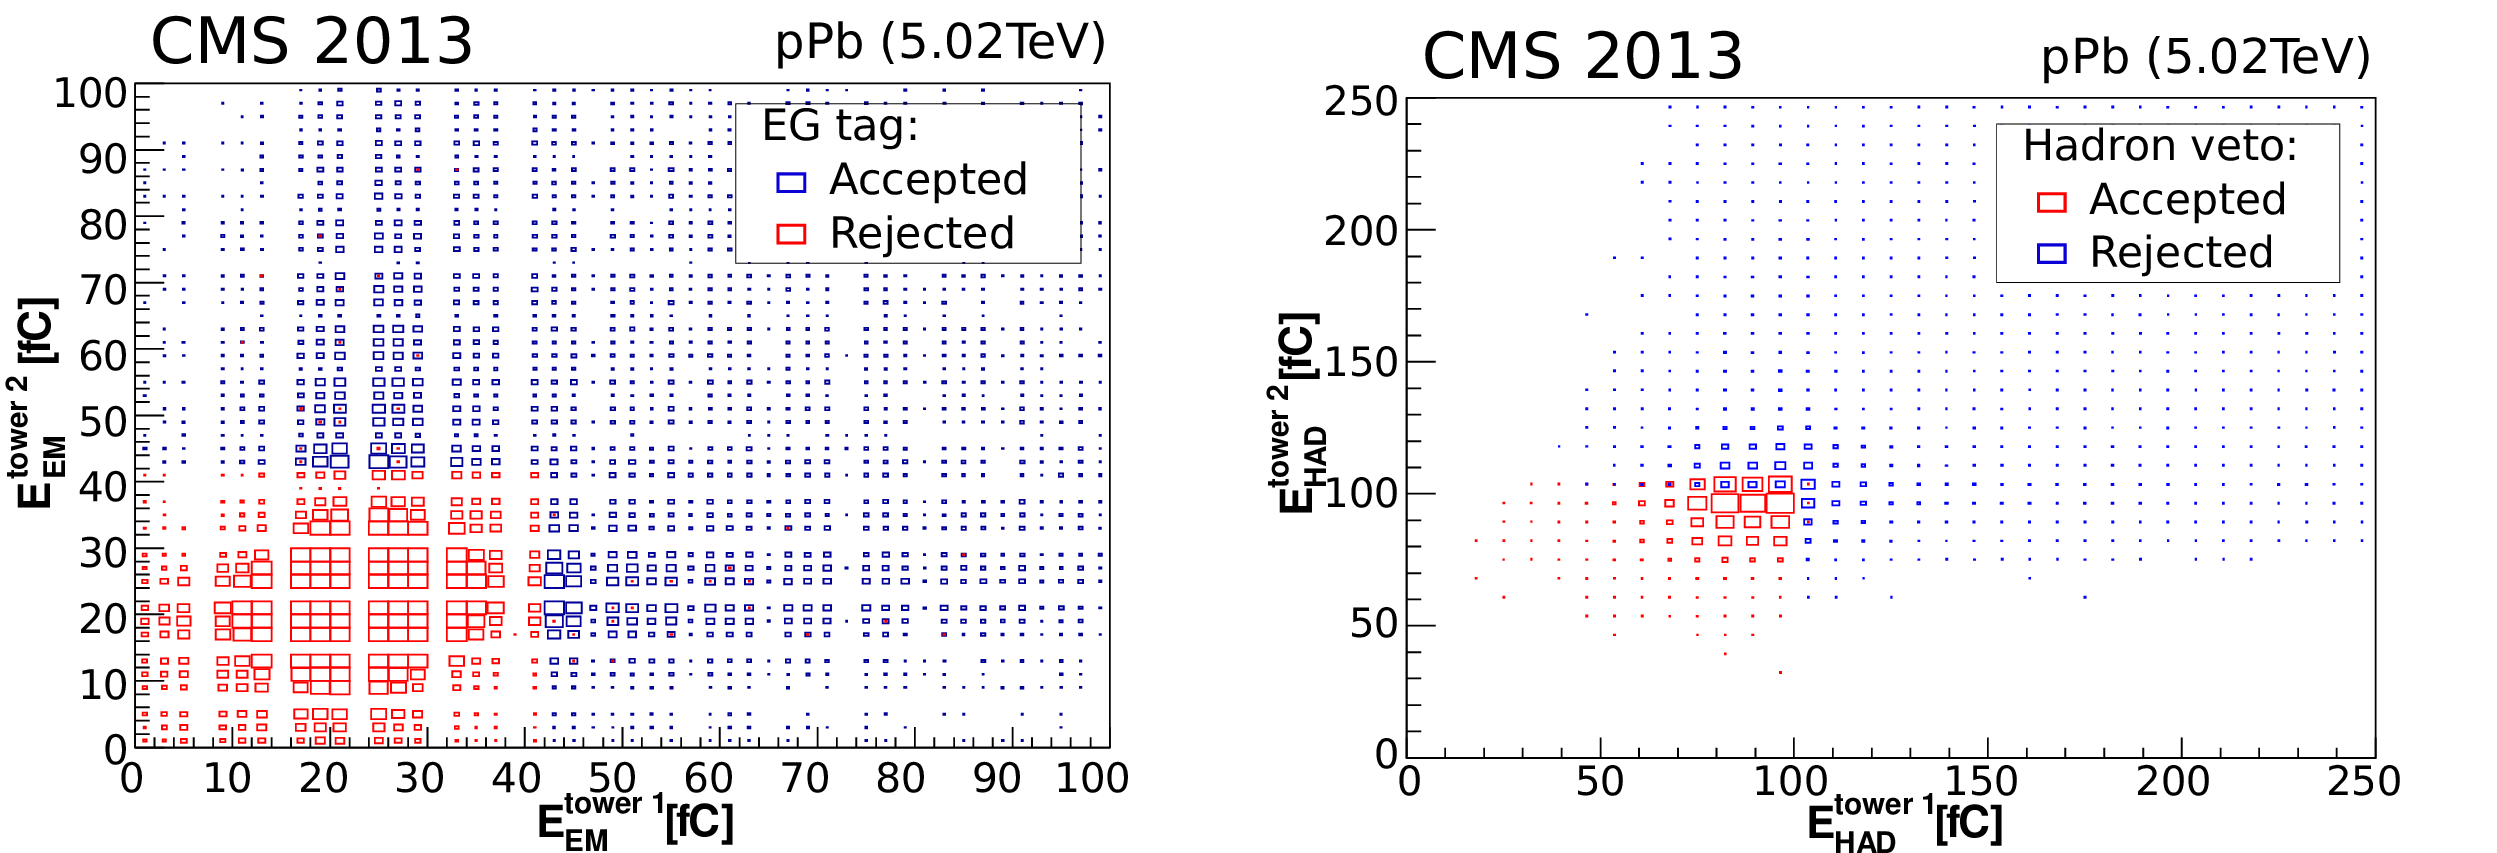
Validation of the electron/gamma (EG) tag (left) and the hadron veto (right) triggers in pPb collisions at $ {\sqrt {\smash [b]{s_{_{\mathrm {NN}}}}}} = $ 5.02 TeV. Shown are density distributions of the number of events with digitized signals (in fC) in pairs of towers in one octant. A trigger is issued for each pair of towers when the logical condition "EG tag $\wedge$ Hadron veto'' is met. The number of events that (do not) produce a trigger signal are in blue (red). At very small signals, one can see additional quantization effects from the nonlinear behavior of the QIE digitizers. |
png pdf |
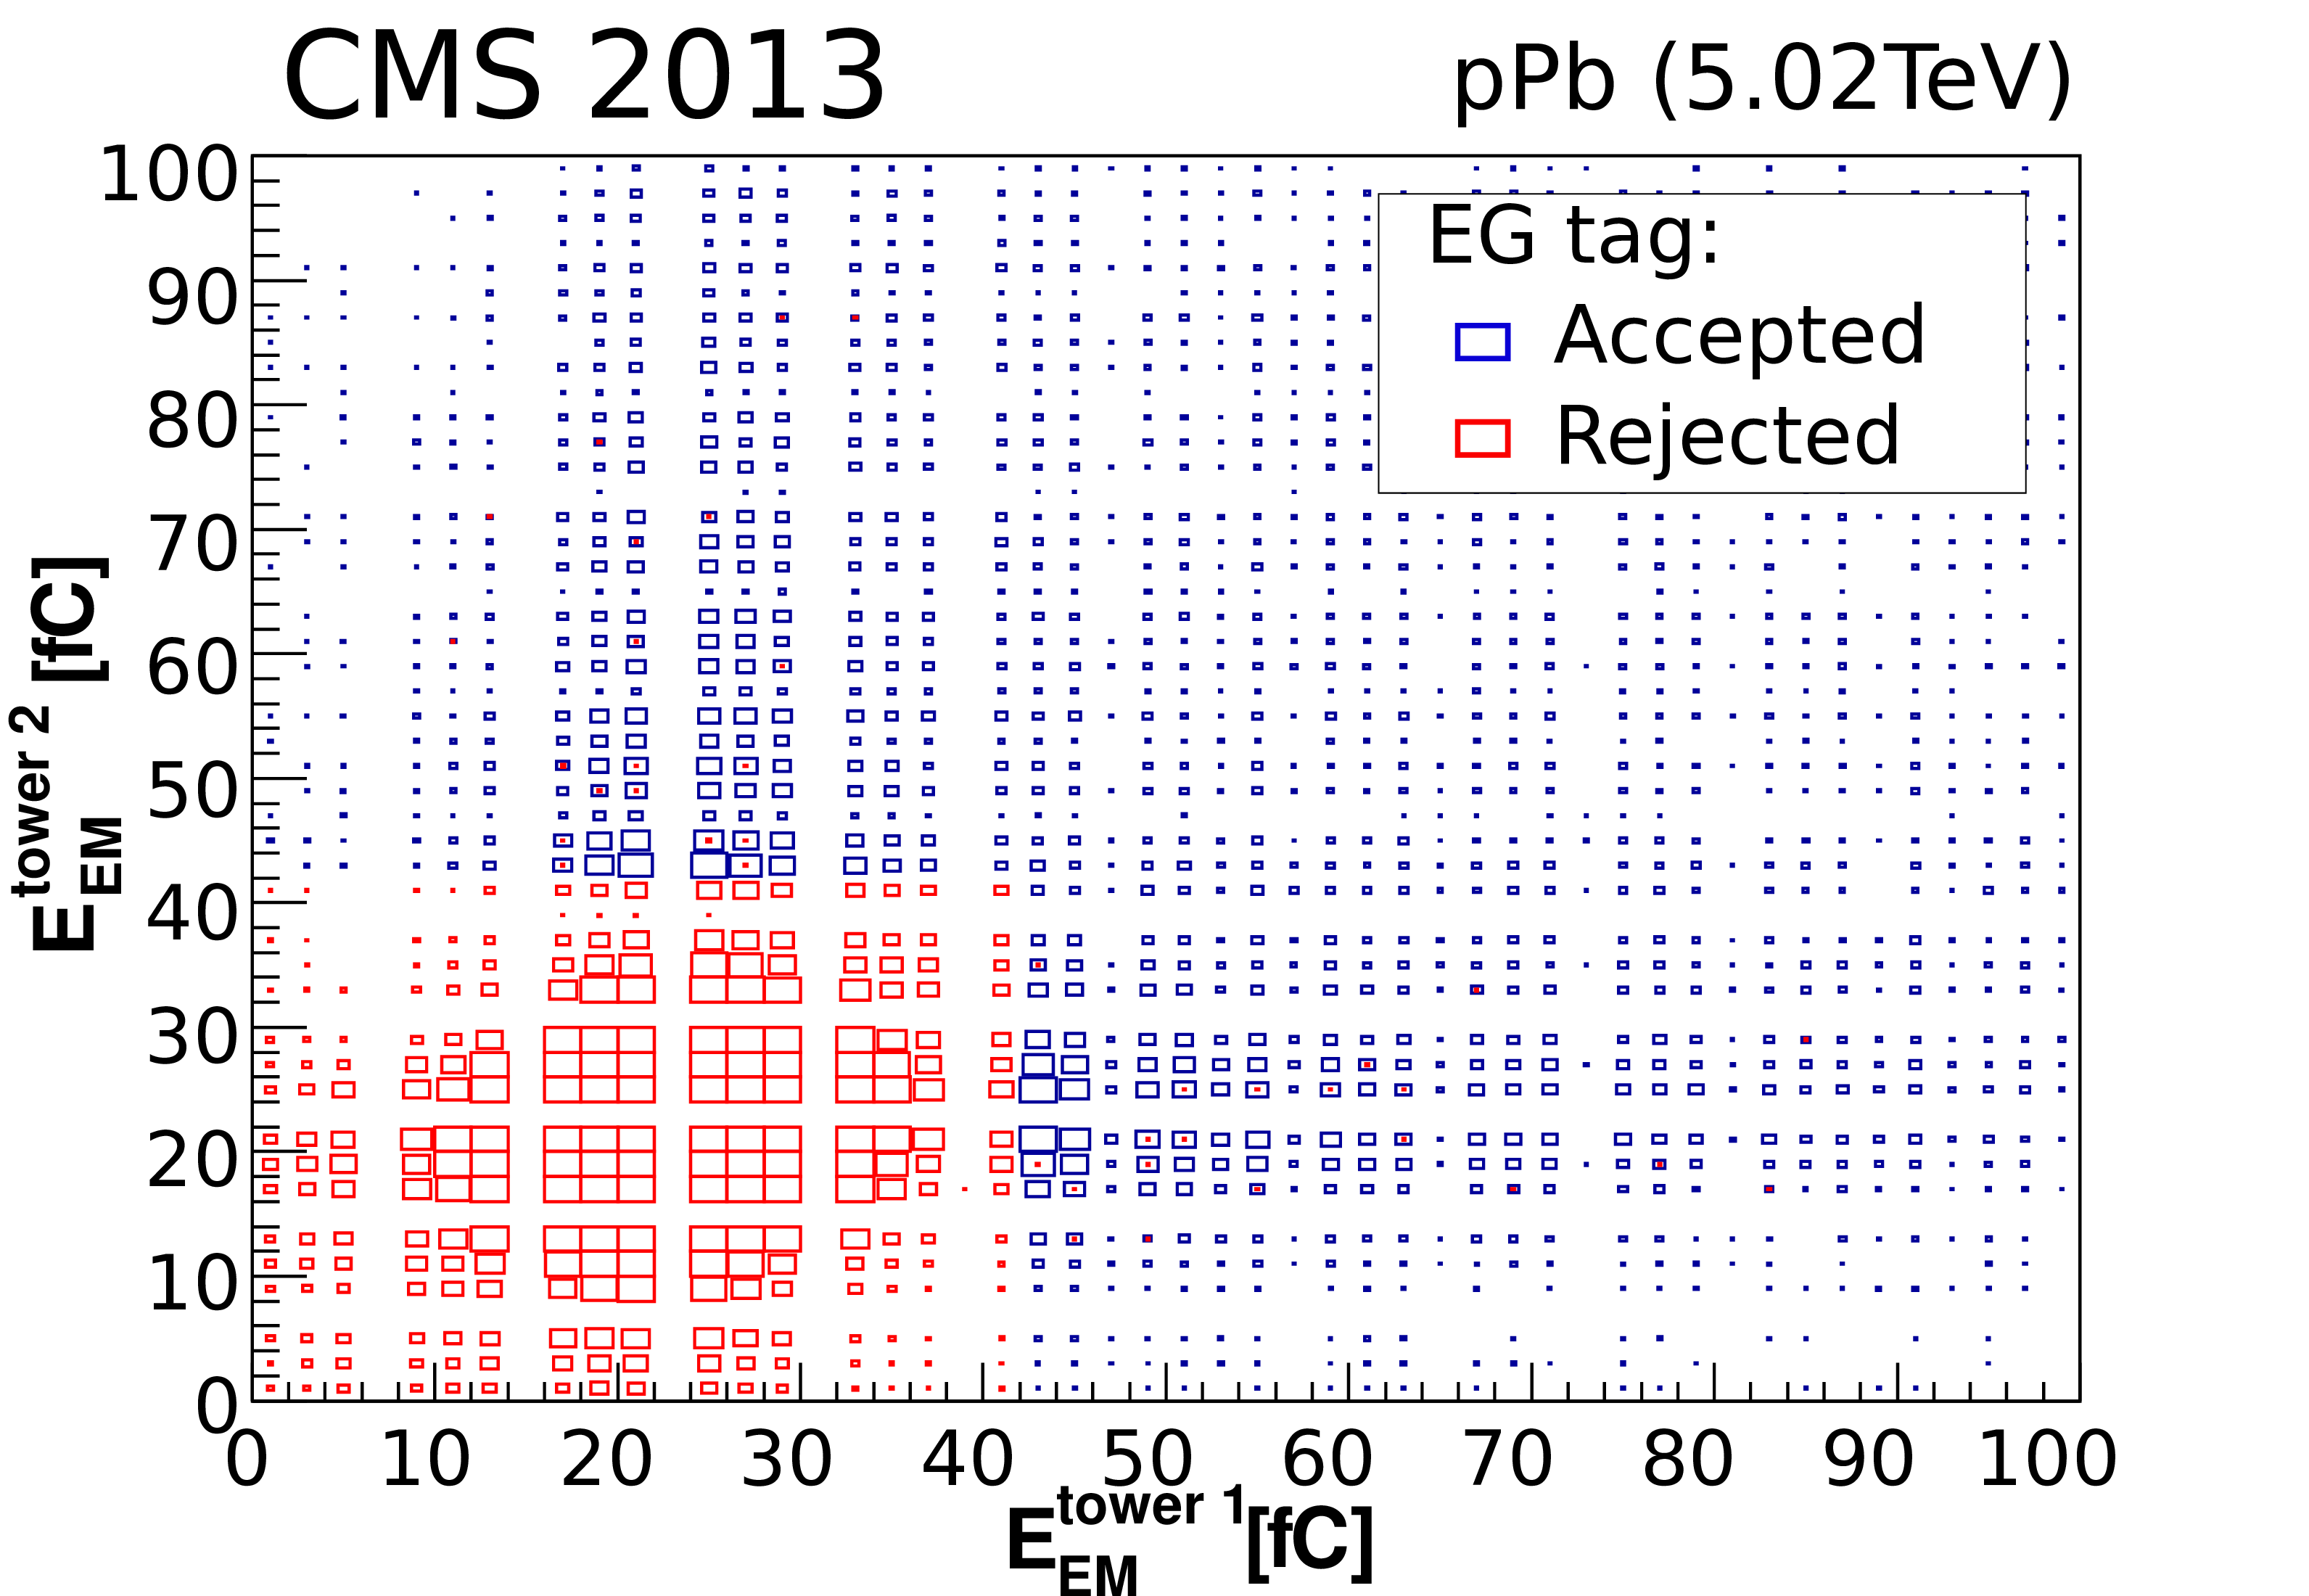
Figure 7-a:
Validation of the electron/gamma (EG) tag triggers in pPb collisions at $ {\sqrt {\smash [b]{s_{_{\mathrm {NN}}}}}} = $ 5.02 TeV. Shown are density distributions of the number of events with digitized signals (in fC) in pairs of towers in one octant. A trigger is issued for each pair of towers when the logical condition "EG tag $\wedge$ Hadron veto'' is met. The number of events that (do not) produce a trigger signal are in blue (red). At very small signals, one can see additional quantization effects from the nonlinear behavior of the QIE digitizers. |
png pdf |
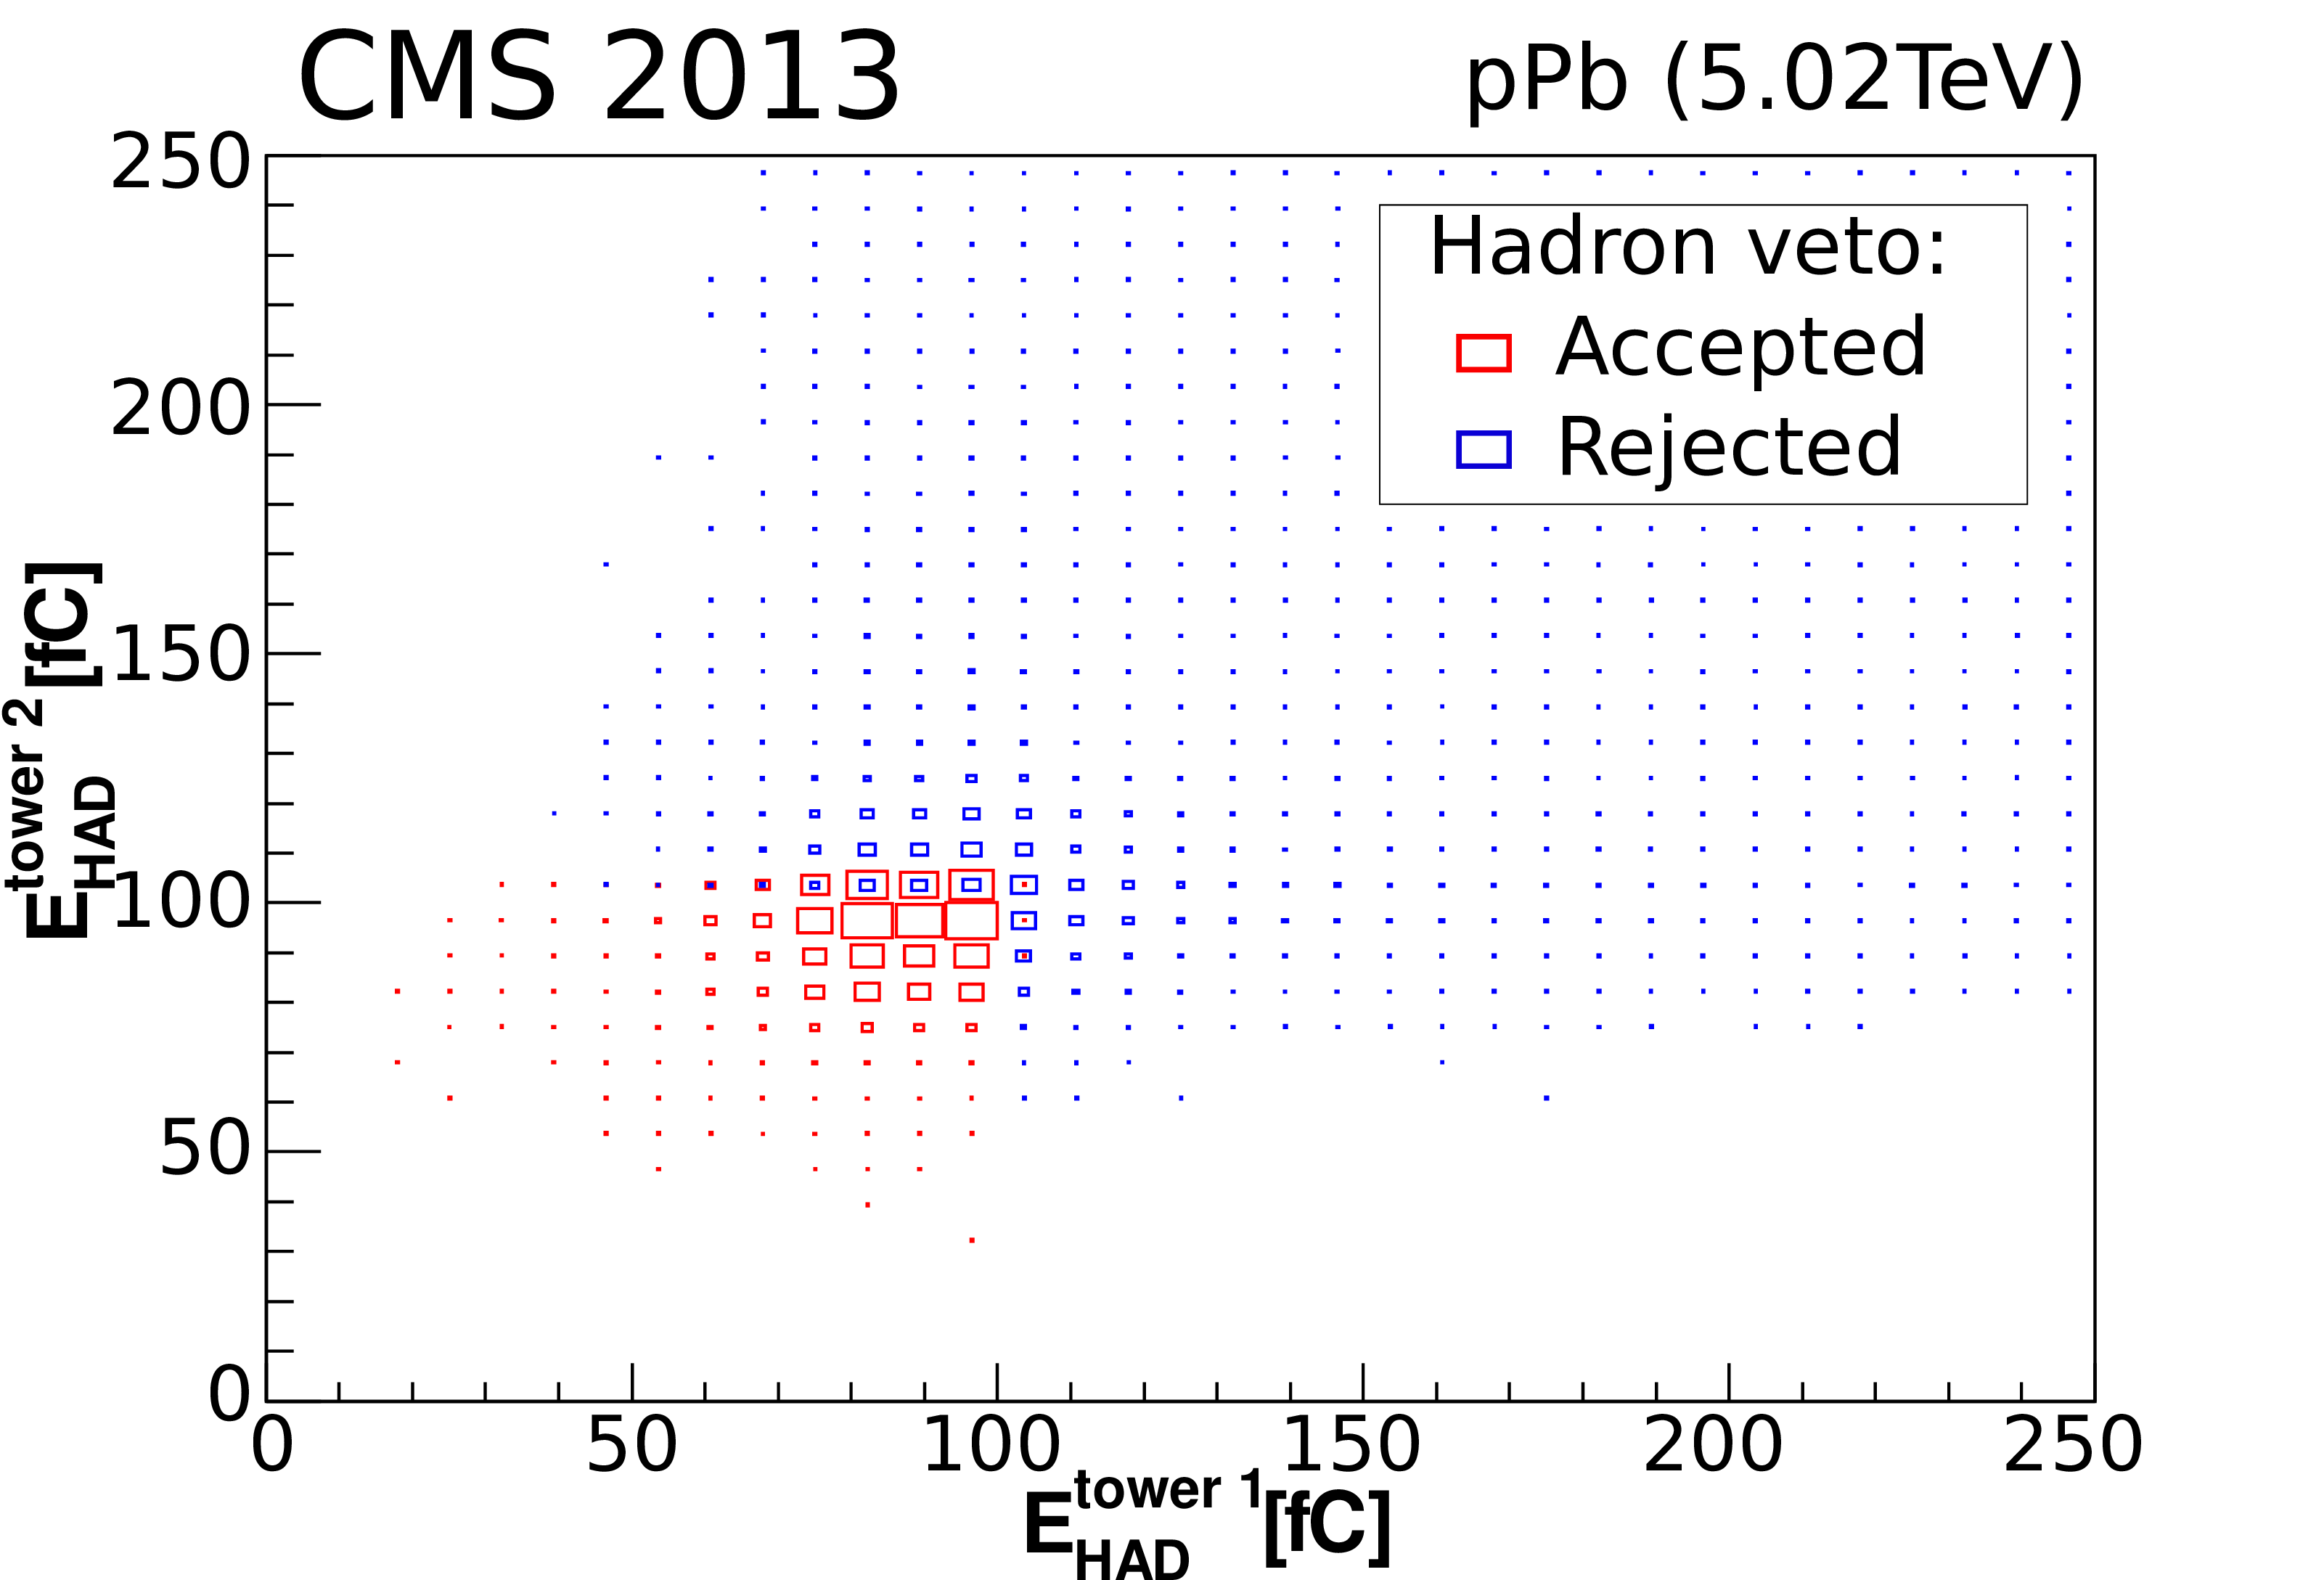
Figure 7-b:
Validation of the hadron veto triggers in pPb collisions at $ {\sqrt {\smash [b]{s_{_{\mathrm {NN}}}}}} = $ 5.02 TeV. Shown are density distributions of the number of events with digitized signals (in fC) in pairs of towers in one octant. A trigger is issued for each pair of towers when the logical condition "EG tag $\wedge$ Hadron veto'' is met. The number of events that (do not) produce a trigger signal are in blue (red). At very small signals, one can see additional quantization effects from the nonlinear behavior of the QIE digitizers. |
png pdf |
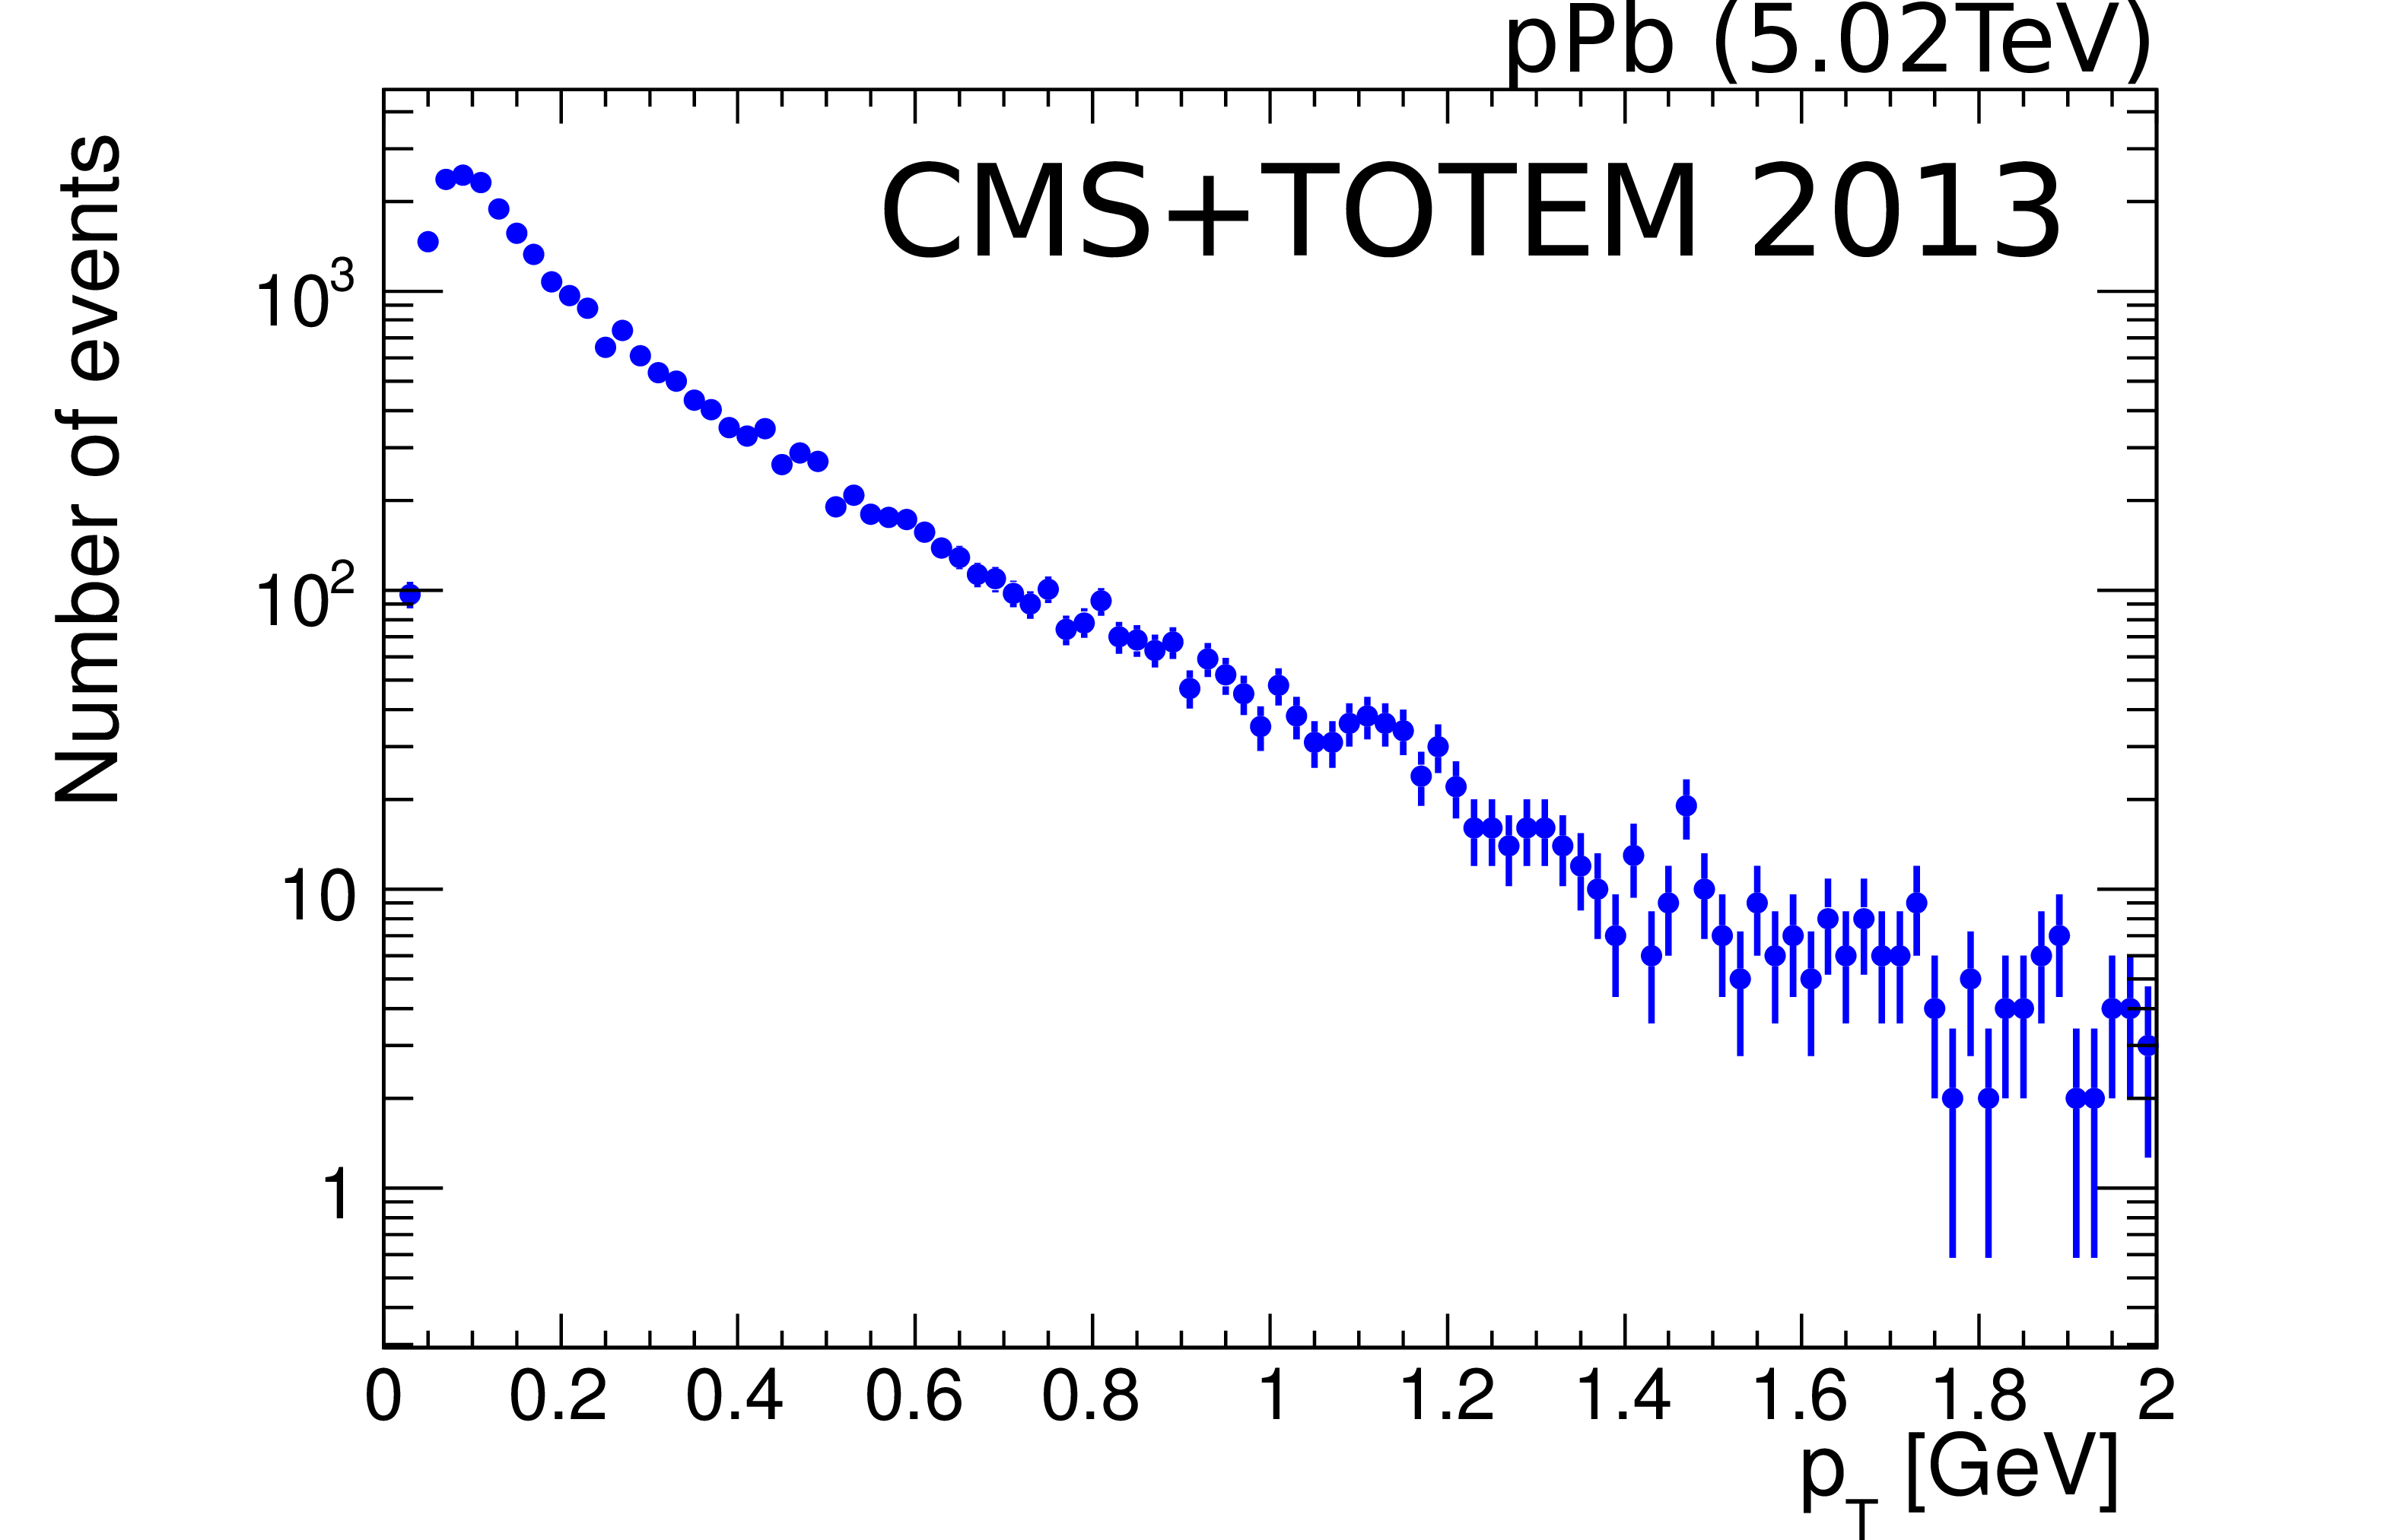
Figure 8:
Detector-level ${p_{\mathrm {T}}}$ distribution of isolated electron candidates recorded in proton-lead collisions in 2013 with a dedicated trigger [65]. It is a unique feature that the ${p_{\mathrm {T}}}$ of these electrons can be precisely determined since the angles of their associated tracks are measured with the TOTEM T2 tracker. The uncertainties are purely statistical. |
png pdf |
Figure 9:
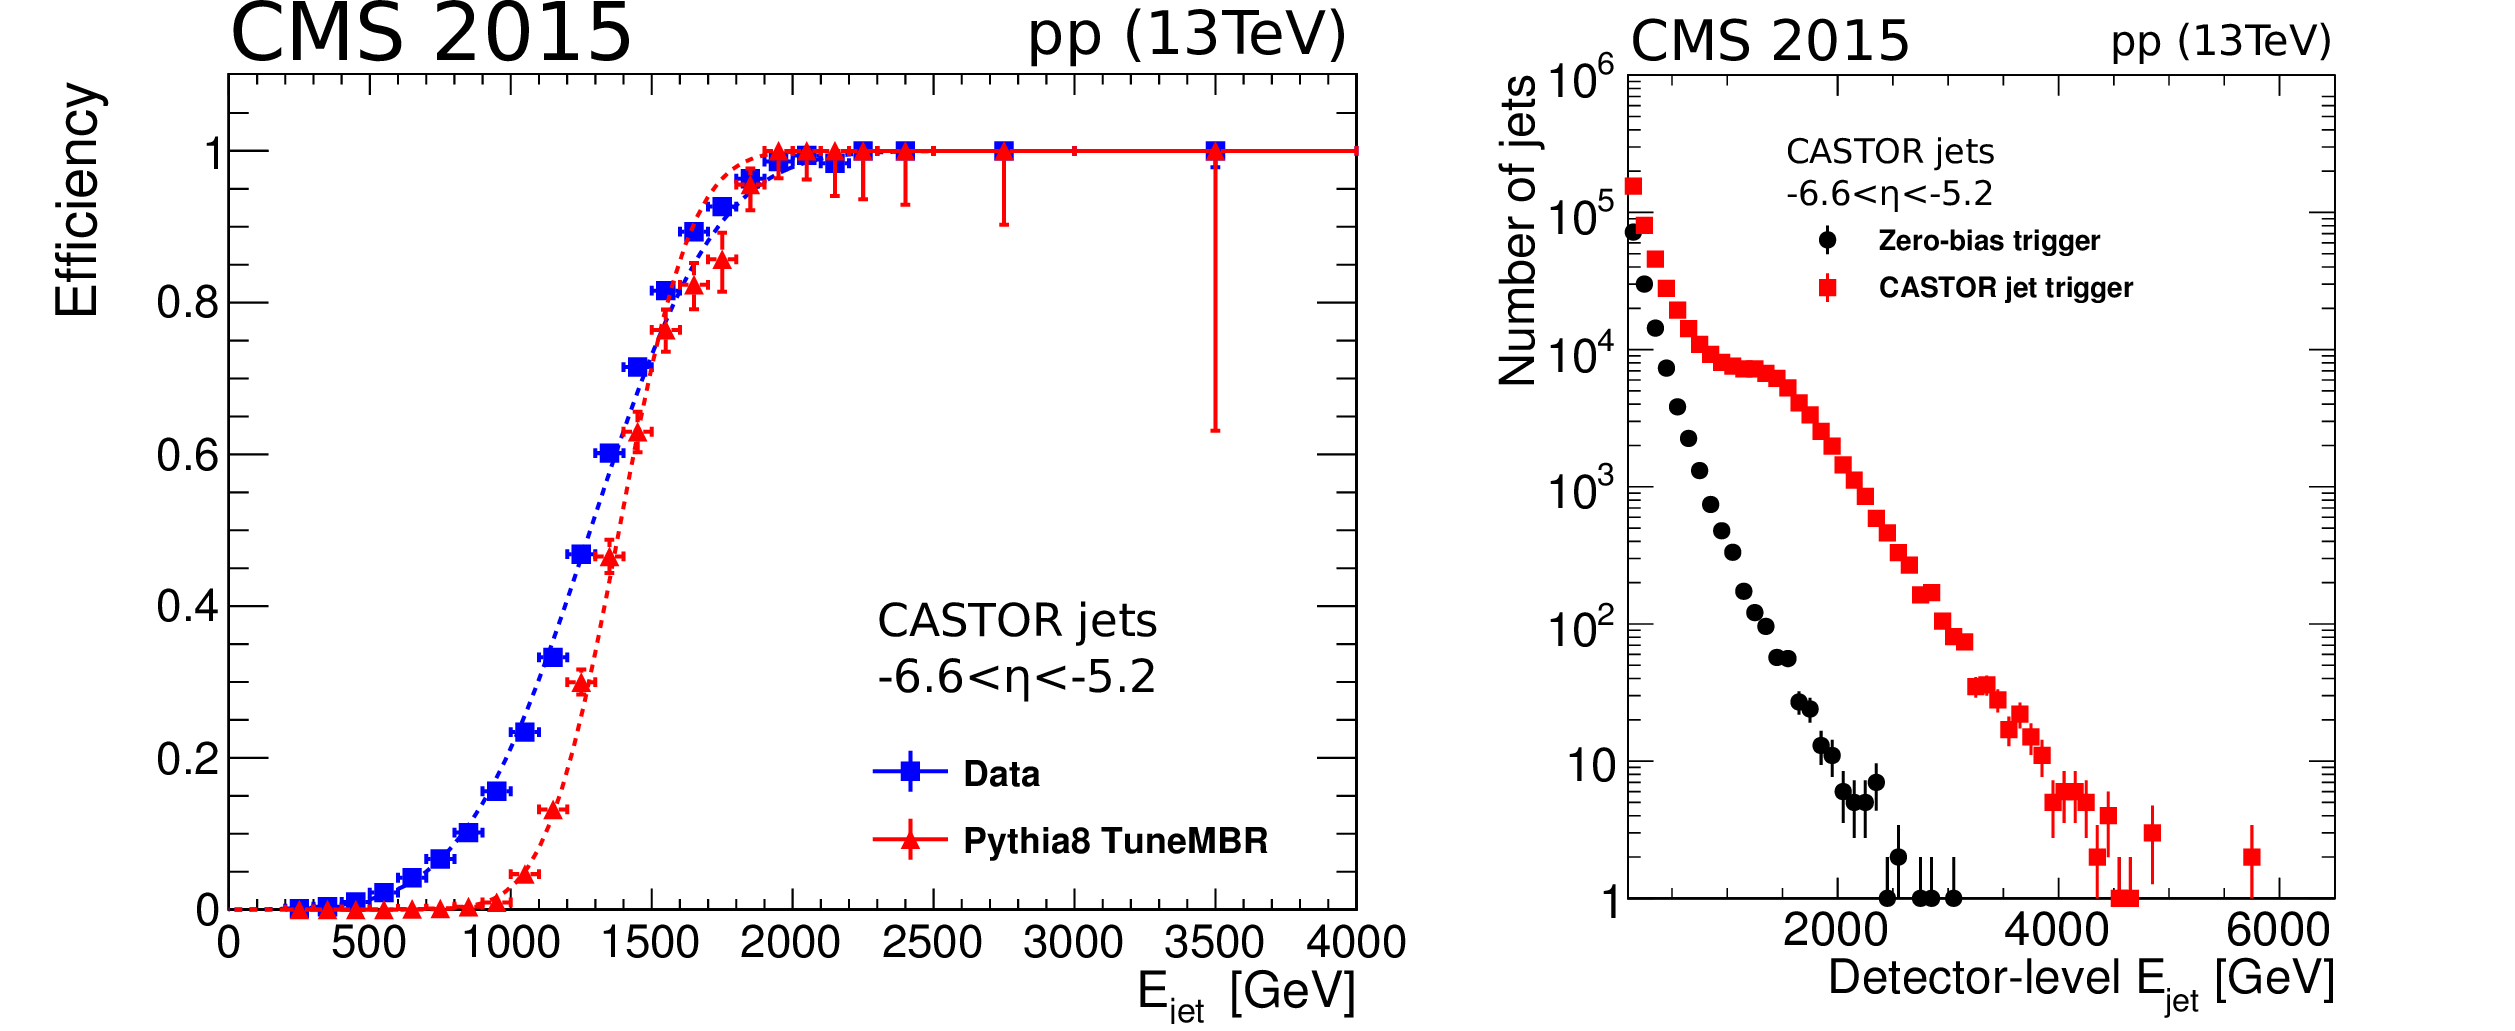
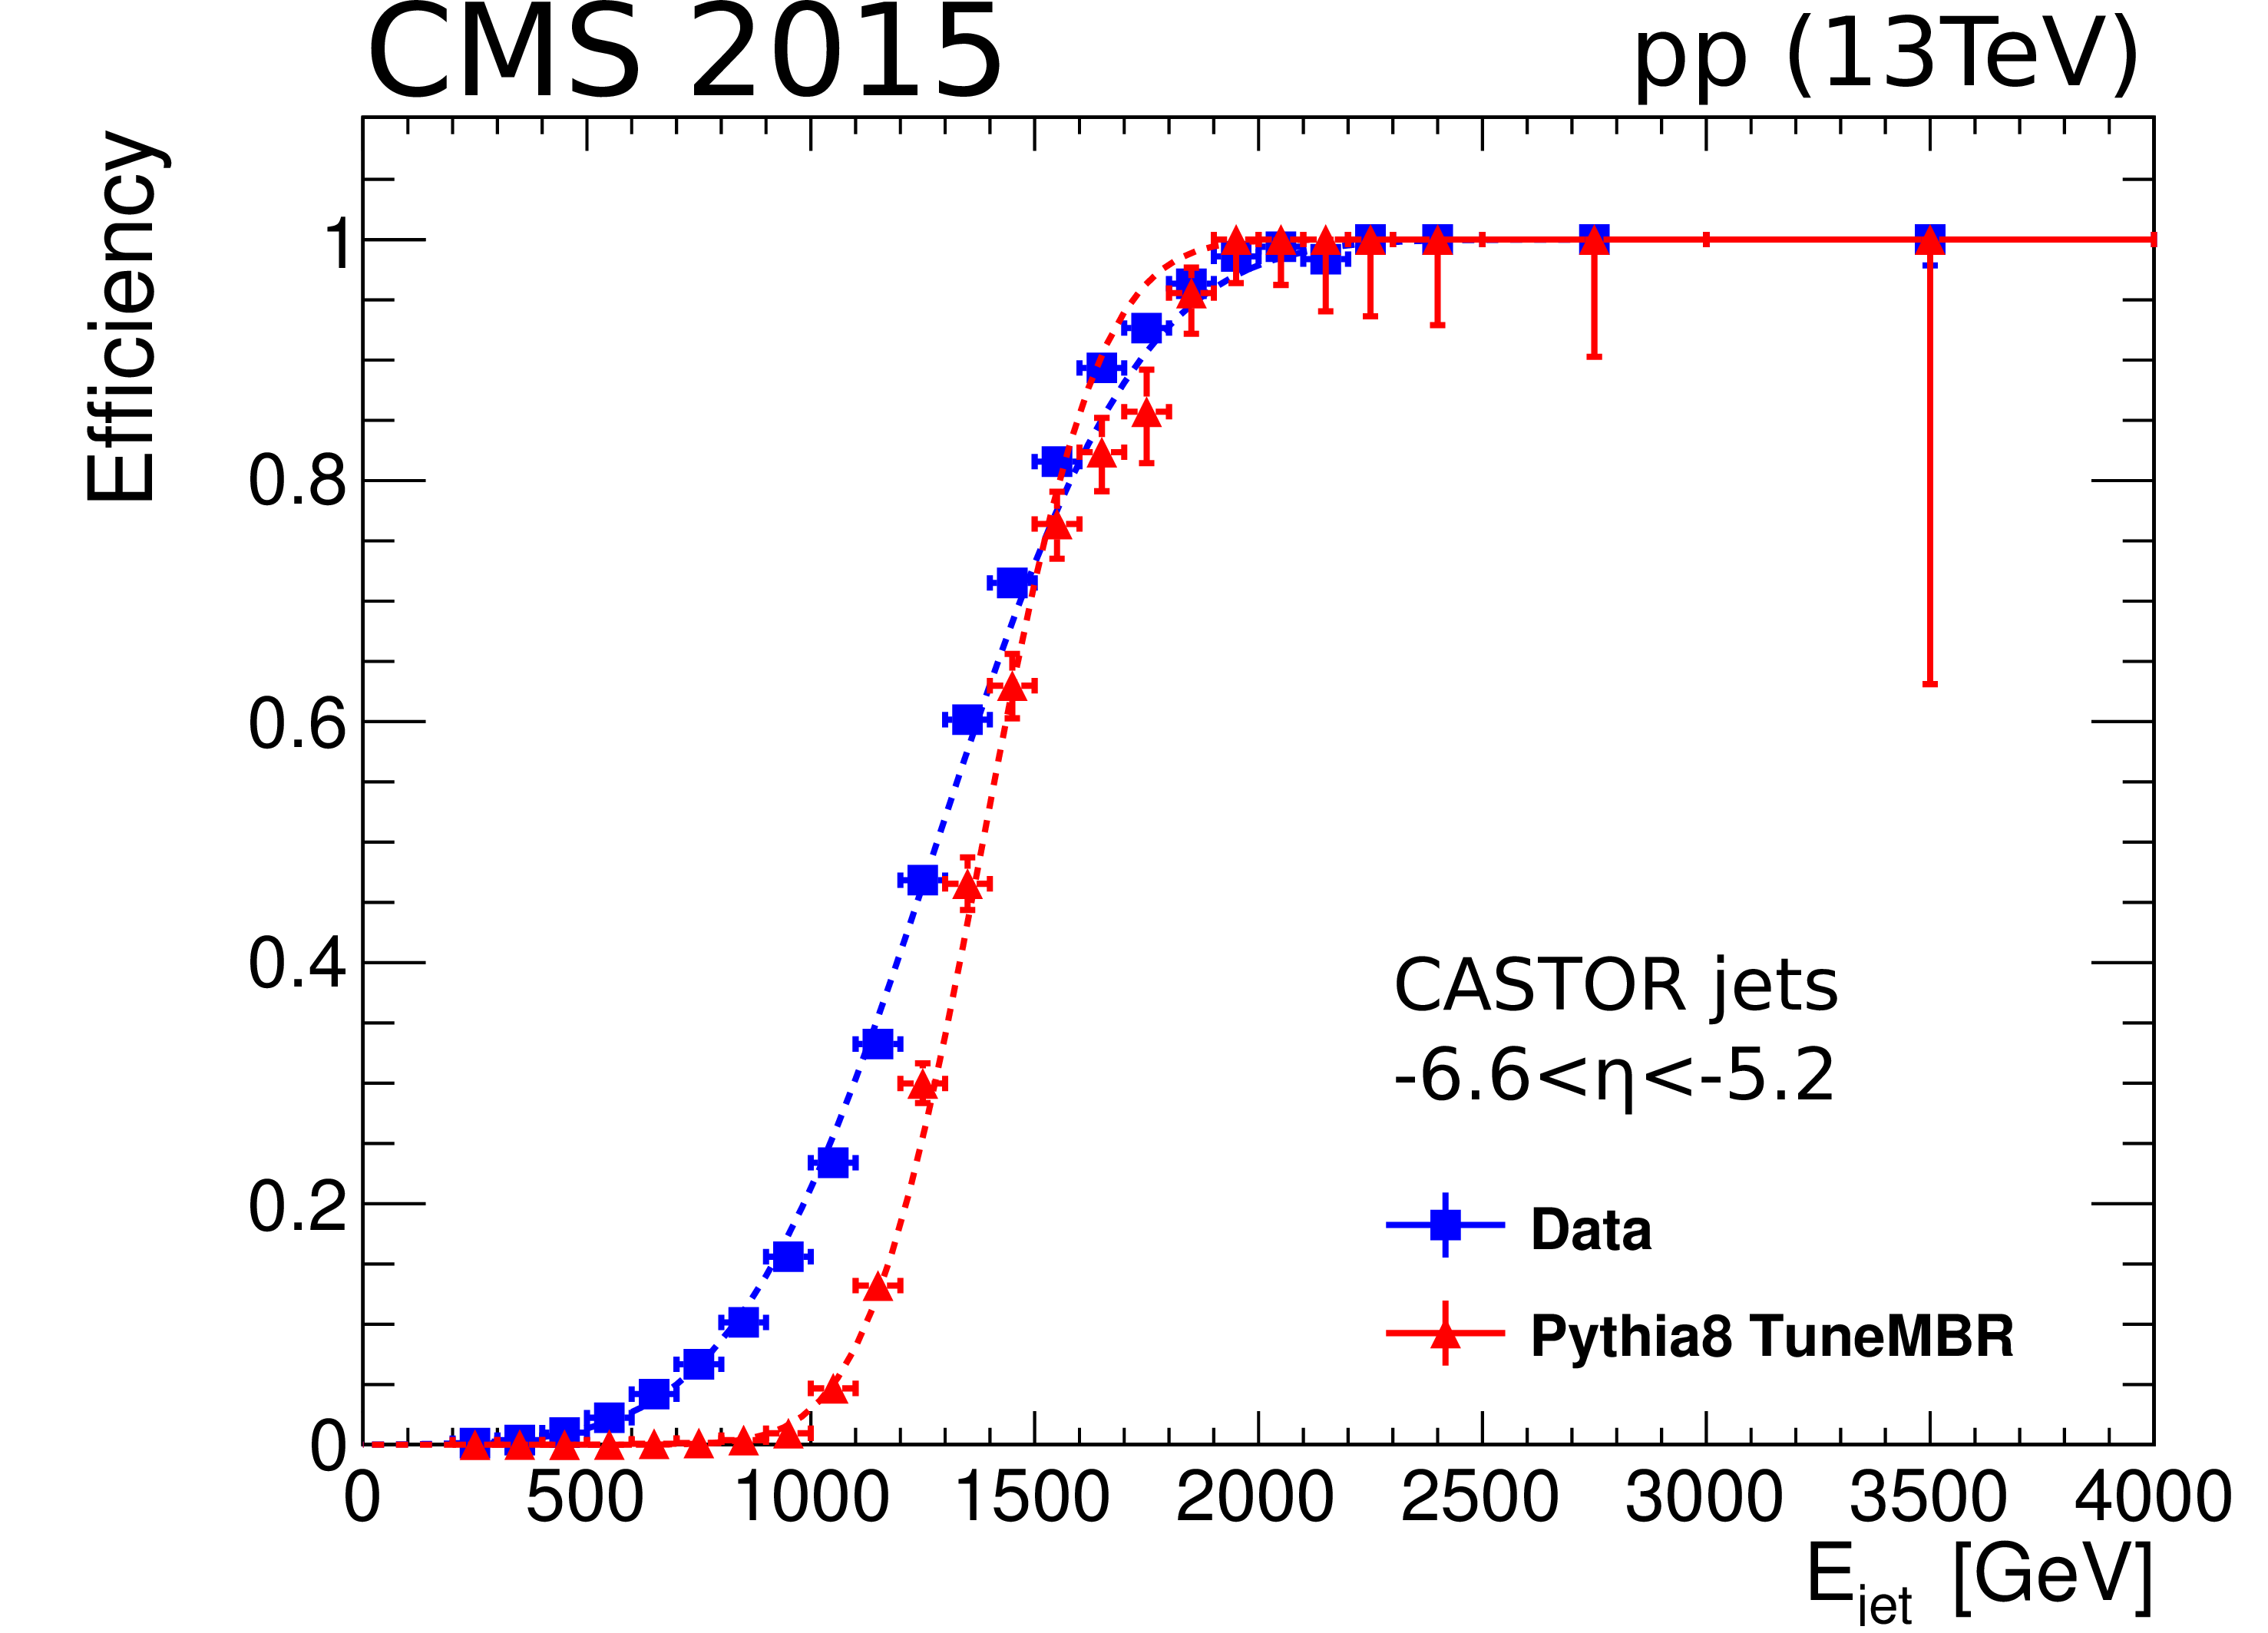
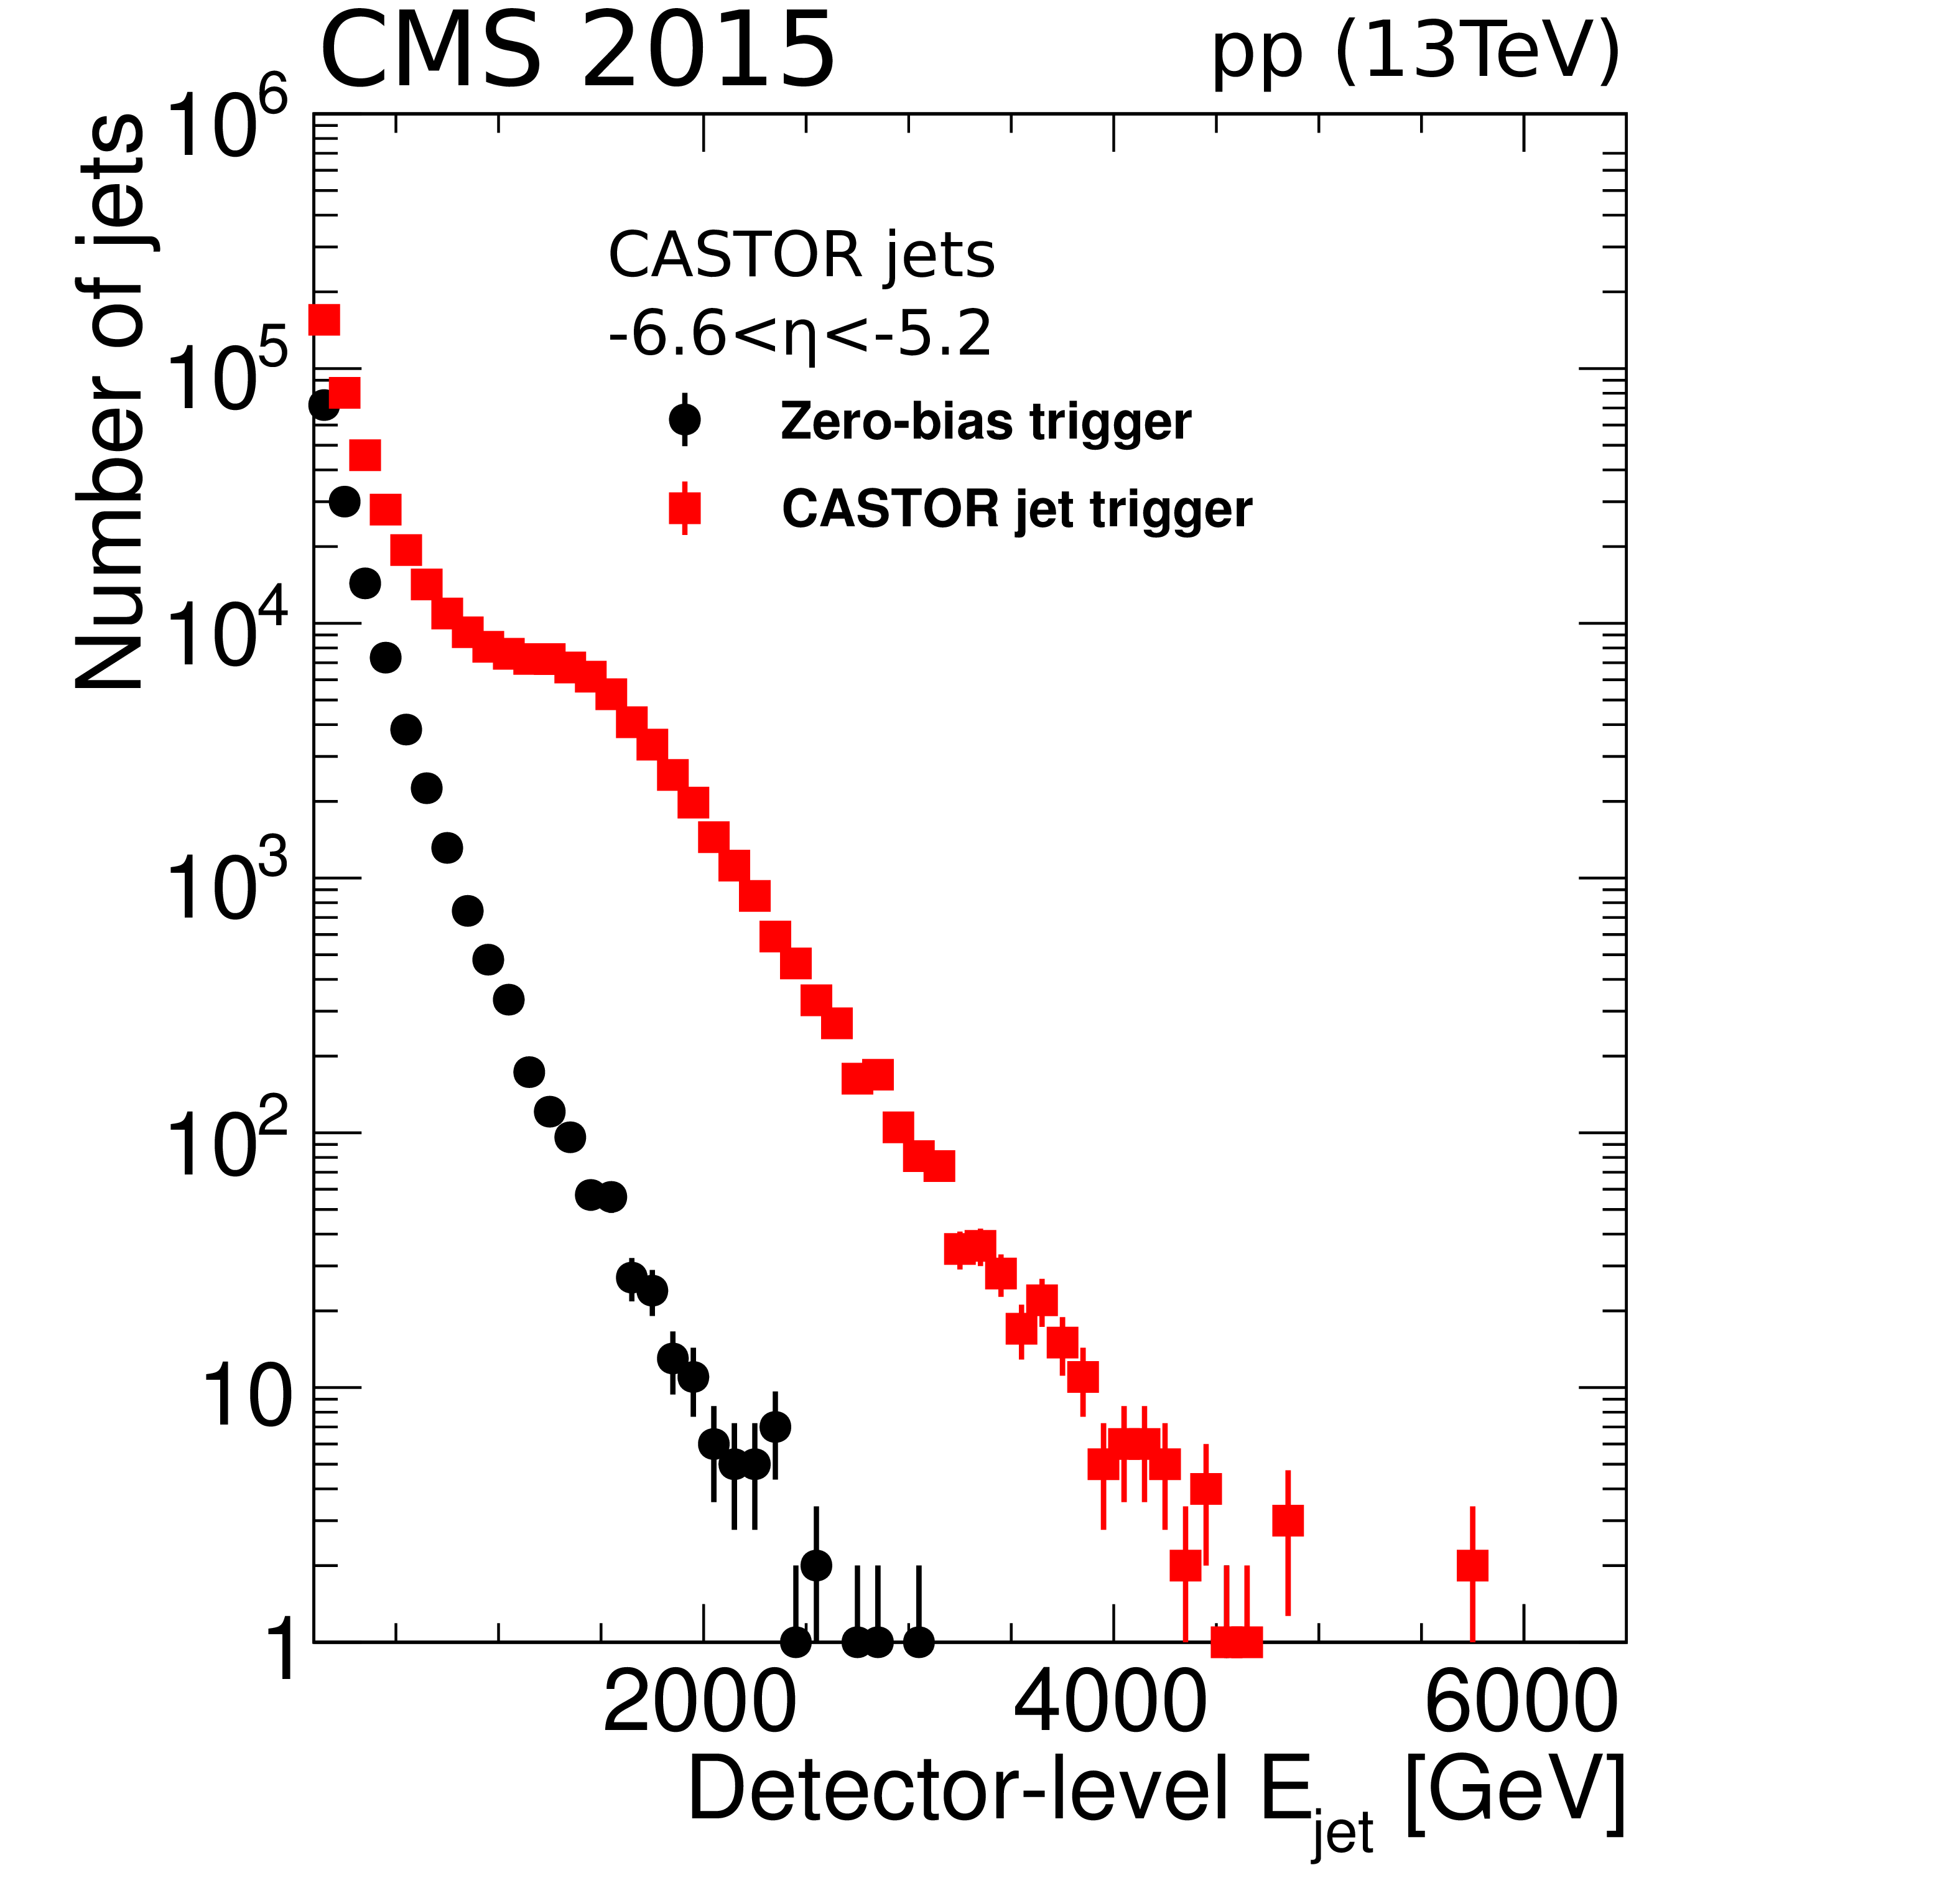
Performance of the CASTOR jet trigger in pp collisions during the LHC Run 2. Left: Trigger efficiency turn-on curve in data and simulations generated with the PYTHIA 8 [67] with the MBR tune [68]. Right: Number of jets as a function of $ {{E_{\mathrm {jet}}}} $ collected with the CMS zero-bias and CASTOR jet triggers. In both figures the uncertainties are statistical only. |
png pdf |
Figure 9-a:
Performance of the CASTOR jet trigger in pp collisions during the LHC Run 2: Trigger efficiency turn-on curve in data and simulations generated with the PYTHIA 8 [67] with the MBR tune [68]. The uncertainties are statistical only. |
png pdf |
Figure 9-b:
Performance of the CASTOR jet trigger in pp collisions during the LHC Run 2: Number of jets as a function of $ {{E_{\mathrm {jet}}}} $ collected with the CMS zero-bias and CASTOR jet triggers. The uncertainties are statistical only. |
png pdf |
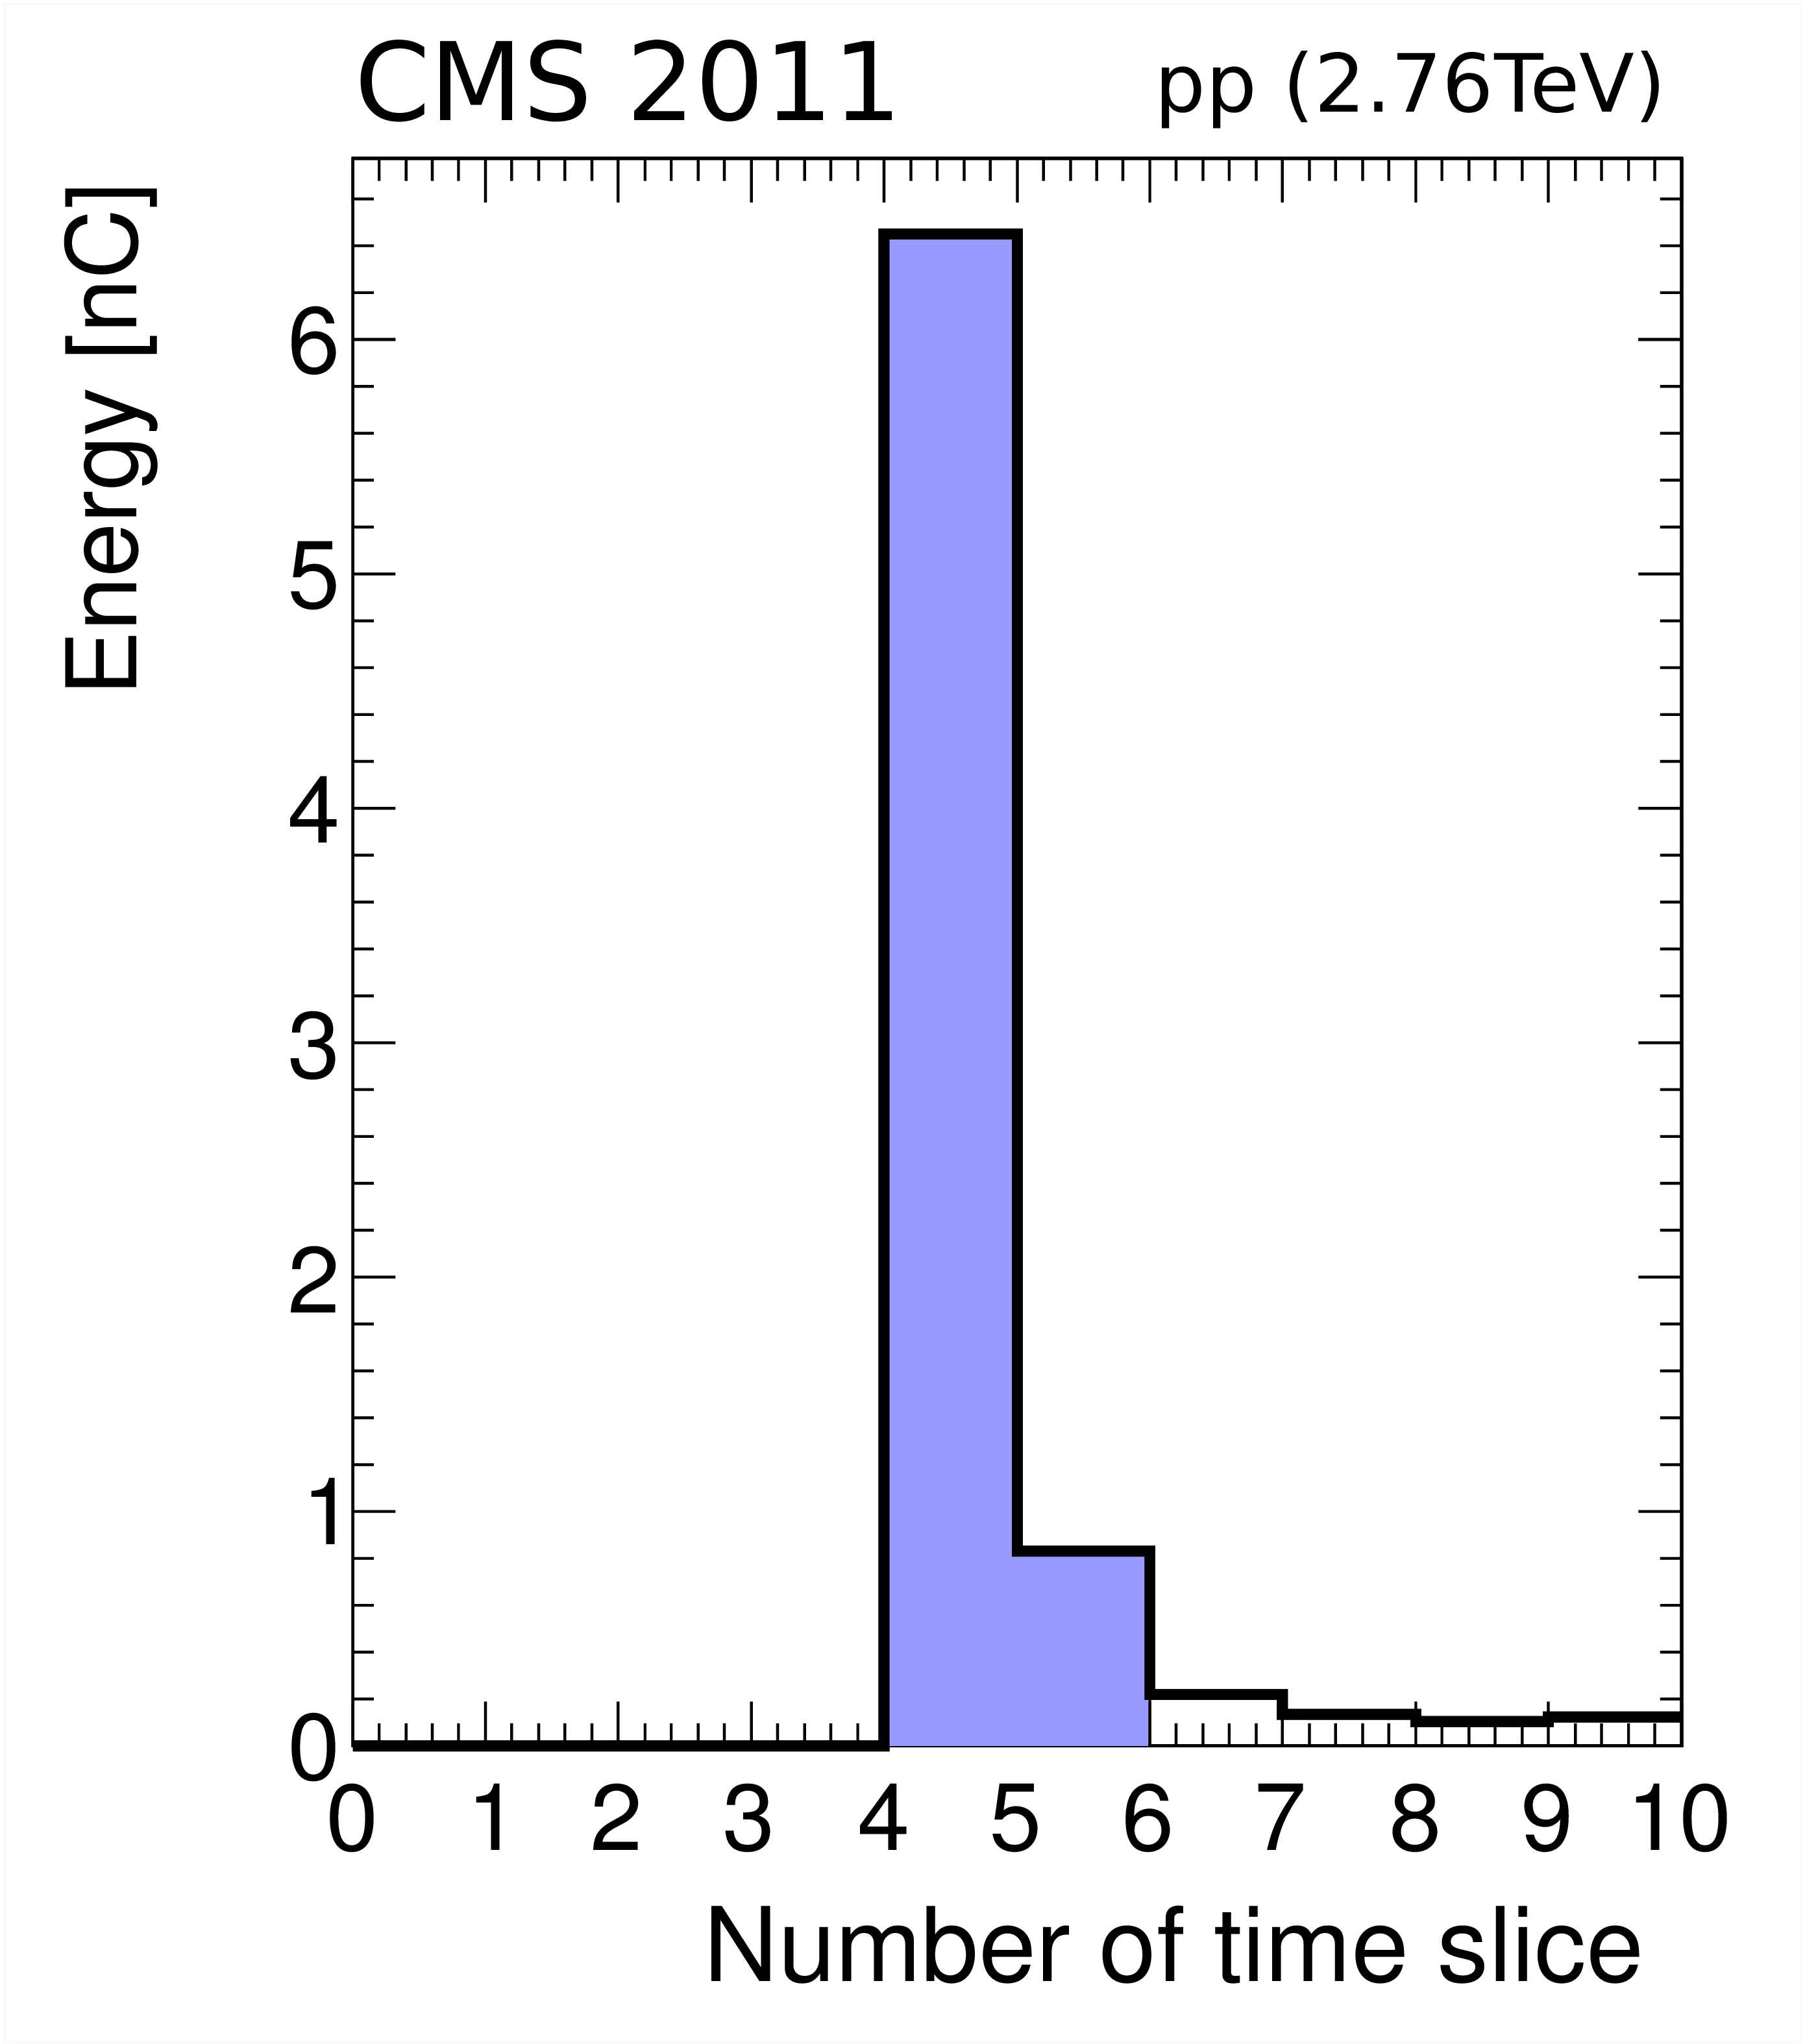
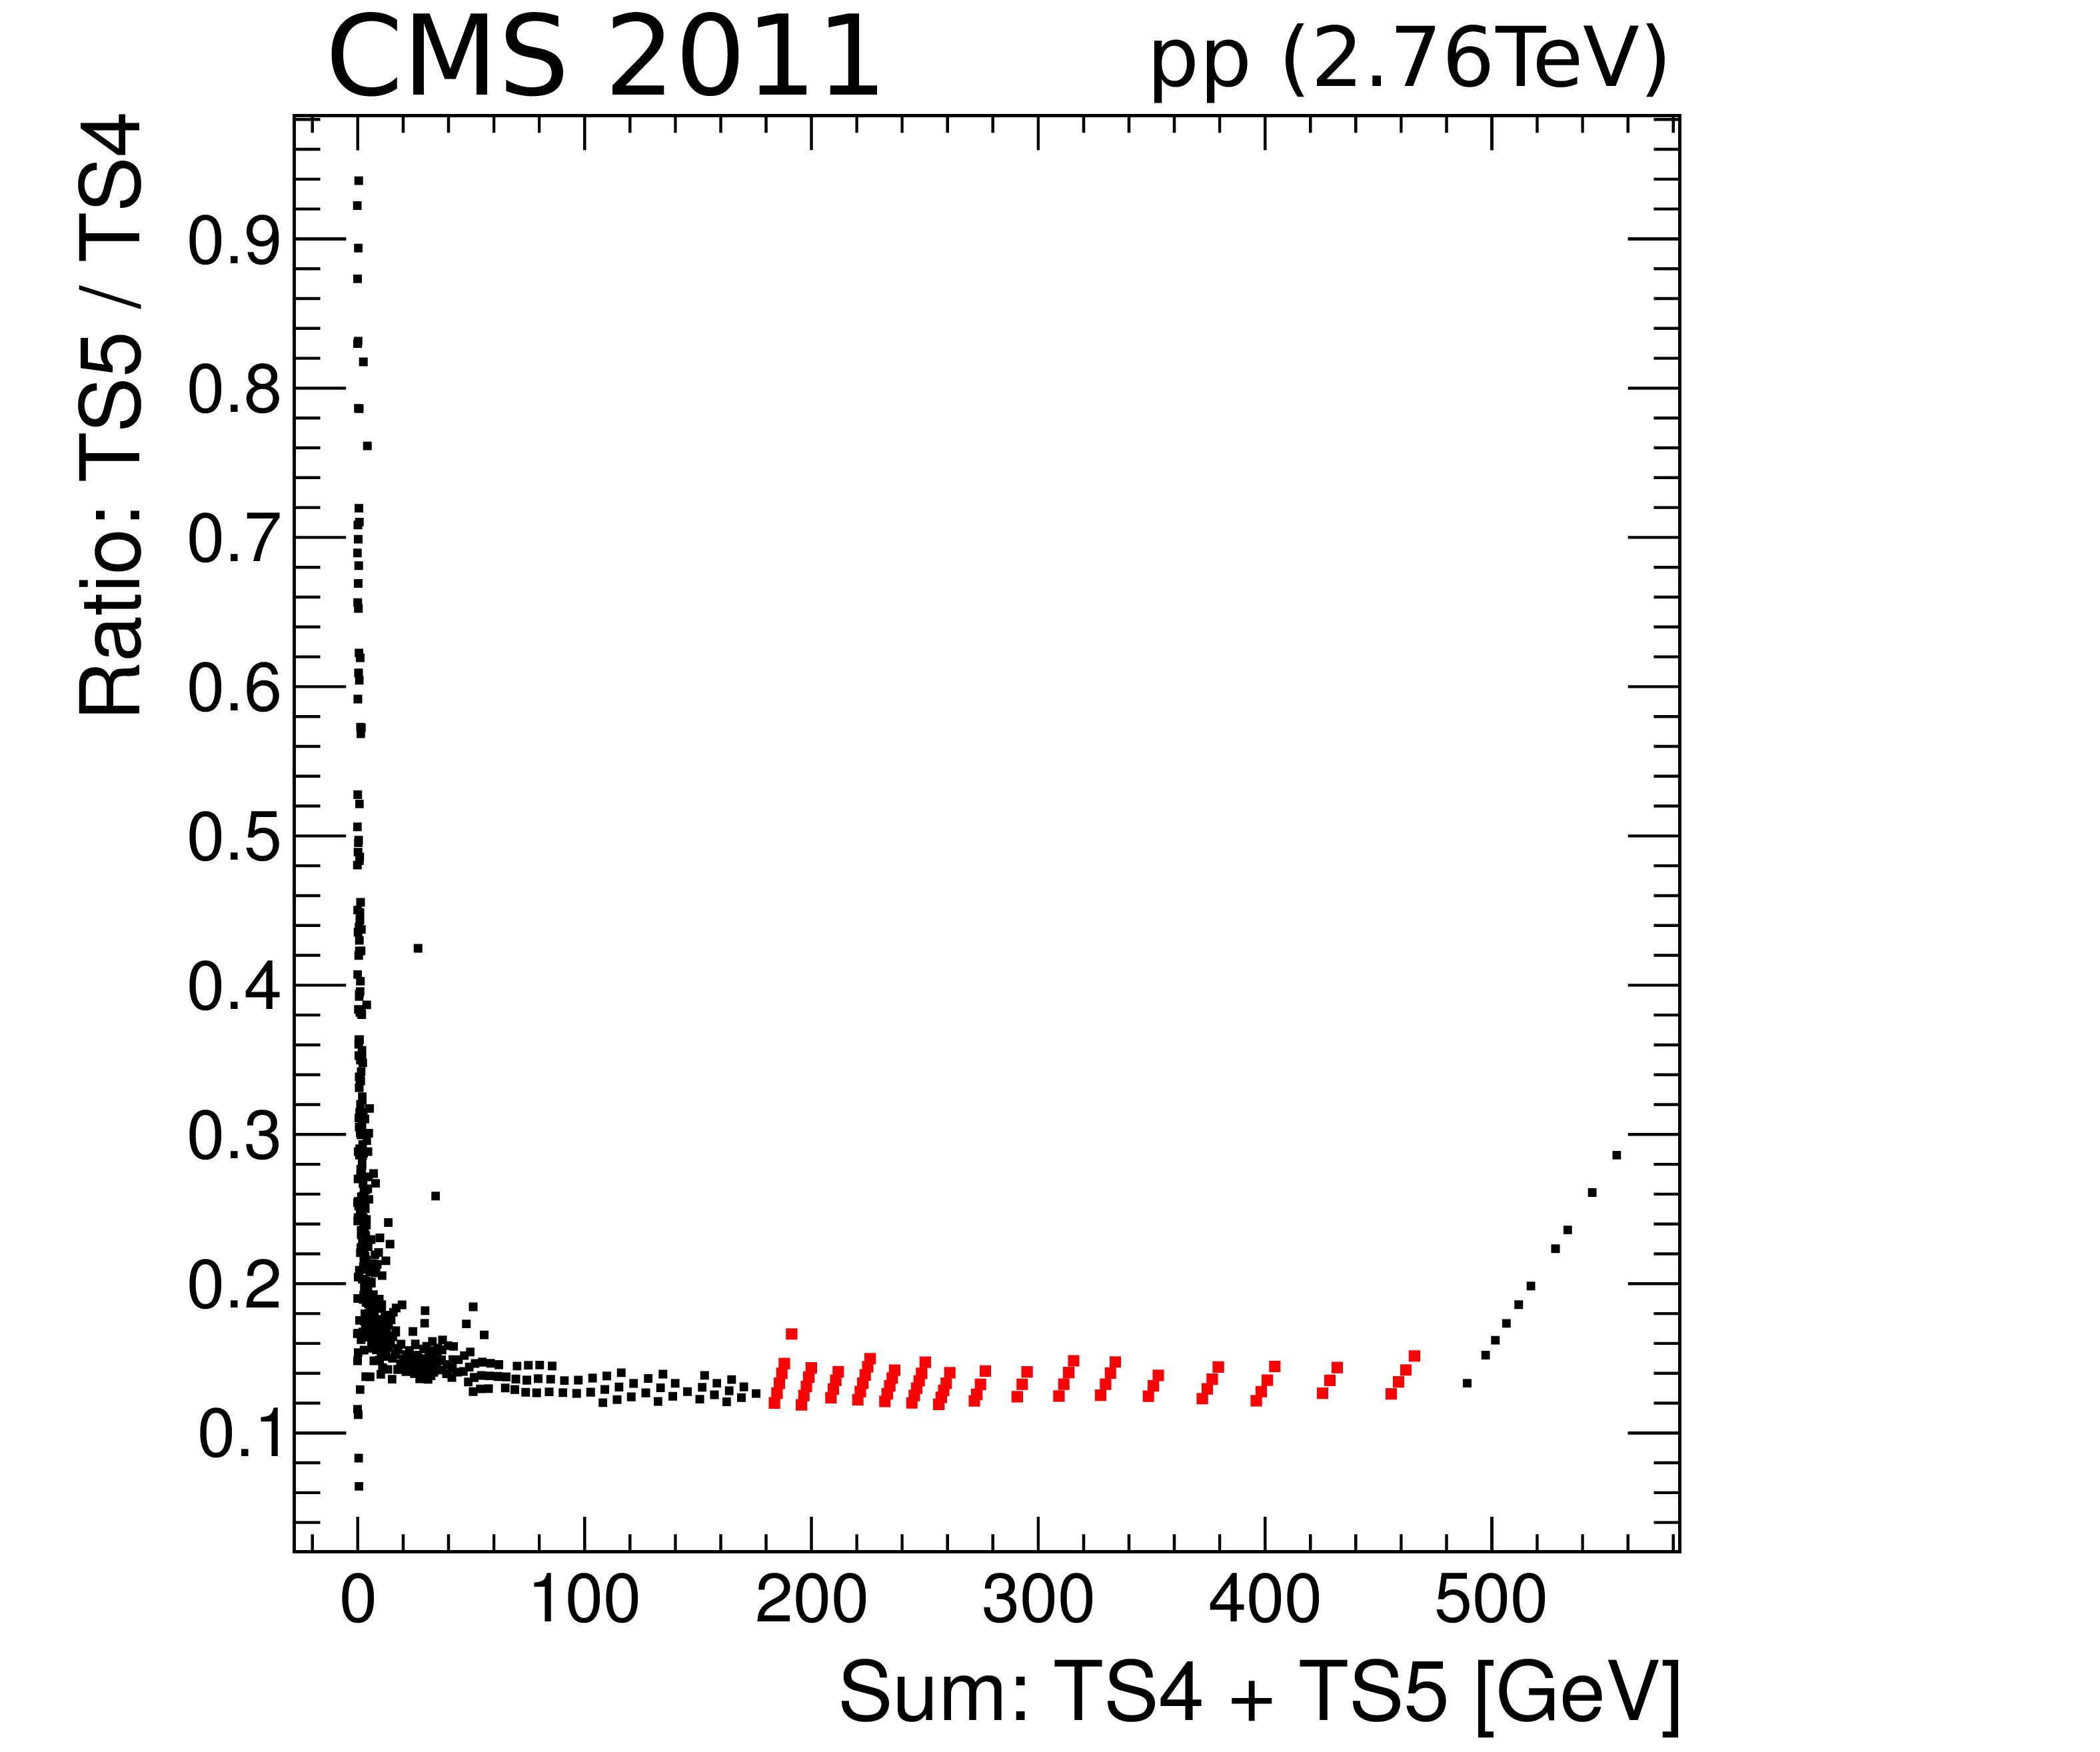
Figure 10:
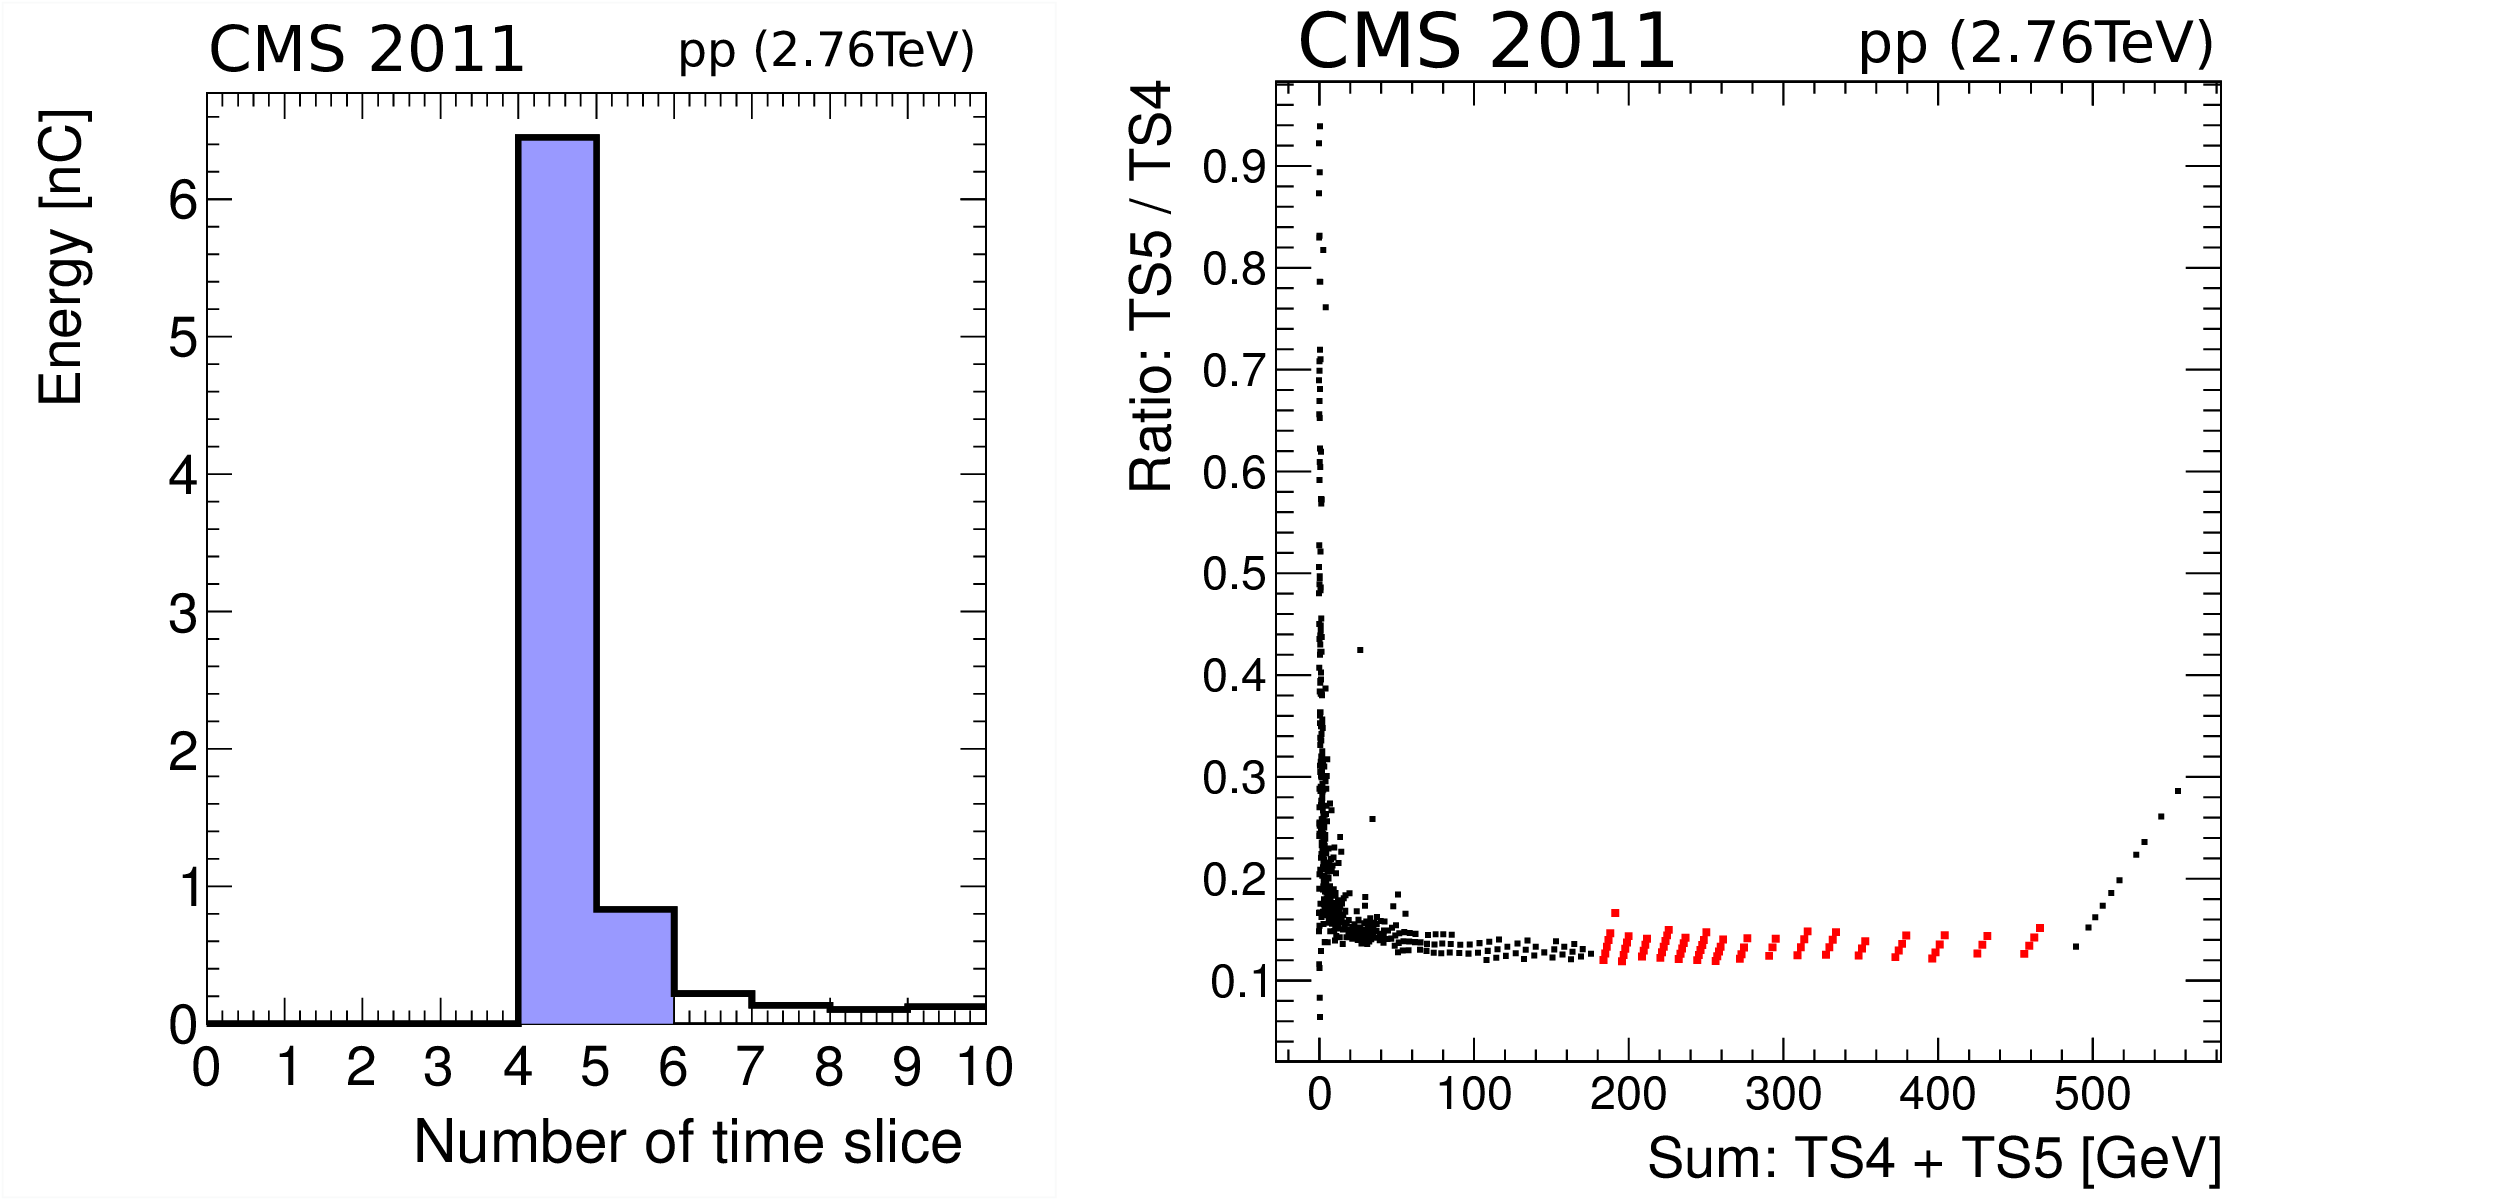
Left: Typical example of a pulse shape in CASTOR showing the energy (in nC) distributed over several time slices, in data recorded in March 2011 using minimum-bias pp collisions at $ {{\sqrt {s}}} = $ 2.76 TeV (the shaded area of the pulse is used to derive the signal energy in the event reconstruction). Right: Ratio of the second-largest (TS5) to largest (TS4) signal time bin for one typical CASTOR channel. The small scale structure in this ratio of neighboring bins apparent for TS4+TS5 larger than $\approx $100 GeV is a feature of the QIE digitizer. Saturation is visible at very high signals, but before saturation sets in, the signal ratio has a stable region (in red) that is used to estimate the channel signal at higher energies. |
png pdf |
Figure 10-a:
Typical example of a pulse shape in CASTOR showing the energy (in nC) distributed over several time slices, in data recorded in March 2011 using minimum-bias pp collisions at $ {{\sqrt {s}}} = $ 2.76 TeV (the shaded area of the pulse is used to derive the signal energy in the event reconstruction). |
png pdf |
Figure 10-b:
Ratio of the second-largest (TS5) to largest (TS4) signal time bin for one typical CASTOR channel. The small scale structure in this ratio of neighboring bins apparent for TS4+TS5 larger than $\approx $100 GeV is a feature of the QIE digitizer. Saturation is visible at very high signals, but before saturation sets in, the signal ratio has a stable region (in red) that is used to estimate the channel signal at higher energies. |
png pdf |
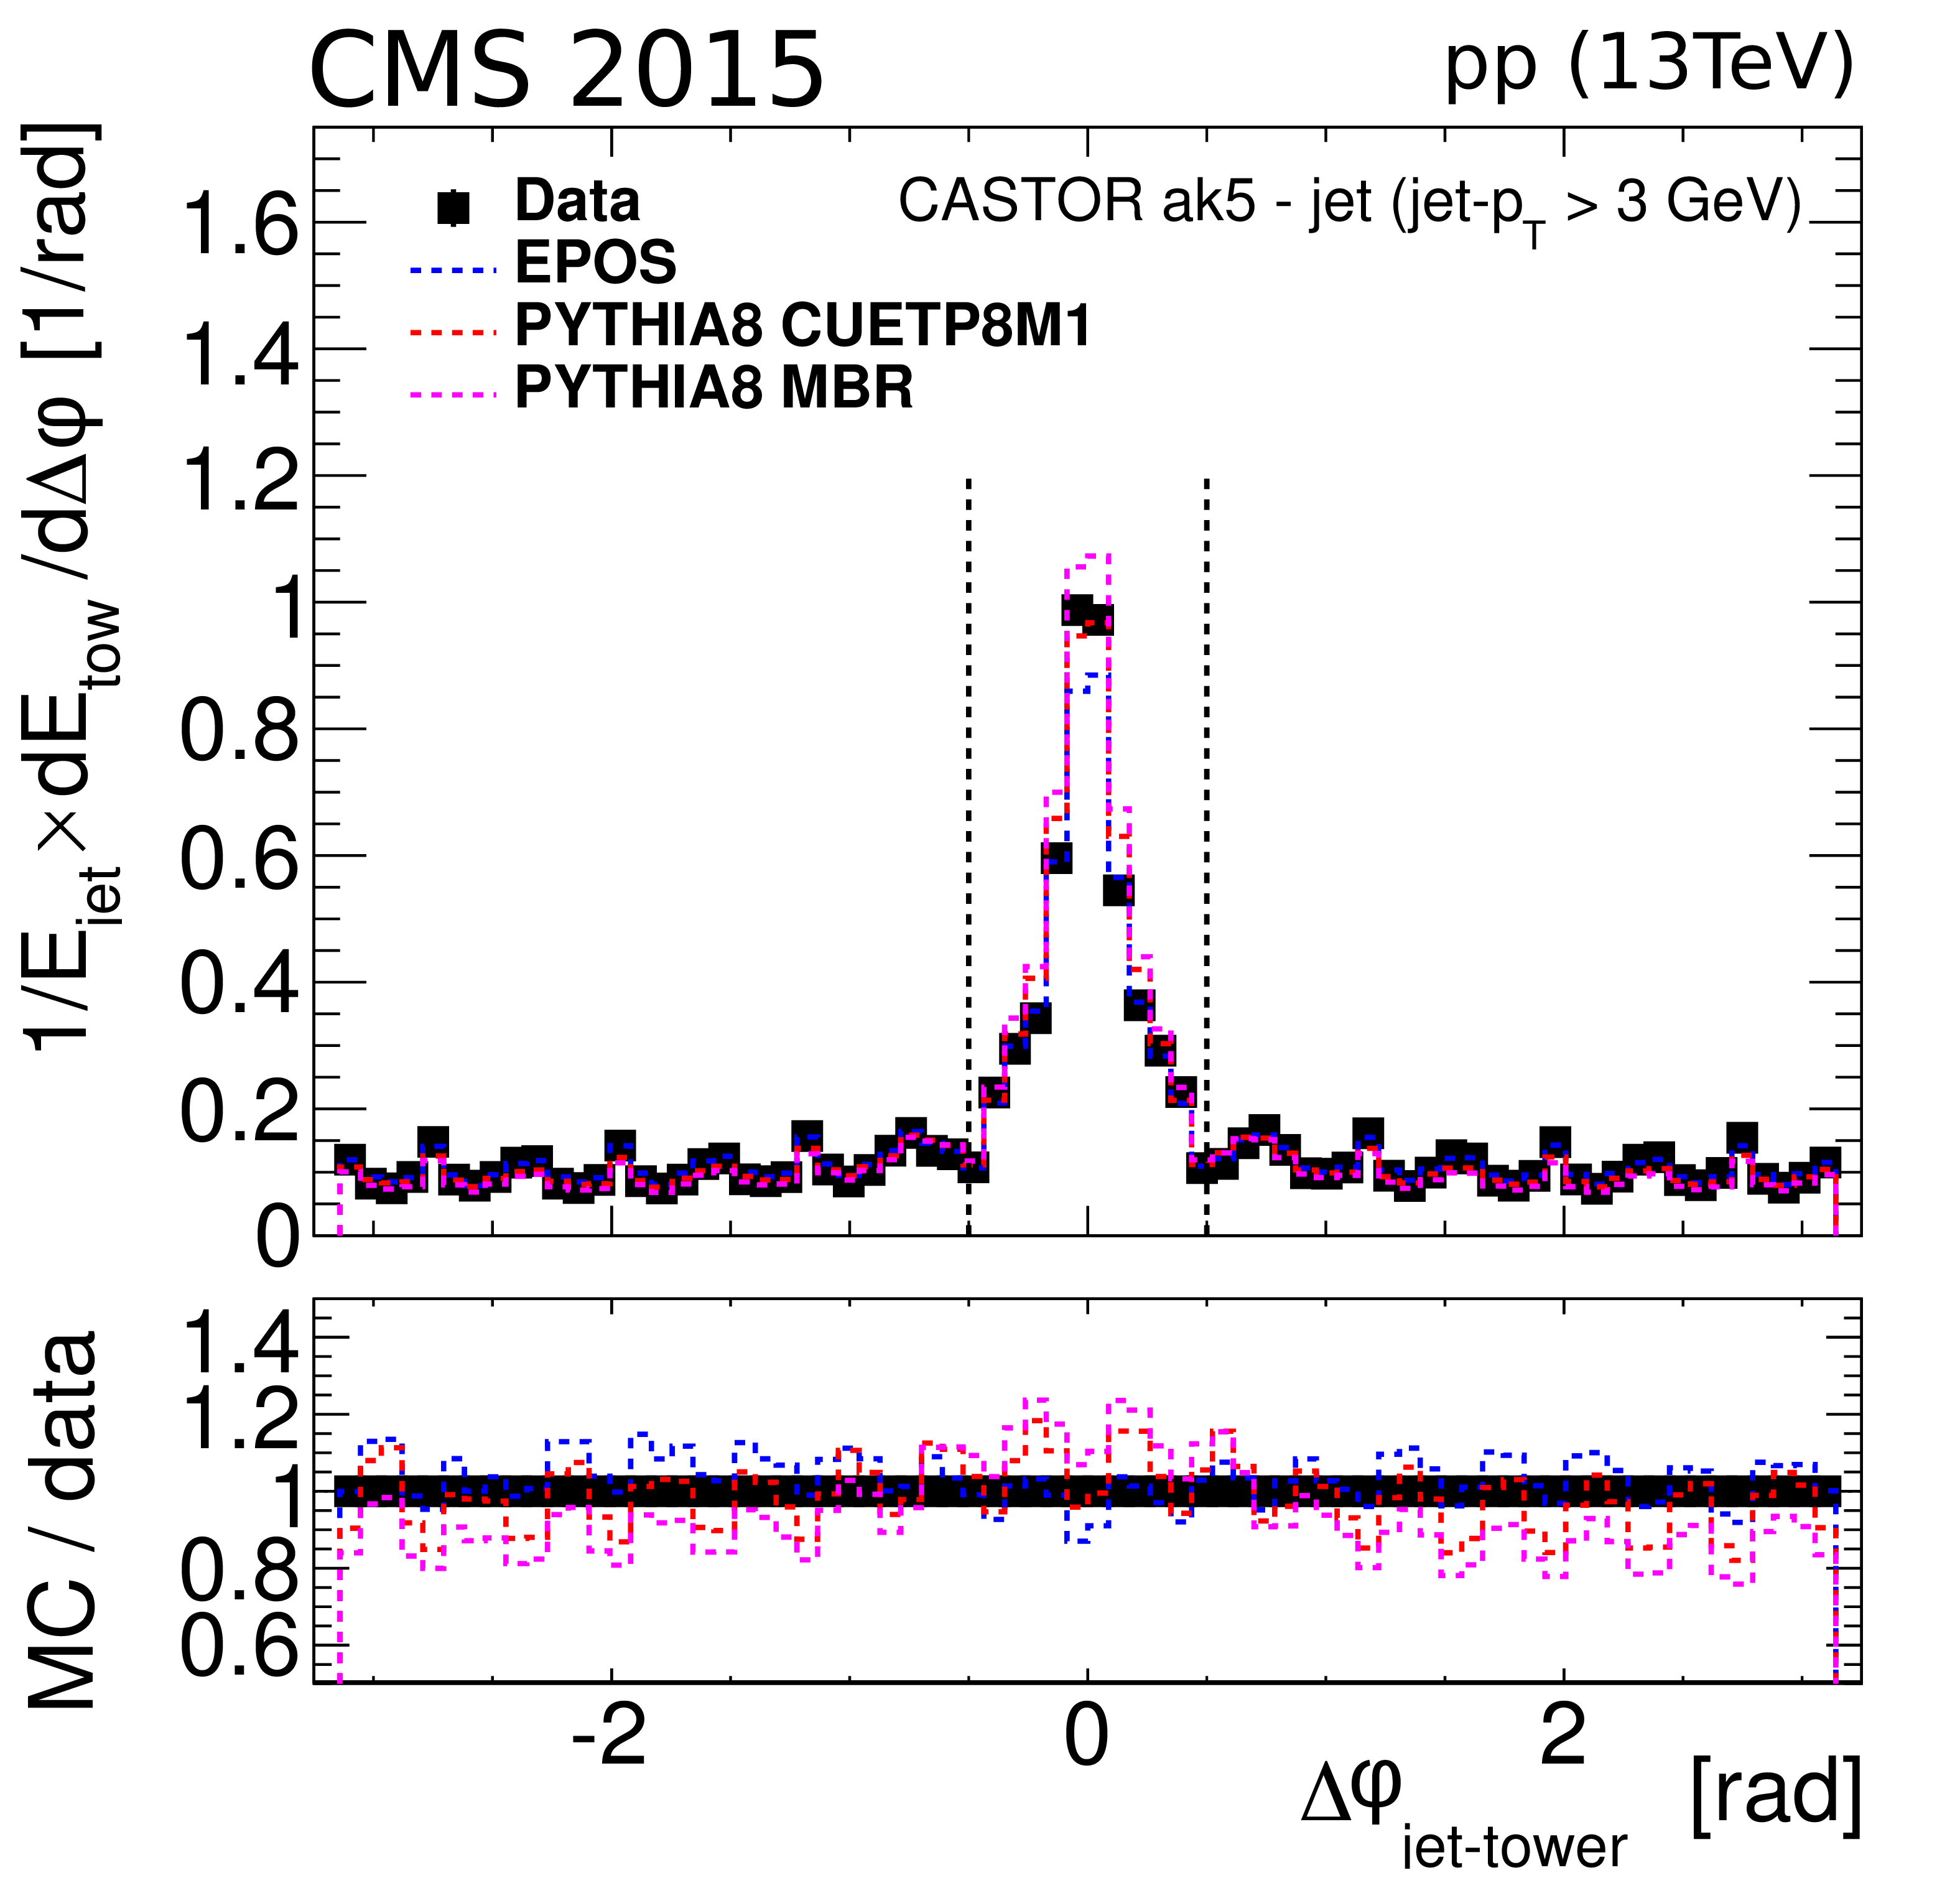
Figure 11:
Average CASTOR tower energies, as a function of their azimuthal separation from the reconstructed jet axis (reconstructed with the anti-$ {k_{\mathrm {T}}}$ algorithm with $R=$ 0.5) measured in data (squares) and in minimum-bias PYTHIA 8 and Epos-LHC MC simulations (histograms) in pp collisions at $ {{\sqrt {s}}} = $ 13 TeV. |
png pdf |
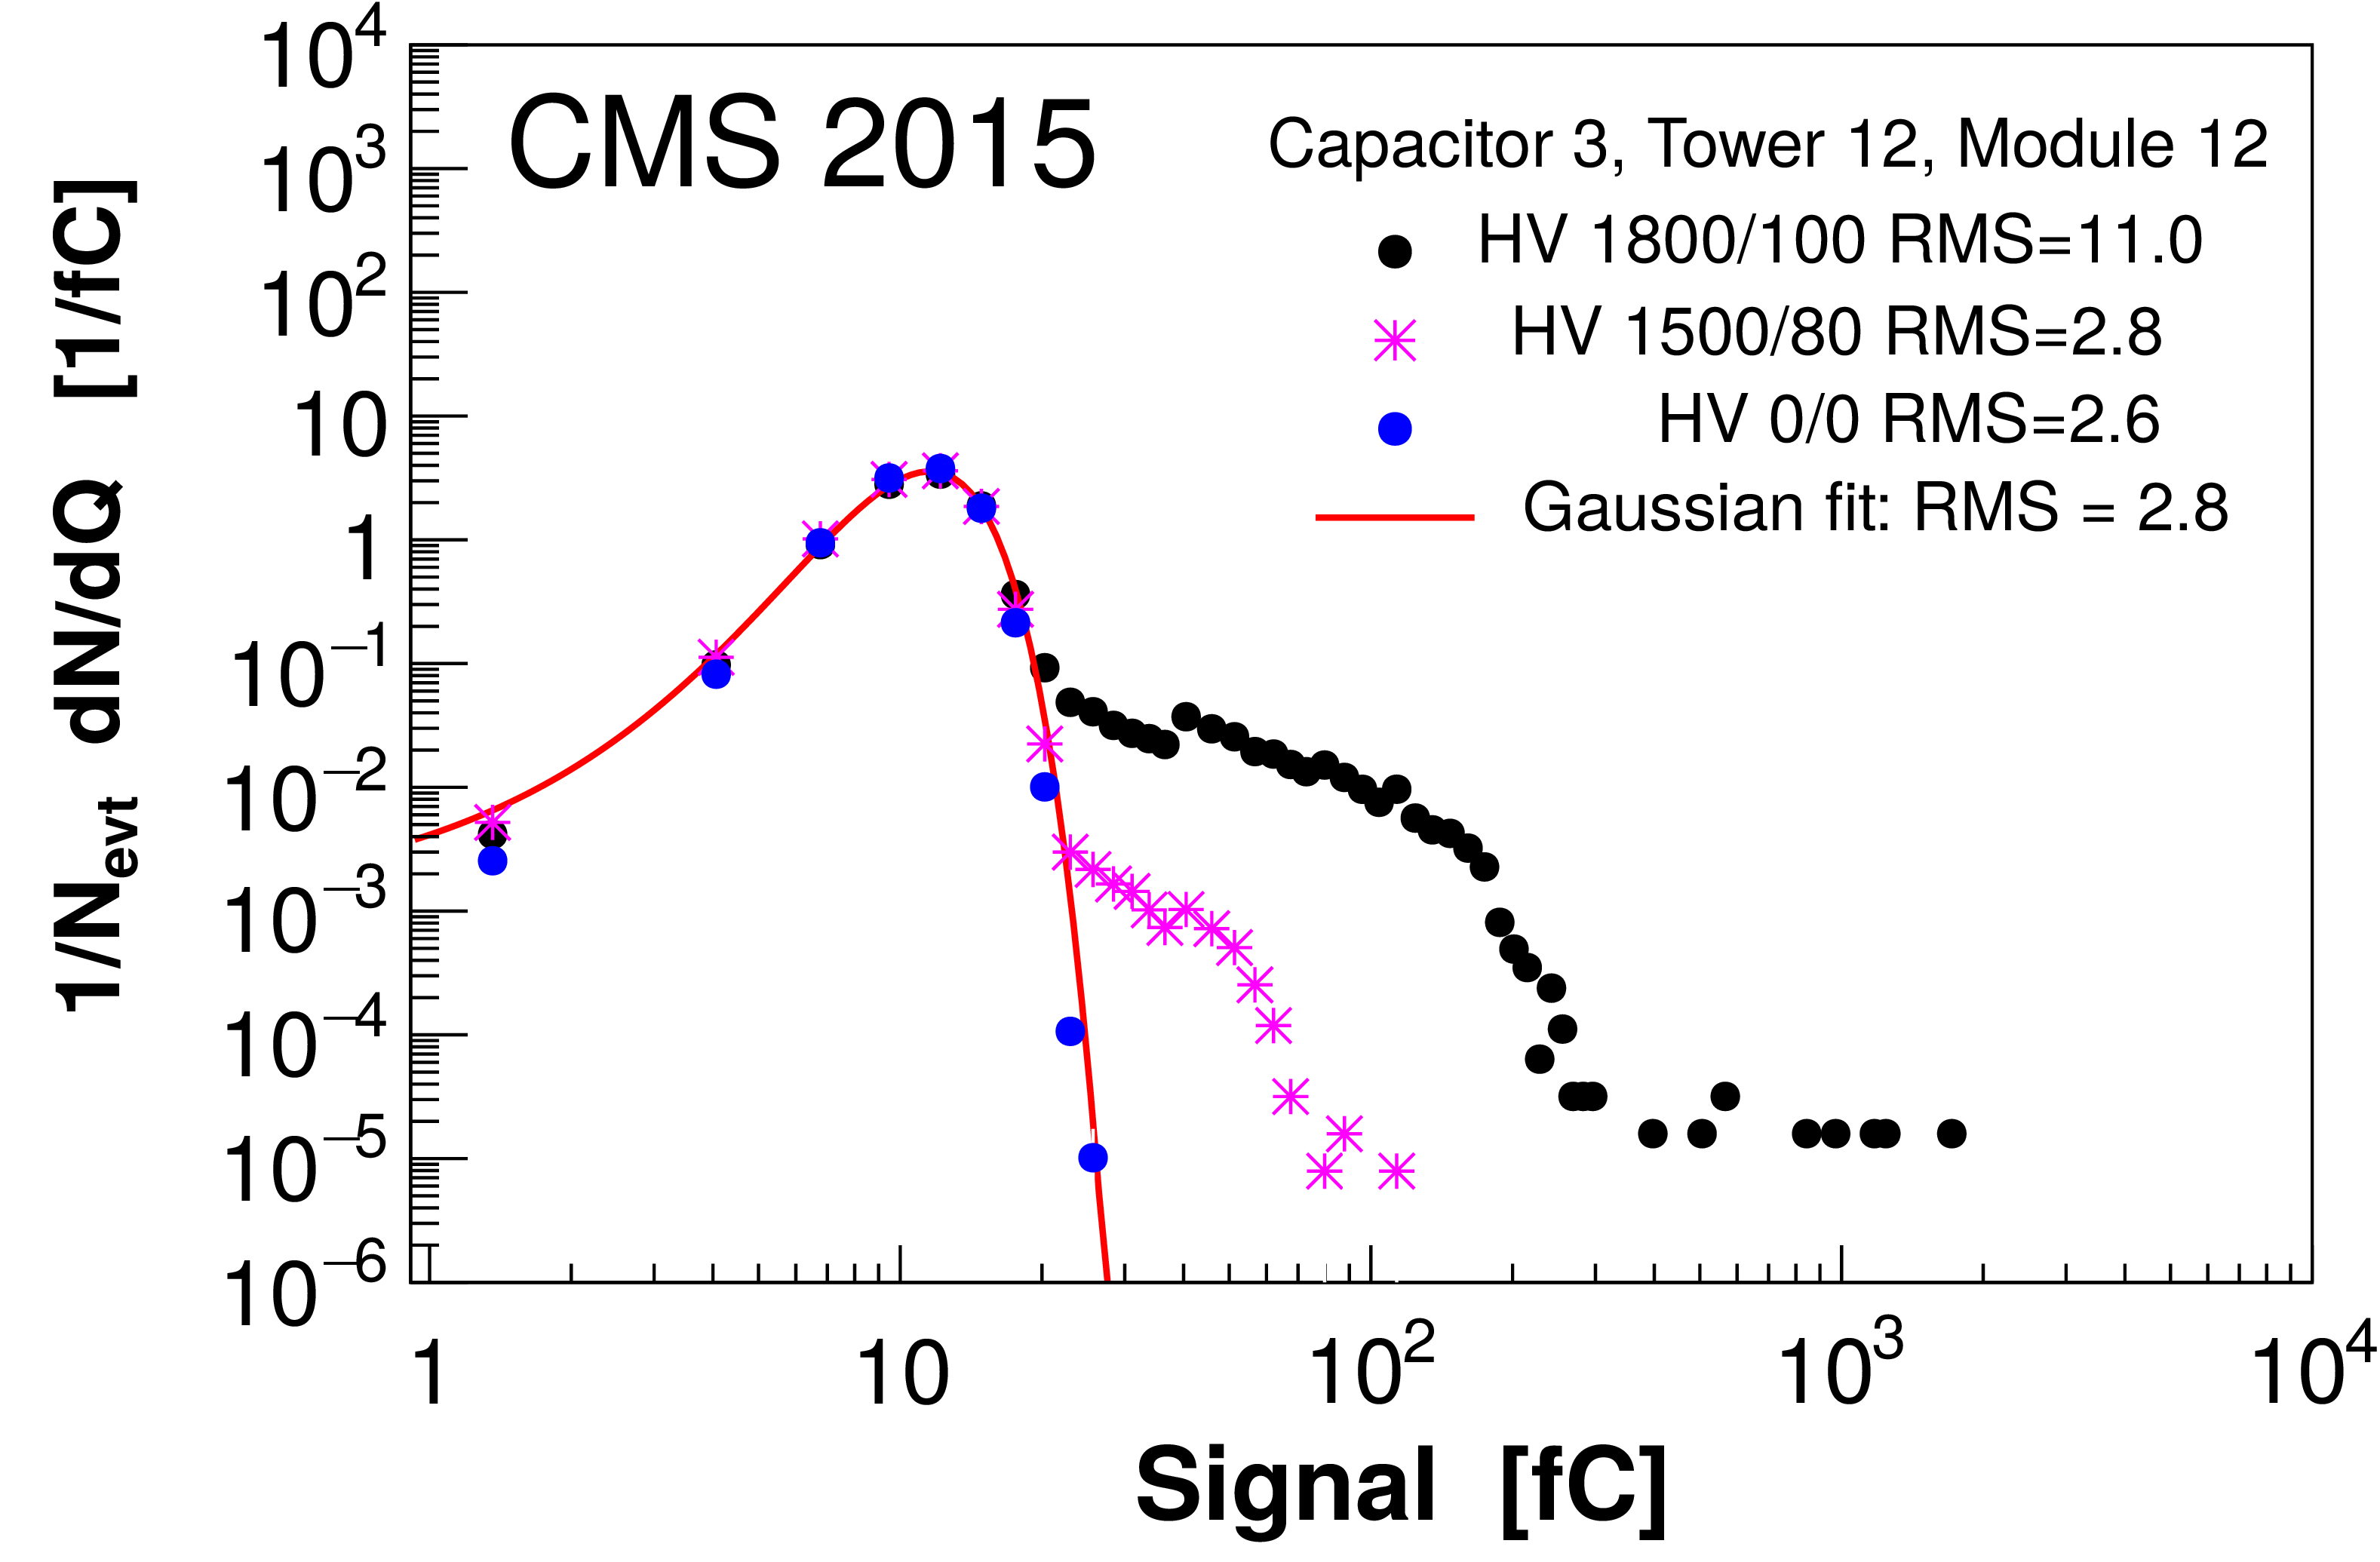
Figure 12:
Charge spectrum for the noisiest capacitor of a typical CASTOR channel (tower 12, module 12) for various cathode/last dynode voltage settings (1800/100, 1500/80, and 0/0 V). A Gaussian fit to the data recorded with 0 V is also shown. |
png pdf |
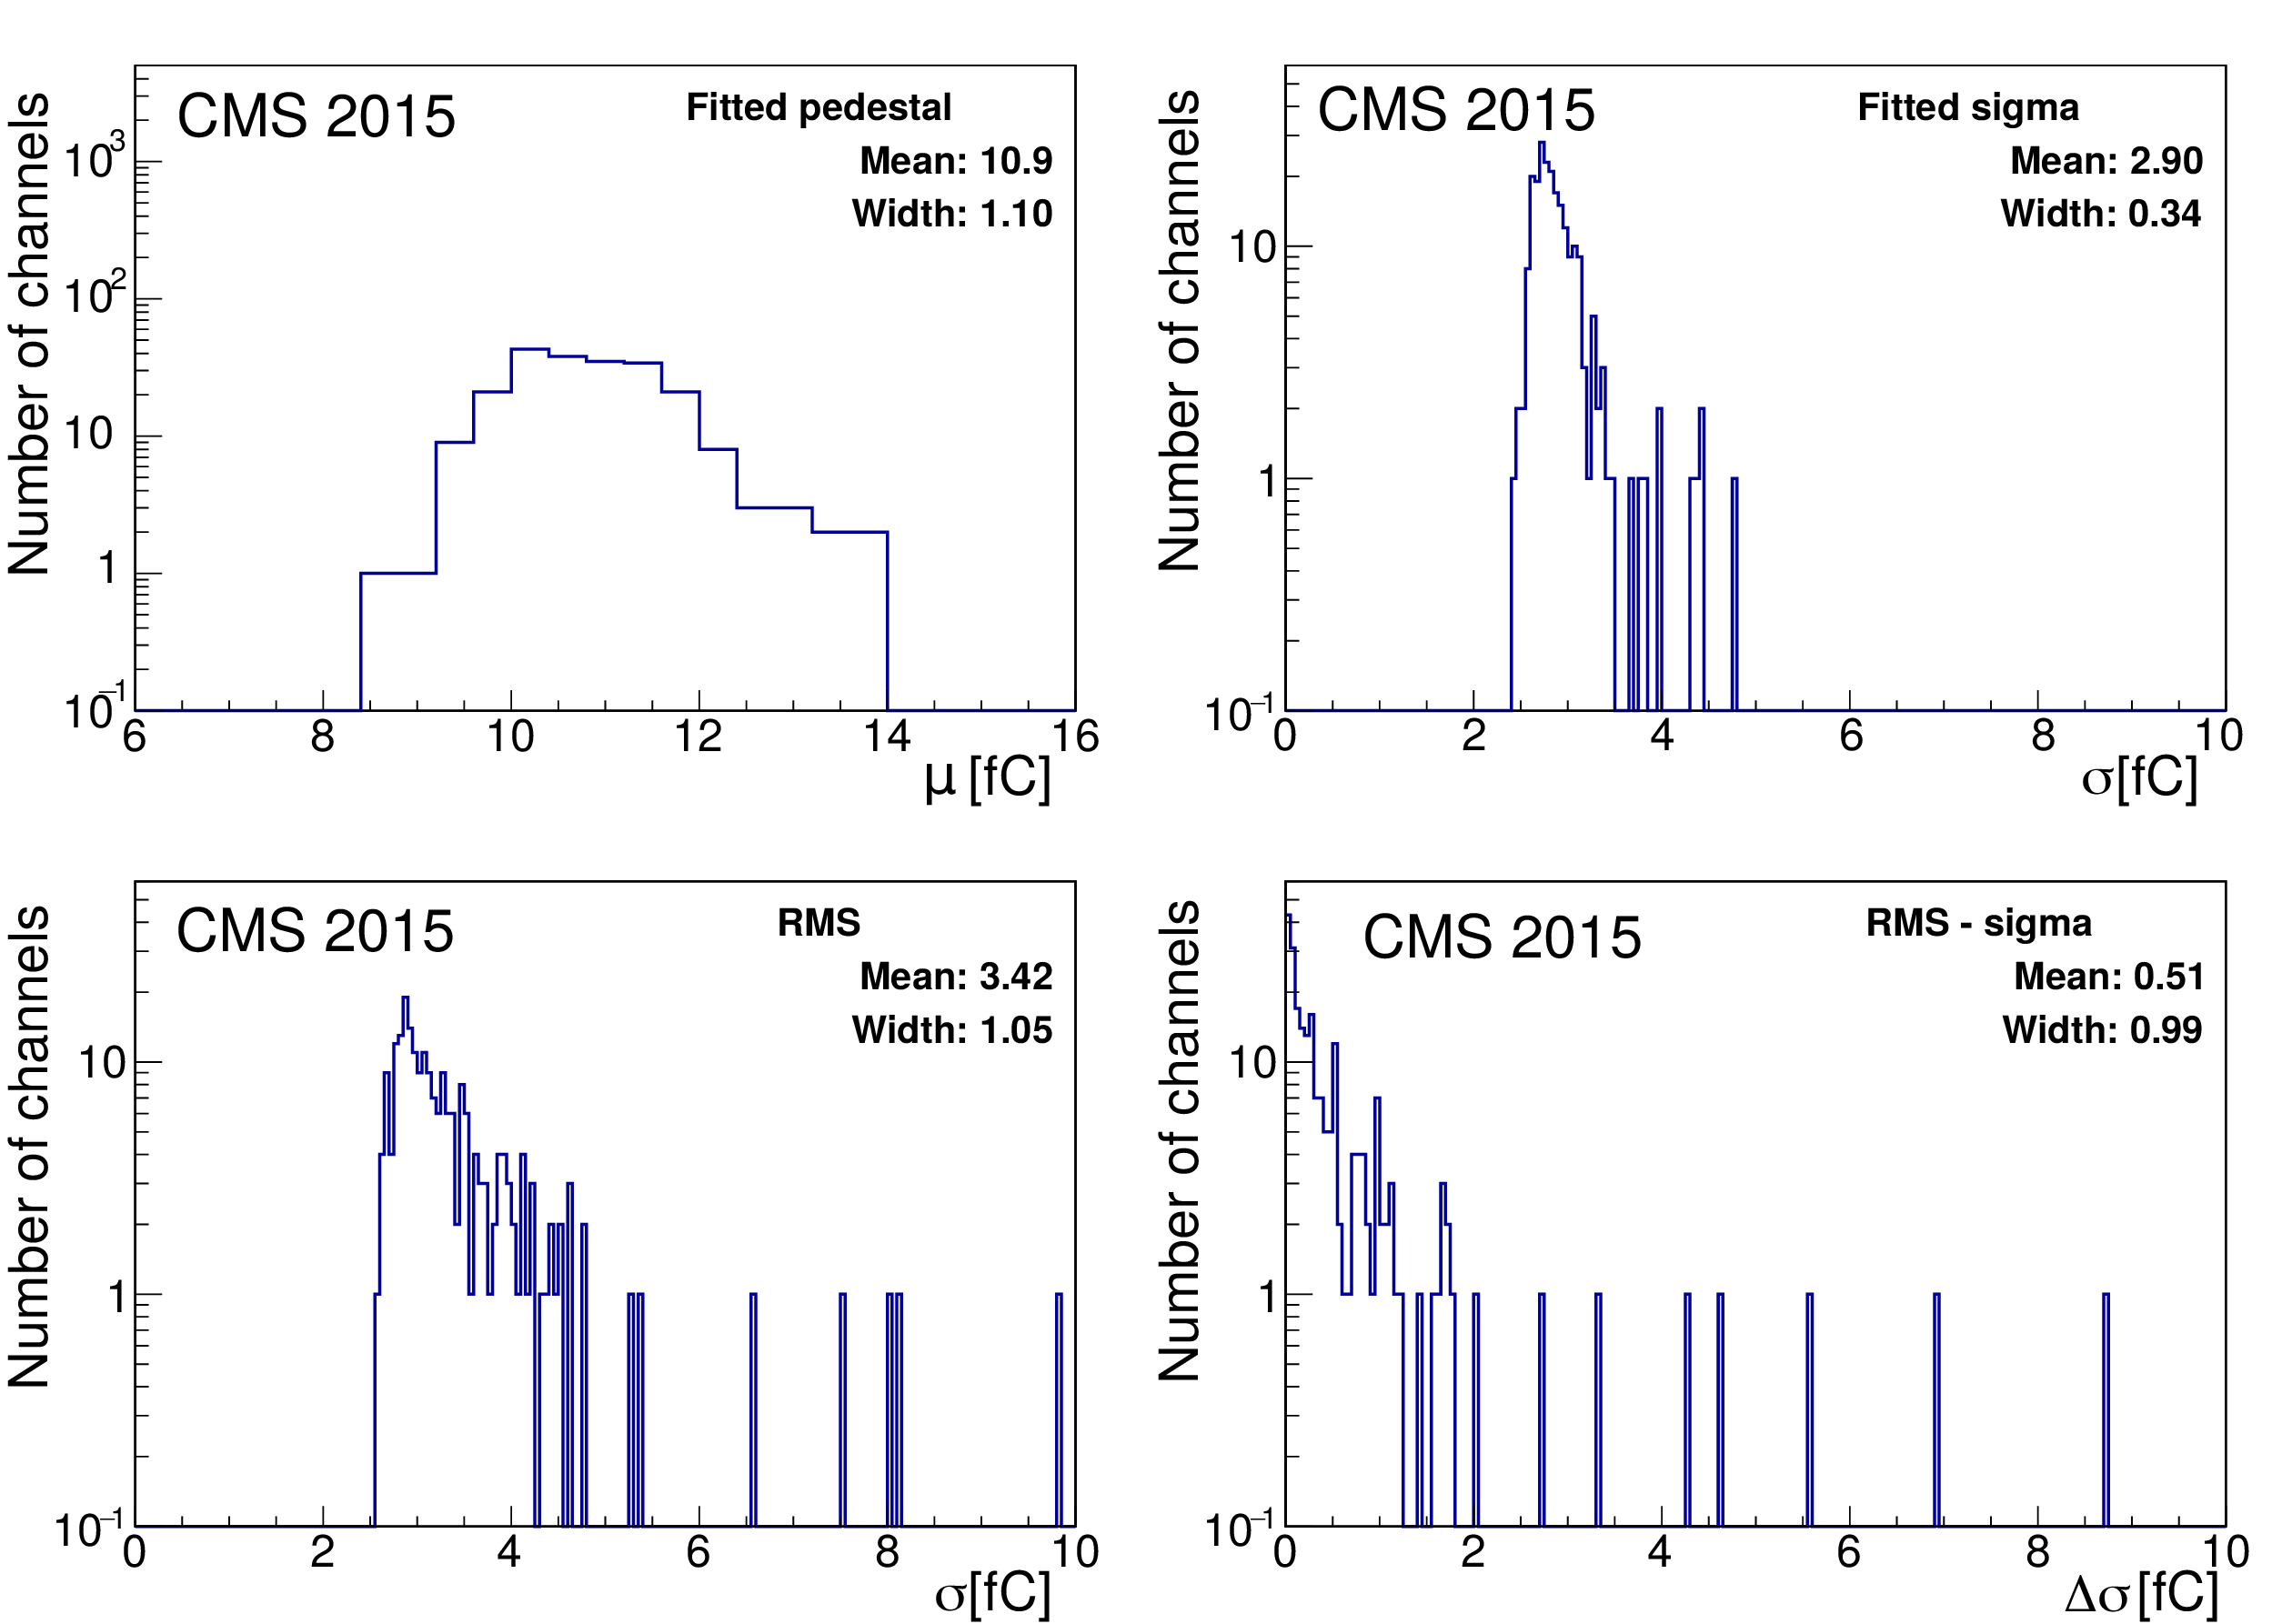
Figure 13:
Distributions of the baseline (upper left) and variances (width $\sigma $, upper right; RMS, lower left; and $\Delta \sigma =$RMS-$\sigma $, lower right) of the CASTOR pedestals, with 1500 V supplied to the PMTs, from data recorded in 2015. |
png pdf |
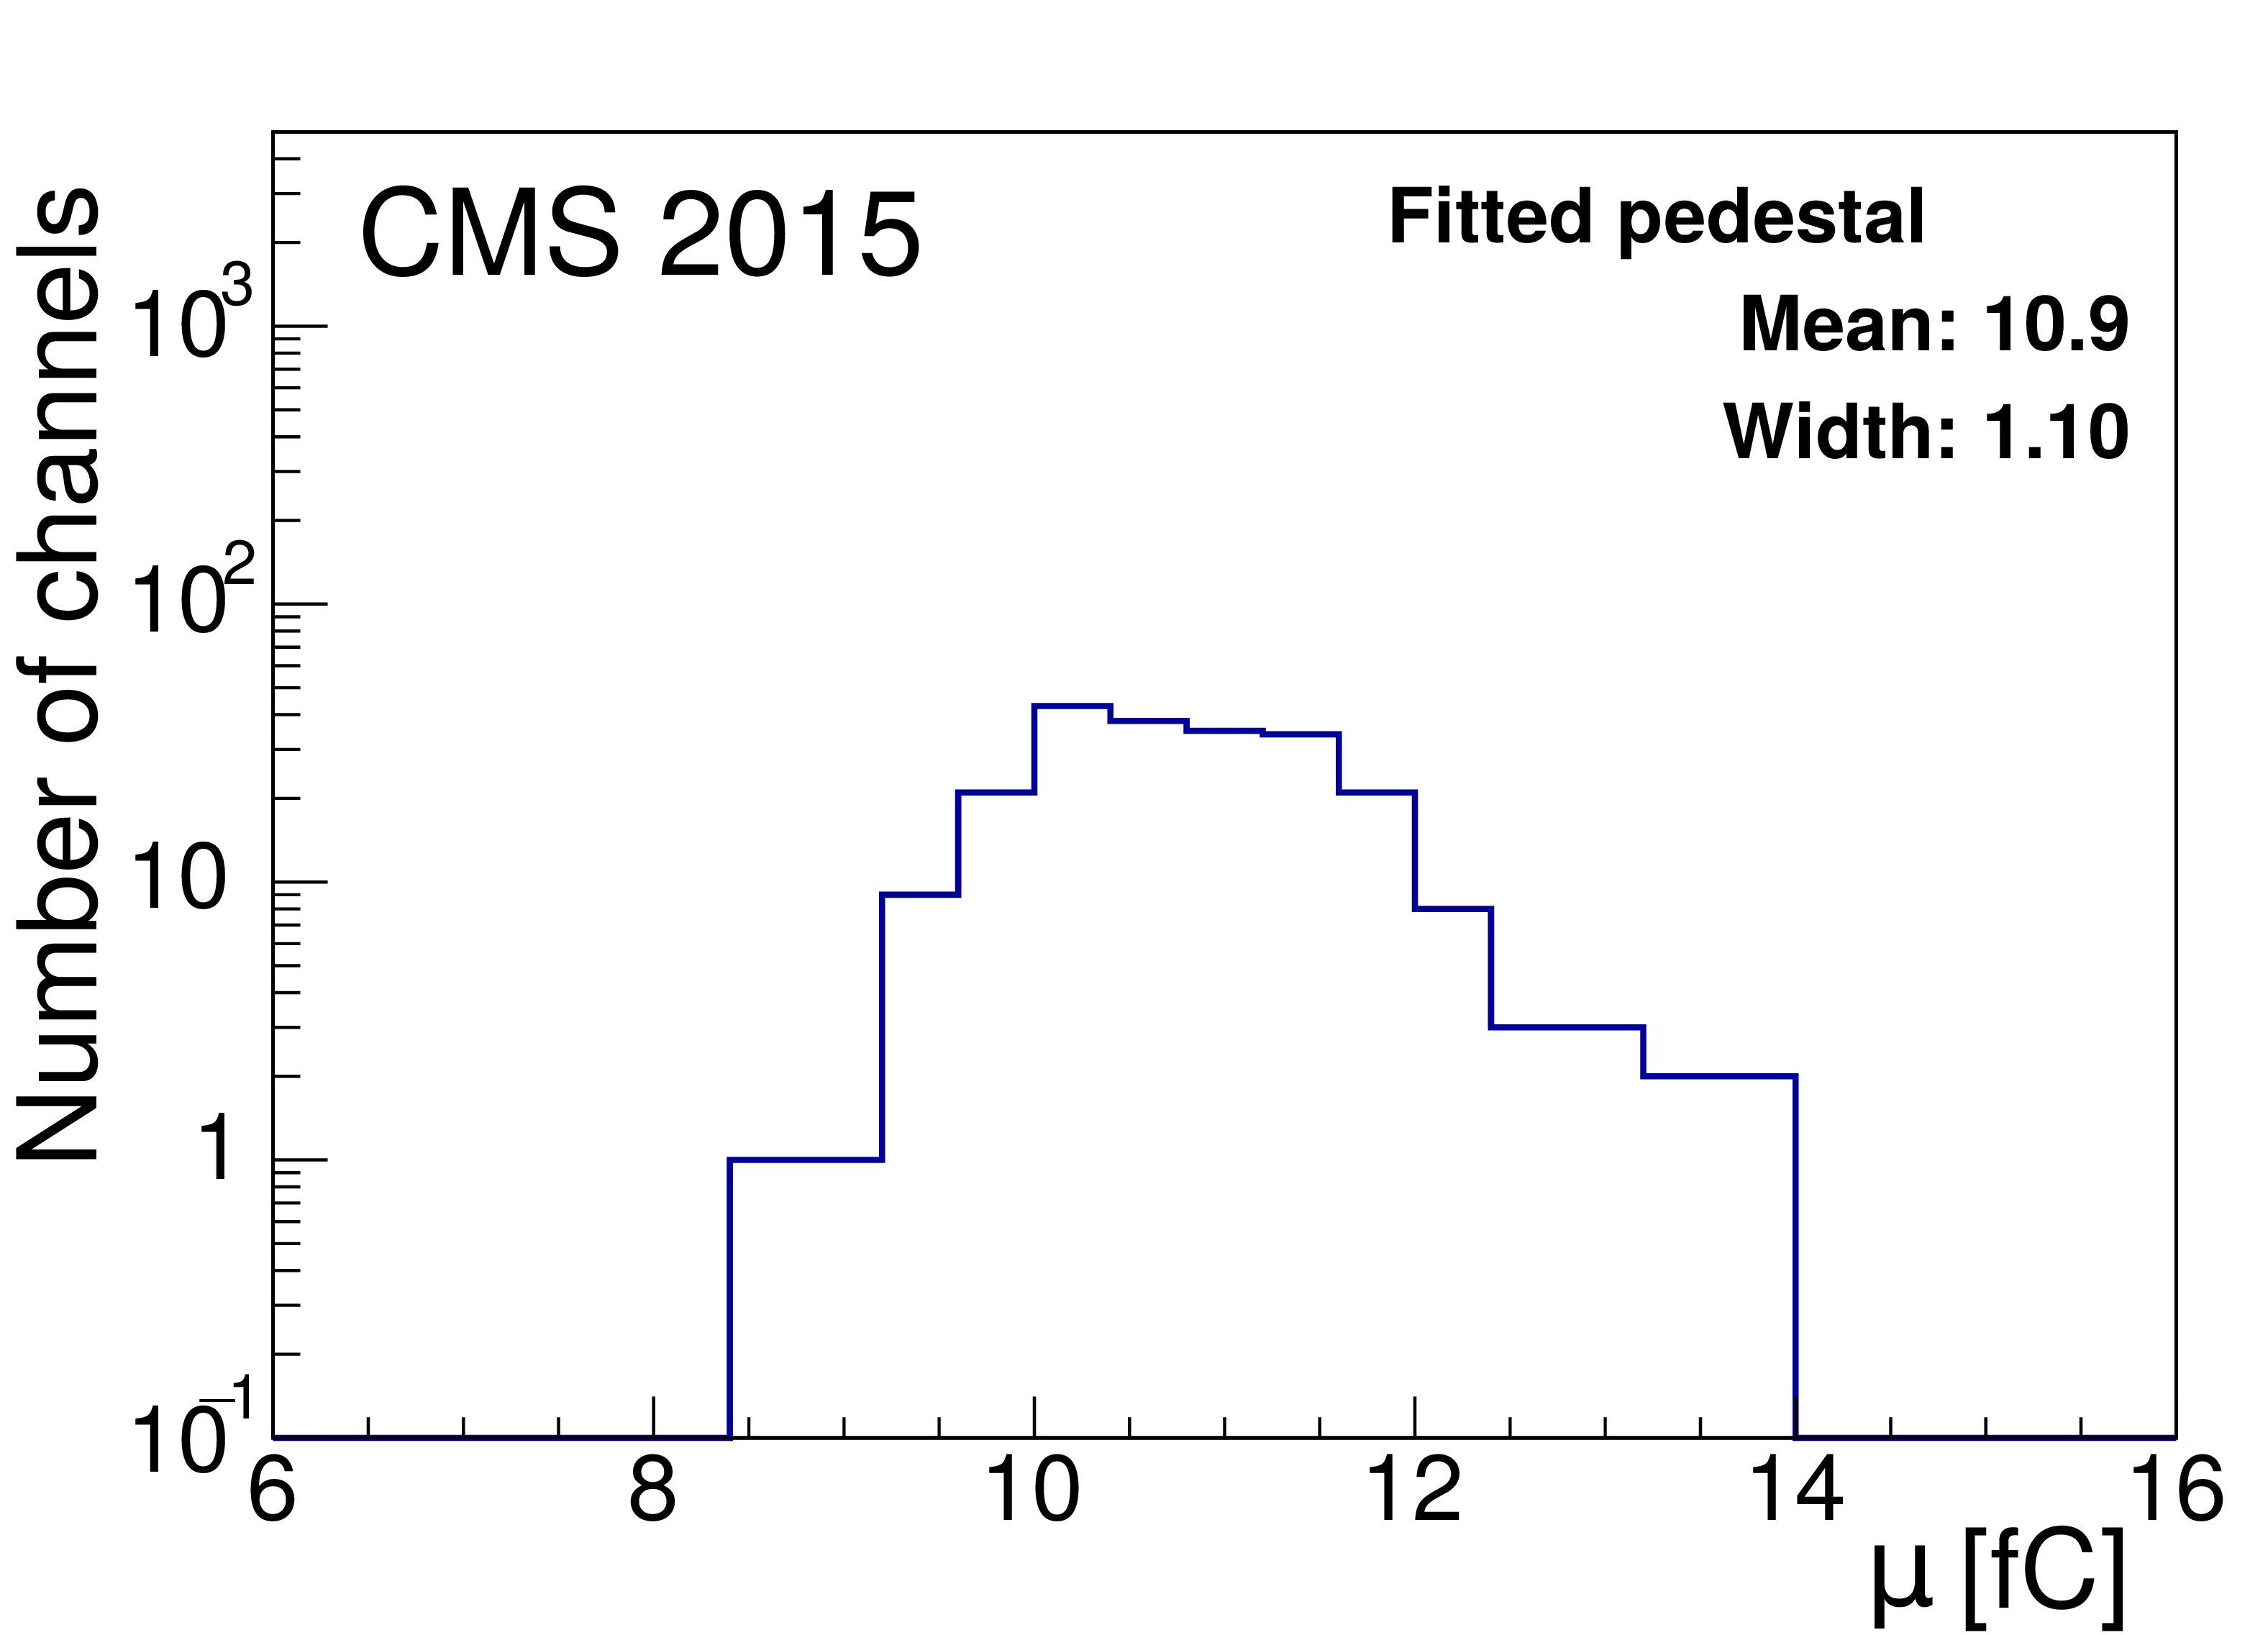
Figure 13-a:
Distribution of the baseline of the CASTOR pedestals, with 1500 V supplied to the PMTs, from data recorded in 2015. |
png pdf |
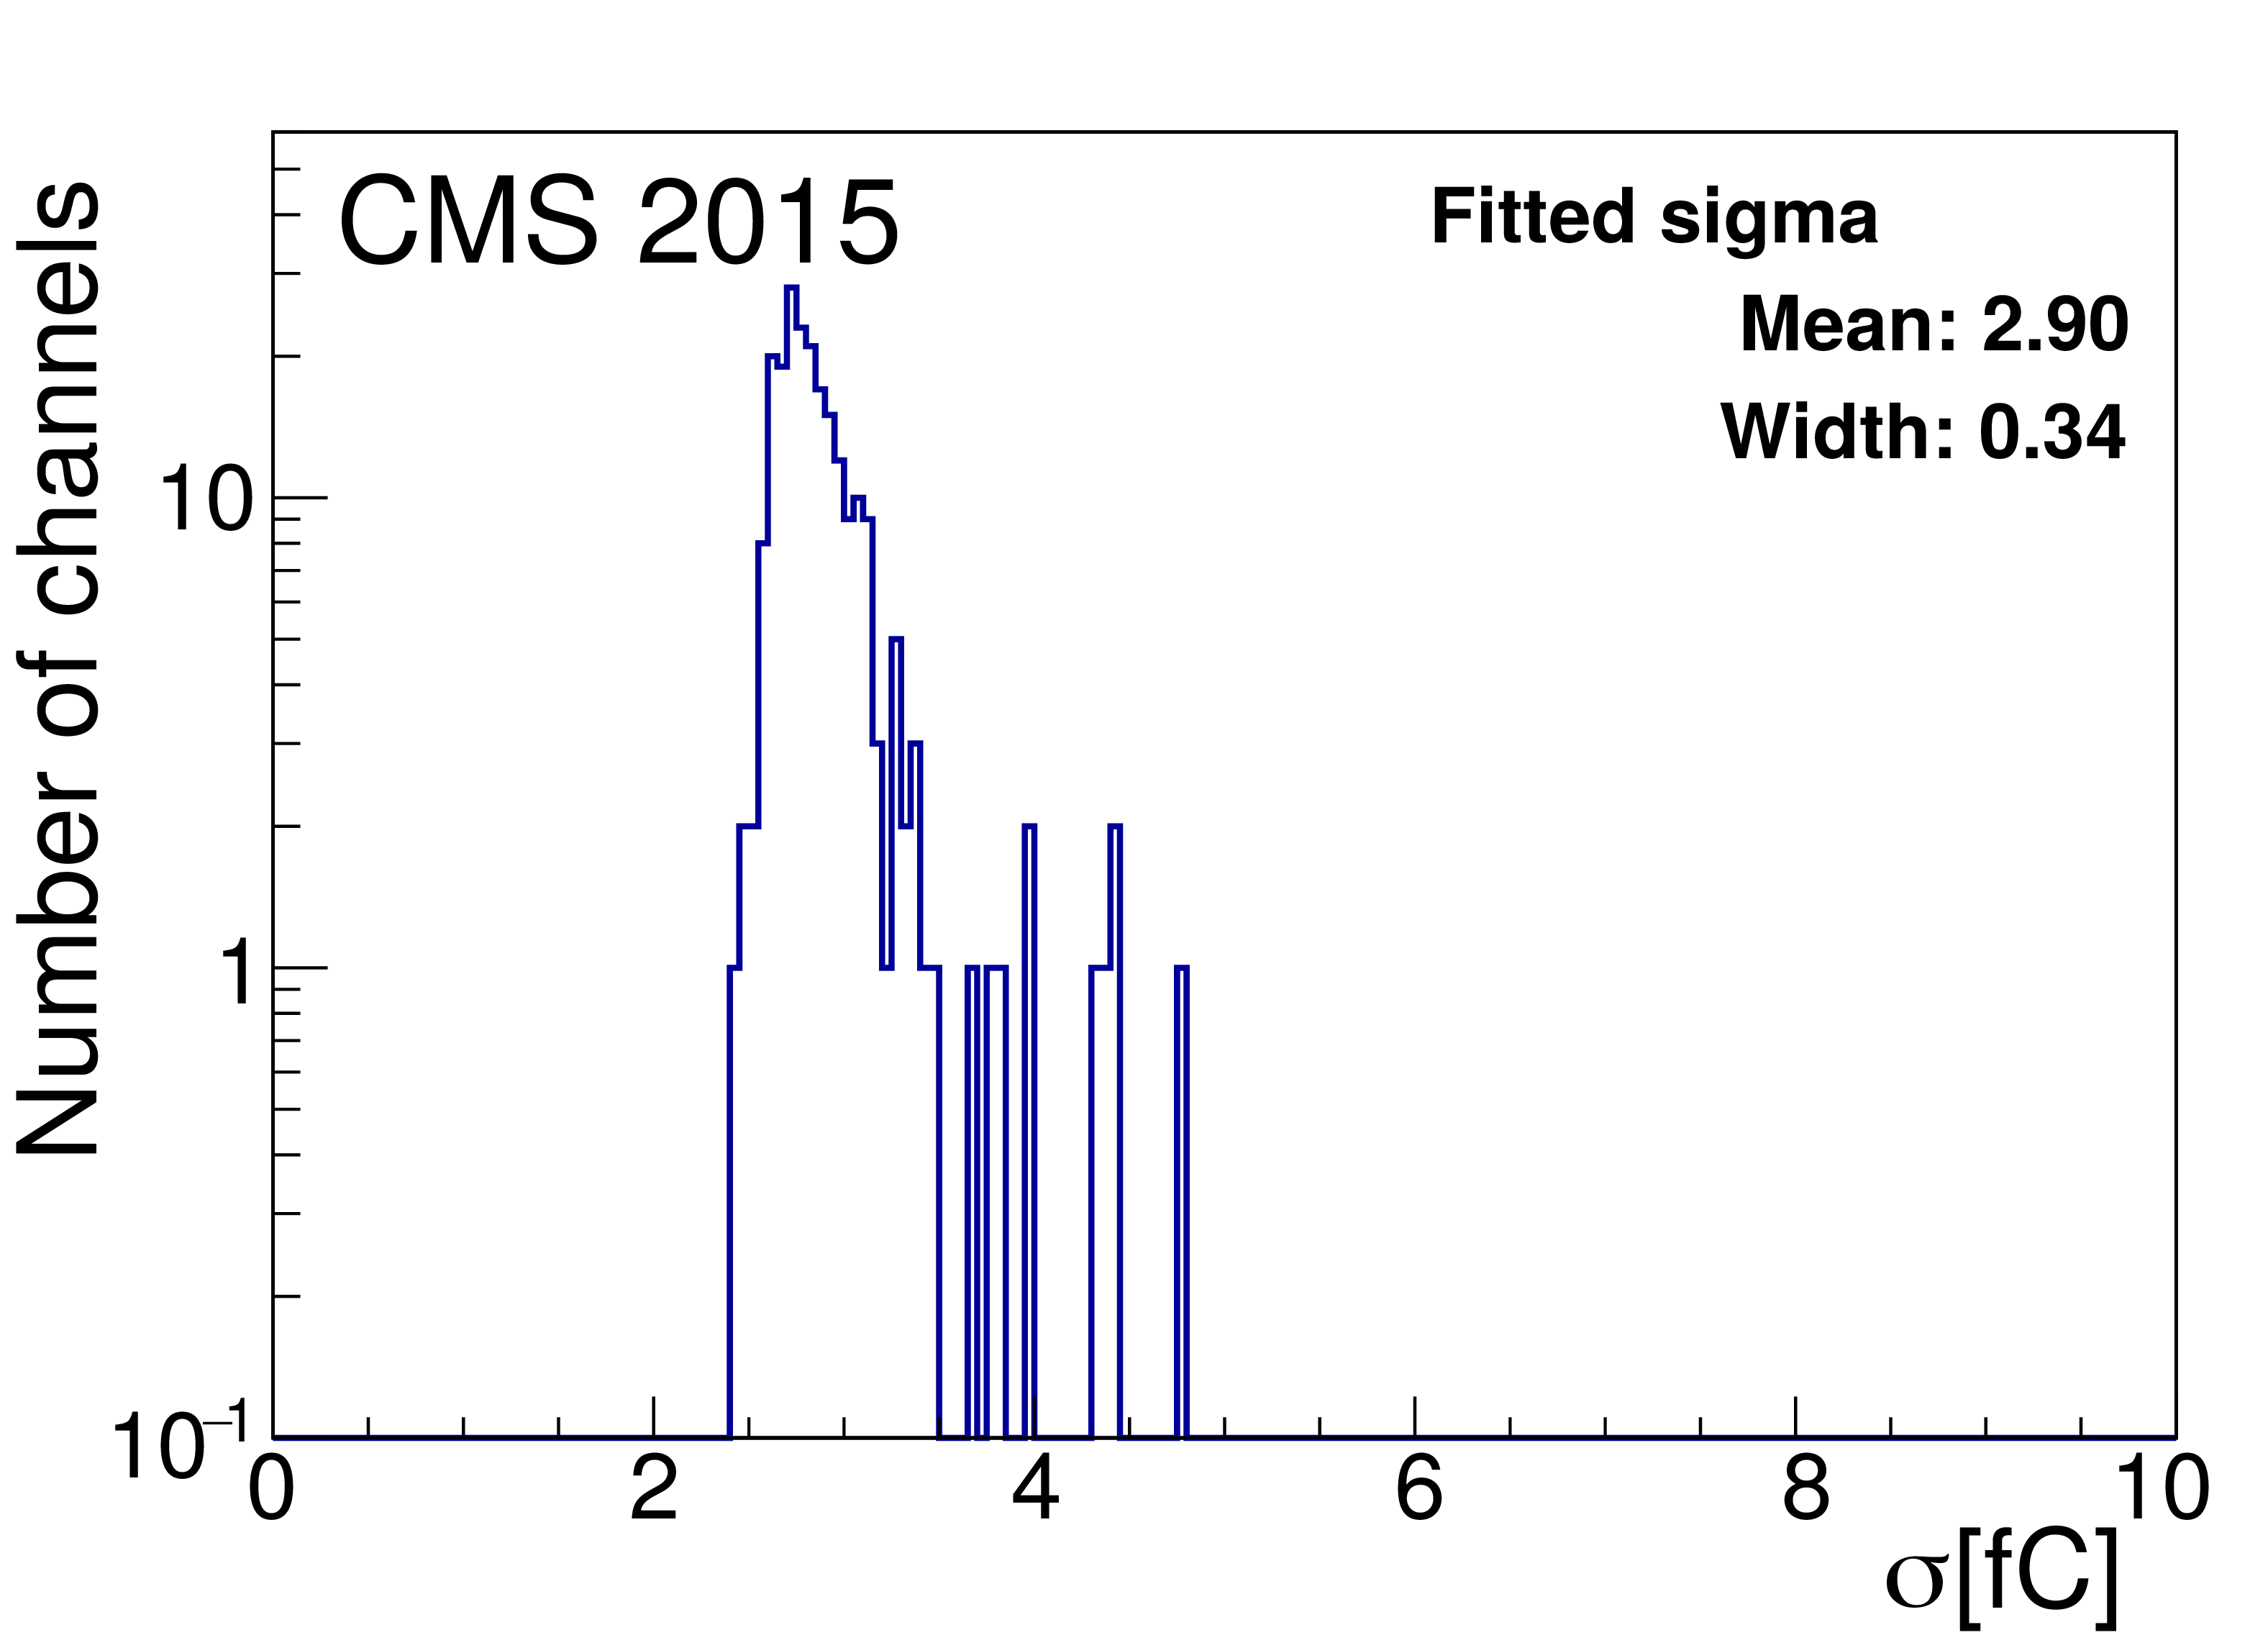
Figure 13-b:
Distribution of the width $\sigma $ of the CASTOR pedestals, with 1500 V supplied to the PMTs, from data recorded in 2015. |
png pdf |
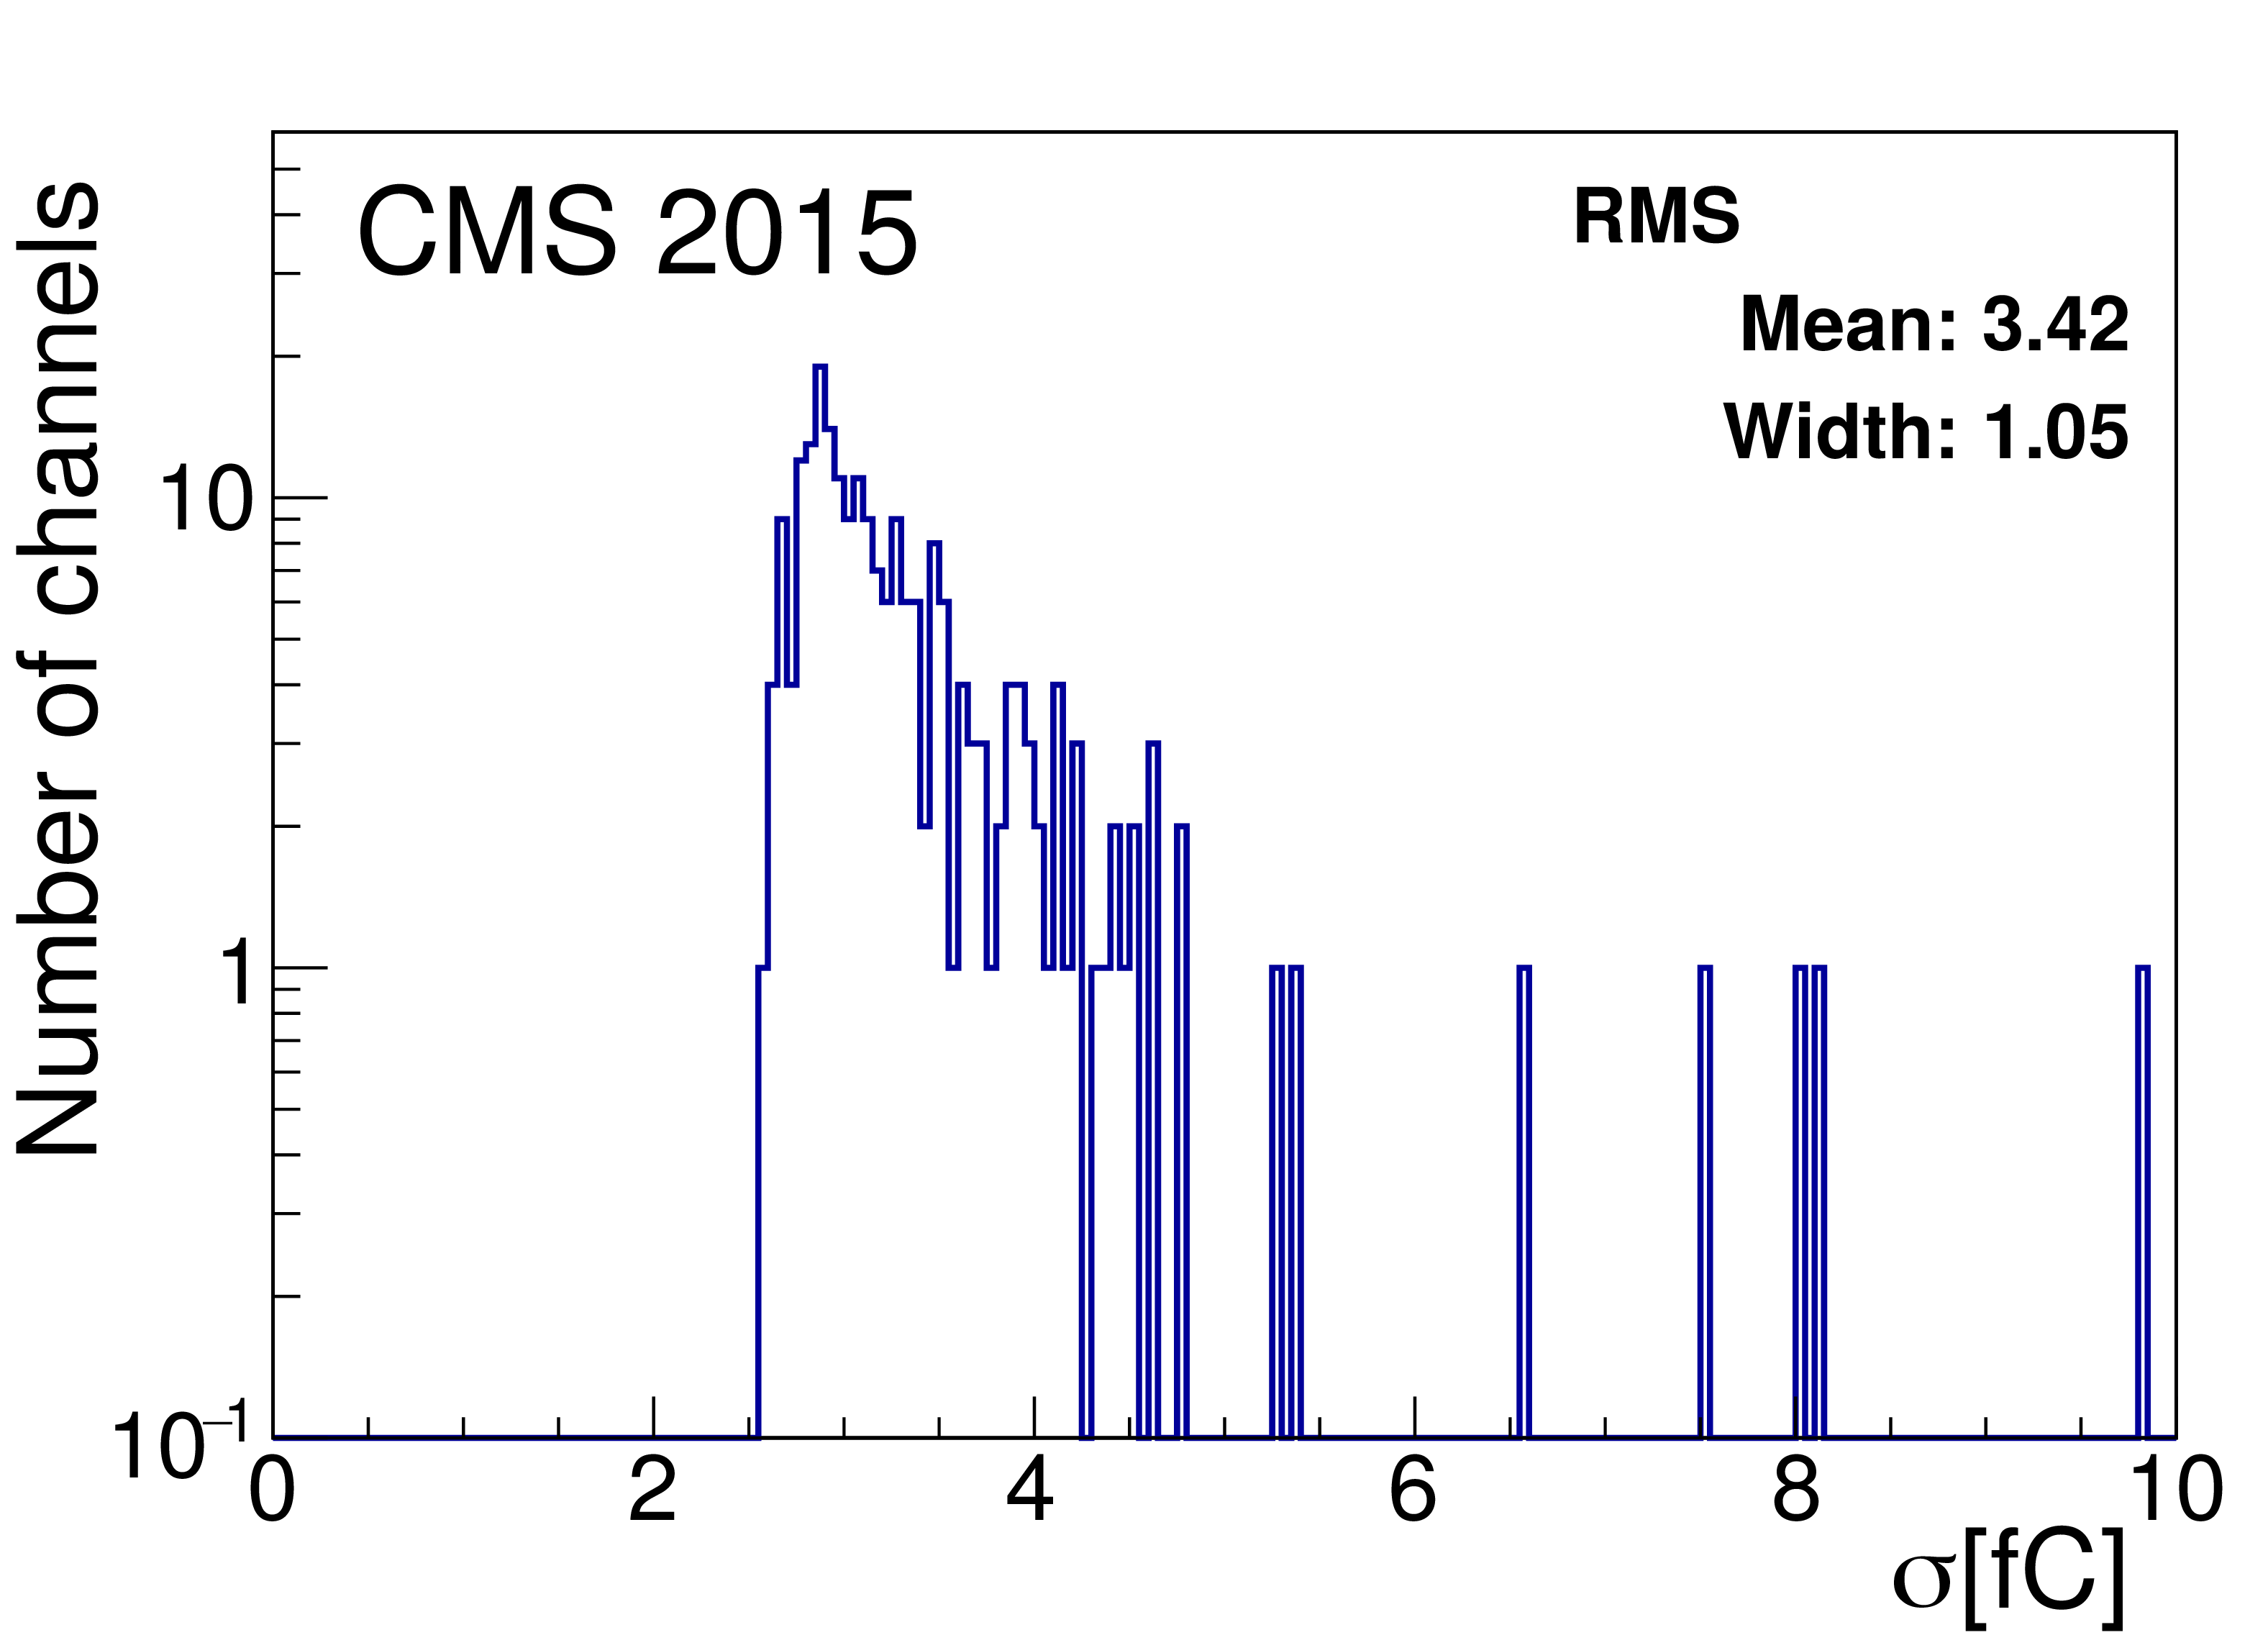
Figure 13-c:
Distribution of the RMS of the CASTOR pedestals, with 1500 V supplied to the PMTs, from data recorded in 2015. |

png pdf |
Figure 13-d:
Distribution of $\Delta \sigma =$RMS-$\sigma $ of the CASTOR pedestals, with 1500 V supplied to the PMTs, from data recorded in 2015. |
png pdf |
Figure 14:
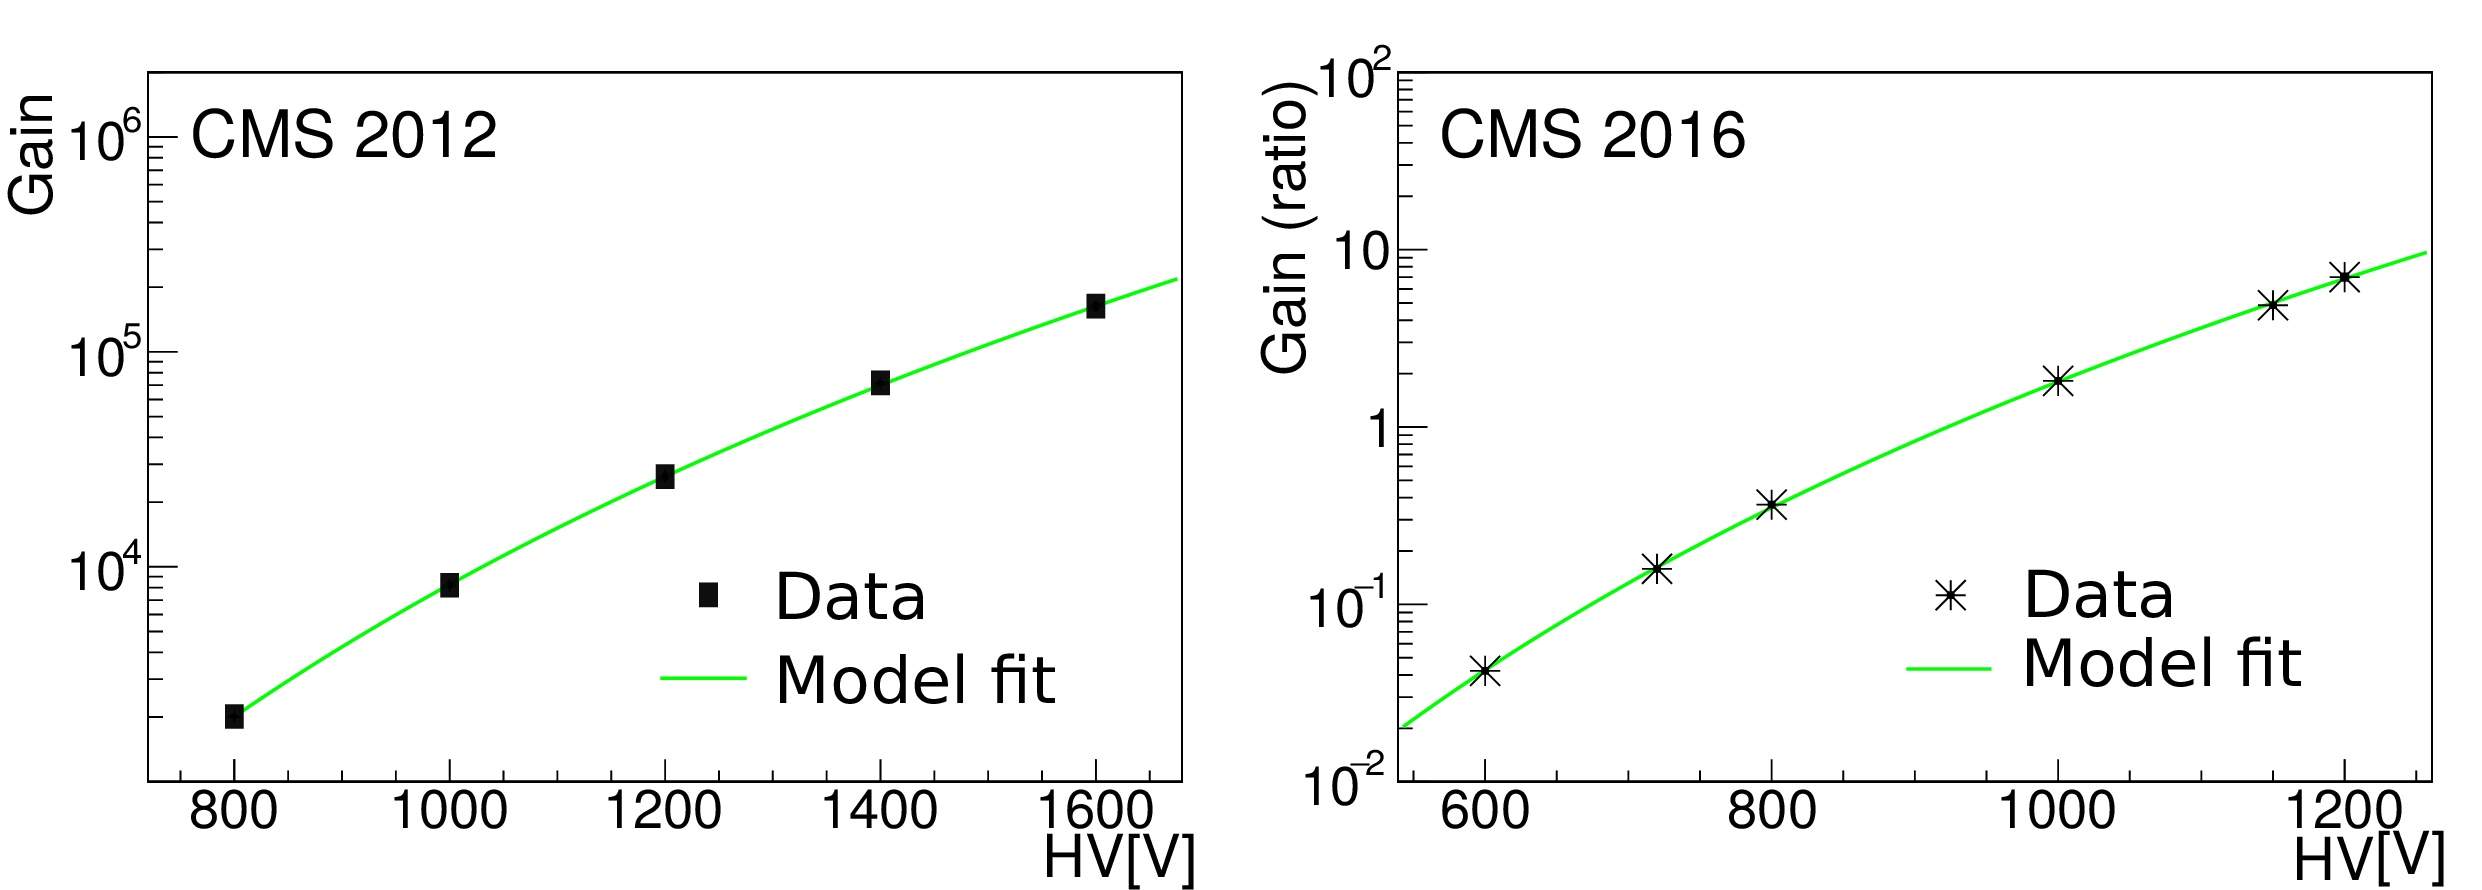
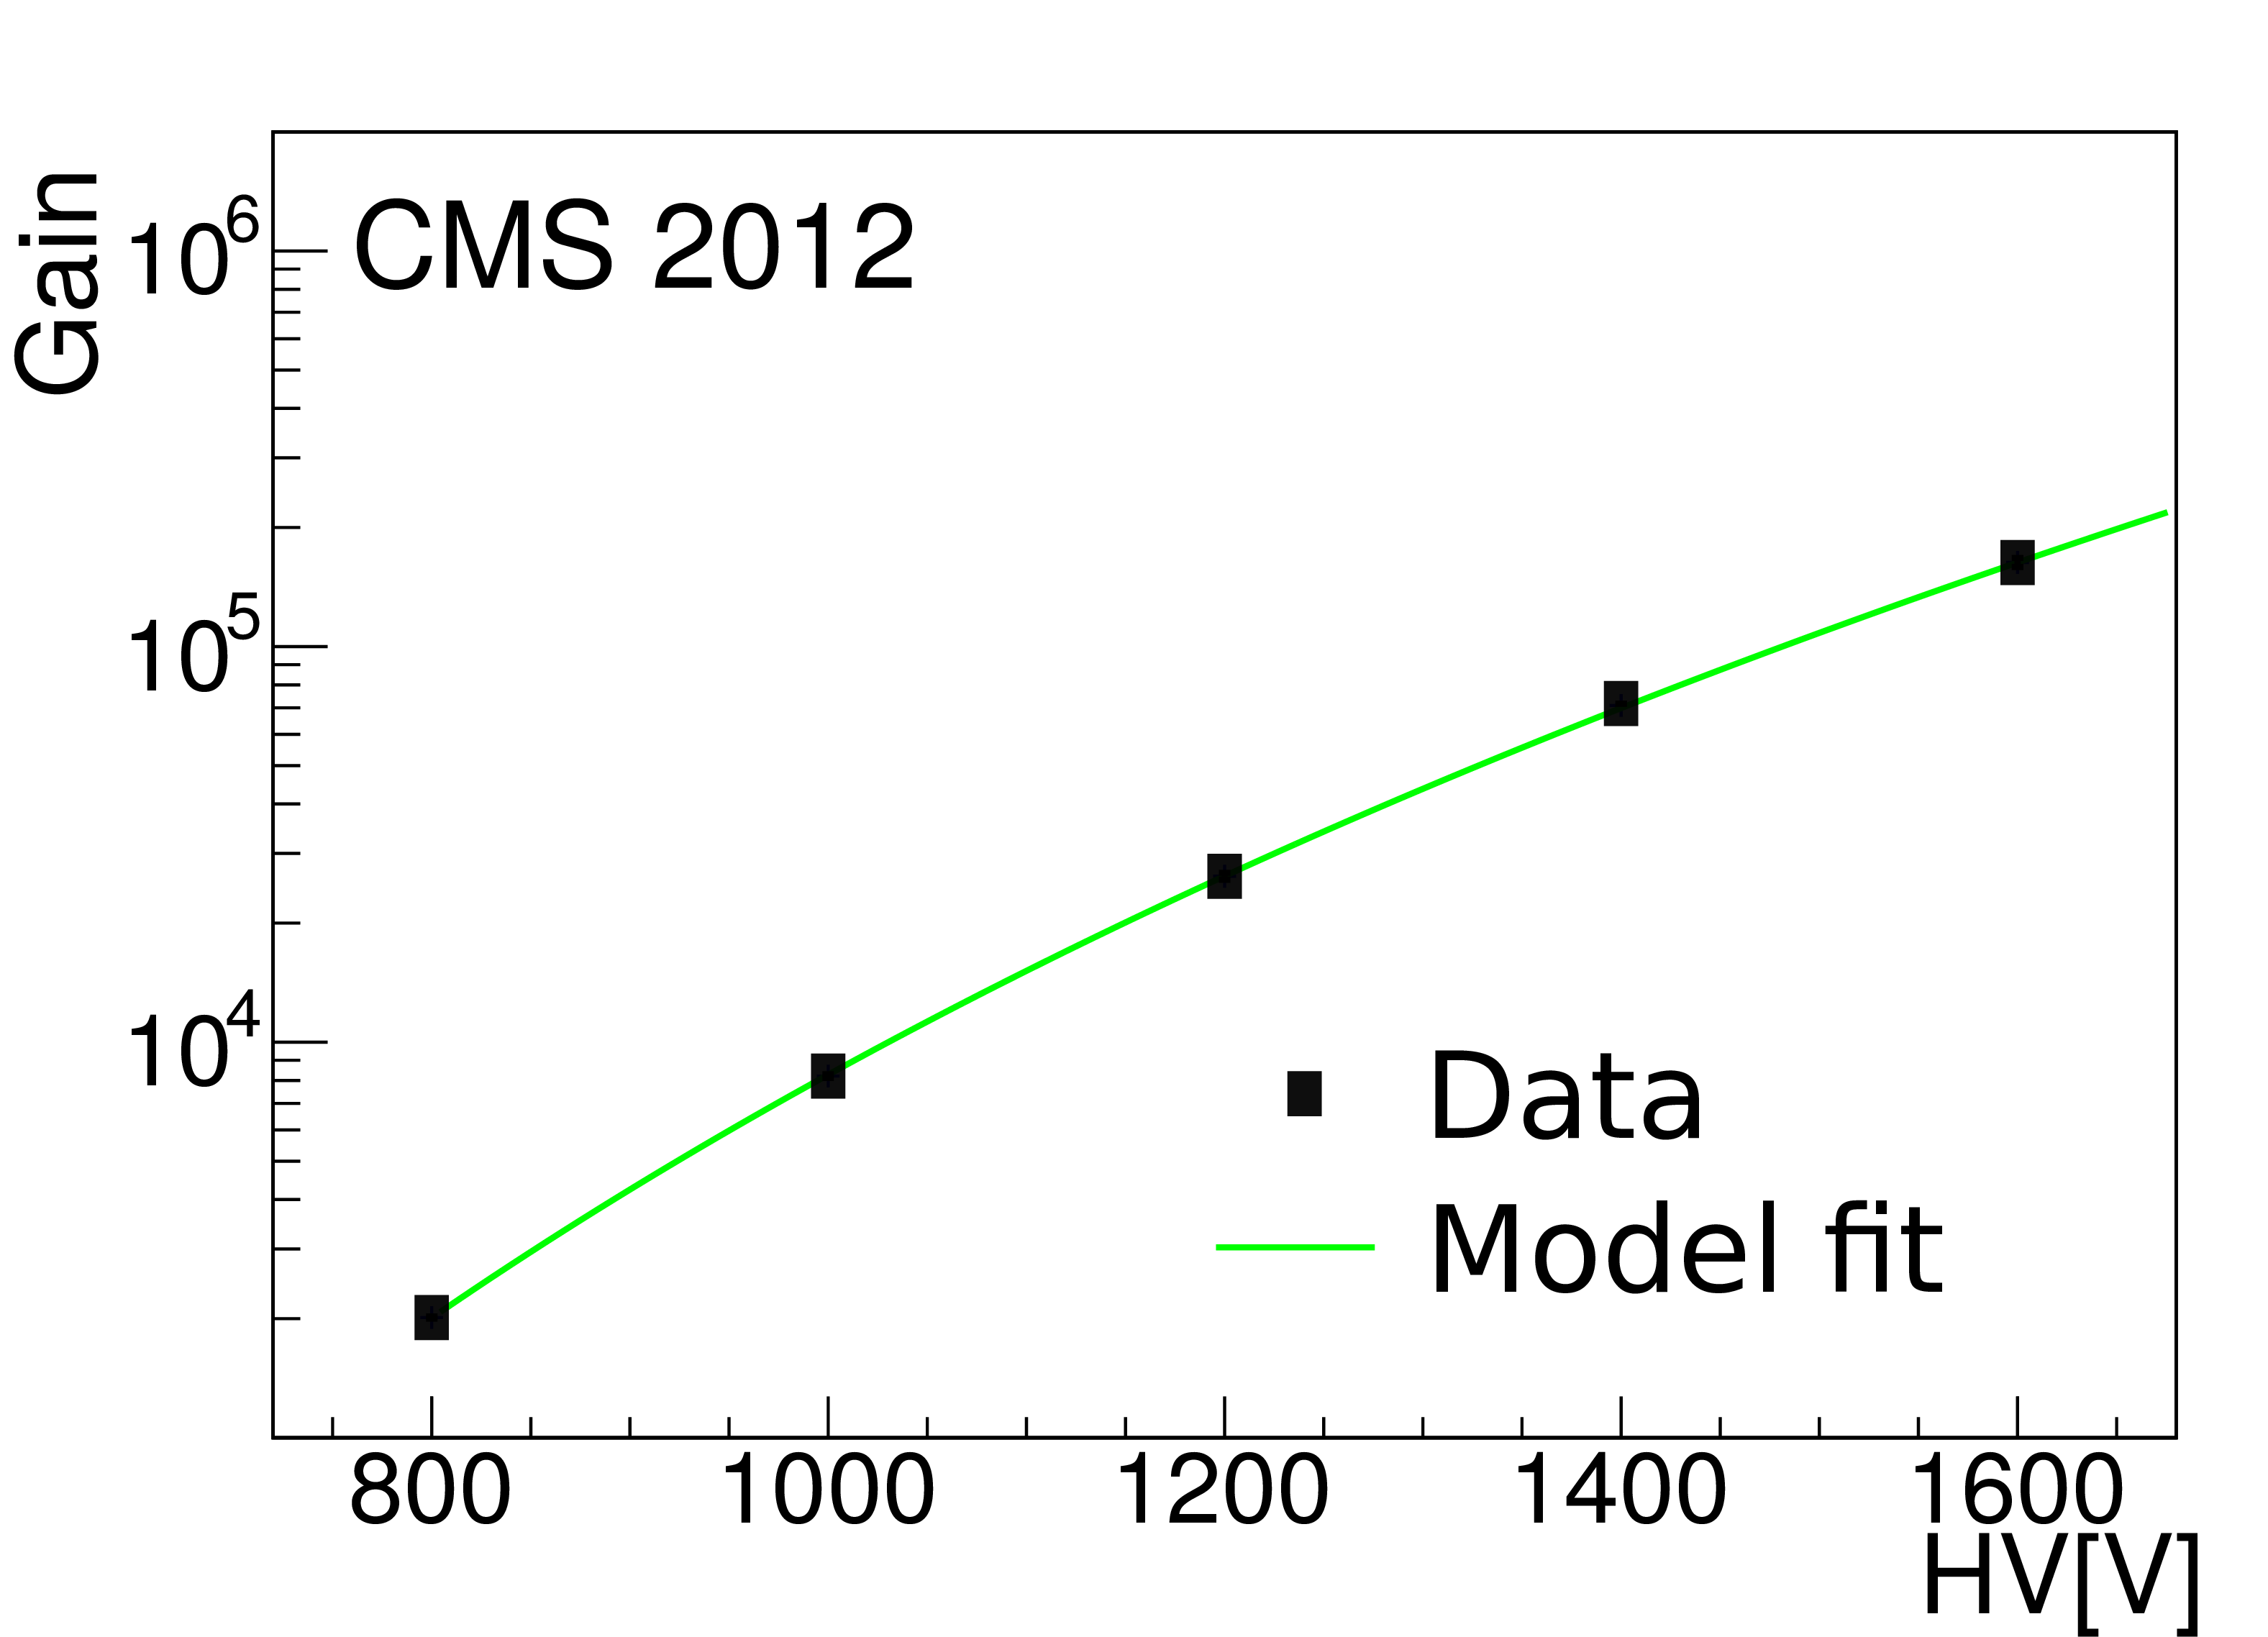
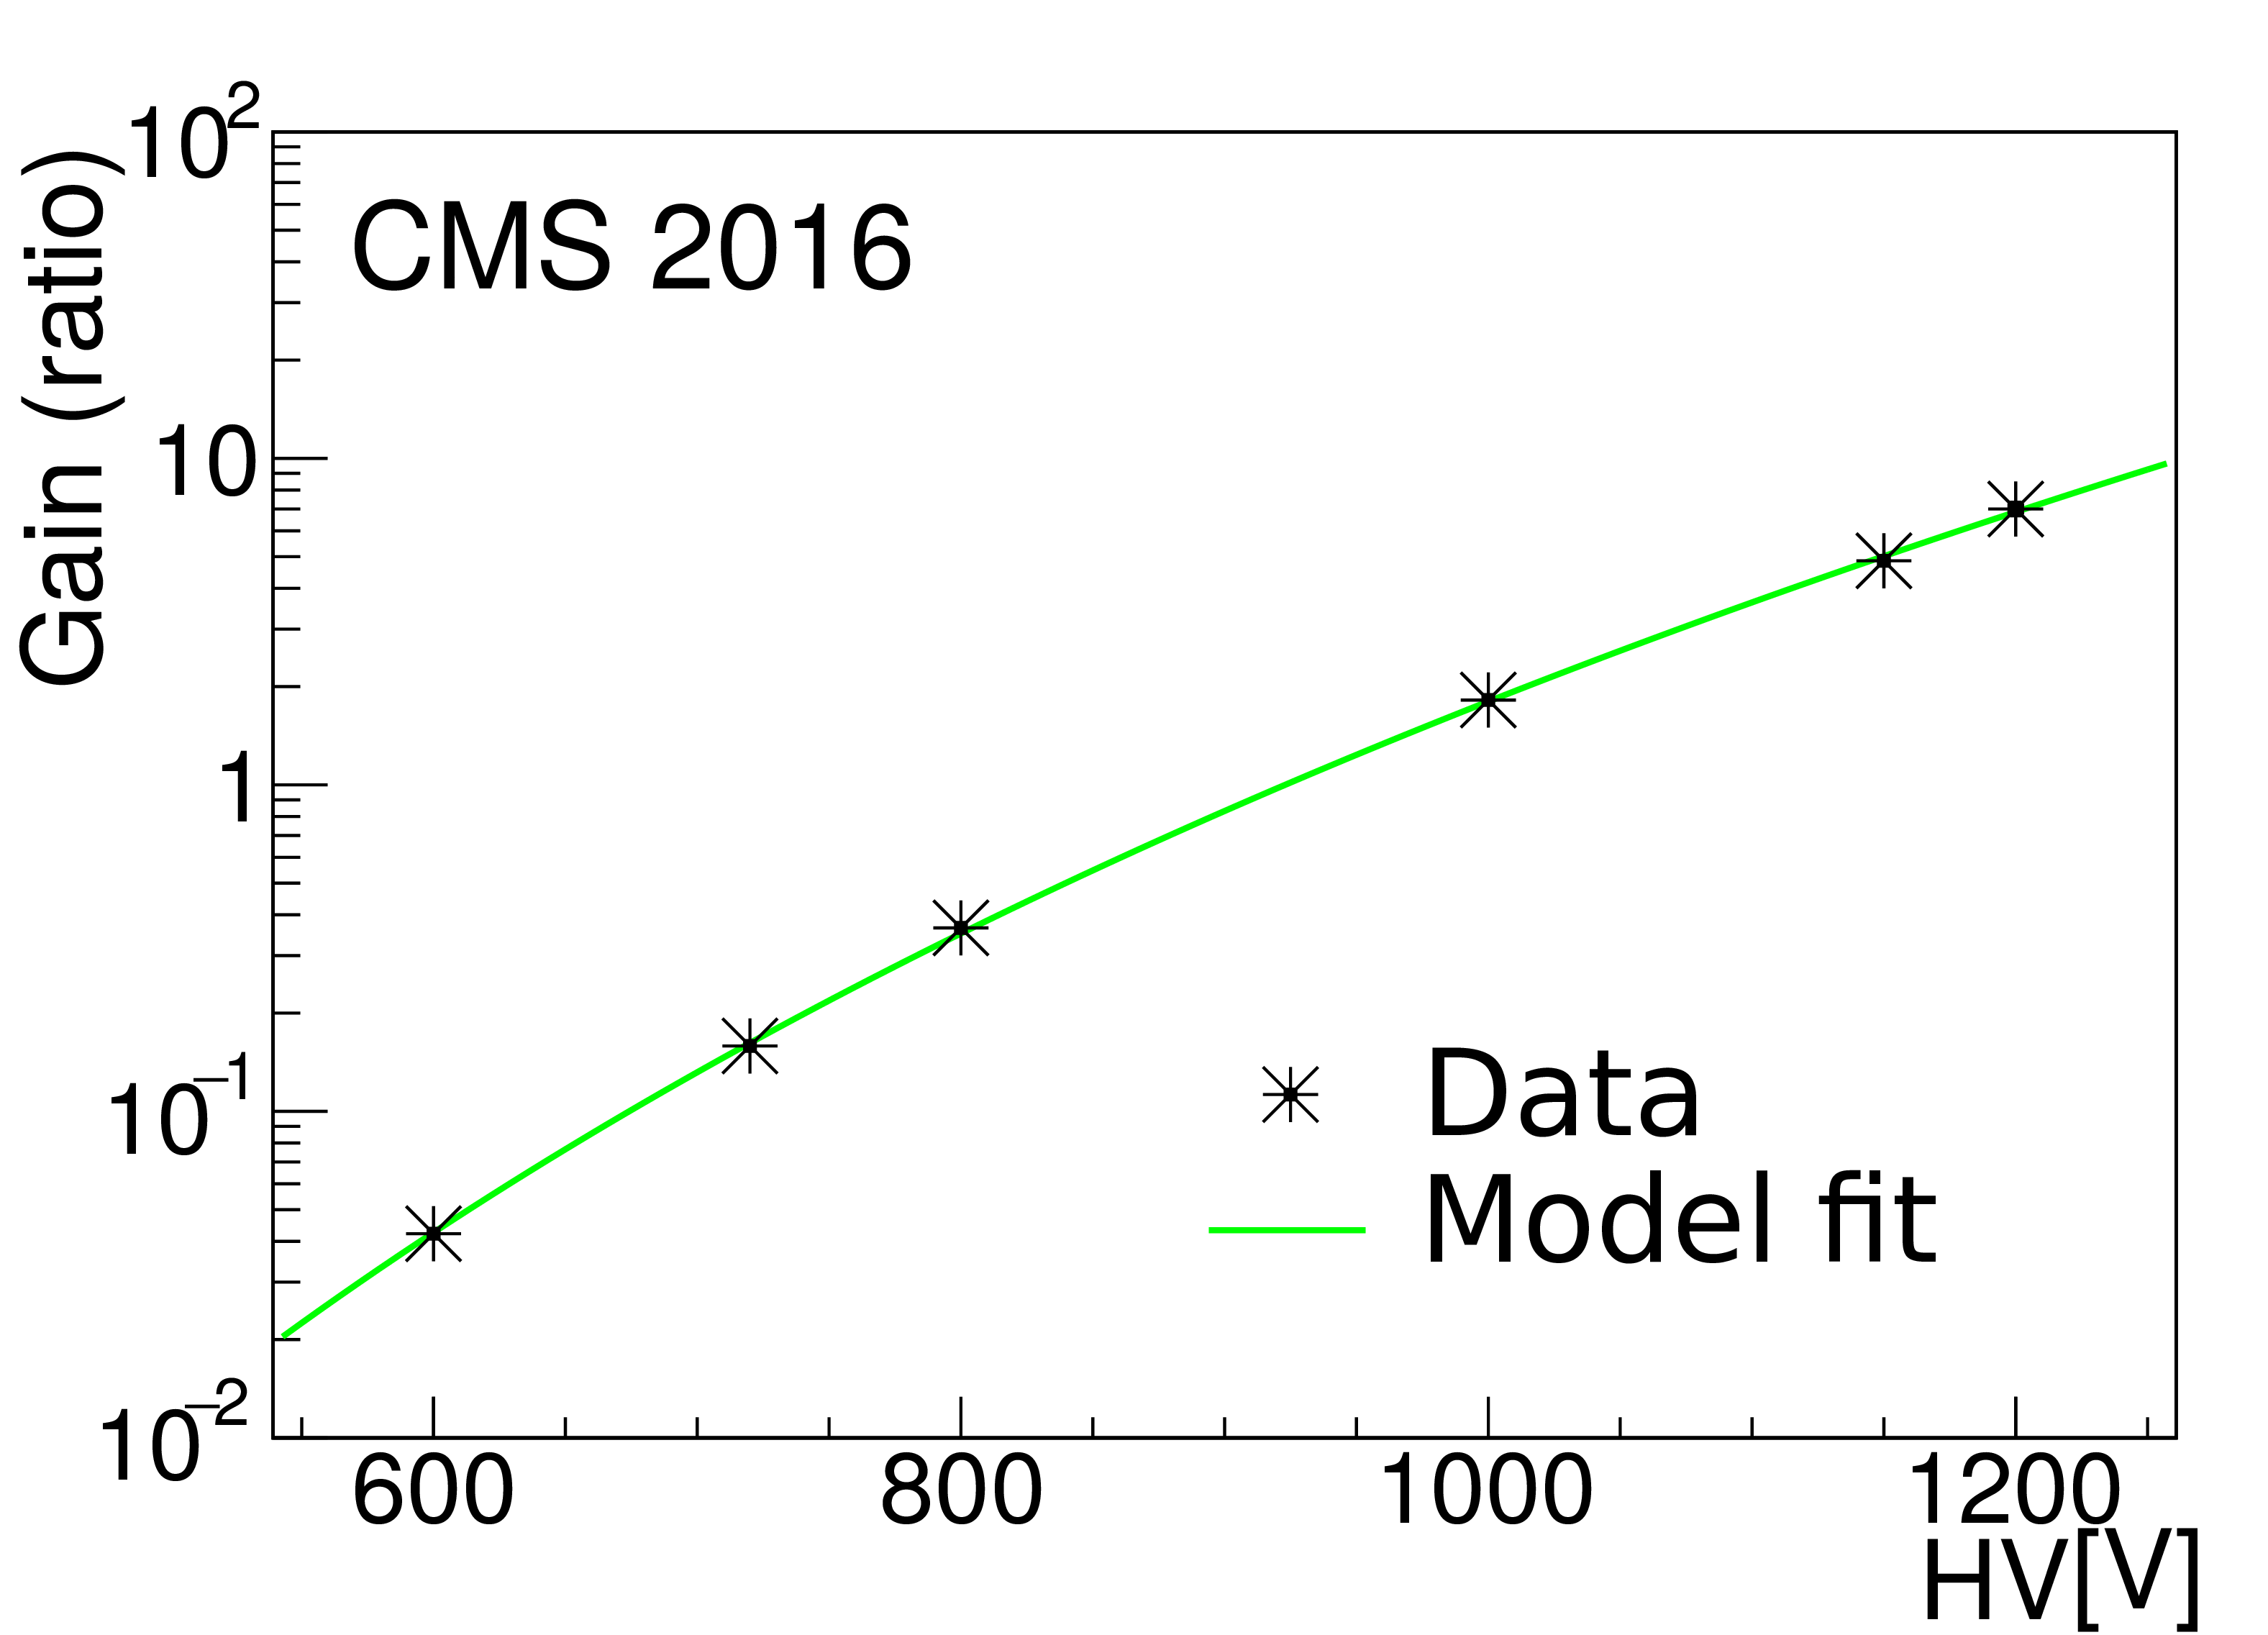
Response of the CASTOR PMT in tower 1, module 3 versus the high-voltage setting prior to data taking exposed to LED pulses (left) and in physics events (right). The (statistical) uncertainties are too small to be seen. For the latter, no absolute gain measurement was performed, and the ratio with respect to the gain at the voltage of 950 V is shown. The model fit is of the form $g(V)={p_0}V^{p_1}$ with two free parameters $p_0$ and $p_1$. |
png pdf |
Figure 14-a:
Response of the CASTOR PMT in tower 1, module 3 versus the high-voltage setting prior to data taking exposed to LED pulses. The (statistical) uncertainties are too small to be seen. The model fit is of the form $g(V)={p_0}V^{p_1}$ with two free parameters $p_0$ and $p_1$. |
png pdf |
Figure 14-b:
Response of the CASTOR PMT in tower 1, module 3 versus the high-voltage setting in physics events. The (statistical) uncertainties are too small to be seen. No absolute gain measurement was performed, and the ratio with respect to the gain at the voltage of 950 V is shown. The model fit is of the form $g(V)={p_0}V^{p_1}$ with two free parameters $p_0$ and $p_1$. |
png pdf |
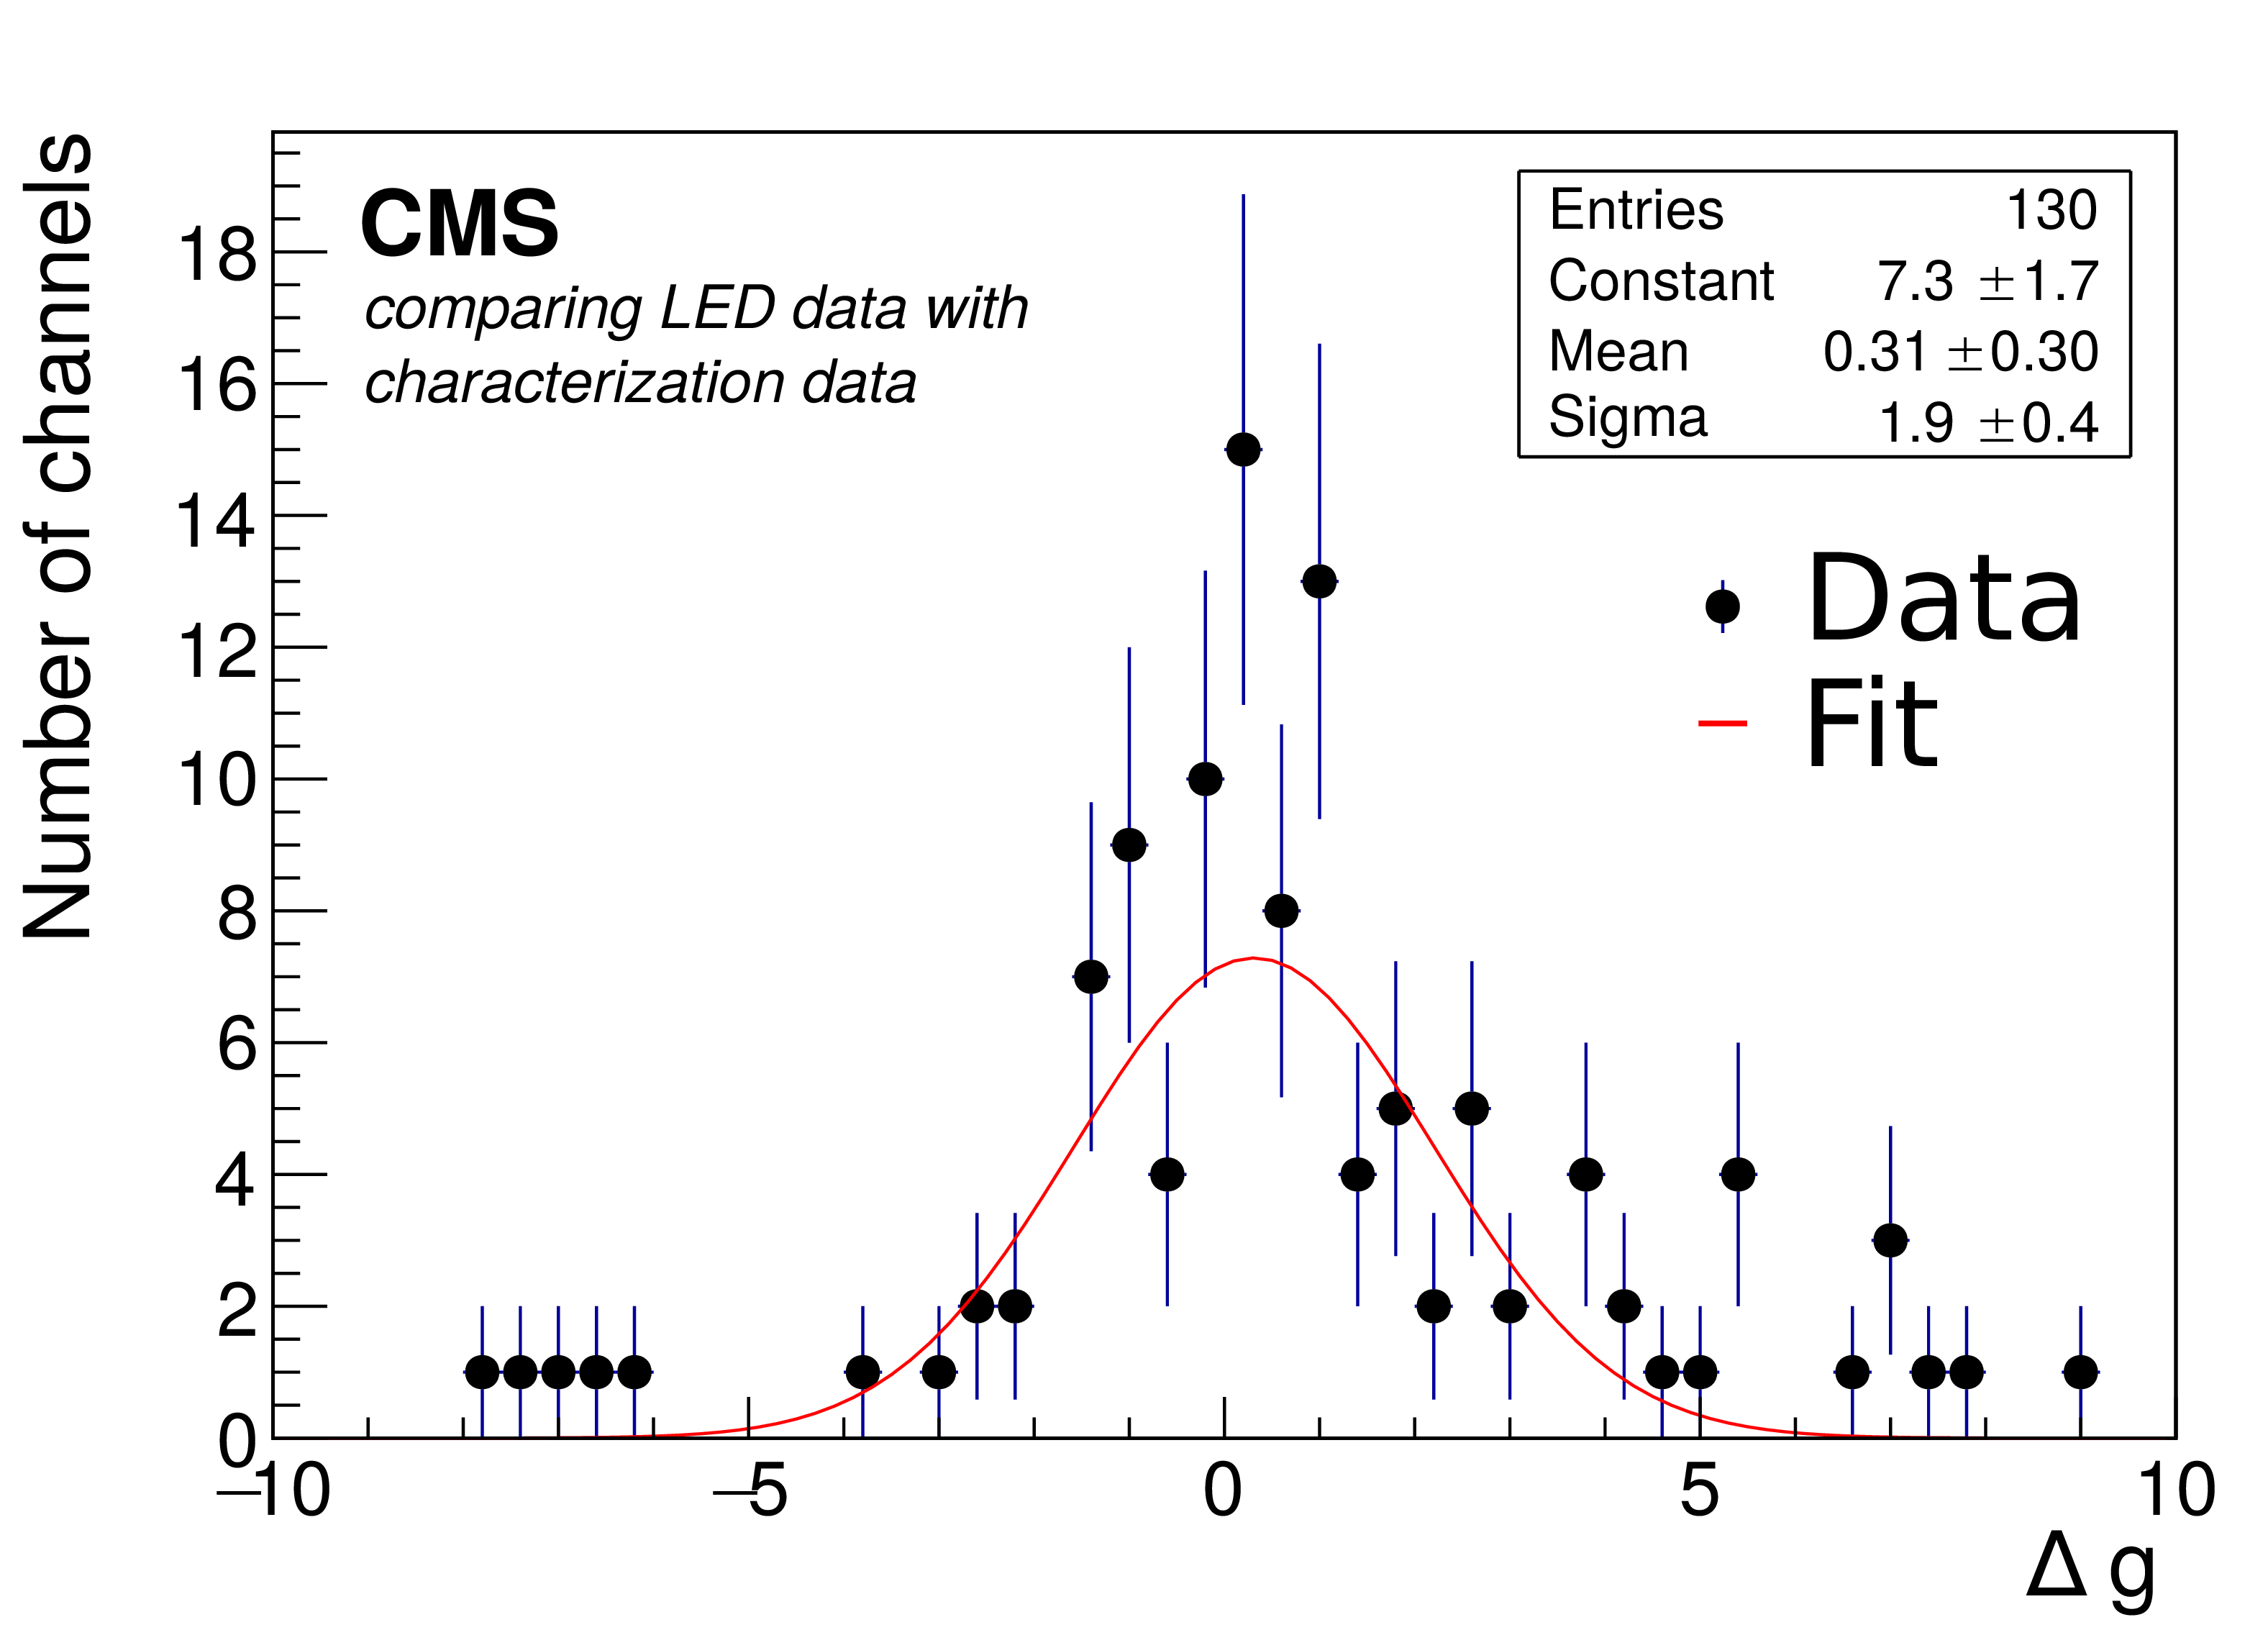
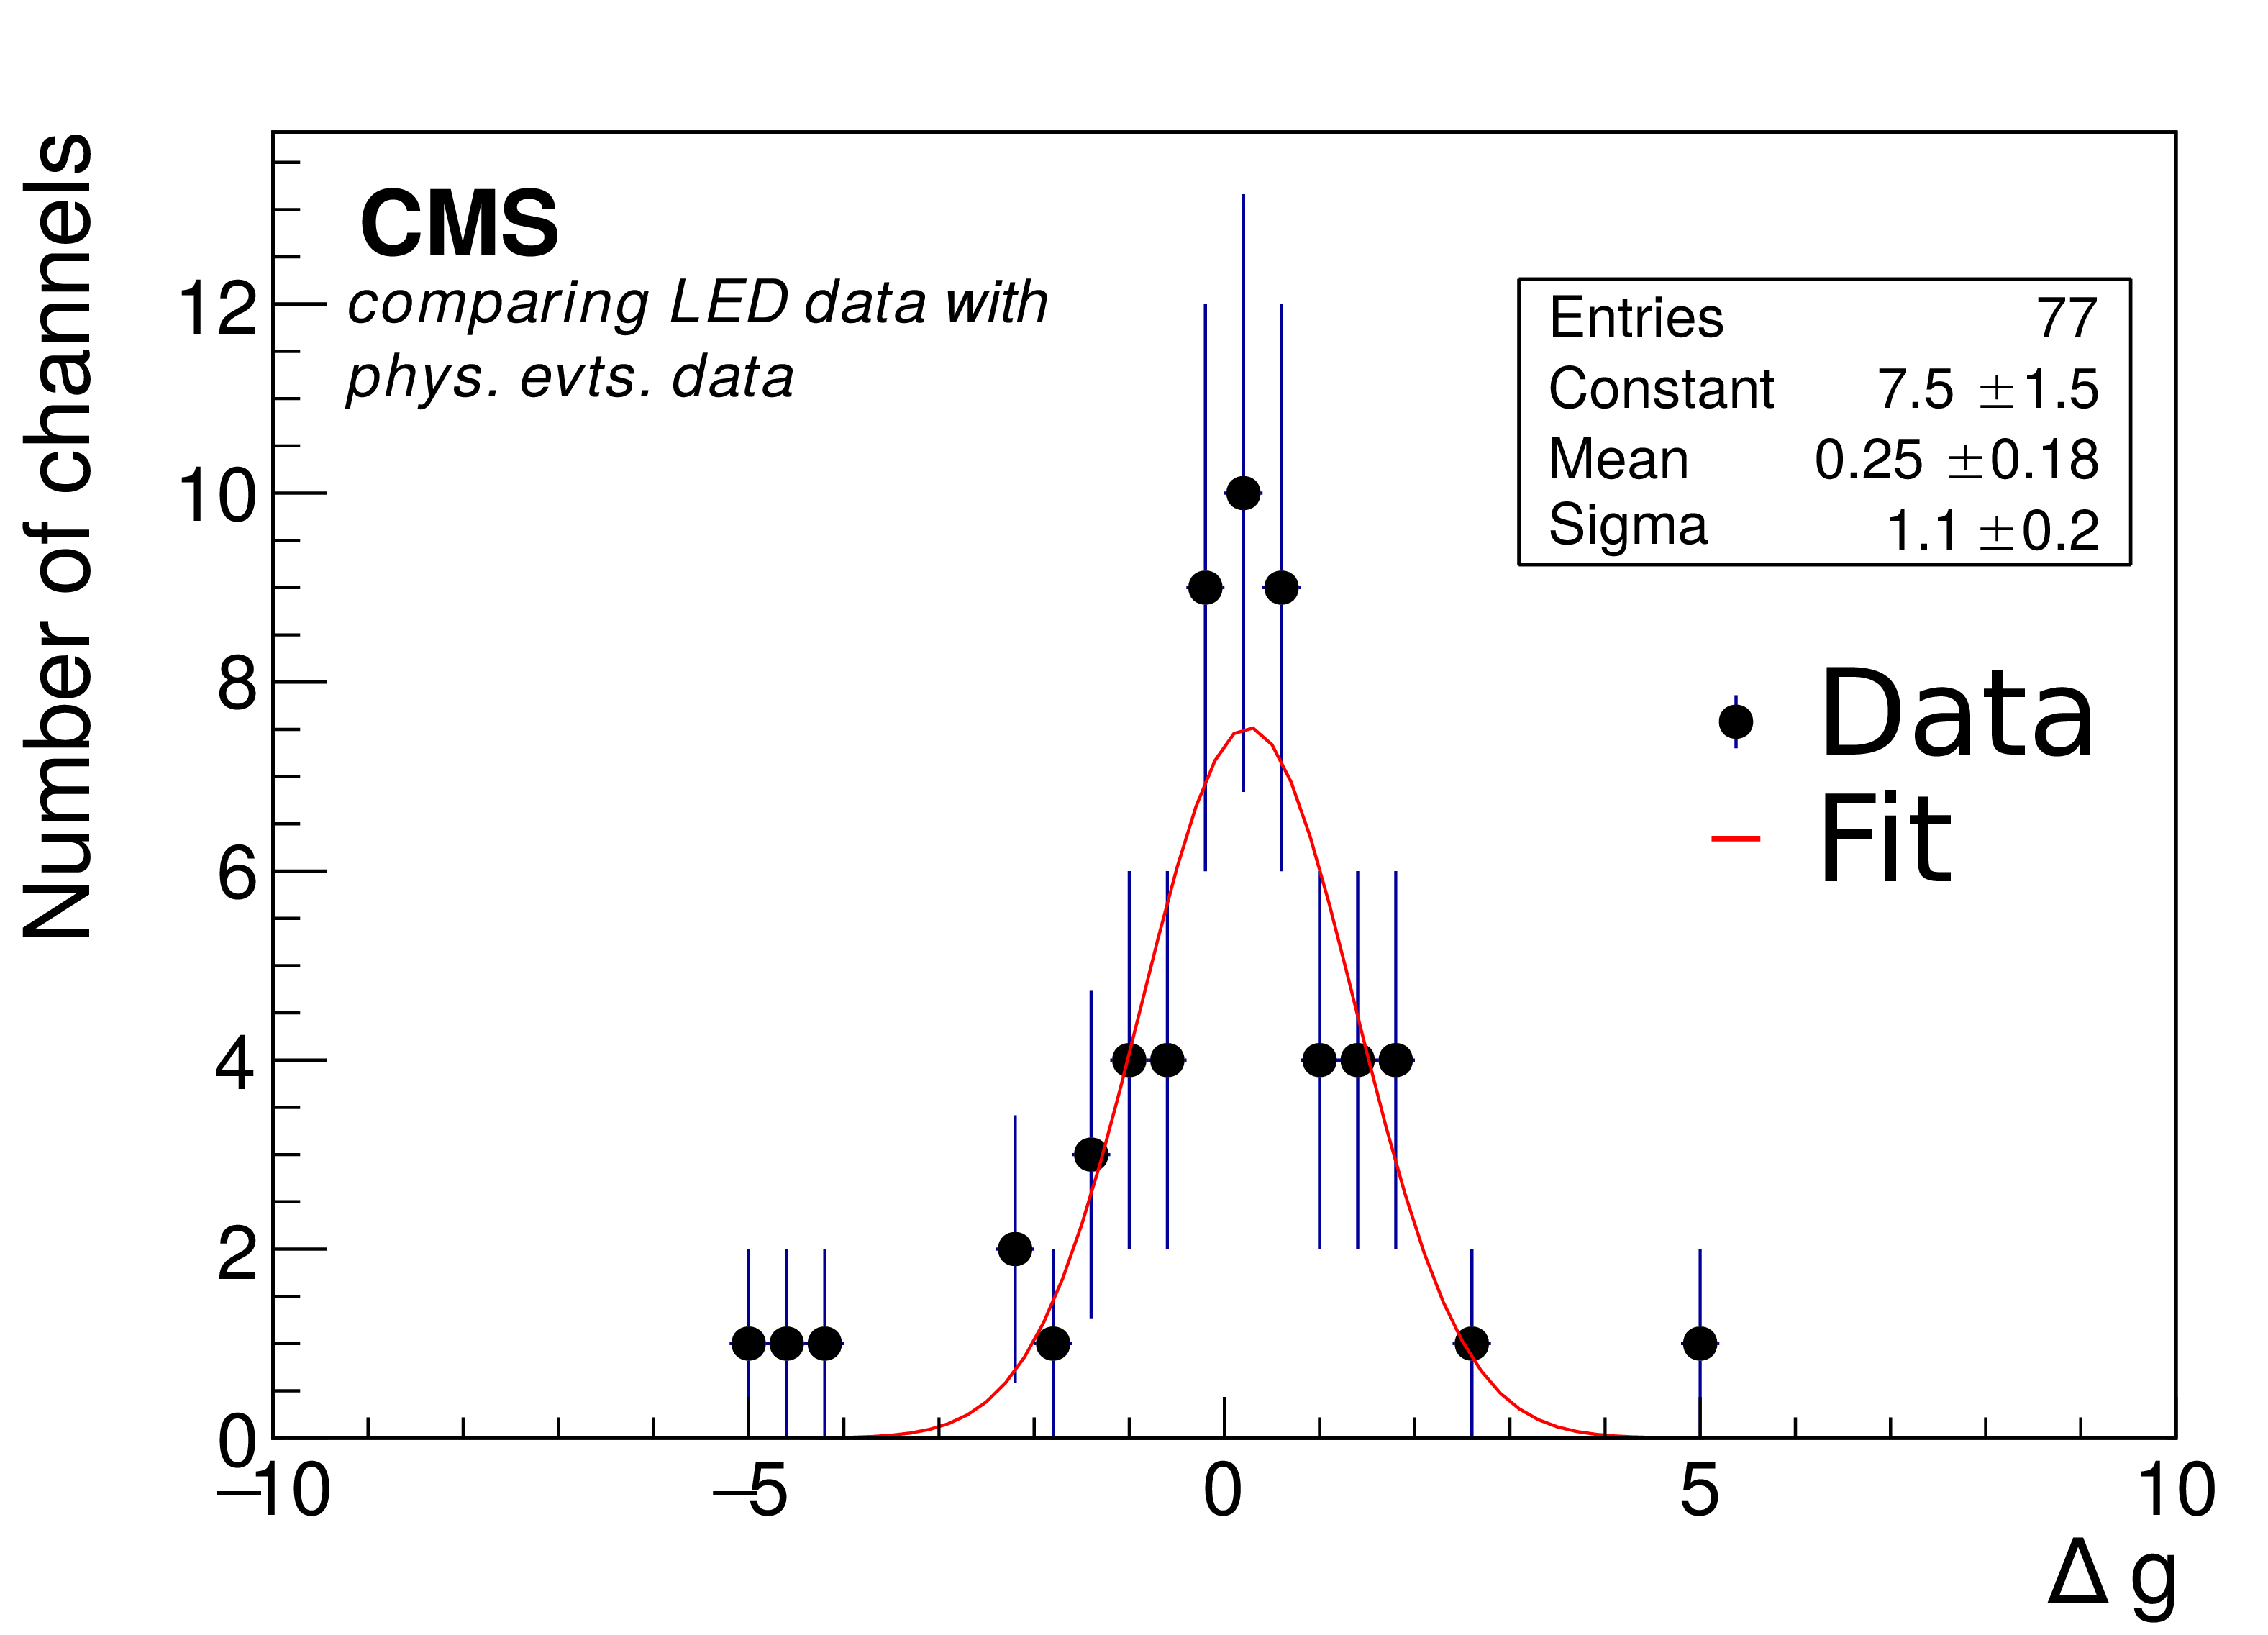
Figure 15:
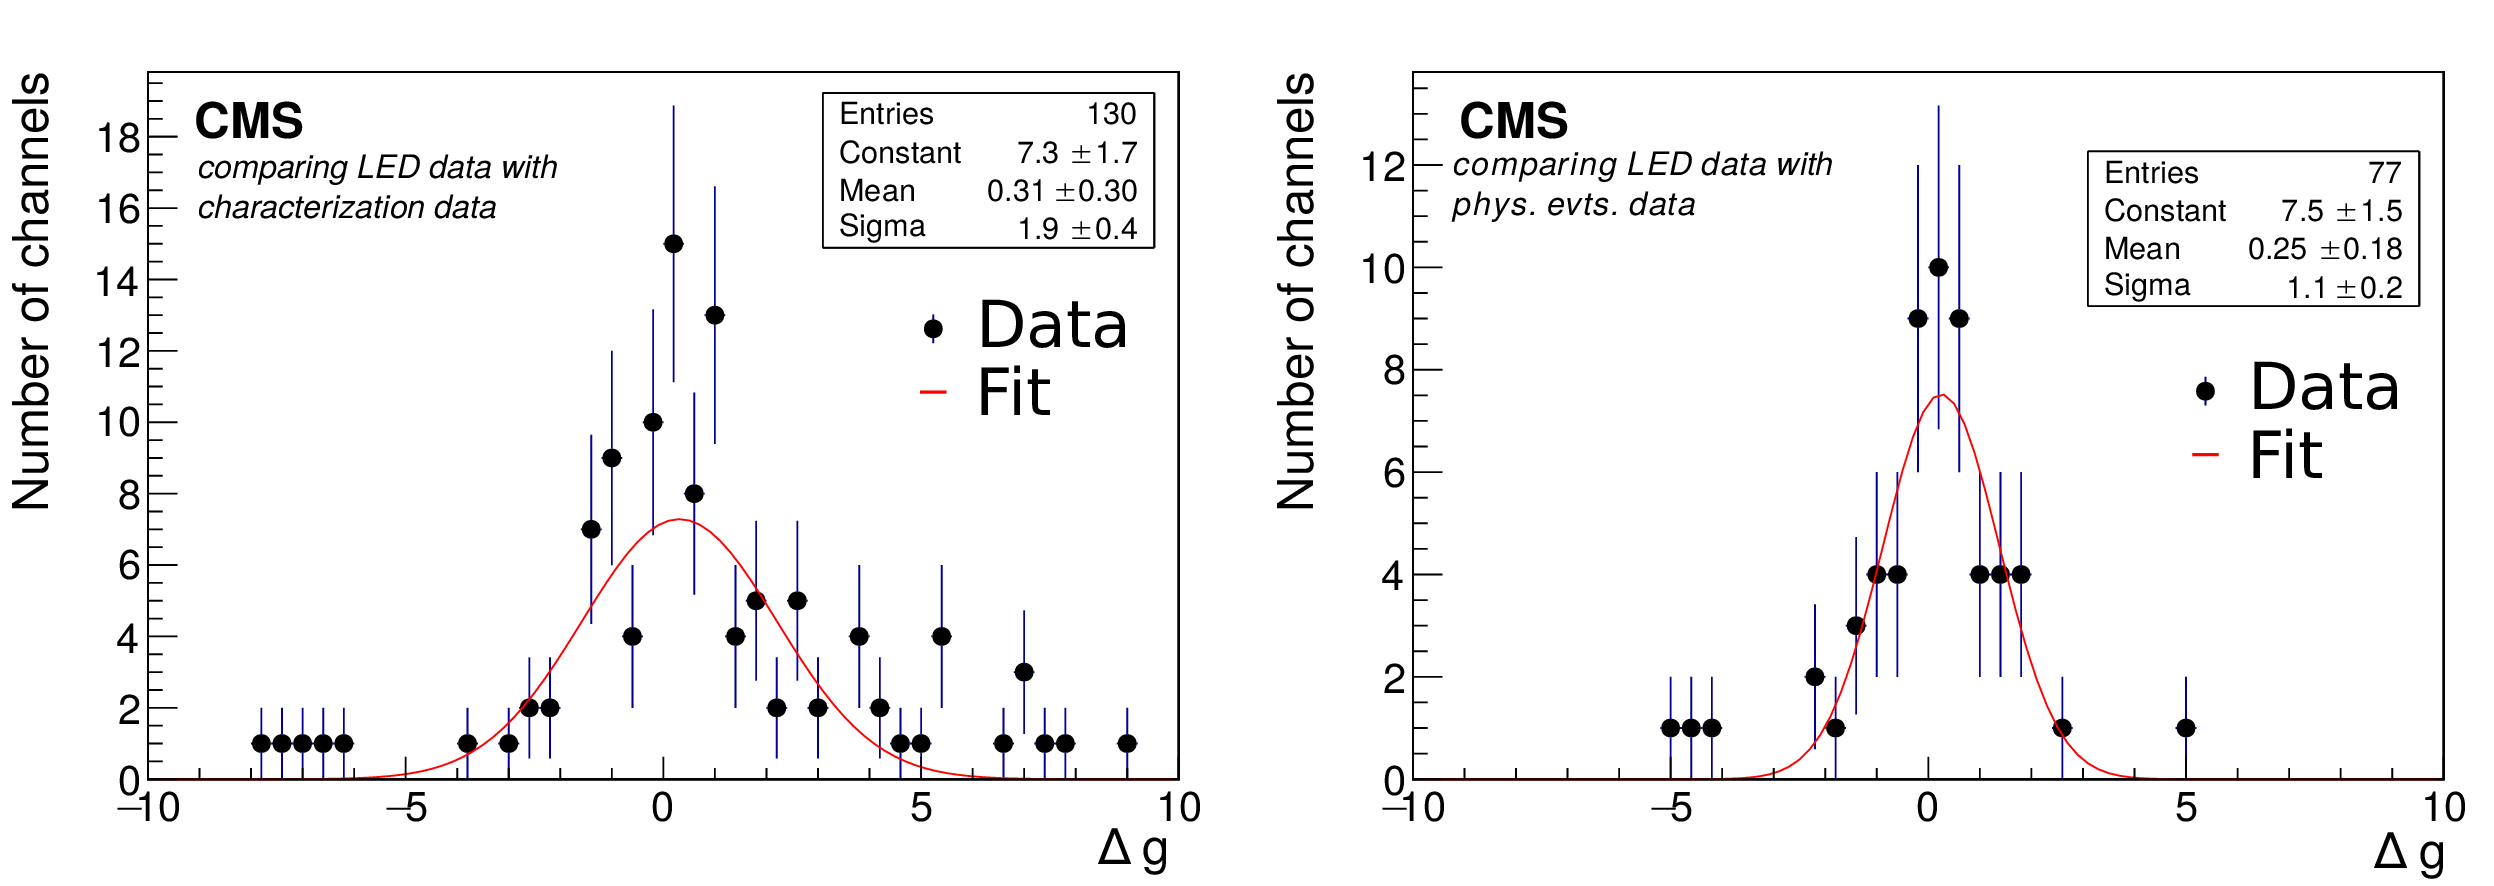
Distributions of the weighed difference of gains, $\Delta g=(g_1-g_2)/\sqrt {\sigma _{g_1}^2+\sigma _{g_2}^2}$, for two sets of correction factors obtained with two different methods, fitted to a Gaussian function. The uncertainties are statistical only. Left: Comparison of LED and PMT characterization methods at $B=$ 0 T for muon halo and proton physics HV settings in 2016. Right: Comparison of LED and physics events methods for muon halo and heavy ion physics HV settings at $B=$ 3.8 T. Note that in both distributions the number of entries differs from 224 since only a subset of all channels has valid data available in both measurements. The boxes show the parameters of the red Gaussian fit. |
png pdf |
Figure 15-a:
Distribution of the weighed difference of gains, $\Delta g=(g_1-g_2)/\sqrt {\sigma _{g_1}^2+\sigma _{g_2}^2}$, for two sets of correction factors obtained with two different methods, fitted to a Gaussian function: Comparison of LED and PMT characterization methods at $B=$ 0 T for muon halo and proton physics HV settings in 2016. The uncertainties are statistical only. Note that the number of entries differs from 224 since only a subset of all channels has valid data available. The boxes show the parameters of the red Gaussian fit. |
png pdf |
Figure 15-b:
Distribution of the weighed difference of gains, $\Delta g=(g_1-g_2)/\sqrt {\sigma _{g_1}^2+\sigma _{g_2}^2}$, for two sets of correction factors obtained with two different methods, fitted to a Gaussian function: Comparison of LED and physics events methods for muon halo and heavy ion physics HV settings at $B=$ 3.8 T. The uncertainties are statistical only. Note that the number of entries differs from 224 since only a subset of all channels has valid data available. The boxes show the parameters of the red Gaussian fit. |
png pdf |
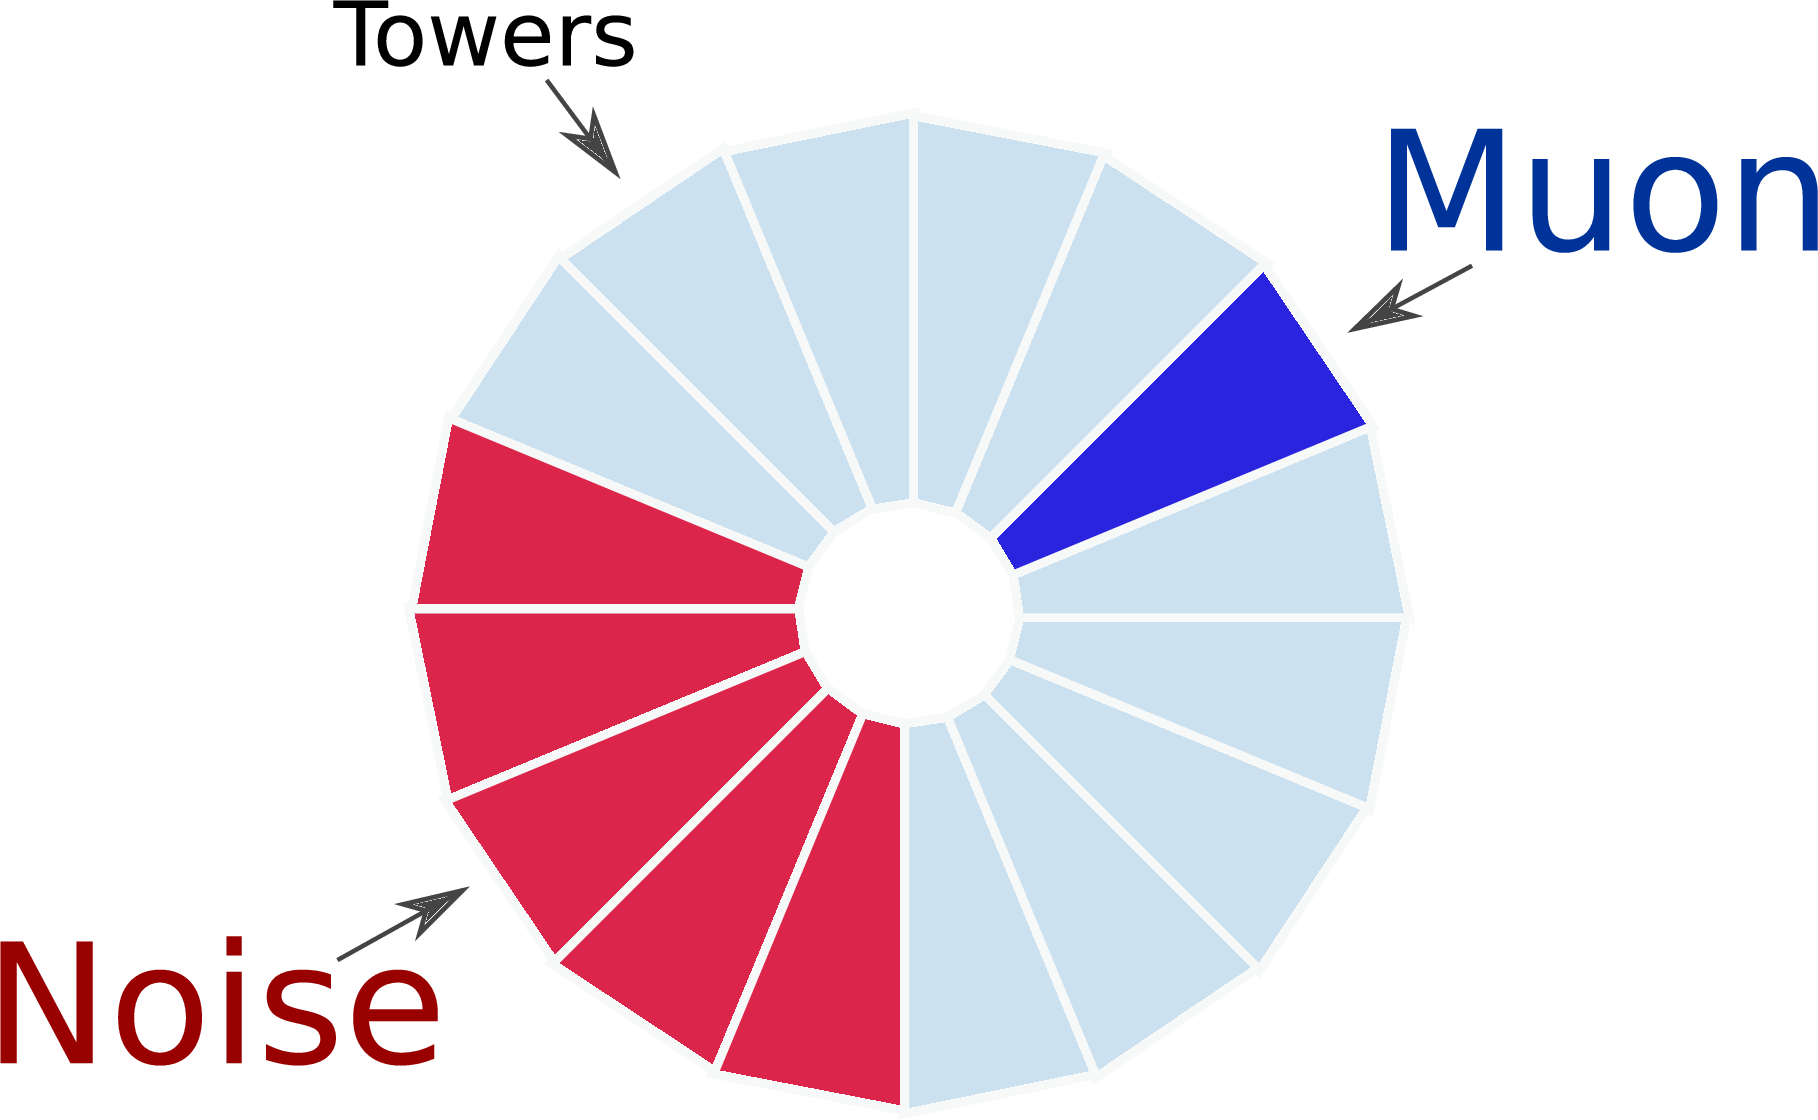
Figure 16:
Schematic front view of CASTOR indicating its 16 towers. In this example event a muon candidate is identified in the blue tower. The calorimeter noise is then updated from the same event in the red towers. |
png pdf |
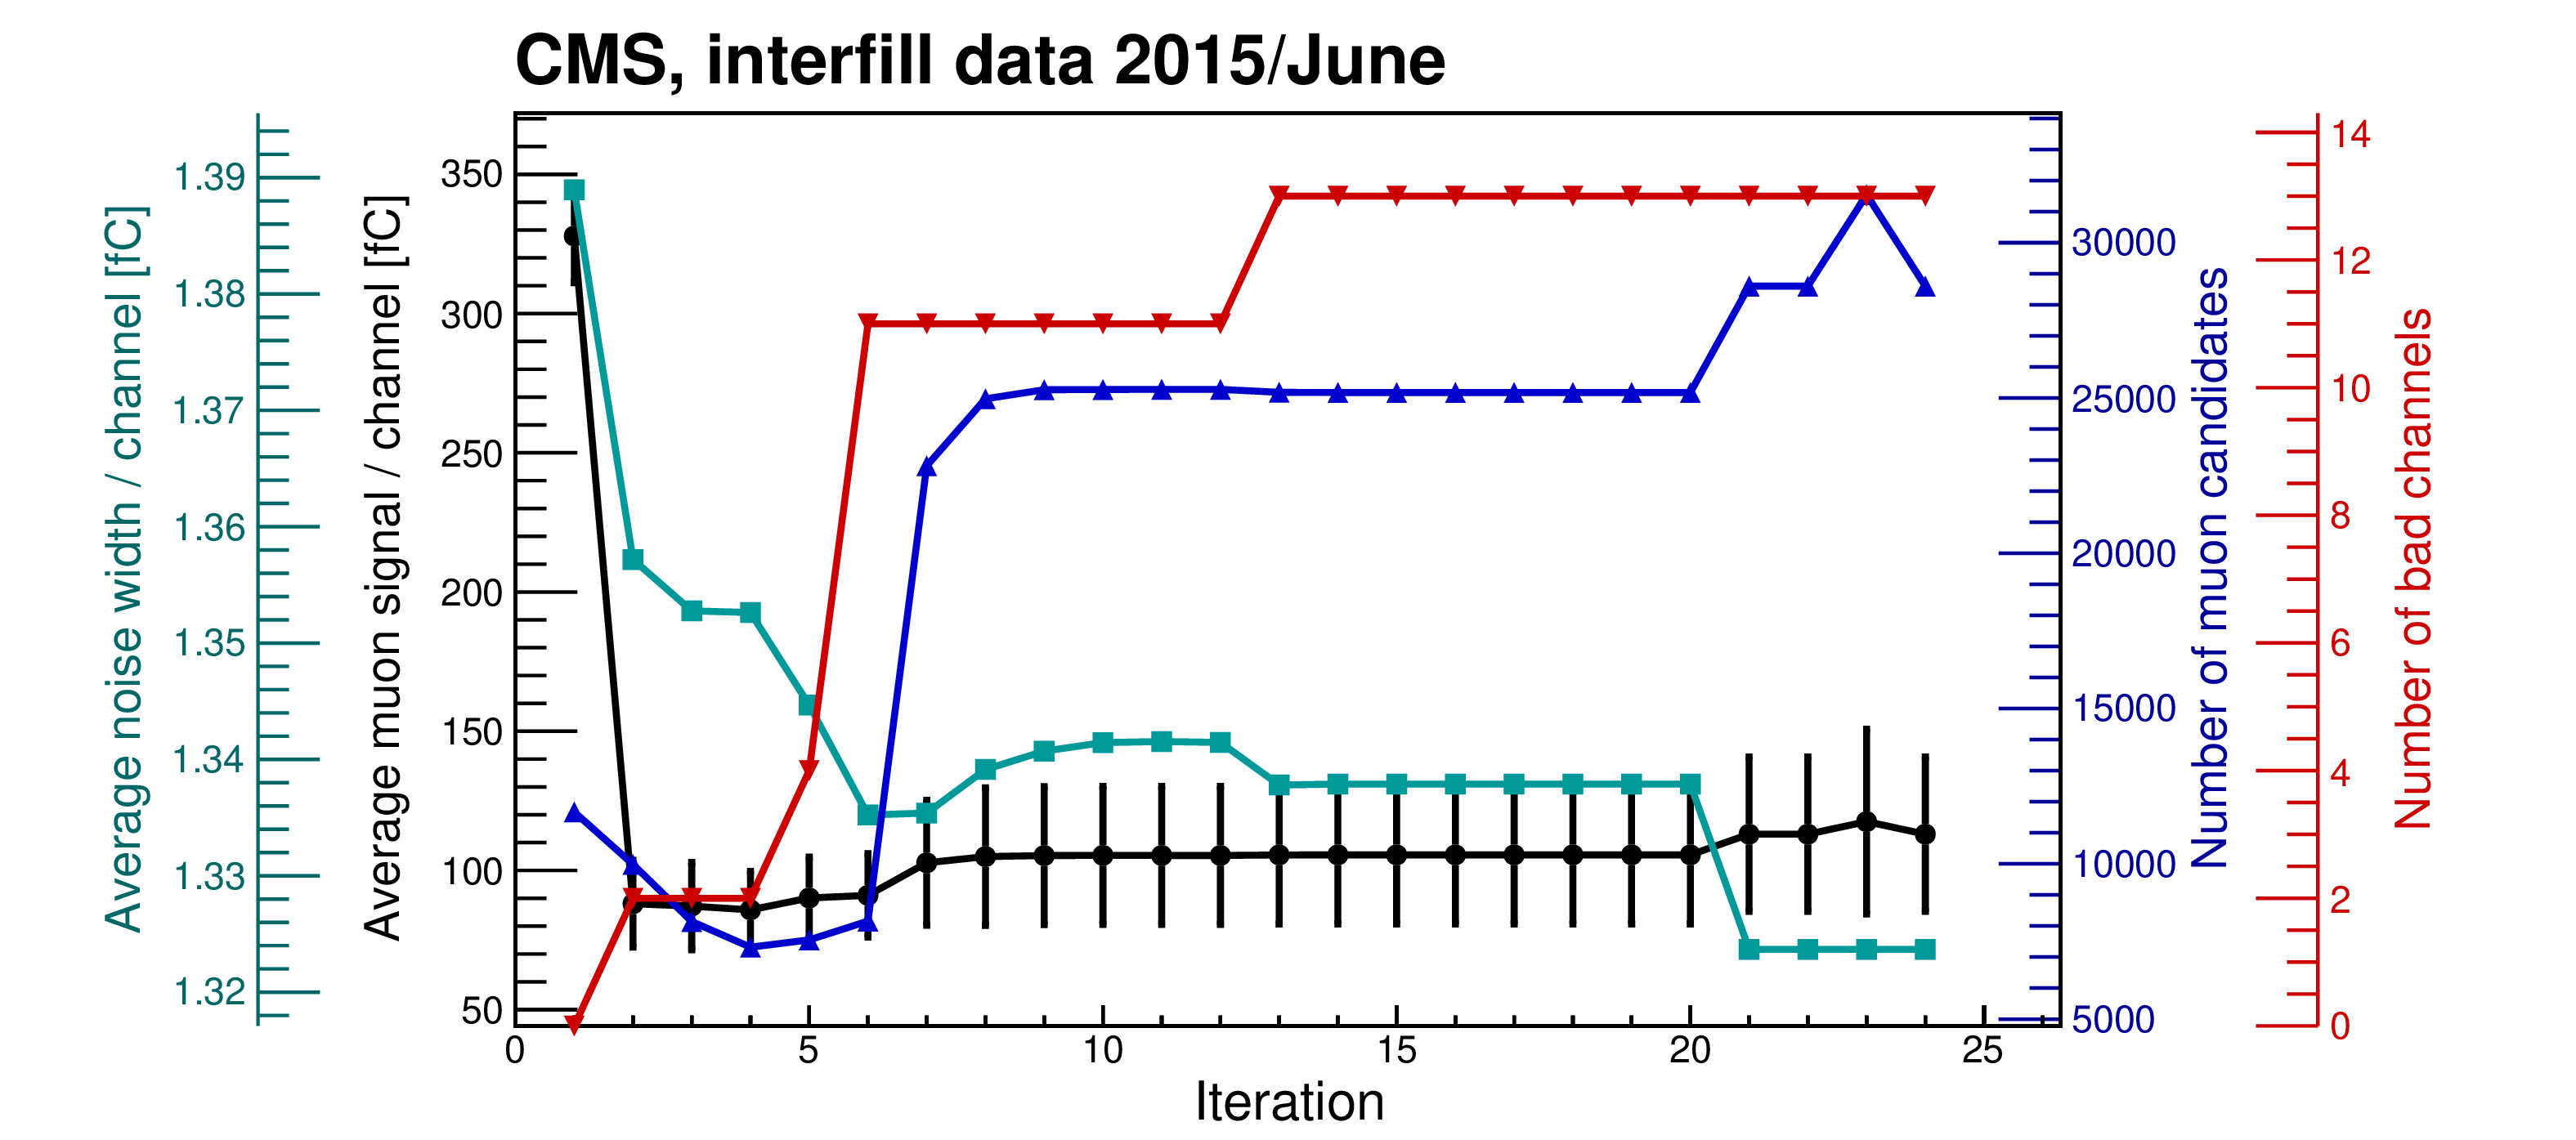
Figure 17:
Visualization of the main parameters of the iterative offline muon event selection process: Average muon signal (black circles), average noise (turquoise squares), number of muon candidates (blue triangles), and number of bad channels (red inverted triangles) versus number of iterations. The progress is mainly steered by first adjusting the number of bad (noisy) channels. The muon and noise responses quickly converge to stable levels. In the last four iterations, global parameters of the procedure are fine tuned. The shown uncertainties are statistical only, however, they are highly correlated in each graph. |
png pdf |
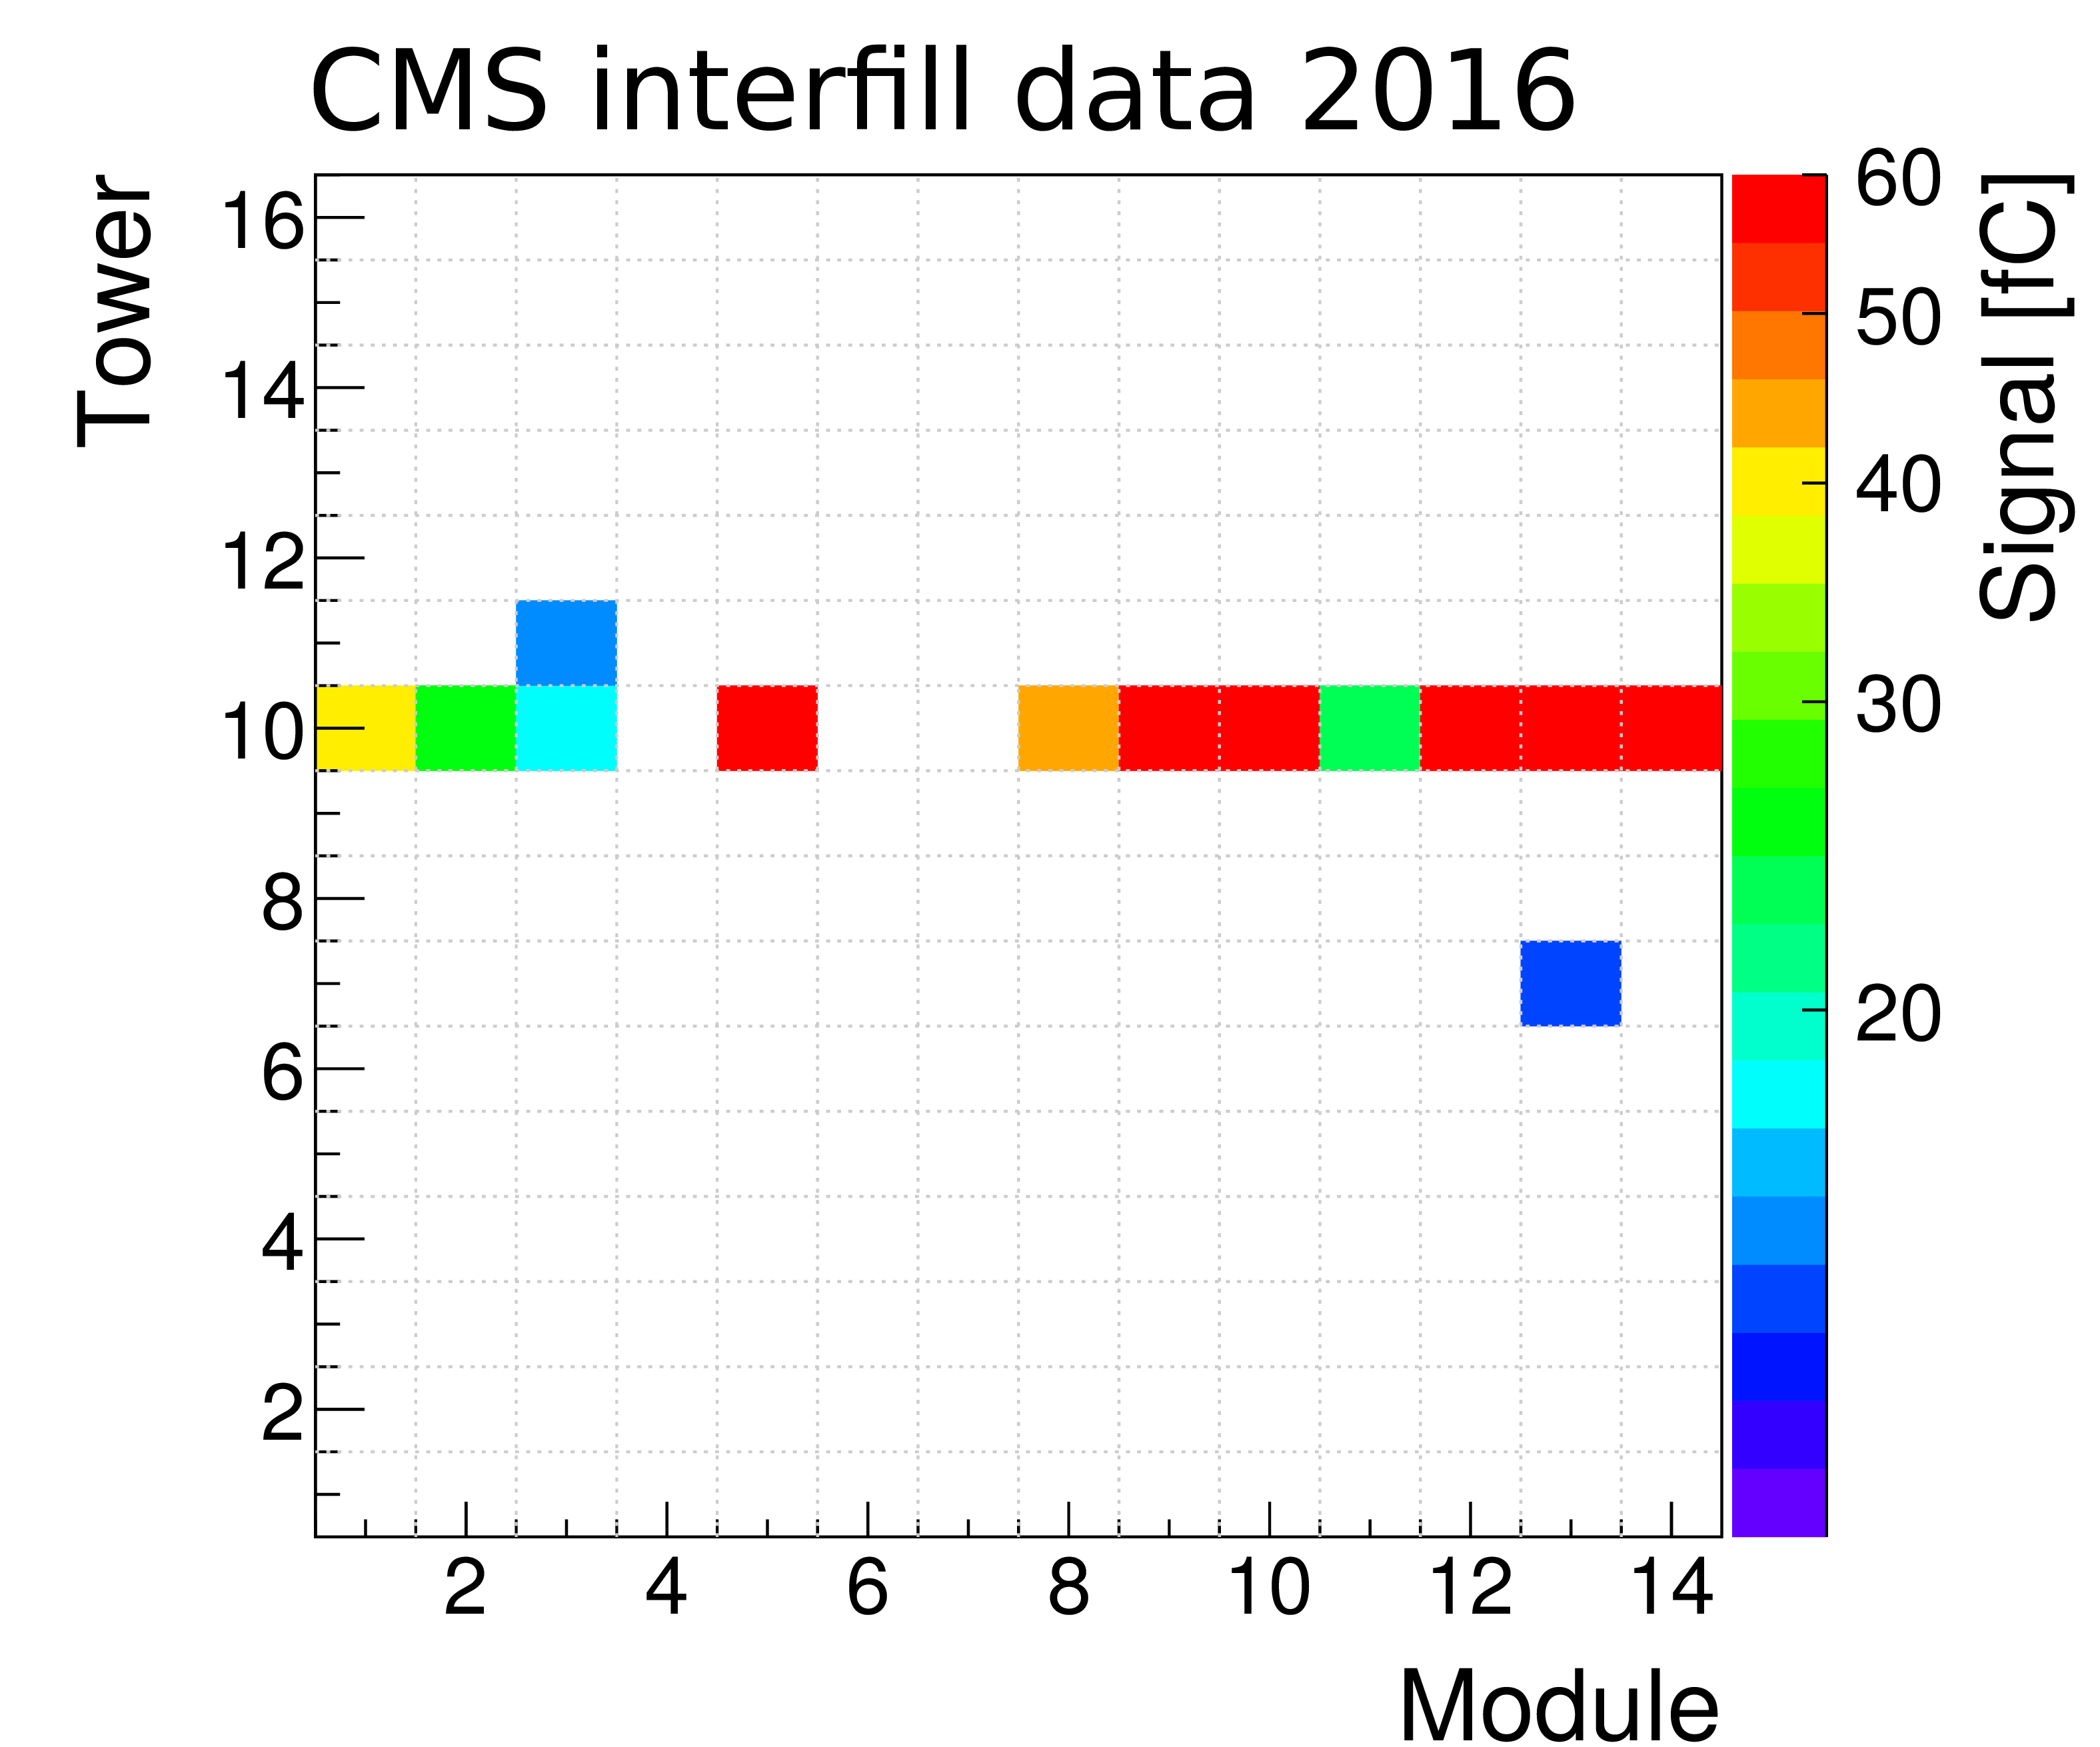
Figure 18:
Example of a reconstructed halo muon event in the tower ($\phi $) vs. module ($z$) plane recorded during the proton-lead run period in 2016; channels are zero suppressed at the 2$\sigma$ noise level. |
png pdf |
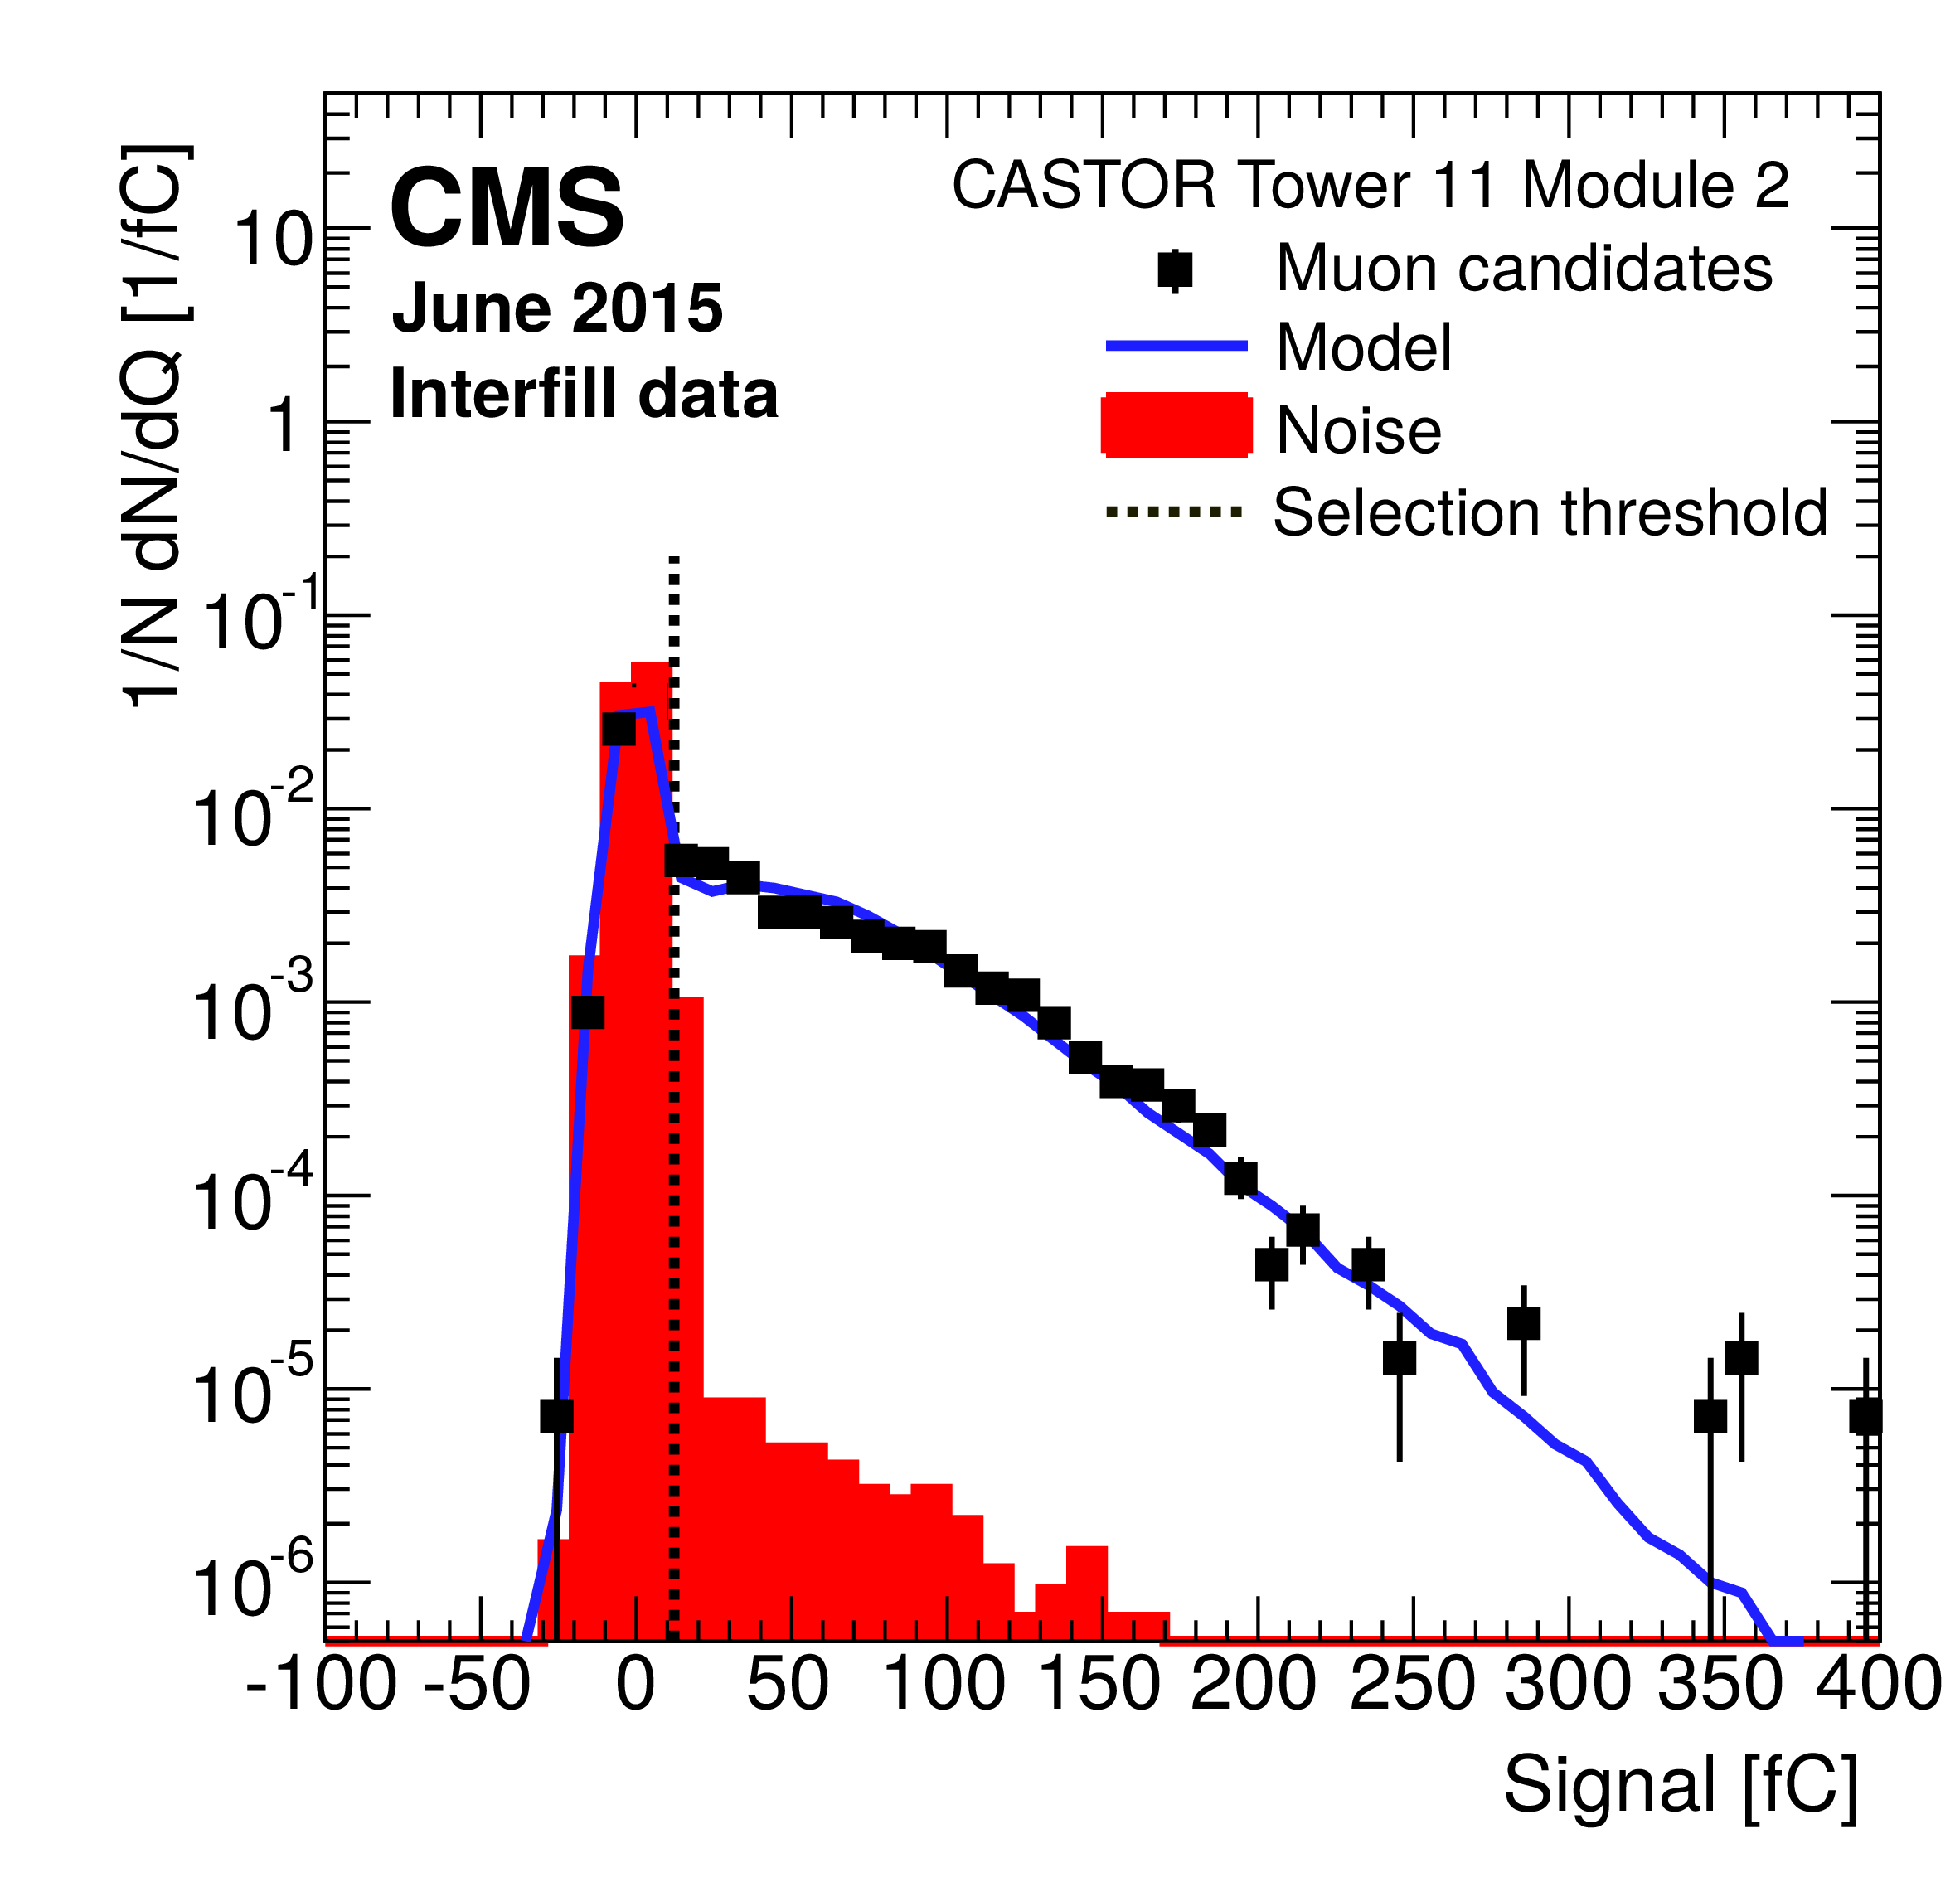
Figure 19:
Signal spectrum for a typical CASTOR channel after an offline isolated muon event selection. The data were recorded in June 2015 with proton beams and CMS magnet at 0 T. The dedicated muon high-voltage setting is used. The uncertainties on the measured data are statistical only. The overlaid noise distribution is measured from noncolliding bunch data. The model line corresponds to a simplified mesh-type PMT with 15 dynodes, amplification/dynode of 2.65, and dynode-miss probability of 0.21, for an average number of photoelectrons $< {{N_{\mathrm {p.e.}}}} > =$ 0.58. |
png pdf |
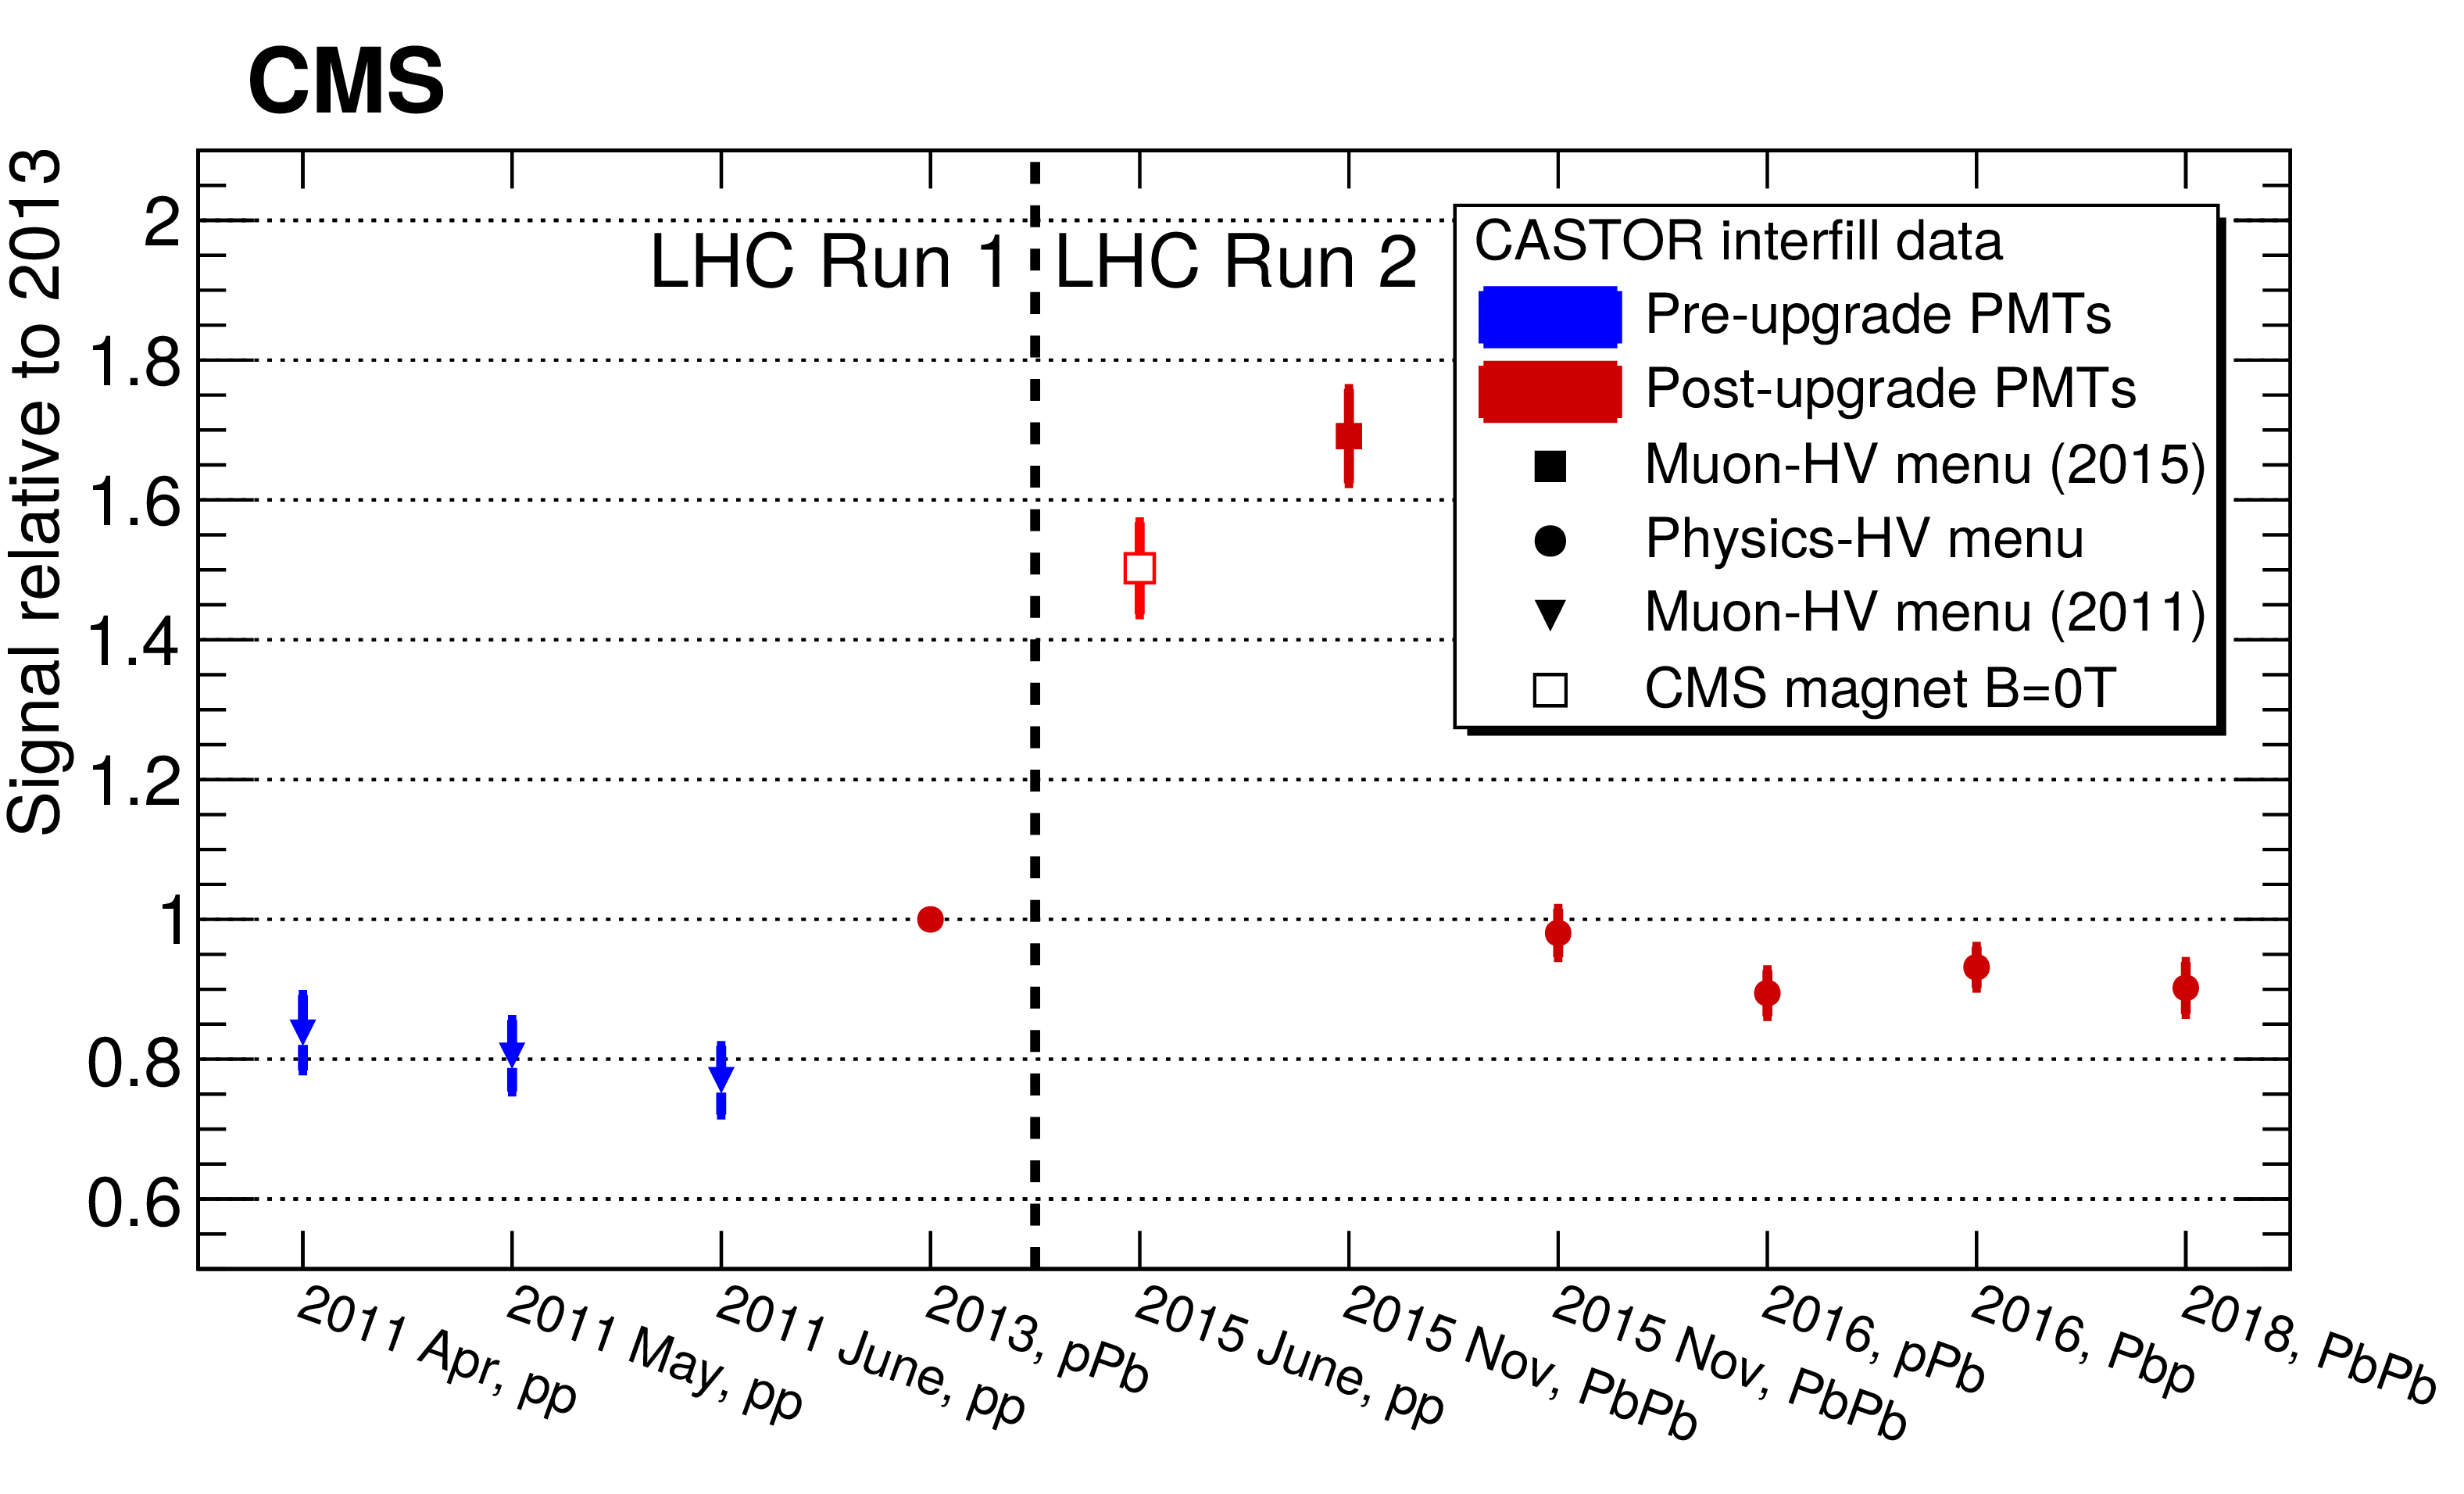
Figure 20:
Relative muon response averaged over all channels versus time. Shown is the average of the channel-by-channel ratios relative to the 2013 data. The vertical bars indicate the RMS of the distributions. All of the distributions are found to be consistent with a Gaussian shape. |
png pdf |
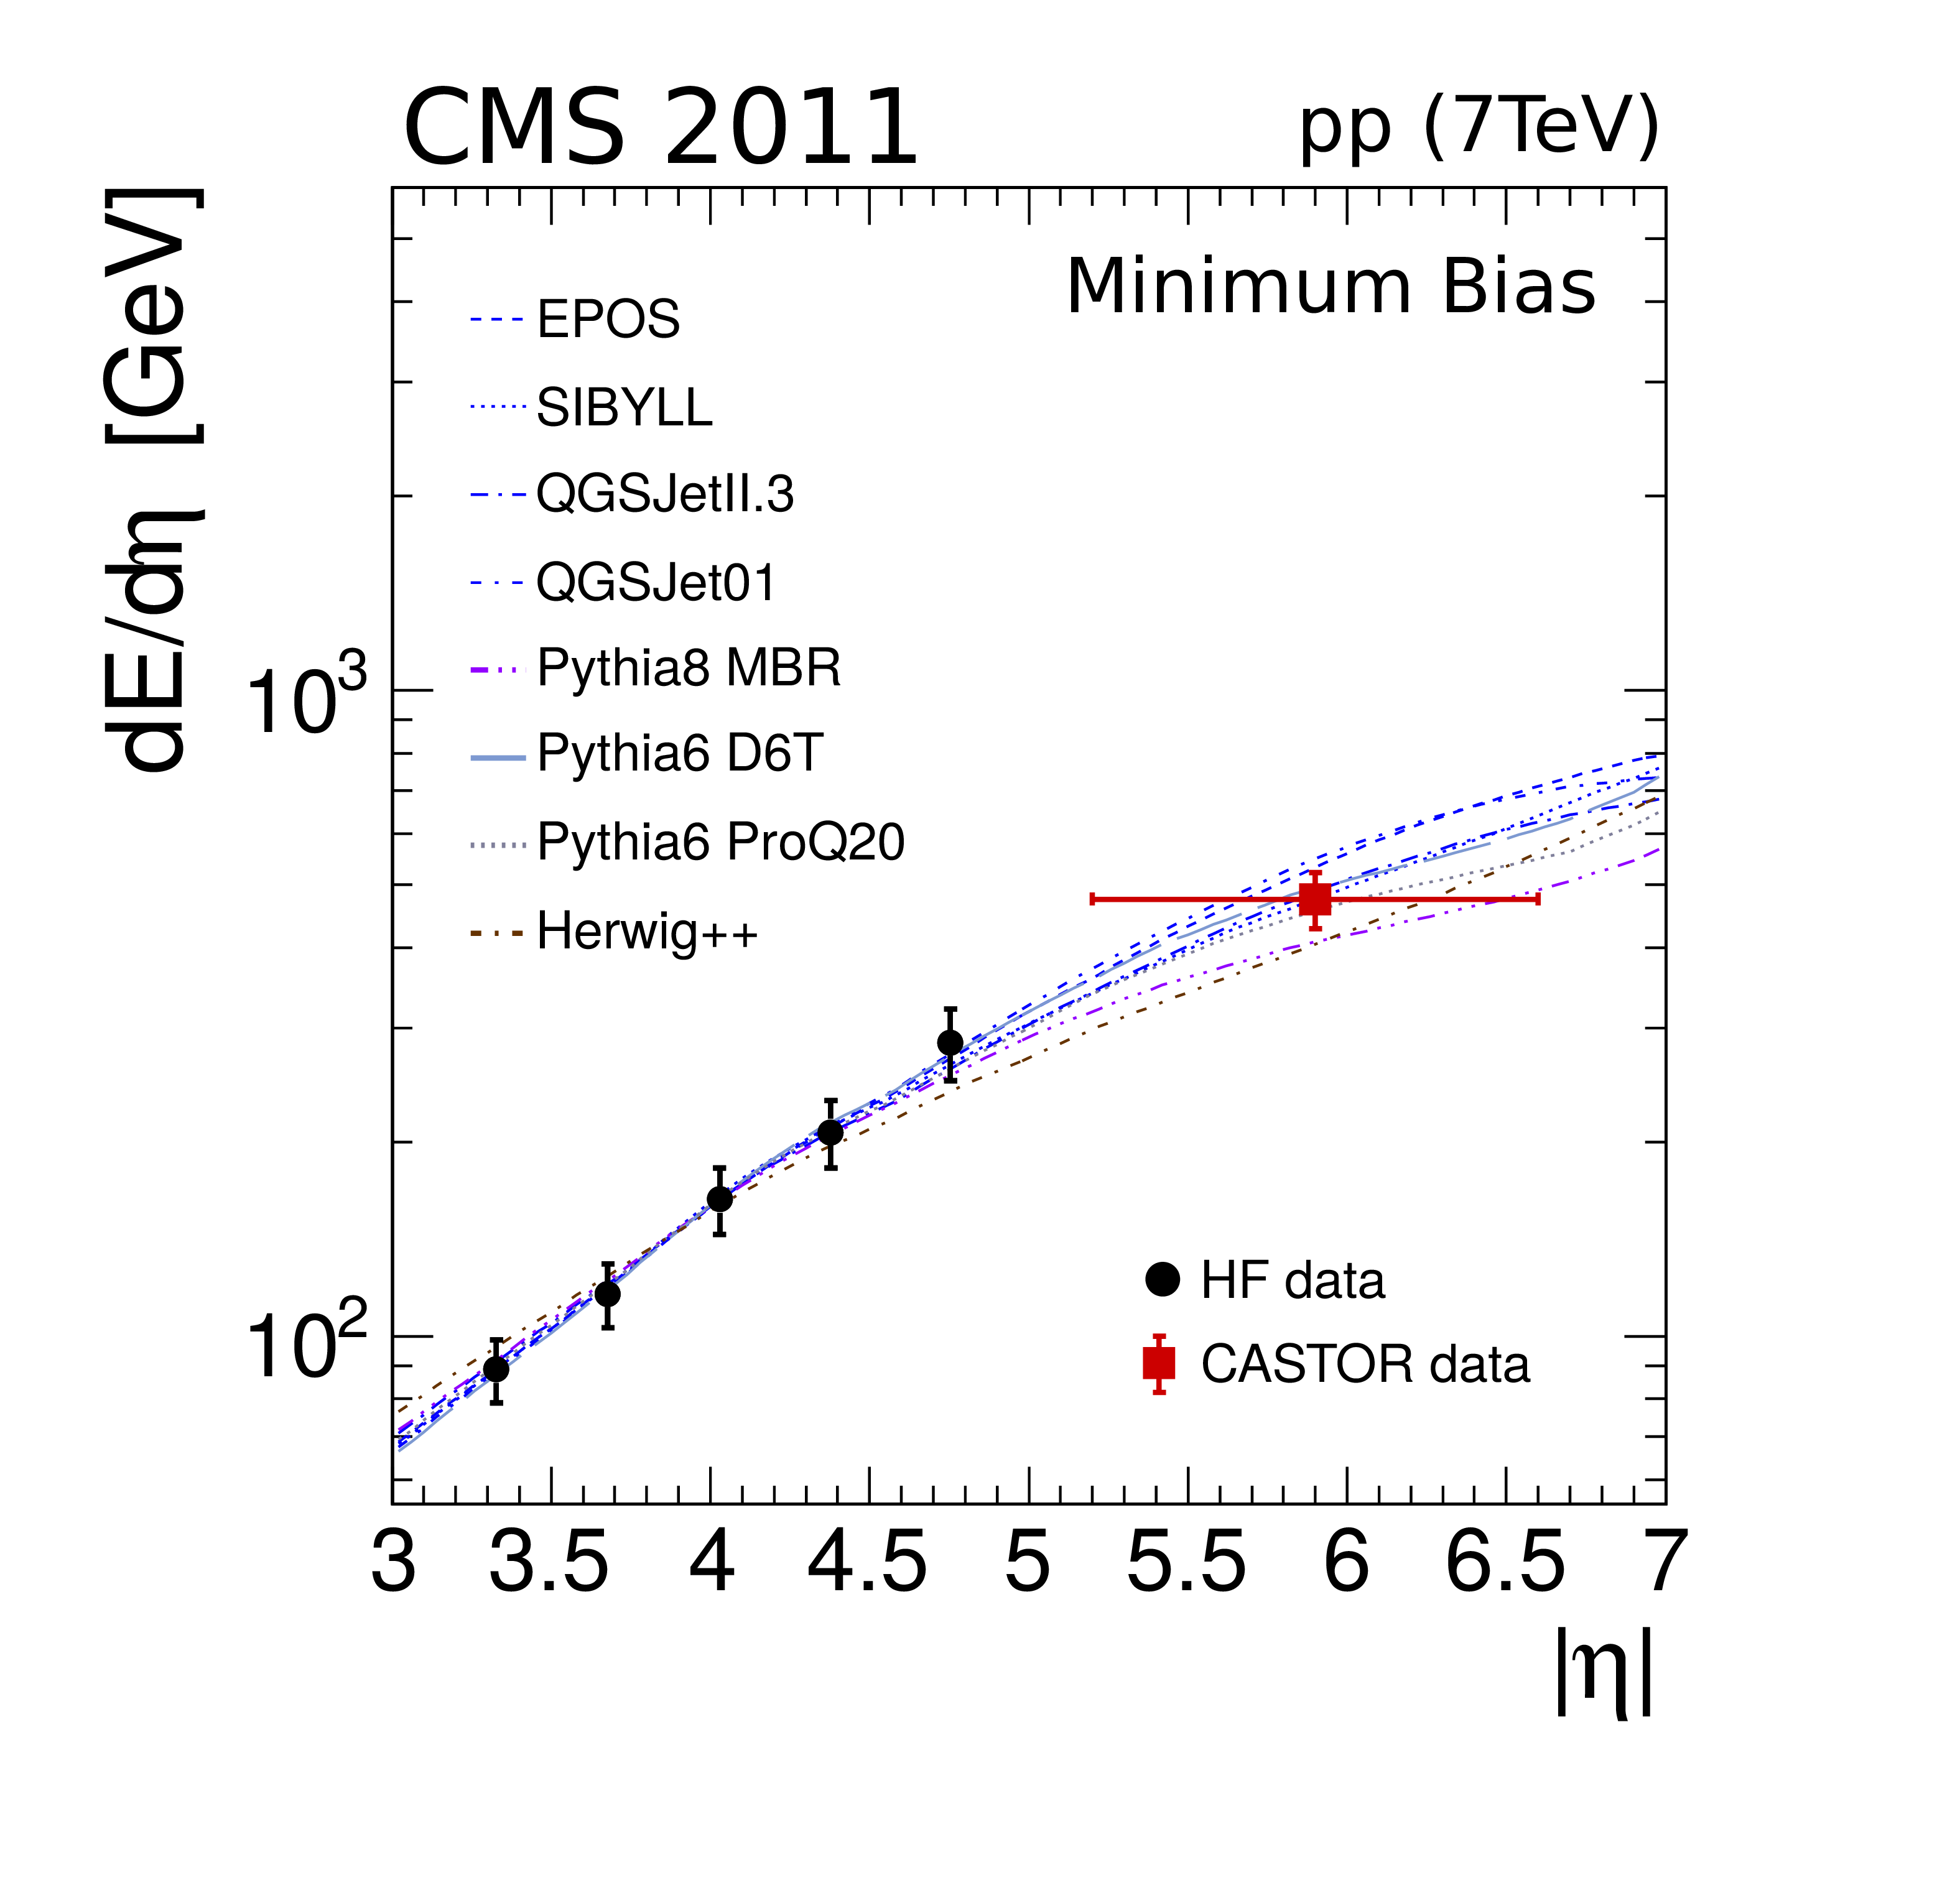
Figure 21:
Pseudorapidity dependence of the forward energy flow in pp collisions at $ {{\sqrt {s}}} = $ 7 TeV measured in HF [15] and CASTOR, compared to MC simulations extrapolated to CASTOR. The uncertainties on the data are dominated by systematic effects. For the CASTOR datum the horizontal error bar indicates the $\eta $ range of the calorimeter. |
png pdf |
Figure 22:
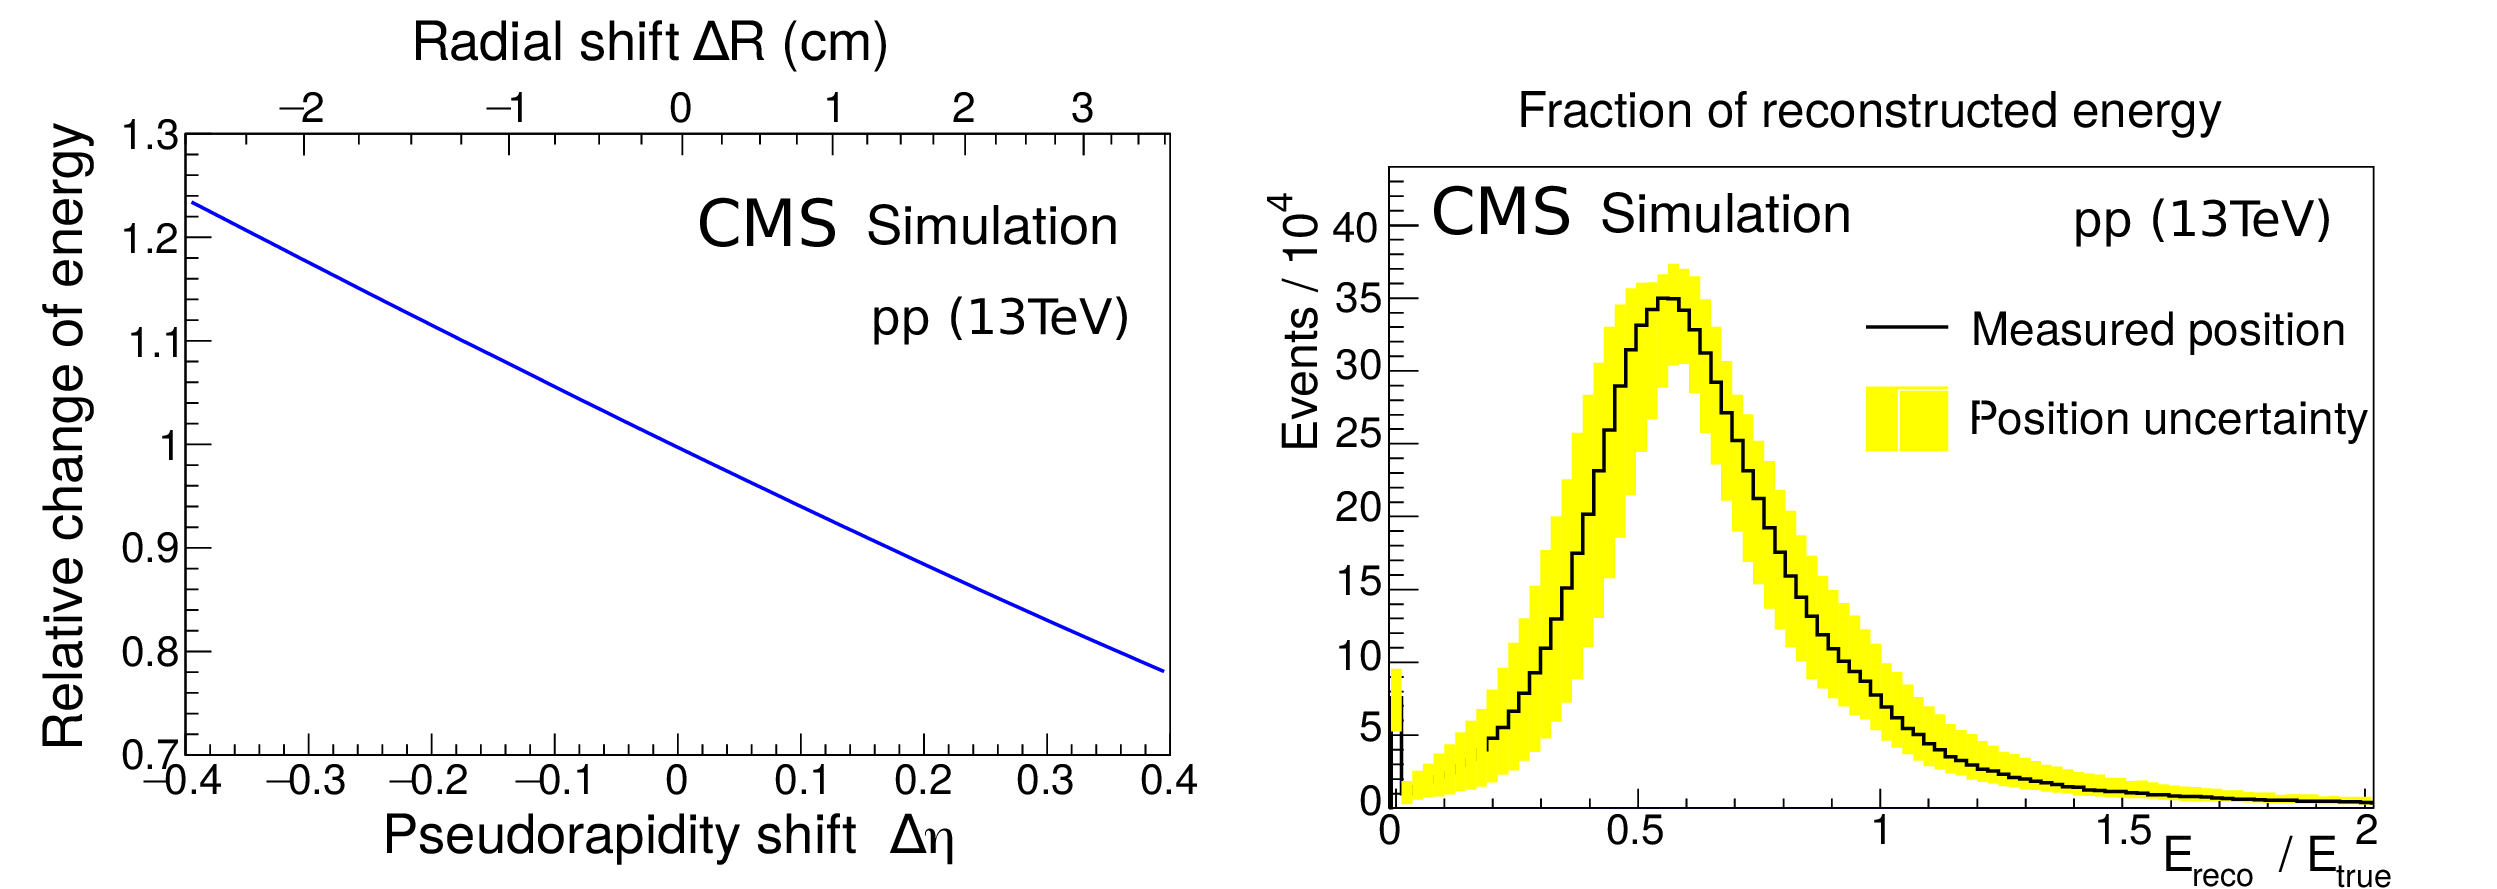
Left: Impact of a pseudorapidity shift $\Delta \eta $ (due to a transverse CASTOR detector displacement $\Delta R$) on the energy response for simulated pp collisions at $ {{\sqrt {s}}} = $ 13 TeV. Right: Distribution of the ratio between reconstructed and true energy measured in pp minimum-bias simulations generated with PYTHIA 8 (CUETP8M1 tune). The average of about 0.6 is due to the noncompensating properties of CASTOR. The yellow error band indicates the uncertainty due to the alignment. |
png pdf |
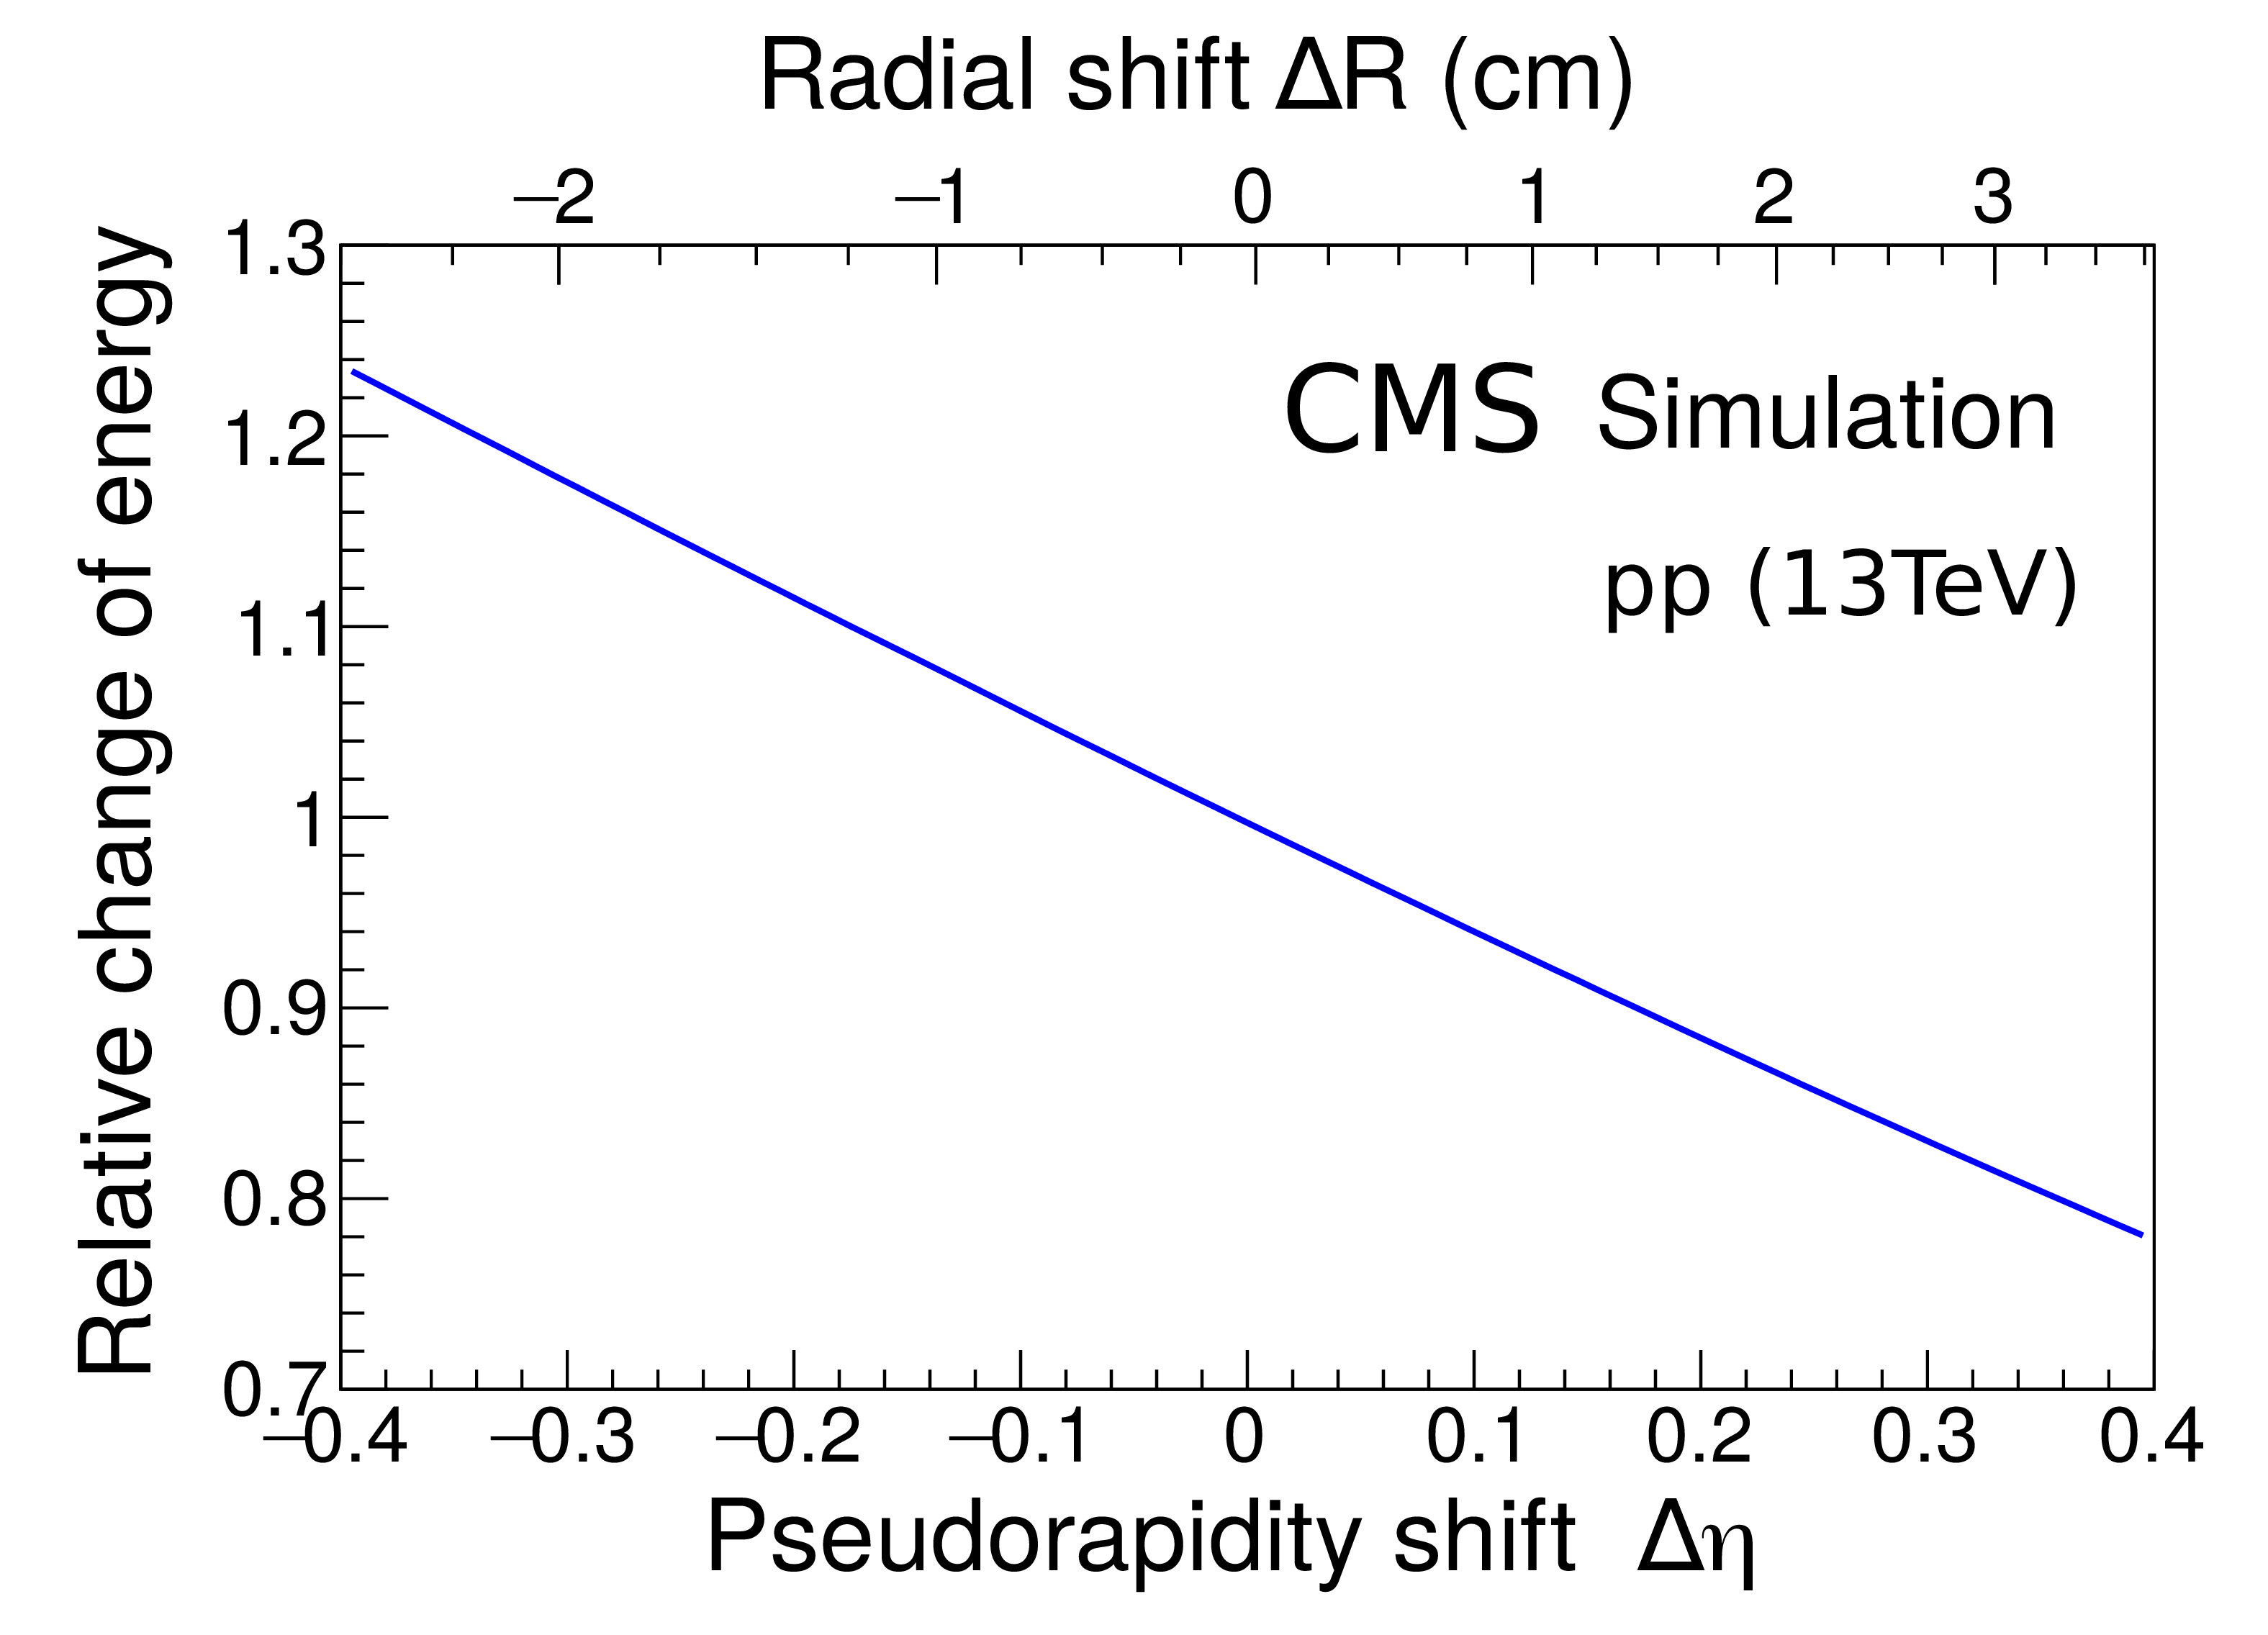
Figure 22-a:
Impact of a pseudorapidity shift $\Delta \eta $ (due to a transverse CASTOR detector displacement $\Delta R$) on the energy response for simulated pp collisions at $ {{\sqrt {s}}} = $ 13 TeV. |
png pdf |
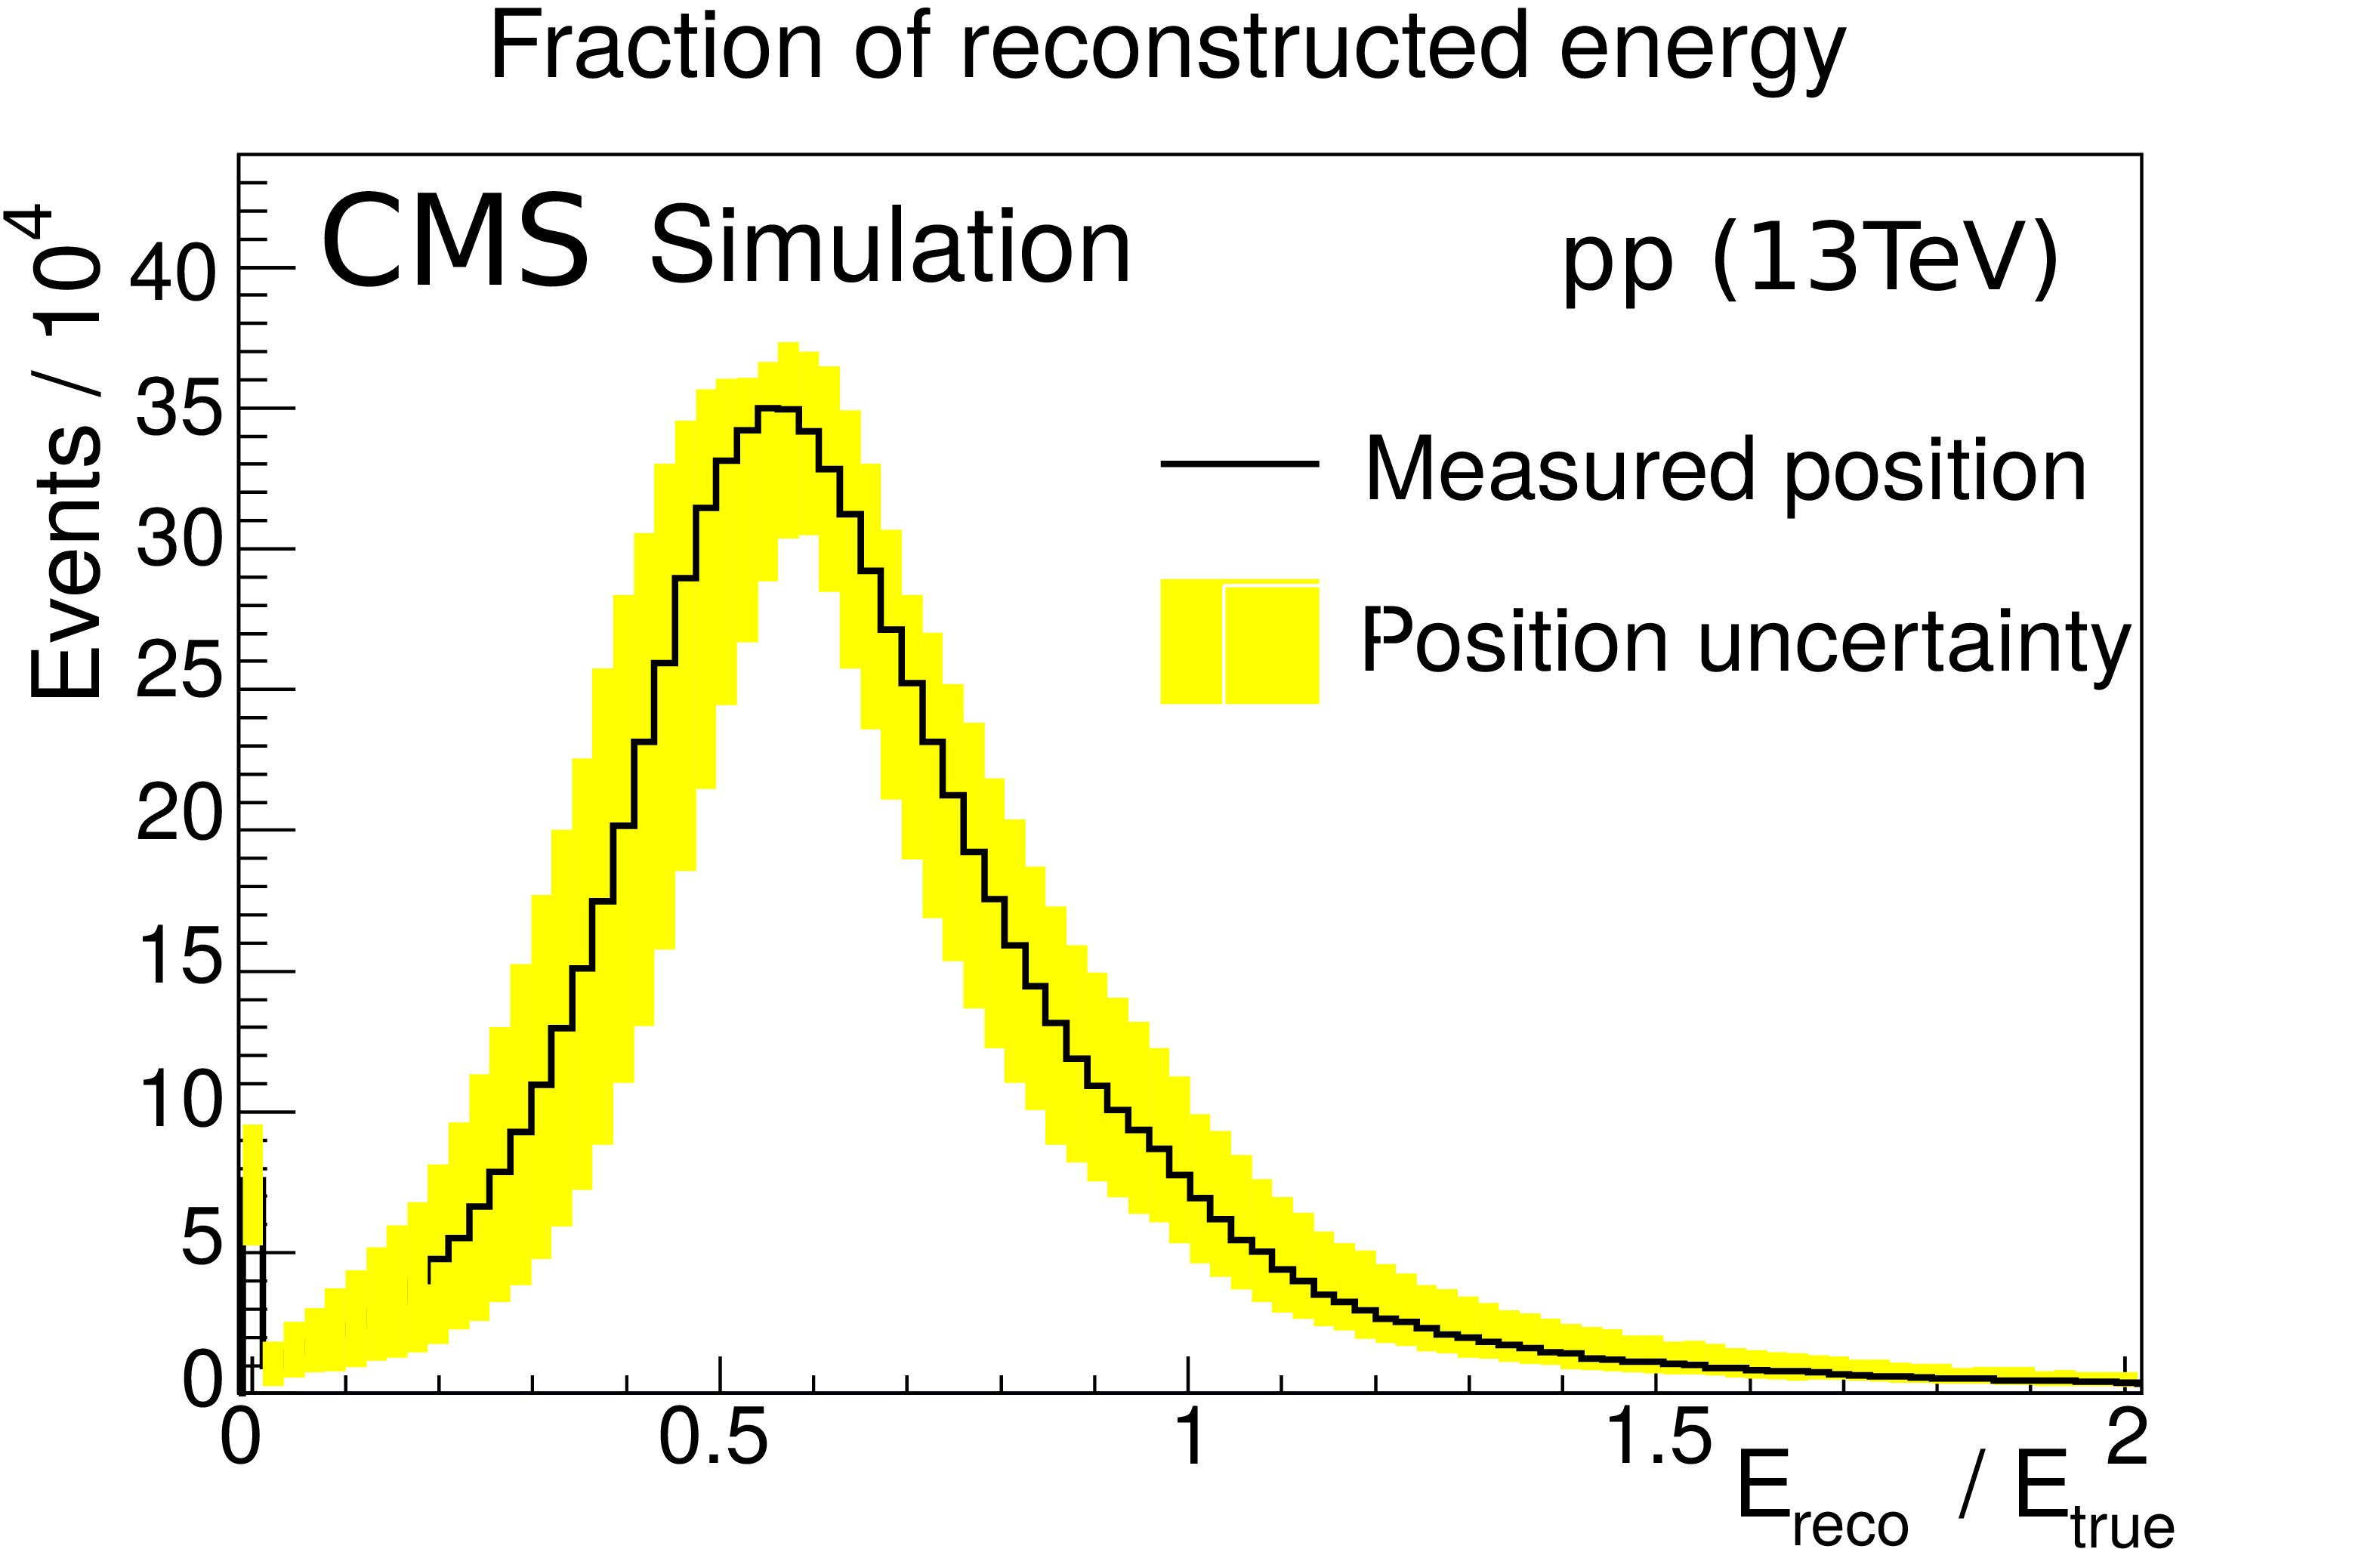
Figure 22-b:
Distribution of the ratio between reconstructed and true energy measured in pp minimum-bias simulations generated with PYTHIA 8 (CUETP8M1 tune). The average of about 0.6 is due to the noncompensating properties of CASTOR. The yellow error band indicates the uncertainty due to the alignment. |

png pdf |
Figure 23:
Infrared distance sensor calibration data in the $(x,y)$ plane. Shown is the measured response during a bidimensional position scan in front of a beam pipe mockup. The used sensors do not work for very close proximities to the beam pipe due to self-shadowing effects, however, this is well outside of the range where the sensors are used in CMS. This effect can be seen in the calibration data at $x=0$ and close to $y=30 mm $. |
png pdf |
Figure 24:
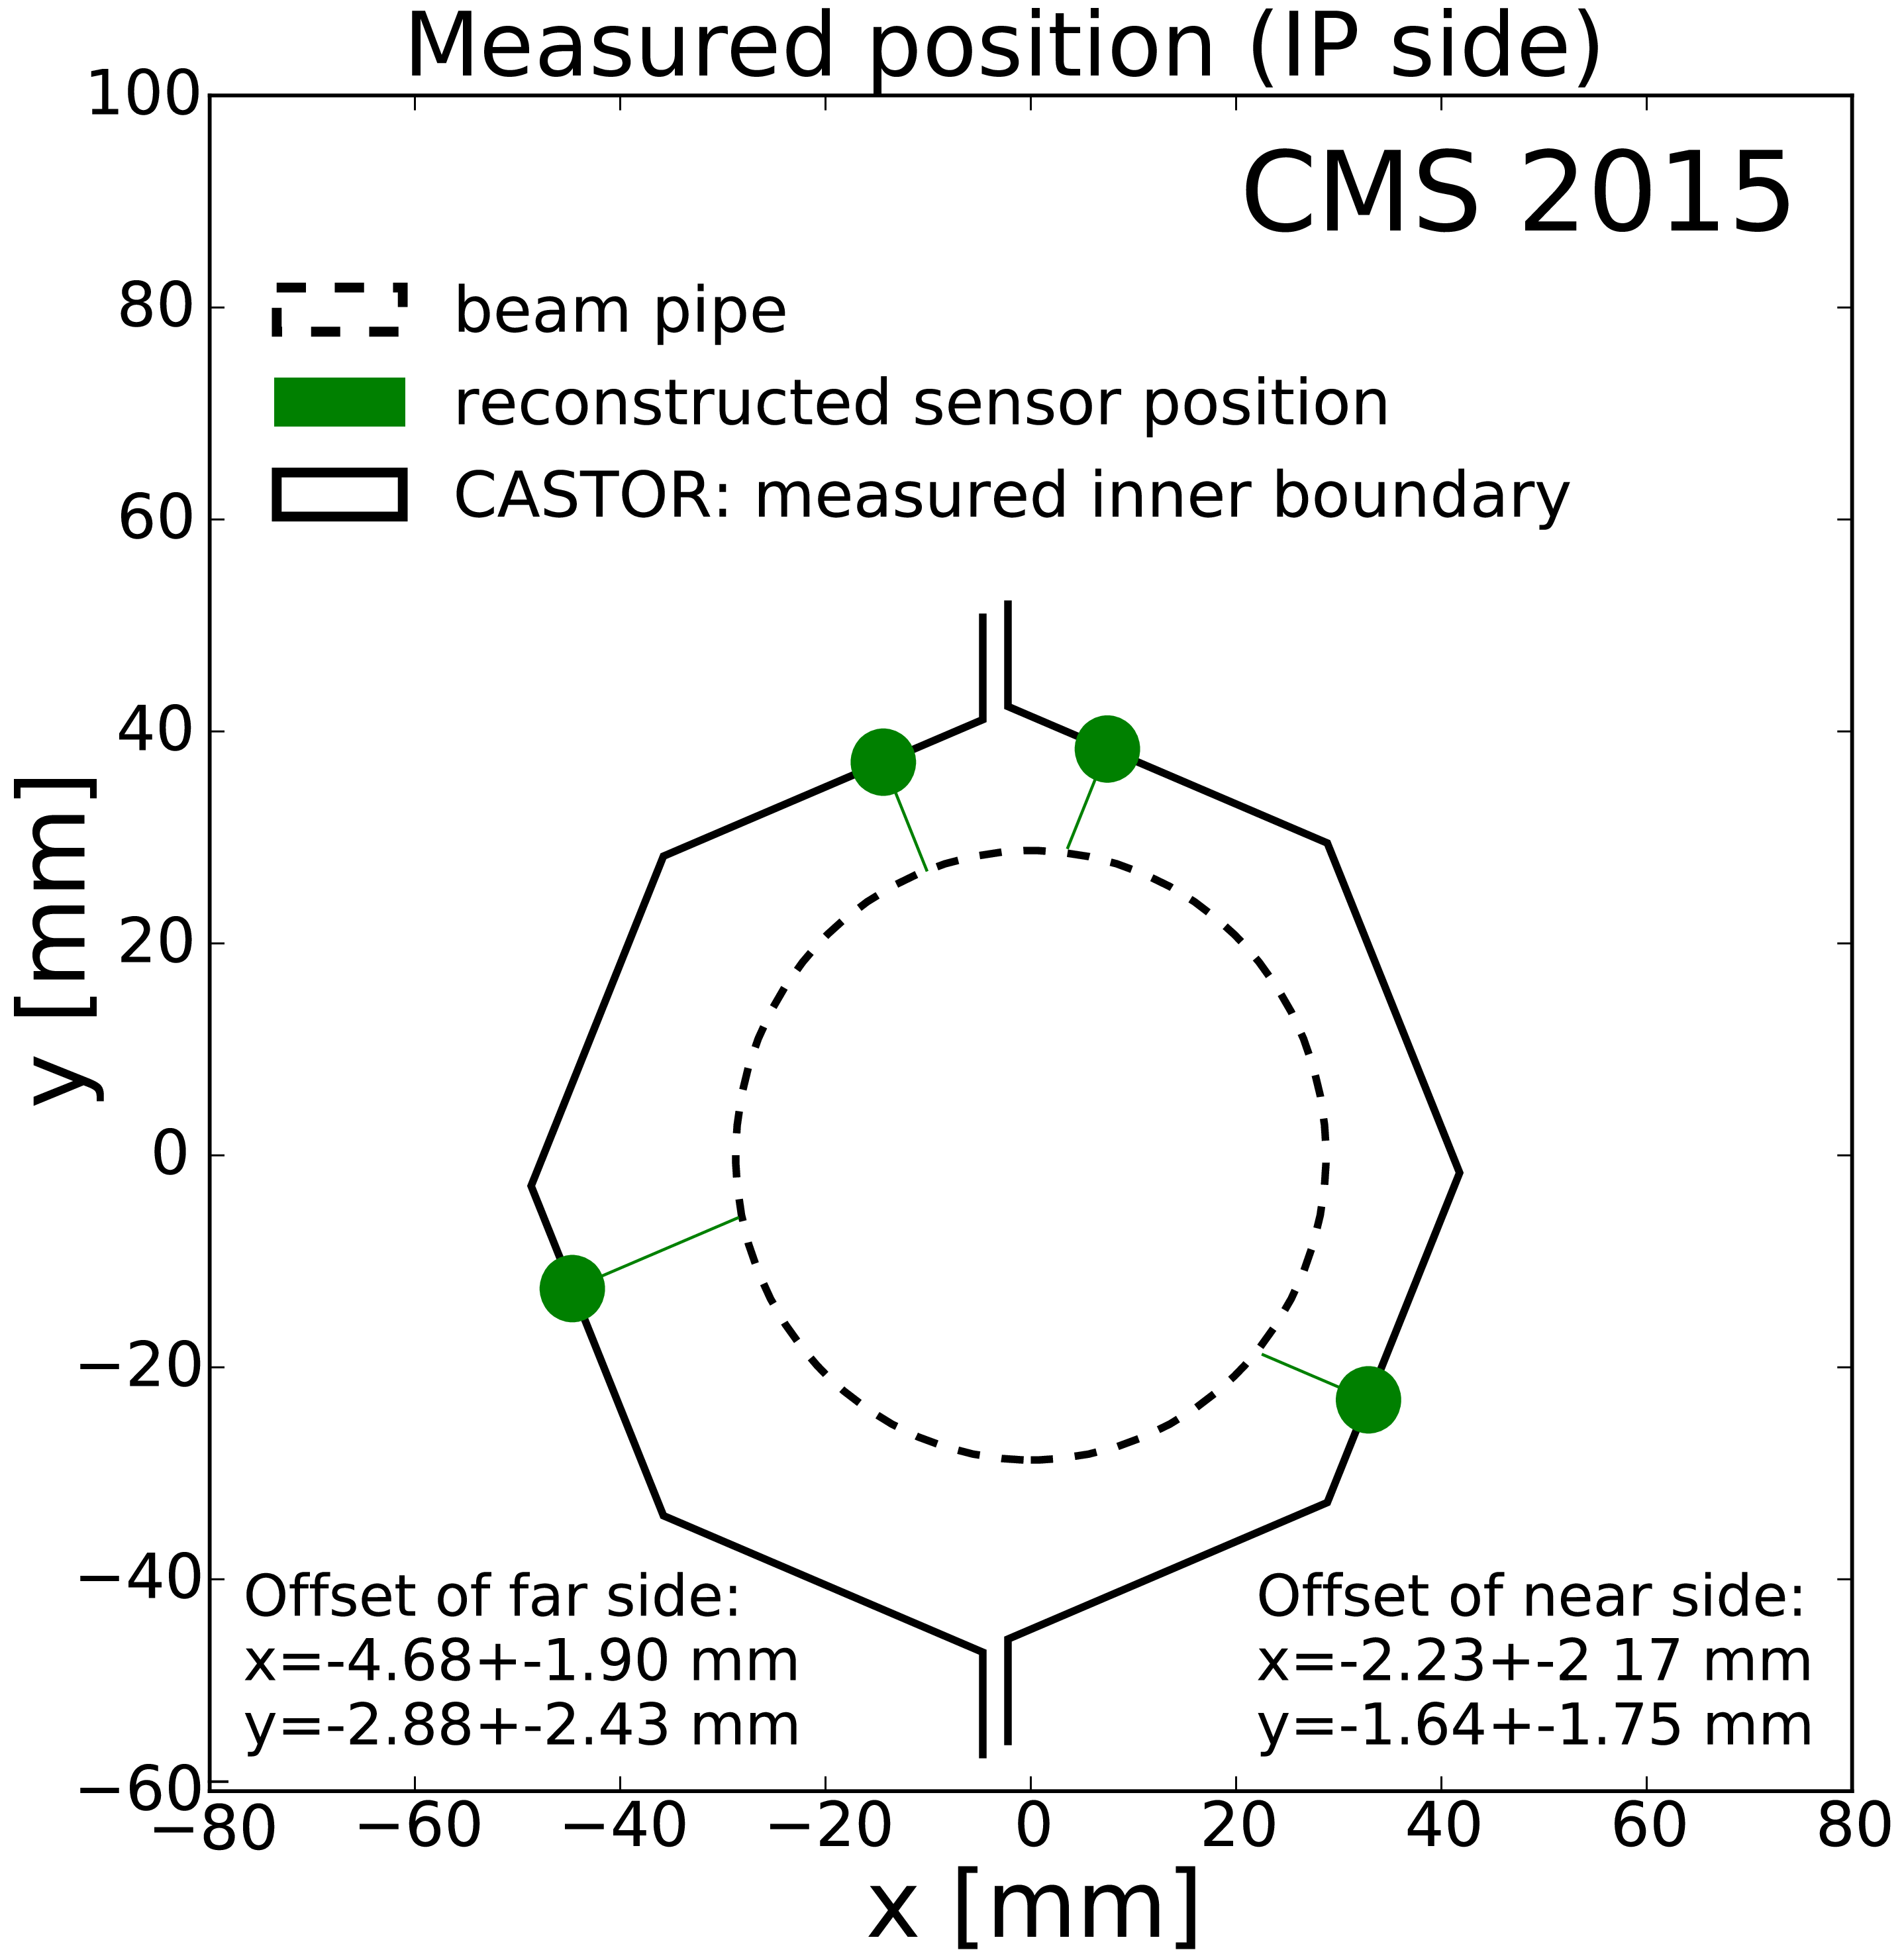
Illustration of the global fit result of the position of both CASTOR halves in the $(x,y)$ plane. The beam pipe is indicated as a dashed circle. The measured distances of the sensors are shown as lines attached to the round markers that indicate the reconstructed sensor positions. The potentiometer sensors are not shown here but are also used as constraints for the alignment. |
png pdf |
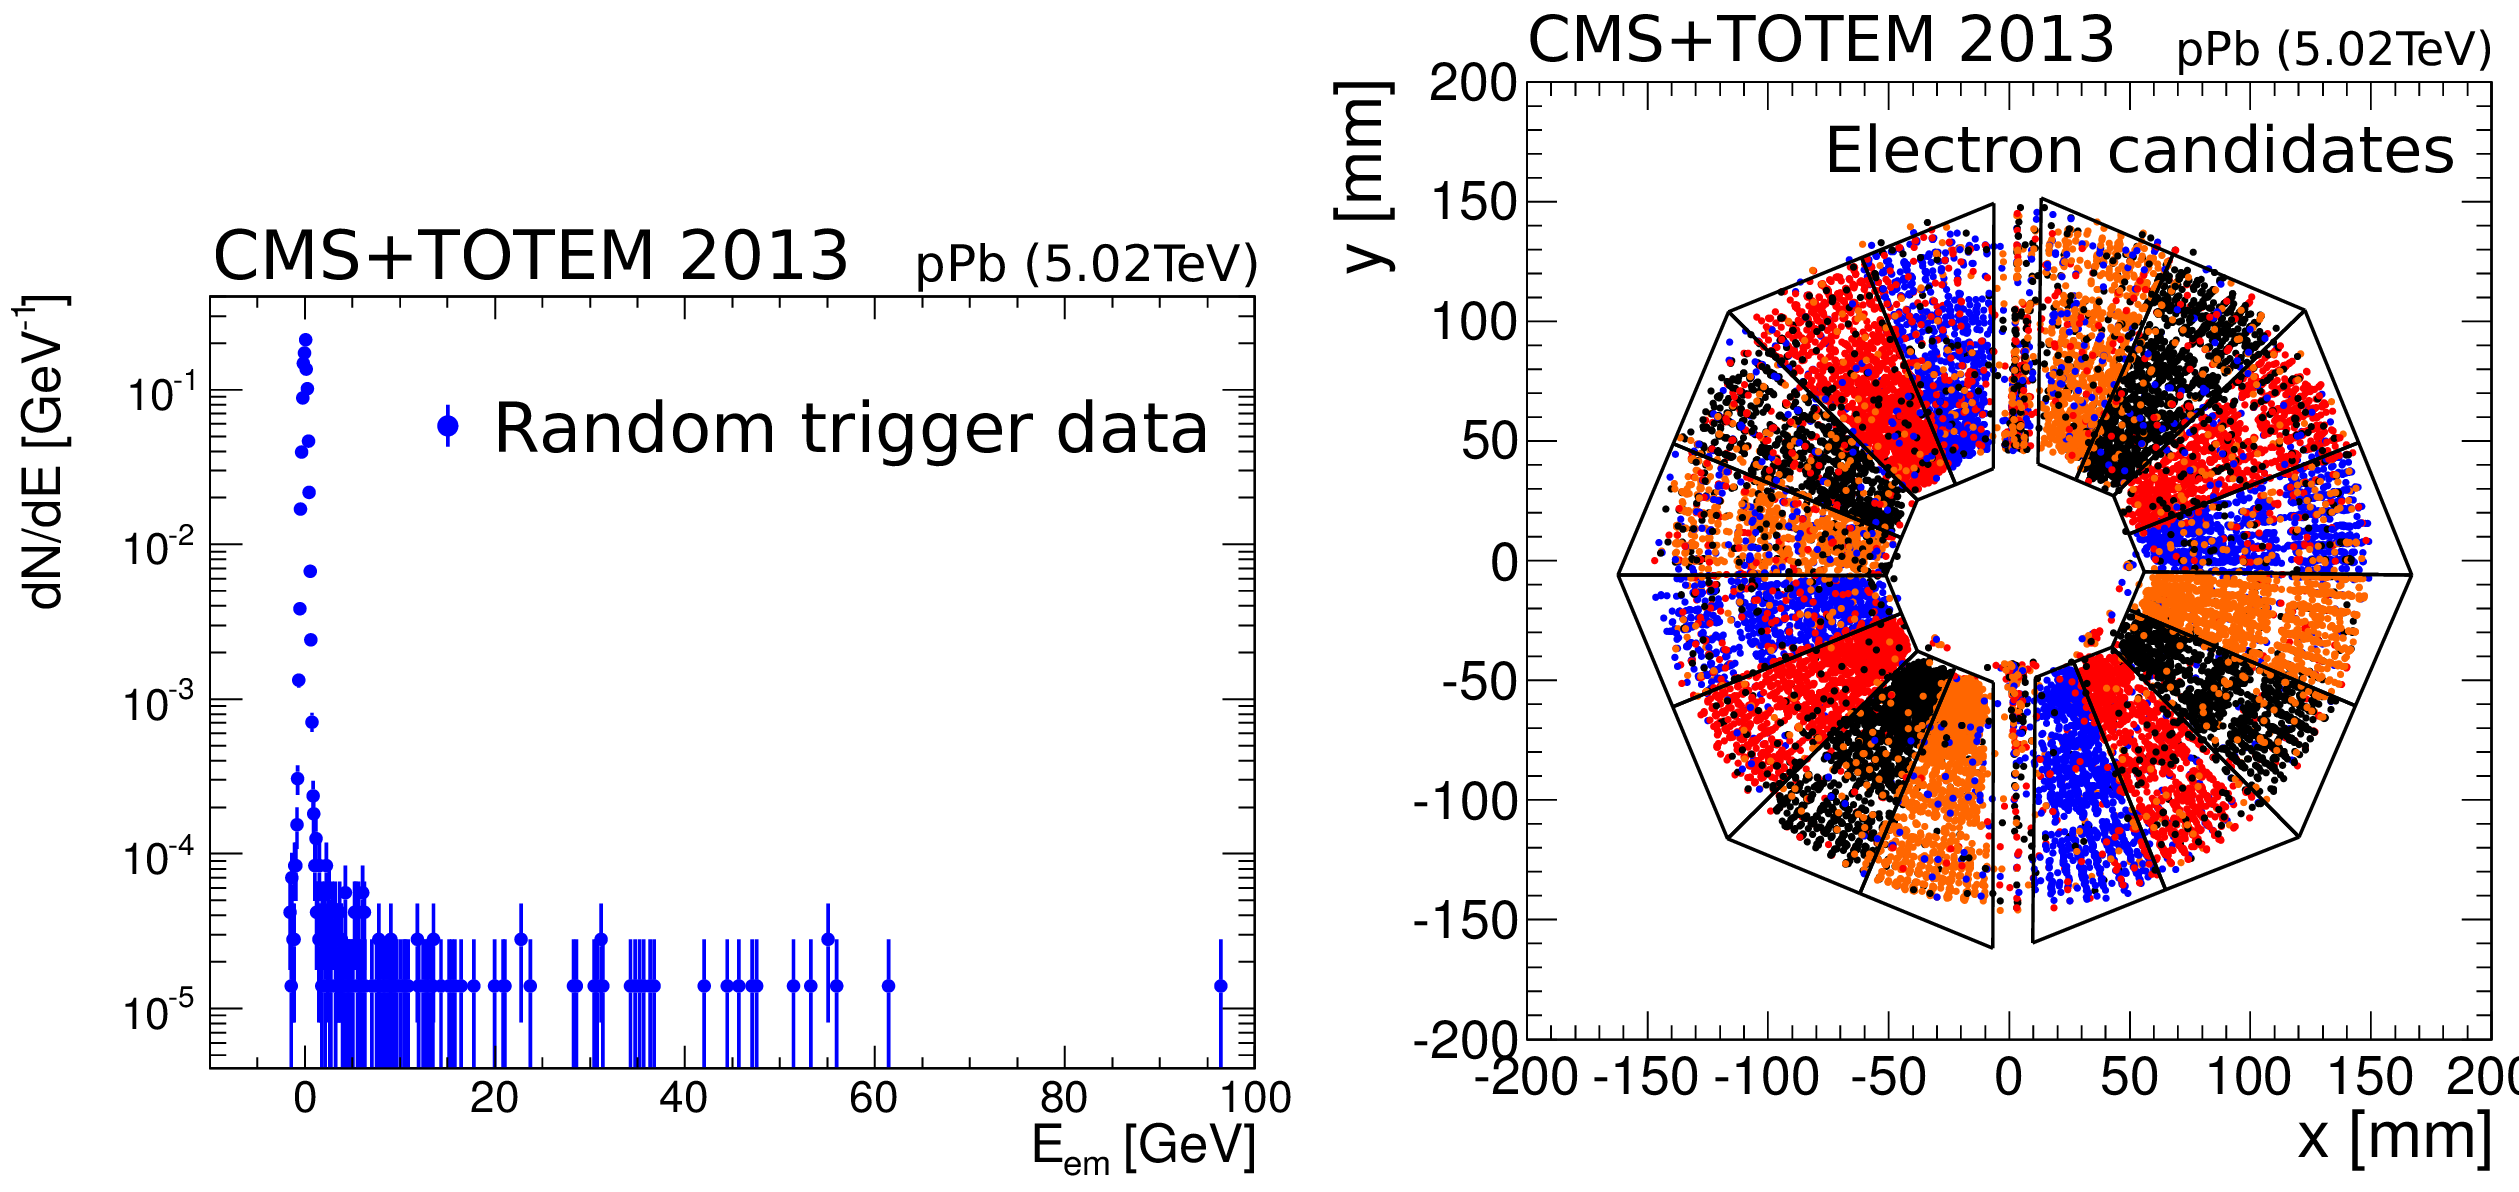
Figure 25:
Left: Noise distribution of e.m.\ clusters in data used for the alignment of CASTOR with TOTEM T2 tracks, measured with a random trigger in pPb events with no collisions [65]. The RMS of the distribution is $ < $1 GeV ; the uncertainties are statistical only. Right: Intersection points in the $(x,y)$ plane of measured single isolated T2 tracks (electron candidates) on the CASTOR front surface. The alternating colors indicate for each track the corresponding active tower that was used to identify the electron and measure its energy. Electron candidates are selected by a single T2 track, in combination with a single CASTOR e.m. cluster above 10 GeV, with all other towers are below 5 GeV [65]. The plotted contours of the two halves of CASTOR represent their optimal positions as derived from this analysis. |
png pdf |
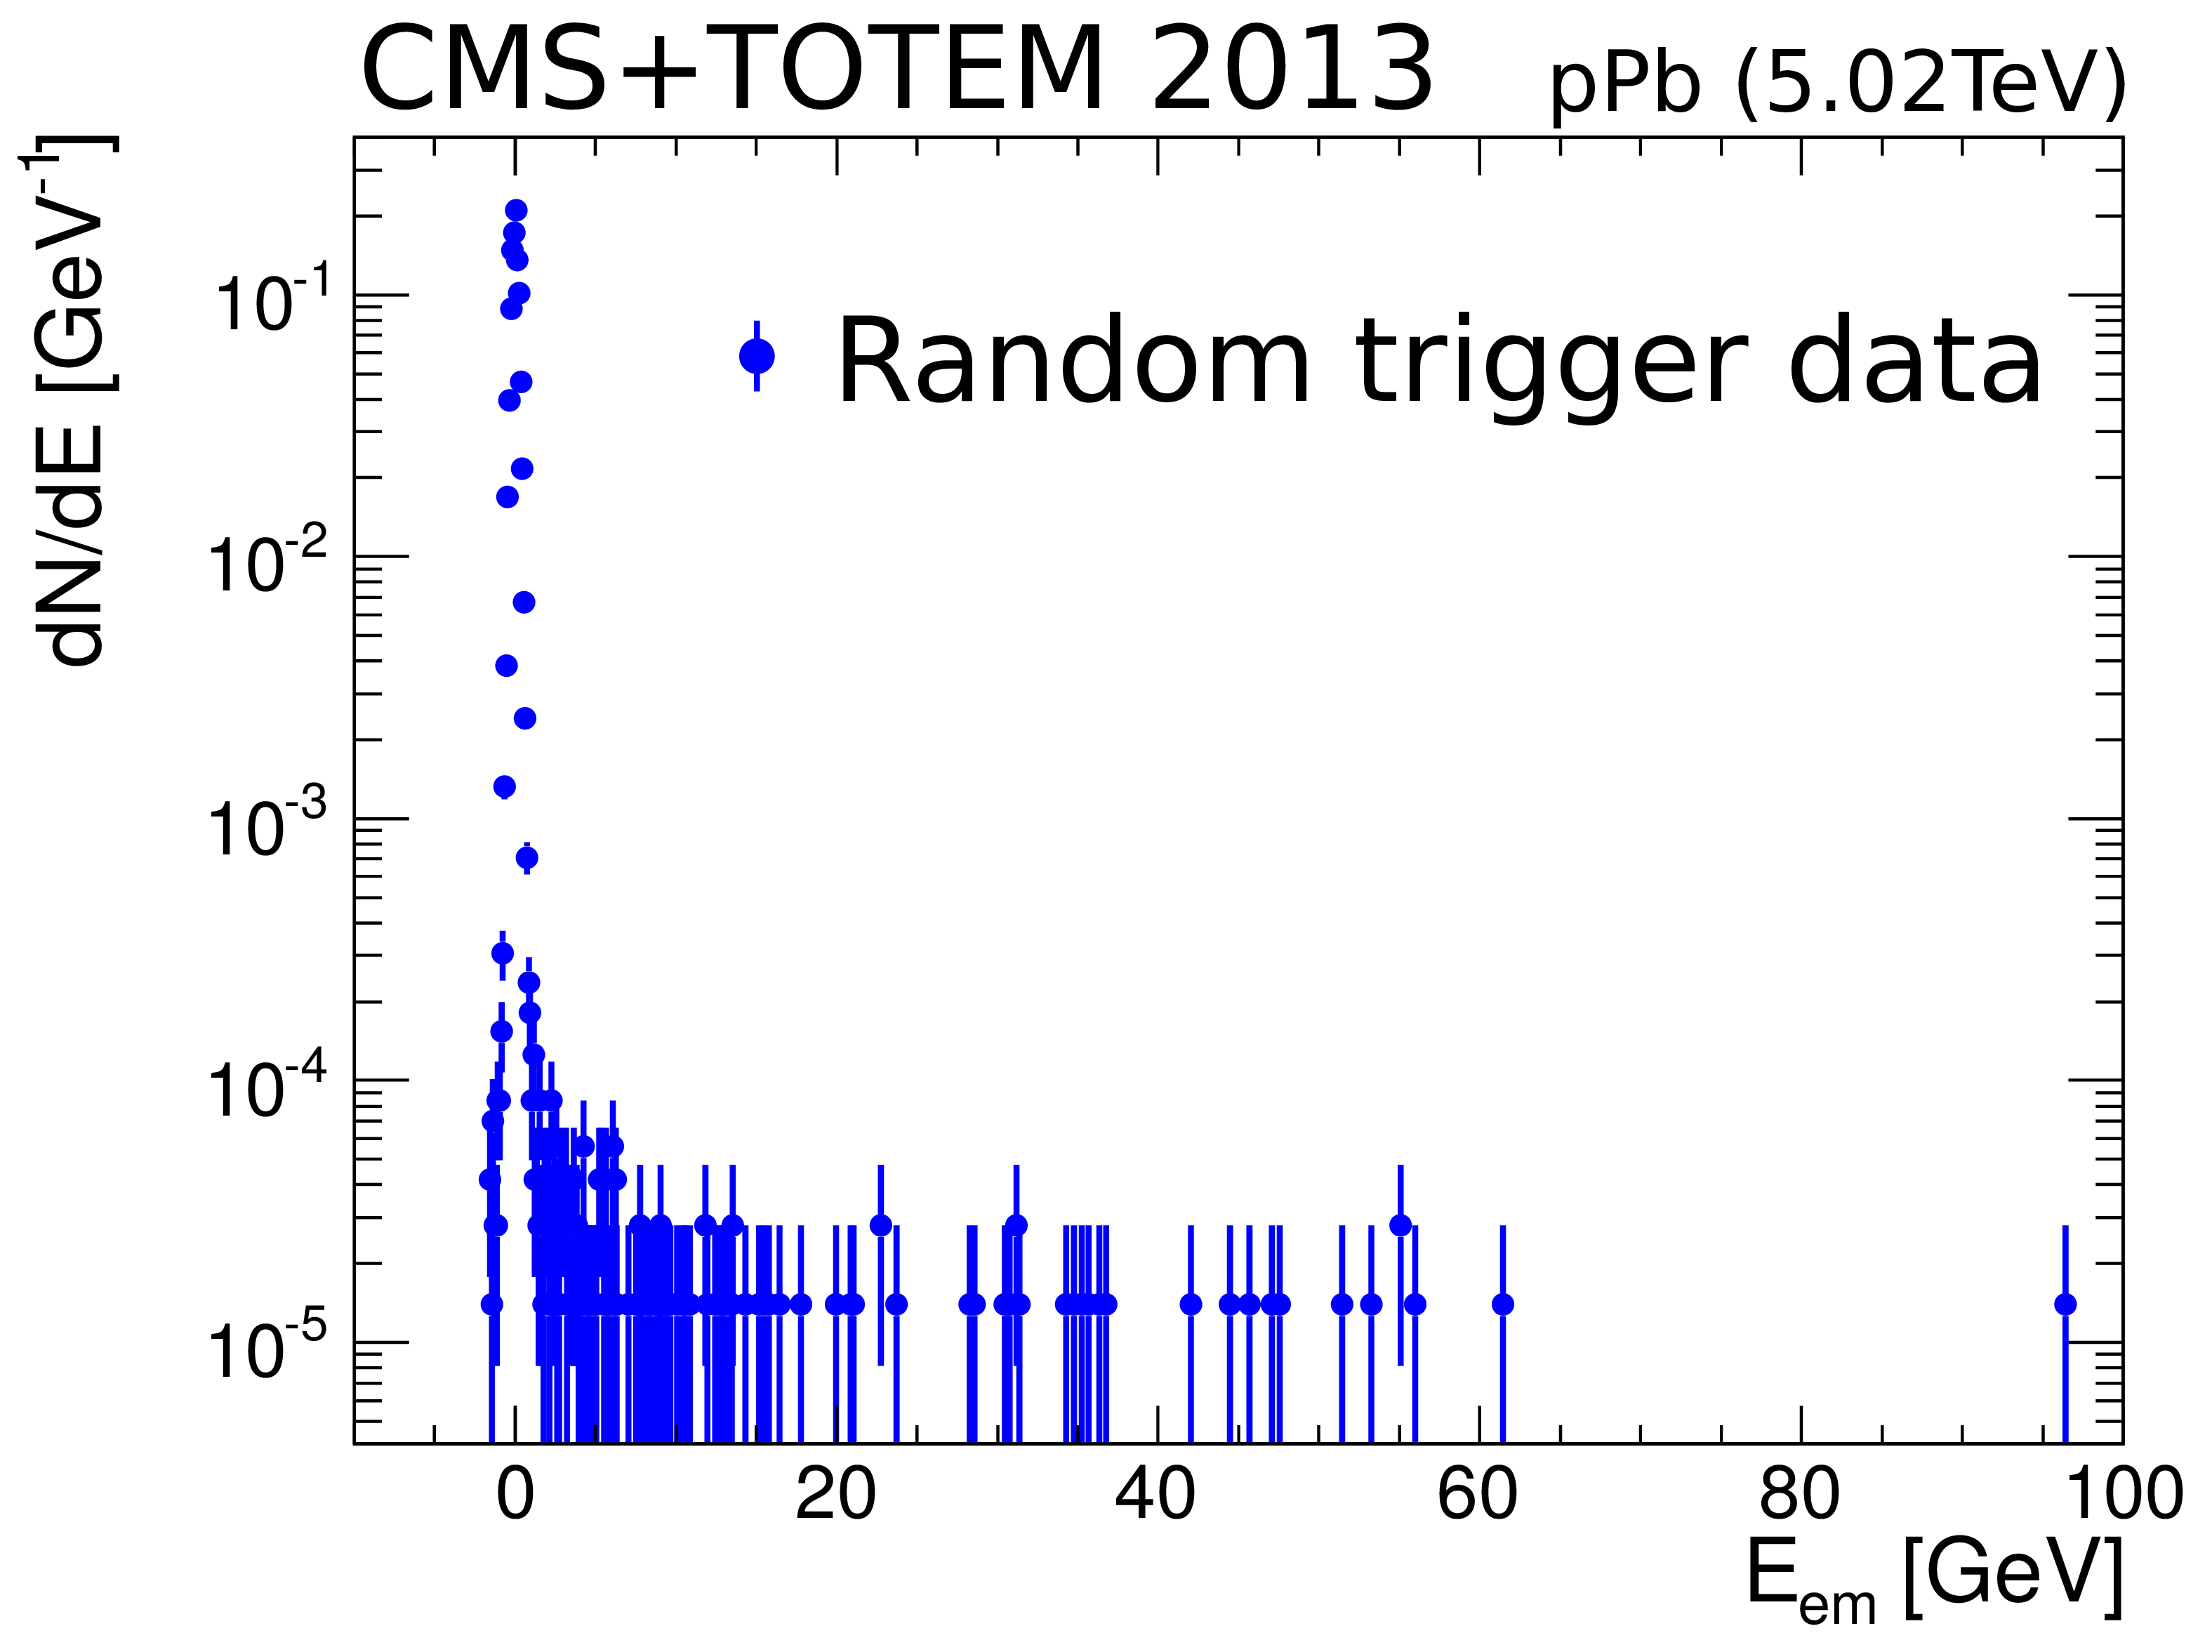
Figure 25-a:
Noise distribution of e.m.\ clusters in data used for the alignment of CASTOR with TOTEM T2 tracks, measured with a random trigger in pPb events with no collisions [65]. The RMS of the distribution is $ < $1 GeV ; the uncertainties are statistical only. |
png pdf |
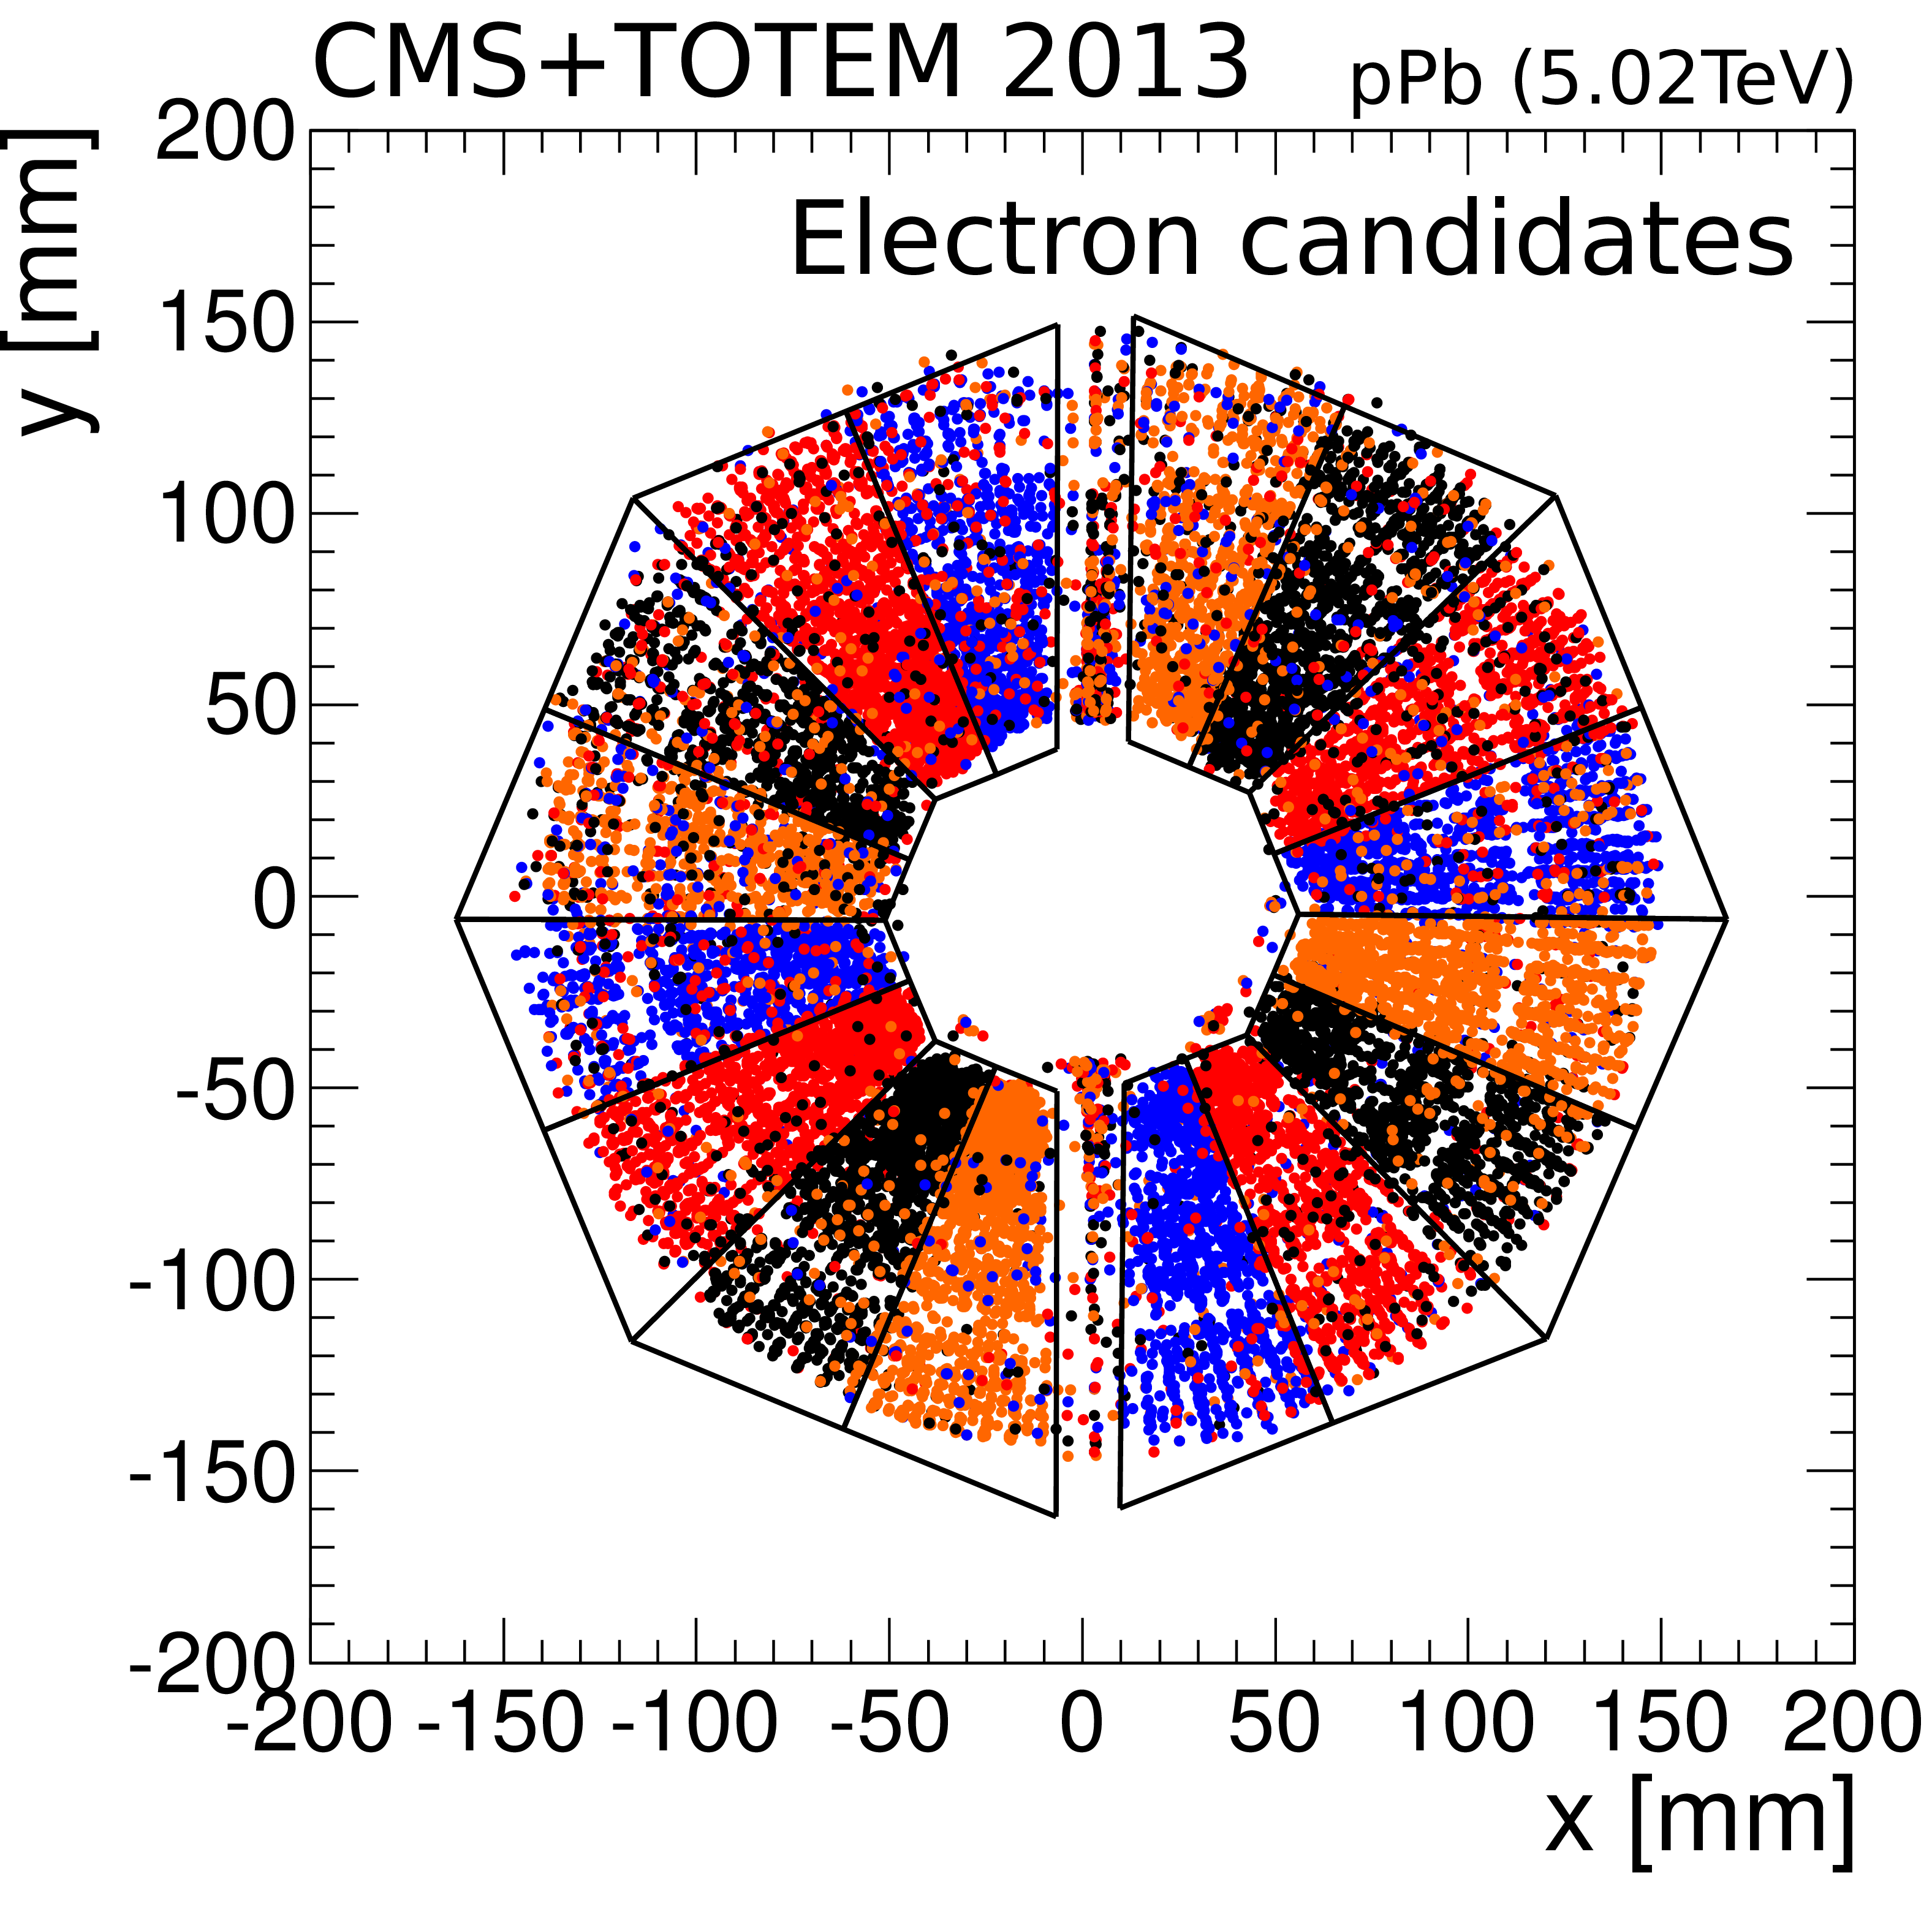
Figure 25-b:
Intersection points in the $(x,y)$ plane of measured single isolated T2 tracks (electron candidates) on the CASTOR front surface. The alternating colors indicate for each track the corresponding active tower that was used to identify the electron and measure its energy. Electron candidates are selected by a single T2 track, in combination with a single CASTOR e.m. cluster above 10 GeV, with all other towers are below 5 GeV [65]. The plotted contours of the two halves of CASTOR represent their optimal positions as derived from this analysis. |
png pdf |
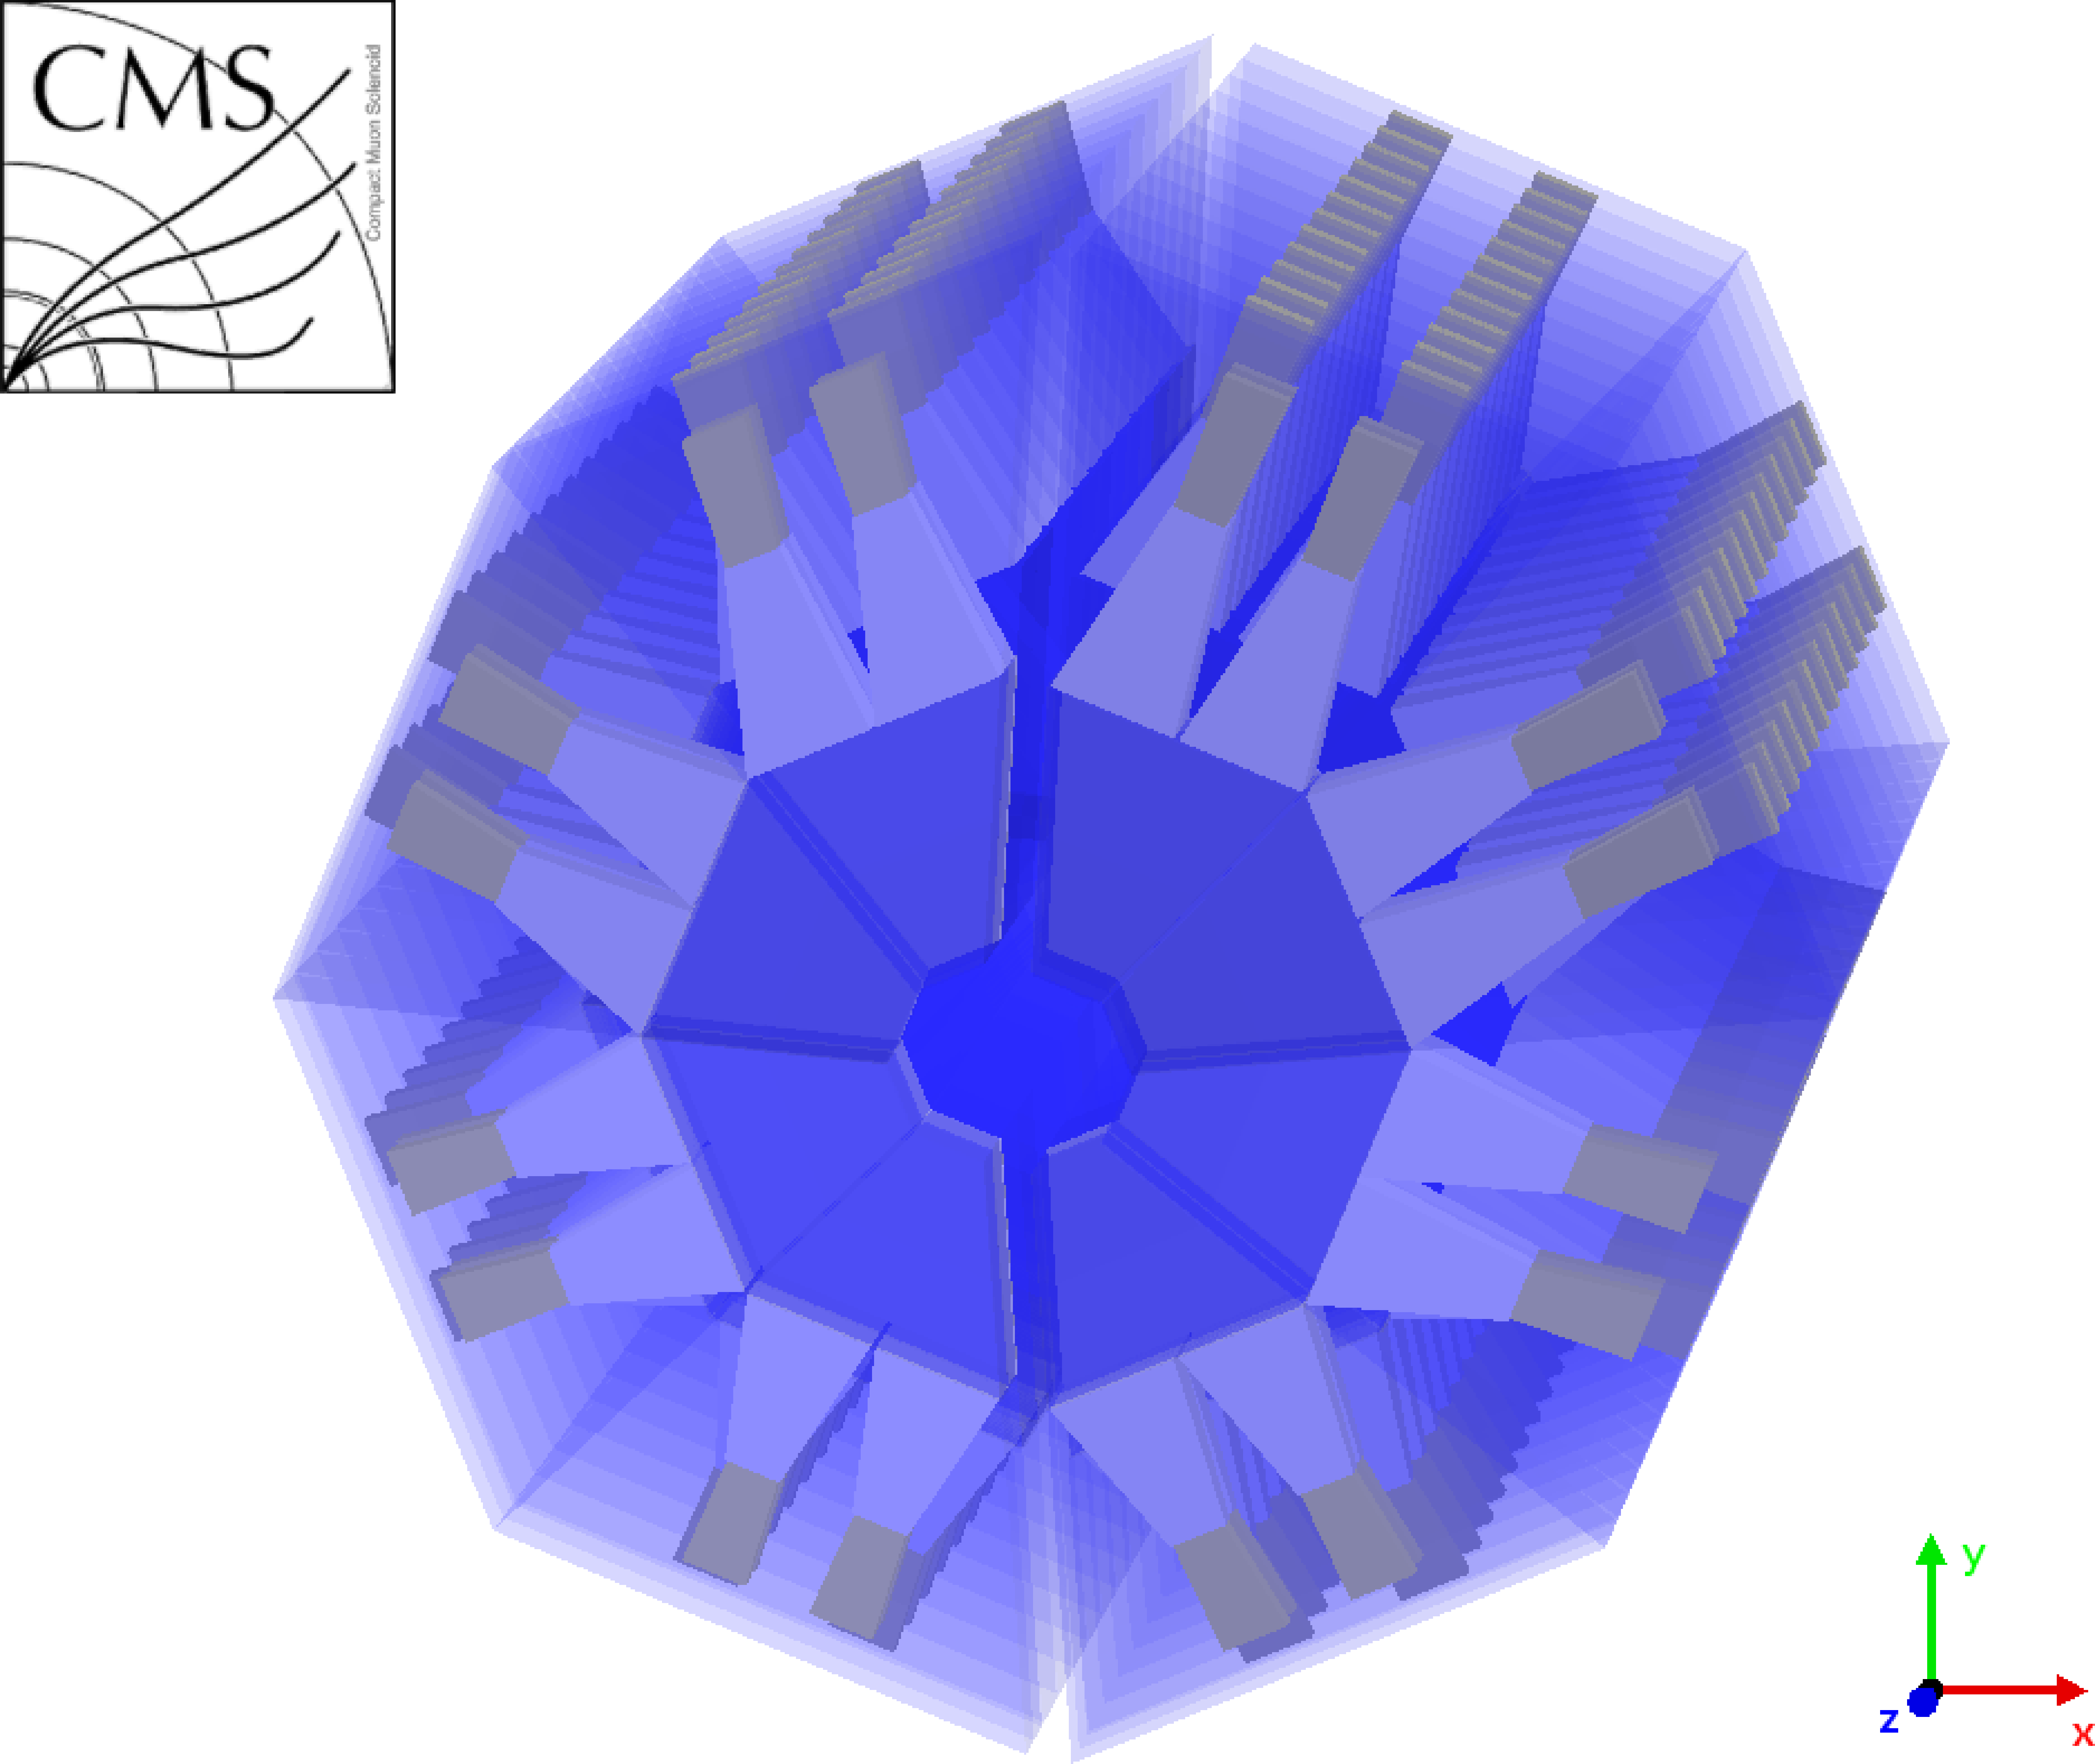
Figure 26:
Visualization of the CASTOR detector geometry in simulations. The inner trapezoids in darker blue are the active volumes, while the outer volumes describe the light guides and the PMTs. The near and far halves are placed at the measured position corresponding to the data taking in 2013. An opening of 2.2 cm along the $x$-axis is visible between the two halves. |
png pdf |
Figure 27:
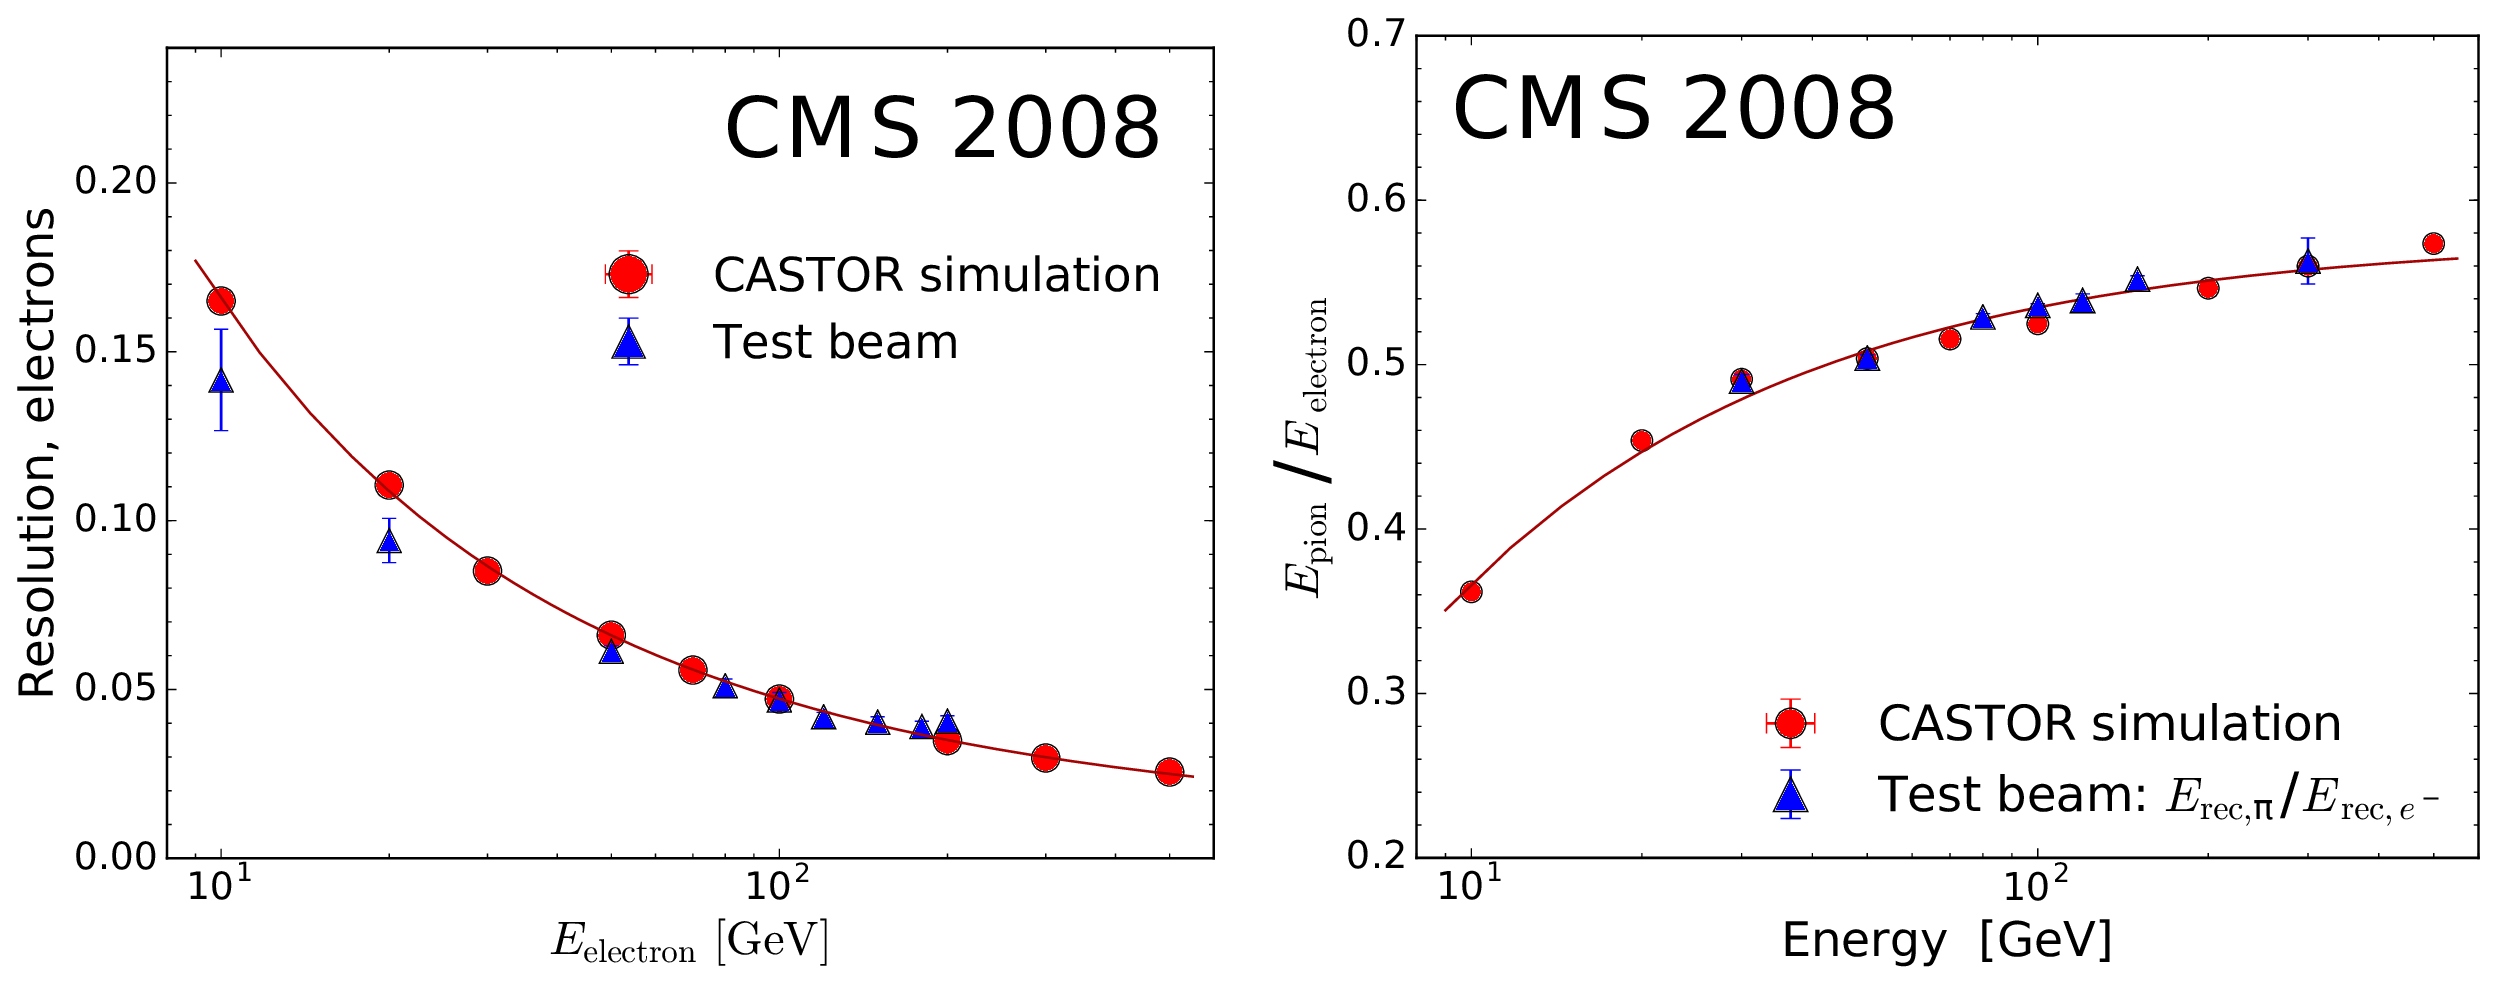
Comparison of detector simulations (circles) to test-beam measurements (triangles). Resolution of electron energy reconstruction (left), and observed charged pion/electron response ratio (right) as a function of test-beam energy. The uncertainties plotted are statistical only, and the fitted curves are shown to guide the eye. |
png pdf |
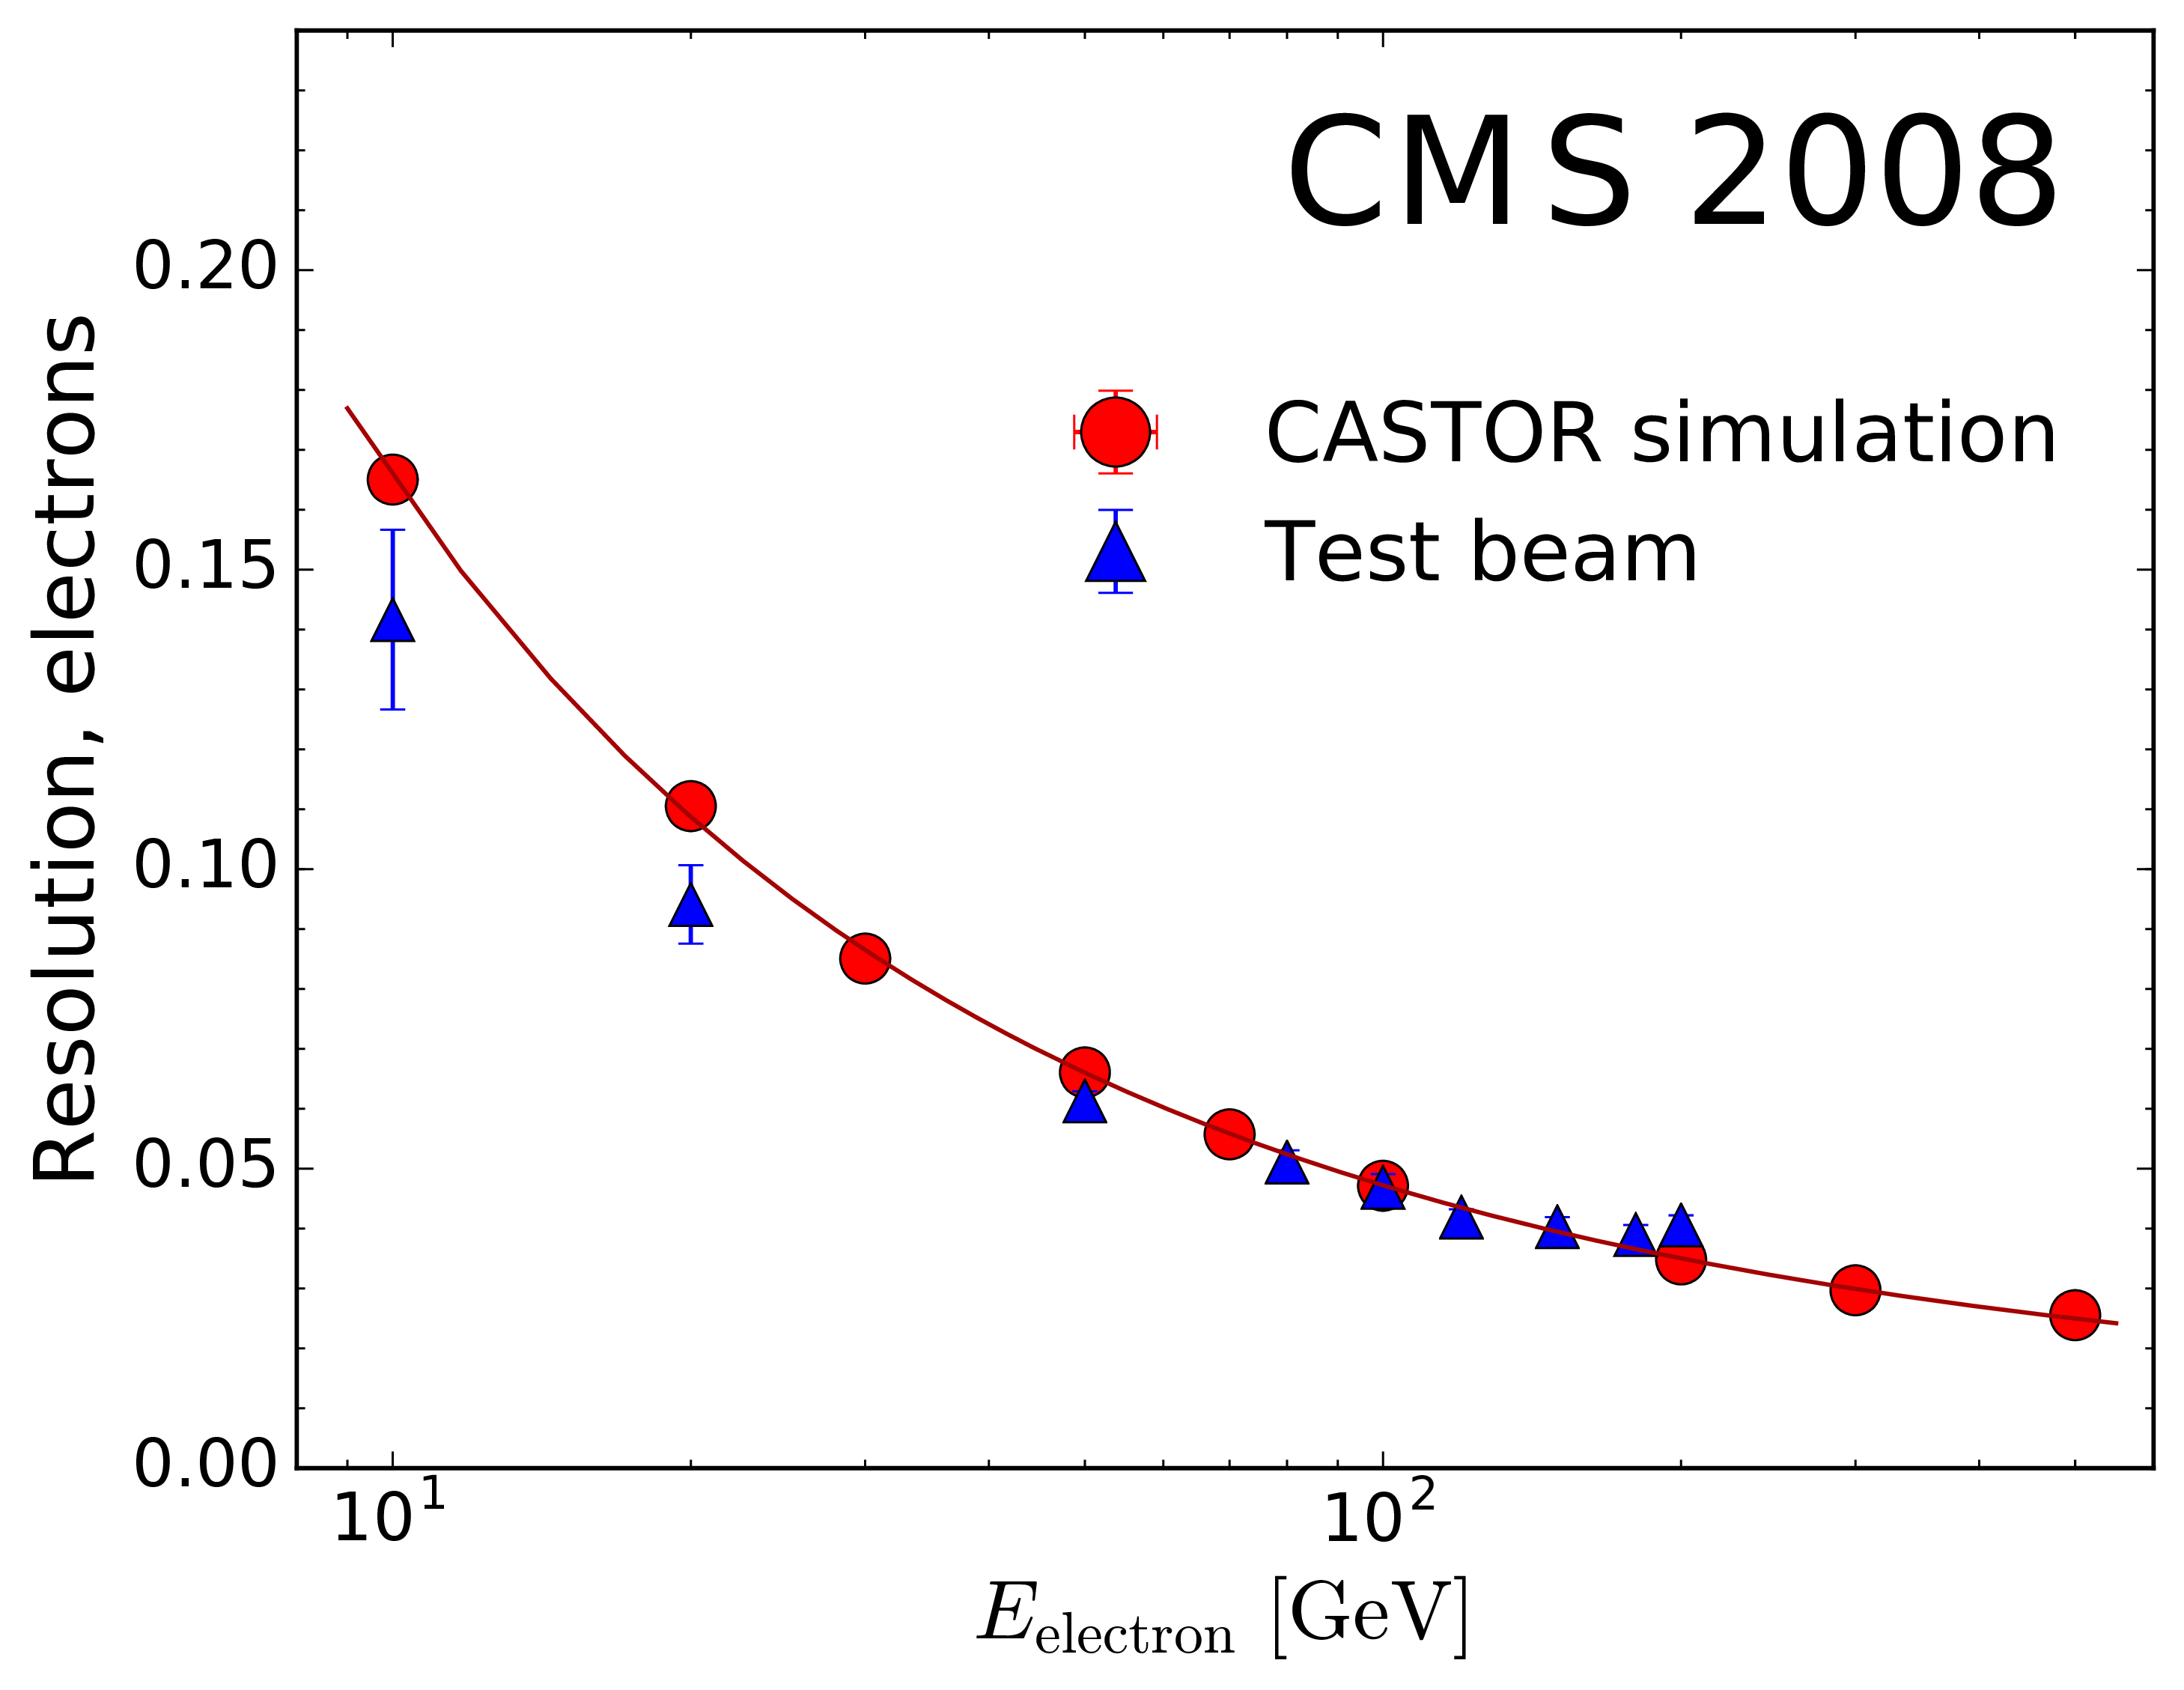
Figure 27-a:
Comparison of detector simulations (circles) to test-beam measurements (triangles). Resolution of the electron energy reconstruction as a function of test-beam energy. The uncertainties plotted are statistical only, and the fitted curve is shown to guide the eye. |
png pdf |
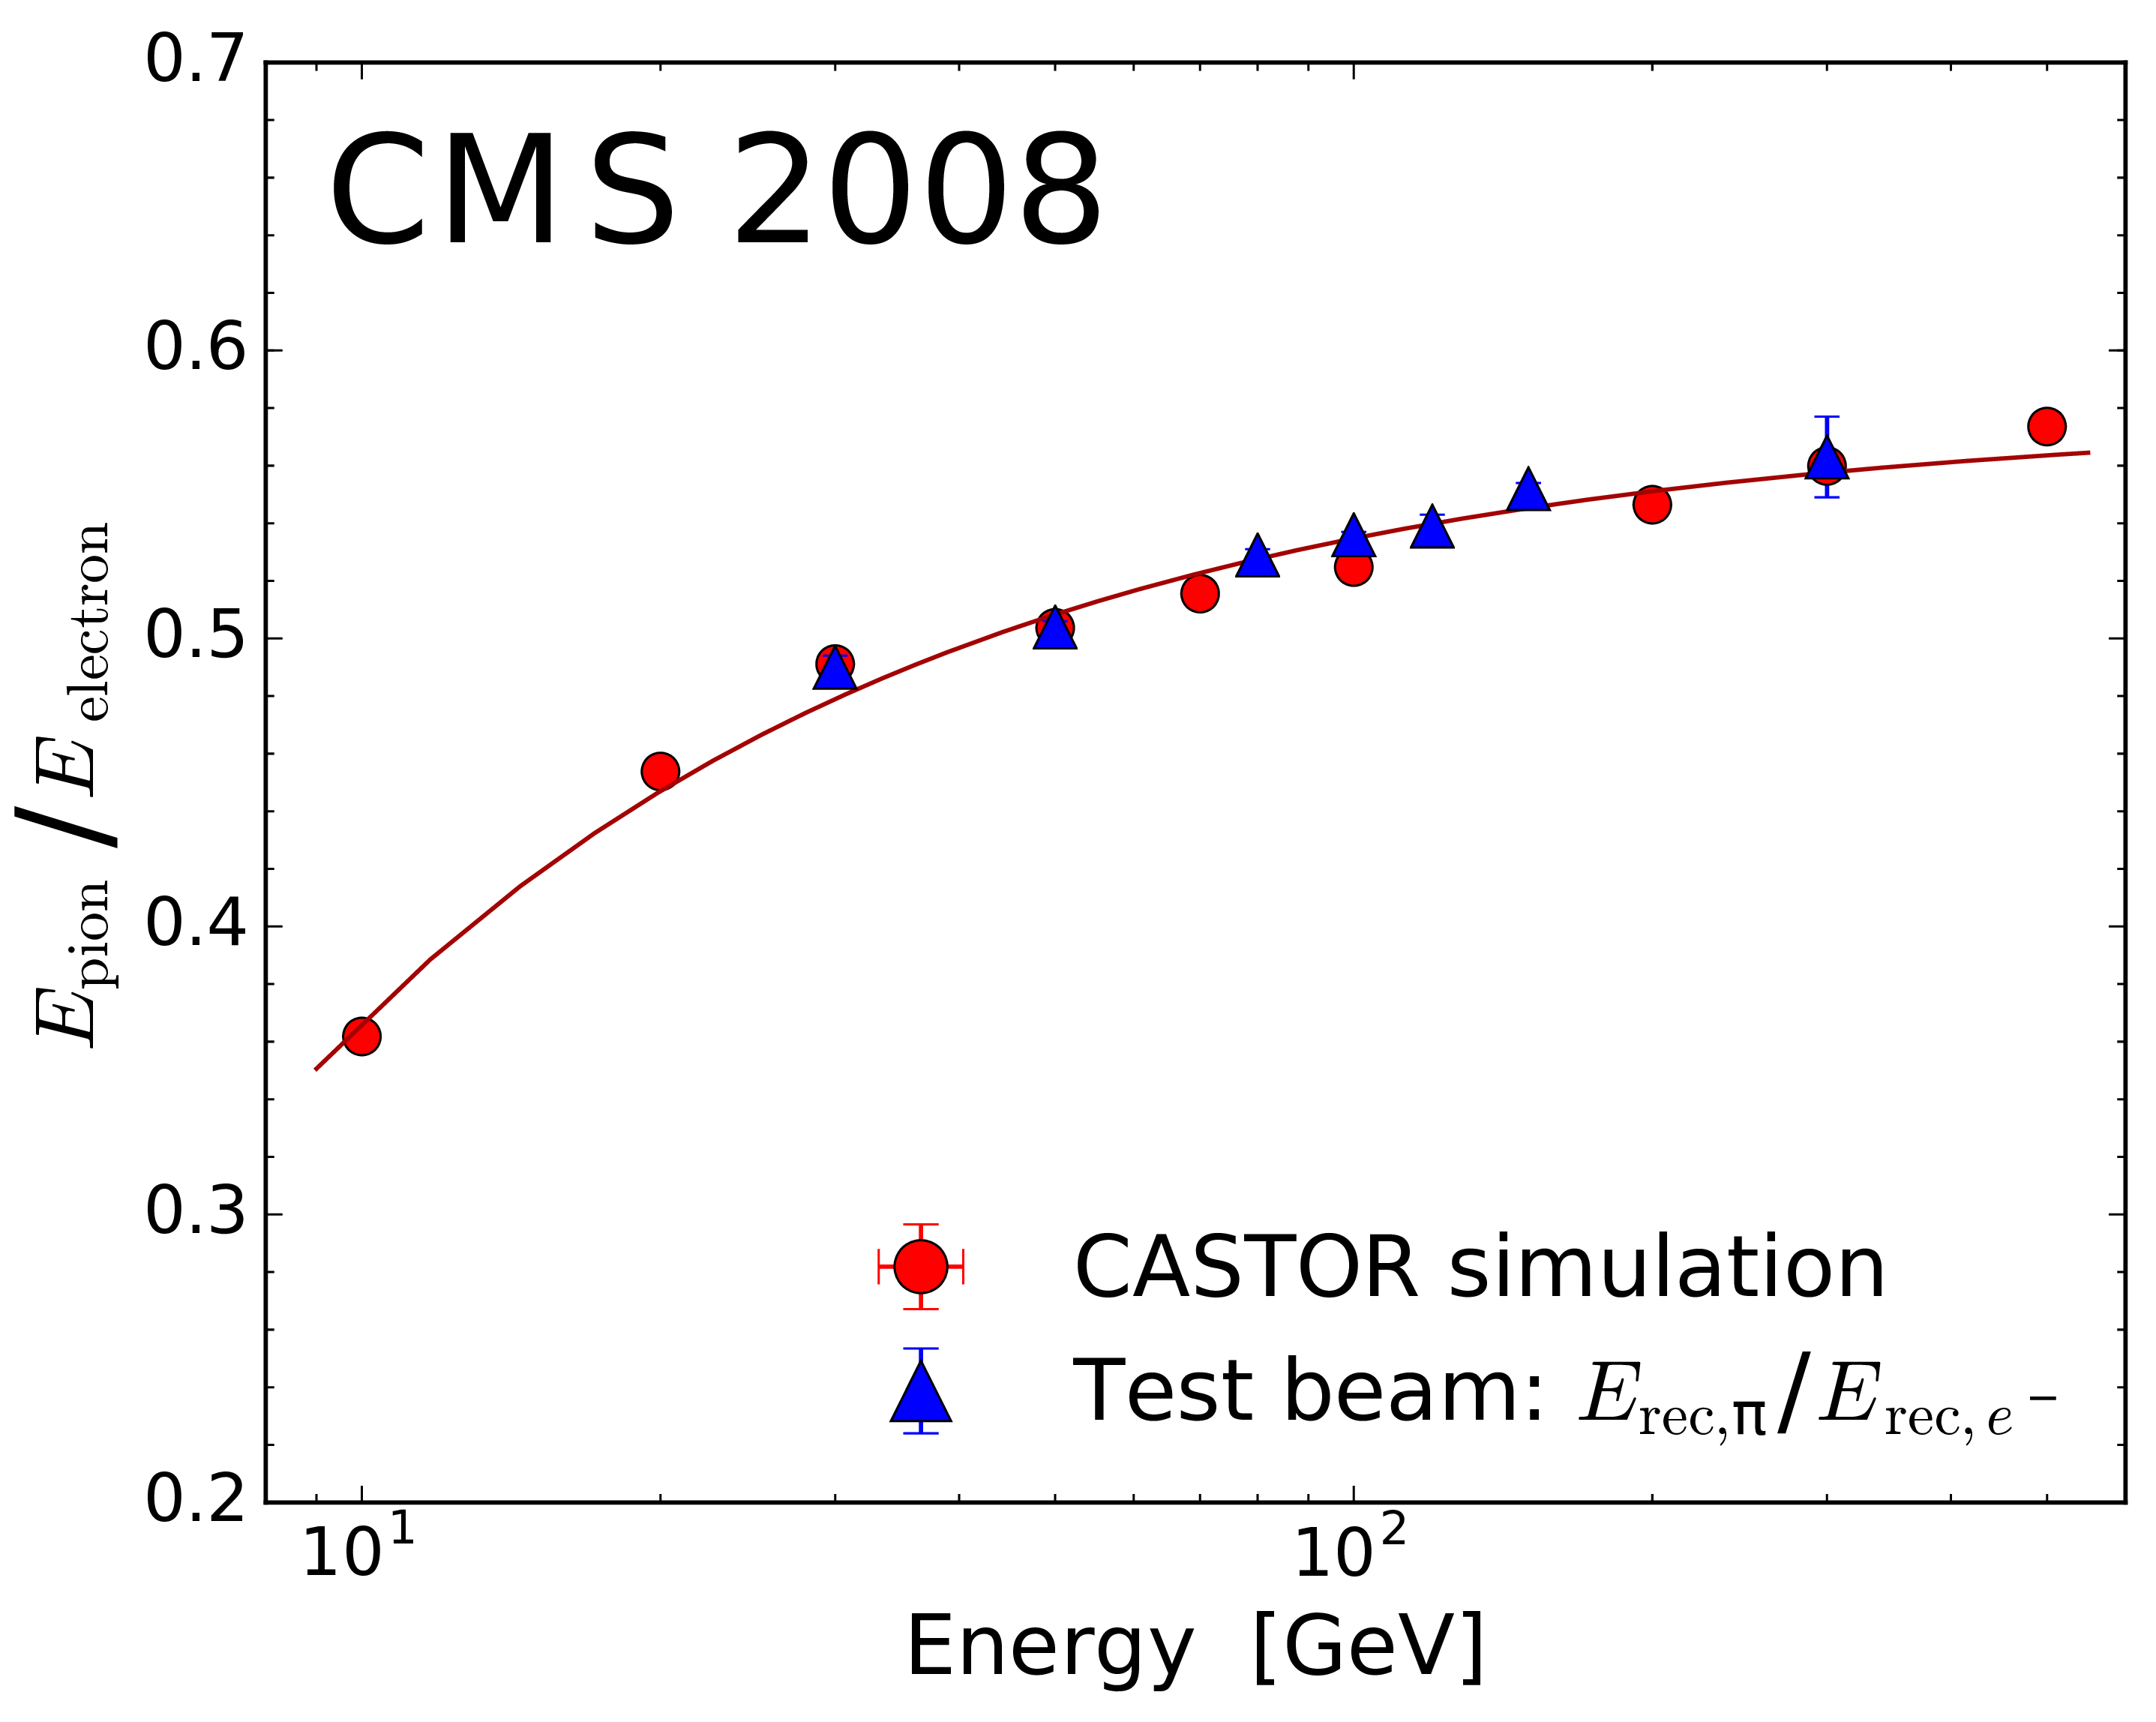
Figure 27-b:
Comparison of detector simulations (circles) to test-beam measurements (triangles). Resolution of the observed charged pion/electron response ratio as a function of test-beam energy. The uncertainties plotted are statistical only, and the fitted curve is shown to guide the eye. |
png pdf |
Figure 28:
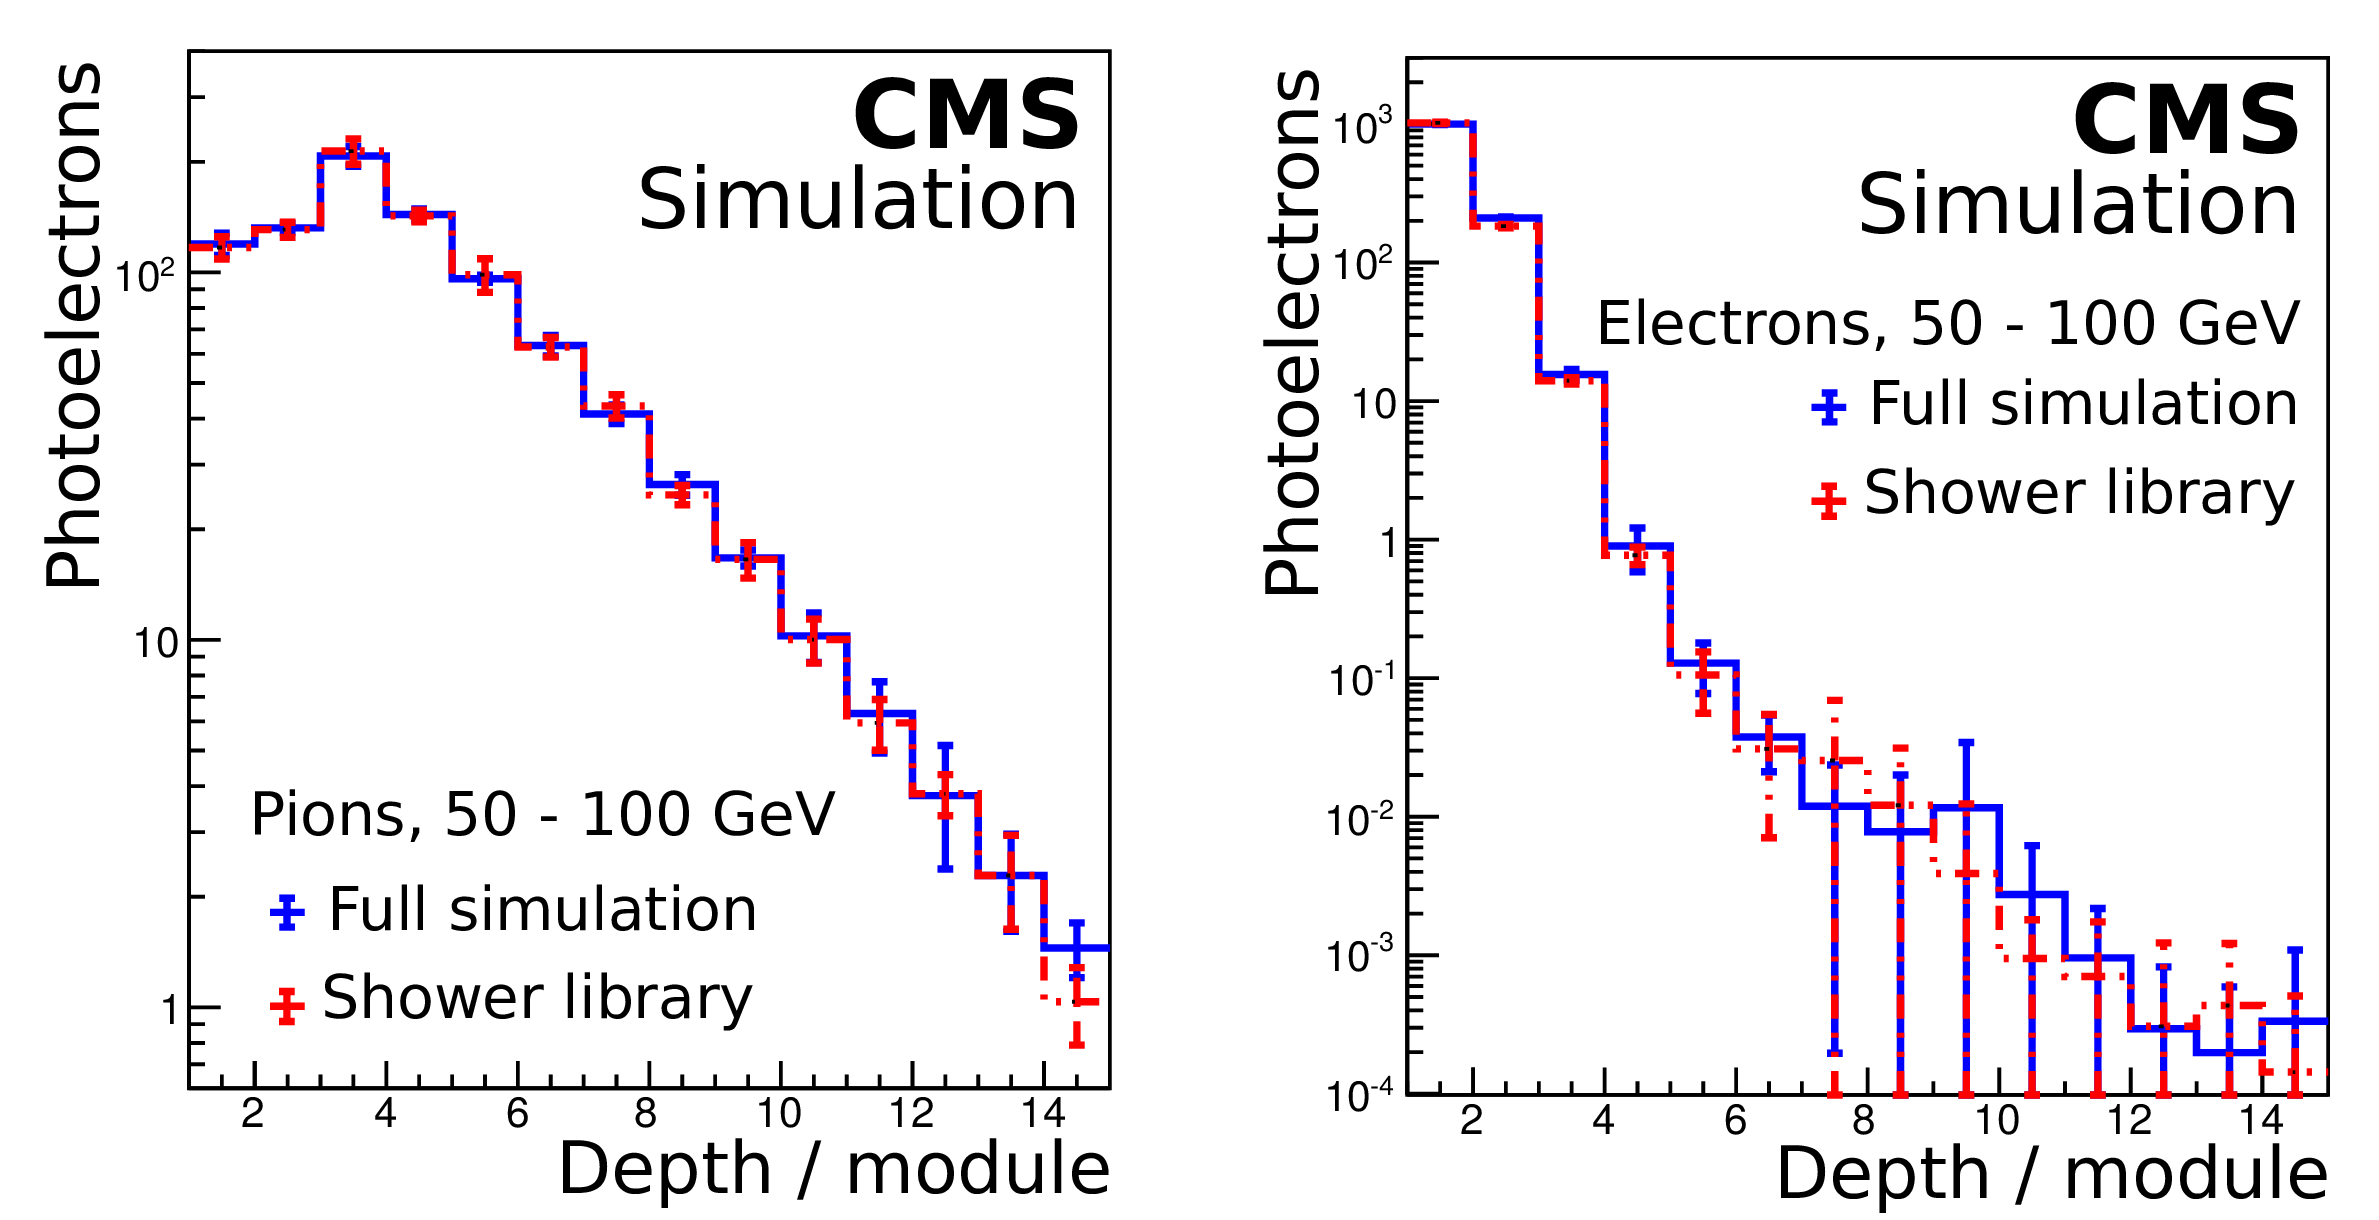
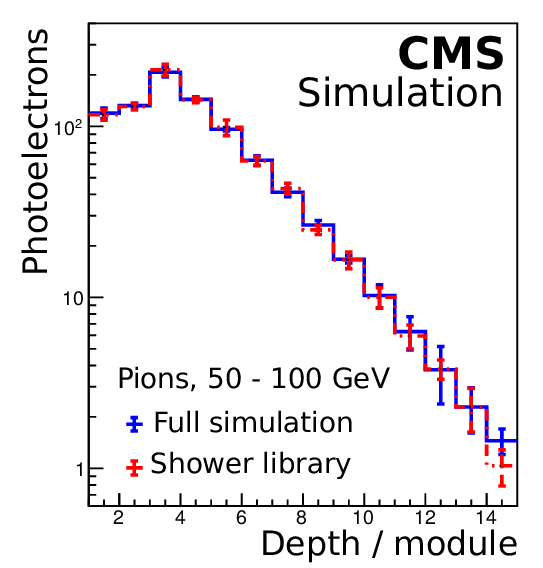
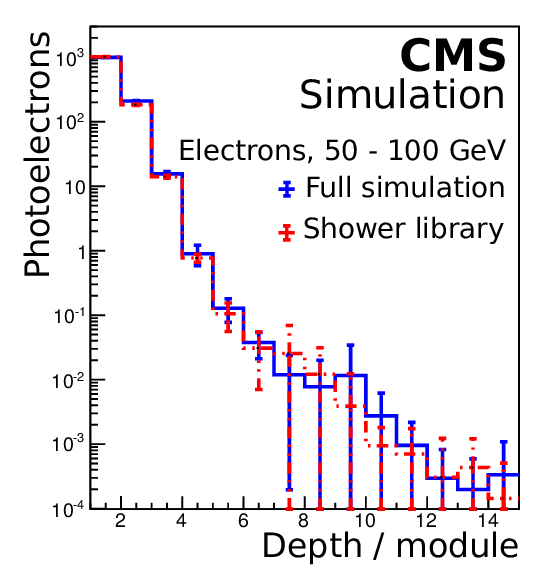
Comparison of the full (blue histogram) and fast (red histogram) simulation responses (number of photoelectrons as a function of detector depth) for charged pion (left) and electron (right) showers penetrating CASTOR with energies from 50 to 100 GeV. Error bars around data points indicate statistical uncertainties. |
png pdf |
Figure 28-a:
Comparison of the full (blue histogram) and fast (red histogram) simulation responses (number of photoelectrons as a function of detector depth) for charged pion showers penetrating CASTOR with energies from 50 to 100 GeV. Error bars around data points indicate statistical uncertainties. |
png pdf |
Figure 28-b:
Comparison of the full (blue histogram) and fast (red histogram) simulation responses (number of photoelectrons as a function of detector depth) for electron showers penetrating CASTOR with energies from 50 to 100 GeV. Error bars around data points indicate statistical uncertainties. |
png pdf |
Figure 29:
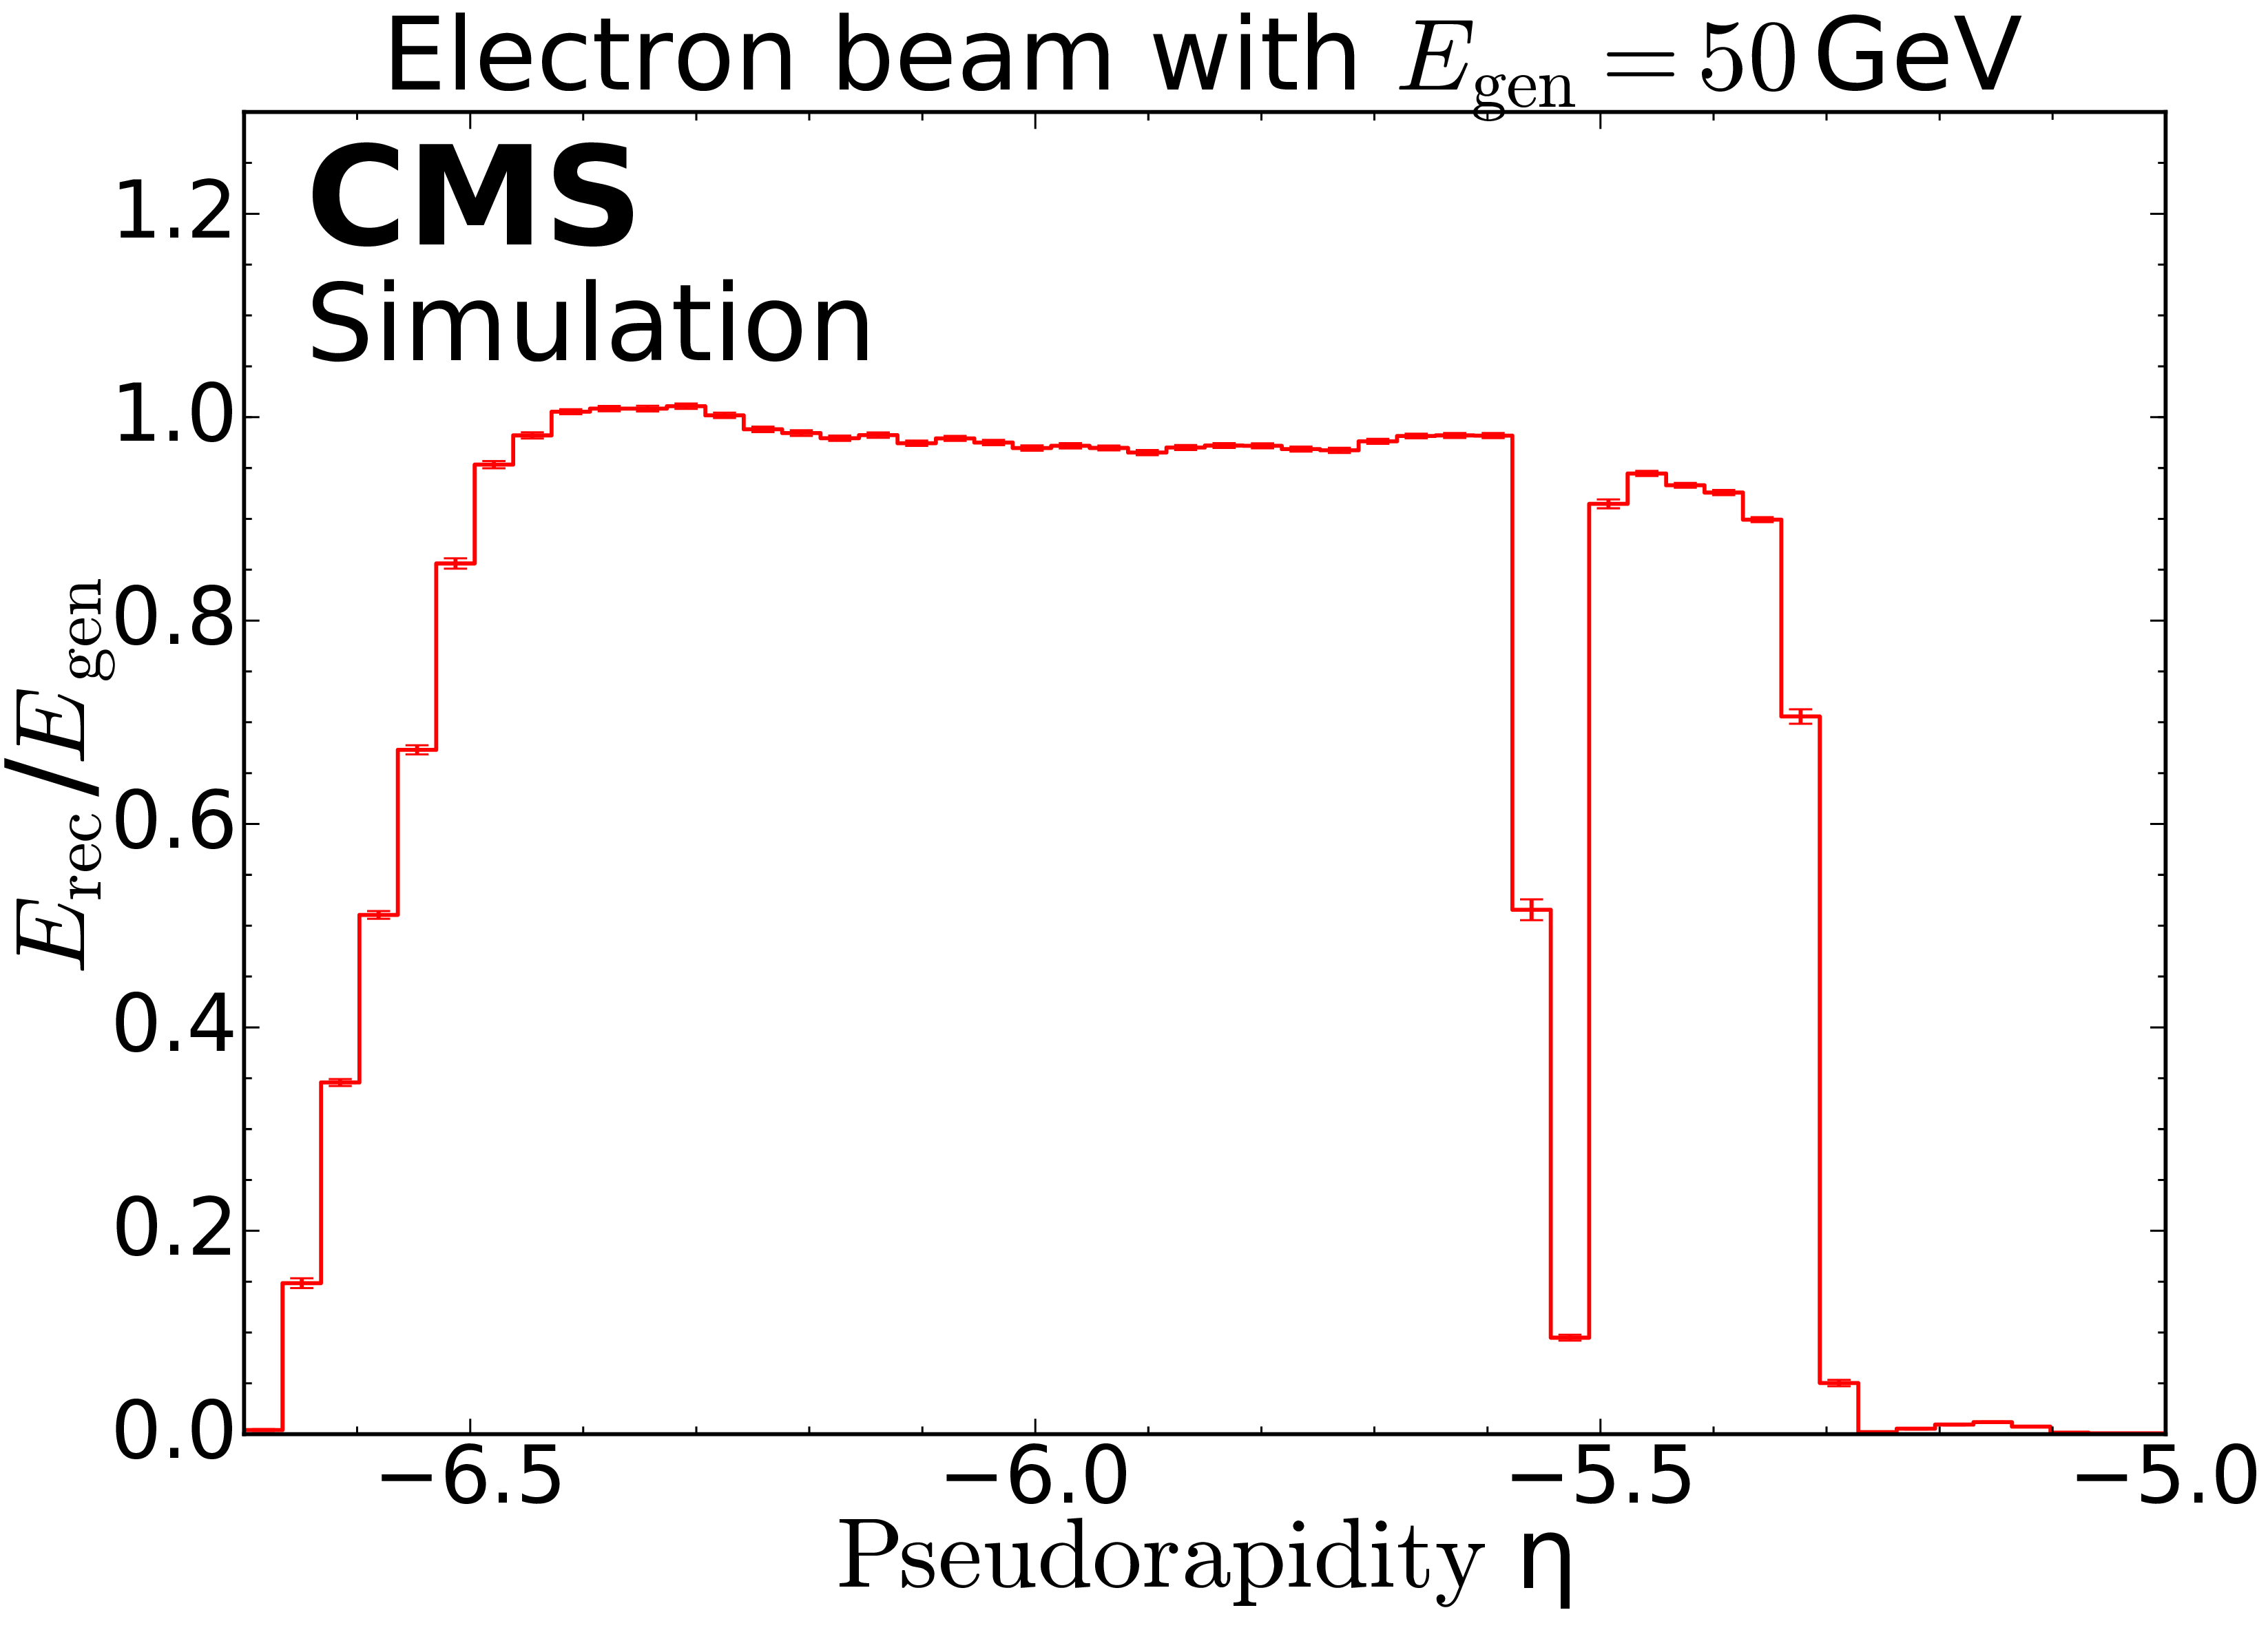
Pseudorapidity dependence of reconstructed energies in CASTOR for 50 GeV electrons emitted from the nominal CMS interaction point. The CASTOR simulation includes all CMS passive and active materials and the beam pipe. The dip around $\eta =-5.5$ corresponds to the projection of the conical beam pipe. |
png pdf |
Figure 30:
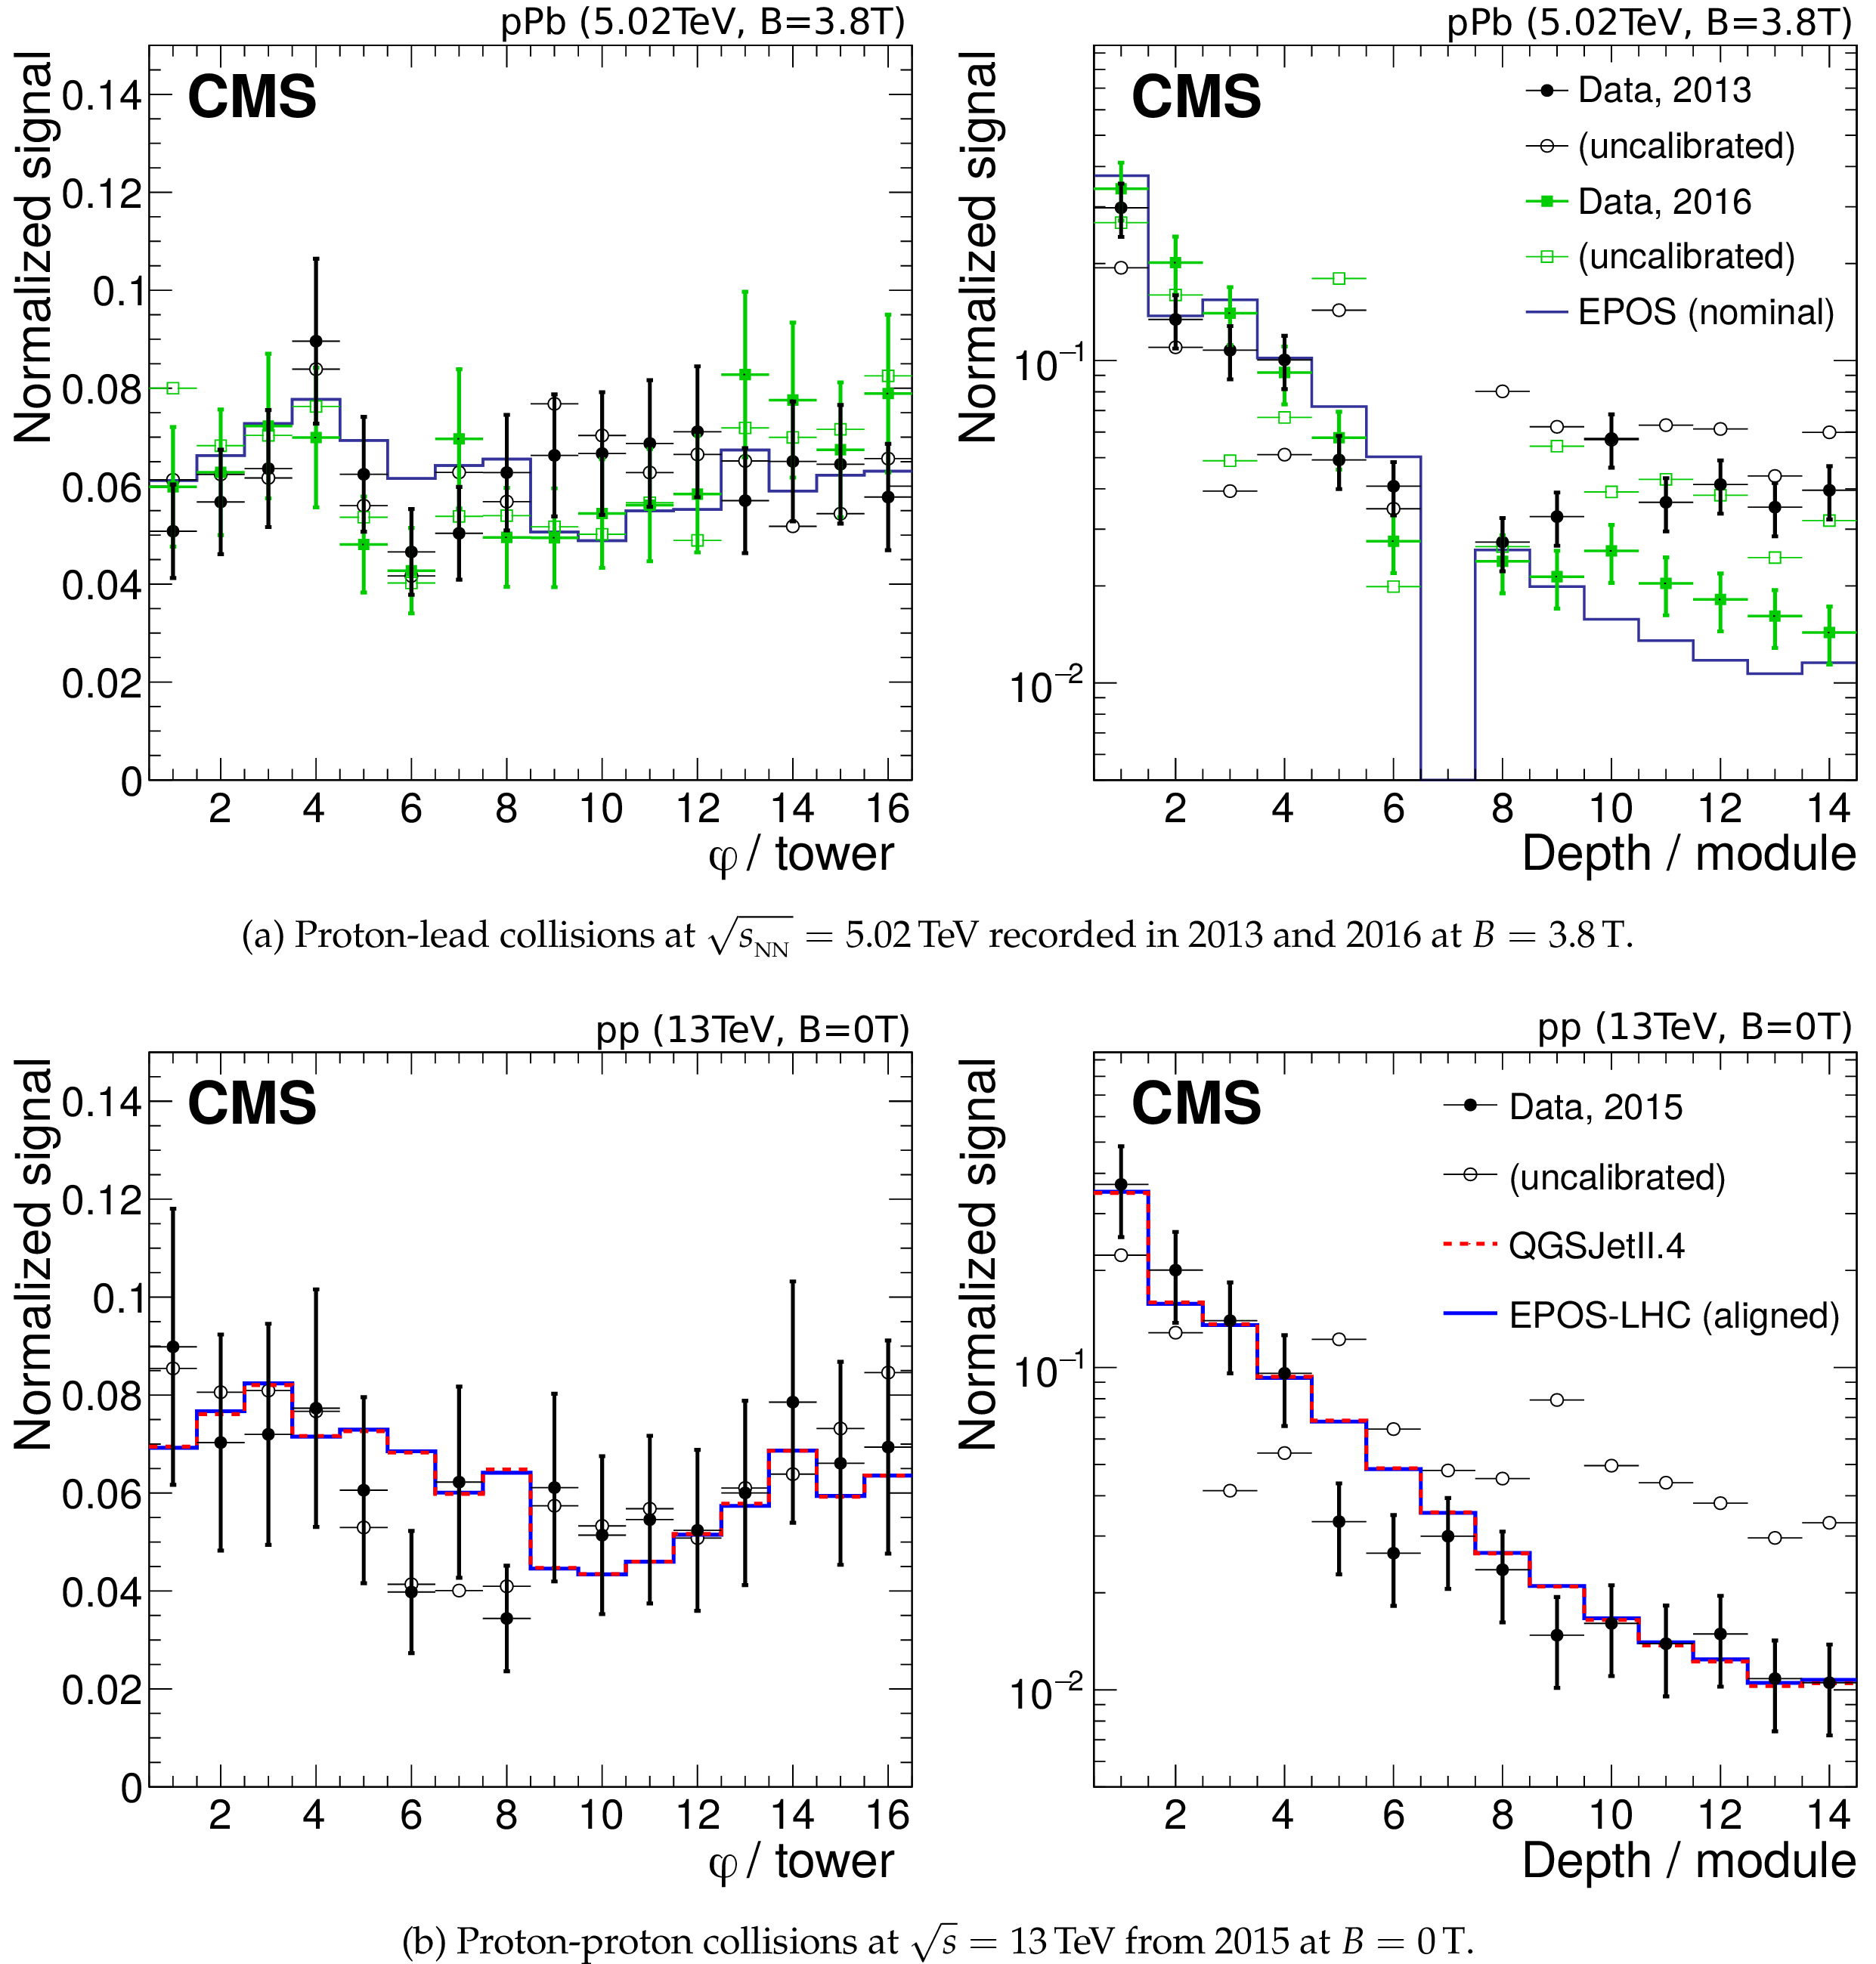
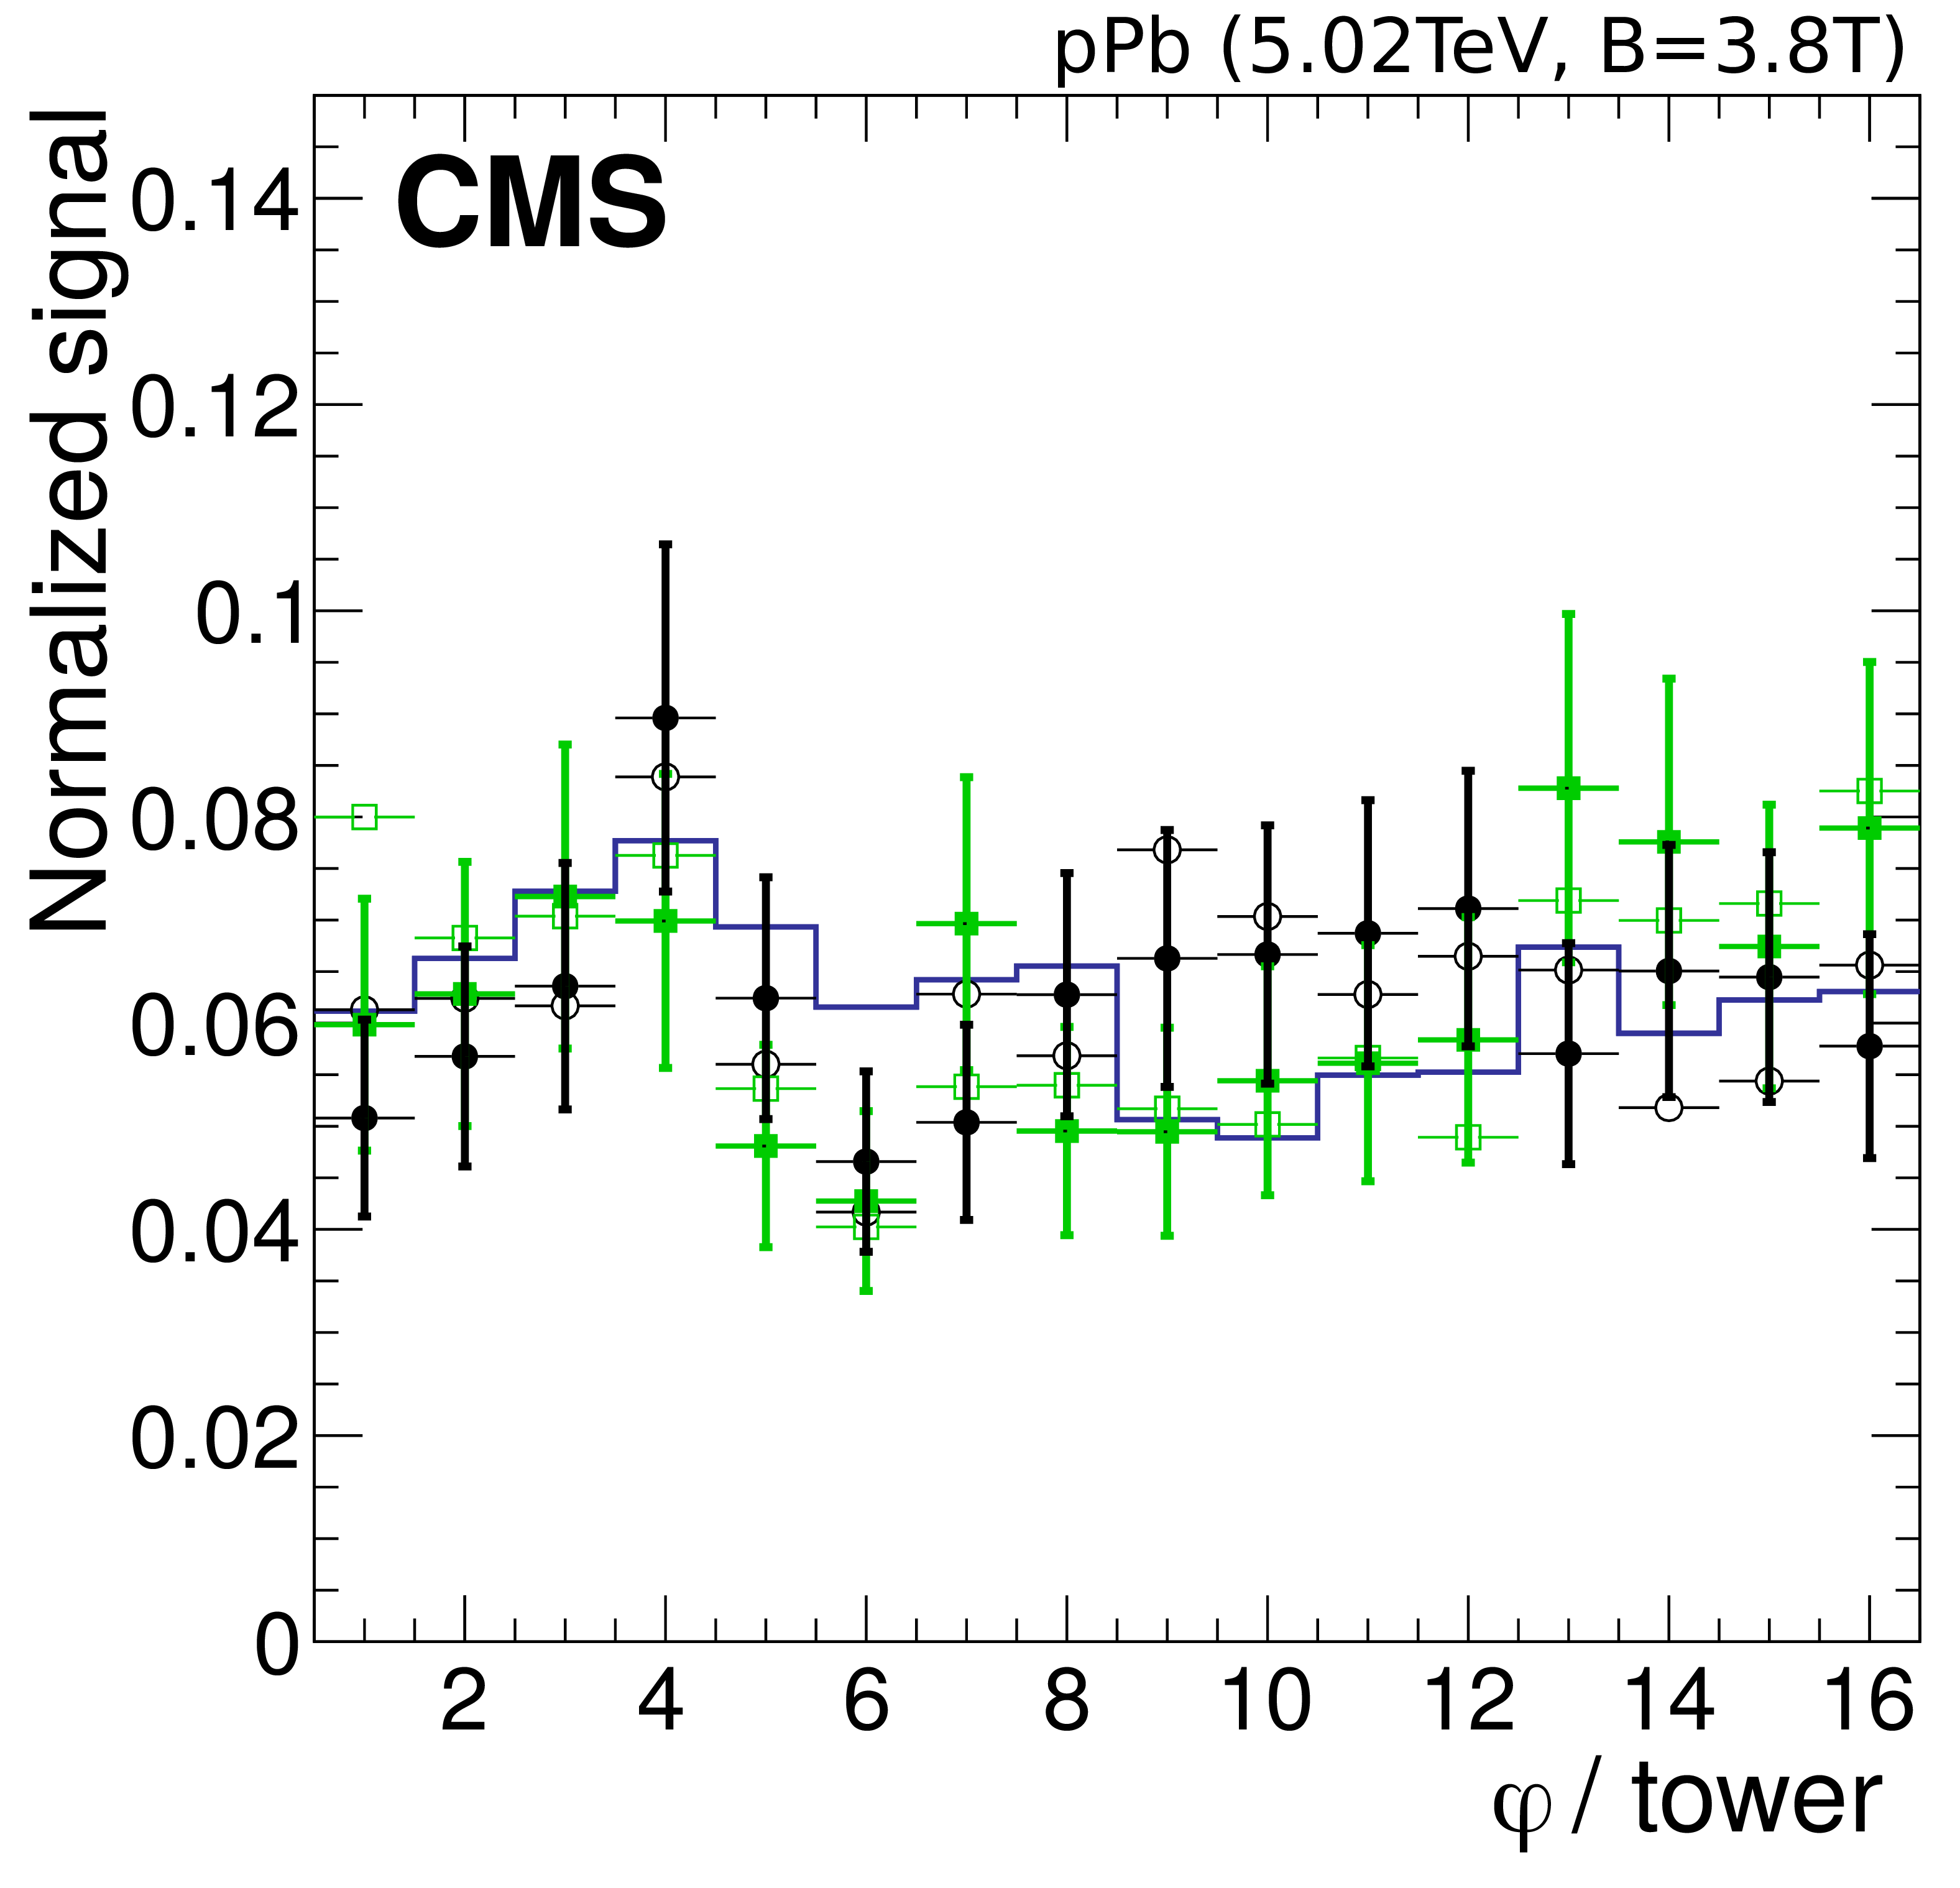
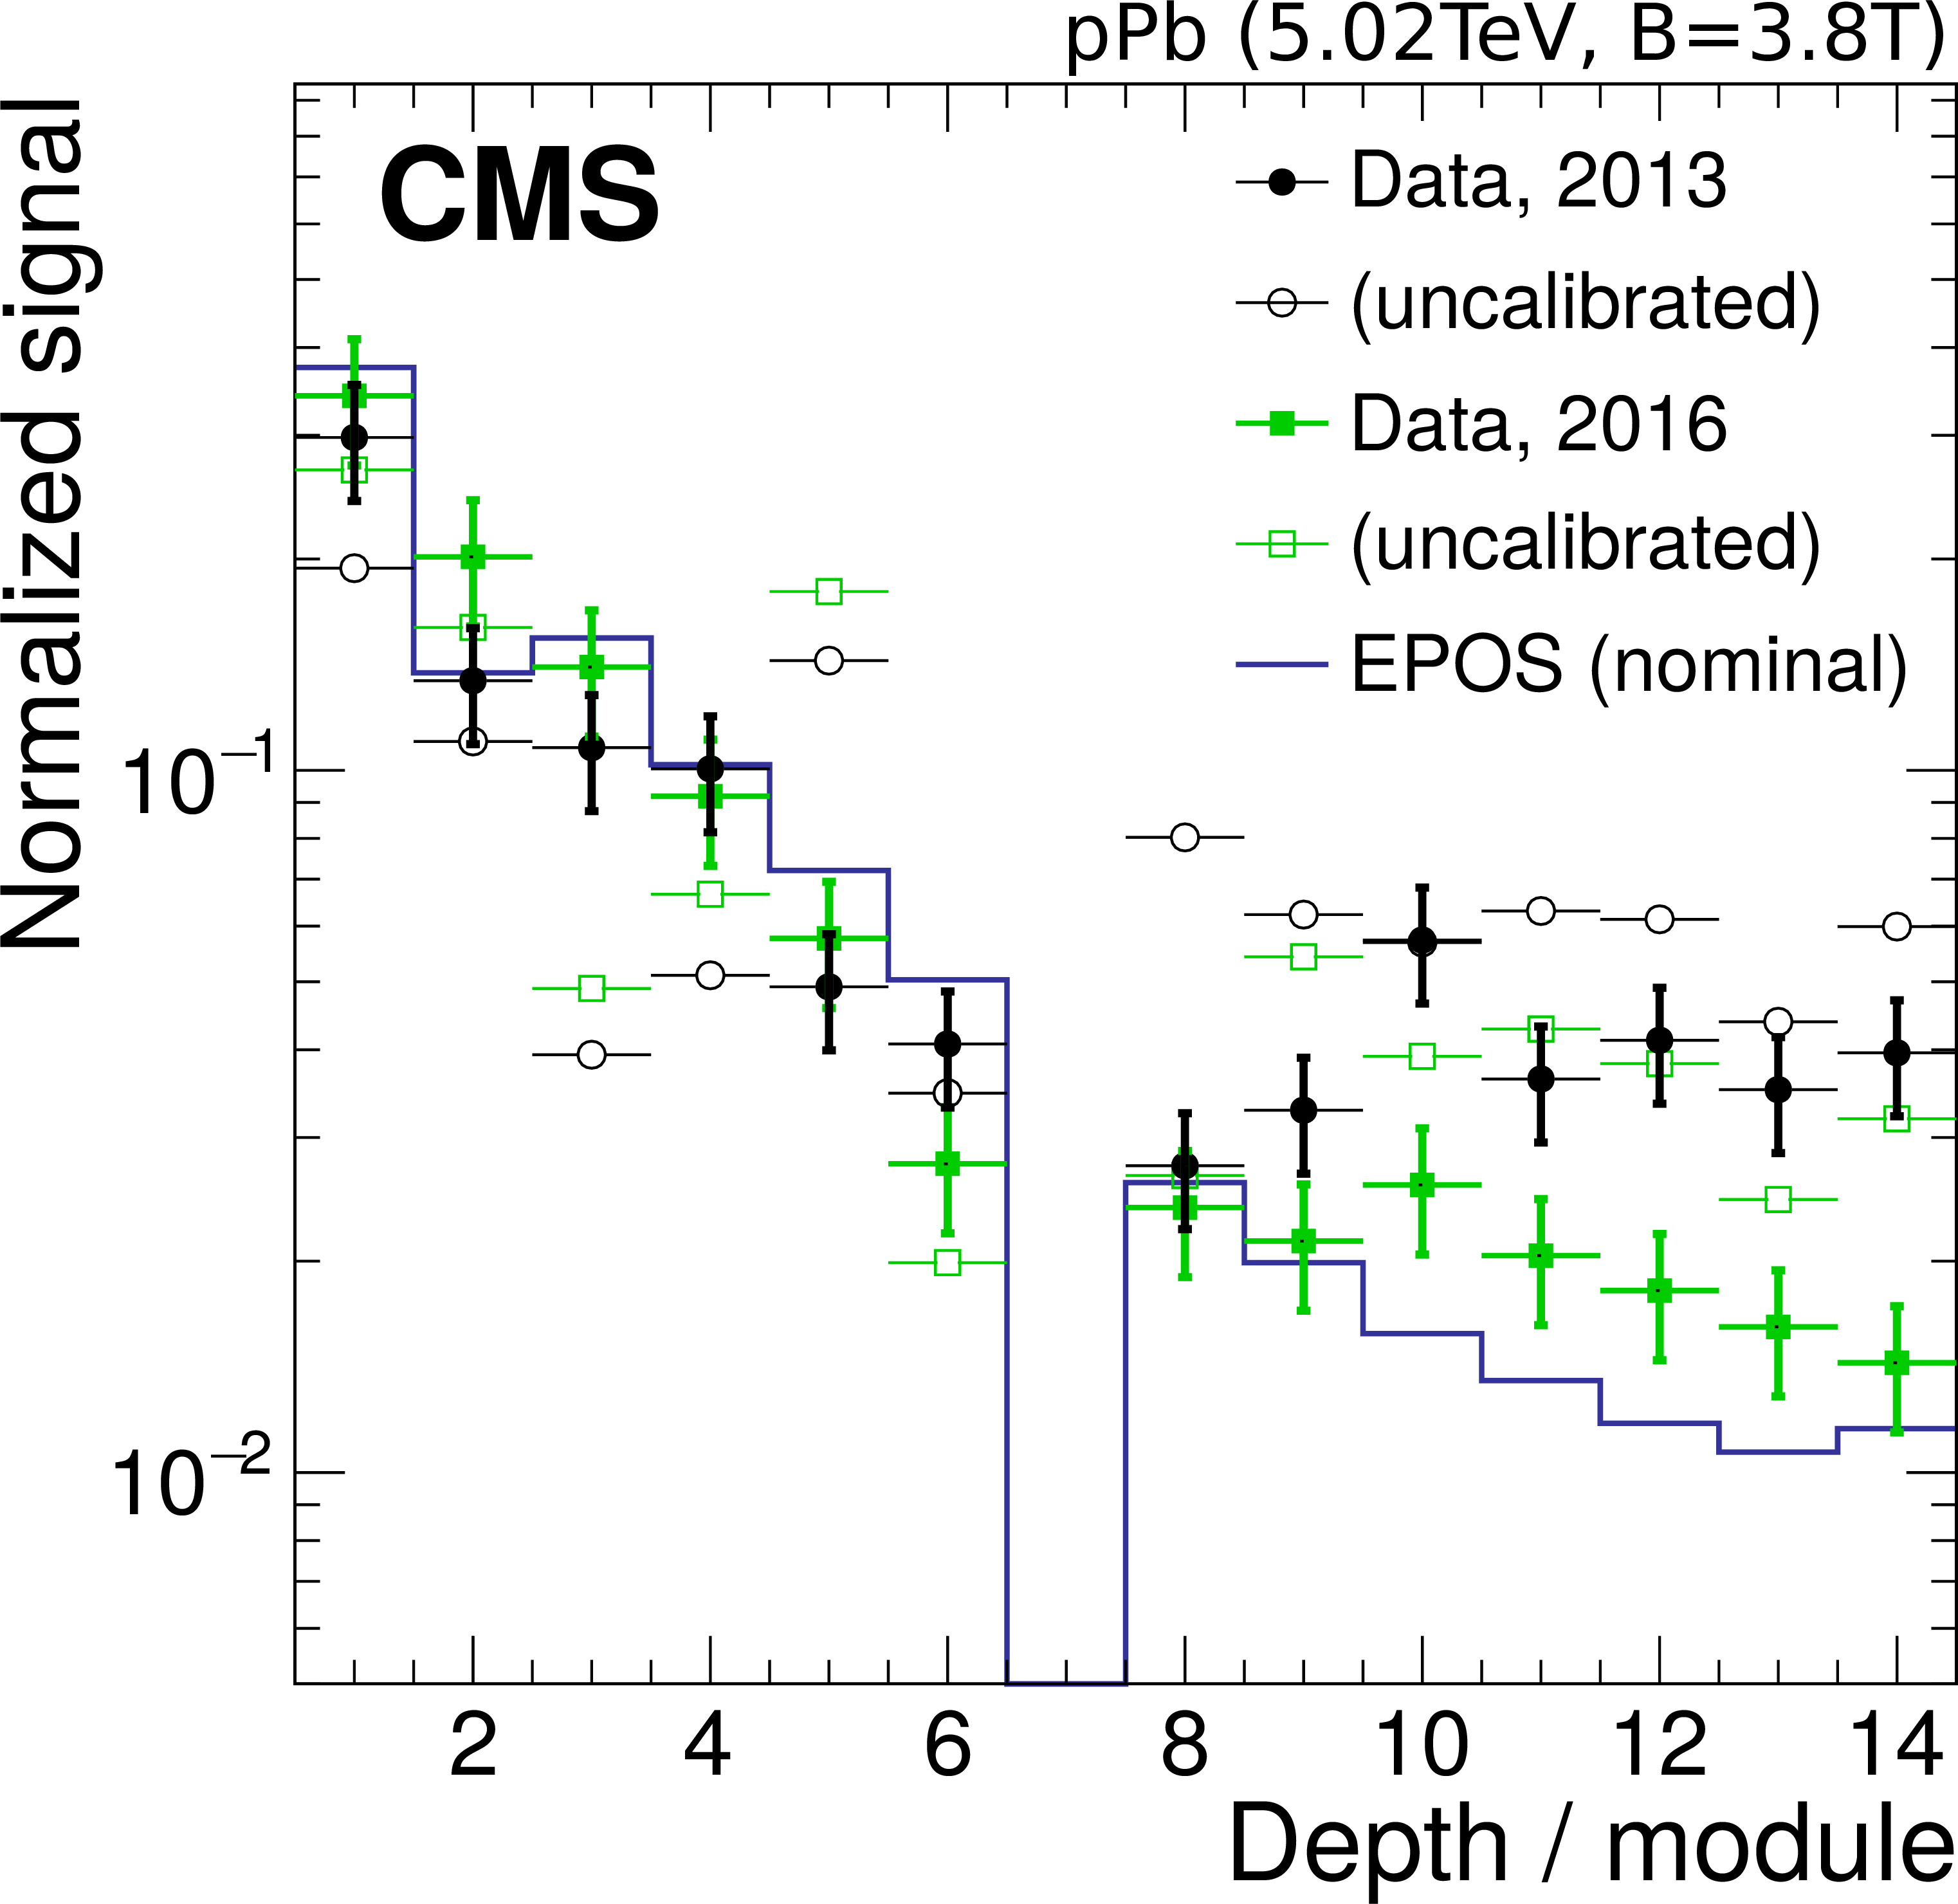
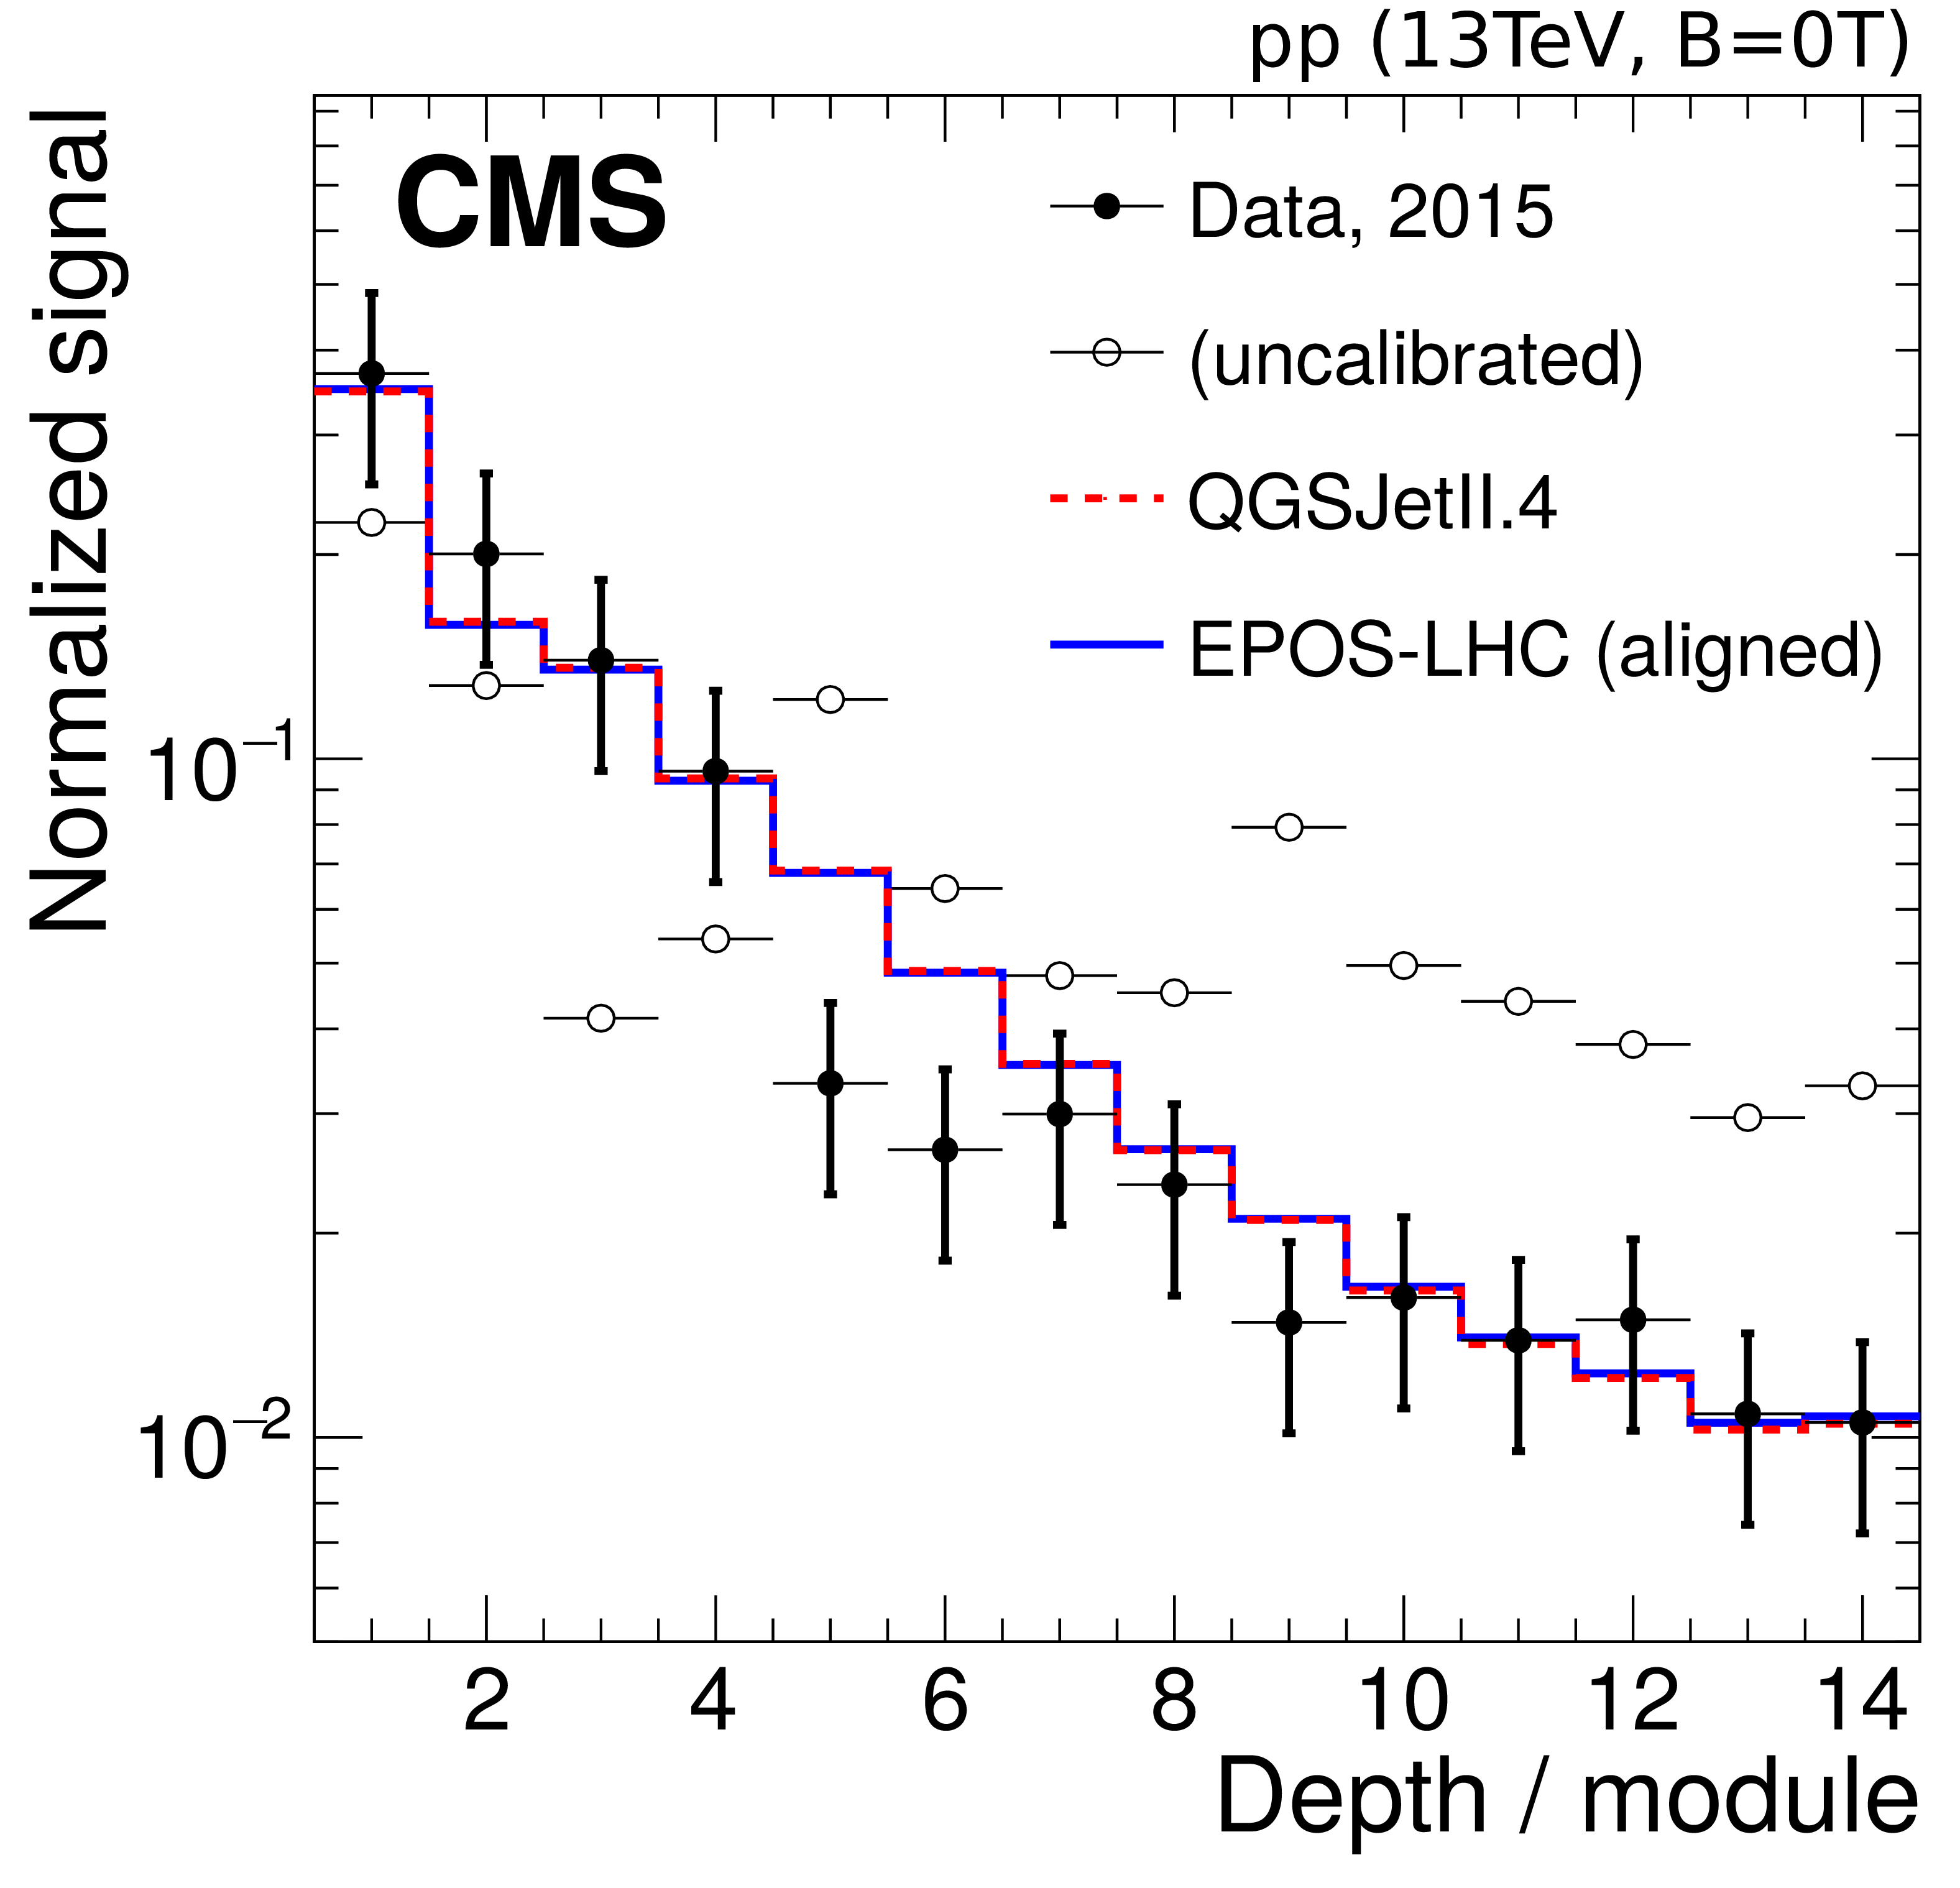
CASTOR signal response in calibrated (filled symbols) and uncalibrated (open symbols) data compared to the detector simulations (histograms), projected into the azimuthal (left) and longitudinal (right) direction. Upper: Comparison of minimum-bias pPb collision data recorded in 2013 and 2016 with the Epos-LHC simulations (with the nominal MC geometry). The impact of the magnetic field around module 7 is clearly visible. Lower: Comparison of the minimum-bias pp collision data at $ {{\sqrt {s}}} = $ 13 TeV to the QGSJetII and Epos-LHC (with geometry tuned to the 2015 data alignment) simulations. The CMS magnet was off while taking those data. The uncertainties of the calibrated data in all plots are statistical only, and originate almost entirely from the limited beam halo statistics for intercalibration. There is an additional scaling factor of 1.25 on the uncertainties of the calibrated data, as discussed in the text. |
png pdf |
Figure 30-a:
CASTOR signal response in calibrated (filled symbols) and uncalibrated (open symbols) data compared to the detector simulations (histograms), projected into the azimuthal direction. Comparison of minimum-bias pPb collision data recorded in 2013 and 2016 with the Epos-LHC simulations (with the nominal MC geometry). The impact of the magnetic field around module 7 is clearly visible. The CMS magnet was off while taking those data. The uncertainties of the calibrated data are statistical only, and originate almost entirely from the limited beam halo statistics for intercalibration. There is an additional scaling factor of 1.25 on the uncertainties of the calibrated data, as discussed in the text. |
png pdf |
Figure 30-b:
CASTOR signal response in calibrated (filled symbols) and uncalibrated (open symbols) data compared to the detector simulations (histograms), projected into the longitudinal direction. Comparison of minimum-bias pPb collision data recorded in 2013 and 2016 with the Epos-LHC simulations (with the nominal MC geometry). The impact of the magnetic field around module 7 is clearly visible. The CMS magnet was off while taking those data. The uncertainties of the calibrated data are statistical only, and originate almost entirely from the limited beam halo statistics for intercalibration. There is an additional scaling factor of 1.25 on the uncertainties of the calibrated data, as discussed in the text. |

png pdf |
Figure 30-c:
CASTOR signal response in calibrated (filled symbols) and uncalibrated (open symbols) data compared to the detector simulations (histograms), projected into the azimuthal direction. Comparison of the minimum-bias pp collision data at $ {{\sqrt {s}}} = $ 13 TeV to the QGSJetII and Epos-LHC (with geometry tuned to the 2015 data alignment) simulations. The CMS magnet was off while taking those data. The uncertainties of the calibrated data are statistical only, and originate almost entirely from the limited beam halo statistics for intercalibration. There is an additional scaling factor of 1.25 on the uncertainties of the calibrated data, as discussed in the text. |
png pdf |
Figure 30-d:
CASTOR signal response in calibrated (filled symbols) and uncalibrated (open symbols) data compared to the detector simulations (histograms), projected into the longitudinal direction. Comparison of the minimum-bias pp collision data at $ {{\sqrt {s}}} = $ 13 TeV to the QGSJetII and Epos-LHC (with geometry tuned to the 2015 data alignment) simulations. The CMS magnet was off while taking those data. The uncertainties of the calibrated data are statistical only, and originate almost entirely from the limited beam halo statistics for intercalibration. There is an additional scaling factor of 1.25 on the uncertainties of the calibrated data, as discussed in the text. |
png pdf |
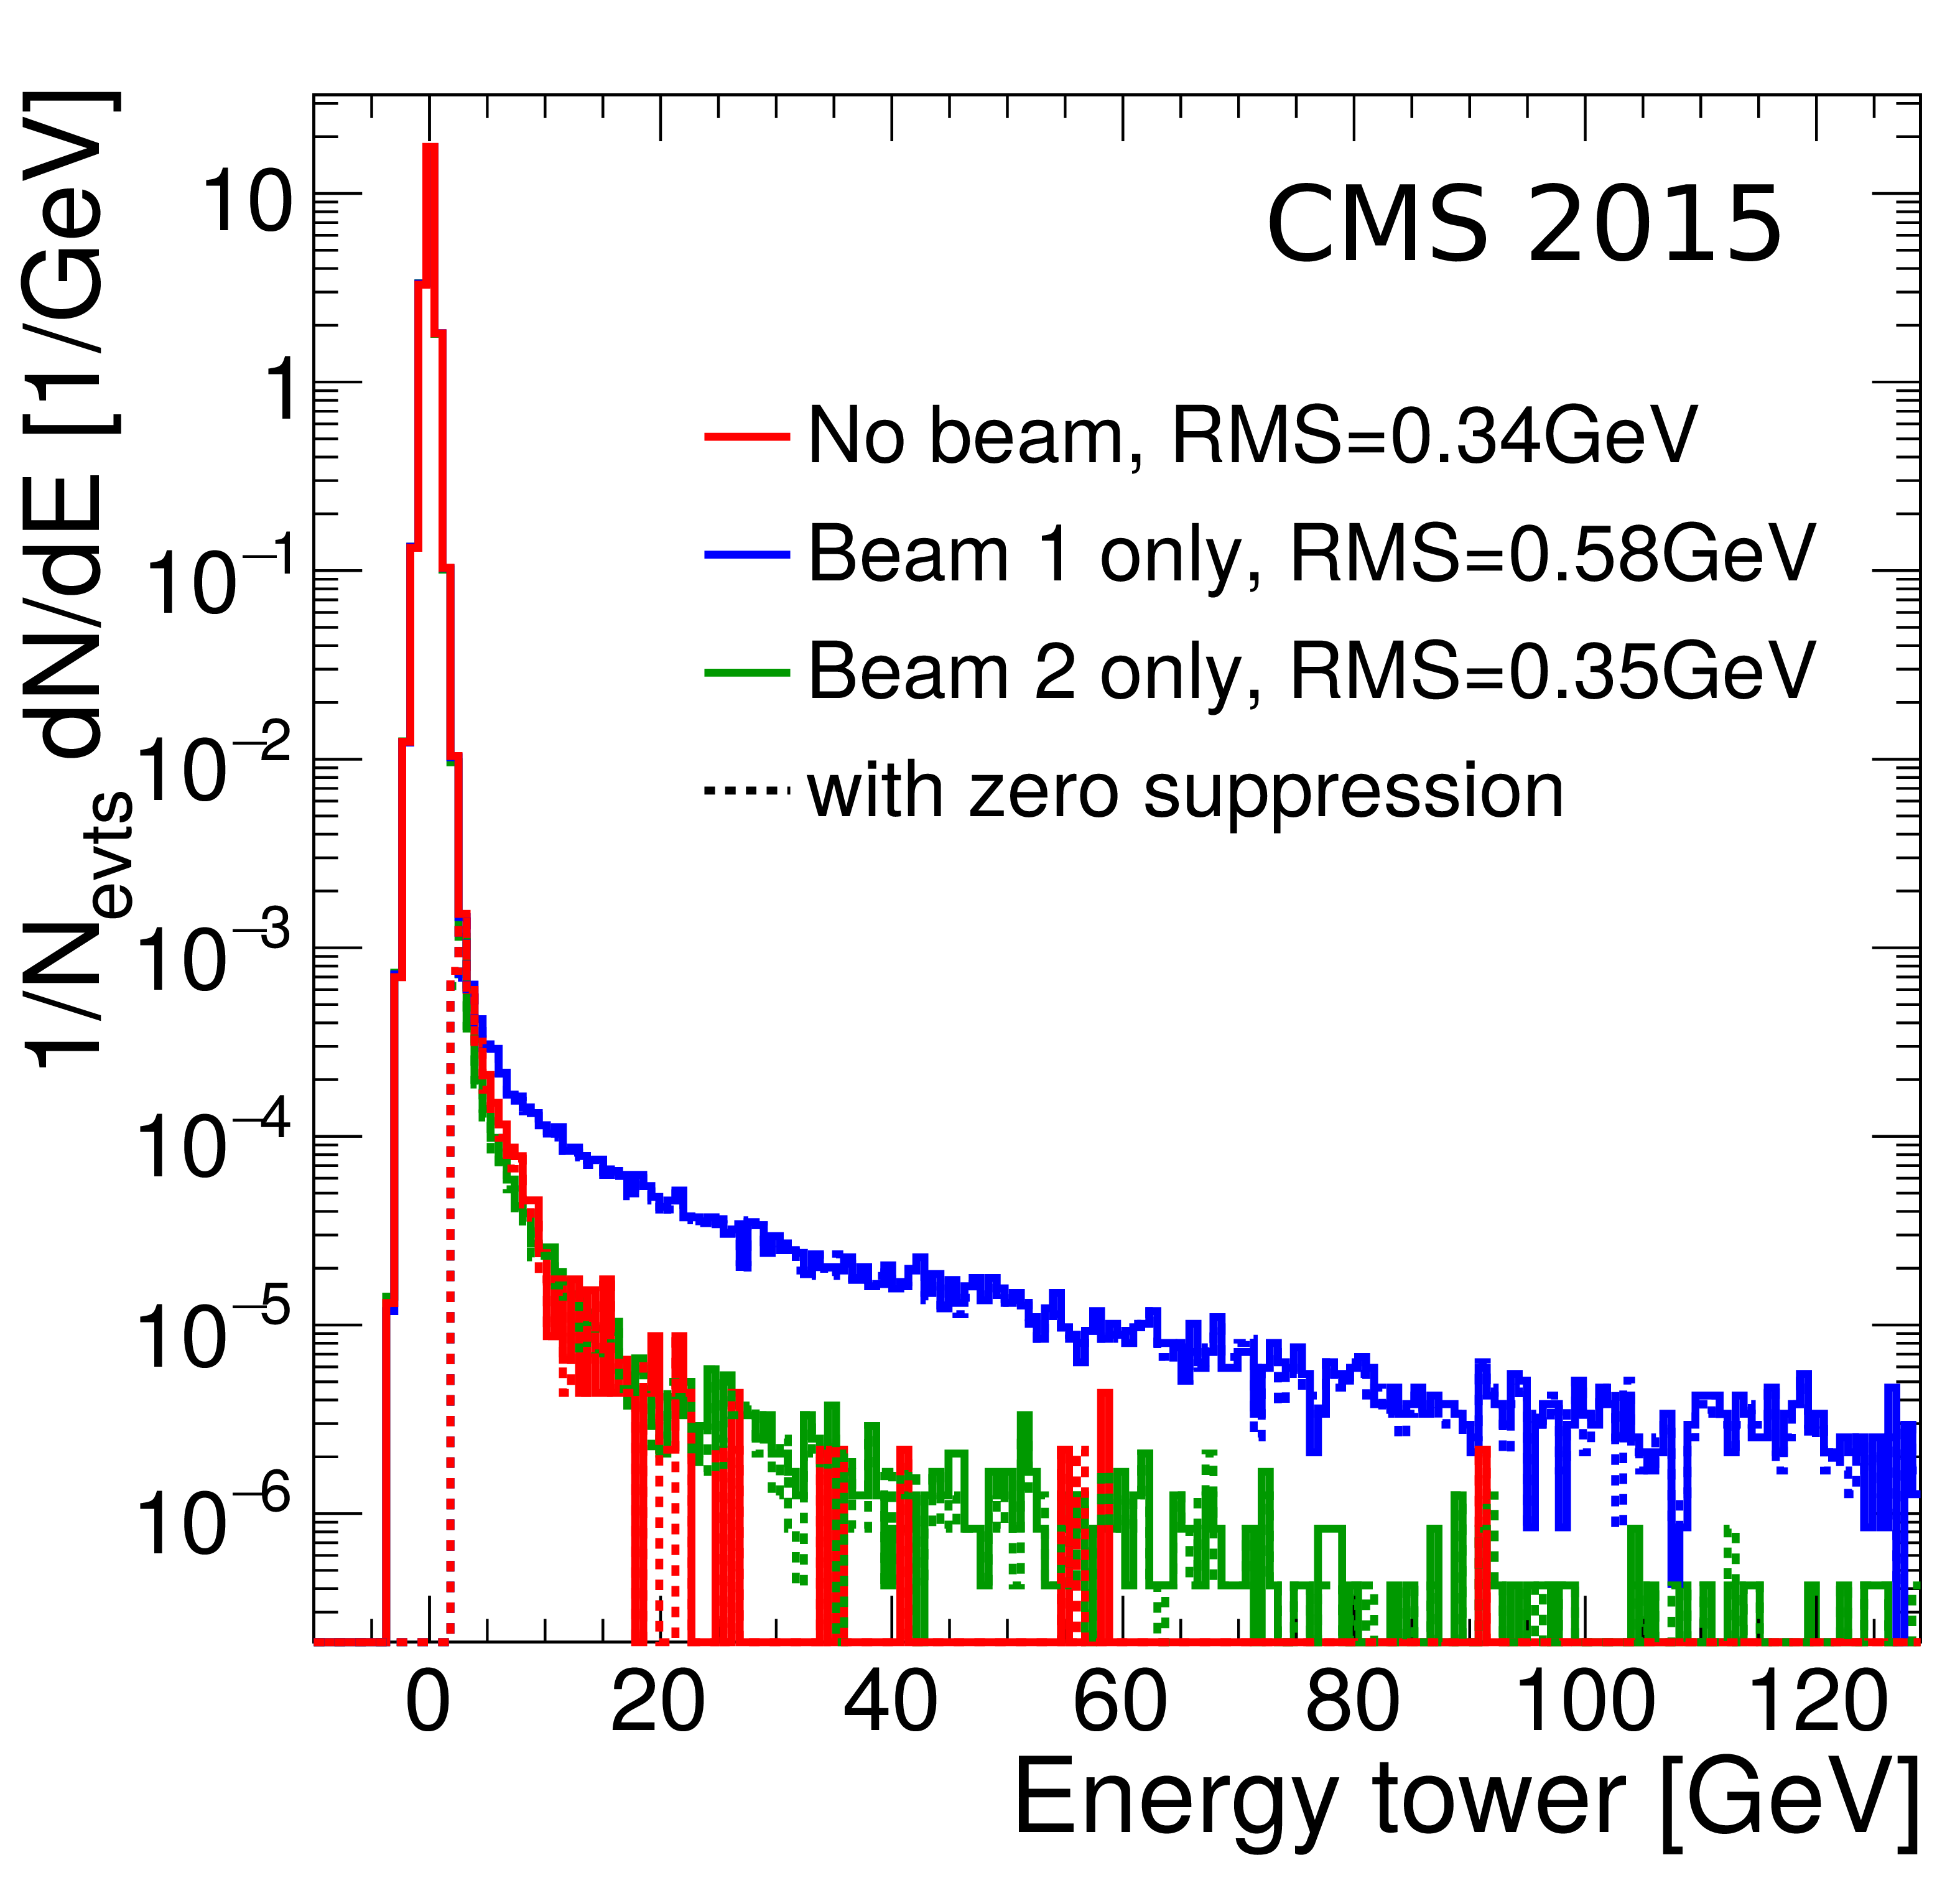
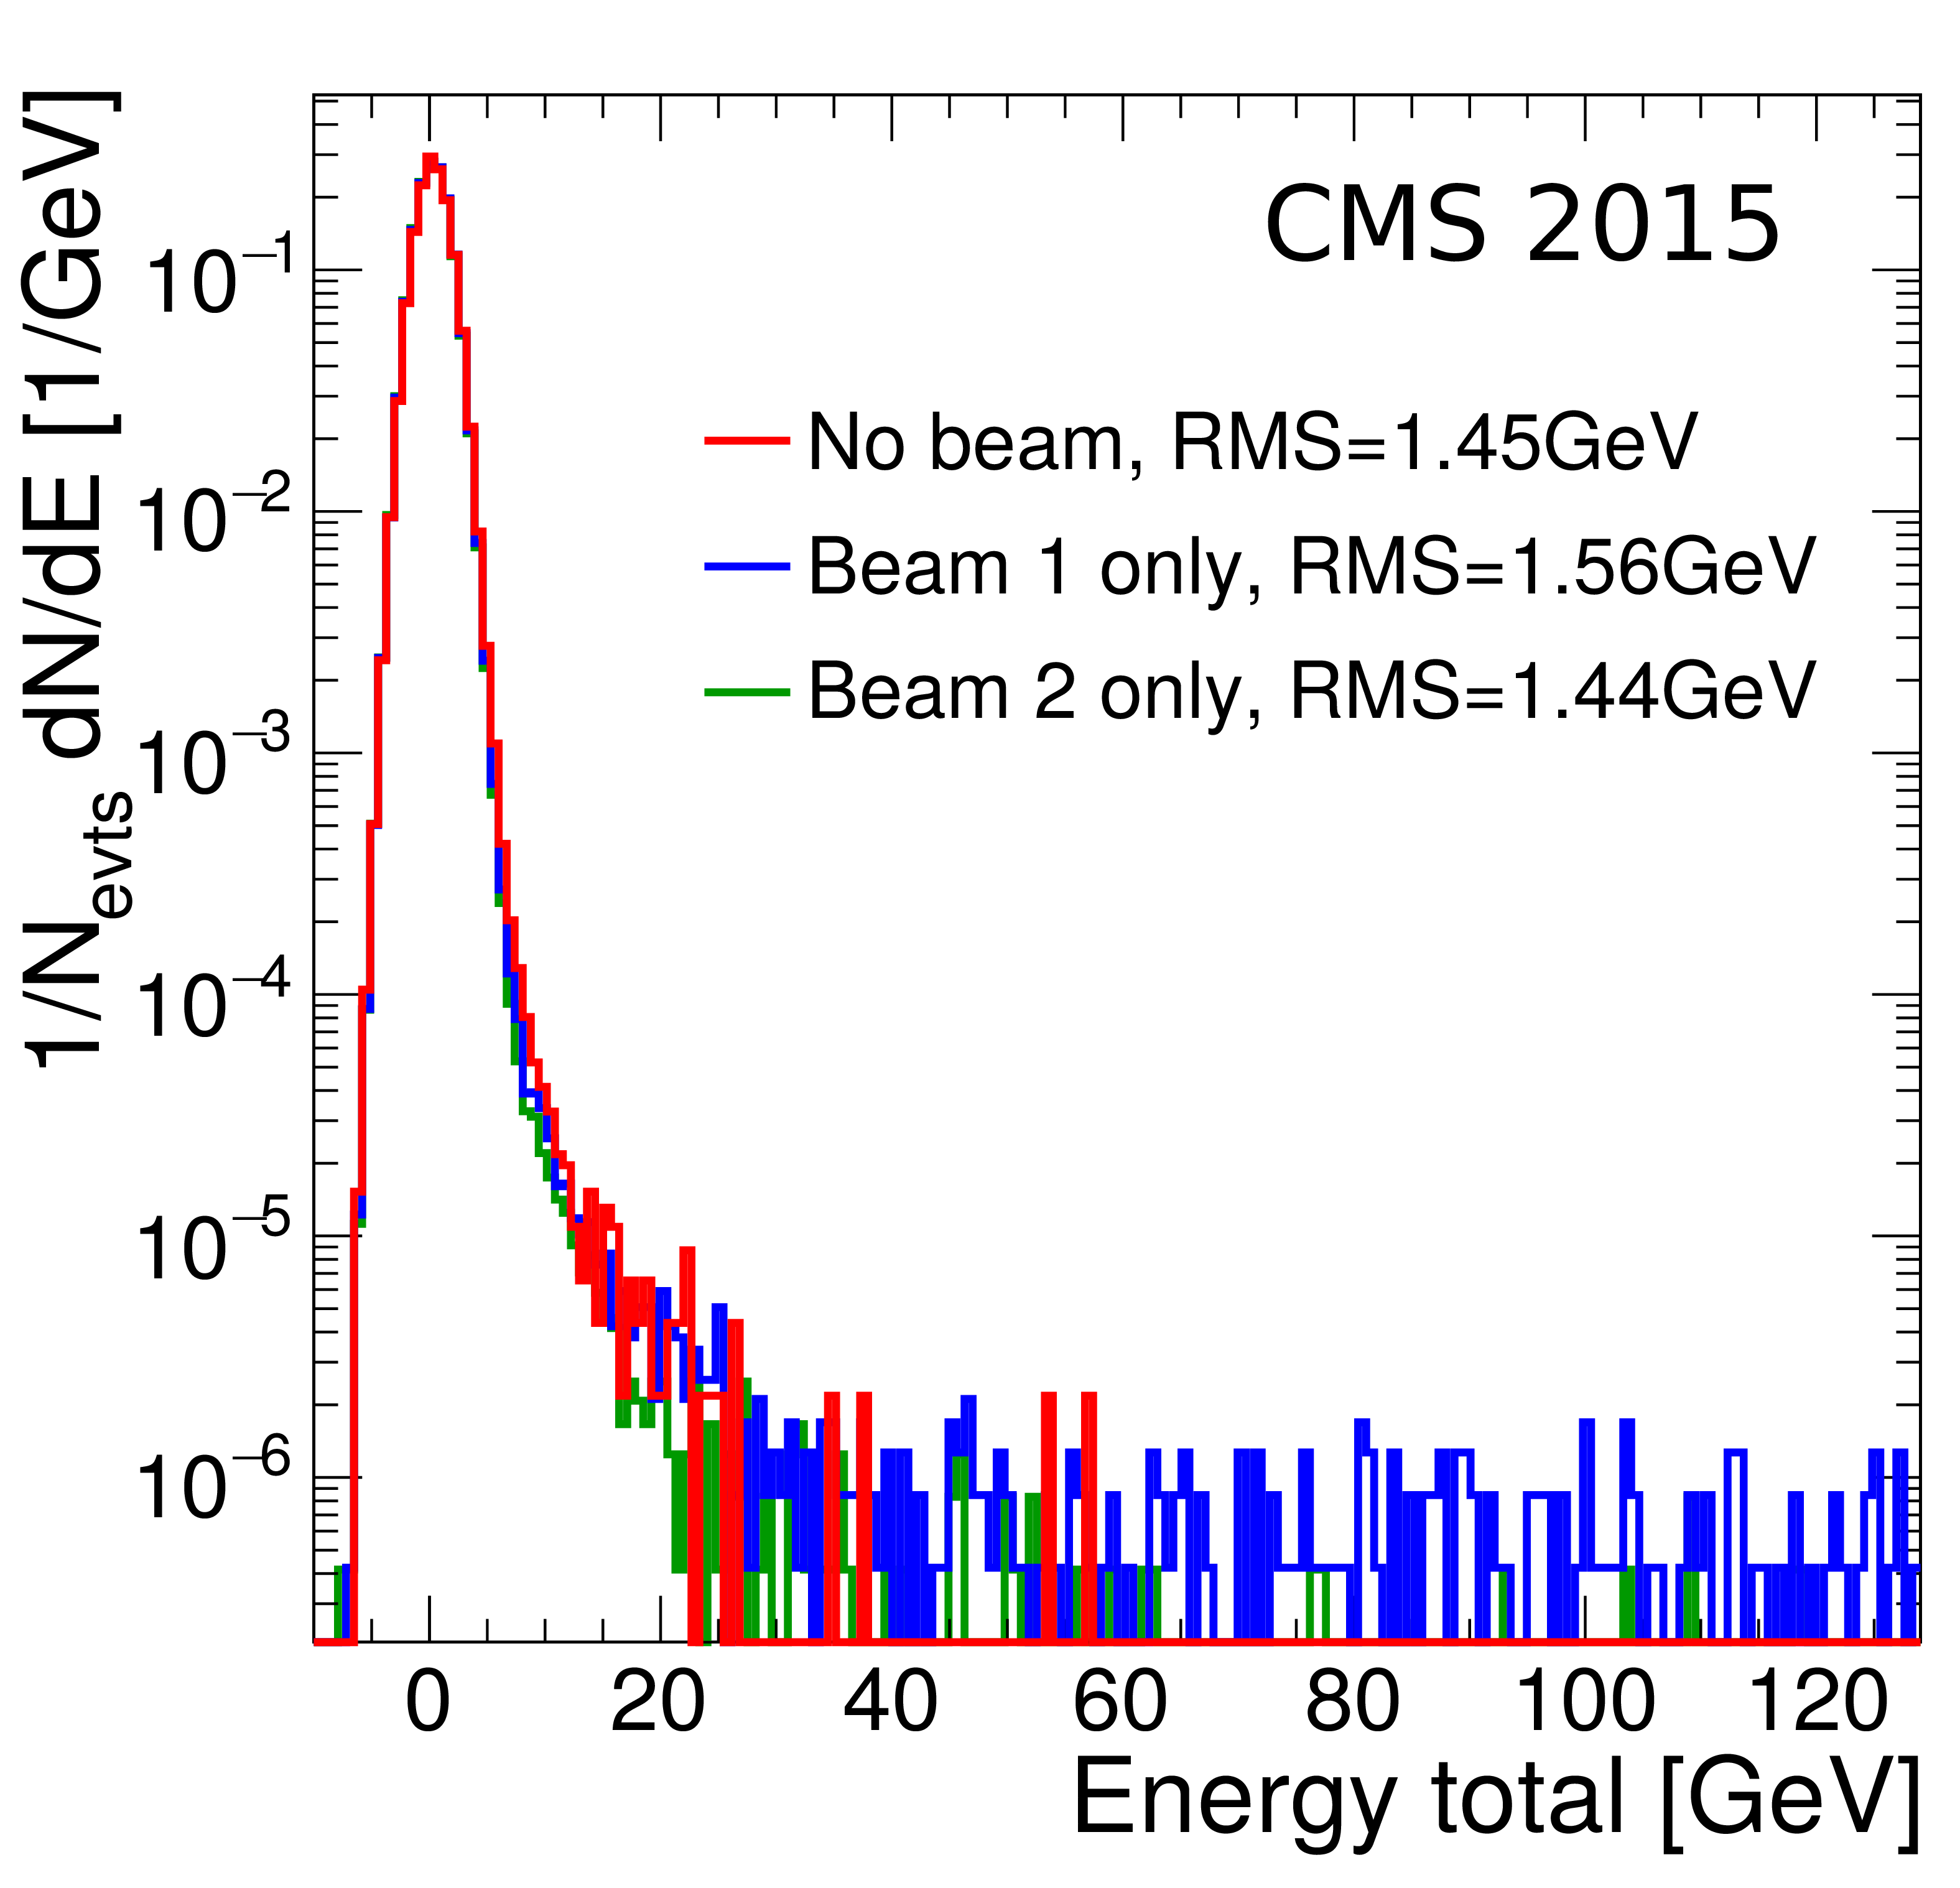
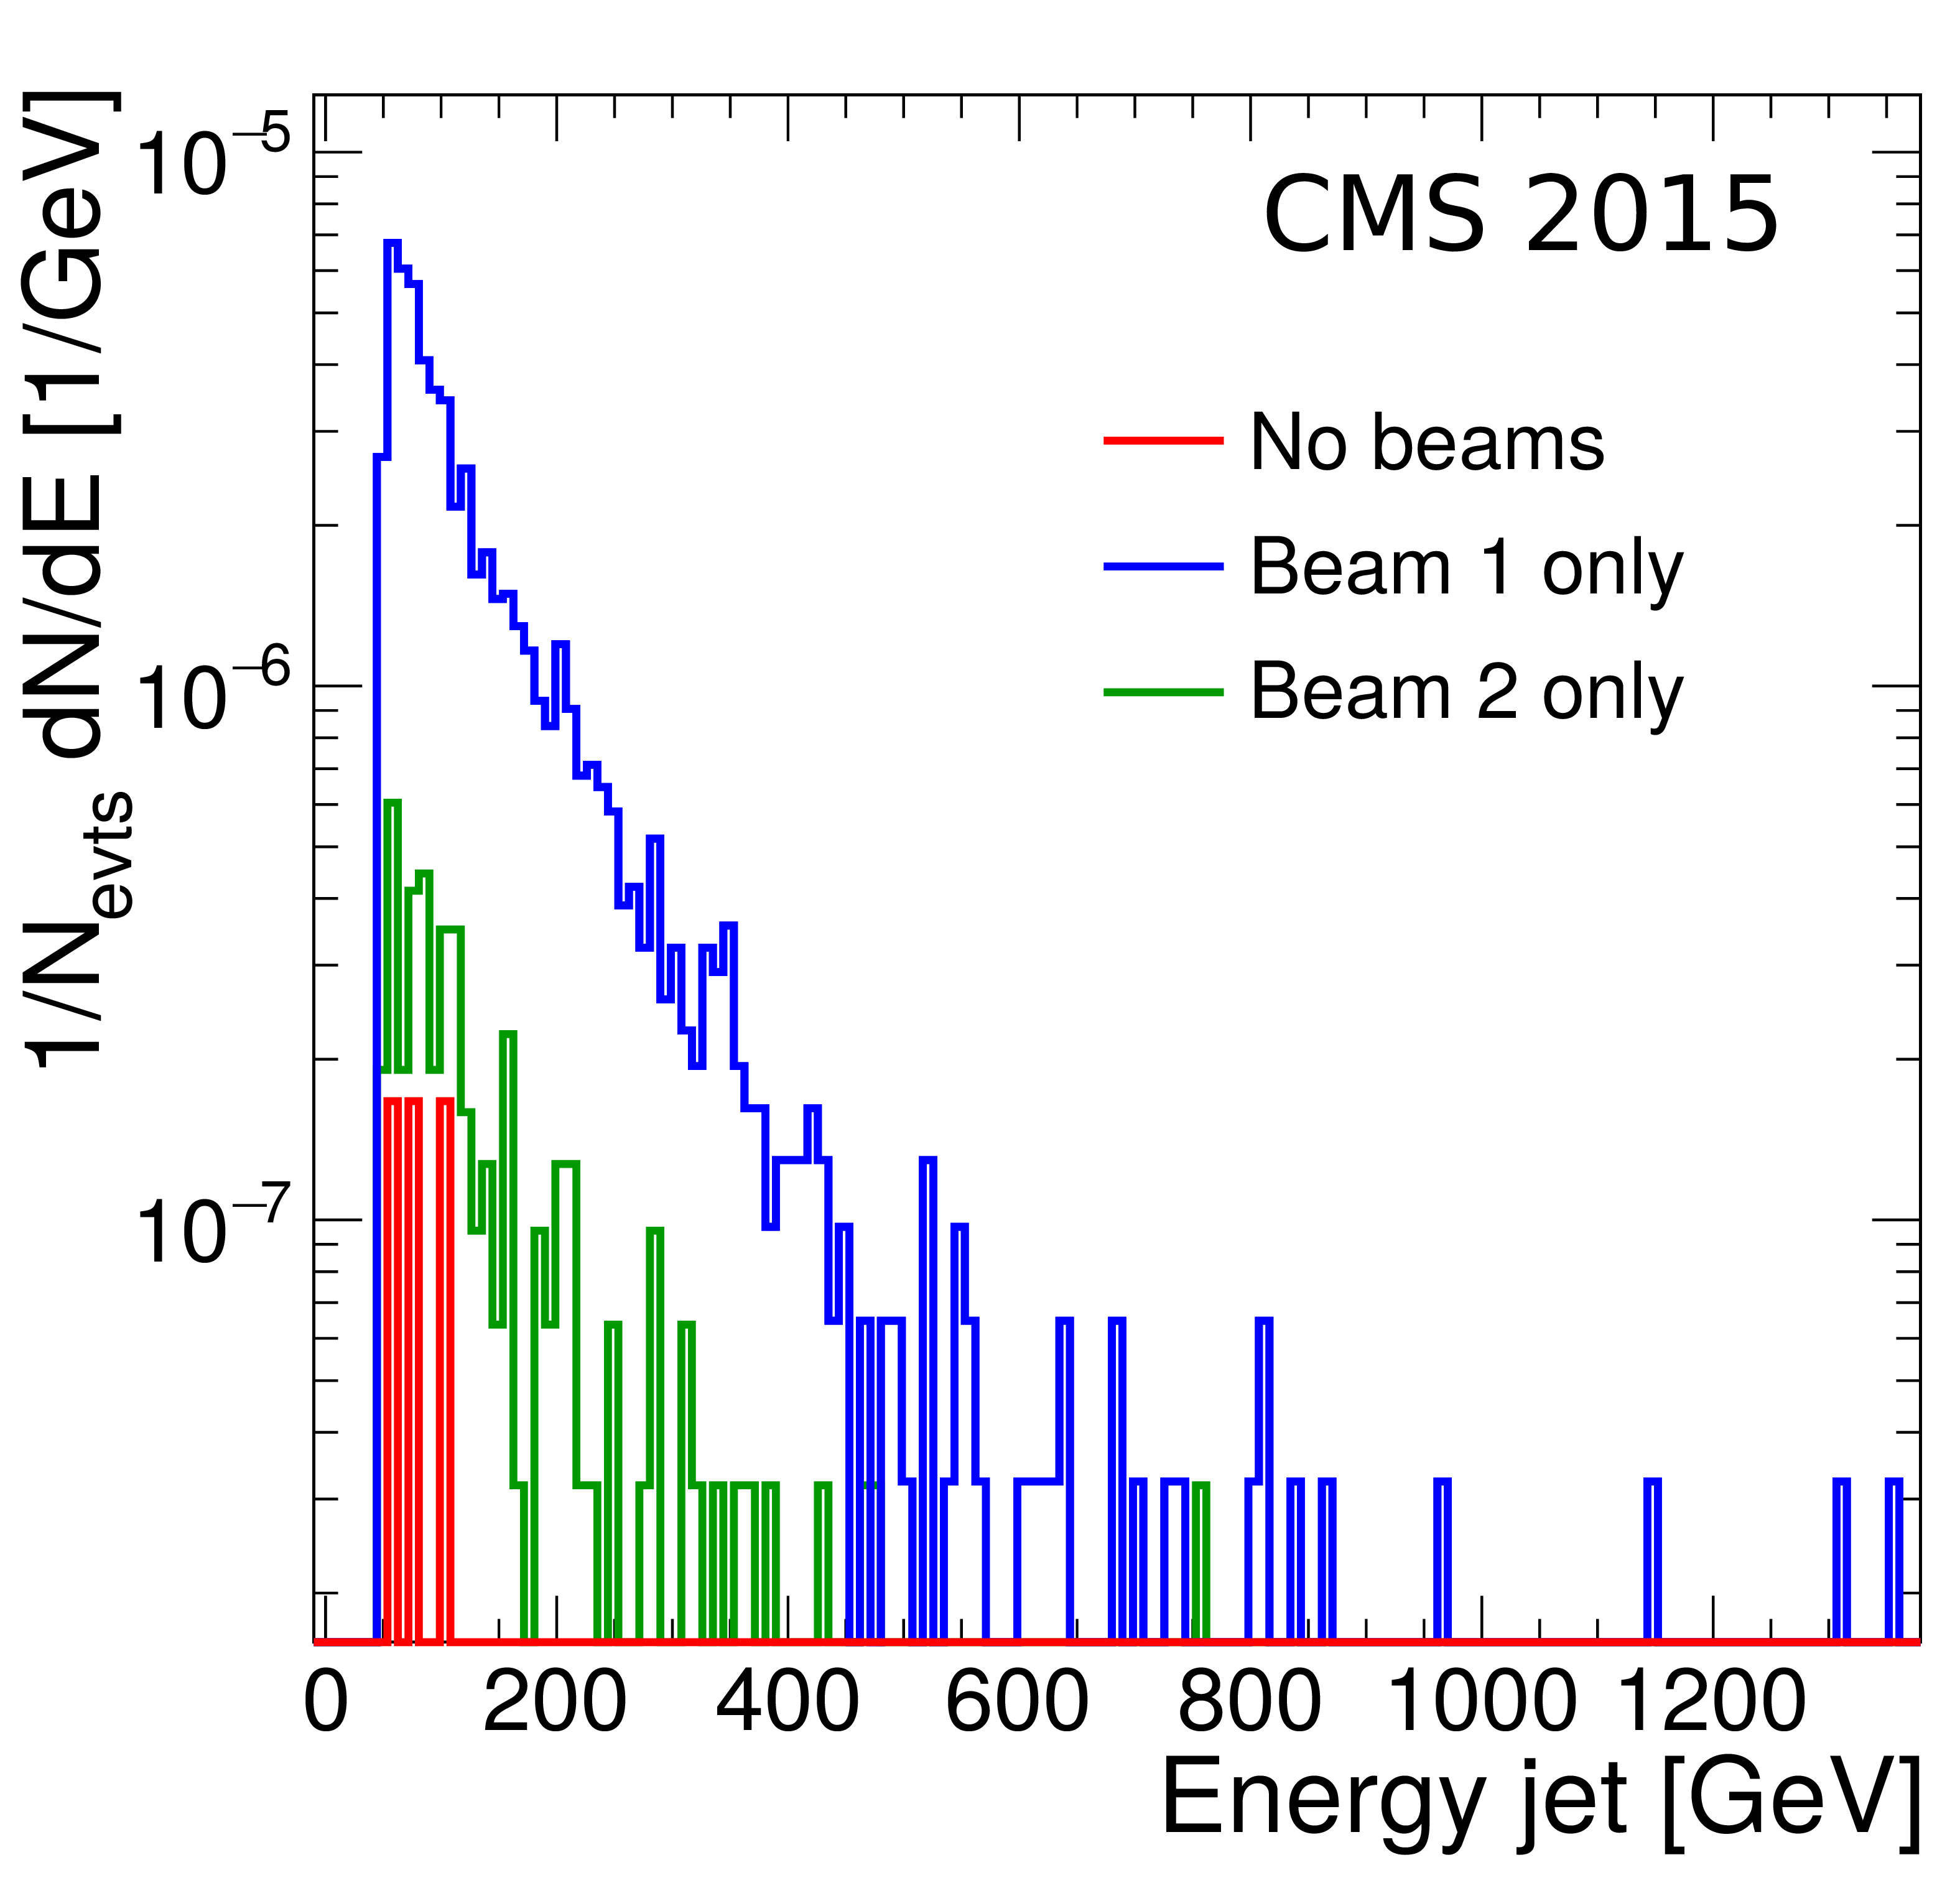
Figure 31:
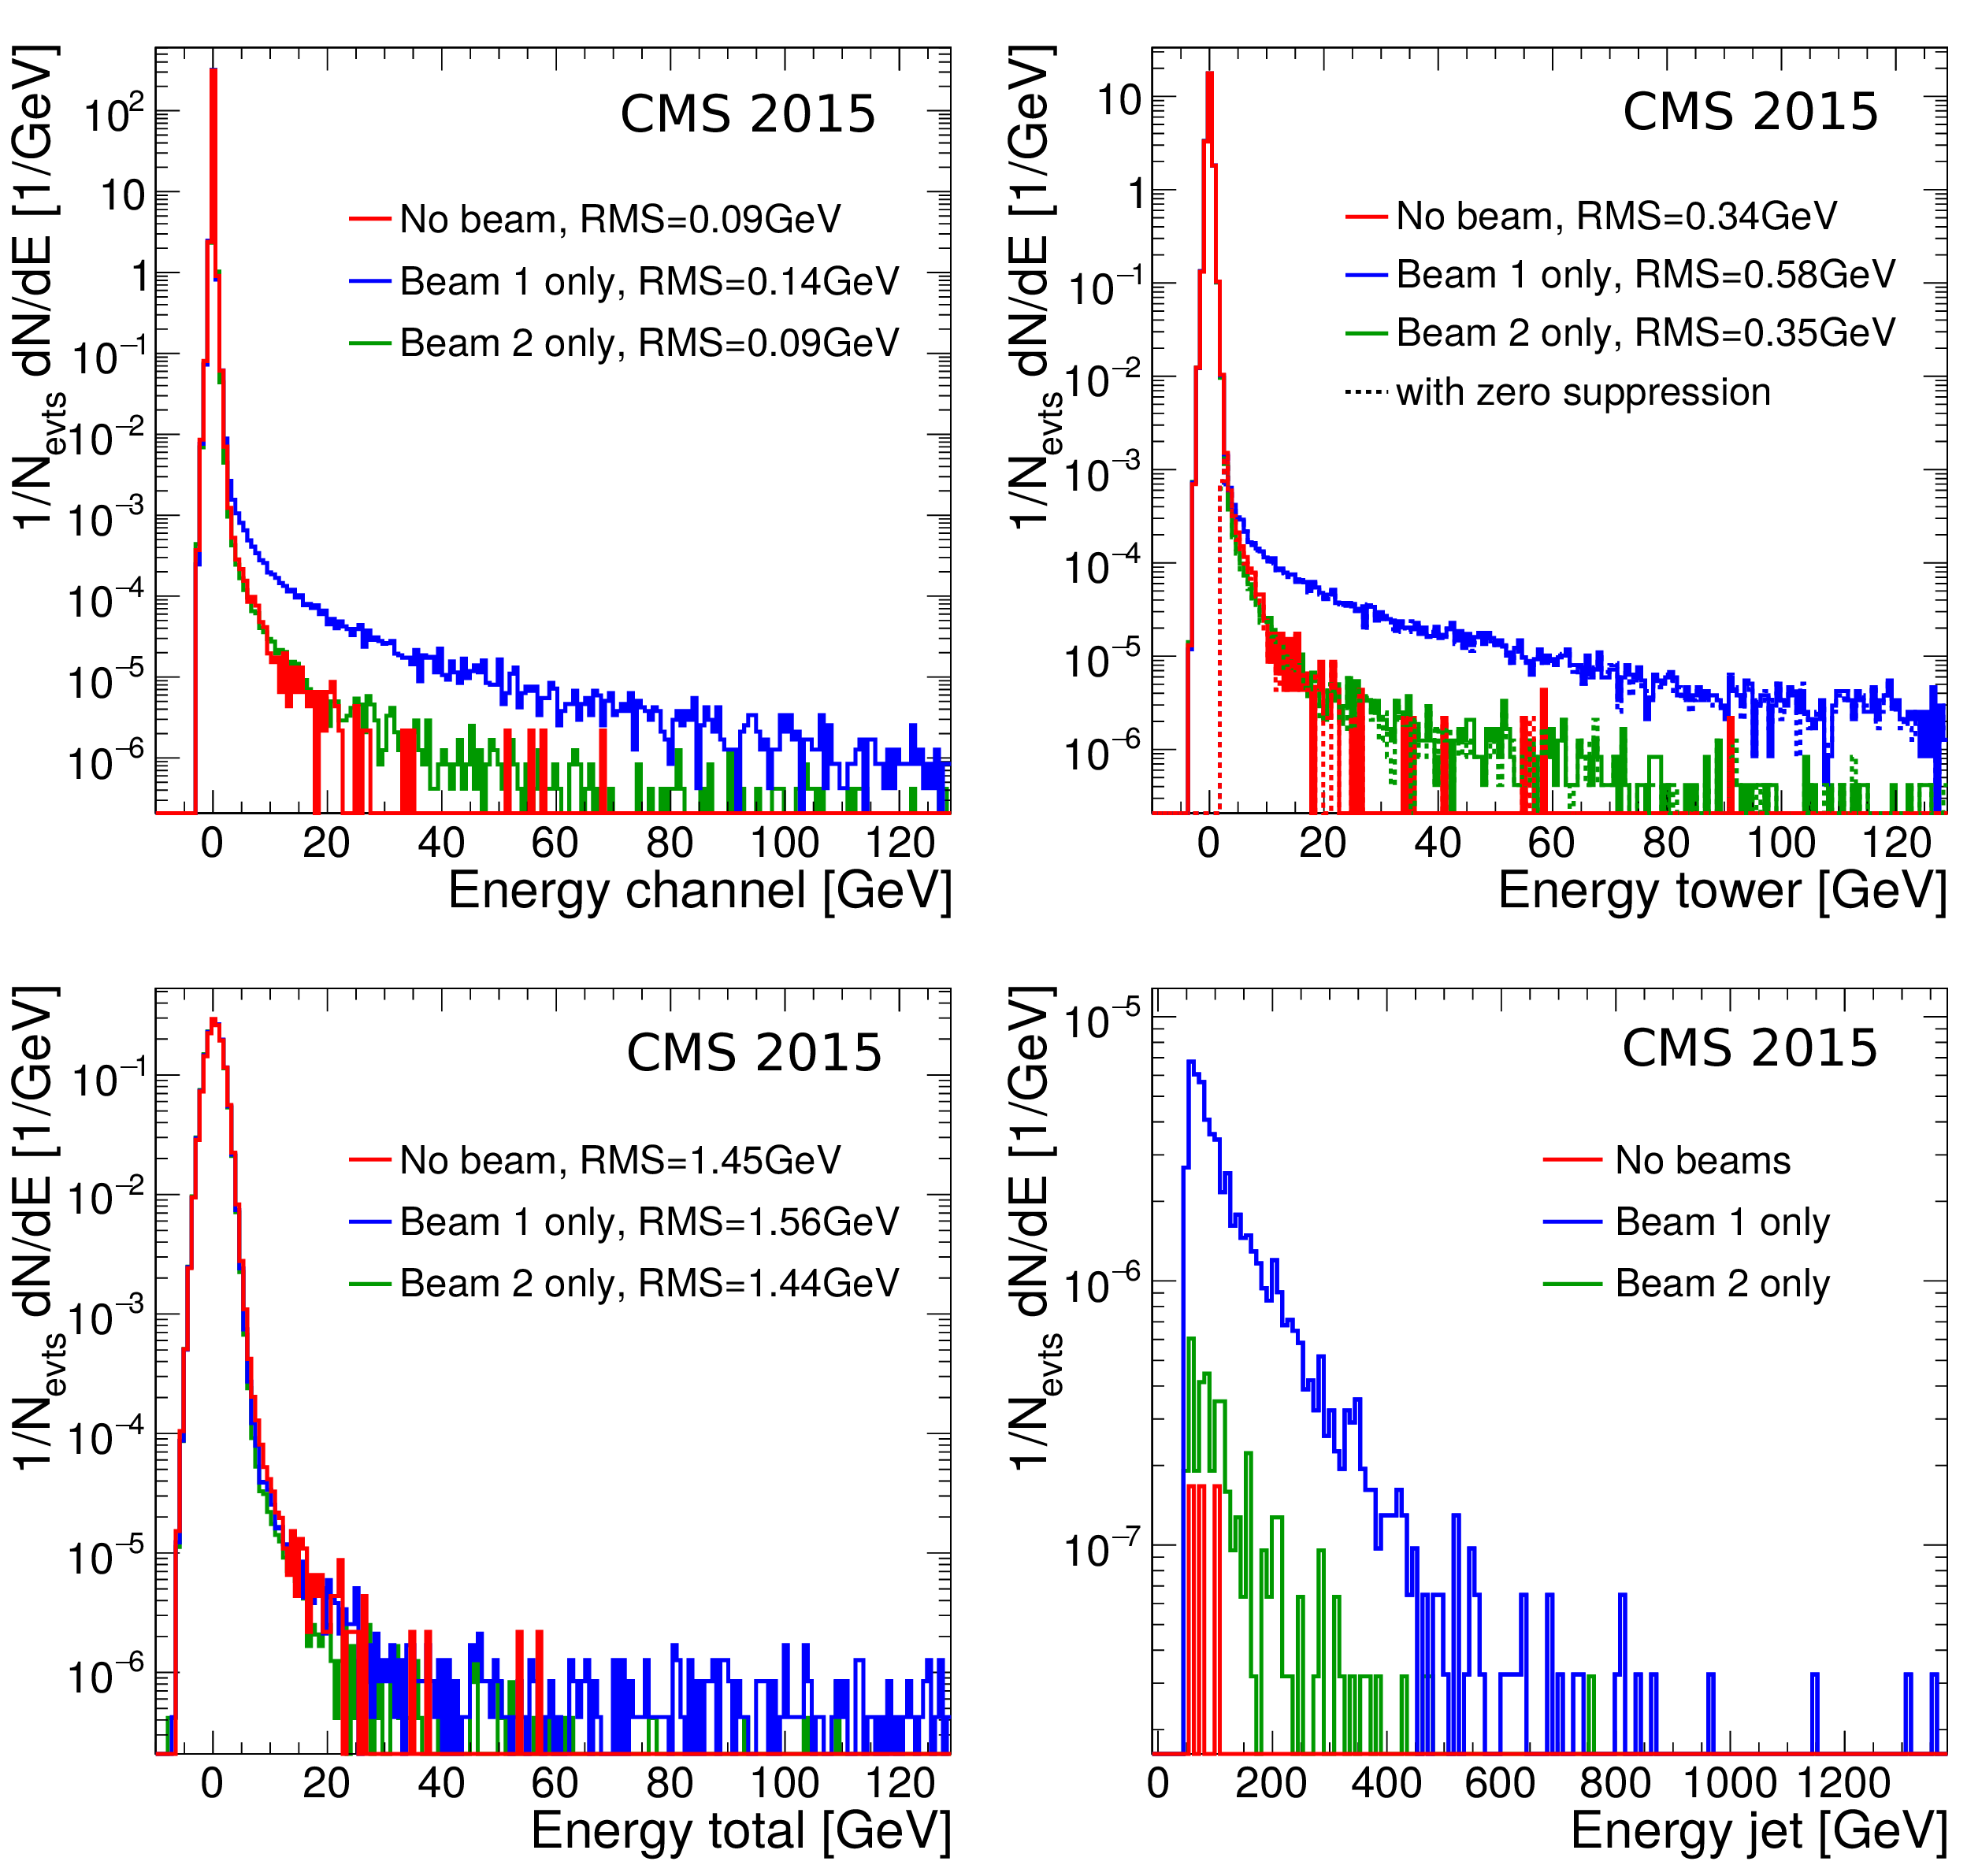
Measured CASTOR noise distributions for reconstructed physics objects at the channel (upper left), tower (upper right), full-CASTOR (lower left), and jet (lower right) levels. The data are from June 2015 during proton-proton collisions at $ {{\sqrt {s}}} = $ 13 TeV. Towers are normally zero suppressed although, here, towers both with (solid) and without (dashed) zero suppression are shown. Since jets are zero suppressed, the distribution is non-Gaussian, and no RMS values are reported in this case. |

png pdf |
Figure 31-a:
Measured CASTOR noise distributions for reconstructed physics objects at the channel level. The data are from June 2015 during proton-proton collisions at $ {{\sqrt {s}}} = $ 13 TeV. |
png pdf |
Figure 31-b:
Measured CASTOR noise distributions for reconstructed physics objects at the tower level. The data are from June 2015 during proton-proton collisions at $ {{\sqrt {s}}} = $ 13 TeV. Towers are normally zero suppressed although, here, towers both with (solid) and without (dashed) zero suppression are shown. |
png pdf |
Figure 31-c:
Measured CASTOR noise distributions for reconstructed physics objects at the full-CASTOR level. The data are from June 2015 during proton-proton collisions at $ {{\sqrt {s}}} = $ 13 TeV. |
png pdf |
Figure 31-d:
Measured CASTOR noise distributions for reconstructed physics objects at the jet level. The data are from June 2015 during proton-proton collisions at $ {{\sqrt {s}}} = $ 13 TeV. Since jets are zero suppressed, the distribution is non-Gaussian, and no RMS values are reported in this case. |
| Tables | |
png pdf |
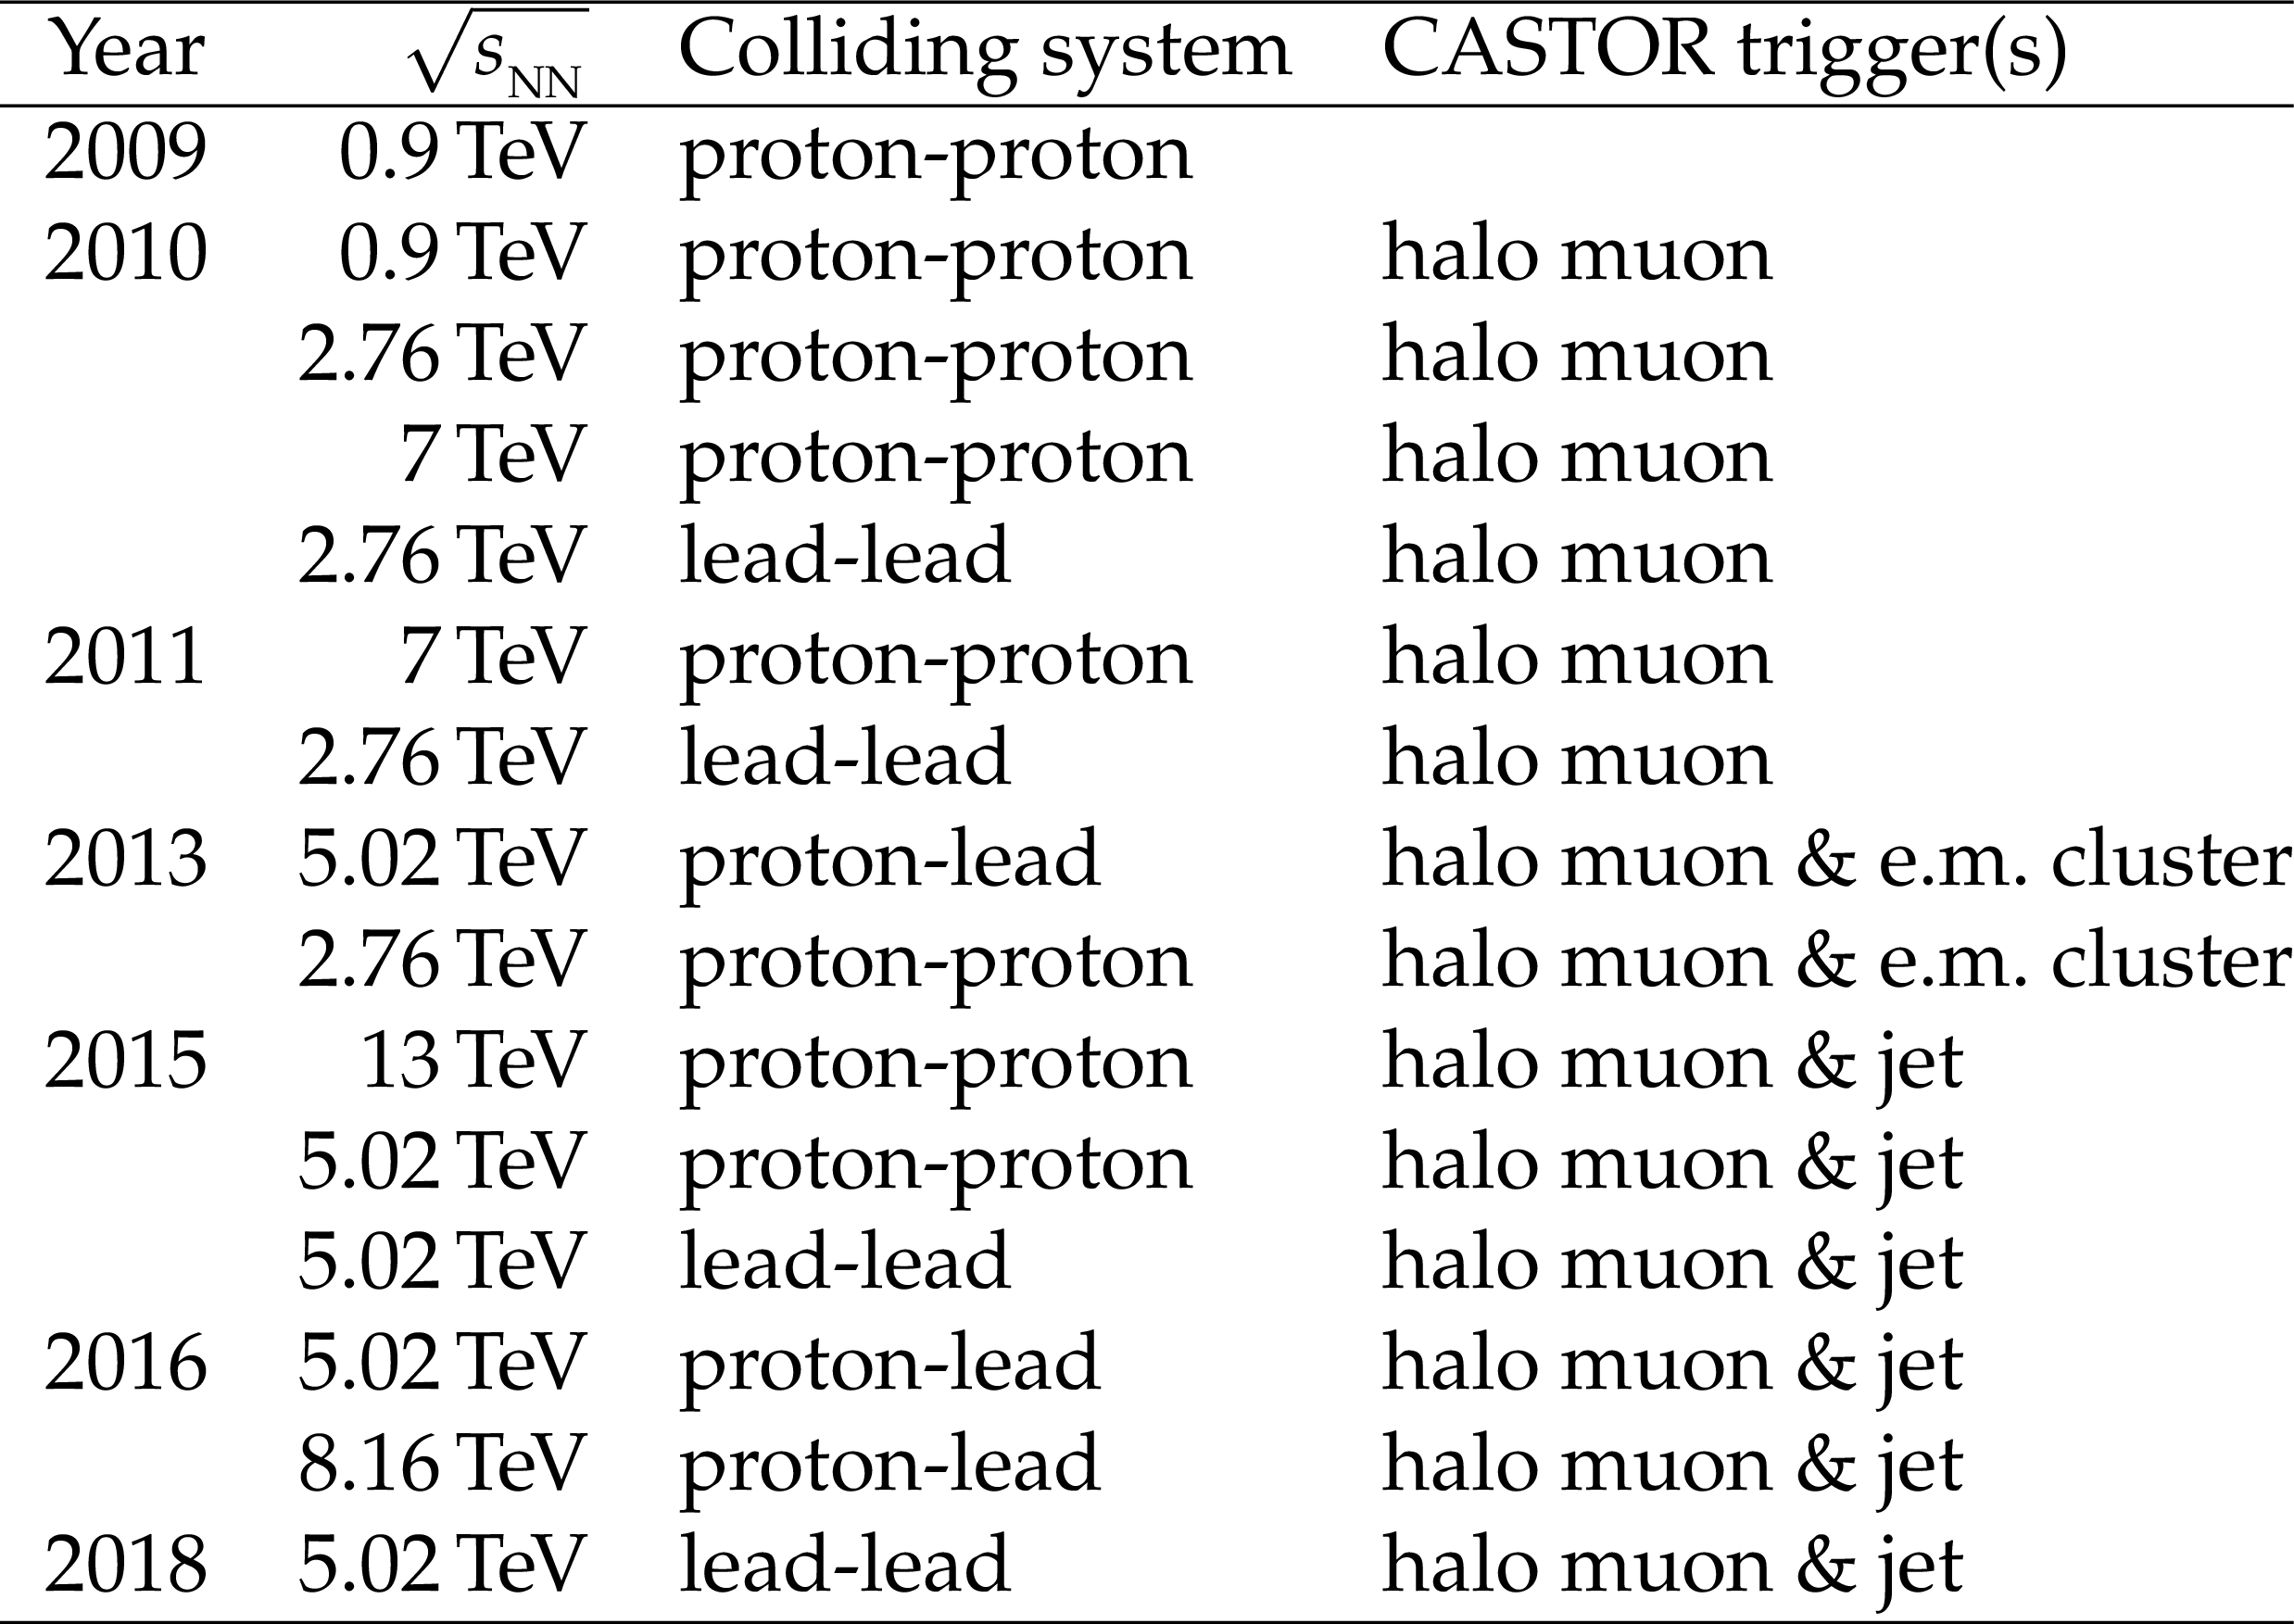
Table 1:
Overview of the running periods of the CASTOR detector, with indication of the year, colliding system, nucleon-nucleon center-of-mass energy, and the triggers provided to the CMS L1 global trigger system. |
| Summary |
|
The physics motivation, detector design, triggers, calibration, alignment, simulation, and overall performance of the CASTOR calorimeter project have been described. The detector, located in an extremely challenging environment at very forward rapidities in the CMS experiment, has proven to be a valuable apparatus for multiple physics measurements in proton and nuclear collisions at the CERN LHC. The physics motivations for the detector construction, as well as measurements carried out during the Run 1 and 2 operations at the LHC, have been outlined. The overall detector design has been reviewed, emphasizing the features that allow its operation under a significant radiation exposure, required fast optical response, high occupancy, magnetic fields, and severe space constraints. The calibration of CASTOR is a major challenge. Three different methods (offbeam, onbeam, and LED pulsers) used to set the gain correction factors of the CASTOR photosensors have been reviewed. The absolute energy scale is determined with a total precision of about 17%, which represents the dominant source of systematic uncertainty for many measurements. Despite the difficulties to precisely determine the absolute energy scale of the calorimeter, beam halo muons have proven a valuable tool to intercalibrate all channels, to monitor the stability of the detector, and to determine the noise levels. The alignment of CASTOR, which has an important impact on the calorimeter energy scale, data-simulation agreement, and on the actual detector acceptance, has been surveyed with two types of sensors, and cross-checked with measurements taken concurrently with the TOTEM T2 tracker in front of CASTOR. An alignment precision of the order of 1 mm was achieved. Different comparisons of the data to Monte Carlo simulations confirm that the reconstructed objects can be used for various physics analyses, from event-type classification to more advanced measurements (jets, single-particle spectra, etc.). Since CASTOR covers a unique phase space at the LHC, and since there are no future plans for the installation of a detector with comparable performance, the exploitation of the recorded data can provide many opportunities for interesting measurements in proton and nuclear collisions at the LHC. |
| References | ||||
| 1 | A. L. S. Angelis and A. D. Panagiotou | CASTOR: A dedicated detector for the detection of Centauros and strangelets at the LHC | JPG 23 (1997) 2069 | |
| 2 | A. Angelis et al. | CASTOR: Centauro and strange object research in nucleus-nucleus collisions at the LHC | NPPS 97 (2001) 227 | |
| 3 | X. Aslanoglou et al. | First performance studies of a prototype for the CASTOR forward calorimeter at the CMS experiment | Acta Phys. Polon. B 39 (2008) 1429 | 0706.2576 |
| 4 | X. Aslanoglou et al. | Performance studies of prototype II for the CASTOR forward calorimeter at the CMS experiment | EPJC 52 (2007) 495 | 0706.2641 |
| 5 | S. Basegmez et al. | Performance studies for the prototype III of the CASTOR forward calorimeter at the CMS experiment | Indian J. Phys. 84 (2010) 1689 | |
| 6 | CMS CASTOR Collaboration | Design and test beam studies for the CASTOR calorimeter of the CMS experiment | NIMA 623 (2010) 225 | |
| 7 | V. Andreev et al. | Performance studies of a full-length prototype for the CASTOR forward calorimeter at the CMS experiment | EPJC 67 (2010) 601 | |
| 8 | CMS Collaboration | The CMS experiment at the CERN LHC | JINST 3 (2008) S08004 | CMS-00-001 |
| 9 | J. D. Bjorken and L. D. McLerran | Explosive quark matter and the Centauro event | PRD 20 (1979) 2353 | |
| 10 | Chacaltaya and Pamir Collaboration | Observation of attenuation behavior of hadrons in extremely high-energy cosmic ray interactions: New hadronic state? | NPB 424 (1994) 241 | |
| 11 | J. Kempa et al. | Emulsion chamber observations of Centauros, aligned events and the long-flying component | Central Eur. J. Phys. 10 (2012) 723 | |
| 12 | M. Albrow et al. | Prospects for diffractive and forward physics at the LHC | technical report, 2006 CERN-LHCC-2006-039-G-124 | |
| 13 | M. Deile, D. d'Enterria, and A. De Roeck, eds. | Elastic and diffractive scattering | Proceedings, 13th International Conference, Blois Workshop, CERN, 2009 | 1002.3527 |
| 14 | CMS Collaboration | CMS physics technical design report: Addendum on high density QCD with heavy ions | JPG 34 (2007) 2307 | |
| 15 | CMS Collaboration | Measurement of energy flow at large pseudorapidities in pp collisions at $ \sqrt{s} = $ 0.9 and 7 TeV | JHEP 11 (2011) 148 | CMS-FWD-10-011 1110.0211 |
| 16 | CMS Collaboration | Study of the underlying event at forward rapidity in pp collisions at $ \sqrt{s} = $ 0.9, 2.76, and 7 TeV | JHEP 04 (2013) 072 | CMS-FWD-11-003 1302.2394 |
| 17 | CMS Collaboration | Measurement of diffraction dissociation cross sections in pp collisions at $ \sqrt{s} = $ 7 TeV | PRD 92 (2015) 012003 | CMS-FSQ-12-005 1503.08689 |
| 18 | CMS Collaboration | Measurement of the inclusive energy spectrum in the very forward direction in proton-proton collisions at $ \sqrt{s}= $ 13 TeV | JHEP 08 (2017) 046 | CMS-FSQ-16-002 1701.08695 |
| 19 | CMS Collaboration | Measurement of the energy density as a function of pseudorapidity in proton-proton collisions at $ \sqrt{s} = $ 13 TeV | EPJC 79 (2019) 391 | CMS-FSQ-15-006 1812.04095 |
| 20 | CMS Collaboration | Measurement of the inelastic proton-proton cross section at $ \sqrt{s}= $ 13 TeV | JHEP 07 (2018) 161 | CMS-FSQ-15-005 1802.02613 |
| 21 | CMS Collaboration | Extraction and validation of a new set of CMS PYTHIA~8 tunes from underlying-event measurements | EPJC 80 (2020) 4 | CMS-GEN-17-001 1903.12179 |
| 22 | CMS Collaboration | Measurement of the average very forward energy as a function of the track multiplicity at central pseudorapidities in proton-proton collisions at $ \sqrt{s}= $ 13 TeV | EPJC 79 (2019) 893 | CMS-FSQ-18-001 1908.01750 |
| 23 | CMS Collaboration | Measurement of inclusive very forward jet cross sections in proton-lead collisions at $ \sqrt{s_{\mathrm{NN}}} = $ 5.02 TeV | JHEP 05 (2019) 043 | CMS-FSQ-17-001 1812.01691 |
| 24 | CMS Collaboration | Centrality and pseudorapidity dependence of the transverse energy density in pPb collisions at $ \sqrt{s_\mathrm{NN}} = $ 5.02 TeV | PRC 100 (2019) 024902 | CMS-HIN-14-014 1810.05745 |
| 25 | CMS Collaboration | Measurement of exclusive $ \rho^0(770) $ photoproduction in ultraperipheral pPb collisions at $ \sqrt{s_\mathrm{NN}} = $ 5.02 TeV | EPJC 79 (2019) 702 | CMS-FSQ-16-007 1902.01339 |
| 26 | CMS Collaboration | Measurement of the pseudorapidity and centrality dependence of the very forward energy density in PbPb collisions at 2.76 ATeV | CDS | |
| 27 | CERN | The CERN Open Data Portal | link | |
| 28 | CMS Collaboration | Open data at CMS: status and plans | PoS LHCP2019 (2019) 260 | |
| 29 | CMS Collaboration | Performance of the combined zero degree calorimeter for CMS | J. Phys. Conf. Ser. 160 (2009) 012059 | 0807.0785 |
| 30 | ATLAS Collaboration | The ATLAS experiment at the CERN Large Hadron Collider | JINST 3 (2008) S08003 | |
| 31 | ALICE Collaboration | The ALICE experiment at the CERN LHC | JINST 3 (2008) S08002 | |
| 32 | LHCf Collaboration | The LHCf detector at the CERN Large Hadron Collider | JINST 3 (2008) S08006 | |
| 33 | LHCb Collaboration | The LHCb detector at the LHC | JINST 3 (2008) S08005 | |
| 34 | TOTEM Collaboration | The TOTEM experiment at the CERN Large Hadron Collider | JINST 3 (2008) S08007 | |
| 35 | ZEUS Collaboration | Measurement of the proton structure function $ F_2 $ in e-p scattering at HERA | PLB 316 (1993) 412 | |
| 36 | H1 Collaboration | Measurement of the proton structure function $ F_2(x,Q^2) $ in the low $ x $ region at HERA | NPB 407 (1993) 515 | |
| 37 | K. Akiba et al. | LHC forward physics | JPG 43 (2016) 110201 | 1611.05079 |
| 38 | CMS Collaboration | Jet production in the very forward direction at 13 TeV with CMS | AIP Conf. Proc. 1815 (2017) 060021 | |
| 39 | V. N. Gribov and L. N. Lipatov | Deep inelastic e-p scattering in perturbation theory | Sov. J. NP 15 (1972) 438.[Yad. Fiz. 15 (1972) 781] | |
| 40 | G. Altarelli and G. Parisi | Asymptotic freedom in parton language | NPB 126 (1977) 298 | |
| 41 | Y. L. Dokshitzer | Calculation of the structure functions for deep inelastic scattering and e$ ^+ $e$ ^- $ annihilation by perturbation theory in quantum chromodynamics | Sov. Phys. JETP 46 (1977) 641.[Zh. Eksp. Teor. Fiz. 73 (1977) 1216] | |
| 42 | E. A. Kuraev, L. N. Lipatov, and V. S. Fadin | The Pomeranchuk singularity in nonabelian gauge theories | Sov. Phys. JETP 45 (1977) 199.[Zh. Eksp. Teor. Fiz. 72 (1977) 377] | |
| 43 | E. A. Kuraev, L. N. Lipatov, and V. S. Fadin | Multi-reggeon processes in the Yang--Mills theory | Sov. Phys. JETP 44 (1976) 443.[Zh. Eksp. Teor. Fiz. 71 (1976) 840] | |
| 44 | I. I. Balitsky and L. N. Lipatov | The Pomeranchuk singularity in quantum chromodynamics | Sov. J. NP 28 (1978) 822.[Yad. Fiz. 28 (1978) 1597] | |
| 45 | L. N. Lipatov | The bare pomeron in quantum chromodynamics | Sov. Phys. JETP 63 (1986) 904.[Zh. Eksp. Teor. Fiz. 90 (1986) 1536] | |
| 46 | E. Iancu, A. Leonidov, and L. McLerran | The color glass condensate: an introduction | QCD perspectives on hot and dense matter. Proceedings, NATO Advanced Study Institute, Summer School, Cargese, France, August 6-18, 2001 (2002) 73 | hep-ph/0202270 |
| 47 | CMS Collaboration | Low-x QCD studies with forward jets in proton-proton collisions at $ \sqrt{s} = $ 14 TeV | AIP Conf. Proc. 1105 (2009) 28 | 0812.2665 |
| 48 | D. d'Enterria | Forward jets physics in ATLAS, CMS and LHCb | in Elastic and Diffractive Scattering. Proceedings, 13th International Conference, Blois Workshop, CERN, Geneva, Switzerland, June 29-July 3, 2009, p. 381 2009 | 0911.1273 |
| 49 | A. H. Mueller and H. Navelet | An inclusive minijet cross-section and the bare pomeron in QCD | NPB 282 (1987) 727 | |
| 50 | CMS Collaboration | Azimuthal decorrelation of jets widely separated in rapidity in pp collisions at $ \sqrt{s}= $ 7 TeV | JHEP 08 (2016) 139 | CMS-FSQ-12-002 1601.06713 |
| 51 | R. Ulrich, R. Engel, and M. Unger | Hadronic multiparticle production at ultra-high energies and extensive air showers | PRD 83 (2011) 054026 | 1010.4310 |
| 52 | D. d'Enterria et al. | Constraints from the first LHC data on hadronic event generators for ultra-high energy cosmic-ray physics | Astropart. Phys. 35 (2011) 98 | 1101.5596 |
| 53 | CMS Collaboration | Results of the CMS-CASTOR very-forward calorimeter in pp collisions at $ \sqrt{s} = $ 13 TeV | PoS ICHEP2016 (2017) 1020 | |
| 54 | EAS-MSU, IceCube, KASCADE-Grande, NEVOD-DECOR, Pierre Auger, SUGAR, Telescope Array, Yakutsk EAS Array Collaboration | Report on tests and measurements of hadronic interaction properties with air showers | EPJWeb Conf. 210 (2019) 02004 | 1902.08124 |
| 55 | Z. Citron et al. | Report from working group 5 | in Report on the physics at the HL-LHC,and perspectives for the HE-LHC, A. Dainese et al., eds., p. 1159 2019 | 1812.06772 |
| 56 | E. Farhi and R. L. Jaffe | Strange matter | PRD 30 (1984) 2379 | |
| 57 | A. A. Anselm | Classical states of the chiral field and nuclear collisions at very high-energy | PLB 217 (1989) 169 | |
| 58 | A. J. Baltz | The physics of ultraperipheral collisions at the LHC | PR 458 (2008) 1 | 0706.3356 |
| 59 | CMS Collaboration | Studies of the nuclear stopping power in PbPb collisions at 2.76 TeV with CMS | NP A 904 (2013) 787c | |
| 60 | G. Bayatian et al. | Design, performance and calibration of the CMS forward calorimeter wedges | EPJC 53 (2008) 139 | |
| 61 | H1 SpaCal Group Collaboration | Series tests of fine mesh photomultiplier tubes in magnetic fields of up to 1.2-Tesla | NIMA 404 (1998) 265 | |
| 62 | H1 SpaCal Group Collaboration | The H1 lead / scintillating fiber calorimeter | NIMA 386 (1997) 397 | |
| 63 | T. M. Shaw et al. | Front end readout electronics for the CMS hadron calorimeter | in Nuclear Science Symposium Conference Record, 2002 IEEE, volume 1, p. 194 2002 | |
| 64 | CMS Collaboration | The CMS trigger system | JINST 12 (2017) P01020 | CMS-TRG-12-001 1609.02366 |
| 65 | CMS and TOTEM Collaboration | Alignment of CASTOR with 2013 pA TOTEM-Data | CMS-DP-2014-014 | |
| 66 | CMS Collaboration | Description and performance of track and primary-vertex reconstruction with the CMS tracker | JINST 9 (2014) P10009 | CMS-TRK-11-001 1405.6569 |
| 67 | T. Sjostrand, S. Mrenna, and P. Z. Skands | A brief introduction to PYTHIA~8.1 | CPC 178 (2008) 852 | 0710.3820 |
| 68 | R. Ciesielski and K. Goulianos | MBR Monte Carlo simulation in PYTHIA~8 | PoS ICHEP2012 (2013) 301 | 1205.1446 |
| 69 | M. Cacciari, G. P. Salam, and G. Soyez | The anti-$ {k_{\mathrm{T}}} $ jet clustering algorithm | JHEP 04 (2008) 063 | 0802.1189 |
| 70 | CMS Collaboration | Event generator tunes obtained from underlying event and multiparton scattering measurements | EPJC 76 (2016) 155 | CMS-GEN-14-001 1512.00815 |
| 71 | K. Werner, F.-M. Liu, and T. Pierog | Parton ladder splitting and the rapidity dependence of transverse momentum spectra in deuteron-gold collisions at RHIC | PRC 74 (2006) 044902 | hep-ph/0506232 |
| 72 | T. Sjostrand, S. Mrenna, and P. Z. Skands | PYTHIA~6.4 physics and manual | JHEP 05 (2006) 026 | hep-ph/0603175 |
| 73 | R. Field | Physics at the Tevatron | Acta Phys. Polon. B 39 (2008)2611 | |
| 74 | A. Buckley et al. | Systematic event generator tuning for the LHC | EPJC 65 (2010) 331 | 0907.2973 |
| 75 | G. Corcella et al. | HERWIG~6: An event generator for hadron emission reactions with interfering gluons (including supersymmetric processes) | JHEP 01 (2001) 010 | hep-ph/0011363 |
| 76 | N. N. Kalmykov, S. S. Ostapchenko, and A. I. Pavlov | EAS and a quark -- gluon string model with jets | Bull. Russ. Acad. Sci. Phys. 58 (1994) 1966.[Izv. Ross. Akad. Nauk Ser. Fiz. 58N12 (1994) 21] | |
| 77 | S. Ostapchenko | Nonlinear screening effects in high energy hadronic interactions | PRD 74 (2006) 014026 | hep-ph/0505259 |
| 78 | E.-J. Ahn et al. | Cosmic ray interaction event generator SIBYLL 2.1 | PRD 80 (2009) 094003 | 0906.4113 |
| 79 | V. N. Gribov | A reggeon diagram technique | Sov. Phys. JETP 26 (1968) 414.[Zh. Eksp. Teor. Fiz. 53 (1967) 654] | |
| 80 | GEANT4 Collaboration | GEANT4--a simulation toolkit | NIMA 506 (2003) 250 | |
| 81 | TOTEM Collaboration | The TOTEM T2 GEM detector assembly and quality assurance | JINST 4 (2009) P11020 | |
| 82 | V. Innocente, L. Silvestris, and D. Stickland | CMS software architecture -- software framework, services and persistency in high level trigger, reconstruction and analysis | CPC 140 (2001) 31 | |
| 83 | HEP Software Foundation Collaboration | HEP software foundation community white paper working group -- detector simulation | technical report | 1803.04165 |
|
|
Compact Muon Solenoid LHC, CERN |
|

|

|

|

|

|