

Compact Muon Solenoid
LHC, CERN
| CMS-SMP-15-003 ; CERN-EP-2017-085 | ||
| Measurements of jet charge with dijet events in pp collisions at $ \sqrt{s} = $ 8 TeV | ||
| CMS Collaboration | ||
| 18 June 2017 | ||
| JHEP 10 (2017) 131 | ||
| Abstract: Jet charge is an estimator of the electric charge of a quark, antiquark, or gluon initiating a jet. It is based on the momentum-weighted sum of the electric charges of the jet constituents. Measurements of three charge observables of the leading jet in transverse momentum $ p_{\mathrm{T}} $ are performed with dijet events. The analysis is carried out with data collected by the CMS experiment at the CERN LHC in proton-proton collisions at $ \sqrt{s} = $ 8 TeV corresponding to an integrated luminosity of 19.7 fb$^{-1}$. The results are presented as a function of the $ p_{\mathrm{T}}$ of the leading jet and compared to predictions from leading- and next-to-leading-order event generators combined with parton showers. Measured jet charge distributions, unfolded for detector effects, are reported, which expand on previous measurements of the jet charge average and standard deviation in pp collisions. | ||
| Links: e-print arXiv:1706.05868 [hep-ex] (PDF) ; CDS record ; inSPIRE record ; HepData record ; CADI line (restricted) ; | ||
| Figures | |
png pdf |
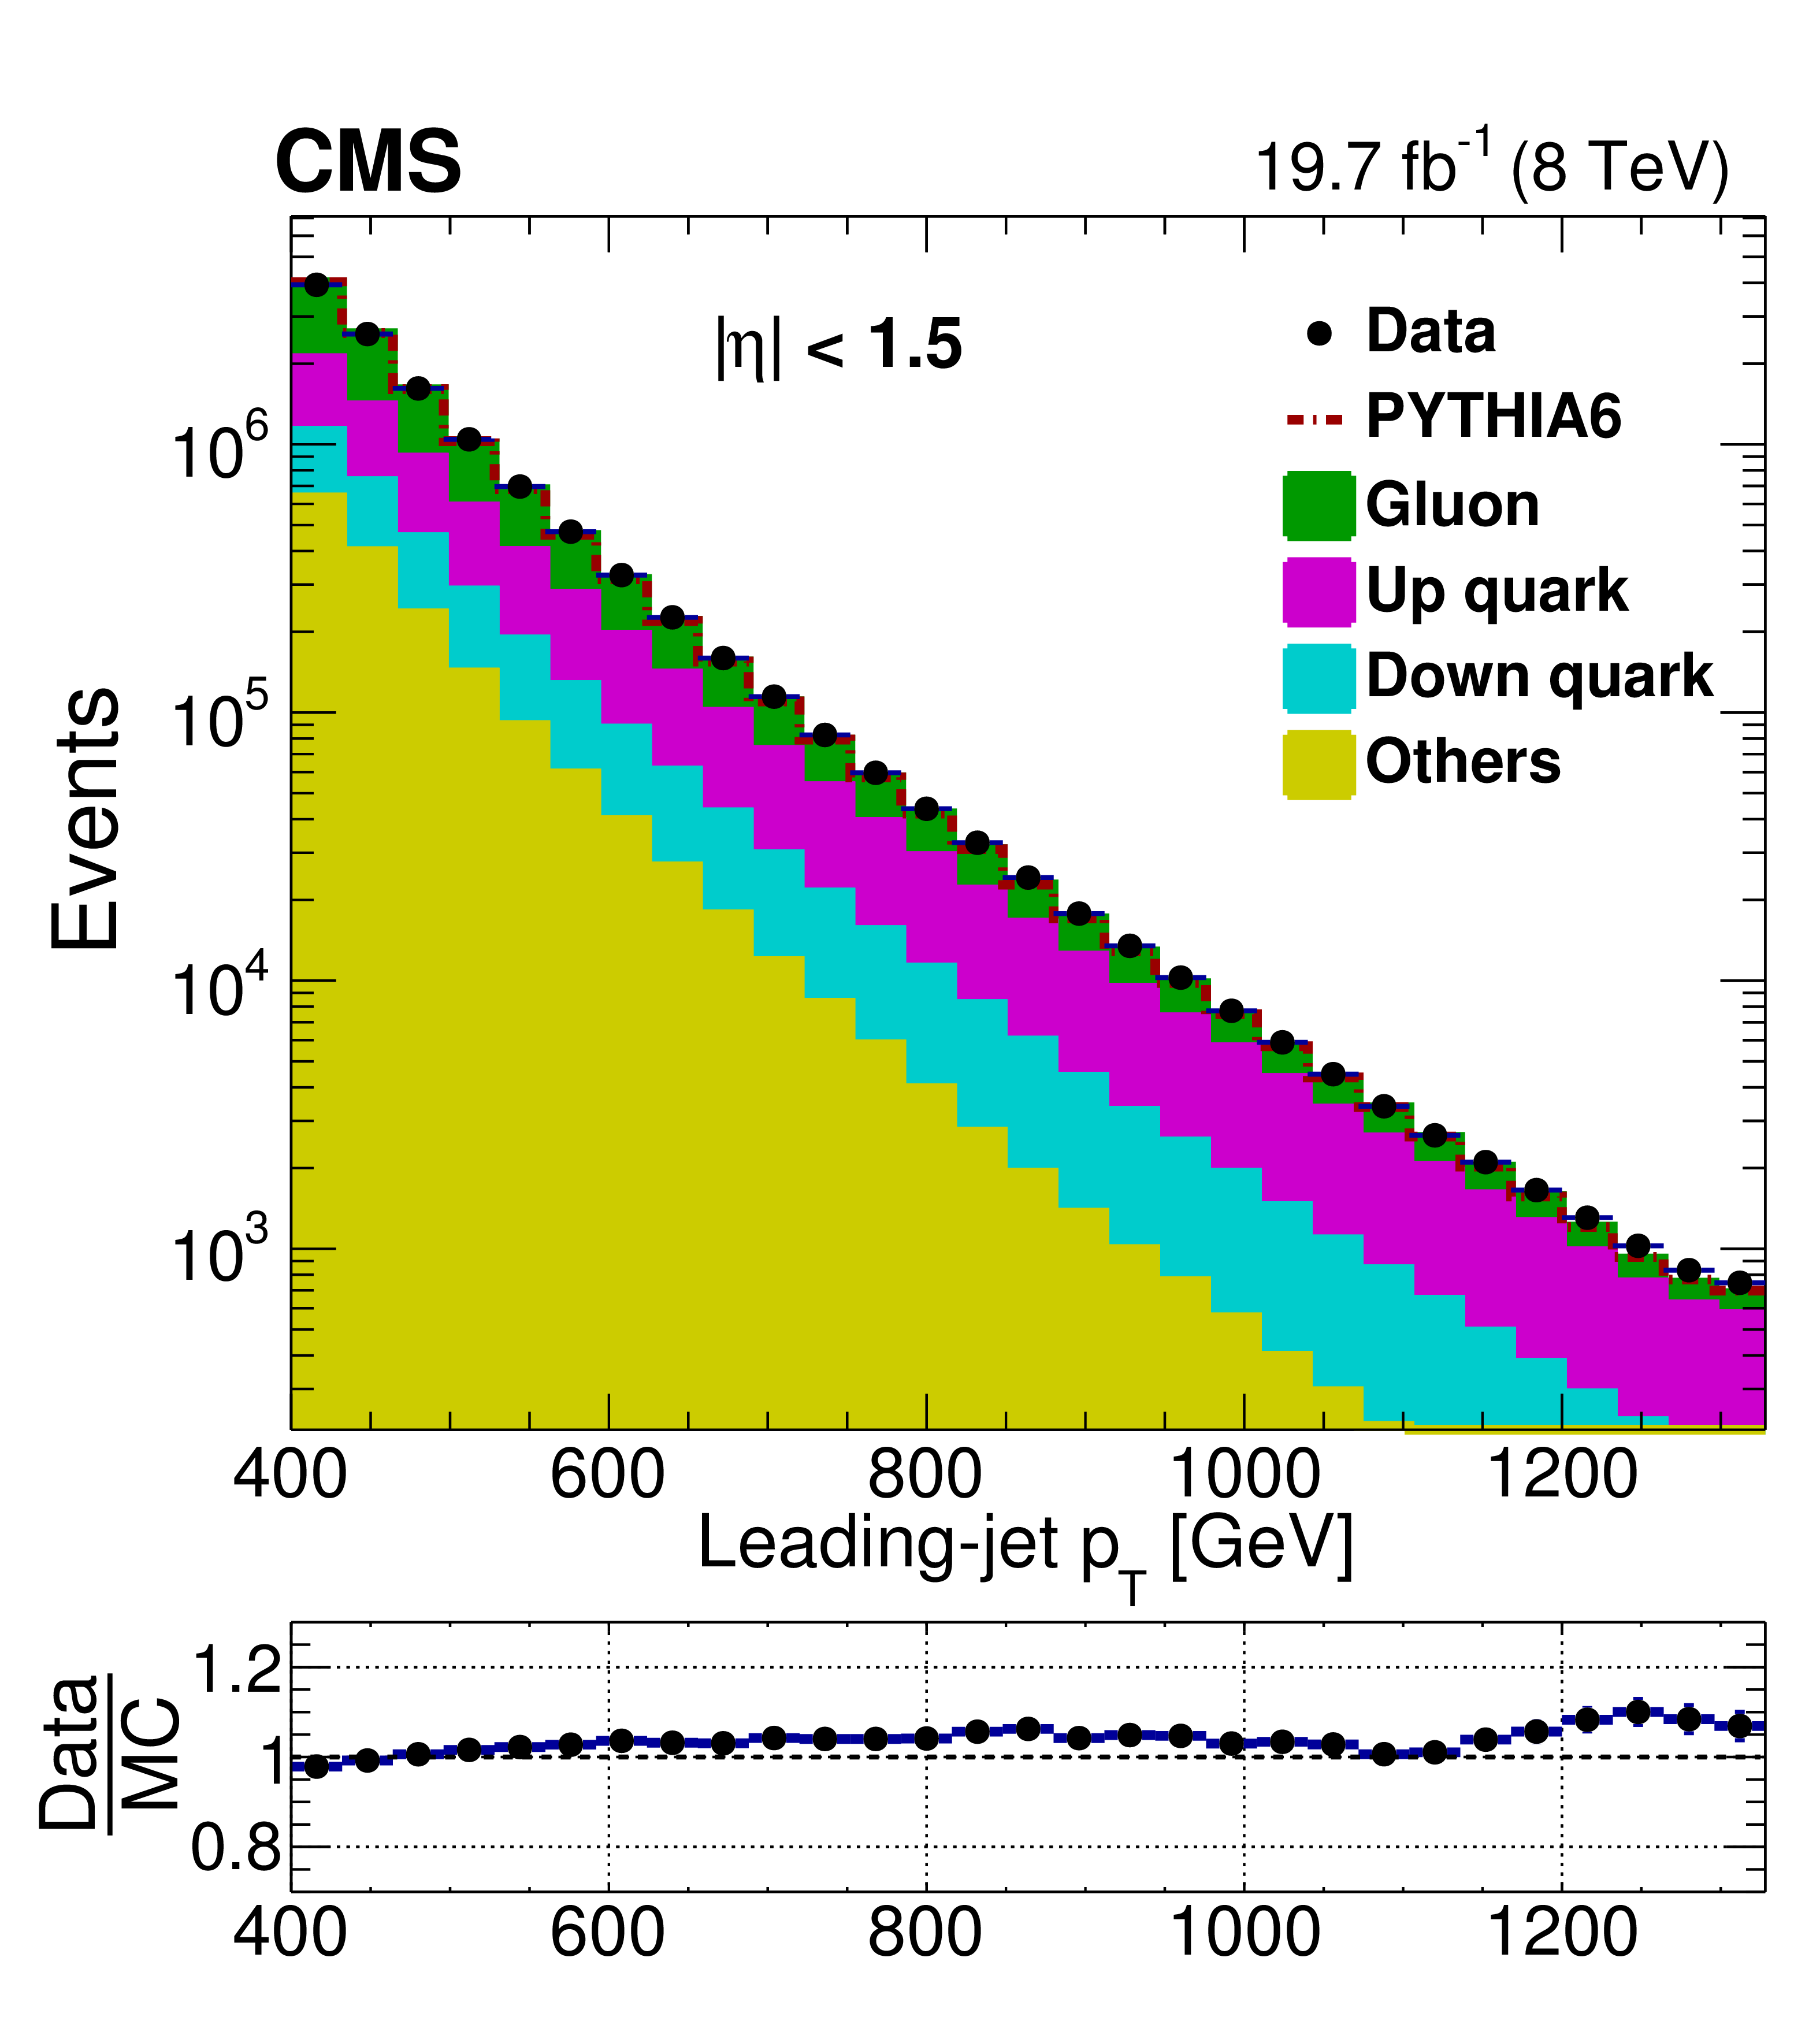
Figure 1:
Leading-jet $ {p_{\mathrm {T}}} $ distribution in data (points) compared to PYTHIA6 simulation. The PYTHIA6 prediction is normalized to match the total number of events observed in data. Only statistical uncertainties are shown. The filled histograms show the contributions from different types of initiating partons, identified by means of the matching algorithm described in the text. The "others'' category represents those jets that are initiated by parton types, the up antiquark ($\bar{ \mathrm{u} } $), the down antiquark ($\bar{ \mathrm{d} } $), the charm, strange, and bottom quarks and antiquarks ($\mathrm{c} $, $\bar{ \mathrm{c} } $, $\mathrm{s} $, $\bar{ \mathrm{s} } $, $\mathrm{ b } $, $\mathrm{ \bar{b} } $), and any unmatched jets. The data points are shown in the center of each jet $ {p_{\mathrm {T}}} $ bin. |

png pdf |
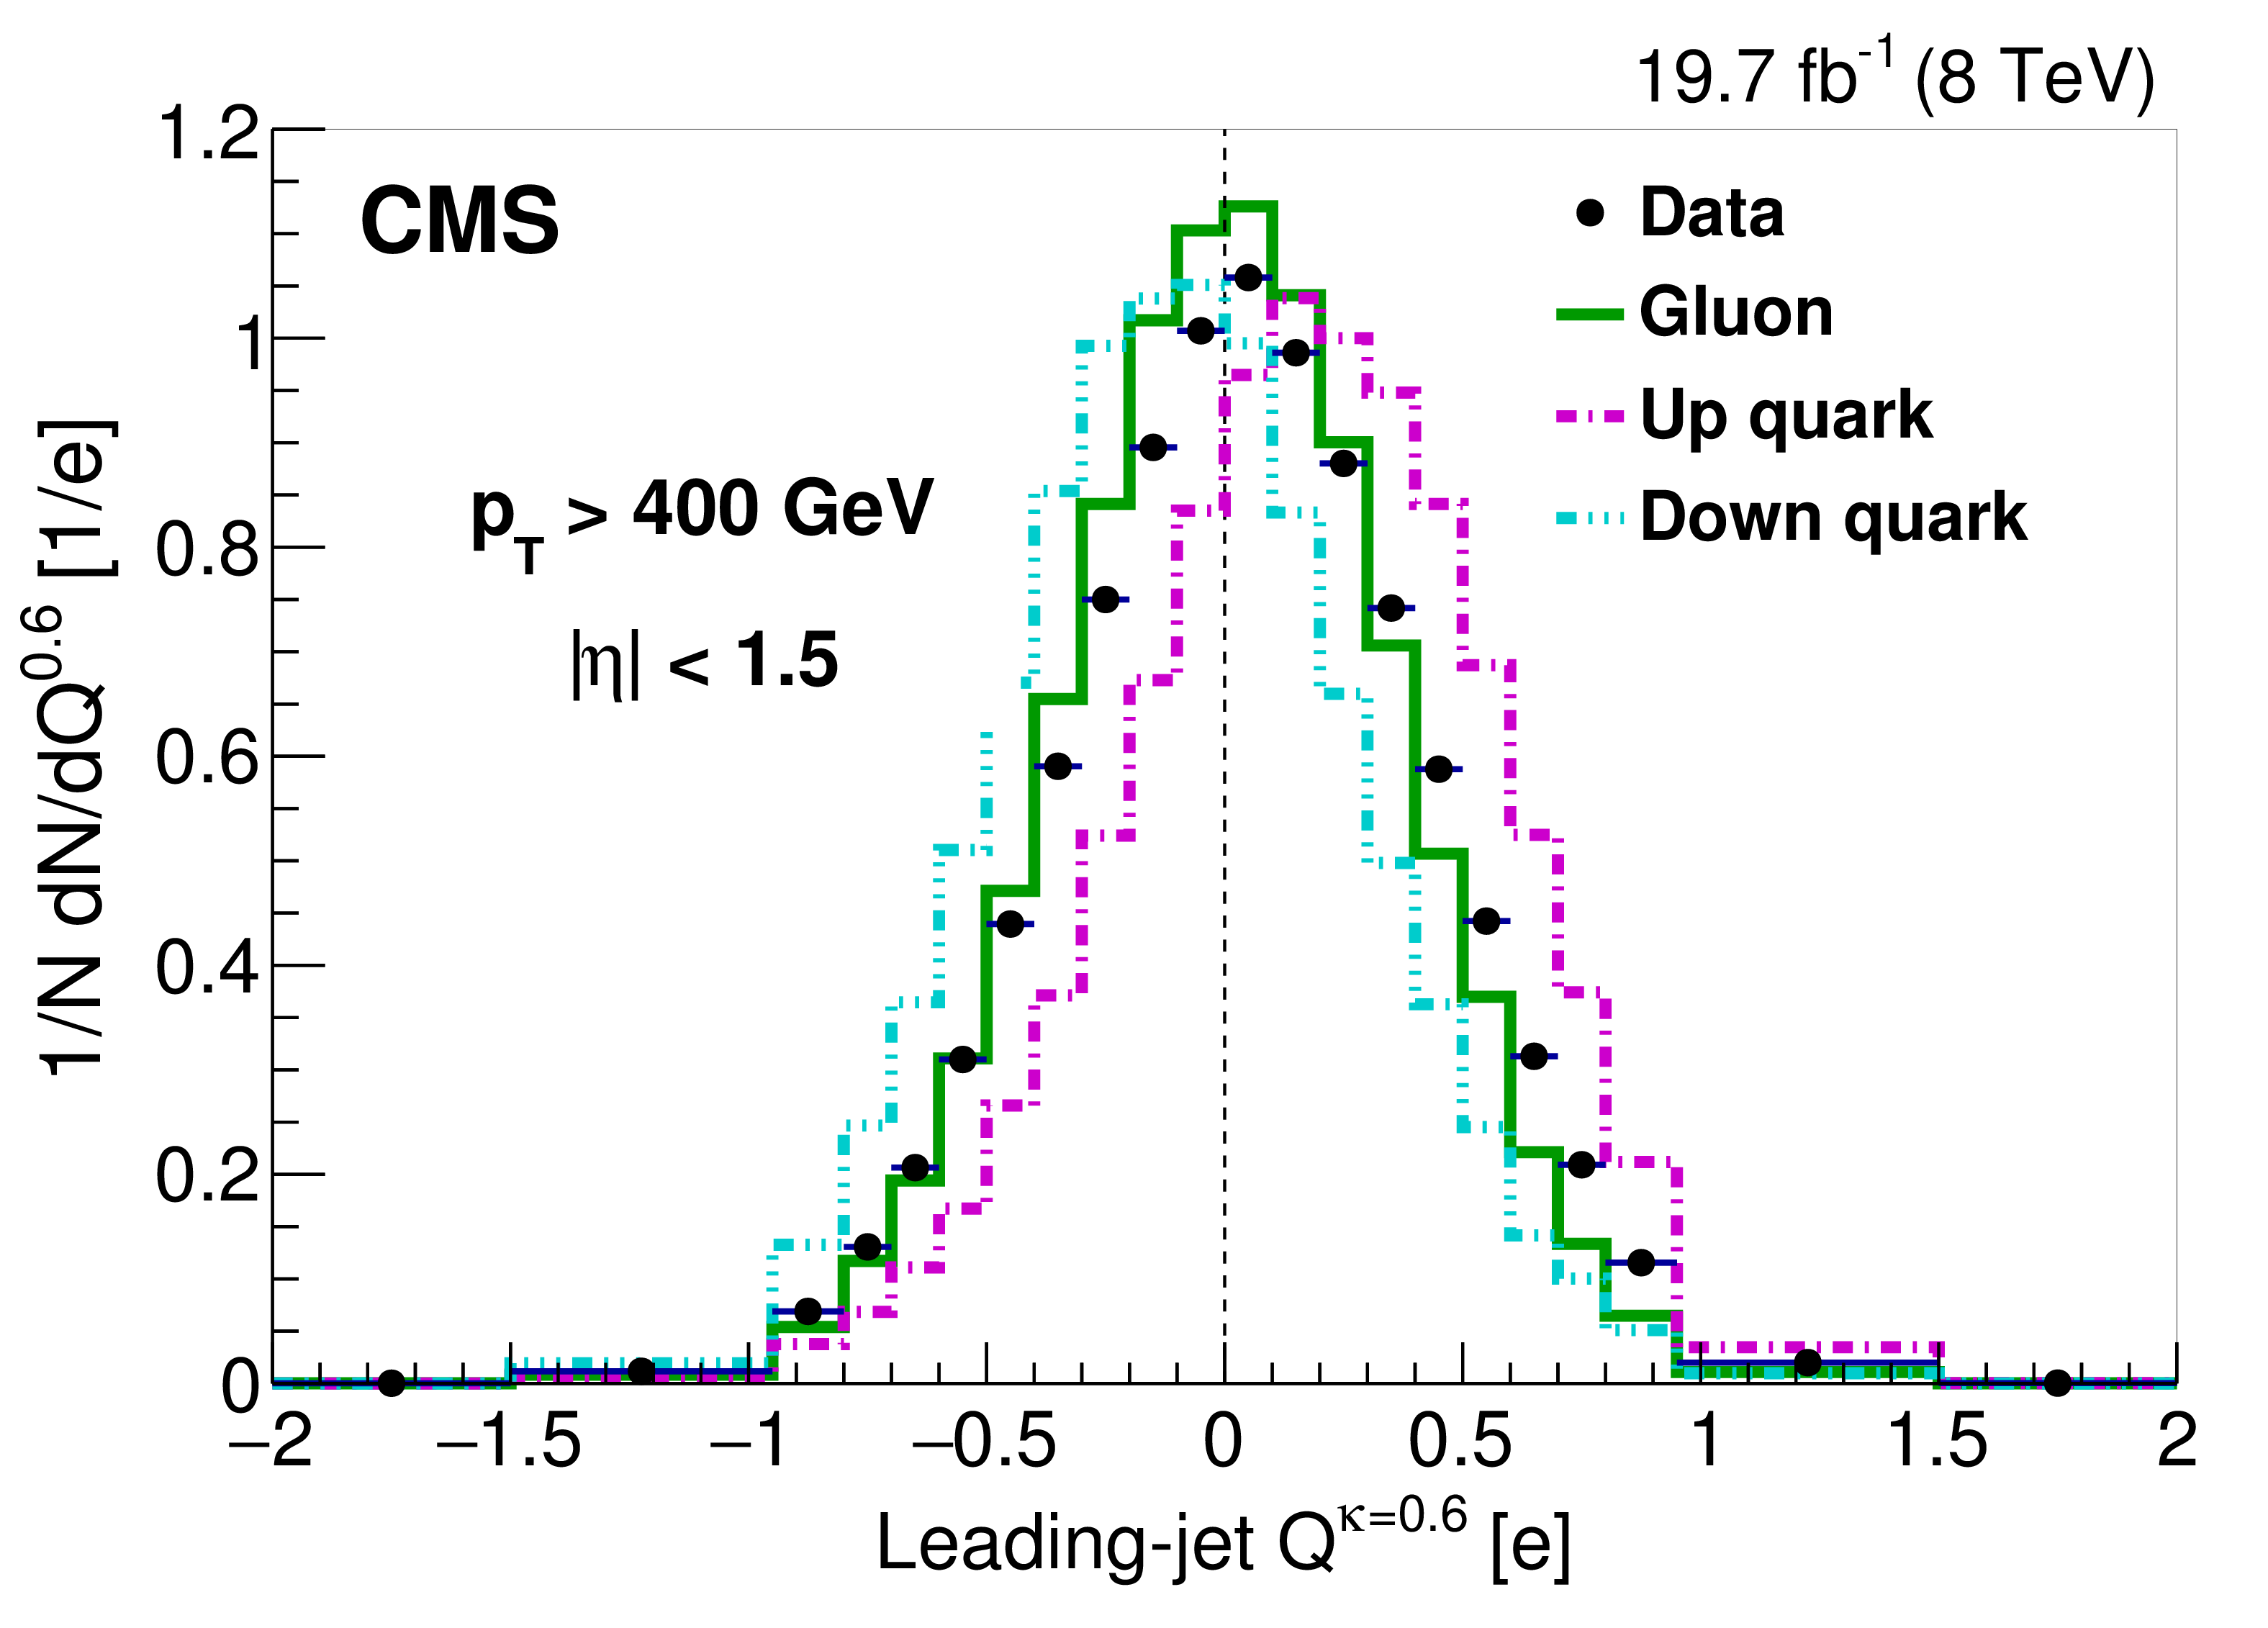
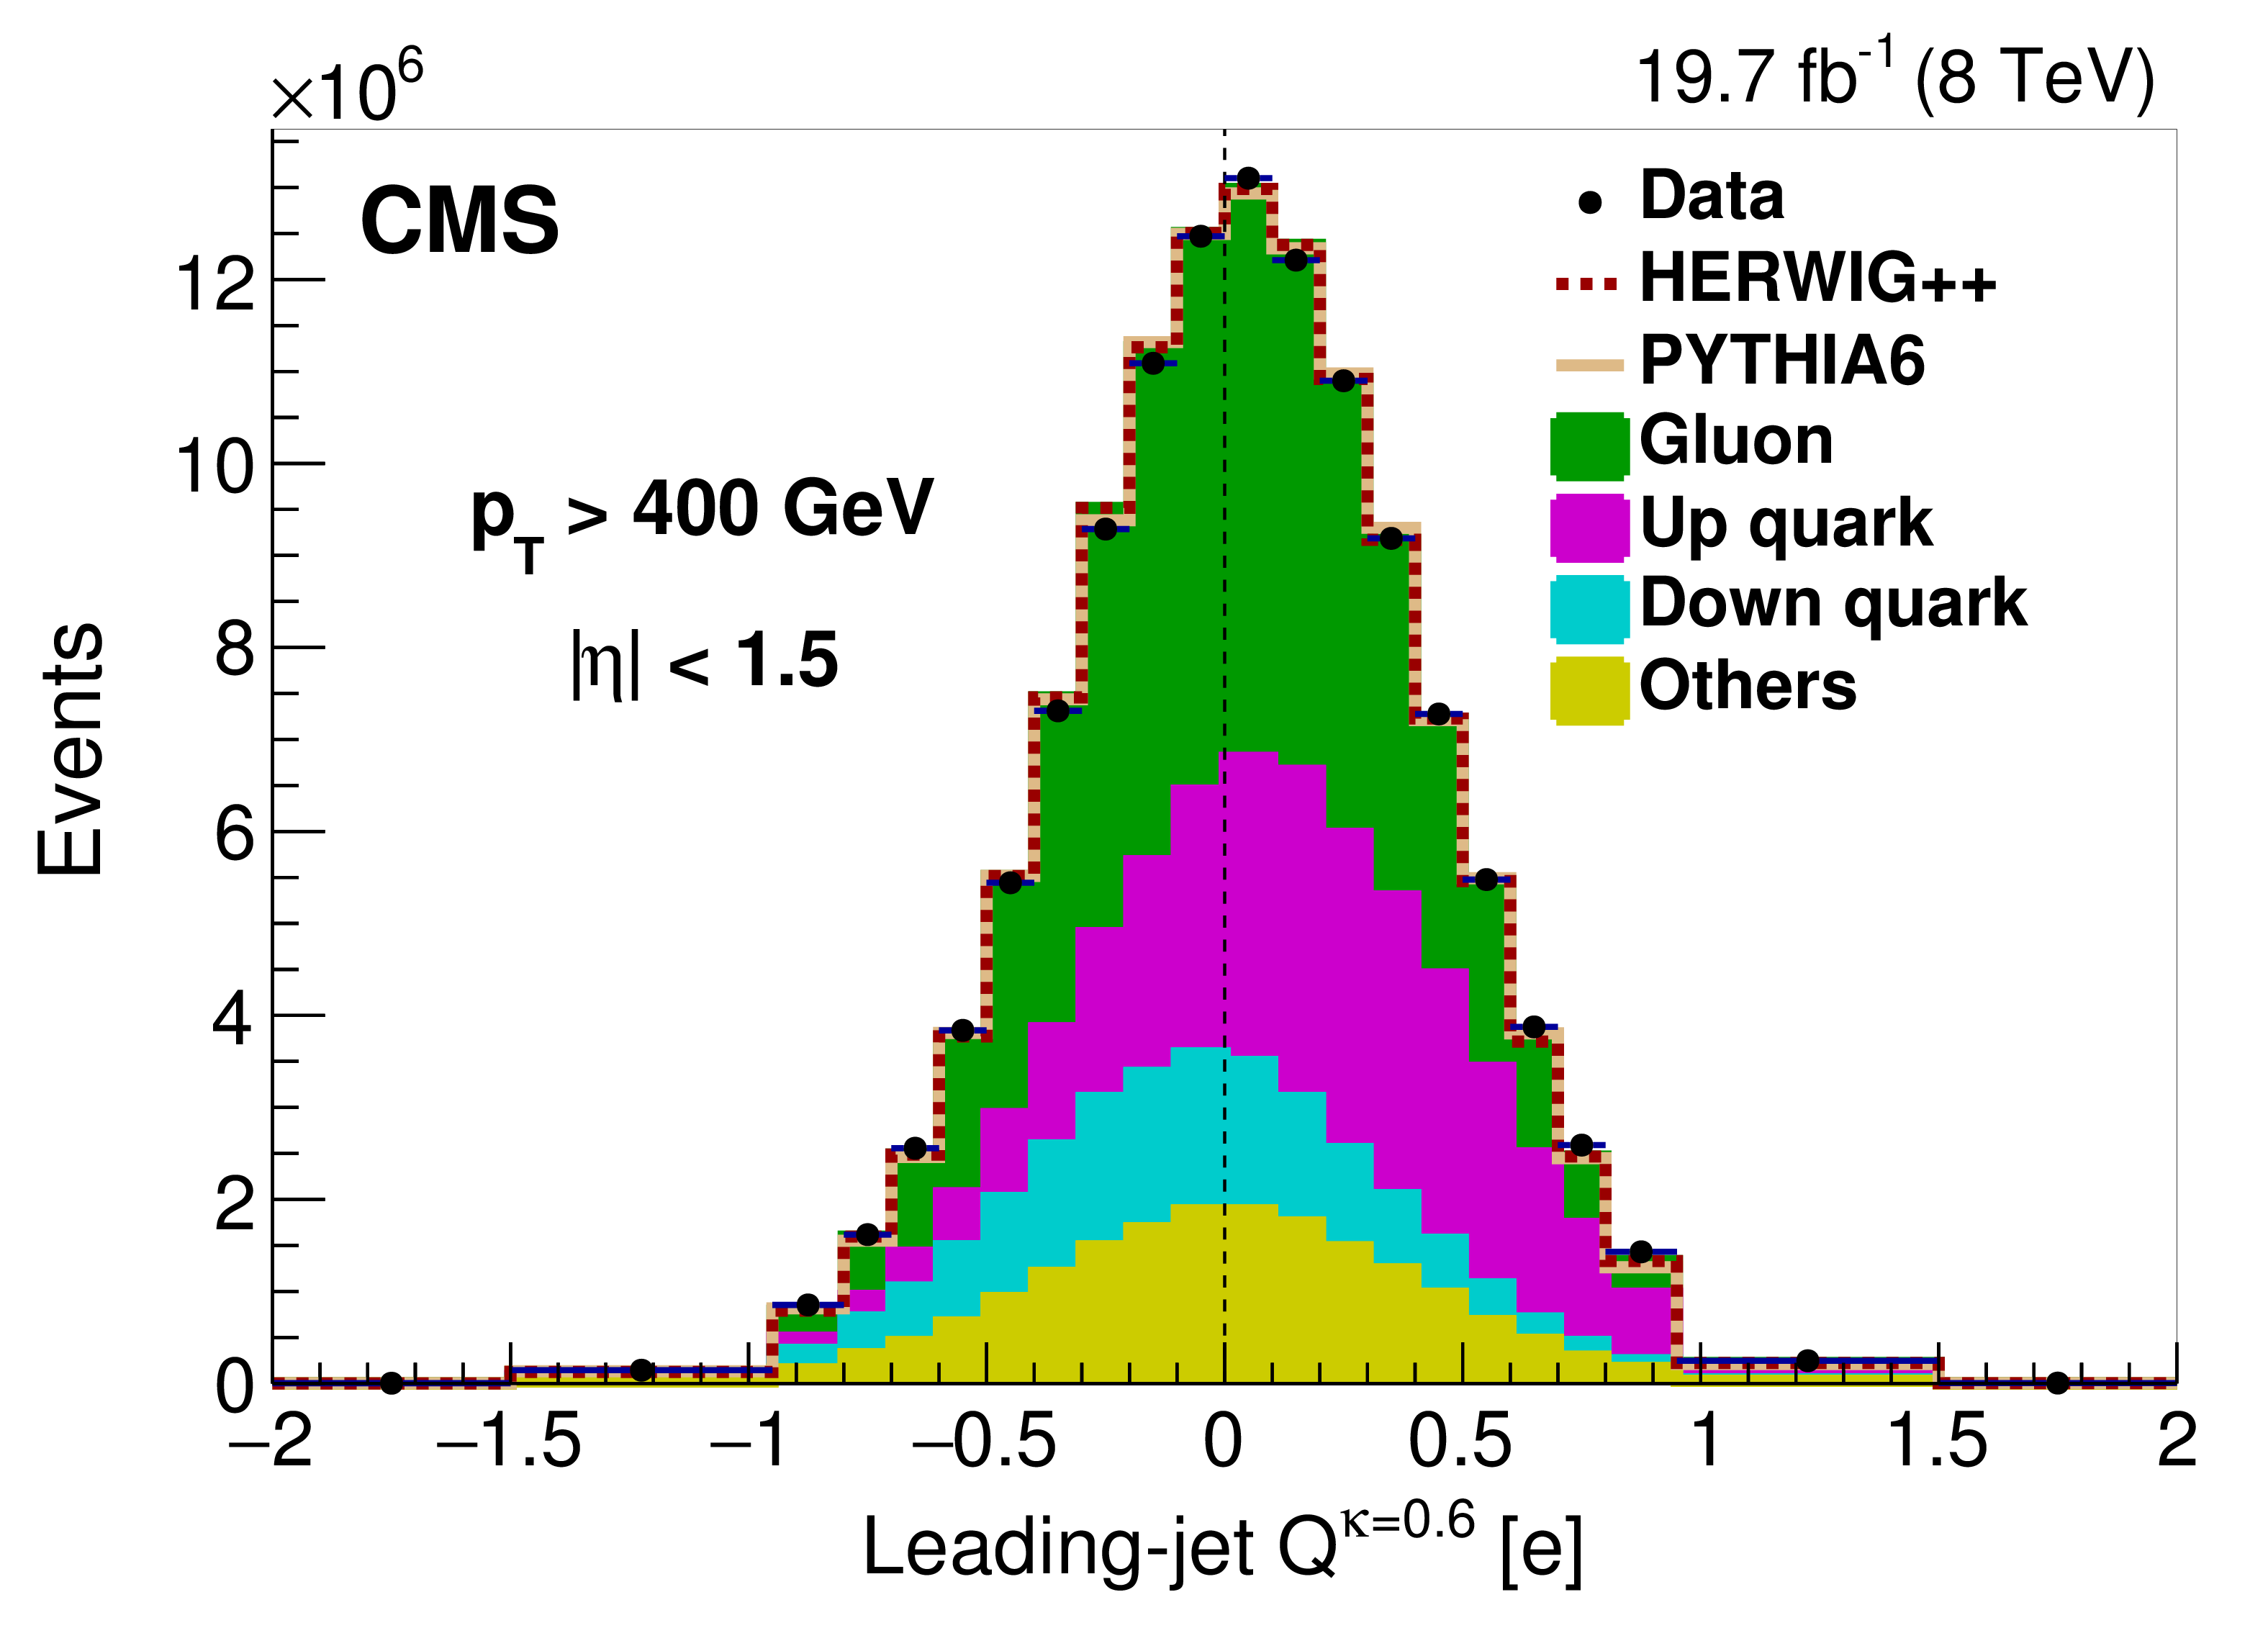
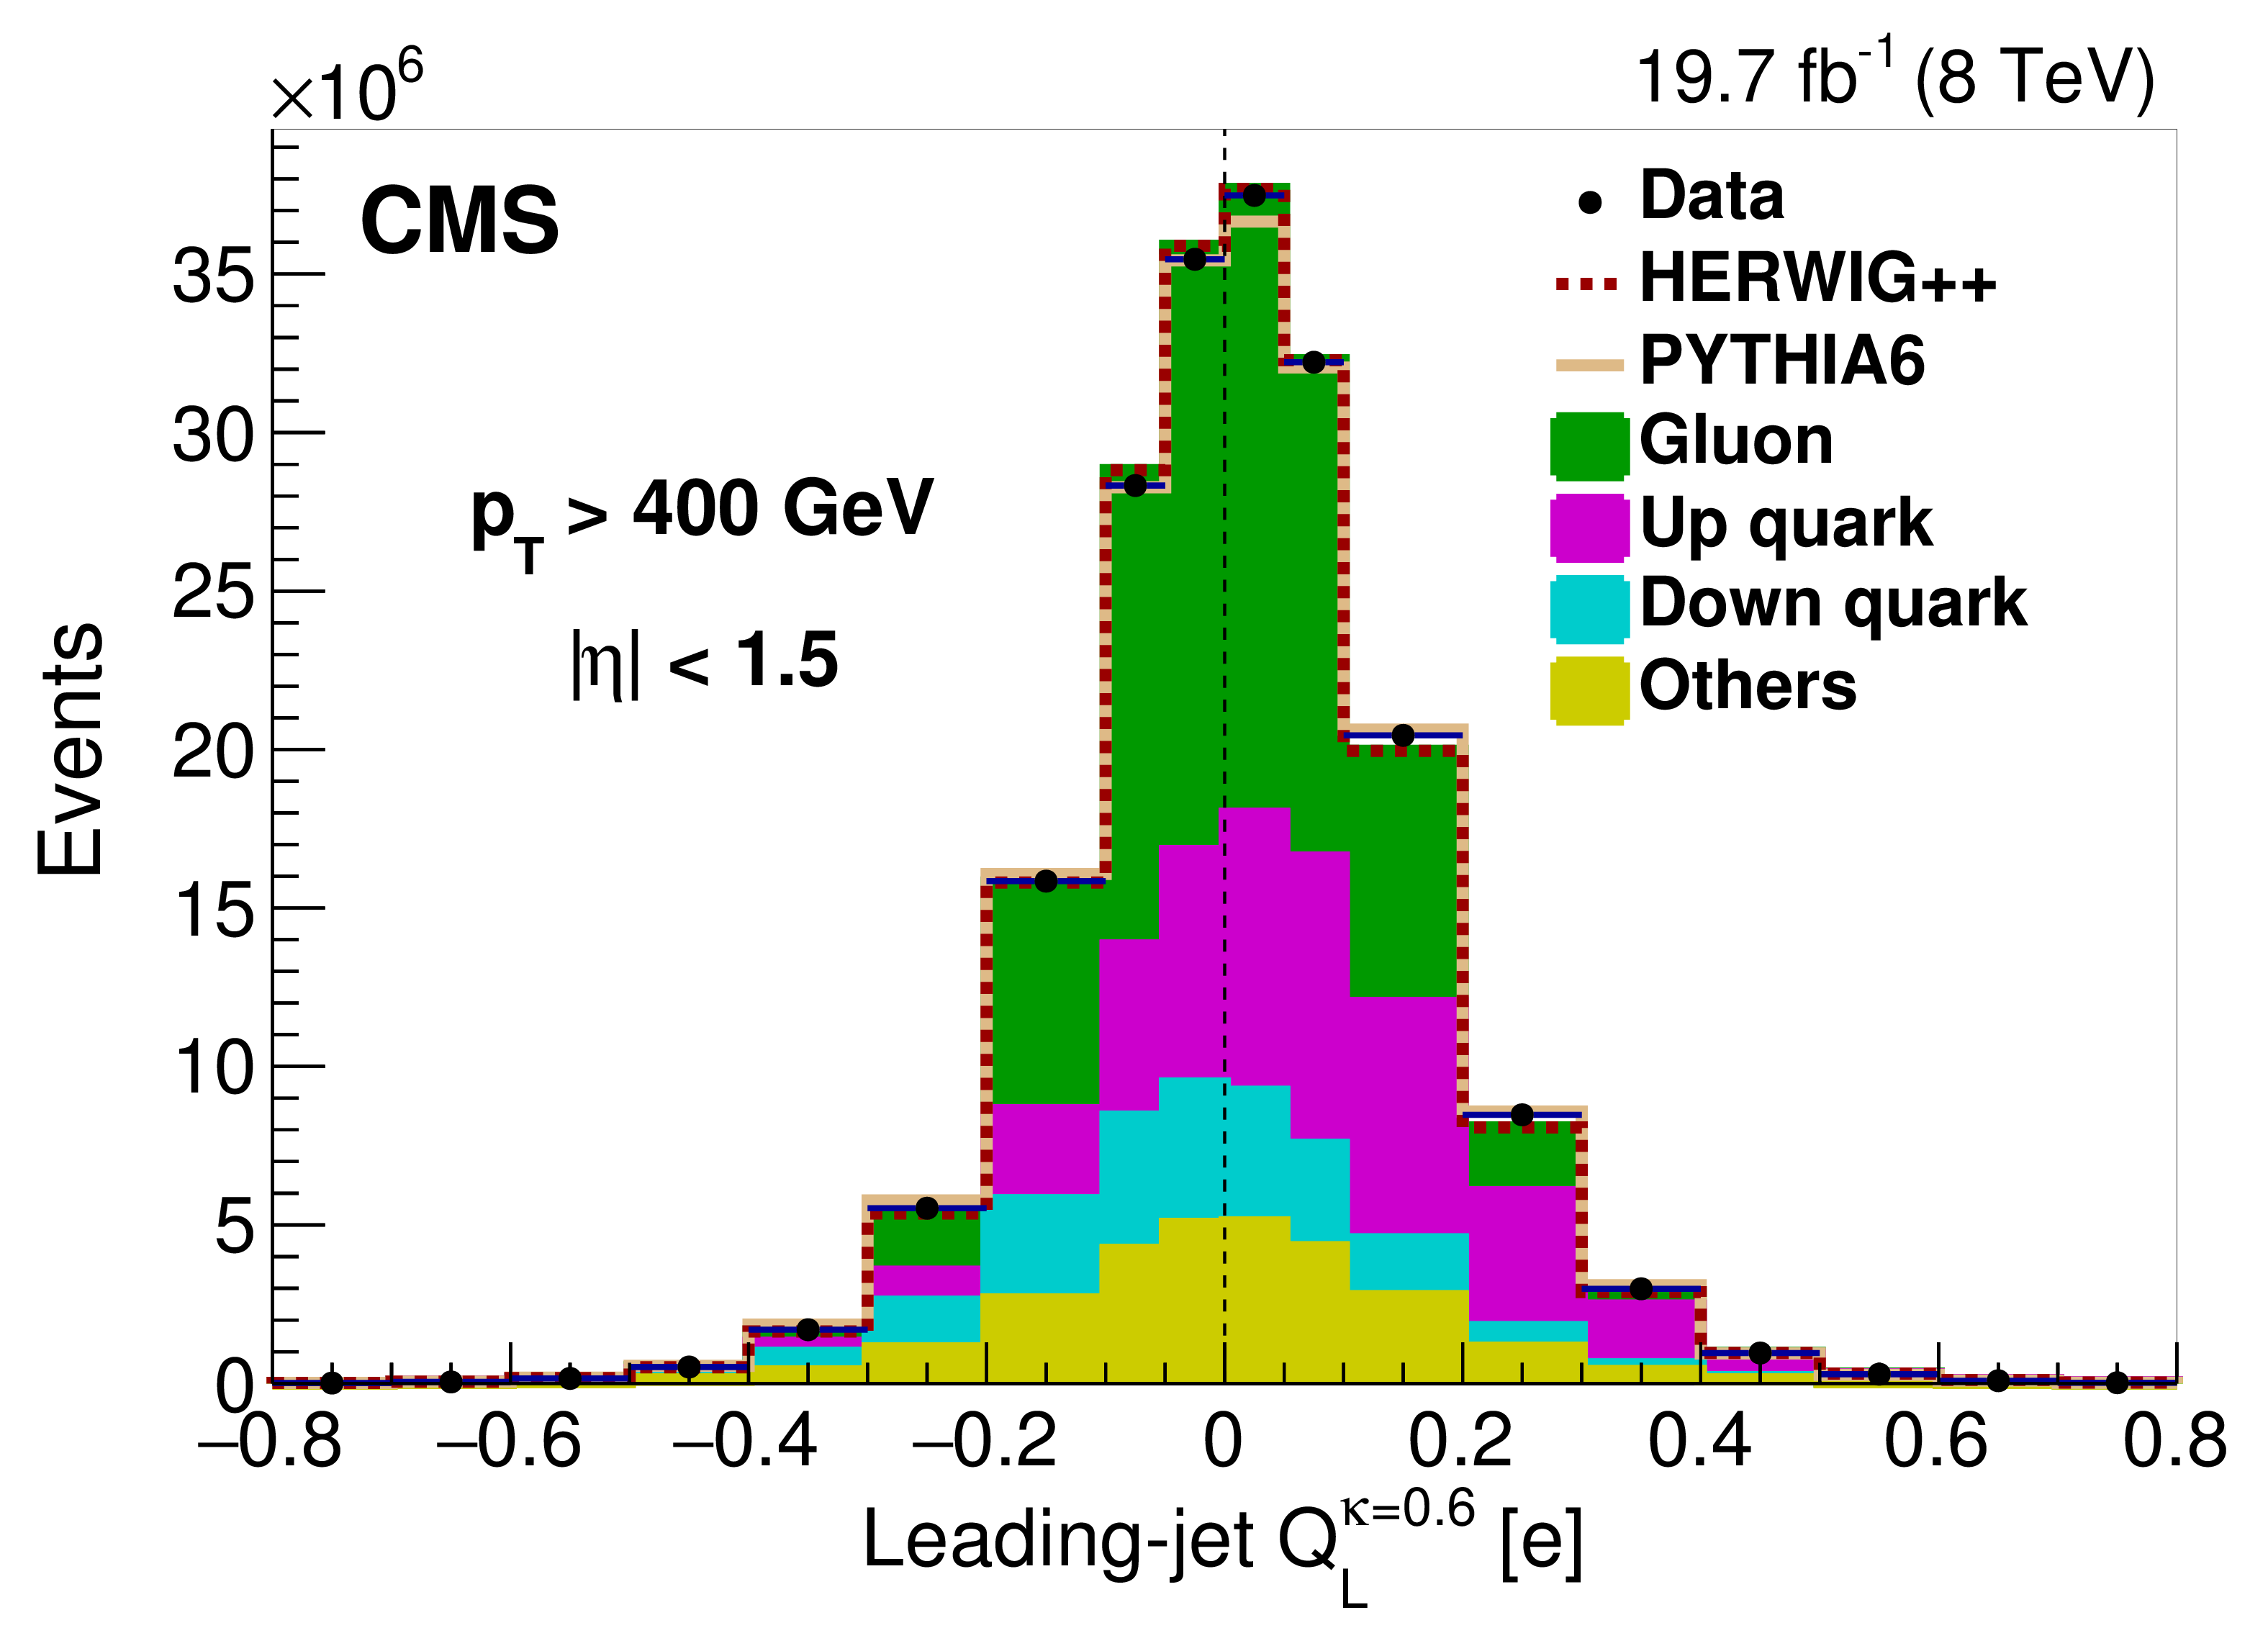
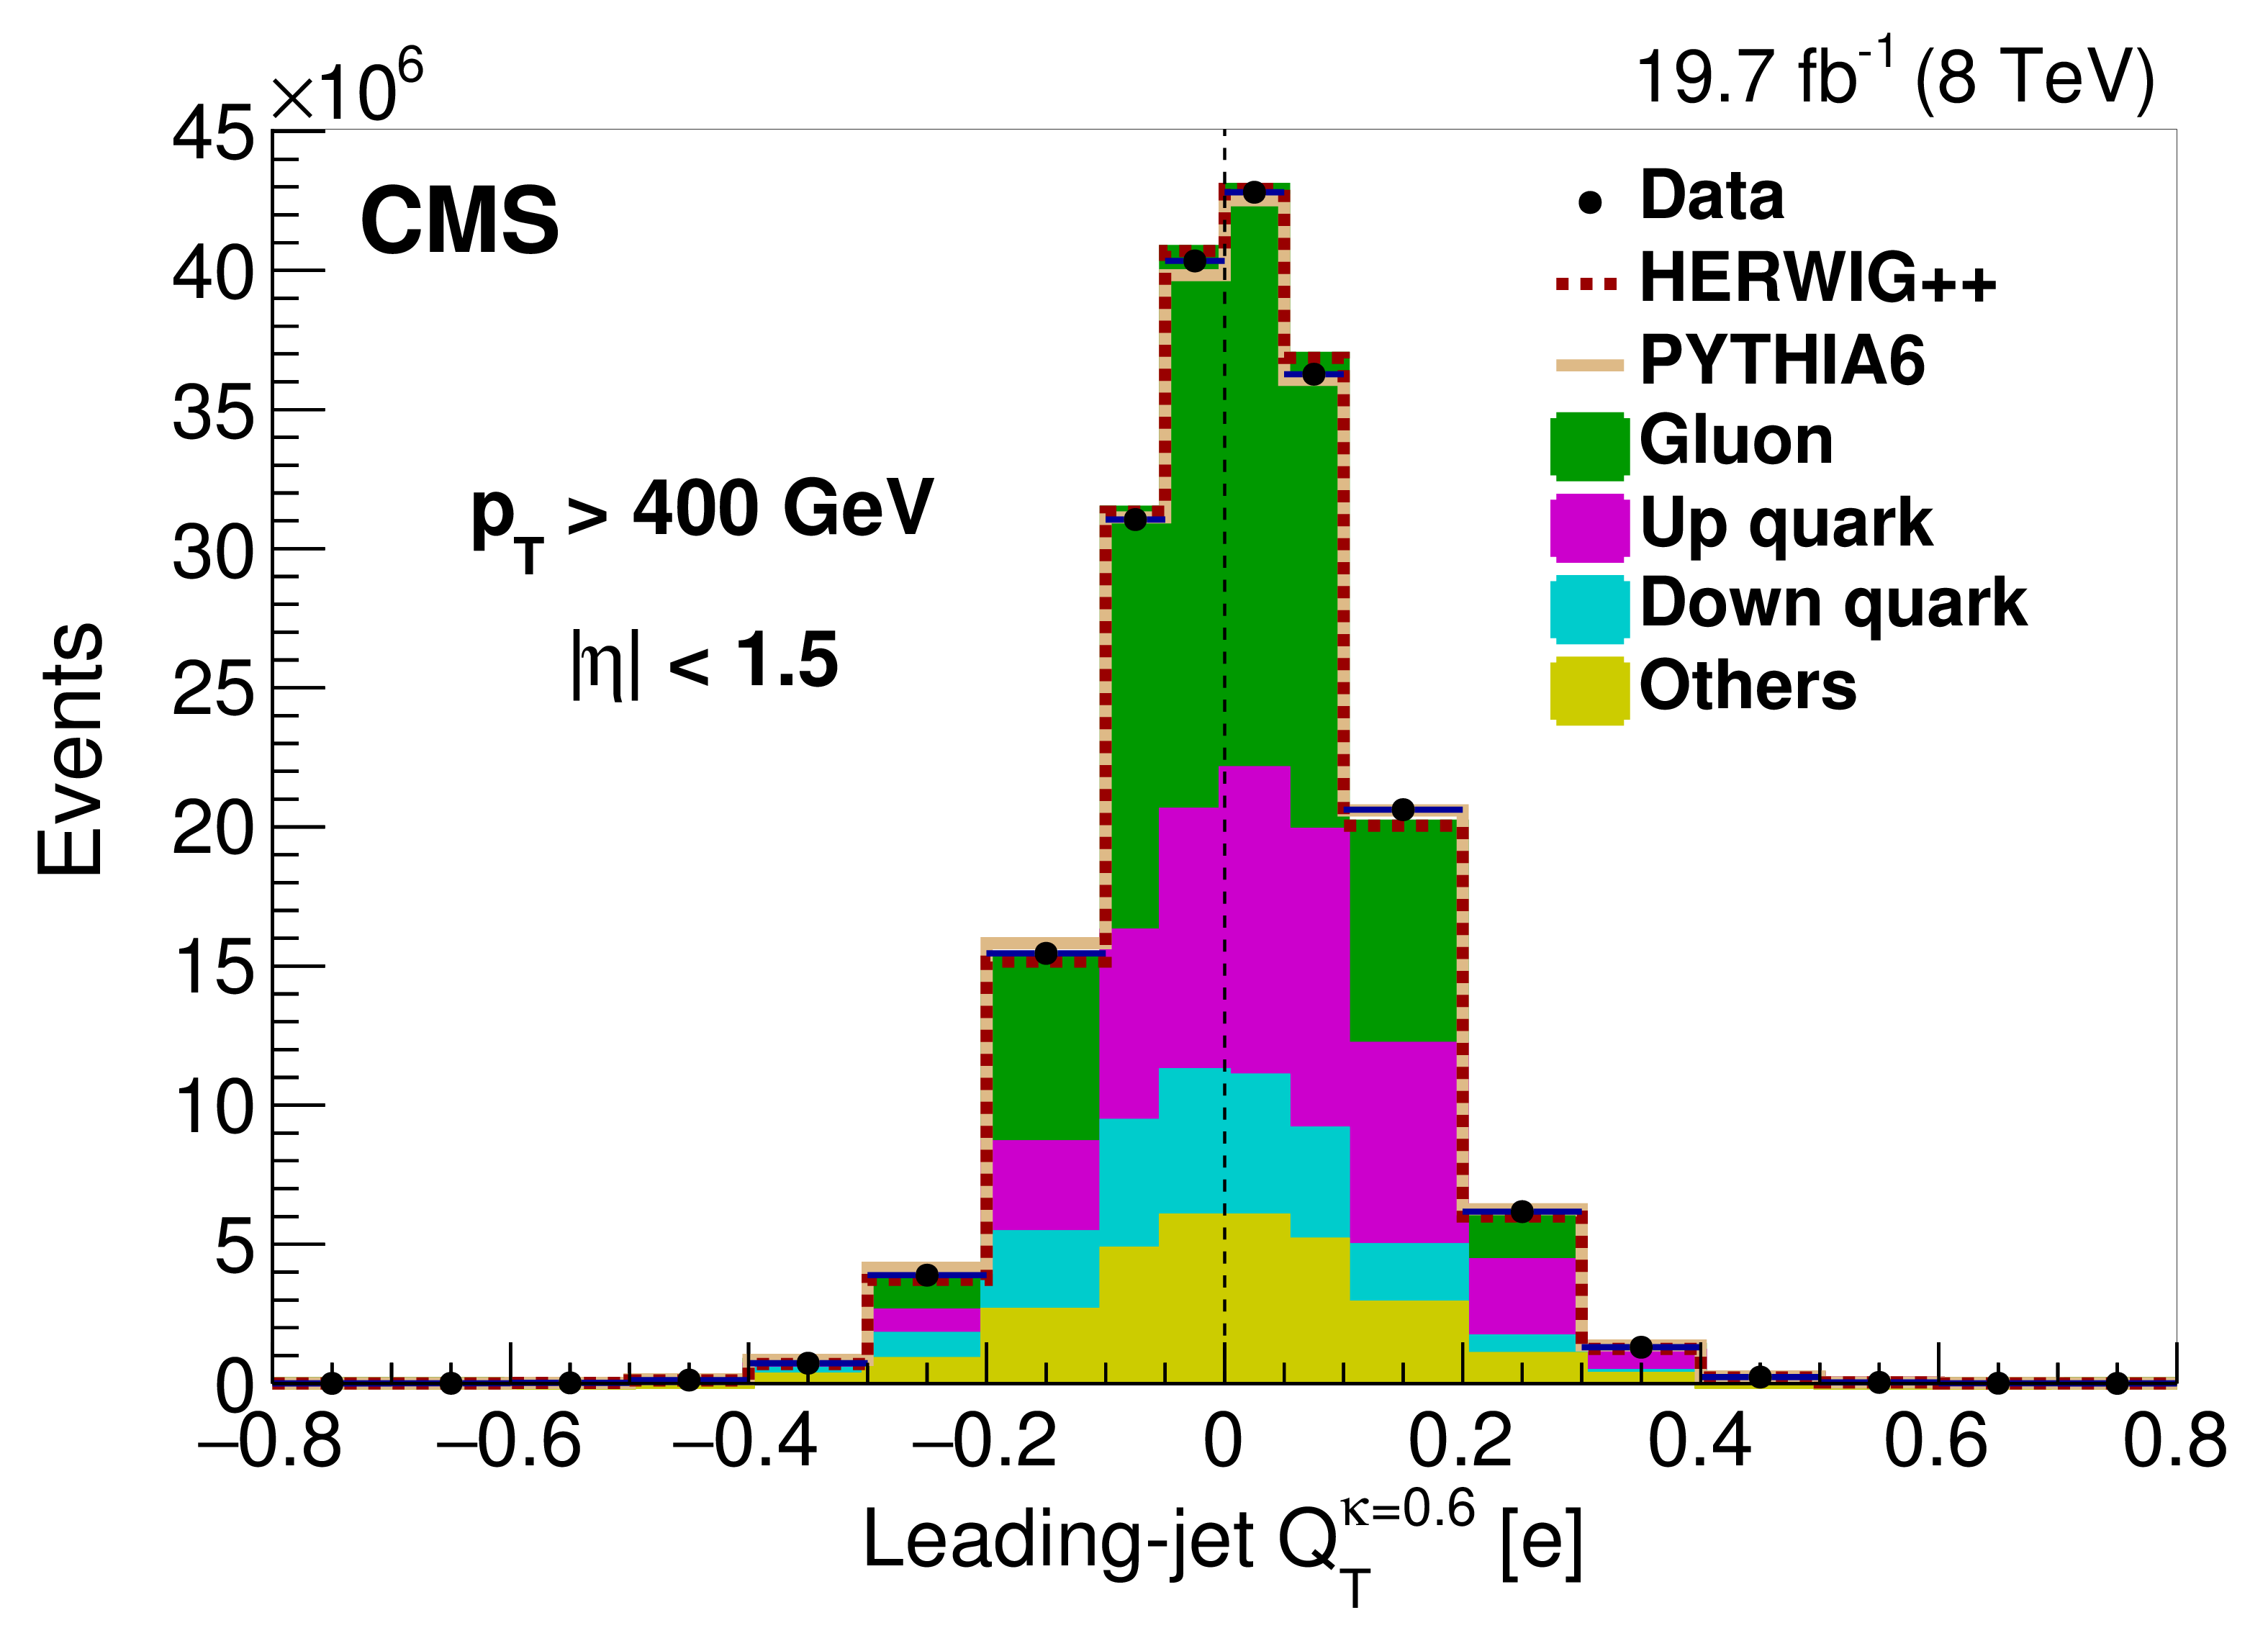
Figure 2:
Distributions of jet charge: $Q^\kappa $ (top row), $Q_{L}^\kappa $ (lower left), and $Q_{T}^\kappa $ (lower right), for leading jets and $\kappa =$ 0.6, in data (points) and MC simulations. The top left panel compares the data with the $\mathrm{u} $, $\mathrm{d} $, and $\mathrm{g} $ distributions from PYTHIA6, with each distribution normalized to unity. The top right and lower panels compare the sum of the contributions in PYTHIA6 and HERWIG++ to data, where the parton type breakdown is determined from PYTHIA6. Only statistical uncertainties are shown. |
png pdf |
Figure 2-a:
Distribution of the $Q^\kappa $ jet charge, for leading jets and $\kappa =$ 0.6, in data (points) and MC simulations. The figure compares the data with the $\mathrm{u} $, $\mathrm{d} $, and $\mathrm{g} $ distributions from PYTHIA6, with each distribution normalized to unity. Only statistical uncertainties are shown. |
png pdf |
Figure 2-b:
Distribution of the $Q^\kappa $ jet charge, for leading jets and $\kappa =$ 0.6, in data (points) and MC simulations. The figure compares the sum of the contributions in PYTHIA6 and HERWIG++ to data, where the parton type breakdown is determined from PYTHIA6. Only statistical uncertainties are shown. |
png pdf |
Figure 2-c:
Distribution of the $Q_{L}^\kappa $ jet charge, for leading jets and $\kappa =$ 0.6, in data (points) and MC simulations. The figure compares the sum of the contributions in PYTHIA6 and HERWIG++ to data, where the parton type breakdown is determined from PYTHIA6. Only statistical uncertainties are shown. |
png pdf |
Figure 2-d:
Distribution of the $Q_{T}^\kappa $ jet charge, for leading jets and $\kappa =$ 0.6, in data (points) and MC simulations. The figure compares the sum of the contributions in PYTHIA6 and HERWIG++ to data, where the parton type breakdown is determined from PYTHIA6. Only statistical uncertainties are shown. |

png pdf |
Figure 3:
Dependence on the $ {p_{\mathrm {T}}} $ of the leading jet of the average leading-jet charge $Q^\kappa $ with $\kappa =$ 0.6 in PYTHIA6, HERWIG++, and data. Only statistical uncertainties are shown. The error bars for the simulation indicate the uncertainty from statistical fluctuations in the MC events. The data points are shown in the center of each jet $ {p_{\mathrm {T}}} $ bin (400, 450, 500, 550, 600, 650, 750, 850, 1000, 1500 GeV). |
png pdf |
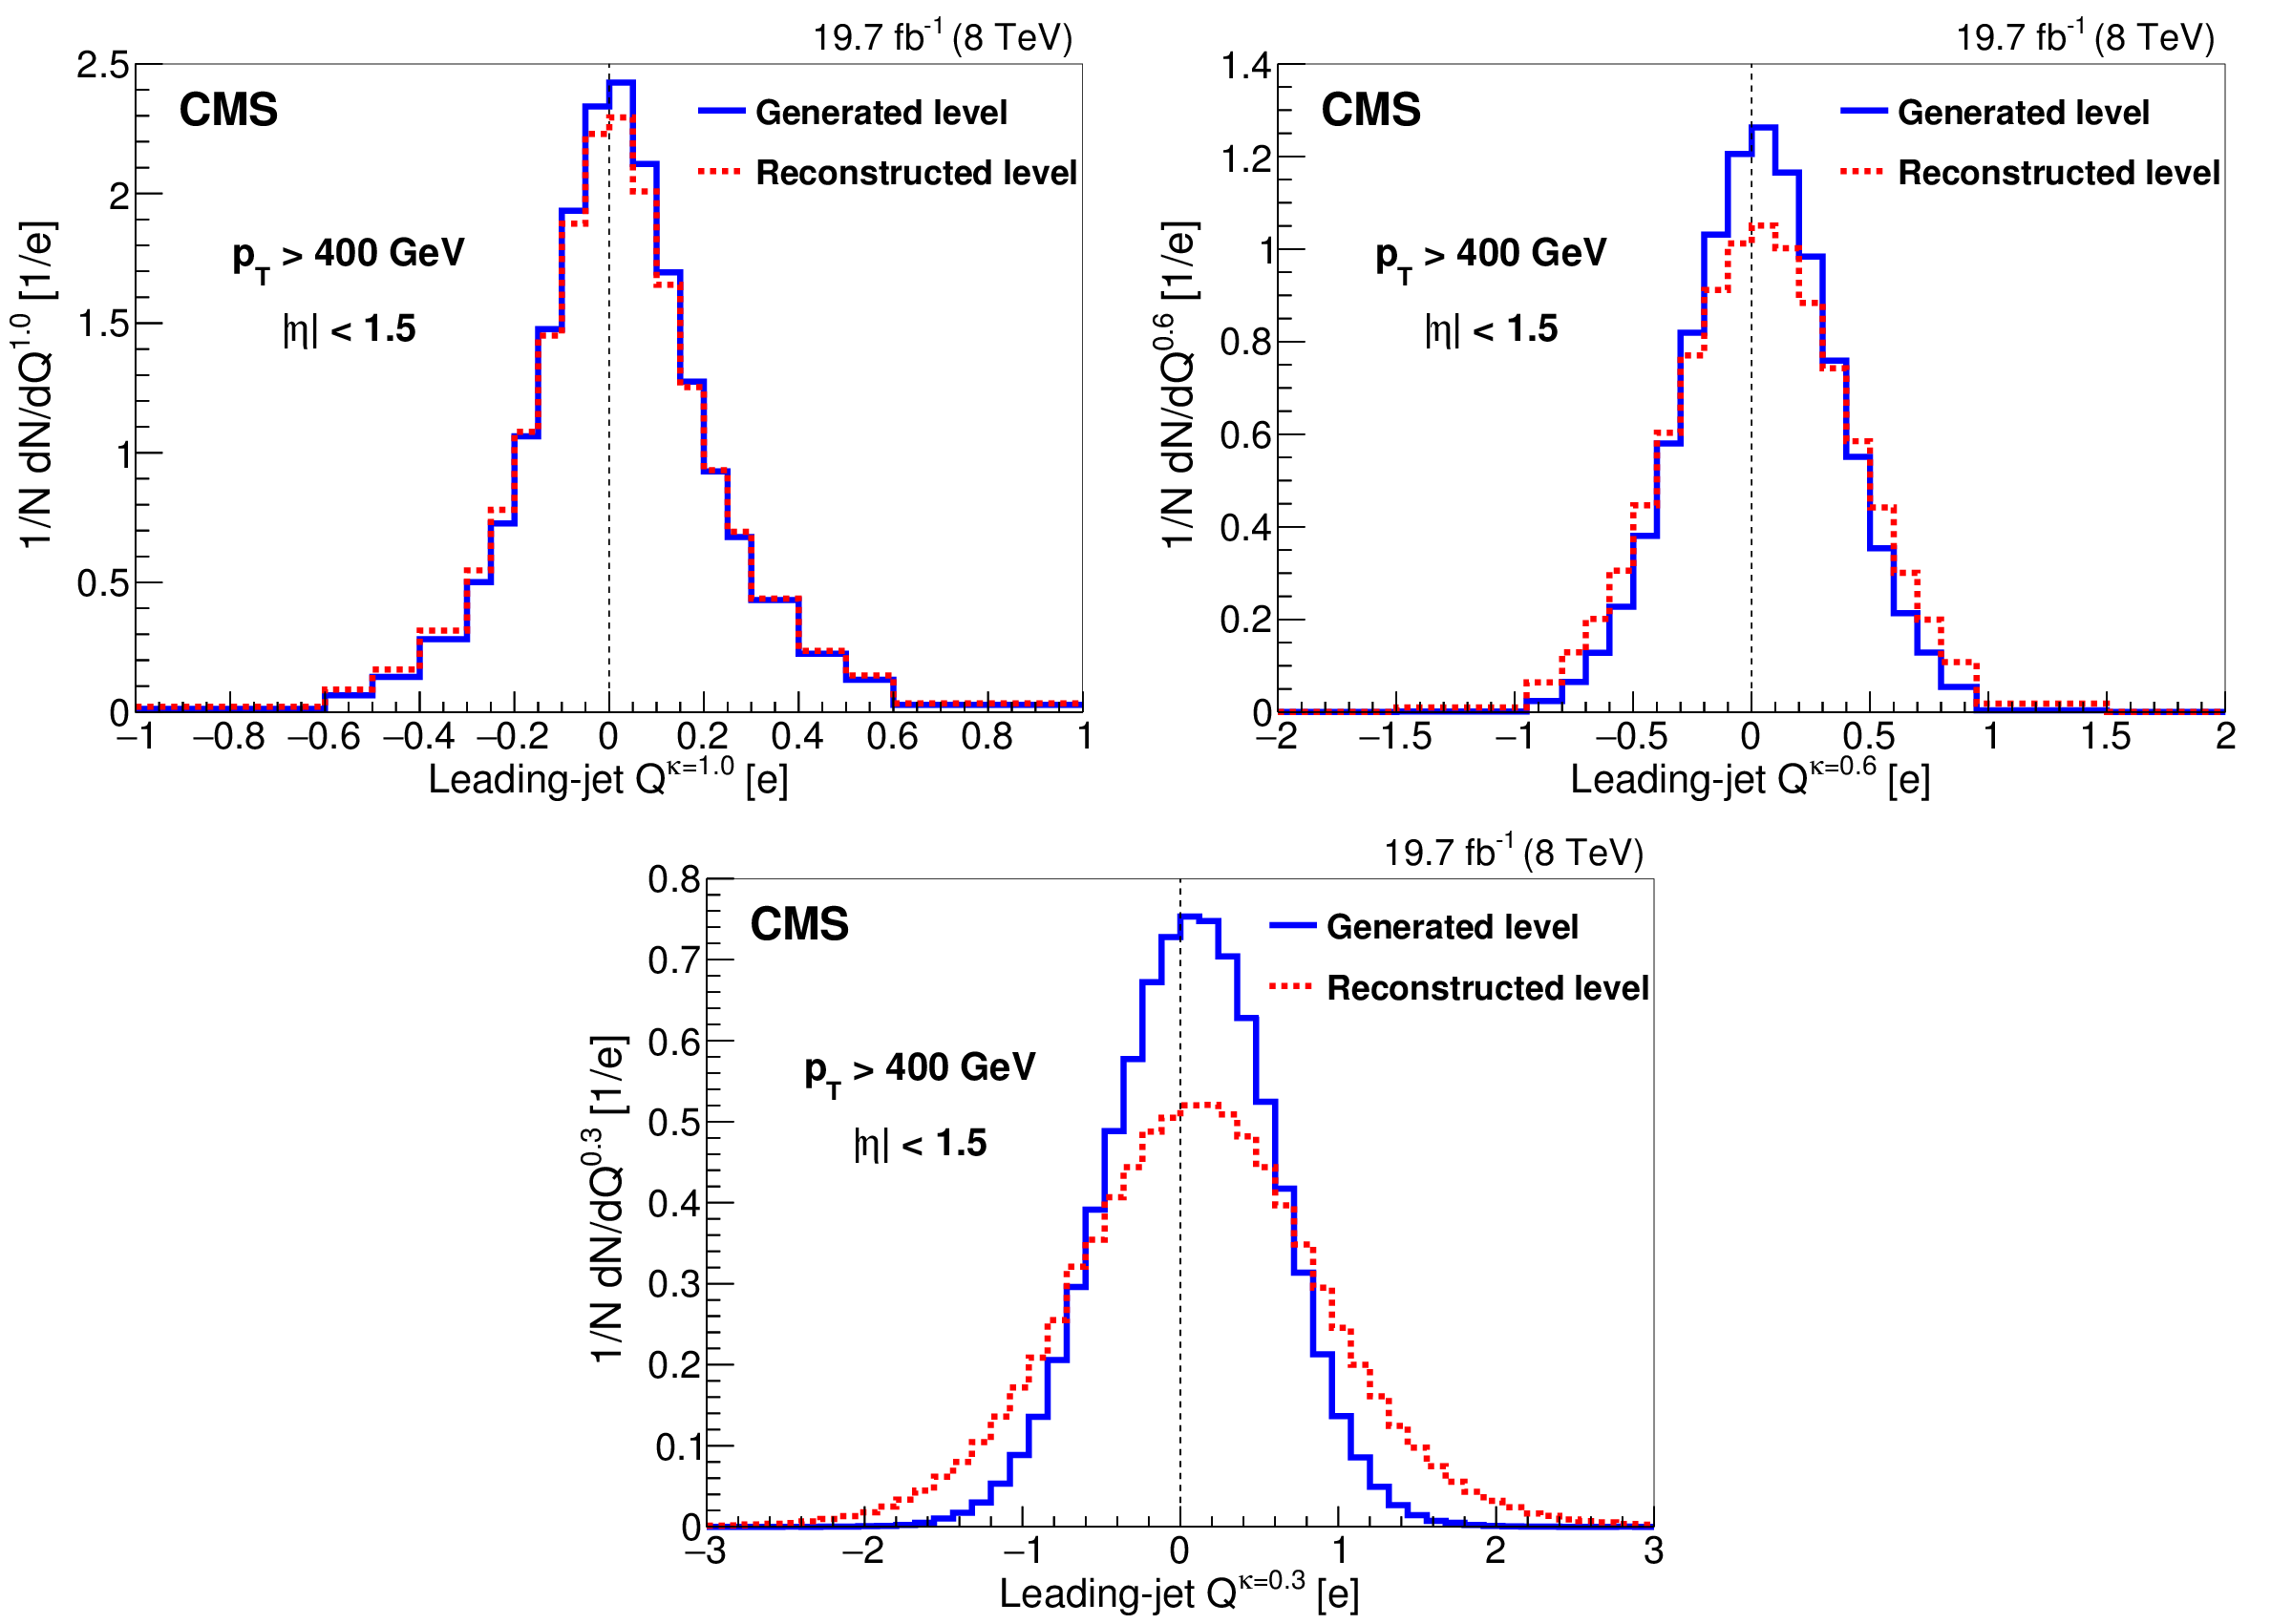
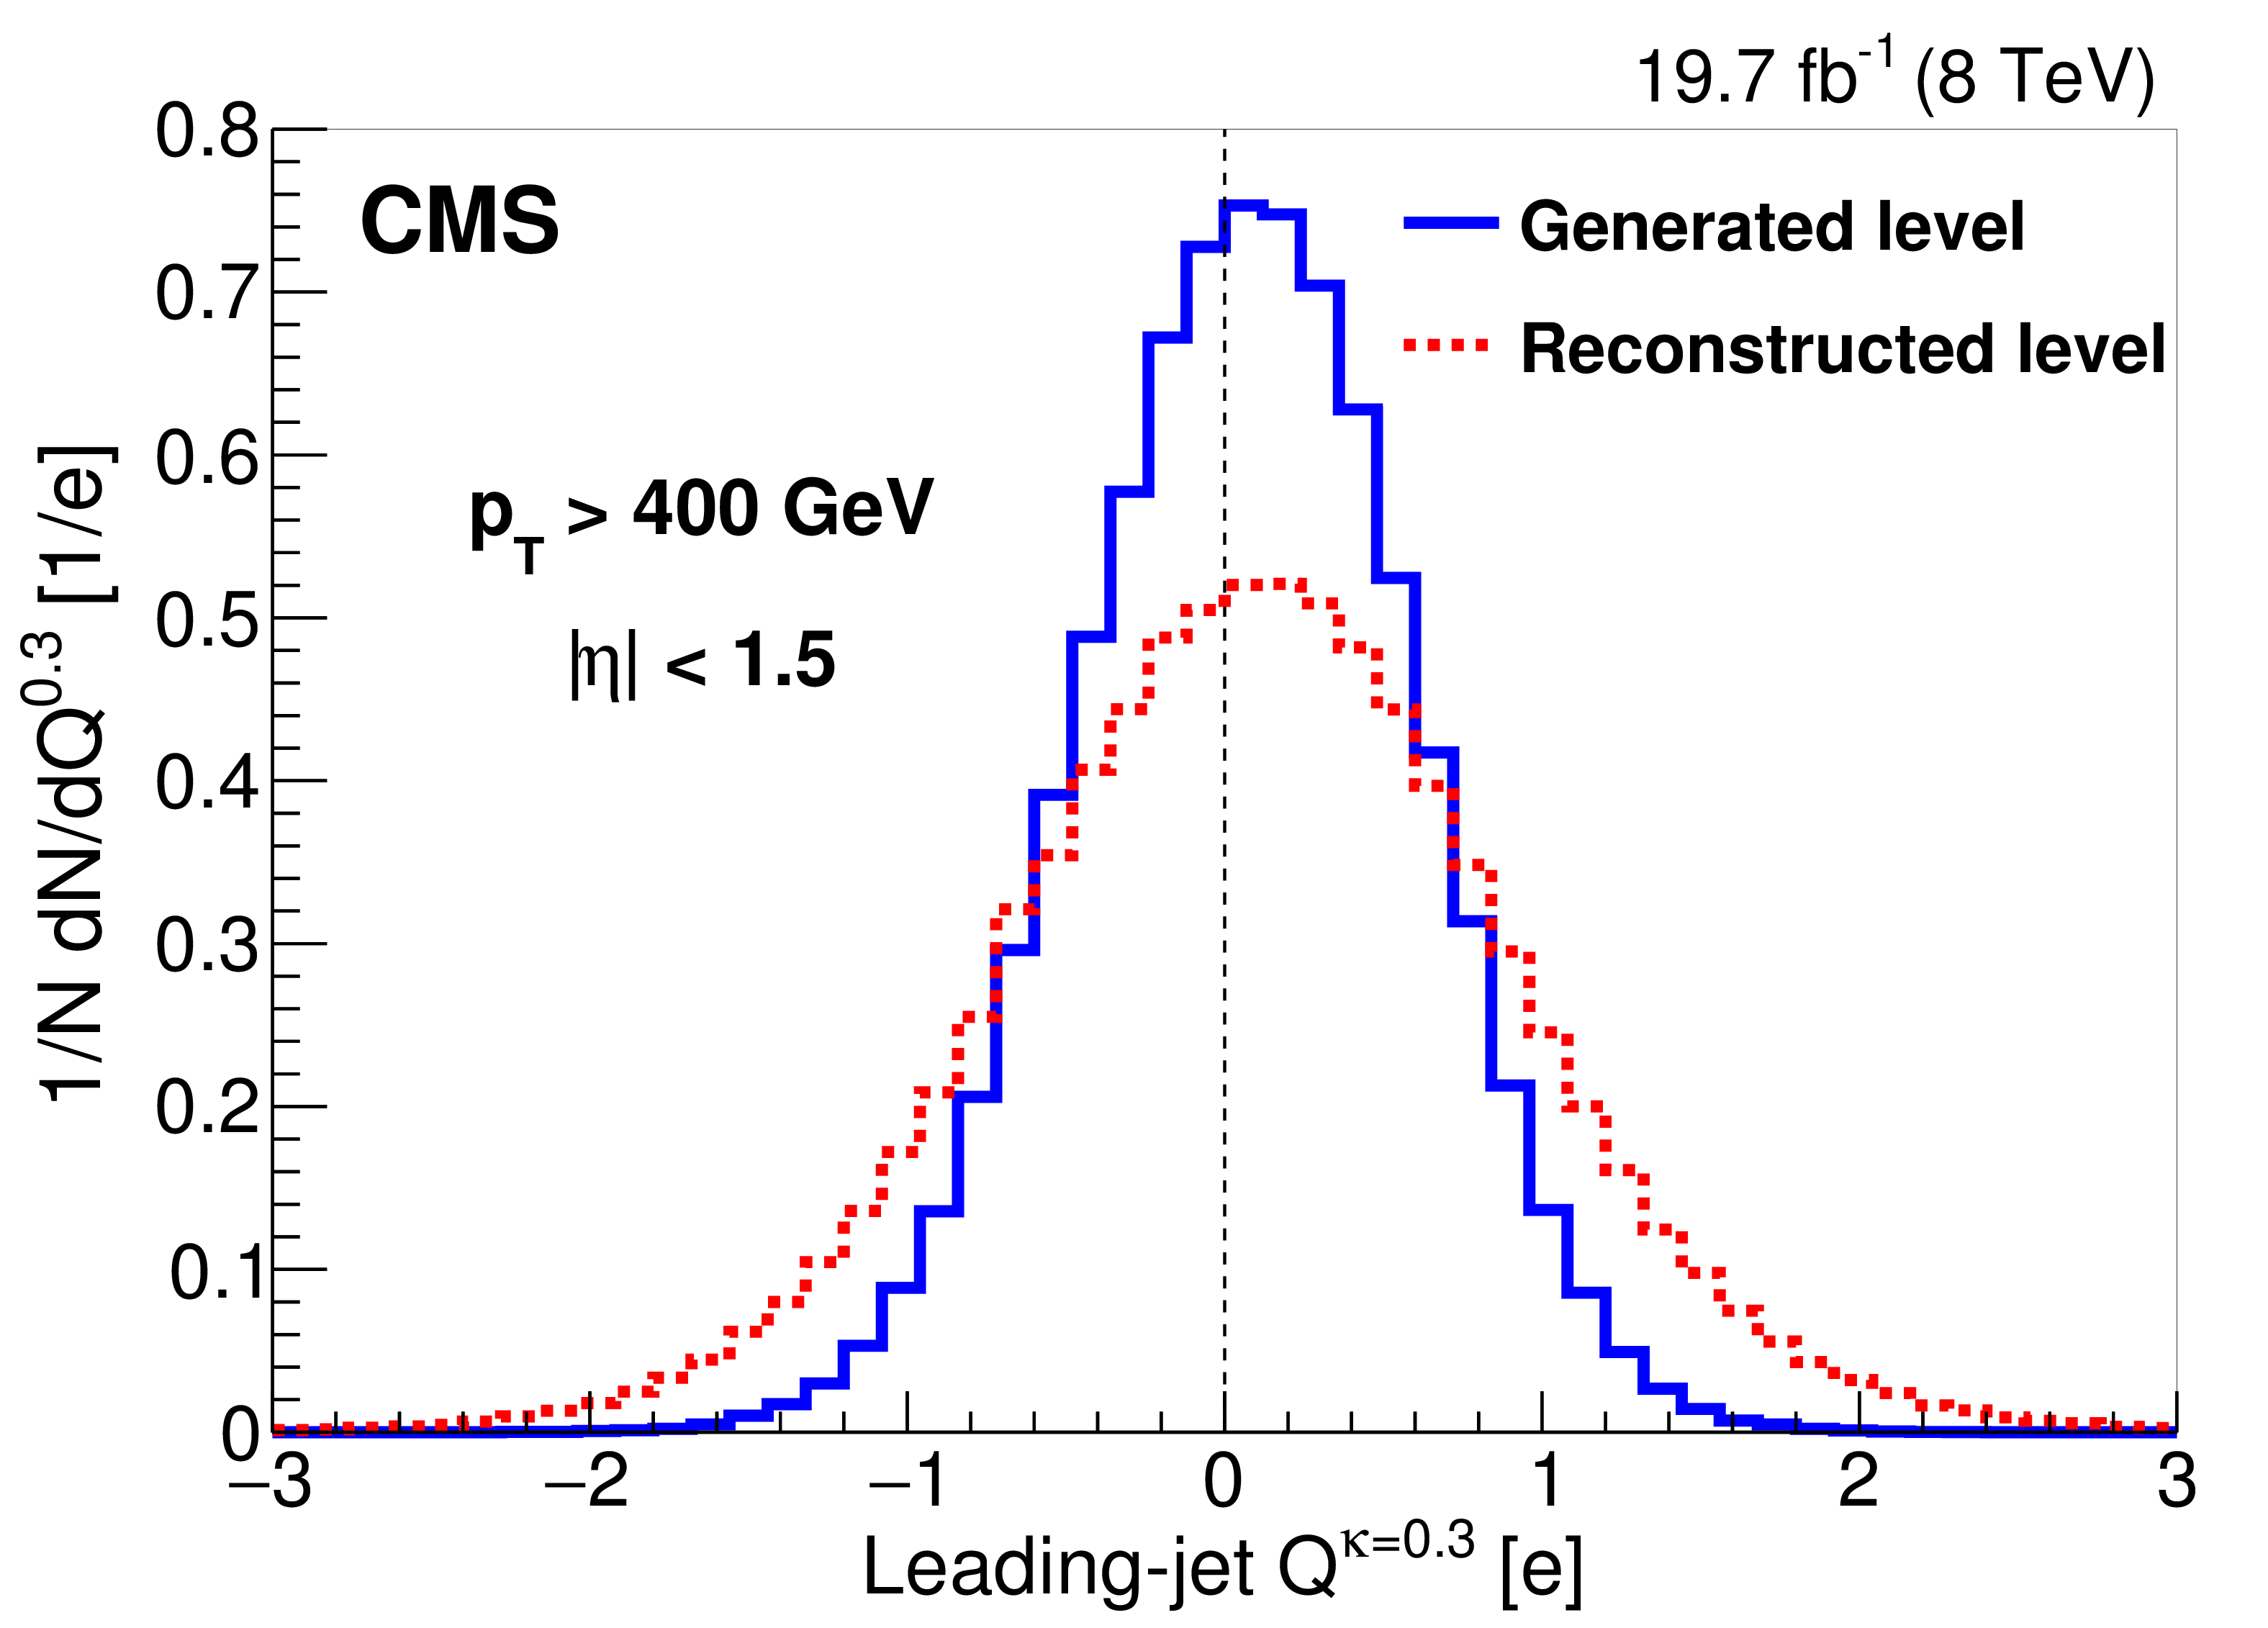
Figure 4:
Distributions of leading-jet charge $Q^\kappa $ at the reconstructed level and generated levels in PYTHIA6, for (upper left) $\kappa =$ 1.0, (upper right) 0.6, and (bottom) 0.3. |
png pdf |
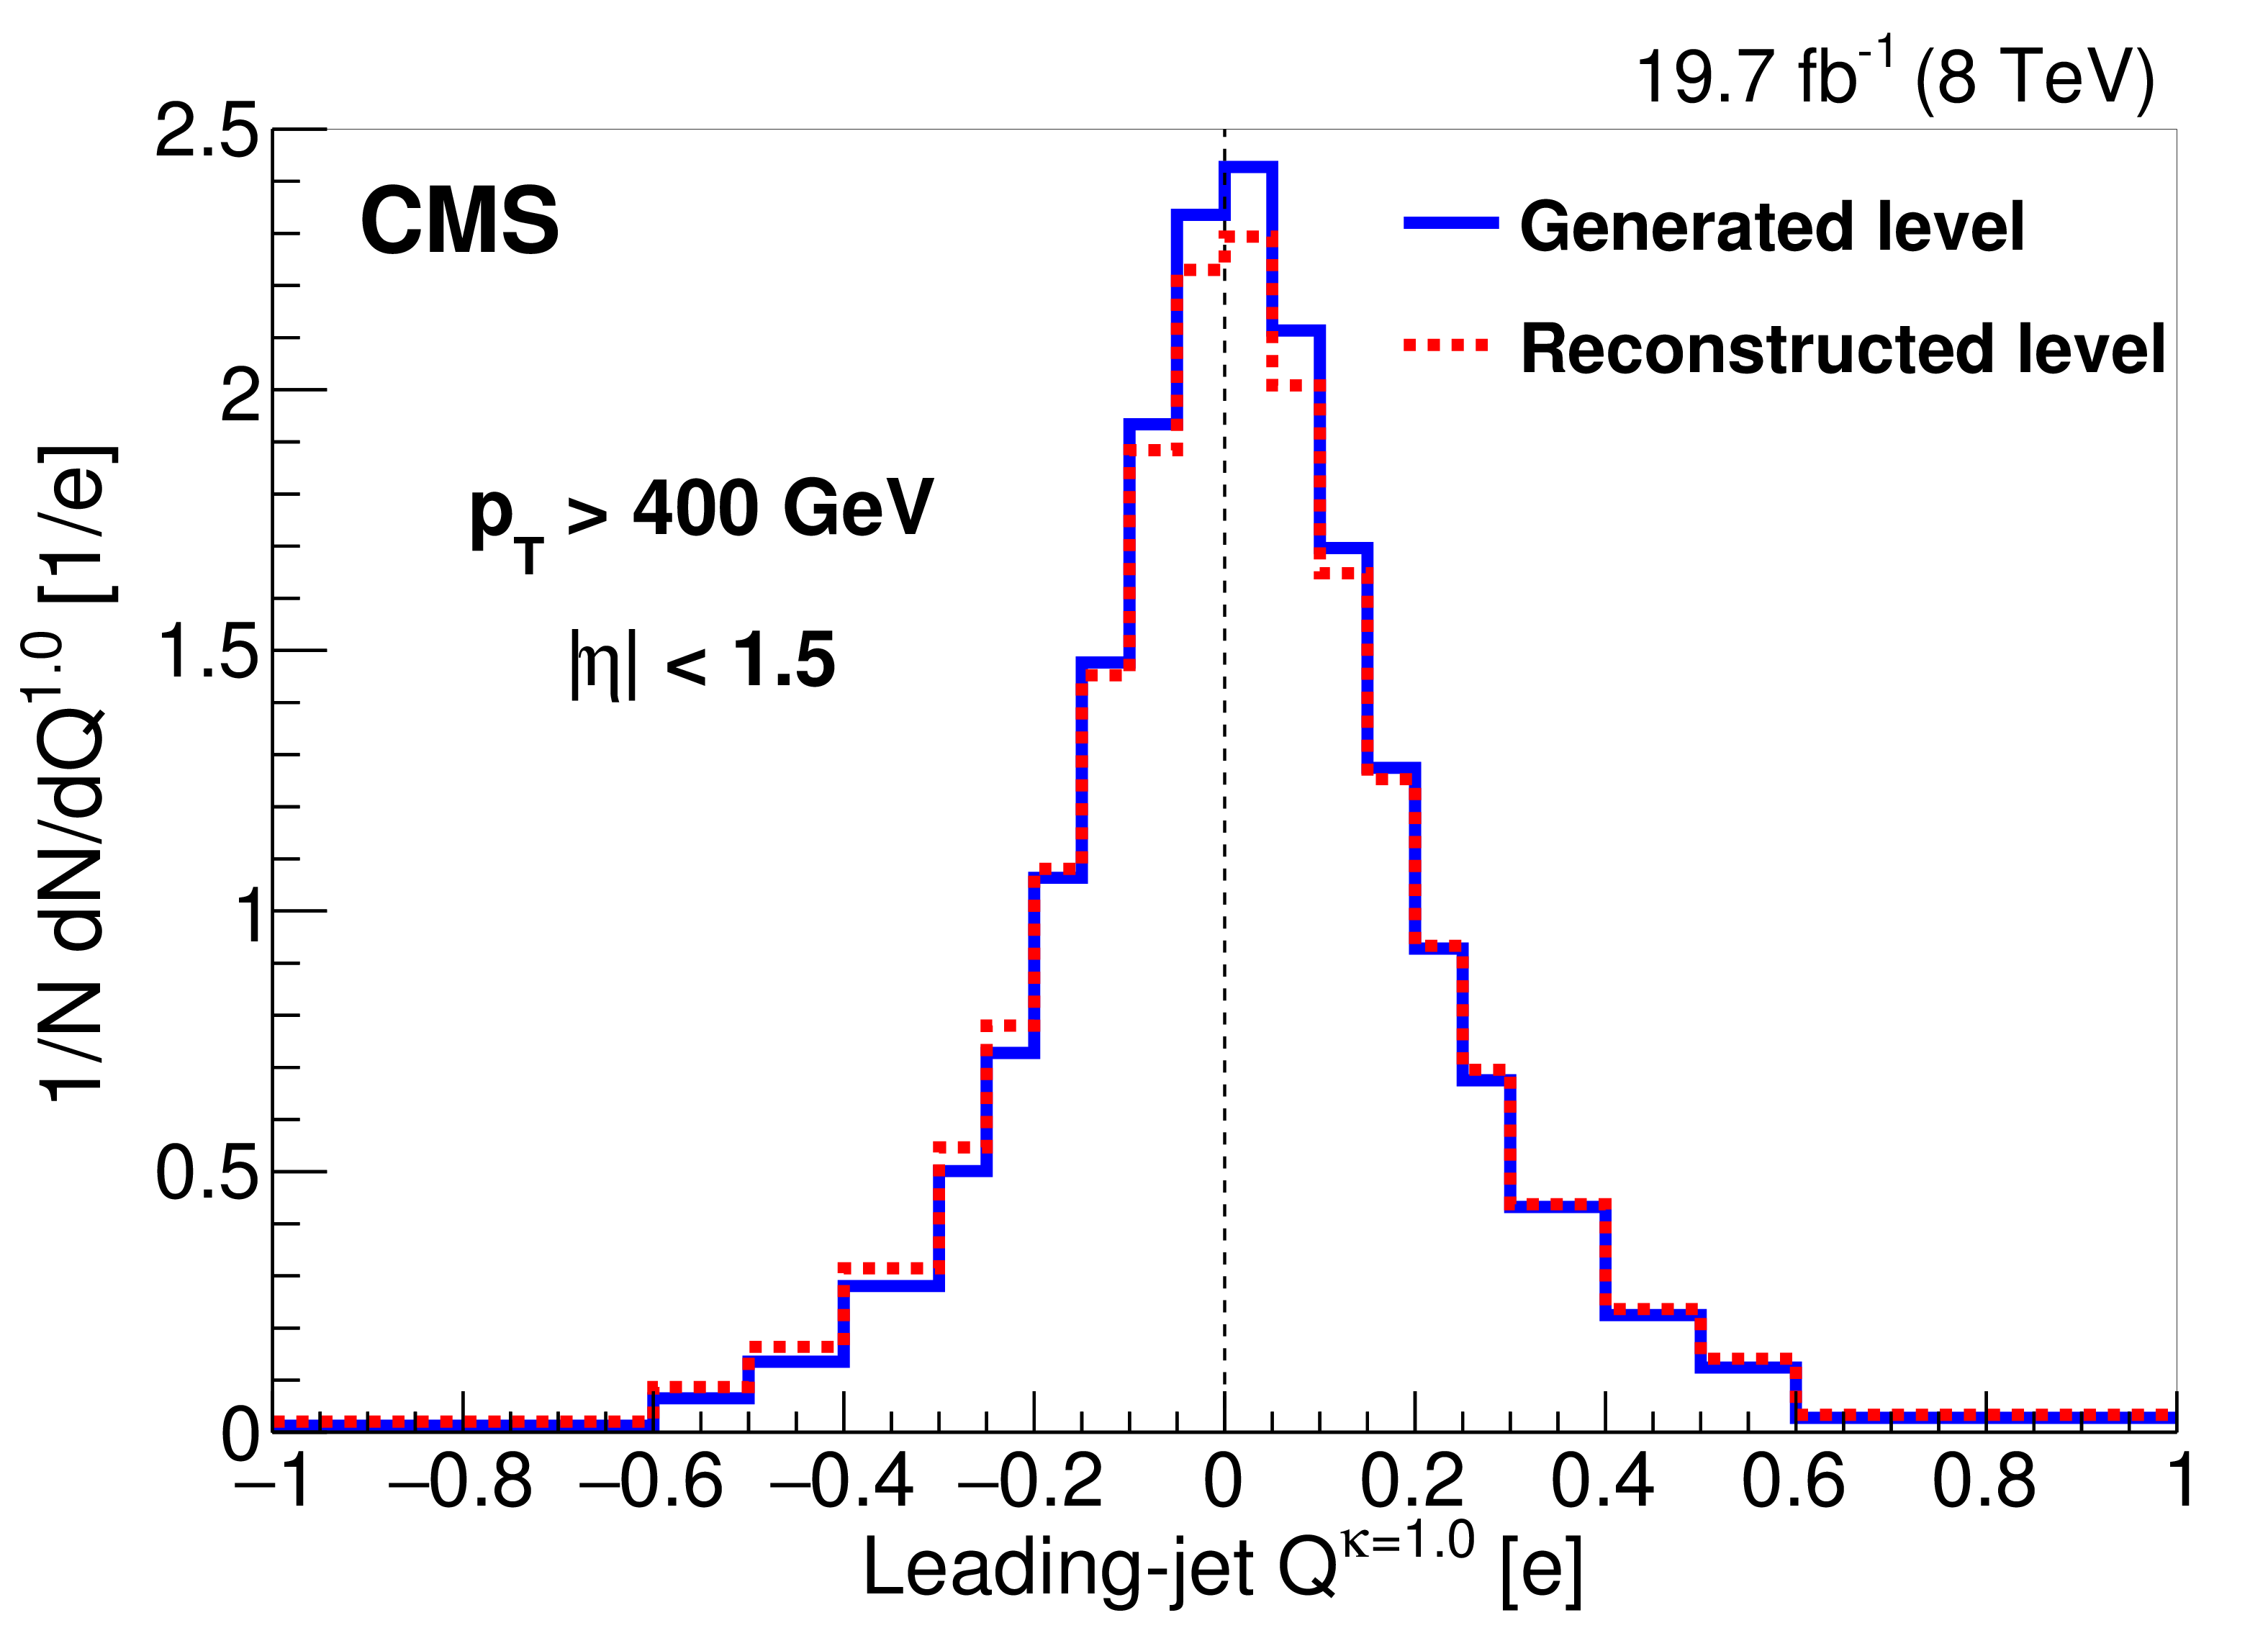
Figure 4-a:
Distributions of leading-jet charge $Q^\kappa $ at the reconstructed level and generated levels in PYTHIA6, for $\kappa =$ 1.0. |
png pdf |
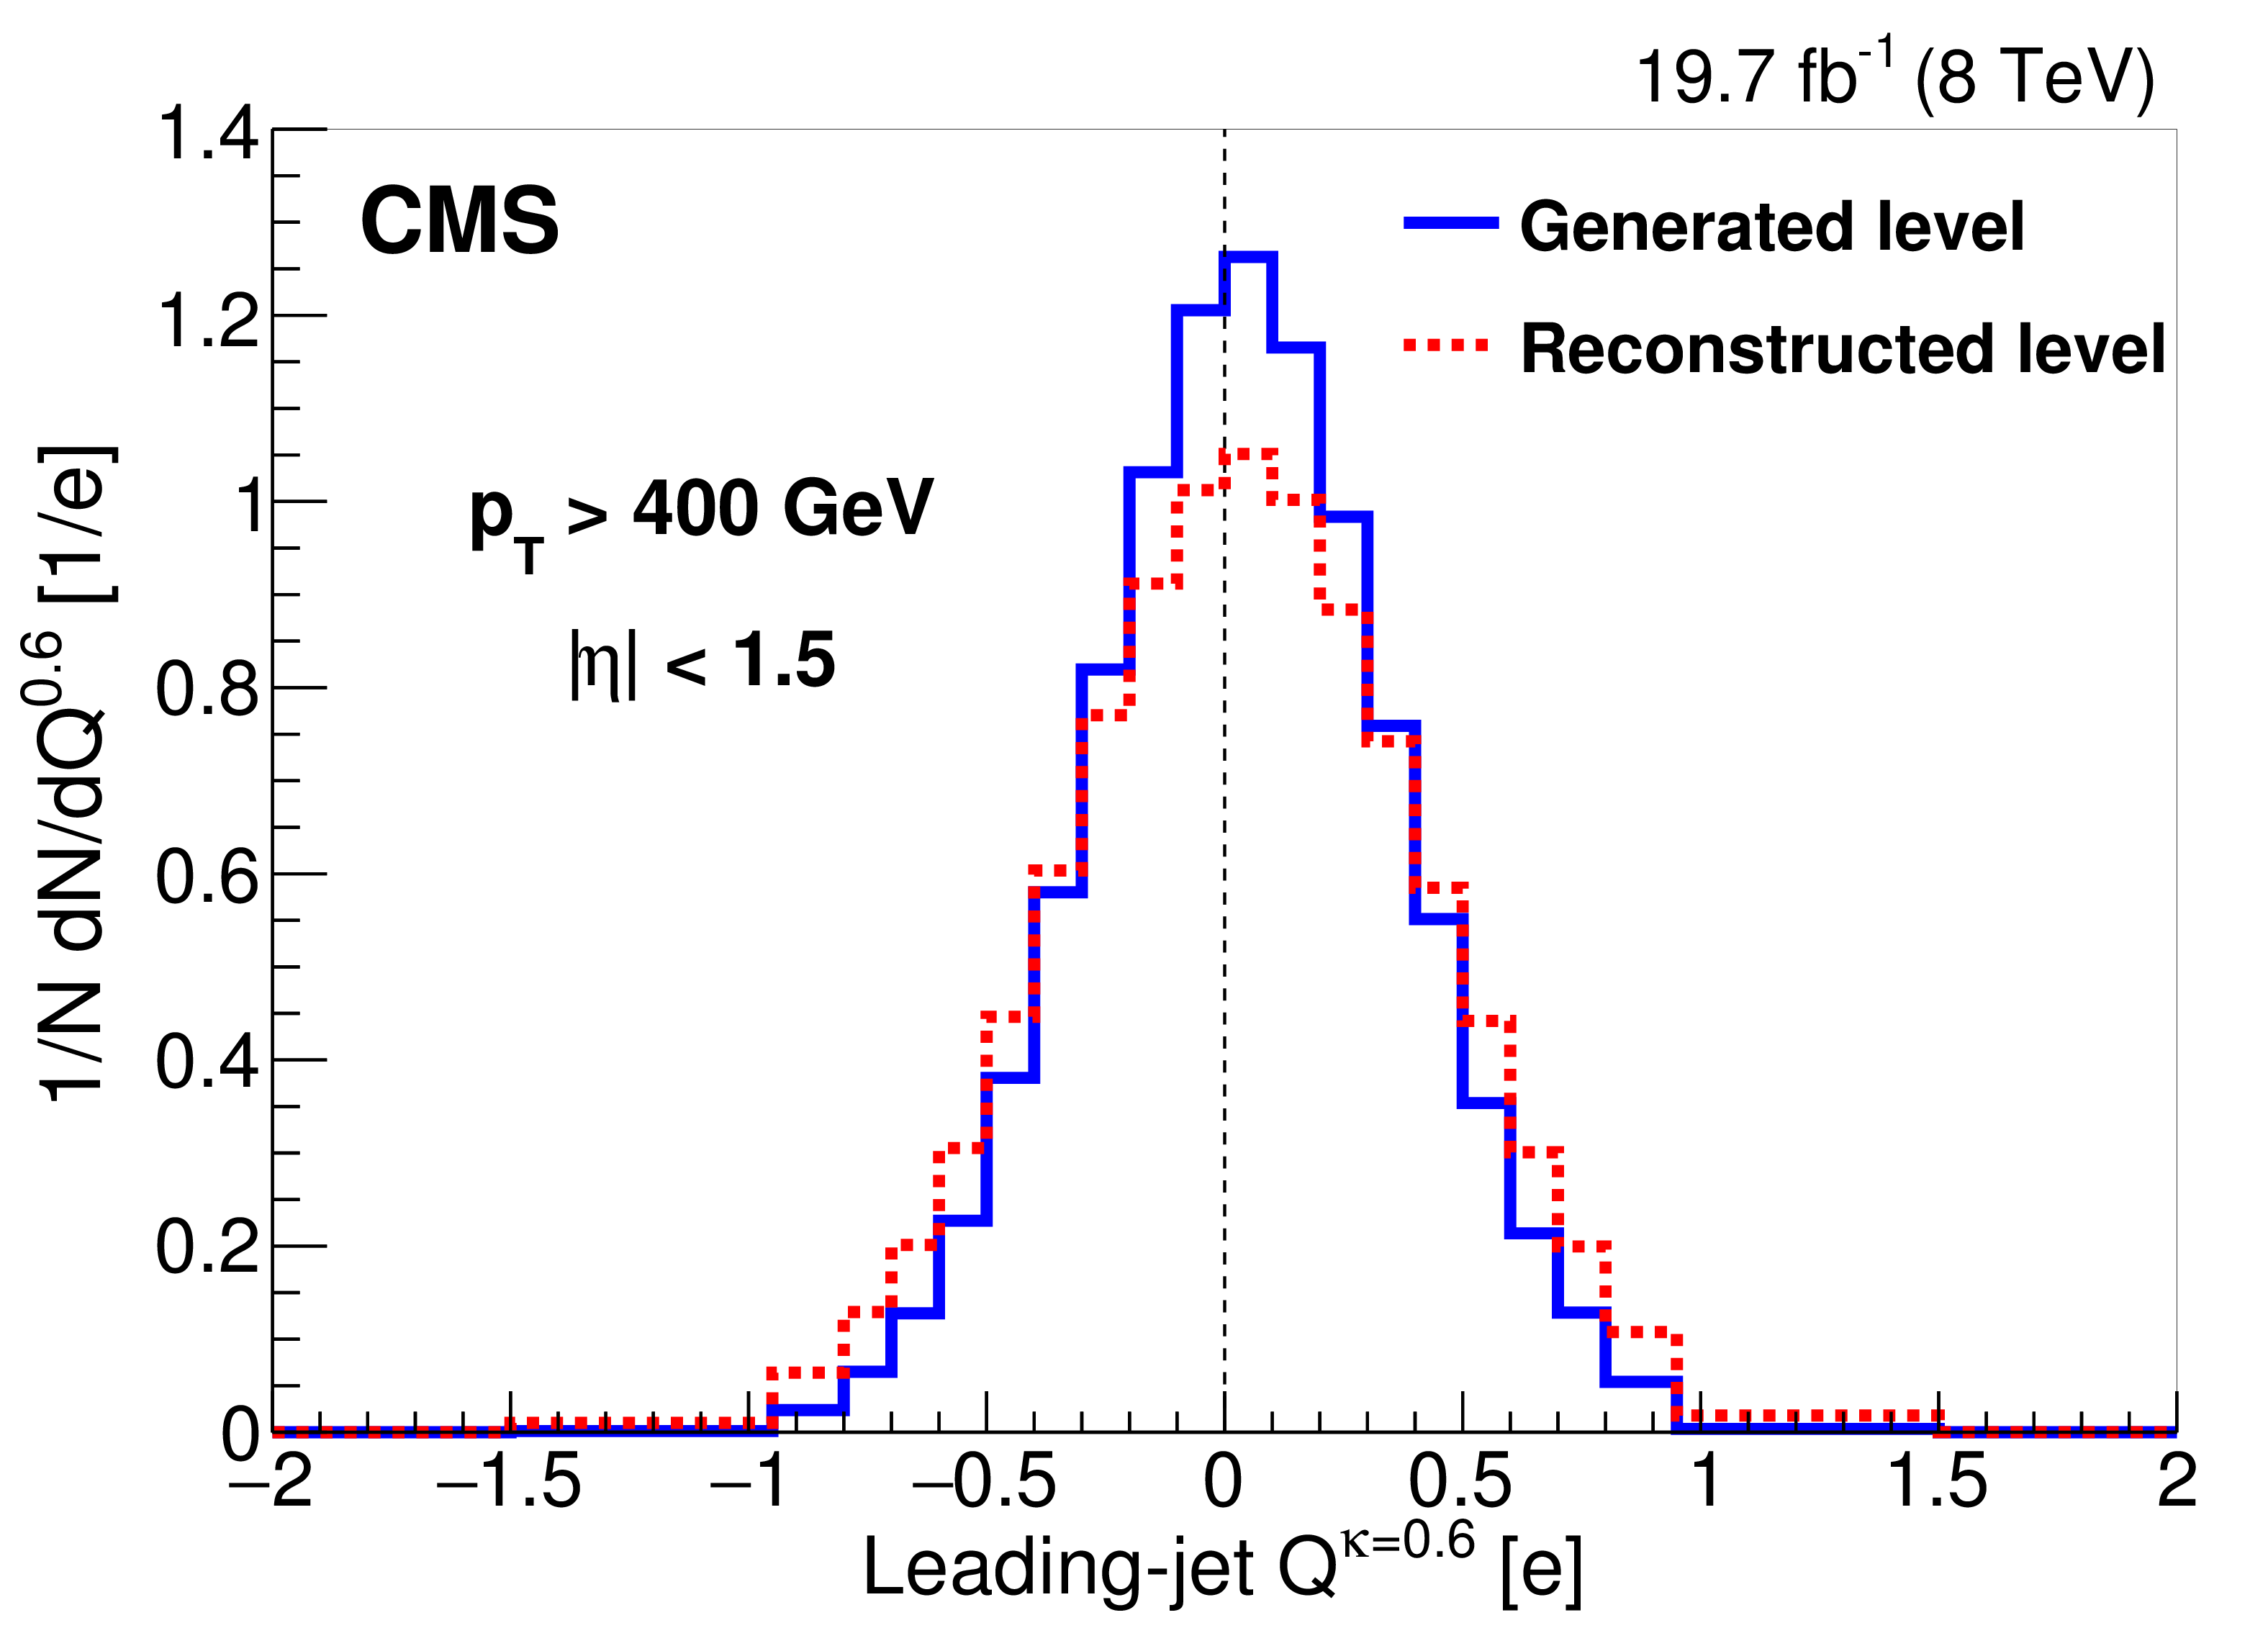
Figure 4-b:
Distributions of leading-jet charge $Q^\kappa $ at the reconstructed level and generated levels in PYTHIA6, for $\kappa =$ 0.6. |
png pdf |
Figure 4-c:
Distributions of leading-jet charge $Q^\kappa $ at the reconstructed level and generated levels in PYTHIA6, for $\kappa =$ 0.3. |
png pdf |
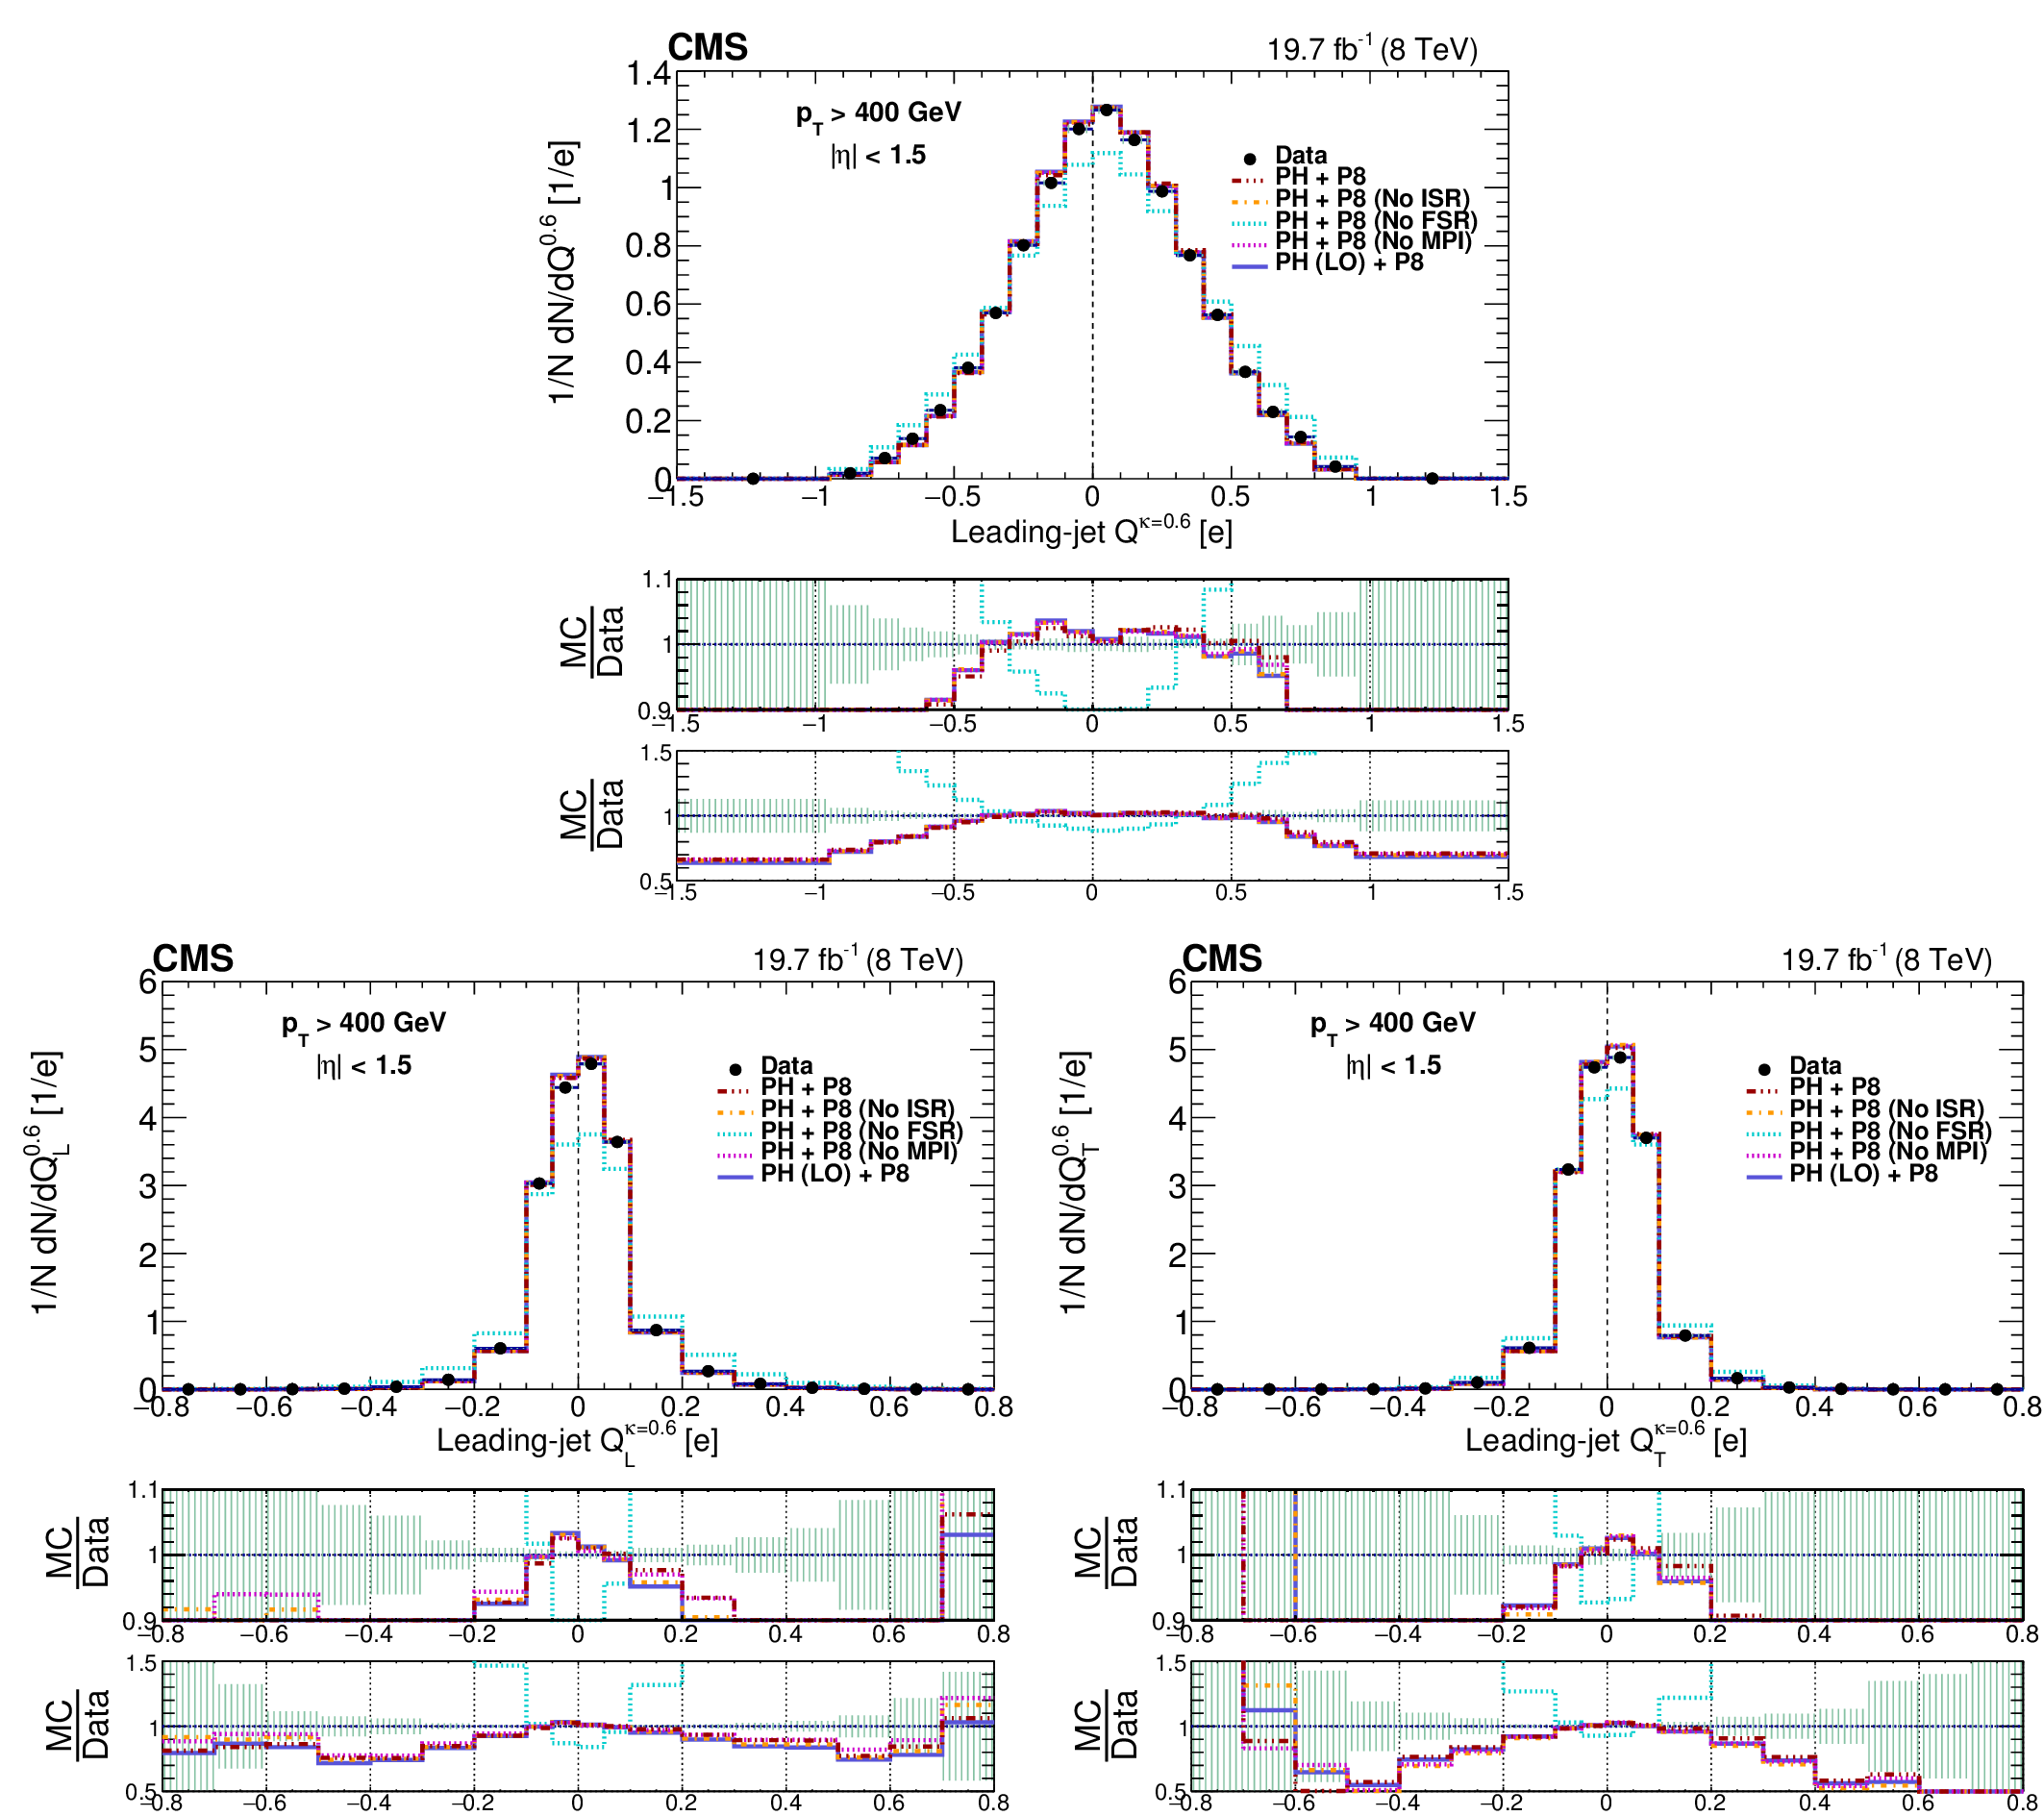
Figure 5:
Comparison of unfolded leading-jet charge distributions with predictions from POWHEG + PYTHIA8 ("PH+P8''). The NLO POWHEG prediction with the NLO CT10 PDF set is compared with predictions where initial-state radiation ("No ISR''), final-state radiation ("No FSR''), or multiple-parton interactions ("No MPI'') are disabled in PYTHIA8. A LO POWHEG prediction using the LO CTEQ6L1 PDF set ("LO'') is also shown. The default jet charge definition ($Q^\kappa $), the longitudinal jet charge definition ($Q_{L}^\kappa $), and the transverse jet charge definition ($Q_{T}^\kappa $) are shown for $\kappa =$ 0.6. Hashed uncertainty bands include both statistical and systematic contributions in data, added in quadrature. The ratio of data to simulation is displayed twice below each plot with two different vertical scales. |
png pdf |
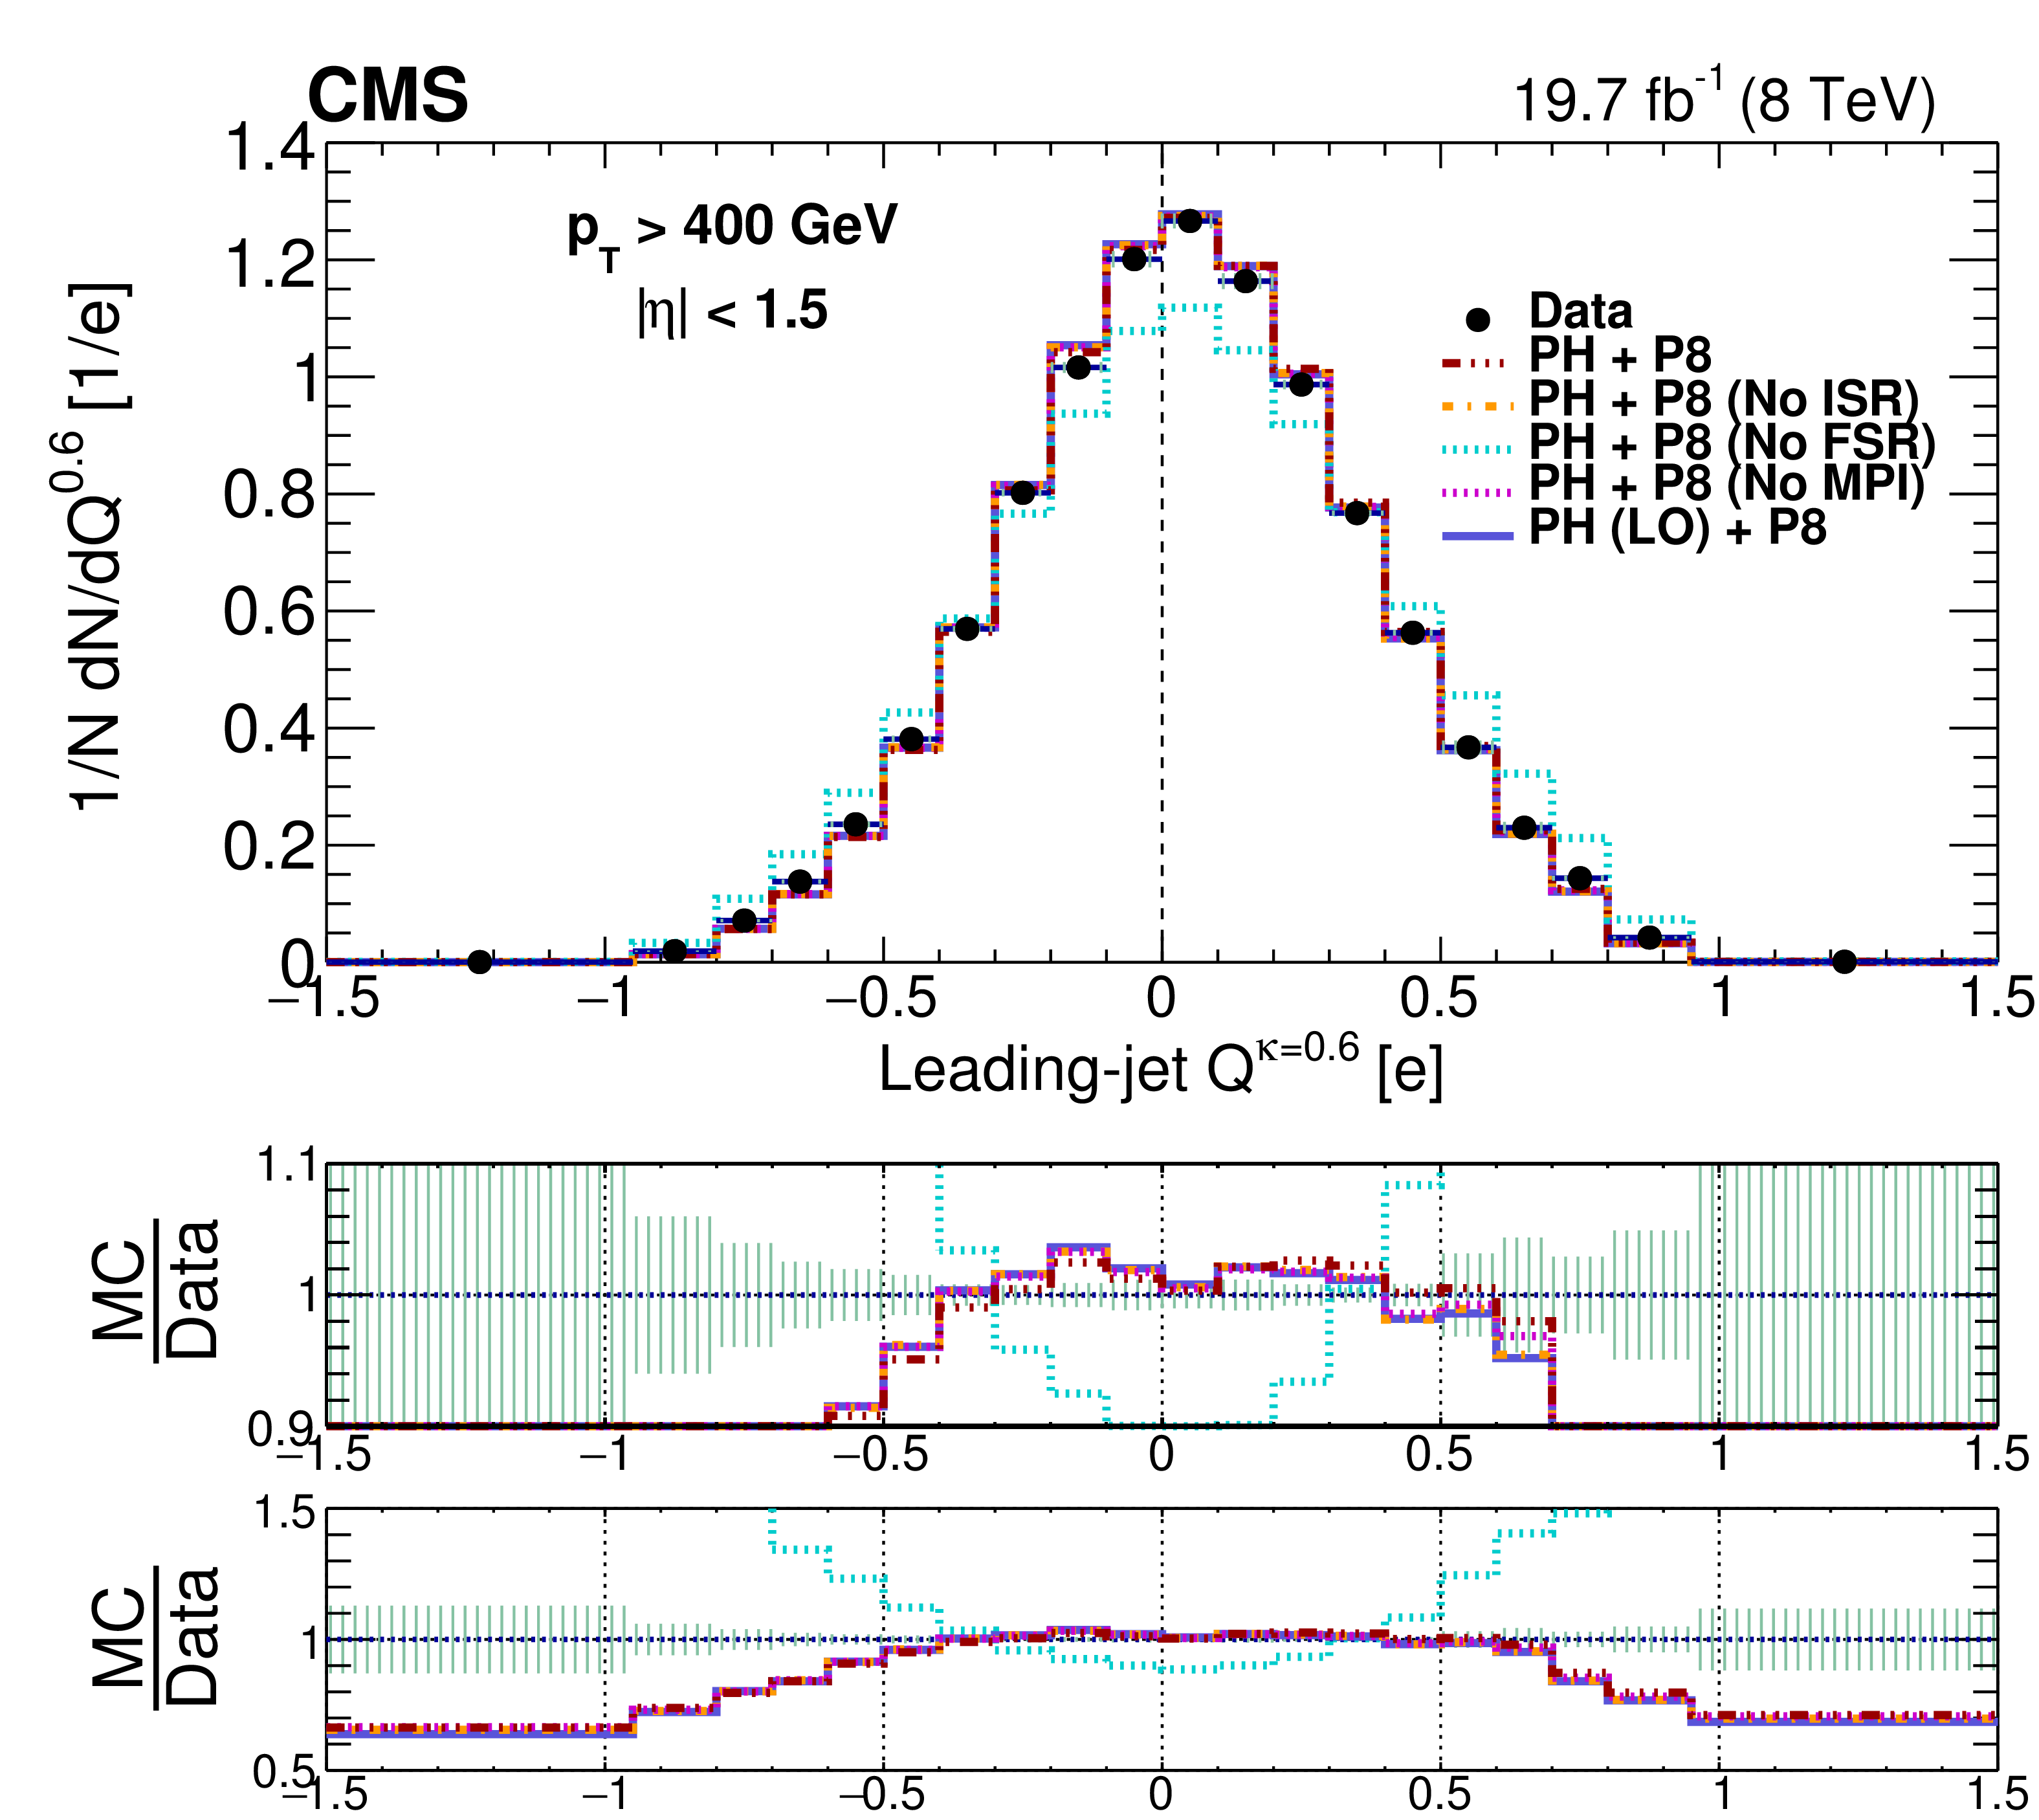
Figure 5-a:
Comparison of unfolded leading-jet charge distributions with predictions from POWHEG + PYTHIA8 ("PH+P8''). The NLO POWHEG prediction with the NLO CT10 PDF set is compared with predictions where initial-state radiation ("No ISR''), final-state radiation ("No FSR''), or multiple-parton interactions ("No MPI'') are disabled in PYTHIA8. A LO POWHEG prediction using the LO CTEQ6L1 PDF set ("LO'') is also shown. The default jet charge definition ($Q^\kappa $) is shown for $\kappa =$ 0.6. Hashed uncertainty bands include both statistical and systematic contributions in data, added in quadrature. The ratio of data to simulation is displayed twice below the plot with two different vertical scales. |

png pdf |
Figure 5-b:
Comparison of unfolded leading-jet charge distributions with predictions from POWHEG + PYTHIA8 ("PH+P8''). The NLO POWHEG prediction with the NLO CT10 PDF set is compared with predictions where initial-state radiation ("No ISR''), final-state radiation ("No FSR''), or multiple-parton interactions ("No MPI'') are disabled in PYTHIA8. A LO POWHEG prediction using the LO CTEQ6L1 PDF set ("LO'') is also shown. The longitudinal jet charge definition ($Q_{L}^\kappa $) is shown for $\kappa =$ 0.6. Hashed uncertainty bands include both statistical and systematic contributions in data, added in quadrature. The ratio of data to simulation is displayed twice below the plot with two different vertical scales. |
png pdf |
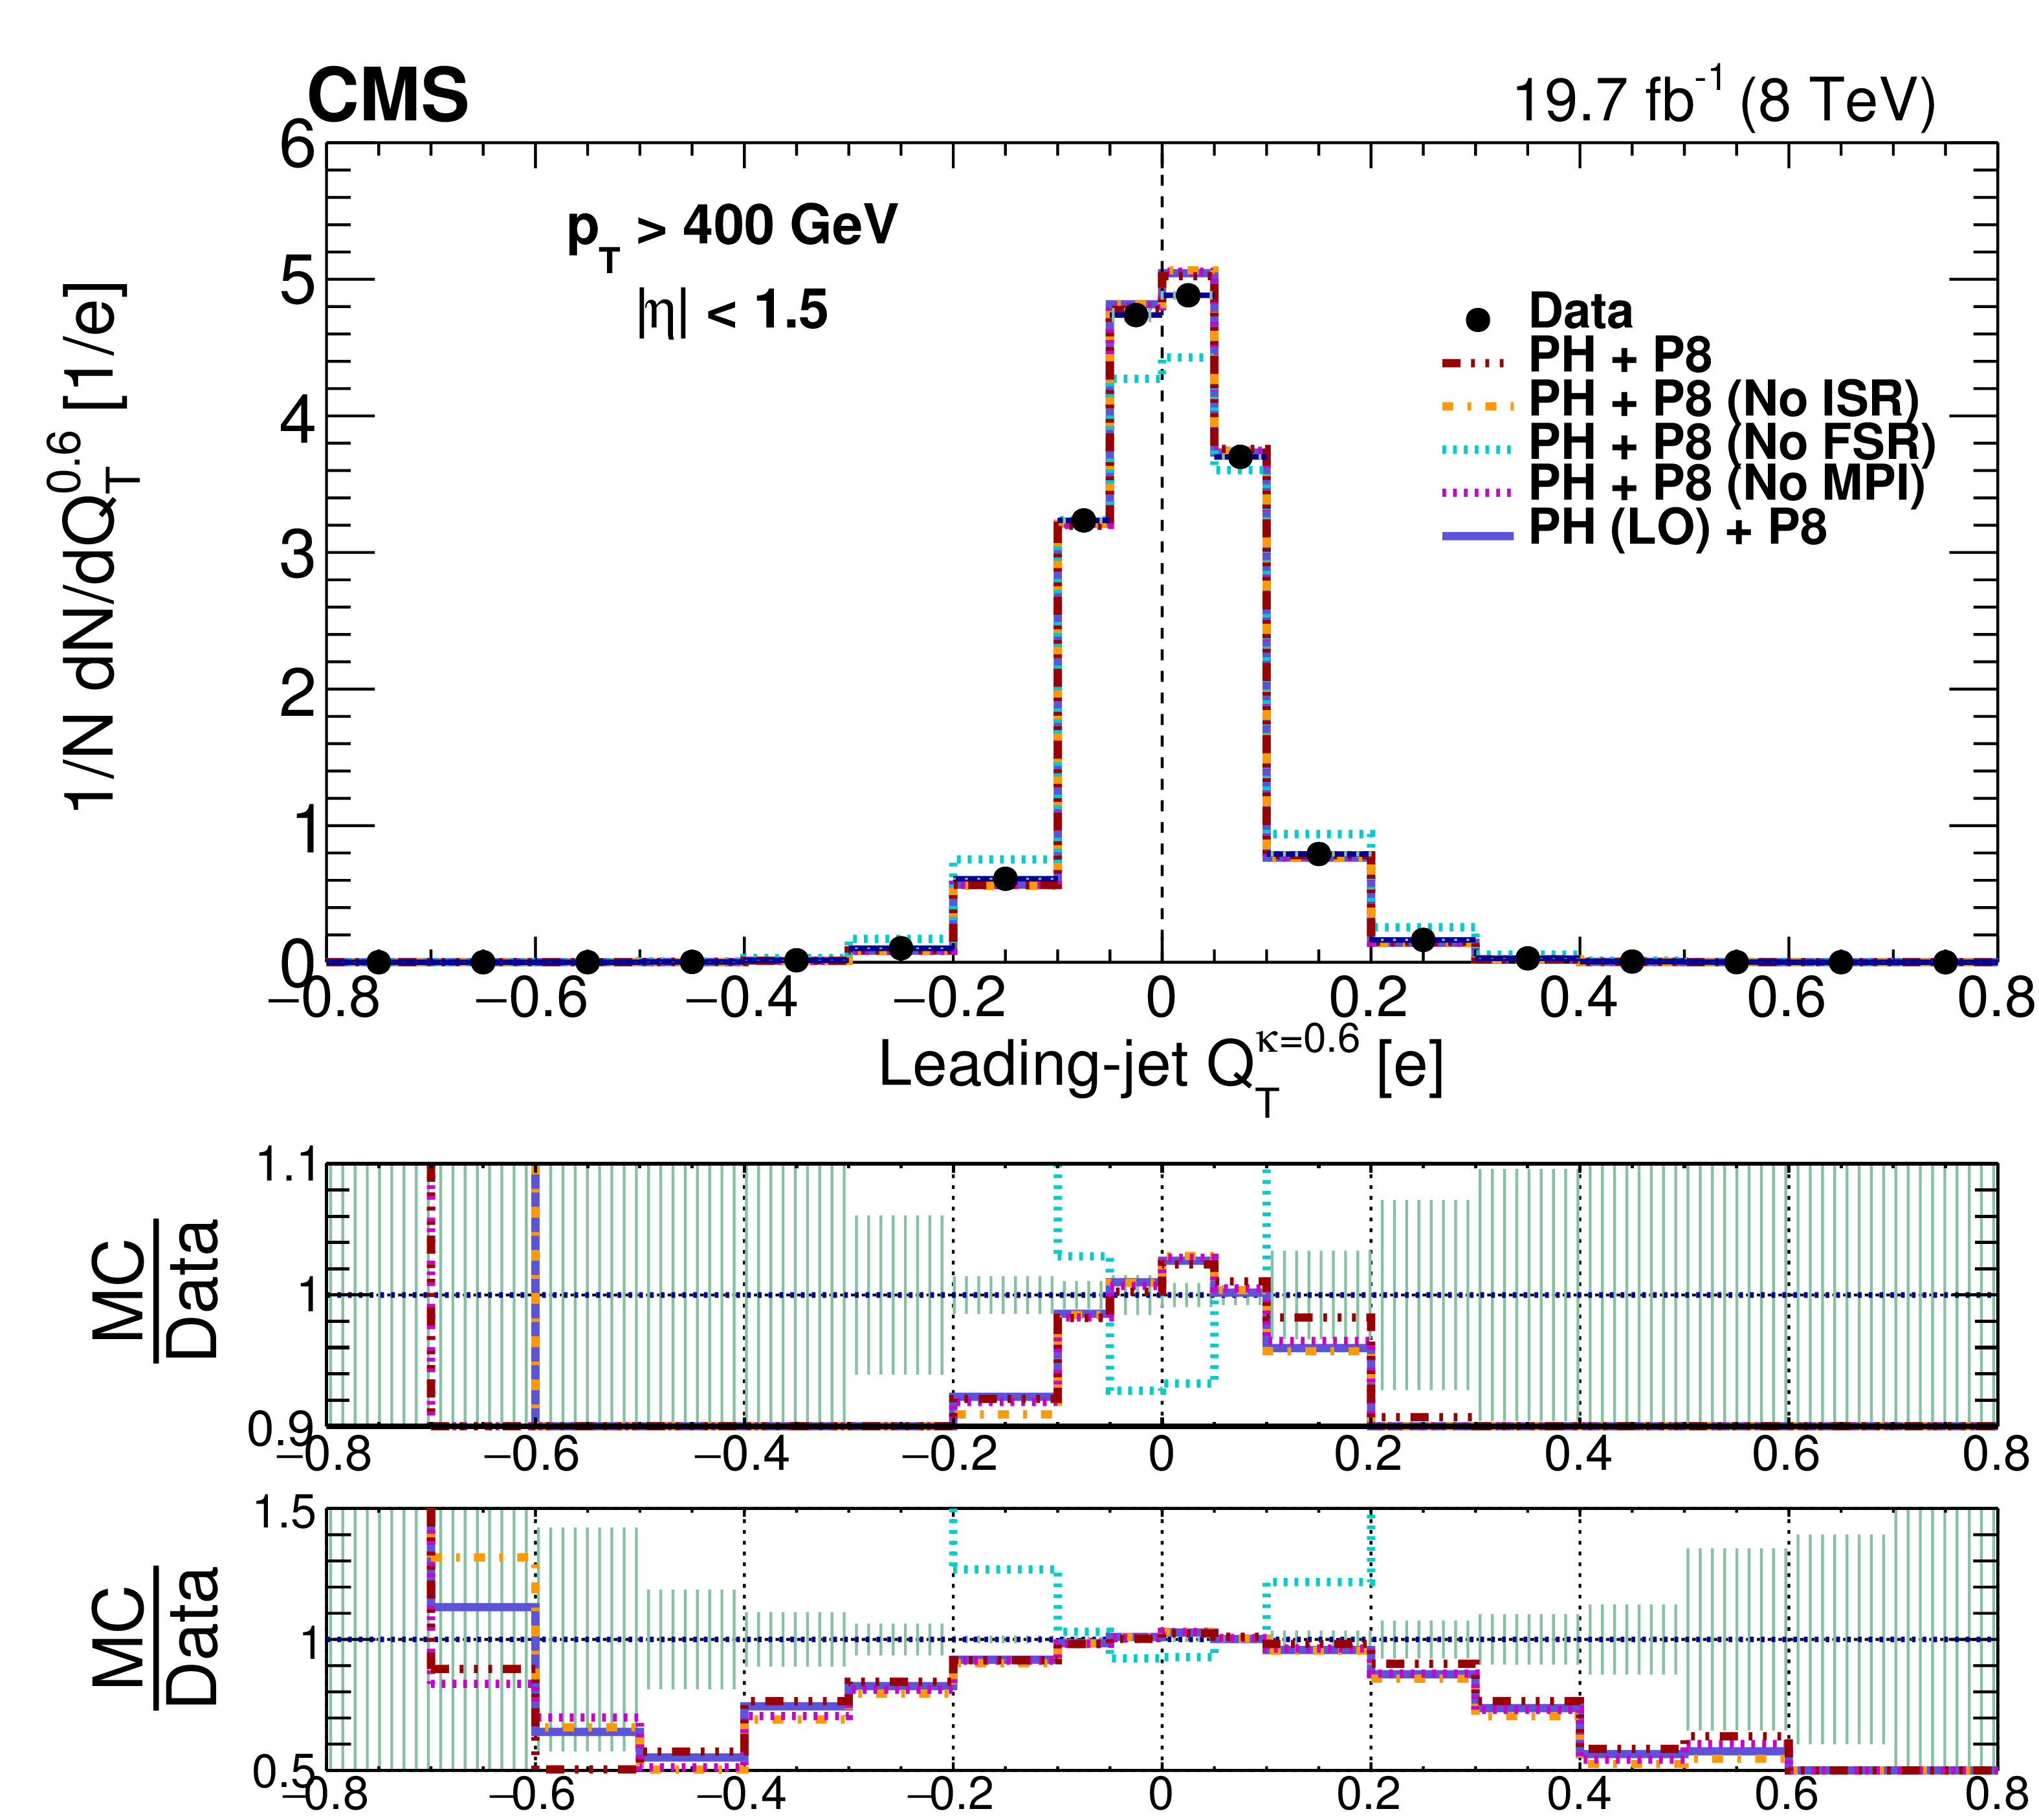
Figure 5-c:
Comparison of unfolded leading-jet charge distributions with predictions from POWHEG + PYTHIA8 ("PH+P8''). The NLO POWHEG prediction with the NLO CT10 PDF set is compared with predictions where initial-state radiation ("No ISR''), final-state radiation ("No FSR''), or multiple-parton interactions ("No MPI'') are disabled in PYTHIA8. A LO POWHEG prediction using the LO CTEQ6L1 PDF set ("LO'') is also shown. The transverse jet charge definition ($Q_{T}^\kappa $) is shown for $\kappa =$ 0.6. Hashed uncertainty bands include both statistical and systematic contributions in data, added in quadrature. The ratio of data to simulation is displayed twice below the plot with two different vertical scales. |
png pdf |
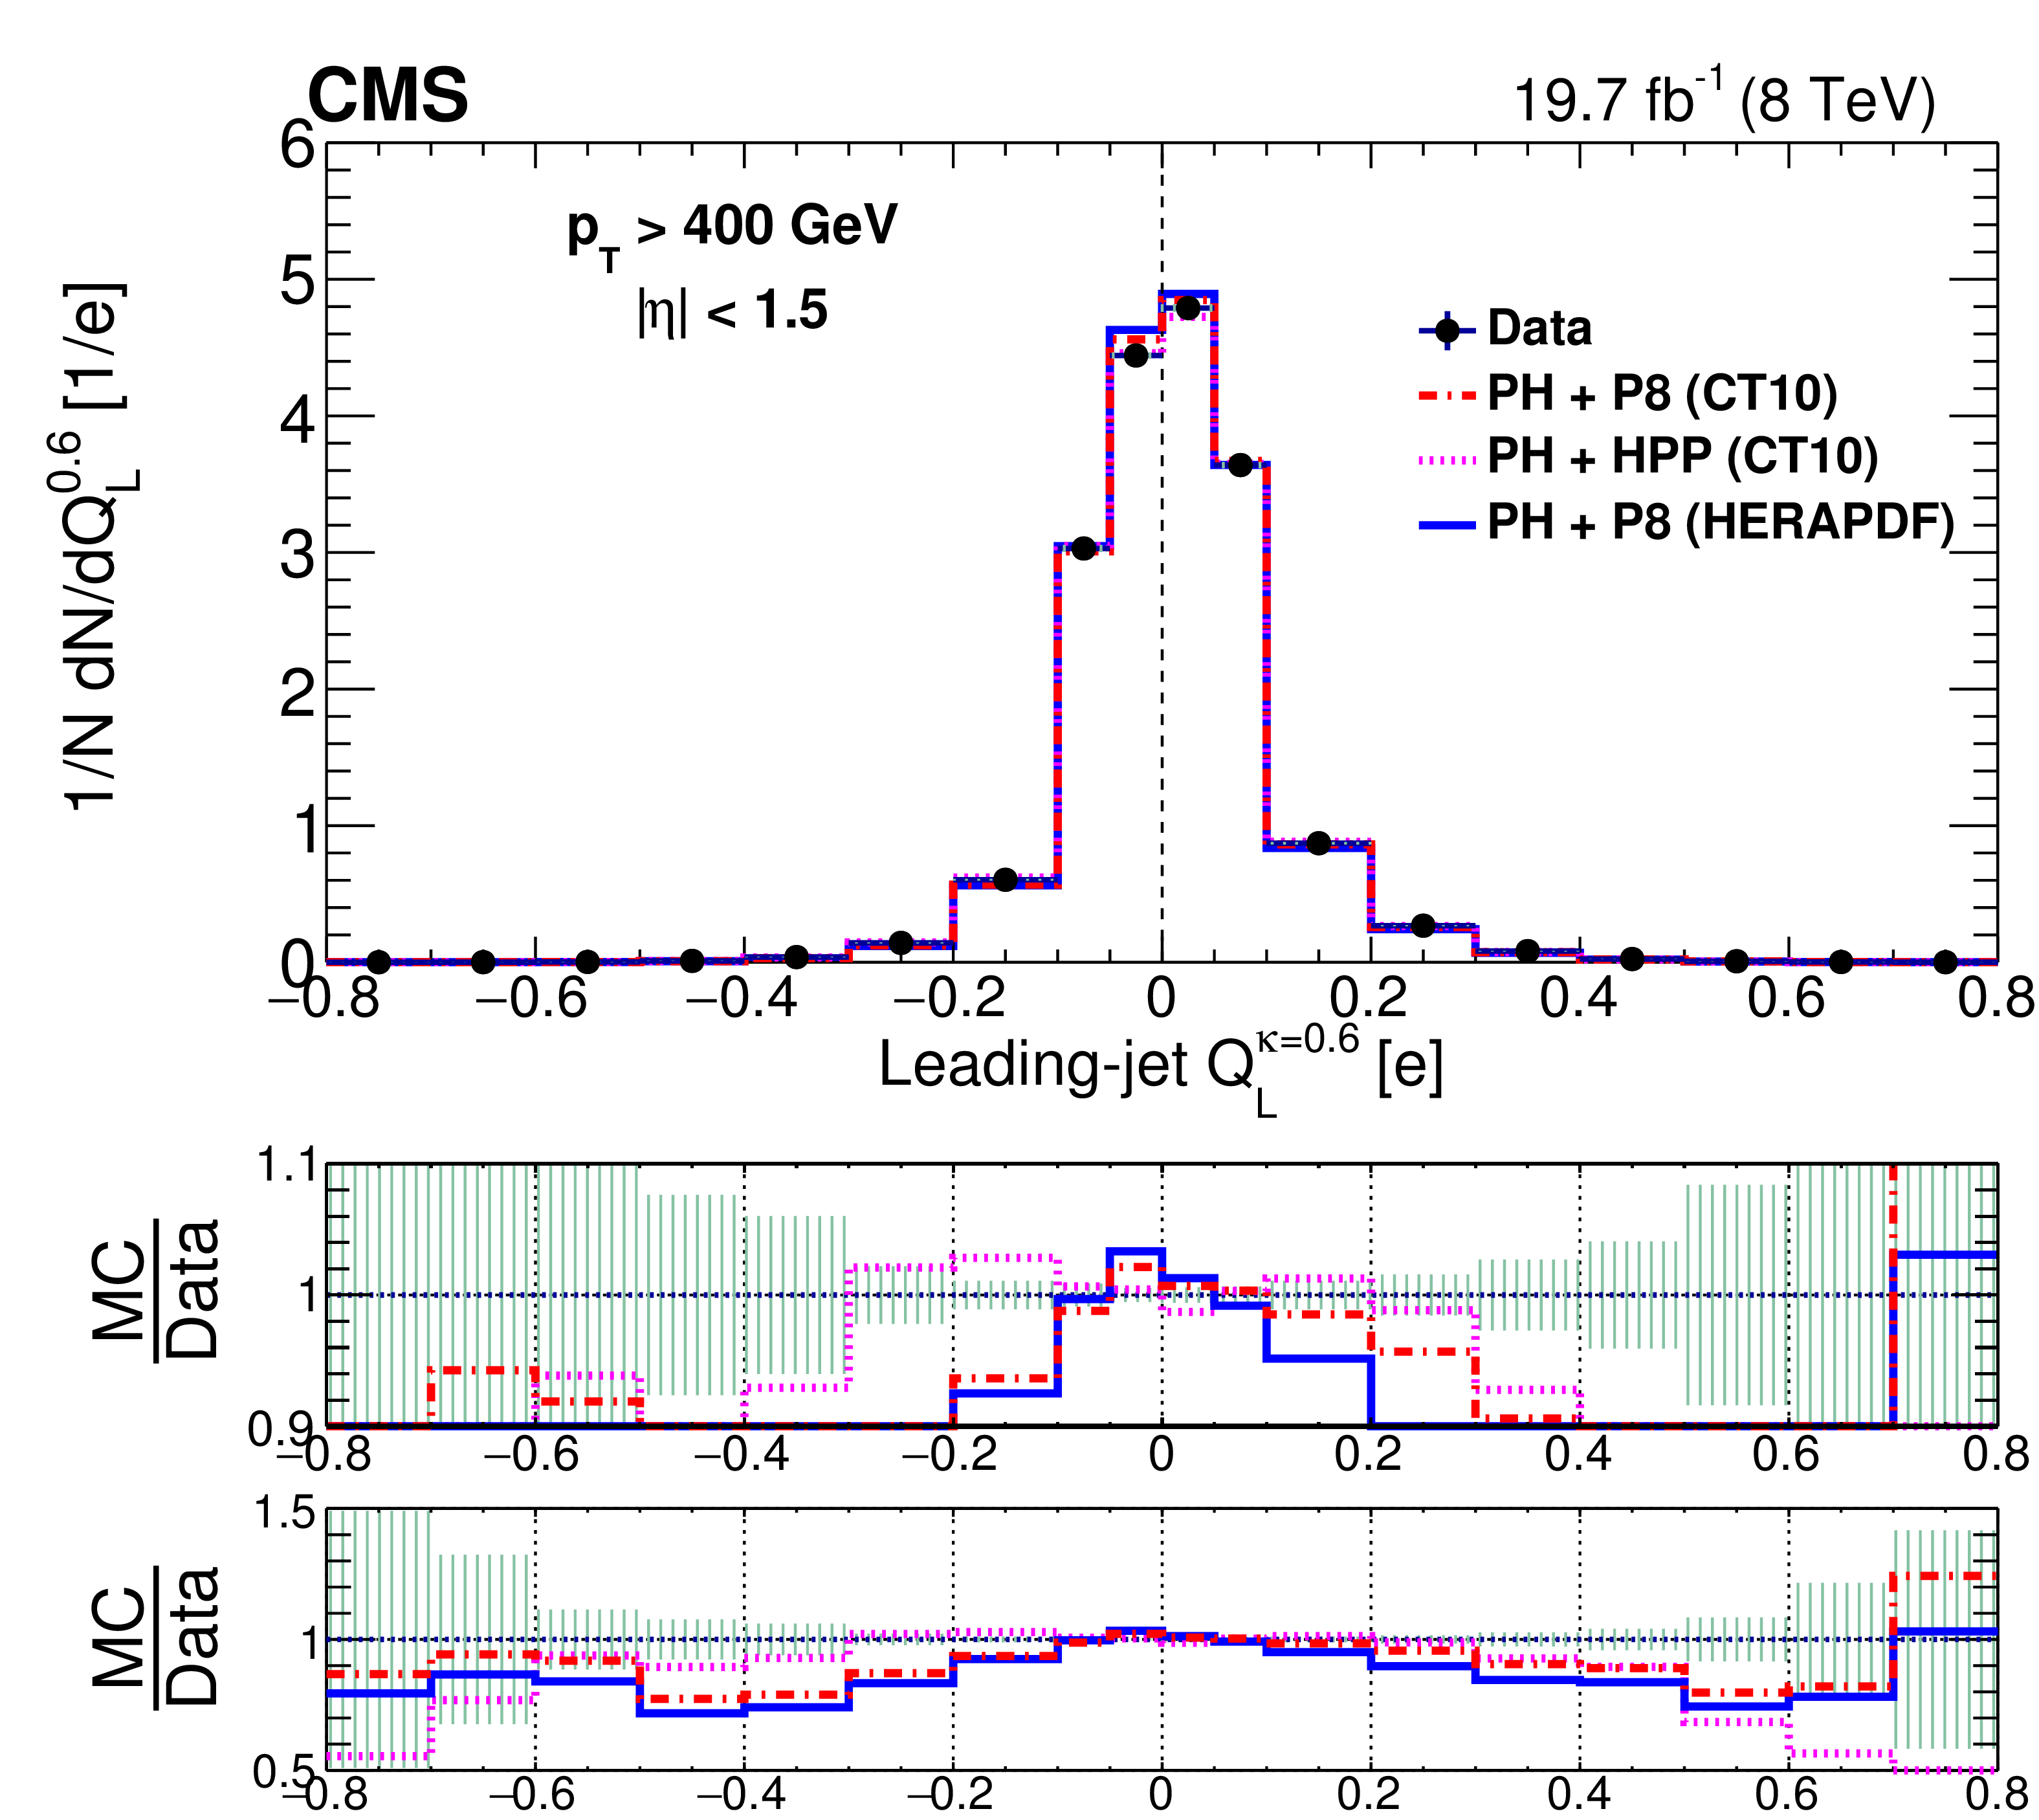
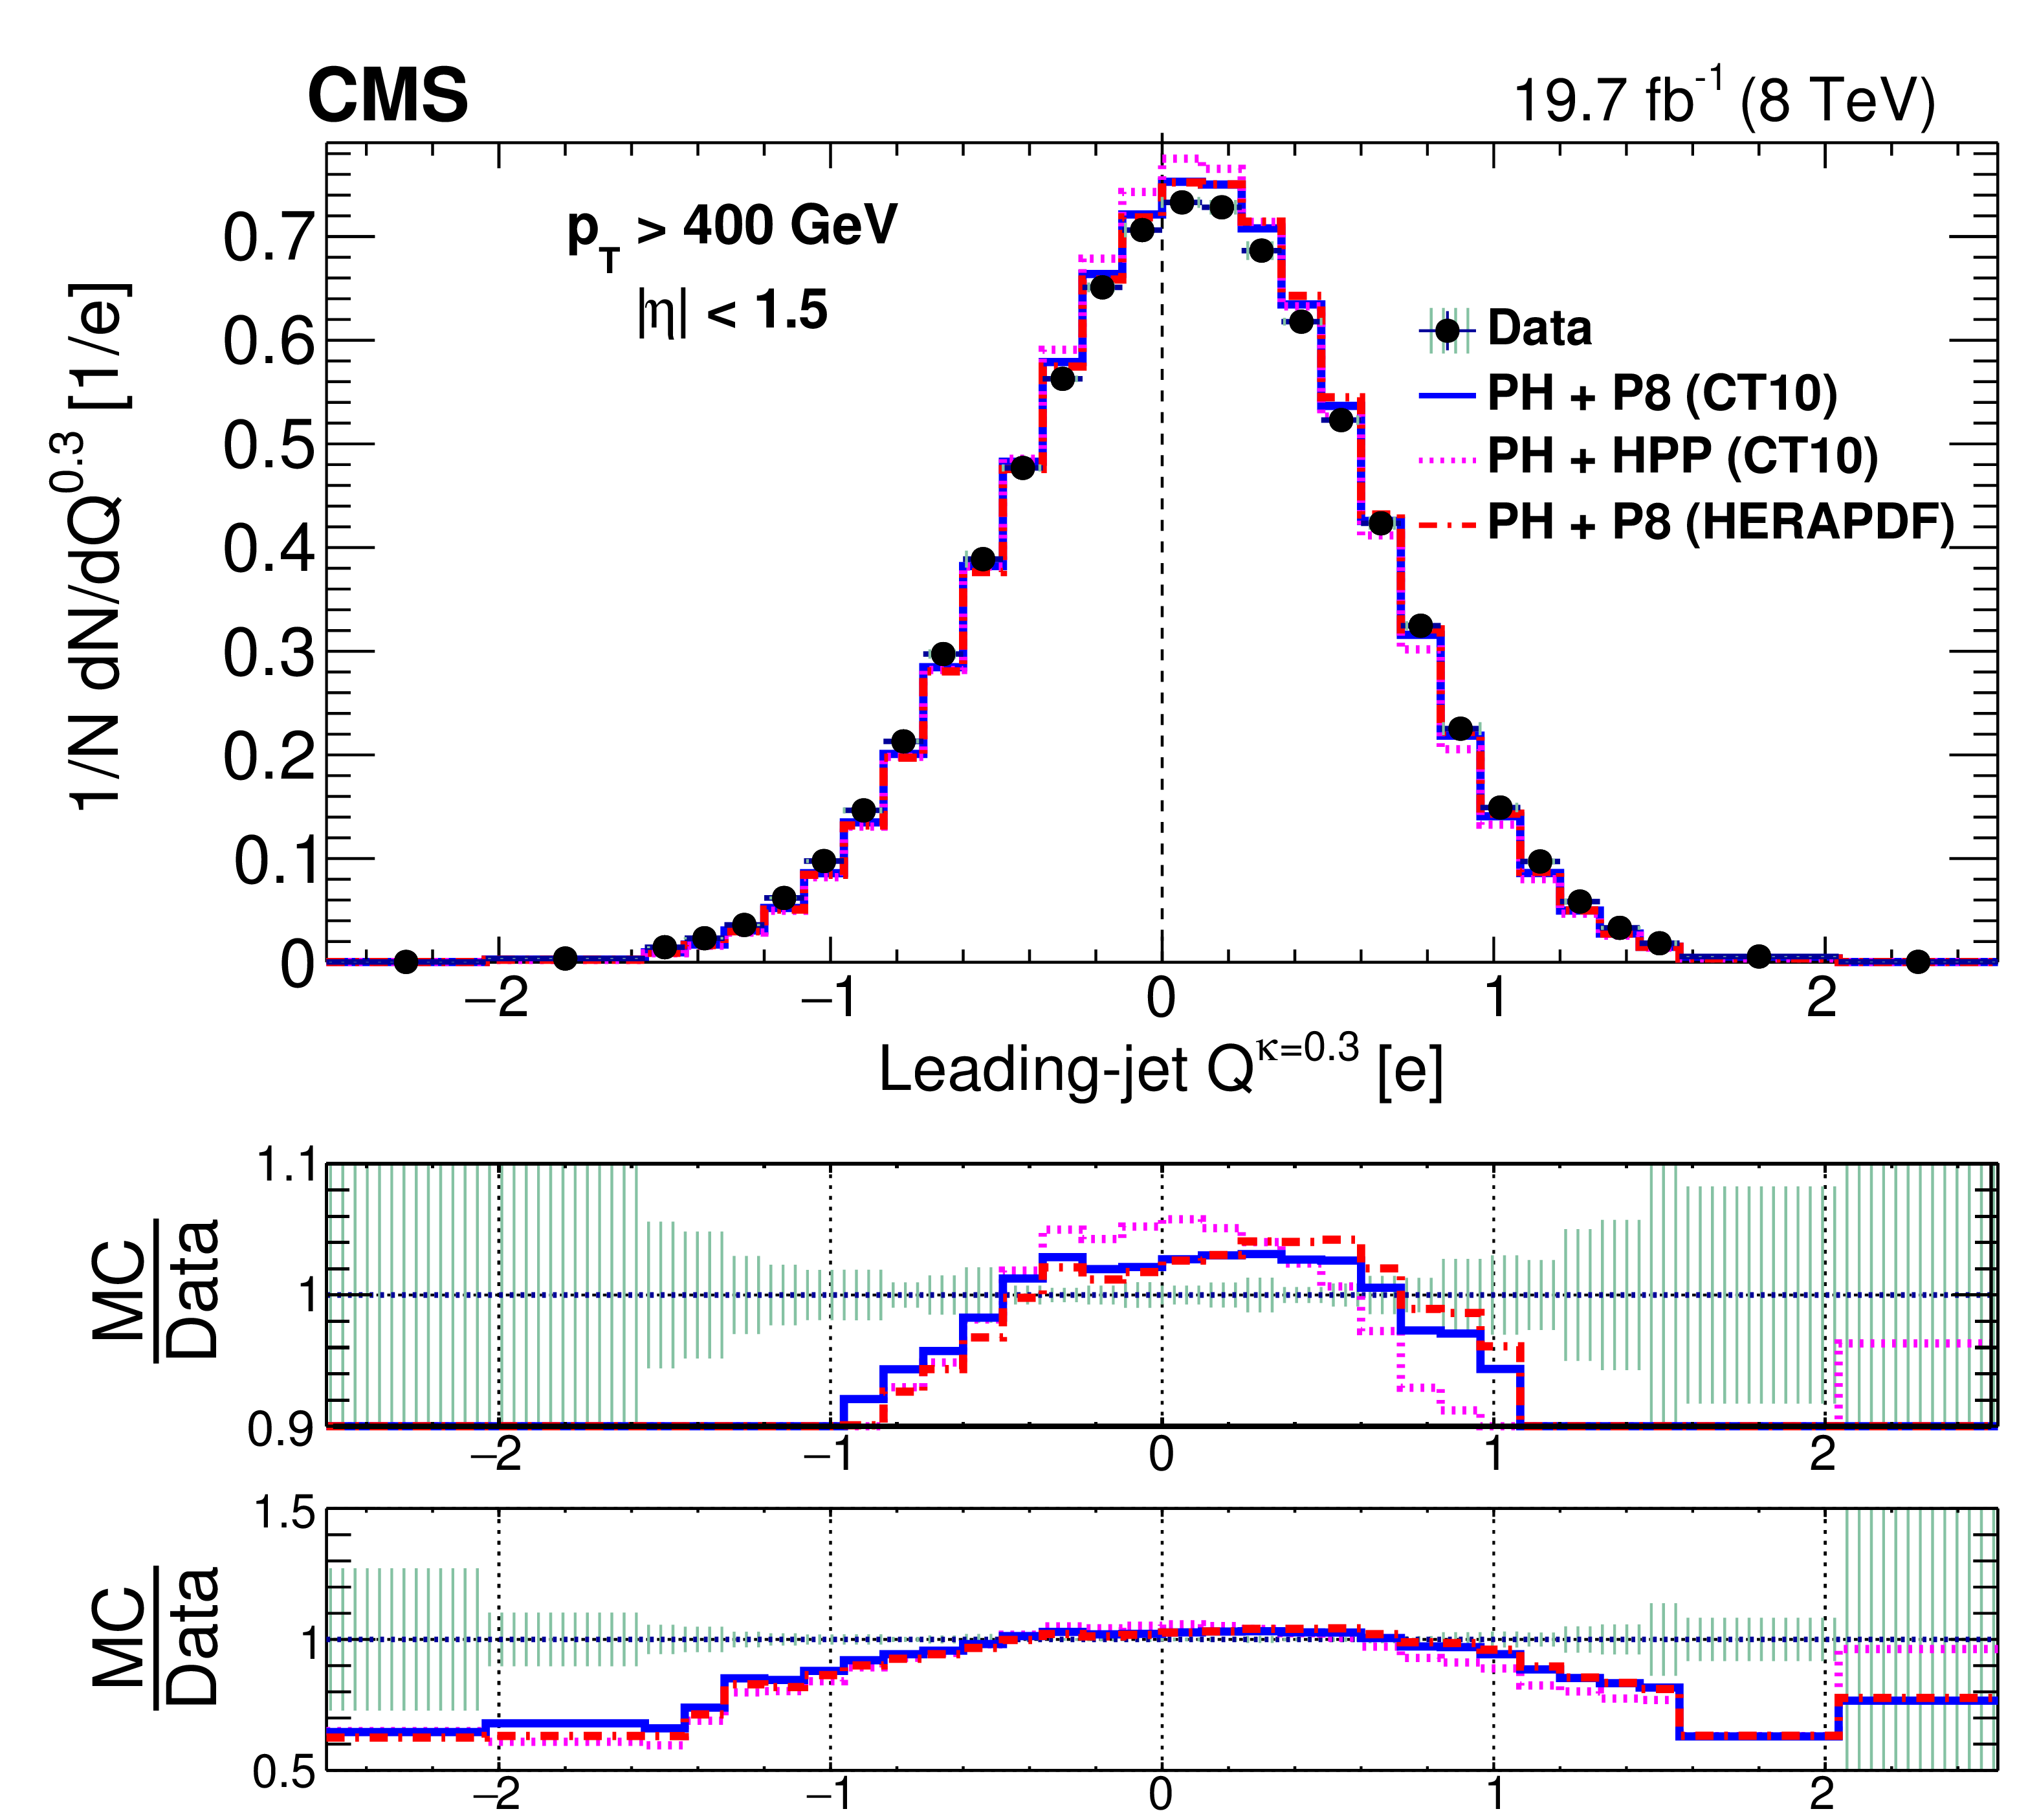
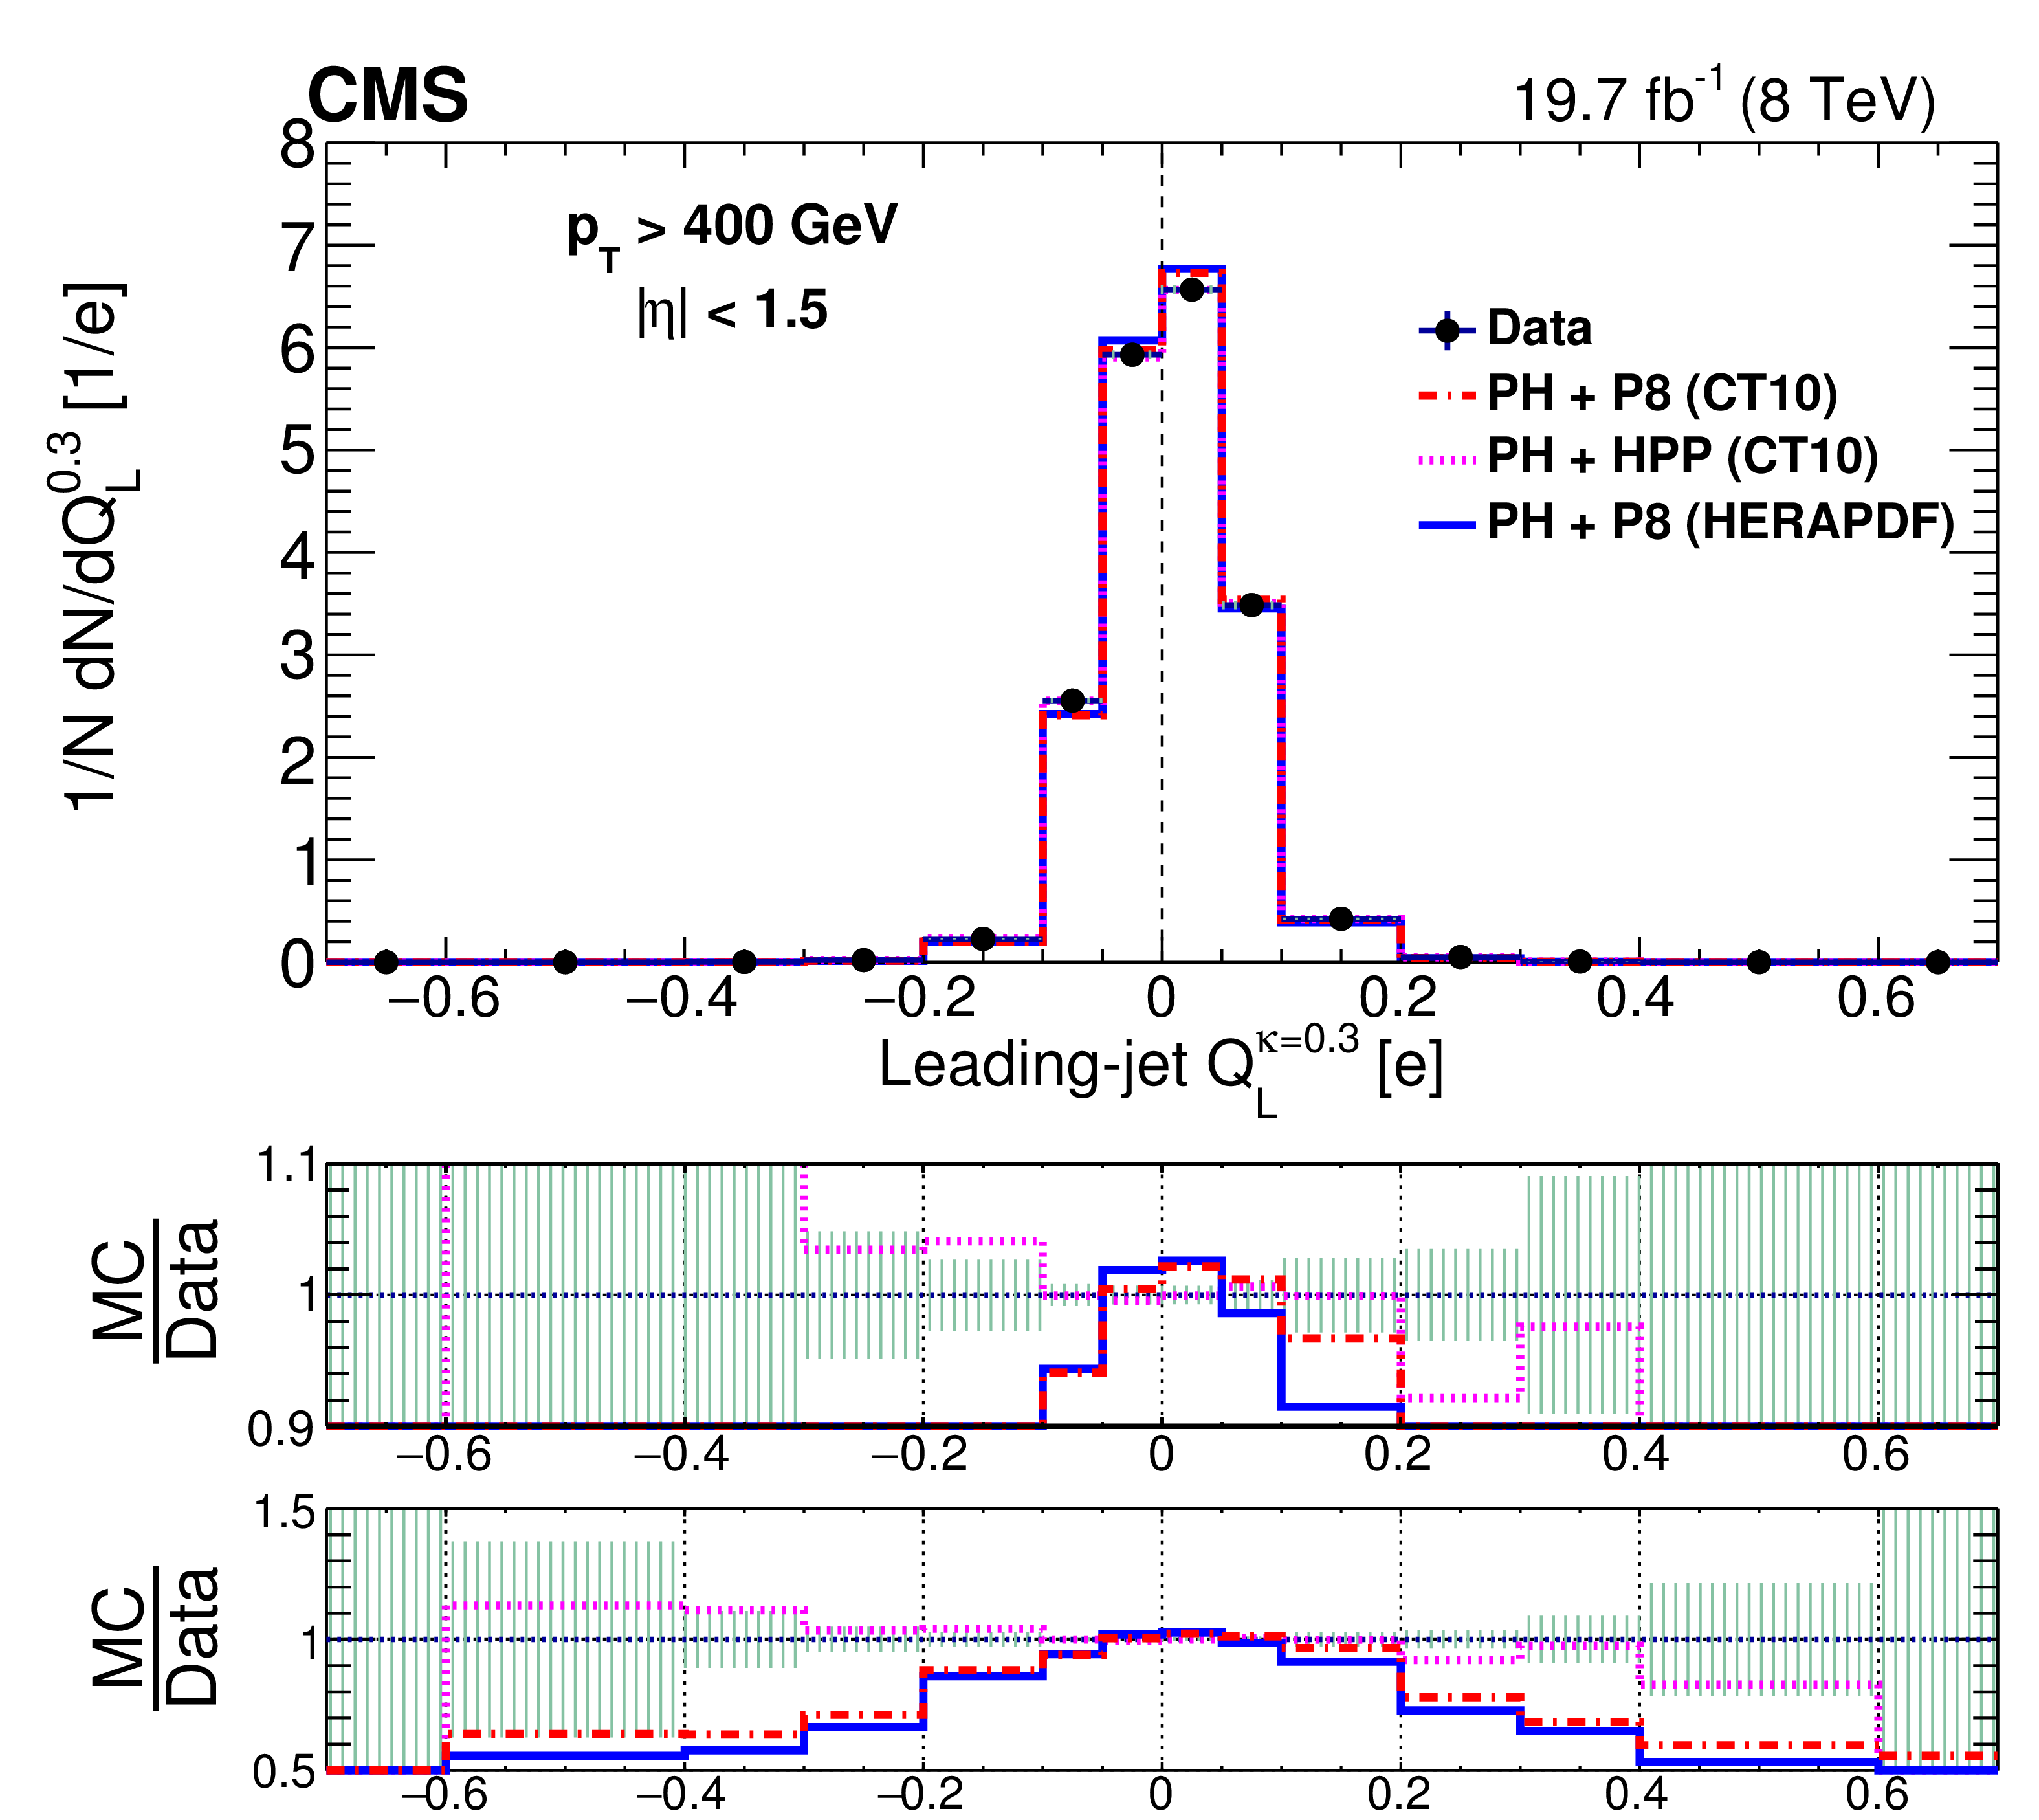
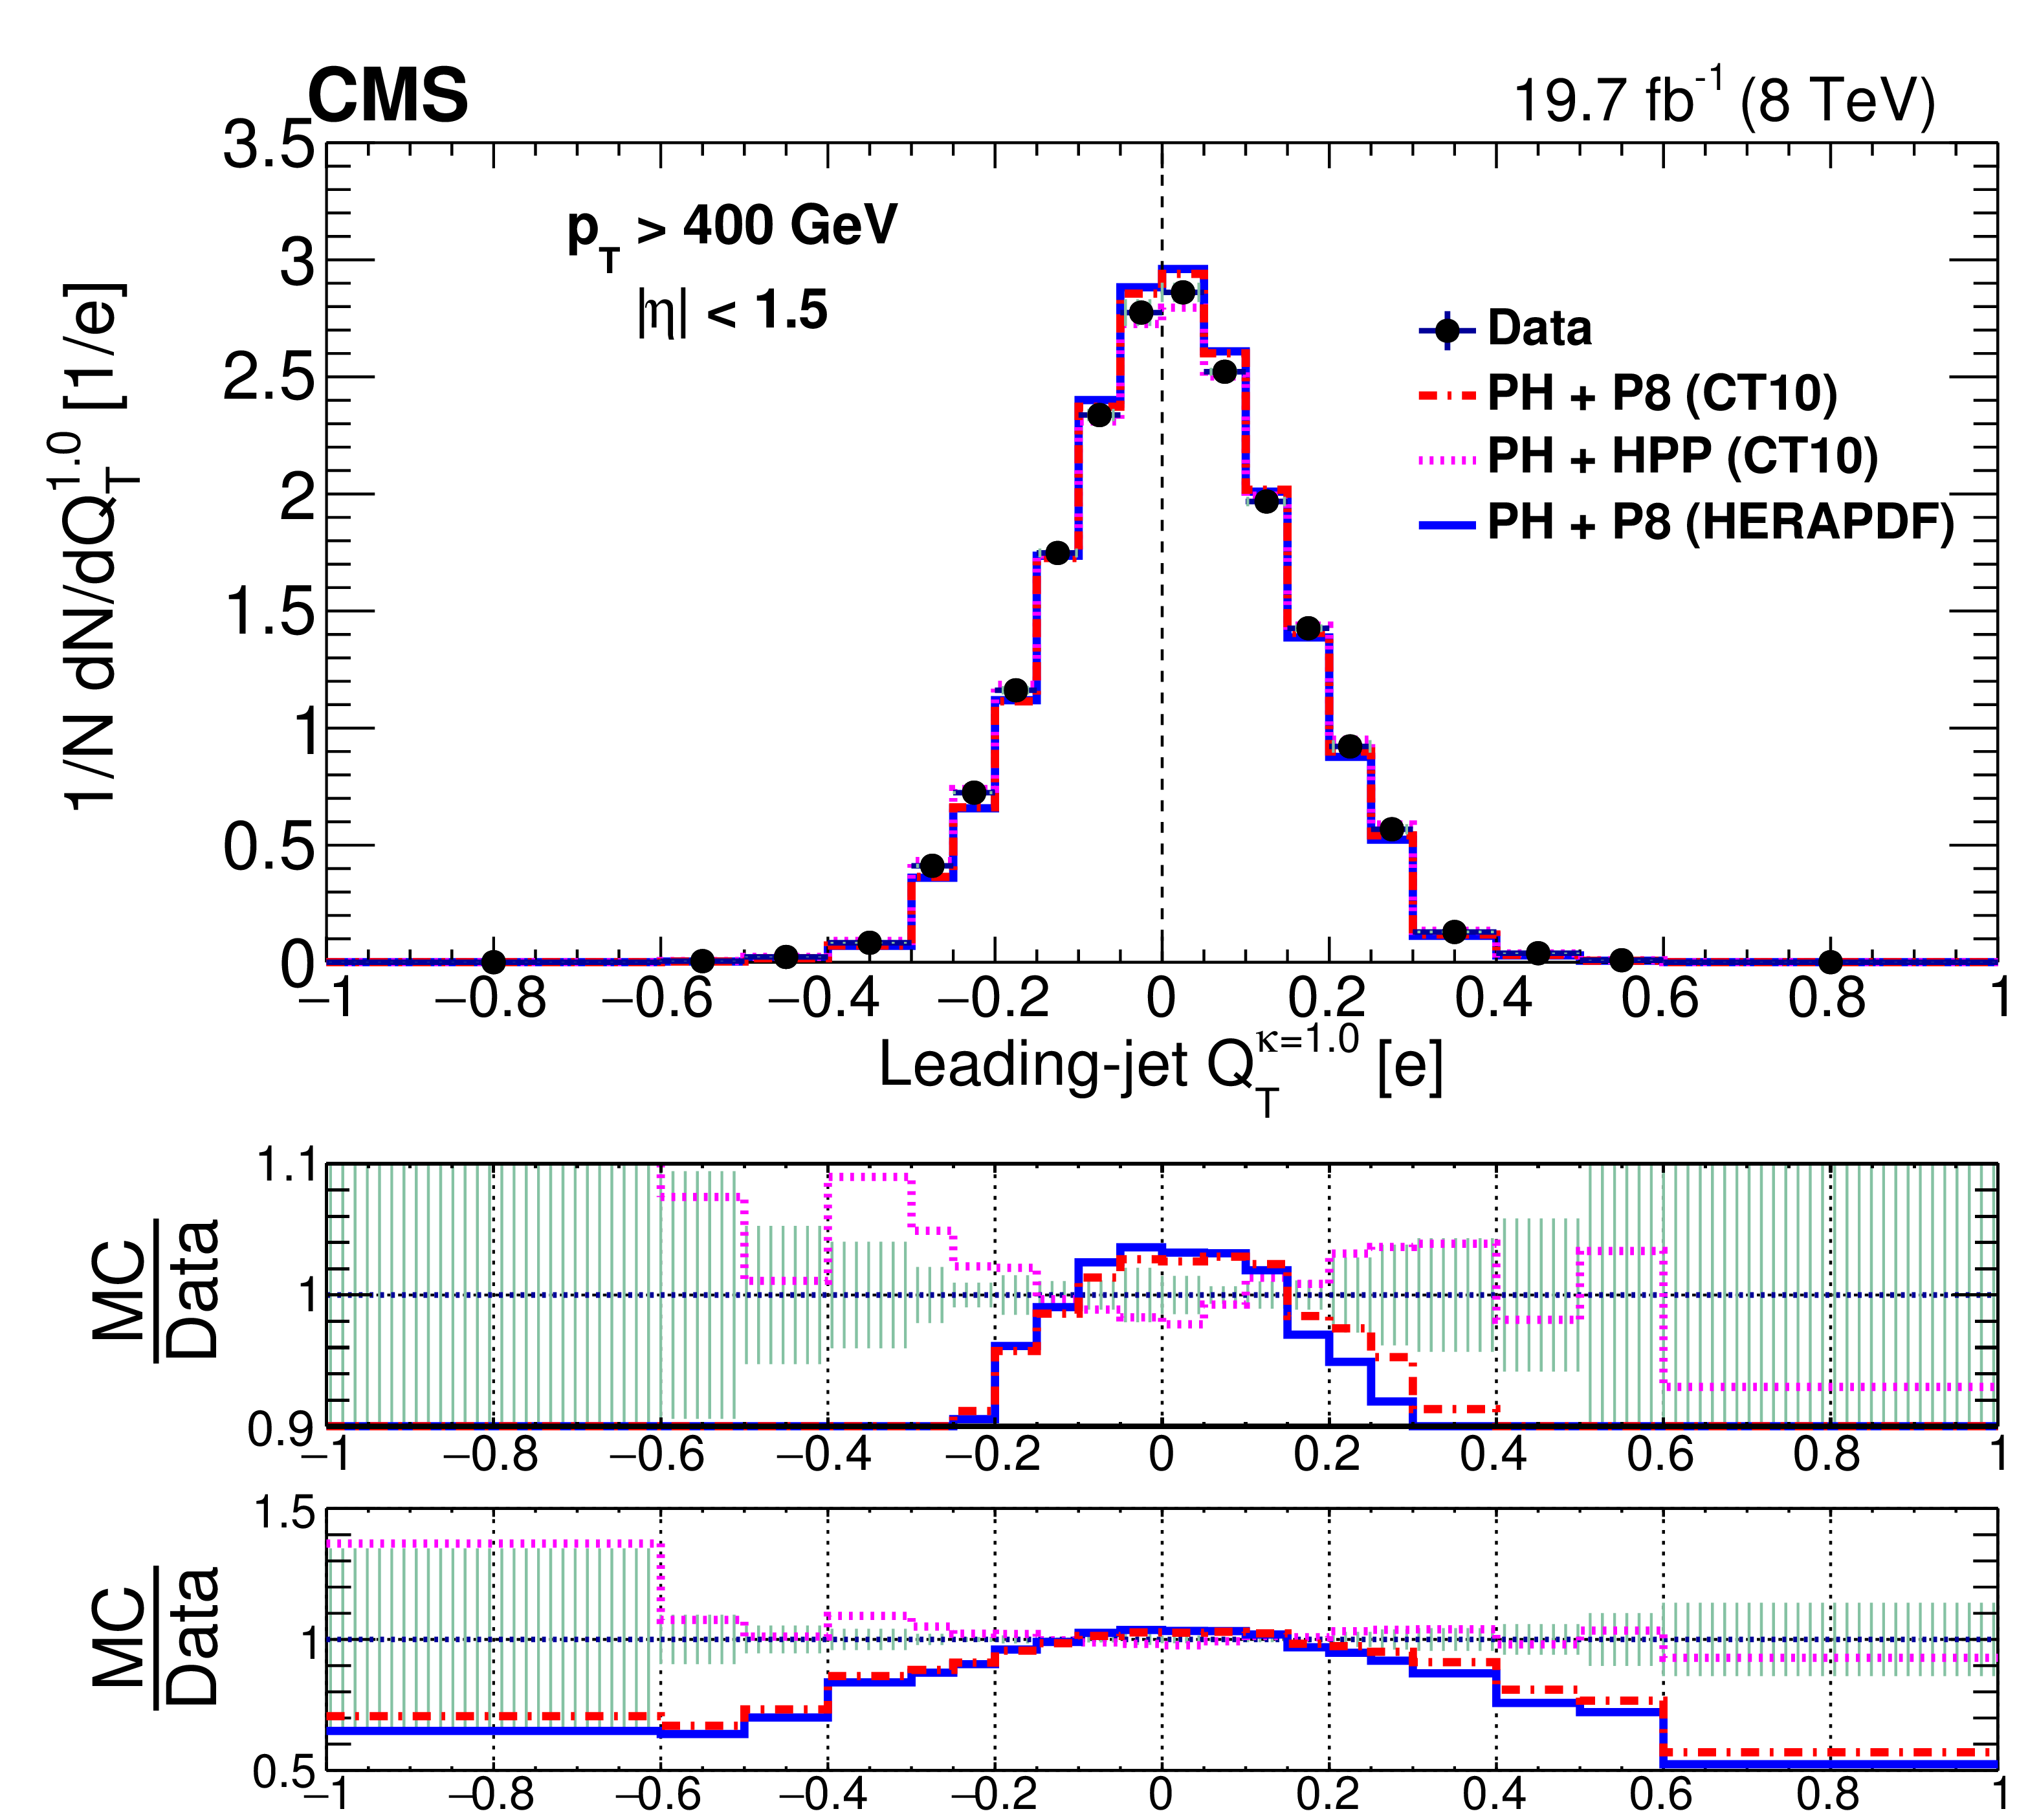
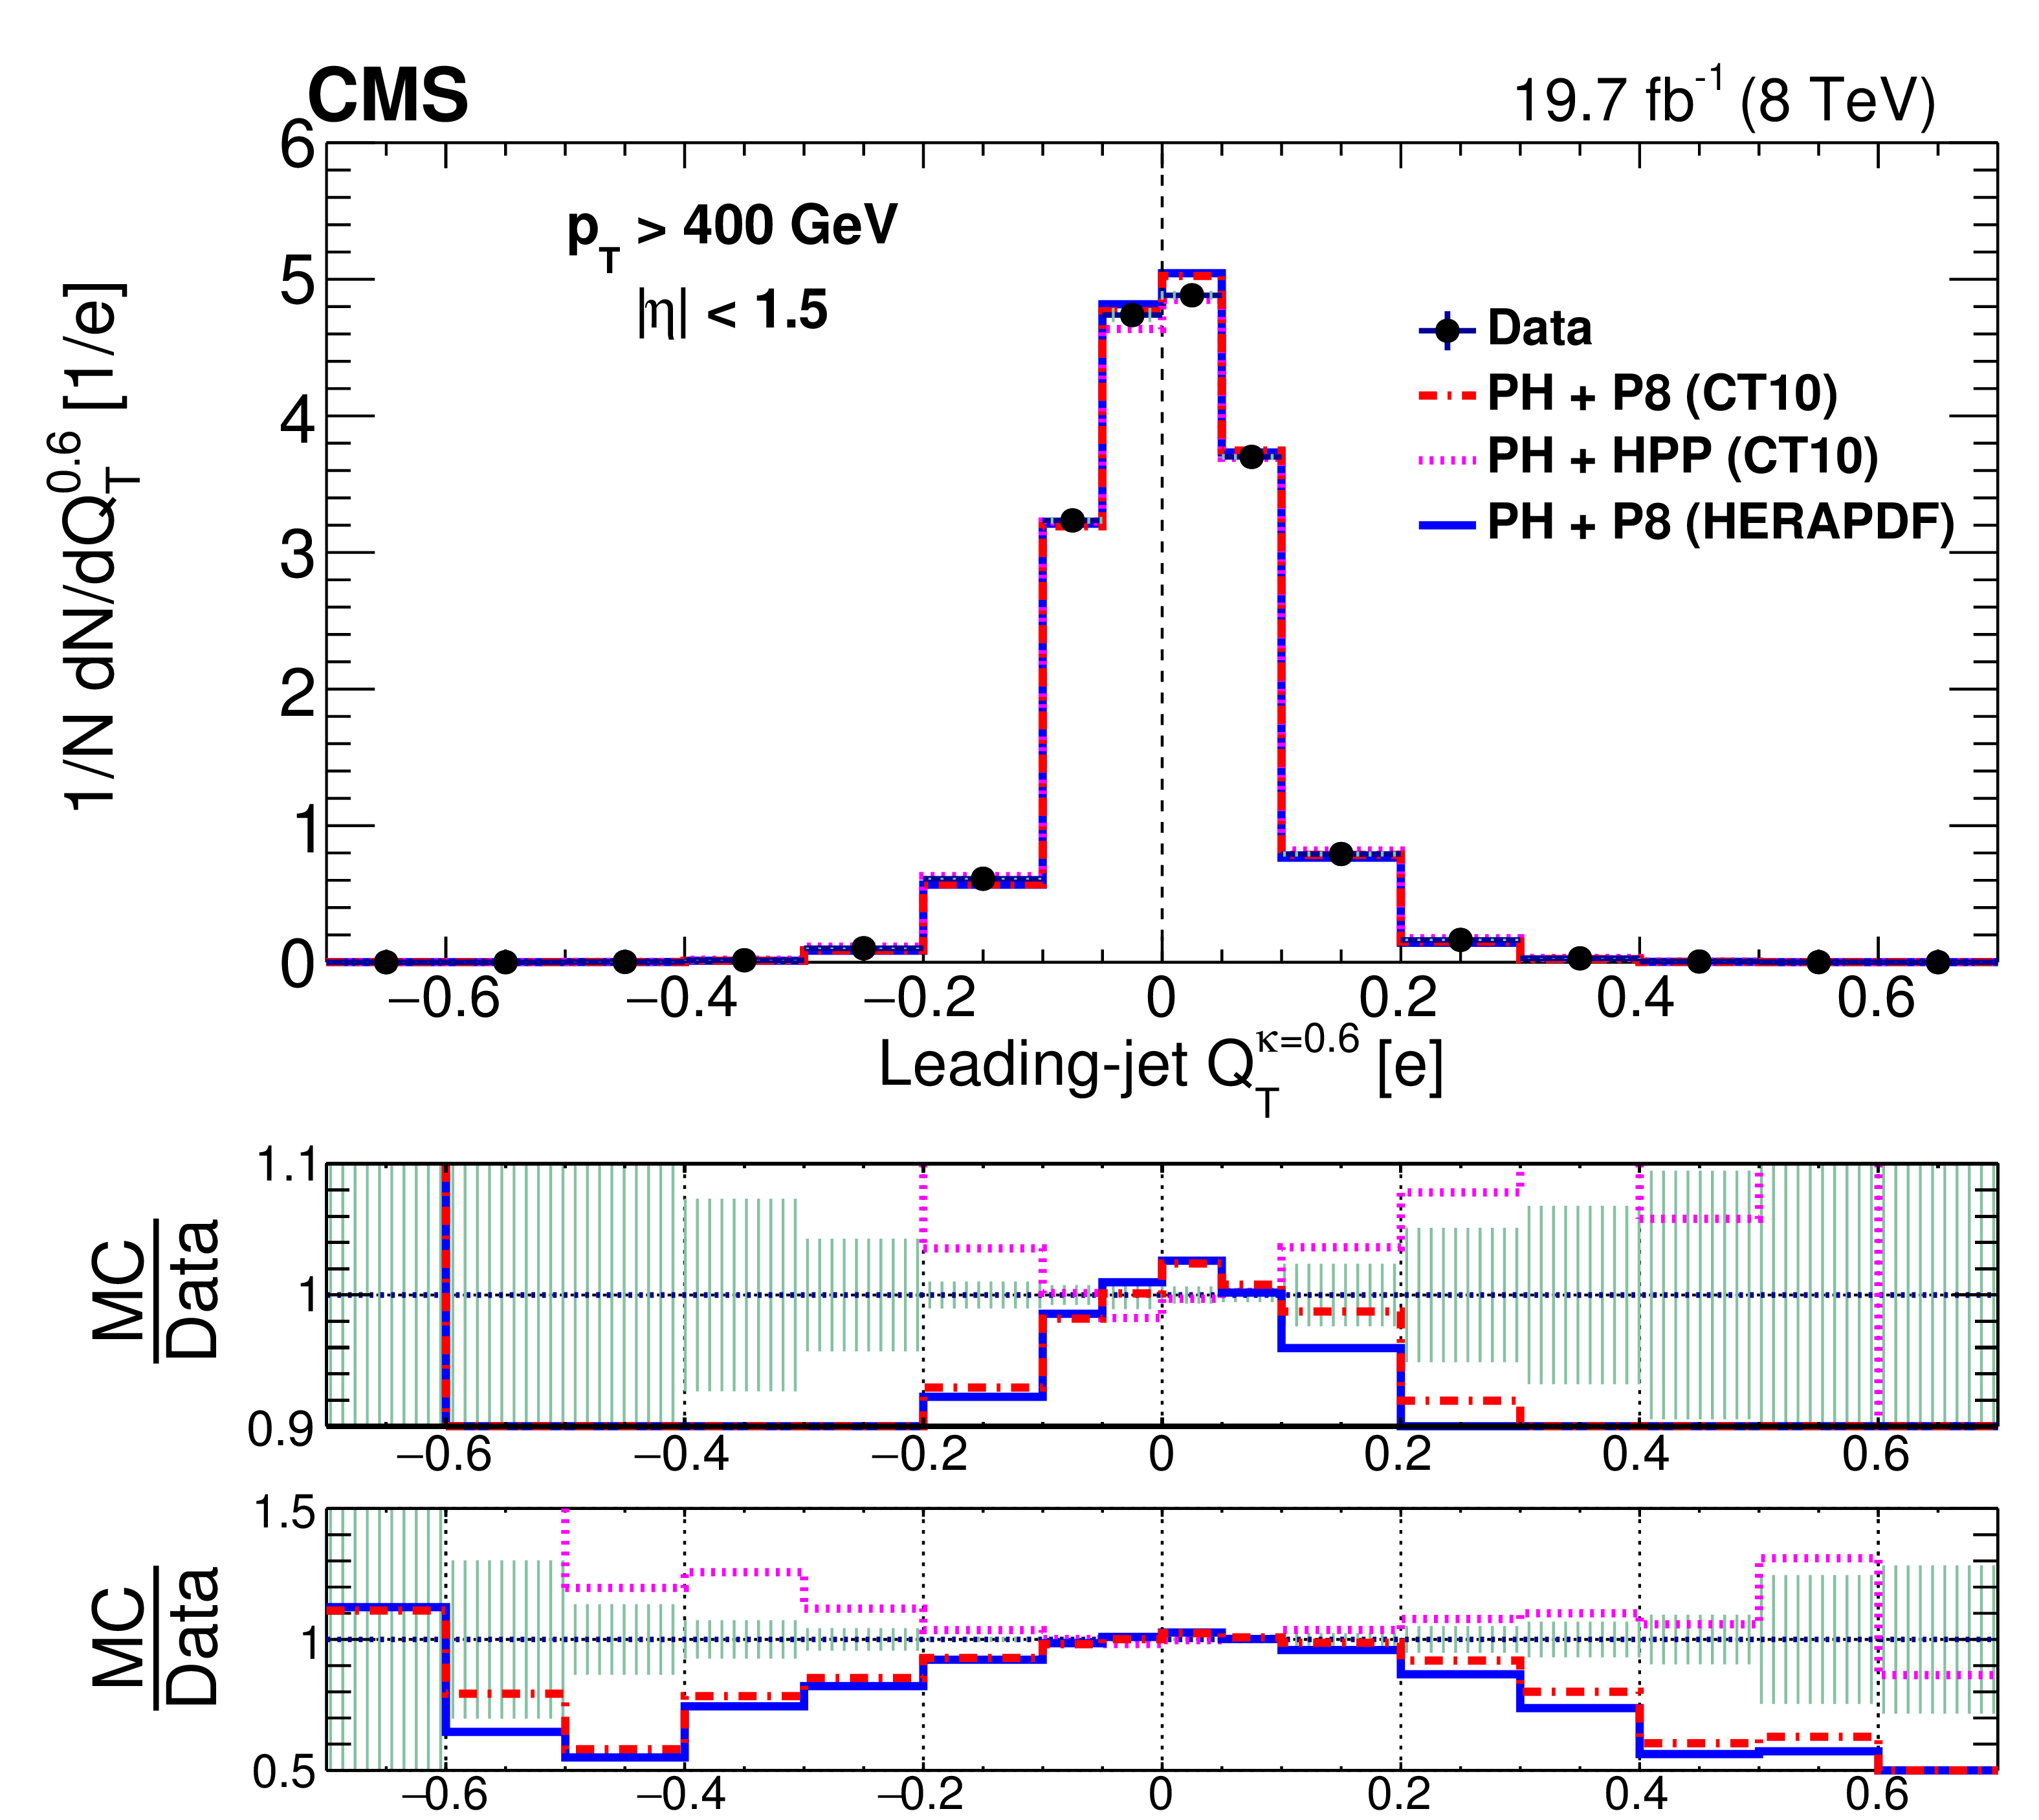
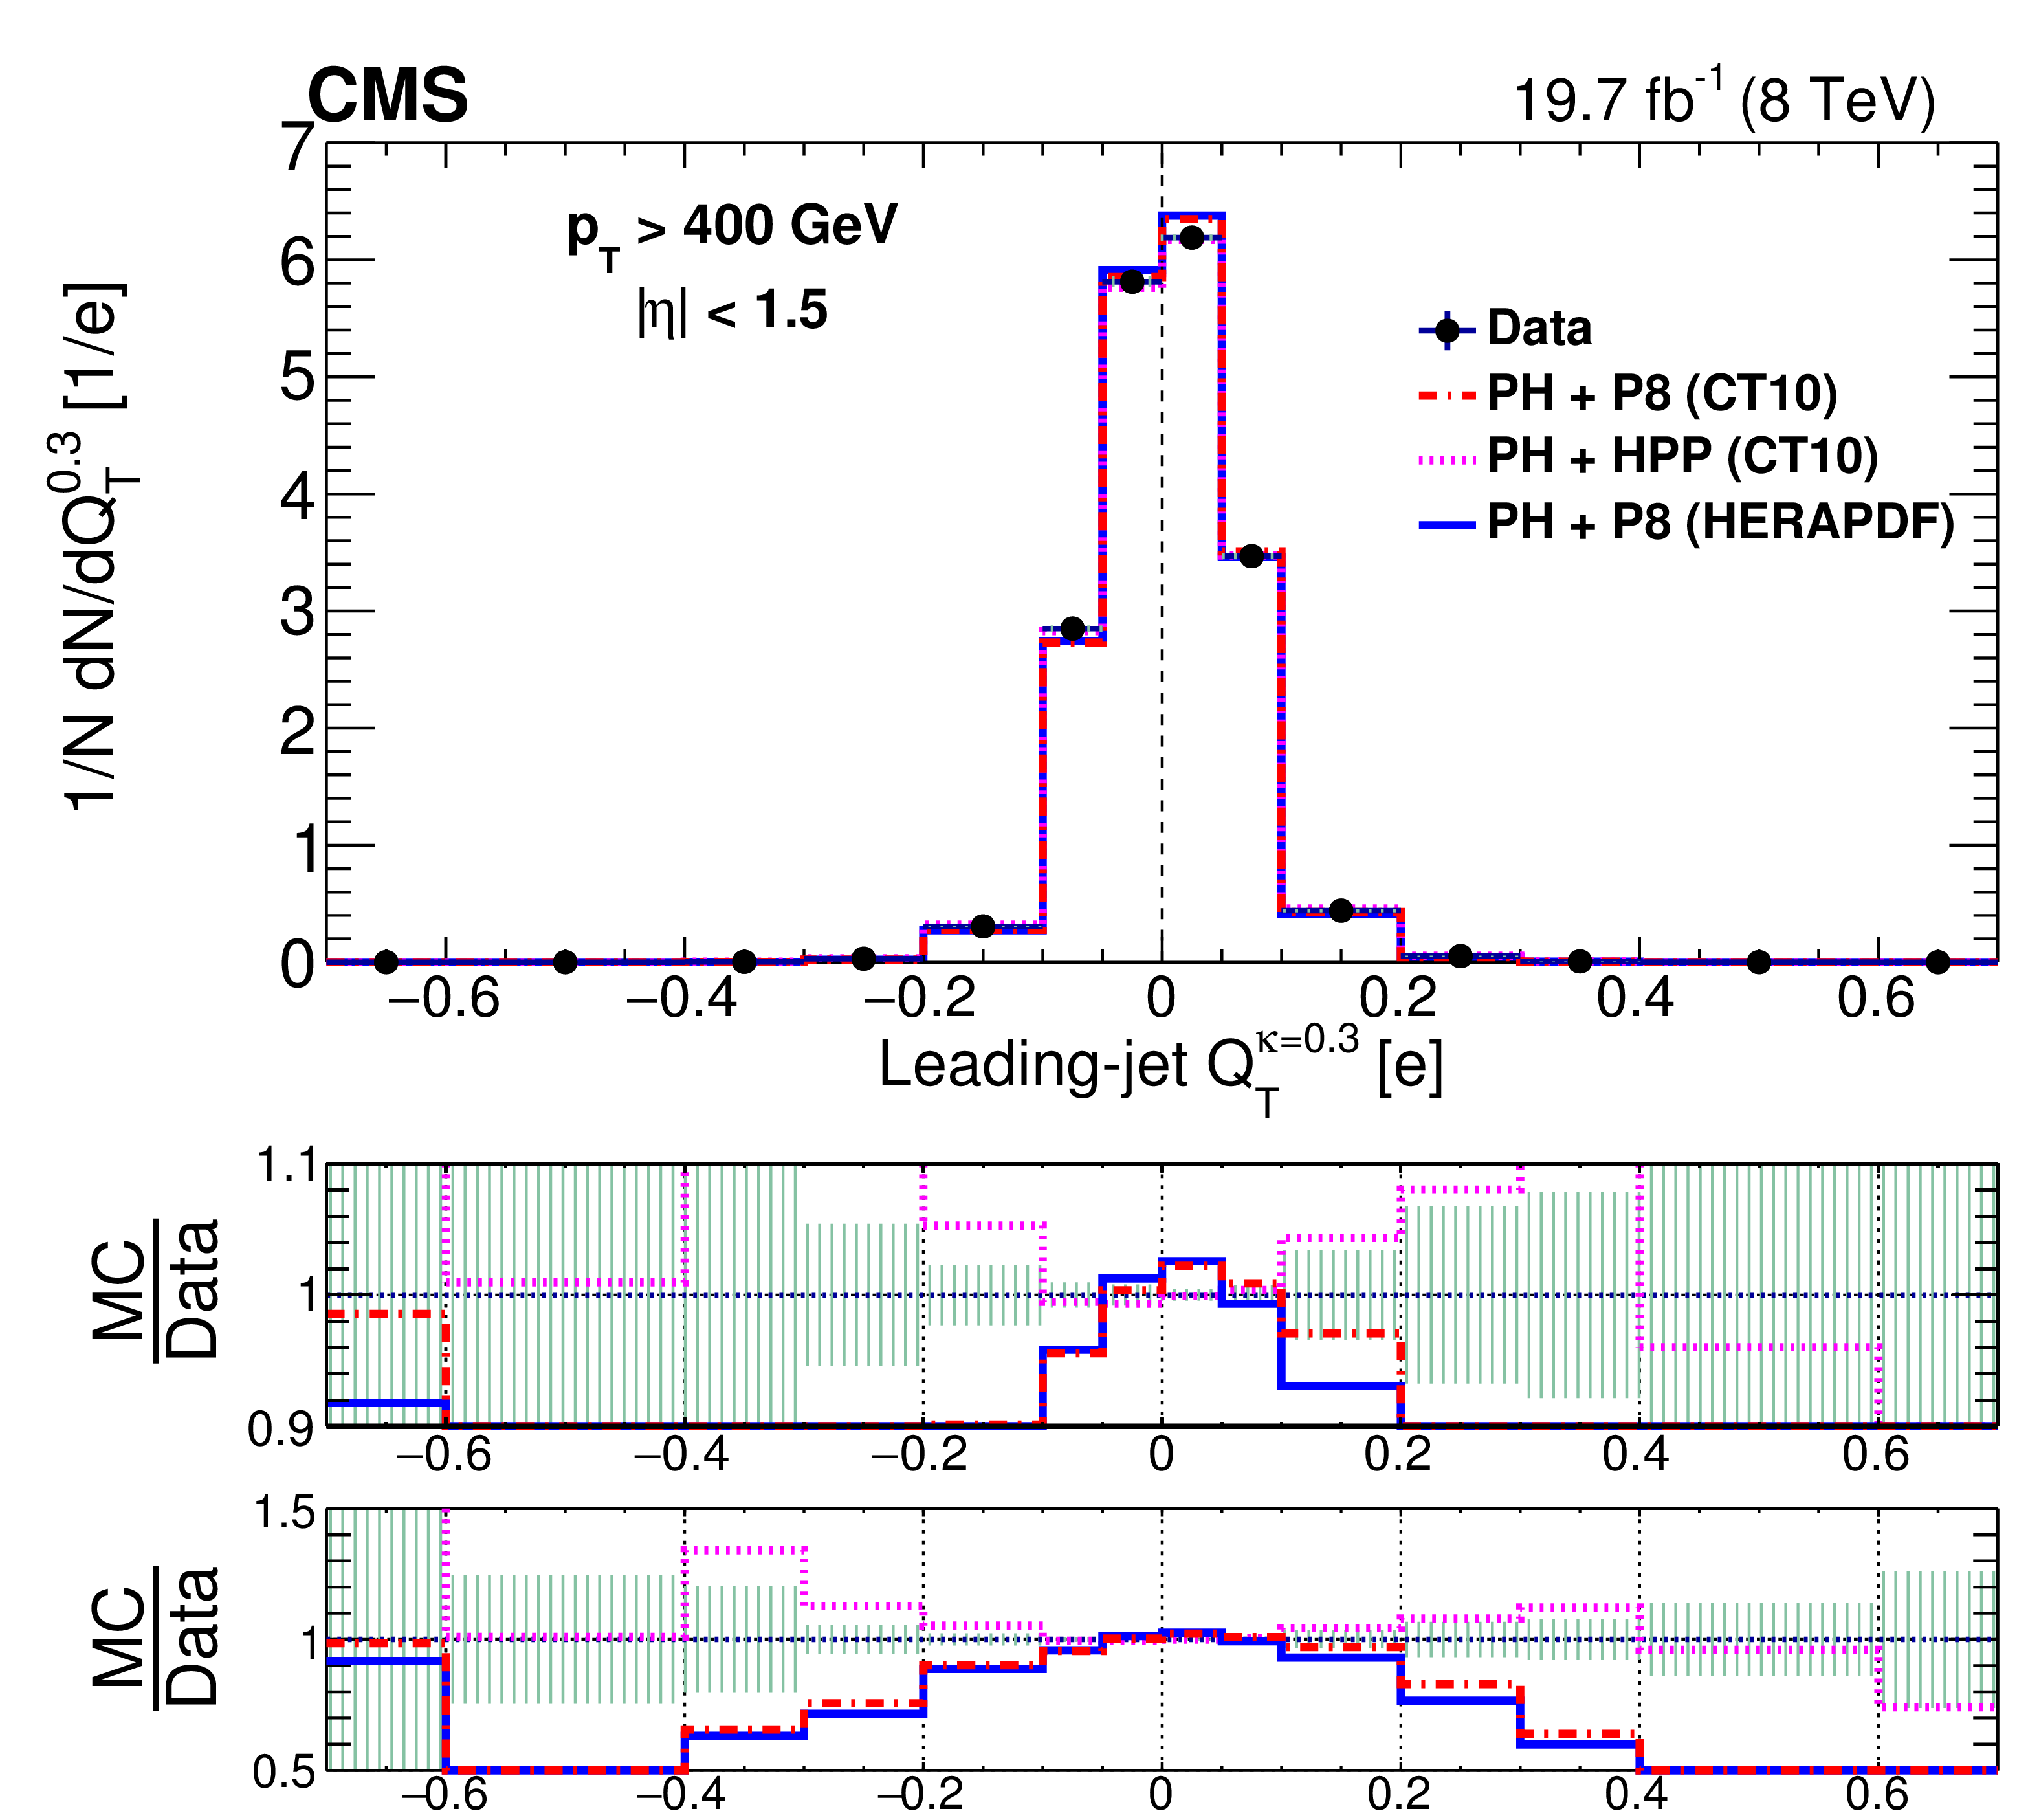
Figure 6:
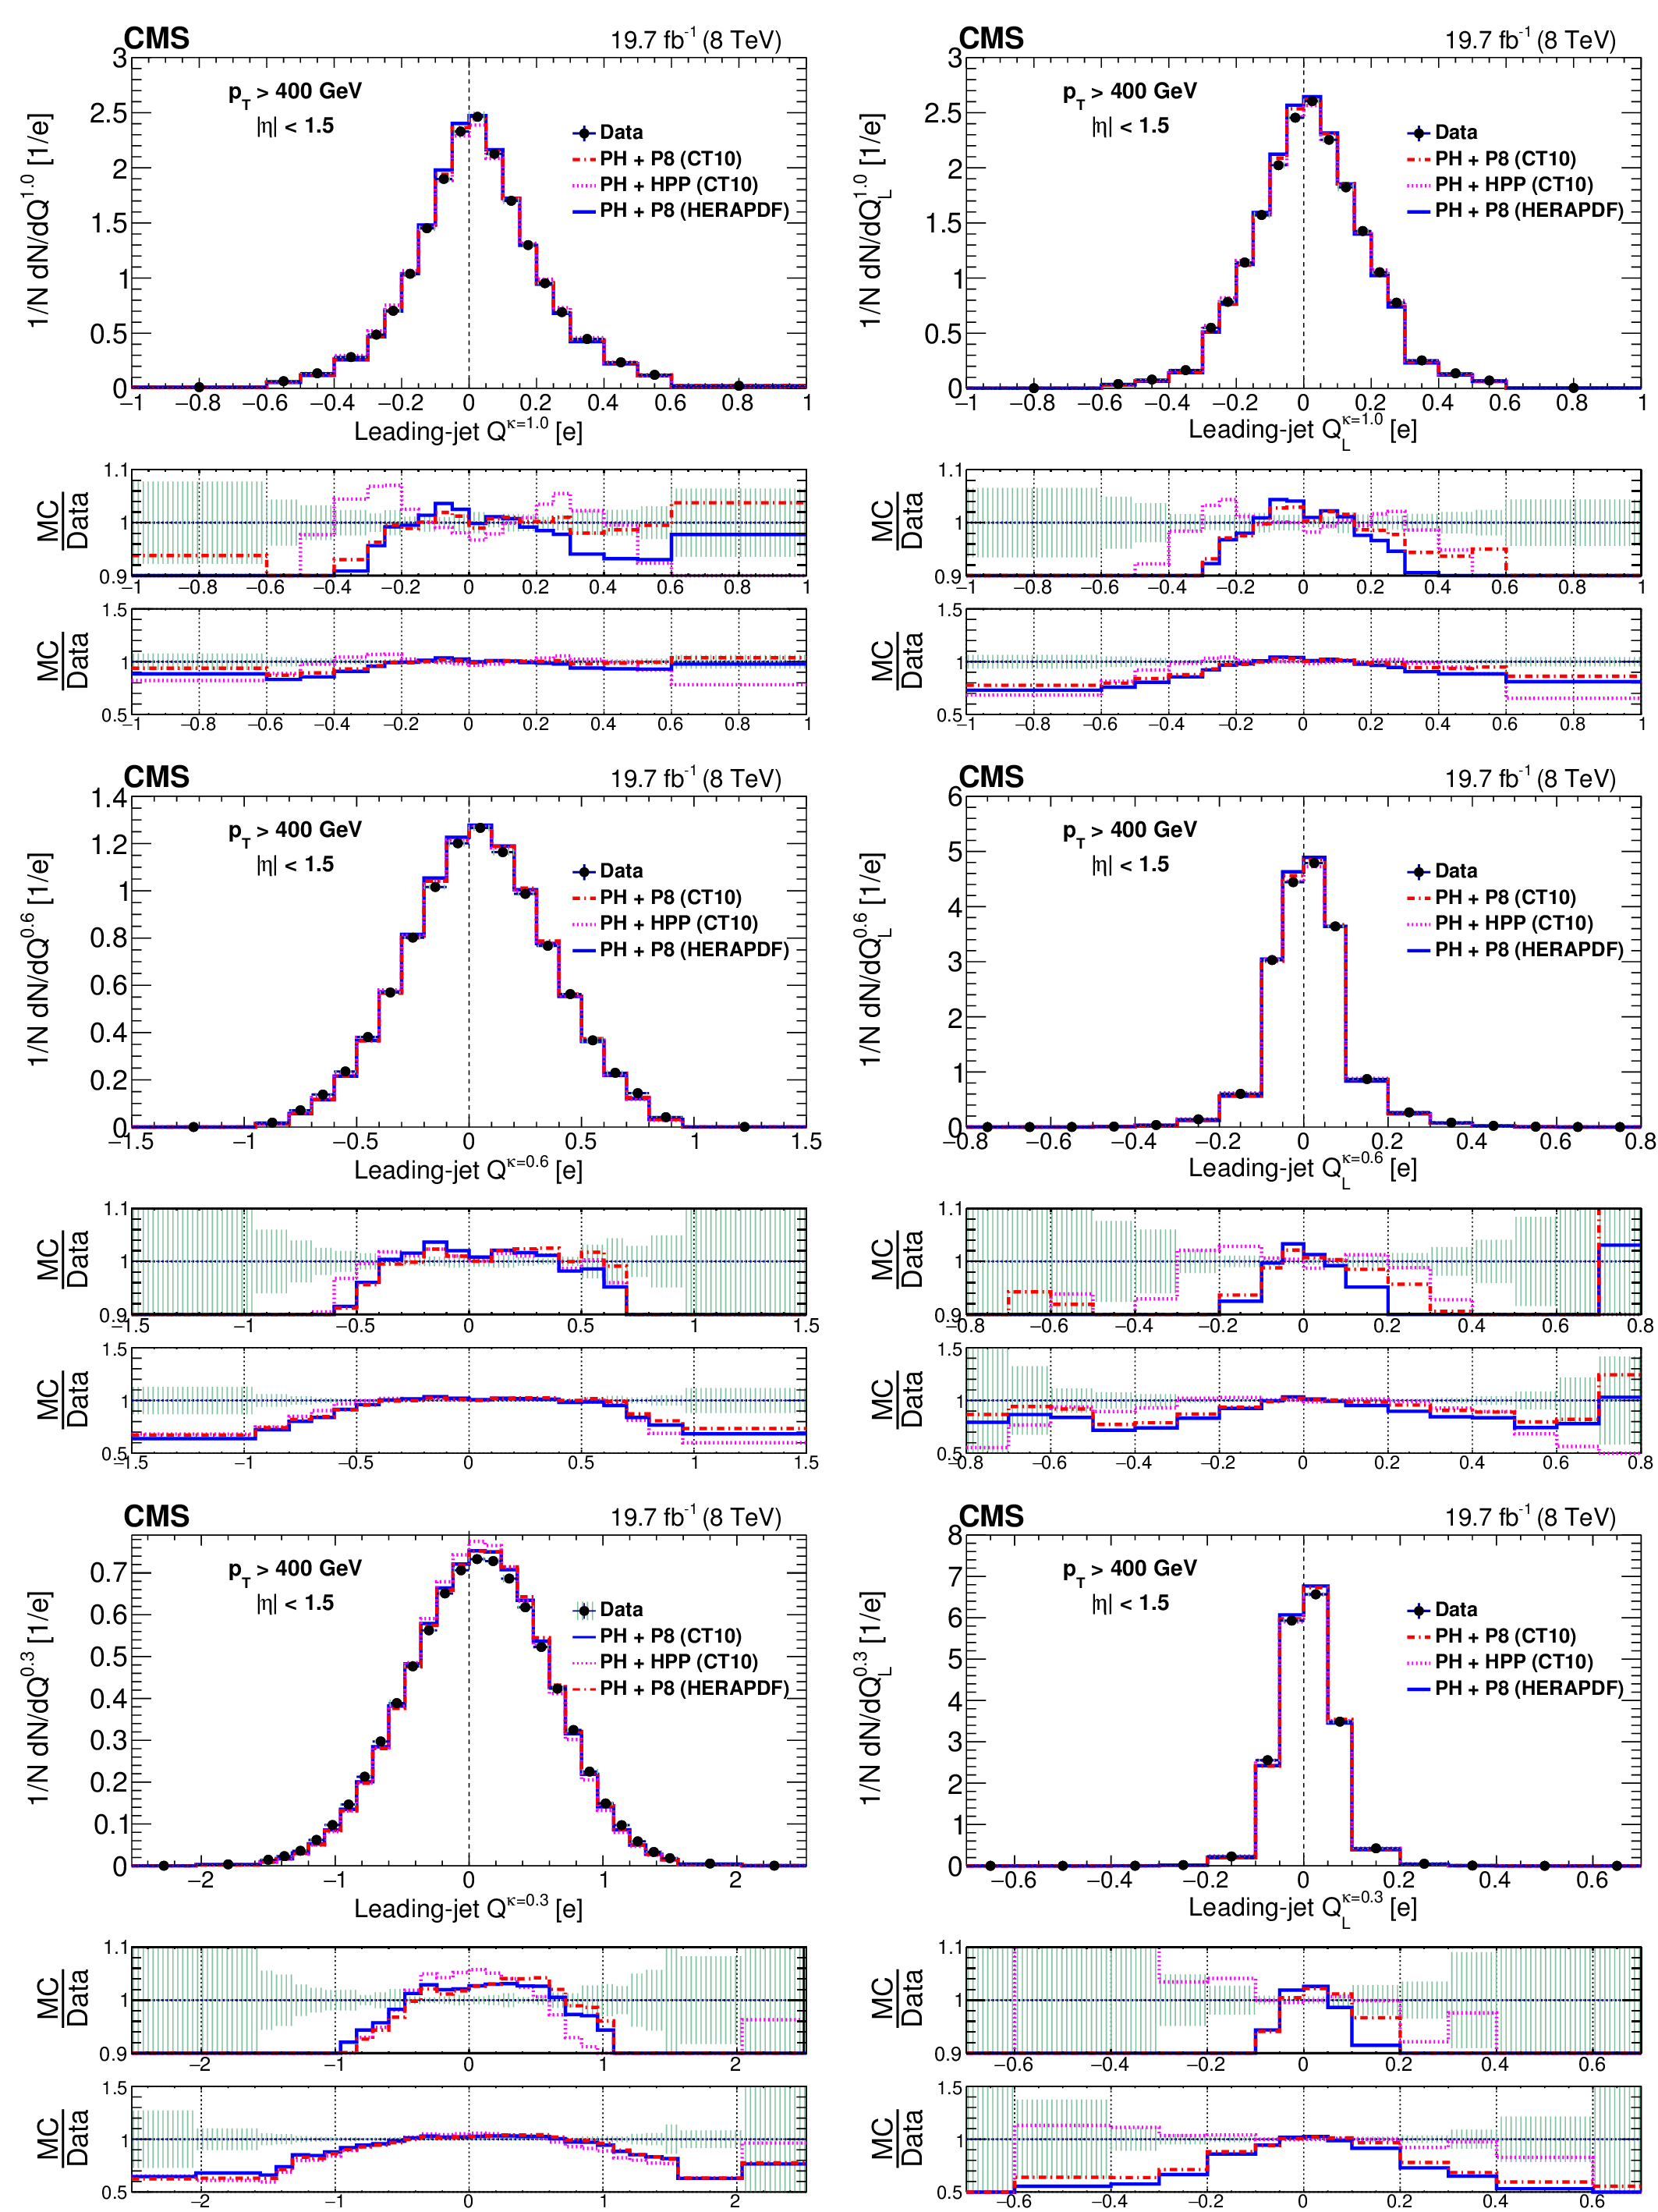
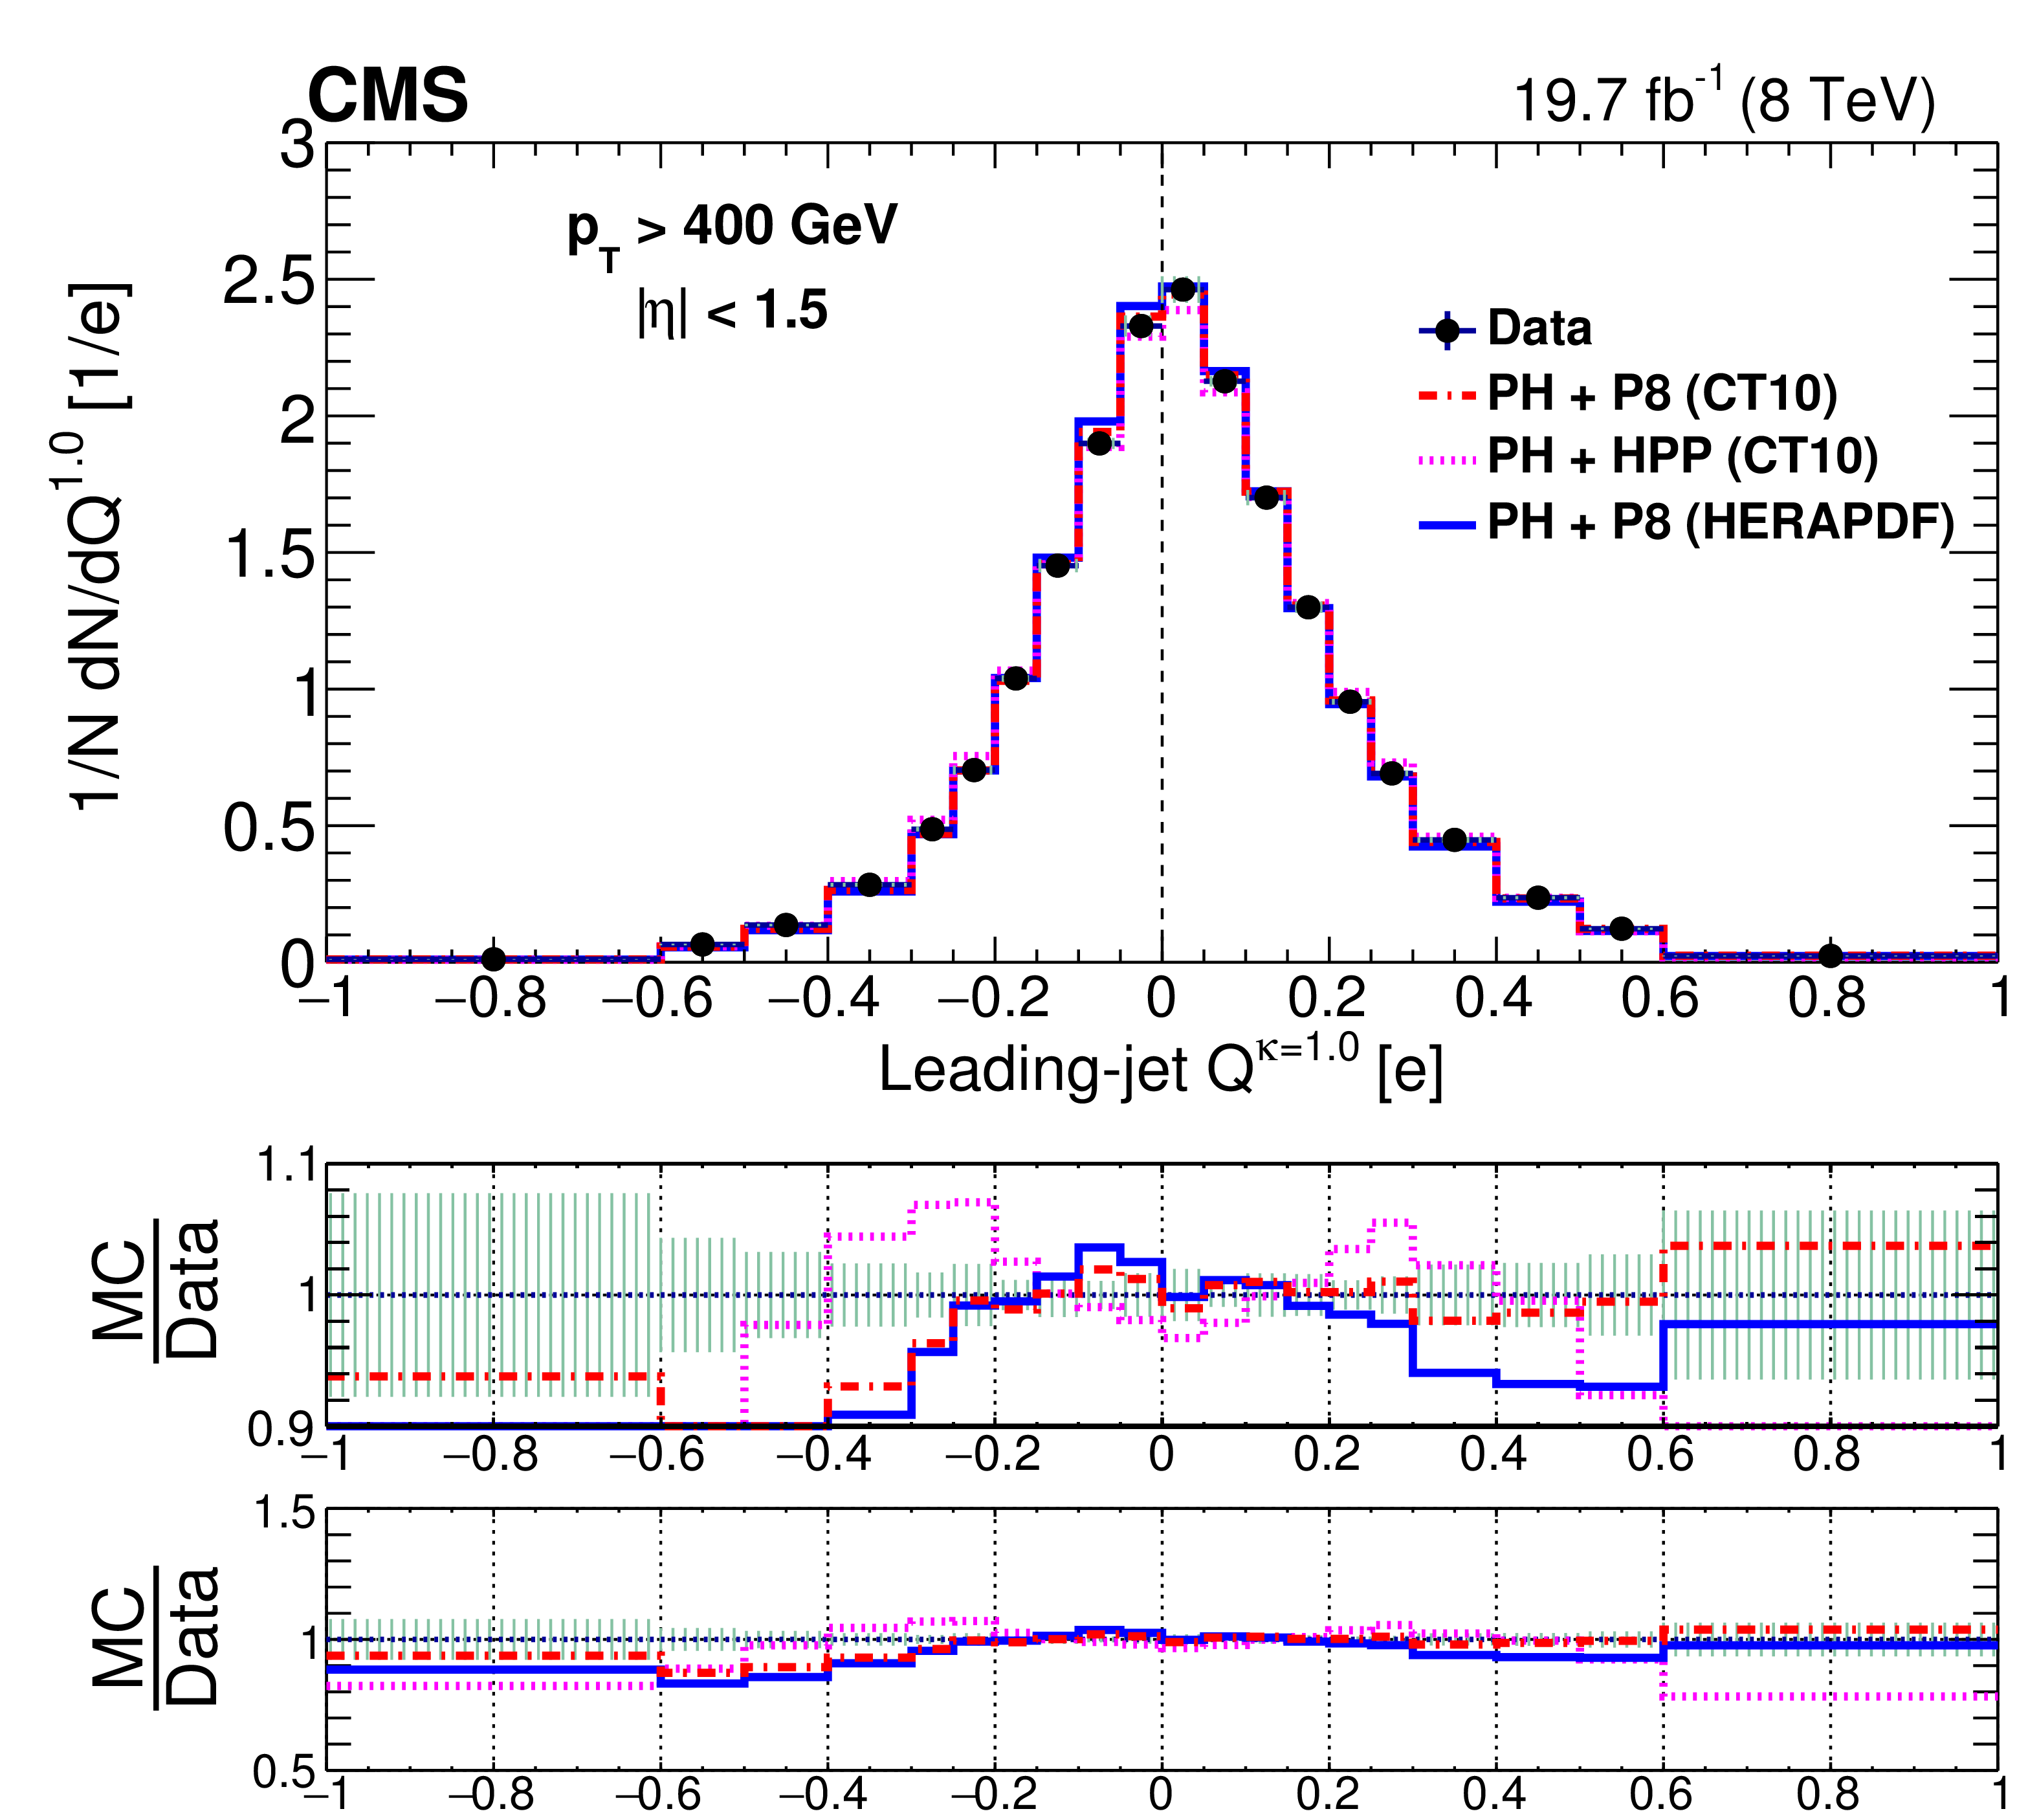
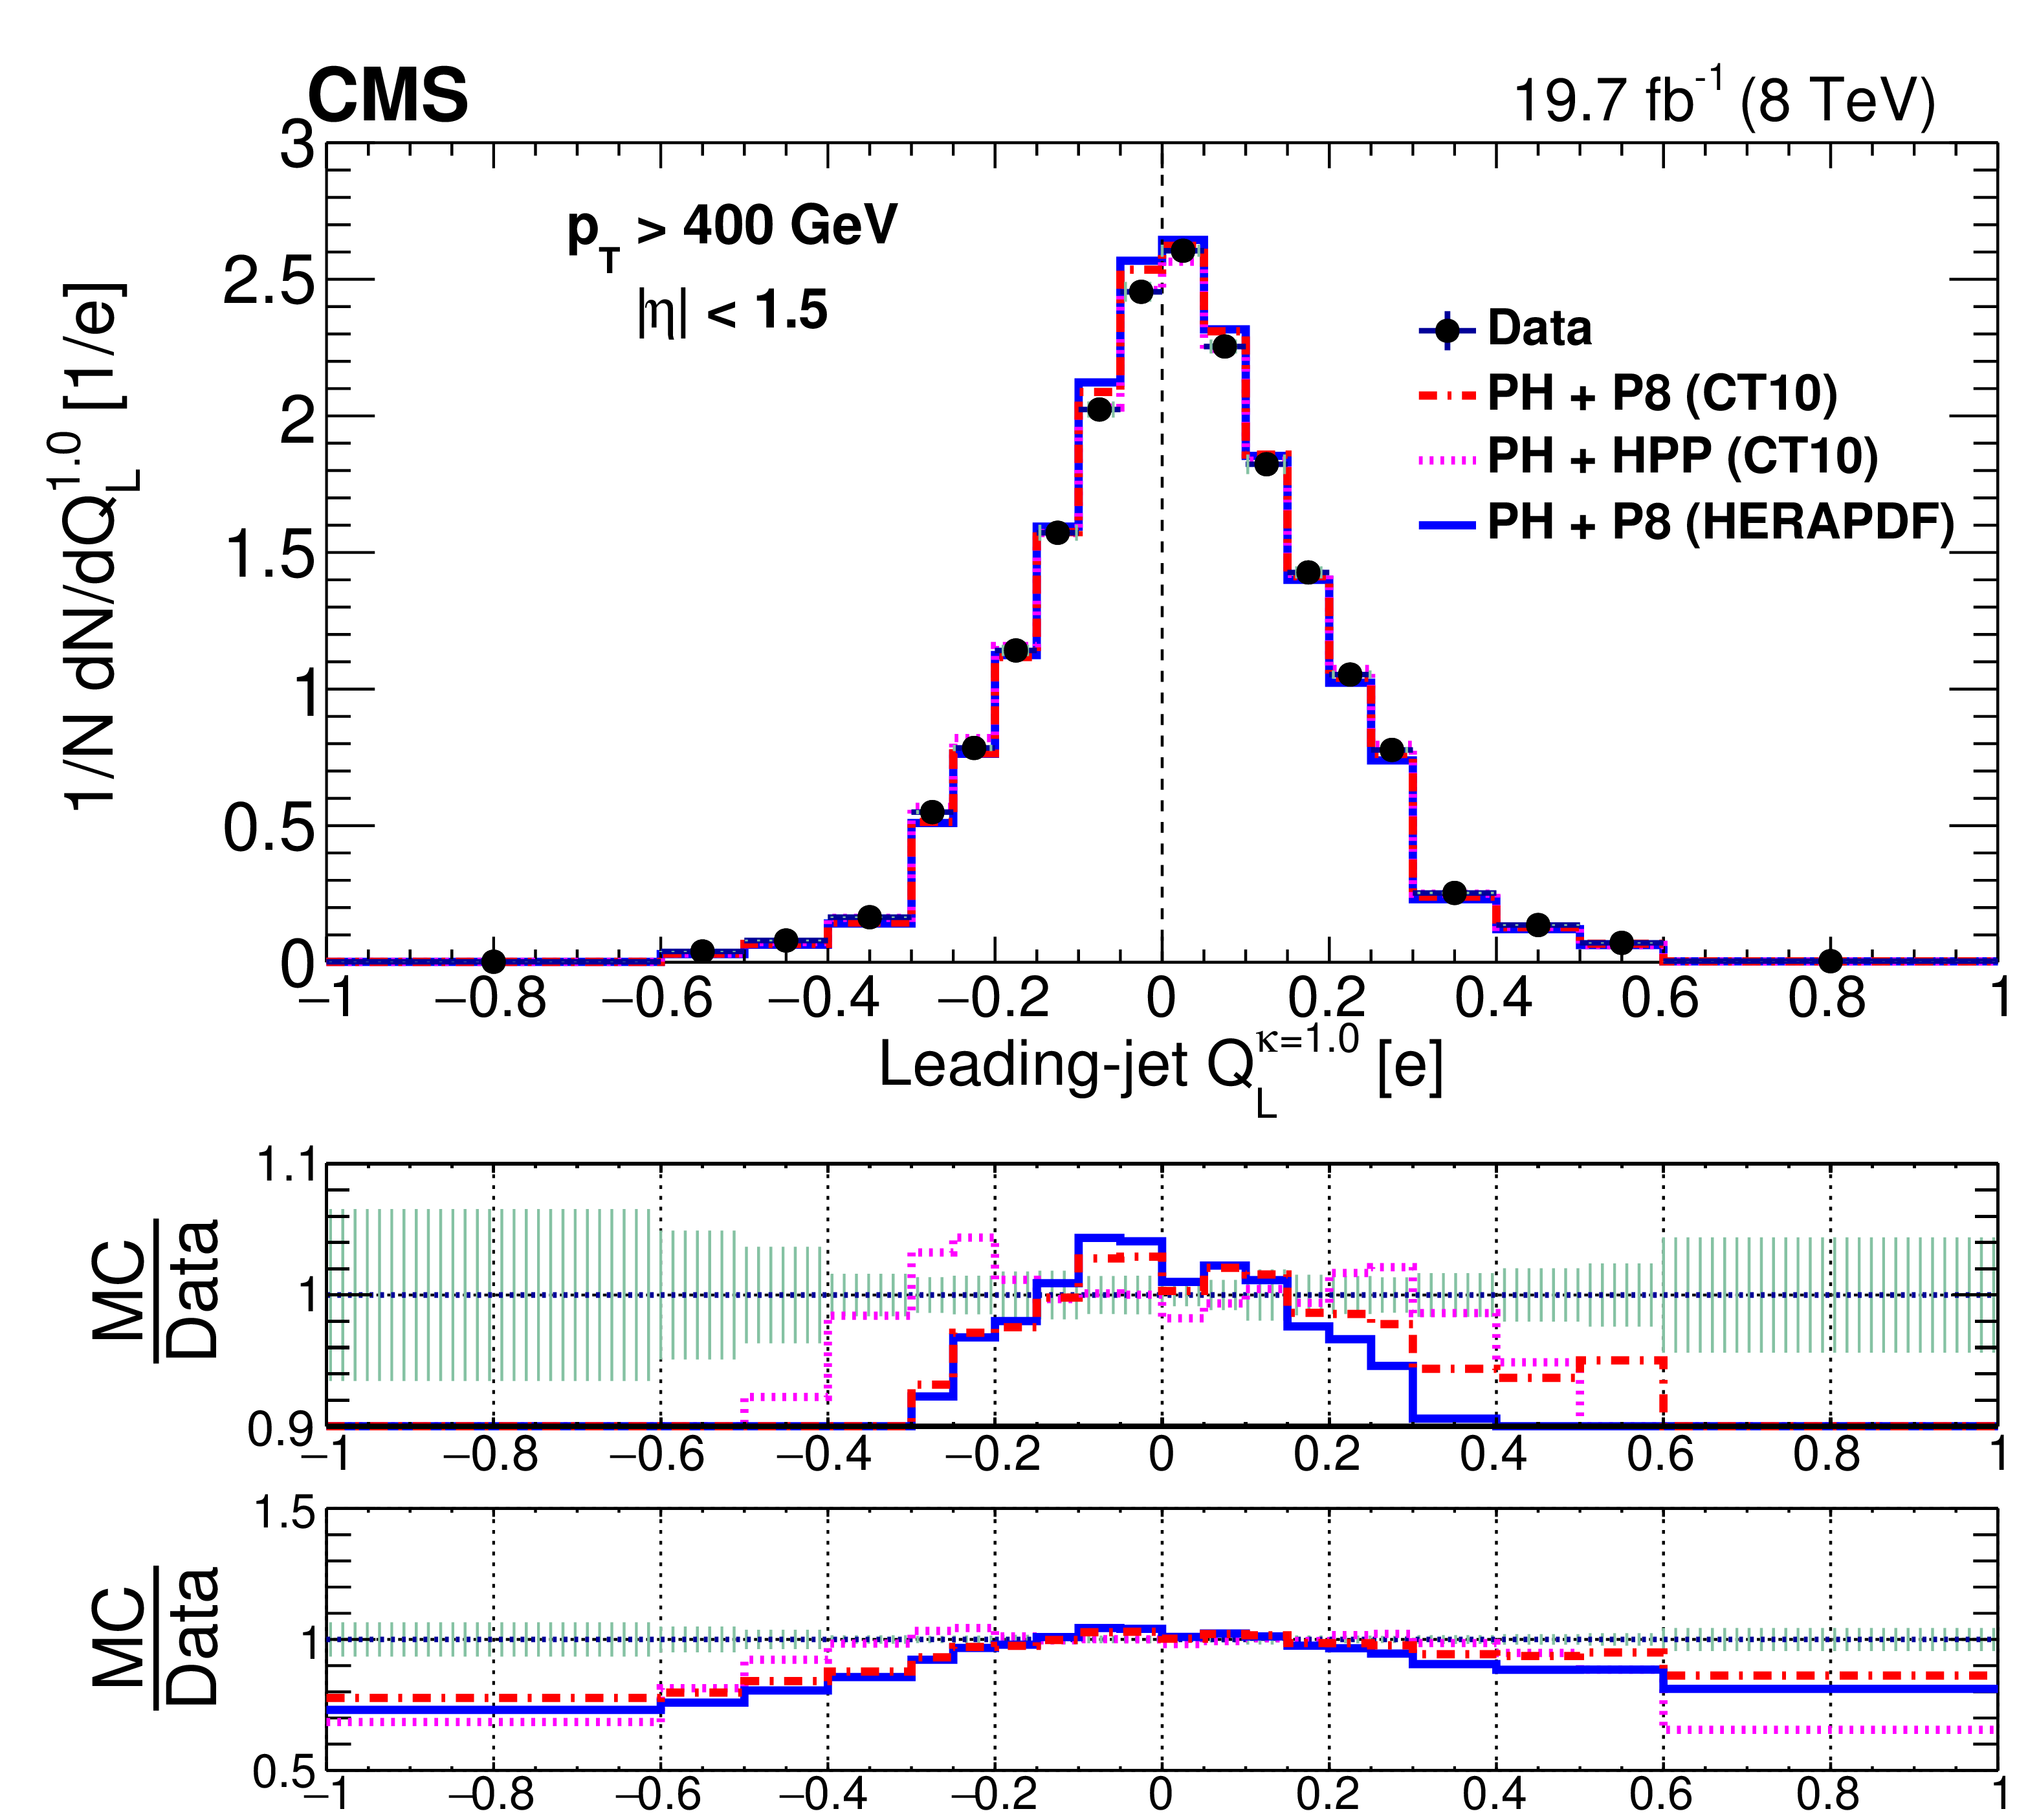
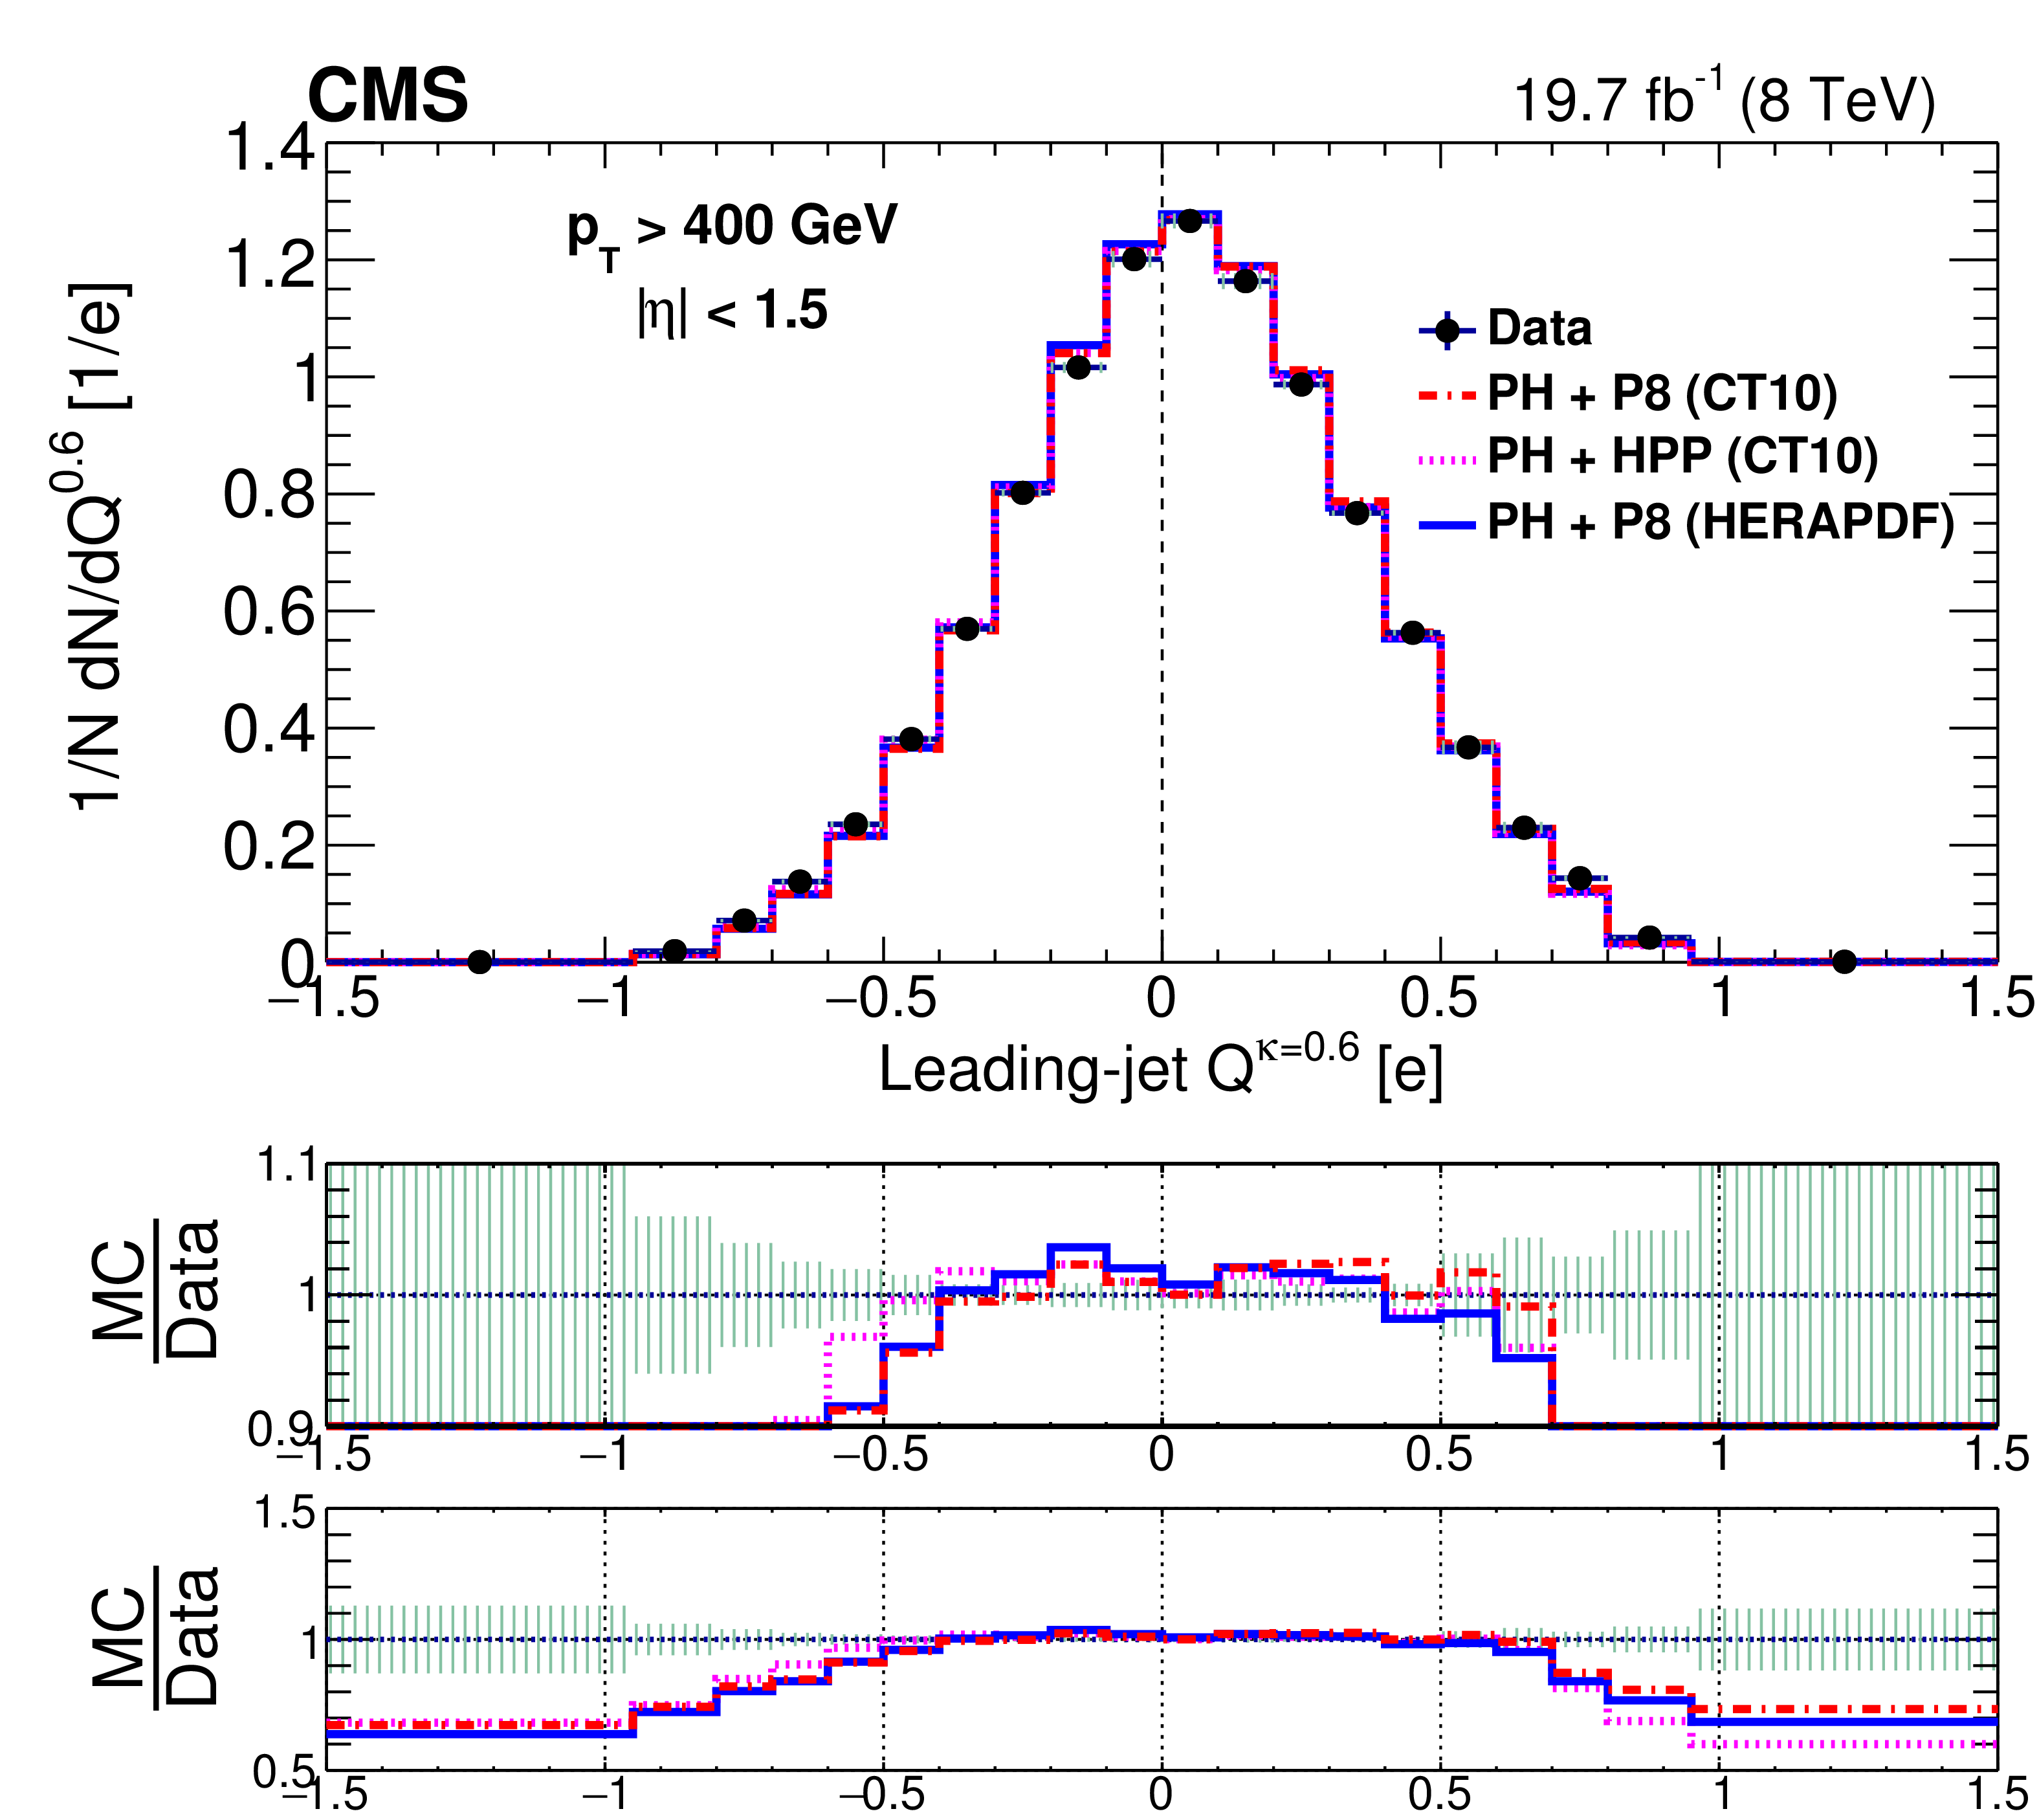
Comparison of unfolded leading-jet charge $Q^\kappa $ and $Q_{L}^\kappa $ distributions with POWHEG + PYTHIA8 ("PH+P8'') and POWHEG + HERWIG++ ("PH+HPP'') generators. In addition to the POWHEG + PYTHIA8 predictions with the NLO CT10 PDF set ("CT10''), the distributions are also compared with the NLO HERAPDF1.5 set ("HERAPDF''). The left column shows the distributions for the default jet charge definition ($Q^\kappa $) with all three different $\kappa $ values, while the right column shows for the longitudinal jet charge definition ($Q_{L}^\kappa $) with all three different values of $\kappa $. Hashed uncertainty bands include both statistical and systematic contributions in data, added in quadrature. The ratio of data to simulation is displayed twice below each plot with two different vertical scales. |
png pdf |
Figure 6-a:
Comparison of unfolded leading-jet |
png pdf |
Figure 6-b:
Comparison of unfolded leading-jet longitudinal jet charge $Q_{L}^\kappa $ |
png pdf |
Figure 6-c:
Comparison of unfolded leading-jet default jet charge definition $Q^\kappa $ distribution with POWHEG + PYTHIA8 ("PH+P8'') and POWHEG + HERWIG++ ("PH+HPP'') generators. In addition to the POWHEG + PYTHIA8 predictions with the NLO CT10 PDF set ("CT10''), the distributions are also compared with the NLO HERAPDF1.5 set ("HERAPDF'') with $\kappa = $ 0.6. Hashed uncertainty bands include both statistical and systematic contributions in data, added in quadrature. The ratio of data to simulation is displayed twice below the plot with two different vertical scales. |
png pdf |
Figure 6-d:
Comparison of unfolded leading-jet longitudinal jet charge $Q_{L}^\kappa $ distribution with POWHEG + PYTHIA8 ("PH+P8'') and POWHEG + HERWIG++ ("PH+HPP'') generators. In addition to the POWHEG + PYTHIA8 predictions with the NLO CT10 PDF set ("CT10''), the distributions are also compared with the NLO HERAPDF1.5 set ("HERAPDF'') with $\kappa = $ 0.6. Hashed uncertainty bands include both statistical and systematic contributions in data, added in quadrature. The ratio of data to simulation is displayed twice below the plot with two different vertical scales. |
png pdf |
Figure 6-e:
Comparison of unfolded leading-jet default jet charge definition $Q^\kappa $ distribution with POWHEG + PYTHIA8 ("PH+P8'') and POWHEG + HERWIG++ ("PH+HPP'') generators. In addition to the POWHEG + PYTHIA8 predictions with the NLO CT10 PDF set ("CT10''), the distributions are also compared with the NLO HERAPDF1.5 set ("HERAPDF'') with $\kappa = $ 0.3. Hashed uncertainty bands include both statistical and systematic contributions in data, added in quadrature. The ratio of data to simulation is displayed twice below the plot with two different vertical scales. |
png pdf |
Figure 6-f:
Comparison of unfolded leading-jet longitudinal jet charge $Q_{L}^\kappa $ distribution with POWHEG + PYTHIA8 ("PH+P8'') and POWHEG + HERWIG++ ("PH+HPP'') generators. In addition to the POWHEG + PYTHIA8 predictions with the NLO CT10 PDF set ("CT10''), the distributions are also compared with the NLO HERAPDF1.5 set ("HERAPDF'') with $\kappa = $ 0.3. Hashed uncertainty bands include both statistical and systematic contributions in data, added in quadrature. The ratio of data to simulation is displayed twice below the plot with two different vertical scales. |
png pdf |
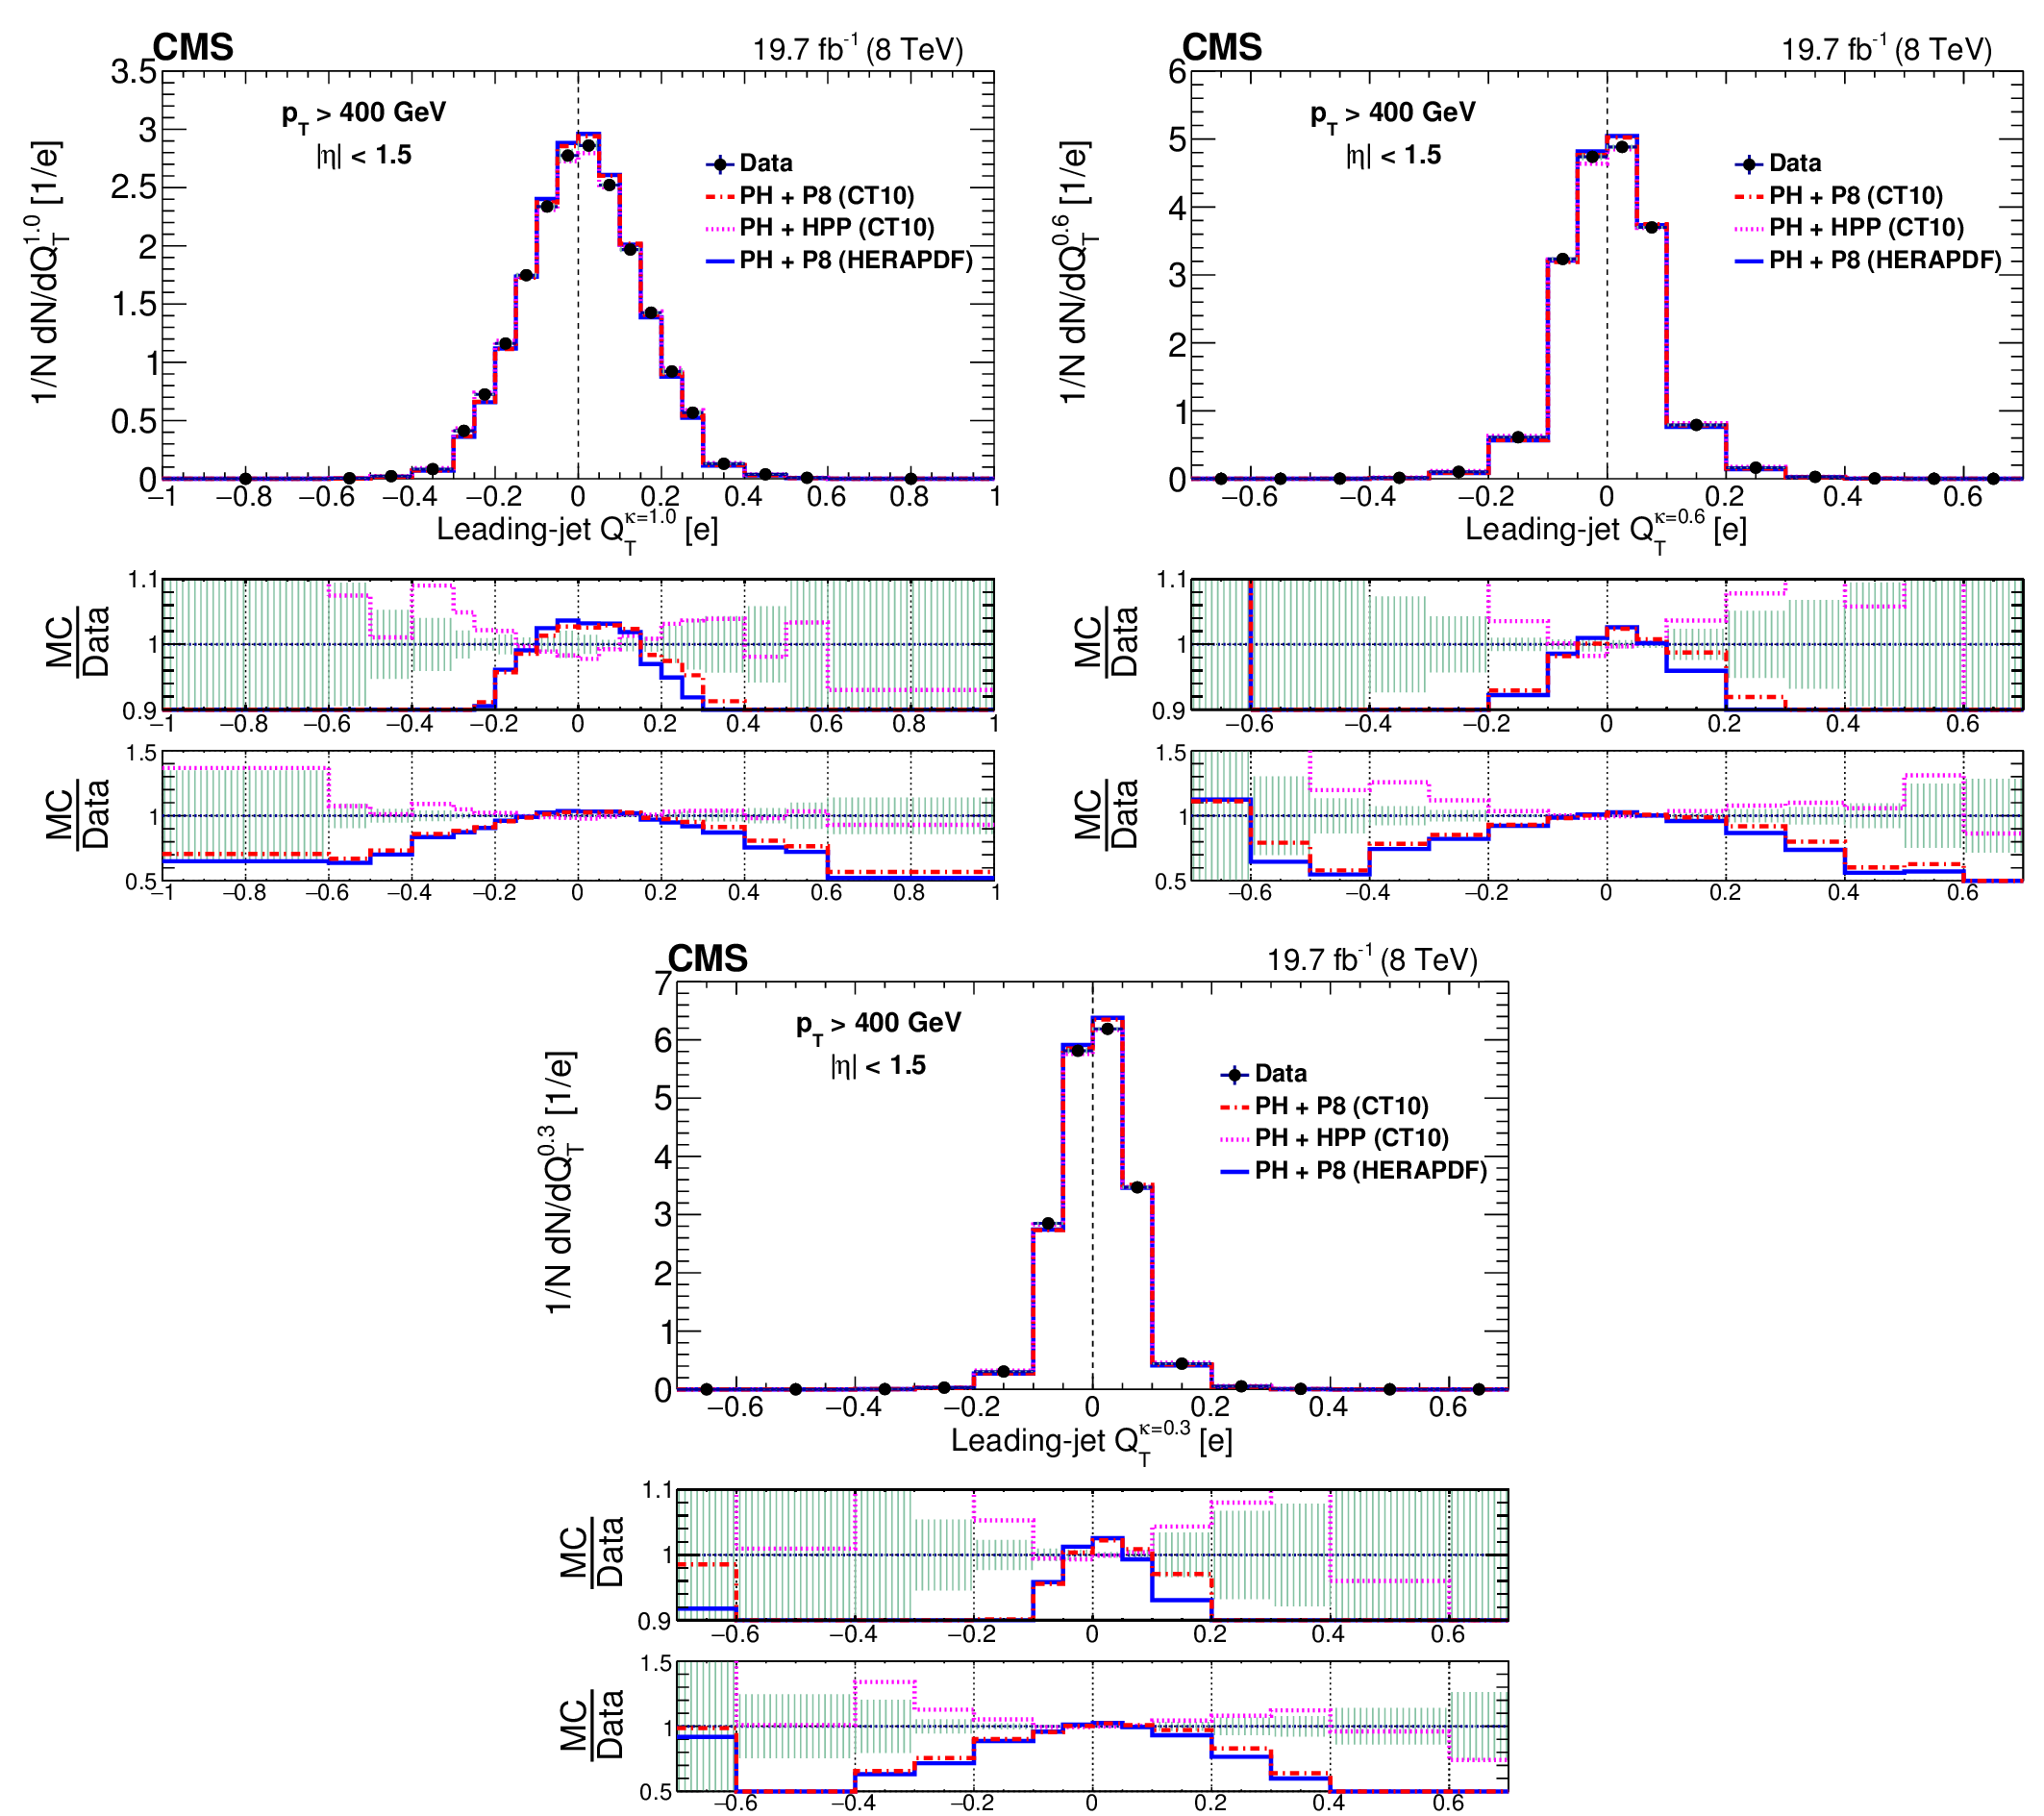
Figure 7:
Comparison of unfolded leading-jet charge distributions $Q_{T}^\kappa $ with POWHEG + PYTHIA8 ("PH+P8'') and POWHEG + HERWIG++ ("PH+HPP'') generators for transverse jet charge definition ($Q_{T}^\kappa $) with all different $\kappa $ values. In addition to the POWHEG + PYTHIA8 predictions with the NLO CT10 PDF set ("CT10''), the distributions are also compared with the NLO HERAPDF1.5 set ("HERAPDF''). Hashed uncertainty bands include both statistical and systematic contributions in data, added in quadrature. The ratio of data to simulation is displayed twice below each plot with two different vertical scales. |
png pdf |
Figure 7-a:
Comparison of unfolded leading-jet charge distributions $Q_{T}^\kappa $ with POWHEG + PYTHIA8 ("PH+P8'') and POWHEG + HERWIG++ ("PH+HPP'') generators for transverse jet charge definition ($Q_{T}^\kappa $) with $\kappa =$ 1.0. In addition to the POWHEG + PYTHIA8 predictions with the NLO CT10 PDF set ("CT10''), the distributions are also compared with the NLO HERAPDF1.5 set ("HERAPDF''). Hashed uncertainty bands include both statistical and systematic contributions in data, added in quadrature. The ratio of data to simulation is displayed twice below each plot with two different vertical scales. |
png pdf |
Figure 7-b:
Comparison of unfolded leading-jet charge distributions $Q_{T}^\kappa $ with POWHEG + PYTHIA8 ("PH+P8'') and POWHEG + HERWIG++ ("PH+HPP'') generators for transverse jet charge definition ($Q_{T}^\kappa $) with $\kappa =$ 0.6. In addition to the POWHEG + PYTHIA8 predictions with the NLO CT10 PDF set ("CT10''), the distributions are also compared with the NLO HERAPDF1.5 set ("HERAPDF''). Hashed uncertainty bands include both statistical and systematic contributions in data, added in quadrature. The ratio of data to simulation is displayed twice below each plot with two different vertical scales. |
png pdf |
Figure 7-c:
Comparison of unfolded leading-jet charge distributions $Q_{T}^\kappa $ with POWHEG + PYTHIA8 ("PH+P8'') and POWHEG + HERWIG++ ("PH+HPP'') generators for transverse jet charge definition ($Q_{T}^\kappa $) with $\kappa =$ 0.3. In addition to the POWHEG + PYTHIA8 predictions with the NLO CT10 PDF set ("CT10''), the distributions are also compared with the NLO HERAPDF1.5 set ("HERAPDF''). Hashed uncertainty bands include both statistical and systematic contributions in data, added in quadrature. The ratio of data to simulation is displayed twice below each plot with two different vertical scales. |

png pdf |
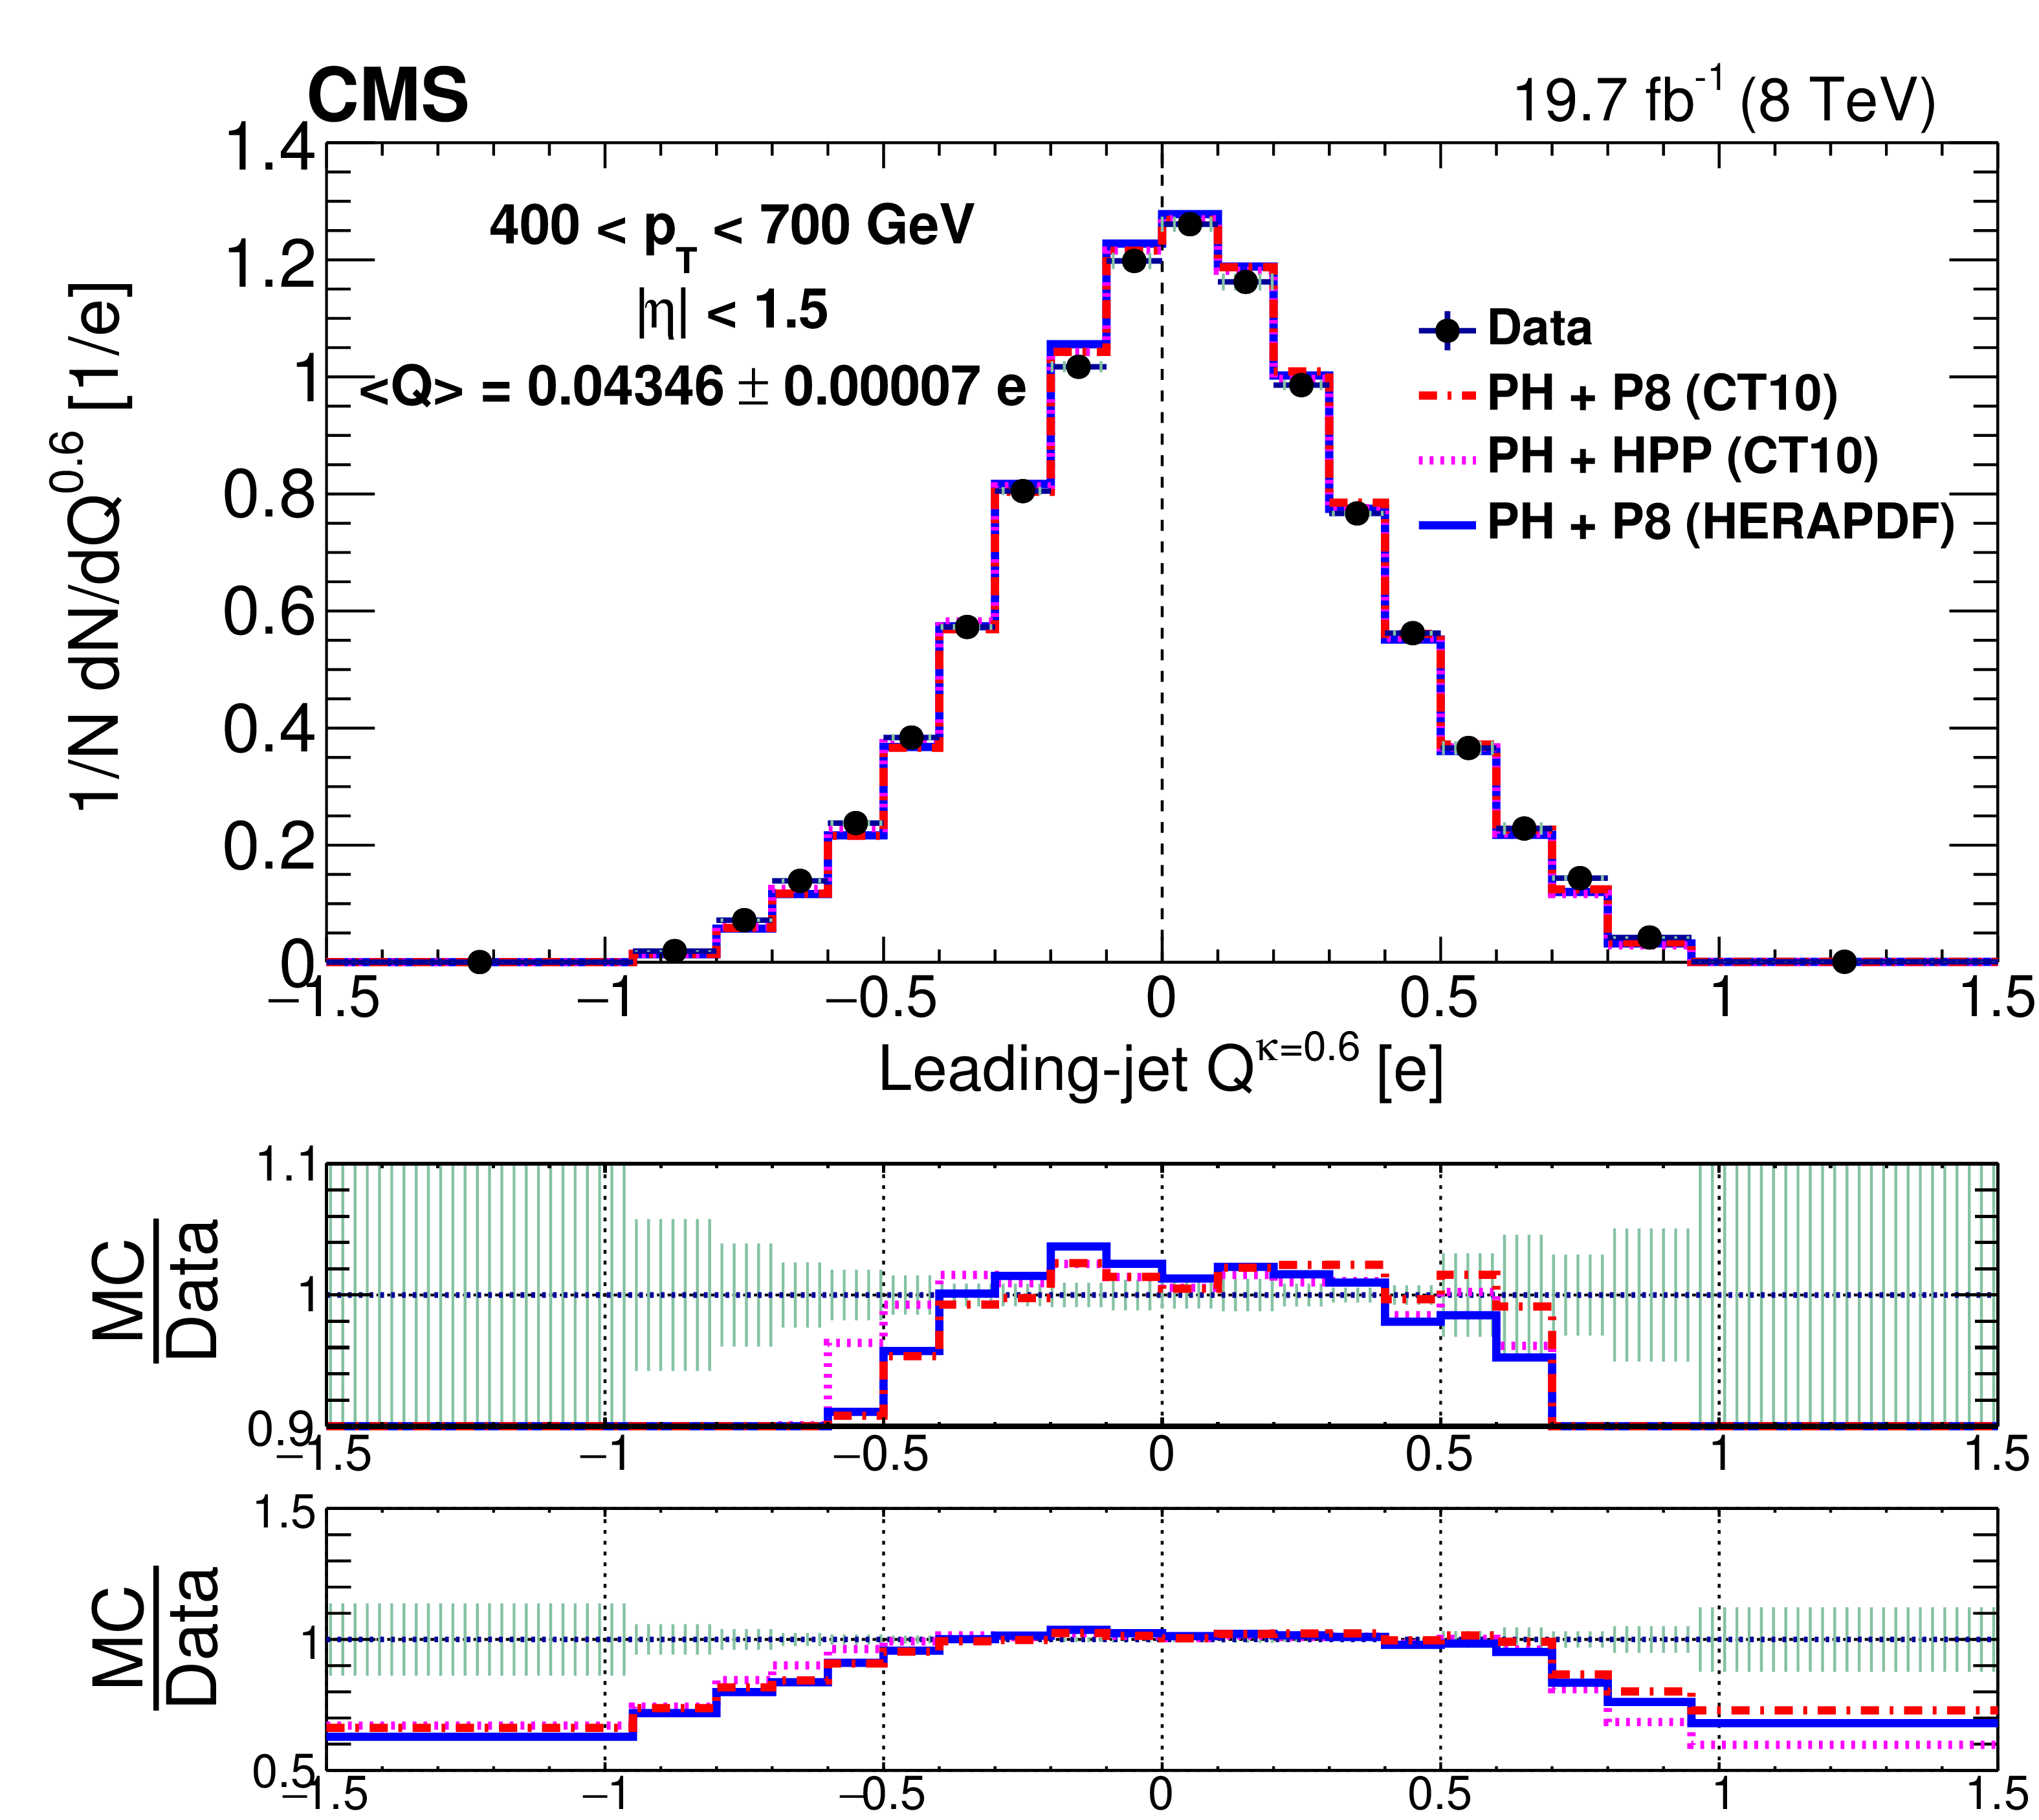
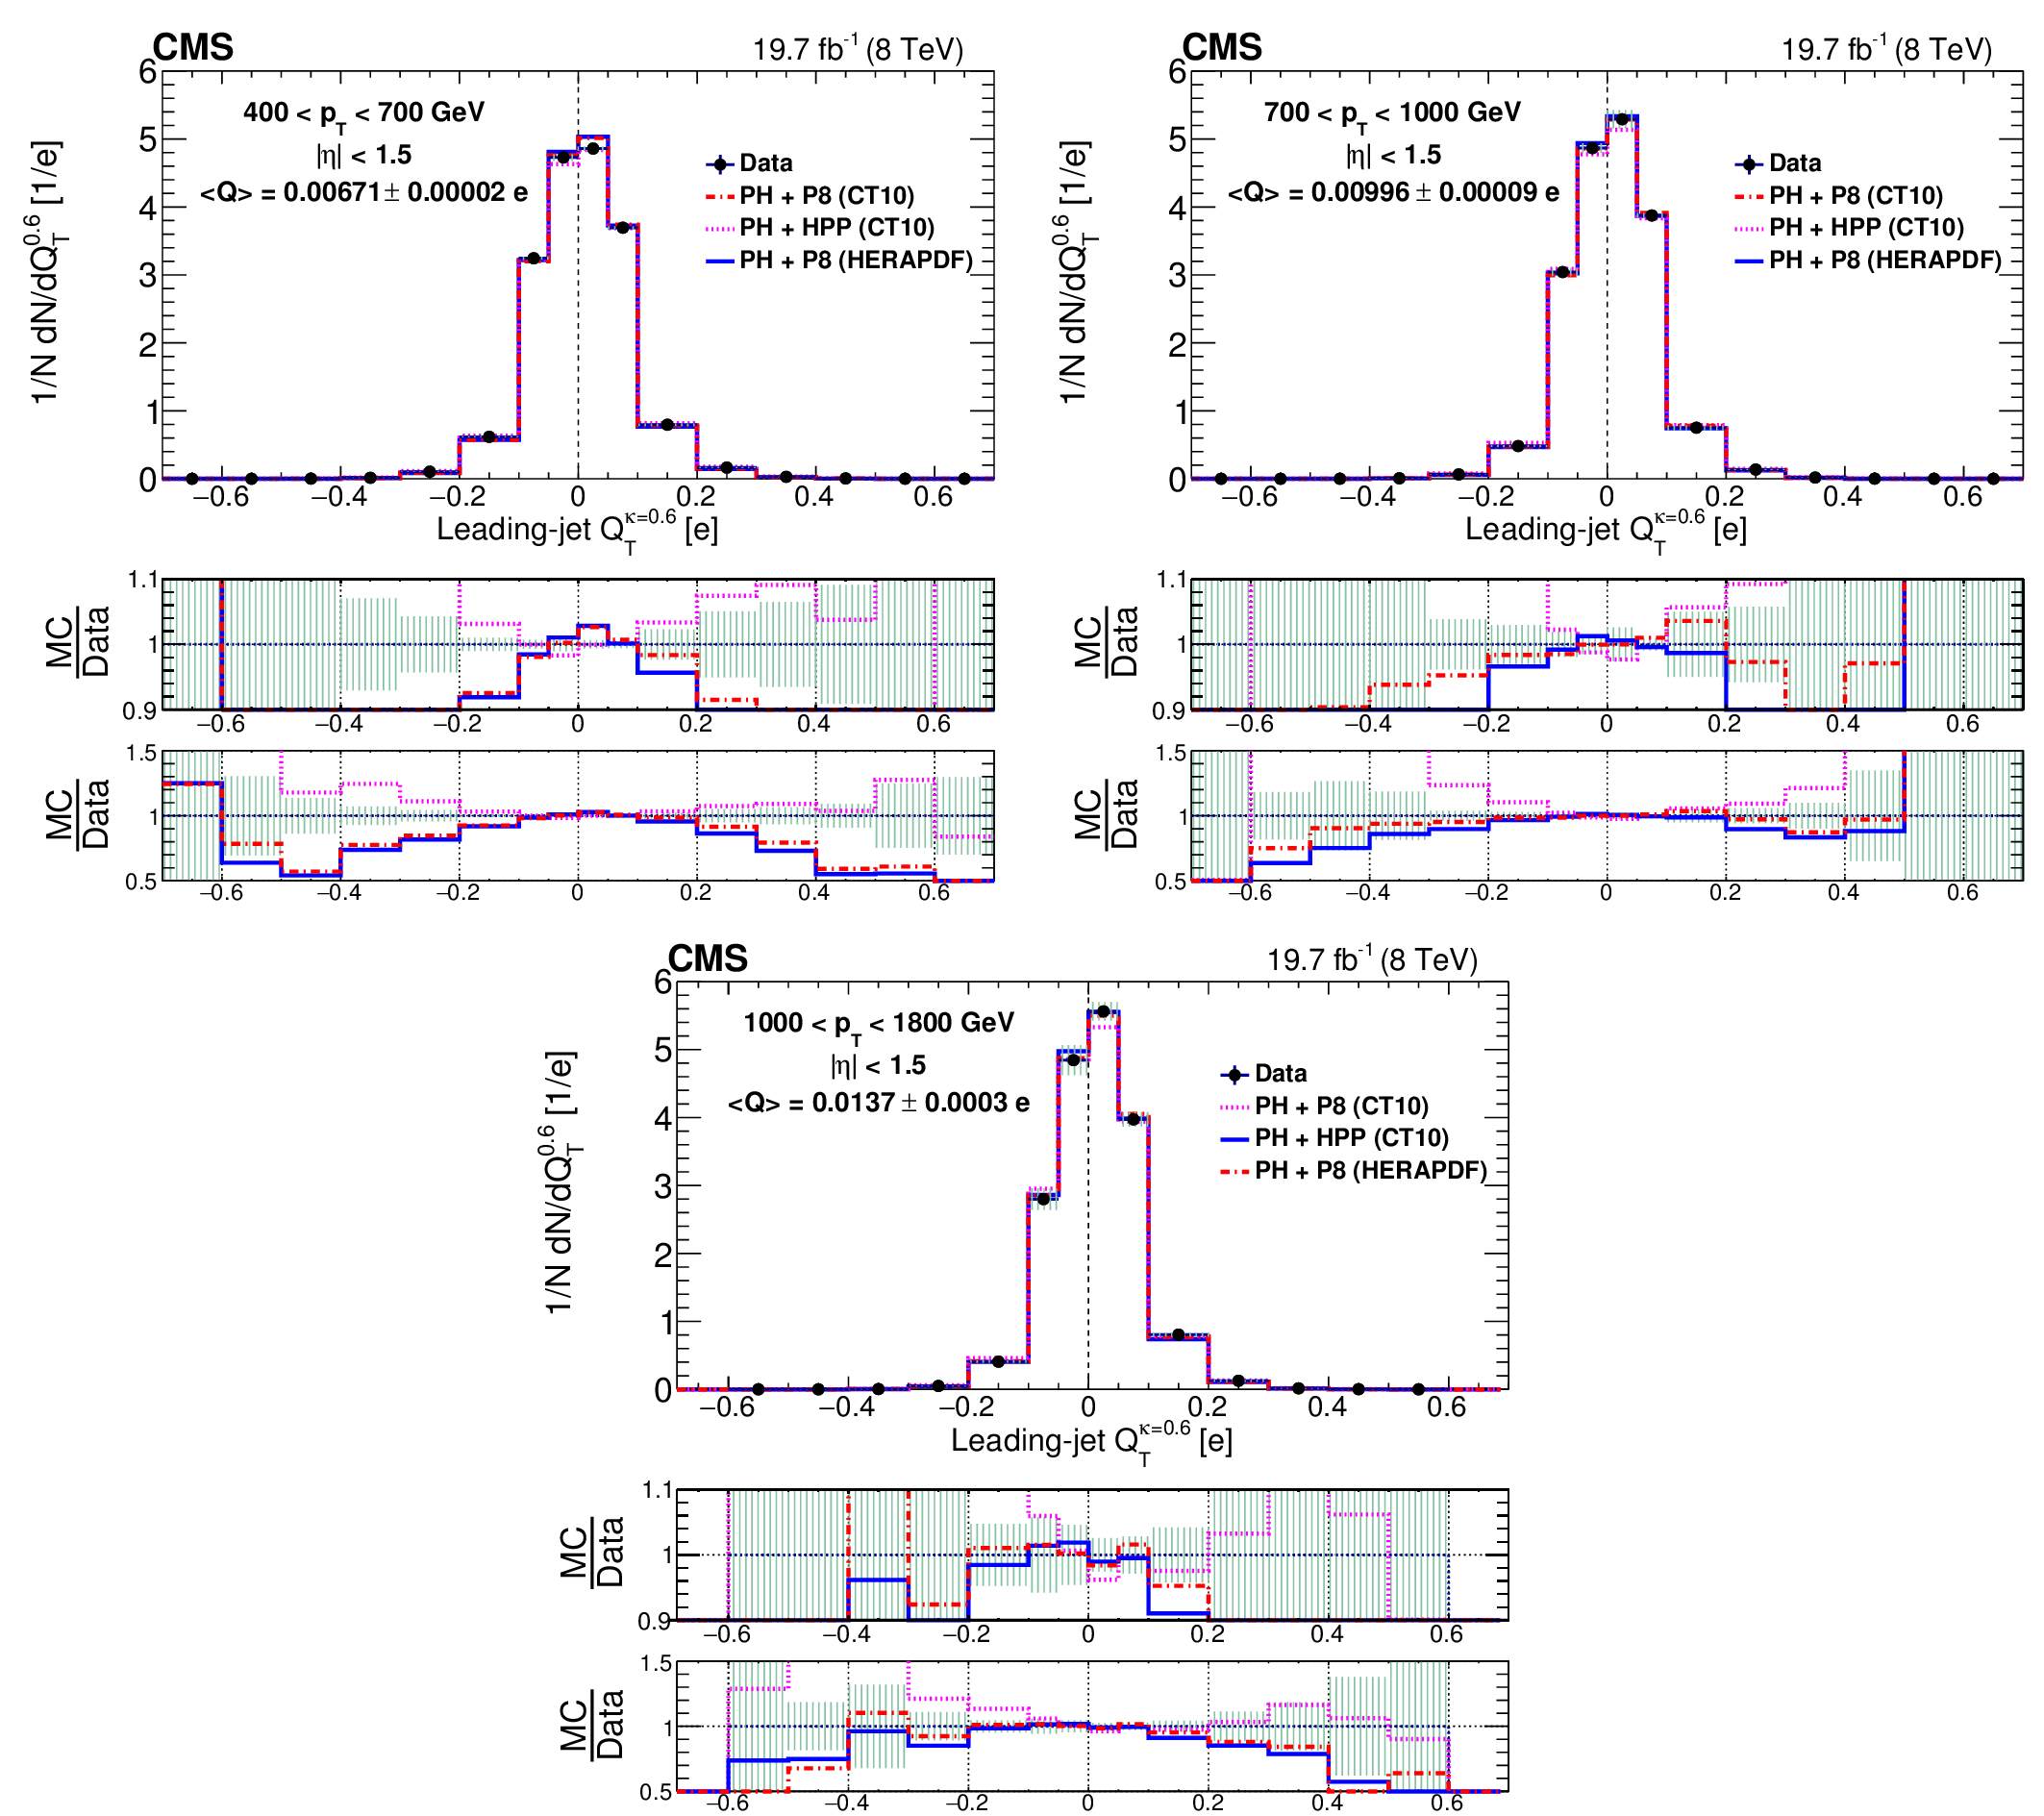
Figure 8:
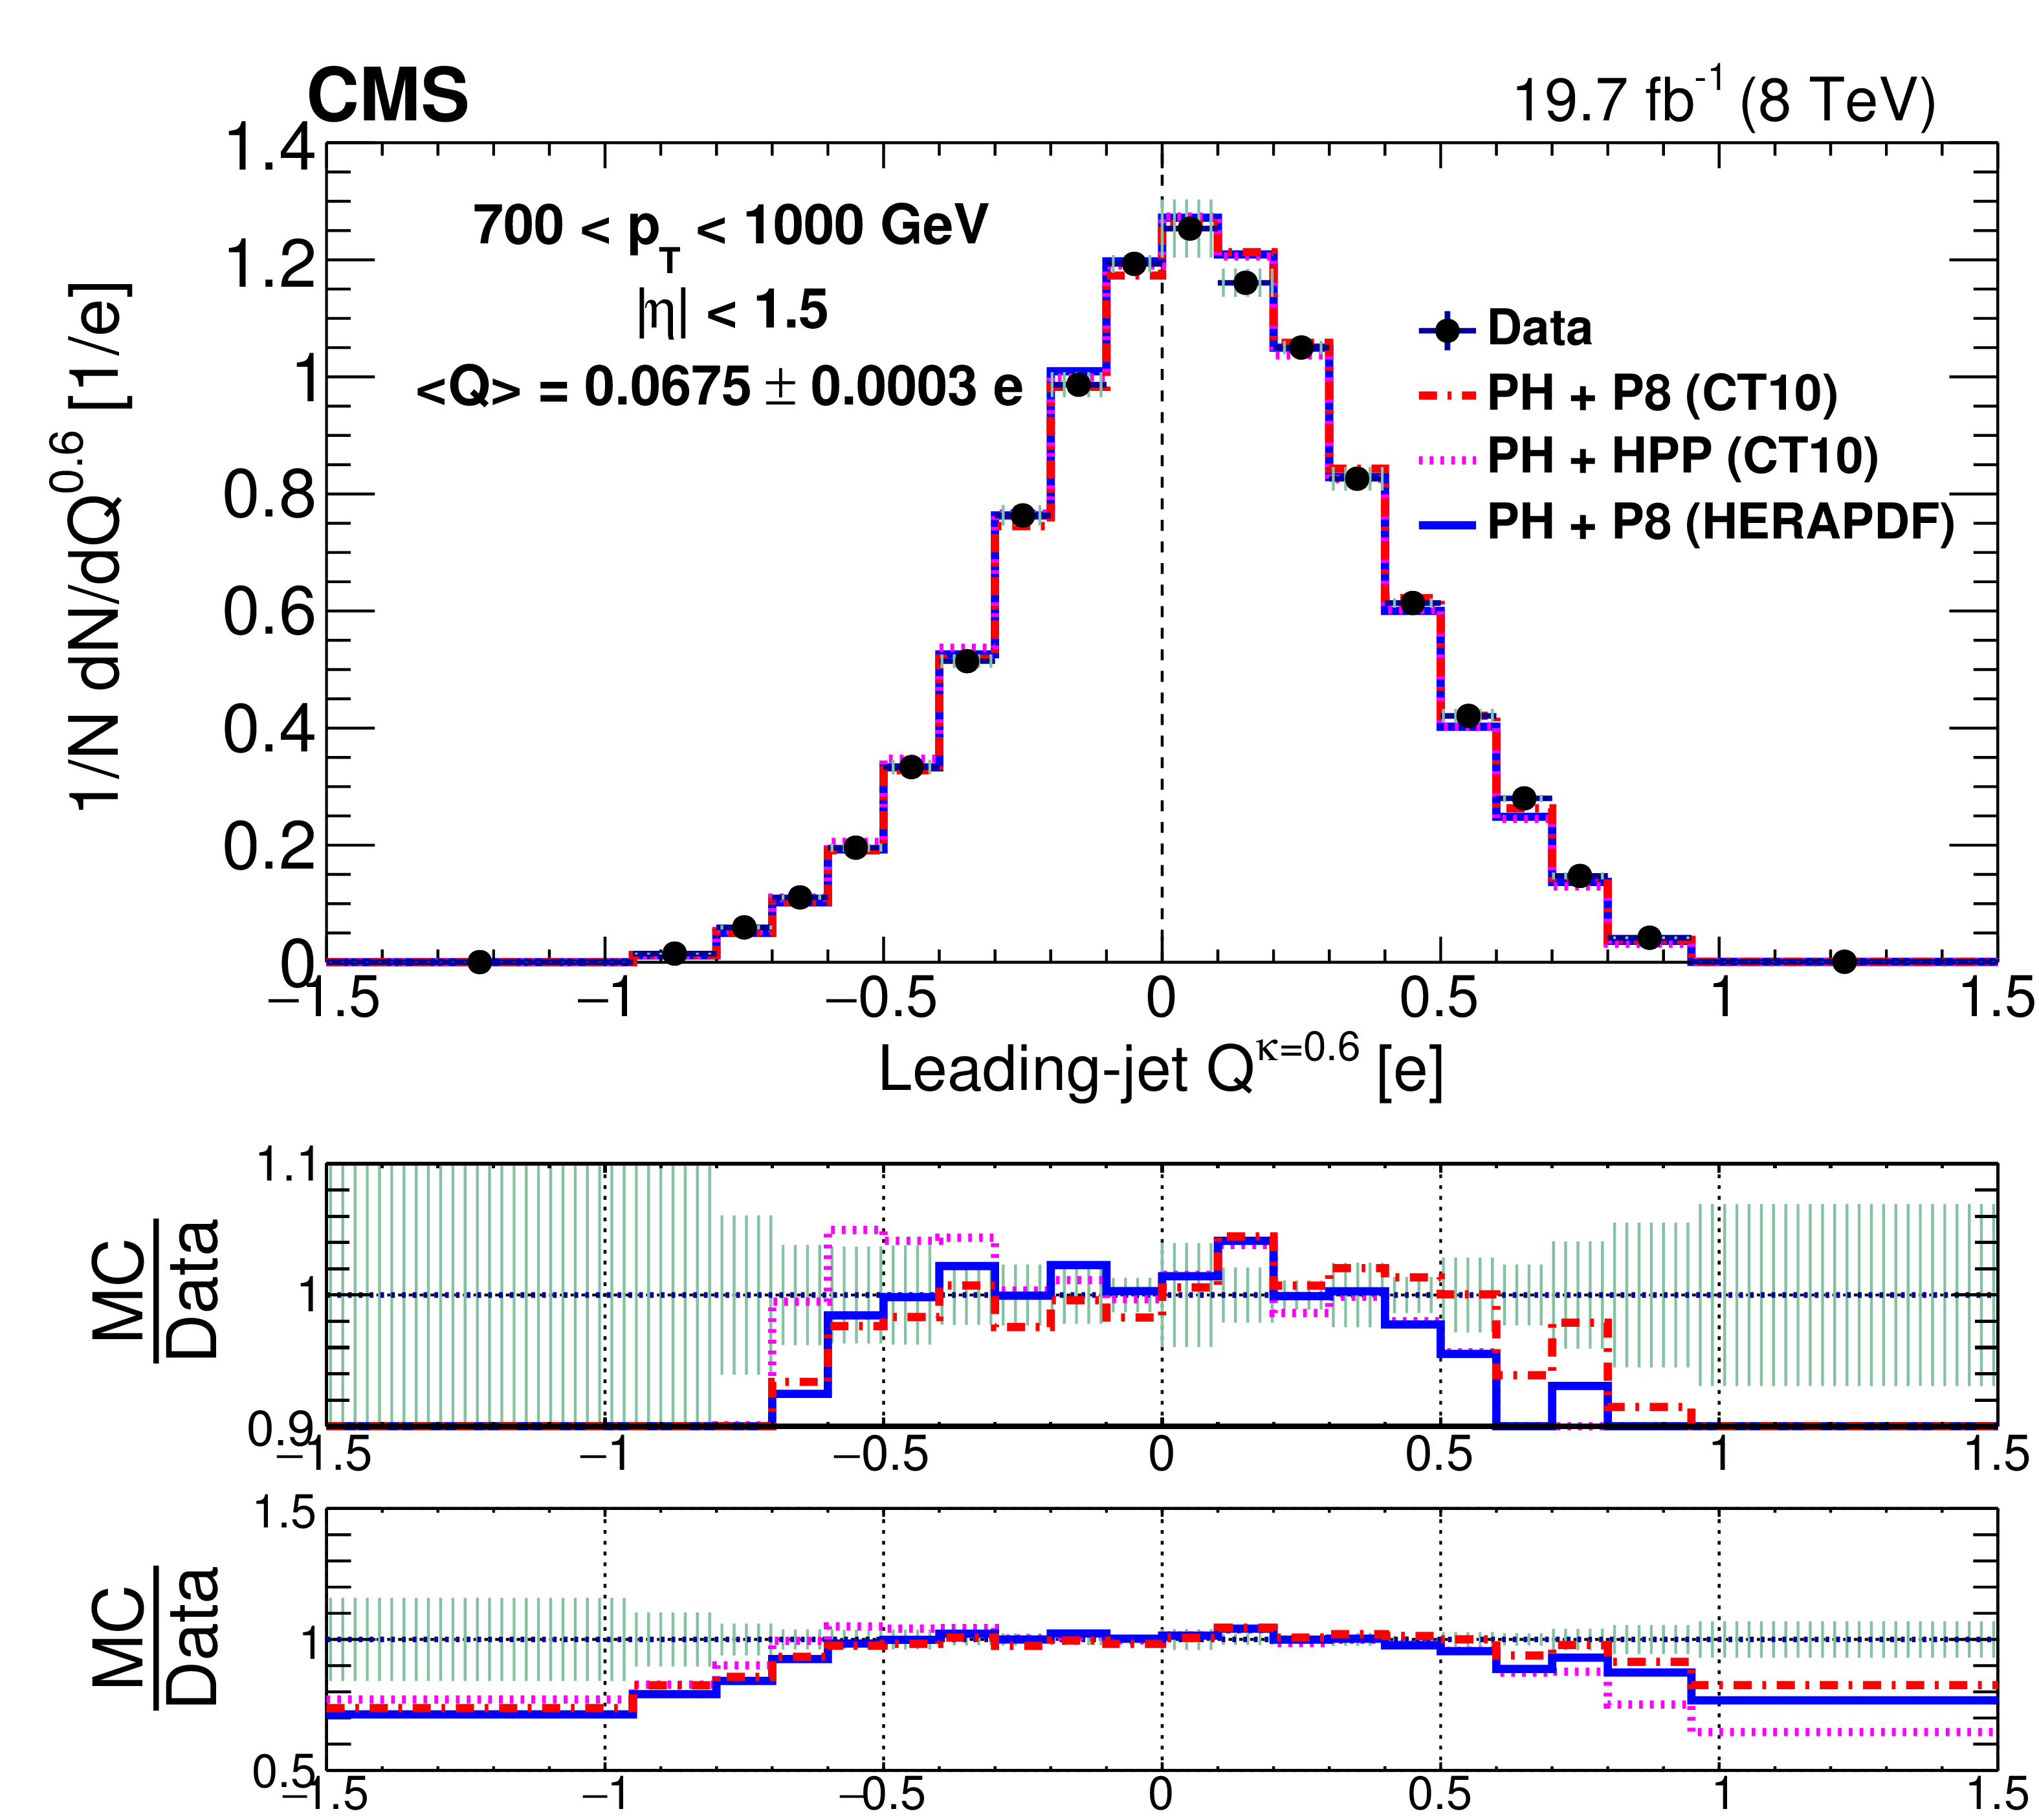
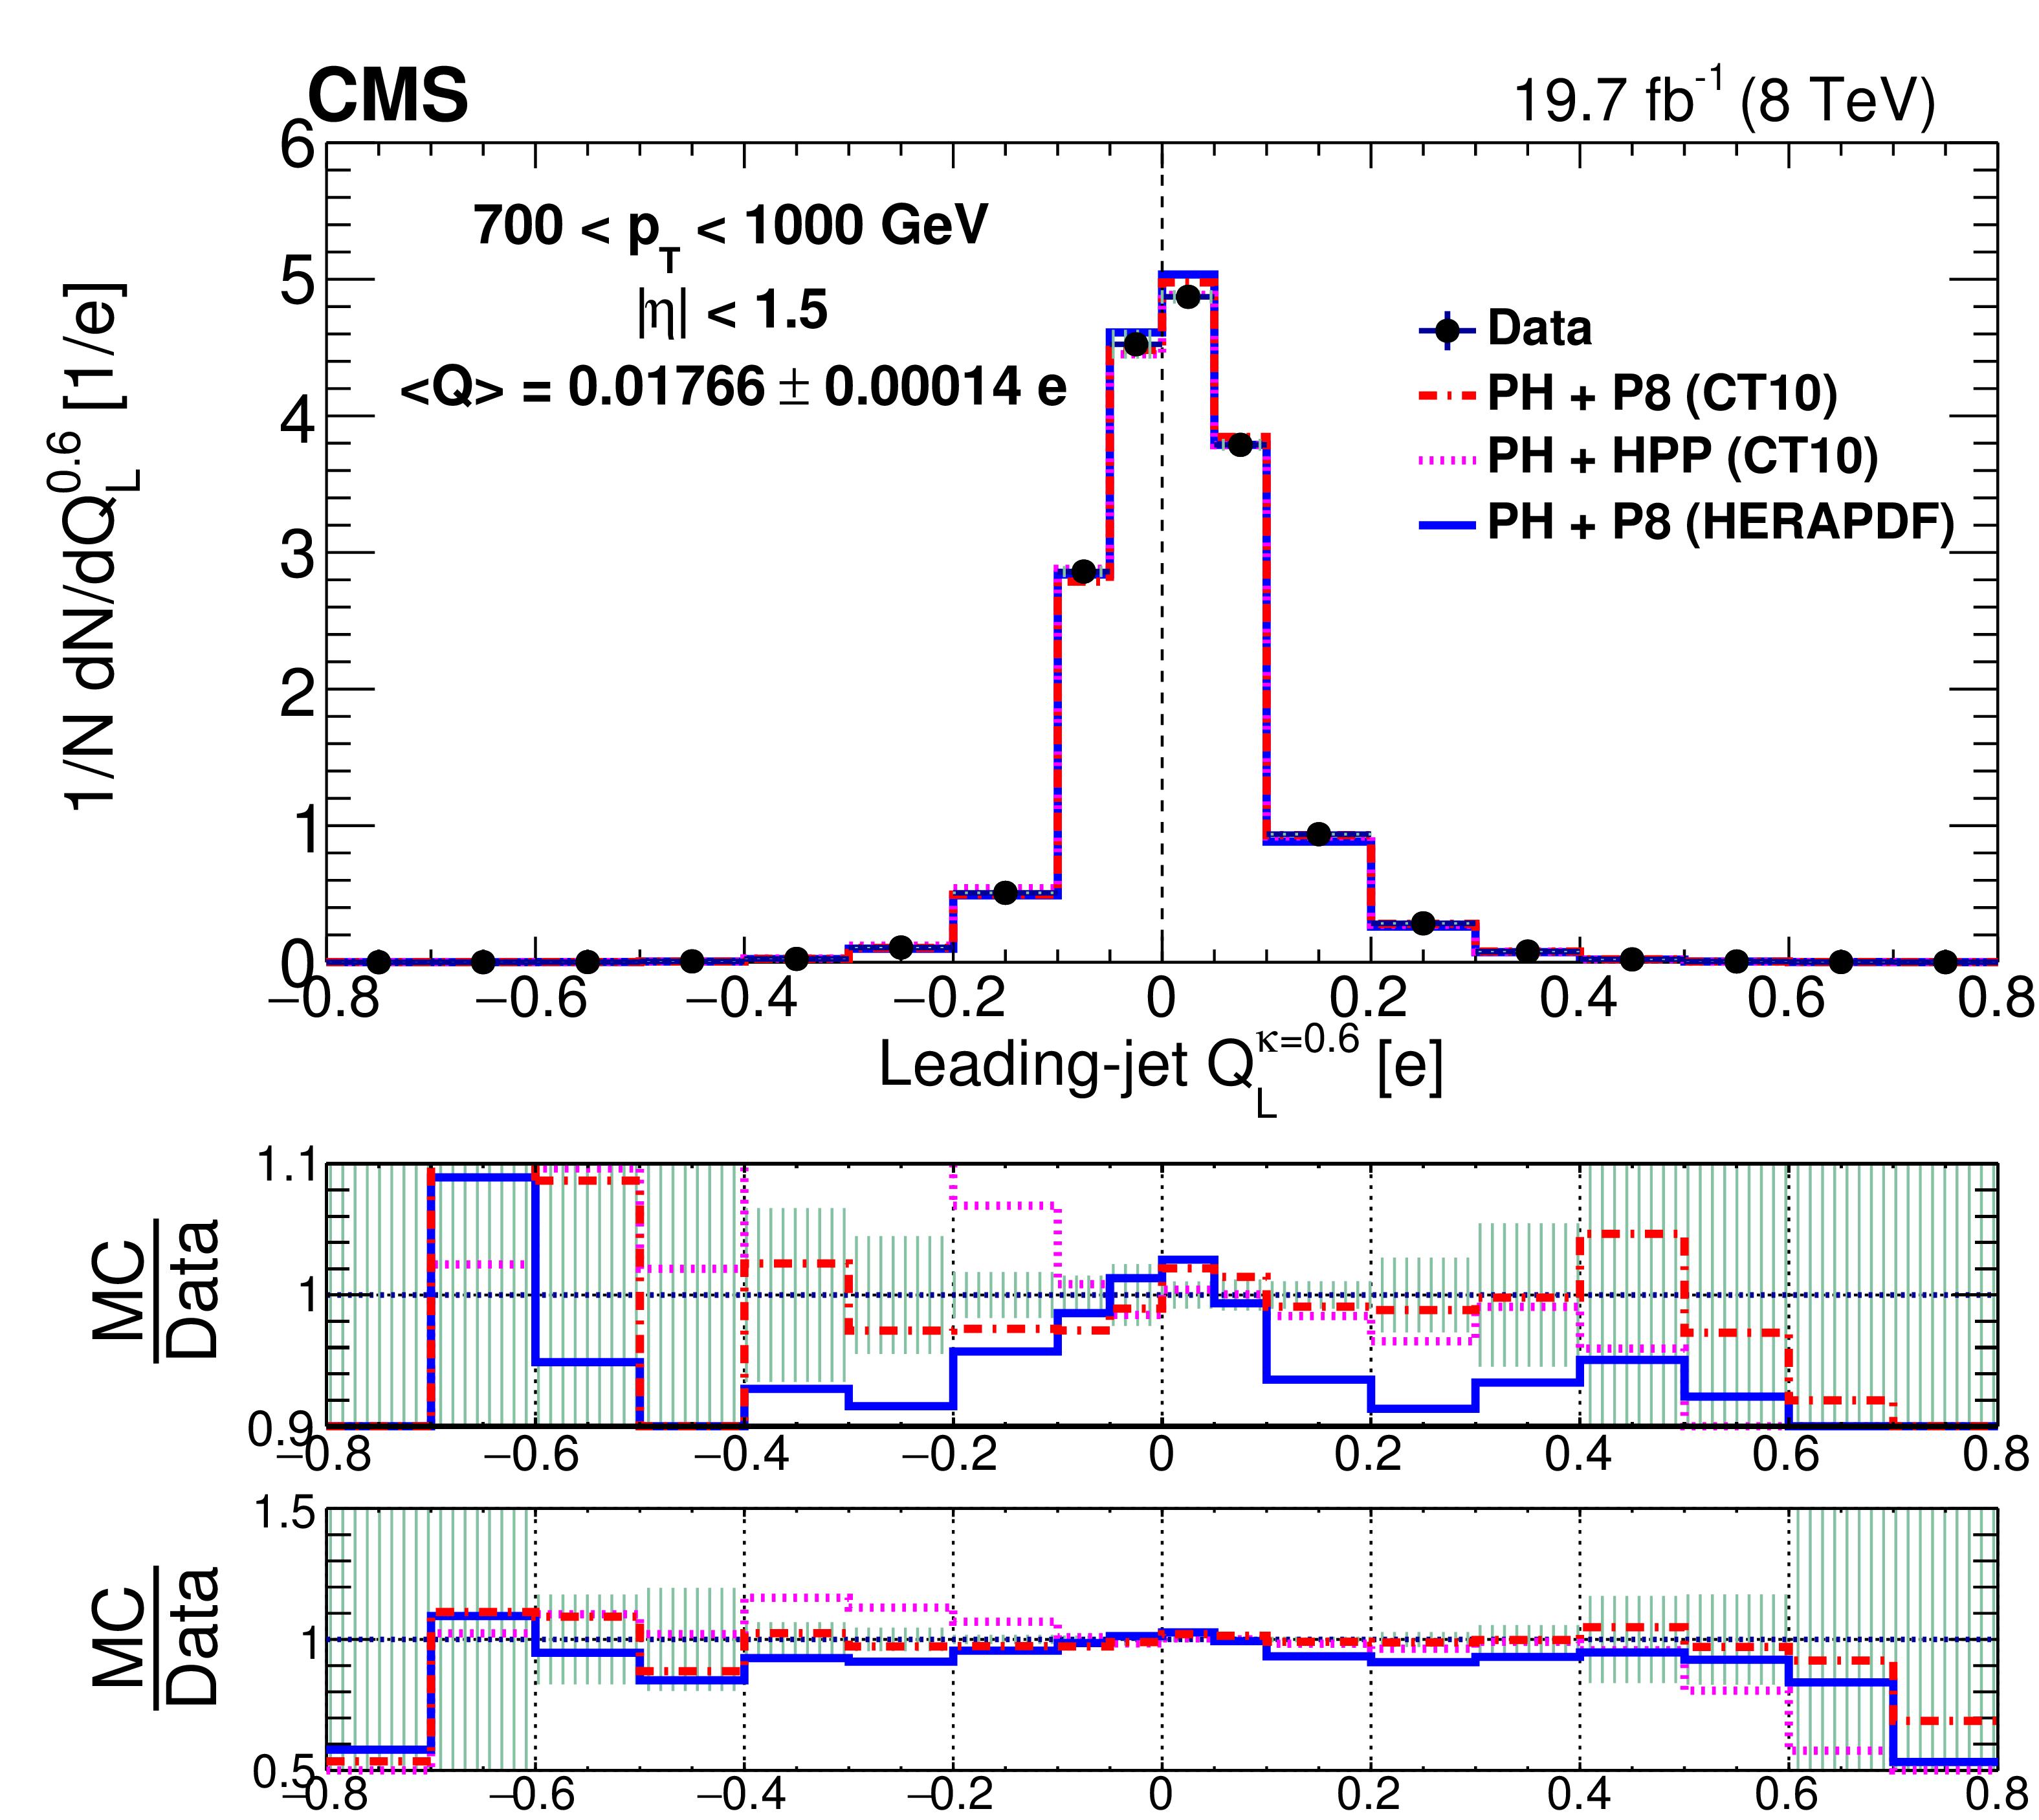
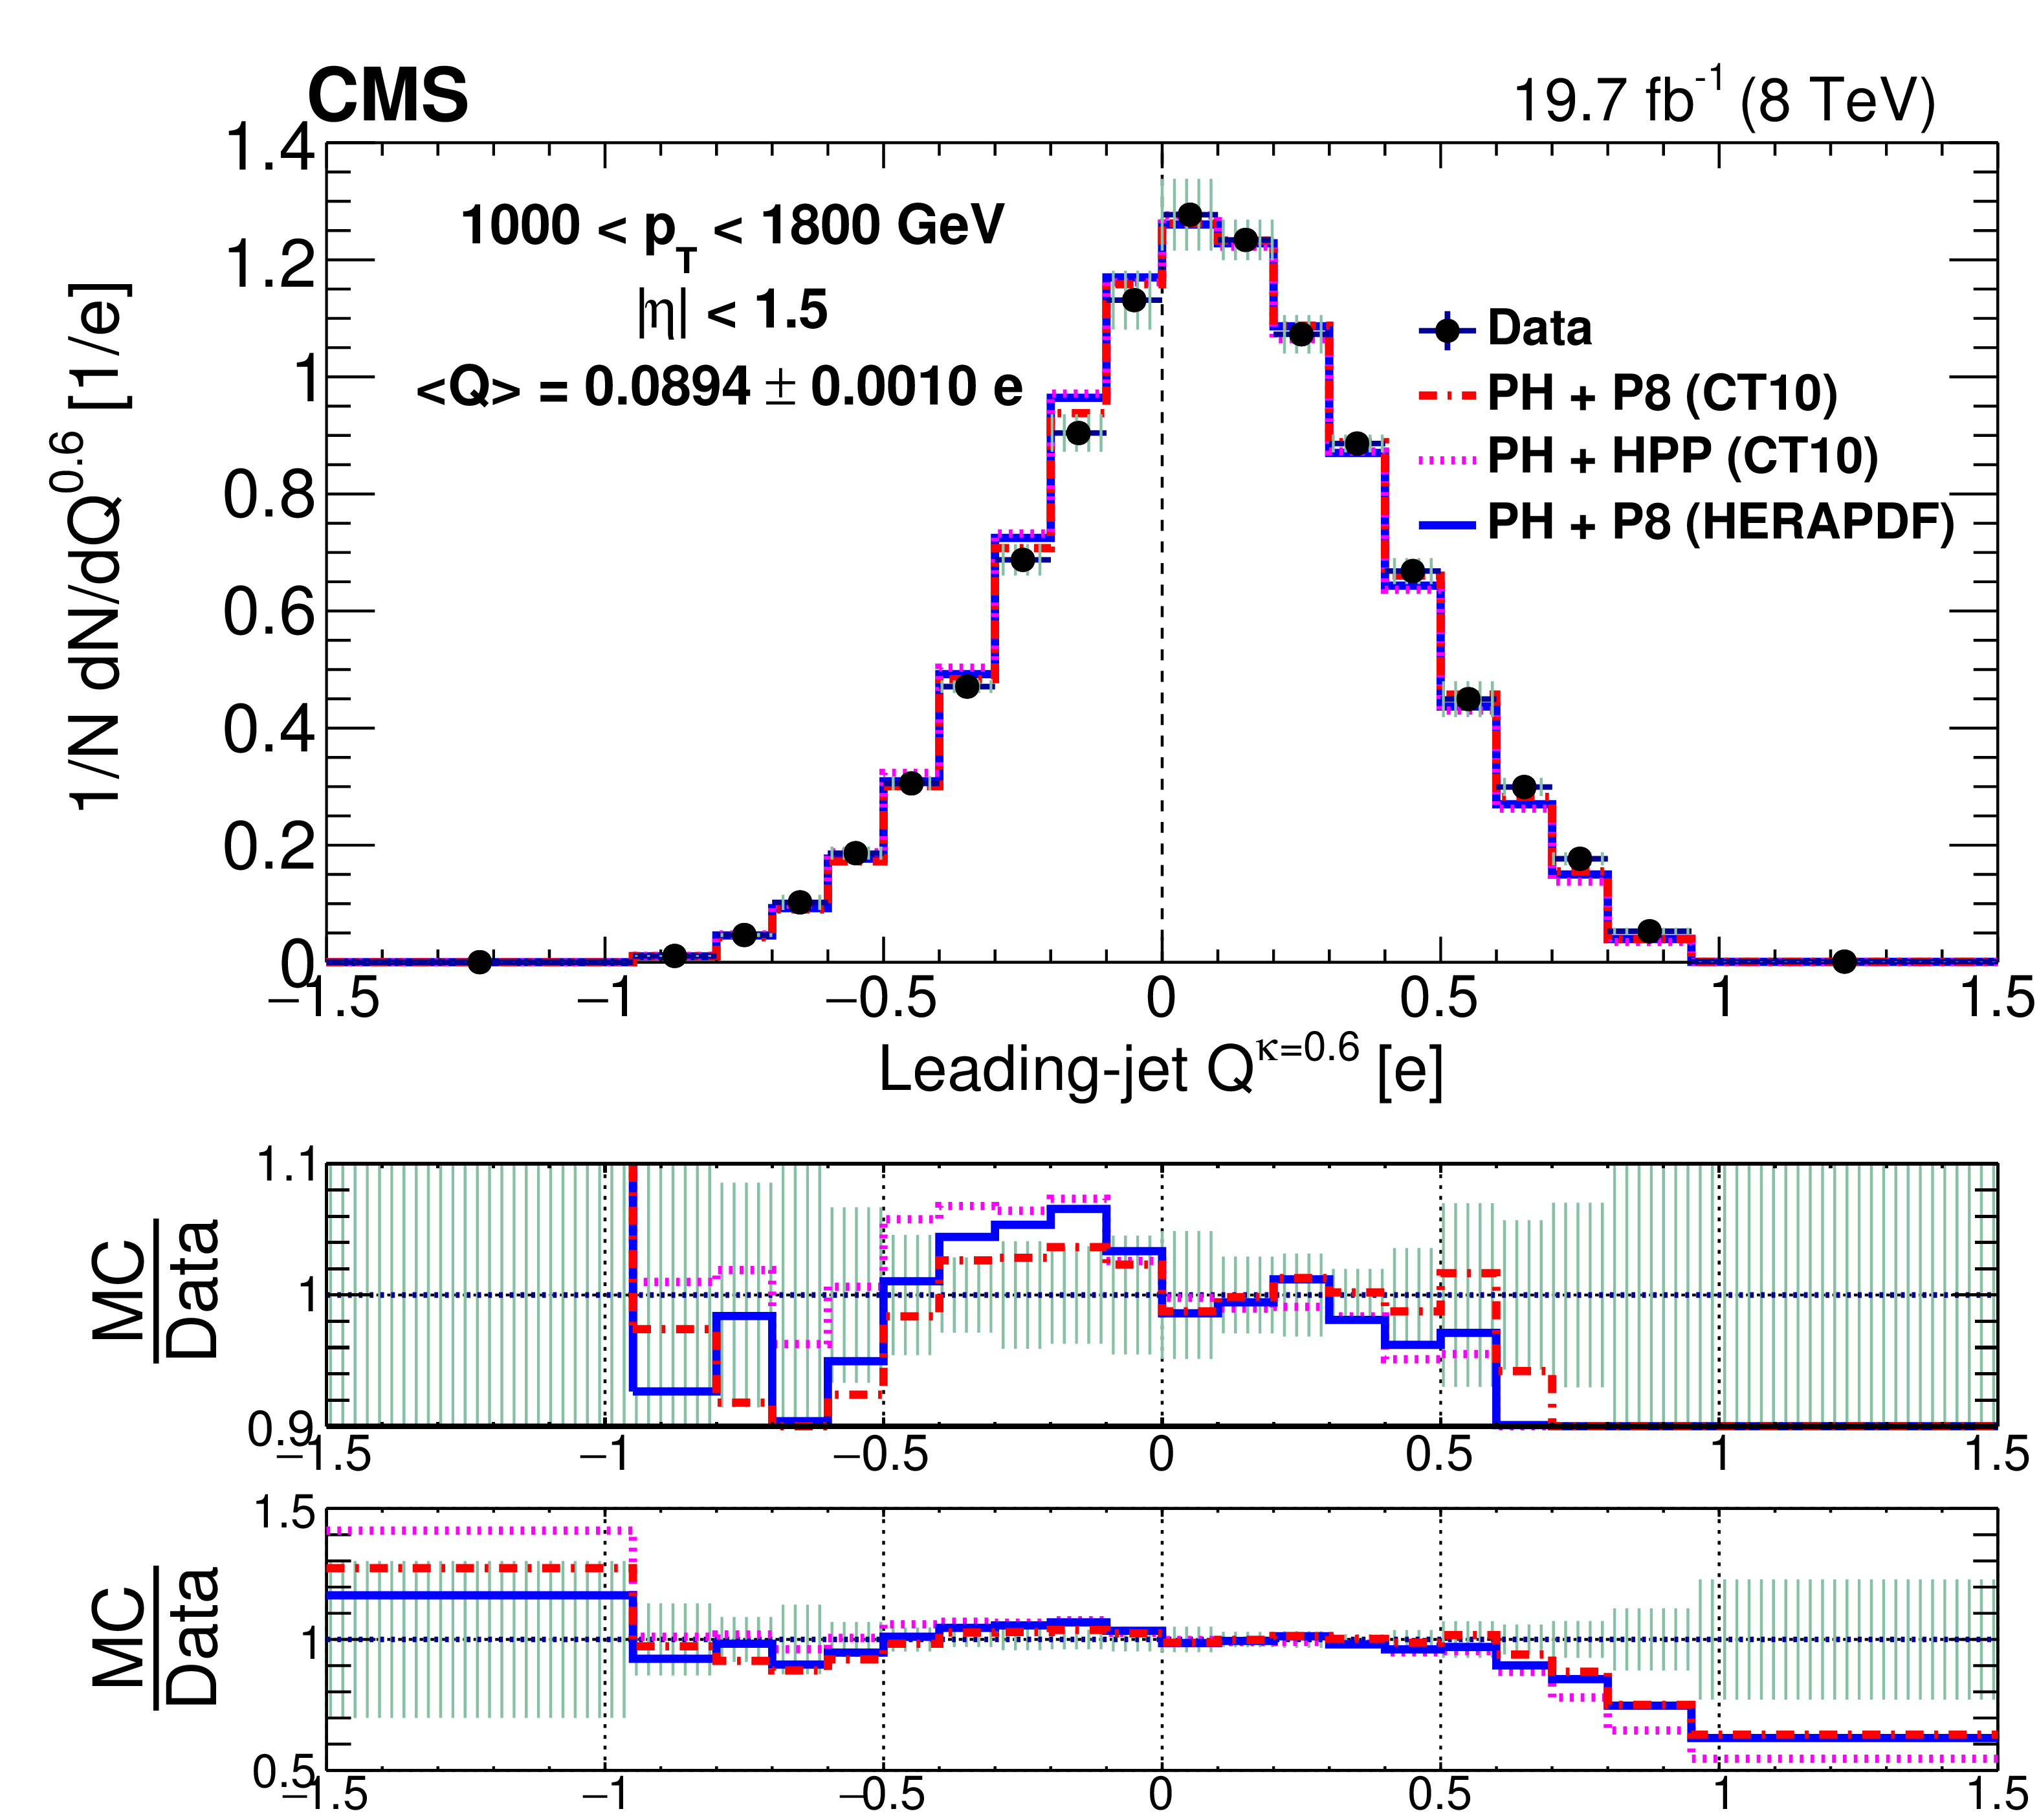
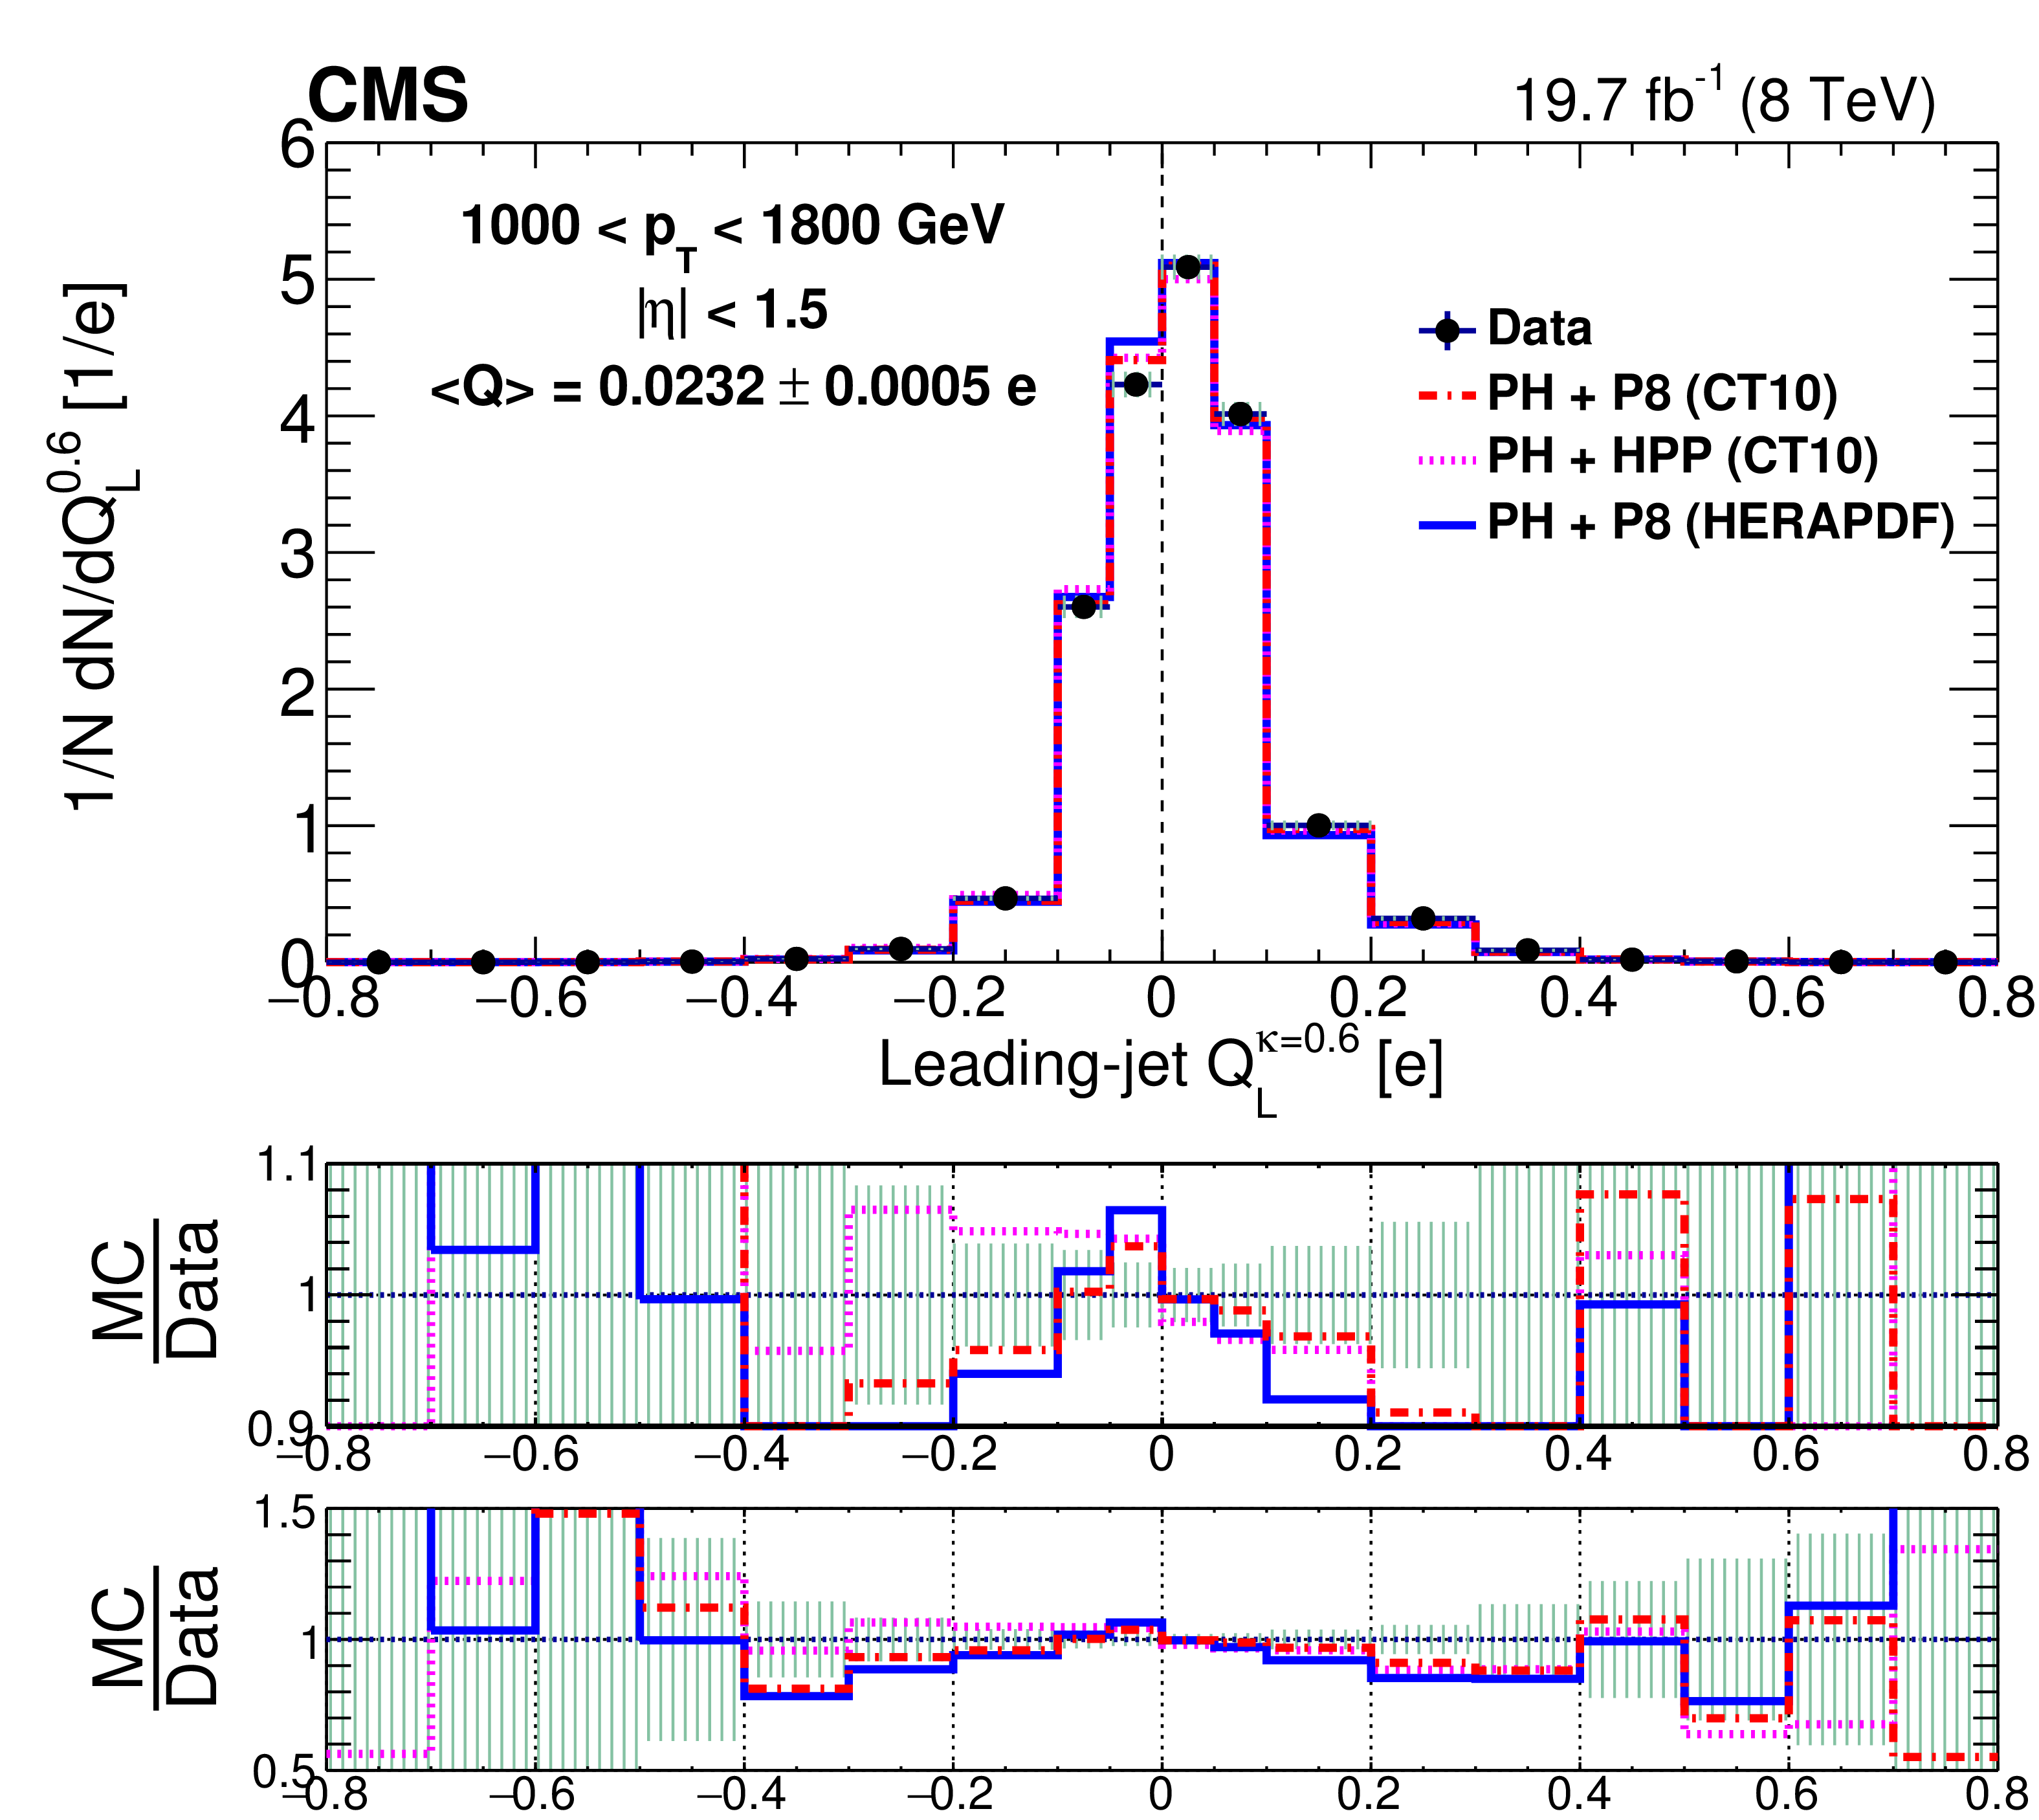
Comparison of unfolded leading-jet charge distributions $Q^\kappa $ and $Q_{L}^\kappa $ with POWHEG + PYTHIA8 ("PH+P8'') and POWHEG + HERWIG++ ("PH+HPP'') generators in 3 ranges of leading-jet $ {p_{\mathrm {T}}} $. In addition to the POWHEG + PYTHIA8 predictions with the NLO CT10 PDF set ("CT10''), the distributions are also compared with the NLO HERAPDF1.5 set ("HERAPDF''). The left column shows the jet $ {p_{\mathrm {T}}} $ dependence for the default jet charge definition ($Q^\kappa $) with $\kappa $ = 0.6. The right column shows the jet $ {p_{\mathrm {T}}} $ dependence for the longitudinal jet charge definition ($Q_{L}^\kappa $) with $\kappa $ = 0.6. Hashed uncertainty bands include both statistical and systematic contributions in data, added in quadrature. The ratio of data to simulation is displayed twice below each plot with two different vertical scales. The average jet charge value is quoted on each panel only with statistical uncertainties. |
png pdf |
Figure 8-a:
Comparison of the unfolded leading-jet default jet charge $Q^\kappa $ distribution with POWHEG + PYTHIA8 ("PH+P8'') and POWHEG + HERWIG++ ("PH+HPP'') generators in 3 ranges of leading-jet $ {p_{\mathrm {T}}} $. In addition to the POWHEG + PYTHIA8 predictions with the NLO CT10 PDF set ("CT10''), the distribution is also compared with the NLO HERAPDF1.5 set ("HERAPDF'') with $\kappa $ = 0.6 for 400 $ < p_{\mathrm{T} < $ 700 GeV. Hashed uncertainty bands include both statistical and systematic contributions in data, added in quadrature. The ratio of data to simulation is displayed twice below the plot with two different vertical scales. The average jet charge value is quoted only with statistical uncertainties. |

png pdf |
Figure 8-b:
Comparison of the unfolded leading-jet longitudinal jet charge $Q_{L}^\kappa $ distribution with POWHEG + PYTHIA8 ("PH+P8'') and POWHEG + HERWIG++ ("PH+HPP'') generators in 3 ranges of leading-jet $ {p_{\mathrm {T}}} $. In addition to the POWHEG + PYTHIA8 predictions with the NLO CT10 PDF set ("CT10''), the distribution is also compared with the NLO HERAPDF1.5 set ("HERAPDF'') with $\kappa $ = 0.6 for 400 $ < p_{\mathrm{T} < $ 700 GeV. Hashed uncertainty bands include both statistical and systematic contributions in data, added in quadrature. The ratio of data to simulation is displayed twice below the plot with two different vertical scales. The average jet charge value is quoted only with statistical uncertainties. |
png pdf |
Figure 8-c:
Comparison of the unfolded leading-jet default jet charge $Q^\kappa $ distribution with POWHEG + PYTHIA8 ("PH+P8'') and POWHEG + HERWIG++ ("PH+HPP'') generators in 3 ranges of leading-jet $ {p_{\mathrm {T}}} $. In addition to the POWHEG + PYTHIA8 predictions with the NLO CT10 PDF set ("CT10''), the distribution is also compared with the NLO HERAPDF1.5 set ("HERAPDF'') with $\kappa $ = 0.6 for 700 $ < p_{\mathrm{T} < $ 1000 GeV. Hashed uncertainty bands include both statistical and systematic contributions in data, added in quadrature. The ratio of data to simulation is displayed twice below the plot with two different vertical scales. The average jet charge value is quoted only with statistical uncertainties. |
png pdf |
Figure 8-d:
Comparison of the unfolded leading-jet longitudinal jet charge $Q_{L}^\kappa $ distribution with POWHEG + PYTHIA8 ("PH+P8'') and POWHEG + HERWIG++ ("PH+HPP'') generators in 3 ranges of leading-jet $ {p_{\mathrm {T}}} $. In addition to the POWHEG + PYTHIA8 predictions with the NLO CT10 PDF set ("CT10''), the distribution is also compared with the NLO HERAPDF1.5 set ("HERAPDF'') with $\kappa $ = 0.6 for the 700 $ < p_{\mathrm{T} < $ 1000 GeV. Hashed uncertainty bands include both statistical and systematic contributions in data, added in quadrature. The ratio of data to simulation is displayed twice below the plot with two different vertical scales. The average jet charge value is quoted only with statistical uncertainties. |
png pdf |
Figure 8-e:
Comparison of the unfolded leading-jet default jet charge $Q^\kappa $ distribution with POWHEG + PYTHIA8 ("PH+P8'') and POWHEG + HERWIG++ ("PH+HPP'') generators in 3 ranges of leading-jet $ {p_{\mathrm {T}}} $. In addition to the POWHEG + PYTHIA8 predictions with the NLO CT10 PDF set ("CT10''), the distribution is also compared with the NLO HERAPDF1.5 set ("HERAPDF'') with $\kappa $ = 0.6 for the 1000 $ < p_{\mathrm{T} < $ 1800 GeV. Hashed uncertainty bands include both statistical and systematic contributions in data, added in quadrature. The ratio of data to simulation is displayed twice below the plot with two different vertical scales. The average jet charge value is quoted only with statistical uncertainties. |
png pdf |
Figure 8-f:
Comparison of the unfolded leading-jet longitudinal jet charge $Q_{L}^\kappa $ distribution with POWHEG + PYTHIA8 ("PH+P8'') and POWHEG + HERWIG++ ("PH+HPP'') generators in 3 ranges of leading-jet $ {p_{\mathrm {T}}} $. In addition to the POWHEG + PYTHIA8 predictions with the NLO CT10 PDF set ("CT10''), the distribution is also compared with the NLO HERAPDF1.5 set ("HERAPDF'') with $\kappa $ = 0.6 for 1000 $ < p_{\mathrm{T} < $ 1800 GeV. Hashed uncertainty bands include both statistical and systematic contributions in data, added in quadrature. The ratio of data to simulation is displayed twice below the plot with two different vertical scales. The average jet charge value is quoted only with statistical uncertainties. |
png pdf |
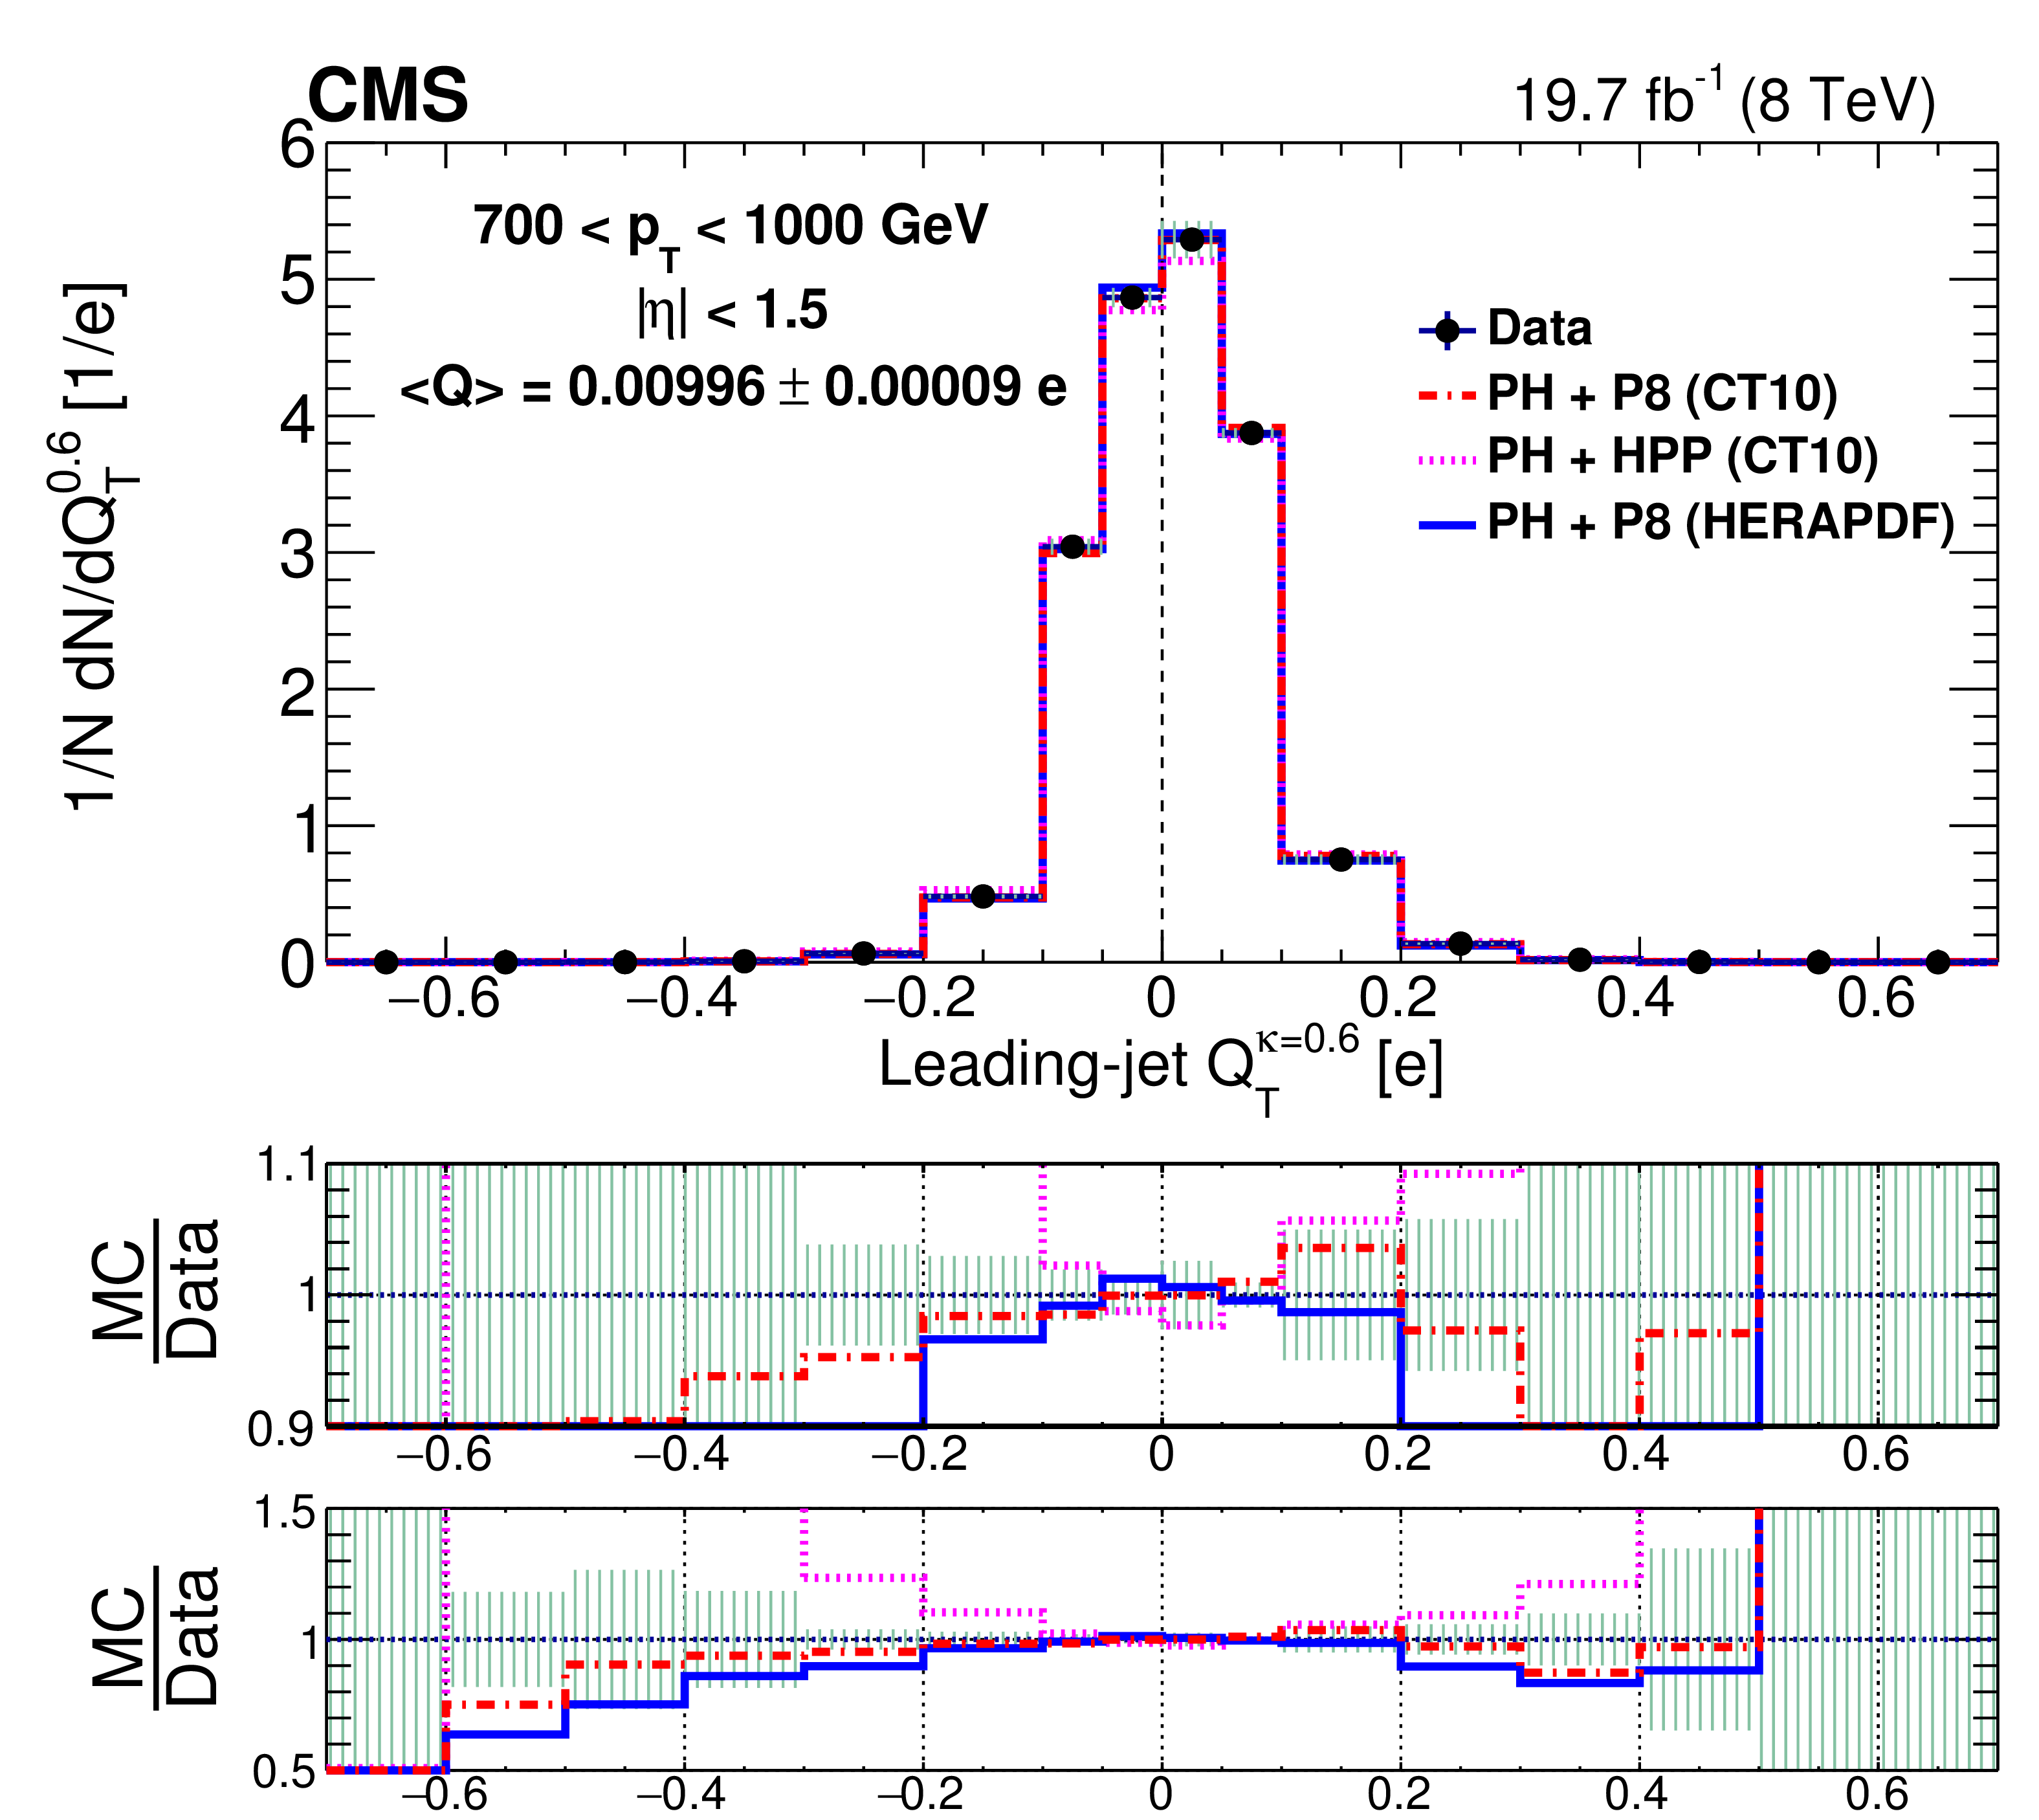
Figure 9:
Comparison of unfolded leading-jet charge distributions $Q_{T}^\kappa $ with POWHEG + PYTHIA8 ("PH+P8'') and POWHEG + HERWIG++ ("PH+HPP'') generators in 3 ranges of leading-jet $ {p_{\mathrm {T}}} $ for the transverse jet charge definition ($Q_{T}^\kappa $) with $\kappa = $ 0.6. In addition to the POWHEG + PYTHIA8 predictions with the NLO CT10 PDF set ("CT10''), the distributions are also compared with the NLO HERAPDF1.5 set ("HERAPDF''). Hashed uncertainty bands include both statistical and systematic contributions in data, added in quadrature. The ratio of data to simulation is displayed twice below each plot with two different vertical scales. The average jet charge value is quoted on each panel only with statistical uncertainties. |

png pdf |
Figure 9-a:
Comparison of unfolded leading-jet transverse jet charge $Q_{T}^\kappa $ distribution with POWHEG + PYTHIA8 ("PH+P8'') and POWHEG + HERWIG++ ("PH+HPP'') generators in the range 400 $ < p_{\mathrm{T} < $ 700 GeV (leading jet) with $\kappa = $ 0.6. In addition to the POWHEG + PYTHIA8 predictions with the NLO CT10 PDF set ("CT10''), the distribution is also compared with the NLO HERAPDF1.5 set ("HERAPDF''). Hashed uncertainty bands include both statistical and systematic contributions in data, added in quadrature. The ratio of data to simulation is displayed twice below the plot with two different vertical scales. The average jet charge value is quoted on each panel only with statistical uncertainties. |
png pdf |
Figure 9-b:
Comparison of unfolded leading-jet transverse jet charge $Q_{T}^\kappa $ distribution with POWHEG + PYTHIA8 ("PH+P8'') and POWHEG + HERWIG++ ("PH+HPP'') generators in the range 700 $ < p_{\mathrm{T} < $ 1000 GeV (leading jet) with $\kappa = $ 0.6. In addition to the POWHEG + PYTHIA8 predictions with the NLO CT10 PDF set ("CT10''), the distribution is also compared with the NLO HERAPDF1.5 set ("HERAPDF''). Hashed uncertainty bands include both statistical and systematic contributions in data, added in quadrature. The ratio of data to simulation is displayed twice below the plot with two different vertical scales. The average jet charge value is quoted on each panel only with statistical uncertainties. |
png pdf |
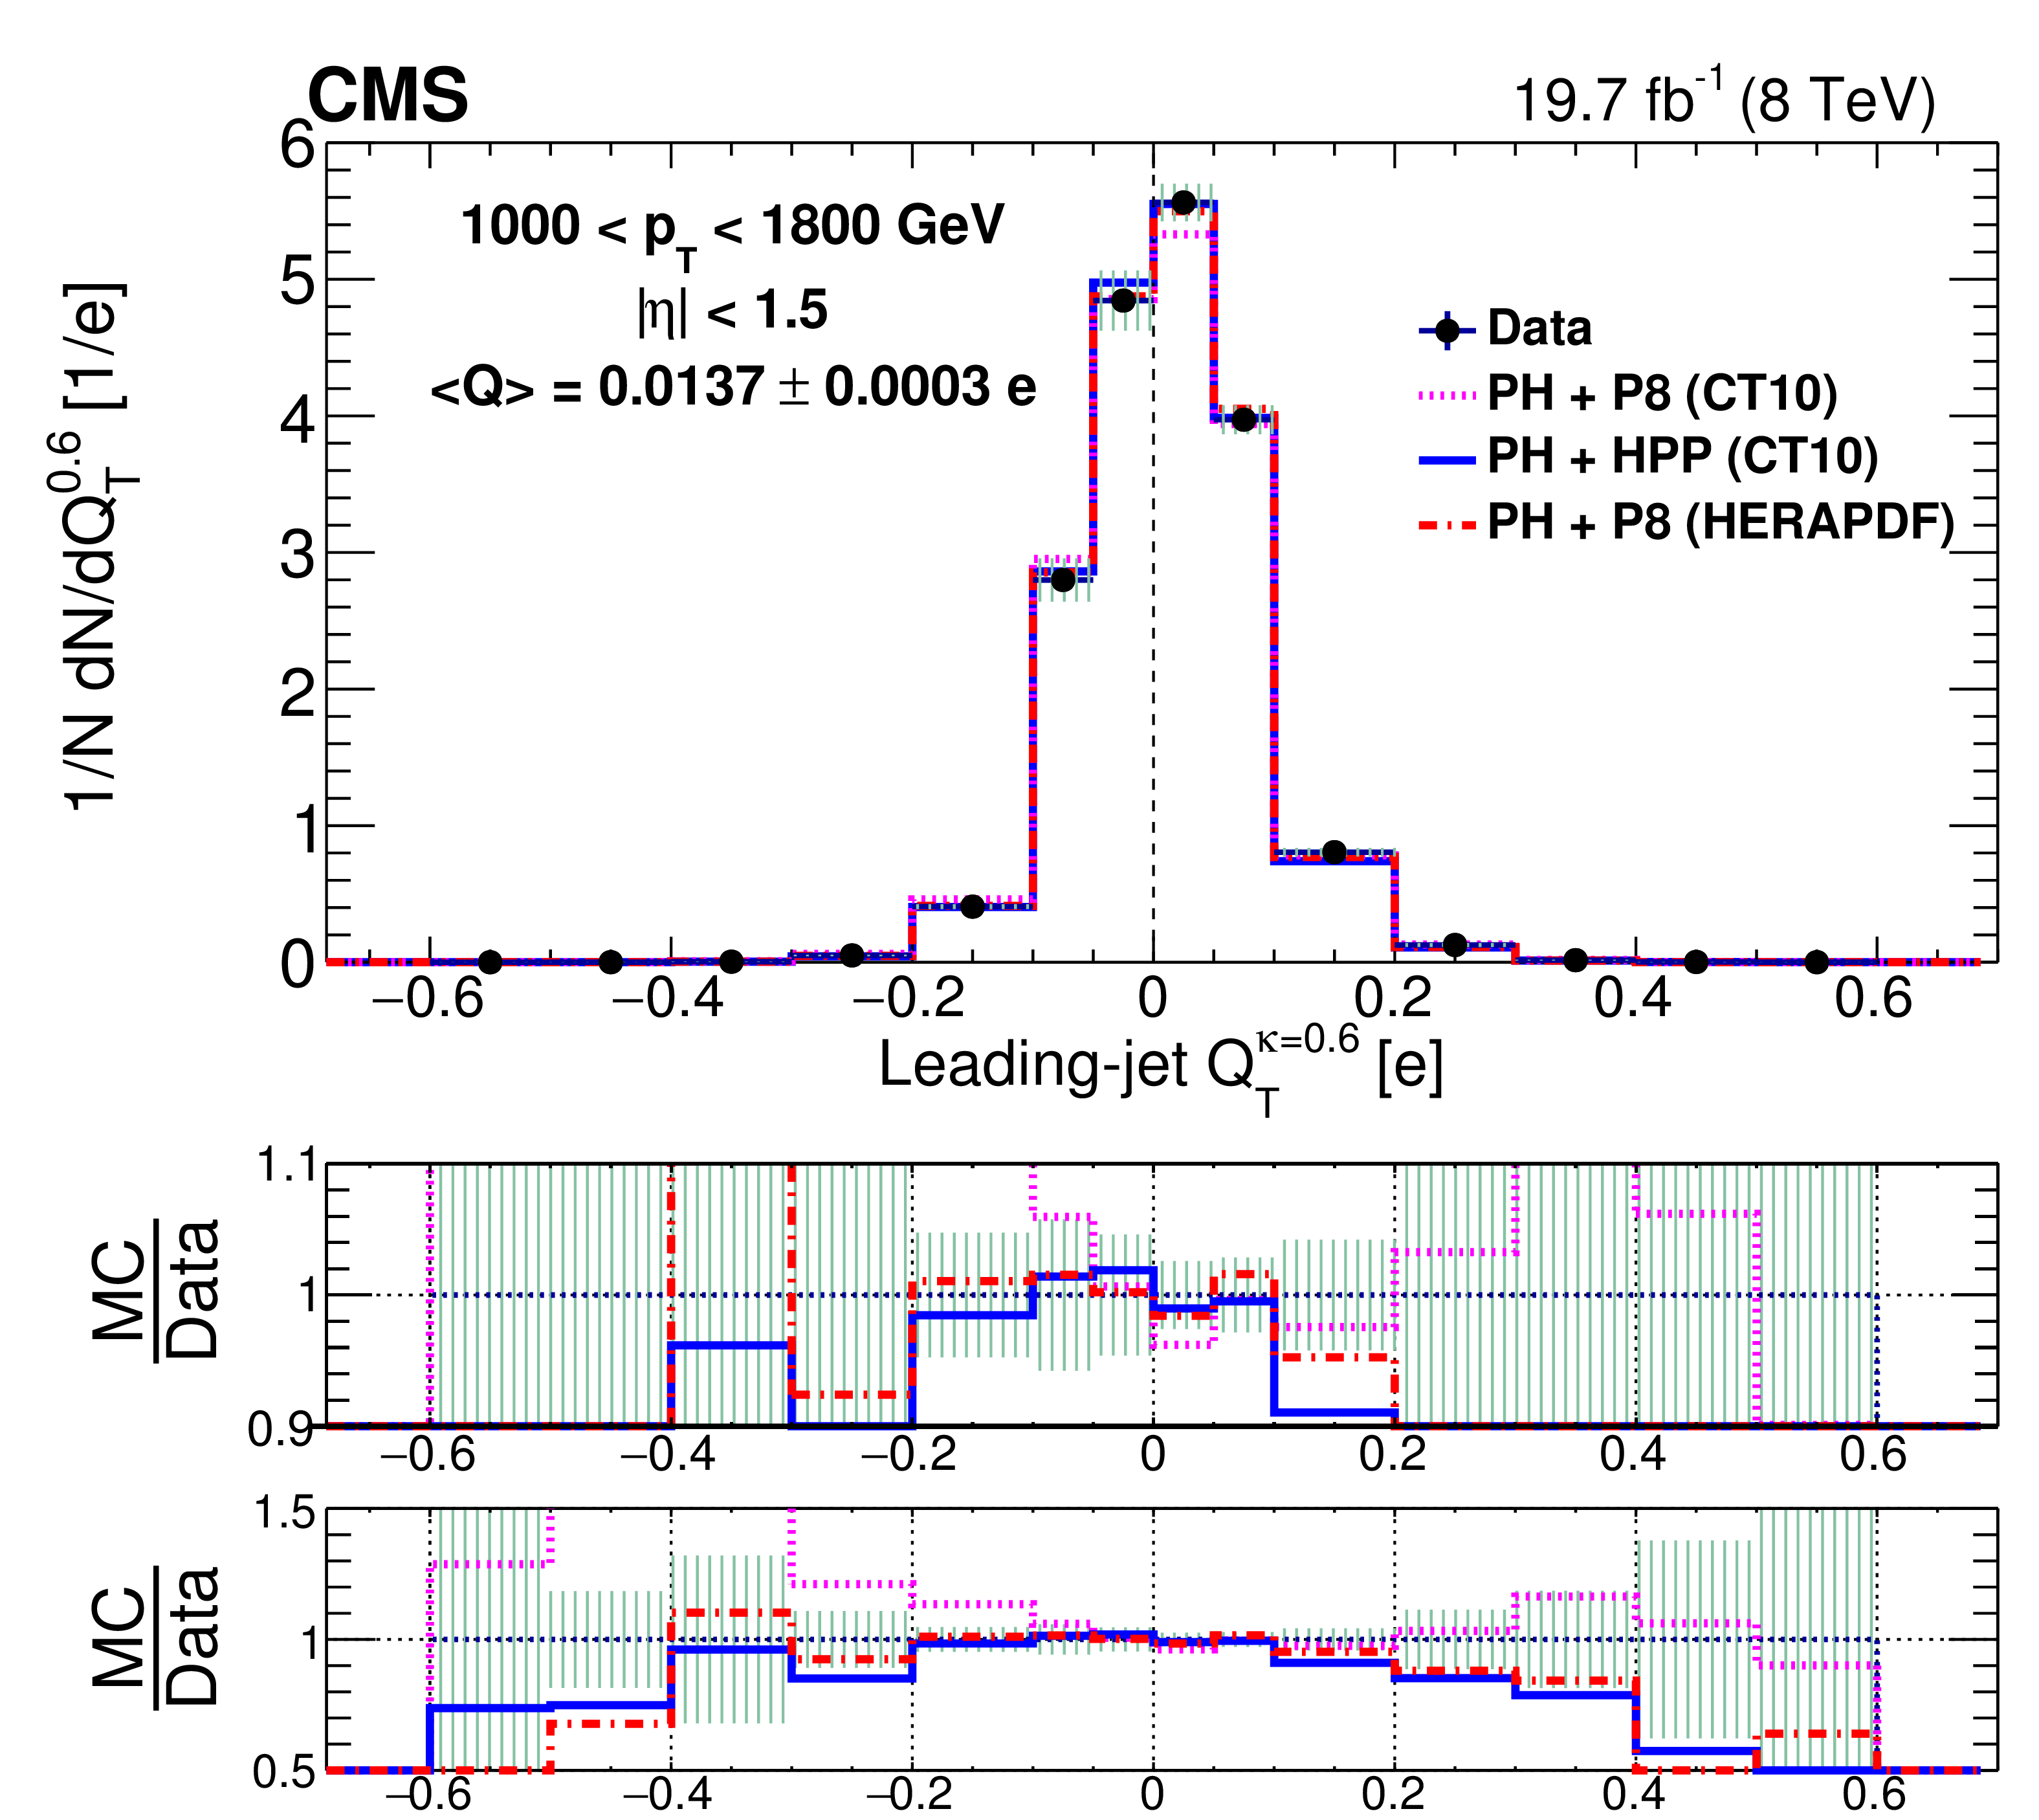
Figure 9-c:
Comparison of unfolded leading-jet transverse jet charge $Q_{T}^\kappa $ distribution with POWHEG + PYTHIA8 ("PH+P8'') and POWHEG + HERWIG++ ("PH+HPP'') generators in the range 1000 $ < p_{\mathrm{T} < $ 1800 GeV (leading jet) with $\kappa = $ 0.6. In addition to the POWHEG + PYTHIA8 predictions with the NLO CT10 PDF set ("CT10''), the distribution is also compared with the NLO HERAPDF1.5 set ("HERAPDF''). Hashed uncertainty bands include both statistical and systematic contributions in data, added in quadrature. The ratio of data to simulation is displayed twice below the plot with two different vertical scales. The average jet charge value is quoted on each panel only with statistical uncertainties. |
png pdf |
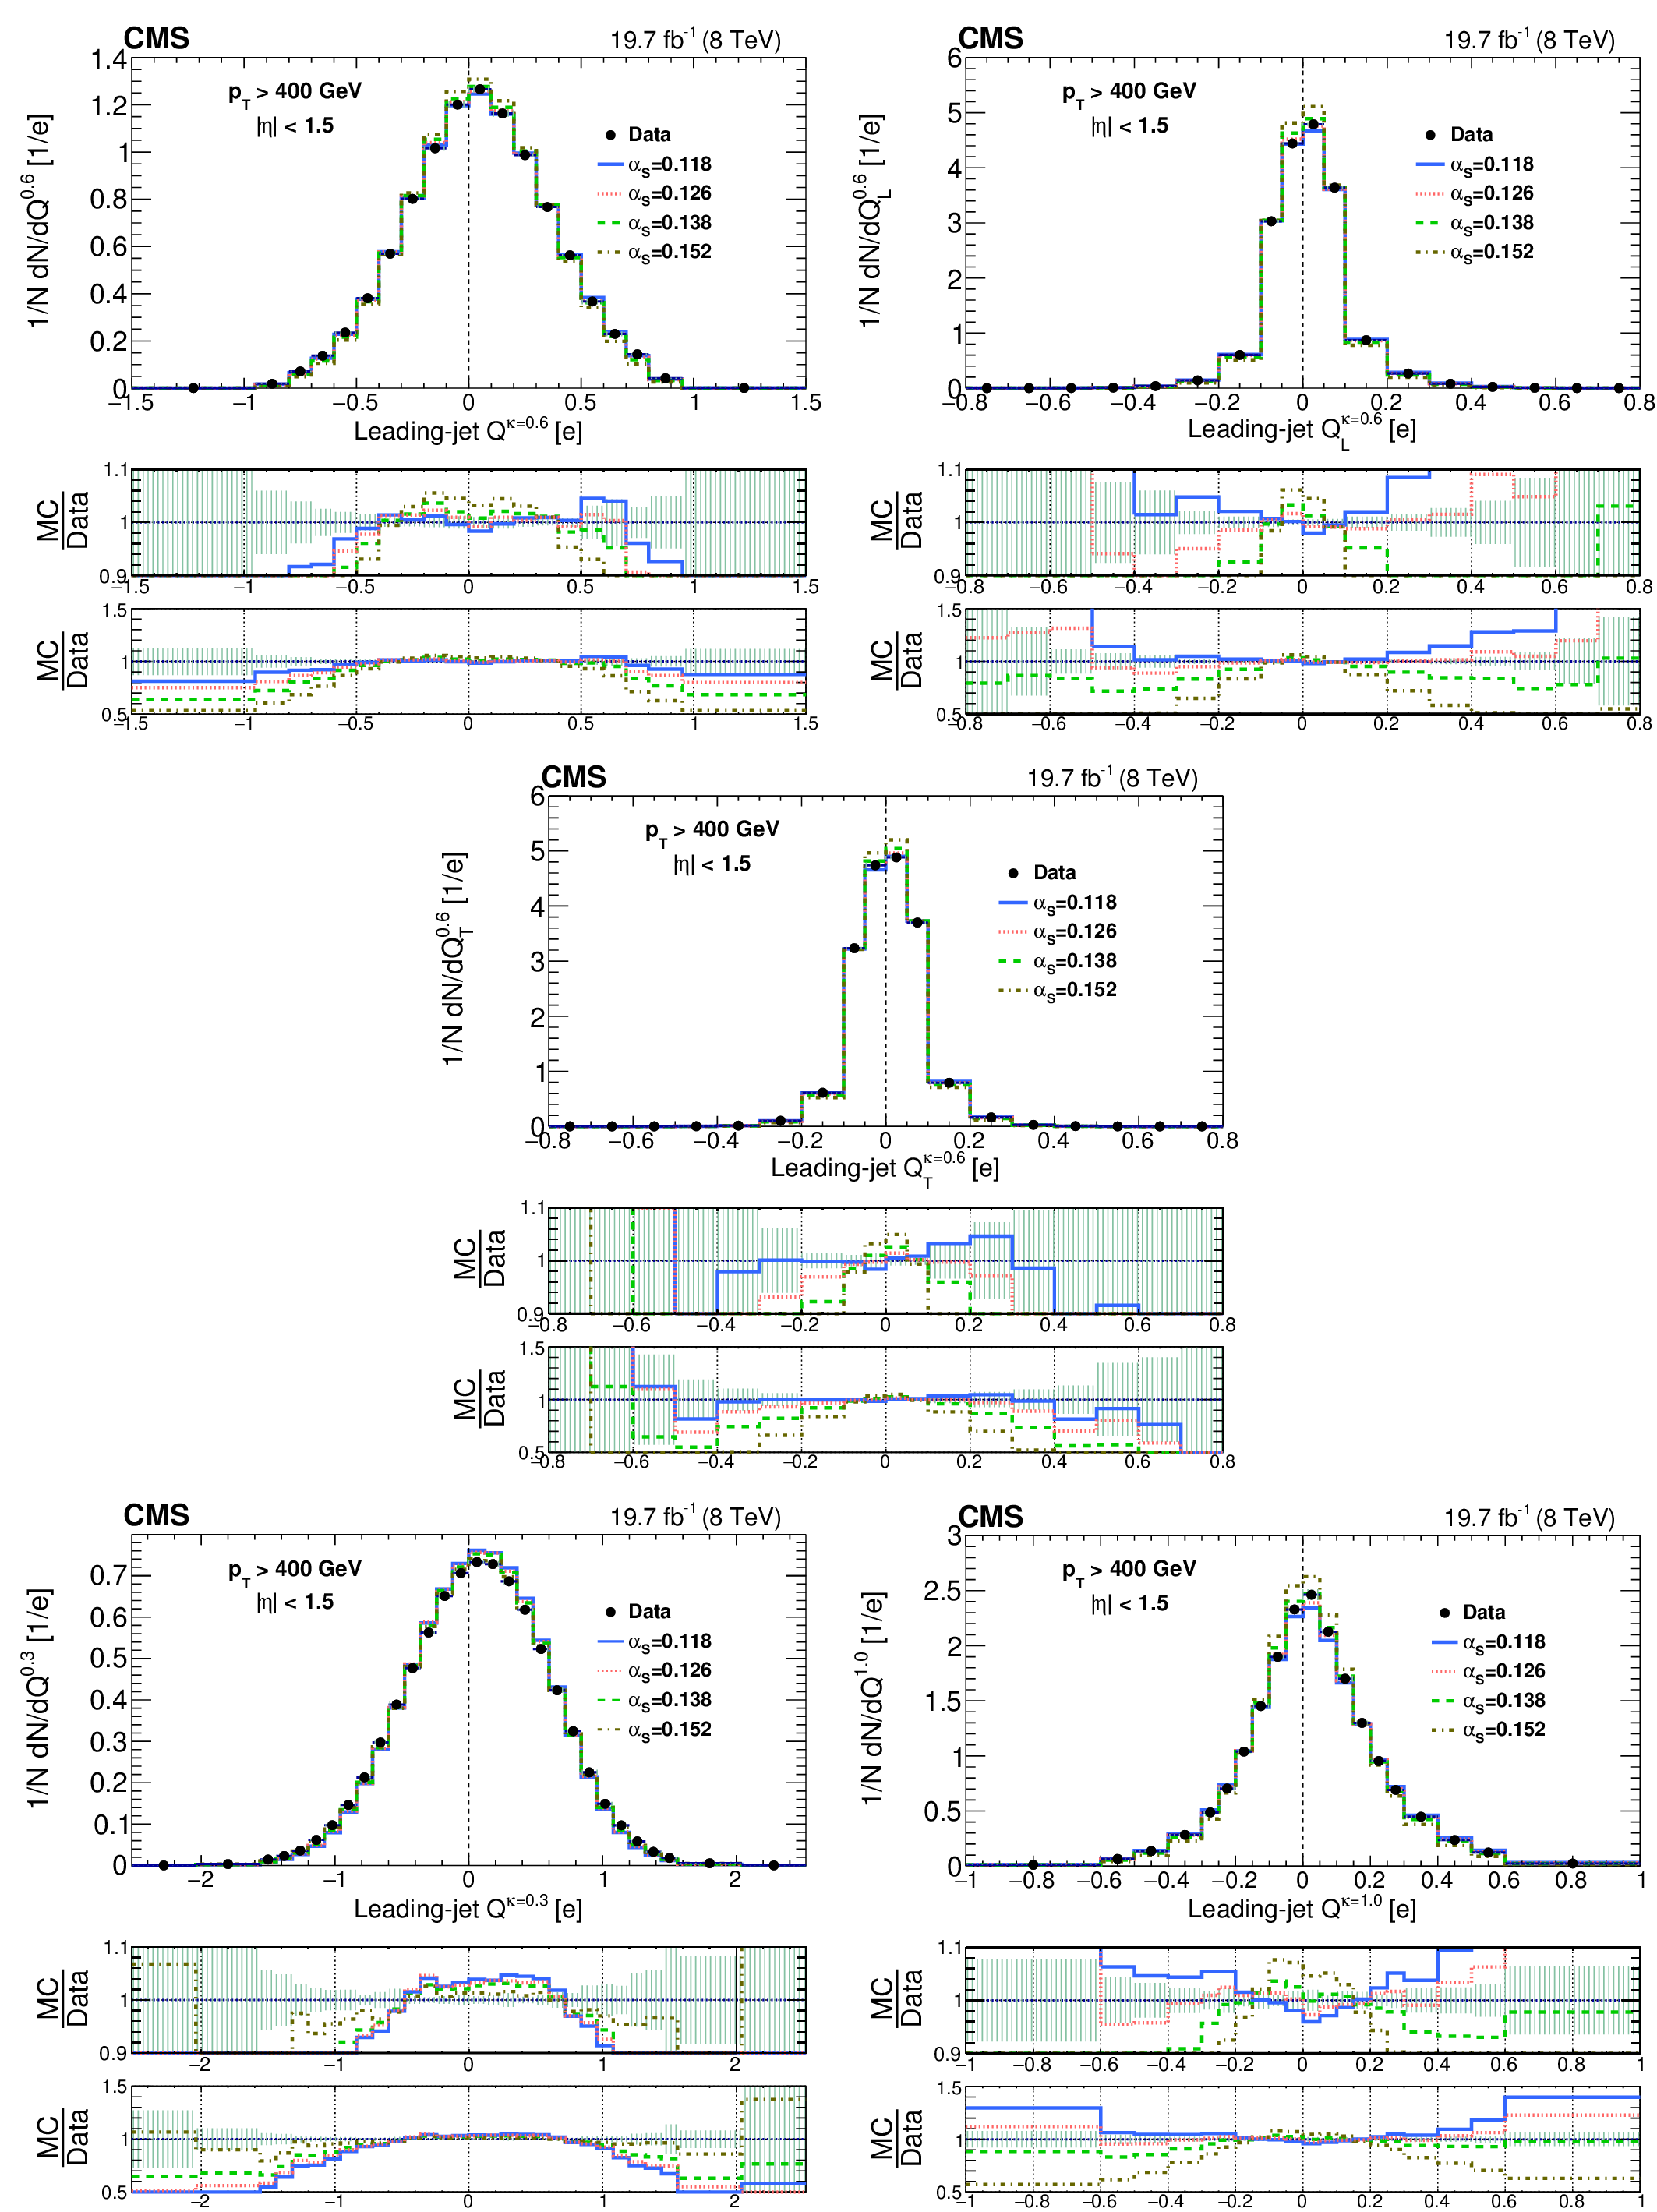
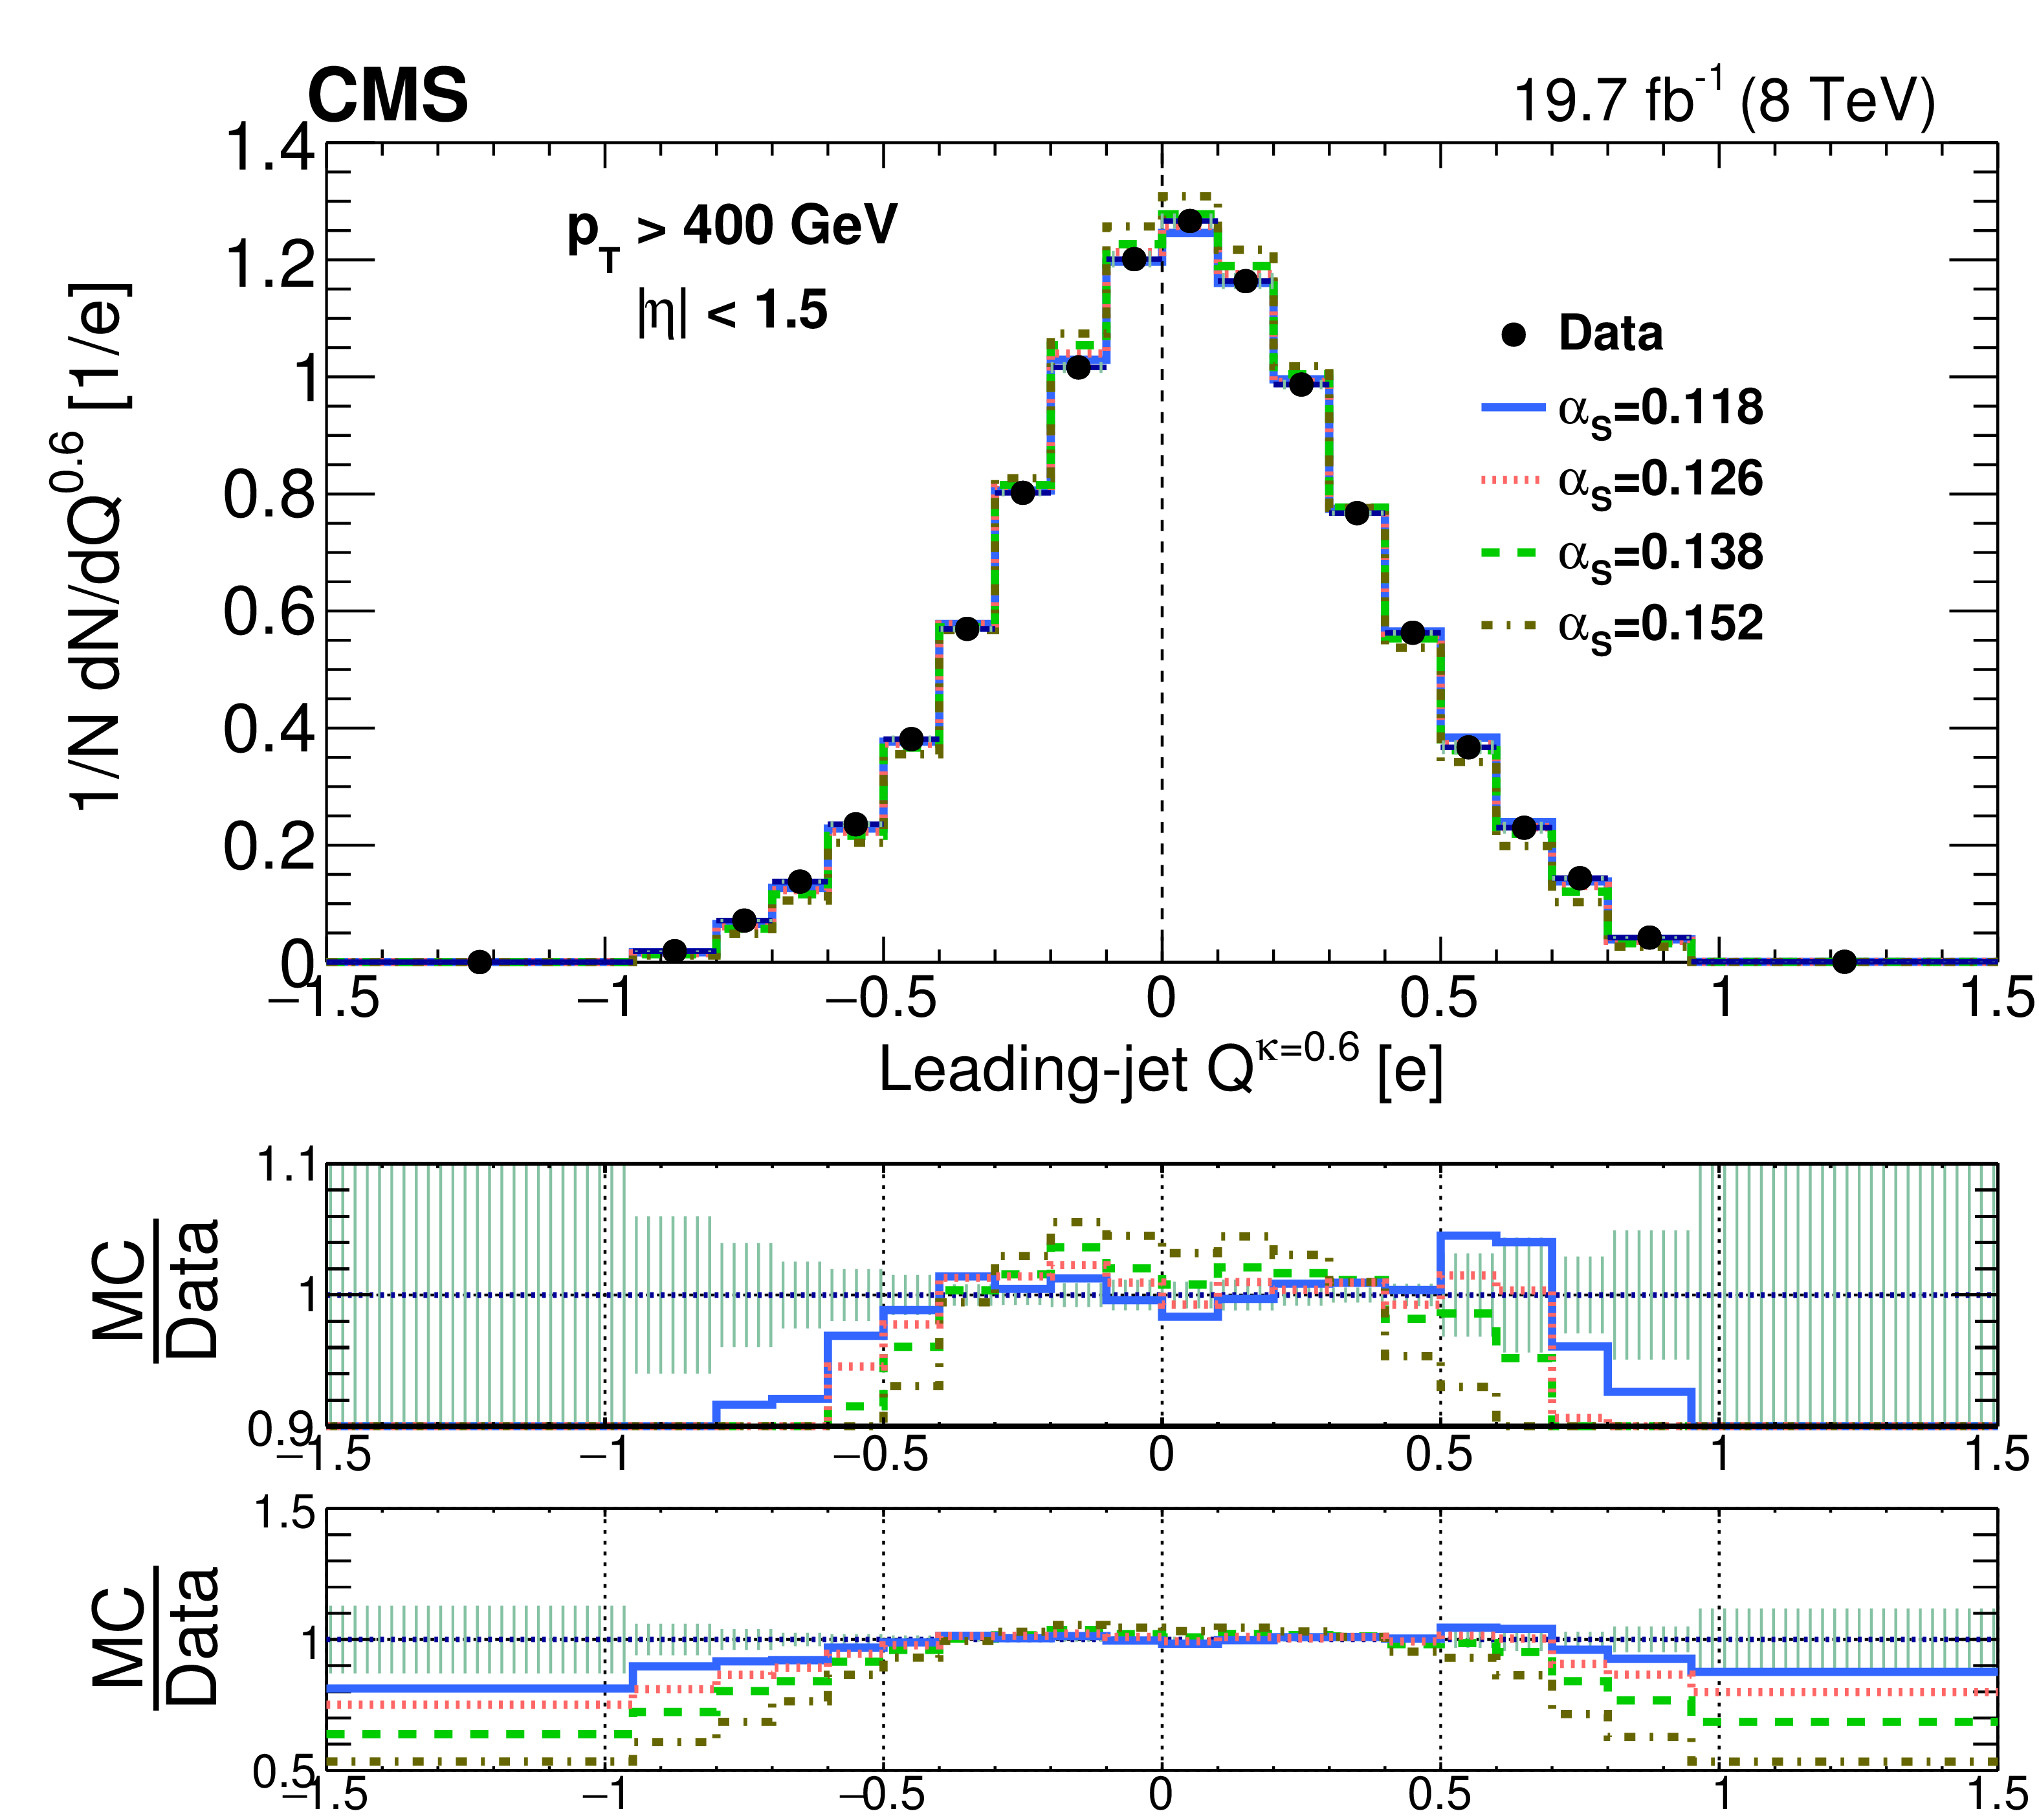
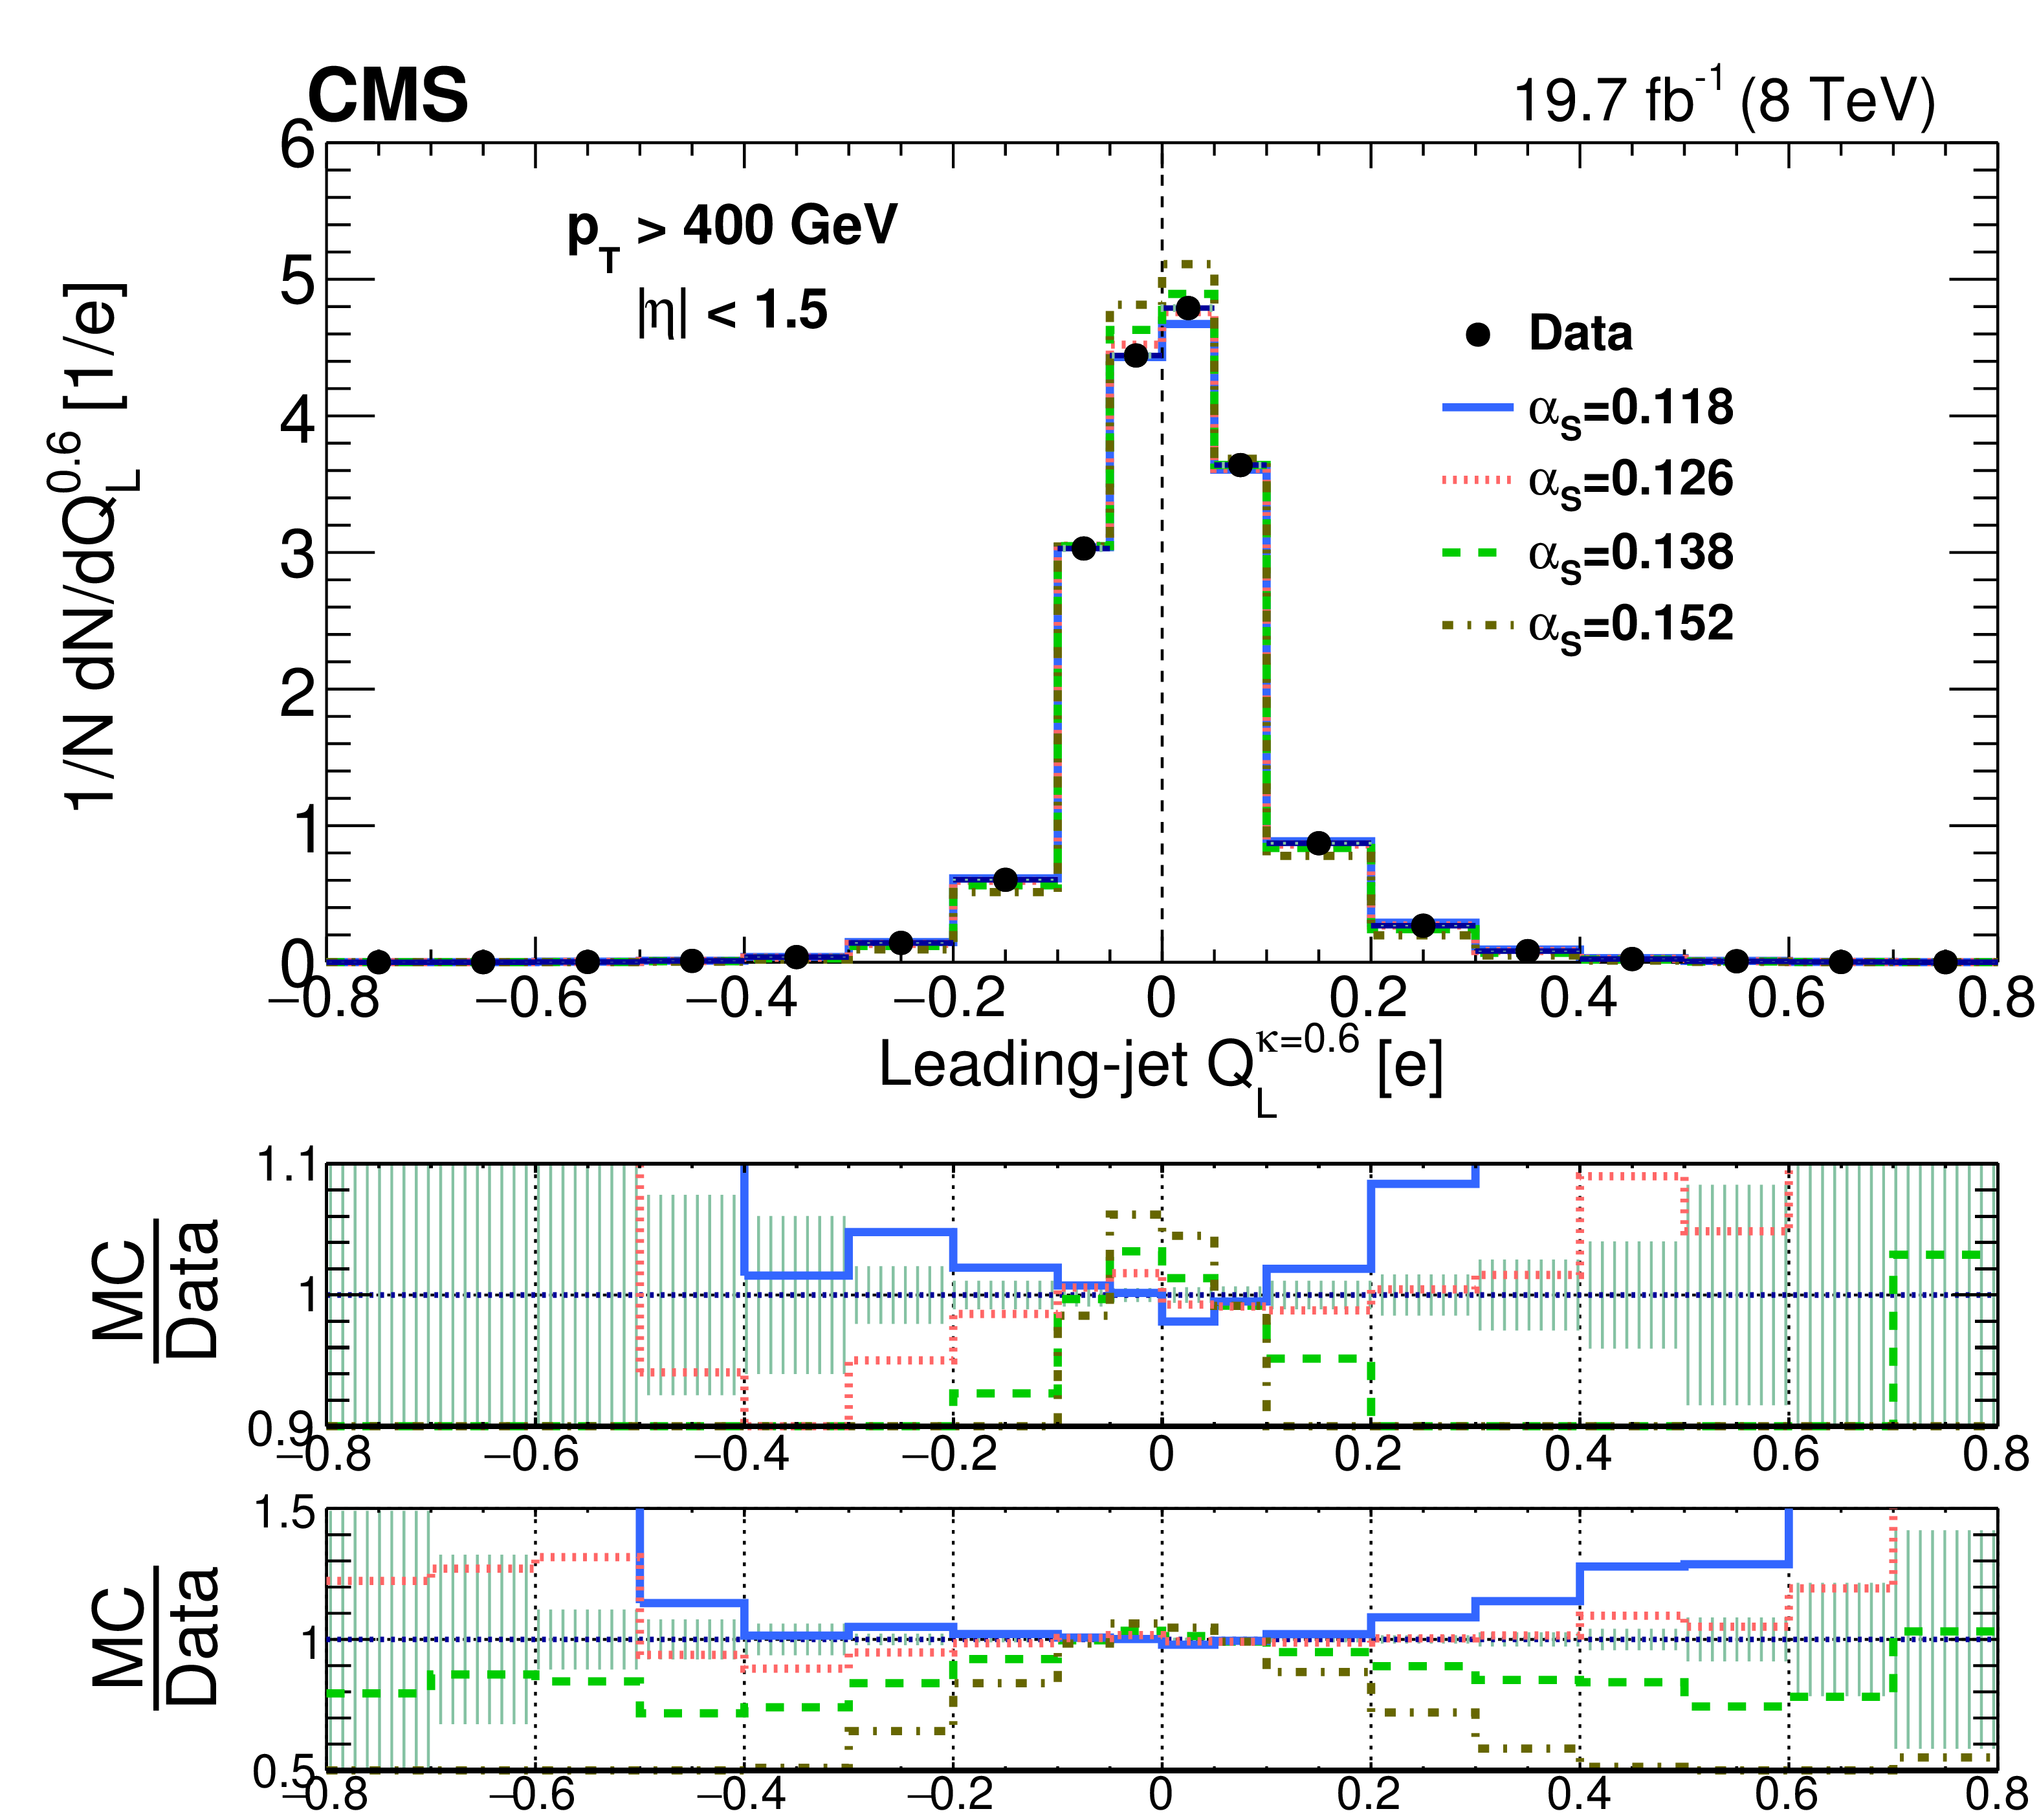
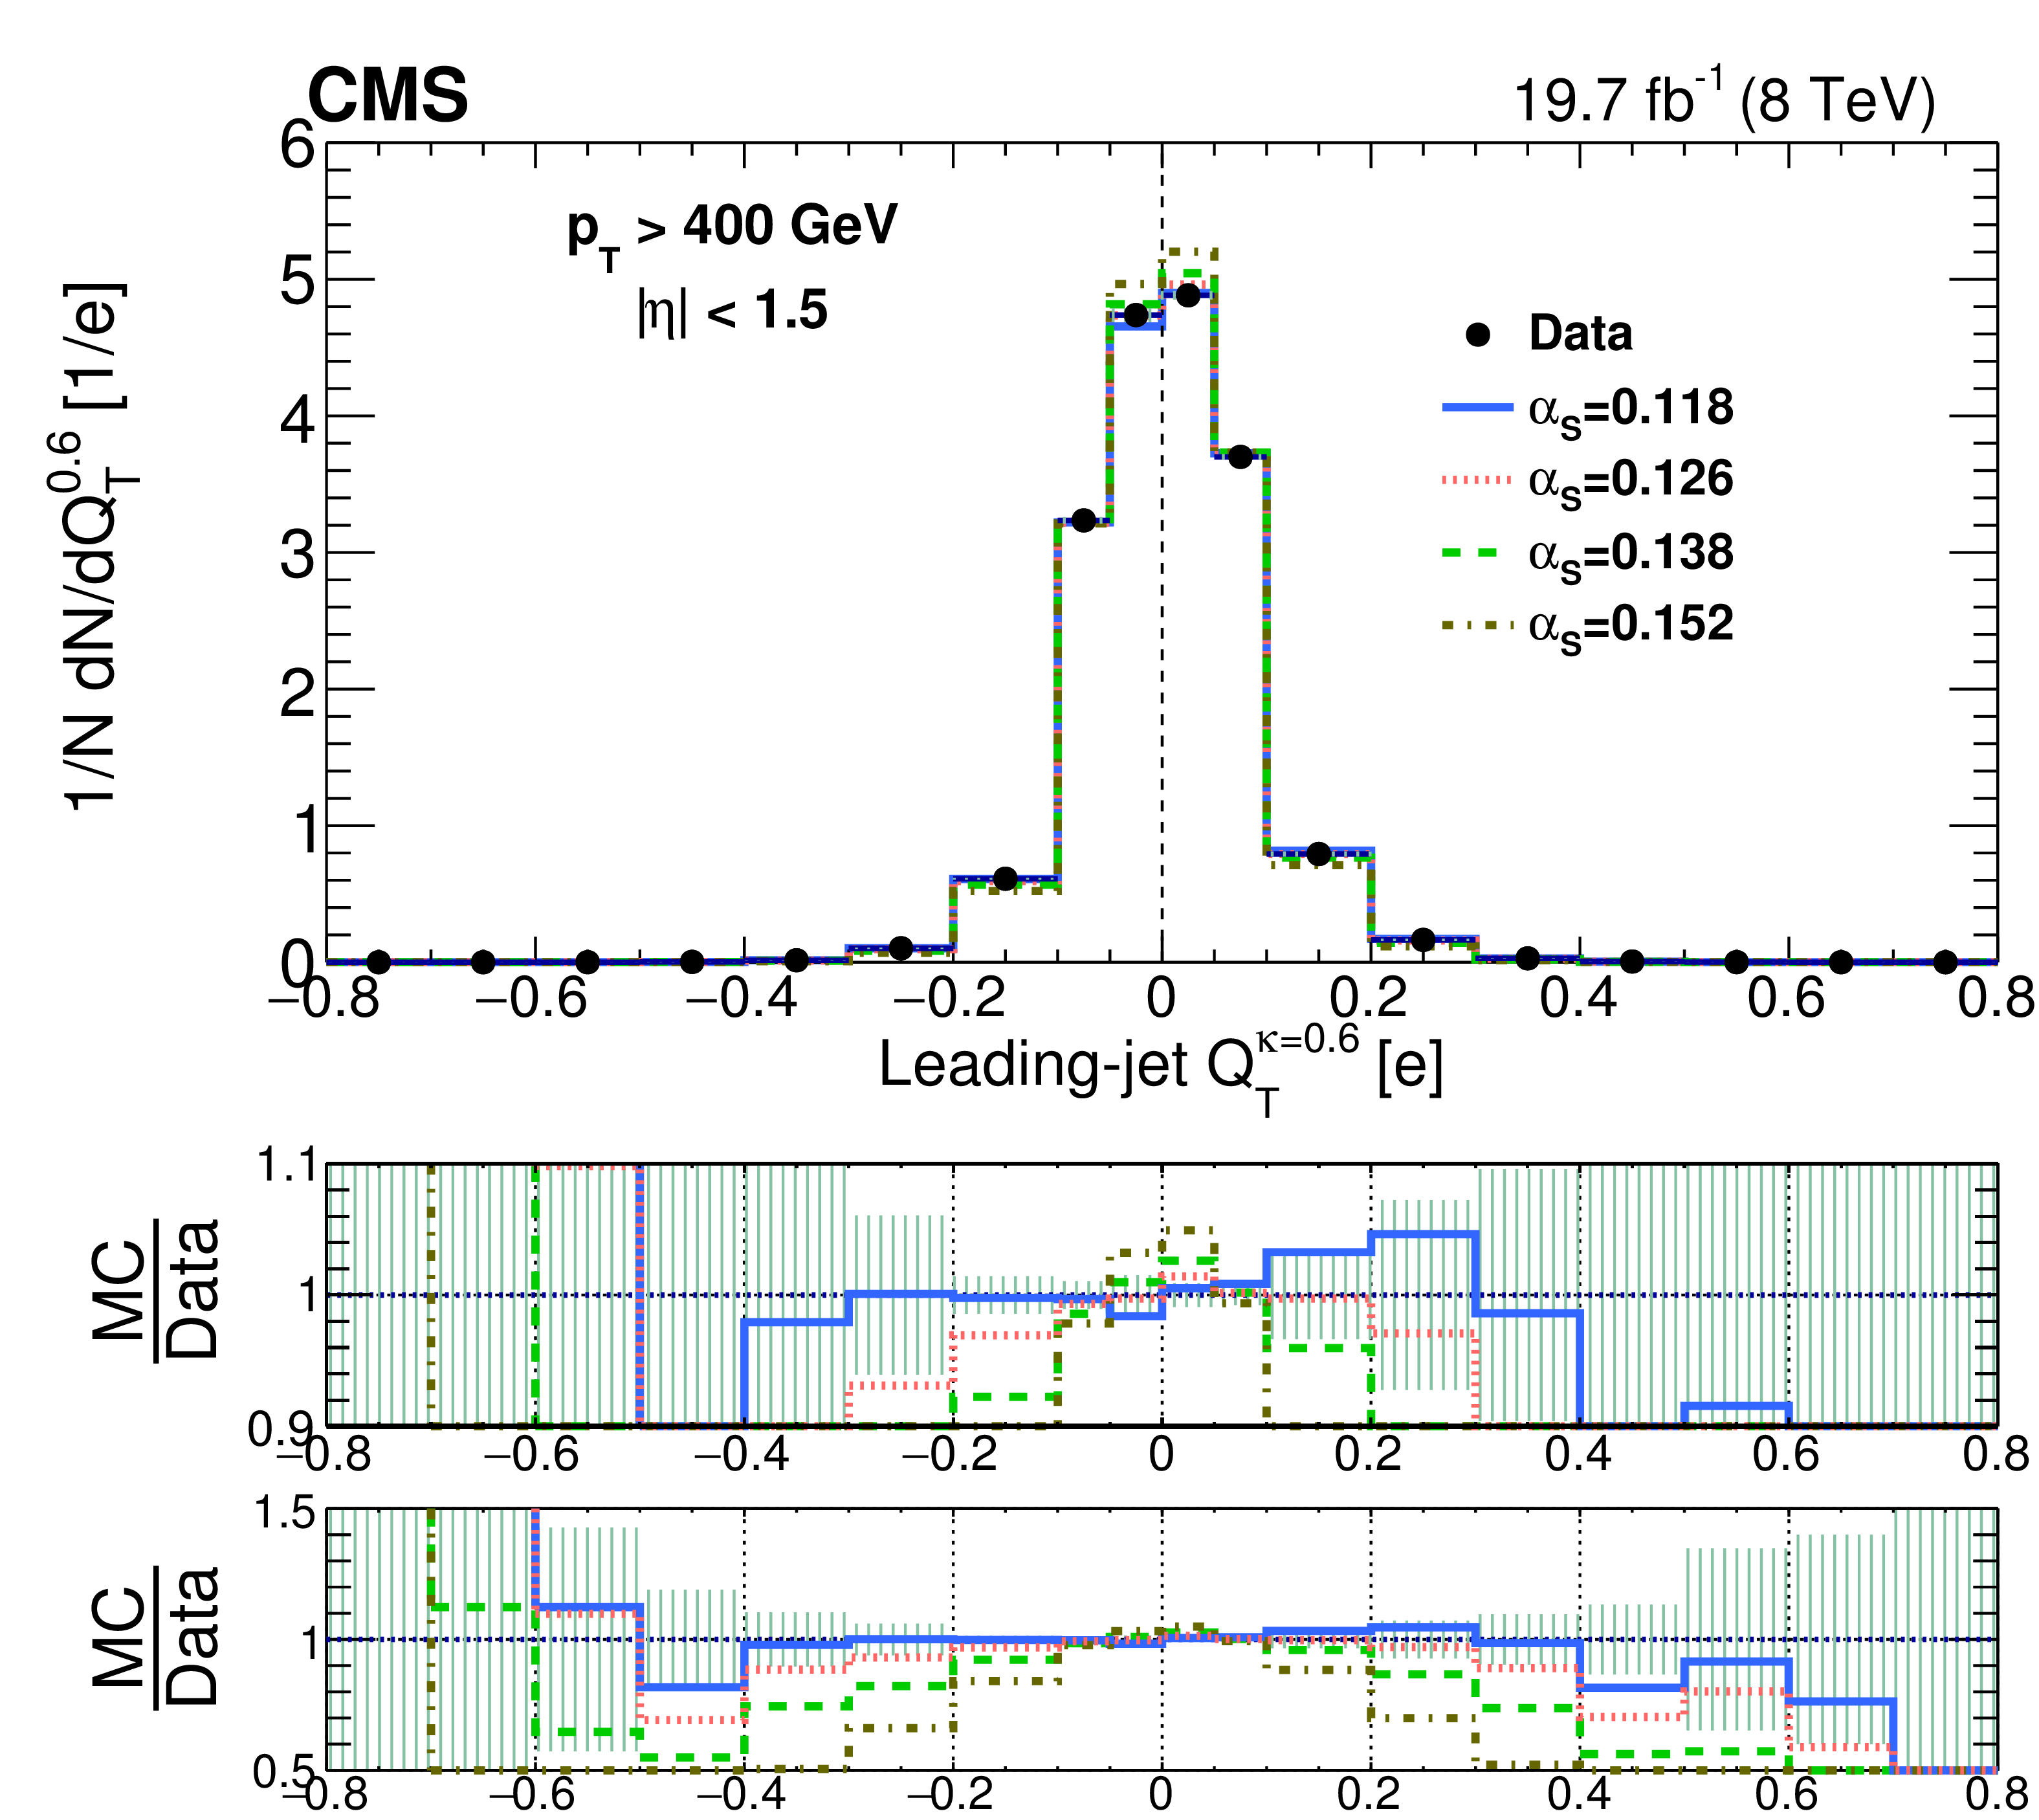
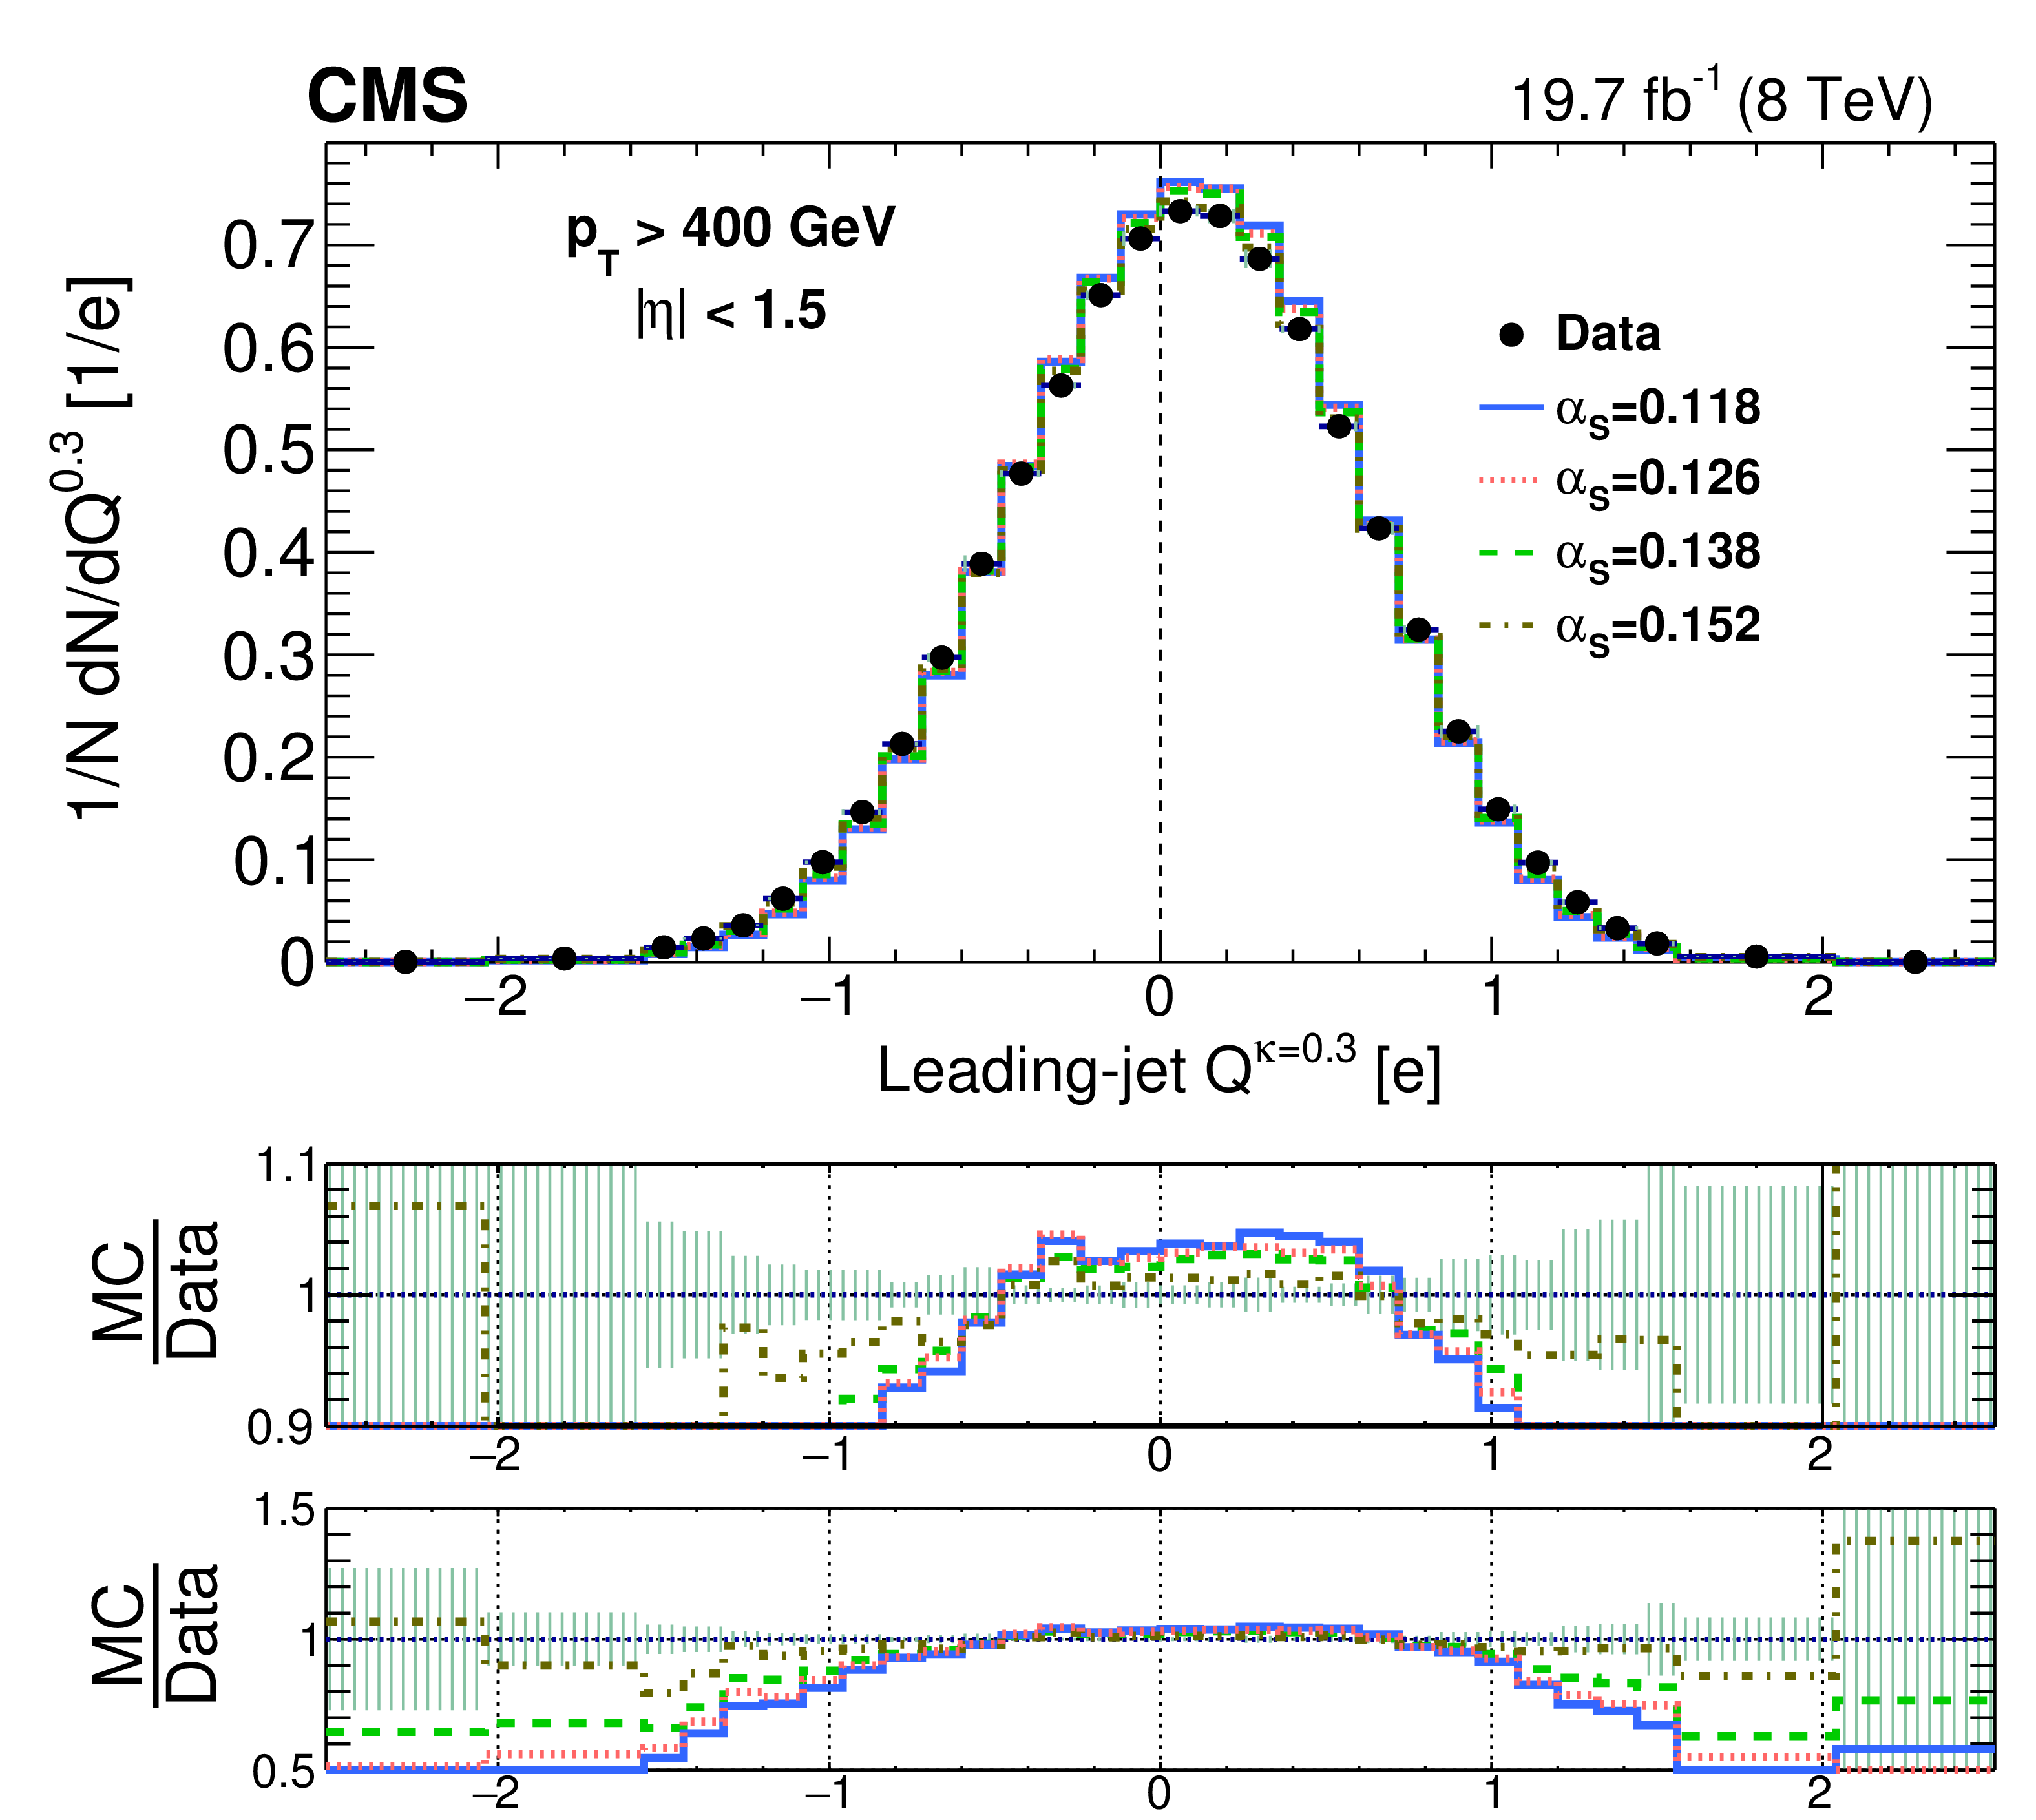
Figure 10:
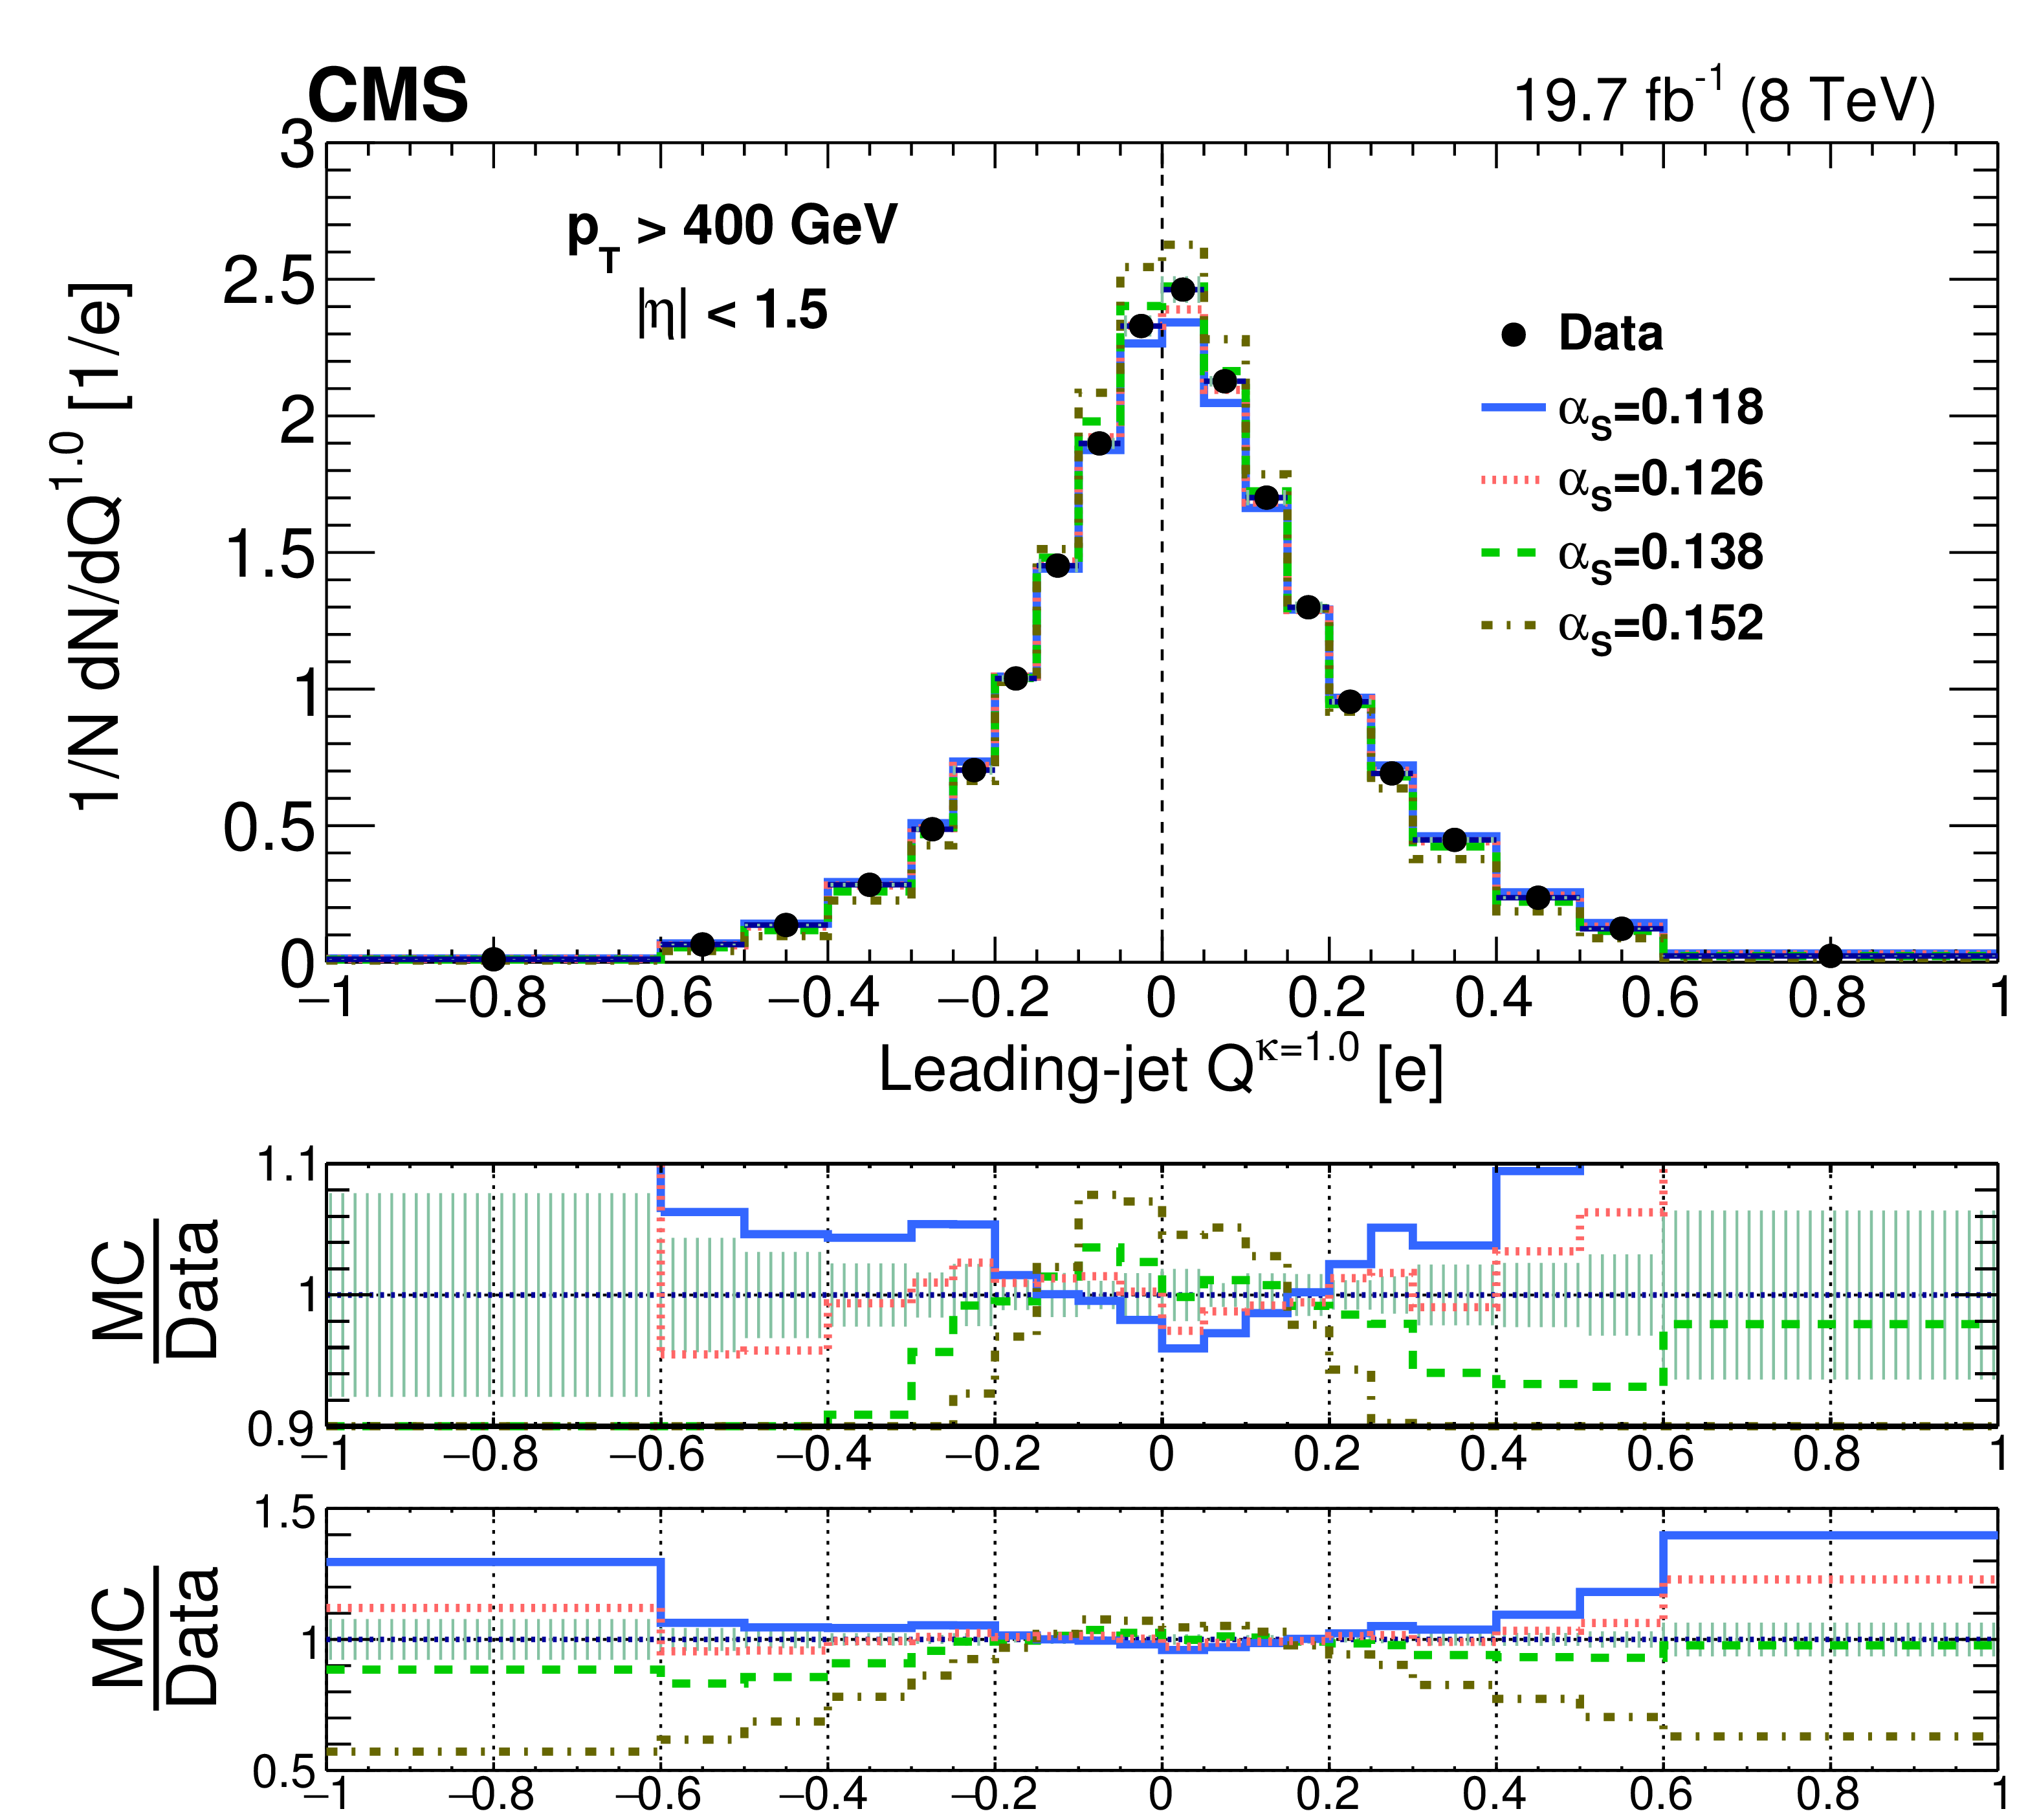
Comparison of unfolded leading-jet charge distributions with predictions from POWHEG + PYTHIA8. The NLO POWHEG prediction with the NLO CT10 PDF set is compared with predictions where the $\alpha _{S}$ parameter for final-state radiation in PYTHIA8 is varied from its default value of 0.138. The default jet charge definition ($Q^\kappa $) for $\kappa = $ 0.3, 0.6, 1.0, the longitudinal jet charge definition ($Q_{L}^\kappa $), and the transverse jet charge definition ($Q_{T}^\kappa $) are shown. Hashed uncertainty bands include both statistical and systematic contributions in data, added in quadrature. The ratio of data to simulation is displayed twice below each plot with two different vertical scales. |
png pdf |
Figure 10-a:
Comparison of the unfolded leading-jet default jet charge $Q^\kappa $ for $\kappa = $ 0.6 with predictions from POWHEG + PYTHIA8. The NLO POWHEG prediction with the NLO CT10 PDF set is compared with predictions where the $\alpha _{S}$ parameter for final-state radiation in PYTHIA8 is varied from its default value of 0.138. Hashed uncertainty bands include both statistical and systematic contributions in data, added in quadrature. The ratio of data to simulation is displayed twice below the plot with two different vertical scales. |
png pdf |
Figure 10-b :
Comparison of the unfolded leading-jet longitudinal jet charge $Q_{L}^\kappa $ for $\kappa = $ 0.6 with predictions from POWHEG + PYTHIA8. The NLO POWHEG prediction with the NLO CT10 PDF set is compared with predictions where the $\alpha _{S}$ parameter for final-state radiation in PYTHIA8 is varied from its default value of 0.138. Hashed uncertainty bands include both statistical and systematic contributions in data, added in quadrature. The ratio of data to simulation is displayed twice below the plot with two different vertical scales. |
png pdf |
Figure 10-c:
Comparison of the unfolded leading-jet transverse jet charge definition $Q_{T}^\kappa $ for $\kappa = $ 0.6 distribution with predictions from POWHEG + PYTHIA8. The NLO POWHEG prediction with the NLO CT10 PDF set is compared with predictions where the $\alpha _{S}$ parameter for final-state radiation in PYTHIA8 is varied from its default value of 0.138. Hashed uncertainty bands include both statistical and systematic contributions in data, added in quadrature. The ratio of data to simulation is displayed twice below the plot with two different vertical scales. |
png pdf |
Figure 10-d:
Comparison of the unfolded leading-jet default jet charge $Q^\kappa $ for $\kappa = $ 0.3 with predictions from POWHEG + PYTHIA8. The NLO POWHEG prediction with the NLO CT10 PDF set is compared with predictions where the $\alpha _{S}$ parameter for final-state radiation in PYTHIA8 is varied from its default value of 0.138. Hashed uncertainty bands include both statistical and systematic contributions in data, added in quadrature. The ratio of data to simulation is displayed twice below the plot with two different vertical scales. |
png pdf |
Figure 10-e:
Comparison of the unfolded leading-jet default jet charge $Q^\kappa $ for $\kappa = $ 1.0 with predictions from POWHEG + PYTHIA8. The NLO POWHEG prediction with the NLO CT10 PDF set is compared with predictions where the $\alpha _{S}$ parameter for final-state radiation in PYTHIA8 is varied from its default value of 0.138. Hashed uncertainty bands include both statistical and systematic contributions in data, added in quadrature. The ratio of data to simulation is displayed twice below the plot with two different vertical scales. |
| Tables | |
png pdf |
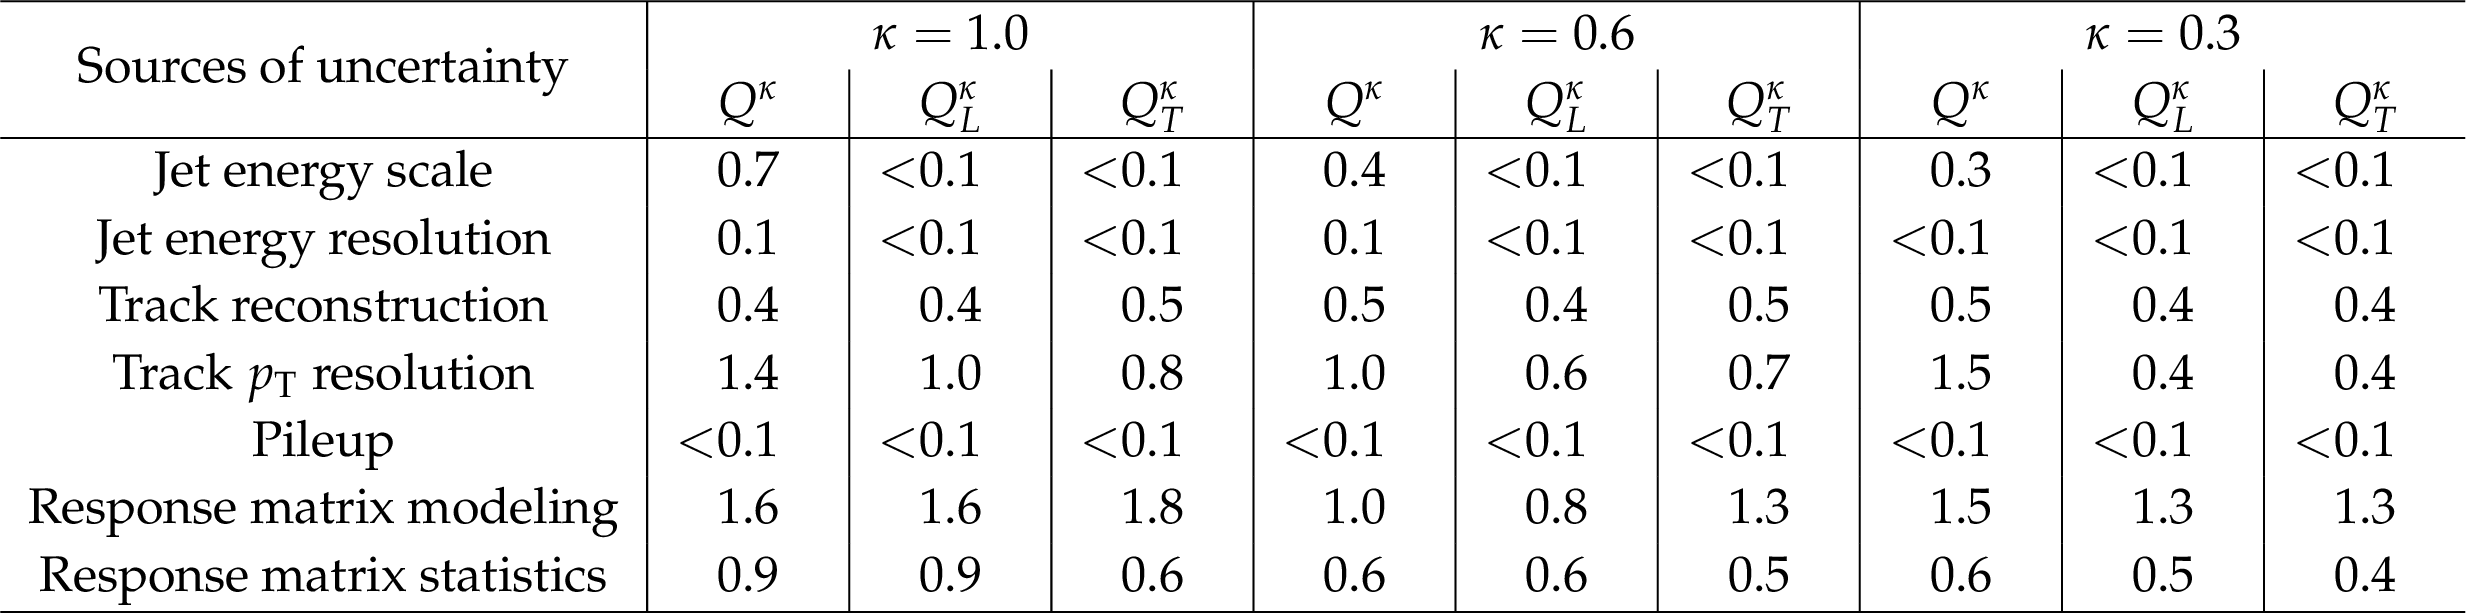
Table 1:
Systematic uncertainties in terms of their corresponding inverse-variance-weighted mean in the fractional deviation as defined in Eq.(4) in percent (%). |
| Summary |
| This paper presents measurements of jet charge distributions, unfolded for detector effects, with dijet events collected in proton-proton collisions at $ \sqrt{s} = $ 8 TeV corresponding to an integrated luminosity of 19.7 fb$^{-1}$. Distributions of the leading-jet charge are obtained for three ranges of leading-jet $ p_{\mathrm{T}} $ and for three definitions of jet charge. These three definitions of jet charge provide different sensitivities to parton fragmentation. Three choices for the $\kappa$ parameter are considered, which provide different sensitivities to the softer and harder particles in the jet. The variation of the jet charge with leading-jet $ p_{\mathrm{T}} $ is sensitive to the quark and gluon jet content in the dijet sample. In general, the predictions from POWHEG + PYTHIA8 and POWHEG + HERWIG++ generators show only mild discrepancies with the data distributions. Nevertheless, the differences between the predictions from POWHEG + PYTHIA8 and POWHEG + HERWIG++ can be reduced with the help of these measurements. |
| References | ||||
| 1 | R. D. Field and R. P. Feynman | A parametrization of the properties of quark jets | NPB 136 (1978) 1 | |
| 2 | Fermilab--Serpukhov--Moscow--Michigan Collaboration | Net charge in deep inelastic antineutrino-nucleon scattering | PLB 91 (1980) 311 | |
| 3 | Fermilab--Serpukhov--Moscow--Michigan Collaboration | Quark jets from antineutrino interactions (i). net charge and factorization in the quark jets | NPB 184 (1981) 13 | |
| 4 | Aachen--Bonn--CERN--Munich--Oxford Collaboration | Multiplicity distributions in neutrino-hydrogen interactions | NPB 181 (1981) 385 | |
| 5 | Aachen--Bonn--CERN--Munich--Oxford Collaboration | Charge properties of the hadronic system in $ \nu p $ and $ \overline{\nu}p $ interactions | PLB 112 (1982) 88 | |
| 6 | European Muon Collaboration | Quark charge retention in final state hadrons from deep inelastic muon scattering | PLB 144 (1984) 302 | |
| 7 | Amsterdam--Bologna--Padua--Pisa--Saclay--Turin Collaboration | Charged hadron multiplicities in high-energy $ \overline{\nu}_{\mu} n $ and $ \overline{\nu}_{\mu} p $ interactions | Z. Phys. C 11 (1982) 283, .[Erratum: \DOI10.1007/BF01571828] | |
| 8 | R. Erickson et al. | Charge Retention in Deep-Inelastic Electroproduction | PRL 42 (1979) 822, .[Erratum: \DOI10.1103/PhysRevLett.42.1246] | |
| 9 | SLD Collaboration | Measurement of the Parity-Violation Parameter $ A_b $ from the Left-Right Forward-Backward Asymmetry of $ b $ Quark Production in $ Z^0 $ Decays Using a Momentum-Weighted Track-Charge Technique | PRL 74 (1995) 2890 | |
| 10 | TASSO Collaboration | Measurement of the asymmetry of $ b $ quark production in $ e^{+}e^{-} $ annihilation at $ \sqrt{s} = $ 35 GeV | Z. Phys. C 48 (1990) 433 | |
| 11 | DELPHI Collaboration | A measurement of $ \sin^2\theta_W $ from the charge asymmetry of hadronic events at the $ Z^0 $ peak | PLB 277 (1992) 371 | |
| 12 | ALEPH Collaboration | Measurement of charge asymmetry in hadronic $ Z $ decays | PLB 259 (1991) 377 | |
| 13 | OPAL Collaboration | A measurement of the forward-backward asymmetry in hadronic decays of the $ Z^{0} $ | PLB 294 (1992) 436 | |
| 14 | OPAL Collaboration | Measurement of the time dependence of $ {\mathrm{B^0_d}} \leftrightarrow \overline{\mathrm{B^0_d}} $ mixing using a jet charge technique | PLB 327 (1994) 411 | |
| 15 | DELPHI Collaboration | Measurement of the $ {\mathrm{B^0_d}} $ oscillation frequency using kaons, leptons and jet charge | Z. Phys. C 72 (1996) 17 | |
| 16 | CDF Collaboration | Measurement of $ {\mathrm{B^0_d}} $, $ \overline{\mathrm{B^0_d}} $ flavor oscillations using jet-charge and lepton flavor tagging in $ {\mathrm{p}}\mathrm{\bar{p}} $ collisions at $ \sqrt{s} = $ 1.8 TeV | PRD 60 (1999) 072003 | hep-ex/9903011 |
| 17 | ALEPH Collaboration | Measurement of triple gauge boson couplings at 172 GeV | PLB 422 (1998) 369 | |
| 18 | DELPHI Collaboration | Measurement of trilinear gauge boson couplings $ WWV $, ($ V \equiv Z, \gamma $) in $ e^+ e^- $ collisions at 189 GeV | PLB 502 (2001) 9 | hep-ex/0102041 |
| 19 | L3 Collaboration | Measurement of triple gauge boson couplings of the $ W $ boson at LEP | PLB 467 (1999) 171 | hep-ex/9910008 |
| 20 | OPAL Collaboration | Measurement of triple gauge boson couplings from $ W^{+} W^{-} $ production at LEP energies up to 189 GeV | EPJC 19 (2001) 1 | hep-ex/0009022 |
| 21 | D0 Collaboration | Experimental Discrimination between Charge $ 2e/3 $ Top Quark and Charge $ 4e/3 $ Exotic Quark Production Scenarios | PRL 98 (2007) 041801 | hep-ex/0608044 |
| 22 | CDF Collaboration | Exclusion of exotic top-like quarks with $ -4/3 $ electric charge using jet-charge tagging in single-lepton $ t \bar{t} $ events at CDF | PRD 88 (2013) 032003 | 1304.4141 |
| 23 | ATLAS Collaboration | Measurement of the top quark charge in $ pp $ collisions at $ \sqrt{s} = $ 7 TeV with the ATLAS detector | JHEP 11 (2013) 031 | 1307.4568 |
| 24 | W. J. Waalewijn | Calculating the charge of a jet | PRD 86 (2012) 094030 | 1209.3019 |
| 25 | D. Krohn, M. D. Schwartz, T. Lin, and W. J. Waalewijn | Jet Charge at the LHC | PRL 110 (2013) 212001 | 1209.2421 |
| 26 | ATLAS Collaboration | Jet charge studies with the ATLAS detector using $ \sqrt{s} = $ 8 TeV proton-proton collision data | ATLAS-CONF-2013-086 | |
| 27 | CMS Collaboration | Identification techniques for highly boosted W bosons that decay into hadrons | JHEP 12 (2014) 017 | CMS-JME-13-006 1410.4227 |
| 28 | ATLAS Collaboration | Measurement of jet charge in dijet events from $ \sqrt{s} = 8 TeV pp $ collisions with the ATLAS detector | PRD 93 (2016) 052003 | 1509.05190 |
| 29 | CMS Collaboration | Description and performance of track and primary-vertex reconstruction with the CMS tracker | JINST 9 (2014) P10009 | CMS-TRK-11-001 1405.6569 |
| 30 | CMS Collaboration | Performance of photon reconstruction and identification with the CMS detector in proton-proton collisions at $ \sqrt{s} = $ 8 TeV | JINST 10 (2015) P08010 | CMS-EGM-14-001 1502.02702 |
| 31 | CMS Collaboration | The CMS trigger system | JINST 12 (2017) P01020 | CMS-TRG-12-001 1609.02366 |
| 32 | CMS Collaboration | The CMS experiment at the CERN LHC | JINST 3 (2008) S08004 | CMS-00-001 |
| 33 | T. Sjostrand, S. Mrenna, and P. Z. Skands | PYTHIA 6.4 physics and manual | JHEP 05 (2006) 026 | hep-ph/0603175 |
| 34 | T. Sjostrand, S. Mrenna, and P. Z. Skands | A brief introduction to PYTHIA 8.1 | CPC 178 (2008) 852 | 0710.3820 |
| 35 | S. Frixione, P. Nason, and C. Oleari | Matching NLO QCD computations with parton shower simulations: the POWHEG method | JHEP 11 (2007) 070 | 0709.2092 |
| 36 | S. Alioli, P. Nason, C. Oleari, and E. Re | A general framework for implementing NLO calculations in shower Monte Carlo programs: the POWHEG BOX | JHEP 06 (2010) 043 | 1002.2581 |
| 37 | P. Nason | A new method for combining NLO QCD with shower Monte Carlo algorithms | JHEP 11 (2004) 040 | hep-ph/0409146 |
| 38 | M. Bahr et al. | Herwig++ physics and manual | EPJC 58 (2008) 639 | 0803.0883 |
| 39 | S. Alioli et al. | Jet pair production in POWHEG | JHEP 11 (2011) 081 | 1012.3380 |
| 40 | CMS Collaboration | Study of the underlying event at forward rapidity in pp collisions at $ \sqrt{s} = $ 0.9, 2.76, and 7 TeV | JHEP 04 (2013) 072 | CMS-FWD-11-003 1302.2394 |
| 41 | CMS Collaboration | Event generator tunes obtained from underlying event and multiparton scattering measurements | EPJC 76 (2016) 155 | CMS-GEN-14-001 1512.00815 |
| 42 | R. Field | Min-Bias and the underlying event at the LHC | 1202.0901 | |
| 43 | B. Andersson, G. Gustafson, G. Ingelman, and T. Sjostrand | Parton fragmentation and string dynamics | PR 97 (1983) 31 | |
| 44 | T. Sjostrand | The merging of jets | PLB 142 (1984) 420 | |
| 45 | NNPDF Collaboration | Parton distributions with QED corrections | NPB. 887 (2013) 290 | 1308.0598 |
| 46 | NNPDF Collaboration | Unbiased global determination of parton distributions and their uncertainties at NNLO and at LO | NPB 855 (2012) 153 | 1107.2652 |
| 47 | S. Gieseke, P. Stephens, and B. Webber | New formalism for QCD parton showers | JHEP 12 (2003) 045 | hep-ph/0310083 |
| 48 | B. R. Webber | A QCD model for jet fragmentation including soft gluon interference | NPB 238 (1984) 492 | |
| 49 | GEANT4 Collaboration | GEANT4---a simulation toolkit | NIMA 506 (2003) 250 | |
| 50 | J. Pumplin et al. | New generation of parton distributions with uncertainties from global QCD analysis | JHEP 07 (2002) 012 | hep-ph/0201195 |
| 51 | H.-L. Lai et al. | New parton distributions for collider physics | PRD 82 (2010) 074024 | 1007.2241 |
| 52 | H1 and ZEUS Collaborations | Combined measurement and QCD analysis of the inclusive $ e^{\pm}p $ scattering cross sections at HERA | JHEP 01 (2010) 109 | 0911.0884 |
| 53 | CMS Collaboration | Particle-flow reconstruction and global event description with the CMS detector | JINST 12 (2017) P10003 | CMS-PRF-14-001 1706.04965 |
| 54 | M. Cacciari, G. P. Salam, and G. Soyez | The anti-$ k_t $ jet clustering algorithm | JHEP 04 (2008) 063 | 0802.1189 |
| 55 | M. Cacciari, G. P. Salam, and G. Soyez | FastJet user manual | EPJC 72 (2012) 1896 | 1111.6097 |
| 56 | CMS Collaboration | Determination of jet energy calibration and transverse momentum resolution in CMS | JINST 6 (2011) P11002 | CMS-JME-10-011 1107.4277 |
| 57 | CMS Collaboration | Jet performance in pp collisions at 7 TeV | CMS-PAS-JME-10-003 | |
| 58 | G. D'Agostini | A multidimensional unfolding method based on Bayes' theorem | NIMA 362 (1995) 487 | |
| 59 | W. H. Richardson | Bayesian-Based Iterative Method of Image Restoration | Opt. Soc. Am. 62 (1972) 55 | |
| 60 | L. B. Lucy | An iterative technique for the rectification of observed distributions | Astron. J. 79 (1974) 745 | |
| 61 | A. Hocker and V. Kartvelishvili | SVD approach to data unfolding | NIMA 372 (1996) 469 | hep-ph/9509307 |
| 62 | T. Adye | Unfolding algorithms and tests using RooUnfold | in Proceedings of the PHYSTAT 2011 Workshop, CERN, Geneva, Switzerland, January 2011, CERN-2011-006, p. 313 2011 | 1105.1160 |
| 63 | CMS Collaboration | Measurement and QCD analysis of double-differential inclusive jet cross sections in pp collisions at $ \sqrt{s} = $ 8 TeV and cross section ratios to 2.76 and 7 TeV | JHEP 03 (2017) 156 | CMS-SMP-14-001 1609.05331 |
|
|
Compact Muon Solenoid LHC, CERN |
|

|

|

|

|

|