

Compact Muon Solenoid
LHC, CERN
| CMS-SMP-17-002 ; CERN-EP-2017-234 | ||
| Measurement of differential cross sections in the $\phi^*$ variable for inclusive $\mathrm{Z}$ boson production in pp collisions at $\sqrt{s} = $ 8 TeV | ||
| CMS Collaboration | ||
| 22 October 2017 | ||
| JHEP 03 (2018) 172 | ||
| Abstract: Measurements of differential cross sections ${\mathrm{d}}\sigma / {\mathrm{d}}\phi^*$ and double-differential cross sections ${\mathrm{d}}^2\sigma / {\mathrm{d}}\phi^*{\mathrm{d}}{|y|}$ for inclusive Z boson production are presented using the dielectron and dimuon final states. The kinematic observable $\phi^*$ correlates with the dilepton transverse momentum but has better resolution, and $y$ is the dilepton rapidity. The analysis is based on data collected with the CMS experiment at a centre-of-mass energy of 8 TeV corresponding to an integrated luminosity of 19.7 fb$^{-1}$. The normalised cross section $(1 / \sigma)\,{\mathrm{d}}\sigma / {\mathrm{d}}\phi^*$, within the fiducial kinematic region, is measured with a precision of better than 0.5% for $\phi^* < $ 1. The measurements are compared to theoretical predictions and they agree, typically, within few percent. | ||
| Links: e-print arXiv:1710.07955 [hep-ex] (PDF) ; CDS record ; inSPIRE record ; HepData record ; CADI line (restricted) ; | ||
| Figures | Summary | Additional Figures & Tables | References | CMS Publications |
|---|
| Figures | |

png pdf |
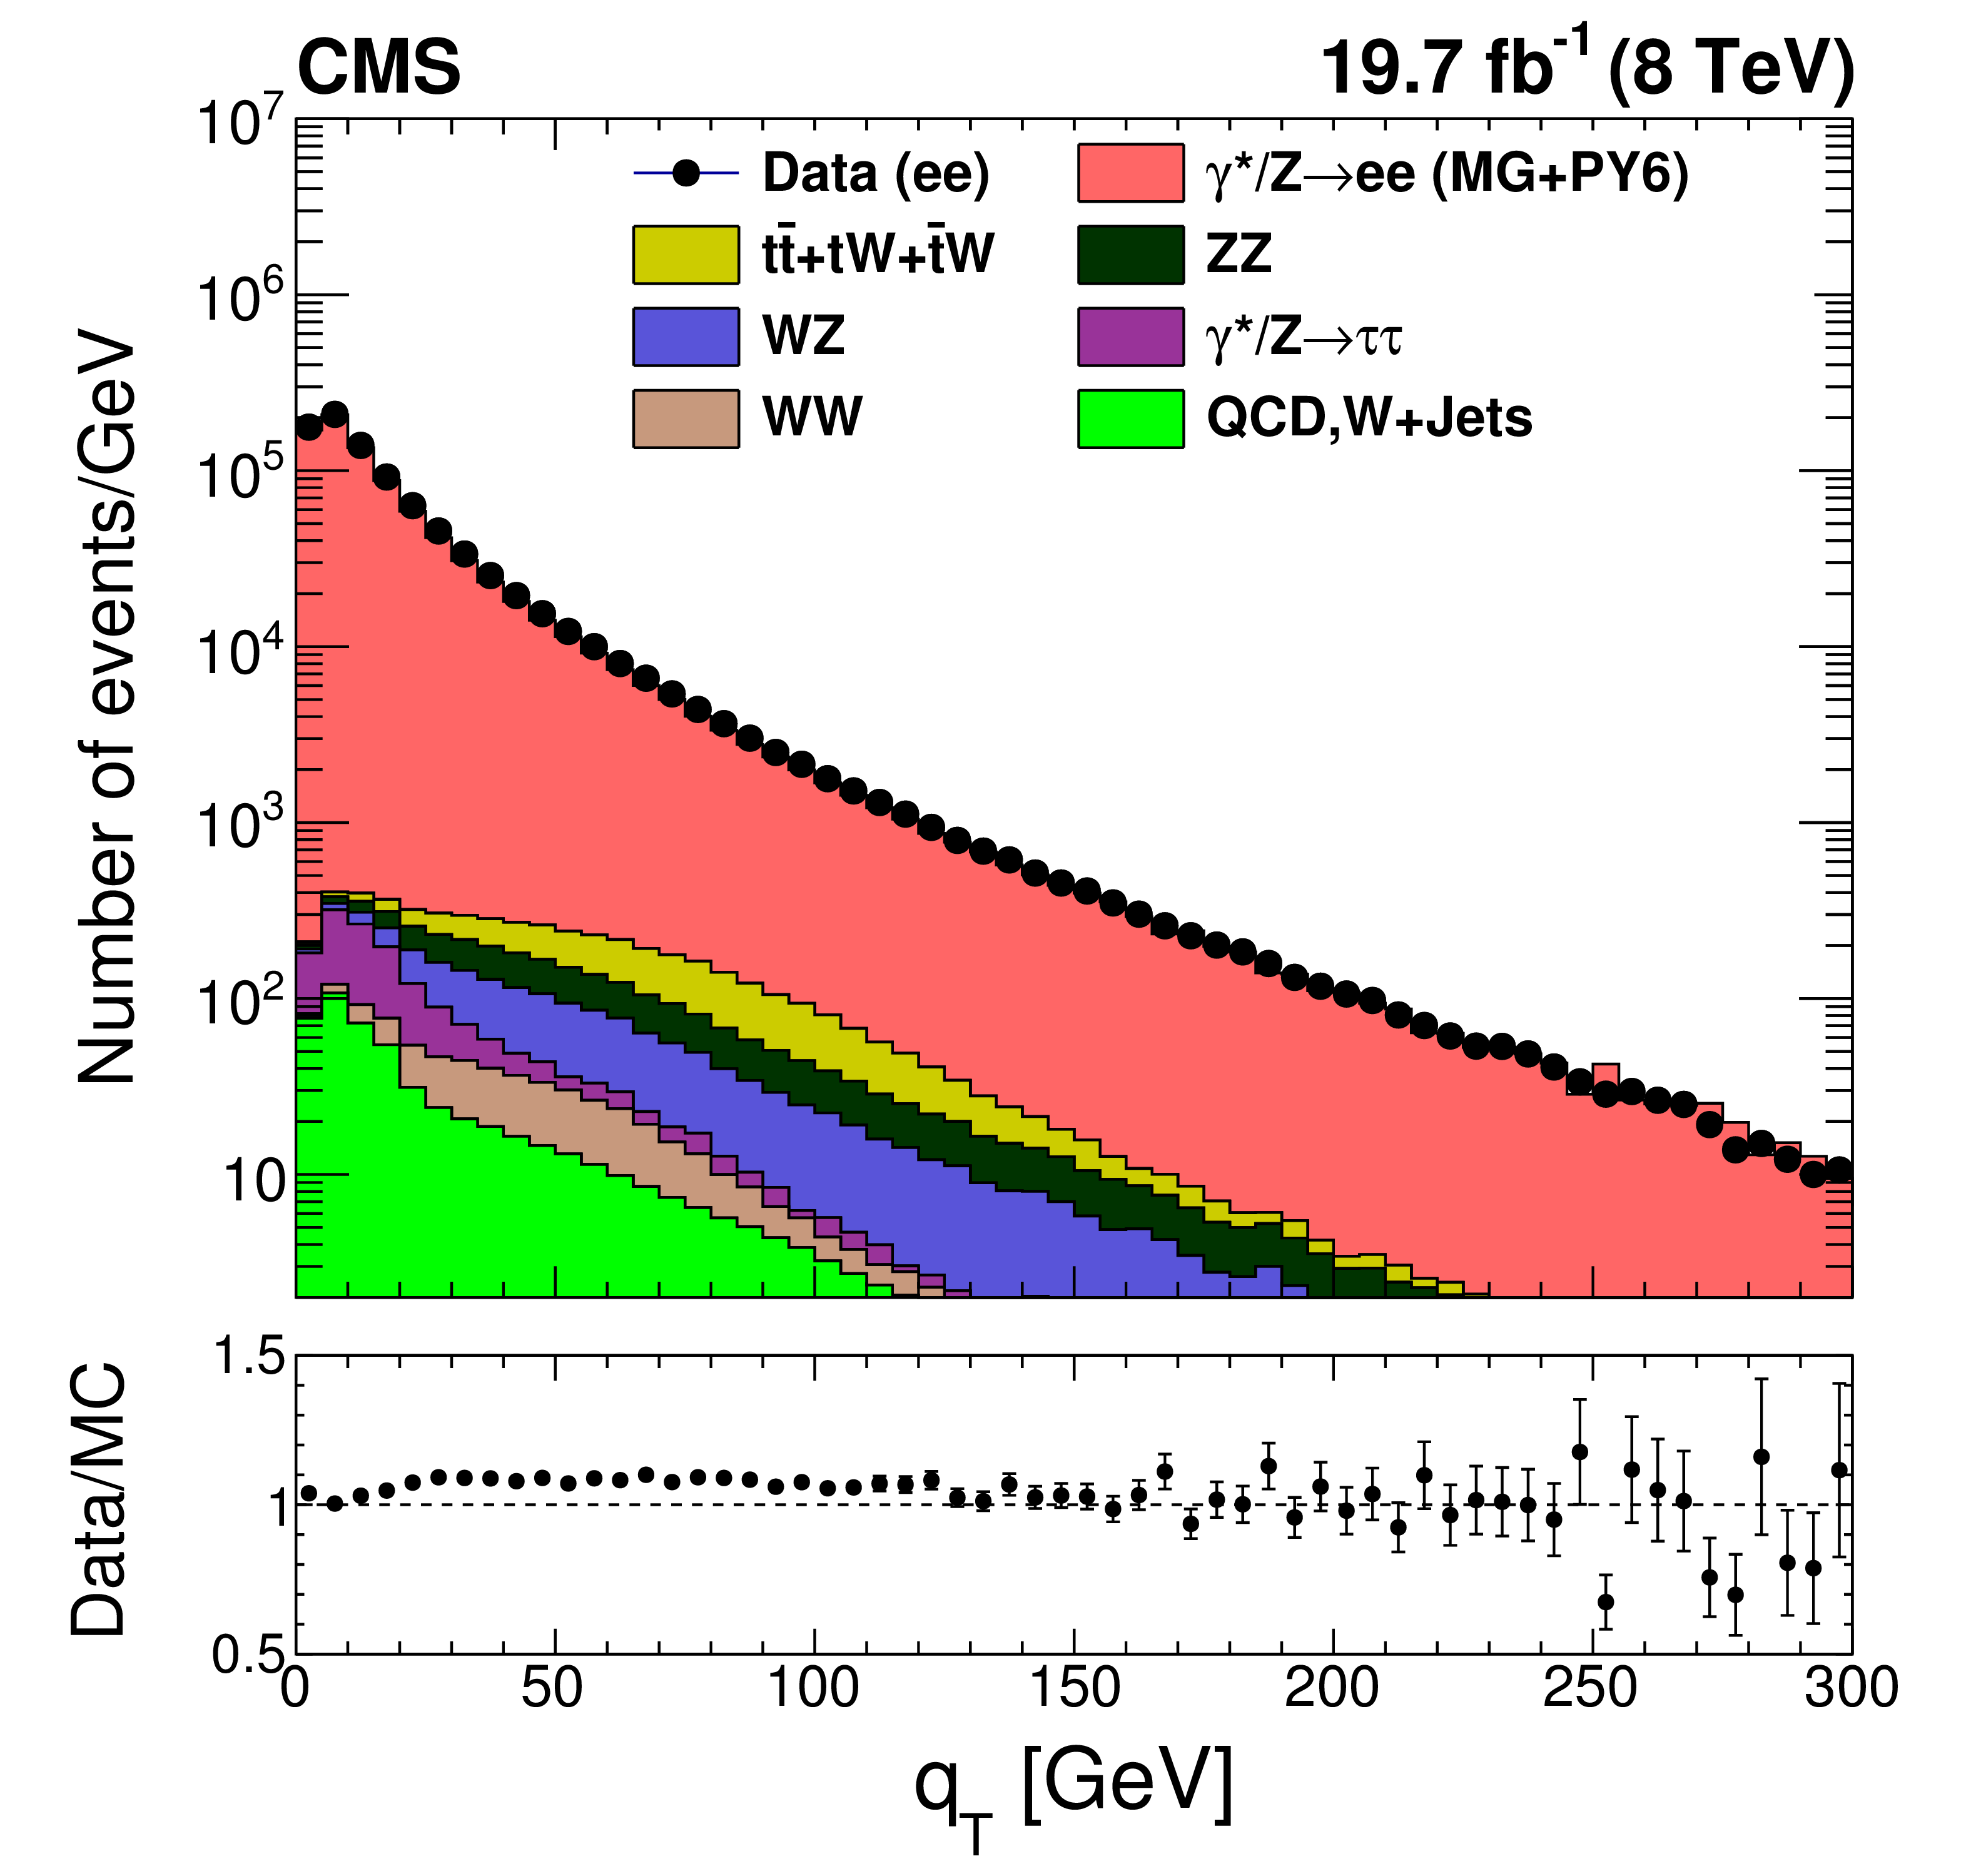
Figure 1:
Distributions of dilepton transverse momentum $ {q_{\mathrm {T}}} $ (upper), $\phi ^*$ (middle), and rapidity $ {< y >}$ (lower) in the dielectron (left) and dimuon (right) channels. The points represent the data and the shaded histograms represent the expectations which are based on simulation, except for the contributions from QCD multijet and W+jets events in the dielectron channel, which are obtained from control samples in data. Here "MG+PY6'' refers to a sample produced with MadGraph interfaced with PYTHIA-6 (Z2* tune). The error bars indicate the statistical uncertainties for data and for simulation only. No unfolding procedure has been applied to these distributions. |
png pdf |
Figure 1-a:
Distribution of the dilepton transverse momentum $ {q_{\mathrm {T}}} $ in the dielectron channel. The points represent the data and the shaded histograms represent the expectations which are based on simulation, except for the contributions from QCD multijet and W+jets events in the dielectron channel, which are obtained from control samples in data. Here "MG+PY6'' refers to a sample produced with MadGraph interfaced with PYTHIA-6 (Z2* tune). The error bars indicate the statistical uncertainties for data and for simulation only. No unfolding procedure has been applied to these distributions. |

png pdf |
Figure 1-b:
Distribution of the dilepton transverse momentum $ {q_{\mathrm {T}}} $ in the dimuon channel. The points represent the data and the shaded histograms represent the expectations which are based on simulation, except for the contributions from QCD multijet and W+jets events in the dielectron channel, which are obtained from control samples in data. Here "MG+PY6'' refers to a sample produced with MadGraph interfaced with PYTHIA-6 (Z2* tune). The error bars indicate the statistical uncertainties for data and for simulation only. No unfolding procedure has been applied to these distributions. |

png pdf |
Figure 1-c:
Distribution of the dilepton $\phi ^*$ in the dielectron channel. The points represent the data and the shaded histograms represent the expectations which are based on simulation, except for the contributions from QCD multijet and W+jets events in the dielectron channel, which are obtained from control samples in data. Here "MG+PY6'' refers to a sample produced with MadGraph interfaced with PYTHIA-6 (Z2* tune). The error bars indicate the statistical uncertainties for data and for simulation only. No unfolding procedure has been applied to these distributions. |

png pdf |
Figure 1-d:
Distribution of the dilepton $\phi ^*$ in the dimuon channel. The points represent the data and the shaded histograms represent the expectations which are based on simulation, except for the contributions from QCD multijet and W+jets events in the dielectron channel, which are obtained from control samples in data. Here "MG+PY6'' refers to a sample produced with MadGraph interfaced with PYTHIA-6 (Z2* tune). The error bars indicate the statistical uncertainties for data and for simulation only. No unfolding procedure has been applied to these distributions. |

png pdf |
Figure 1-e:
Distribution of the dilepton rapidity $ {< y >}$ in the dielectron channel. The points represent the data and the shaded histograms represent the expectations which are based on simulation, except for the contributions from QCD multijet and W+jets events in the dielectron channel, which are obtained from control samples in data. Here "MG+PY6'' refers to a sample produced with MadGraph interfaced with PYTHIA-6 (Z2* tune). The error bars indicate the statistical uncertainties for data and for simulation only. No unfolding procedure has been applied to these distributions. |

png pdf |
Figure 1-f:
Distribution of the dilepton rapidity $ {< y >}$ in the dimuon channel. The points represent the data and the shaded histograms represent the expectations which are based on simulation, except for the contributions from QCD multijet and W+jets events in the dielectron channel, which are obtained from control samples in data. Here "MG+PY6'' refers to a sample produced with MadGraph interfaced with PYTHIA-6 (Z2* tune). The error bars indicate the statistical uncertainties for data and for simulation only. No unfolding procedure has been applied to these distributions. |

png pdf |
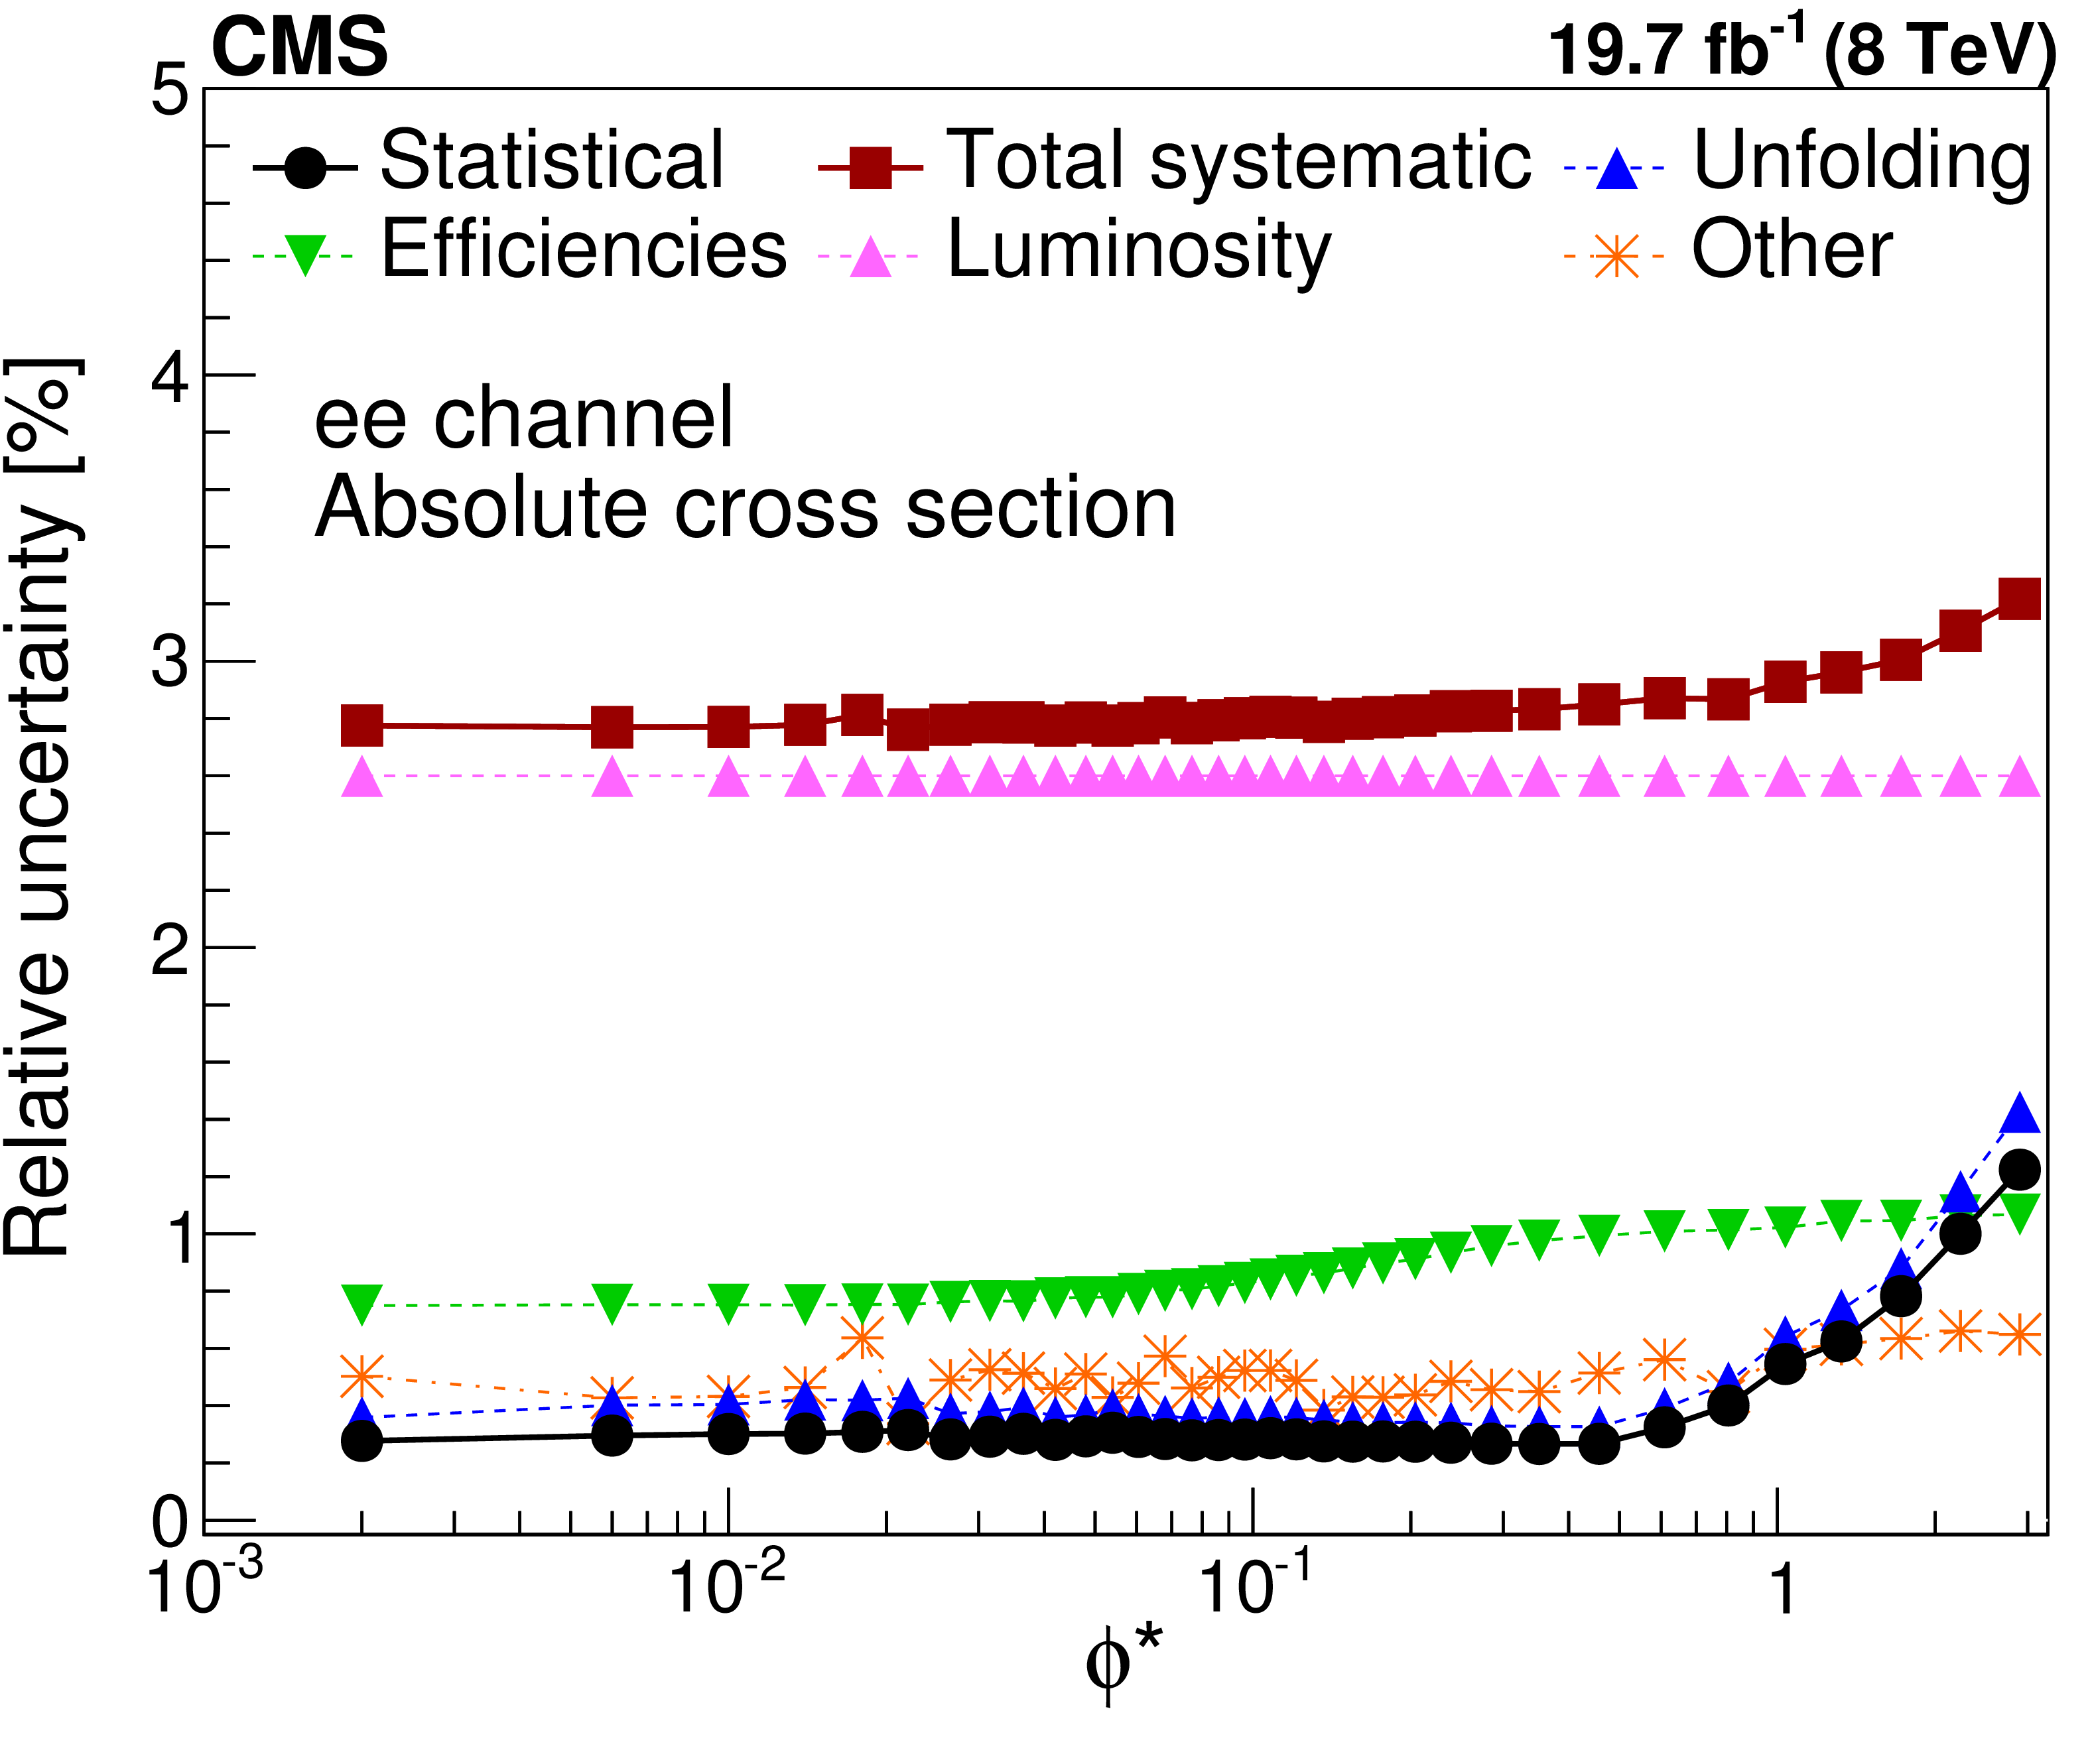
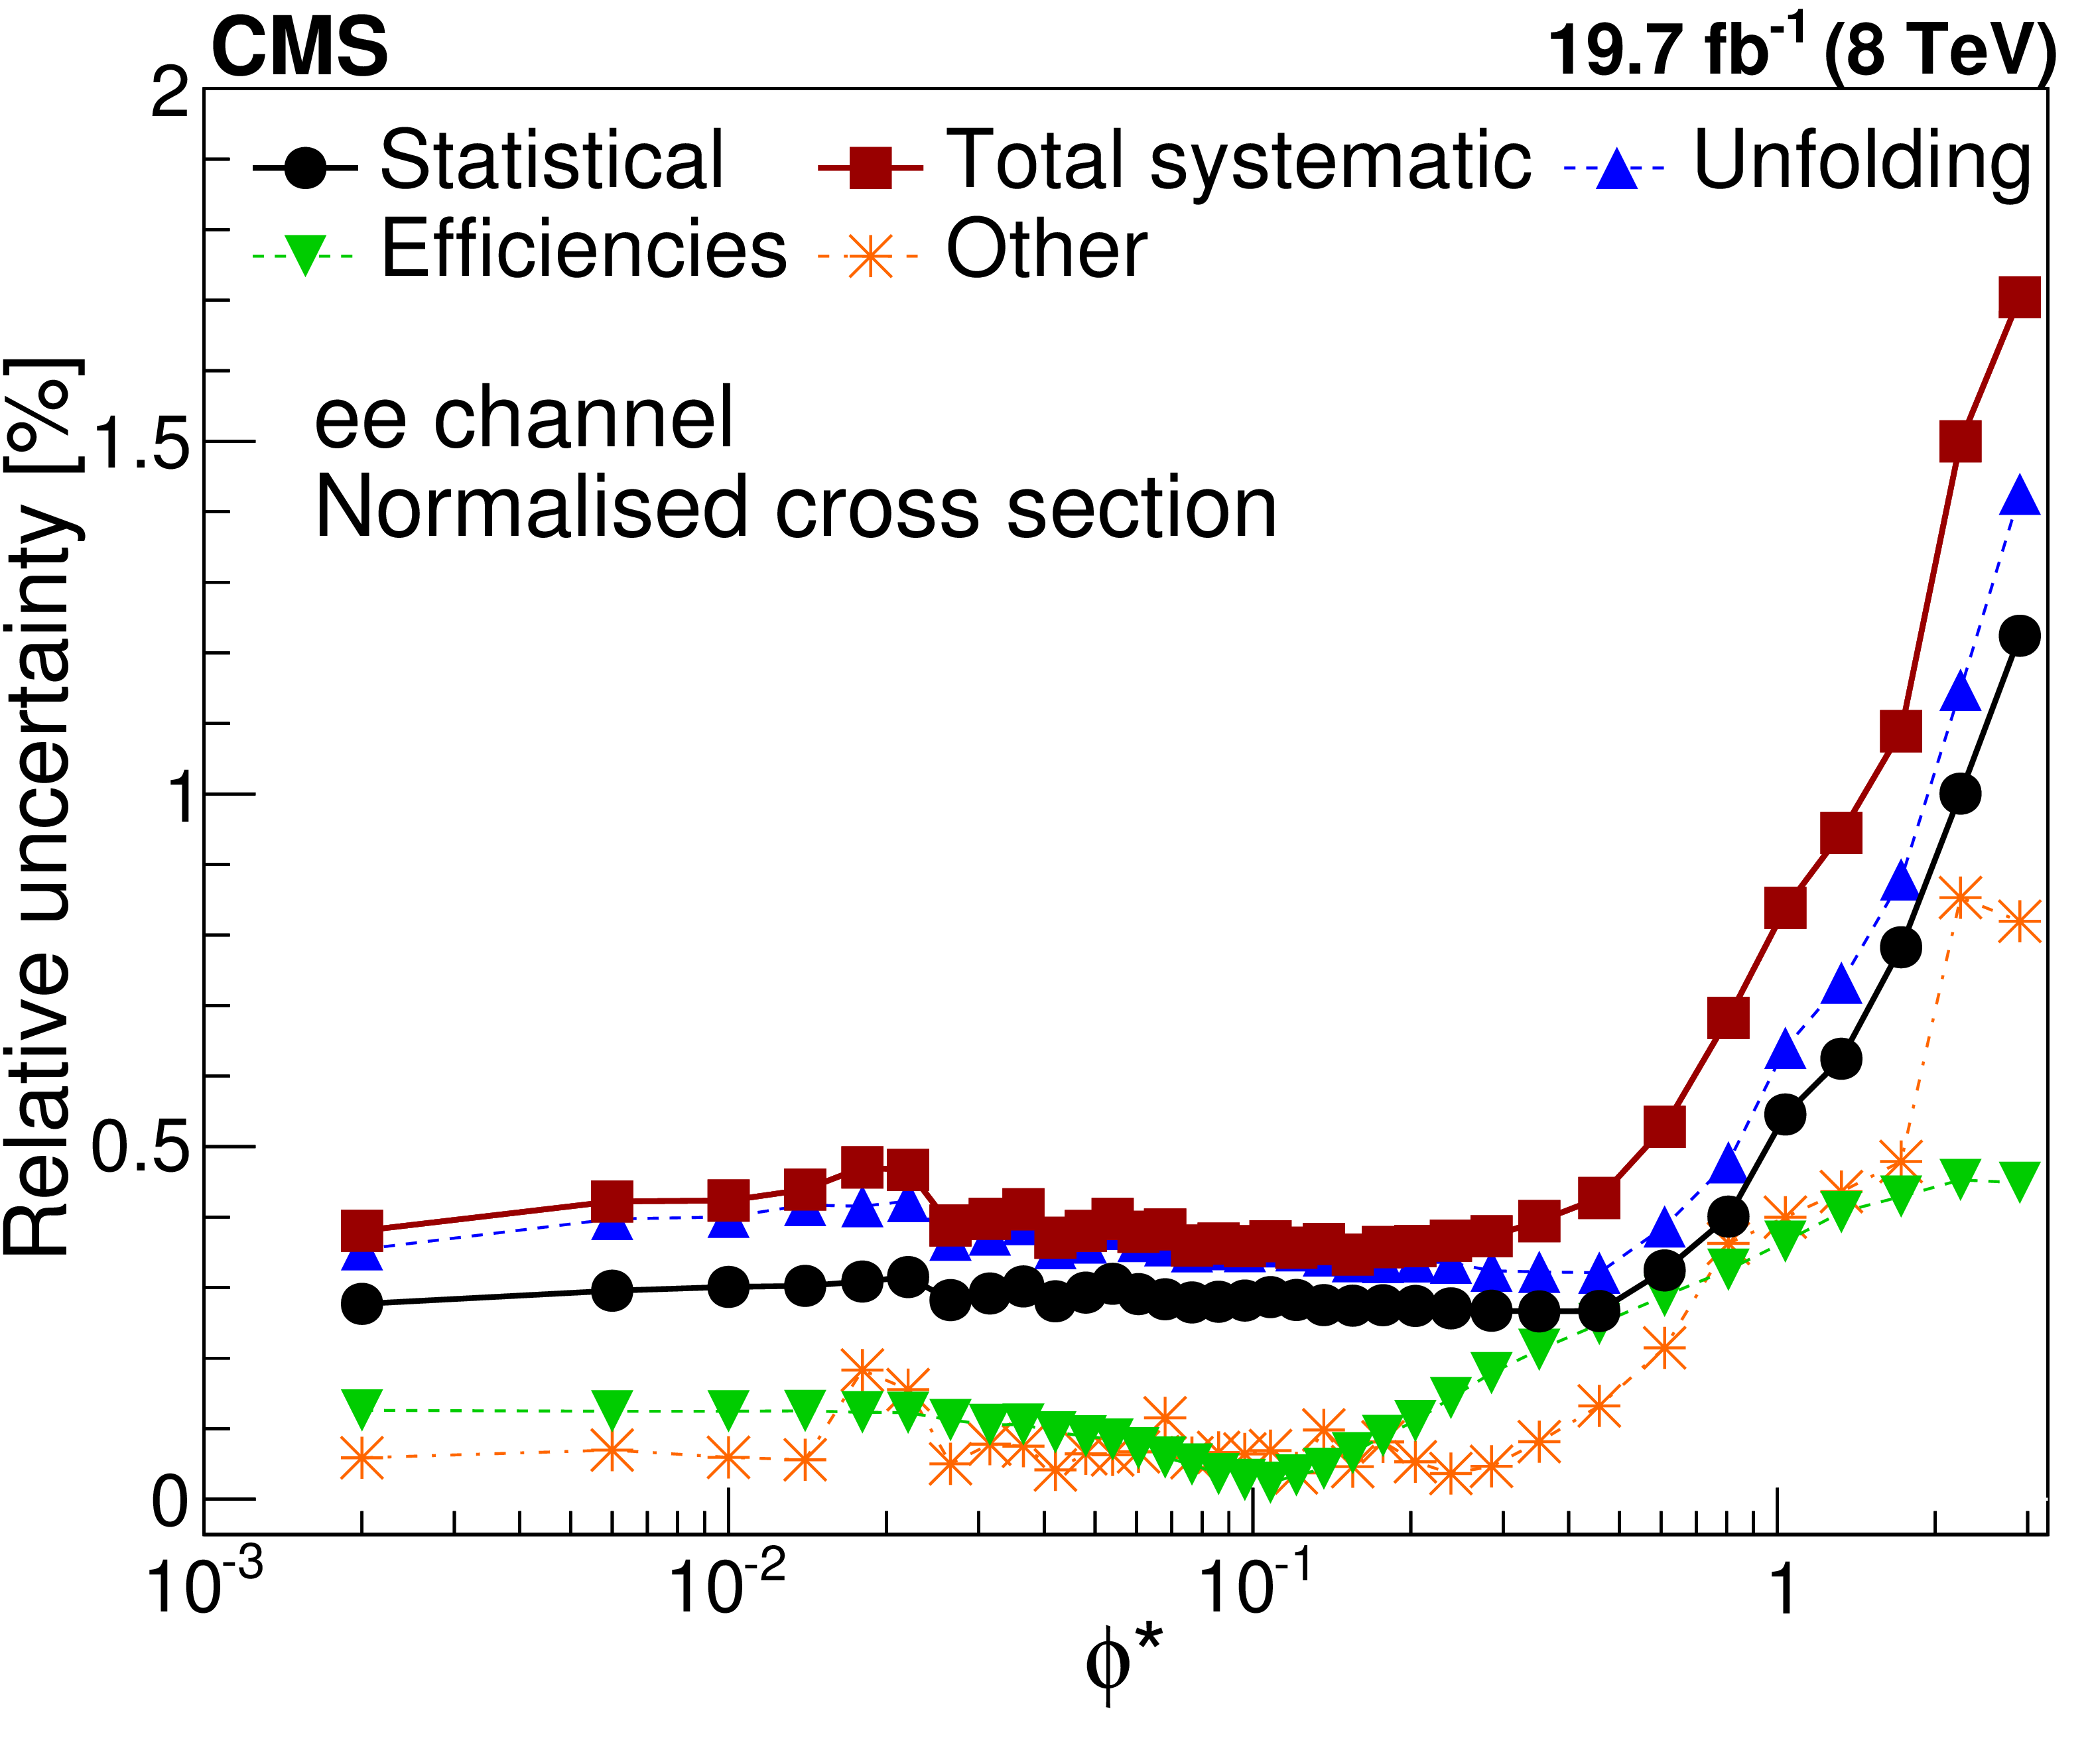
Figure 2:
The variation of statistical and systematic uncertainties with $\phi ^*$. The upper row shows the relative uncertainty for the absolute cross section while the lower one shows the relative uncertainty for the normalised cross section. The left plots pertain to the dielectron channel and the right plots pertain to the dimuon channel. The uncertainties from the background, pileup, the electron energy scale or the muon $ {p_{\mathrm {T}}} $ resolution, and from QED-FSR modelling are combined under the label "Other''. |
png pdf |
Figure 2-a:
The variation of statistical and systematic uncertainties with $\phi ^*$. The plot shows the relative uncertainty for the absolute cross section, and pertains to the dielectron channel. The uncertainties from the background, pileup, the electron energy scale, and from QED-FSR modelling are combined under the label "Other''. |

png pdf |
Figure 2-b:
The variation of statistical and systematic uncertainties with $\phi ^*$. The plot shows the relative uncertainty for the absolute cross section, and pertains to the dimuon channel. The uncertainties from the background, pileup, the muon $ {p_{\mathrm {T}}} $ resolution, and from QED-FSR modelling are combined under the label "Other''. |
png pdf |
Figure 2-c:
The variation of statistical and systematic uncertainties with $\phi ^*$. The plot shows the relative uncertainty for the normalised cross section, and pertains to the dielectron channel. The uncertainties from the background, pileup, the electron energy scale, and from QED-FSR modelling are combined under the label "Other''. |

png pdf |
Figure 2-d:
The variation of statistical and systematic uncertainties with $\phi ^*$. The plot shows the relative uncertainty for the normalised cross section, and pertains to the dimuon channel. The uncertainties from the background, pileup, the muon $ {p_{\mathrm {T}}} $ resolution, and from QED-FSR modelling are combined under the label "Other''. |

png pdf |
Figure 3:
The variation of statistical and systematic uncertainties, in representative $ {< y >}$ bins, for the ${{\mathrm {d}}}^2 \sigma / {{\mathrm {d}}} \phi ^* {{\mathrm {d}}} {< y >}$ measurements, in the dielectron (left) and dimuon (right) channels. The main components are shown individually while uncertainties from the background, pileup, the electron energy scale or the muon $ {p_{\mathrm {T}}} $ resolution, and from QED-FSR are combined under the label "Other''. |

png pdf |
Figure 3-a:
The variation of statistical and systematic uncertainties, in representative $ {< y >}$ bins, for the ${{\mathrm {d}}}^2 \sigma / {{\mathrm {d}}} \phi ^* {{\mathrm {d}}} {< y >}$ measurements, in the dielectron channel. The main components are shown individually while uncertainties from the background, pileup, the electron energy scale, and from QED-FSR are combined under the label "Other''. |

png pdf |
Figure 3-b:
The variation of statistical and systematic uncertainties, in representative $ {< y >}$ bins, for the ${{\mathrm {d}}}^2 \sigma / {{\mathrm {d}}} \phi ^* {{\mathrm {d}}} {< y >}$ measurements, in the dimuon channel. The main components are shown individually while uncertainties from the background, pileup, the muon $ {p_{\mathrm {T}}} $ resolution, and from QED-FSR are combined under the label "Other''. |

png pdf |
Figure 4:
The variation of statistical and systematic uncertainties, for the normalised double-differential cross section measurements, in representative $ {< y >}$ bins, in the dielectron (left) and dimuon (right) channel. The main components are shown individually while uncertainties from the background, pileup, the electron energy scale or the muon $ {p_{\mathrm {T}}} $ resolution, and from QED-FSR are combined under the label "Other''. |

png pdf |
Figure 4-a:
The variation of statistical and systematic uncertainties, for the normalised double-differential cross section measurements, in representative $ {< y >}$ bins, in the dielectron channel. The main components are shown individually while uncertainties from the background, pileup, the electron energy scale, and from QED-FSR are combined under the label "Other''. |

png pdf |
Figure 4-b:
The variation of statistical and systematic uncertainties, for the normalised double-differential cross section measurements, in representative $ {< y >}$ bins, in the dimuon channel. The main components are shown individually while uncertainties from the background, pileup, the muon $ {p_{\mathrm {T}}} $ resolution, and from QED-FSR are combined under the label "Other''. |

png pdf |
Figure 5:
Comparison of theoretical values for the fiducial cross section with the measured value. The grey error bar represents the total experimental uncertainty for the measured value. The error bars for the theoretical values include the uncertainties due to statistical precision, the PDFs, and the scale choice. The fiducial cross section for FEWZ is obtained by multiplying the total cross section with the acceptance determined from the simulated MadGraph+PYTHIA-6 sample; the uncertainty in the prediction corresponds to that in the FEWZ calculation. |

png pdf |
Figure 6:
The measured absolute (left) and the normalised (right) cross sections after the combination of dielectron and dimuon channels. The measurement is compared with the predictions from RESBOS, MadGraph and POWHEG interfaced with PYTHIA-6 (Z2* tune), and aMC@NLO and POWHEG interfaced with PYTHIA-8 (CUETP8M1 tune). In the lower panels, the horizontal bands correspond to the experimental uncertainty, while the error bars correspond to the statistical, PDF, and scale uncertainties in the theoretical predictions from RESBOS, POWHEG and aMC@NLO and only the statistical uncertainty for MadGraph. |

png pdf |
Figure 6-a:
The measured absolute cross section after the combination of dielectron and dimuon channels. The measurement is compared with the predictions from RESBOS, MadGraph and POWHEG interfaced with PYTHIA-6 (Z2* tune), and aMC@NLO and POWHEG interfaced with PYTHIA-8 (CUETP8M1 tune). In the lower panels, the horizontal bands correspond to the experimental uncertainty, while the error bars correspond to the statistical, PDF, and scale uncertainties in the theoretical predictions from RESBOS, POWHEG and aMC@NLO and only the statistical uncertainty for MadGraph. |

png pdf |
Figure 6-b:
The measured normalised cross section after the combination of dielectron and dimuon channels. The measurement is compared with the predictions from RESBOS, MadGraph and POWHEG interfaced with PYTHIA-6 (Z2* tune), and aMC@NLO and POWHEG interfaced with PYTHIA-8 (CUETP8M1 tune). In the lower panels, the horizontal bands correspond to the experimental uncertainty, while the error bars correspond to the statistical, PDF, and scale uncertainties in the theoretical predictions from RESBOS, POWHEG and aMC@NLO and only the statistical uncertainty for MadGraph. |

png pdf |
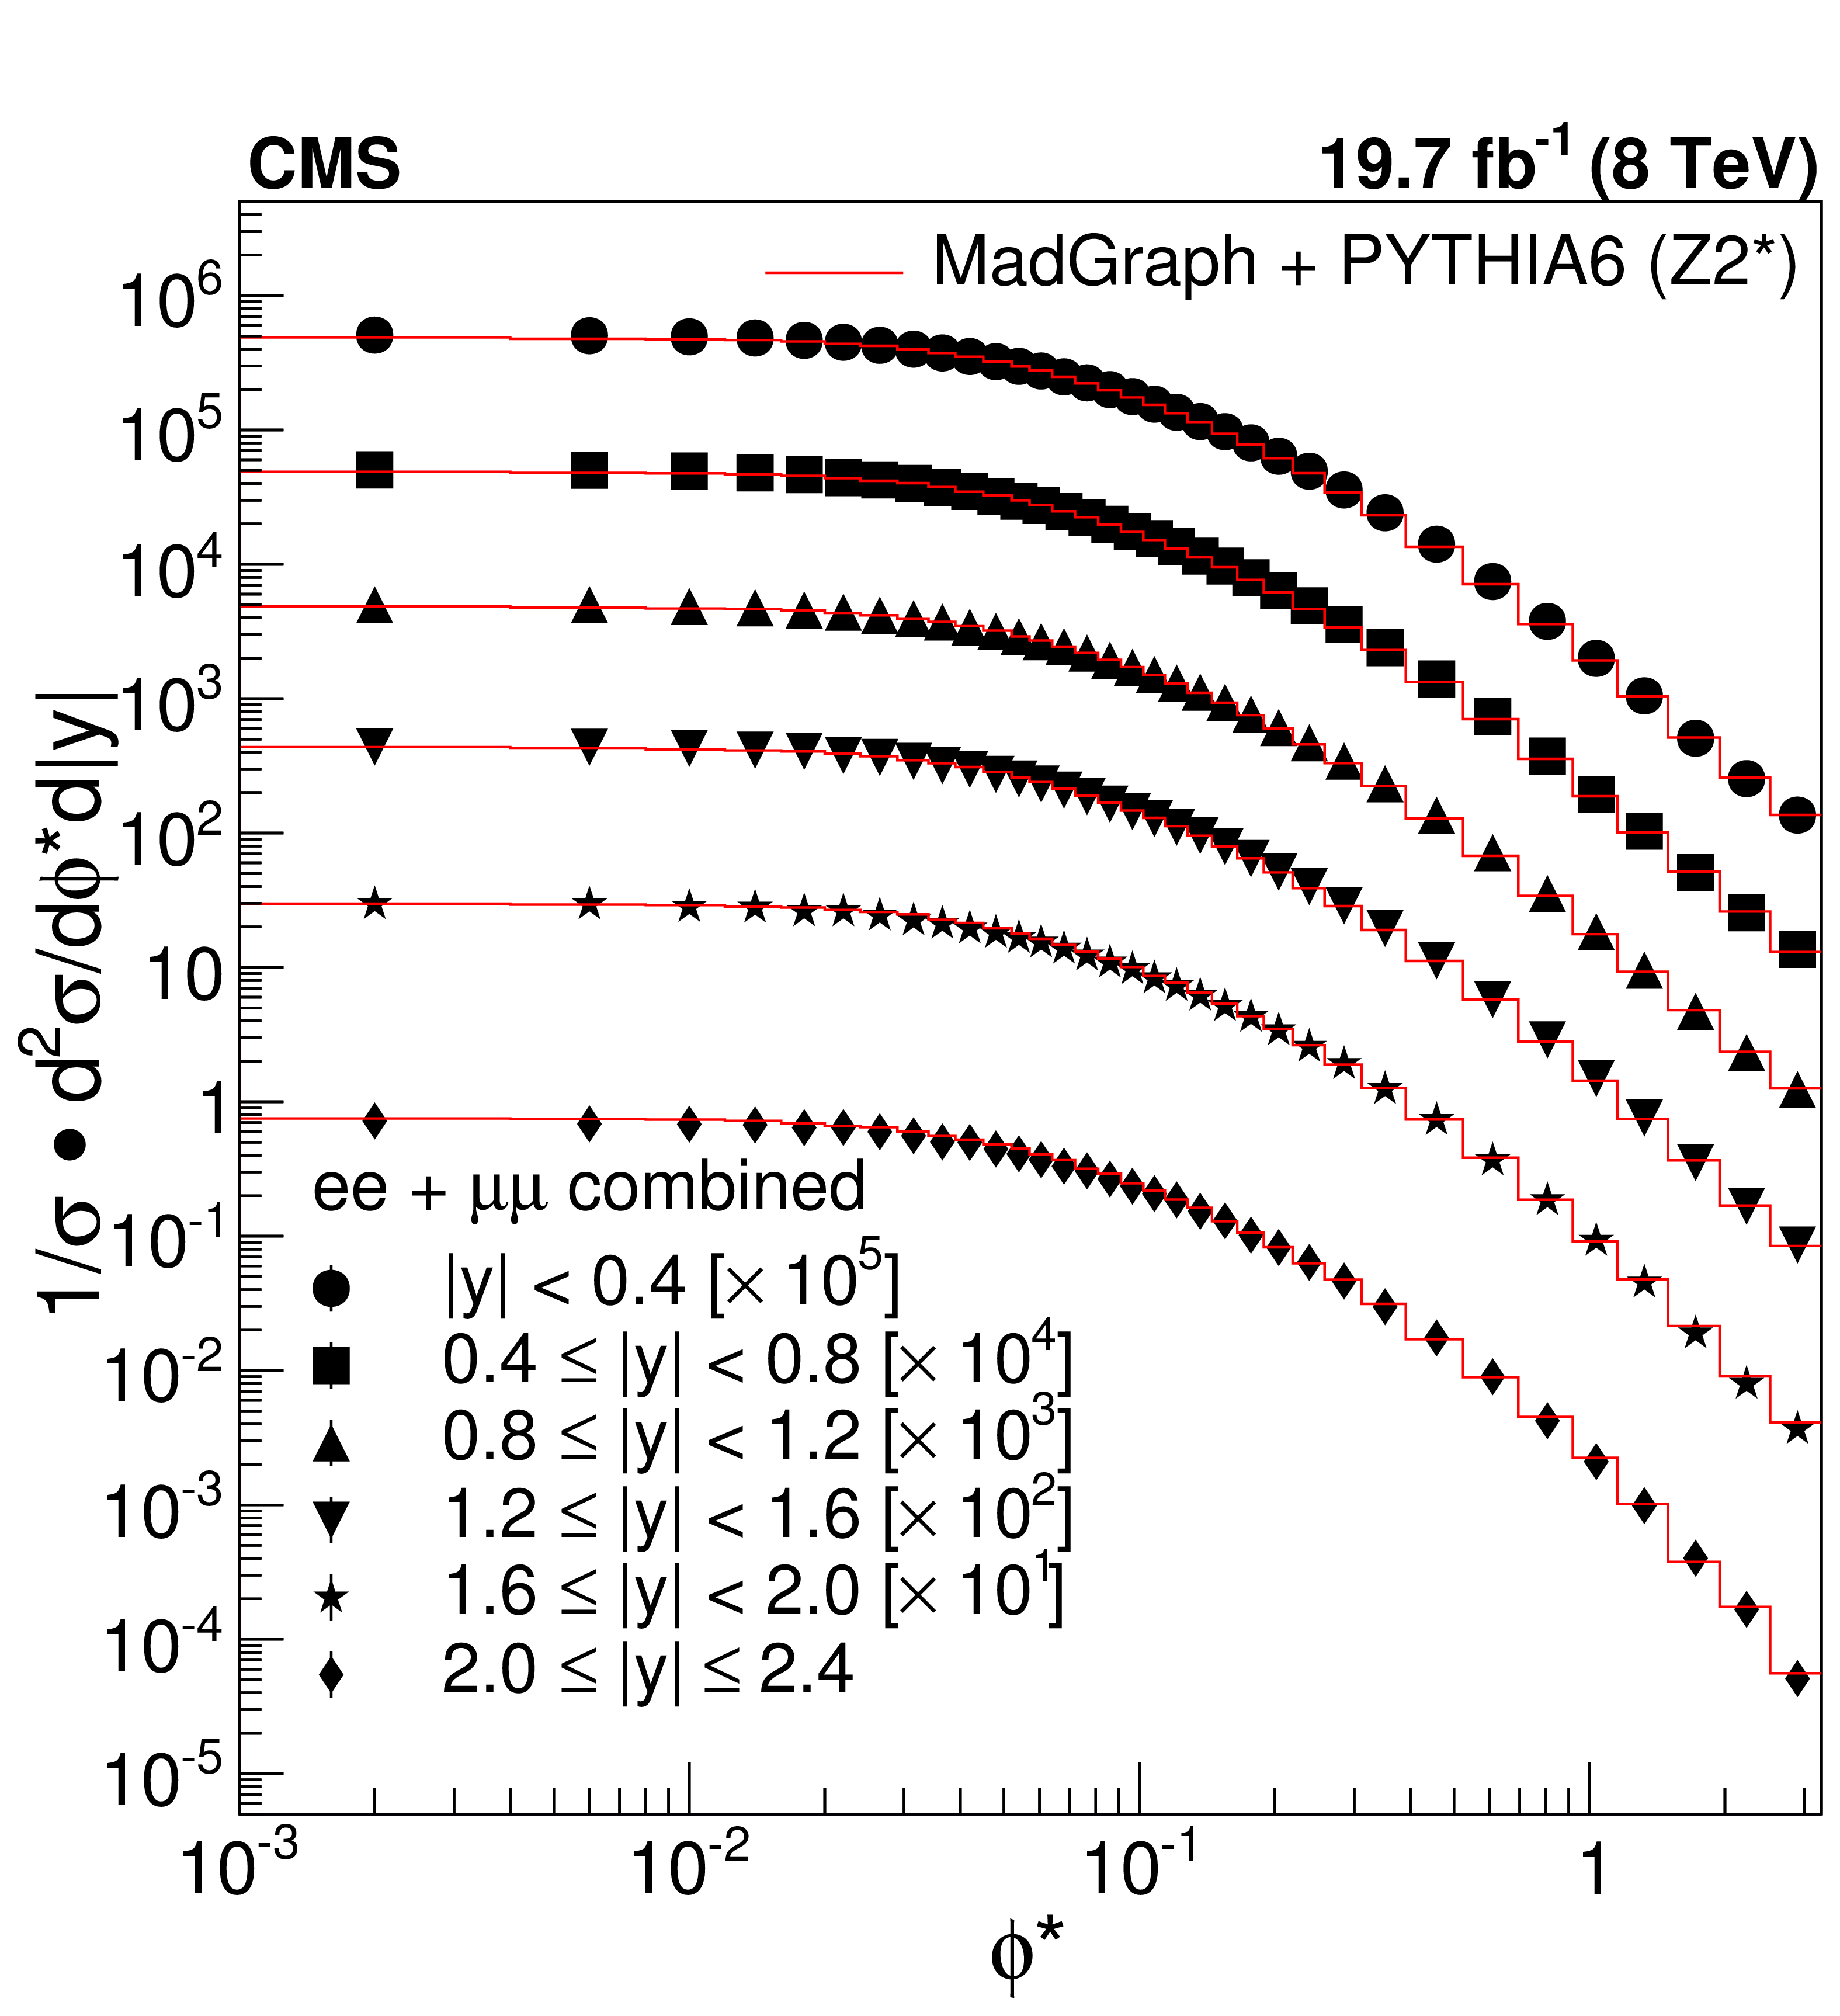
Figure 7:
The combined absolute (left) and the normalised (right) double-differential cross sections as a function of $\phi ^*$ for six ranges of $ {< y >}$. Experimental data is compared with prediction from MadGraph+PYTHIA-6 with Z2* tune. |

png pdf |
Figure 7-a:
The combined absolute double-differential cross section as a function of $\phi ^*$ for six ranges of $ {< y >}$. Experimental data is compared with prediction from MadGraph+PYTHIA-6 with Z2* tune. |
png pdf |
Figure 7-b:
The combined normalised double-differential cross section as a function of $\phi ^*$ for six ranges of $ {< y >}$. Experimental data is compared with prediction from MadGraph+PYTHIA-6 with Z2* tune. |

png pdf |
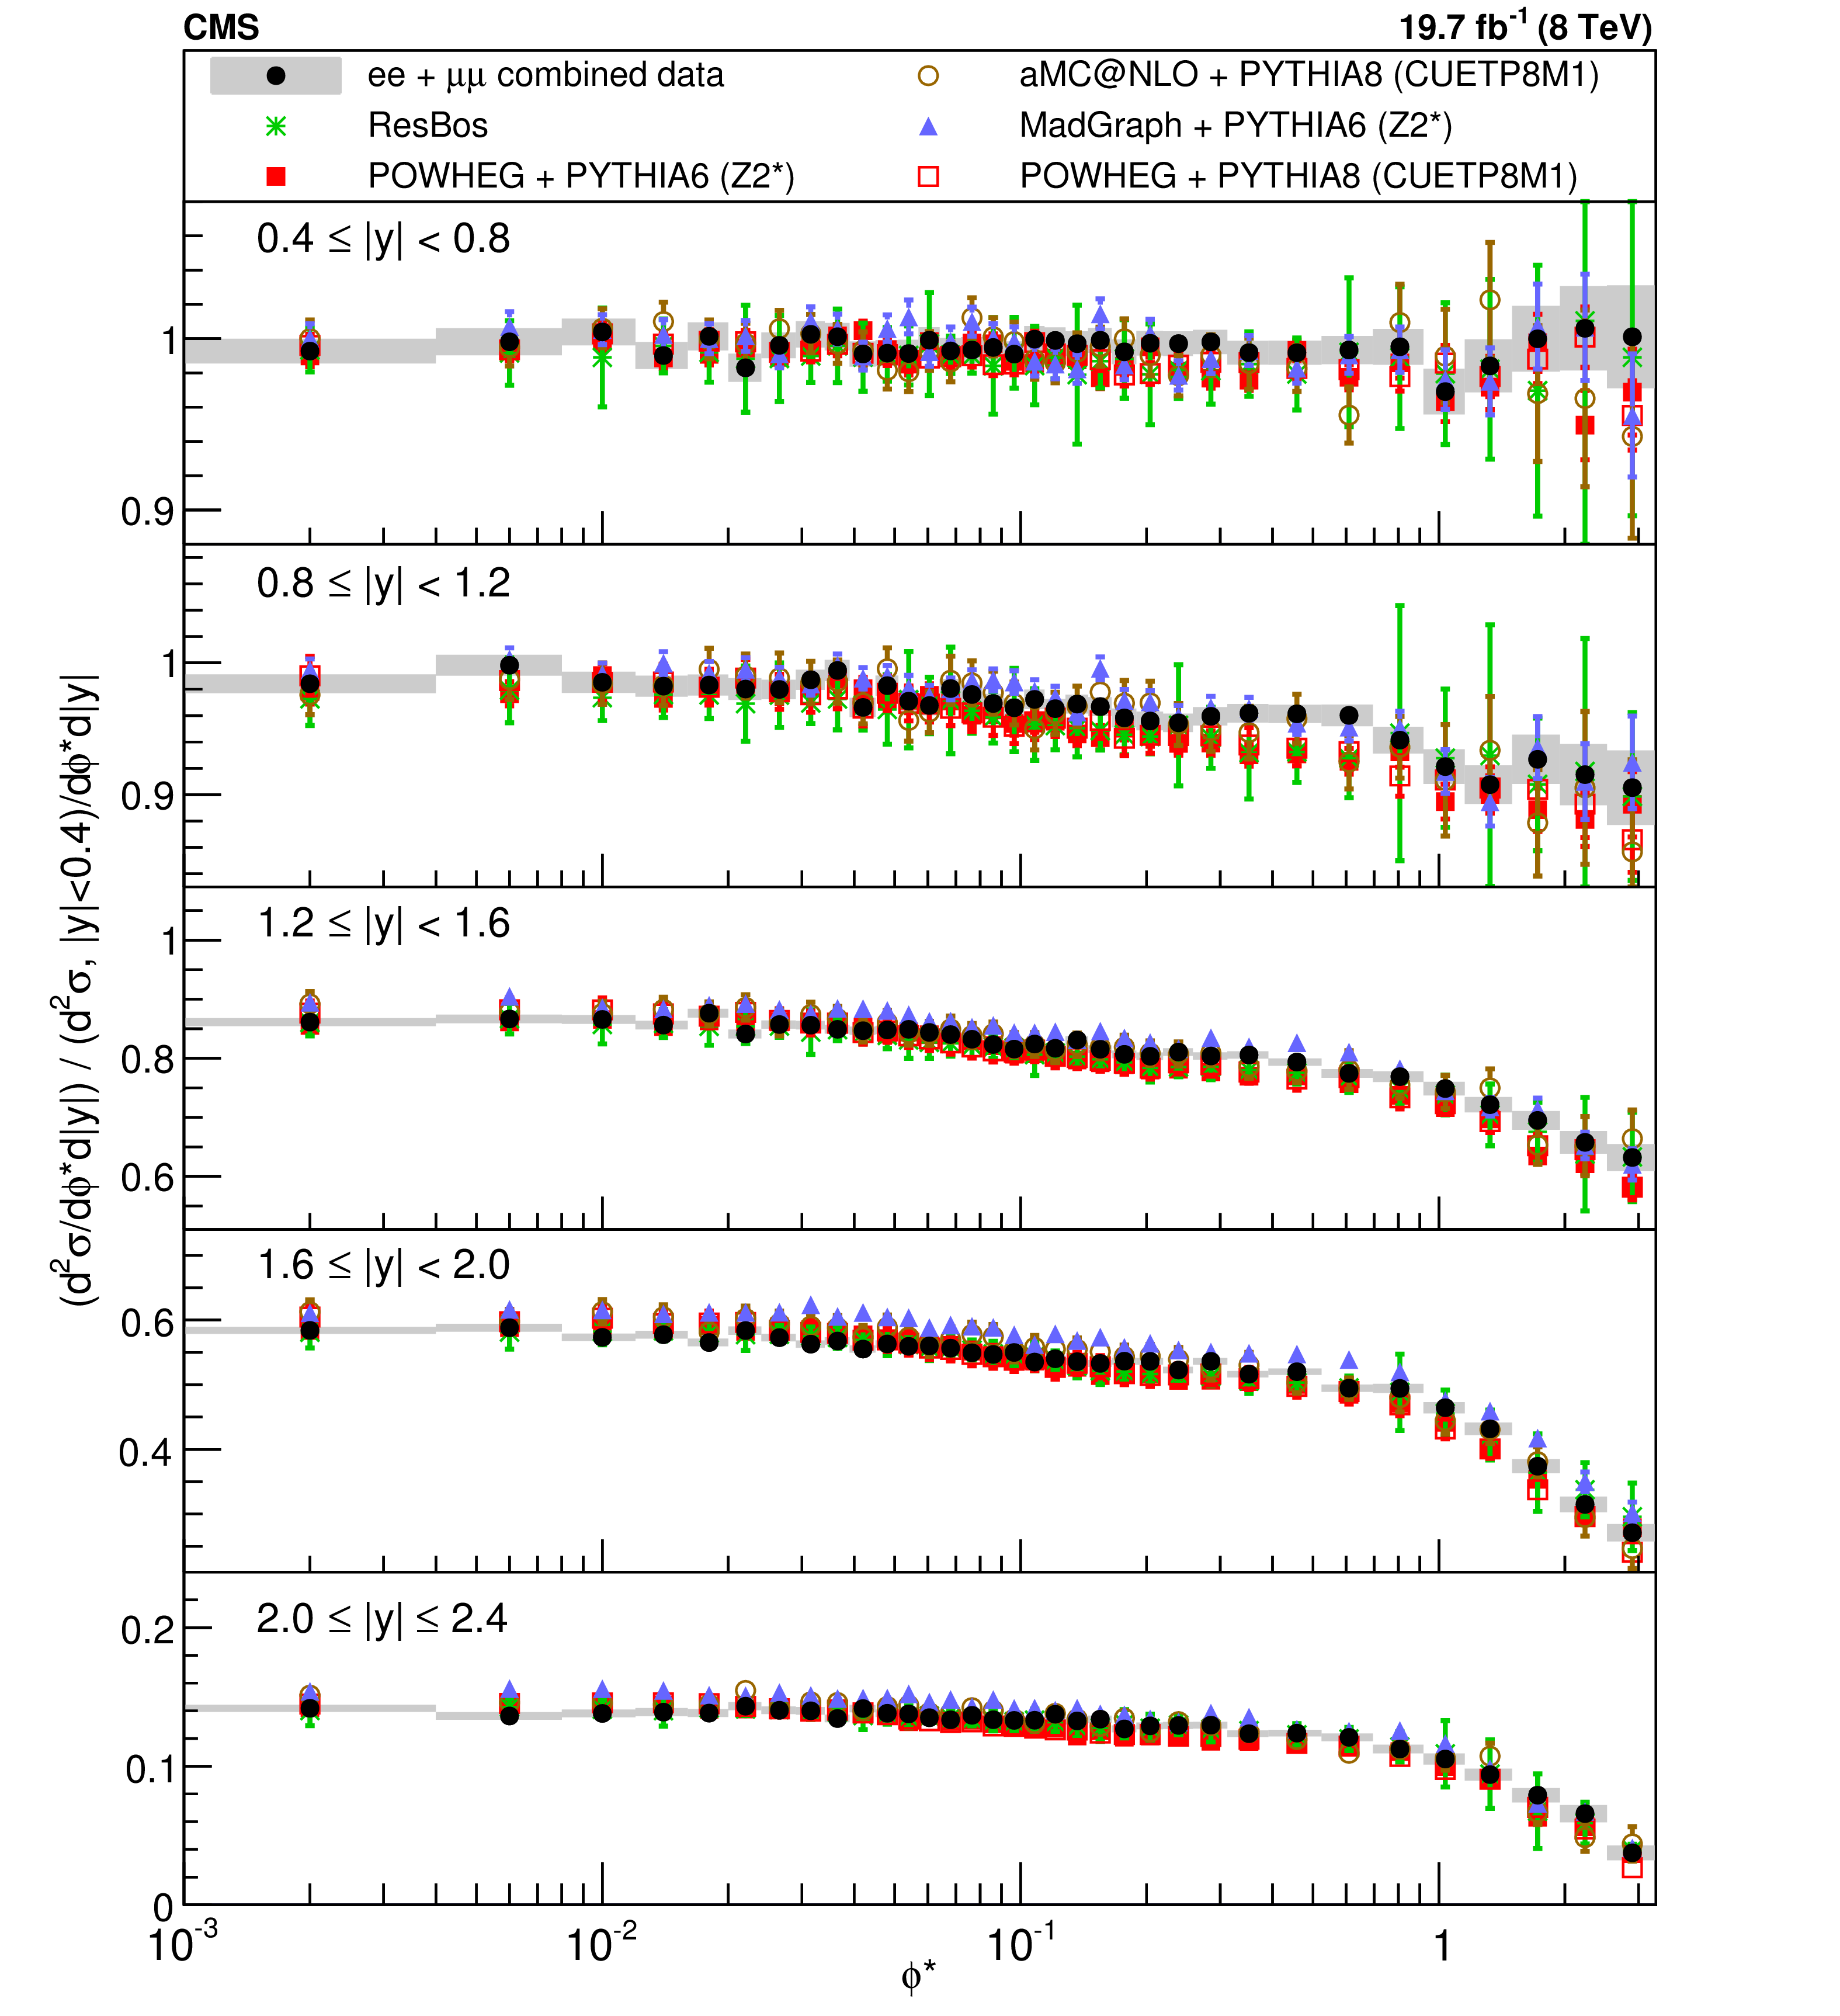
Figure 8:
The ratio of predicted over measured normalised differential cross sections, $(1 / \sigma) \, {{\mathrm {d}}}^2 \sigma / {{\mathrm {d}}} \phi ^* {{\mathrm {d}}} {< y >}$, as a function of $\phi ^*$ for six bins in $ {< y >}$. The theoretical predictions from MadGraph+PYTHIA-6, POWHEG+PYTHIA-6, POWHEG+PYTHIA-8, RESBOS, and aMC@NLO+PYTHIA-8 are shown. The horizontal band corresponds to the uncertainty in the experimental measurement. The vertical bars are dominated by the statistical uncertainties in the theoretical predictions. |
png pdf |
Figure 9:
The ratio of ${{\mathrm {d}}}^2 \sigma / {{\mathrm {d}}} \phi ^* {{\mathrm {d}}} {< y >}$ for higher rapidity bins ($ {< y >} > 0.4$) normalised to the values in the most central bin $ {< y >} < 0.4$. The theoretical predictions from MadGraph+PYTHIA-6, POWHEG+PYTHIA-6, POWHEG+PYTHIA-8, RESBOS, and aMC@NLO+PYTHIA-8 are also shown. The uncertainties in the theoretical predictions at large $\phi ^*$ are dominated by the statistical component. |
| Summary |
|
Measurements of the absolute differential cross sections ${\mathrm{d}}\sigma / {\mathrm{d}}\phi^*$ and ${{\mathrm{d}}}^2 \sigma / {{\mathrm{d}}} \phi^* {{\mathrm{d}}}{|y|}$ and the corresponding normalised differential cross sections in the combined dielectron and dimuon channels were presented for the dilepton mass range of 60 to 120 GeV. The measurements are based on a sample of proton-proton collision data at a centre-of-mass energy of 8 TeV collected with the CMS detector at the LHC and correspond to an integrated luminosity of 19.7 fb$^{-1}$. They provide a sensitive test of theoretical predictions. The normalised cross section $(1/\sigma)\,{\mathrm{d}}\sigma / {\mathrm{d}}\phi^*$ is precise at the level of 0.24-1.2%. Theoretical predictions differ from the measurements at the level of 3% (RESBOS), 3% (POWHEG+PYTHIA-8), 4% (MadGraph+PYTHIA-6), 6% (aMC@NLO+PYTHIA-8) and 11% (POWHEG+PYTHIA-6) for $\phi^* < $ 0.1. For higher values of $\phi^*$ the differences are larger: about 9, 8, 5, 10 and 15% respectively. These observations suggest that more advanced calculations of the hard-scattering process reproduce the data better. At the same time, the large difference in theoretical predictions from a single POWHEG sample interfaced with two different versions of PYTHIA and underlying event tunes indicates the combined importance of the showering method, nonperturbative effects and the need for soft-gluon resummation on the predicted values of cross sections reported in this paper. The variation of the cross section with $|y|$ is reproduced by RESBOS within 1%, while MadGraph+PYTHIA-6 differs from the data by 5% comparing the most central and most forward rapidity bins. The predictions from aMC@NLO+PYTHIA-8, POWHEG+PYTHIA-6, and POWHEG+PYTHIA-8 deviate from the measurement by at most 2%. This analysis validates the overall theoretical description of inclusive production of vector bosons at the LHC energies by the perturbative formalism of the standard model. Nevertheless, further tuning of the description of the underlying event is necessary for an accurate prediction of the kinematics of the Drell-Yan production of lepton pairs. |
| Additional Figures | |

png pdf |
Additional Figure 1:
Correlation matrix for the measured single-differential absolute cross section. |
png pdf |
Additional Figure 2:
Covariance matrix for the measured single-differential absolute cross section. |

png pdf |
Additional Figure 3:
Correlation matrix for the measured single-differential normalized cross section. |

png pdf |
Additional Figure 4:
Covariance matrix for the measured single-differential normalized cross section. |

png pdf |
Additional Figure 5:
Correlation matrix for the measured double-differential absolute cross section as a function of $\phi *$ and $y$. The axis bin numbers refer to the bin numbers as defined in the measurement tables. |

png pdf |
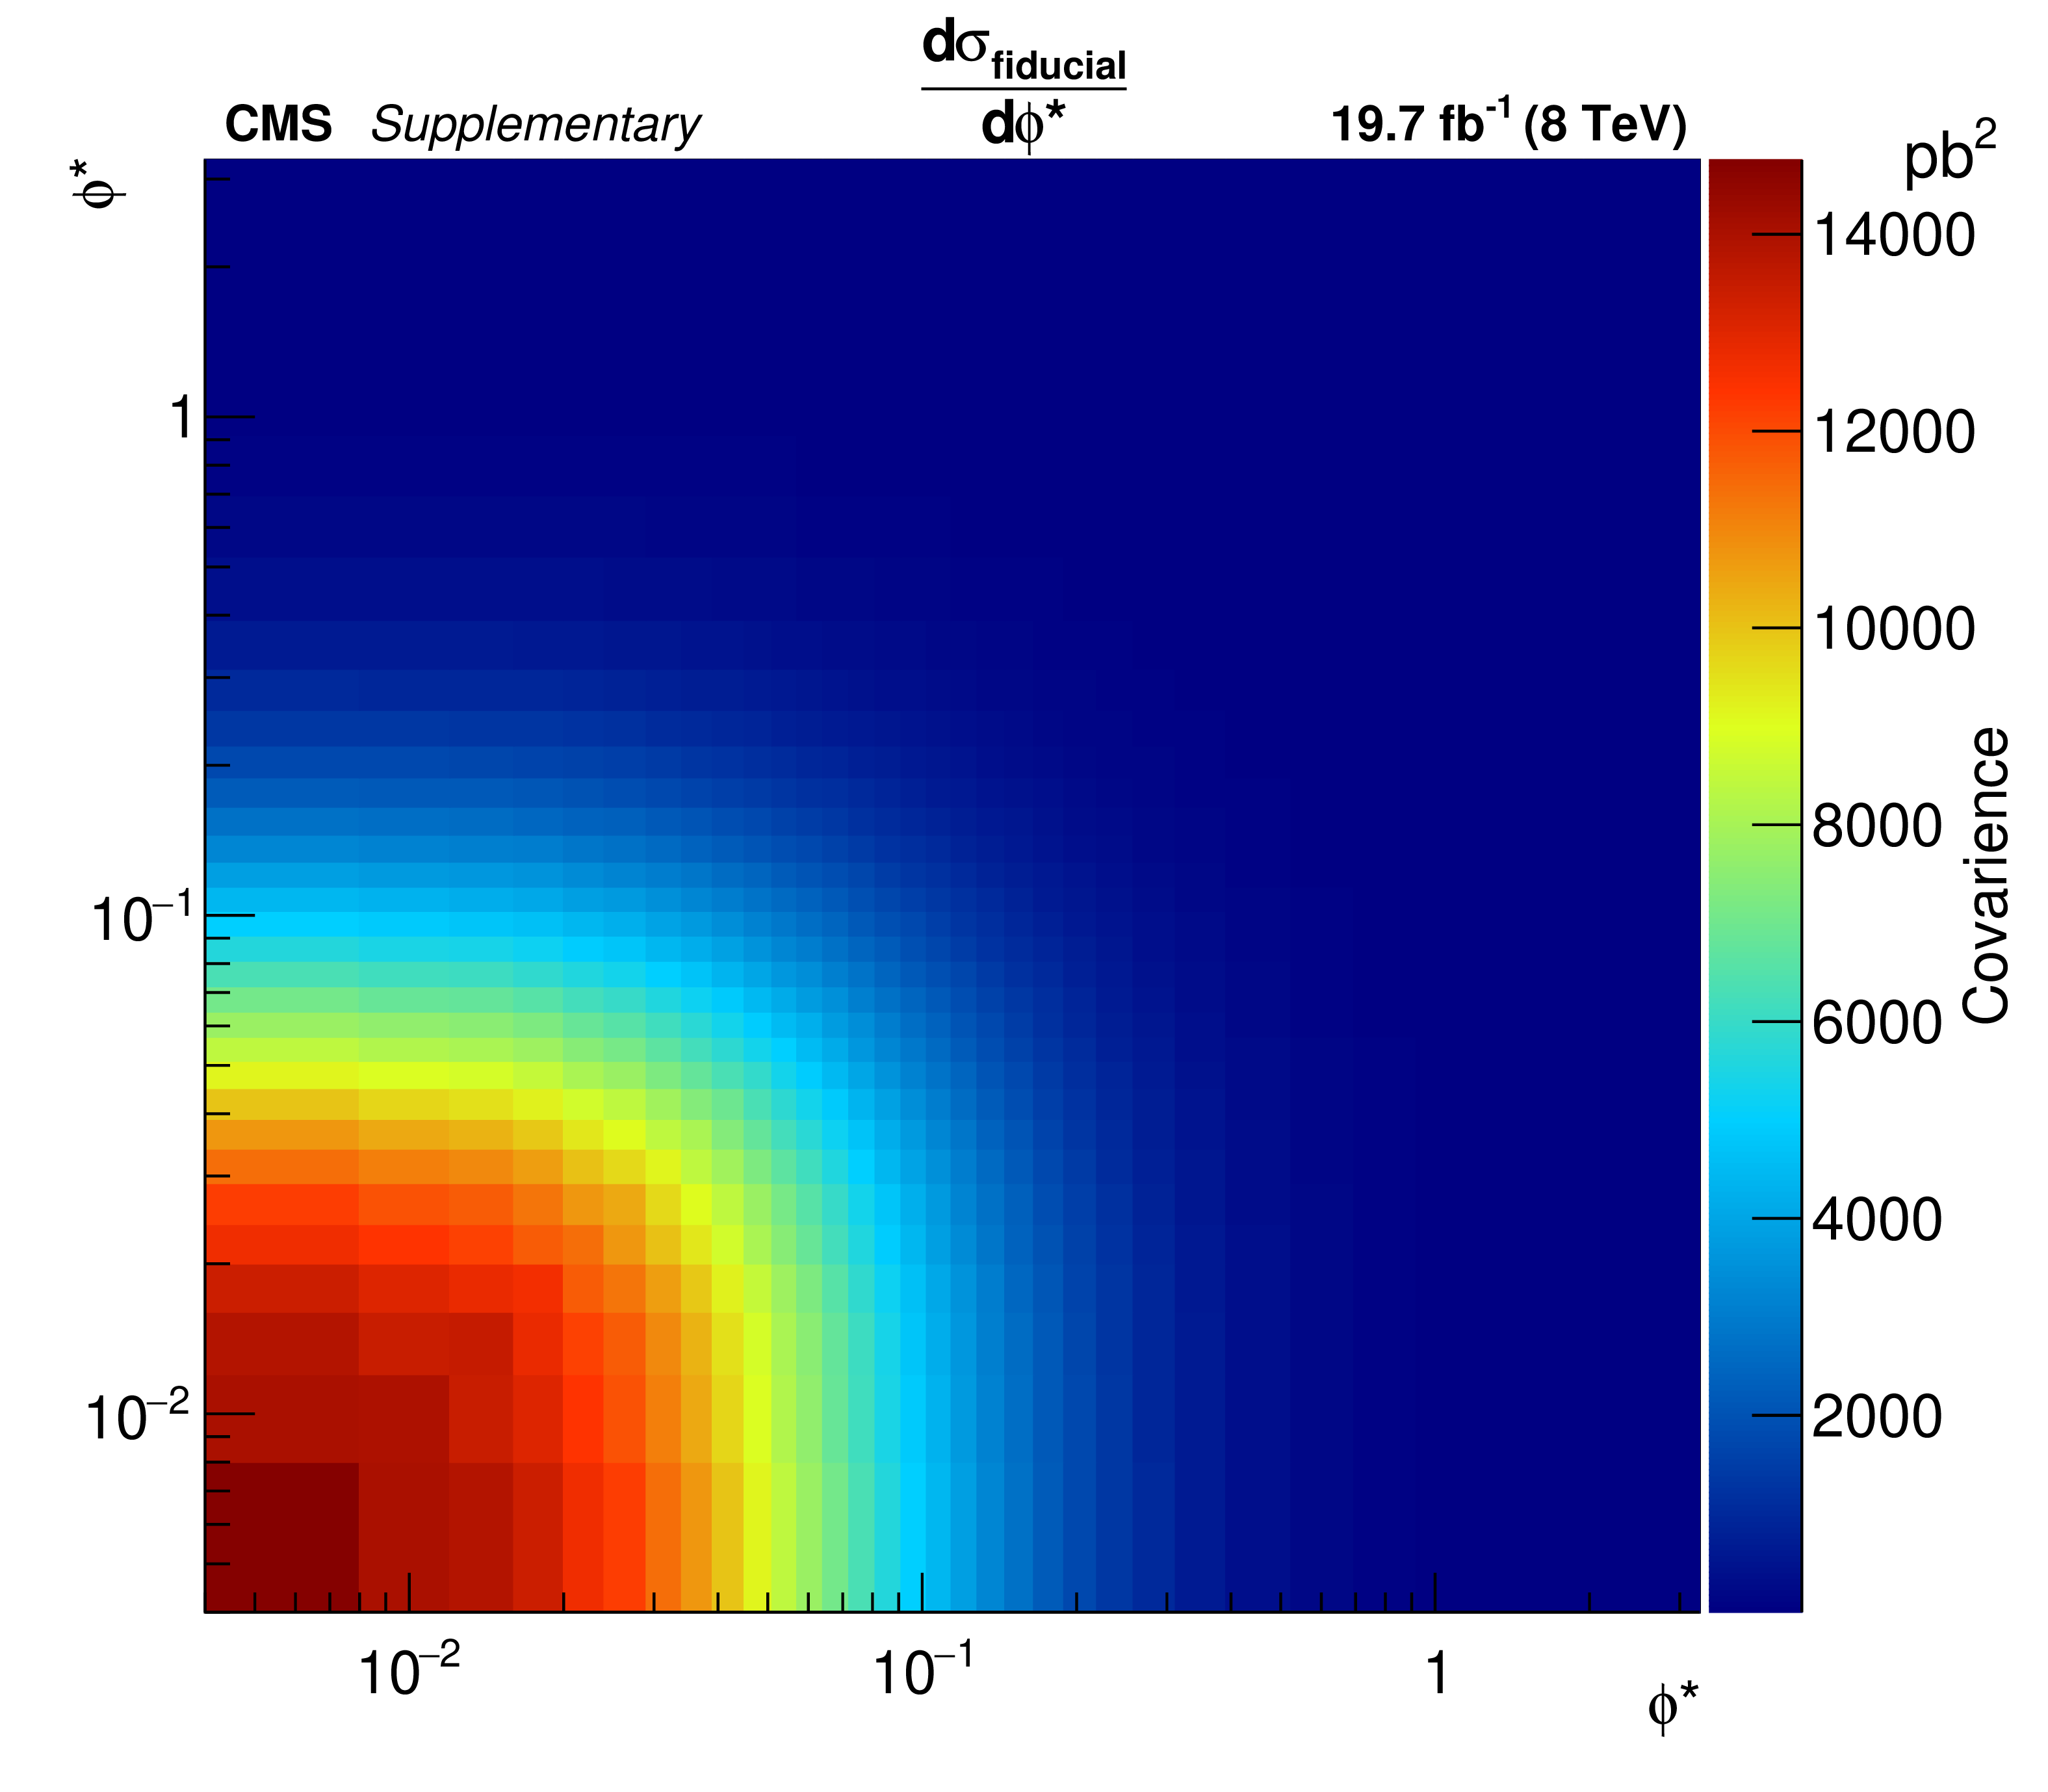
Additional Figure 6:
Covariance matrix for the measured double-differential absolute cross section as a function of $\phi *$ and $y$. The axis bin numbers refer to the bin numbers as defined in the measurement tables. |

png pdf |
Additional Figure 7:
Correlation matrix for the measured double-differential normalized cross section as a function of $\phi *$ and $y$. The axis bin numbers refer to the bin numbers as defined in the measurement tables. |
png pdf |
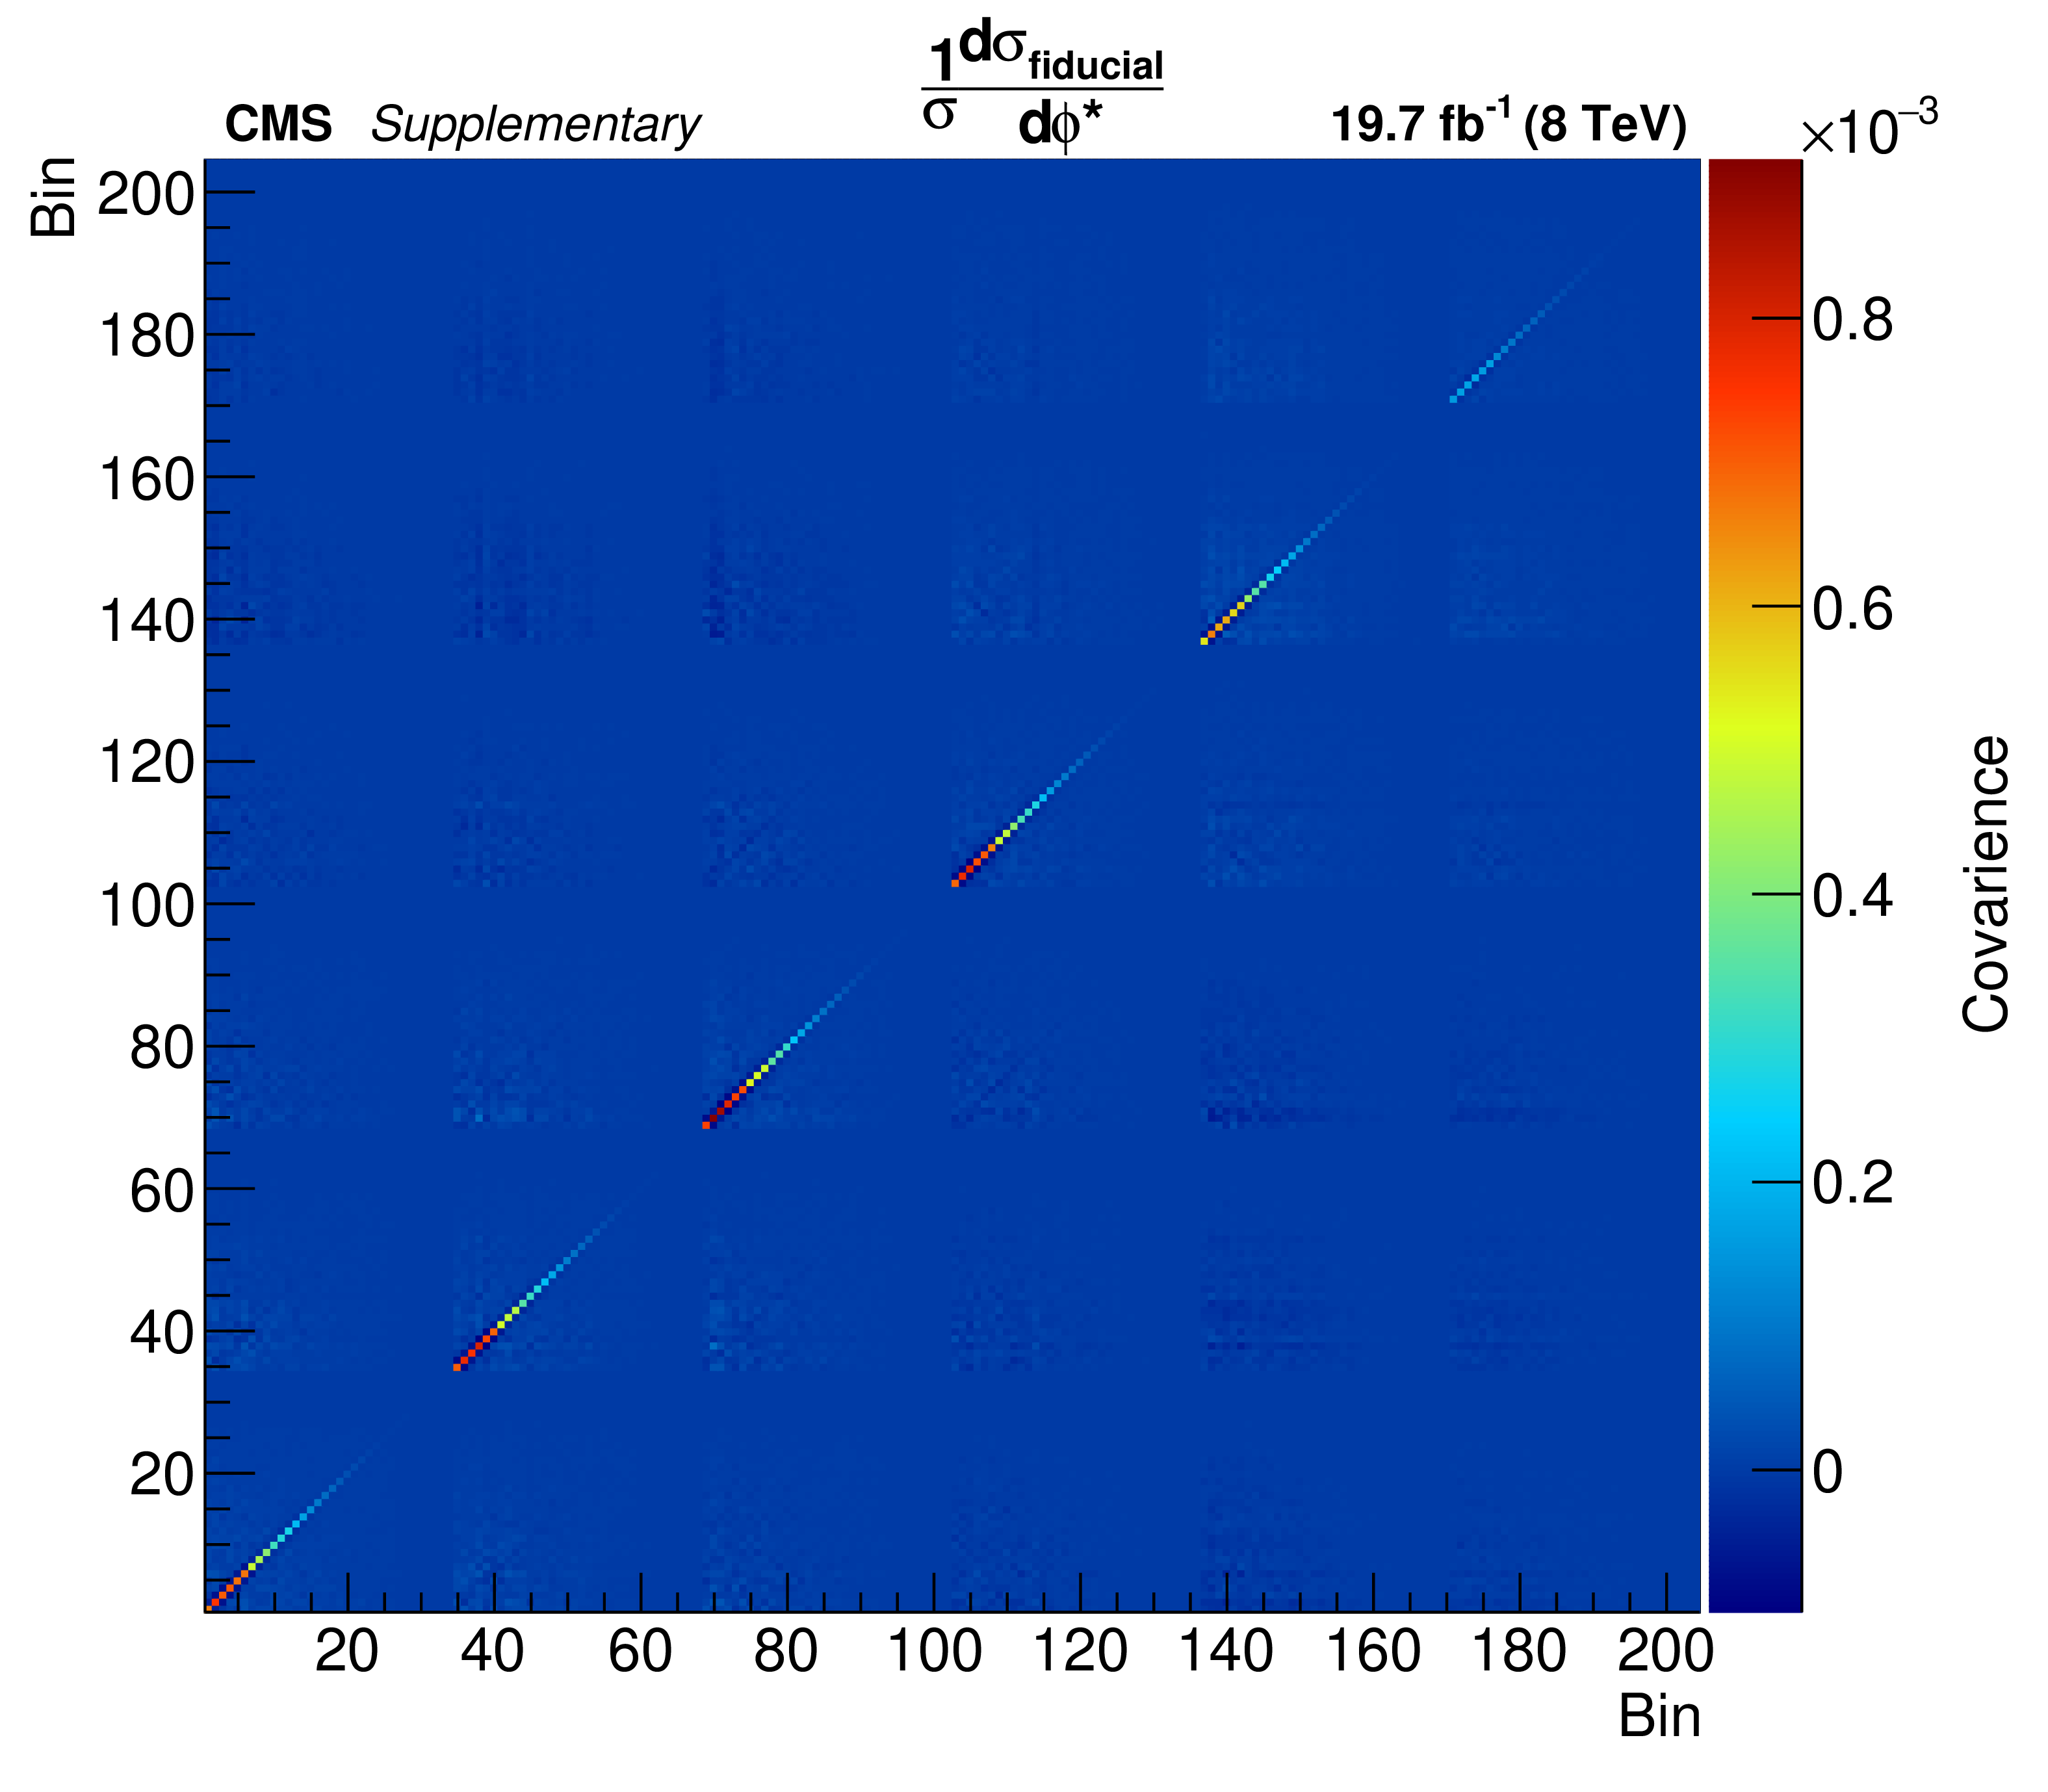
Additional Figure 8:
Covariance matrix for the measured double-differential normalized cross section as a function of $\phi *$ and $y$. The axis bin numbers refer to the bin numbers as defined in the measurement tables. |
| Additional Tables | |

png pdf |
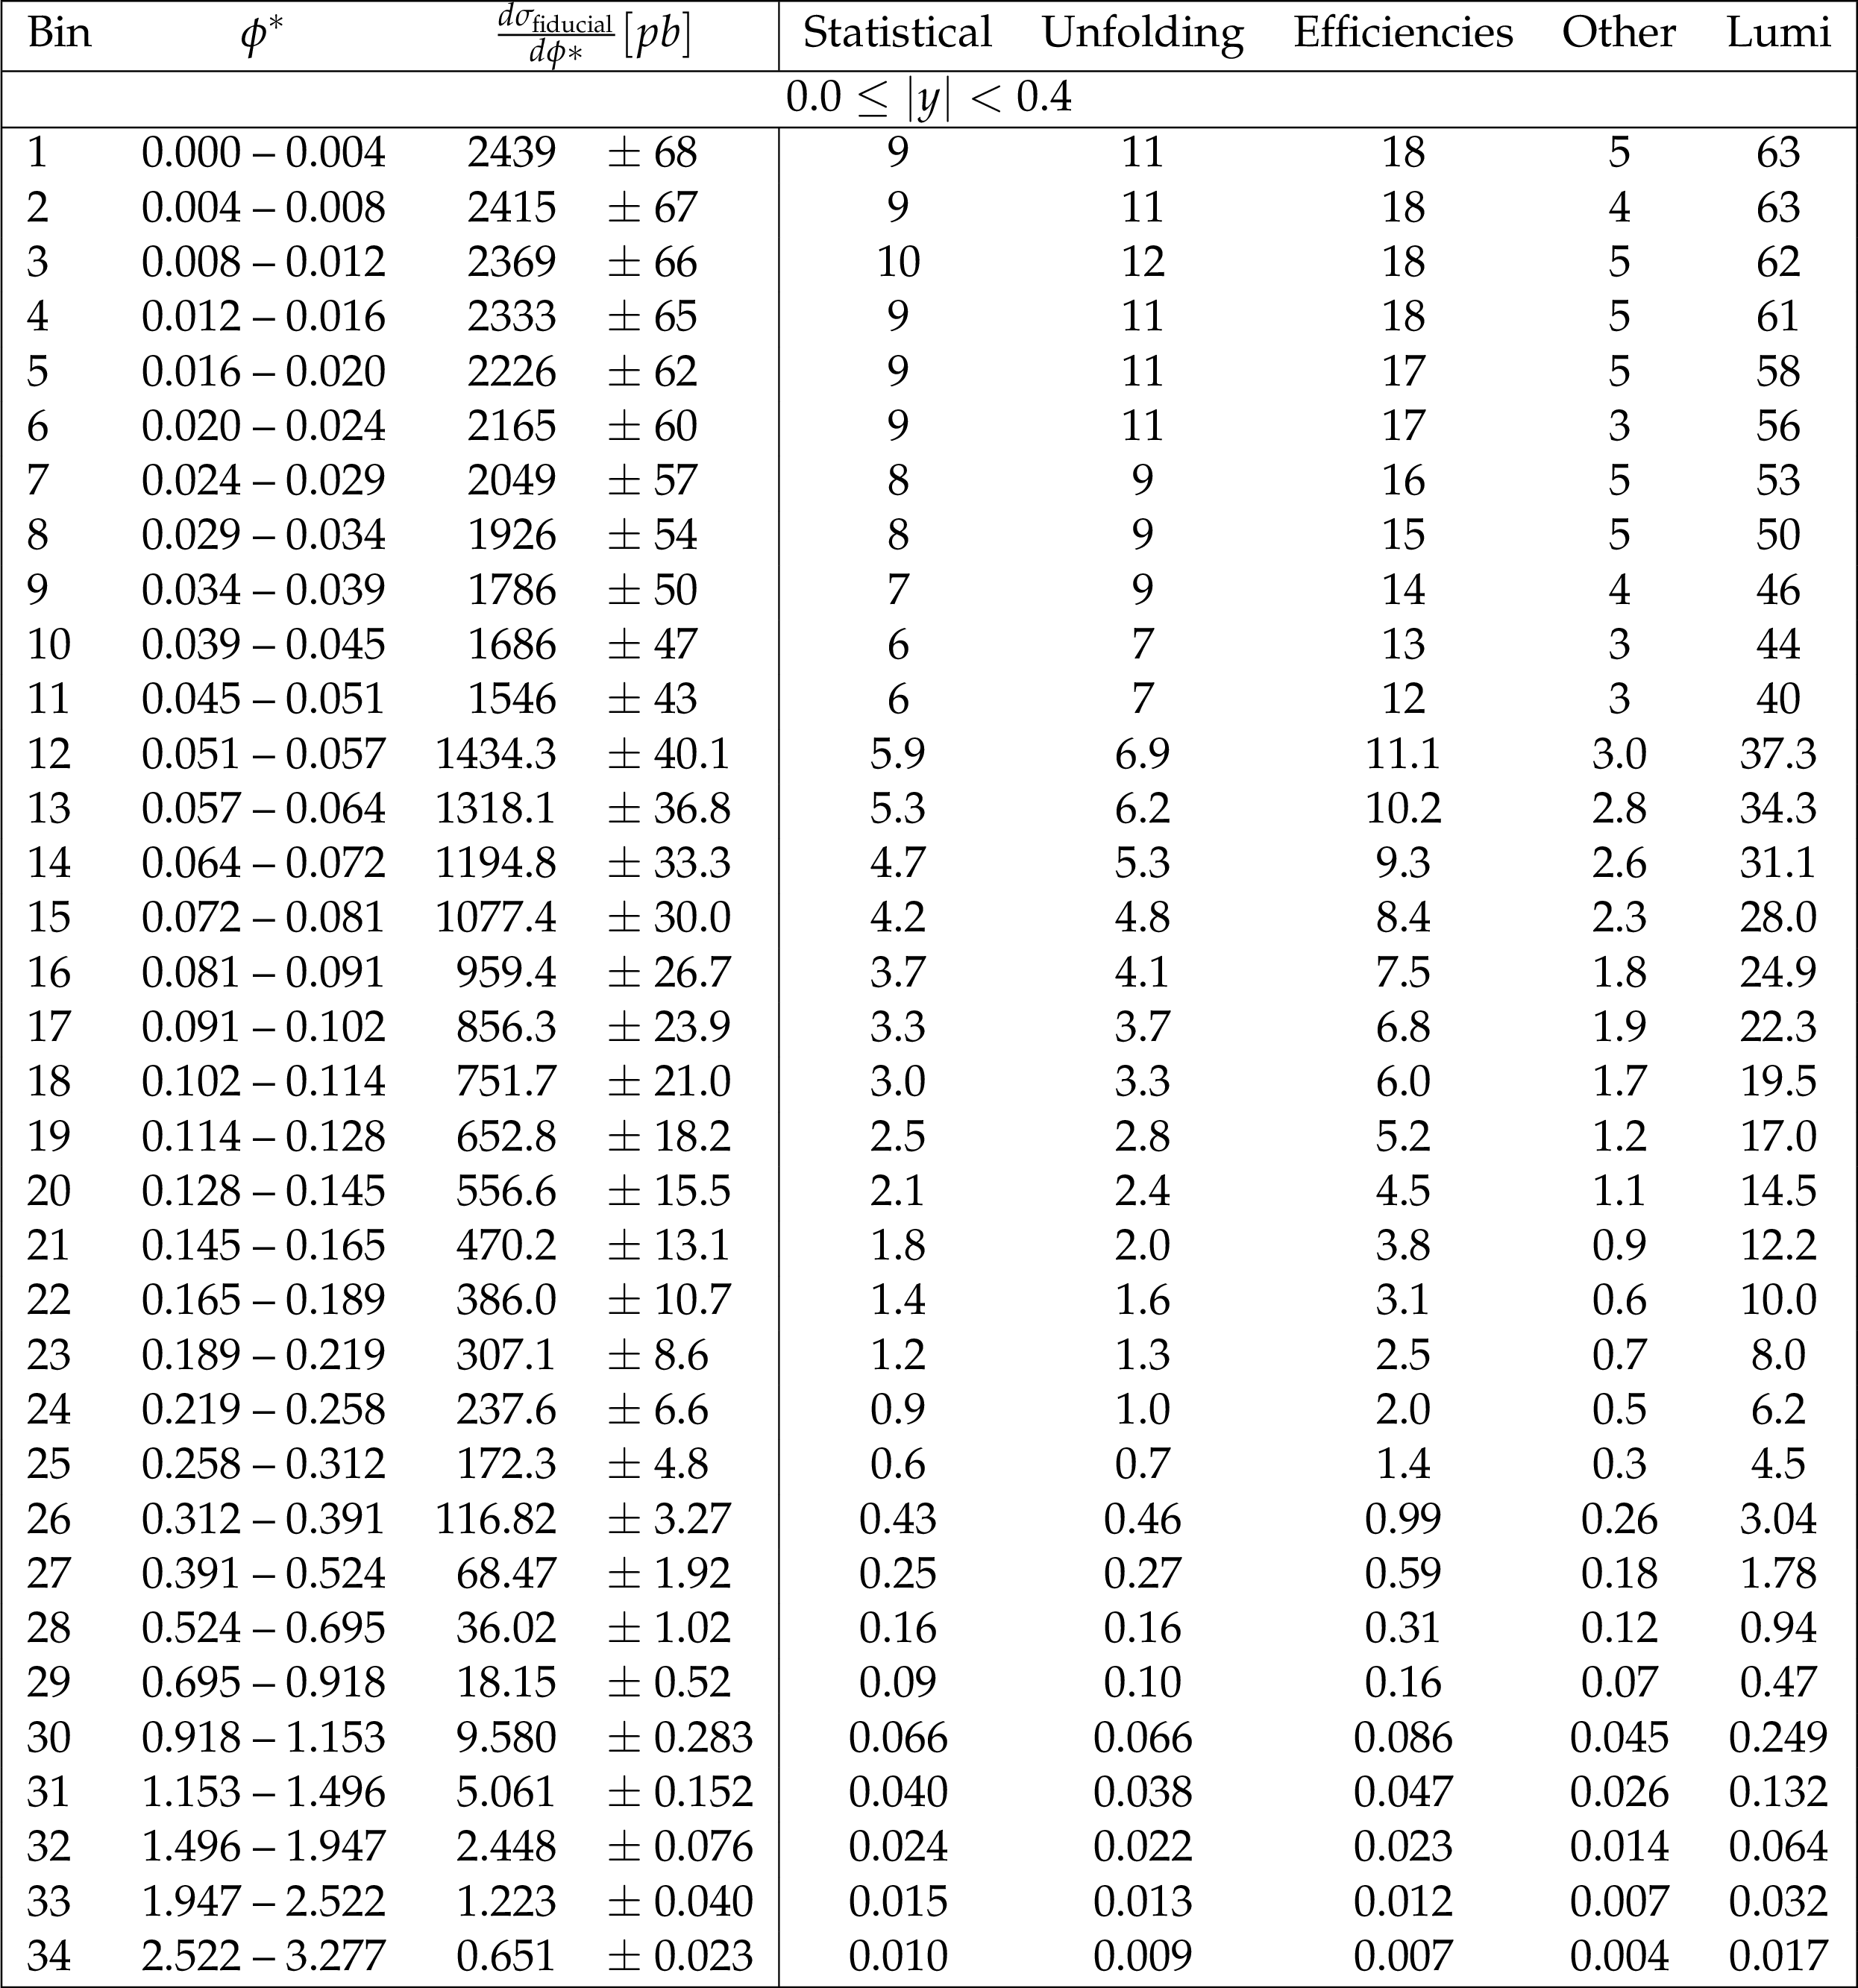
Additional Table 1:
The measured single-differential absolute cross section measurement as a function of $\phi *$ after the combination of dielectron and dimuon channels, with the breakdown of uncertainties. |
png pdf |
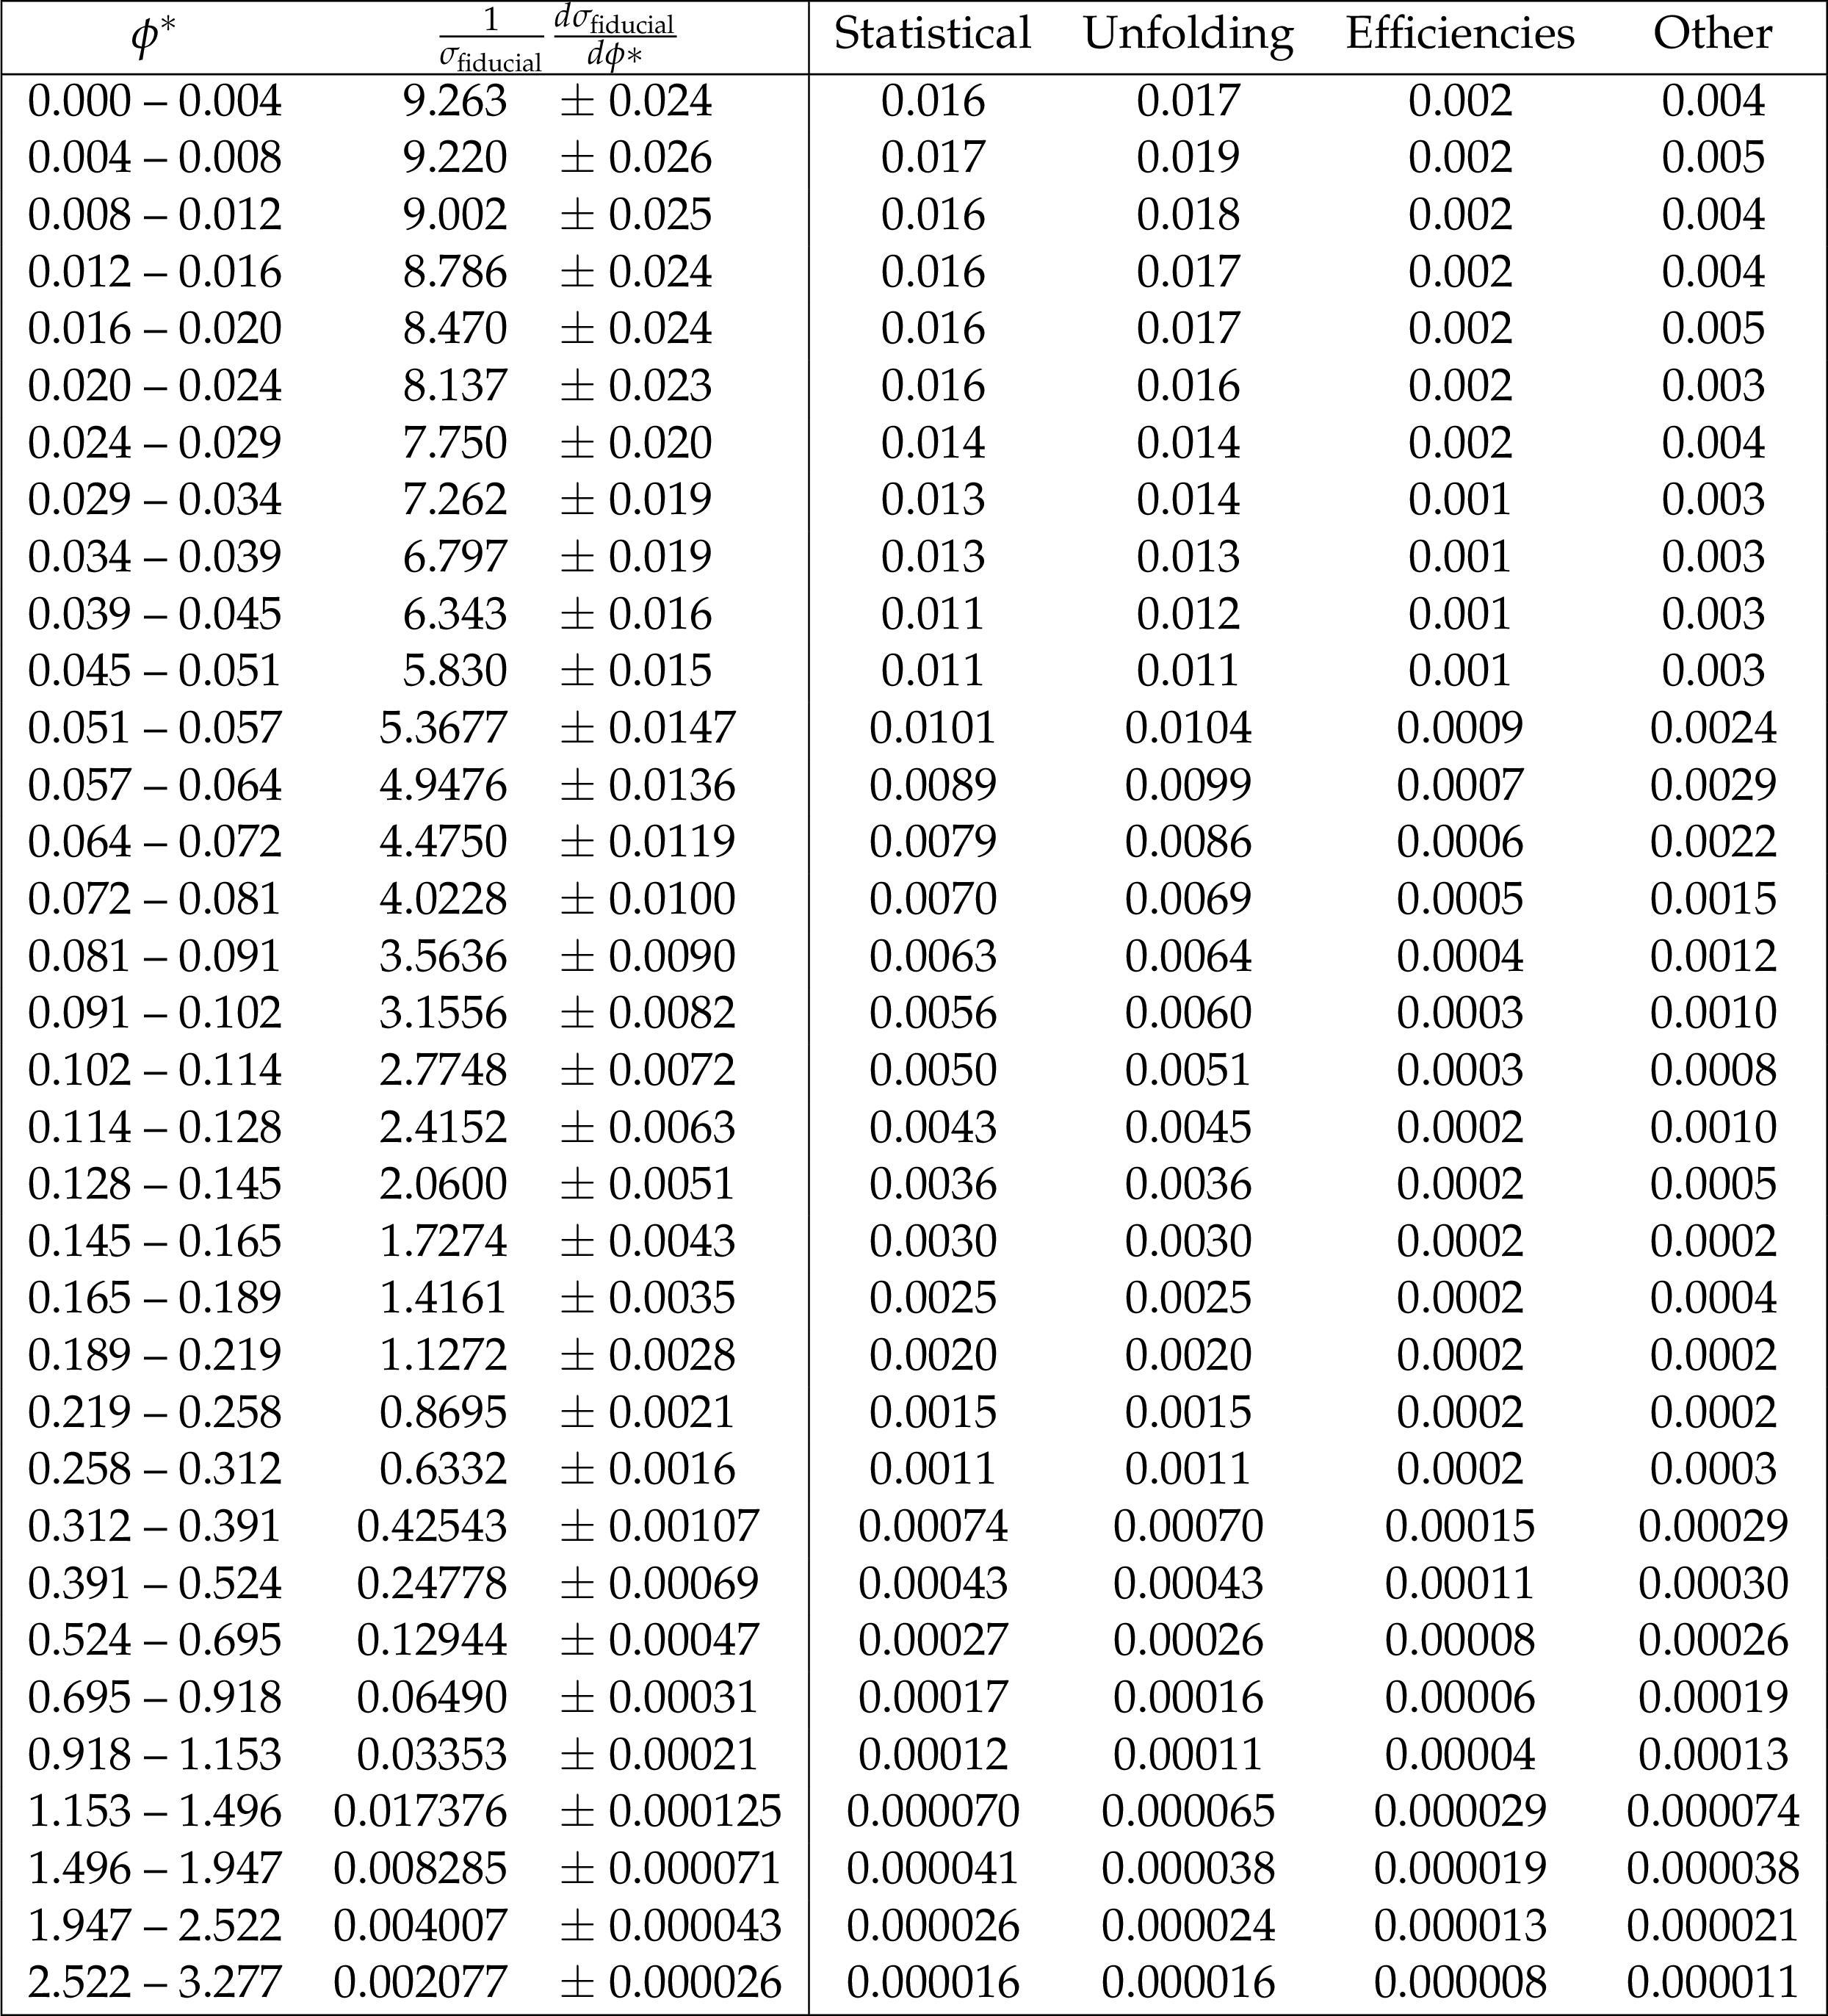
Additional Table 2:
The measured single-differential normalized cross section measurement as a function of $\phi *$ after the combination of dielectron and dimuon channels, with the breakdown of uncertainties. |
png pdf |
Additional Table 3:
The measured double-differential absolute cross section measurement as a function of $\phi *$ and $y$, for 0.0 $\le |y| < $ 0.4, after the combination of dielectron and dimuon channels, with the breakdown of uncertainties. |

png pdf |
Additional Table 4:
The measured double-differential absolute cross section measurement as a function of $\phi *$ and $y$, for 0.4 $\le |y| < $ 0.8, after the combination of dielectron and dimuon channels, with the breakdown of uncertainties. |

png pdf |
Additional Table 5:
The measured double-differential absolute cross section measurement as a function of $\phi *$ and $y$, for 0.8 $\le |y| < $ 1.2, after the combination of dielectron and dimuon channels, with the breakdown of uncertainties. |

png pdf |
Additional Table 6:
The measured double-differential absolute cross section measurement as a function of $\phi *$ and $y$, for 1.2 $\le |y| < $ 1.6, after the combination of dielectron and dimuon channels, with the breakdown of uncertainties. |

png pdf |
Additional Table 7:
The measured double-differential absolute cross section measurement as a function of $\phi *$ and $y$, for 1.6 $\le |y| < $ 2.0, after the combination of dielectron and dimuon channels, with the breakdown of uncertainties. |

png pdf |
Additional Table 8:
The measured double-differential absolute cross section measurement as a function of $\phi *$ and $y$, for 2.0 $\le |y| < $ 2.4, after the combination of dielectron and dimuon channels, with the breakdown of uncertainties. |

png pdf |
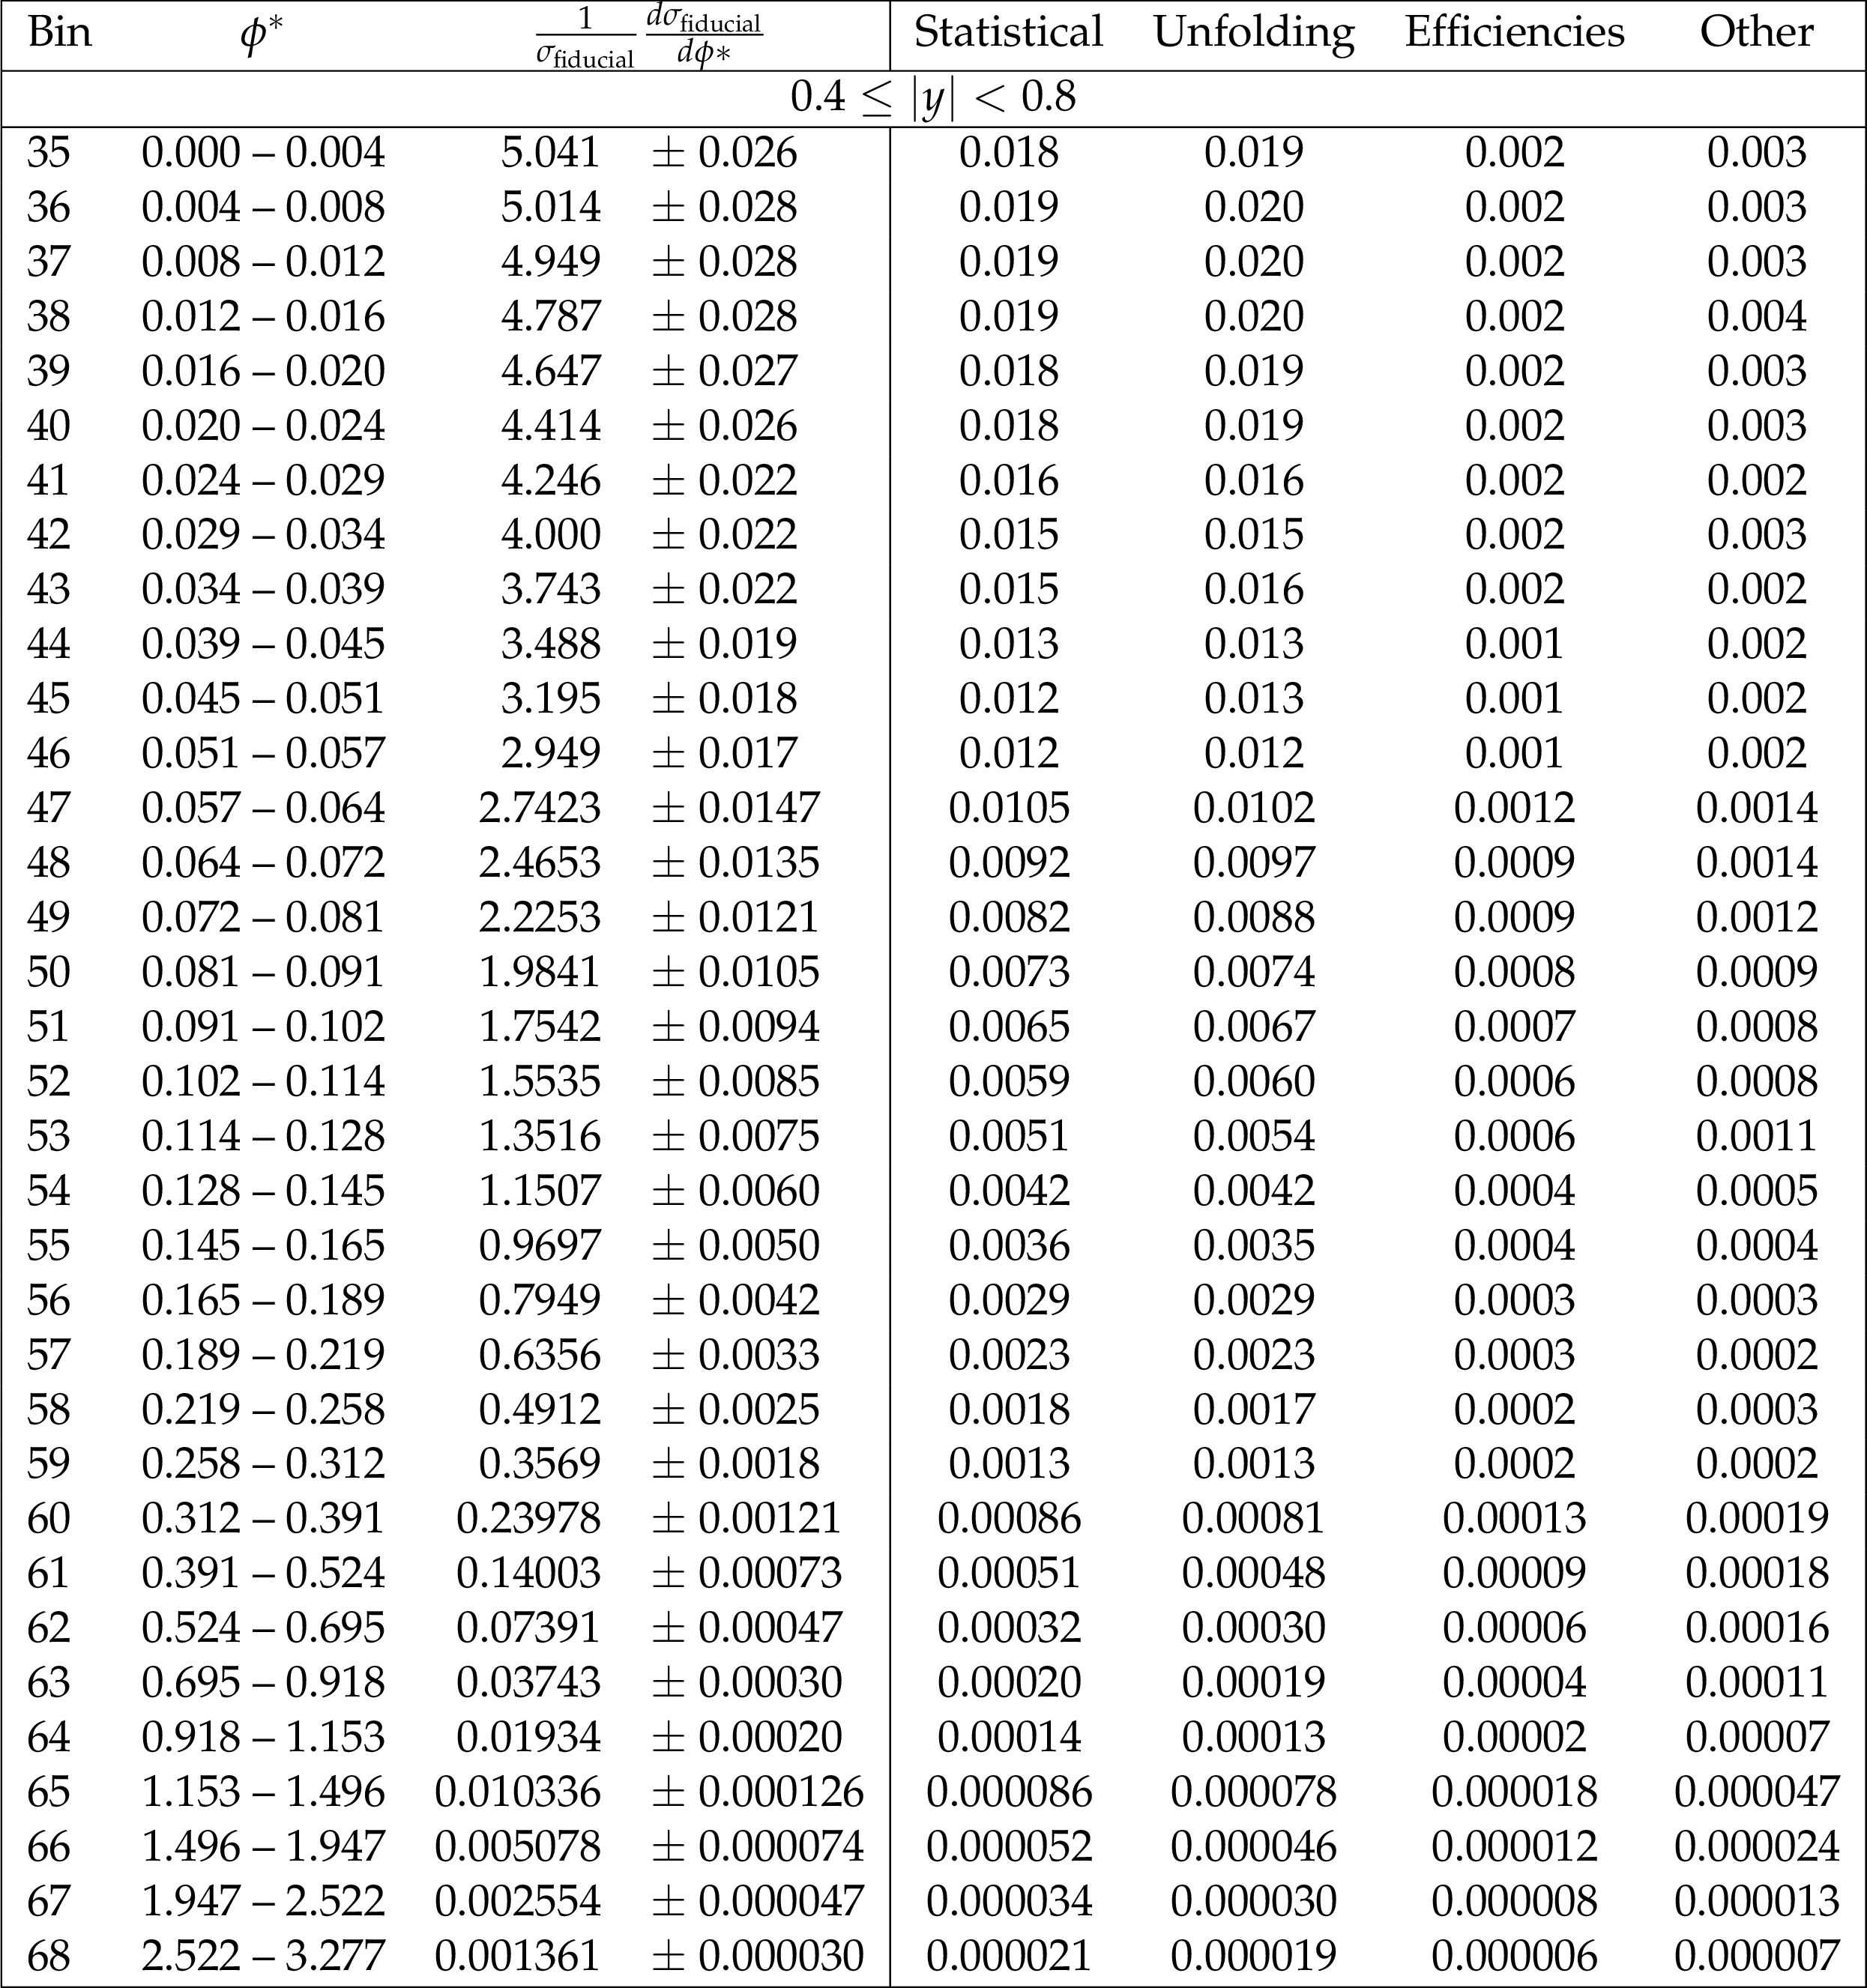
Additional Table 9:
The measured double-differential normalized cross section measurement as a function of $\phi *$ and $y$, for 0.0 $\le |y| < $ 0.4, after the combination of dielectron and dimuon channels, with the breakdown of uncertainties. The bin numbers are used in the covarience plots. |
png pdf |
Additional Table 10:
The measured double-differential normalized cross section measurement as a function of $\phi *$ and $y$, for 0.4 $\le |y| < $ 0.8, after the combination of dielectron and dimuon channels, with the breakdown of uncertainties. The bin numbers are used in the covarience plots. |

png pdf |
Additional Table 11:
The measured double-differential normalized cross section measurement as a function of $\phi *$ and $y$, for 0.8 $\le |y| < $ 1.2, after the combination of dielectron and dimuon channels, with the breakdown of uncertainties. The bin numbers are used in the covarience plots. |

png pdf |
Additional Table 12:
The measured double-differential normalized cross section measurement as a function of $\phi *$ and $y$, for 1.2 $\le |y| < $ 1.6, after the combination of dielectron and dimuon channels, with the breakdown of uncertainties. The bin numbers are used in the covarience plots. |

png pdf |
Additional Table 13:
The measured double-differential normalized cross section measurement as a function of $\phi *$ and $y$, for 1.6 $\le |y| < $ 2.0, after the combination of dielectron and dimuon channels, with the breakdown of uncertainties. The bin numbers are used in the covarience plots. |

png pdf |
Additional Table 14:
The measured double-differential normalized cross section measurement as a function of $\phi *$ and $y$, for 2.0 $\le |y| < $ 2.4, after the combination of dielectron and dimuon channels, with the breakdown of uncertainties. The bin numbers are used in the covarience plots. |
| References | ||||
| 1 | C. Anastasiou, L. J. Dixon, K. Melnikov, and F. Petriello | High precision QCD at hadron colliders: electroweak gauge boson rapidity distributions at NNLO | PRD 69 (2004) 094008 | hep-ph/0312266 |
| 2 | K. Melnikov and F. Petriello | Electroweak gauge boson production at hadron colliders through $ \mathcal{O}({{\alpha}}_{s}^{2}) $ | PRD 74 (2006) 114017 | |
| 3 | Y. Li and F. Petriello | Combining QCD and electroweak corrections to dilepton production in the framework of the FEWZ simulation code | PRD 86 (2012) 094034 | 1208.5967 |
| 4 | S. Alioli et al. | Drell-Yan production at NNLL'+NNLO matched to parton showers | PRD 92 (2015) 094020 | 1508.01475 |
| 5 | CMS Collaboration | Measurement of the differential and double-differential Drell-Yan cross sections in proton-proton collisions at $ \sqrt{s} = $ 7 TeV | JHEP 12 (2013) 030 | CMS-SMP-13-003 1310.7291 |
| 6 | CMS Collaboration | Measurements of differential and double-differential Drell-Yan cross sections in proton-proton collisions at $ \sqrt{s}= $ 8 TeV | EPJC 75 (2015) 147 | CMS-SMP-14-003 1412.1115 |
| 7 | ATLAS Collaboration | Measurement of the low-mass Drell--Yan differential cross section at $ \sqrt{s} = $ 7 TeV using the ATLAS detector | JHEP 06 (2014) 112 | 1404.1212 |
| 8 | ATLAS Collaboration | Measurement of the high-mass Drell--Yan differential cross-section in pp collisions at $ \sqrt{s} = $ 7 TeV with the ATLAS detector | PLB 725 (2013) 223 | 1305.4192 |
| 9 | ATLAS Collaboration | Measurement of the transverse momentum distribution of Z$ /\gamma^* $ bosons in proton-proton collisions at $ \sqrt{s} = $ 7 TeV with the ATLAS detector | PLB 705 (2011) 415 | 1107.2381 |
| 10 | CMS Collaboration | Measurement of the rapidity and transverse momentum distributions of Z~bosons in $ {\mathrm{p}}{\mathrm{p}} $~collisions at $ \sqrt{s} = $ 7 TeV | PRD 85 (2012) 032002 | CMS-EWK-10-010 1110.4973 |
| 11 | LHCb Collaboration | Measurement of the cross-section for $ {\rm Z} \to {\rm e}^+{\rm e}^- $ production in $ {\mathrm{p}}{\mathrm{p}}\ $ collisions at $ \sqrt{s} = $ 7 TeV | JHEP 02 (2013) 106 | 1212.4620 |
| 12 | CMS Collaboration | Measurement of the Z boson differential cross section in transverse momentum and rapidity in proton-proton collisions at 8 TeV | PLB 749 (2015) 187 | CMS-SMP-13-013 1504.03511 |
| 13 | ATLAS Collaboration | Measurement of the transverse momentum and $ \phi ^*_{\eta} $ distributions of Drell--Yan lepton pairs in proton-proton collisions at $ \sqrt{s} = $ 8 TeV with the ATLAS detector | EPJC 76 (2016) 291 | 1512.02192 |
| 14 | S. Hoeche, Y. Li, and S. Prestel | Drell-Yan lepton pair production at NNLO QCD with parton showers | PRD 91 (2015) 074015 | 1405.3607 |
| 15 | J. C. Collins | Sudakov form-factors | Adv. Ser. Direct. High Energy Phys. 5 (1989) 573 | hep-ph/0312336 |
| 16 | A. Banfi et al. | Optimisation of variables for studying dilepton transverse momentum distributions at hadron colliders | EPJC 71 (2011) 1600 | 1009.1580 |
| 17 | A. Banfi, M. Dasgupta, S. Marzani, and L. Tomlinson | Predictions for Drell-Yan $ \phi^* $ and $ Q_T $ observables at the LHC | PLB 715 (2012) 152 | 1205.4760 |
| 18 | S. Marzani | $ Q_T $ and $ \phi^* $ observables in Drell-Yan processes | EPJ Web Conf. 49 (2013) 14007 | |
| 19 | D0 Collaboration | Precise Study of the $ Z/\gamma^* $ Boson Transverse Momentum Distribution in $ p\bar{p} $ Collisions Using a Novel Technique | PRL 106 (2011) 122001 | 1010.0262 |
| 20 | ATLAS Collaboration | Measurement of angular correlations in Drell-Yan lepton pairs to probe Z$ /\gamma^* $ boson transverse momentum at $ \sqrt{s} = $ 7 TeV with the ATLAS detector | PLB 720 (2013) 32 | 1211.6899 |
| 21 | CMS Collaboration | The CMS experiment at the CERN LHC | JINST 3 (2008) S08004 | CMS-00-001 |
| 22 | CMS Collaboration | The CMS trigger system | JINST 12 (2017) P01020 | CMS-TRG-12-001 1609.02366 |
| 23 | M. Cacciari, G. P. Salam, and G. Soyez | The anti-$ k_t $ jet clustering algorithm | JHEP 04 (2008) 063 | 0802.1189 |
| 24 | M. Cacciari, G. P. Salam, and G. Soyez | FastJet user manual | EPJC 72 (2012) 1896 | 1111.6097 |
| 25 | CMS Collaboration | Particle-flow reconstruction and global event description with the cms detector | JINST 12 (2017) P10003 | CMS-PRF-14-001 1706.04965 |
| 26 | CMS Collaboration | Performance of electron reconstruction and selection with the CMS detector in proton-proton collisions at $ \sqrt{s} = $ 8 TeV | JINST 10 (2015) P06005 | CMS-EGM-13-001 1502.02701 |
| 27 | CMS Collaboration | Performance of CMS muon reconstruction in pp collision events at $ \sqrt{s} = $ 7 TeV | JINST 7 (2012) P10002 | CMS-MUO-10-004 1206.4071 |
| 28 | M. Cacciari and G. P. Salam | Pileup subtraction using jet areas | PLB 659 (2008) 119 | 0707.1378 |
| 29 | J. Alwall et al. | MadGraph 5: going beyond | JHEP 06 (2011) 128 | 1106.0522 |
| 30 | J. Pumplin et al. | New generation of parton distributions with uncertainties from global QCD analysis | JHEP 07 (2002) 012 | hep-ph/0201195 |
| 31 | T. Sjostrand, S. Mrenna, and P. Z. Skands | PYTHIA 6.4 physics and manual | JHEP 05 (2006) 026 | hep-ph/0603175 |
| 32 | J. Alwall et al. | Comparative study of various algorithms for the merging of parton showers and matrix elements in hadronic collisions | EPJC 53 (2008) 473 | 0706.2569 |
| 33 | CMS Collaboration | Study of the underlying event at forward rapidity in pp collisions at $ \sqrt{s} = $ 0.9, 2.76, and 7 TeV | JHEP 04 (2013) 072 | CMS-FWD-11-003 1302.2394 |
| 34 | CMS Collaboration | Event generator tunes obtained from underlying event and multiparton scattering measurements | EPJC 76 (2016) 155 | CMS-GEN-14-001 1512.00815 |
| 35 | P. Golonka et al. | The tauola-photos-F environment for the TAUOLA and PHOTOS packages, release II | CPC 174 (2006) 818 | hep-ph/0312240 |
| 36 | R. Gavin, Y. Li, F. Petriello, and S. Quackenbush | FEWZ 2.0: A code for hadronic Z production at next-to-next-to-leading order | CPC 182 (2011) 2388 | 1011.3540 |
| 37 | NNPDF Collaboration | Parton distributions for the LHC Run II | JHEP 04 (2015) 040 | 1410.8849 |
| 38 | M. Czakon and A. Mitov | Top++: A program for the calculation of the top-pair cross-section at hadron colliders | CPC 185 (2014) 2930 | 1112.5675 |
| 39 | M. Aliev et al. | HATHOR: HAdronic Top and Heavy quarks crOss section calculatoR | CPC 182 (2011) 1034 | 1007.1327 |
| 40 | P. Kant et al. | HATHOR for single top-quark production: Updated predictions and uncertainty estimates for single top-quark production in hadronic collisions | CPC 191 (2015) 74 | 1406.4403 |
| 41 | J. M. Campbell, R. K. Ellis, and C. Williams | Vector boson pair production at the LHC | JHEP 07 (2011) 018 | 1105.0020 |
| 42 | T. Melia, P. Nason, R. Rontsch, and G. Zanderighi | $ {\rm W}^+{\rm W}^- $, $ {\rm WZ} $ and $ {\rm ZZ} $ production in the POWHEG BOX | JHEP 11 (2011) 078 | 1107.5051 |
| 43 | GEANT4 Collaboration | GEANT4 -- a simulation toolkit | NIMA 506 (2003) 250 | |
| 44 | CMS Collaboration | Measurement of the Drell--Yan cross section in $ {\mathrm{p}}{\mathrm{p}} $ collisions at $ \sqrt{s} = $ 7 TeV | JHEP 10 (2011) 132 | CMS-EWK-10-005 1107.4789 |
| 45 | A. Bodek et al. | Extracting muon momentum scale corrections for hadron collider experiments | EPJC 72 (2012) 2194 | 1208.3710 |
| 46 | CMS Collaboration | Measurement of the properties of a Higgs boson in the four-lepton final state | PRD 89 (2014) 092007 | CMS-HIG-13-002 1312.5353 |
| 47 | G. D'Agostini | A multidimensional unfolding method based on Bayes' theorem | NIMA 362 (1995) 487 | |
| 48 | T. Adye | Unfolding algorithms and tests using RooUnfold | in PHYSTAT 2011 Workshop on Statistical Issues Related to Discovery Claims in Search Experiments and Unfolding, H. Prosper and L. Lyons, eds., p. 313 Geneva, Switzerland | 1105.1160 |
| 49 | CMS Collaboration | CMS luminosity based on pixel cluster counting - summer 2013 update | CMS-PAS-LUM-13-001 | CMS-PAS-LUM-13-001 |
| 50 | CMS Collaboration | Measurement of the $ \overline{\rm t}{\rm t} $ production cross section in the $ e\mu $ channel in proton-proton collisions at $ \sqrt s = $ 7 and 8 TeV | JHEP 08 (2016) 029 | CMS-TOP-13-004 1603.02303 |
| 51 | CMS Collaboration | Measurement of the WZ production cross section in pp collisions at $ \sqrt{s} = $ 7 and 8 TeV and search for anomalous triple gauge couplings at $ \sqrt{s} = $ 8 TeV | EPJC 77 (2017) 236 | CMS-SMP-14-014 1609.05721 |
| 52 | CMS Collaboration | Measurement of the $ {\rm pp} \rightarrow {\rm ZZ} $ production cross section and constraints on anomalous triple gauge couplings in four-lepton final states at $ \sqrt{s} = $ 8 TeV | PLB 740 (2015) 250 | CMS-SMP-13-005 1406.0113 |
| 53 | G. Nanava and Z. W\cas | How to use SANC to improve the PHOTOS Monte Carlo simulation of bremsstrahlung in leptonic W-boson decays | Acta Phys. Polon. B 34 (2003) 4561 | hep-ph/0303260 |
| 54 | P. Nason | A new method for combining NLO QCD with shower Monte Carlo algorithms | JHEP 11 (2004) 040 | hep-ph/0409146 |
| 55 | S. Alioli, P. Nason, C. Oleari, and E. Re | A general framework for implementing NLO calculations in shower Monte Carlo programs: the POWHEG BOX | JHEP 06 (2010) 043 | 1002.2581 |
| 56 | S. Alioli, P. Nason, C. Oleari, and E. Re | Vector boson plus one jet production in POWHEG | JHEP 01 (2011) 095 | 1009.5594 |
| 57 | S. Frixione, P. Nason, and C. Oleari | Matching NLO QCD computations with parton shower simulations: the POWHEG method | JHEP 11 (2007) 070 | 0709.2092 |
| 58 | J. Gao et al. | CT10 next-to-next-to-leading order global analysis of QCD | PRD 89 (2014) 033009 | 1302.6246 |
| 59 | T. Sjostrand et al. | An introduction to pYTHIA 8.2 | CPC 191 (2015) 159 | 1410.3012 |
| 60 | R. D. Ball et al. | A first unbiased global NLO determination of parton distributions and their uncertainties | NPB 838 (2010) 136 | 1002.4407 |
| 61 | R. D. Ball et al. | Impact of heavy quark masses on parton distributions and LHC phenomenology | NPB 849 (2011) 296 | 1101.1300 |
| 62 | G. A. Ladinsky and C. P. Yuan | The nonperturbative regime in QCD resummation for gauge boson production at hadron colliders | PRD 50 (1994) 4239 | hep-ph/9311341 |
| 63 | C. Balazs and C. P. Yuan | Soft gluon effects on lepton pairs at hadron colliders | PRD 56 (1997) 5558 | hep-ph/9704258 |
| 64 | F. Landry, R. Brock, P. M. Nadolsky, and C. P. Yuan | Tevatron Run-1 $ Z $ boson data and Collins-Soper-Sterman resummation formalism | PRD 67 (2003) 073016 | hep-ph/0212159 |
| 65 | J. Alwall et al. | The automated computation of tree-level and next-to-leading order differential cross sections, and their matching to parton shower simulations | JHEP 07 (2014) 079 | 1405.0301 |
| 66 | R. Frederix and S. Frixione | Merging meets matching in MC@NLO | JHEP 12 (2012) 061 | 1209.6215 |
| 67 | S. Alekhin et al. | The PDF4LHC Working Group Interim Report | 1101.0536 | |
| 68 | M. Botje et al. | The PDF4LHC Working Group Interim Recommendations | 1101.0538 | |
| 69 | L. Lyons, D. Gibaut, and P. Clifford | How to combine correlated estimates of a single physical quantity | NIMA 270 (1988) 110 | |
| 70 | A. Valassi | Combining correlated measurements of several different physical quantities | NIMA 500 (2003) 391 | |
| 71 | R. Nisius | On the combination of correlated estimates of a physics observable | EPJC 74 (2014) 3004 | 1402.4016 |
|
|
Compact Muon Solenoid LHC, CERN |
|

|

|

|

|

|