

Compact Muon Solenoid
LHC, CERN
| CMS-SMP-19-004 ; CERN-EP-2019-262 | ||
| Measurement of the associated production of a Z boson with charm or bottom quark jets in proton-proton collisions at $\sqrt{s}=$ 13 TeV | ||
| CMS Collaboration | ||
| 19 January 2020 | ||
| Phys. Rev. D 102 (2020) 032007 | ||
| Abstract: Ratios of cross sections, $\sigma(\mathrm{Z+c\ \text{jets}})/\sigma(\mathrm{Z+ \text{jets}})$, $\sigma(\mathrm{Z+b\ \text{jets}})/\sigma(\mathrm{Z+ \text{jets}})$, and $\sigma(\mathrm{Z+c\ \text{jets}})/\sigma(\mathrm{Z+b\ \text{jets}})$ in the associated production of a Z boson with at least one charm or bottom quark jet are measured in proton-proton collisions at $\sqrt{s}=$ 13 TeV. The data sample, collected by the CMS experiment at the CERN LHC, corresponds to an integrated luminosity of 35.9 fb$^{-1}$, with a fiducial volume of ${p_{\mathrm{T}}} > $ 30 GeV and $|\eta| < $ 2.4 for the jets, where ${p_{\mathrm{T}}}$ and $\eta$ represent transverse momentum and pseudorapidity, respectively. The Z boson candidates come from leptonic decays into electrons or muons with ${p_{\mathrm{T}}} > $ 25 GeV and $|{\eta}| < $ 2.4, and the dilepton mass satisfies 71 $ < m_{\mathrm{Z}} < $ 111 GeV. The measured values are $\sigma(\mathrm{Z+c\ \text{jets}})/\sigma(\mathrm{Z+ \text{jets}}) = $ 0.102 $\pm$ 0.002 $\pm$ 0.009, $\sigma(\mathrm{Z+b\ \text{jets}})/\sigma(\mathrm{Z+ \text{jets}}) = $ 0.0633 $\pm$ 0.0004 $\pm$ 0.0015, and $\sigma(\mathrm{Z+c\ \text{jets}})/\sigma(\mathrm{Z+b\ \text{jets}}) = $ 1.62 $\pm$ 0.03 $\pm$ 0.15. Results on the inclusive and differential cross section ratios as functions of jet and Z boson transverse momentum are compared with predictions from leading and next-to-leading order perturbative quantum chromodynamics calculations. These are the first measurements of the cross section ratios at 13 TeV, and the measurement precision is better than that of the current theoretical predictions. | ||
| Links: e-print arXiv:2001.06899 [hep-ex] (PDF) ; CDS record ; inSPIRE record ; HepData record ; CADI line (restricted) ; | ||
| Figures | |
png pdf |
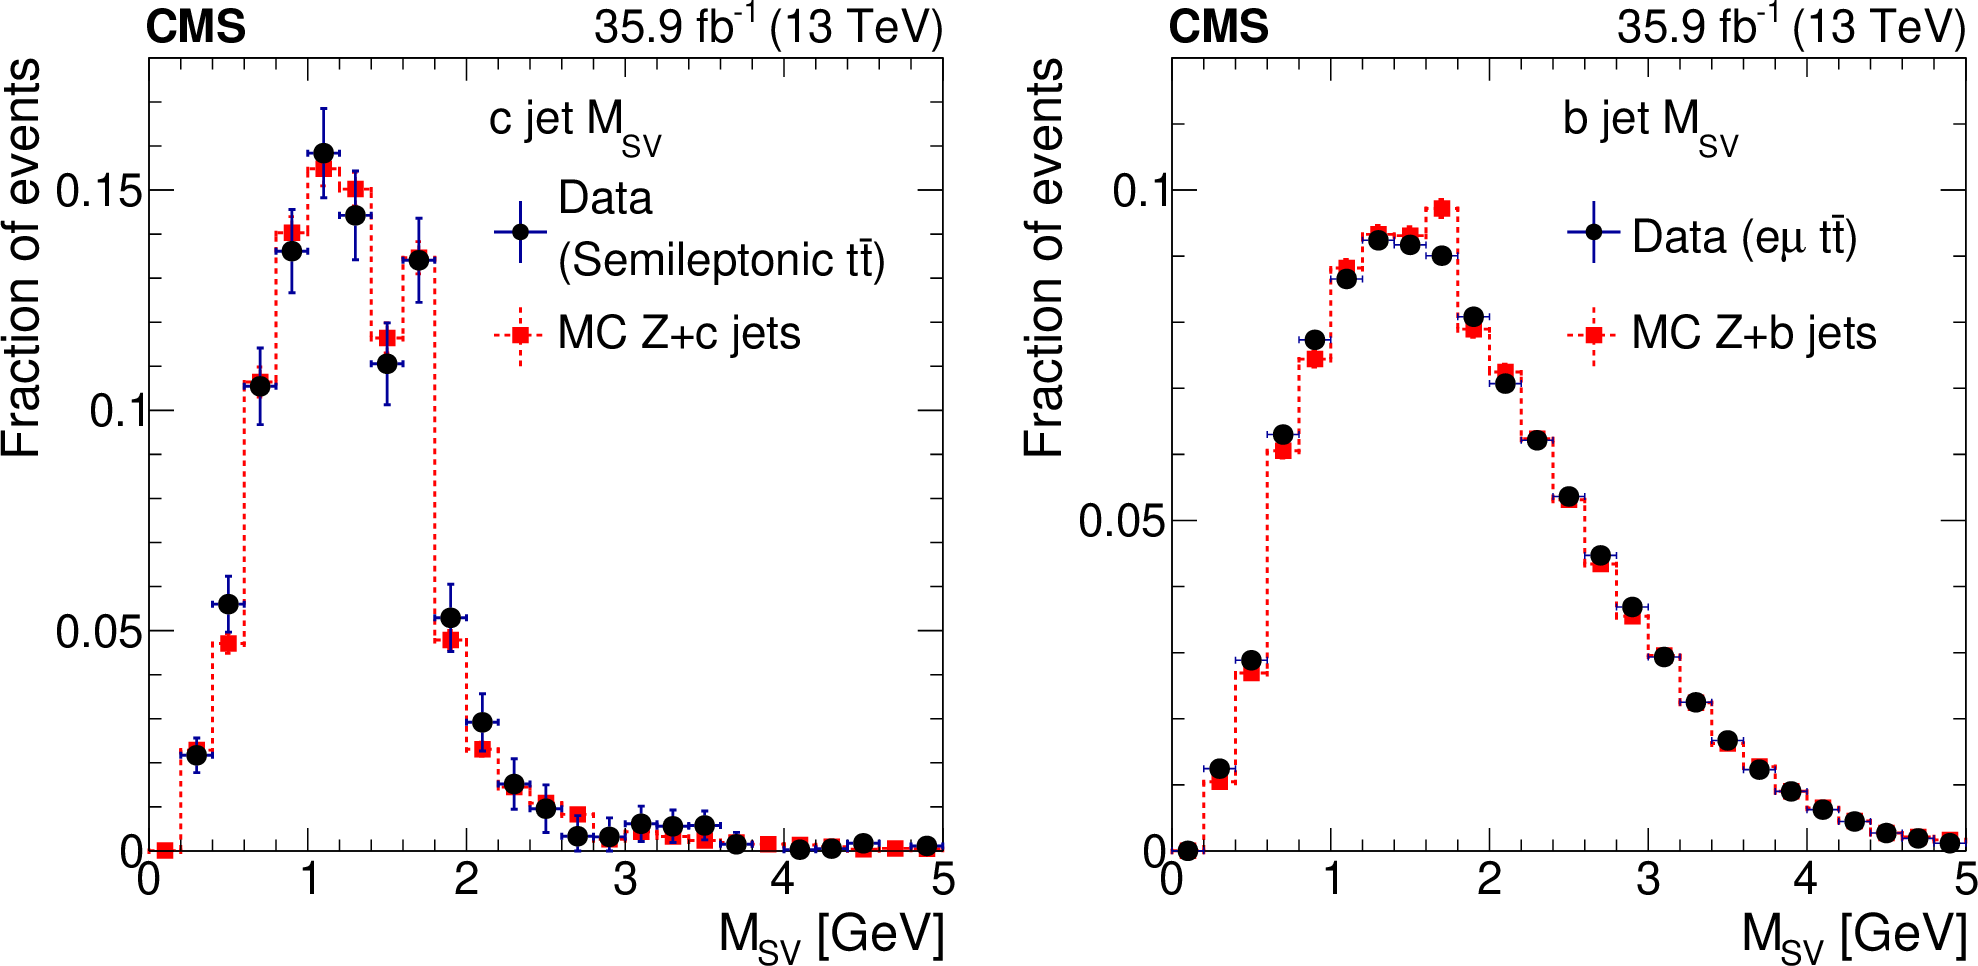
Figure 1:
Comparisons of c jet (left) and b jet (right) ${M_\ \text {SV}}$ distributions for data and simulation. A shape correction is applied to the data-driven distribution in the right panel to account for the difference between the jets in ${\mathrm{t} {}\mathrm{\bar{t}}}$ and $\mathrm{Z+b \ \text{jets}}$ processes. |
png pdf |
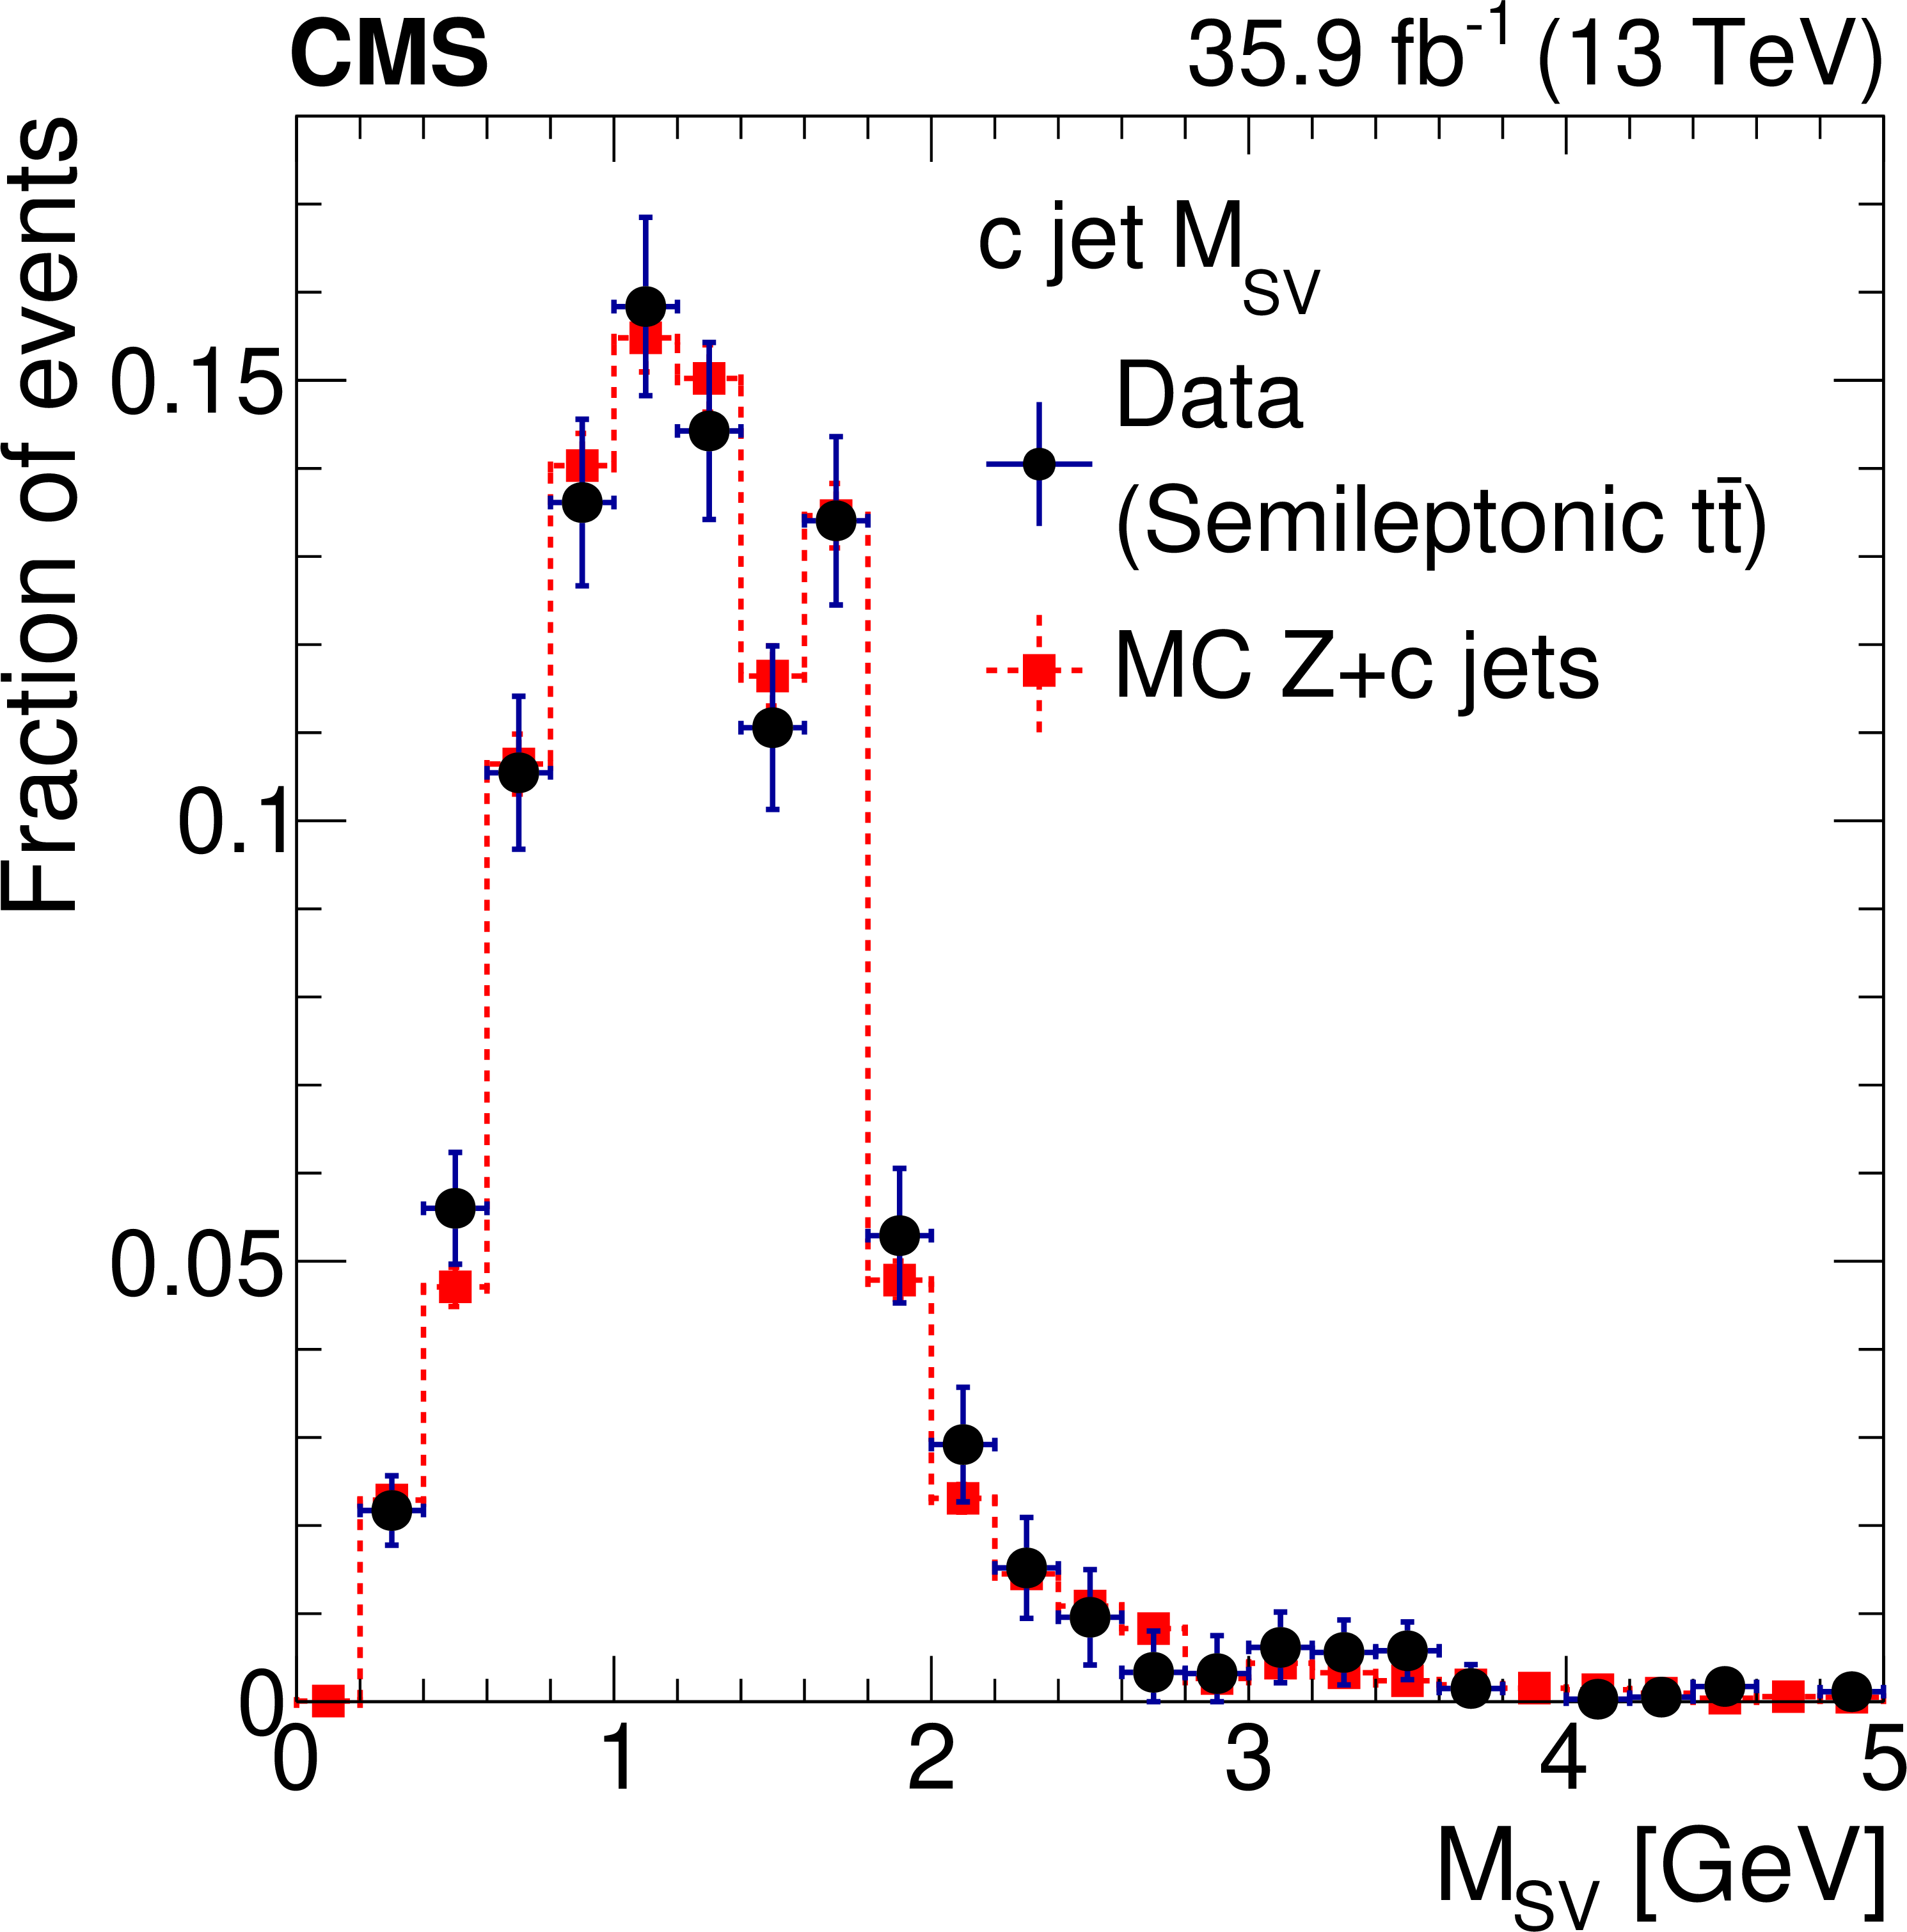
Figure 1-a:
Comparisons of c jet (left) and b jet (right) ${M_\ \text {SV}}$ distributions for data and simulation. A shape correction is applied to the data-driven distribution in the right panel to account for the difference between the jets in ${\mathrm{t} {}\mathrm{\bar{t}}}$ and $\mathrm{Z+b \ \text{jets}}$ processes. |
png pdf |
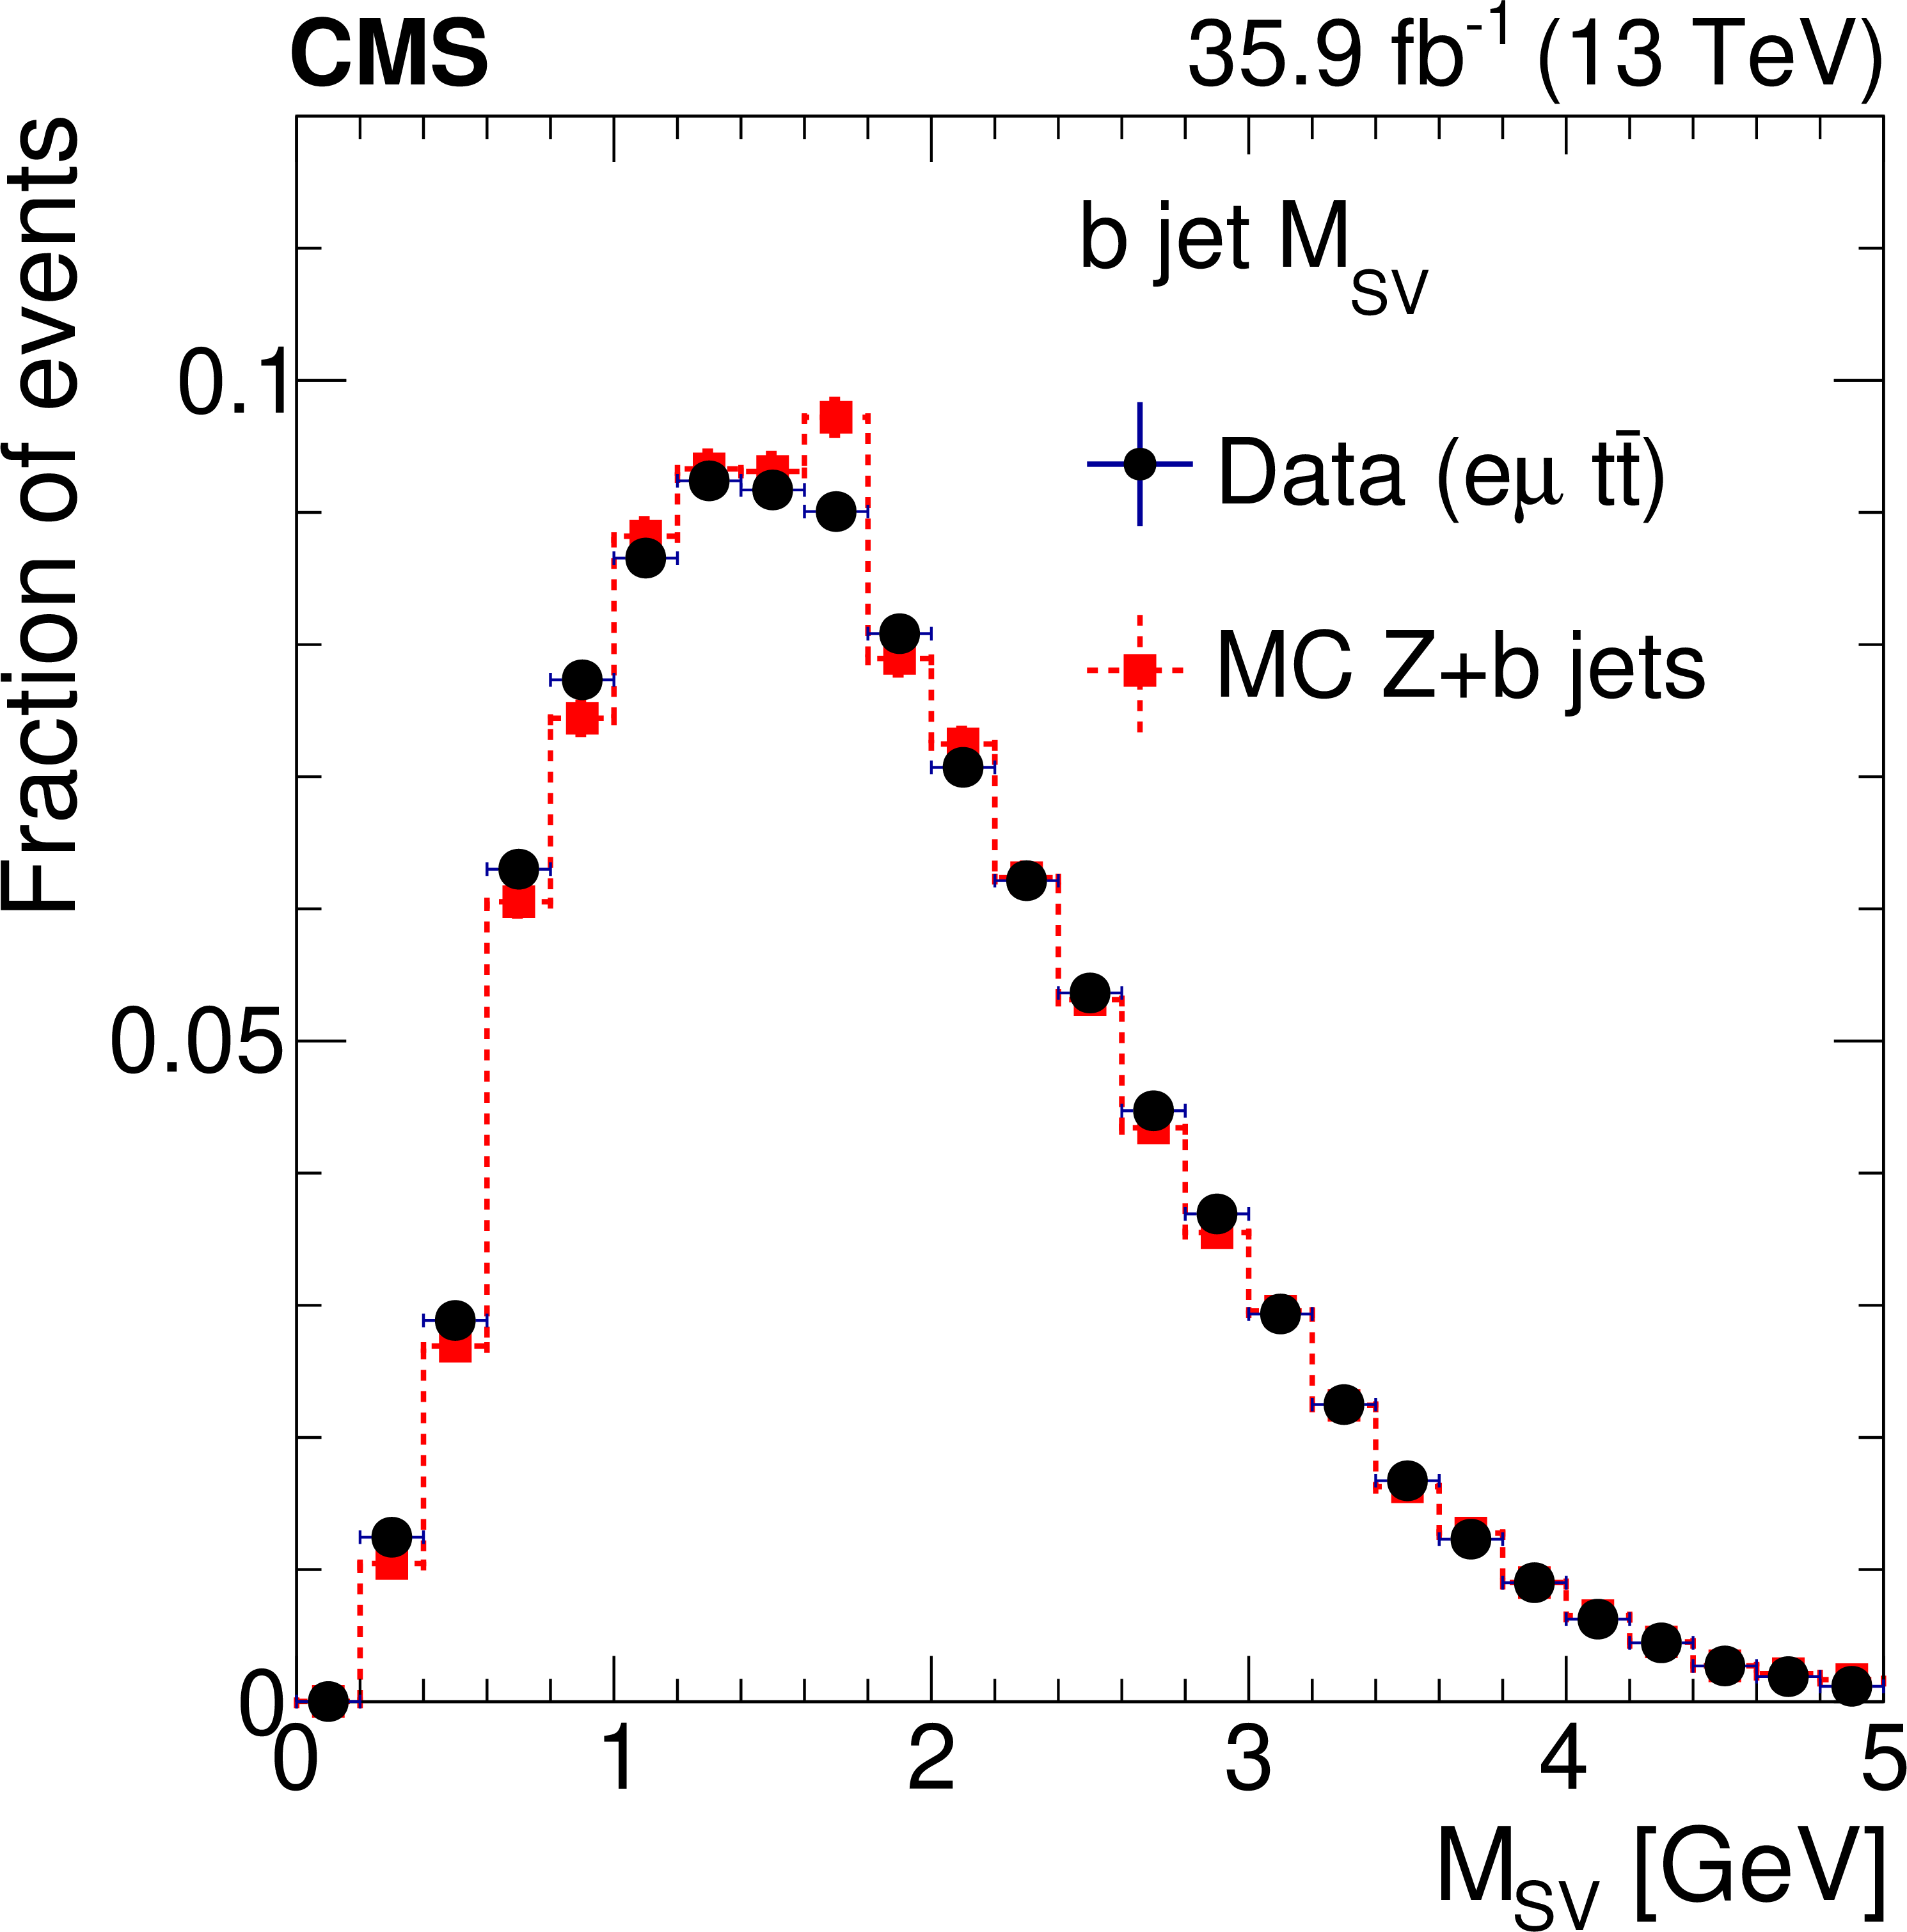
Figure 1-b:
Comparisons of c jet (left) and b jet (right) ${M_\ \text {SV}}$ distributions for data and simulation. A shape correction is applied to the data-driven distribution in the right panel to account for the difference between the jets in ${\mathrm{t} {}\mathrm{\bar{t}}}$ and $\mathrm{Z+b \ \text{jets}}$ processes. |
png pdf |
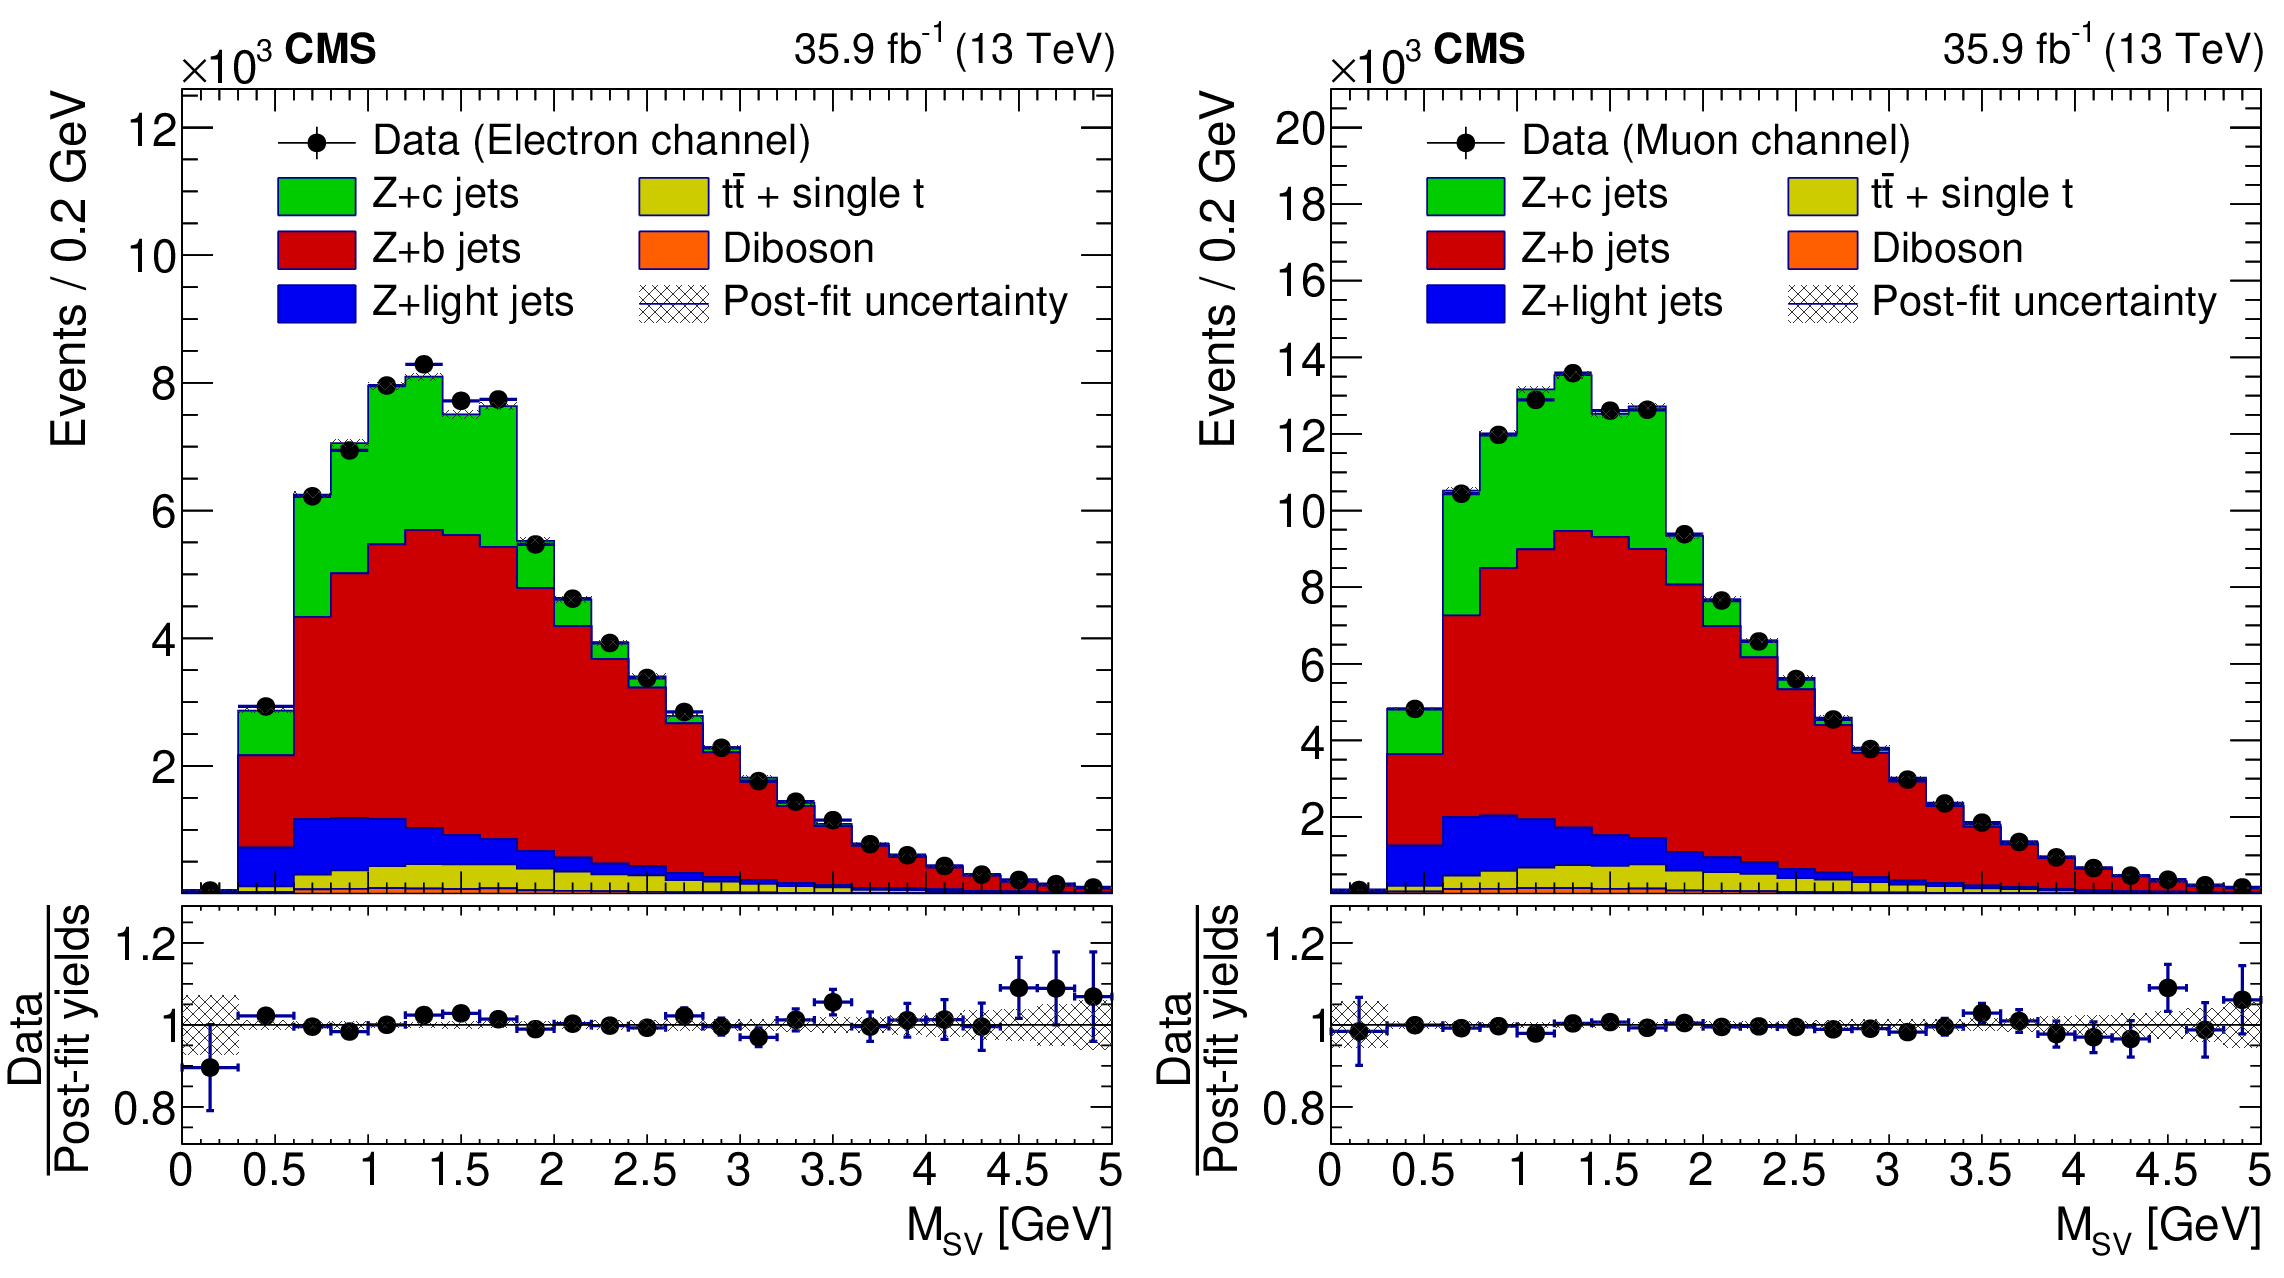
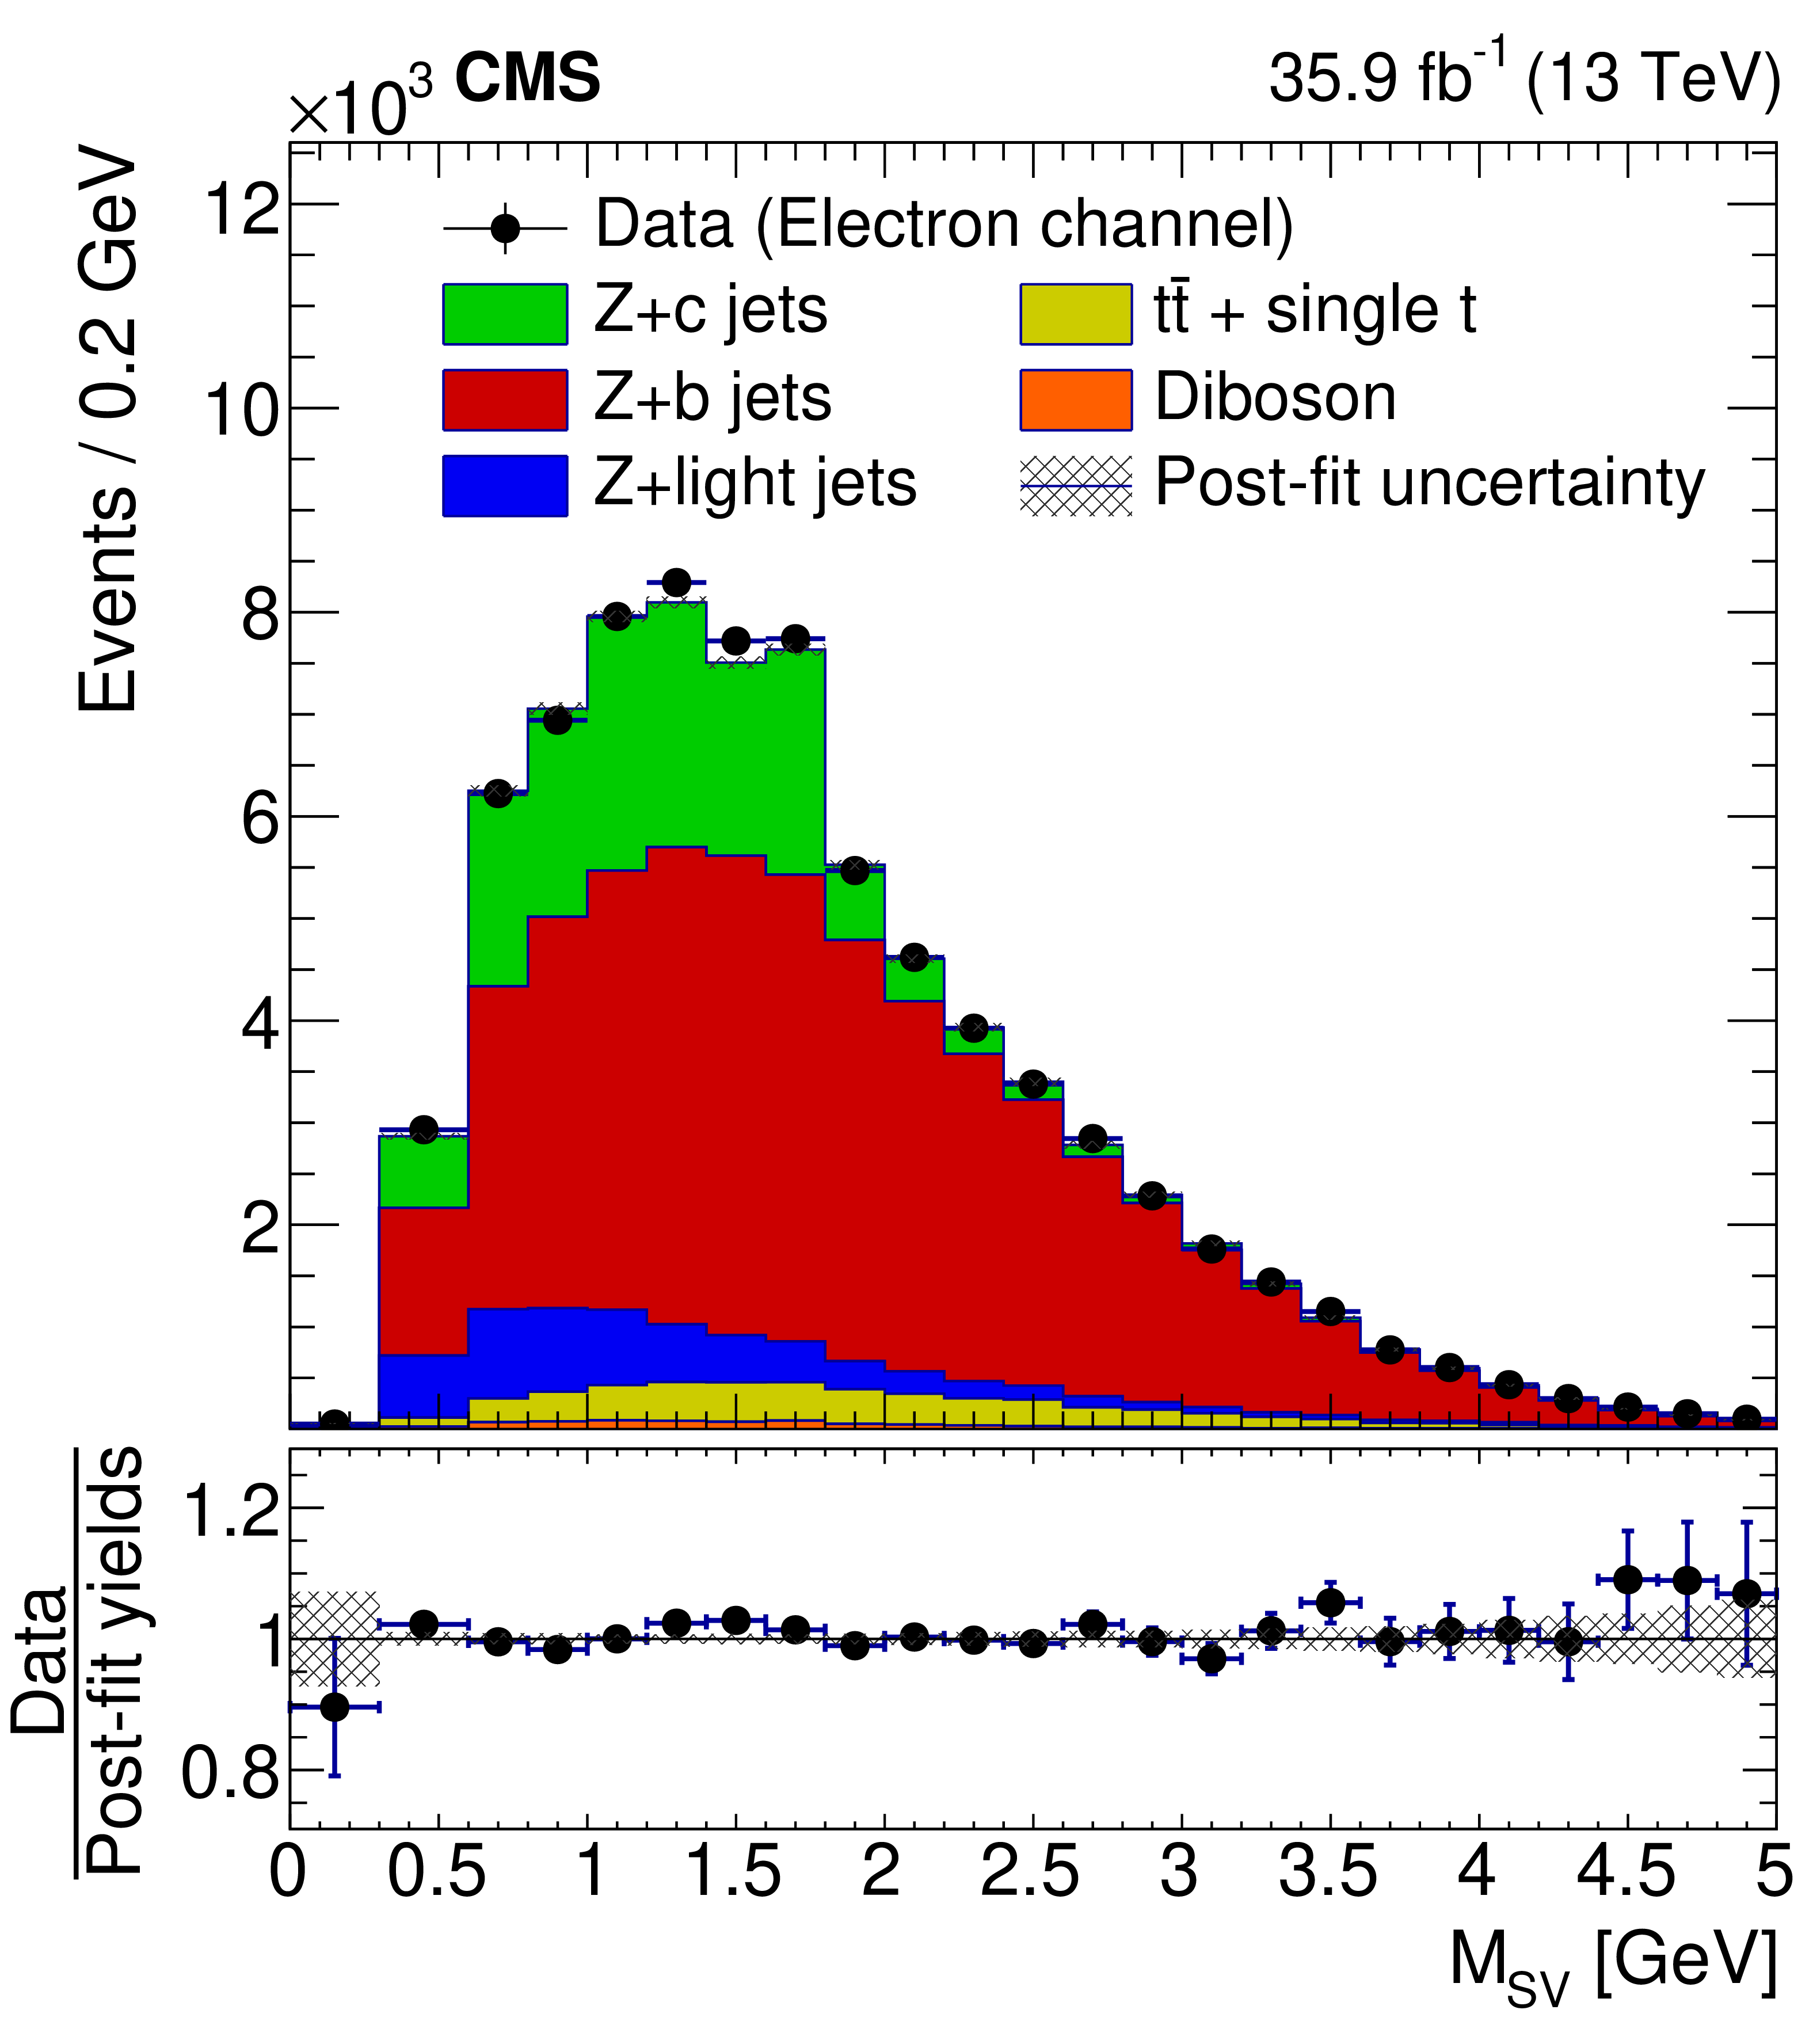
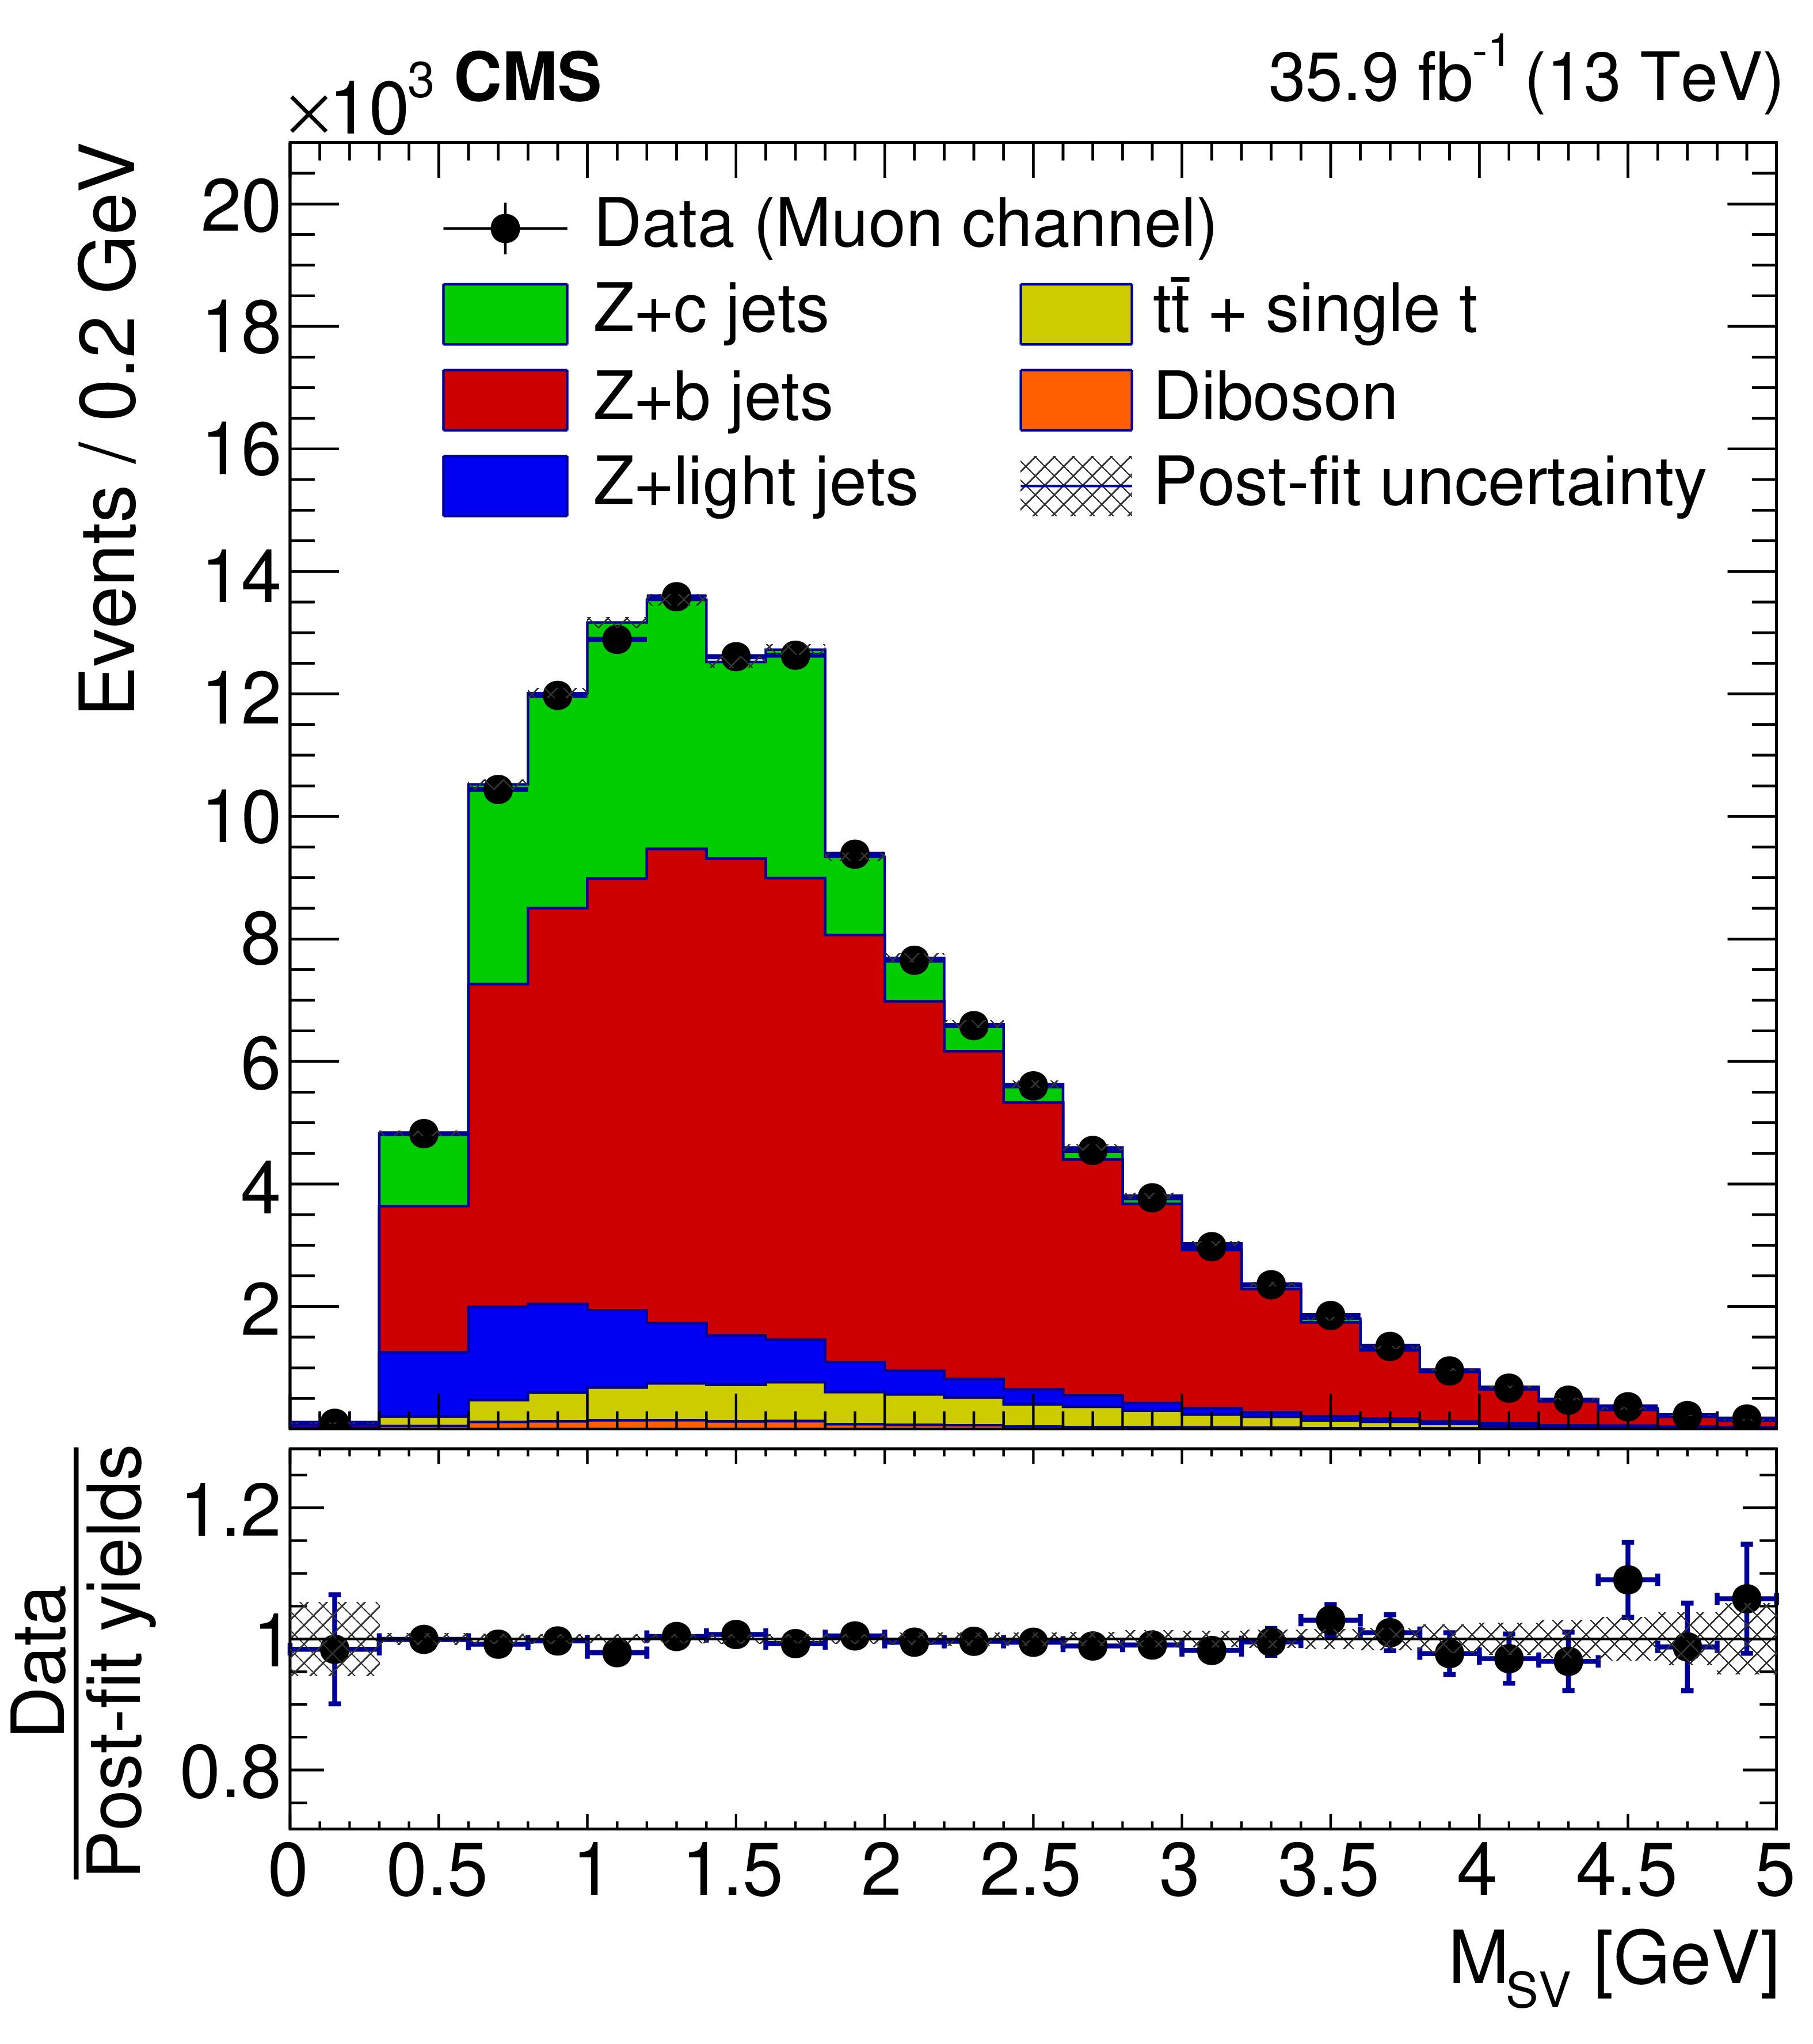
Figure 2:
Secondary vertex invariant mass distributions for the electron (left) and muon (right) channels derived from fits using the inclusive $\mathrm{Z+\ \text{HF jets}}$ data sample. The post-fit uncertainty bands indicate the total uncertainties, added in quadrature, of the best-fit values of signal and background process rates. |
png pdf |
Figure 2-a:
Secondary vertex invariant mass distributions for the electron (left) and muon (right) channels derived from fits using the inclusive $\mathrm{Z+\ \text{HF jets}}$ data sample. The post-fit uncertainty bands indicate the total uncertainties, added in quadrature, of the best-fit values of signal and background process rates. |
png pdf |
Figure 2-b:
Secondary vertex invariant mass distributions for the electron (left) and muon (right) channels derived from fits using the inclusive $\mathrm{Z+\ \text{HF jets}}$ data sample. The post-fit uncertainty bands indicate the total uncertainties, added in quadrature, of the best-fit values of signal and background process rates. |
png pdf |
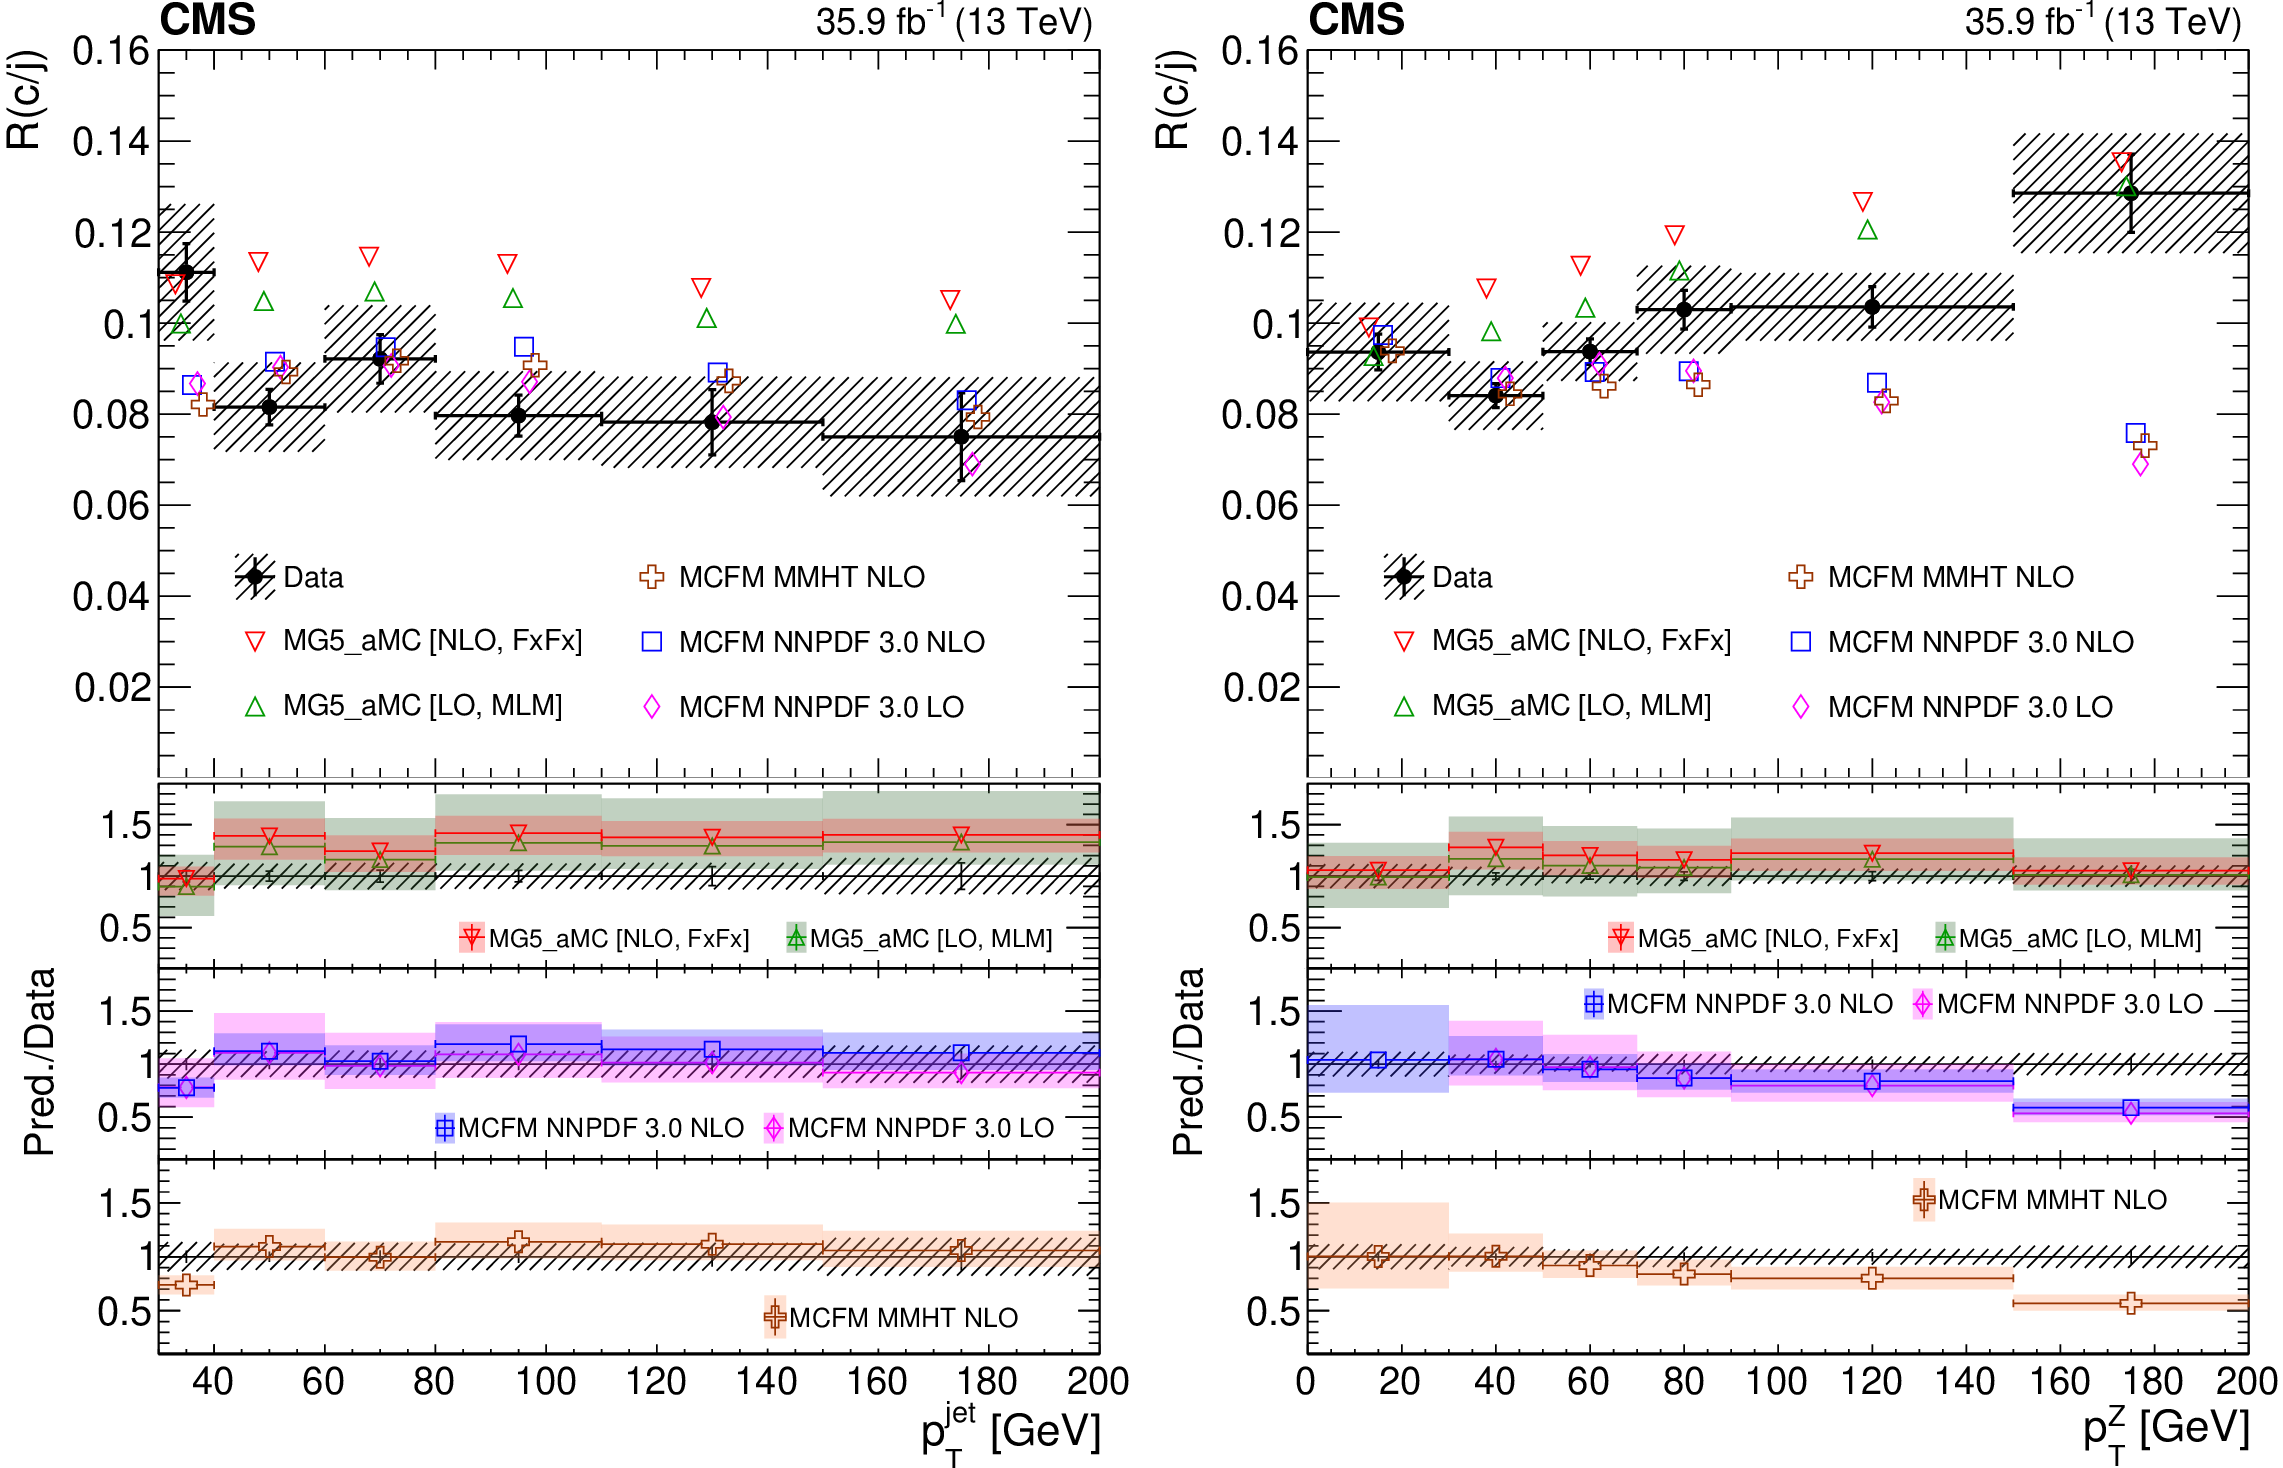
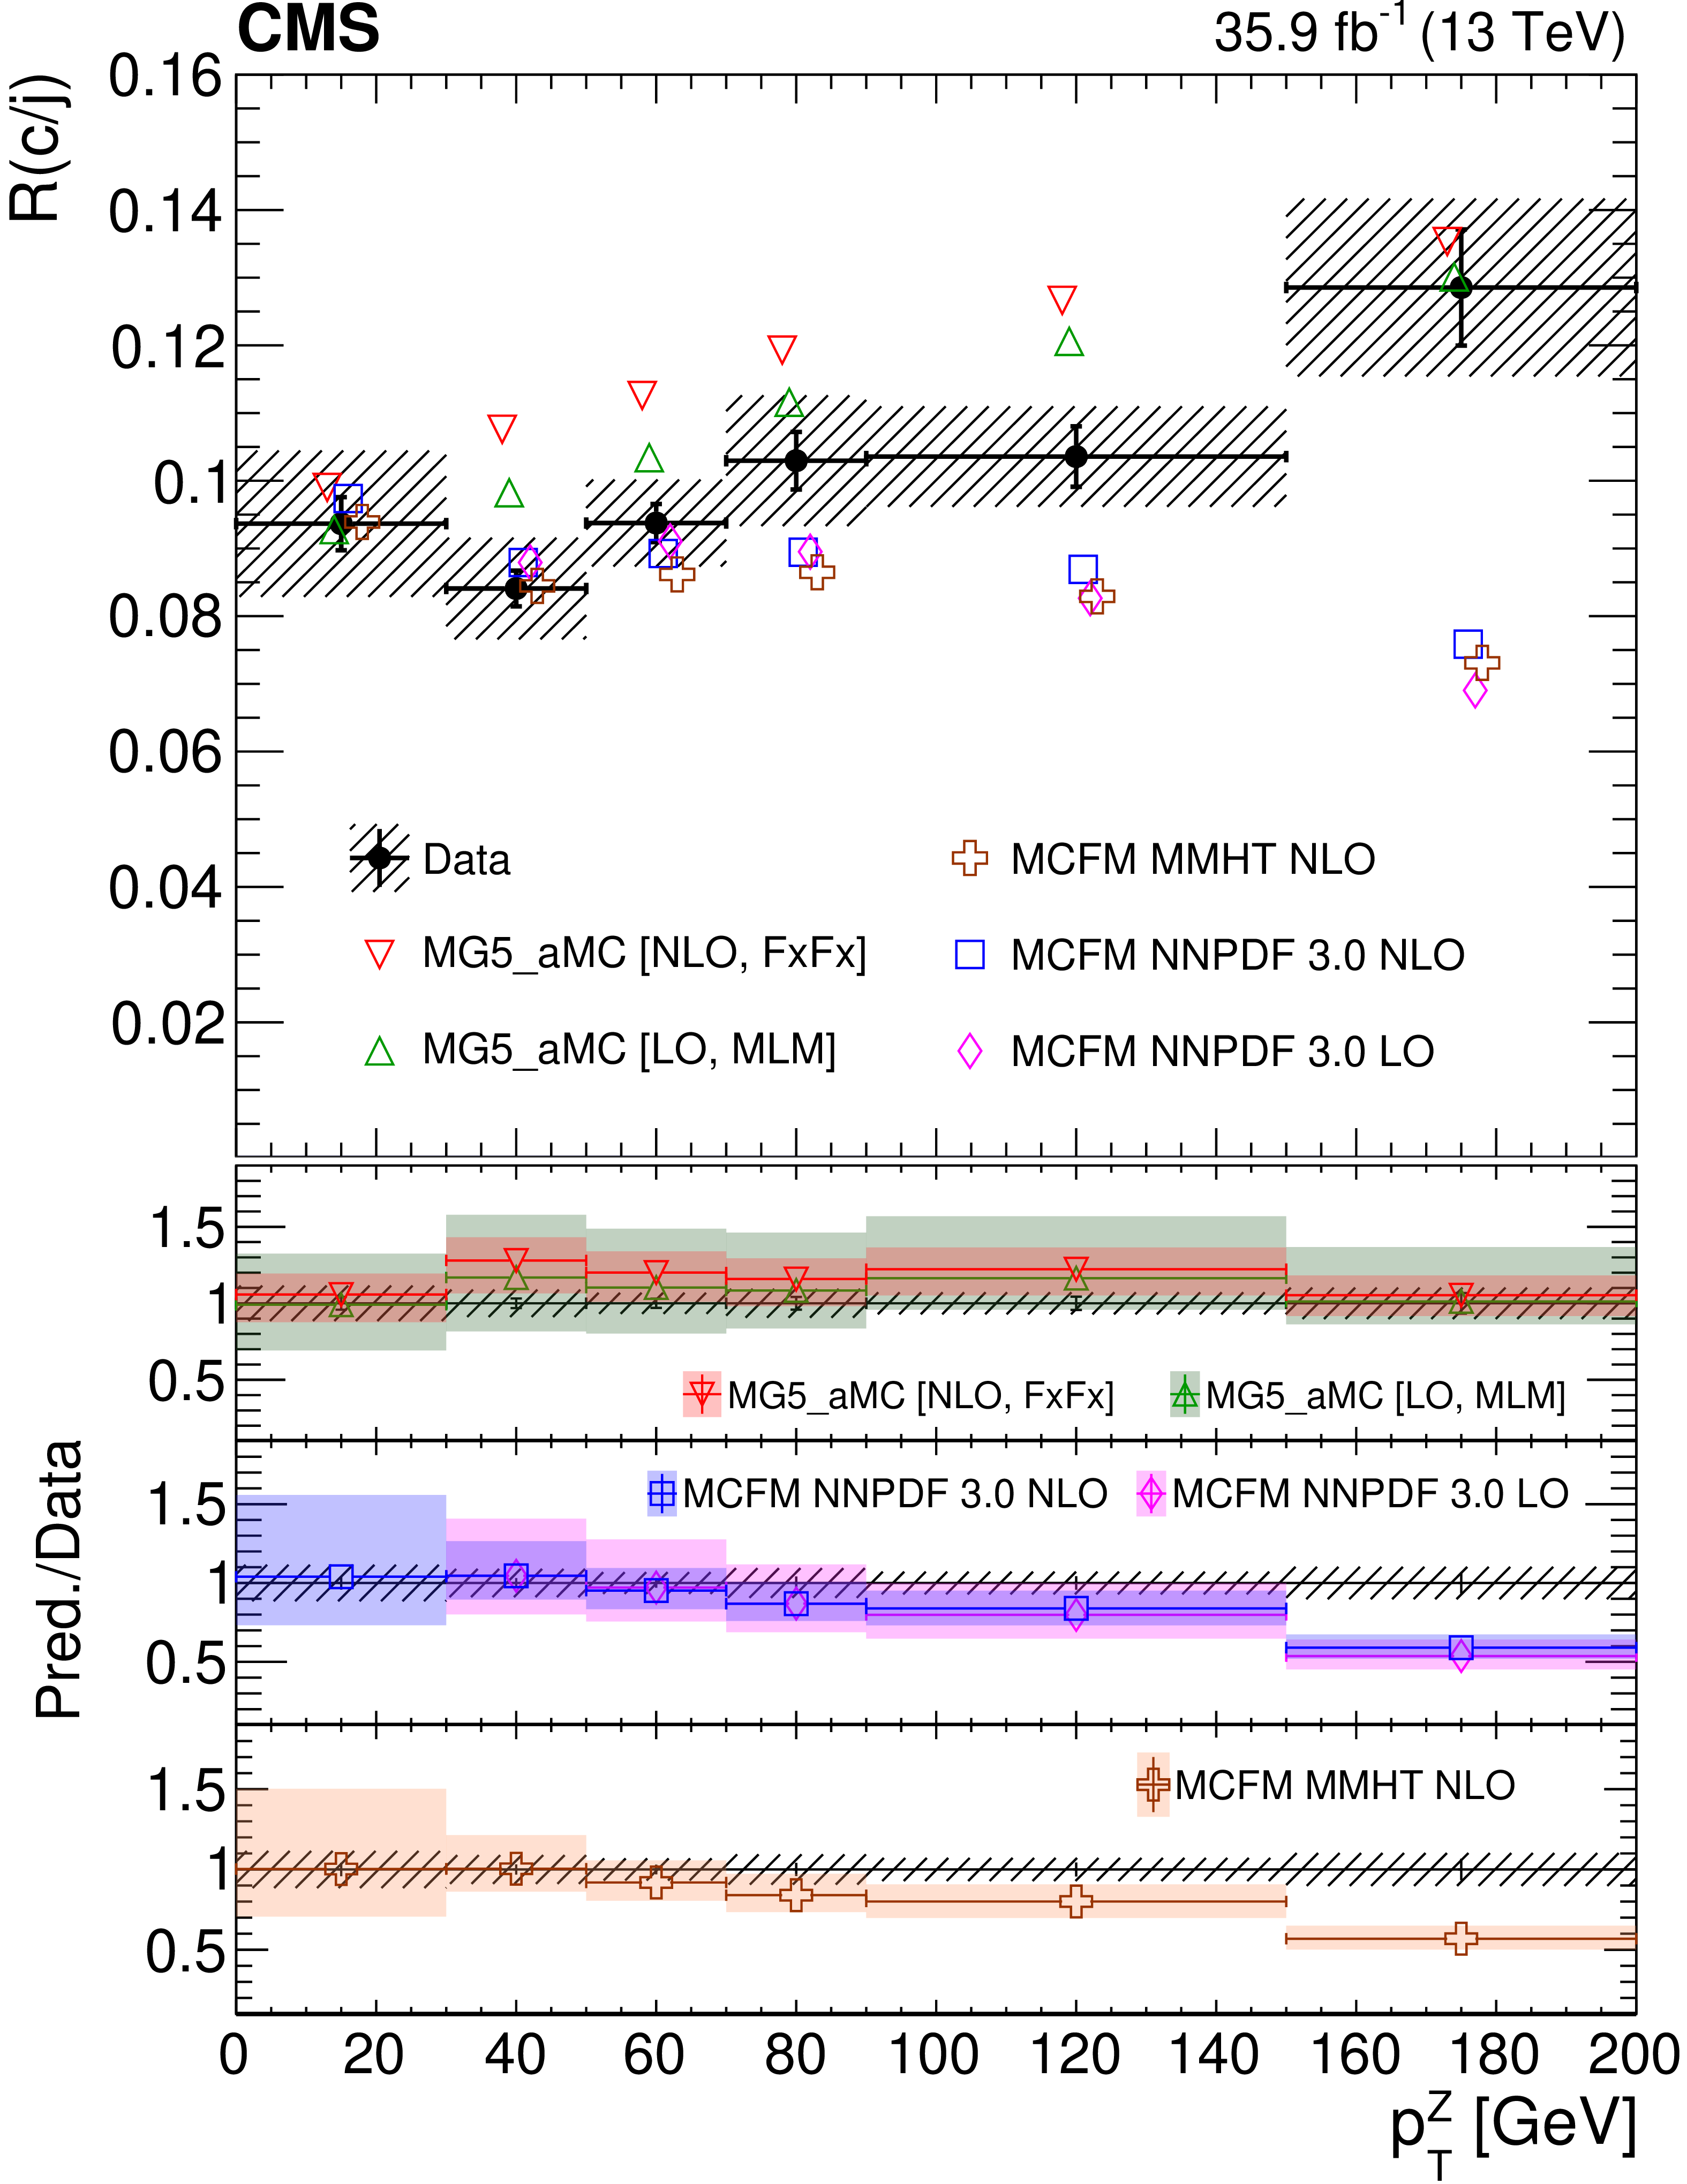
Figure 3:
Unfolded, particle-level mg5\_aMC, and parton-level mcfm R(c/j) cross section ratios versus jet (left) and Z boson (right) transverse momentum. The vertical error bars for the data points are statistical while the hatched band represents the total uncertainties. The predictions are slightly shifted along the $x$-axis for readability in the upper plots, and their total PDF and scale uncertainties are shown as error bands in the ratio plots. |
png pdf |
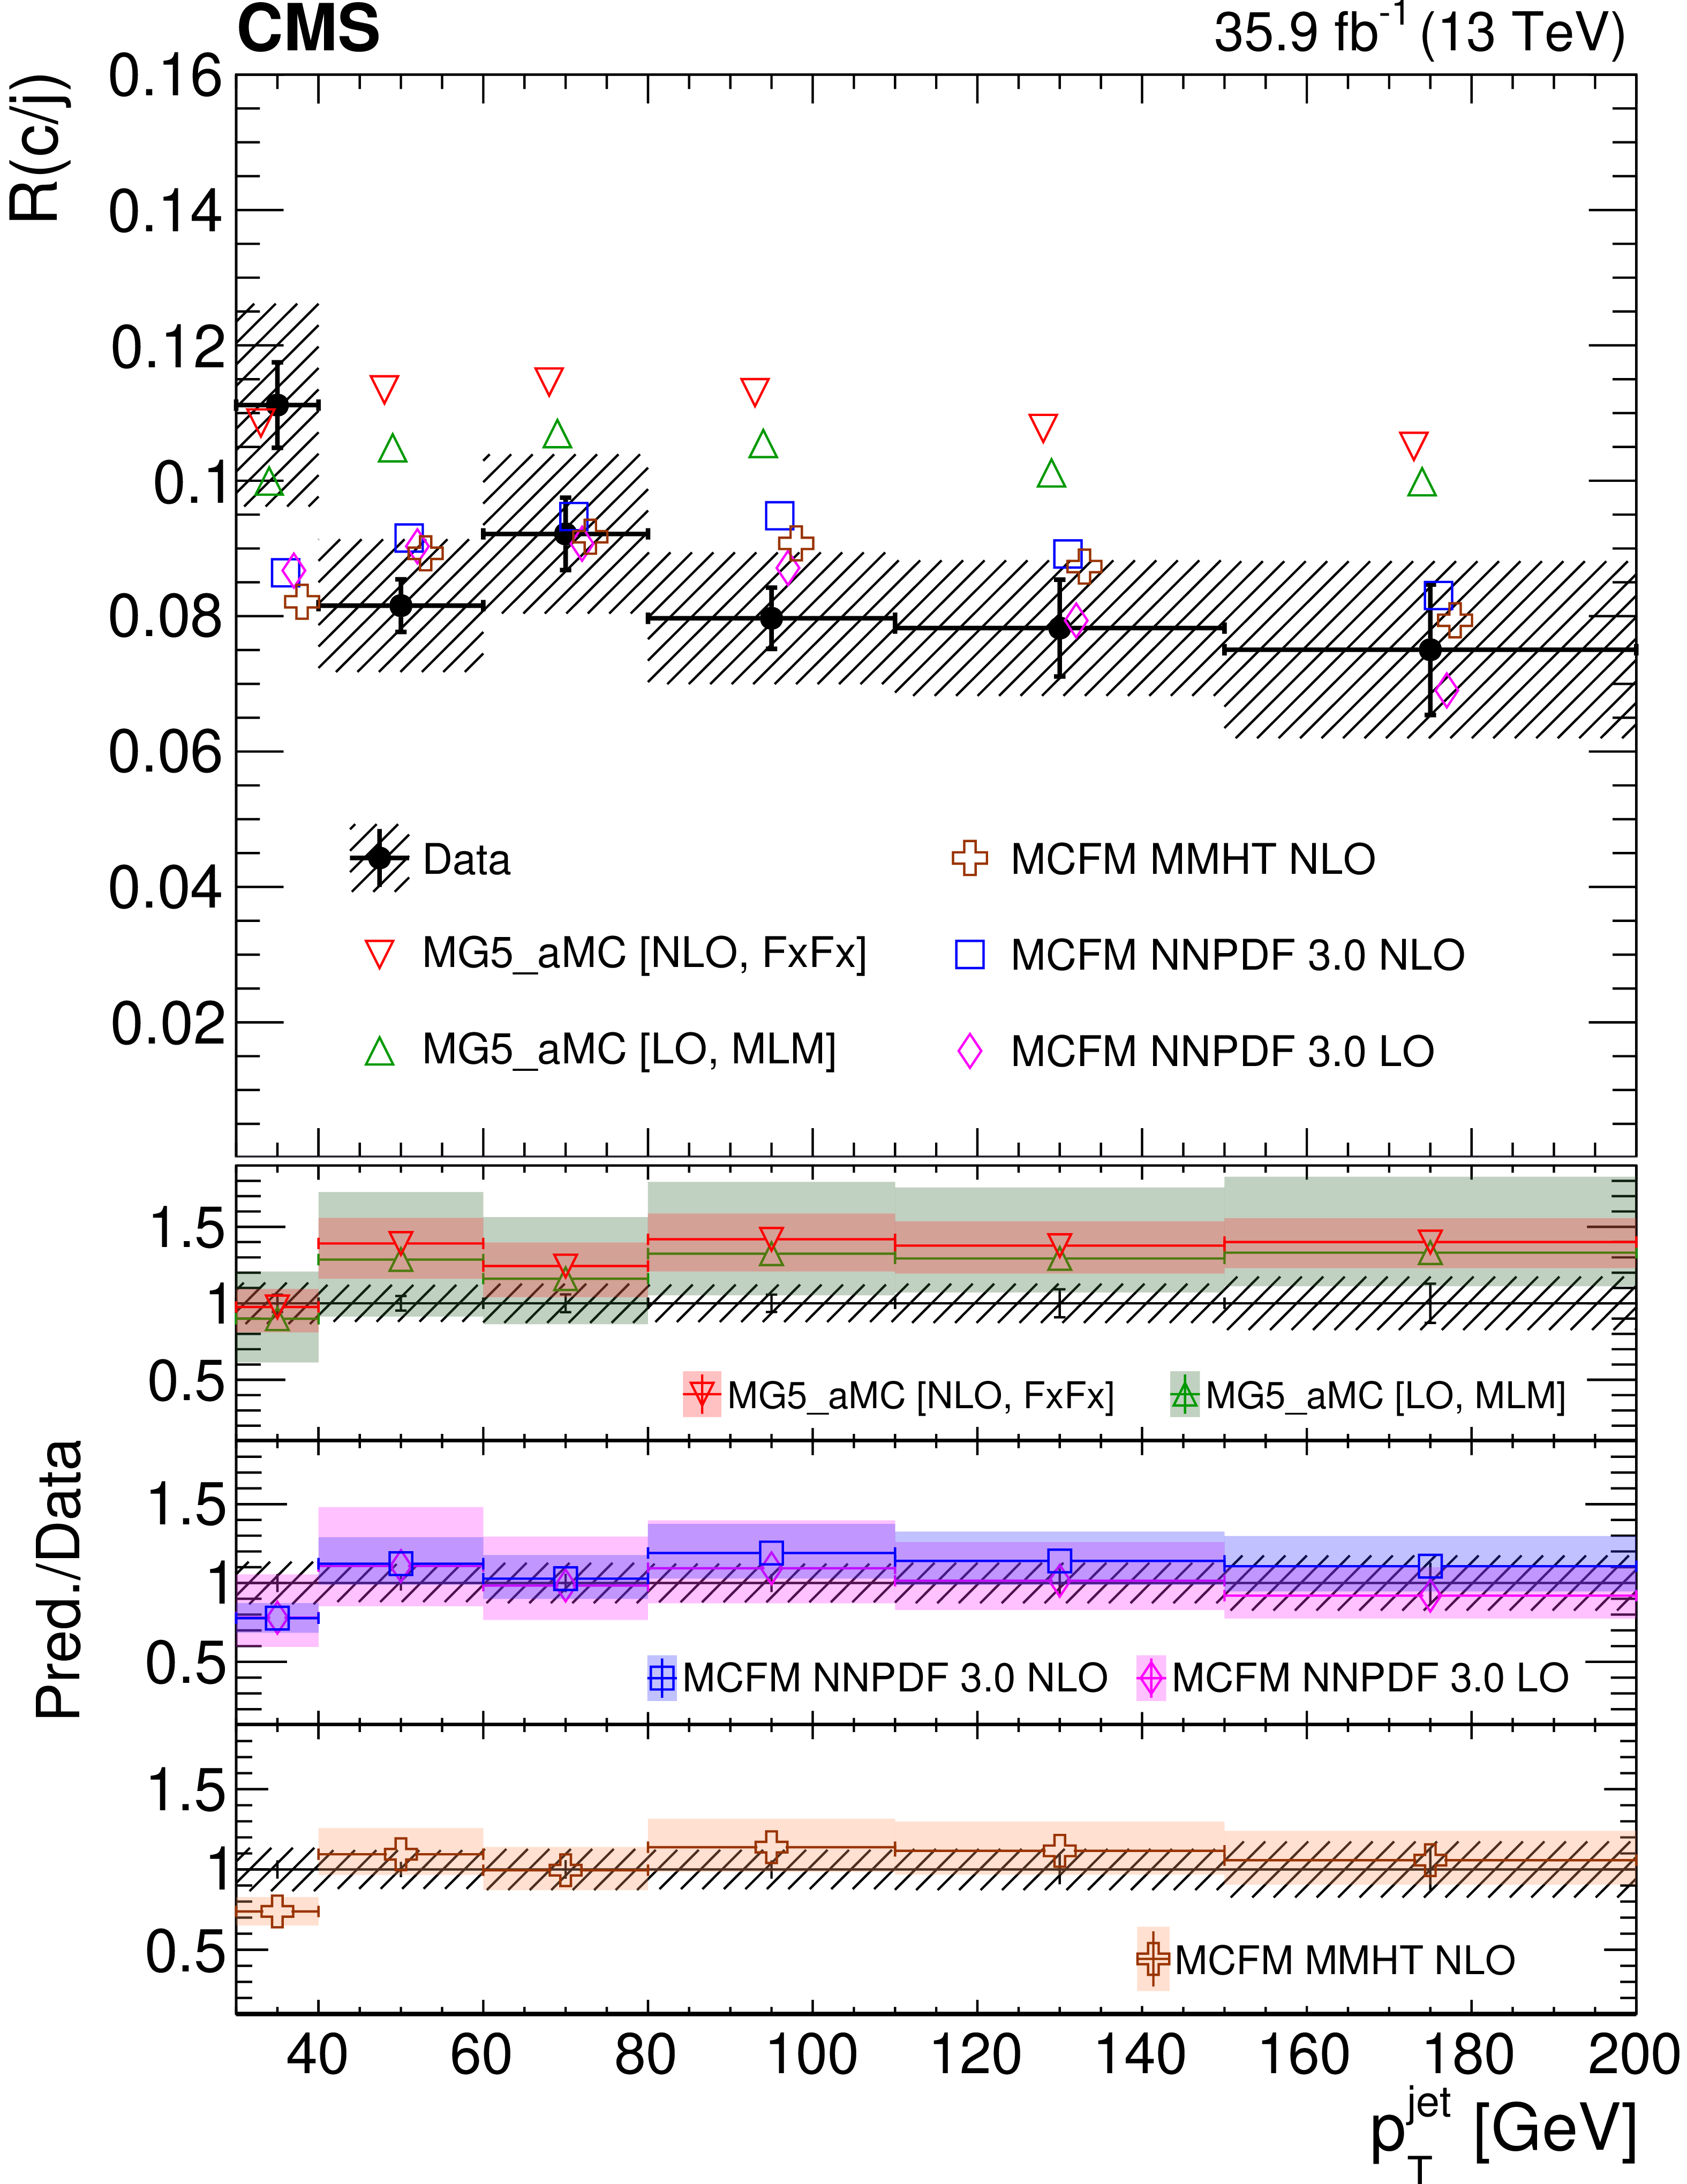
Figure 3-a:
Unfolded, particle-level mg5\_aMC, and parton-level mcfm R(c/j) cross section ratios versus jet (left) and Z boson (right) transverse momentum. The vertical error bars for the data points are statistical while the hatched band represents the total uncertainties. The predictions are slightly shifted along the $x$-axis for readability in the upper plots, and their total PDF and scale uncertainties are shown as error bands in the ratio plots. |
png pdf |
Figure 3-b:
Unfolded, particle-level mg5\_aMC, and parton-level mcfm R(c/j) cross section ratios versus jet (left) and Z boson (right) transverse momentum. The vertical error bars for the data points are statistical while the hatched band represents the total uncertainties. The predictions are slightly shifted along the $x$-axis for readability in the upper plots, and their total PDF and scale uncertainties are shown as error bands in the ratio plots. |
png pdf |
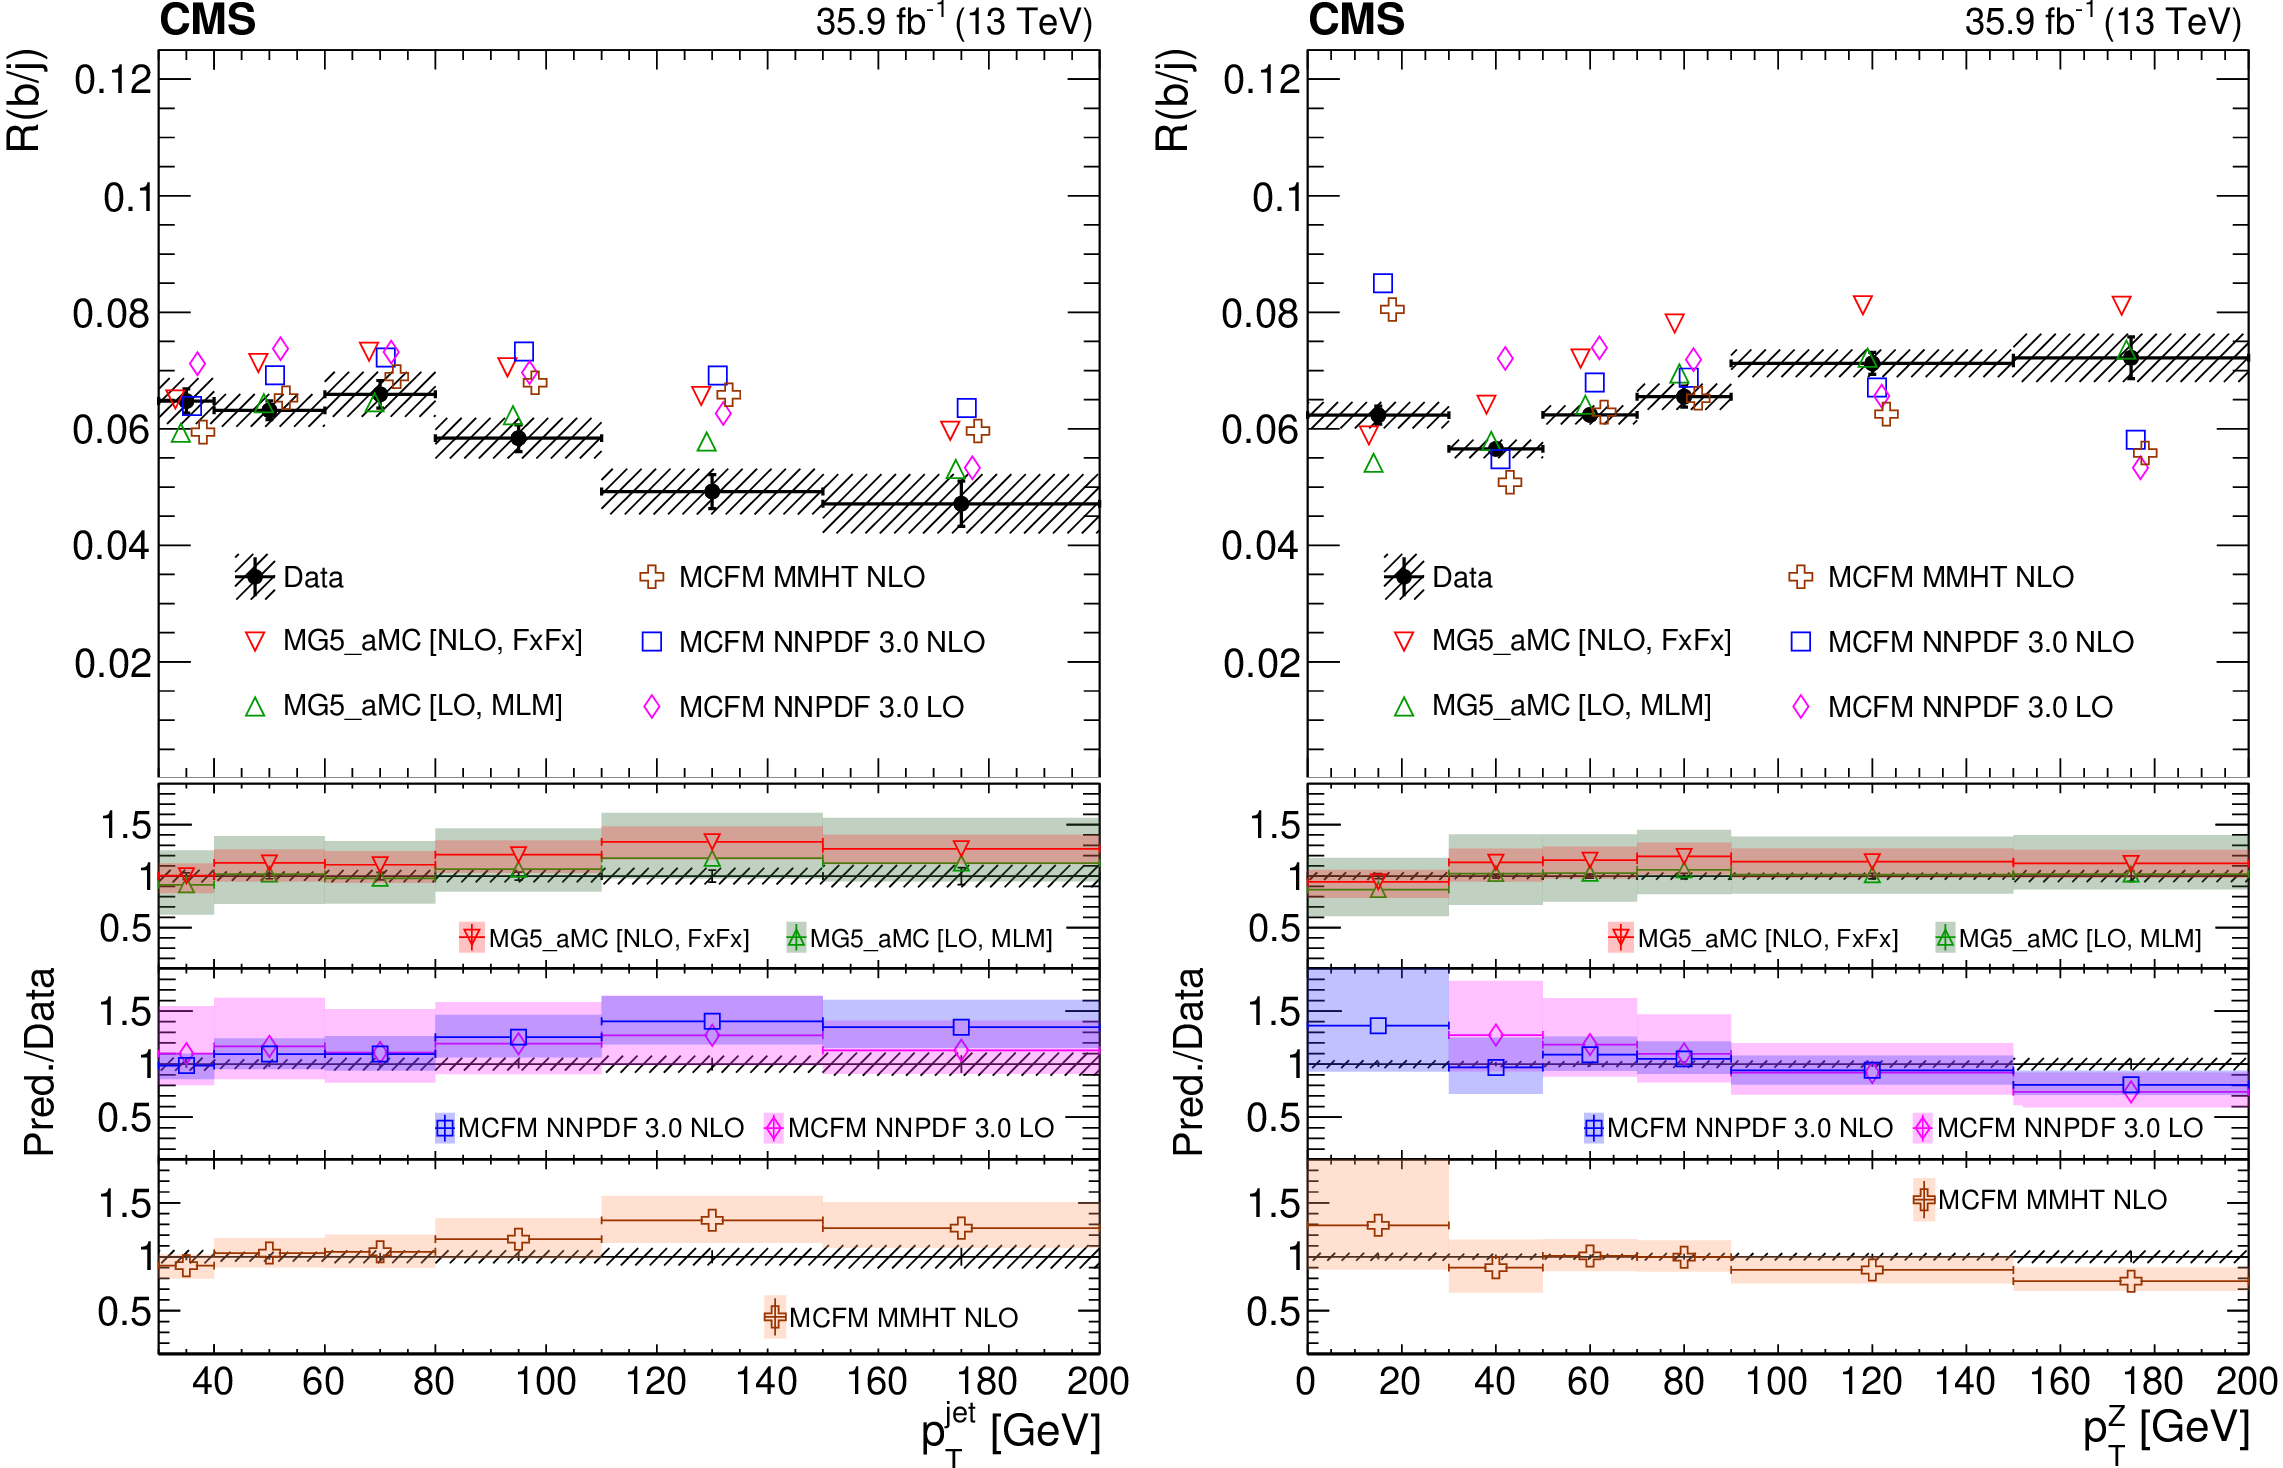
Figure 4:
Unfolded, particle-level mg5\_aMC, and parton-level mcfm R(b/j) cross section ratio versus jet (left) and Z boson (right) transverse momentum. The vertical error bars for the data points are statistical while the hatched band presents the total uncertainties. The predictions are slightly shifted along the $x$-axis for readability in the upper plots, and their total PDF and scale uncertainties are shown as error bands in the ratio plots. |
png pdf |
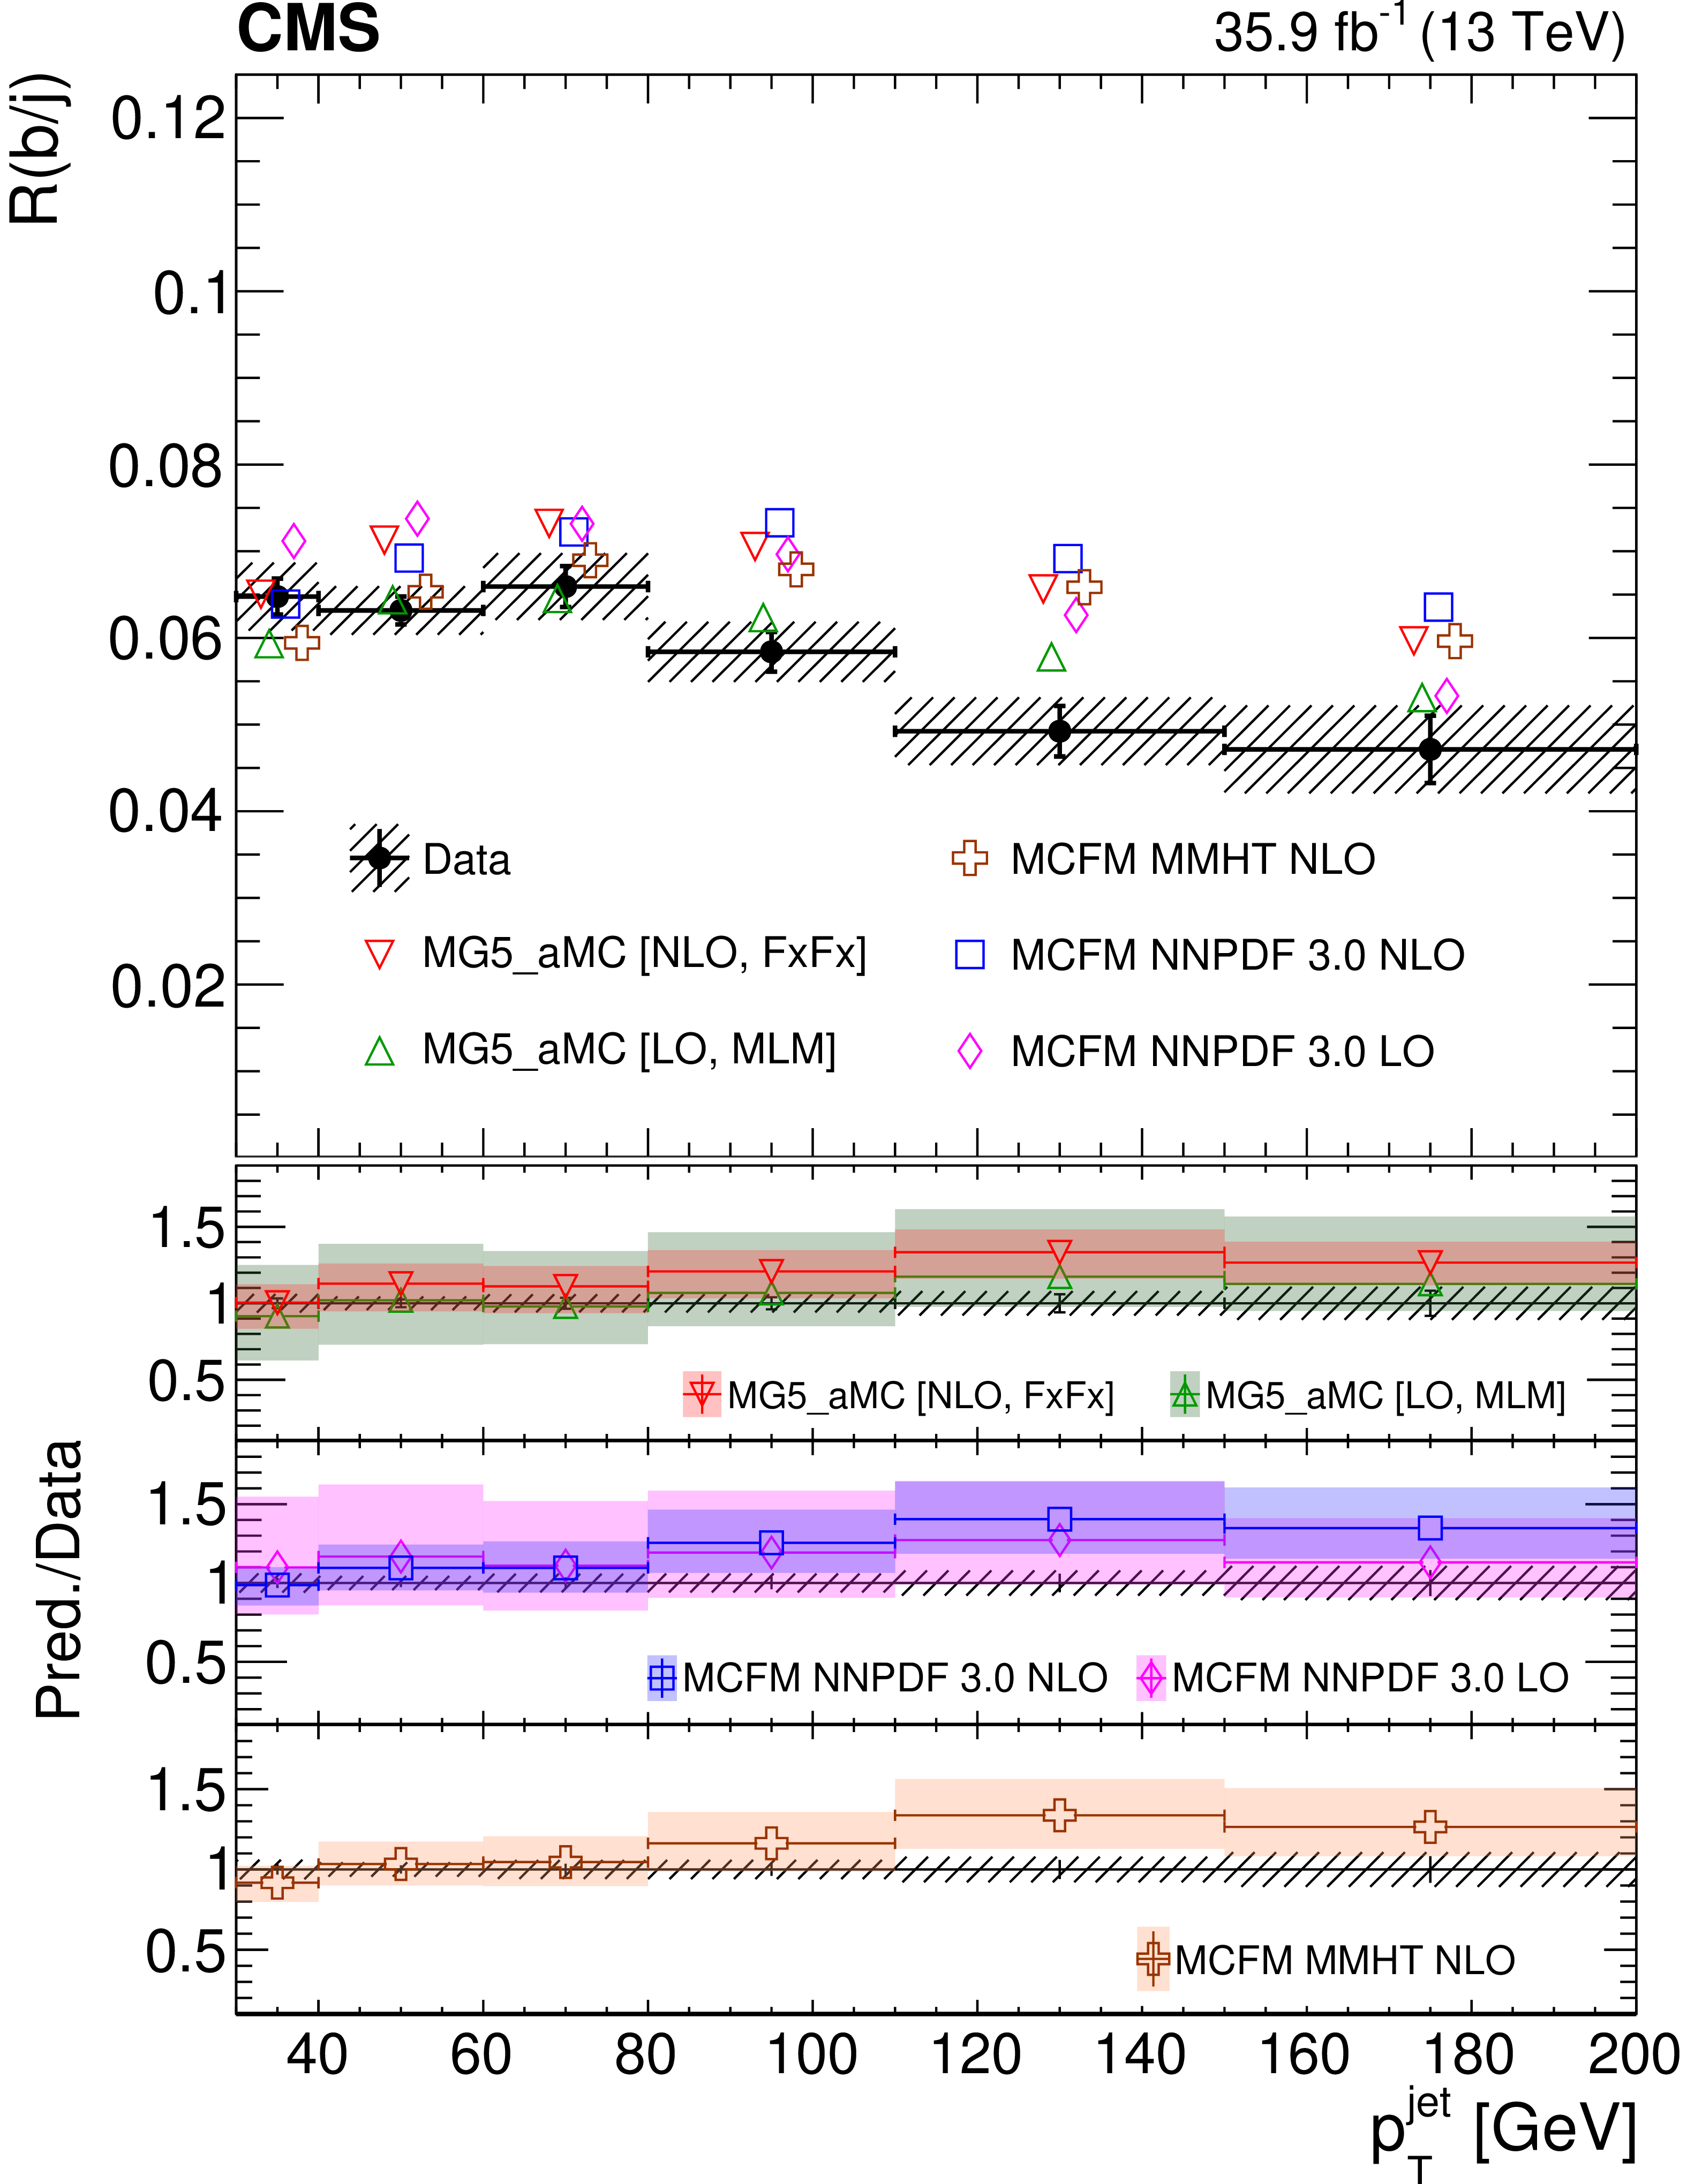
Figure 4-a:
Unfolded, particle-level mg5\_aMC, and parton-level mcfm R(b/j) cross section ratio versus jet (left) and Z boson (right) transverse momentum. The vertical error bars for the data points are statistical while the hatched band presents the total uncertainties. The predictions are slightly shifted along the $x$-axis for readability in the upper plots, and their total PDF and scale uncertainties are shown as error bands in the ratio plots. |
png pdf |
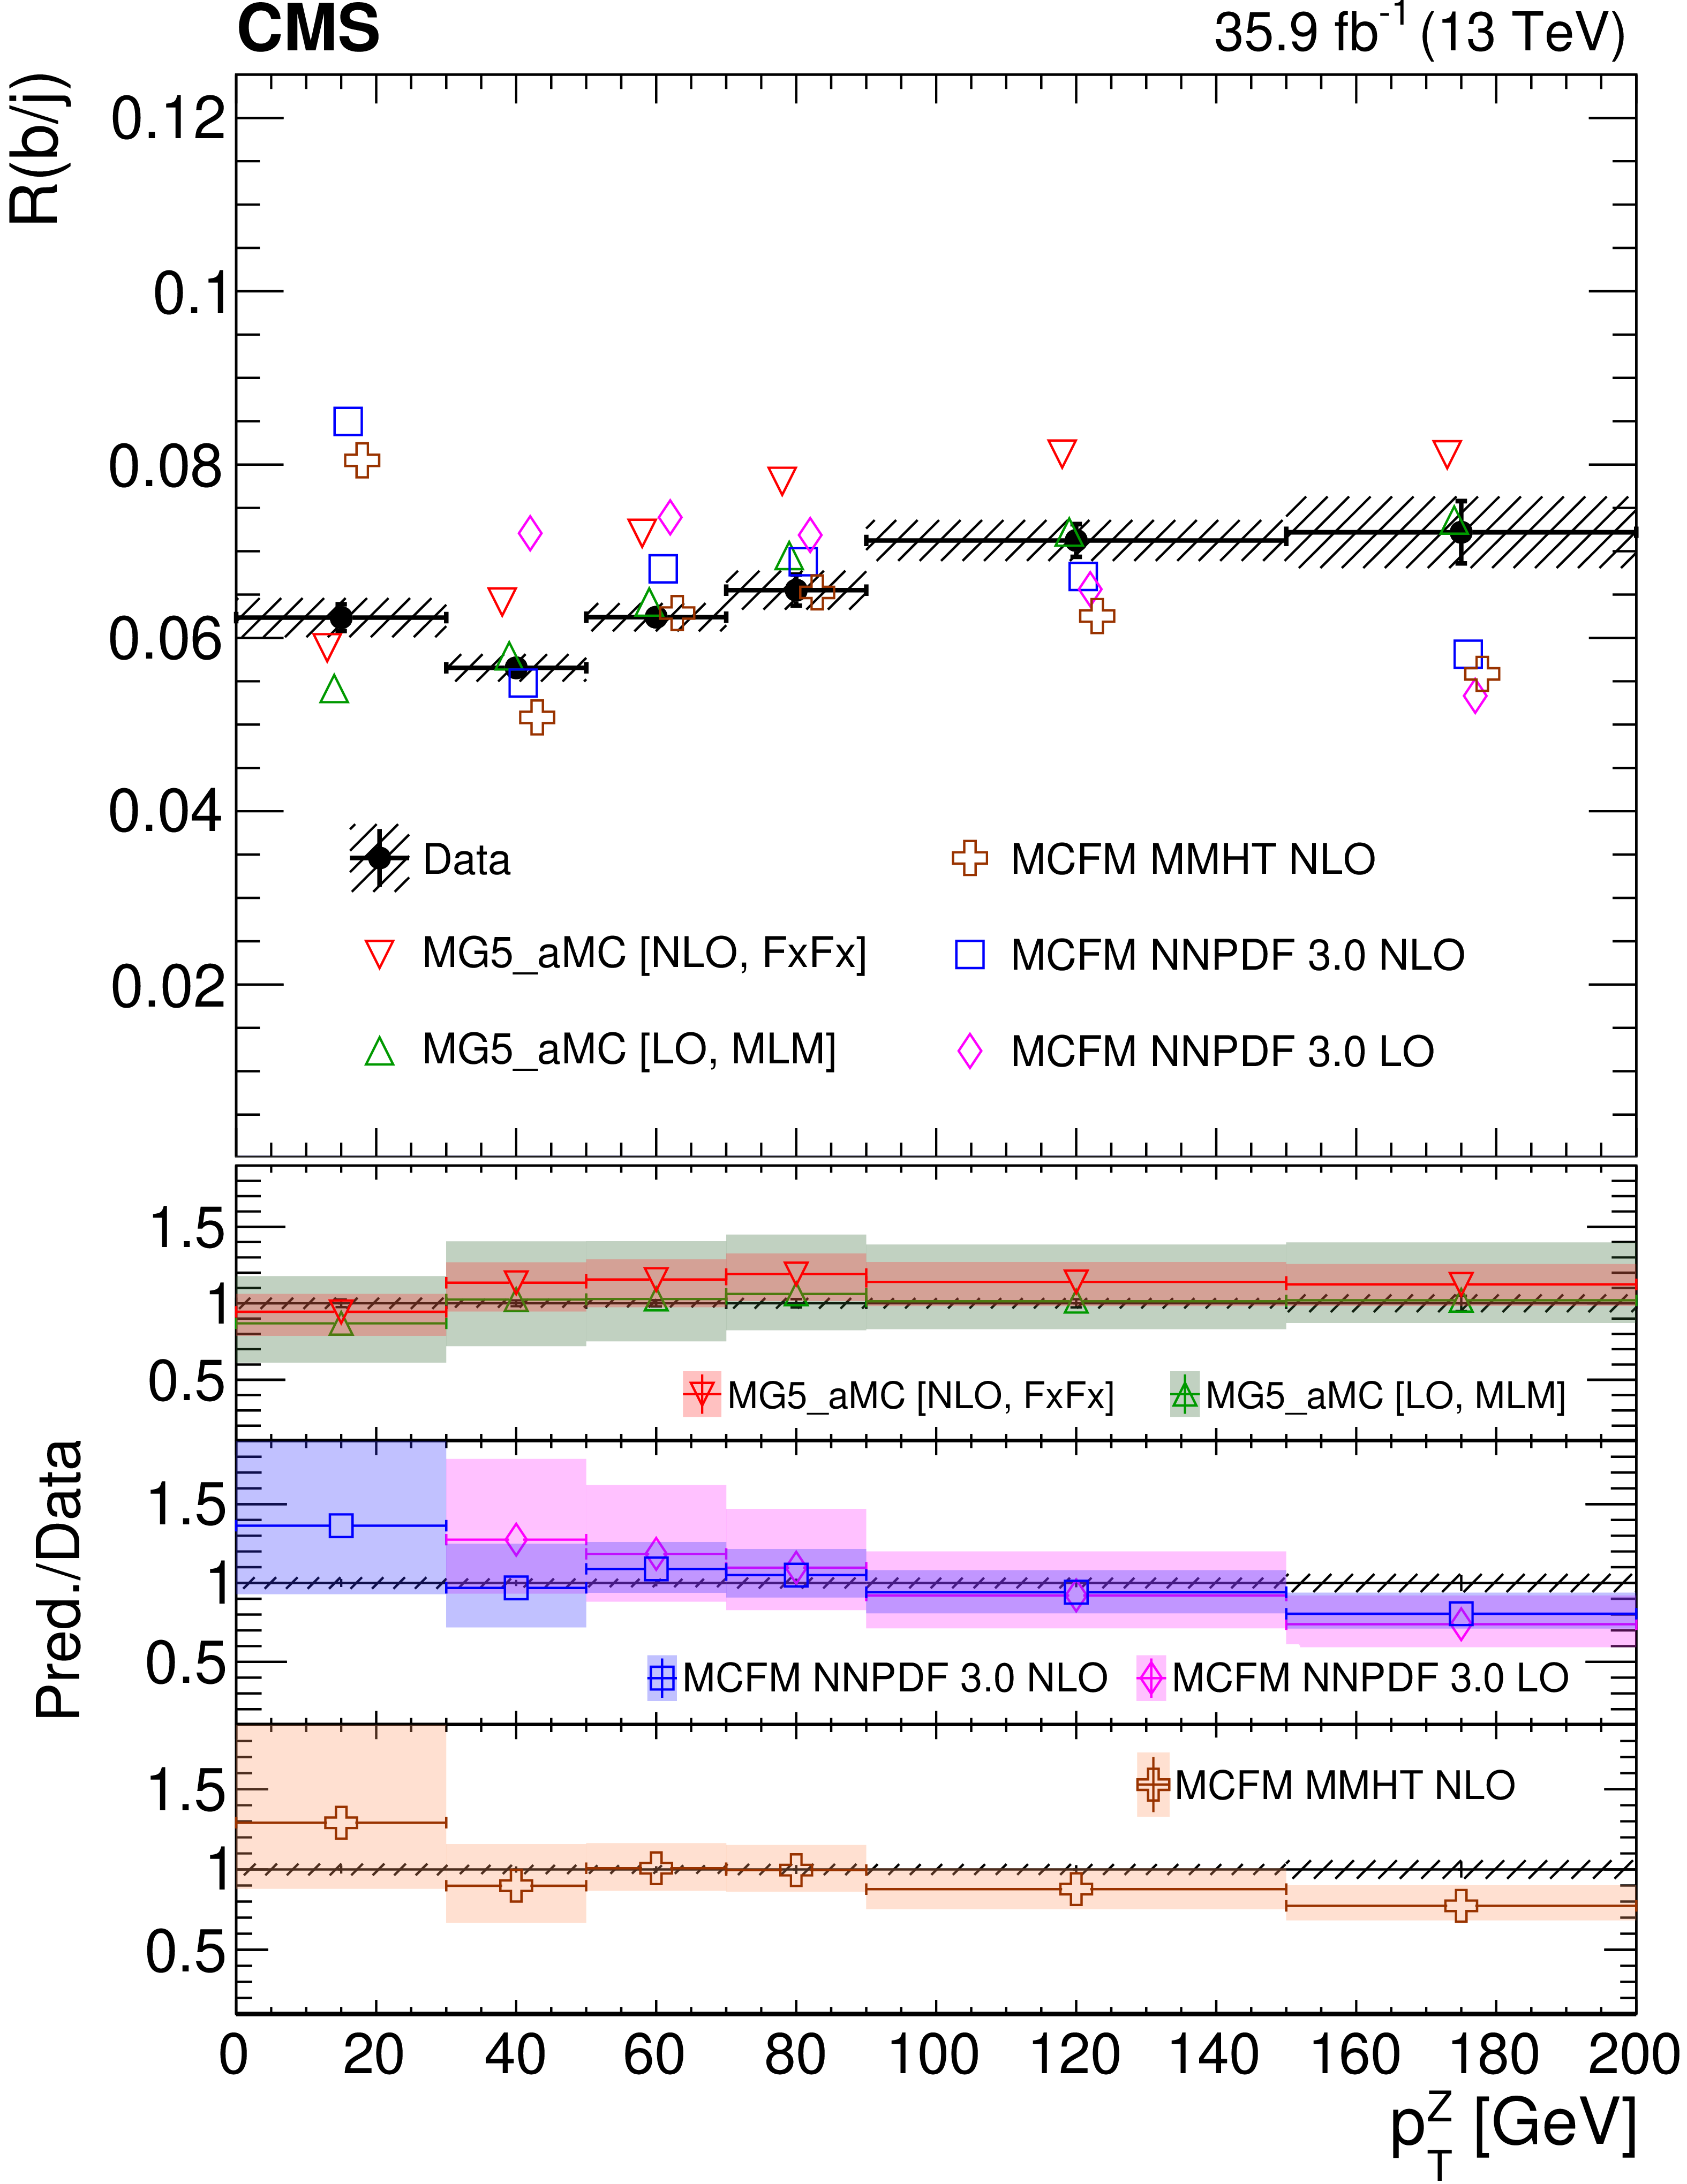
Figure 4-b:
Unfolded, particle-level mg5\_aMC, and parton-level mcfm R(b/j) cross section ratio versus jet (left) and Z boson (right) transverse momentum. The vertical error bars for the data points are statistical while the hatched band presents the total uncertainties. The predictions are slightly shifted along the $x$-axis for readability in the upper plots, and their total PDF and scale uncertainties are shown as error bands in the ratio plots. |
png pdf |
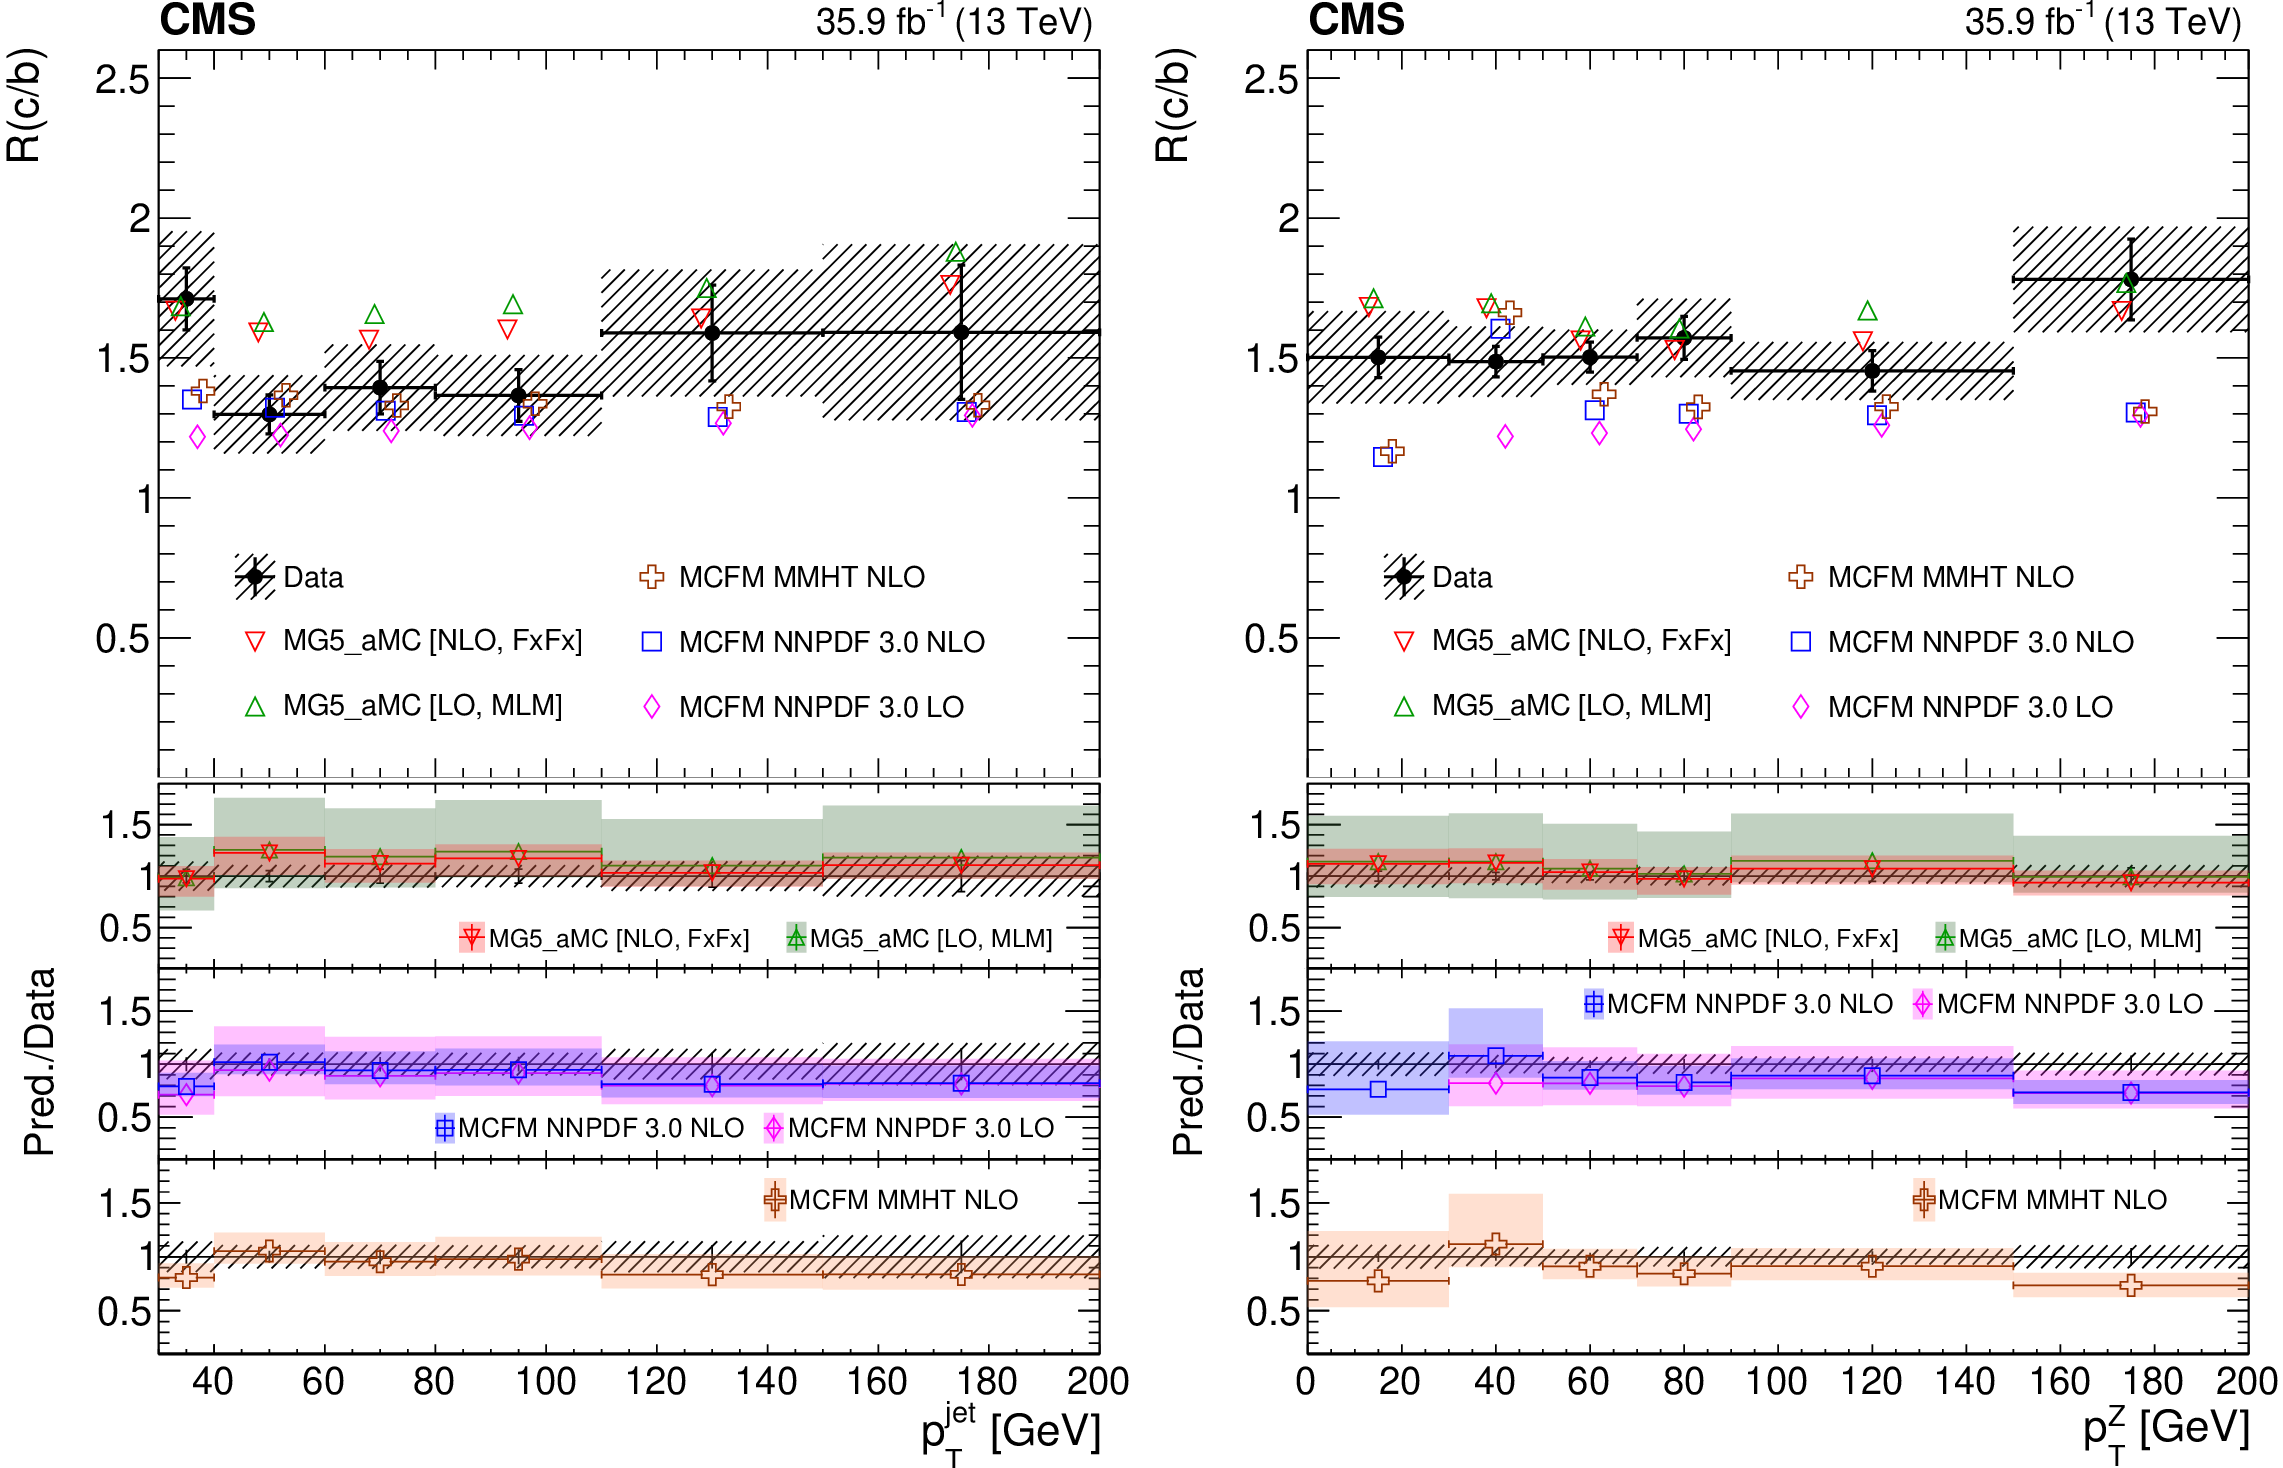
Figure 5:
Unfolded, particle-level mg5\_aMC, and parton-level mcfm R(c/b) cross section ratio versus jet (left) and Z boson (right) transverse momentum. The vertical error bars for the data points are statistical while the hatched band represents the total uncertainties. The predictions are slightly shifted along the $x$-axis for readability in the upper plots, and their total PDF and scale uncertainties are shown as error bands in the ratio plots. |
png pdf |
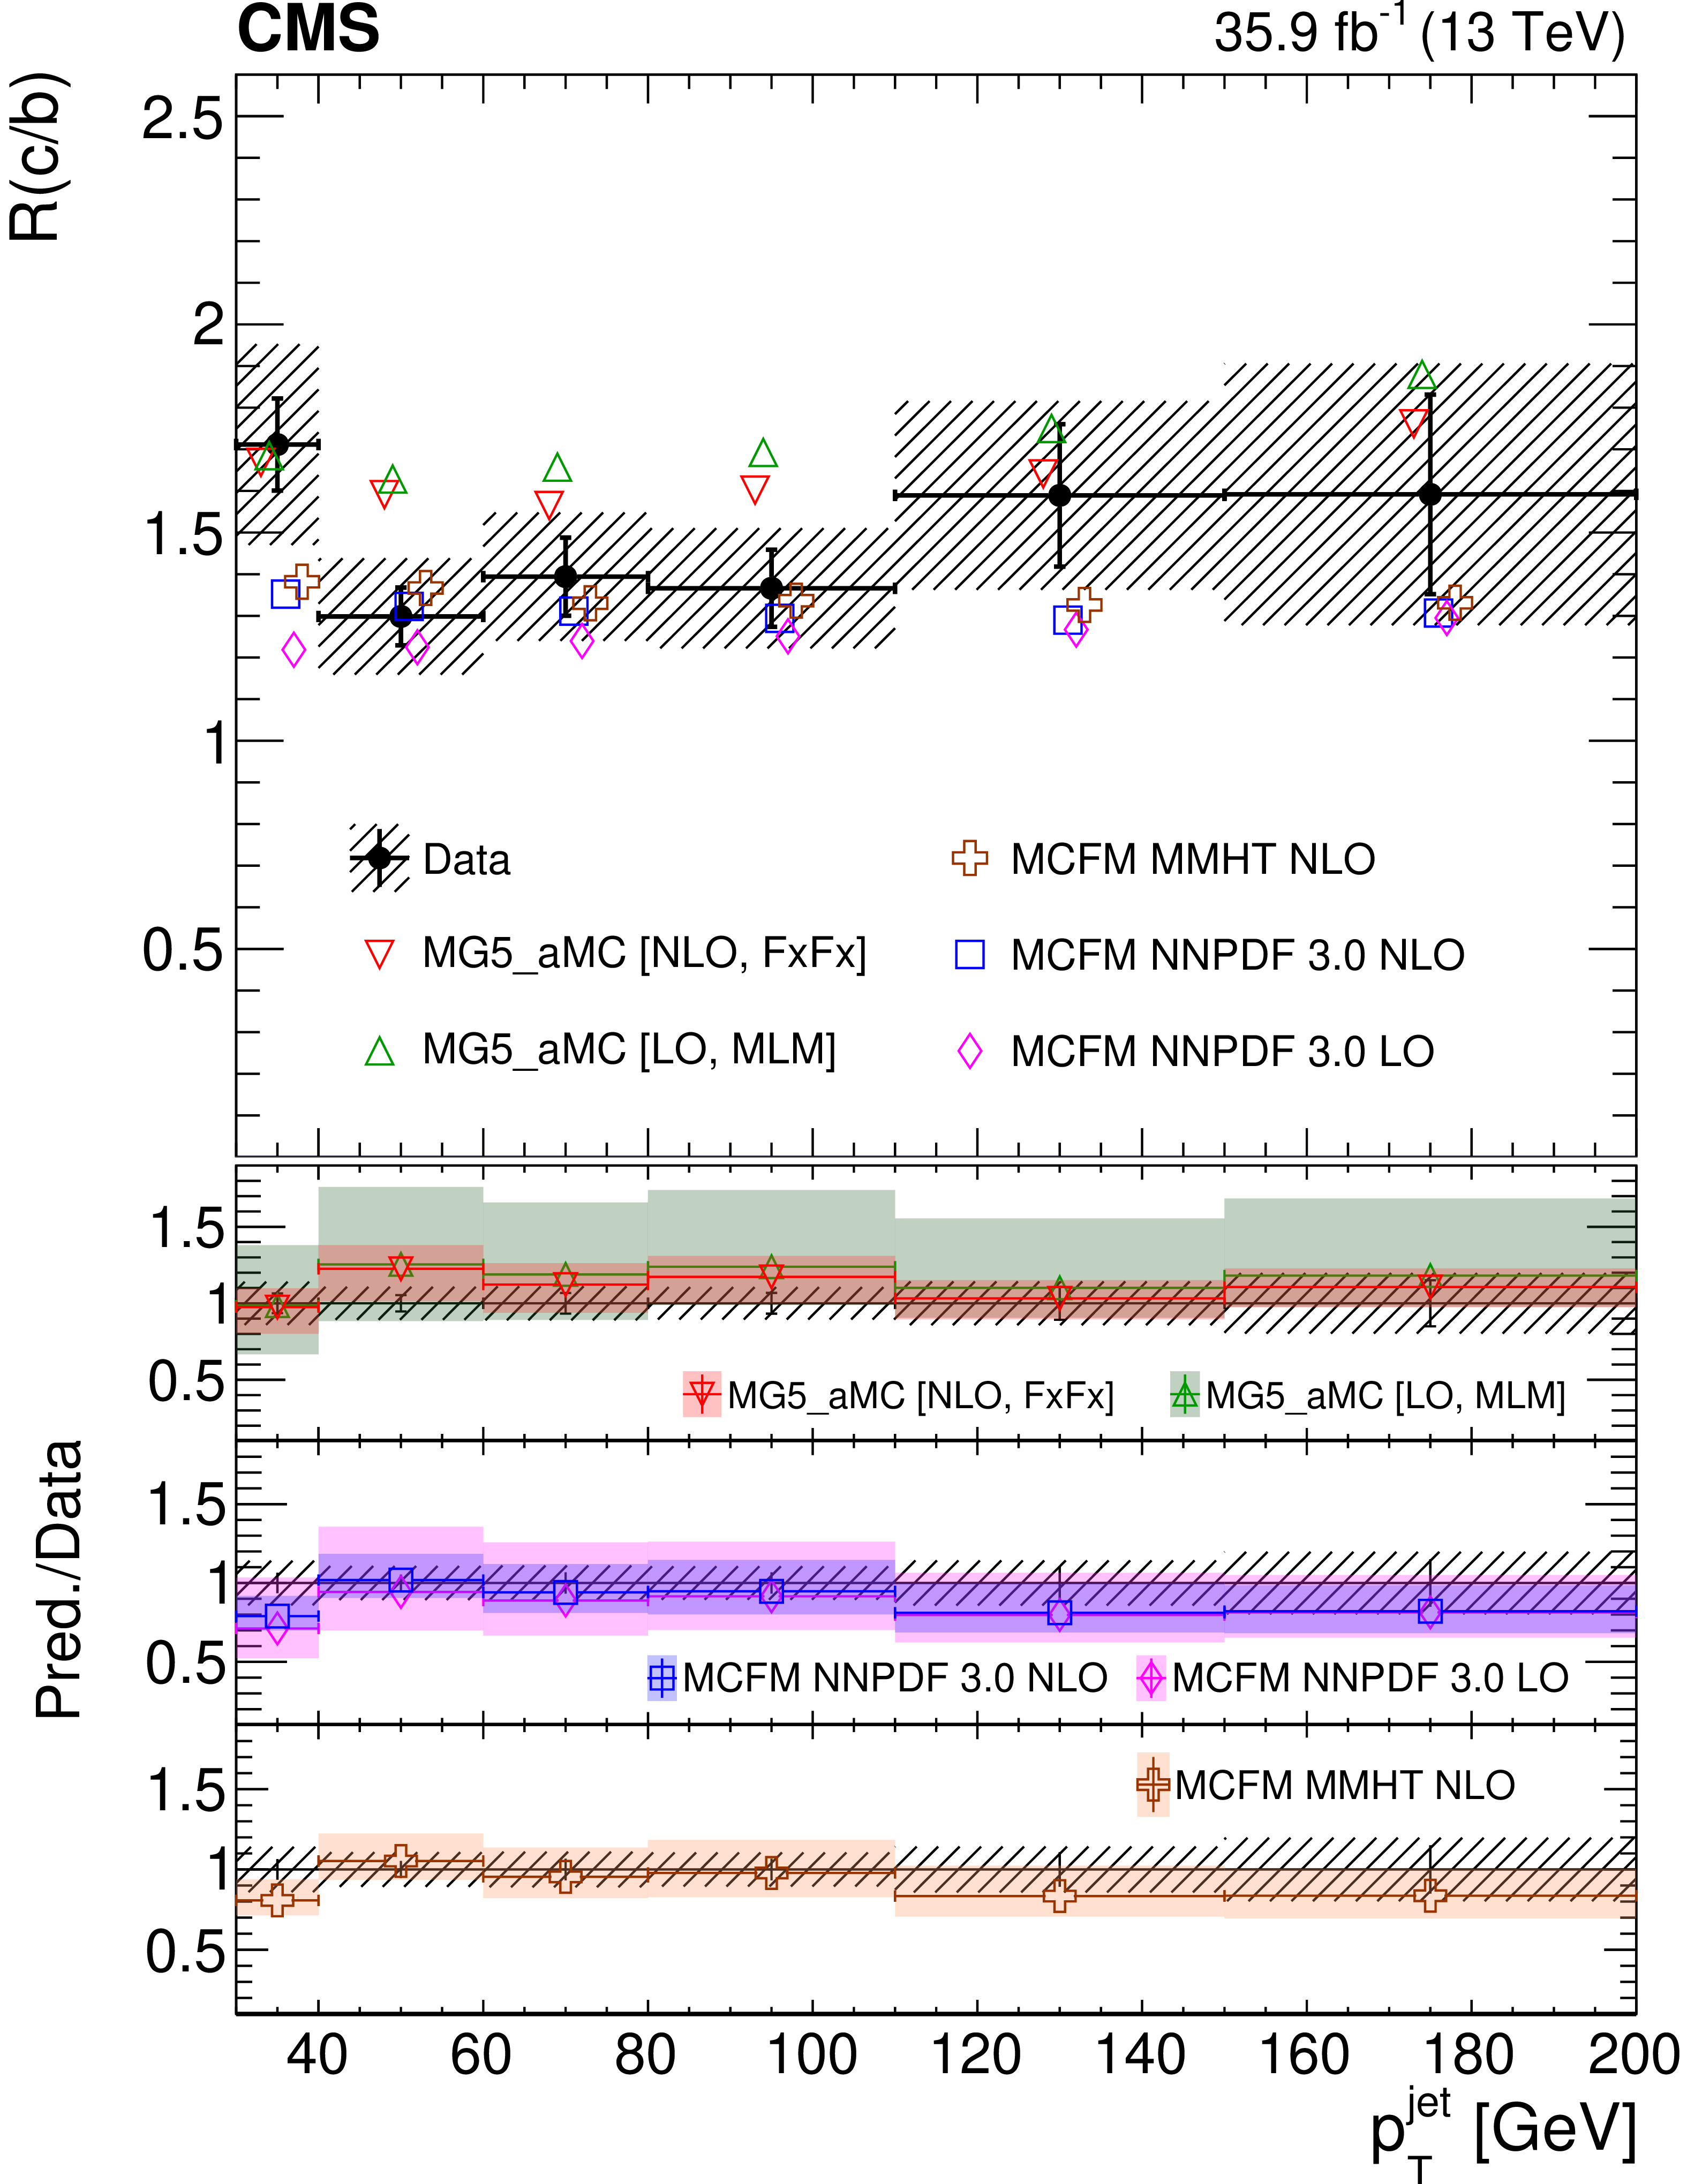
Figure 5-a:
Unfolded, particle-level mg5\_aMC, and parton-level mcfm R(c/b) cross section ratio versus jet (left) and Z boson (right) transverse momentum. The vertical error bars for the data points are statistical while the hatched band represents the total uncertainties. The predictions are slightly shifted along the $x$-axis for readability in the upper plots, and their total PDF and scale uncertainties are shown as error bands in the ratio plots. |
png pdf |
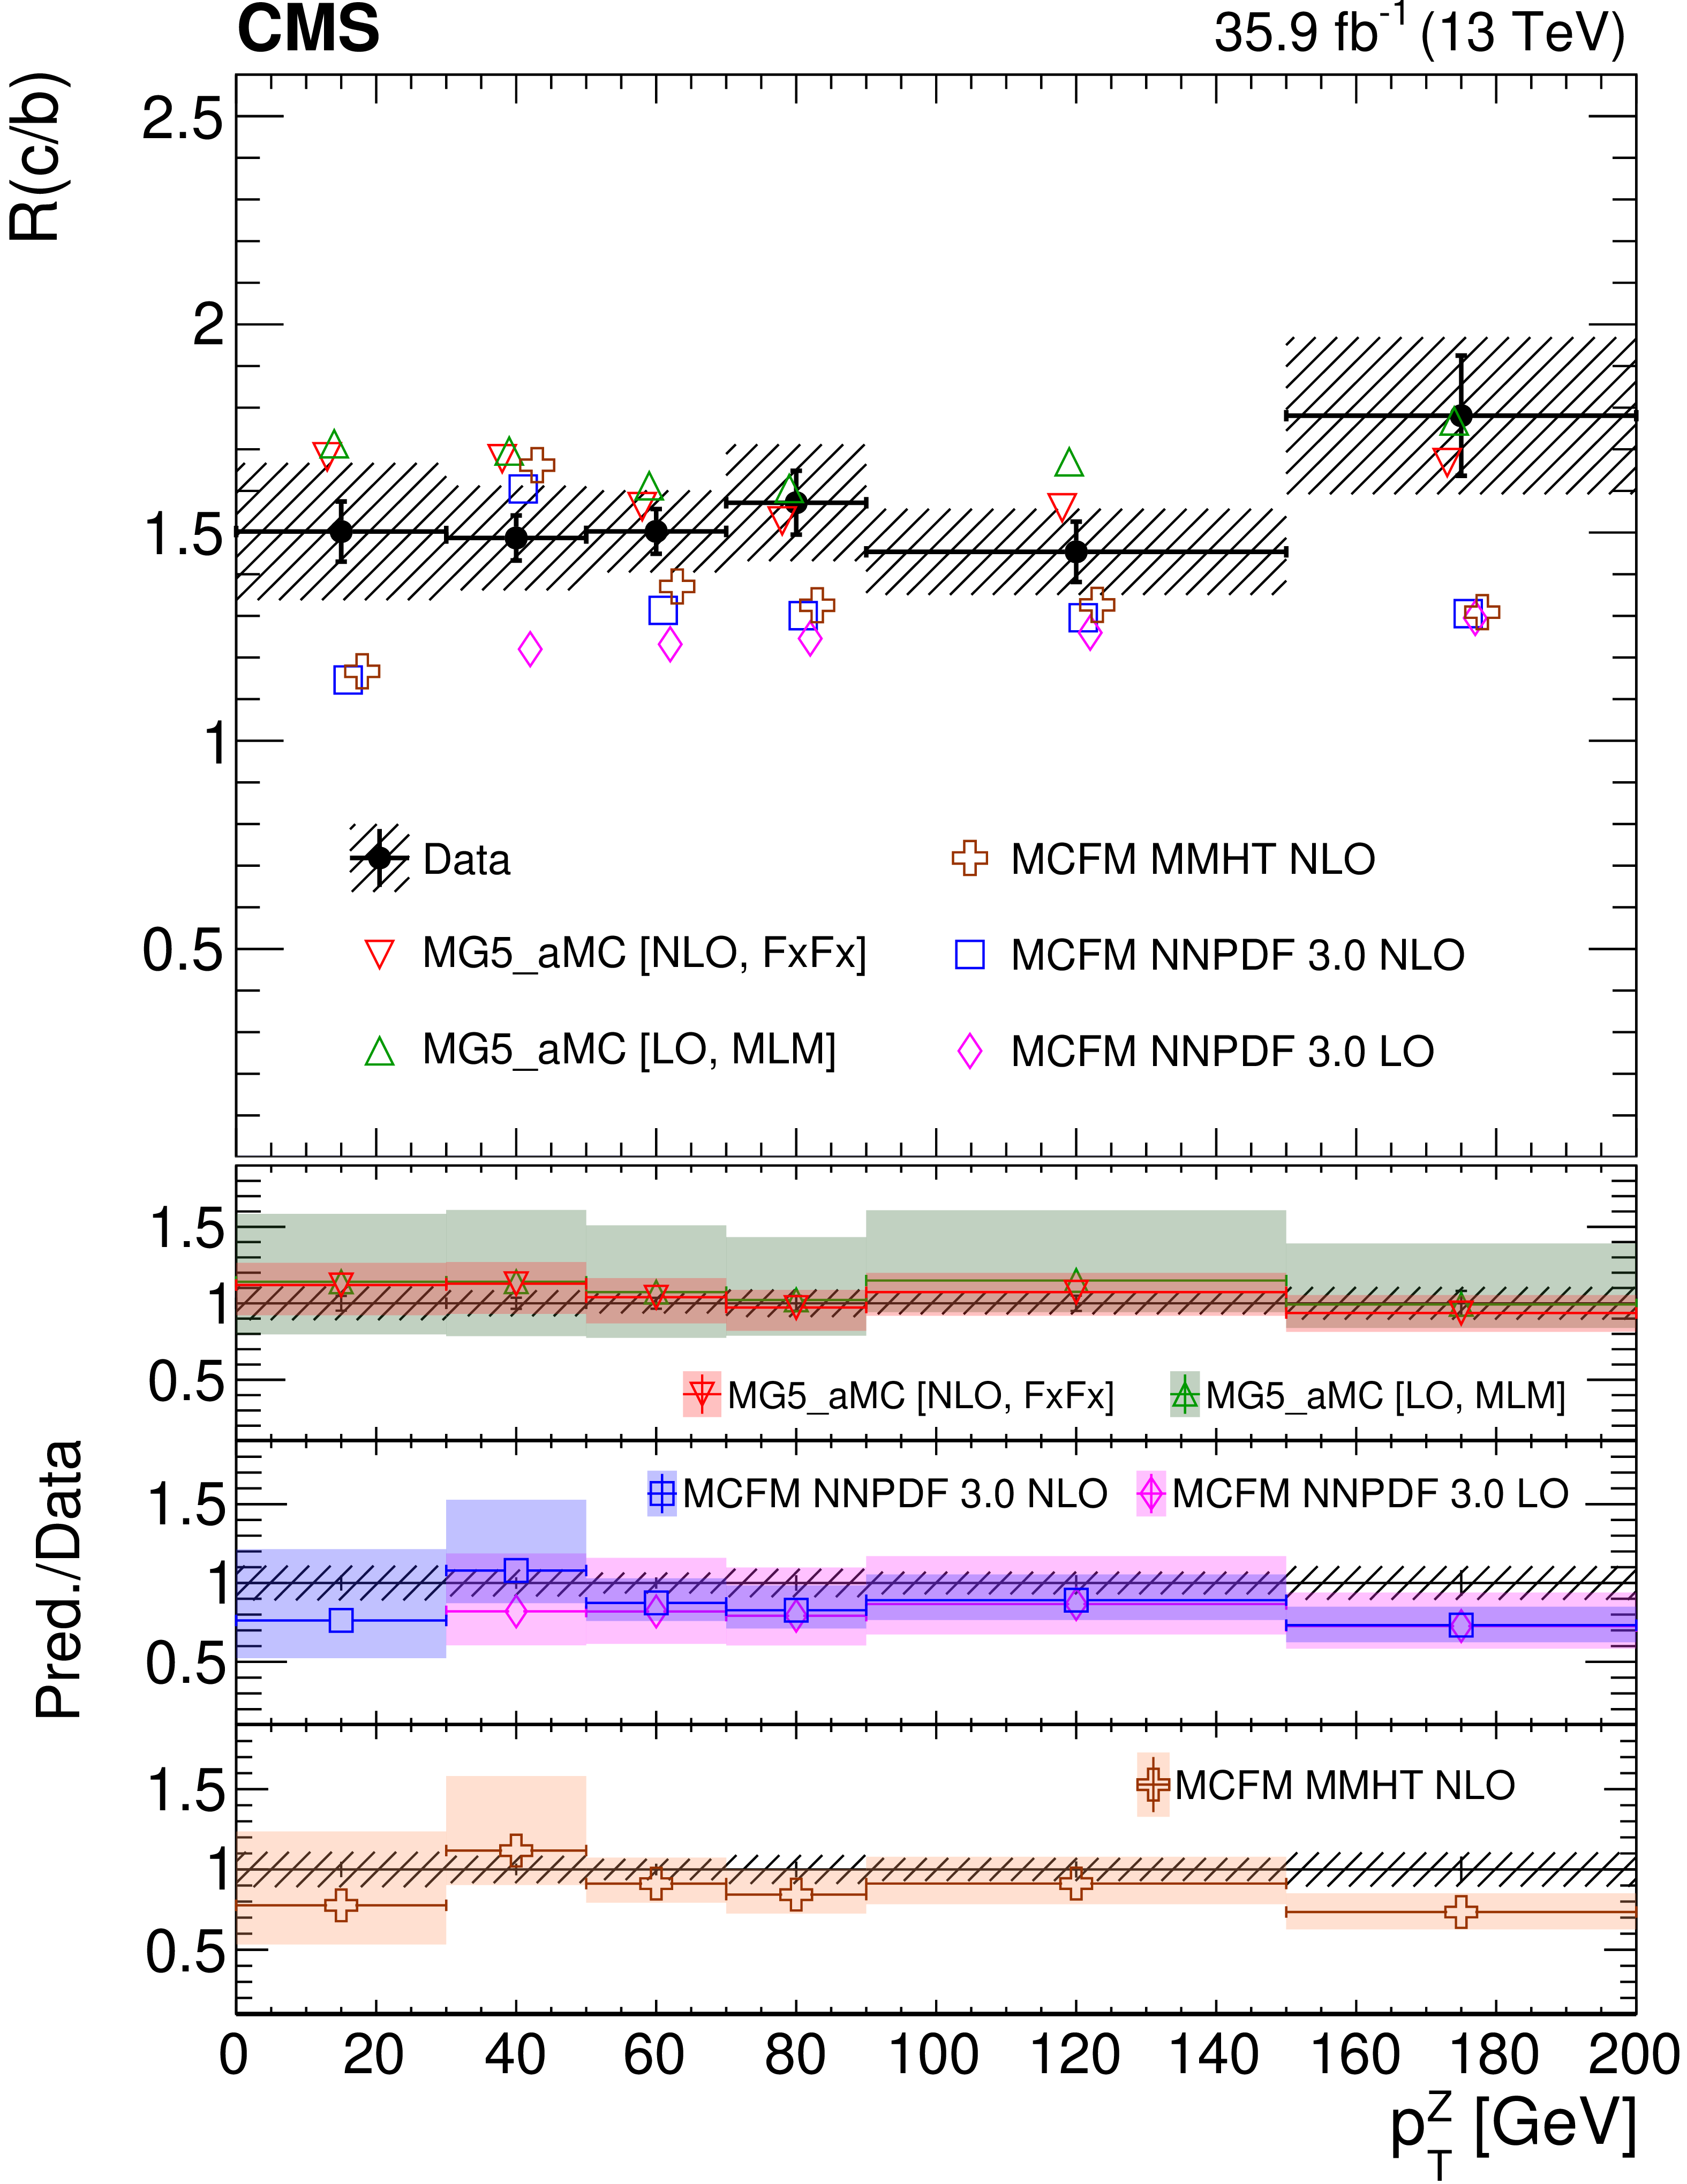
Figure 5-b:
Unfolded, particle-level mg5\_aMC, and parton-level mcfm R(c/b) cross section ratio versus jet (left) and Z boson (right) transverse momentum. The vertical error bars for the data points are statistical while the hatched band represents the total uncertainties. The predictions are slightly shifted along the $x$-axis for readability in the upper plots, and their total PDF and scale uncertainties are shown as error bands in the ratio plots. |
| Tables | |
png pdf |
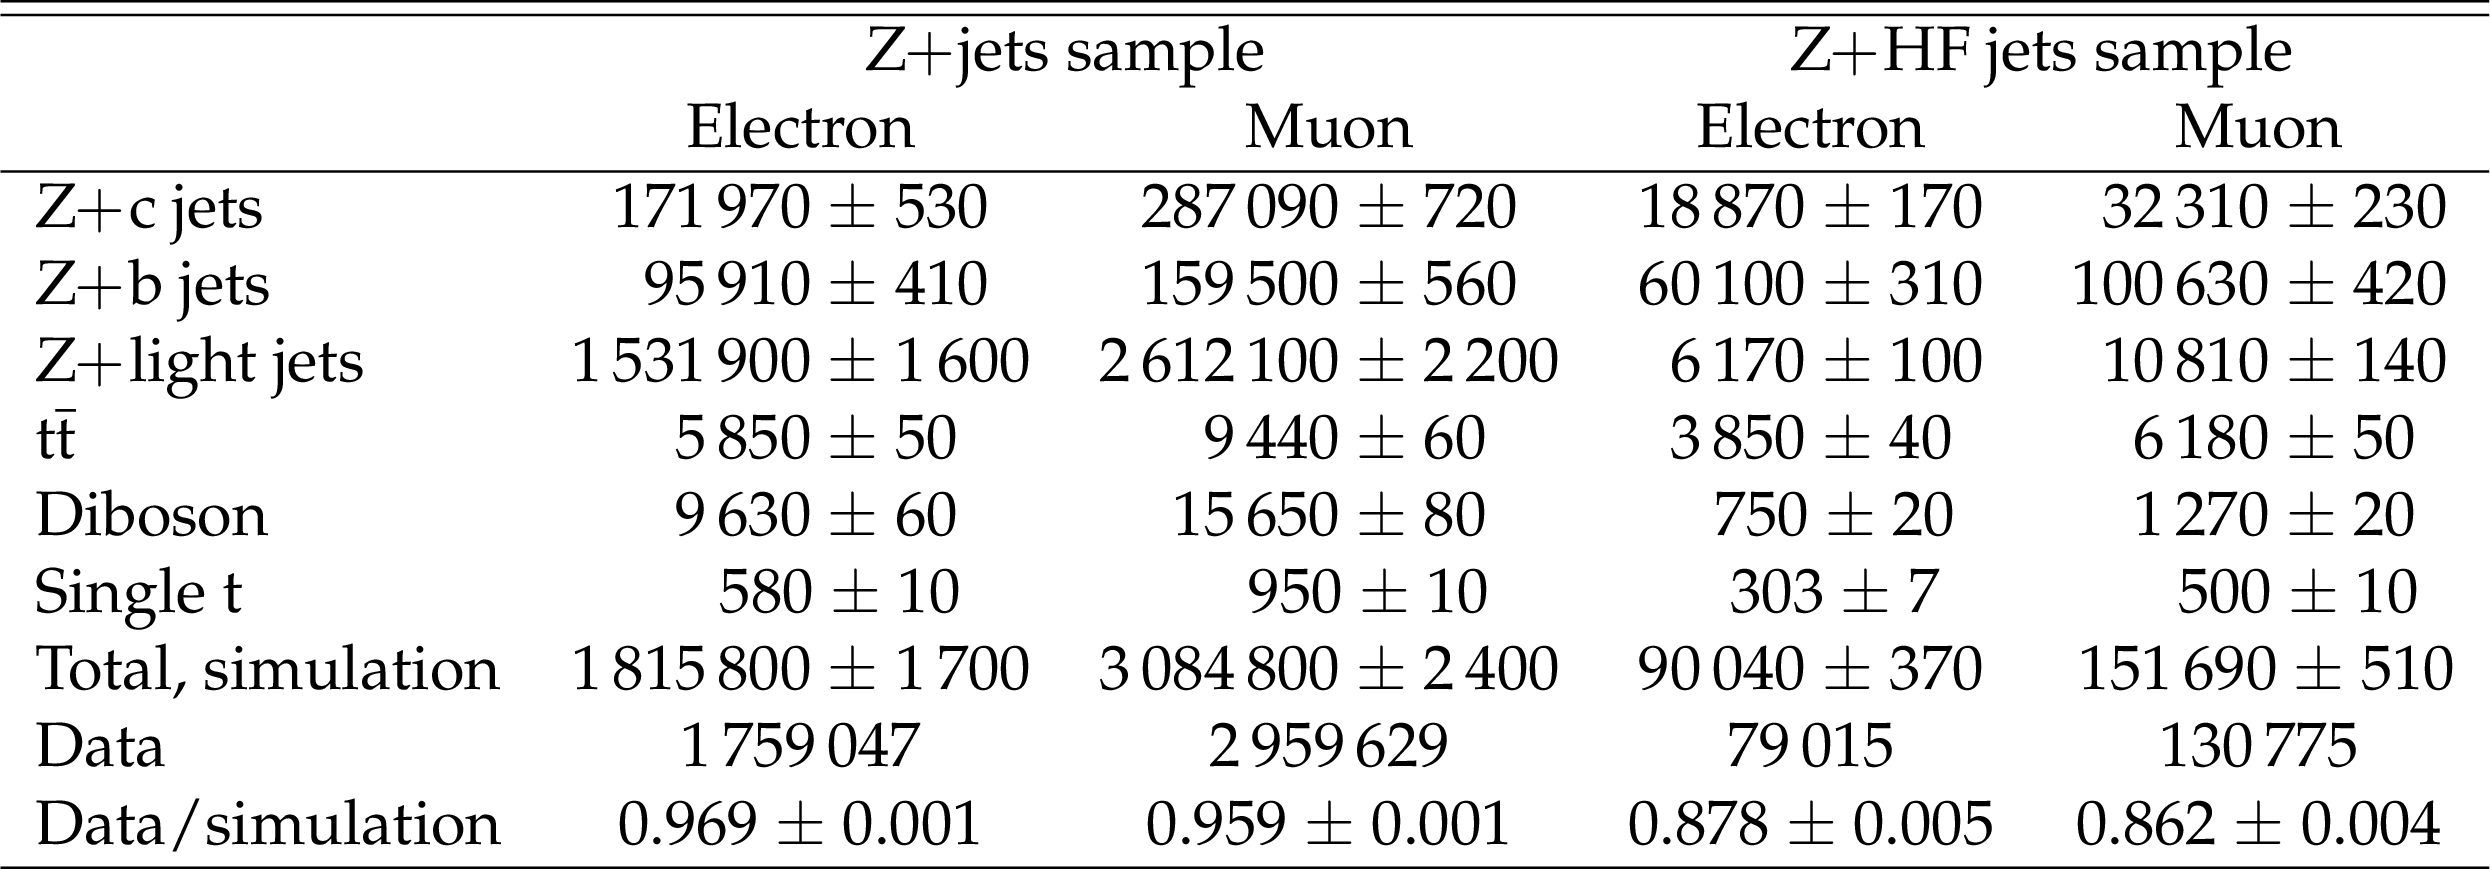
Table 1:
Numbers of events that satisfy the $\mathrm{Z+ \text{jets}}$ and $\mathrm{Z+\ \text{HF jets}}$ selection criteria in the electron and muon channels. The uncertainties are statistical only. |
png pdf |
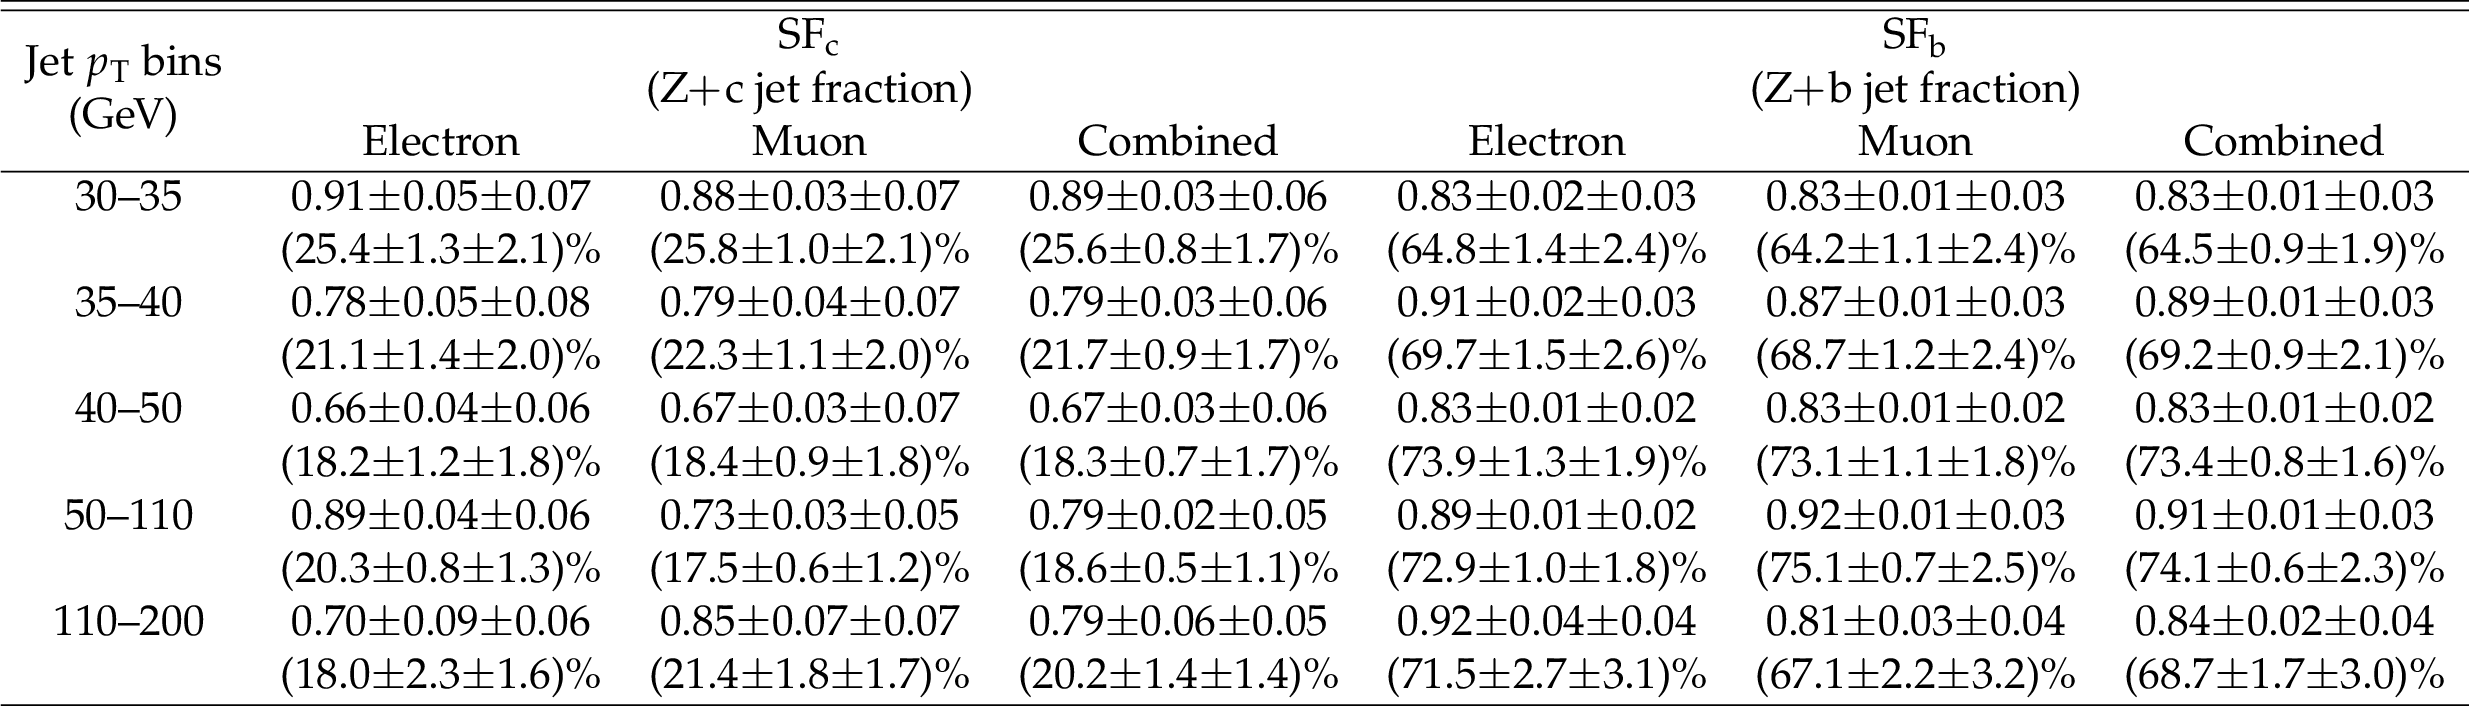
Table 2:
The ${\mathrm {SF}_{\mathrm{c}}}$ and ${\mathrm {SF}_{\mathrm{b}}}$ scale factor fit results for electron, muon, and combined channels in jet ${p_{\mathrm {T}}}$ bins. The first and second uncertainty values correspond to the statistical and systematic contributions, respectively. The fractions of the observed number of $\mathrm{Z+c \ \text{jets}}$ and $\mathrm{Z+b \ \text{jets}}$ in the total number of $\mathrm{Z+ \text{jets}}$ events selected in the $\mathrm{Z+\ \text{HF jets}}$ sample are shown in the parentheses and are determined by applying the scale factors to the corresponding MC events. |
png pdf |
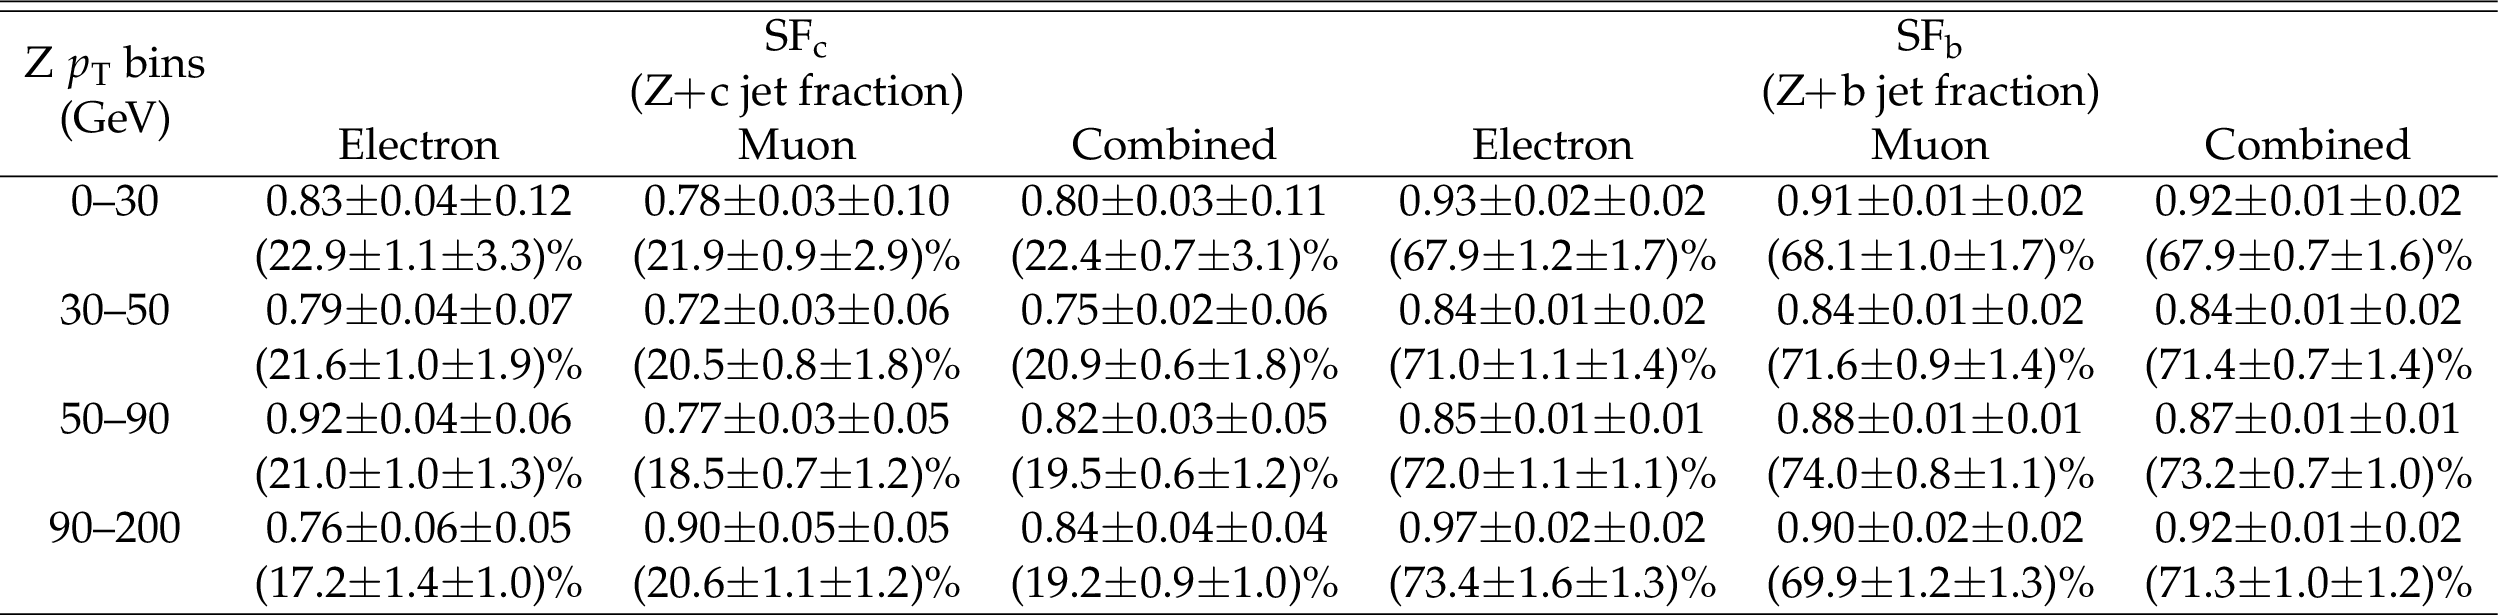
Table 3:
The ${\mathrm {SF}_{\mathrm{c}}}$ and ${\mathrm {SF}_{\mathrm{b}}}$ scale factor fit results for electron, muon, and combined channels in Z ${p_{\mathrm {T}}}$ bins. The first and second uncertainty values correspond to the statistical and systematic contributions, respectively. The fraction of the observed number of $\mathrm{Z+c \ \text{jets}}$ and $\mathrm{Z+b \ \text{jets}}$ in the total number of $\mathrm{Z+ \text{jets}}$ events selected in the $\mathrm{Z+\ \text{HF jets}}$ sample are shown in the parentheses and are derived by applying the scale factors to the corresponding MC events. |
png pdf |
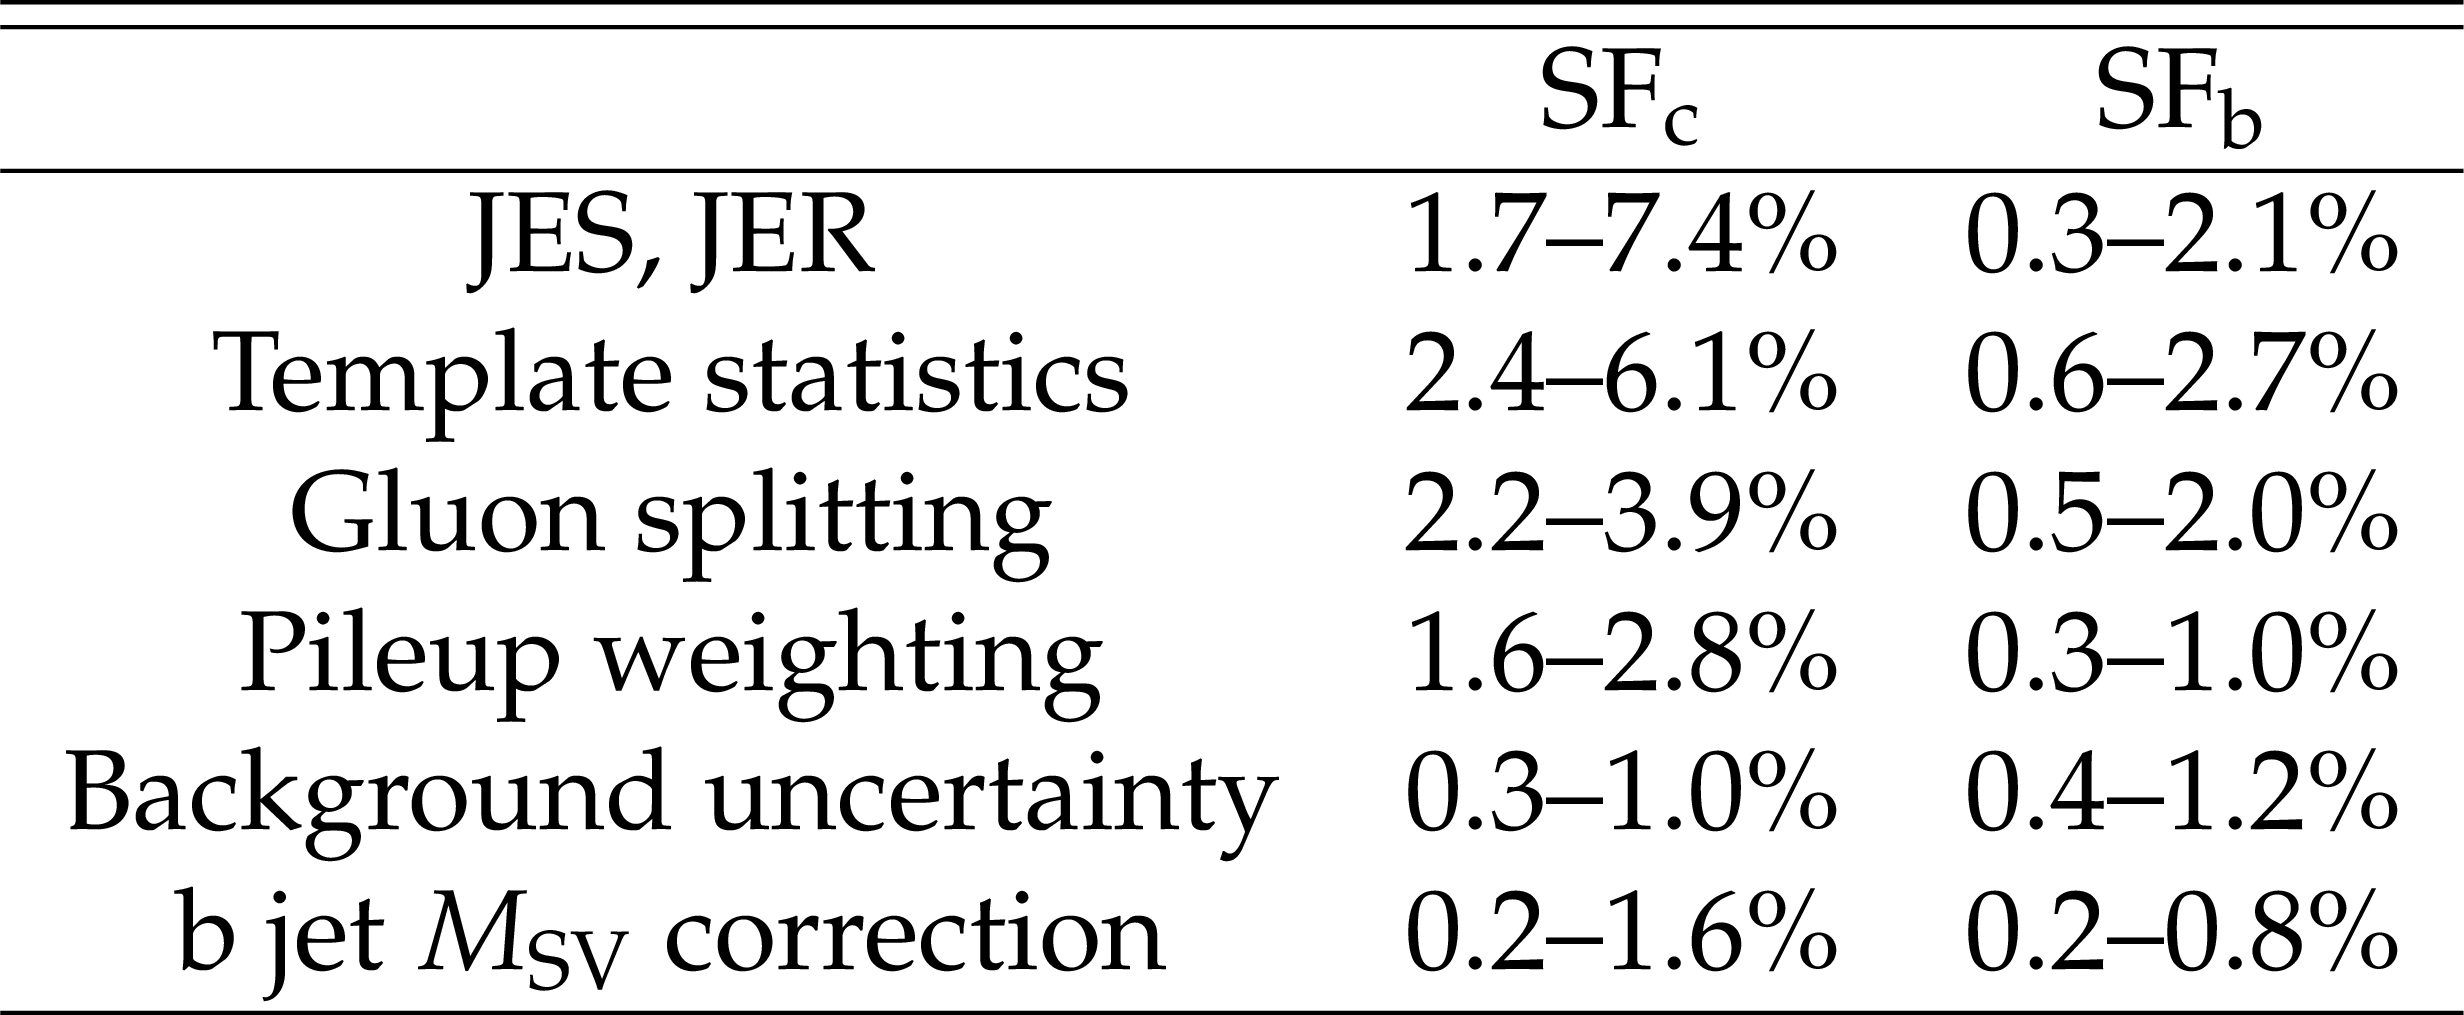
Table 4:
Systematic uncertainties in the scale factor measurements. The uncertainty ranges correspond to variations across jet and Z ${p_{\mathrm {T}}}$ bins. |
png pdf |
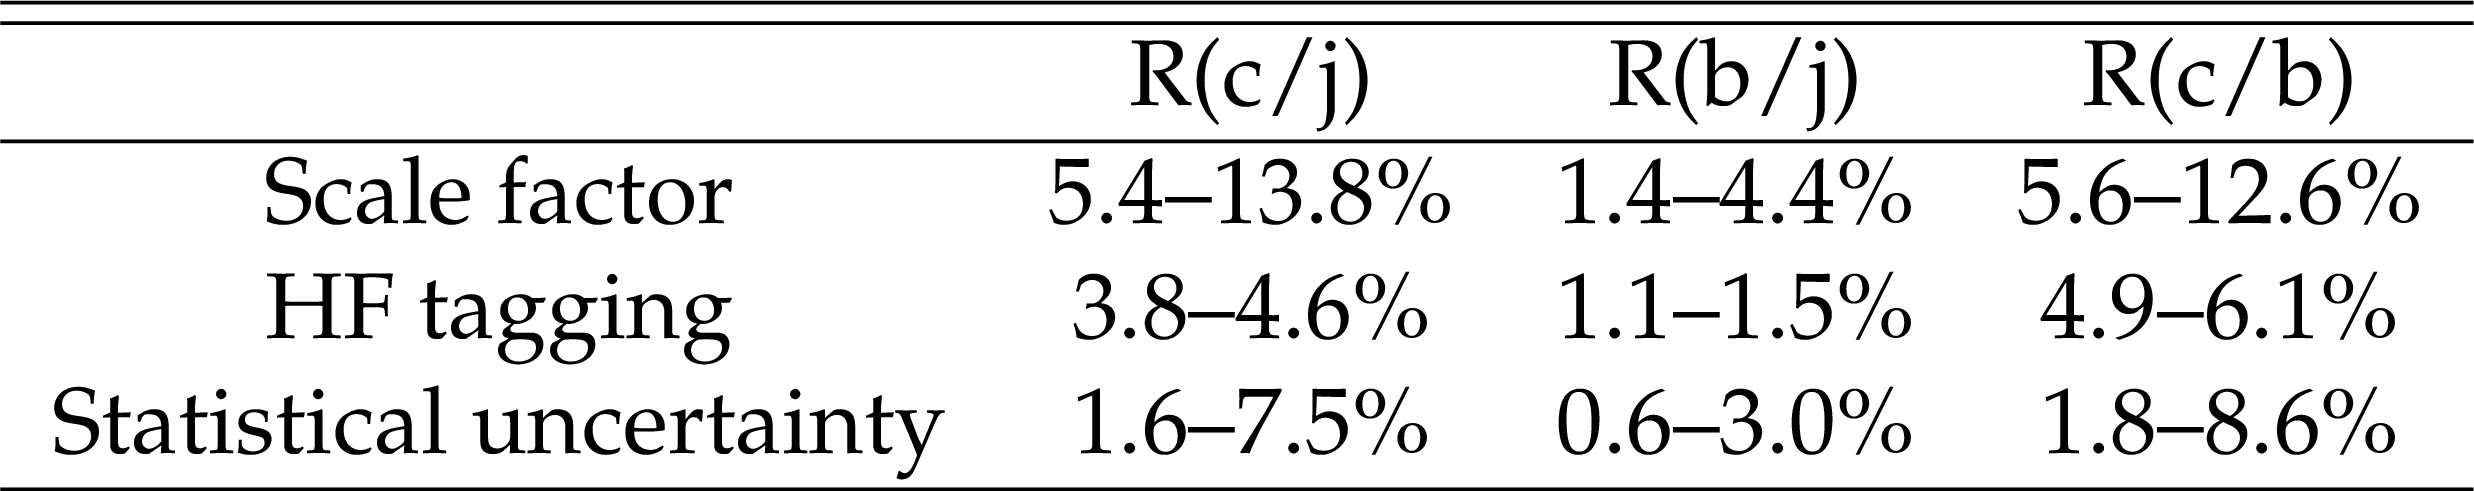
Table 5:
The systematic uncertainties in the cross section ratio measurements. The uncertainty ranges correspond to variations across jet and Z ${p_{\mathrm {T}}}$ bins. |
png pdf |
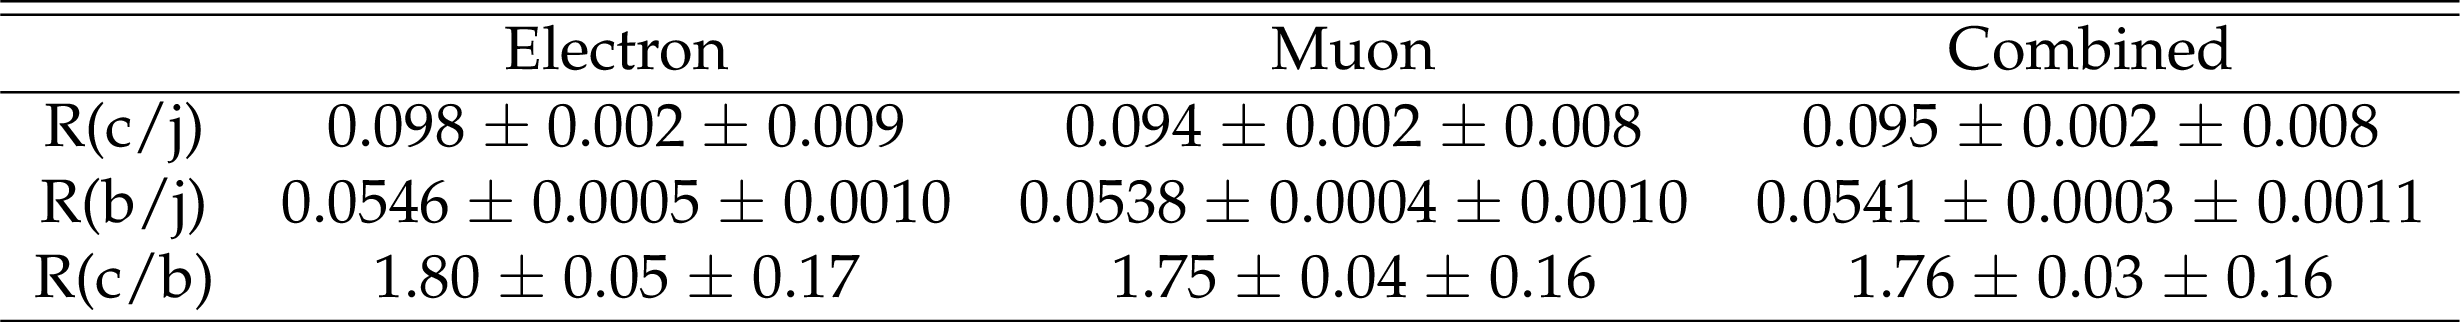
Table 6:
Cross section ratios measured in the electron and muon channels, along with the combined results. The first and second uncertainty values correspond to the statistical and systematic contributions, respectively. |
png pdf |
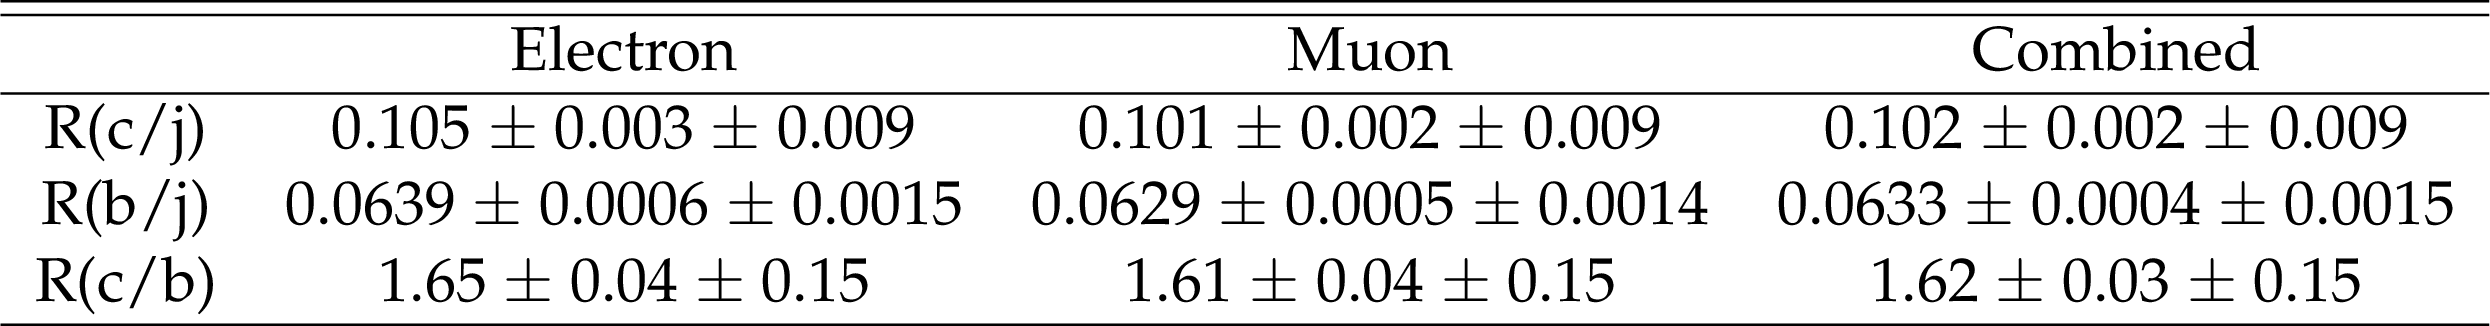
Table 7:
Unfolded cross section ratios in the electron and muon channels, along with the combined results. The first and second uncertainty values correspond to the statistical and systematic contributions, respectively. |
png pdf |
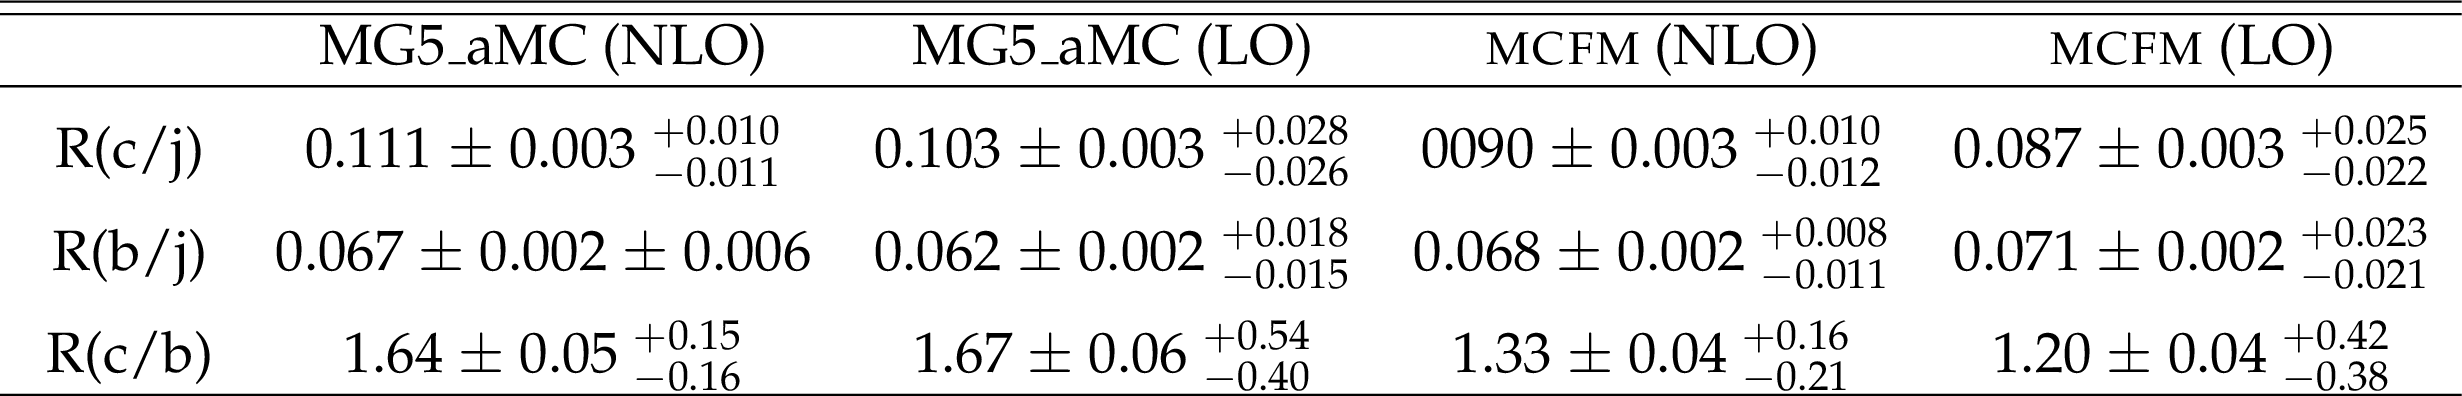
Table 8:
Predicted cross section ratios from mg5\_aMC and mcfm at LO and NLO accuracy. The first and second sets of uncertainties correspond to PDF and scale variations, respectively. |
png pdf |
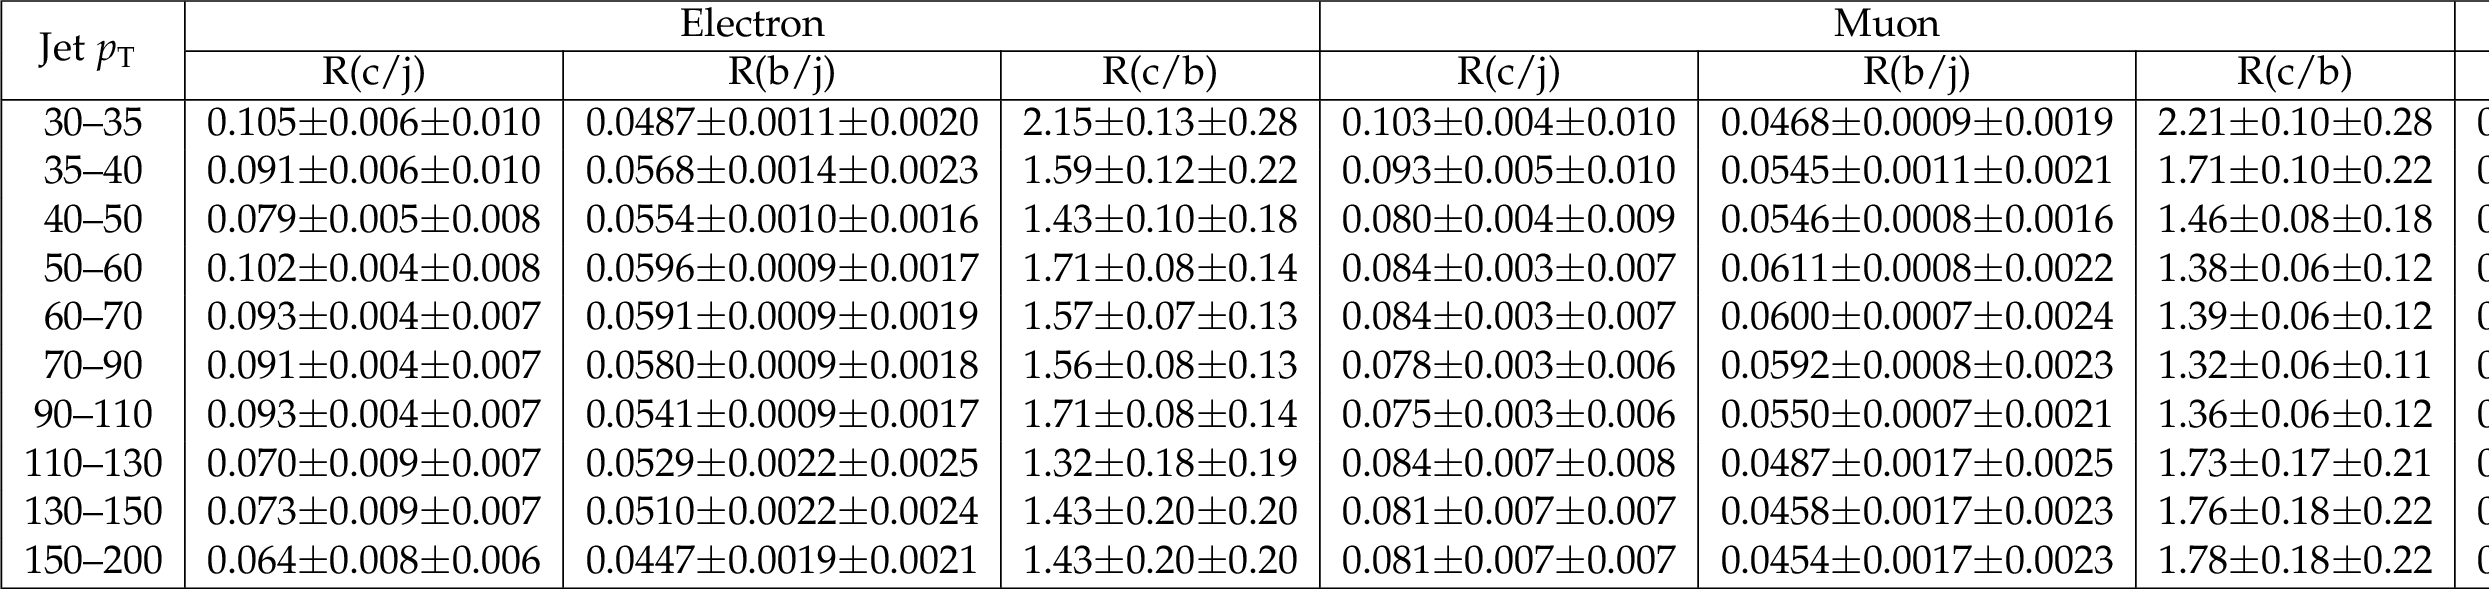
Table 9:
The cross section ratios for the electron, muon, and combined channels in jet ${p_{\mathrm {T}}}$ bins. |
png pdf |
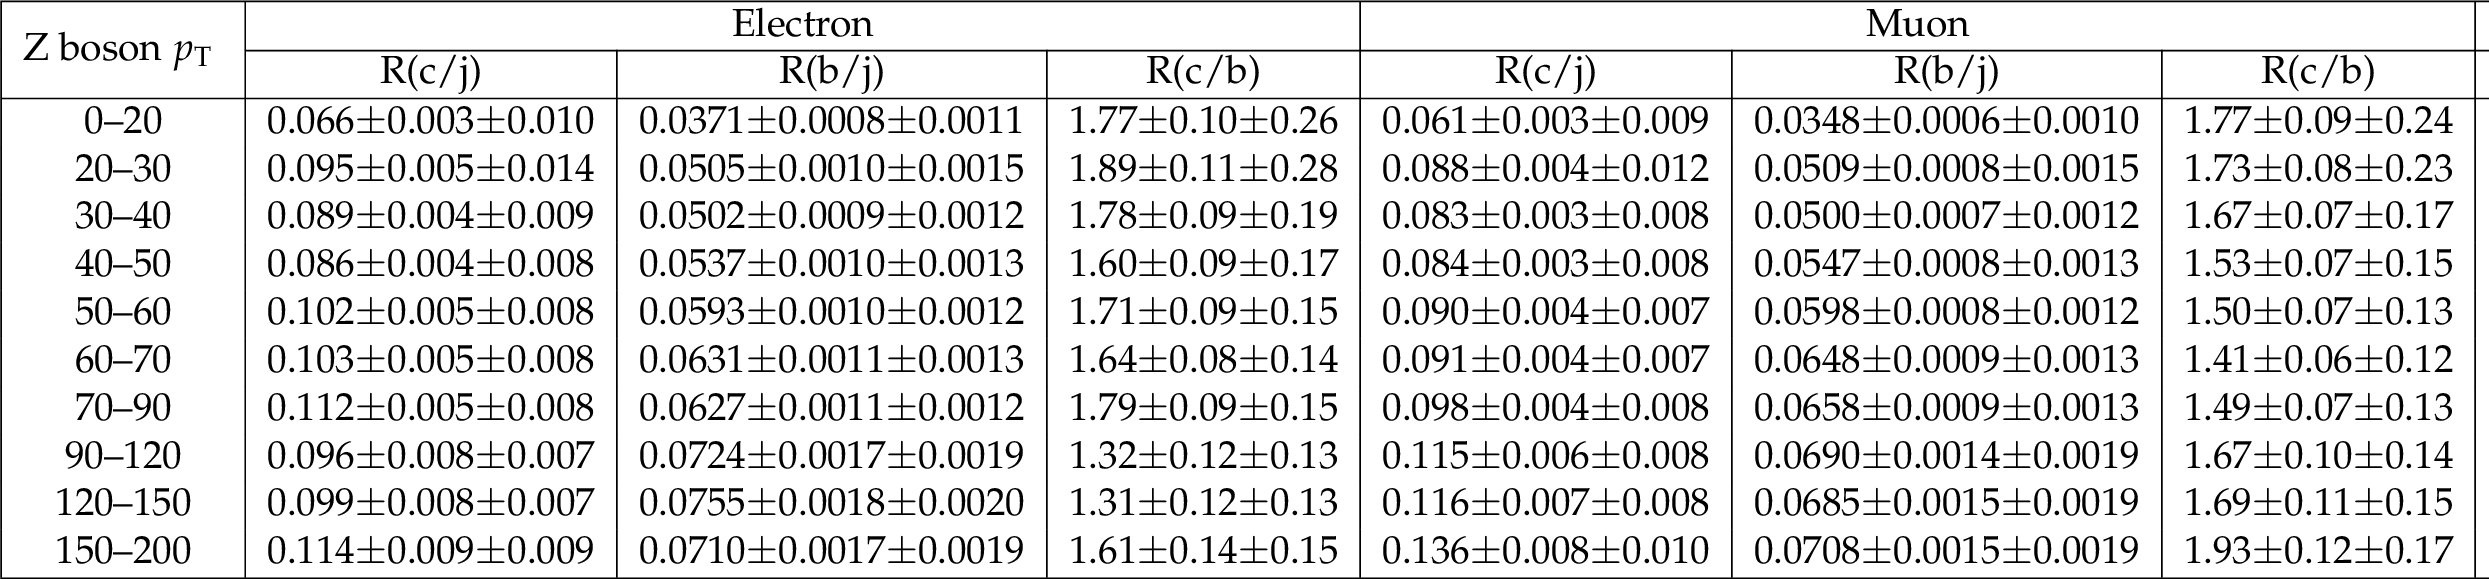
Table 10:
The cross section ratios in the electron, muon and combined channels in the Z boson ${p_{\mathrm {T}}}$ bins. |
| Summary |
| Ratios of cross sections, $\sigma(\mathrm{Z+c\ \text{jets}})/\sigma(\mathrm{Z+ \text{jets}})$, $\sigma(\mathrm{Z+b\ \text{jets}})/\sigma(\mathrm{Z+ \text{jets}})$, and $\sigma(\mathrm{Z+c\ \text{jets}})/\sigma(\mathrm{Z+b\ \text{jets}})$ in the associated production of a Z boson with at least one charm or bottom quark jet have been measured in proton-proton collisions at $\sqrt{s} = $ 13 TeV using 35.9 fb$^{-1}$ of data collected by the CMS experiment at the LHC. The fiducial volume of the measurement is defined by ${p_{\mathrm{T}}} > $ 30 GeV and $|\eta| < $ 2.4 for the jets, where ${p_{\mathrm{T}}}$ and $\eta$ represent transverse momentum and pseudorapidity, respectively. The Z bosons are selected within the mass range of 71 and 111 GeV requiring leptons (electrons or muons) with ${p_{\mathrm{T}}} > $ 25 GeV and $|{\eta}| < $ 2.4. The measured values are $\sigma(\mathrm{Z+c\ \text{jets}})/\sigma(\mathrm{Z+ \text{jets}}) = $ 0.102 $\pm$ 0.002 $\pm$ 0.009, $\sigma(\mathrm{Z+b\ \text{jets}})/\sigma(\mathrm{Z+ \text{jets}}) = $ 0.0633 $\pm$ 0.0004 $\pm$ 0.0015, and $\sigma(\mathrm{Z+c\ \text{jets}})/\sigma(\mathrm{Z+b\ \text{jets}}) = $ 1.62 $\pm$ 0.03 $\pm$ 0.15. Results for the inclusive and differential cross section ratios as functions of jet and Z boson transverse momentum are compared with predictions from leading and next-to-leading order perturbative quantum chromodynamics calculations. These are the first results of this kind at 13 TeV, and the measurement precision exceeds that of the current theoretical predictions. |
| References | ||||
| 1 | J. M. Campbell, R. K. Ellis, F. Maltoni, and S. Willenbrock | Associated production of a Z boson and a single heavy quark jet | PRD 69 (2004) 074021 | hep-ph/0312024 |
| 2 | F. Febres Cordero, L. Reina, and D. Wackeroth | W and Z boson production with a massive bottom-quark pair at the Large Hadron Collider | PRD 80 (2009) 034015 | 0906.1923 |
| 3 | F. Maltoni, G. Ridolfi, and M. Ubiali | b-initiated processes at the LHC: a reappraisal | JHEP 07 (2012) 022 | 1203.6393 |
| 4 | CDF Collaboration | Measurement of cross sections for $ \mathrm{b} $ jet production in events with a Z boson in $ \mathrm{p}\bar{\mathrm{p}} $ collisions at $ \sqrt{s} = $ 1.96 TeV | PRD 79 (2009) 052008 | 0812.4458 |
| 5 | D0 Collaboration | Measurement of associated production of Z bosons with charm quark jets in $ \mathrm{p}\bar{\mathrm{p}} $ collisions at $ \sqrt{s}= $ 1.96 TeV | PRL 112 (2014) 042001 | 1308.4384 |
| 6 | D0 Collaboration | Measurement of the ratio of inclusive cross sections $ \sigma (\mathrm{p}\bar{\mathrm{p}} \rightarrow \mathrm{Z} + 2 \mathrm{b}\ \text{jets}) / \sigma (\mathrm{p}\bar{\mathrm{p}} \rightarrow \mathrm{Z} + \text{2 jets}) $ in $ \mathrm{p}\bar{\mathrm{p}} $ collisions at $ \sqrt s= $ 1.96 TeV | PRD 91 (2015) 052010 | 1501.05325 |
| 7 | ATLAS Collaboration | Measurement of differential production cross-sections for a Z boson in association with b jets in 7 TeV proton-proton collisions with the ATLAS detector | JHEP 10 (2014) 141 | 1407.3643 |
| 8 | CMS Collaboration | Measurement of the production cross sections for a Z boson and one or more b jets in pp collisions at $ \sqrt{s} = $ 7 TeV | JHEP 06 (2014) 120 | CMS-SMP-13-004 1402.1521 |
| 9 | CMS Collaboration | Measurement of associated $ \mathrm{Z} $ + charm production in proton-proton collisions at $ \sqrt{s}= $ 8 TeV | EPJC 78 (2018) 287 | CMS-SMP-15-009 1711.02143 |
| 10 | J. Alwall et al. | Madgraph 5: going beyond | JHEP 06 (2011) 128 | 1106.0522 |
| 11 | J. Alwall et al. | The automated computation of tree-level and next-to-leading order differential cross sections, and their matching to parton shower simulations | JHEP 07 (2014) 079 | 1405.0301 |
| 12 | CMS Collaboration | The CMS trigger system | JINST 12 (2017) P01020 | CMS-TRG-12-001 1609.02366 |
| 13 | CMS Collaboration | The CMS experiment at the CERN LHC | JINST 3 (2008) S08004 | CMS-00-001 |
| 14 | CMS Collaboration | CMS luminosity measurements for the 2016 data taking period | CMS-PAS-LUM-17-001 | CMS-PAS-LUM-17-001 |
| 15 | GEANT4 Collaboration | GEANT4--a simulation toolkit | NIMA 506 (2003) 250 | |
| 16 | T. Sjostrand et al. | An introduction to PYTHIA 8.2 | CPC 191 (2015) 159 | 1410.3012 |
| 17 | R. Frederix and S. Frixione | Merging meets matching in MC@NLO | JHEP 12 (2012) 061 | 1209.6215 |
| 18 | K. Melnikov and F. Petriello | Electroweak gauge boson production at hadron colliders through $ \mathcal{O}(\alpha_S^2) $ | PRD 74 (2006) 114017 | hep-ph/0609070 |
| 19 | P. Nason | A new method for combining NLO QCD with shower Monte Carlo algorithms | JHEP 11 (2004) 040 | hep-ph/0409146 |
| 20 | S. Frixione, P. Nason, and C. Oleari | Matching NLO QCD computations with parton shower simulations: the POWHEG method | JHEP 11 (2007) 070 | 0709.2092 |
| 21 | S. Alioli, P. Nason, C. Oleari, and E. Re | A general framework for implementing NLO calculations in shower Monte Carlo programs: the POWHEG BOX | JHEP 06 (2010) 043 | 1002.2581 |
| 22 | S. Frixione, P. Nason, and G. Ridolfi | A positive-weight next-to-leading-order Monte Carlo for heavy flavour hadroproduction | JHEP 09 (2007) 126 | 0707.3088 |
| 23 | M. Czakon and A. Mitov | Top++: a program for the calculation of the top-pair cross-section at hadron colliders | CPC 185 (2014) 2930 | 1112.5675 |
| 24 | J. M. Campbell, R. K. Ellis, and C. Williams | Vector boson pair production at the LHC | JHEP 07 (2011) 018 | 1105.0020 |
| 25 | N. Kidonakis | Top quark production | in Proceedings, Helmholtz International Summer School on Physics of Heavy Quarks and Hadrons (HQ 2013)JINR, Dubna, Russia, 2013 | 1311.0283 |
| 26 | NNPDF Collaboration | Parton distributions for the LHC run II | JHEP 04 (2015) 040 | 1410.8849 |
| 27 | CMS Collaboration | Event generator tunes obtained from underlying event and multiparton scattering measurements | EPJC 76 (2016) 155 | CMS-GEN-14-001 1512.00815 |
| 28 | CMS Collaboration | Investigations of the impact of the parton shower tuning in PYTHIA 8 in the modelling of $ \mathrm{t\bar{t}} $ at $ \sqrt{s}= $ 8 and 13 TeV | CMS-PAS-TOP-16-021 | CMS-PAS-TOP-16-021 |
| 29 | CMS Collaboration | Particle-flow reconstruction and global event description with the CMS detector | JINST 12 (2017) P10003 | CMS-PRF-14-001 1706.04965 |
| 30 | M. Cacciari, G. P. Salam, and G. Soyez | The anti-$ k_{\mathrm{T}} $ jet clustering algorithm | JHEP 04 (2008) 063 | 0802.1189 |
| 31 | M. Cacciari, G. P. Salam, and G. Soyez | FastJet user manual | EPJC 72 (2012) 1896 | 1111.6097 |
| 32 | CMS Collaboration | Performance of electron reconstruction and selection with the CMS detector in proton-proton collisions at $ \sqrt{s} = $ 8 TeV | JINST 10 (2015) P06005 | CMS-EGM-13-001 1502.02701 |
| 33 | CMS Collaboration | Performance of the CMS muon detector and muon reconstruction with proton-proton collisions at $ \sqrt{s} = $ 13 TeV | JINST 13 (2018) P06015 | CMS-MUO-16-001 1804.04528 |
| 34 | M. Cacciari and G. P. Salam | Pileup subtraction using jet areas | PLB 659 (2008) 119 | 0707.1378 |
| 35 | CMS Collaboration | Determination of jet energy calibration and transverse momentum resolution in CMS | JINST 6 (2011) P11002 | CMS-JME-10-011 1107.4277 |
| 36 | CMS Collaboration | Jet energy scale and resolution in the CMS experiment in pp collisions at 8 TeV | JINST 12 (2017) P02014 | CMS-JME-13-004 1607.03663 |
| 37 | CMS Collaboration | Jet algorithms performance in 13 TeV data | CMS-PAS-JME-16-003 | CMS-PAS-JME-16-003 |
| 38 | CMS Collaboration | Performance of missing transverse momentum in proton-proton collisions at $ \sqrt{s} = $ 13 TeV using the CMS detector | JINST 14 (2019) P07004 | CMS-JME-17-001 1903.06078 |
| 39 | CMS Collaboration | Identification of heavy-flavour jets with the CMS detector in pp collisions at 13 TeV | JINST 13 (2018) P05011 | CMS-BTV-16-002 1712.07158 |
| 40 | W. Waltenberger | Adaptive vertex reconstruction | CMS-NOTE-2008-033 | |
| 41 | CMS Collaboration | Identification of b-quark jets with the CMS experiment | JINST 8 (2013) P04013 | CMS-BTV-12-001 1211.4462 |
| 42 | S. Schmitt | TUnfold: an algorithm for correcting migration effects in high energy physics | JINST 7 (2012) T10003 | 1205.6201 |
| 43 | CMS Collaboration | Measurement of the inelastic proton-proton cross section at $ \sqrt{s} = $ 13 TeV | JHEP 07 (2018) 161 | CMS-FSQ-15-005 1802.02613 |
| 44 | ALEPH Collaboration | A measurement of the gluon splitting rate into $ \mathrm{c\bar{c}} $ pairs in hadronic $ \mathrm{Z} $ decays | PLB 561 (2003) 213 | hep-ex/0302003 |
| 45 | ALEPH Collaboration | A measurement of the gluon splitting rate into $ \mathrm{b\bar{b}} $ pairs in hadronic $ \mathrm{Z} $ decays | PLB 434 (1998) 437 | |
| 46 | M. Bahr et al. | Herwig++ physics and manual | EPJC 58 (2008) 639 | 0803.0883 |
| 47 | J. Alwall et al. | Comparative study of various algorithms for the merging of parton showers and matrix elements in hadronic collisions | EPJC 53 (2008) 473 | 0706.2569 |
| 48 | J. Alwall, S. de Visscher, and F. Maltoni | QCD radiation in the production of heavy colored particles at the LHC | JHEP 02 (2009) 017 | 0810.5350 |
| 49 | J. M. Campbell and R. K. Ellis | An update on vector boson pair production at hadron colliders | PRD 60 (1999) 113006 | hep-ph/9905386 |
| 50 | J. M. Campbell, R. K. Ellis, and W. Giele | A multi-threaded version of MCFM | EPJC 75 (2015) 246 | 1503.06182 |
| 51 | L. A. Harland-Lang, A. D. Martin, P. Motylinski, and R. S. Thorne | Parton distributions in the LHC era: MMHT 2014 PDFs | EPJC 75 (2015) 204 | 1412.3989 |
| 52 | CMS Collaboration | Measurements of the associated production of a $ \mathrm{Z} $ boson and b jets in pp collisions at $ \sqrt{s} = $ 8 TeV | EPJC 77 (2017) 751 | CMS-SMP-14-010 1611.06507 |
|
|
Compact Muon Solenoid LHC, CERN |
|

|

|

|

|

|