

Compact Muon Solenoid
LHC, CERN
| CMS-SMP-19-006 ; CERN-EP-2020-229 | ||
| Hard color-singlet exchange in dijet events in proton-proton collisions at $\sqrt{s} = $ 13 TeV | ||
| CMS and TOTEM Collaborations | ||
| 13 February 2021 | ||
| Phys. Rev. D 104 (2021) 032009 | ||
| Abstract: Events where the two leading jets are separated by a pseudorapidity interval devoid of particle activity, known as jet-gap-jet events, are studied in proton-proton collisions at $\sqrt{s} = $ 13 TeV. The signature is expected from hard color-singlet exchange. Each of the highest transverse momentum (${p_{\mathrm{T}}}$) jets must have ${p_{\mathrm{T}}}^\text{jet} > $ 40 GeV and pseudorapidity 1.4 $ < |{\eta^\text{jet}}| < $ 4.7, with $\eta^\text{jet1} \eta^\text{jet2} < $ 0, where jet1 and jet2 are the leading and subleading jets in ${p_{\mathrm{T}}}$, respectively. The analysis is based on data collected by the CMS and TOTEM experiments during a low luminosity, high-$\beta^*$ run at the CERN LHC in 2015, with an integrated luminosity of 0.66 pb$^{-1}$. Events with a low number of charged particles with ${p_{\mathrm{T}}} > $ 0.2 GeV in the interval $|{\eta}| < $ 1 between the jets are observed in excess of calculations that assume only color-exchange. The fraction of events produced via color-singlet exchange, $f_\text{CSE}$, is measured as a function of ${p_{\mathrm{T}}}^\text{jet2}$, the pseudorapidity difference between the two leading jets, and the azimuthal angular separation between the two leading jets. The fraction $f_\text{CSE}$ has values of 0.6-1.0%. The results are compared with previous measurements and with predictions from perturbative quantum chromodynamics. In addition, the first study of jet-gap-jet events detected in association with an intact proton using a subsample of events with an integrated luminosity of 0.40 pb$^{-1}$ is presented. The intact protons are detected with the Roman pot detectors of the TOTEM experiment. The $f_\text{CSE}$ in this sample is 2.91 $\pm$ 0.70 (stat) $^{+ 1.02}_{- 0.94}$(syst) times larger than that for inclusive dijet production in dijets with similar kinematics. | ||
| Links: e-print arXiv:2102.06945 [hep-ex] (PDF) ; CDS record ; inSPIRE record ; CADI line (restricted) ; | ||
| Figures | |
png pdf |
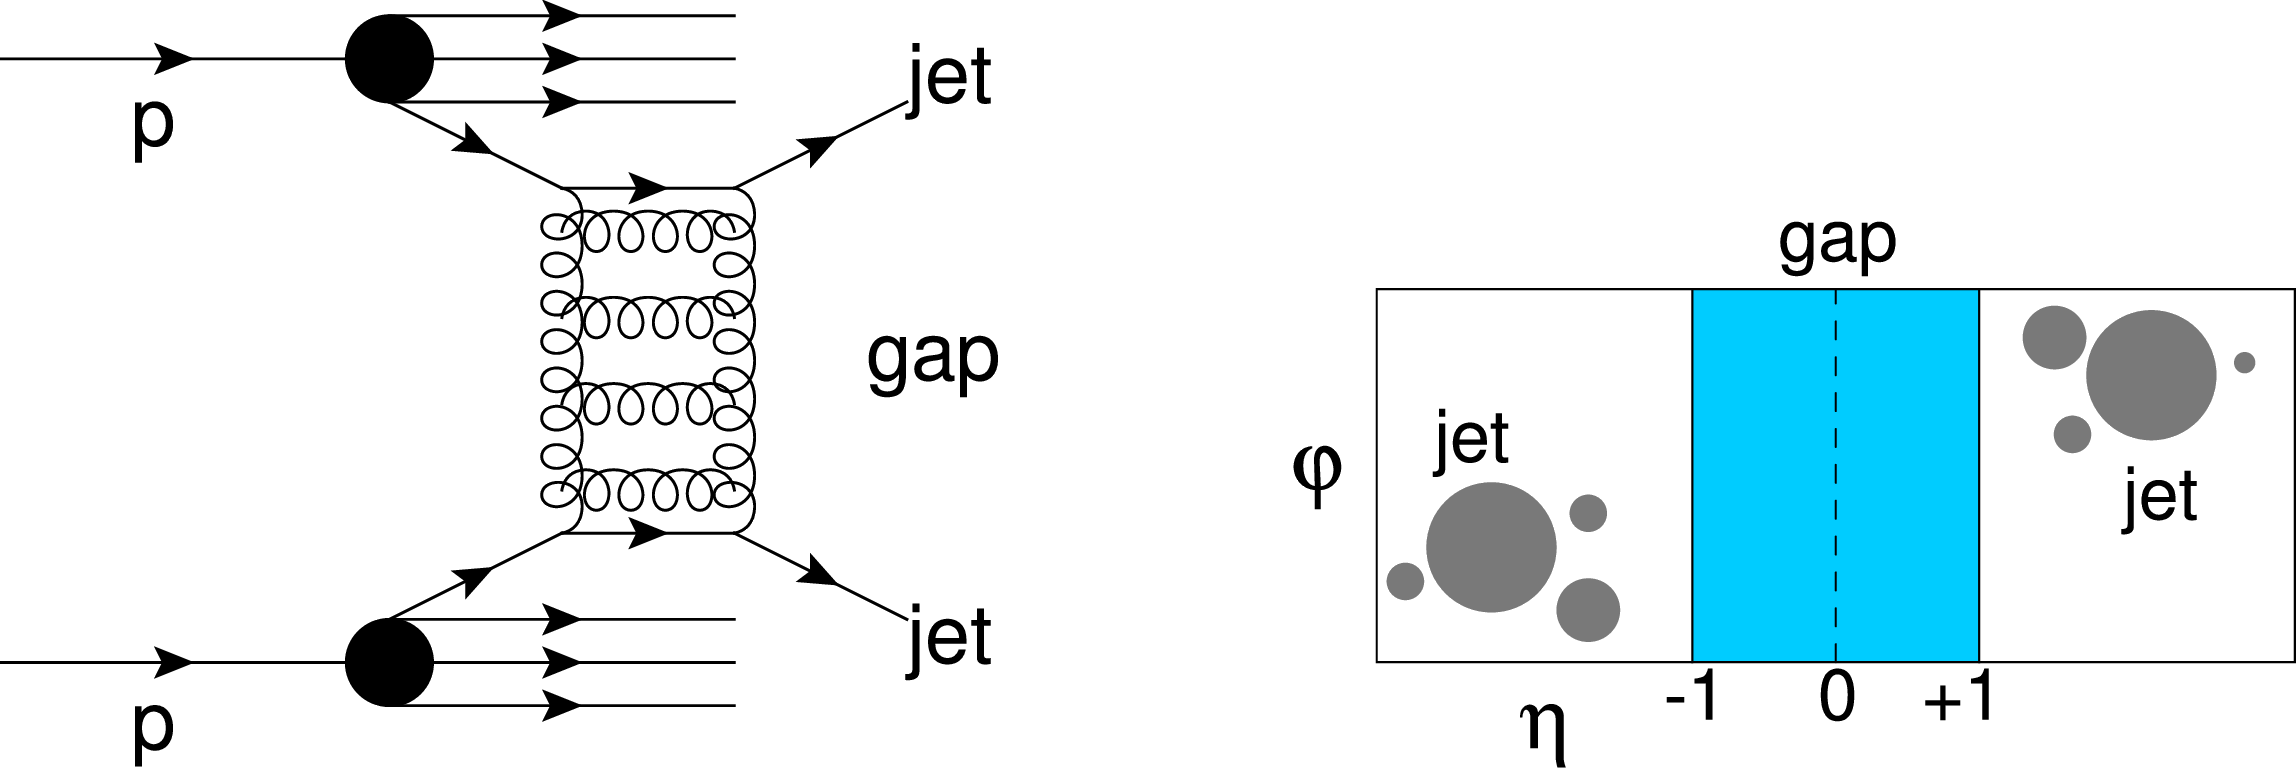
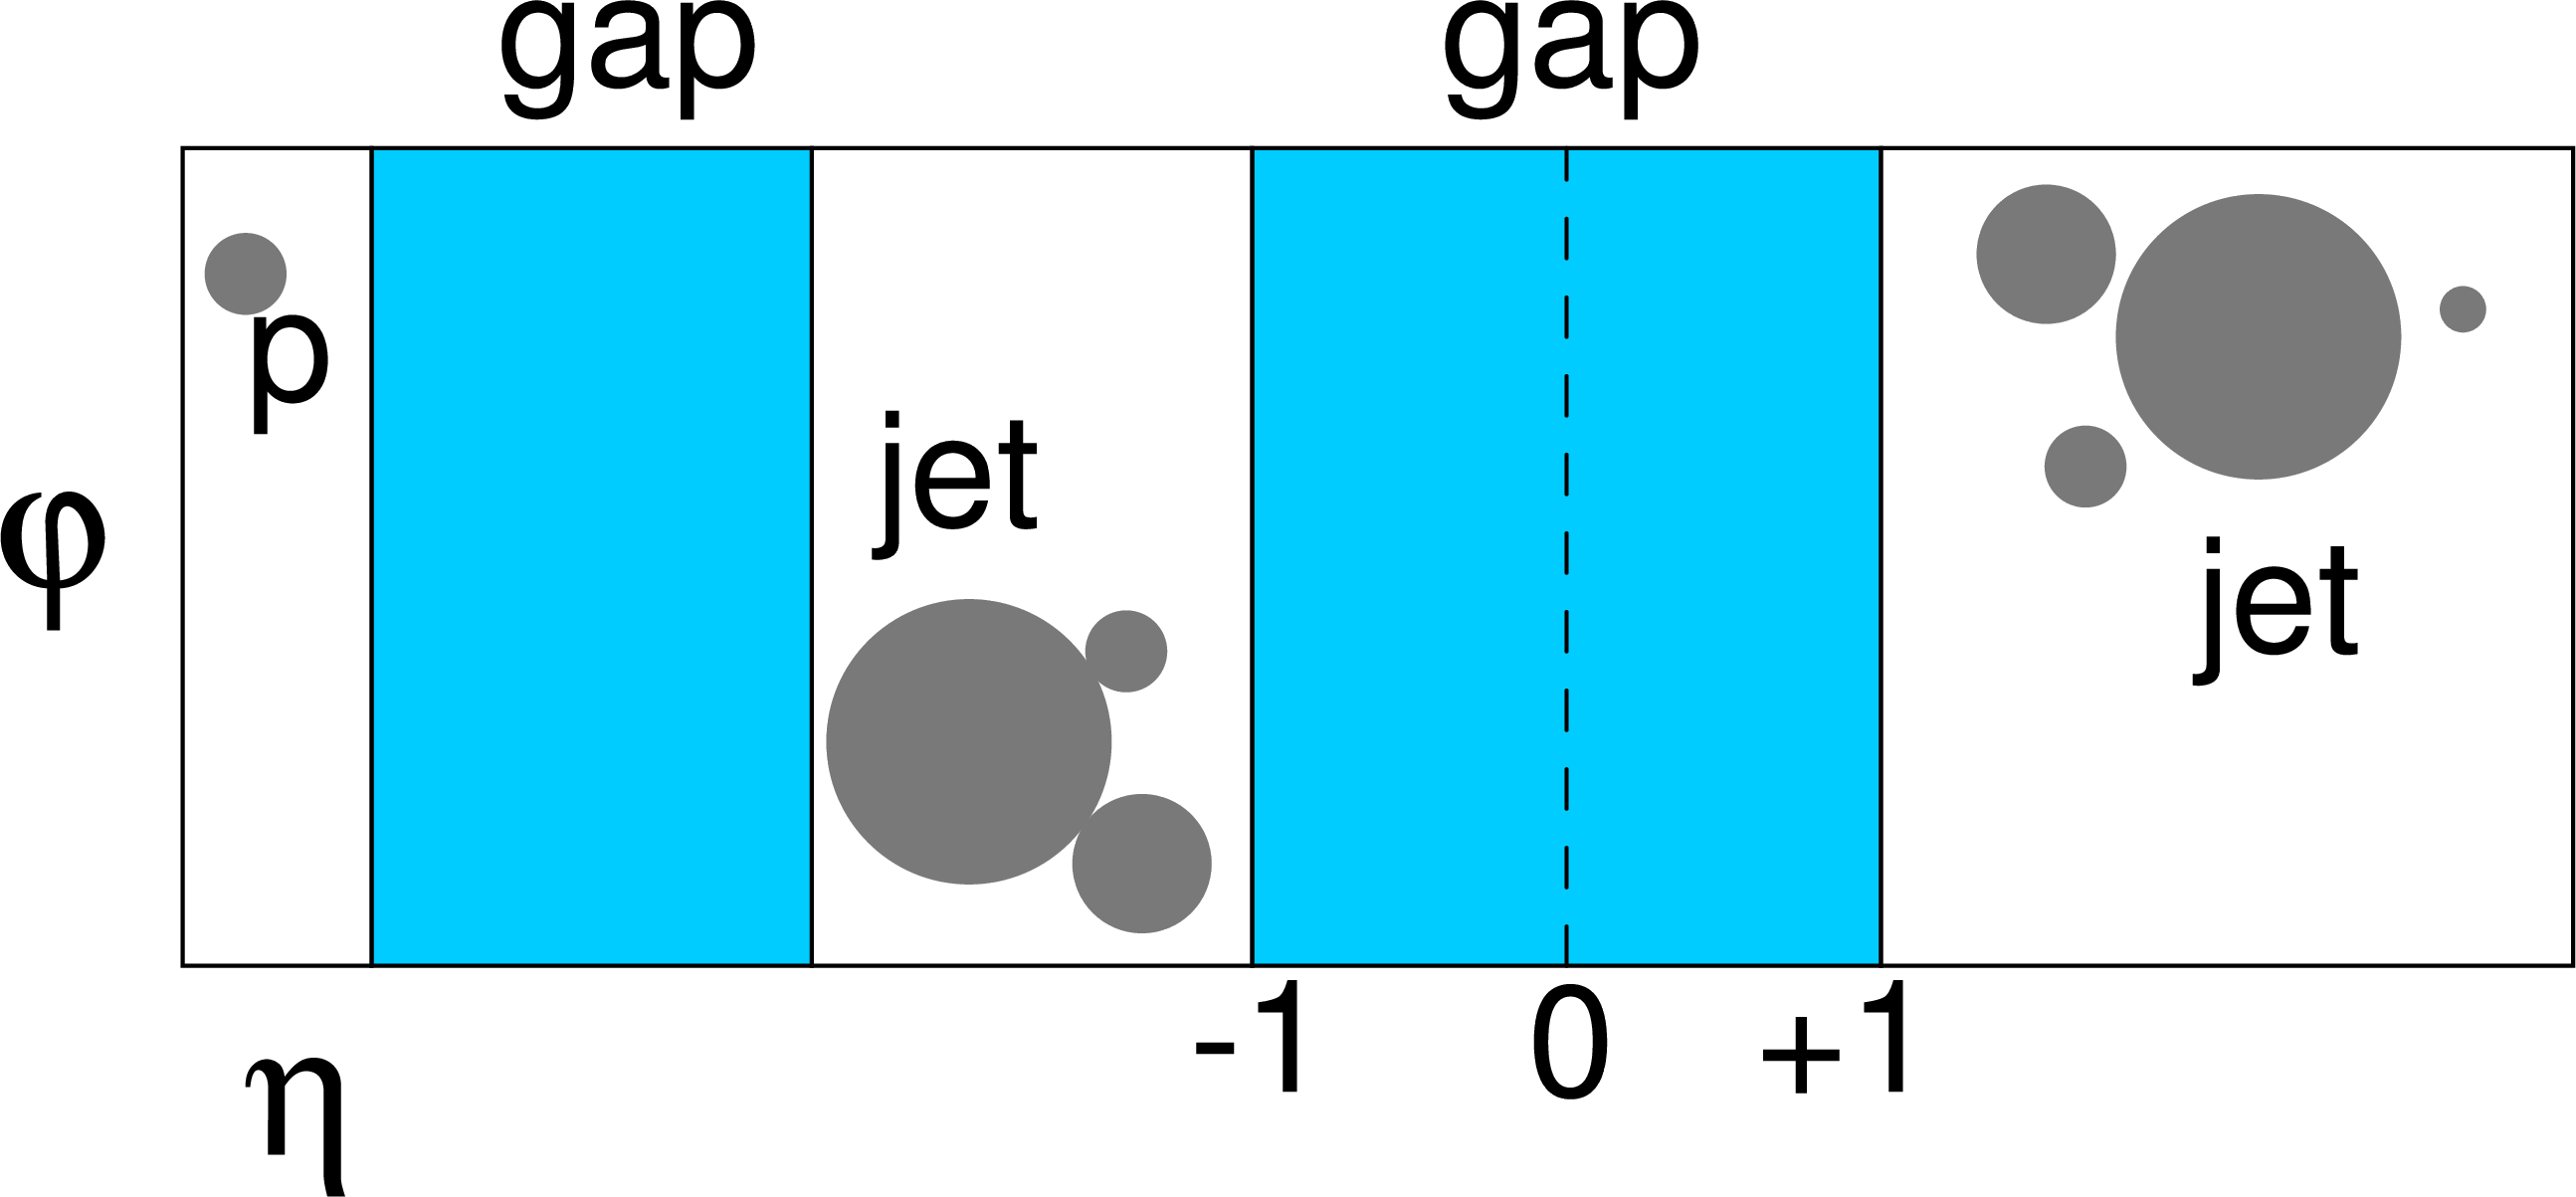
Figure 1:
(Left) Schematic diagram of a jet-gap-jet event by hard color-singlet exchange in pp collisions. The lines following the protons represent the proton breakup. (Right) Jet-gap-jet event signature in the $\eta $-$\phi $ plane. The filled circles represent final-state particles. The shaded rectangular area between the jets denotes the interval $ {| \eta |} < $ 1 devoid of charged particles. |
png pdf |
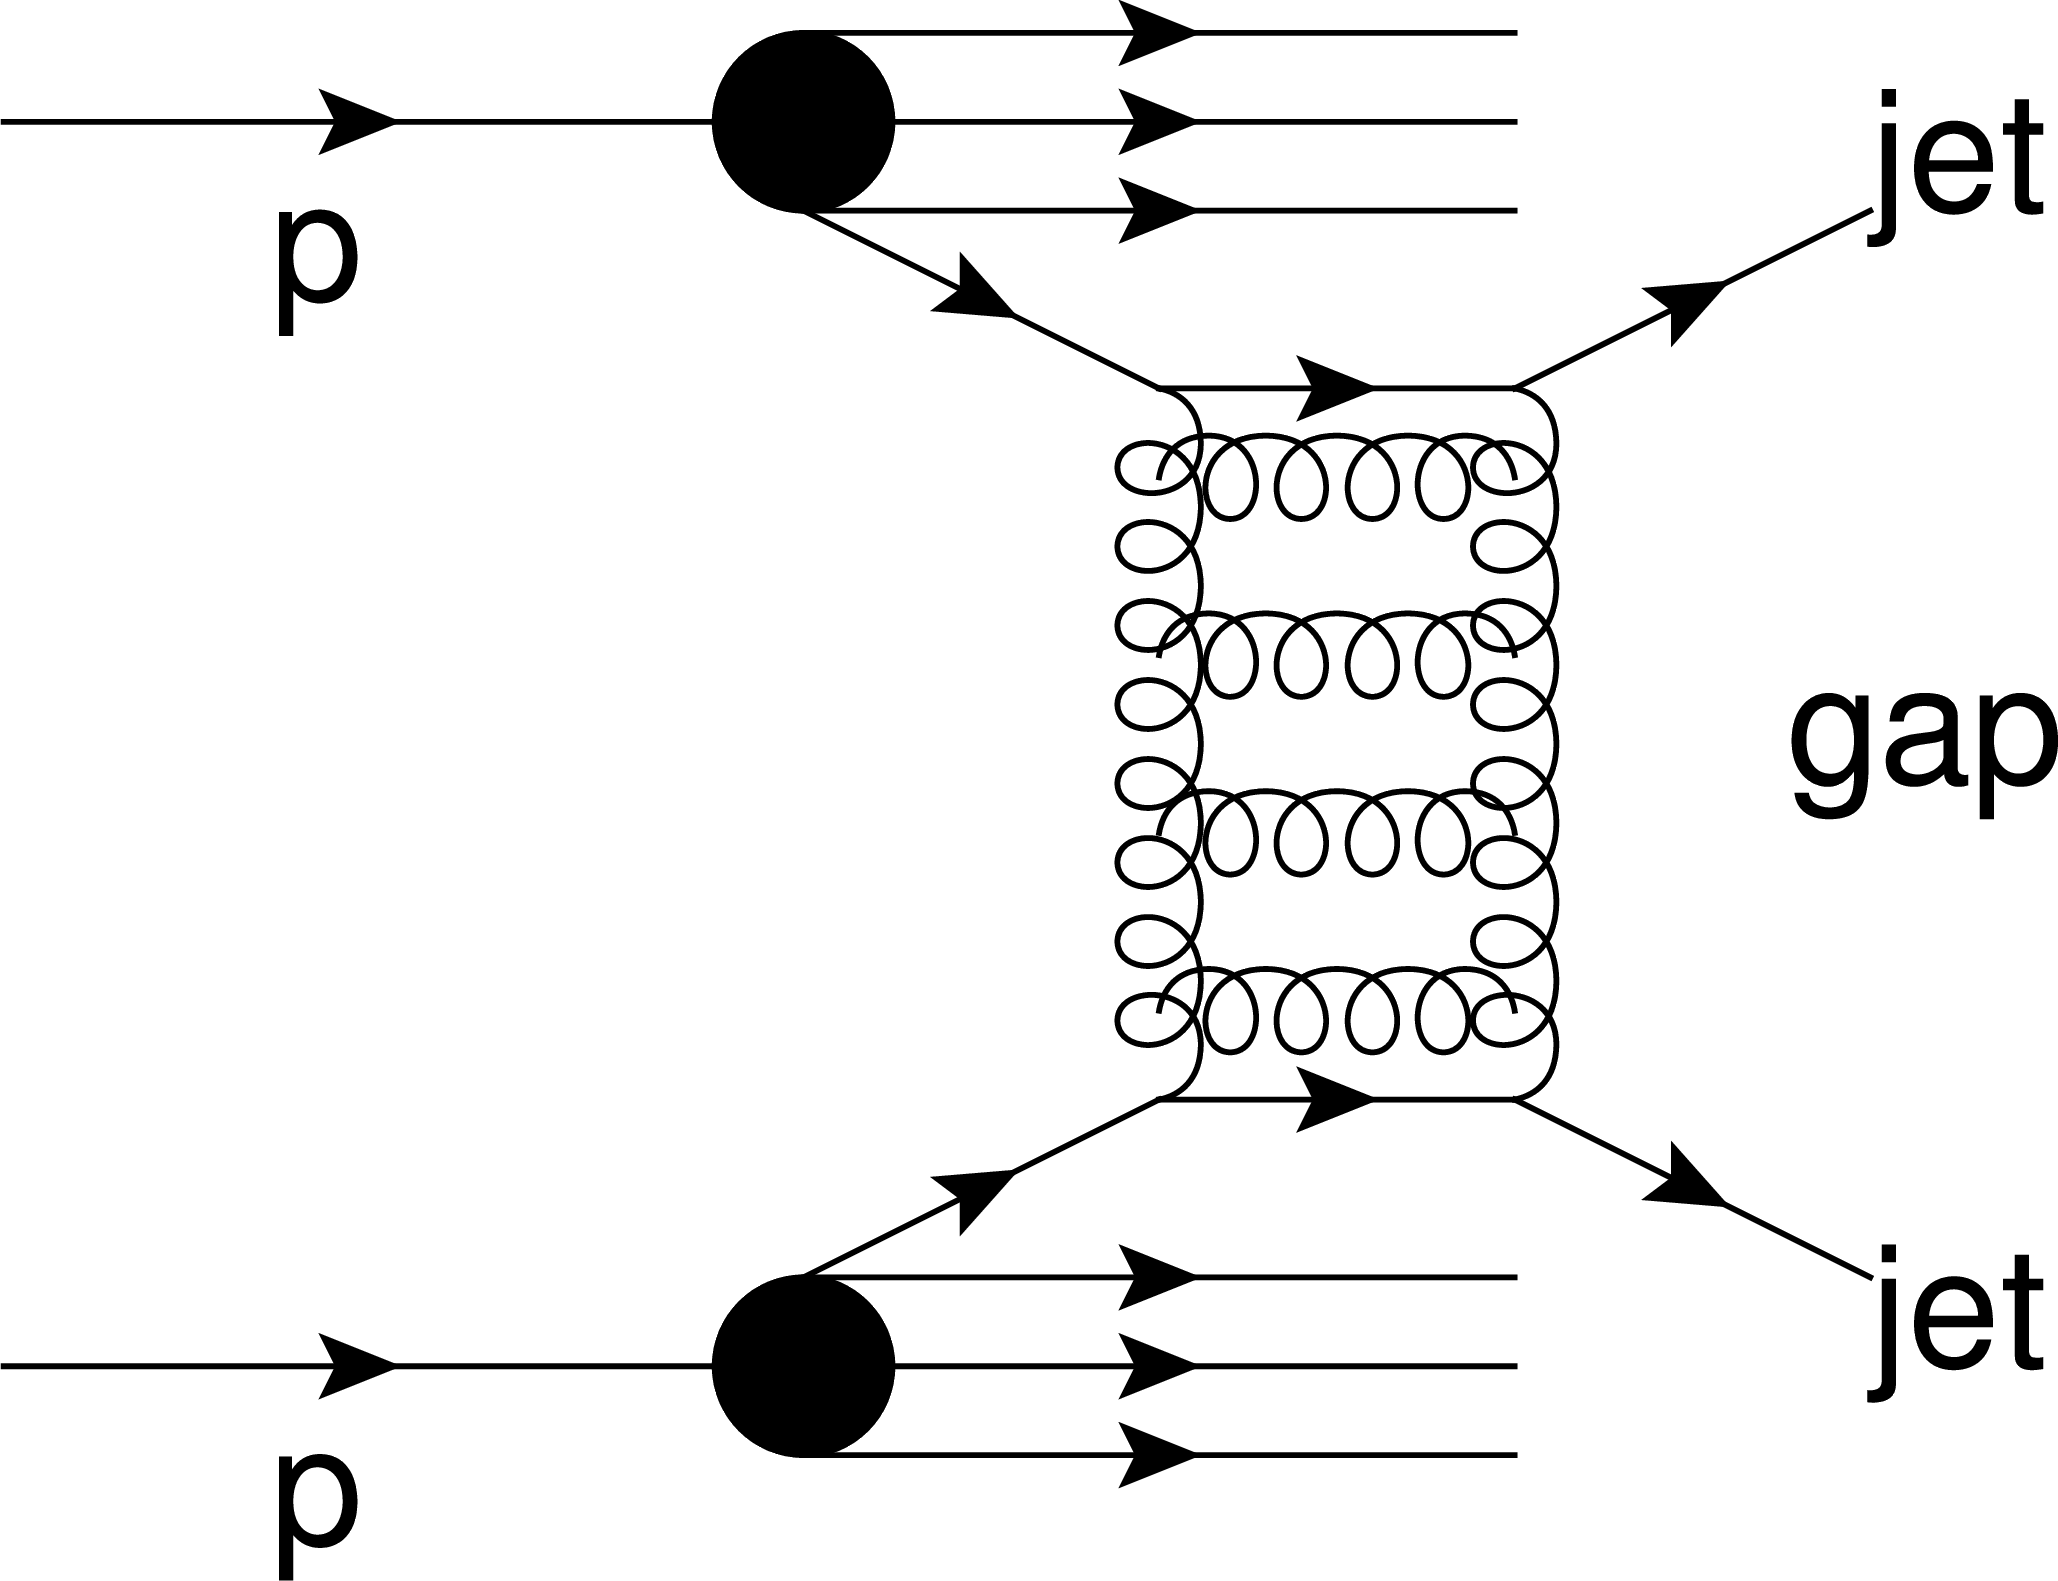
Figure 1-a:
Schematic diagram of a jet-gap-jet event by hard color-singlet exchange in pp collisions. The lines following the protons represent the proton breakup. |
png pdf |
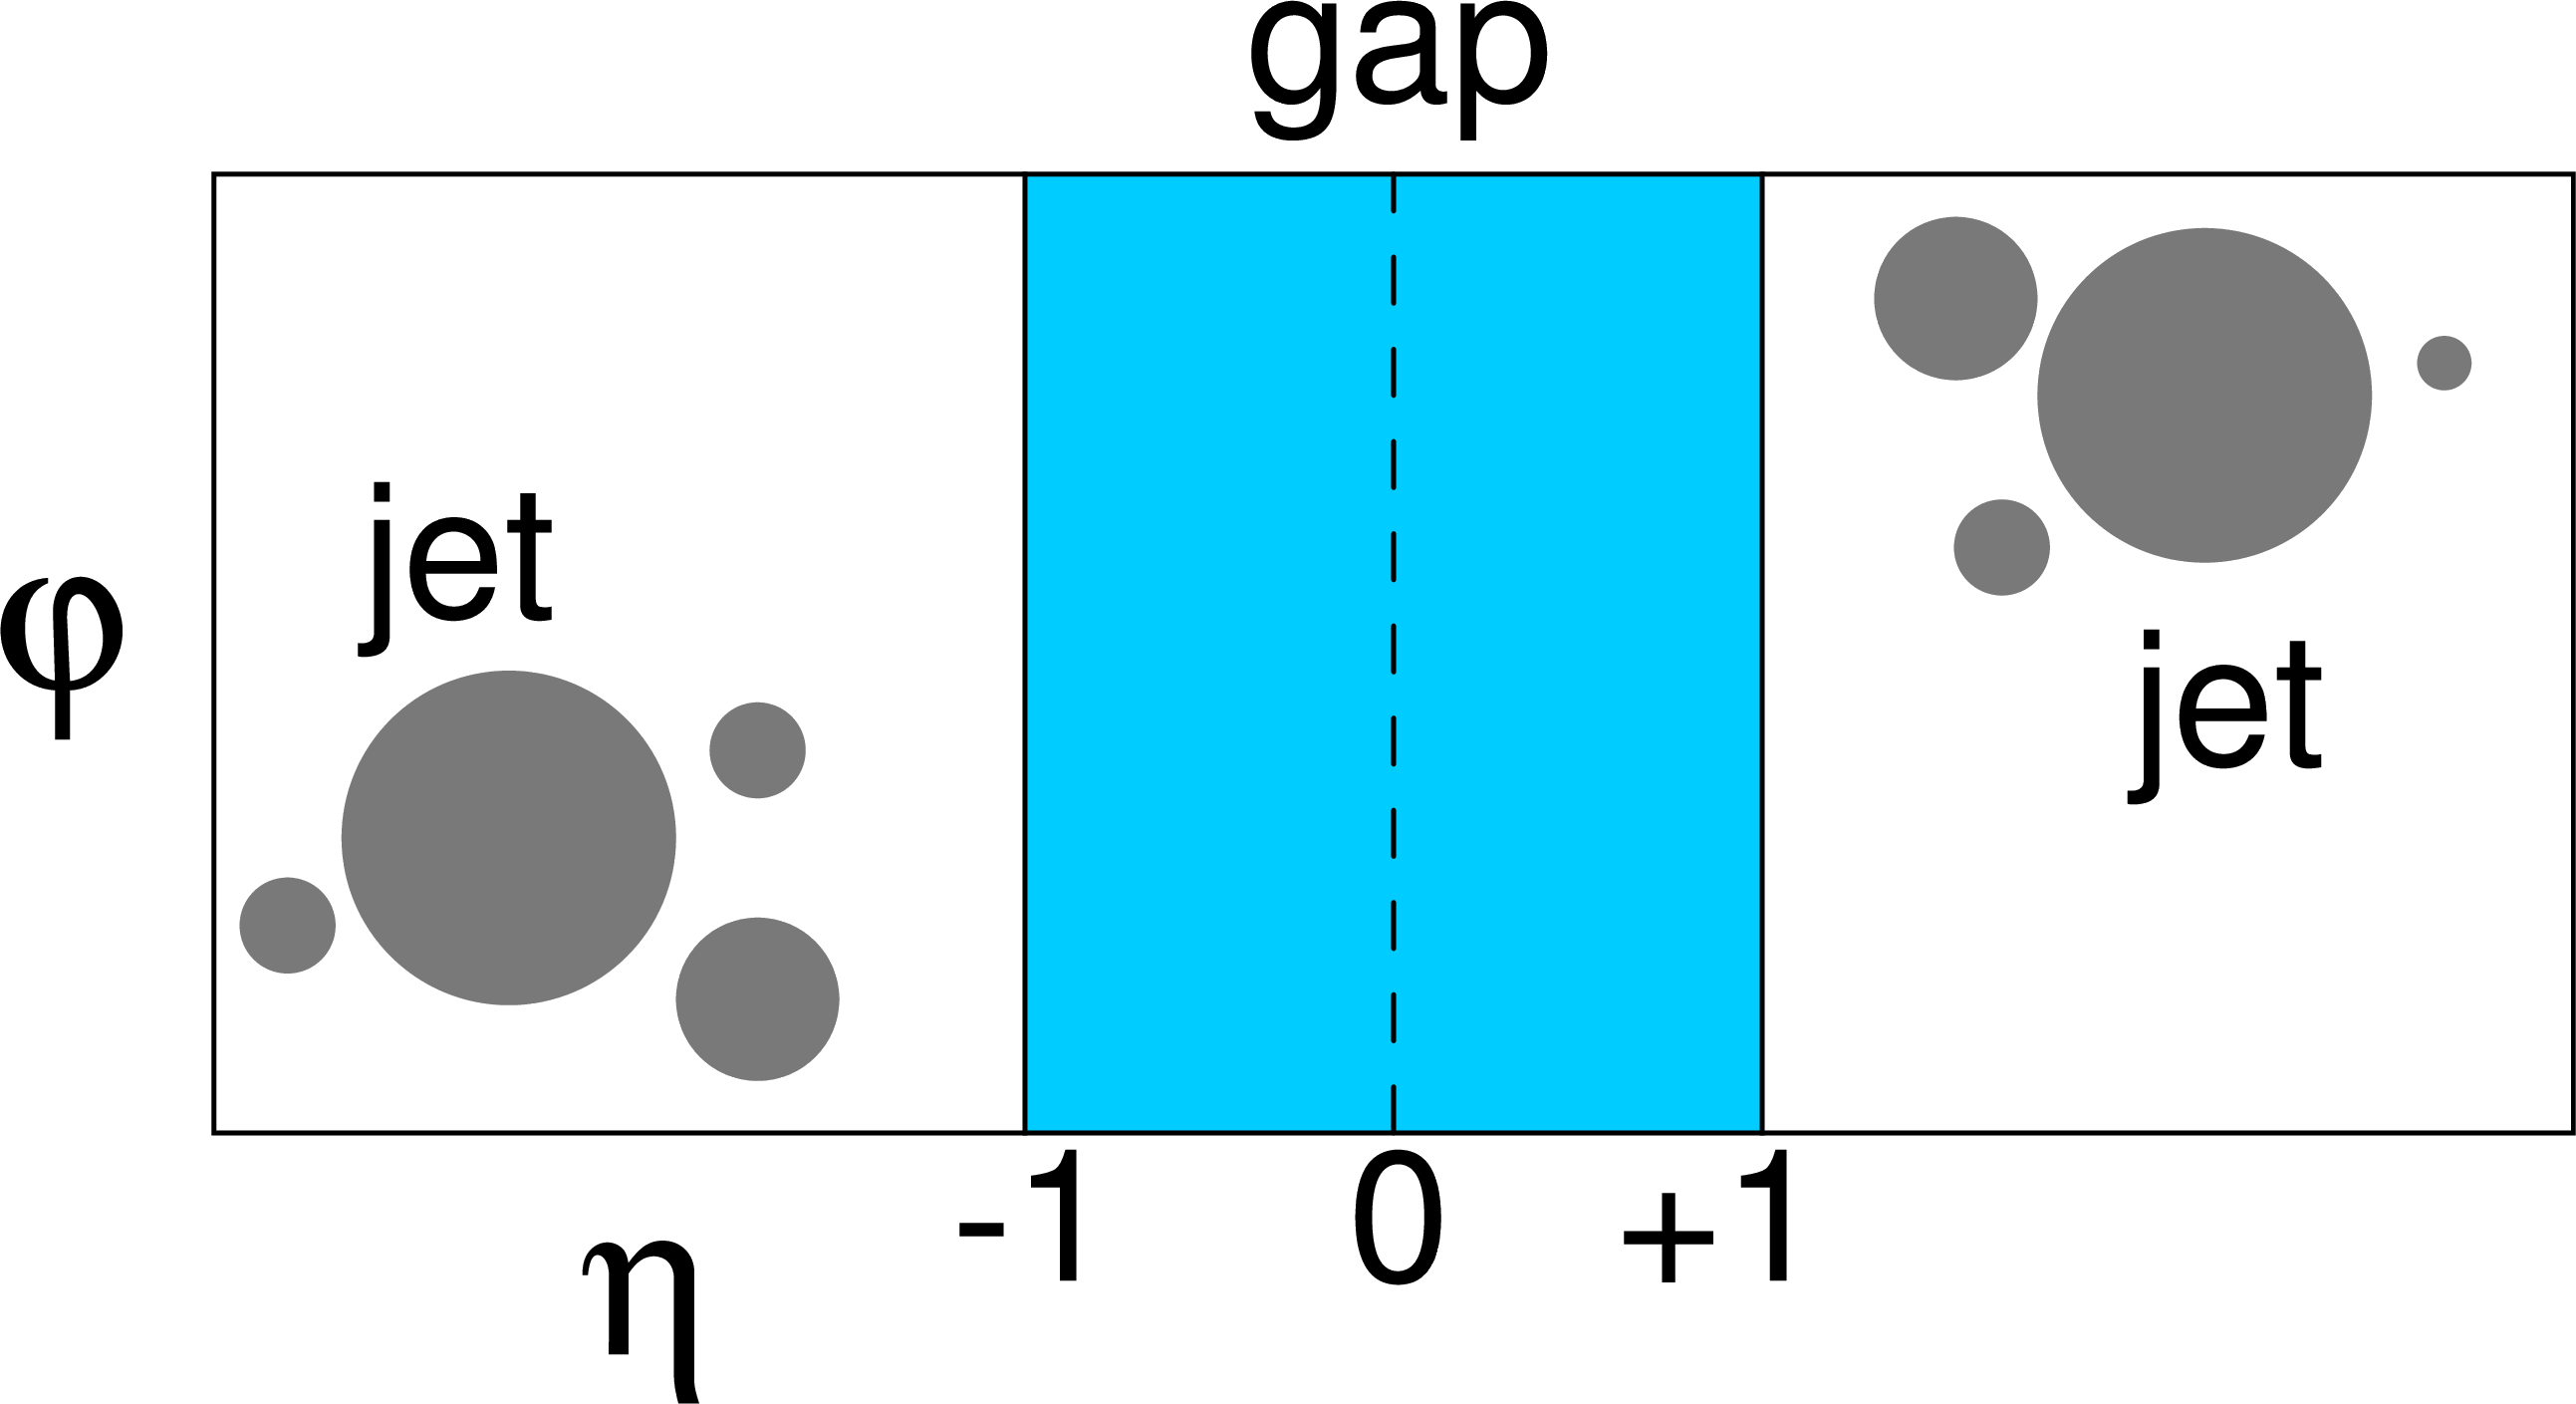
Figure 1-b:
Jet-gap-jet event signature in the $\eta $-$\phi $ plane. The filled circles represent final-state particles. The shaded rectangular area between the jets denotes the interval $ {| \eta |} < $ 1 devoid of charged particles. |

png pdf |
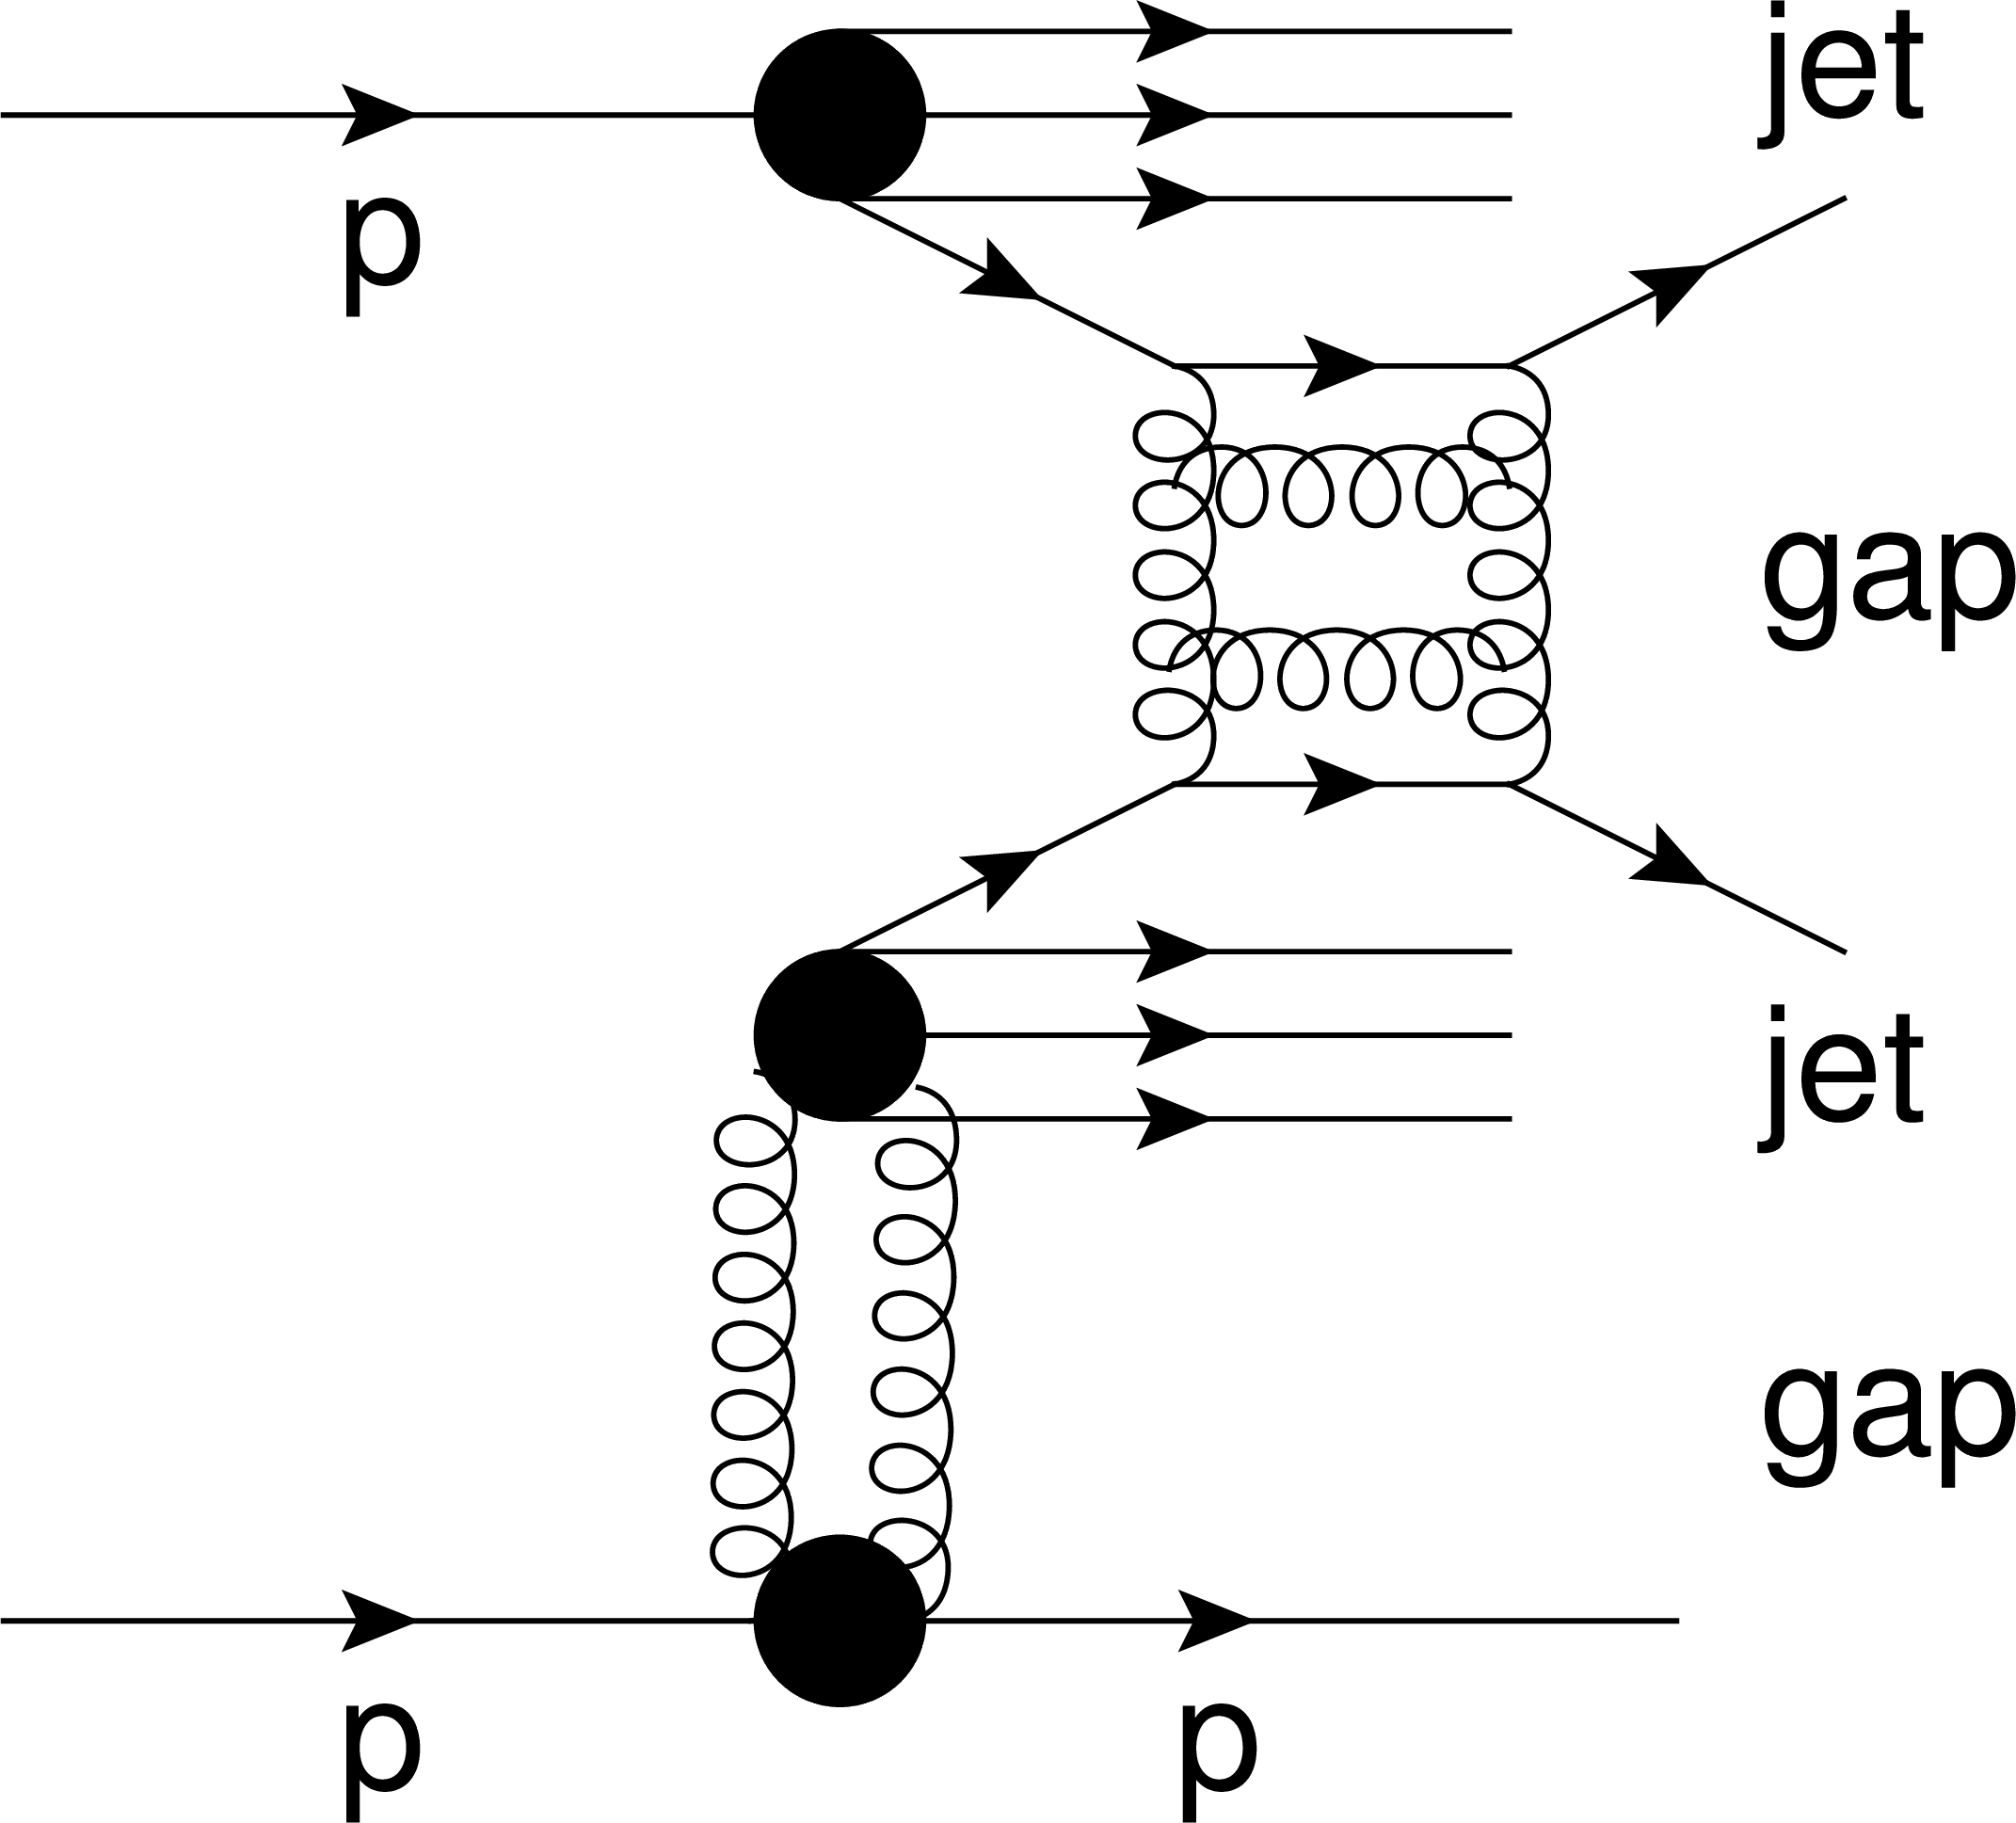
Figure 2:
(Left) Schematic diagram of a jet-gap-jet event by hard color-singlet exchange with an intact proton in pp collisions. The jet-gap-jet is reconstructed in the CMS detector, while the intact proton is detected with one of the forward proton spectrometers of the TOTEM experiment. (Right) Proton-gap-jet-gap-jet event signature in the $\eta $-$\phi $ plane. The filled circles represent final-state particles. The shaded rectangular areas denote the central gap region $ {| \eta |} < $ 1 devoid of charged particles and the forward gap that is inferred from the forward proton detection. |
png pdf |
Figure 2-a:
Schematic diagram of a jet-gap-jet event by hard color-singlet exchange with an intact proton in pp collisions. The jet-gap-jet is reconstructed in the CMS detector, while the intact proton is detected with one of the forward proton spectrometers of the TOTEM experiment. |
png pdf |
Figure 2-b:
Proton-gap-jet-gap-jet event signature in the $\eta $-$\phi $ plane. The filled circles represent final-state particles. The shaded rectangular areas denote the central gap region $ {| \eta |} < $ 1 devoid of charged particles and the forward gap that is inferred from the forward proton detection. |

png pdf |
Figure 3:
Profile schematic of the CMS-TOTEM detector configuration during the 2015 run. The horizontal dashed line represents the beamline. The CMS detector is denoted by the filled circle in the center. The intact proton(s) are transported via the accelerator magnetic fields (violet light rectangles), eventually passing through the silicon detectors housed in the Roman pots (black dark rectangles) of the TOTEM experiment. Sectors 45 and 56 are located in the positive and negative $\eta $ regions in the CMS coordinate system, respectively. |
png pdf |
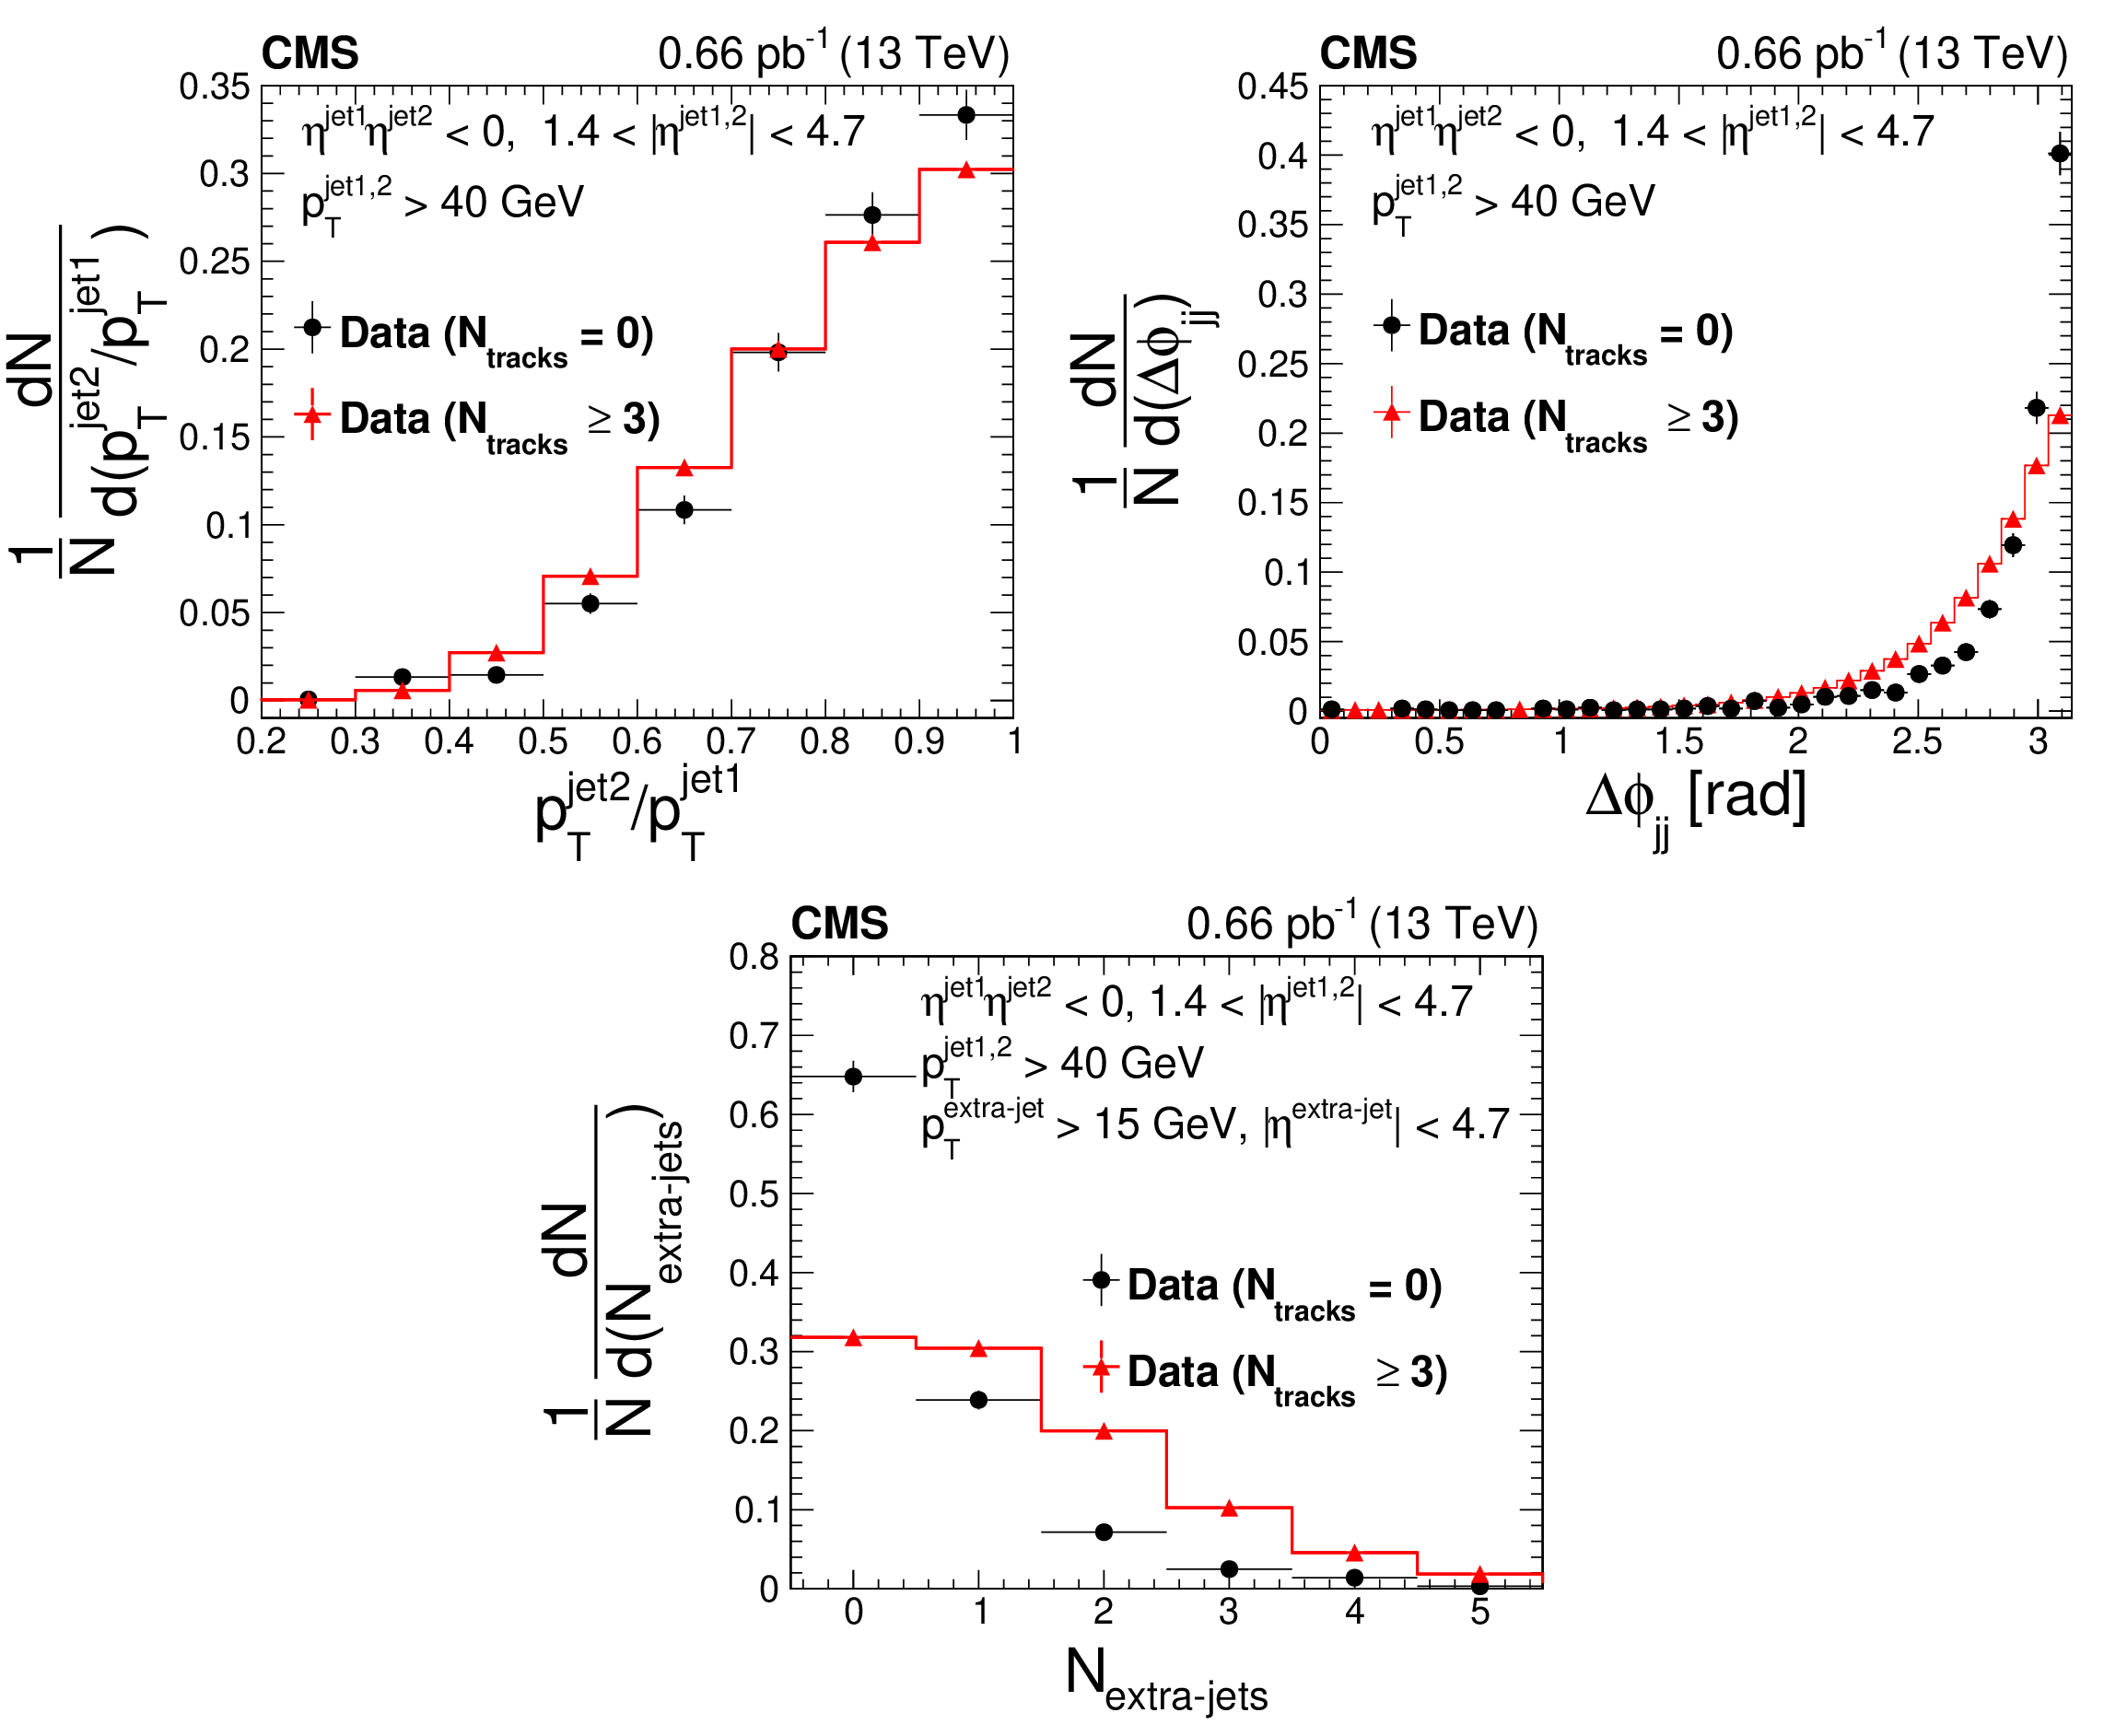
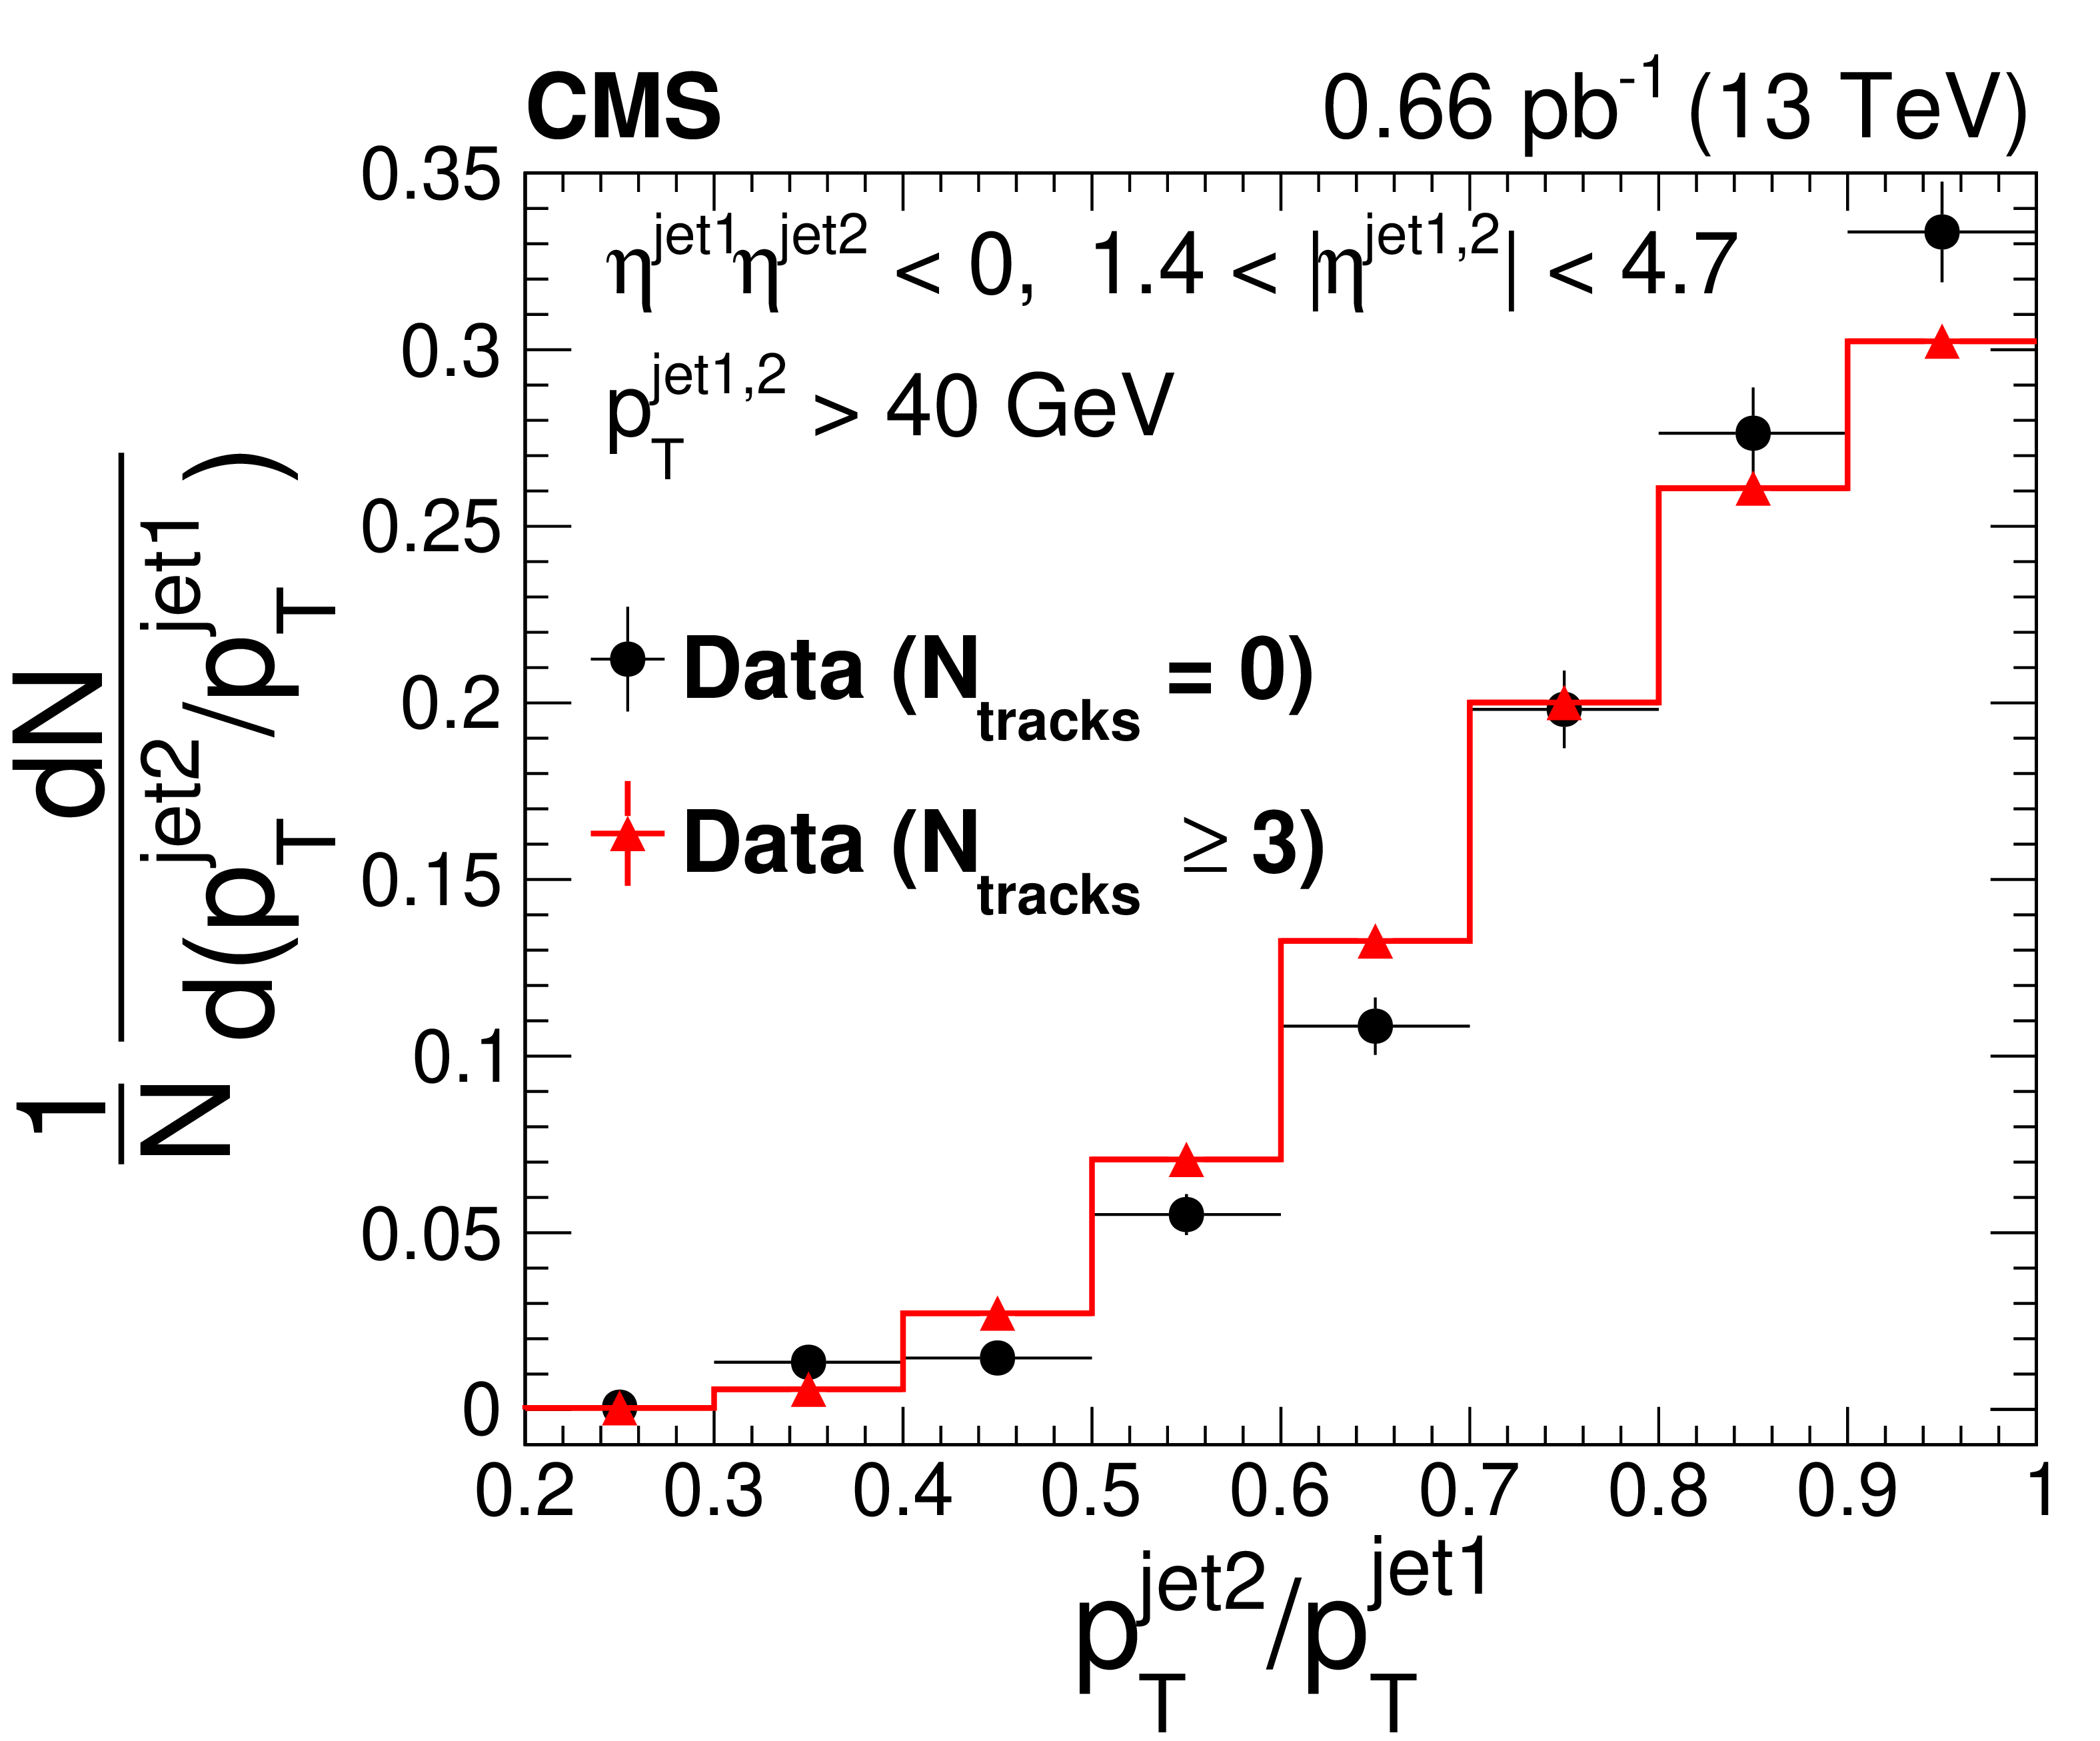
Figure 4:
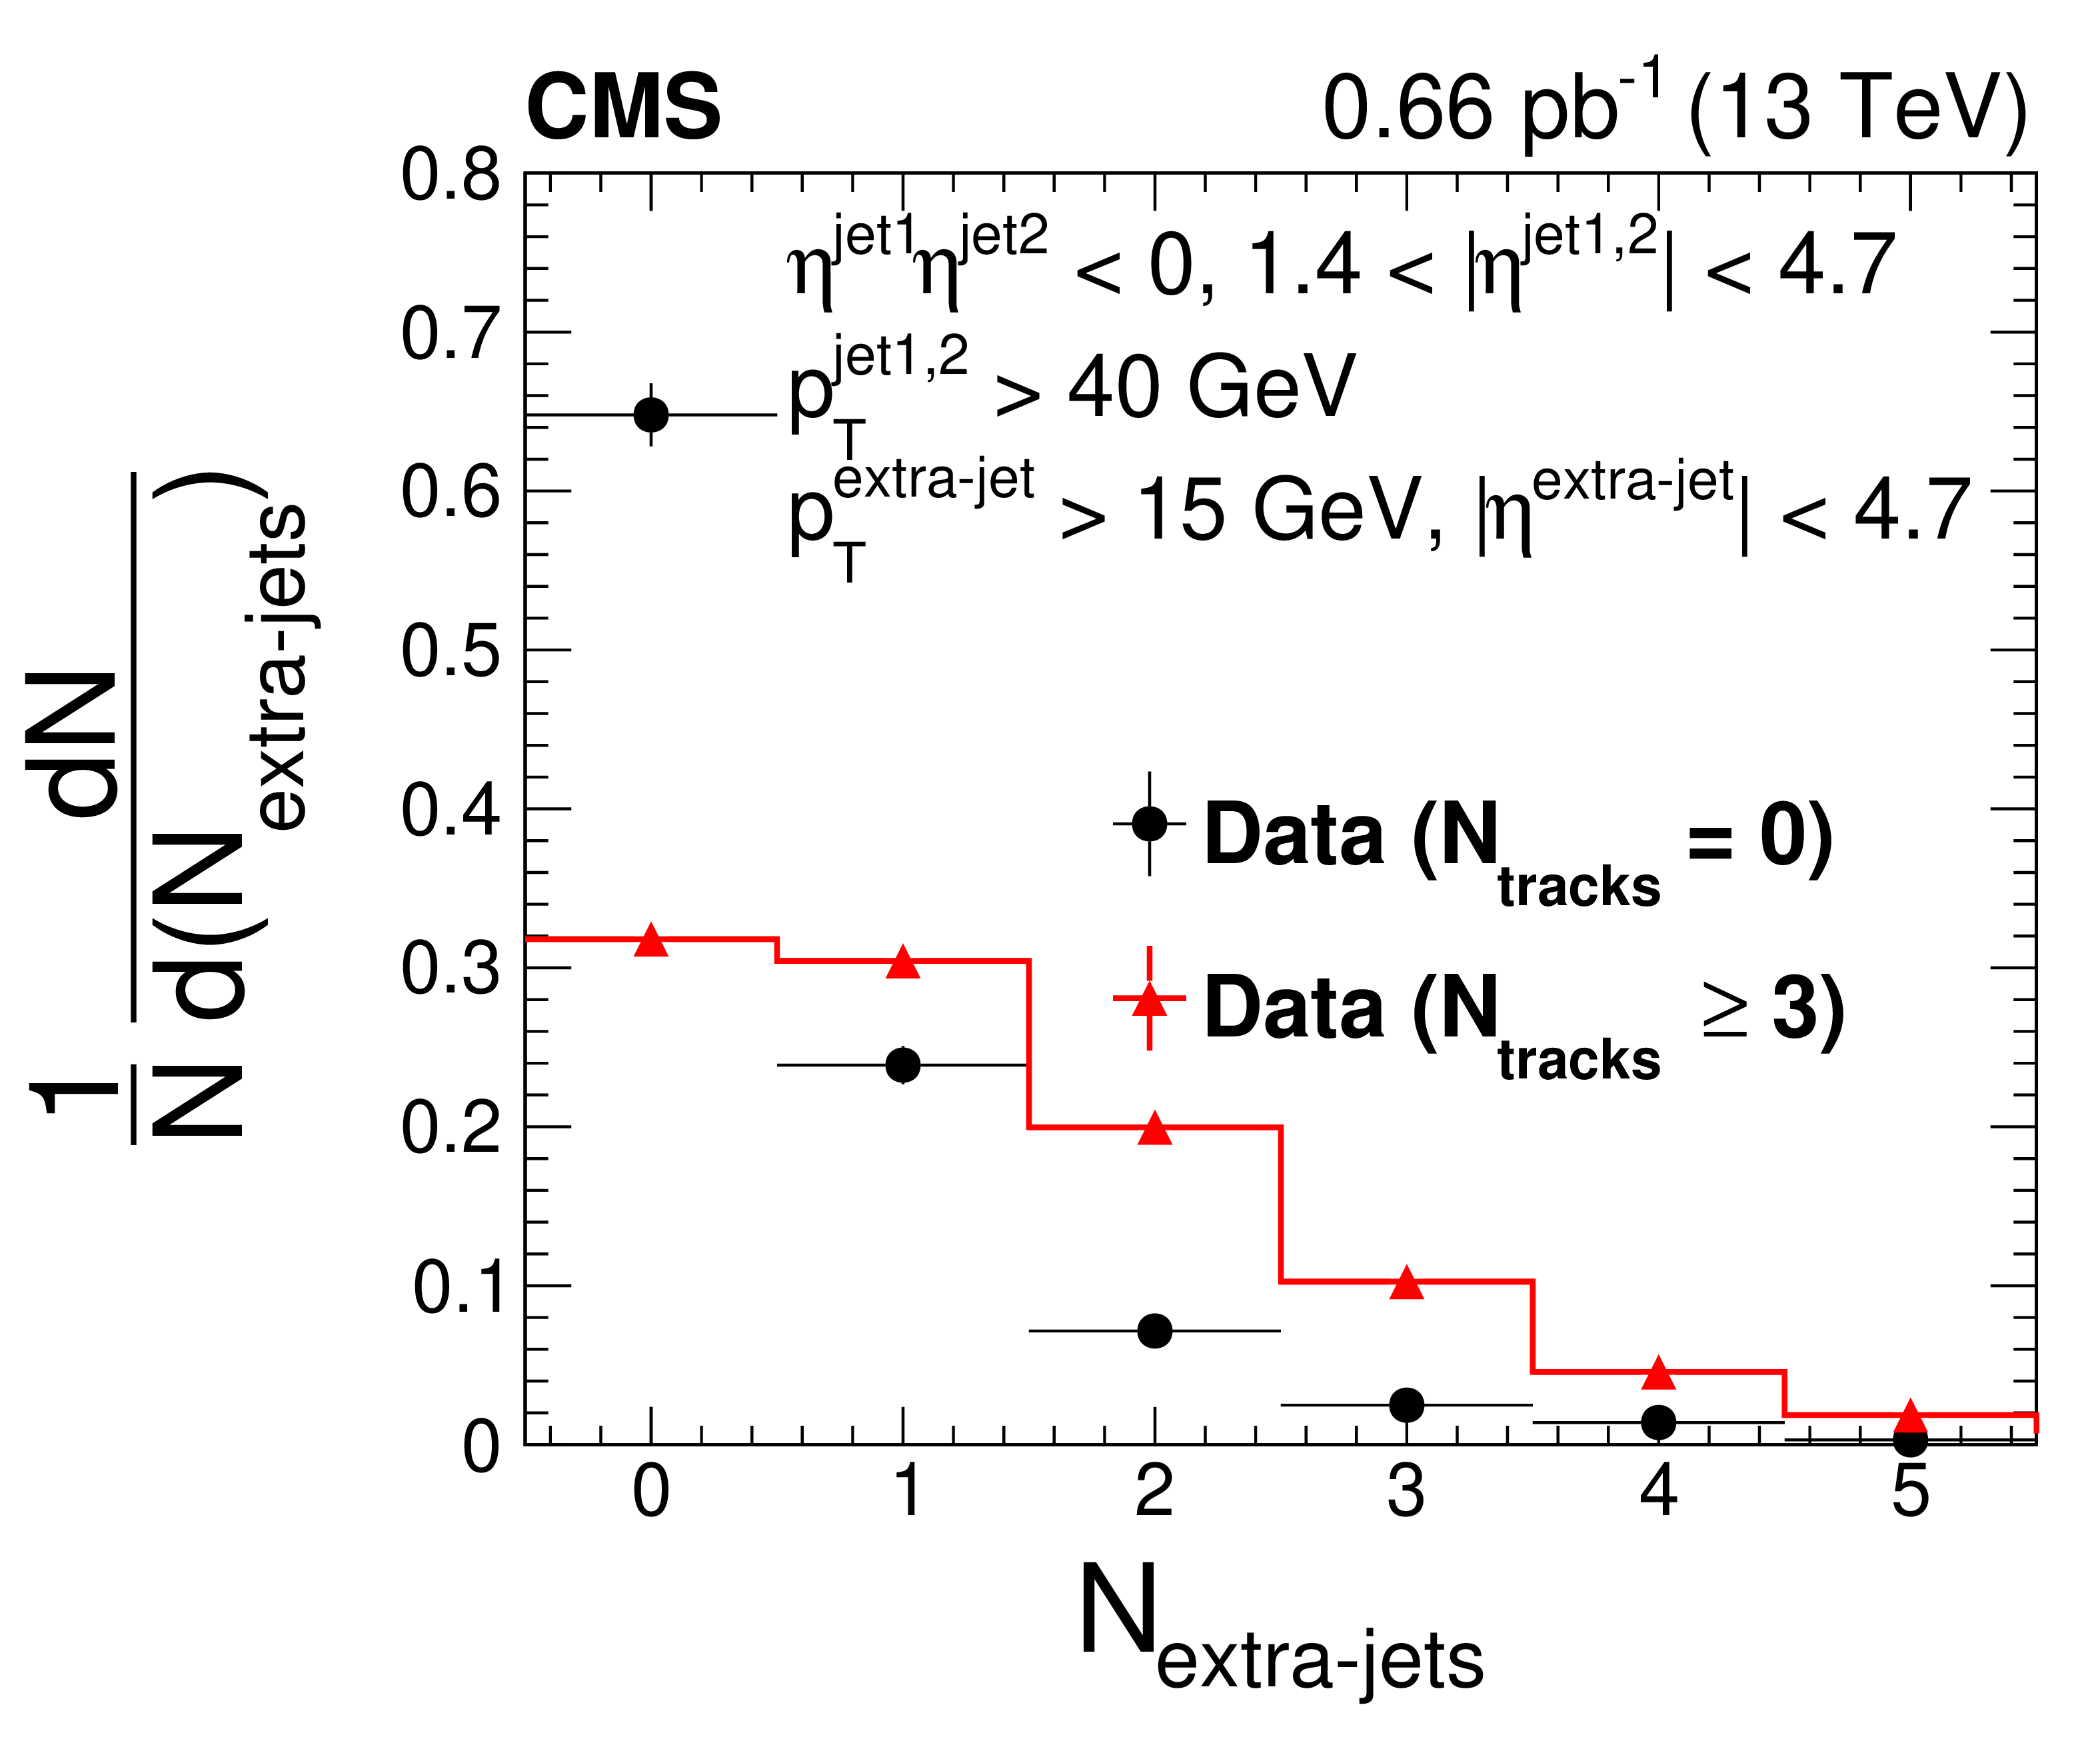
Distributions of the ratio of the subleading jet to leading jet transverse momenta $ {p_{\mathrm {T}}} ^\text {jet2}/ {p_{\mathrm {T}}} ^\text {jet1}$ (left panel), the azimuthal angular separation between the two leading jets $\Delta \phi _\text {jj}$ (right panel), and the number of additional jets $N_\text {extra-jets}$ with $ {p_{\mathrm {T}}} ^\text {extra-jet} > $ 15 GeV (lower panel), for jet-gap-jet candidates with $N_\text {tracks} = $ 0 in $ {| \eta |} < $ 1 (black circle) and color-exchange dijet candidates $N_\text {tracks} \geq $ 3 in $ {| \eta |} < $ 1 (red triangle). The vertical bars represent the statistical uncertainties, which are smaller than the marker for some data points. The horizontal bars represent the bin width. The distributions are normalized to unity. |
png pdf |
Figure 4-a:
Distribution of |
png pdf |
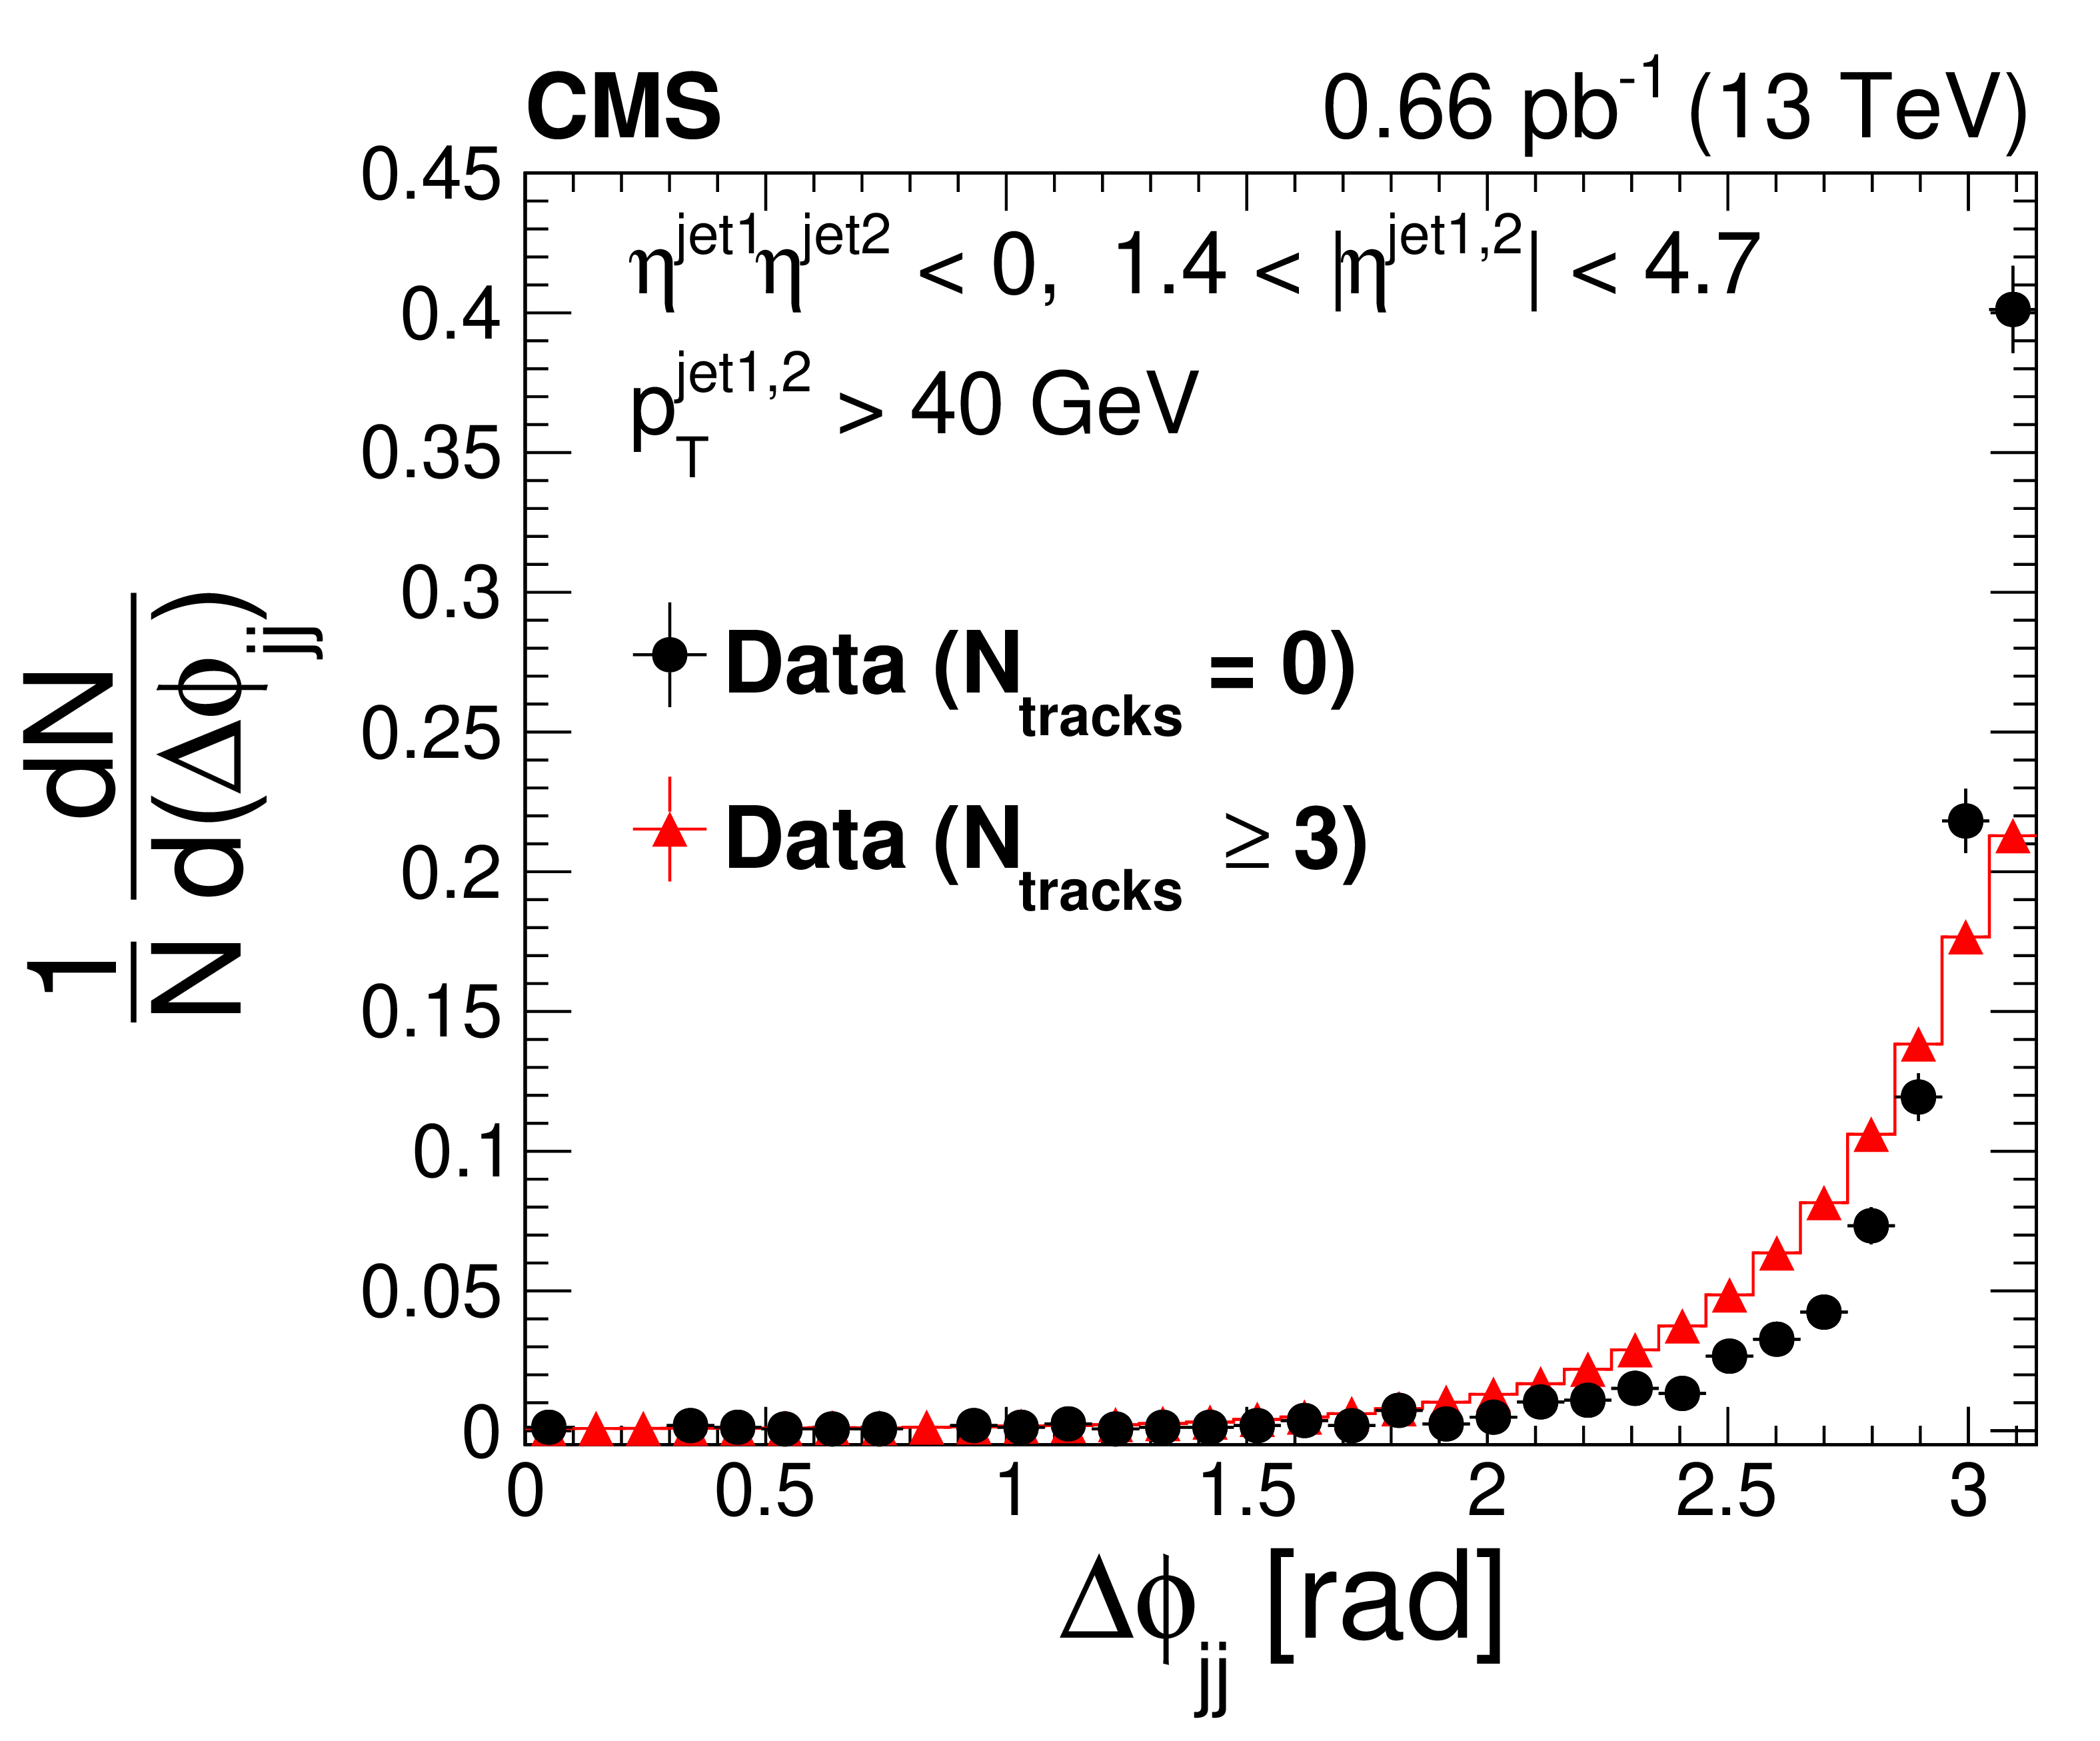
Figure 4-b:
Distribution of the azimuthal angular separation between the two leading jets $\Delta \phi _\text {jj}$, for jet-gap-jet candidates with $N_\text {tracks} = $ 0 in $ {| \eta |} < $ 1 (black circle) and color-exchange dijet candidates $N_\text {tracks} \geq $ 3 in $ {| \eta |} < $ 1 (red triangle). The vertical bars represent the statistical uncertainties, which are smaller than the marker for some data points. The horizontal bars represent the bin width. The distributions are normalized to unity. |
png pdf |
Figure 4-c:
Distribution of the number of additional jets $N_\text {extra-jets}$ with $ {p_{\mathrm {T}}} ^\text {extra-jet} > $ 15 GeV, for jet-gap-jet candidates with $N_\text {tracks} = $ 0 in $ {| \eta |} < $ 1 (black circle) and color-exchange dijet candidates $N_\text {tracks} \geq $ 3 in $ {| \eta |} < $ 1 (red triangle). The vertical bars represent the statistical uncertainties, which are smaller than the marker for some data points. The horizontal bars represent the bin width. The distributions are normalized to unity. |
png pdf |
Figure 5:
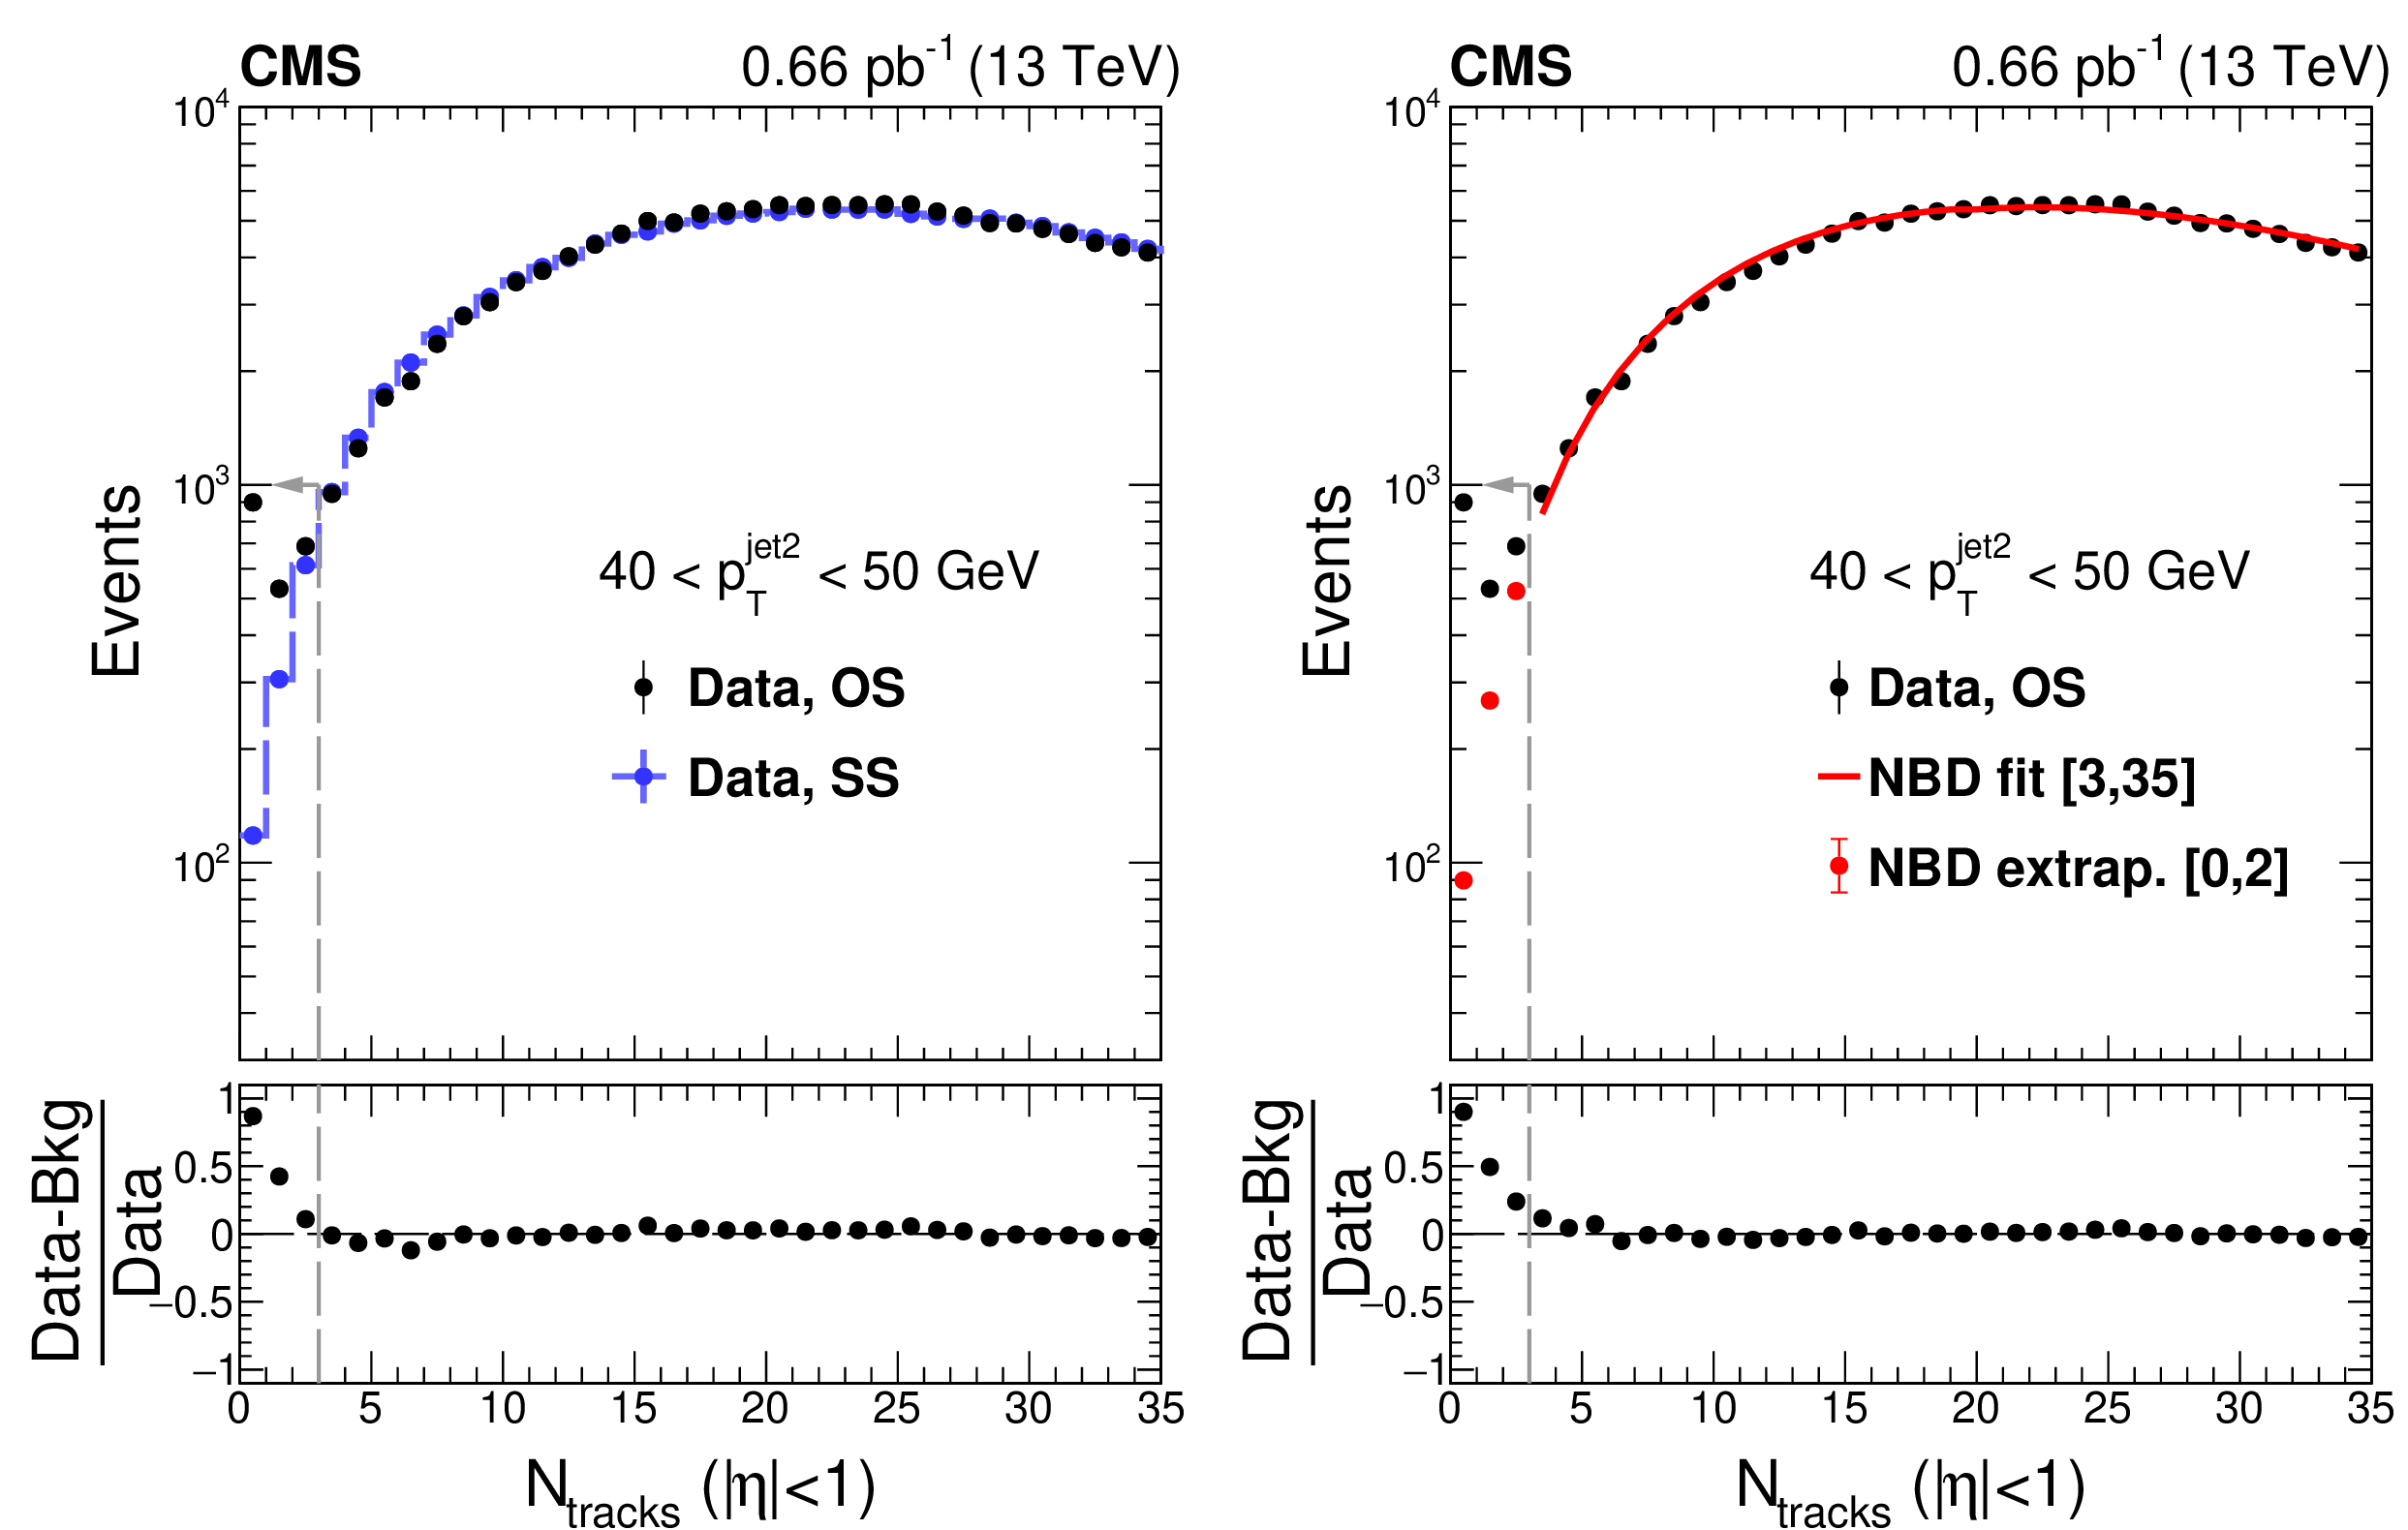
Charged particle multiplicity distribution $N_\text {tracks}$ in the $ {| \eta |} < $ 1 region for charged particle tracks with $ {p_{\mathrm {T}}} > $ 200 MeV for opposite side (OS) dijet events satisfying $\eta ^\text {jet1} \eta ^\text {jet2} < $ 0 with 40 $ < {p_{\mathrm {T}}} ^\text {jet2} < $ 50 GeV. Vertical bars, which represent statistical uncertainties, are smaller than the markers for most data points. Results from color-exchange dijet background estimation based on the same side (SS) dijet events and the negative binomial distribution (NBD) function fit are shown on the left and right panels, respectively. The NBD function is fit in the interval 3 $ \leq N_\text {tracks} \leq $ 35, and extrapolated to $N_\text {tracks} = $ 0. The dashed-line arrow represents the jet-gap-jet signal region used in the analysis, $N_\text {tracks} \leq $ 2. The fraction $f_\text {CSE}$ corresponds to the ratio of the excess of events at low multiplicities relative to the integrated number of events, as described in the text. |
png pdf |
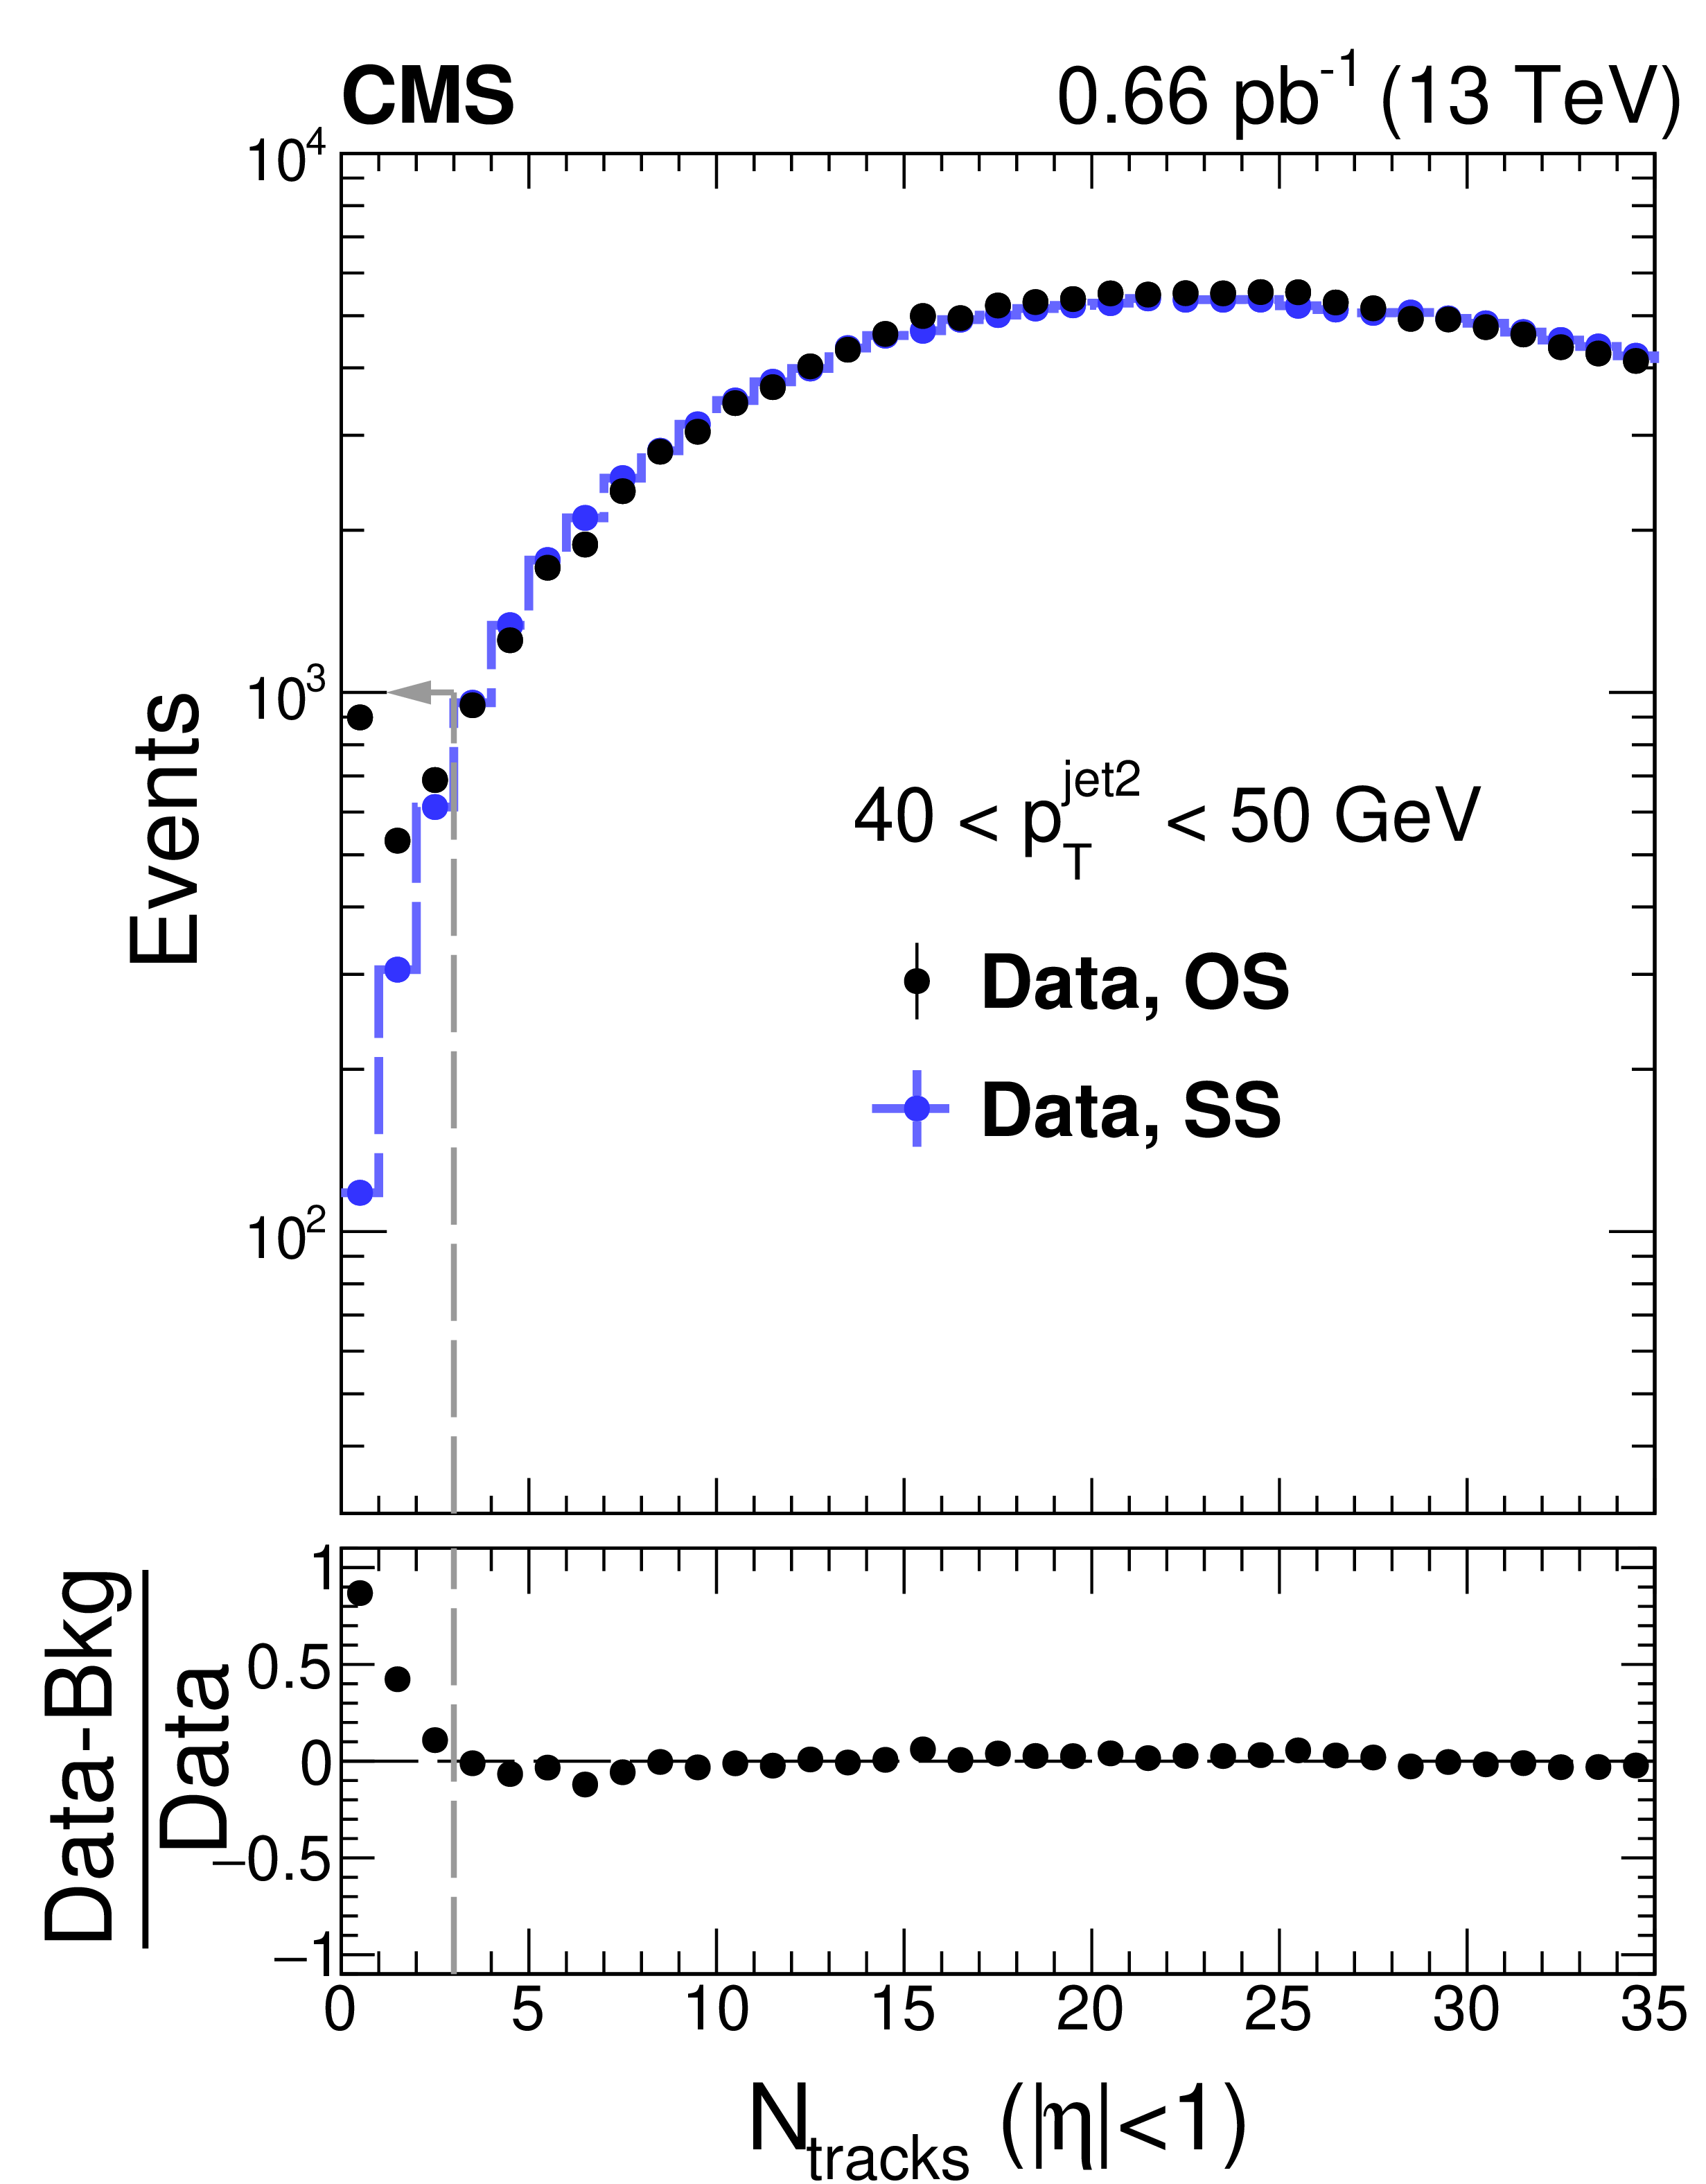
Figure 5-a:
Charged particle multiplicity distribution $N_\text {tracks}$ in the $ {| \eta |} < $ 1 region for charged particle tracks with $ {p_{\mathrm {T}}} > $ 200 MeV for opposite side (OS) dijet events satisfying $\eta ^\text {jet1} \eta ^\text {jet2} < $ 0 with 40 $ < {p_{\mathrm {T}}} ^\text {jet2} < $ 50 GeV. Vertical bars, which represent statistical uncertainties, are smaller than the markers for most data points. Results from color-exchange dijet background estimation based on the same side (SS) dijet events are shown. The dashed-line arrow represents the jet-gap-jet signal region used in the analysis, $N_\text {tracks} \leq $ 2. The fraction $f_\text {CSE}$ corresponds to the ratio of the excess of events at low multiplicities relative to the integrated number of events, as described in the text. |
png pdf |
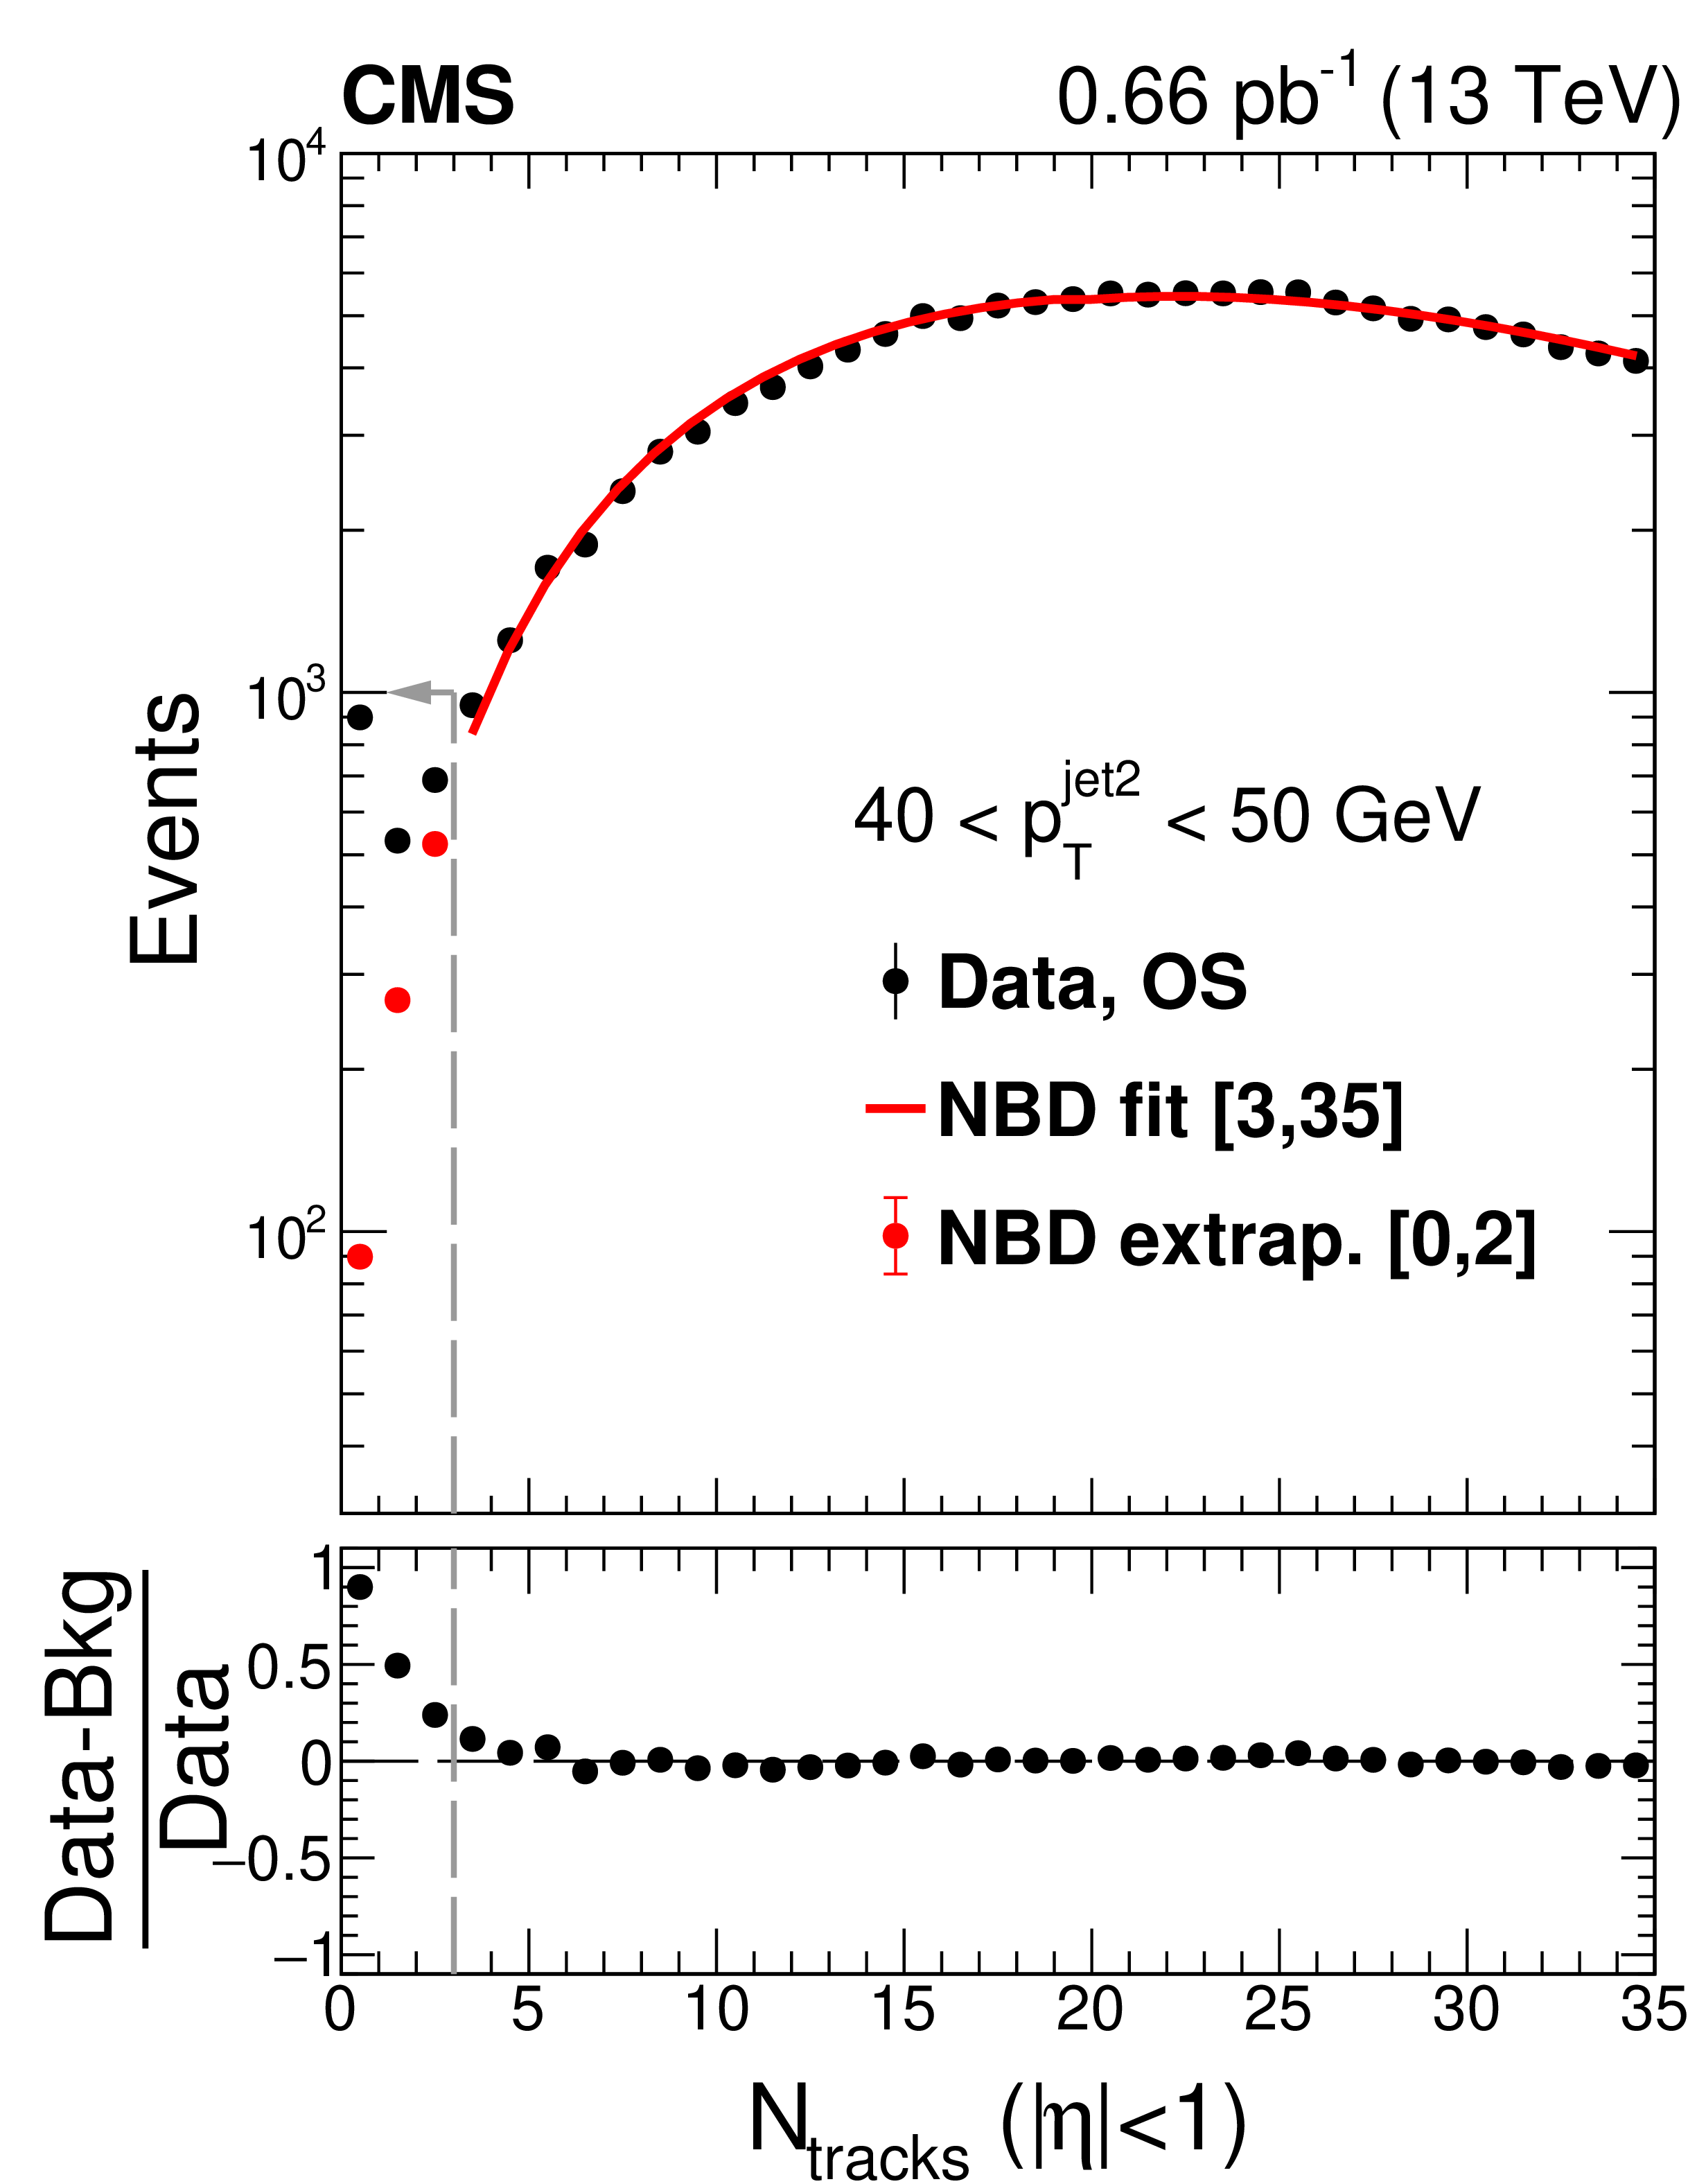
Figure 5-b:
Charged particle multiplicity distribution $N_\text {tracks}$ in the $ {| \eta |} < $ 1 region for charged particle tracks with $ {p_{\mathrm {T}}} > $ 200 MeV for opposite side (OS) dijet events satisfying $\eta ^\text {jet1} \eta ^\text {jet2} < $ 0 with 40 $ < {p_{\mathrm {T}}} ^\text {jet2} < $ 50 GeV. Vertical bars, which represent statistical uncertainties, are smaller than the markers for most data points. Results from color-exchange dijet background estimation based on the negative binomial distribution (NBD) function fit are shown. The NBD function is fit in the interval 3 $ \leq N_\text {tracks} \leq $ 35, and extrapolated to $N_\text {tracks} = $ 0. The dashed-line arrow represents the jet-gap-jet signal region used in the analysis, $N_\text {tracks} \leq $ 2. The fraction $f_\text {CSE}$ corresponds to the ratio of the excess of events at low multiplicities relative to the integrated number of events, as described in the text. |
png pdf |
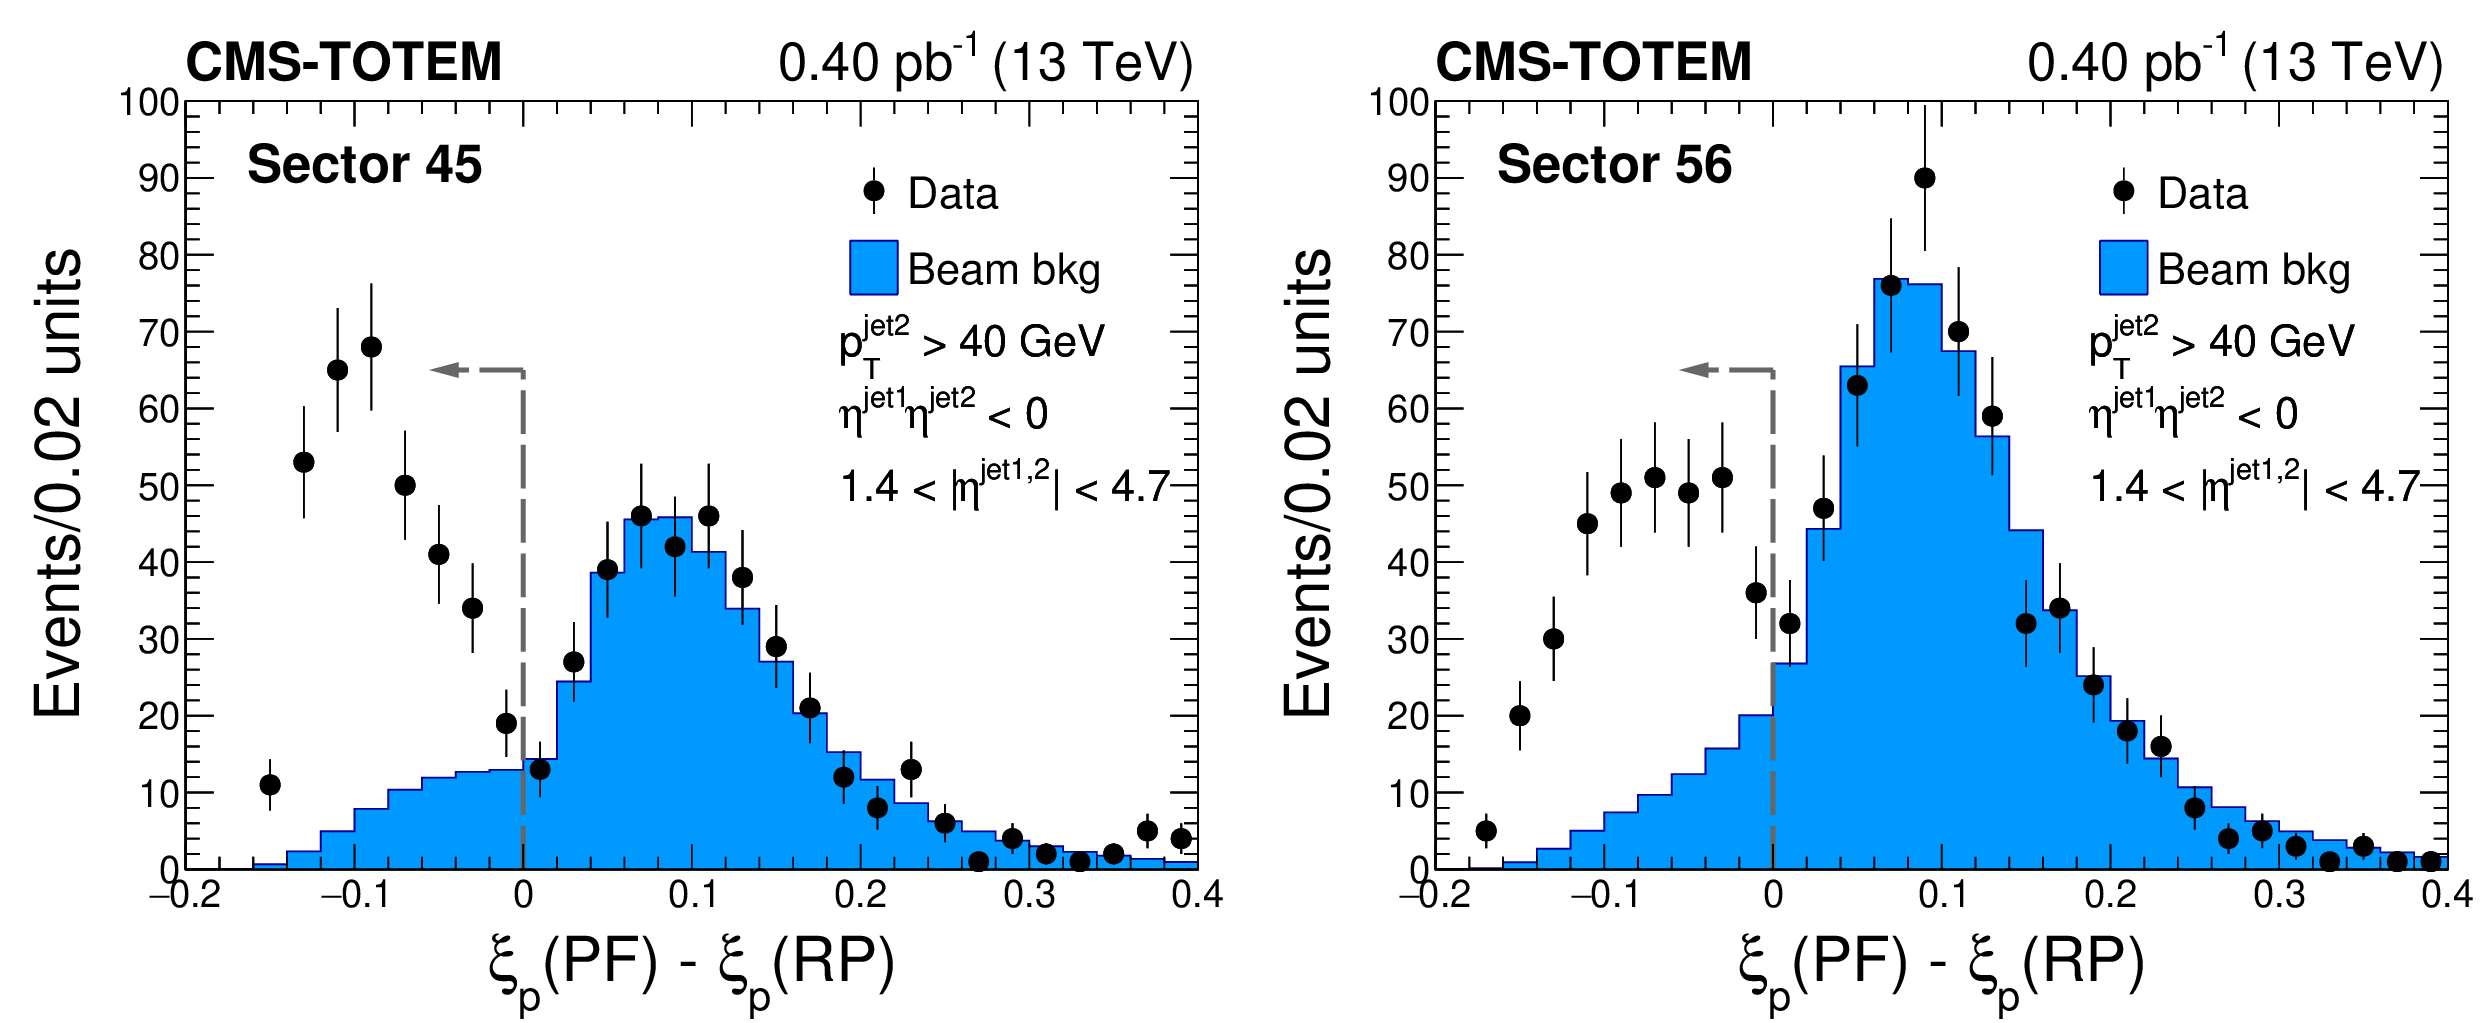
Figure 6:
Distribution of $\xi _{\mathrm{p}} (\text {PF}) - \xi _{\mathrm{p}} (\text {RP})$ in sectors 45 (left) and 56 (right) in data, where $\xi _{\mathrm{p}} (\text {PF})$ and $\xi _{\mathrm{p}} (\text {RP})$ denote the fractional momentum loss of the proton reconstructed with the particle-flow (PF) candidates of CMS and the Roman pots (RP) of TOTEM, respectively. Vertical bars indicate statistical uncertainties only. The estimated background contamination (beam background events) is represented by the filled histogram, and is estimated from the data, as described in the text. No central gap is required for this plot. The dashed-line arrow represents the requirement applied in the analysis to remove most of the beam background contribution. |
png pdf |
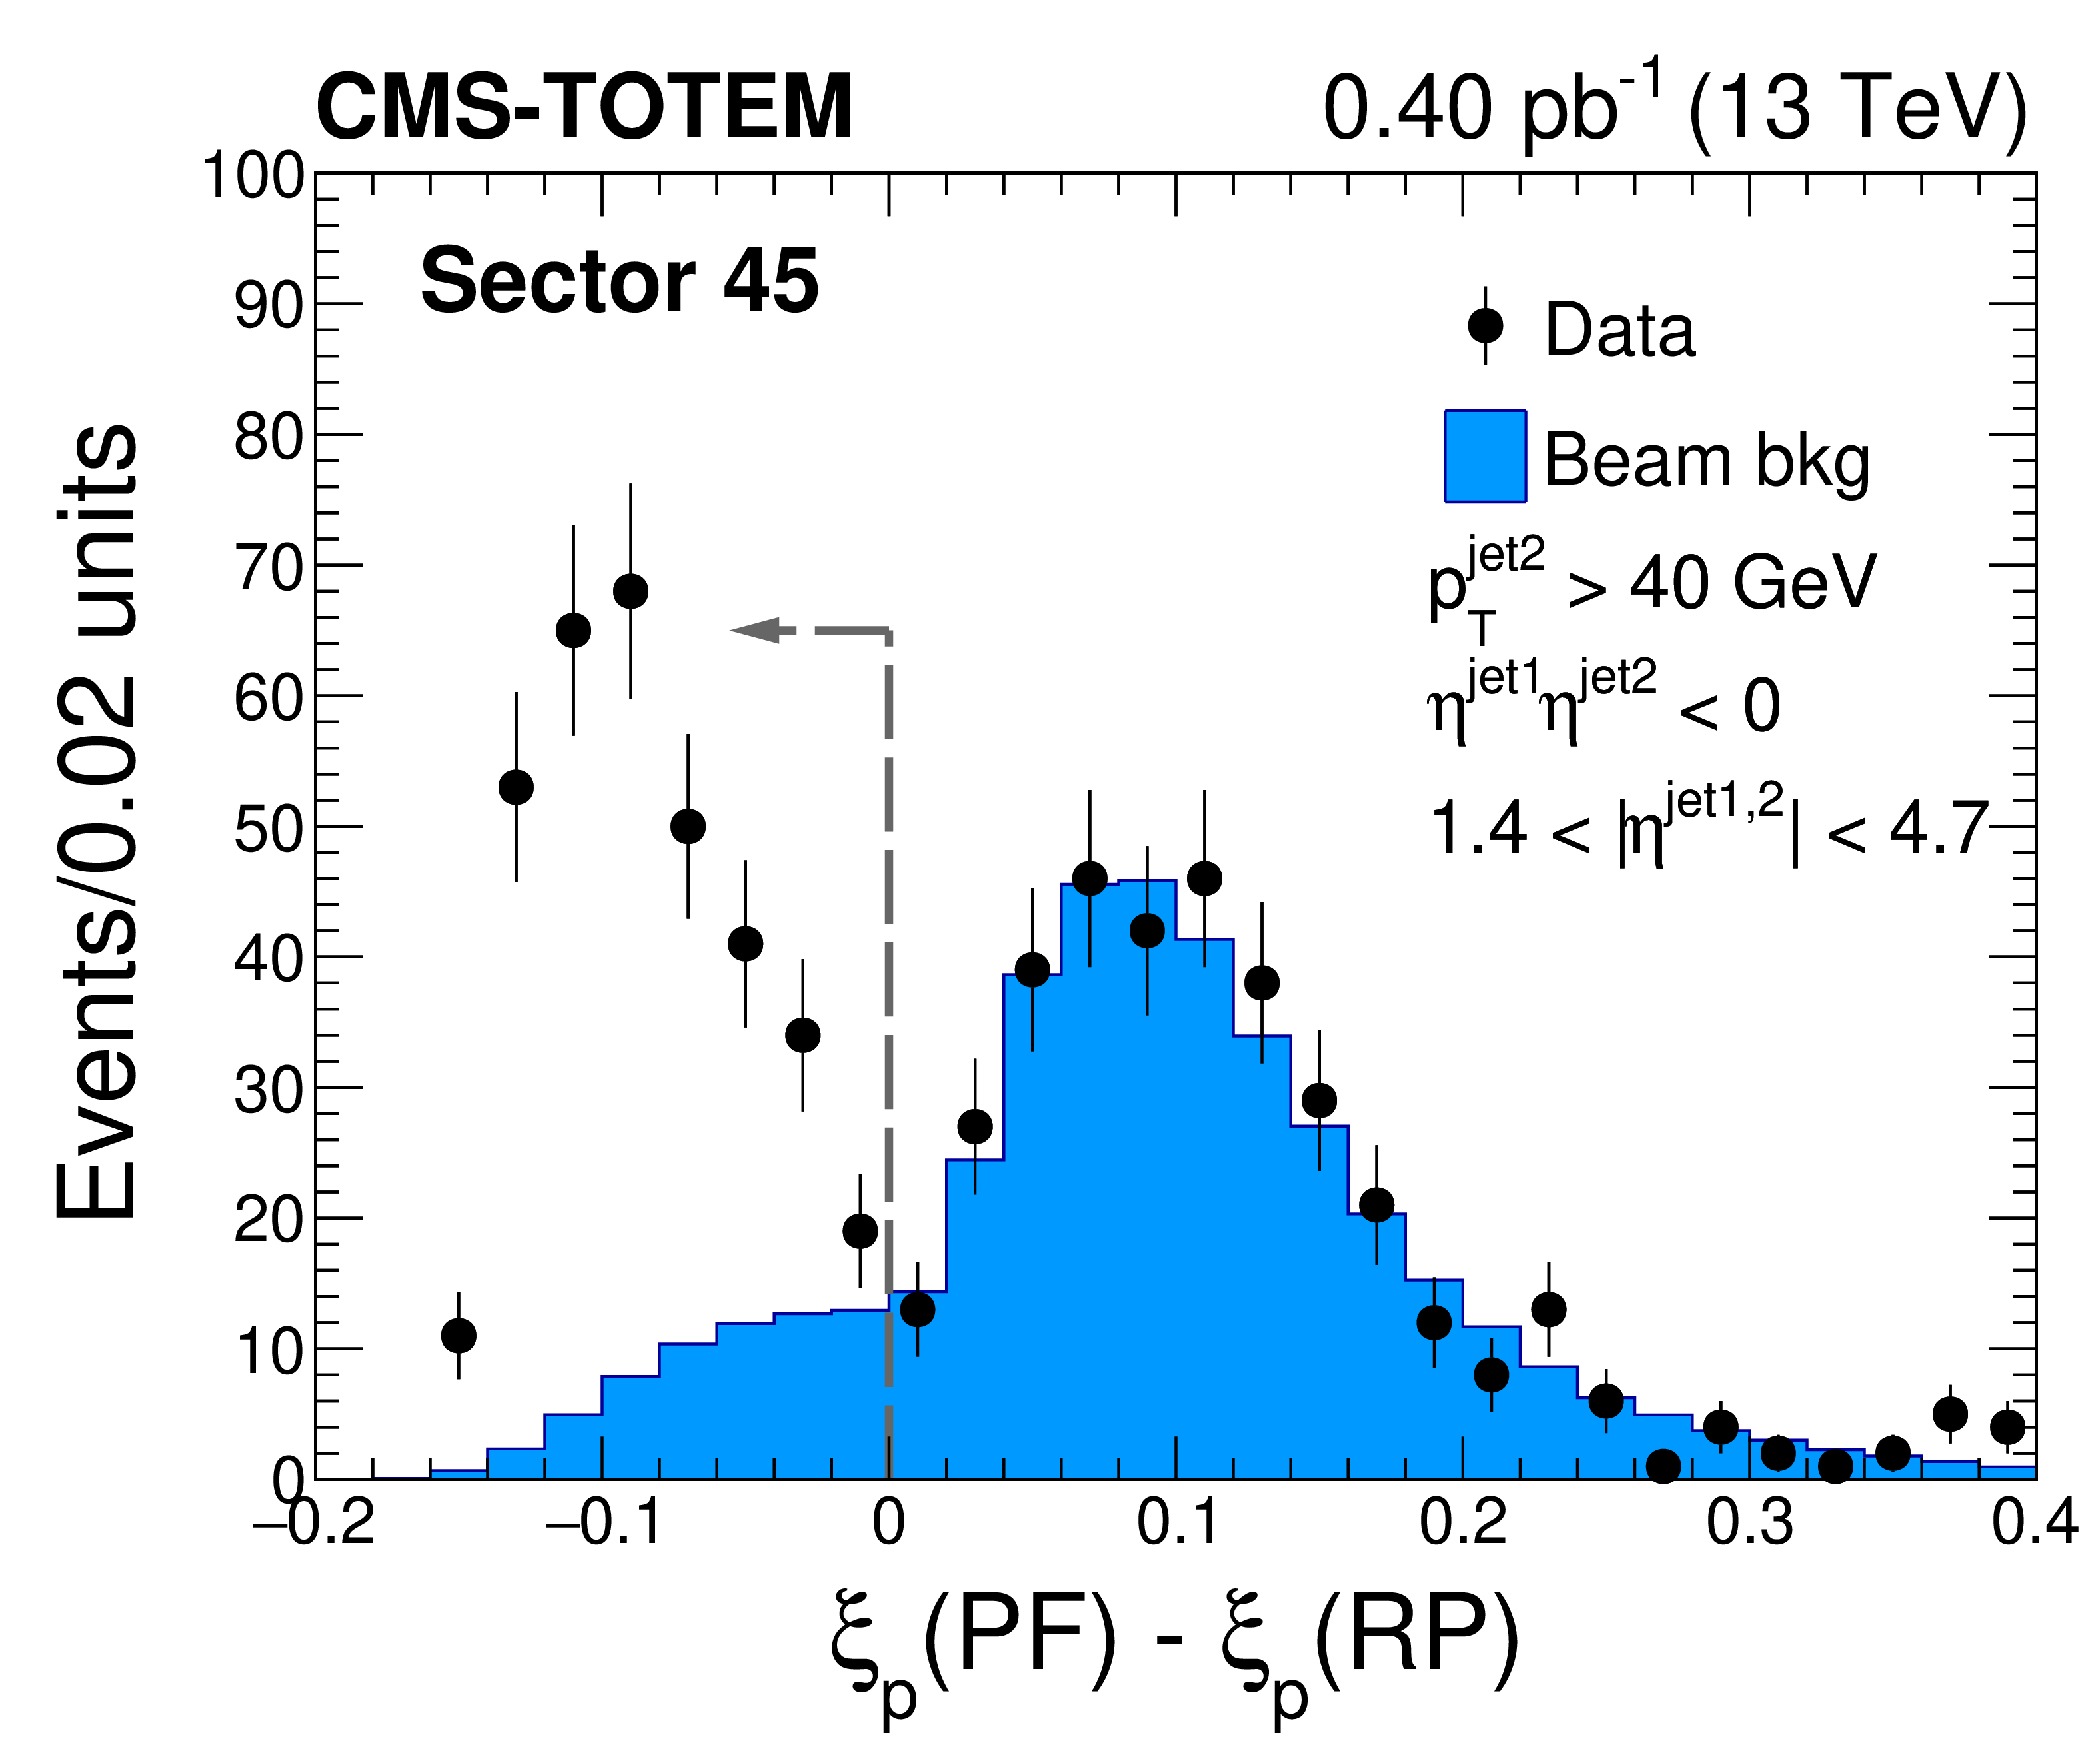
Figure 6-a:
Distribution of $\xi _{\mathrm{p}} (\text {PF}) - \xi _{\mathrm{p}} (\text {RP})$ in sector 45 in data, where $\xi _{\mathrm{p}} (\text {PF})$ and $\xi _{\mathrm{p}} (\text {RP})$ denote the fractional momentum loss of the proton reconstructed with the particle-flow (PF) candidates of CMS and the Roman pots (RP) of TOTEM, respectively. Vertical bars indicate statistical uncertainties only. The estimated background contamination (beam background events) is represented by the filled histogram, and is estimated from the data, as described in the text. No central gap is required for this plot. The dashed-line arrow represents the requirement applied in the analysis to remove most of the beam background contribution. |

png pdf |
Figure 6-b:
Distribution of $\xi _{\mathrm{p}} (\text {PF}) - \xi _{\mathrm{p}} (\text {RP})$ in sector 56 in data, where $\xi _{\mathrm{p}} (\text {PF})$ and $\xi _{\mathrm{p}} (\text {RP})$ denote the fractional momentum loss of the proton reconstructed with the particle-flow (PF) candidates of CMS and the Roman pots (RP) of TOTEM, respectively. Vertical bars indicate statistical uncertainties only. The estimated background contamination (beam background events) is represented by the filled histogram, and is estimated from the data, as described in the text. No central gap is required for this plot. The dashed-line arrow represents the requirement applied in the analysis to remove most of the beam background contribution. |
png pdf |
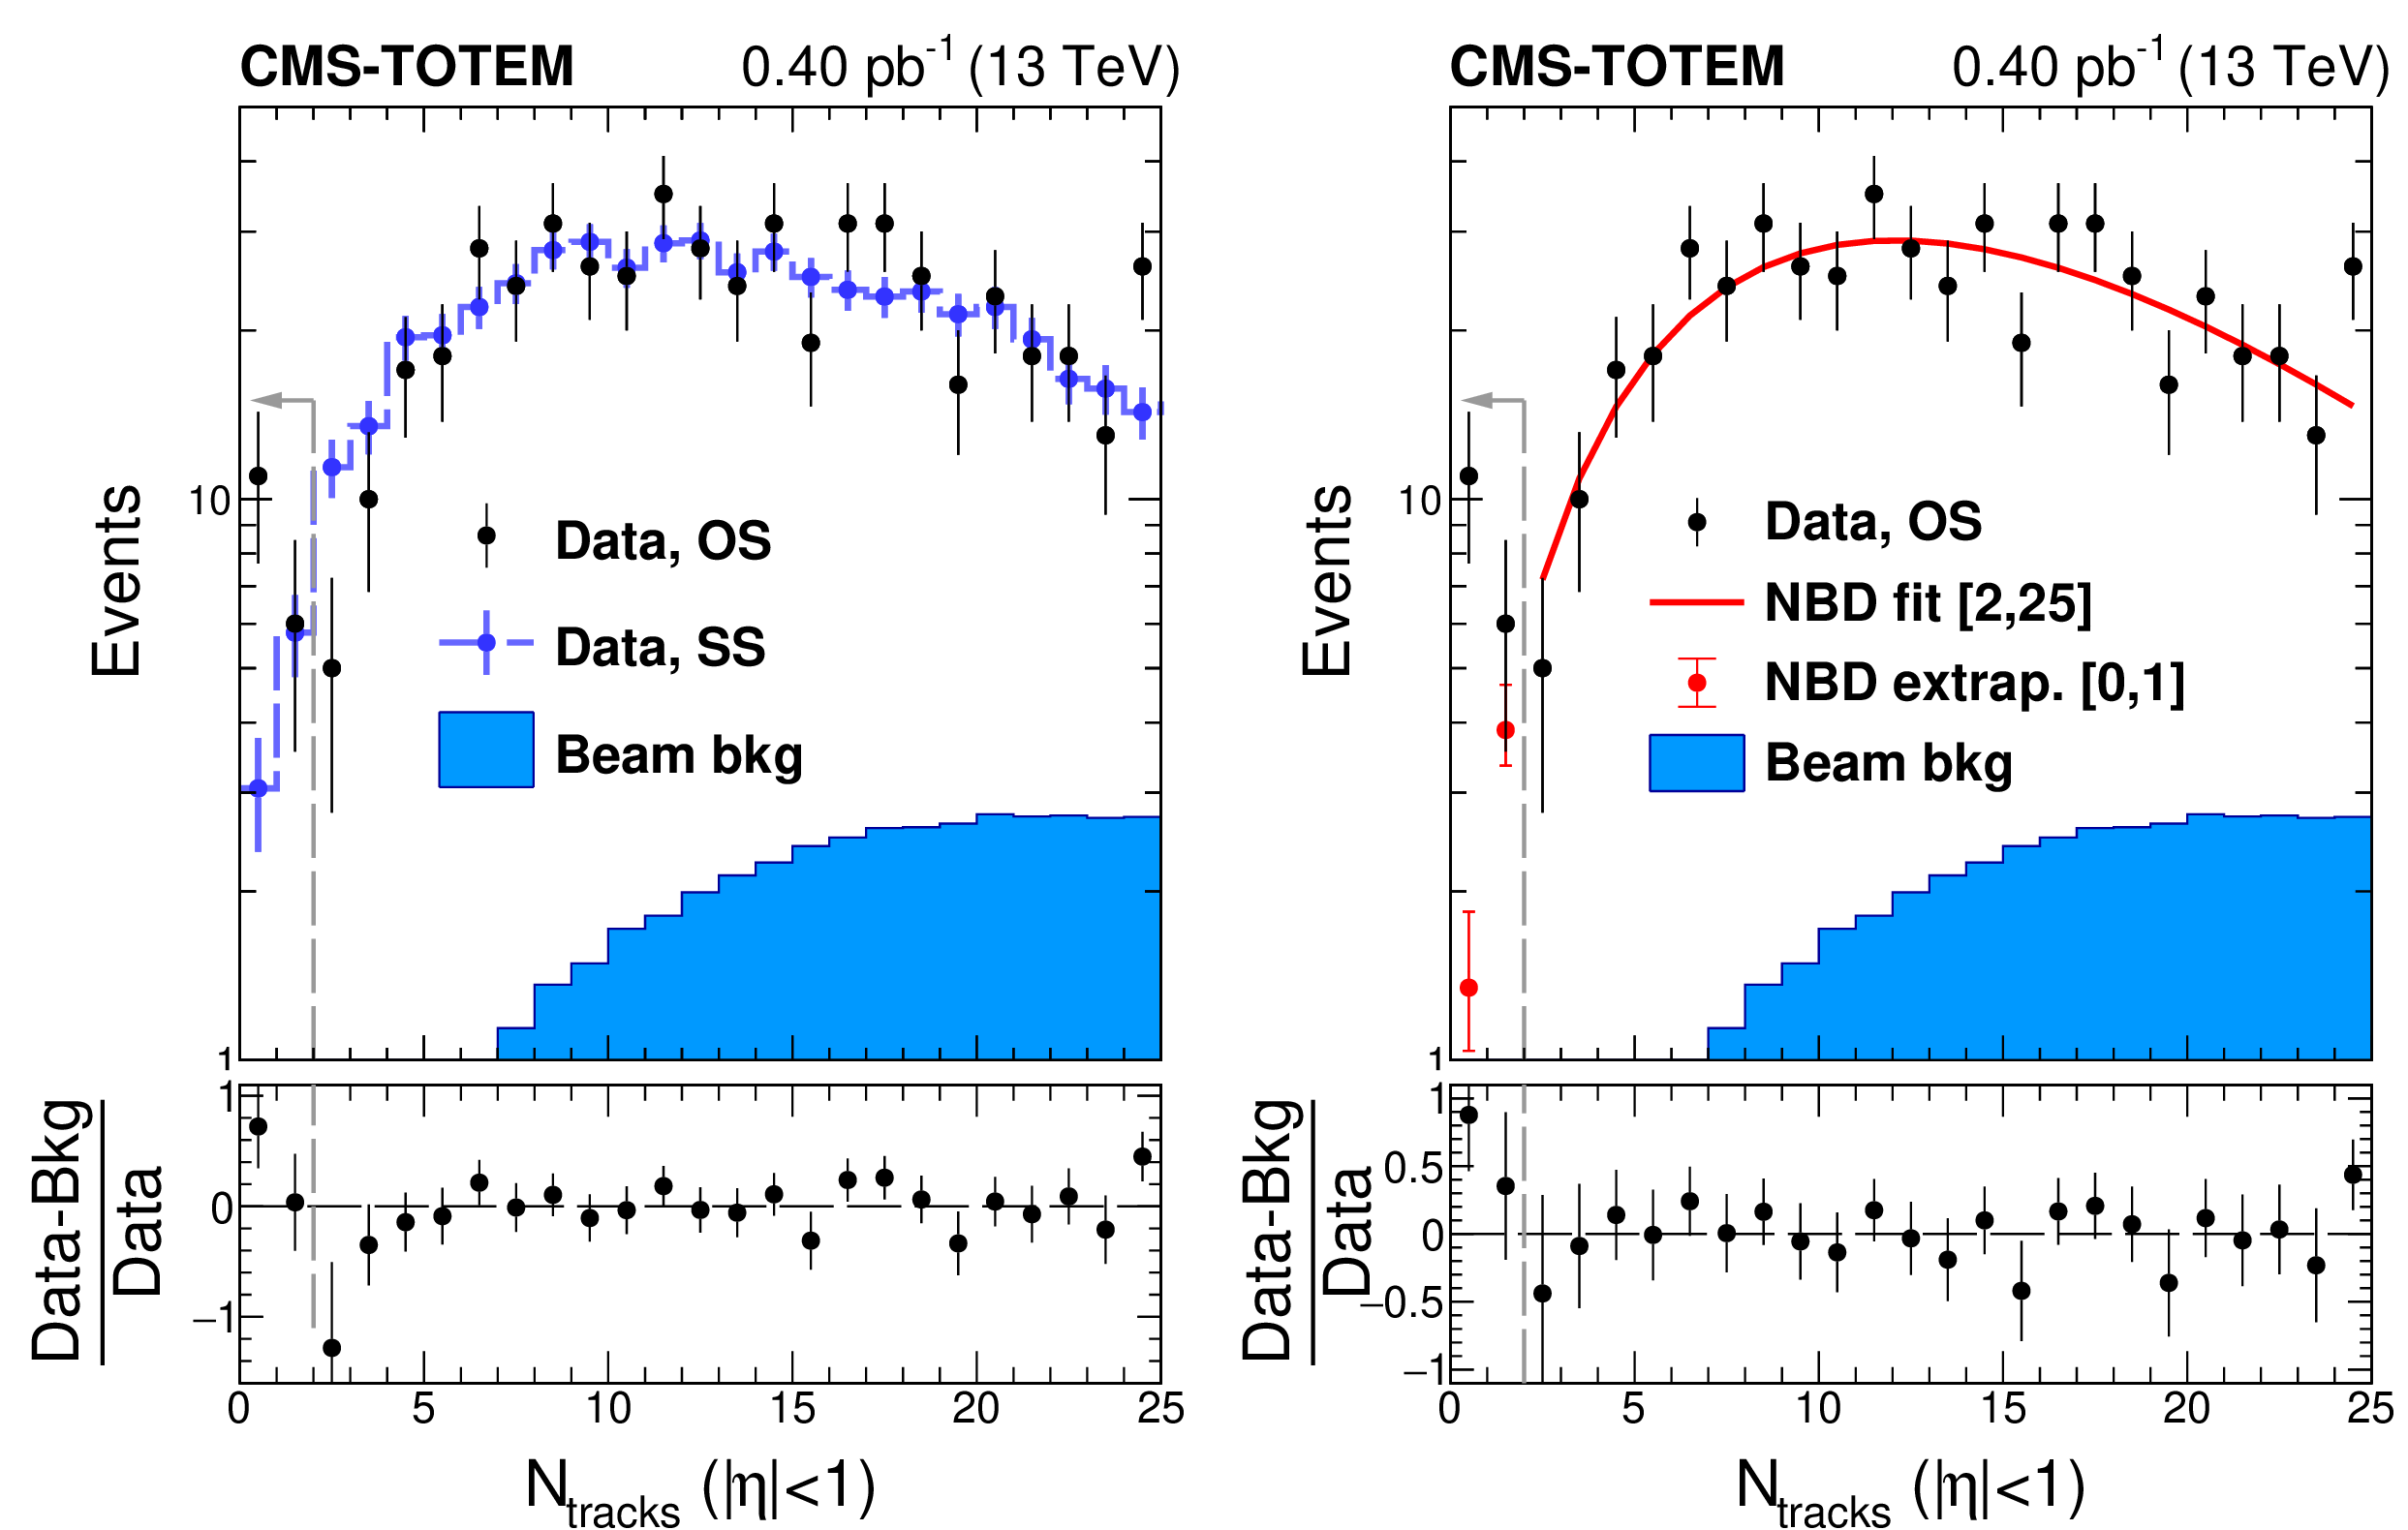
Figure 7:
Charged particle multiplicity distribution in the $ {| \eta |} < $ 1 region after the dijet and proton selection. Opposite side (OS) dijet events satisfy $\eta ^\text {jet1} \eta ^\text {jet2} < $ 0. Vertical bars represent the statistical uncertainties. The filled histogram represents the residual beam background contamination. The contribution of standard diffractive dijet events that feature a central gap is modeled with the same side (SS) dijet events (left) and with the negative binomial distribution (NBD) function fit (right), as described in the text. The NBD function is fit in the interval $2 \leq N_\text {tracks} \leq 25$, and extrapolated to $N_\text {tracks} = $ 0. The dashed-line arrow represents the region $N_\text {tracks} < 2$ used for signal extraction in the analysis. |
png pdf |
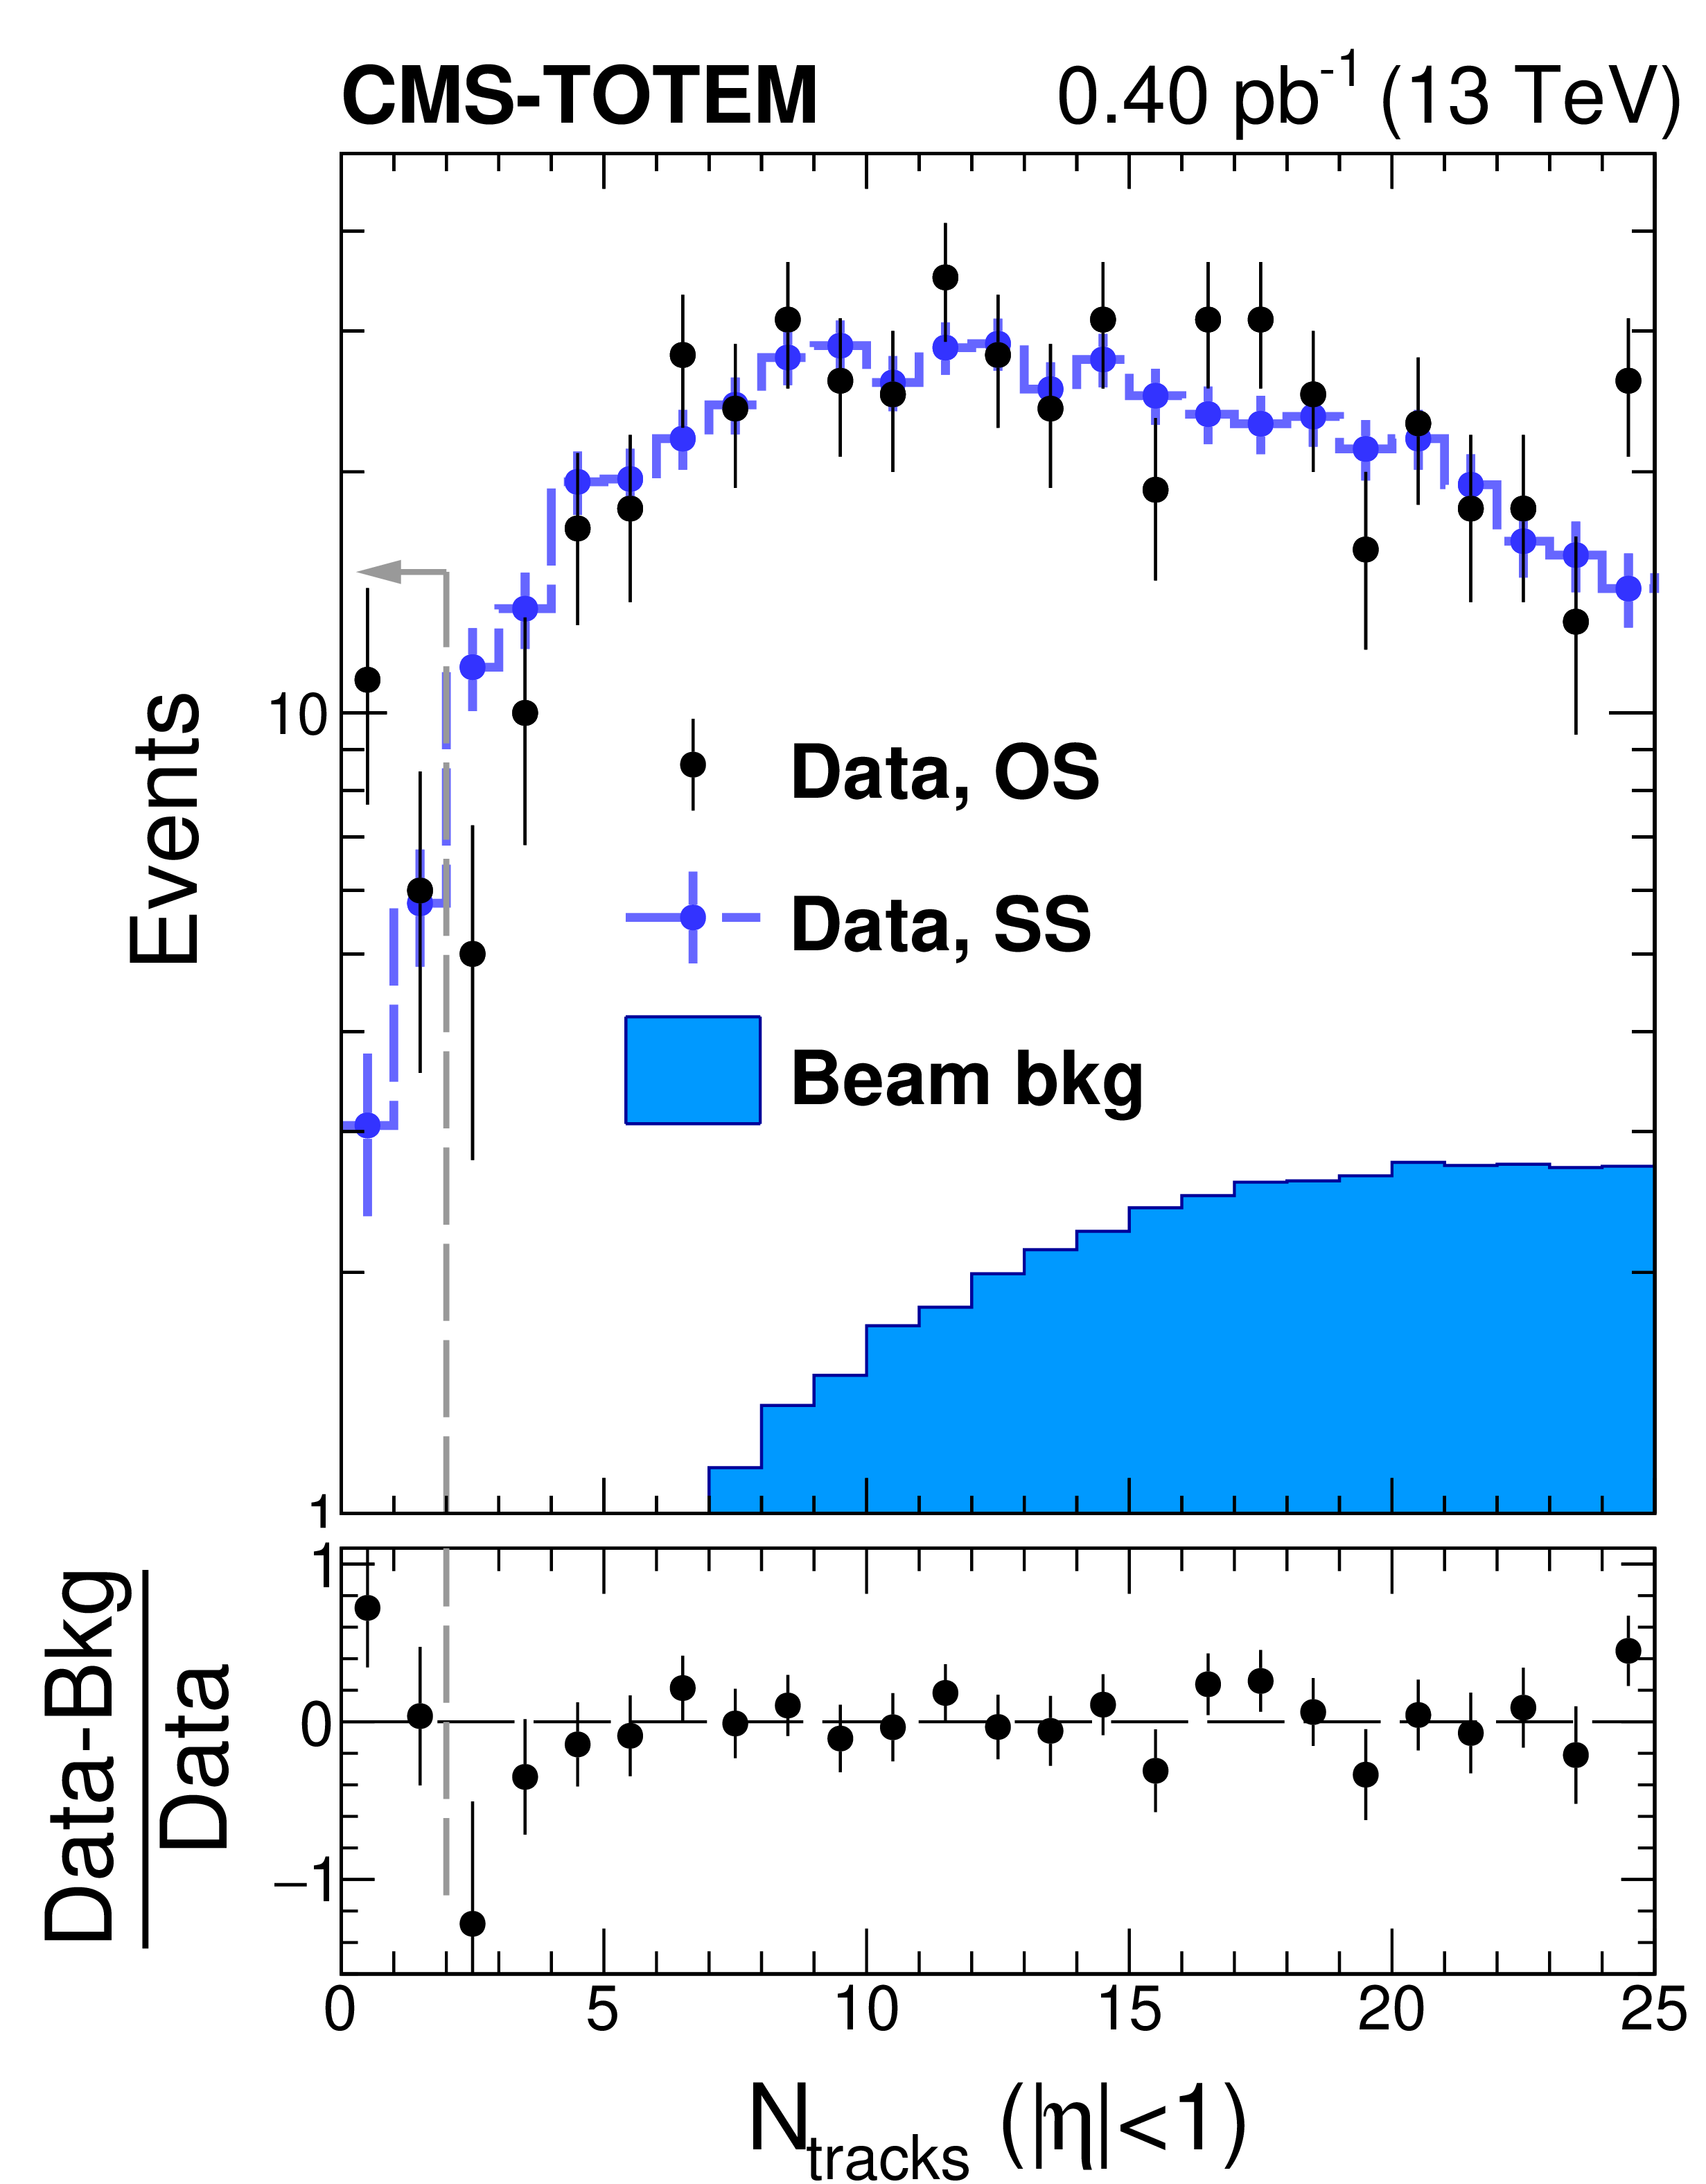
Figure 7-a:
Charged particle multiplicity distribution in the $ {| \eta |} < $ 1 region after the dijet and proton selection. Opposite side (OS) dijet events satisfy $\eta ^\text {jet1} \eta ^\text {jet2} < $ 0. Vertical bars represent the statistical uncertainties. The filled histogram represents the residual beam background contamination. The contribution of standard diffractive dijet events that feature a central gap is modeled with the same side (SS) dijet events, as described in the text. The dashed-line arrow represents the region $N_\text {tracks} < 2$ used for signal extraction in the analysis. |

png pdf |
Figure 7-b:
Charged particle multiplicity distribution in the $ {| \eta |} < $ 1 region after the dijet and proton selection. Opposite side (OS) dijet events satisfy $\eta ^\text {jet1} \eta ^\text {jet2} < $ 0. Vertical bars represent the statistical uncertainties. The filled histogram represents the residual beam background contamination. The contribution of standard diffractive dijet events that feature a central gap is modeled with the negative binomial distribution (NBD) function fit, as described in the text. The NBD function is fit in the interval $2 \leq N_\text {tracks} \leq 25$, and extrapolated to $N_\text {tracks} = $ 0. The dashed-line arrow represents the region $N_\text {tracks} < 2$ used for signal extraction in the analysis. |
png pdf |
Figure 8:
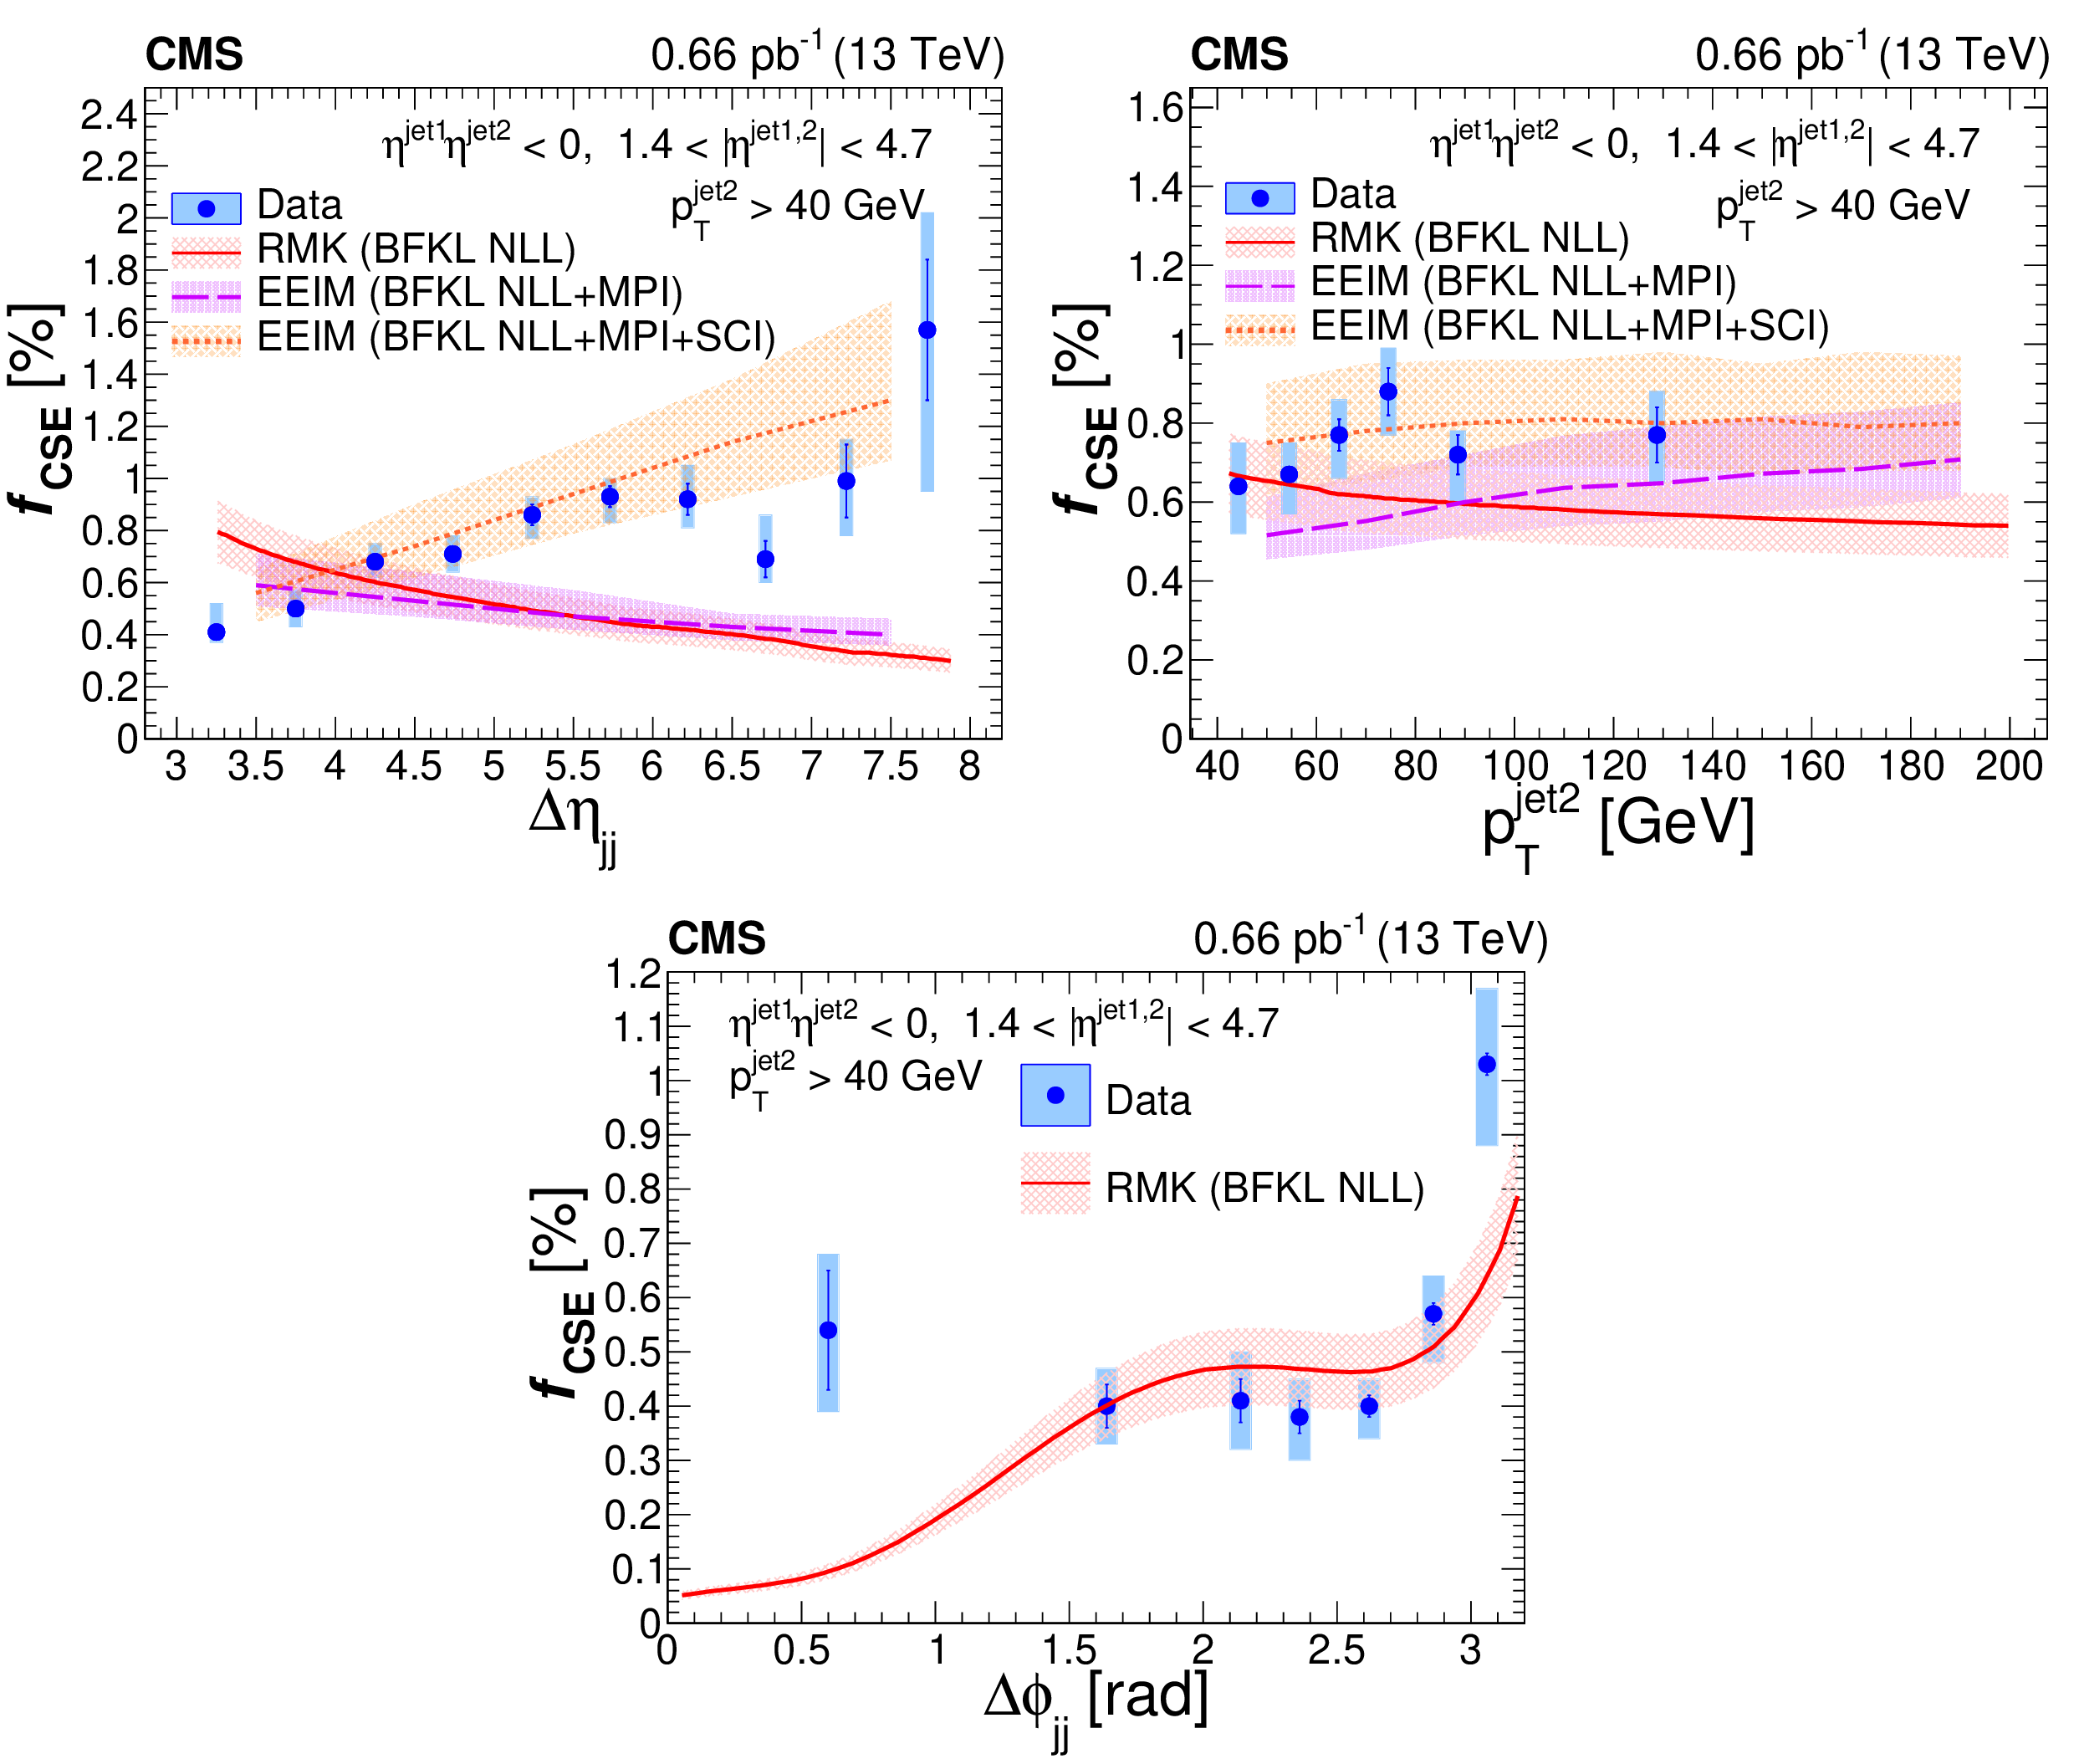
Fraction of color-singlet exchange dijet events, $f_\text {CSE}$, measured as a function of $\Delta \eta _\text {jj}$, $ {p_{\mathrm {T}}} ^\text {jet2}$, and $\Delta \phi _\text {jj}$ in pp collisions at $\sqrt {s} = $ 13 TeV. Vertical bars represent statistical uncertainties, while boxes represent the combination of statistical and systematic uncertainties in quadrature. The results are plotted at the mean values of $\Delta \eta _\text {jj}$, $ {p_{\mathrm {T}}} ^\text {jet2}$, and $\Delta \phi _\text {jj}$ in the bin. For a given plot of $f_\text {CSE}$ versus a kinematic variable of interest ($ {p_{\mathrm {T}}} ^\text {jet2}$, $\Delta \eta _\text {jj}$, or $\Delta \phi _\text {jj}$), the other kinematic variables are integrated over their allowed range. The red solid curve corresponds to theoretical predictions based on the RMK model [54,55] with gap survival probability of $ {| \mathcal {S} |}^2 = 10$%. The EEIM model [53,56] predictions with MPI-only contributions and $ {| \mathcal {S} |}^2 = 1.2$% or MPI+SCI are represented by the purple dashed and orange dotted curves, respectively. The bands around the curves represent the associated theoretical uncertainties. The EEIM model, not shown versus $\Delta \phi _\text {jj}$, has only small contributions far from back-to-back jets since no hard NLO $2\to 3$ processes are included. |
png pdf |
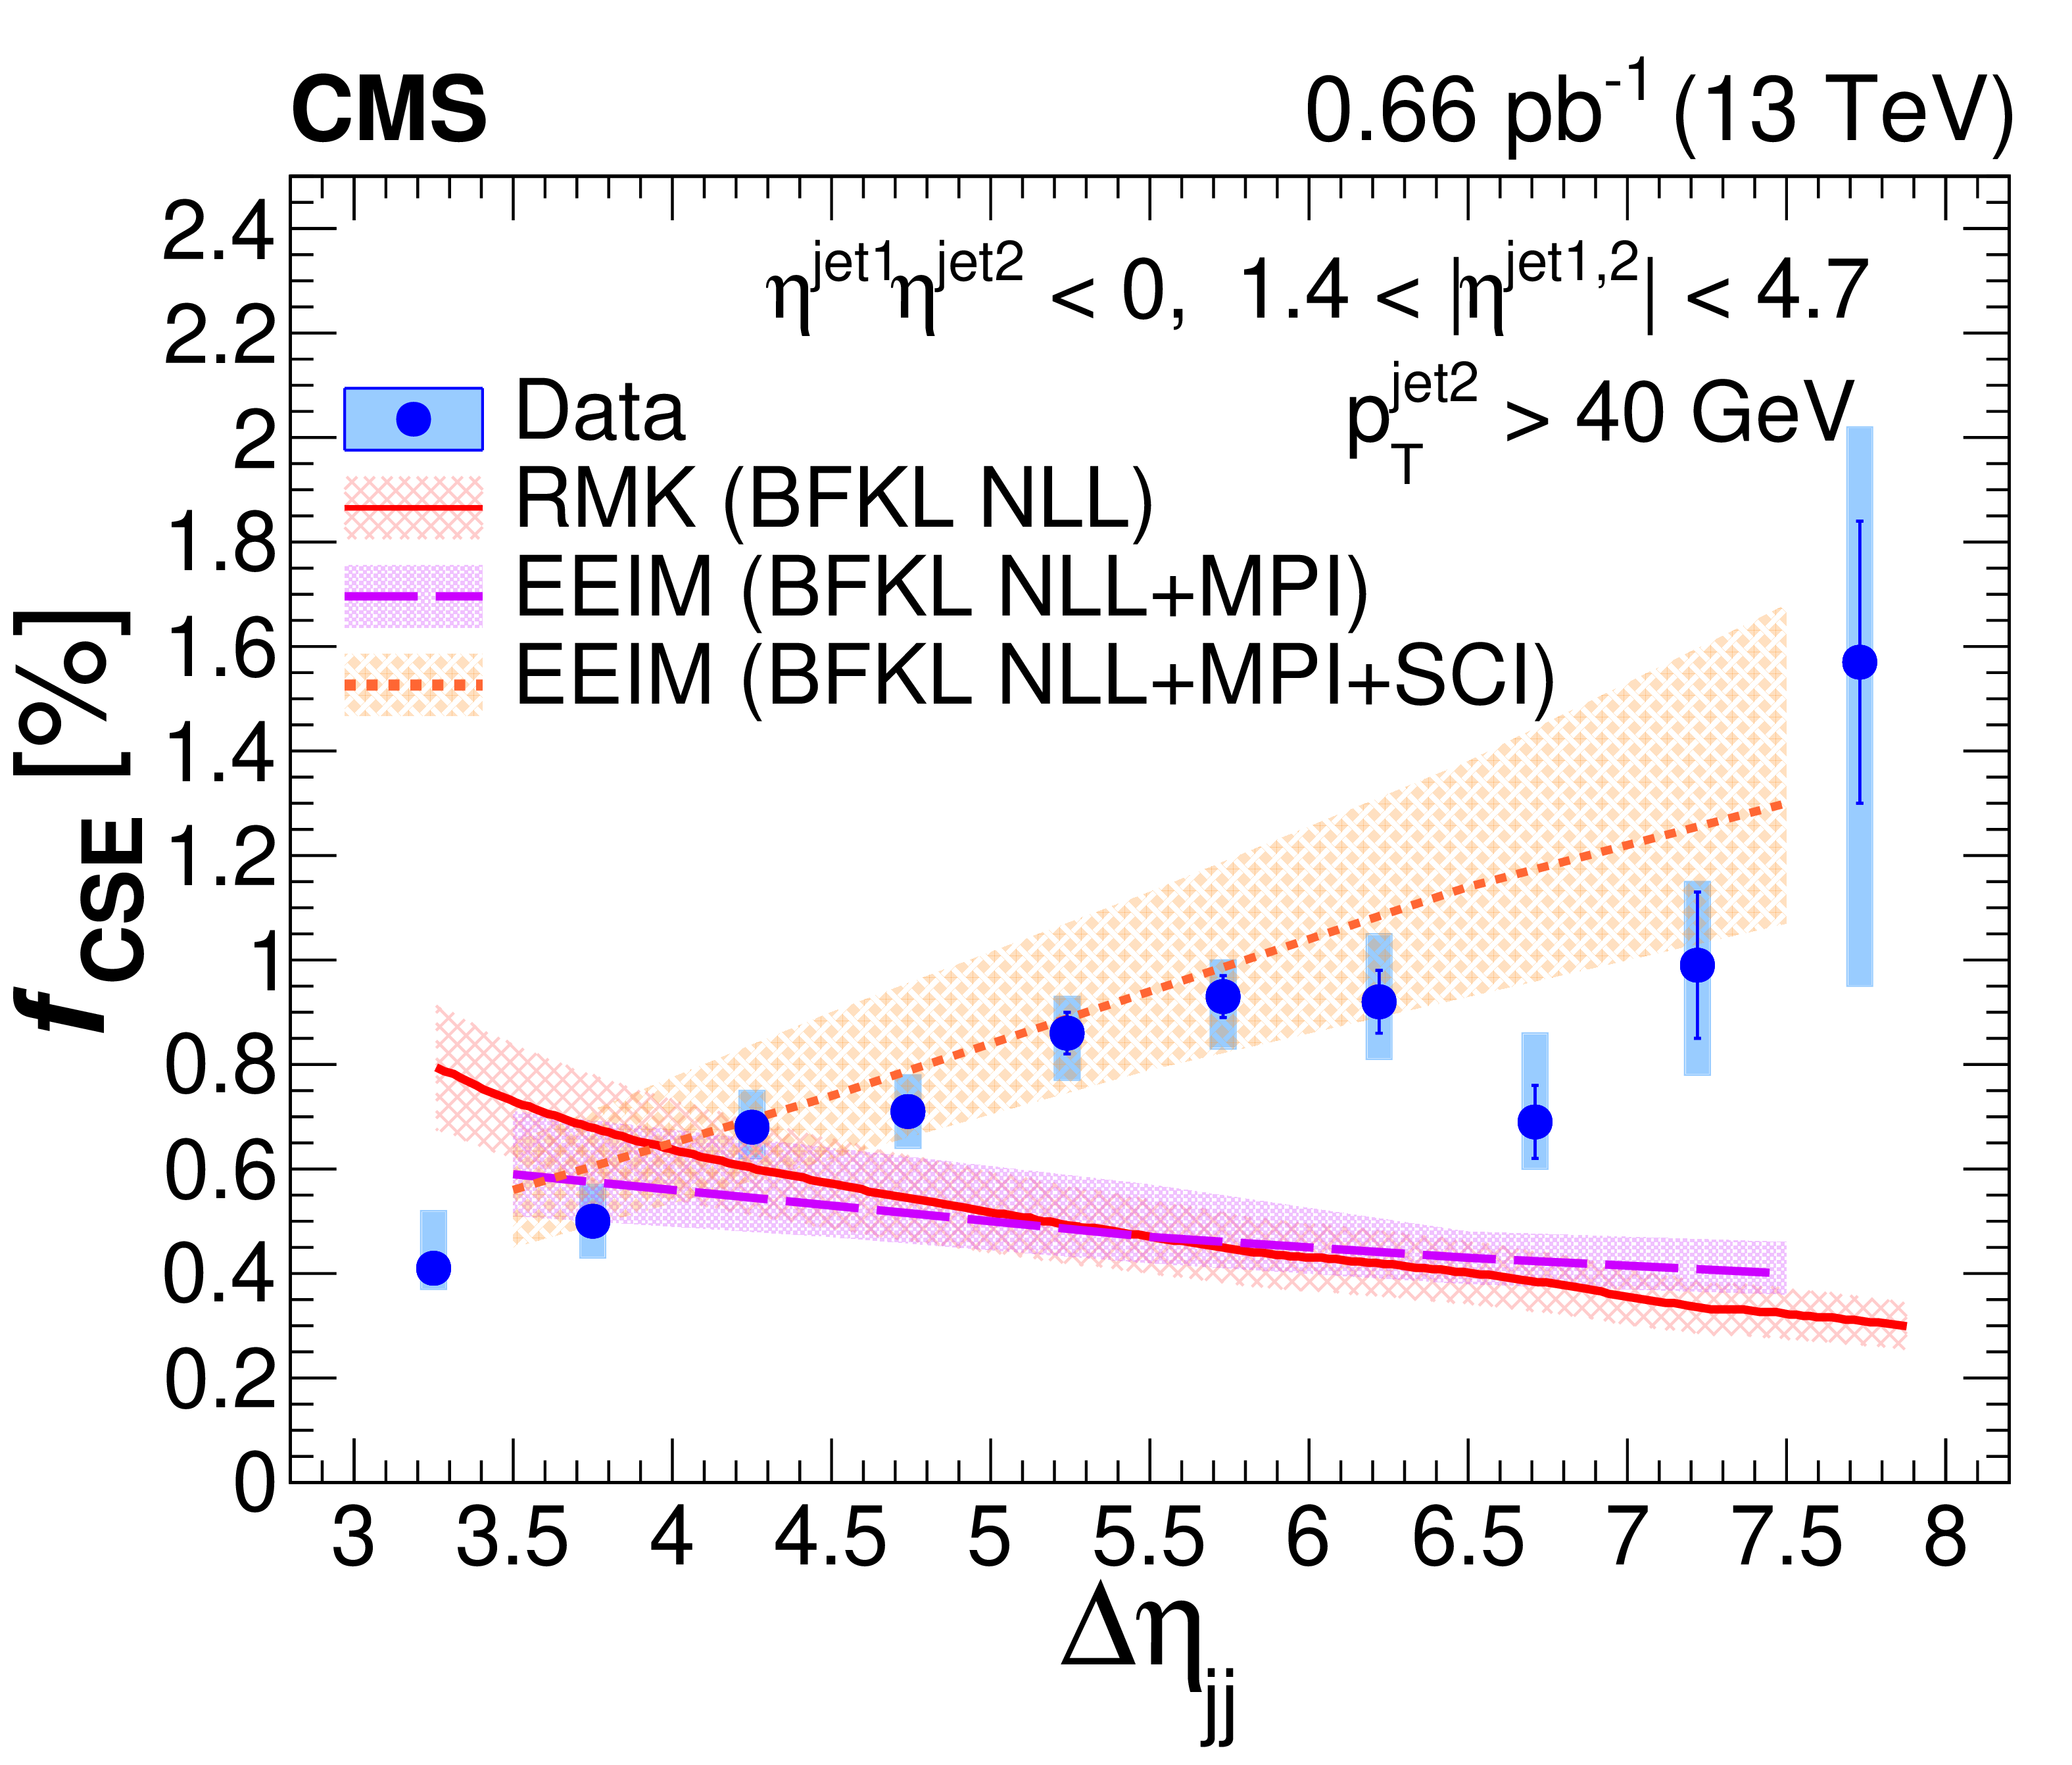
Figure 8-a:
Fraction of color-singlet exchange dijet events, $f_\text {CSE}$, measured as a function of $\Delta \eta _\text {jj}$ in pp collisions at $\sqrt {s} = $ 13 TeV. Vertical bars represent statistical uncertainties, while boxes represent the combination of statistical and systematic uncertainties in quadrature. The results are plotted at the mean values of $\Delta \eta _\text {jj}$, $ {p_{\mathrm {T}}} ^\text {jet2}$, and $\Delta \phi _\text {jj}$ in the bin. For a given plot of $f_\text {CSE}$ versus a kinematic variable of interest ($ {p_{\mathrm {T}}} ^\text {jet2}$, $\Delta \eta _\text {jj}$, or $\Delta \phi _\text {jj}$), the other kinematic variables are integrated over their allowed range. The red solid curve corresponds to theoretical predictions based on the RMK model [54,55] with gap survival probability of $ {| \mathcal {S} |}^2 = 10$%. The EEIM model [53,56] predictions with MPI-only contributions and $ {| \mathcal {S} |}^2 = 1.2$% or MPI+SCI are represented by the purple dashed and orange dotted curves, respectively. The bands around the curves represent the associated theoretical uncertainties. The EEIM model, not shown versus $\Delta \phi _\text {jj}$, has only small contributions far from back-to-back jets since no hard NLO $2\to 3$ processes are included. |

png pdf |
Figure 8-b:
Fraction of color-singlet exchange dijet events, $f_\text {CSE}$, measured as a function of $ {p_{\mathrm {T}}} ^\text {jet2}$ in pp collisions at $\sqrt {s} = $ 13 TeV. Vertical bars represent statistical uncertainties, while boxes represent the combination of statistical and systematic uncertainties in quadrature. The results are plotted at the mean values of $\Delta \eta _\text {jj}$, $ {p_{\mathrm {T}}} ^\text {jet2}$, and $\Delta \phi _\text {jj}$ in the bin. For a given plot of $f_\text {CSE}$ versus a kinematic variable of interest ($ {p_{\mathrm {T}}} ^\text {jet2}$, $\Delta \eta _\text {jj}$, or $\Delta \phi _\text {jj}$), the other kinematic variables are integrated over their allowed range. The red solid curve corresponds to theoretical predictions based on the RMK model [54,55] with gap survival probability of $ {| \mathcal {S} |}^2 = 10$%. The EEIM model [53,56] predictions with MPI-only contributions and $ {| \mathcal {S} |}^2 = 1.2$% or MPI+SCI are represented by the purple dashed and orange dotted curves, respectively. The bands around the curves represent the associated theoretical uncertainties. The EEIM model, not shown versus $\Delta \phi _\text {jj}$, has only small contributions far from back-to-back jets since no hard NLO $2\to 3$ processes are included. |

png pdf |
Figure 8-c:
Fraction of color-singlet exchange dijet events, $f_\text {CSE}$, measured as a function of $\Delta \phi _\text {jj}$ in pp collisions at $\sqrt {s} = $ 13 TeV. Vertical bars represent statistical uncertainties, while boxes represent the combination of statistical and systematic uncertainties in quadrature. The results are plotted at the mean values of $\Delta \eta _\text {jj}$, $ {p_{\mathrm {T}}} ^\text {jet2}$, and $\Delta \phi _\text {jj}$ in the bin. For a given plot of $f_\text {CSE}$ versus a kinematic variable of interest ($ {p_{\mathrm {T}}} ^\text {jet2}$, $\Delta \eta _\text {jj}$, or $\Delta \phi _\text {jj}$), the other kinematic variables are integrated over their allowed range. The red solid curve corresponds to theoretical predictions based on the RMK model [54,55] with gap survival probability of $ {| \mathcal {S} |}^2 = 10$%. The EEIM model [53,56] predictions with MPI-only contributions and $ {| \mathcal {S} |}^2 = 1.2$% or MPI+SCI are represented by the purple dashed and orange dotted curves, respectively. The bands around the curves represent the associated theoretical uncertainties. The EEIM model, not shown versus $\Delta \phi _\text {jj}$, has only small contributions far from back-to-back jets since no hard NLO $2\to 3$ processes are included. |
png pdf |
Figure 9:
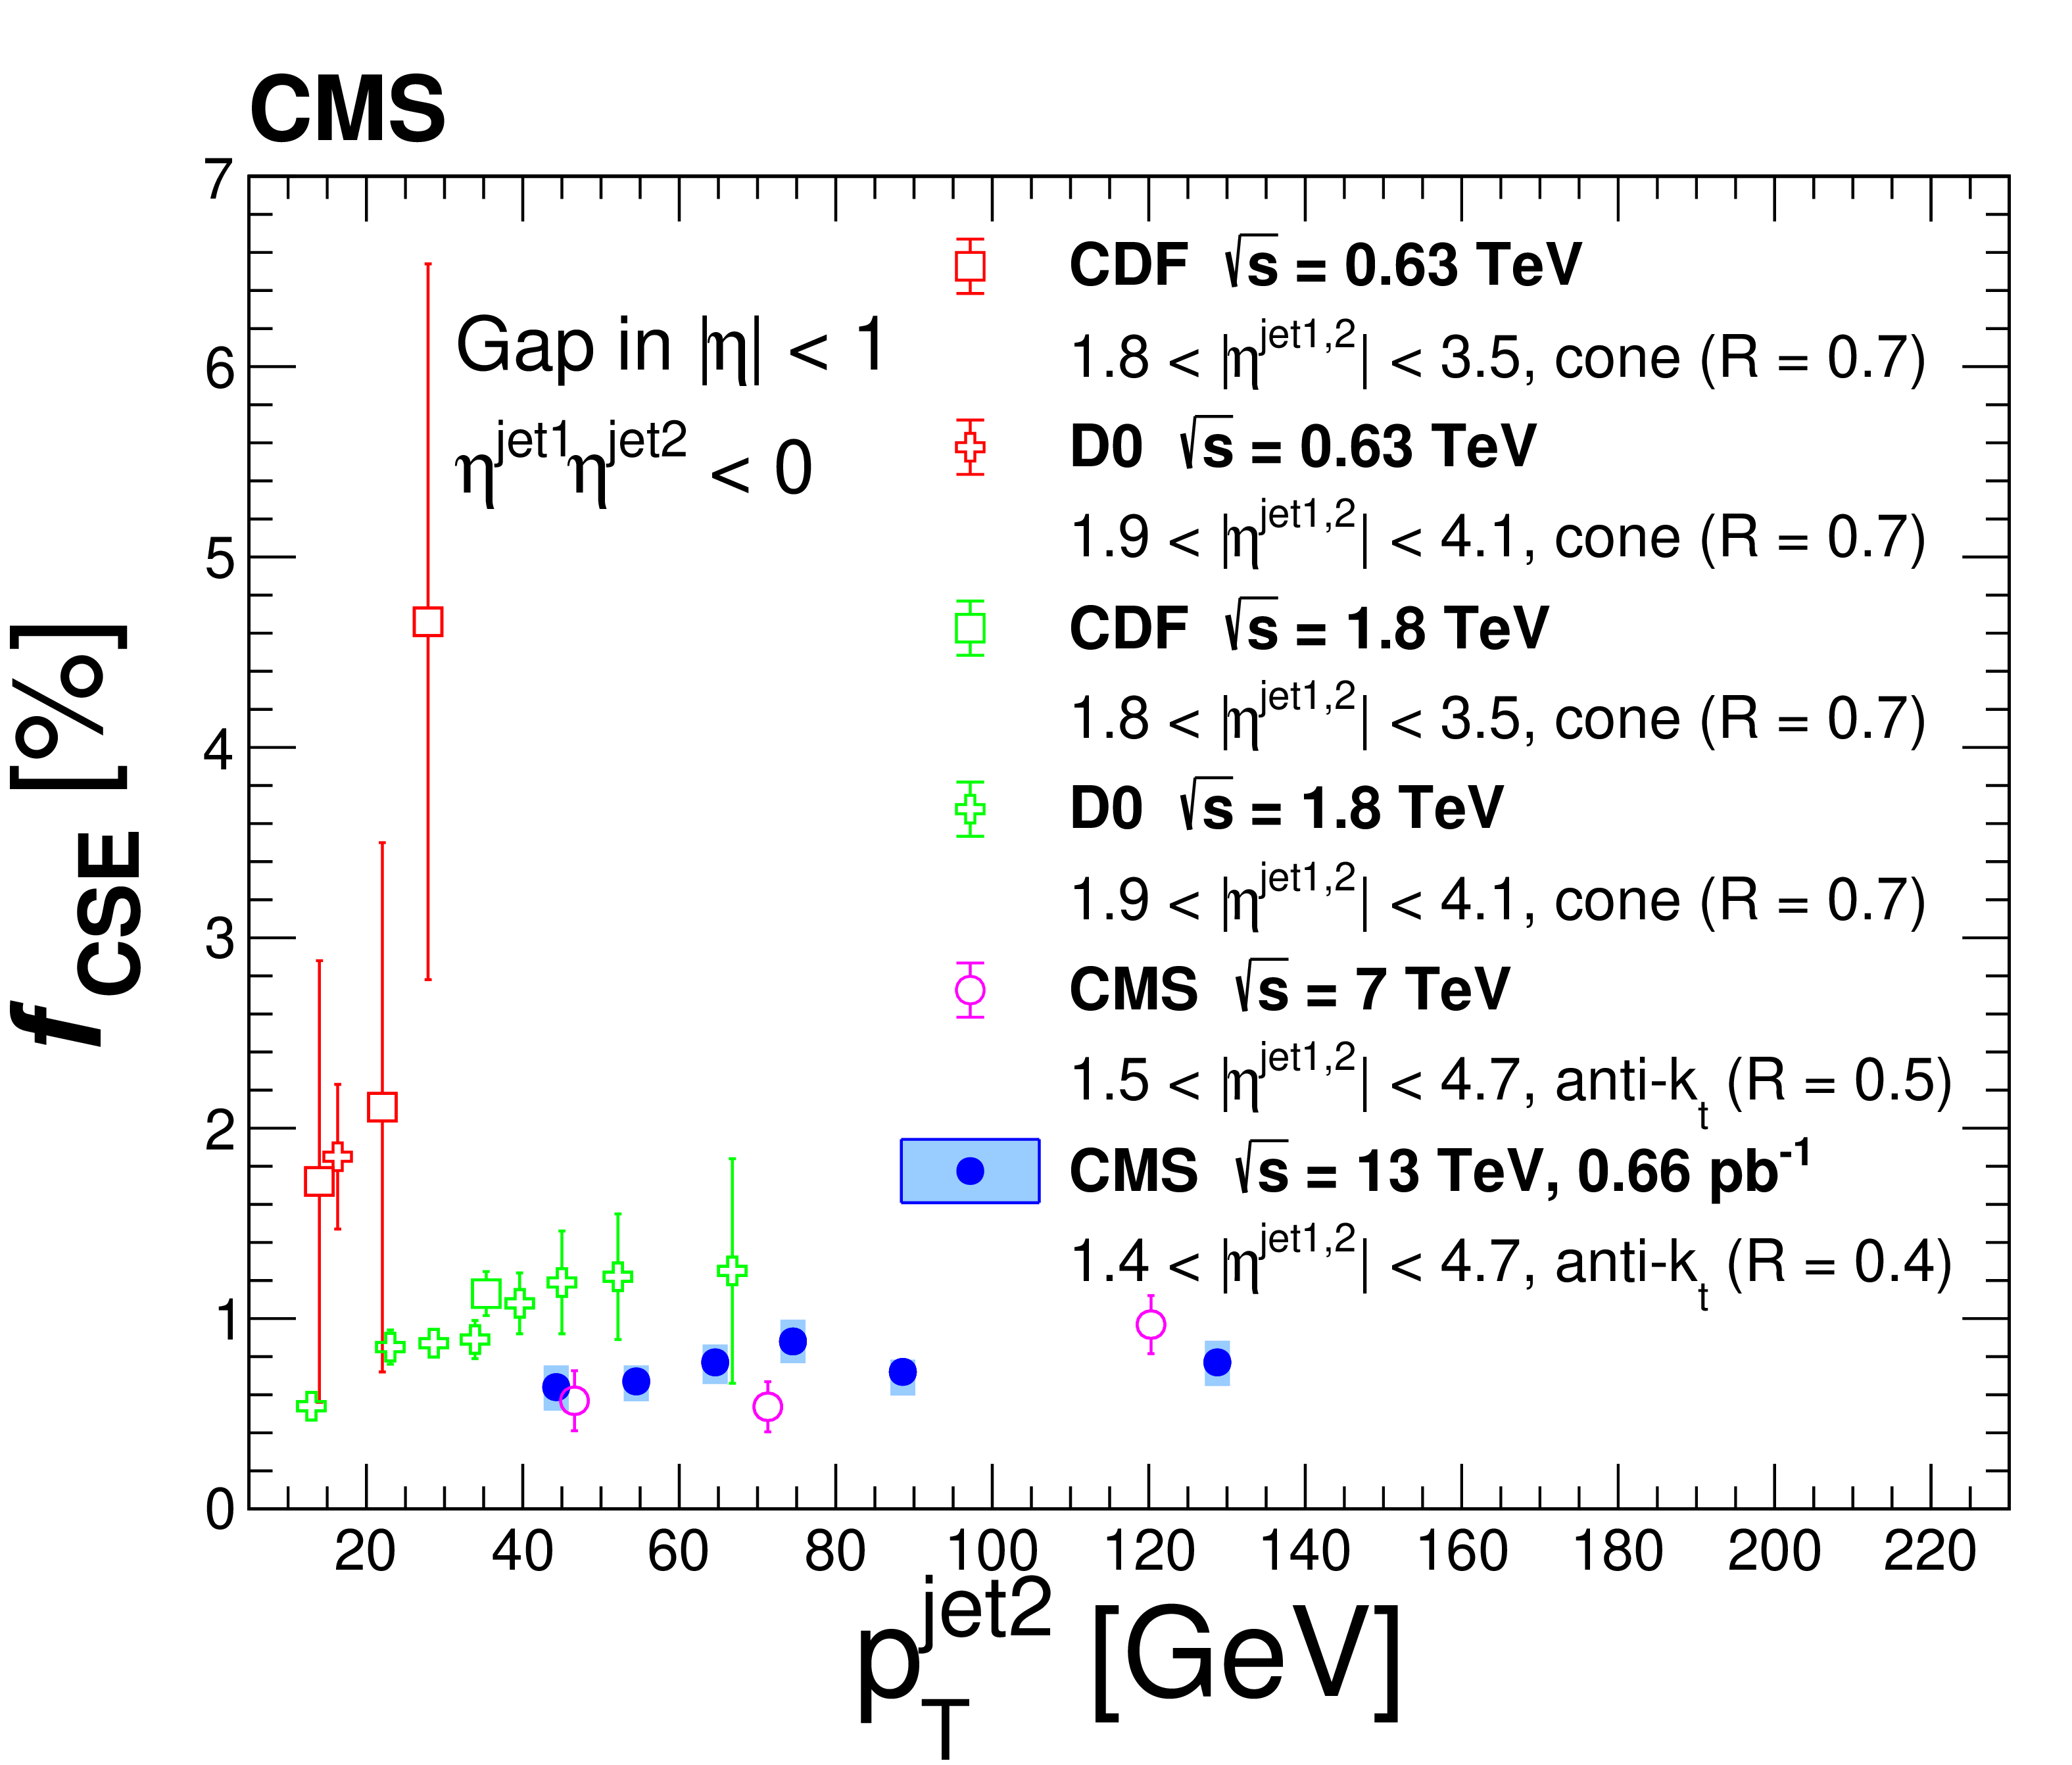
Fraction of color-singlet exchange dijet events, $f_\text {CSE}$, measured as a function of $ {p_{\mathrm {T}}} ^\text {jet2}$ by the D0 and CDF Collaborations [43,45,46] at $\sqrt {s} = $ 0.63 (red open symbols) and 1.8 TeV (green open symbols), by the CMS Collaboration [47] at 7 TeV (magenta open symbols), and the present results at 13 TeV (filled circles). Vertical bars of the open symbols represent the total experimental uncertainties. Vertical bars of the 13 TeV measurement represent the statistical uncertainties, and boxes represent the combination of statistical and systematic uncertainties in quadrature. The central gap is defined by means of the particle activity in the $ {| \eta |} < $ 1 interval in these measurements, as described in the text. |
png pdf |
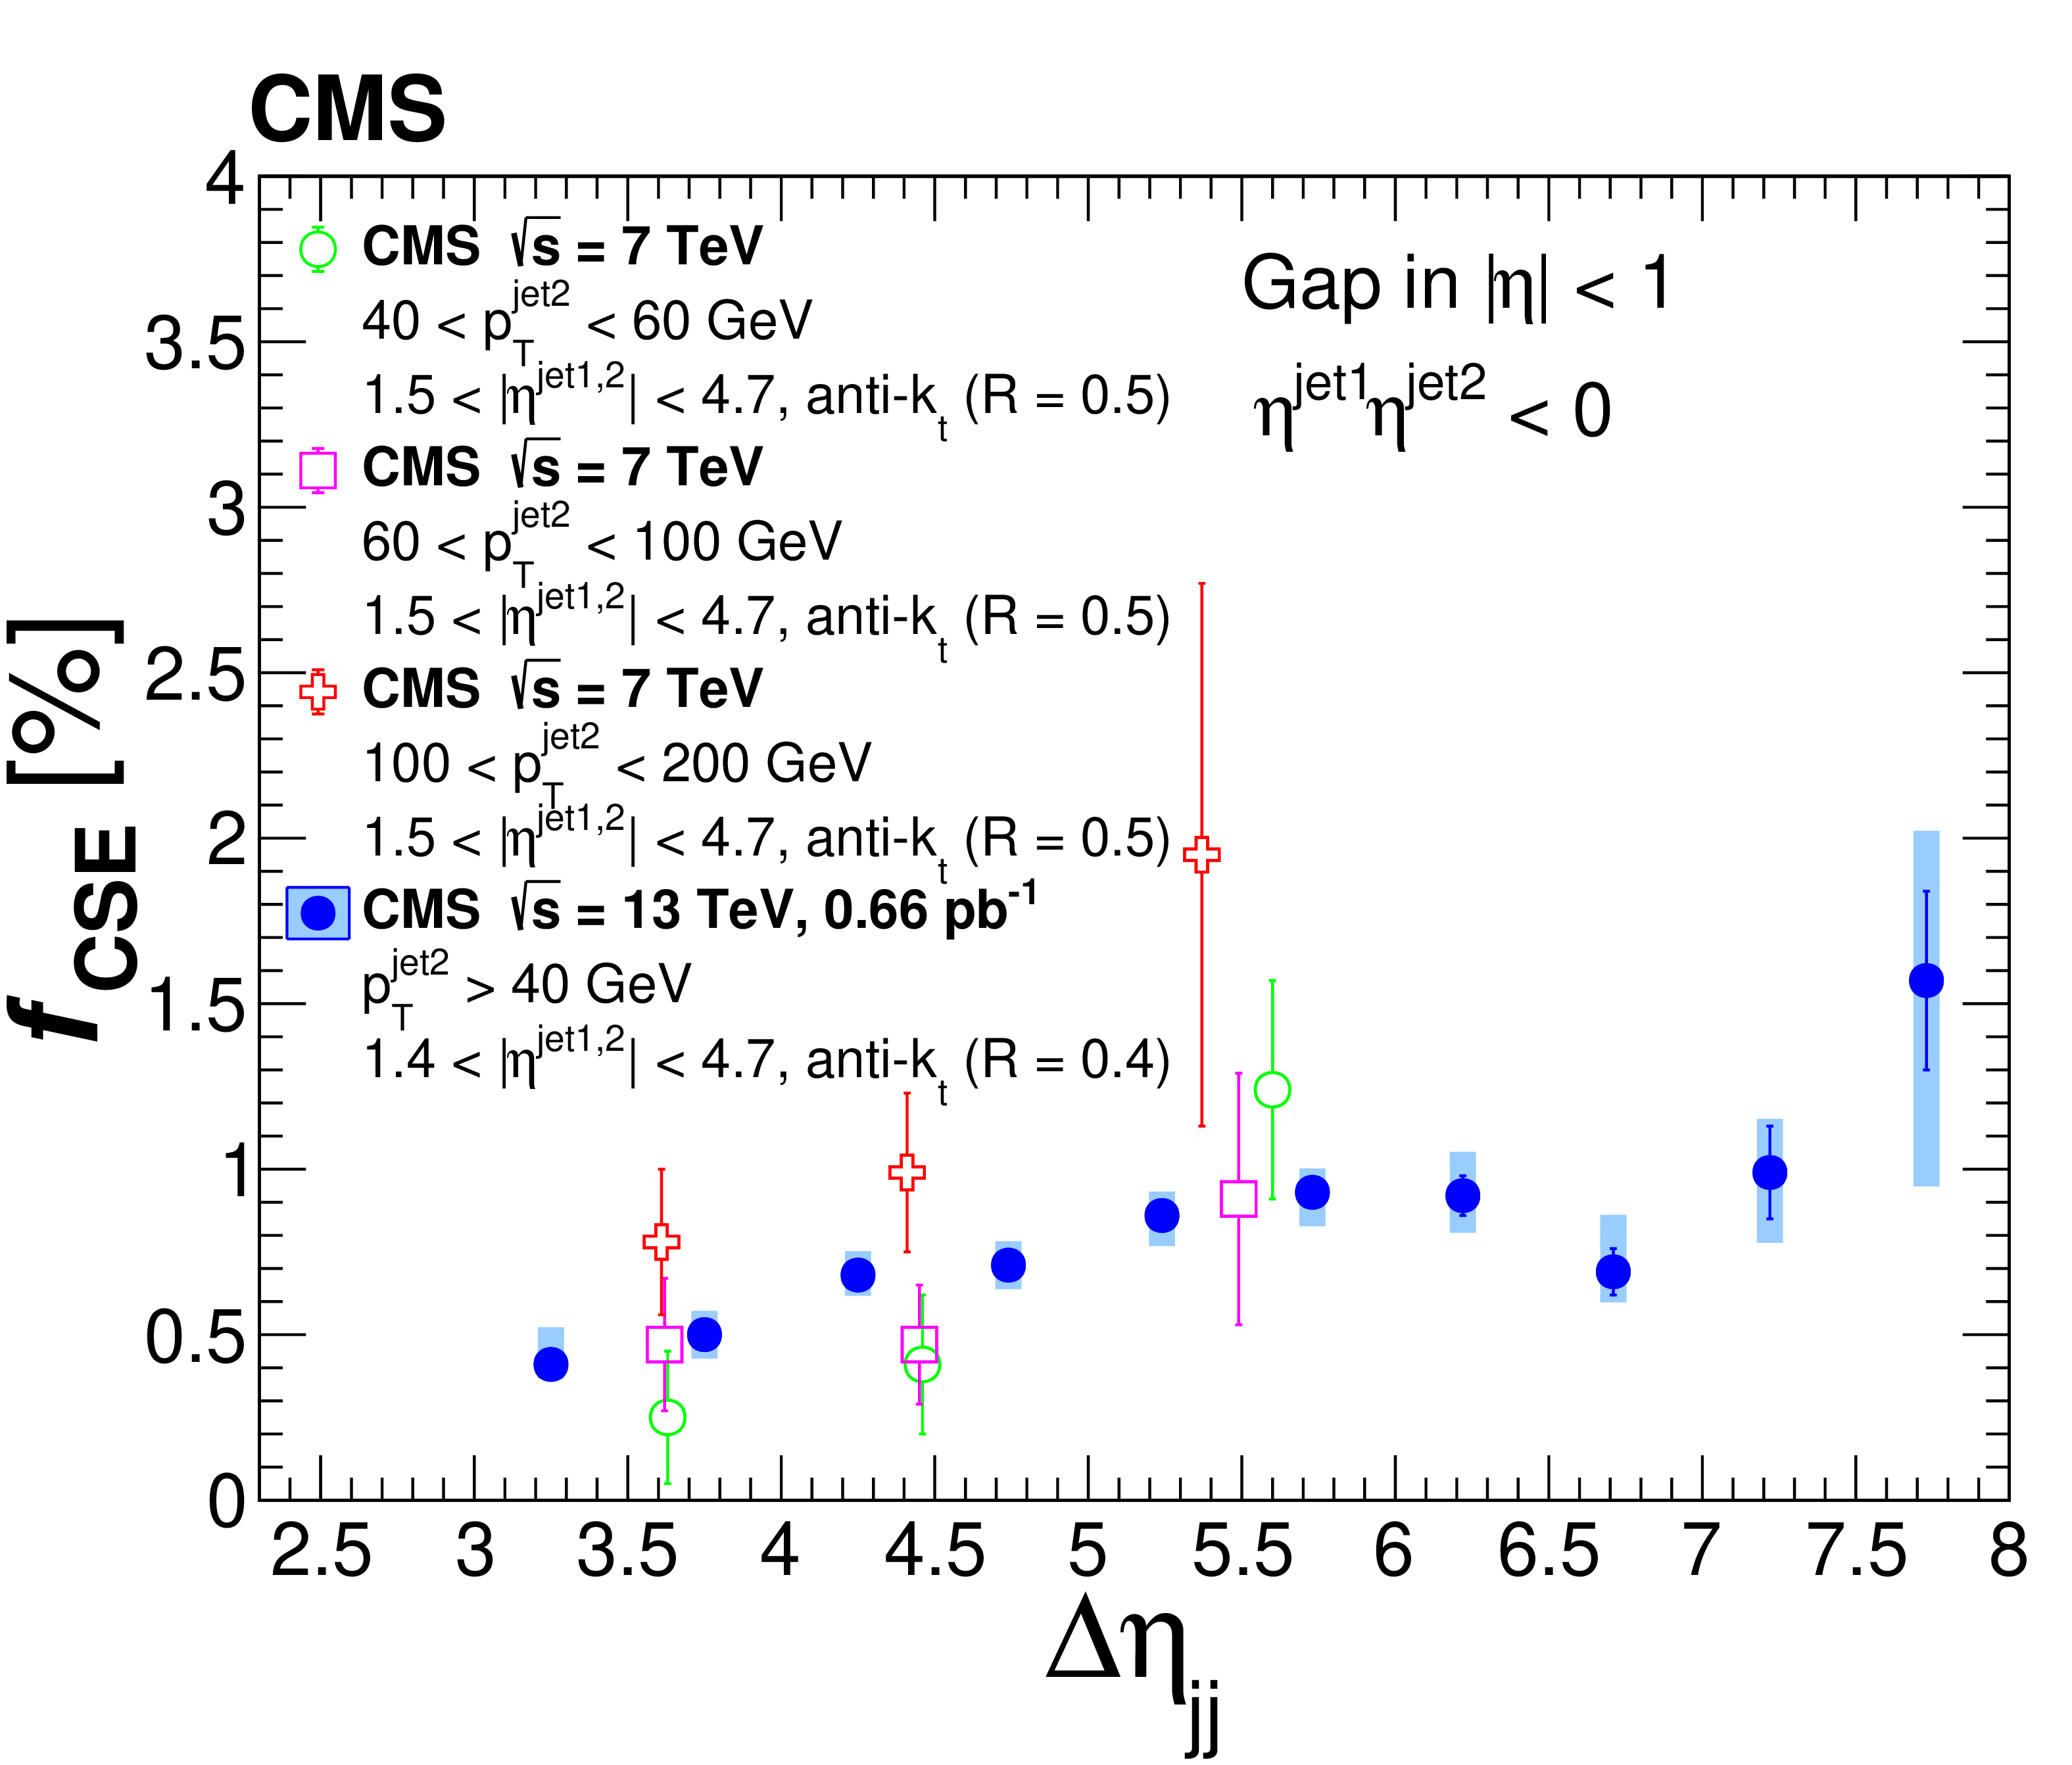
Figure 10:
Fraction of color-singlet exchange dijet events, $f_\text {CSE}$, measured as a function of $\Delta \eta _\text {jj}$ by CMS at 7 TeV [47] and the present measurement at 13 TeV. The 7 TeV measurement was performed in three bins of $ {p_{\mathrm {T}}} ^\text {jet2} = $ 40-60, 60-100, and 100-200 GeV, which are represented by the open circle, open square, and open cross symbols, respectively. The present 13 TeV results are represented by the filled circles. Vertical bars of the 7 TeV measurement represent the total experimental uncertainties. Vertical bars of the 13 TeV measurement represent the statistical uncertainties, and boxes represent the combination of statistical and systematic uncertainties in quadrature. |
png pdf |
Figure 11:
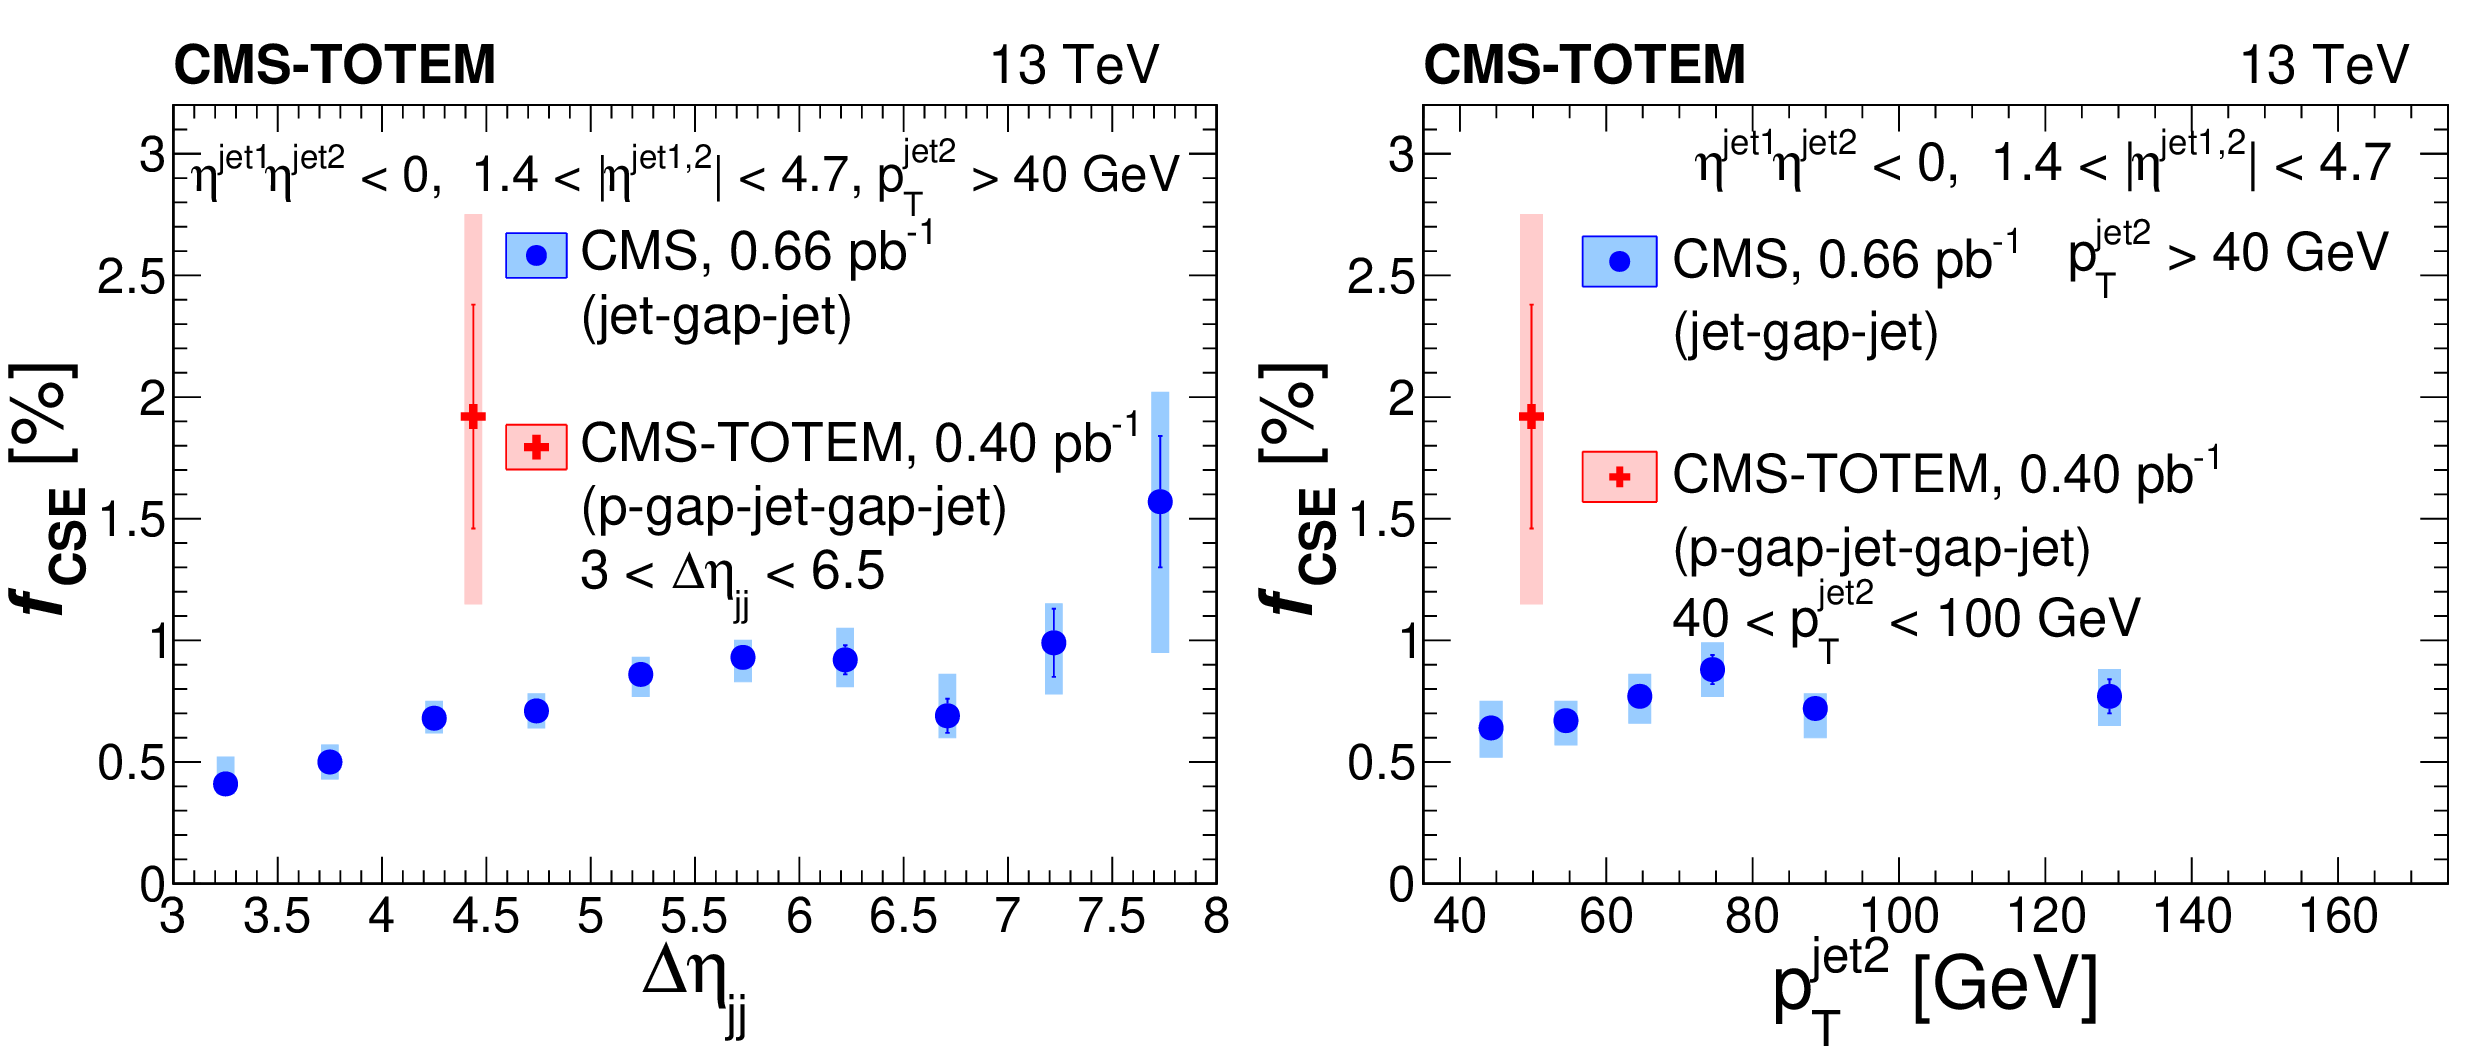
Fraction of hard color-singlet exchange dijet events $f_\text {CSE}$, measured as a function of $\Delta \eta _\text {jj}$ (left) and $ {p_{\mathrm {T}}} ^\text {jet2}$ (right) extracted in inclusive dijet event production (labeled CMS, represented by the blue circle markers) and in dijet events with an intact proton at 13 TeV (labeled CMS-TOTEM, represented by the red cross marker). Vertical bars represent the statistical uncertainties, and boxes represent the combination of statistical and systematic uncertainties in quadrature. The CMS results are plotted at the mean values of $\Delta \eta _\text {jj}$ and $ {p_{\mathrm {T}}} ^\text {jet2}$ in the bin. The CMS-TOTEM result is plotted at the mean value of $\Delta \eta _\text {jj}$ and $ {p_{\mathrm {T}}} ^\text {jet2}$ in the allowed range of these variables. The 40 $ < {p_{\mathrm {T}}} ^\text {jet2} < $ 100 GeV and 3.0 $ < \Delta \eta _\text {jj} < $ 6.5 ranges below the CMS-TOTEM legend represent the dijet phase space covered by events with an intact proton with the present sample size, rather than a selection requirement, as described in the text. |
png pdf |
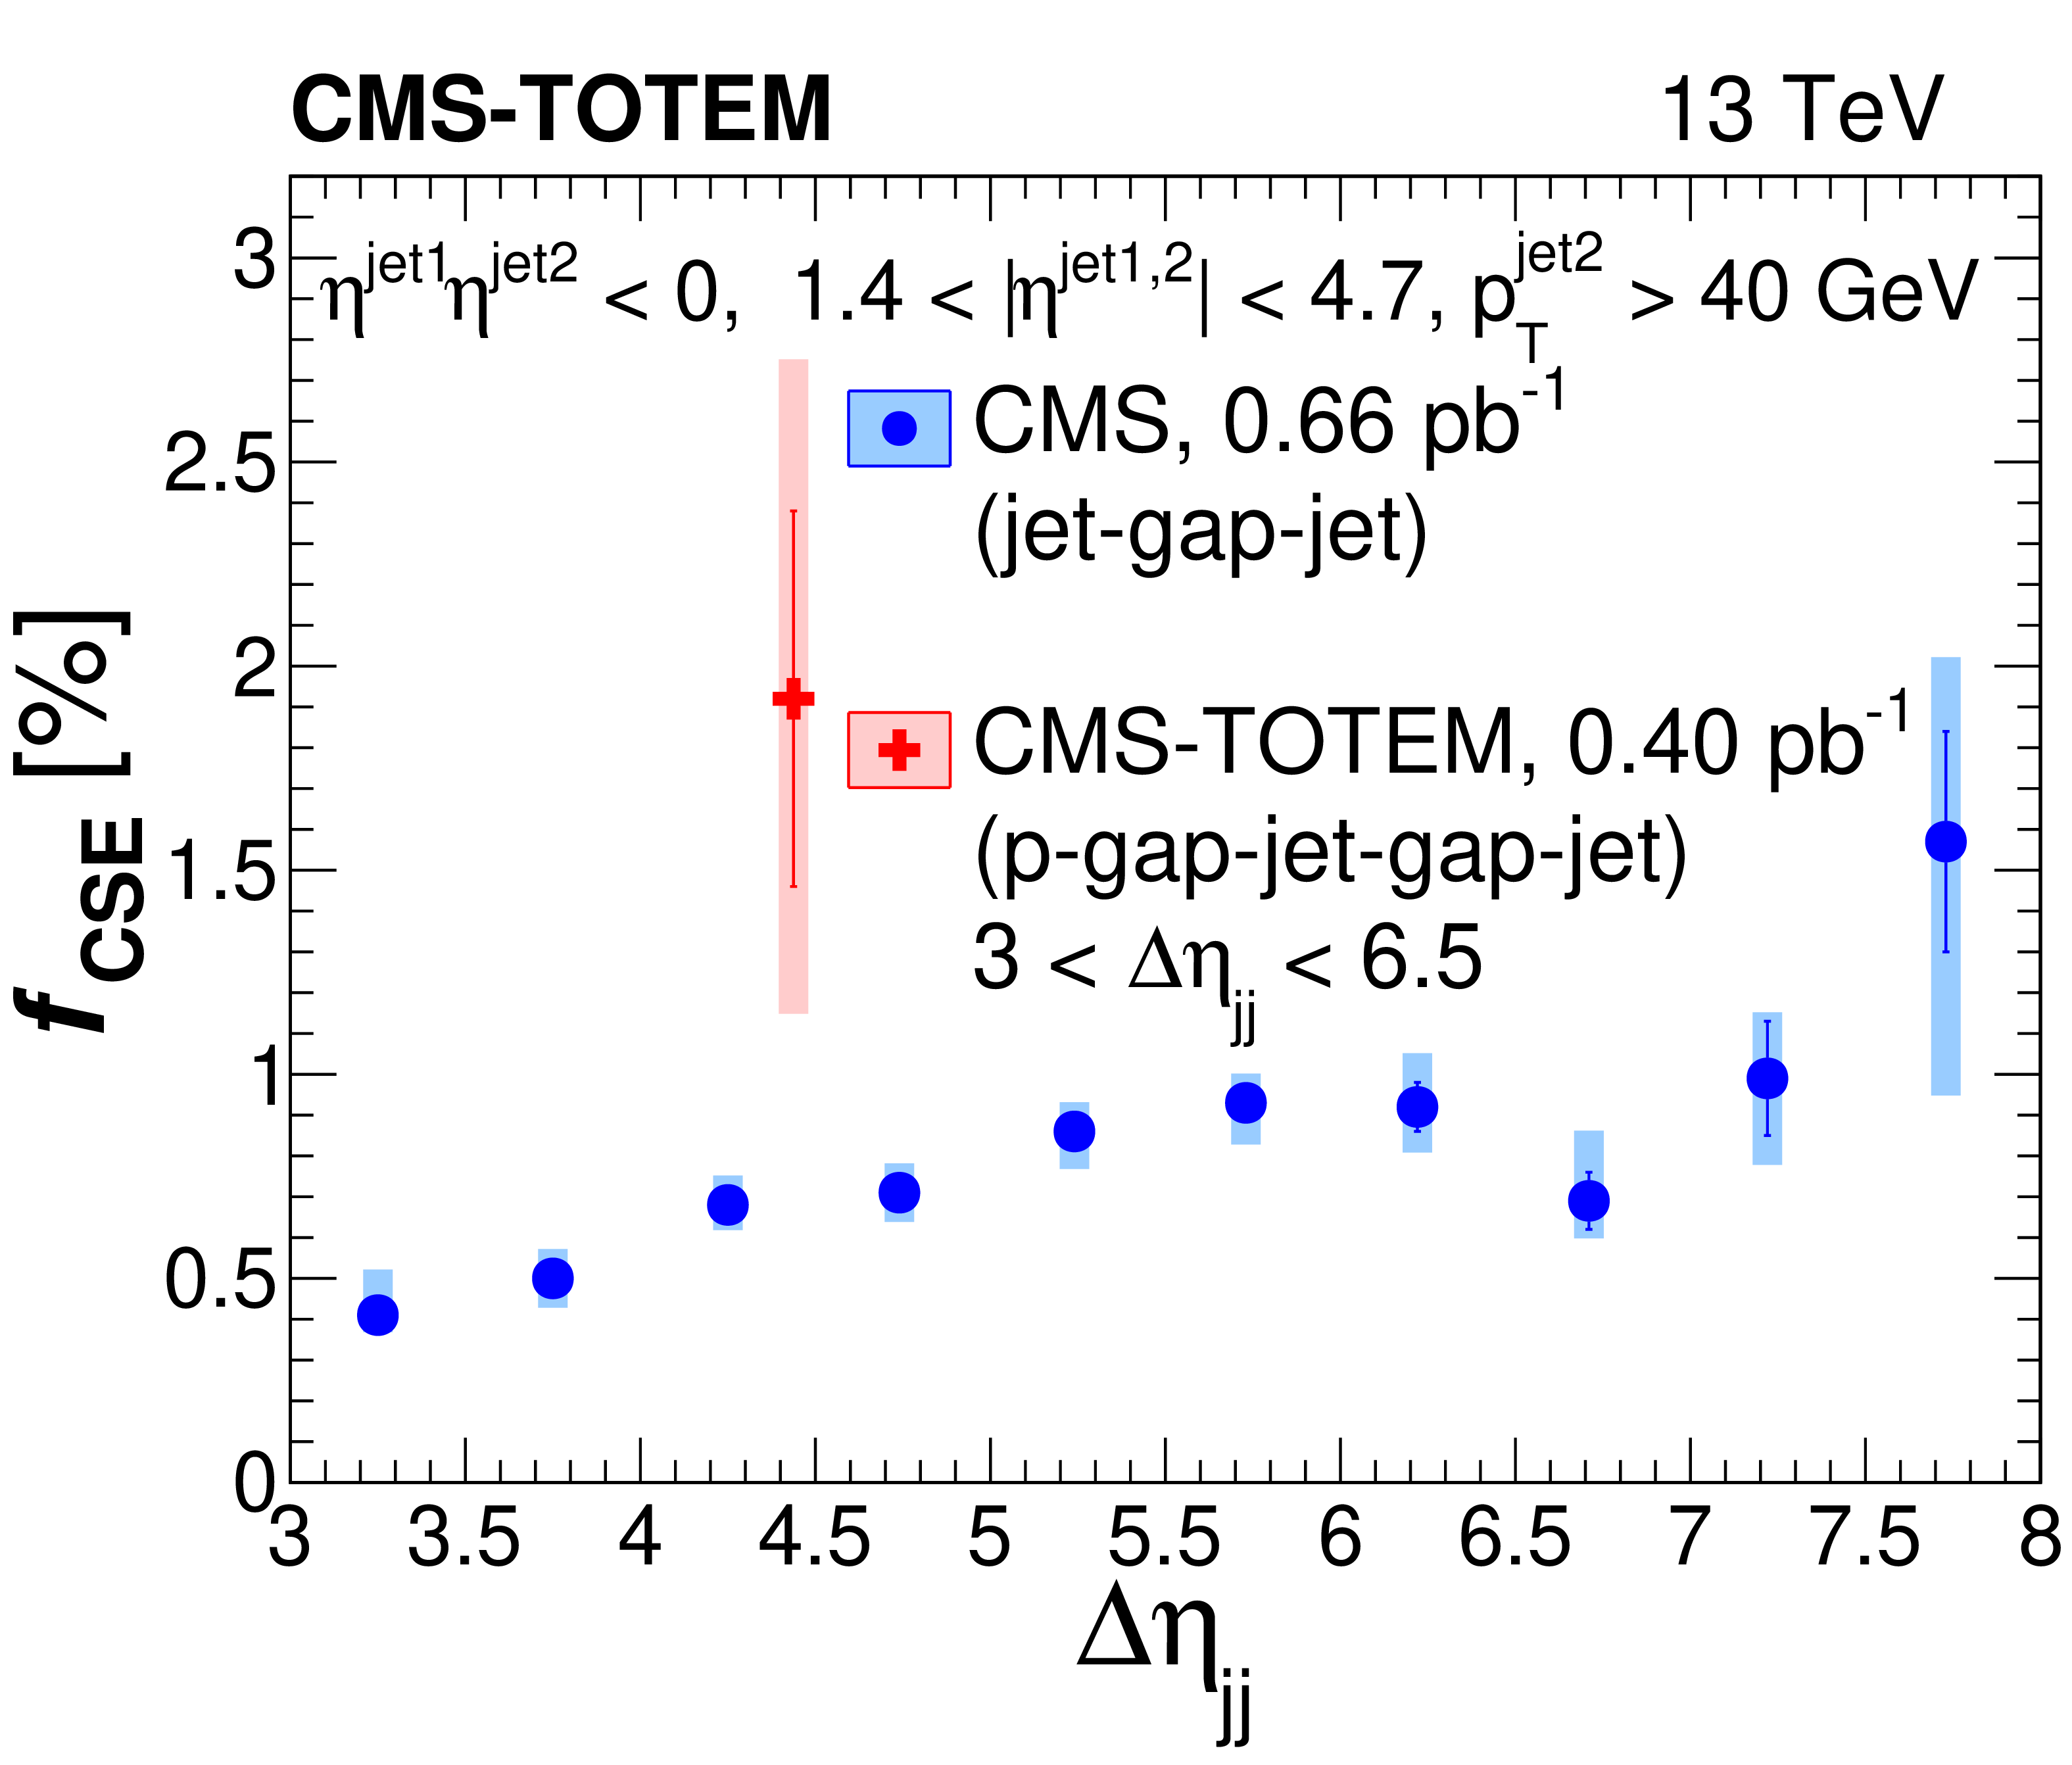
Figure 11-a:
Fraction of hard color-singlet exchange dijet events $f_\text {CSE}$, measured as a function of $\Delta \eta _\text {jj}$ extracted in inclusive dijet event production (labeled CMS, represented by the blue circle markers) and in dijet events with an intact proton at 13 TeV (labeled CMS-TOTEM, represented by the red cross marker). Vertical bars represent the statistical uncertainties, and boxes represent the combination of statistical and systematic uncertainties in quadrature. The CMS results are plotted at the mean values of $\Delta \eta _\text {jj}$ and $ {p_{\mathrm {T}}} ^\text {jet2}$ in the bin. The CMS-TOTEM result is plotted at the mean value of $\Delta \eta _\text {jj}$ and $ {p_{\mathrm {T}}} ^\text {jet2}$ in the allowed range of these variables. The 40 $ < {p_{\mathrm {T}}} ^\text {jet2} < $ 100 GeV and 3.0 $ < \Delta \eta _\text {jj} < $ 6.5 ranges below the CMS-TOTEM legend represent the dijet phase space covered by events with an intact proton with the present sample size, rather than a selection requirement, as described in the text. |
png pdf |
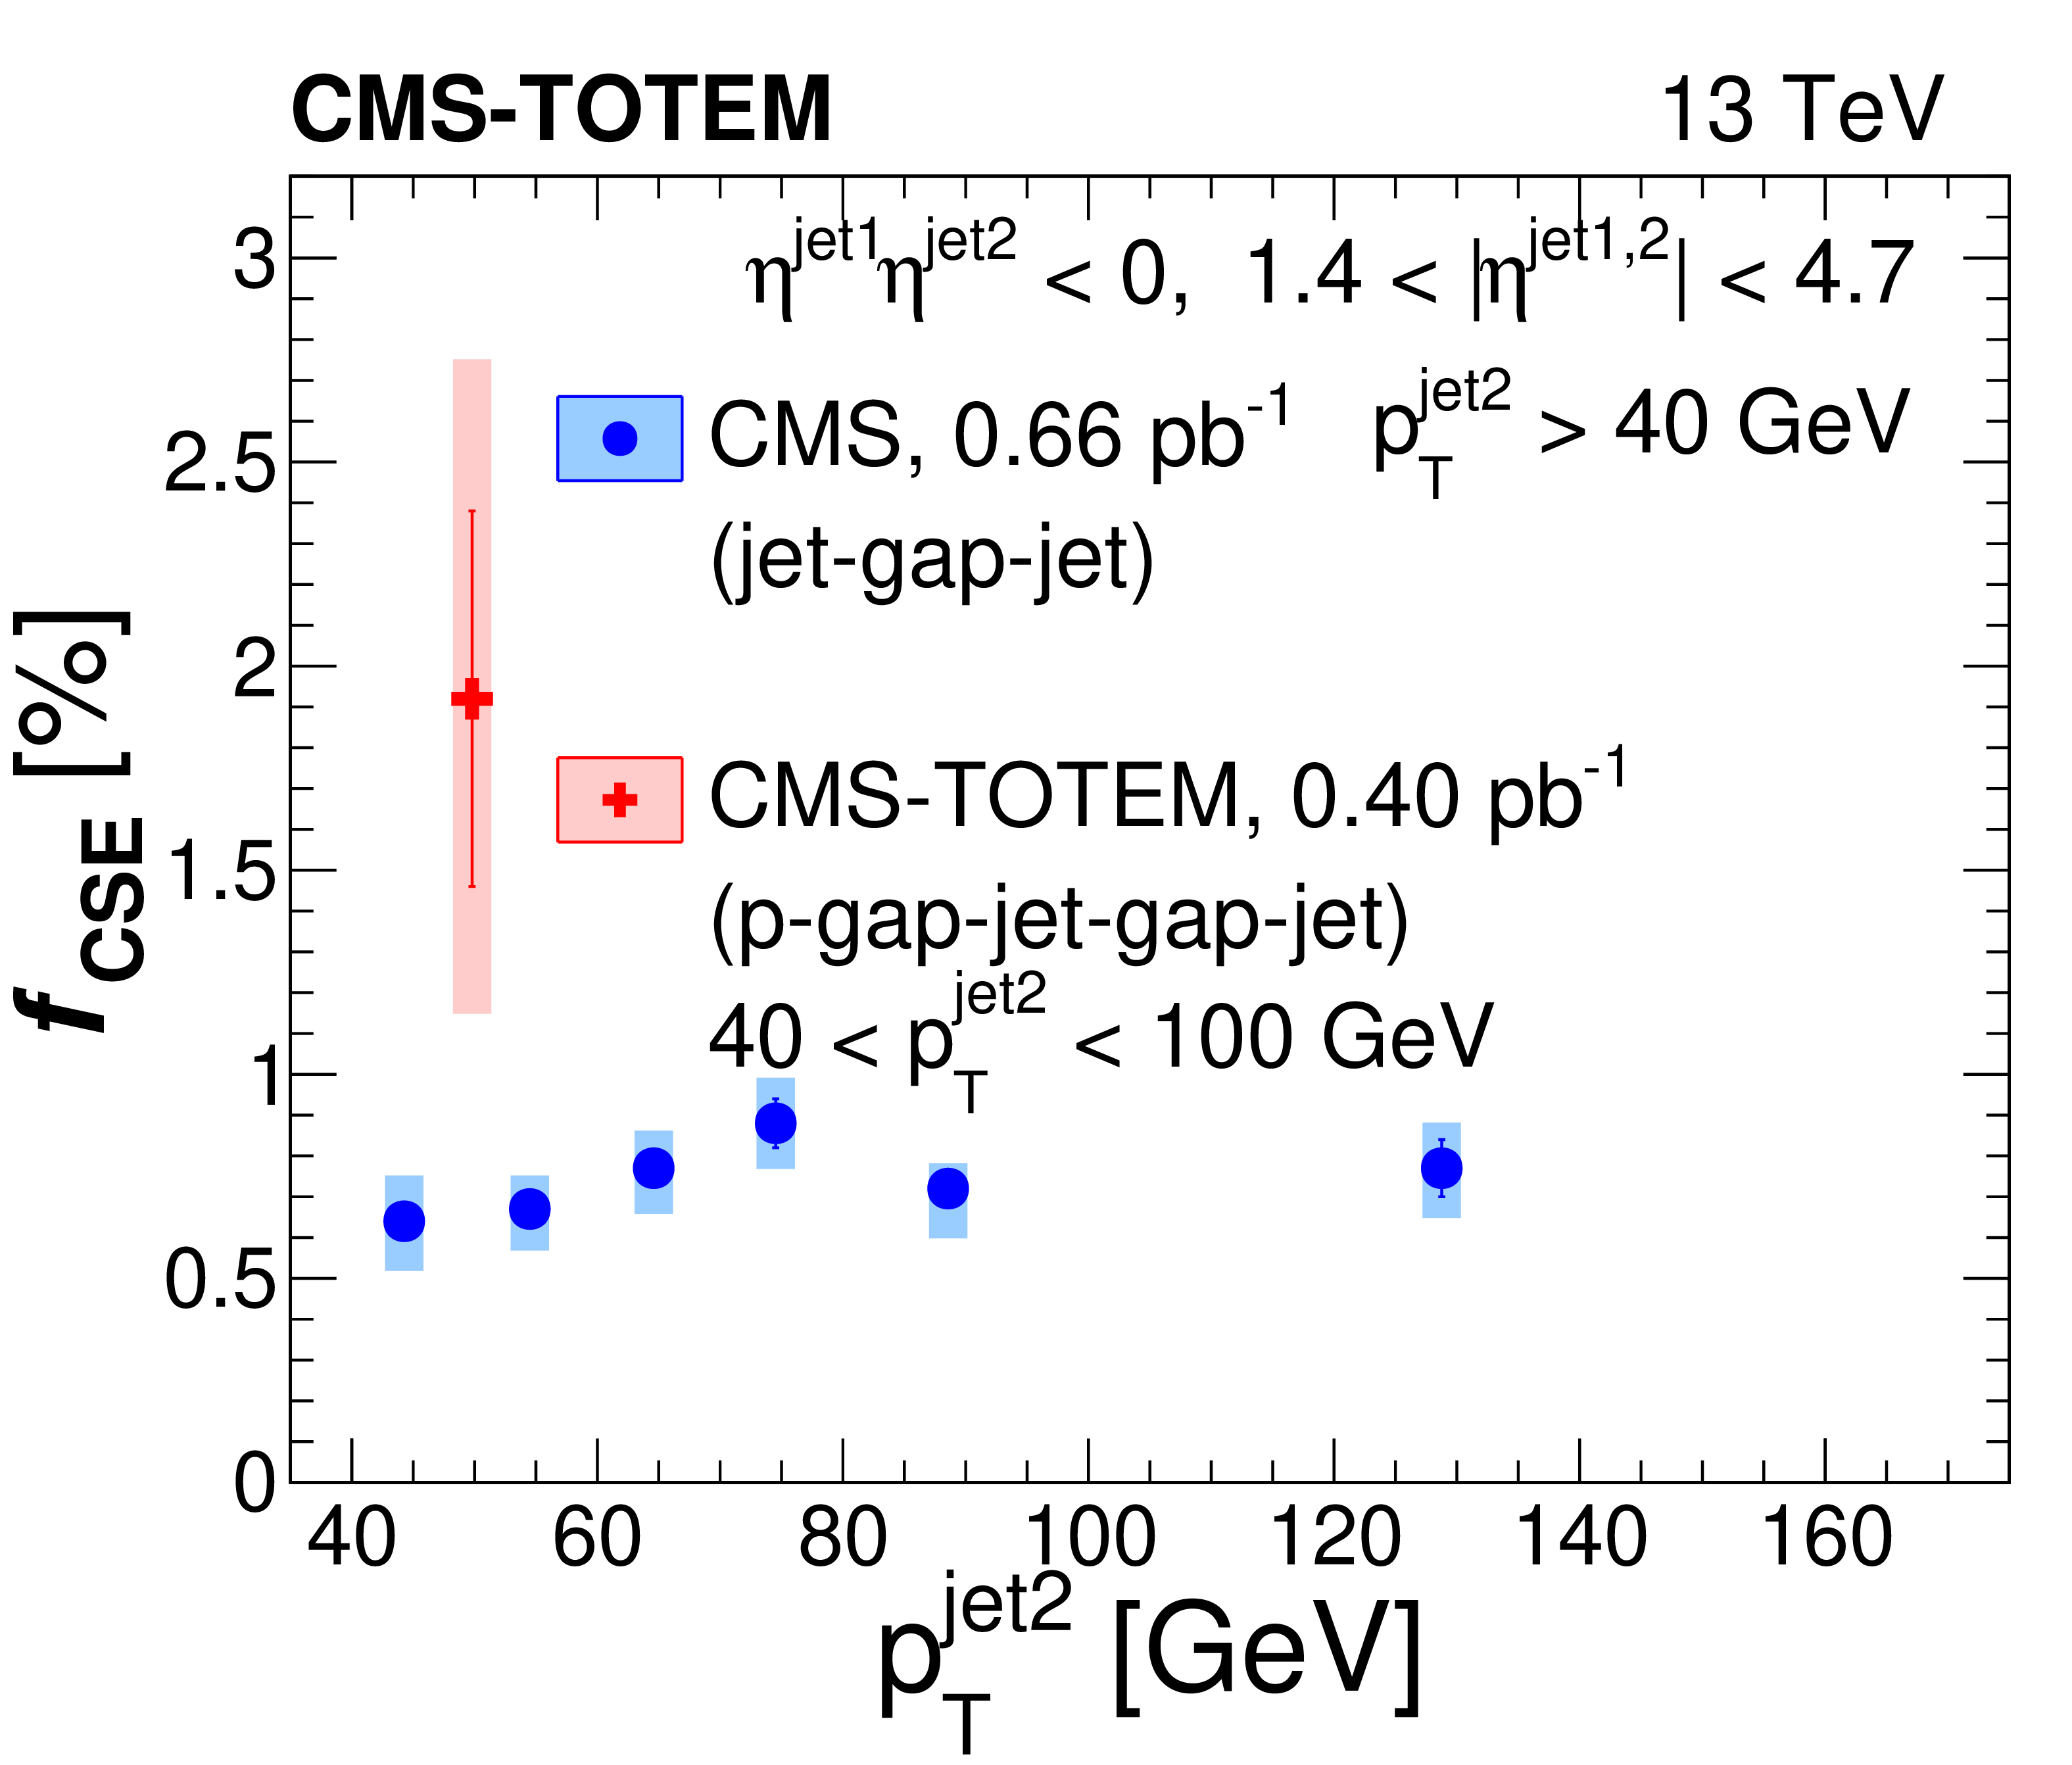
Figure 11-b:
Fraction of hard color-singlet exchange dijet events $f_\text {CSE}$, measured as a function of $ {p_{\mathrm {T}}} ^\text {jet2}$ extracted in inclusive dijet event production (labeled CMS, represented by the blue circle markers) and in dijet events with an intact proton at 13 TeV (labeled CMS-TOTEM, represented by the red cross marker). Vertical bars represent the statistical uncertainties, and boxes represent the combination of statistical and systematic uncertainties in quadrature. The CMS results are plotted at the mean values of $\Delta \eta _\text {jj}$ and $ {p_{\mathrm {T}}} ^\text {jet2}$ in the bin. The CMS-TOTEM result is plotted at the mean value of $\Delta \eta _\text {jj}$ and $ {p_{\mathrm {T}}} ^\text {jet2}$ in the allowed range of these variables. The 40 $ < {p_{\mathrm {T}}} ^\text {jet2} < $ 100 GeV and 3.0 $ < \Delta \eta _\text {jj} < $ 6.5 ranges below the CMS-TOTEM legend represent the dijet phase space covered by events with an intact proton with the present sample size, rather than a selection requirement, as described in the text. |
| Tables | |
png pdf |
Table 1:
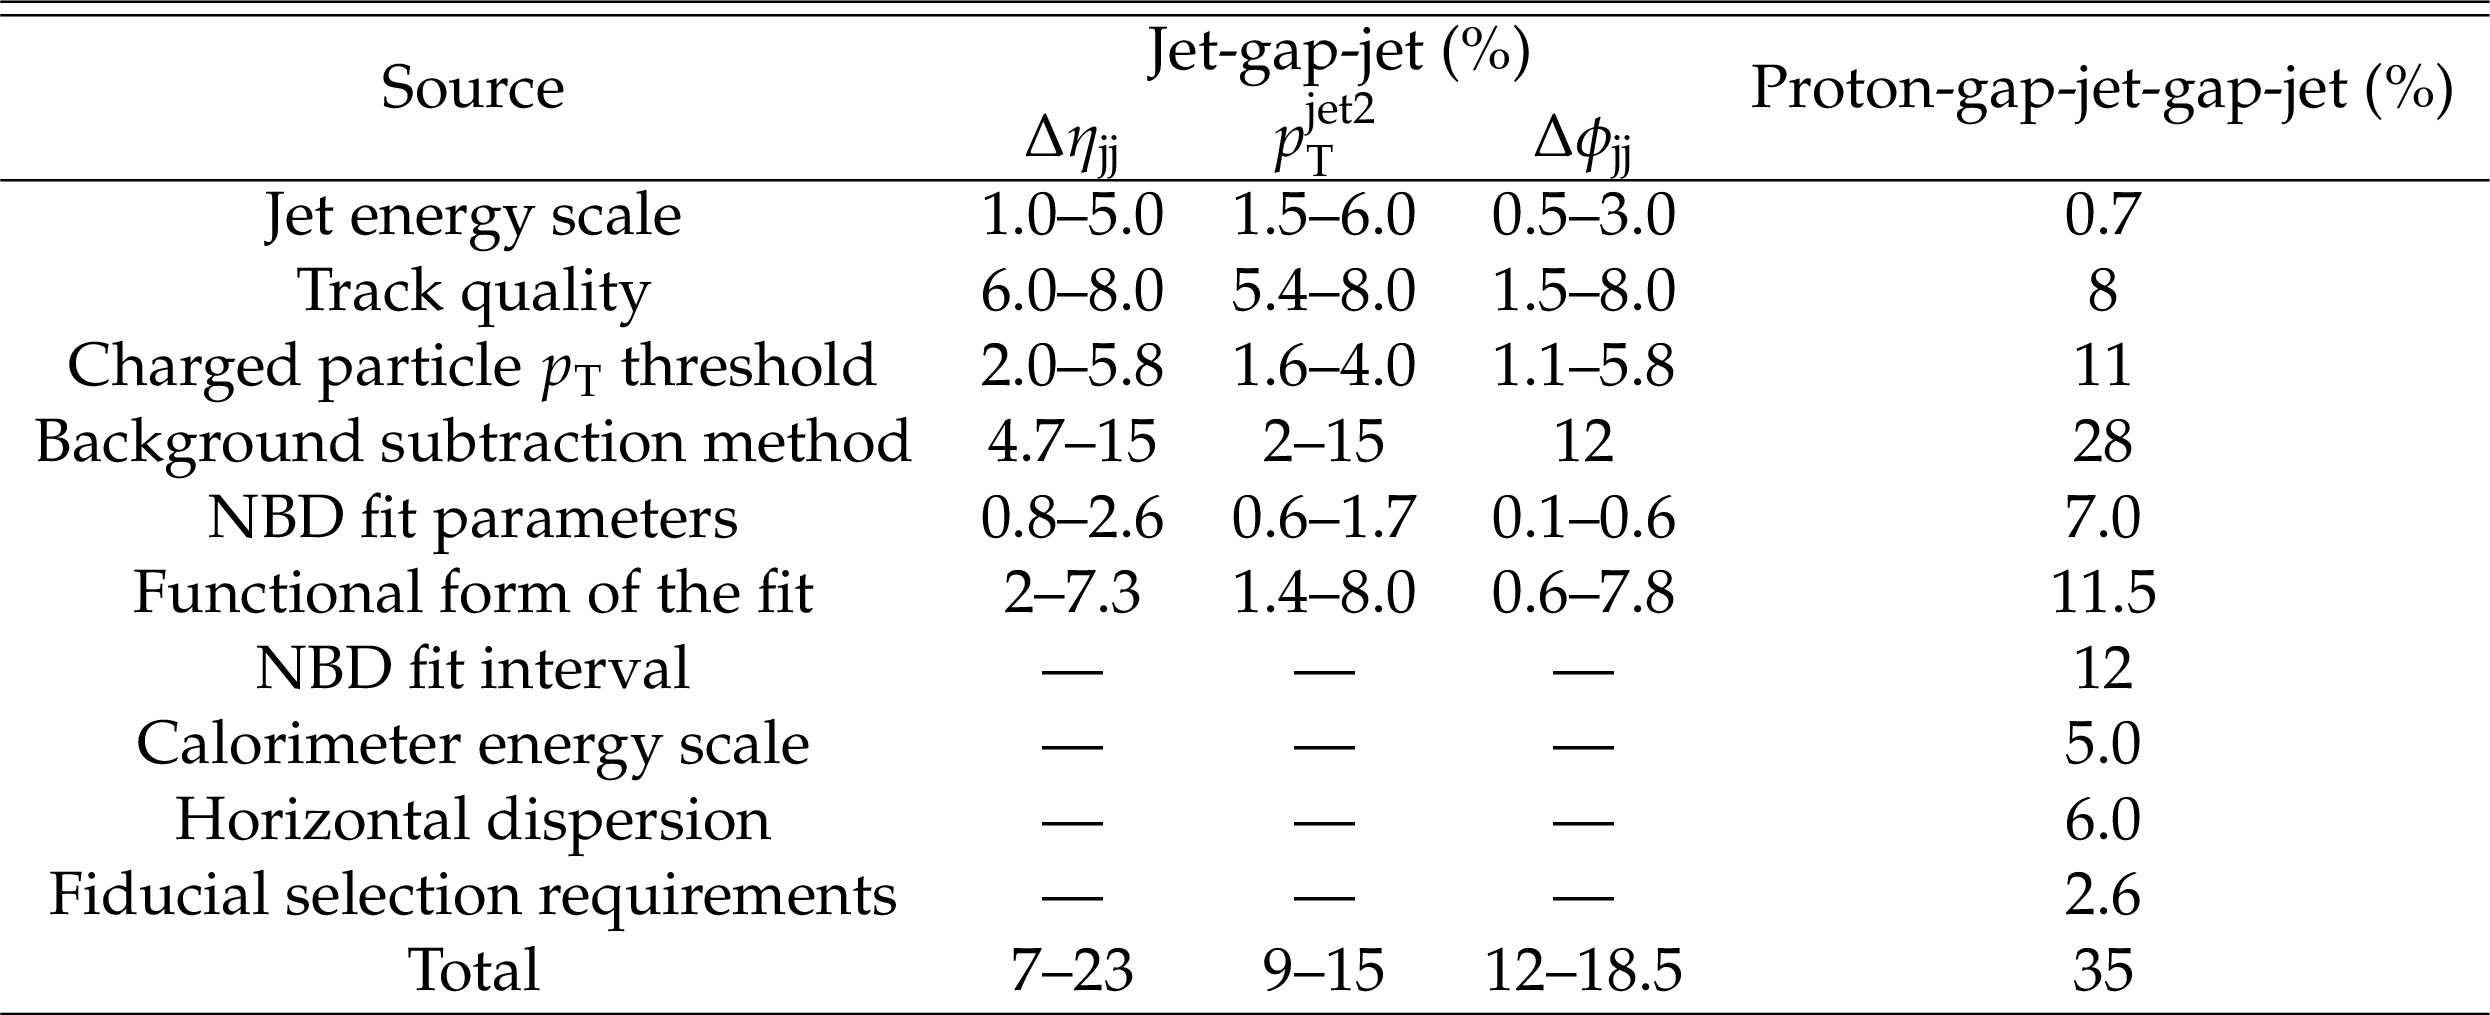
Relative systematic uncertainties in percentage for the measurements of $f_\text {CSE}$ in jet-gap-jet and proton-gap-jet-gap-jet events. The jet-gap-jet results summarize the systematic uncertainties in bins of the kinematic variables of interest $ {p_{\mathrm {T}}} ^\text {jet2}$, $\Delta \eta _\text {jj}$, and $\Delta \phi _\text {jj}$. When an uncertainty range is given, the range of values is representative of the variation found in $f_\text {CSE}$ in bins of the kinematic variables of interest. |
png pdf |
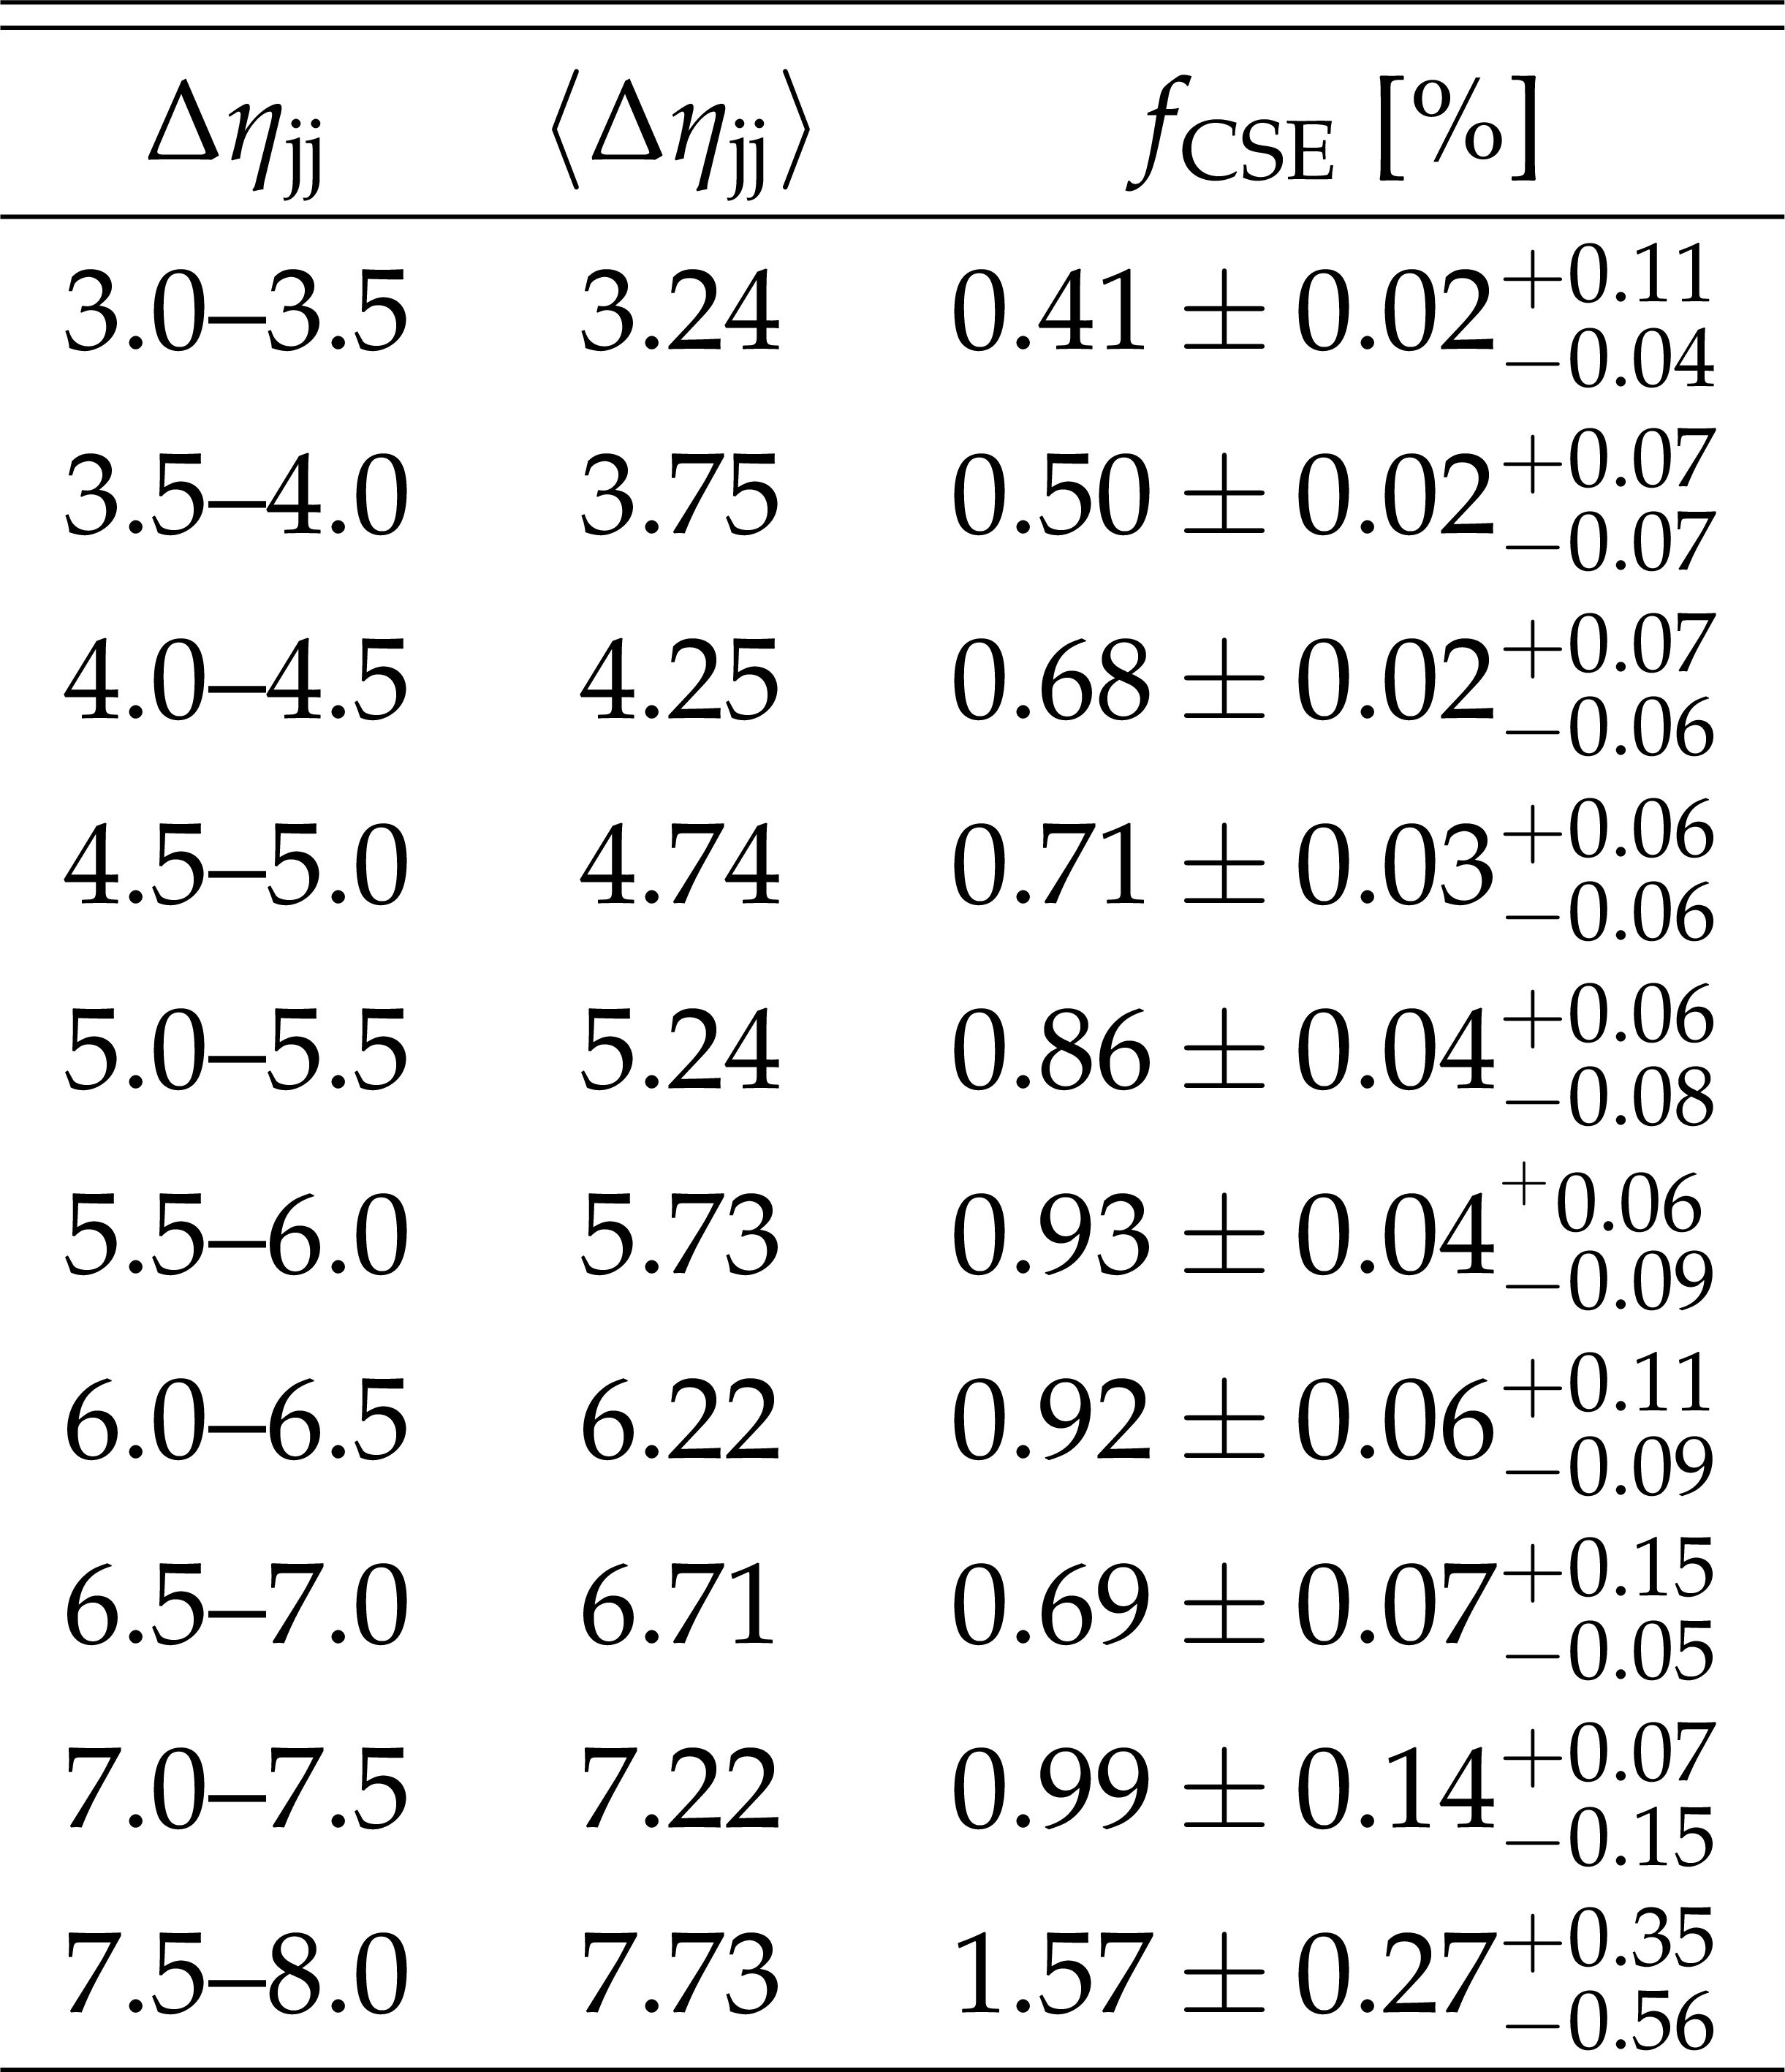
Table 2:
Measured values of the fraction of color-singlet exchange events $f_\text {CSE}$ in bins of the pseudorapidity difference between the two leading jets $\Delta \eta _\text {jj}$. The first column indicates the $\Delta \eta _\text {jj}$ intervals and the last column represents the measured fraction. The first and second uncertainties correspond to the statistical and systematic components, respectively. The results are integrated over the allowed $ {p_{\mathrm {T}}} ^\text {jet2}$ and $\Delta \phi _\text {jj}$ values. The mean values of $\Delta \eta _\text {jj}$ in the bin are given in the middle column. |
png pdf |
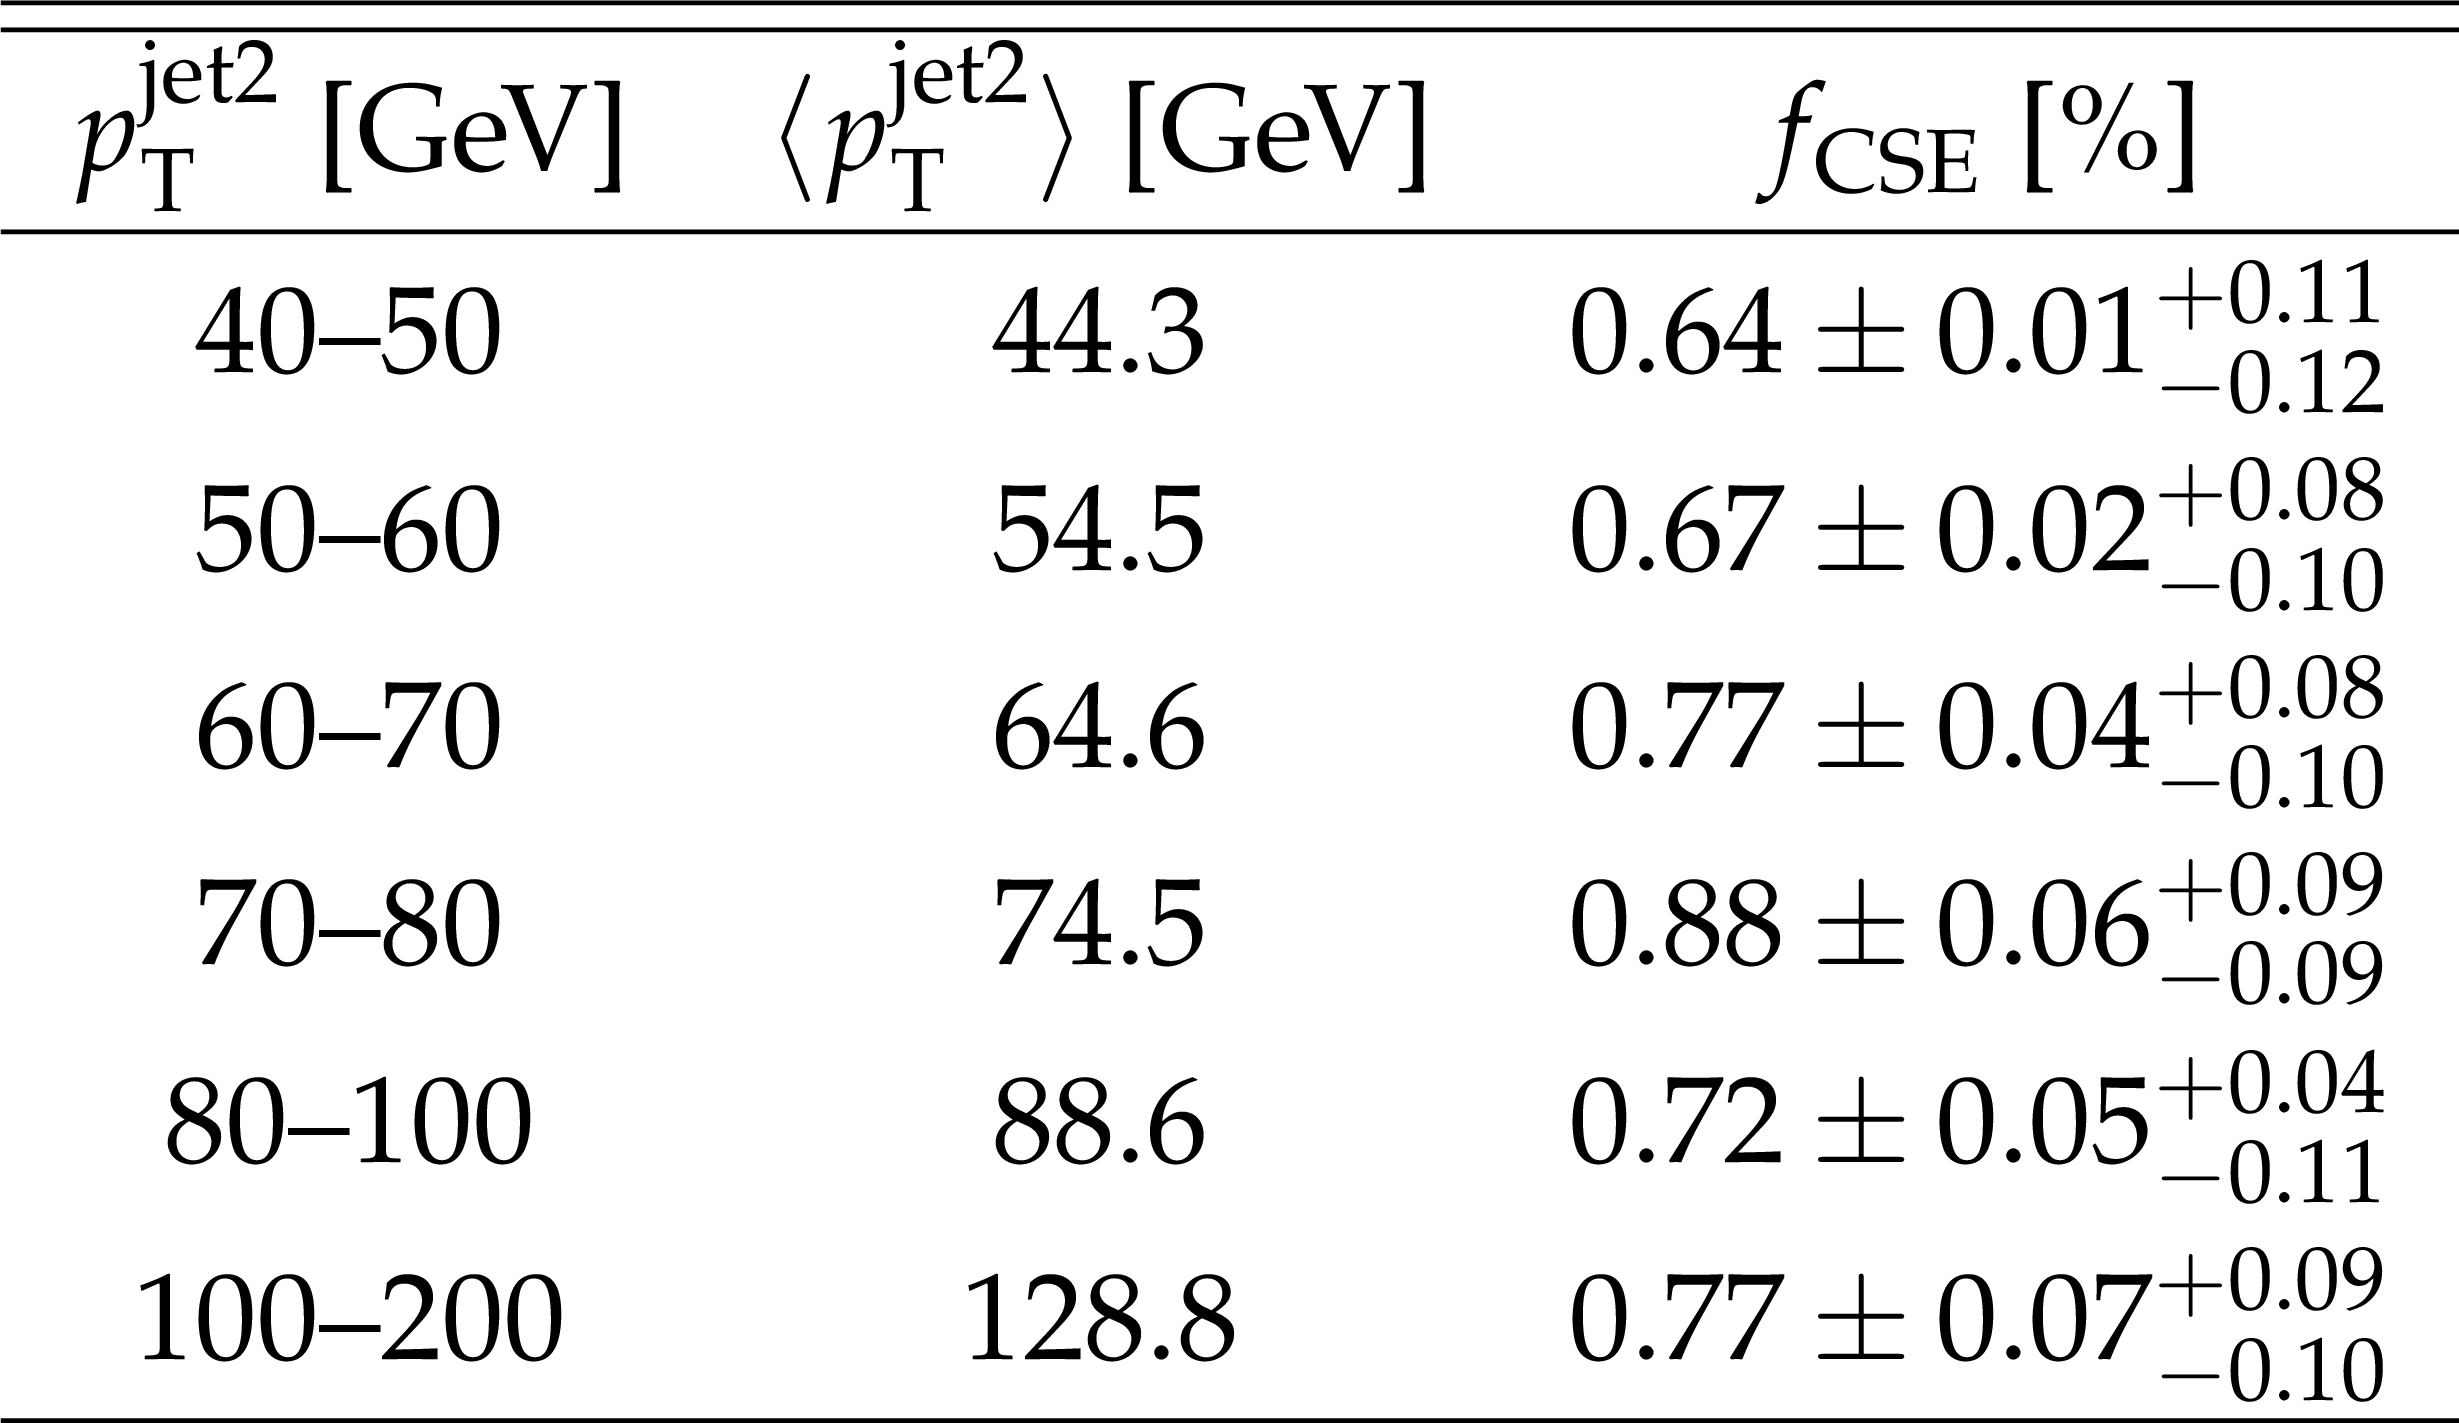
Table 3:
Measured values of the fraction of color-singlet exchange events $f_\text {CSE}$ in bins of the subleading jet transverse momentum $ {p_{\mathrm {T}}} ^\text {jet2}$. The first column indicates the $ {p_{\mathrm {T}}} ^\text {jet2}$ bin intervals and the last column represents the measured fraction. The first and second uncertainties correspond to the statistical and systematic components, respectively. The results are integrated over the allowed $\Delta \eta _\text {jj}$ and $\Delta \phi _\text {jj}$ values. The mean values of $ {p_{\mathrm {T}}} ^\text {jet2}$ in the bin are given in the middle column. |
png pdf |
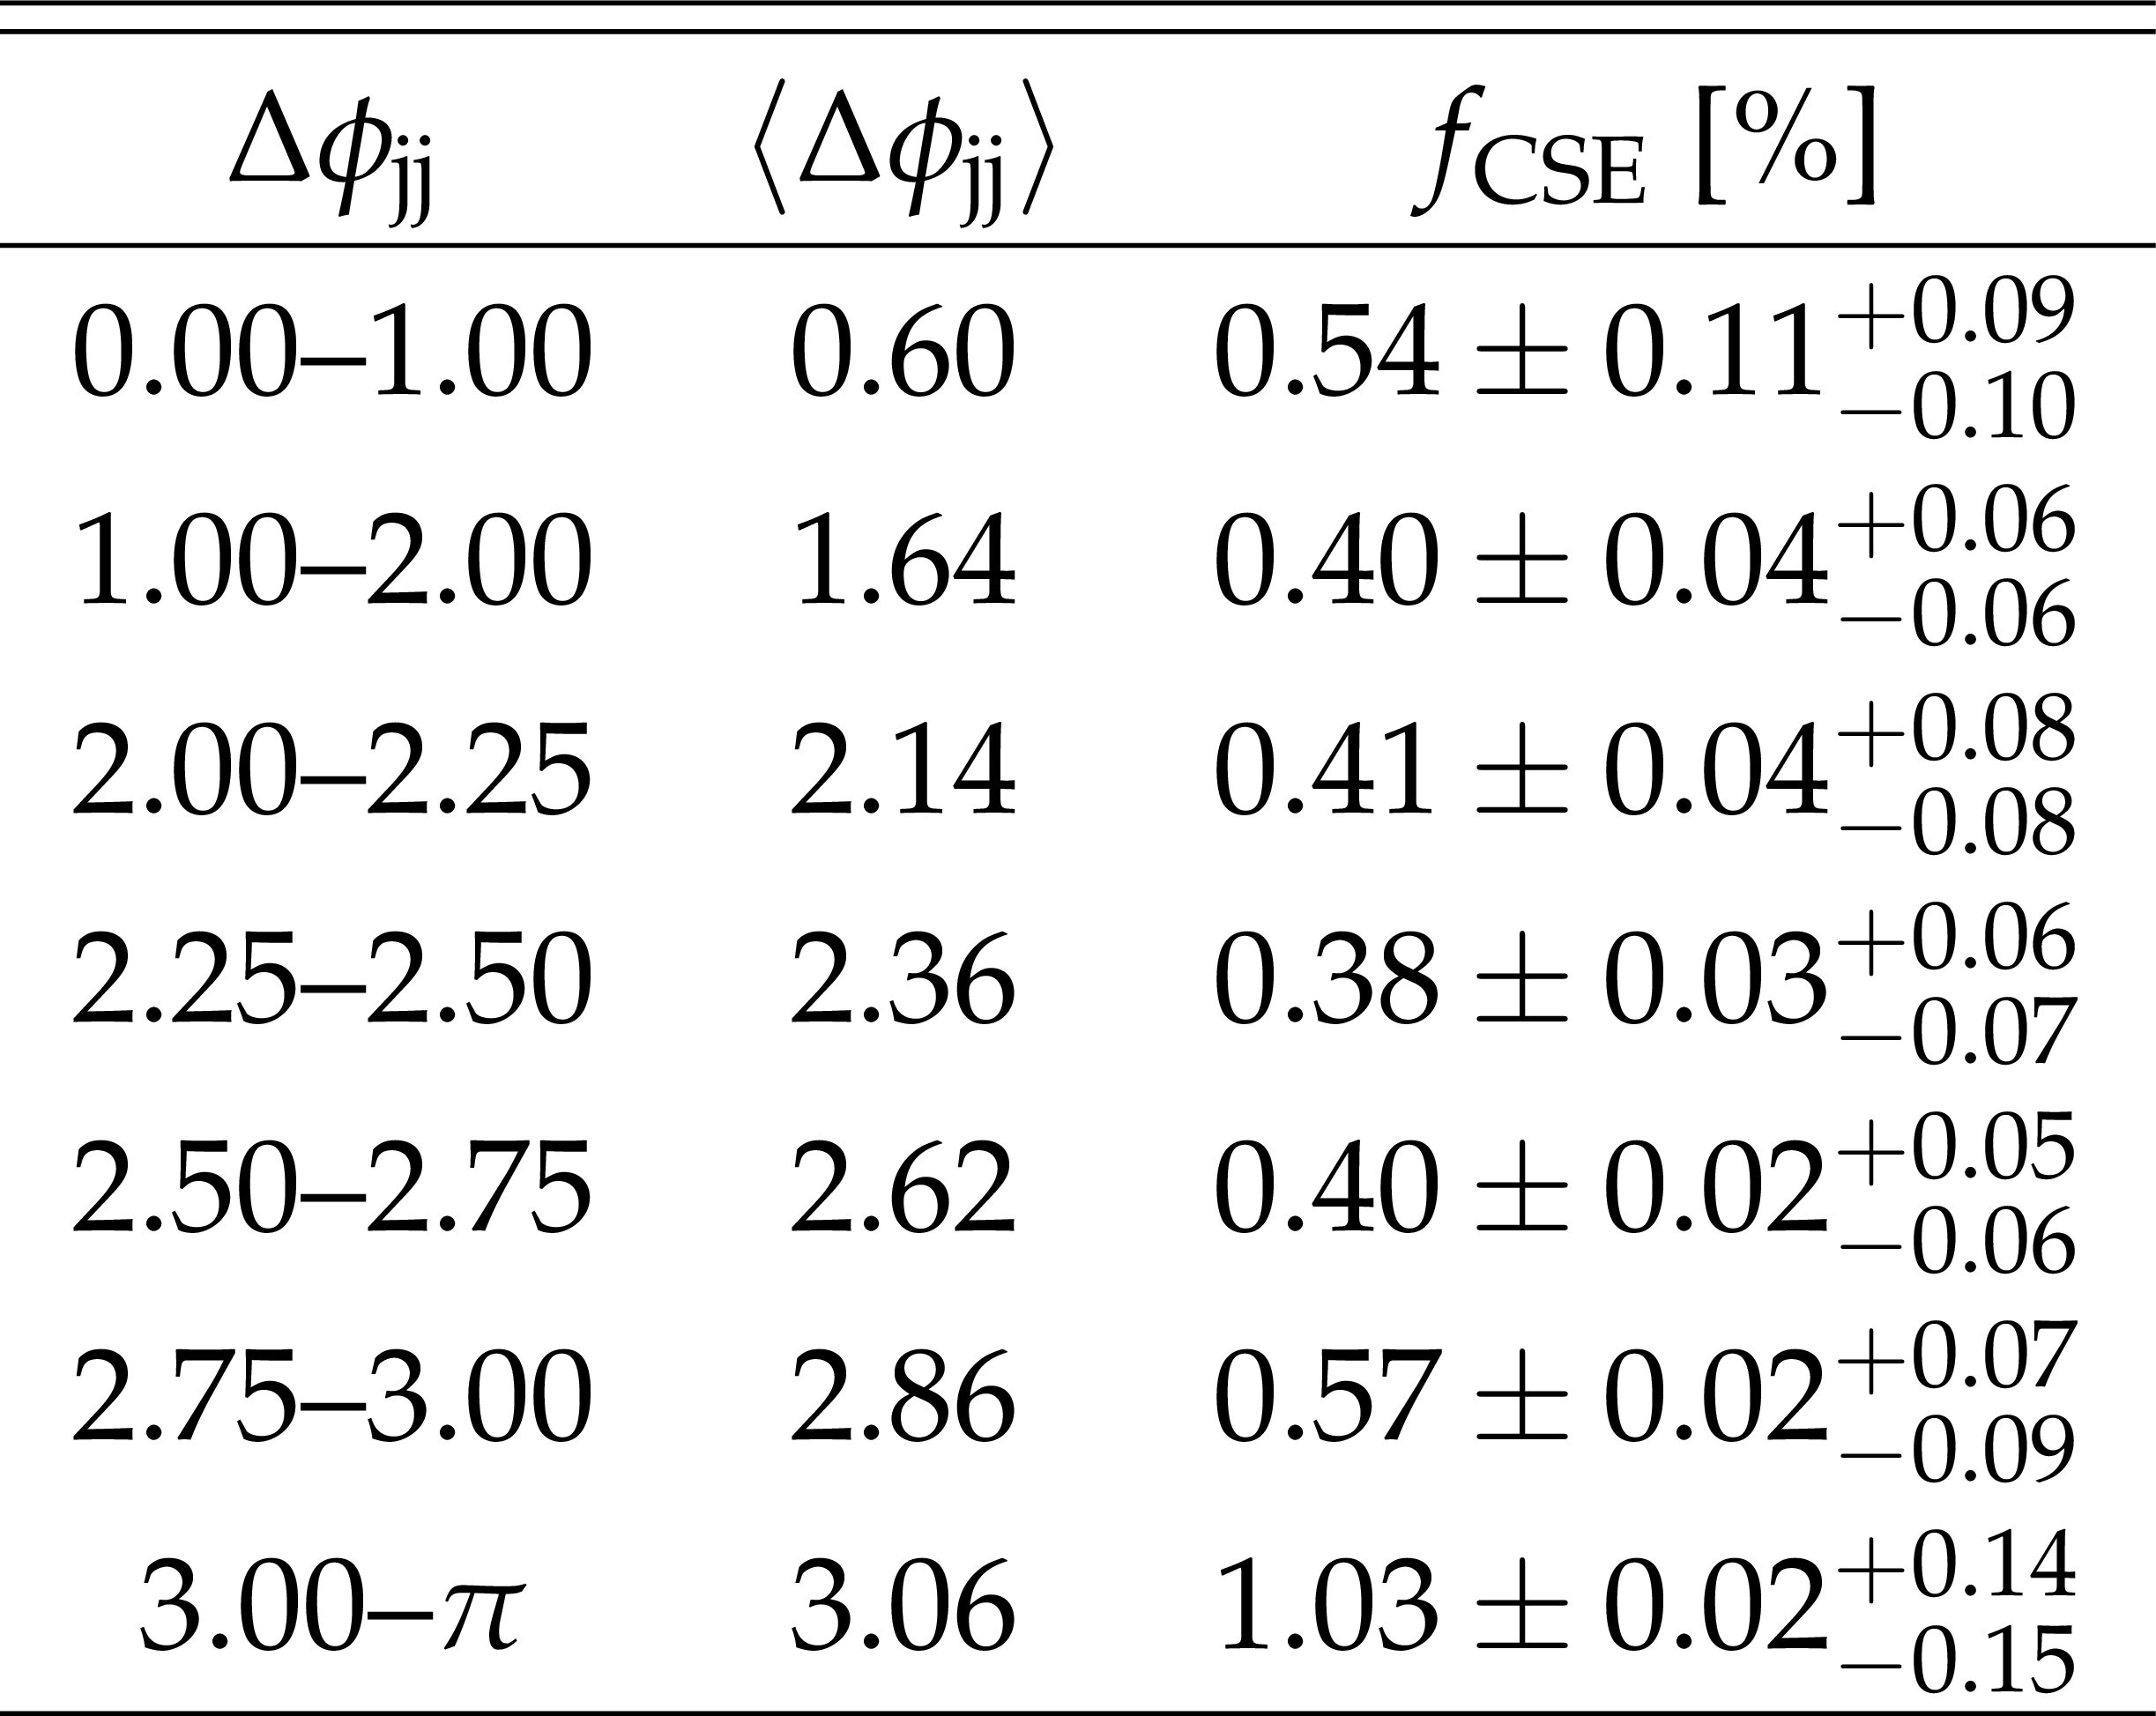
Table 4:
Measured values of the fraction of color-singlet exchange events $f_\text {CSE}$ in bins of the azimuthal angular difference between the two leading jets $\Delta \phi _\text {jj}$. The first column indicates the $\Delta \phi _\text {jj}$ bin intervals and the last column represents the measured fraction. The first and second uncertainties correspond to the statistical and systematic components, respectively. The results are integrated over the allowed $ {p_{\mathrm {T}}} ^\text {jet2}$ and $\Delta \eta _\text {jj}$ values. The mean values of $\Delta \phi _\text {jj}$ in the bin are given in the middle column. |
| Summary |
|
Events with two leading jets separated by a large pseudorapidity ($\eta$) gap have been studied in proton-proton (pp) collisions at $\sqrt{s} = $ 13 TeV with the CMS and TOTEM experiments at the CERN LHC in 2015. The pseudorapidity gap is defined by the absence of charged particles with transverse momentum ${p_{\mathrm{T}}} > $ 200 MeV in the $|{\eta}| < $ 1 region. Each of the two leading ${p_{\mathrm{T}}}$ jets has 1.4 $ < |{\eta^\text{jet}}| < $ 4.7 and ${p_{\mathrm{T}}}^\text{jet} > $ 40 GeV, with $\eta^\text{jet1} \eta^\text{jet2} < $ 0, where jet1 and jet2 are the leading and subleading jets in ${p_{\mathrm{T}}}$. The pseudorapidity gap signature is assumed to be caused by hard color-singlet exchange, which is described in terms of two-gluon exchange in perturbative quantum chromodynamics. Color-singlet exchange events appear as an excess of events over the expected charged particle multiplicity contribution from color-exchange dijet events at the lowest charged particle multiplicity. The ratio of color-singlet exchange events to all dijet events, $f_\text{CSE}$, has been measured as a function of ${p_{\mathrm{T}}}^\text{jet2}$, the $\eta$ difference between the two leading jets, $\Delta\eta_\text{jj} \equiv |{\eta^\text{jet1} - \eta^\text{jet2}}|$, and the azimuthal angular separation between the two leading jets, $\Delta\phi_\text{jj} \equiv |{\phi^\text{jet1} - \phi^\text{jet2}}|$. The measured $f_\text{CSE}$ values are in the range of 0.6-1.0%. The ratio $f_\text{CSE}$ increases with $\Delta\eta_\text{jj}$, has a weak dependence on ${p_{\mathrm{T}}}^\text{jet2}$, and increases as $\Delta\phi_\text{jj}$ approaches $\pi$. No significant difference in $f_\text{CSE}$ is observed between the 13 TeV results and those presented by the CMS Collaboration at 7 TeV. This is in contrast to the trend found at lower energies of 0.63 and 1.8 TeV by the D0 and CDF Collaborations, where a significant decrease of $f_\text{CSE}$ with increasing $\sqrt{s}$ was observed, as illustrated in Fig. 9. The results are compared with calculations based on the Balitsky-Fadin-Kuraev-Lipatov framework [3,4,5] with resummation of large logarithms of energy at next-to-leading logarithmic accuracy using leading order impact factors, and various treatments of gap survival probability effects. The implementation by Royon, Marquet, and Kepka [54,55] describes some features of the data, but is not able to simultaneously describe all aspects of the measurements. The implementation by Ekstedt, Enberg, Ingelman, and Motyka [53,56] gives a fair description of the data in $\Delta\eta_\text{jj}$ and ${p_{\mathrm{T}}}^\text{jet2}$ within the uncertainties only when considering survival probability effects based on multiple-parton interactions and their soft color interaction model. In addition, a sample of dijet events with intact protons collected by the CMS and TOTEM experiments is used to study jet-gap-jet events with intact protons, which correspond to proton-gap-jet-gap-jet topologies. This is the first analysis of this diffractive event topology. The $f_\text{CSE}$ value extracted in this sample is 2.91 $\pm$ 0.70 (stat)$^{+ 1.02}_{- 0.94}$ (syst) times larger than that found in inclusive dijet production, possibly suggesting a larger abundance of jets with central gaps in events with detected intact protons. This can be interpreted in terms of a lower spectator parton activity in events with intact protons, which decreases the likelihood of the central gap signature being spoiled. |
| References | ||||
| 1 | Particle Data Group, P. A. Zyla et al. | Review of particle physics | Prog. Theor. Exp. Phys. 2020 (2020) 083C01 | |
| 2 | K. Akiba et al. | LHC forward physics | JPG 43 (2016) 110201 | 1611.05079 |
| 3 | E. A. Kuraev, L. N. Lipatov, and V. S. Fadin | The Pomeranchuk singularity in nonabelian gauge theories | Sov. Phys. JETP 45 (1977)199 | |
| 4 | I. I. Balitsky and L. N. Lipatov | The Pomeranchuk singularity in quantum chromodynamics | Sov. J. NP 28 (1978)822 | |
| 5 | L. N. Lipatov | The bare pomeron in quantum chromodynamics | Sov. Phys. JETP 63 (1986)904 | |
| 6 | V. S. Fadin and L. N. Lipatov | BFKL pomeron in the next-to-leading approximation | PLB 429 (1998) 127 | hep-ph/9802290 |
| 7 | M. Ciafaloni and G. Camici | Energy scale(s) and next-to-leading BFKL equation | PLB 430 (1998) 349 | hep-ph/9803389 |
| 8 | CMS Collaboration | Azimuthal decorrelation of jets widely separated in rapidity in pp collisions at $ \sqrt{s}= $ 7 TeV | JHEP 08 (2016) 139 | CMS-FSQ-12-002 1601.06713 |
| 9 | ATLAS Collaboration | Measurement of dijet production with a veto on additional central jet activity in pp collisions at $ \sqrt{s}= $ 7 TeV using the ATLAS detector | JHEP 09 (2011) 053 | 1107.1641 |
| 10 | CMS Collaboration | Ratios of dijet production cross sections as a function of the absolute difference in rapidity between jets in proton-proton collisions at $ \sqrt{s}= $ 7 TeV | EPJC 72 (2012) 2216 | CMS-FWD-10-014 1204.0696 |
| 11 | LHCb Collaboration | Updated measurements of exclusive $ \mathrm{J}/\psi $ and $ \psi $(2S) production cross sections in pp collisions at $ \sqrt{s}= $ 7 TeV | JPG 41 (2014) 055002 | 1401.3288 |
| 12 | LHCb Collaboration | Measurement of the exclusive $ \Upsilon $ production cross section in pp collisions at $ \sqrt{s}=$ 7 TeV and 8 TeV | JHEP 09 (2015) 084 | 1505.08139 |
| 13 | ALICE Collaboration | Coherent $ \mathrm{J}/\psi $ photoproduction in ultraperipheral Pb-Pb collisions at $ \sqrt{s_\text{NN}} = $ 2.76 TeV | PLB 718 (2013) 1273 | 1209.3715 |
| 14 | ALICE Collaboration | Exclusive $ \mathrm{J}/\psi $ photoproduction off protons in ultraperipheral p-Pb collisions at $ \sqrt{s_{\rm NN}}= $ 5.02 TeV | PRL 113 (2014) 232504 | 1406.7819 |
| 15 | ALICE Collaboration | Coherent $ \rho^{0} $ photoproduction in ultraperipheral Pb-Pb collisions at $ \sqrt{s_{\mathrm{NN}}}= $ 2.76 TeV | JHEP 09 (2015) 095 | 1503.09177 |
| 16 | CMS Collaboration | Measurement of exclusive $ \Upsilon $ photoproduction from protons in pPb collisions at $ \sqrt{s_\mathrm{NN}} = $ 5.02 TeV | EPJC 79 (2019) 277 | CMS-FSQ-13-009 1809.11080 |
| 17 | CMS Collaboration | Measurement of exclusive $ \rho(770)^0 $ photoproduction in ultraperipheral pPb collisions at $ \sqrt{s_\mathrm{NN}} = $ 5.02 TeV | EPJC 79 (2019) 702 | CMS-FSQ-16-007 1902.01339 |
| 18 | I. Bautista, A. Ferández Téllez, and M. Hentschinski | BFKL evolution and the growth with energy of exclusive $ J/\psi $ and $ \Upsilon $ photoproduction cross sections | PRD 94 (2016) 054002 | 1607.05203 |
| 19 | A. Arroyo García, M. Hentschinski, and K. Kutak | QCD evolution based evidence for the onset of gluon saturation in exclusive photo-production of vector mesons | PLB 795 (2019) 569 | 1904.04394 |
| 20 | V. N. Gribov and L. N. Lipatov | Deep inelastic ep scattering in perturbation theory | Sov. J. NP 15 (1972)438 | |
| 21 | G. Altarelli and G. Parisi | Asymptotic freedom in parton language | NPB 126 (1977) 298 | |
| 22 | Y. L. Dokshitzer | Calculation of the structure functions for deep inelastic scattering and e$ ^{+} $ e$ ^{-} $ annihilation by perturbation theory in quantum chromodynamics | Sov. Phys. JETP 46 (1977)641 | |
| 23 | CMS Collaboration | Measurement of the differential dijet production cross section in proton-proton collisions at $ \sqrt{s}= $ 7 TeV | PLB 700 (2011) 187 | CMS-QCD-10-025 1104.1693 |
| 24 | CMS Collaboration | Measurement of the inclusive production cross sections for forward jets and for dijet events with one forward and one central jet in pp collisions at $ \sqrt{s}= $ 7 TeV | JHEP 06 (2012) 036 | CMS-FWD-11-002 1202.0704 |
| 25 | CMS Collaboration | Measurement of the inclusive jet cross section in pp collisions at $ \sqrt{s} = $ 2.76 TeV | EPJC 76 (2016) 265 | CMS-SMP-14-017 1512.06212 |
| 26 | CMS Collaboration | Measurement of dijet azimuthal decorrelation in pp collisions at $ \sqrt{s}= $ 8 TeV | EPJC 76 (2016) 536 | CMS-SMP-14-015 1602.04384 |
| 27 | CMS Collaboration | Measurement of the double-differential inclusive jet cross section in proton-proton collisions at $ \sqrt{s} = $ 13 TeV | EPJC 76 (2016) 451 | CMS-SMP-15-007 1605.04436 |
| 28 | CMS Collaboration | Measurement and QCD analysis of double-differential inclusive jet cross sections in pp collisions at $ \sqrt{s}= $ 8 TeV and cross section ratios to 2.76 and 7 TeV | JHEP 03 (2017) 156 | CMS-SMP-14-001 1609.05331 |
| 29 | CMS Collaboration | Azimuthal correlations for inclusive 2-jet, 3-jet, and 4-jet events in pp collisions at $ \sqrt{s}= $ 13 TeV | EPJC 78 (2018) 566 | CMS-SMP-16-014 1712.05471 |
| 30 | CMS Collaboration | Measurement of inclusive very forward jet cross sections in proton-lead collisions at $ \sqrt{s_{\mathrm{NN}}} = $ 5.02 TeV | JHEP 05 (2019) 043 | CMS-FSQ-17-001 1812.01691 |
| 31 | ATLAS Collaboration | Measurement of inclusive jet and dijet cross sections in proton-proton collisions at 7 TeV centre-of-mass energy with the ATLAS detector | EPJC 71 (2011) 1512 | 1009.5908 |
| 32 | ATLAS Collaboration | Measurement of inclusive jet and dijet production in pp collisions at $ \sqrt{s}= $ 7 TeV using the ATLAS detector | PRD 86 (2012) 014022 | 1112.6297 |
| 33 | ATLAS Collaboration | Measurement of dijet cross sections in pp collisions at 7 TeV centre-of-mass energy using the ATLAS detector | JHEP 05 (2014) 059 | 1312.3524 |
| 34 | ATLAS Collaboration | Measurements of jet vetoes and azimuthal decorrelations in dijet events produced in pp collisions at $ \sqrt{s}= $ 7 TeV using the ATLAS detector | EPJC 74 (2014) 3117 | 1407.5756 |
| 35 | ATLAS Collaboration | Measurement of the inclusive jet cross sections in proton-proton collisions at $ \sqrt{s}= $ 8 TeV with the ATLAS detector | JHEP 09 (2017) 020 | 1706.03192 |
| 36 | ATLAS Collaboration | Measurement of dijet azimuthal decorrelations in pp collisions at $ \sqrt{s}= $ 8 TeV with the ATLAS detector and determination of the strong coupling | PRD 98 (2018) 092004 | 1805.04691 |
| 37 | R. D. Ball et al. | Parton distributions with small-$ x $ resummation: evidence for BFKL dynamics in HERA data | EPJC 78 (2018) 321 | 1710.05935 |
| 38 | A. H. Mueller and W. K. Tang | High energy parton-parton elastic scattering in QCD | PLB 284 (1992) 123 | |
| 39 | H1 Collaboration | Energy flow and rapidity gaps between jets in photoproduction at HERA | EPJC 24 (2002) 517 | hep-ex/0203011 |
| 40 | ZEUS Collaboration | Rapidity gaps between jets in photoproduction at HERA | PLB 369 (1996) 55 | hep-ex/9510012 |
| 41 | D0 Collaboration | Rapidity gaps between jets in p$ \bar{\mathrm{p}} $ collisions at $ \sqrt{s} = $ 1.8 TeV | PRL 72 (1994) 2332 | |
| 42 | D0 Collaboration | Jet production via strongly-interacting color-singlet exchange in p$ \bar{\mathrm{p}} $ collisions | PRL 76 (1996) 734 | hep-ex/9509013 |
| 43 | D0 Collaboration | Probing hard color-singlet exchange in p$ \bar{\mathrm{p}} $ collisions at $ \sqrt{s} = $ 630 GeV and 1800 GeV | PLB 440 (1998) 189 | hep-ex/9809016 |
| 44 | CDF Collaboration | Observation of rapidity gaps in $ \bar{\mathrm{p}} $p collisions at 1.8 TeV | PRL 74 (1995) 855 | |
| 45 | CDF Collaboration | Dijet production by color-singlet exchange at the Fermilab Tevatron | PRL 80 (1998) 1156 | |
| 46 | CDF Collaboration | Events with a rapidity gap between jets in $ \bar{\mathrm{p}} $p collisions at $ \sqrt{s} = $ 630 GeV | PRL 81 (1998) 5278 | |
| 47 | CMS Collaboration | Study of dijet events with a large rapidity gap between the two leading jets in pp collisions at $ \sqrt{s}= $ 7 TeV | EPJC 78 (2018) 242 | CMS-FSQ-12-001 1710.02586 |
| 48 | J. D. Bjorken | Rapidity gaps and jets as a new-physics signature in very-high-energy hadron-hadron collisions | PRD 47 (1993) 101 | |
| 49 | V. Barone and E. Predazzi | High-energy particle diffraction | Springer, Berlin | |
| 50 | S. Donnachie, G. Dosch, P. Landshoff, and O. Nachtmann | Pomeron physics and QCD | Cambridge Monographs on Particle Physics, Nuclear Physics and Cosmology. Cambridge University Press | |
| 51 | J. R. Forshaw and D. A. Ross | Quantum chromodynamics and the pomeron | Cambridge Lecture Notes in Physics. Cambridge University Press | |
| 52 | B. Cox, J. R. Forshaw, and L. Lonnblad | Hard color-singlet exchange at the Tevatron | JHEP 10 (1999) 023 | hep-ph/9908464 |
| 53 | R. Enberg, G. Ingelman, and L. Motyka | Hard color-singlet exchange and gaps between jets at the Tevatron | PLB 524 (2002) 273 | hep-ph/0111090 |
| 54 | F. Chevallier, O. Kepka, C. Marquet, and C. Royon | Gaps between jets at hadron colliders in the next-to-leading BFKL framework | PRD 79 (2009) 094019 | 0903.4598 |
| 55 | O. Kepka, C. Marquet, and C. Royon | Gaps between jets in hadronic collisions | PRD 83 (2011) 034036 | 1012.3849 |
| 56 | A. Ekstedt, R. Enberg, and G. Ingelman | Hard color-singlet BFKL exchange and gaps between jets at the LHC | 1703.10919 | |
| 57 | J. D. Bjorken | A full-acceptance detector for SSC physics at low and intermediate mass scales: an expression of interest to the SSC | \it Int. J. Mod. Phys. A 07 (1992) 4189 | |
| 58 | E. Gotsman, E. Levin, and U. Maor | Energy dependence of the survival probability of large rapidity gaps | PLB 438 (1998) 229 | hep-ph/9804404 |
| 59 | V. A. Khoze, A. D. Martin, and M. G. Ryskin | Diffraction at the LHC | EPJC 73 (2013) 2503 | 1306.2149 |
| 60 | E. Gotsman, E. Levin, and U. Maor | CGC/saturation approach for soft interactions at high energy: survival probability of central exclusive production | EPJC 76 (2016) 177 | 1510.07249 |
| 61 | V. A. Khoze, A. D. Martin, and M. G. Ryskin | Multiple interactions and rapidity gap survival | JPG 45 (2018) 053002 | 1710.11505 |
| 62 | I. Babiarz, R. Staszewski, and A. Szczurek | Multi-parton interactions and rapidity gap survival probability in jet-gap-jet processes | PLB 771 (2017) 532 | 1704.00546 |
| 63 | C. Marquet, C. Royon, M. Trzebiński, and R. Žebčík | Gaps between jets in double-pomeron-exchange processes at the LHC | PRD 87 (2013) 034010 | 1212.2059 |
| 64 | TOTEM Collaboration | The TOTEM experiment at the CERN Large Hadron Collider | JINST 3 (2008) S08007 | |
| 65 | O. S. Broning et al. | LHC design report | CERN-2004-003-v-1. 2004 | |
| 66 | CMS Collaboration | Description and performance of track and primary-vertex reconstruction with the CMS tracker | JINST 9 (2014) P10009 | CMS-TRK-11-001 1405.6569 |
| 67 | CMS Collaboration | Particle-flow reconstruction and global event description with the CMS detector | JINST 12 (2017) P10003 | CMS-PRF-14-001 1706.04965 |
| 68 | M. Cacciari, G. P. Salam, and G. Soyez | The anti-$ {k_{\mathrm{T}}} $ jet clustering algorithm | JHEP 04 (2008) 063 | 0802.1189 |
| 69 | M. Cacciari, G. P. Salam, and G. Soyez | $ FastJet $ user manual | EPJC 72 (2012) 1896 | 1111.6097 |
| 70 | CMS Collaboration | Jet energy scale and resolution in the CMS experiment in pp collisions at 8 TeV | JINST 12 (2017) P02014 | CMS-JME-13-004 1607.03663 |
| 71 | CMS Collaboration | The CMS experiment at the CERN LHC | JINST 3 (2008) S08004 | CMS-00-001 |
| 72 | TOTEM Collaboration | LHC optics measurement with proton tracks detected by the Roman pots of the TOTEM experiment | New J. Phys. 16 (2014) 103041 | 1406.0546 |
| 73 | TOTEM Collaboration | Performance of the TOTEM detectors at the LHC | Int. J. Mod. Phys. A 28 (2013) 1330046 | 1310.2908 |
| 74 | H. Niewiadomski | Reconstruction of protons in the TOTEM Roman pot detectors at the LHC | PhD thesis, Manchester U., 2008 CERN-THESIS-2008-080 | |
| 75 | CMS and TOTEM Collaborations | Measurement of single-diffractive dijet production in proton-proton collisions at $ \sqrt{s} = $ 8 TeV with the CMS and TOTEM experiments | EPJC 80 (2020) 1164 | 2002.12146 |
| 76 | CMS Collaboration | The CMS trigger system | JINST 12 (2017) P01020 | CMS-TRG-12-001 1609.02366 |
| 77 | CMS Collaboration | Observation of a diffractive contribution to dijet production in proton-proton collisions at $ \sqrt{s}= $ 7 TeV | PRD 87 (2013) 012006 | CMS-FWD-10-004 1209.1805 |
| 78 | M. Hentschinski, J. D. Madrigal Martínez, B. Murdaca, and A. Sabio Vera | The next-to-leading order vertex for a forward jet plus a rapidity gap at high energies | PLB 735 (2014) 168 | 1404.2937 |
| 79 | M. Hentschinski, J. D. Madrigal Martínez, B. Murdaca, and A. Sabio Vera | The gluon-induced Mueller-Tang jet impact factor at next-to-leading order | NPB 889 (2014) 549 | 1409.6704 |
| 80 | A. Giovannini and L. Van Hove | Negative binomial multiplicity distributions in high energy hadron collisions | Z. Phys. C 30 (1986) 391 | |
| 81 | P. Ghosh | Negative binomial multiplicity distribution in proton-proton collisions in limited pseudorapidity intervals at LHC up to $ \sqrt{s} = $ 7 TeV and the clan model | PRD 85 (2012) 054017 | 1202.4221 |
| 82 | UA5 Collaboration | Multiplicity distributions in different pseudorapidity intervals at a center-of-mass energy of 540 GeV | PLB 160 (1985) 193 | |
| 83 | UA5 Collaboration | Charged particle multiplicity distributions at 200 GeV and 900 GeV center-of-mass energy | Z. Phys. C 43 (1989) 357 | |
| 84 | ALICE Collaboration | Charged-particle multiplicities in proton-proton collisions at $ \sqrt{s} = $ 0.9 to 8 TeV | EPJC 77 (2017) 33 | 1509.07541 |
| 85 | T. Sjostrand et al. | An introduction to PYTHIA 8.2 | CPC 191 (2015) 159 | 1410.3012 |
| 86 | NNPDF Collaboration | Unbiased global determination of parton distributions and their uncertainties at NNLO and at LO | NPB 855 (2012) 153 | 1107.2652 |
| 87 | NNPDF Collaboration | Parton distributions with QED corrections | NPB 877 (2013) 290 | 1308.0598 |
| 88 | B. Andersson, G. Gustafson, G. Ingelman, and T. Sjostrand | Parton fragmentation and string dynamics | PR 97 (1983) 31 | |
| 89 | CMS Collaboration | Event generator tunes obtained from underlying event and multiparton scattering measurements | EPJC 76 (2016) 155 | CMS-GEN-14-001 1512.00815 |
| 90 | G. Corcella et al. | HERWIG 6: an event generator for hadron emission reactions with interfering gluons (including supersymmetric processes) | JHEP 01 (2001) 010 | hep-ph/0011363 |
| 91 | J. Pumplin et al. | New generation of parton distributions with uncertainties from global QCD analysis | JHEP 07 (2002) 012 | hep-ph/0201195 |
| 92 | B. R. Webber | A QCD model for jet fragmentation including soft gluon interference | NPB 238 (1984) 492 | |
| 93 | J. M. Butterworth, J. R. Forshaw, and M. H. Seymour | Multiparton interactions in photoproduction at HERA | Z. Phys. C 72 (1996) 637 | hep-ph/9601371 |
| 94 | GEANT4 Collaboration | GEANT4--A simulation toolkit | NIMA 506 (2003) 250 | |
| 95 | D0 Collaboration | Hard single diffraction in $ \mathrm{\bar{p}}{\mathrm{p}} $ collisions at $ \sqrt{s} = $ 630 GeV and 1800 GeV | PLB 531 (2002) 52 | hep-ex/9912061 |
| 96 | CDF Collaboration | Diffractive dijets with a leading antiproton in $ \mathrm{\bar{p}}{\mathrm{p}} $ collisions at $ \sqrt{s} = $ 1800 GeV | PRL 84 (2000) 5043 | |
| 97 | CDF Collaboration | Diffractive dijet production at $ \sqrt{s} = $ 630 GeV and 1800 GeV at the Fermilab Tevatron | PRL 88 (2002) 151802 | hep-ex/0109025 |
| 98 | CDF Collaboration | Observation of exclusive dijet production at the Fermilab Tevatron $ \mathrm{\bar{p}}{\mathrm{p}} $ Collider | PRD 77 (2008) 052004 | 0712.0604 |
| 99 | CDF Collaboration | Diffractive dijet production in $ \mathrm{\bar{p}}{\mathrm{p}} $ collisions at $ \sqrt{s}= $ 1.96 TeV | PRD 86 (2012) 032009 | 1206.3955 |
| 100 | H1 Collaboration | Diffractive dijet production with a leading proton in $ \rm{e}{\mathrm{p}} $ collisions at HERA | JHEP 05 (2015) 056 | 1502.01683 |
| 101 | P. Świerska and M. Trzebiński | BFKL amplitude parametrization for the jet-gap-jet events at the LHC energies | Acta Phys. Polon. B 46 (2015) 2477 | 1504.06271 |
| 102 | D. Colferai, F. Schwennsen, L. Szymanowski, and S. Wallon | Mueller--Navelet jets at LHC - complete NLL BFKL calculation | JHEP 12 (2010) 026 | 1002.1365 |
| 103 | CDF Collaboration | Dijet production by double-pomeron exchange at the Fermilab Tevatron | PRL 85 (2000) 4215 | |
|
|
Compact Muon Solenoid LHC, CERN |
|

|

|

|

|

|