

Compact Muon Solenoid
LHC, CERN
| CMS-SUS-16-044 ; CERN-EP-2017-127 | ||
| Search for higgsino pair production in pp collisions at $\sqrt{s} = $ 13 TeV in final states with large missing transverse momentum and two Higgs bosons decaying via $\mathrm{H}\to\mathrm{b\bar{b}}$ | ||
| CMS Collaboration | ||
| 14 September 2017 | ||
| Phys. Rev. D 97 (2018) 032007 | ||
| Abstract: Results are reported from a search for new physics in 13 TeV proton-proton collisions in the final state with large missing transverse momentum and two Higgs bosons decaying via $\mathrm{H}\to\mathrm{b\bar{b}}$. The search uses a data sample accumulated by the CMS experiment at the LHC in 2016, corresponding to an integrated luminosity of 35.9 fb$^{-1}$. The search is motivated by models based on gauge-mediated supersymmetry breaking, which predict the electroweak production of a pair of higgsinos, each of which can decay via a cascade process to a Higgs boson and an undetected lightest supersymmetric particle. The observed event yields in the signal regions are consistent with the standard model background expectation obtained from control regions in data. Higgsinos in the mass range 230-770 GeV are excluded at 95% confidence level in the context of a simplified model for the production and decay of approximately degenerate higgsinos. | ||
| Links: e-print arXiv:1709.04896 [hep-ex] (PDF) ; CDS record ; inSPIRE record ; CADI line (restricted) ; | ||
| Figures & Tables | Summary | Additional Figures & Tables | References | CMS Publications |
|---|
|
Additional information on efficiencies needed for reinterpretation of these results are available here
Additional technical material for CMS speakers can be found here |
| Figures | |
png pdf |
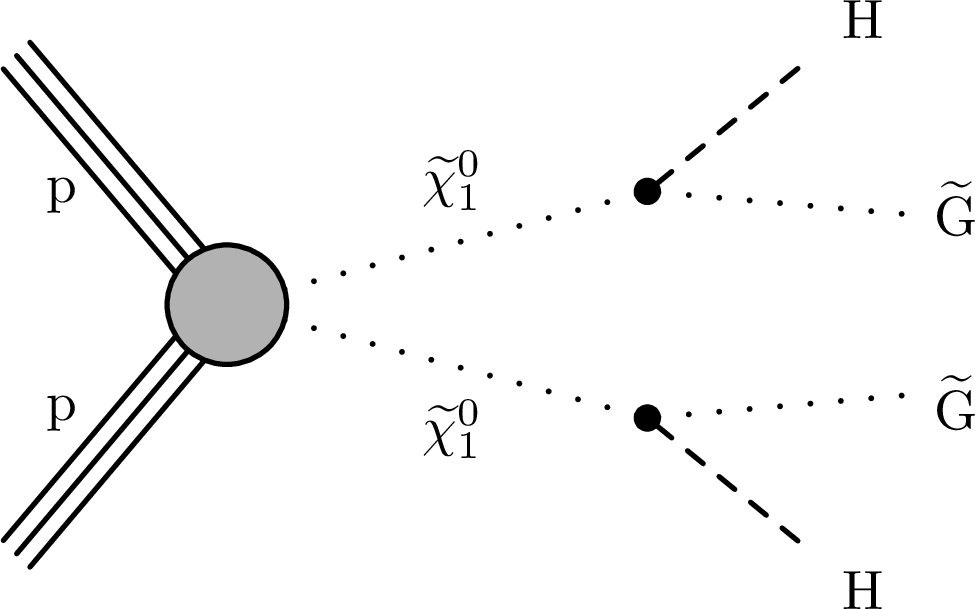
Figure 1:
Diagram for the gauge-mediated symmetry breaking signal model, $\tilde{\chi}^0_1 \tilde{\chi}^0_1 \to \mathrm{H} \mathrm{H} \tilde{\mathrm{G}} \tilde{\mathrm{G}} $ (TChiHH), where $ \tilde{\mathrm{G}} $ is a goldstino. The NLSPs $ \tilde{\chi}^0_1 $ are not directly pair produced, but are instead produced in the cascade decays of several different combinations of neutralinos and charginos, as described in the text. |

png pdf |
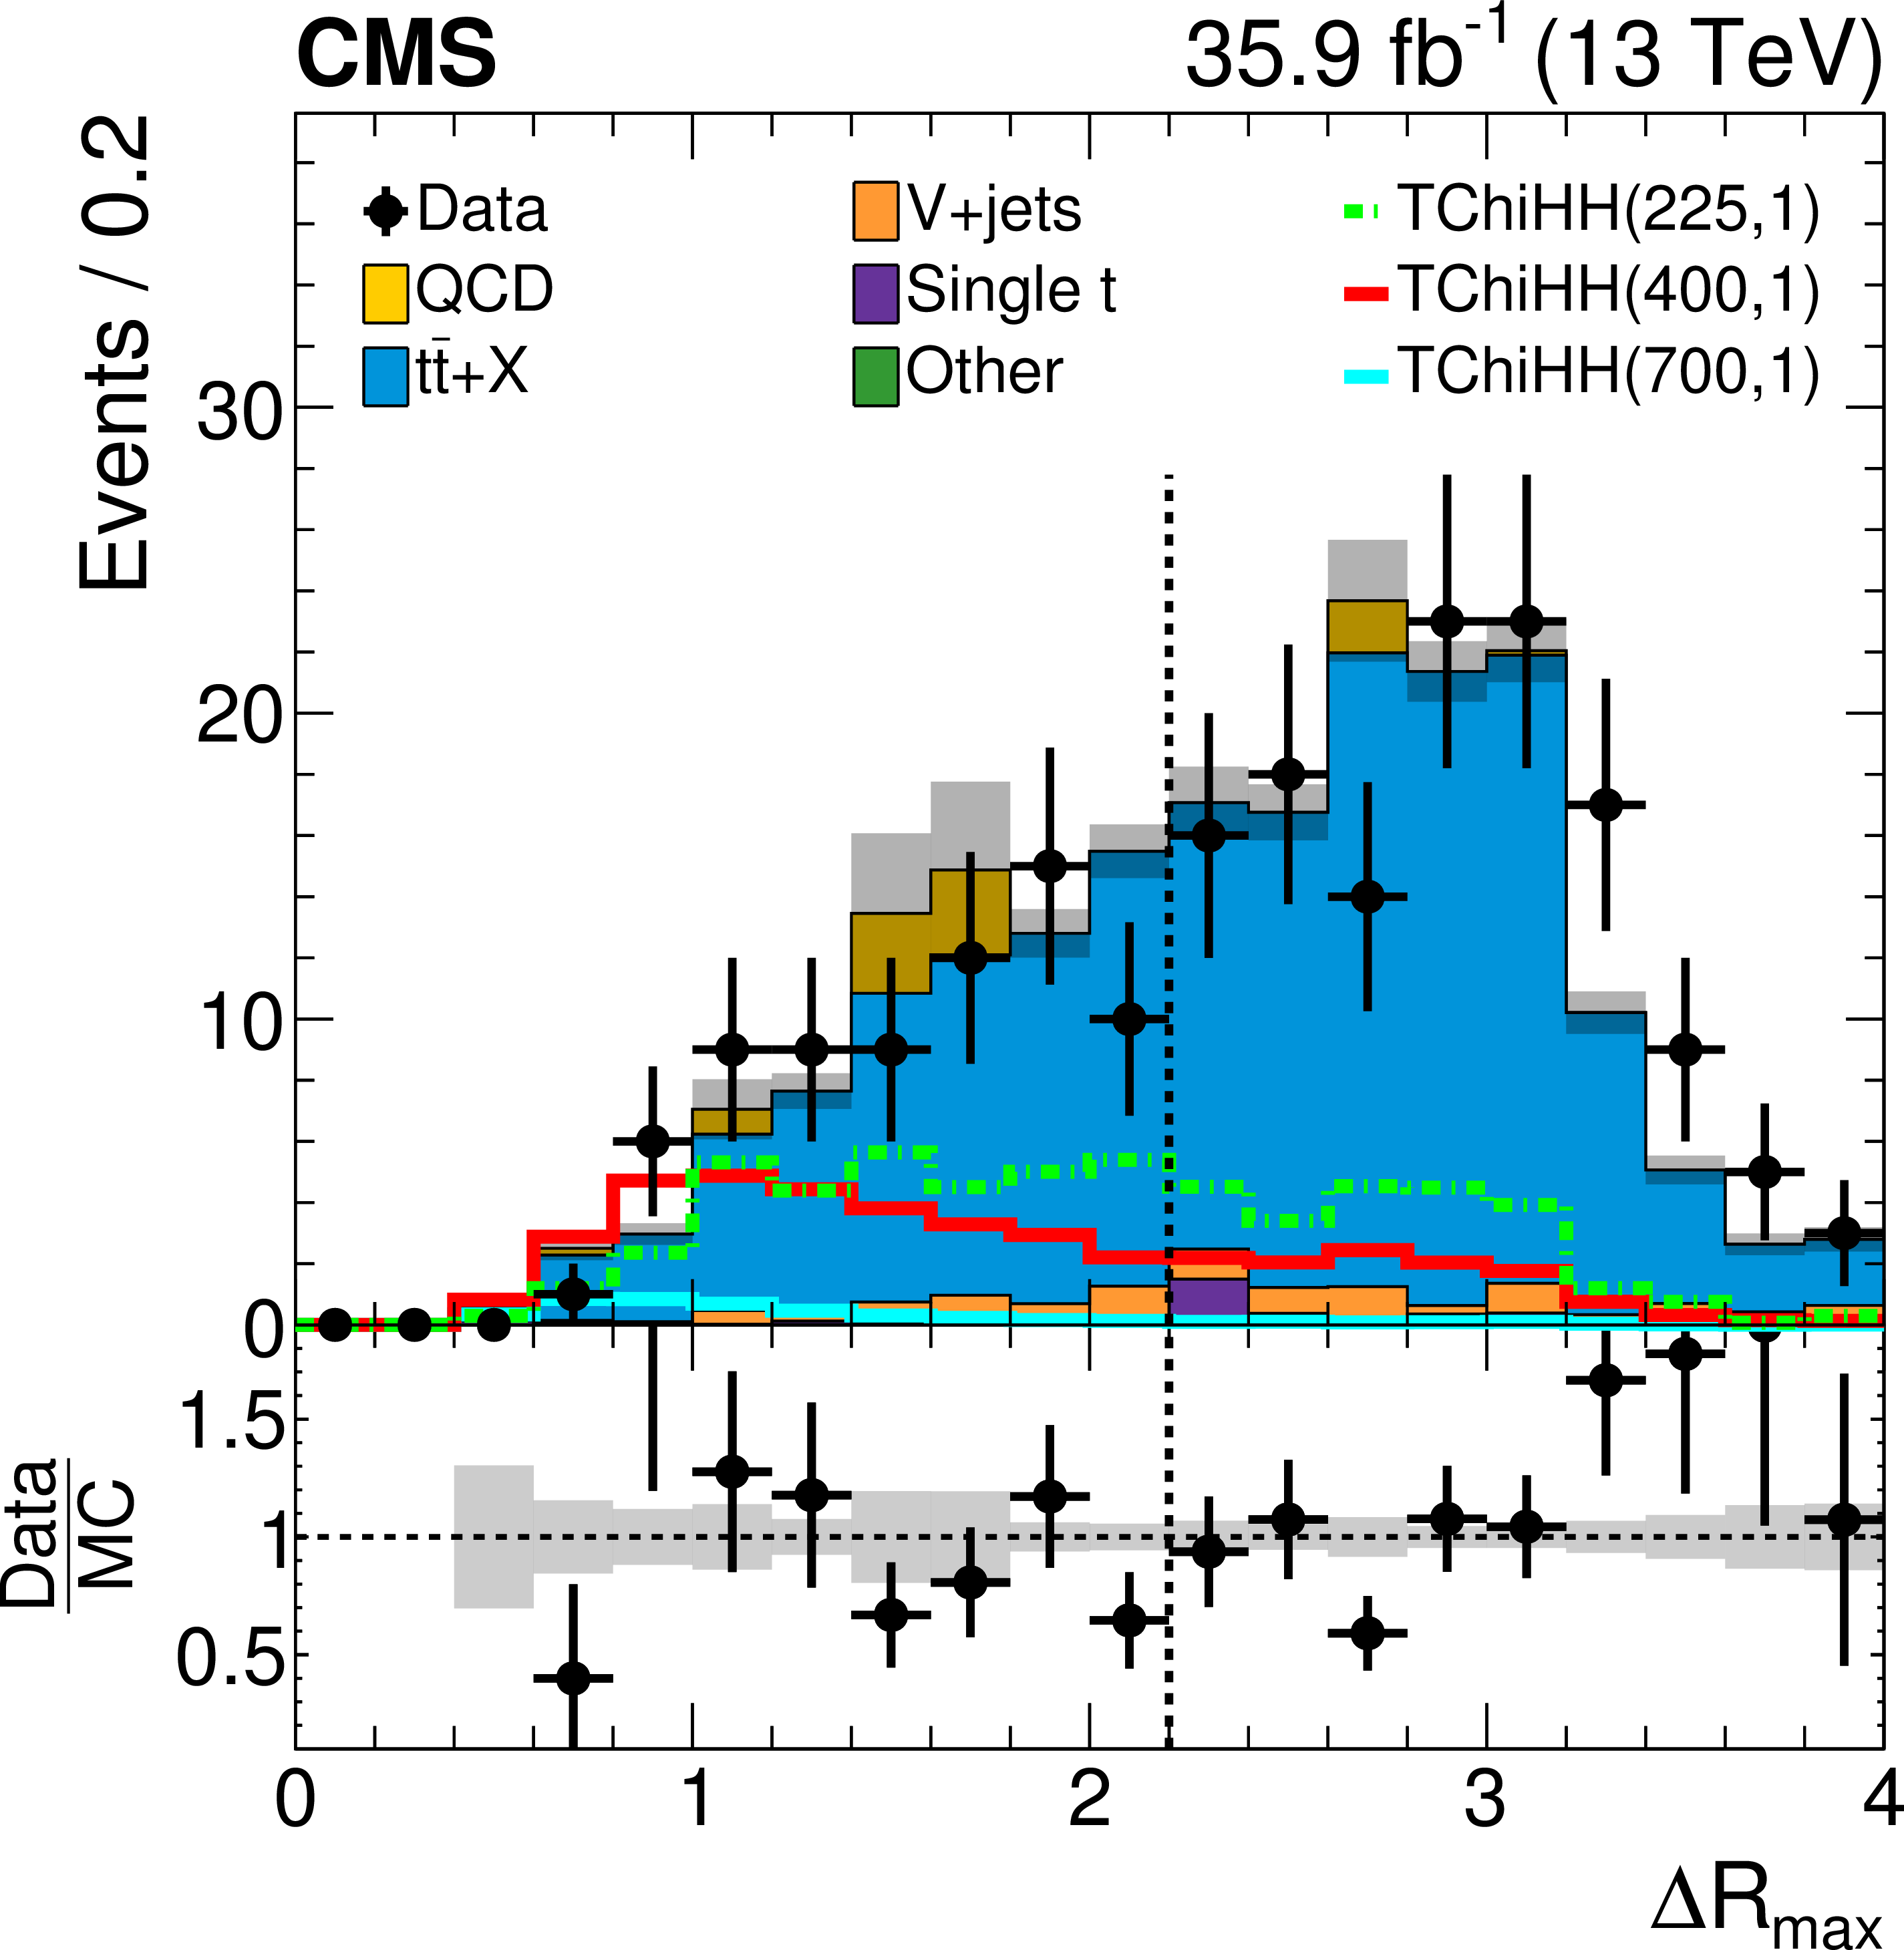
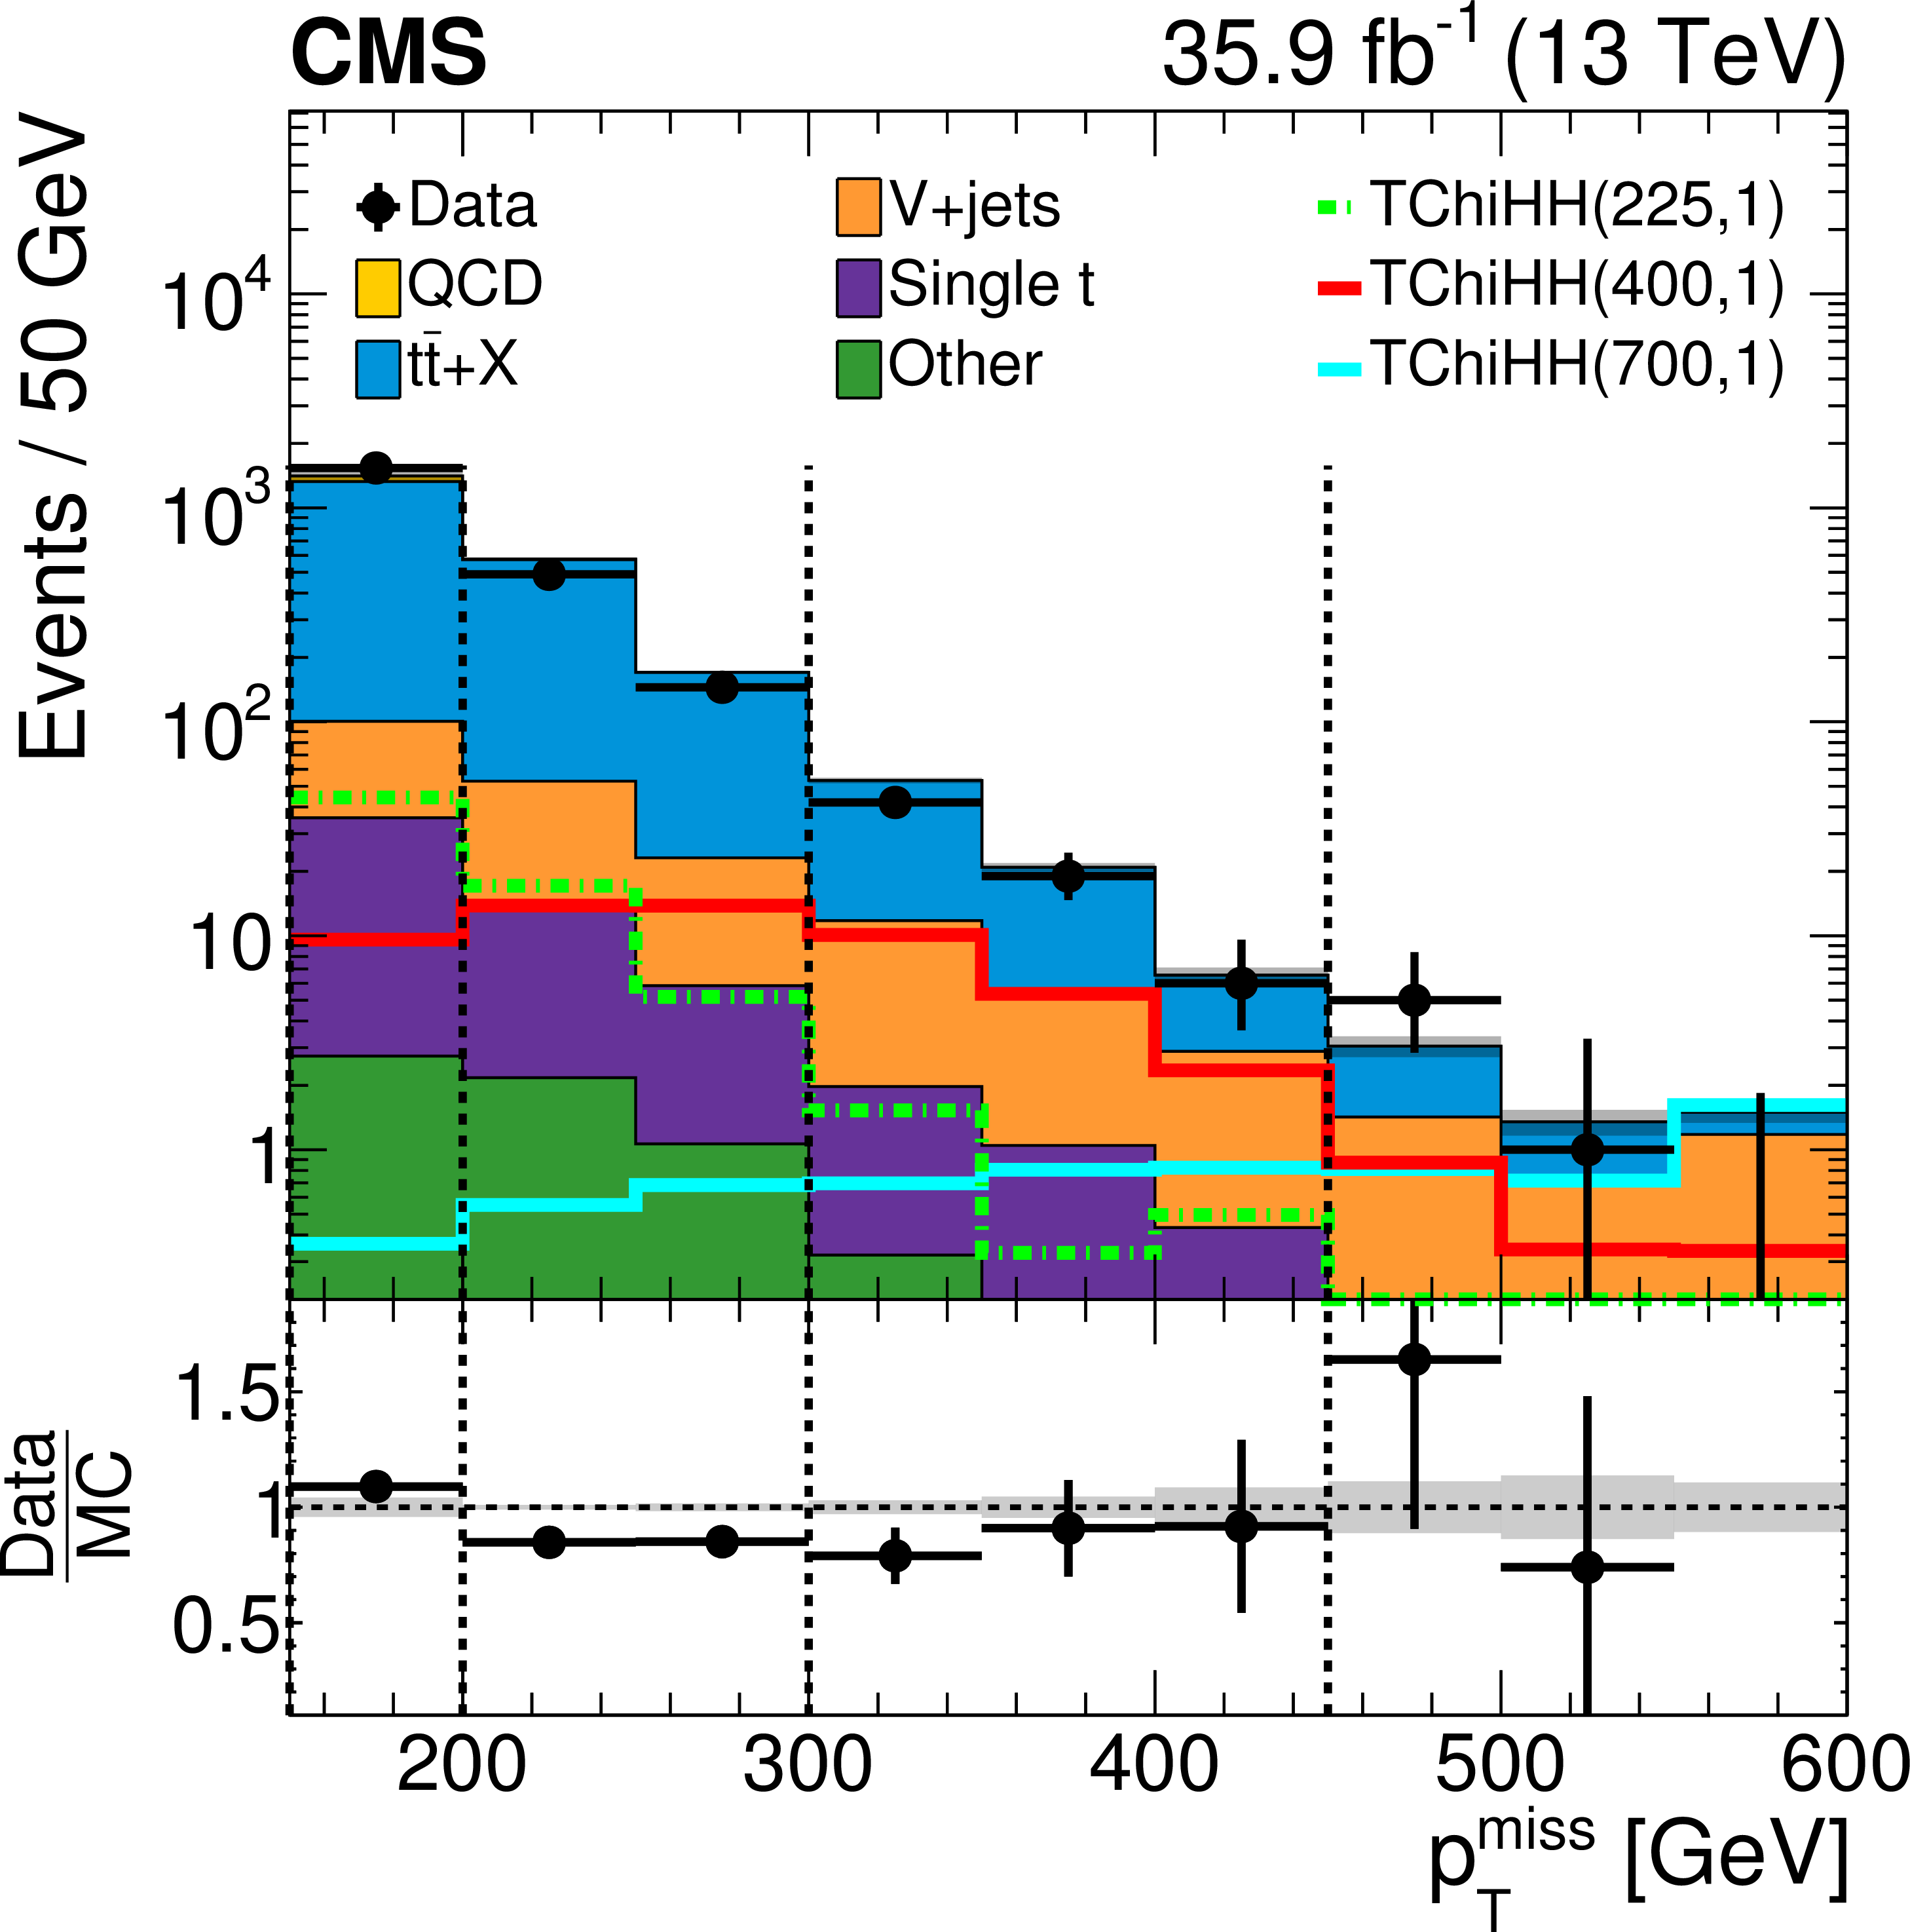
Figure 2:
Distributions of $ {\Delta m} $, $ {\Delta R_\text {max}} $, $ { < m > } $, and $ {{p_{\mathrm {T}}} ^\text {miss}} $ for data and simulated background samples, as well as three signal benchmark points denoted as TChiHH($ {m_{\tilde{\chi}^0_1}} $, $ {m_{\tilde{\mathrm{G}}}} $), with $ {m_{\tilde{\chi}^0_1}} $ and $ {m_{\tilde{\mathrm{G}}}} $ in units of GeV. All figures include baseline requirements (except on the variable being plotted in the case of $ {\Delta m} $ and $ {\Delta R_\text {max}} $). The $ {\Delta m} $, $ { < m > } $, and $ {\Delta R_\text {max}} $ distributions also include the 4b selection. The simulation is normalized to the observed data yields. The gray shading indicates the statistical uncertainty in the total simulated background. The vertical dotted lines indicate baseline requirements in the top row figures, the search region mass window in $ { < m > } $ in the bottom left figure, and the $ {{p_{\mathrm {T}}} ^\text {miss}} $ binning in the bottom right figure. The last bin includes overflow. |

png pdf |
Figure 2-a:
Distribution of $ {\Delta m} $ for data and simulated background samples, as well as three signal benchmark points denoted as TChiHH($ {m_{\tilde{\chi}^0_1}} $, $ {m_{\tilde{\mathrm{G}}}} $), with $ {m_{\tilde{\chi}^0_1}} $ and $ {m_{\tilde{\mathrm{G}}}} $ in units of GeV. All baseline requirements except for $\Delta m < $ 40 GeV are applied. The distribution also includes the 4b selection. The simulation is normalized to the observed data yields. The gray shading indicates the statistical uncertainty in the total simulated background. The vertical dotted lines indicate baseline requirements. The last bin includes overflow. |
png pdf |
Figure 2-b:
Distribution of $ {\Delta R_\text {max}} $ for data and simulated background samples, as well as three signal benchmark points denoted as TChiHH($ {m_{\tilde{\chi}^0_1}} $, $ {m_{\tilde{\mathrm{G}}}} $), with $ {m_{\tilde{\chi}^0_1}} $ and $ {m_{\tilde{\mathrm{G}}}} $ in units of GeV. All baseline requirements except for $ \Delta R_{\text{max}} < $ 2.2 are applied. The distribution also include the 4b selection. The simulation is normalized to the observed data yields. The gray shading indicates the statistical uncertainty in the total simulated background. The vertical dotted lines indicate baseline requirements. The last bin includes overflow. |

png pdf |
Figure 2-c:
Distribution of $ { < m > } $ for data and simulated background samples, as well as three signal benchmark points denoted as TChiHH($ {m_{\tilde{\chi}^0_1}} $, $ {m_{\tilde{\mathrm{G}}}} $), with $ {m_{\tilde{\chi}^0_1}} $ and $ {m_{\tilde{\mathrm{G}}}} $ in units of GeV. The figure includes baseline requirements. The distribution also include the 4b selection. The simulation is normalized to the observed data yields. The gray shading indicates the statistical uncertainty in the total simulated background. The vertical dotted lines indicate the search region mass window in $ { < m > } $. The last bin includes overflow. |
png pdf |
Figure 2-d:
Distribution of $ {{p_{\mathrm {T}}} ^\text {miss}} $ for data and simulated background samples, as well as three signal benchmark points denoted as TChiHH($ {m_{\tilde{\chi}^0_1}} $, $ {m_{\tilde{\mathrm{G}}}} $), with $ {m_{\tilde{\chi}^0_1}} $ and $ {m_{\tilde{\mathrm{G}}}} $ in units of GeV. The figure includes baseline requirements. The simulation is normalized to the observed data yields. The gray shading indicates the statistical uncertainty in the total simulated background. The vertical dotted lines indicate the $ {{p_{\mathrm {T}}} ^\text {miss}} $ binning. The last bin includes overflow. |
png pdf |
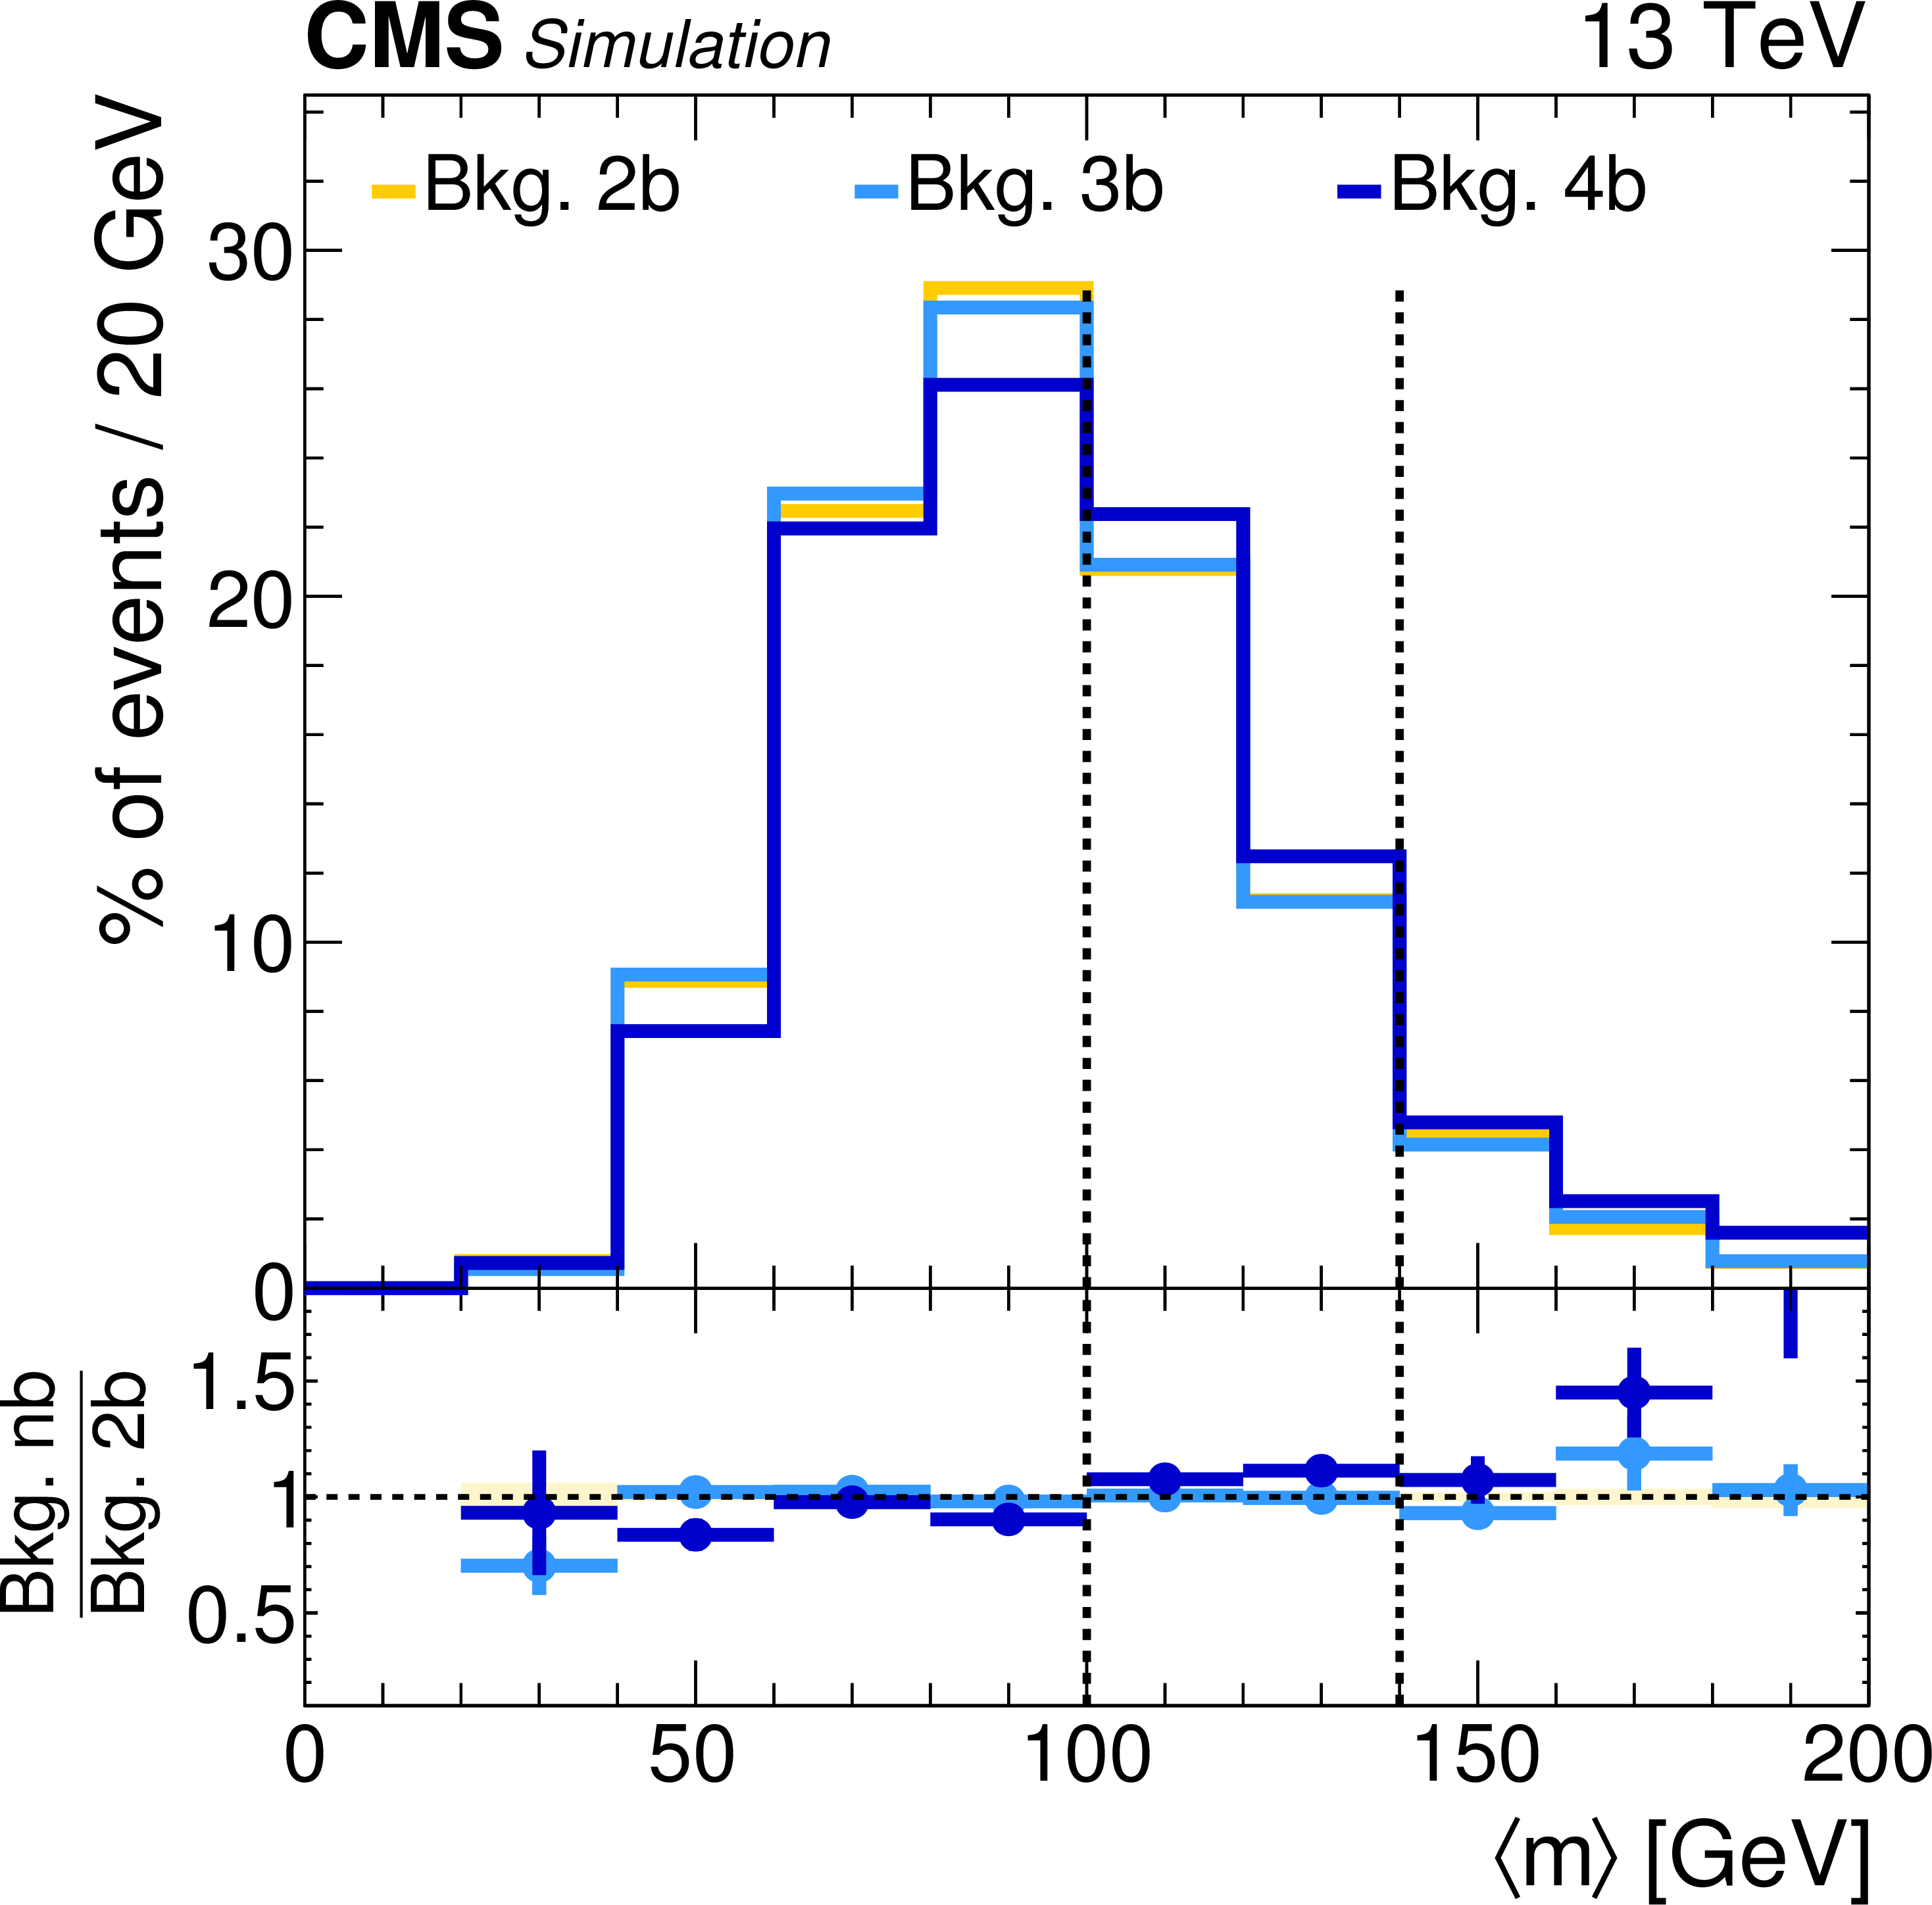
Figure 3:
Distribution of $ { < m > } $ after the baseline selection, showing the agreement between the $ { < m > } $ shapes among the three b tag categories. The comparison is based on simulation including all backgrounds except QCD multijet production, for which the simulation suffers from large statistical uncertainties. QCD multijet events account for less than 5% of the total yield. The vertical dotted lines indicate the Higgs boson mass window. |
png pdf |
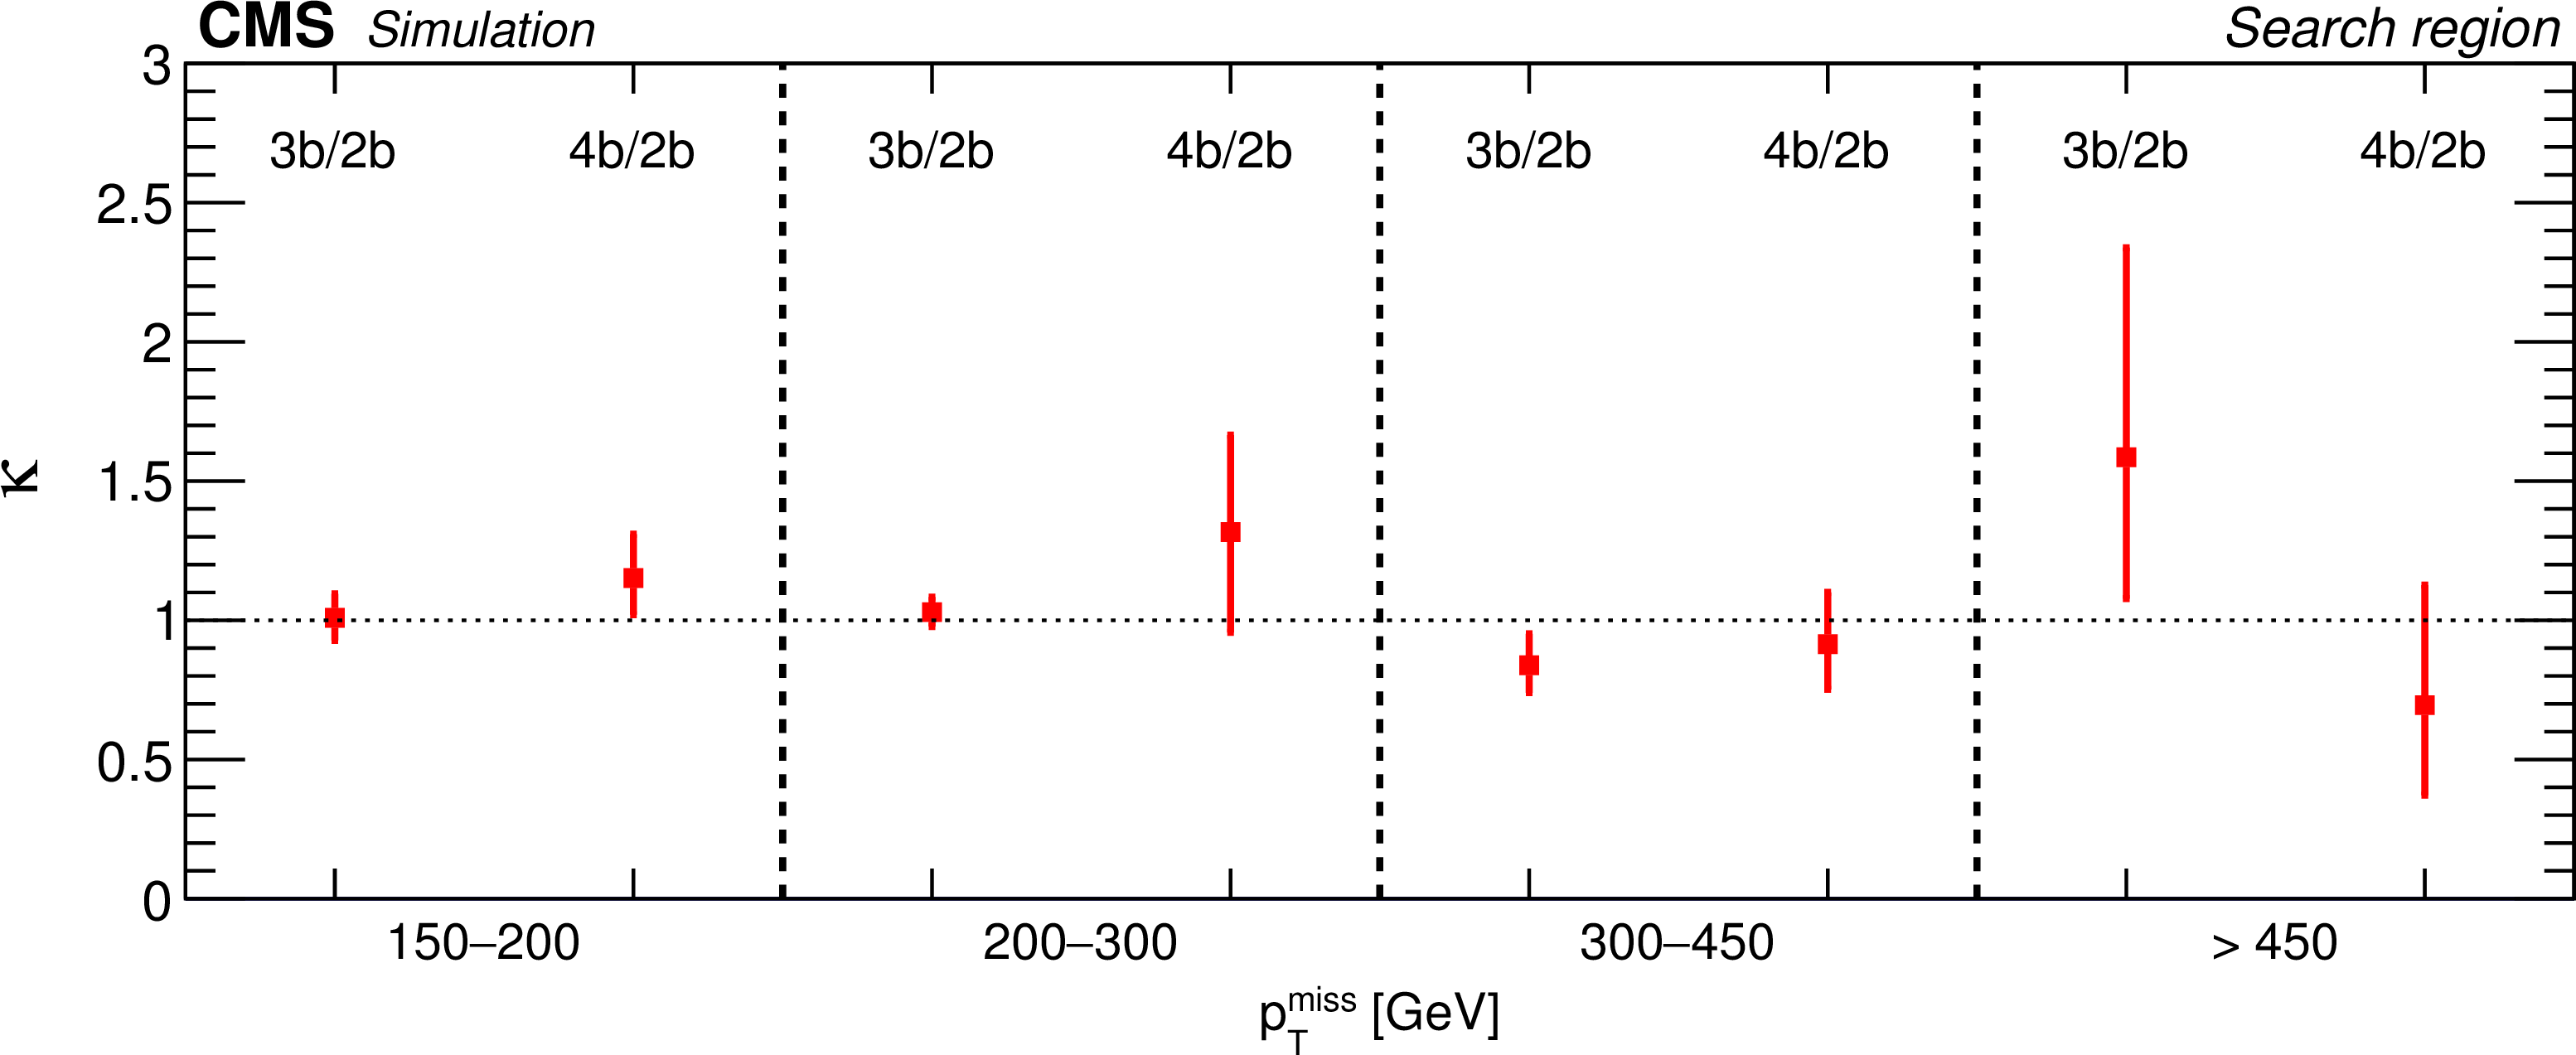
Figure 4:
Values of the double ratios $\kappa _{3\text {b}}$ and $\kappa _{4\text {b}}$ obtained from the background simulation for each of the $ {{p_{\mathrm {T}}} ^\text {miss}} $ bins. The error bars correspond to the statistical uncertainty of the background simulation. |

png pdf |
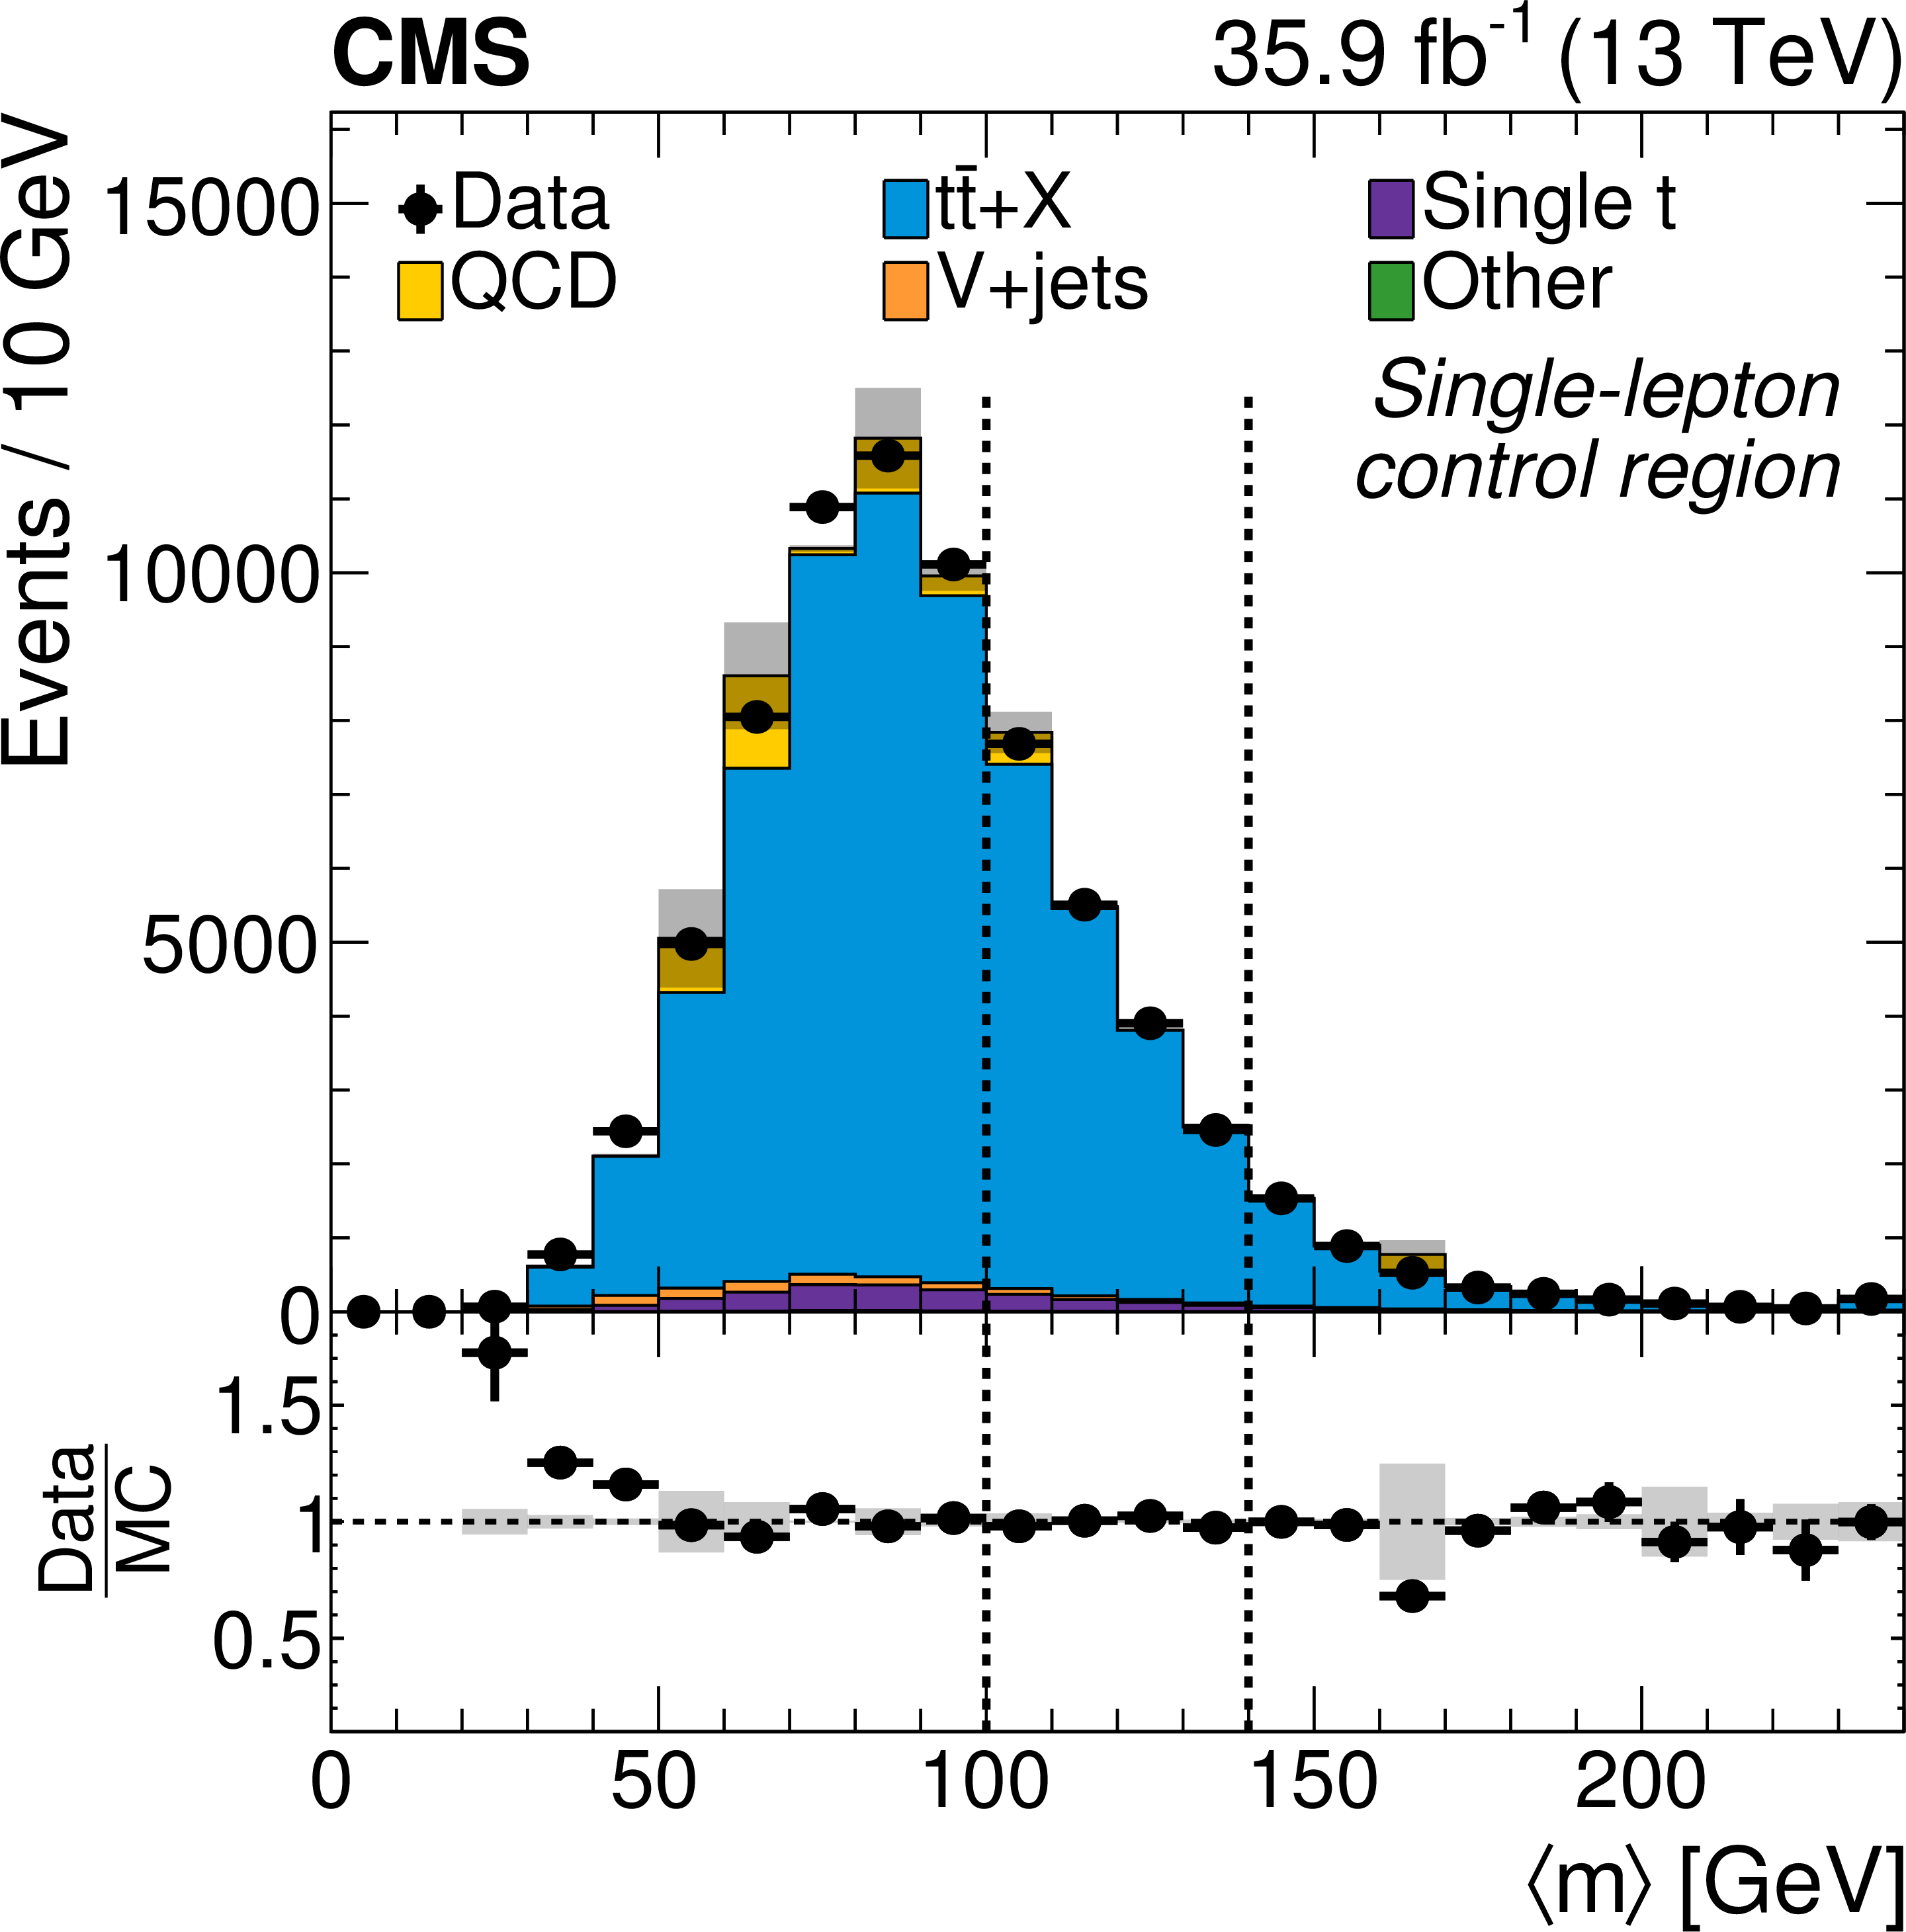
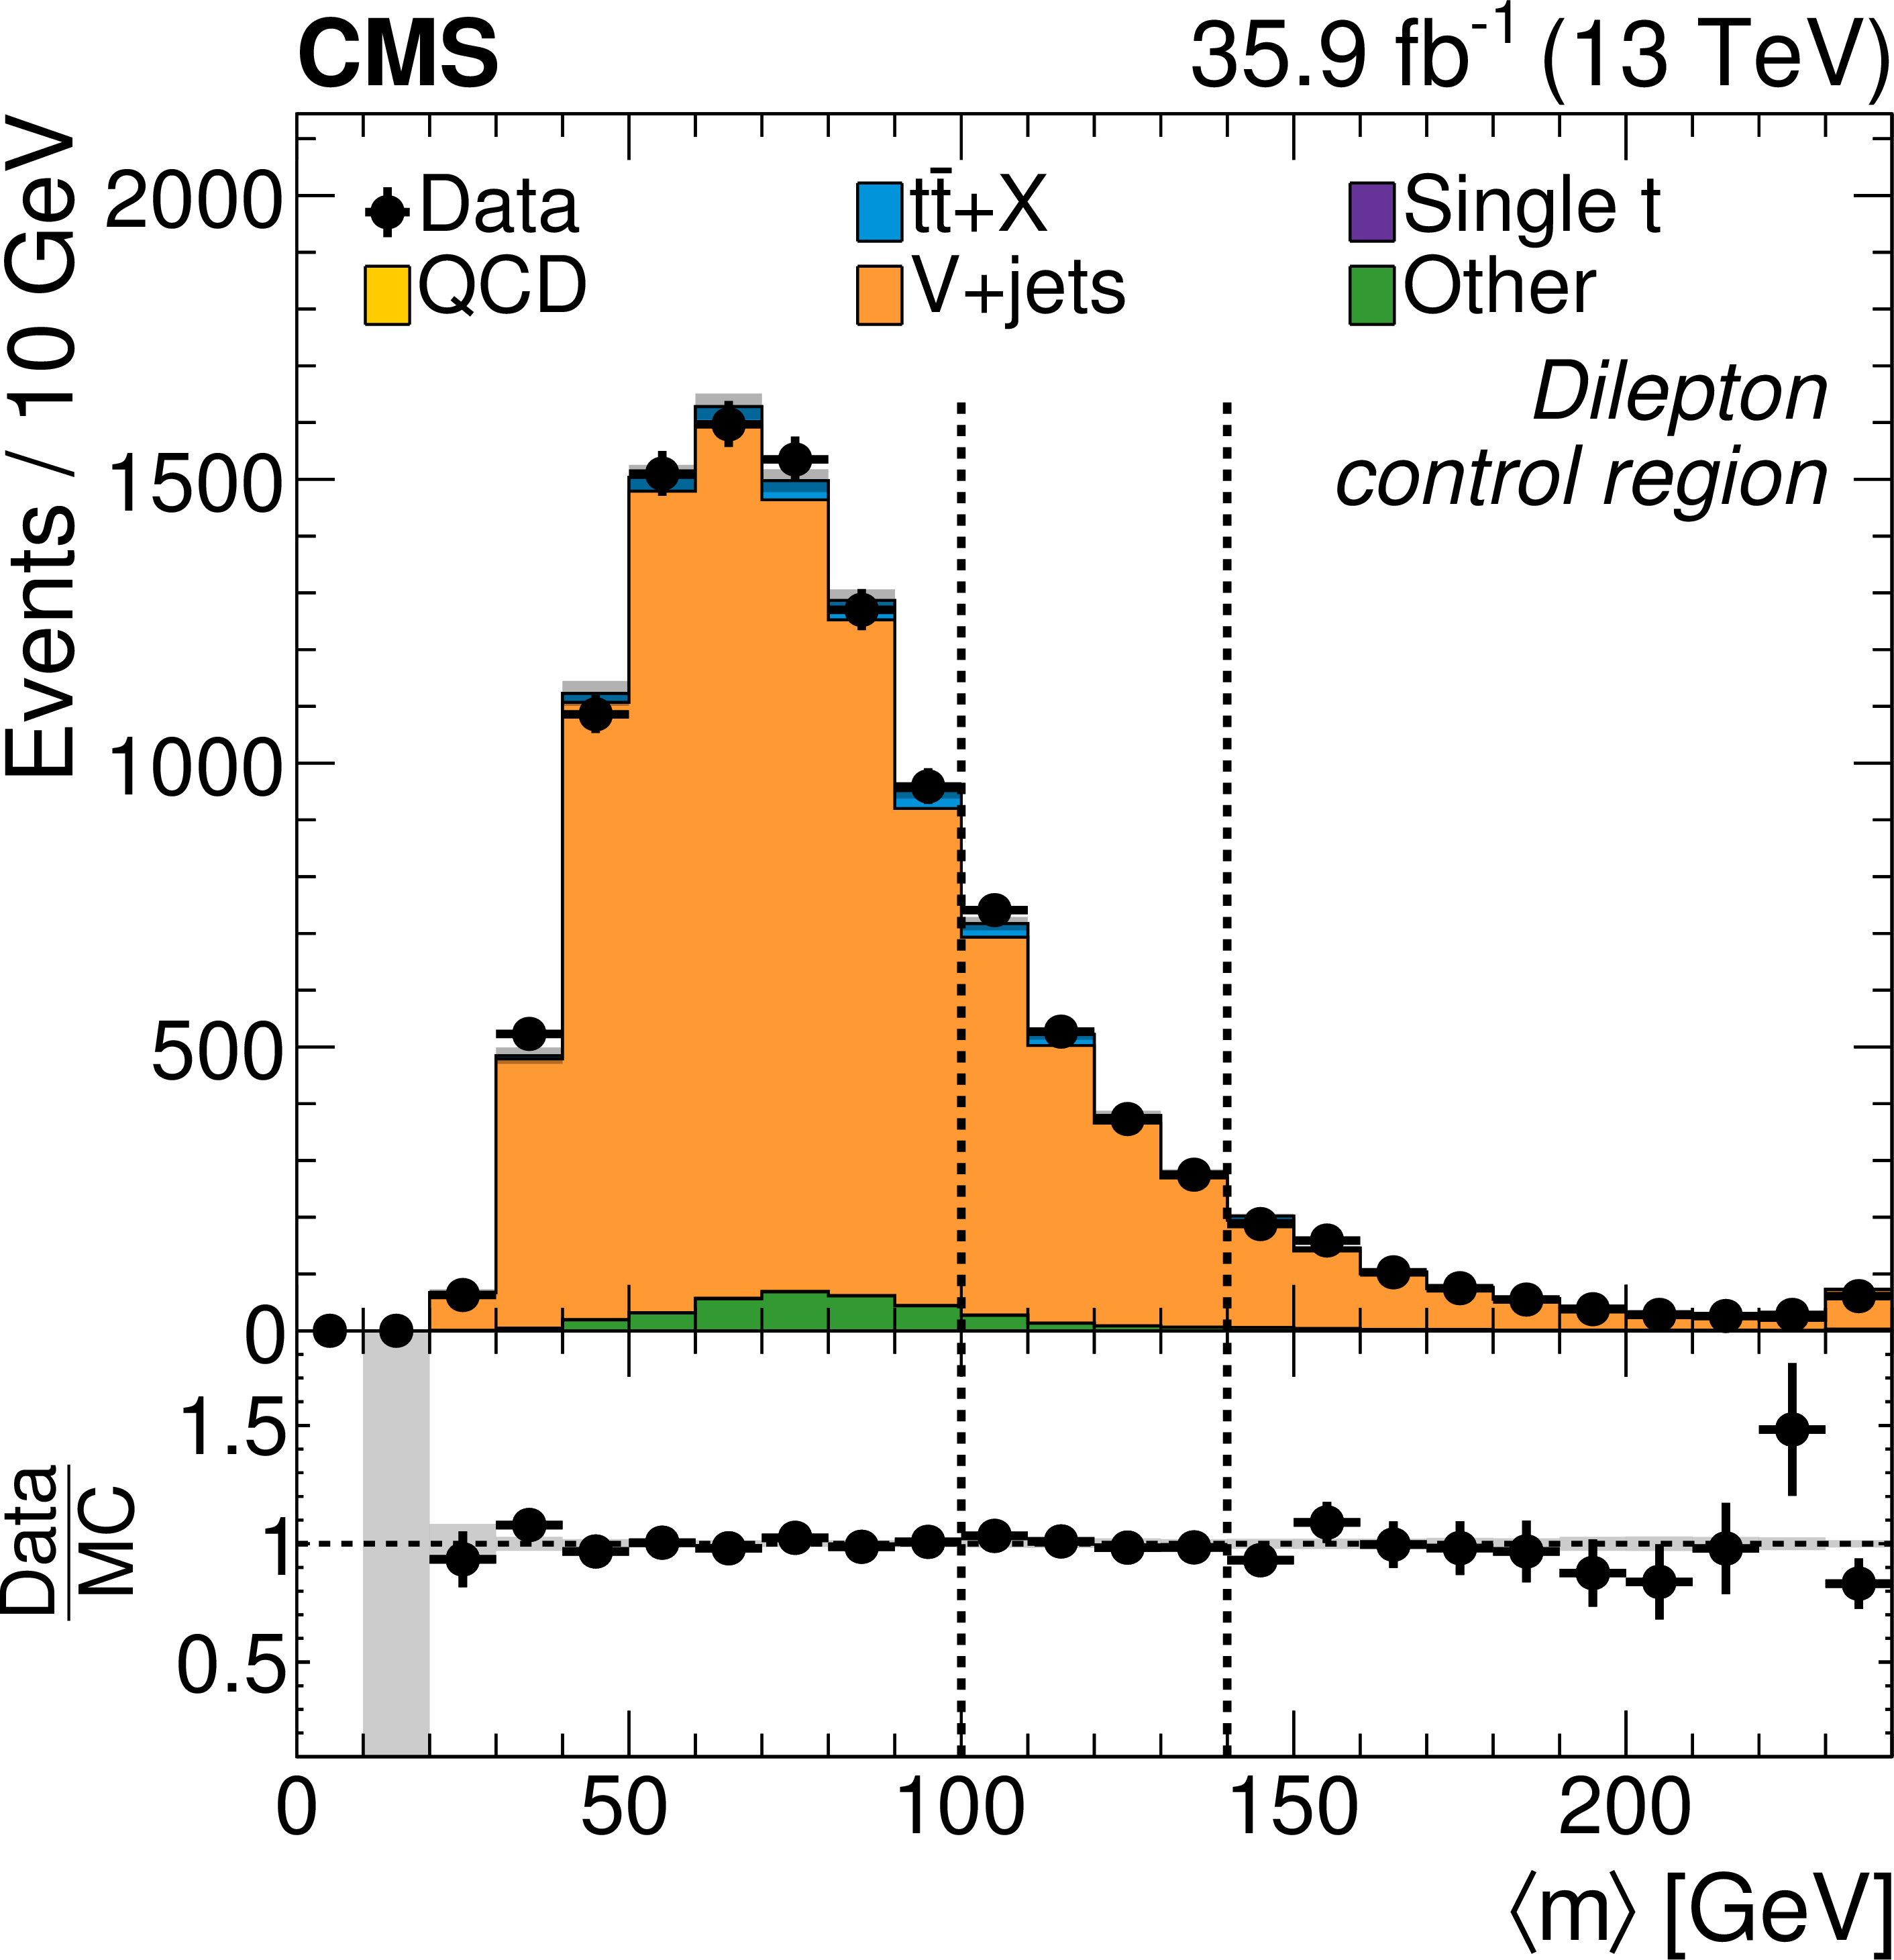
Figure 5:
Comparison of the distributions of $ { < m > } $ in data and simulation in the single-lepton control sample (left) and in the dilepton control sample (right), where in both cases we have integrated over $ {{p_{\mathrm {T}}} ^\text {miss}} $. The overall yields in simulation have been normalized to those observed in data. The gray shading indicates the statistical uncertainty in the total simulated background. The last bin includes overflow. |
png pdf |
Figure 5-a:
Comparison of the distributions of $ { < m > } $ in data and simulation in the single-lepton control sample, where we have integrated over $ {{p_{\mathrm {T}}} ^\text {miss}} $. The overall yields in simulation have been normalized to those observed in data. The gray shading indicates the statistical uncertainty in the total simulated background. The last bin includes overflow. |
png pdf |
Figure 5-b:
Comparison of the distributions of $ { < m > } $ in data and simulation in the dilepton control sample, where we have integrated over $ {{p_{\mathrm {T}}} ^\text {miss}} $. The overall yields in simulation have been normalized to those observed in data. The gray shading indicates the statistical uncertainty in the total simulated background. The last bin includes overflow. |
png pdf |
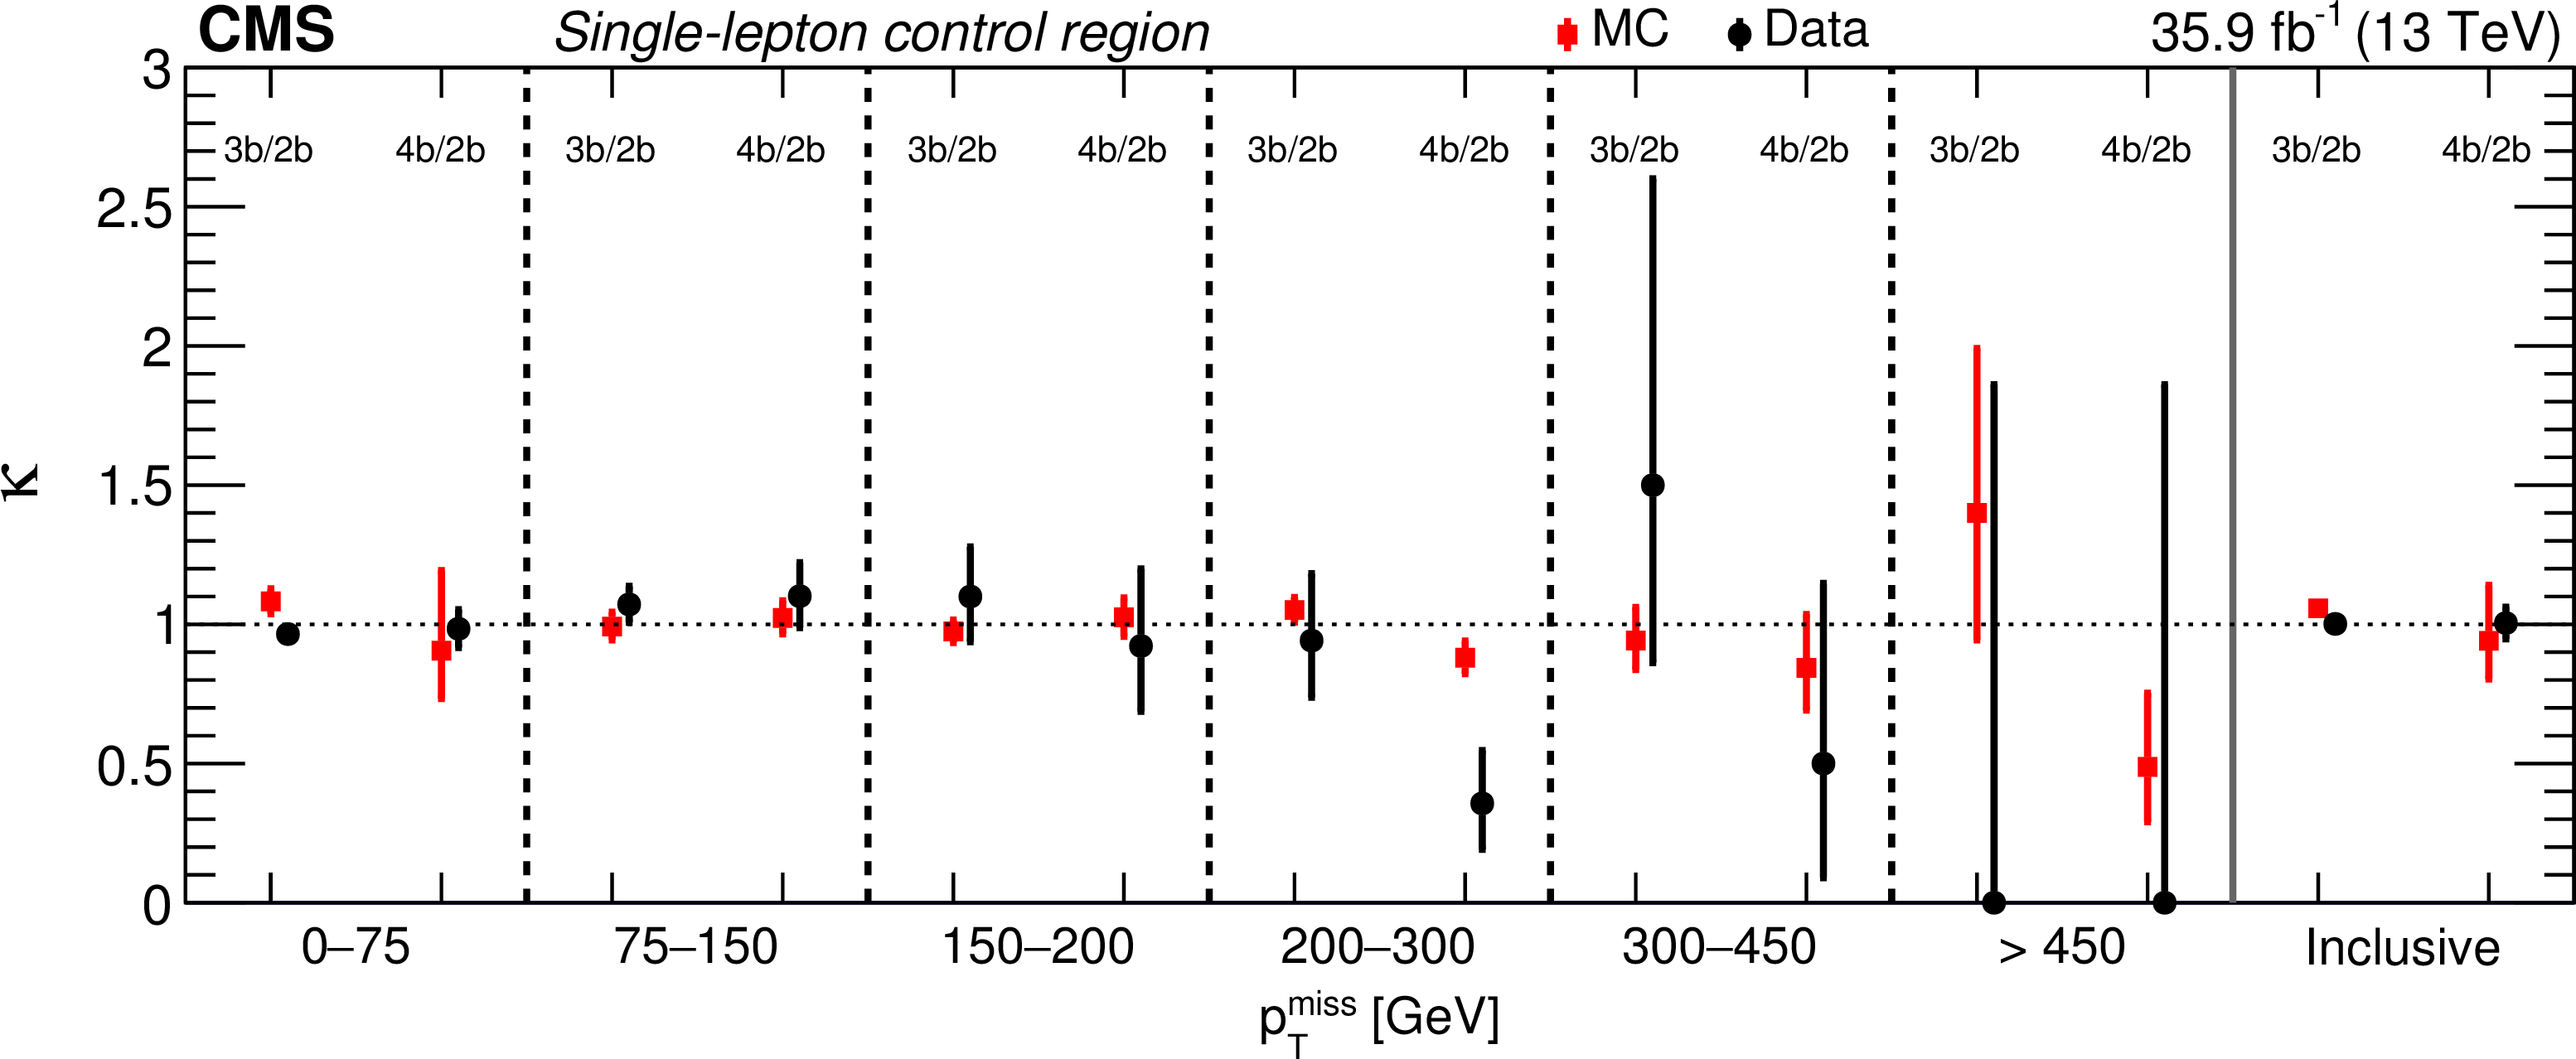
Figure 6:
Comparison of the ${\kappa}$ values found in the single-lepton control sample, for data and simulated events, for the 3b /2b and 4b /2b ABCD tests in each $ {{p_{\mathrm {T}}} ^\text {miss}} $ bin as well as after integrating over $ {{p_{\mathrm {T}}} ^\text {miss}} $ (labeled as "Inclusive''). |
png pdf |
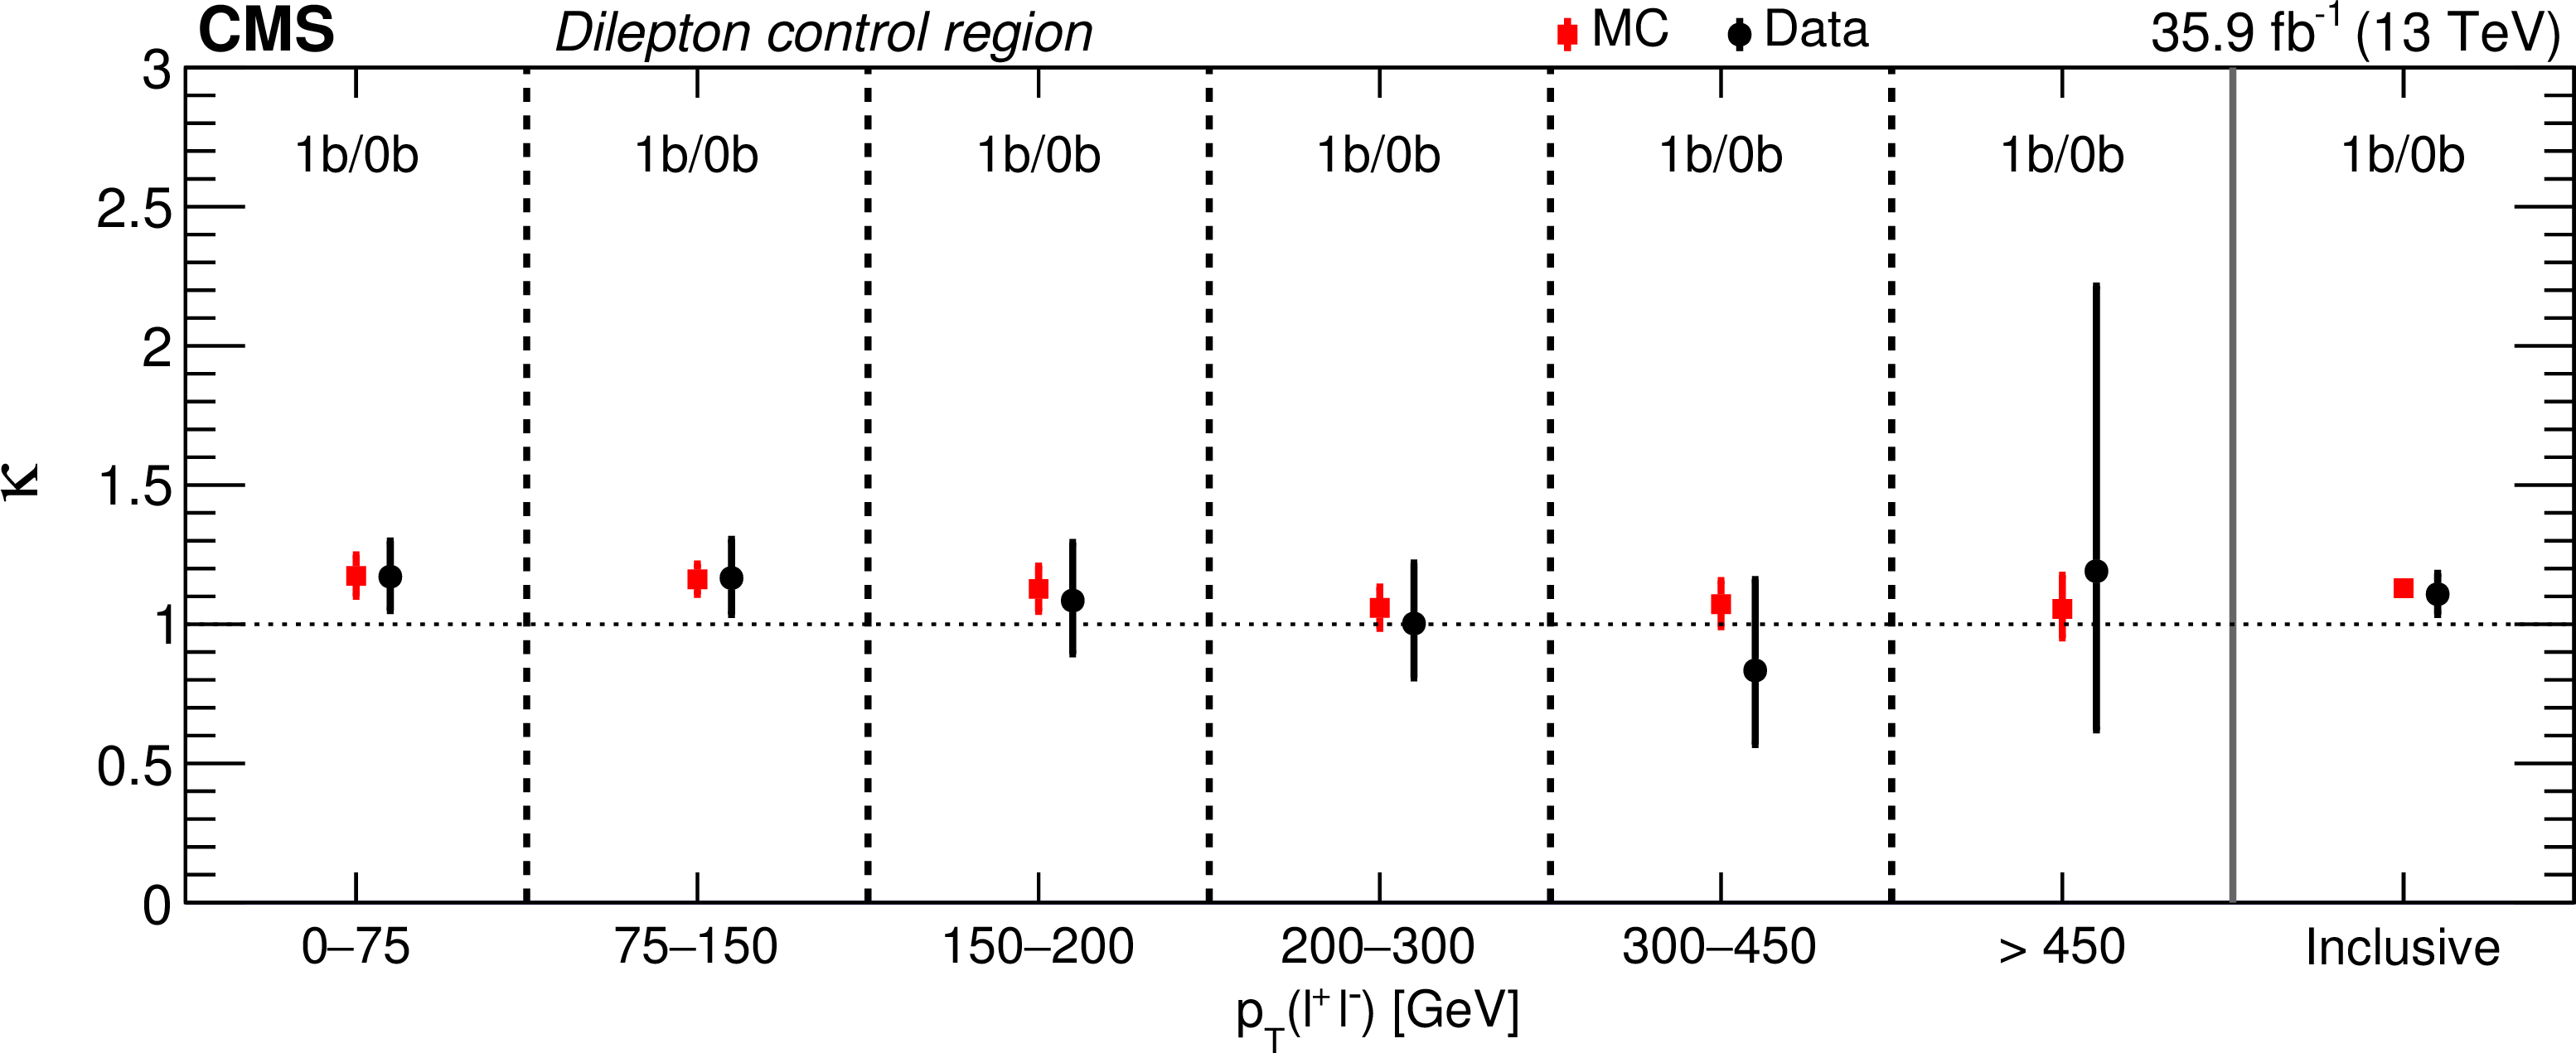
Figure 7:
Comparison of the $ {\kappa} $ values found in the dilepton control sample, data and simulation, for the 1b /0b ABCD tests in bins of $ {p_{\mathrm {T}}(\ell ^{+}\ell ^{-})} $ as well as after integrating over $ {p_{\mathrm {T}}(\ell ^{+}\ell ^{-})} $ (labeled as "Inclusive''). |
png pdf |
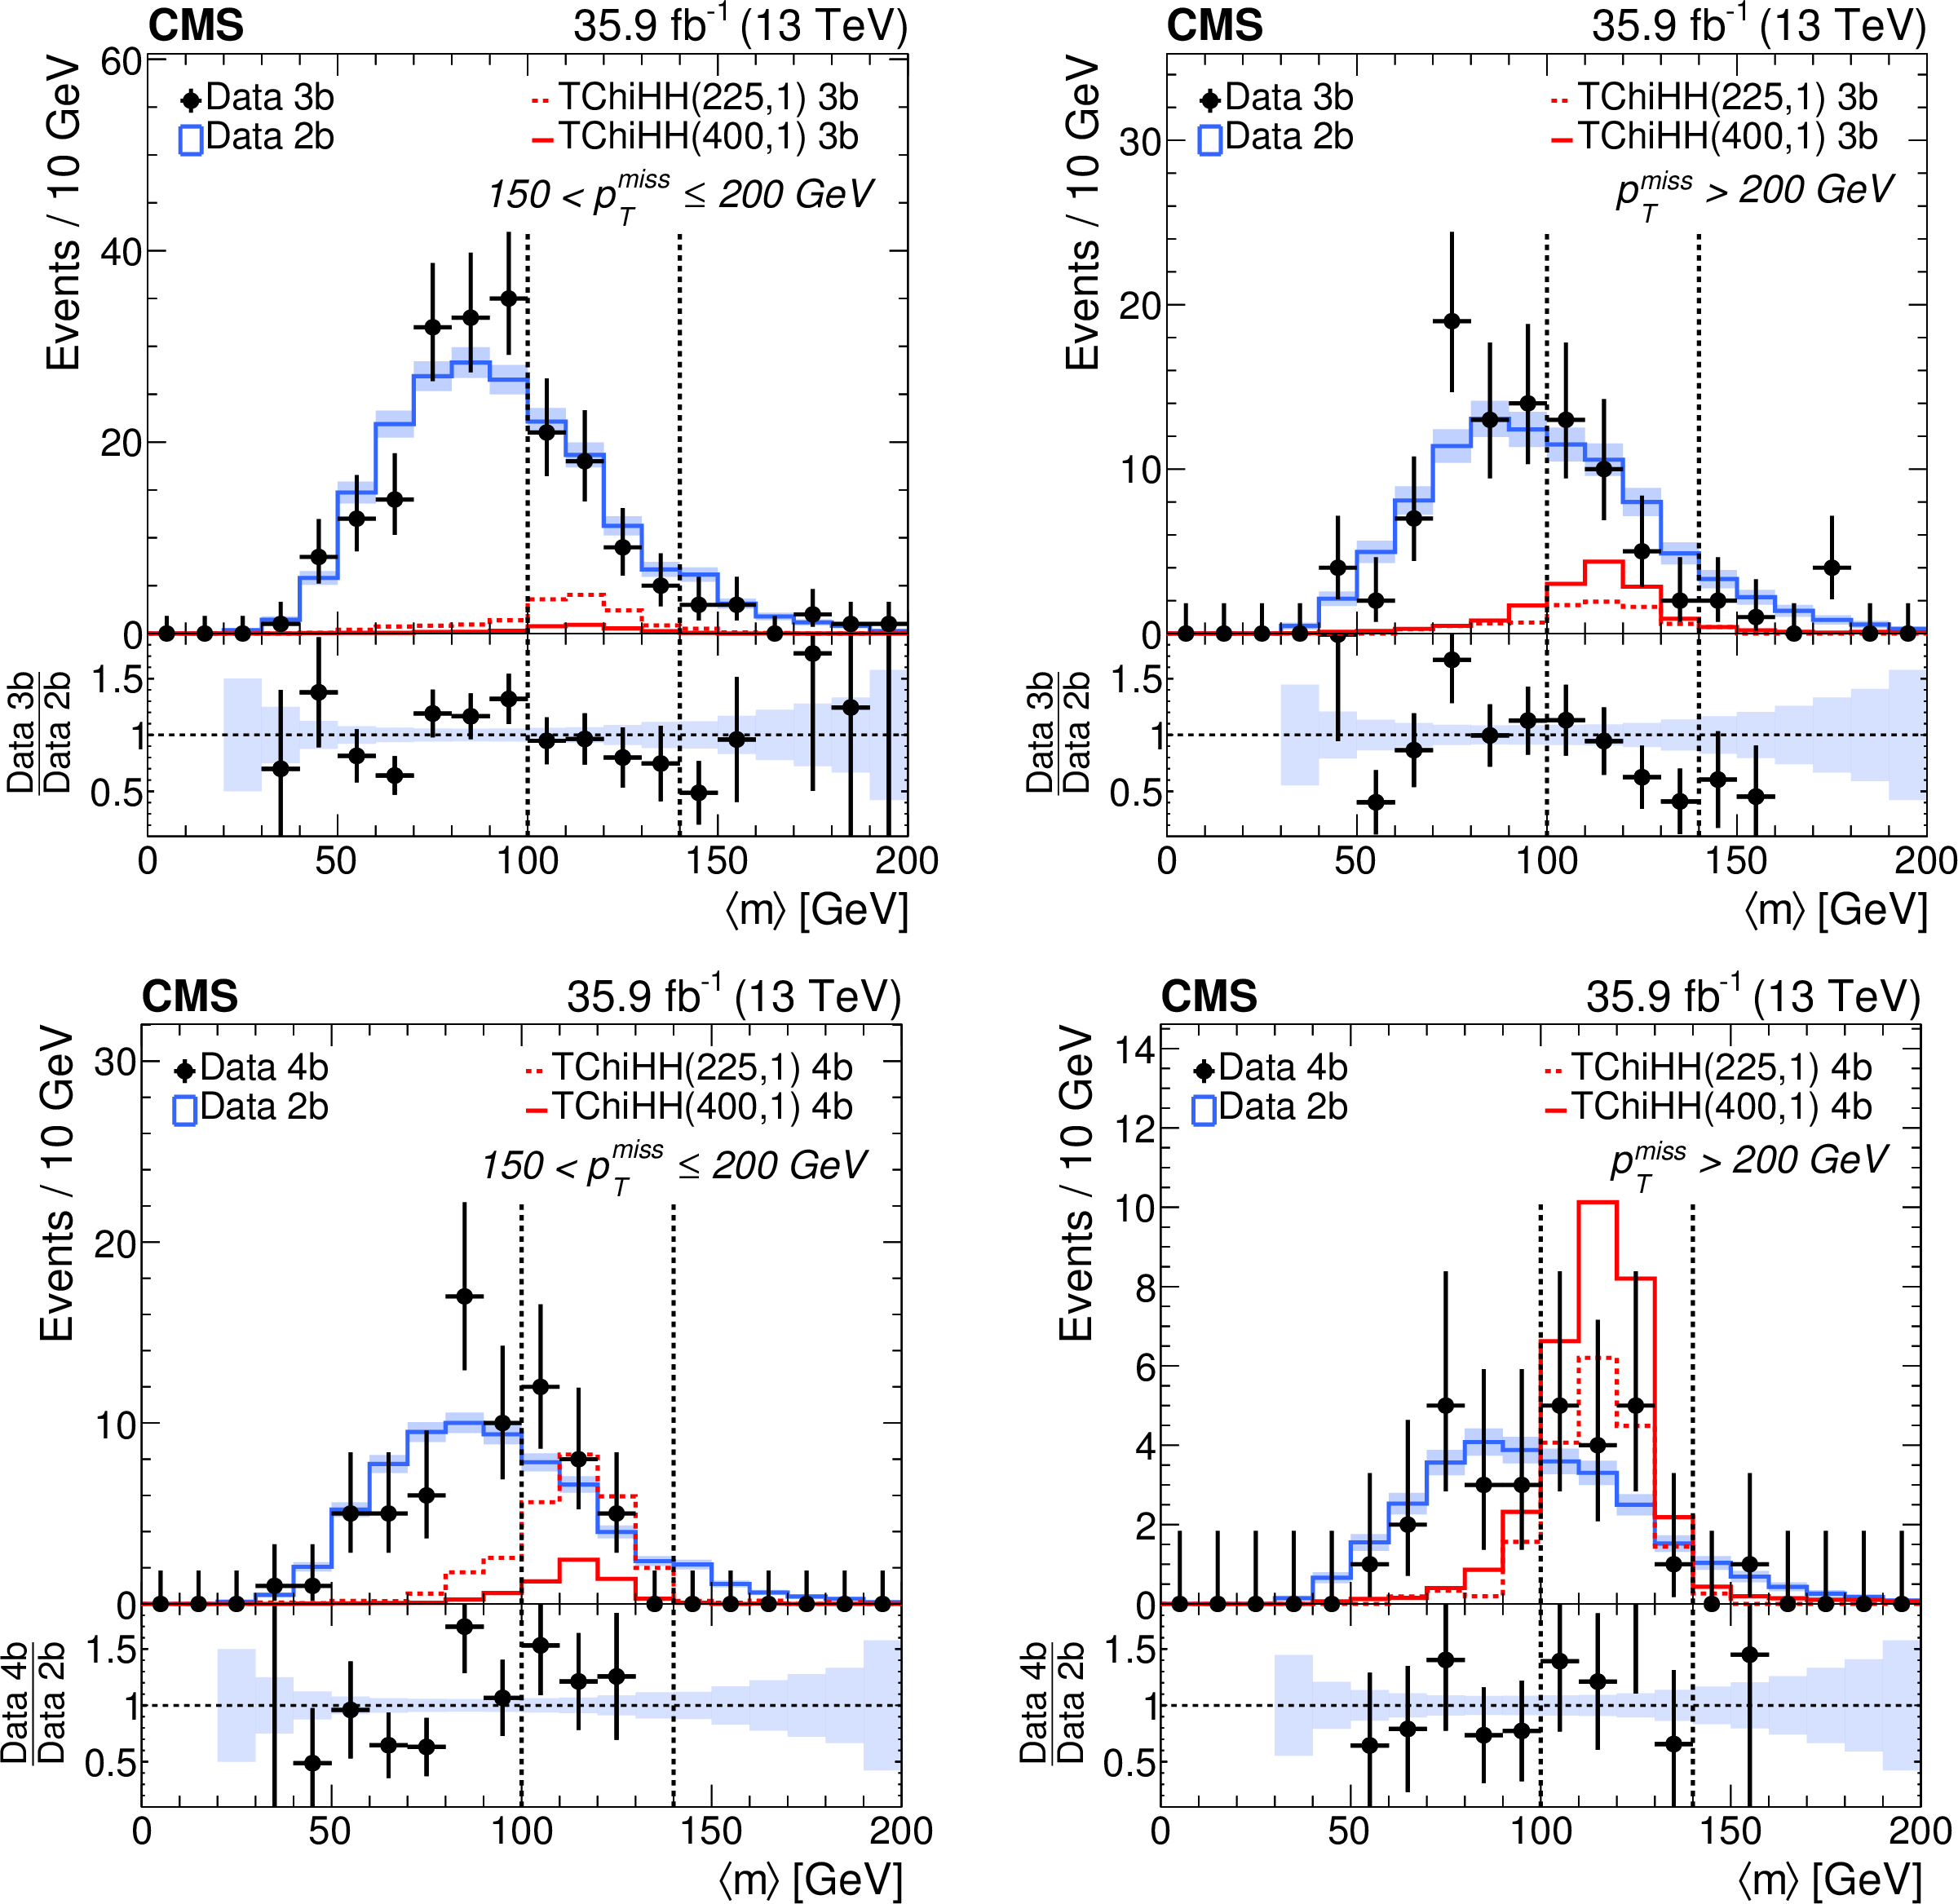
Figure 8:
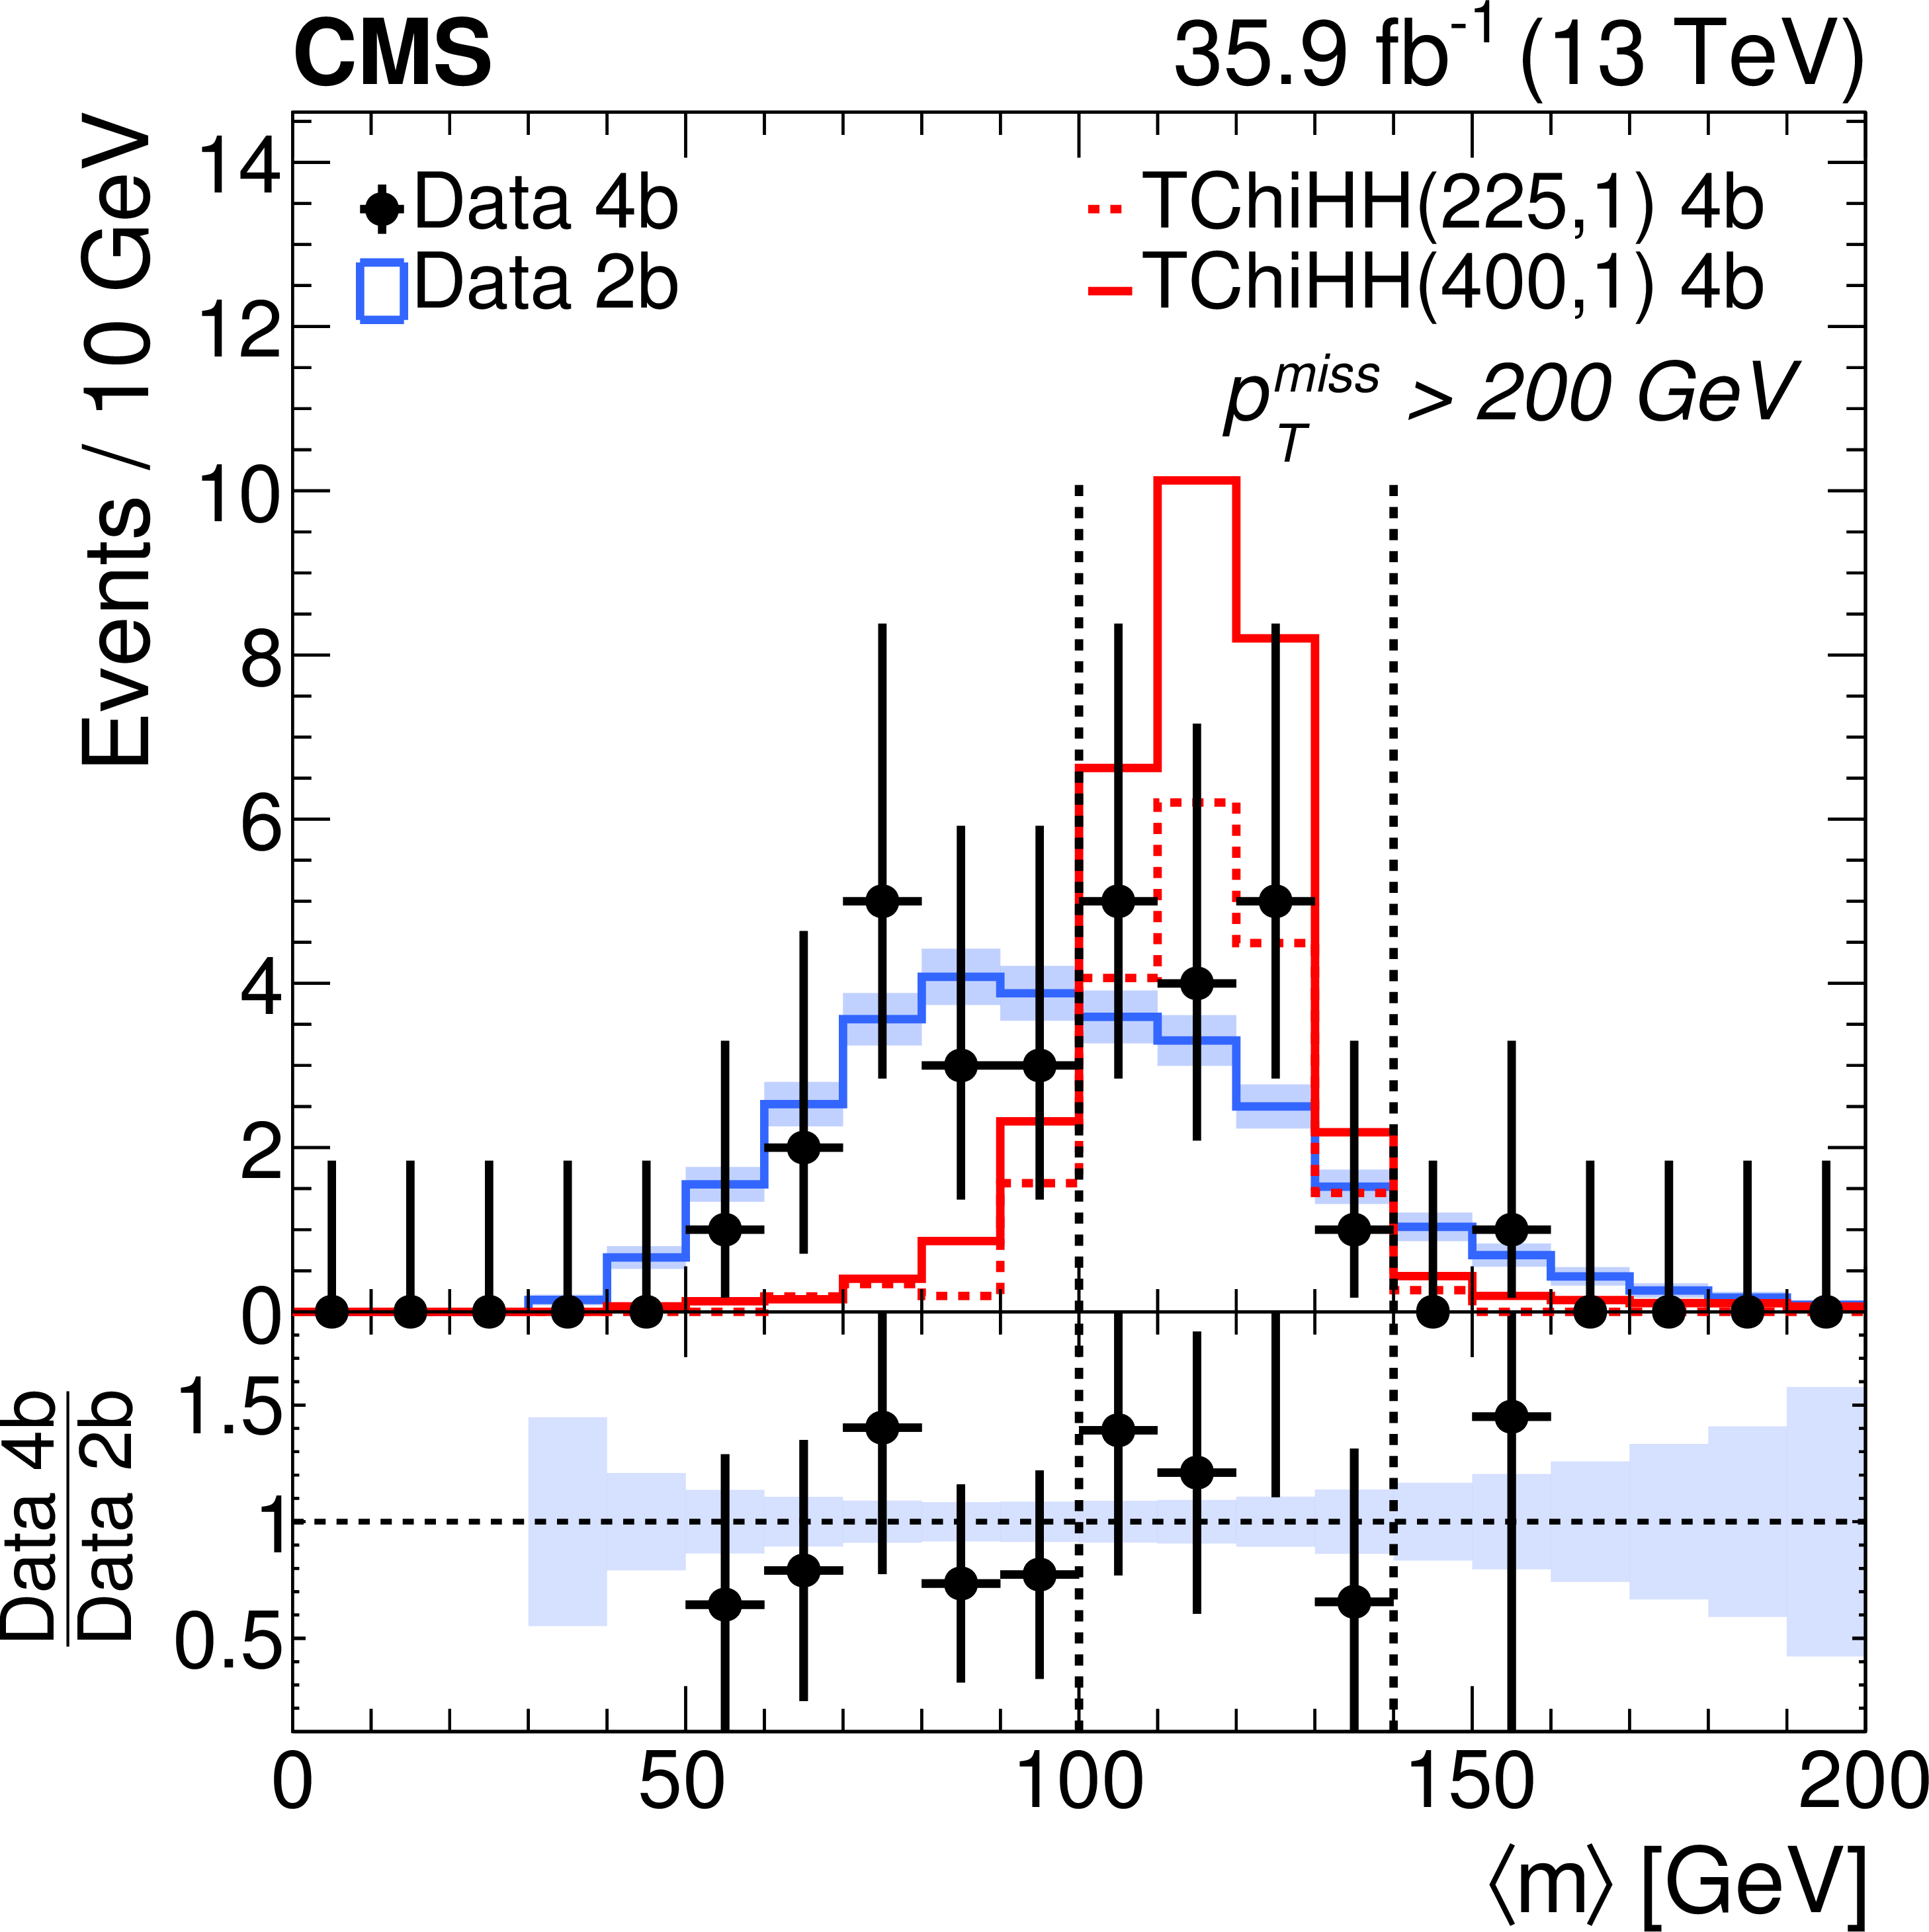
Distributions of $ { < m > } $ in data and two signal benchmark models denoted as TChiHH($ {m_{\tilde{\chi}^0_1}} $, $ {m_{\tilde{\mathrm{G}}}} $), with $ {m_{\tilde{\chi}^0_1}} $ and $ {m_{\tilde{\mathrm{G}}}} $ in units of GeV. The points with error bars show the data in the 3b (top) and 4b bins (bottom) for 150 $ < {{p_{\mathrm {T}}} ^\text {miss}} \leq $ 200 GeV (left) and $ {{p_{\mathrm {T}}} ^\text {miss}} > $ 200 GeV (right). The histograms show the shape of the $ { < m > } $ distribution observed in the 2b bin with an overall event yield normalized to those observed in the 3b and 4b samples. The shaded areas reflect the statistical uncertainty in the $ { < m > } $ distribution in the 2b data. The vertical dashed lines denote the boundaries between the HIG and the SBD regions. The ratio plots demonstrate that the shapes are in agreement. |
png pdf |
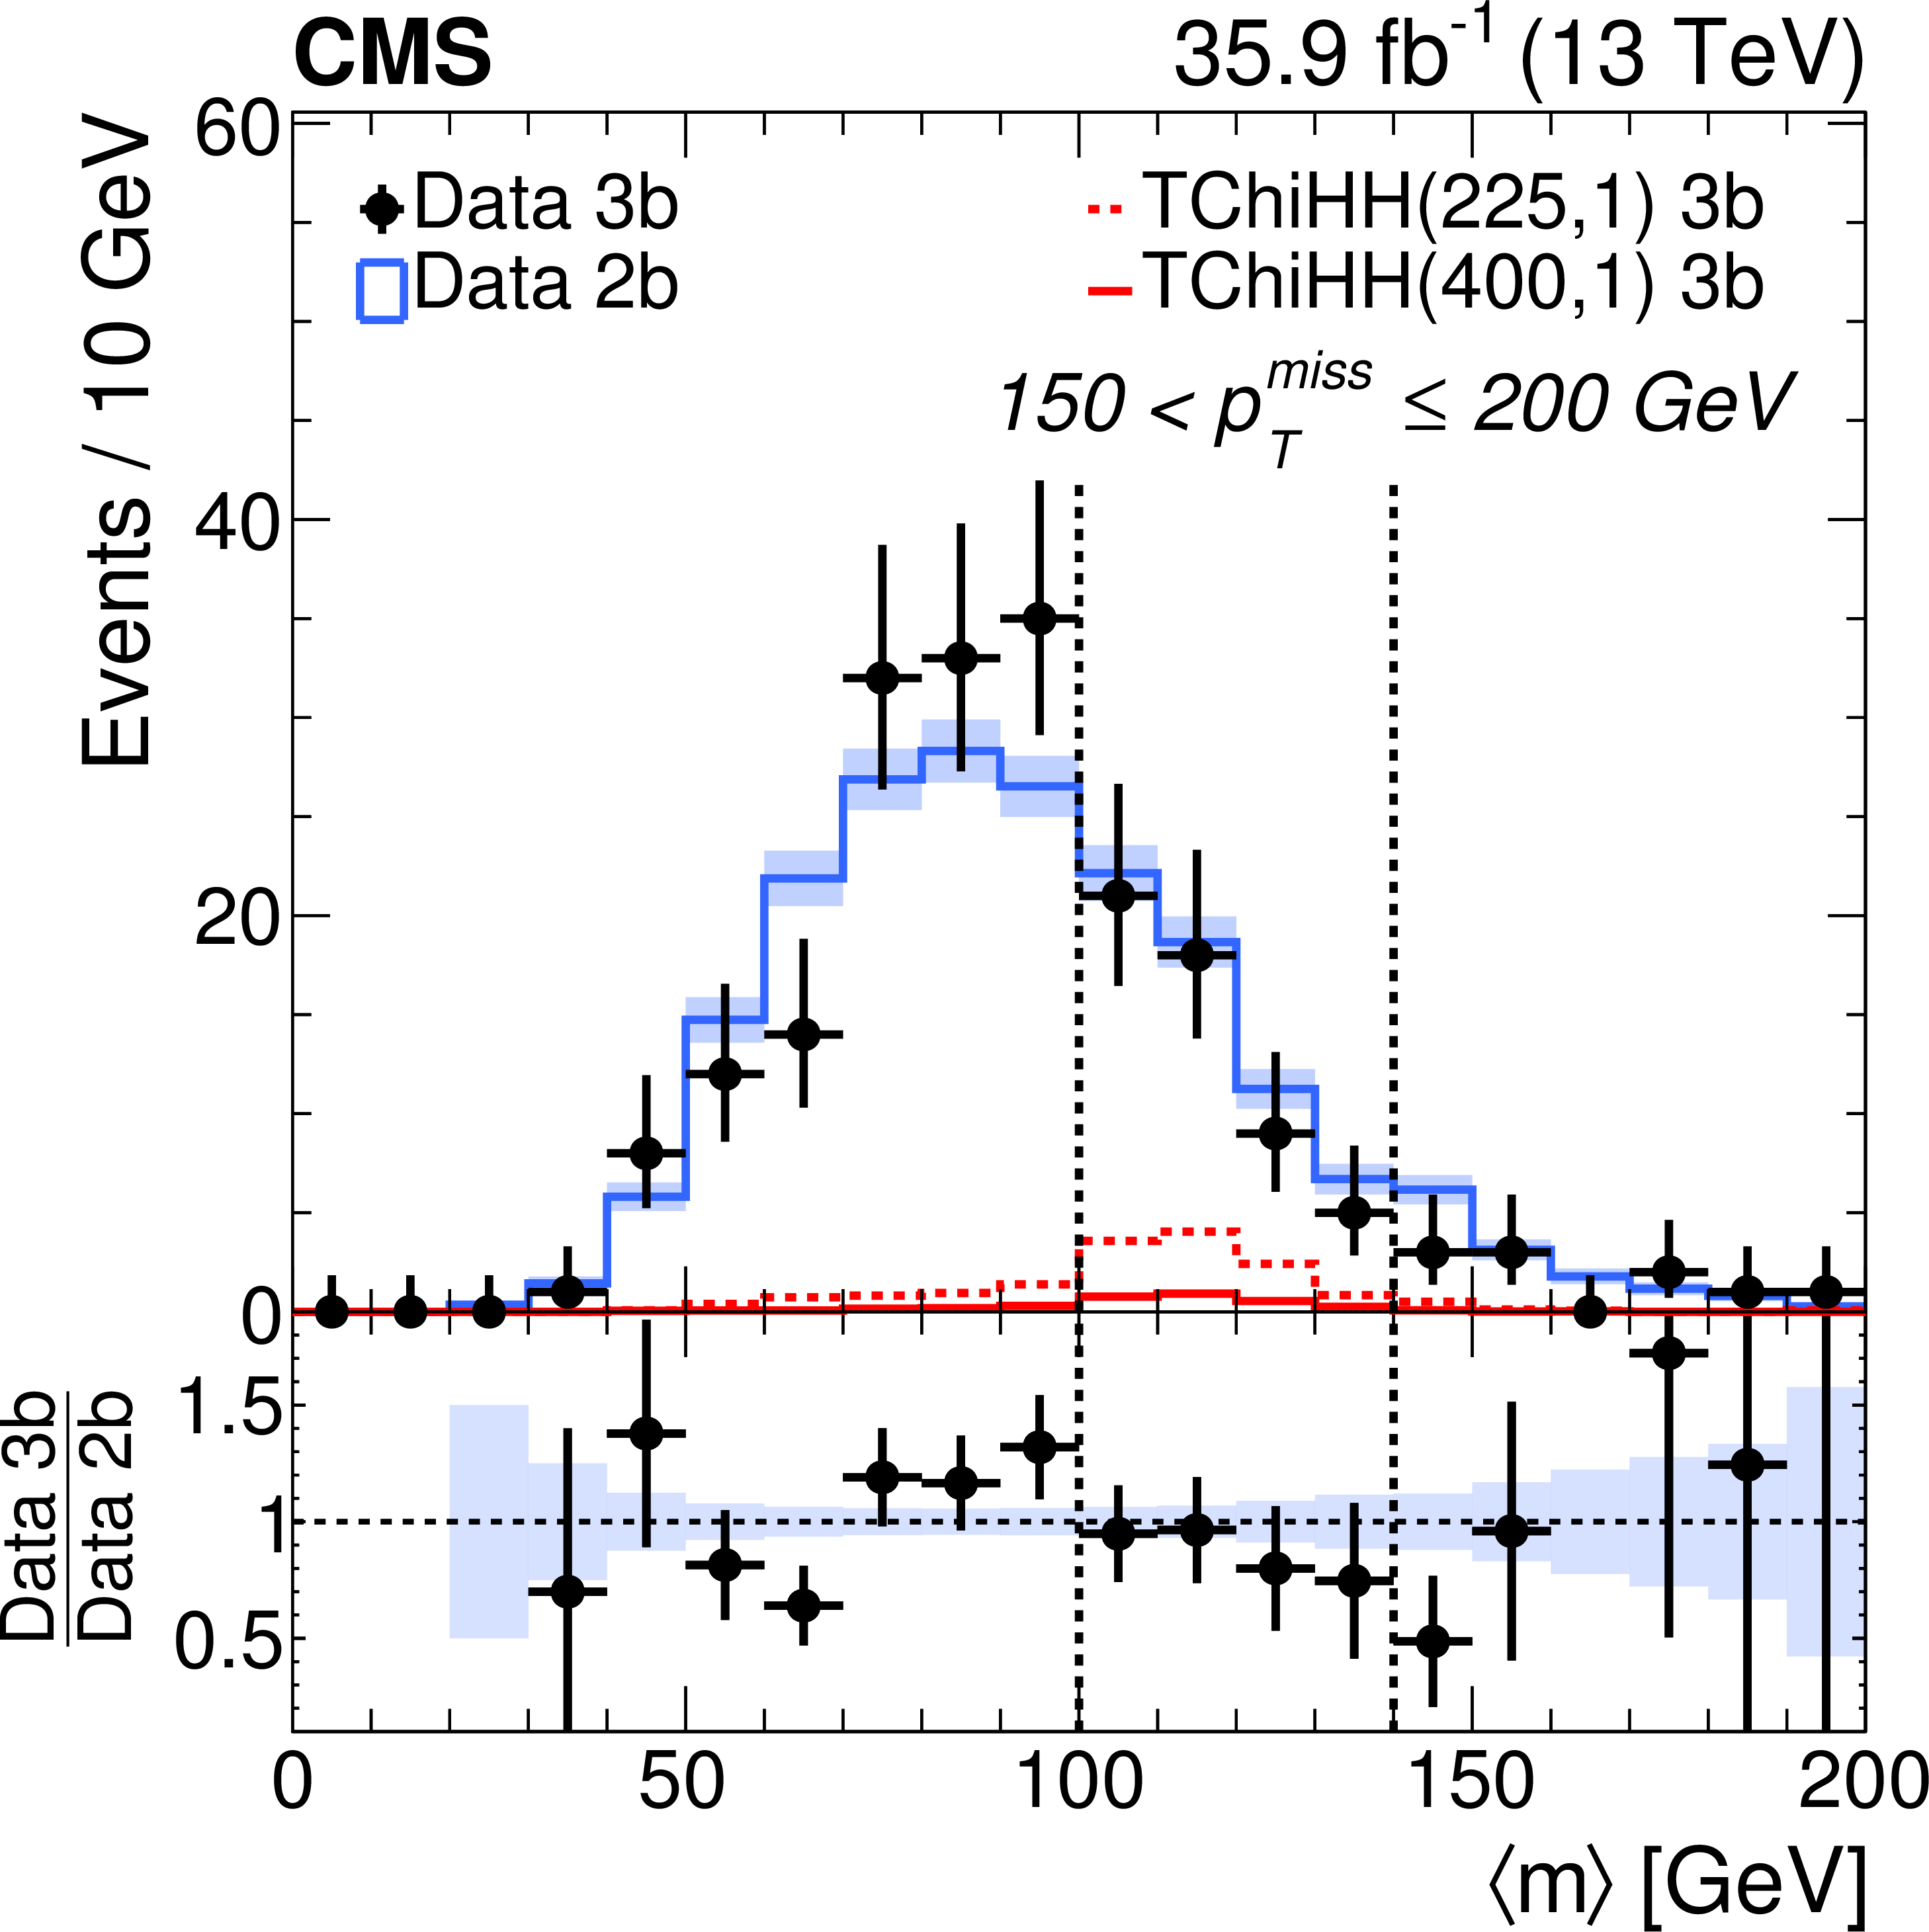
Figure 8-a:
Distribution of $ { < m > } $ in data and two signal benchmark models denoted as TChiHH($ {m_{\tilde{\chi}^0_1}} $, $ {m_{\tilde{\mathrm{G}}}} $), with $ {m_{\tilde{\chi}^0_1}} $ and $ {m_{\tilde{\mathrm{G}}}} $ in units of GeV. The points with error bars show the data in the 3b bins for 150 $ < {{p_{\mathrm {T}}} ^\text {miss}} \leq $ 200 GeV. The histograms show the shape of the $ { < m > } $ distribution observed in the 2b bin with an overall event yield normalized to those observed in the 3b sample. The shaded areas reflect the statistical uncertainty in the $ { < m > } $ distribution in the 2b data. The vertical dashed lines denote the boundaries between the HIG and the SBD regions. The ratio plots demonstrate that the shapes are in agreement. |
png pdf |
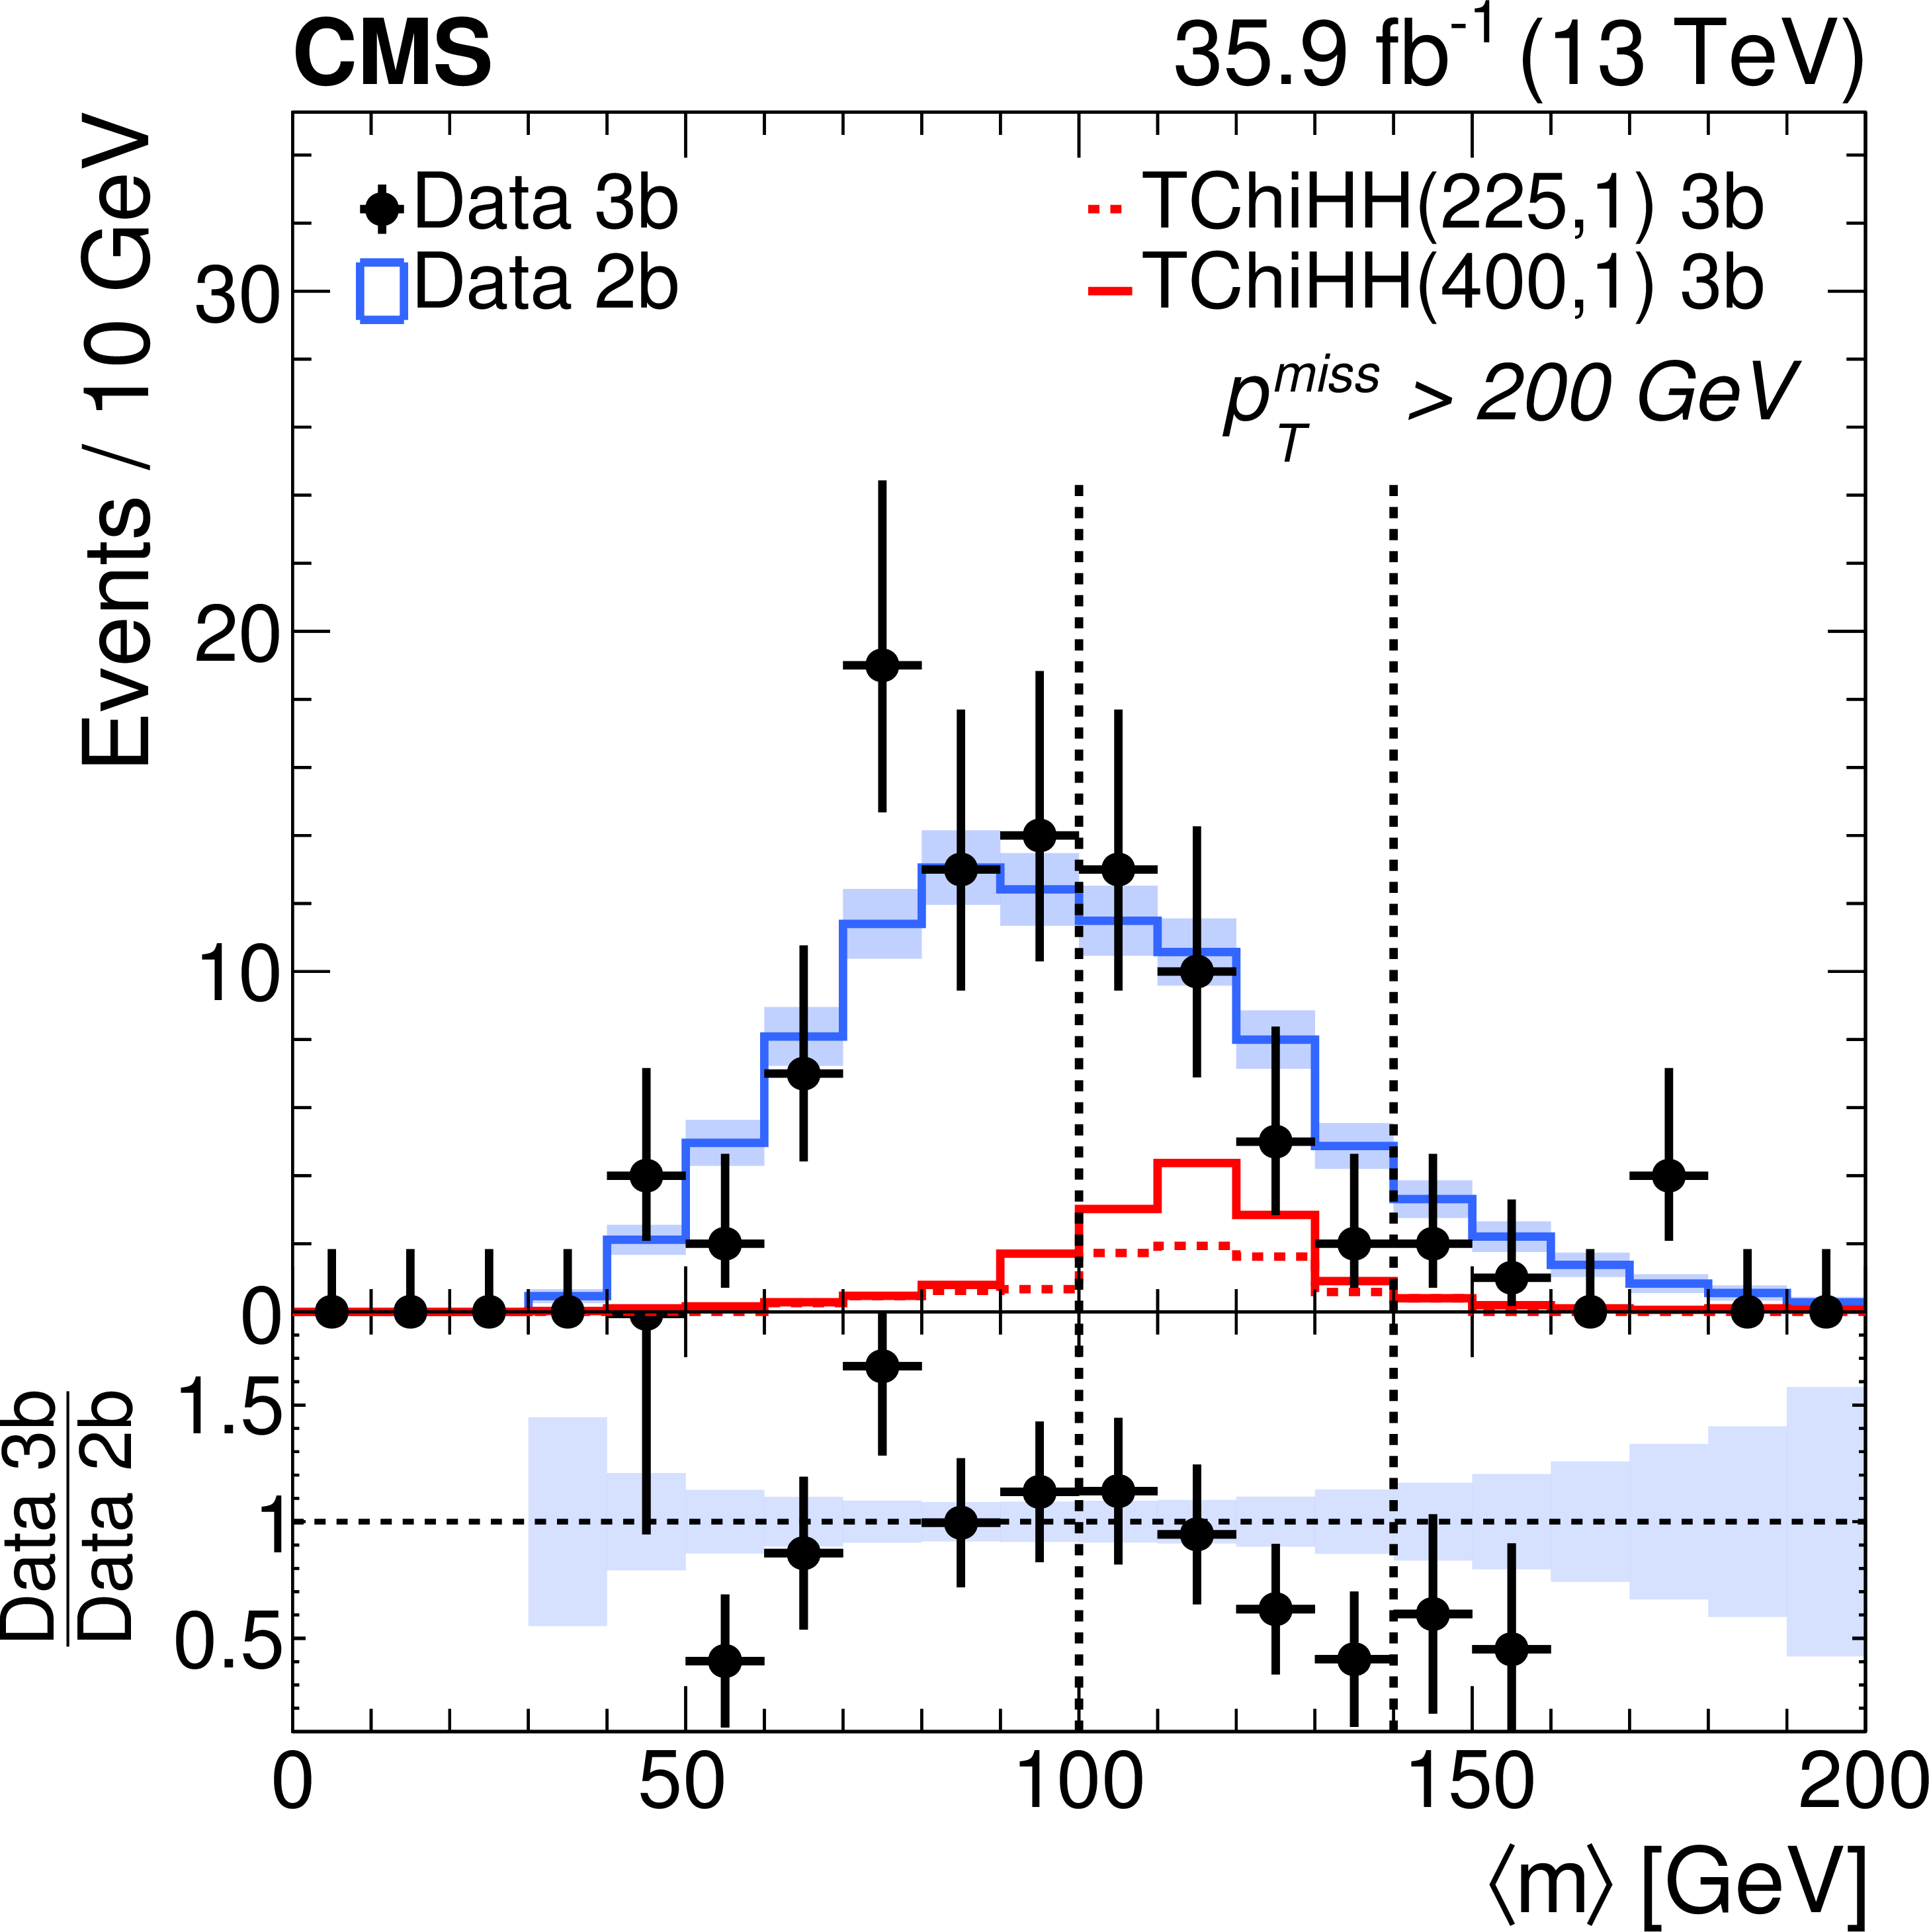
Figure 8-b:
Distribution of $ { < m > } $ in data and two signal benchmark models denoted as TChiHH($ {m_{\tilde{\chi}^0_1}} $, $ {m_{\tilde{\mathrm{G}}}} $), with $ {m_{\tilde{\chi}^0_1}} $ and $ {m_{\tilde{\mathrm{G}}}} $ in units of GeV. The points with error bars show the data in the 3b bins for $ {{p_{\mathrm {T}}} ^\text {miss}} > $ 200 GeV. The histograms show the shape of the $ { < m > } $ distribution observed in the 2b bin with an overall event yield normalized to those observed in the 3b sample. The shaded areas reflect the statistical uncertainty in the $ { < m > } $ distribution in the 2b data. The vertical dashed lines denote the boundaries between the HIG and the SBD regions. The ratio plots demonstrate that the shapes are in agreement. |
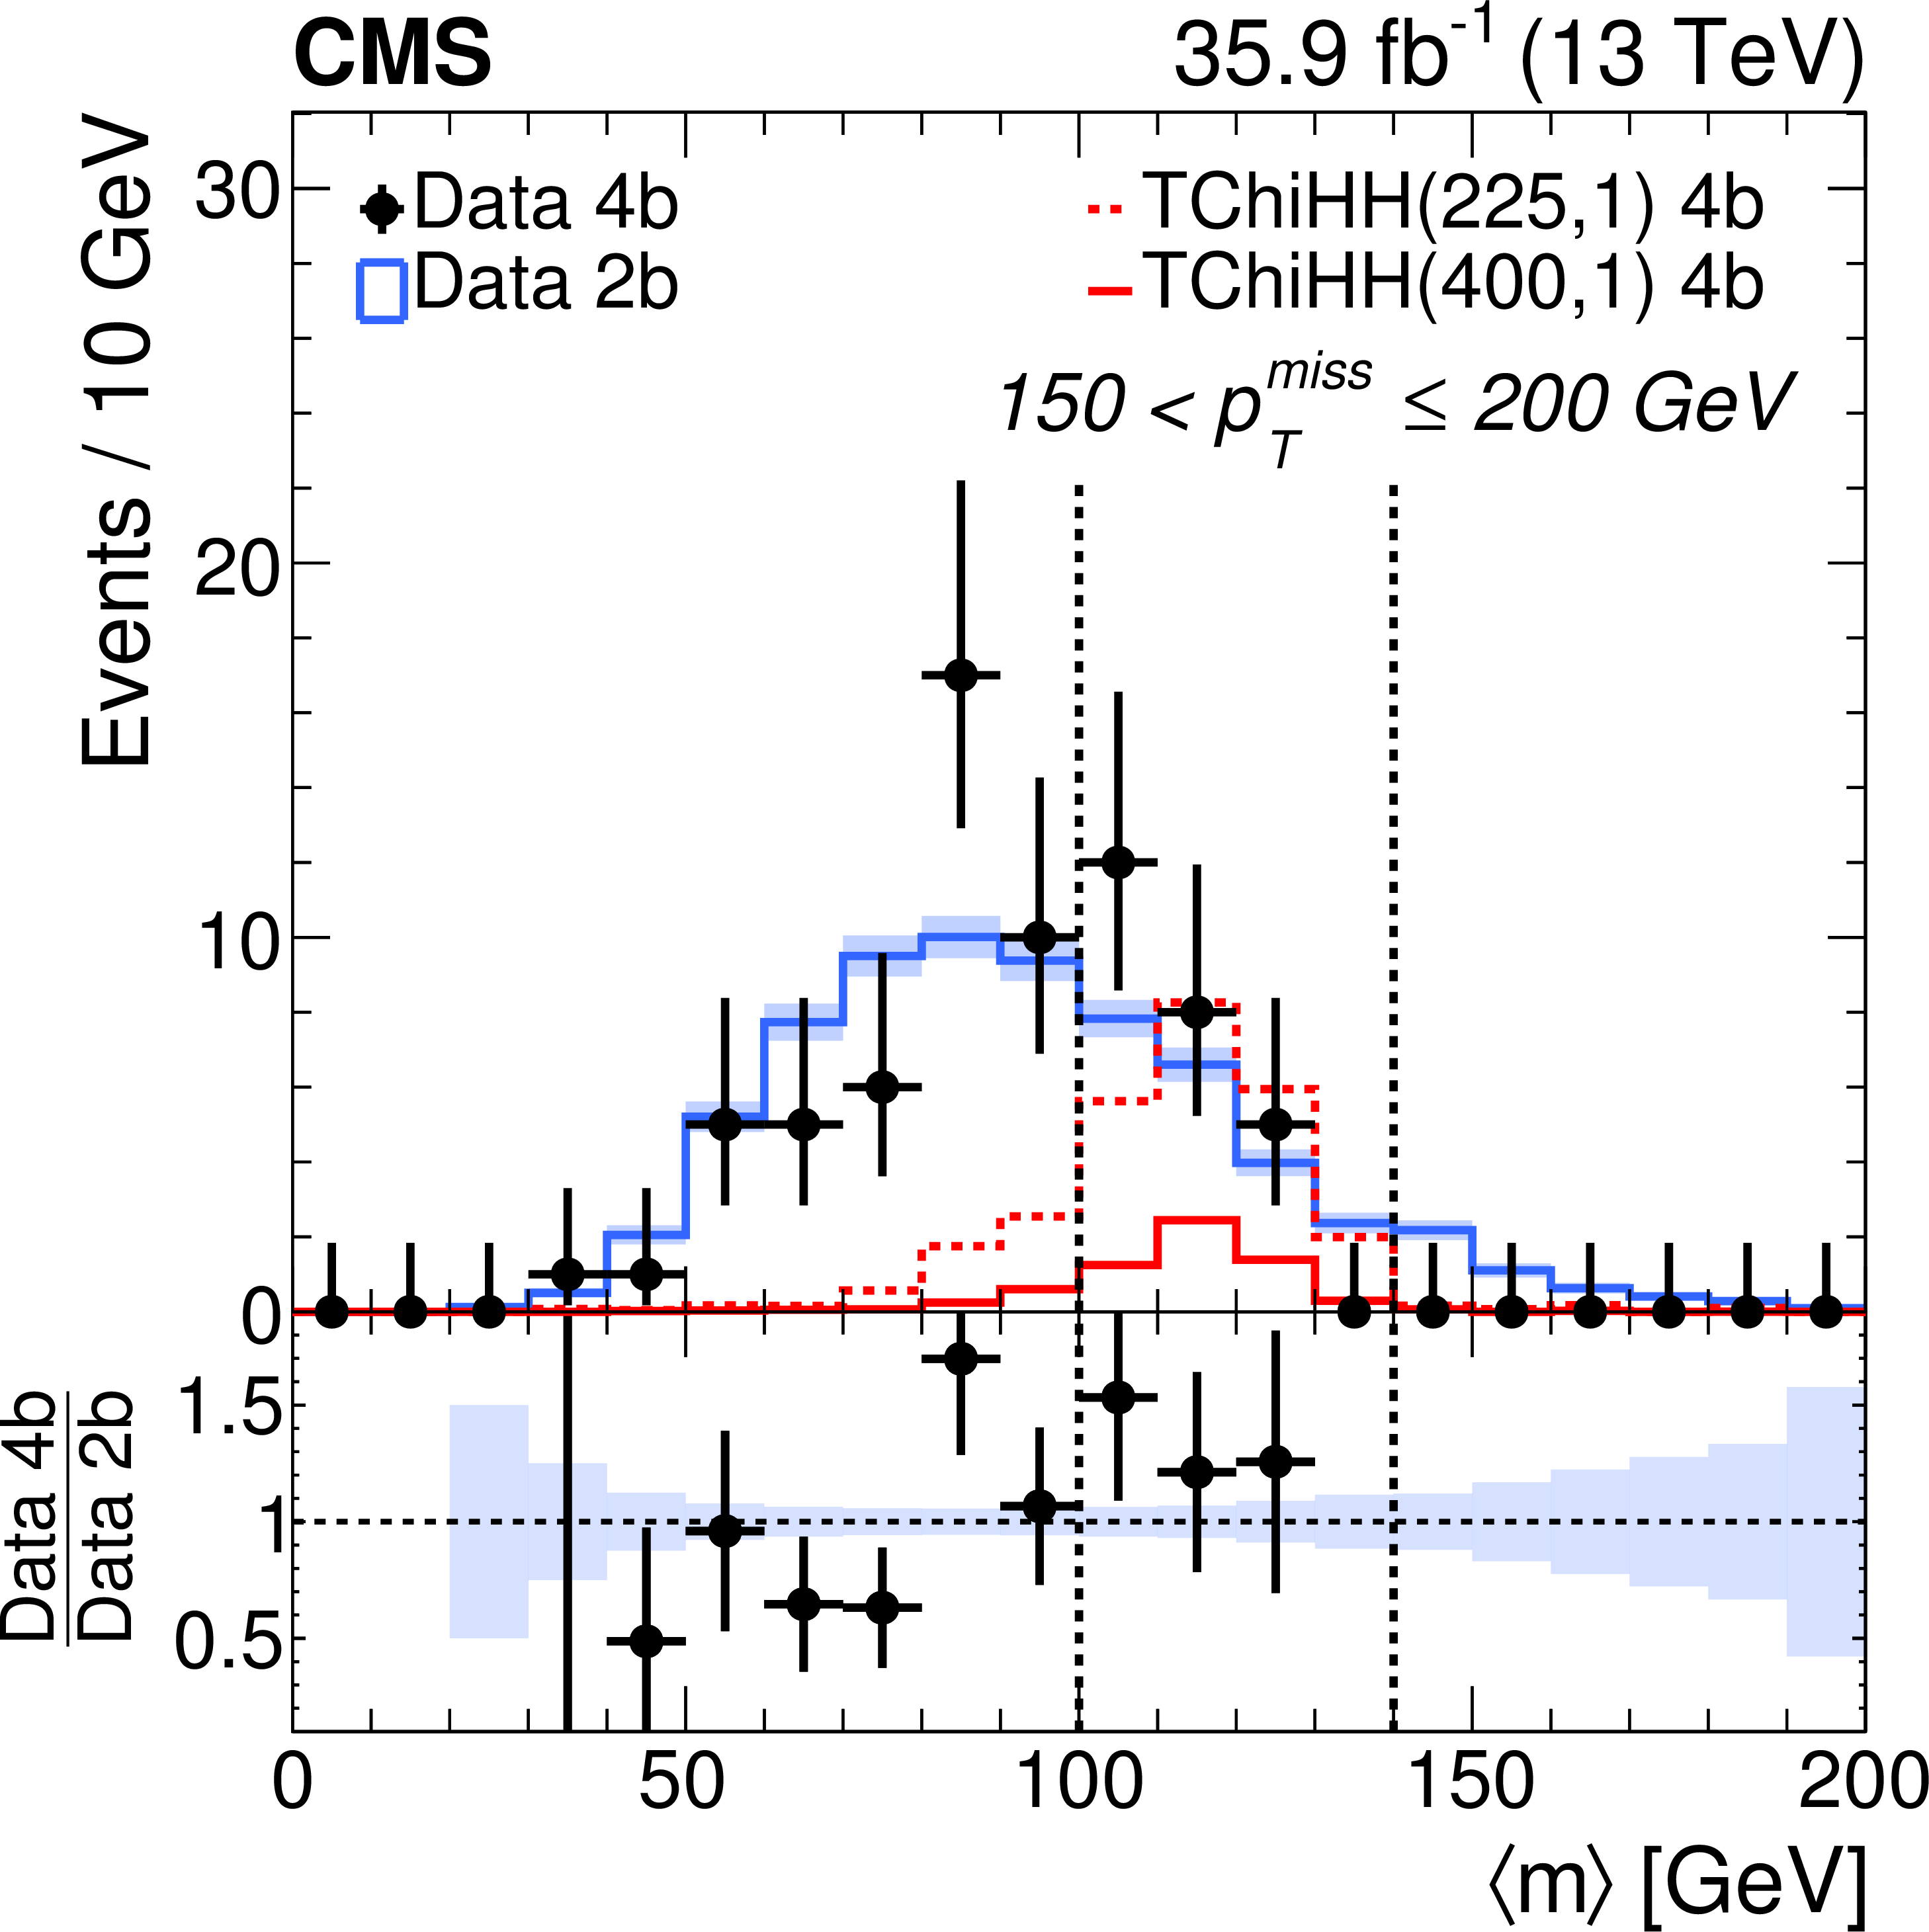
png pdf |
Figure 8-c:
Distribution of $ { < m > } $ in data and two signal benchmark models denoted as TChiHH($ {m_{\tilde{\chi}^0_1}} $, $ {m_{\tilde{\mathrm{G}}}} $), with $ {m_{\tilde{\chi}^0_1}} $ and $ {m_{\tilde{\mathrm{G}}}} $ in units of GeV. The points with error bars show the data in the 4b bins for 150 $ < {{p_{\mathrm {T}}} ^\text {miss}} \leq $ 200 GeV. The histograms show the shape of the $ { < m > } $ distribution observed in the 2b bin with an overall event yield normalized to those observed in the 4b sample. The shaded areas reflect the statistical uncertainty in the $ { < m > } $ distribution in the 2b data. The vertical dashed lines denote the boundaries between the HIG and the SBD regions. The ratio plots demonstrate that the shapes are in agreement. |
png pdf |
Figure 8-d:
Distribution of $ { < m > } $ in data and two signal benchmark models denoted as TChiHH($ {m_{\tilde{\chi}^0_1}} $, $ {m_{\tilde{\mathrm{G}}}} $), with $ {m_{\tilde{\chi}^0_1}} $ and $ {m_{\tilde{\mathrm{G}}}} $ in units of GeV. The points with error bars show the data in the 4b bins for $ {{p_{\mathrm {T}}} ^\text {miss}} > $ 200 GeV. The histograms show the shape of the $ { < m > } $ distribution observed in the 2b bin with an overall event yield normalized to those observed in the 4b sample. The shaded areas reflect the statistical uncertainty in the $ { < m > } $ distribution in the 2b data. The vertical dashed lines denote the boundaries between the HIG and the SBD regions. The ratio plots demonstrate that the shapes are in agreement. |

png pdf root |
Figure 9:
Expected (dashed black line) and observed (solid black line) excluded cross sections at 95% CL as a function of the higgsino mass. The theoretical cross section for the TChiHH simplified model is shown as the red solid line. |
| Tables | |
png pdf |
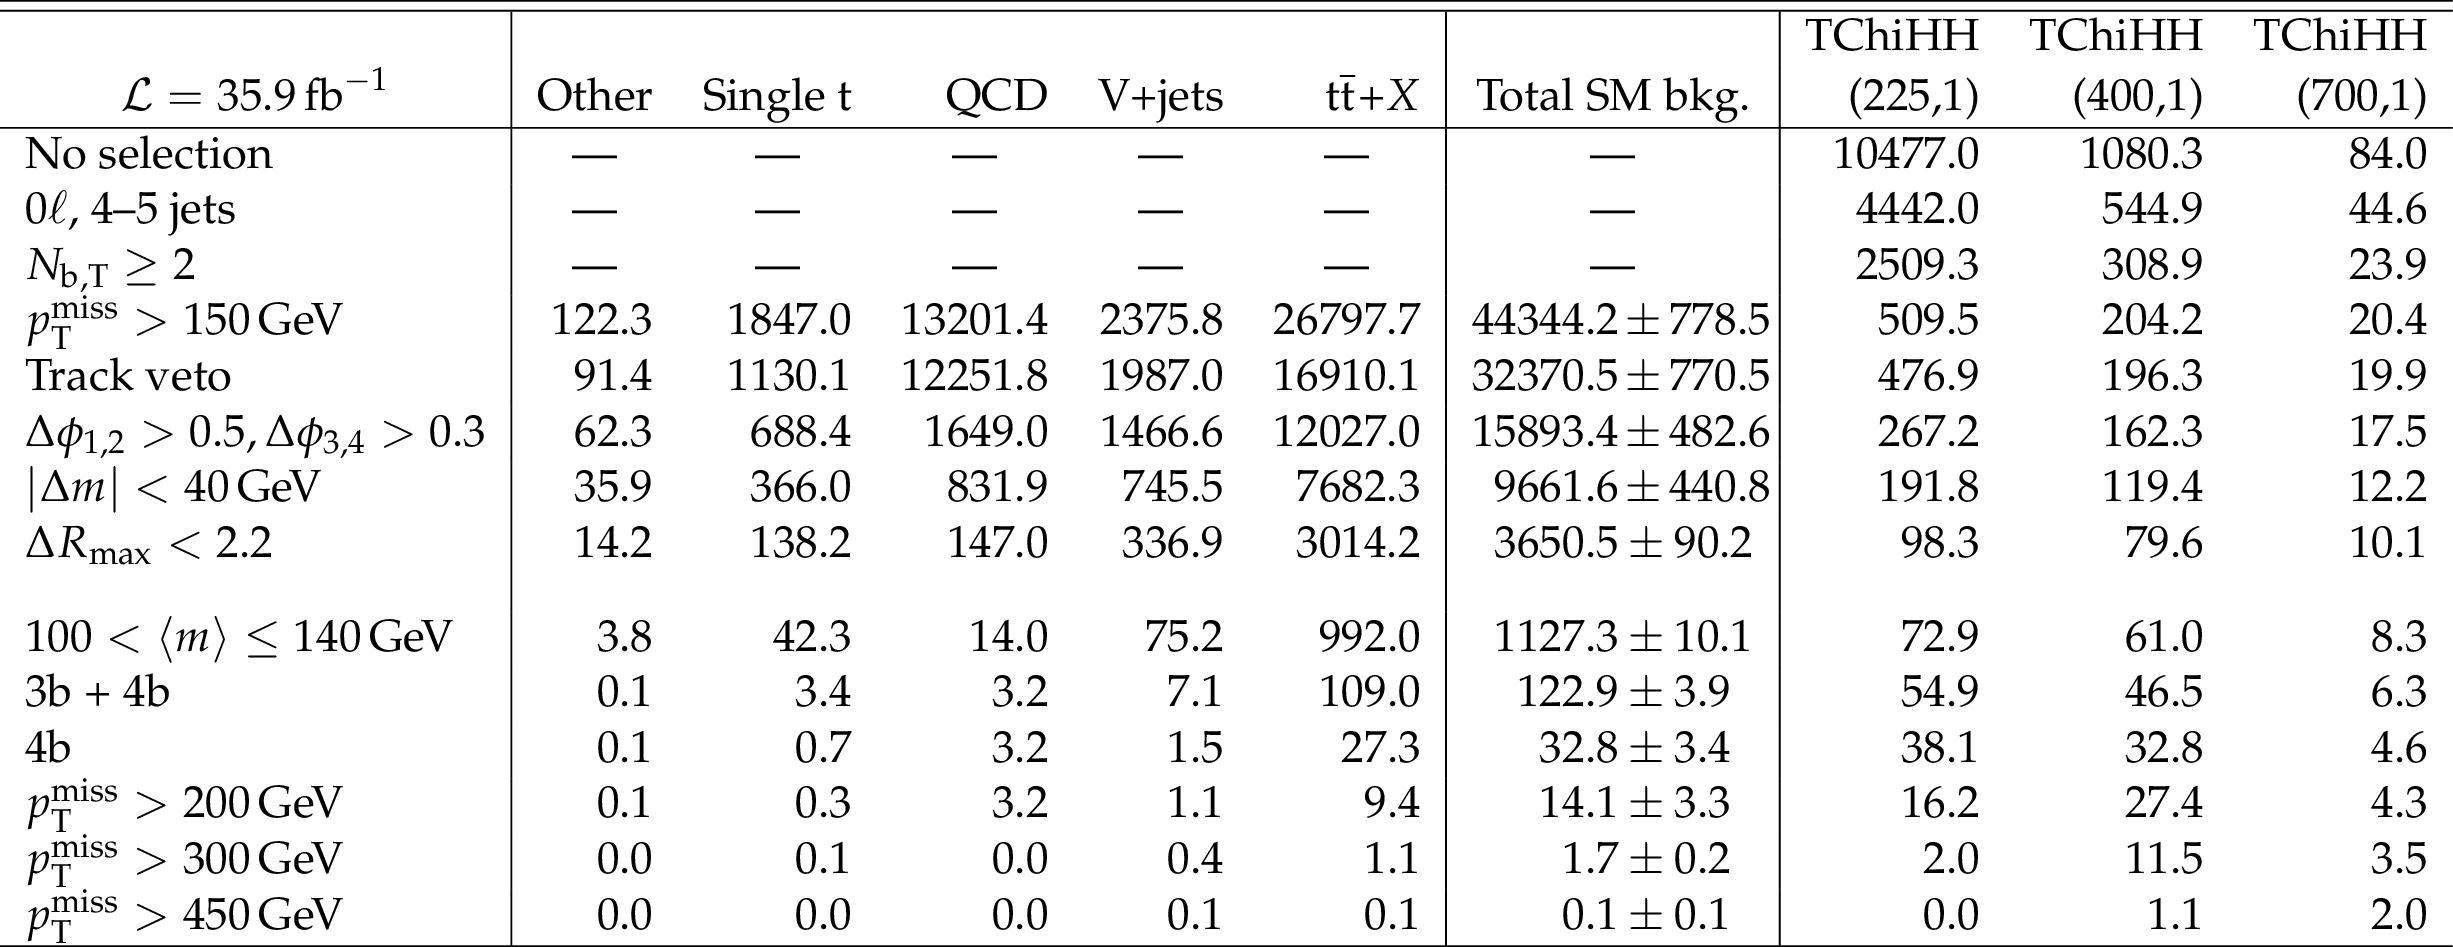
Table 1:
Event yields obtained from simulated event samples scaled to an integrated luminosity of 35.9 fb$^{-1}$, as the event selection criteria are applied. The category "${\mathrm{t} {}\mathrm{\bar{t}}} $+$X$'' is dominated by $ {\mathrm{t} {}\mathrm{\bar{t}}} $ (98.5%), but also includes small contributions from ${\mathrm{t} {}\mathrm{\bar{t}}} {\mathrm{t} {}\mathrm{\bar{t}}} $, ${\mathrm{t} {}\mathrm{\bar{t}}} \mathrm{W} $, ${\mathrm{t} {}\mathrm{\bar{t}}} \mathrm{Z} $, ${\mathrm{t} {}\mathrm{\bar{t}}} \mathrm{H} $, and ${\mathrm{t} {}\mathrm{\bar{t}}} \gamma $ backgrounds. The category "V+jets'' includes Z+jets and W+jets backgrounds in all their decay modes. The category "Other'' includes ZZ, WZ, WW, WH ($\to {\mathrm{b} \mathrm{\bar{b}}}$), and ZH ($\to {\mathrm{b} \mathrm{\bar{b}}}$) processes. The event selection requirements listed above the horizontal line in the middle of the table are defined as the baseline selection. The trigger efficiency is applied as an event weight and is first taken into account in the $ {{p_{\mathrm {T}}} ^\text {miss}} > $ 150 GeV row. The uncertainties in the "Total SM bkg.'' column is statistical only. The columns corresponding to the yields for three signal benchmark points are labeled by TChiHH($ {m_{\tilde{\chi}^0_1}} $, $ {m_{\tilde{\mathrm{G}}}} $), with $ {m_{\tilde{\chi}^0_1}} $ and $ {m_{\tilde{\mathrm{G}}}} $ in units of GeV. The simulated samples for TChiHH(225,1), TChiHH(400,1), and TChiHH(700,1) are equivalent to 10, 100, and over 1000 times the data sample, respectively, so the statistical uncertainties in the signal yields are small. |
png pdf |
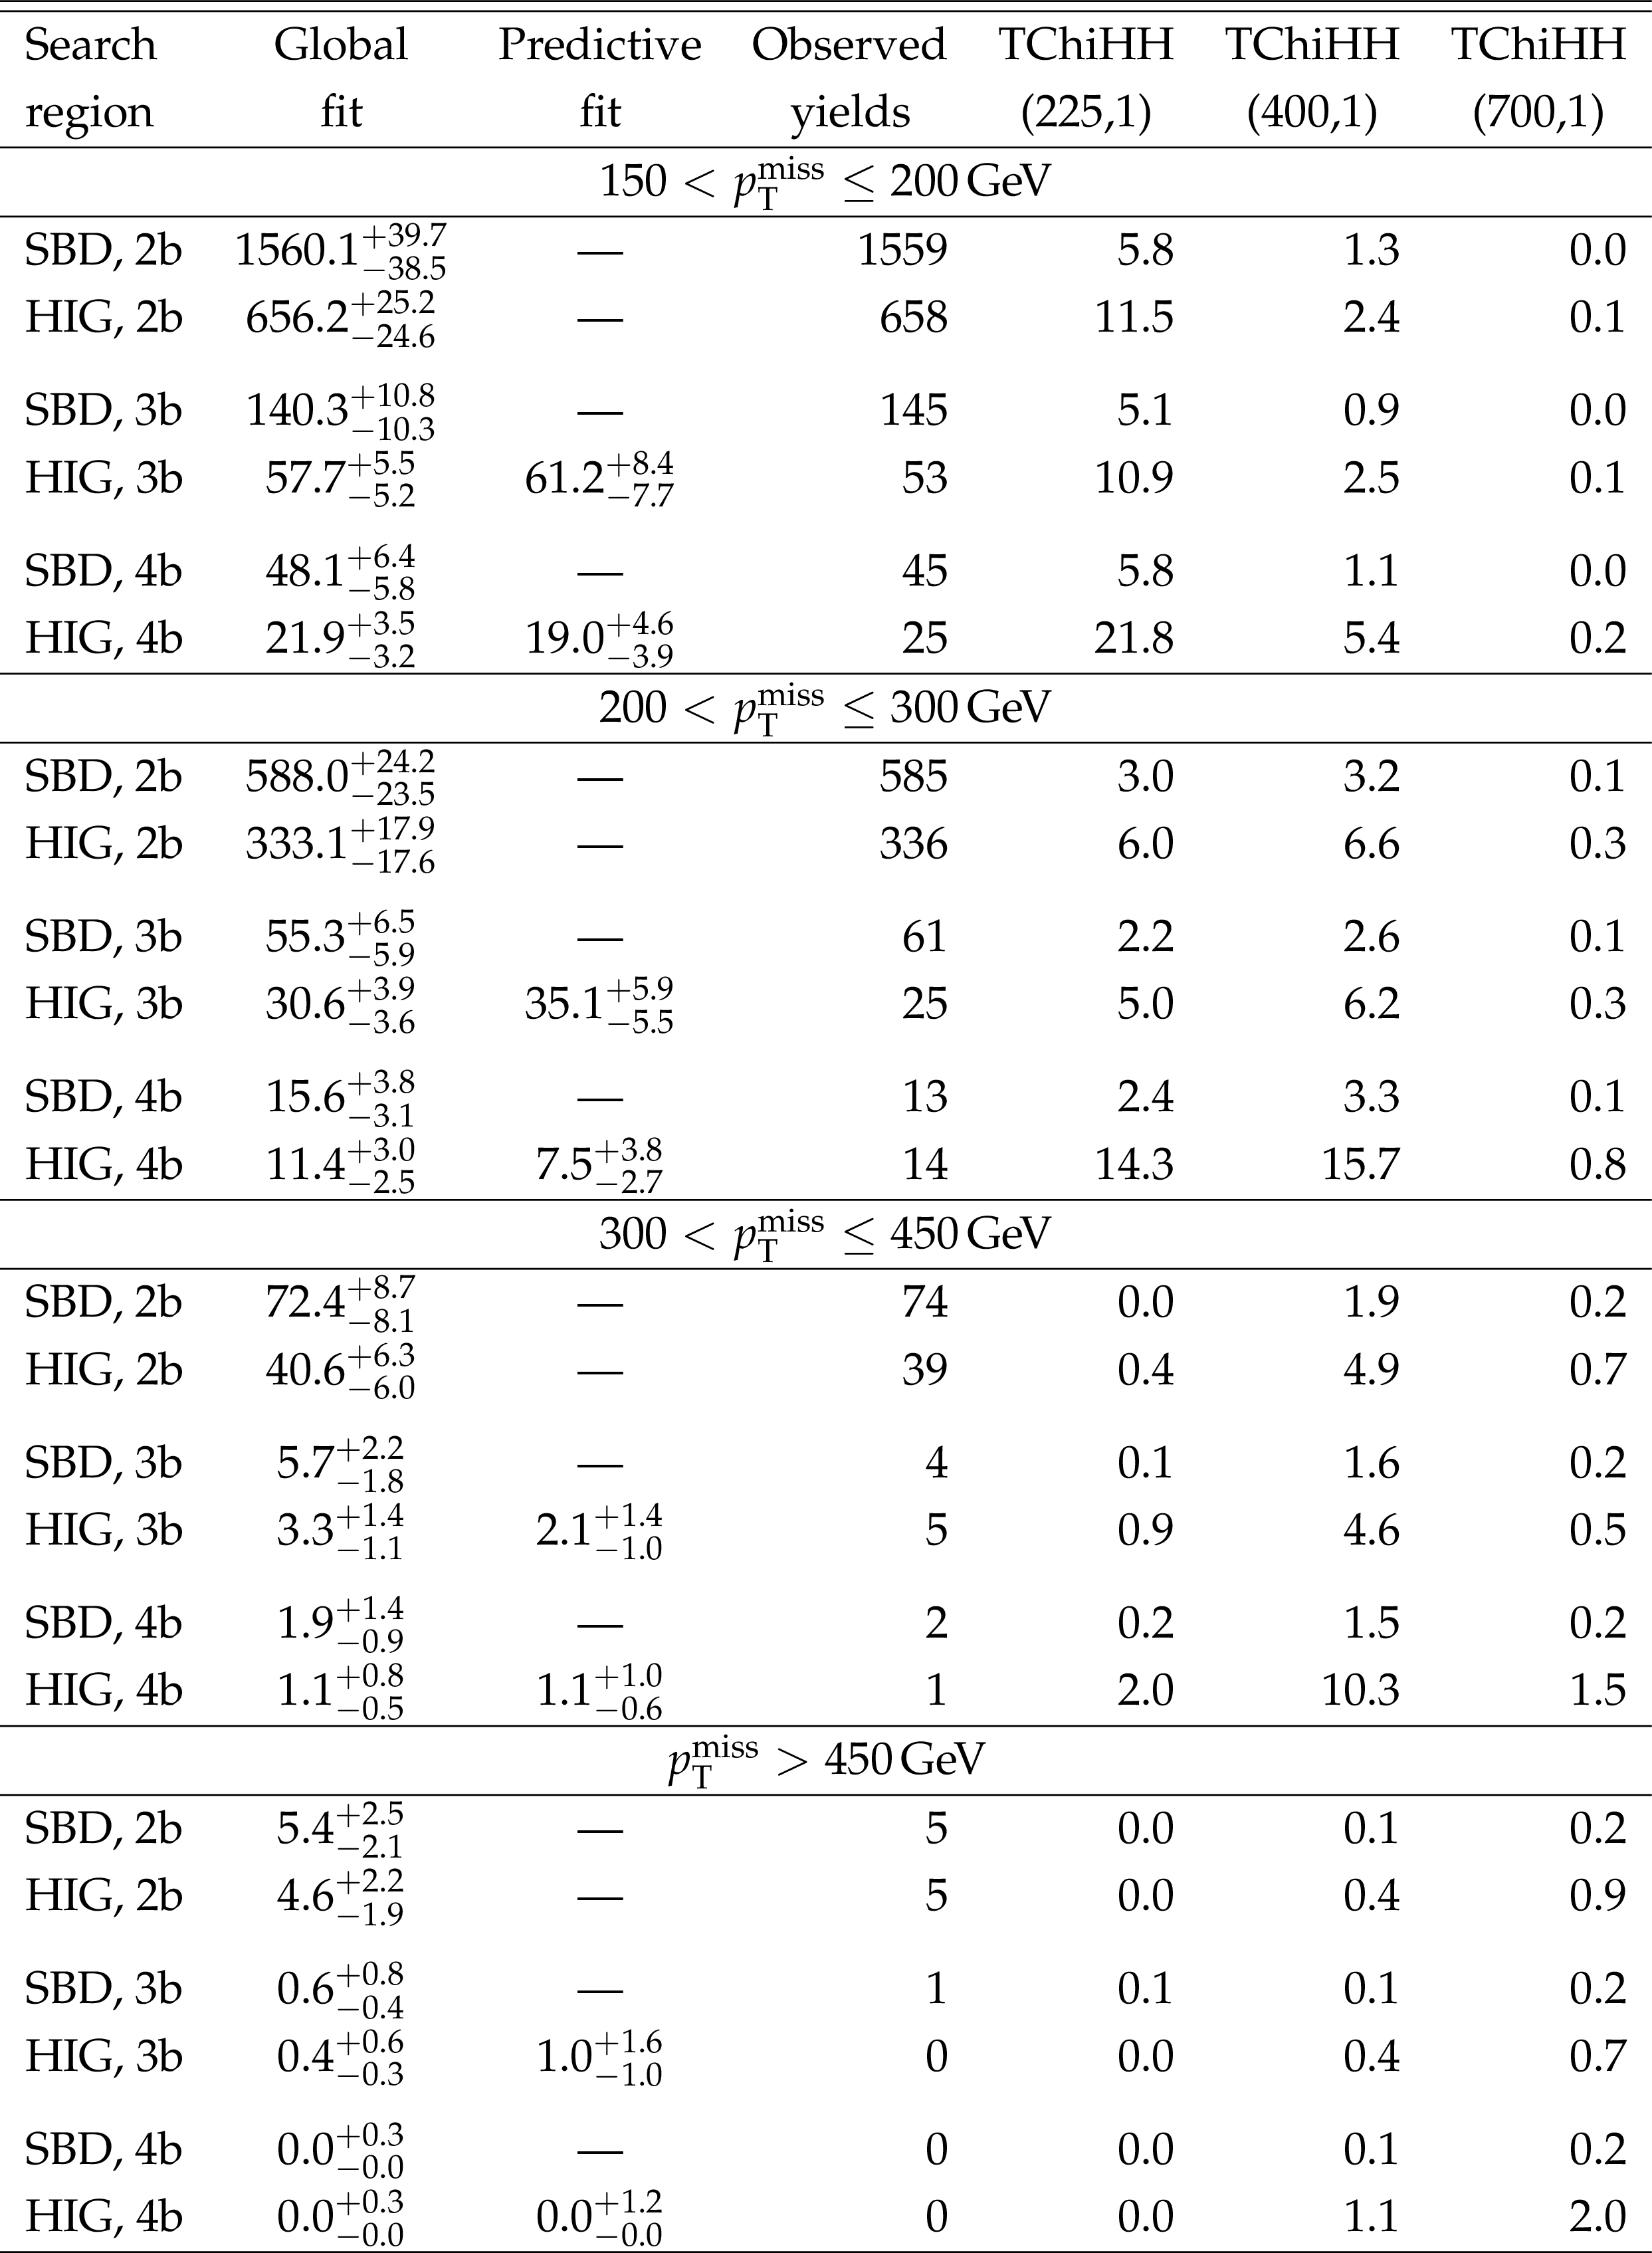
Table 2:
Observed event yields for all control regions--(HIG,2b), (SBD,2b), (SBD,3b), and (SBD, 4b)--and the two signal regions--(HIG,3b) and (HIG, 4b)--in each of the four $ {{p_{\mathrm {T}}} ^\text {miss}} $ bins. The second column shows the results of the global fit which uses the observed yields in all control and signal regions, under the background-only hypothesis ($r=$ 0). The third column gives the predicted SM background rates in the signal regions obtained via the predictive fit which only takes as input the observed event yields in the control regions. The expected signal yields for three signal benchmark points denoted as TChiHH($ {m_{\tilde{\chi}^0_1}} $, $ {m_{\tilde{\mathrm{G}}}} $), with $ {m_{\tilde{\chi}^0_1}} $ and $ {m_{\tilde{\mathrm{G}}}} $ in units of GeV, are also shown for reference. |
png pdf |
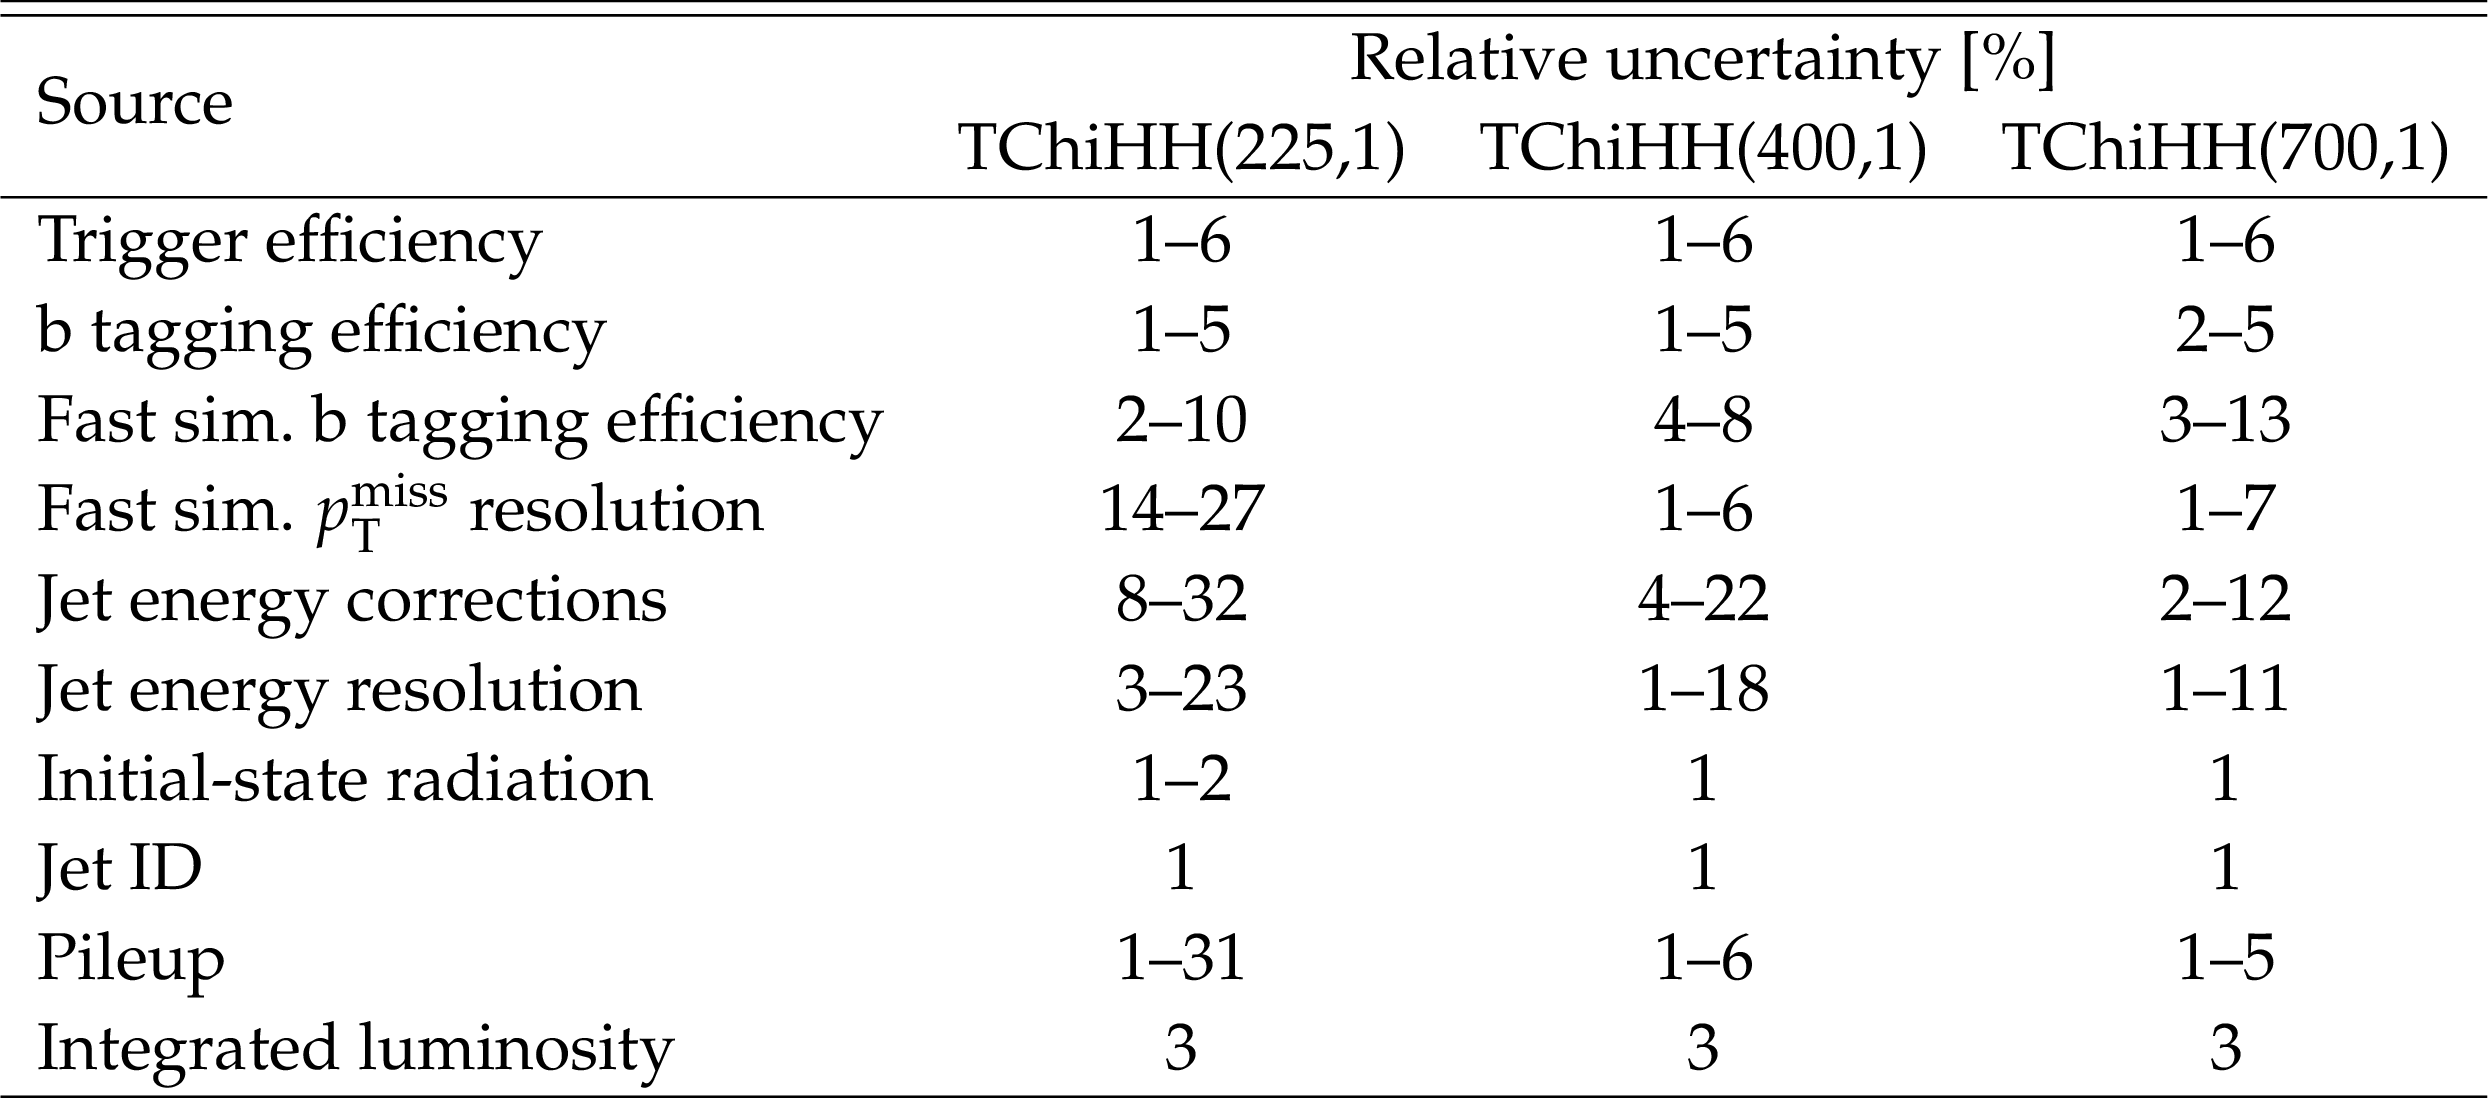
Table 3:
Range of values for the systematic uncertainties in the signal efficiency and acceptance across all analysis bin for three signal benchmark points denoted as TChiHH($ {m_{\tilde{\chi}^0_1}} $, $ {m_{\tilde{\mathrm{G}}}} $), with $ {m_{\tilde{\chi}^0_1}} $ and $ {m_{\tilde{\mathrm{G}}}} $ in units of GeV. Uncertainties due to a particular source are treated as fully correlated among bins, while uncertainties due to different sources are treated as uncorrelated. |
| Summary |
|
A search for an excess of events is performed in proton-proton collisions in the channel with two Higgs bosons and large missing transverse momentum ($ {p_{\mathrm{T}}}^{\text{miss}} $), with each of the Higgs bosons reconstructed in its $\mathrm{H}\to\mathrm{b\bar{b}}$ decay. The data sample corresponds to an integrated luminosity of 35.9 fb$^{-1}$ at $\sqrt{s} =13$ TeV. Because the signal has four b quarks, while the background is dominated by $\mathrm{t\bar{t}}$ events containing only two b quarks from the $\mathrm{t}$ quark decays, the analysis is binned in the number of b-tagged jets. In each event, the mass difference between the two Higgs boson candidates is required to be small, and the average mass of the two candidates is used in conjunction with the number of observed b tags to define signal and sideband regions. The observed event yields in these regions are used to obtain estimates for the standard model background in the signal regions without input from simulated event samples. The data are also binned in regions of ${p_{\mathrm{T}}}^{\text{miss}}$ to enhance the sensitivity to the signal. The observed event yields in the signal regions are consistent with the background predictions. These results are interpreted in the context of a model in which each higgsino decays into a Higgs boson and a nearly massless lightest supersymmetric particle (LSP), which is weakly interacting. Such a scenario occurs in gauge-mediated supersymmetry breaking models, in which the LSP is a goldstino. The cross section calculation assumes that the higgsino sector is mass degenerate and sums over the cross sections for the pair production of all relevant combinations of higgsinos, but all decays are assumed to be prompt. Higgsinos with masses in the range 230 to 770 GeV are excluded at 95% confidence level. These results constitute the most stringent exclusion limits on this model to date. |
| Additional Figures | |
png pdf root |
Additional Figure 1:
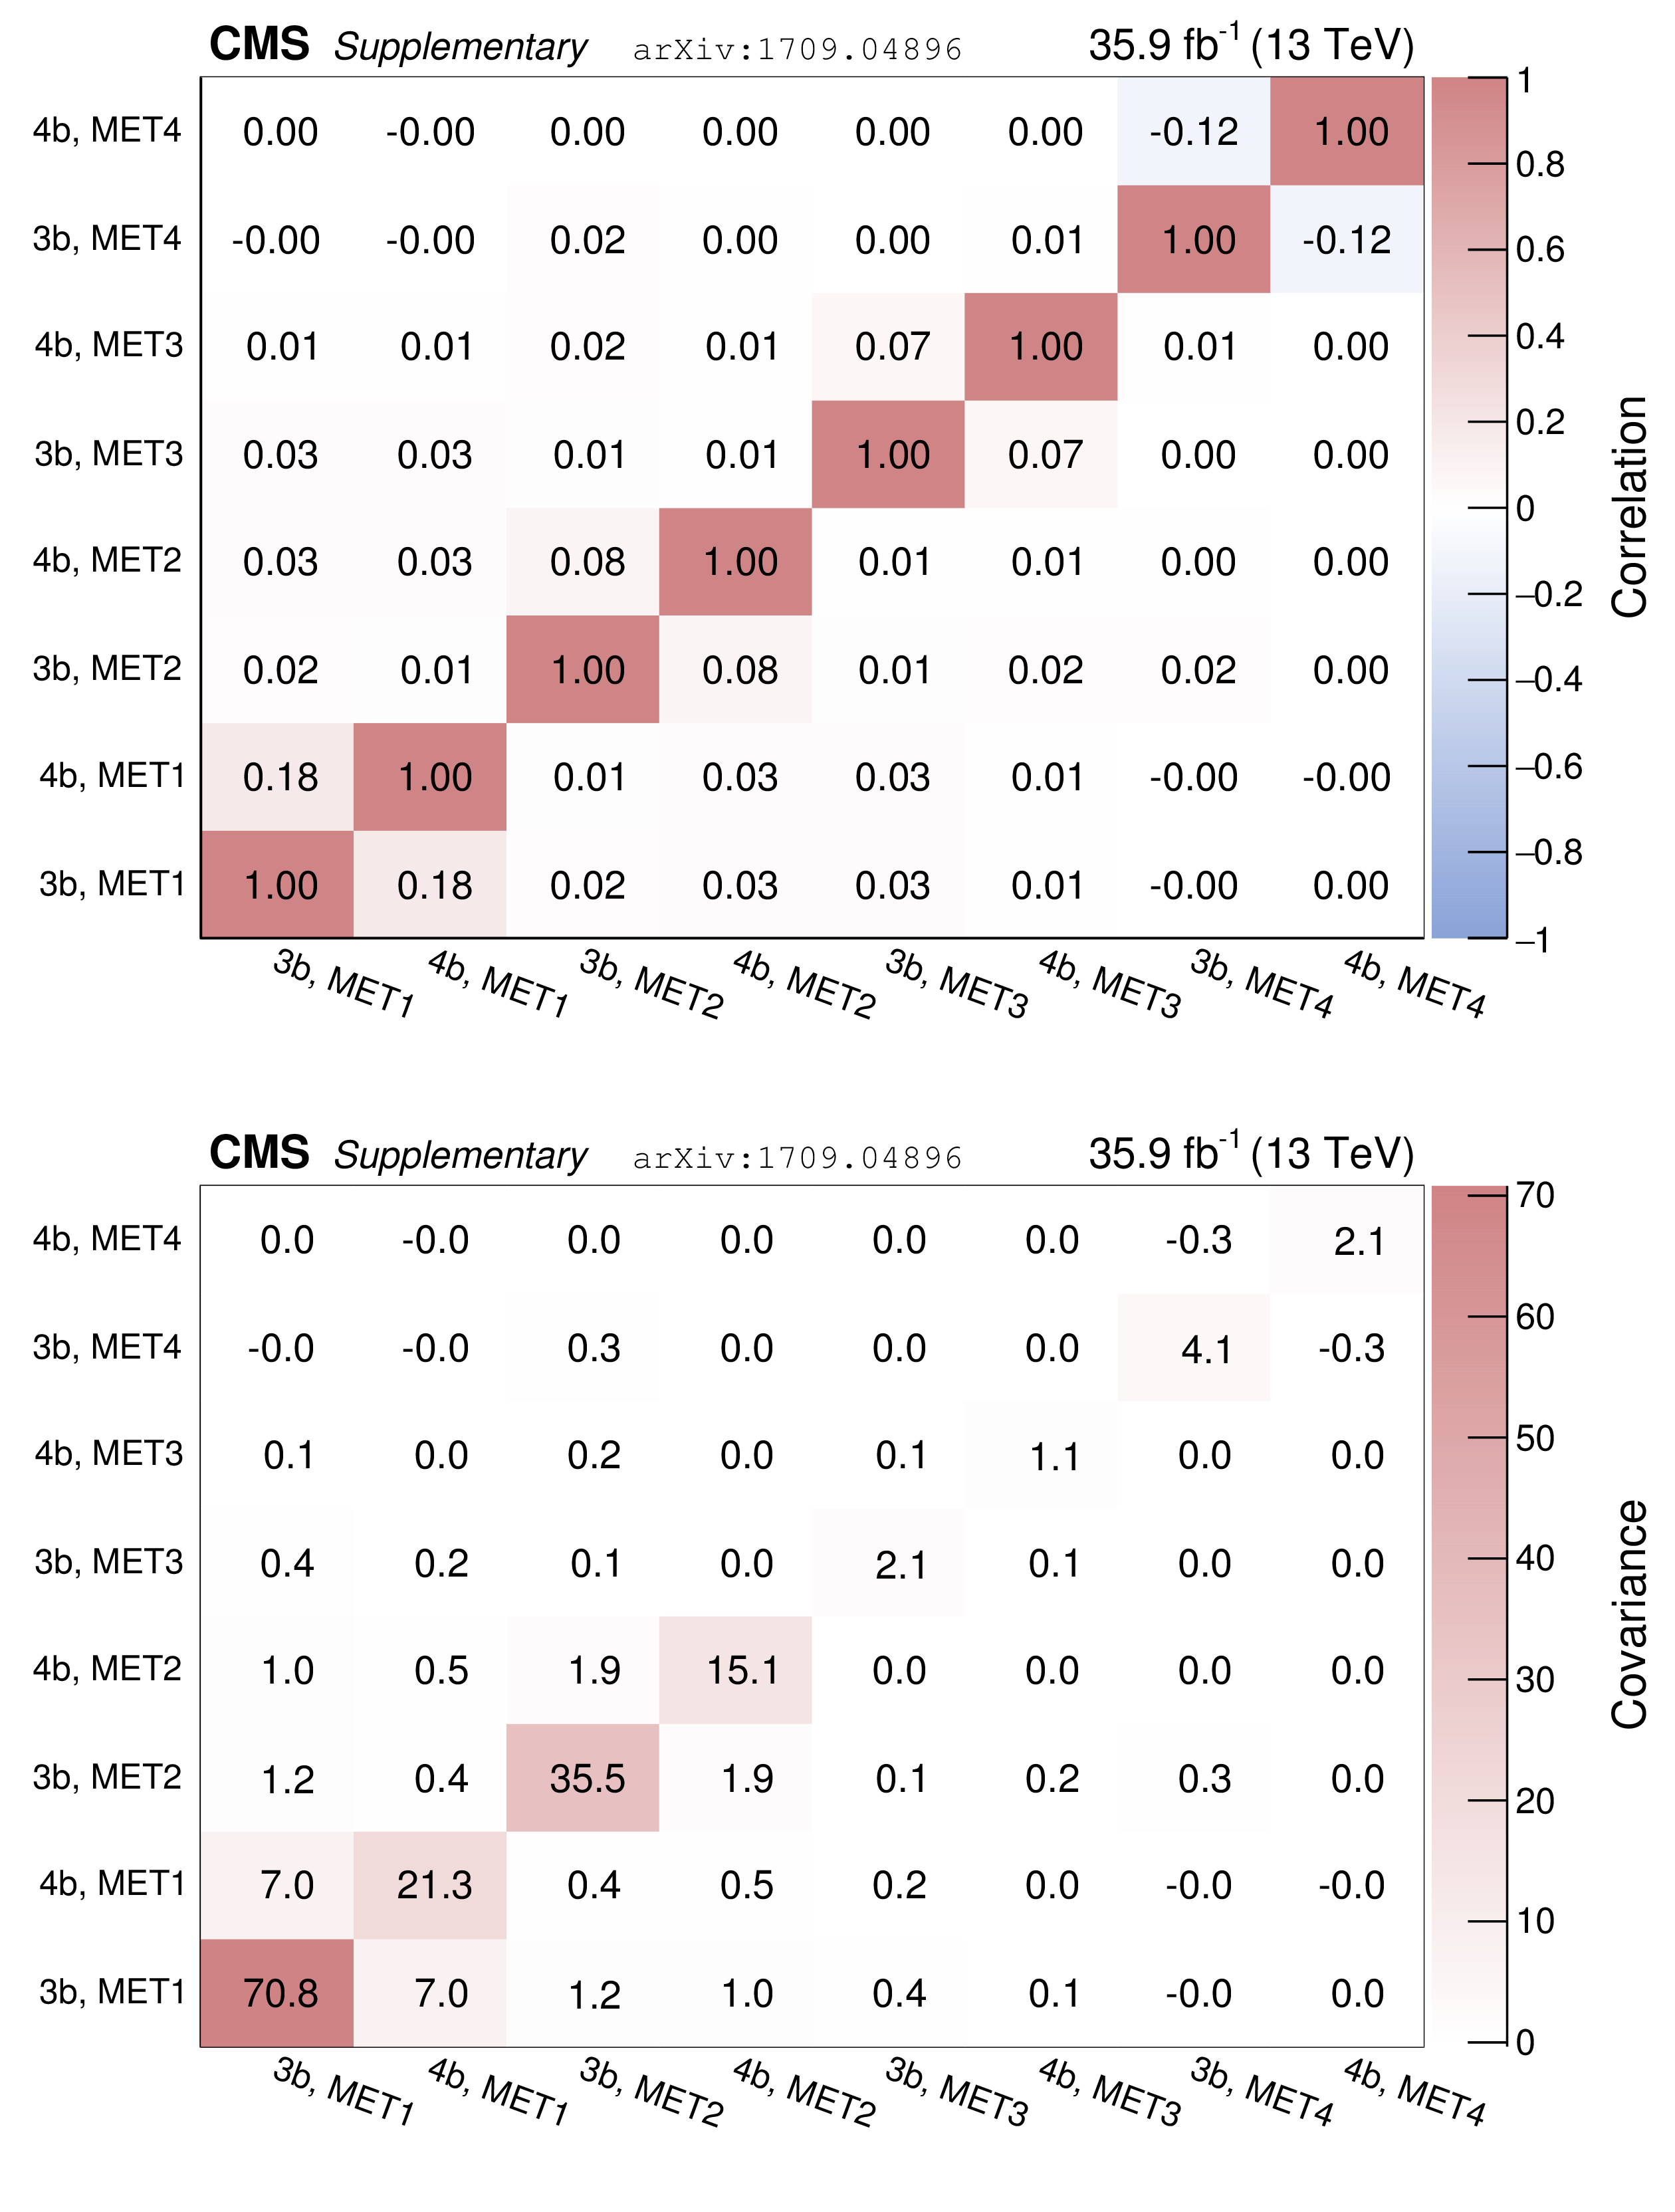
(a) Correlation and (b) covariance matrices for the background rates obtained with the predictive fit in the 8 signal bins. "MET1'' corresponds to 150 $ < p_{\rm T}^{\rm miss}\leq $ 200 GeV, "MET2'' to 200 $ < p_{\rm T}^{\rm miss}\leq $ 300 GeV, "MET3'' to 300 $ < p_{\rm T}^{\rm miss}\leq $ 450 GeV, and "MET4'' to $p_{\rm T}^{\rm miss} > $ 450 GeV. |
png pdf root |
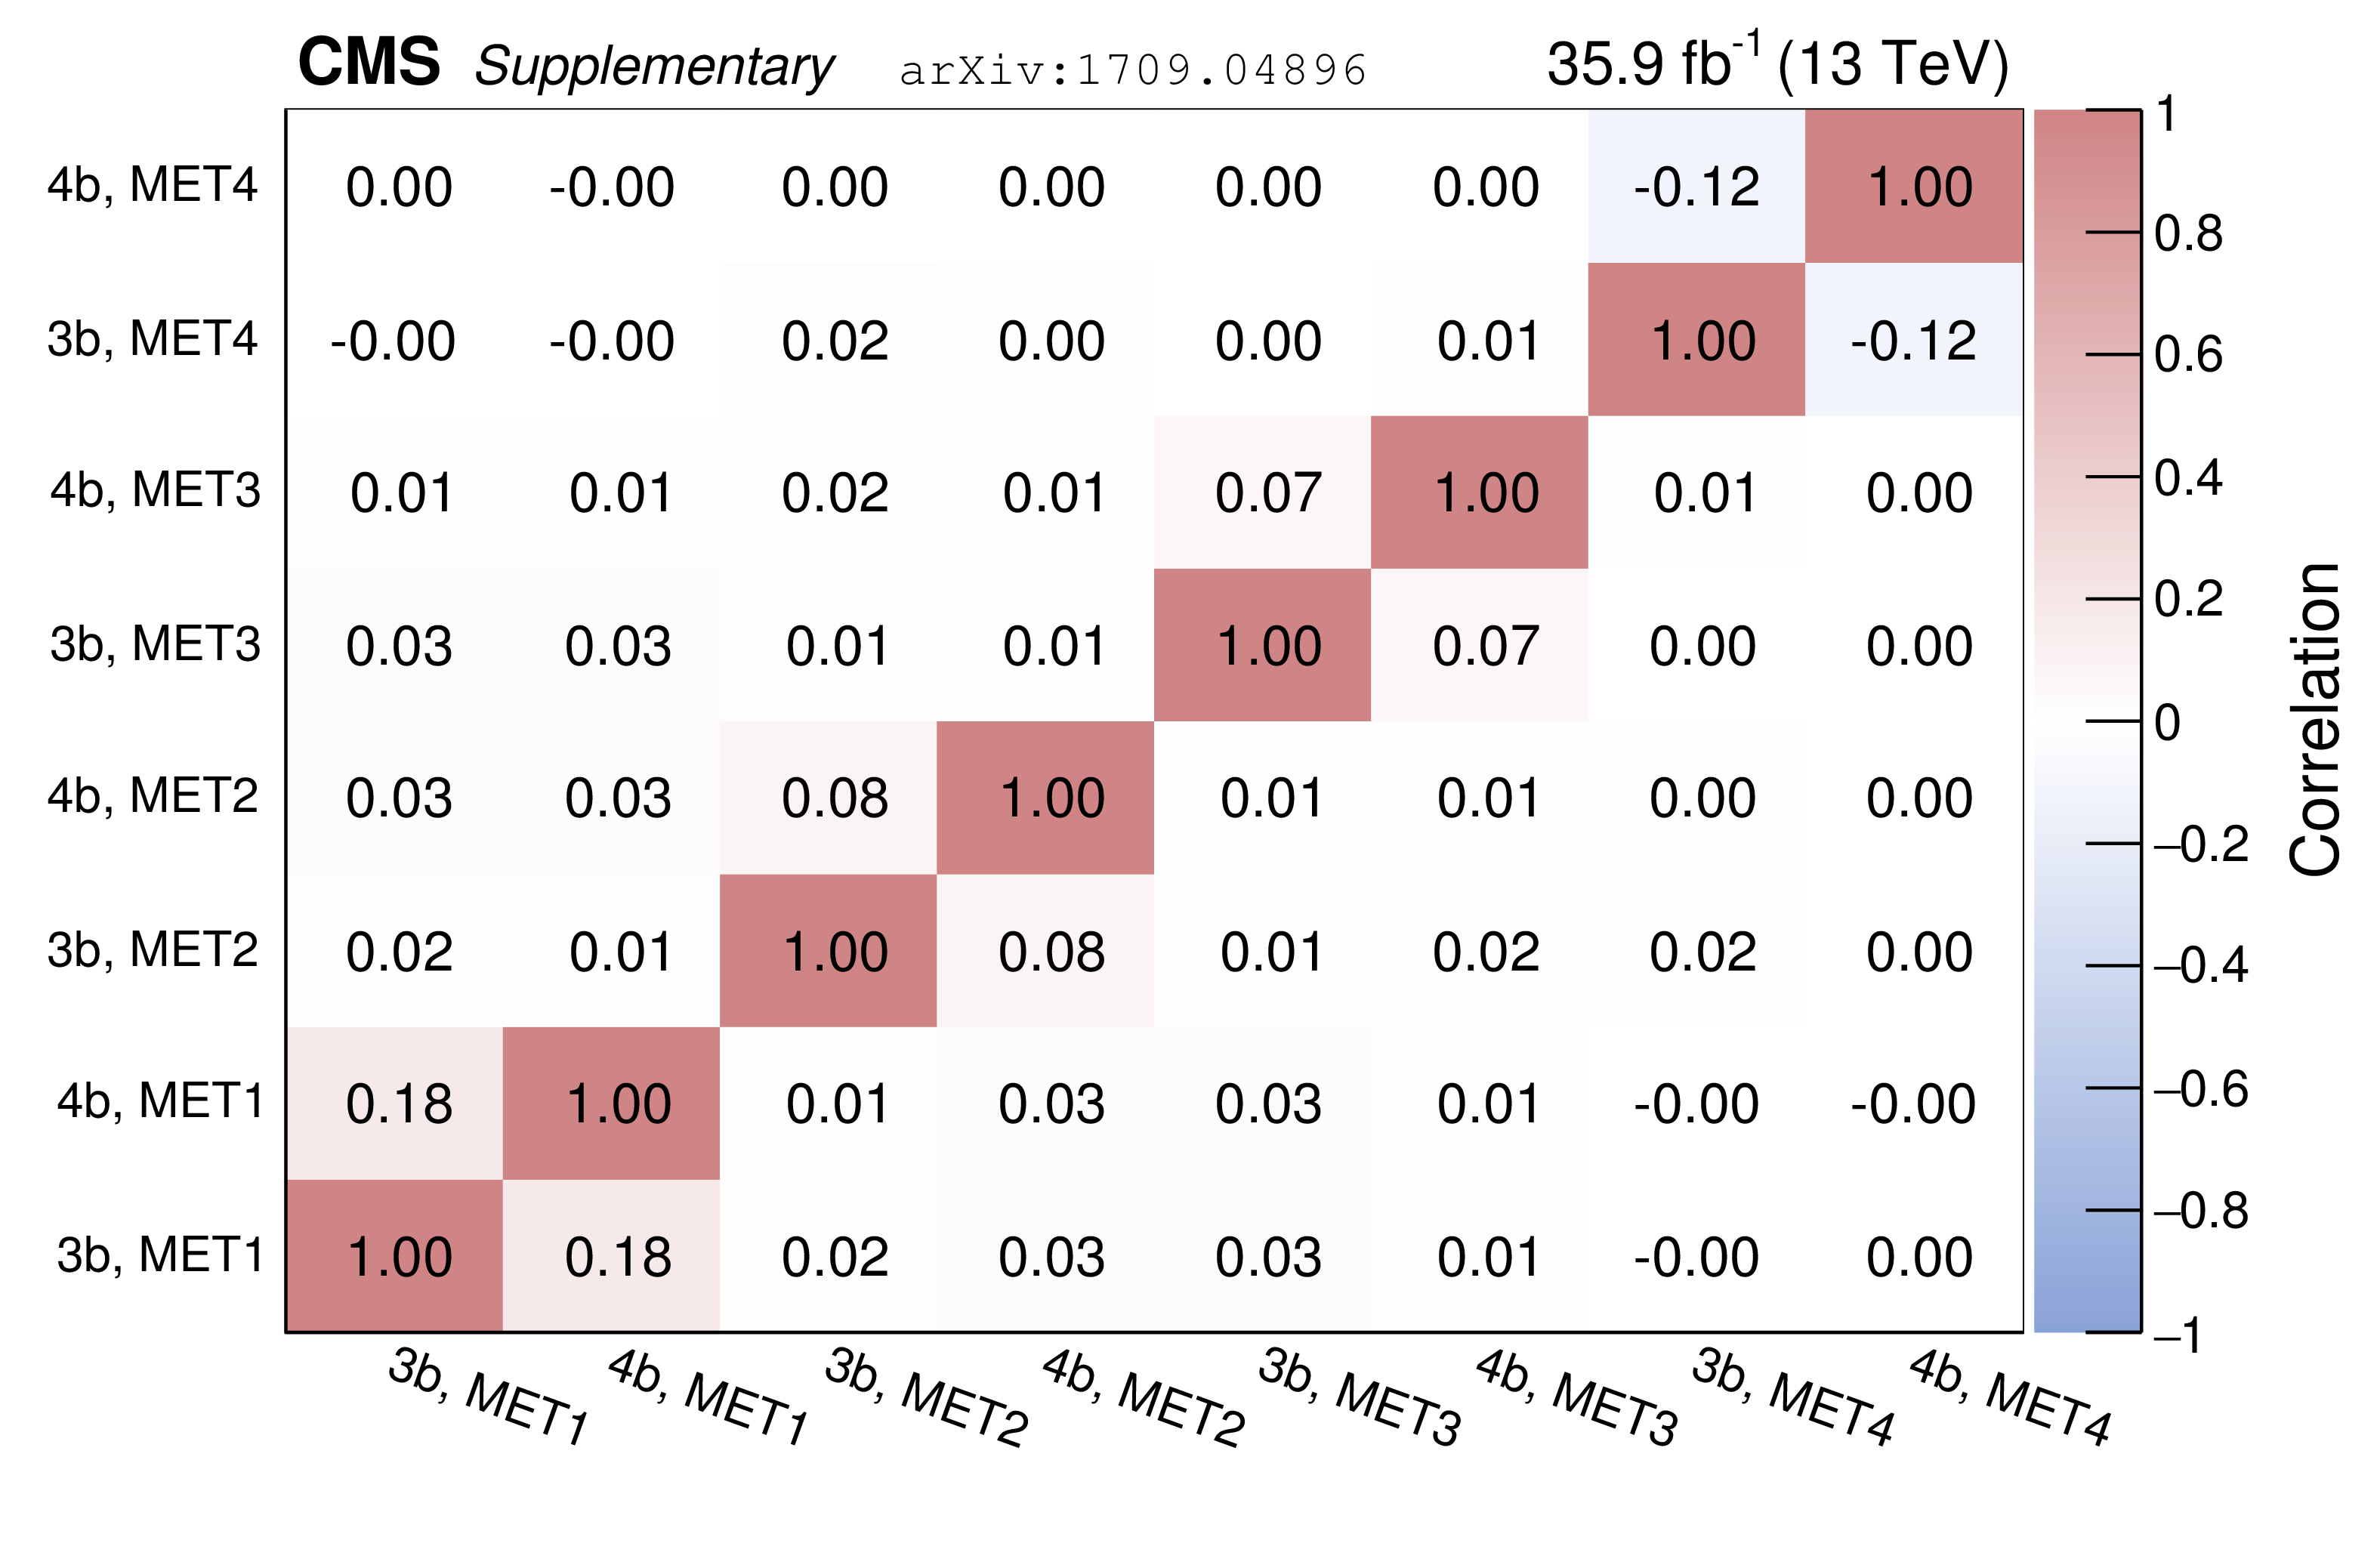
Additional Figure 1-a:
Correlation matrix for the background rates obtained with the predictive fit in the 8 signal bins. "MET1'' corresponds to 150 $ < p_{\rm T}^{\rm miss}\leq $ 200 GeV, "MET2'' to 200 $ < p_{\rm T}^{\rm miss}\leq $ 300 GeV, "MET3'' to 300 $ < p_{\rm T}^{\rm miss}\leq $ 450 GeV, and "MET4'' to $p_{\rm T}^{\rm miss} > $ 450 GeV. |
png pdf root |
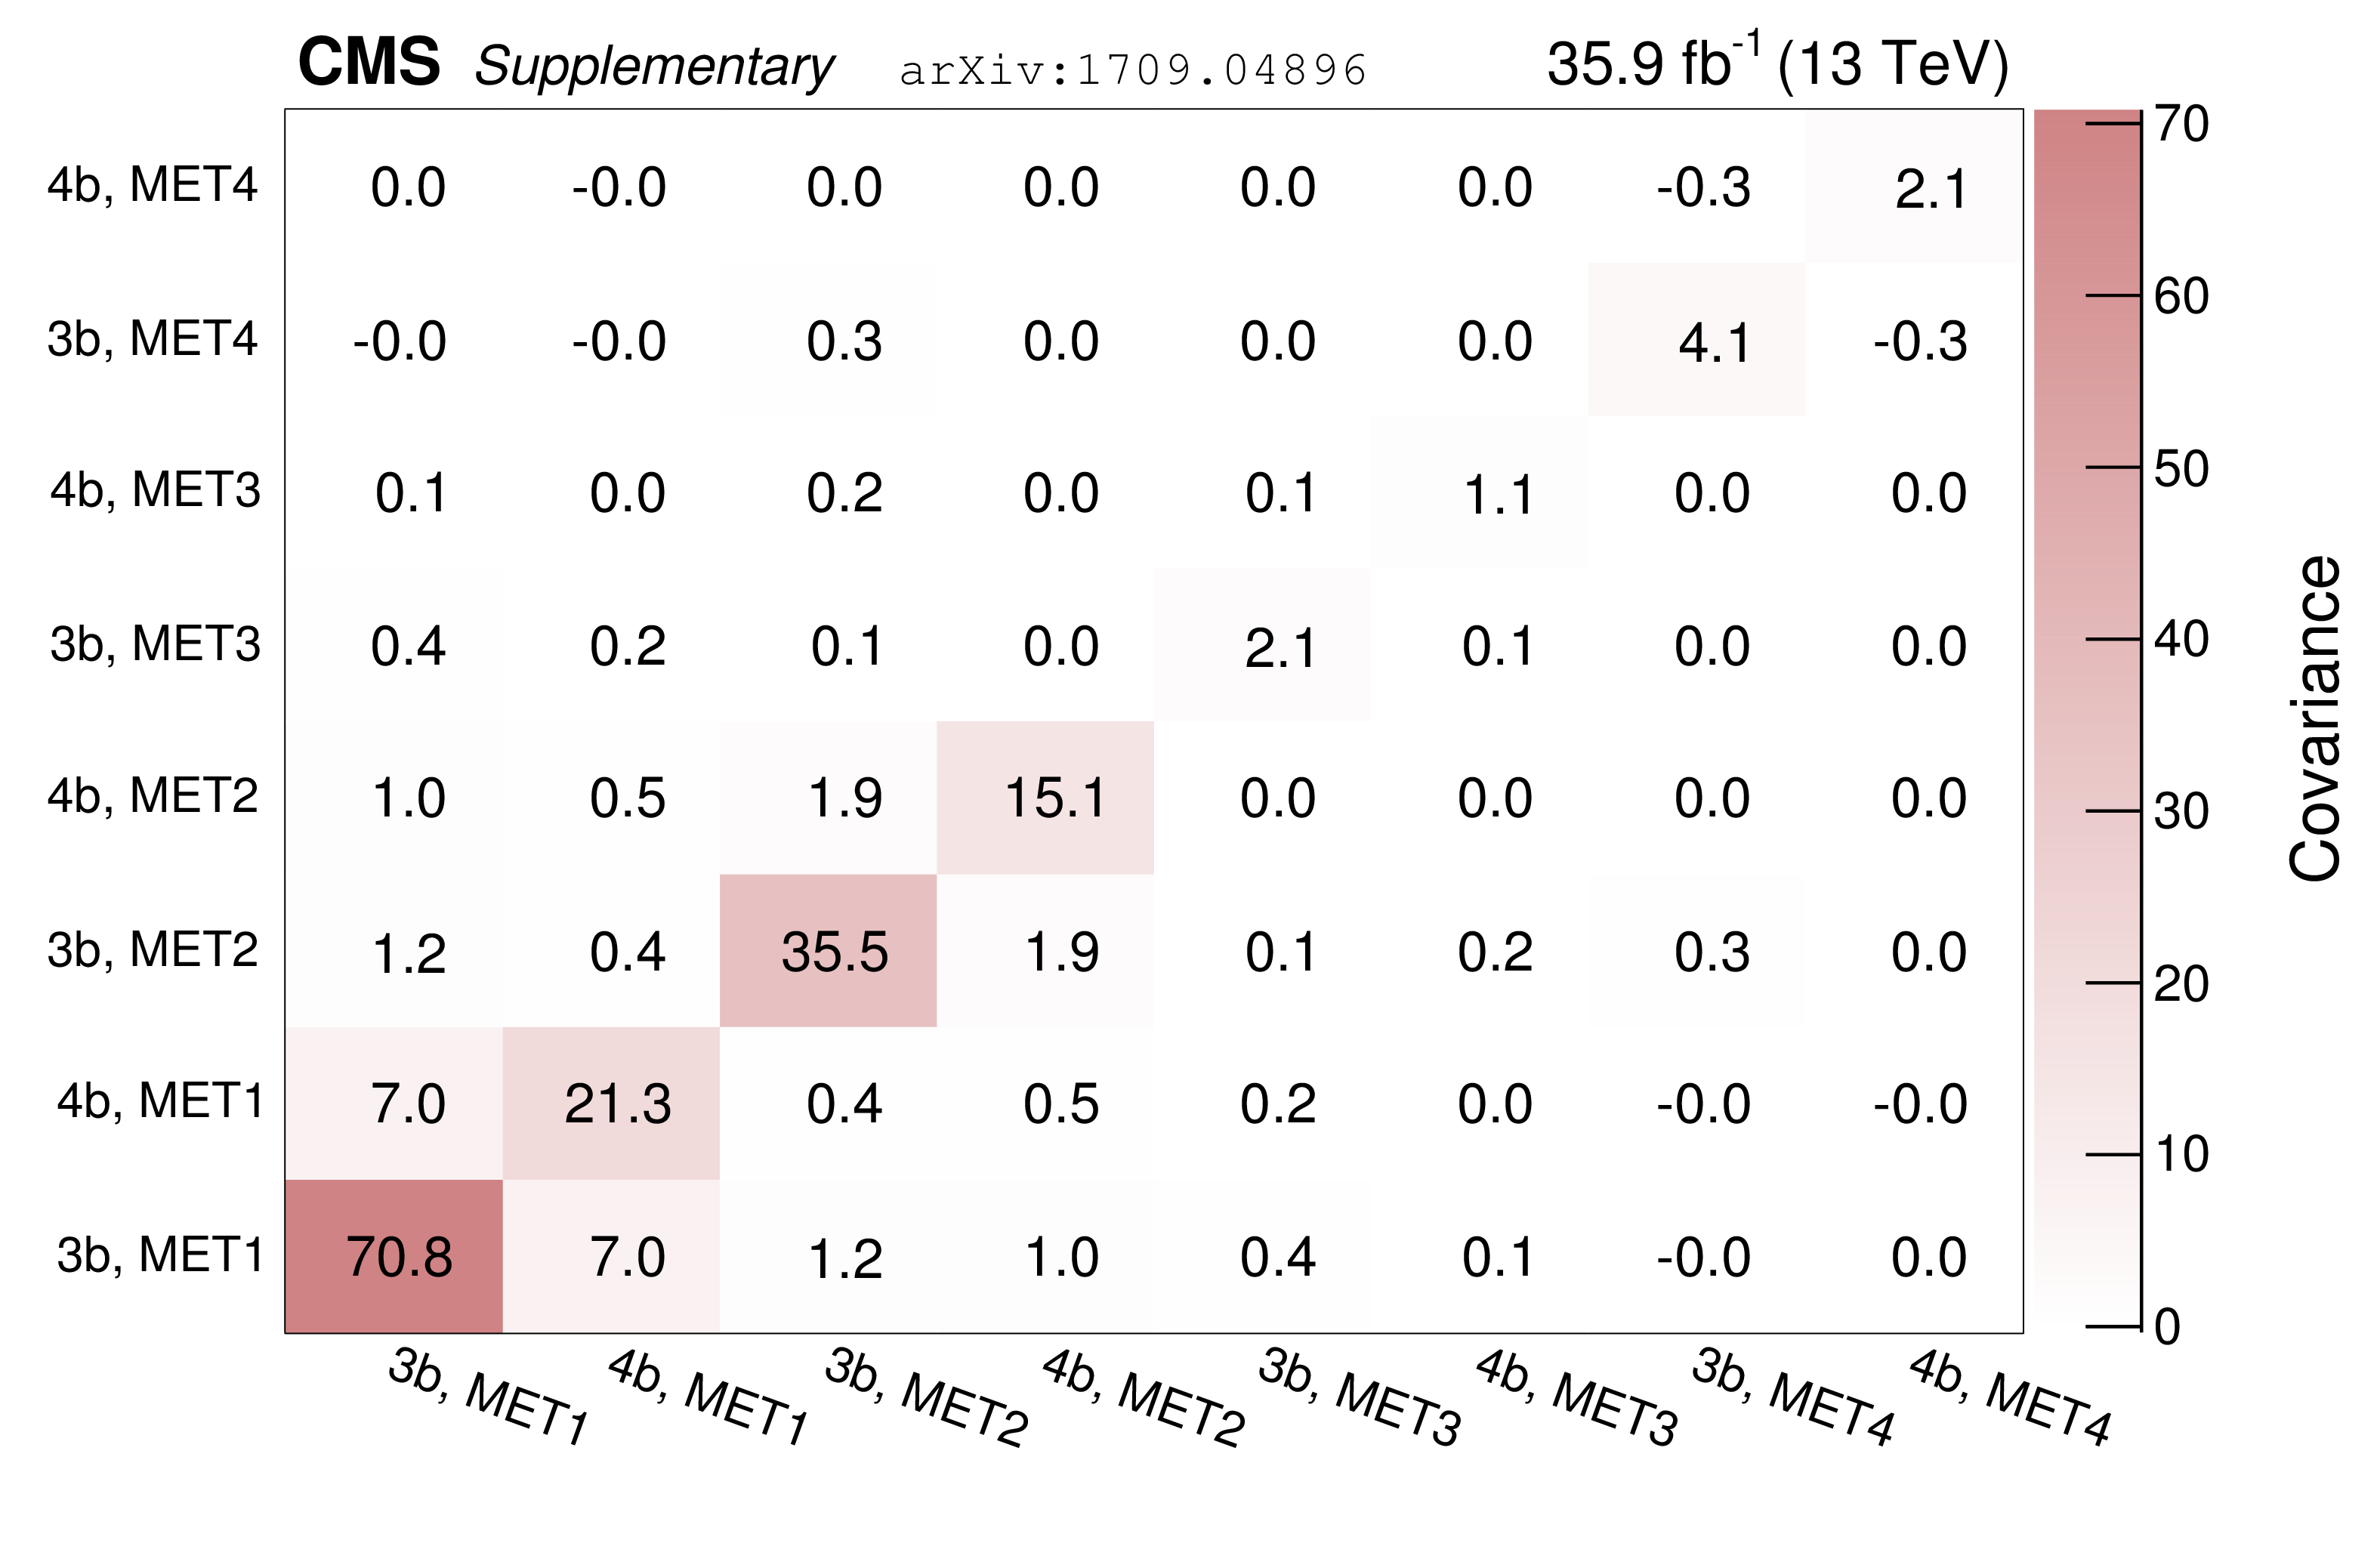
Additional Figure 1-b:
Covariance matrix for the background rates obtained with the predictive fit in the 8 signal bins. "MET1'' corresponds to 150 $ < p_{\rm T}^{\rm miss}\leq $ 200 GeV, "MET2'' to 200 $ < p_{\rm T}^{\rm miss}\leq $ 300 GeV, "MET3'' to 300 $ < p_{\rm T}^{\rm miss}\leq $ 450 GeV, and "MET4'' to $p_{\rm T}^{\rm miss} > $ 450 GeV. |
png pdf |
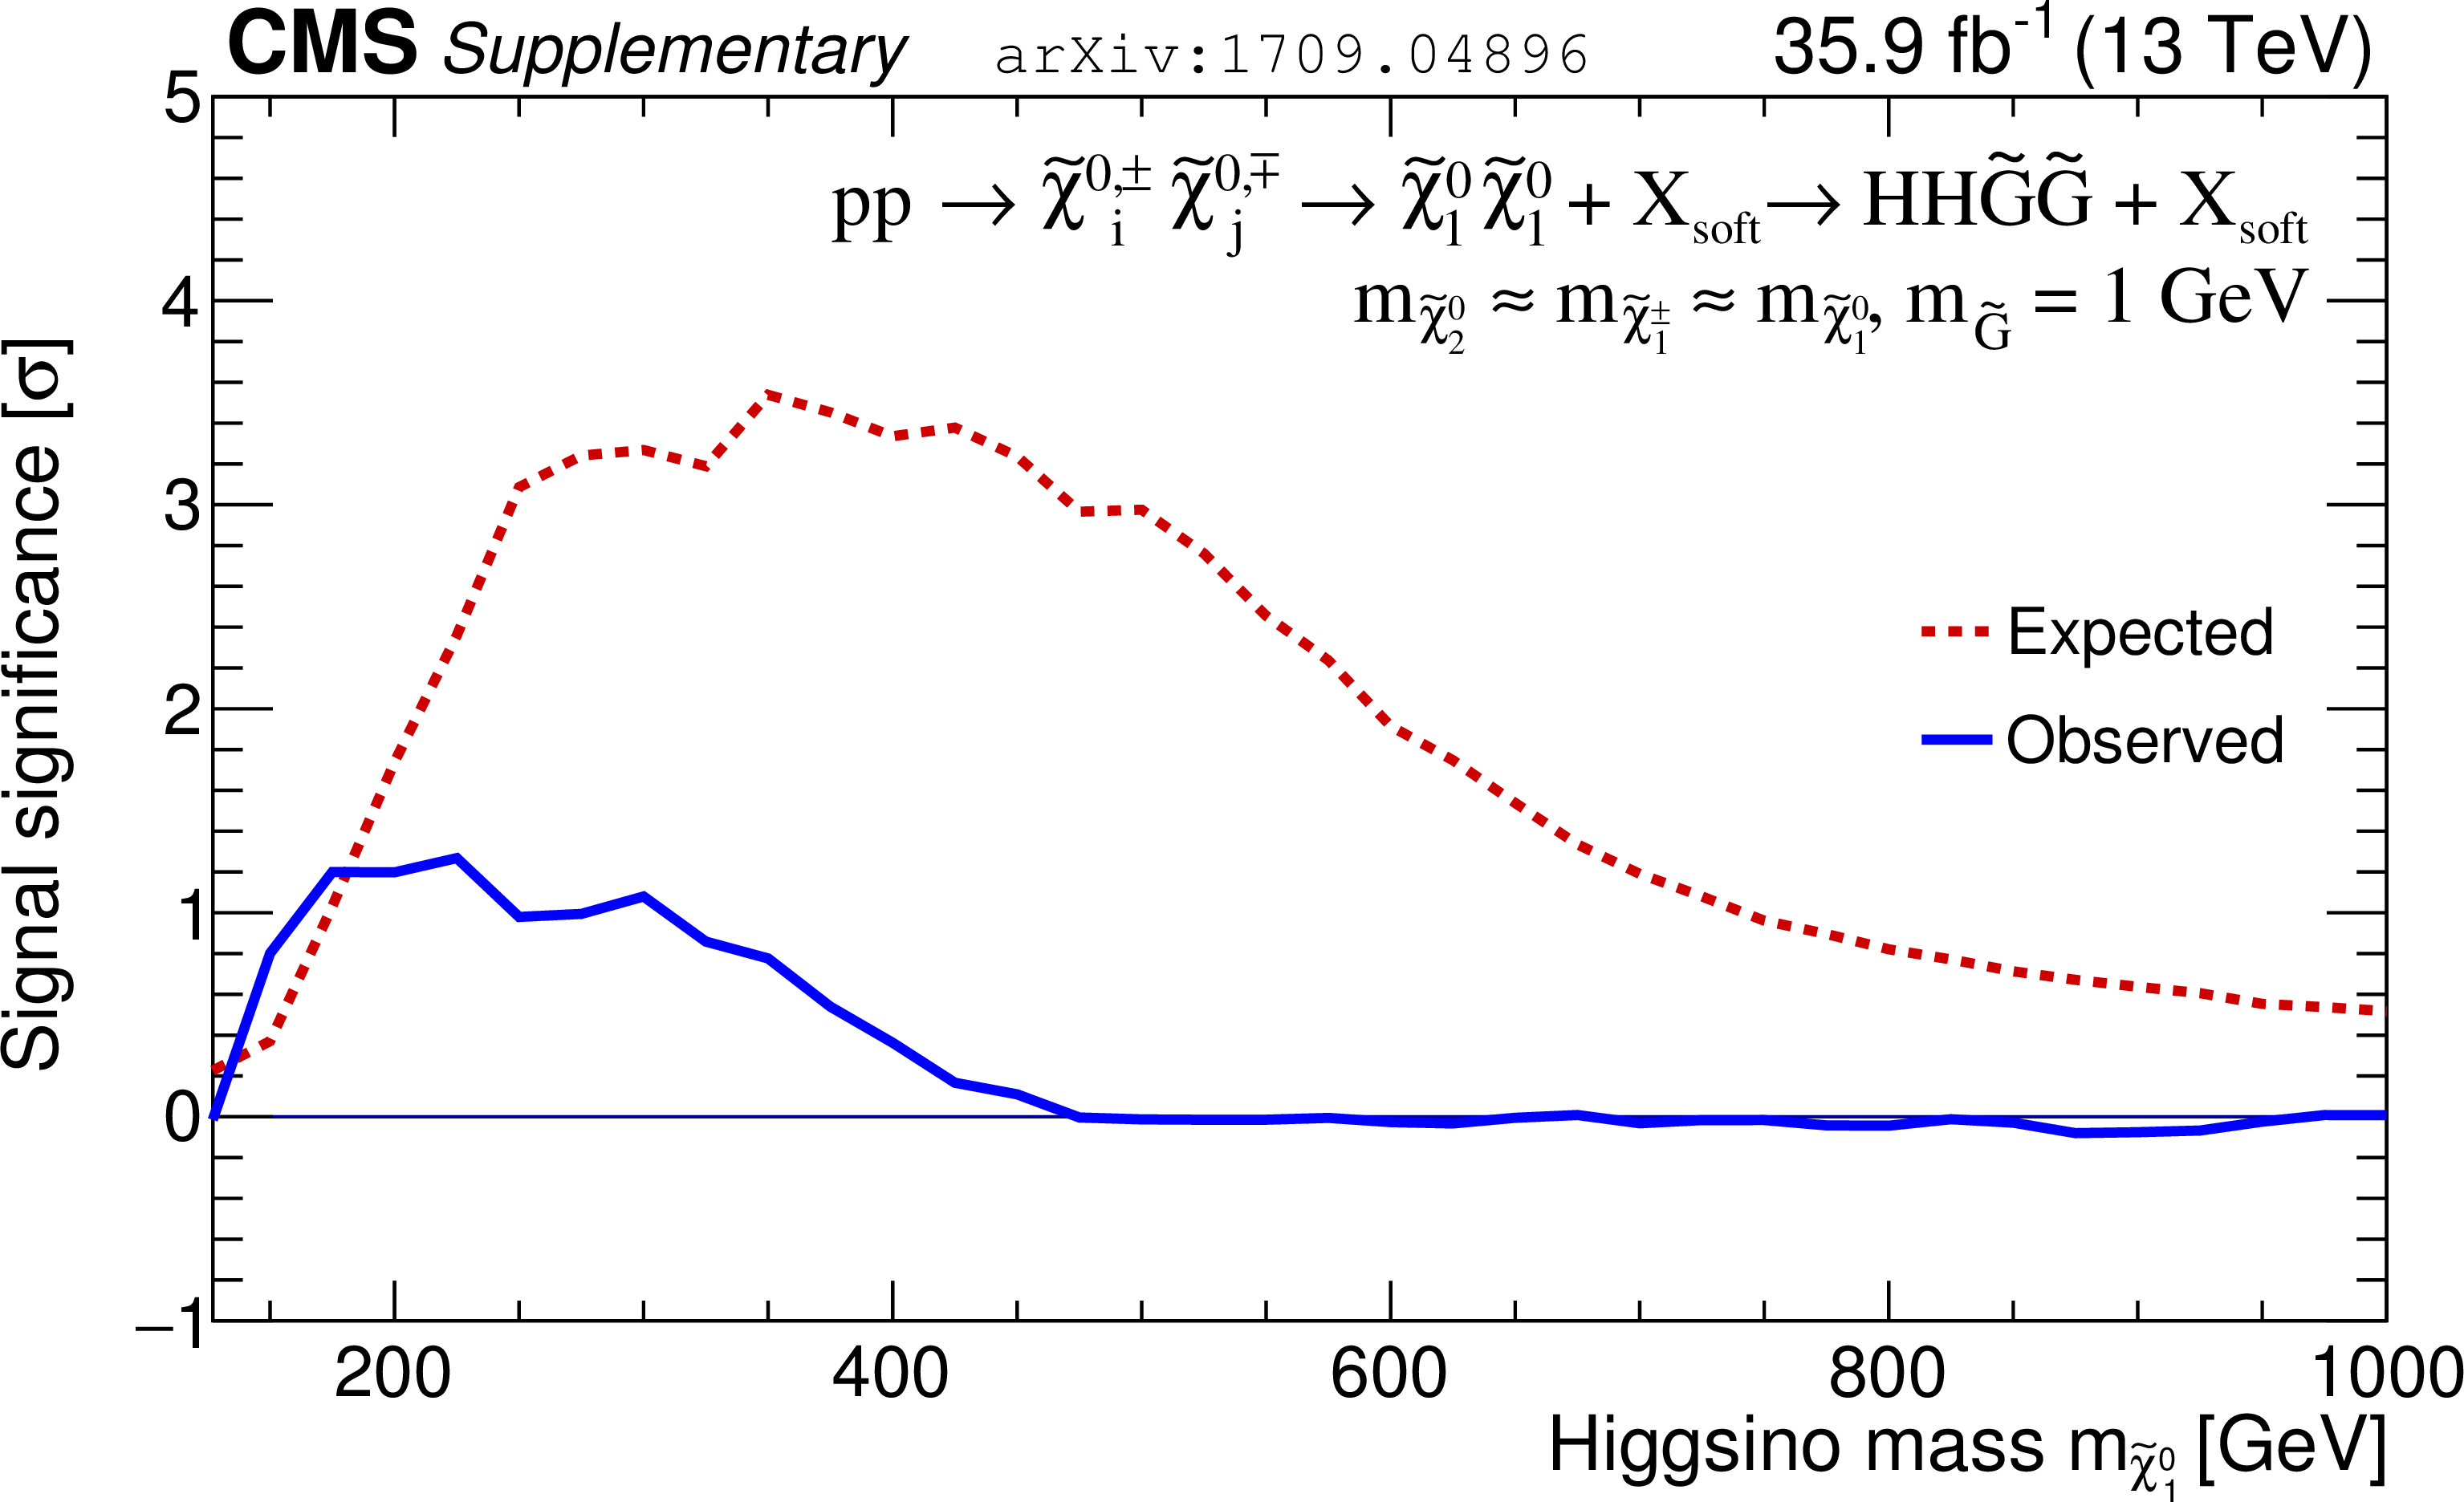
Additional Figure 2:
A posteriori expected discovery significance and observed significance for the TChiHH model as a function of the higgsino mass. |
png pdf root |
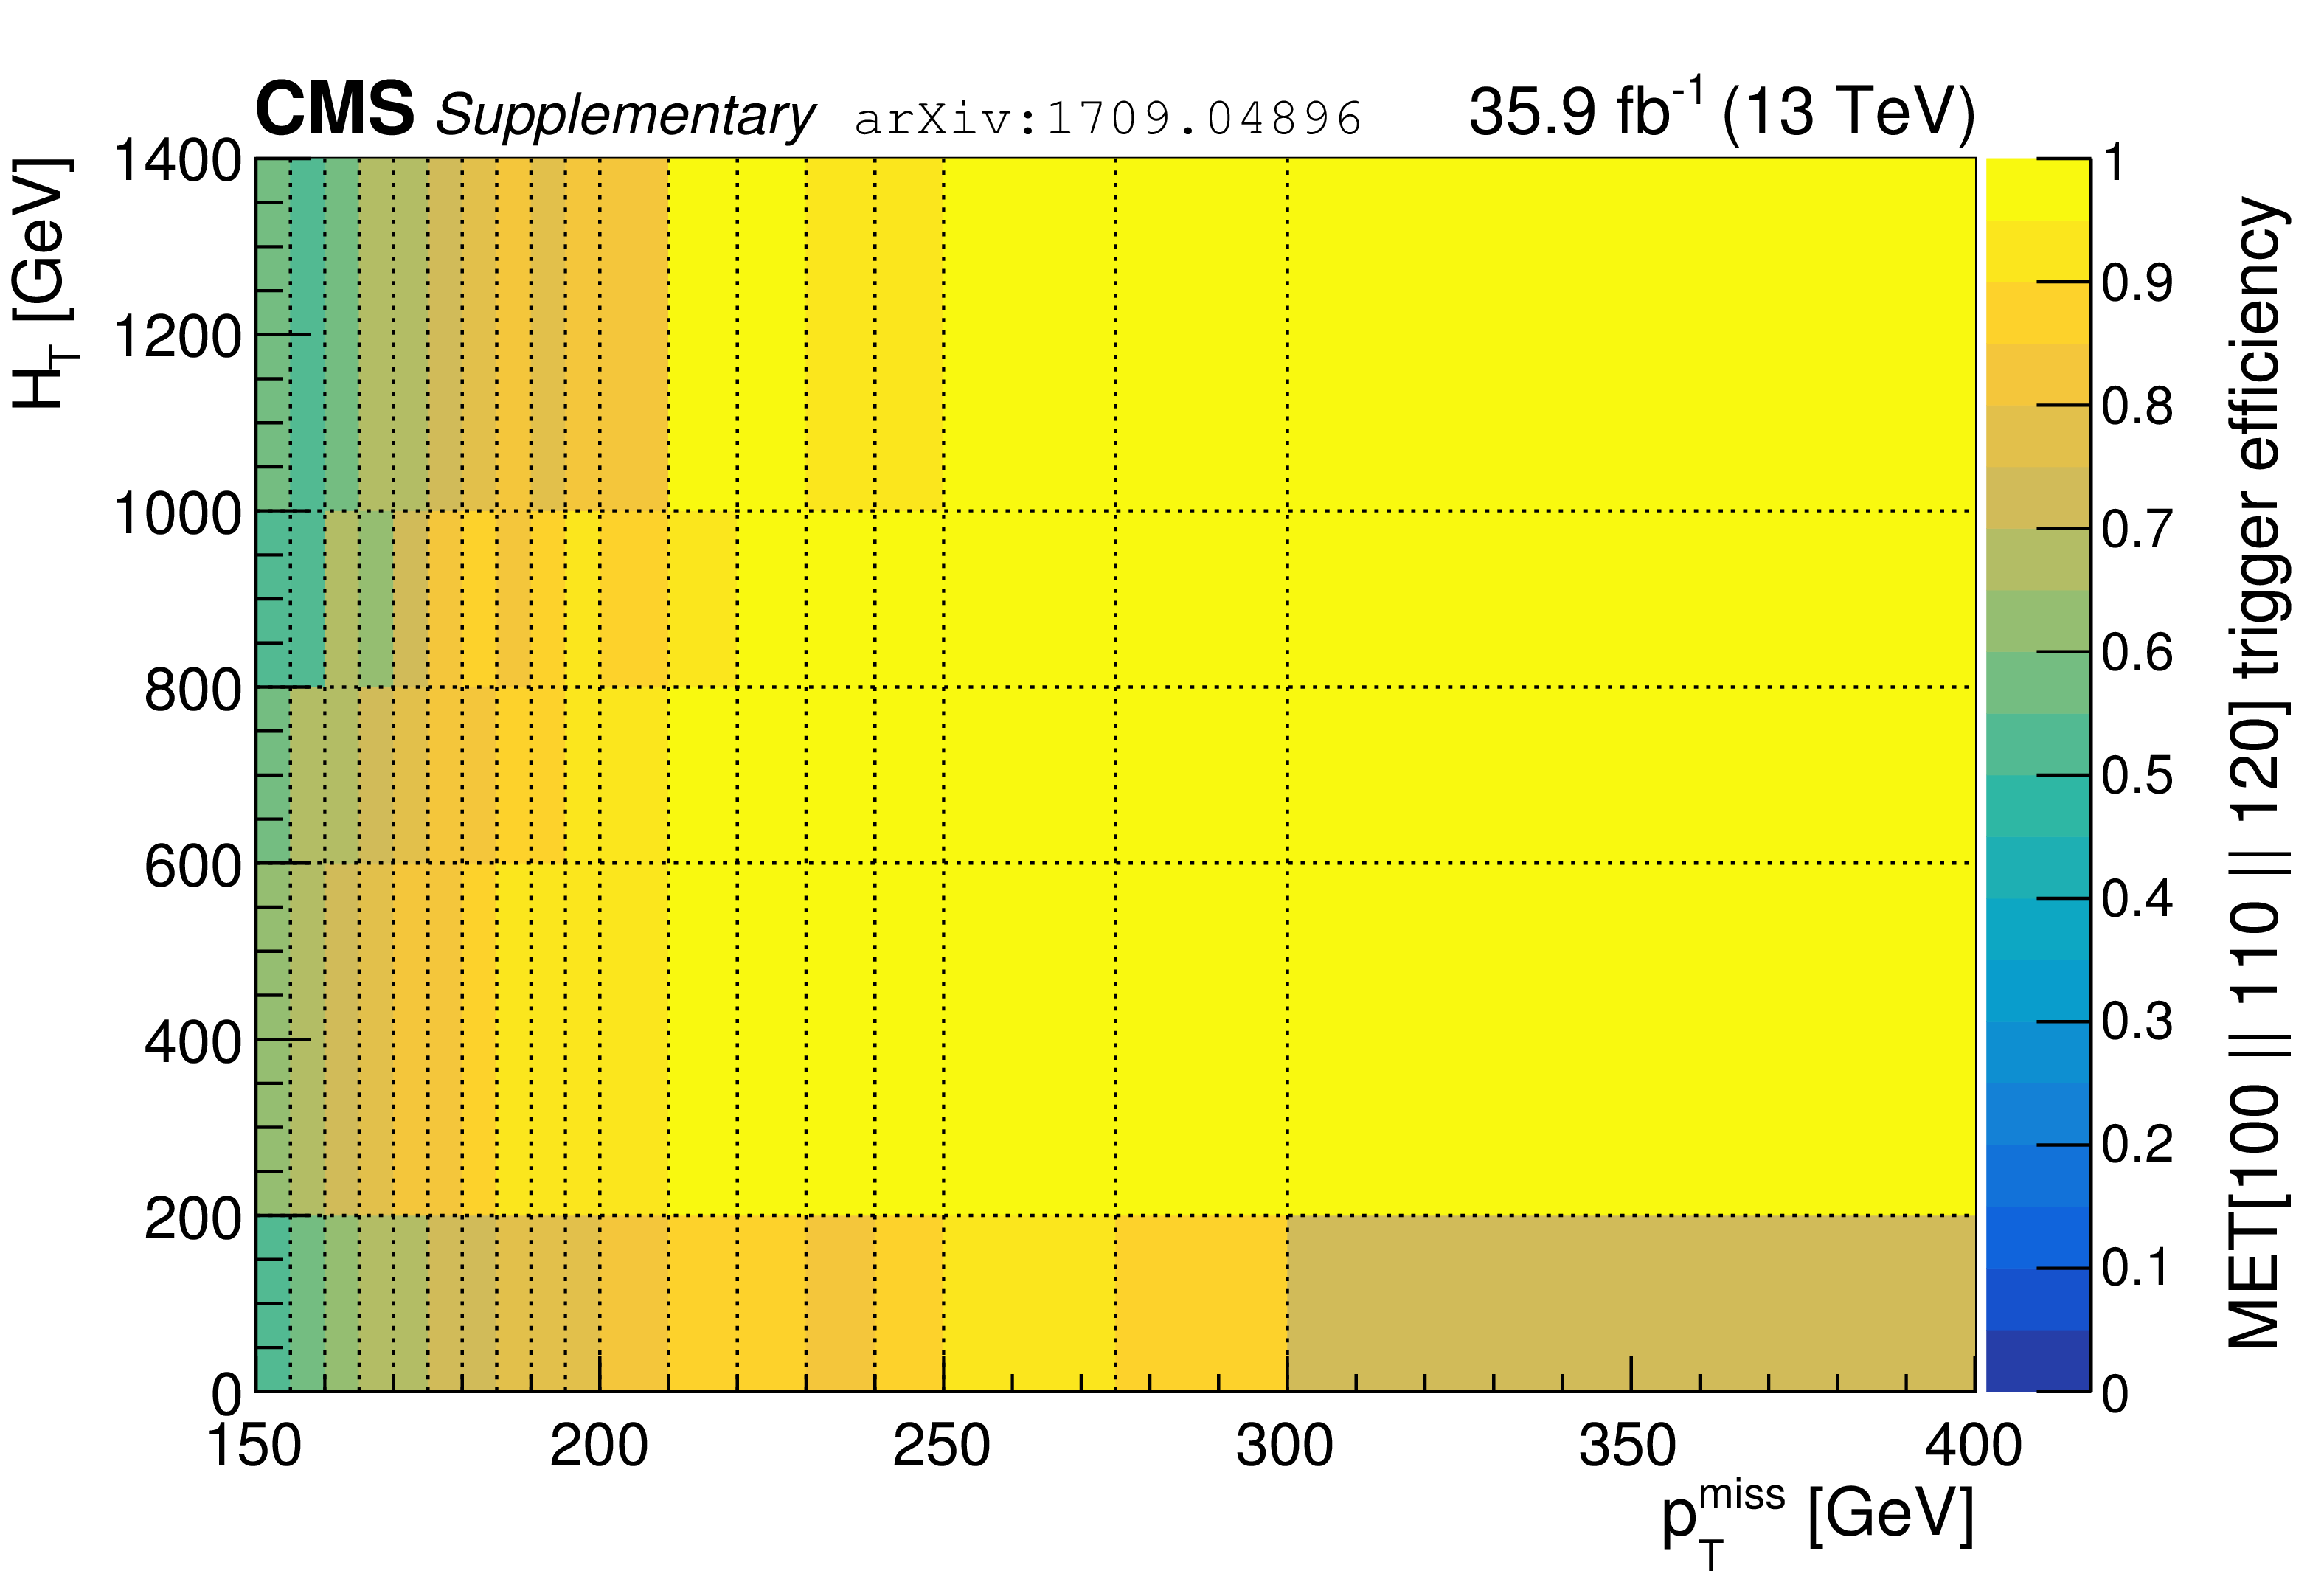
Additional Figure 3:
Efficiency for the logical OR of the various $p_{\rm T}^{\rm miss}$ triggers used in the analysis as a function of $p_{\rm T}^{\rm miss}$ and $H_{\rm T}$. |
png pdf root |
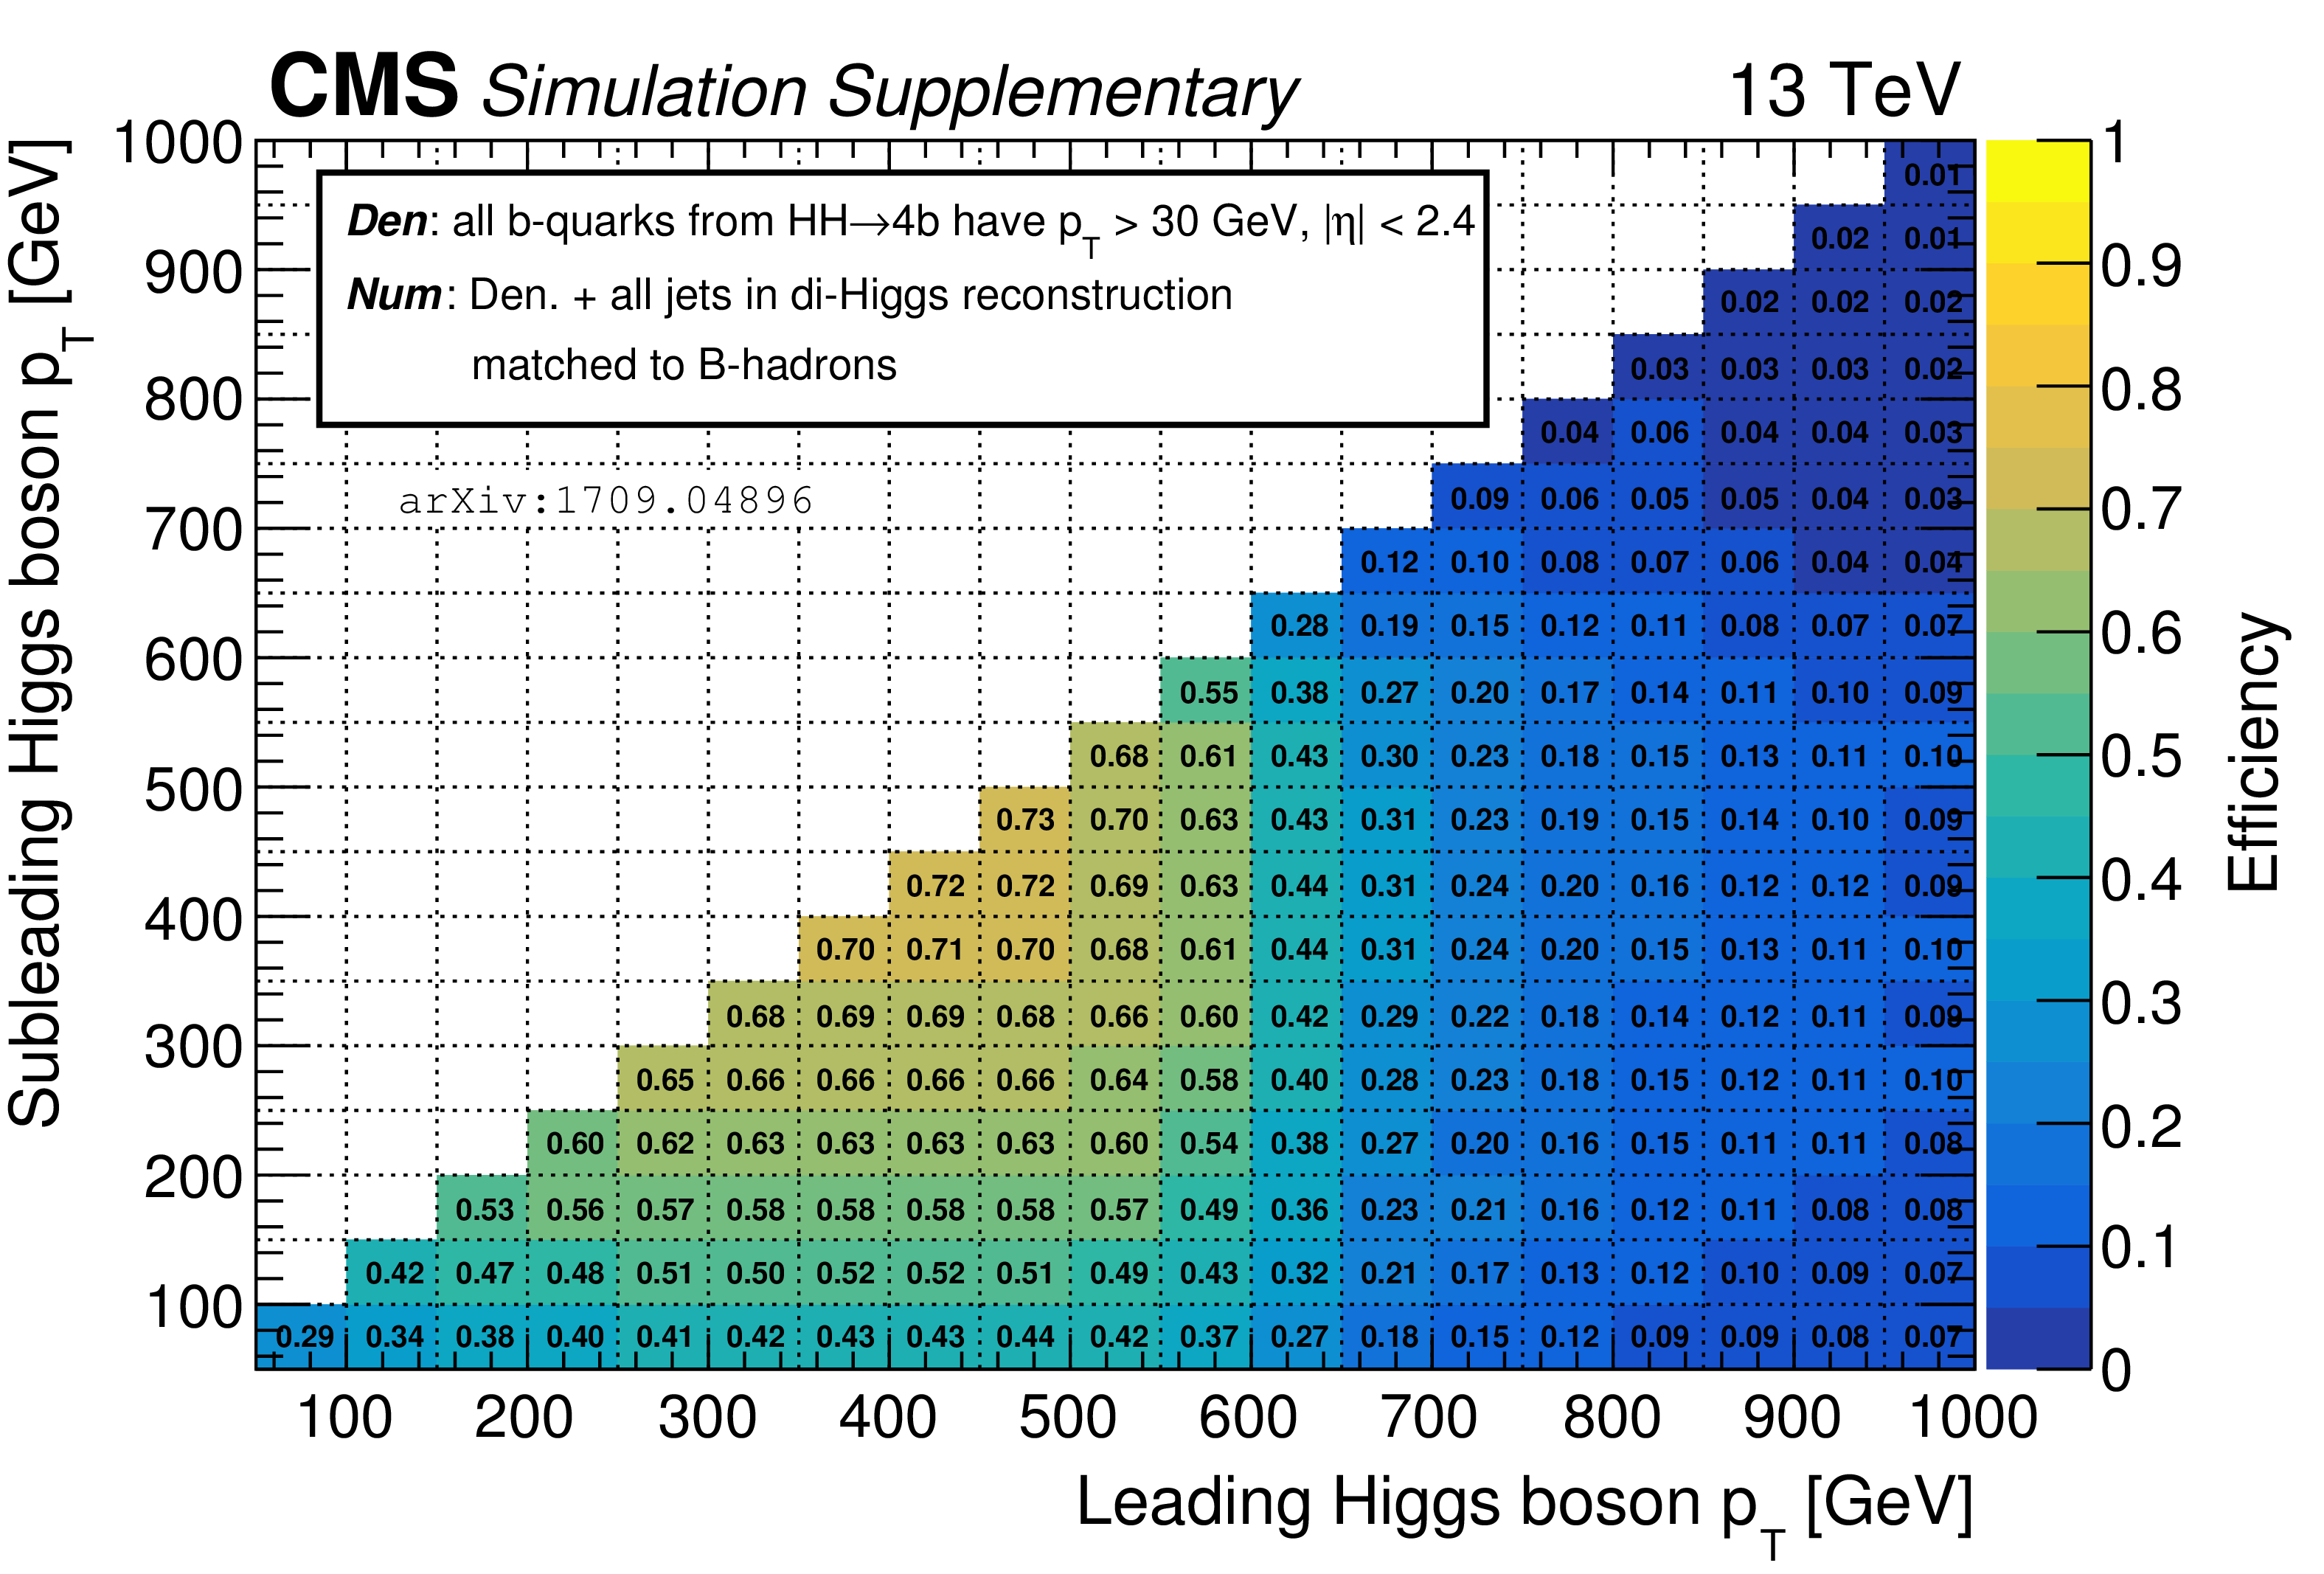
Additional Figure 4:
Efficiency to reconstruct all b-quarks from the two Higgs boson decays as individual jets, given that all four of the b-quarks are within acceptance, $p_{\mathrm{T}} > $ 30 GeV and $ | \eta | < $ 2.4. The efficiency is calculated based on the TChiHH model with all higgsino masses included. |
png pdf root |
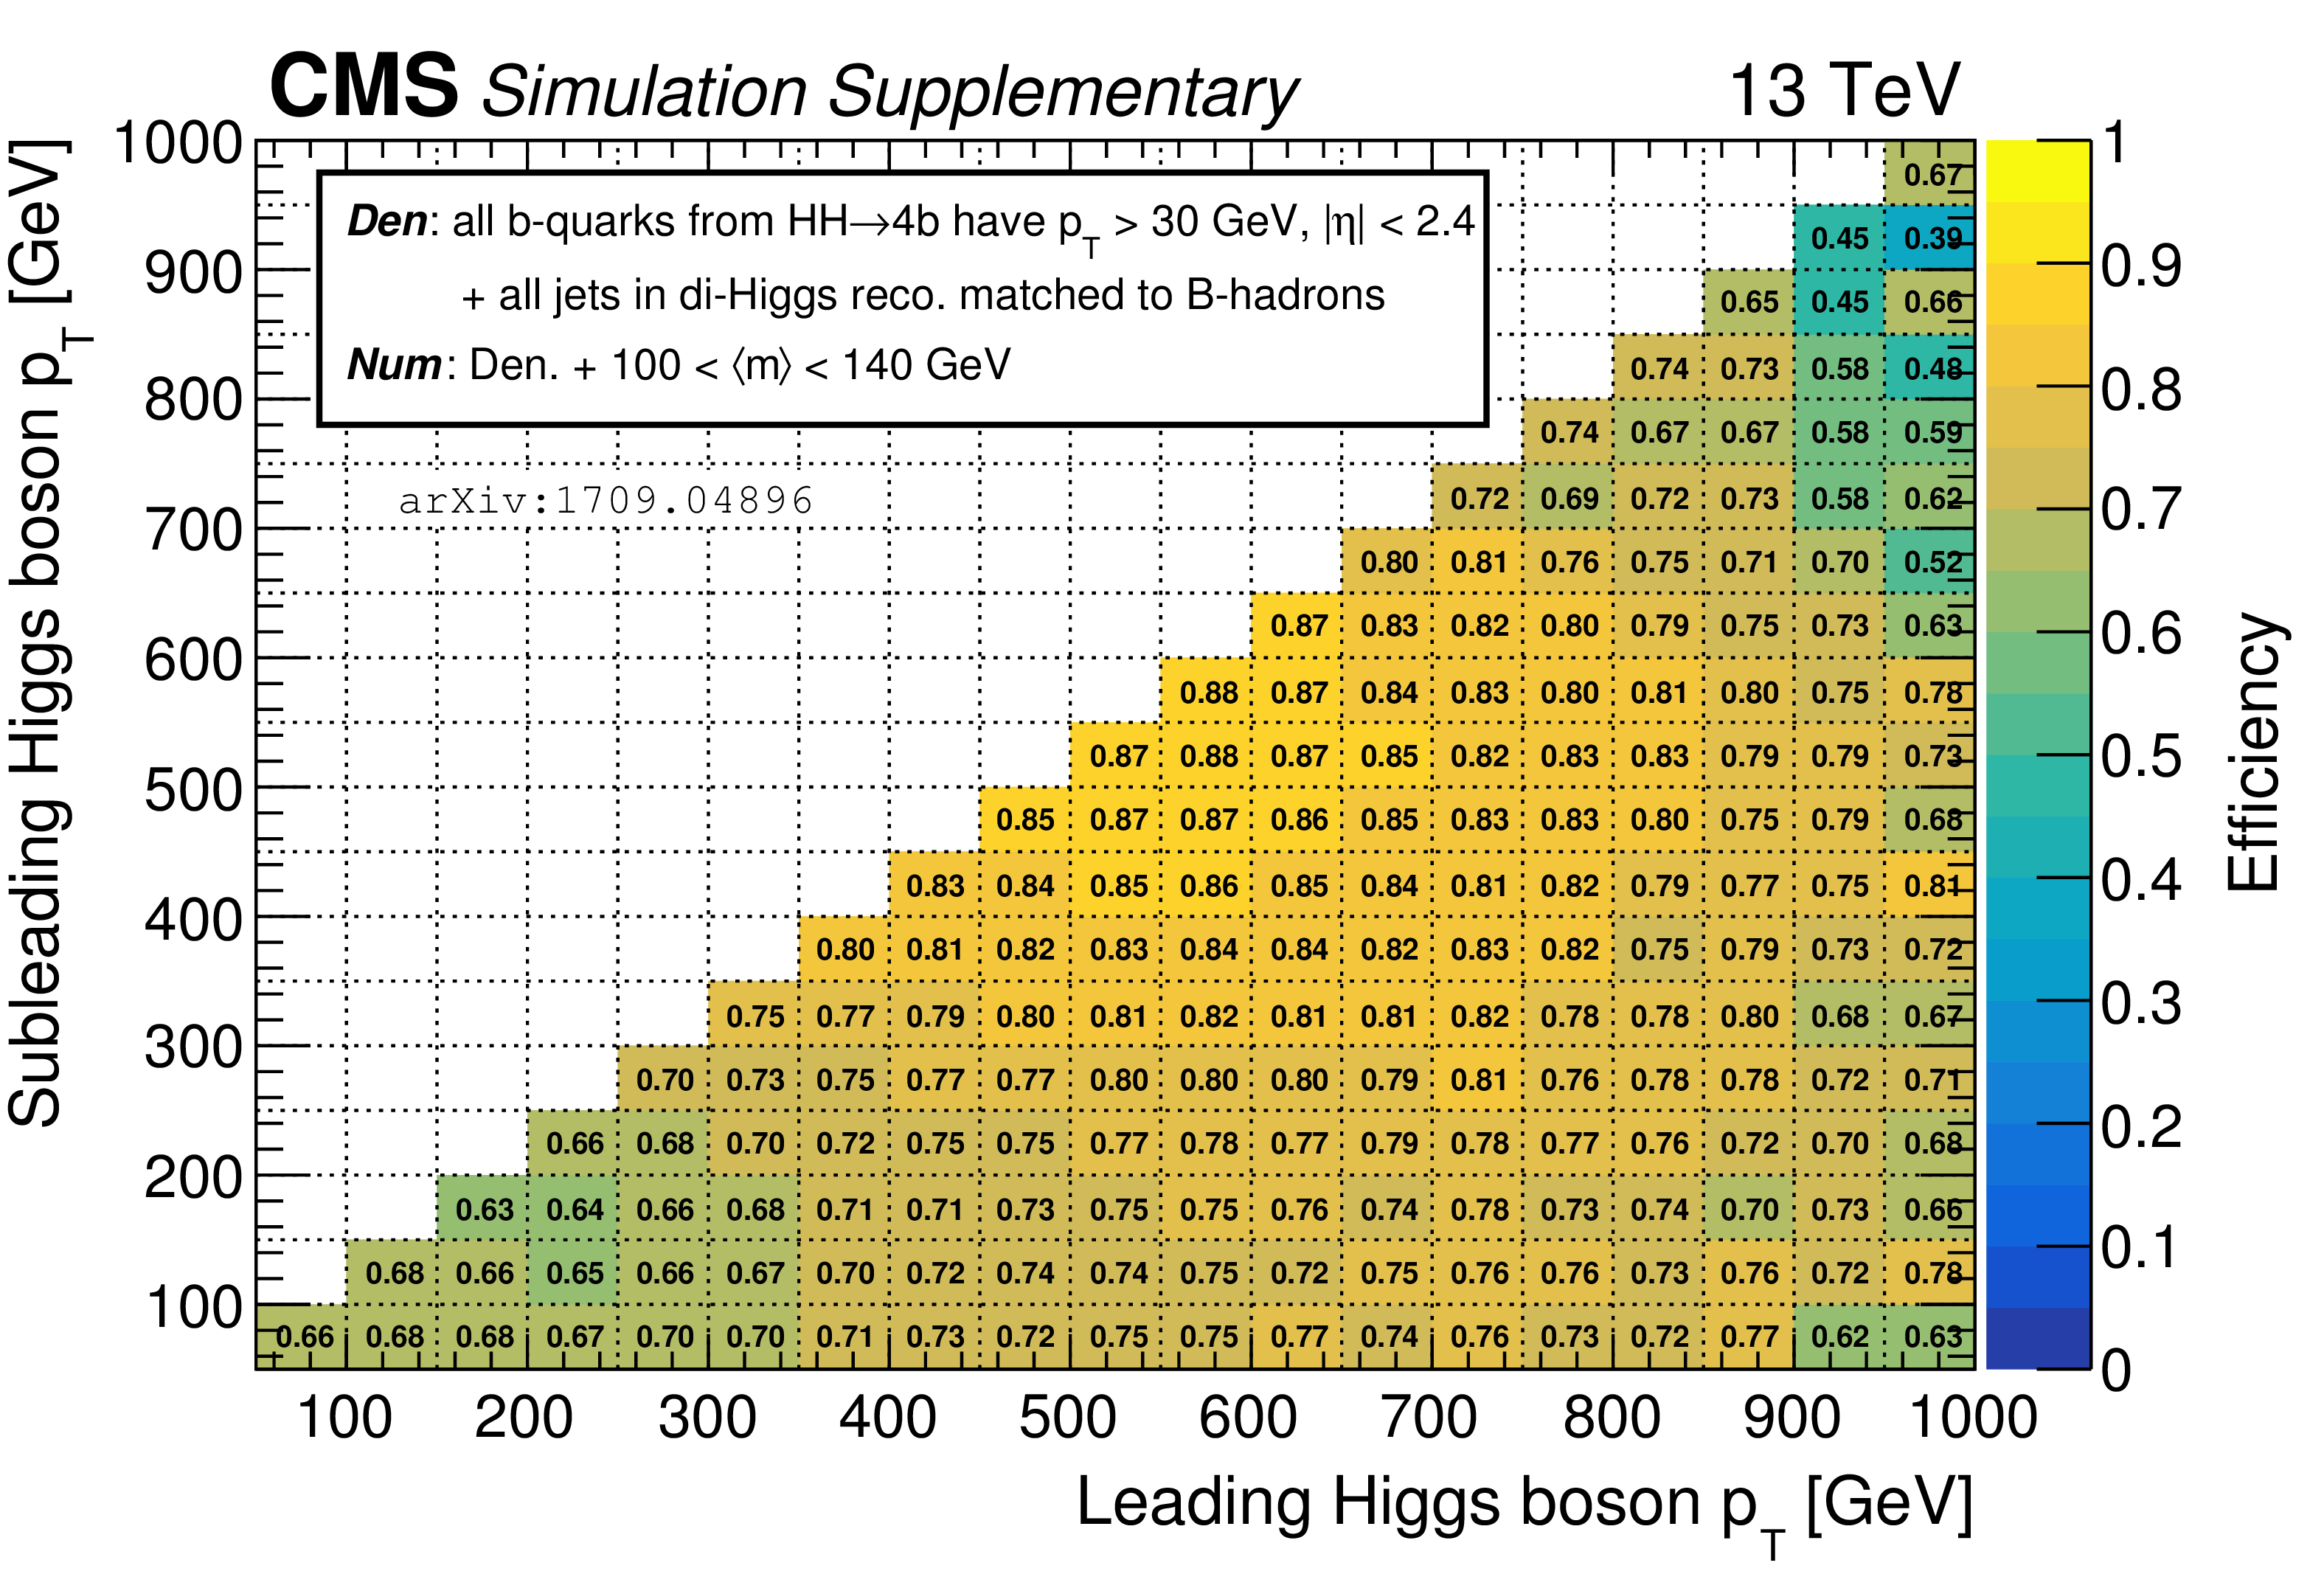
Additional Figure 5:
Efficiency to pass the mass requirement, $ < m > $ between 100 and 140 GeV, given that all b-quarks from the di-Higgs system are reconstructed as individual jets. The efficiency is calculated based on the TChiHH model with all higgsino masses included. |
| Additional Tables | |

png pdf |
Additional Table 1:
Total background and signal yields in simulation for selections based on the CSVv2 b-tagging discriminator. To be compared to the equivalent table based on the DeepCSV discriminator used in the analysis. |
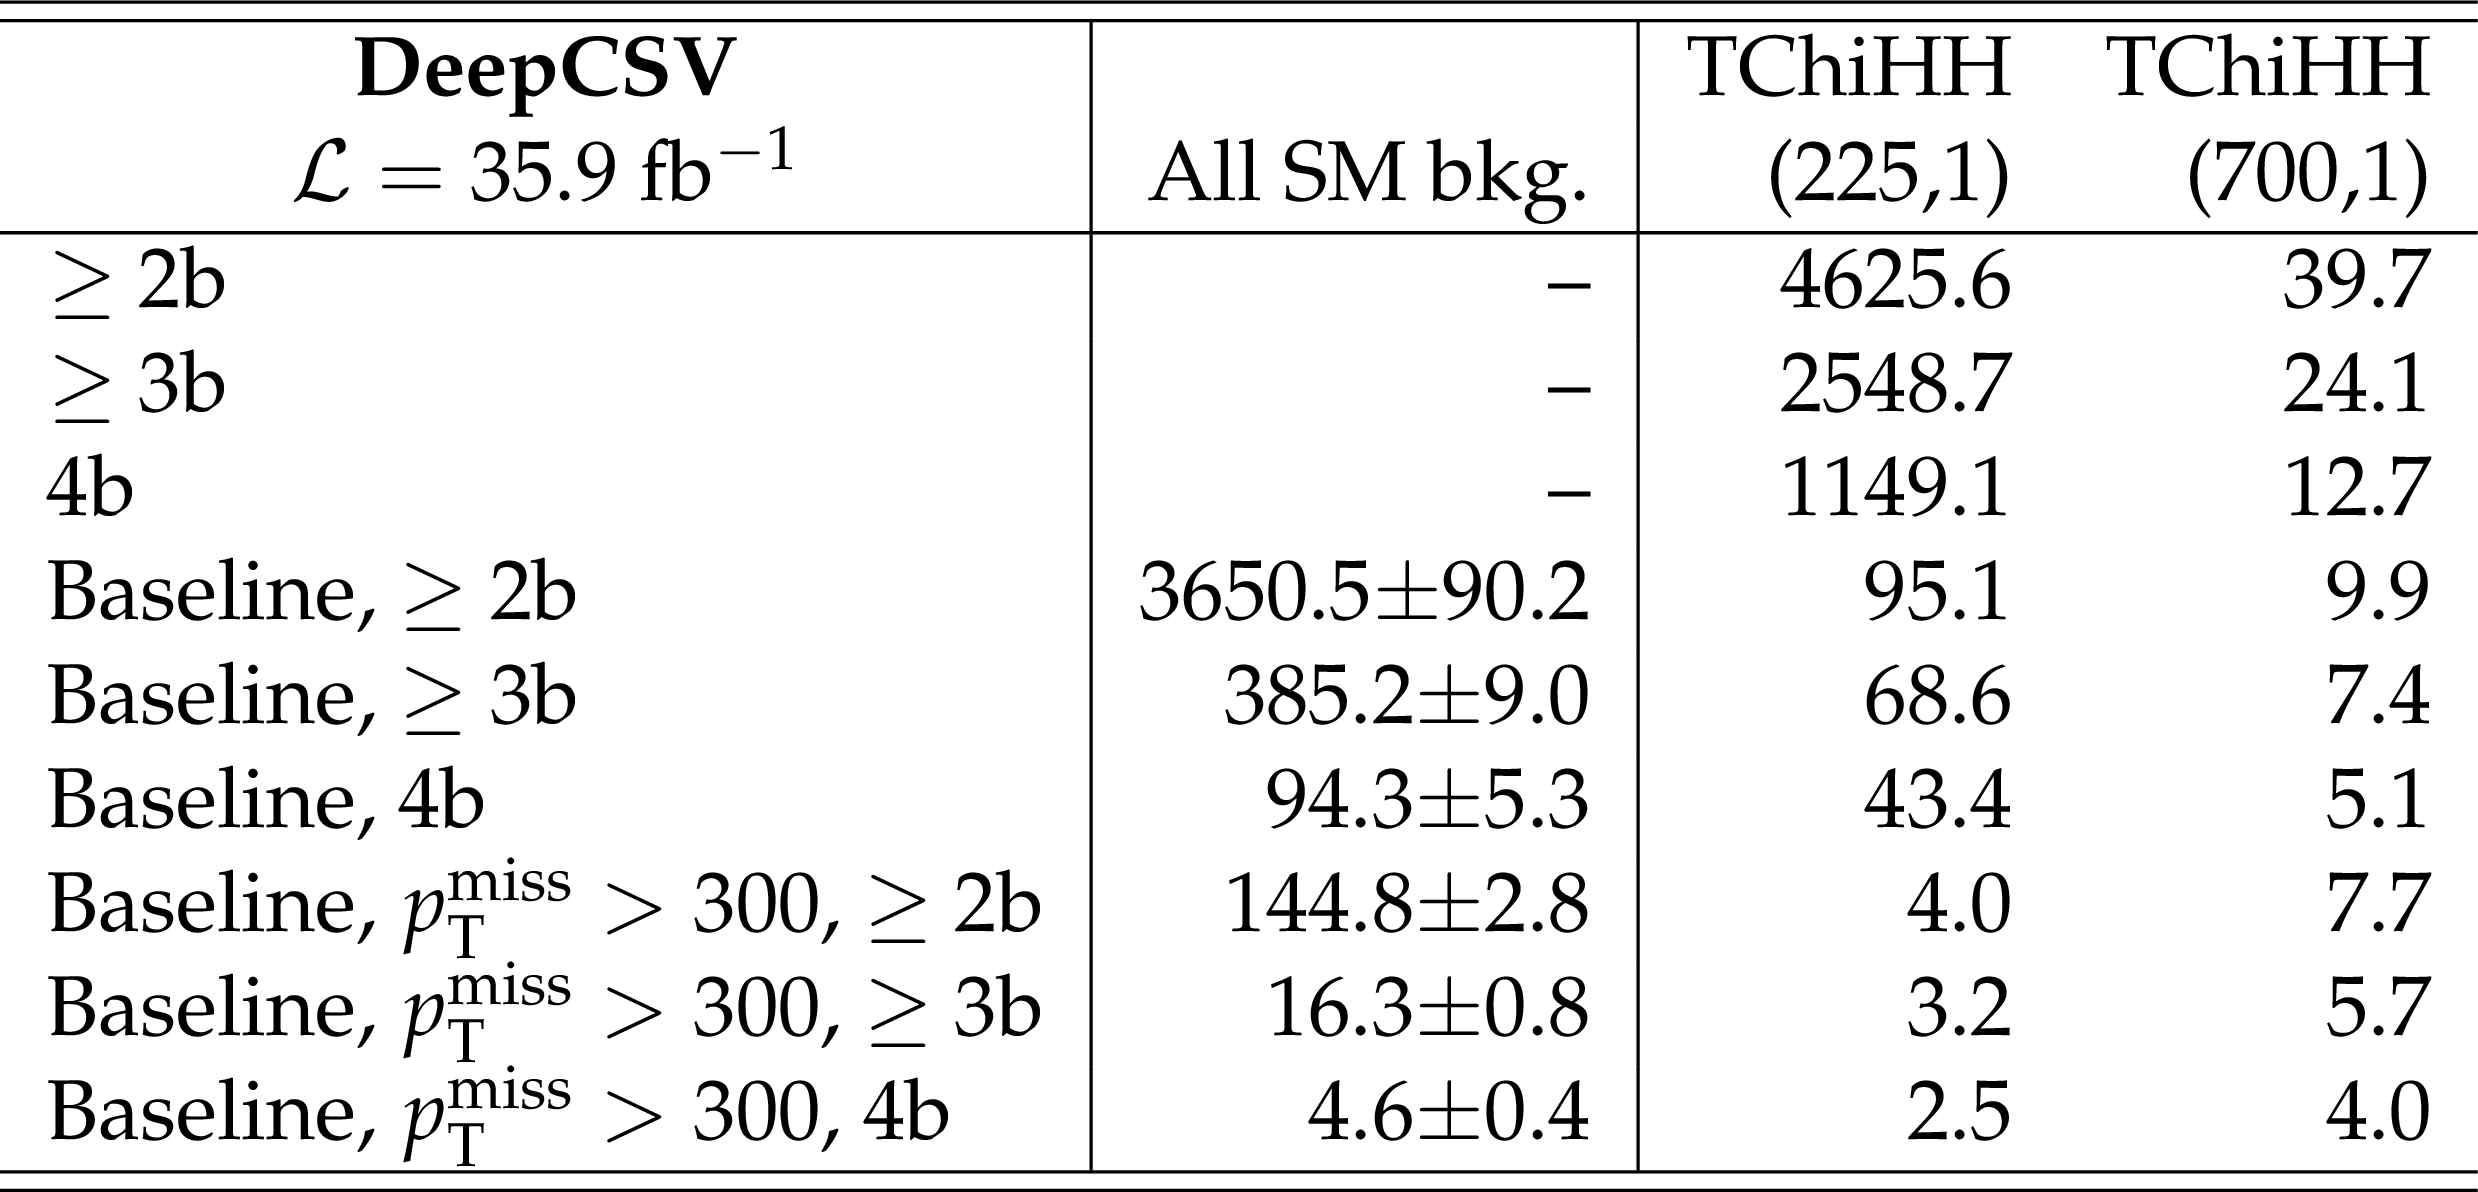
png pdf |
Additional Table 2:
Total background and signal yields in simulation for selections based on the DeepCSV b-tagging discriminator. The background is dominated by events with 2 true b quarks, while the signal has 4 b quarks. Compared to CSVv2, the high b-tagging efficiency of the DeepCSV algorithm extends the a-posteriori expected exclusion limit by approximately 150 GeV in the higgsino mass, corresponding to a cross-section that is 3 times smaller. This gain in mass reach is aided by the increasingly more favorable kinematics of the signal at higher higgsino masses and the observed yields in the signal regions. |
| References | ||||
| 1 | ATLAS Collaboration | Observation of a new particle in the search for the Standard Model Higgs boson with the ATLAS detector at the LHC | PLB 716 (2012) 1 | 1207.7214 |
| 2 | CMS Collaboration | Observation of a new boson at a mass of 125 GeV with the CMS experiment at the LHC | PLB 716 (2012) 30 | CMS-HIG-12-028 1207.7235 |
| 3 | CMS Collaboration | Observation of a new boson with mass near 125 GeV in pp collisions at $ \sqrt{s} = $ 7 and 8 TeV | JHEP 06 (2013) 081 | CMS-HIG-12-036 1303.4571 |
| 4 | CMS Collaboration | Precise determination of the mass of the Higgs boson and tests of compatibility of its couplings with the standard model predictions using proton collisions at 7 and 8 TeV | EPJC 75 (2015) 212 | CMS-HIG-14-009 1412.8662 |
| 5 | ATLAS Collaboration | Measurement of the Higgs boson mass from the $ \textrm{H}\rightarrow \gamma\gamma $ and $ \textrm{H} \rightarrow \textrm{ZZ}^{*} \rightarrow 4\ell $ channels with the ATLAS detector using 25 fb$ ^{-1} $ of $ \textrm{pp} $ collision data | PRD 90 (2014) 052004 | 1406.3827 |
| 6 | ATLAS and CMS Collaborations | Combined measurement of the Higgs boson mass in pp collisions at $ \sqrt{s}= $ 7 and 8 TeV with the ATLAS and CMS experiments | PRL 114 (2015) 191803 | 1503.07589 |
| 7 | P. Ramond | Dual theory for free fermions | PRD 3 (1971) 2415 | |
| 8 | Y. A. Gol'fand and E. P. Likhtman | Extension of the algebra of Poincare group generators and violation of P invariance | JEPTL 13 (1971)323 | |
| 9 | A. Neveu and J. H. Schwarz | Factorizable dual model of pions | NPB 31 (1971) 86 | |
| 10 | D. V. Volkov and V. P. Akulov | Possible universal neutrino interaction | JEPTL 16 (1972)438 | |
| 11 | J. Wess and B. Zumino | A lagrangian model invariant under supergauge transformations | PLB 49 (1974) 52 | |
| 12 | J. Wess and B. Zumino | Supergauge transformations in four dimensions | NPB 70 (1974) 39 | |
| 13 | P. Fayet | Supergauge invariant extension of the Higgs mechanism and a model for the electron and its neutrino | NPB 90 (1975) 104 | |
| 14 | H. P. Nilles | Supersymmetry, supergravity and particle physics | Phys. Rep. 110 (1984) 1 | |
| 15 | CMS Collaboration | Searches for electroweak neutralino and chargino production in channels with Higgs, Z, and W bosons in pp collisions at 8 TeV | PRD 90 (2014) 092007 | CMS-SUS-14-002 1409.3168 |
| 16 | CMS Collaboration | Searches for electroweak production of charginos, neutralinos, and sleptons decaying to leptons and W, Z, and Higgs bosons in pp collisions at 8 TeV | EPJC 74 (2014) 3036 | CMS-SUS-13-006 1405.7570 |
| 17 | CMS Collaboration | Search for top squark and higgsino production using diphoton Higgs boson decays | PRL 112 (2014) 161802 | CMS-SUS-13-014 1312.3310 |
| 18 | CMS Collaboration | Search for top-squark pairs decaying into Higgs or Z bosons in pp collisions at $ \sqrt{s}= $ 8 ~TeV | PLB 736 (2014) 371 | CMS-SUS-13-024 1405.3886 |
| 19 | ATLAS Collaboration | Search for direct pair production of a chargino and a neutralino decaying to the 125 GeV Higgs boson in $ \sqrt{s} = $ 8 TeV pp collisions with the ATLAS detector | EPJC 75 (2015) 208 | 1501.07110 |
| 20 | ATLAS Collaboration | Search for supersymmetry in events with photons, bottom quarks, and missing transverse momentum in proton-proton collisions at a centre-of-mass energy of 7 TeV with the ATLAS detector | PLB 719 (2013) 261 | 1211.1167 |
| 21 | G. 't Hooft | Naturalness, chiral symmetry, and spontaneous chiral symmetry breaking | NATO Sci. Ser. B 59 (1980) 135 | |
| 22 | E. Witten | Dynamical breaking of supersymmetry | NPB 188 (1981) 513 | |
| 23 | M. Dine, W. Fischler, and M. Srednicki | Supersymmetric technicolor | NPB 189 (1981) 575 | |
| 24 | S. Dimopoulos and S. Raby | Supercolor | NPB 192 (1981) 353 | |
| 25 | S. Dimopoulos and H. Georgi | Softly broken supersymmetry and SU(5) | NPB 193 (1981) 150 | |
| 26 | R. K. Kaul and P. Majumdar | Cancellation of quadratically divergent mass corrections in globally supersymmetric spontaneously broken gauge theories | NPB 199 (1982) 36 | |
| 27 | R. Barbieri and G. F. Giudice | Upper bounds on supersymmetric particle masses | NPB 306 (1988) 63 | |
| 28 | S. Dimopoulos and G. F. Giudice | Naturalness constraints in supersymmetric theories with nonuniversal soft terms | PLB 357 (1995) 573 | hep-ph/9507282 |
| 29 | R. Barbieri and D. Pappadopulo | S-particles at their naturalness limits | JHEP 10 (2009) 061 | 0906.4546 |
| 30 | M. Papucci, J. T. Ruderman, and A. Weiler | Natural SUSY endures | JHEP 09 (2012) 035 | 1110.6926 |
| 31 | J. L. Feng | Naturalness and the Status of Supersymmetry | Ann. Rev. Nucl. Part. Sci. 63 (2013) 351 | 1302.6587 |
| 32 | G. R. Farrar and P. Fayet | Phenomenology of the production, decay, and detection of new hadronic states associated with supersymmetry | PLB 76 (1978) 575 | |
| 33 | Z. Han, G. D. Kribs, A. Martin, and A. Menon | Hunting quasidegenerate Higgsinos | PRD 89 (2014) 075007 | 1401.1235 |
| 34 | C. Han, D. Kim, S. Munir, and M. Park | Accessing the core of naturalness, nearly degenerate higgsinos, at the LHC | JHEP 04 (2015) 132 | 1502.03734 |
| 35 | H. Baer et al. | Physics at a Higgsino factory | JHEP 06 (2014) 172 | 1404.7510 |
| 36 | ATLAS Collaboration | Search for new phenomena in final states with an energetic jet and large missing transverse momentum in pp collisions at $ \sqrt{s}= $ 8 TeV with the ATLAS detector | EPJC 75 (2015) 299 | 1502.01518 |
| 37 | CMS Collaboration | Search for dark matter in proton-proton collisions at 8 TeV with missing transverse momentum and vector boson tagged jets | JHEP 12 (2016) 083 | CMS-EXO-12-055 1607.05764 |
| 38 | ATLAS Collaboration | Search for new phenomena in final states with an energetic jet and large missing transverse momentum in pp collisions at $ \sqrt{s}= $ 13 TeV using the ATLAS detector | PRD 94 (2016) 032005 | 1604.07773 |
| 39 | ATLAS Collaboration | Search for dark matter produced in association with a hadronically decaying vector boson in pp collisions at $ \sqrt{s} = $ 13 TeV with the ATLAS detector | PLB 763 (2016) 251 | 1608.02372 |
| 40 | CMS Collaboration | Search for dark matter produced with an energetic jet or a hadronically decaying W or Z boson at $ \sqrt{s} = $ 13 TeV | JHEP 07 (2017) , Submitted to JHEP | CMS-EXO-16-037 1703.01651 |
| 41 | C. Han et al. | Probing light Higgsinos in natural SUSY from monojet signals at the LHC | JHEP 02 (2014) 049 | 1310.4274 |
| 42 | J. T. Ruderman and D. Shih | General Neutralino NLSPs at the Early LHC | JHEP 08 (2012) 159 | 1103.6083 |
| 43 | S. Dimopoulos, M. Dine, S. Raby, and S. D. Thomas | Experimental signatures of low-energy gauge mediated supersymmetry breaking | PRL 76 (1996) 3494 | hep-ph/9601367 |
| 44 | K. T. Matchev and S. D. Thomas | Higgs and $ Z $ boson signatures of supersymmetry | PRD 62 (2000) 077702 | hep-ph/9908482 |
| 45 | B. Fuks, M. Klasen, D. R. Lamprea, and M. Rothering | Gaugino production in proton-proton collisions at a center-of-mass energy of 8 TeV | JHEP 10 (2012) 081 | 1207.2159 |
| 46 | B. Fuks, M. Klasen, D. R. Lamprea, and M. Rothering | Precision predictions for electroweak superpartner production at hadron colliders with $ \sc $ Resummino | EPJC 73 (2013) 2480 | 1304.0790 |
| 47 | J. Alwall, P. C. Schuster, and N. Toro | Simplified models for a first characterization of new physics at the LHC | PRD 79 (2009) 075020 | 0810.3921 |
| 48 | J. Alwall, M.-P. Le, M. Lisanti, and J. G. Wacker | Model-independent jets plus missing energy searches | PRD 79 (2009) 015005 | 0809.3264 |
| 49 | D. Alves et al. | Simplified models for LHC new physics searches | JPG 39 (2012) 105005 | 1105.2838 |
| 50 | P. Meade, M. Reece, and D. Shih | Prompt decays of general neutralino NLSPs at the Tevatron | JHEP 05 (2010) 105 | 0911.4130 |
| 51 | CMS Collaboration | The CMS experiment at the CERN LHC | JINST 3 (2008) S08004 | CMS-00-001 |
| 52 | J. Alwall et al. | The automated computation of tree-level and next-to-leading order differential cross sections, and their matching to parton shower simulations | JHEP 07 (2014) 079 | 1405.0301 |
| 53 | J. Alwall et al. | Comparative study of various algorithms for the merging of parton showers and matrix elements in hadronic collisions | EPJC 53 (2008) 473 | 0706.2569 |
| 54 | S. Alioli, P. Nason, C. Oleari, and E. Re | NLO single-top production matched with shower in POWHEG: $ s $- and $ t $-channel contributions | JHEP 09 (2009) 111 | 0907.4076 |
| 55 | E. Re | Single-top $ Wt $-channel production matched with parton showers using the POWHEG method | EPJC 71 (2011) 1547 | 1009.2450 |
| 56 | R. Frederix and S. Frixione | Merging meets matching in MC@NLO | JHEP 12 (2012) 061 | 1209.6215 |
| 57 | NNPDF Collaboration | Parton distributions for the LHC Run II | JHEP 04 (2015) 040 | 1410.8849 |
| 58 | T. Sjostrand et al. | An introduction to PYTHIA 8.2 | CPC 191 (2015) 159 | 1410.3012 |
| 59 | CMS Collaboration | Event generator tunes obtained from underlying event and multiparton scattering measurements | EPJC 76 (2016) 155 | CMS-GEN-14-001 1512.00815 |
| 60 | GEANT4 Collaboration | GEANT4 --- a simulation toolkit | NIMA 506 (2003) 250 | |
| 61 | J. Allison et al. | GEANT4 developments and applications | IEEE Trans. Nucl. Sci. 53 (2006) 270 | |
| 62 | J. Allison et al. | Recent developments in GEANT4 | NIMA 835 (2016) 186 | |
| 63 | M. Beneke, P. Falgari, S. Klein, and C. Schwinn | Hadronic top-quark pair production with NNLL threshold resummation | NPB 855 (2012) 695 | 1109.1536 |
| 64 | M. Cacciari et al. | Top-pair production at hadron colliders with next-to-next-to-leading logarithmic soft-gluon resummation | PLB 710 (2012) 612 | 1111.5869 |
| 65 | P. Barnreuther, M. Czakon, and A. Mitov | Percent-level-precision physics at the Tevatron: Next-to-next-to-leading order QCD corrections to $ q\bar{q}\to t\bar{t} + X $ | PRL 109 (2012) 132001 | 1204.5201 |
| 66 | M. Czakon and A. Mitov | NNLO corrections to top-pair production at hadron colliders: the all-fermionic scattering channels | JHEP 12 (2012) 054 | 1207.0236 |
| 67 | M. Czakon and A. Mitov | NNLO corrections to top pair production at hadron colliders: the quark-gluon reaction | JHEP 01 (2013) 080 | 1210.6832 |
| 68 | M. Czakon, P. Fiedler, and A. Mitov | Total top-quark pair-production cross section at hadron colliders through $ O(\alpha_S^4) $ | PRL 110 (2013) 252004 | 1303.6254 |
| 69 | R. Gavin, Y. Li, F. Petriello, and S. Quackenbush | W Physics at the LHC with FEWZ 2.1 | CPC 184 (2013) 208 | 1201.5896 |
| 70 | R. Gavin, Y. Li, F. Petriello, and S. Quackenbush | FEWZ 2.0: A code for hadronic Z production at next-to-next-to-leading order | CPC 182 (2011) 2388 | 1011.3540 |
| 71 | T. Melia, P. Nason, R. Rontsch, and G. Zanderighi | W+W-, WZ and ZZ production in the POWHEG BOX | JHEP 11 (2011) 078 | 1107.5051 |
| 72 | P. Z. Skands et al. | SUSY Les Houches accord: Interfacing SUSY spectrum calculators, decay packages, and event generators | JHEP 07 (2004) 036 | hep-ph/0311123 |
| 73 | D. de Florian et al. | Handbook of LHC Higgs cross sections: 4. deciphering the nature of the Higgs sector | CERN-2017-002-M | 1610.07922 |
| 74 | S. Abdullin et al. | The fast simulation of the CMS detector at LHC | J. Phys. Conf. Ser. 331 (2011) 032049 | |
| 75 | CMS Collaboration | Particle-flow reconstruction and global event description with the CMS detector | Submitted to JINST | CMS-PRF-14-001 1706.04965 |
| 76 | M. Cacciari, G. P. Salam, and G. Soyez | The anti-$ k_t $ jet clustering algorithm | JHEP 04 (2008) 063 | 0802.1189 |
| 77 | M. Cacciari, G. P. Salam, and G. Soyez | FastJet user manual | EPJC 72 (2012) 1896 | 1111.6097 |
| 78 | CMS Collaboration | Jet energy scale and resolution in the CMS experiment in pp collisions at 8 TeV | JINST 12 (2017) P02014 | CMS-JME-13-004 1607.03663 |
| 79 | CMS Collaboration | Jet performance in pp collisions at $ \sqrt{s}= $ 7 TeV | CMS-PAS-JME-10-003 | |
| 80 | CMS Collaboration | Identification of heavy-flavour jets with the CMS detector in pp collisions at 13 TeV | Submitted to JINST | CMS-BTV-16-002 1712.07158 |
| 81 | D. Guest et al. | Jet flavor classification in high-energy physics with deep neural networks | PRD 94 (2016) 112002 | 1607.08633 |
| 82 | CMS Collaboration | Particle flow event reconstruction in CMS and performance for jets, taus and $ E_{\mathrm{T}}^{\text{miss}} $ | CDS | |
| 83 | CMS Collaboration | Commissioning of the particle-flow event reconstruction with the first lhc collisions recorded in the cms detector | CDS | |
| 84 | CMS Collaboration | Performance of electron reconstruction and selection with the CMS detector in proton-proton collisions at $ \sqrt{s} = $ 8 TeV | JINST 10 (2015) P06005 | CMS-EGM-13-001 1502.02701 |
| 85 | CMS Collaboration | Performance of CMS muon reconstruction in pp collision events at $ \sqrt{s}= $ 7 TeV | JINST 7 (2012) P10002 | CMS-MUO-10-004 1206.4071 |
| 86 | K. Rehermann and B. Tweedie | Efficient identification of boosted semileptonic top quarks at the LHC | JHEP 03 (2011) 059 | 1007.2221 |
| 87 | CMS Collaboration | Search for supersymmetry in pp collisions at $ \sqrt{s}= $ 13 TeV in the single-lepton final state using the sum of masses of large-radius jets | JHEP 08 (2016) 122 | CMS-SUS-15-007 1605.04608 |
| 88 | CMS Collaboration | CMS luminosity measurements for the 2016 data taking period | CMS-PAS-LUM-17-001 | CMS-PAS-LUM-17-001 |
| 89 | T. Junk | Confidence level computation for combining searches with small statistics | NIMA 434 (1999) 435 | hep-ex/9902006 |
| 90 | A. L. Read | Presentation of search results: the $ CL_s $ technique | in Durham IPPP Workshop: Advanced Statistical Techniques in Particle Physics, p. 2693 Durham, UK, March, 2002 [JPG 28 (2002) 2693] | |
| 91 | ATLAS Collaboration, CMS Collaboration, LHC Higgs Combination Group | Procedure for the LHC Higgs boson search combination in Summer 2011 | CMS-NOTE-2011-005 | |
| 92 | G. Cowan, K. Cranmer, E. Gross, and O. Vitells | Asymptotic formulae for likelihood-based tests of new physics | EPJC 71 (2011) 1554 | 1007.1727 |
| 93 | CMS Collaboration | Search for supersymmetry with Higgs boson to diphoton decays using the razor variables at $ \sqrt{s}= $ 13 TeV | Submitted to PLB | CMS-SUS-16-045 1709.00384 |
| 94 | CMS Collaboration | Search for electroweak production of charginos and neutralinos in multilepton final states in proton-proton collisions at $ \sqrt{s}= $ 13 TeV | Submitted to JHEP | CMS-SUS-16-039 1709.05406 |
|
|
Compact Muon Solenoid LHC, CERN |
|

|

|

|

|

|