

Compact Muon Solenoid
LHC, CERN
| CMS-B2G-16-026 ; CERN-EP-2017-238 | ||
| Search for a massive resonance decaying to a pair of Higgs bosons in the four b quark final state in proton-proton collisions at $\sqrt{s}=$ 13 TeV | ||
| CMS Collaboration | ||
| 16 October 2017 | ||
| Phys. Lett. B 781 (2018) 244 | ||
| Abstract: A search for a massive resonance decaying into a pair of standard model Higgs bosons, in a final state consisting of two b quark-antiquark pairs, is performed. A data sample of proton-proton collisions at a centre-of-mass energy of 13 TeV is used, collected by the CMS experiment at the CERN LHC in 2016, and corresponding to an integrated luminosity of 35.9 fb$^{-1}$. The Higgs bosons are highly Lorentz-boosted and are each reconstructed as a single large-area jet. The signal is characterized by a peak in the dijet invariant mass distribution, above a background from the standard model multijet production. The observations are consistent with the background expectations, and are interpreted as upper limits on the products of the $s$-channel production cross sections and branching fractions of narrow bulk gravitons and radions in warped extra-dimensional models. The limits range from 126 to 1.4 fb at 95% confidence level for resonances with masses between 750 and 3000 GeV, and are the most stringent to date, over the explored mass range. | ||
| Links: e-print arXiv:1710.04960 [hep-ex] (PDF) ; CDS record ; inSPIRE record ; CADI line (restricted) ; | ||
| Figures | |
png pdf |
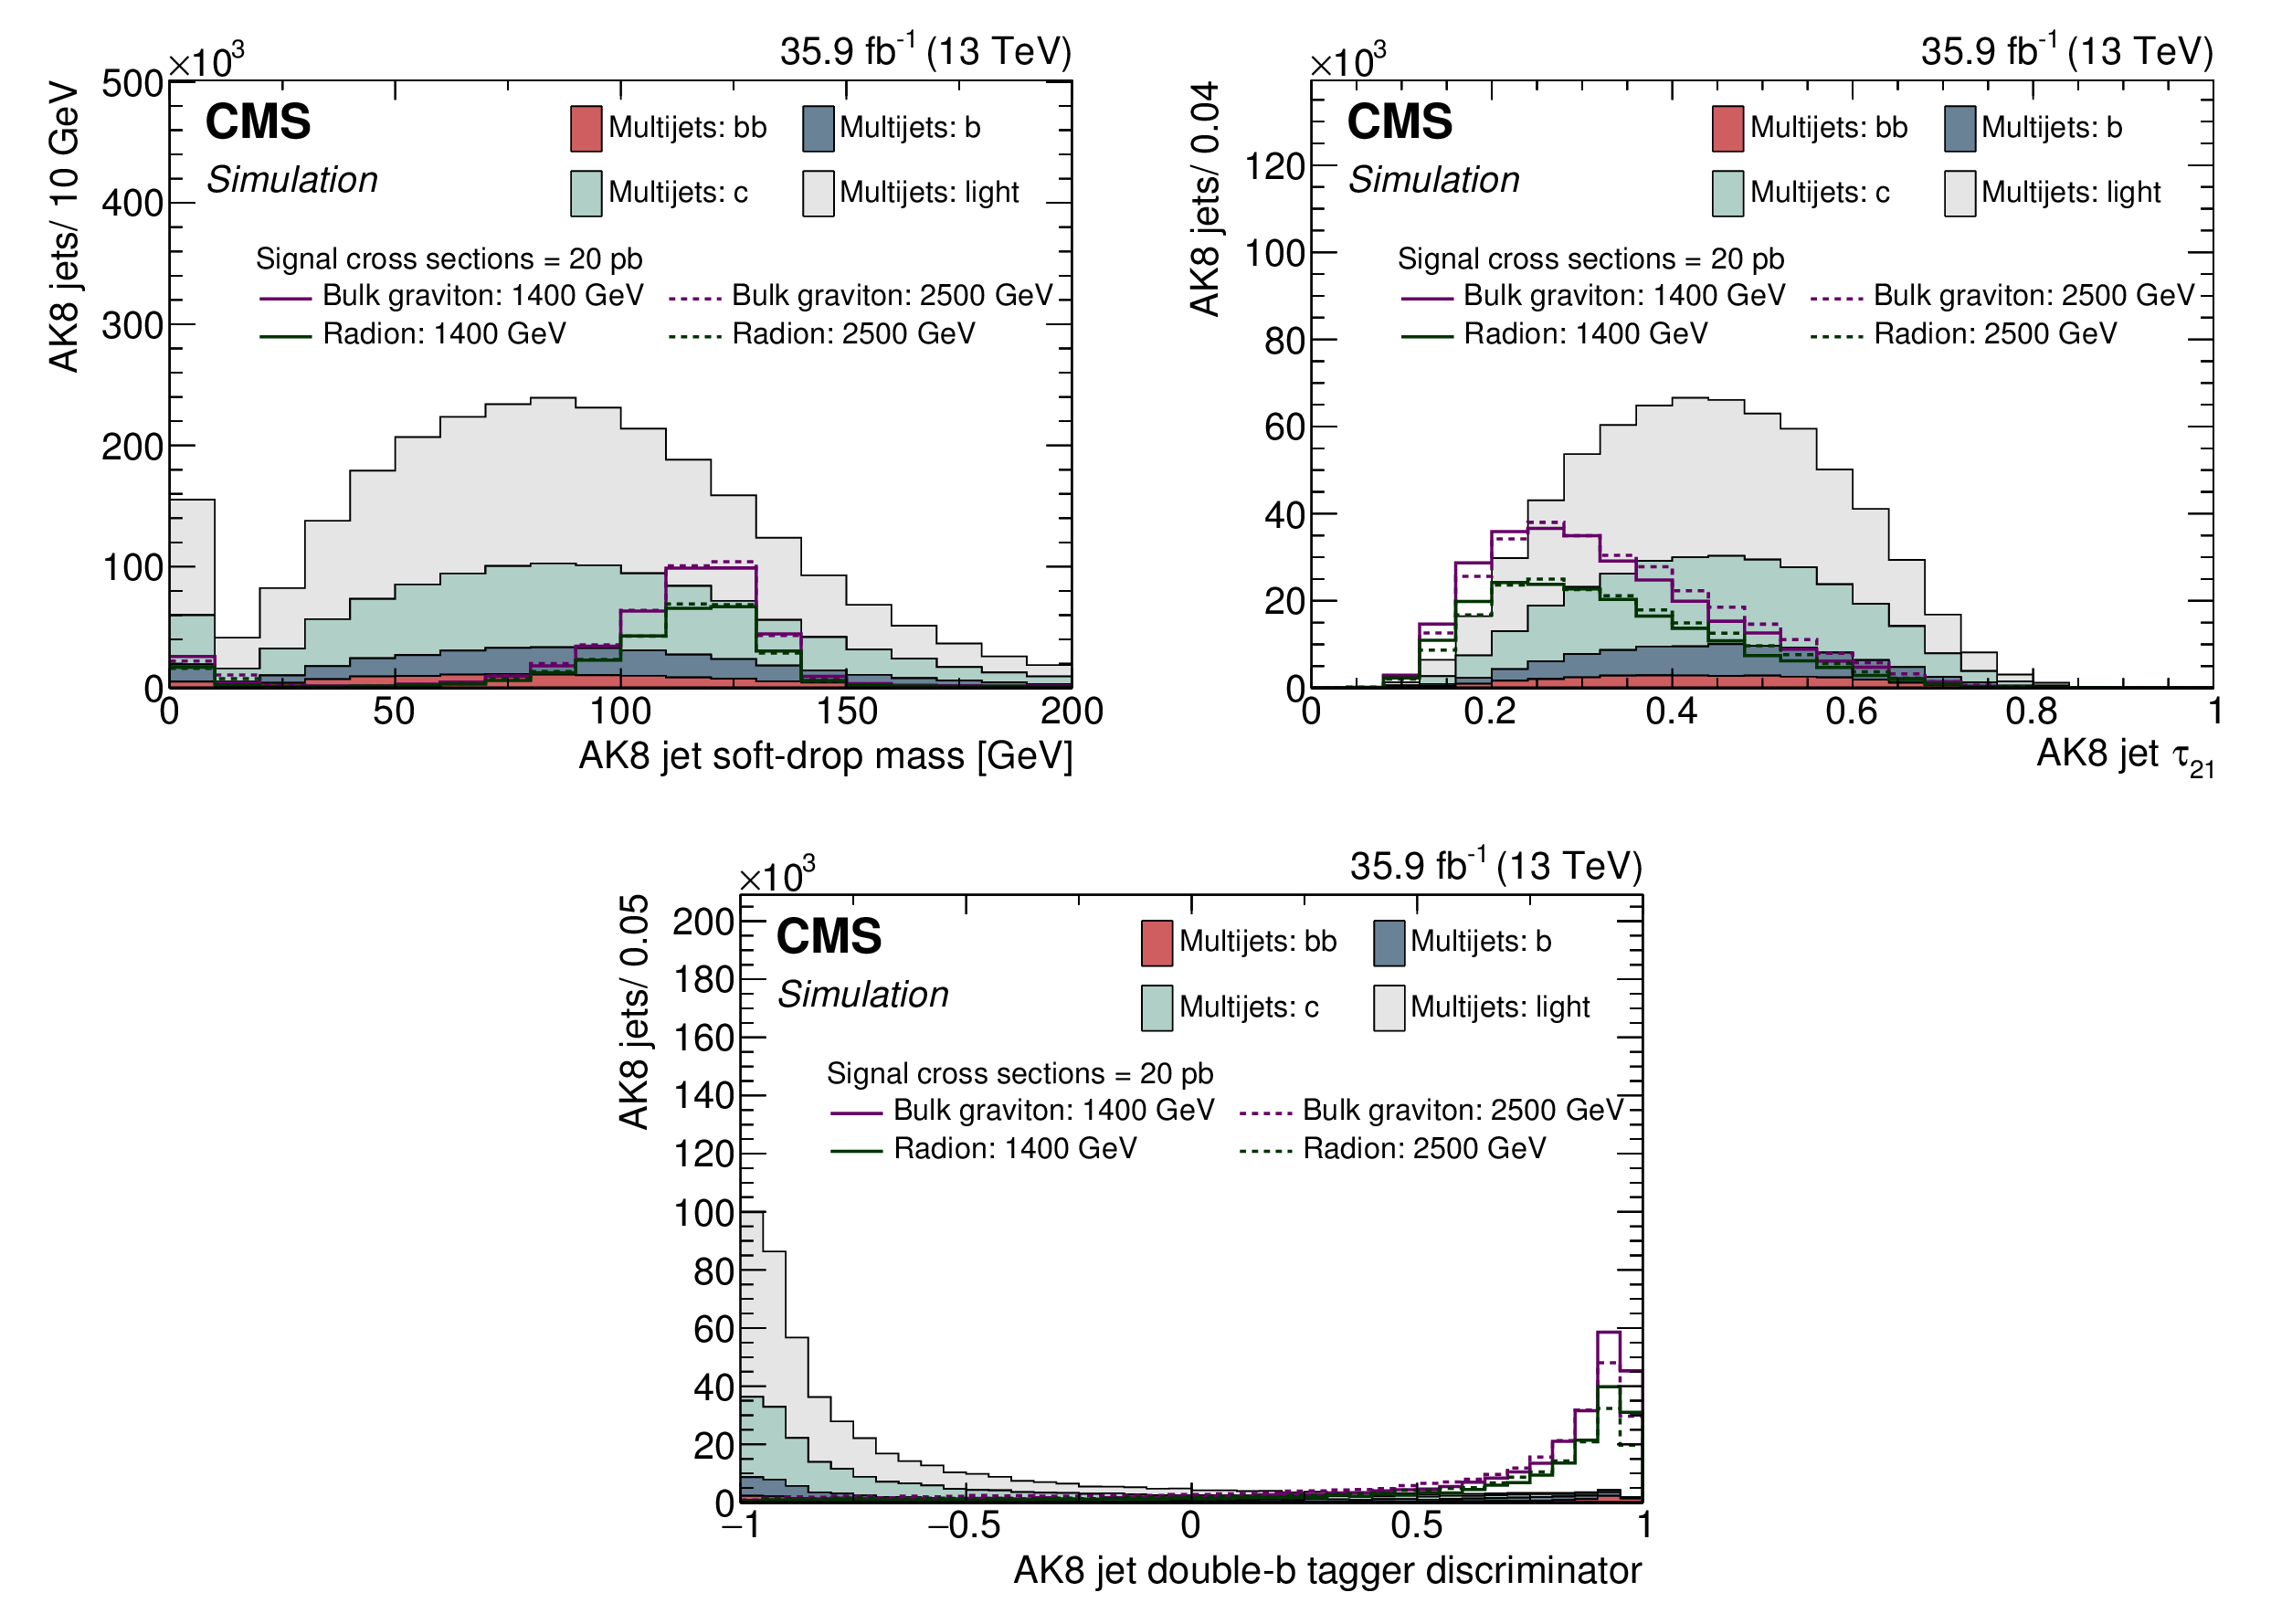
Figure 1:
The soft-drop mass (upper left), the N-subjettiness $ {\tau _{21}} $ (upper right), and the double-b tagger discriminator (lower) distributions of the selected AK8 jets. The multijet background components for the different jet flavours are shown, along with simulated bulk graviton and radion signals of masses 1400 and 2500 GeV. The number of signal and background events correspond to an integrated luminosity of 35.9 fb$^{-1}$. A signal cross section of 20 pb is assumed for all the mass hypotheses. The events are required to have passed the trigger selection, lepton rejection, the AK8 jet kinematic selections $ {p_{\mathrm {T}}} > $ 300 GeV and $ < \eta > < $ 2.4, and $ < {\Delta \eta (\text {j}_{1}, \text {j}_{2})} > < $ 1.3. The reduced dijet invariant mass $ {m_{\text {jj,red}}} $ is required to be greater than 750 GeV. The N-subjettiness requirement of $ {\tau _{21}} < $ 0.55 is applied to the upper left and lower figures. The soft-drop masses of the two jets are between 105-135 GeV for the upper right and lower figures. |
png pdf |
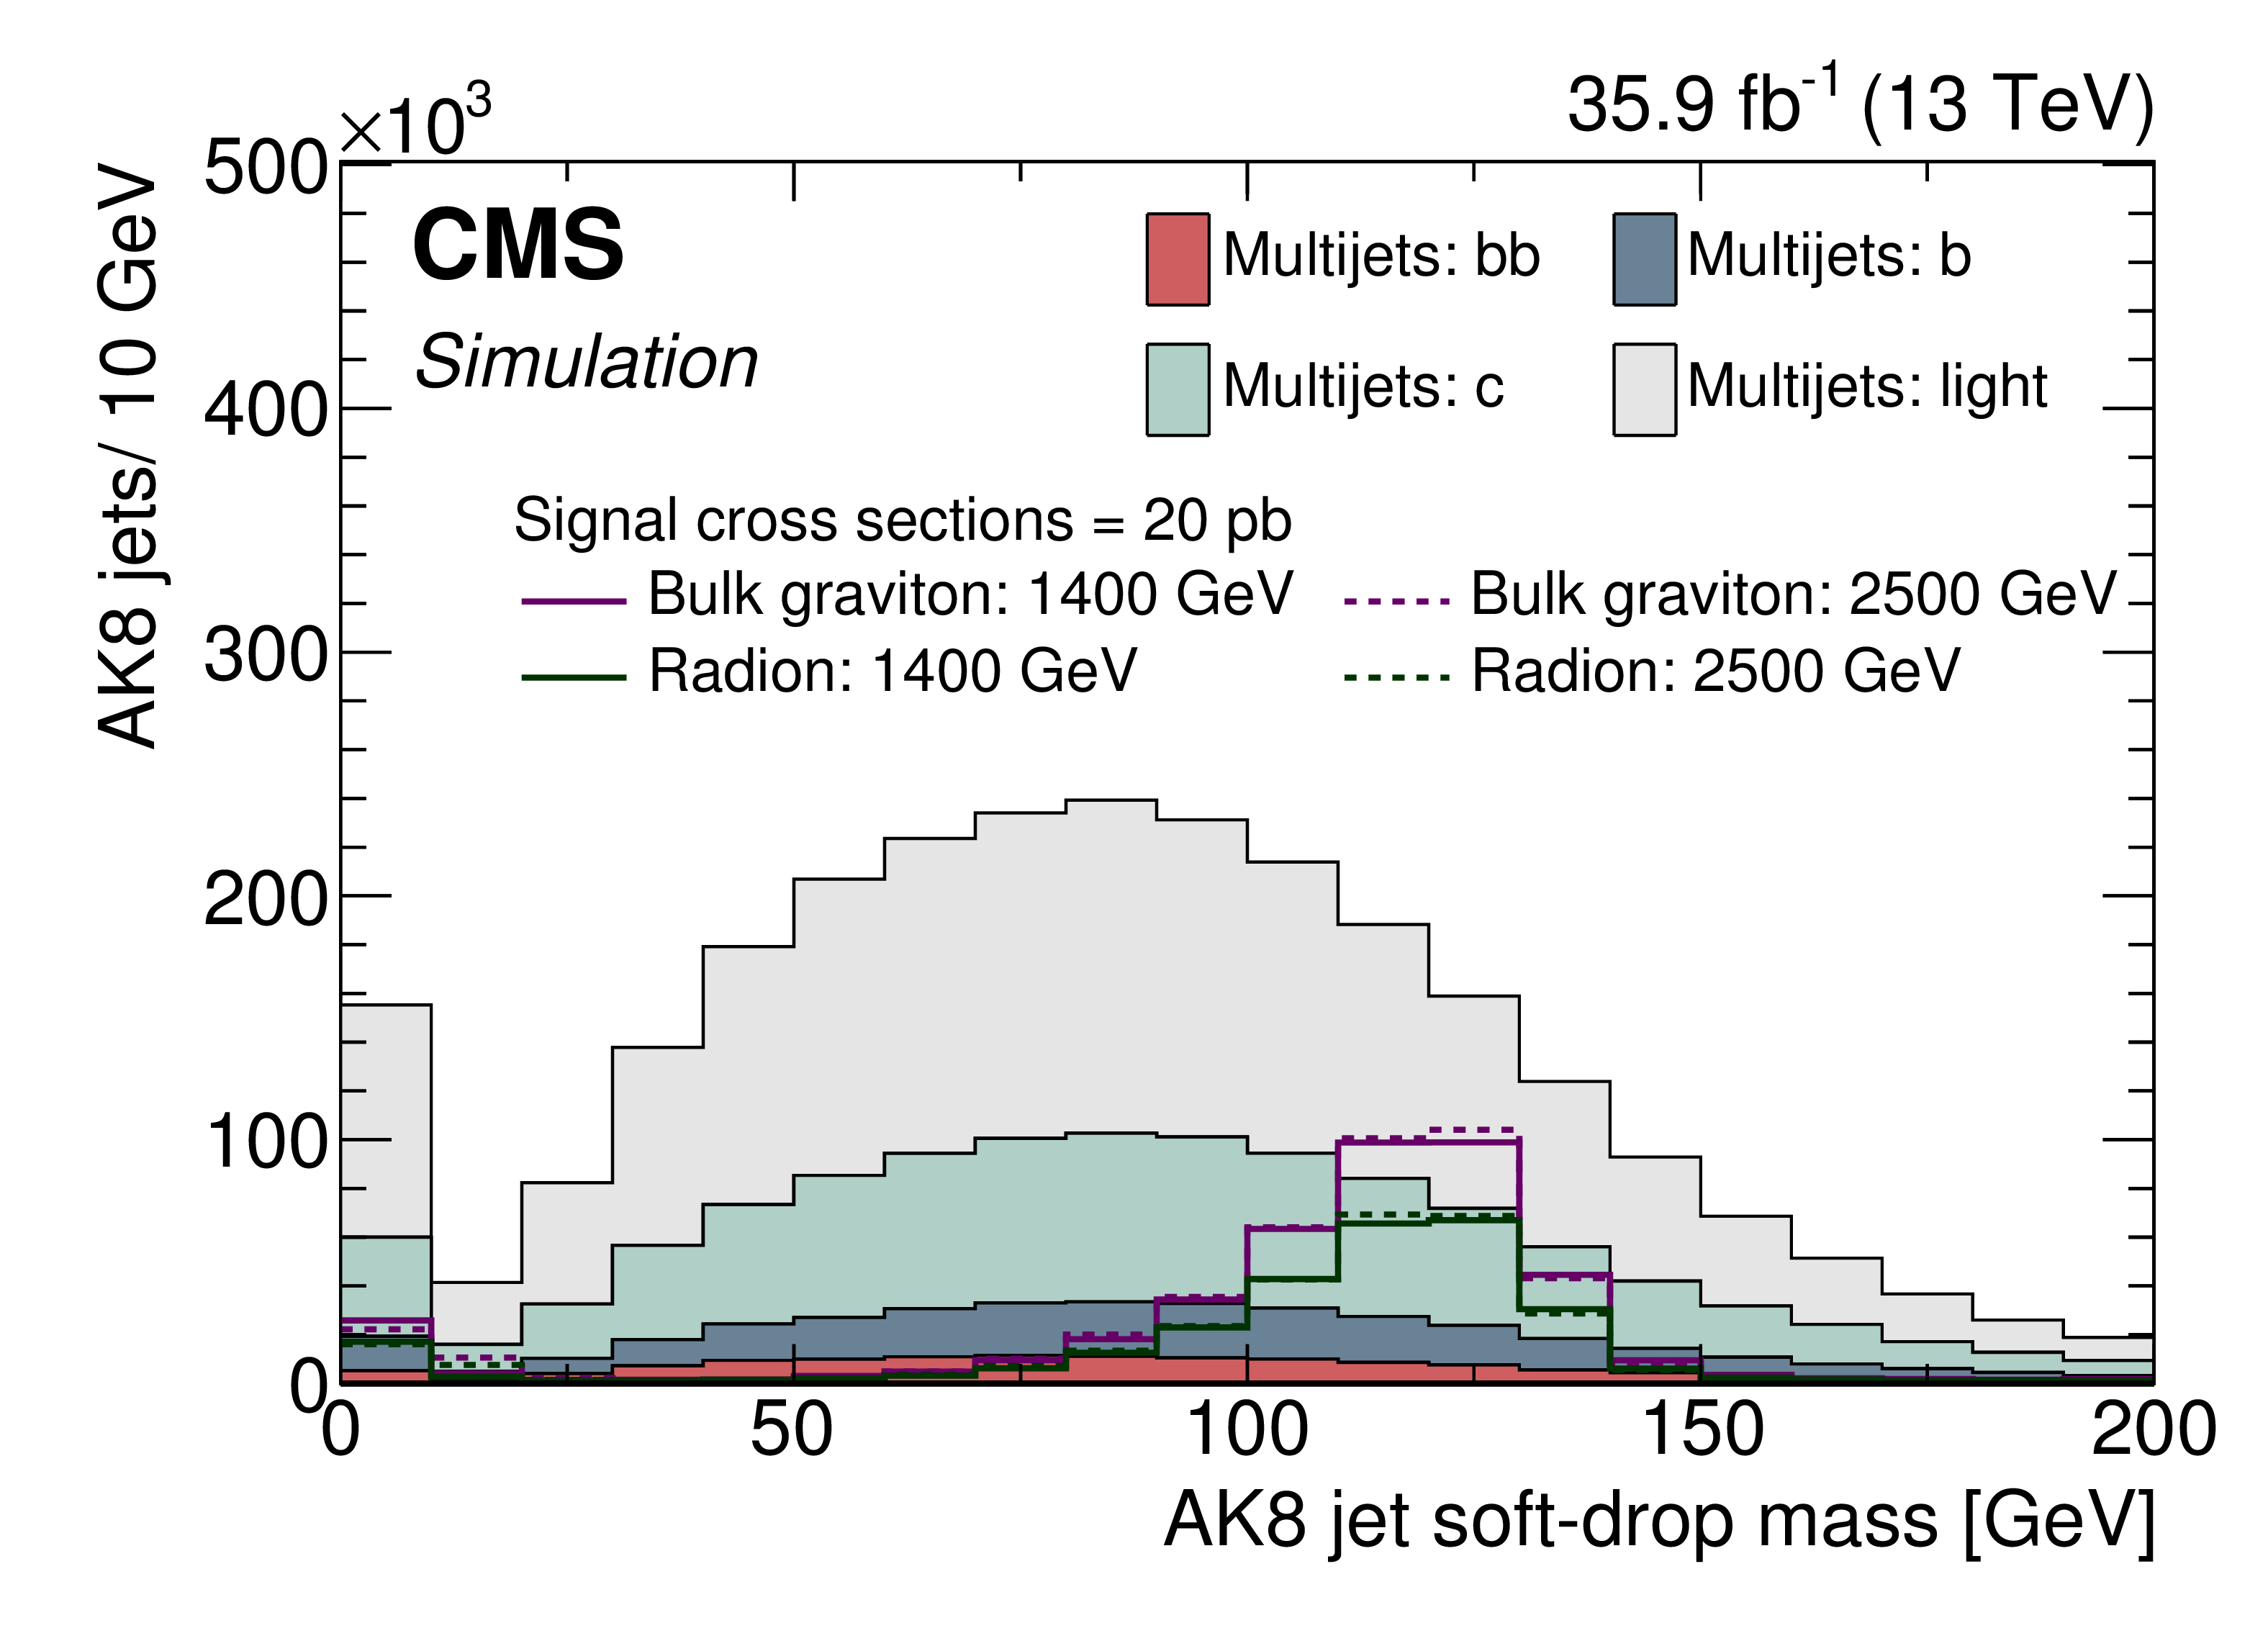
Figure 1-a:
The soft-drop mass distribution of the selected AK8 jets. The multijet background components for the different jet flavours are shown, along with simulated bulk graviton and radion signals of masses 1400 and 2500 GeV. The number of signal and background events correspond to an integrated luminosity of 35.9 fb$^{-1}$. A signal cross section of 20 pb is assumed for all the mass hypotheses. The events are required to have passed the trigger selection, lepton rejection, the AK8 jet kinematic selections $ {p_{\mathrm {T}}} > $ 300 GeV and $ < \eta > < $ 2.4, and $ < {\Delta \eta (\text {j}_{1}, \text {j}_{2})} > < $ 1.3. The reduced dijet invariant mass $ {m_{\text {jj,red}}} $ is required to be greater than 750 GeV. The N-subjettiness requirement of $ {\tau _{21}} < $ 0.55 is applied to the upper left and lower figures. The soft-drop masses of the two jets are between 105-135 GeV for the upper right and lower figures. |

png pdf |
Figure 1-b:
The N-subjettiness $ {\tau _{21}} $ distribution of the selected AK8 jets. The multijet background components for the different jet flavours are shown, along with simulated bulk graviton and radion signals of masses 1400 and 2500 GeV. The number of signal and background events correspond to an integrated luminosity of 35.9 fb$^{-1}$. A signal cross section of 20 pb is assumed for all the mass hypotheses. The events are required to have passed the trigger selection, lepton rejection, the AK8 jet kinematic selections $ {p_{\mathrm {T}}} > $ 300 GeV and $ < \eta > < $ 2.4, and $ < {\Delta \eta (\text {j}_{1}, \text {j}_{2})} > < $ 1.3. The reduced dijet invariant mass $ {m_{\text {jj,red}}} $ is required to be greater than 750 GeV. The N-subjettiness requirement of $ {\tau _{21}} < $ 0.55 is applied to the upper left and lower figures. The soft-drop masses of the two jets are between 105-135 GeV for the upper right and lower figures. |
png pdf |
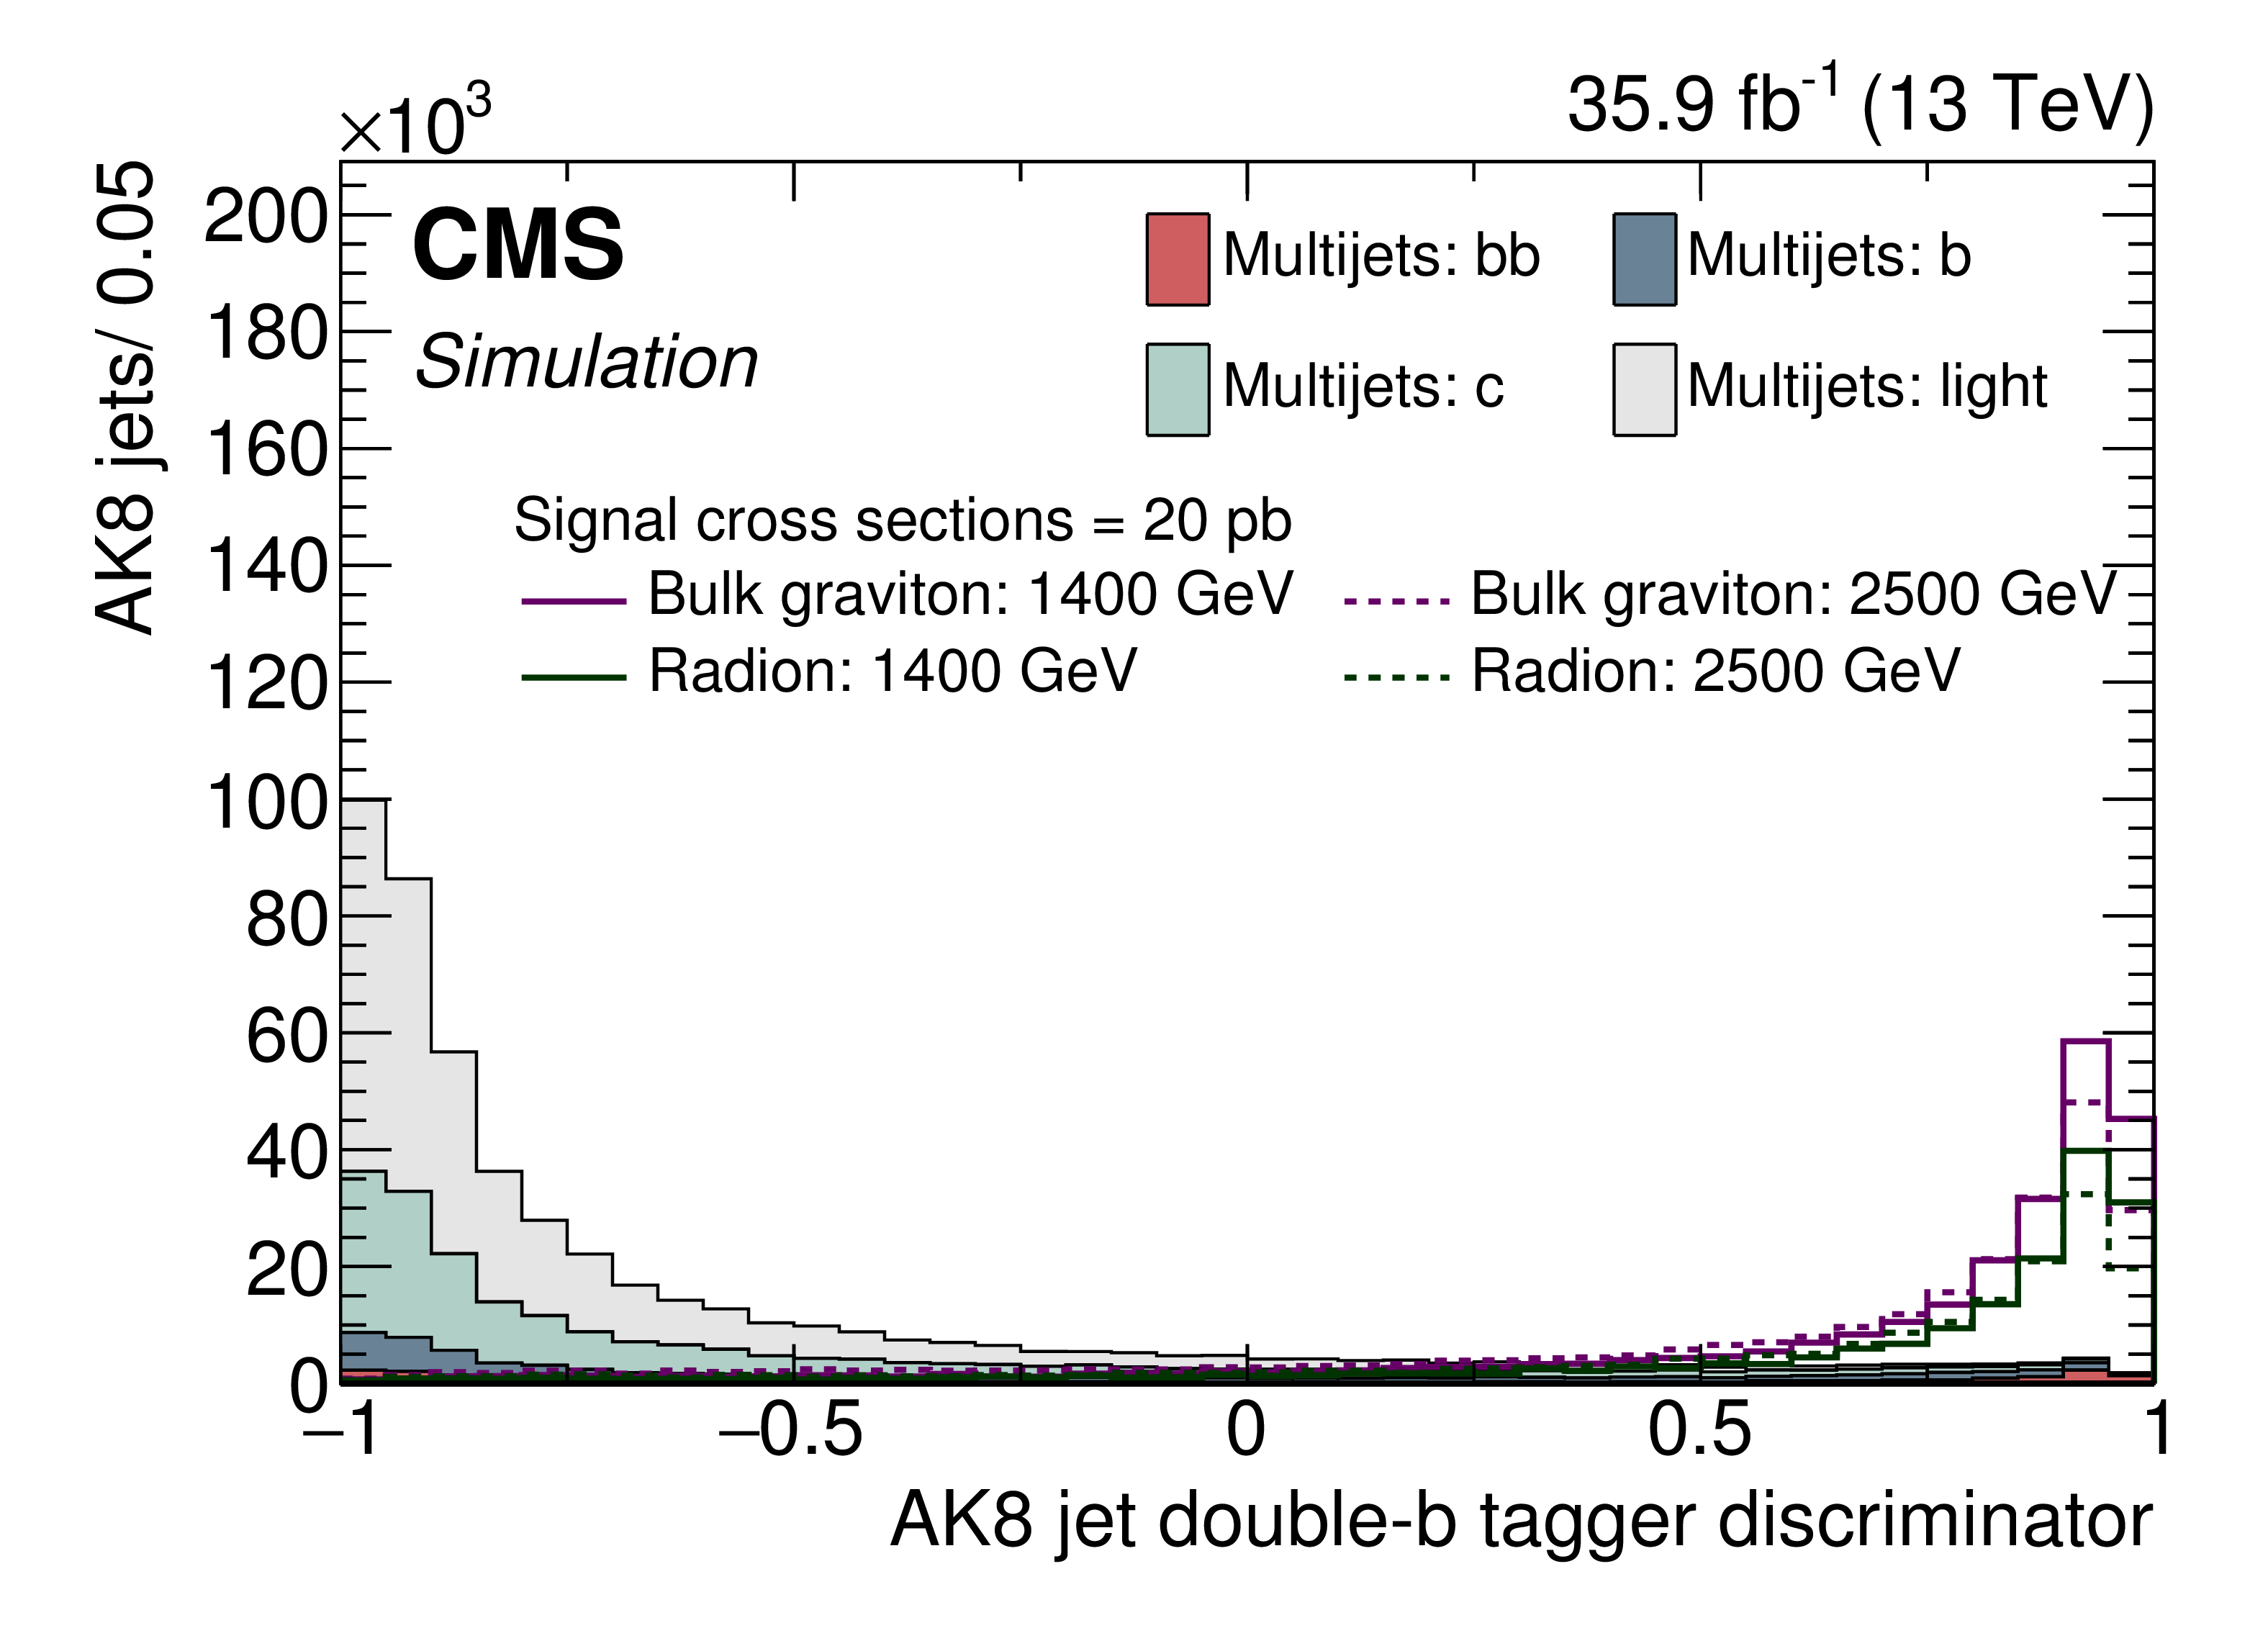
Figure 1-c:
The double-b tagger discriminator distribution of the selected AK8 jets. The multijet background components for the different jet flavours are shown, along with simulated bulk graviton and radion signals of masses 1400 and 2500 GeV. The number of signal and background events correspond to an integrated luminosity of 35.9 fb$^{-1}$. A signal cross section of 20 pb is assumed for all the mass hypotheses. The events are required to have passed the trigger selection, lepton rejection, the AK8 jet kinematic selections $ {p_{\mathrm {T}}} > $ 300 GeV and $ < \eta > < $ 2.4, and $ < {\Delta \eta (\text {j}_{1}, \text {j}_{2})} > < $ 1.3. The reduced dijet invariant mass $ {m_{\text {jj,red}}} $ is required to be greater than 750 GeV. The N-subjettiness requirement of $ {\tau _{21}} < $ 0.55 is applied to the upper left and lower figures. The soft-drop masses of the two jets are between 105-135 GeV for the upper right and lower figures. |
png pdf |
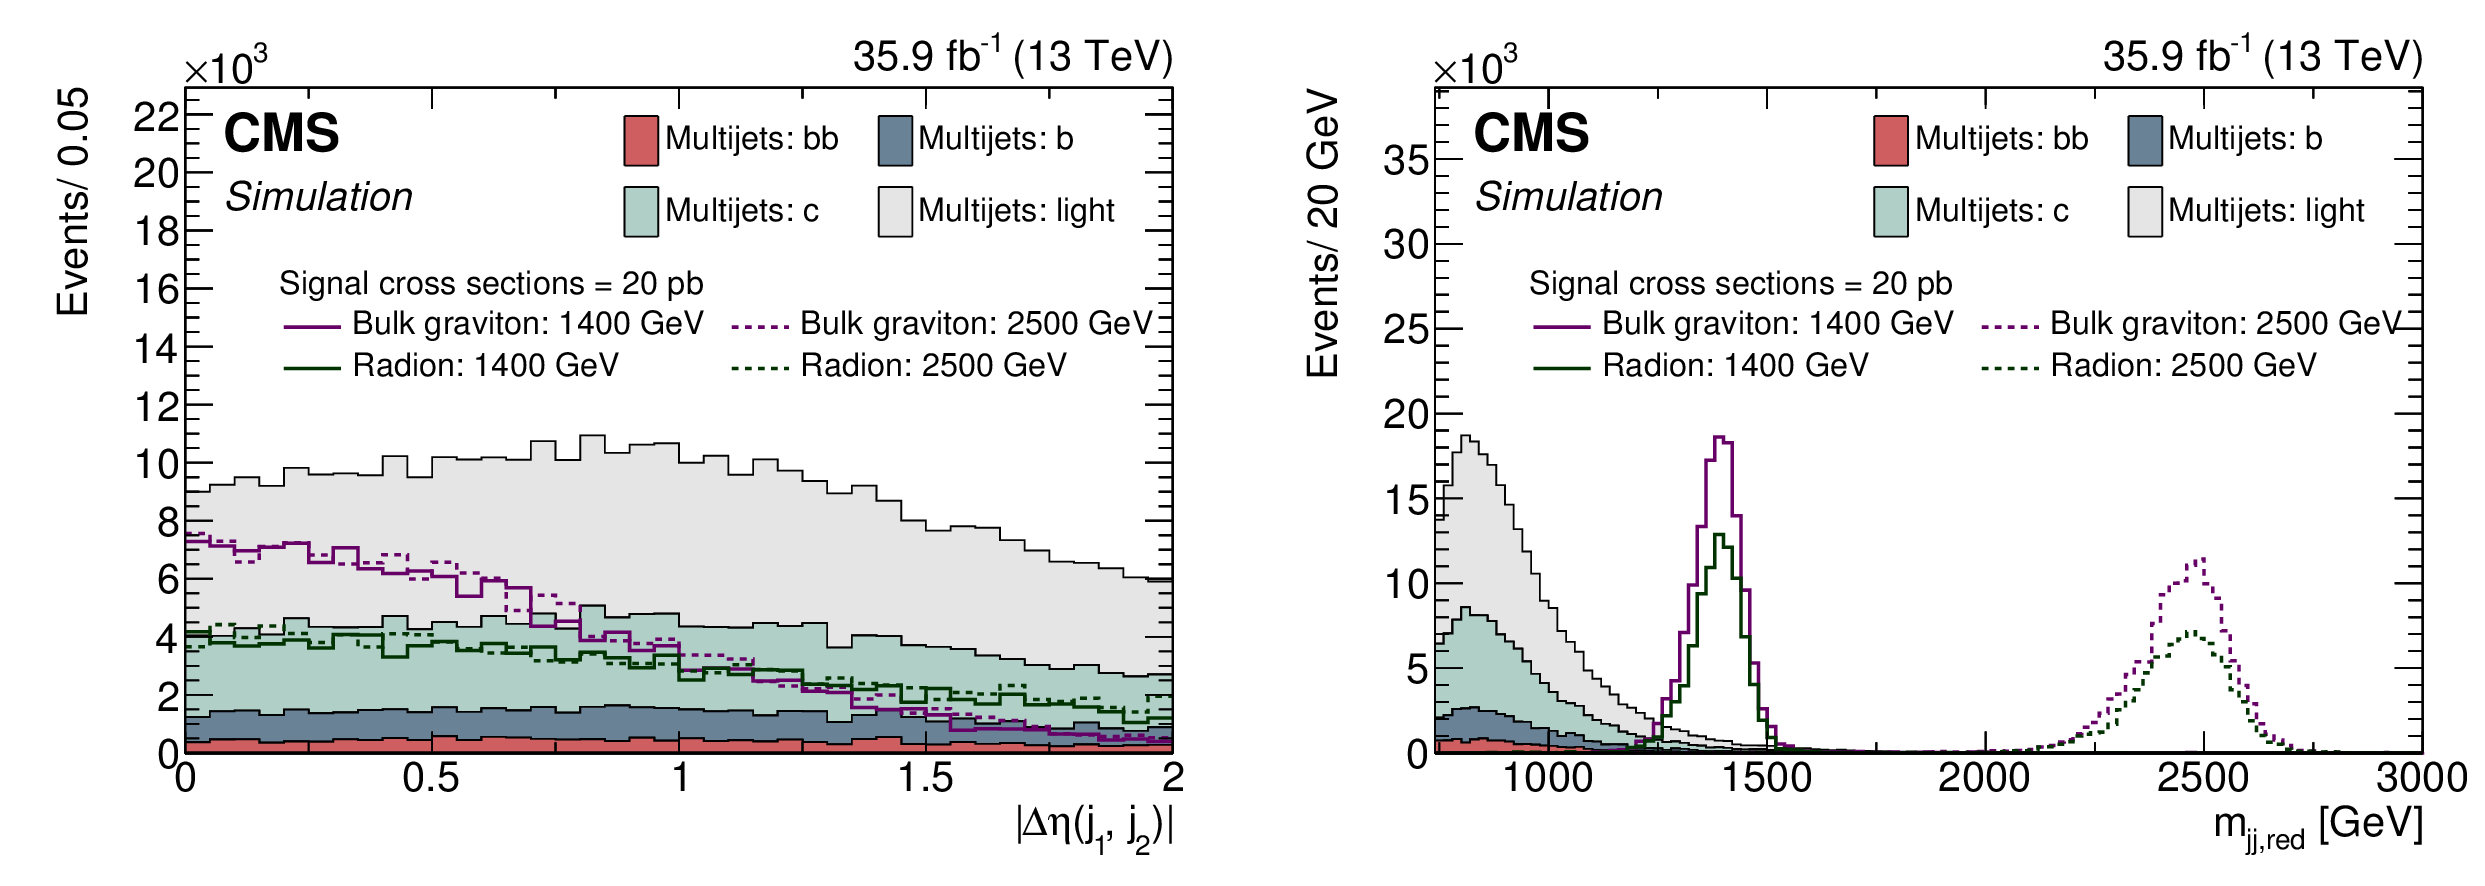
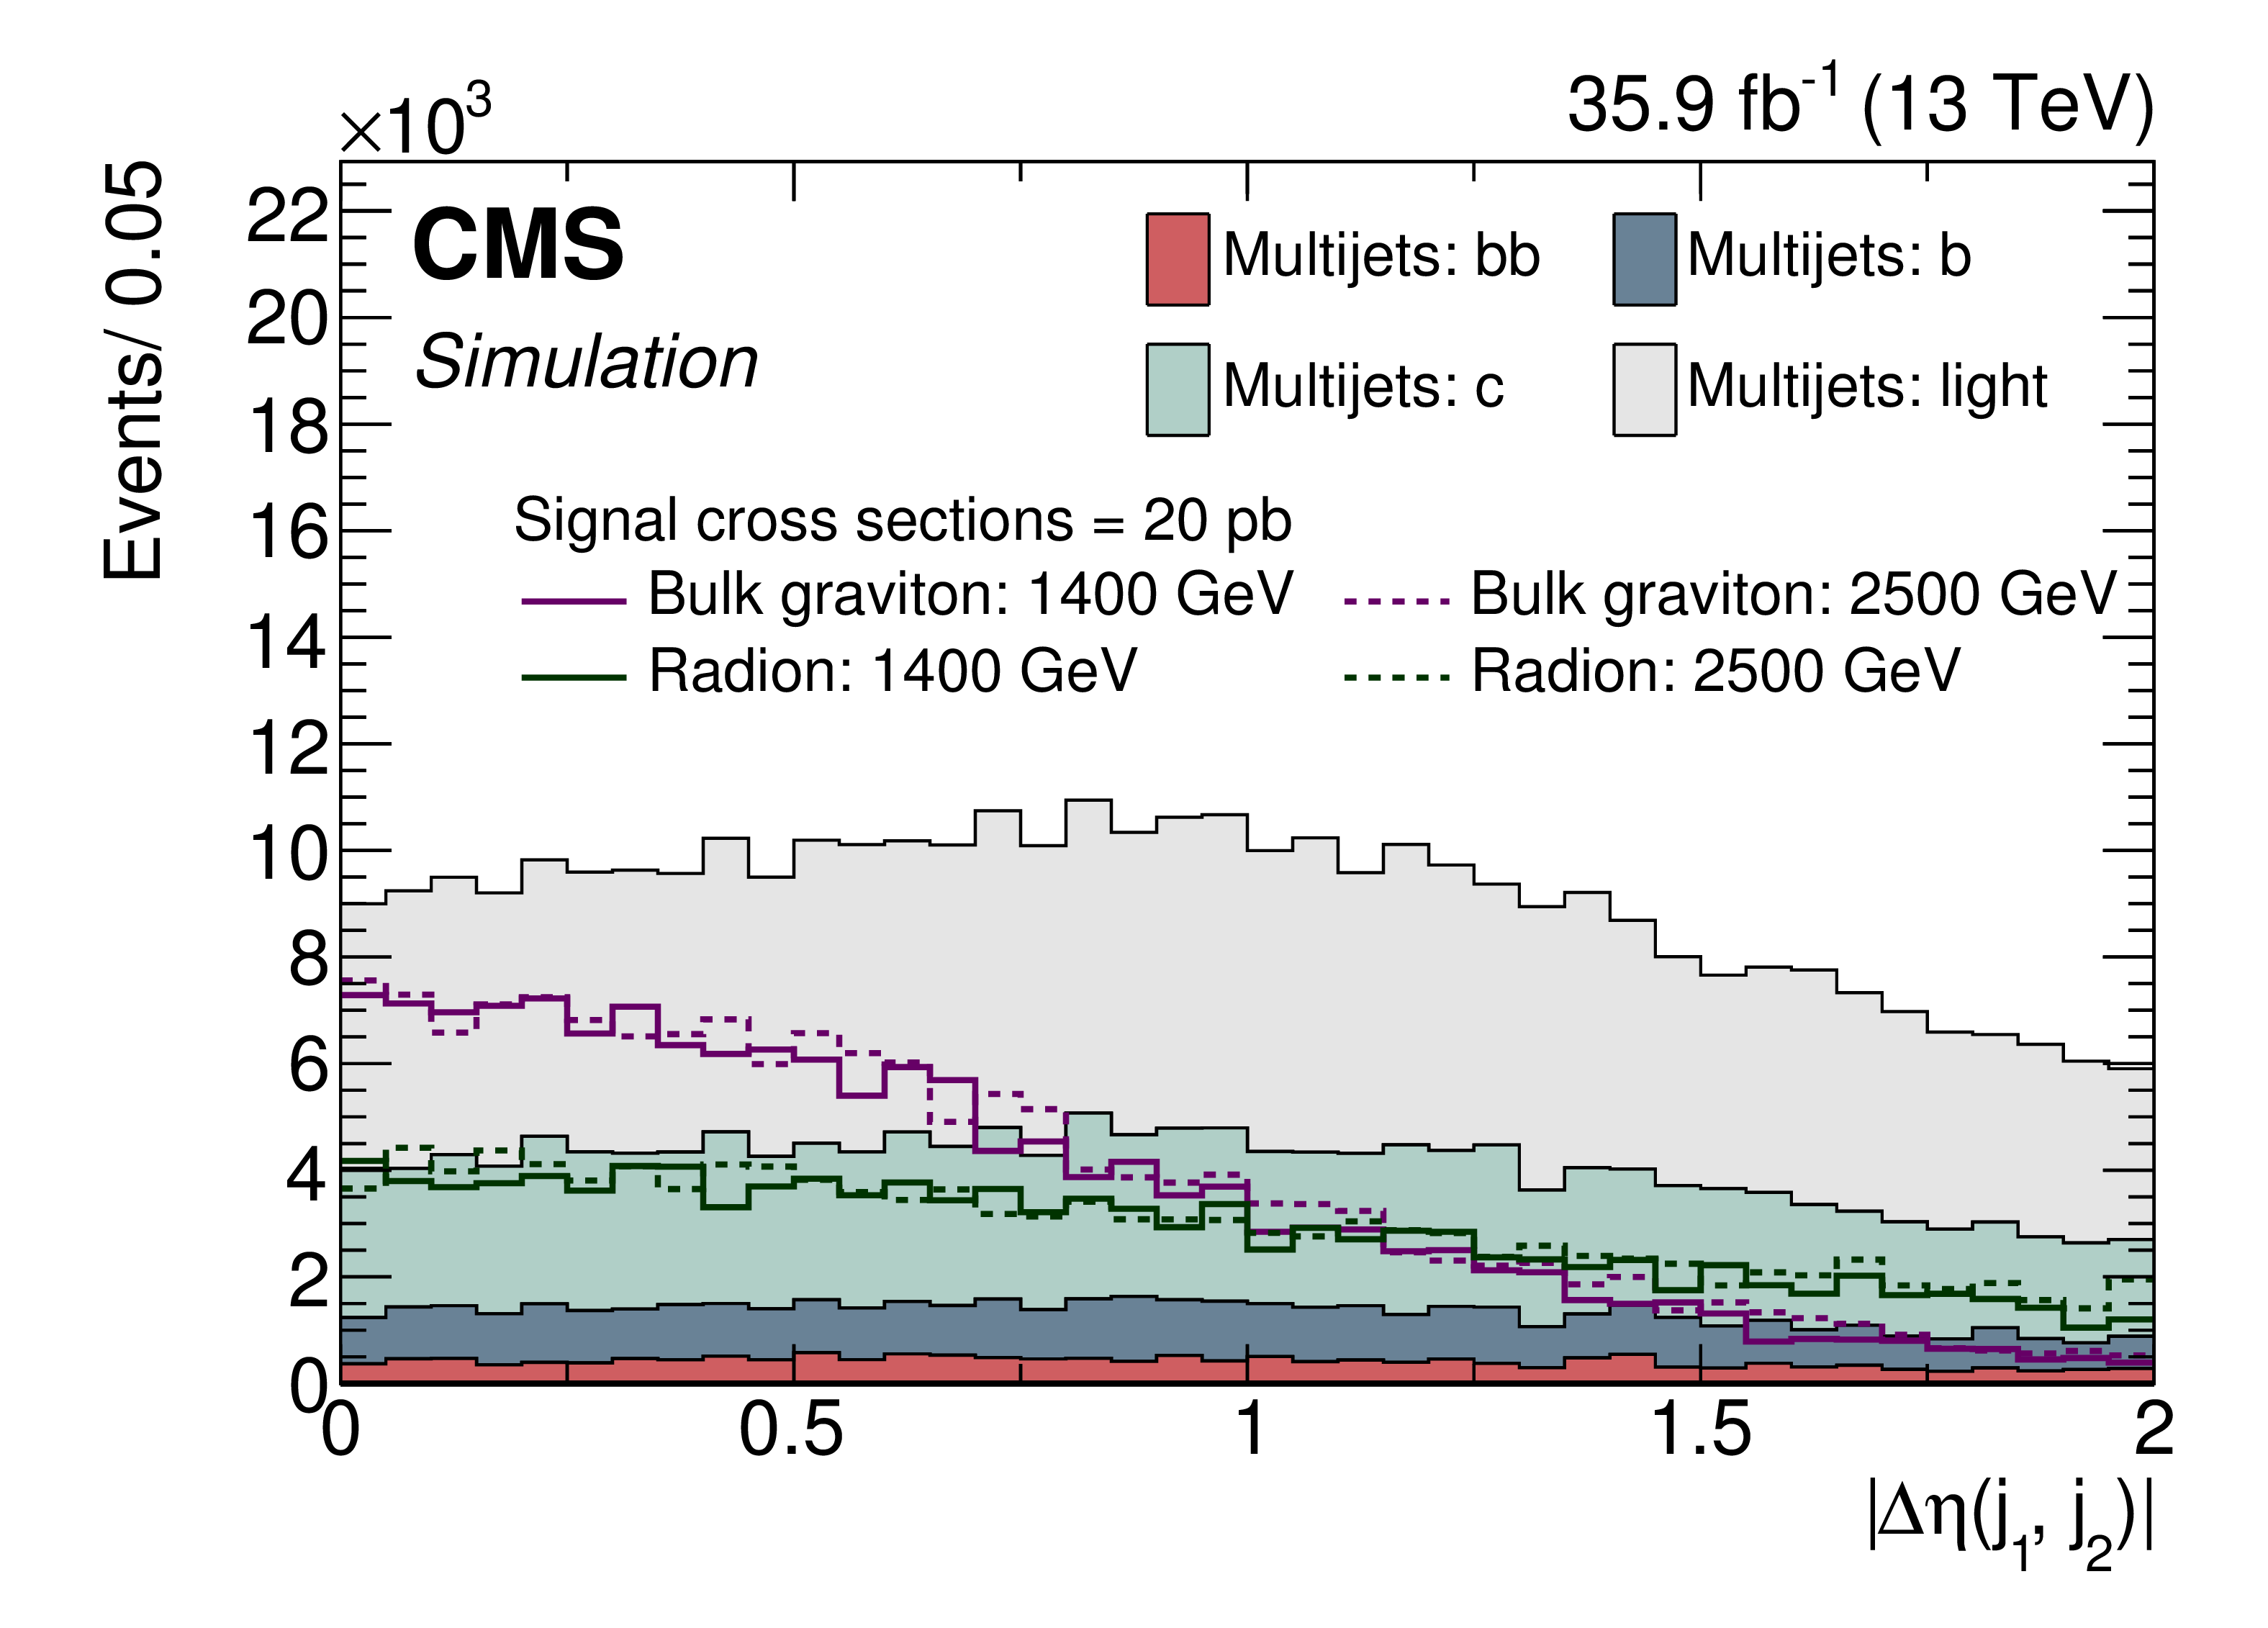
Figure 2:
The jet separation $ < {\Delta \eta (\text {j}_{1}, \text {j}_{2})} >$ (left) and the reduced dijet invariant mass $ {m_{\text {jj,red}}} $ (right) distributions. The multijet background components for the different jet flavours are shown, along with simulated bulk graviton and radion signals of masses 1400 and 2500 GeV. The numbers of signal and background events correspond to an integrated luminosity of 35.9 fb$^{-1}$. The signal cross section is assumed to be 20 {\text { pb}} for all the mass hypotheses. The events are required to have passed the online selection, lepton rejection, the AK8 jet kinematic selections $ {p_{\mathrm {T}}} > $ 300 GeV, $ < \eta > < $ 2.4. The soft-drop masses of the two jets are between 105 and 135 GeV, and the N-subjettiness requirement of $ {\tau _{21}} < $ 0.55 is applied. The $ < {\Delta \eta (\text {j}_{1}, \text {j}_{2})} >$ distributions (left) require $ {m_{\text {jj,red}}} < $ 750 GeV; the $ {m_{\text {jj,red}}} $ distributions (right) require $ < {\Delta \eta (\text {j}_{1}, \text {j}_{2})} > < $ 1.3. |
png pdf |
Figure 2-a:
The jet separation $ < {\Delta \eta (\text {j}_{1}, \text {j}_{2})} >$ distribution. The multijet background components for the different jet flavours are shown, along with simulated bulk graviton and radion signals of masses 1400 and 2500 GeV. The numbers of signal and background events correspond to an integrated luminosity of 35.9 fb$^{-1}$. The signal cross section is assumed to be 20 {\text { pb}} for all the mass hypotheses. The events are required to have passed the online selection, lepton rejection, the AK8 jet kinematic selections $ {p_{\mathrm {T}}} > $ 300 GeV, $ < \eta > < $ 2.4. The soft-drop masses of the two jets are between 105 and 135 GeV, and the N-subjettiness requirement of $ {\tau _{21}} < $ 0.55 is applied. The $ < {\Delta \eta (\text {j}_{1}, \text {j}_{2})} >$ distributions (left) require $ {m_{\text {jj,red}}} < $ 750 GeV; the $ {m_{\text {jj,red}}} $ distributions (right) require $ < {\Delta \eta (\text {j}_{1}, \text {j}_{2})} > < $ 1.3. |

png pdf |
Figure 2-b:
The reduced dijet invariant mass $ {m_{\text {jj,red}}} $ distribution. The multijet background components for the different jet flavours are shown, along with simulated bulk graviton and radion signals of masses 1400 and 2500 GeV. The numbers of signal and background events correspond to an integrated luminosity of 35.9 fb$^{-1}$. The signal cross section is assumed to be 20 {\text { pb}} for all the mass hypotheses. The events are required to have passed the online selection, lepton rejection, the AK8 jet kinematic selections $ {p_{\mathrm {T}}} > $ 300 GeV, $ < \eta > < $ 2.4. The soft-drop masses of the two jets are between 105 and 135 GeV, and the N-subjettiness requirement of $ {\tau _{21}} < $ 0.55 is applied. The $ < {\Delta \eta (\text {j}_{1}, \text {j}_{2})} >$ distributions (left) require $ {m_{\text {jj,red}}} < $ 750 GeV; the $ {m_{\text {jj,red}}} $ distributions (right) require $ < {\Delta \eta (\text {j}_{1}, \text {j}_{2})} > < $ 1.3. |
png pdf |
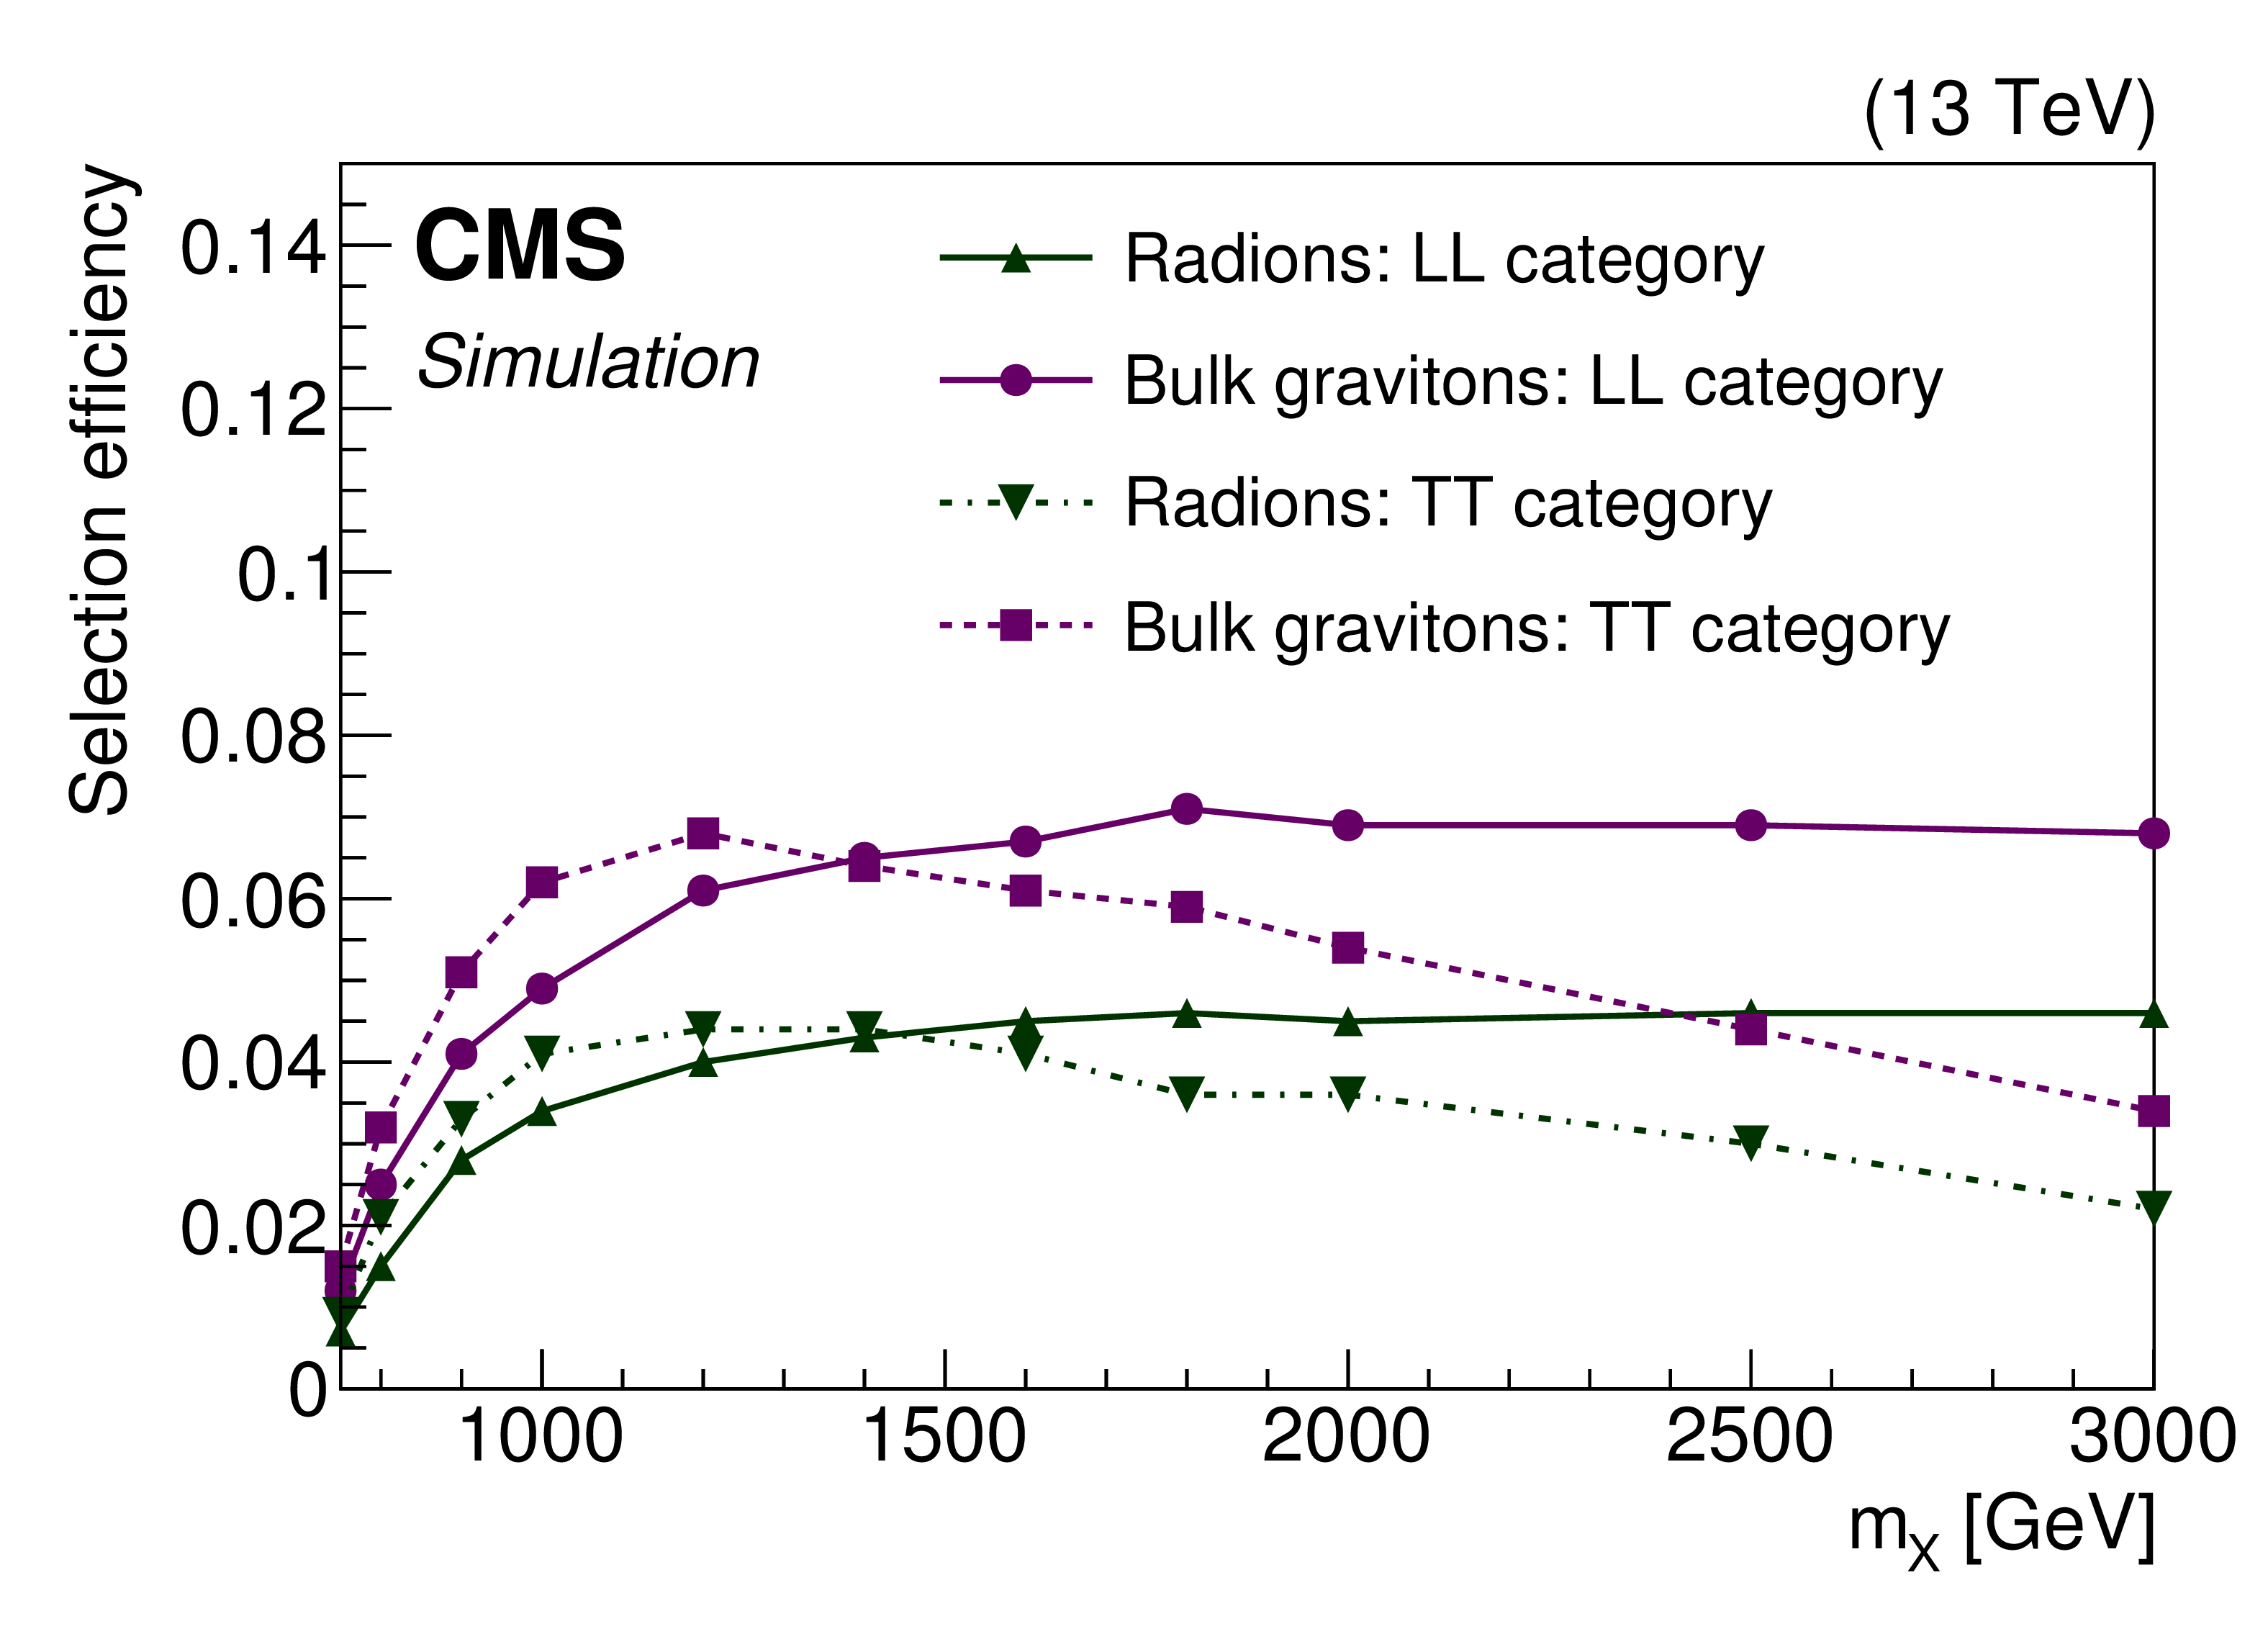
Figure 3:
The signal selection efficiencies for the bulk graviton and radion models for different mass hypotheses of the resonances, shown for the LL and the TT signal event categories. Owing to the large sample sizes of the simulated events, the statistical uncertainties are negligible. |
png pdf |
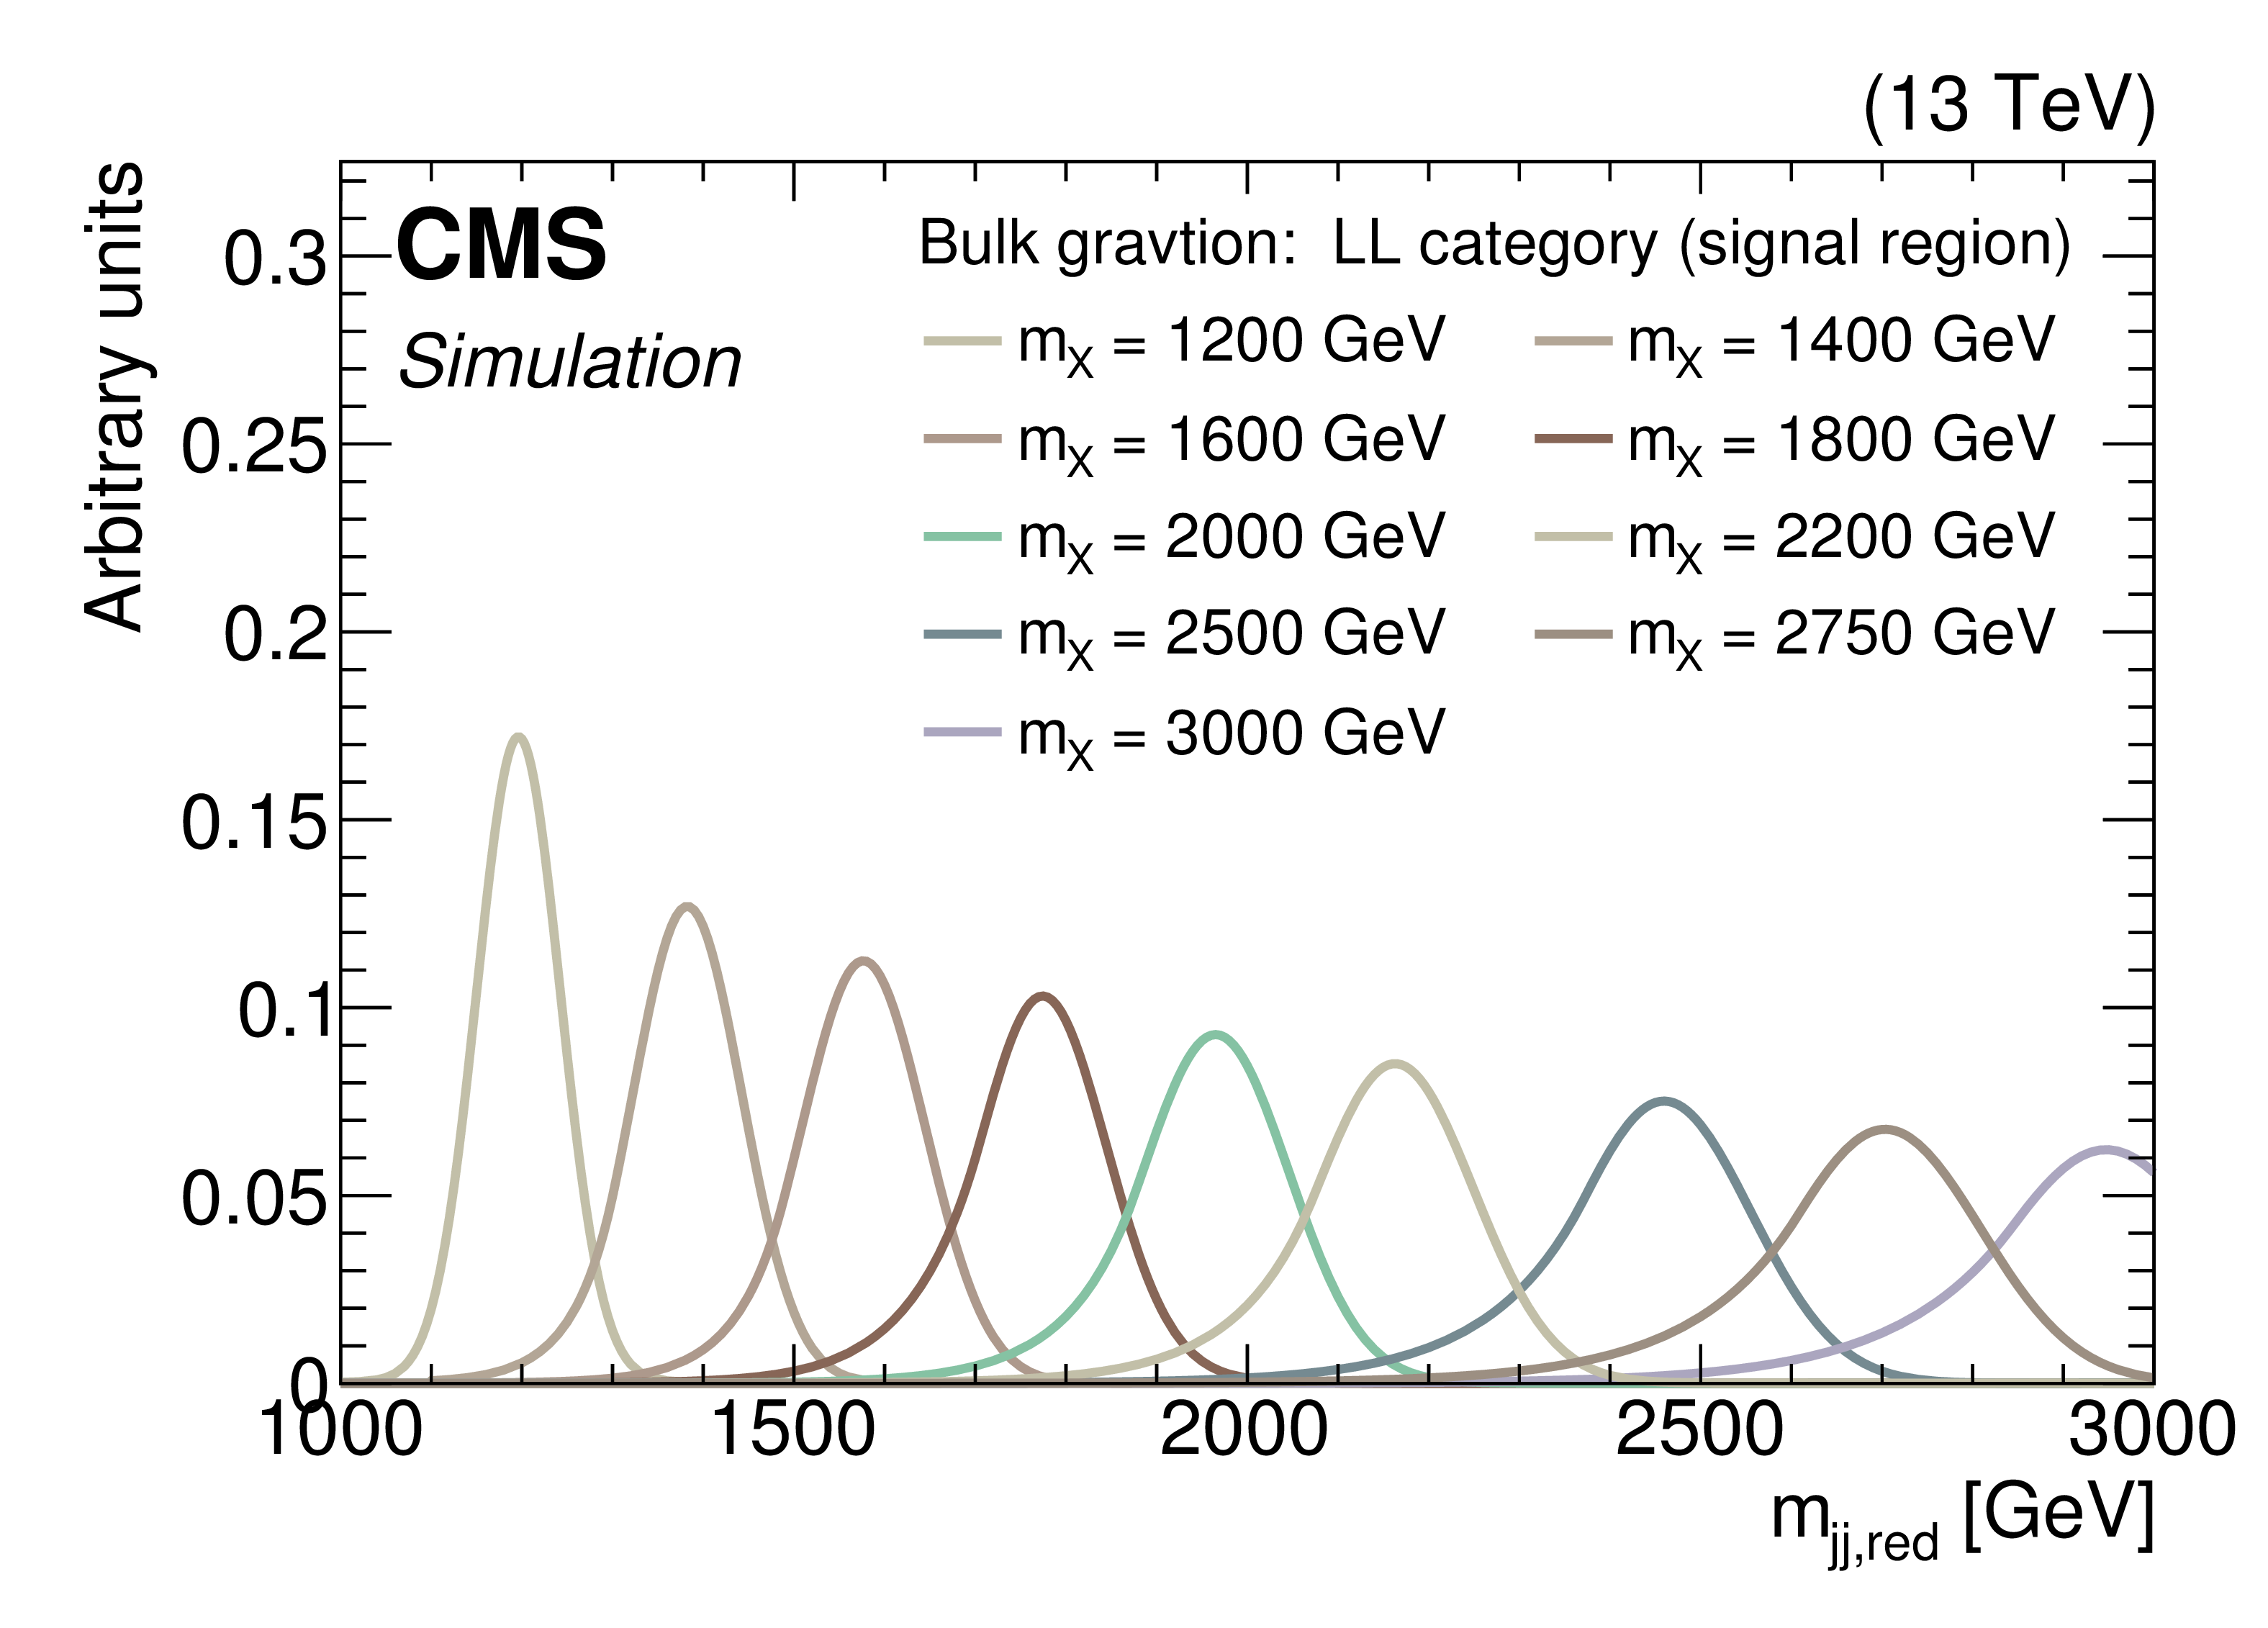
Figure 4:
The bulk graviton signal $ {m_{\text {jj,red}}} $ distribution for the LL category, modelled using the sum of Gaussian and Crystal Ball functions. This modelling is performed for signals in the range 1100 $ < {m_{\text {jj,red}}} < $ 3000 GeV, where the background distribution falls smoothly. No events are observed above this value of ${m_{\text {jj,red}}}$. |
png pdf |
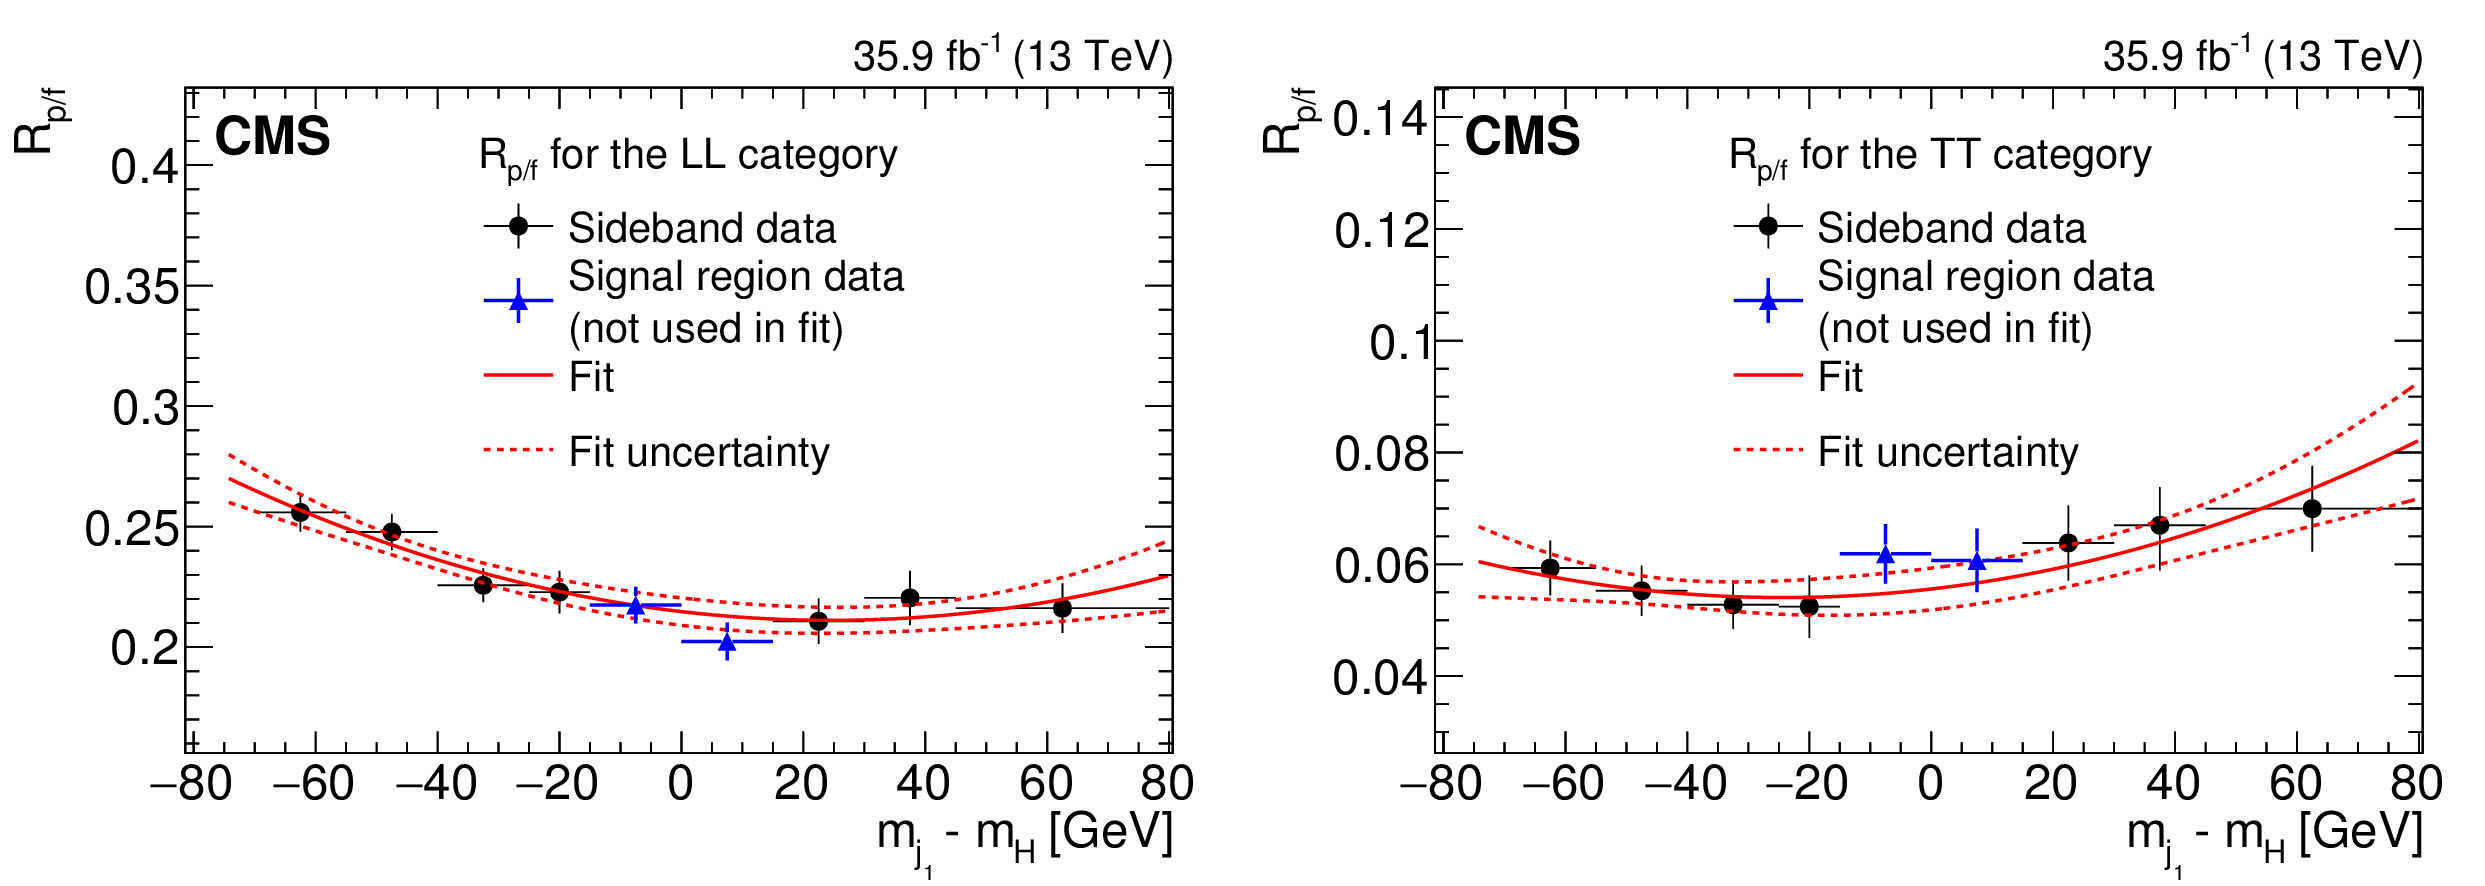
Figure 5:
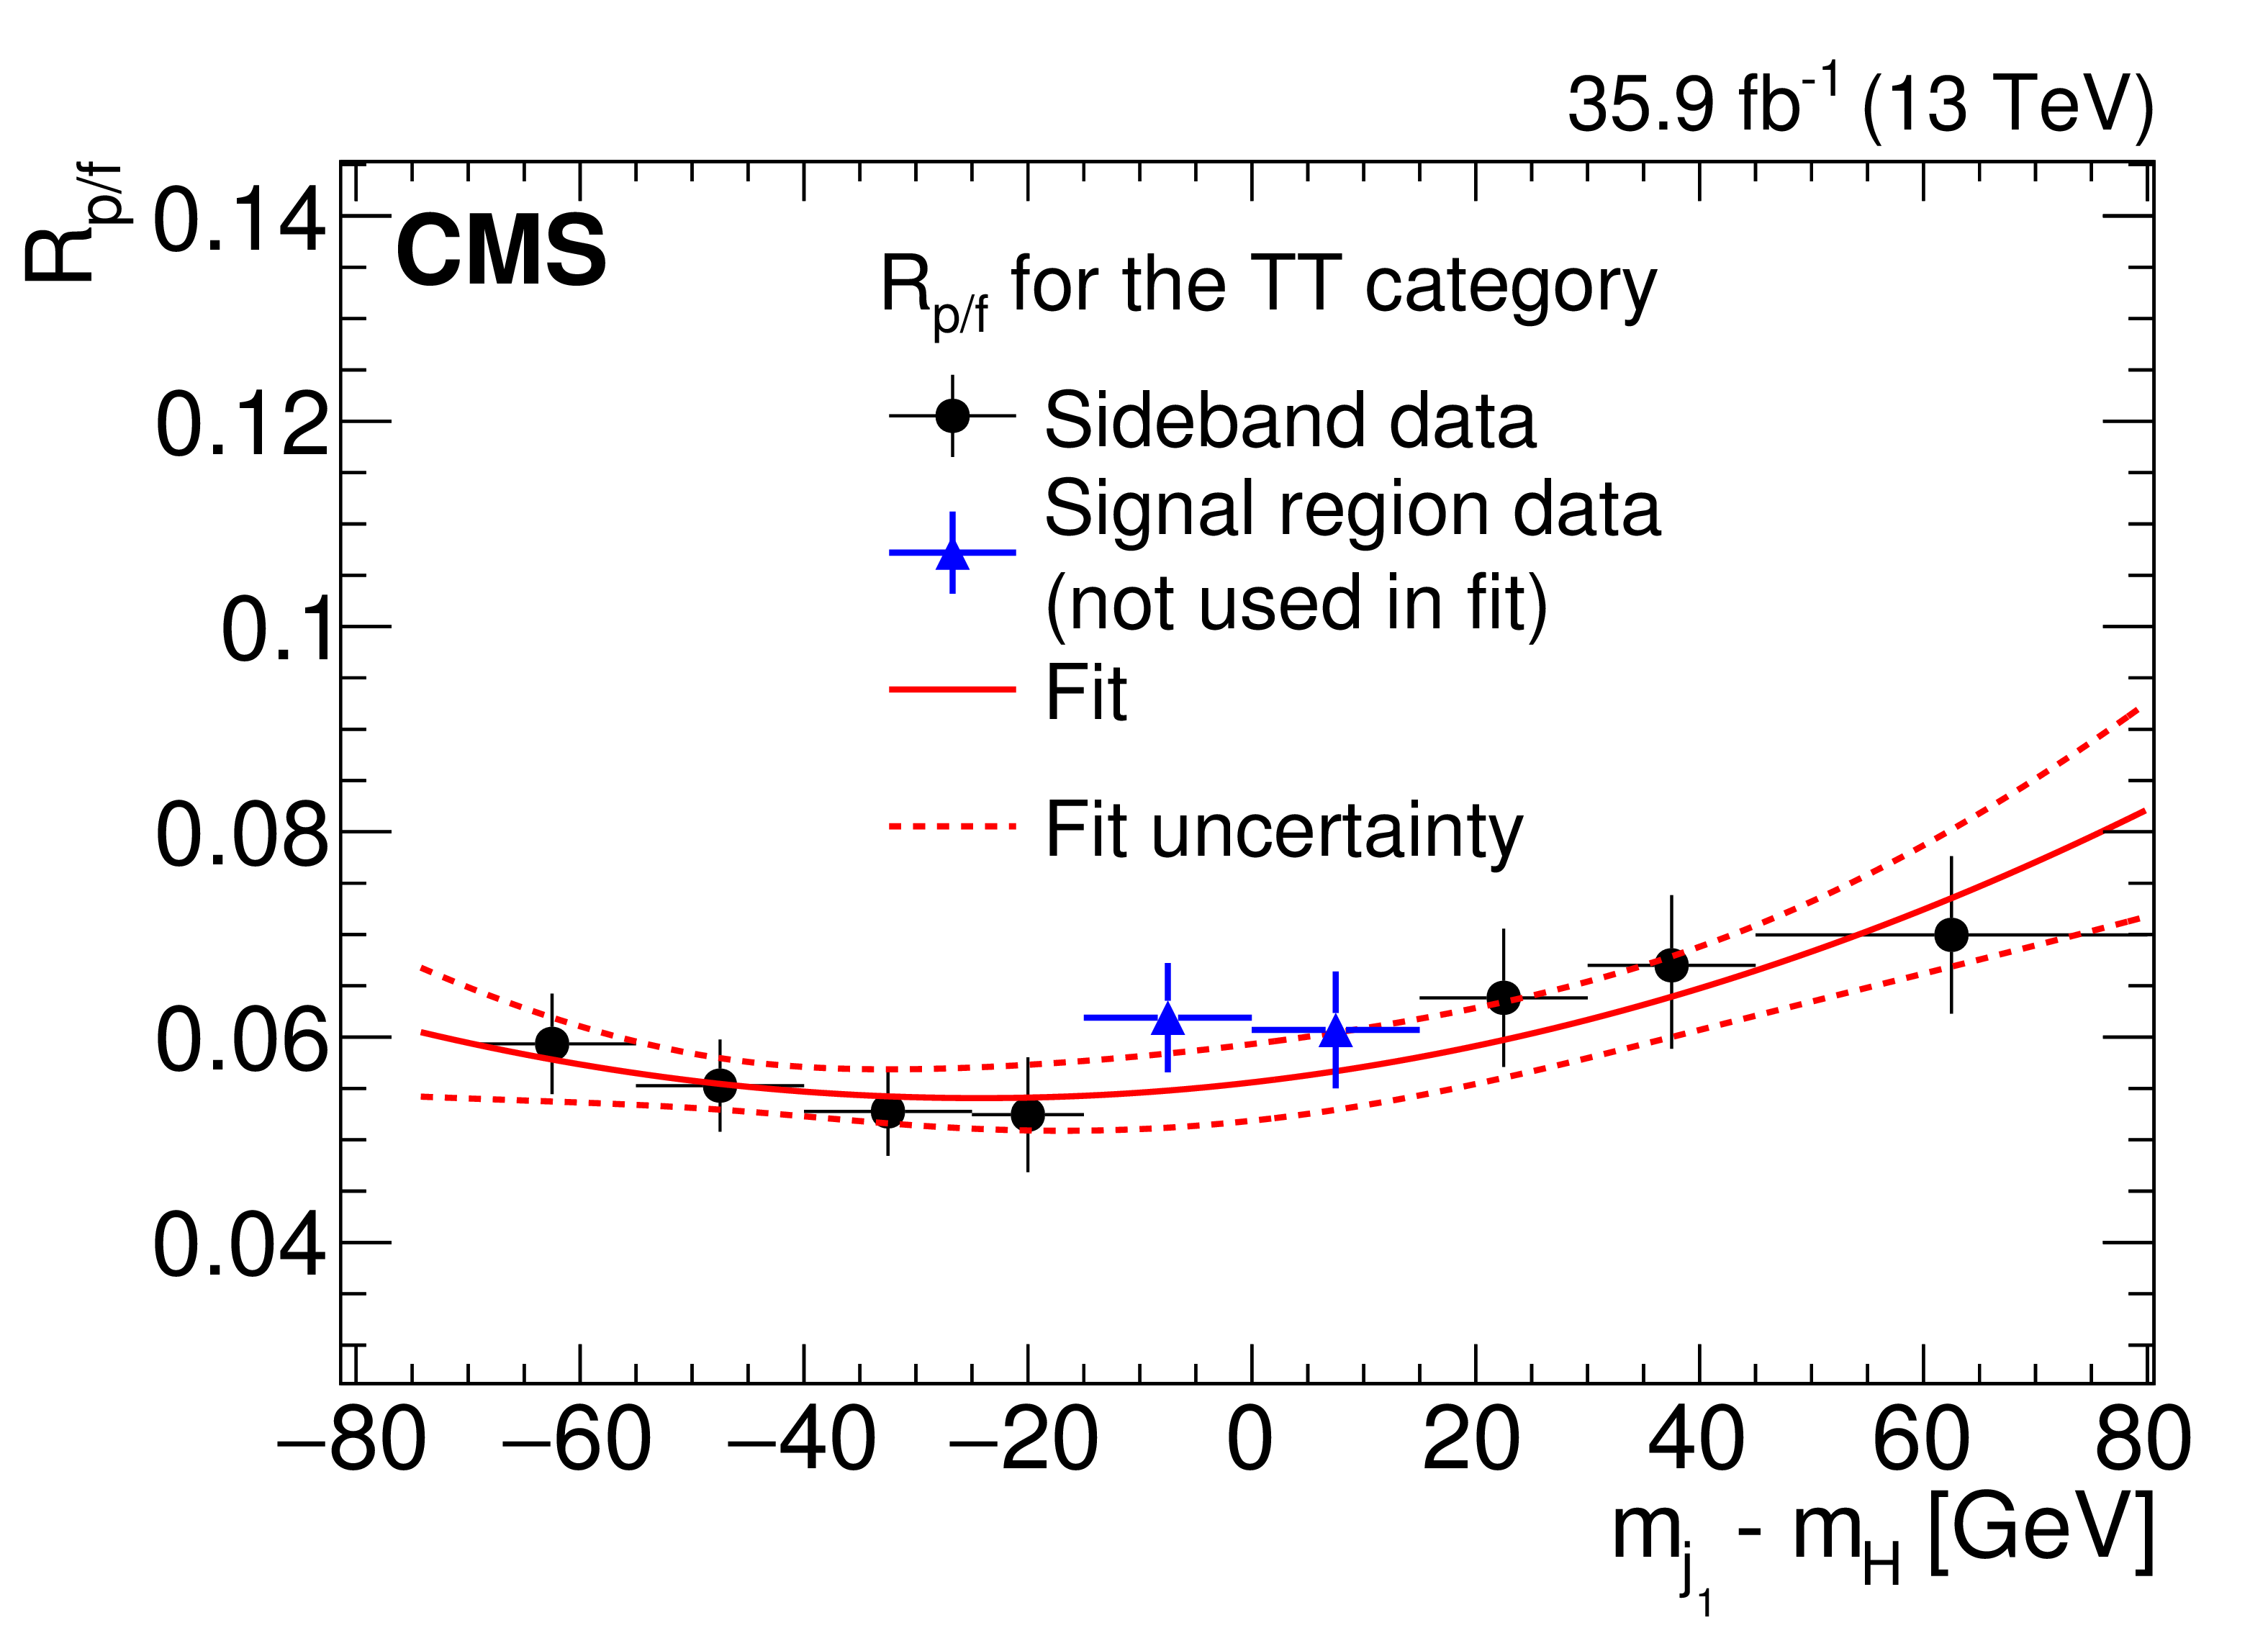
The pass-fail ratio $R_\text {p/f}$ of the leading $ {p_{\mathrm {T}}} $ jet for the LL (left) and TT (right) signal region categories as a function of the difference between the soft-drop mass of the leading jet and the Higgs boson mass, ${{m_{\text {j}_{1}}} - {m_{\mathrm{H}}}}$. The measured ratio in different bins of $ {m_{\text {j}_{1}}} - {m_{\mathrm{H}}} $ is used in the fit (red solid line), except in the region around $ {m_{\text {j}_{1}}} - {m_{\mathrm{H}}} = 0$, which corresponds to the signal region (blue triangular markers). The fitted function is interpolated to obtain $R_\text {p/f}$ in the signal region. The horizontal bars on the data points indicate the bin widths. |

png pdf |
Figure 5-a:
The pass-fail ratio $R_\text {p/f}$ of the leading $ {p_{\mathrm {T}}} $ jet for the LL signal region category as a function of the difference between the soft-drop mass of the leading jet and the Higgs boson mass, ${{m_{\text {j}_{1}}} - {m_{\mathrm{H}}}}$. The measured ratio in different bins of $ {m_{\text {j}_{1}}} - {m_{\mathrm{H}}} $ is used in the fit (red solid line), except in the region around $ {m_{\text {j}_{1}}} - {m_{\mathrm{H}}} = 0$, which corresponds to the signal region (blue triangular markers). The fitted function is interpolated to obtain $R_\text {p/f}$ in the signal region. The horizontal bars on the data points indicate the bin widths. |
png pdf |
Figure 5-b:
The pass-fail ratio $R_\text {p/f}$ of the leading $ {p_{\mathrm {T}}} $ jet for the TT signal region category as a function of the difference between the soft-drop mass of the leading jet and the Higgs boson mass, ${{m_{\text {j}_{1}}} - {m_{\mathrm{H}}}}$. The measured ratio in different bins of $ {m_{\text {j}_{1}}} - {m_{\mathrm{H}}} $ is used in the fit (red solid line), except in the region around $ {m_{\text {j}_{1}}} - {m_{\mathrm{H}}} = 0$, which corresponds to the signal region (blue triangular markers). The fitted function is interpolated to obtain $R_\text {p/f}$ in the signal region. The horizontal bars on the data points indicate the bin widths. |
png pdf |
Figure 6:
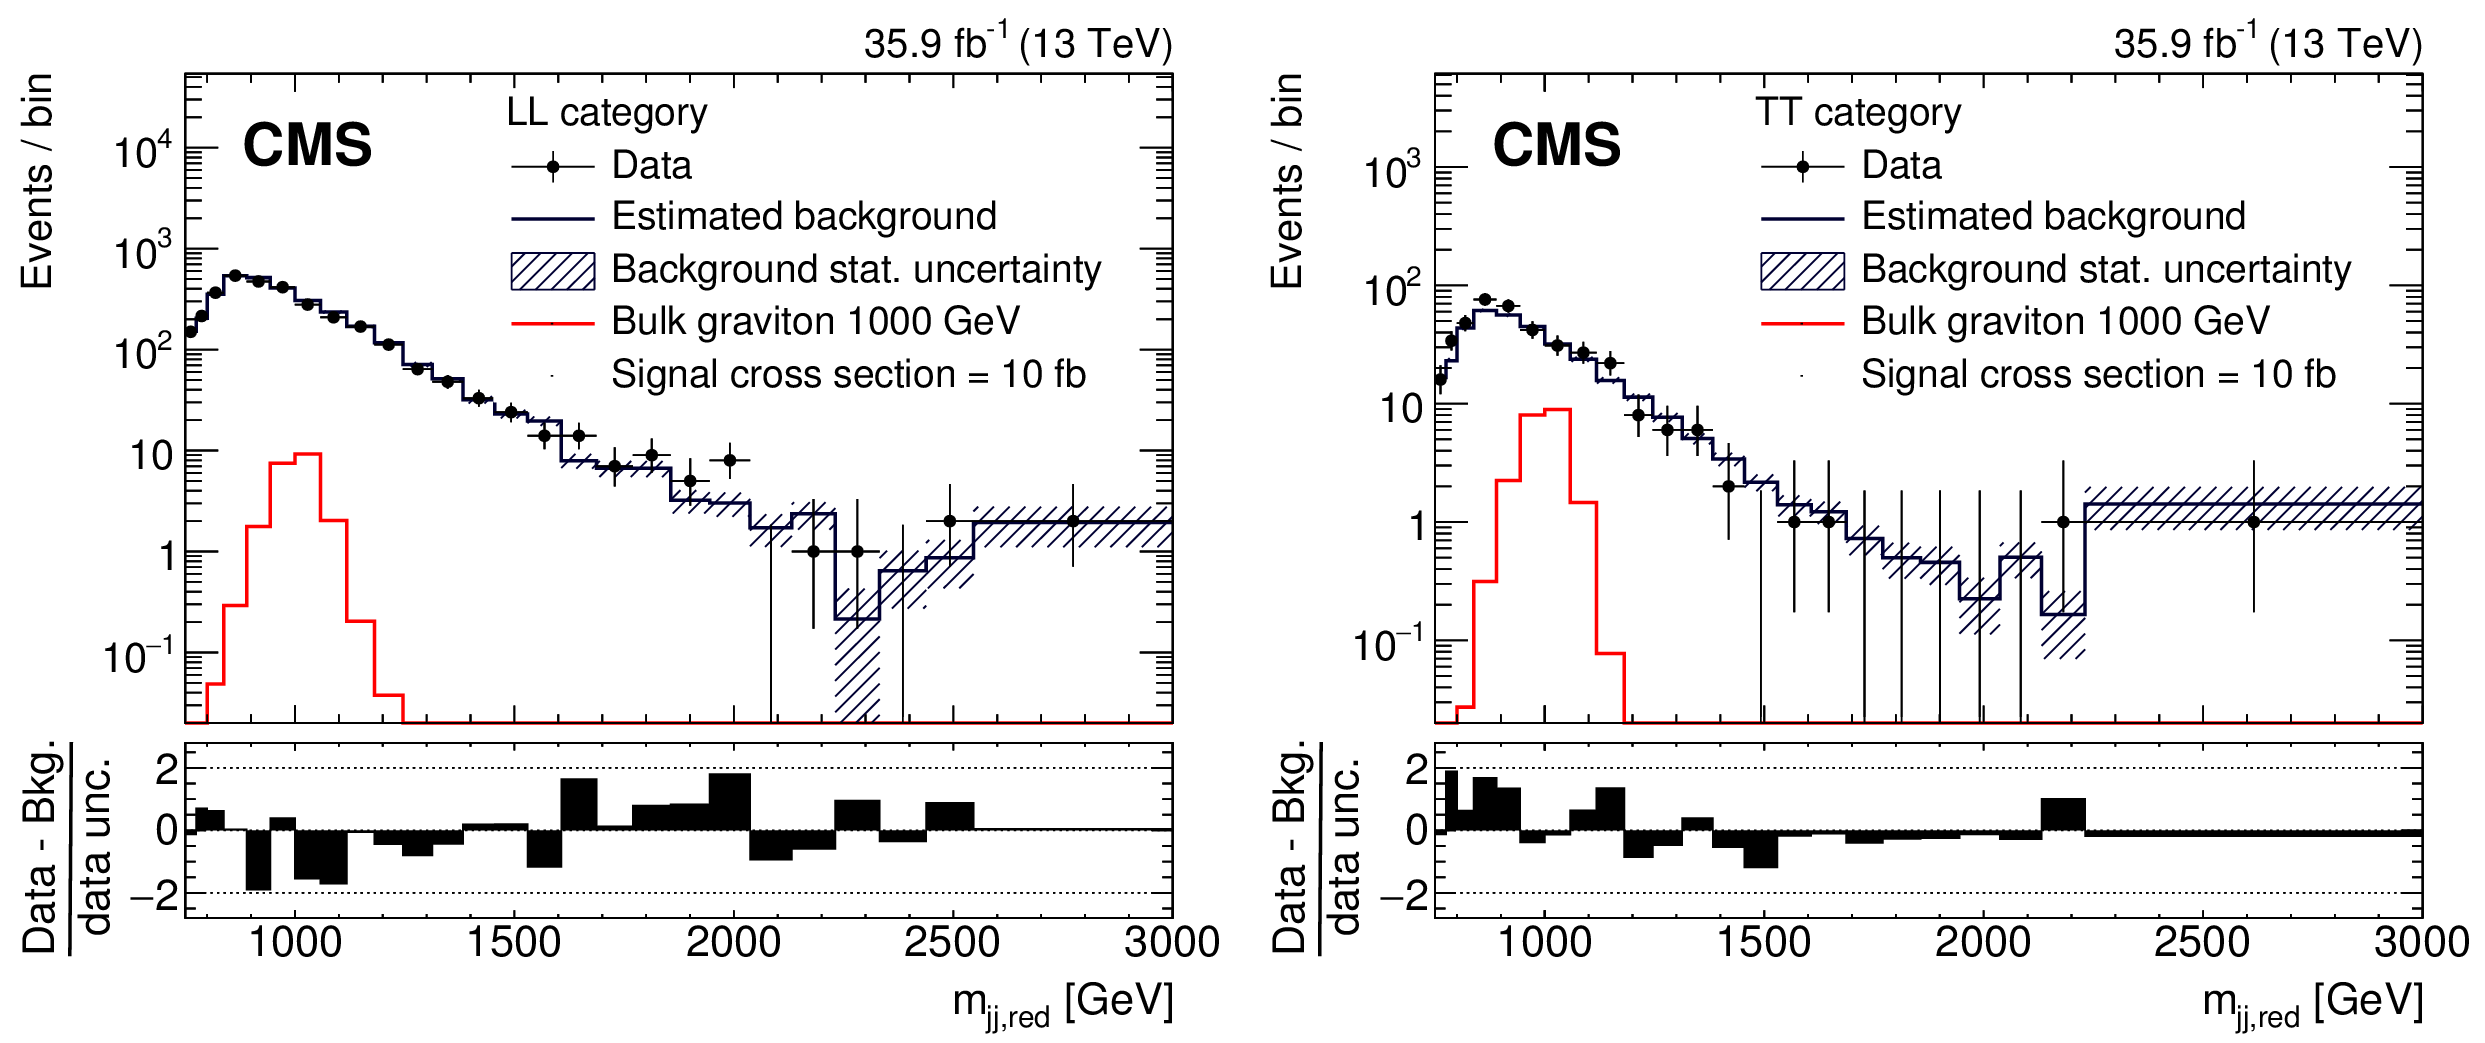
The reduced mass distributions ${m_{\text {jj,red}}}$ for the LL (left) and TT (right) signal region categories. The points with bars show the data, the histogram with shaded band shows the estimated background and associated uncertainty. The ${m_{\text {jj,red}}}$ spectrum for the background is obtained by weighting the ${m_{\text {jj,red}}}$ spectrum in the antitag region by the ratio $R_\text {p/f}$ of Fig. 5. The signal predictions for a bulk graviton of mass 1000 GeV, are overlaid for comparison, assuming a production cross section of 10 fb. The last bins of the distributions contain all events with $ {m_{\text {jj,red}}} > $ 3000 GeV. The differences between the data and the predicted background, divided by the data statistical uncertainty (data unc.) as given by the Garwood interval [66], are shown in the lower panels. |
png pdf |
Figure 6-a:
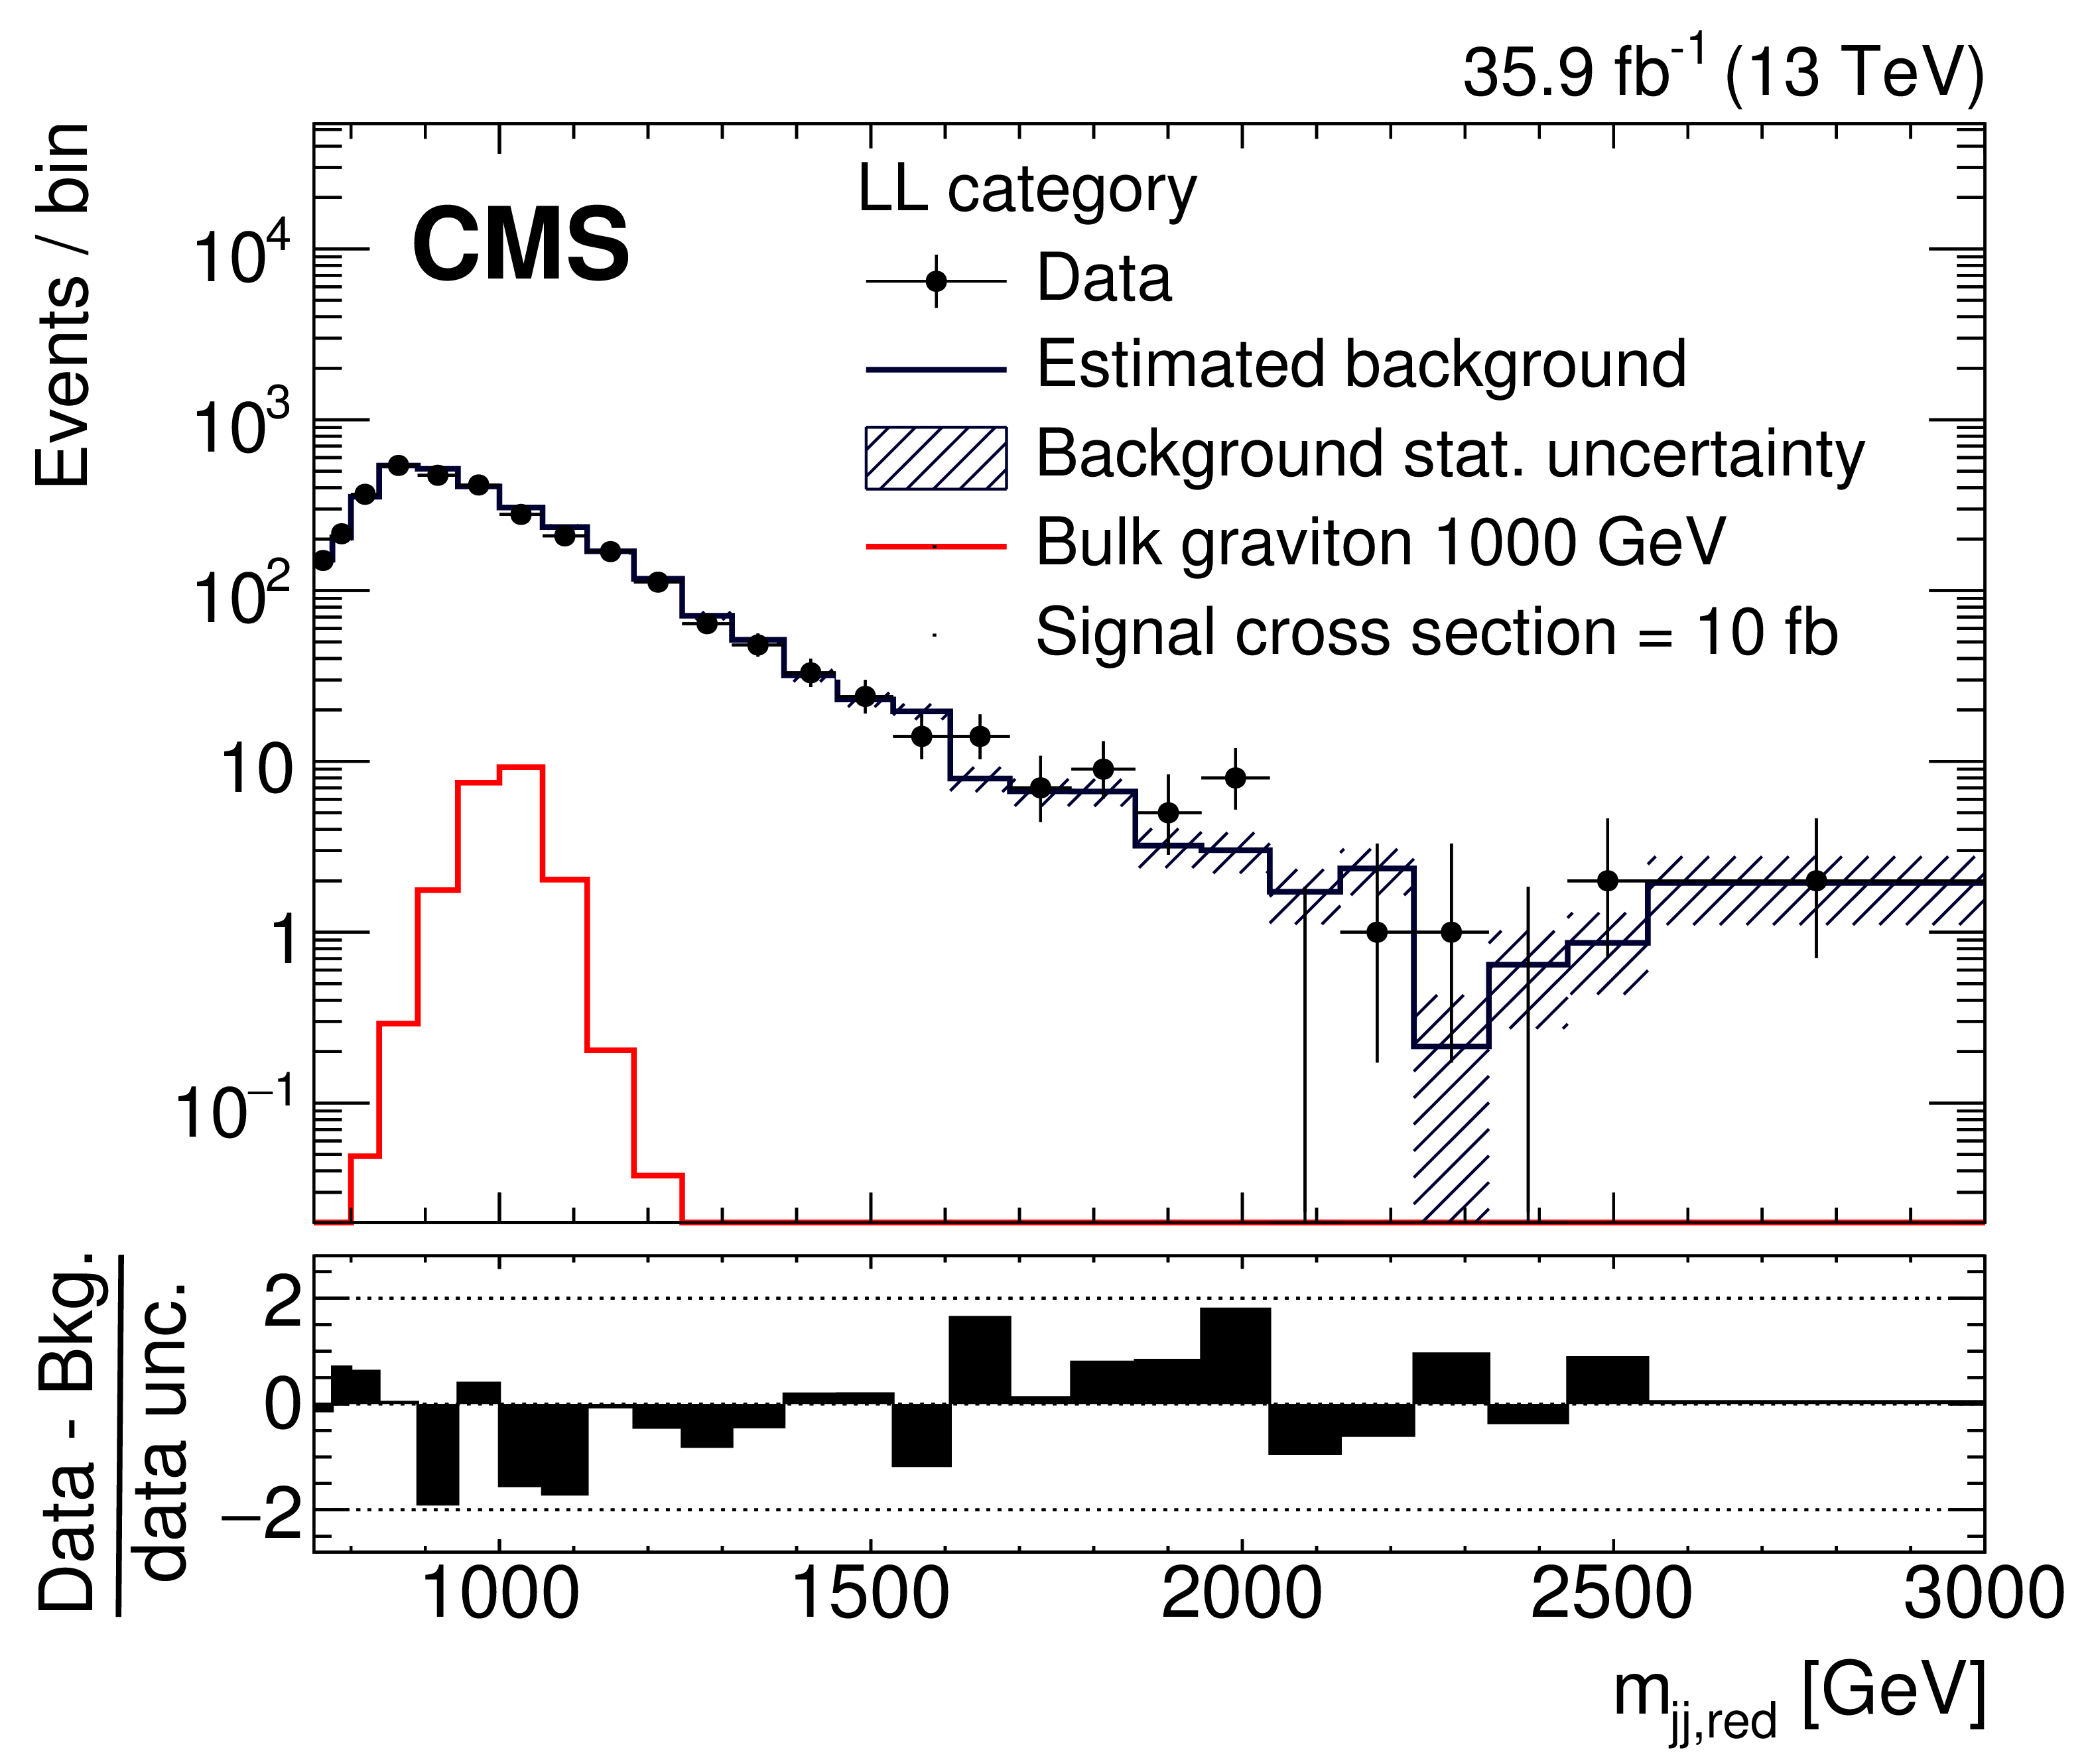
The reduced mass distributions ${m_{\text {jj,red}}}$ for the LL signal region category. The points with bars show the data, the histogram with shaded band shows the estimated background and associated uncertainty. The ${m_{\text {jj,red}}}$ spectrum for the background is obtained by weighting the ${m_{\text {jj,red}}}$ spectrum in the antitag region by the ratio $R_\text {p/f}$ of Fig. 5. The signal predictions for a bulk graviton of mass 1000 GeV, are overlaid for comparison, assuming a production cross section of 10 fb. The last bins of the distributions contain all events with $ {m_{\text {jj,red}}} > $ 3000 GeV. The differences between the data and the predicted background, divided by the data statistical uncertainty (data unc.) as given by the Garwood interval [66], are shown in the lower panels. |
png pdf |
Figure 6-b:
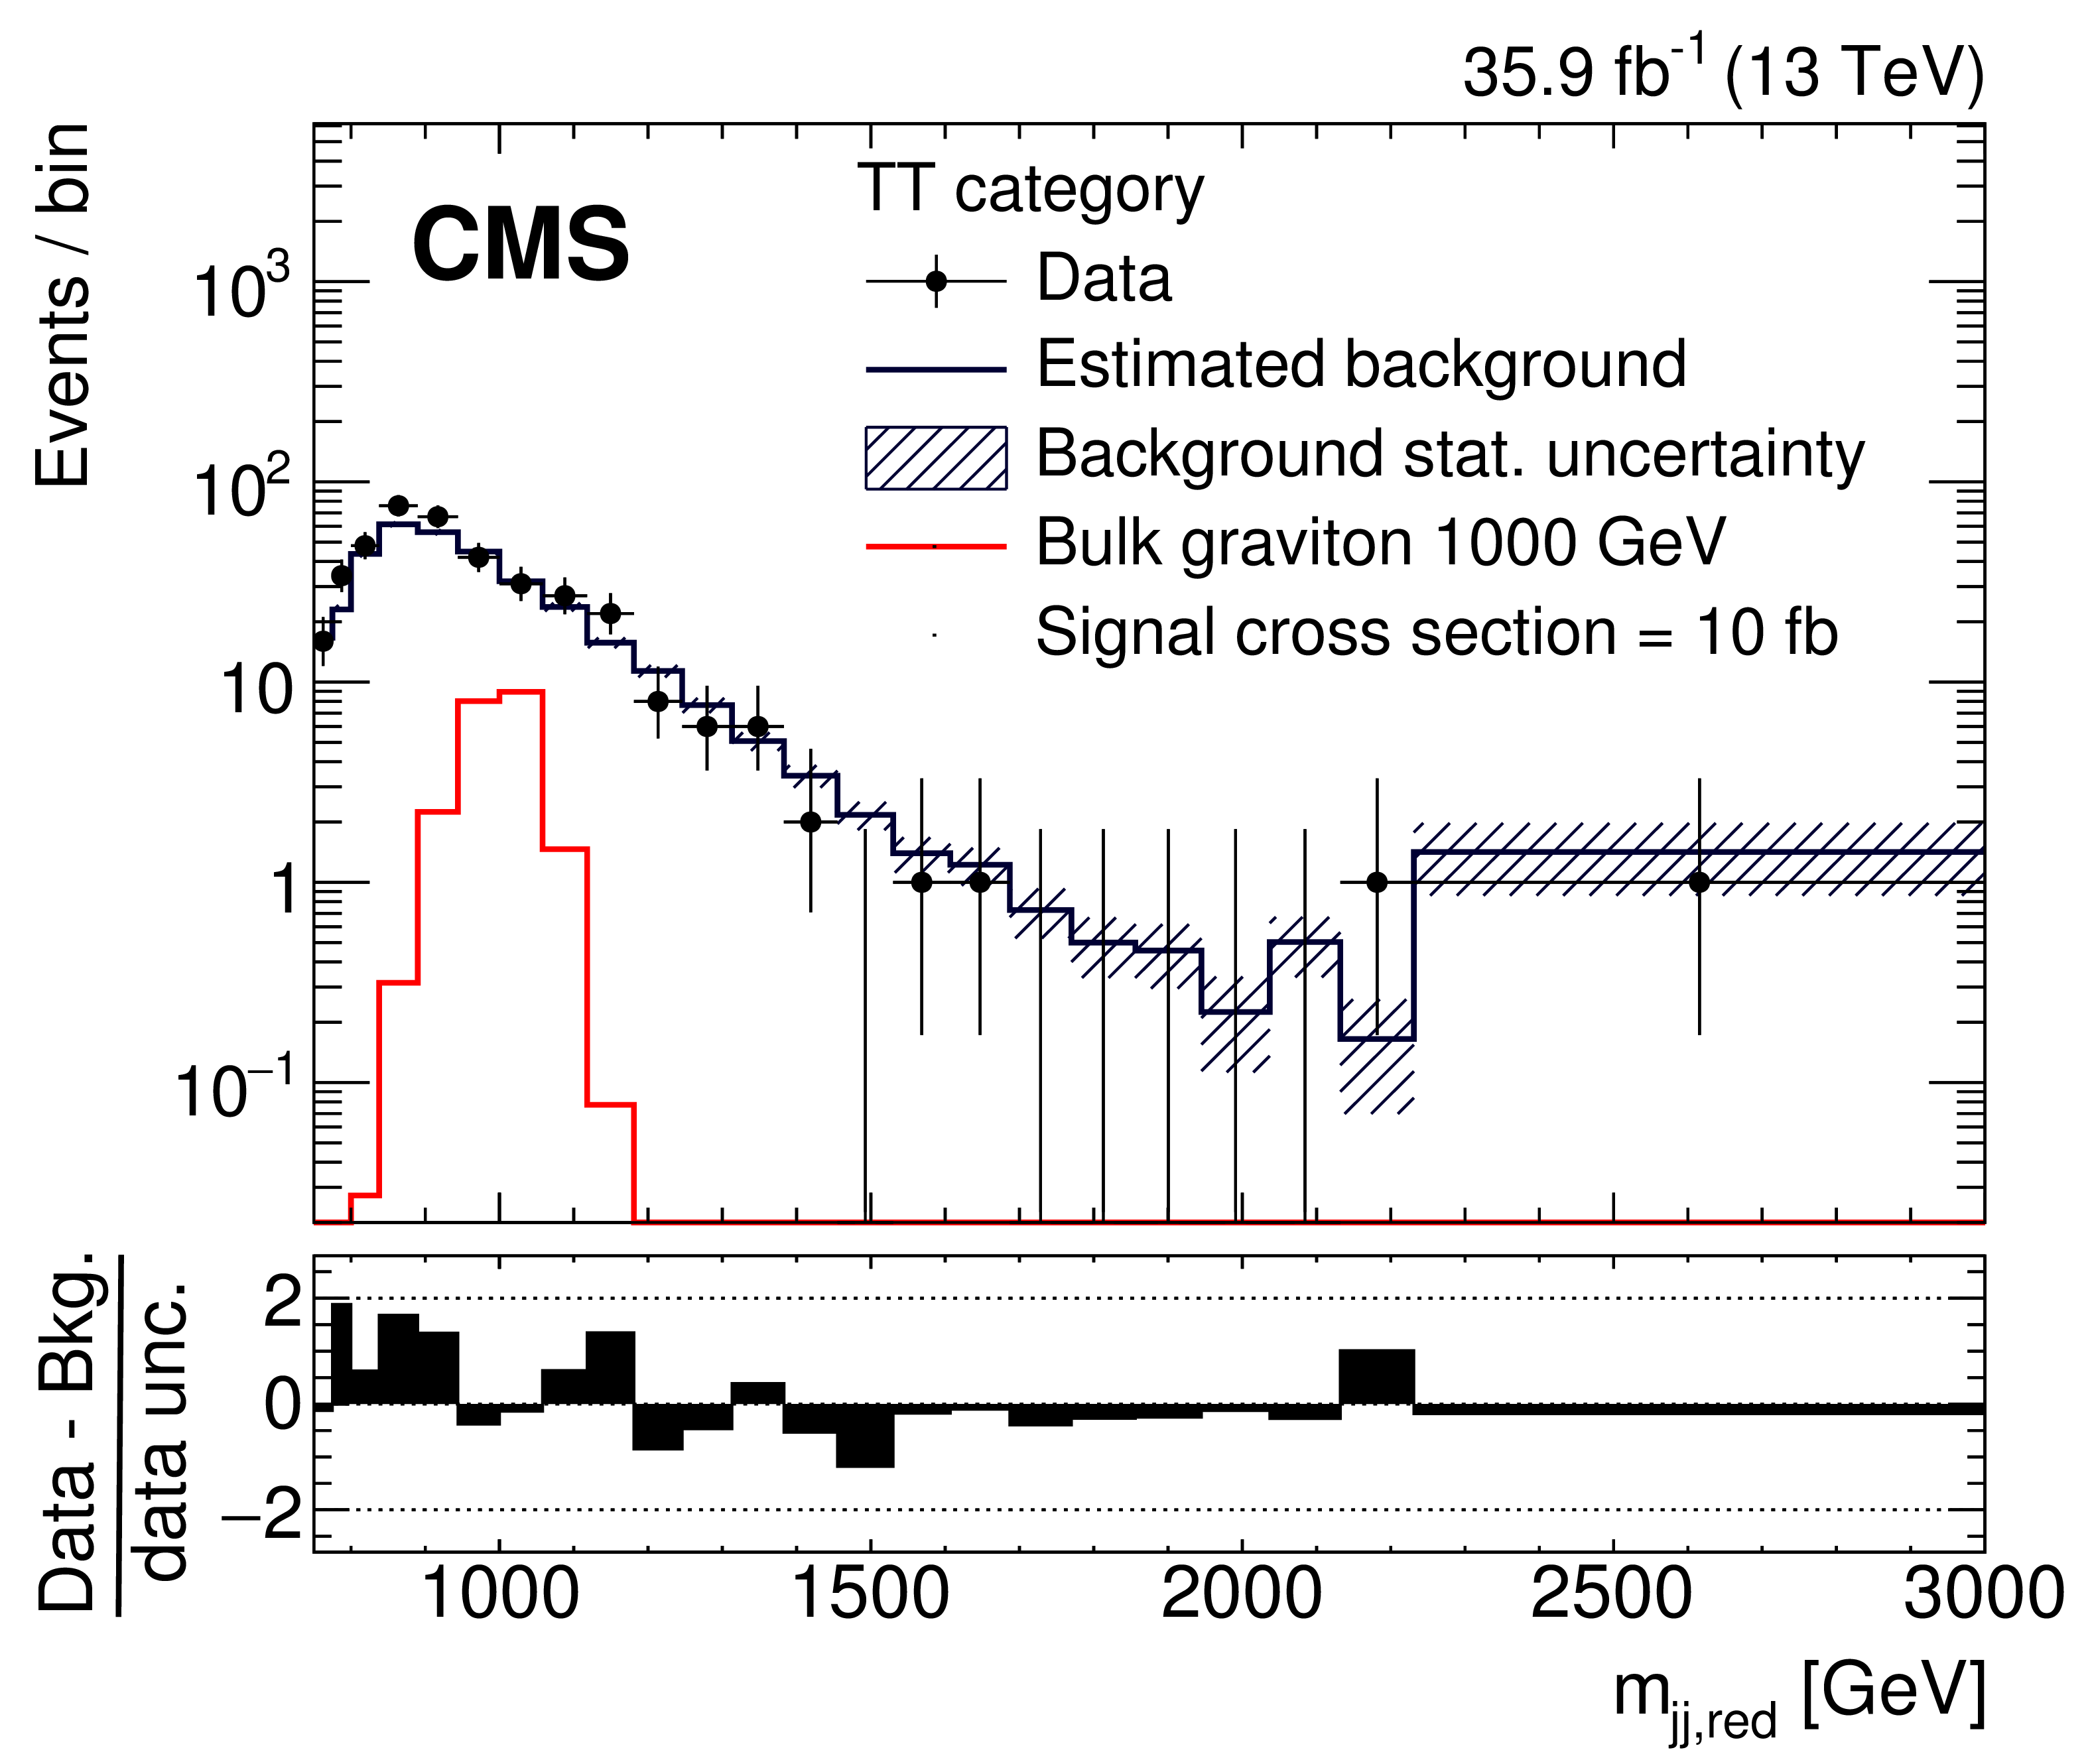
The reduced mass distributions ${m_{\text {jj,red}}}$ for the TT signal region category. The points with bars show the data, the histogram with shaded band shows the estimated background and associated uncertainty. The ${m_{\text {jj,red}}}$ spectrum for the background is obtained by weighting the ${m_{\text {jj,red}}}$ spectrum in the antitag region by the ratio $R_\text {p/f}$ of Fig. 5. The signal predictions for a bulk graviton of mass 1000 GeV, are overlaid for comparison, assuming a production cross section of 10 fb. The last bins of the distributions contain all events with $ {m_{\text {jj,red}}} > $ 3000 GeV. The differences between the data and the predicted background, divided by the data statistical uncertainty (data unc.) as given by the Garwood interval [66], are shown in the lower panels. |
png pdf |
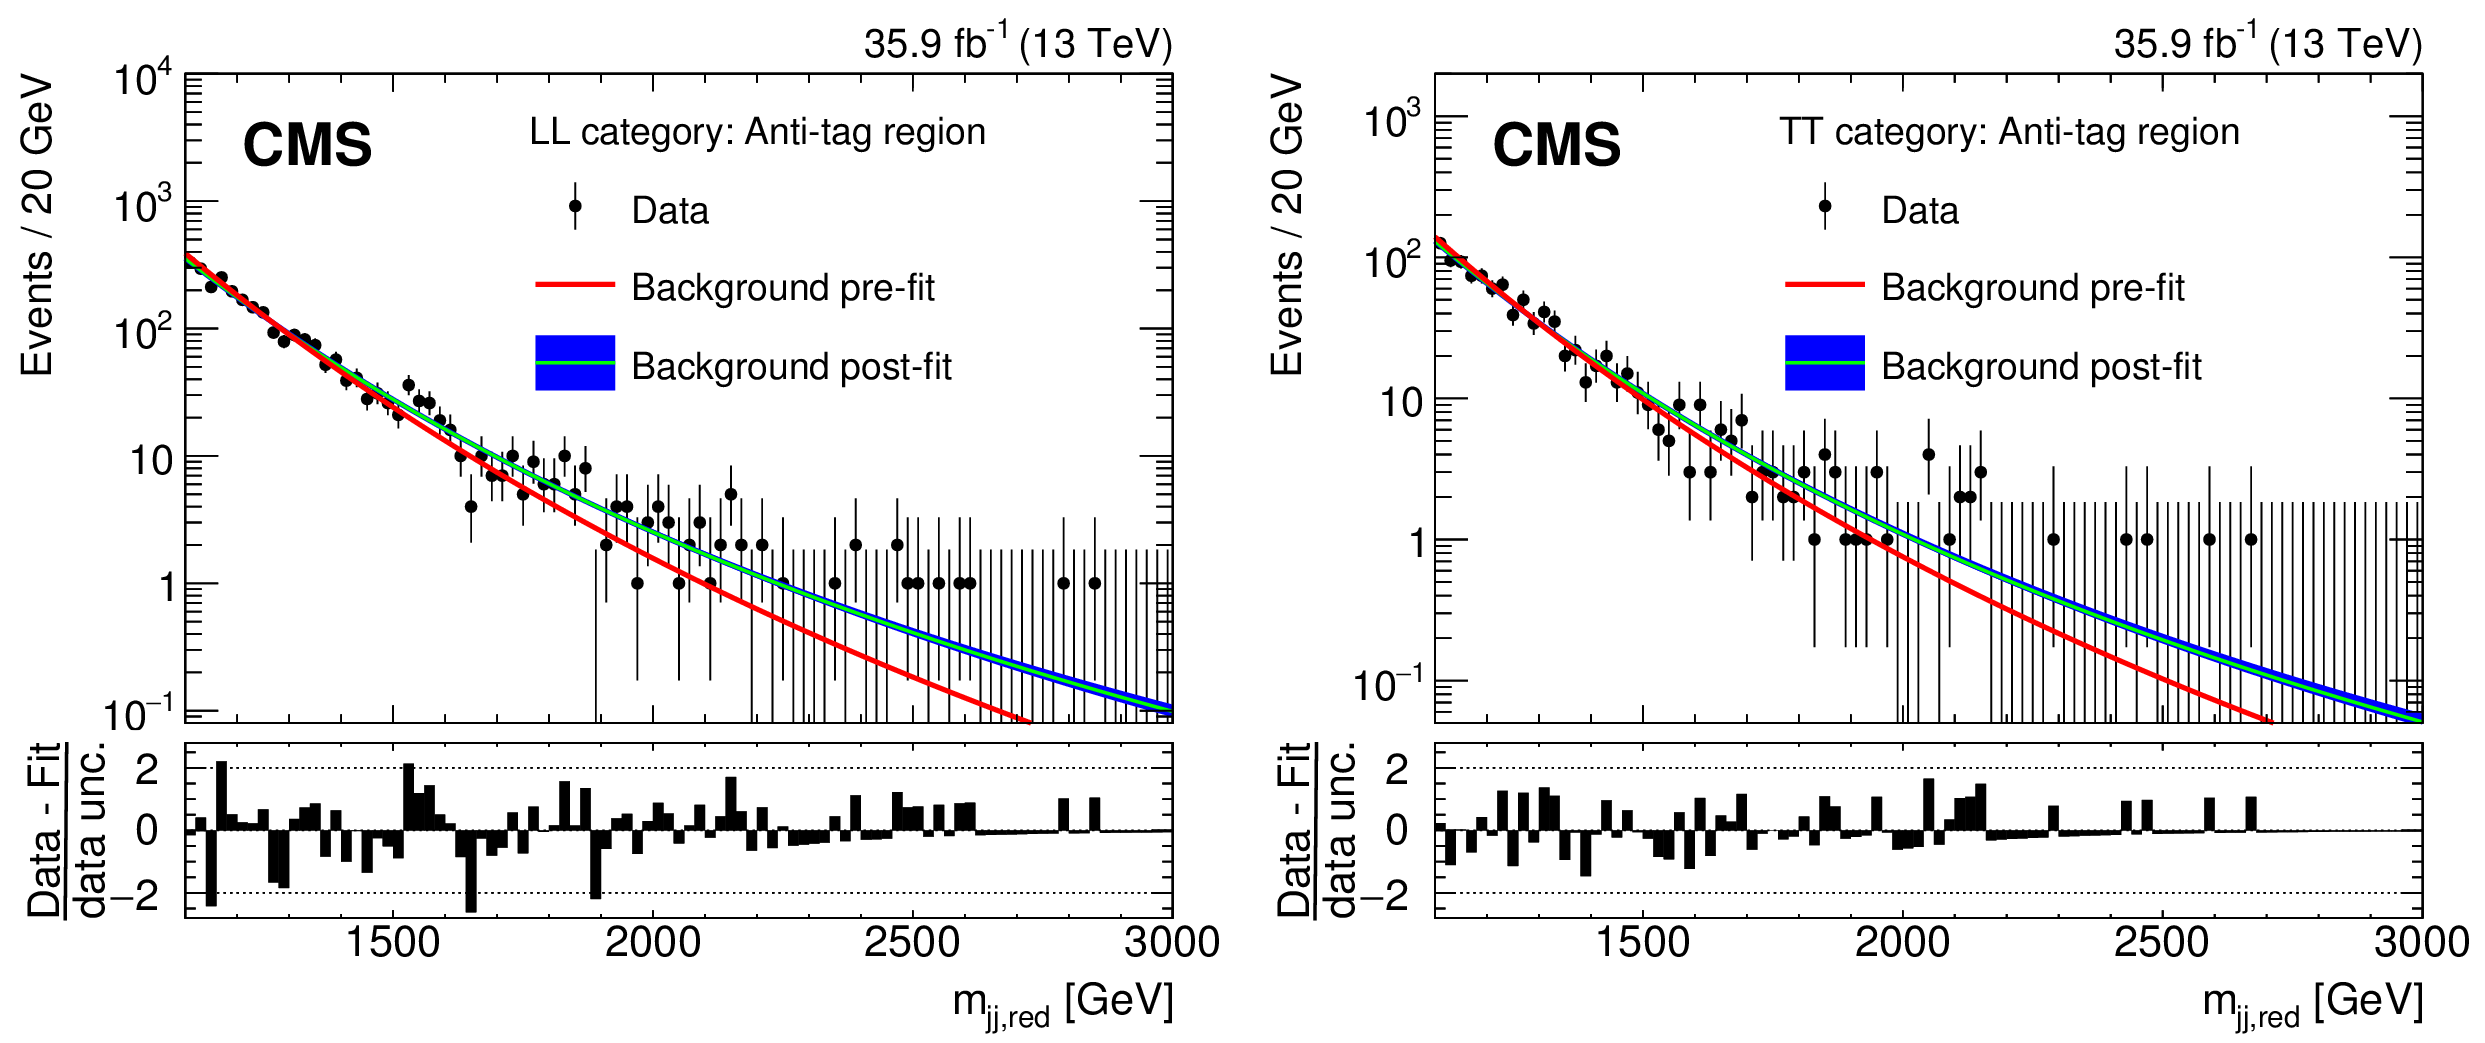
Figure 7:
The reduced mass ${m_{\text {jj,red}}}$ distributions in the antitag region for the LL (left) and TT (right) categories. The black markers are the data while the curves show the pre-fit and post-fit background shapes. The differences between the data and the predicted background, divided by the statistical uncertainty in the data (data unc.) as given by the Garwood interval [66], are shown in the lower panels. |

png pdf |
Figure 7-a:
The reduced mass ${m_{\text {jj,red}}}$ distributions in the antitag region for the LL category. The black markers are the data while the curves show the pre-fit and post-fit background shapes. The differences between the data and the predicted background, divided by the statistical uncertainty in the data (data unc.) as given by the Garwood interval [66], are shown in the lower panels. |

png pdf |
Figure 7-b:
The reduced mass ${m_{\text {jj,red}}}$ distributions in the antitag region for the TT category. The black markers are the data while the curves show the pre-fit and post-fit background shapes. The differences between the data and the predicted background, divided by the statistical uncertainty in the data (data unc.) as given by the Garwood interval [66], are shown in the lower panels. |
png pdf |
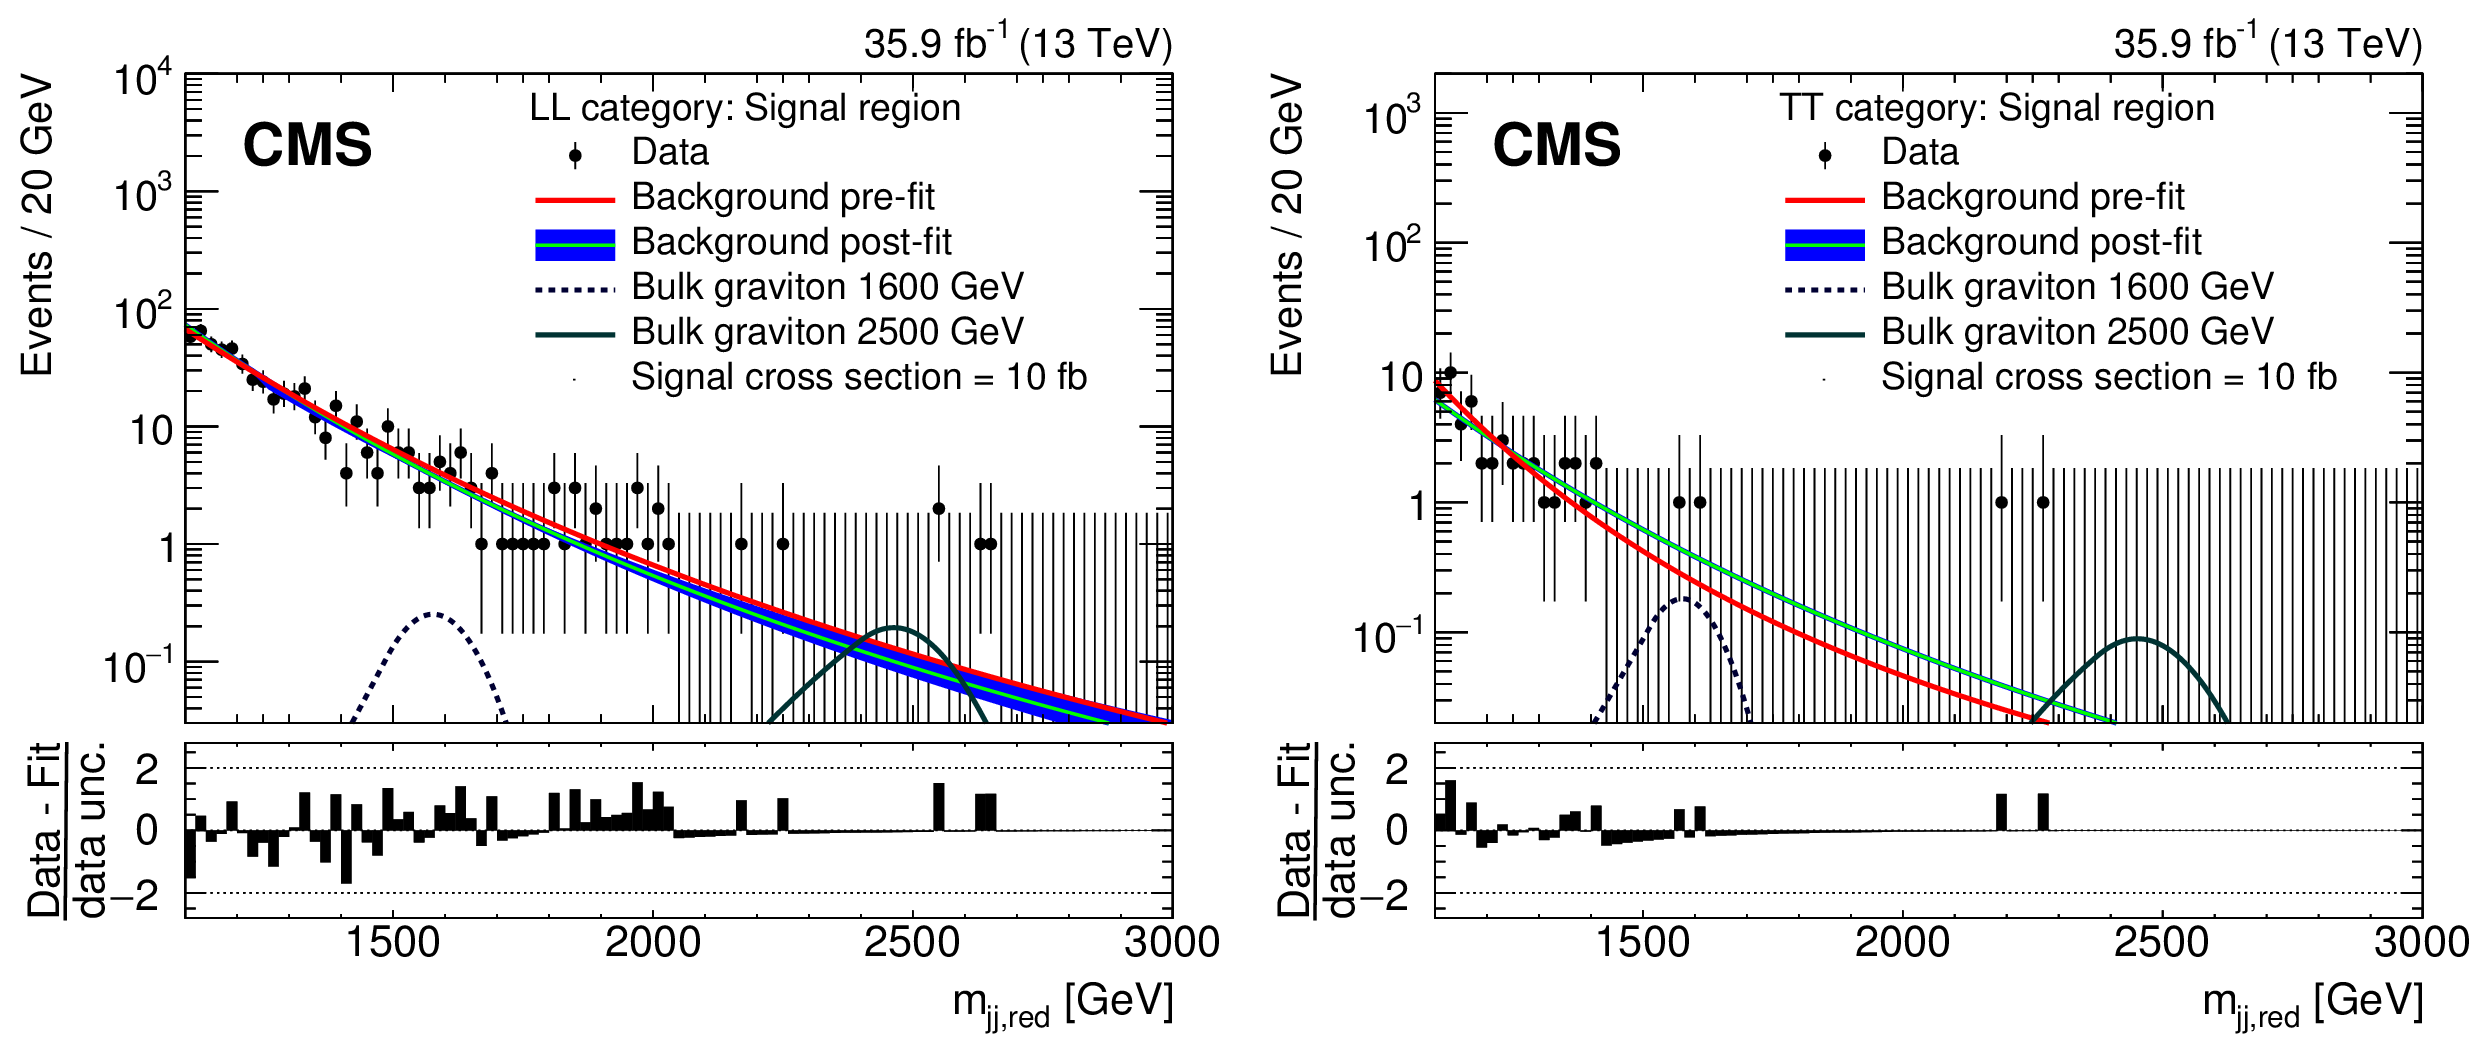
Figure 8:
The reduced mass ${m_{\text {jj,red}}}$ distributions in the signal region for the LL (left) and the TT (right) categories. The black markers are the data while the curves show the pre-fit and post-fit background shapes. The contribution of bulk gravitons of masses 1600 and 2500 GeV in the signal region are shown assuming a production cross section of 10 fb. The differences between the data and the predicted background, divided by the statistical uncertainty in the data (data unc.) as given by the Garwood interval [66], are shown in the lower panels. |
png pdf |
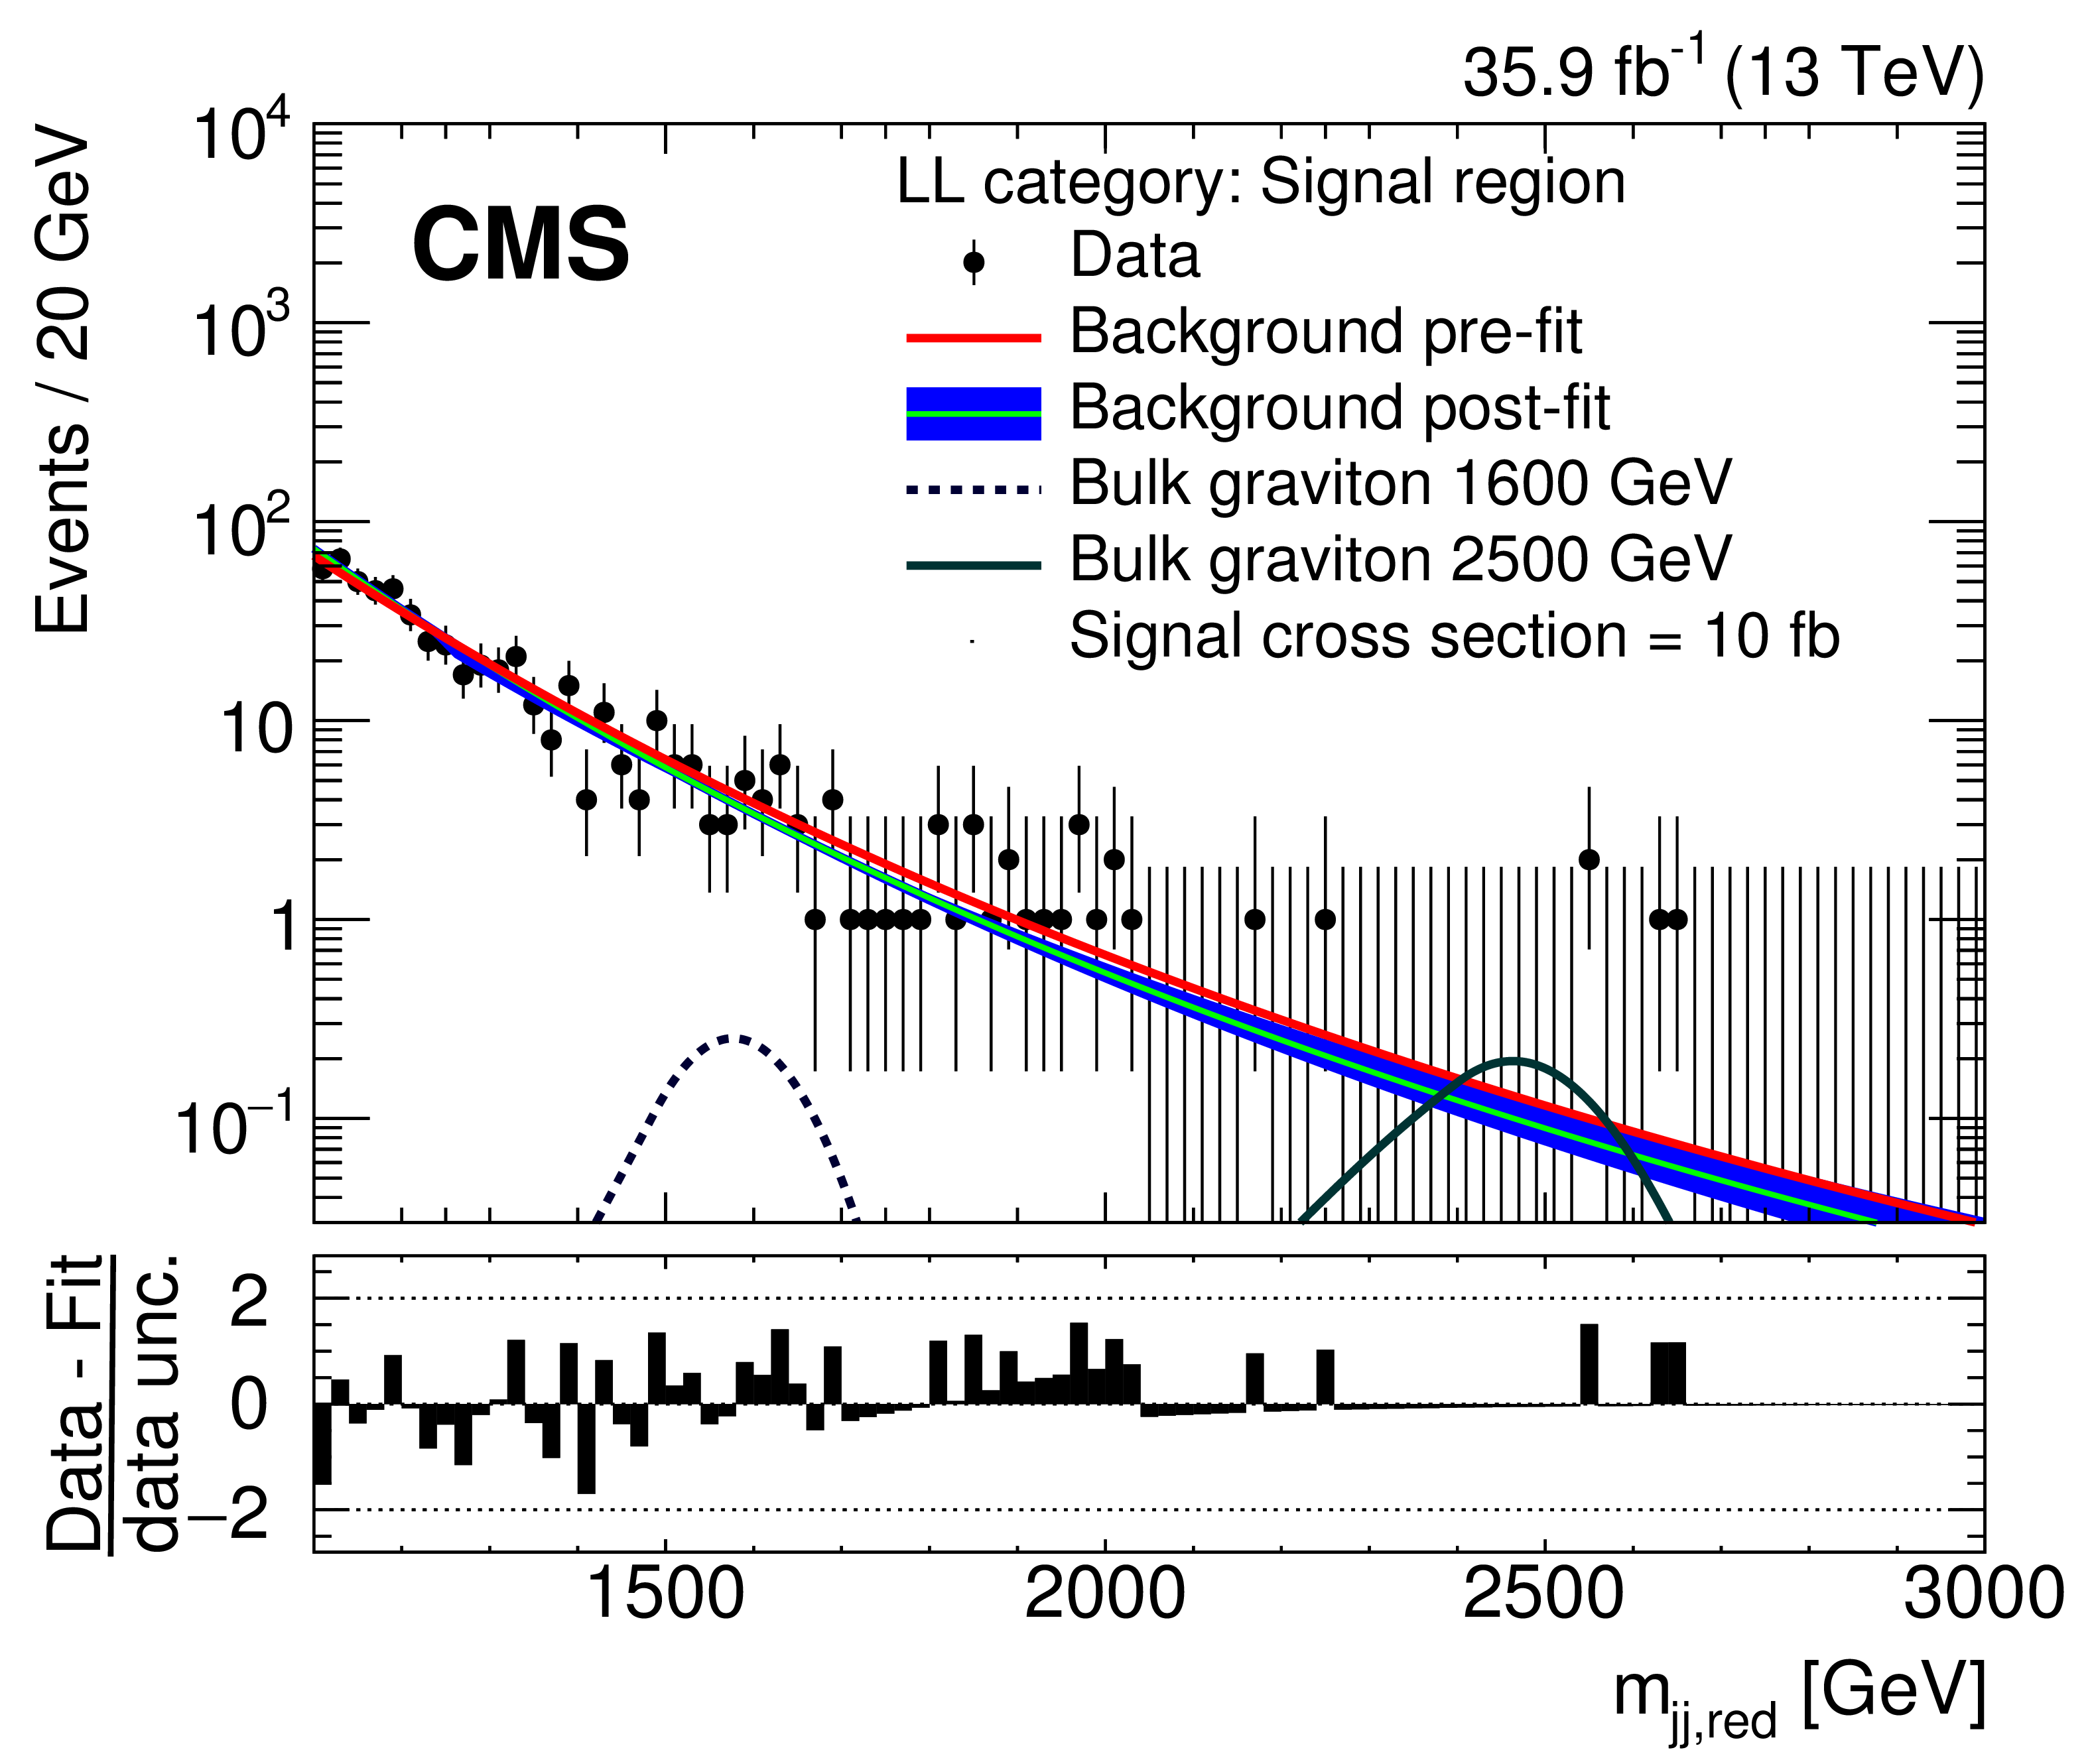
Figure 8-a:
The reduced mass ${m_{\text {jj,red}}}$ distributions in the signal region for the LL category. The black markers are the data while the curves show the pre-fit and post-fit background shapes. The contribution of bulk gravitons of masses 1600 and 2500 GeV in the signal region are shown assuming a production cross section of 10 fb. The differences between the data and the predicted background, divided by the statistical uncertainty in the data (data unc.) as given by the Garwood interval [66], are shown in the lower panels. |
png pdf |
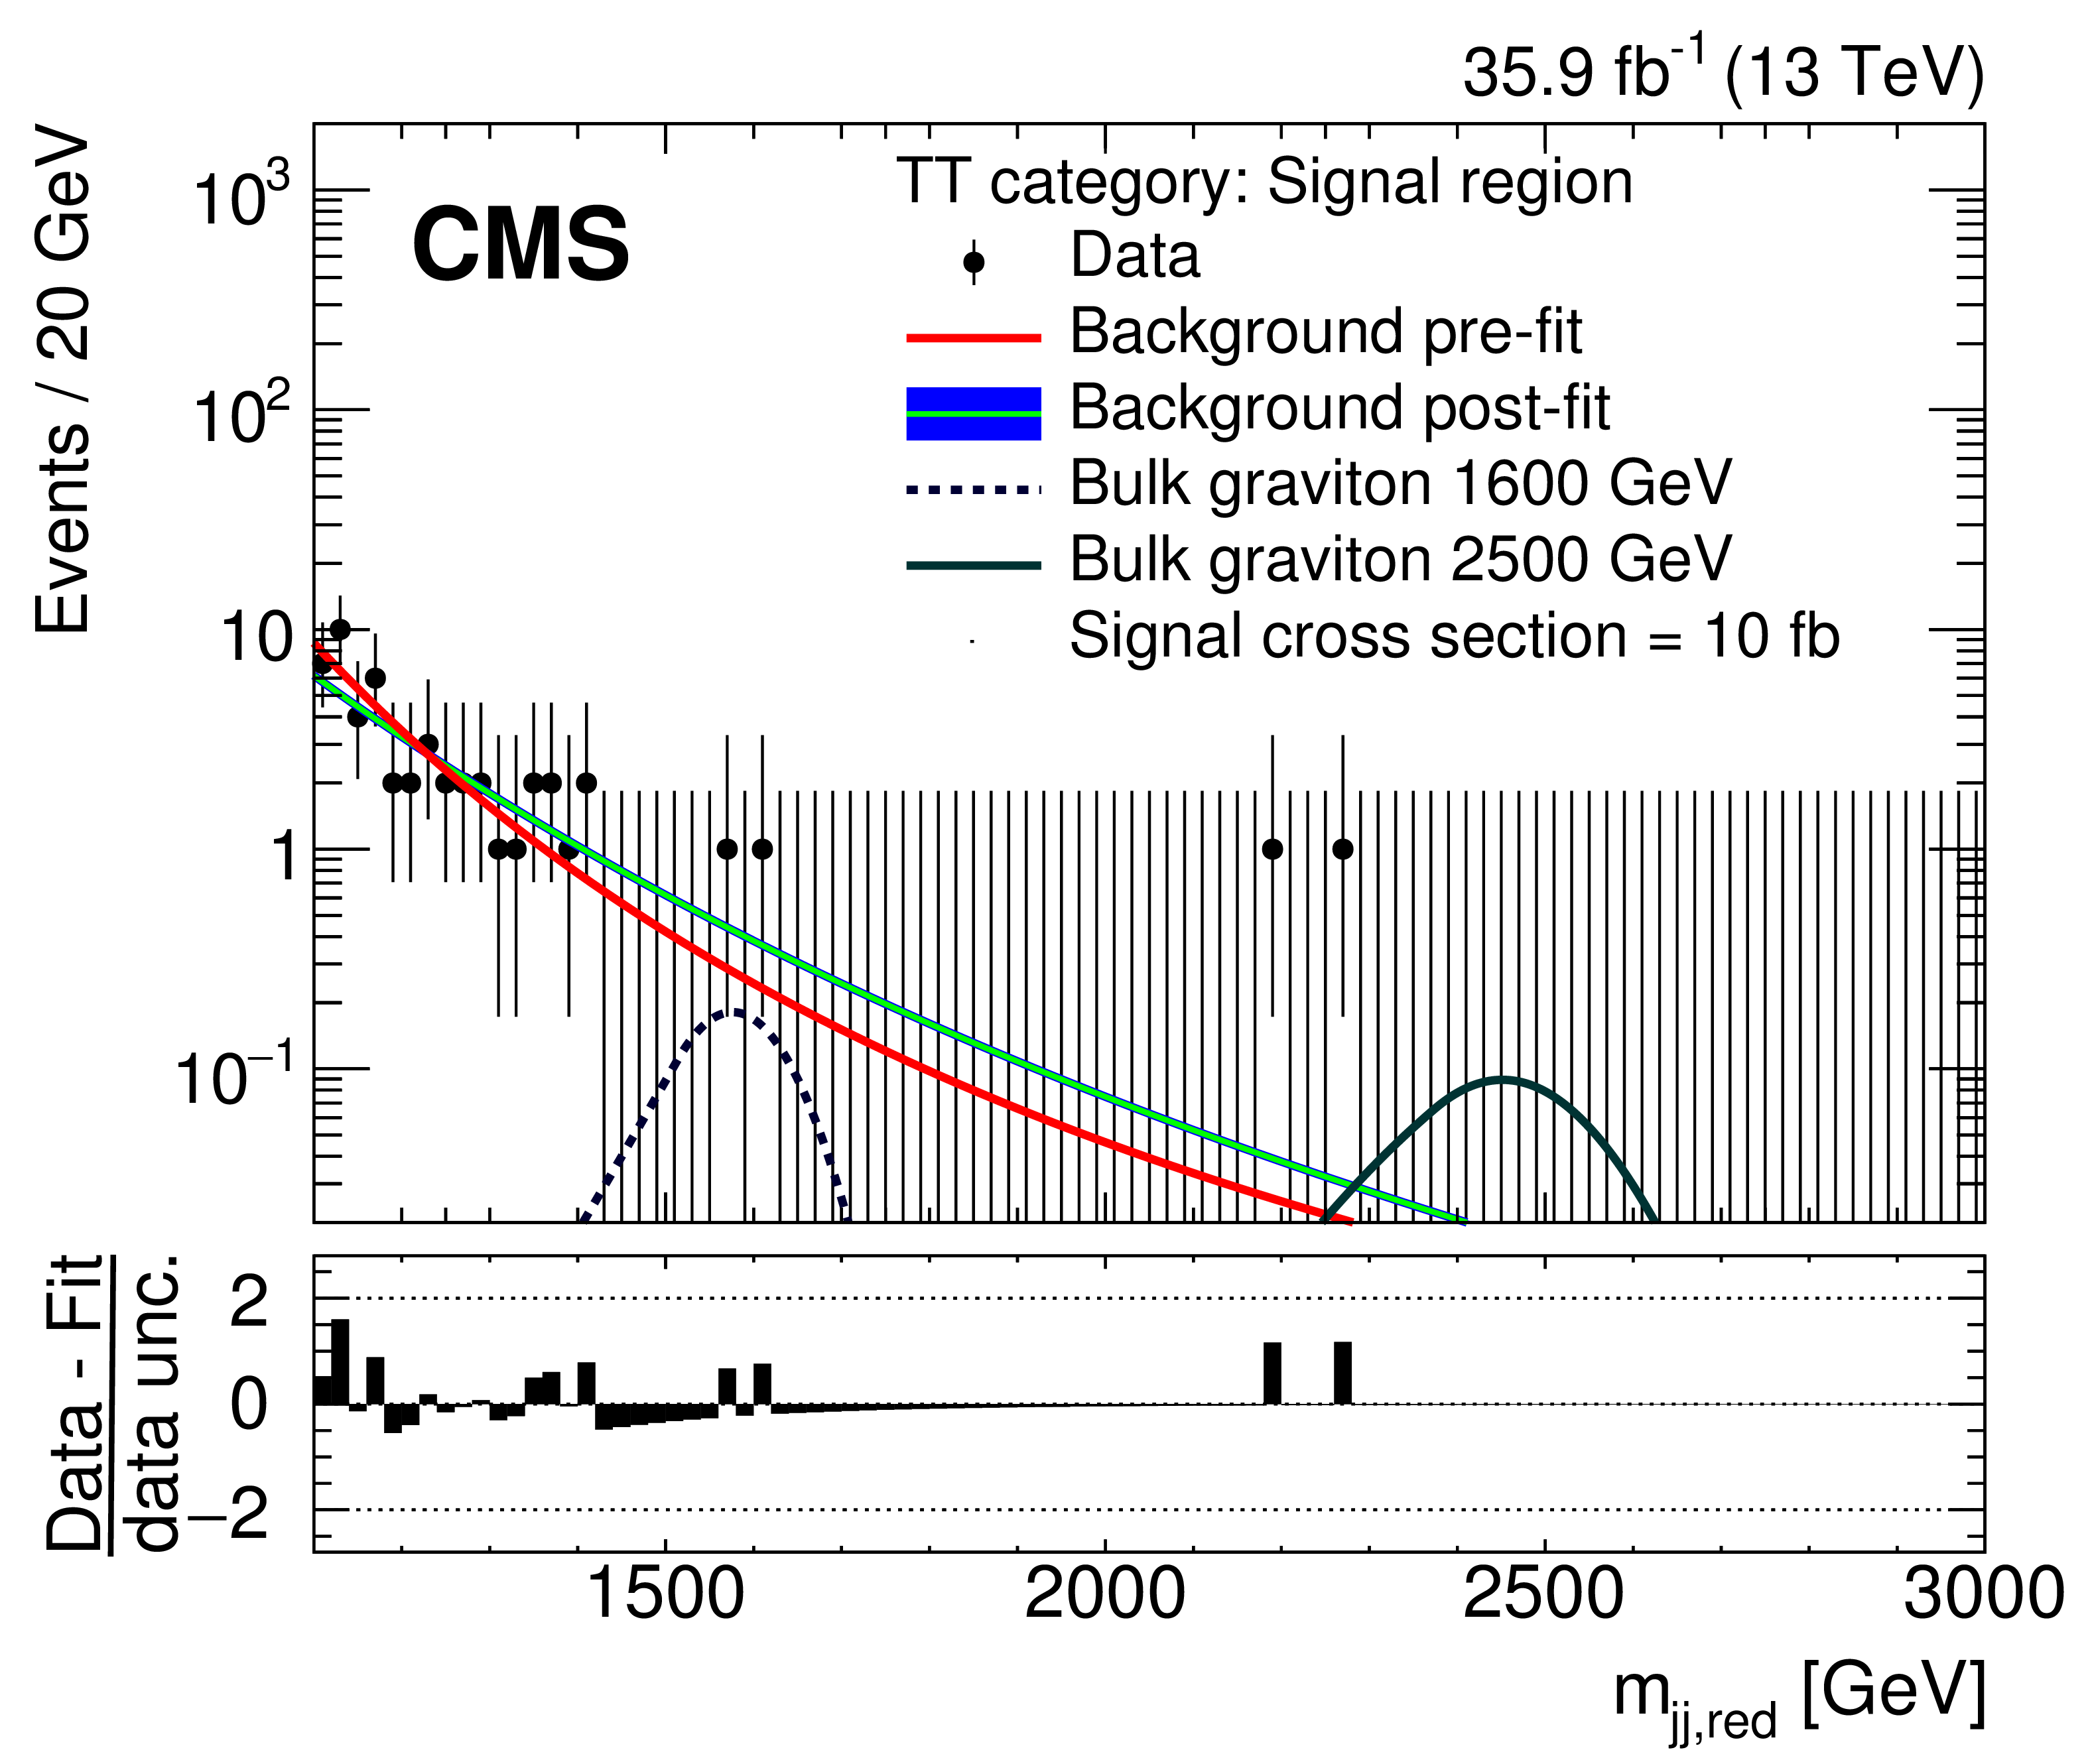
Figure 8-b:
The reduced mass ${m_{\text {jj,red}}}$ distributions in the signal region for the TT category. The black markers are the data while the curves show the pre-fit and post-fit background shapes. The contribution of bulk gravitons of masses 1600 and 2500 GeV in the signal region are shown assuming a production cross section of 10 fb. The differences between the data and the predicted background, divided by the statistical uncertainty in the data (data unc.) as given by the Garwood interval [66], are shown in the lower panels. |
png pdf |
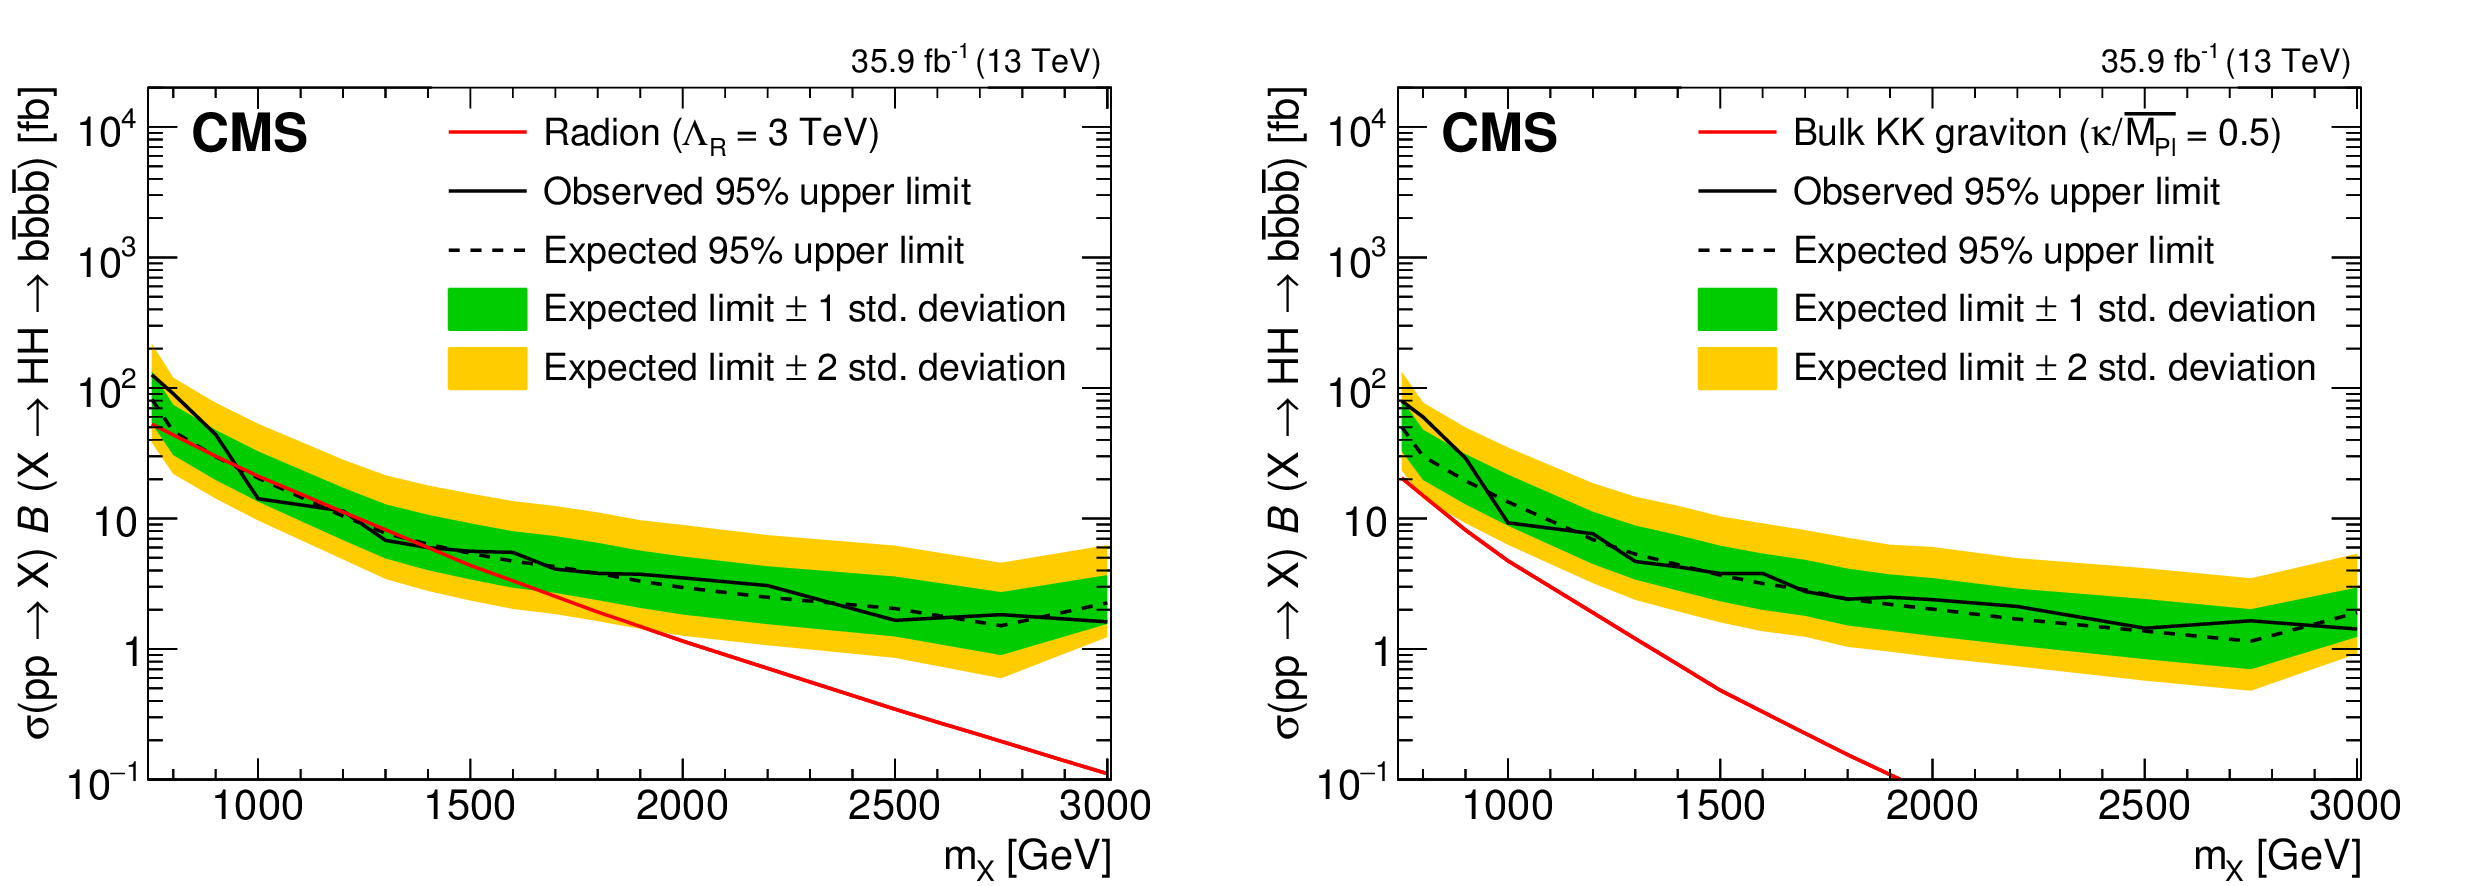
Figure 9:
The limits for the spin-0 radion (left) and the spin-2 bulk graviton (right) models. The result for $ {m_{\mathrm{X}}} < $ 1200 GeV uses the background predicted using the control regions, while for $ {m_{\mathrm{X}}} \ge $ 1200 GeV the background is derived from a combined signal and background fit to the data in the control and the signal regions. The predicted theoretical cross sections for a narrow radion or a bulk graviton are also shown. |

png pdf |
Figure 9-a:
The limits for the spin-0 radion model. The result for $ {m_{\mathrm{X}}} < $ 1200 GeV uses the background predicted using the control regions, while for $ {m_{\mathrm{X}}} \ge $ 1200 GeV the background is derived from a combined signal and background fit to the data in the control and the signal regions. The predicted theoretical cross sections for a narrow radion or a bulk graviton are also shown. |

png pdf |
Figure 9-b:
The limits for the spin-2 bulk graviton model. The result for $ {m_{\mathrm{X}}} < $ 1200 GeV uses the background predicted using the control regions, while for $ {m_{\mathrm{X}}} \ge $ 1200 GeV the background is derived from a combined signal and background fit to the data in the control and the signal regions. The predicted theoretical cross sections for a narrow radion or a bulk graviton are also shown. |
| Tables | |

png pdf |
Table 1:
Definition of the signal, the antitag, and the sideband regions used for the background estimation. The regions are defined in terms of the soft-drop masses of the leading $ {p_{\mathrm {T}}} $ H jet (j$_{1}$) and the subleading $ {p_{\mathrm {T}}} $ H jet (j$_{2}$), and their double-b tagger discriminator values. |
png pdf |
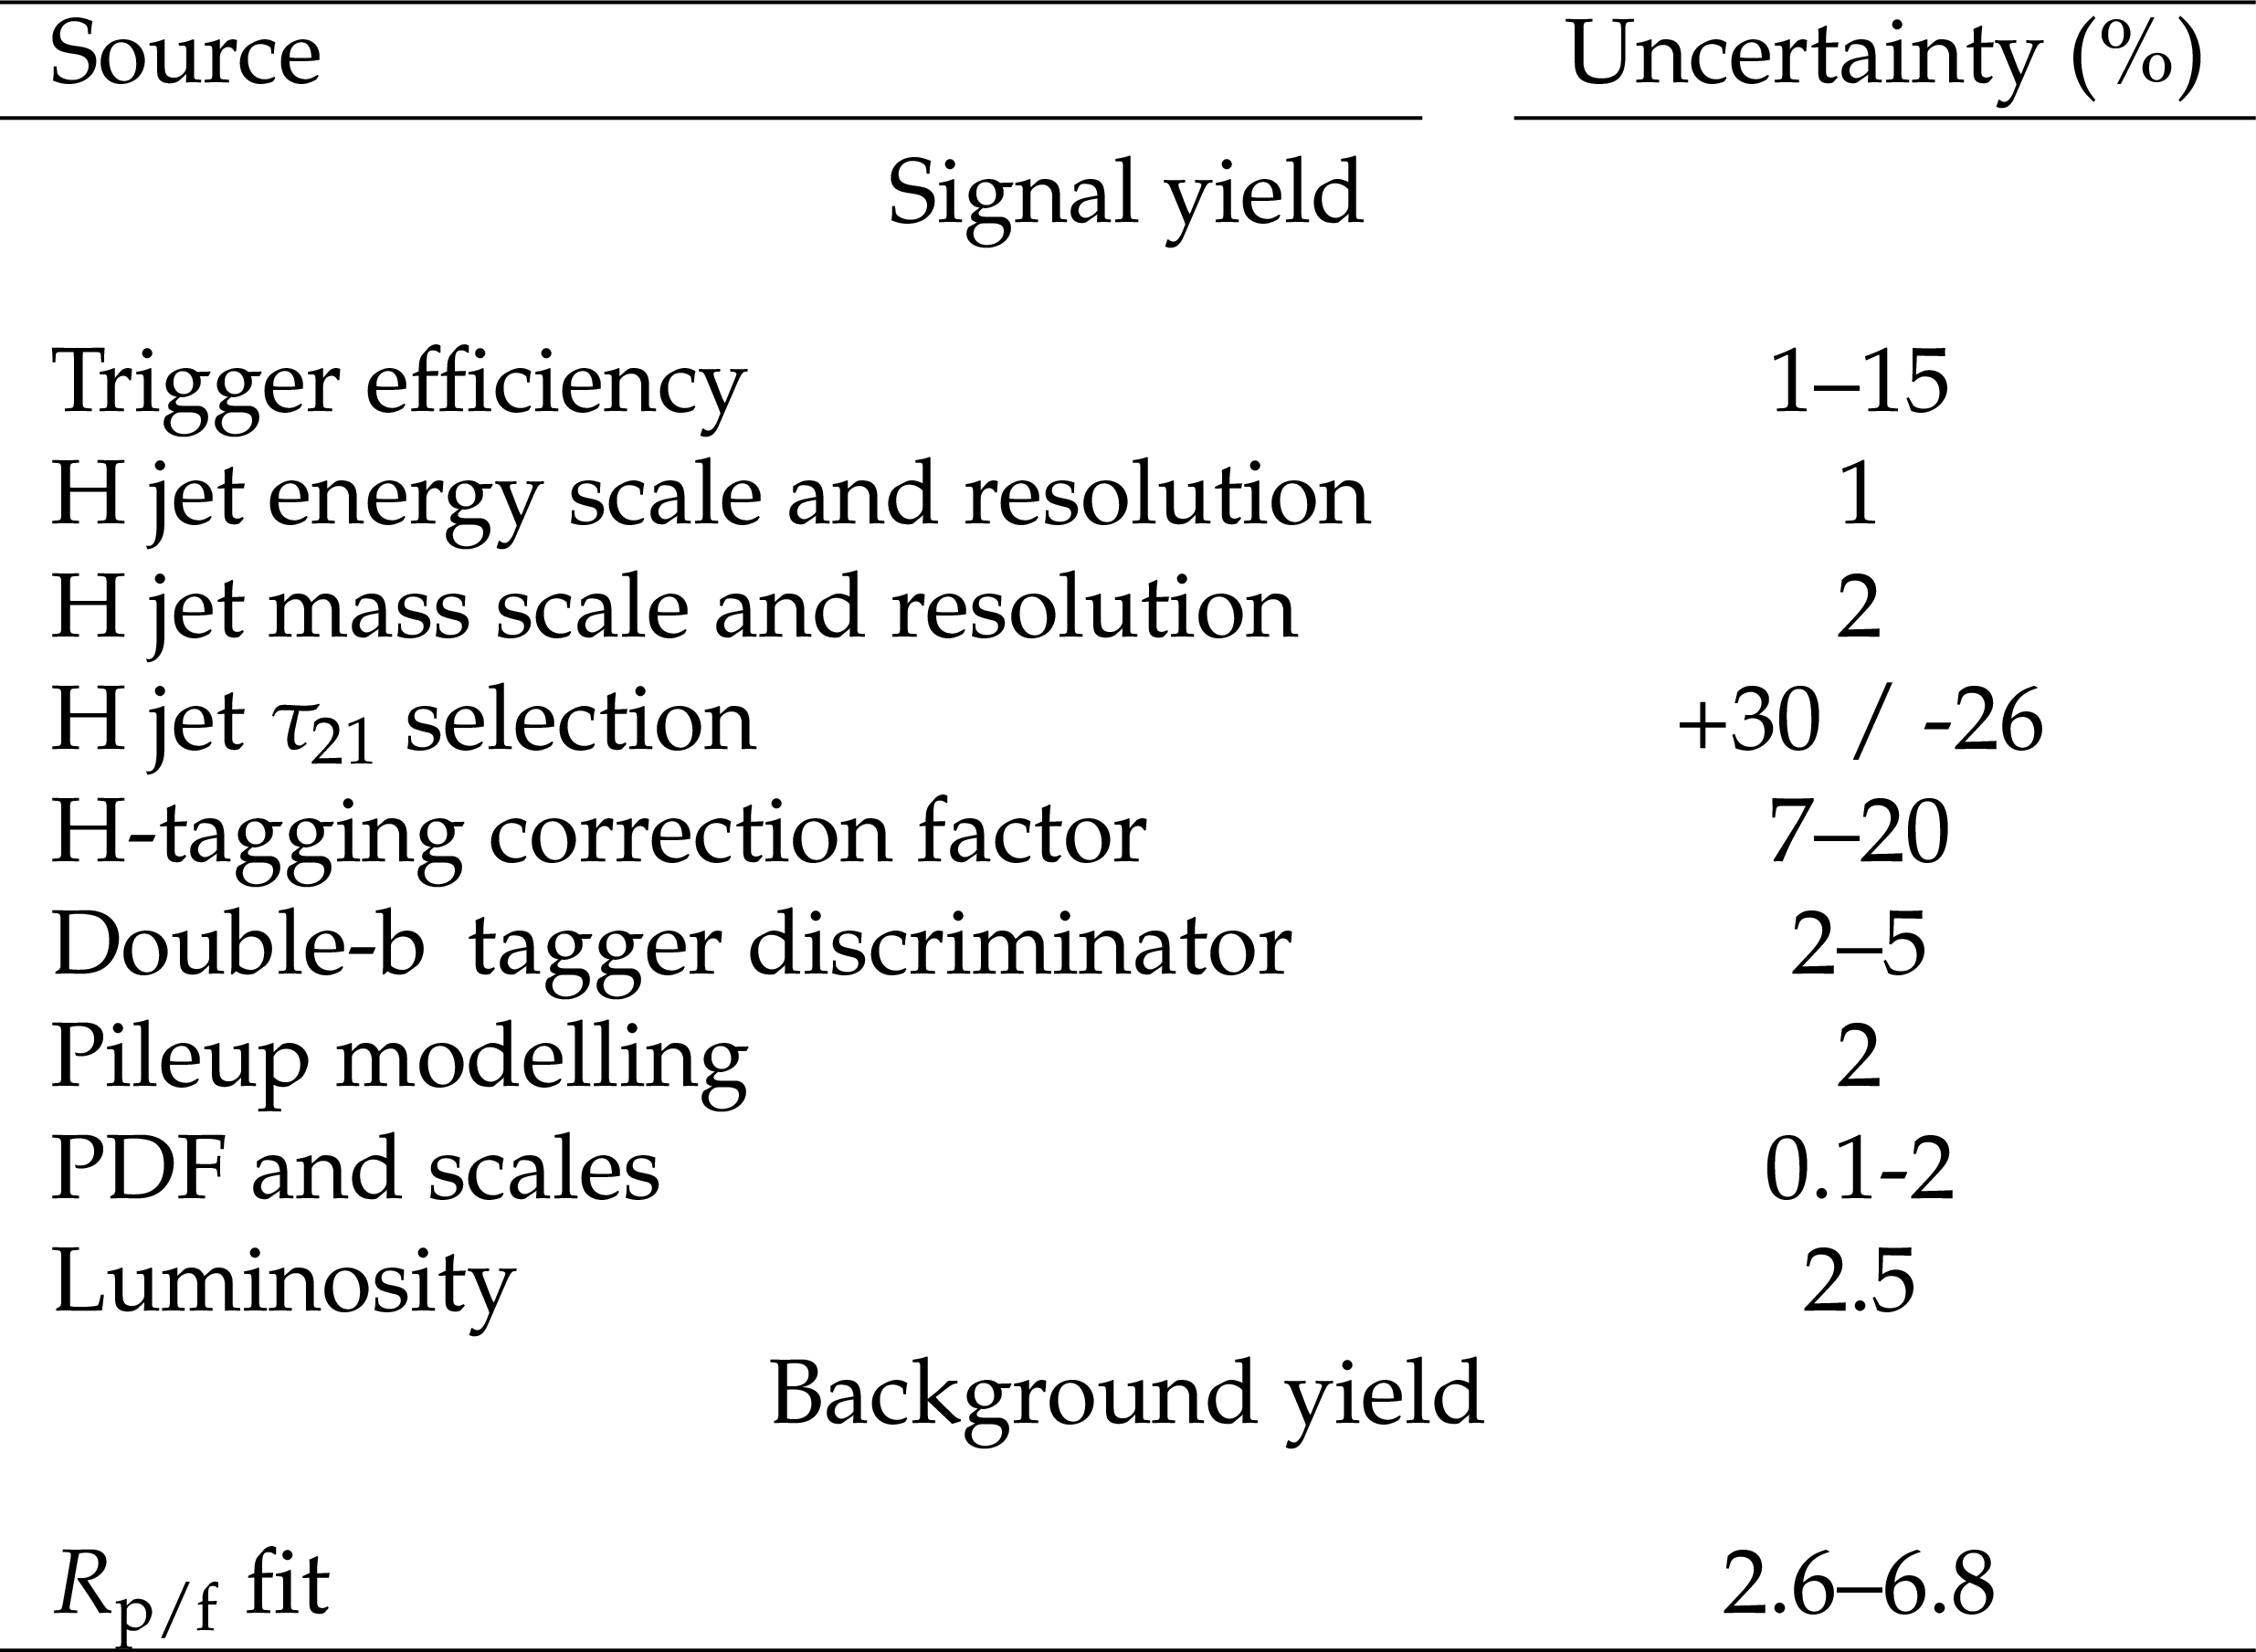
Table 2:
Summary of systematic uncertainties in the signal and background yields. |
| Summary |
| A search for a narrow massive resonance decaying to two standard model Higgs bosons is performed using the LHC proton-proton collision data collected at a centre-of-mass energy of 13 TeV by the CMS detector, and corresponding to an integrated luminosity of 35.9 fb$^{-1}$. The final state consists of events with both Higgs bosons decaying to b quark-antiquark pairs, which were identified using jet substructure and b-tagging techniques applied to large-area jets. The data are found to be consistent with the standard model expectations, dominated by multijet events. Upper limits are set on the products of the resonant production cross sections of a Kaluza-Klein bulk graviton and a Randall-Sundrum radion, and their branching fraction to $\mathrm{H}\mathrm{H} \to \mathrm{b\bar{b}}\mathrm{b\bar{b}}$. The limits range from 126 to 1.4 fb at 95% confidence level for bulk gravitons and radions in the mass range 750-3000 GeV. For the mass scale $\lambda_{\mathrm{R}} = $ 3 TeV, a radion of mass between 970 and 1400 GeV (except in a small region close to 1200 GeV) is excluded. These limits on the bulk graviton and the radion are the most stringent to date, over the mass range explored. |
| References | ||||
| 1 | ATLAS Collaboration | Observation of a new particle in the search for the Standard Model Higgs boson with the ATLAS detector at the LHC | PLB 716 (2012) 01 | 1207.7214 |
| 2 | CMS Collaboration | Observation of a new boson at a mass of 125 GeV with the CMS experiment at the LHC | PLB 716 (2012) 30 | CMS-HIG-12-028 1207.7235 |
| 3 | CMS Collaboration | Observation of a new boson with mass near 125 GeV in pp collisions at $ \sqrt{s} = $ 7 and 8 TeV | JHEP 06 (2013) 081 | CMS-HIG-12-036 1303.4571 |
| 4 | D. de Florian and J. Mazzitelli | Higgs boson pair production at next-to-next-to-leading order in QCD | PRL 111 (2013) 201801 | 1309.6594 |
| 5 | L. Randall and R. Sundrum | A large mass hierarchy from a small extra dimension | PRL 83 (1999) 3370 | hep-ph/9905221 |
| 6 | W. D. Goldberger and M. B. Wise | Modulus stabilization with bulk fields | PRL 83 (1999) 4922 | hep-ph/9907447 |
| 7 | O. DeWolfe, D. Z. Freedman, S. S. Gubser, and A. Karch | Modeling the fifth dimension with scalars and gravity | PRD 62 (2000) 046008 | hep-th/9909134 |
| 8 | C. Csaki, M. Graesser, L. Randall, and J. Terning | Cosmology of brane models with radion stabilization | PRD 62 (2000) 045015 | hep-ph/9911406 |
| 9 | H. Davoudiasl, J. L. Hewett, and T. G. Rizzo | Phenomenology of the Randall-Sundrum gauge hierarchy model | PRL 84 (2000) 2080 | hep-ph/9909255 |
| 10 | C. Csaki, M. L. Graesser, and G. D. Kribs | Radion dynamics and electroweak physics | PRD 63 (2001) 065002 | hep-th/0008151 |
| 11 | K. Agashe, H. Davoudiasl, G. Perez, and A. Soni | Warped gravitons at the LHC and beyond | PRD 76 (2007) 036006 | hep-ph/0701186 |
| 12 | G. F. Giudice, R. Rattazzi, and J. D. Wells | Graviscalars from higher dimensional metrics and curvature Higgs mixing | NPB 595 (2001) 250 | hep-ph/0002178 |
| 13 | A. Oliveira | Gravity particles from warped extra dimensions, a review. part i - KK graviton | 1404.0102 | |
| 14 | ATLAS Collaboration | Search for Higgs boson pair production in the $ \gamma\gamma b\bar{b} $ final state using $ pp $ collision data at $ \sqrt{s}= $ 8 TeV from the ATLAS detector | PRL 114 (2015) 081802 | 1406.5053 |
| 15 | ATLAS Collaboration | Search for Higgs boson pair production in the $ b\bar{b}b\bar{b} $ final state from pp collisions at $ \sqrt{s} = $ 8 TeV with the ATLAS detector | EPJC 75 (2015) 412 | 1506.00285 |
| 16 | ATLAS Collaboration | Searches for Higgs boson pair production in the $ hh\to bb\tau\tau, \gamma\gamma WW^*, \gamma\gamma bb, bbbb $ channels with the ATLAS detector | PRD 92 (2015) 092004 | 1509.04670 |
| 17 | CMS Collaboration | Searches for heavy Higgs bosons in two-Higgs-doublet models and for $ t \rightarrow ch $ decay using multilepton and diphoton final states in $ pp $ collisions at 8 TeV | PRD 90 (2014) 112013 | CMS-HIG-13-025 1410.2751 |
| 18 | CMS Collaboration | Search for resonant pair production of Higgs bosons decaying to two bottom quark-antiquark pairs in proton-proton collisions at 8 TeV | PLB 749 (2015) 560 | CMS-HIG-14-013 1503.04114 |
| 19 | CMS Collaboration | Searches for a heavy scalar boson H decaying to a pair of 125 GeV Higgs bosons hh or for a heavy pseudoscalar boson A decaying to Zh, in the final states with $ \text{h} \to \tau \tau $ | PLB 755 (2016) 217 | CMS-HIG-14-034 1510.01181 |
| 20 | CMS Collaboration | Search for two Higgs bosons in final states containing two photons and two bottom quarks in proton-proton collisions at 8 TeV | PRD 94 (2016) 052012 | CMS-HIG-13-032 1603.06896 |
| 21 | ATLAS Collaboration | Search for high-mass diboson resonances with boson-tagged jets in proton-proton collisions at $ \sqrt{s}= $ 8 TeV with the ATLAS detector | JHEP 12 (2015) 055 | 1506.00962 |
| 22 | ATLAS Collaboration | Search for production of $ WW/WZ $ resonances decaying to a lepton, neutrino and jets in $ pp $ collisions at $ \sqrt{s}= $ 8 TeV with the ATLAS detector | EPJC 75 (2015) 209 | 1503.04677 |
| 23 | ATLAS Collaboration | Search for resonant diboson production in the $ \mathrm {\ell \ell}q\bar{q} $ final state in $ pp $ collisions at $ \sqrt{s} = $ 8 TeV with the ATLAS detector | EPJC 75 (2015) 69 | 1409.6190 |
| 24 | CMS Collaboration | Search for massive resonances in dijet systems containing jets tagged as W or Z boson decays in pp collisions at $ \sqrt{s} = $ 8 TeV | JHEP 08 (2014) 173 | CMS-EXO-12-024 1405.1994 |
| 25 | CMS Collaboration | Search for massive resonances decaying into pairs of boosted bosons in semi-leptonic final states at $ \sqrt{s} = $ 8 TeV | JHEP 08 (2014) 174 | CMS-EXO-13-009 1405.3447 |
| 26 | ATLAS Collaboration | Search for pair production of Higgs bosons in the $ b\bar{b}b\bar{b} $ final state using proton--proton collisions at $ \sqrt{s} = $ 13 TeV with the ATLAS detector | PRD 94 (2016) 052002 | 1606.04782 |
| 27 | D. de Florian et al. | Handbook of LHC Higgs cross sections: 4. deciphering the nature of the Higgs sector | CERN-2017-002-M, CERN | 1610.07922 |
| 28 | CMS Collaboration | Search for heavy resonances decaying to two Higgs bosons in final states containing four b quarks | EPJC 76 (2016) 371 | CMS-EXO-12-053 1602.08762 |
| 29 | J. M. Butterworth, A. R. Davison, M. Rubin, and G. P. Salam | Jet substructure as a new Higgs search channel at the LHC | PRL 100 (2008) 242001 | 0802.2470 |
| 30 | B. Cooper, N. Konstantinidis, L. Lambourne, and D. Wardrope | Boosted $ hh \rightarrow b\bar{b}b\bar{b} $: a new topology in searches for TeV-scale resonances at the LHC | PRD 88 (2013) 114005 | 1307.0407 |
| 31 | M. Gouzevitch et al. | Scale-invariant resonance tagging in multijet events and new physics in Higgs pair production | JHEP 07 (2013) 148 | 1303.6636 |
| 32 | CMS Collaboration | The CMS experiment at the CERN LHC | JINST 3 (2008) S08004 | CMS-00-001 |
| 33 | CMS Collaboration | The CMS trigger system | JINST 12 (2017) P01020 | CMS-TRG-12-001 1609.02366 |
| 34 | CMS Collaboration | Particle-flow reconstruction and global event description with the CMS detector | JINST 12 (2017) P10003 | CMS-PRF-14-001 1706.04965 |
| 35 | M. Cacciari, G. P. Salam, and G. Soyez | The anti-$ k_t $ jet clustering algorithm | JHEP 04 (2008) 063 | 0802.1189 |
| 36 | M. Cacciari, G. P. Salam, and G. Soyez | FastJet user manual | EPJC 72 (2012) 1896 | 1111.6097 |
| 37 | J. Alwall et al. | The automated computation of tree-level and next-to-leading order differential cross sections, and their matching to parton shower simulations | JHEP 07 (2014) 079 | 1405.0301 |
| 38 | S. Carrazza, J. I. Latorre, J. Rojo, and G. Watt | A compression algorithm for the combination of PDF sets | EPJC 75 (2015) 474 | 1504.06469 |
| 39 | J. Butterworth et al. | PDF4LHC recommendations for LHC Run II | JPG 43 (2016) 023001 | 1510.03865 |
| 40 | S. Dulat et al. | The CT14 Global Analysis of Quantum Chromodynamics | PRD 93 (2015) 033006 | 1506.07443 |
| 41 | L. A. Harland-Lang, A. D. Martin, P. Motylinski, and R. S. Thorne | Parton distributions in the LHC era: MMHT 2014 PDFs | EPJC 75 (2015) 204 | 1412.3989 |
| 42 | NNPDF Collaboration | Parton distributions for the LHC Run II | JHEP 04 (2015) 040 | 1410.8849 |
| 43 | A. Buckley et al. | LHAPDF6: parton density access in the LHC precision era | EPJC 75 (2015) 132 | 1412.7420 |
| 44 | T. Sjostrand et al. | An Introduction to PYTHIA 8.2 | CPC 191 (2015) 159 | 1410.3012 |
| 45 | M. Bahr et al. | Herwig++ physics and manual | EPJC 58 (2008) 639 | 0803.0883 |
| 46 | CMS Collaboration | Event generator tunes obtained from underlying event and multiparton scattering measurements | EPJC 76 (2016) 155 | CMS-GEN-14-001 1512.00815 |
| 47 | S. Gieseke, C. Rohr, and A. Siodmok | Colour reconnections in Herwig++ | EPJC 72 (2012) 2225 | 1206.0041 |
| 48 | S. Frixione, G. Ridolfi, and P. Nason | A positive-weight next-to-leading-order monte carlo for heavy flavour hadroproduction | JHEP 09 (2007) 126 | 0707.3088 |
| 49 | S. Frixione, P. Nason, and C. Oleari | Matching NLO QCD computations with Parton Shower simulations: the POWHEG method | JHEP 11 (2007) 070 | 0709.2092 |
| 50 | S. Alioli, P. Nason, C. Oleari, and E. Re | A general framework for implementing NLO calculations in shower Monte Carlo programs: the POWHEG BOX | JHEP 06 (2010) 043 | 1002.2581 |
| 51 | GEANT4 Collaboration | GEANT4---a simulation toolkit | NIMA 506 (2003) 250 | |
| 52 | J. Allison et al. | Geant4 developments and applications | IEEE Trans. Nucl. Sci. 53 (2006) 270 | |
| 53 | D. Krohn, J. Thaler, and L.-T. Wang | Jet trimming | JHEP 02 (2010) 084 | 0912.1342 |
| 54 | D. Bertolini, P. Harris, M. Low, and N. Tran | Pileup per particle identification | JHEP 10 (2014) 059 | 1407.6013 |
| 55 | CMS Collaboration | Performance of electron reconstruction and selection with the CMS detector in proton-proton collisions at $ \sqrt{s} = $ 8 TeV | JINST 10 (2015) P06005 | CMS-EGM-13-001 1502.02701 |
| 56 | CMS Collaboration | Performance of CMS muon reconstruction in pp collision events at $ \sqrt{s} = $ 7 TeV | JINST 7 (2012) P10002 | CMS-MUO-10-004 1206.4071 |
| 57 | G. P. Salam | Towards jetography | EPJC 67 (2010) 637 | 0906.1833 |
| 58 | M. Dasgupta, A. Fregoso, S. Marzani, and G. P. Salam | Towards an understanding of jet substructure | JHEP 09 (2013) 029 | 1307.0007 |
| 59 | A. J. Larkoski, S. Marzani, G. Soyez, and J. Thaler | Soft drop | JHEP 05 (2014) 146 | 1402.2657 |
| 60 | CMS Collaboration | Jet algorithms performance in 13 TeV data | CMS-PAS-JME-16-003 | CMS-PAS-JME-16-003 |
| 61 | J. Thaler and K. Van Tilburg | Maximizing boosted top identification by minimizing N-subjettiness | JHEP 02 (2012) 093 | 1108.2701 |
| 62 | CMS Collaboration | Identification of double-b quark jets in boosted topologies | CMS-PAS-BTV-15-002 | CMS-PAS-BTV-15-002 |
| 63 | ATLAS and CMS Collaborations | Combined measurement of the Higgs boson mass in $ pp $ collisions at $ \sqrt{s}= $ 7 and 8 tev with the ATLAS and CMS experiments | PRL 114 (2015) 191803 | 1503.07589 |
| 64 | CMS Collaboration | Measurements of properties of the Higgs boson decaying into the four-lepton final state in pp collisions at sqrt(s) = 13 TeV | Submitted to JHEP | CMS-HIG-16-041 1706.09936 |
| 65 | M. J. Oreglia | A study of the reactions $\psi' \to \gamma\gamma \psi$ | PhD thesis, Stanford University, 1980 SLAC Report SLAC-R-236, see Appendix D | |
| 66 | F. Garwood | (i) Fiducial limits for the Poisson distribution | Biometrika 28 (1936) 437 | |
| 67 | R. G. Lomax and D. L. Hahs-Vaughn | Statistical concepts: a second course | Taylor and Francis, Hoboken, NJ | |
| 68 | CMS Collaboration | Jet energy scale and resolution in the CMS experiment in pp collisions at 8 TeV | JINST 12 (2017) P02014 | CMS-JME-13-004 1607.03663 |
| 69 | CMS Collaboration | Jet energy scale and resolution performances with 13 TeV data | CDS | |
| 70 | CMS Collaboration | CMS luminosity measurement for the 2016 data taking period | CMS-PAS-LUM-17-001 | |
| 71 | R. Barlow and C. Beeston | Fitting using finite Monte Carlo samples | CPC 77 (1993) 219 | |
| 72 | J. S. Conway | Incorporating nuisance parameters in likelihoods for multisource spectra | in Proceedings, PHYSTAT 2011 Workshop on Statistical Issues Related to Discovery Claims in Search Experiments and Unfolding, CERN 2011 | 1103.0354 |
| 73 | A. L. Read | Presentation of search results: The $ CL_s $ technique | JPG 28 (2002) 2693 | |
| 74 | T. Junk | Confidence level computation for combining searches with small statistics | NIMA 434 (1999) 435 | hep-ex/9902006 |
| 75 | G. Cowan, K. Cranmer, E. Gross, and O. Vitells | Asymptotic formulae for likelihood-based tests of new physics | EPJC 71 (2011) 1554 | 1007.1727 |
|
|
Compact Muon Solenoid LHC, CERN |
|

|

|

|

|

|