

Compact Muon Solenoid
LHC, CERN
| CMS-B2G-17-013 ; CERN-EP-2018-037 | ||
| Search for a new heavy resonance decaying into a Z boson and a Z or W boson in $ 2\ell 2\mathrm{q} $ final states at $\sqrt{s} = $ 13 TeV | ||
| CMS Collaboration | ||
| 27 March 2018 | ||
| JHEP 09 (2018) 101 | ||
| Abstract: A search has been performed for new, heavy resonances decaying to ZZ or ZW in $ 2\ell 2\mathrm{q} $ final states, with two charged leptons ($\ell= \mathrm{e}$, $\mu$) produced by the decay of a Z boson, and two quarks produced by the decay of a W or Z boson. The analysis is sensitive to resonances with masses in the range from 400 to 4500 GeV. Two categories are defined based on the merged or resolved reconstruction of the hadronically decaying vector boson, optimized for high- and low-mass resonances, respectively. The search is based on data collected during 2016 by the CMS experiment at the LHC in proton-proton collisions with a center-of-mass energy of $\sqrt{s} = $ 13 TeV, corresponding to an integrated luminosity of 35.9 fb$^{-1}$. No excess is observed in the data above the standard model background expectation. Upper limits on the production cross section of heavy, narrow spin-1 and spin-2 resonances are derived as a function of the resonance mass, and exclusion limits on the production of W' bosons and bulk graviton particles are calculated in the framework of the heavy vector triplet model and warped extra dimensions, respectively. | ||
| Links: e-print arXiv:1803.10093 [hep-ex] (PDF) ; CDS record ; inSPIRE record ; HepData record ; CADI line (restricted) ; | ||
| Figures | |
png pdf |
Figure 1:
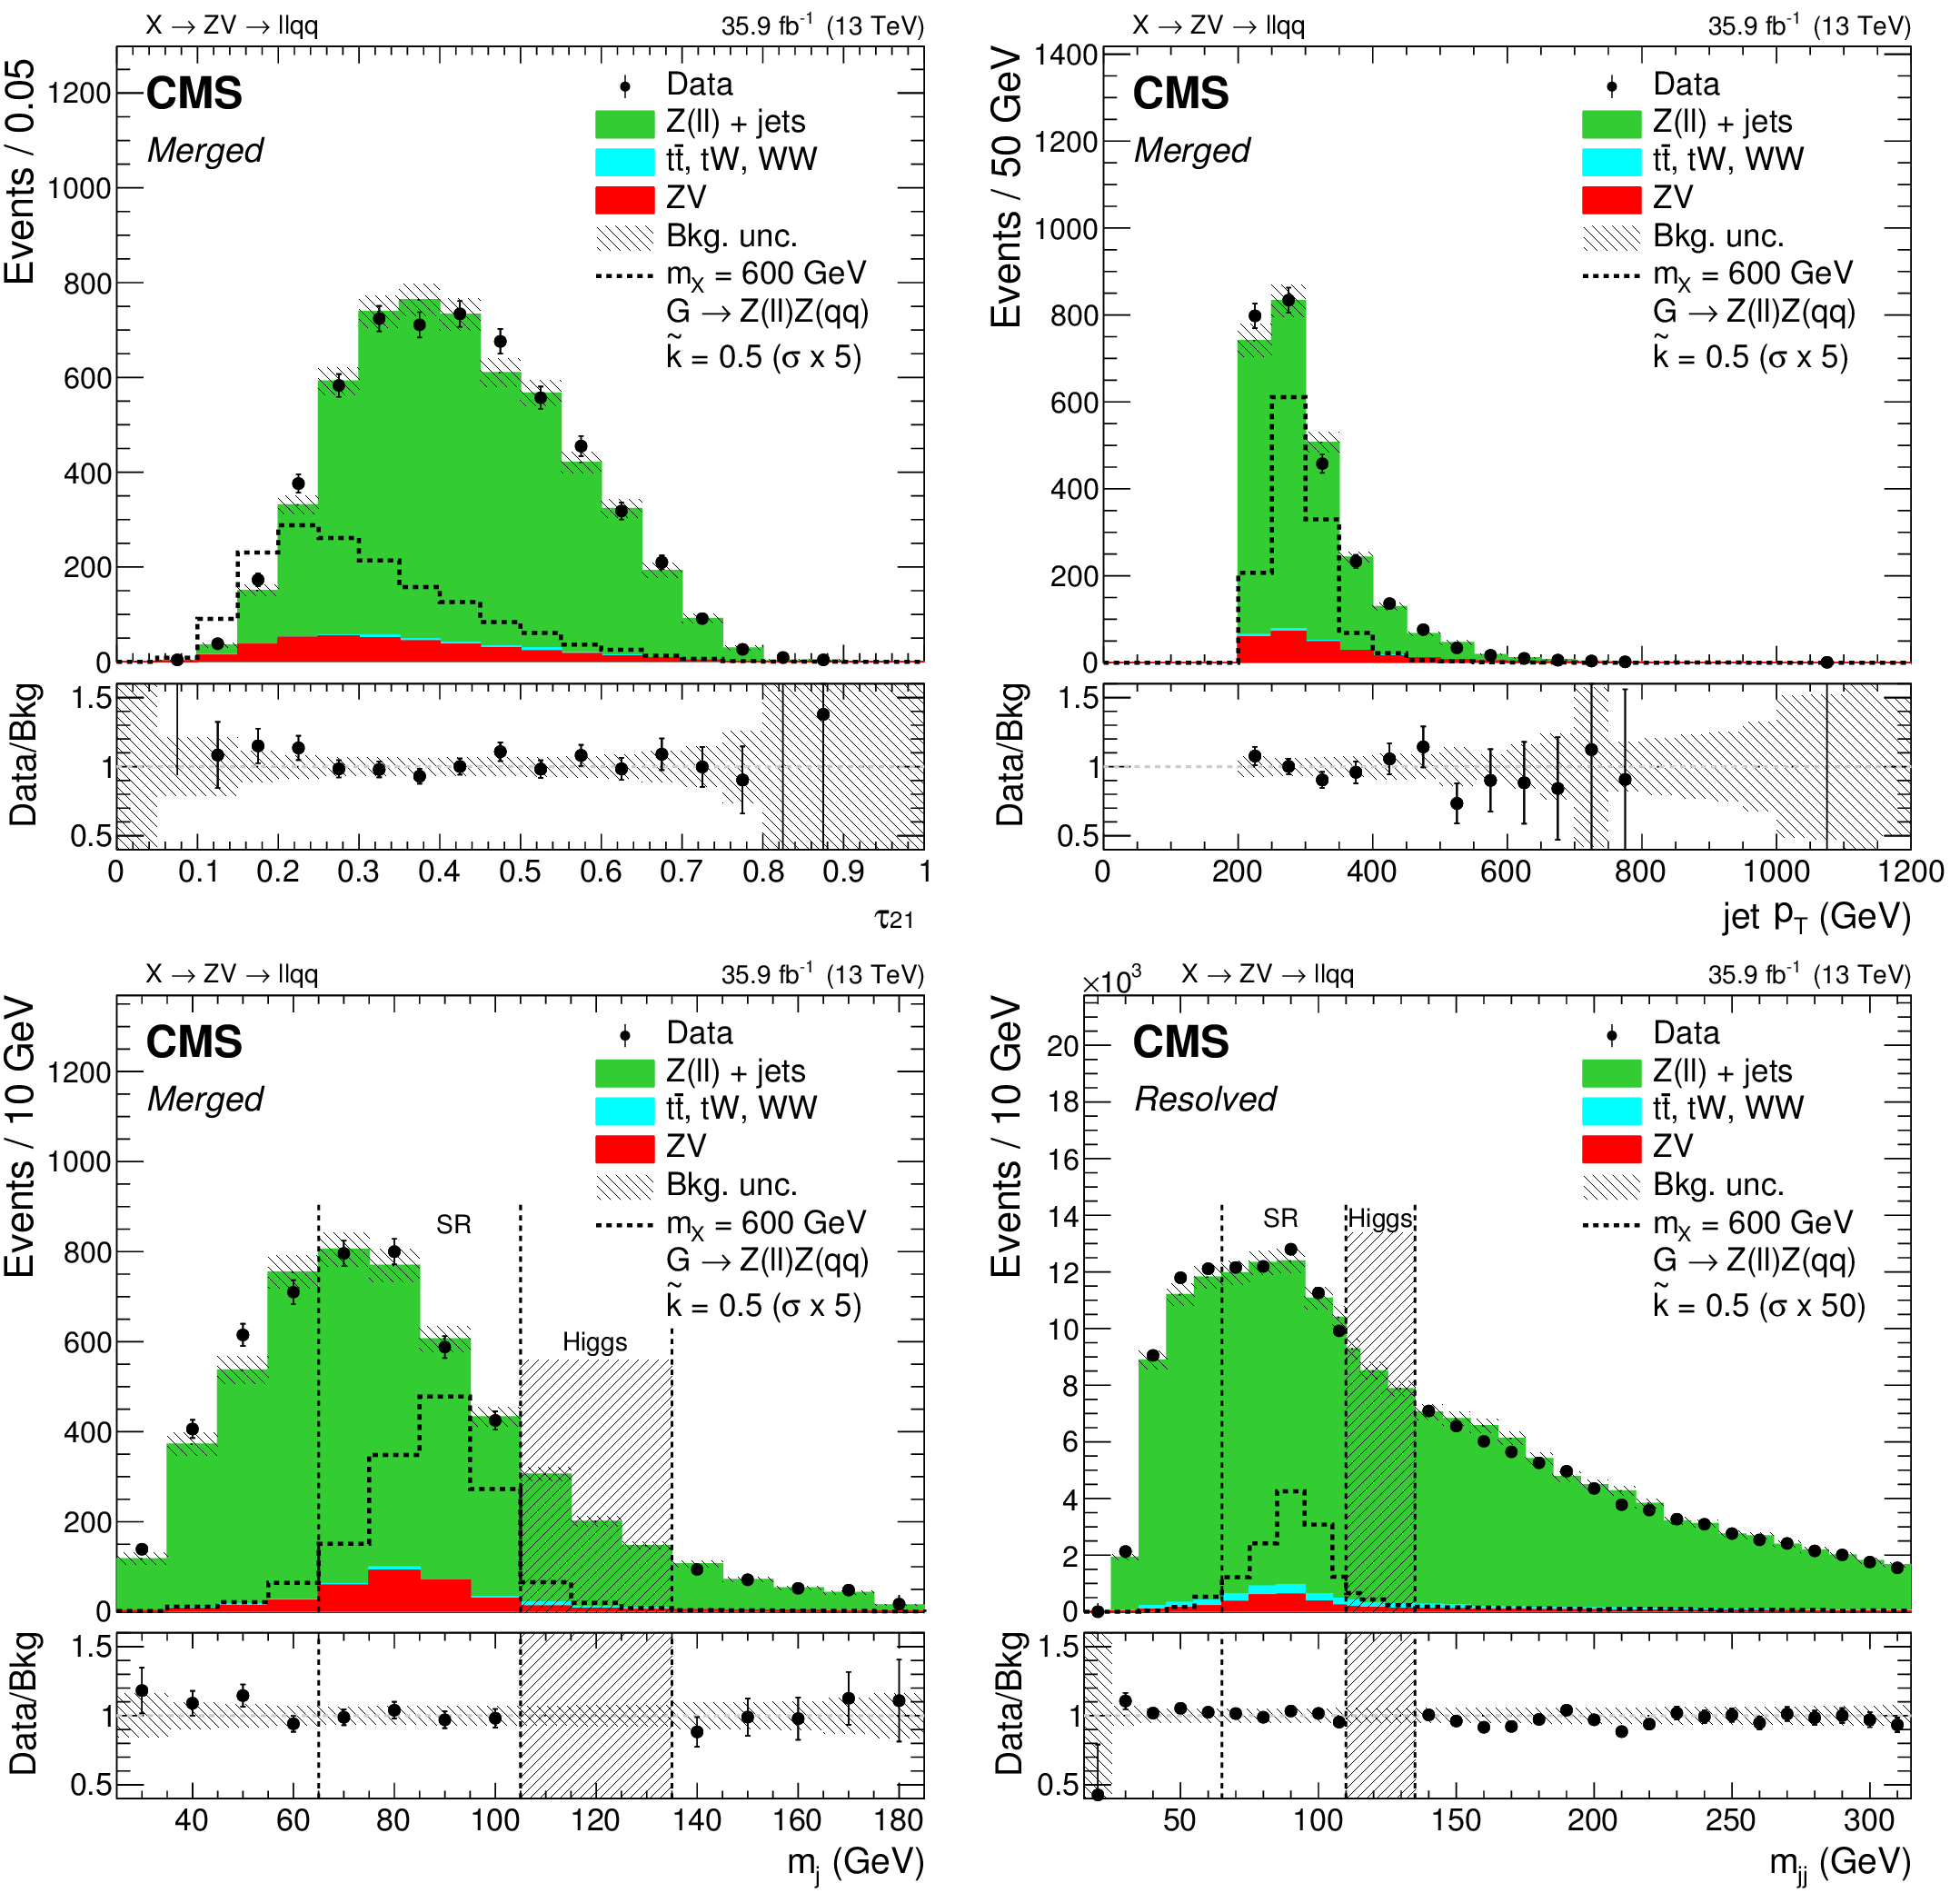
Upper row: distribution of the merged V candidate $ {\tau _{21}} $ (left), where the $ {\tau _{21}} < 0.4$ requirement has been removed, and the jet $ {p_{\mathrm {T}}} $ (right) in data and simulation for events in the signal region of the low-mass analysis. Lower row: V candidate $ {m_\mathrm {j}} $ (left) and $ {m_\mathrm {jj}} $ (right) in data and simulation for events in the signal regions of the low-mass search. The points show the data while the filled histograms show the background contributions. The gray band shows the statistical and systematic uncertainties in the background, while the dashed vertical region ("Higgs'') shows the expected SM Higgs boson mass range, which is excluded from this analysis. A 600 GeV bulk graviton signal prediction is represented by the black dashed histogram; for visibility, the signal cross-section is increased by a factor of 5 in the merged category and 50 in the resolved category. The background normalization is derived from the final fit to the $ {m_{{{\mathrm {V}} \mathrm{Z}}}} $ observable in data. |
png pdf |
Figure 1-a:
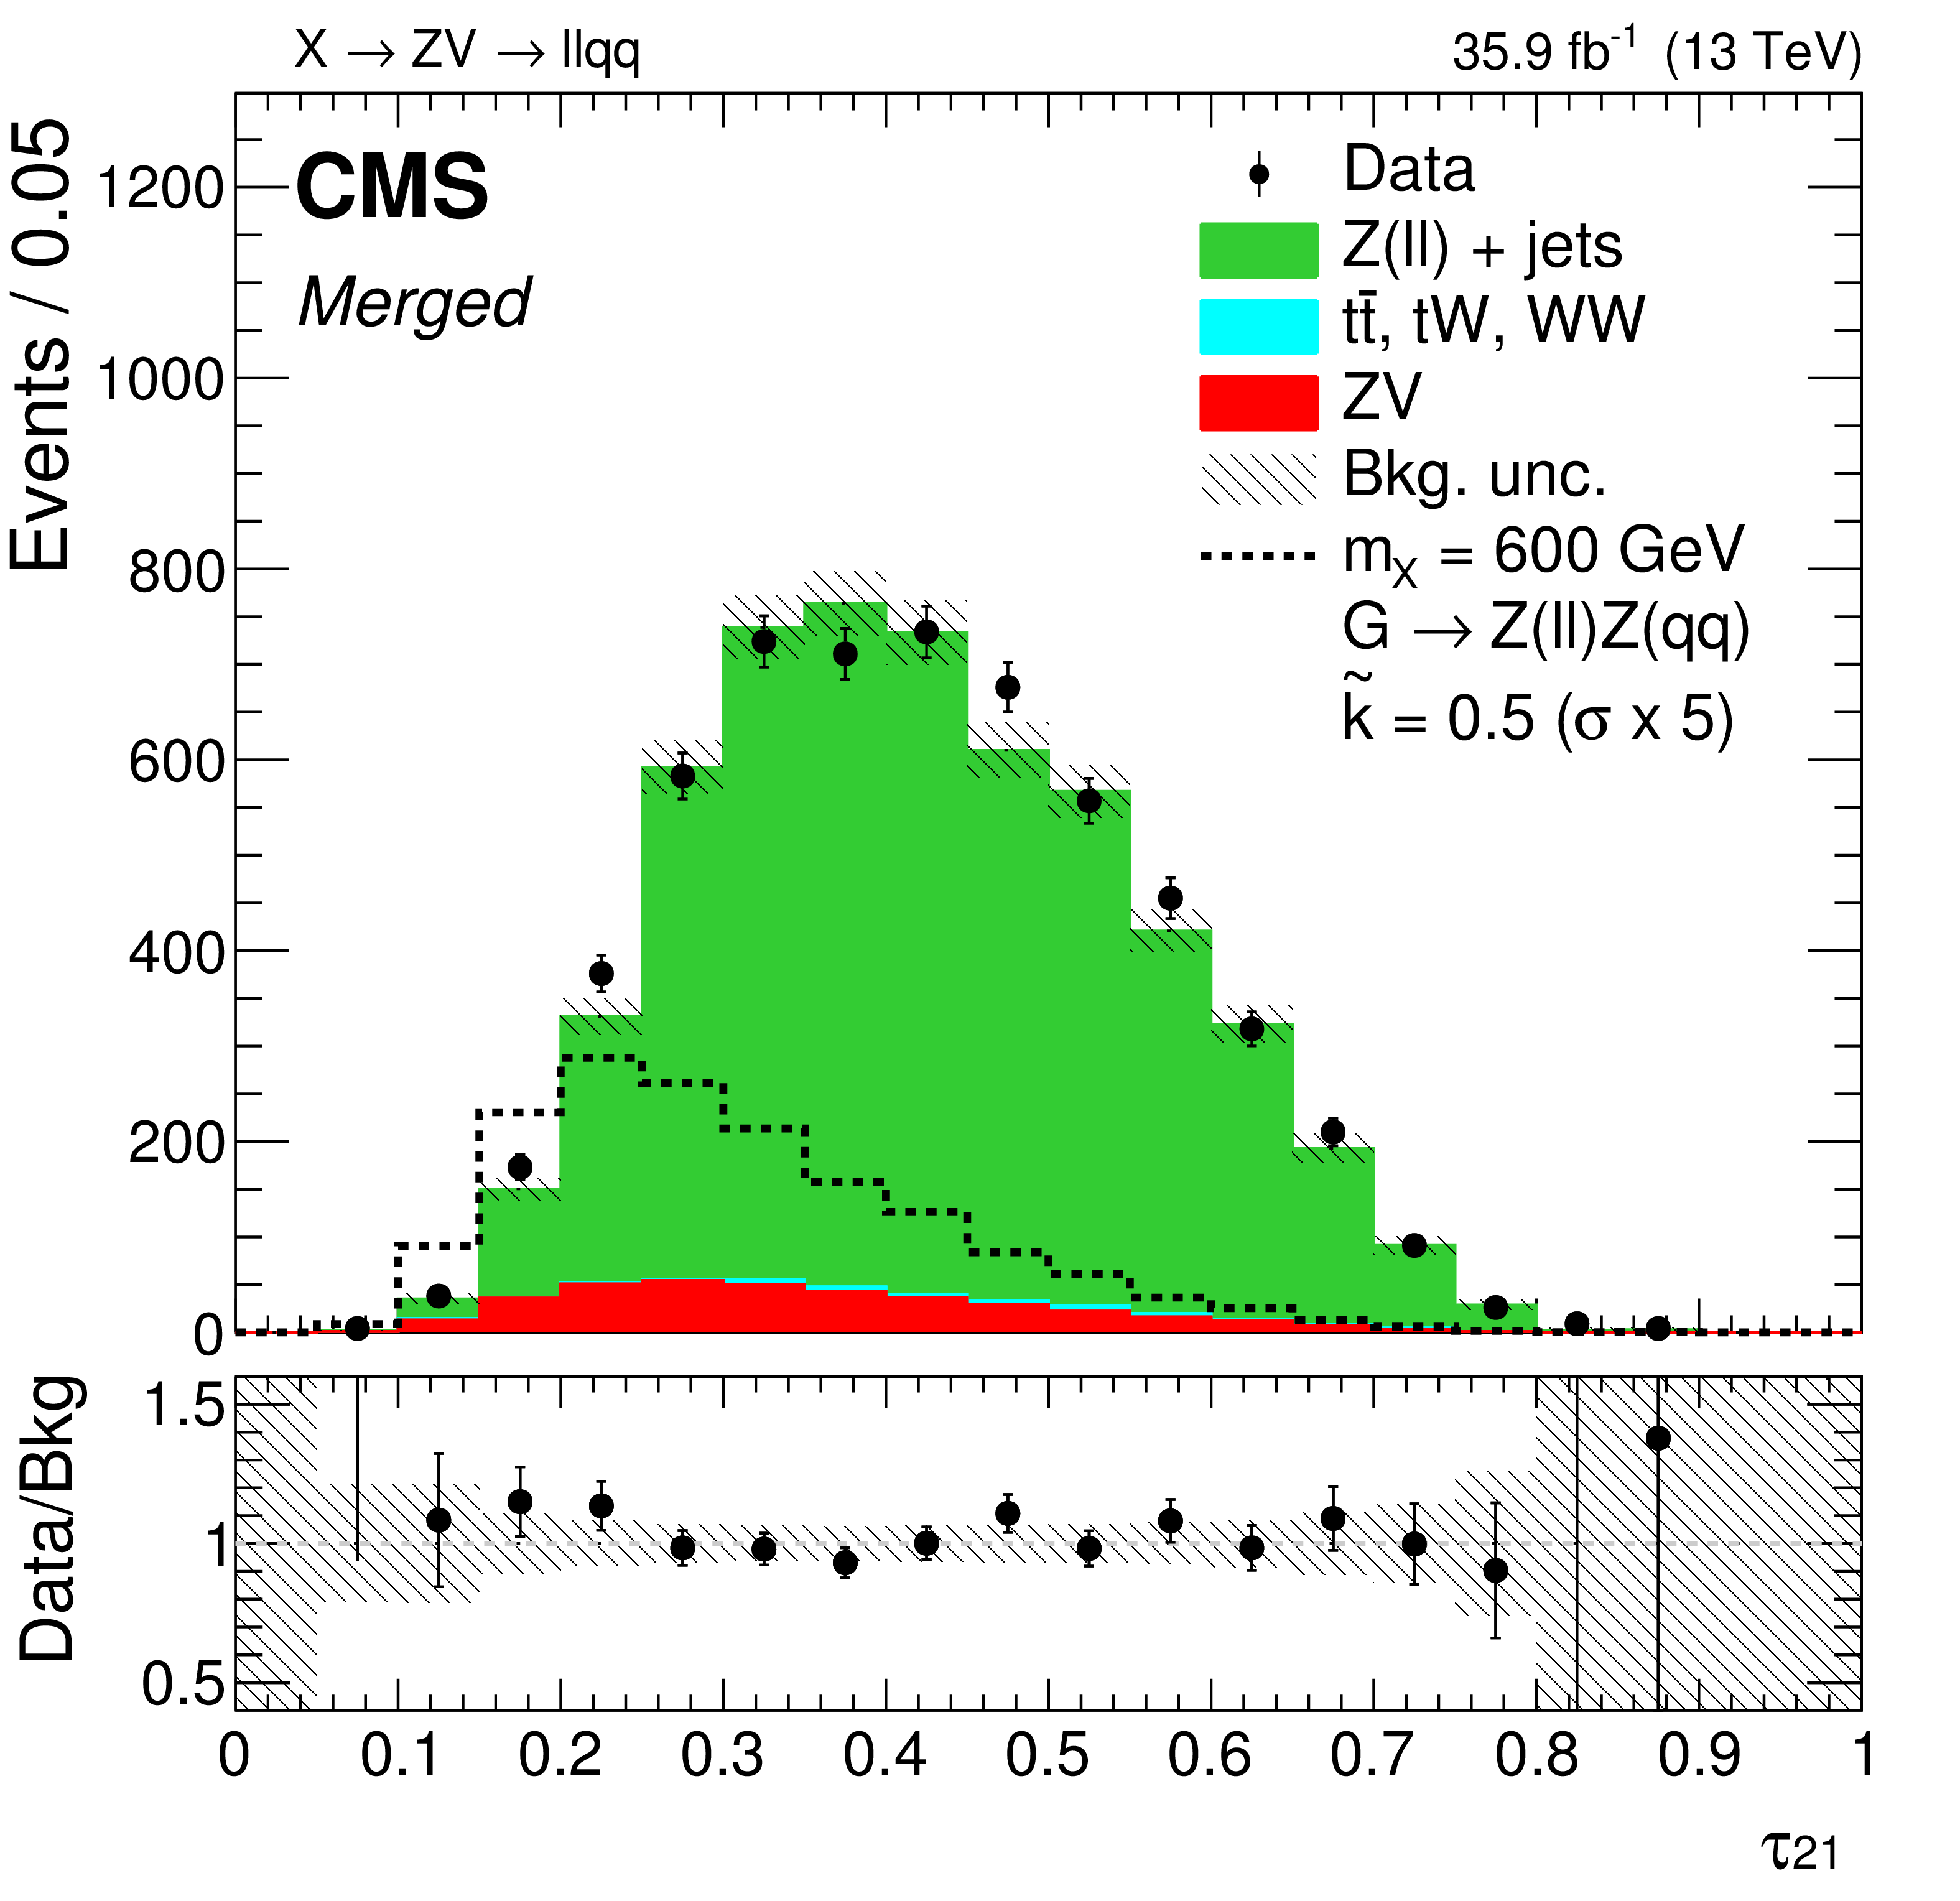
Distribution of the merged V candidate $ {\tau _{21}} $, where the $ {\tau _{21}} < 0.4$ requirement has been removed, in data and simulation for events in the signal region of the low-mass analysis. The points show the data while the filled histograms show the background contributions. The gray band shows the statistical and systematic uncertainties in the background, while the dashed vertical region ("Higgs'') shows the expected SM Higgs boson mass range, which is excluded from this analysis. A 600 GeV bulk graviton signal prediction is represented by the black dashed histogram; for visibility, the signal cross-section is increased by a factor of 5. The background normalization is derived from the final fit to the $ {m_{{{\mathrm {V}} \mathrm{Z}}}} $ observable in data. |

png pdf |
Figure 1-b:
Distribution of the jet $ {p_{\mathrm {T}}} $ in data and simulation for events in the signal region of the low-mass analysis. The points show the data while the filled histograms show the background contributions. The gray band shows the statistical and systematic uncertainties in the background, while the dashed vertical region ("Higgs'') shows the expected SM Higgs boson mass range, which is excluded from this analysis. A 600 GeV bulk graviton signal prediction is represented by the black dashed histogram; for visibility, the signal cross-section is increased by a factor of 5. The background normalization is derived from the final fit to the $ {m_{{{\mathrm {V}} \mathrm{Z}}}} $ observable in data. |

png pdf |
Figure 1-c:
Distribution of V candidate $ {m_\mathrm {j}} $ in data and simulation for events in the signal regions of the low-mass search. The points show the data while the filled histograms show the background contributions. The gray band shows the statistical and systematic uncertainties in the background, while the dashed vertical region ("Higgs'') shows the expected SM Higgs boson mass range, which is excluded from this analysis. A 600 GeV bulk graviton signal prediction is represented by the black dashed histogram; for visibility, the signal cross-section is increased by a factor of 5. The background normalization is derived from the final fit to the $ {m_{{{\mathrm {V}} \mathrm{Z}}}} $ observable in data. |
png pdf |
Figure 1-d:
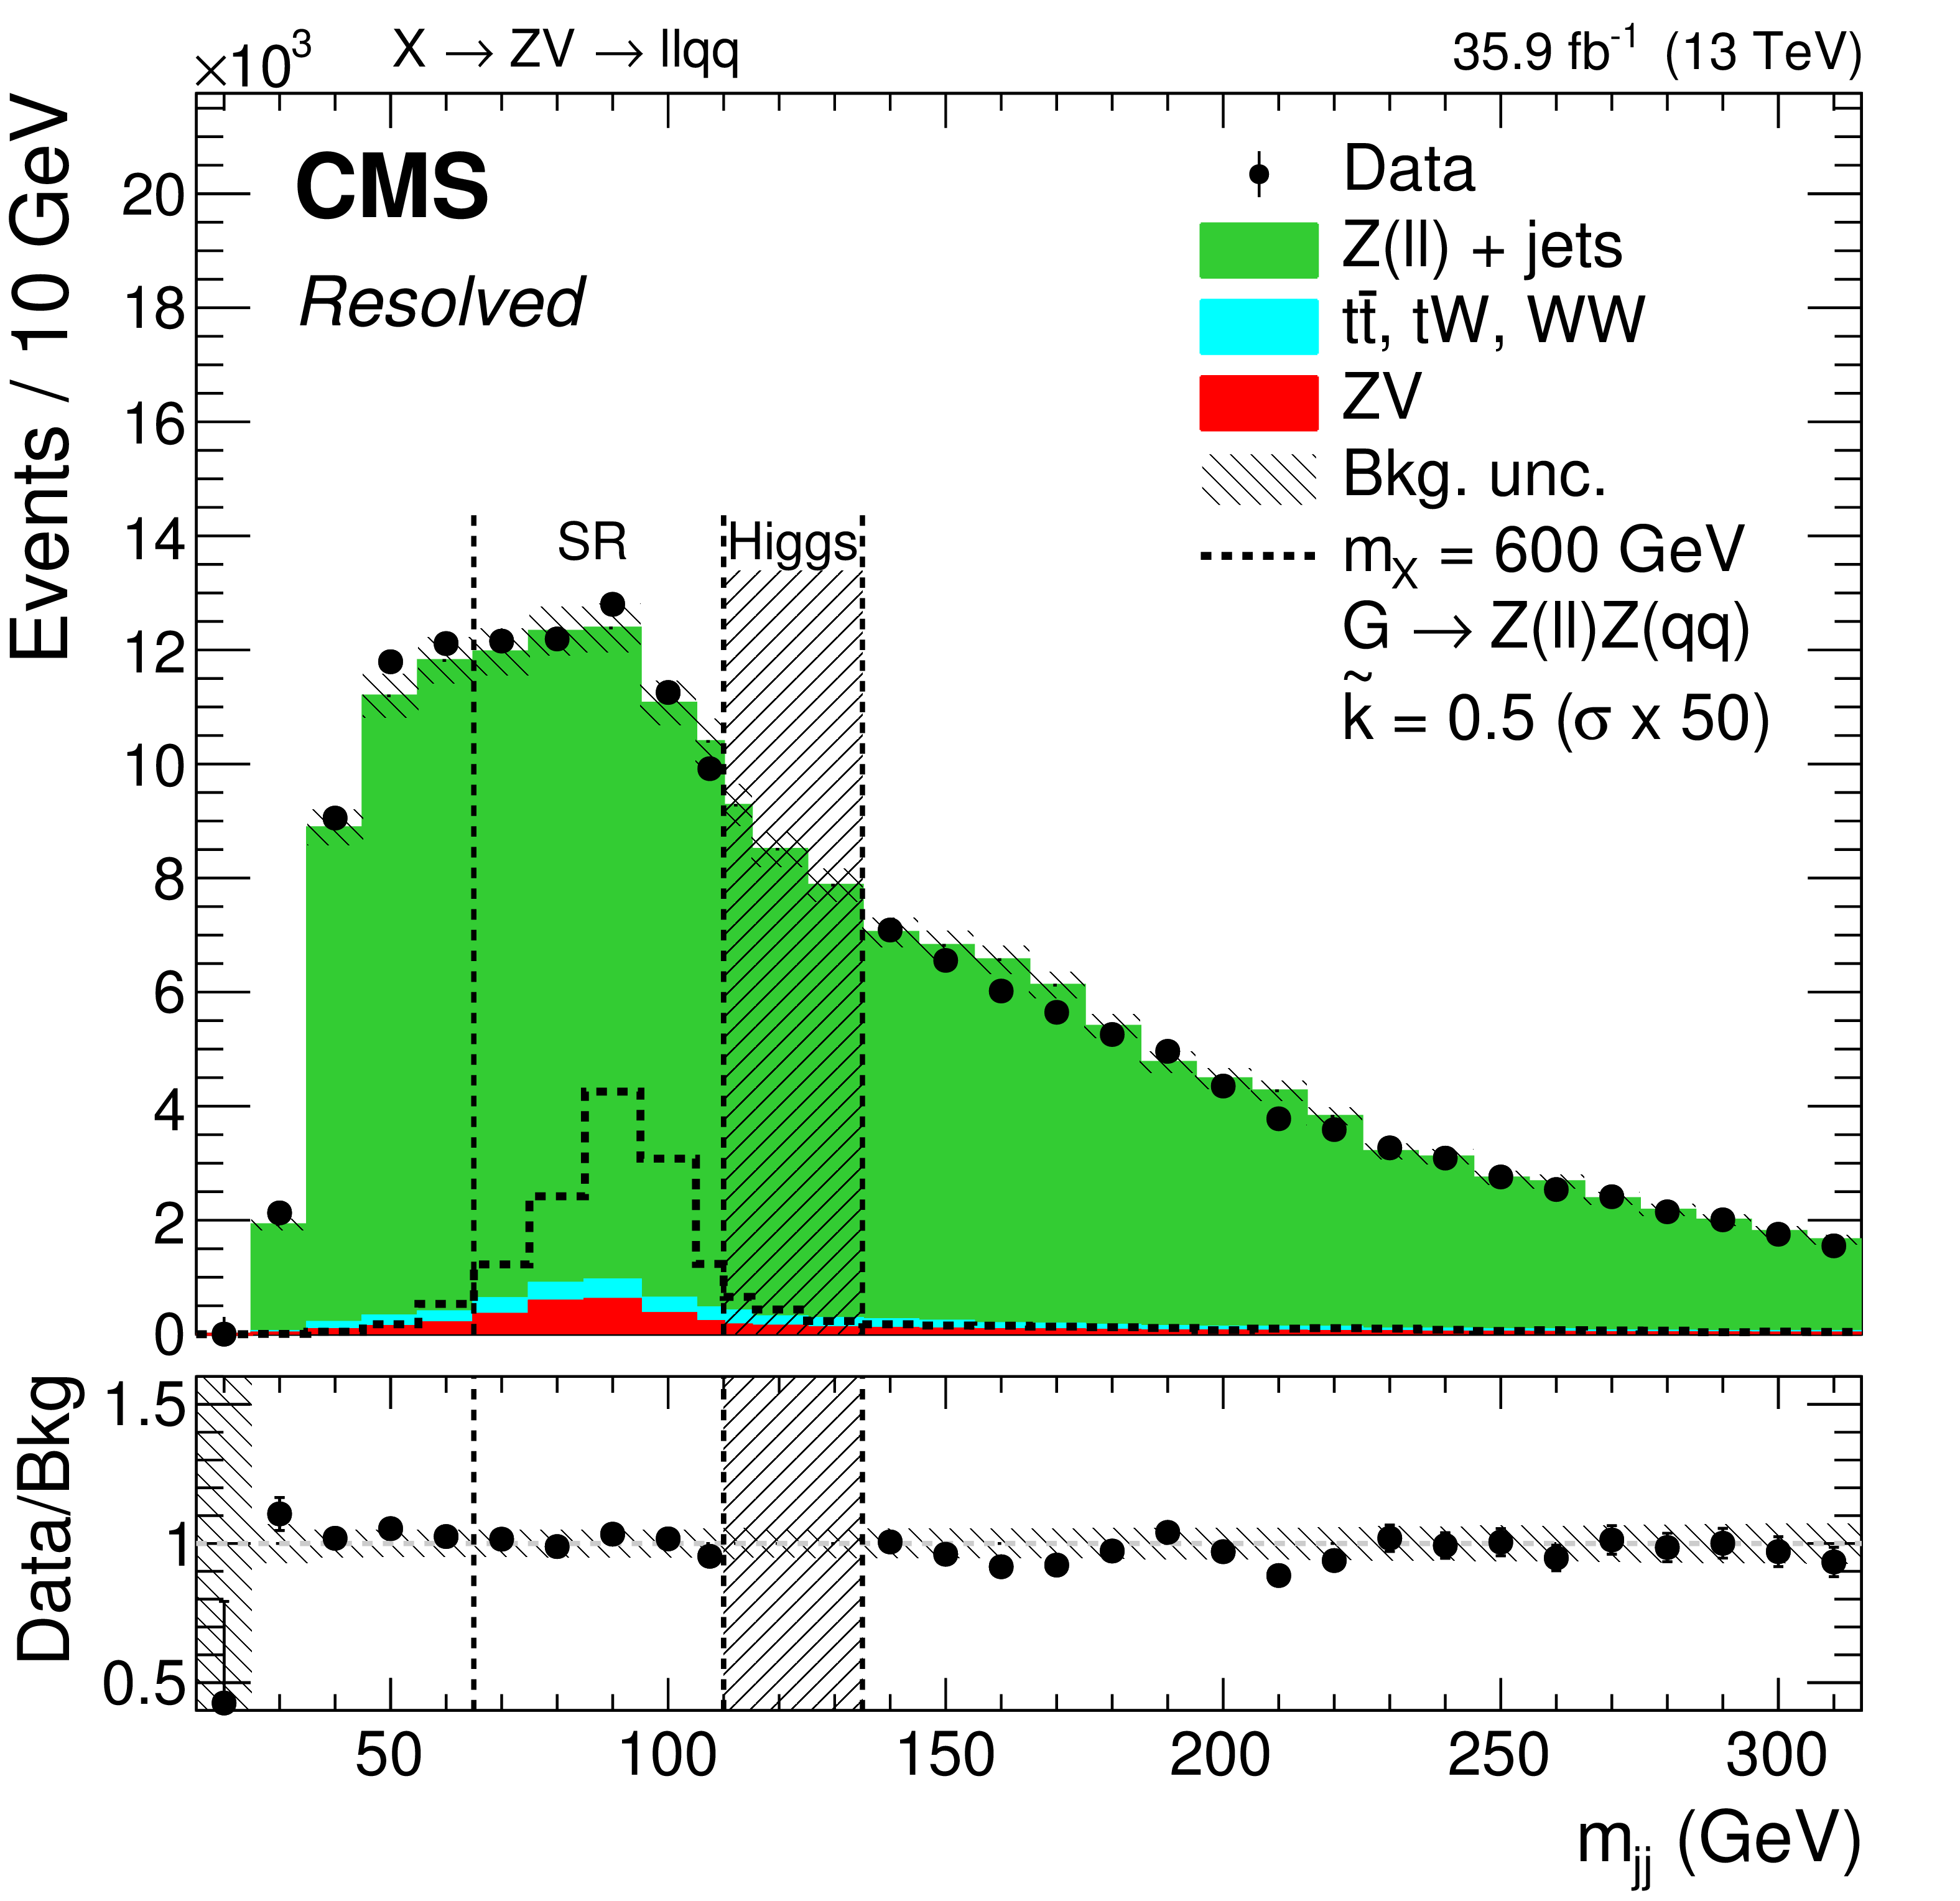
Distribution of $ {m_\mathrm {jj}} $ in data and simulation for events in the signal regions of the low-mass search. The points show the data while the filled histograms show the background contributions. The gray band shows the statistical and systematic uncertainties in the background, while the dashed vertical region ("Higgs'') shows the expected SM Higgs boson mass range, which is excluded from this analysis. A 600 GeV bulk graviton signal prediction is represented by the black dashed histogram; for visibility, the signal cross-section is increased by a factor of 50. The background normalization is derived from the final fit to the $ {m_{{{\mathrm {V}} \mathrm{Z}}}} $ observable in data. |
png pdf |
Figure 2:
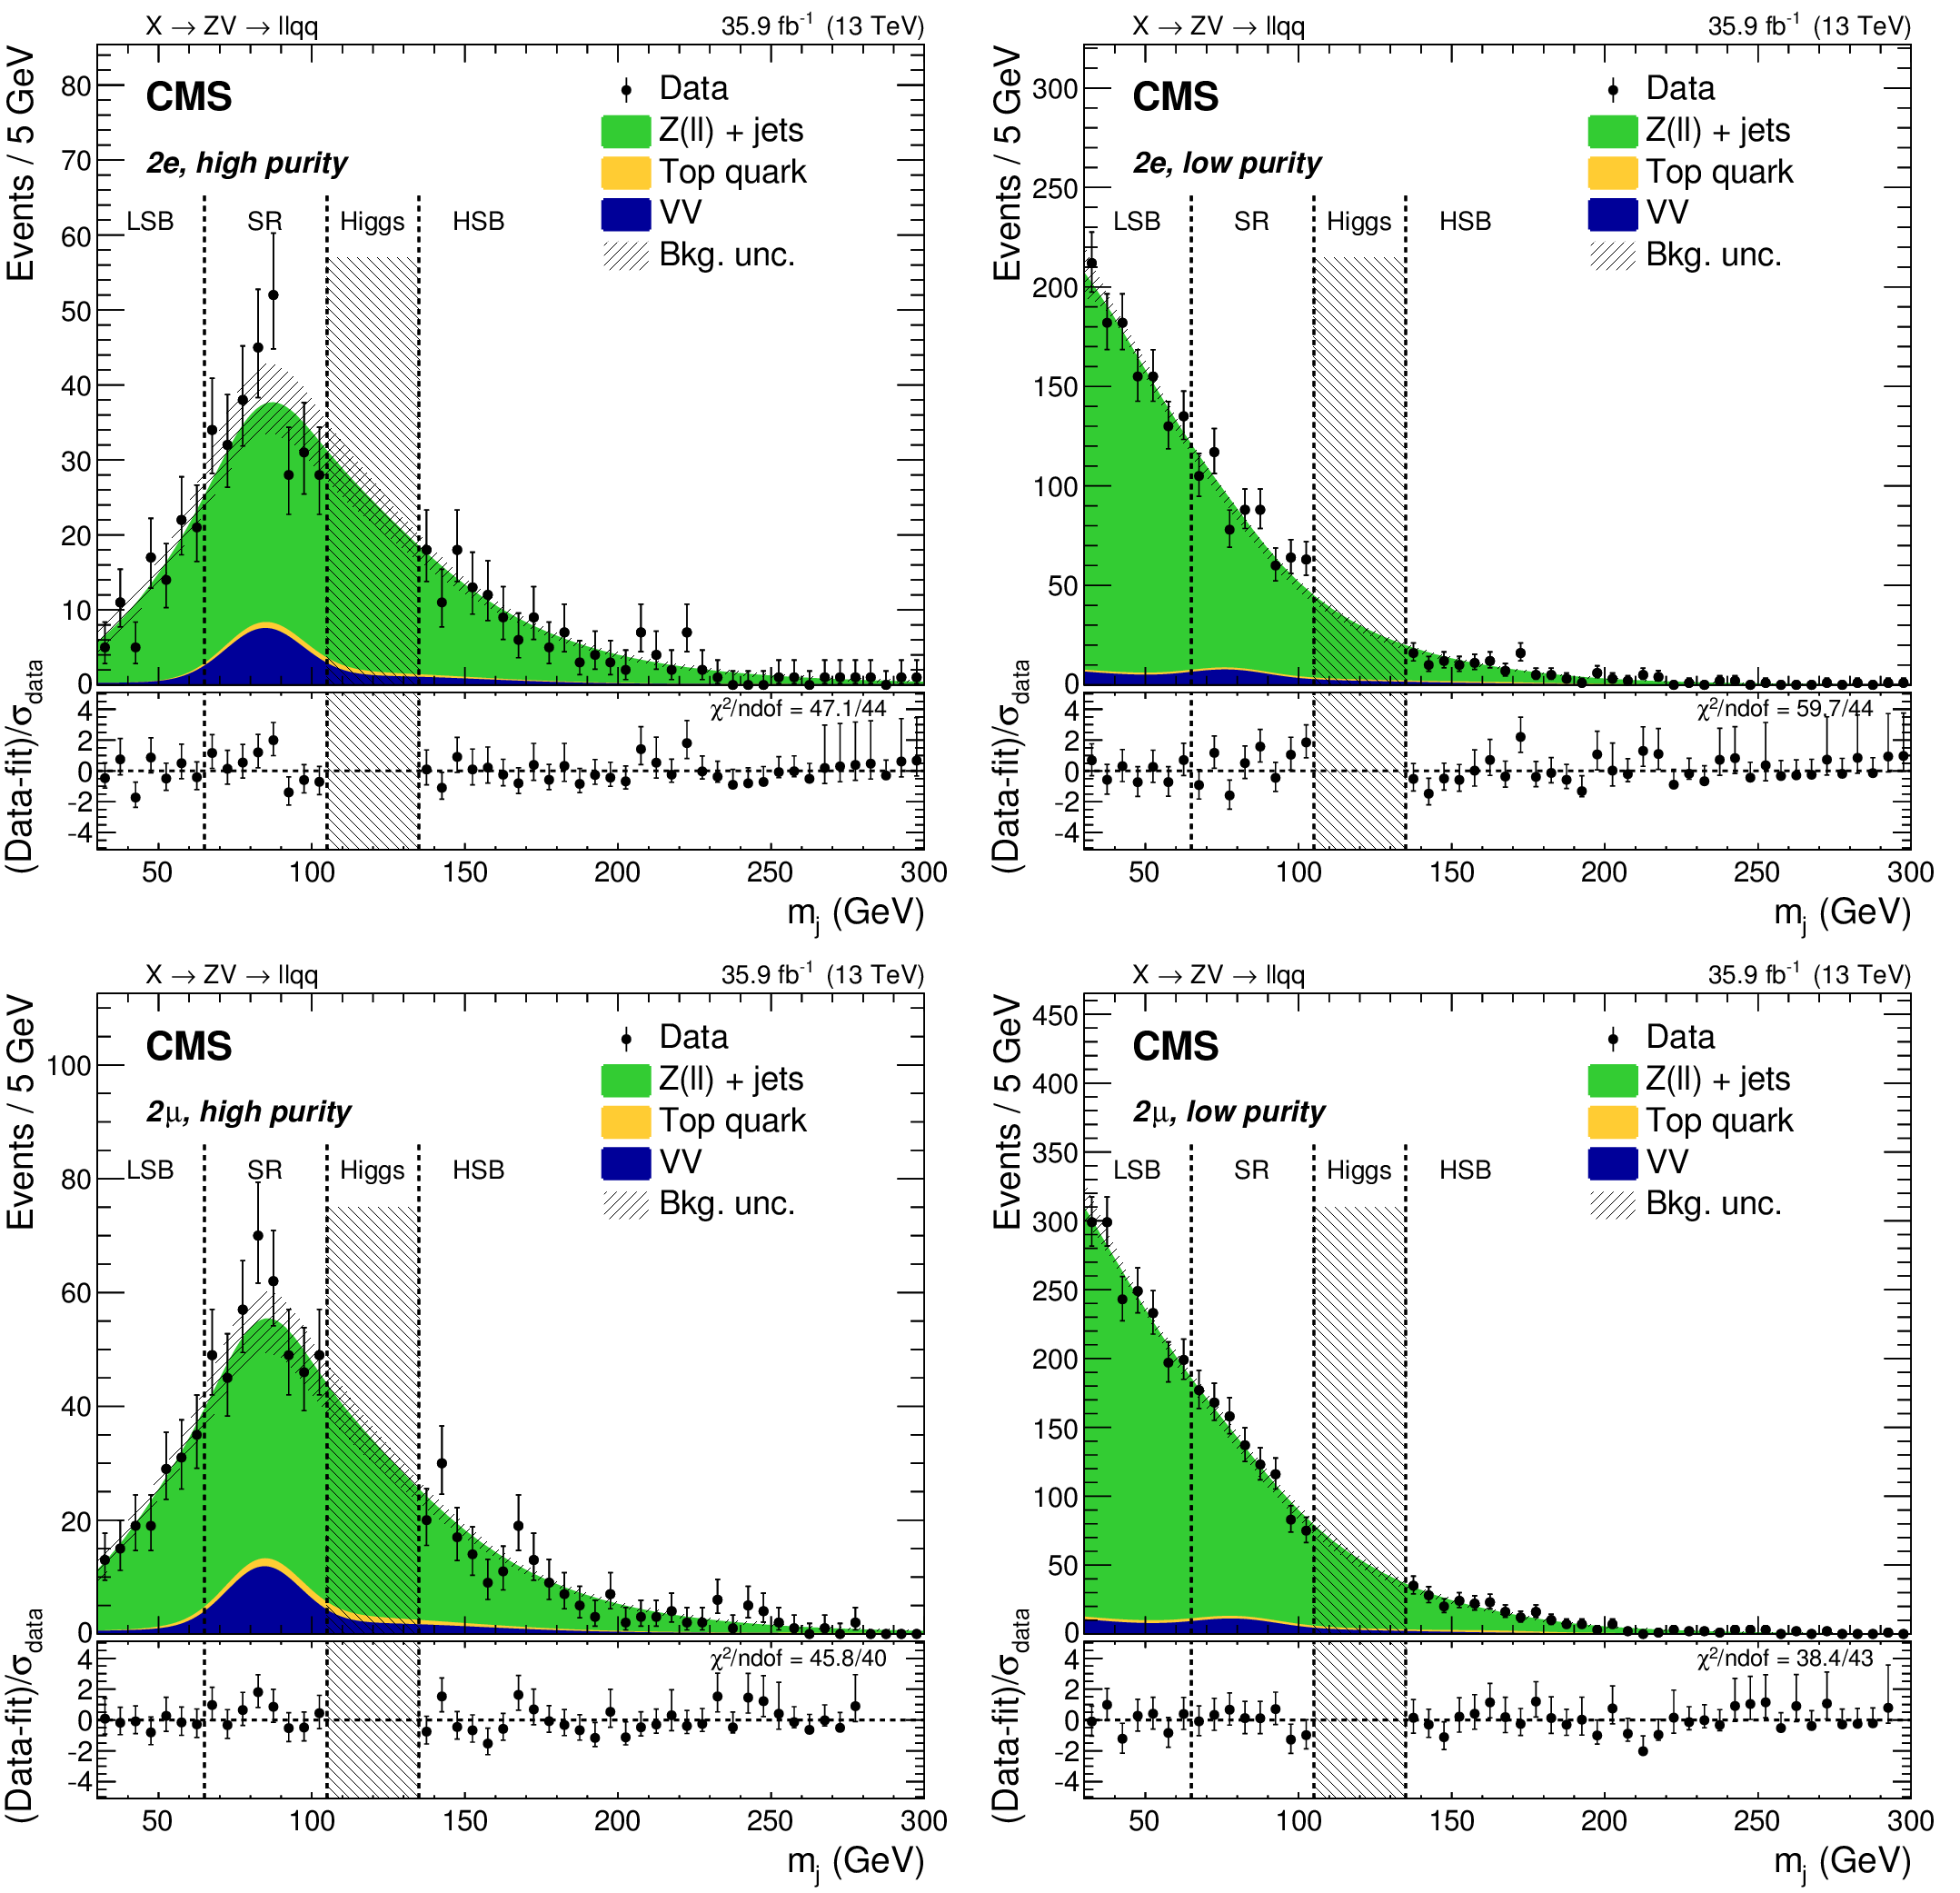
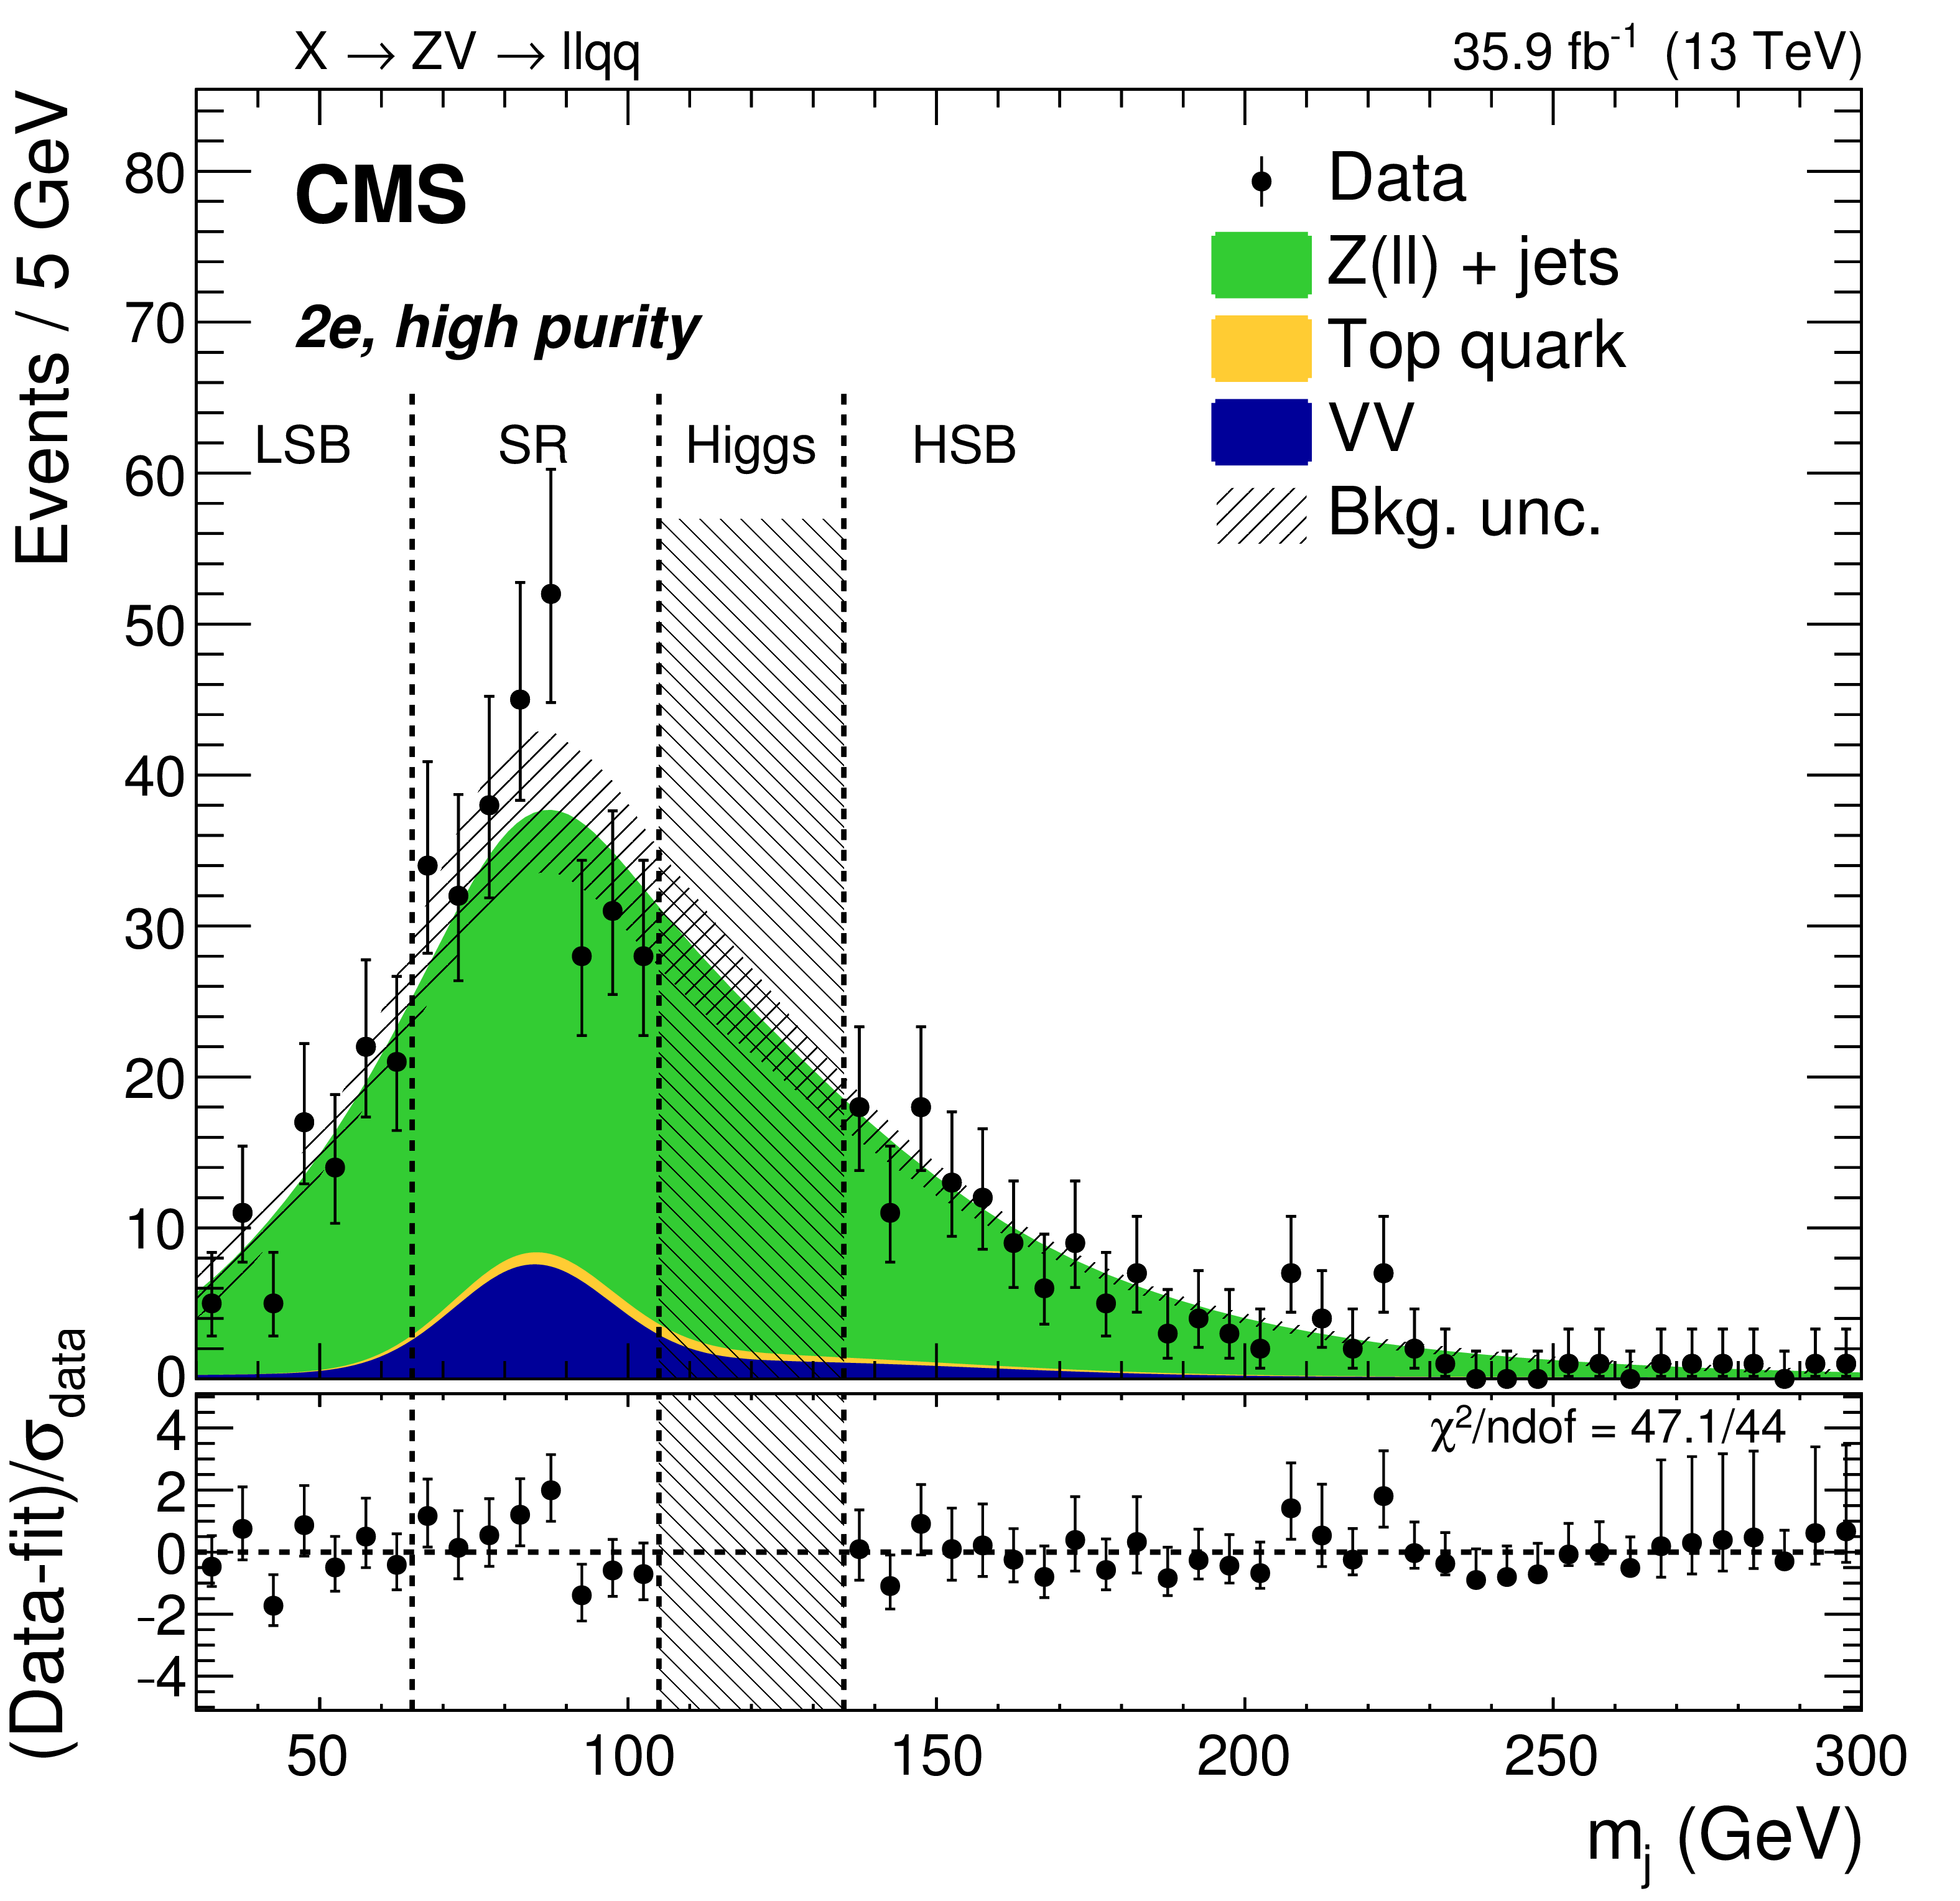
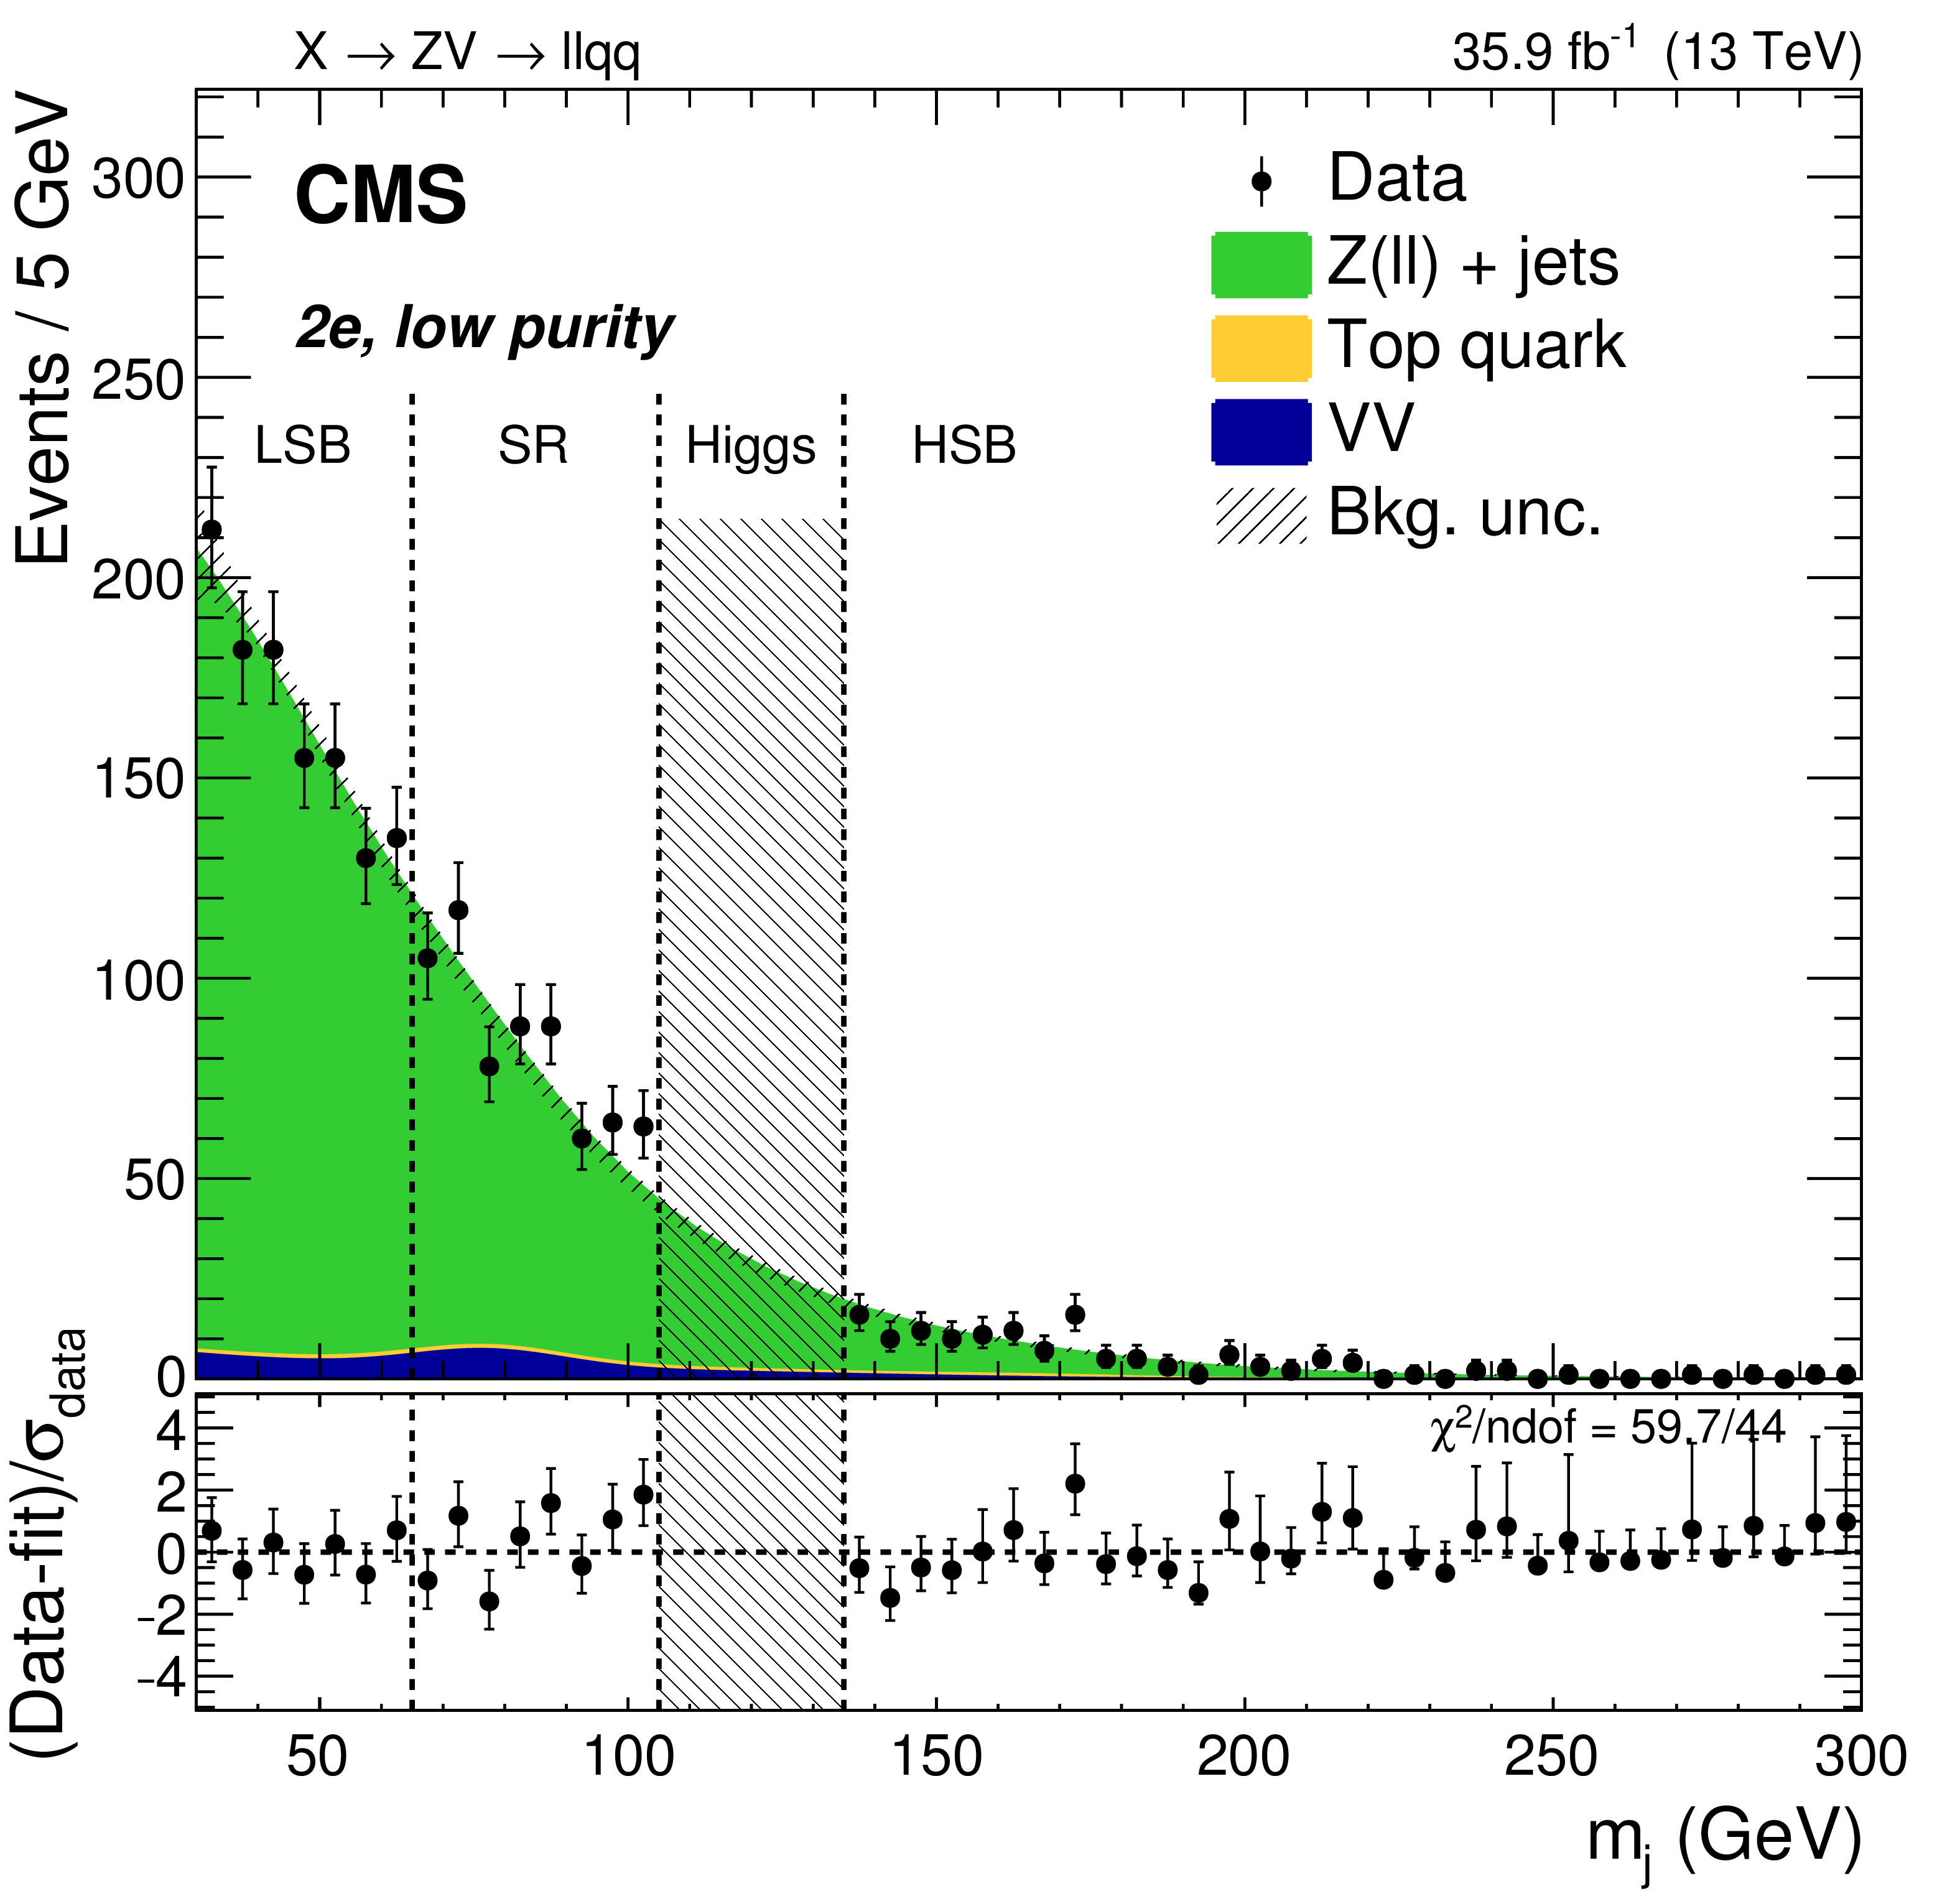
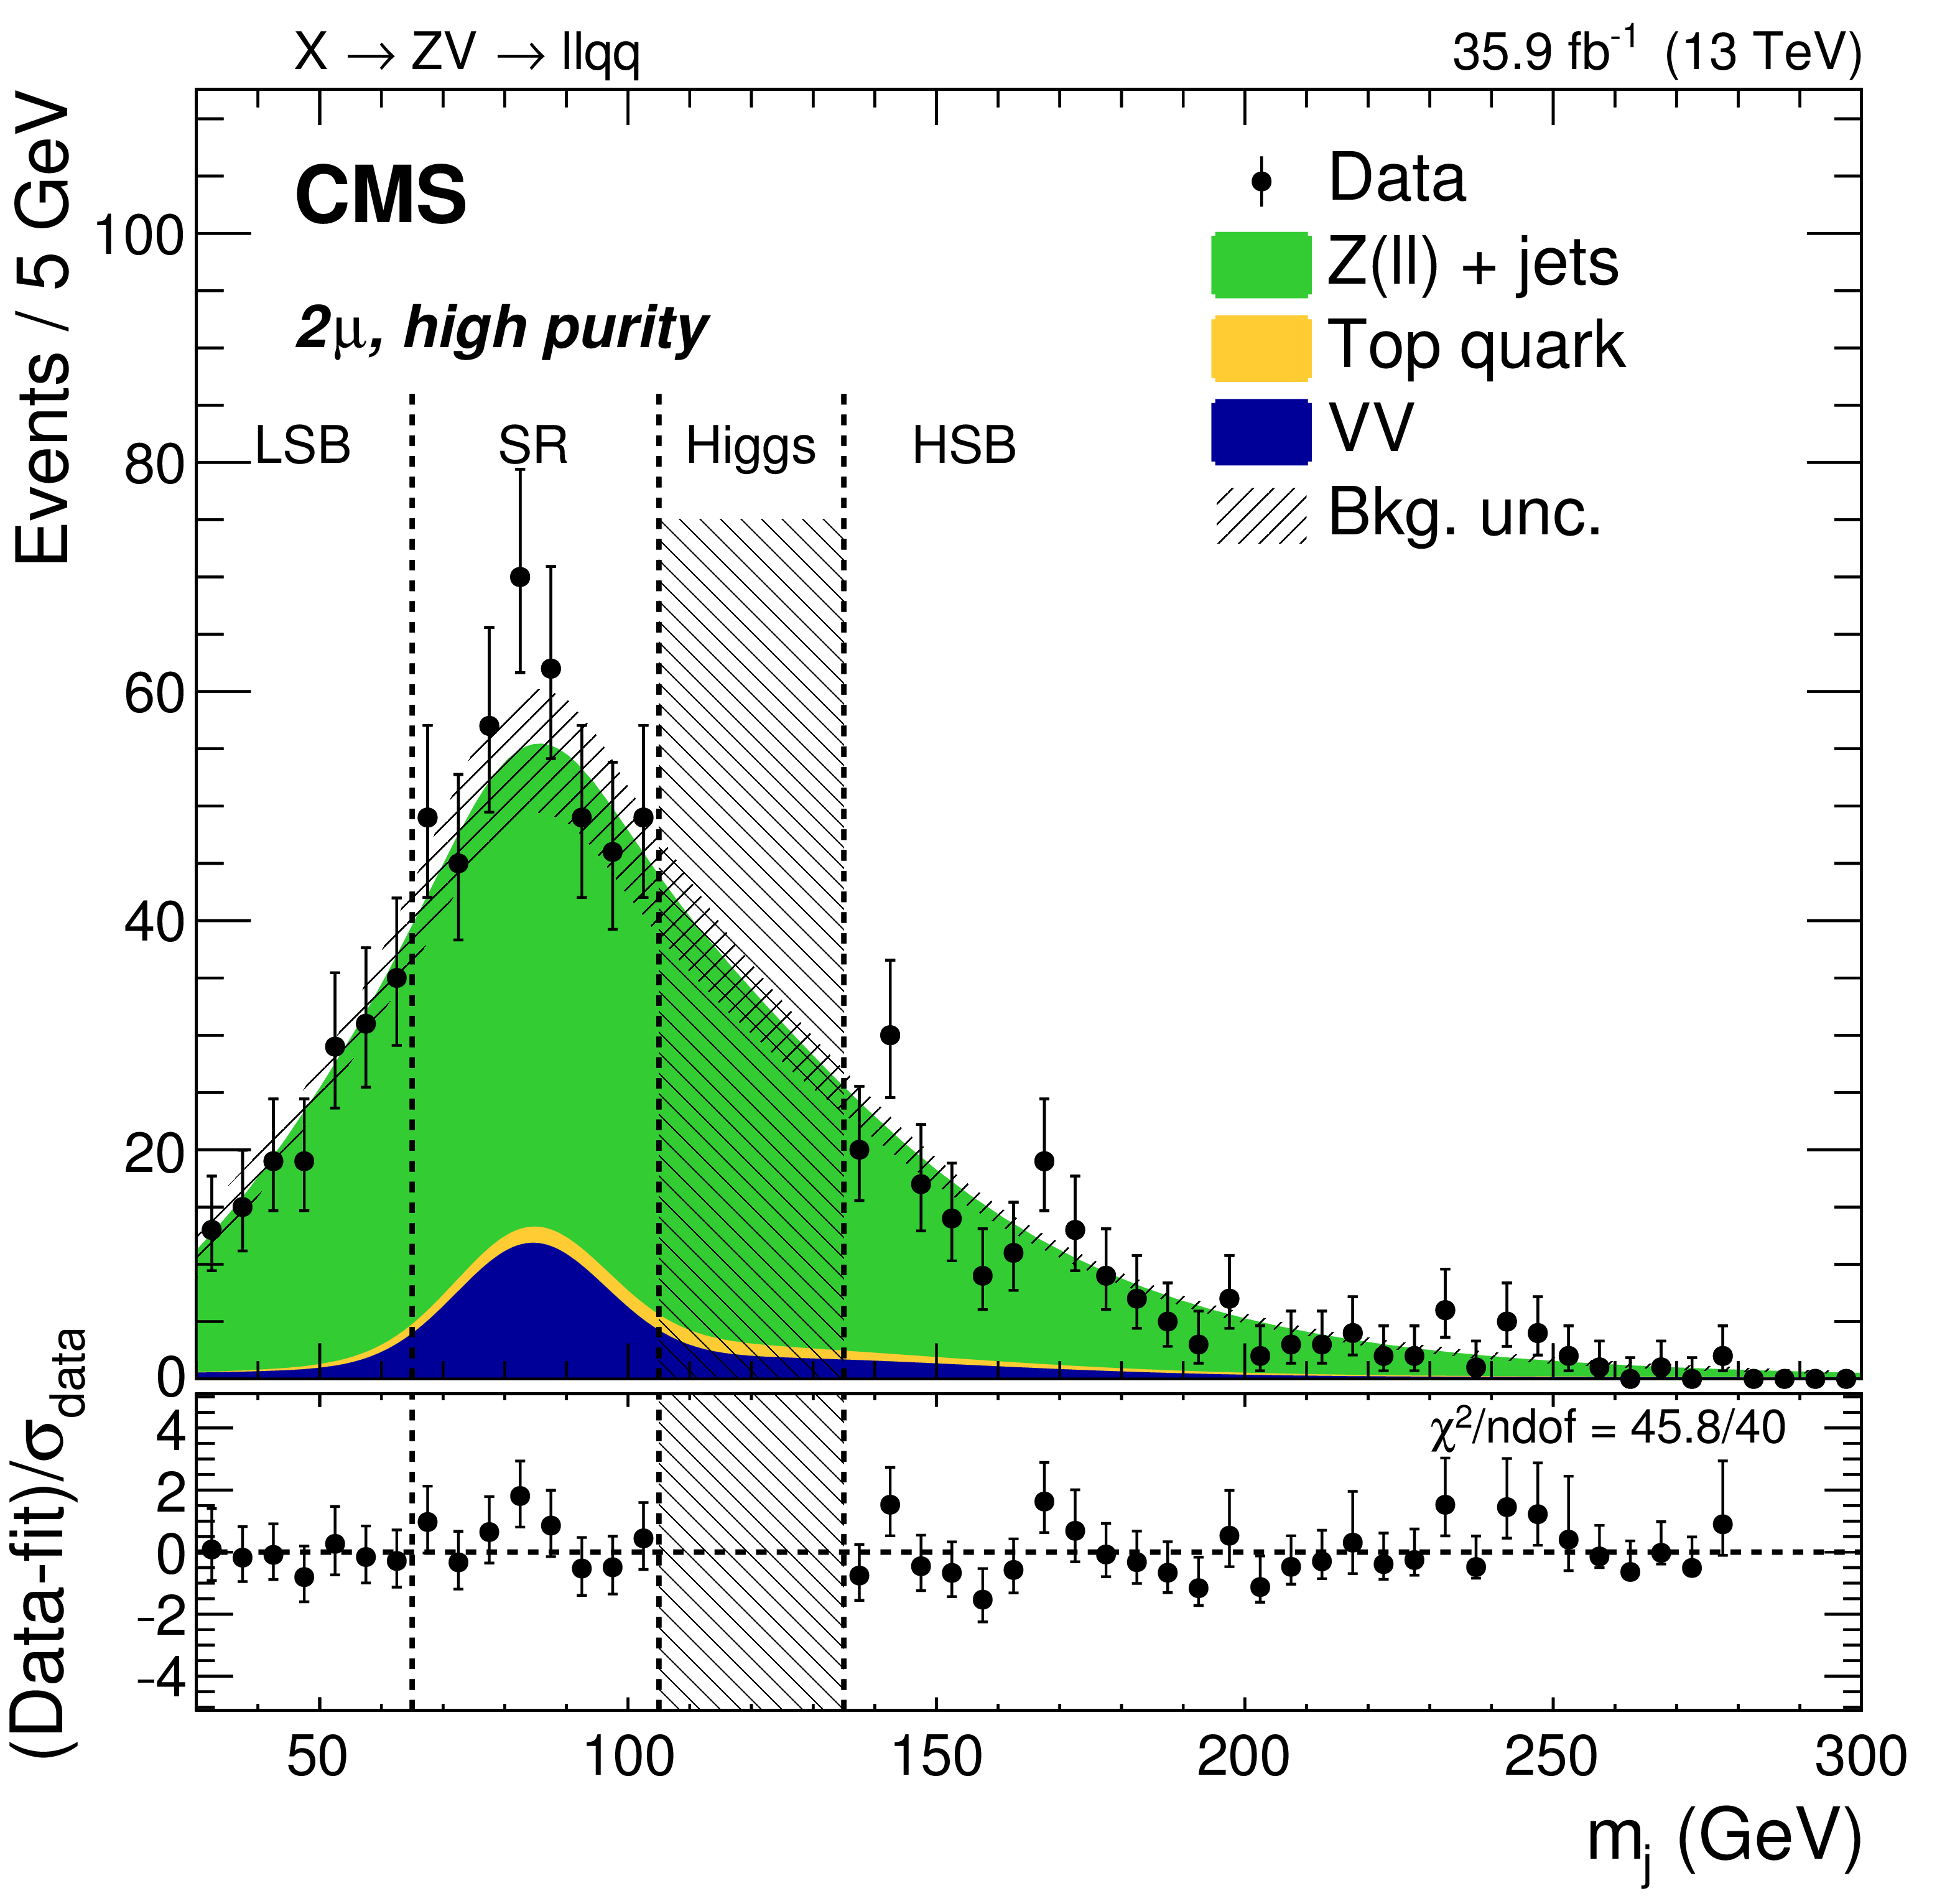
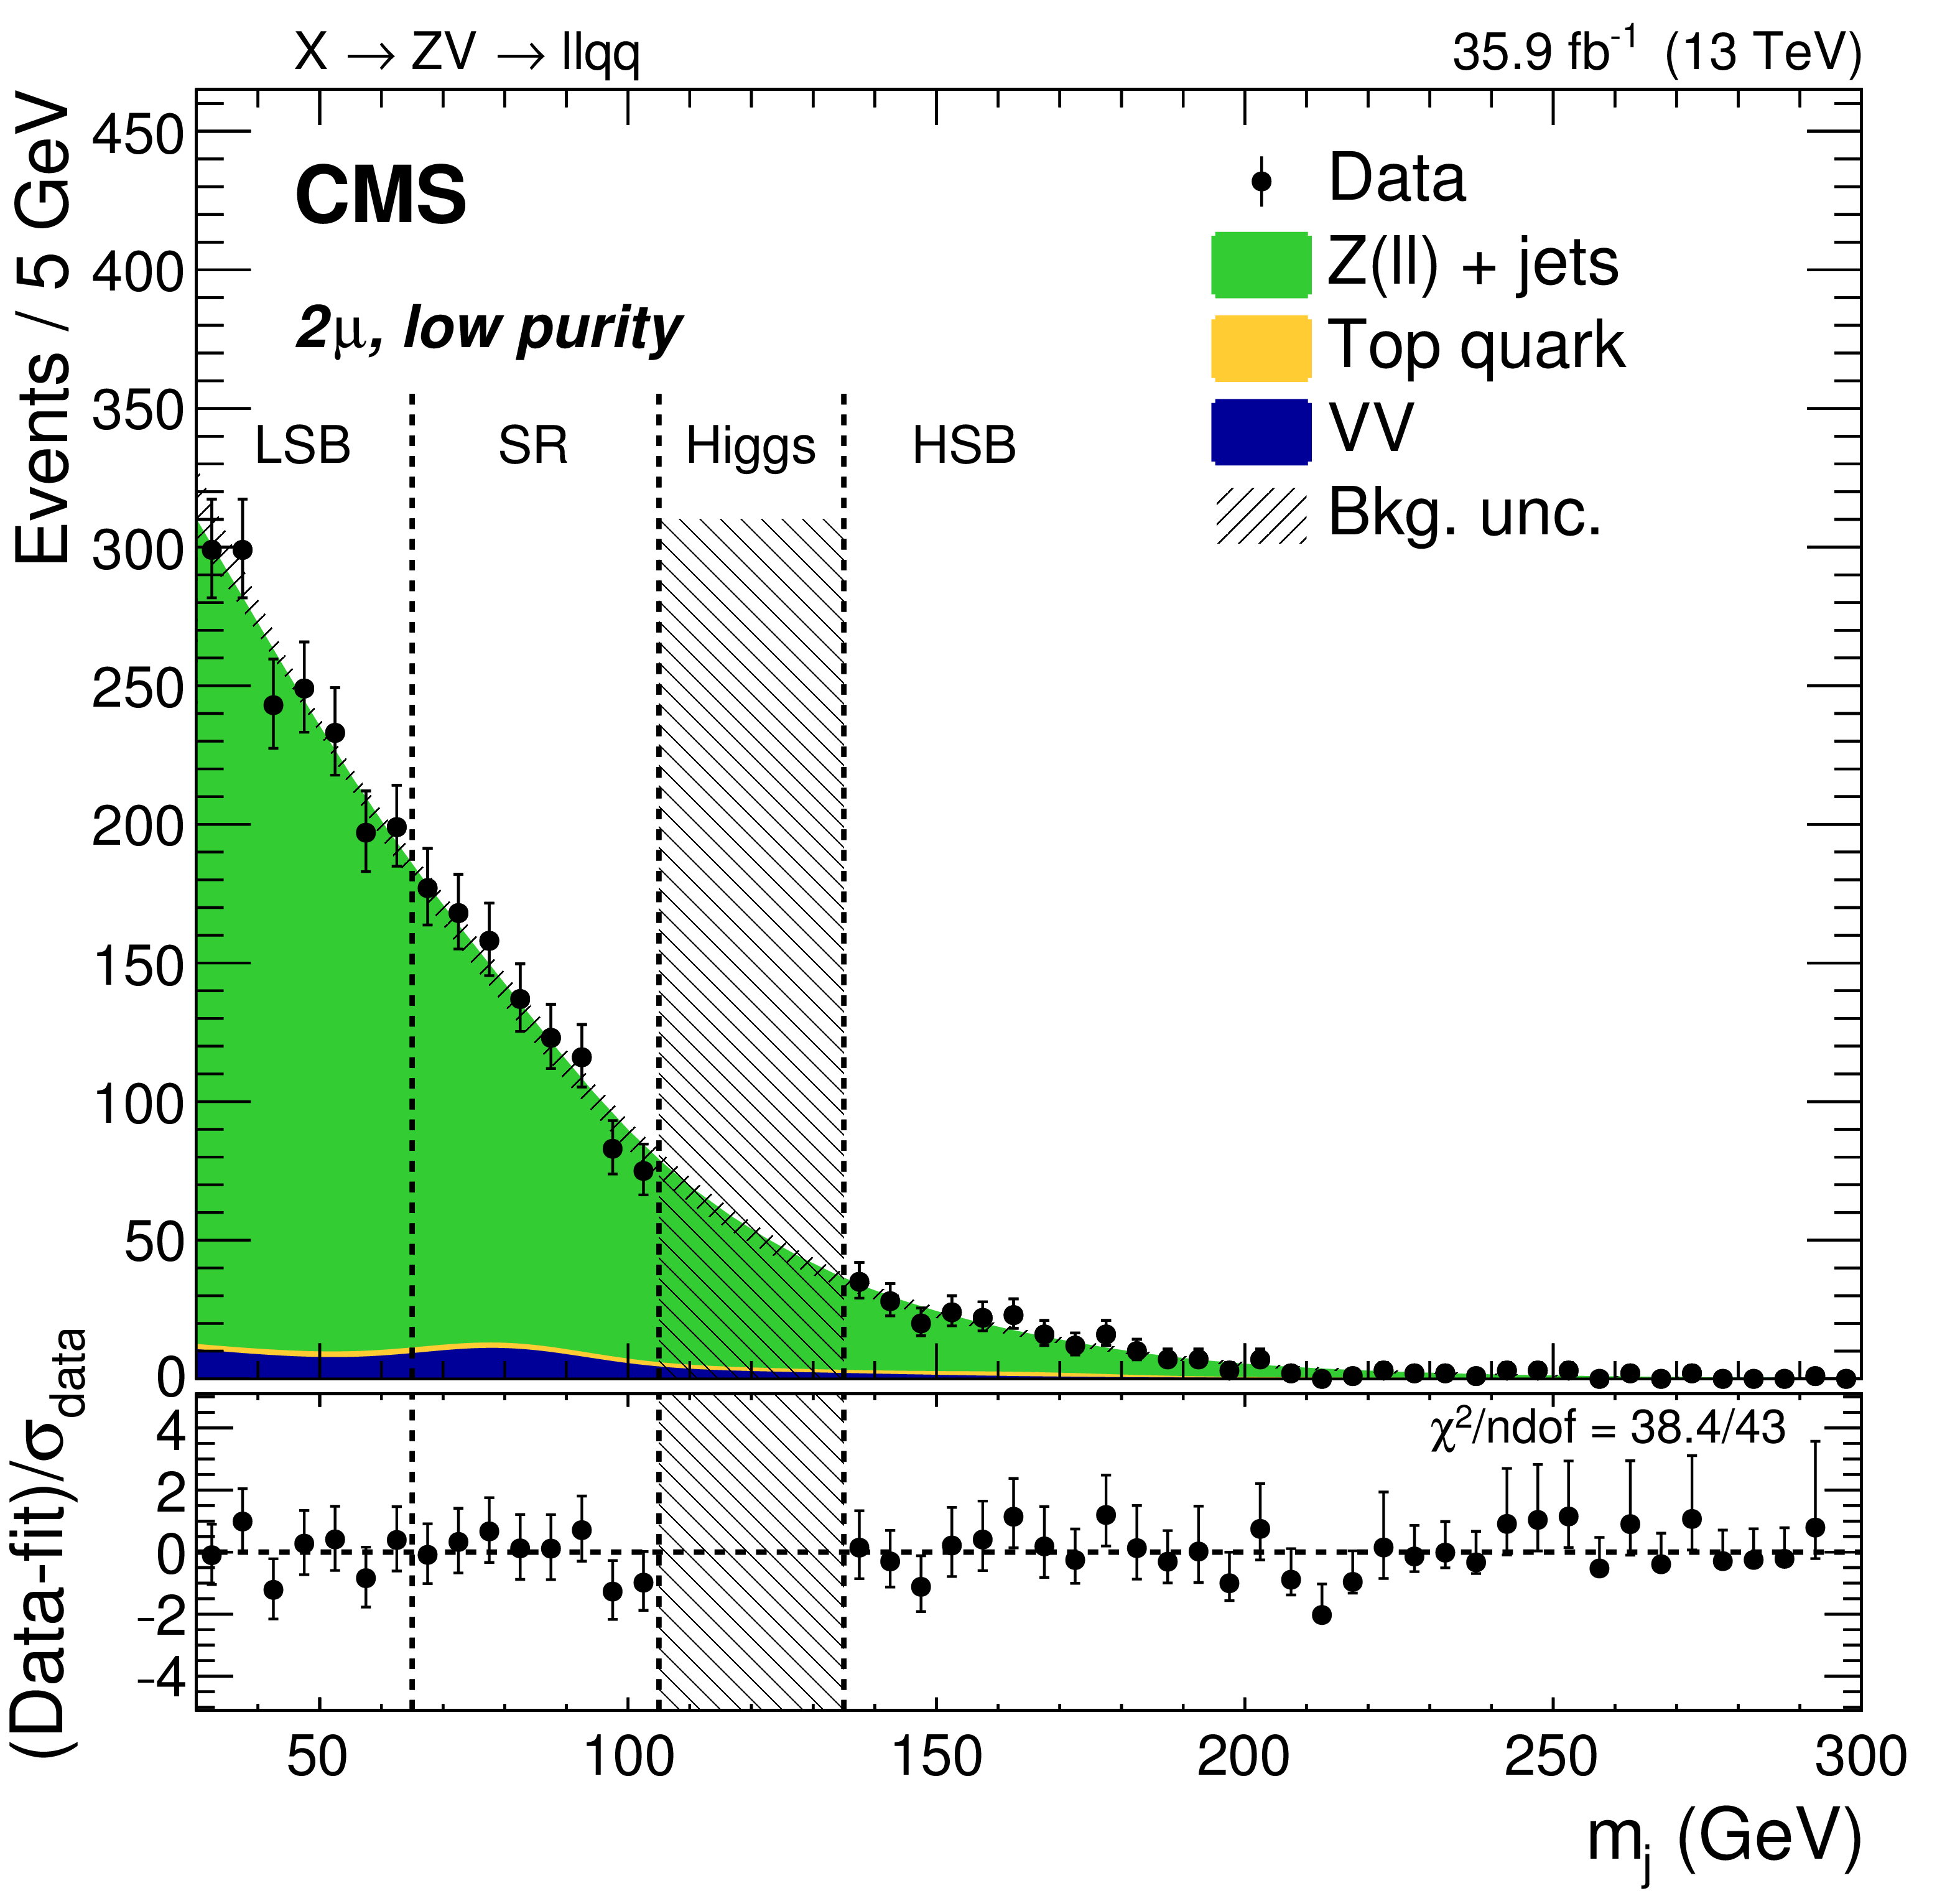
The $ {m_\mathrm {j}} $ distributions of the events in data, compared to the expected background shape, for the high-mass analysis in the electron (upper) and muon (lower) channels, and for the high-purity (left) and low-purity (right) categories. The expected background shape is extracted from a fit to the data sidebands (Z+jets) or derived from simulation ("top quark'' and "VV''). The shaded area represents the uncertainty in the Z+jets distribution, while the dashed vertical region ("Higgs'') shows the expected SM Higgs boson mass range, excluded from the analysis. The bottom panels show the pull distribution between data and SM background expectation from the fit, where $\sigma _\text {data}$ is the Poisson uncertainty in the data. |
png pdf |
Figure 2-a:
The $ {m_\mathrm {j}} $ distributions of the events in data, compared to the expected background shape, for the high-mass analysis in the electron channel, and for the high-purity category. The expected background shape is extracted from a fit to the data sidebands (Z+jets) or derived from simulation ("top quark'' and "VV''). The shaded area represents the uncertainty in the Z+jets distribution, while the dashed vertical region ("Higgs'') shows the expected SM Higgs boson mass range, excluded from the analysis. The bottom panel shows the pull distribution between data and SM background expectation from the fit, where $\sigma _\text {data}$ is the Poisson uncertainty in the data. |
png pdf |
Figure 2-b:
The $ {m_\mathrm {j}} $ distributions of the events in data, compared to the expected background shape, for the high-mass analysis in the electron channel, and for the low-purity category. The expected background shape is extracted from a fit to the data sidebands (Z+jets) or derived from simulation ("top quark'' and "VV''). The shaded area represents the uncertainty in the Z+jets distribution, while the dashed vertical region ("Higgs'') shows the expected SM Higgs boson mass range, excluded from the analysis. The bottom panel shows the pull distribution between data and SM background expectation from the fit, where $\sigma _\text {data}$ is the Poisson uncertainty in the data. |
png pdf |
Figure 2-c:
The $ {m_\mathrm {j}} $ distributions of the events in data, compared to the expected background shape, for the high-mass analysis in the muon channel, and for the high-purity category. The expected background shape is extracted from a fit to the data sidebands (Z+jets) or derived from simulation ("top quark'' and "VV''). The shaded area represents the uncertainty in the Z+jets distribution, while the dashed vertical region ("Higgs'') shows the expected SM Higgs boson mass range, excluded from the analysis. The bottom panel shows the pull distribution between data and SM background expectation from the fit, where $\sigma _\text {data}$ is the Poisson uncertainty in the data. |
png pdf |
Figure 2-d:
The $ {m_\mathrm {j}} $ distributions of the events in data, compared to the expected background shape, for the high-mass analysis in the muon channel, and for the low-purity category. The expected background shape is extracted from a fit to the data sidebands (Z+jets) or derived from simulation ("top quark'' and "VV''). The shaded area represents the uncertainty in the Z+jets distribution, while the dashed vertical region ("Higgs'') shows the expected SM Higgs boson mass range, excluded from the analysis. The bottom panel shows the pull distribution between data and SM background expectation from the fit, where $\sigma _\text {data}$ is the Poisson uncertainty in the data. |
png pdf |
Figure 3:
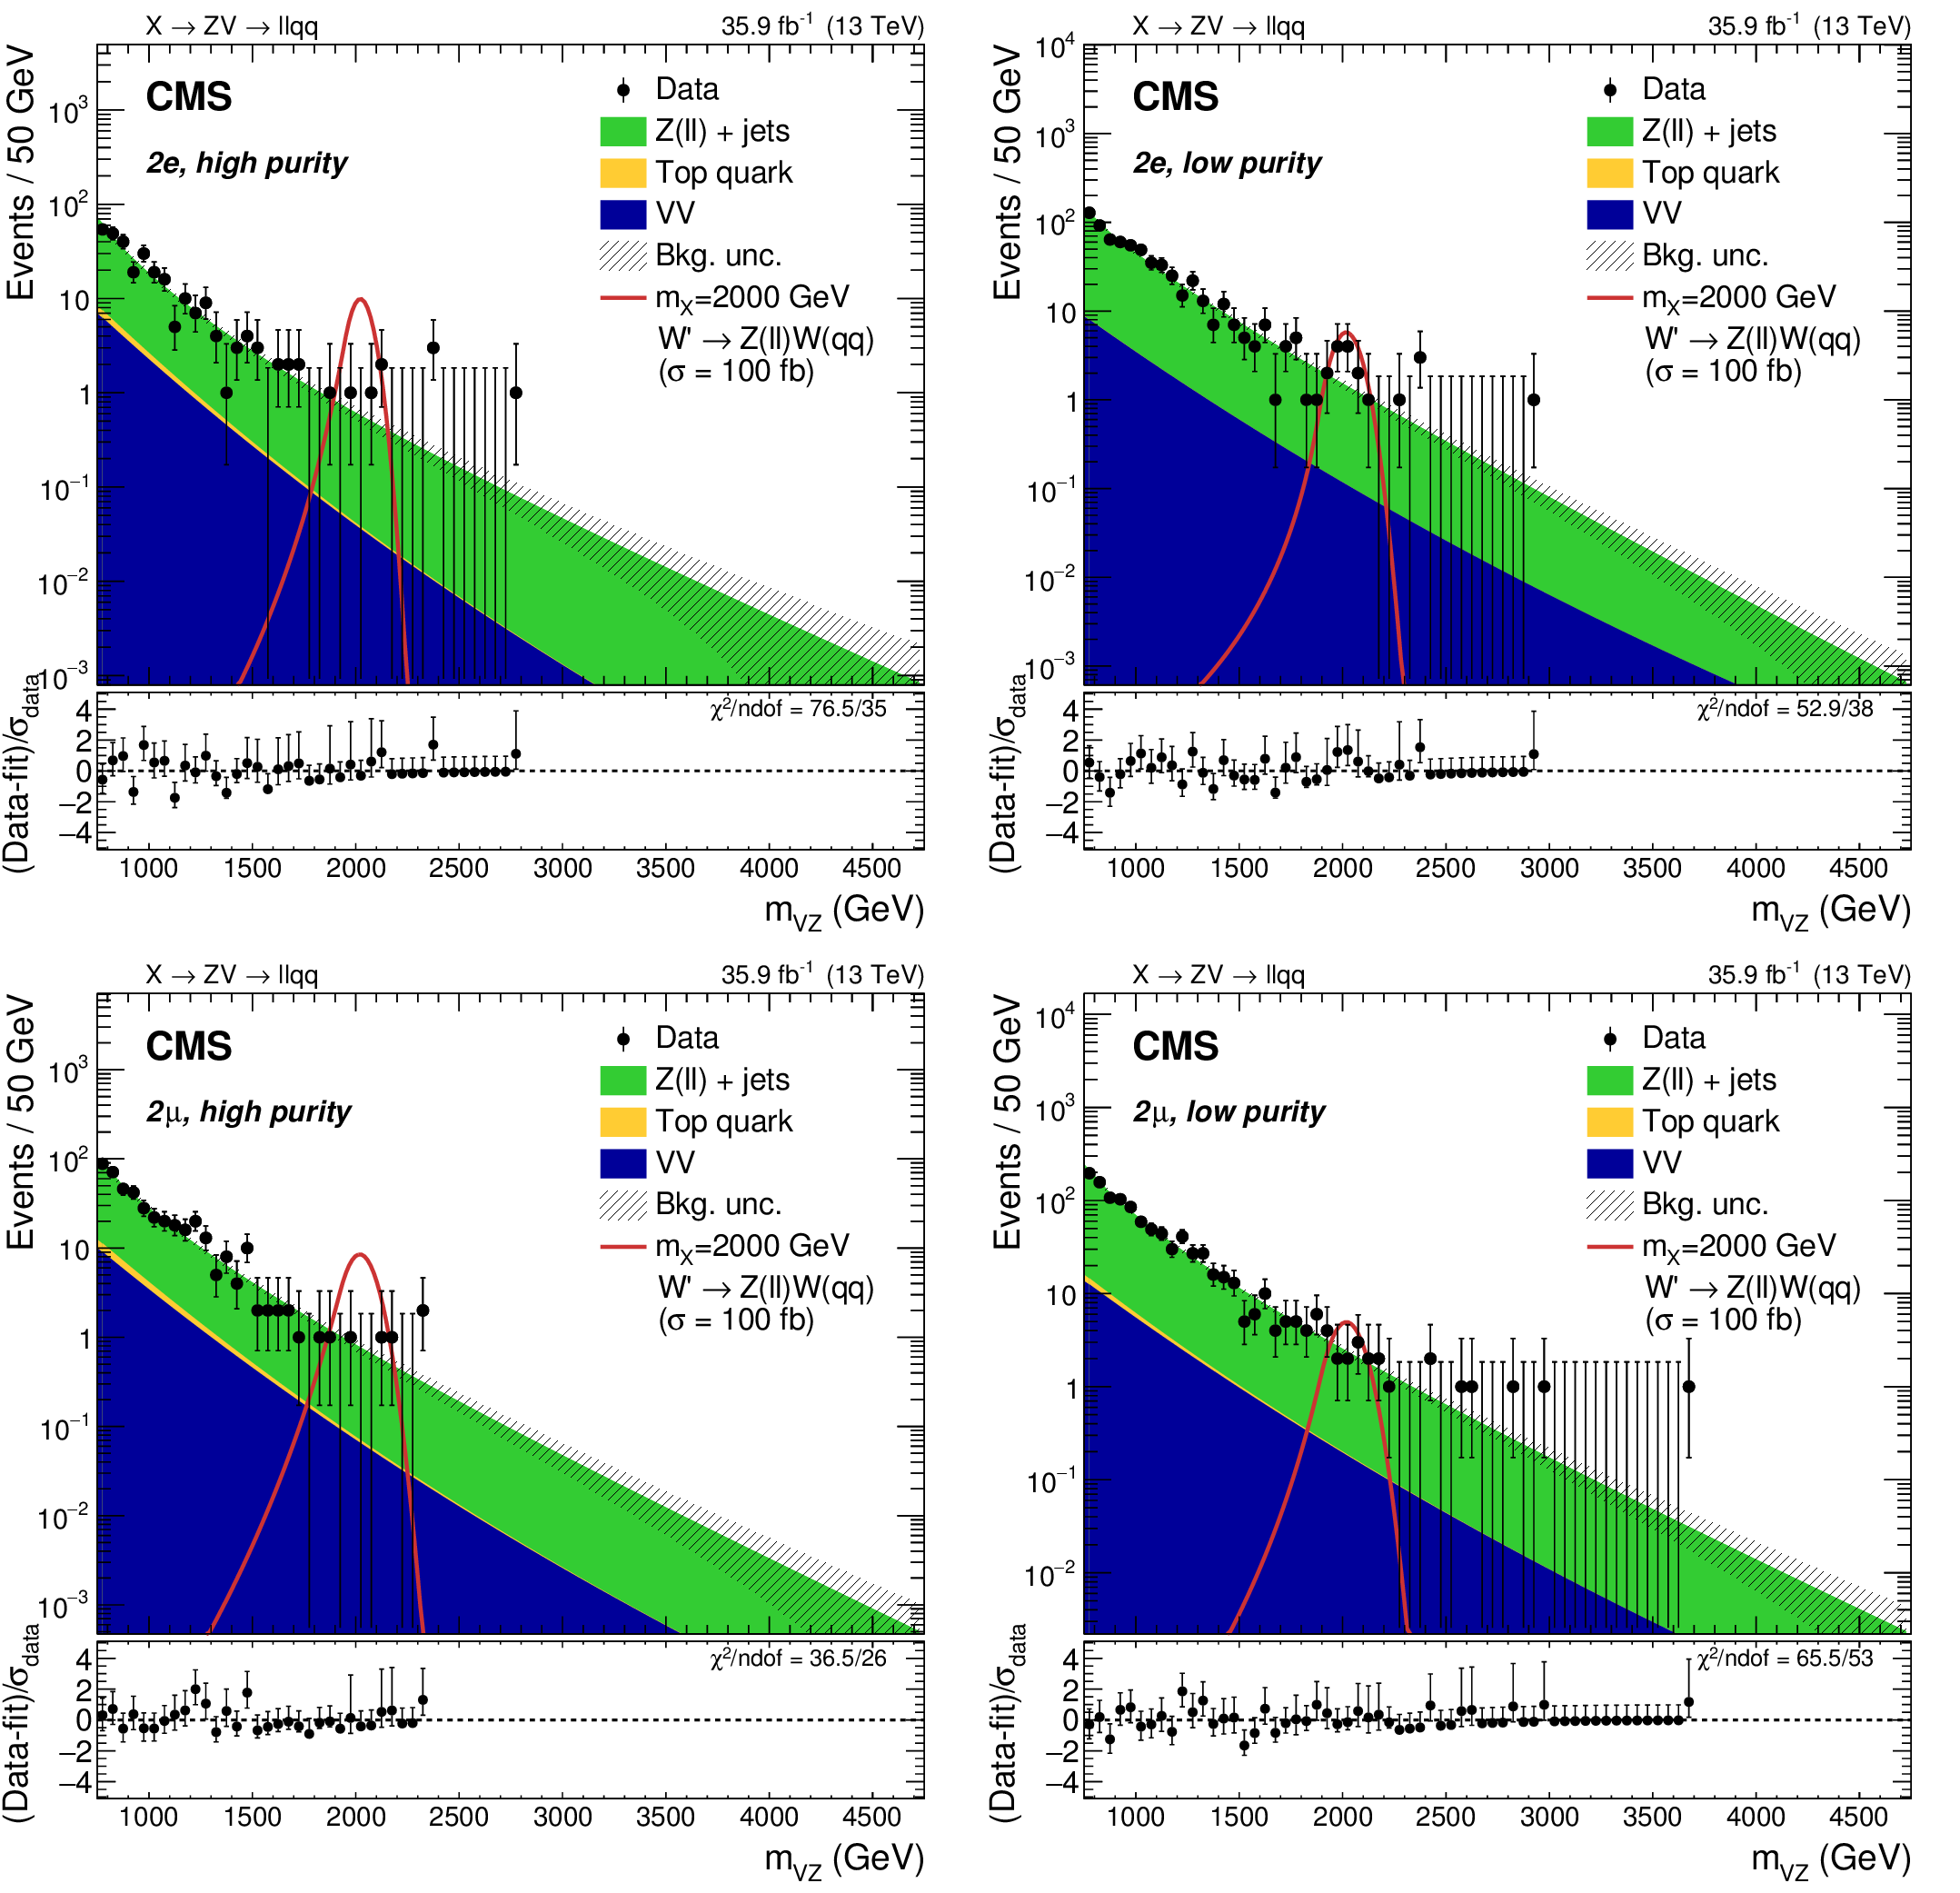
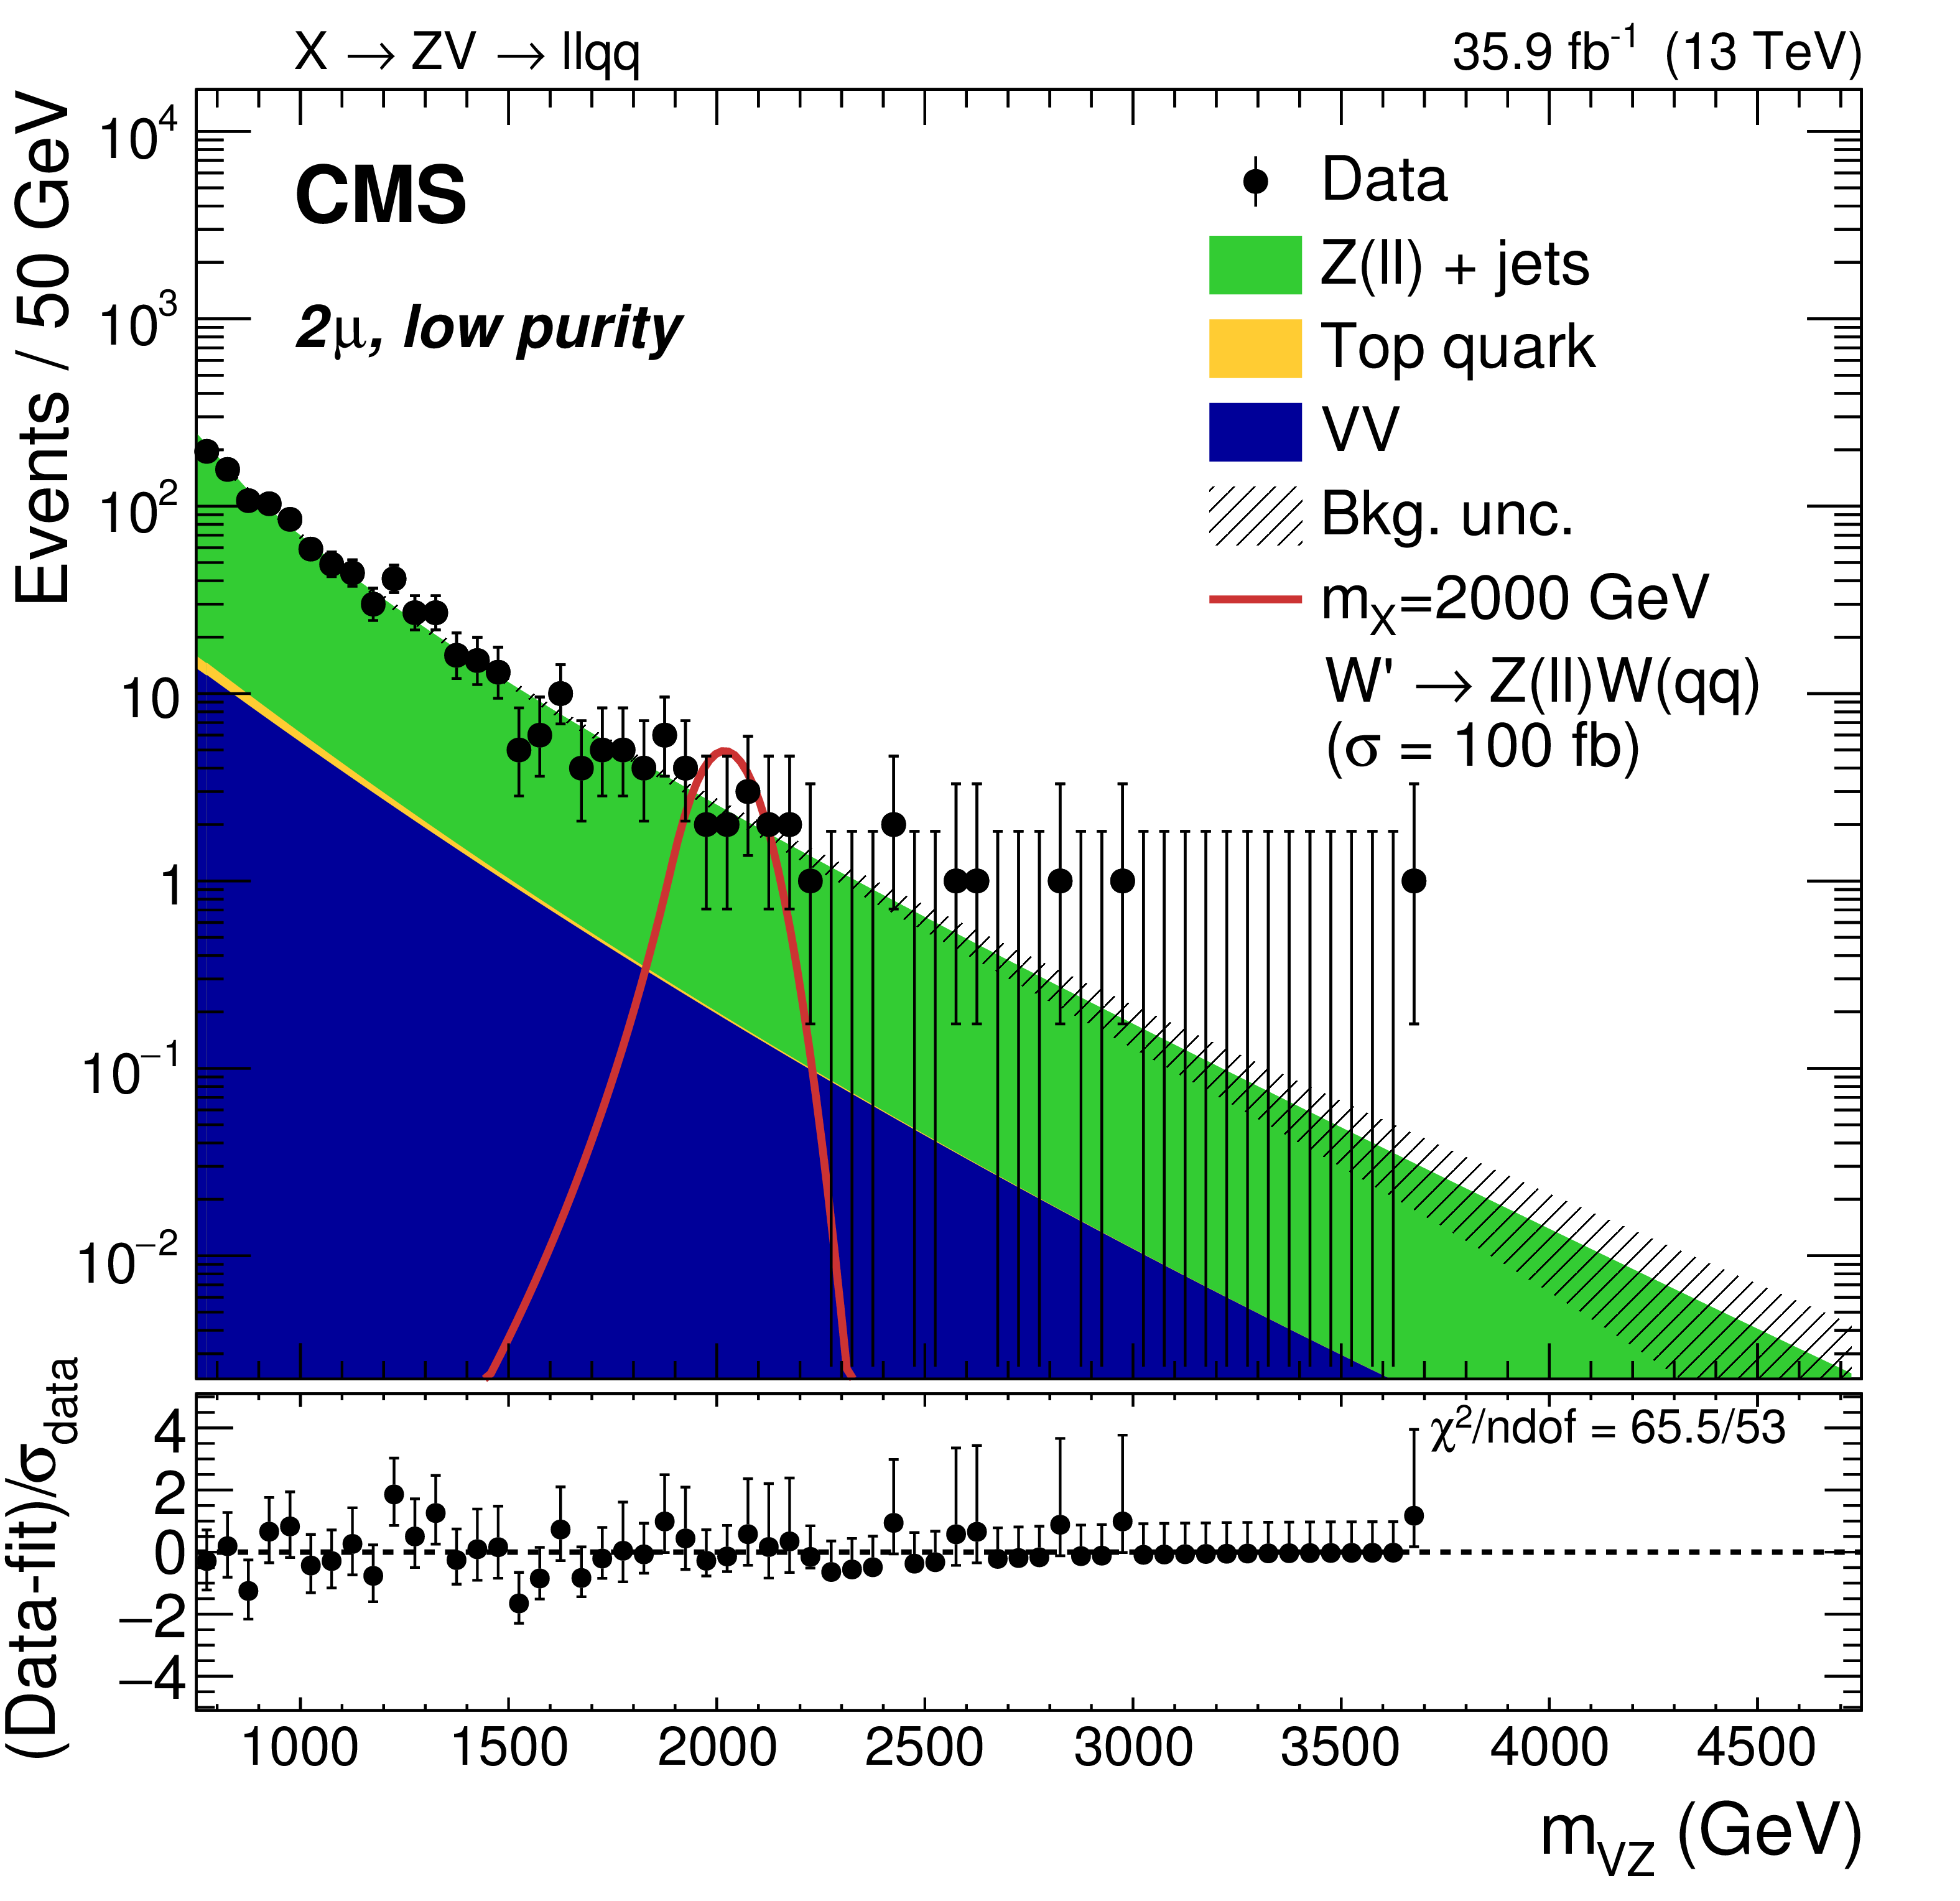
Expected and observed distributions of the resonance candidate mass $ {m_{{{\mathrm {V}} \mathrm{Z}}}} $ in the high-mass analysis, in the electron (upper) and muon (lower) channels, and separately for the high-purity (left) and low-purity (right) categories. The shaded area represents the post-fit uncertainty in the background. The bottom panels show the pull distribution between data and post-fit SM background fit, where $\sigma _\text {data}$ is the Poisson uncertainty in the data. The expected contribution from W' signal candidates with mass $ {m_{{\mathrm {X}}}} = $ 2000 GeV, normalized to a cross section of 100 fb, is also shown. |
png pdf |
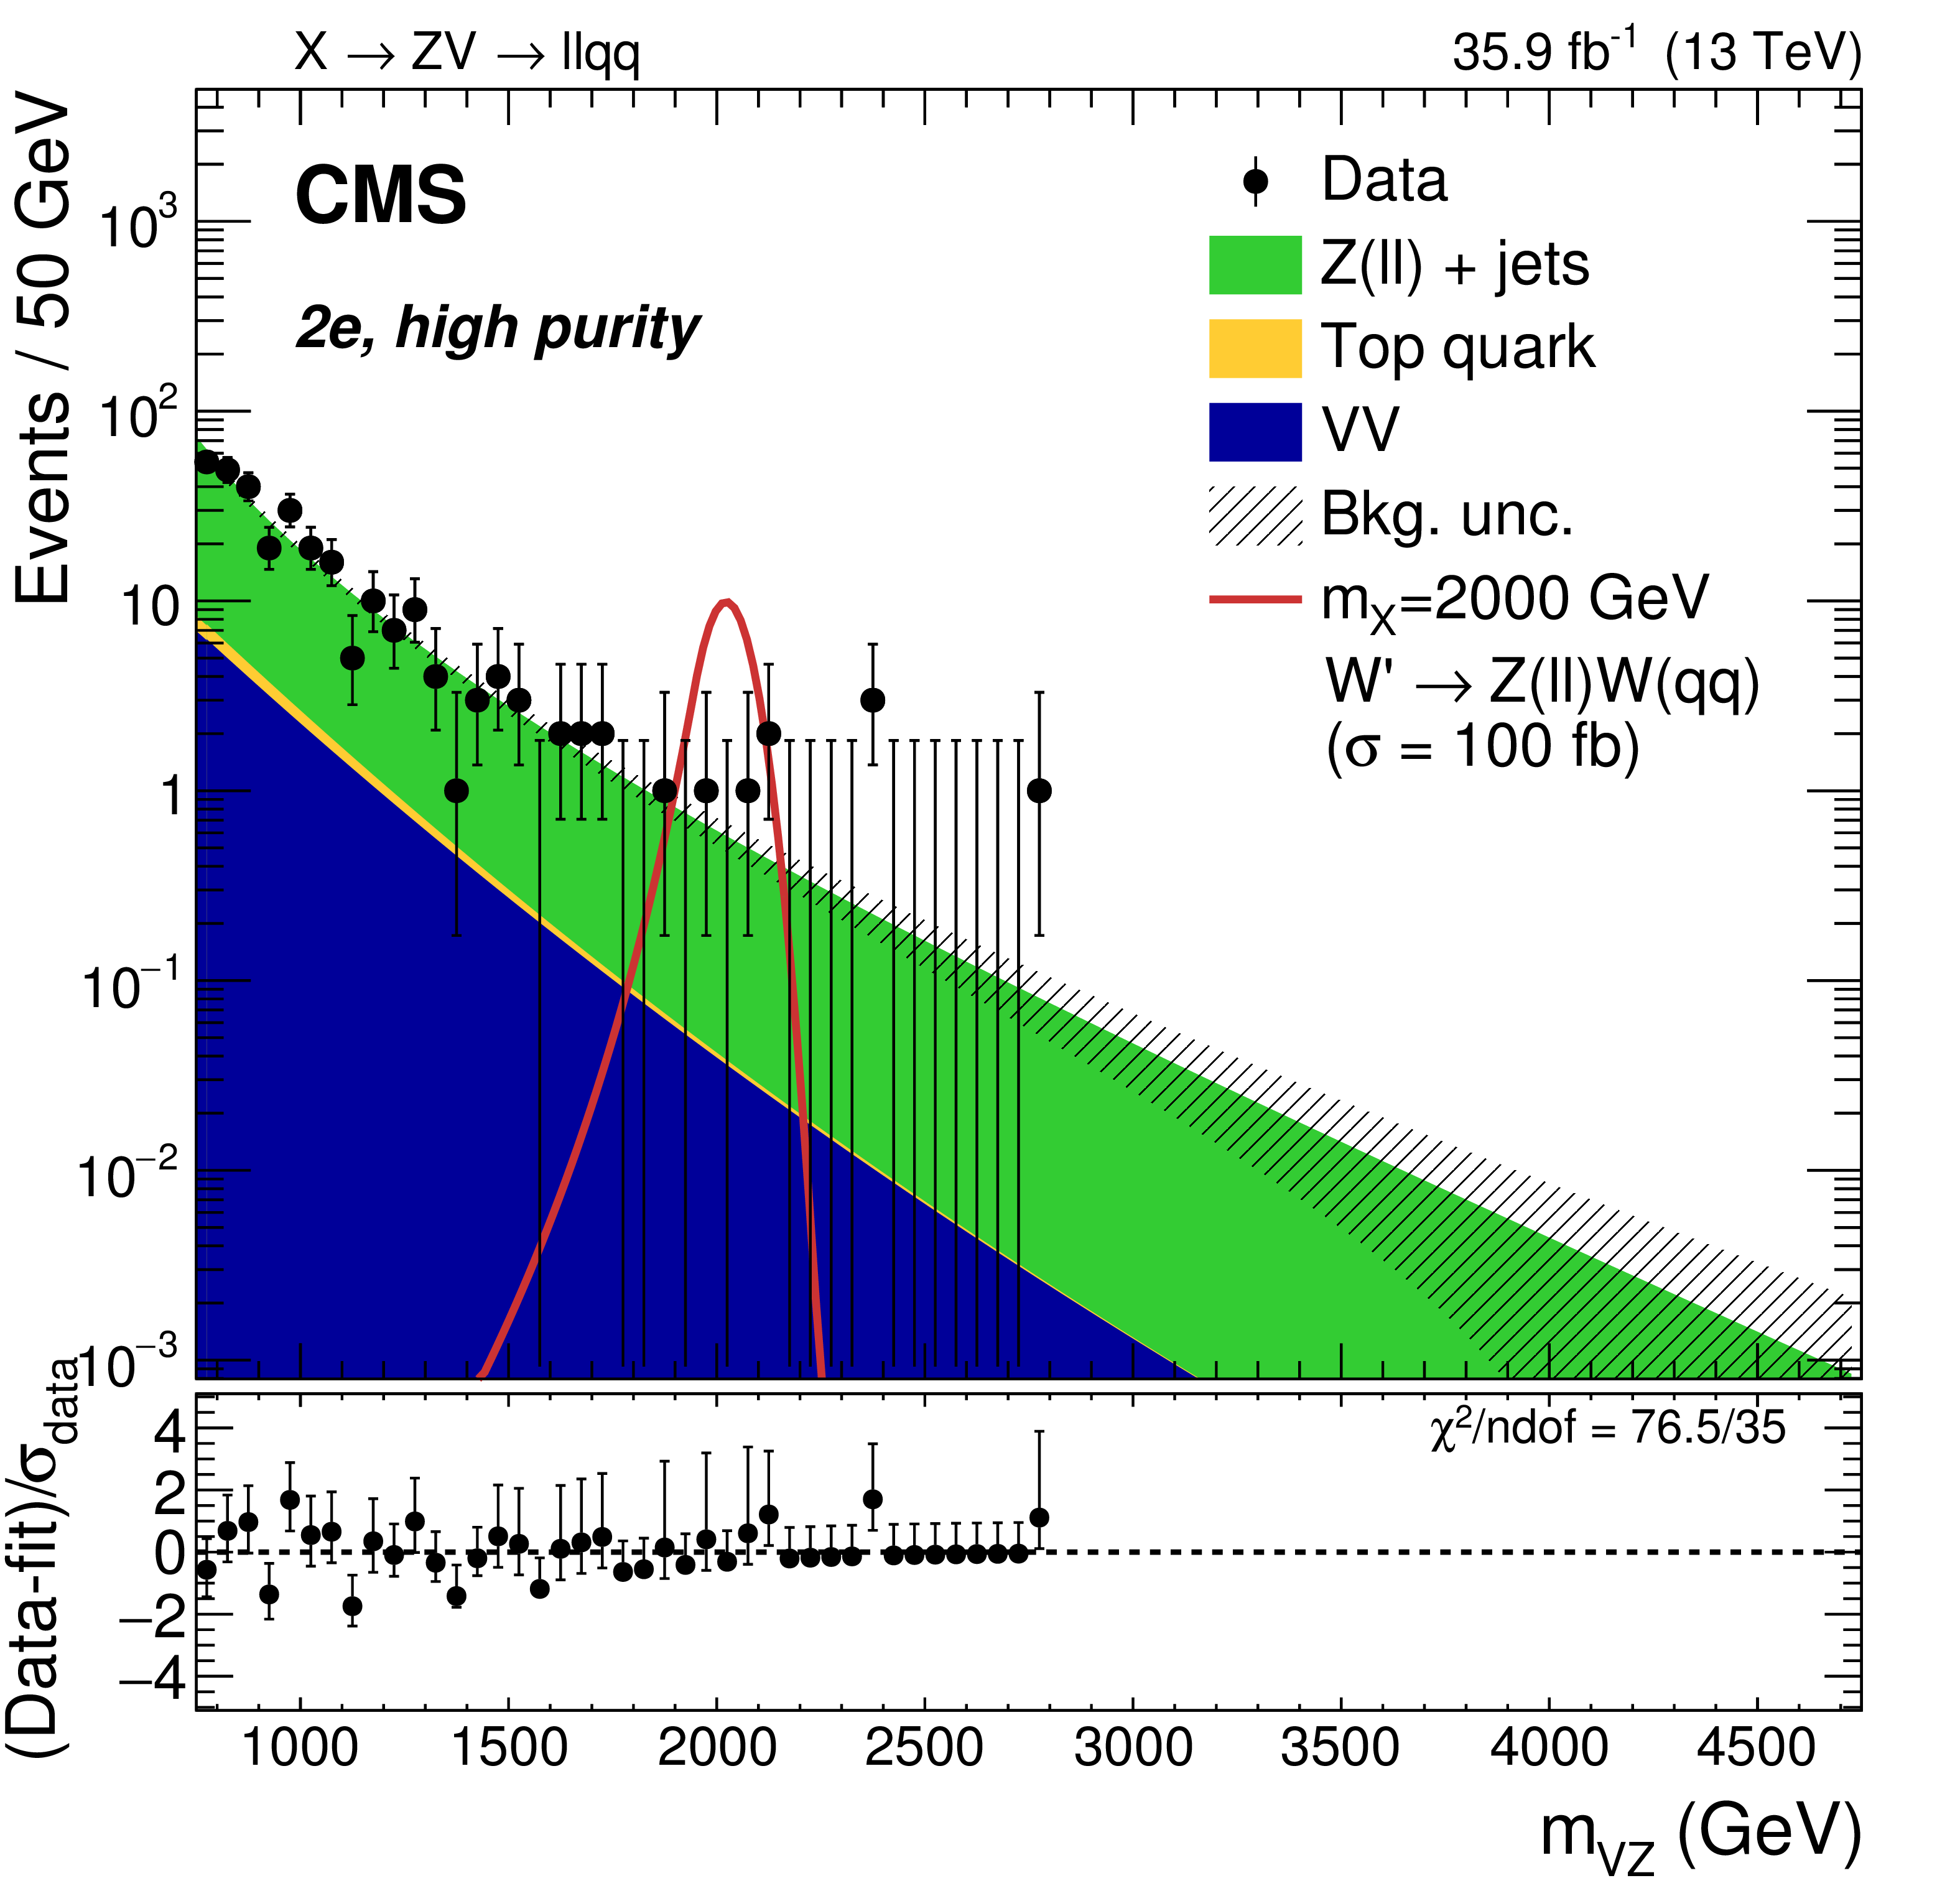
Figure 3-a:
Expected and observed distribution of the resonance candidate mass $ {m_{{{\mathrm {V}} \mathrm{Z}}}} $ in the high-mass analysis, in the electron channel, and separately for the high-purity category. The shaded area represents the post-fit uncertainty in the background. The bottom panel shows the pull distribution between data and post-fit SM background fit, where $\sigma _\text {data}$ is the Poisson uncertainty in the data. The expected contribution from W' signal candidates with mass $ {m_{{\mathrm {X}}}} = $ 2000 GeV, normalized to a cross section of 100 fb, is also shown. |
png pdf |
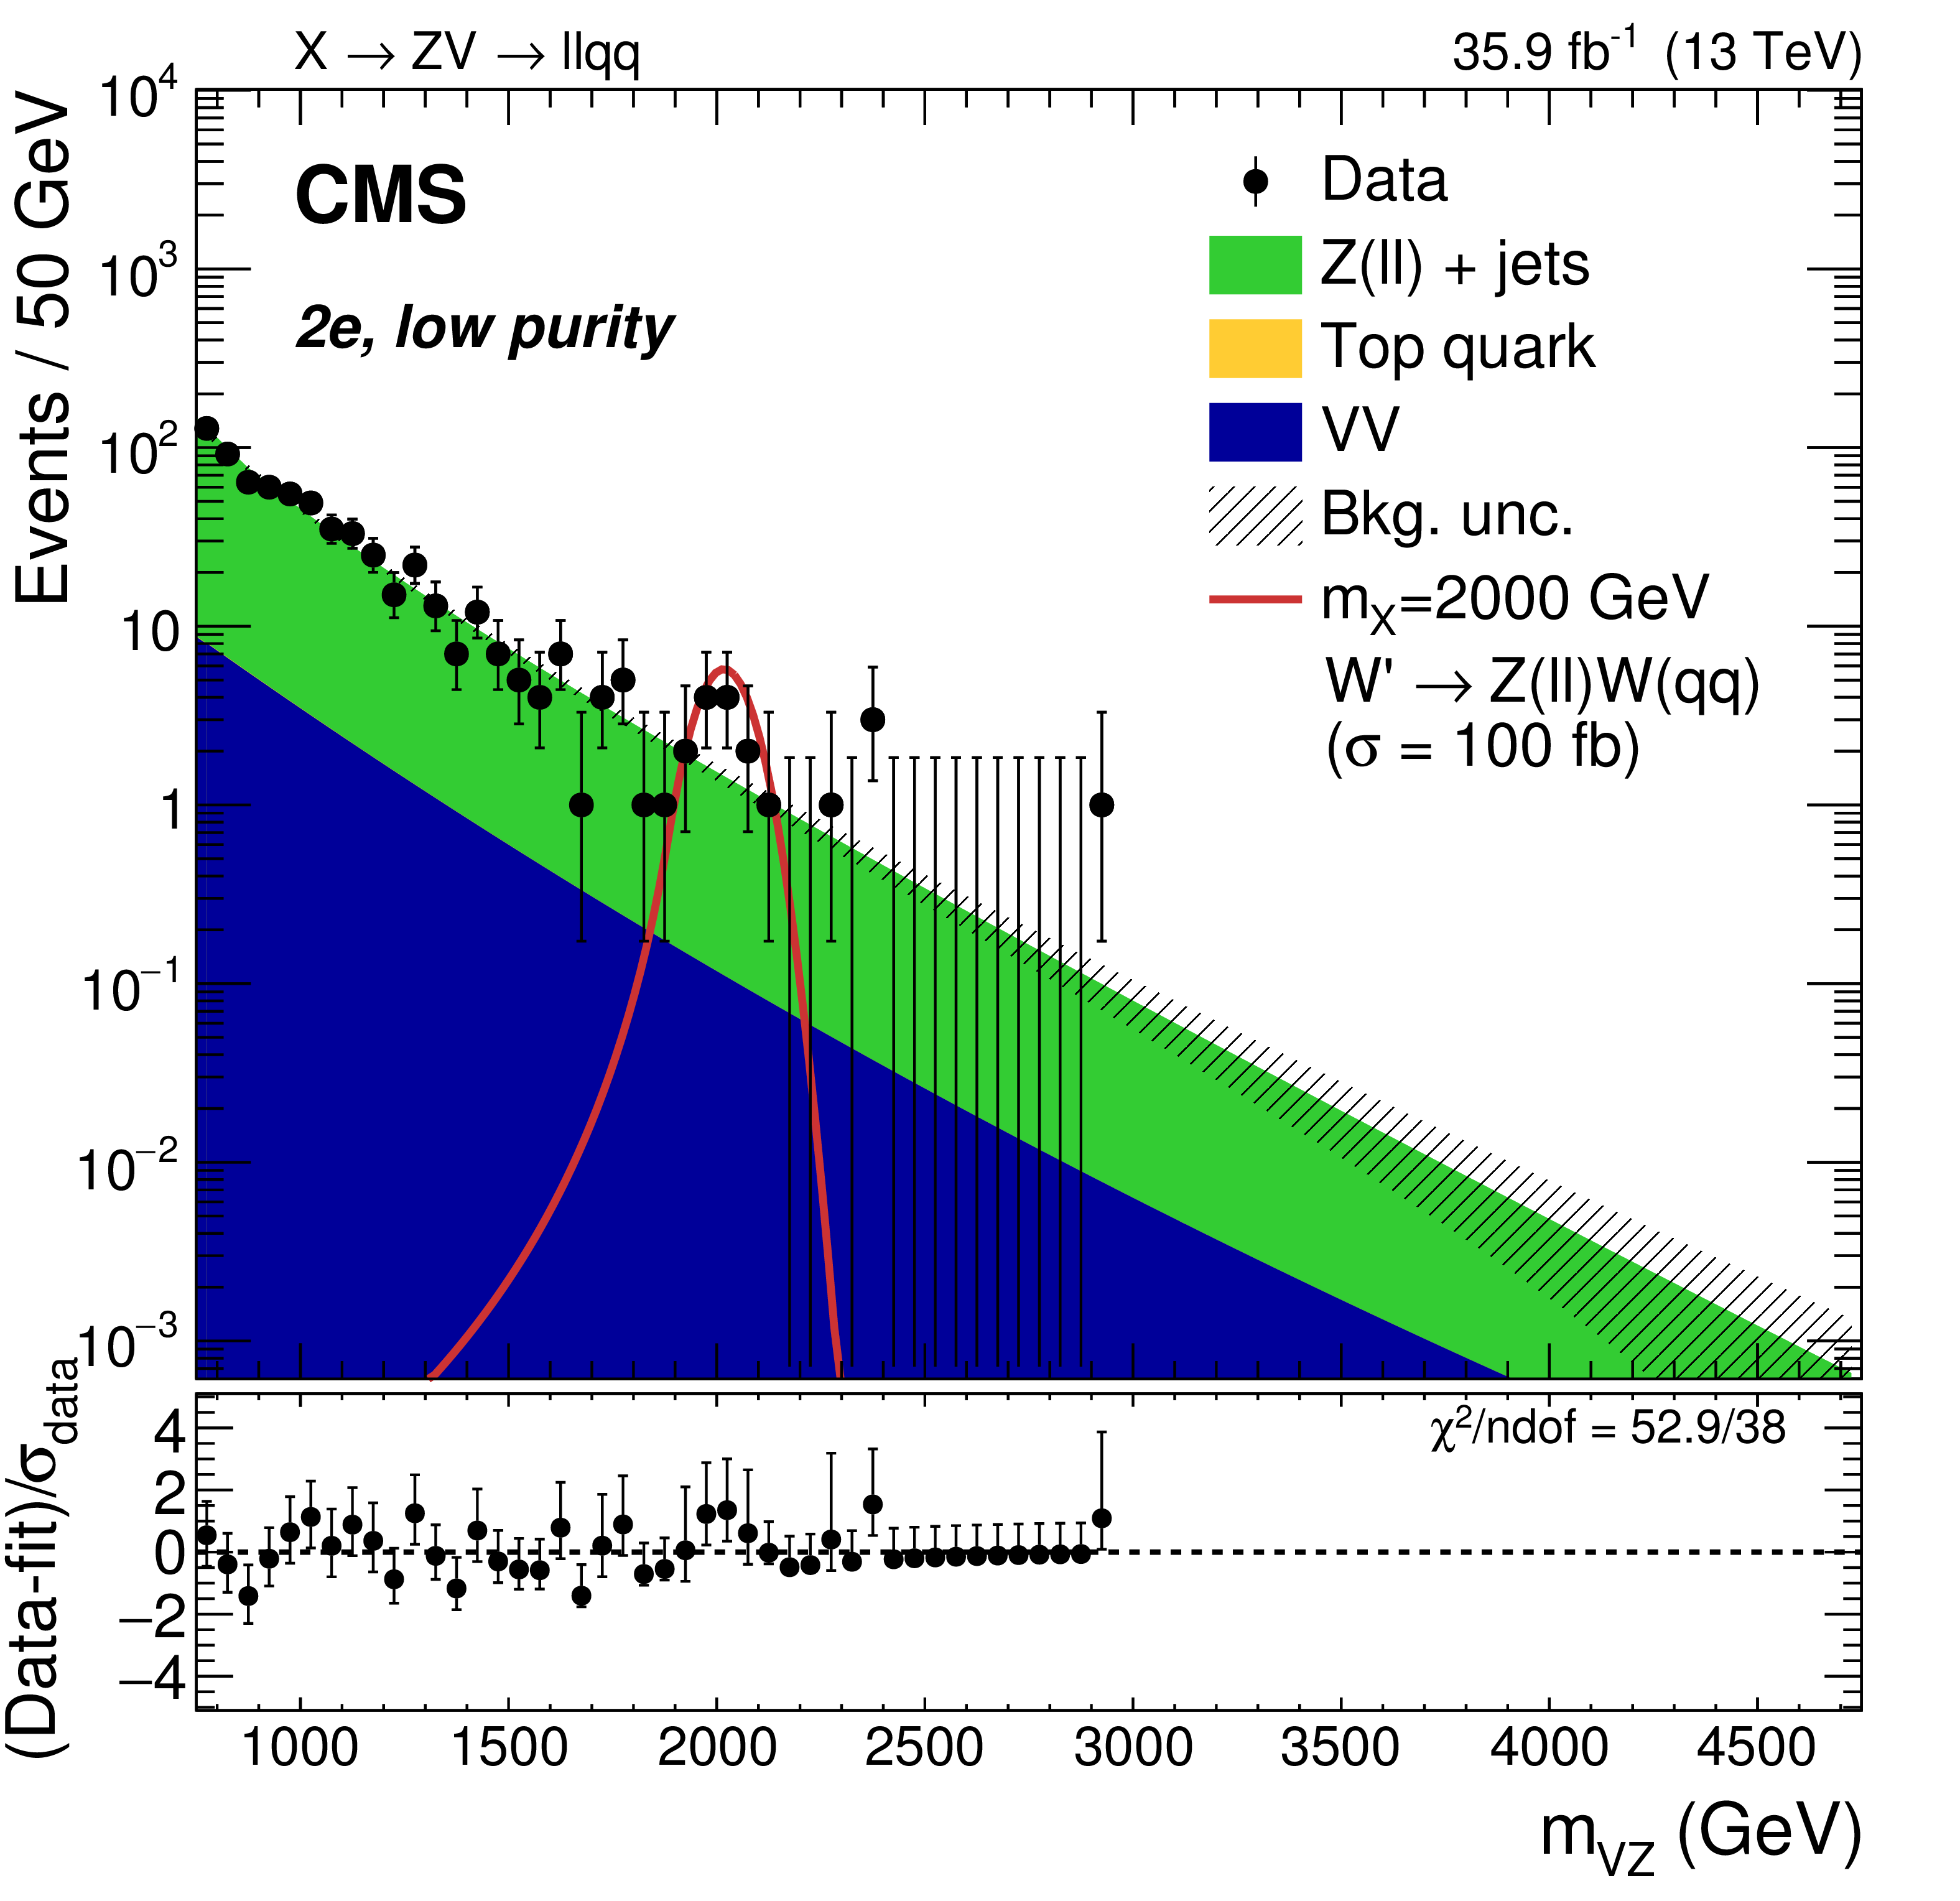
Figure 3-b:
Expected and observed distribution of the resonance candidate mass $ {m_{{{\mathrm {V}} \mathrm{Z}}}} $ in the high-mass analysis, in the electron channel, and separately for the low-purity category. The shaded area represents the post-fit uncertainty in the background. The bottom panel shows the pull distribution between data and post-fit SM background fit, where $\sigma _\text {data}$ is the Poisson uncertainty in the data. The expected contribution from W' signal candidates with mass $ {m_{{\mathrm {X}}}} = $ 2000 GeV, normalized to a cross section of 100 fb, is also shown. |
png pdf |
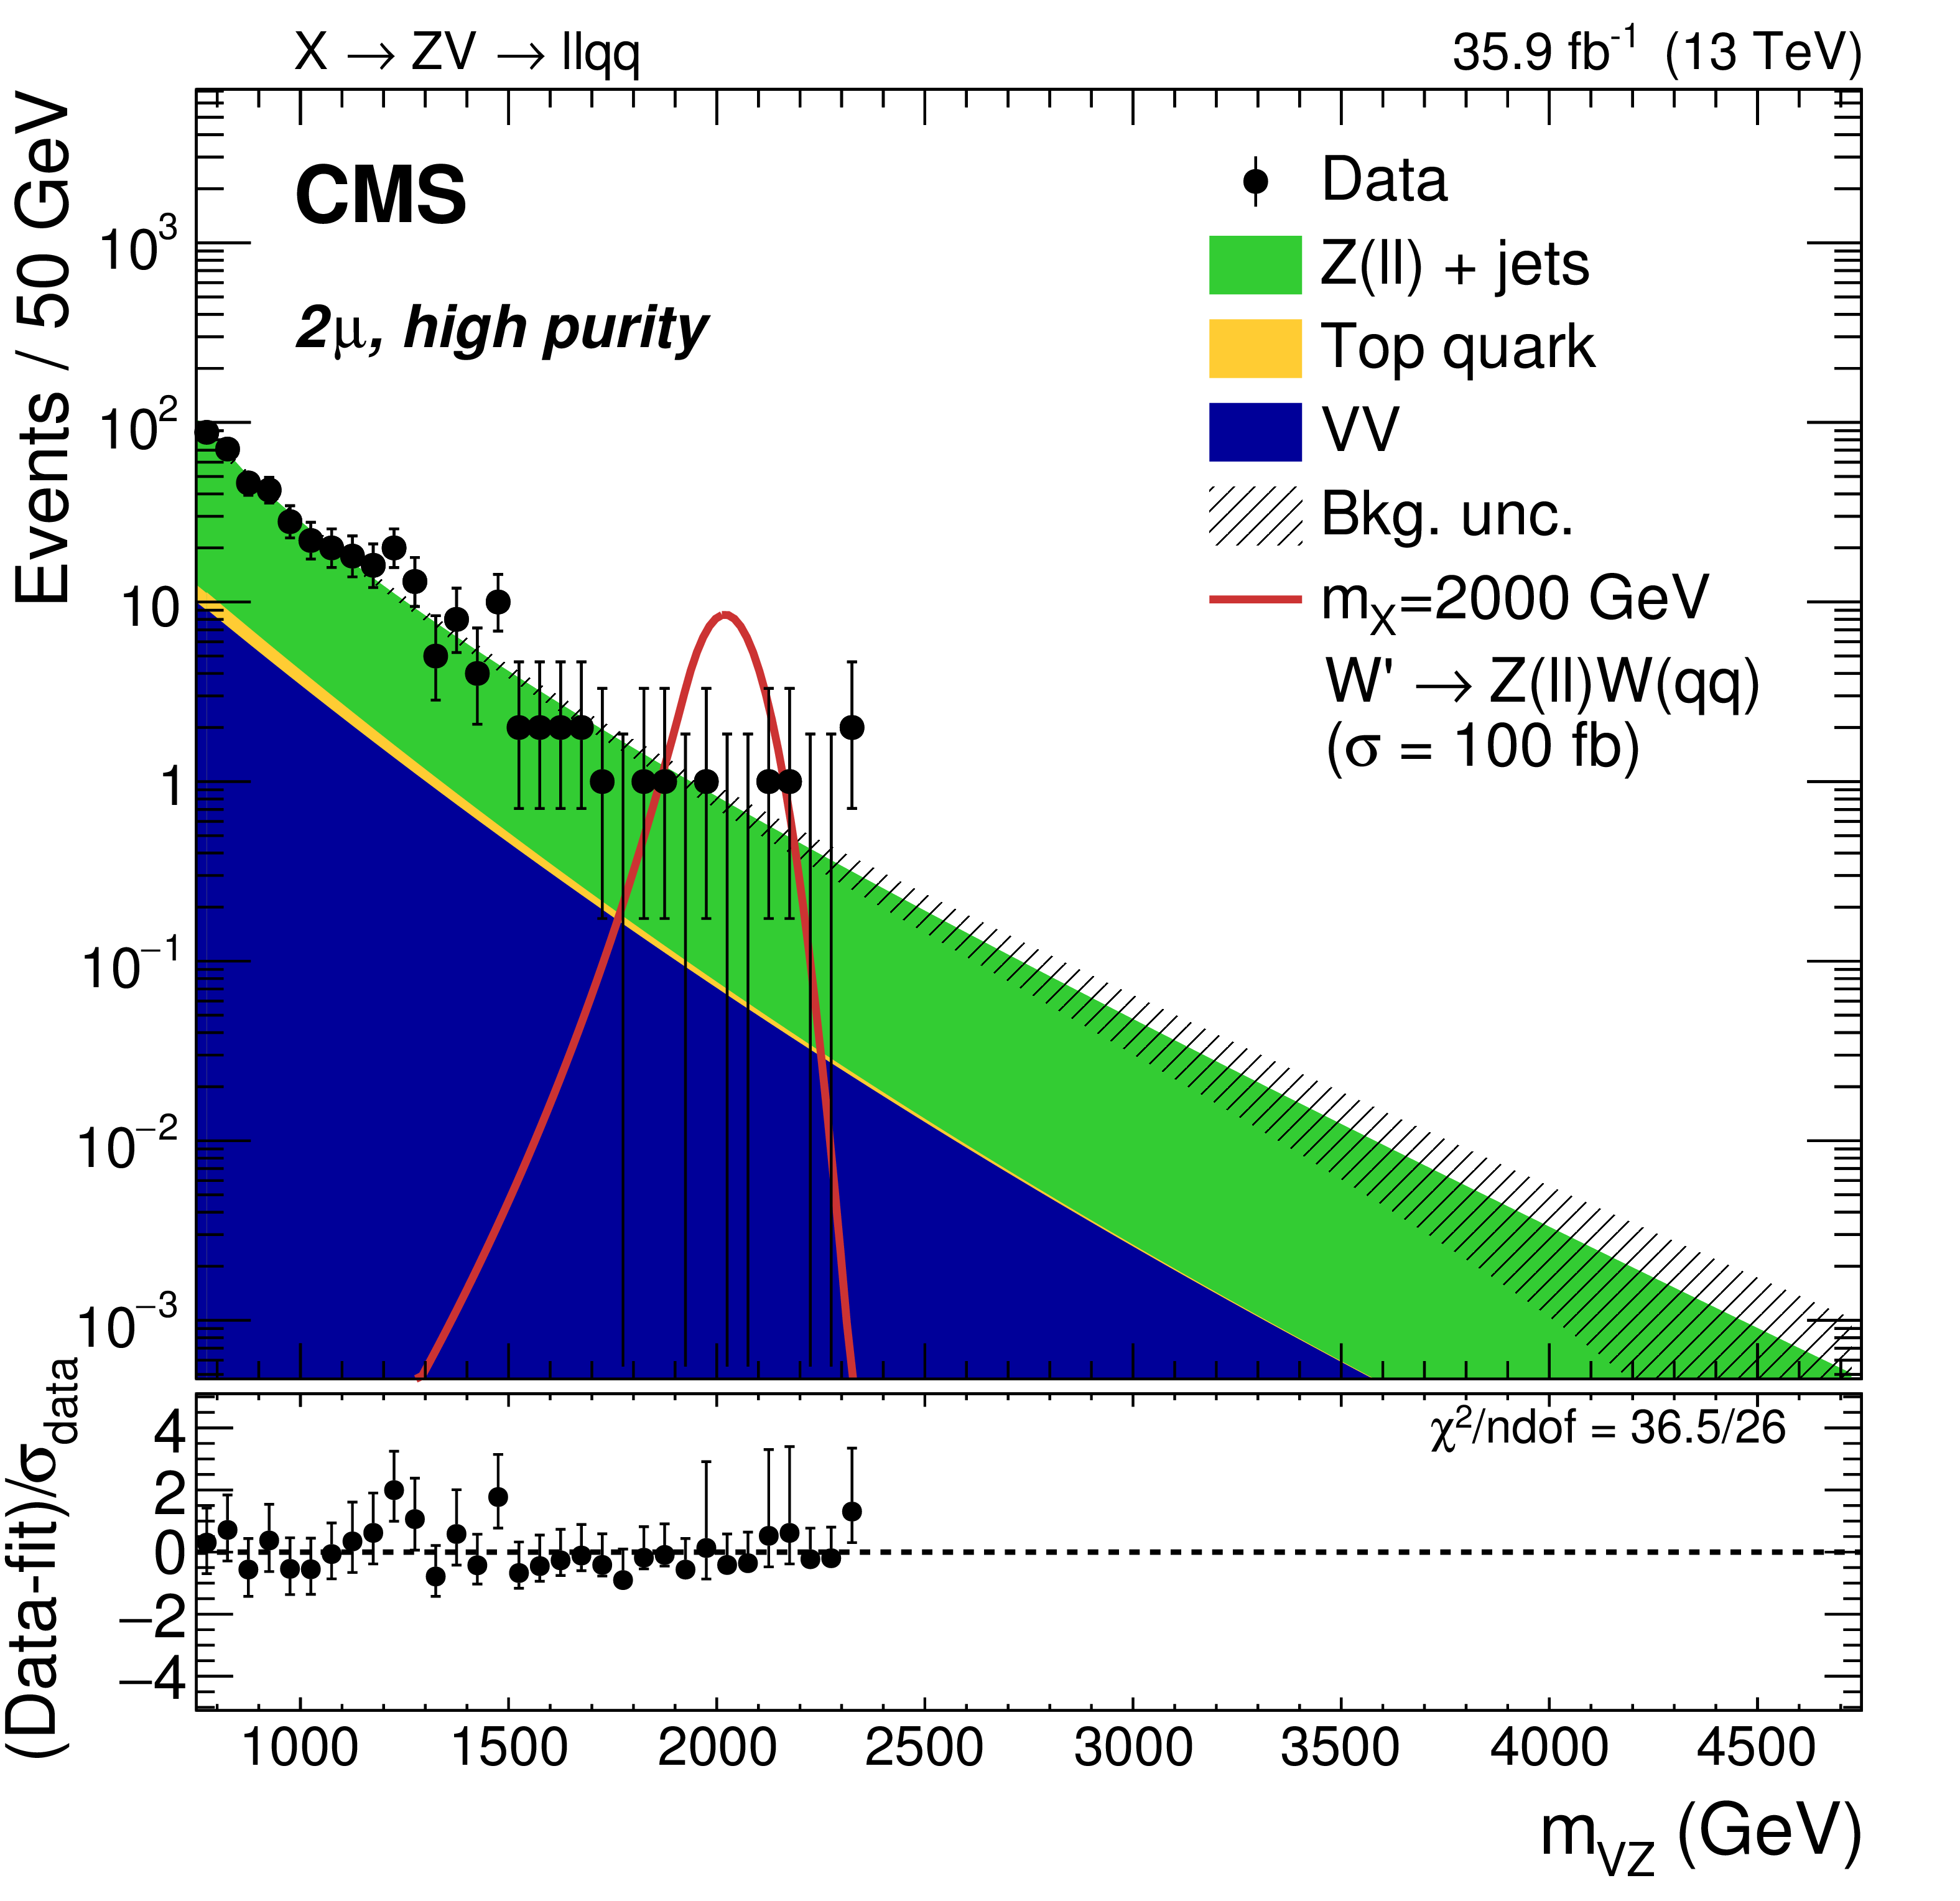
Figure 3-c:
Expected and observed distribution of the resonance candidate mass $ {m_{{{\mathrm {V}} \mathrm{Z}}}} $ in the high-mass analysis, in the muon channel, and separately for the high-purity category. The shaded area represents the post-fit uncertainty in the background. The bottom panel shows the pull distribution between data and post-fit SM background fit, where $\sigma _\text {data}$ is the Poisson uncertainty in the data. The expected contribution from W' signal candidates with mass $ {m_{{\mathrm {X}}}} = $ 2000 GeV, normalized to a cross section of 100 fb, is also shown. |
png pdf |
Figure 3-d:
Expected and observed distribution of the resonance candidate mass $ {m_{{{\mathrm {V}} \mathrm{Z}}}} $ in the high-mass analysis, in the muon channel, and separately for the low-purity category. The shaded area represents the post-fit uncertainty in the background. The bottom panel shows the pull distribution between data and post-fit SM background fit, where $\sigma _\text {data}$ is the Poisson uncertainty in the data. The expected contribution from W' signal candidates with mass $ {m_{{\mathrm {X}}}} = $ 2000 GeV, normalized to a cross section of 100 fb, is also shown. |
png pdf |
Figure 4:
Sideband $ {m_{{{\mathrm {V}} \mathrm{Z}}}} $ distributions for the low-mass search in the merged V (upper), resolved V (lower), untagged (left), and tagged (right) categories, after fitting the sideband data alone. The points show the data while the filled histograms show the background contributions. Electron and muon categories are combined. The gray band indicates the statistical and post-fit systematic uncertainties in the normalization and shape of the background. Larger bin widths are used at higher values of $ {m_{{{\mathrm {V}} \mathrm{Z}}}} $; the bin widths are indicated by the horizontal error bars. |

png pdf |
Figure 4-a:
Sideband $ {m_{{{\mathrm {V}} \mathrm{Z}}}} $ distribution for the low-mass search in the merged V, untagged category, after fitting the sideband data alone. The points show the data while the filled histograms show the background contributions. Electron and muon categories are combined. The gray band indicates the statistical and post-fit systematic uncertainties in the normalization and shape of the background. Larger bin widths are used at higher values of $ {m_{{{\mathrm {V}} \mathrm{Z}}}} $; the bin widths are indicated by the horizontal error bars. |
png pdf |
Figure 4-b:
Sideband $ {m_{{{\mathrm {V}} \mathrm{Z}}}} $ distribution for the low-mass search in the merged V, tagged category, after fitting the sideband data alone. The points show the data while the filled histograms show the background contributions. Electron and muon categories are combined. The gray band indicates the statistical and post-fit systematic uncertainties in the normalization and shape of the background. Larger bin widths are used at higher values of $ {m_{{{\mathrm {V}} \mathrm{Z}}}} $; the bin widths are indicated by the horizontal error bars. |
png pdf |
Figure 4-c:
Sideband $ {m_{{{\mathrm {V}} \mathrm{Z}}}} $ distribution for the low-mass search in the resolved V, untagged category, after fitting the sideband data alone. The points show the data while the filled histograms show the background contributions. Electron and muon categories are combined. The gray band indicates the statistical and post-fit systematic uncertainties in the normalization and shape of the background. Larger bin widths are used at higher values of $ {m_{{{\mathrm {V}} \mathrm{Z}}}} $; the bin widths are indicated by the horizontal error bars. |
png pdf |
Figure 4-d:
Sideband $ {m_{{{\mathrm {V}} \mathrm{Z}}}} $ distribution for the low-mass search in the resolved V, tagged category, after fitting the sideband data alone. The points show the data while the filled histograms show the background contributions. Electron and muon categories are combined. The gray band indicates the statistical and post-fit systematic uncertainties in the normalization and shape of the background. Larger bin widths are used at higher values of $ {m_{{{\mathrm {V}} \mathrm{Z}}}} $; the bin widths are indicated by the horizontal error bars. |
png pdf |
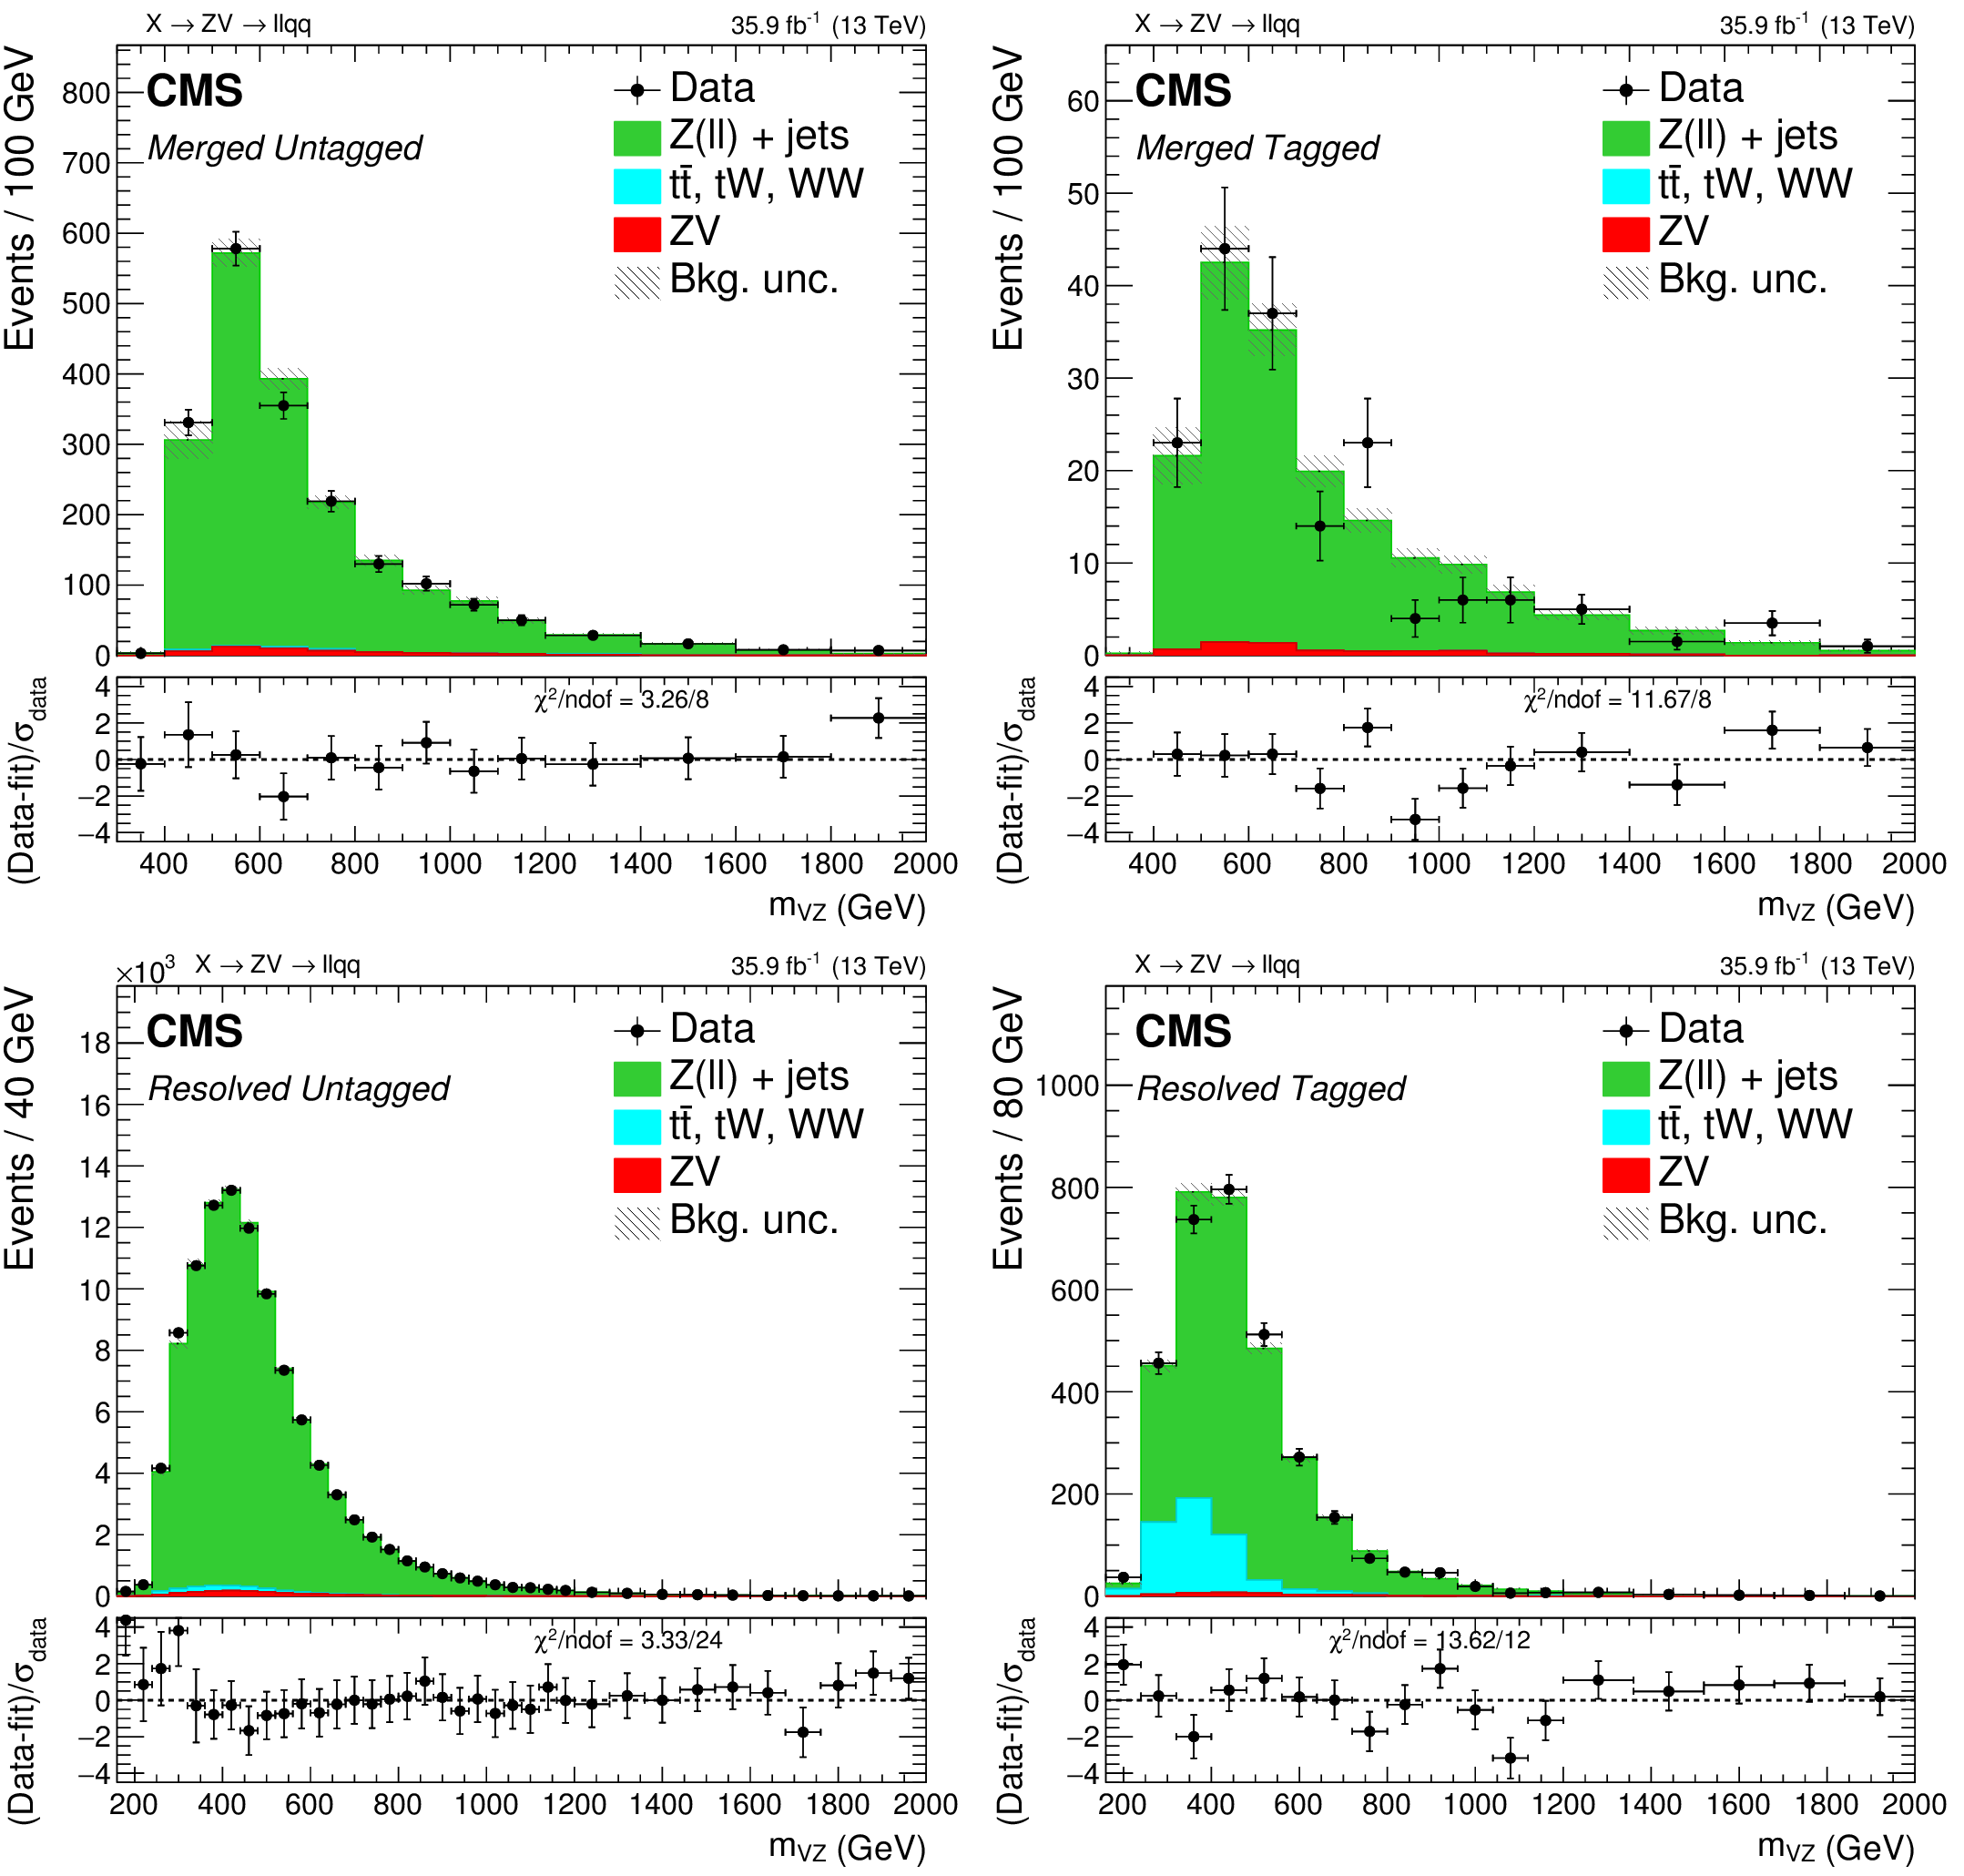
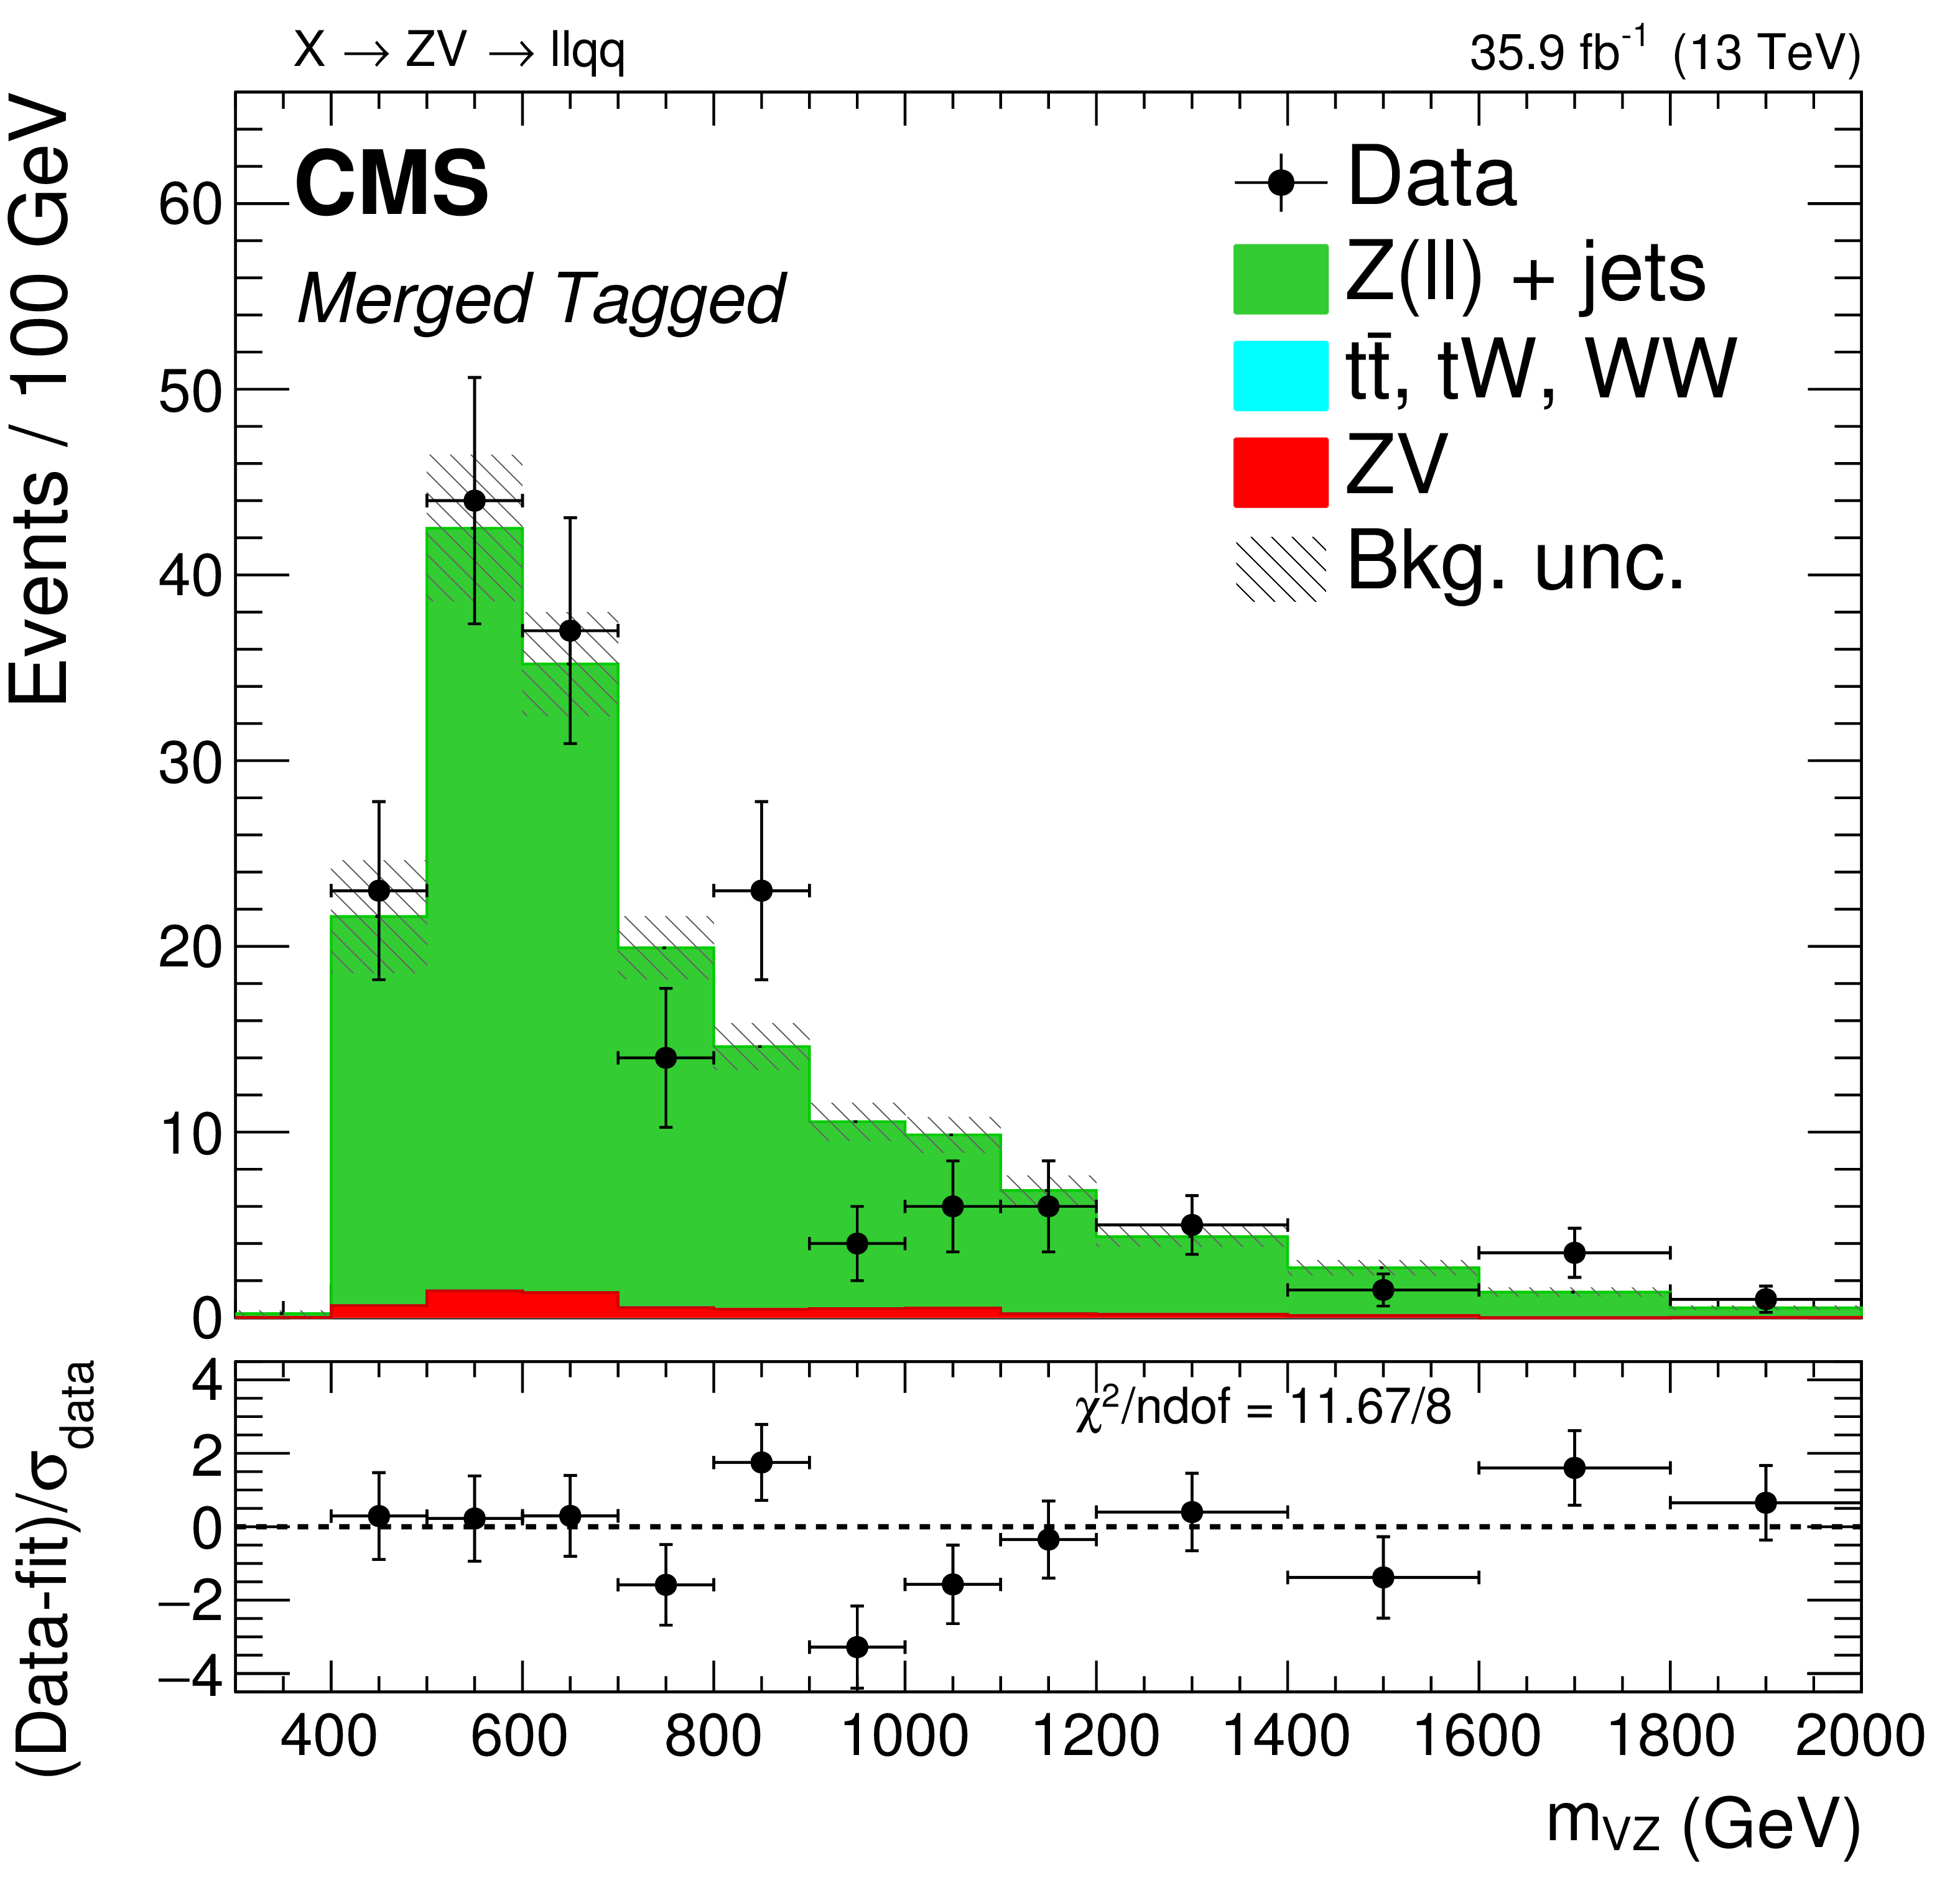
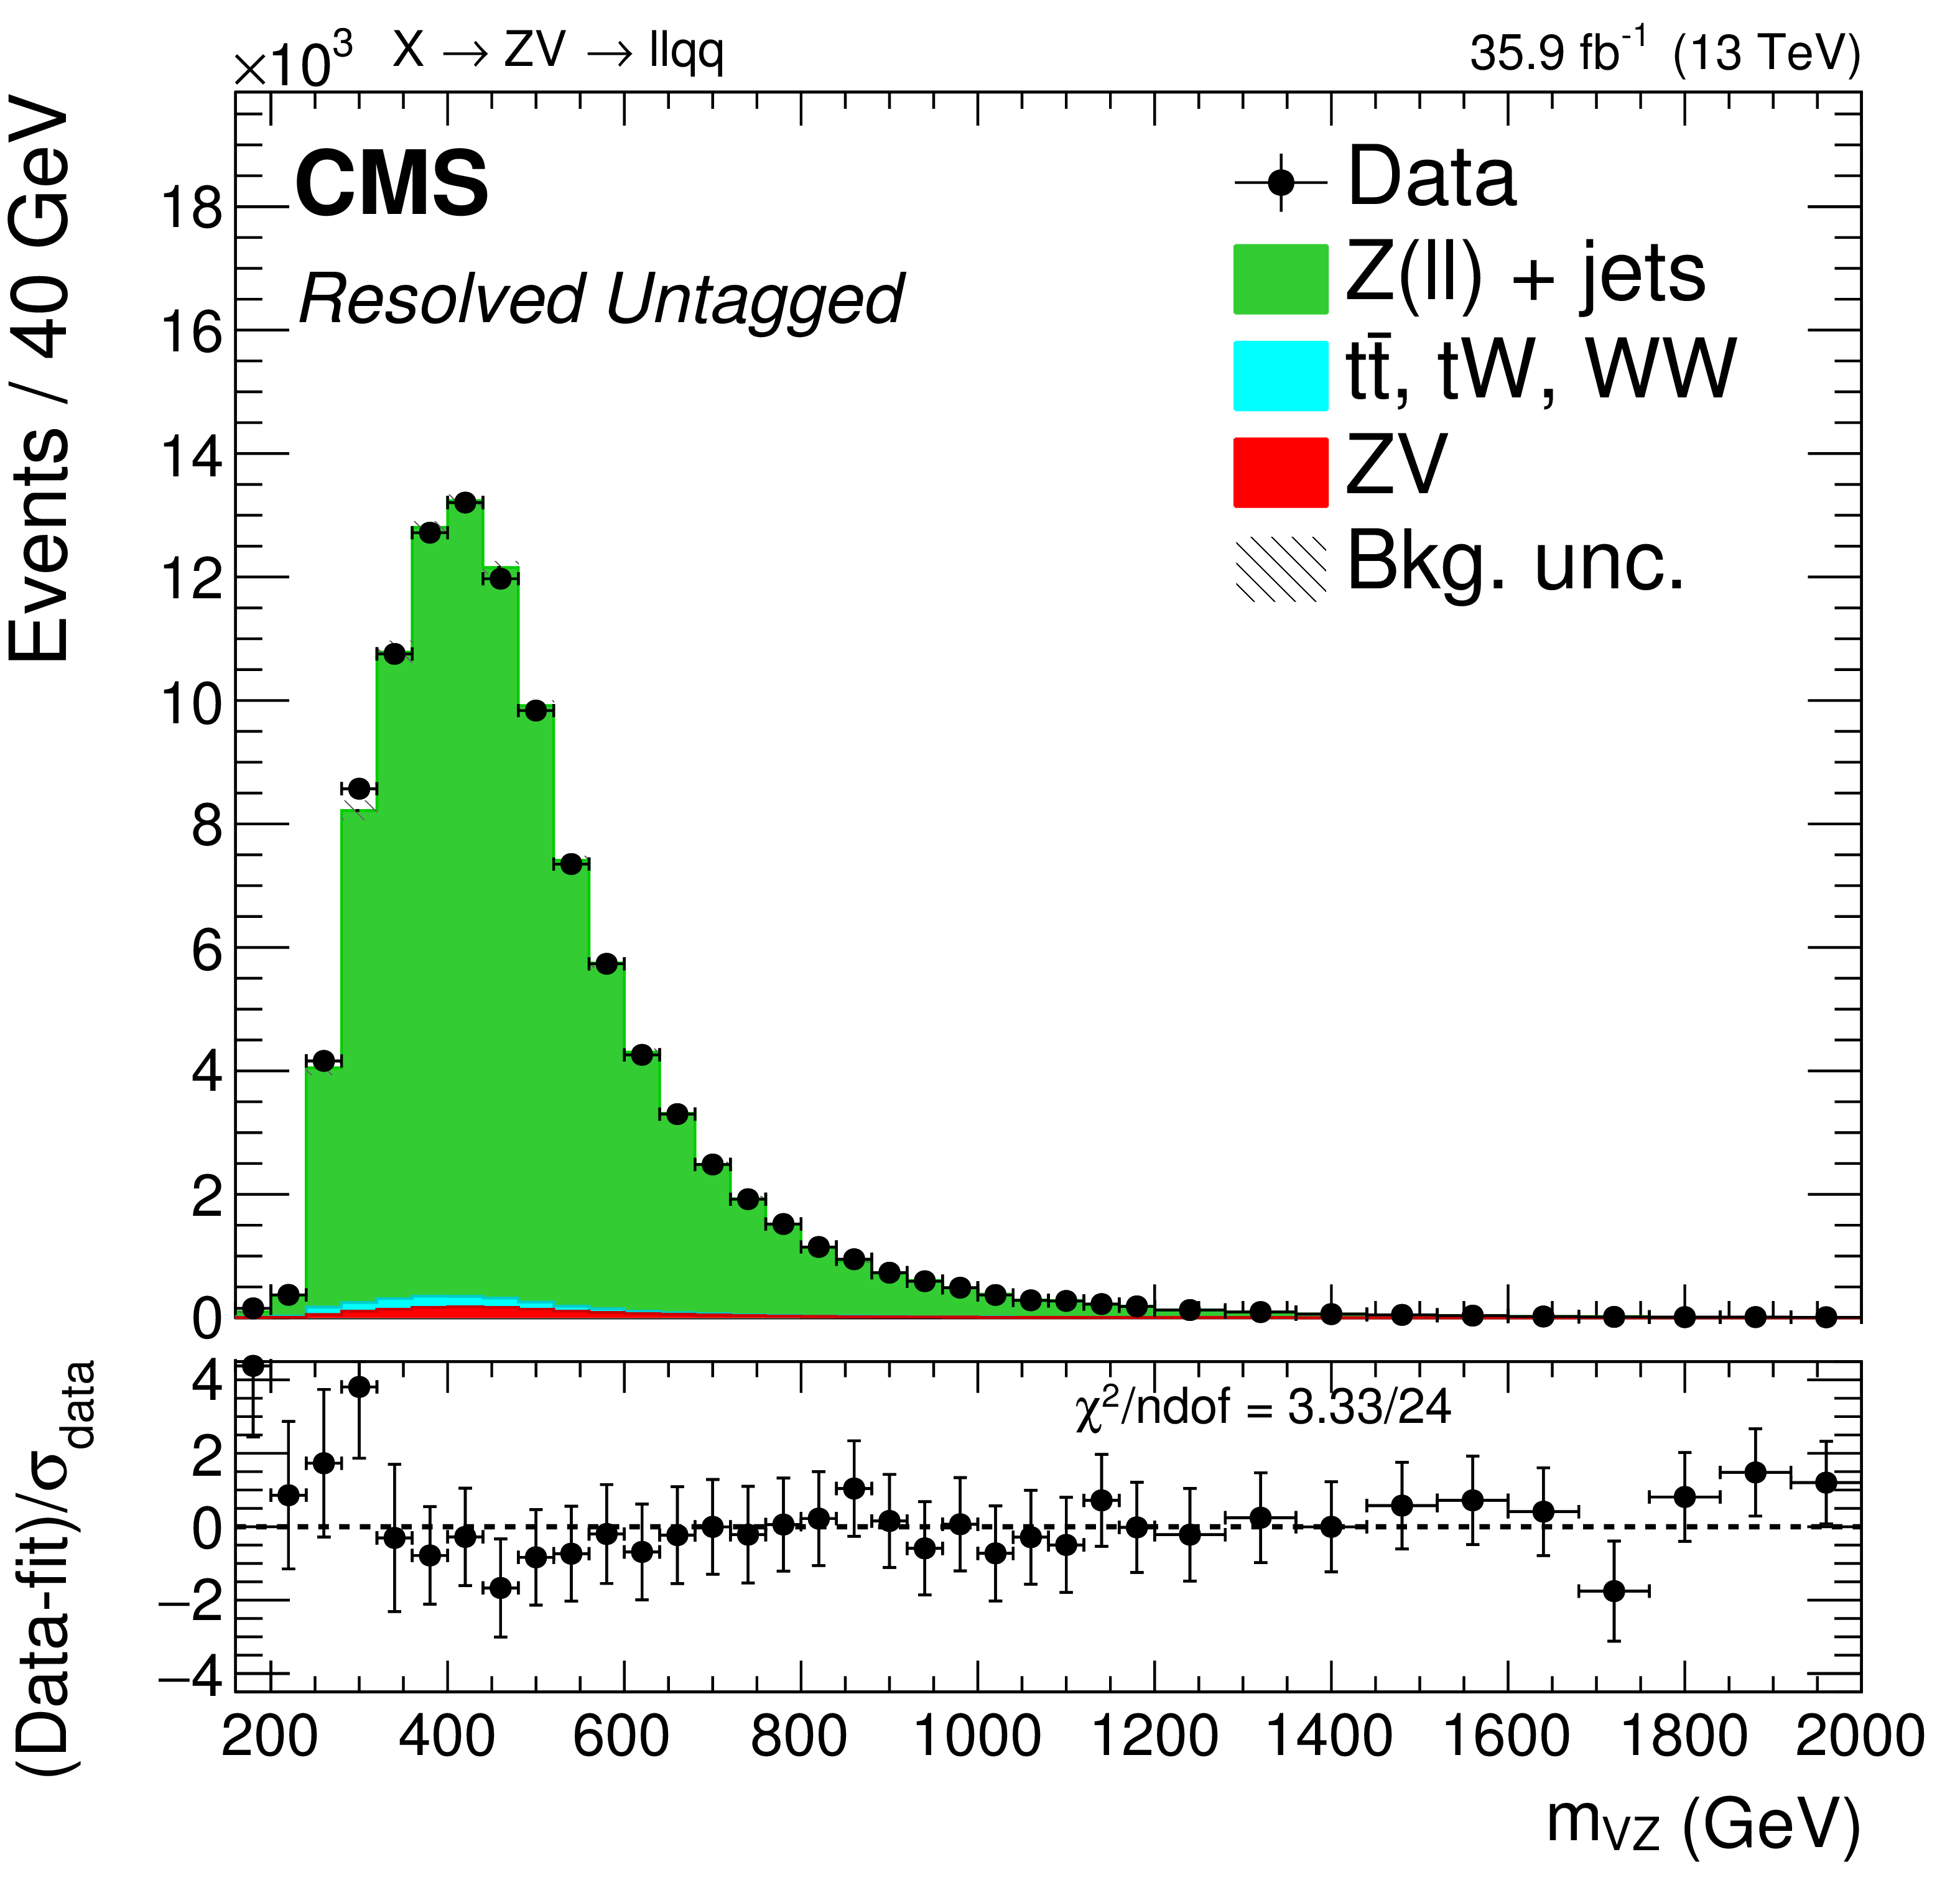
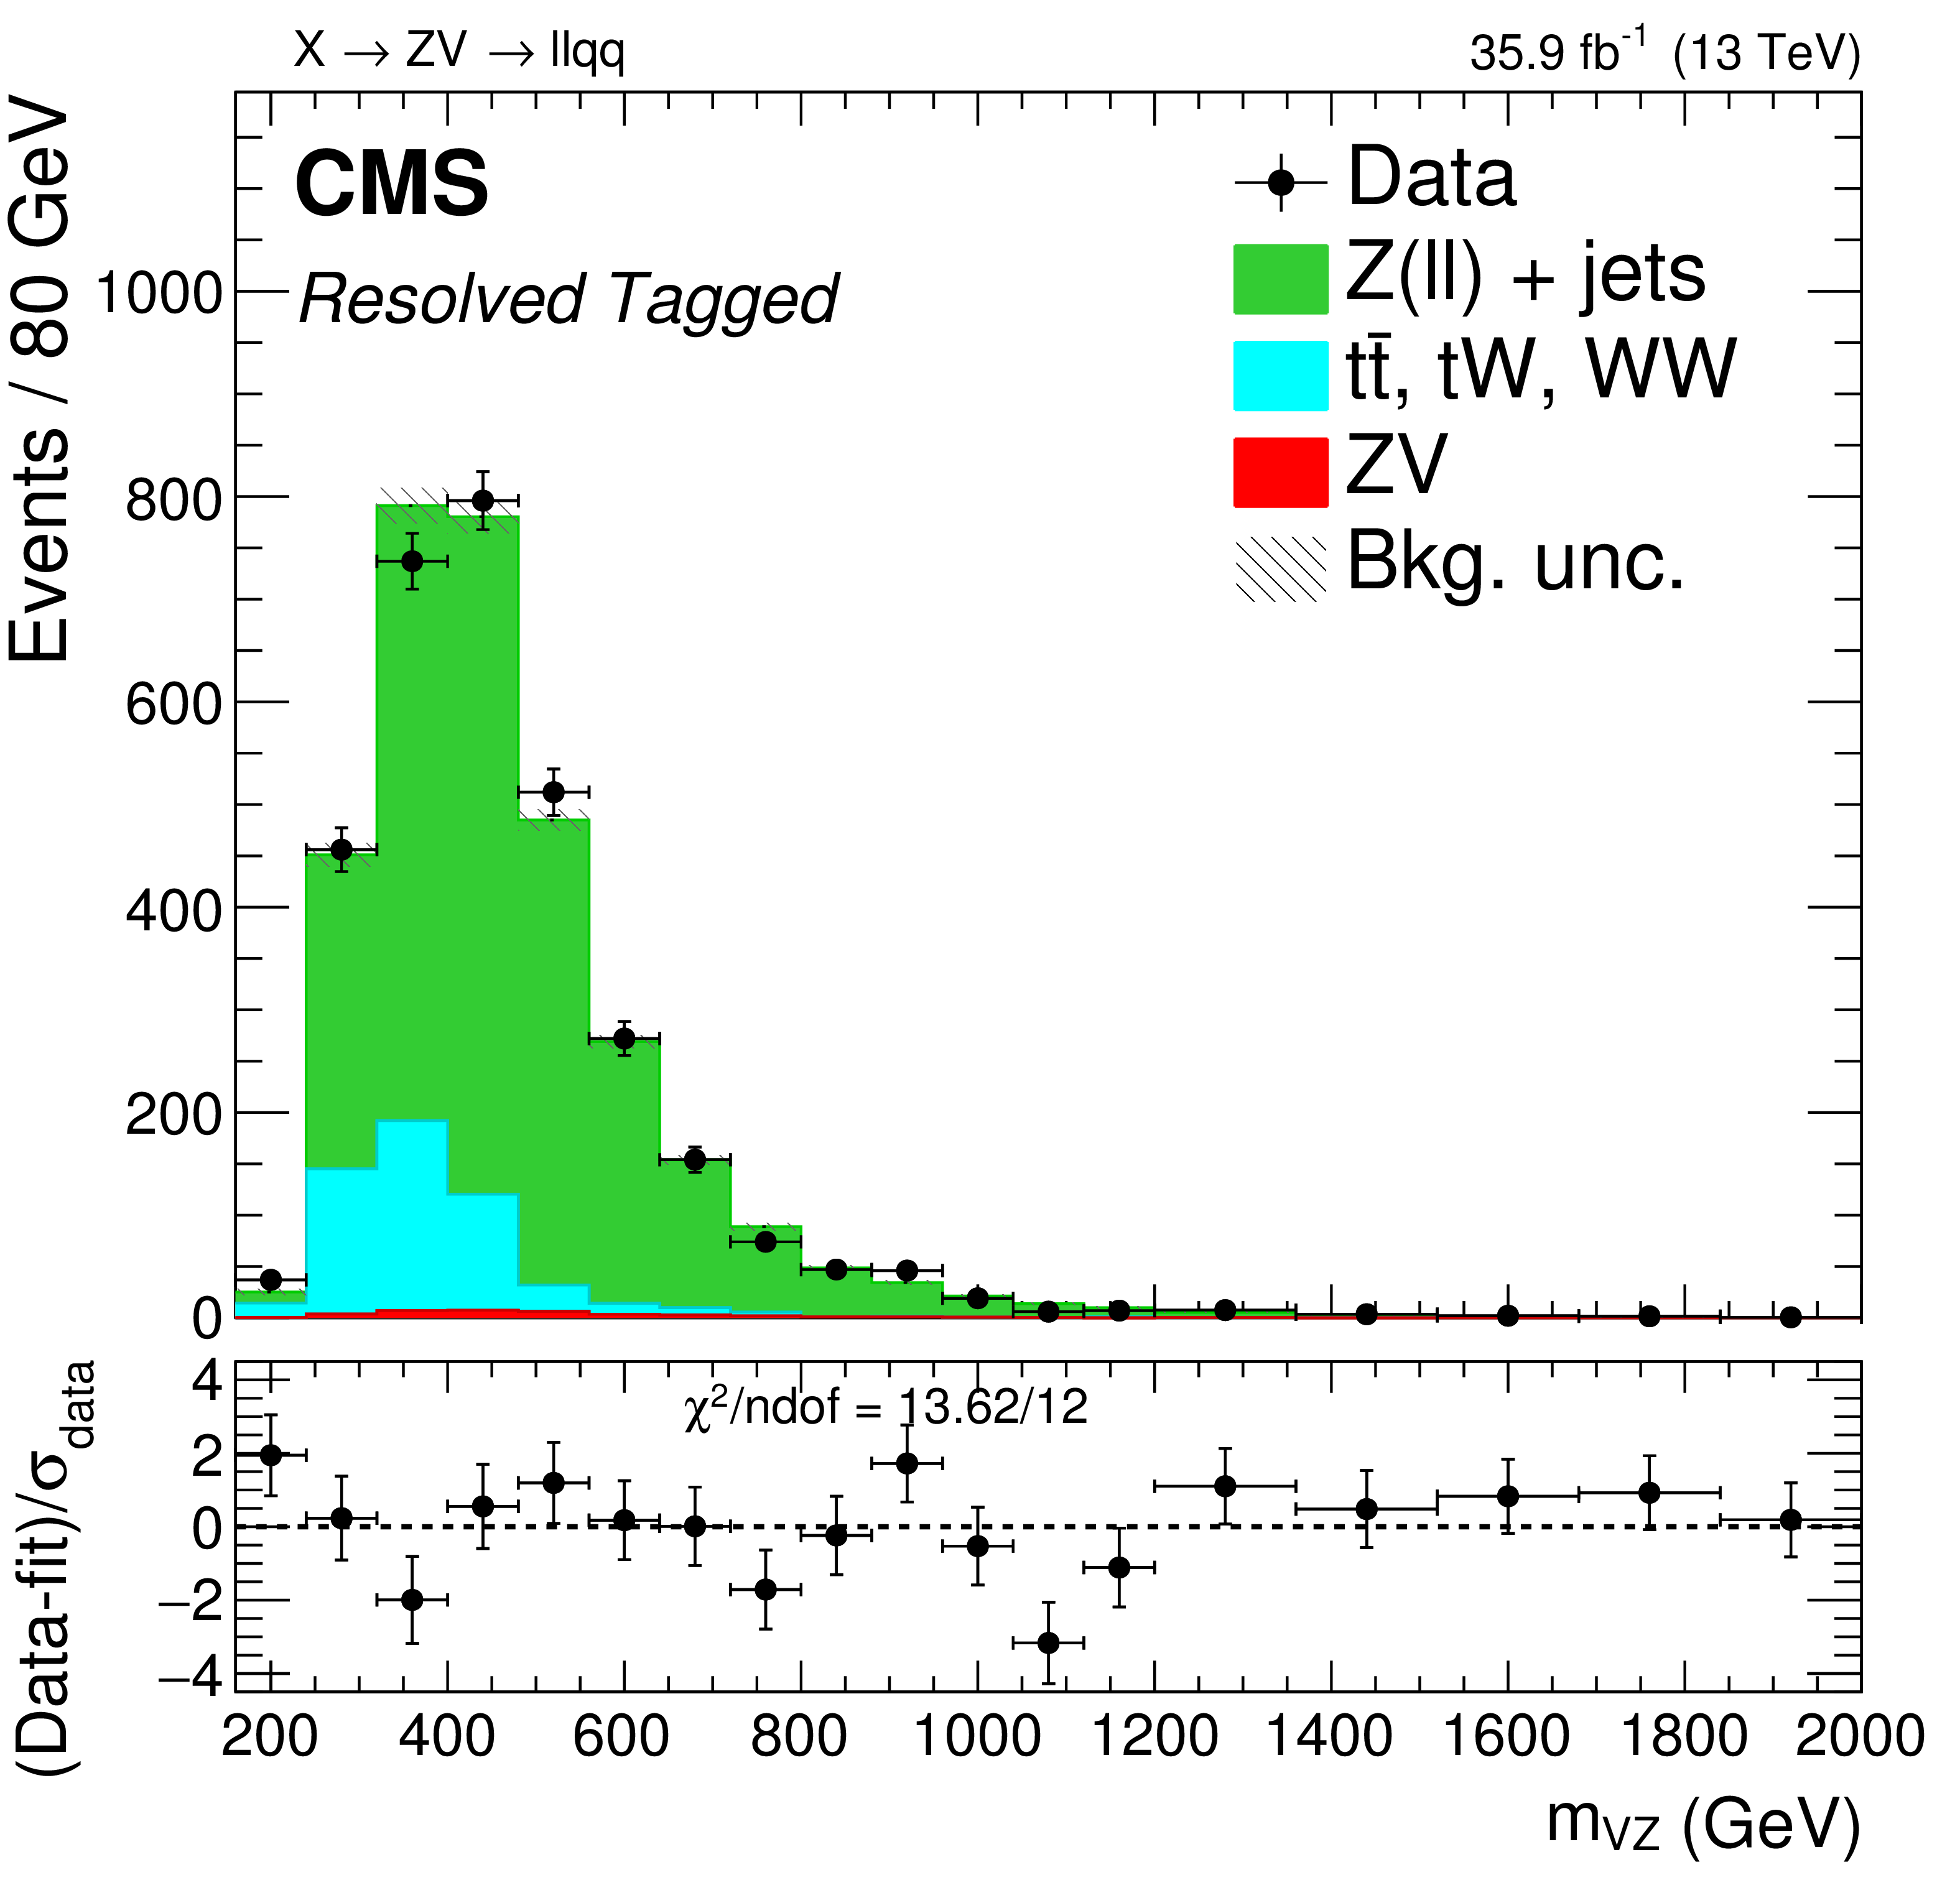
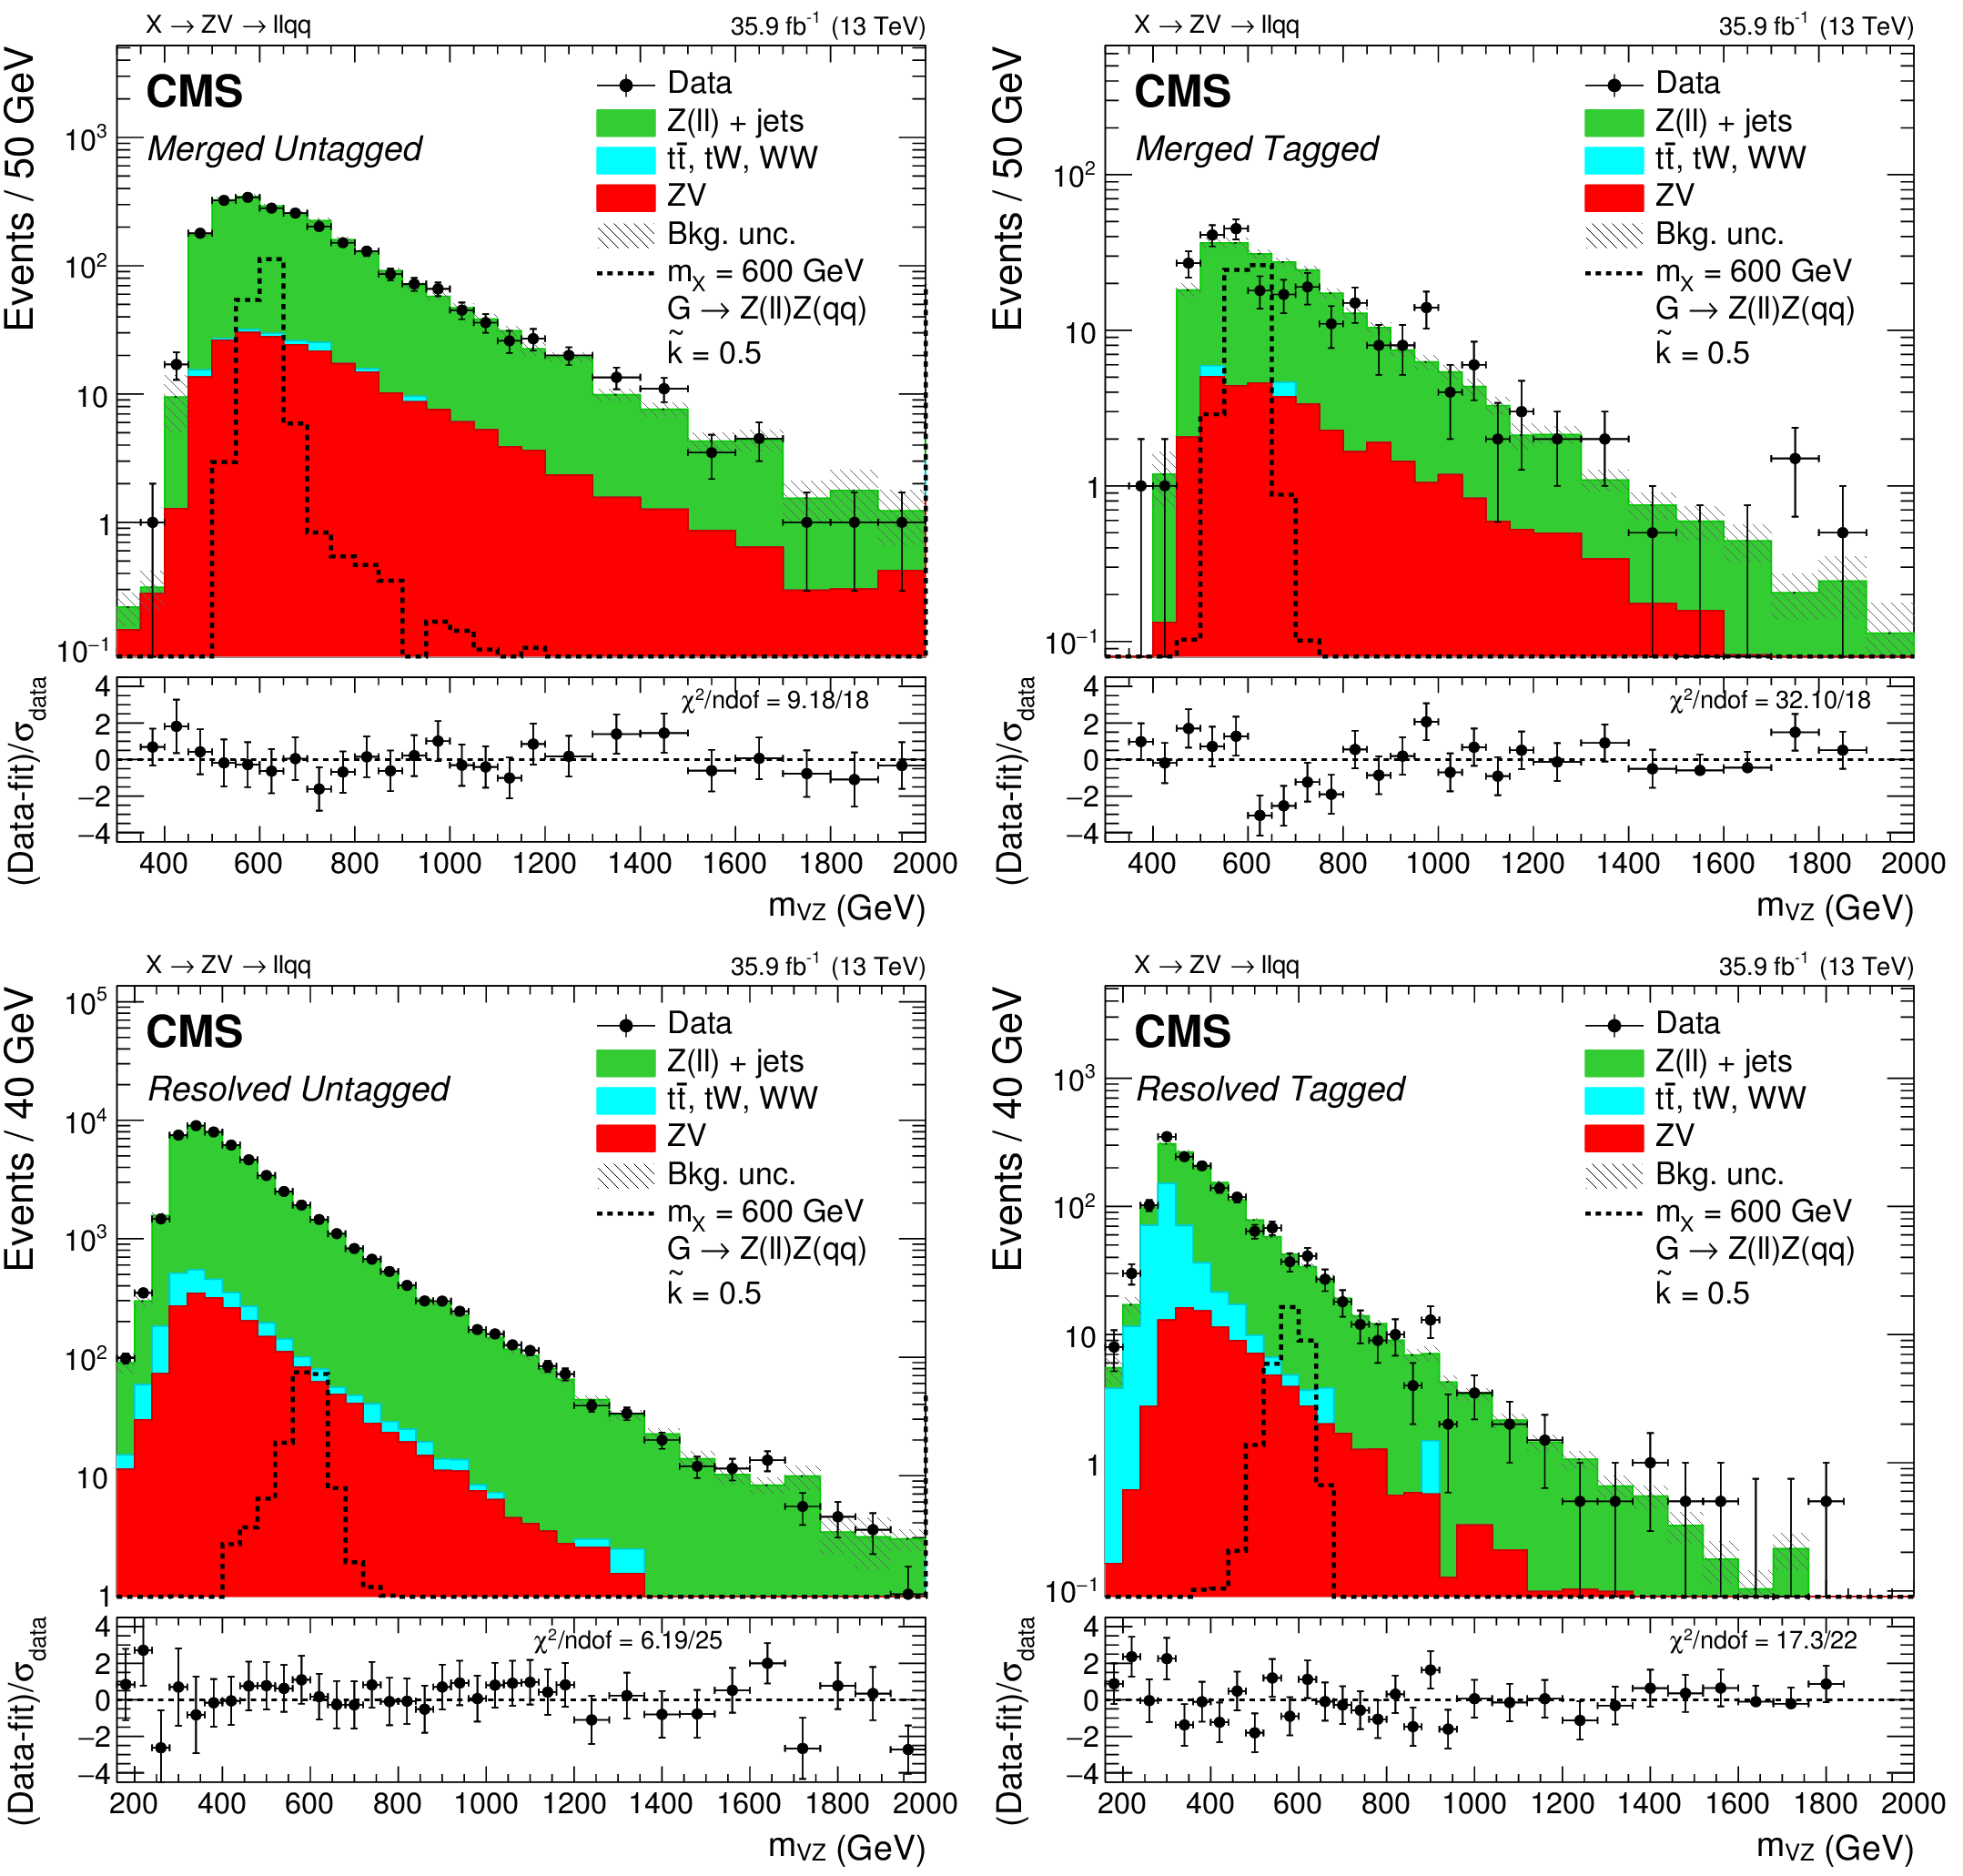
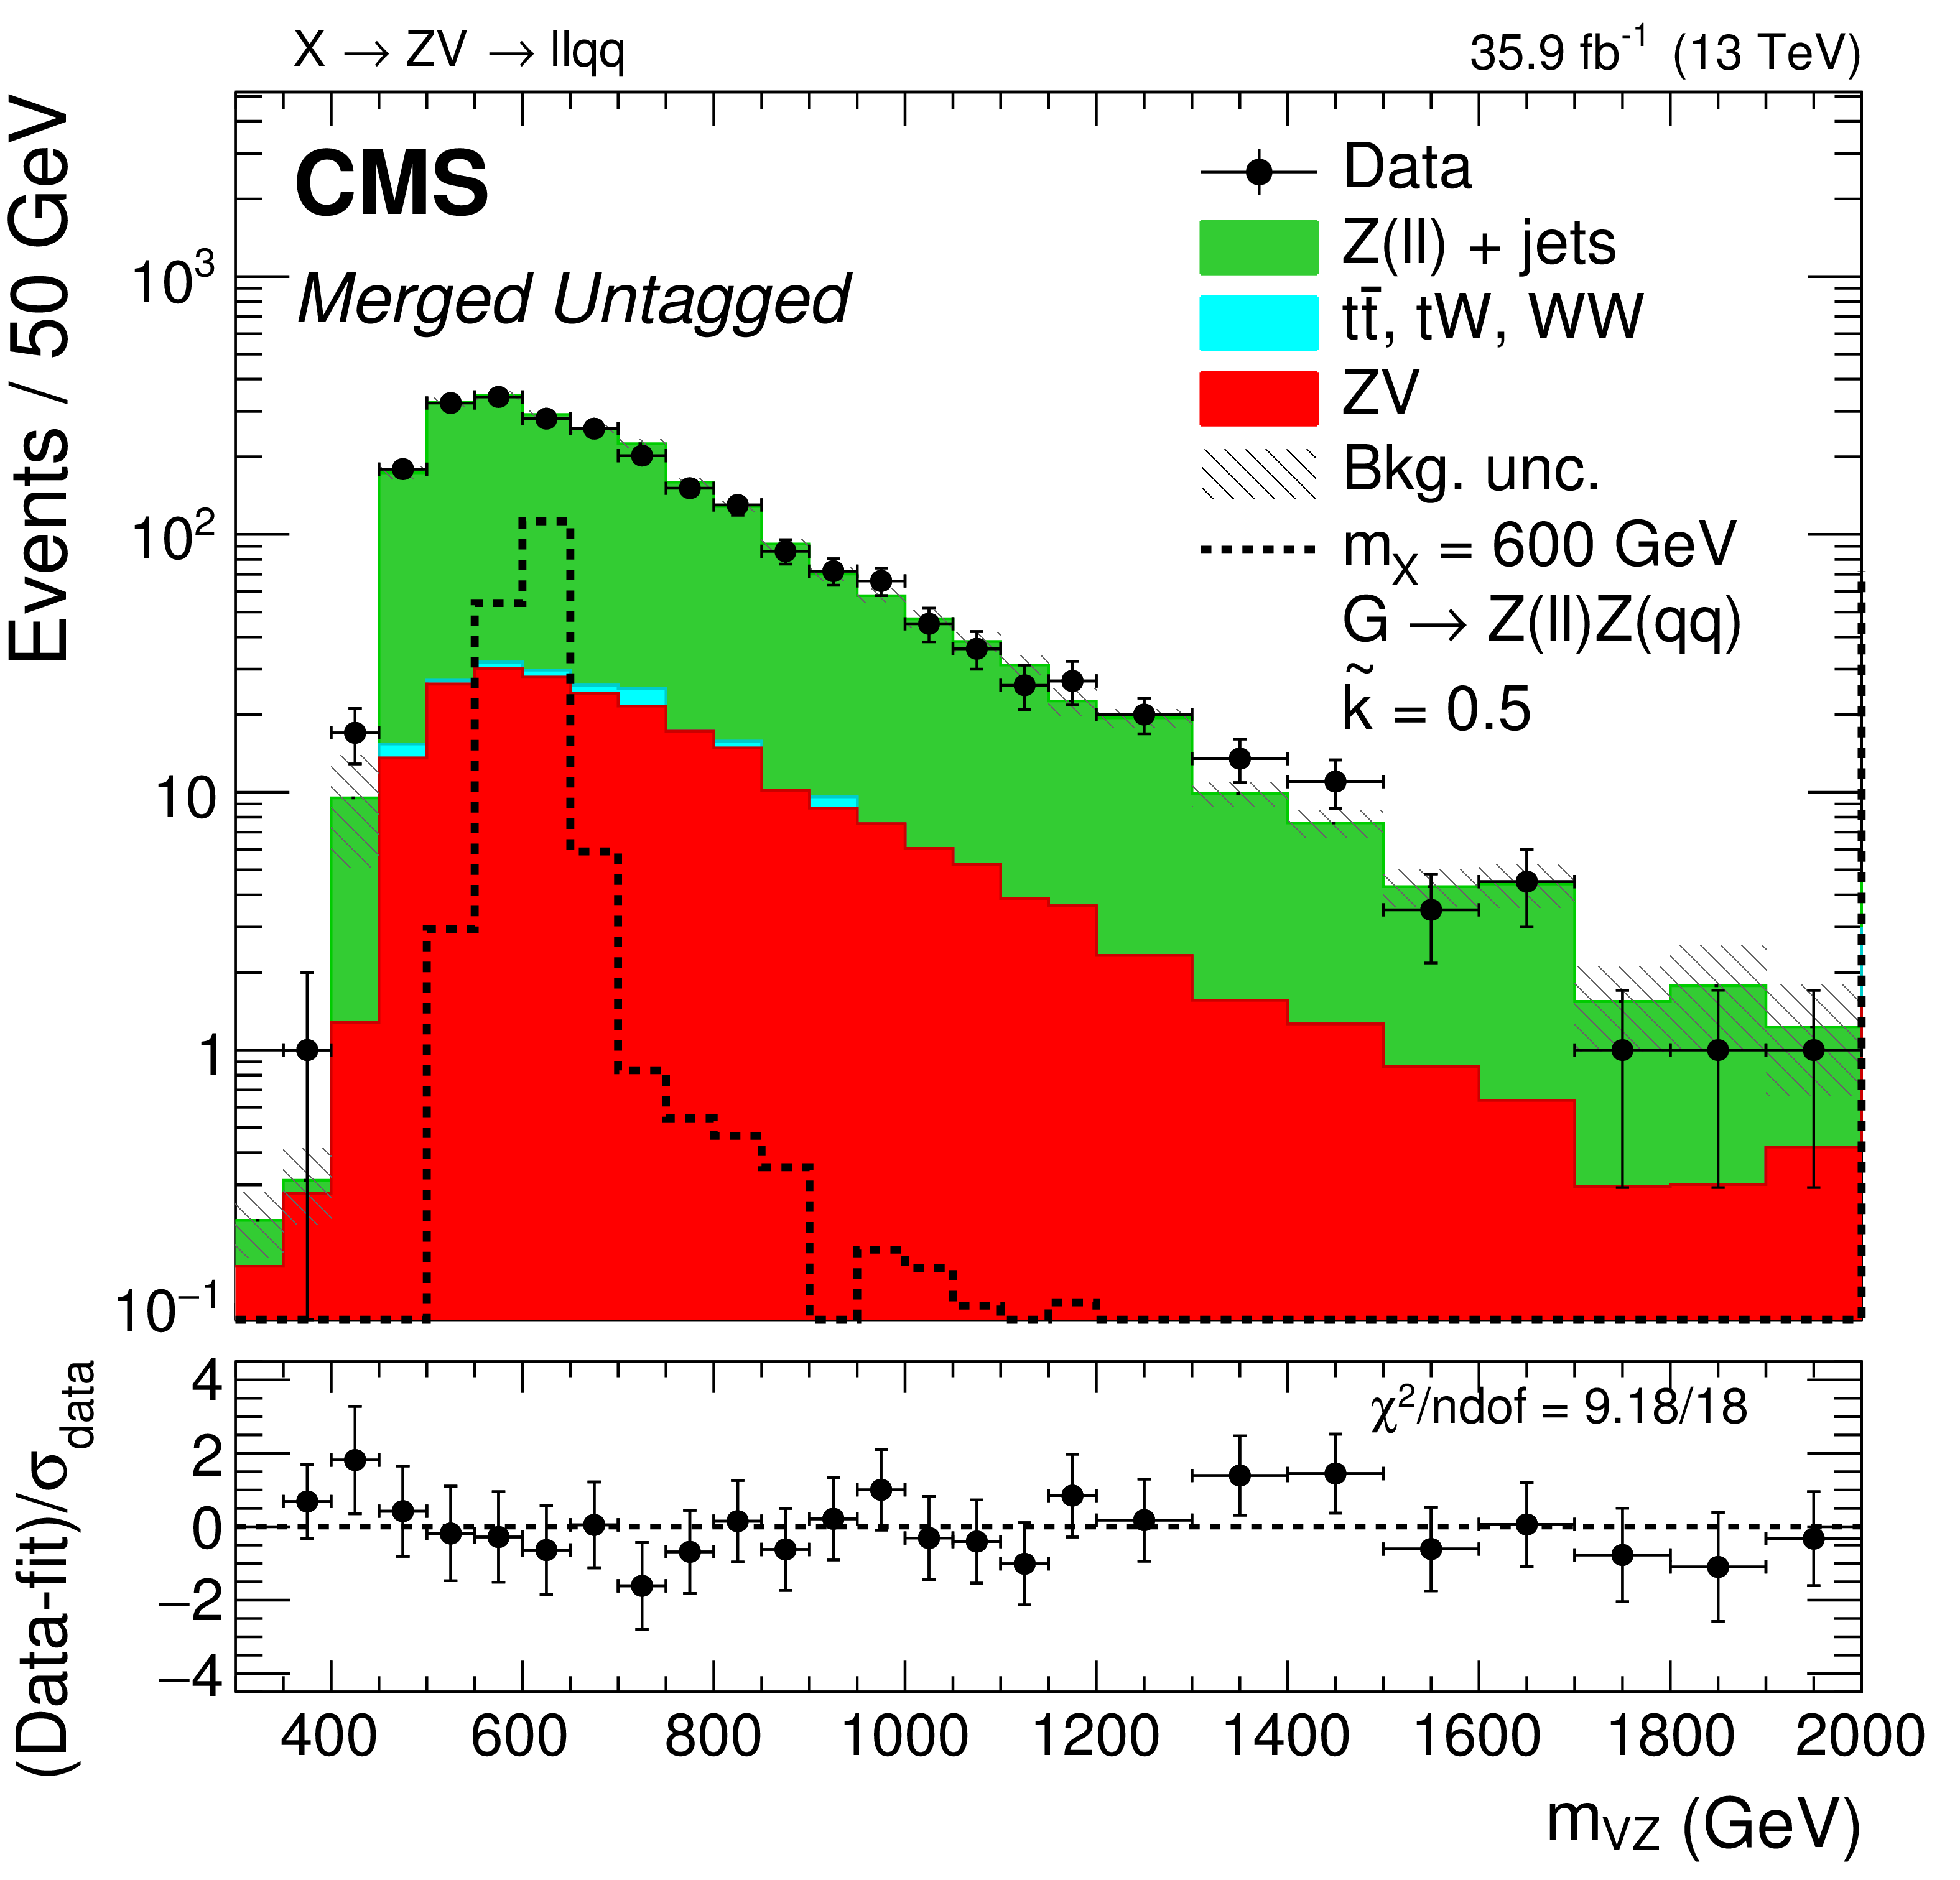
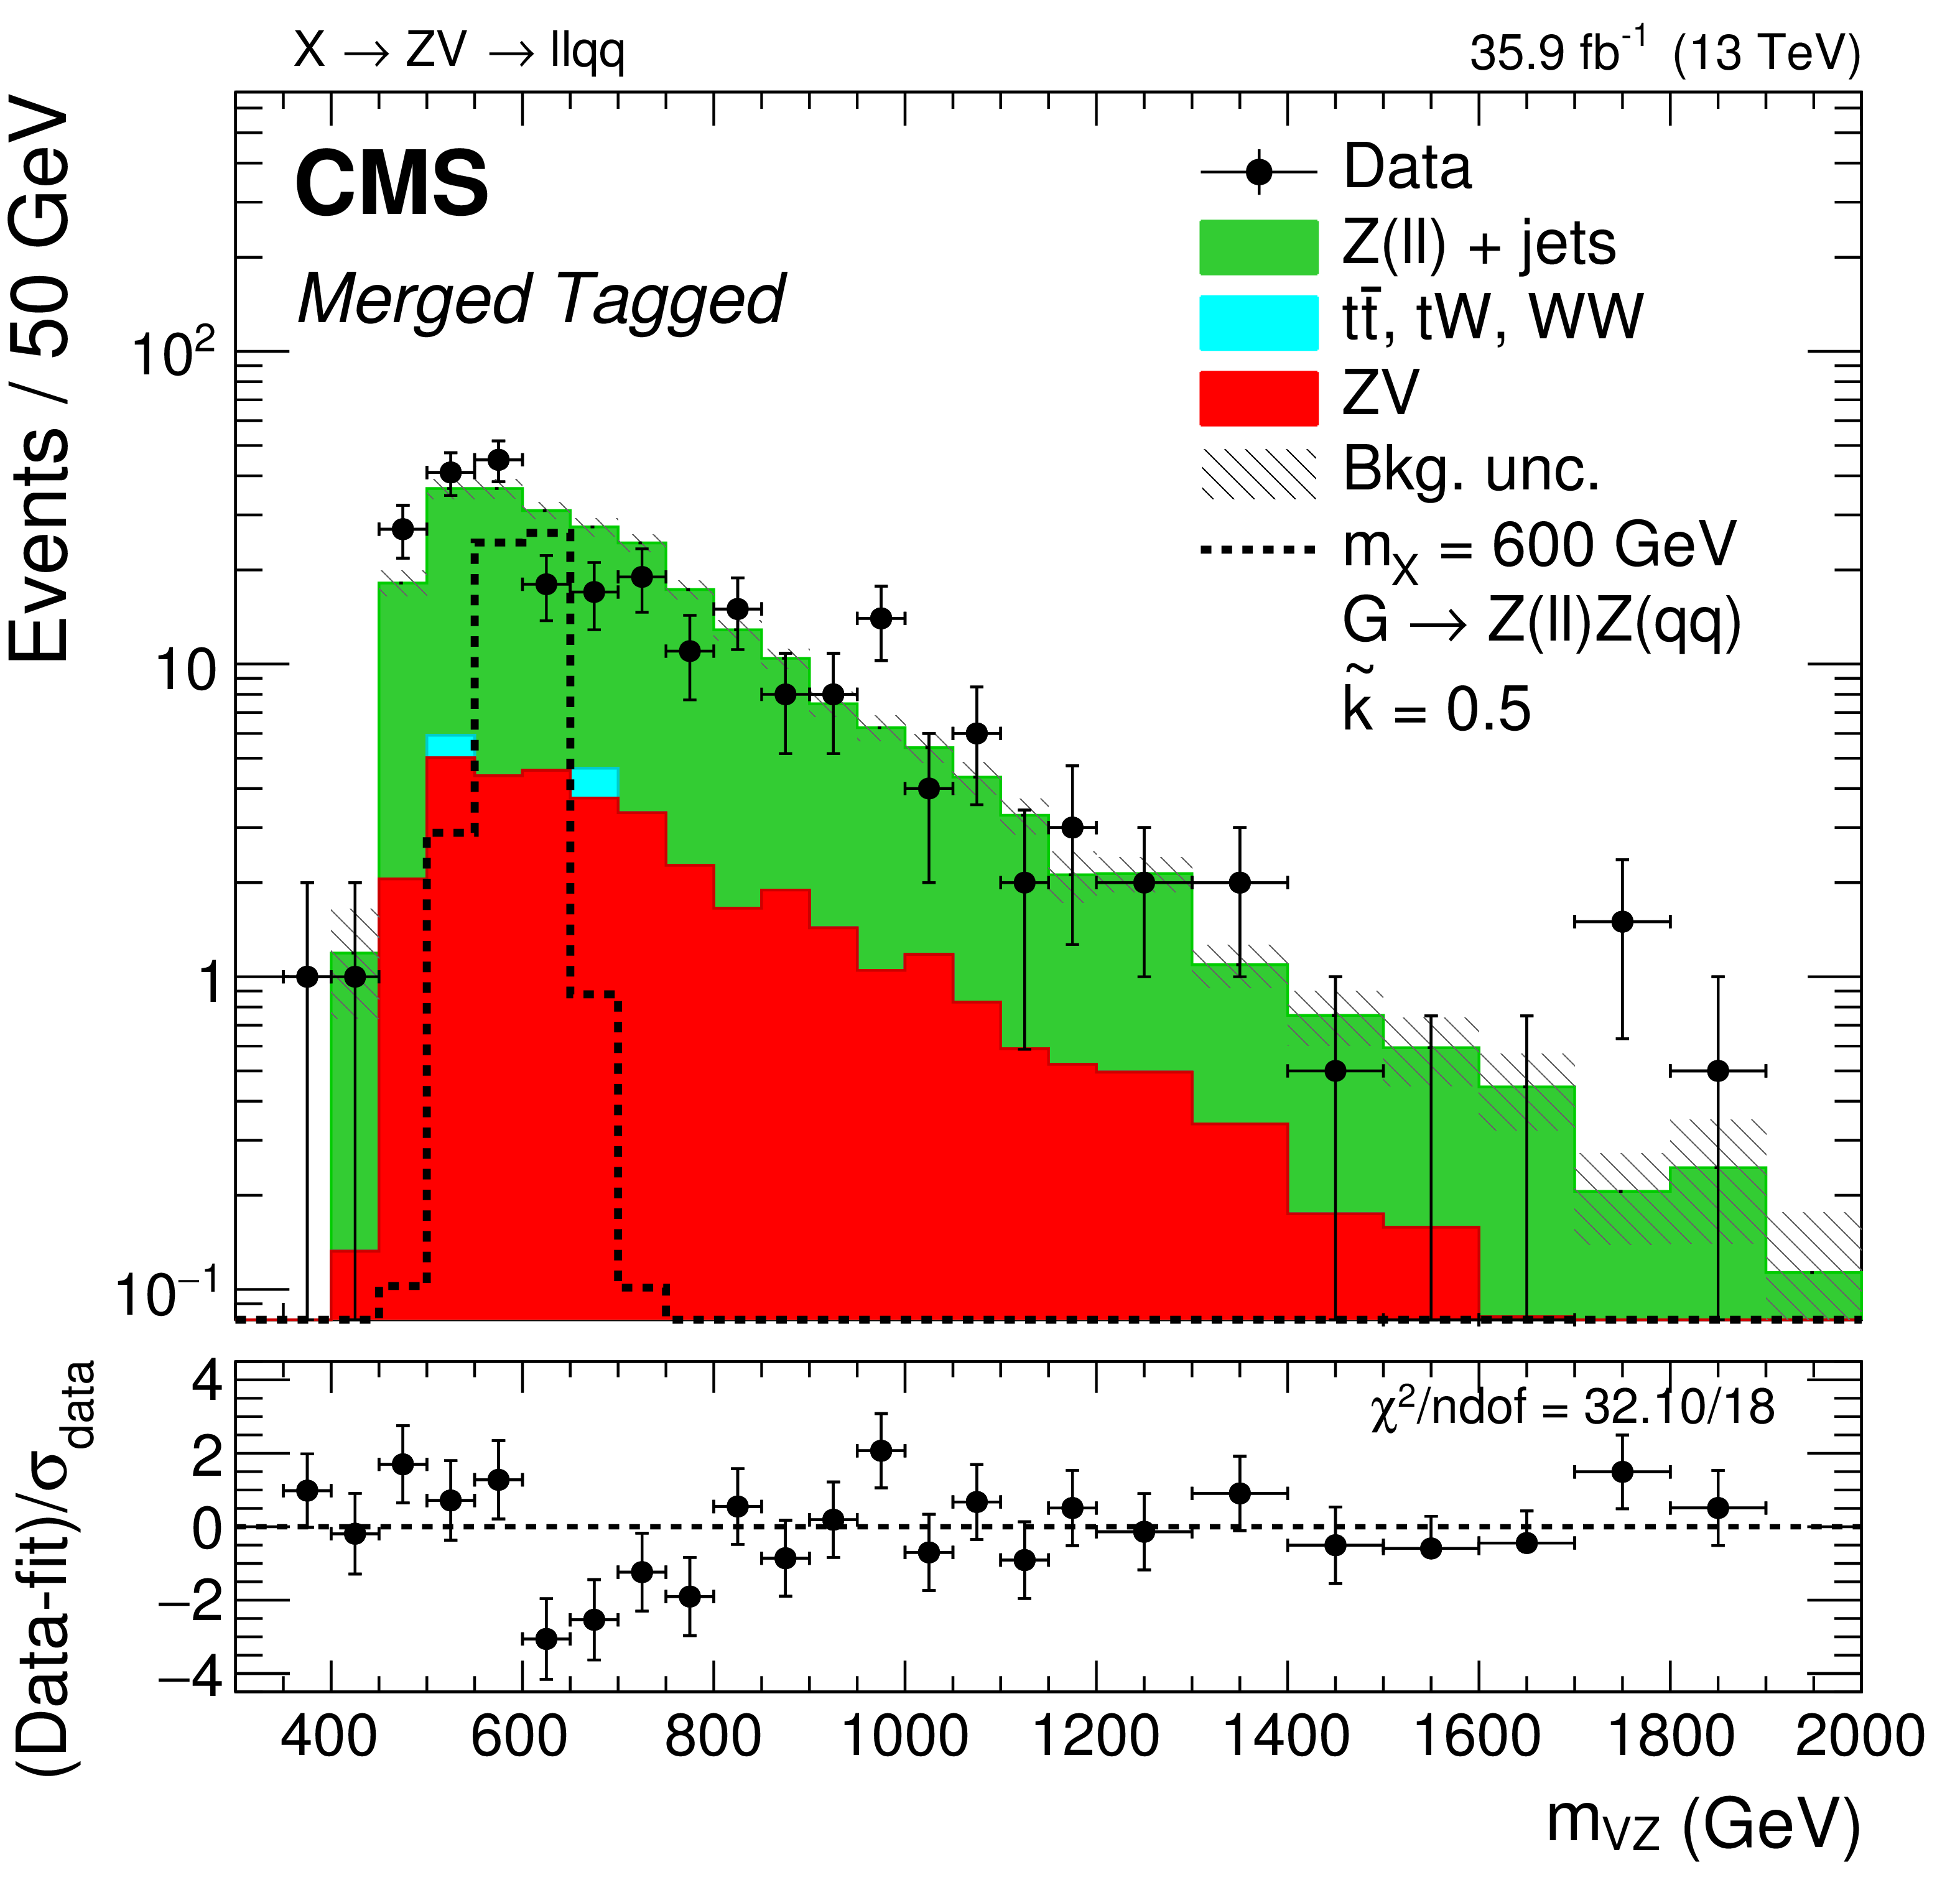
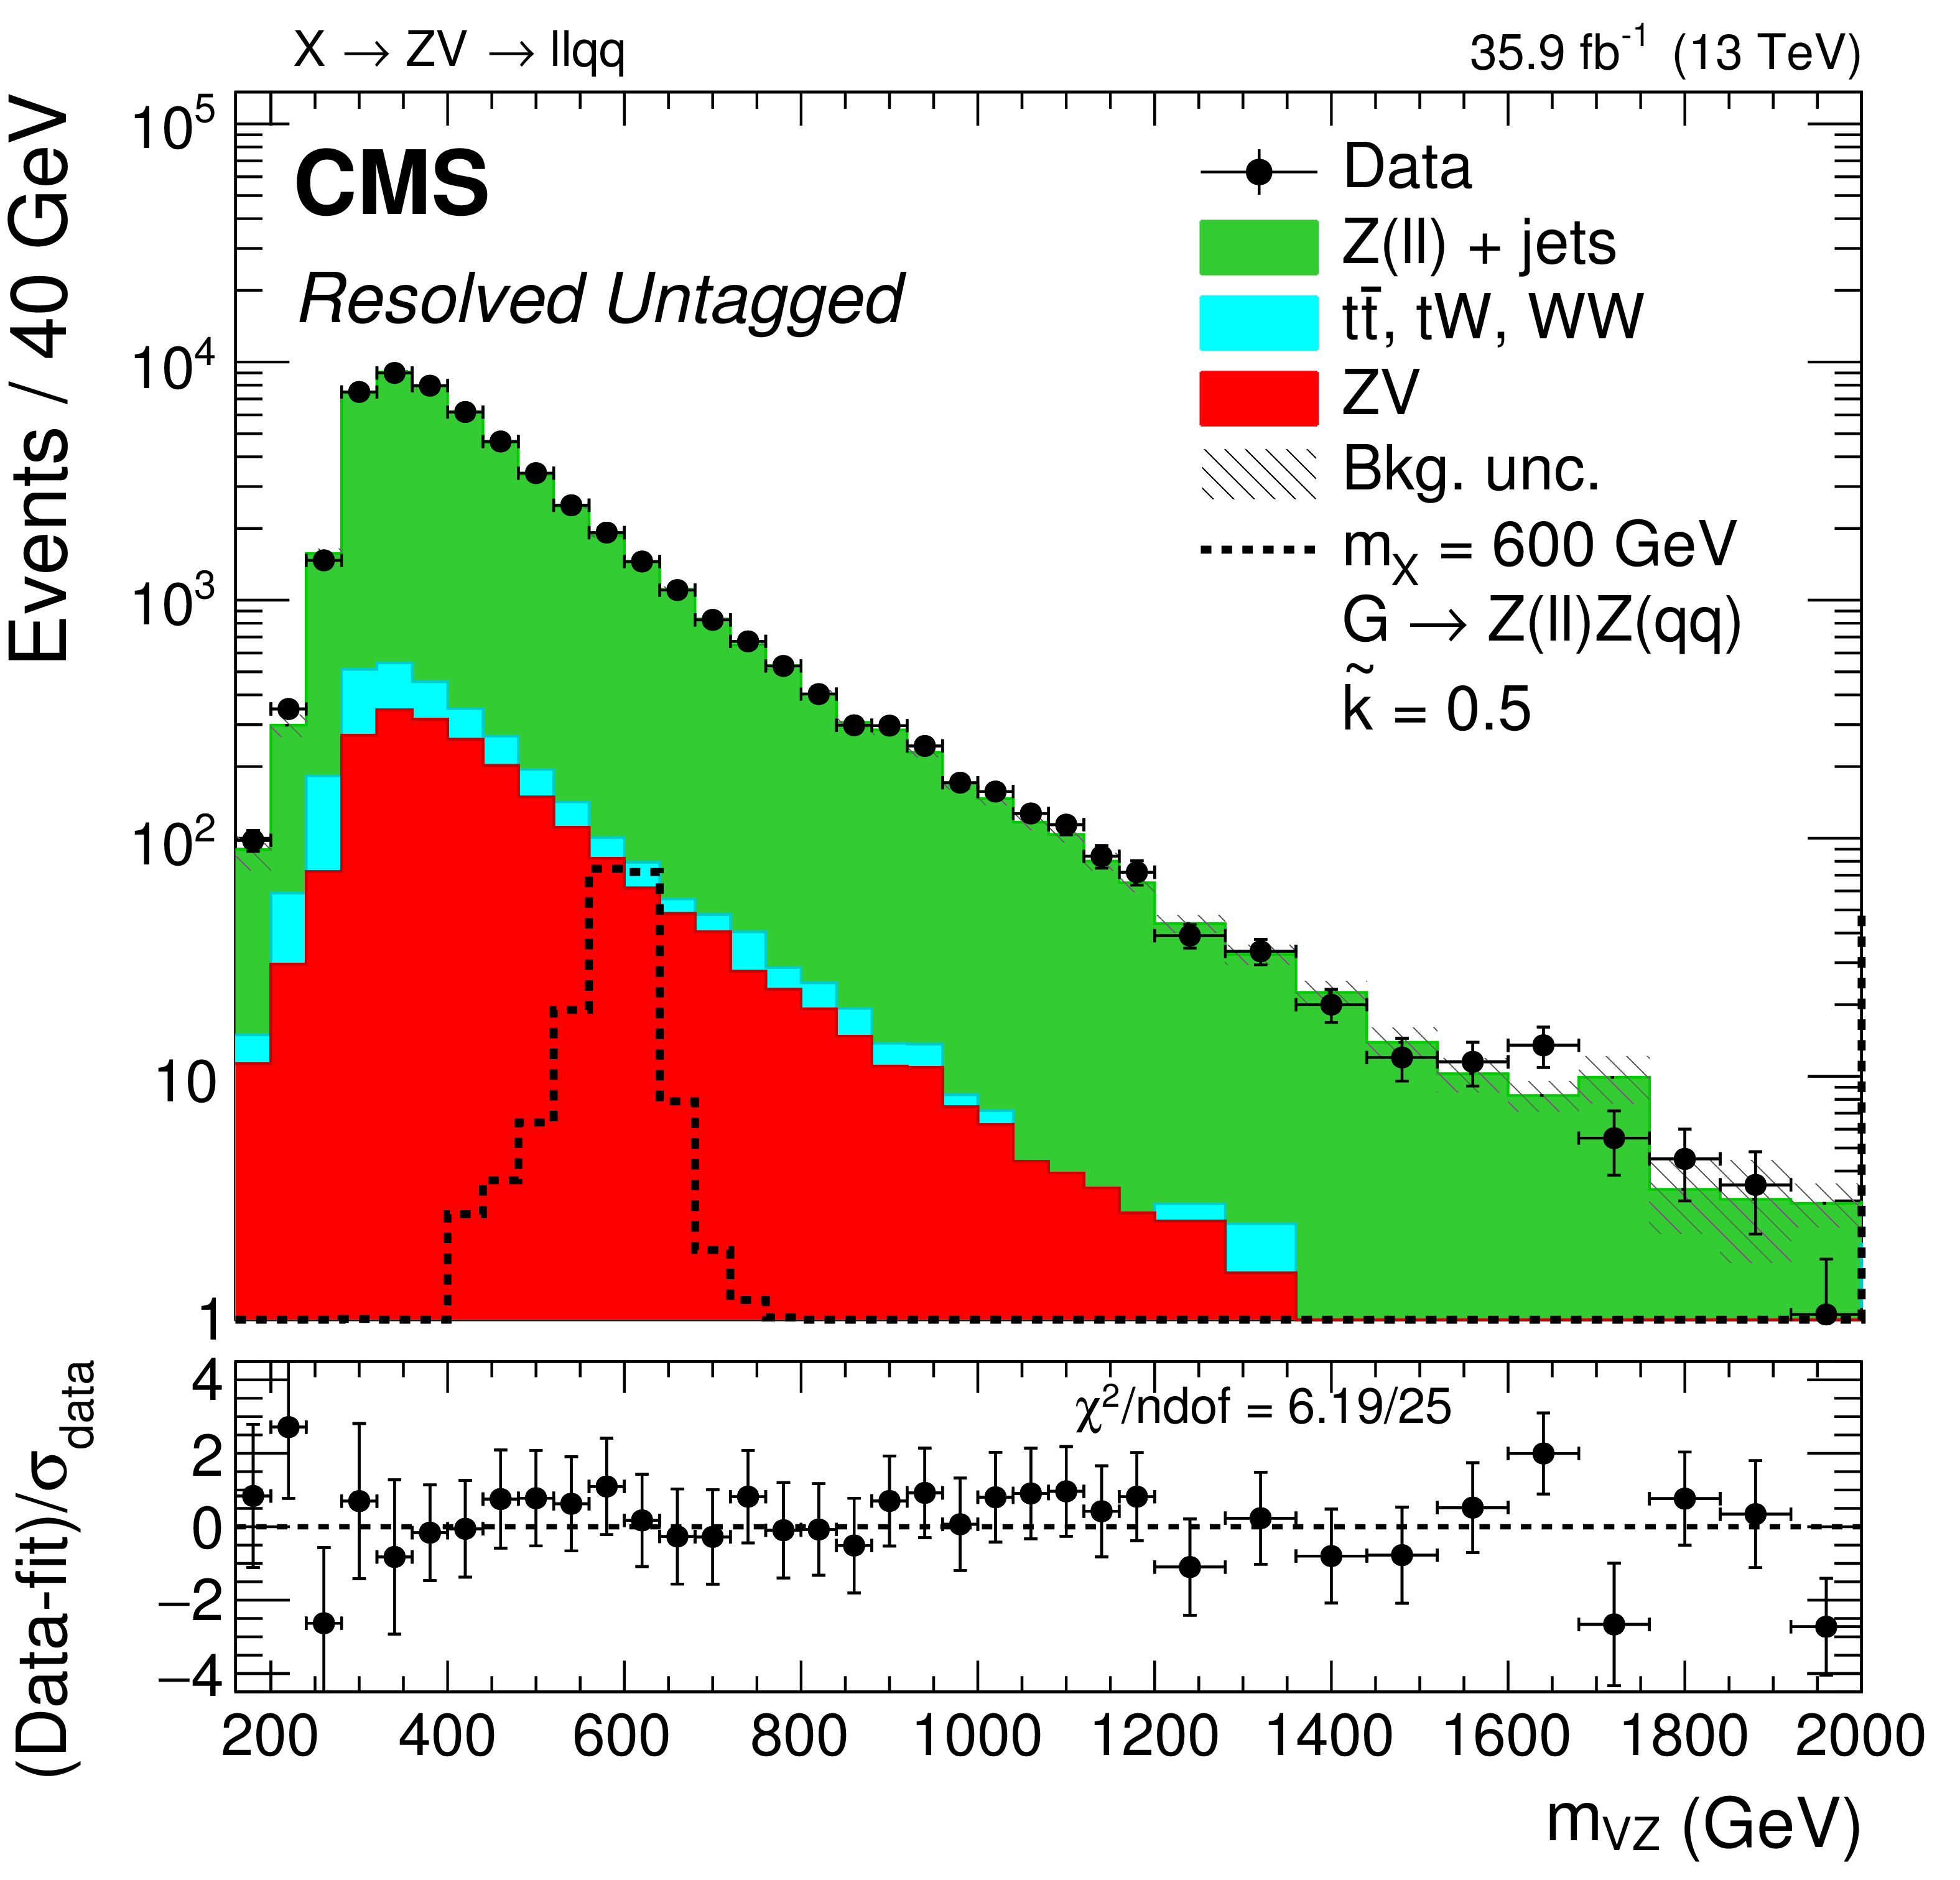
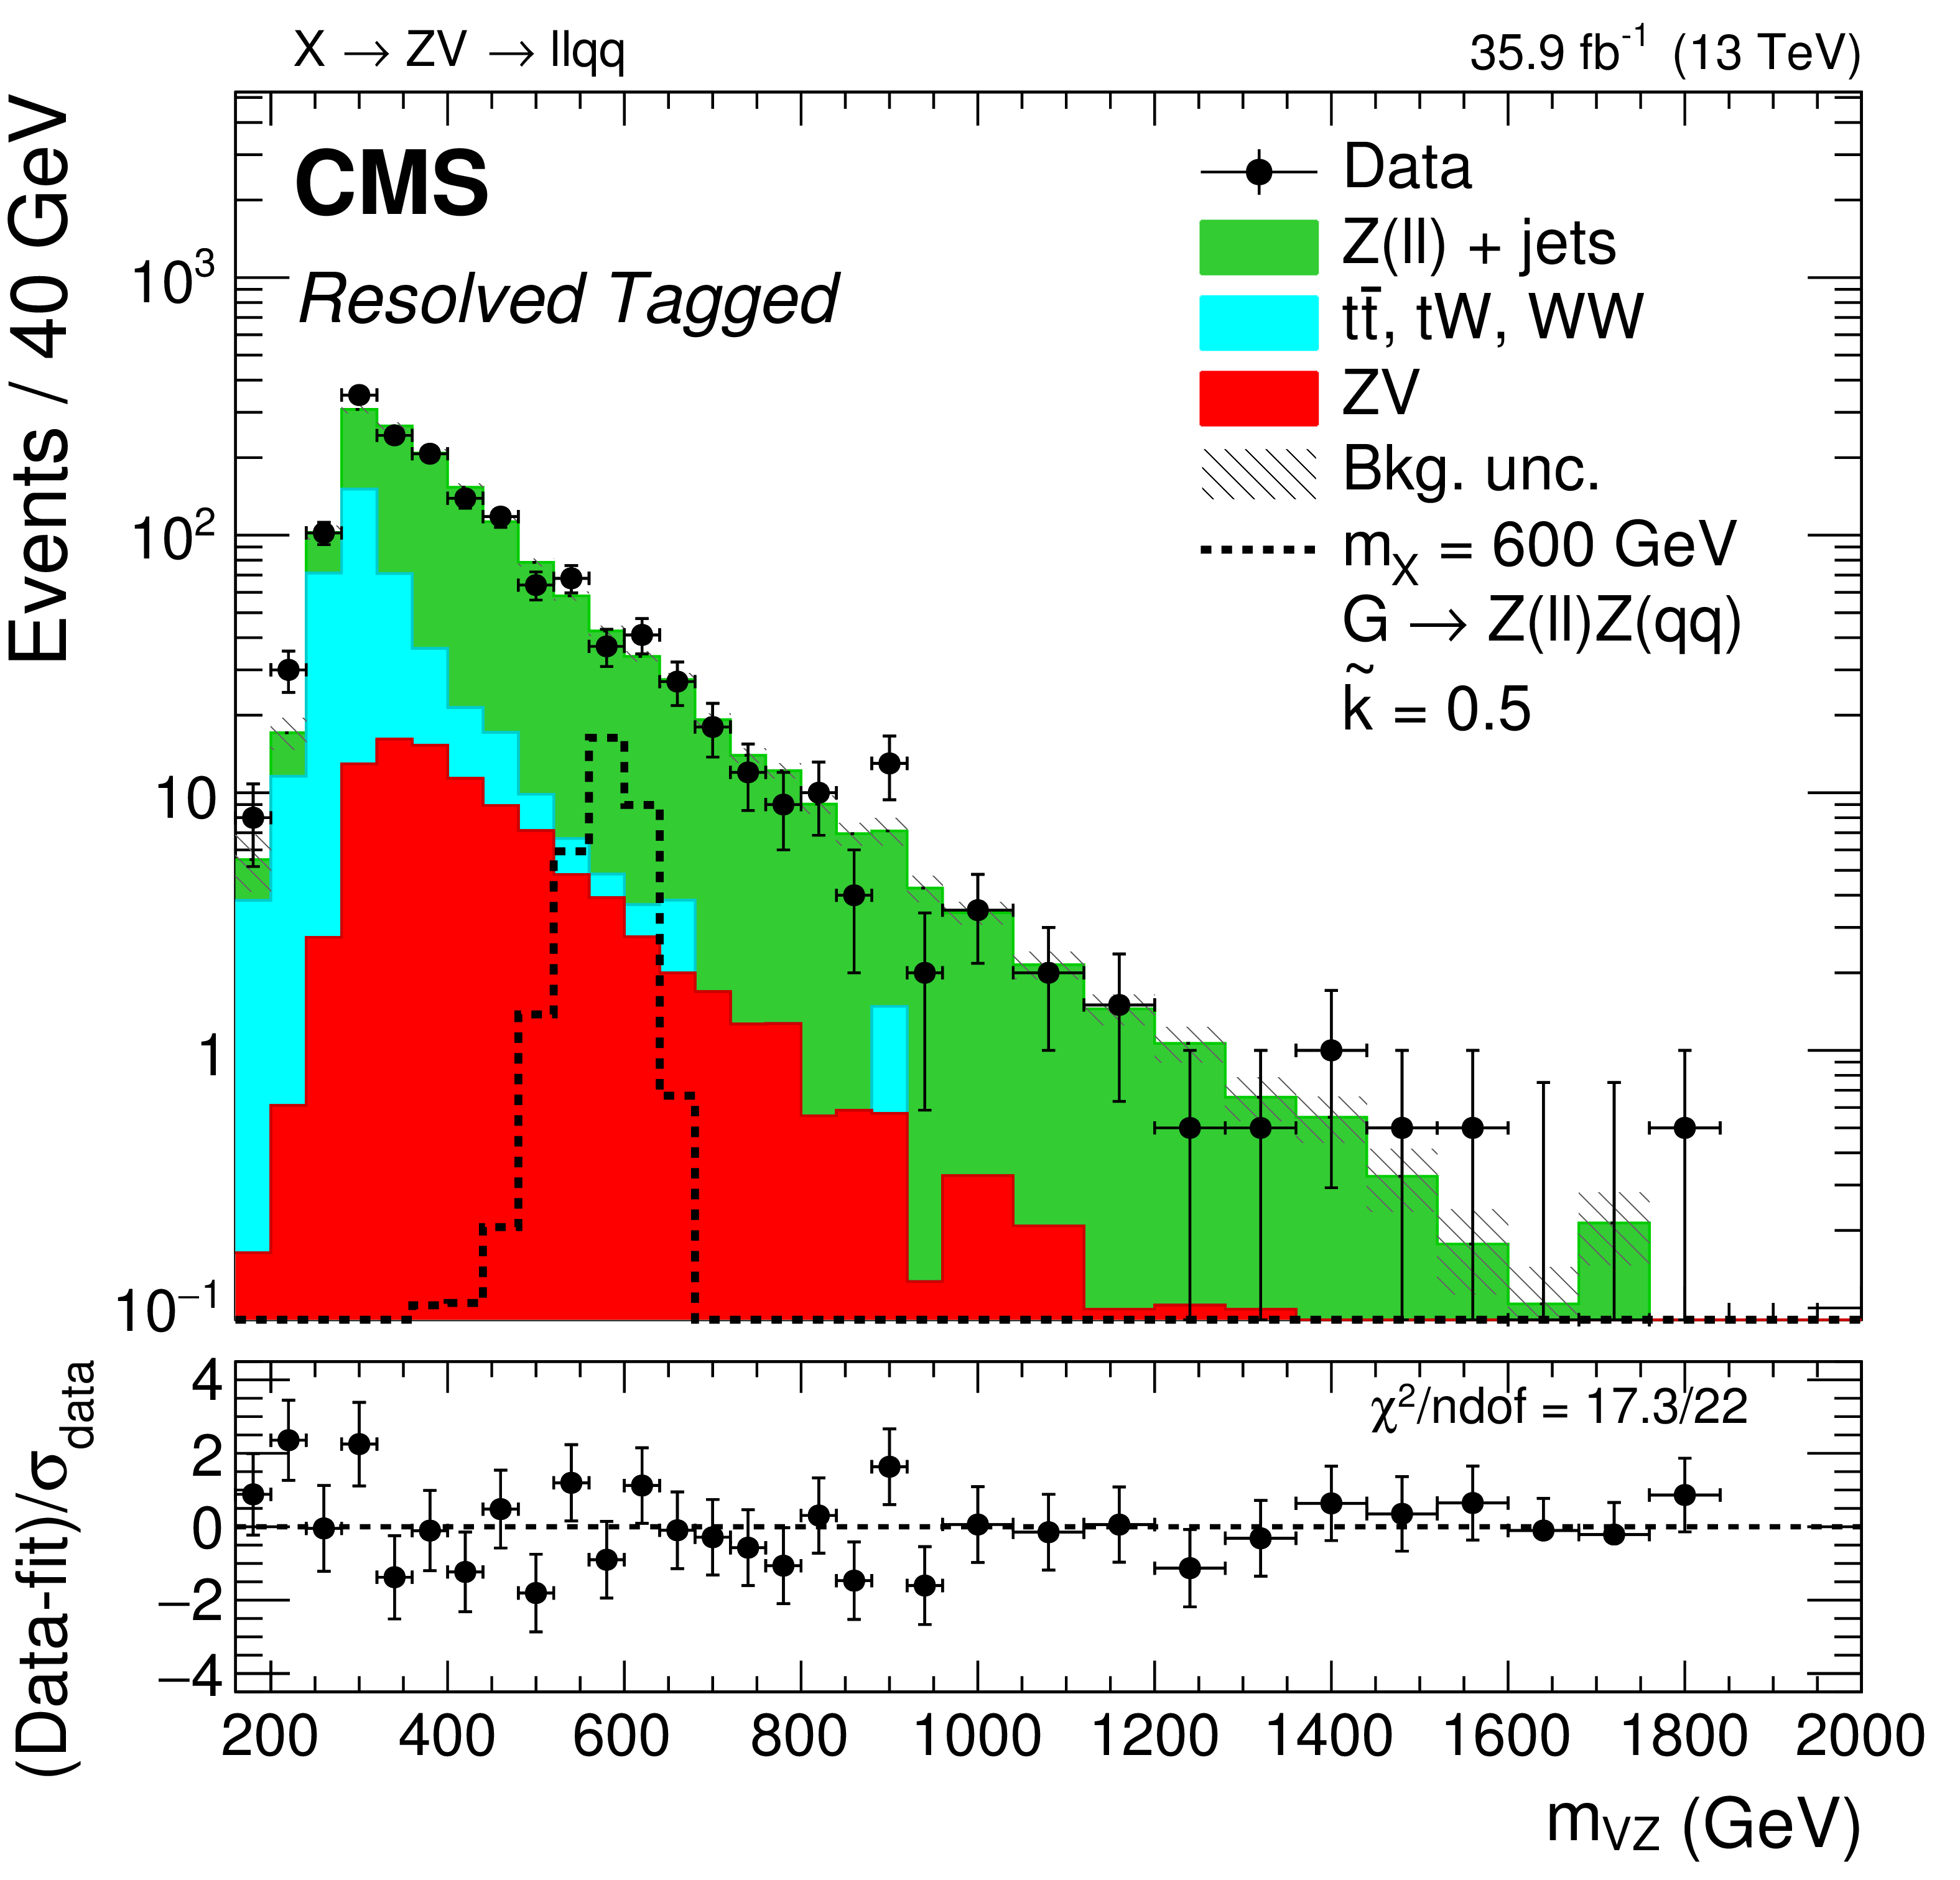
Figure 5:
The signal region $ {m_{{{\mathrm {V}} \mathrm{Z}}}} $ distributions for the low-mass search, in the the merged V (upper), resolved V (lower), untagged (left), and tagged (right) categories, after fitting the signal and sideband regions. Electron and muon categories are combined. A 600 GeV bulk graviton signal prediction is represented by the black dashed histogram. The gray band indicates the statistical and post-fit systematic uncertainties in the normalization and shape of the background. Larger bin widths are used at higher values of $ {m_{{{\mathrm {V}} \mathrm{Z}}}} $; the bin widths are indicated by the horizontal error bars. |
png pdf |
Figure 5-a:
The signal region $ {m_{{{\mathrm {V}} \mathrm{Z}}}} $ distribution for the low-mass search, in the the merged V, untagged category, after fitting the signal and sideband regions. Electron and muon categories are combined. A 600 GeV bulk graviton signal prediction is represented by the black dashed histogram. The gray band indicates the statistical and post-fit systematic uncertainties in the normalization and shape of the background. Larger bin widths are used at higher values of $ {m_{{{\mathrm {V}} \mathrm{Z}}}} $; the bin widths are indicated by the horizontal error bars. |
png pdf |
Figure 5-b:
The signal region $ {m_{{{\mathrm {V}} \mathrm{Z}}}} $ distribution for the low-mass search, in the the merged V, tagged category, after fitting the signal and sideband regions. Electron and muon categories are combined. A 600 GeV bulk graviton signal prediction is represented by the black dashed histogram. The gray band indicates the statistical and post-fit systematic uncertainties in the normalization and shape of the background. Larger bin widths are used at higher values of $ {m_{{{\mathrm {V}} \mathrm{Z}}}} $; the bin widths are indicated by the horizontal error bars. |
png pdf |
Figure 5-c:
The signal region $ {m_{{{\mathrm {V}} \mathrm{Z}}}} $ distribution for the low-mass search, in the the resolved V, untagged category, after fitting the signal and sideband regions. Electron and muon categories are combined. A 600 GeV bulk graviton signal prediction is represented by the black dashed histogram. The gray band indicates the statistical and post-fit systematic uncertainties in the normalization and shape of the background. Larger bin widths are used at higher values of $ {m_{{{\mathrm {V}} \mathrm{Z}}}} $; the bin widths are indicated by the horizontal error bars. |
png pdf |
Figure 5-d:
The signal region $ {m_{{{\mathrm {V}} \mathrm{Z}}}} $ distribution for the low-mass search, in the the resolved V, tagged category, after fitting the signal and sideband regions. Electron and muon categories are combined. A 600 GeV bulk graviton signal prediction is represented by the black dashed histogram. The gray band indicates the statistical and post-fit systematic uncertainties in the normalization and shape of the background. Larger bin widths are used at higher values of $ {m_{{{\mathrm {V}} \mathrm{Z}}}} $; the bin widths are indicated by the horizontal error bars. |
png pdf |
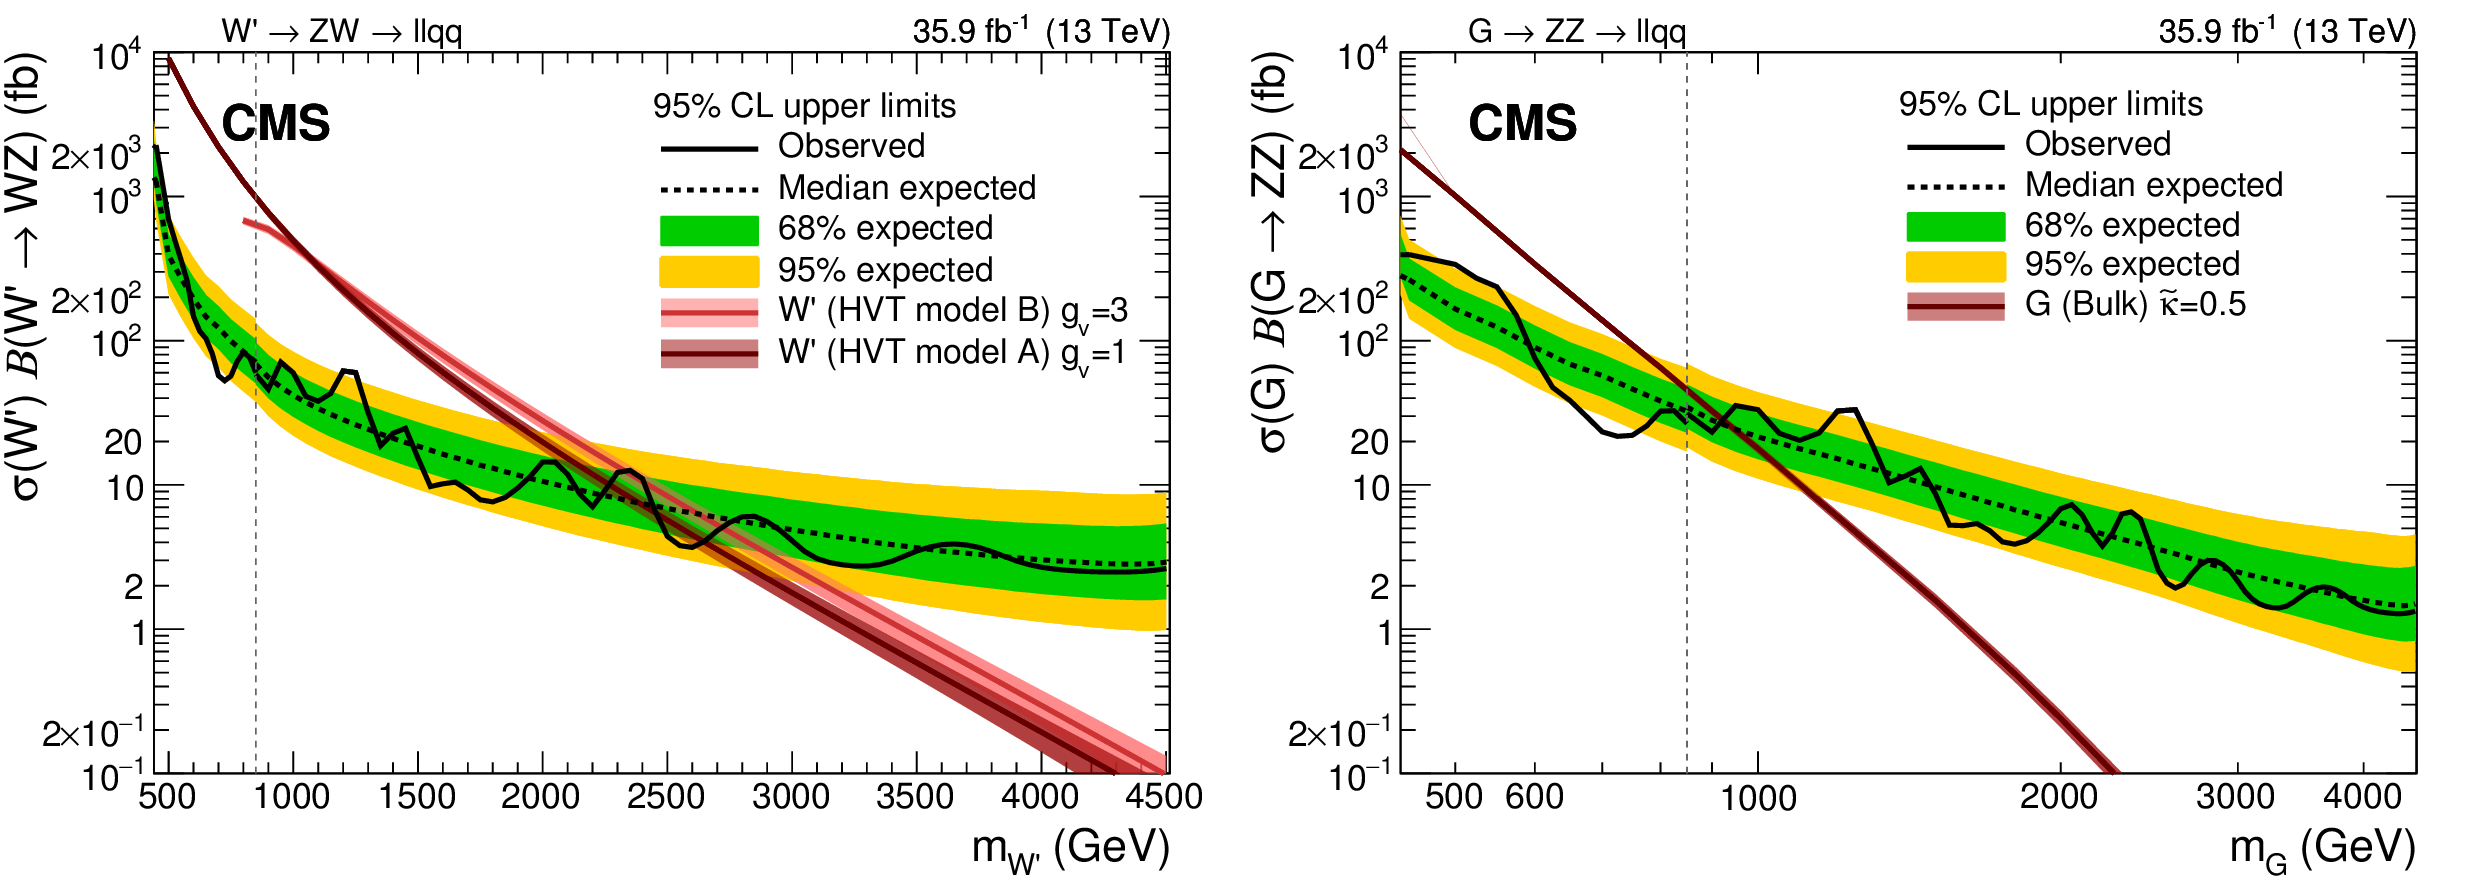
Figure 6:
Observed and expected 95% {\text {CL}} upper limit on $\sigma _{\mathrm{W'}} {\mathcal {B}} (\mathrm{W'} \to {\mathrm{Z} \mathrm{W}})$ (left) and $\sigma _{\mathrm{G}} {\mathcal {B}} (\mathrm{G} \to {\mathrm{Z} \mathrm{Z}})$ (right) as a function of the resonance mass, taking into account all statistical and systematic uncertainties. The electron and muon channels and the various categories used in the analysis are combined together. The green (inner) and yellow (outer) bands represent the 68% and 95% coverage of the expected limit in the background-only hypothesis. The dashed vertical line represents the transition from the low-mass to the high-mass analysis strategy. Theoretical predictions for the signal production cross section are also shown: (left) W' produced in the framework of HVT model A with $g_\mathrm {v}=$ 1 and model B with $g_\mathrm {v}=$ 3; (right) G produced in the WED bulk graviton model with $ {\tilde{\kappa}} =$ 0.5. |

png pdf |
Figure 6-a:
Observed and expected 95% {\text {CL}} upper limit on $\sigma _{\mathrm{W'}} {\mathcal {B}} (\mathrm{W'} \to {\mathrm{Z} \mathrm{W}})$ as a function of the resonance mass, taking into account all statistical and systematic uncertainties. The electron and muon channels and the various categories used in the analysis are combined together. The green (inner) and yellow (outer) bands represent the 68% and 95% coverage of the expected limit in the background-only hypothesis. The dashed vertical line represents the transition from the low-mass to the high-mass analysis strategy. The theoretical prediction for the cross section of W' production in the framework of HVT model A with $g_\mathrm {v}=$ 1 and model B with $g_\mathrm {v}=$ 3 is also shown. |

png pdf |
Figure 6-b:
Observed and expected 95% {\text {CL}} upper limit on $\sigma _{\mathrm{G}} {\mathcal {B}} (\mathrm{G} \to {\mathrm{Z} \mathrm{Z}})$ as a function of the resonance mass, taking into account all statistical and systematic uncertainties. The electron and muon channels and the various categories used in the analysis are combined together. The green (inner) and yellow (outer) bands represent the 68% and 95% coverage of the expected limit in the background-only hypothesis. The dashed vertical line represents the transition from the low-mass to the high-mass analysis strategy. The theoretical prediction for the cross section of G production in the WED bulk graviton model with $ {\tilde{\kappa}} =$ 0.5 is also shown. |

png pdf |
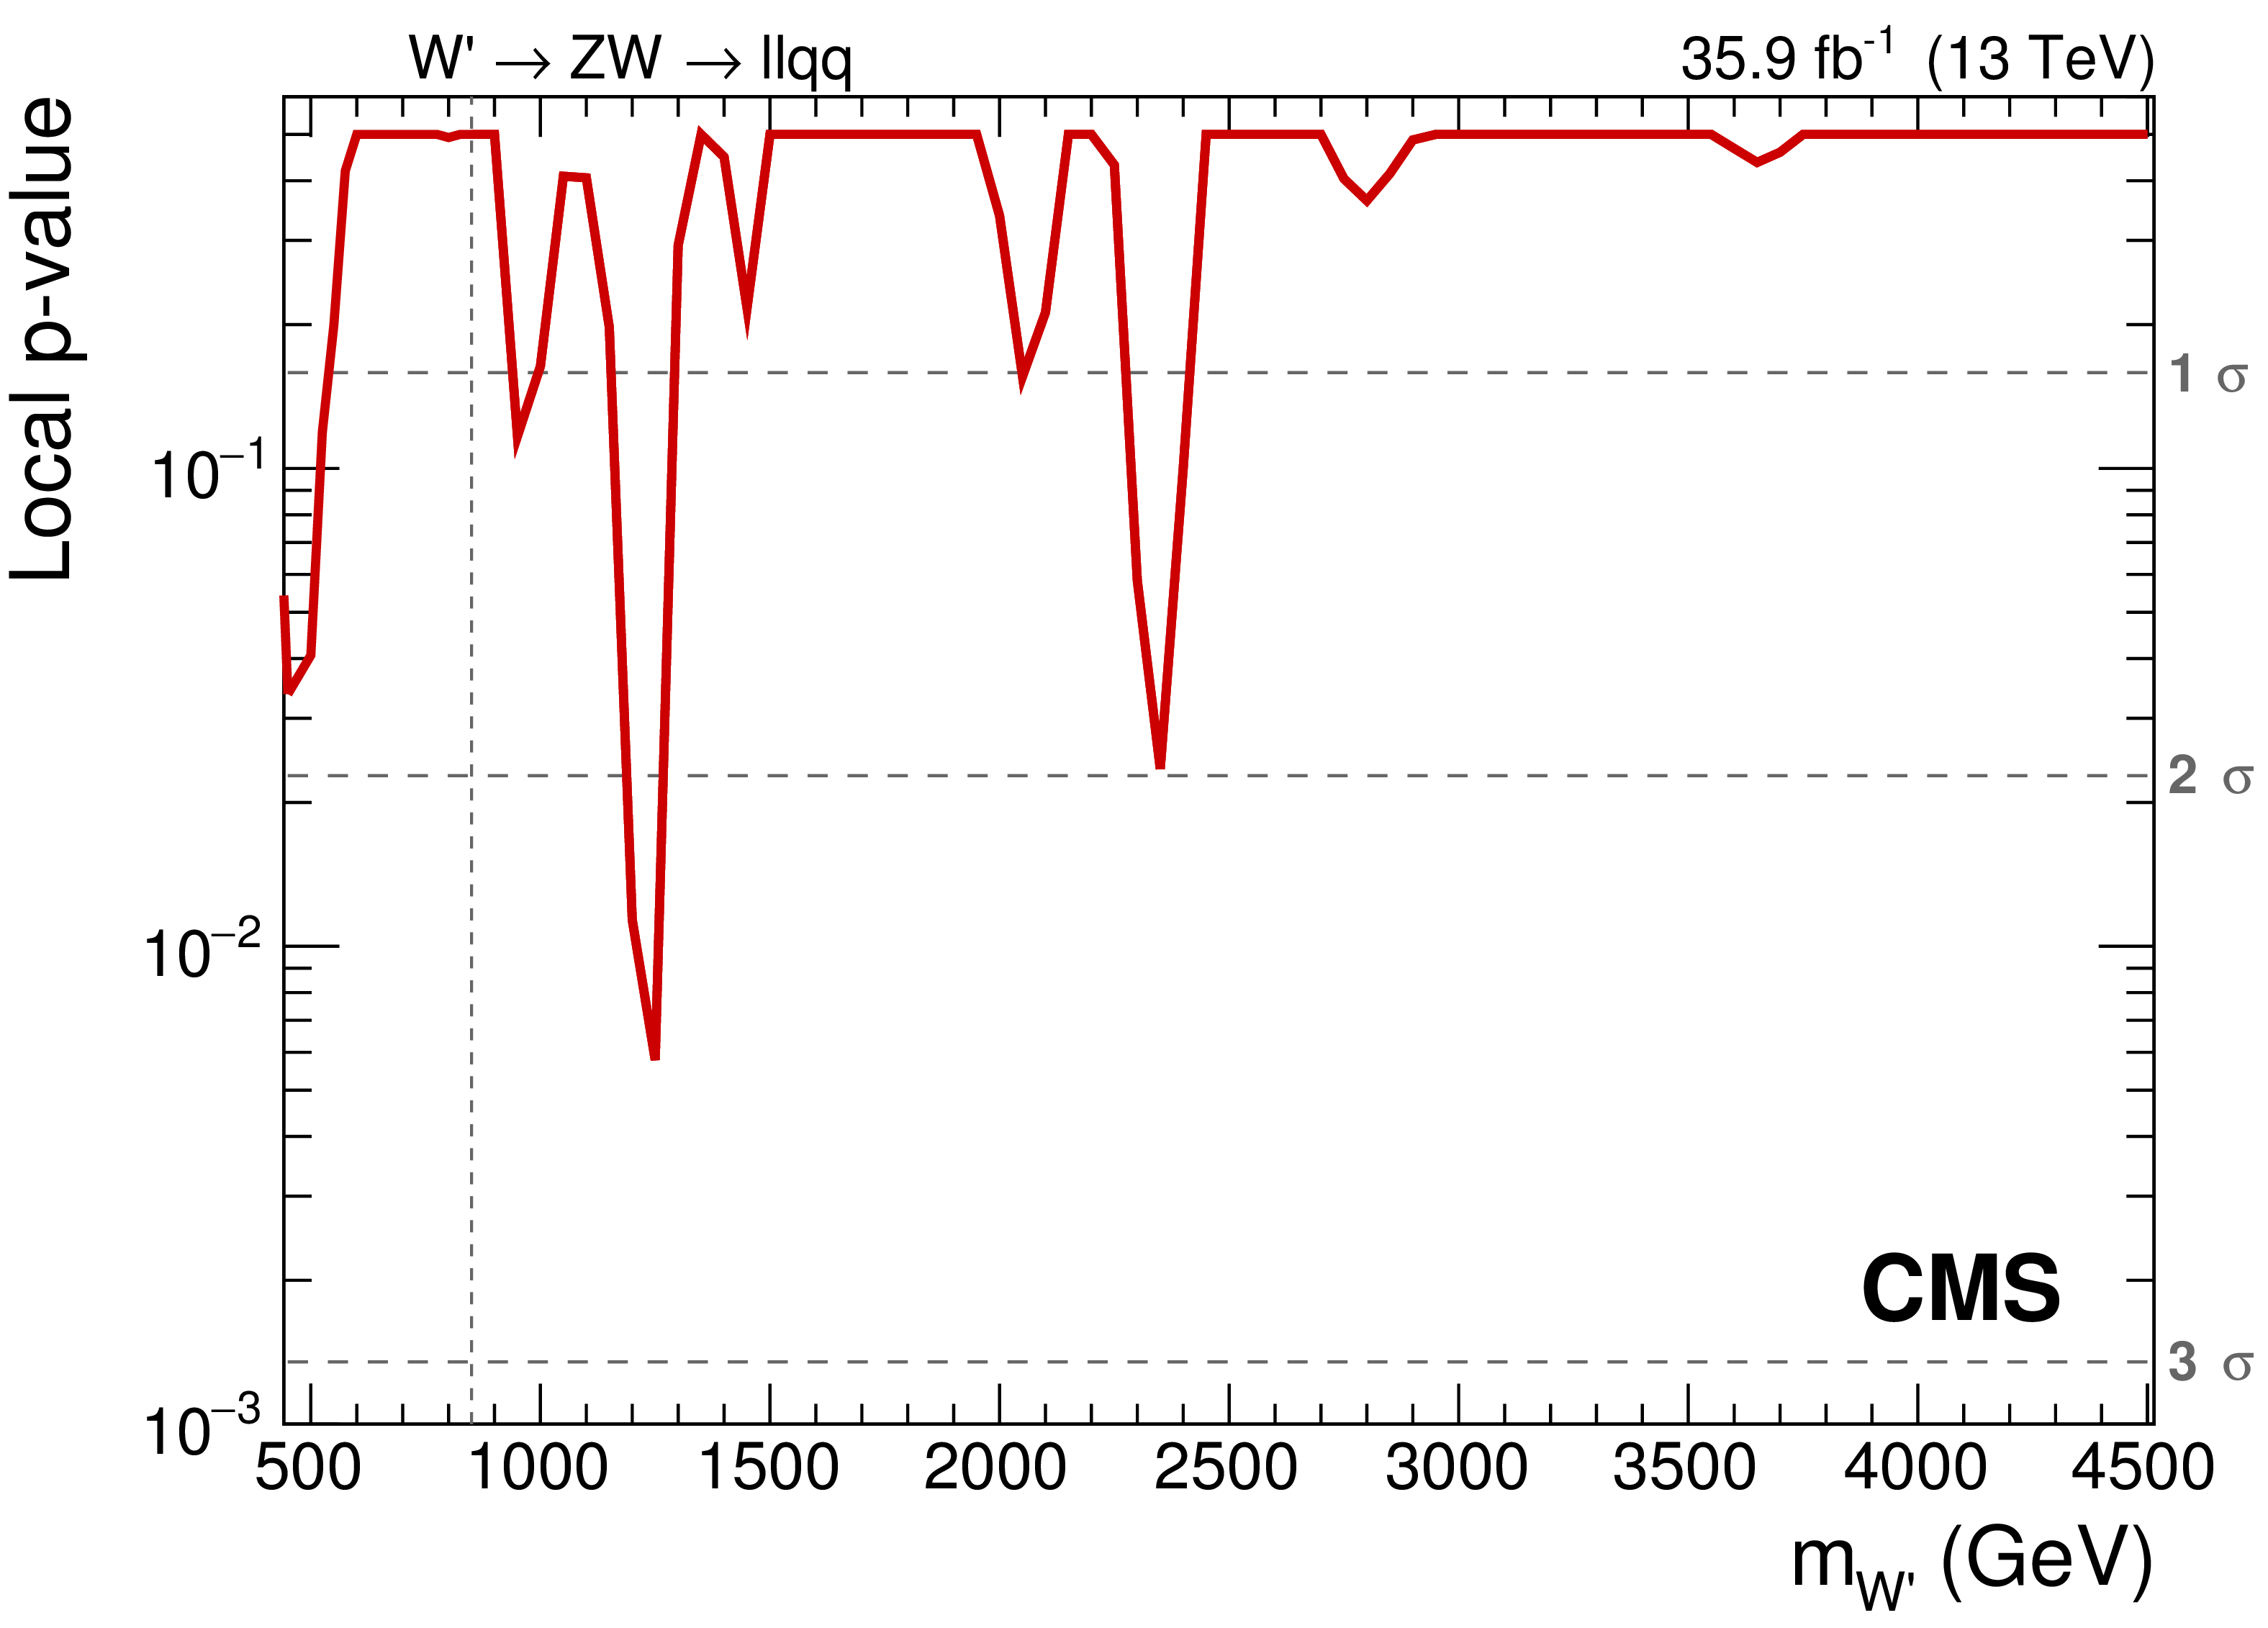
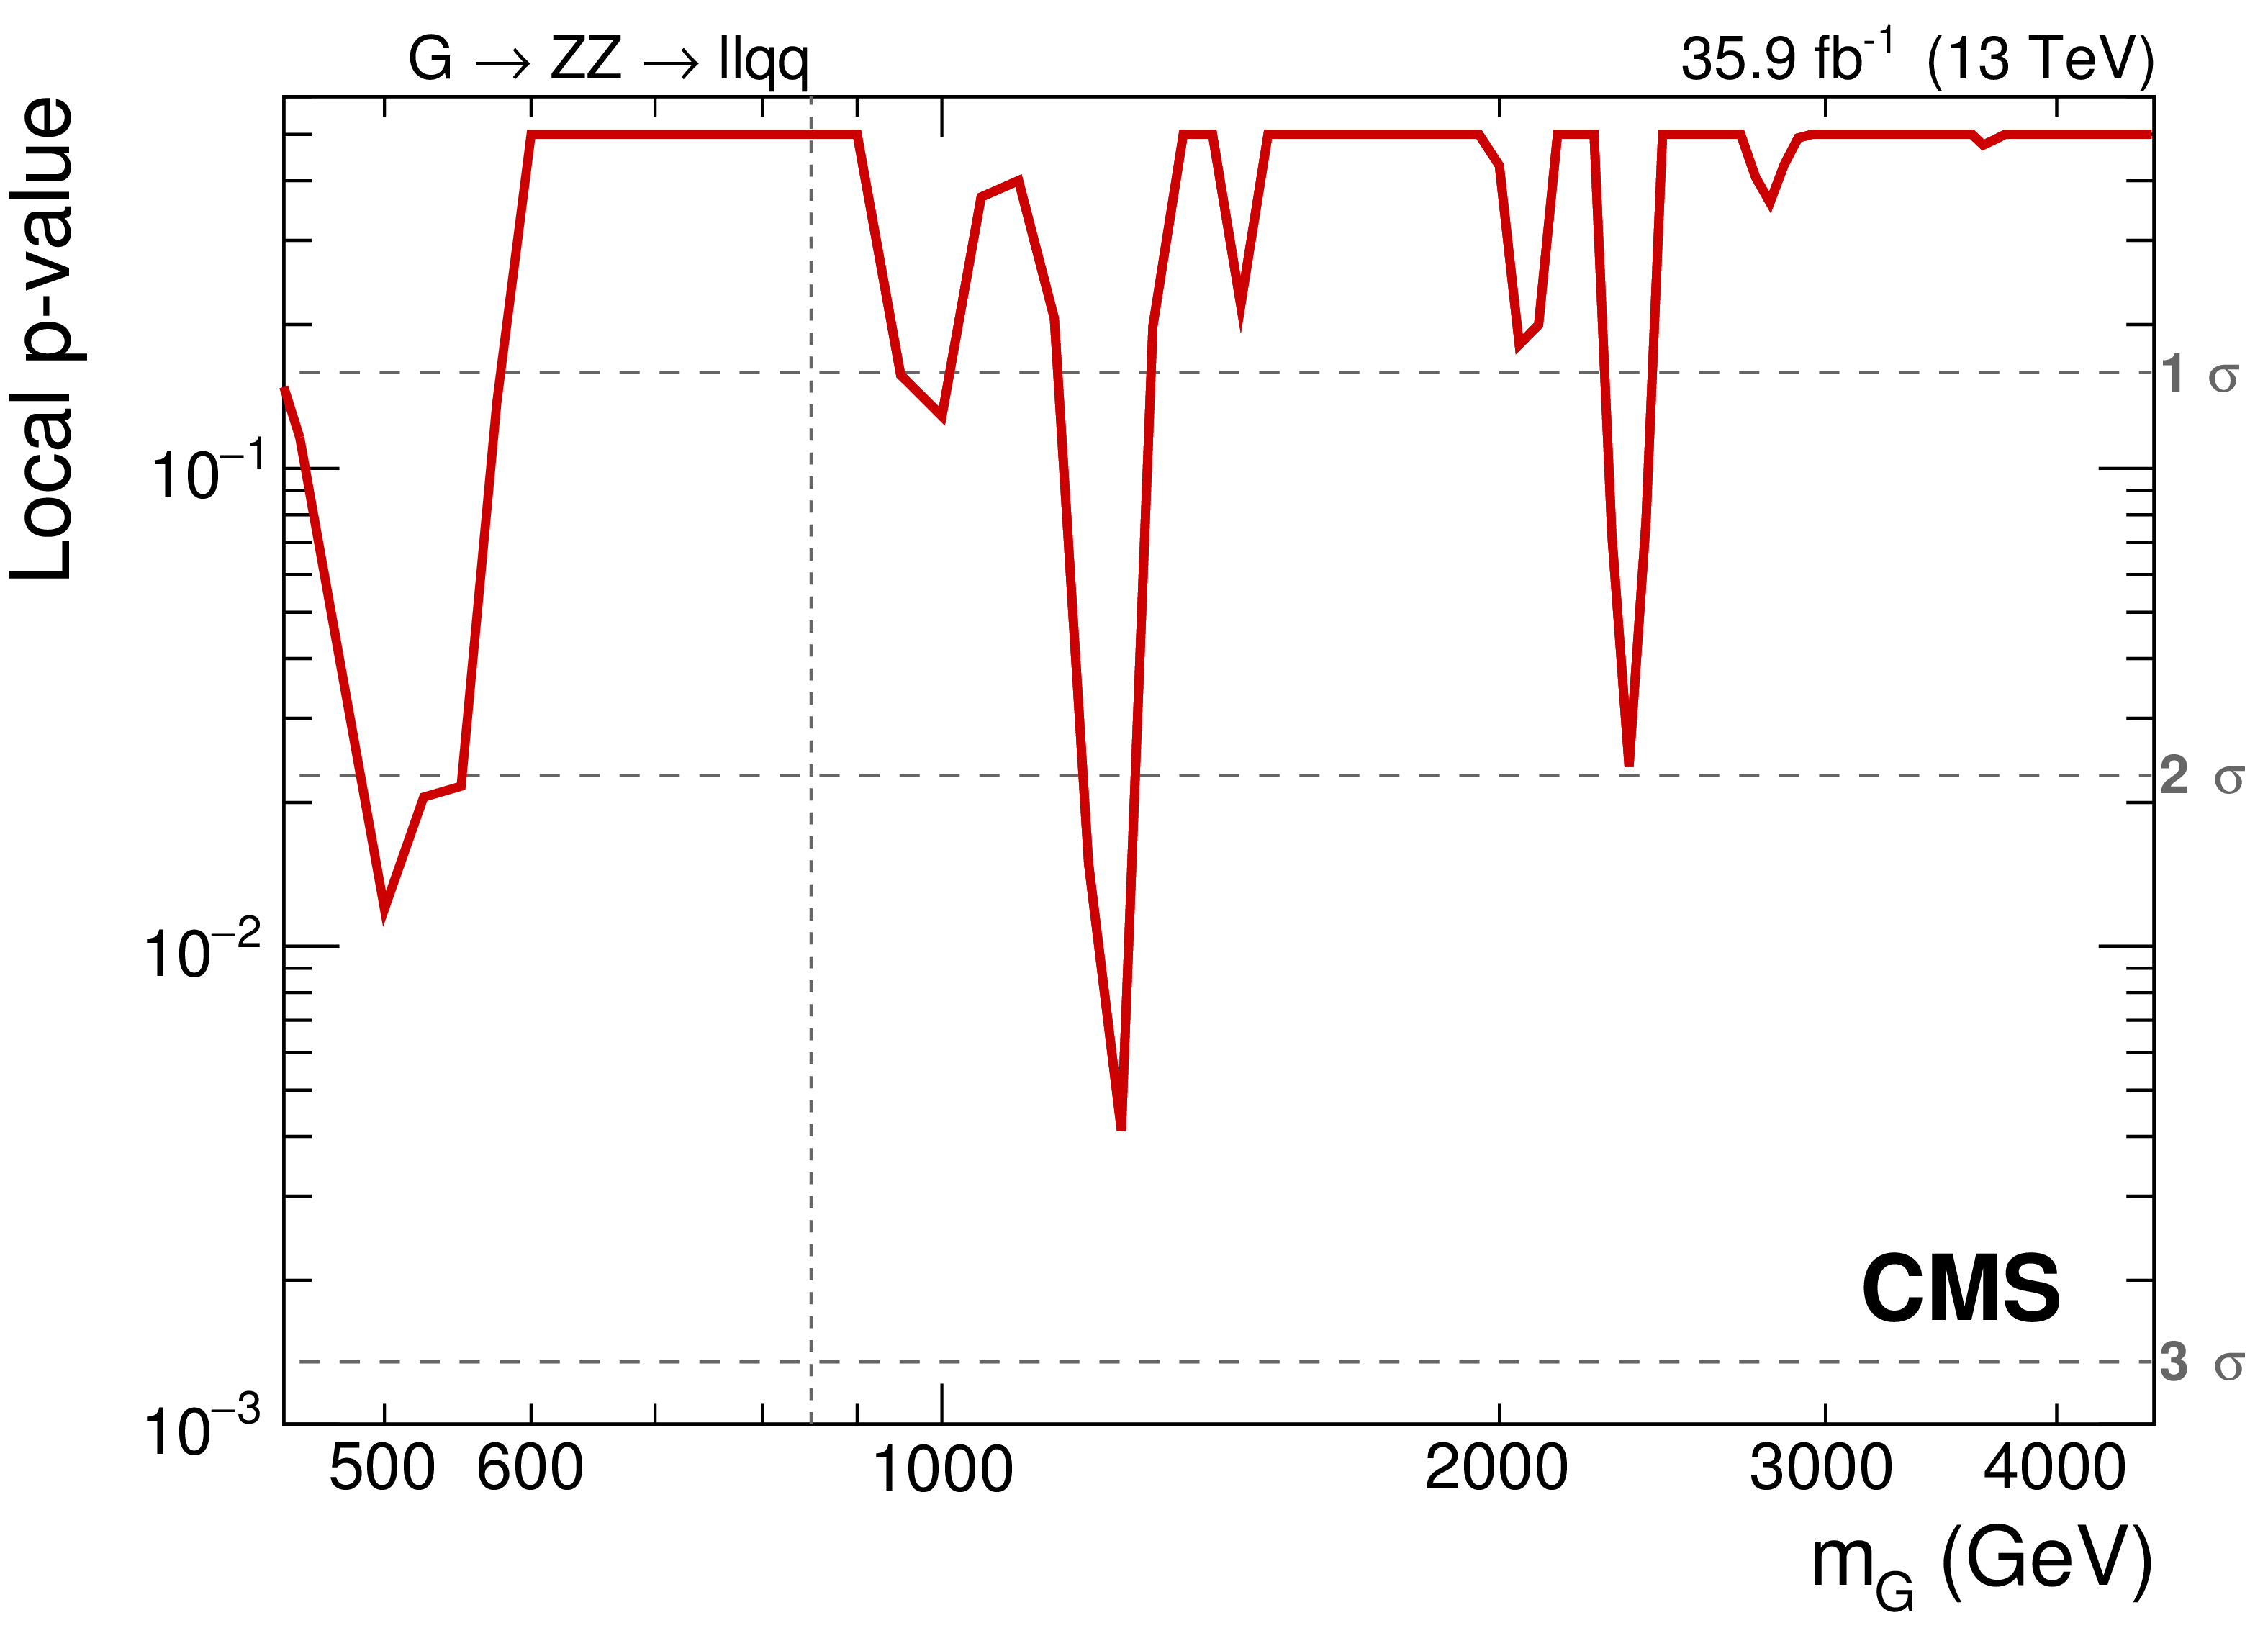
Figure 7:
Observed local $p$-values for W' (left) and G (right) narrow resonances as a function of the resonance mass. The dashed vertical line represents the transition from the low-mass to the high-mass analysis strategy. |
png pdf |
Figure 7-a:
Observed local $p$-value for W' narrow resonance as a function of the resonance mass. The dashed vertical line represents the transition from the low-mass to the high-mass analysis strategy. |
png pdf |
Figure 7-b:
Observed local $p$-value for G narrow resonance as a function of the resonance mass. The dashed vertical line represents the transition from the low-mass to the high-mass analysis strategy. |
| Tables | |

png pdf |
Table 1:
Summary of systematic uncertainties, quoted in percent, affecting the normalization of background and signal samples. Where a systematic uncertainty depends on the resonance mass (for signal) or on the category (for background), the smallest and largest values are reported in the table. A dash (--) represents uncertainties either estimated to be negligible (below 0.1%), or not applicable in the specific analysis category. |
| Summary |
| A search for a heavy resonance decaying into a Z boson and a Z or a W boson in $ 2\ell 2\mathrm{q} $ final states has been presented. The data analyzed were collected by the CMS experiment in proton-proton collisions at $\sqrt{s} = $ 13 TeV during 2016 operations at the LHC, corresponding to an integrated luminosity of 35.9 fb$^{-1}$. The final state of interest consists of a Z boson decaying leptonically into an electron or muon pair, and the decay of an additional W or Z boson into a pair of quarks. Two analysis strategies, dedicated to the low- and high-mass regimes (below and above 850 GeV, respectively), have been used to set limits in the range of resonance mass from 400 to 4500 GeV. Depending on the resonance mass, expected upper limits of 3-3000 and 1.5-400 fb have been set on the product of the cross section of a spin-1 W' and the ZW branching fraction, and on the product of the cross section of a spin-2 graviton and the ZZ branching fraction, respectively. |
| References | ||||
| 1 | K. Agashe, H. Davoudiasl, G. Perez, and A. Soni | Warped gravitons at the LHC and beyond | PRD 76 (2007) 036006 | hep-ph/0701186 |
| 2 | L. Randall and R. Sundrum | A large mass hierarchy from a small extra dimension | PRL 83 (1999) 3370 | hep-ph/9905221 |
| 3 | L. Randall and R. Sundrum | An alternative to compactification | PRL 83 (1999) 4690 | hep-th/9906064 |
| 4 | A. L. Fitzpatrick, J. Kaplan, L. Randall, and L.-T. Wang | Searching for the Kaluza-Klein graviton in bulk RS models | JHEP 09 (2007) 013 | hep-ph/0701150 |
| 5 | W. D. Goldberger and M. B. Wise | Modulus stabilization with bulk fields | PRL 83 (1999) 4922 | hep-ph/9907447 |
| 6 | D. Pappadopulo, A. Thamm, R. Torre, and A. Wulzer | Heavy vector triplets: Bridging theory and data | JHEP 09 (2014) 060 | 1402.4431 |
| 7 | CMS Collaboration | Search for heavy resonances decaying into a vector boson and a Higgs boson in final states with charged leptons, neutrinos, and b quarks | PLB 768 (2017) 137 | CMS-B2G-16-003 1610.08066 |
| 8 | CMS Collaboration | Search for massive resonances decaying into WW, WZ or ZZ bosons in proton-proton collisions at $ \sqrt{s} = $ 13 TeV | JHEP 03 (2017) 162 | CMS-B2G-16-004 1612.09159 |
| 9 | CMS Collaboration | Combination of searches for heavy resonances decaying to WW, WZ, ZZ, WH, and ZH boson pairs in proton-proton collisions at $ \sqrt{s}= $ 8 and 13 TeV | PLB 774 (2017) 533 | CMS-B2G-16-007 1705.09171 |
| 10 | ATLAS Collaboration | Search for heavy resonances decaying to a $ W $ or $ Z $ boson and a Higgs boson in the $ q\bar{q}^{(\prime)}b\bar{b} $ final state in $ pp $ collisions at $ \sqrt{s} = $ 13 TeV with the ATLAS detector | PLB 774 (2017) 494 | 1707.06958 |
| 11 | CMS Collaboration | Search for a heavy resonance decaying into a Z boson and a vector boson in the $ \nu\overline{\nu}\mathrm{q}\overline{\mathrm{q}} $ final state | Submitted to \it JHEP | CMS-B2G-17-005 1803.03838 |
| 12 | J. Alwall et al. | The automated computation of tree-level and next-to-leading order differential cross sections, and their matching to parton shower simulations | JHEP 07 (2014) 079 | 1405.0301 |
| 13 | A. Carvalho | Gravity particles from warped extra dimensions, predictions for LHC | 1404.0102 | |
| 14 | R. Frederix and S. Frixione | Merging meets matching in MC@NLO | JHEP 12 (2012) 061 | 1209.6215 |
| 15 | R. Gavin, Y. Li, F. Petriello, and S. Quackenbush | FEWZ 2.0: A code for hadronic Z production at next-to-next-to-leading order | CPC 182 (2011) 2388 | 1011.3540 |
| 16 | J. Alwall et al. | Comparative study of various algorithms for the merging of parton showers and matrix elements in hadronic collisions | EPJC 53 (2008) 473 | 0706.2569 |
| 17 | P. Nason | A new method for combining NLO QCD with shower Monte Carlo algorithms | JHEP 11 (2004) 040 | hep-ph/0409146 |
| 18 | S. Frixione, P. Nason, and C. Oleari | Matching NLO QCD computations with parton shower simulations: the POWHEG method | JHEP 11 (2007) 070 | 0709.2092 |
| 19 | S. Alioli, P. Nason, C. Oleari, and E. Re | A general framework for implementing NLO calculations in shower Monte Carlo programs: the POWHEG BOX | JHEP 06 (2010) 043 | 1002.2581 |
| 20 | S. Alioli, P. Nason, C. Oleari, and E. Re | NLO single-top production matched with shower in POWHEG: $ s $- and $ t $-channel contributions | JHEP 09 (2009) 111 | 0907.4076 |
| 21 | E. Re | Single-top Wt-channel production matched with parton showers using the POWHEG method | EPJC 71 (2011) 1547 | 1009.2450 |
| 22 | T. Sjostrand et al. | An introduction to PYTHIA 8.2 | CPC 191 (2015) 159 | 1410.3012 |
| 23 | CMS Collaboration | Event generator tunes obtained from underlying event and multiparton scattering measurements | EPJC 76 (2016) 155 | CMS-GEN-14-001 1512.00815 |
| 24 | NNPDF Collaboration | Parton distributions from high-precision collider data | EPJC 77 (2017) 663 | 1706.00428 |
| 25 | GEANT4 Collaboration | GEANT4: A simulation toolkit | NIMA 506 (2003) 250 | |
| 26 | CMS Collaboration | The CMS experiment at the CERN LHC | JINST 3 (2008) S08004 | CMS-00-001 |
| 27 | CMS Collaboration | Particle-flow reconstruction and global event description with the CMS detector | JINST 12 (2017) P10003 | CMS-PRF-14-001 1706.04965 |
| 28 | CMS Collaboration | Description and performance of track and primary-vertex reconstruction with the CMS tracker | JINST 9 (2014) P10009 | CMS-TRK-11-001 1405.6569 |
| 29 | CMS Collaboration | Performance of electron reconstruction and selection with the CMS detector in proton-proton collisions at $ \sqrt{s} = $ 8 TeV | JINST 10 (2015) P06005 | CMS-EGM-13-001 1502.02701 |
| 30 | CMS Collaboration | Performance of CMS muon reconstruction in pp collision events at $ \sqrt{s} = $ 7 TeV | JINST 7 (2012) P10002 | CMS-MUO-10-004 1206.4071 |
| 31 | M. Cacciari, G. P. Salam, and G. Soyez | The anti-$ {k_{\mathrm{T}}} $ jet clustering algorithm | JHEP 04 (2008) 063 | 0802.1189 |
| 32 | M. Cacciari, G. P. Salam, and G. Soyez | FastJet user manual | EPJC 72 (2012) 1896 | 1111.6097 |
| 33 | CMS Collaboration | Jet energy scale and resolution in the CMS experiment in pp collisions at 8 TeV | JINST 12 (2017) P02014 | CMS-JME-13-004 1607.03663 |
| 34 | M. Dasgupta, A. Fregoso, S. Marzani, and G. P. Salam | Towards an understanding of jet substructure | JHEP 09 (2013) 029 | 1307.0007 |
| 35 | A. J. Larkoski, S. Marzani, G. Soyez, and J. Thaler | Soft drop | JHEP 05 (2014) 146 | 1402.2657 |
| 36 | D. Bertolini, P. Harris, M. Low, and N. Tran | Pileup per particle identification | JHEP 10 (2014) 059 | 1407.6013 |
| 37 | J. Thaler and K. Van Tilburg | Identifying boosted objects with N-subjettiness | JHEP 03 (2011) 015 | 1011.2268 |
| 38 | CMS Collaboration | Identification of b-quark jets with the CMS experiment | JINST 8 (2013) P04013 | CMS-BTV-12-001 1211.4462 |
| 39 | CMS Collaboration | Identification of b quark jets at the CMS experiment in the LHC Run 2 | CMS-PAS-BTV-15-001 | CMS-PAS-BTV-15-001 |
| 40 | CMS Collaboration | The CMS trigger system | JINST 12 (2017) P01020 | CMS-TRG-12-001 1609.02366 |
| 41 | M. J. Oreglia | A study of the reactions $\psi' \to \gamma\gamma \psi$ | PhD thesis, Stanford University, 1980 SLAC Report SLAC-R-236, see Appendix D | |
| 42 | CMS Collaboration | Measurement of the ZZ production cross section and Z~$ \to \ell^+\ell^-\ell'^+\ell'^- $ branching fraction in pp collisions at $ \sqrt s = $ 13 TeV | PLB 763 (2016) 280 | CMS-SMP-16-001 1607.08834 |
| 43 | CMS Collaboration | Measurement of the WZ production cross section in pp collisions at $ \sqrt{s} = $ 13 TeV | PLB 766 (2017) 268 | CMS-SMP-16-002 1607.06943 |
| 44 | CMS Collaboration | Measurement of the $ \mathrm{t\bar{t}} $ production cross section using events in the e$ \mu $ final state in pp collisions at $ \sqrt{s} = $ 13 TeV | EPJC 77 (2017) 172 | CMS-TOP-16-005 1611.04040 |
| 45 | CMS Collaboration | Jet algorithms performance in 13 TeV data | CMS-PAS-JME-16-003 | CMS-PAS-JME-16-003 |
| 46 | CMS Collaboration | Identification techniques for highly boosted W bosons that decay into hadrons | JHEP 12 (2014) 017 | CMS-JME-13-006 1410.4227 |
| 47 | M. Bahr et al. | Herwig++ physics and manual | EPJC 58 (2008) 639 | 0803.0883 |
| 48 | CMS Collaboration | CMS luminosity measurements for the 2016 data taking period | CMS-PAS-LUM-17-001 | CMS-PAS-LUM-17-001 |
| 49 | A. L. Read | Presentation of search results: The CL$ _{\text{s}} $ technique | JPG 28 (2002) 2693 | |
| 50 | T. Junk | Confidence level computation for combining searches with small statistics | NIMA 434 (1999) 435 | hep-ex/9902006 |
| 51 | G. Cowan, K. Cranmer, E. Gross, and O. Vitells | Asymptotic formulae for likelihood-based tests of new physics | EPJC 71 (2011) 1554 | 1007.1727 |
| 52 | The ATLAS Collaboration, The CMS Collaboration, The LHC Higgs Combination Group | Procedure for the LHC Higgs boson search combination in Summer 2011 | CMS-NOTE-2011-005 | |
| 53 | L. Demortier | P values and nuisance parameters | in Statistical issues for LHC physics. Proceedings, Workshop, PHYSTAT-LHC, Geneva, Switzerland, June 27-29, 2007, p. 23 2008 | |
|
|
Compact Muon Solenoid LHC, CERN |
|

|

|

|

|

|