

Compact Muon Solenoid
LHC, CERN
| CMS-B2G-20-005 ; CERN-EP-2021-049 | ||
| Search for W' bosons decaying to a top and a bottom quark at $\sqrt{s} = $ 13 TeV in the hadronic final state | ||
| CMS Collaboration | ||
| 11 April 2021 | ||
| Phys. Lett. B 820 (2021) 136535 | ||
| Abstract: A search is performed for W' bosons decaying to a top and a bottom quark in the all-hadronic final state, in proton-proton collisions at a center-of-mass energy of 13 TeV. The analyzed data were collected by the CMS experiment between 2016 and 2018 and correspond to an integrated luminosity of 137 fb$^{-1}$. Deep neural network algorithms are used to identify the jet initiated by the bottom quark and the jet containing the decay products of the top quark when the W boson from the top quark decays hadronically. No excess above the estimated standard model background is observed. Upper limits on the production cross sections of W' bosons decaying to a top and a bottom quark are set. Both left- and right-handed W' bosons with masses below 3.4 TeV are excluded at 95% confidence level, and the most stringent limits to date on W' bosons decaying to a top and a bottom quark in the all-hadronic final state are obtained. | ||
| Links: e-print arXiv:2104.04831 [hep-ex] (PDF) ; CDS record ; inSPIRE record ; HepData record ; CADI line (restricted) ; | ||
| Figures & Tables | Summary | Additional Figures | References | CMS Publications |
|---|
| Figures | |
png pdf |
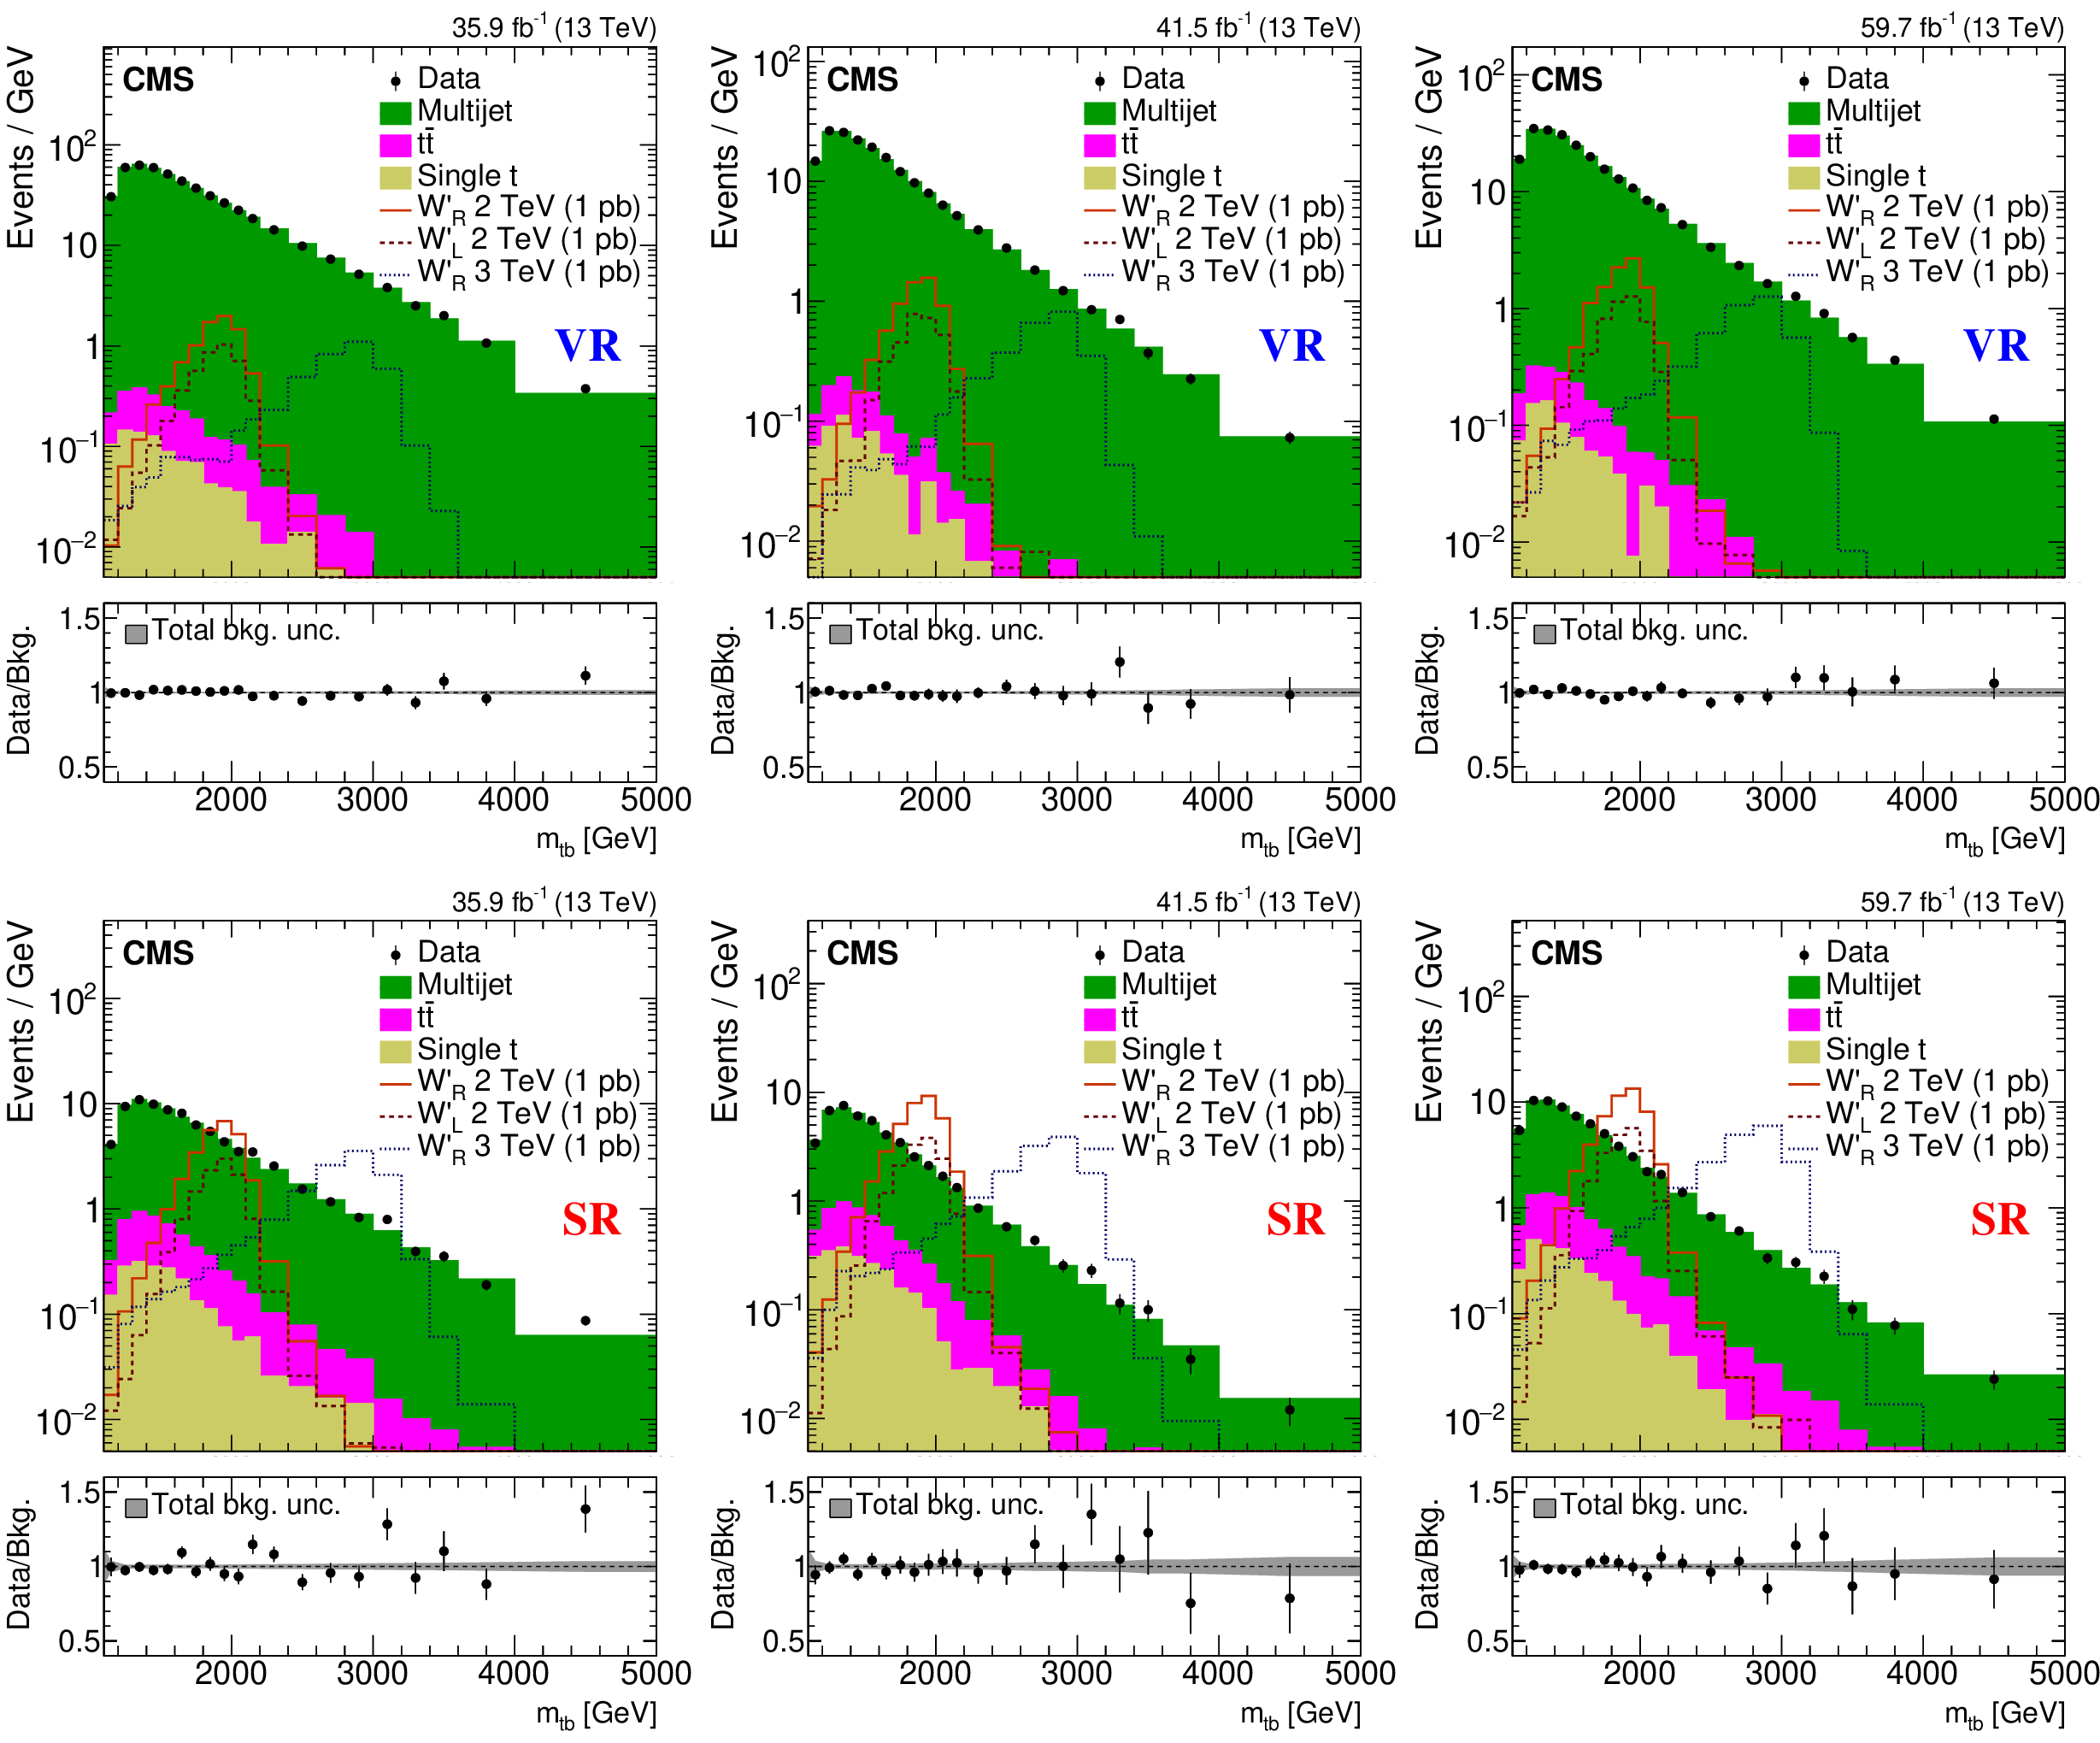
Figure 1:
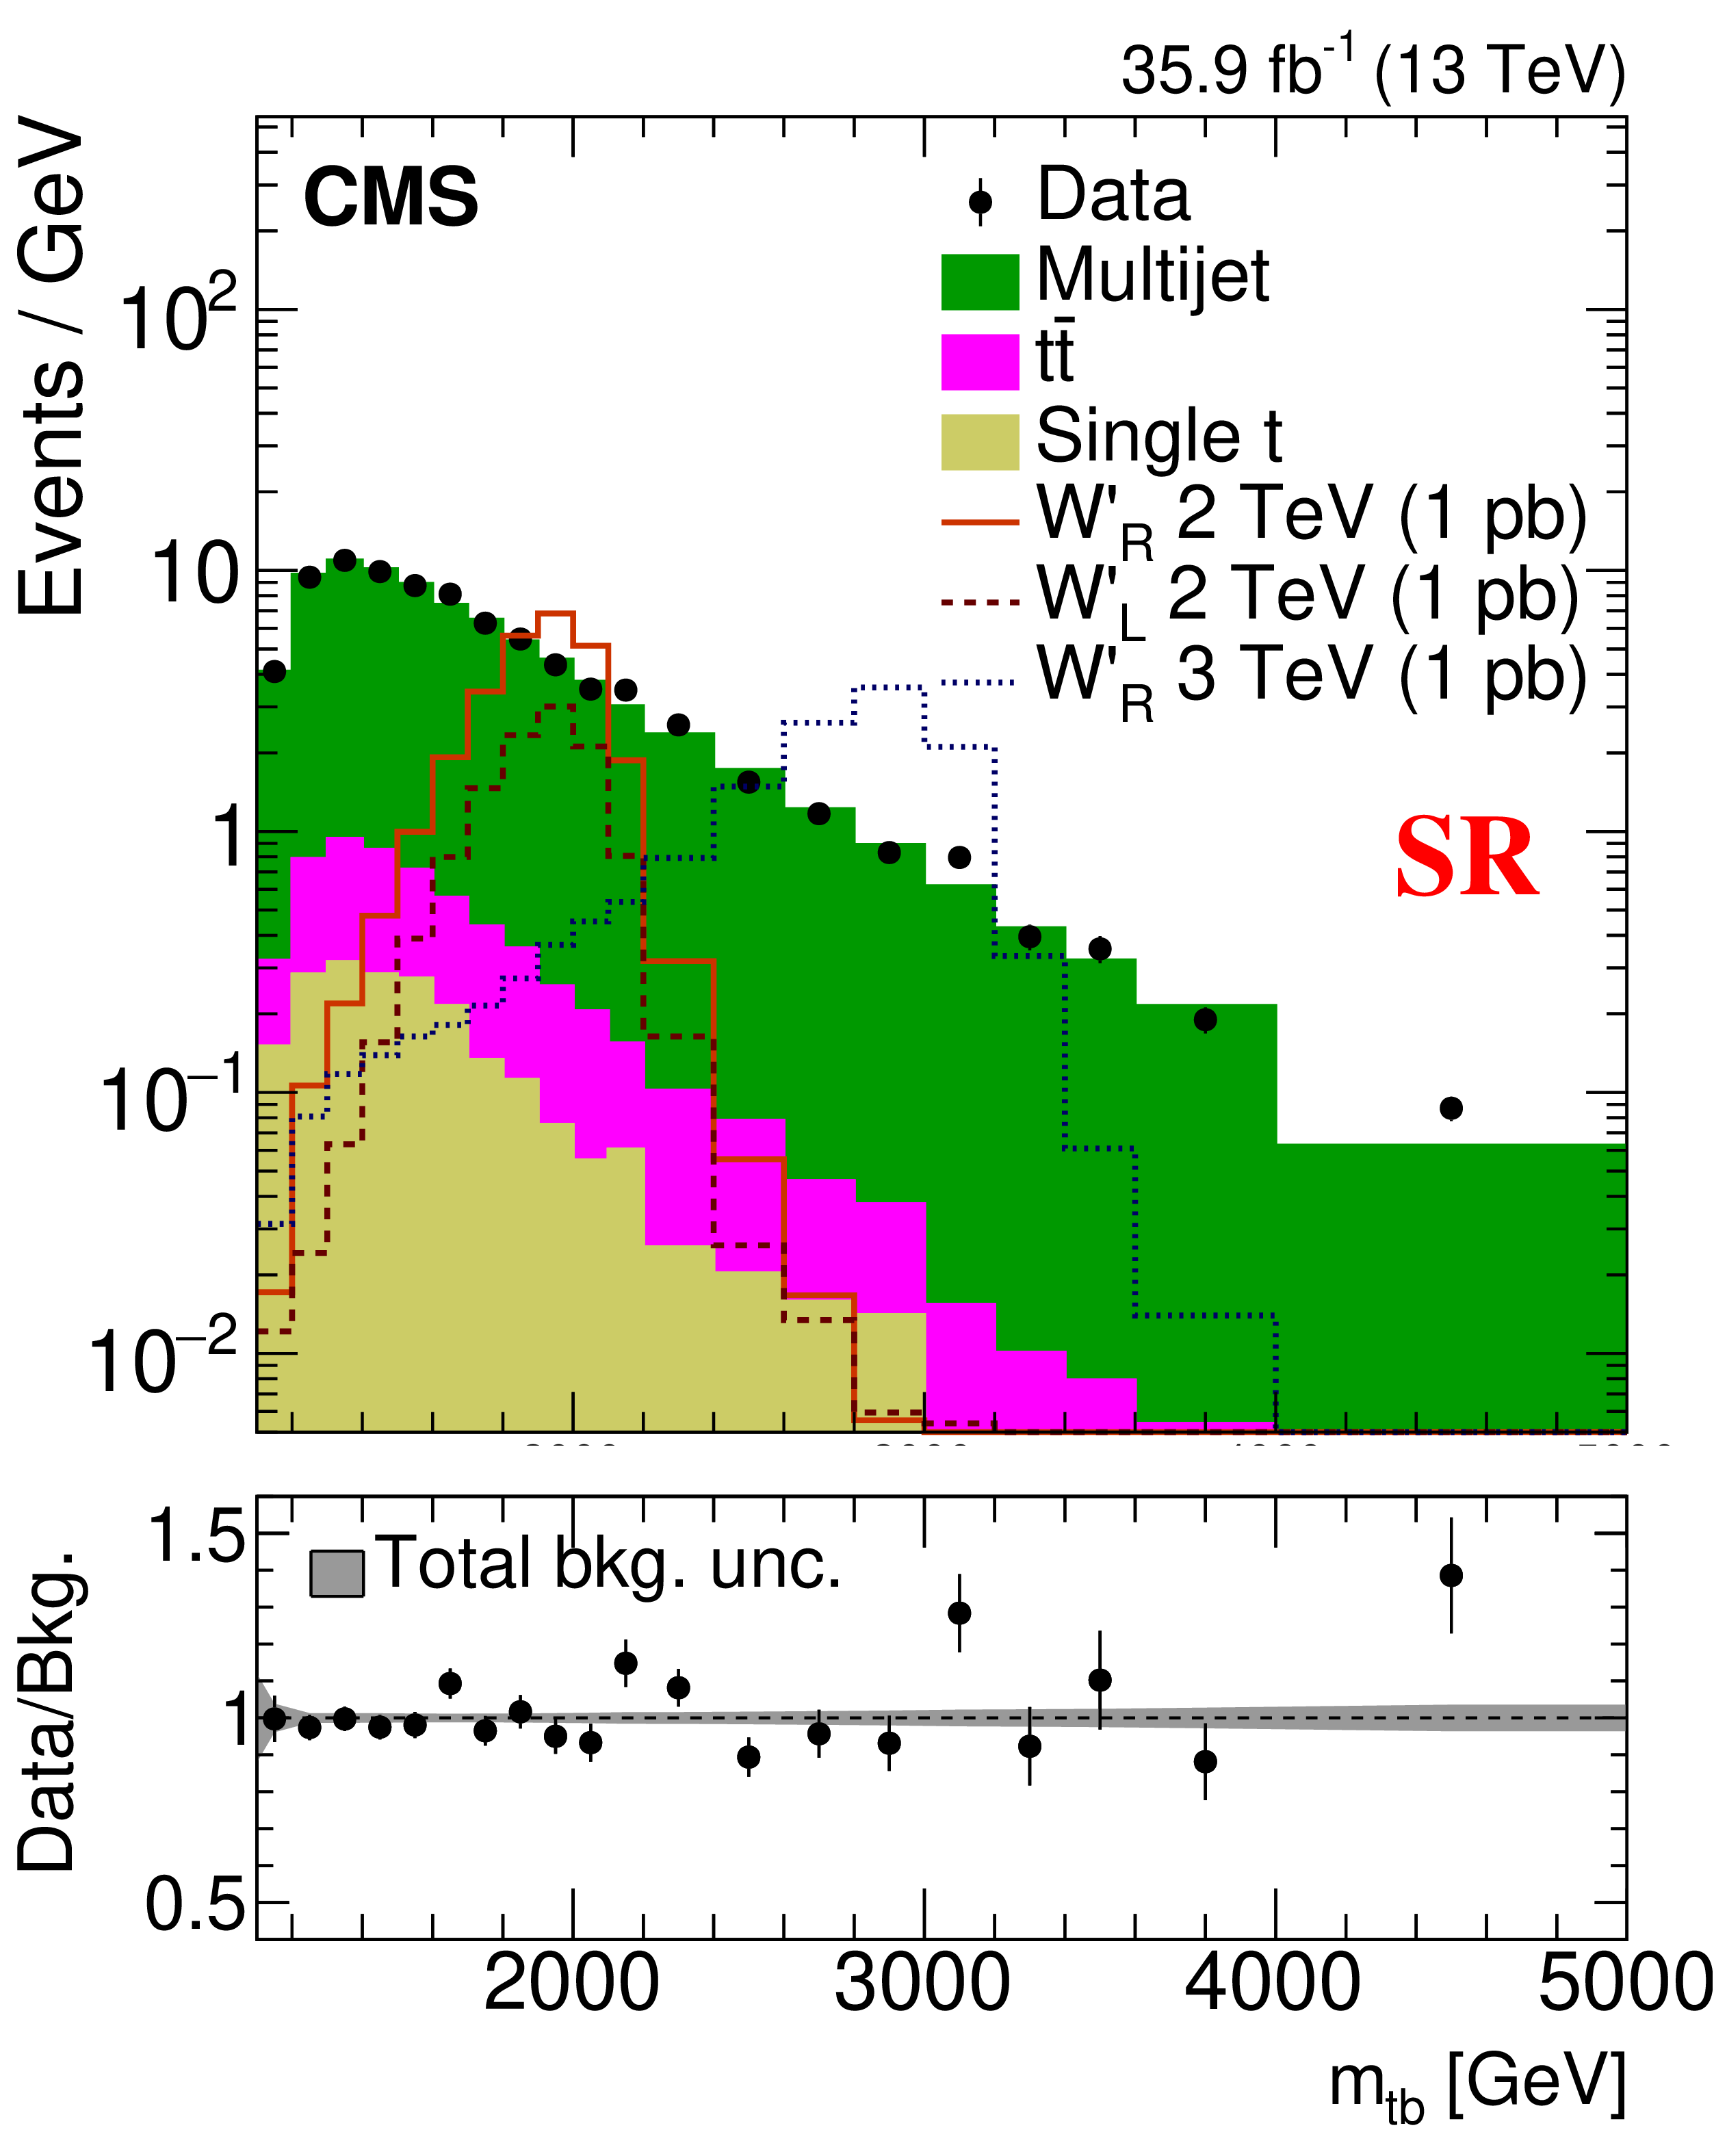
The reconstructed ${m_{\mathrm{t} \mathrm{b}}}$ distributions in data (black points with error bars), and backgrounds in the VR (upper row) and SR (lower row) for the data-taking periods of 2016 (left), 2017 (middle), and 2018 (right). The yield in each bin is divided by the corresponding bin width. Distributions expected from right-handed W' bosons of mass 2 and 3 TeV and a left-handed W' boson of mass 2 TeV are shown normalized to the integrated luminosity of the data using a product of cross section and branching fraction of 1 pb. The lower panel in each plot shows the ratio of data to the background prediction. The shaded band indicates the total uncertainty in the estimated background, including both statistical and systematic components. |
png pdf |
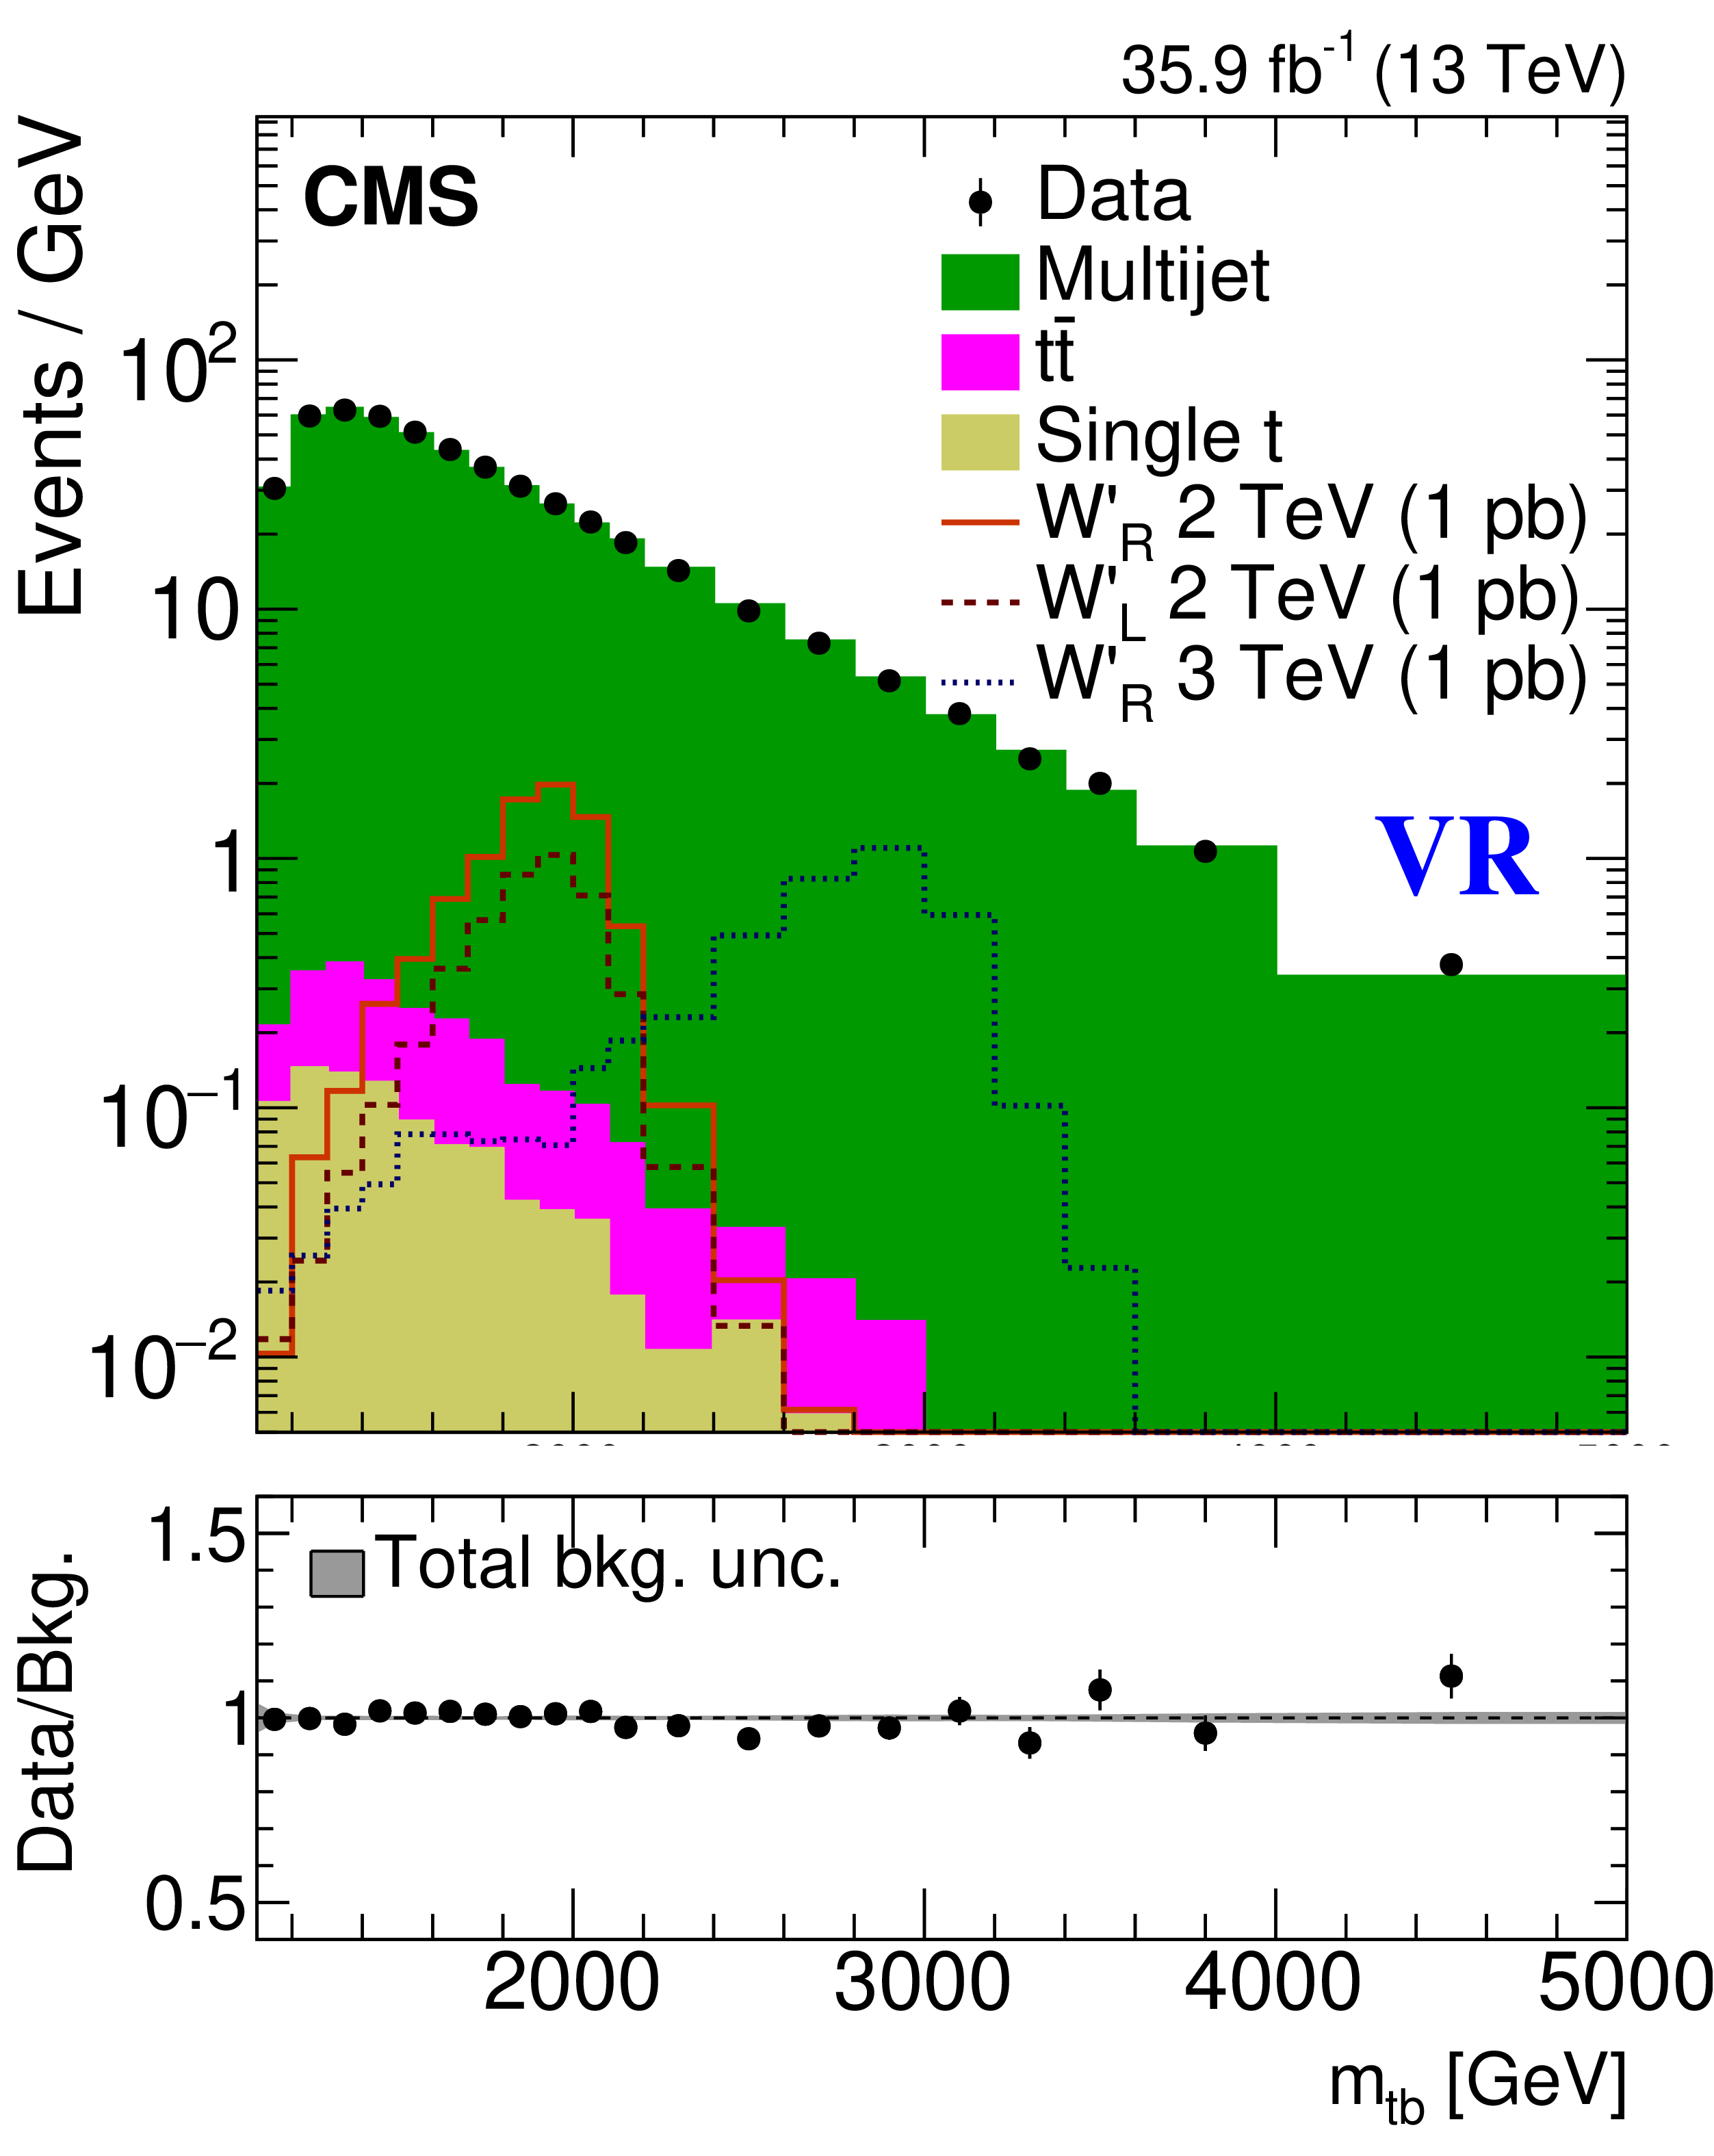
Figure 1-a:
The reconstructed ${m_{\mathrm{t} \mathrm{b}}}$ distributions in data (black points with error bars), and backgrounds in the VR, for the data-taking periods of 2016. The yield in each bin is divided by the corresponding bin width. Distributions expected from right-handed W' bosons of mass 2 and 3 TeV and a left-handed W' boson of mass 2 TeV are shown normalized to the integrated luminosity of the data using a product of cross section and branching fraction of 1 pb. The lower panel in each plot shows the ratio of data to the background prediction. The shaded band indicates the total uncertainty in the estimated background, including both statistical and systematic components. |
png pdf |
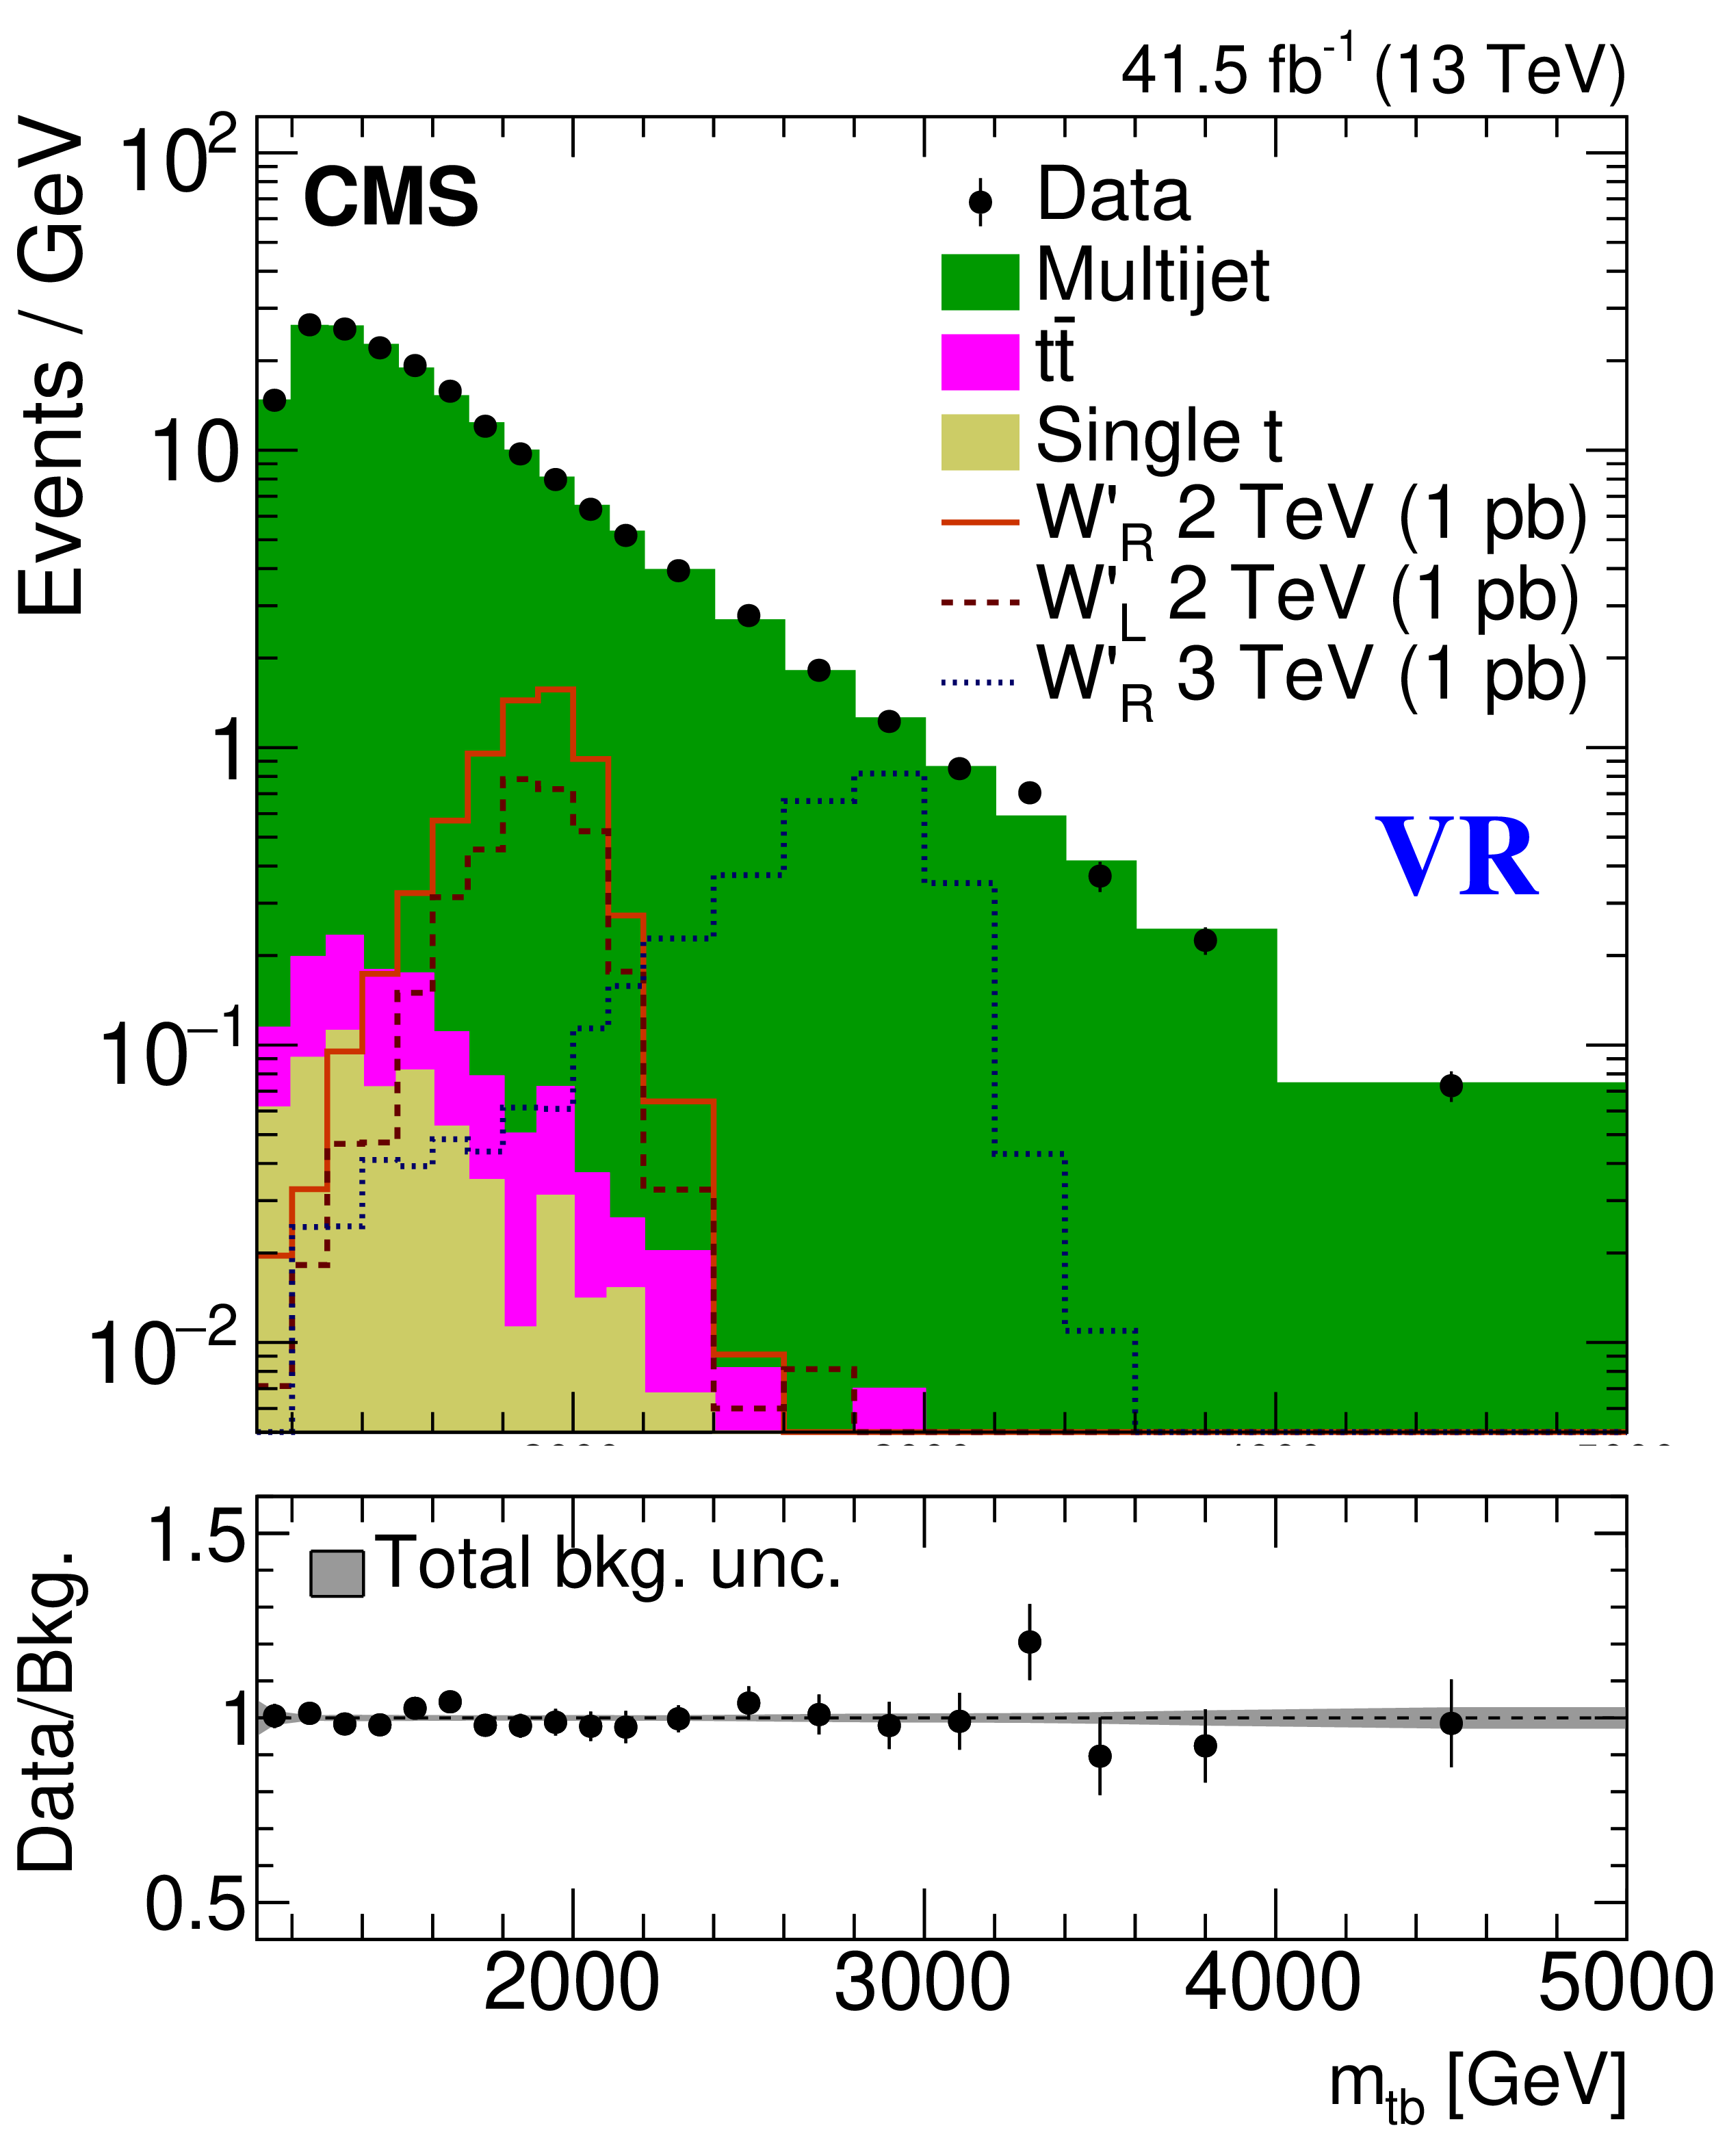
Figure 1-b:
The reconstructed ${m_{\mathrm{t} \mathrm{b}}}$ distributions in data (black points with error bars), and backgrounds in the VR, for the data-taking periods of 2017. The yield in each bin is divided by the corresponding bin width. Distributions expected from right-handed W' bosons of mass 2 and 3 TeV and a left-handed W' boson of mass 2 TeV are shown normalized to the integrated luminosity of the data using a product of cross section and branching fraction of 1 pb. The lower panel in each plot shows the ratio of data to the background prediction. The shaded band indicates the total uncertainty in the estimated background, including both statistical and systematic components. |
png pdf |
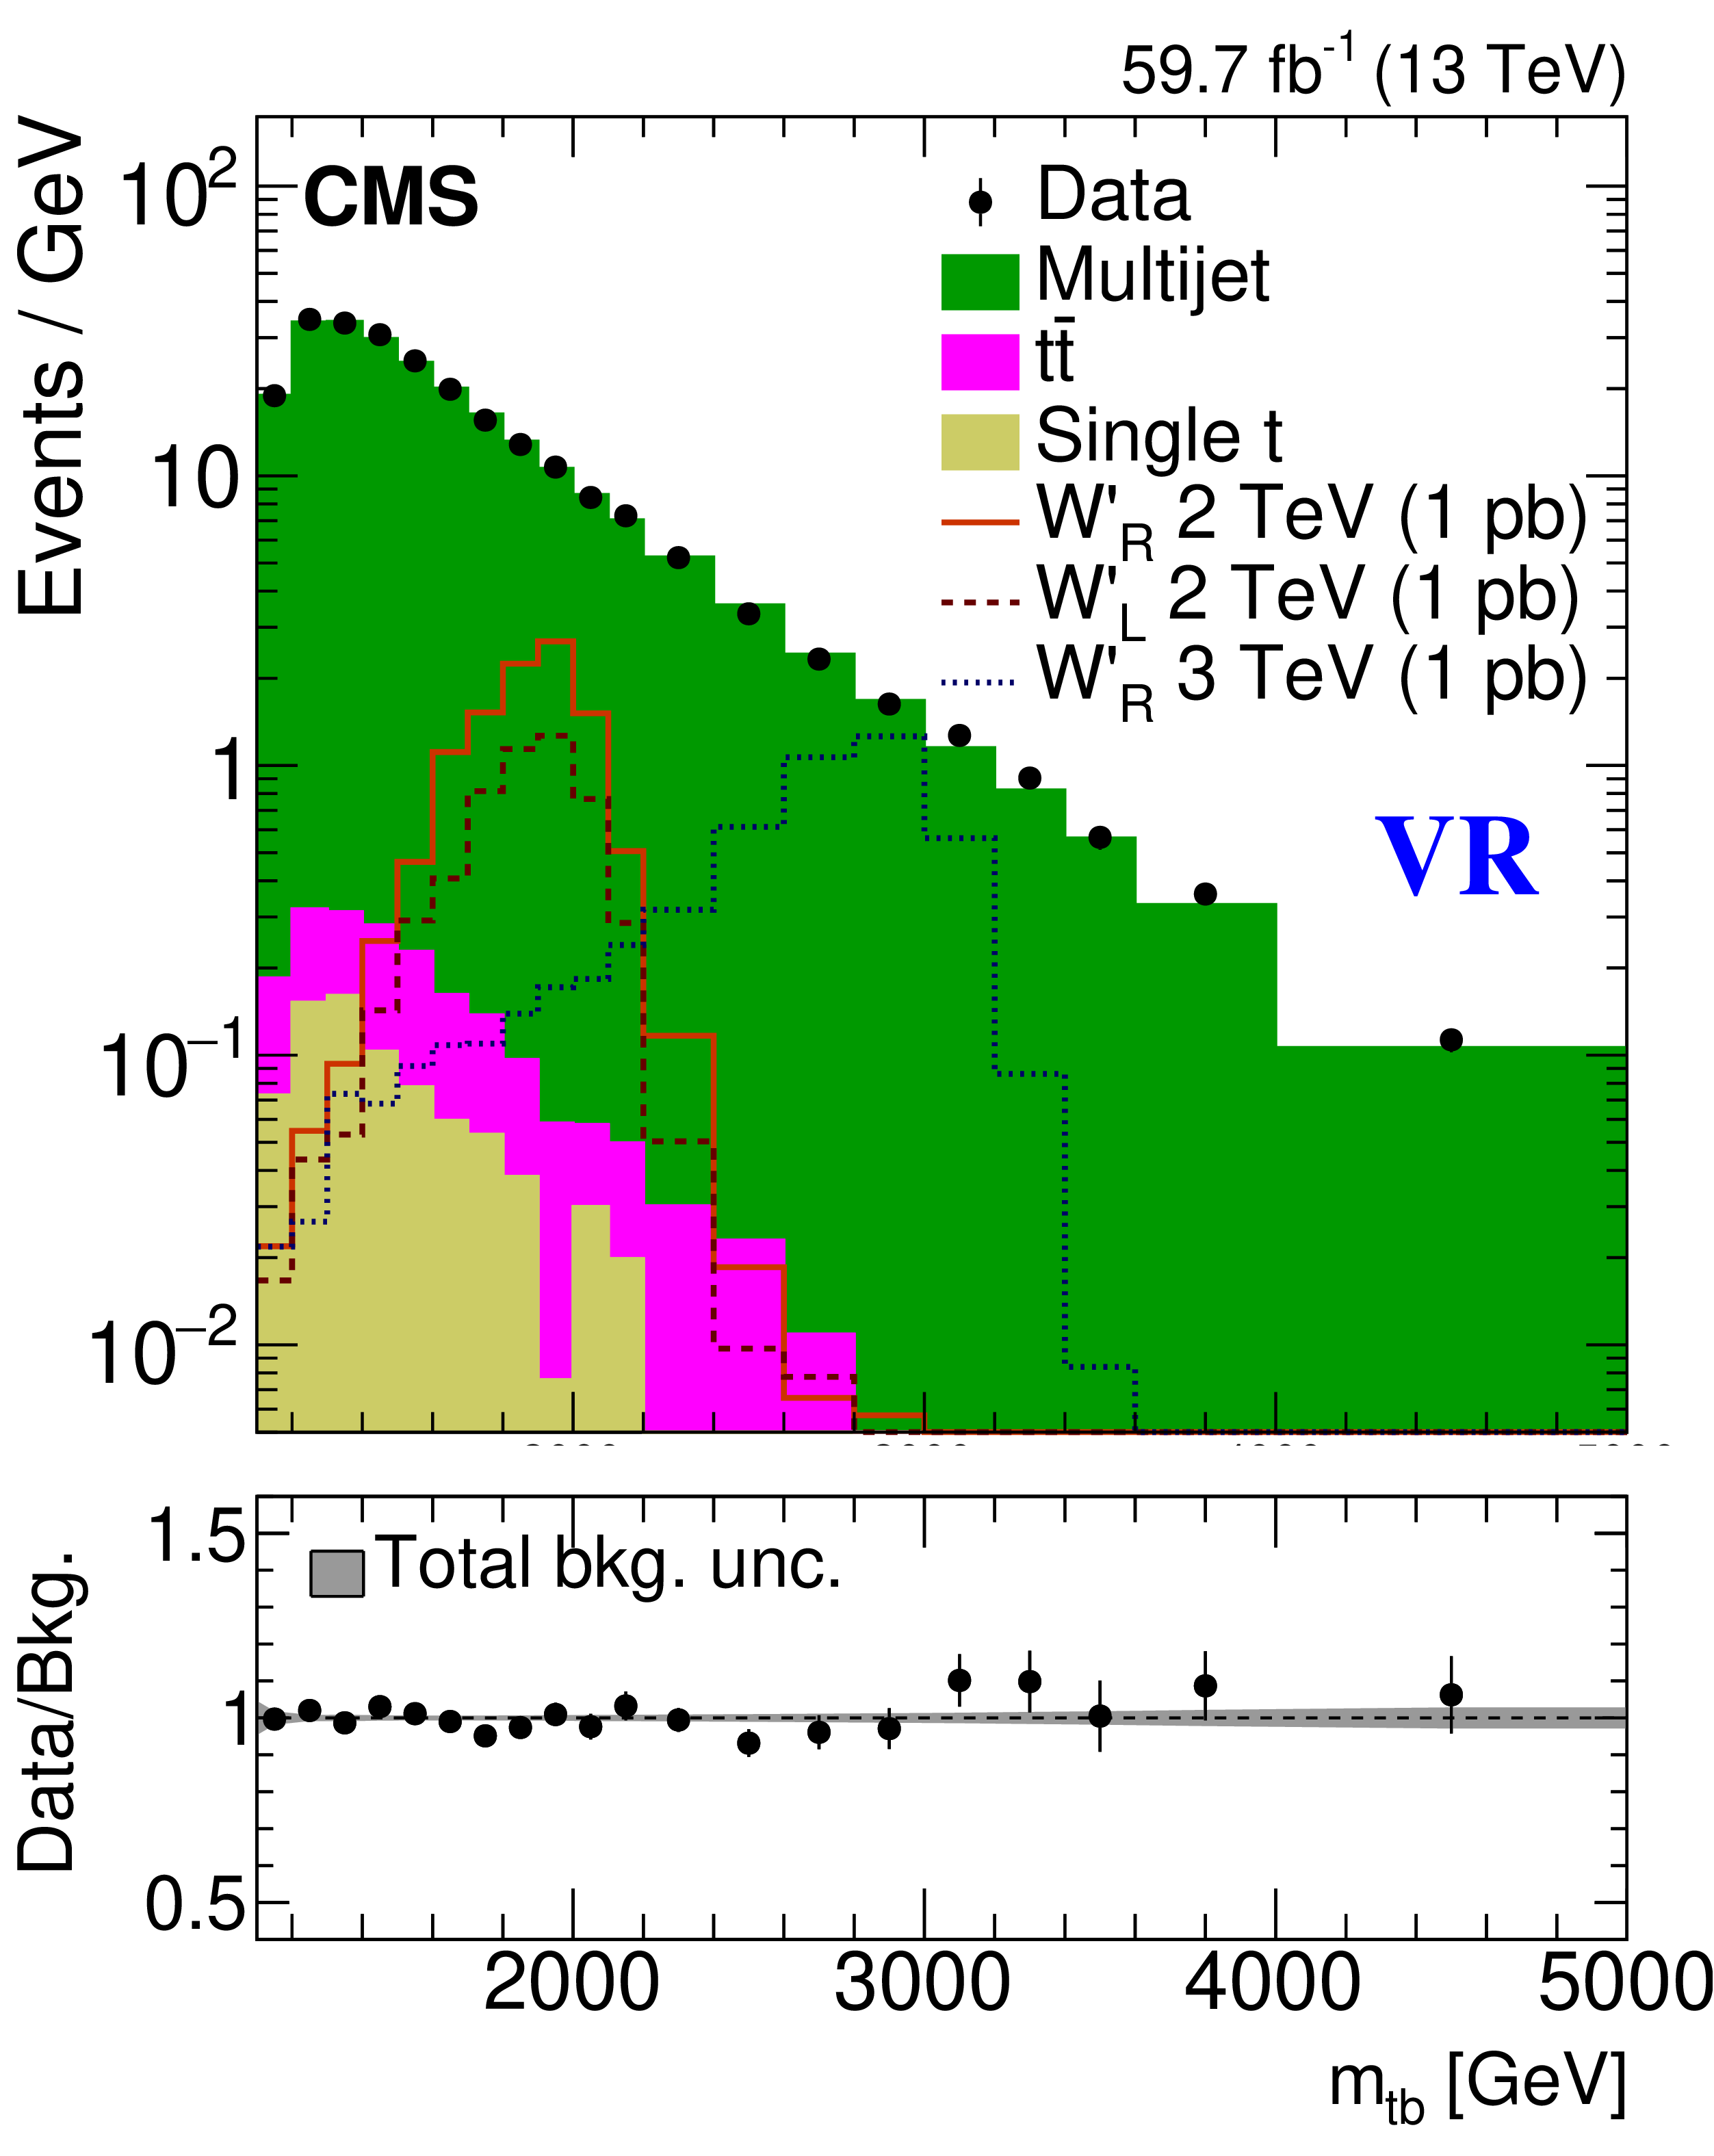
Figure 1-c:
The reconstructed ${m_{\mathrm{t} \mathrm{b}}}$ distributions in data (black points with error bars), and backgrounds in the VR, for the data-taking periods of 2018. The yield in each bin is divided by the corresponding bin width. Distributions expected from right-handed W' bosons of mass 2 and 3 TeV and a left-handed W' boson of mass 2 TeV are shown normalized to the integrated luminosity of the data using a product of cross section and branching fraction of 1 pb. The lower panel in each plot shows the ratio of data to the background prediction. The shaded band indicates the total uncertainty in the estimated background, including both statistical and systematic components. |
png pdf |
Figure 1-d:
The reconstructed ${m_{\mathrm{t} \mathrm{b}}}$ distributions in data (black points with error bars), and backgrounds in the SR, for the data-taking periods of 2016. The yield in each bin is divided by the corresponding bin width. Distributions expected from right-handed W' bosons of mass 2 and 3 TeV and a left-handed W' boson of mass 2 TeV are shown normalized to the integrated luminosity of the data using a product of cross section and branching fraction of 1 pb. The lower panel in each plot shows the ratio of data to the background prediction. The shaded band indicates the total uncertainty in the estimated background, including both statistical and systematic components. |
png pdf |
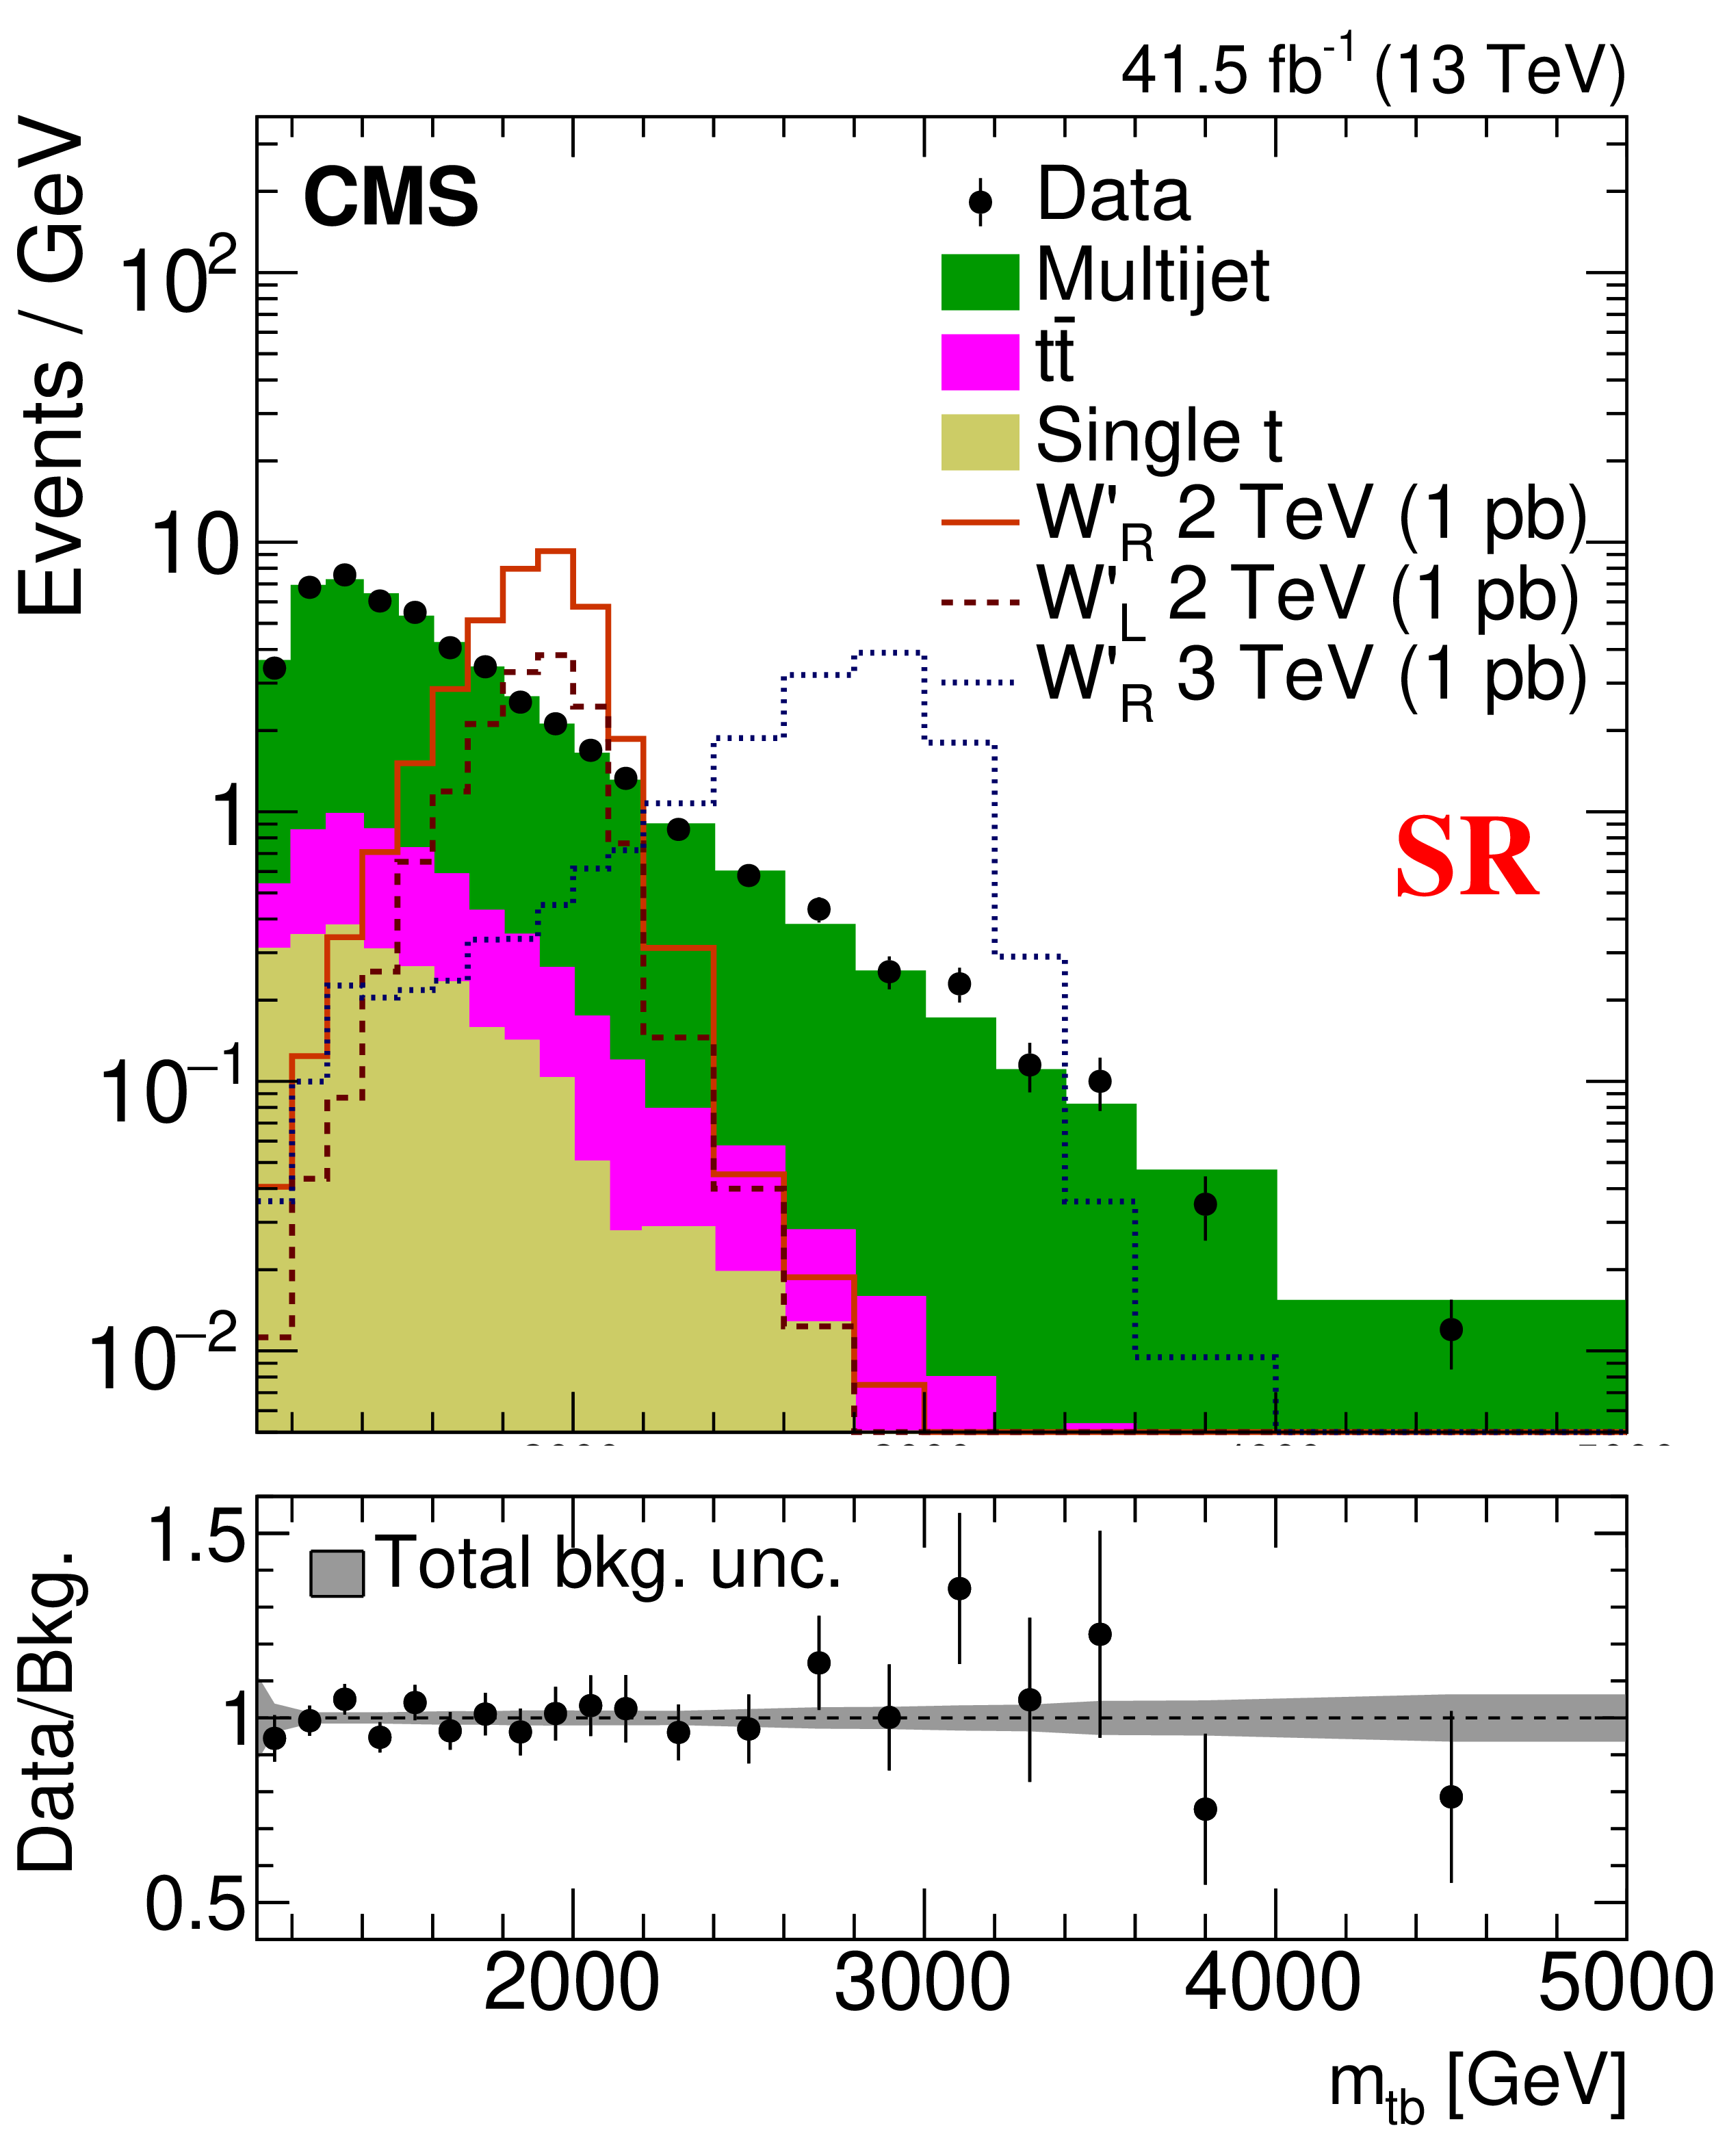
Figure 1-e:
The reconstructed ${m_{\mathrm{t} \mathrm{b}}}$ distributions in data (black points with error bars), and backgrounds in the SR, for the data-taking periods of 2017. The yield in each bin is divided by the corresponding bin width. Distributions expected from right-handed W' bosons of mass 2 and 3 TeV and a left-handed W' boson of mass 2 TeV are shown normalized to the integrated luminosity of the data using a product of cross section and branching fraction of 1 pb. The lower panel in each plot shows the ratio of data to the background prediction. The shaded band indicates the total uncertainty in the estimated background, including both statistical and systematic components. |
png pdf |
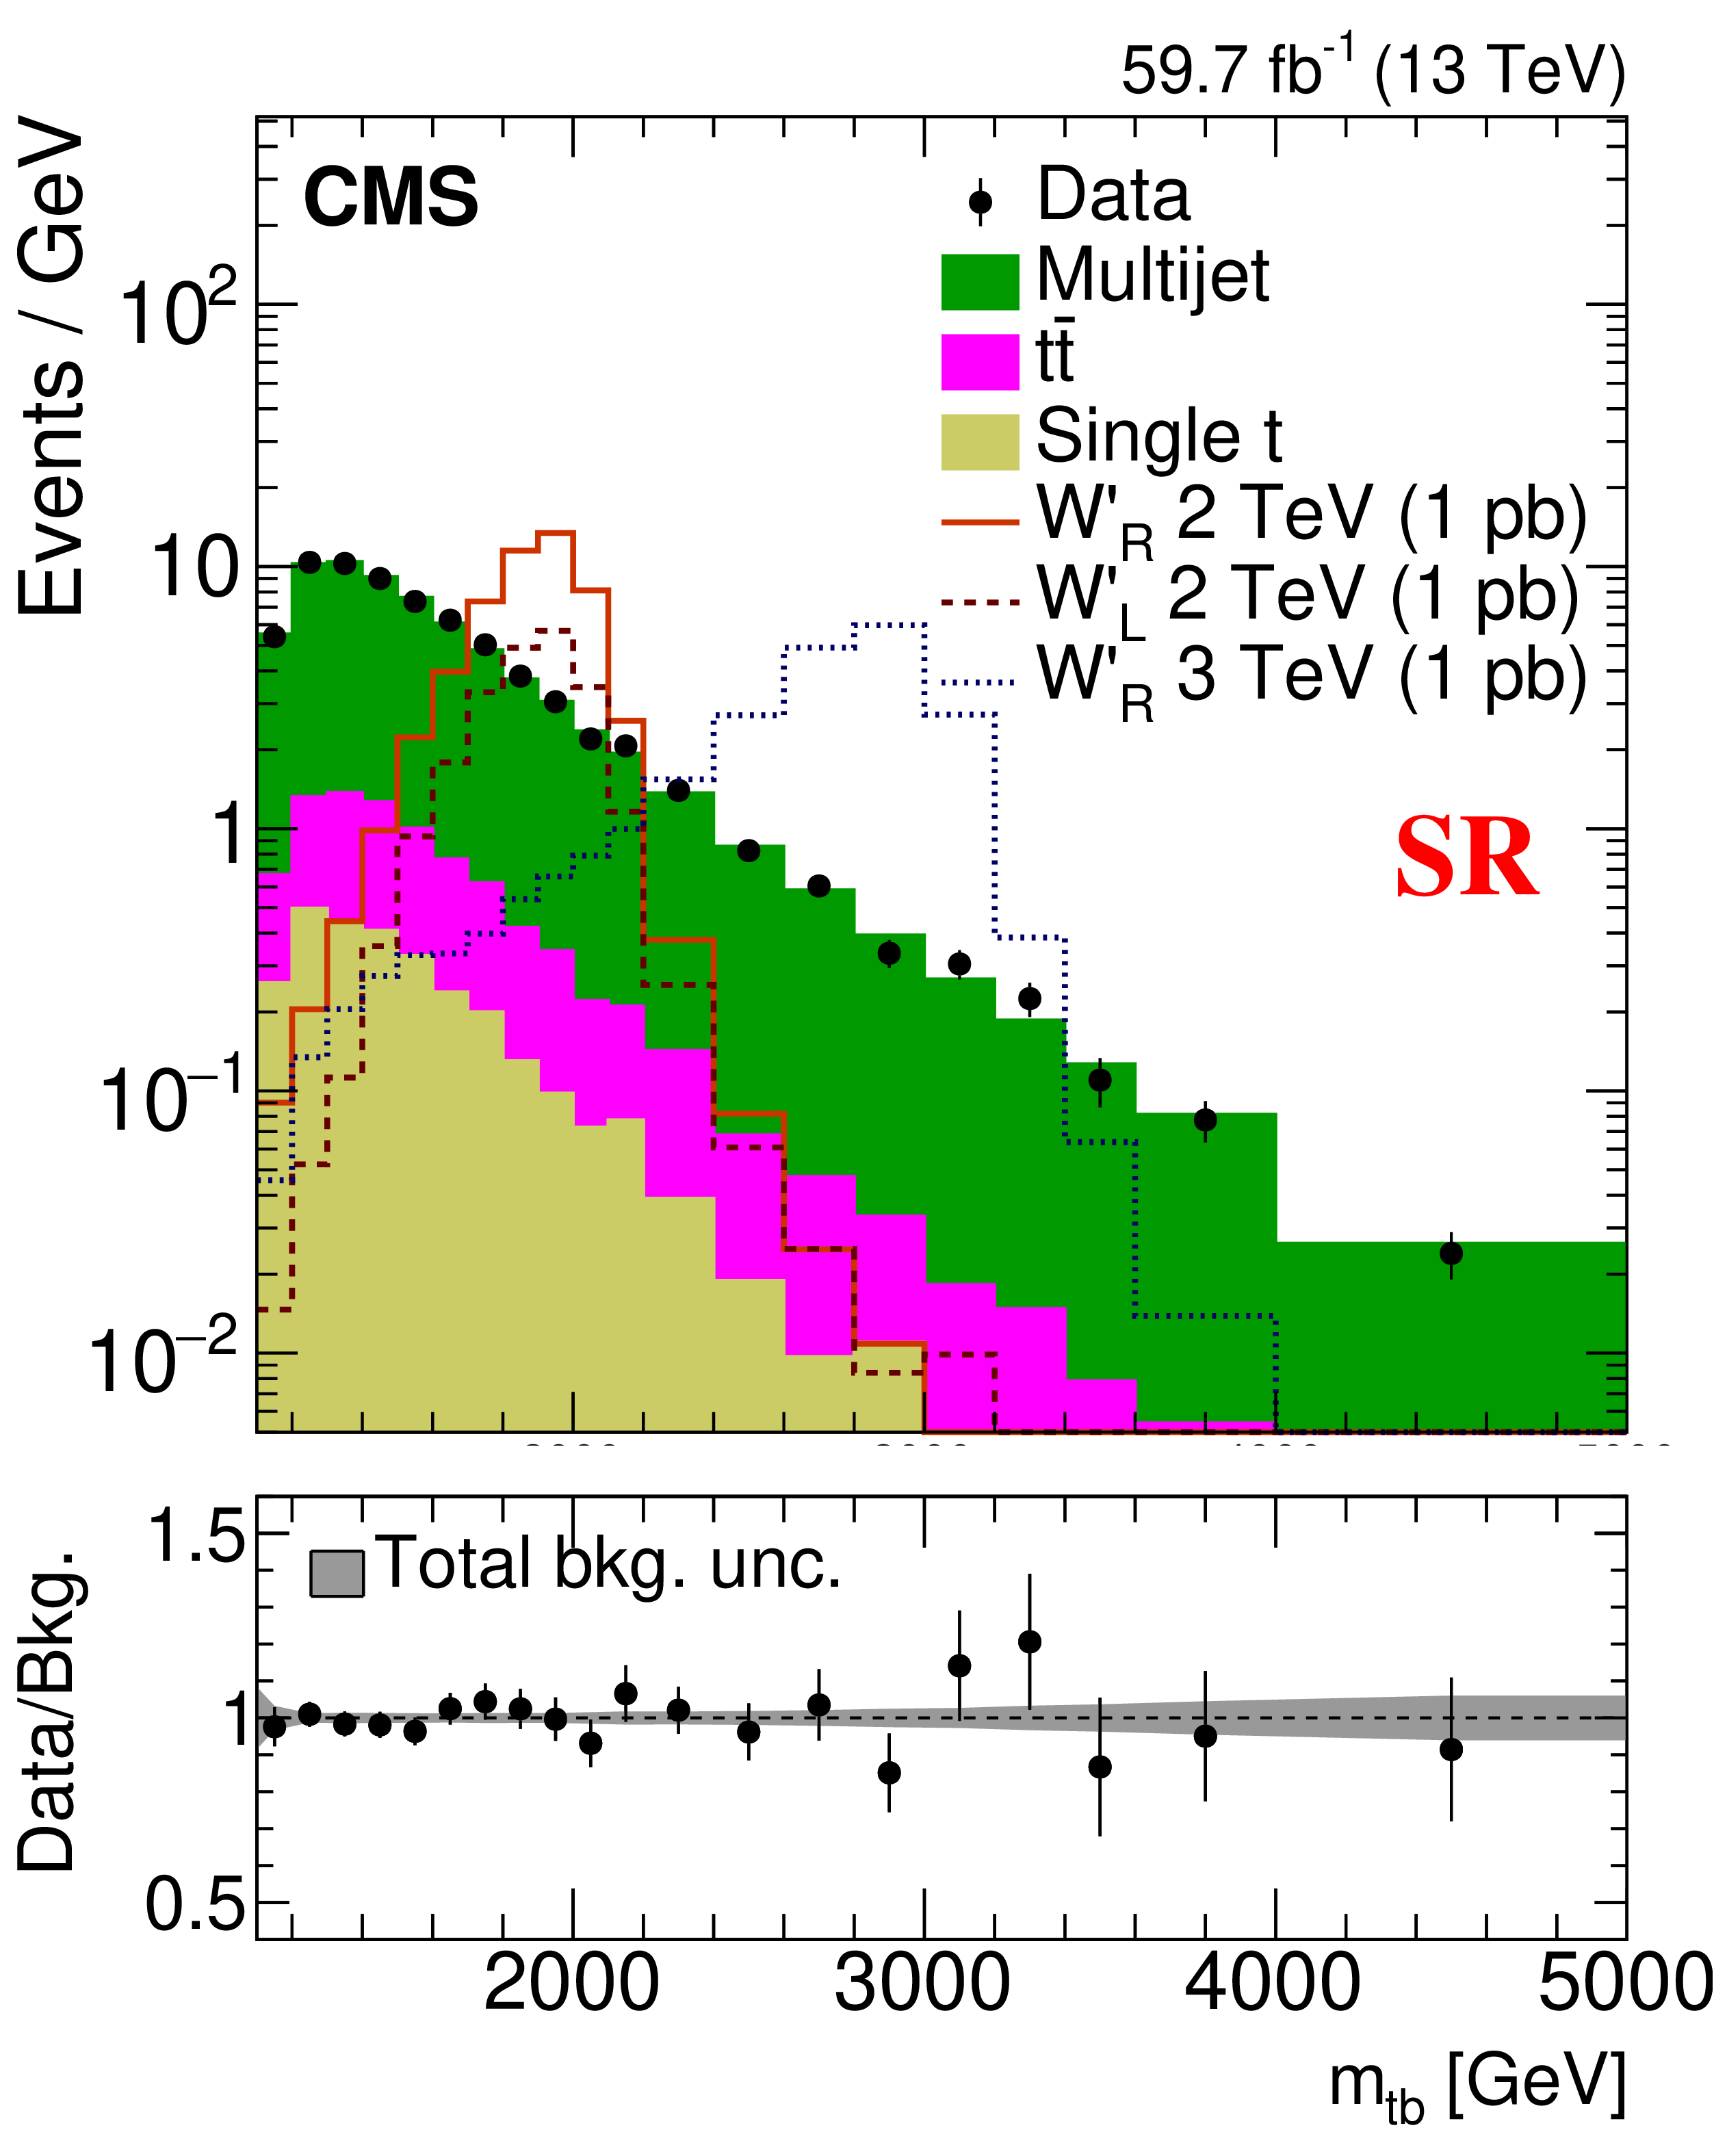
Figure 1-f:
The reconstructed ${m_{\mathrm{t} \mathrm{b}}}$ distributions in data (black points with error bars), and backgrounds in the SR, for the data-taking periods of 2018. The yield in each bin is divided by the corresponding bin width. Distributions expected from right-handed W' bosons of mass 2 and 3 TeV and a left-handed W' boson of mass 2 TeV are shown normalized to the integrated luminosity of the data using a product of cross section and branching fraction of 1 pb. The lower panel in each plot shows the ratio of data to the background prediction. The shaded band indicates the total uncertainty in the estimated background, including both statistical and systematic components. |

png pdf |
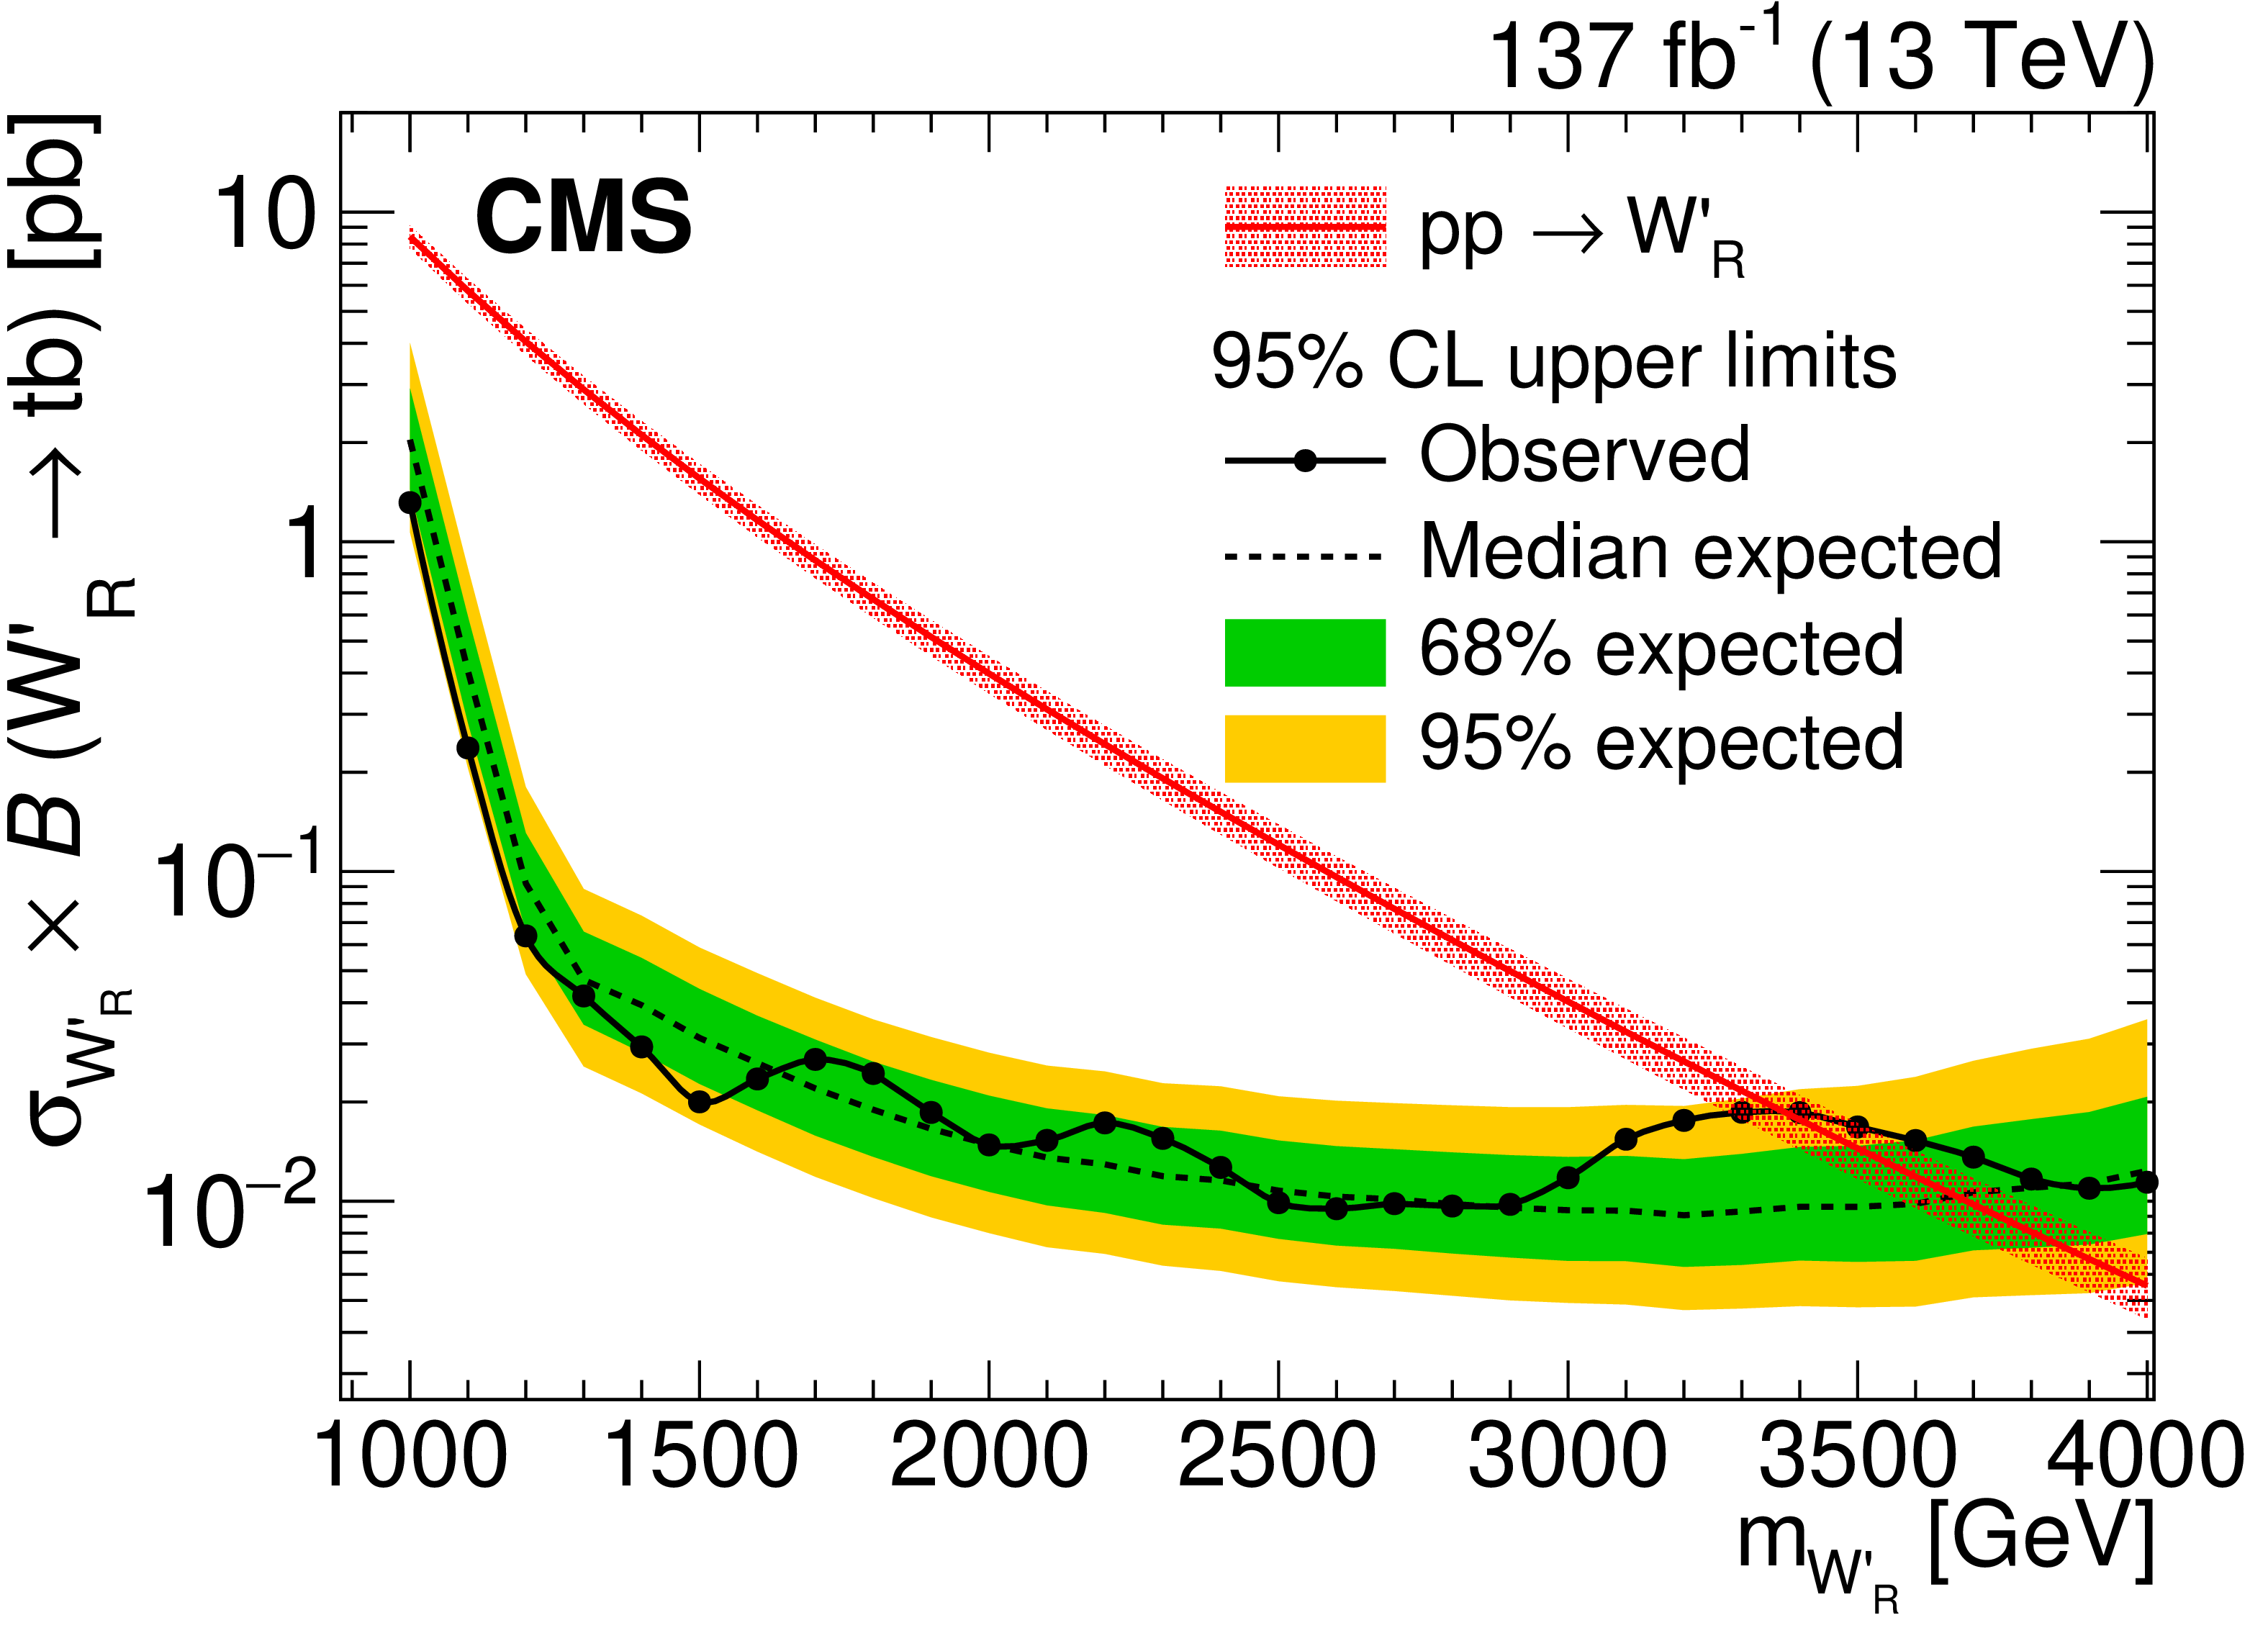
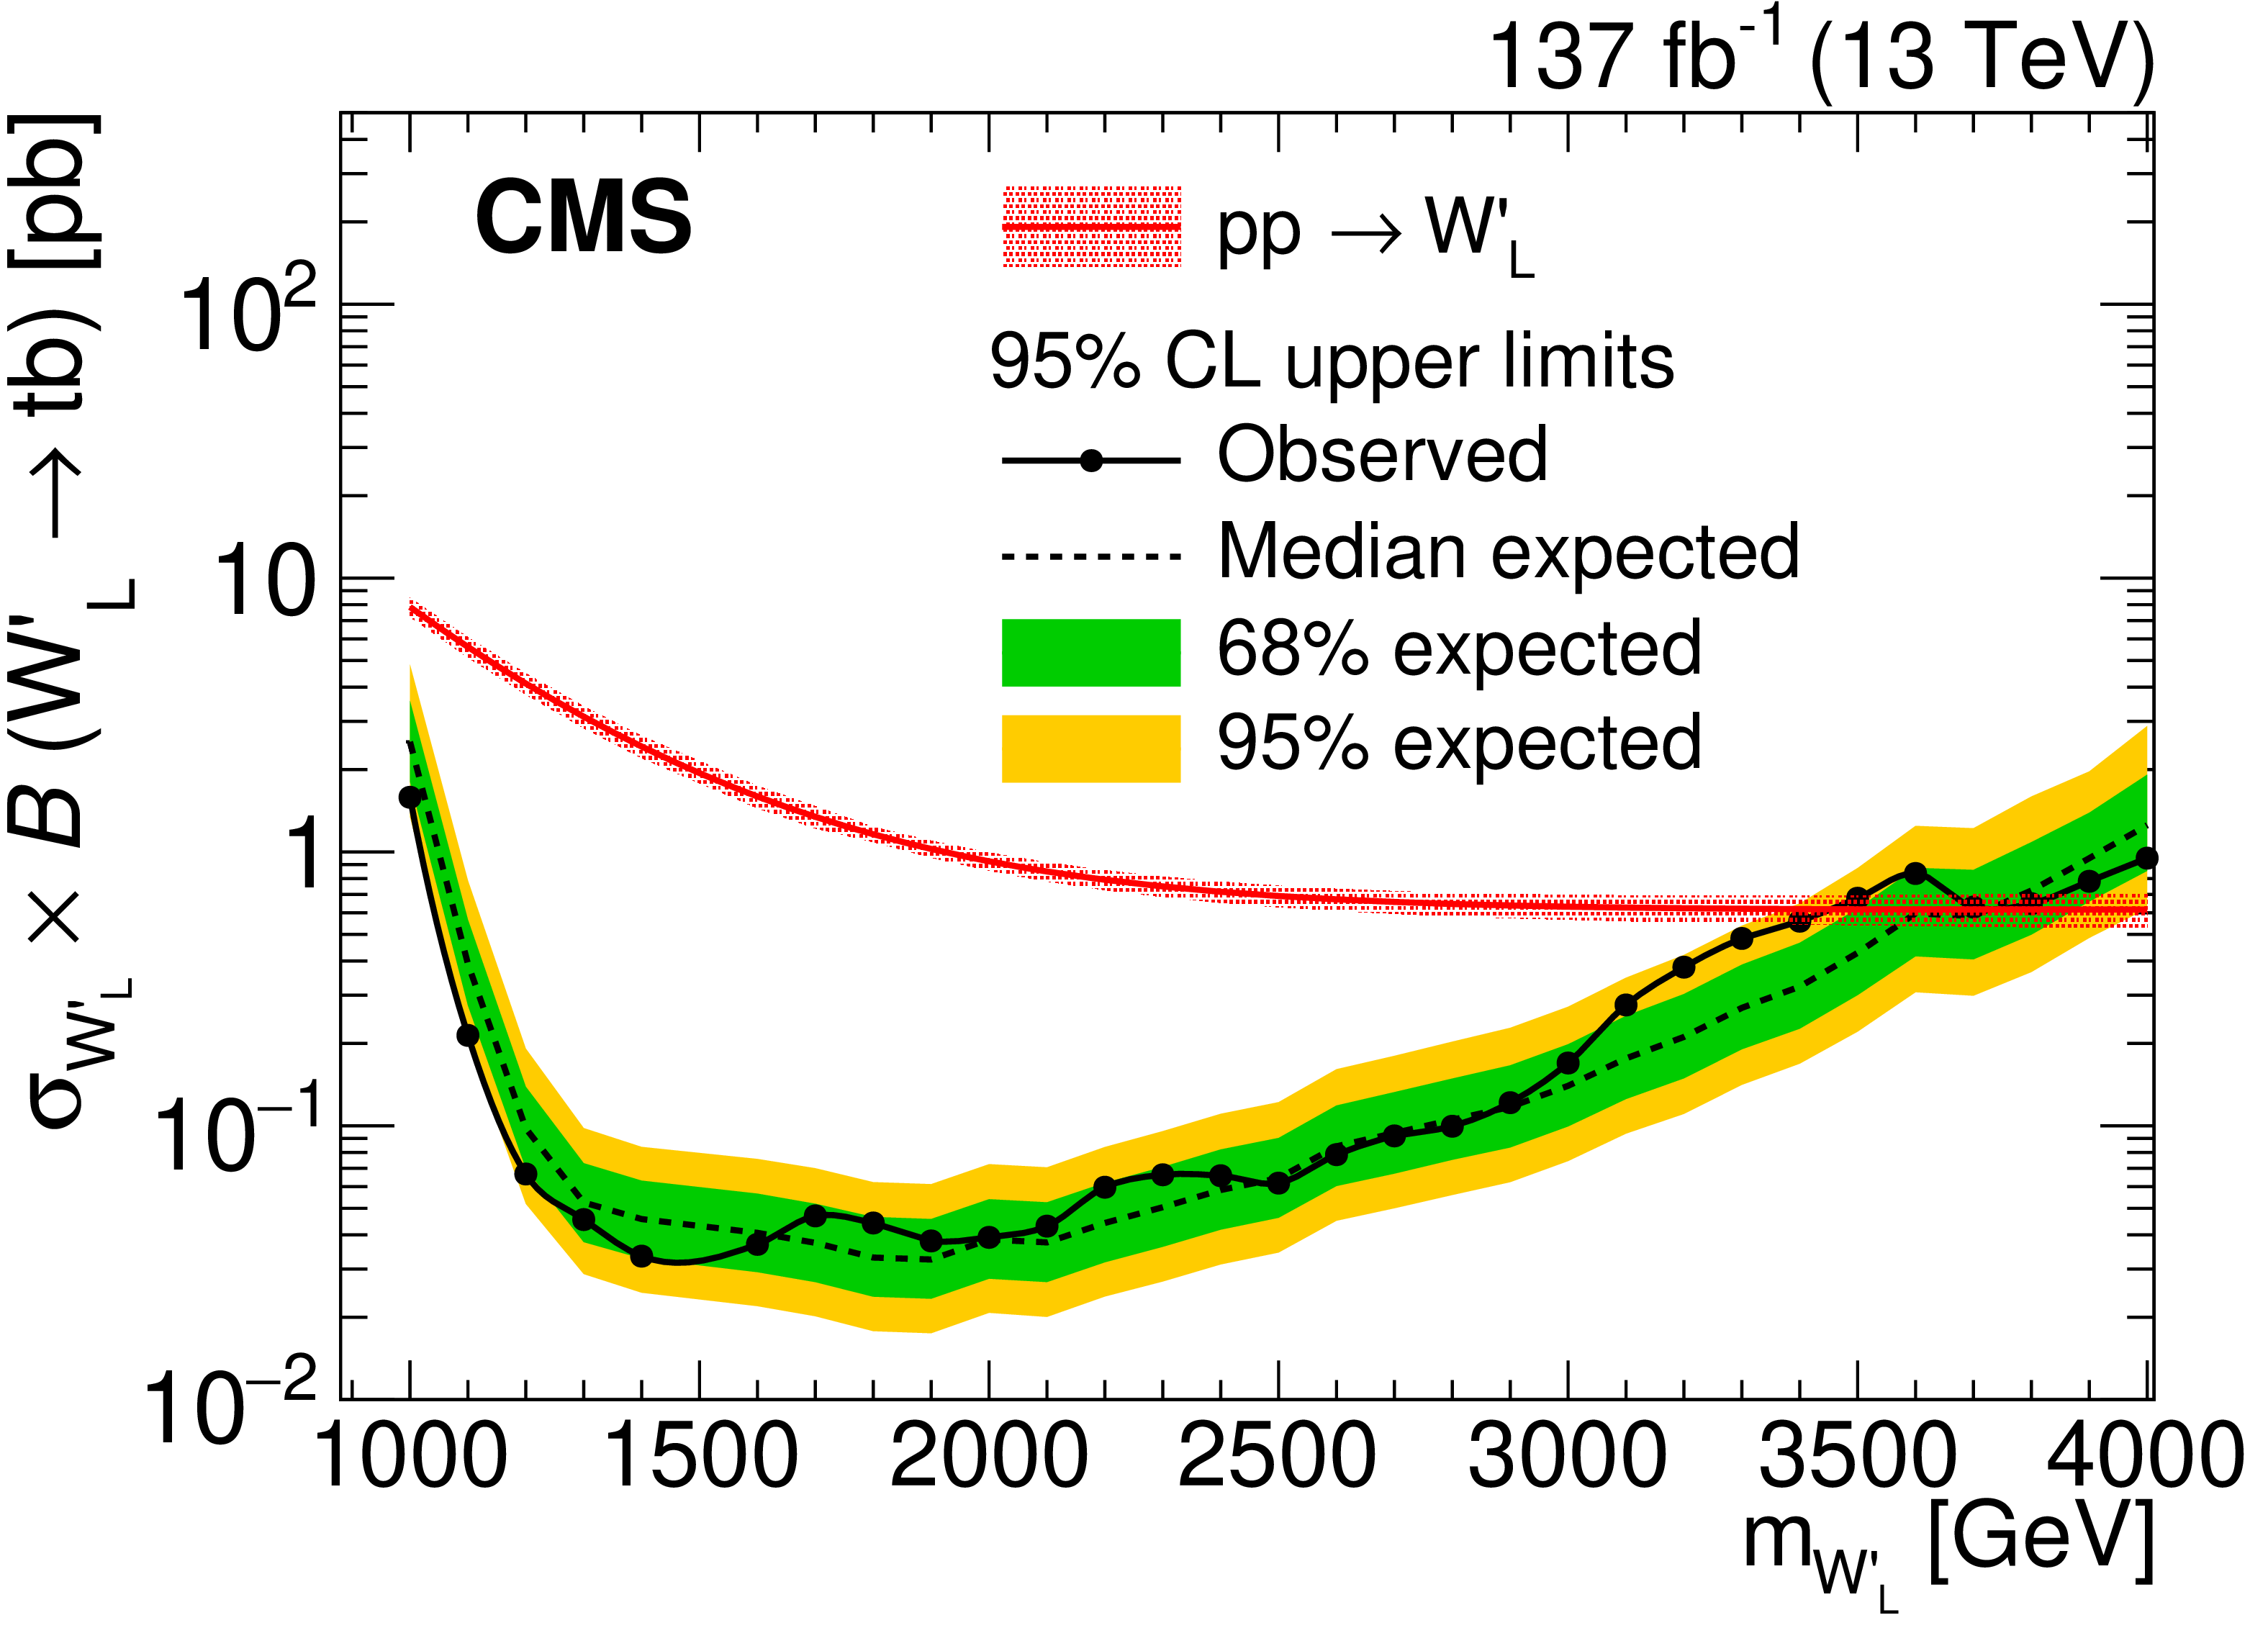
Figure 2:
Upper limits at 95% CL on the production cross section and branching fraction of a W'$_{\mathrm {R}}$ boson (upper row) and a W'$_{\mathrm {L}}$ boson with the SM interference (lower row) decaying to a top and a bottom quark, using combined 2016-2018 data and backgrounds. The observed and median expected limits are shown with the black solid and dashed lines, respectively. The inner green and outer yellow bands represent the 68 and 95% confidence level intervals, respectively, of the expected limit, computed using the background-only hypothesis. The theoretical prediction and its uncertainty due to the choice of QCD scale and PDF set are indicated by the red curve and associated red shaded band, respectively. |
png pdf |
Figure 2-a:
Upper limits at 95% CL on the production cross section and branching fraction of a W'$_{\mathrm {R}}$ boson decaying to a top and a bottom quark, using combined 2016-2018 data and backgrounds. The observed and median expected limits are shown with the black solid and dashed lines, respectively. The inner green and outer yellow bands represent the 68 and 95% confidence level intervals, respectively, of the expected limit, computed using the background-only hypothesis. The theoretical prediction and its uncertainty due to the choice of QCD scale and PDF set are indicated by the red curve and associated red shaded band, respectively. |
png pdf |
Figure 2-b:
Upper limits at 95% CL on the production cross section and branching fraction of a W'$_{\mathrm {L}}$ boson with the SM interference decaying to a top and a bottom quark, using combined 2016-2018 data and backgrounds. The observed and median expected limits are shown with the black solid and dashed lines, respectively. The inner green and outer yellow bands represent the 68 and 95% confidence level intervals, respectively, of the expected limit, computed using the background-only hypothesis. The theoretical prediction and its uncertainty due to the choice of QCD scale and PDF set are indicated by the red curve and associated red shaded band, respectively. |
| Tables | |
png pdf |
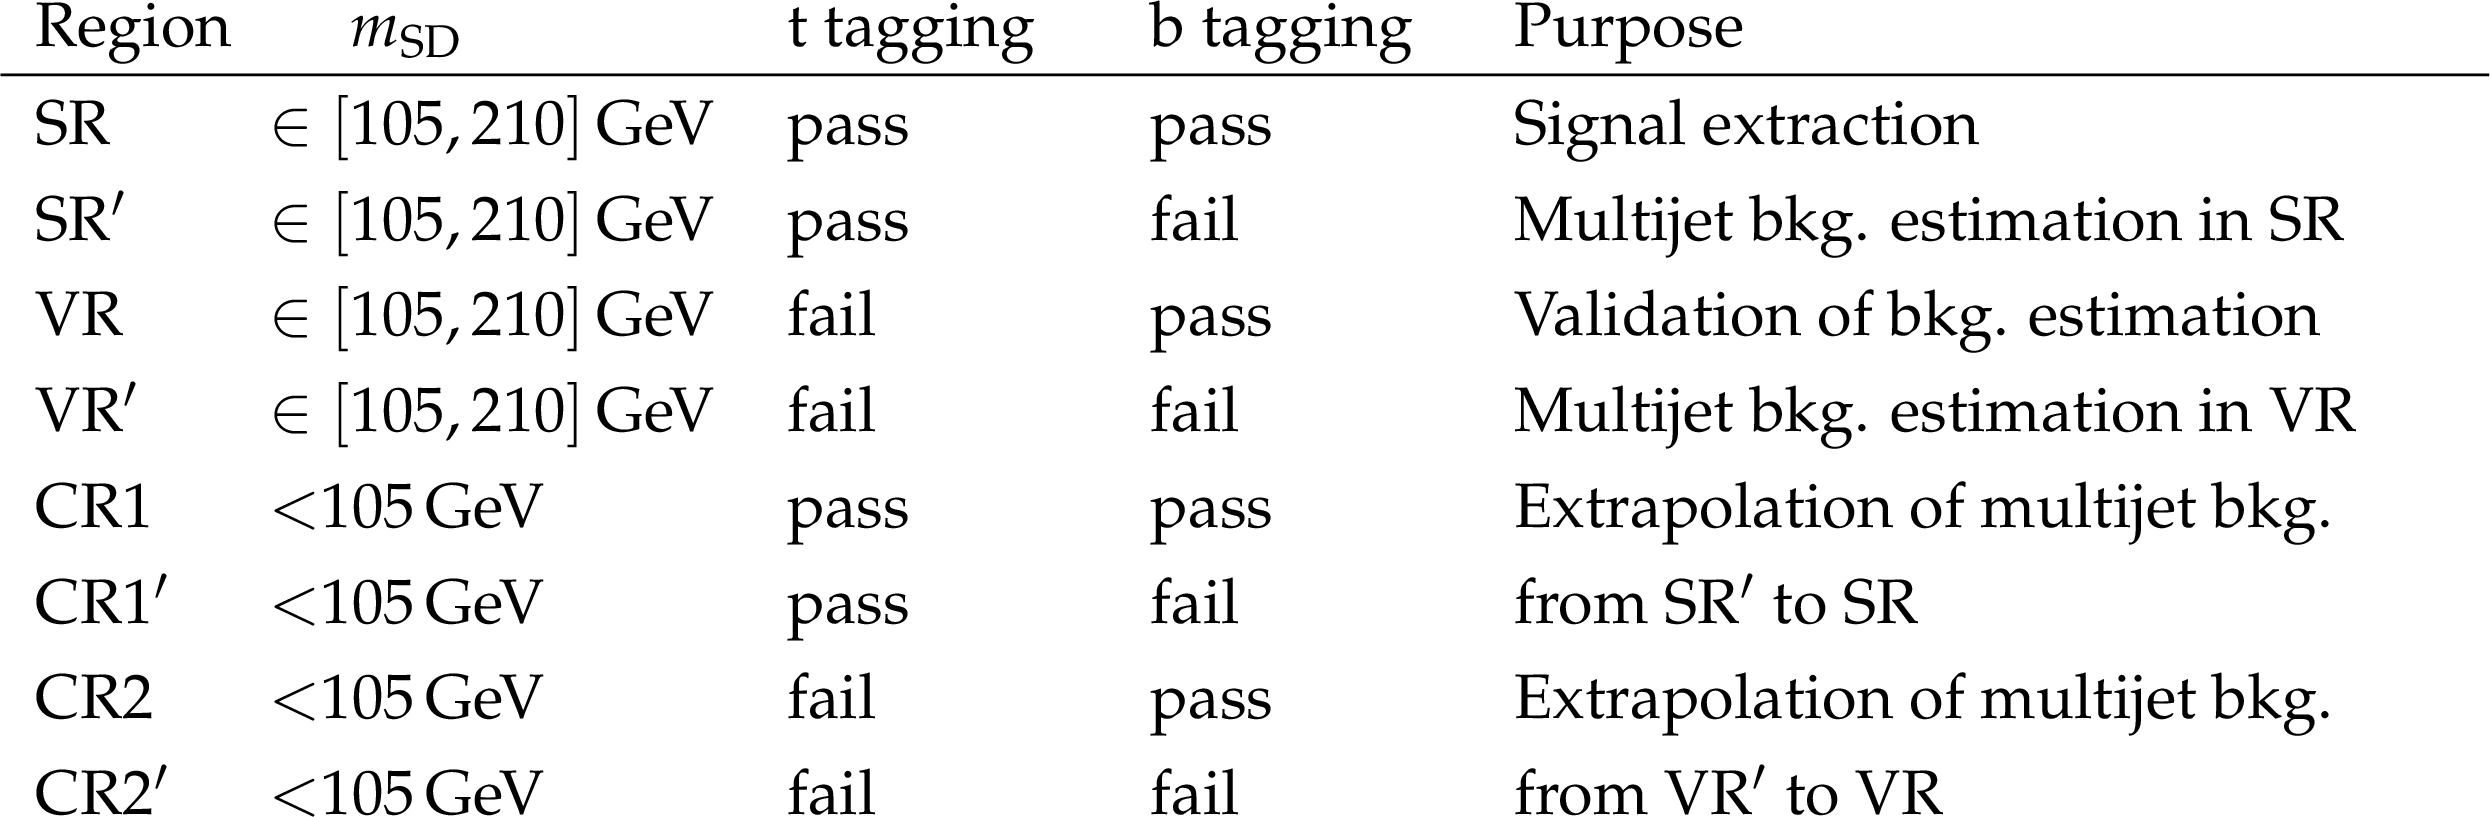
Table 1:
Regions of parameter space used in the analysis. The ${m_{\mathrm {SD}}}$ and t tagging refer to the soft drop mass and the {DeepAK8} t-tagger score requirements of the top quark candidate AK8 jet. The b tagging refers to the DeepJet b-tagger score requirement of the bottom quark candidate AK4 jet. |
| Summary |
| A search has been performed for heavy W' bosons decaying to a top and a bottom quark in the hadronic final state using data corresponding to an integrated luminosity of 137 fb$^{-1}$ collected by the CMS experiment during the data taking period from 2016 to 2018. The analysis utilizes top quark tagging and bottom quark tagging algorithms based on deep neural networks. No excess above the estimated standard model background is observed. Upper limits on the production cross section times branching fraction of a W' boson decaying to a top and a bottom quark are obtained at 95% confidence level for W' boson masses in the range 1-4 TeV. Left- and right-handed W' bosons with masses below 3.4 TeV are excluded at 95% confidence level. The limits provided on W' bosons decaying to a top and a bottom quark in the all-hadronic decay mode are the most stringent to date. |
| Additional Figures | |
png pdf |
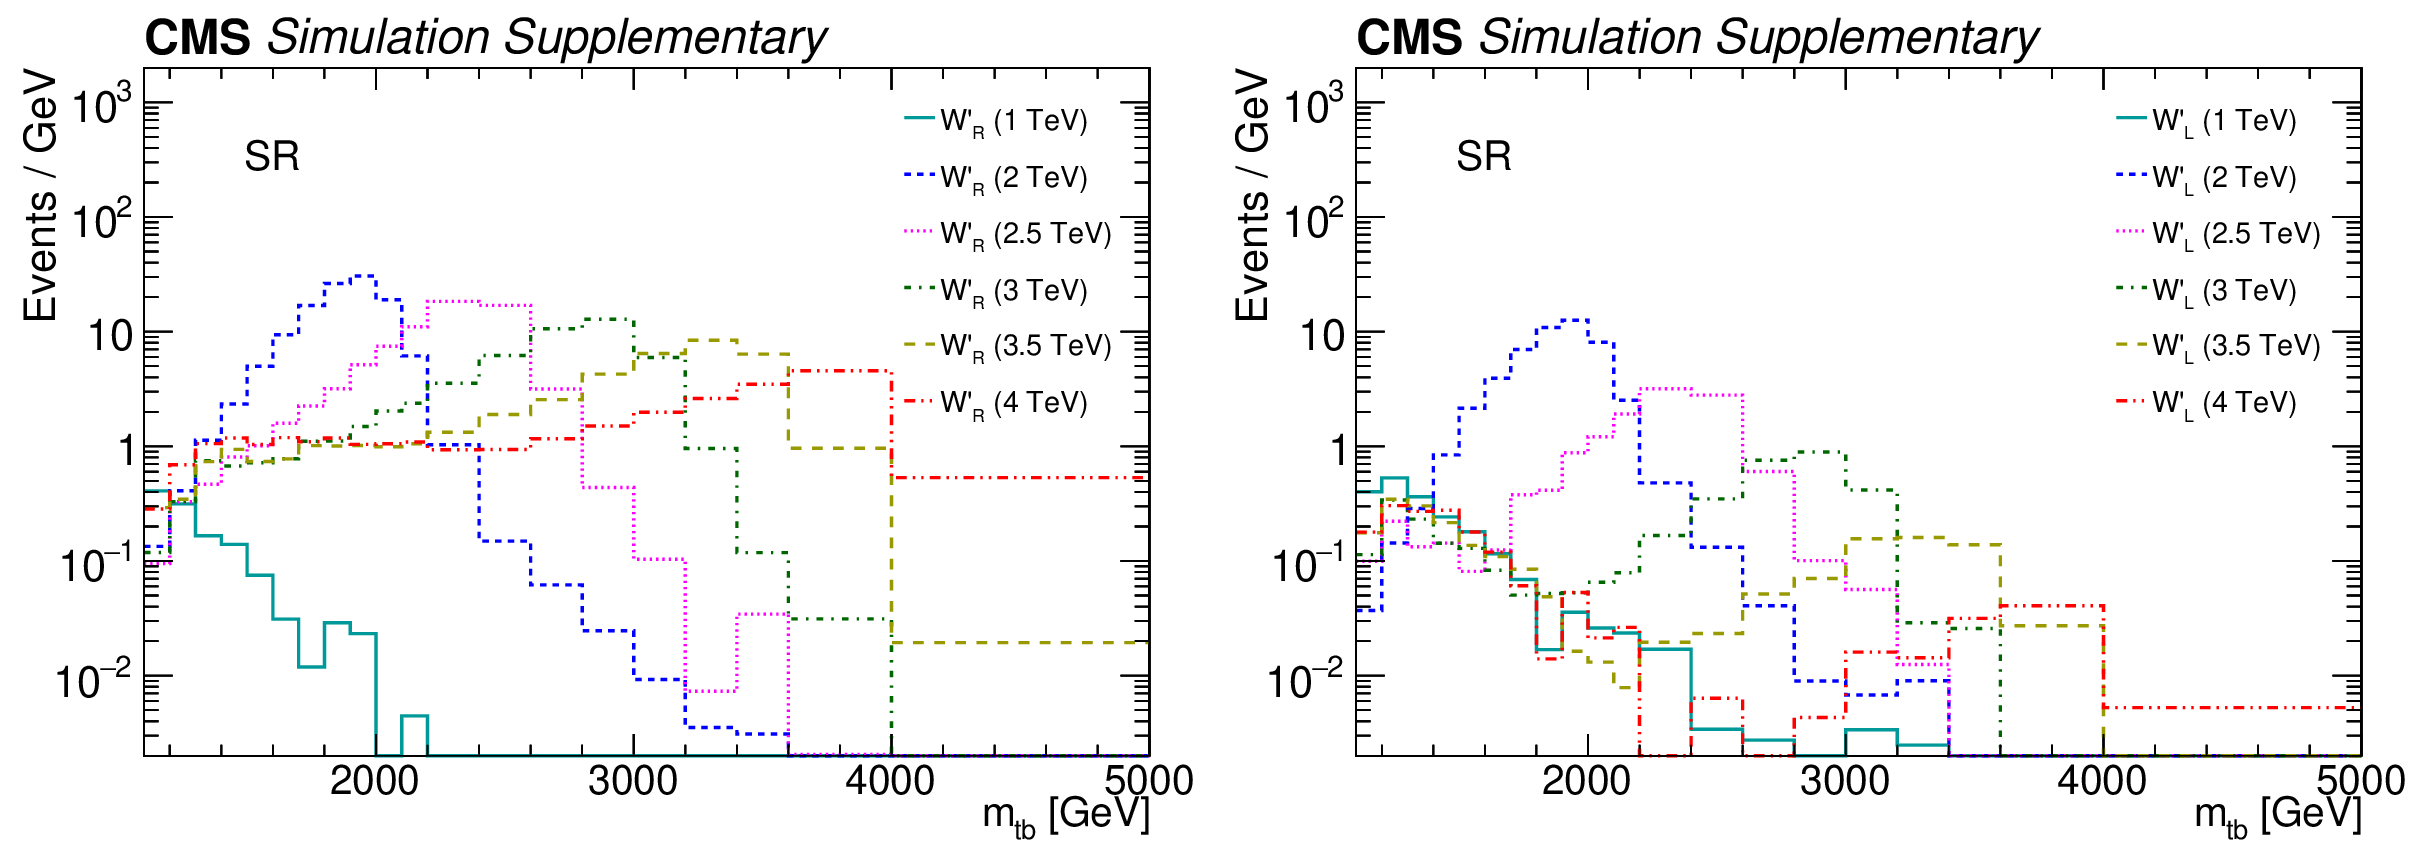
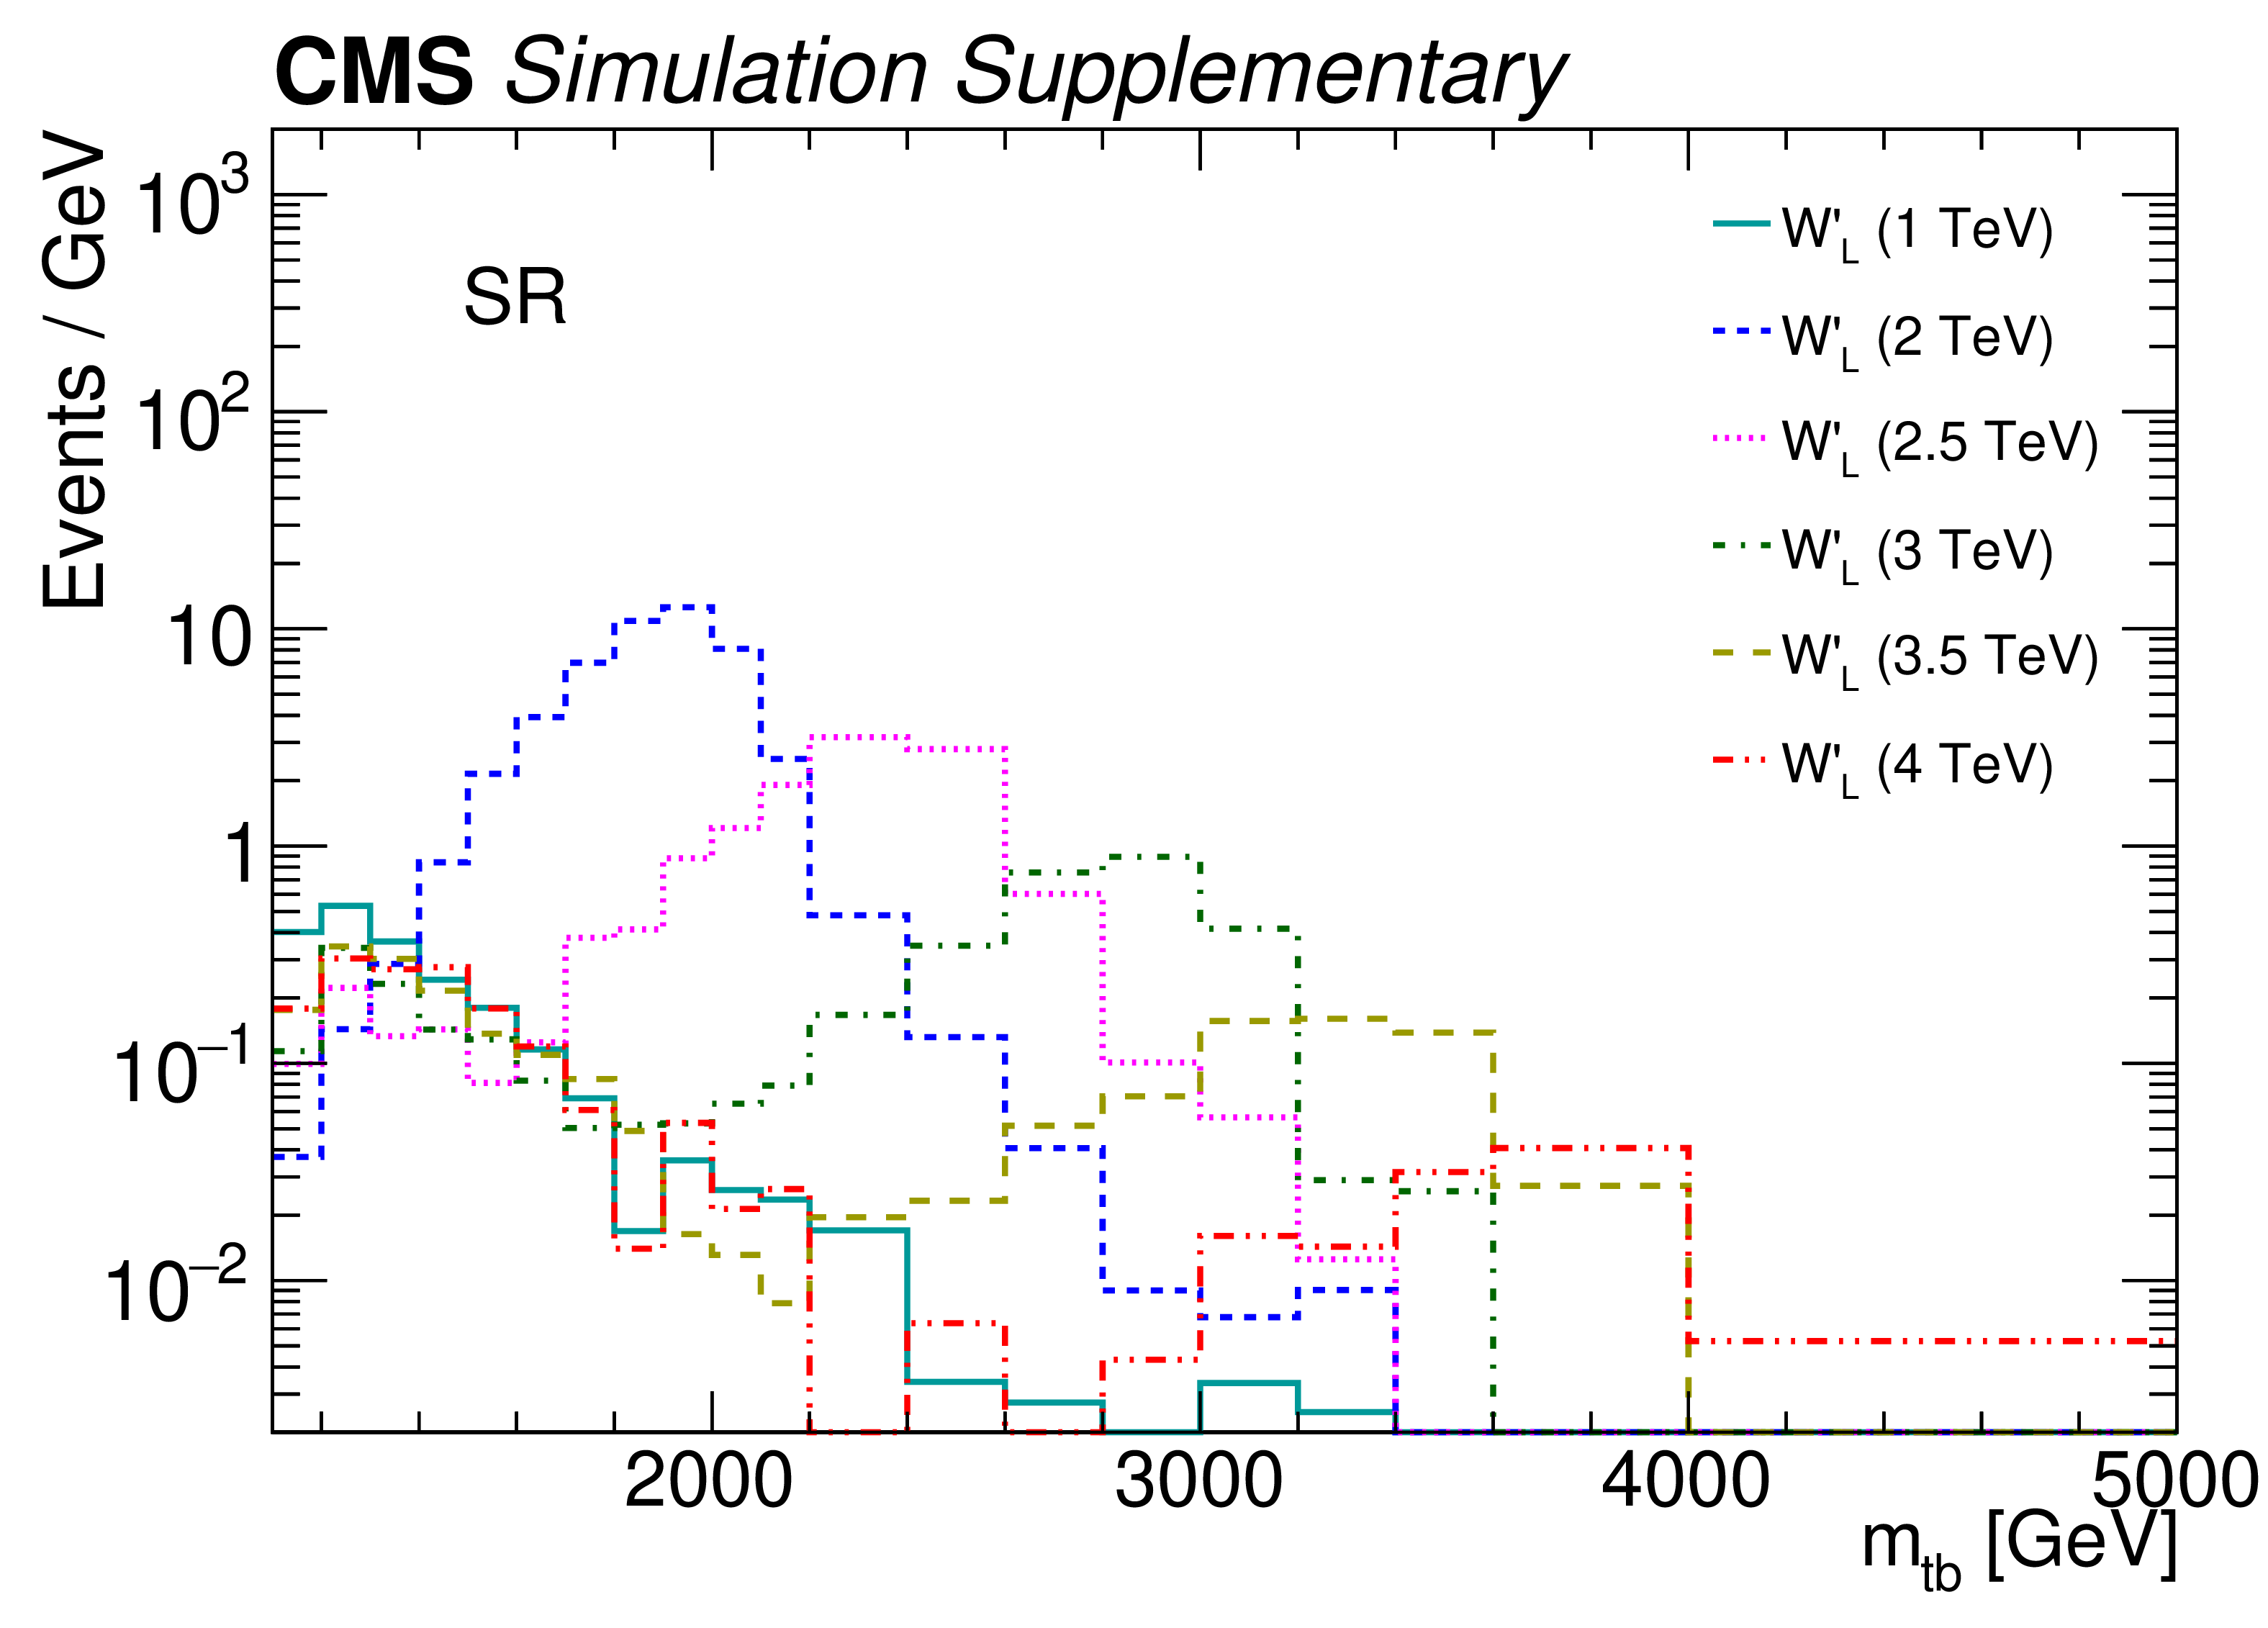
Additional Figure 1:
The reconstructed ${m_{{\mathrm {t}} {\mathrm {b}}}}$ distributions for (left) right-handed and (right) left-handed W' bosons of mass 1, 2, 2.5, 3, 3.5, and 4 TeV normalized to an integrated luminosity of 137 fb$^{-1}$ using a product of cross section and branching fraction of 1 pb. The yield in each bin is divided by the corresponding bin width. |
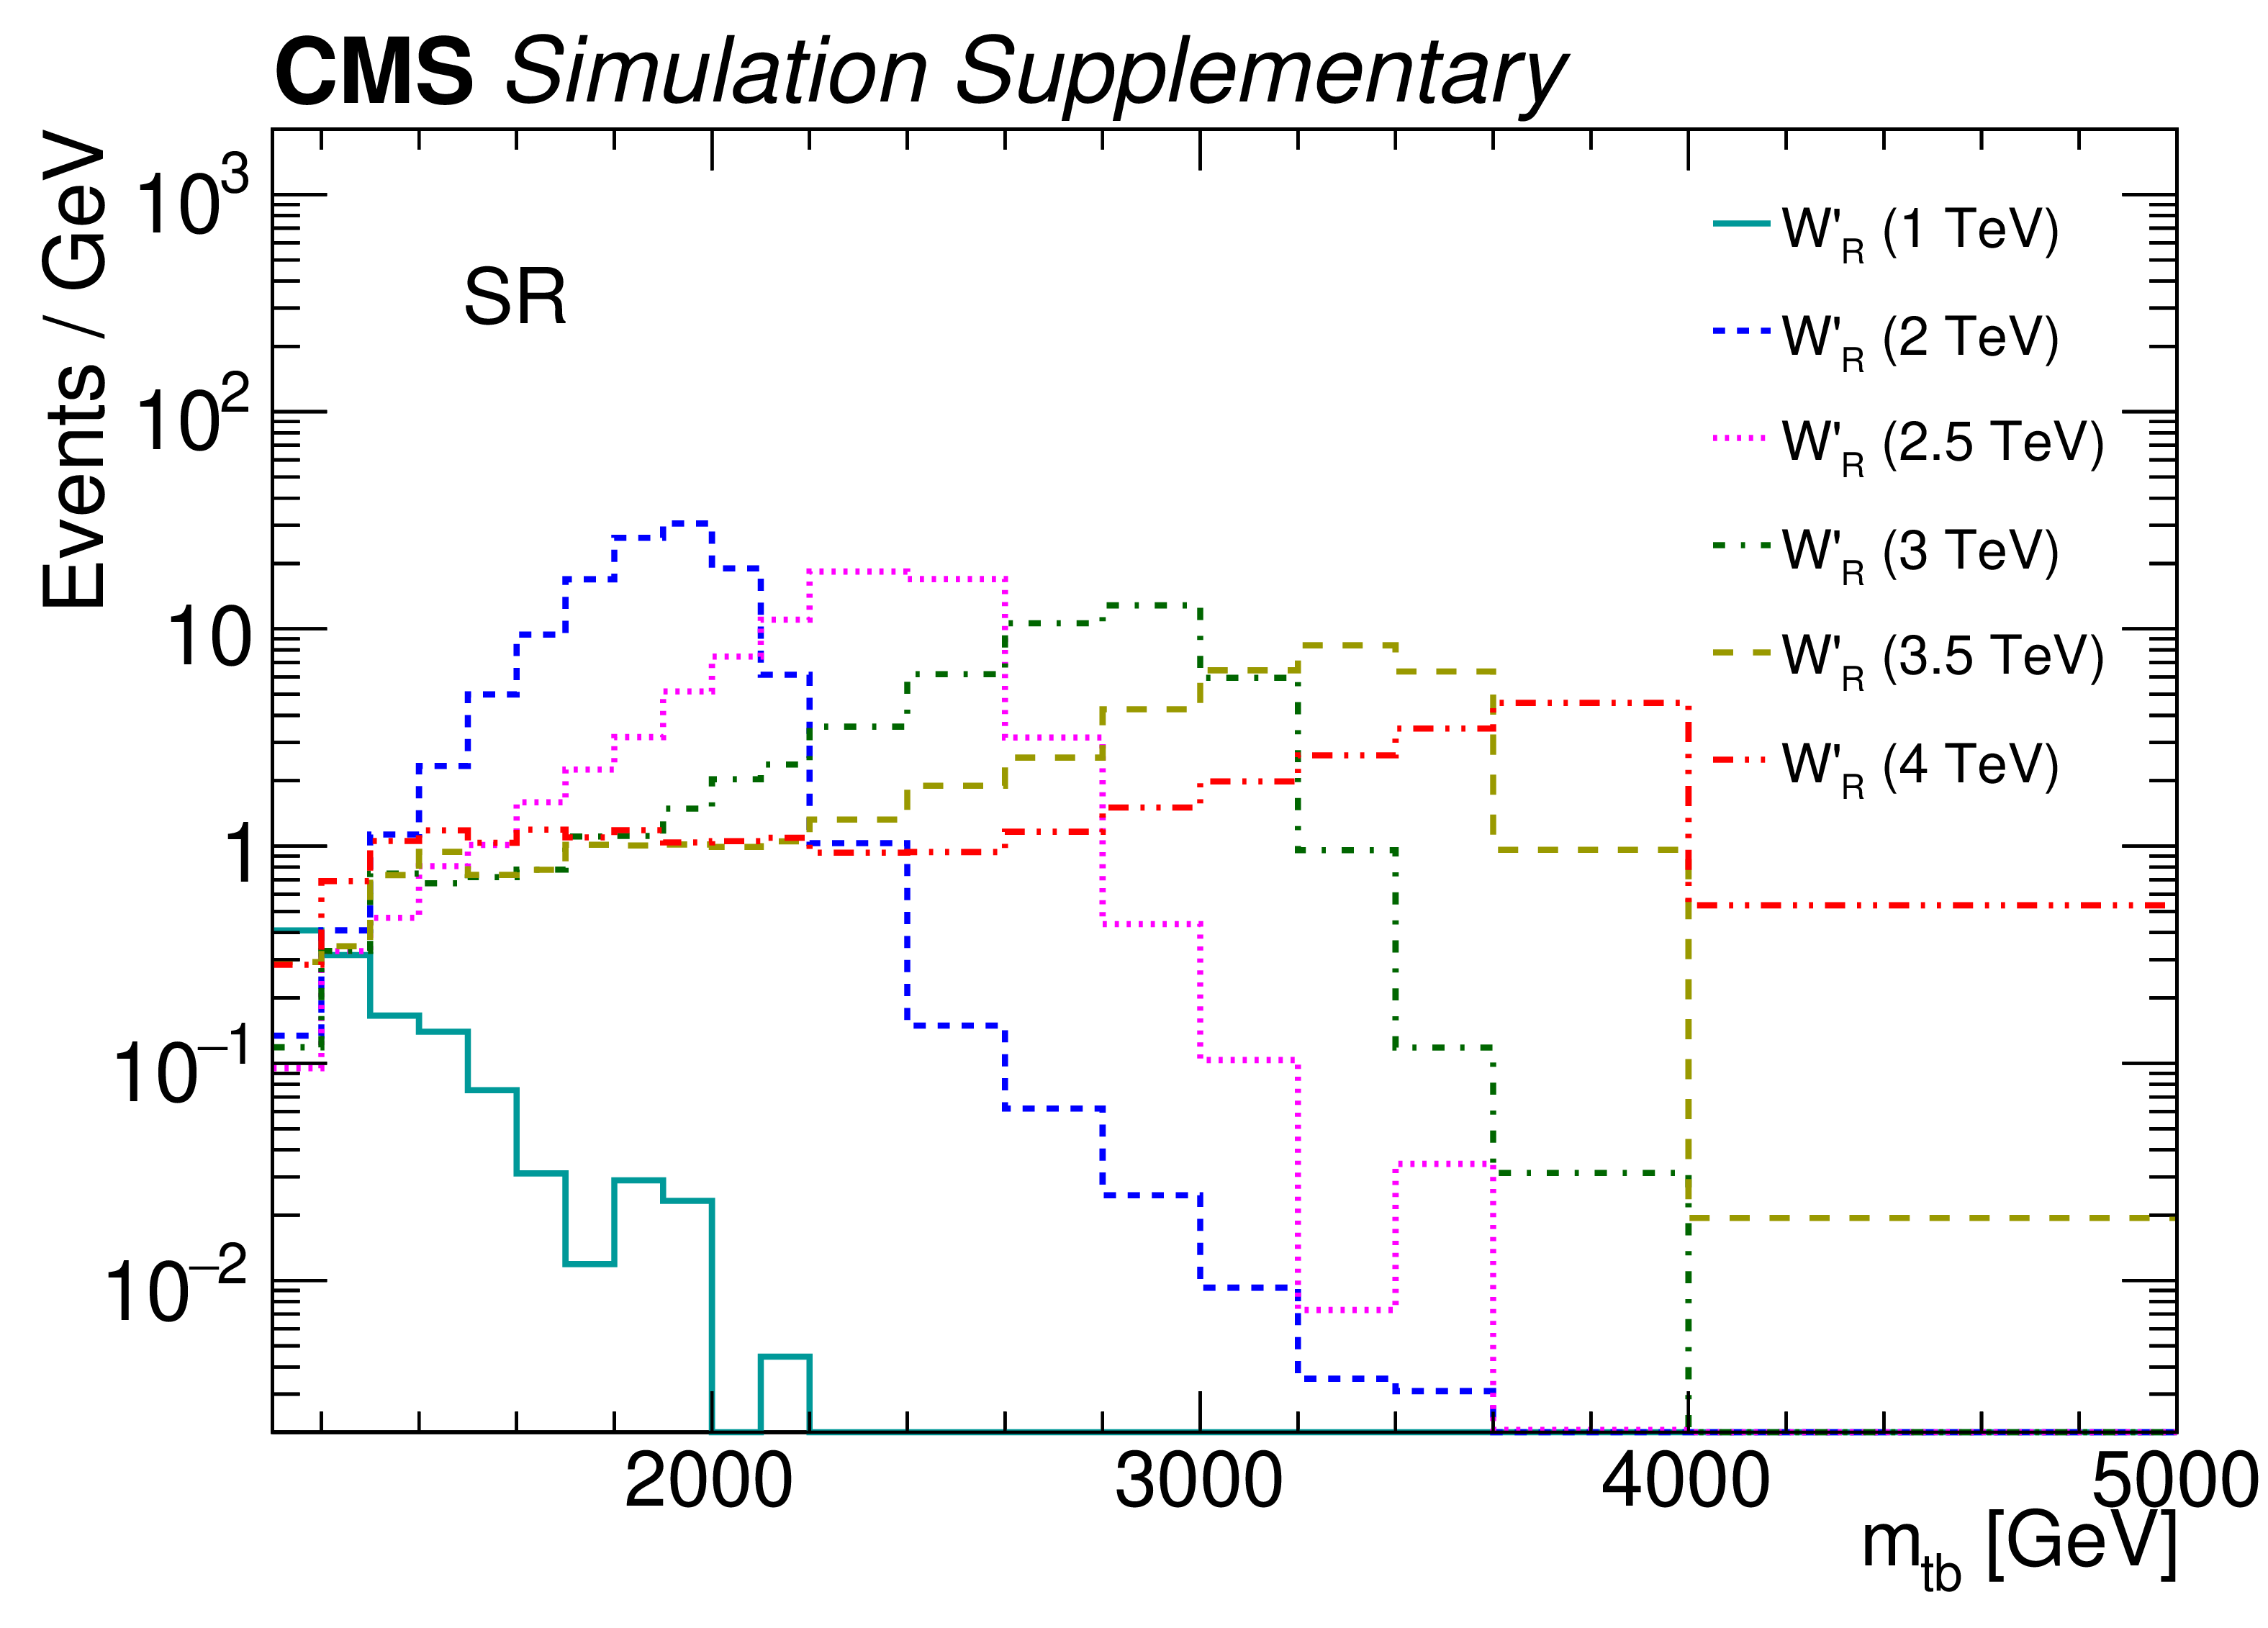
png pdf |
Additional Figure 1-a:
The reconstructed ${m_{{\mathrm {t}} {\mathrm {b}}}}$ distributions for right-handed W' bosons of mass 1, 2, 2.5, 3, 3.5, and 4 TeV normalized to an integrated luminosity of 137 fb$^{-1}$ using a product of cross section and branching fraction of 1 pb. The yield in each bin is divided by the corresponding bin width. |
png pdf |
Additional Figure 1-b:
The reconstructed ${m_{{\mathrm {t}} {\mathrm {b}}}}$ distributions for left-handed W' bosons of mass 1, 2, 2.5, 3, 3.5, and 4 TeV normalized to an integrated luminosity of 137 fb$^{-1}$ using a product of cross section and branching fraction of 1 pb. The yield in each bin is divided by the corresponding bin width. |
png pdf |
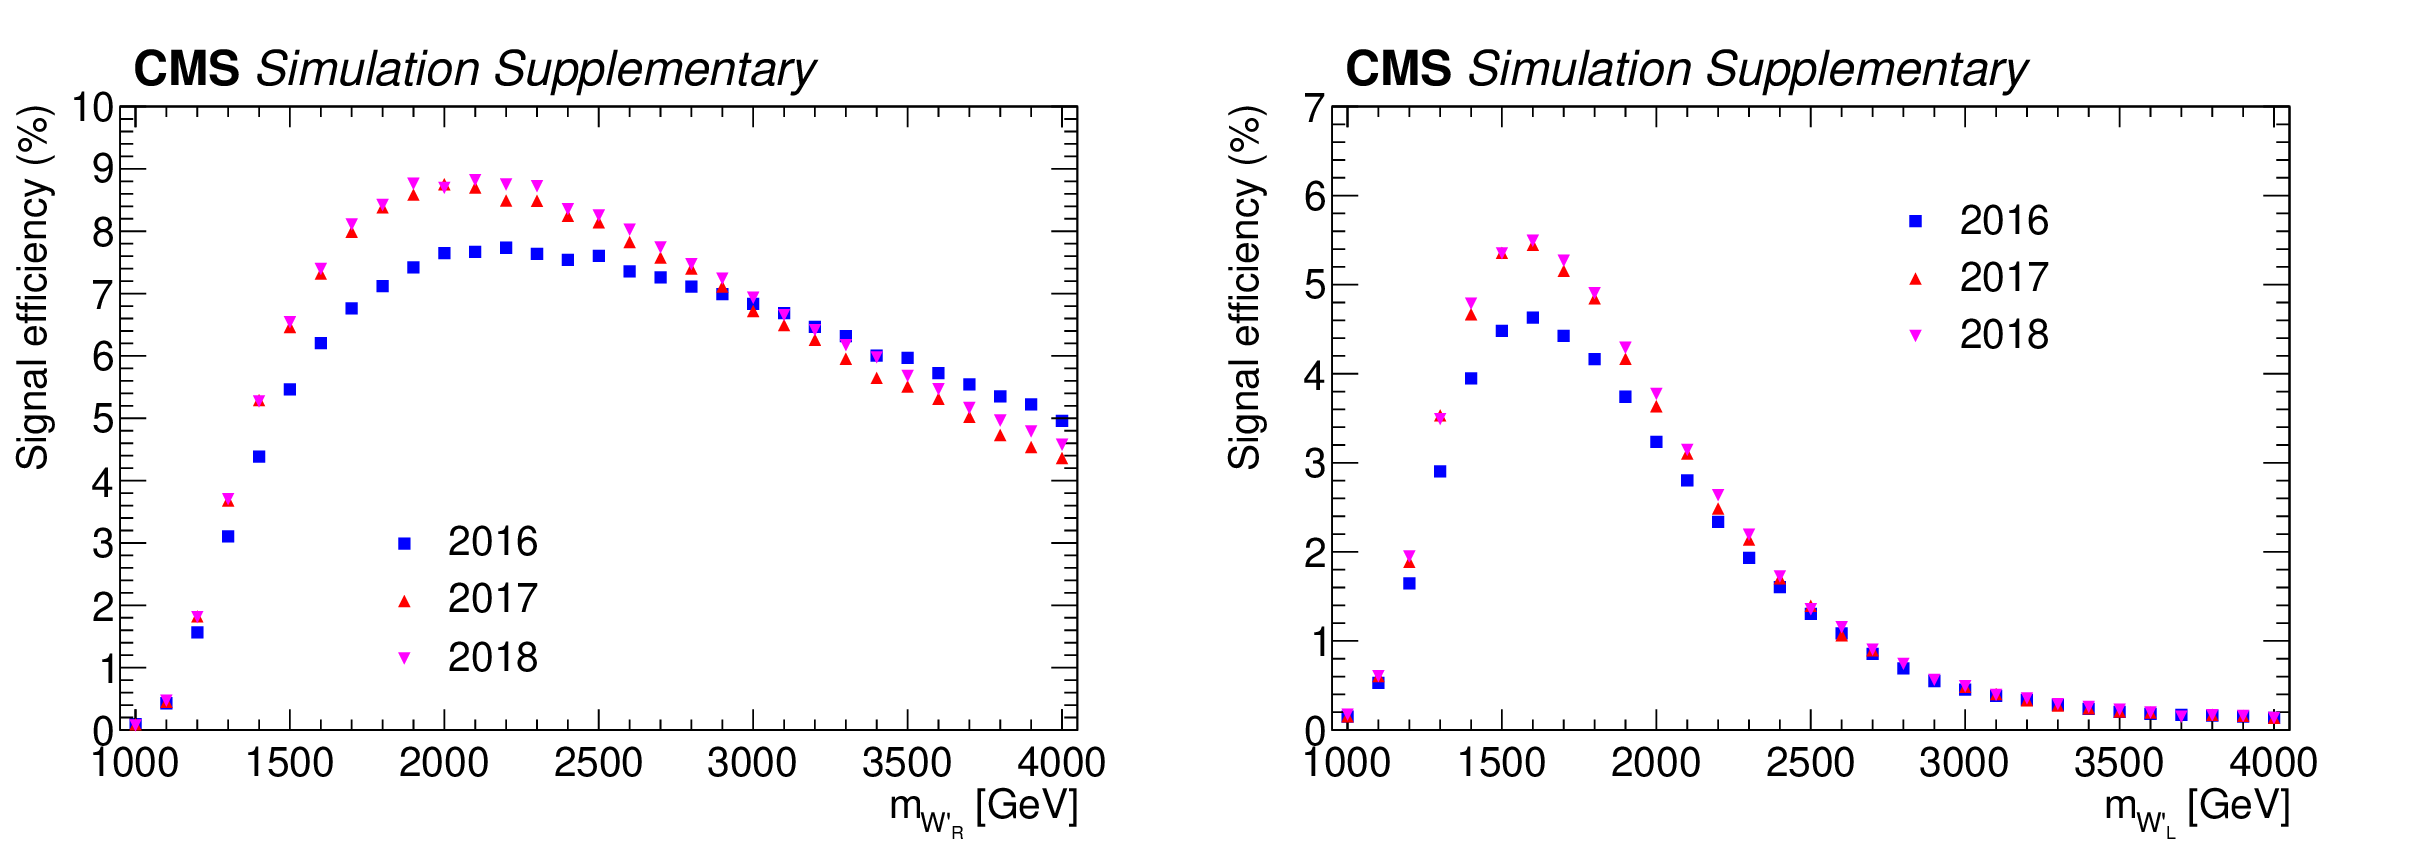
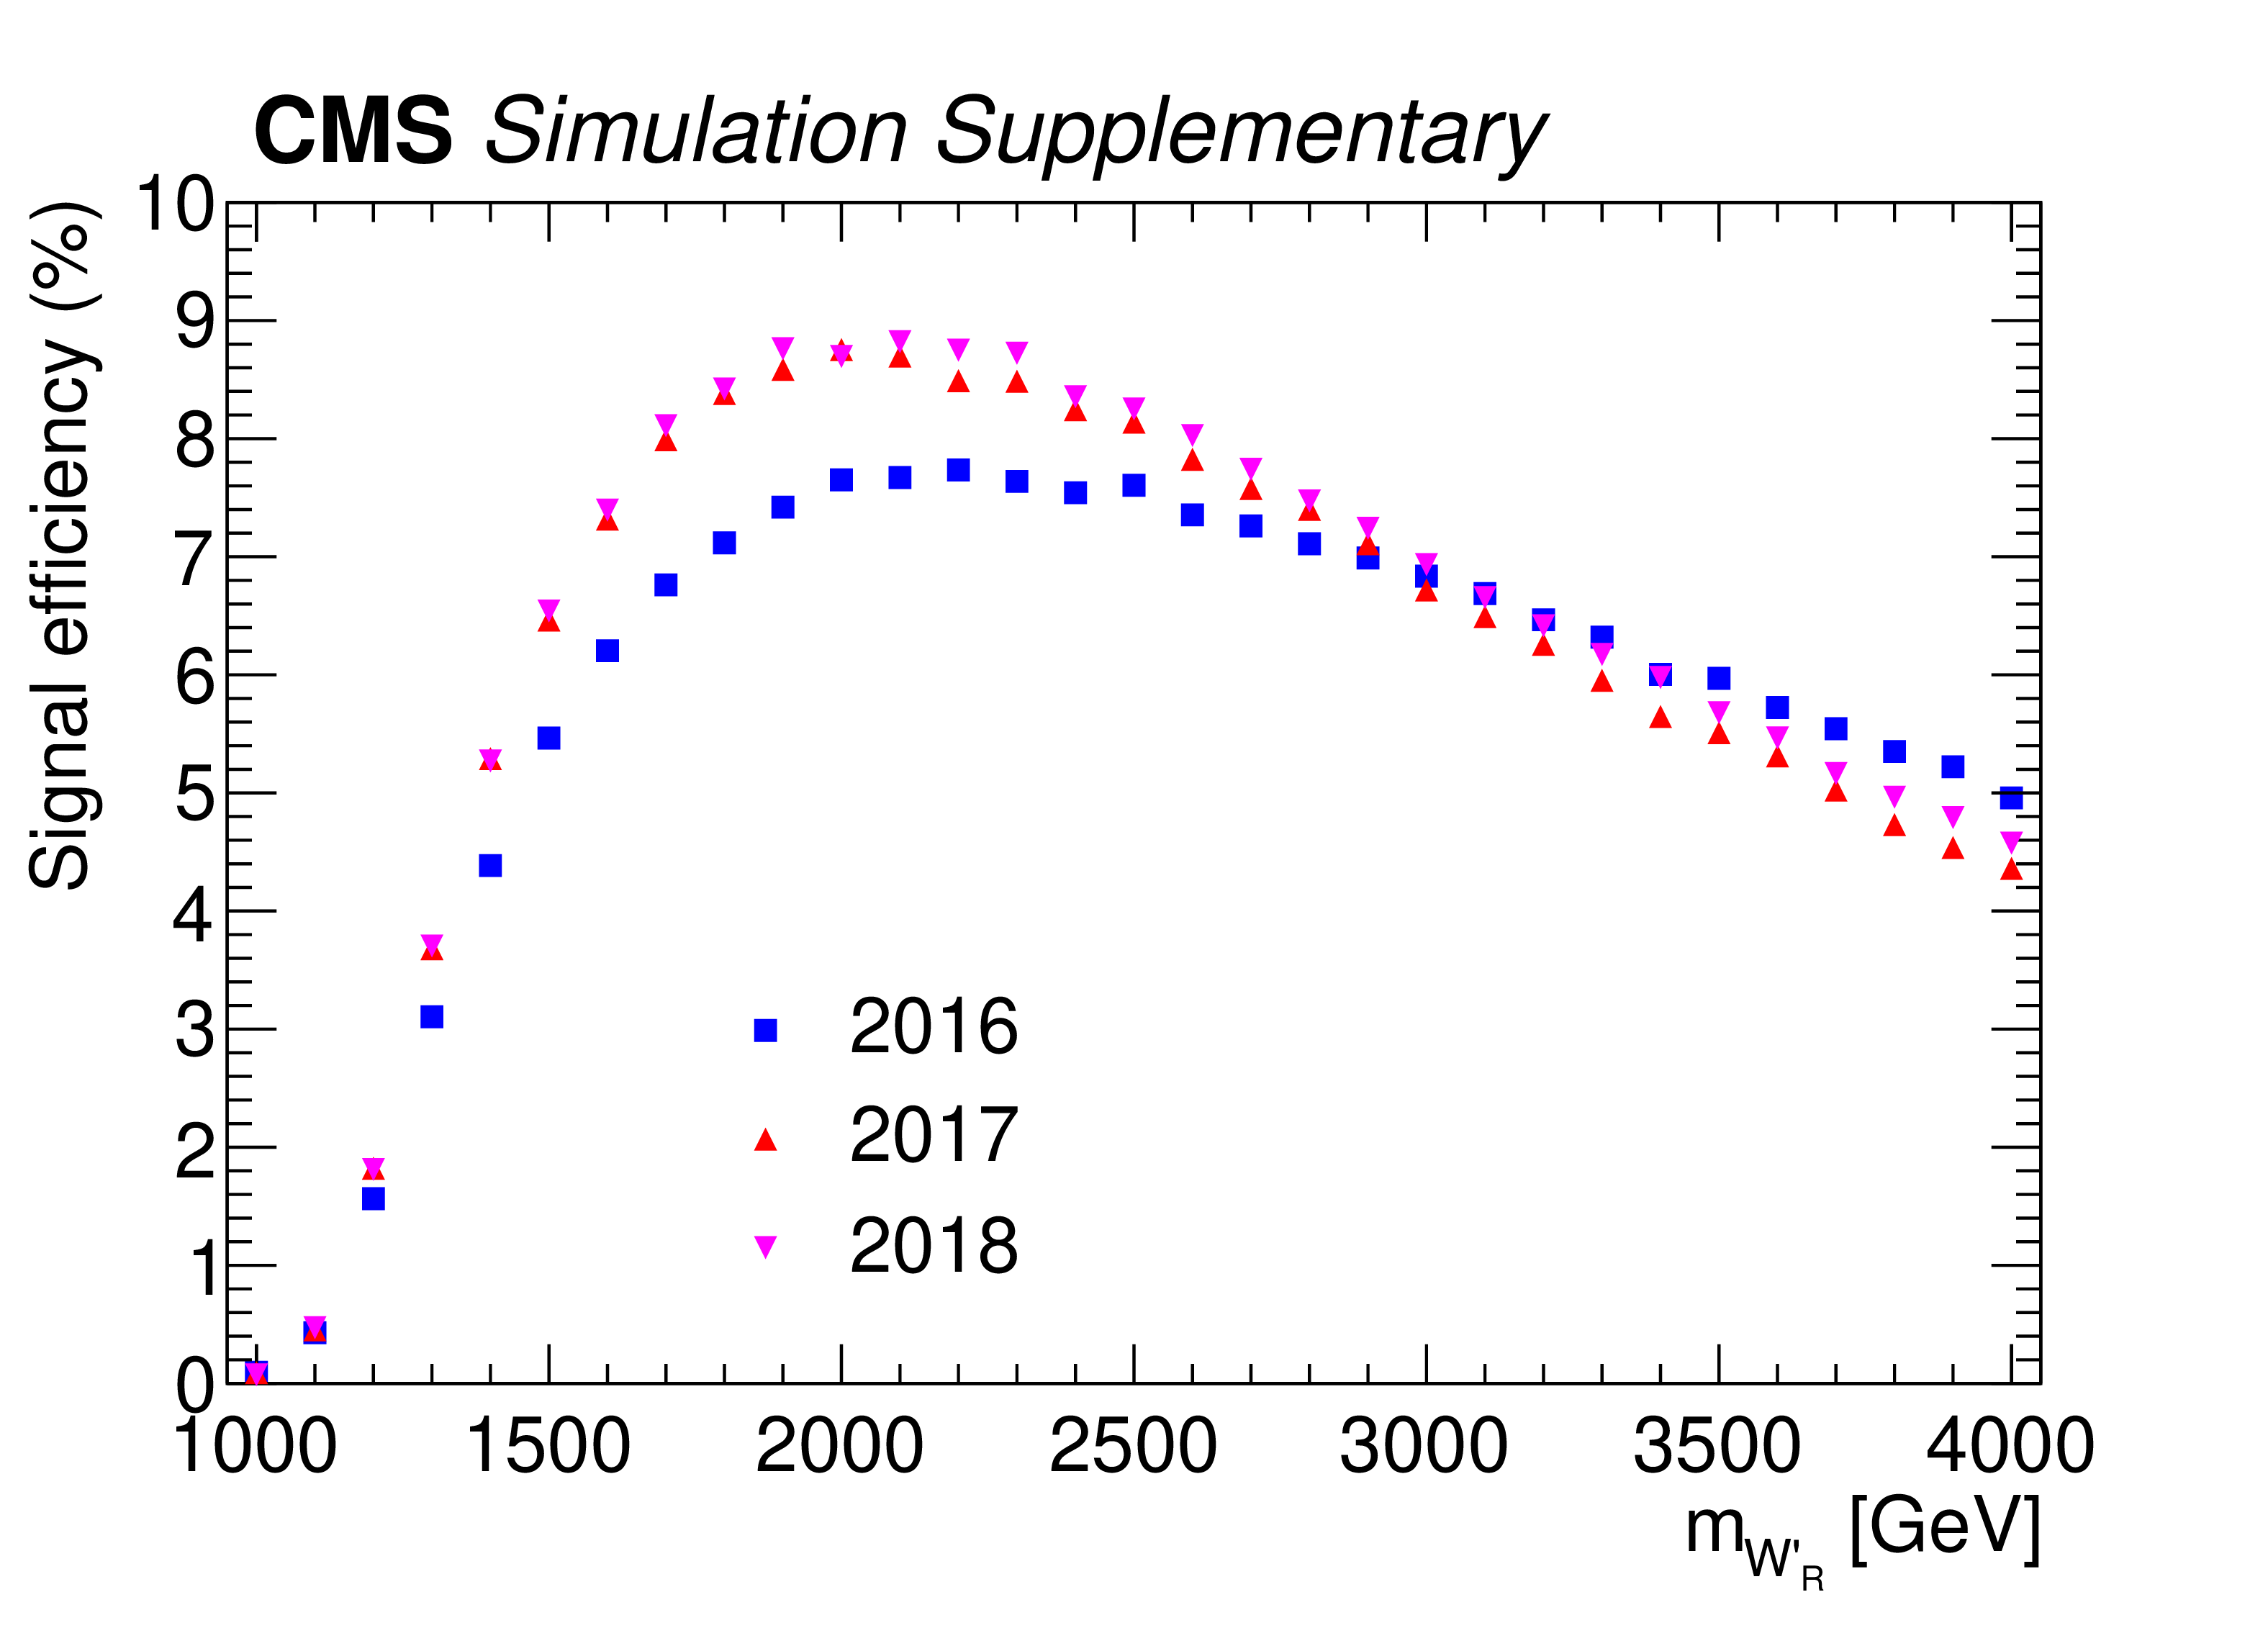
Additional Figure 2:
The signal selection efficiency for (left) right-handed and (right) left-handed W' bosons of masses in the range 1-4 TeV. The large difference between the signal selection efficiency for left-handed and right-handed W' bosons, especially for high resonance masses, is due to the interference with single top quark production in the case of left-handed W' bosons. |
png pdf |
Additional Figure 2-a:
The signal selection efficiency for right-handed W' bosons of masses in the range 1-4 TeV. |

png pdf |
Additional Figure 2-b:
The signal selection efficiency for left-handed W' bosons of masses in the range 1-4 TeV. |
png pdf |
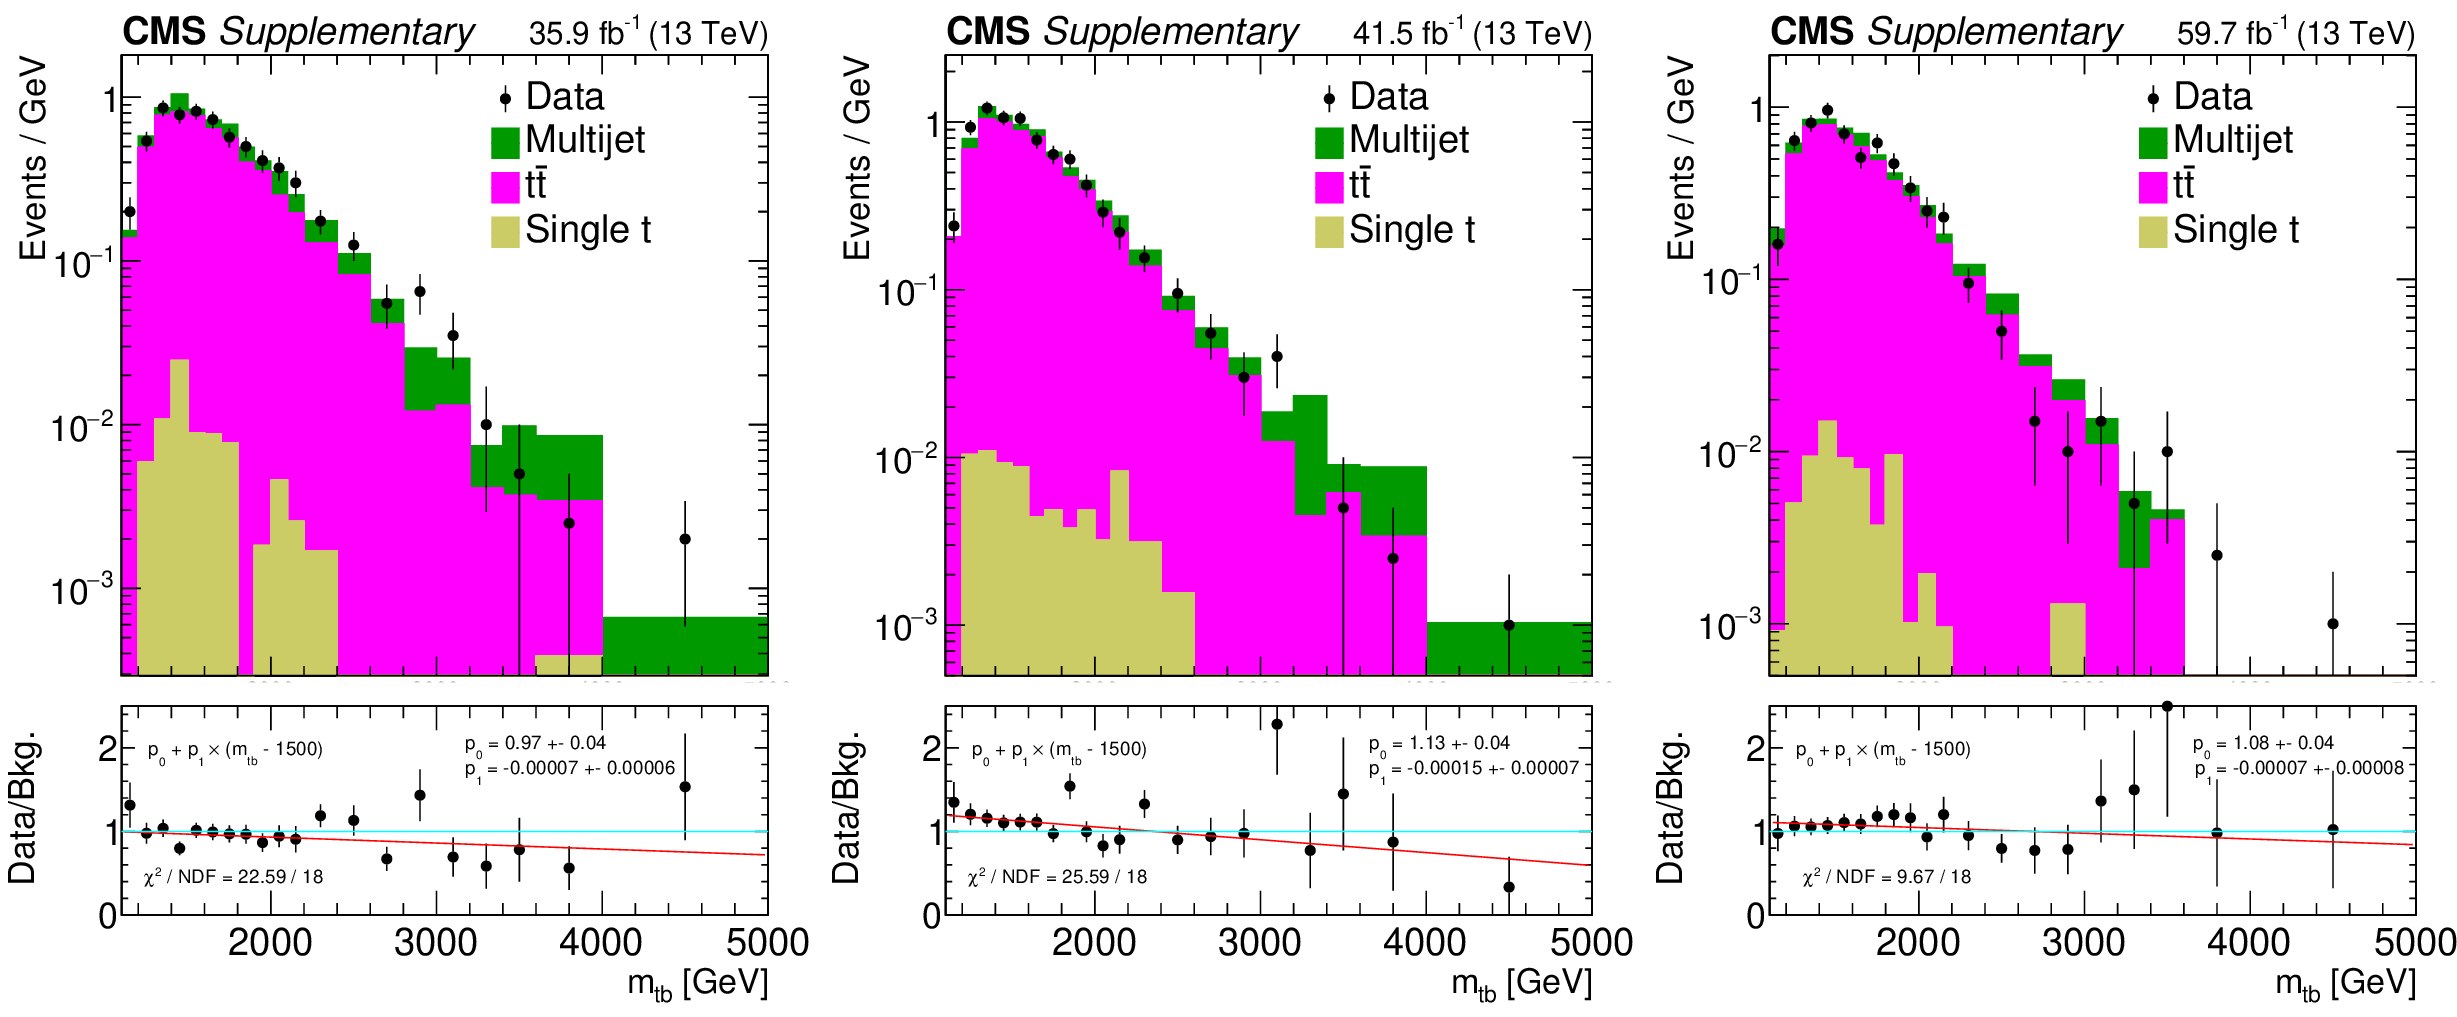
Additional Figure 3:
The reconstructed ${m_{{\mathrm {t}} {\mathrm {b}}}}$ distributions in data (black points with error bars), and backgrounds in the ${{\mathrm {t}} {\overline {\mathrm {t}}}}$-enriched control region for the data-taking periods of (left) 2016, (middle) 2017, and (right) 2018. The yield in each bin is divided by the corresponding bin width. The lower panel in each plot shows the ratio of data to the background prediction. The ratio is fitted with a first-order polynomial. The values of the fitted parameters and the quality of the fit are shown in the lower panel. |

png pdf |
Additional Figure 3-a:
The reconstructed ${m_{{\mathrm {t}} {\mathrm {b}}}}$ distributions in data (black points with error bars), and backgrounds in the ${{\mathrm {t}} {\overline {\mathrm {t}}}}$-enriched control region for the data-taking period of 2016. The yield in each bin is divided by the corresponding bin width. The lower panel shows the ratio of data to the background prediction. The ratio is fitted with a first-order polynomial. The values of the fitted parameters and the quality of the fit are shown in the lower panel. |

png pdf |
Additional Figure 3-b:
The reconstructed ${m_{{\mathrm {t}} {\mathrm {b}}}}$ distributions in data (black points with error bars), and backgrounds in the ${{\mathrm {t}} {\overline {\mathrm {t}}}}$-enriched control region for the data-taking period of 2017. The yield in each bin is divided by the corresponding bin width. The lower panel shows the ratio of data to the background prediction. The ratio is fitted with a first-order polynomial. The values of the fitted parameters and the quality of the fit are shown in the lower panel. |

png pdf |
Additional Figure 3-c:
The reconstructed ${m_{{\mathrm {t}} {\mathrm {b}}}}$ distributions in data (black points with error bars), and backgrounds in the ${{\mathrm {t}} {\overline {\mathrm {t}}}}$-enriched control region for the data-taking period of 2018. The yield in each bin is divided by the corresponding bin width. The lower panel shows the ratio of data to the background prediction. The ratio is fitted with a first-order polynomial. The values of the fitted parameters and the quality of the fit are shown in the lower panel. |
png pdf |
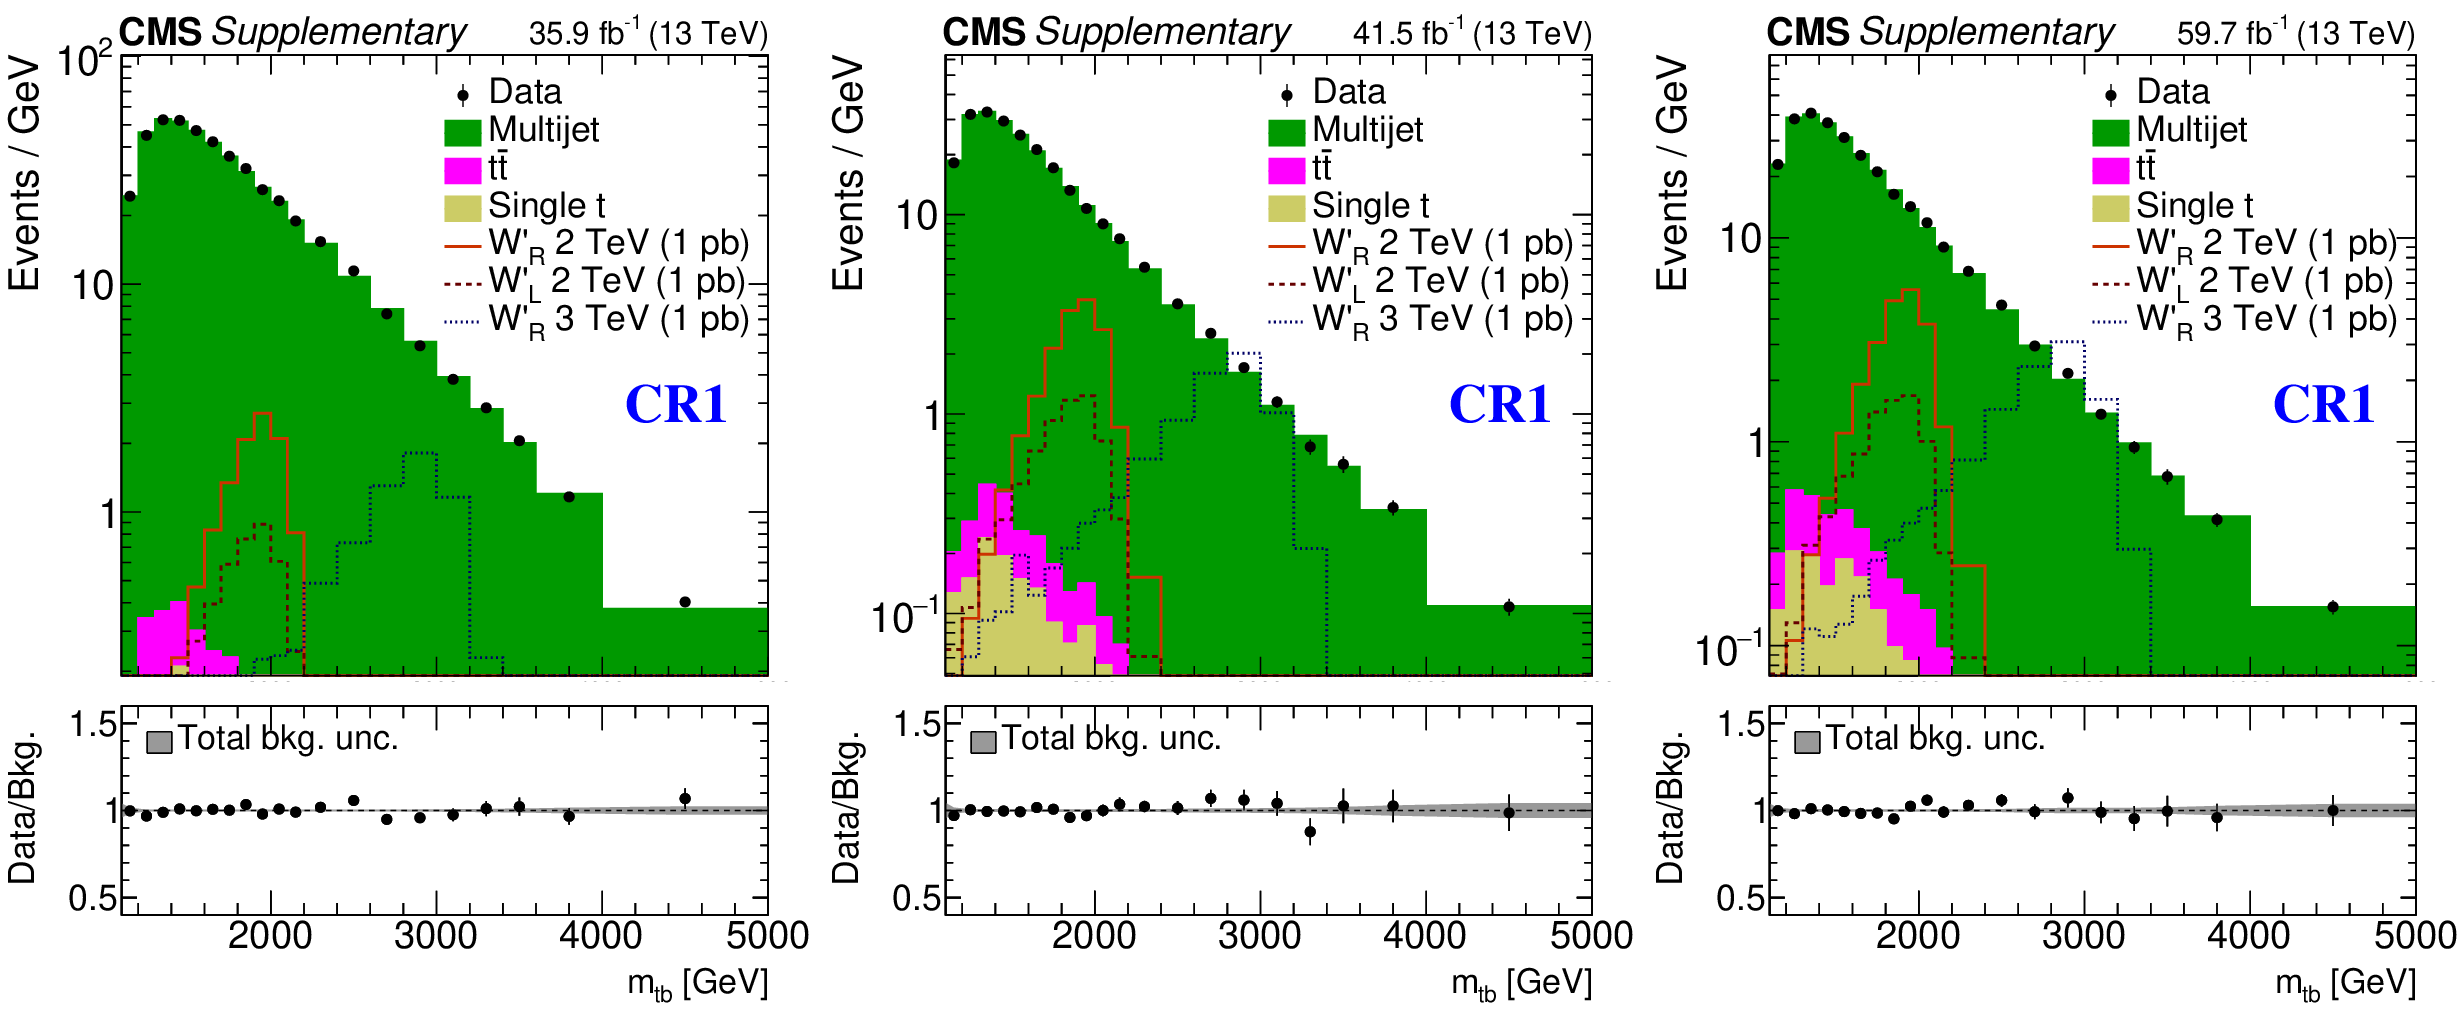
Additional Figure 4:
The reconstructed ${m_{{\mathrm {t}} {\mathrm {b}}}}$ distributions in data (black points with error bars), and backgrounds in the CR1 for the data-taking periods of (left) 2016, (middle) 2017, and (right) 2018. The yield in each bin is divided by the corresponding bin width. Distributions expected from right-handed W' bosons of mass 2 and 3 TeV and a left-handed W' boson of mass 2 TeV are shown normalized to the integrated luminosity of the data using a product of cross section and branching fraction of 1 pb. The lower panel in each plot shows the ratio of data to the background prediction. The shaded band indicates the total uncertainty in the estimated background, including both statistical and systematic components. |

png pdf |
Additional Figure 4-a:
The reconstructed ${m_{{\mathrm {t}} {\mathrm {b}}}}$ distributions in data (black points with error bars), and backgrounds in the CR1 for the data-taking period of 2016. The yield in each bin is divided by the corresponding bin width. Distributions expected from right-handed W' bosons of mass 2 and 3 TeV and a left-handed W' boson of mass 2 TeV are shown normalized to the integrated luminosity of the data using a product of cross section and branching fraction of 1 pb. The lower panel shows the ratio of data to the background prediction. The shaded band indicates the total uncertainty in the estimated background, including both statistical and systematic components. |
png pdf |
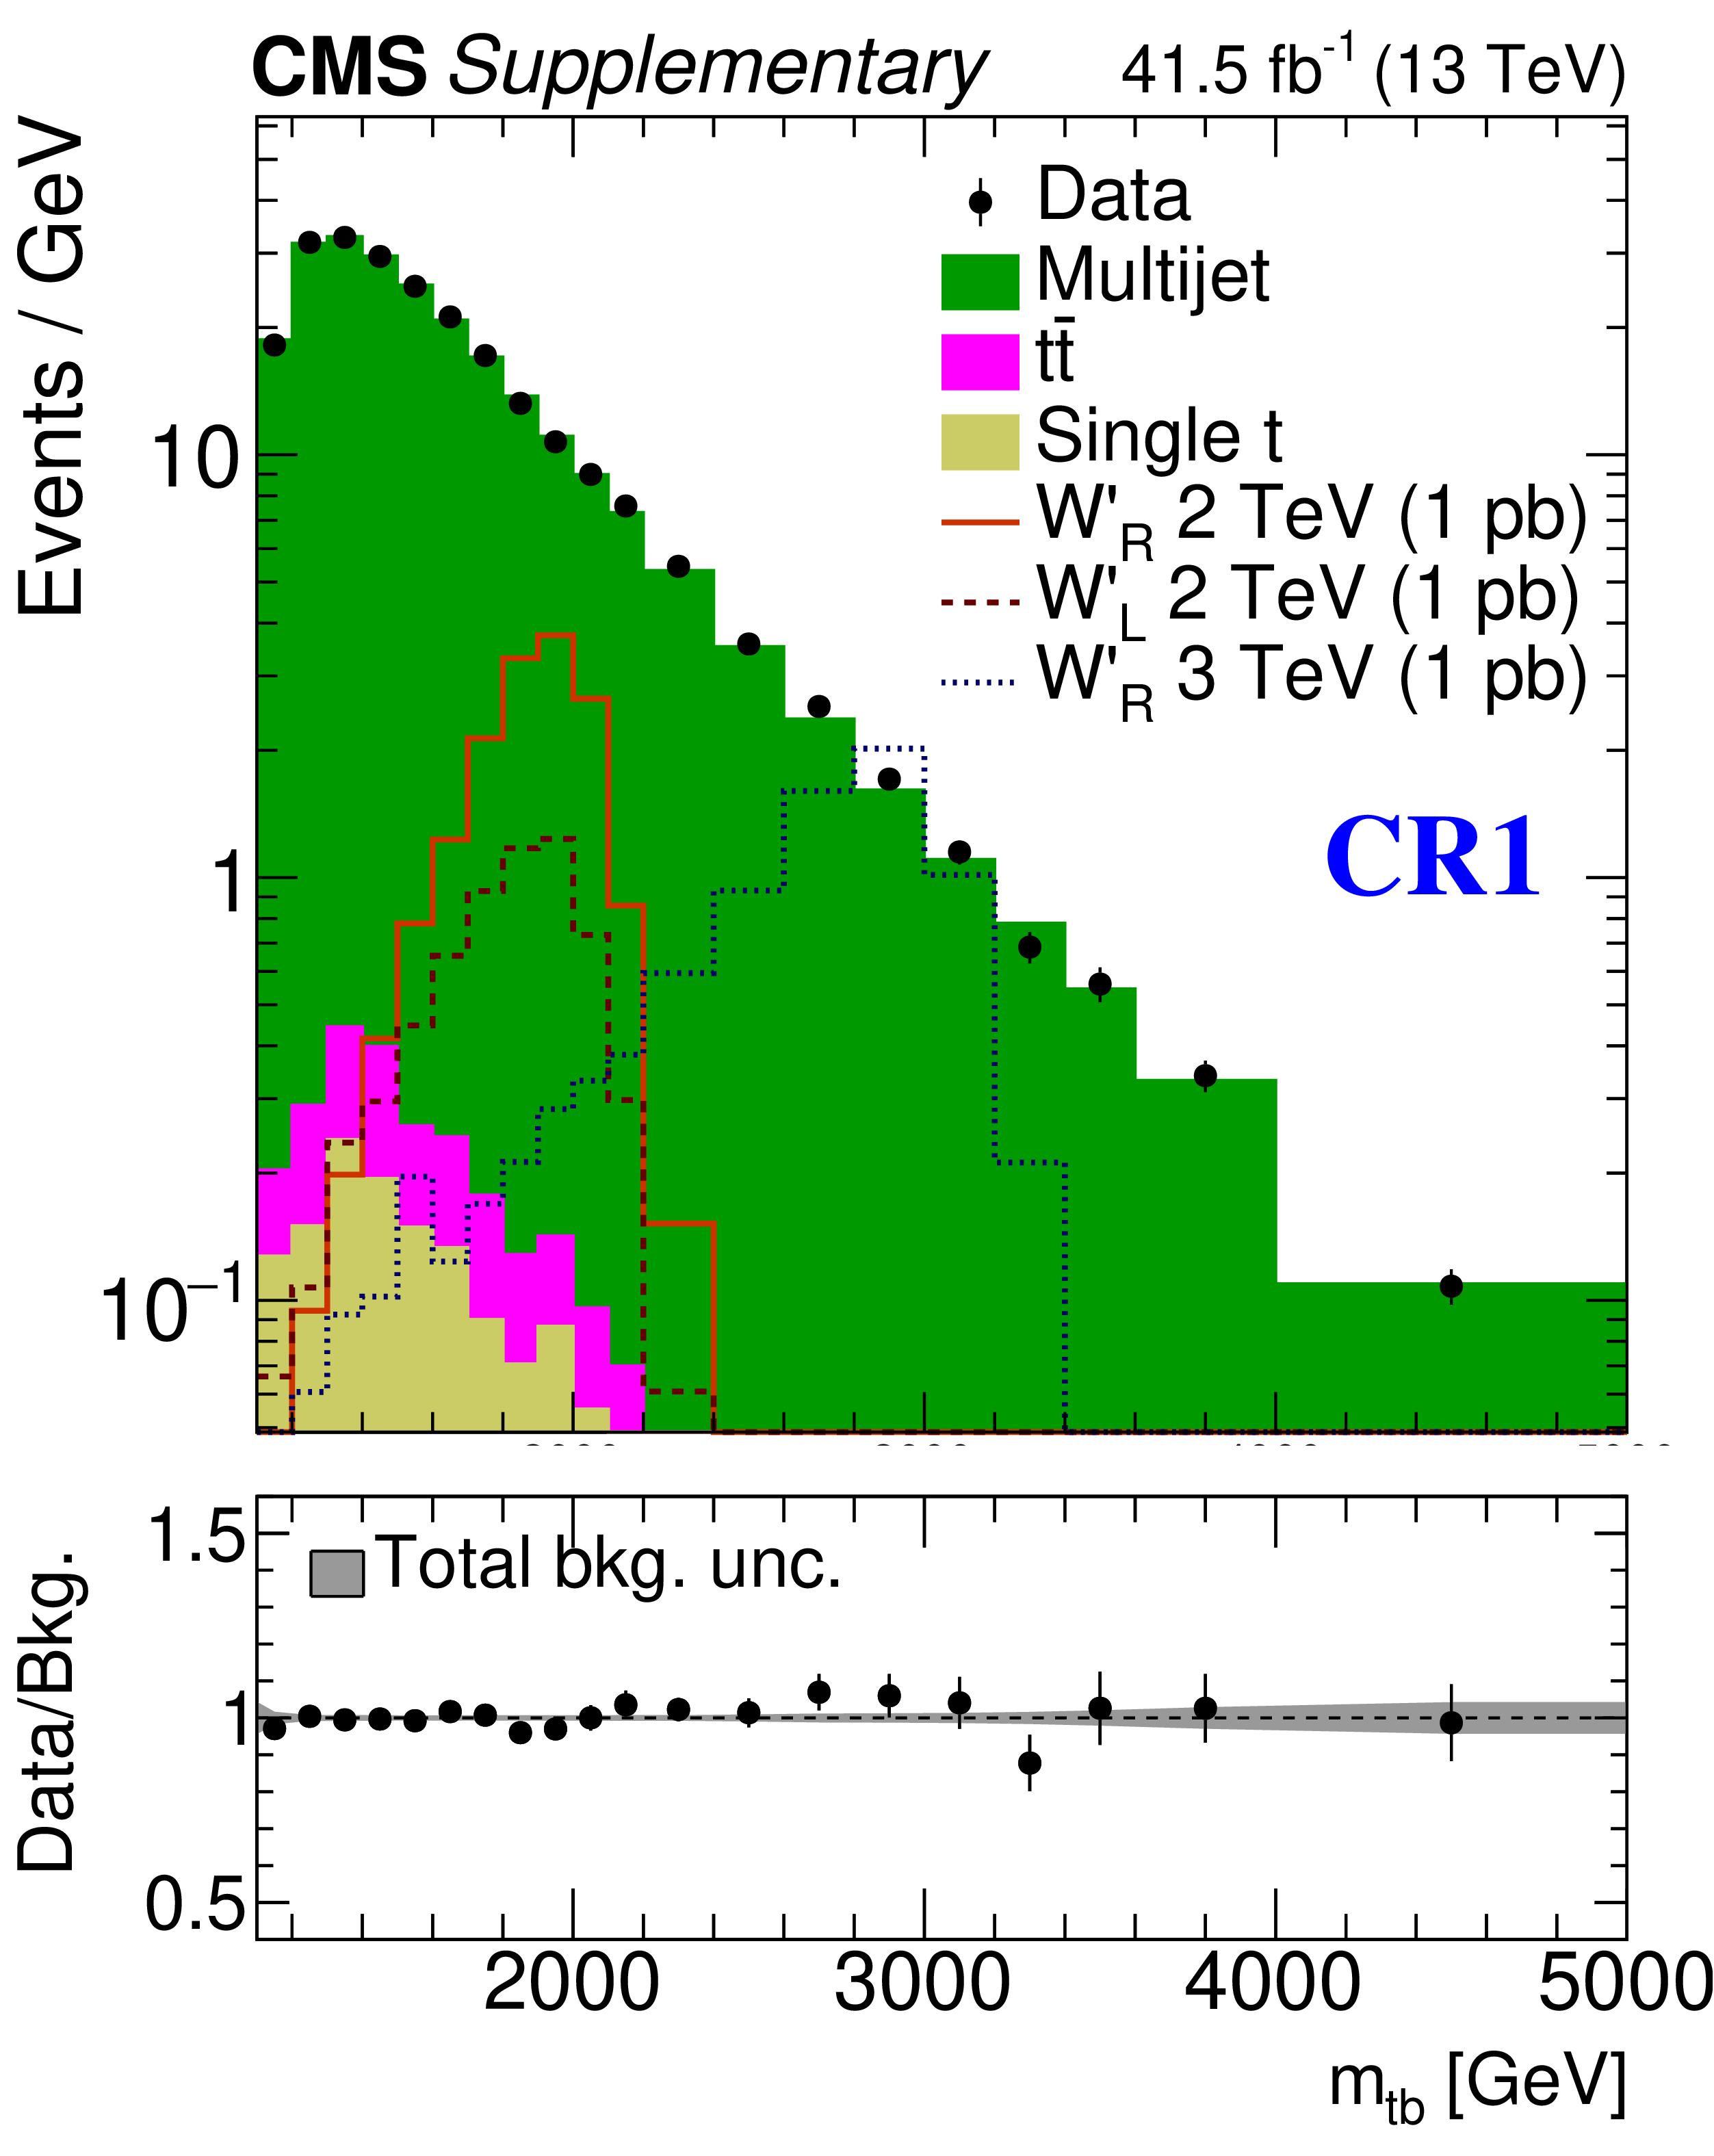
Additional Figure 4-b:
The reconstructed ${m_{{\mathrm {t}} {\mathrm {b}}}}$ distributions in data (black points with error bars), and backgrounds in the CR1 for the data-taking period of 2017. The yield in each bin is divided by the corresponding bin width. Distributions expected from right-handed W' bosons of mass 2 and 3 TeV and a left-handed W' boson of mass 2 TeV are shown normalized to the integrated luminosity of the data using a product of cross section and branching fraction of 1 pb. The lower panel shows the ratio of data to the background prediction. The shaded band indicates the total uncertainty in the estimated background, including both statistical and systematic components. |
png pdf |
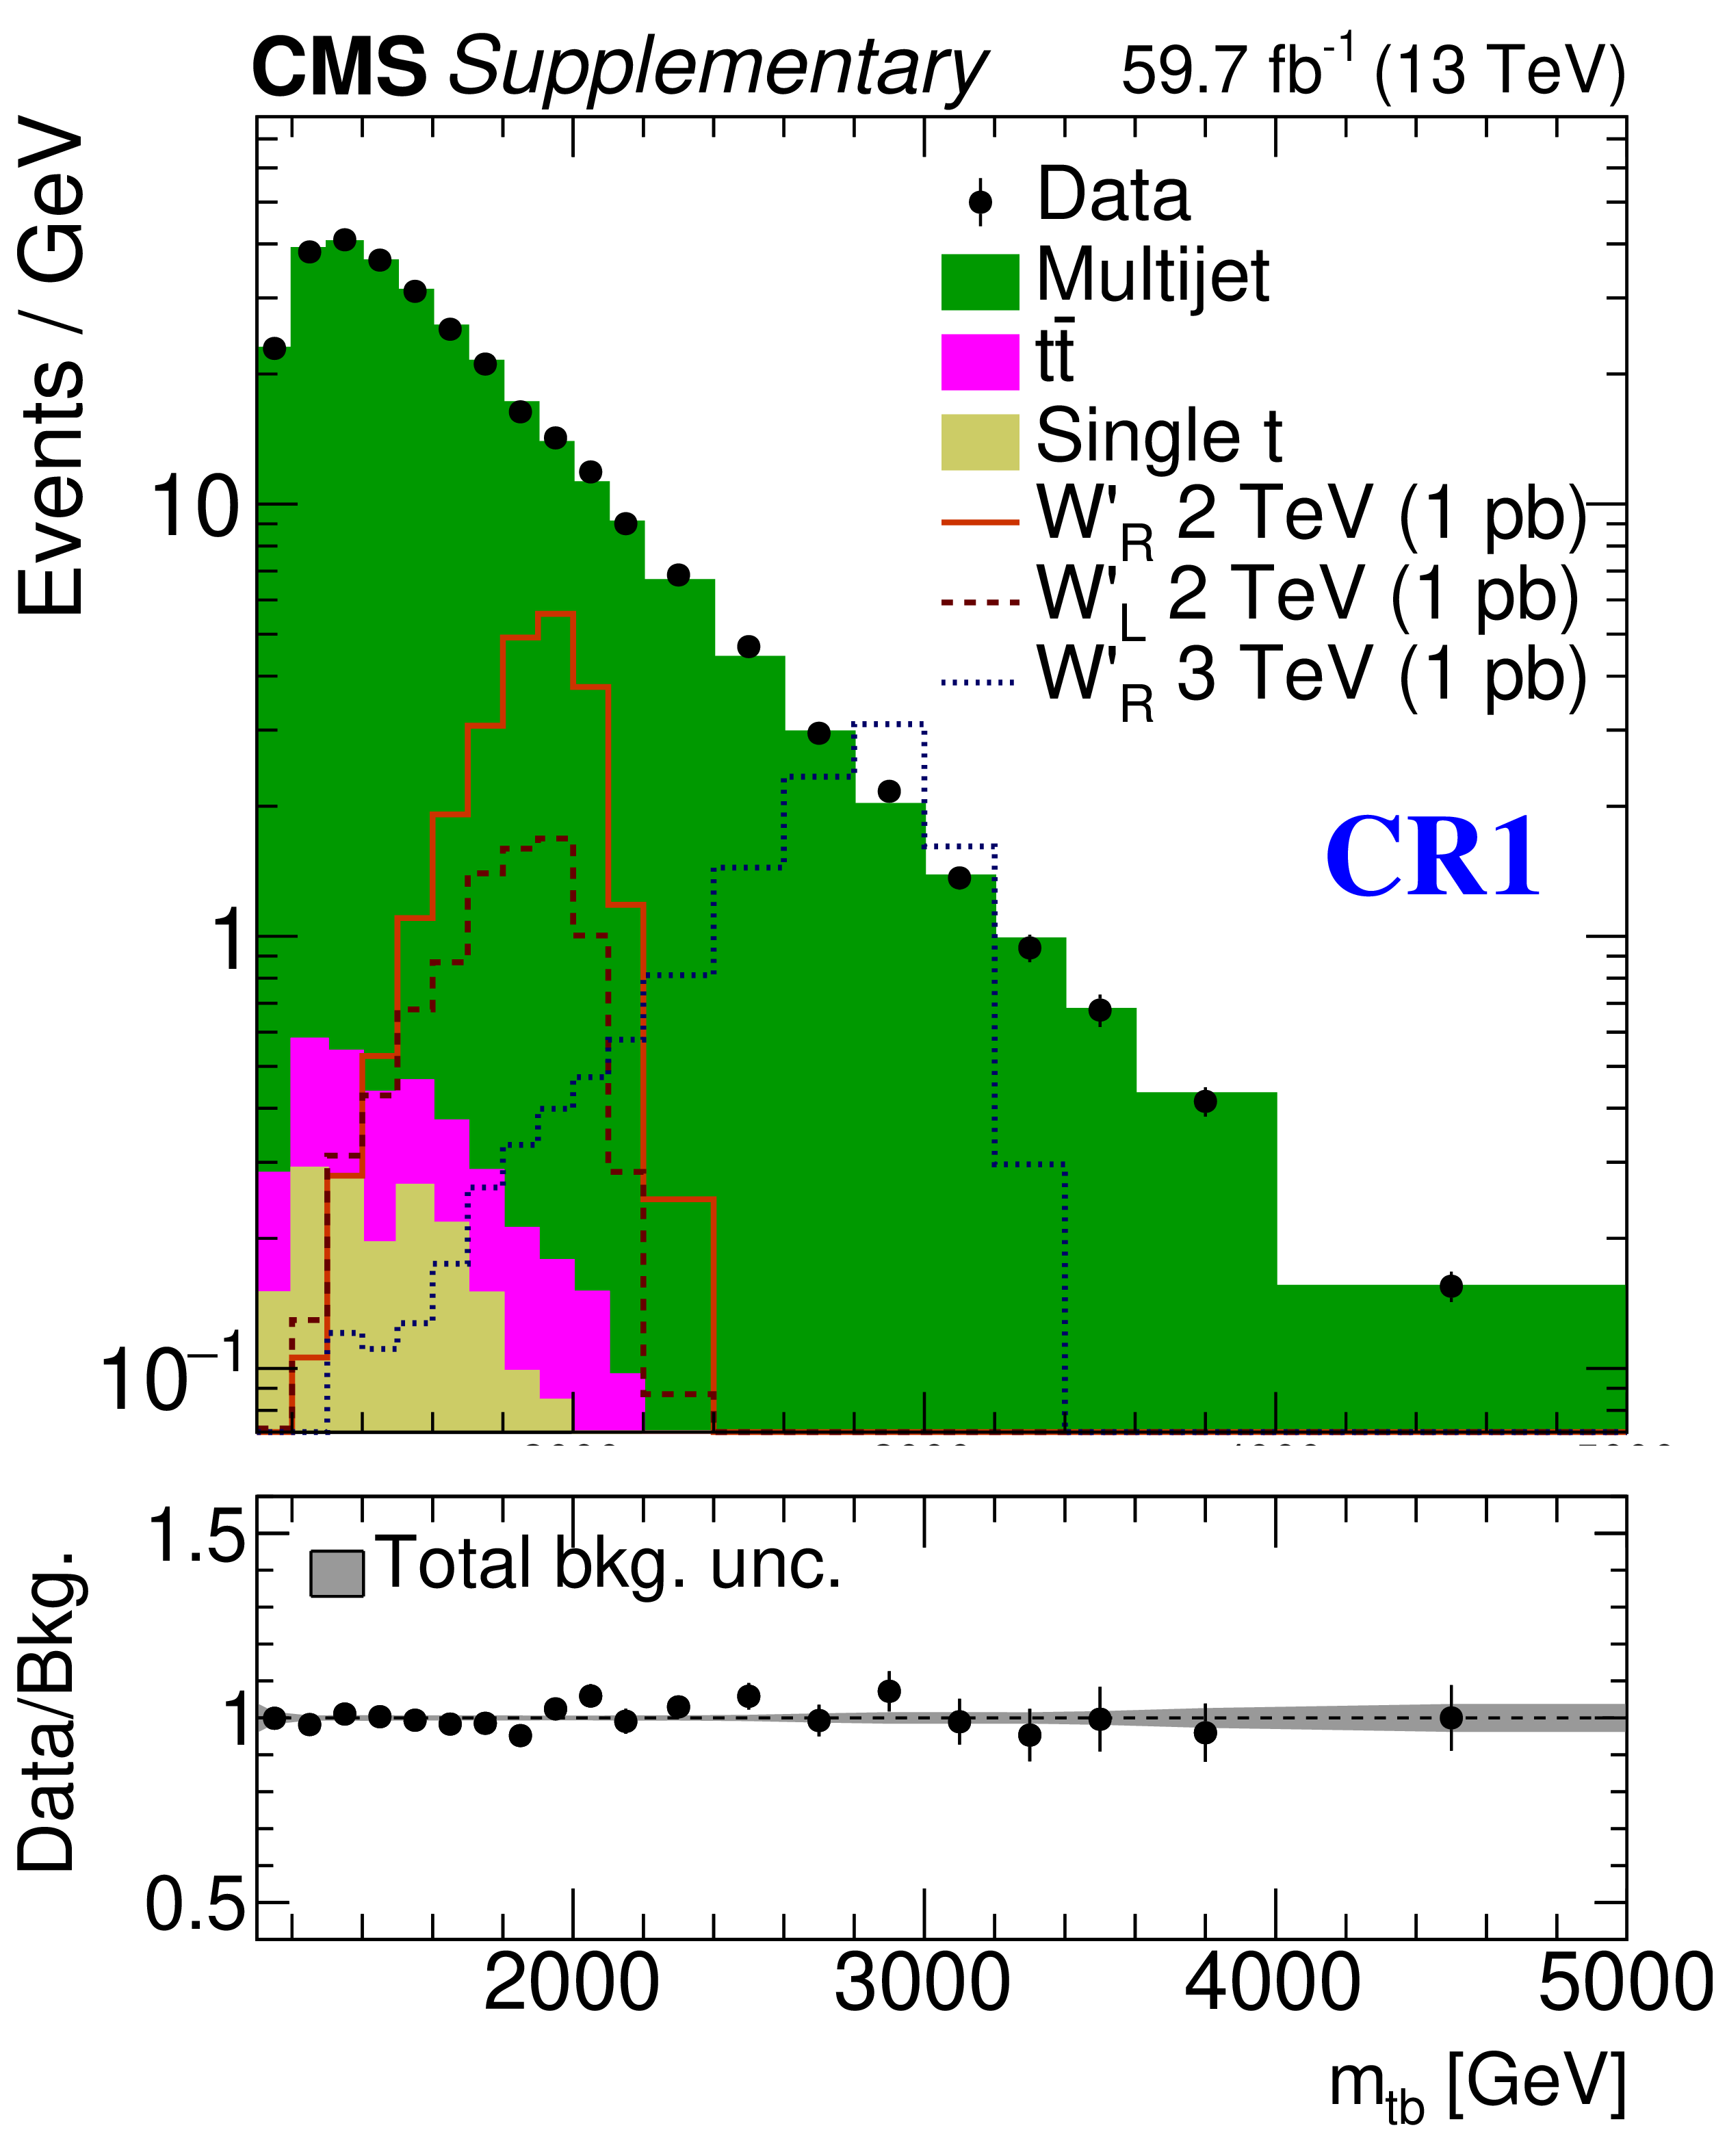
Additional Figure 4-c:
The reconstructed ${m_{{\mathrm {t}} {\mathrm {b}}}}$ distributions in data (black points with error bars), and backgrounds in the CR1 for the data-taking period of 2018. The yield in each bin is divided by the corresponding bin width. Distributions expected from right-handed W' bosons of mass 2 and 3 TeV and a left-handed W' boson of mass 2 TeV are shown normalized to the integrated luminosity of the data using a product of cross section and branching fraction of 1 pb. The lower panel shows the ratio of data to the background prediction. The shaded band indicates the total uncertainty in the estimated background, including both statistical and systematic components. |
png pdf |
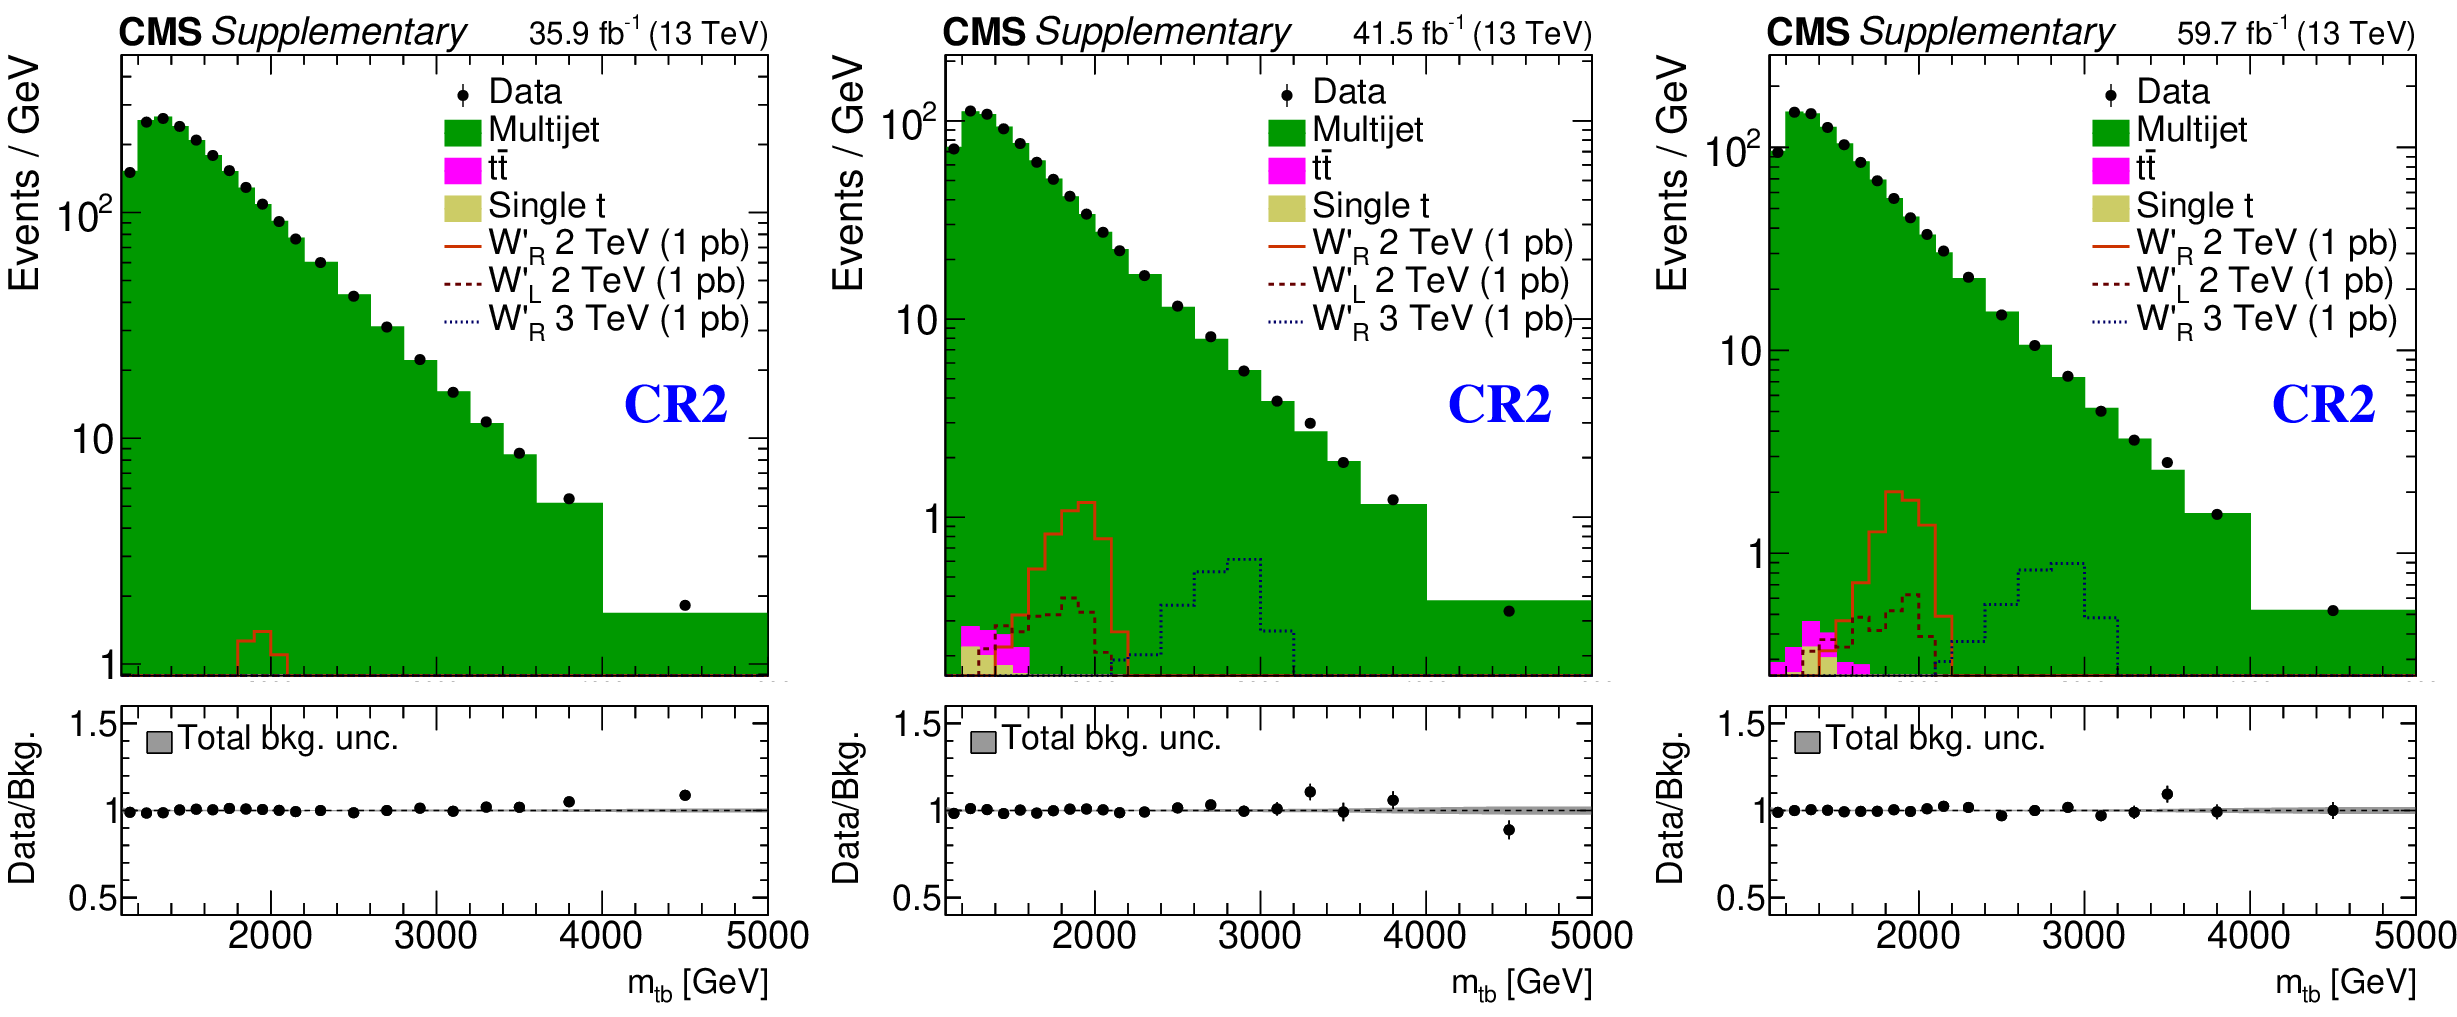
Additional Figure 5:
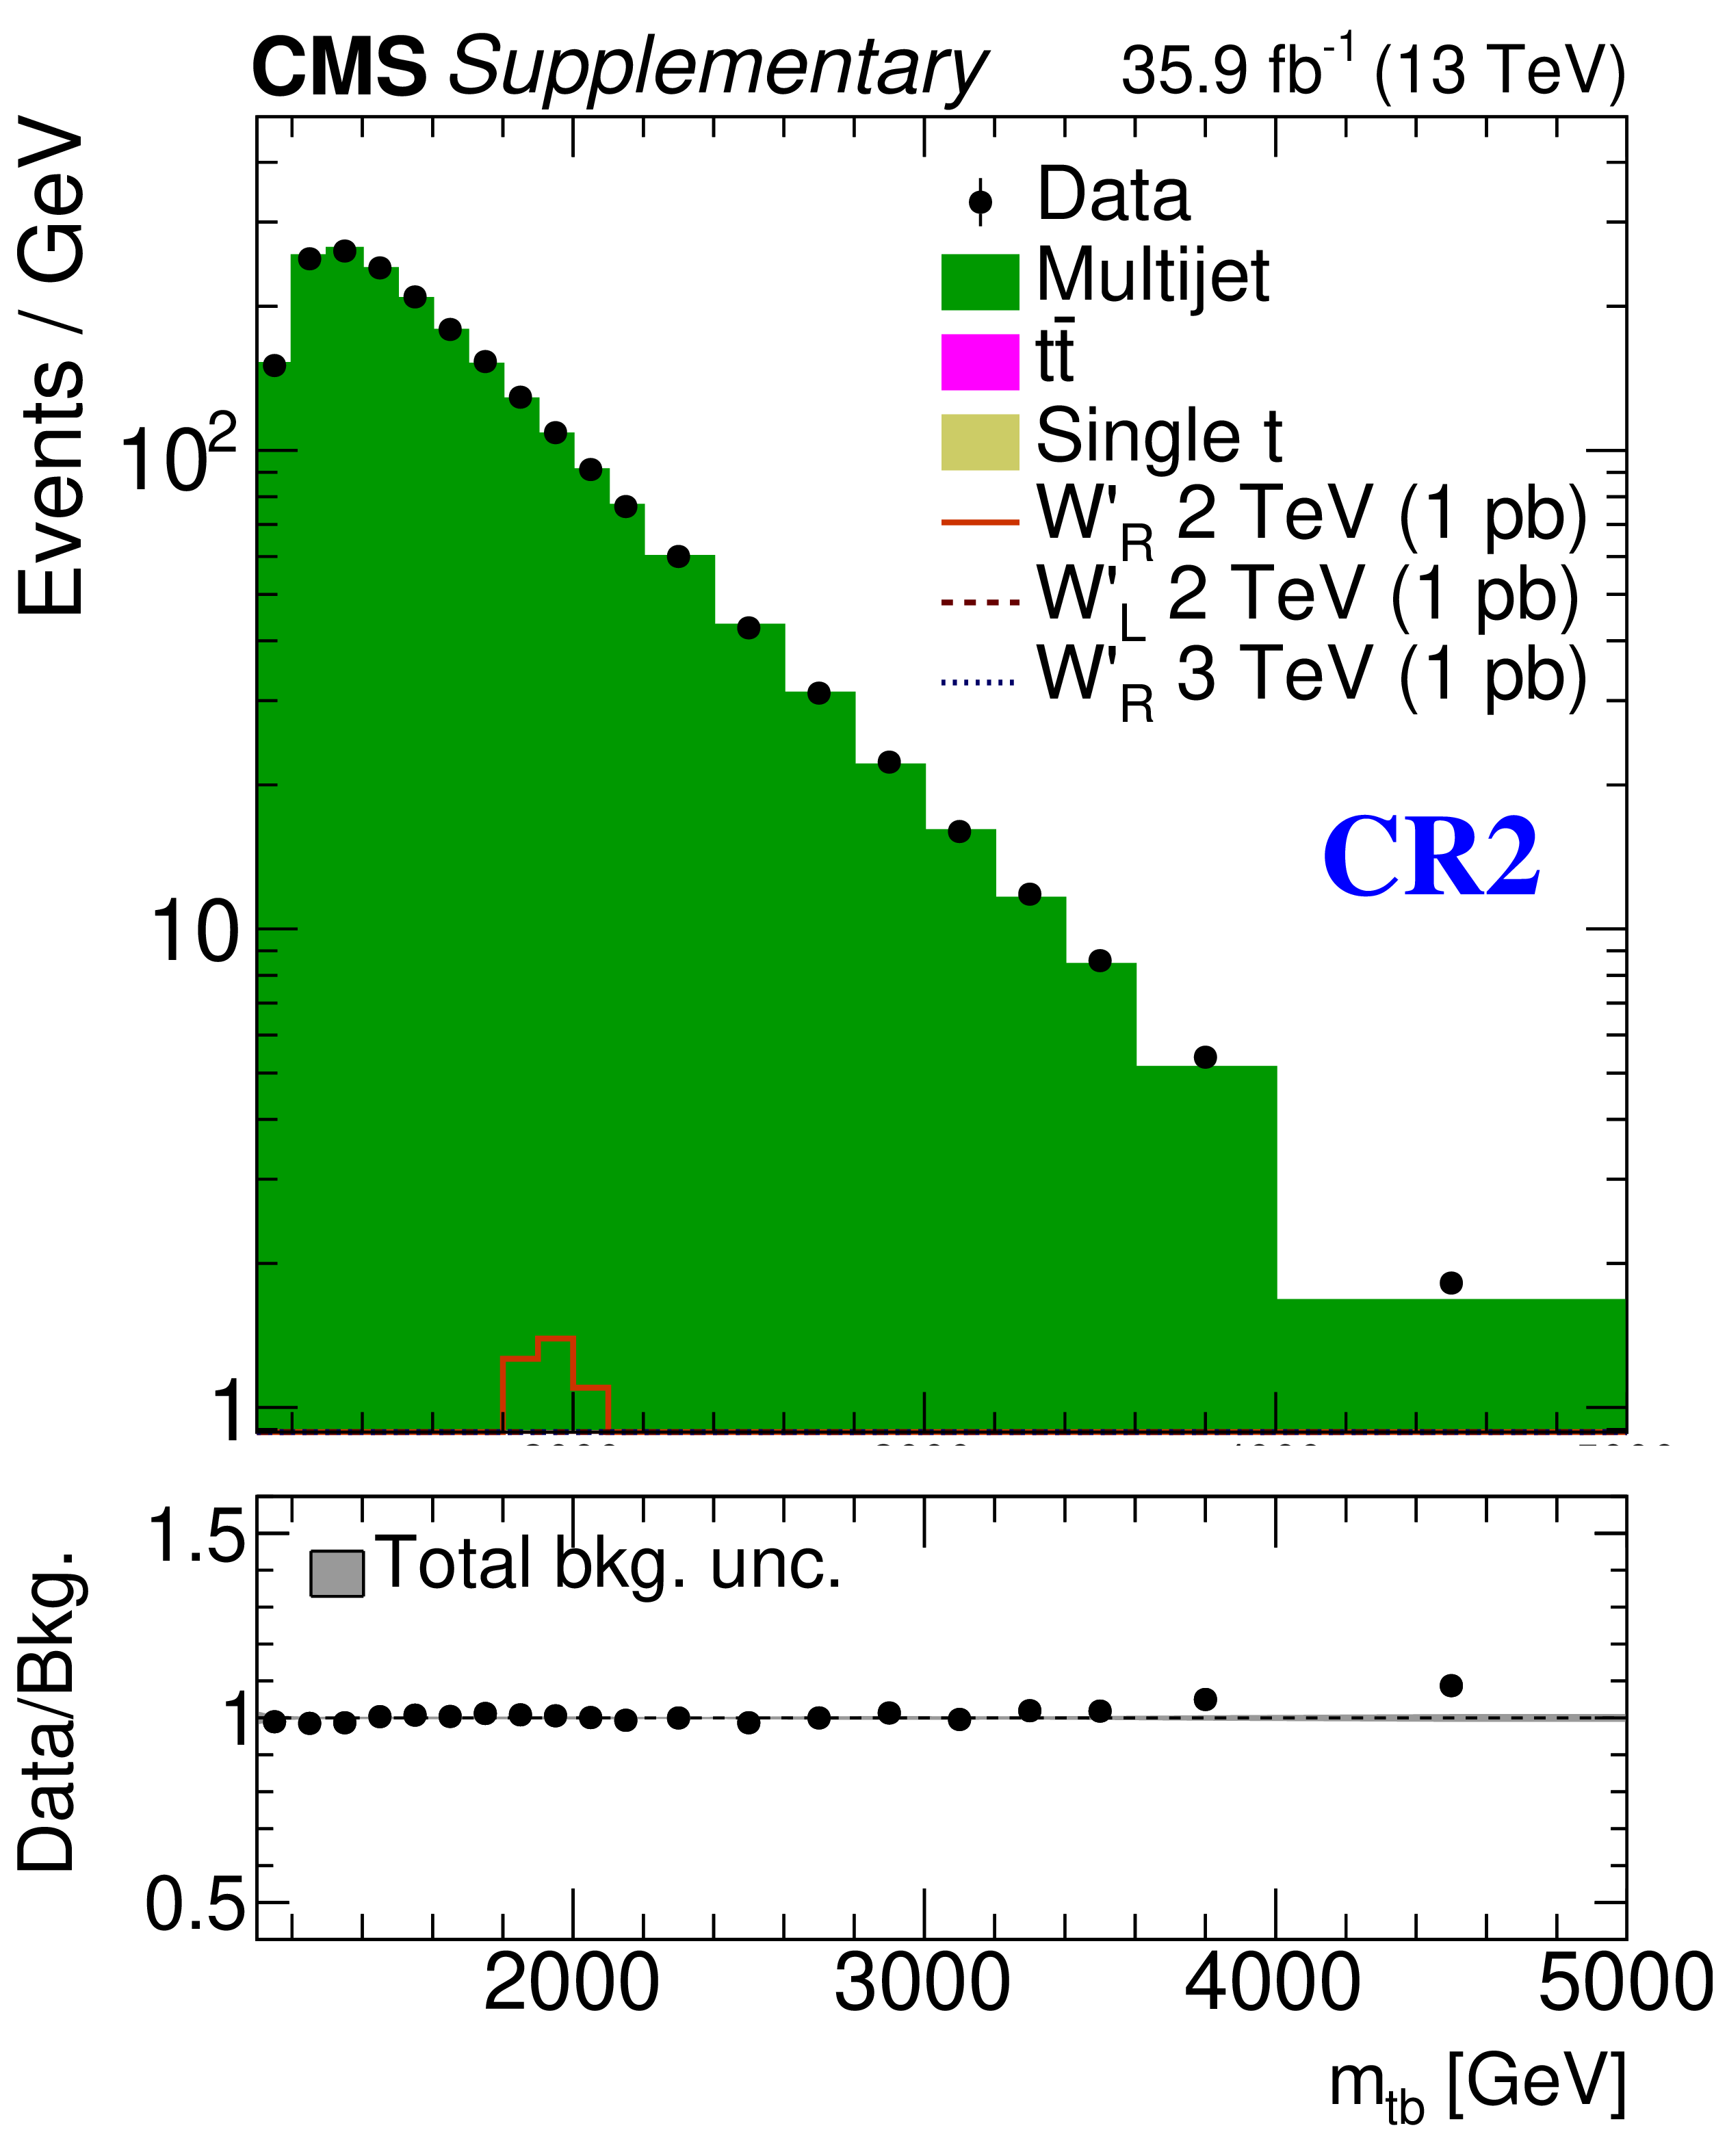
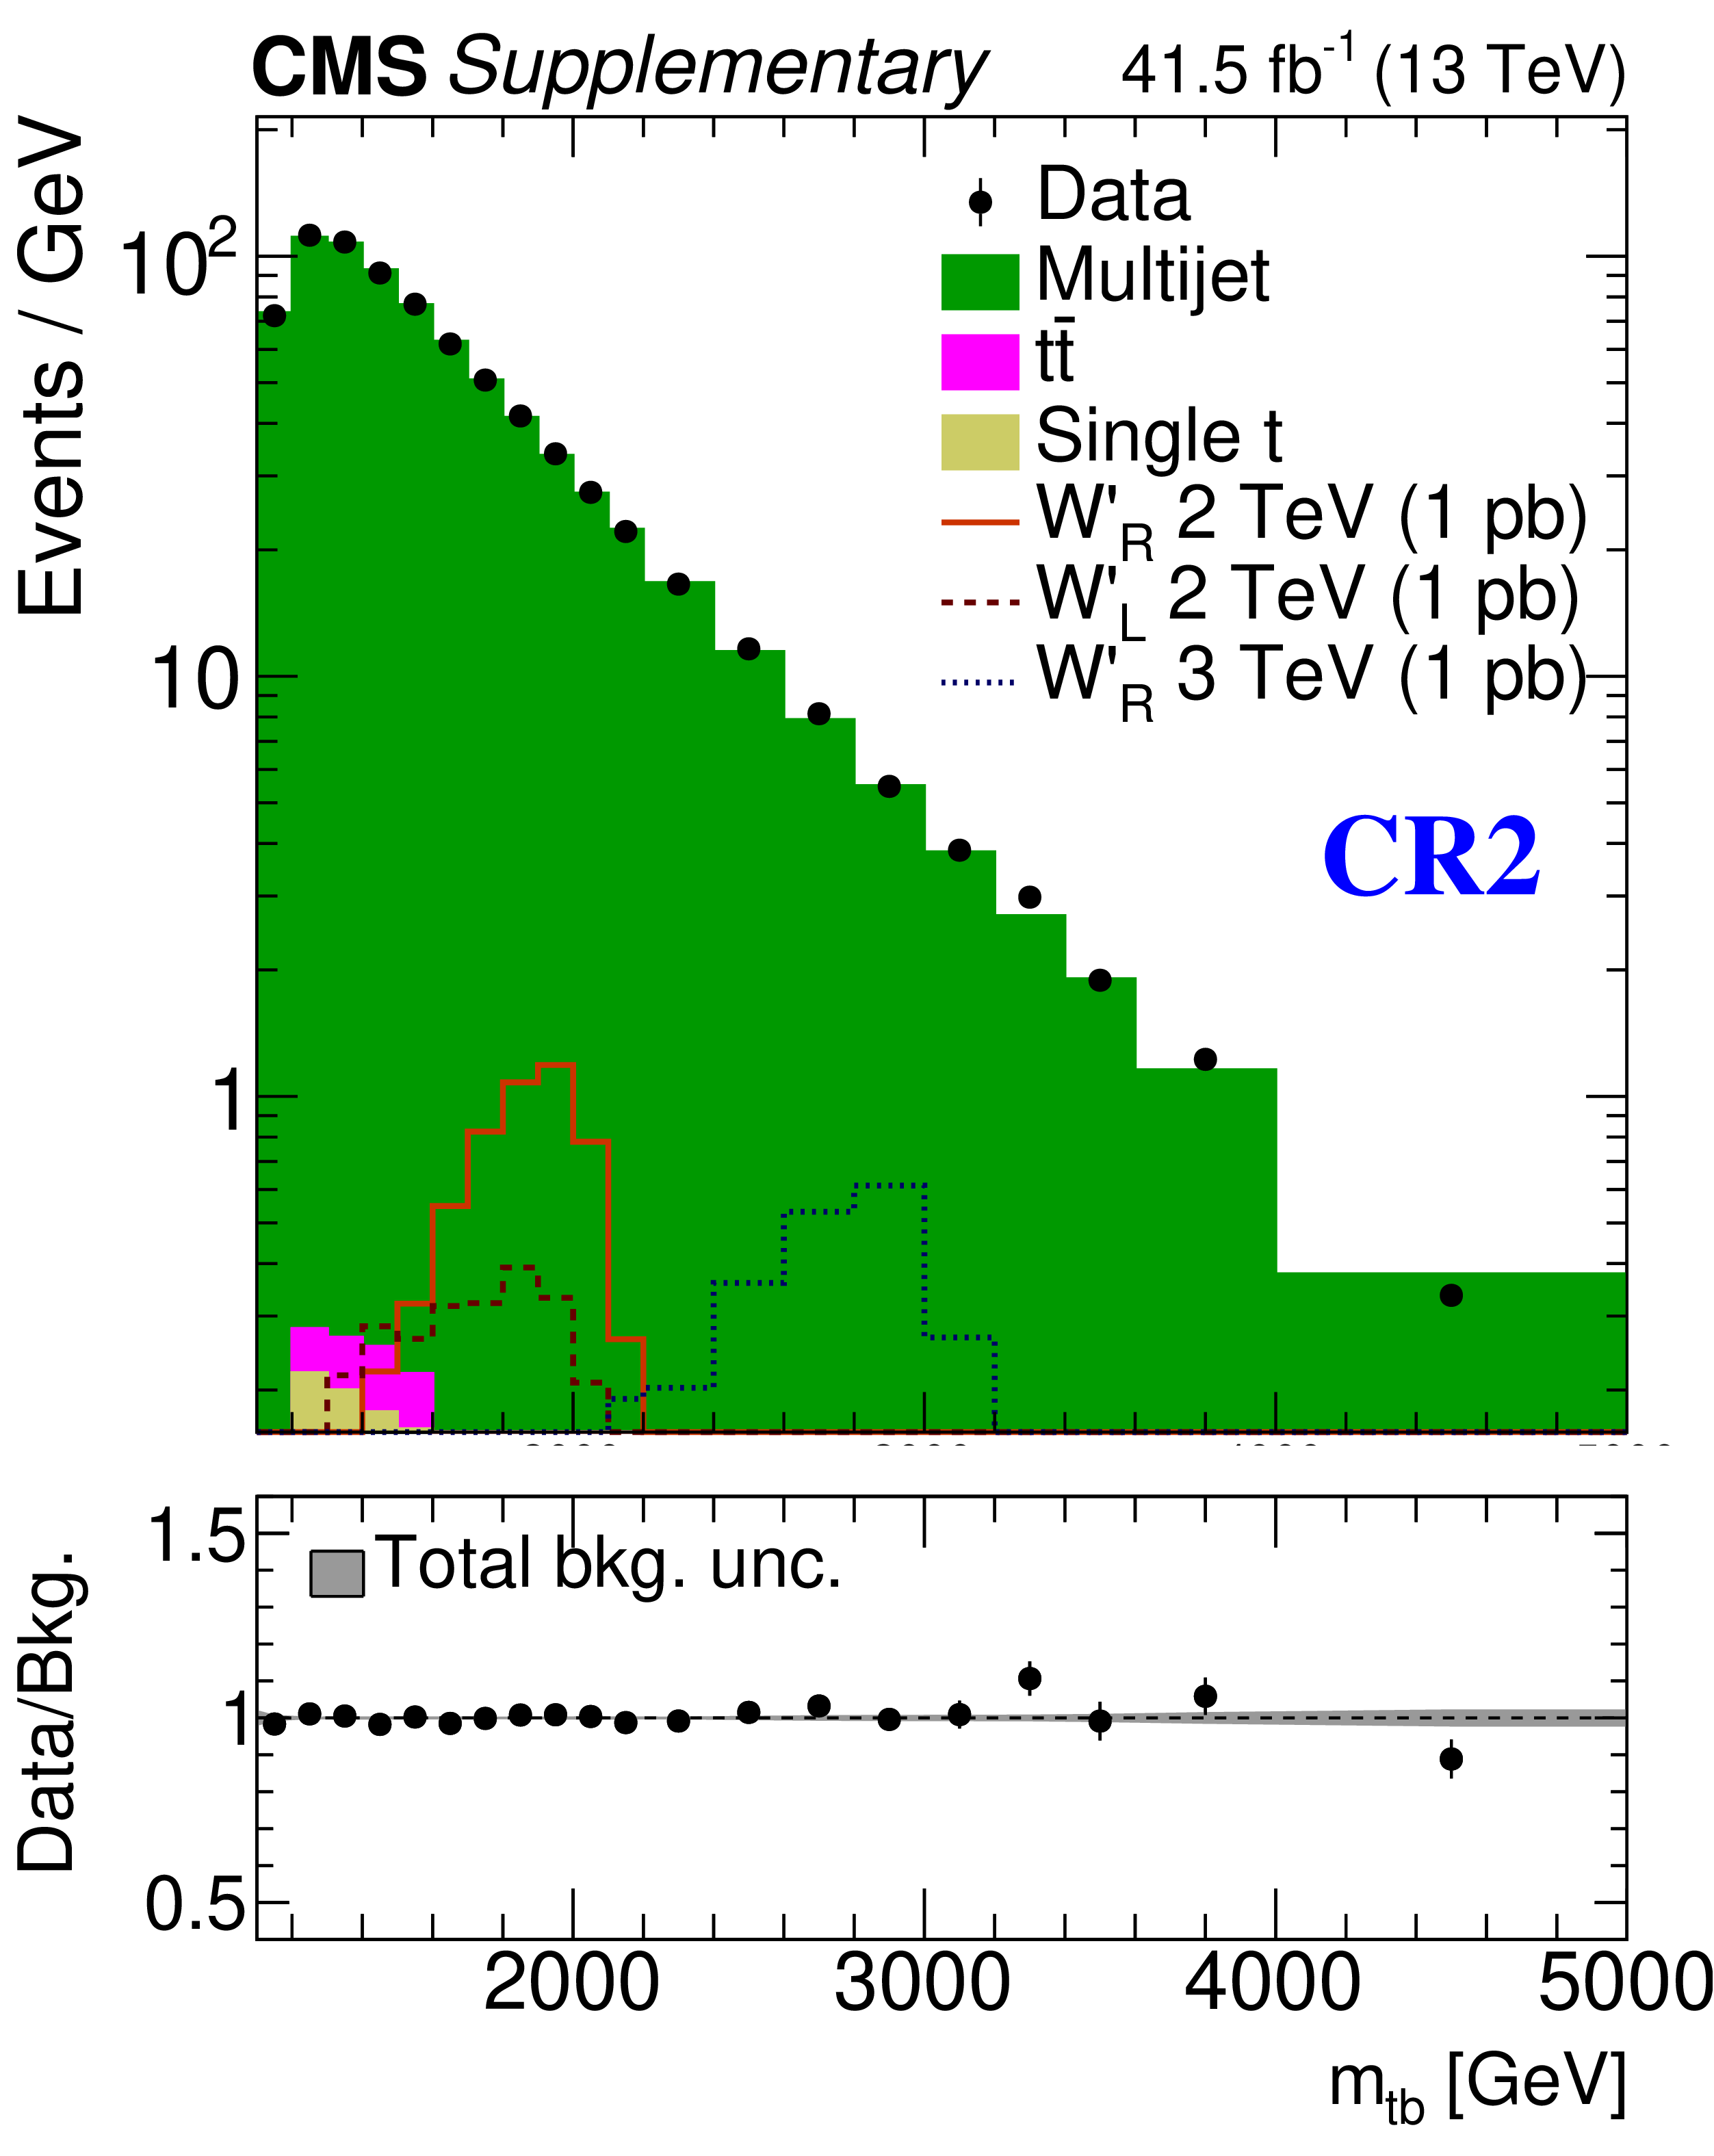
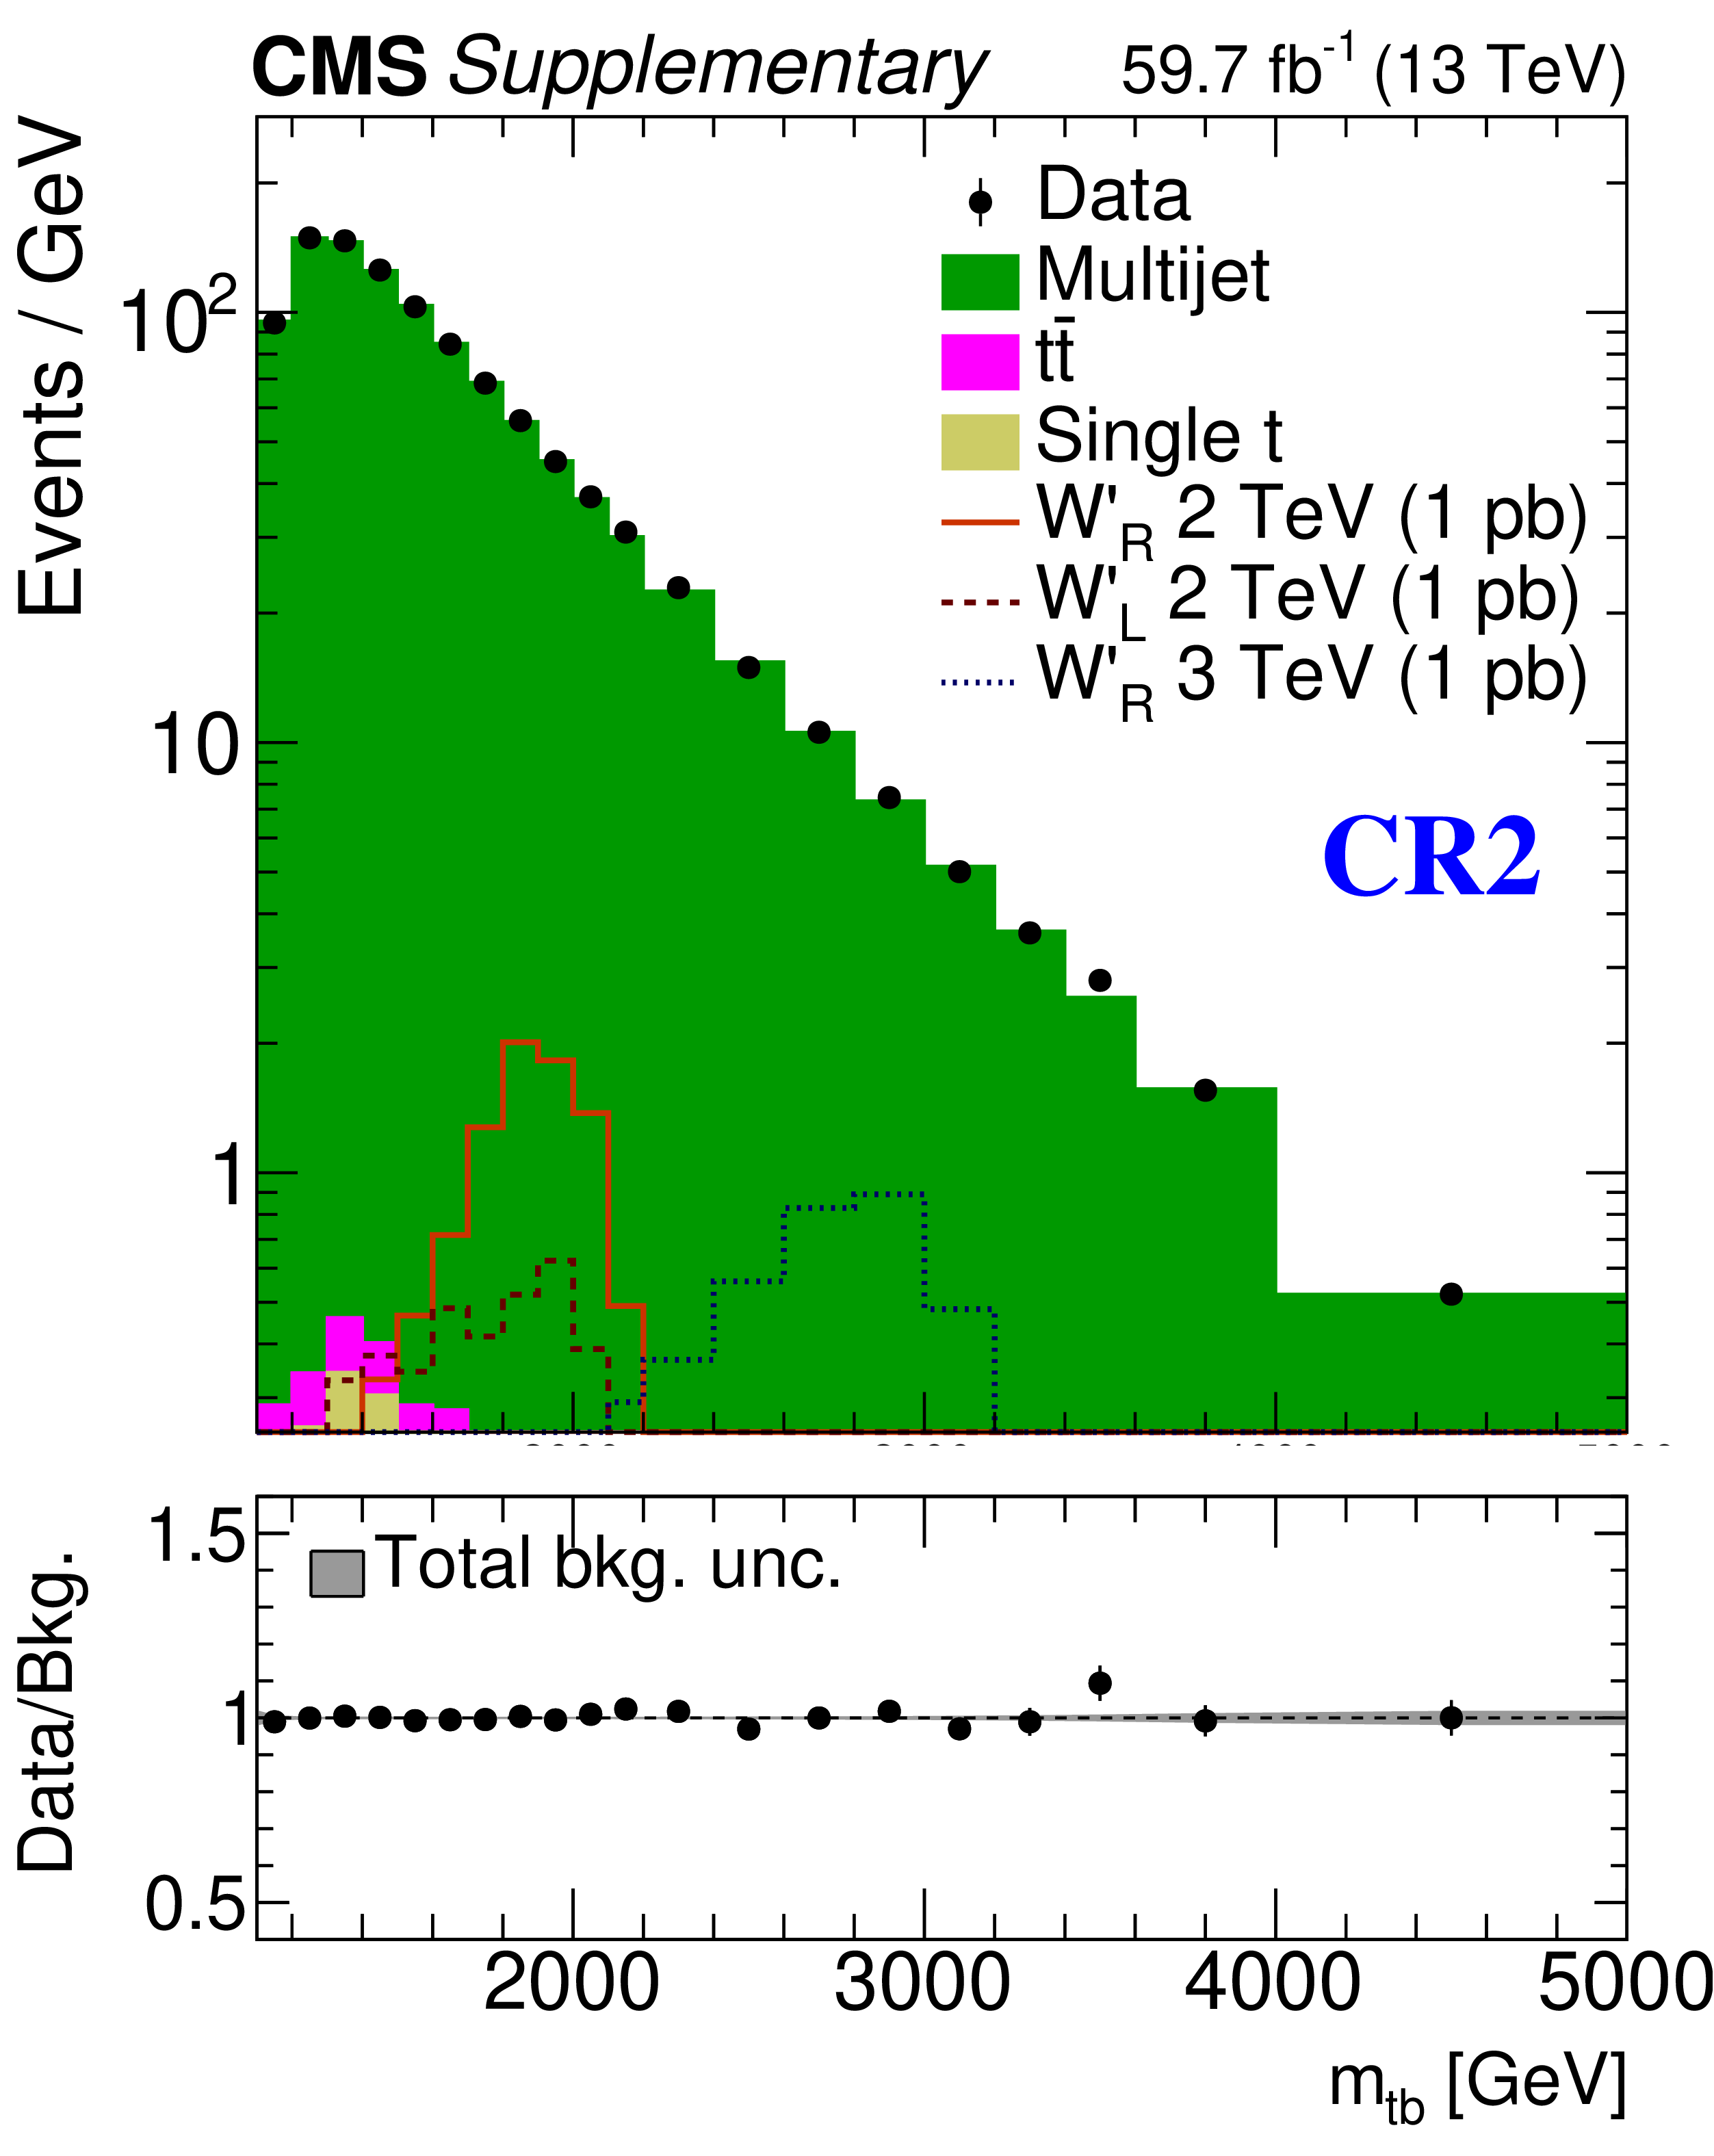
The reconstructed ${m_{{\mathrm {t}} {\mathrm {b}}}}$ distributions in data (black points with error bars), and backgrounds in the CR2 for the data-taking periods of (left) 2016, (middle) 2017, and (right) 2018. The yield in each bin is divided by the corresponding bin width. Distributions expected from right-handed W' bosons of mass 2 and 3 TeV and a left-handed W' boson of mass 2 TeV are shown normalized to the integrated luminosity of the data using a product of cross section and branching fraction of 1 pb. The lower panel in each plot shows the ratio of data to the background prediction. The shaded band indicates the total uncertainty in the estimated background, including both statistical and systematic components. |
png pdf |
Additional Figure 5-a:
The reconstructed ${m_{{\mathrm {t}} {\mathrm {b}}}}$ distributions in data (black points with error bars), and backgrounds in the CR2 for the data-taking periods of 2016. The yield in each bin is divided by the corresponding bin width. Distributions expected from right-handed W' bosons of mass 2 and 3 TeV and a left-handed W' boson of mass 2 TeV are shown normalized to the integrated luminosity of the data using a product of cross section and branching fraction of 1 pb. The lower panel shows the ratio of data to the background prediction. The shaded band indicates the total uncertainty in the estimated background, including both statistical and systematic components. |
png pdf |
Additional Figure 5-b:
The reconstructed ${m_{{\mathrm {t}} {\mathrm {b}}}}$ distributions in data (black points with error bars), and backgrounds in the CR2 for the data-taking periods of 2017. The yield in each bin is divided by the corresponding bin width. Distributions expected from right-handed W' bosons of mass 2 and 3 TeV and a left-handed W' boson of mass 2 TeV are shown normalized to the integrated luminosity of the data using a product of cross section and branching fraction of 1 pb. The lower panel shows the ratio of data to the background prediction. The shaded band indicates the total uncertainty in the estimated background, including both statistical and systematic components. |
png pdf |
Additional Figure 5-c:
The reconstructed ${m_{{\mathrm {t}} {\mathrm {b}}}}$ distributions in data (black points with error bars), and backgrounds in the CR2 for the data-taking periods of 2018. The yield in each bin is divided by the corresponding bin width. Distributions expected from right-handed W' bosons of mass 2 and 3 TeV and a left-handed W' boson of mass 2 TeV are shown normalized to the integrated luminosity of the data using a product of cross section and branching fraction of 1 pb. The lower panel shows the ratio of data to the background prediction. The shaded band indicates the total uncertainty in the estimated background, including both statistical and systematic components. |
| References | ||||
| 1 | R. N. Mohapatra and J. C. Pati | A natural left-right symmetry | PRD 11 (1975) 2558 | |
| 2 | K. S. Babu, X.-G. He, and E. Ma | New supersymmetric left-right gauge model: Higgs-boson structure and neutral-current analysis | PRD 36 (1987) 878 | |
| 3 | G. Burdman, B. A. Dobrescu, and E. Ponton | Resonances from two universal extra dimensions | PRD 74 (2006) 075008 | hep-ph/0601186 |
| 4 | J. C. Pati and A. Salam | Lepton number as the fourth color | PRD 10 (1974) 275 | |
| 5 | E. Boos, V. Bunichev, L. Dudko, and M. Perfilov | Interference between W' and W in single-top quark production processes | PLB 655 (2007) 245 | hep-ph/0610080 |
| 6 | C. T. Hill | Topcolor assisted technicolor | PLB 345 (1995) 483 | hep-ph/9411426 |
| 7 | D. J. Muller and S. Nandi | Top flavor: a separate SU(2) for the third family | PLB 383 (1996) 345 | hep-ph/9602390 |
| 8 | M. Abdullah et al. | Probing a simplified, $ W^{\prime} $ model of $ R(D^{(\ast)}) $ anomalies using $ b $-tags, $ \tau $ leptons and missing energy | PRD 98 (2018) 055016 | 1805.01869 |
| 9 | CDF Collaboration | Search for resonances decaying to top and bottom quarks with the CDF experiment | PRL 115 (2015) 061801 | 1504.01536 |
| 10 | D0 Collaboration | Search for $ W^\prime \to tb $ resonances with left- and right-handed couplings to fermions | PLB 699 (2011) 145 | 1101.0806 |
| 11 | CMS Collaboration | Search for a W$ ^{\prime} $ boson decaying to a bottom quark and a top quark in pp collisions at $ \sqrt{s}= $ 7 TeV | PLB 718 (2013) 1229 | CMS-EXO-12-001 1208.0956 |
| 12 | CMS Collaboration | Search for W$ ^\prime \to $ tb decays in the lepton+jets final state in pp collisions at $ \sqrt{s} = $ 8 TeV | JHEP 05 (2014) 108 | CMS-B2G-12-010 1402.2176 |
| 13 | ATLAS Collaboration | Search for $ W^\prime \to t\bar{b} $ in the lepton plus jets final state in proton-proton collisions at a centre-of-mass energy of $ \sqrt{s} = $ 8 TeV with the ATLAS detector | PLB 743 (2015) 235 | 1410.4103 |
| 14 | CMS Collaboration | Search for W$ ^\prime \to $ tb in proton-proton collisions at $ \sqrt{s} = $ 8 TeV | JHEP 02 (2016) 122 | CMS-B2G-12-009 1509.06051 |
| 15 | ATLAS Collaboration | Search for $ W^\prime \to tb $ decays in the hadronic final state using pp collisions at $ \sqrt{s}= $ 13 TeV with the ATLAS detector | PLB 781 (2018) 327 | 1801.07893 |
| 16 | CMS Collaboration | Search for heavy resonances decaying to a top quark and a bottom quark in the lepton+jets final state in proton-proton collisions at 13 TeV | PLB 777 (2018) 39 | CMS-B2G-17-010 1708.08539 |
| 17 | A. J. Larkoski, I. Moult, and B. Nachman | Jet substructure at the Large Hadron Collider: a review of recent advances in theory and machine learning | PR 841 (2020) 1 | 1709.04464 |
| 18 | R. Kogler et al. | Jet substructure at the Large Hadron Collider: Experimental review | Rev. Mod. Phys. 91 (2019) 045003 | 1803.06991 |
| 19 | A. Butter et al. | The machine learning landscape of top taggers | SciPost Phys. 7 (2019) 014 | 1902.09914 |
| 20 | CMS Collaboration | Identification of heavy, energetic, hadronically decaying particles using machine-learning techniques | JINST 15 (2020) P06005 | CMS-JME-18-002 2004.08262 |
| 21 | E. Bols et al. | Jet flavour classification using DeepJet | JINST 15 (2020) P12012 | 2008.10519 |
| 22 | CMS Collaboration | Hepdata record for this analysis | ``Hepdata record for this analysis'' | |
| 23 | CMS Collaboration | The CMS experiment at the CERN LHC | JINST 3 (2008) S08004 | CMS-00-001 |
| 24 | CMS Collaboration | Description and performance of track and primary-vertex reconstruction with the CMS tracker | JINST 9 (2014) P10009 | CMS-TRK-11-001 1405.6569 |
| 25 | CMS Collaboration | Track impact parameter resolution for the full pseudo rapidity coverage in the 2017 dataset with the CMS Phase-1 Pixel detector | CDS | |
| 26 | CMS Collaboration | The CMS trigger system | JINST 12 (2017) P01020 | CMS-TRG-12-001 1609.02366 |
| 27 | CMS Collaboration | Particle-flow reconstruction and global event description with the CMS detector | JINST 12 (2017) P10003 | CMS-PRF-14-001 1706.04965 |
| 28 | M. Cacciari, G. P. Salam, and G. Soyez | The anti-$ {k_{\mathrm{T}}} $ jet clustering algorithm | JHEP 04 (2008) 063 | 0802.1189 |
| 29 | M. Cacciari, G. P. Salam, and G. Soyez | FastJet user manual | EPJC 72 (2012) 1896 | 1111.6097 |
| 30 | M. Cacciari and G. P. Salam | Pileup subtraction using jet areas | PLB 659 (2008) 119 | 0707.1378 |
| 31 | CMS Collaboration | Jet energy scale and resolution in the CMS experiment in pp collisions at 8 TeV | JINST 12 (2017) P02014 | CMS-JME-13-004 1607.03663 |
| 32 | D. Bertolini, P. Harris, M. Low, and N. Tran | Pileup per particle identification | JHEP 10 (2014) 059 | 1407.6013 |
| 33 | CMS Collaboration | Pileup mitigation at CMS in 13 TeV data | JINST 15 (2020) P09018 | CMS-JME-18-001 2003.00503 |
| 34 | CMS Collaboration | Jet algorithms performance in 13 TeV data | CMS-PAS-JME-16-003 | CMS-PAS-JME-16-003 |
| 35 | CMS Collaboration | Jet energy scale and resolution performance with 13 TeV data collected by CMS in 2016 | CDS | |
| 36 | CDF Collaboration | Charged jet evolution and the underlying event in proton-antiproton collisions at 1.8 TeV | PRD 65 (2002) 092002 | |
| 37 | J. M. Butterworth, A. R. Davison, M. Rubin, and G. P. Salam | Jet substructure as a new Higgs search channel at the LHC | PRL 100 (2008) 242001 | 0802.2470 |
| 38 | M. Dasgupta, A. Fregoso, S. Marzani, and G. P. Salam | Towards an understanding of jet substructure | JHEP 09 (2013) 029 | 1307.0007 |
| 39 | A. J. Larkoski, S. Marzani, G. Soyez, and J. Thaler | Soft Drop | JHEP 05 (2014) 146 | 1402.2657 |
| 40 | Y. L. Dokshitzer, G. D. Leder, S. Moretti, and B. R. Webber | Better jet clustering algorithms | JHEP 08 (1997) 001 | hep-ph/9707323 |
| 41 | M. Wobisch and T. Wengler | Hadronization corrections to jet cross-sections in deep inelastic scattering | in Proceedings of the Workshop on Monte Carlo Generators for HERA Physics, Hamburg, 1998 | hep-ph/9907280 |
| 42 | CompHEP Collaboration | CompHEP 4.4: Automatic computations from Lagrangians to events | NIMA 534 (2004) 250 | hep-ph/0403113 |
| 43 | Z. Sullivan | Fully differential $ W^{\prime} $ production and decay at next-to-leading order in QCD | PRD 66 (2002) 075011 | hep-ph/0207290 |
| 44 | D. Duffty and Z. Sullivan | Model independent reach for W-prime bosons at the LHC | PRD 86 (2012) 075018 | 1208.4858 |
| 45 | P. Nason | A new method for combining NLO QCD with shower Monte Carlo algorithms | JHEP 11 (2004) 040 | hep-ph/0409146 |
| 46 | S. Frixione, P. Nason, and C. Oleari | Matching NLO QCD computations with parton shower simulations: the POWHEG method | JHEP 11 (2007) 070 | 0709.2092 |
| 47 | S. Alioli, P. Nason, C. Oleari, and E. Re | A general framework for implementing NLO calculations in shower Monte Carlo programs: the POWHEG BOX | JHEP 06 (2010) 043 | 1002.2581 |
| 48 | S. Frixione, P. Nason, and G. Ridolfi | A positive-weight next-to-leading-order Monte Carlo for heavy flavour hadroproduction | JHEP 09 (2007) 126 | 0707.3088 |
| 49 | M. Czakon and A. Mitov | Top++: a program for the calculation of the top-pair cross-section at hadron colliders | CPC 185 (2014) 2930 | 1112.5675 |
| 50 | R. Frederix, E. Re, and P. Torrielli | Single-top $ t $-channel hadroproduction in the four-flavour scheme with POWHEG and aMC@NLO | JHEP 09 (2012) 130 | 1207.5391 |
| 51 | E. Re | Single-top $ \rm Wt $-channel production matched with parton showers using the POWHEG method | EPJC 71 (2011) 1547 | 1009.2450 |
| 52 | N. Kidonakis | Two-loop soft anomalous dimensions for single top quark associated production with a W$ ^{-} $ or H$ ^{-} $ | PRD 82 (2010) 054018 | 1005.4451 |
| 53 | J. Alwall et al. | The automated computation of tree-level and next-to-leading order differential cross sections, and their matching to parton shower simulations | JHEP 07 (2014) 079 | 1405.0301 |
| 54 | P. Artoisenet, R. Frederix, O. Mattelaer, and R. Rietkerk | Automatic spin-entangled decays of heavy resonances in Monte Carlo simulations | JHEP 03 (2013) 015 | 1212.3460 |
| 55 | NNPDF Collaboration | Parton distributions for the LHC Run II | JHEP 04 (2015) 040 | 1410.8849 |
| 56 | NNPDF Collaboration | Parton distributions from high-precision collider data | EPJC 77 (2017) 663 | 1706.00428 |
| 57 | J. Pumplin et al. | New generation of parton distributions with uncertainties from global QCD analysis | JHEP 07 (2002) 012 | hep-ph/0201195 |
| 58 | T. Sjostrand et al. | An introduction to PYTHIA 8.2 | CPC 191 (2015) 159 | 1410.3012 |
| 59 | R. Frederix and S. Frixione | Merging meets matching in MC@NLO | JHEP 12 (2012) 061 | 1209.6215 |
| 60 | CMS Collaboration | Extraction and validation of a new set of CMS PYTHIA8 tunes from underlying-event measurements | EPJC 80 (2020) 4 | CMS-GEN-17-001 1903.12179 |
| 61 | CMS Collaboration | Event generator tunes obtained from underlying event and multiparton scattering measurements | EPJC 76 (2016) 155 | CMS-GEN-14-001 1512.00815 |
| 62 | CMS Collaboration | Measurement of the inelastic proton-proton cross section at $ \sqrt{s}= $ 13 TeV | JHEP 07 (2018) 161 | CMS-FSQ-15-005 1802.02613 |
| 63 | GEANT4 Collaboration | GEANT4--a simulation toolkit | NIMA 506 (2003) 250 | |
| 64 | D. Krohn, J. Thaler, and L.-T. Wang | Jet trimming | JHEP 02 (2010) 084 | 0912.1342 |
| 65 | J. Pumplin et al. | Uncertainties of predictions from parton distribution functions. 2. The Hessian method | PRD 65 (2001) 014013 | hep-ph/0101032 |
| 66 | CMS Collaboration | CMS luminosity measurements for the 2016 data-taking period | CMS-PAS-LUM-17-001 | CMS-PAS-LUM-17-001 |
| 67 | CMS Collaboration | CMS luminosity measurement for the 2017 data-taking period at $ \sqrt{s} = $ 13 TeV | CMS-PAS-LUM-17-004 | CMS-PAS-LUM-17-004 |
| 68 | CMS Collaboration | CMS luminosity measurement for the 2018 data-taking period at $ \sqrt{s} = $ 13 TeV | CMS-PAS-LUM-18-002 | CMS-PAS-LUM-18-002 |
| 69 | CMS Collaboration | Measurement of the $ \mathrm{t\bar{t}} $ production cross section using events with one lepton and at least one jet in pp collisions at $ \sqrt{s} = $ 13 TeV | JHEP 09 (2017) 051 | CMS-TOP-16-006 1701.06228 |
| 70 | CMS Collaboration | Measurement of the single top quark and antiquark production cross sections in the $ t $ channel and their ratio in proton-proton collisions at $ \sqrt{s}= $ 13 TeV | PLB 800 (2020) 135042 | CMS-TOP-17-011 1812.10514 |
| 71 | CMS Collaboration | Measurement of the production cross section for single top quarks in association with W bosons in proton-proton collisions at $ \sqrt{s}= $ 13 TeV | JHEP 10 (2018) 117 | CMS-TOP-17-018 1805.07399 |
| 72 | J. S. Conway | Incorporating nuisance parameters in likelihoods for multisource spectra | in Proc. workshop on statistical issues related to discovery claims in search experiments and unfolding (PHYSTAT 2011) | 1103.0354 |
| 73 | T. Junk | Confidence level computation for combining searches with small statistics | NIMA 434 (1999) 435 | hep-ex/9902006 |
| 74 | A. L. Read | Presentation of search results: the CL$ _{s} $ technique | JPG 28 (2002) 2693 | |
| 75 | G. Cowan, K. Cranmer, E. Gross, and O. Vitells | Asymptotic formulae for likelihood-based tests of new physics | EPJC 71 (2011) 1554 | 1007.1727 |
|
|
Compact Muon Solenoid LHC, CERN |
|

|

|

|

|

|