

Compact Muon Solenoid
LHC, CERN
| CMS-EXO-16-048 ; CERN-EP-2017-294 | ||
| Search for new physics in final states with an energetic jet or a hadronically decaying W or Z boson and transverse momentum imbalance at $\sqrt{s} = $ 13 TeV | ||
| CMS Collaboration | ||
| 6 December 2017 | ||
| Phys. Rev. D 97 (2018) 092005 | ||
| Abstract: A search for new physics using events containing an imbalance in transverse momentum and one or more energetic jets arising from initial-state radiation or the hadronic decay of W or Z bosons is presented. A data sample of proton-proton collisions at $\sqrt{s} = $ 13 TeV, collected with the CMS detector at the LHC and corresponding to an integrated luminosity of 35.9 fb$^{-1}$, is used. The observed data are found to be in agreement with the expectation from standard model processes. The results are interpreted as limits on the dark matter production cross section in simplified models with vector, axial-vector, scalar, and pseudoscalar mediators. Interpretations in the context of fermion portal and nonthermal dark matter models are also provided. In addition, the results are interpreted in terms of invisible decays of the Higgs boson and set stringent limits on the fundamental Planck scale in the Arkani-Hamed, Dimopoulos, and Dvali model with large extra spatial dimensions. | ||
| Links: e-print arXiv:1712.02345 [hep-ex] (PDF) ; CDS record ; inSPIRE record ; HepData record ; CADI line (restricted) ; | ||
| Figures | |

png pdf |
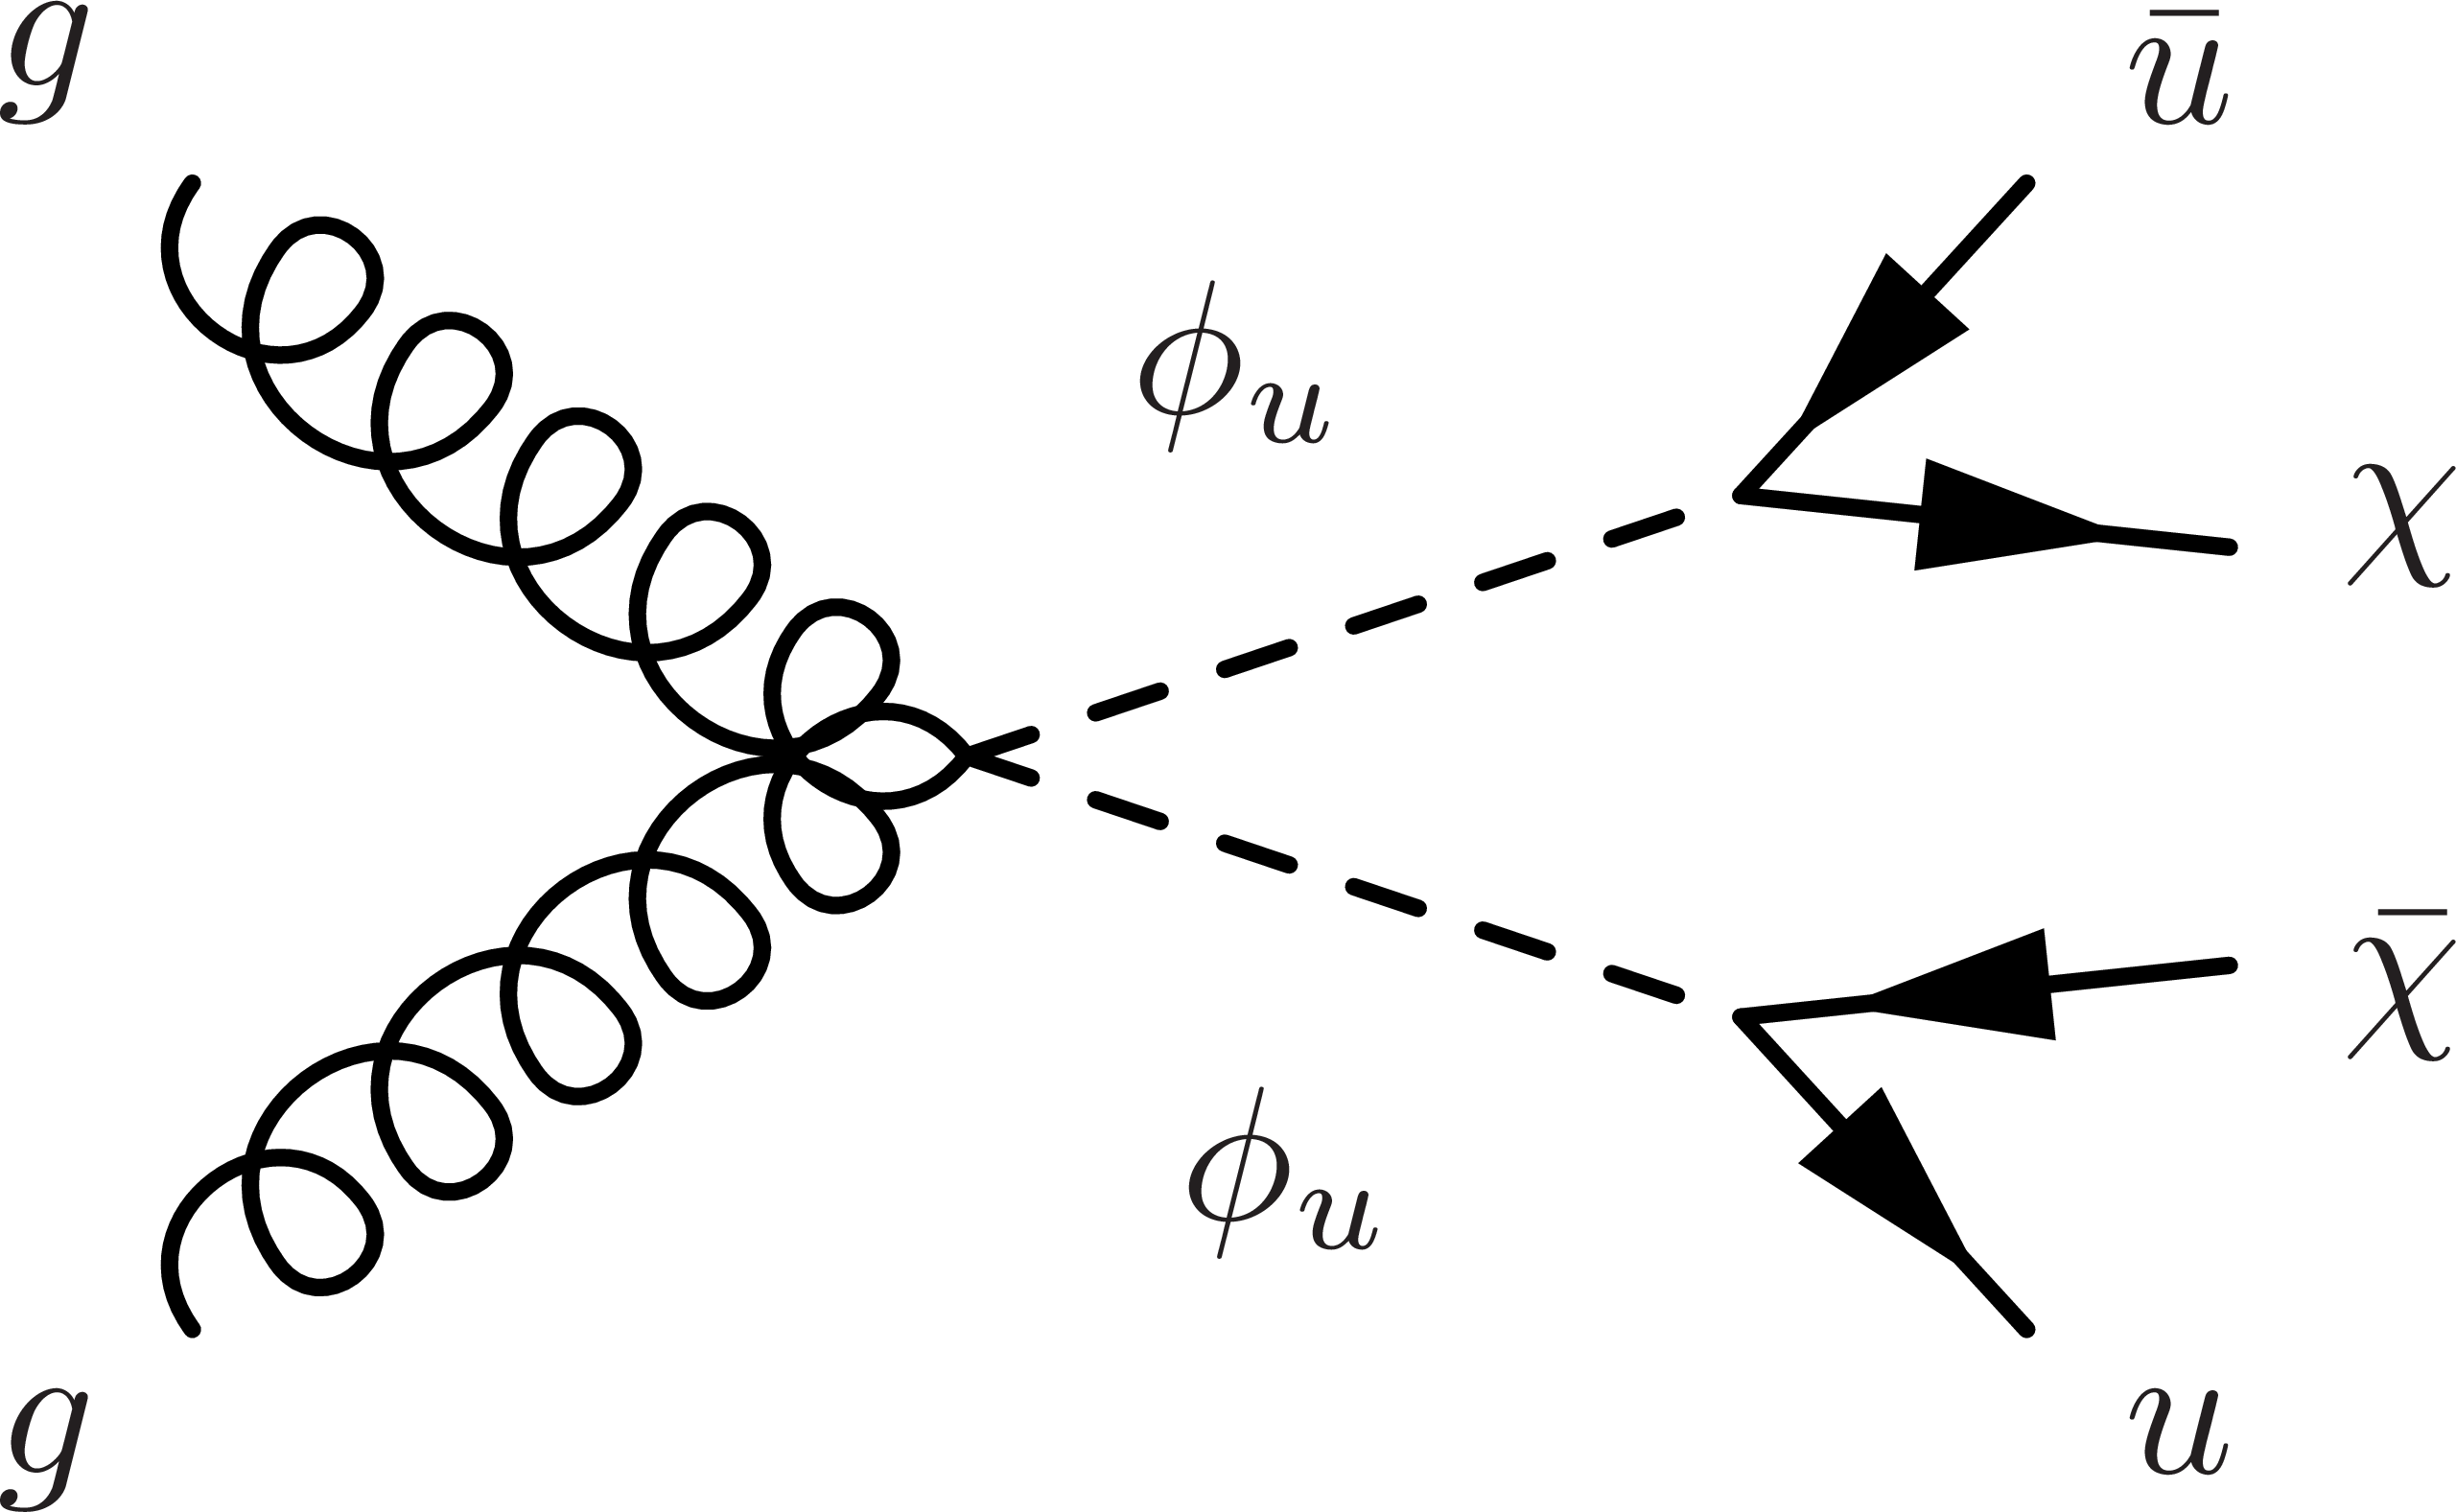
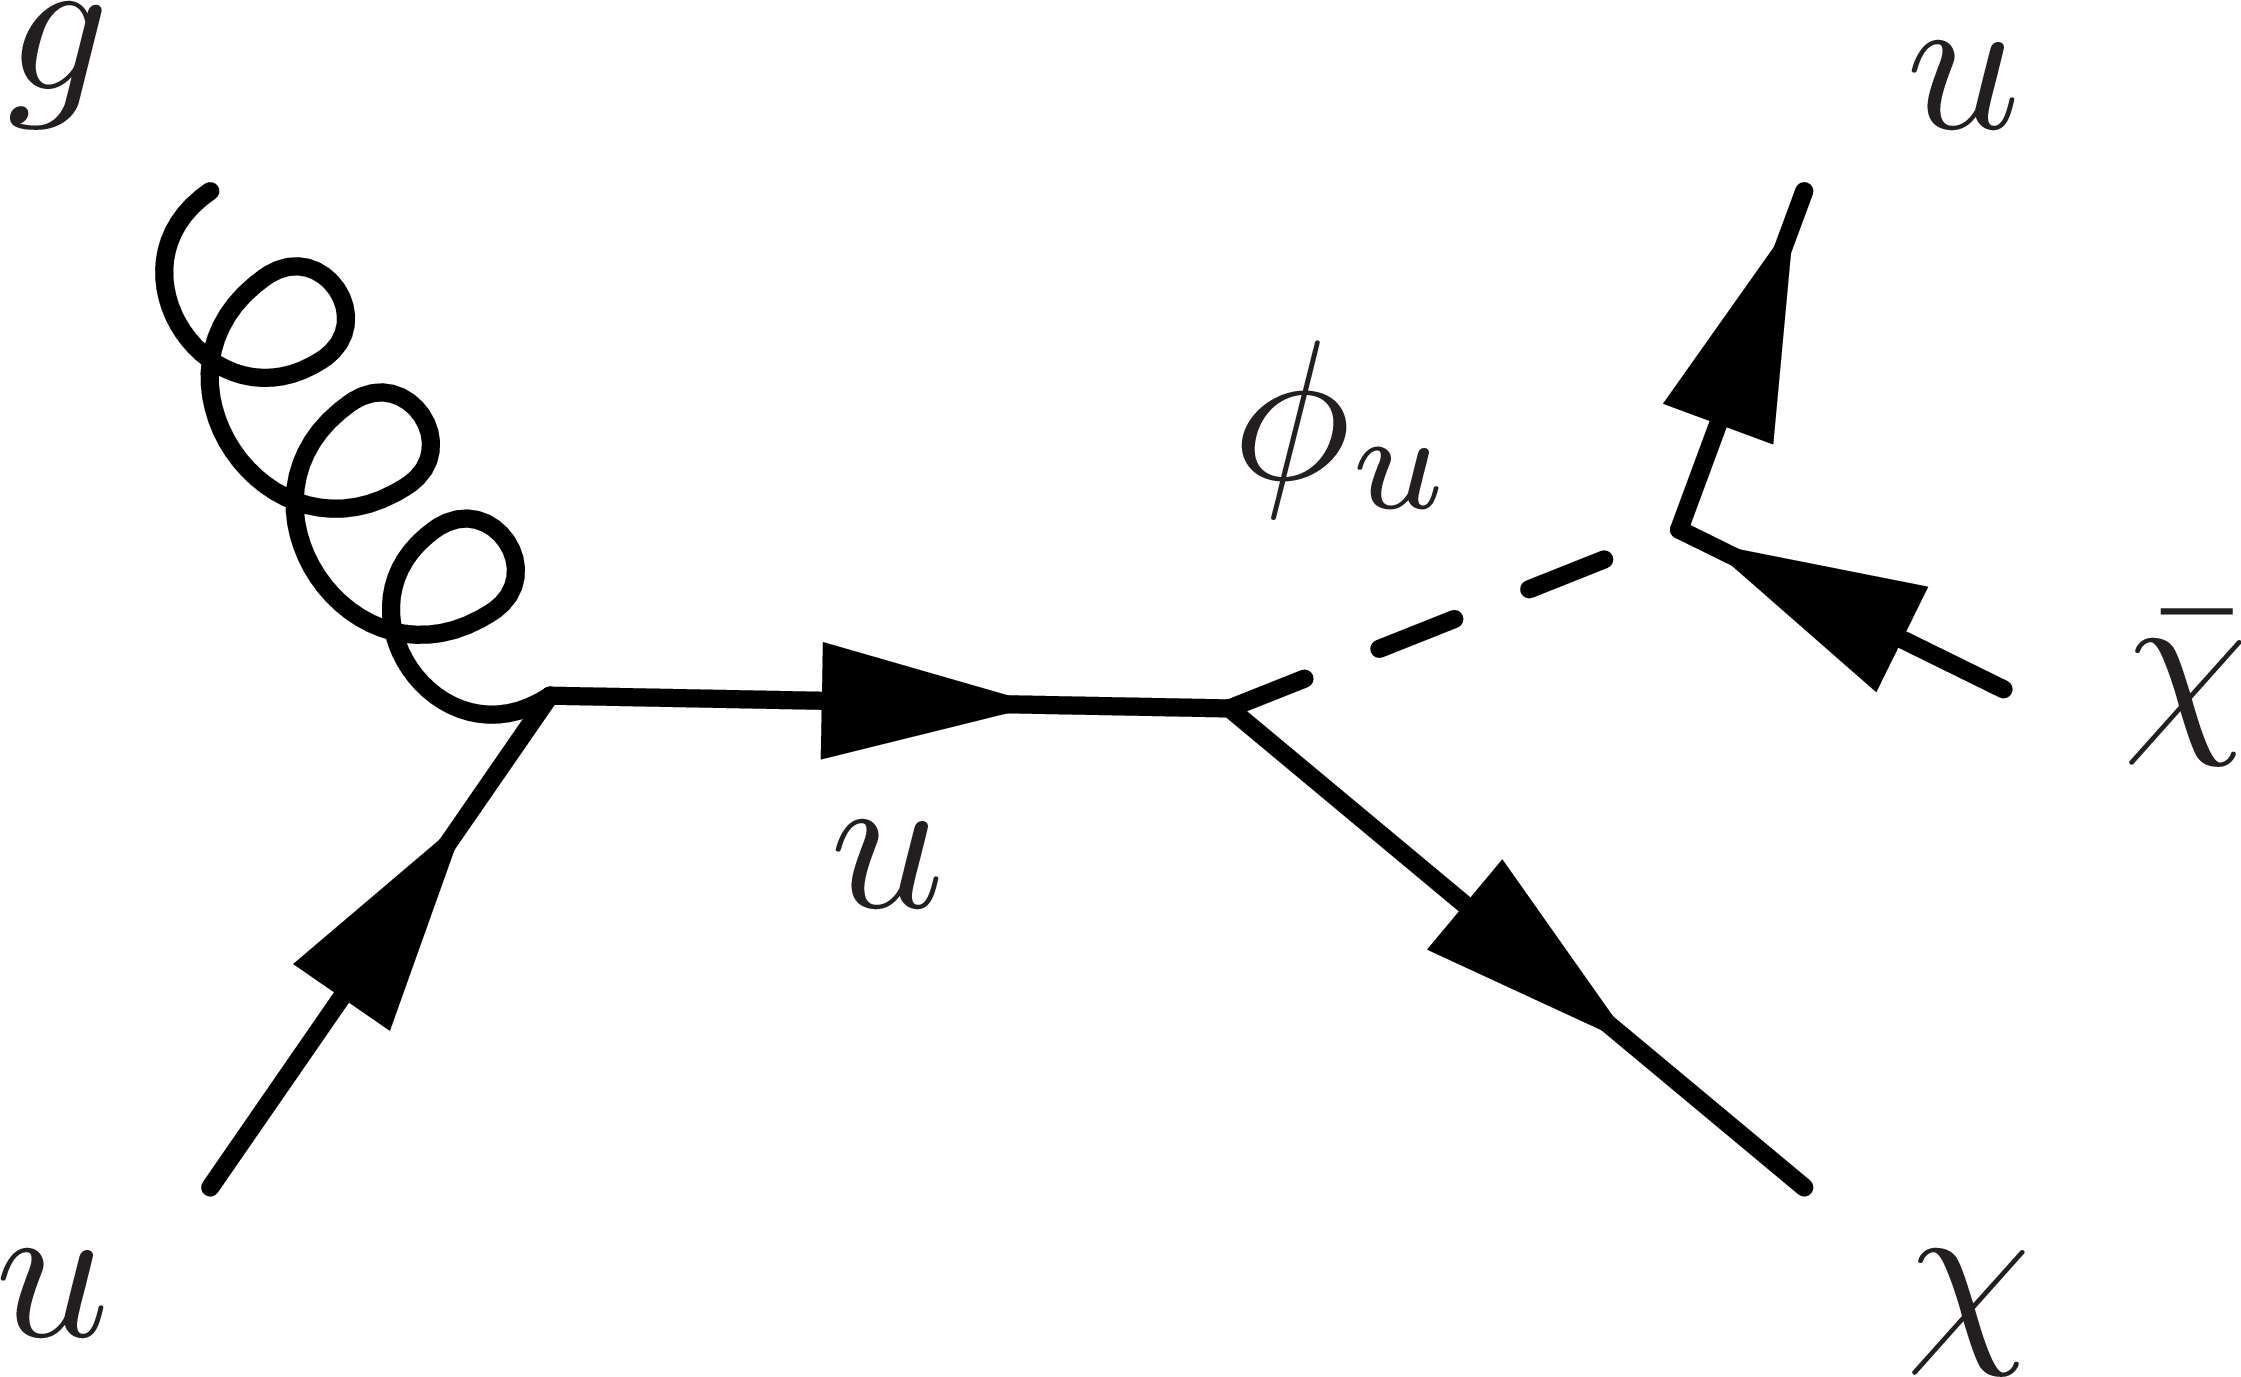
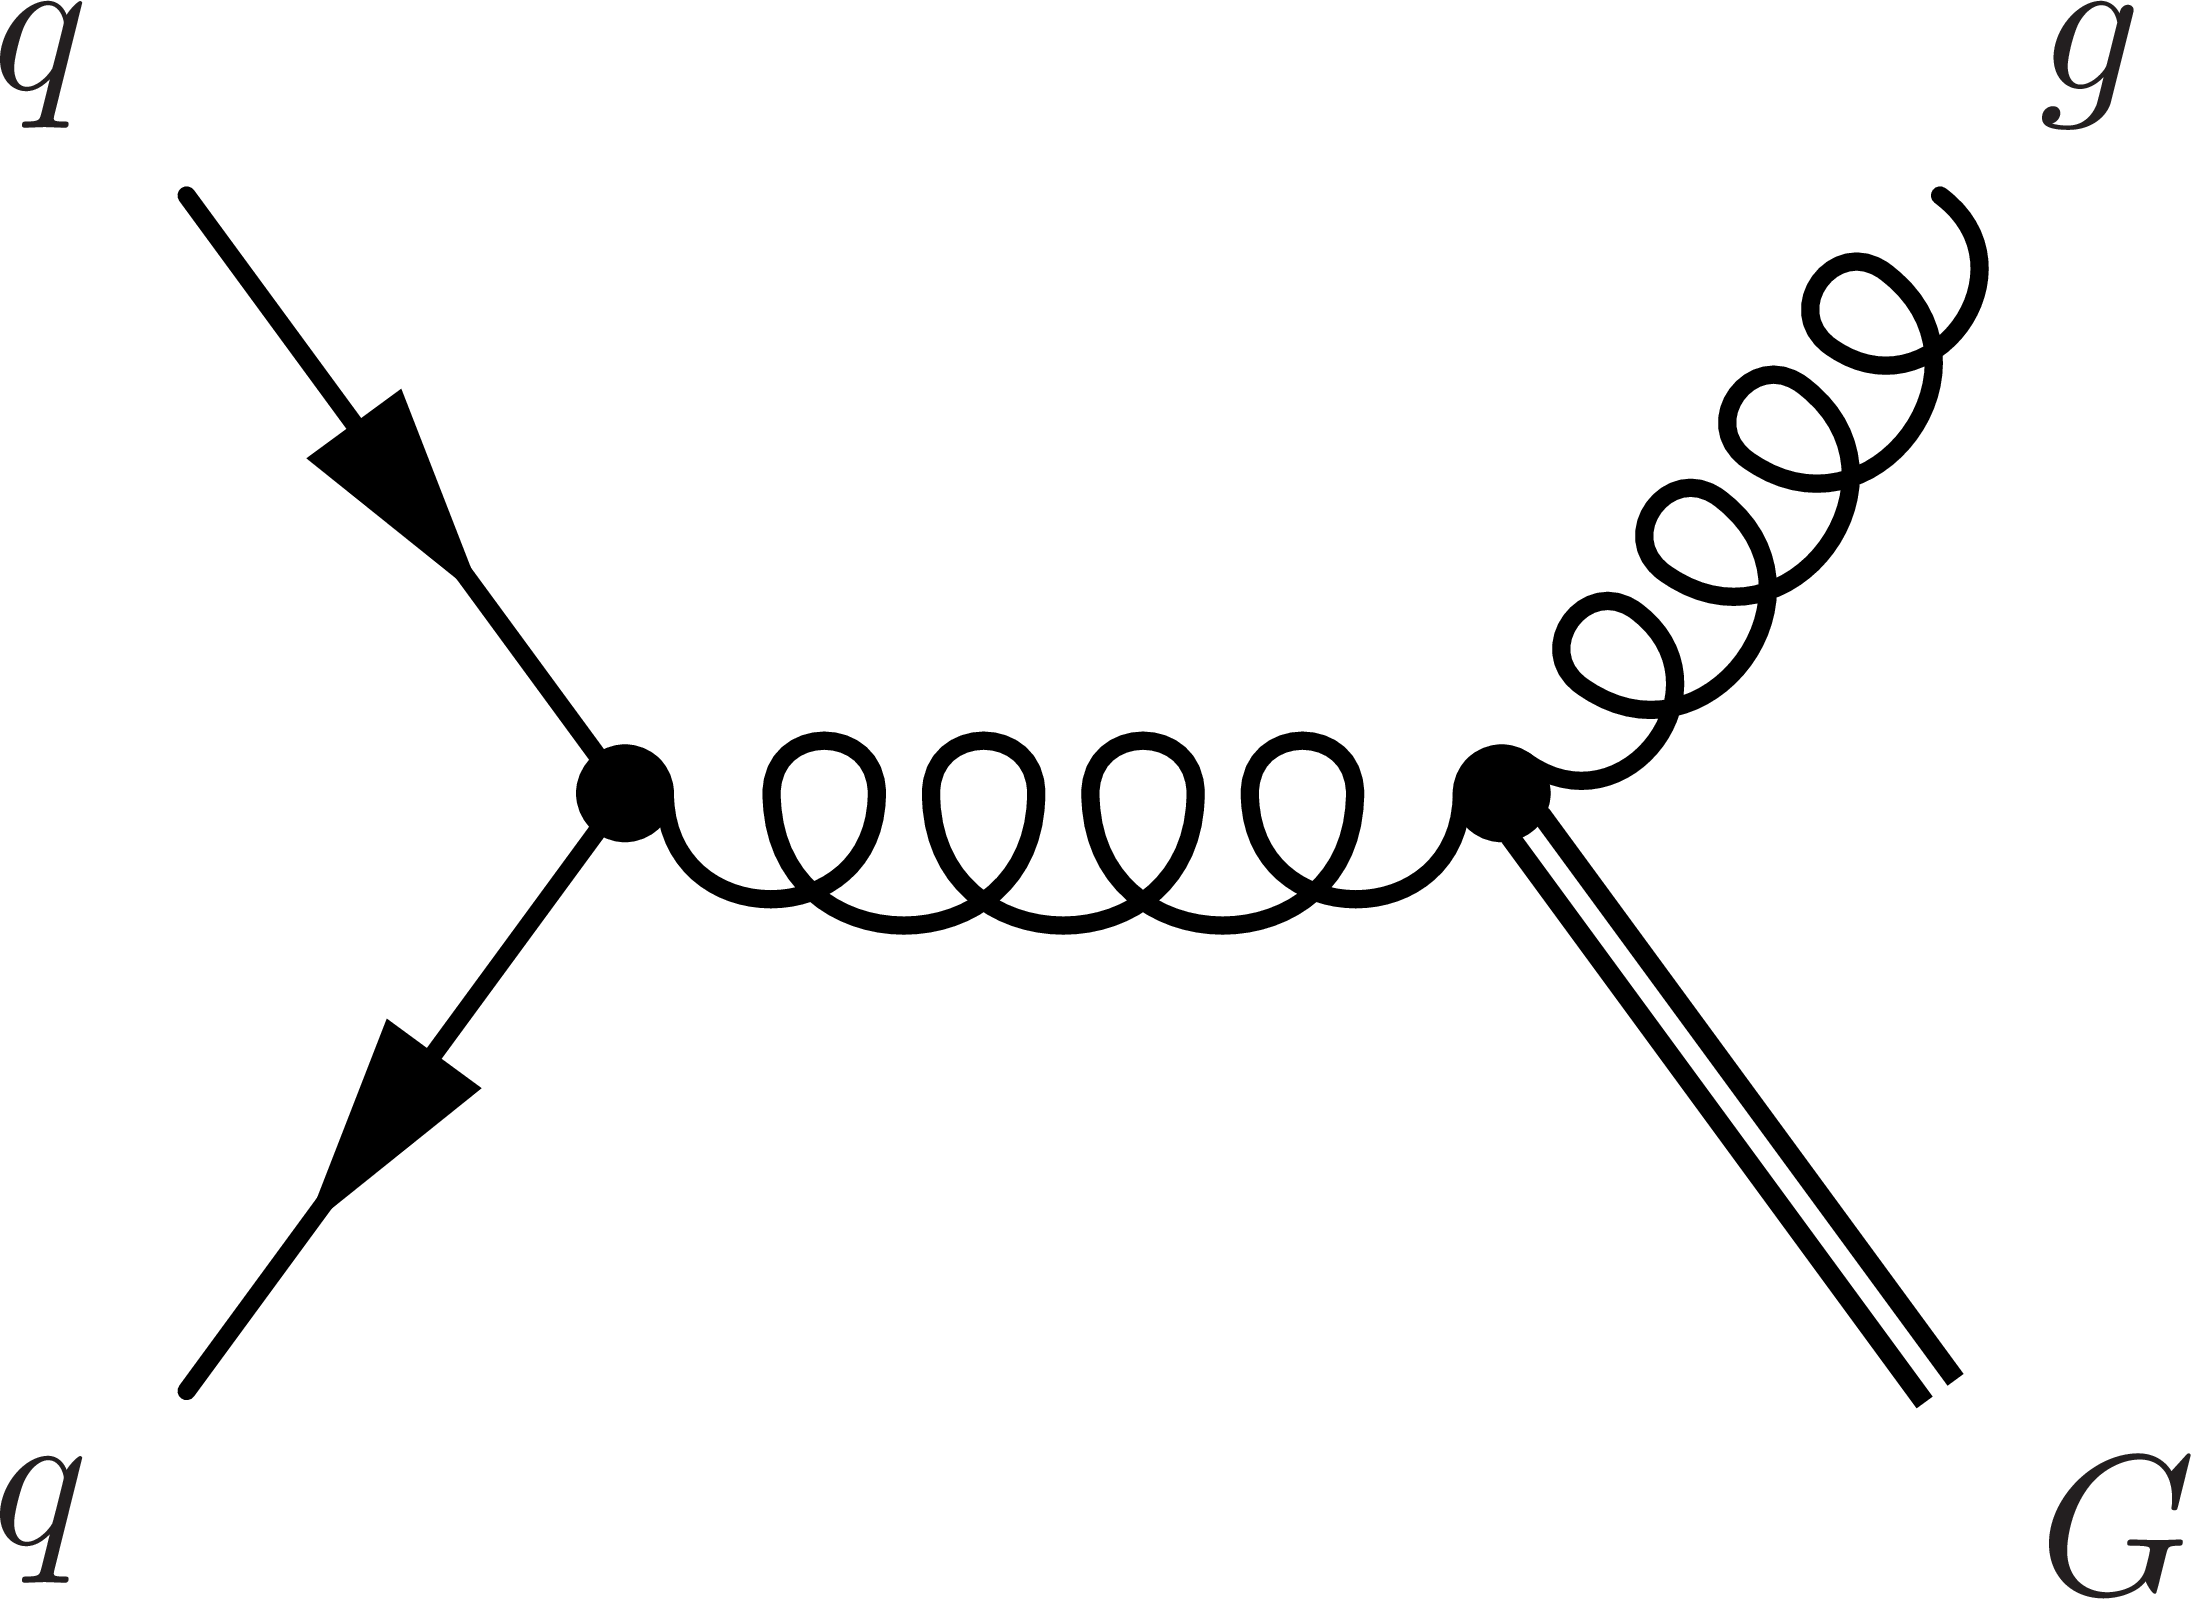
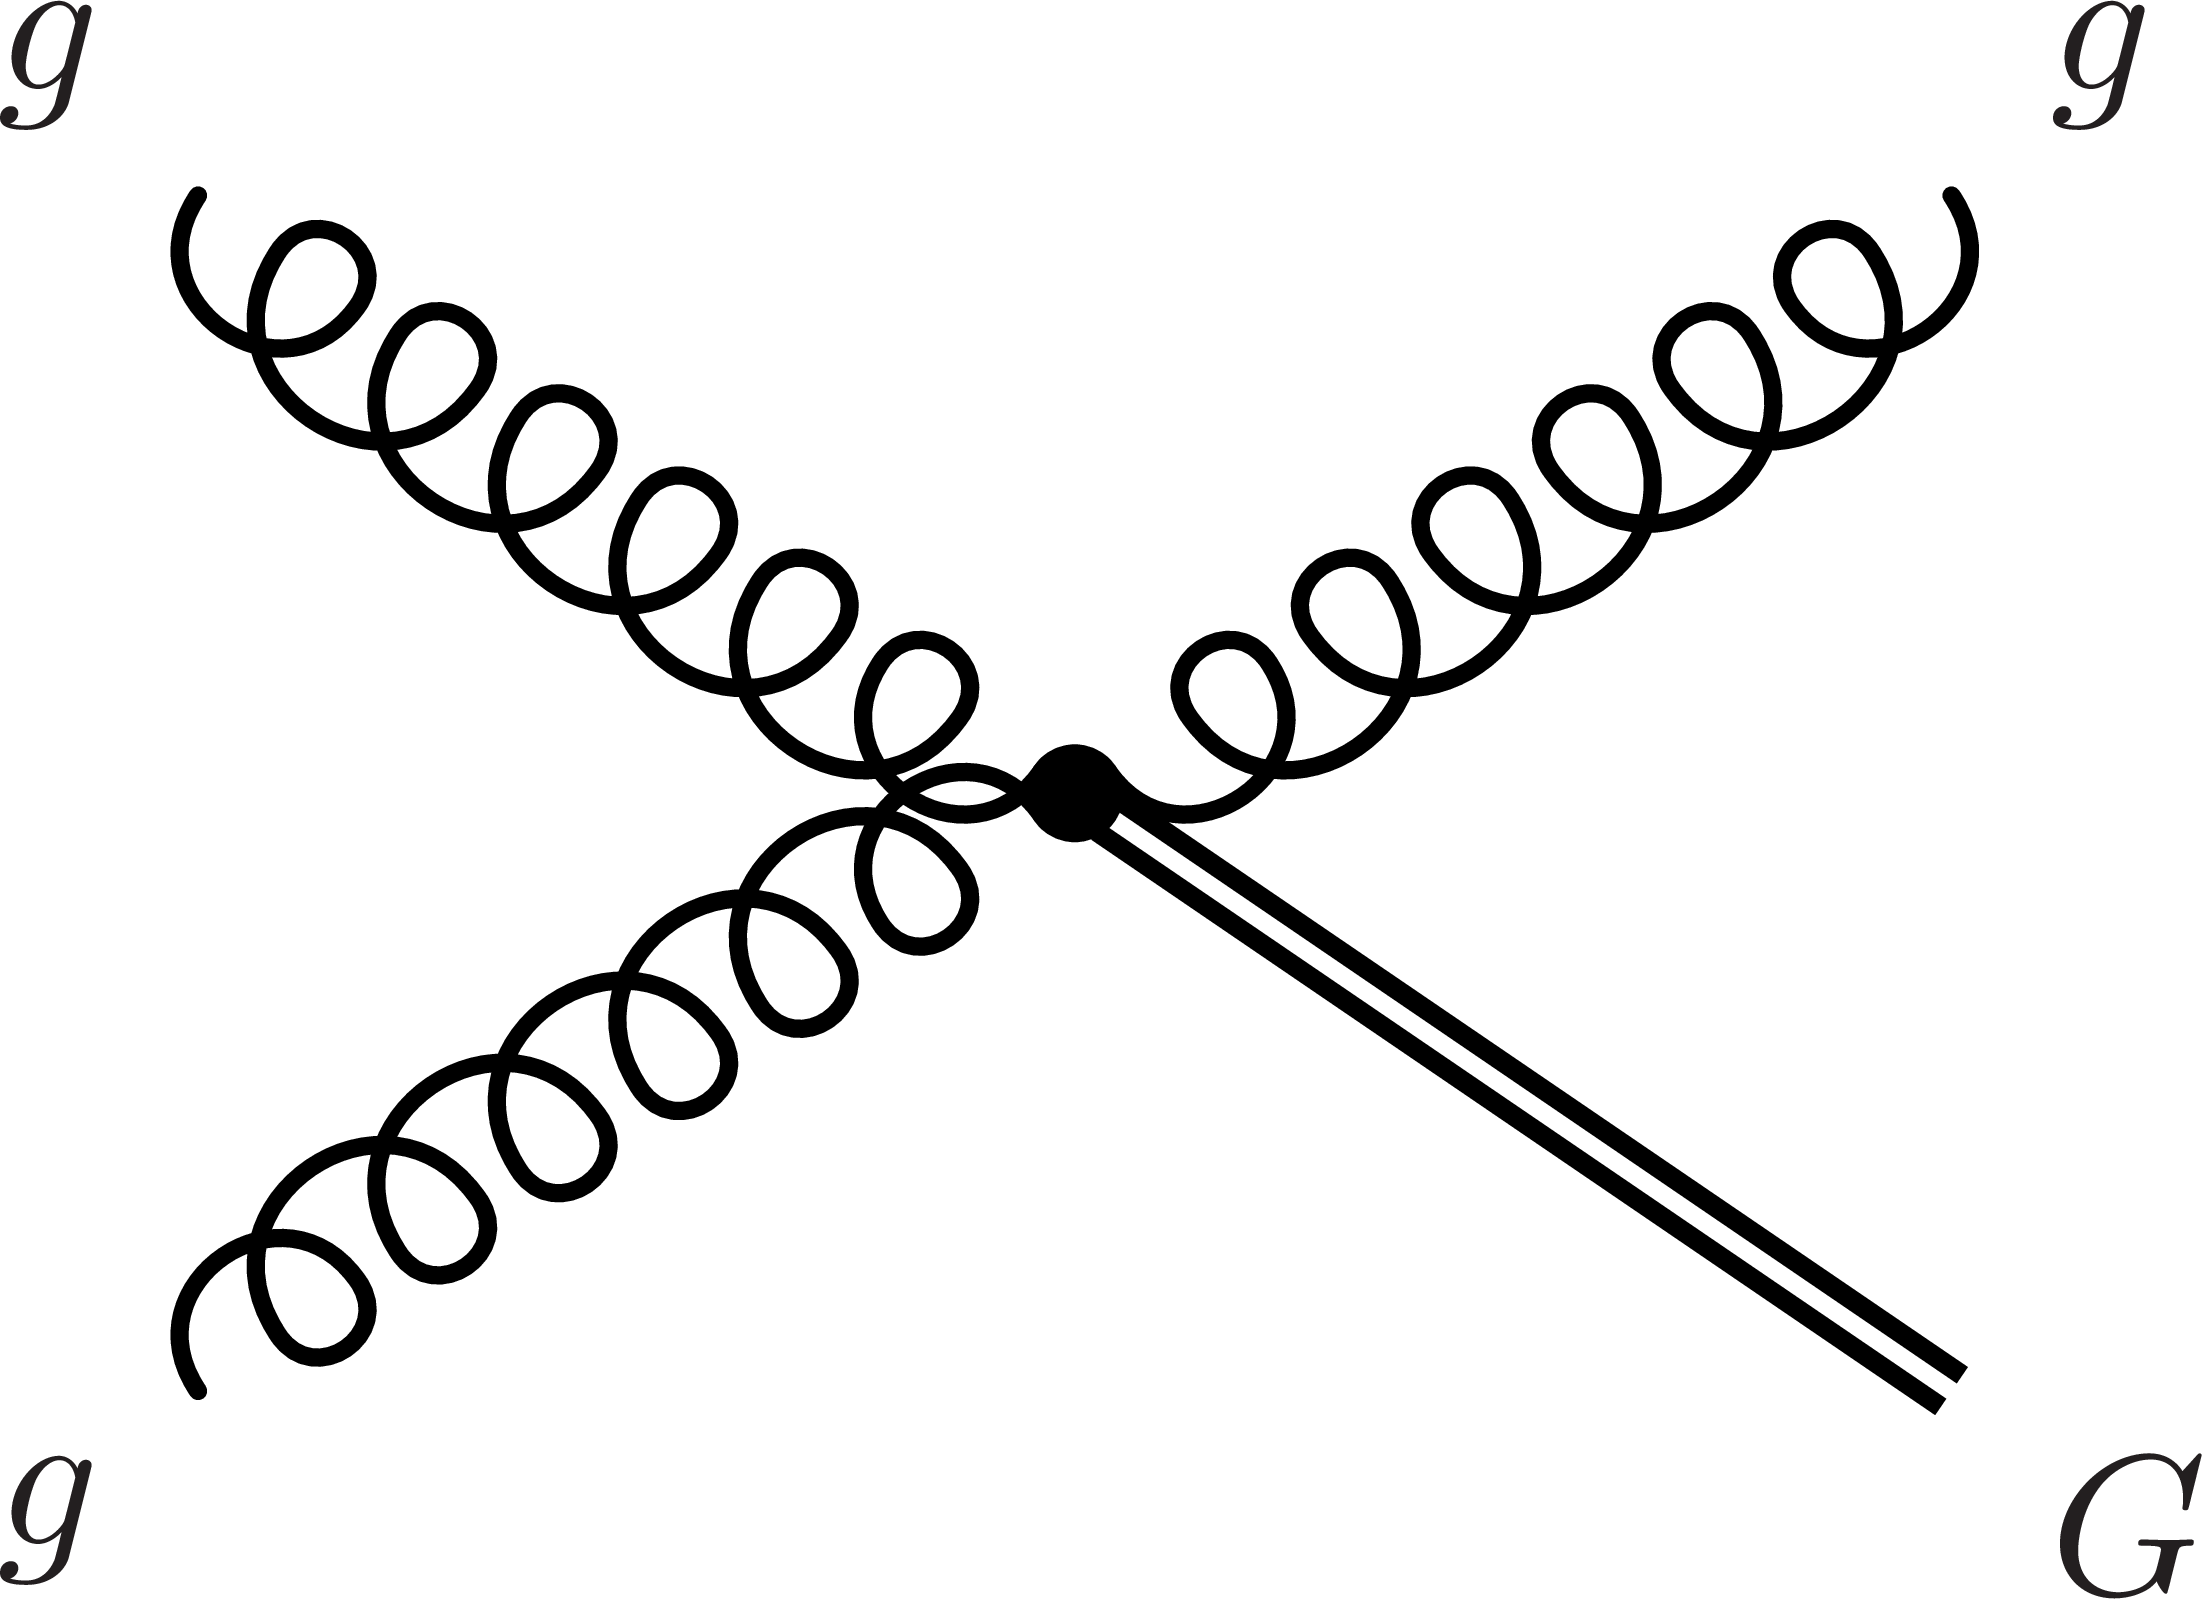
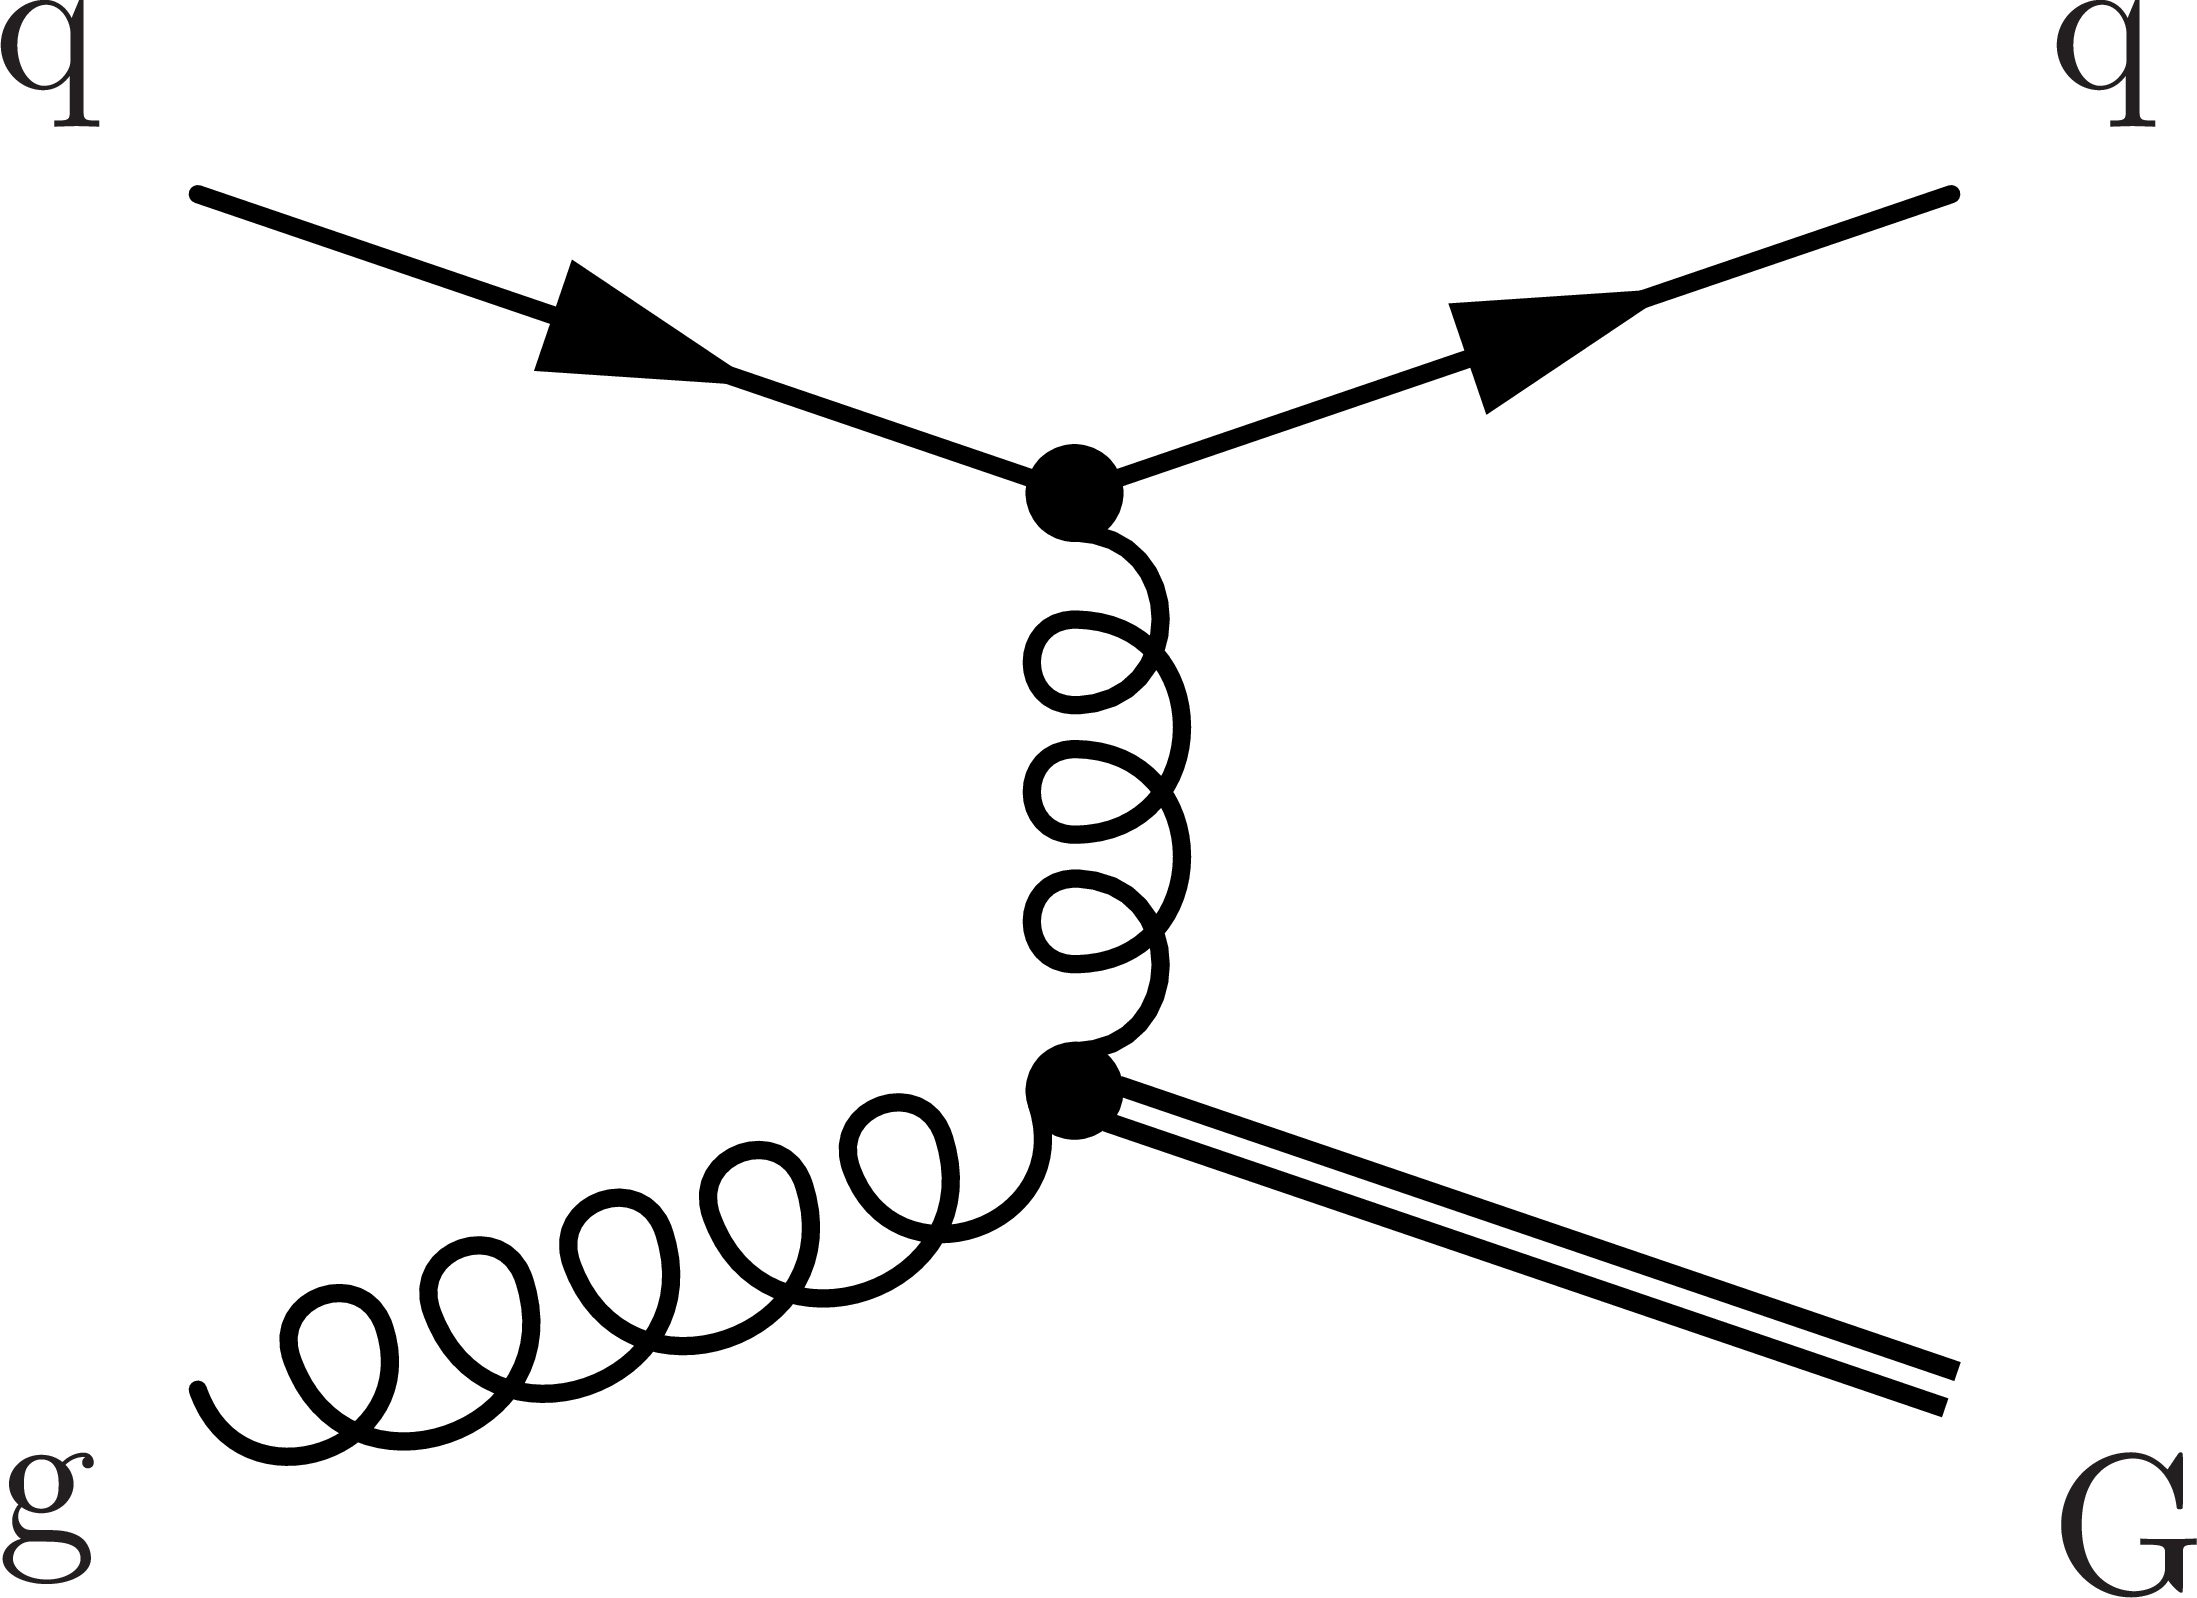
Figure 1:
Examples of Feynman diagrams of the main production mechanisms at the LHC of DM particles in association with a quark or gluon in the fermion portal model providing multijet (left) and monojet (middle, right) signatures. |
png pdf |
Figure 1-a:
Example of Feynman diagram of the one of the production mechanisms of DM particles in association with a quark or gluon in the fermion portal model providing a multijet signature. |
png pdf |
Figure 1-b:
Example of Feynman diagram of the one of the production mechanisms of DM particles in association with a quark or gluon in the fermion portal model providing a monojet signature. |

png pdf |
Figure 1-c:
Example of Feynman diagram of the one of the production mechanisms of DM particles in association with a quark or gluon in the fermion portal model providing a monojet signature. |
png pdf |
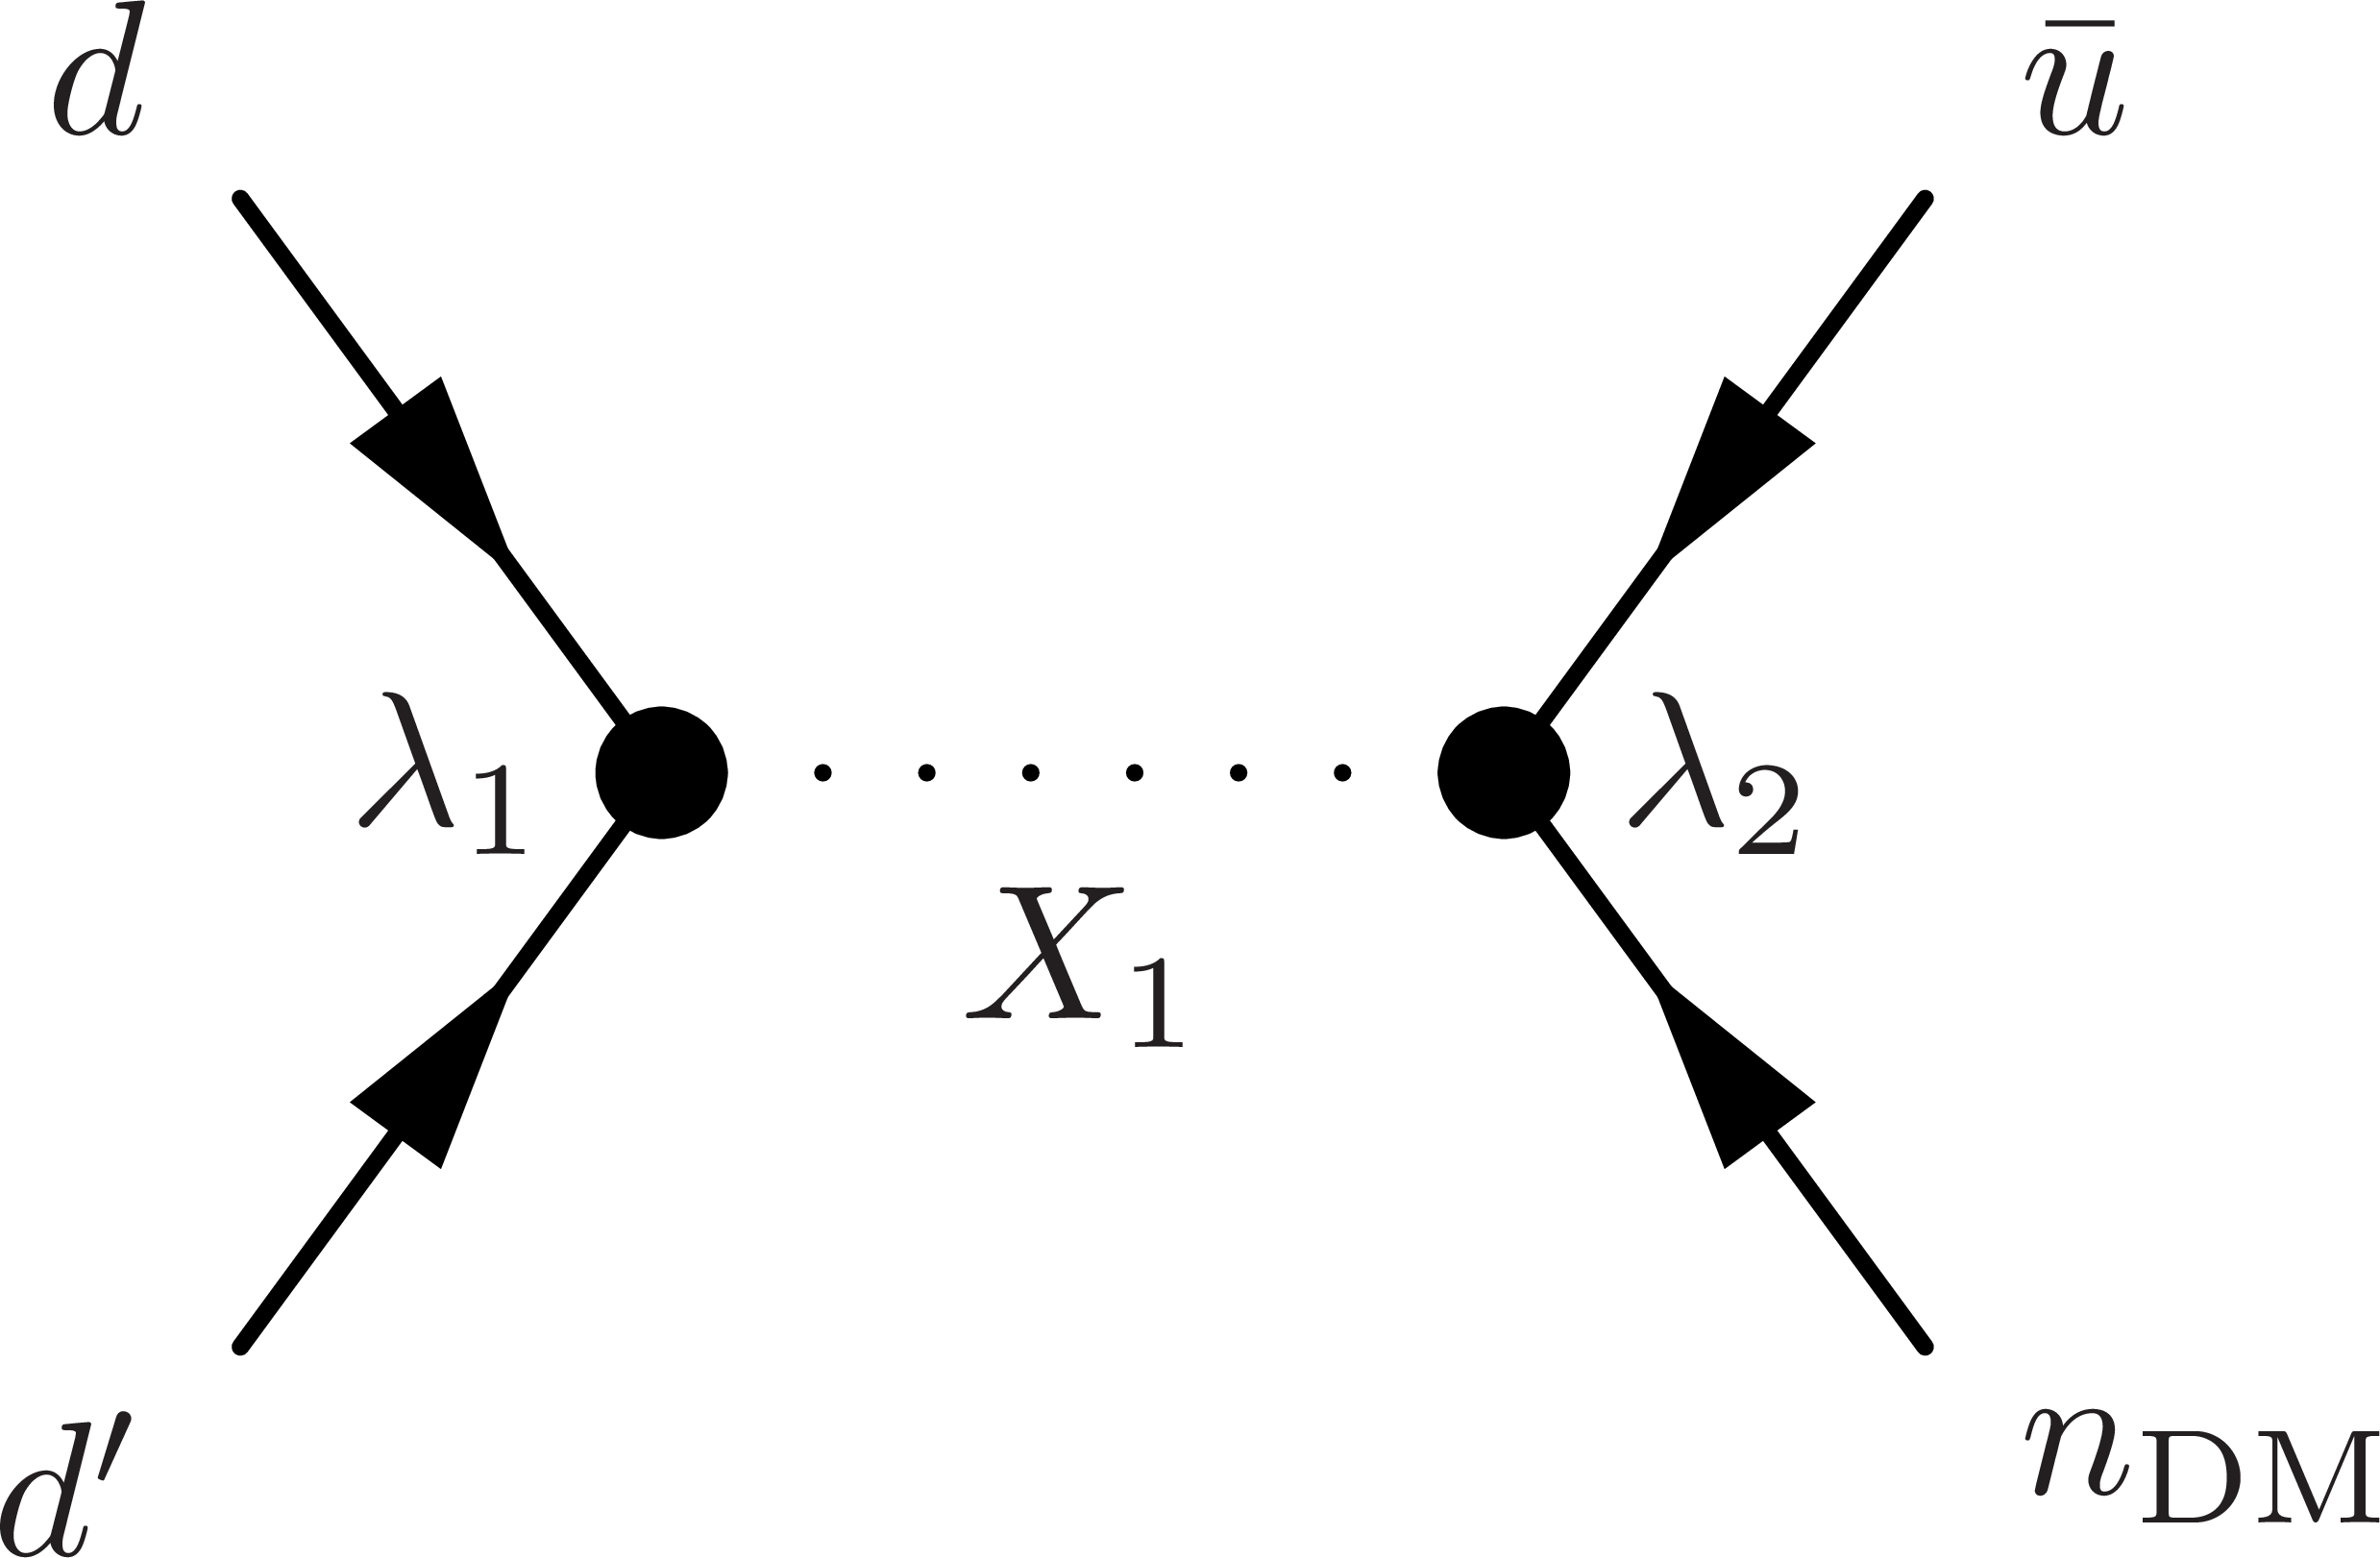
Figure 2:
Example of Feynman diagram of the main production mechanism at the LHC of DM particles in the nonthermal model resulting in the monojet final state. In this diagram, $\rm {d}$ and $\rm {d^{'}}$ represent different down-type quark generations. |
png pdf |
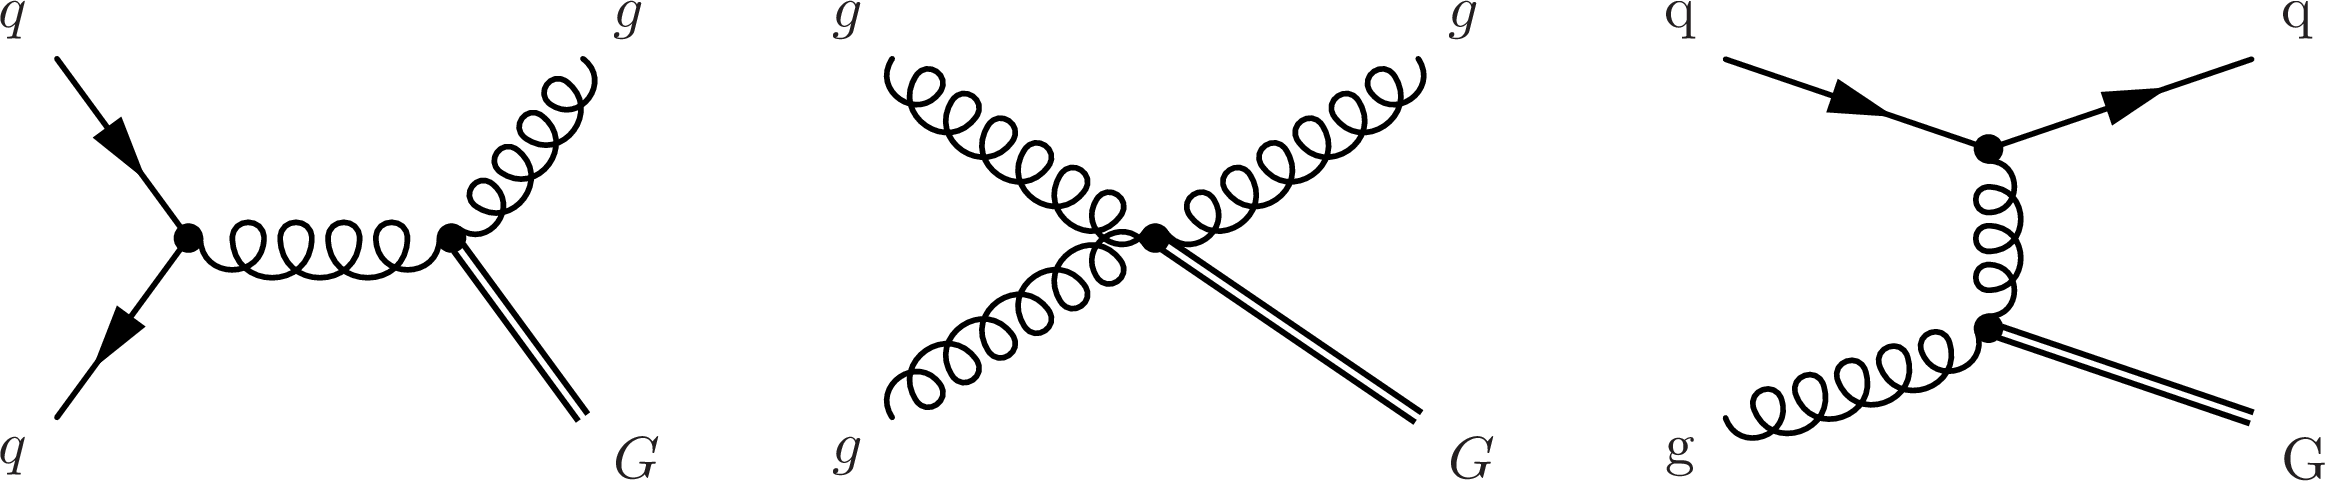
Figure 3:
Examples of Feynman diagrams of the main production mechanisms of gravitons at the LHC that provide monojet signatures in the ADD model. |
png pdf |
Figure 3-a:
Example of Feynman diagram of one of the main production mechanisms of gravitons at the LHC that provide monojet signatures in the ADD model. |
png pdf |
Figure 3-b:
Example of Feynman diagram of one of the main production mechanisms of gravitons at the LHC that provide monojet signatures in the ADD model. |
png pdf |
Figure 3-c:
Example of Feynman diagram of one of the main production mechanisms of gravitons at the LHC that provide monojet signatures in the ADD model. |

png pdf |
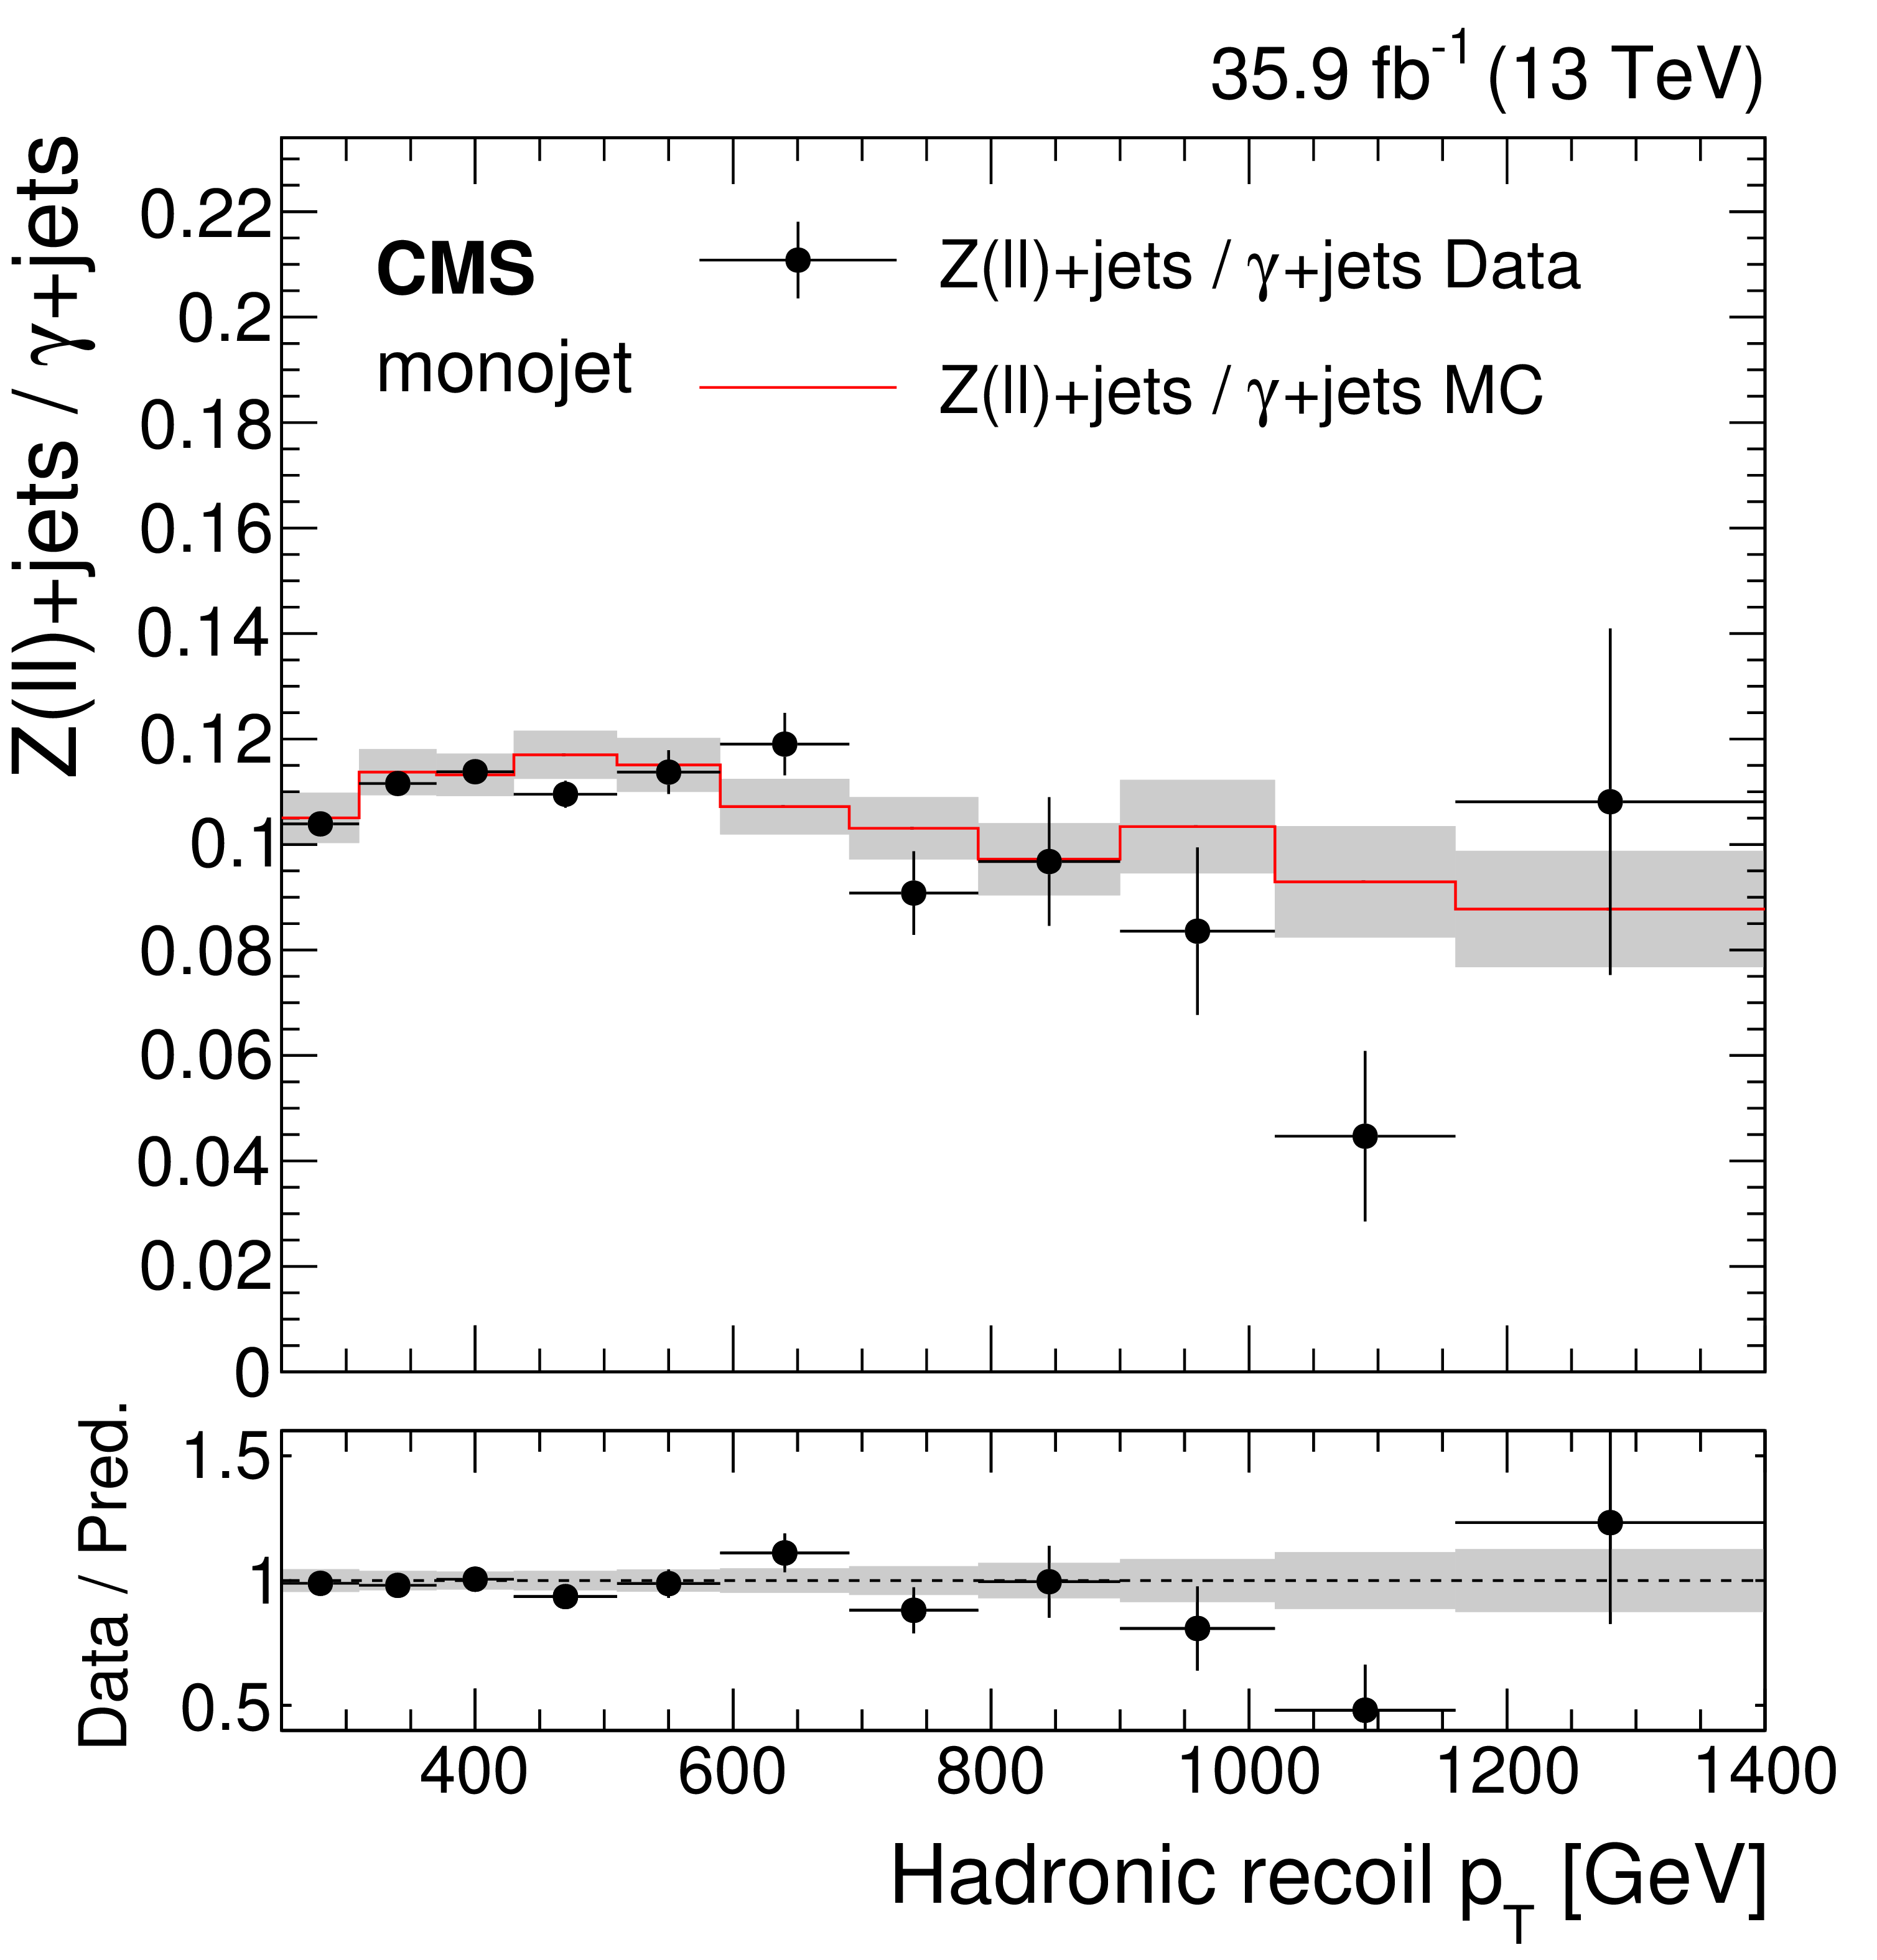
Figure 4:
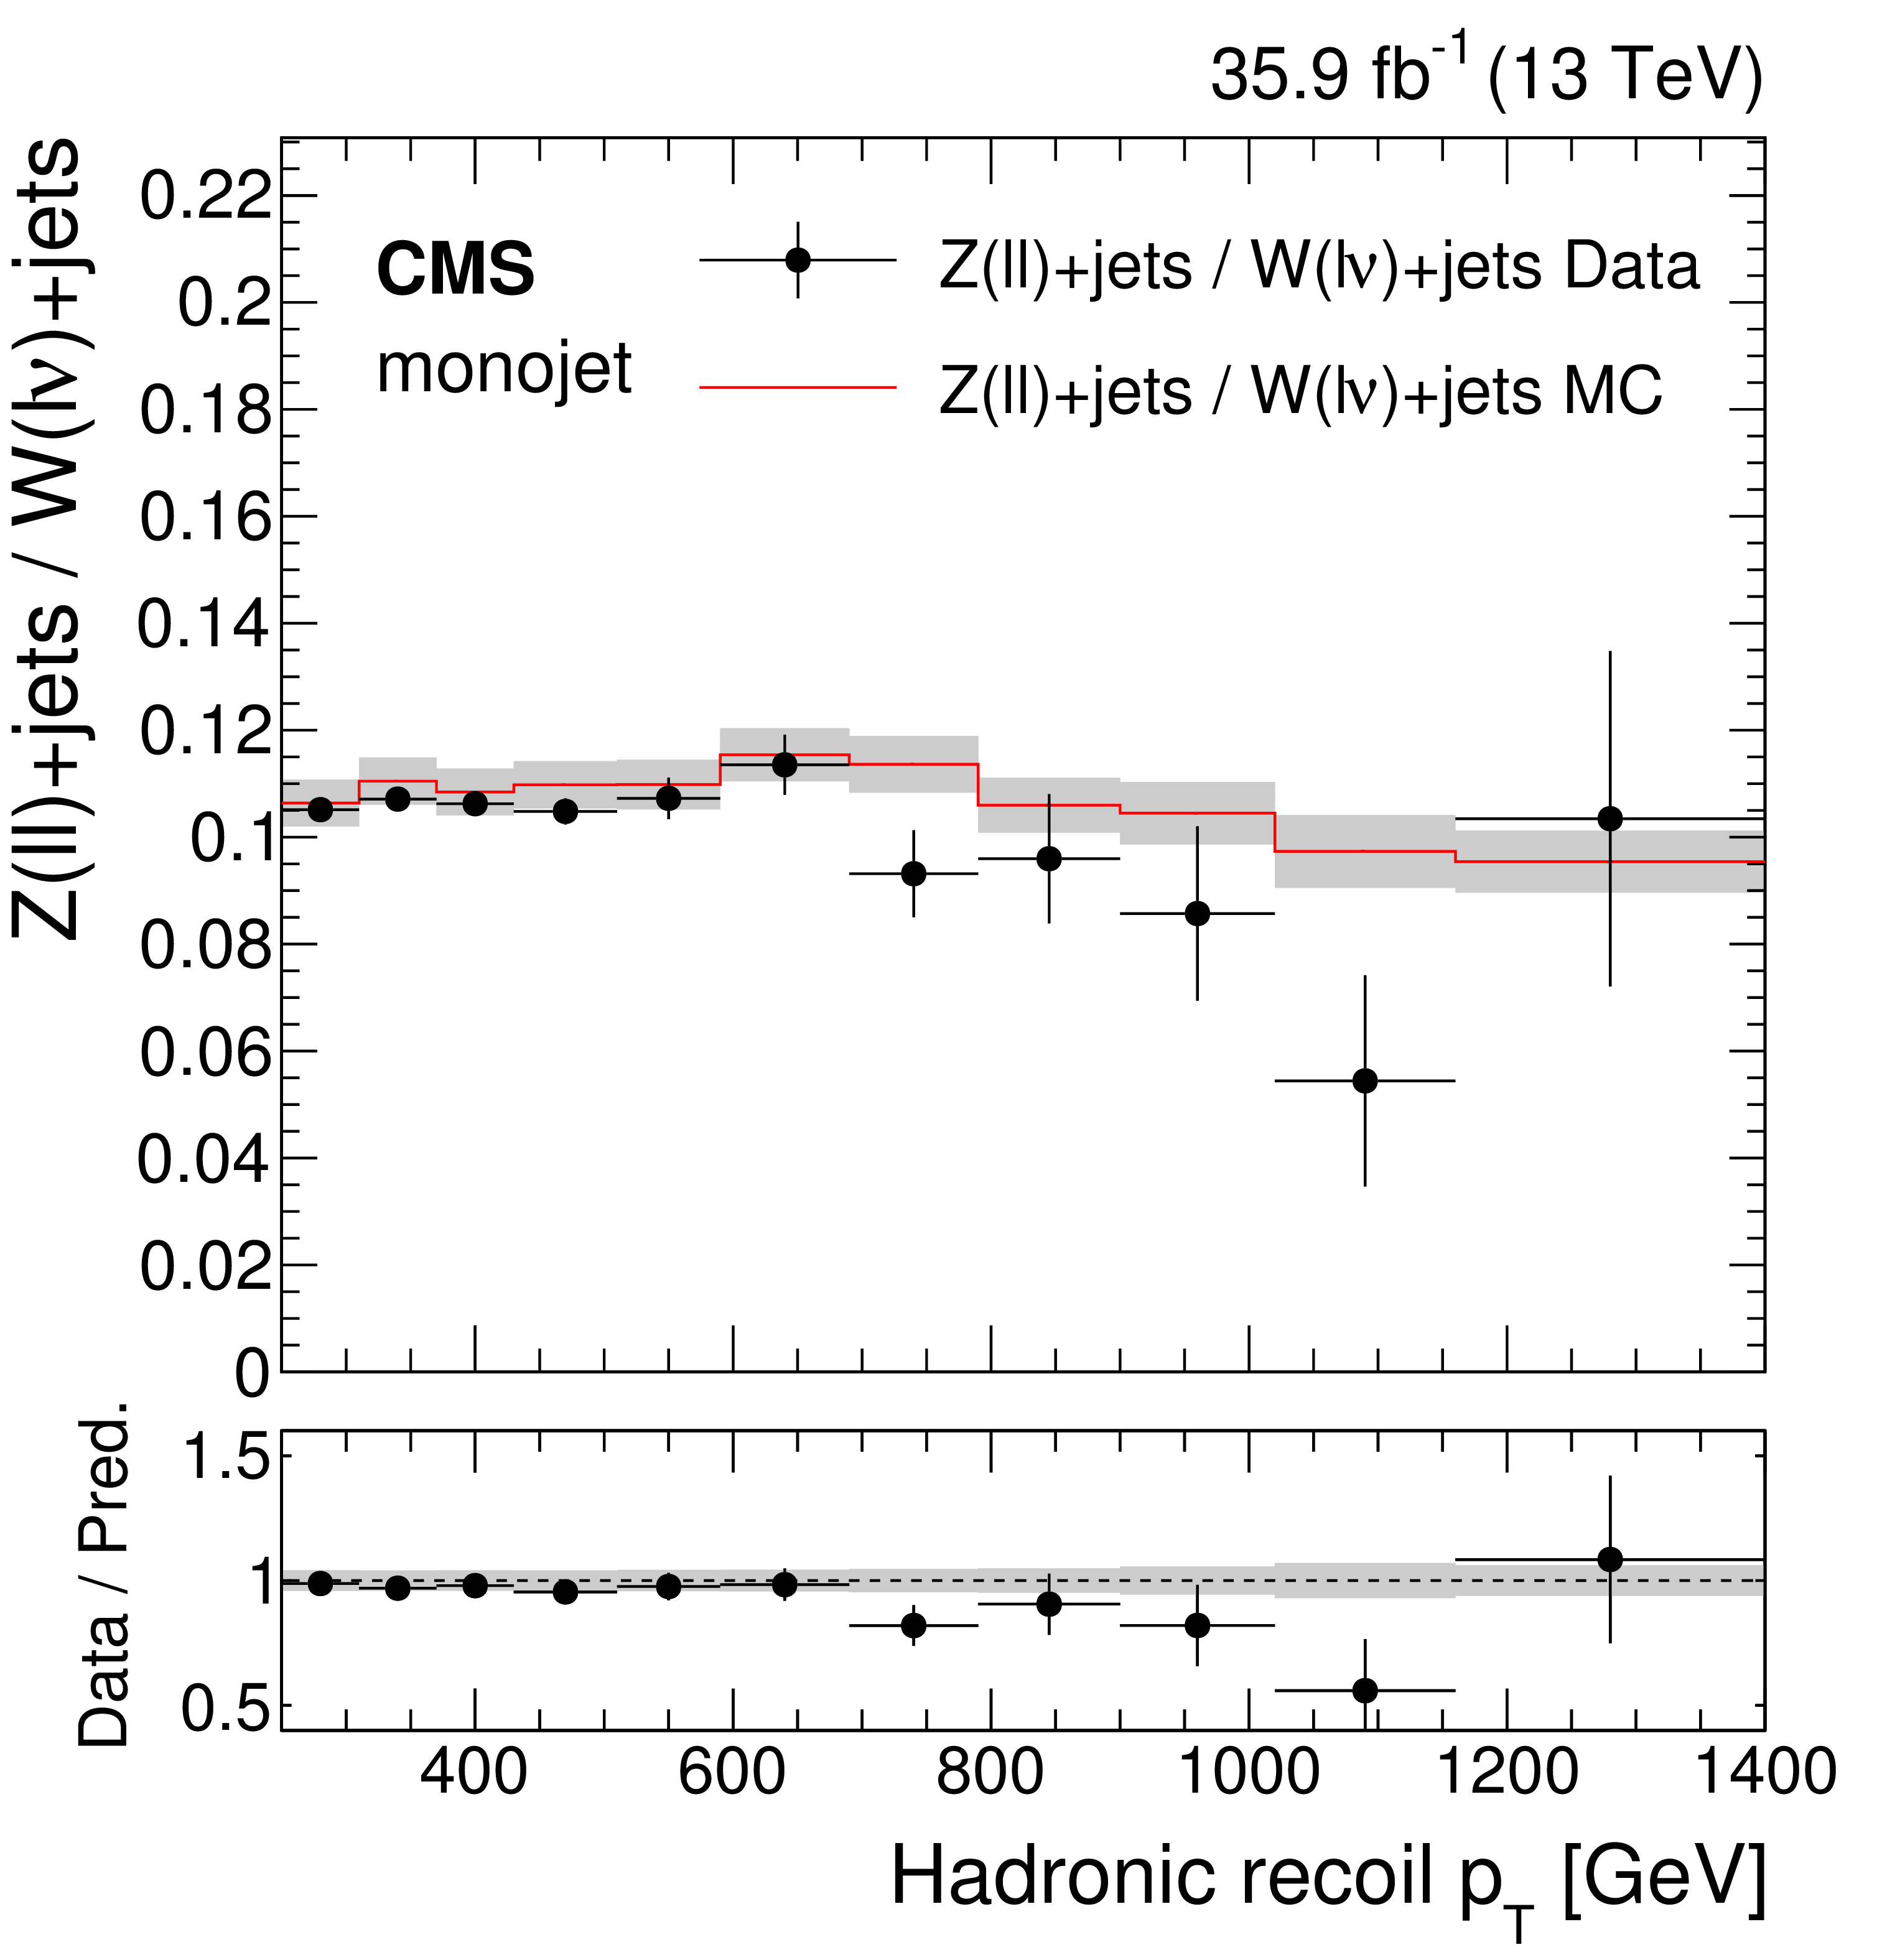
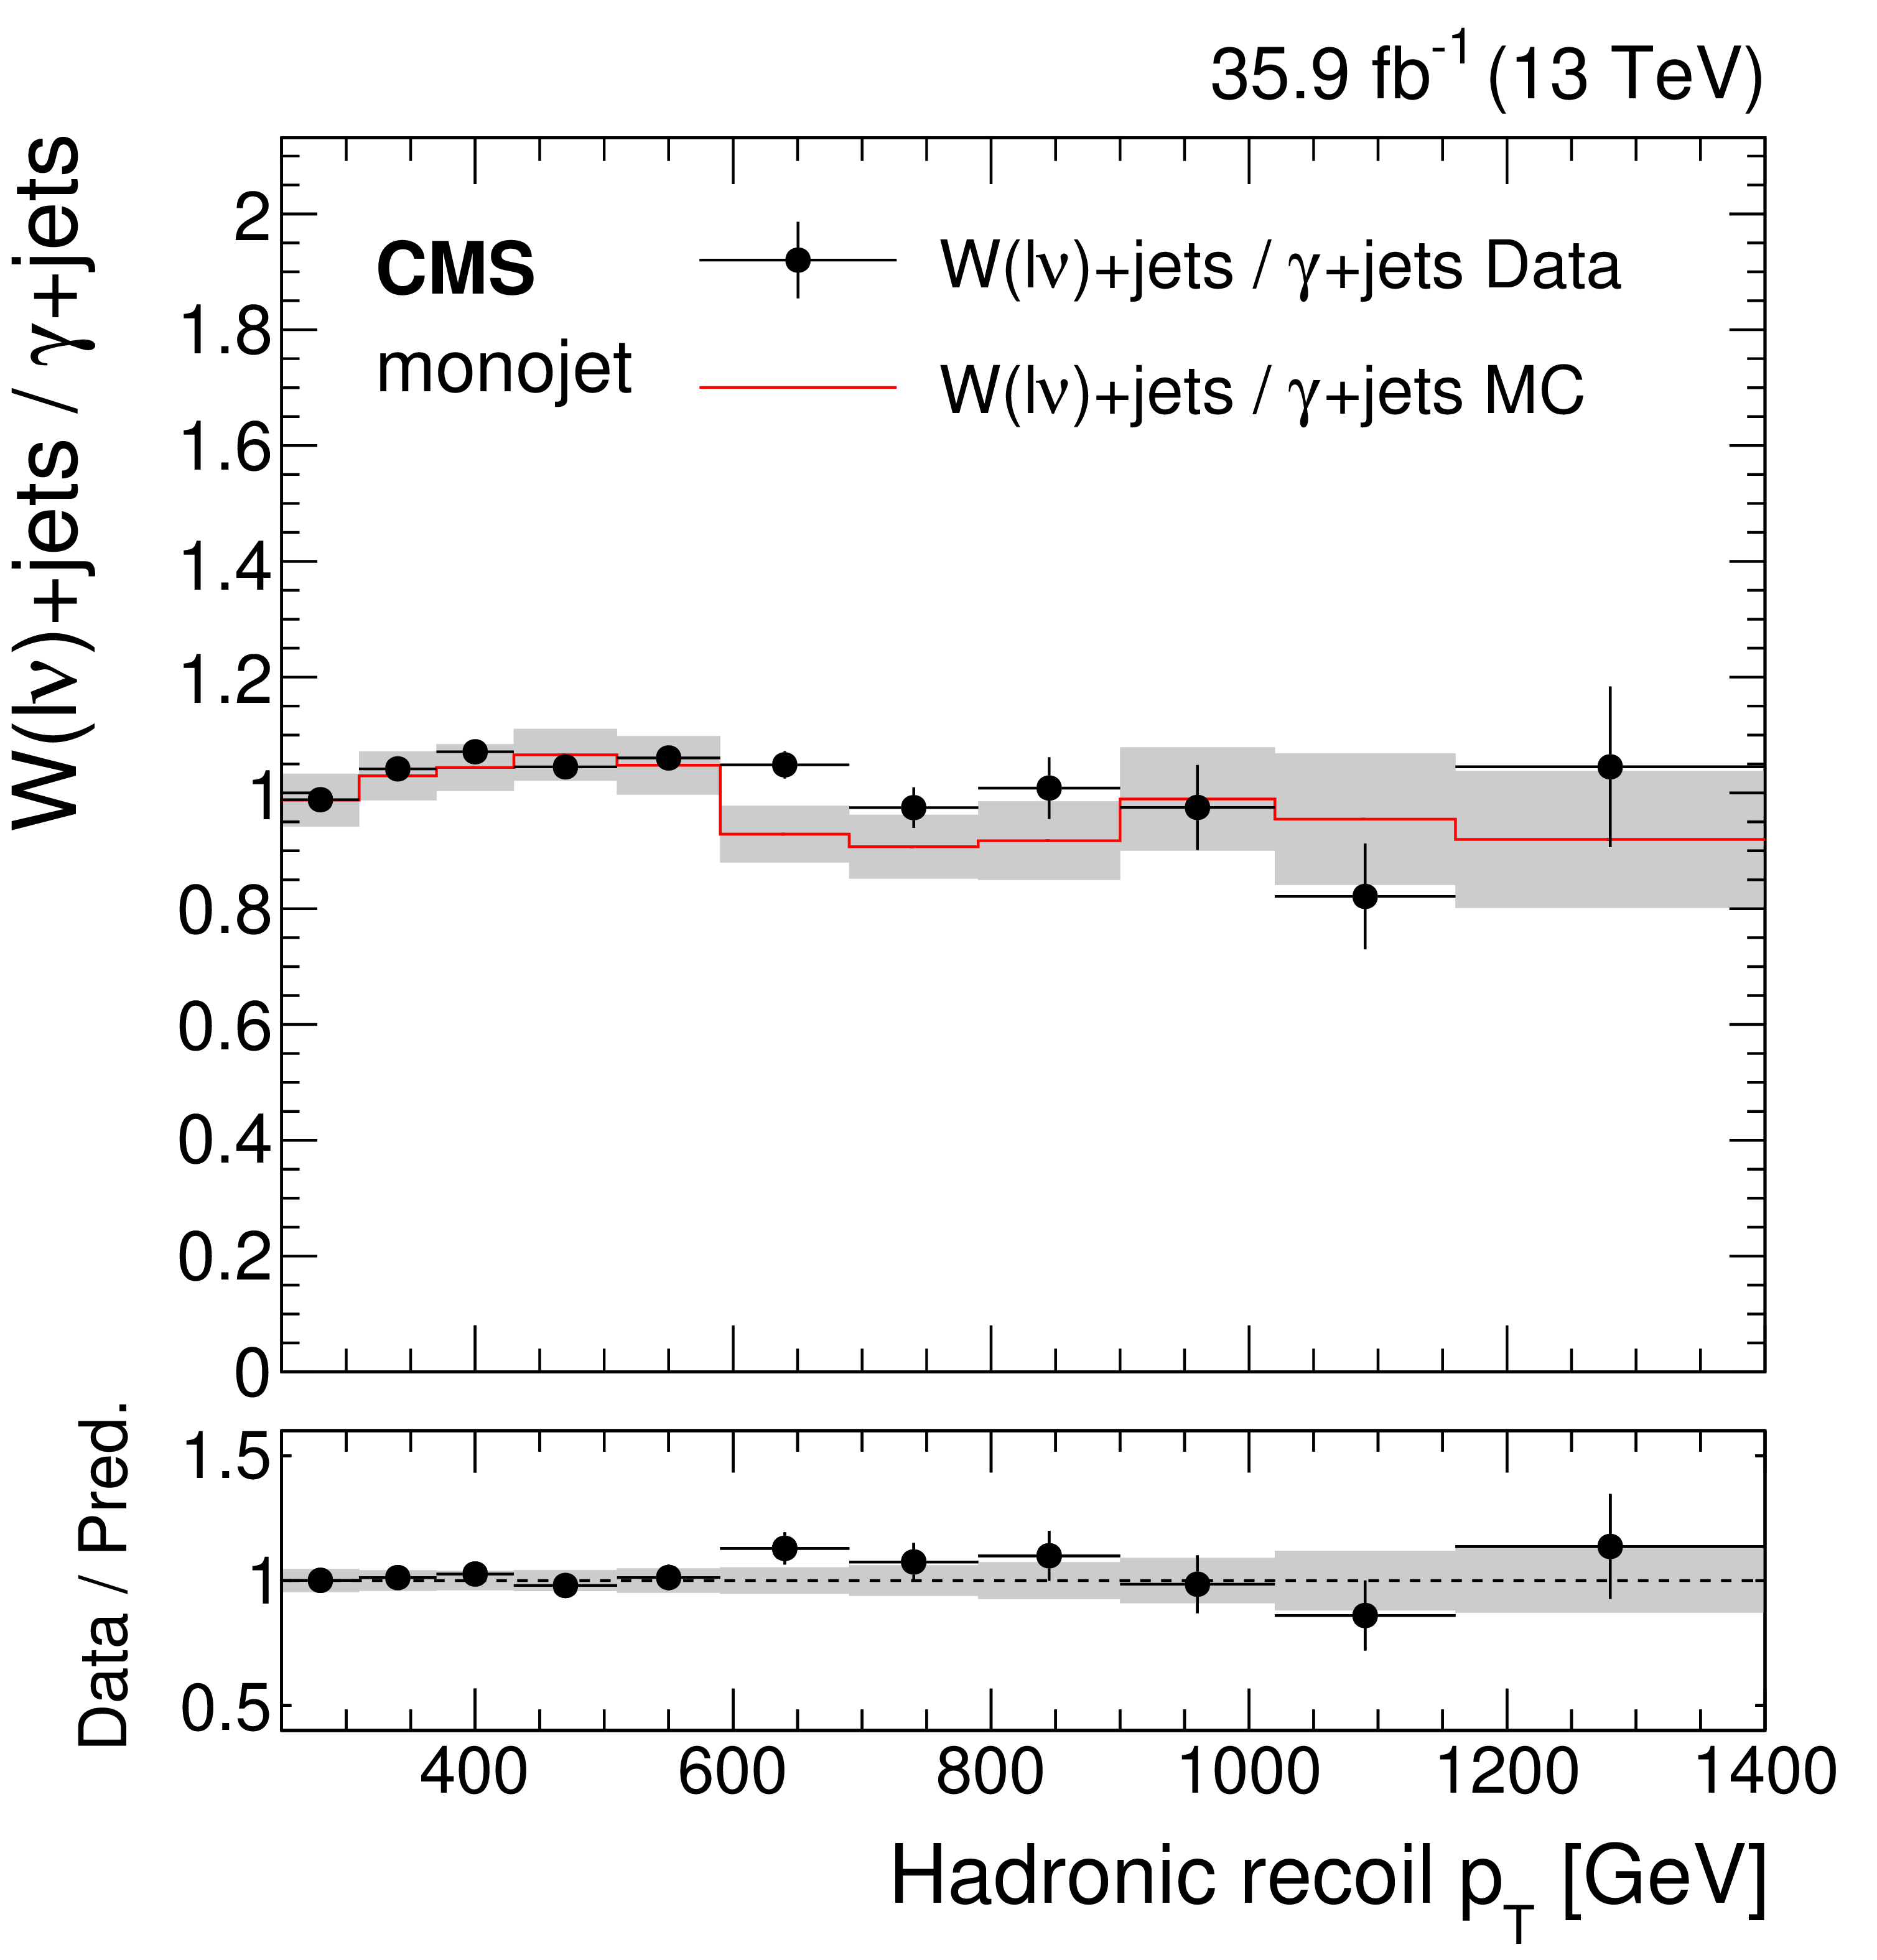
Comparison between data and MC simulation for the $\mathrm{Z} (\ell \ell)$/$\gamma $+jets, $\mathrm{Z} (\ell \ell)$/$\mathrm{W} (\ell \nu)$, and $\mathrm{W} (\ell \nu)$/$\gamma $+jets ratios as a function of the hadronic recoil in the monojet category. In the lower panels, ratios of data with the pre-fit background prediction are shown. The gray bands include both the pre-fit systematic uncertainties and the statistical uncertainty in the simulation. |
png pdf |
Figure 4-a:
Comparison between data and MC simulation for the $\mathrm{Z} (\ell \ell)$/$\gamma $+jets ratio as a function of the hadronic recoil in the monojet category. In the lower panel, the ratio of data with the pre-fit background prediction is shown. The gray bands include both the pre-fit systematic uncertainties and the statistical uncertainty in the simulation. |
png pdf |
Figure 4-b:
Comparison between data and MC simulation for the $\mathrm{Z} (\ell \ell)$/$\mathrm{W} (\ell \nu)$ ratio as a function of the hadronic recoil in the monojet category. In the lower panel, the ratio of data with the pre-fit background prediction is shown. The gray bands include both the pre-fit systematic uncertainties and the statistical uncertainty in the simulation. |
png pdf |
Figure 4-c:
Comparison between data and MC simulation for the $\mathrm{W} (\ell \nu)$/$\gamma $+jets ratio as a function of the hadronic recoil in the monojet category. In the lower panel, the ratio of data with the pre-fit background prediction is shown. The gray bands include both the pre-fit systematic uncertainties and the statistical uncertainty in the simulation. |
png pdf |
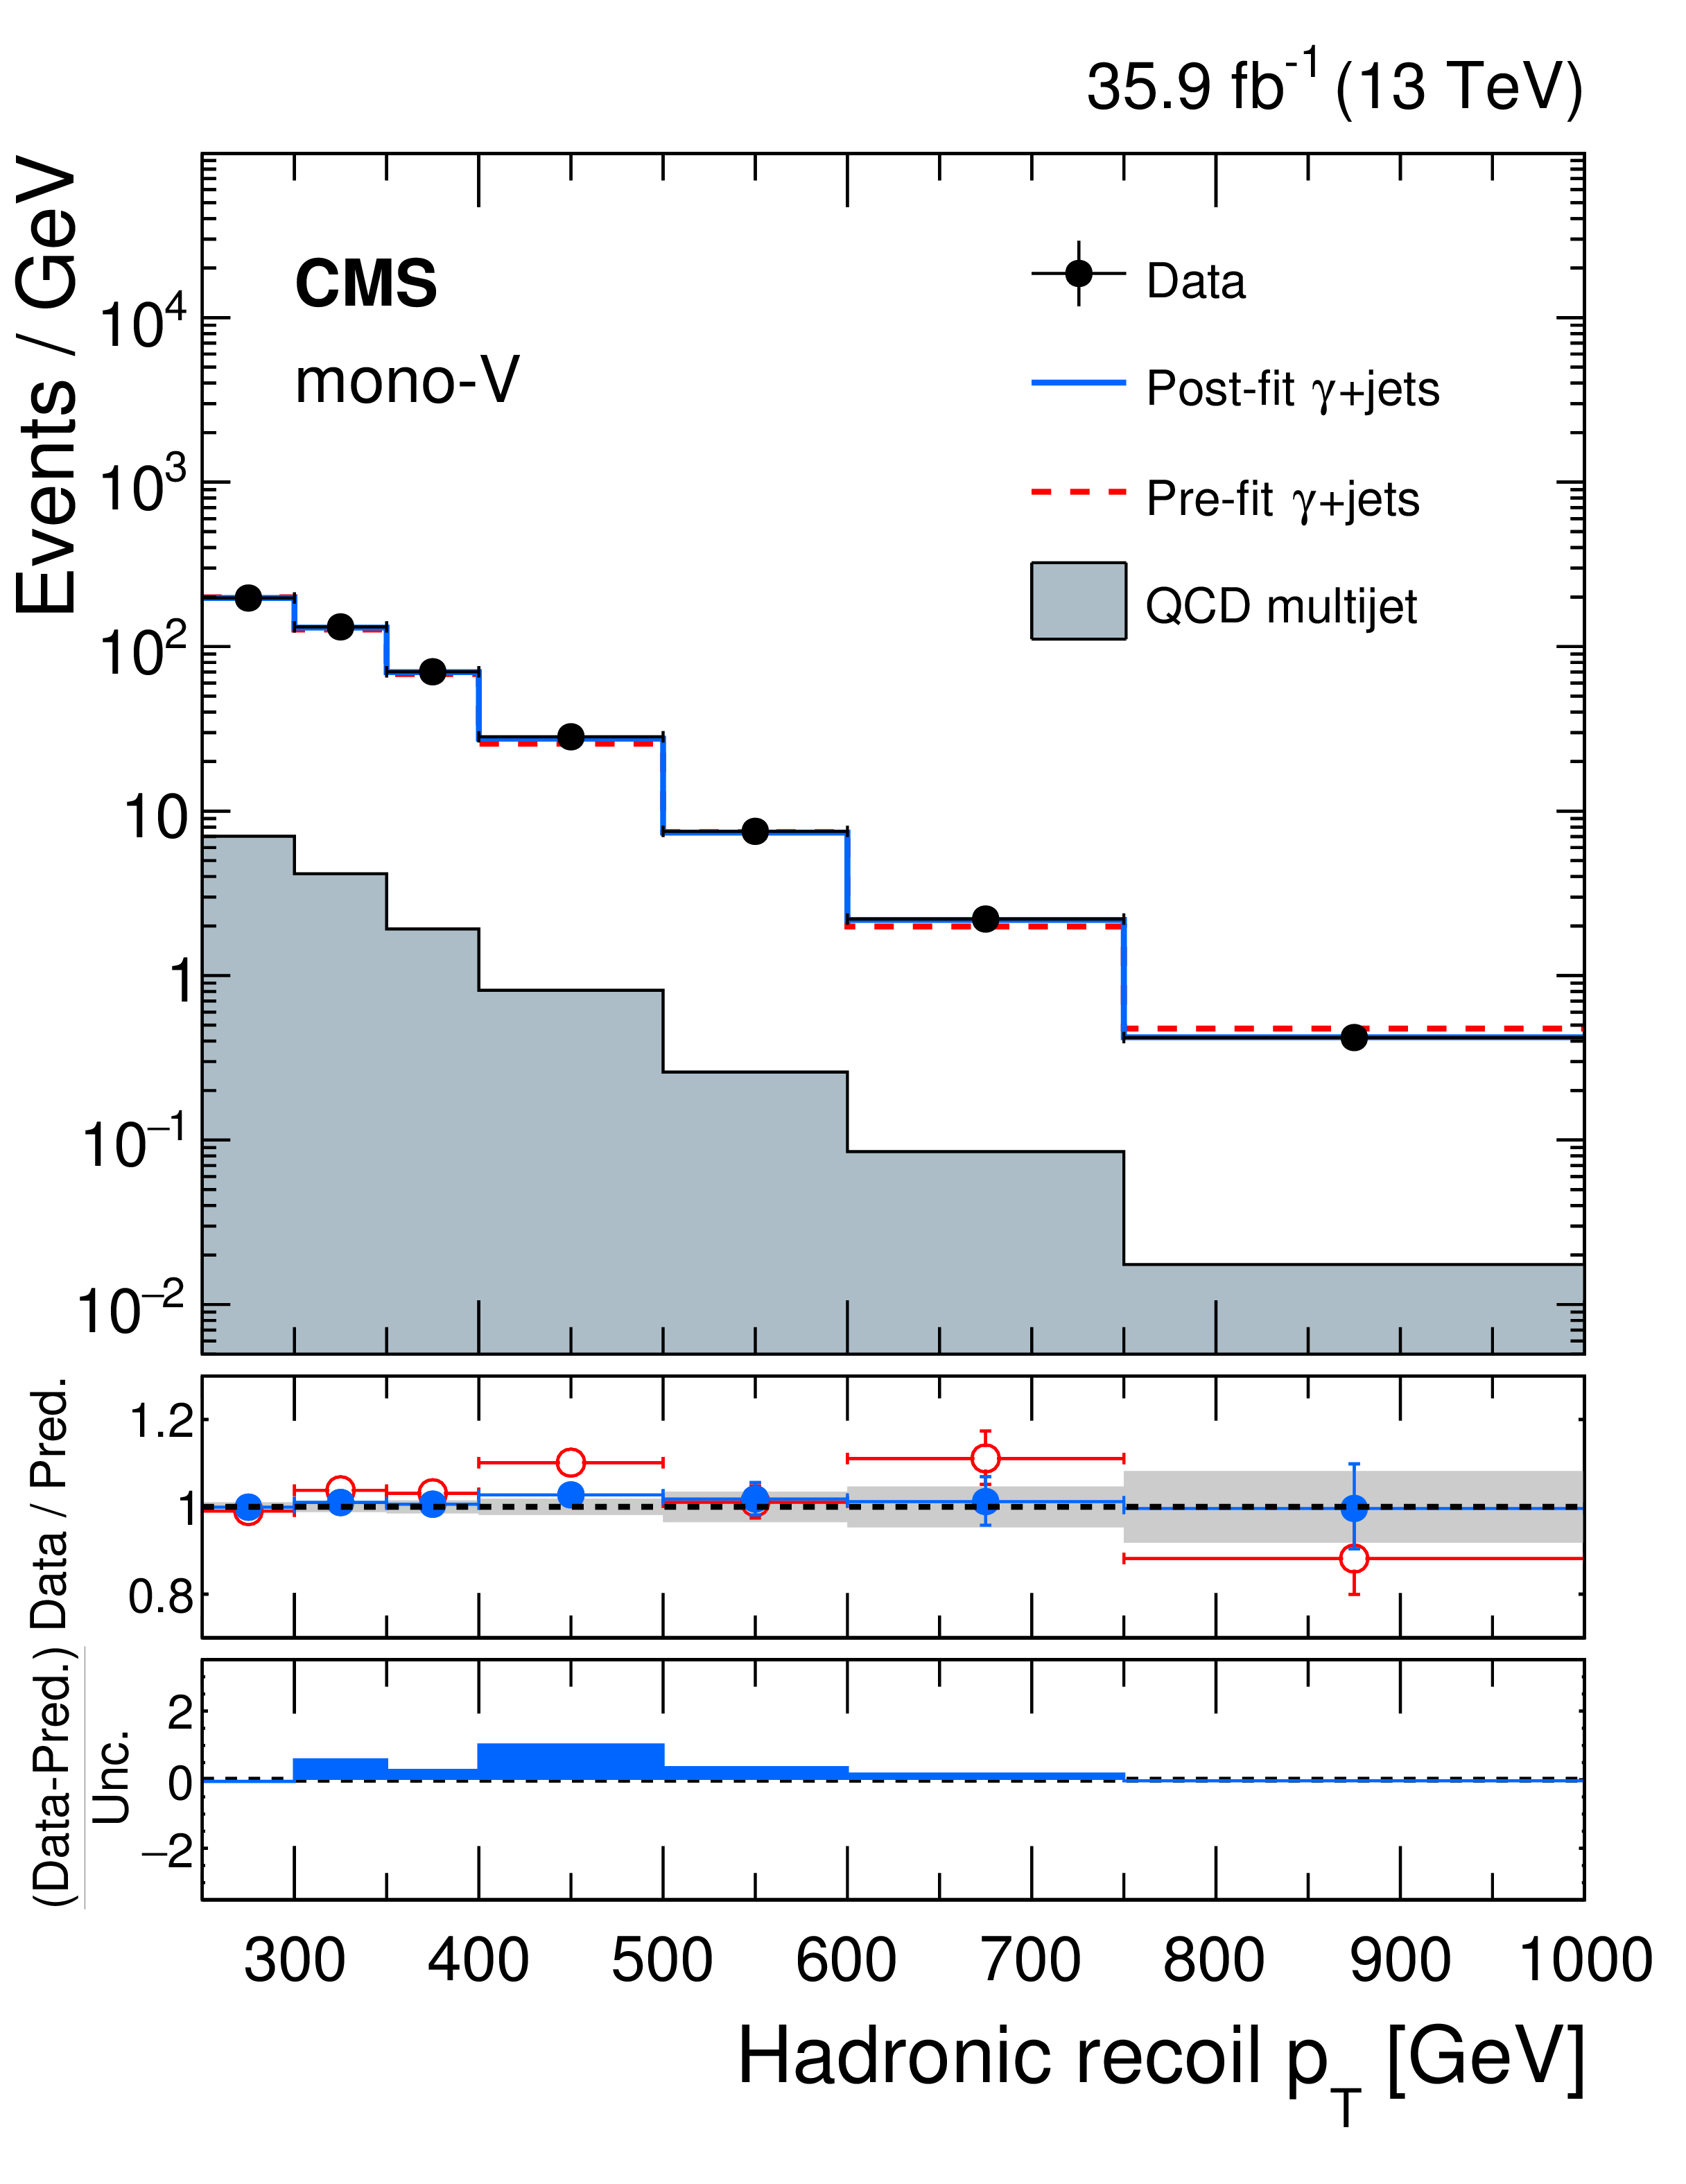
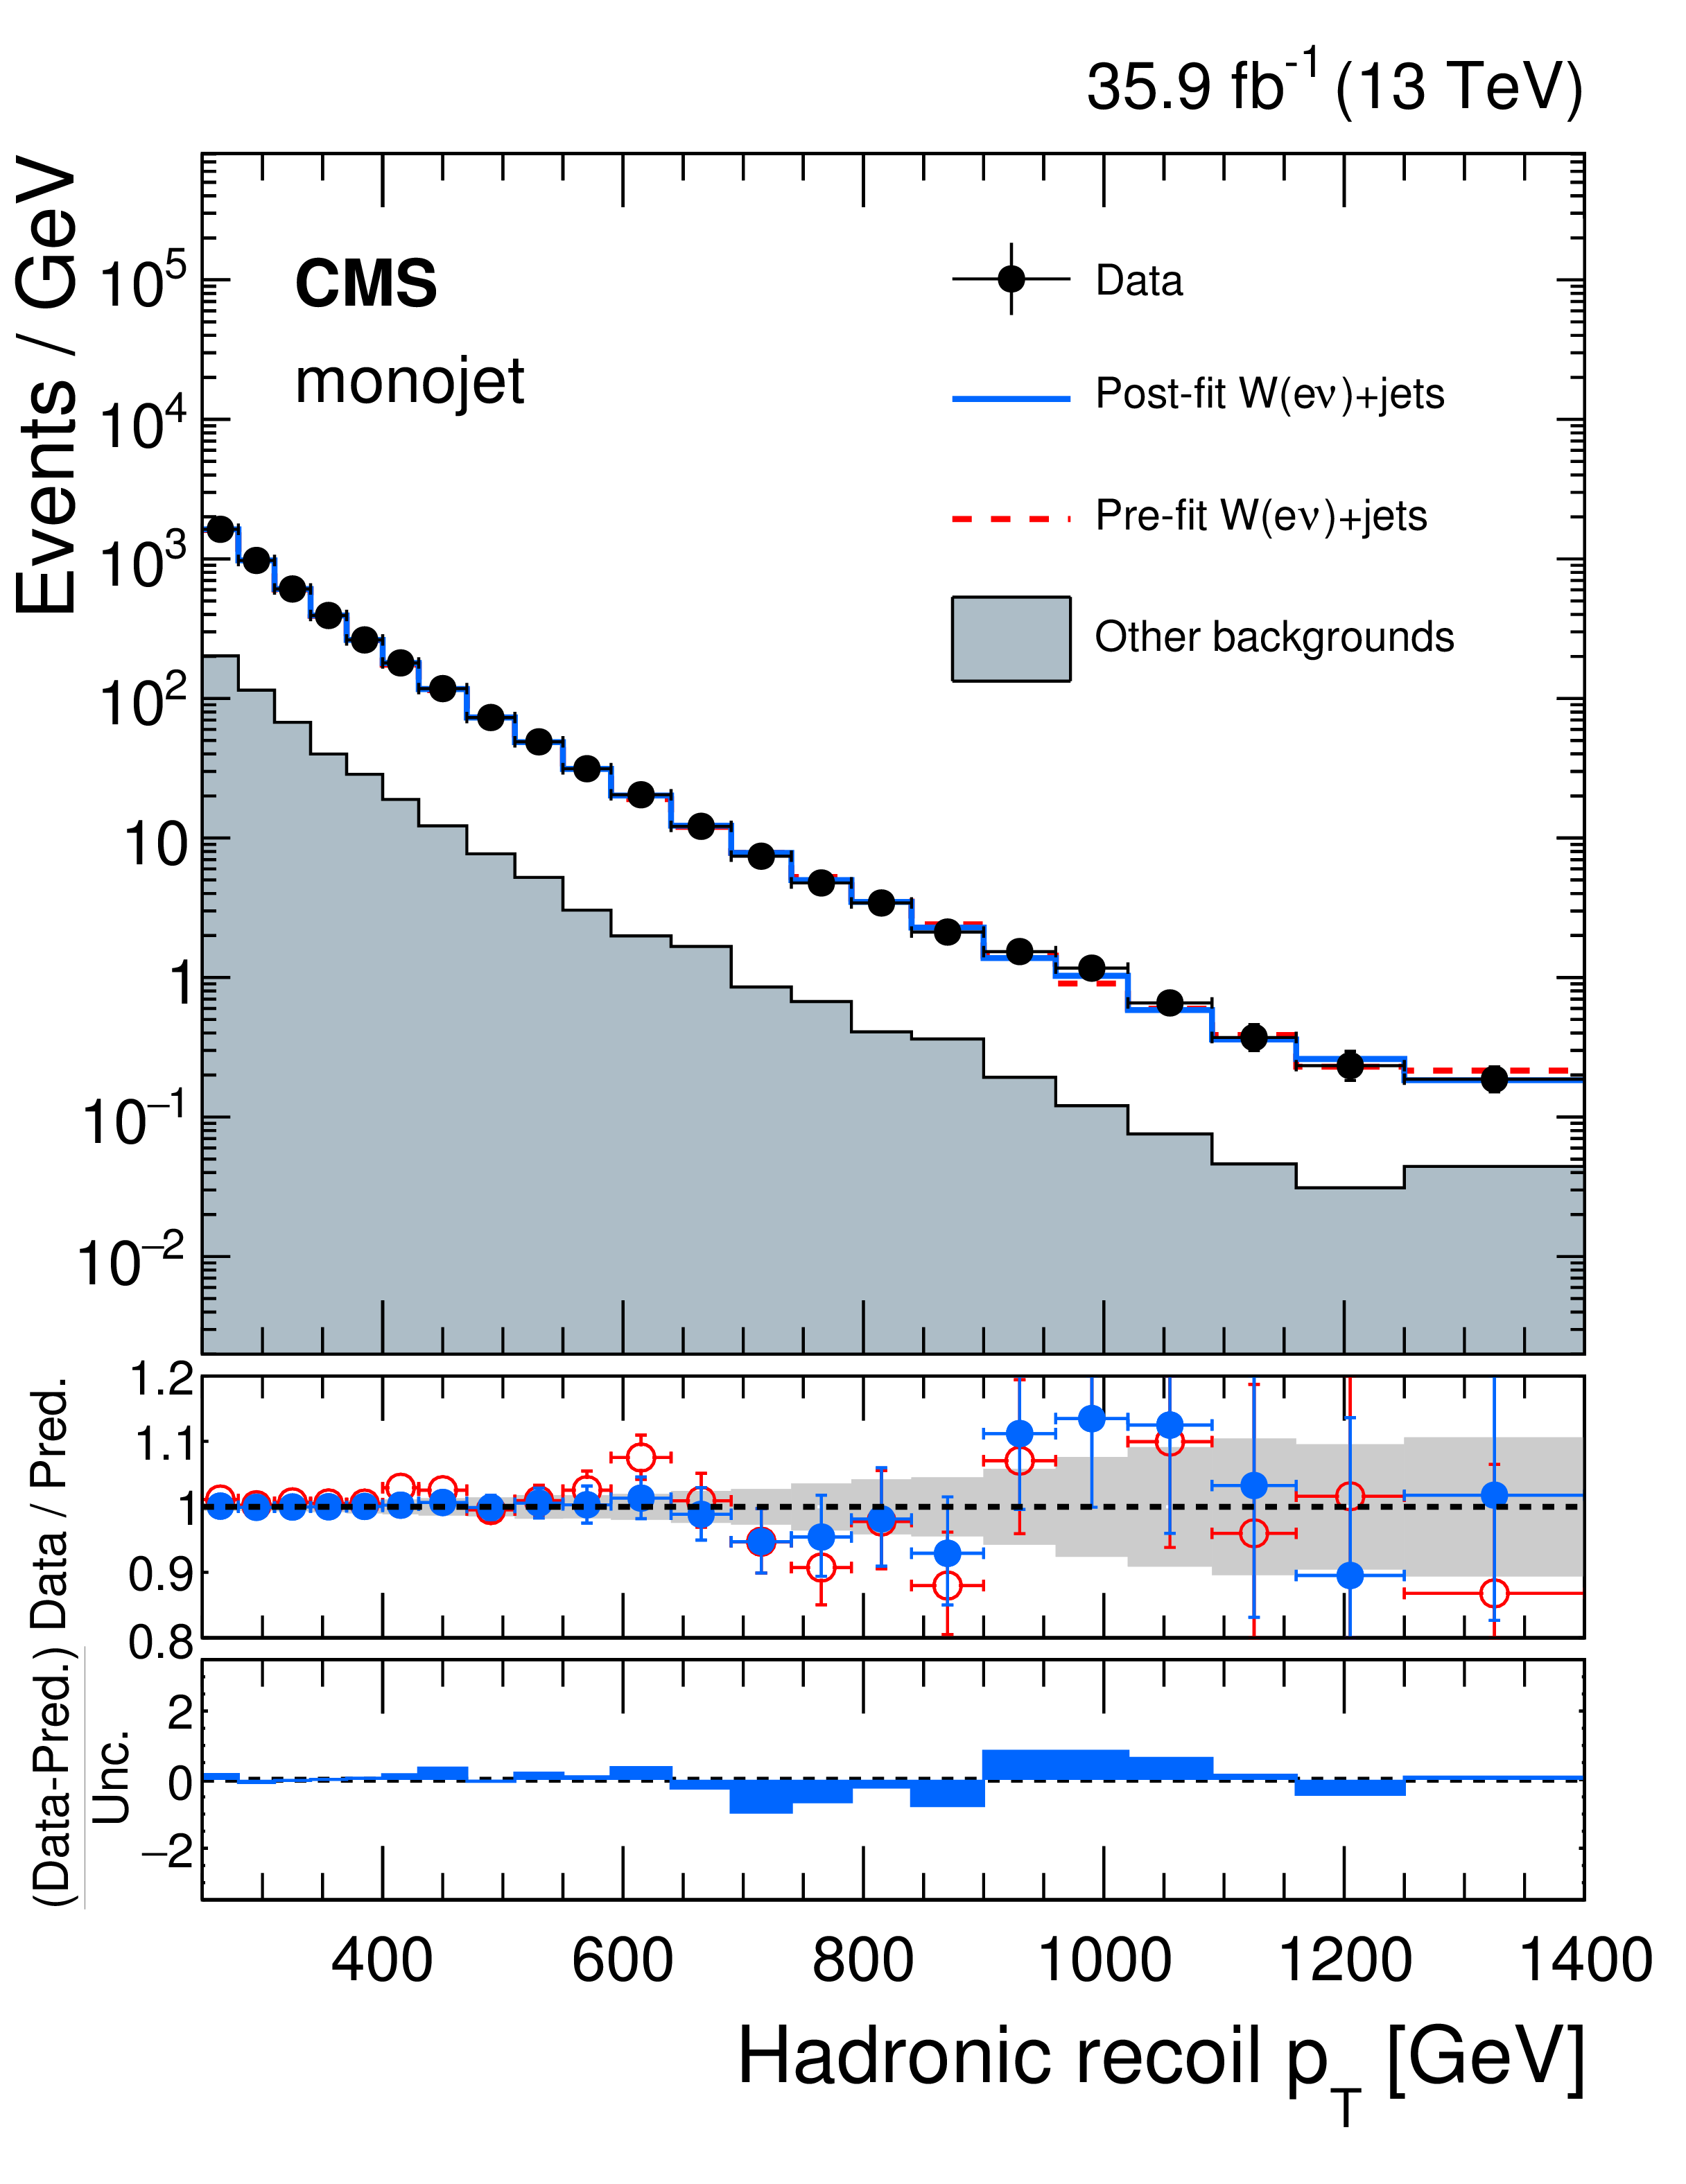
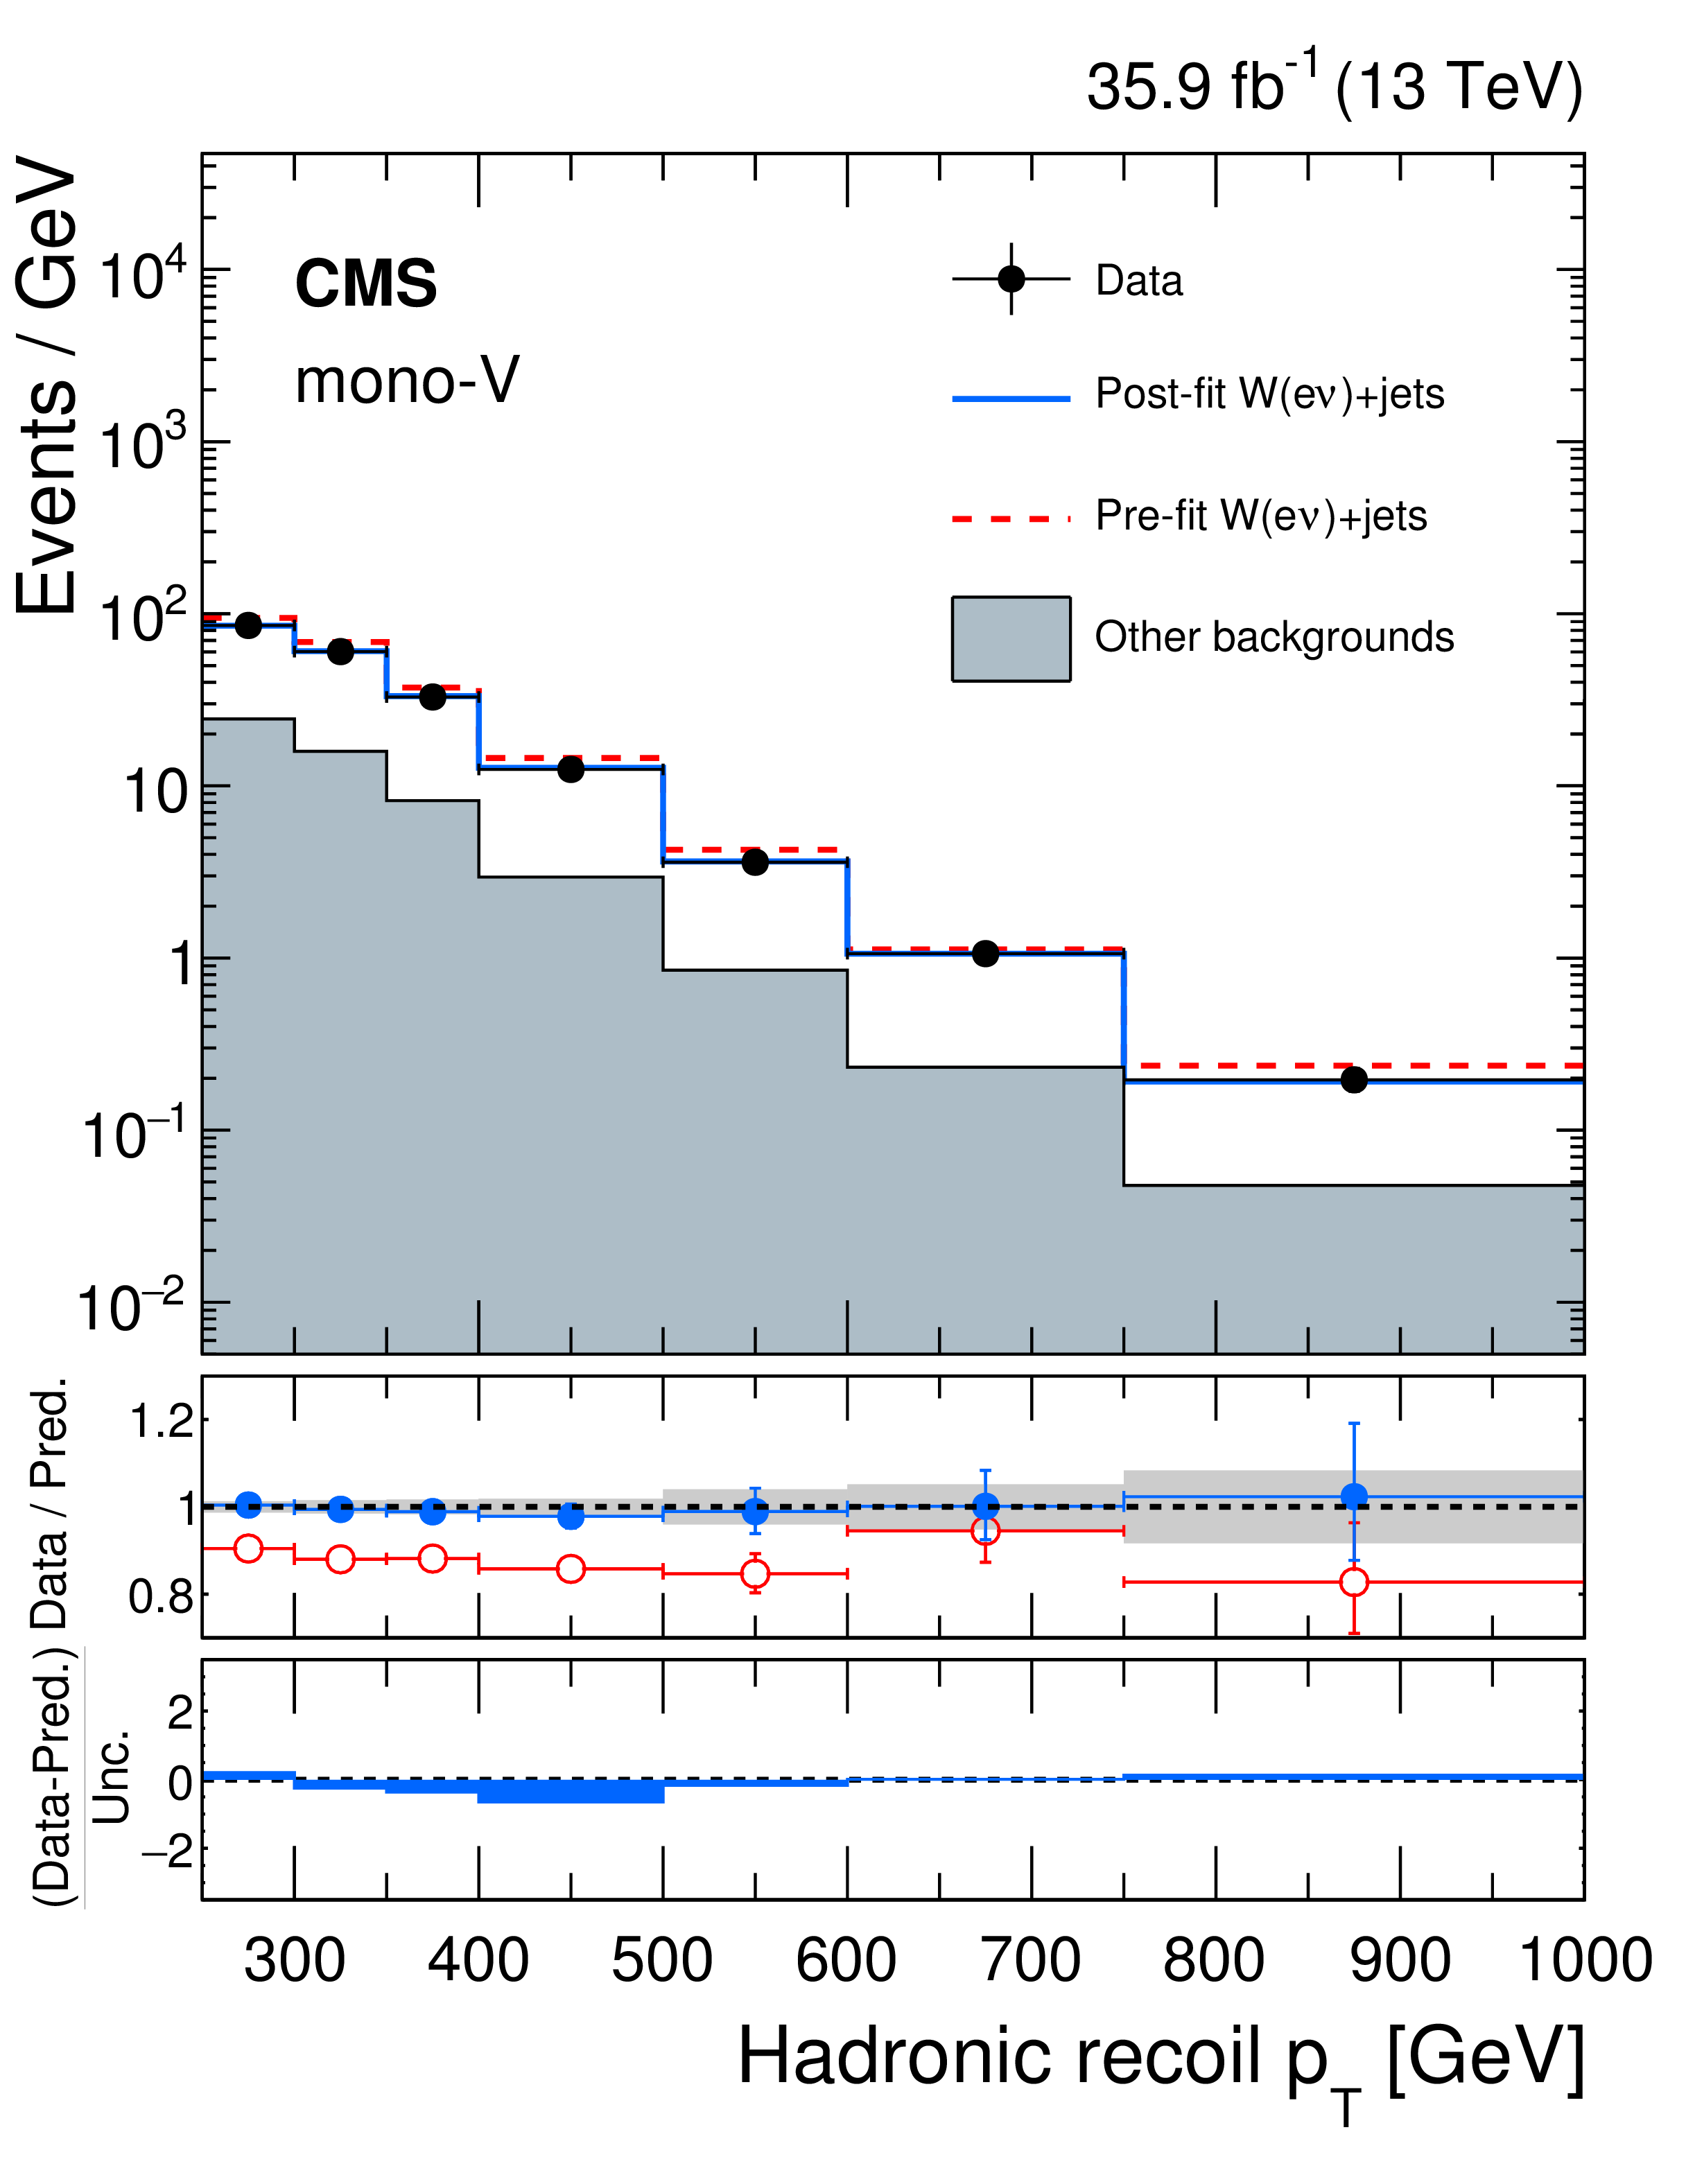
Figure 5:
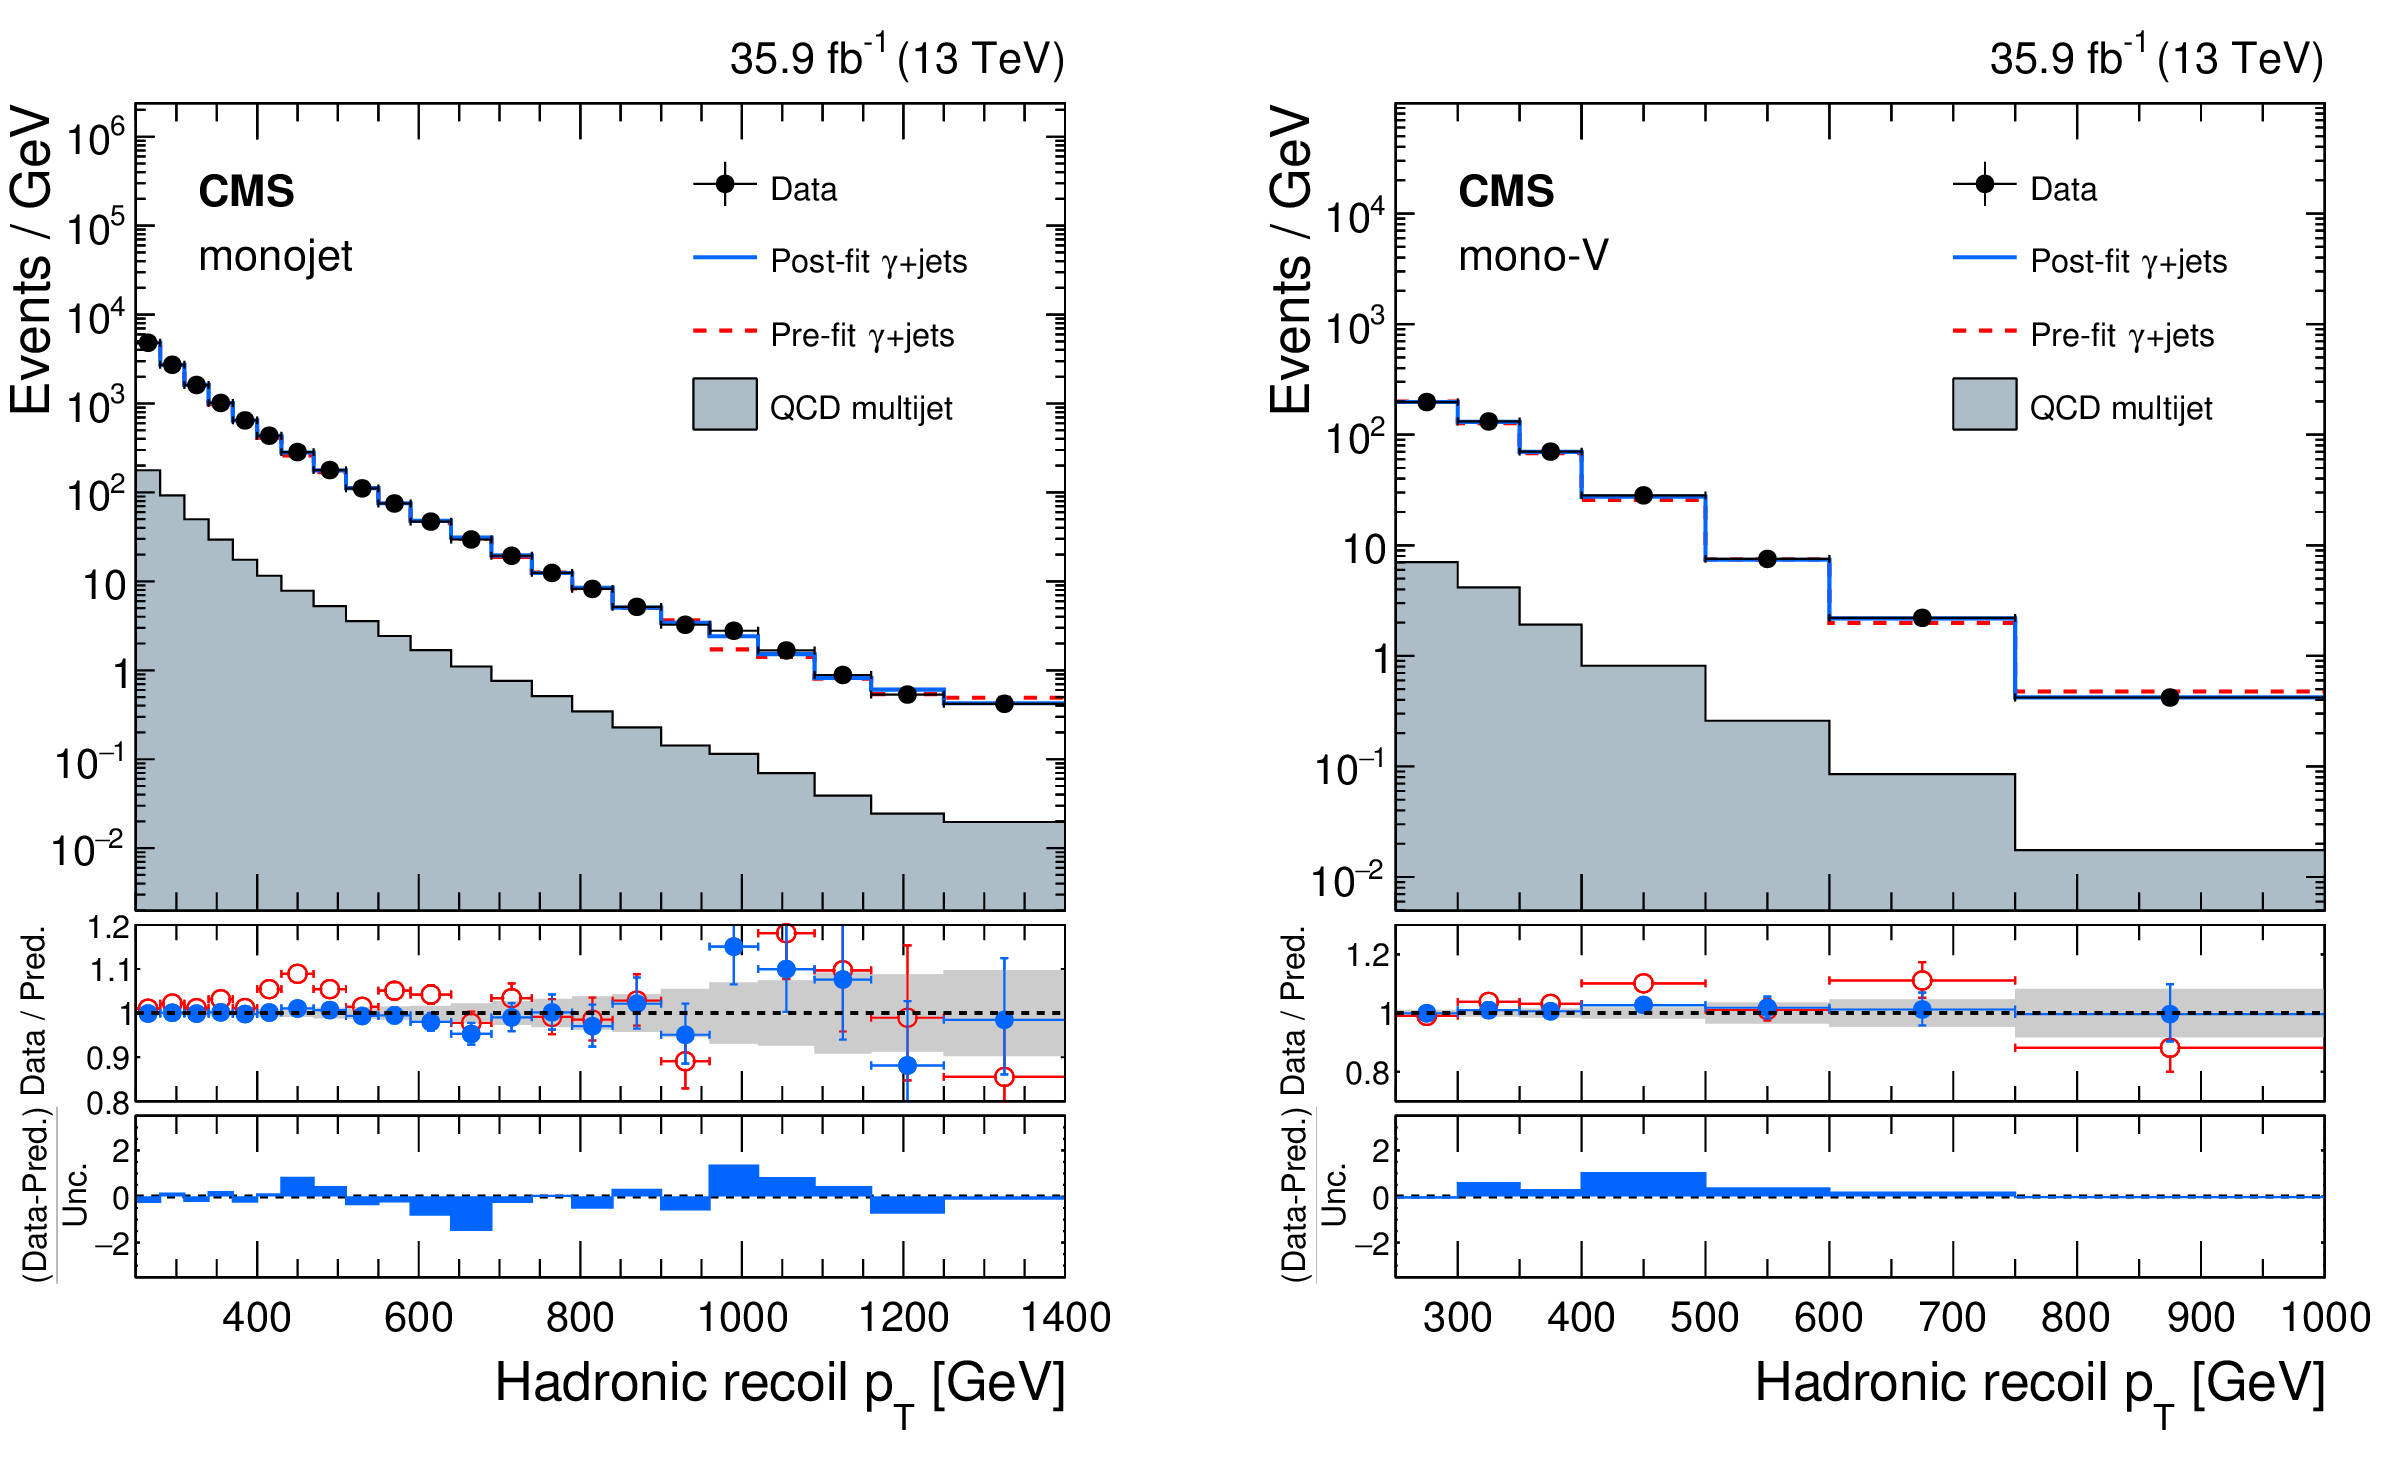
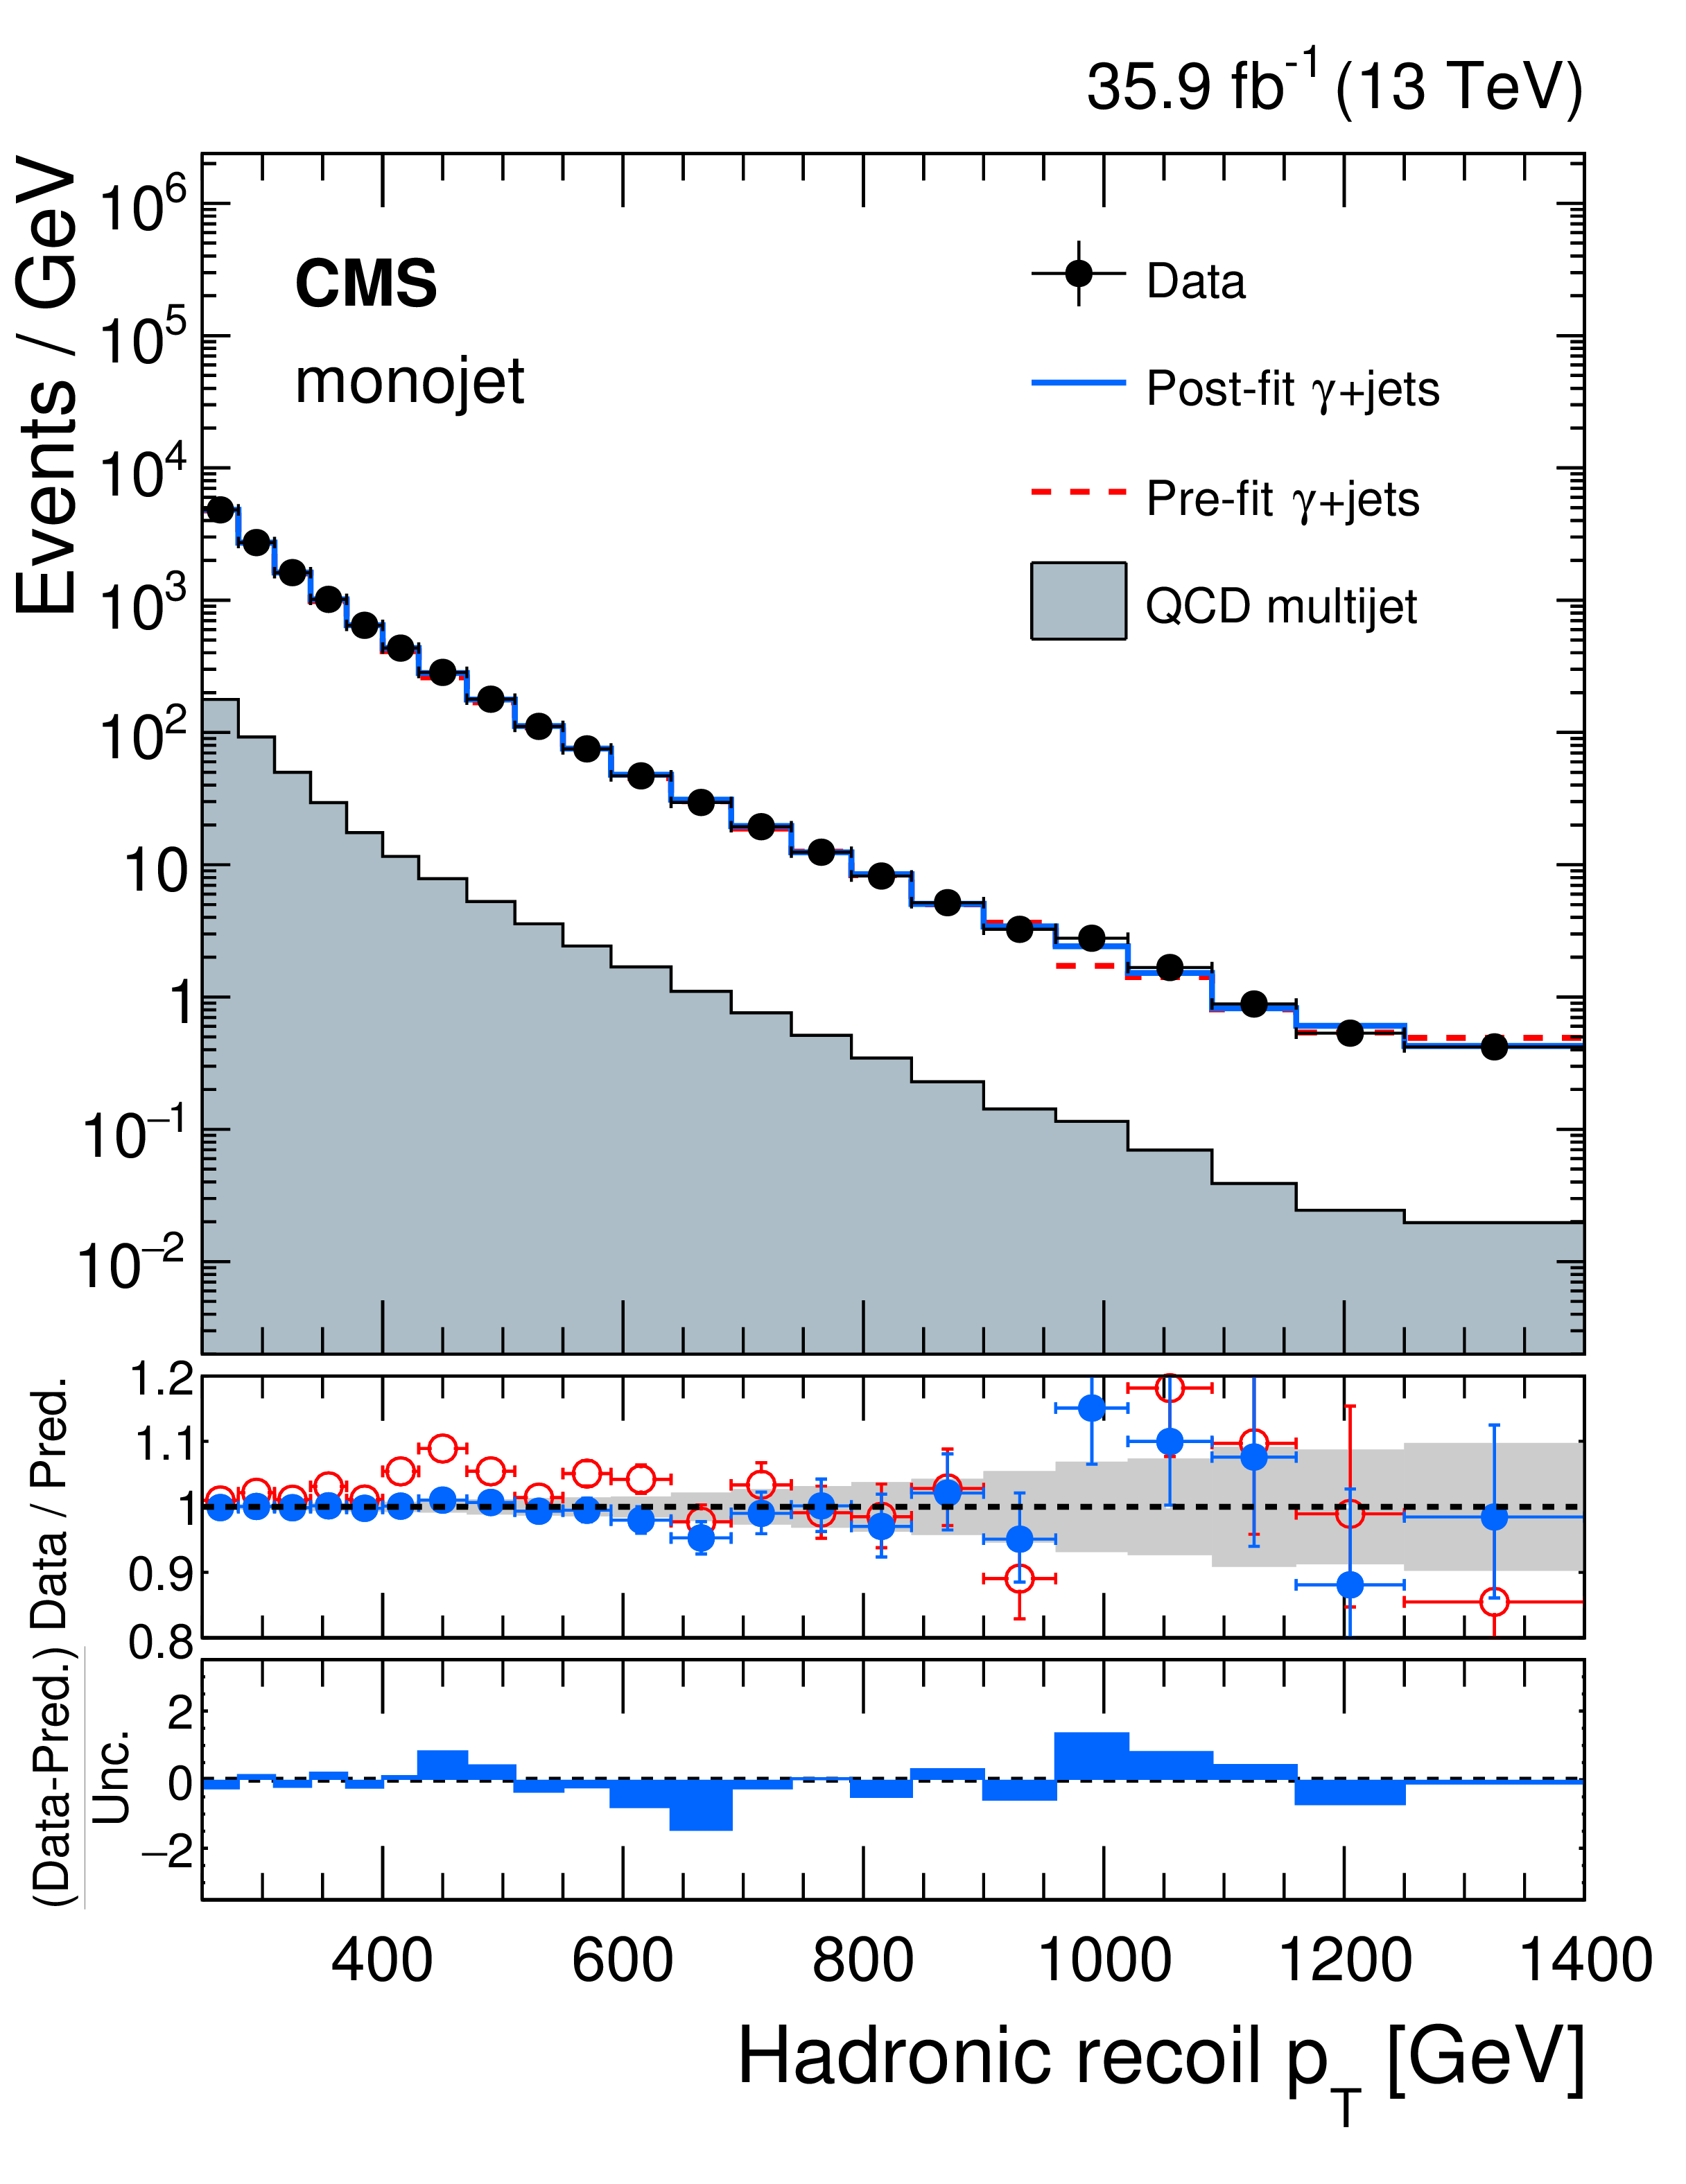
Comparison between data and MC simulation in the $\gamma $+jets control sample before and after performing the simultaneous fit across all the control samples and the signal region assuming the absence of any signal. The left plot shows the monojet category and the right plot shows the mono-V category. The hadronic recoil $ {p_{\mathrm {T}}} $ in $\gamma $+jets events is used as a proxy for $ {{p_{\mathrm {T}}} ^\text {miss}} $ in the signal region. The last bin includes all events with hadronic recoil $ {p_{\mathrm {T}}} $ larger than 1250 (750) GeV in the monojet (mono-V) category. In the lower panels, ratios of data with the pre-fit background prediction (red open points) and post-fit background prediction (blue full points) are shown for both the monojet and mono-V categories. The gray band in the lower panel indicates the post-fit uncertainty after combining all the systematic uncertainties. Finally, the distribution of the pulls, defined as the difference between data and the post-fit background prediction relative to the quadrature sum of the post-fit uncertainty in the prediction and statistical uncertainty in data, are also shown in the lowest panel. |
png pdf |
Figure 5-a:
Comparison between data and MC simulation in the $\gamma $+jets control sample before and after performing the simultaneous fit across all the control samples and the signal region assuming the absence of any signal. The plot shows the monojet category. The hadronic recoil $ {p_{\mathrm {T}}} $ in $\gamma $+jets events is used as a proxy for $ {{p_{\mathrm {T}}} ^\text {miss}} $ in the signal region. The last bin includes all events with hadronic recoil $ {p_{\mathrm {T}}} $ larger than 1250 (750) GeV in the monojet category. In the lower panel, the ratio of data with the pre-fit background prediction (red open points) and post-fit background prediction (blue full points) is shown. The gray band in the lower panel indicates the post-fit uncertainty after combining all the systematic uncertainties. Finally, the distribution of the pulls, defined as the difference between data and the post-fit background prediction relative to the quadrature sum of the post-fit uncertainty in the prediction and statistical uncertainty in data, are also shown in the lowest panel. |
png pdf |
Figure 5-b:
Comparison between data and MC simulation in the $\gamma $+jets control sample before and after performing the simultaneous fit across all the control samples and the signal region assuming the absence of any signal. The plot shows the mono-V category. The hadronic recoil $ {p_{\mathrm {T}}} $ in $\gamma $+jets events is used as a proxy for $ {{p_{\mathrm {T}}} ^\text {miss}} $ in the signal region. The last bin includes all events with hadronic recoil $ {p_{\mathrm {T}}} $ larger than 1250 (750) GeV in the mono-V category. In the lower panel, the ratio of data with the pre-fit background prediction (red open points) and post-fit background prediction (blue full points) is shown. The gray band in the lower panel indicates the post-fit uncertainty after combining all the systematic uncertainties. Finally, the distribution of the pulls, defined as the difference between data and the post-fit background prediction relative to the quadrature sum of the post-fit uncertainty in the prediction and statistical uncertainty in data, are also shown in the lowest panel. |
png pdf |
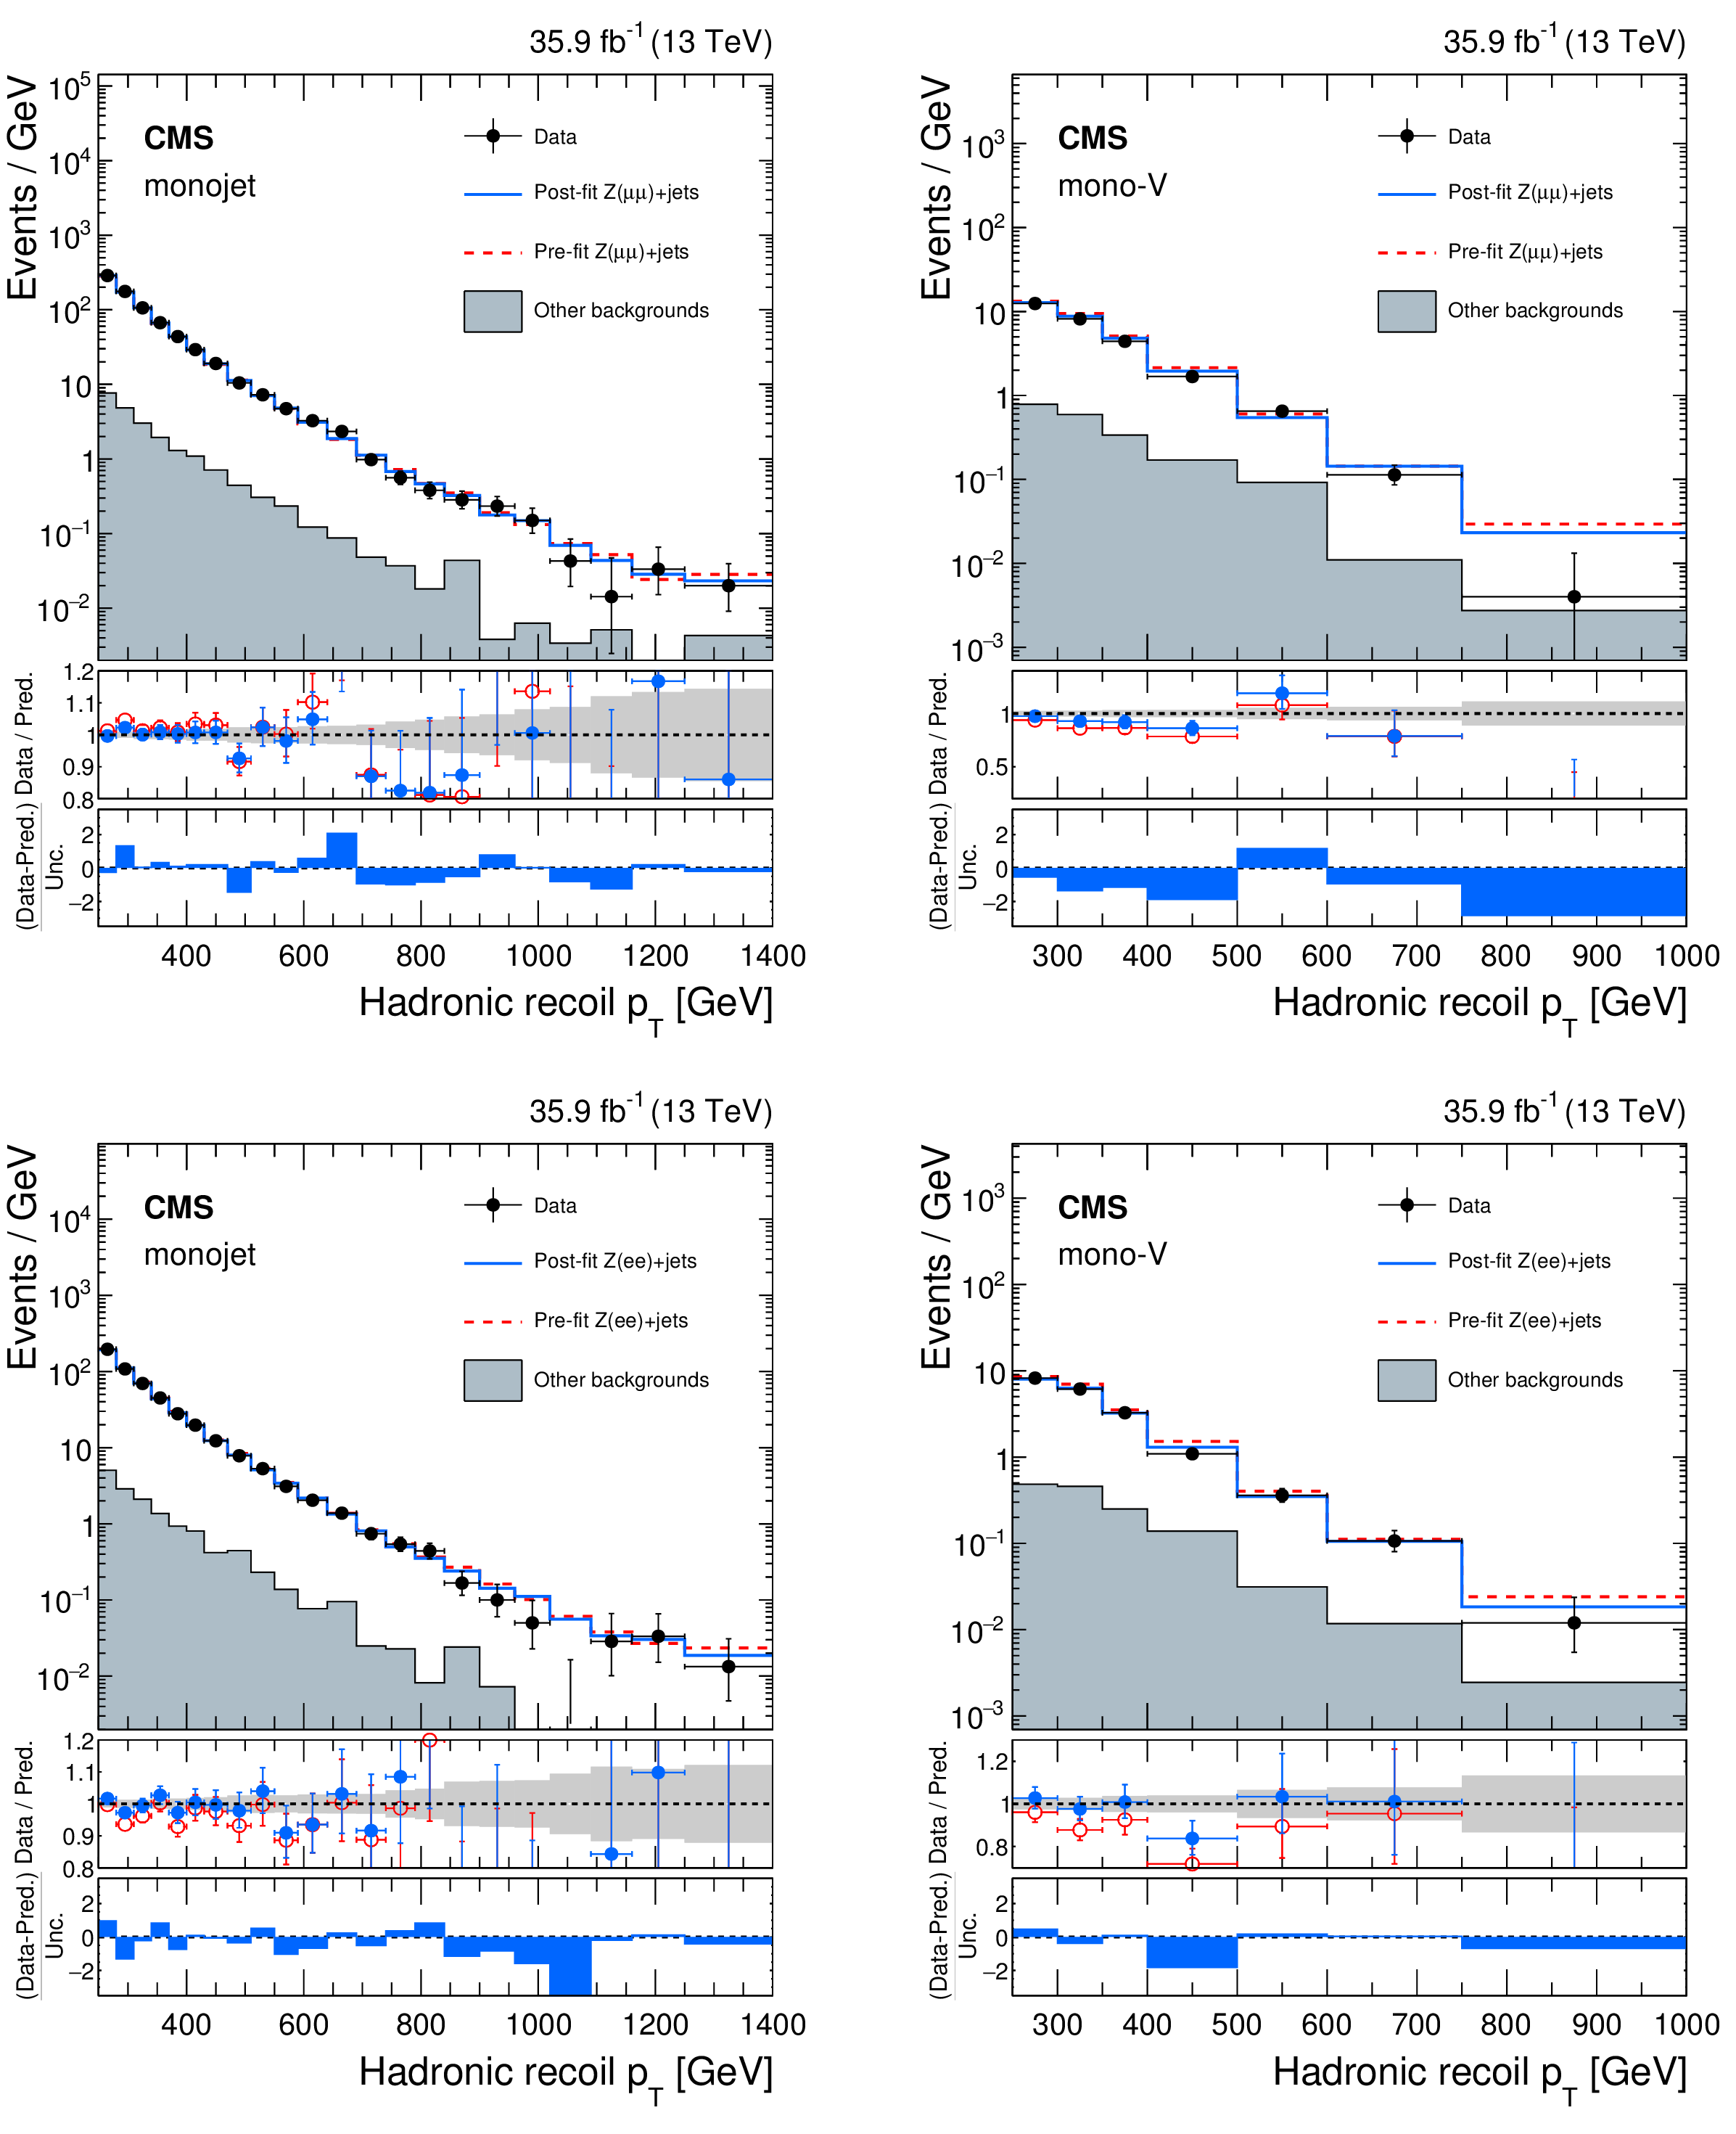
Figure 6:
Comparison between data and MC simulation in the dimuon (upper row) and dielectron (lower row) control samples before and after performing the simultaneous fit across all the control samples and the signal region assuming the absence of any signal. Plots correspond to the monojet (left) and mono-V (right) categories, respectively, in the dilepton control sample. The hadronic recoil $ {p_{\mathrm {T}}} $ in dilepton events is used as a proxy for $ {{p_{\mathrm {T}}} ^\text {miss}} $ in the signal region. The other backgrounds include top quark, diboson, and W+jets processes. The description of the lower panels is the same as in Fig. 5. |
png pdf |
Figure 6-a:
Comparison between data and MC simulation in the dimuon control sample before and after performing the simultaneous fit across all the control samples and the signal region assuming the absence of any signal. The plot corresponds to the monojet category. The hadronic recoil $ {p_{\mathrm {T}}} $ in dilepton events is used as a proxy for $ {{p_{\mathrm {T}}} ^\text {miss}} $ in the signal region. The other backgrounds include top quark, diboson, and W+jets processes. |
png pdf |
Figure 6-b:
Comparison between data and MC simulation in the dimuon control sample before and after performing the simultaneous fit across all the control samples and the signal region assuming the absence of any signal. The plot corresponds to the mono-V category. The hadronic recoil $ {p_{\mathrm {T}}} $ in dilepton events is used as a proxy for $ {{p_{\mathrm {T}}} ^\text {miss}} $ in the signal region. The other backgrounds include top quark, diboson, and W+jets processes. |
png pdf |
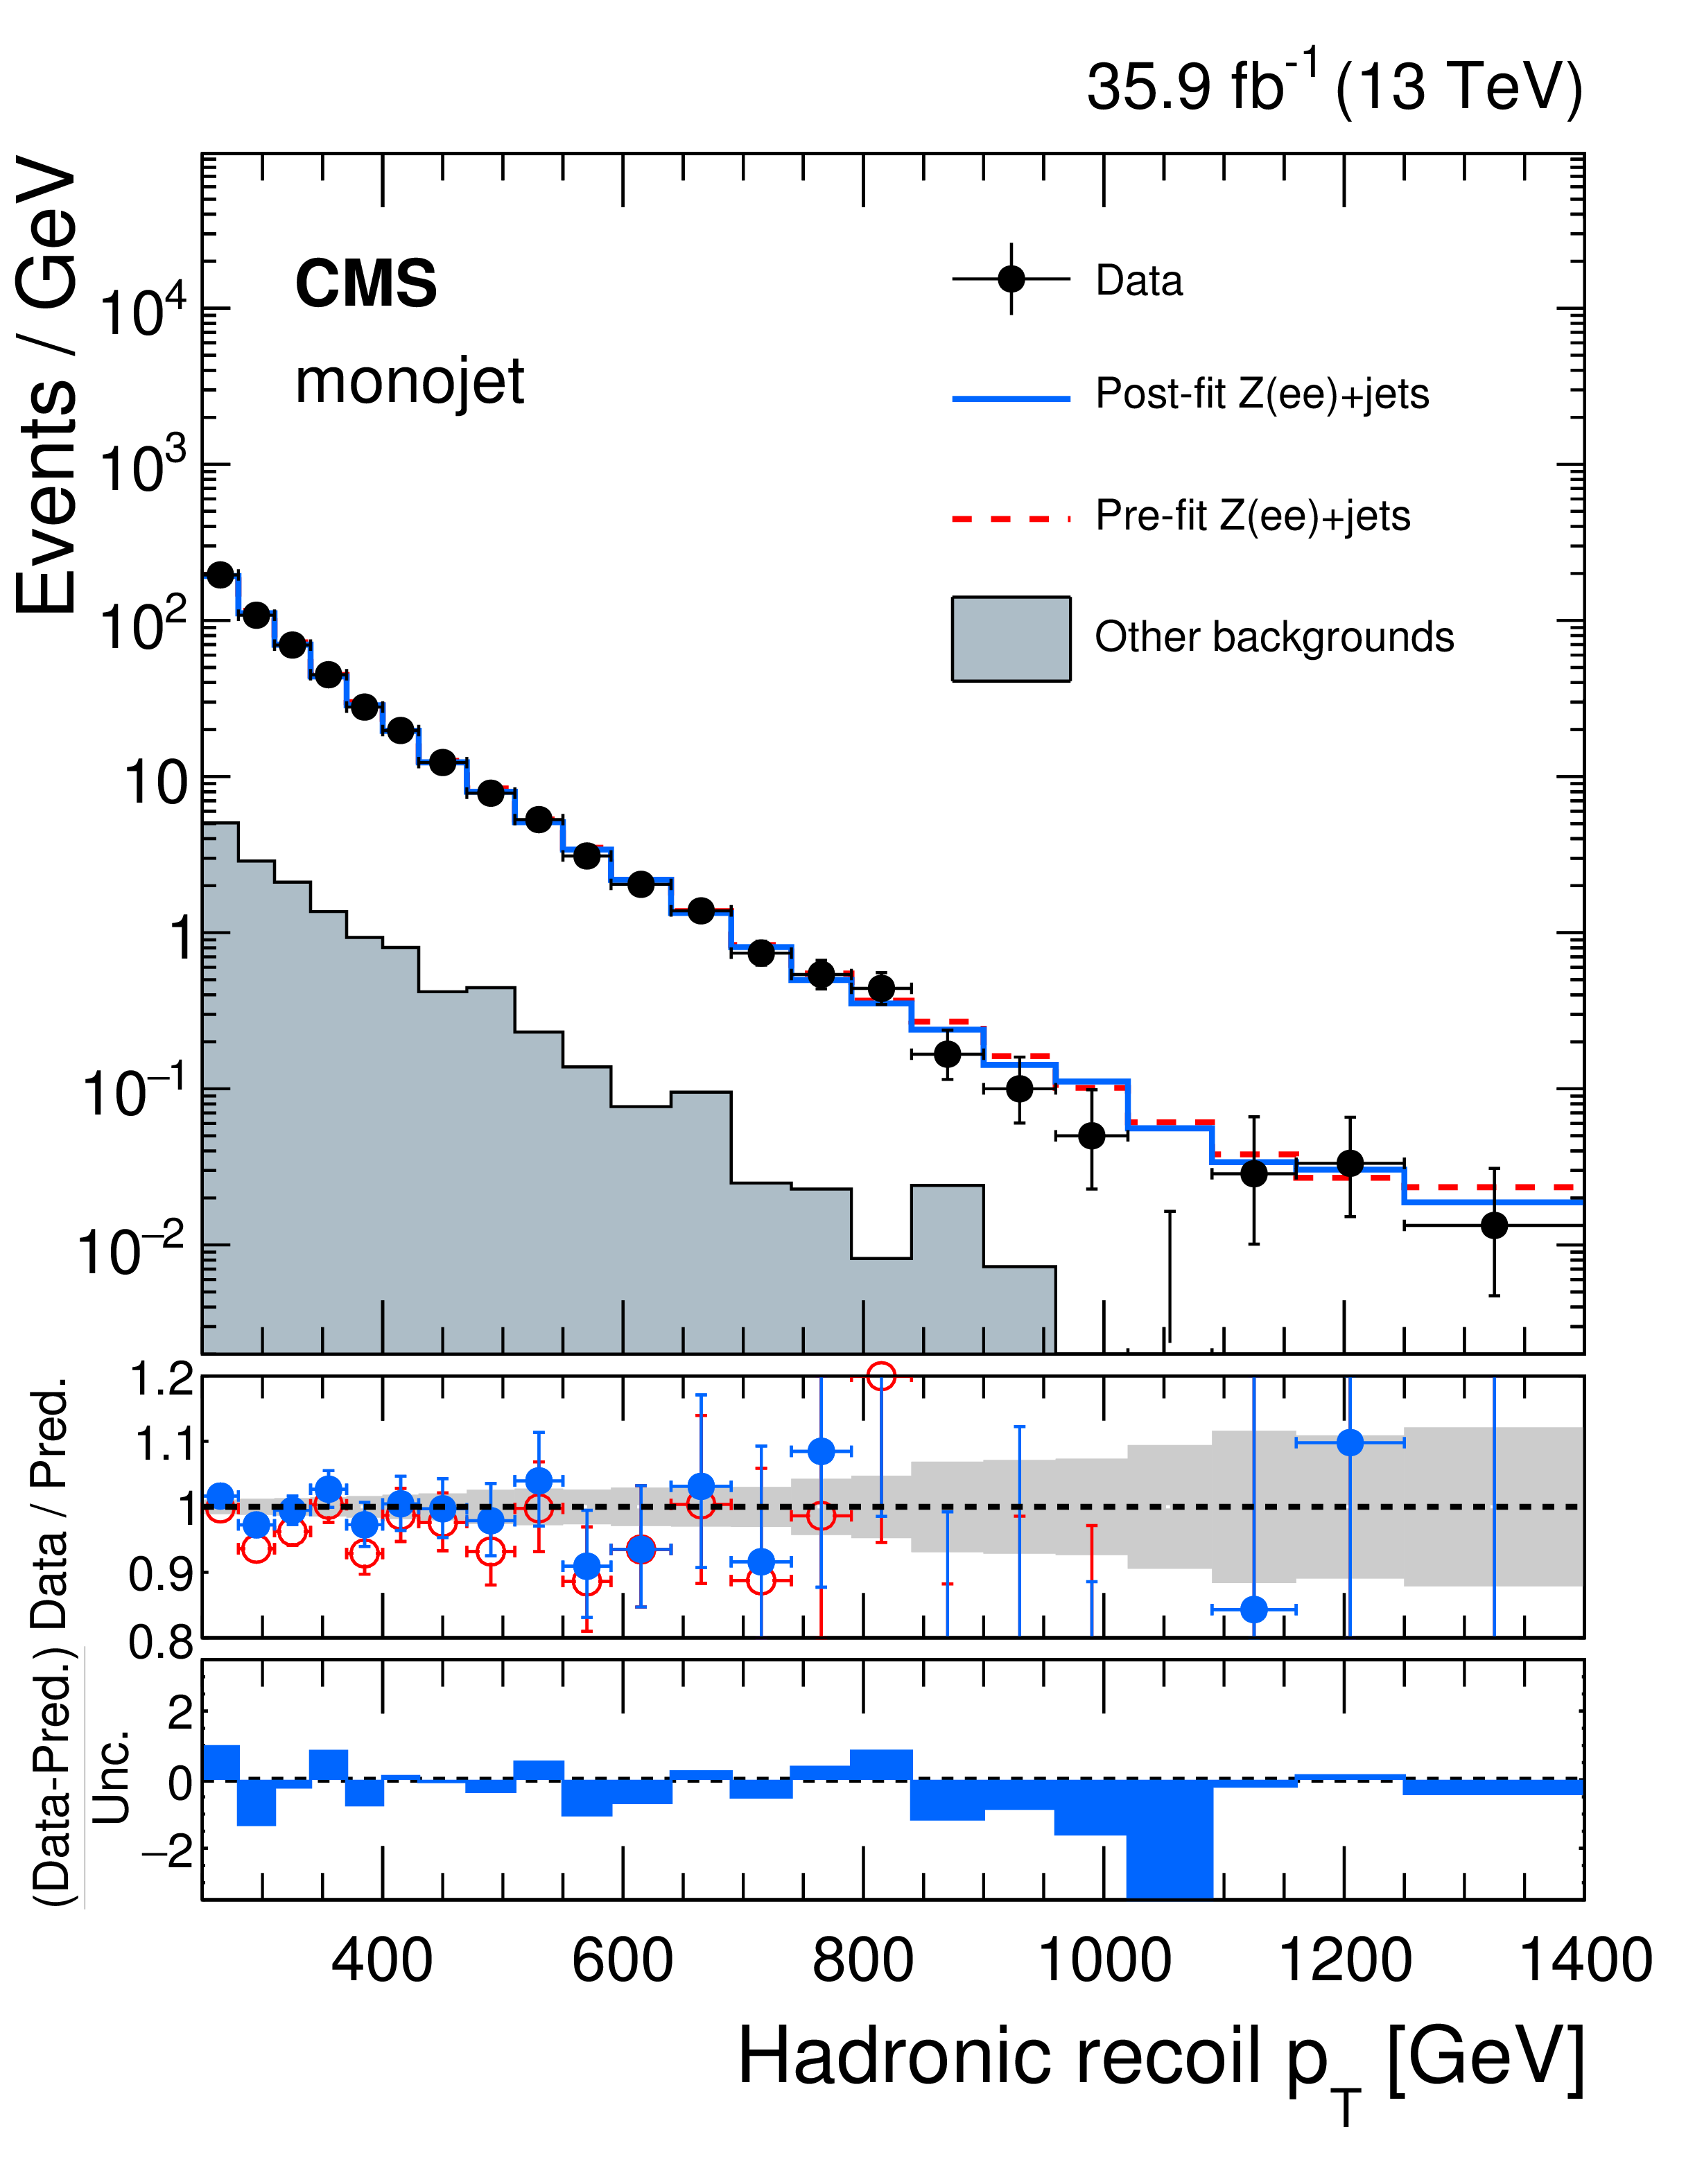
Figure 6-c:
Comparison between data and MC simulation in the dielectron control sample before and after performing the simultaneous fit across all the control samples and the signal region assuming the absence of any signal. The plot corresponds to the monojet category. The hadronic recoil $ {p_{\mathrm {T}}} $ in dilepton events is used as a proxy for $ {{p_{\mathrm {T}}} ^\text {miss}} $ in the signal region. The other backgrounds include top quark, diboson, and W+jets processes. |

png pdf |
Figure 6-d:
Comparison between data and MC simulation in the dielectron control sample before and after performing the simultaneous fit across all the control samples and the signal region assuming the absence of any signal. The plot corresponds to the mono-V category. The hadronic recoil $ {p_{\mathrm {T}}} $ in dilepton events is used as a proxy for $ {{p_{\mathrm {T}}} ^\text {miss}} $ in the signal region. The other backgrounds include top quark, diboson, and W+jets processes. |
png pdf |
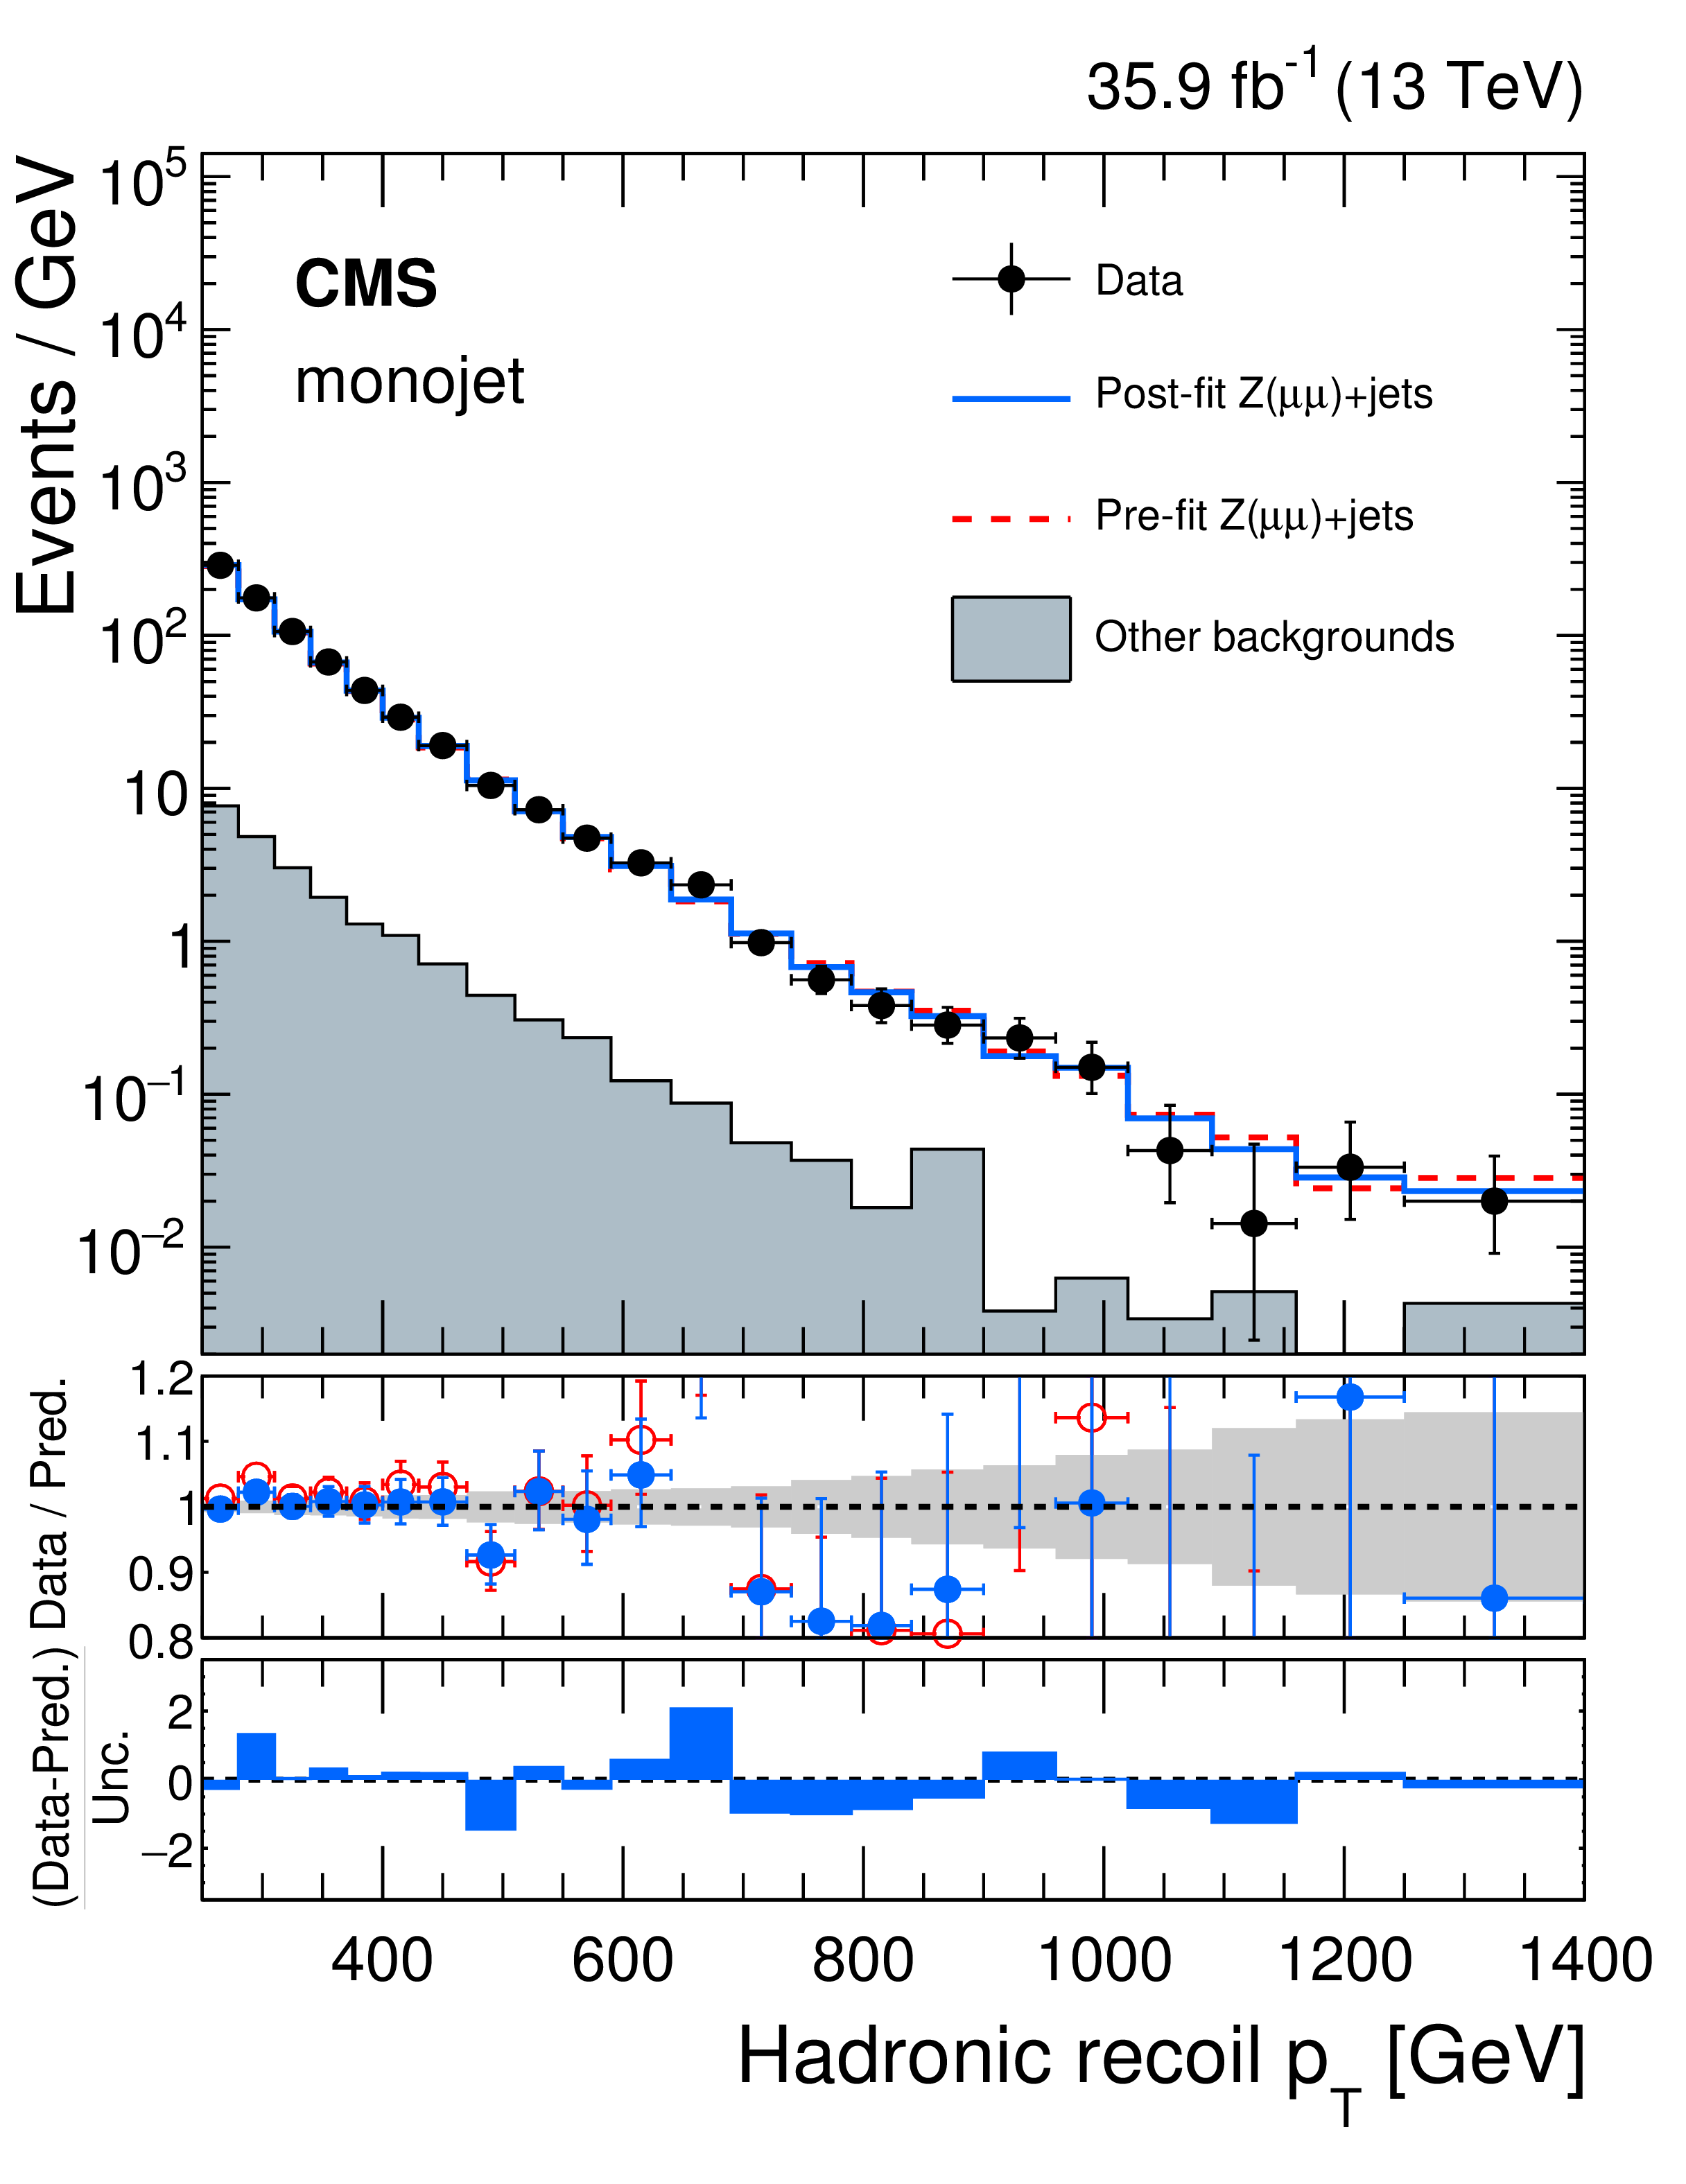
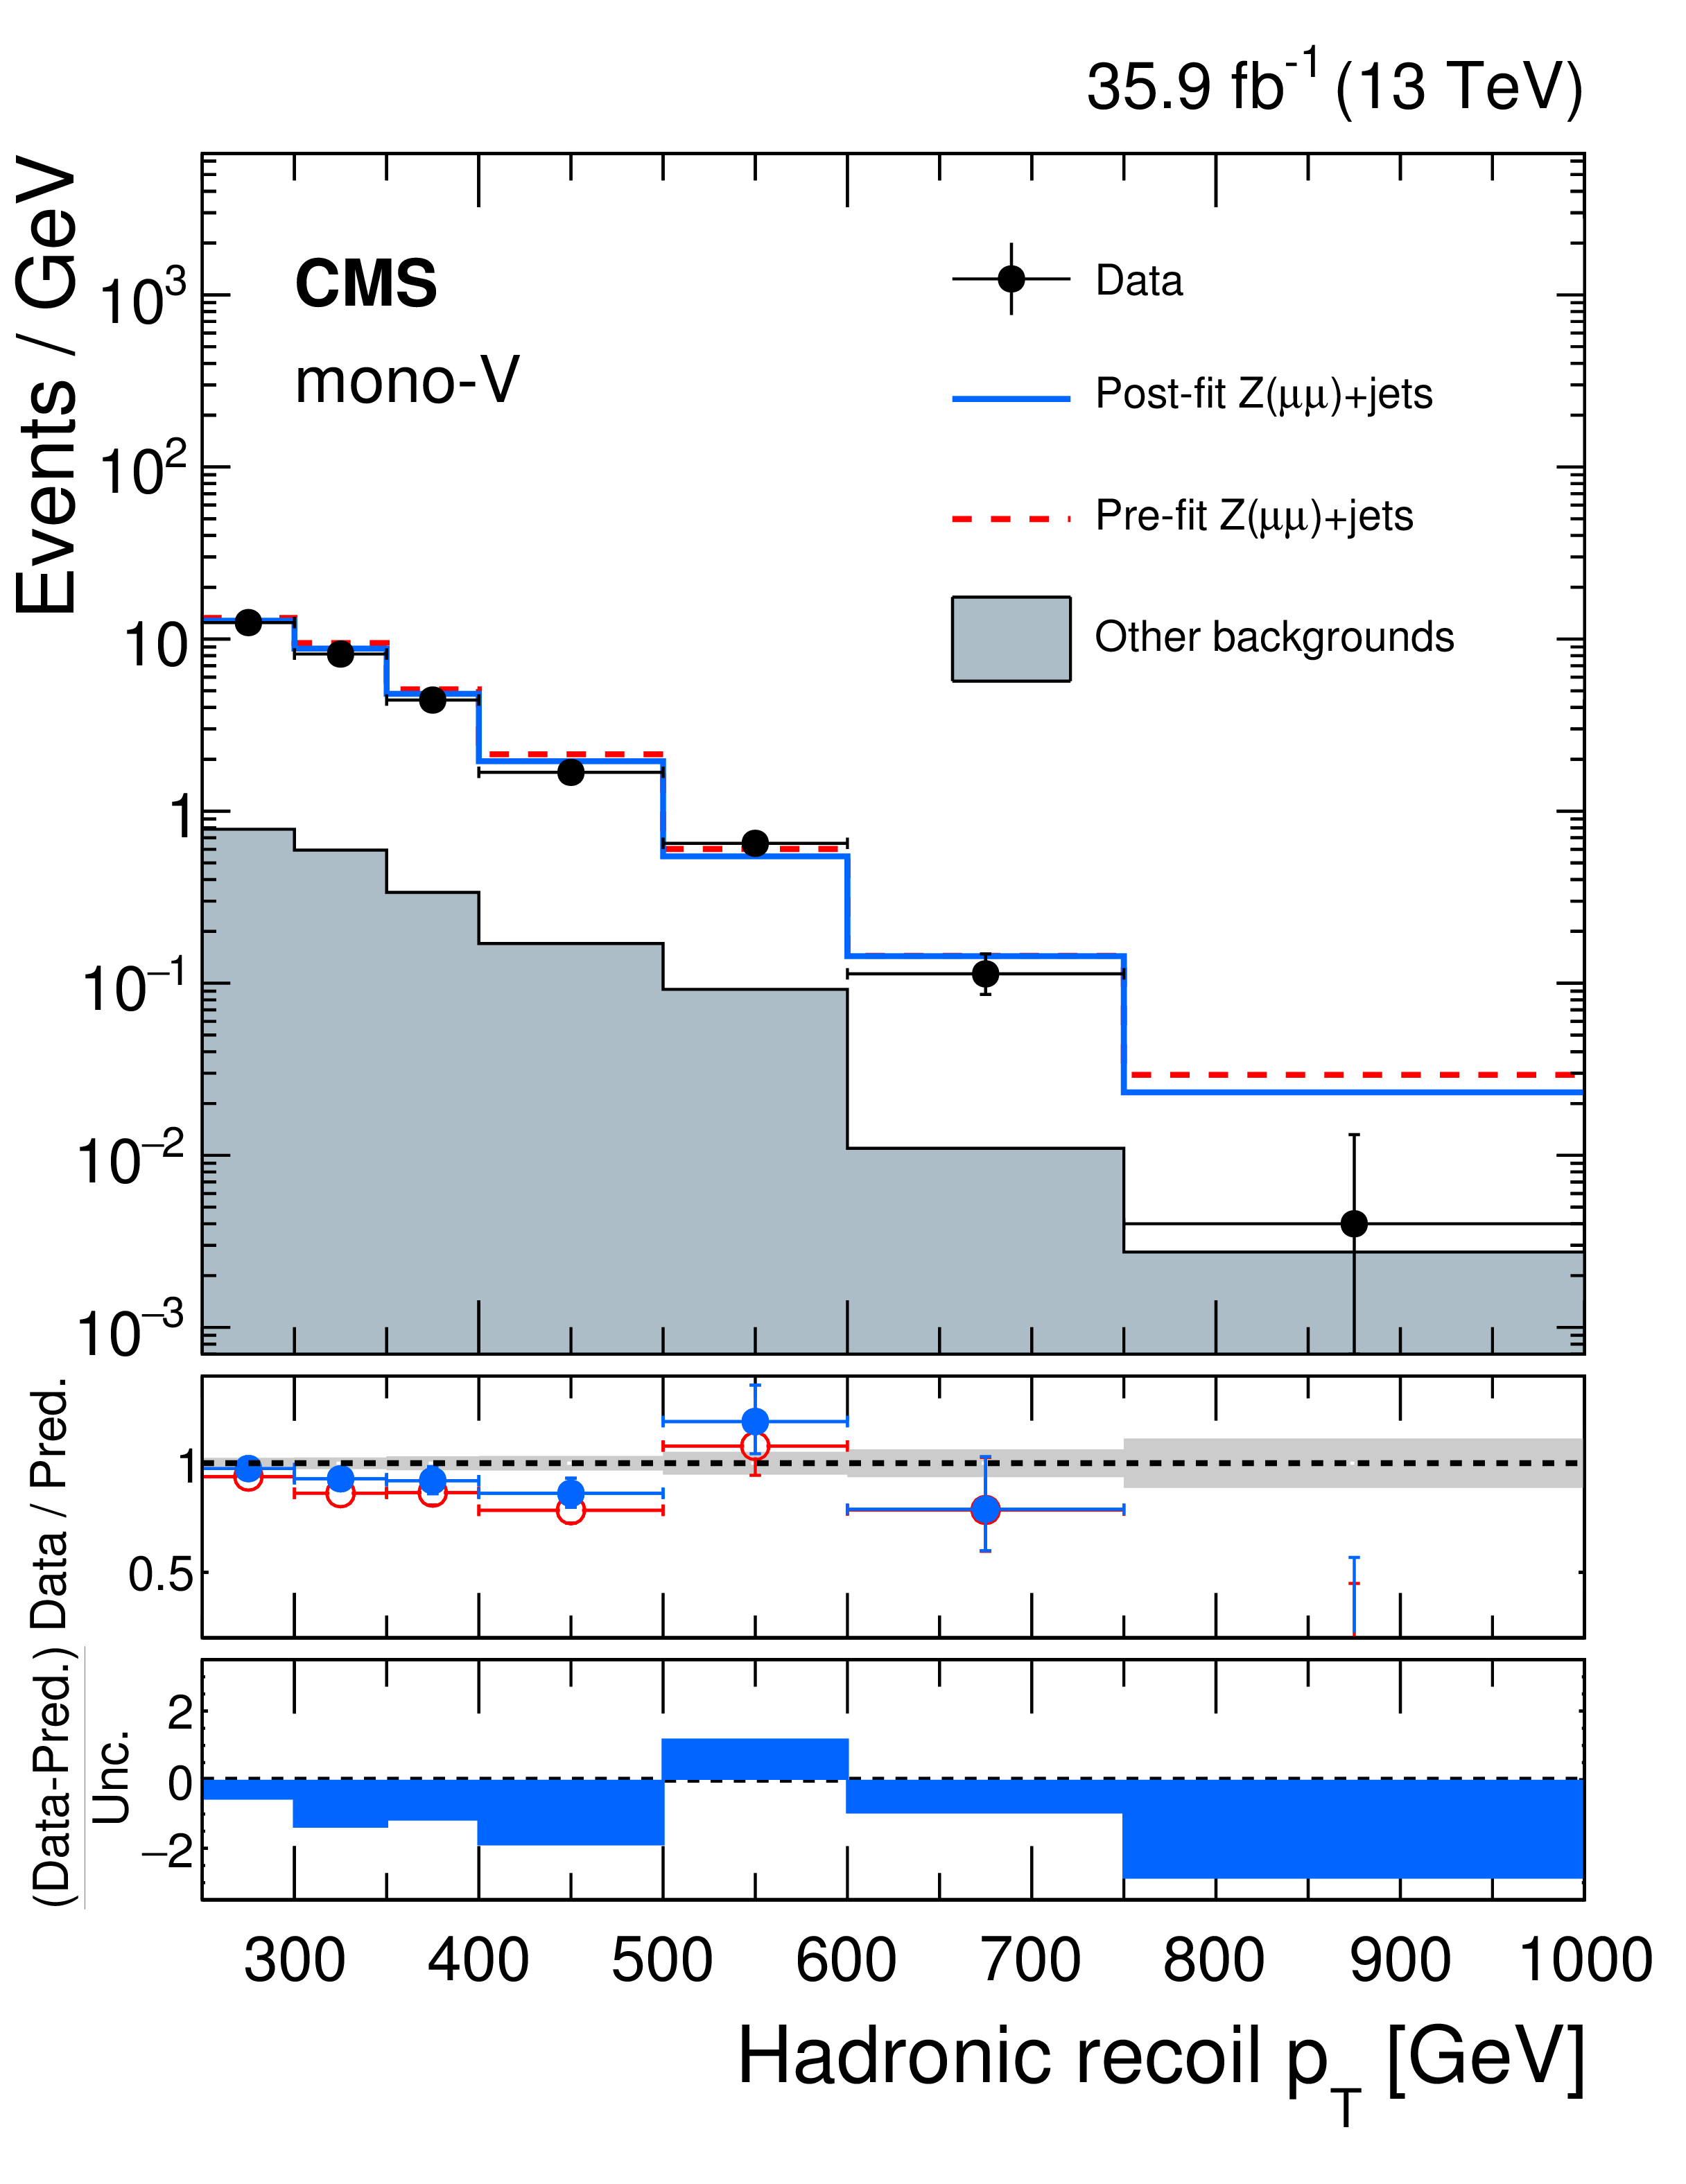
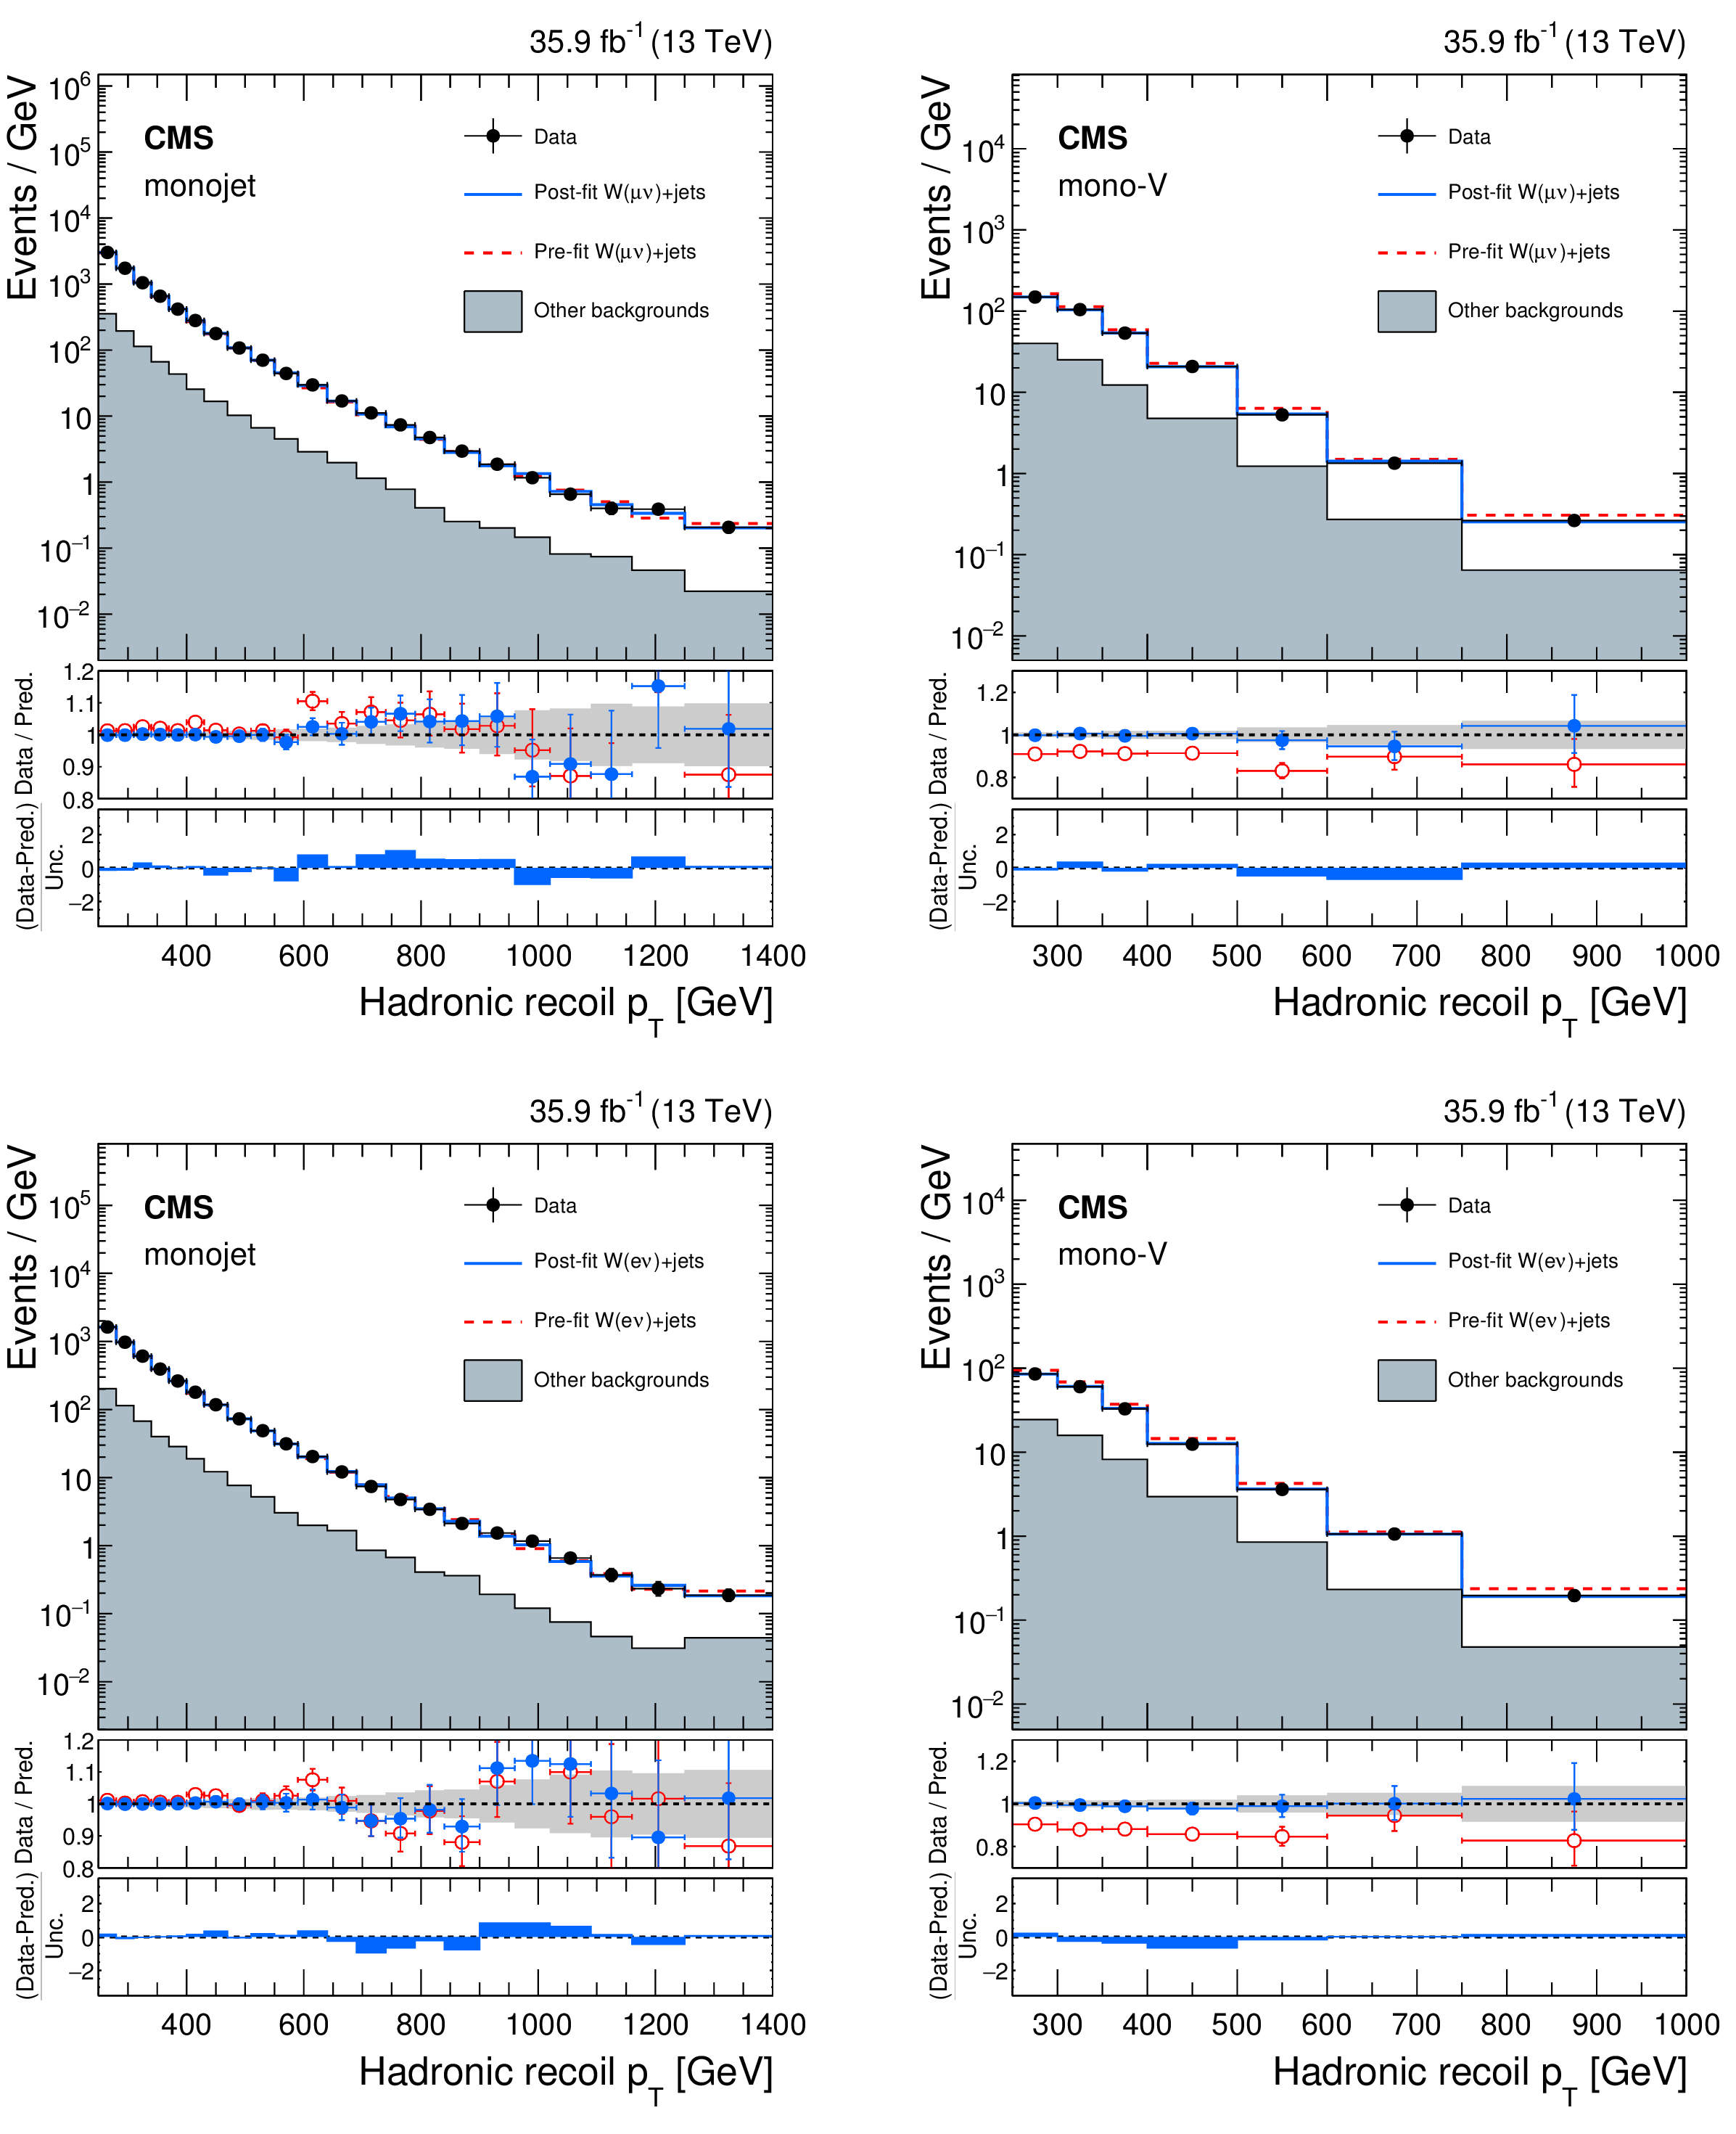
Figure 7:
Comparison between data and MC simulation in the single-muon (upper row) and single-electron (lower row) control samples before and after performing the simultaneous fit across all the control samples and the signal region assuming the absence of any signal. Plots correspond to the monojet (left) and mono-V (right) categories, respectively, in the single-lepton control samples. The hadronic recoil $ {p_{\mathrm {T}}} $ in single-lepton events is used as a proxy for $ {{p_{\mathrm {T}}} ^\text {miss}} $ in the signal region. The other backgrounds include top quark, diboson, and QCD multijet processes. The description of the lower panels is the same as in Fig. 5. |
png pdf |
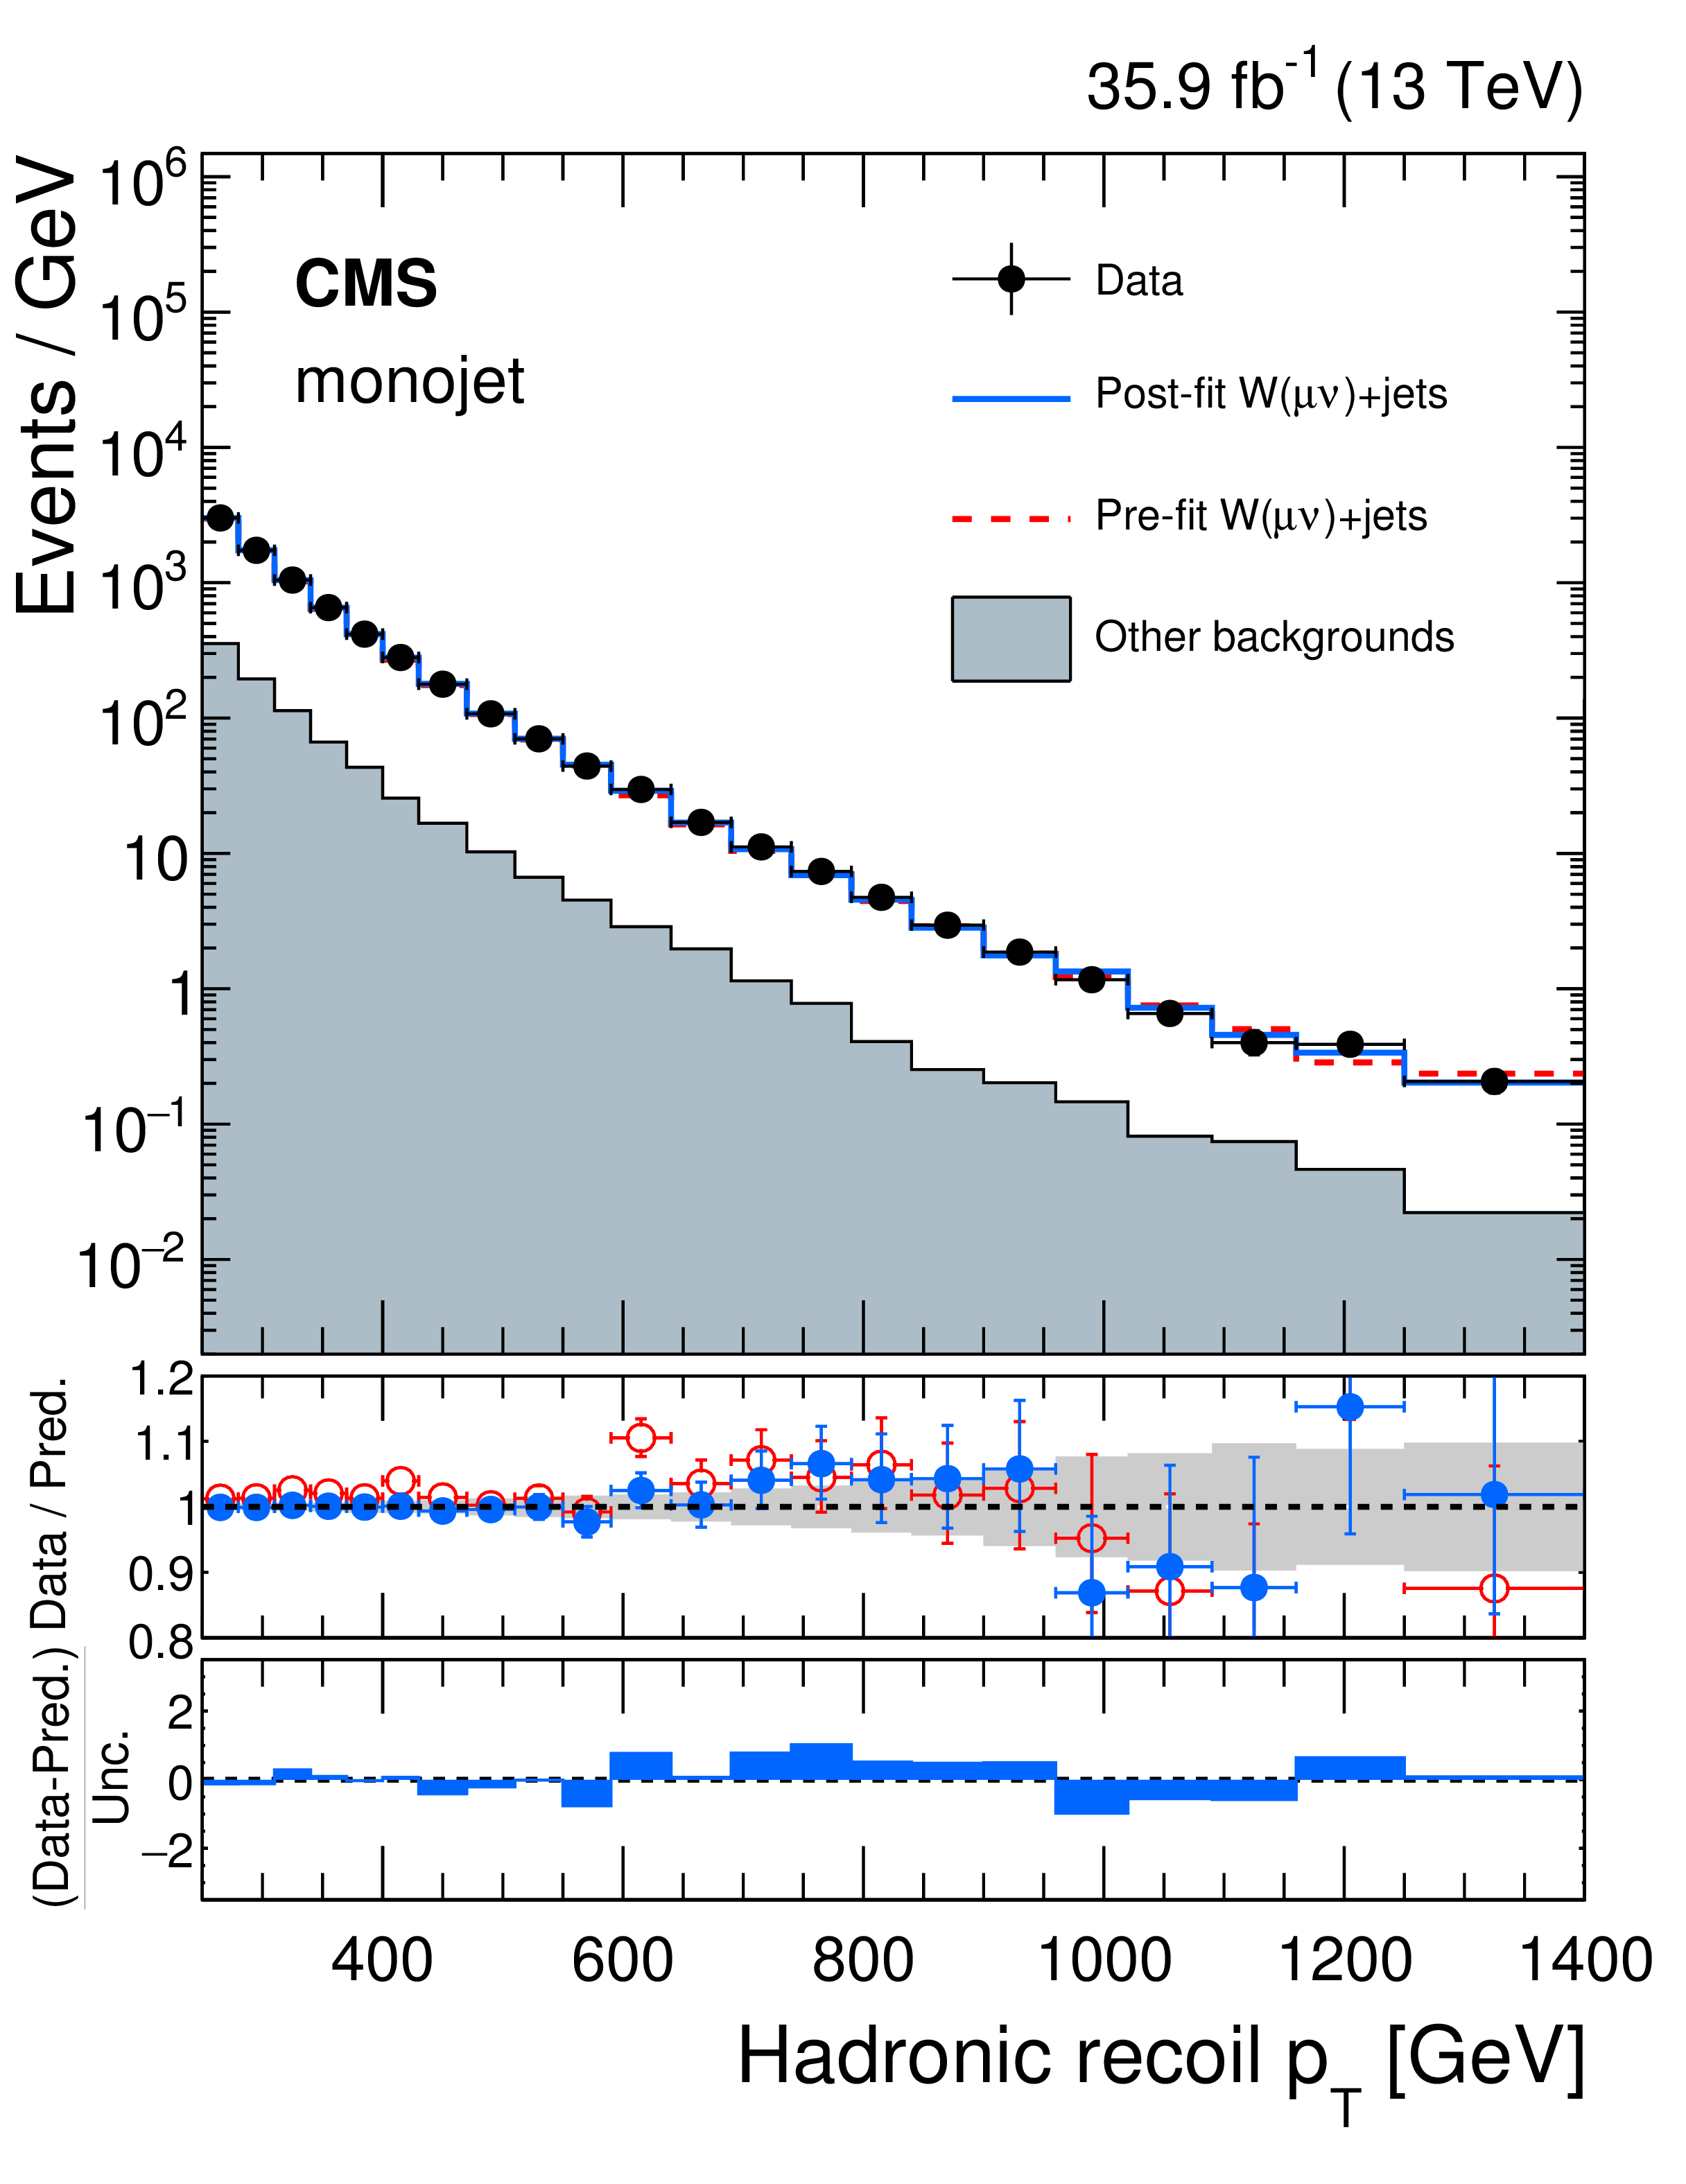
Figure 7-a:
Comparison between data and MC simulation in the single-muon control sample before and after performing the simultaneous fit across all the control samples and the signal region assuming the absence of any signal. The plot corresponds to the monojet category. The hadronic recoil $ {p_{\mathrm {T}}} $ in single-lepton events is used as a proxy for $ {{p_{\mathrm {T}}} ^\text {miss}} $ in the signal region. The other backgrounds include top quark, diboson, and QCD multijet processes. |
png pdf |
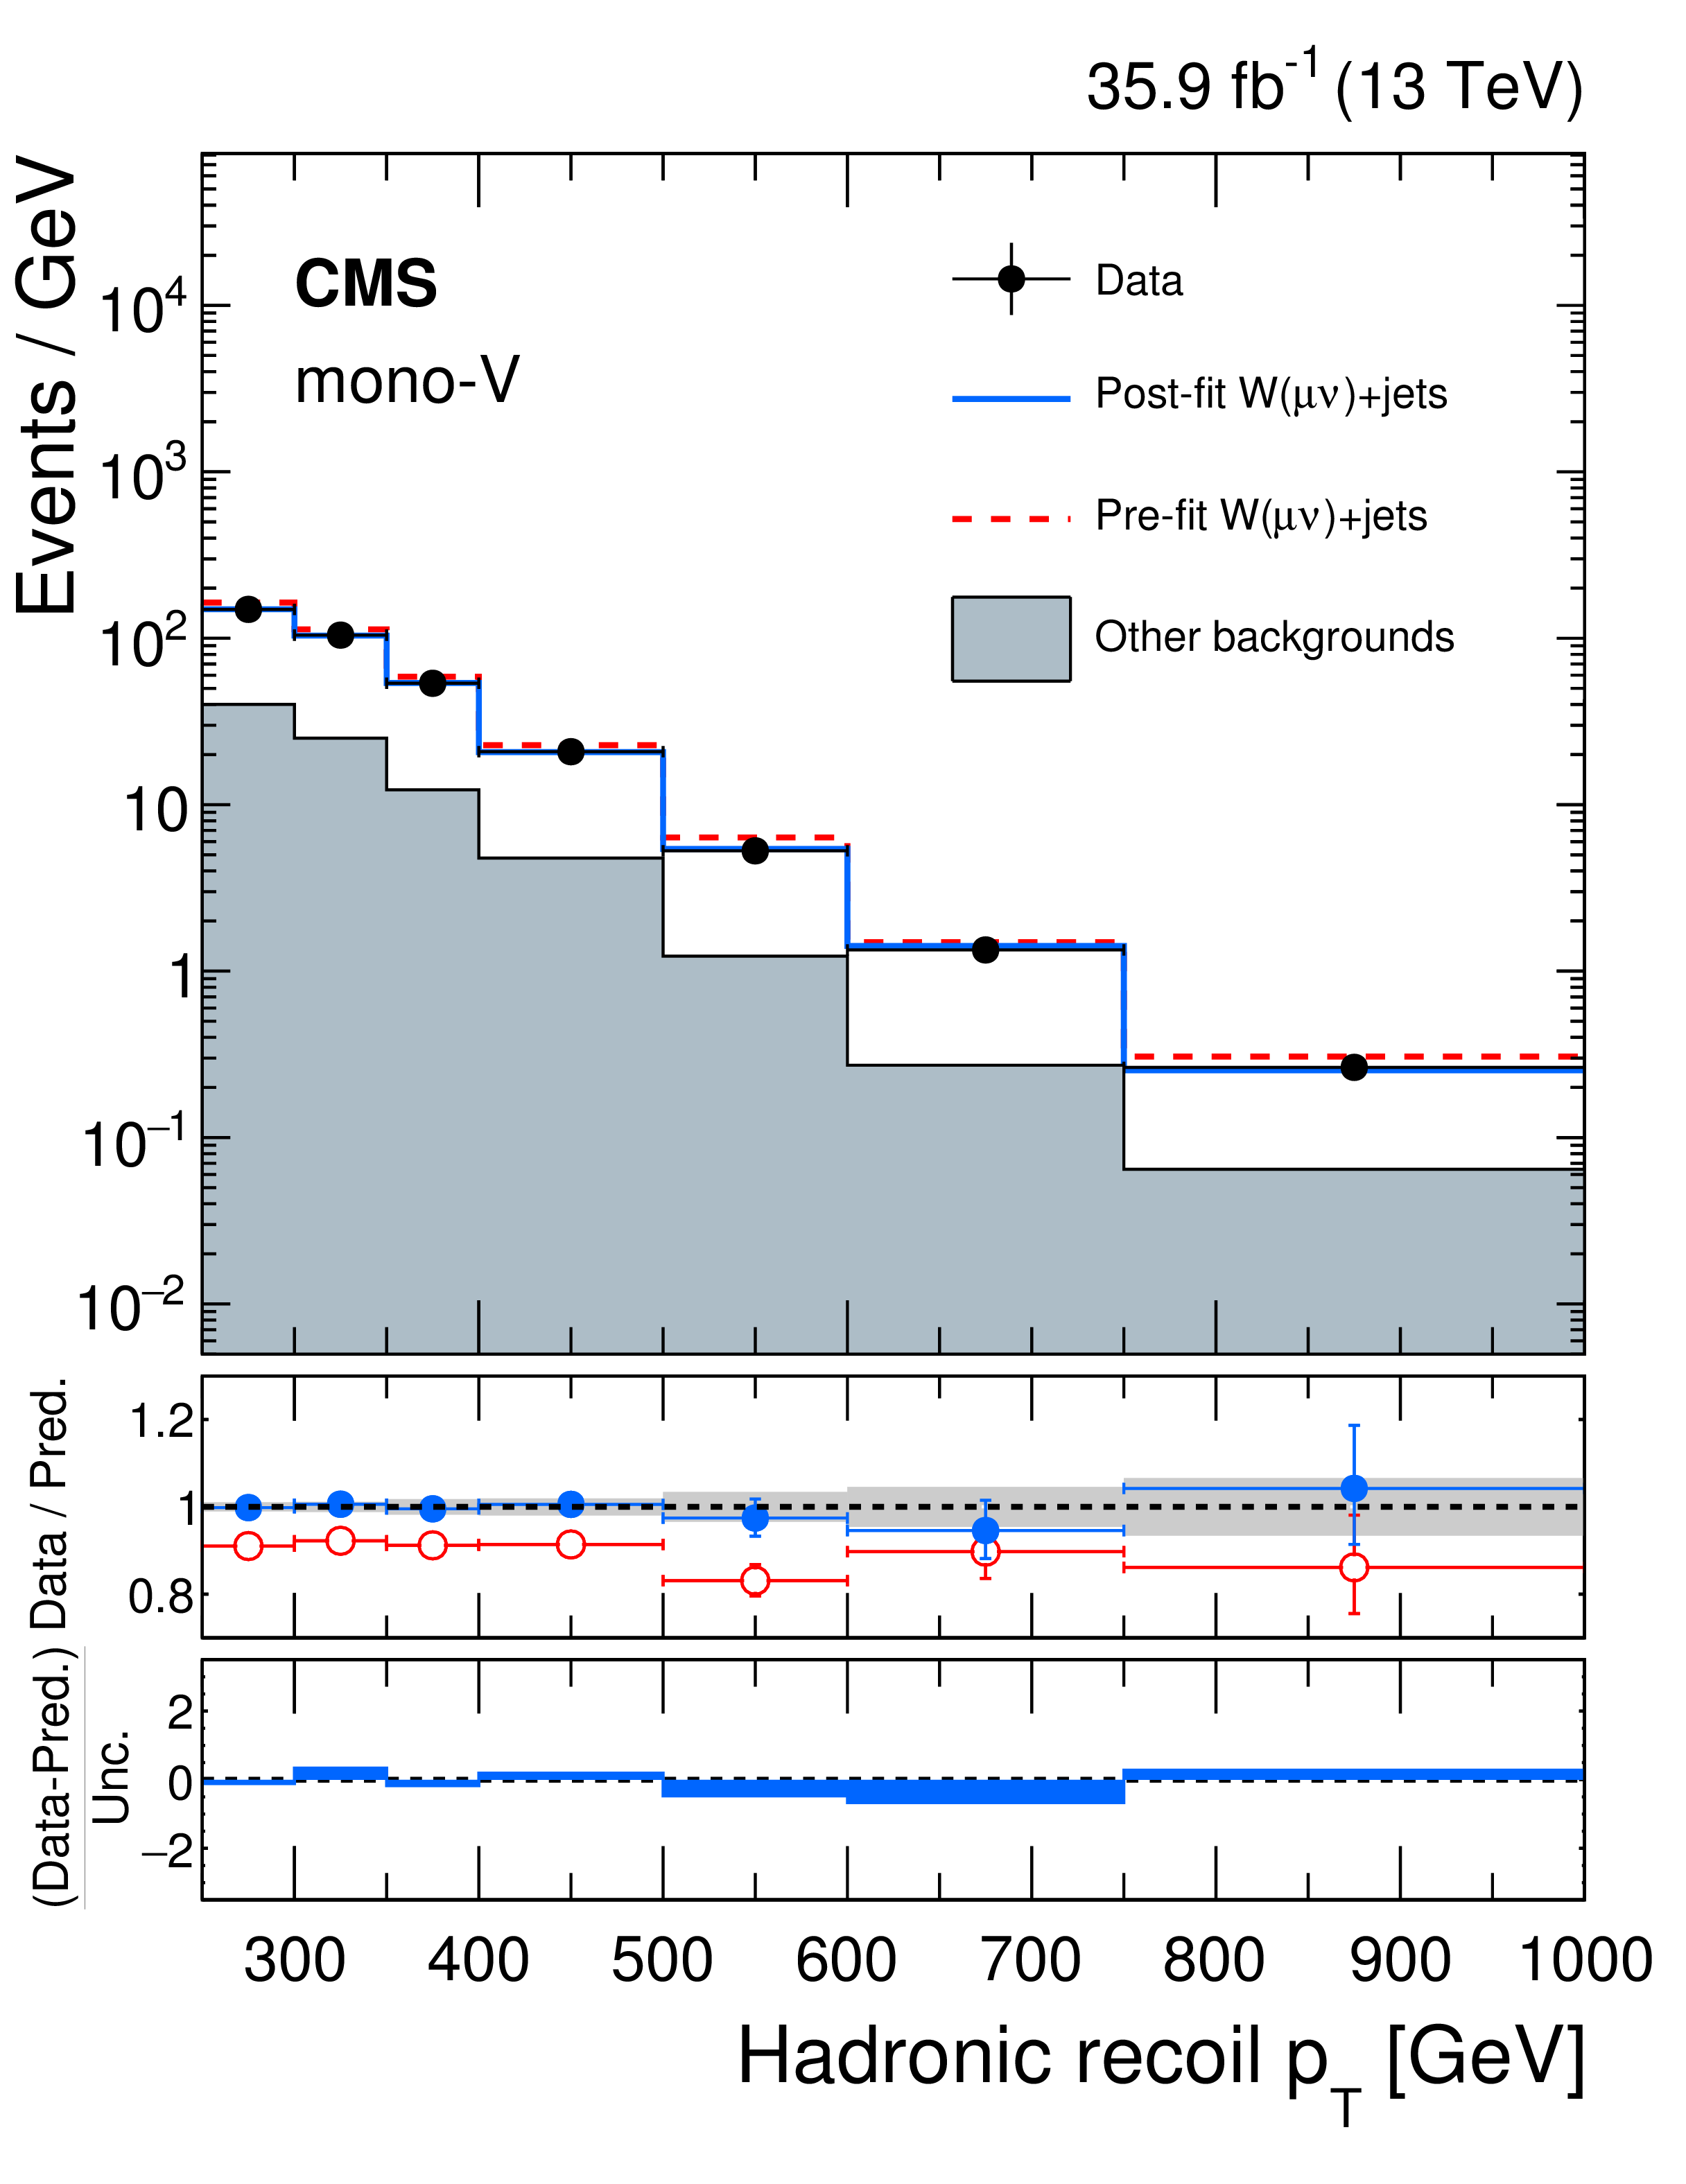
Figure 7-b:
Comparison between data and MC simulation in the single-muon control sample before and after performing the simultaneous fit across all the control samples and the signal region assuming the absence of any signal. The plot corresponds to the mono-V category. The hadronic recoil $ {p_{\mathrm {T}}} $ in single-lepton events is used as a proxy for $ {{p_{\mathrm {T}}} ^\text {miss}} $ in the signal region. The other backgrounds include top quark, diboson, and QCD multijet processes. |
png pdf |
Figure 7-c:
Comparison between data and MC simulation in the single-electron control sample before and after performing the simultaneous fit across all the control samples and the signal region assuming the absence of any signal. The plot corresponds to the monojet category. The hadronic recoil $ {p_{\mathrm {T}}} $ in single-lepton events is used as a proxy for $ {{p_{\mathrm {T}}} ^\text {miss}} $ in the signal region. The other backgrounds include top quark, diboson, and QCD multijet processes. |
png pdf |
Figure 7-d:
Comparison between data and MC simulation in the single-electron control sample before and after performing the simultaneous fit across all the control samples and the signal region assuming the absence of any signal. The plot corresponds to the mono-V category. The hadronic recoil $ {p_{\mathrm {T}}} $ in single-lepton events is used as a proxy for $ {{p_{\mathrm {T}}} ^\text {miss}} $ in the signal region. The other backgrounds include top quark, diboson, and QCD multijet processes. |
png pdf |
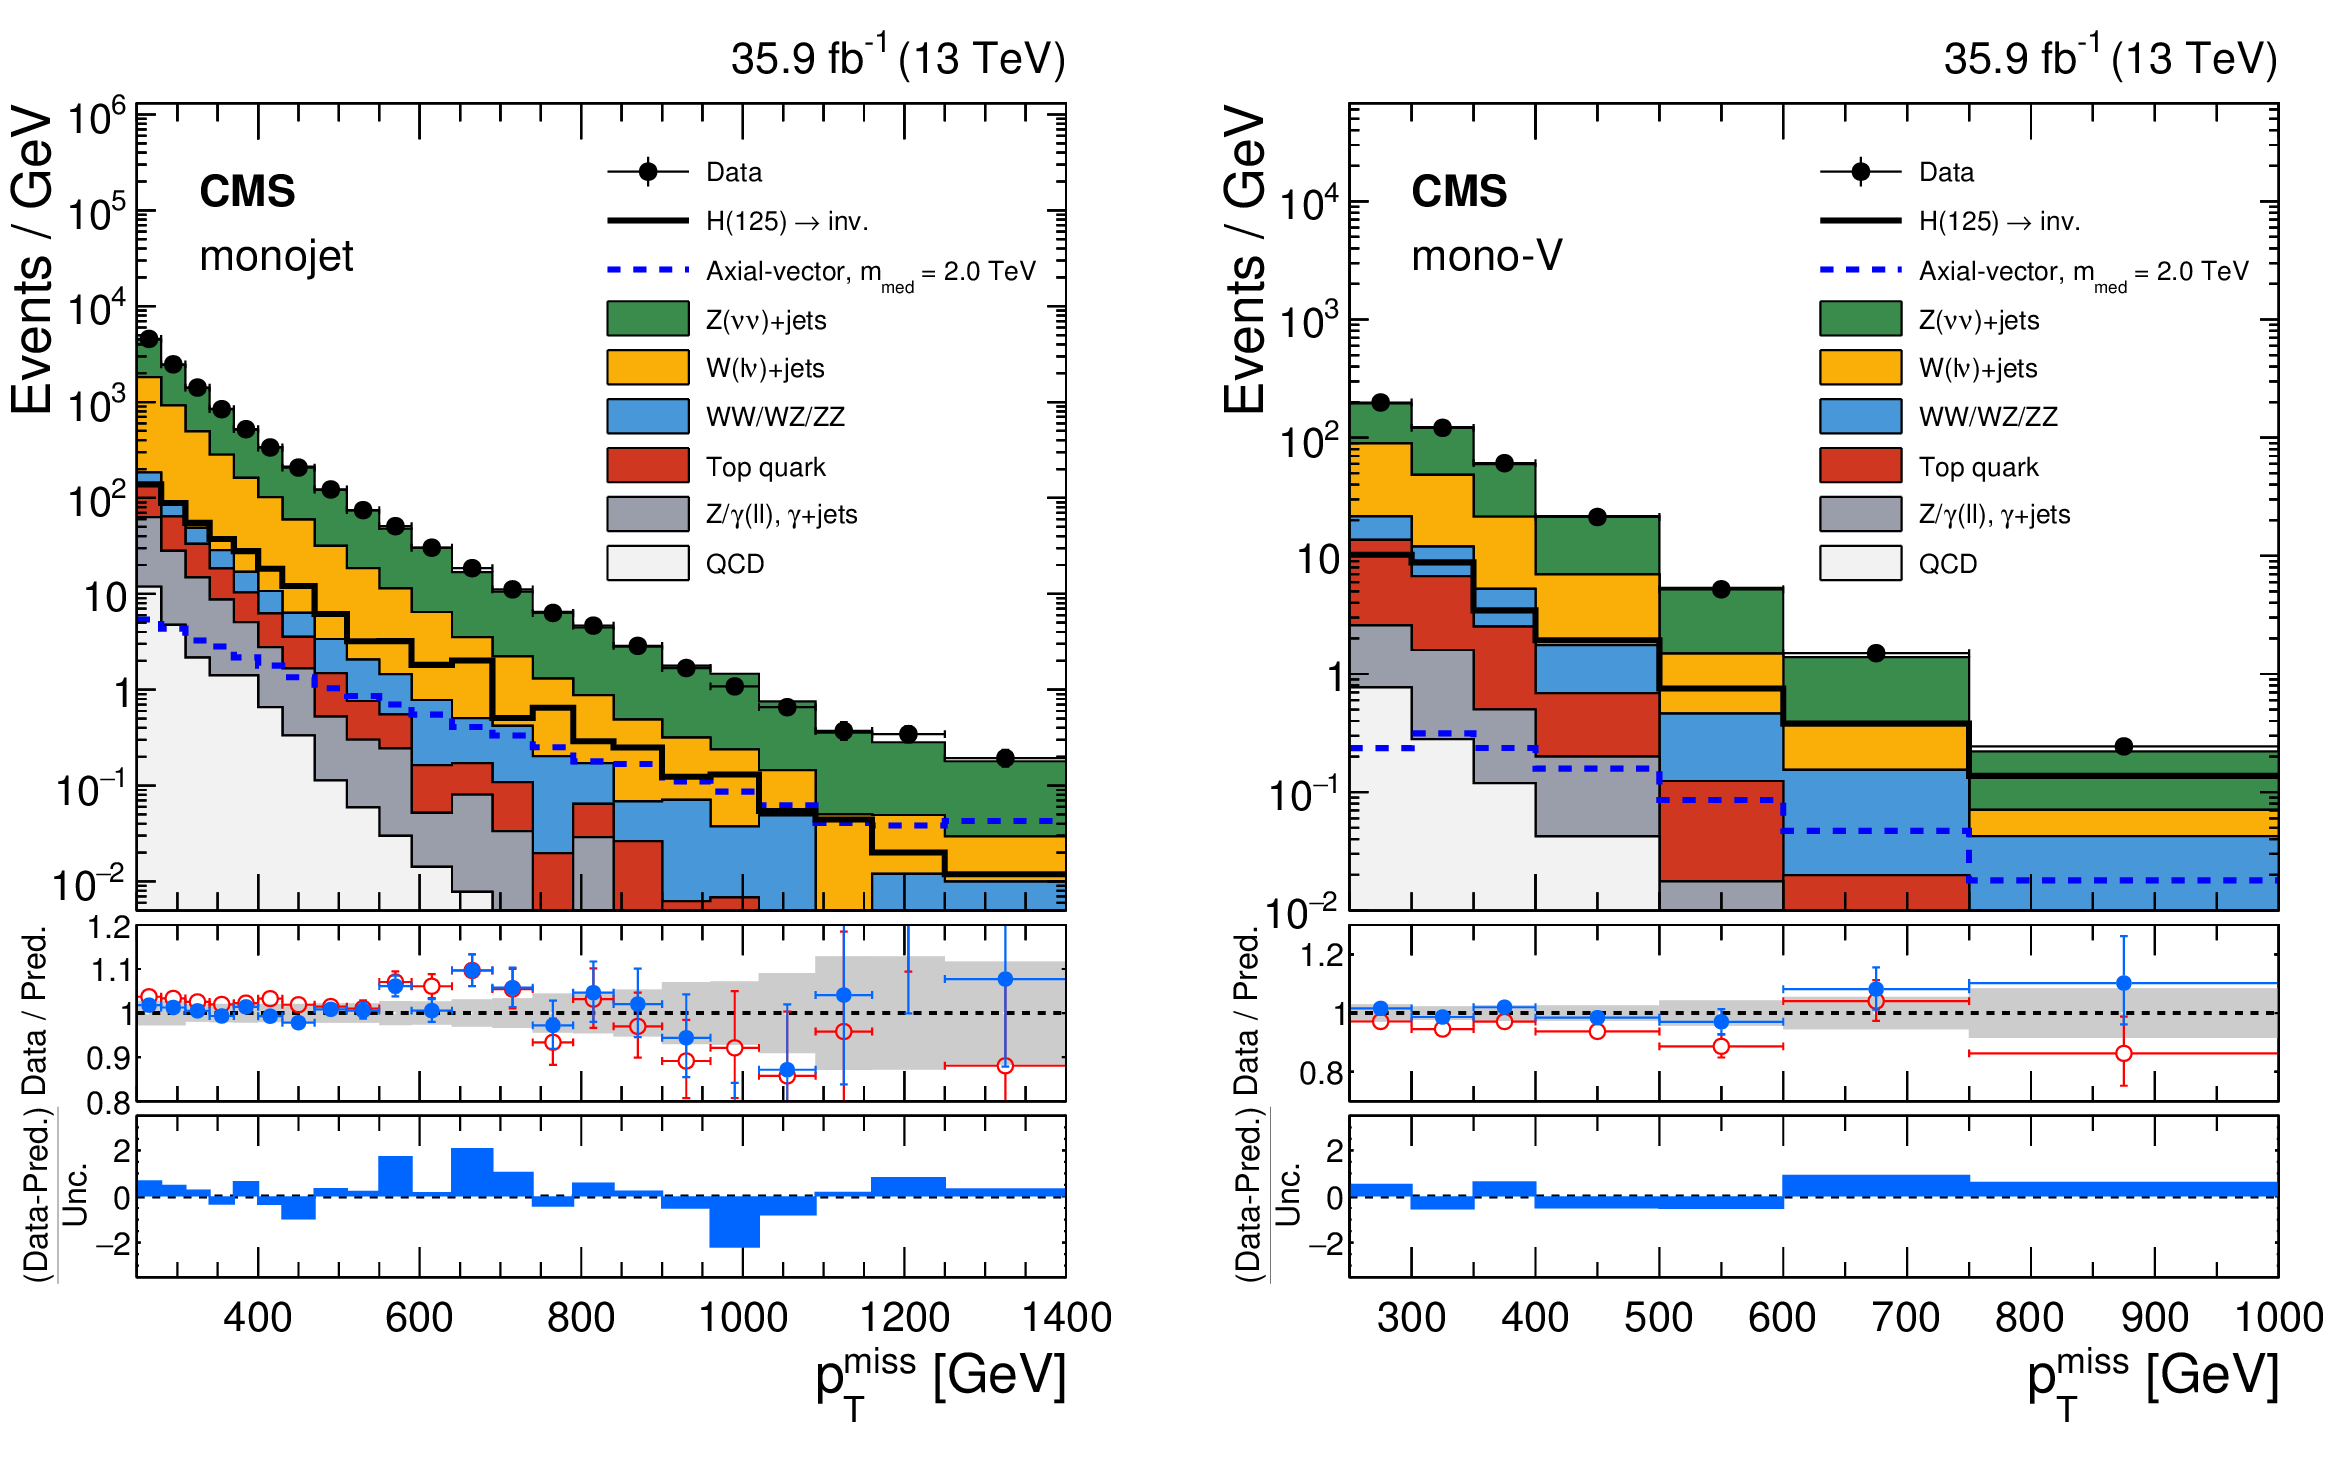
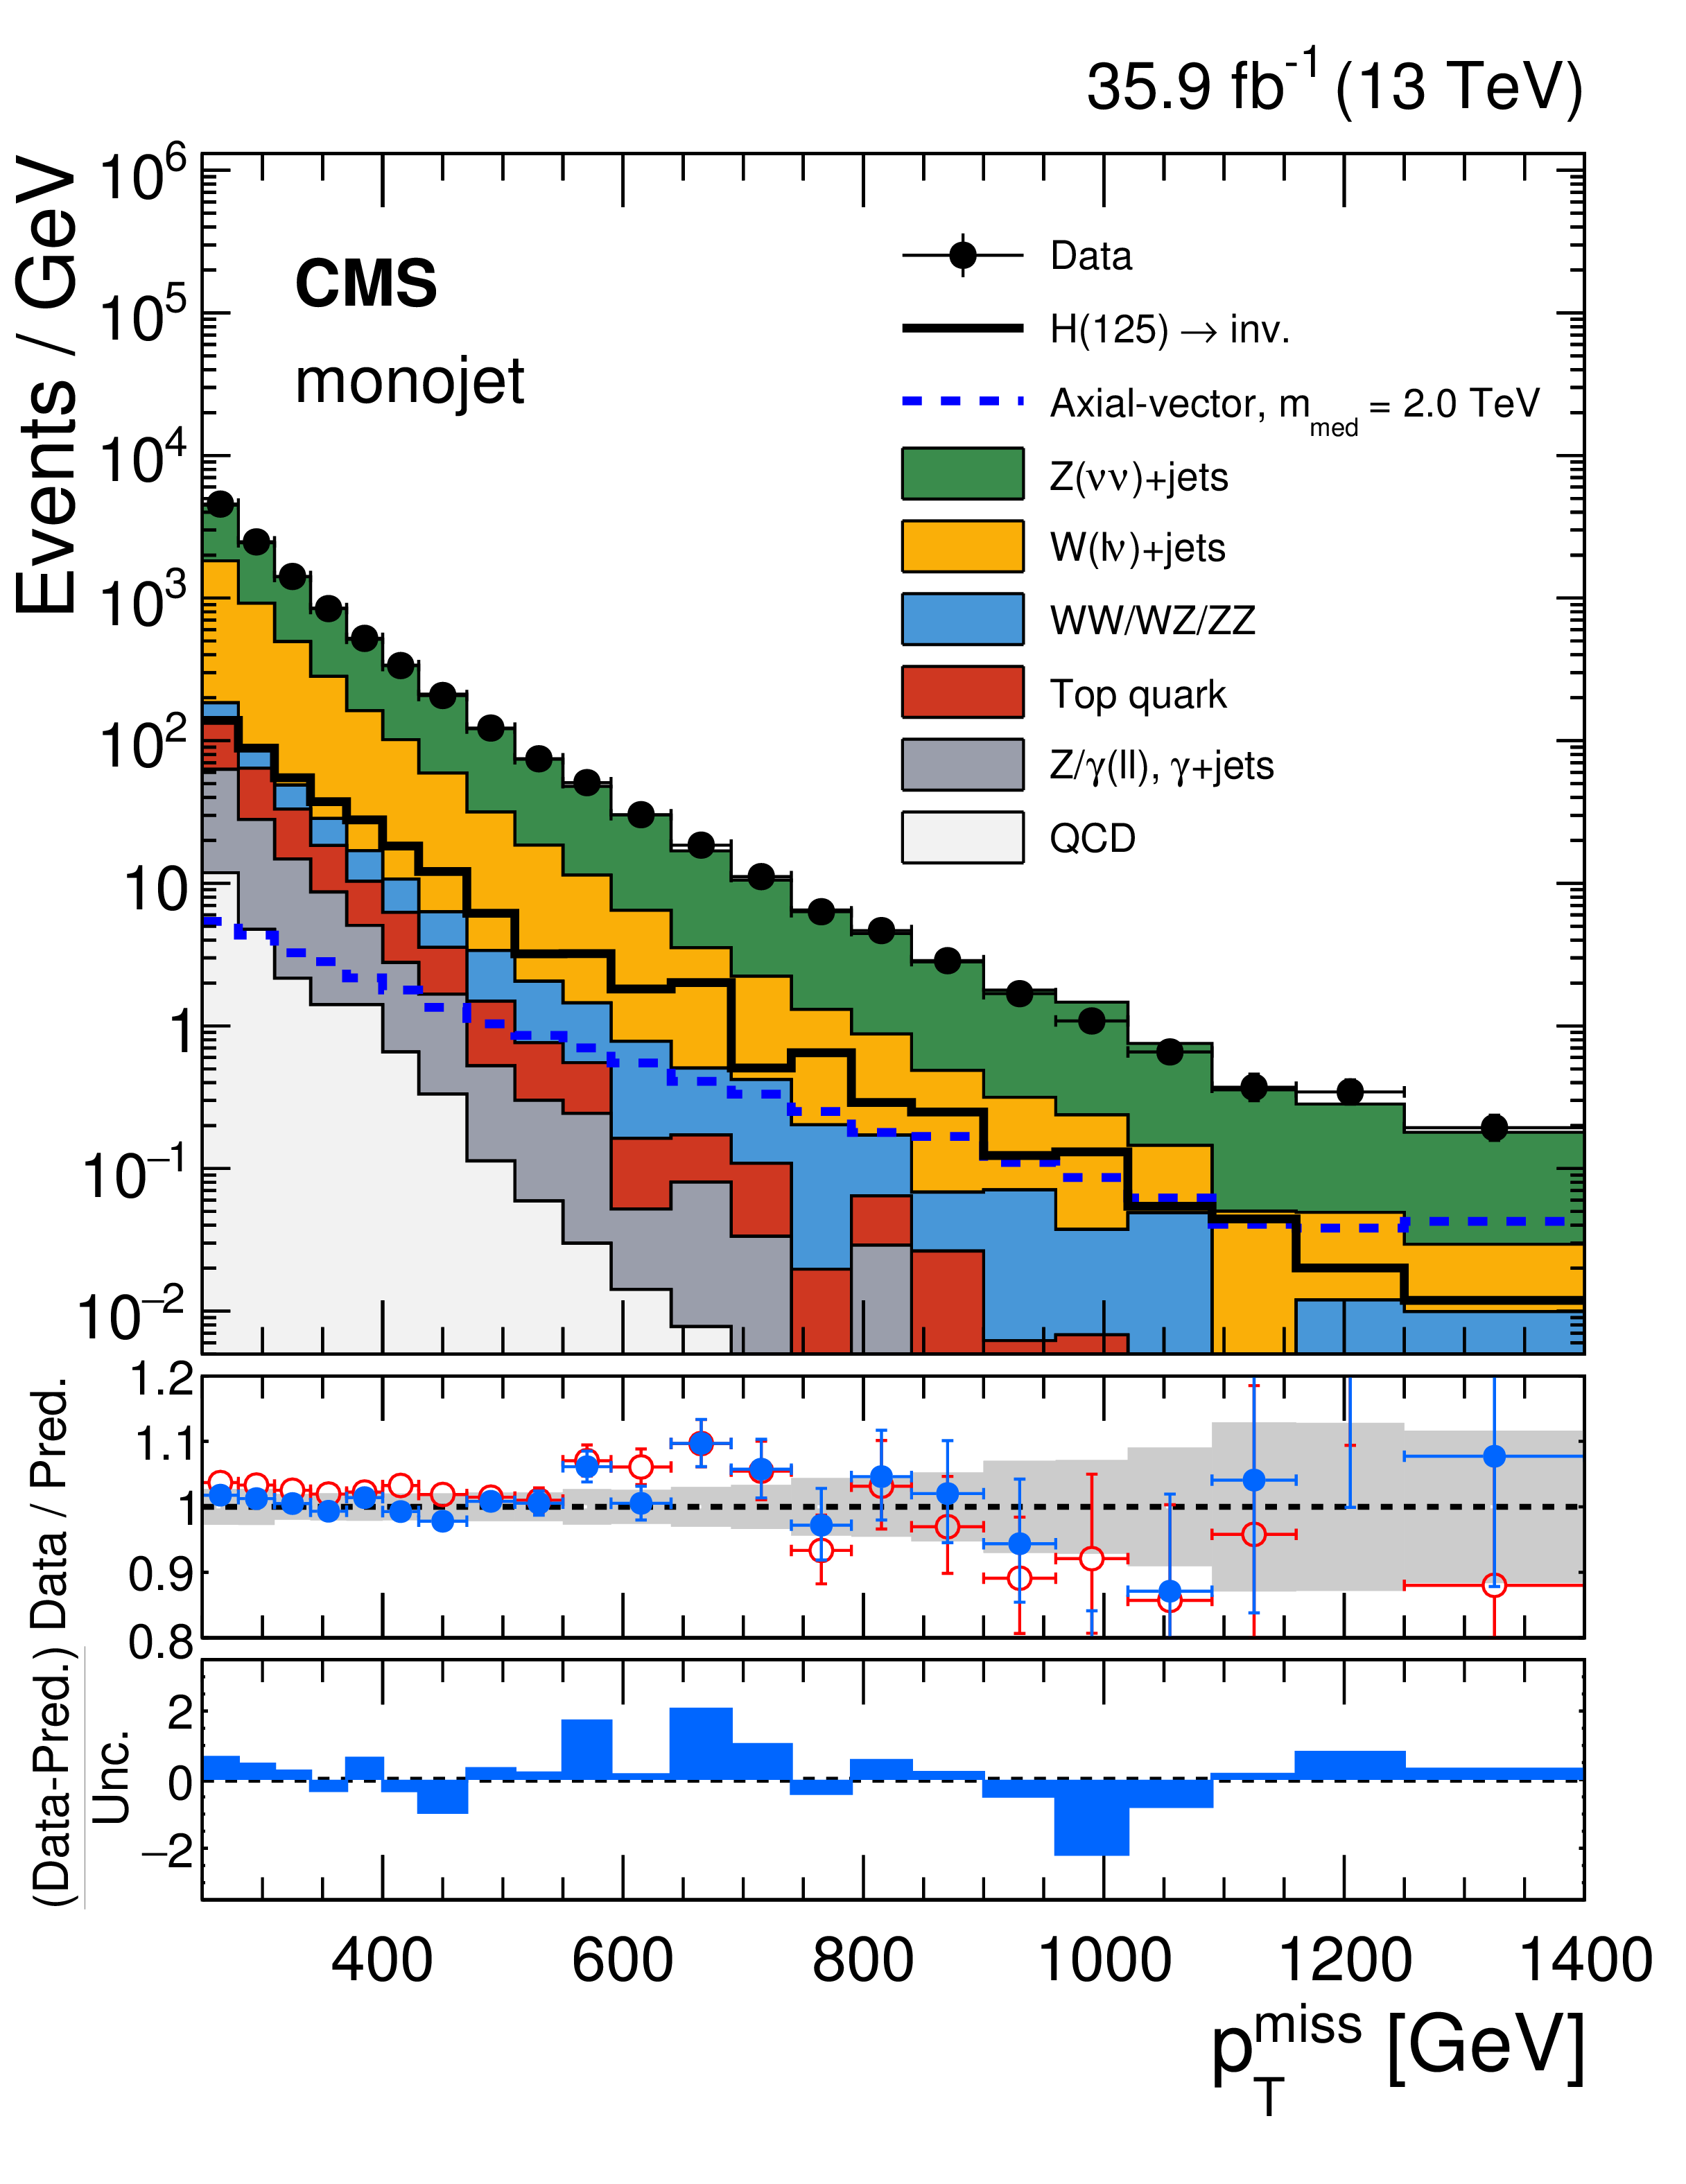
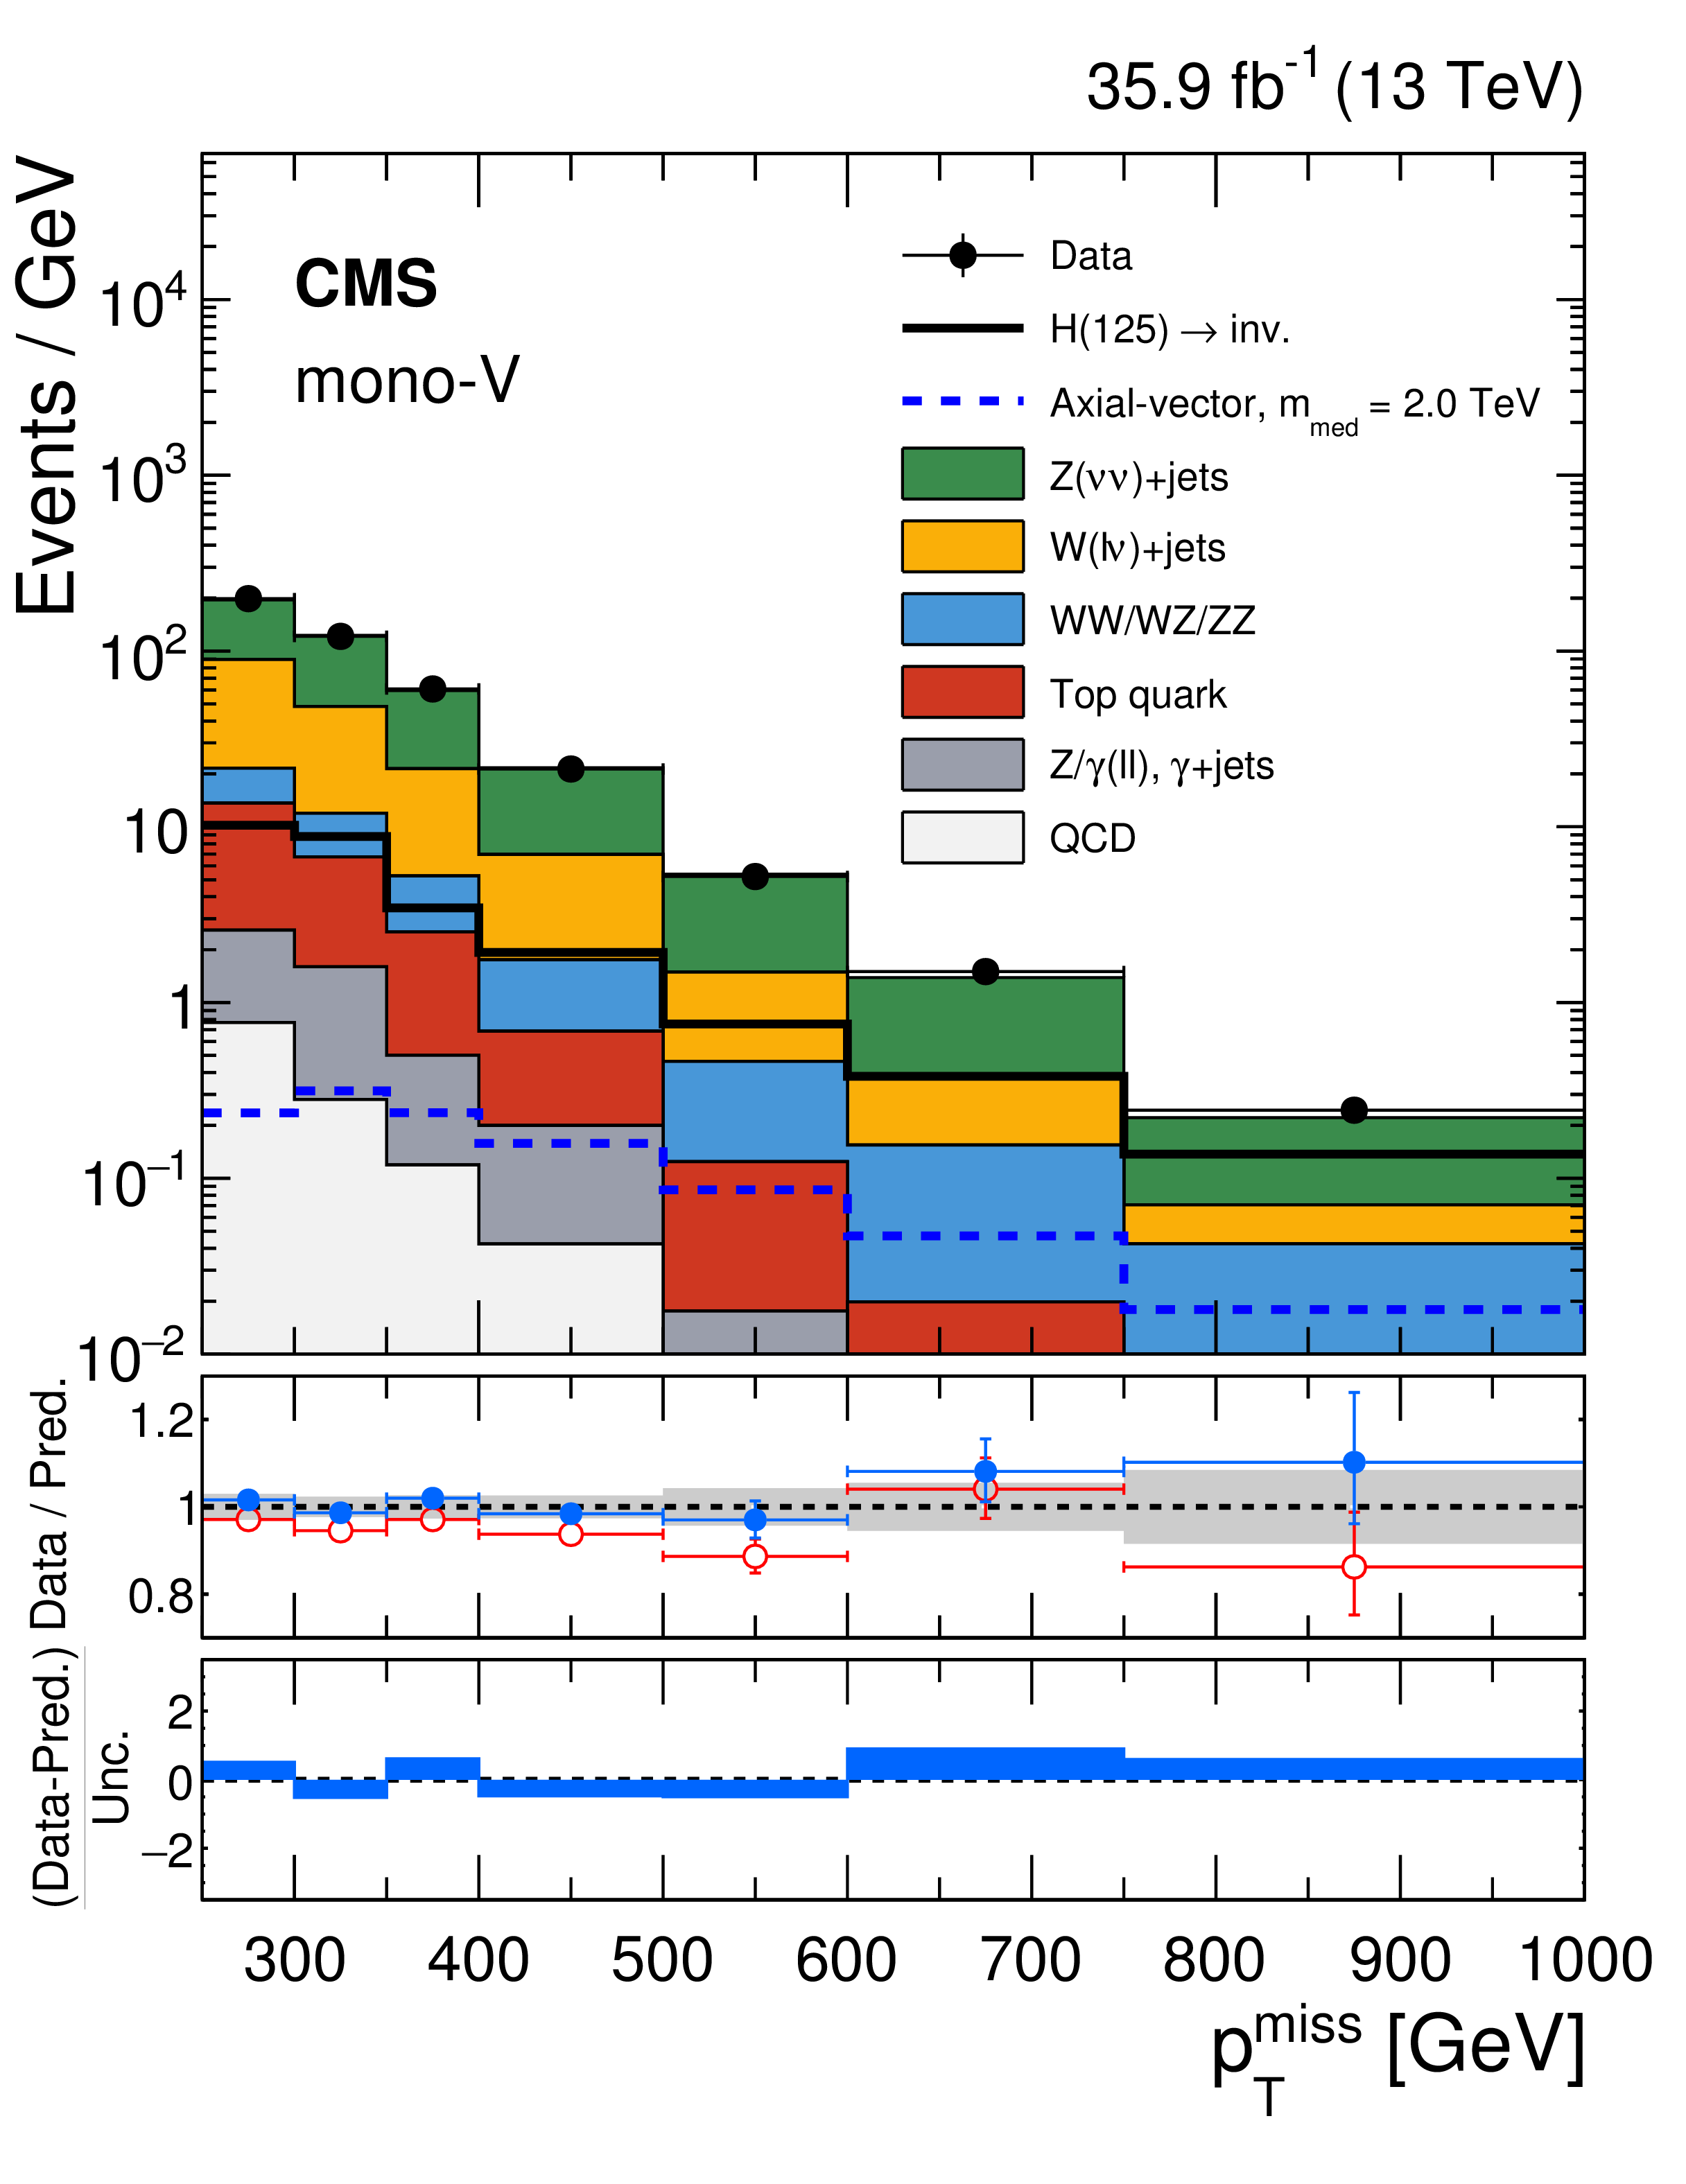
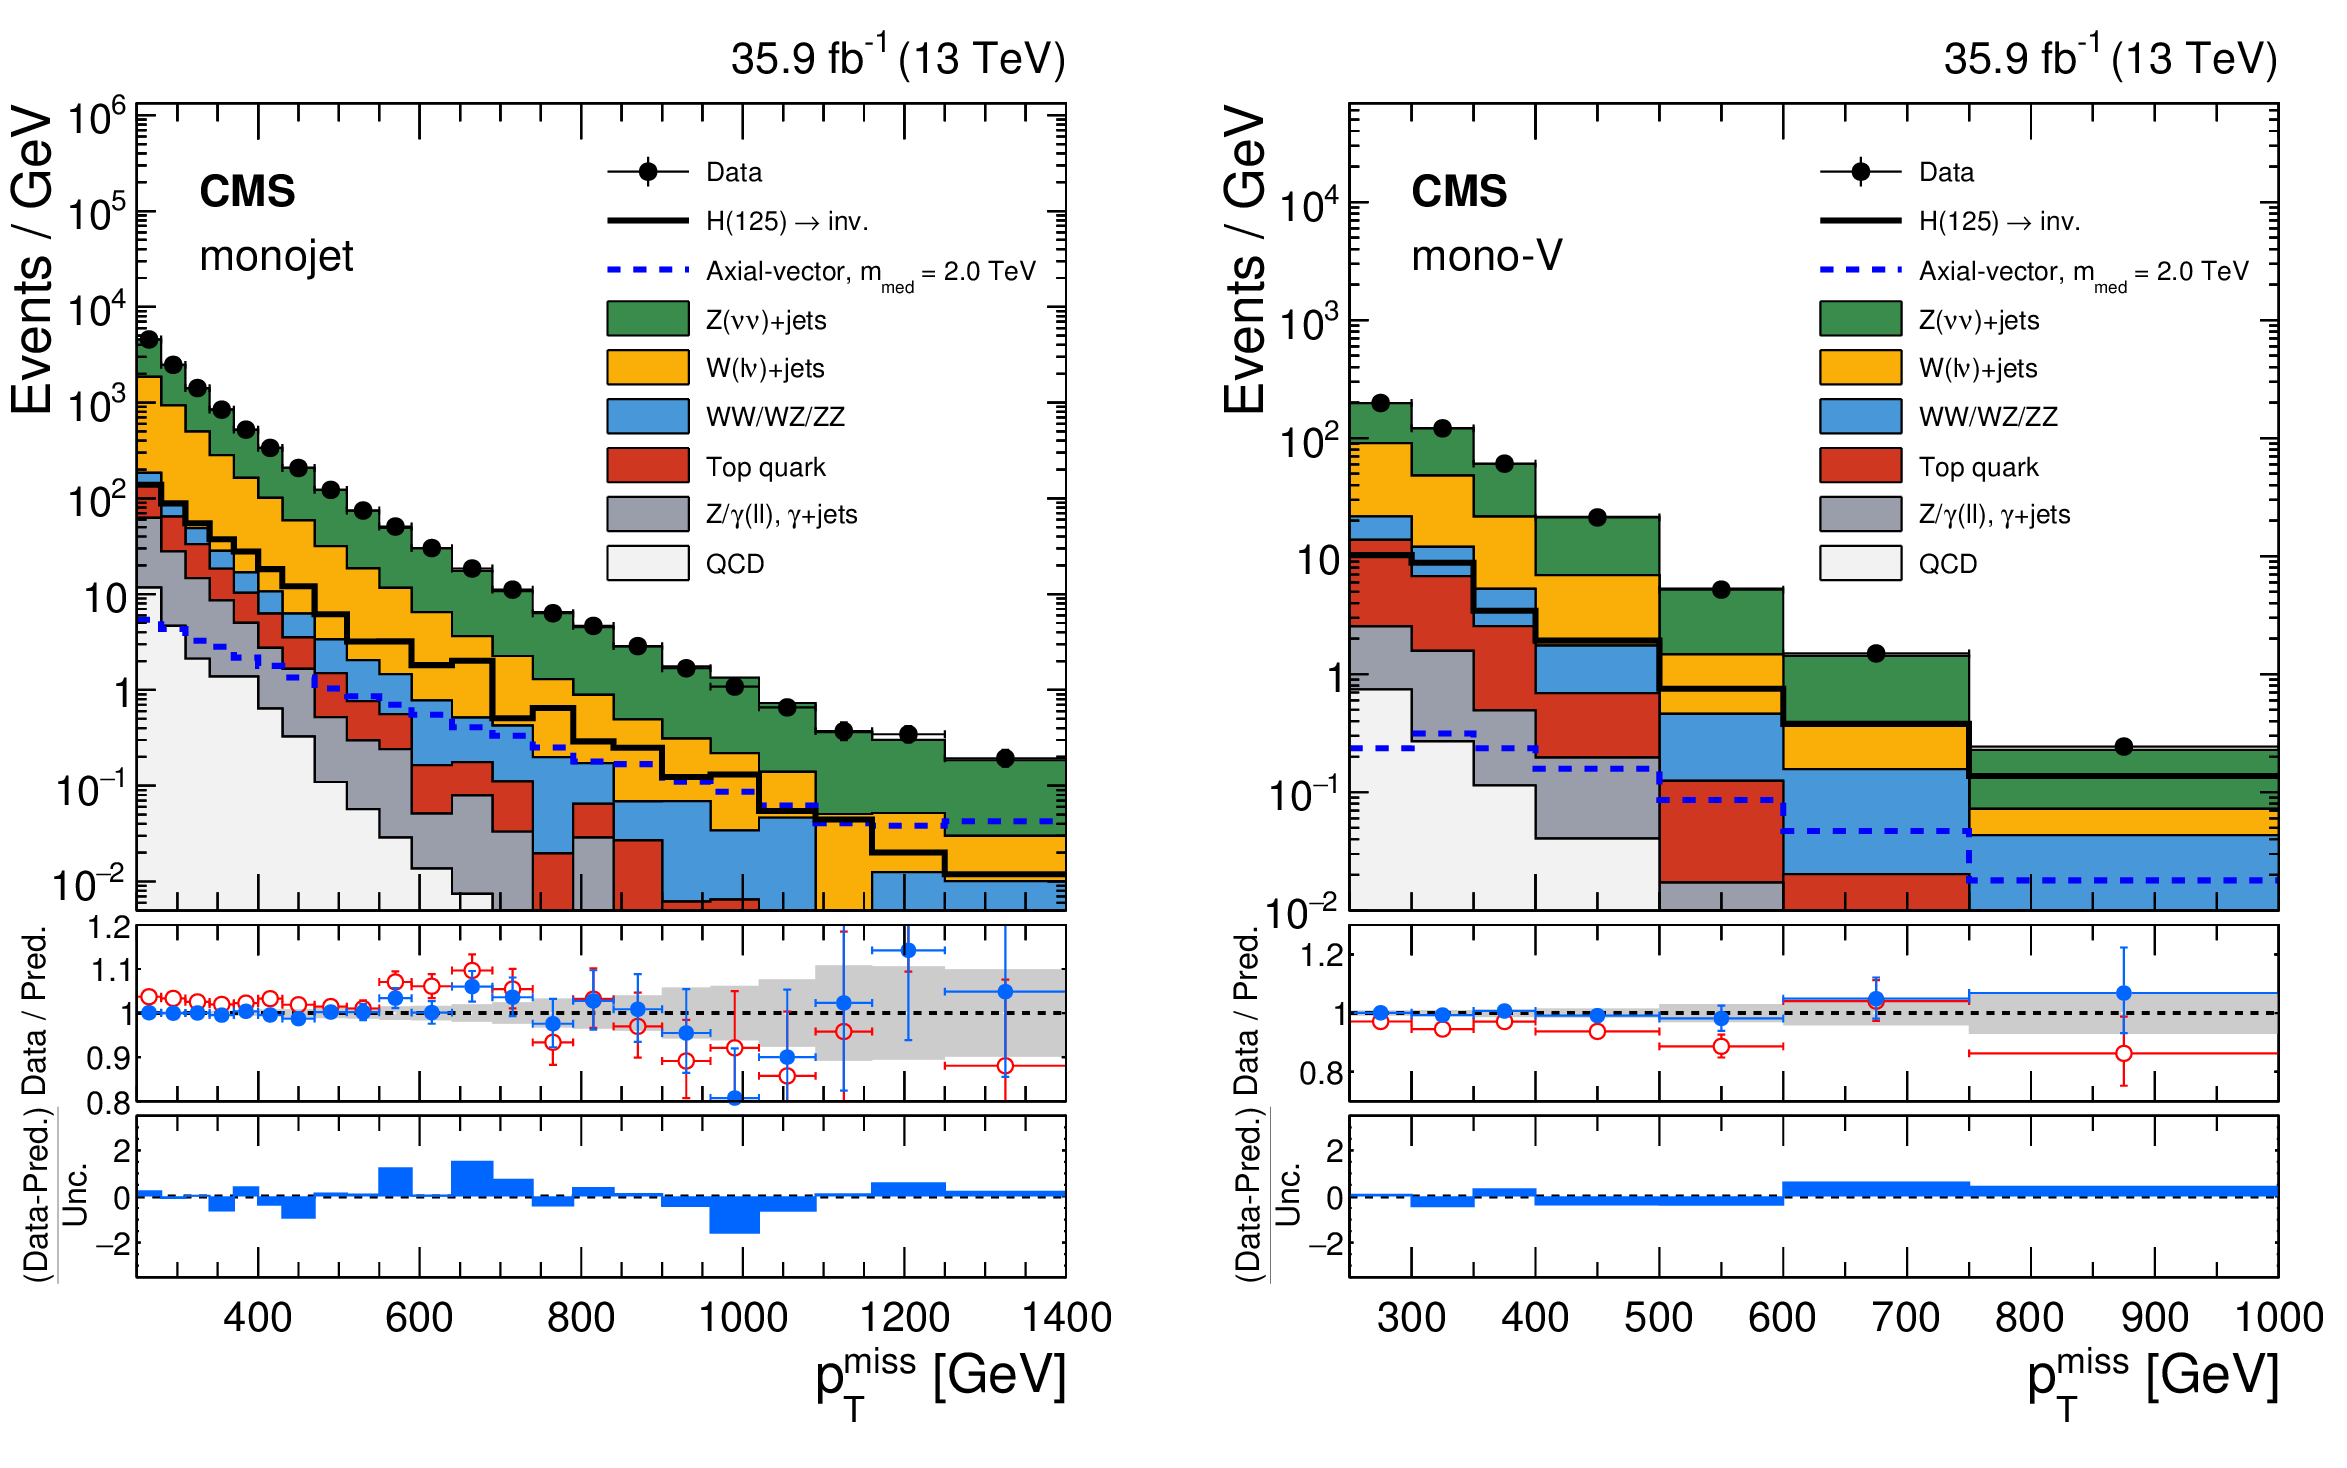
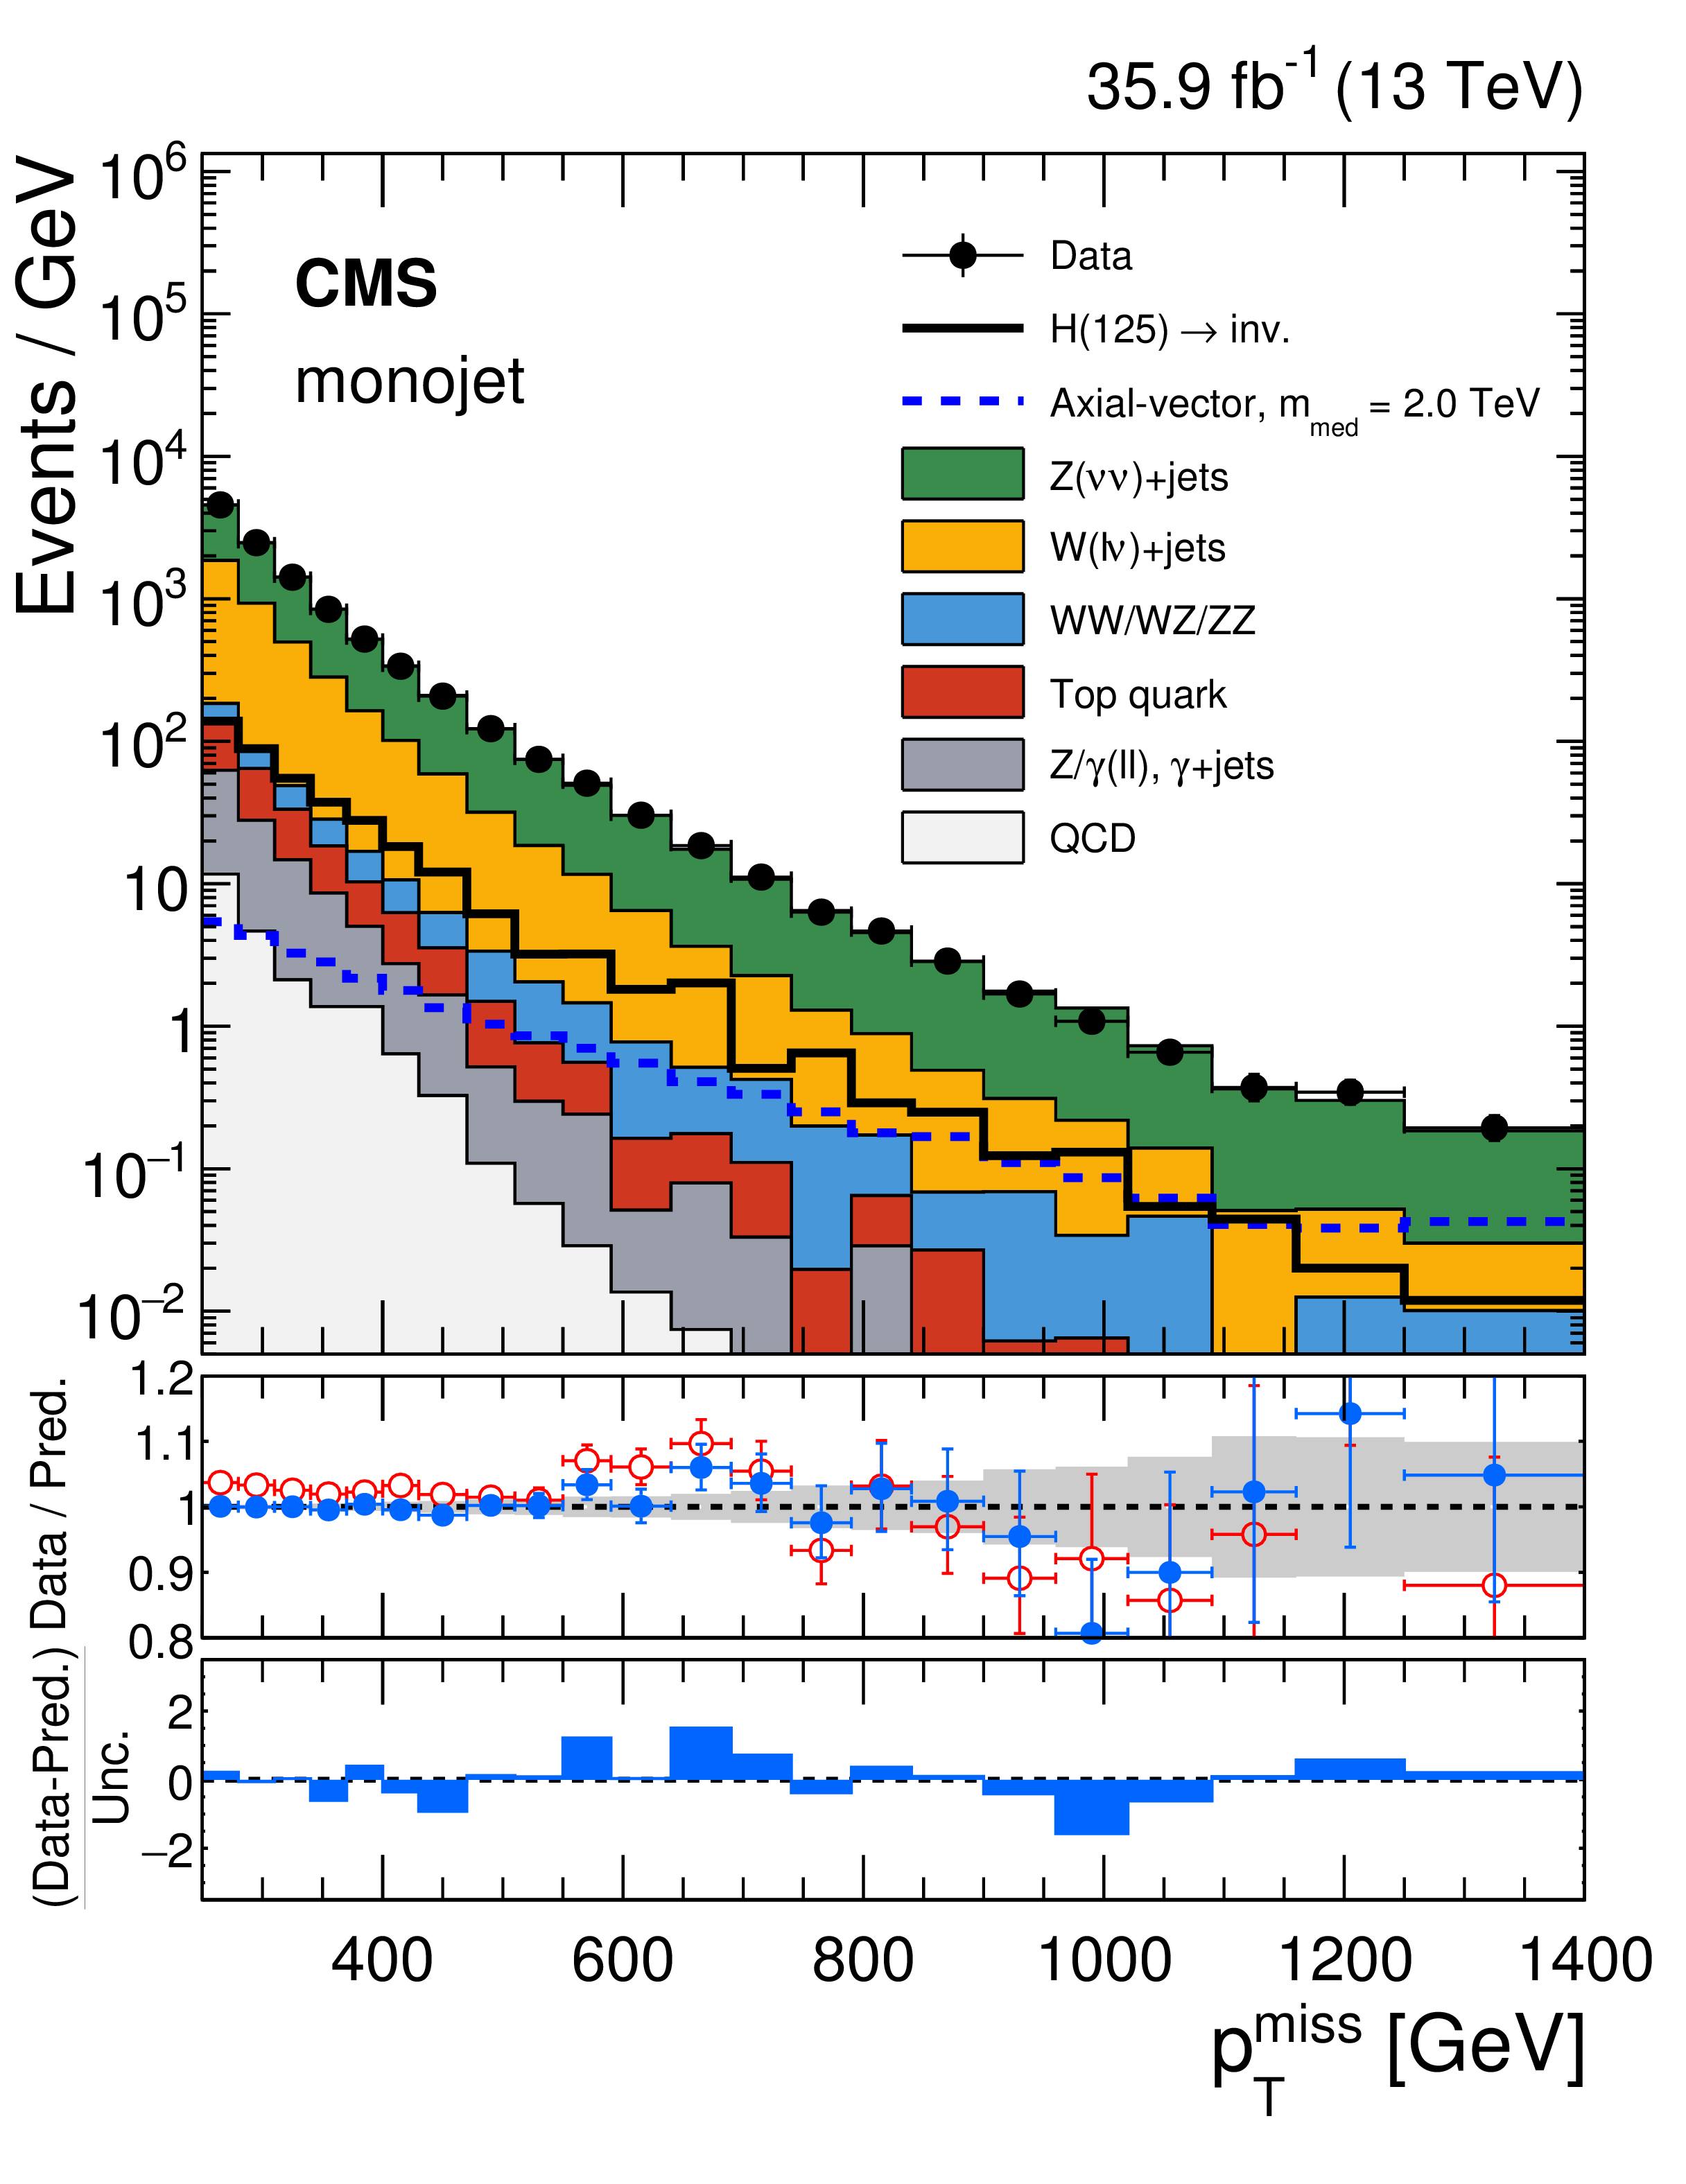
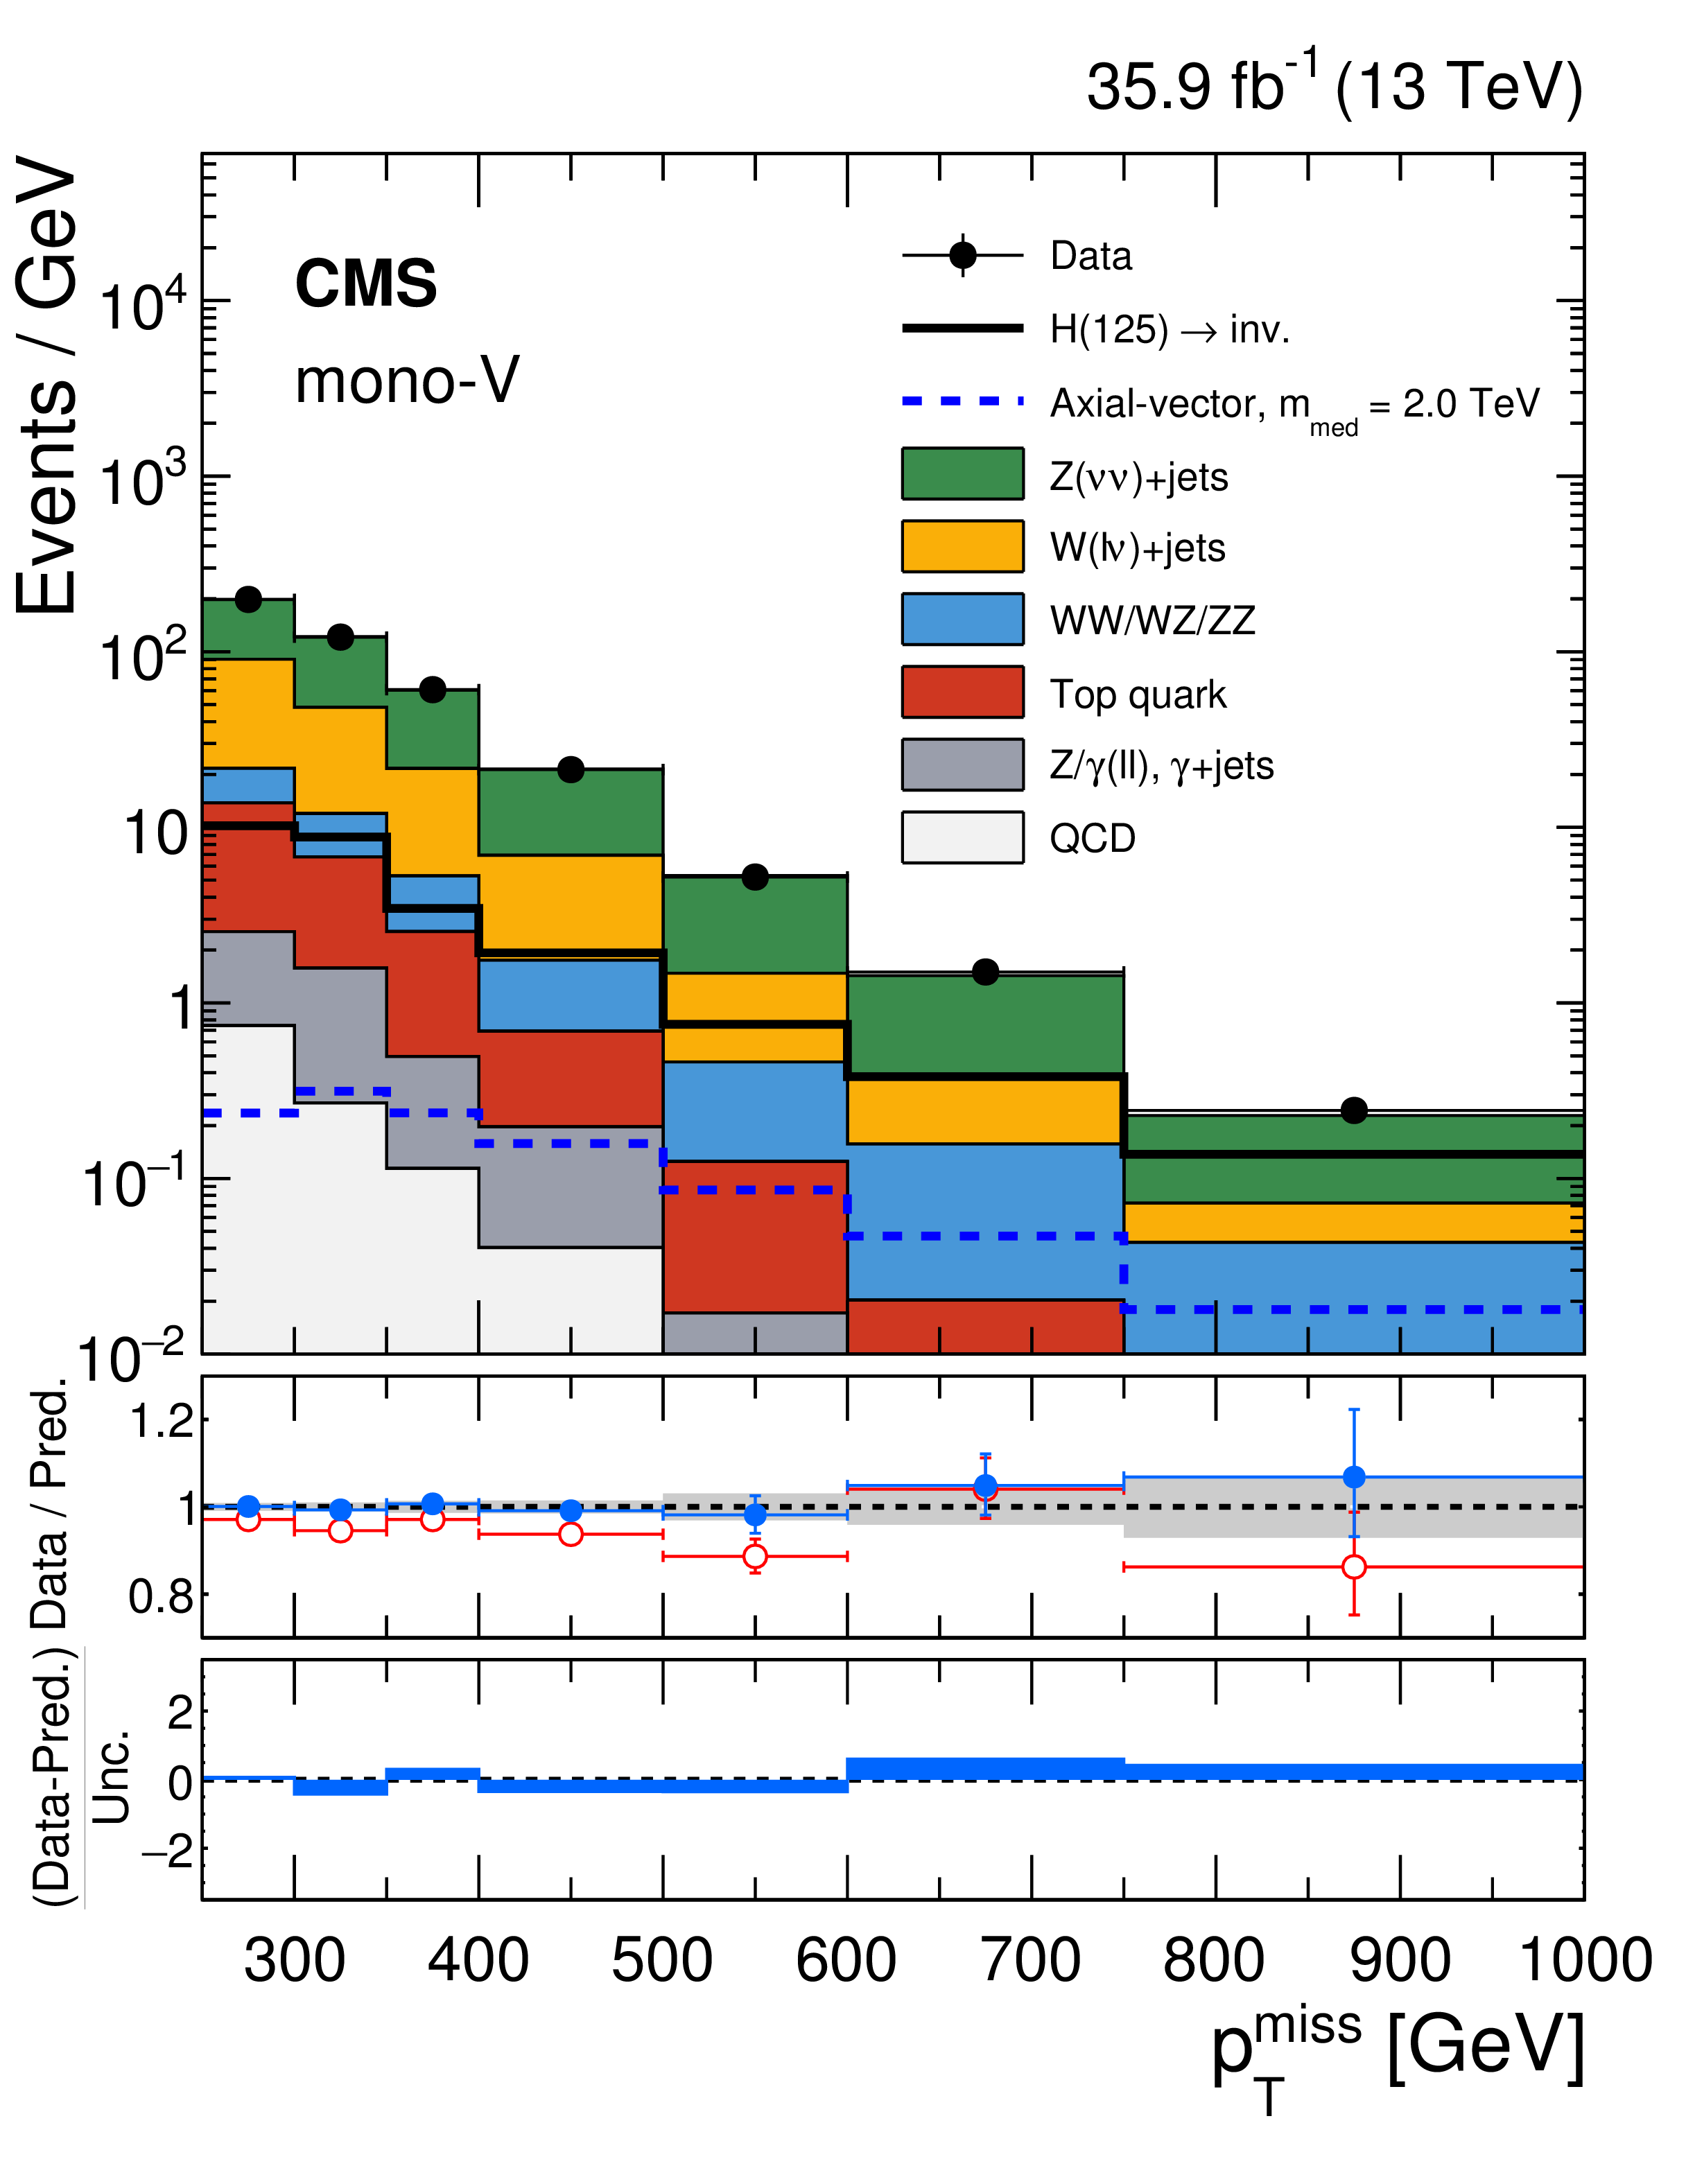
Figure 8:
Observed $ {{p_{\mathrm {T}}} ^\text {miss}} $ distribution in the monojet (left) and mono-V (right) signal regions compared with the post-fit background expectations for various SM processes. The last bin includes all events with $ {{p_{\mathrm {T}}} ^\text {miss}} > $ 1250 GeV for the monojet (mono-V) category. The expected background distributions are evaluated after performing a combined fit to the data in all the control samples, not including the signal region. Expected signal distributions for the 125 GeV Higgs boson decaying exclusively to invisible particles, and a 2 TeV axial-vector mediator decaying to 1 GeV DM particles, are overlaid. The description of the lower panels is the same as in Fig. 5. |
png pdf |
Figure 8-a:
Observed $ {{p_{\mathrm {T}}} ^\text {miss}} $ distribution in the monojet signal region compared with the post-fit background expectations for various SM processes. The last bin includes all events with $ {{p_{\mathrm {T}}} ^\text {miss}} > $ 1250 GeV for the monojet (mono-V) category. The expected background distributions are evaluated after performing a combined fit to the data in all the control samples, not including the signal region. Expected signal distributions for the 125 GeV Higgs boson decaying exclusively to invisible particles, and a 2 TeV axial-vector mediator decaying to 1 GeV DM particles, are overlaid. |
png pdf |
Figure 8-b:
Observed $ {{p_{\mathrm {T}}} ^\text {miss}} $ distribution in the mono-V signal region compared with the post-fit background expectations for various SM processes. The last bin includes all events with $ {{p_{\mathrm {T}}} ^\text {miss}} > $ 1250 GeV for the monojet (mono-V) category. The expected background distributions are evaluated after performing a combined fit to the data in all the control samples, not including the signal region. Expected signal distributions for the 125 GeV Higgs boson decaying exclusively to invisible particles, and a 2 TeV axial-vector mediator decaying to 1 GeV DM particles, are overlaid. |
png pdf |
Figure 9:
Observed $ {{p_{\mathrm {T}}} ^\text {miss}} $ distribution in the monojet (left) and mono-V (right) signal regions compared with the post-fit background expectations for various SM processes. The last bin includes all events with $ {{p_{\mathrm {T}}} ^\text {miss}} > $ 1250 GeV for the monojet (mono-V) category. The expected background distributions are evaluated after performing a combined fit to the data in all the control samples, as well as in the signal region. The fit is performed assuming the absence of any signal. Expected signal distributions for the 125 GeV Higgs boson decaying exclusively to invisible particles, and a 2 TeV axial-vector mediator decaying to 1 GeV DM particles, are overlaid. The description of the lower panels is the same as in Fig. 5. |
png pdf |
Figure 9-a:
Observed $ {{p_{\mathrm {T}}} ^\text {miss}} $ distribution in the monojet signal region compared with the post-fit background expectations for various SM processes. The last bin includes all events with $ {{p_{\mathrm {T}}} ^\text {miss}} > $ 1250 GeV for the monojet (mono-V) category. The expected background distributions are evaluated after performing a combined fit to the data in all the control samples, as well as in the signal region. The fit is performed assuming the absence of any signal. Expected signal distributions for the 125 GeV Higgs boson decaying exclusively to invisible particles, and a 2 TeV axial-vector mediator decaying to 1 GeV DM particles, are overlaid. |
png pdf |
Figure 9-b:
Observed $ {{p_{\mathrm {T}}} ^\text {miss}} $ distribution in the mono-V signal region compared with the post-fit background expectations for various SM processes. The last bin includes all events with $ {{p_{\mathrm {T}}} ^\text {miss}} > $ 1250 GeV for the monojet (mono-V) category. The expected background distributions are evaluated after performing a combined fit to the data in all the control samples, as well as in the signal region. The fit is performed assuming the absence of any signal. Expected signal distributions for the 125 GeV Higgs boson decaying exclusively to invisible particles, and a 2 TeV axial-vector mediator decaying to 1 GeV DM particles, are overlaid. |

png pdf |
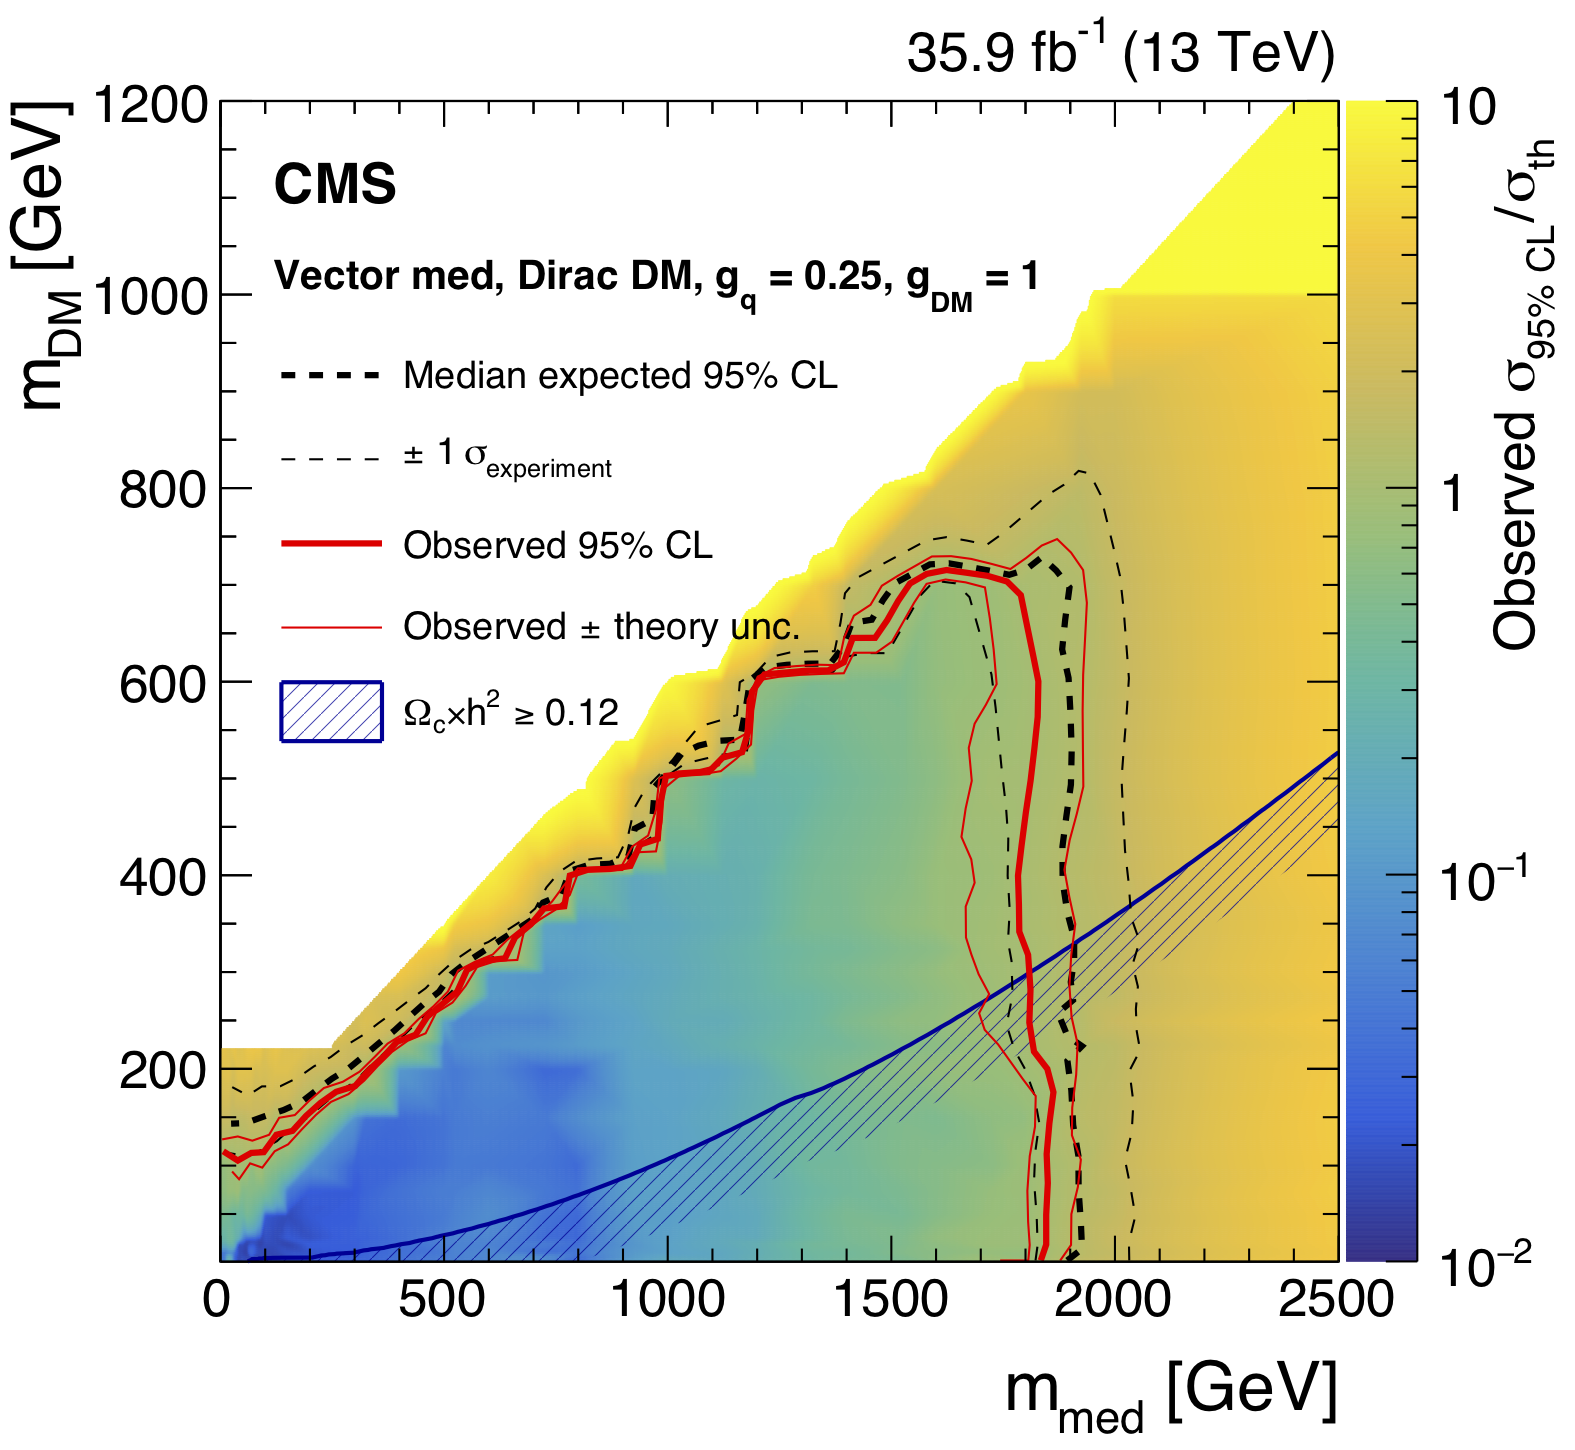
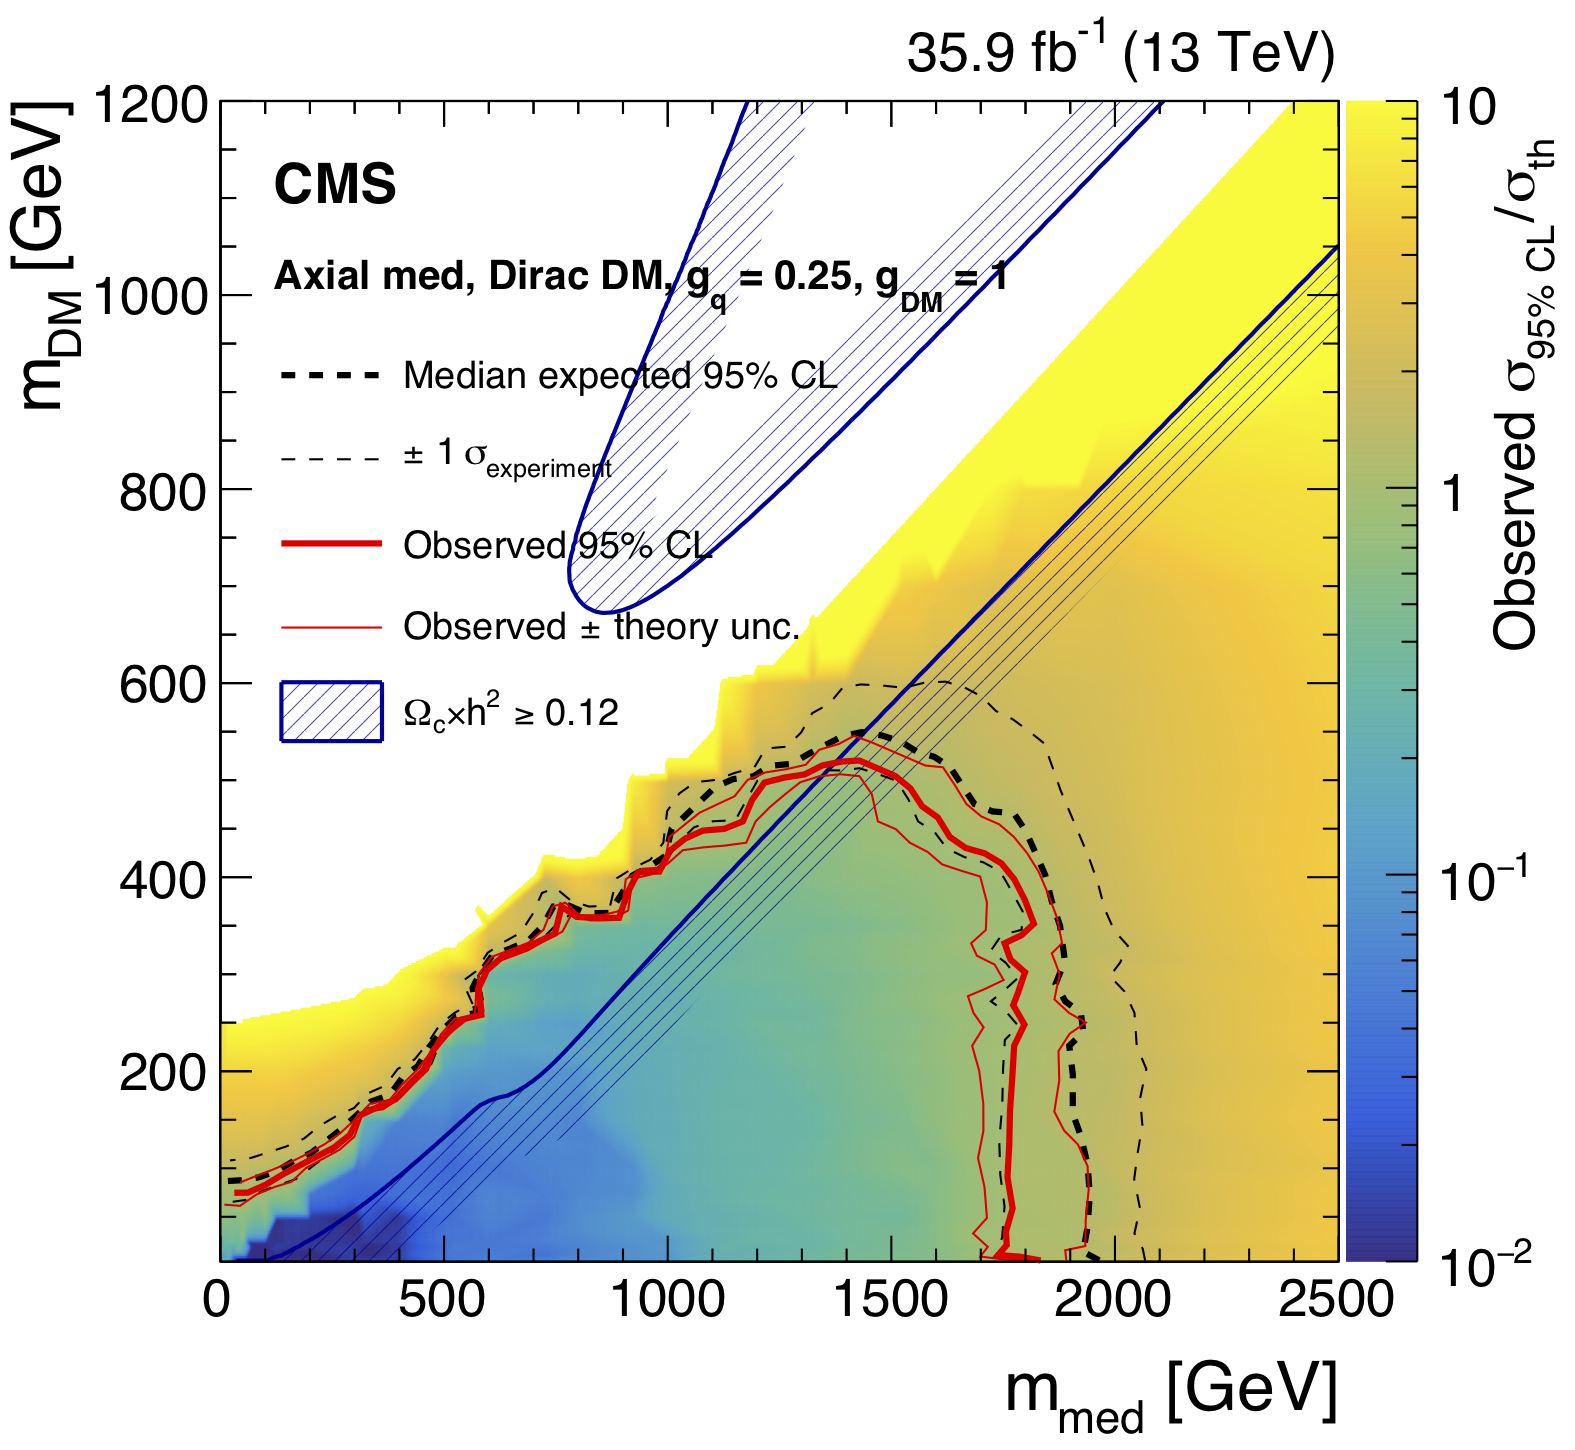
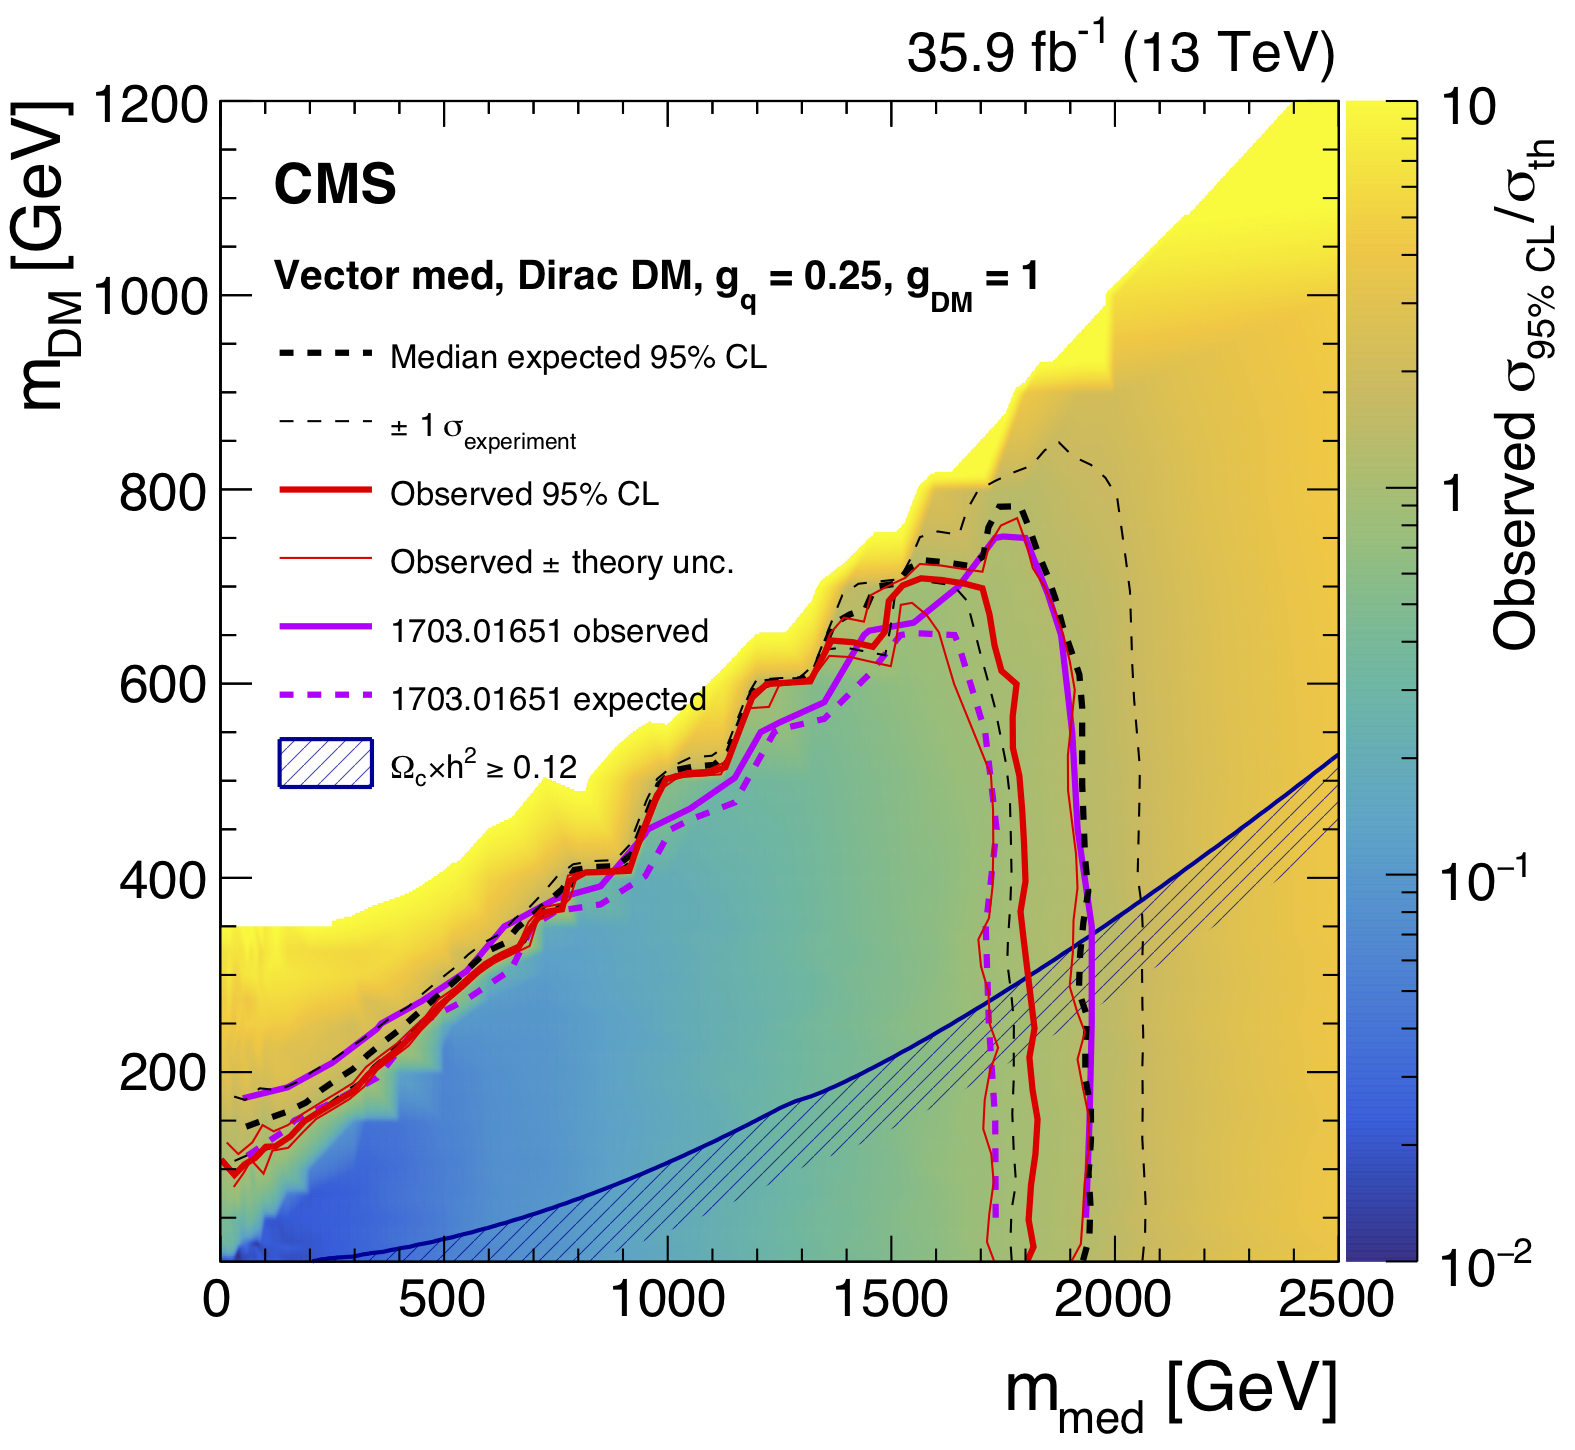
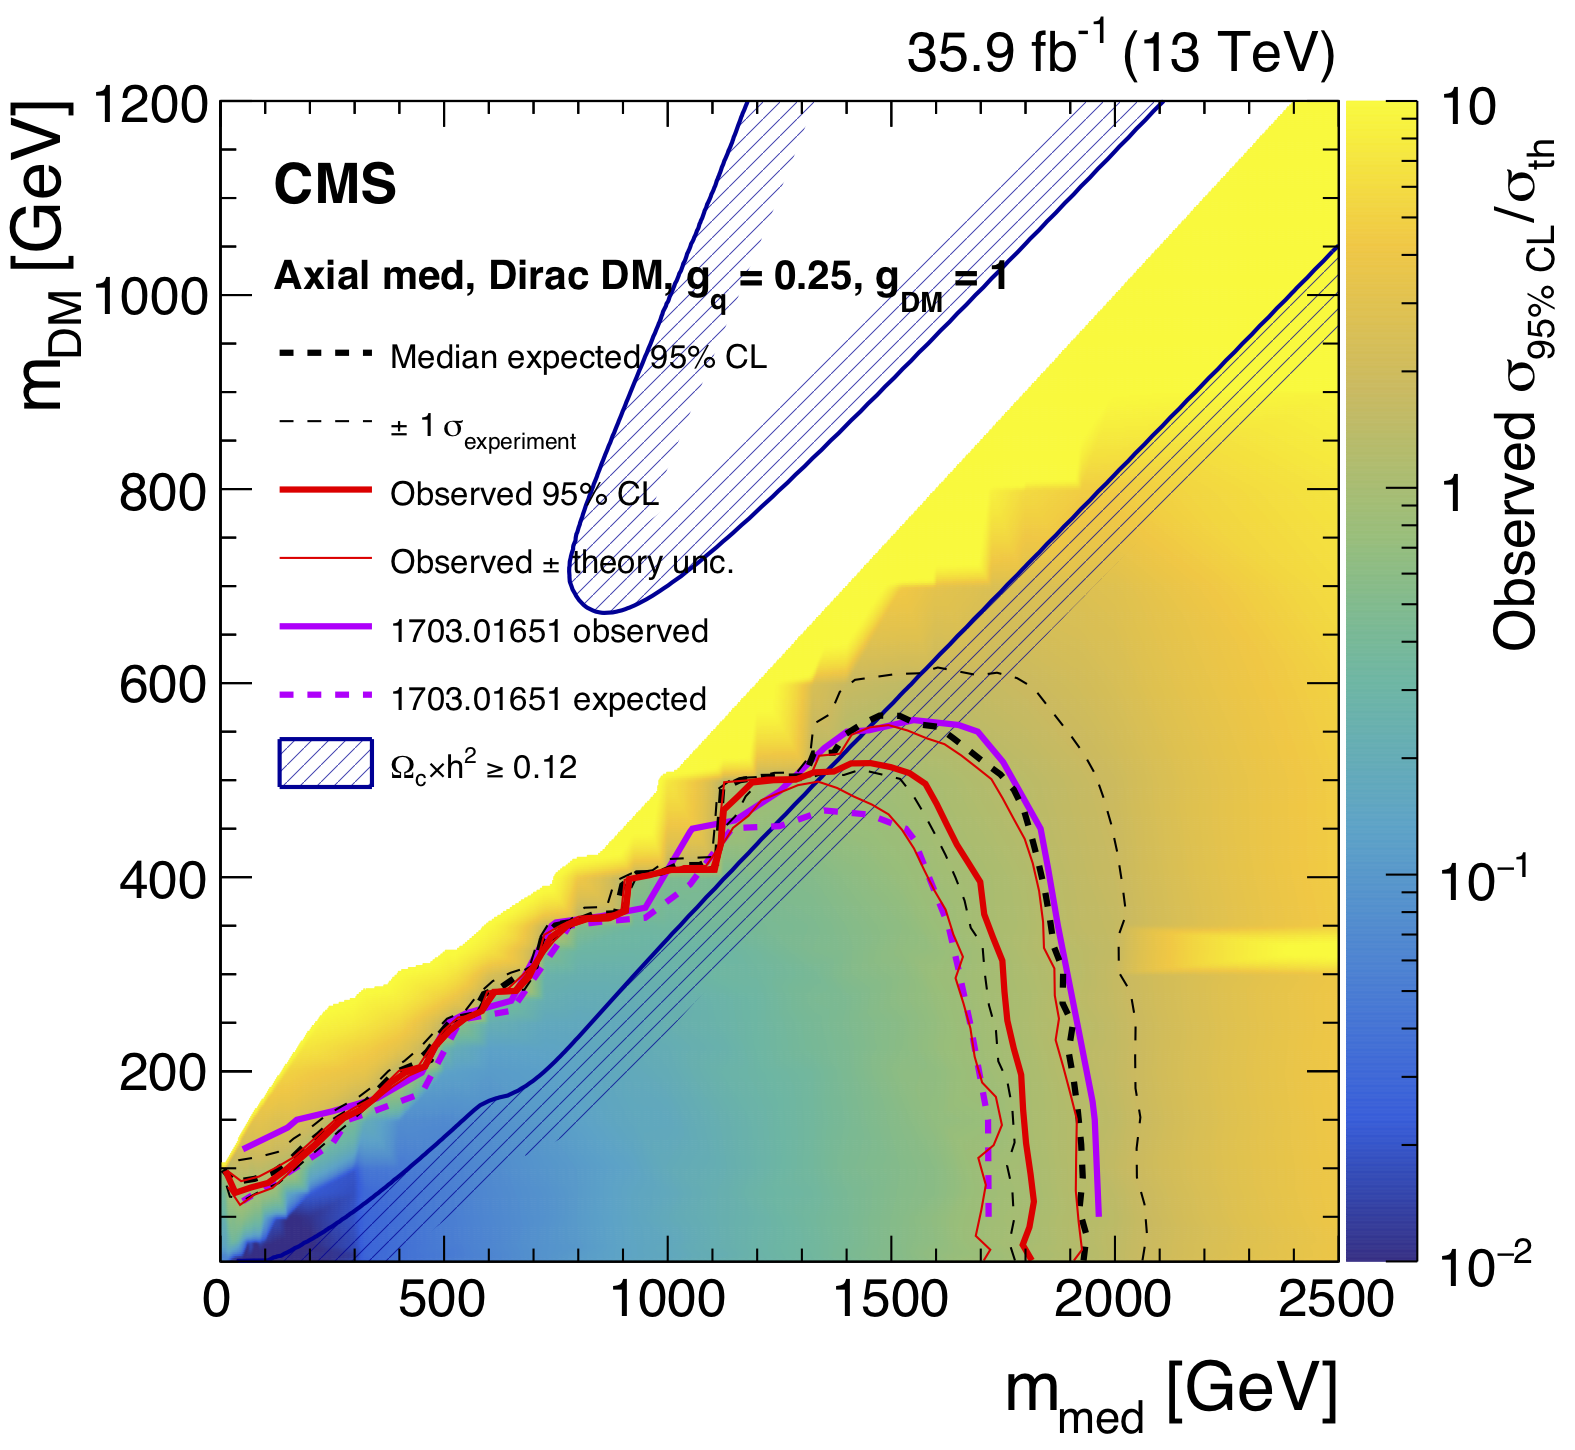
Figure 10:
Exclusion limits at 95%CL on $\mu =\sigma /\sigma _{\textrm {th}}$ in the $m_{\textrm {med}}$-$m_{\textrm {DM}}$ plane assuming vector (left) and axial-vector (right) mediators. The solid (dotted) red (black) line shows the contour for the observed (expected) exclusion. The solid contours around the observed limit and the dashed contours around the expected limit represent one standard deviation due to theoretical uncertainties in the signal cross section and the combination of the statistical and experimental systematic uncertainties, respectively. Constraints from the Planck satellite experiment [97] are shown as dark blue contours; in the shaded area DM is overabundant. |
png root |
Figure 10-a:
Exclusion limits at 95%CL on $\mu =\sigma /\sigma _{\textrm {th}}$ in the $m_{\textrm {med}}$-$m_{\textrm {DM}}$ plane assuming vector mediators. The solid (dotted) red (black) line shows the contour for the observed (expected) exclusion. The solid contours around the observed limit and the dashed contours around the expected limit represent one standard deviation due to theoretical uncertainties in the signal cross section and the combination of the statistical and experimental systematic uncertainties, respectively. Constraints from the Planck satellite experiment [97] are shown as dark blue contours; in the shaded area DM is overabundant. |
png root |
Figure 10-b:
Exclusion limits at 95%CL on $\mu =\sigma /\sigma _{\textrm {th}}$ in the $m_{\textrm {med}}$-$m_{\textrm {DM}}$ plane assuming axial-vector mediators. The solid (dotted) red (black) line shows the contour for the observed (expected) exclusion. The solid contours around the observed limit and the dashed contours around the expected limit represent one standard deviation due to theoretical uncertainties in the signal cross section and the combination of the statistical and experimental systematic uncertainties, respectively. Constraints from the Planck satellite experiment [97] are shown as dark blue contours; in the shaded area DM is overabundant. |
png pdf |
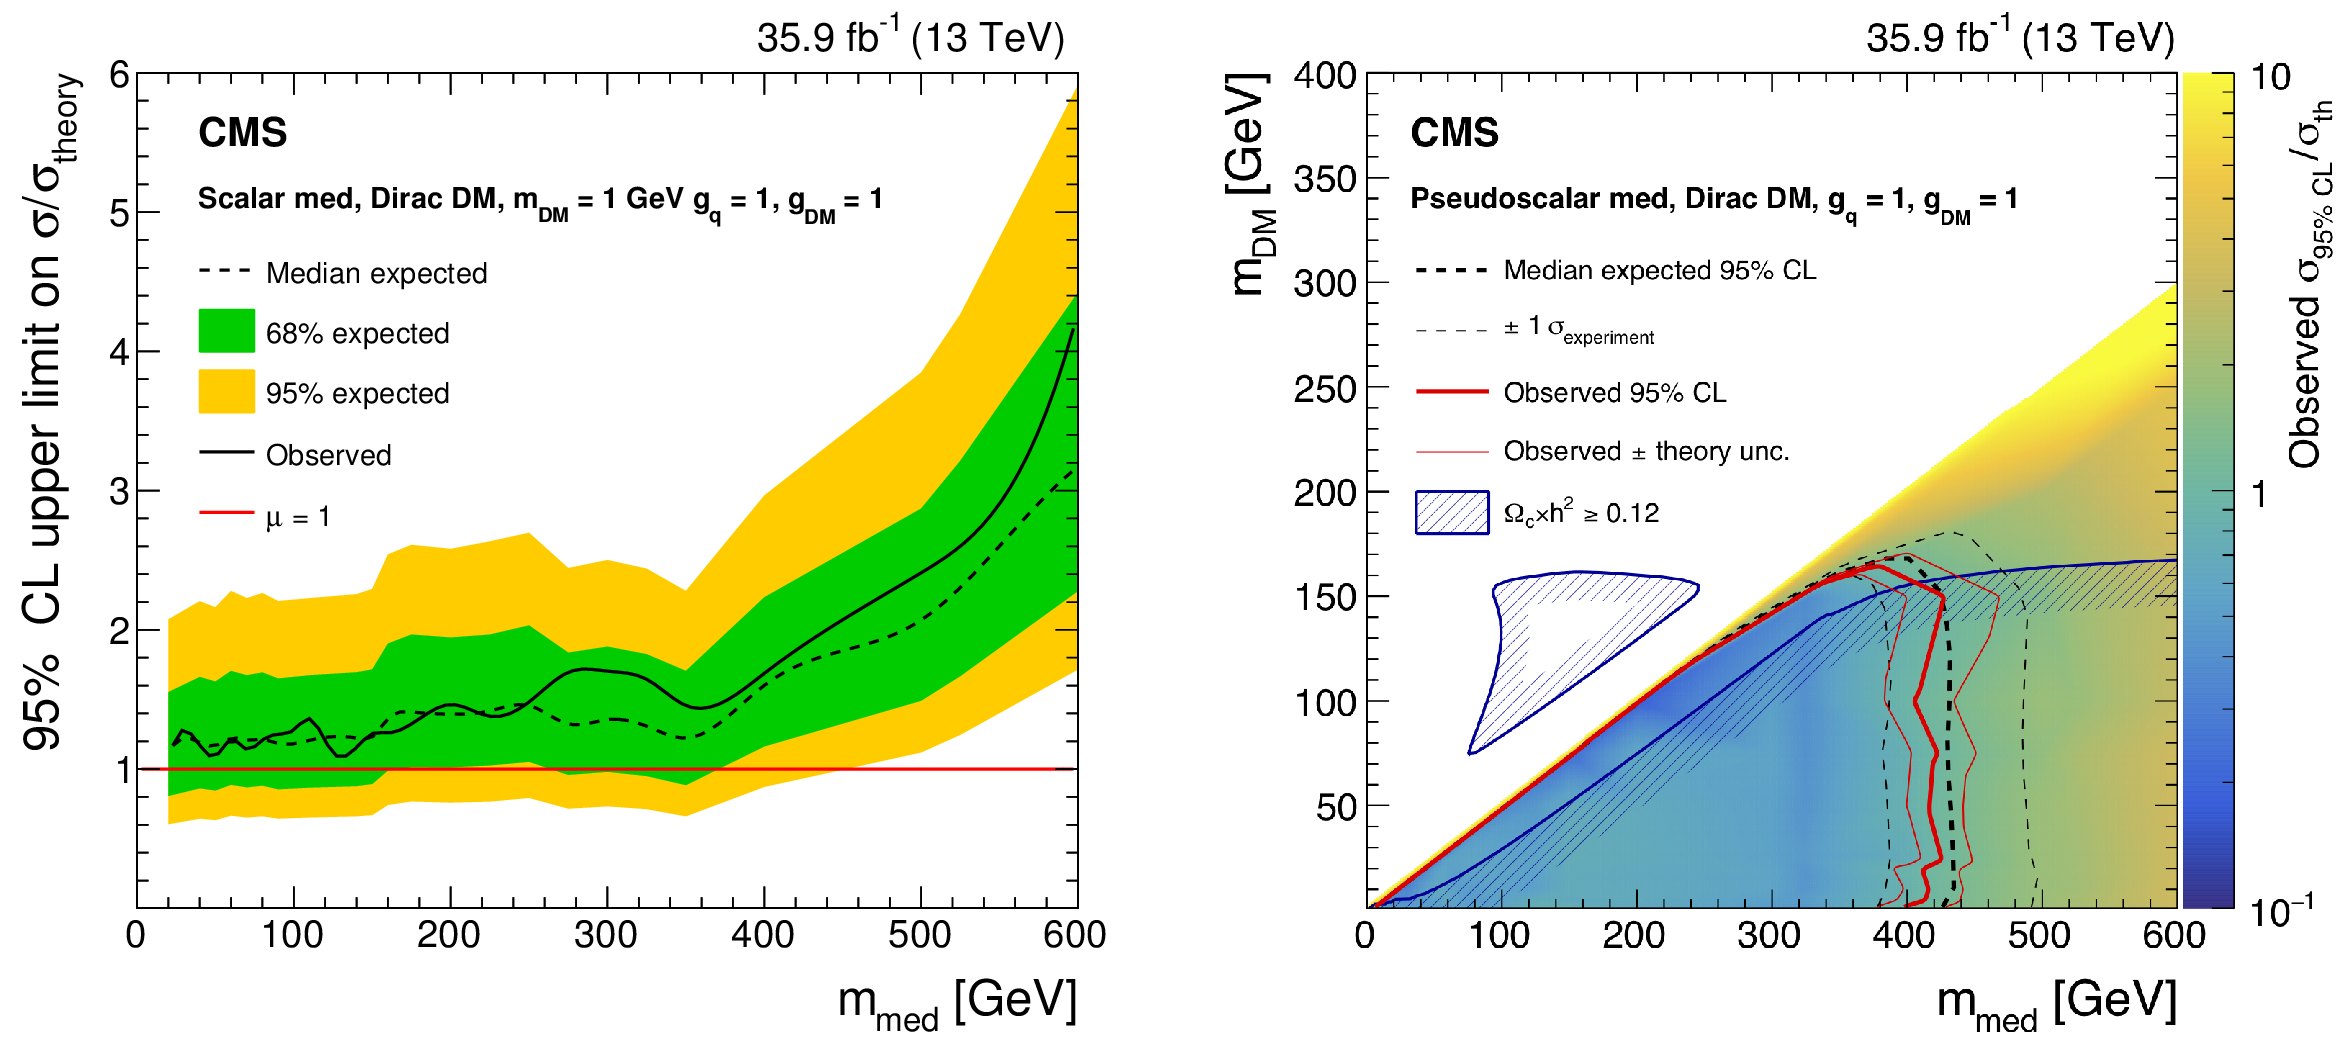
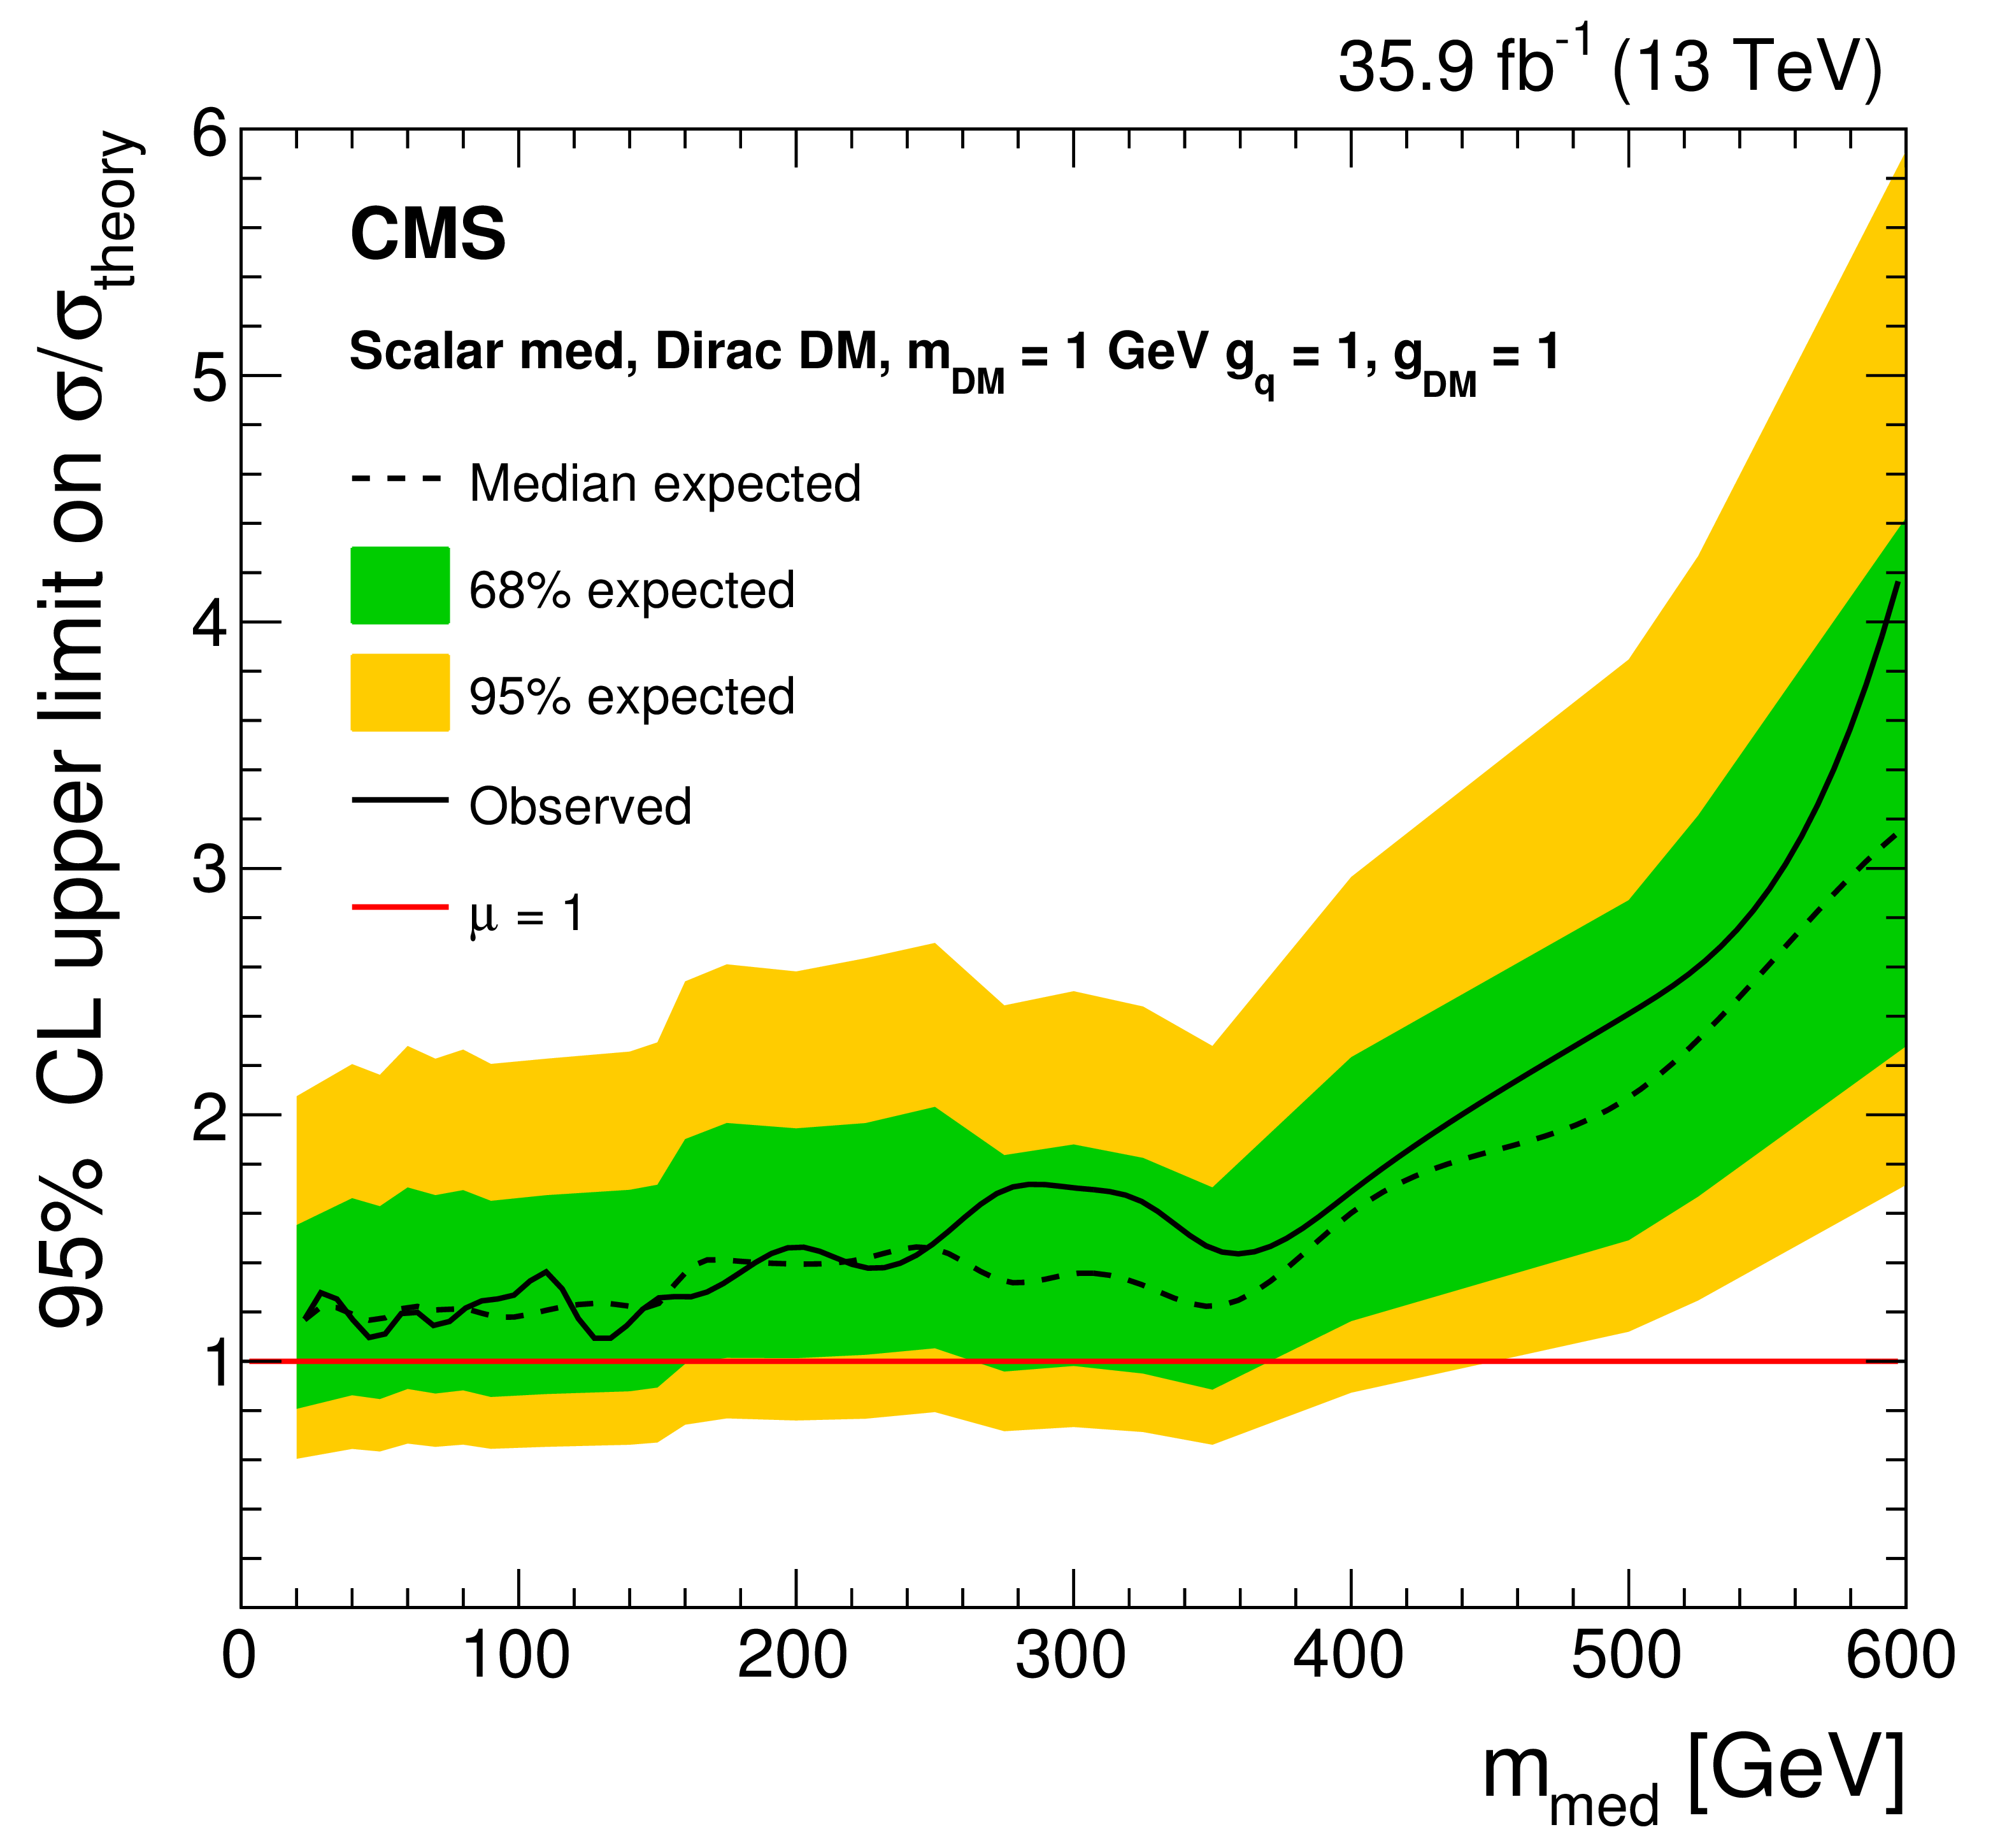
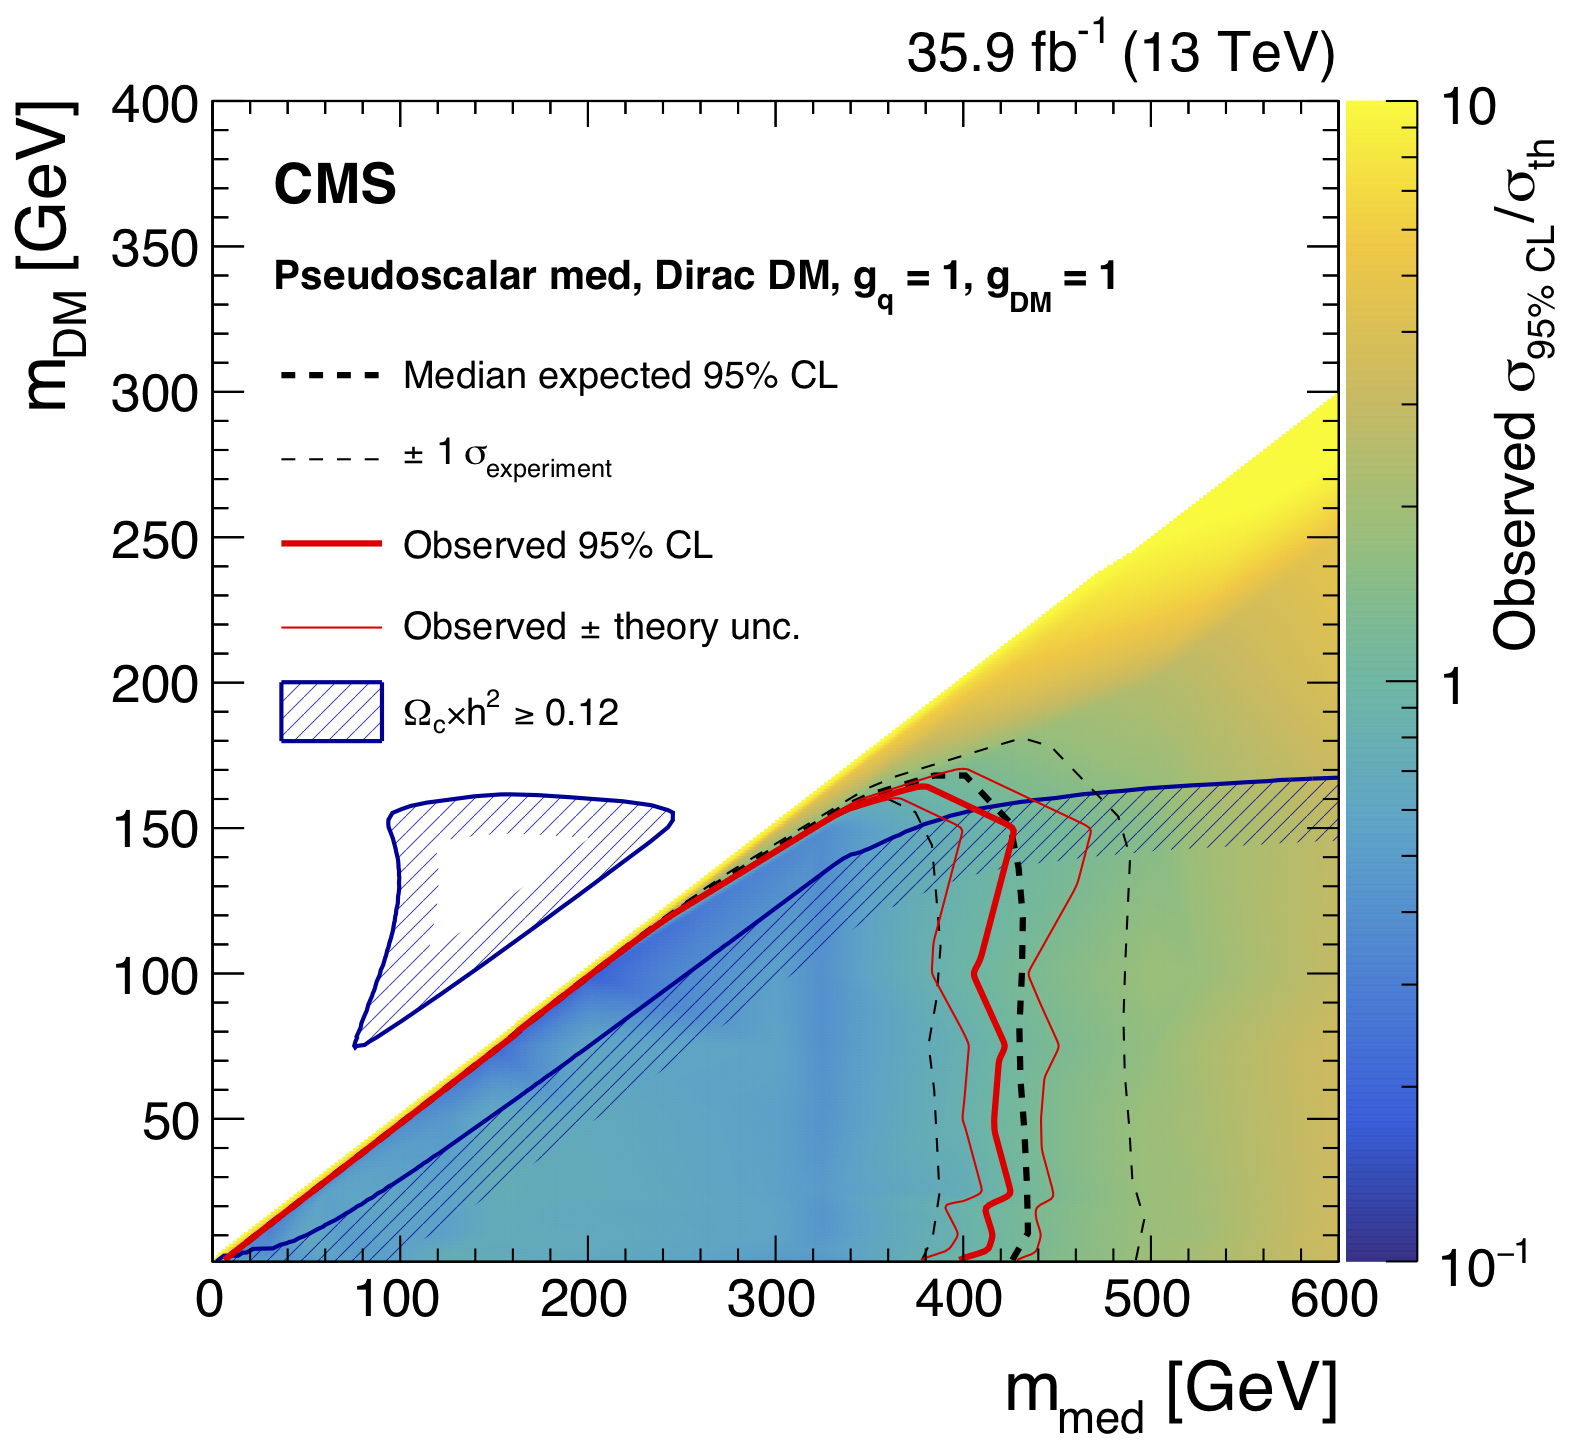
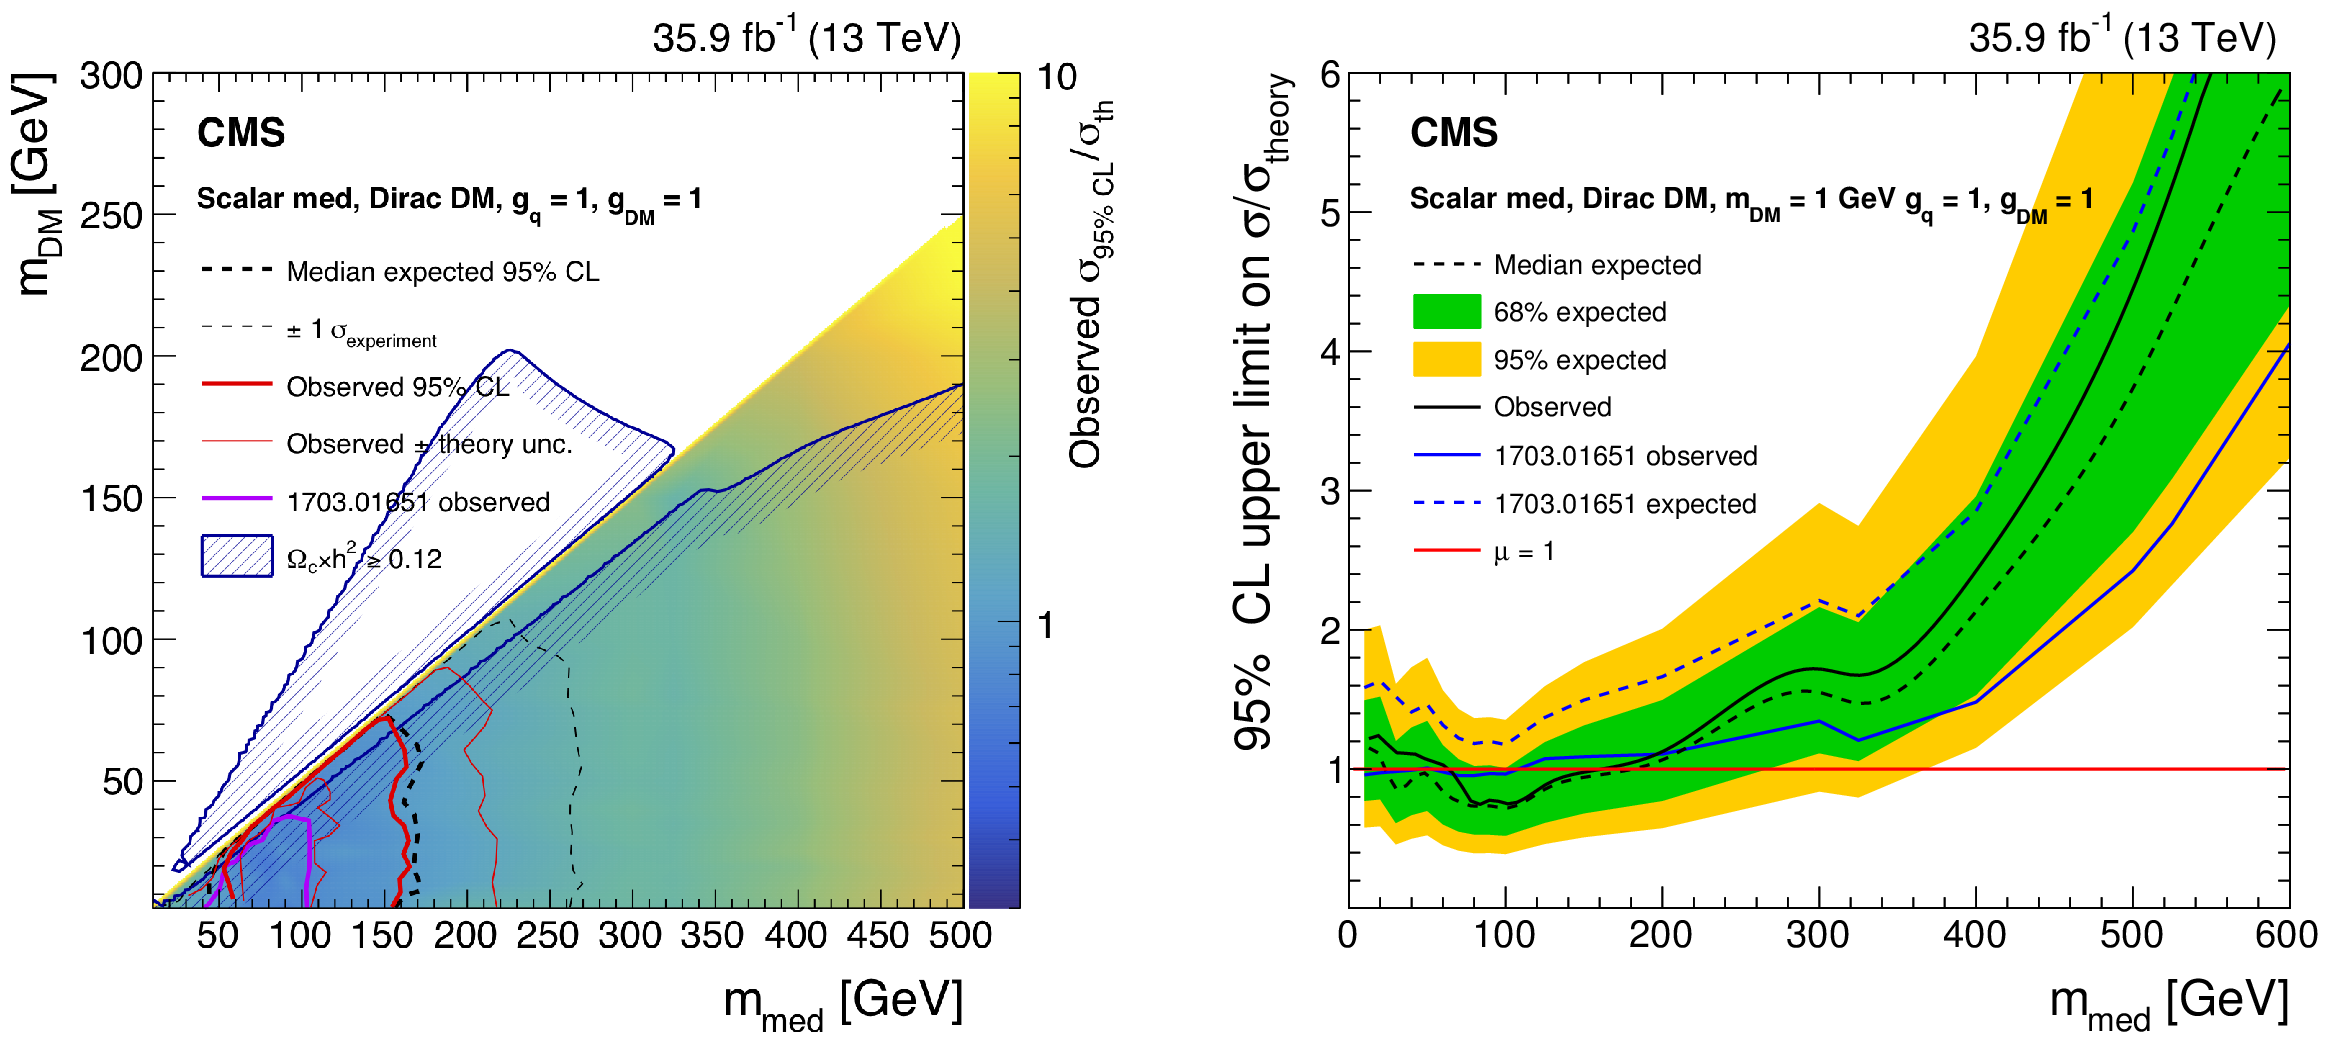
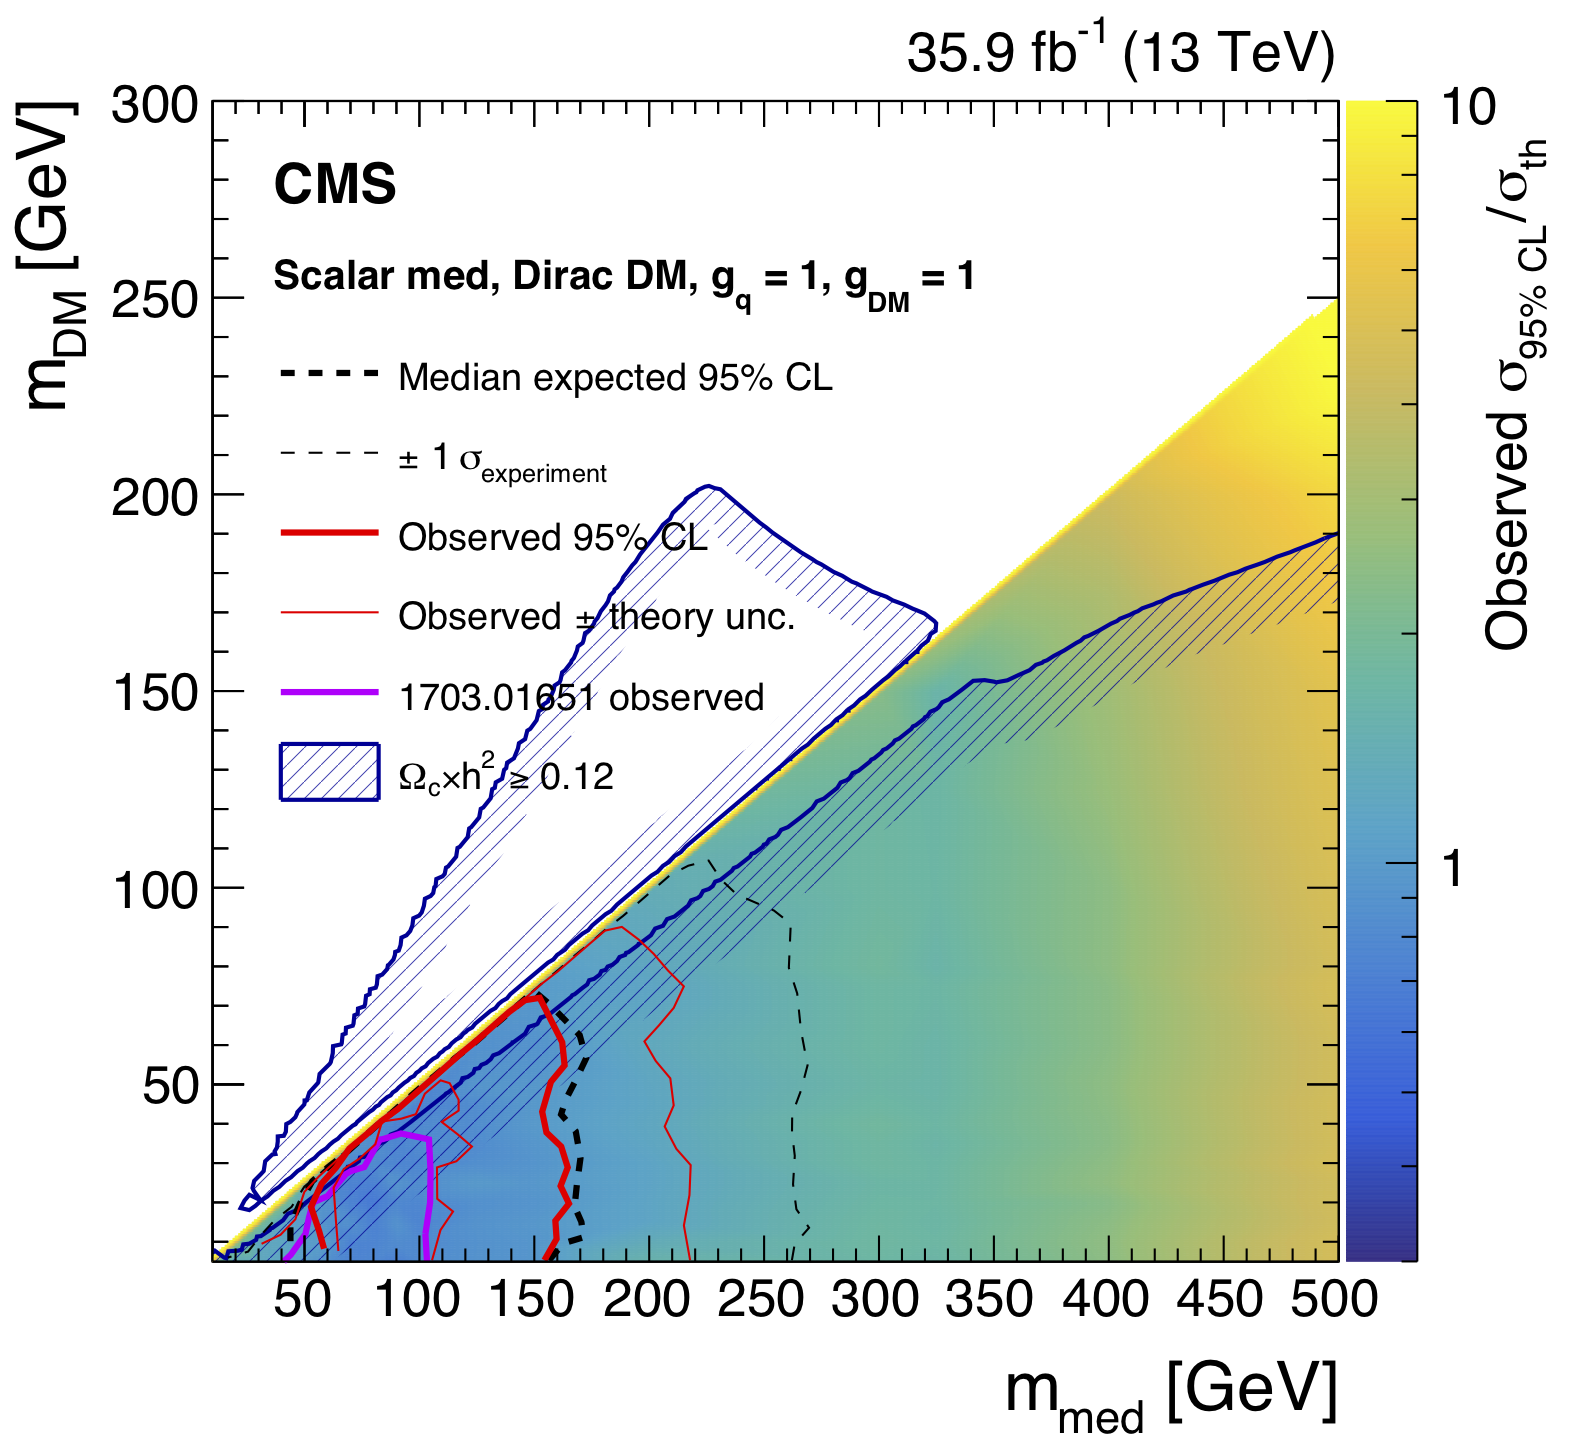
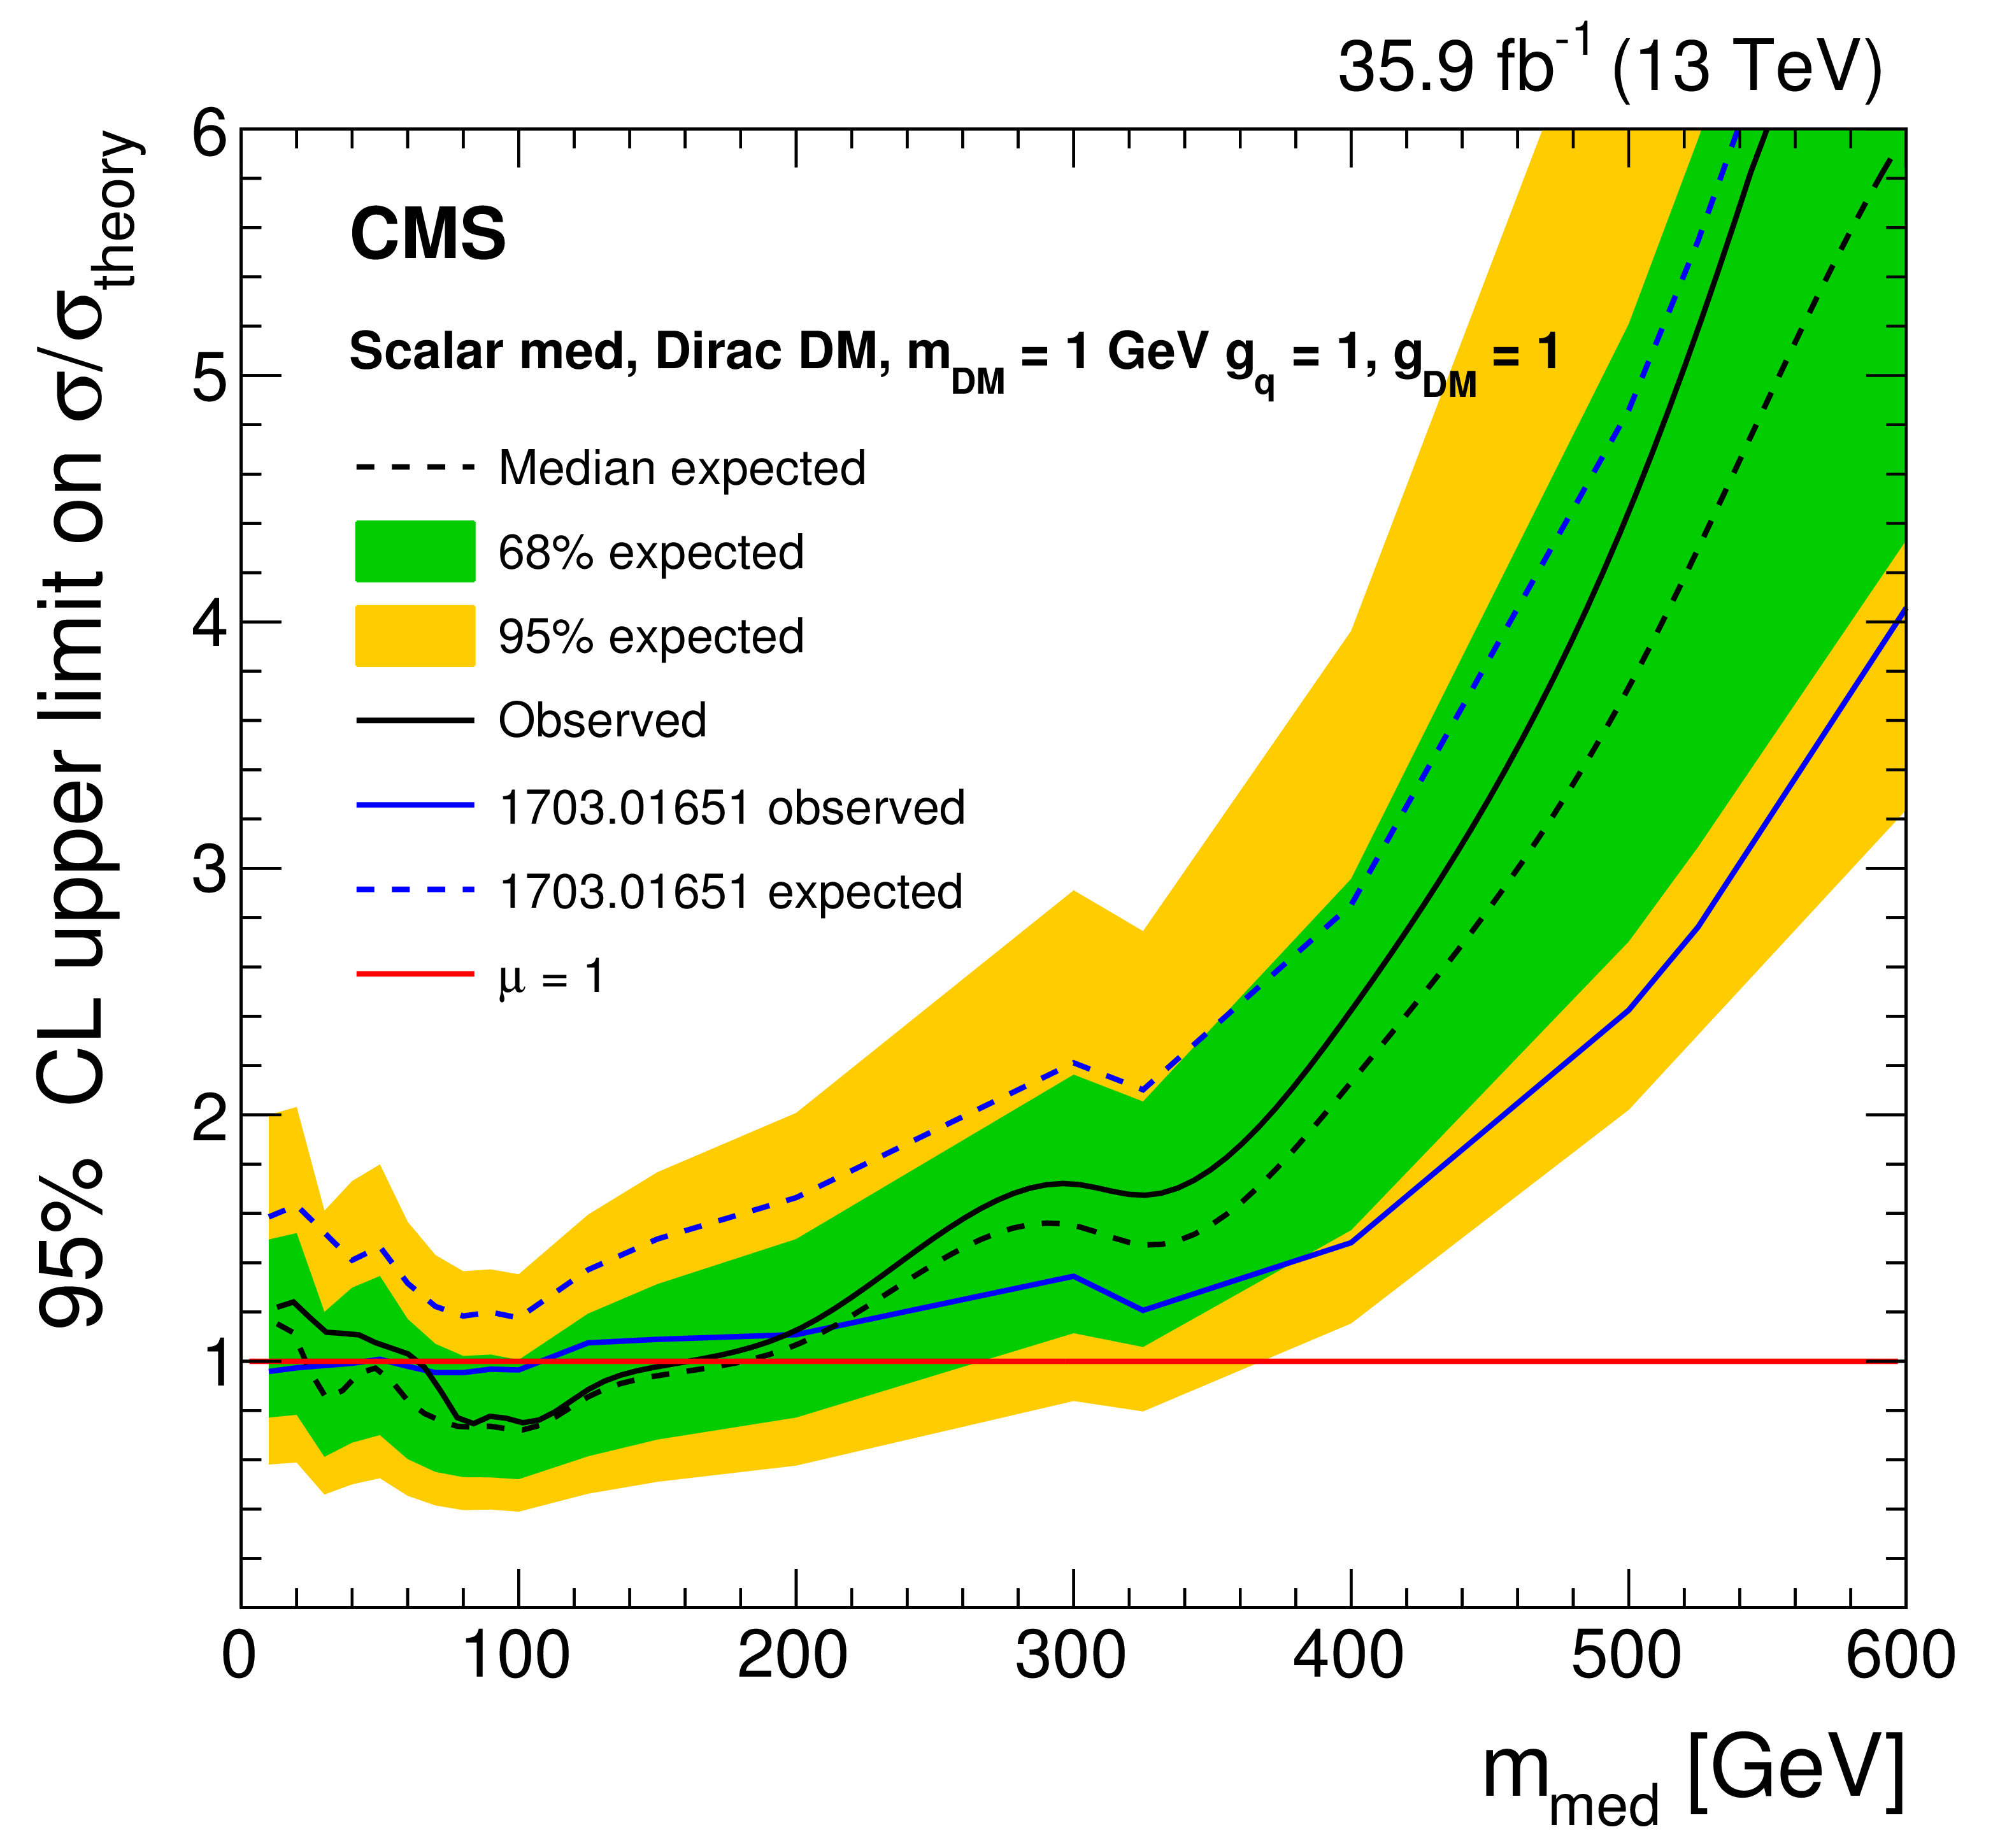
Figure 11:
Expected (dotted black line) and observed (solid black line) 95%CL upper limits on the signal strength $\mu =\sigma /\sigma _{\textrm {th}}$ as a function of the mediator mass for the scalar mediators (left) for $m_{\textrm {DM}} = $ 1 GeV. The horizontal red line denotes $\mu = $ 1. Exclusion limits at 95%CL on $\mu =\sigma /\sigma _{\textrm {th}}$ in the $m_{\textrm {med}}$-$m_{\textrm {DM}}$ plane assuming pseudoscalar mediators (right). The solid (dashed) red (back) line shows the contours for the observed (expected) exclusion. Constraints from the Planck satellite experiment [97] are shown with the dark blue contours; in the shaded area DM is overabundant. |
png pdf |
Figure 11-a:
Expected (dotted black line) and observed (solid black line) 95%CL upper limits on the signal strength $\mu =\sigma /\sigma _{\textrm {th}}$ as a function of the mediator mass for the scalar mediators for $m_{\textrm {DM}} = $ 1 GeV. The horizontal red line denotes $\mu = $ 1. |
png root |
Figure 11-b:
Exclusion limits at 95%CL on $\mu =\sigma /\sigma _{\textrm {th}}$ in the $m_{\textrm {med}}$-$m_{\textrm {DM}}$ plane assuming pseudoscalar mediators. The solid (dashed) red (back) line shows the contours for the observed (expected) exclusion. Constraints from the Planck satellite experiment [97] are shown with the dark blue contours; in the shaded area DM is overabundant. |
png pdf |
Figure 12:
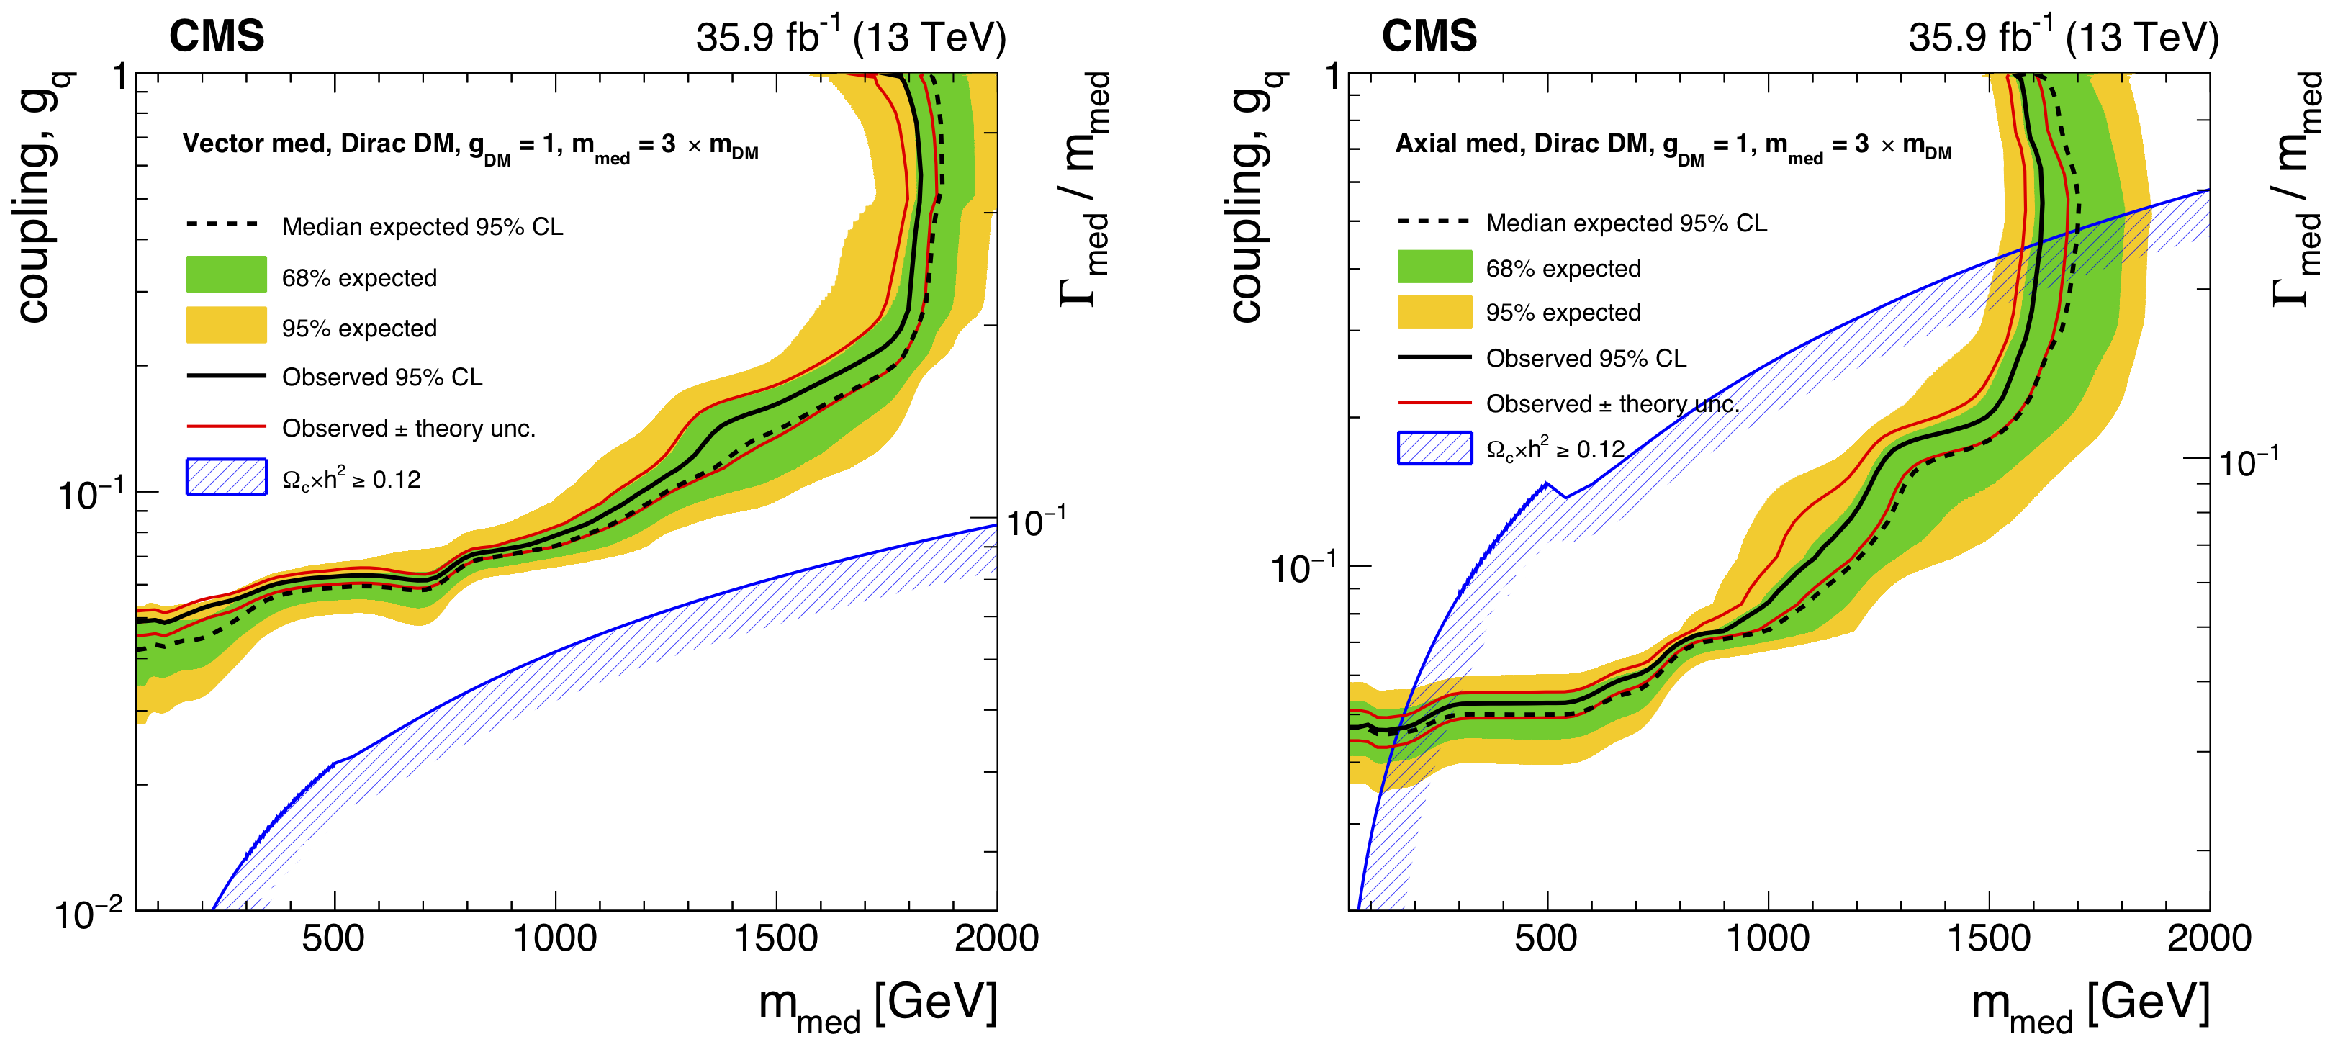
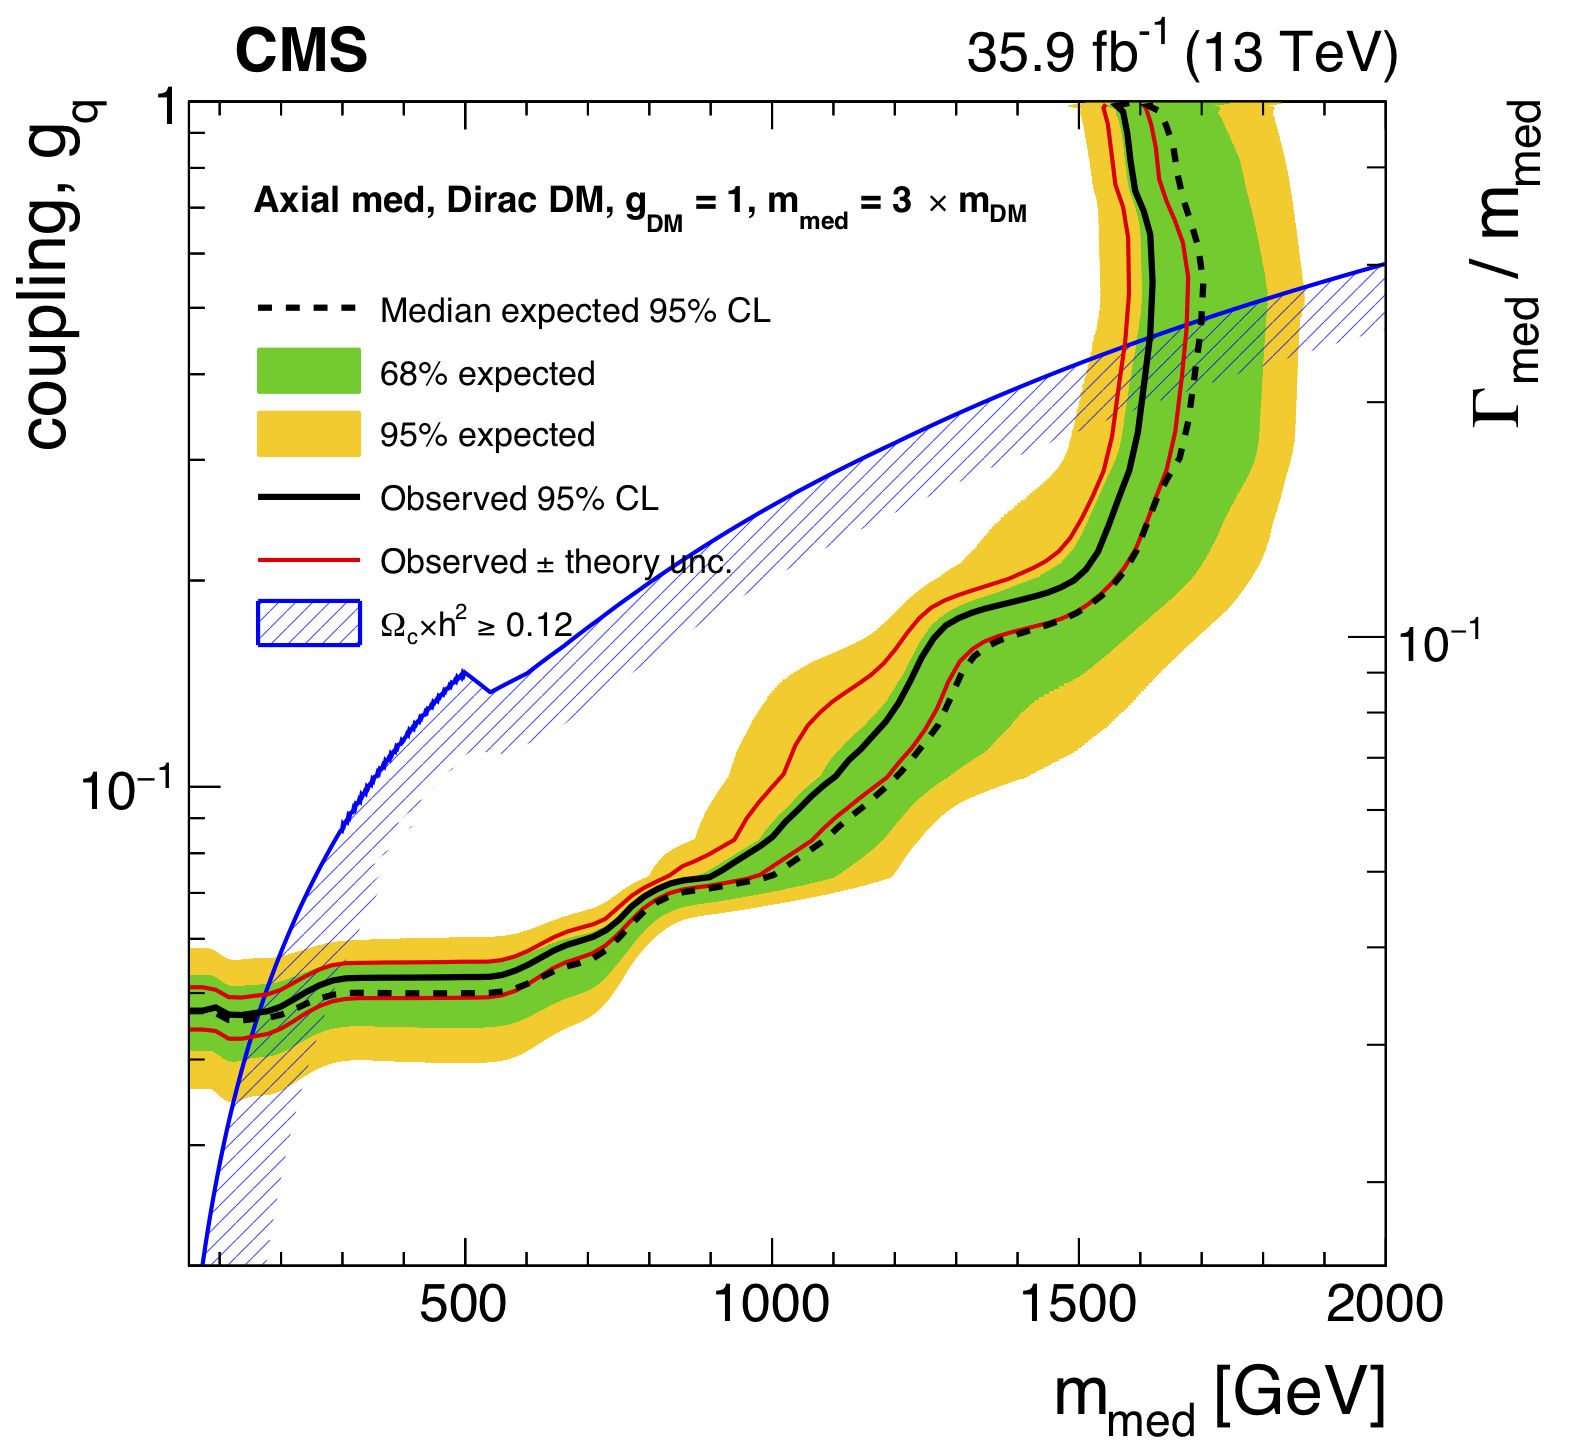
Exclusion limits at 95%CL on $\mu =\sigma /\sigma _{\textrm {th}}$ in the $m_{\textrm {med}}$-$g_{\mathrm {q}}$ plane assuming vector (left) and axial-vector (right) mediators. The widths shown on the axis correspond to mediator masses above 400 GeV, where the top quark decay channel is fully open. For the mediator masses below the top quark decay channel threshold the width is 9% less. The solid (dotted) black line shows the contour for the observed (expected) exclusion. The solid red contours around the observed limit represent one standard deviation due to theoretical uncertainties in the signal cross section. Constraints from the Planck satellite experiment [97] are shown as dark blue contours; in the shaded area DM is overabundant. |

png |
Figure 12-a:
Exclusion limits at 95%CL on $\mu =\sigma /\sigma _{\textrm {th}}$ in the $m_{\textrm {med}}$-$g_{\mathrm {q}}$ plane assuming vector mediators. The widths shown on the axis correspond to mediator masses above 400 GeV, where the top quark decay channel is fully open. For the mediator masses below the top quark decay channel threshold the width is 9% less. The solid (dotted) black line shows the contour for the observed (expected) exclusion. The solid red contours around the observed limit represent one standard deviation due to theoretical uncertainties in the signal cross section. Constraints from the Planck satellite experiment [97] are shown as dark blue contours; in the shaded area DM is overabundant. |
png |
Figure 12-b:
Exclusion limits at 95%CL on $\mu =\sigma /\sigma _{\textrm {th}}$ in the $m_{\textrm {med}}$-$g_{\mathrm {q}}$ plane assuming axial-vector mediators. The widths shown on the axis correspond to mediator masses above 400 GeV, where the top quark decay channel is fully open. For the mediator masses below the top quark decay channel threshold the width is 9% less. The solid (dotted) black line shows the contour for the observed (expected) exclusion. The solid red contours around the observed limit represent one standard deviation due to theoretical uncertainties in the signal cross section. Constraints from the Planck satellite experiment [97] are shown as dark blue contours; in the shaded area DM is overabundant. |

png pdf |
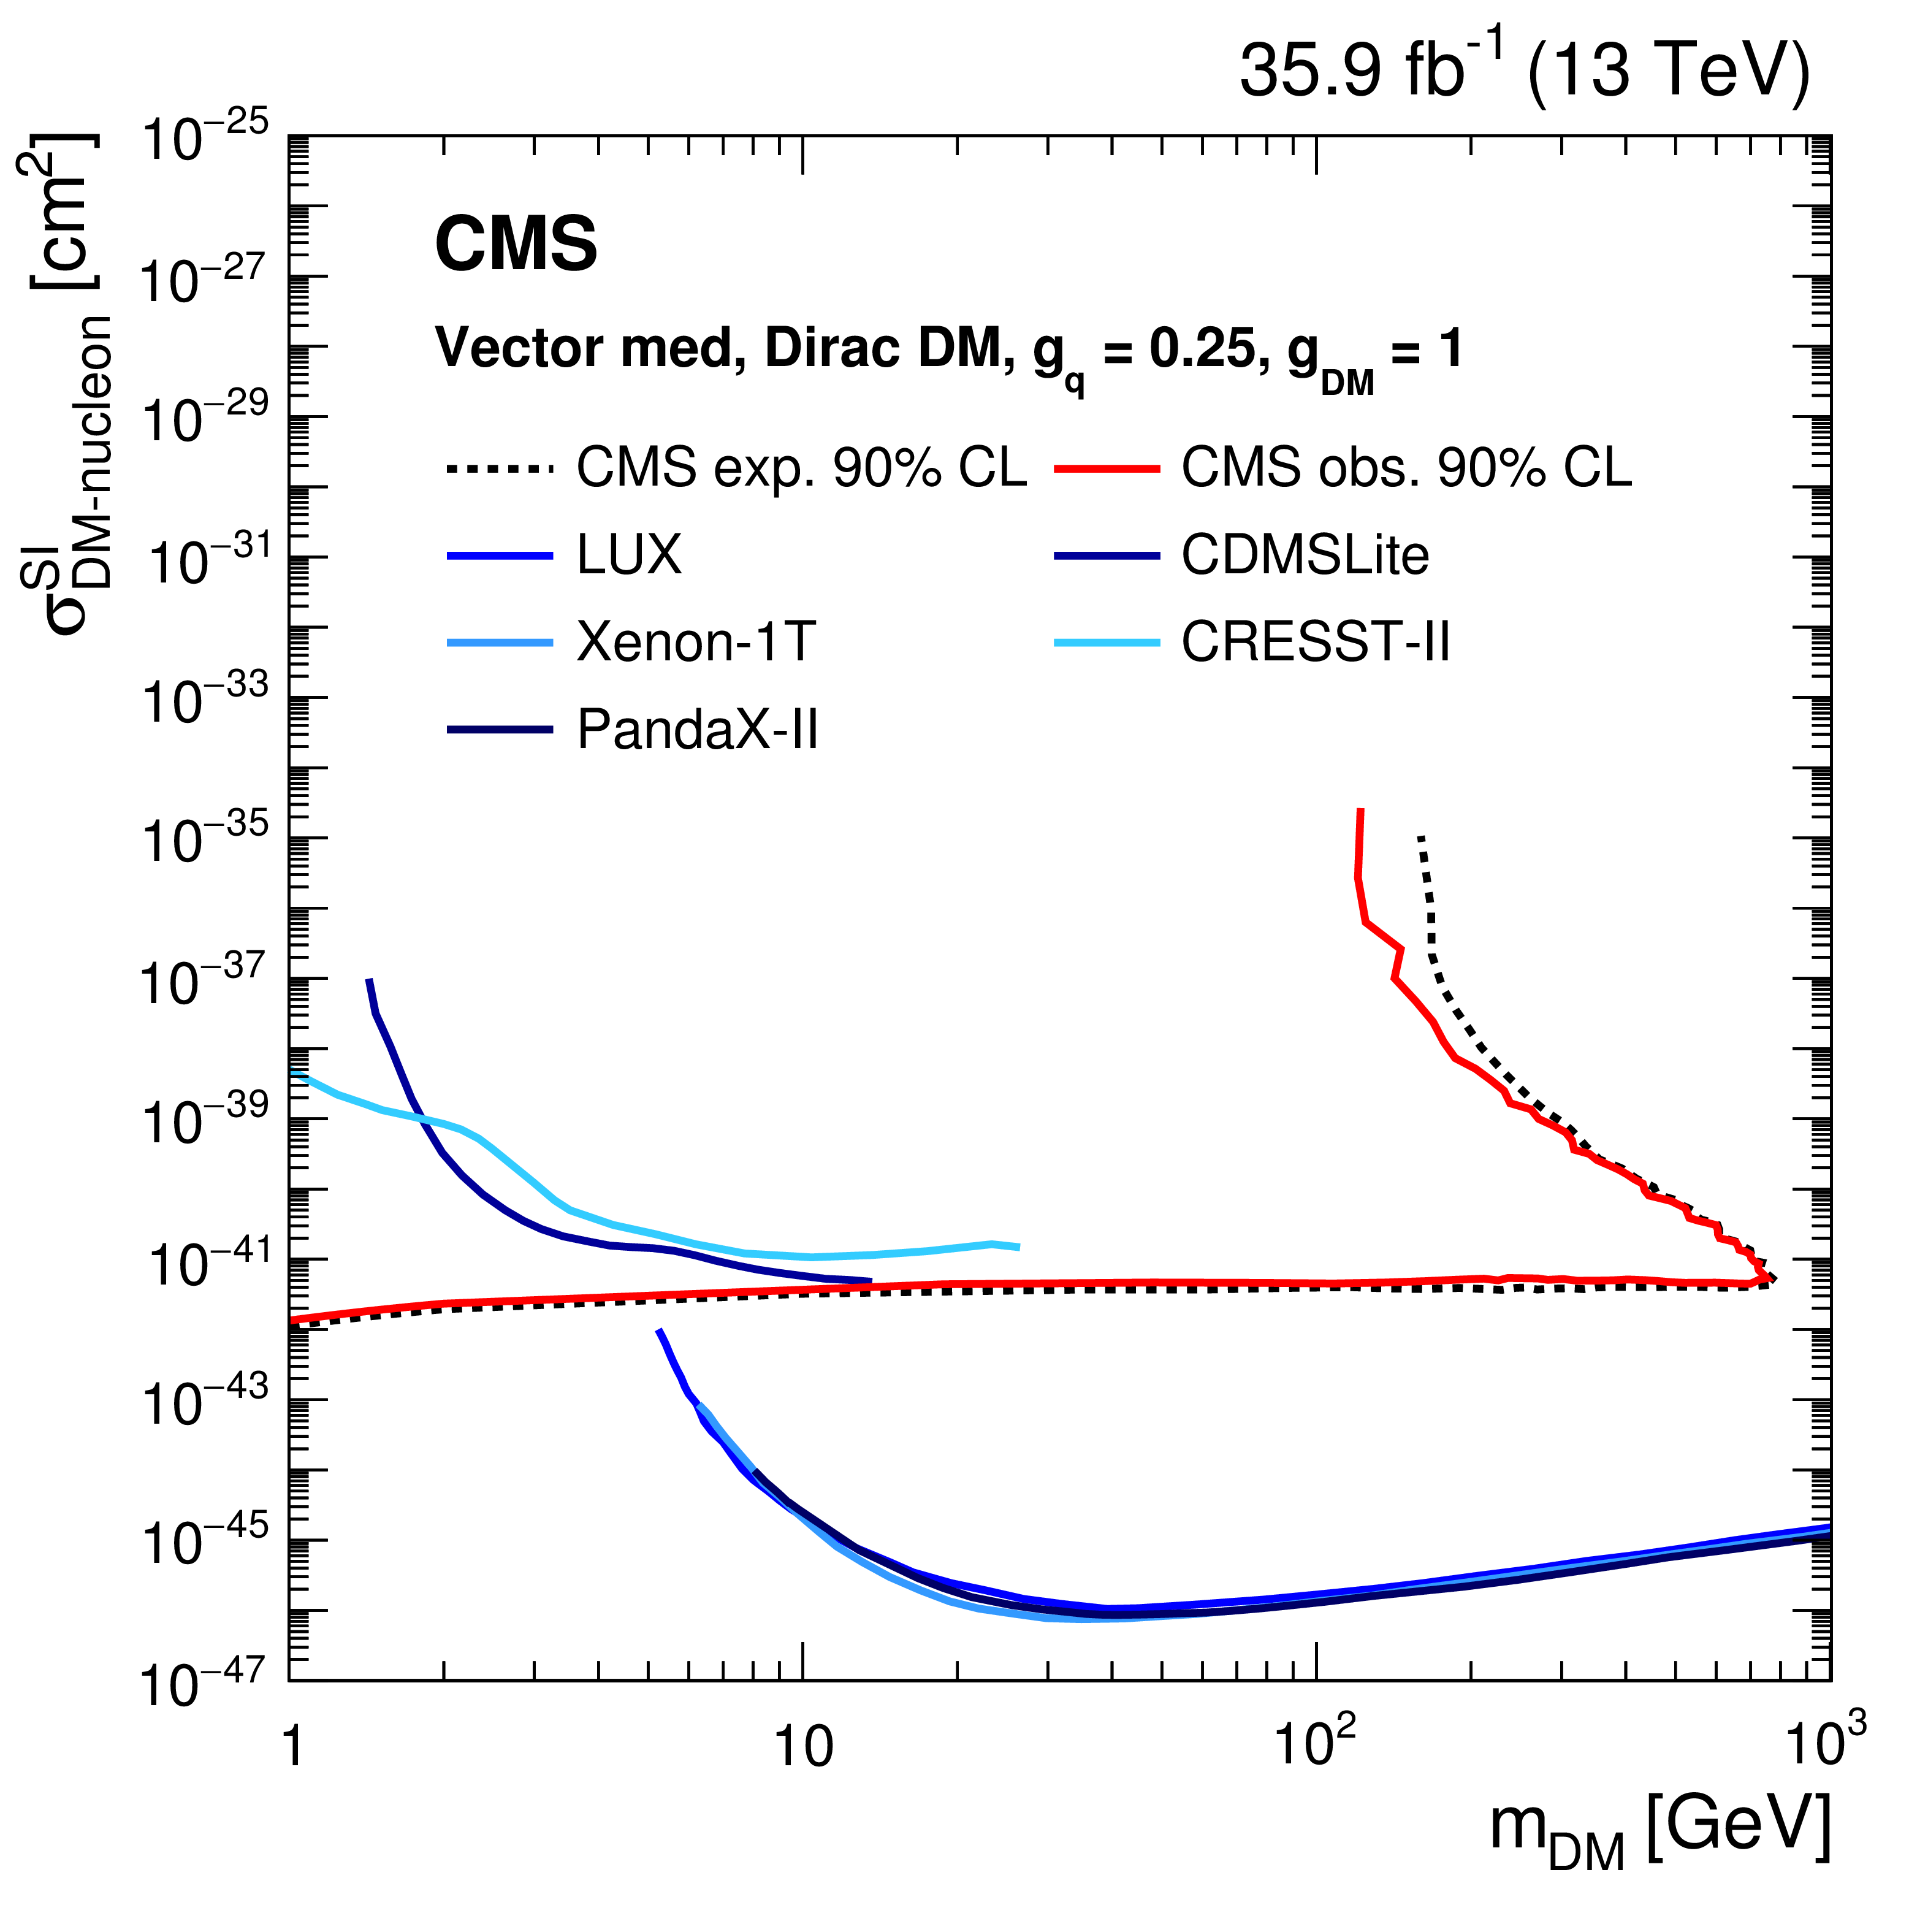
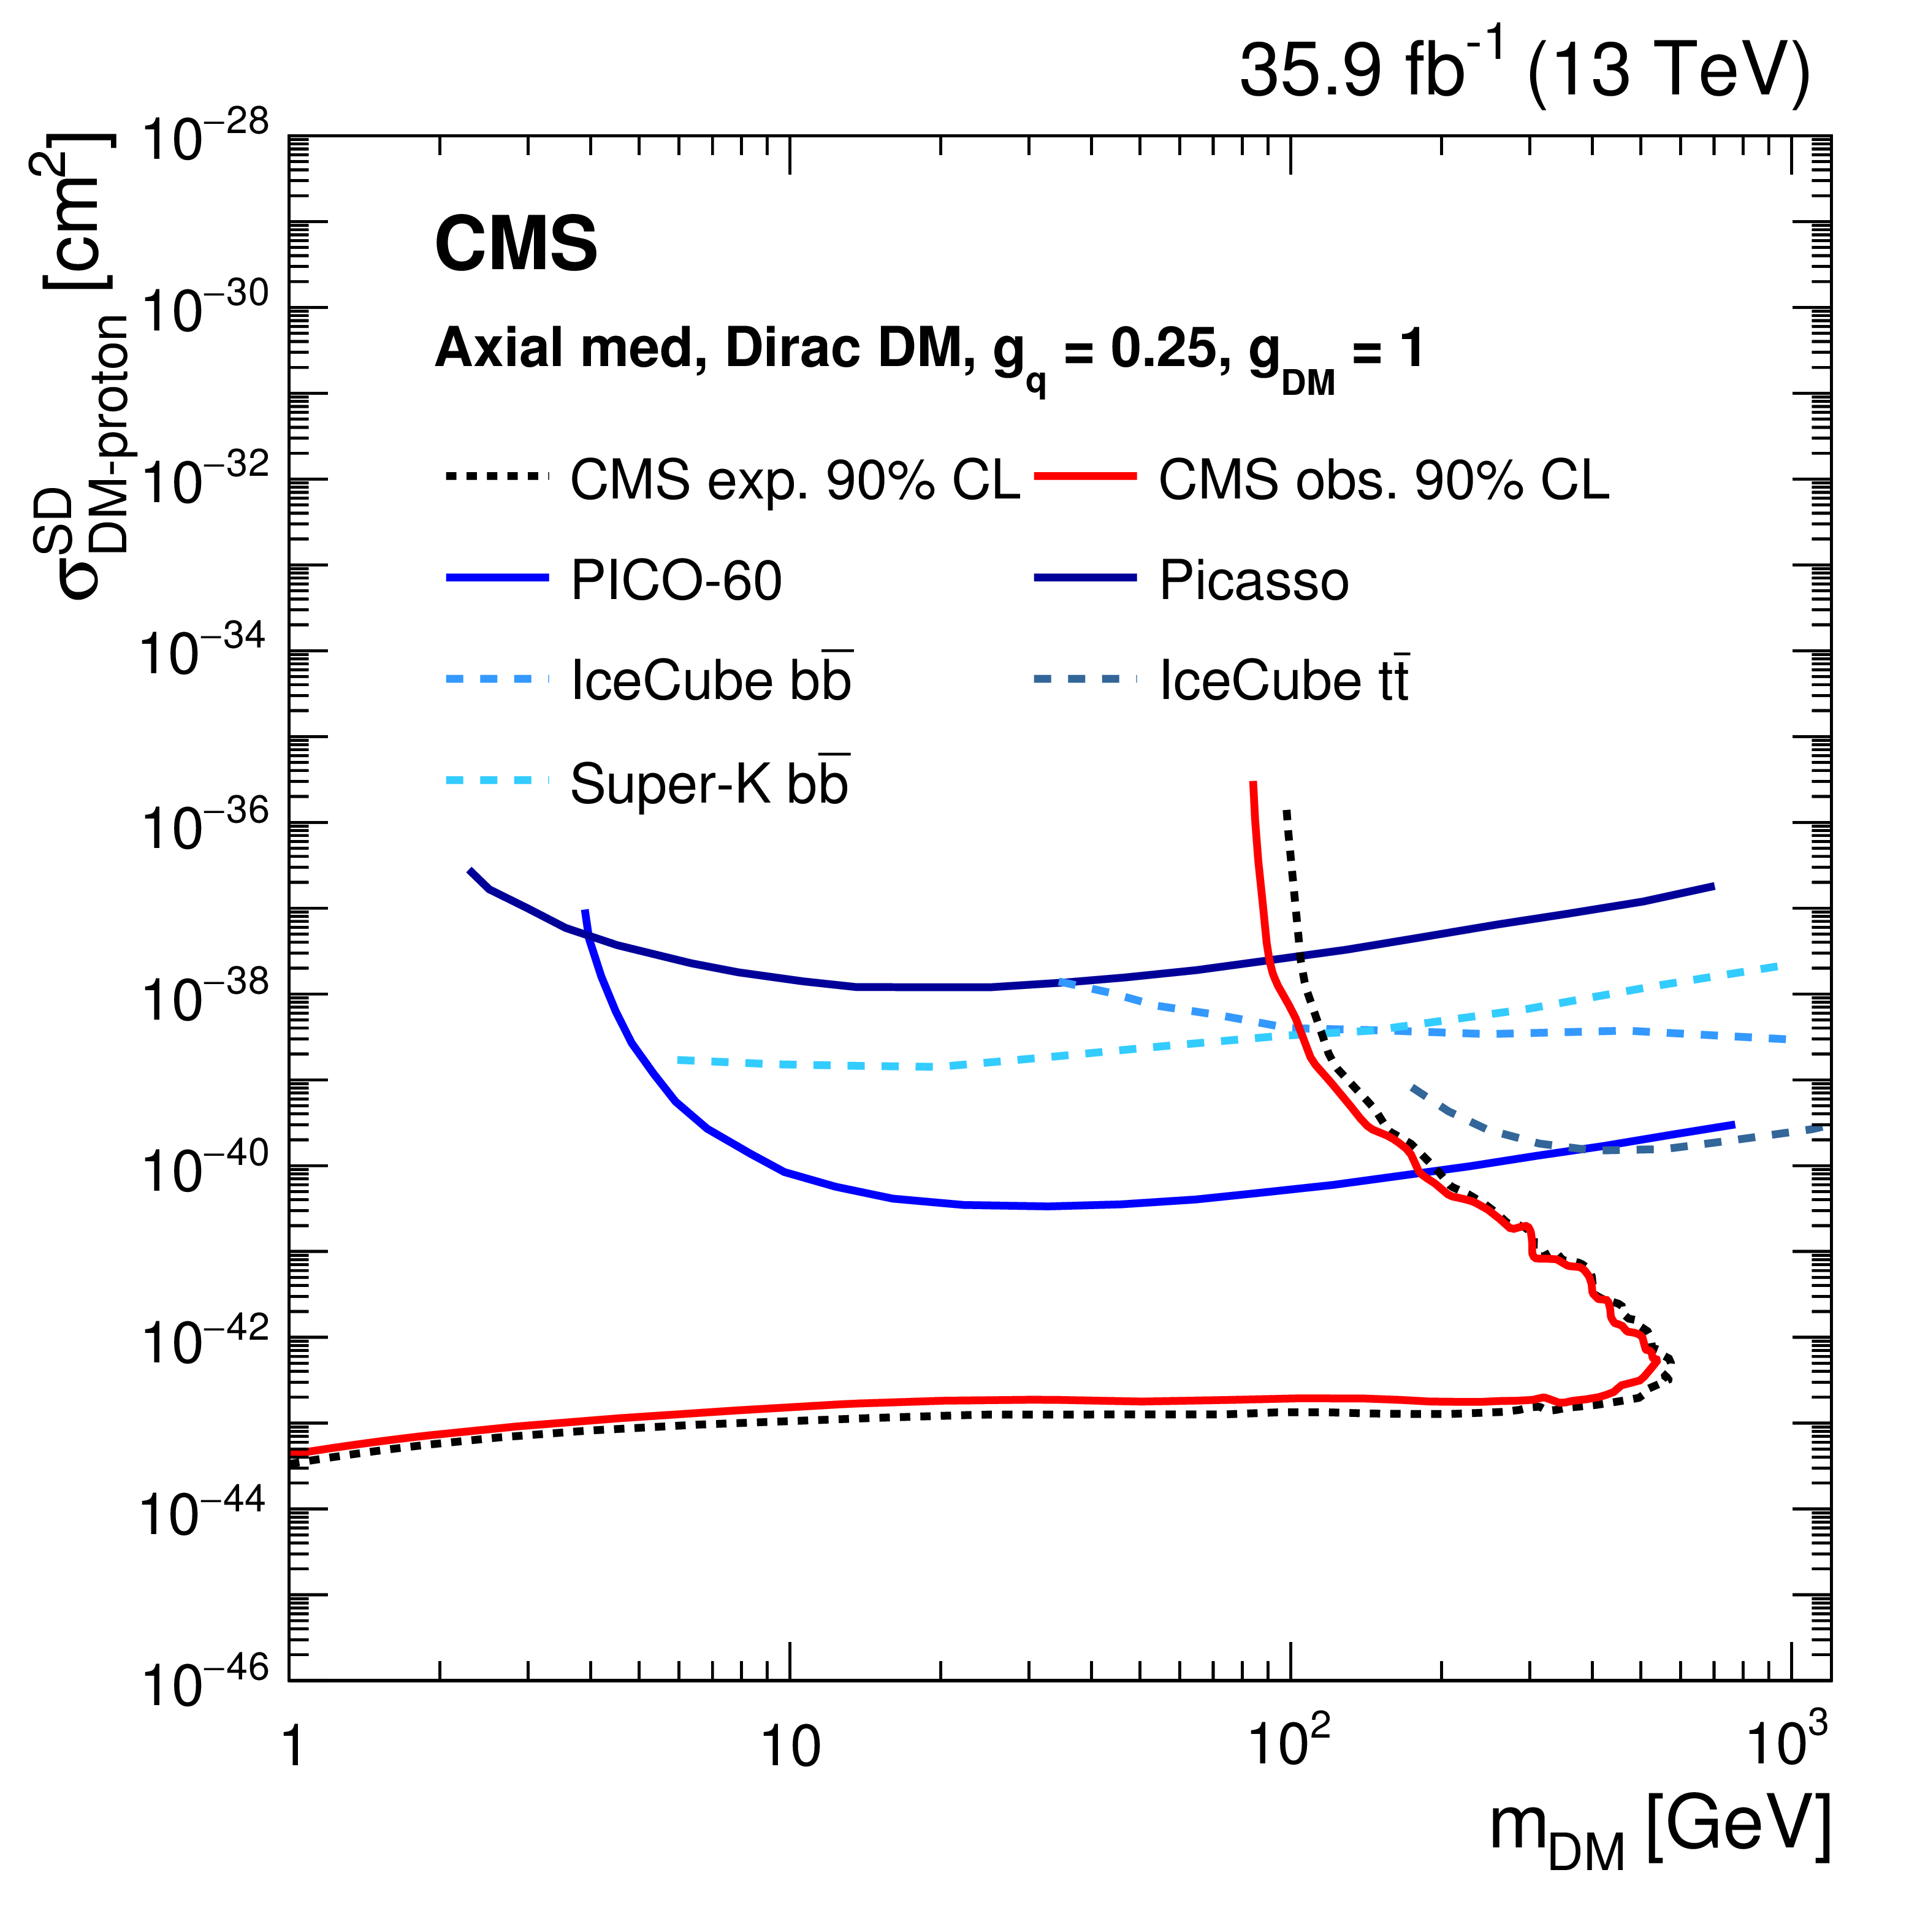
Figure 13:
Exclusion limits at 90%CL in the $m_{\textrm {DM}}$ vs. $\sigma _{\textrm {SI/SD}}$ plane for vector (left) and axial-vector (right) mediator models. The solid red (dotted black) line shows the contour for the observed (expected) exclusion in this search. Limits from CDMSLite [102], LUX [103], XENON-1T [104], and CRESST-II [105] are shown for the vector mediator. Limits from Picasso [106], PICO-60 [107], IceCube [108], and Super-Kamiokande [109] are shown for the axial-vector mediator. |
png pdf |
Figure 13-a:
Exclusion limits at 90%CL in the $m_{\textrm {DM}}$ vs. $\sigma _{\textrm {SI/SD}}$ plane for the vector mediator model. The solid red (dotted black) line shows the contour for the observed (expected) exclusion in this search. Limits from CDMSLite [102], LUX [103], XENON-1T [104], and CRESST-II [105] are shown. |
png pdf |
Figure 13-b:
Exclusion limits at 90%CL in the $m_{\textrm {DM}}$ vs. $\sigma _{\textrm {SI/SD}}$ plane for the axial-vector mediator model. The solid red (dotted black) line shows the contour for the observed (expected) exclusion in this search. Limits from Picasso [106], PICO-60 [107], IceCube [108], and Super-Kamiokande [109] are shown . |
png pdf |
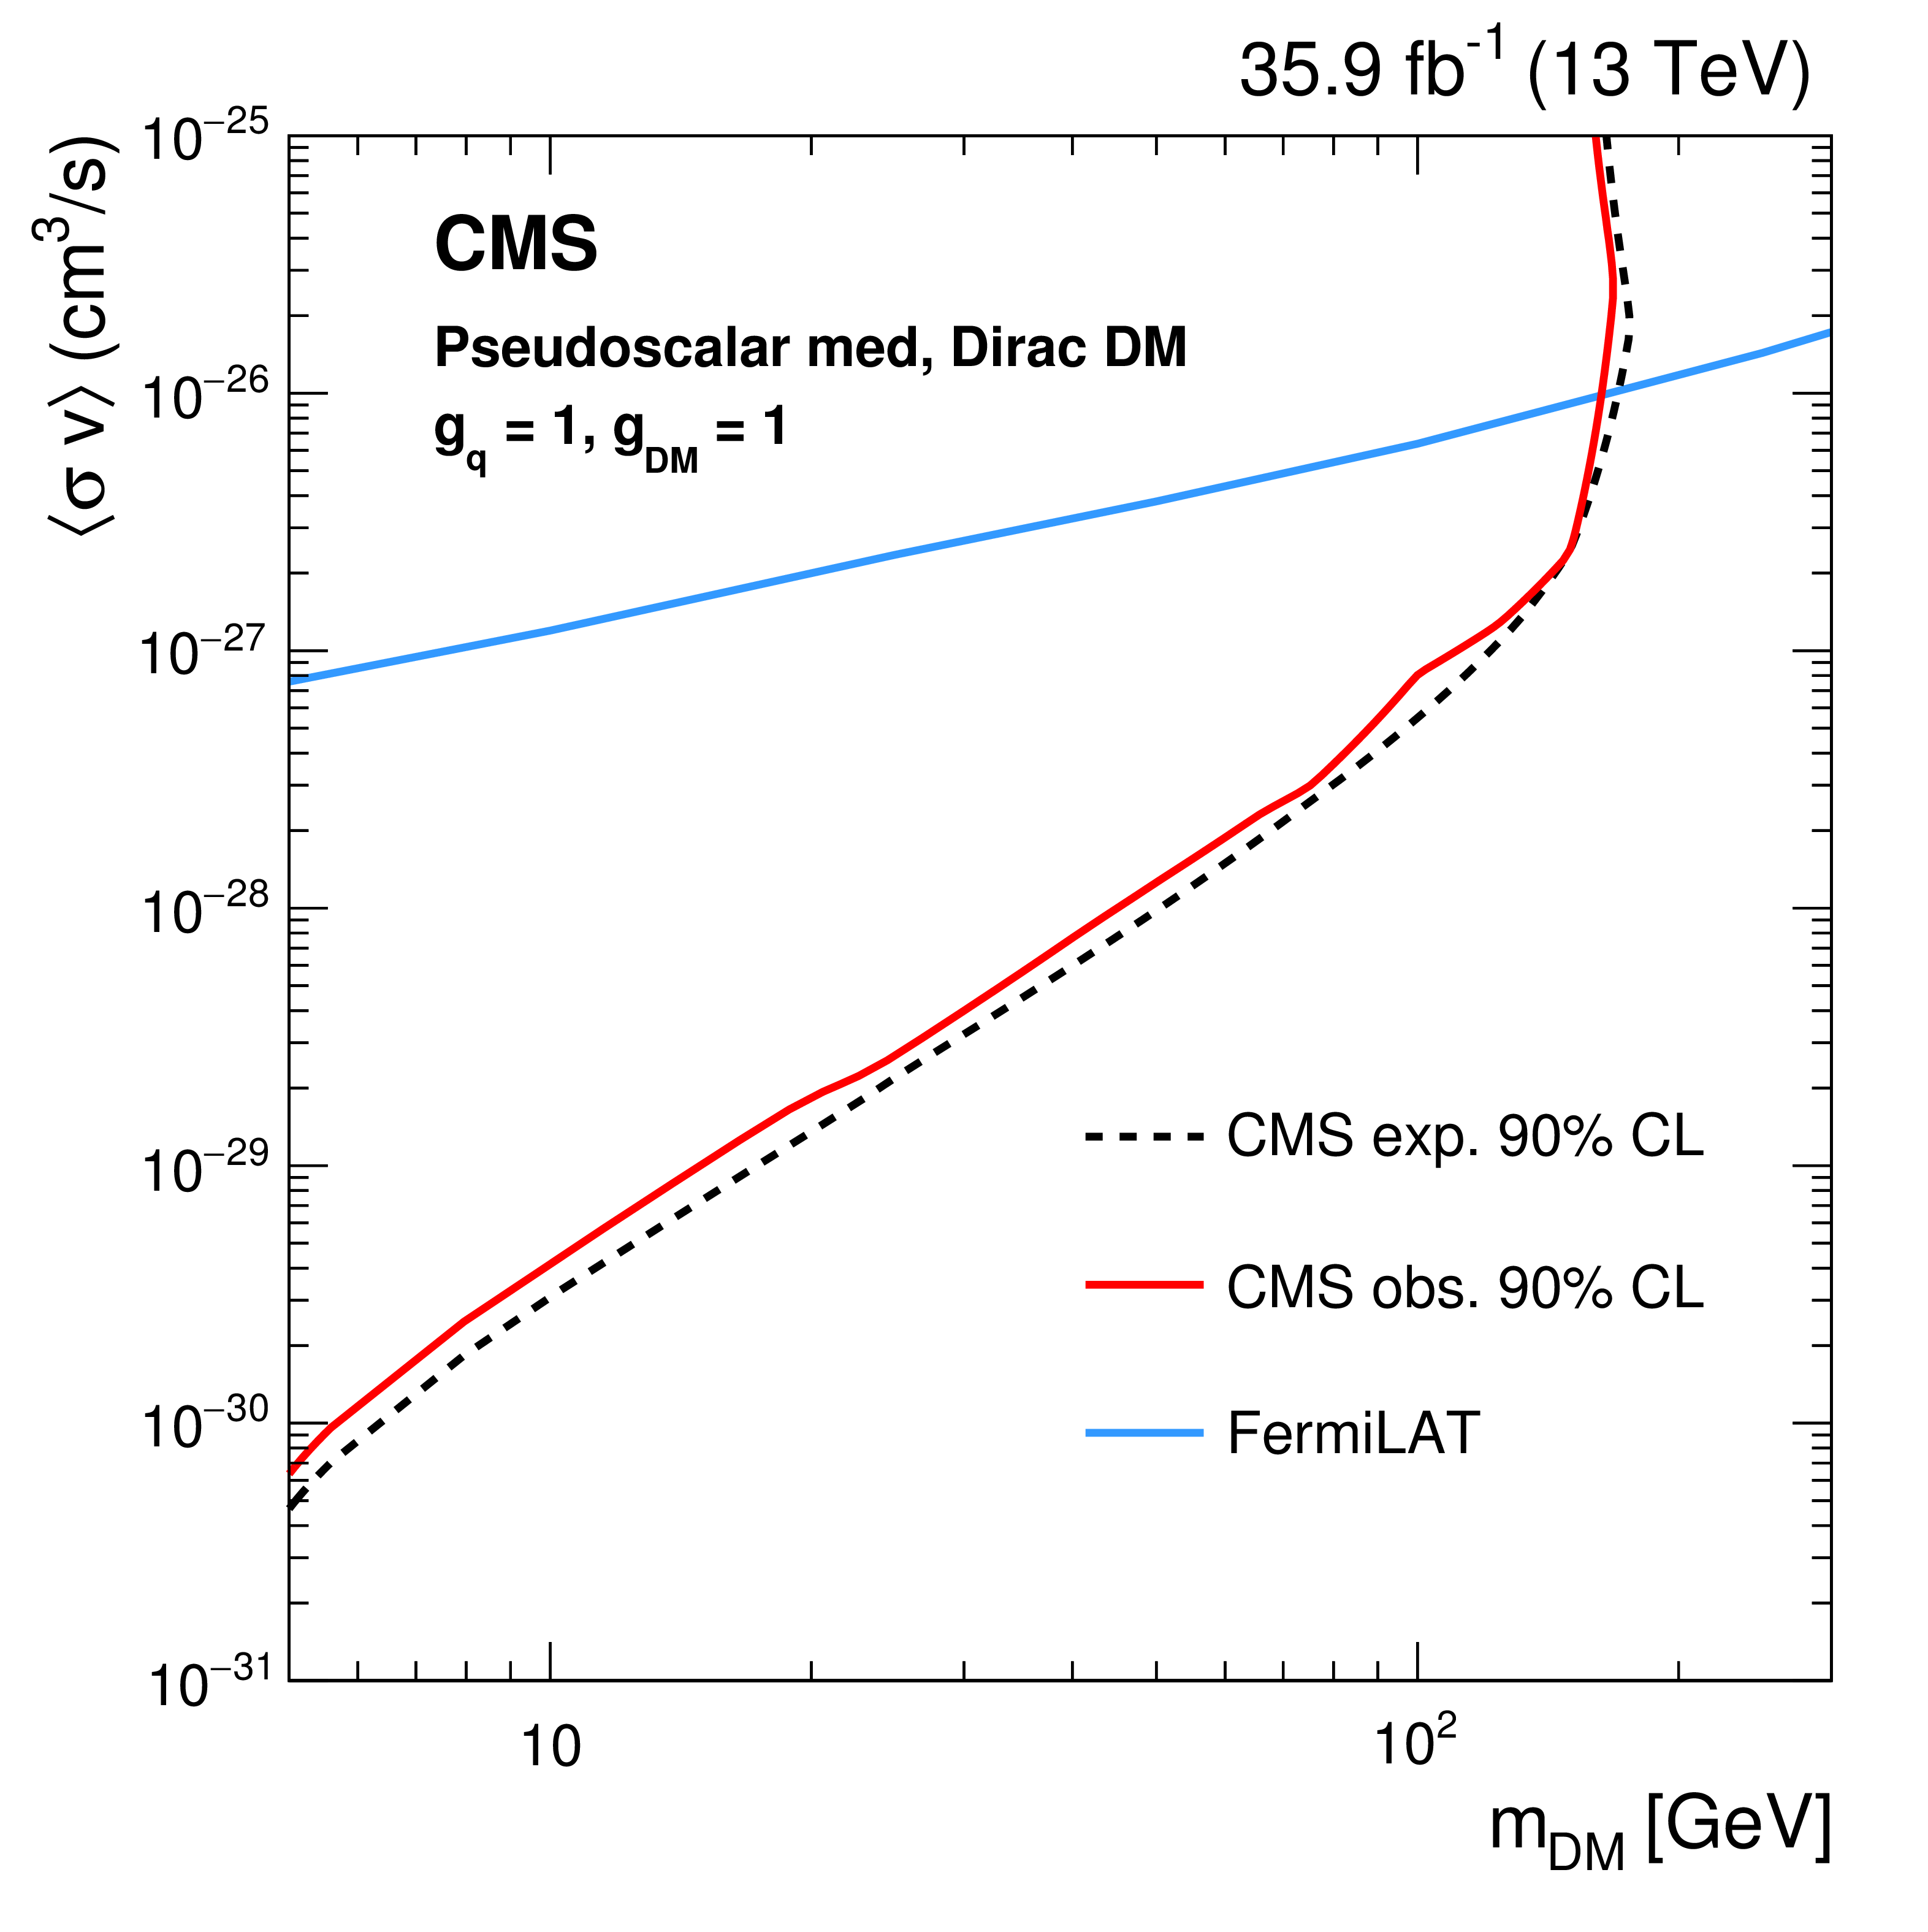
Figure 14:
For the pseudoscalar mediator, limits are compared to the the velocity averaged DM annihilation cross section upper limits from Fermi-LAT [101]. There are no comparable limits from direct detection experiments, as the scattering cross section between DM particles and SM quarks is suppressed at nonrelativistic velocities for a pseudoscalar mediator [110,111]. |
png pdf |
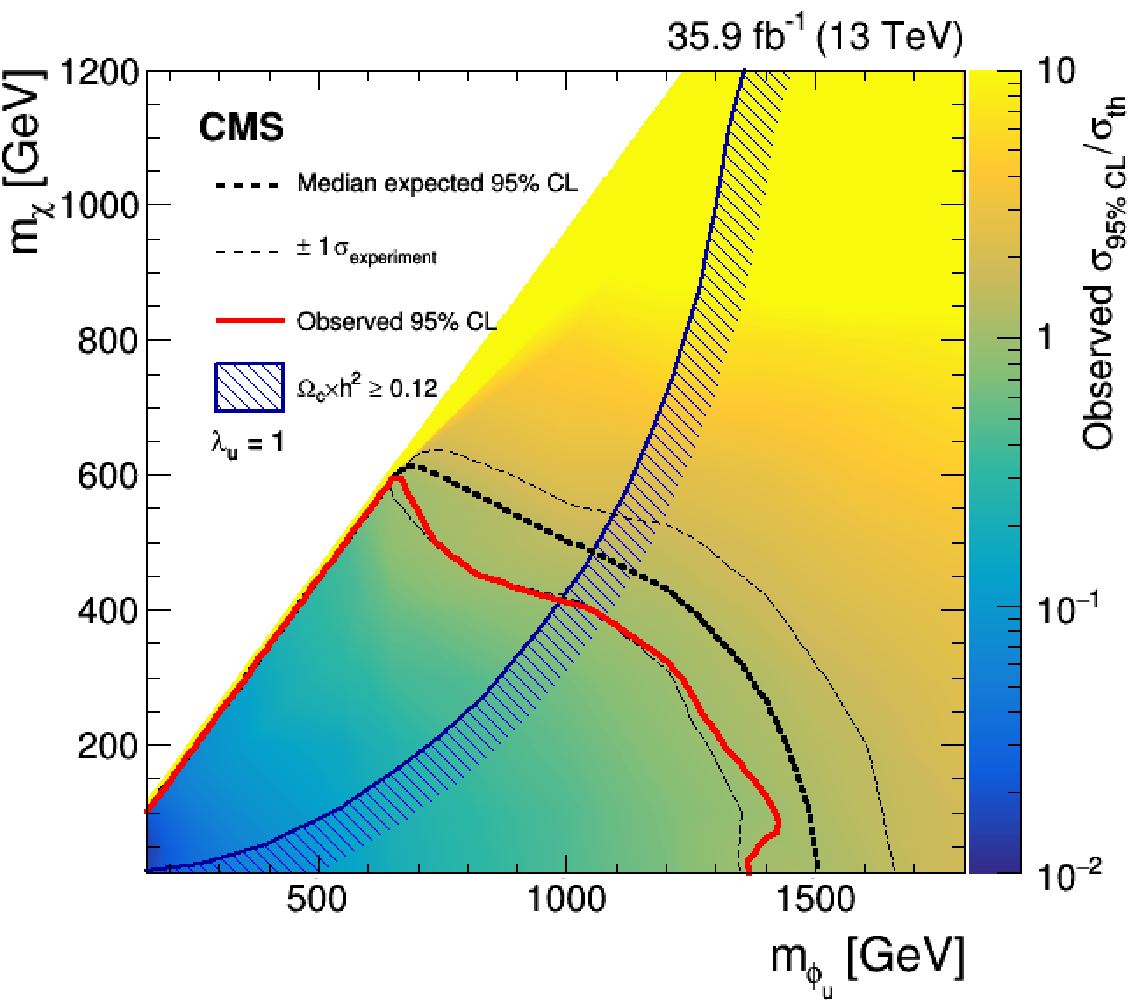
Figure 15:
The 95%CL expected (black dashed line) and observed (red solid line) upper limits on $\mu =\sigma /\sigma _{\rm {th}}$ in the context of the fermion portal DM model, for Dirac DM particles with coupling strengths to the up quark corresponding to $\lambda _{\rm {u}} = $ 1 in the $m_{\phi _{\rm {u}}}$-$m_\chi $ plane. Constraints from the Planck satellite experiment [97] are shown as dark blue contours; in the shaded area DM is overabundant. |

png pdf |
Figure 16:
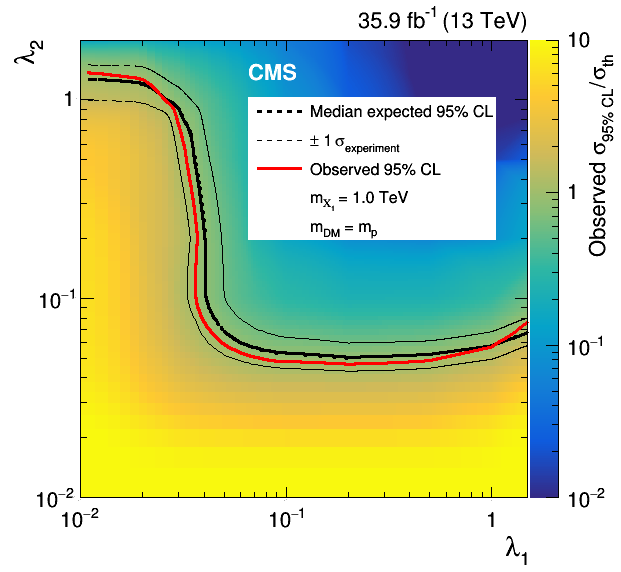
Expected (black dashed line) and observed (red solid line) 95%CL upper limits on the signal strength $\mu =\sigma /\sigma _{\rm {th}}$, in the context of a nonthermal dark matter model. Results are reported in the $\lambda _1$-$\lambda _2$ plane, which represents the coupling strength of the interaction of the new scalar mediator with down-type quarks and DM with up-type quarks, respectively. Limits are shown for $m_{\rm X_1}$ of 1 TeV (left) and 2 TeV (right). |
png |
Figure 16-a:
Expected (black dashed line) and observed (red solid line) 95%CL upper limits on the signal strength $\mu =\sigma /\sigma _{\rm {th}}$, in the context of a nonthermal dark matter model. Results are reported in the $\lambda _1$-$\lambda _2$ plane, which represents the coupling strength of the interaction of the new scalar mediator with down-type quarks and DM with up-type quarks, respectively. Limits are shown for $m_{\rm X_1}$ of 1 TeV. |

png |
Figure 16-b:
Expected (black dashed line) and observed (red solid line) 95%CL upper limits on the signal strength $\mu =\sigma /\sigma _{\rm {th}}$, in the context of a nonthermal dark matter model. Results are reported in the $\lambda _1$-$\lambda _2$ plane, which represents the coupling strength of the interaction of the new scalar mediator with down-type quarks and DM with up-type quarks, respectively. Limits are shown for $m_{\rm X_1}$ of 2 TeV. |
png pdf |
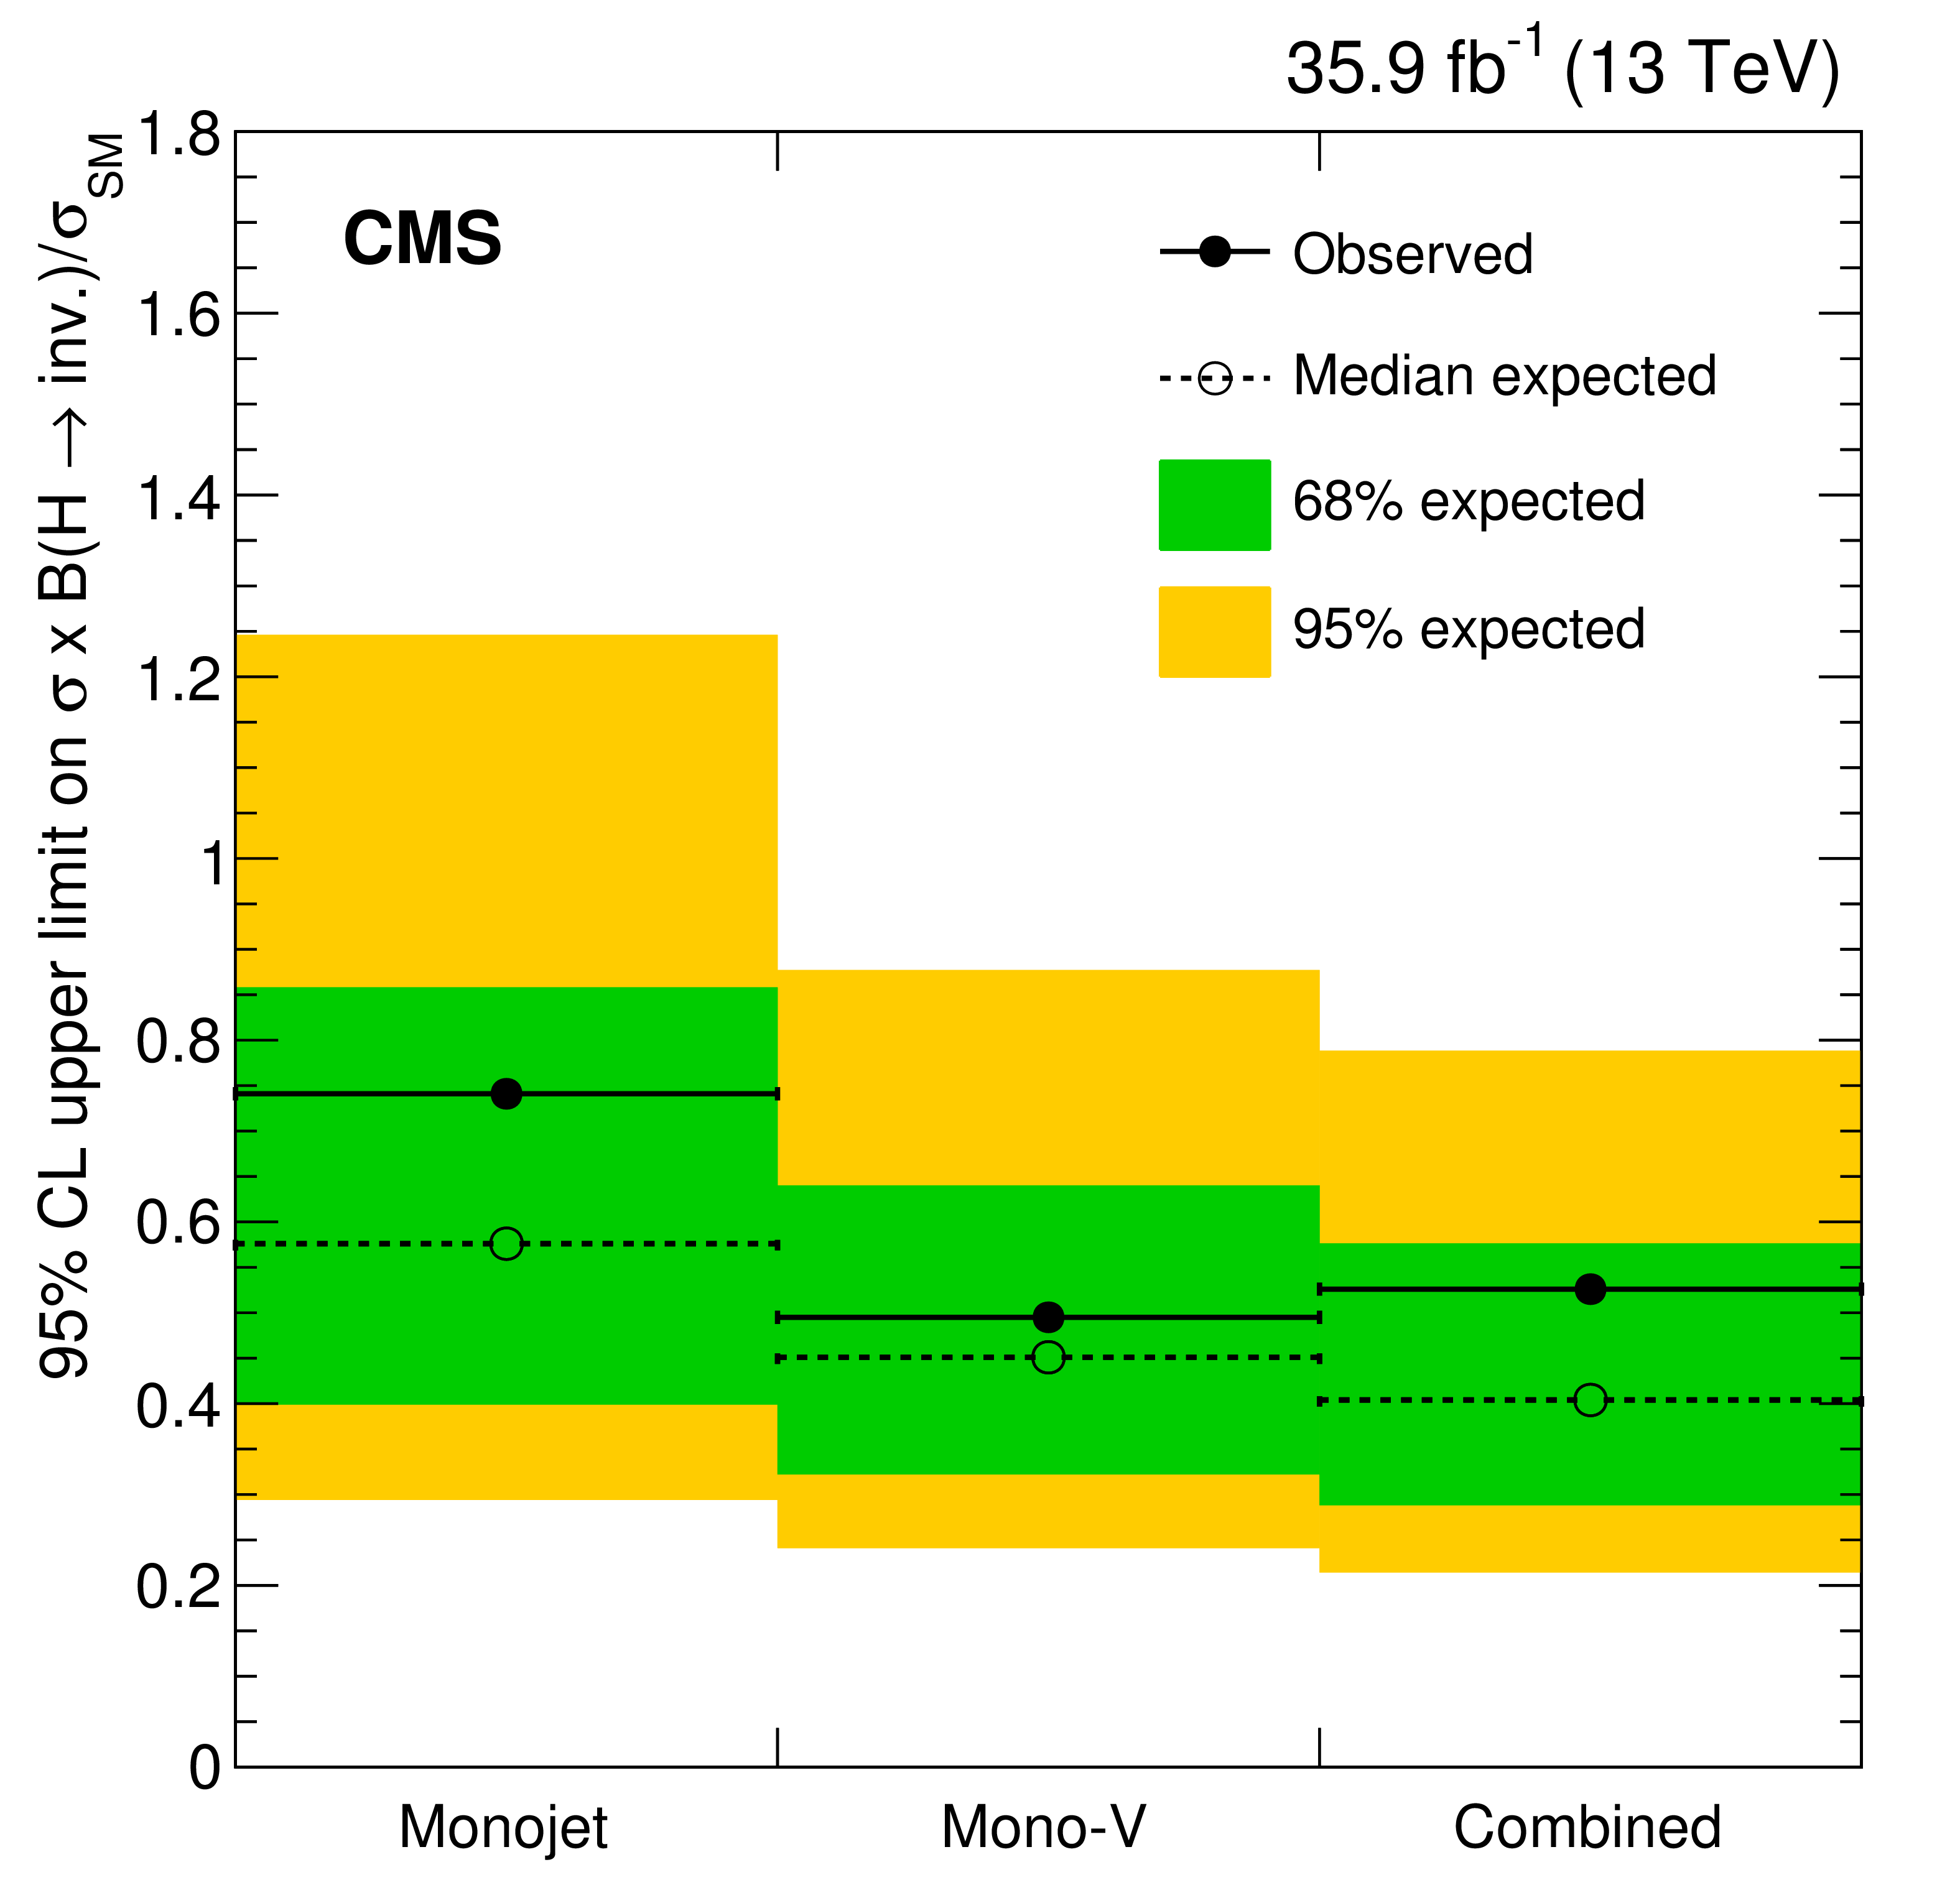
Figure 17:
Expected (dotted line) and observed (solid line) 95%CL upper limits on the invisible branching fraction of the 125 GeV SM-like Higgs boson. Limits are shown for the monojet and mono-V categories separately, and also for their combination. |
png pdf |
Figure 18:
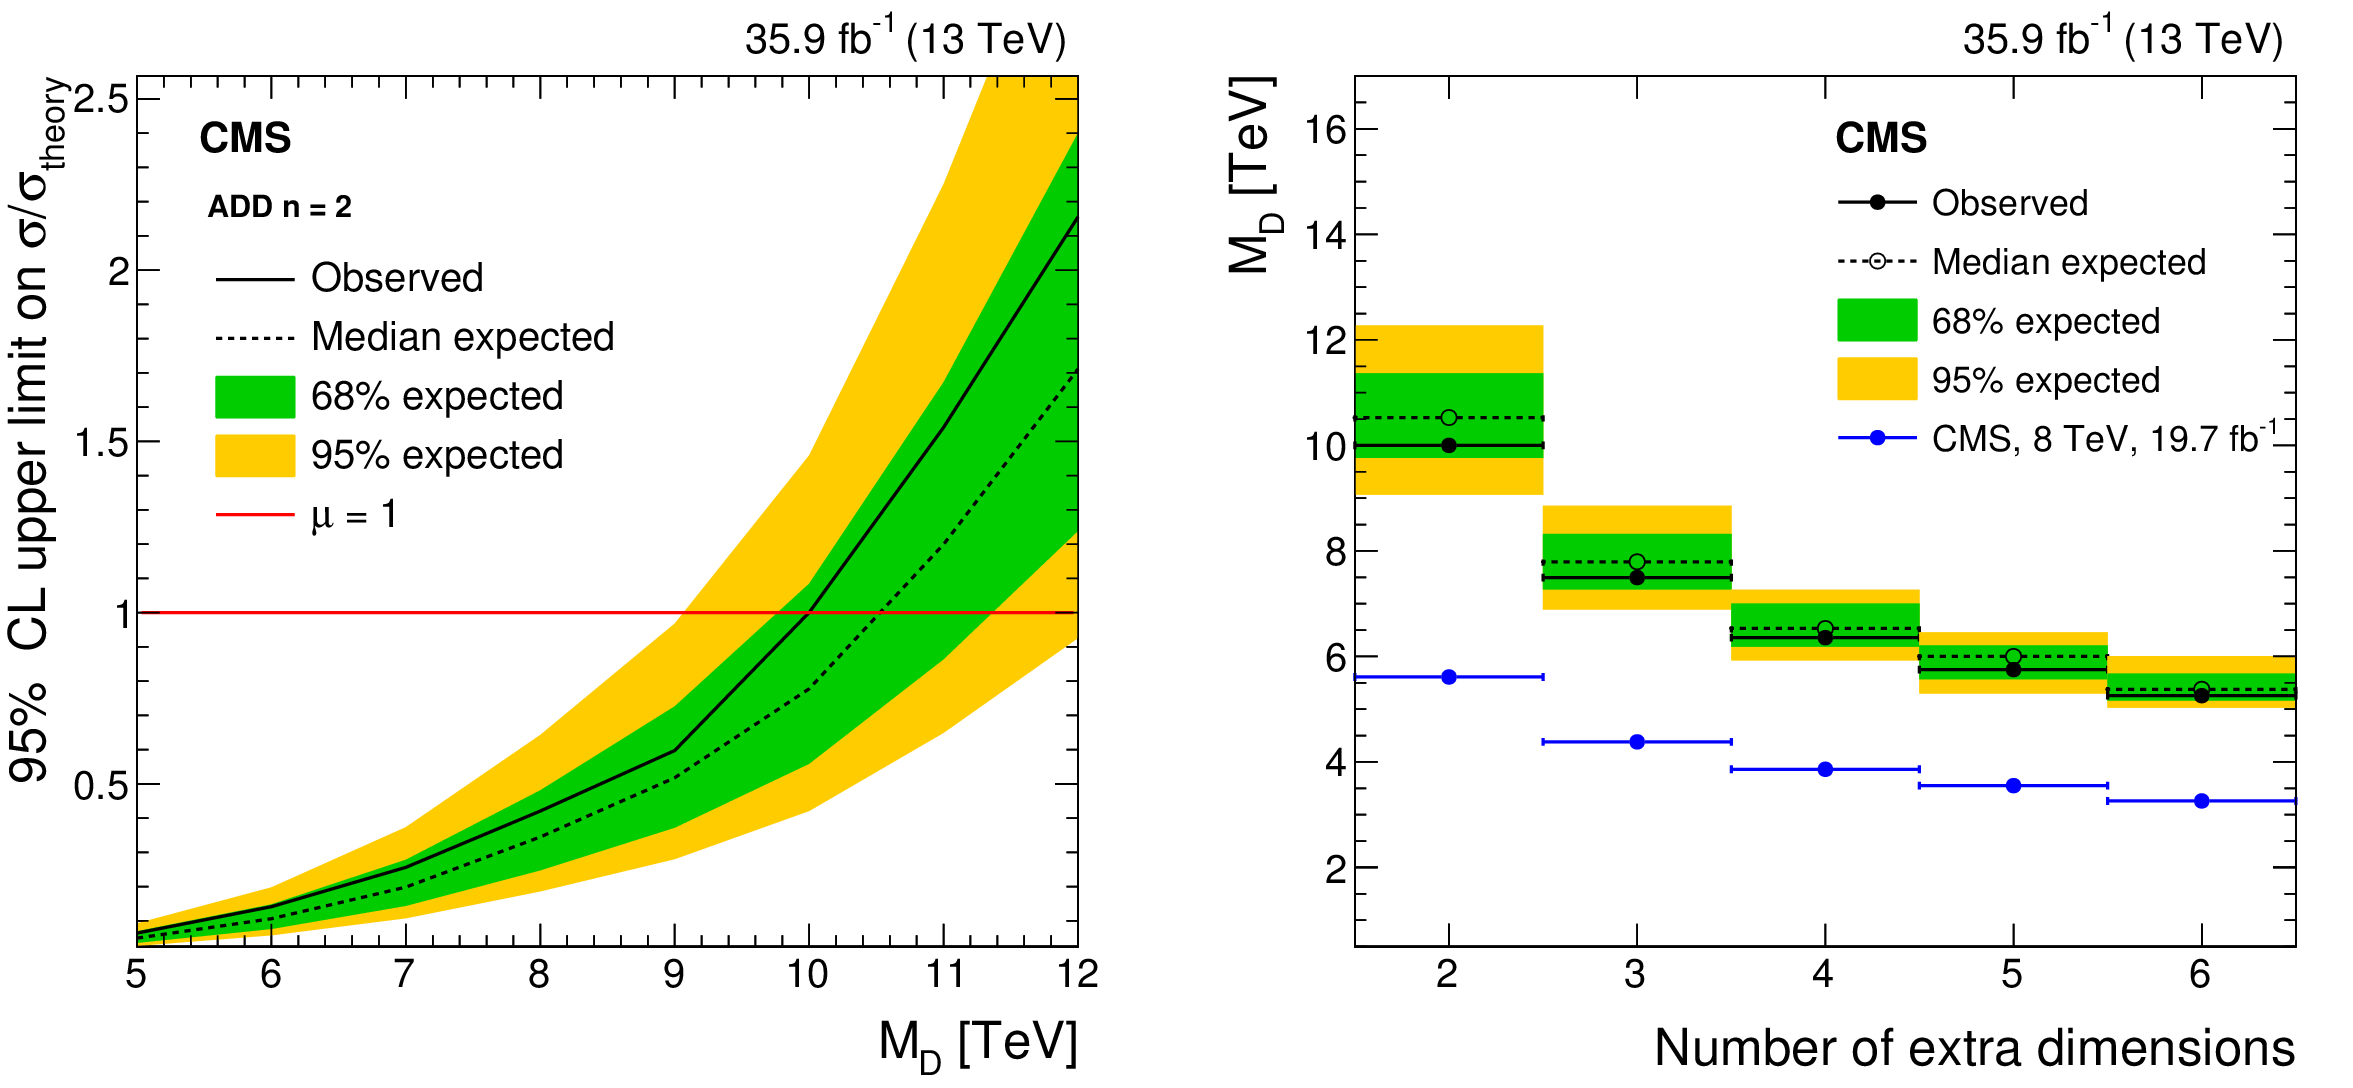
The 95%CL expected (dotted) and observed (solid) upper limits on the signal strength $\mu =\sigma /\sigma _{\rm {th}}$ for ADD graviton production (left), as a function of fundamental Planck scale ($M_{\mathrm {D}}$) for $n=$ 2, where $n$ is the number of extra spatial dimensions. The 95%CL expected (dotted) and observed (solid) lower limits (right) on $M_{\mathrm {D}}$ as a function of $n$ in the ADD model. The results are also compared to earlier ones obtained by the CMS Collaboration with data corresponding to an integrated luminosity of 19.7 fb$^{-1}$ at a centre-of-mass energy of 8 TeV [10] (blue points). |

png pdf |
Figure 18-a:
The 95%CL expected (dotted) and observed (solid) upper limits on the signal strength $\mu =\sigma /\sigma _{\rm {th}}$ for ADD graviton production, as a function of fundamental Planck scale ($M_{\mathrm {D}}$) for $n=$ 2, where $n$ is the number of extra spatial dimensions. |
png pdf |
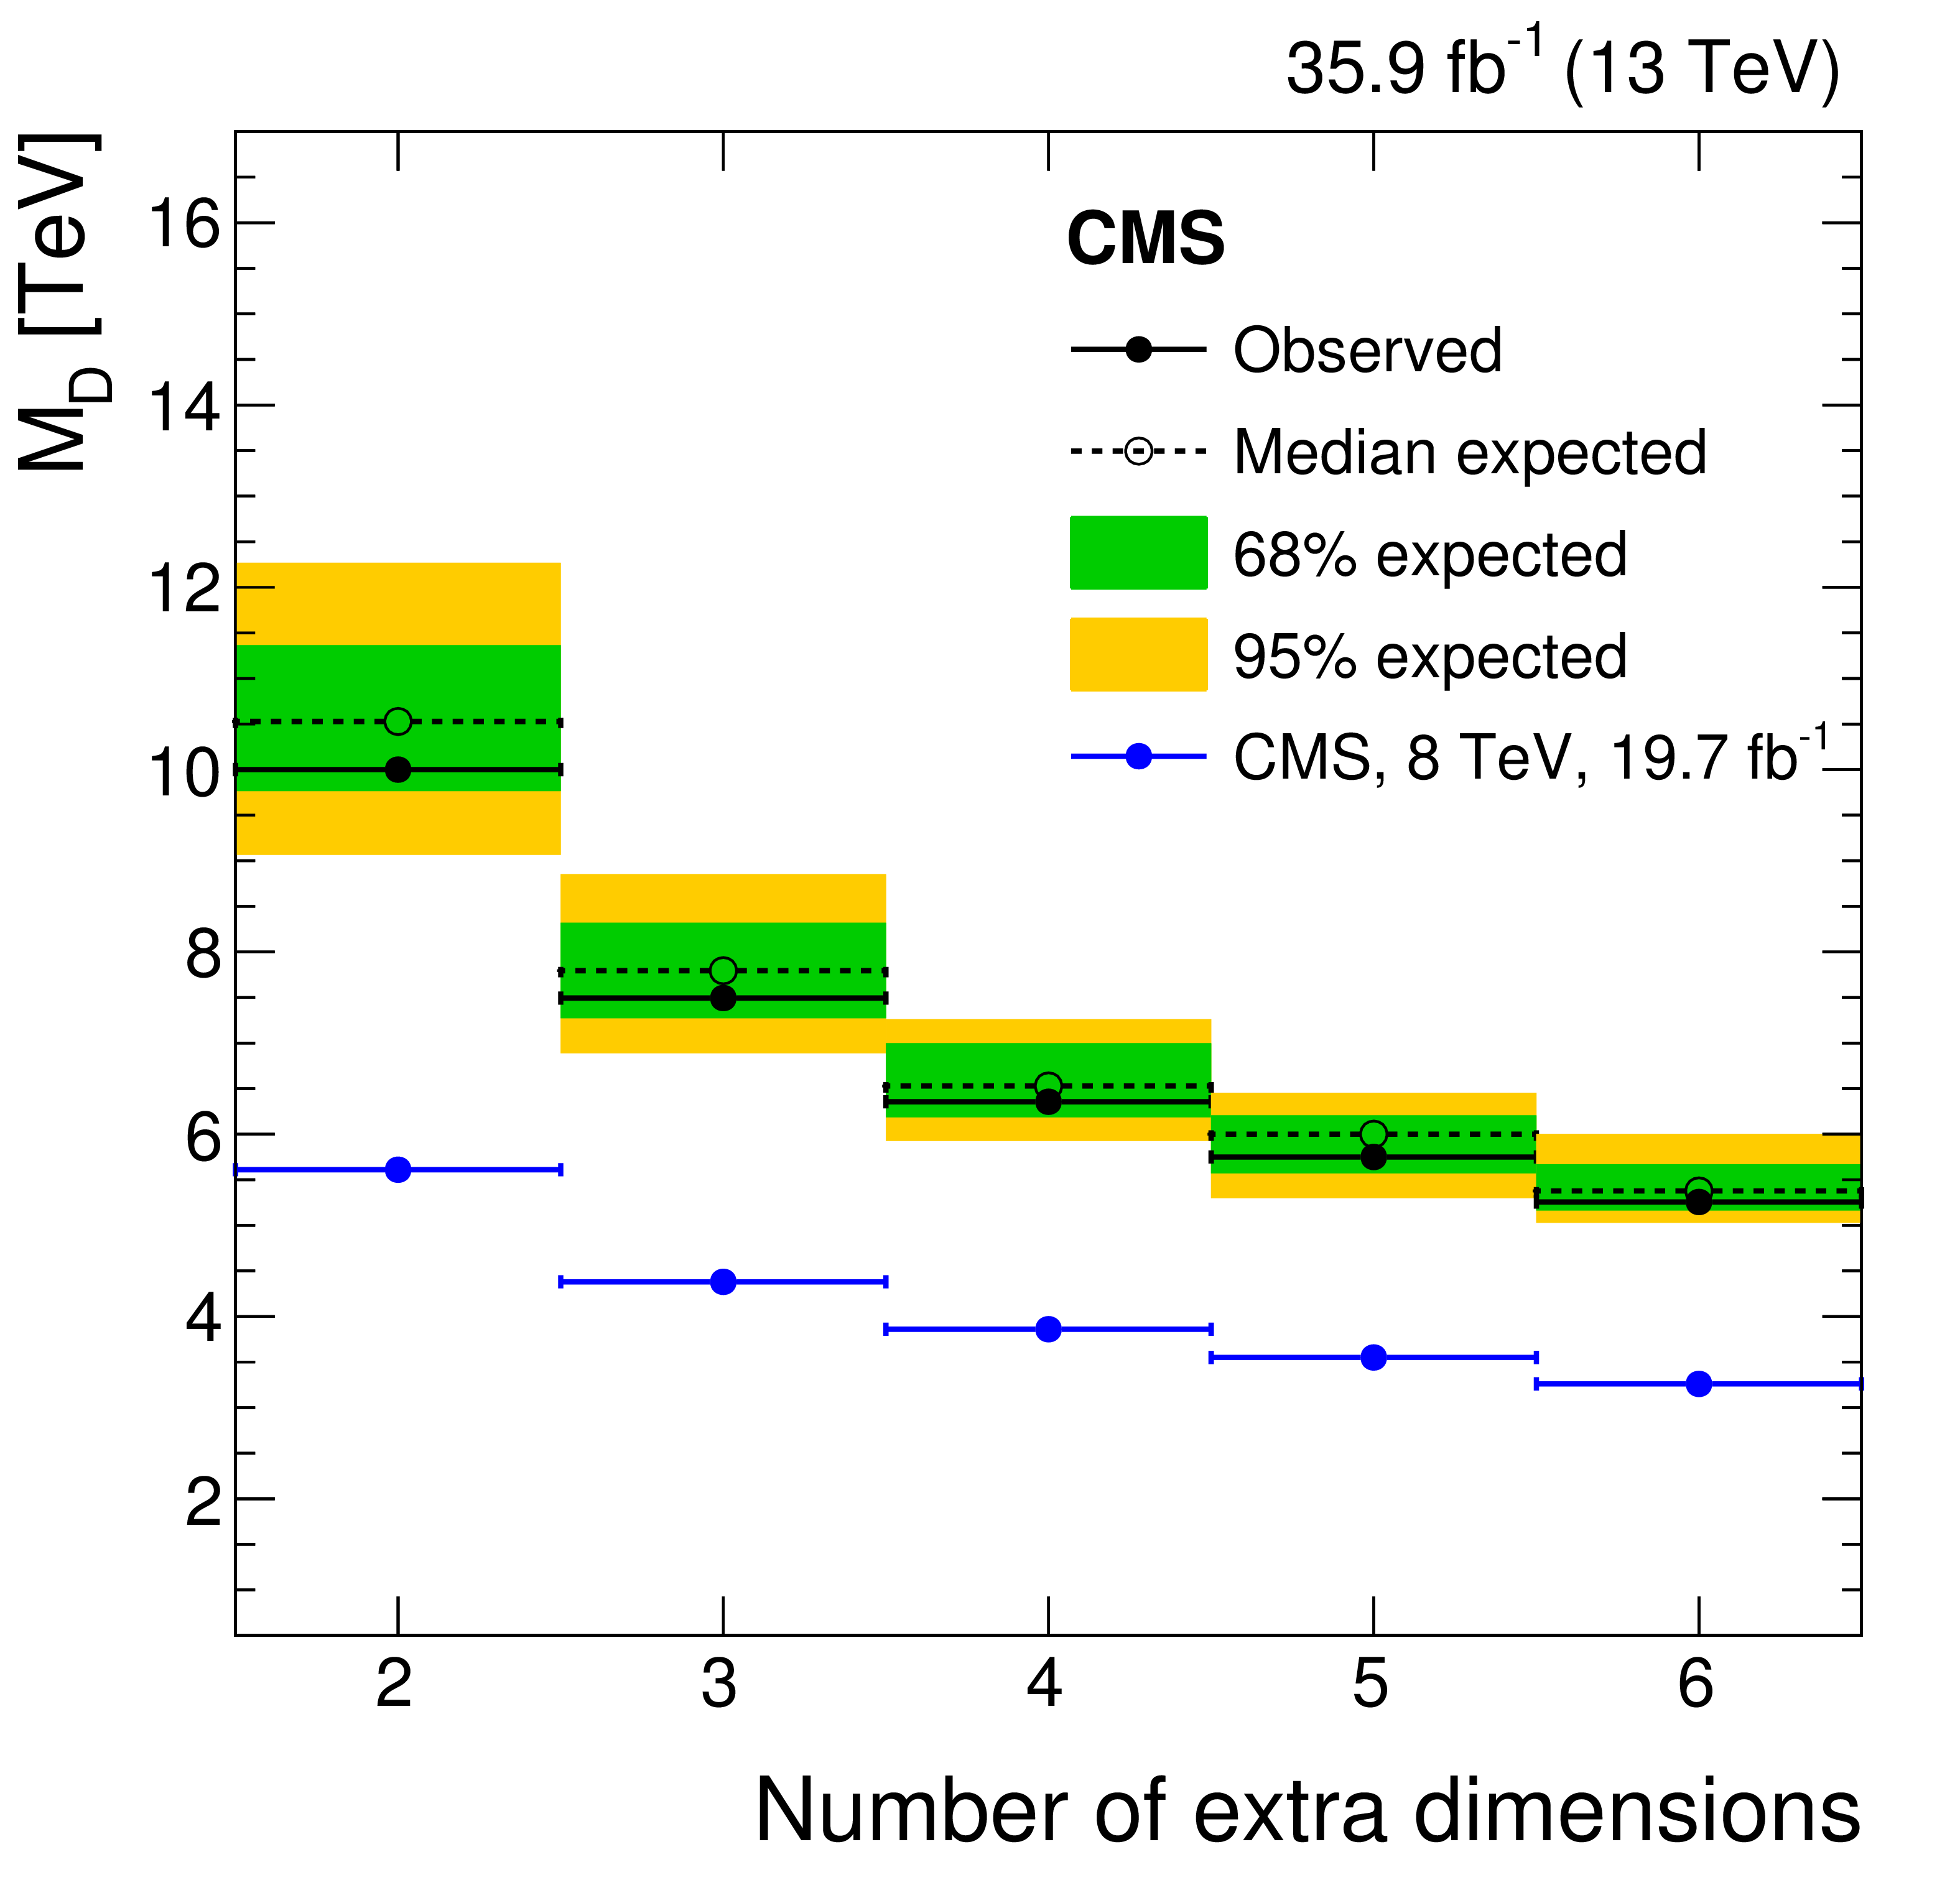
Figure 18-b:
The 95%CL expected (dotted) and observed (solid) lower limits on $M_{\mathrm {D}}$ as a function of $n$ in the ADD model. The results are also compared to earlier ones obtained by the CMS Collaboration with data corresponding to an integrated luminosity of 19.7 fb$^{-1}$ at a centre-of-mass energy of 8 TeV [10] (blue points). |
png pdf |
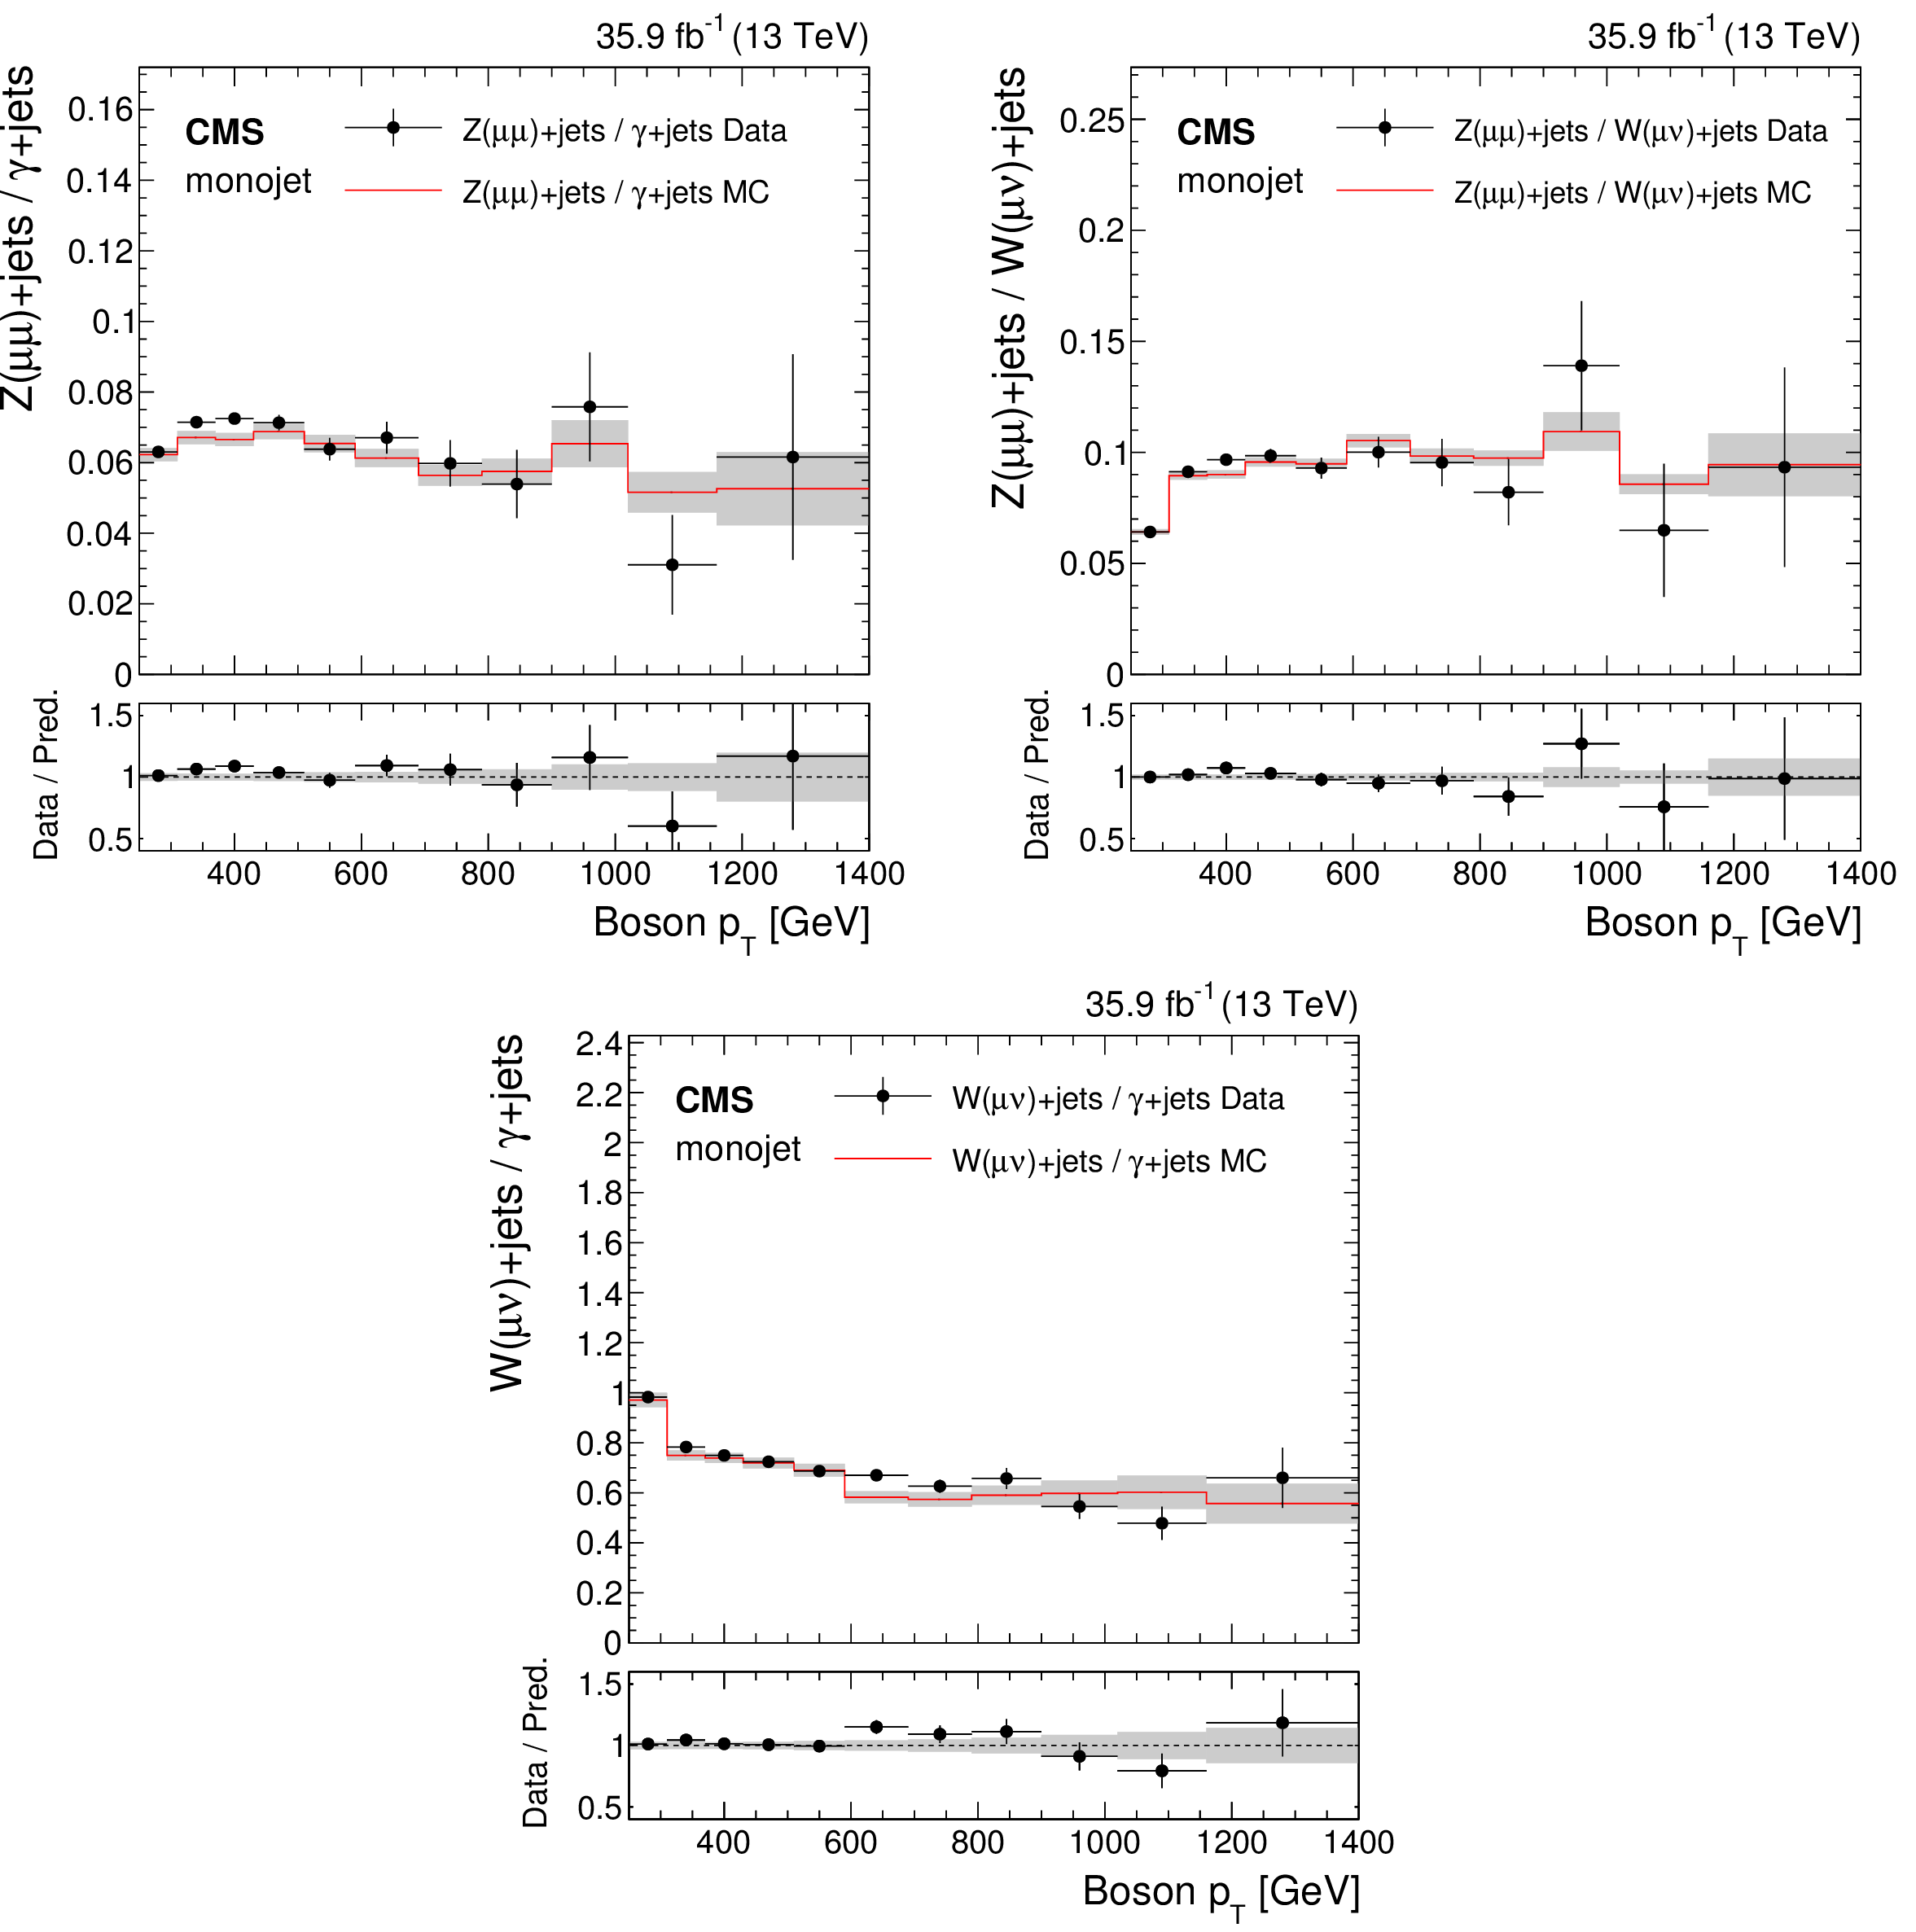
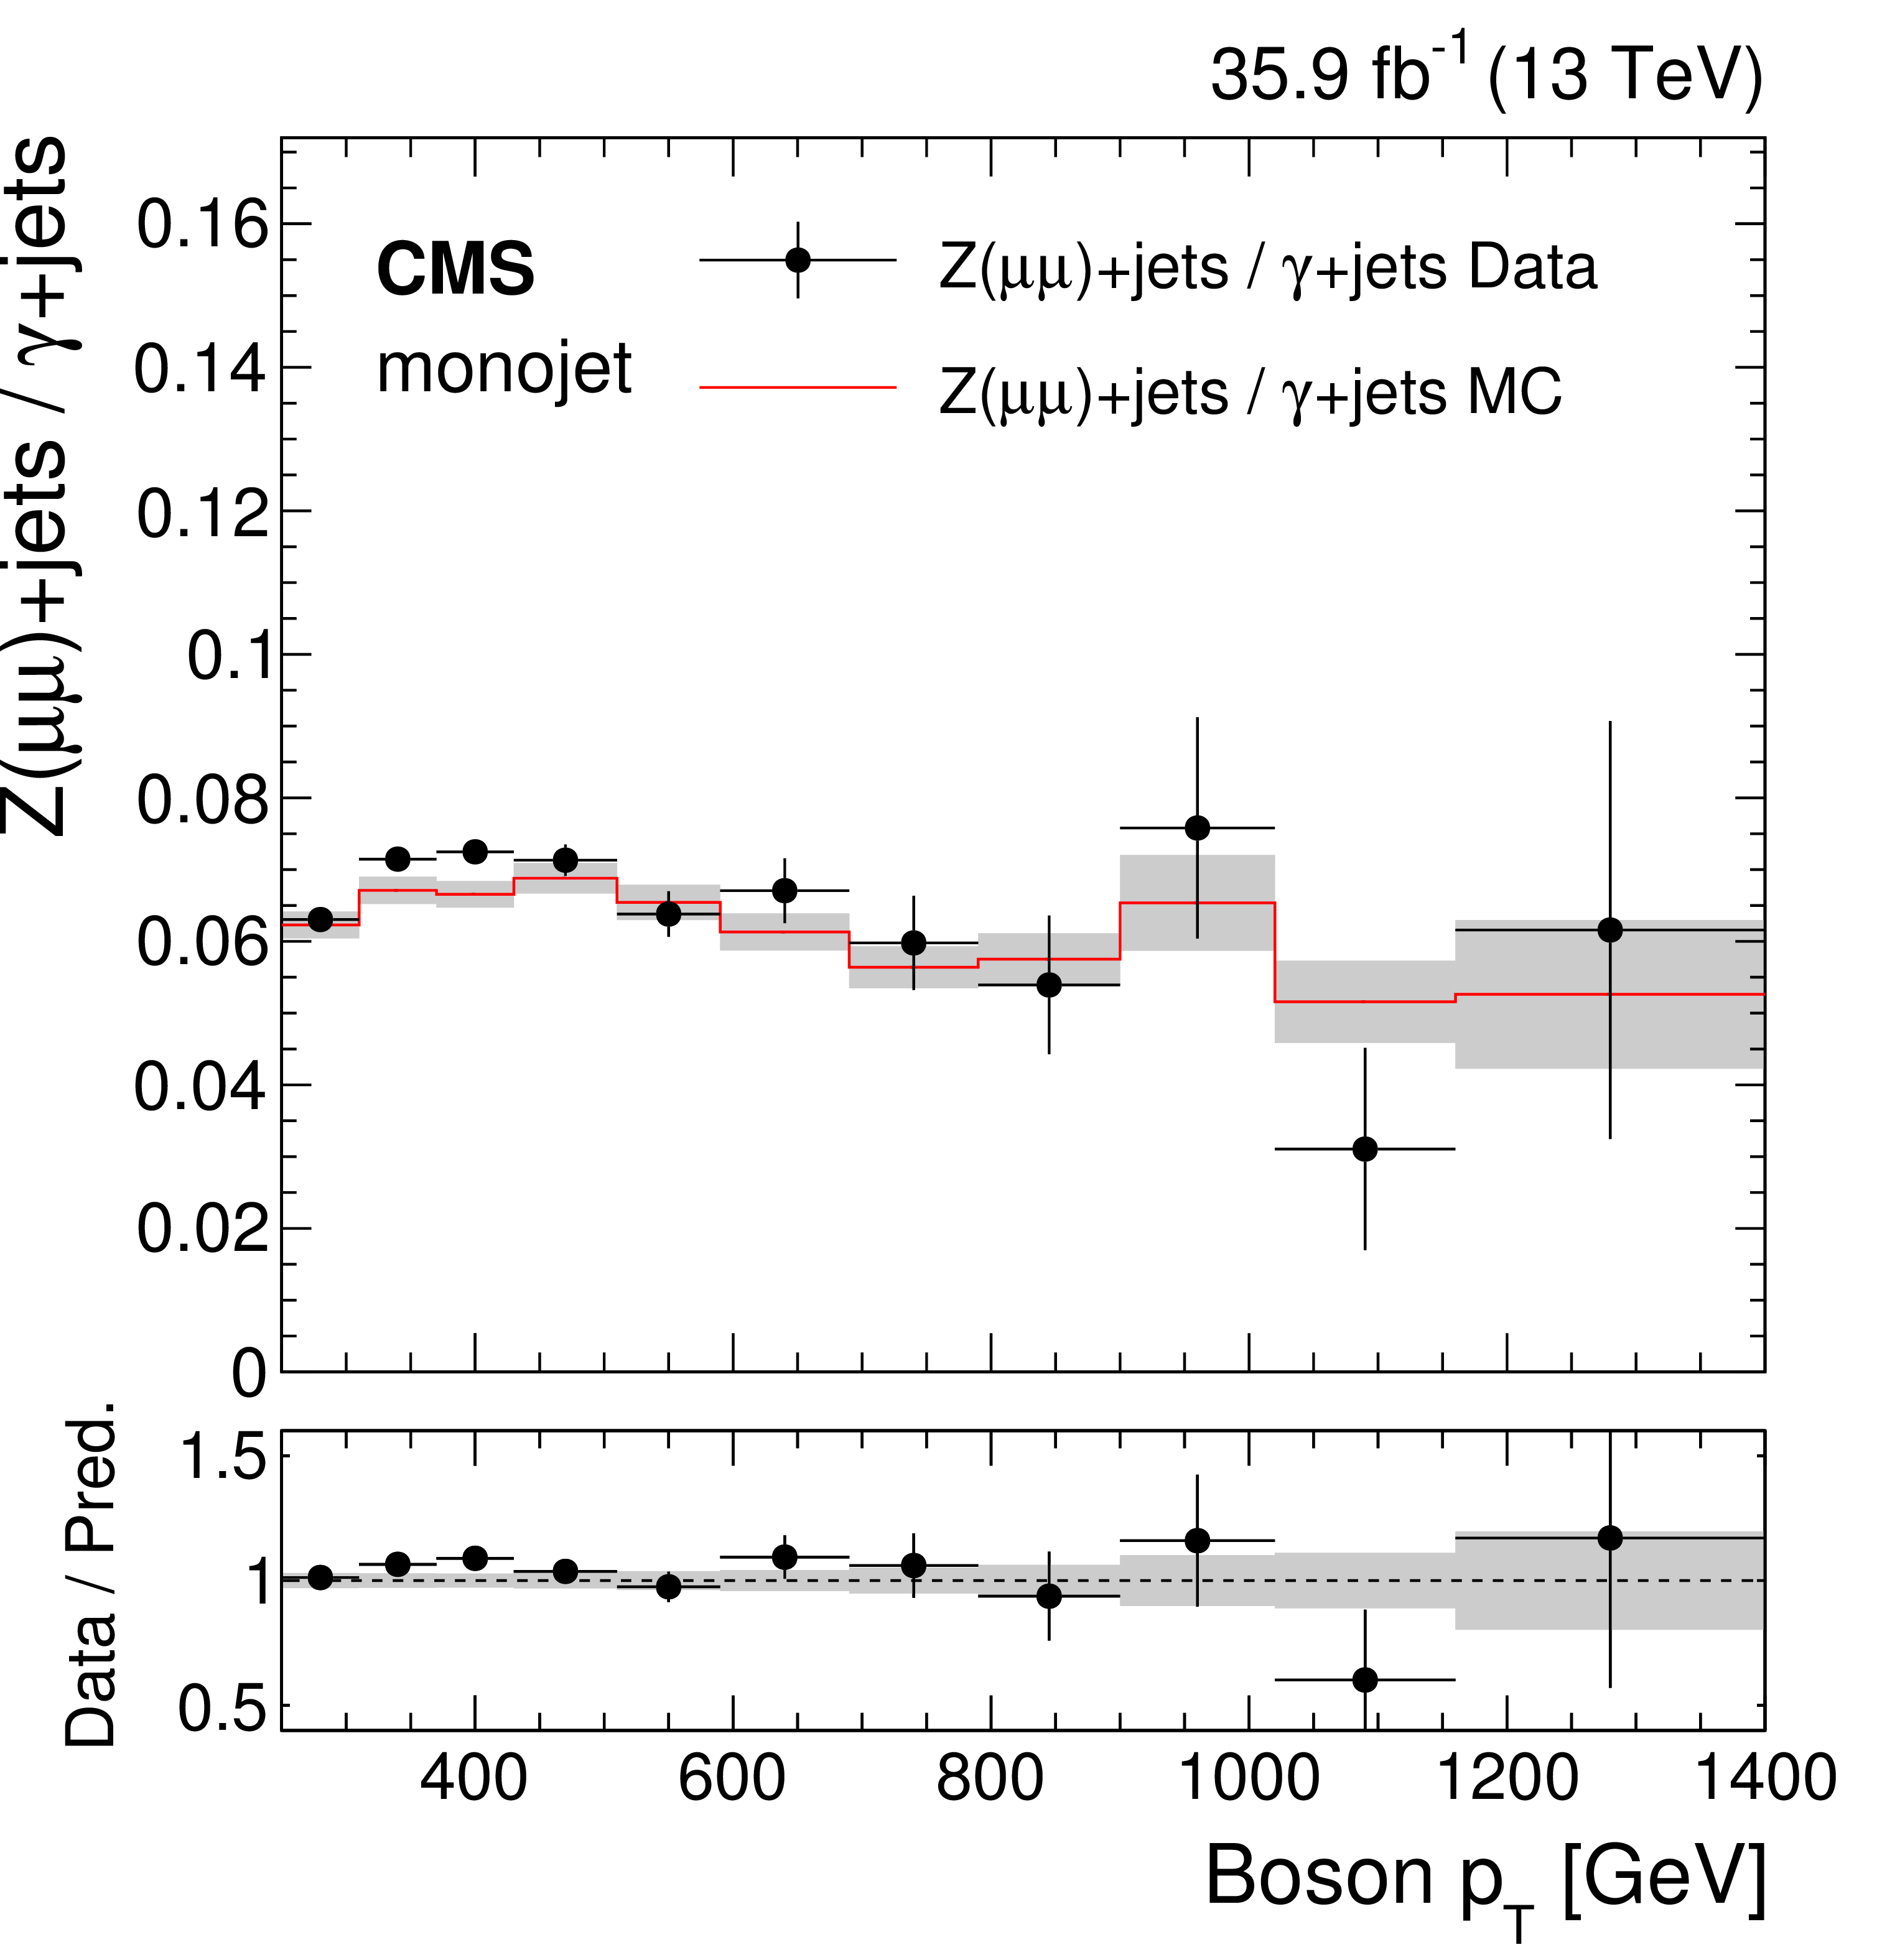
Figure 19:
Comparison between data and Monte Carlo simulation of the $\mathrm{Z} (\mu \mu)$/$\gamma $+jets, $\mathrm{Z} (\mu \mu)$/$\mathrm{W} (\mu \nu)$ and $\mathrm{W} (\mu \nu)$/$\gamma $+jets ratios, as a function of boson $ {p_{\mathrm {T}}} $, in the monojet category. In the ratio panel, ratios of data with the pre-fit background prediction are shown. The gray bands include both the pre-fit systematic uncertainties and the statistical uncertainty in the simulation. |
png pdf |
Figure 19-a:
Comparison between data and Monte Carlo simulation of the $\mathrm{Z} (\mu \mu)$/$\gamma $+jets ratio, as a function of boson $ {p_{\mathrm {T}}} $, in the monojet category. In the ratio panel, the ratio of data with the pre-fit background prediction is shown. The gray bands include both the pre-fit systematic uncertainties and the statistical uncertainty in the simulation. |
png pdf |
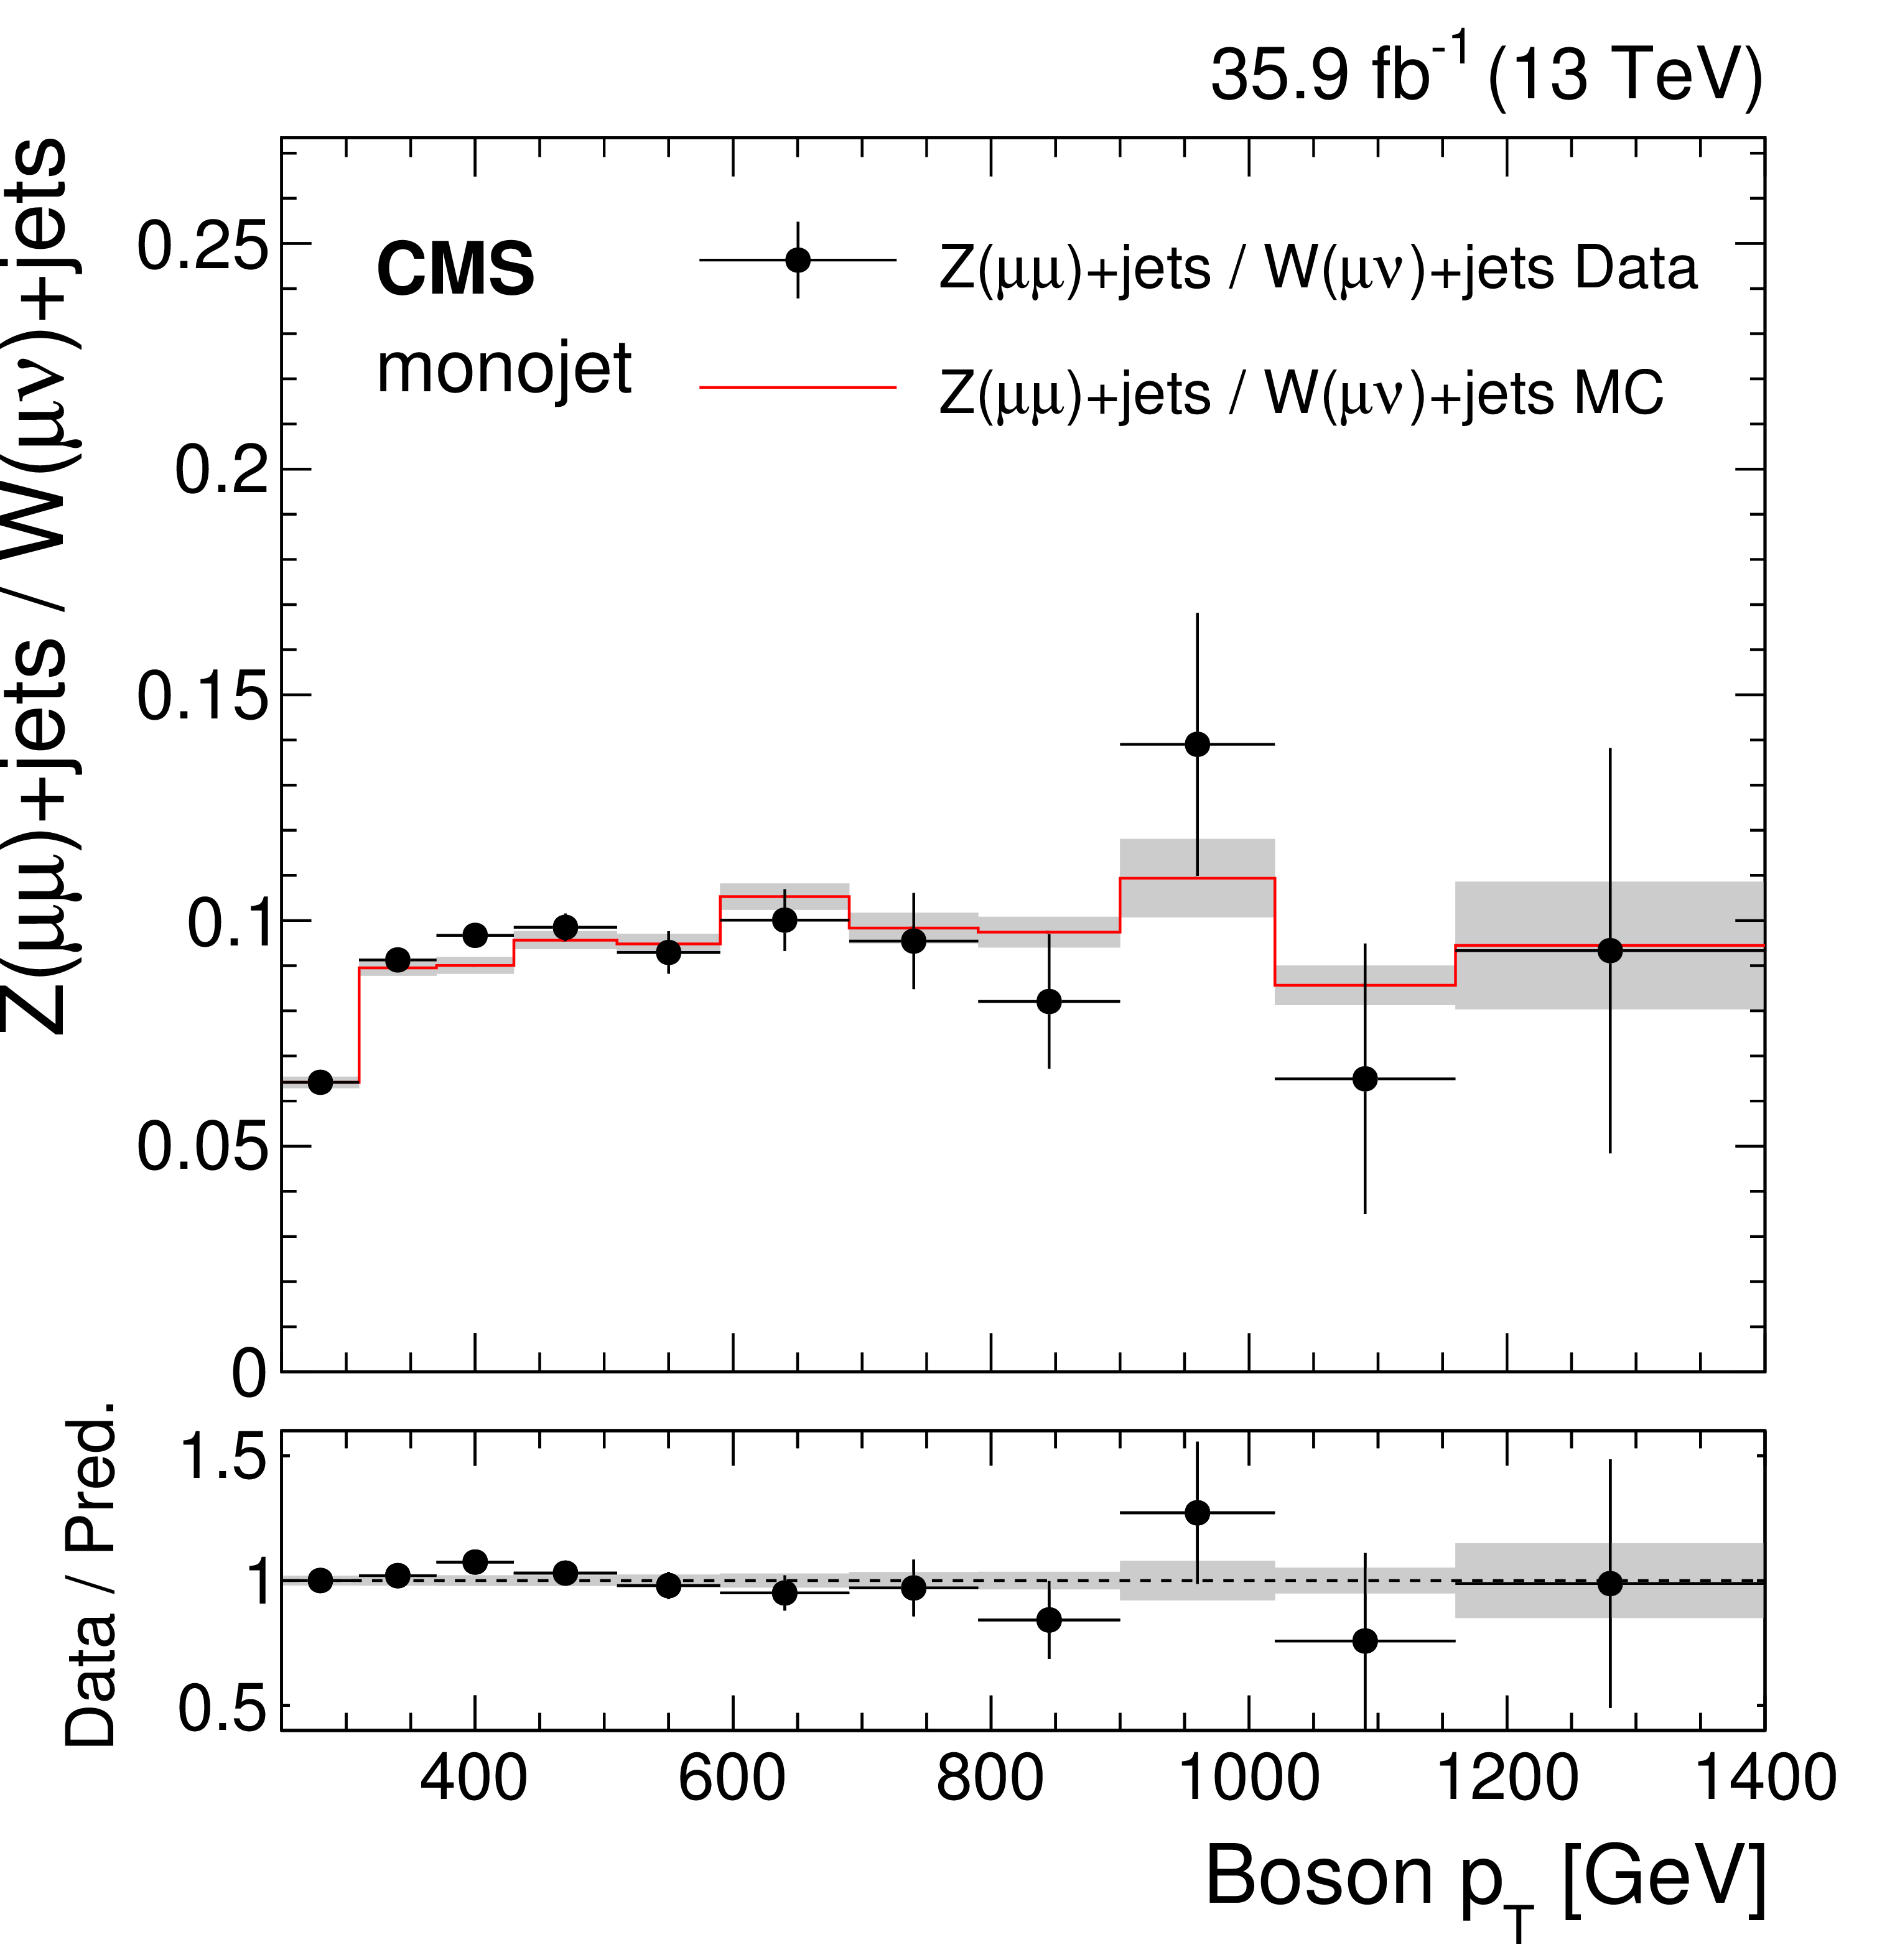
Figure 19-b:
Comparison between data and Monte Carlo simulation of the $\mathrm{Z} (\mu \mu)$/$\mathrm{W} (\mu \nu)$ ratio, as a function of boson $ {p_{\mathrm {T}}} $, in the monojet category. In the ratio panel, the ratio of data with the pre-fit background prediction is shown. The gray bands include both the pre-fit systematic uncertainties and the statistical uncertainty in the simulation. |
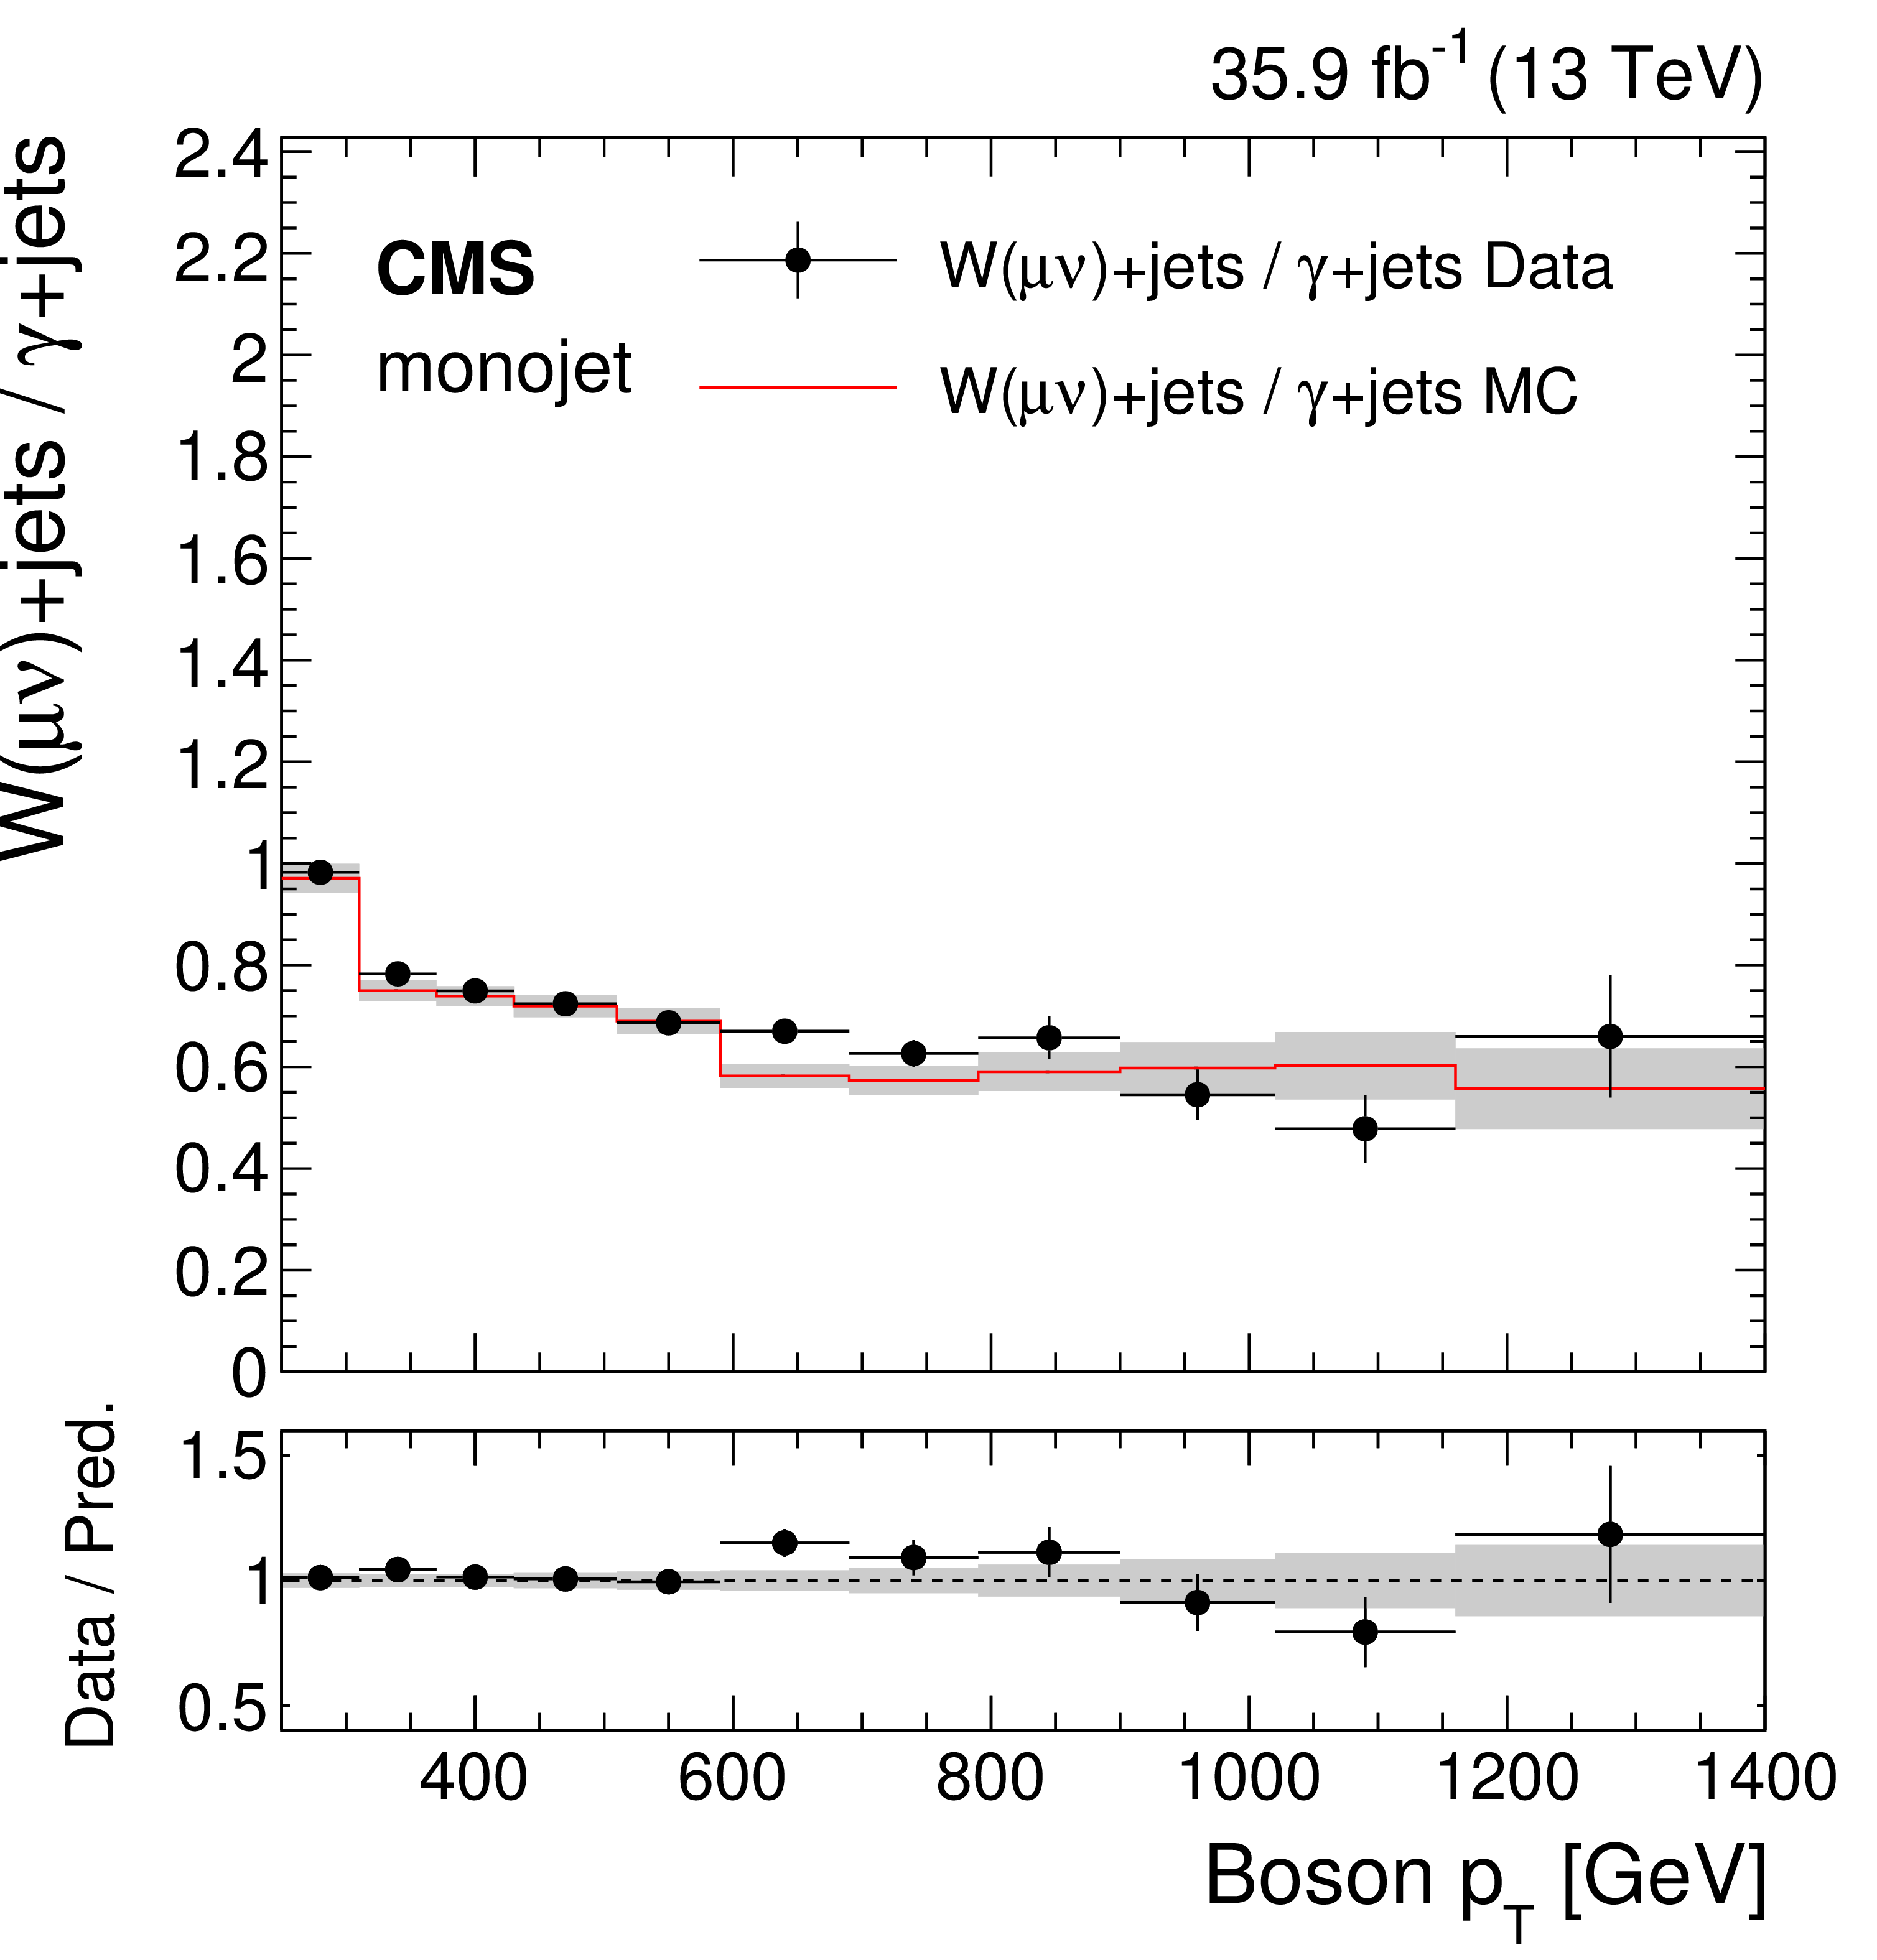
png pdf |
Figure 19-c:
Comparison between data and Monte Carlo simulation of the $\mathrm{W} (\mu \nu)$/$\gamma $+jets ratio, as a function of boson $ {p_{\mathrm {T}}} $, in the monojet category. In the ratio panel, the ratio of data with the pre-fit background prediction is shown. The gray bands include both the pre-fit systematic uncertainties and the statistical uncertainty in the simulation. |
png pdf |
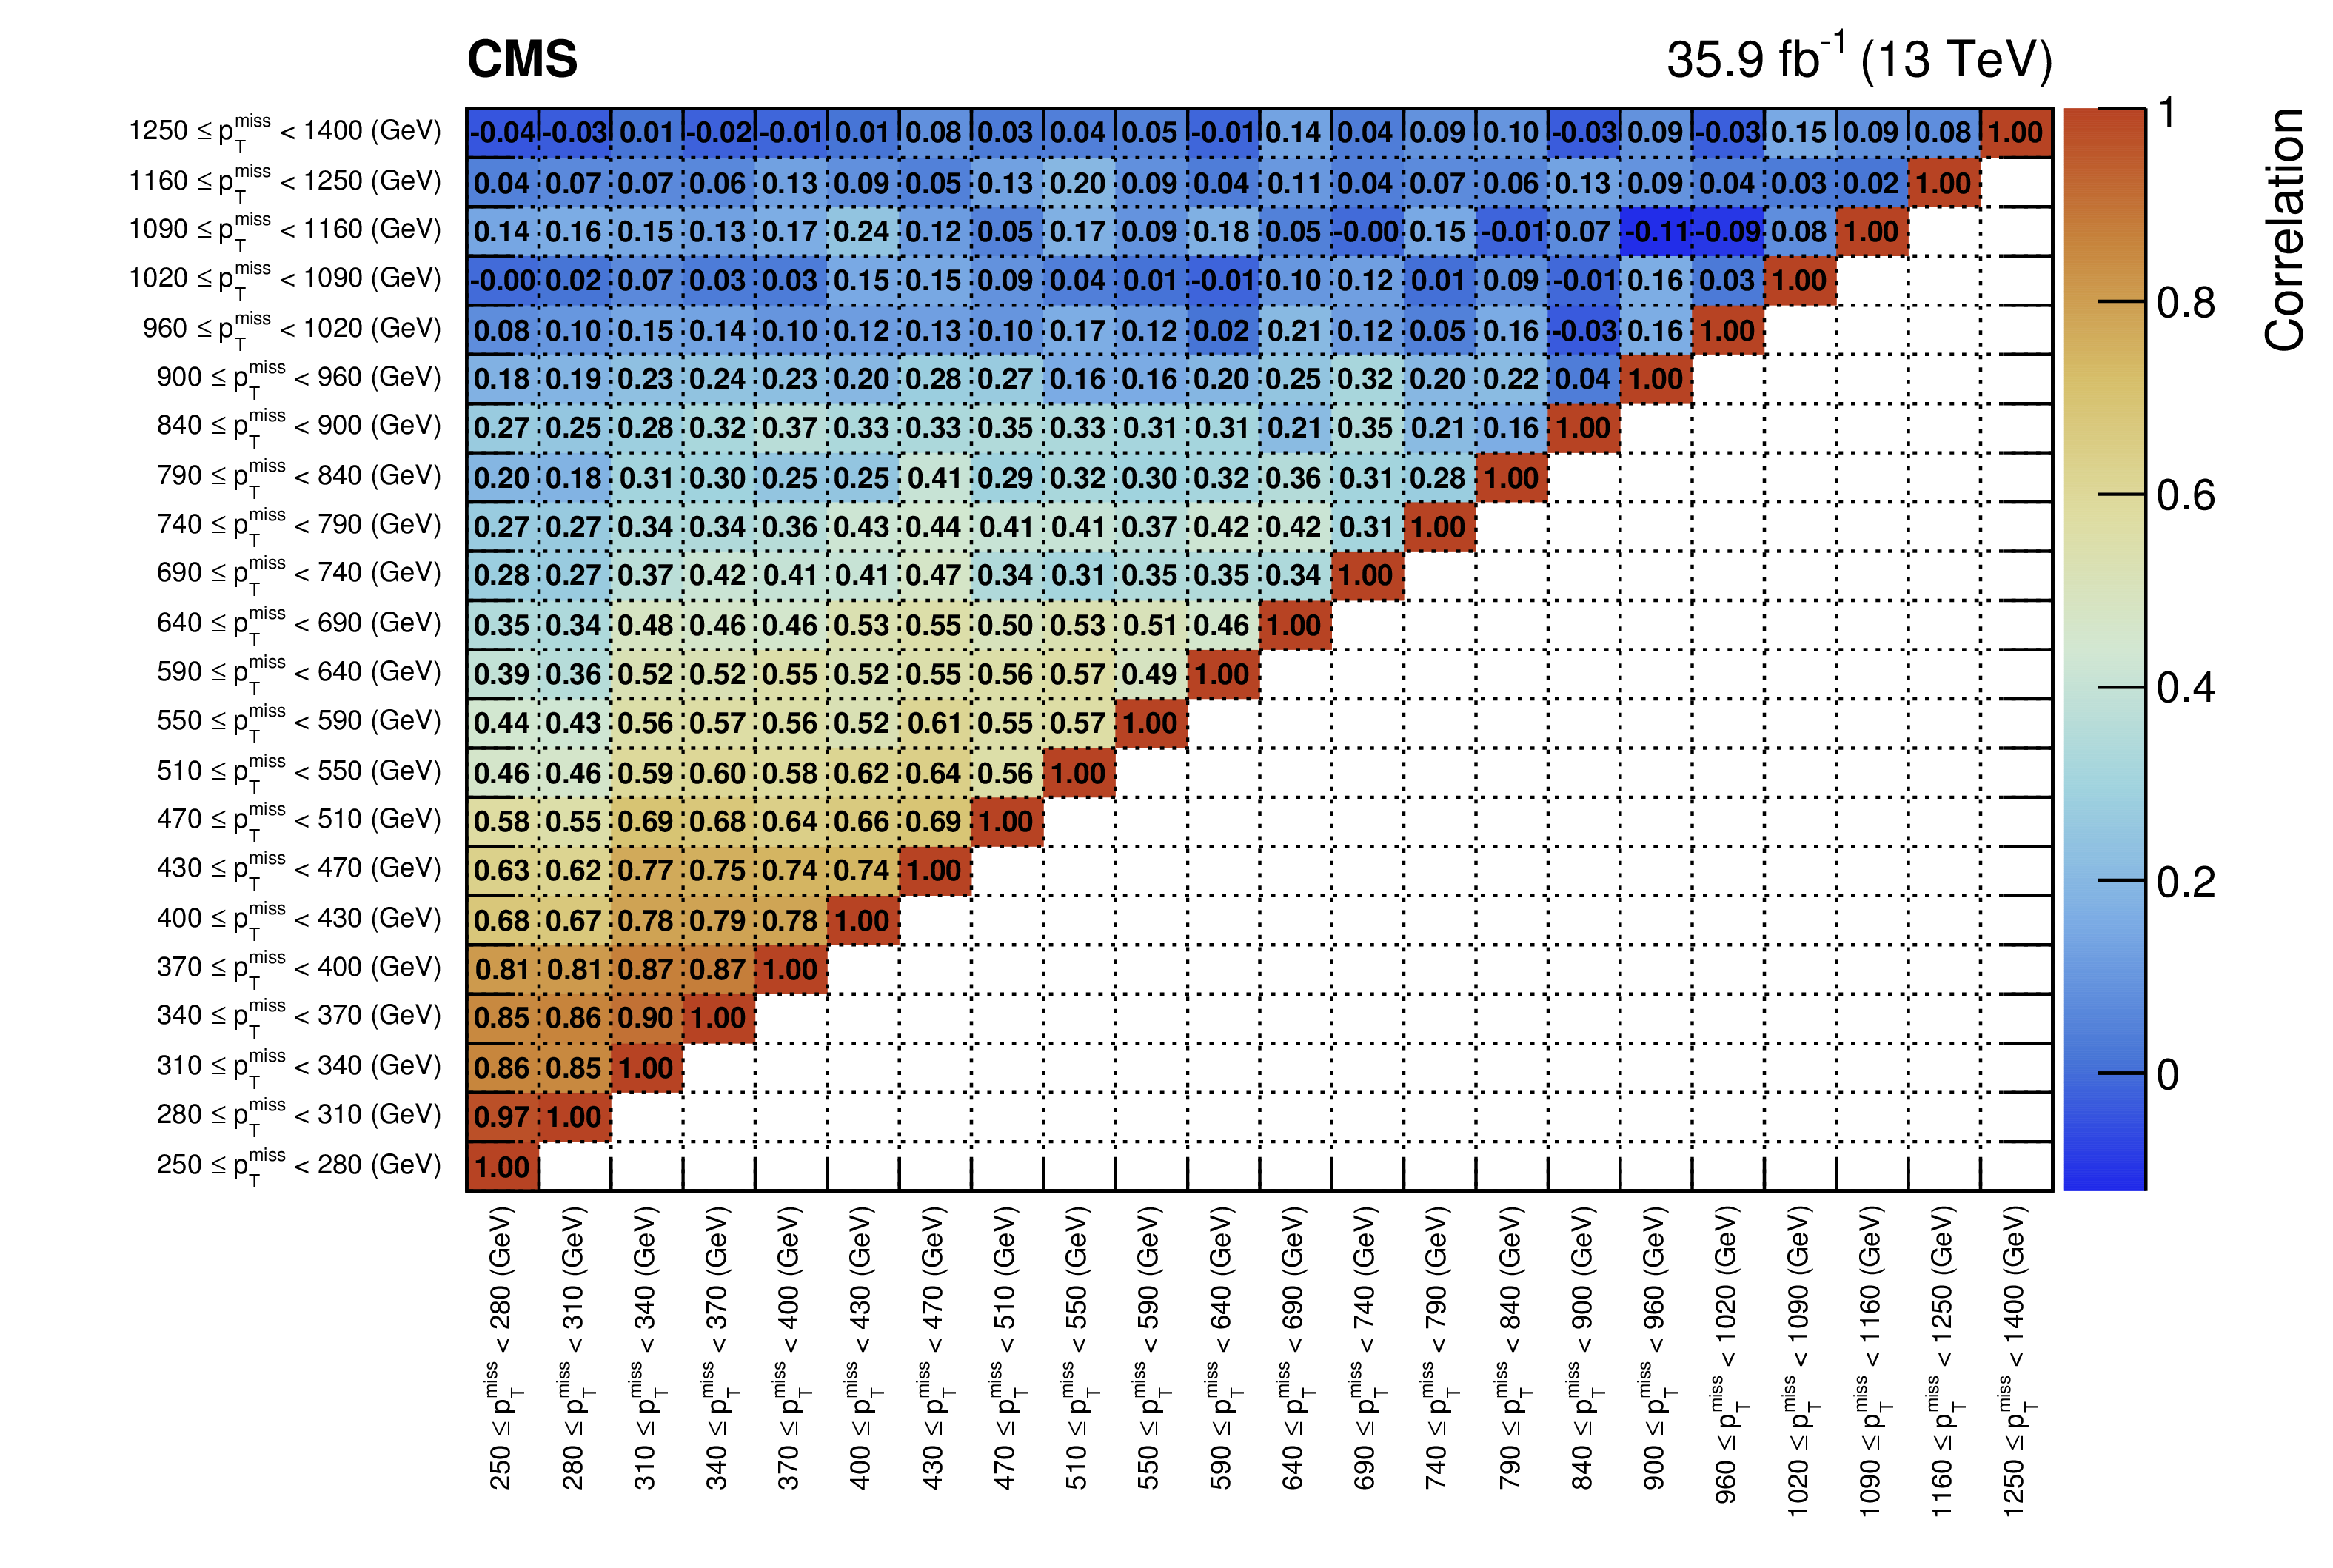
Figure 20:
Correlations between the predicted background yields in all the $ {E_{\mathrm {T}}^{\text {miss}}} $ bins of the monojet signal region. The boundaries of the $ {E_{\mathrm {T}}^{\text {miss}}} $ bins, expressed in GeV, are shown at the bottom and on the left. |

png pdf |
Figure 21:
Correlations between the predicted background yields in all the $ {E_{\mathrm {T}}^{\text {miss}}} $ bins of the mono-V signal region. The boundaries of the $ {E_{\mathrm {T}}^{\text {miss}}} $ bins, expressed in GeV, are shown at the bottom and on the left. |
png pdf |
Figure 22:
Exclusion limits at 95%CL on $\mu =\sigma /\sigma _{\textrm {th}}$ in the $m_{\textrm {med}}$-$m_{\textrm {DM}}$ plane assuming scalar mediators (left) allowing for vector boson couplings simulated at LO in QCD. The solid (dotted) red (black) line shows the contour for the observed (expected) exclusion. The solid contours around the observed limit and the dashed contours around the expected limit represent one standard deviation due to theoretical uncertainties in the signal cross section and the quadratic sum of the statistical and experimental systematic uncertainties, respectively. Expected and observed sensitivity of the previous CMS publication [14]are also presented. Results of the Planck satellite experiment [97] are shown as dark blue contours. In the shaded area DM is overabundant. Expected (dotted black line) and observed (solid black line) 95%CL upper limits on the signal strength $\mu $ as a function of the mediator mass for the spin-0 models (right). |
png |
Figure 22-a:
Exclusion limits at 95%CL on $\mu =\sigma /\sigma _{\textrm {th}}$ in the $m_{\textrm {med}}$-$m_{\textrm {DM}}$ plane assuming scalar mediators allowing for vector boson couplings simulated at LO in QCD. The solid (dotted) red (black) line shows the contour for the observed (expected) exclusion. The solid contours around the observed limit and the dashed contours around the expected limit represent one standard deviation due to theoretical uncertainties in the signal cross section and the quadratic sum of the statistical and experimental systematic uncertainties, respectively. Expected and observed sensitivity of the previous CMS publication [14]are also presented. Results of the Planck satellite experiment [97] are shown as dark blue contours. In the shaded area DM is overabundant. |
png pdf |
Figure 22-b:
Expected (dotted black line) and observed (solid black line) 95%CL upper limits on the signal strength $\mu $ as a function of the mediator mass for the spin-0 models. |

png pdf |
Figure 23:
Exclusion limits at 95%CL on $\mu =\sigma /\sigma _{\textrm {th}}$ in the $m_{\textrm {med}}$-$m_{\textrm {DM}}$ plane assuming vector (left) and axial-vector (right) mediators where the the mono-V signal is simulated at LO in QCD. The solid (dotted) red (black) line shows the contour for the observed (expected) exclusion. The solid contours around the observed limit and the dashed contours around the expected limit represent one standard deviation due to theoretical uncertainties in the signal cross section and the quadratic sum of the statistical and experimental systematic uncertainties, respectively. Planck satellite experiment [97] are shown as dark blue contours. In the shaded area DM is overabundant. |
png |
Figure 23-a:
Exclusion limits at 95%CL on $\mu =\sigma /\sigma _{\textrm {th}}$ in the $m_{\textrm {med}}$-$m_{\textrm {DM}}$ plane assuming vector mediators where the the mono-V signal is simulated at LO in QCD. The solid (dotted) red (black) line shows the contour for the observed (expected) exclusion. The solid contours around the observed limit and the dashed contours around the expected limit represent one standard deviation due to theoretical uncertainties in the signal cross section and the quadratic sum of the statistical and experimental systematic uncertainties, respectively. Planck satellite experiment [97] are shown as dark blue contours. In the shaded area DM is overabundant. |
png |
Figure 23-b:
Exclusion limits at 95%CL on $\mu =\sigma /\sigma _{\textrm {th}}$ in the $m_{\textrm {med}}$-$m_{\textrm {DM}}$ plane assuming axial-vector mediators where the the mono-V signal is simulated at LO in QCD. The solid (dotted) red (black) line shows the contour for the observed (expected) exclusion. The solid contours around the observed limit and the dashed contours around the expected limit represent one standard deviation due to theoretical uncertainties in the signal cross section and the quadratic sum of the statistical and experimental systematic uncertainties, respectively. Planck satellite experiment [97] are shown as dark blue contours. In the shaded area DM is overabundant. |
| Tables | |
png pdf |
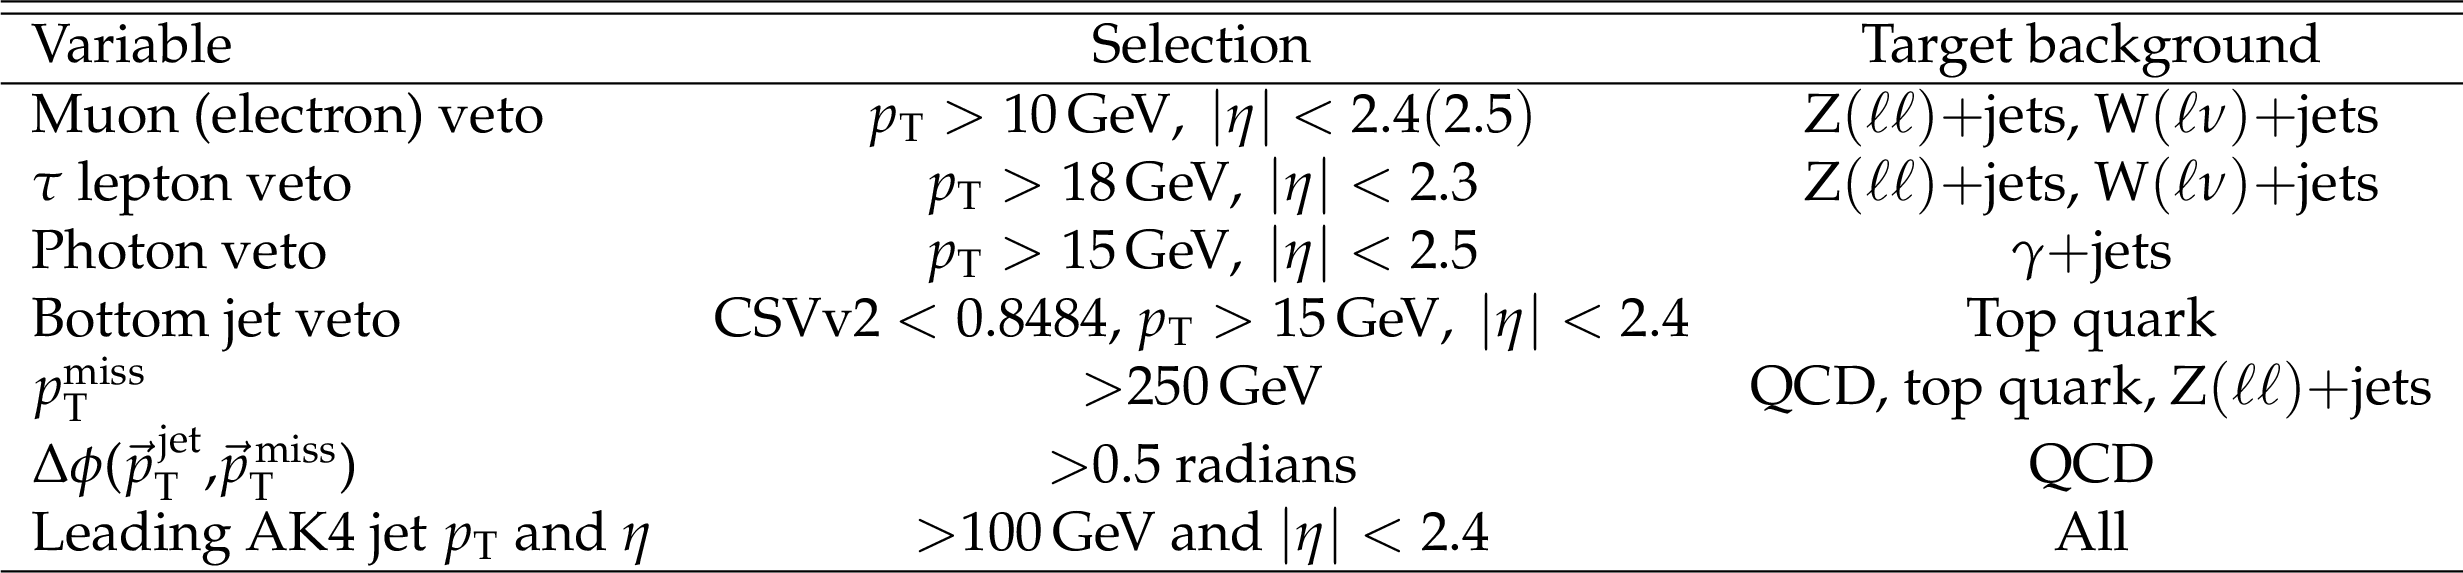
Table 1:
Summary of the common selection requirements for mono-V and monojet categories. |

png pdf |
Table 2:
Summary of the selection requirements for the mono-V category. Events that fail the mono-V selection are assigned to the monojet category. |

png pdf |
Table 3:
Theoretical uncertainties considered in the V-jets and $\gamma $+jets processes, and their ratios. The correlation between each process and between the $ {p_{\mathrm {T}}} $ bins are described. |

png pdf |
Table 4:
Expected event yields in each $ {{p_{\mathrm {T}}} ^\text {miss}} $ bin for various background processes in the monojet signal region. The background yields and the corresponding uncertainties are obtained after performing a combined fit to data in all the control samples, excluding data in the signal region. The other backgrounds include QCD multijet and $\gamma $+jets processes.The expected signal contribution for a 2 TeV axial-vector mediator decaying to 1 GeV DM particles and the observed event yields in the monojet signal region are also reported. |

png pdf |
Table 5:
Expected event yields in each $ {{p_{\mathrm {T}}} ^\text {miss}} $ bin for various background processes in the mono-V signal region. The background yields and the corresponding uncertainties are obtained after performing a combined fit to data in all the control samples, but excluding data in the signal region. The other backgrounds include QCD multijet and $\gamma $+jets processes. The expected signal contribution for a 2 TeV axial-vector mediator decaying to 1 GeV DM particles and the observed event yields in the mono-V signal region are also reported. |
png pdf |
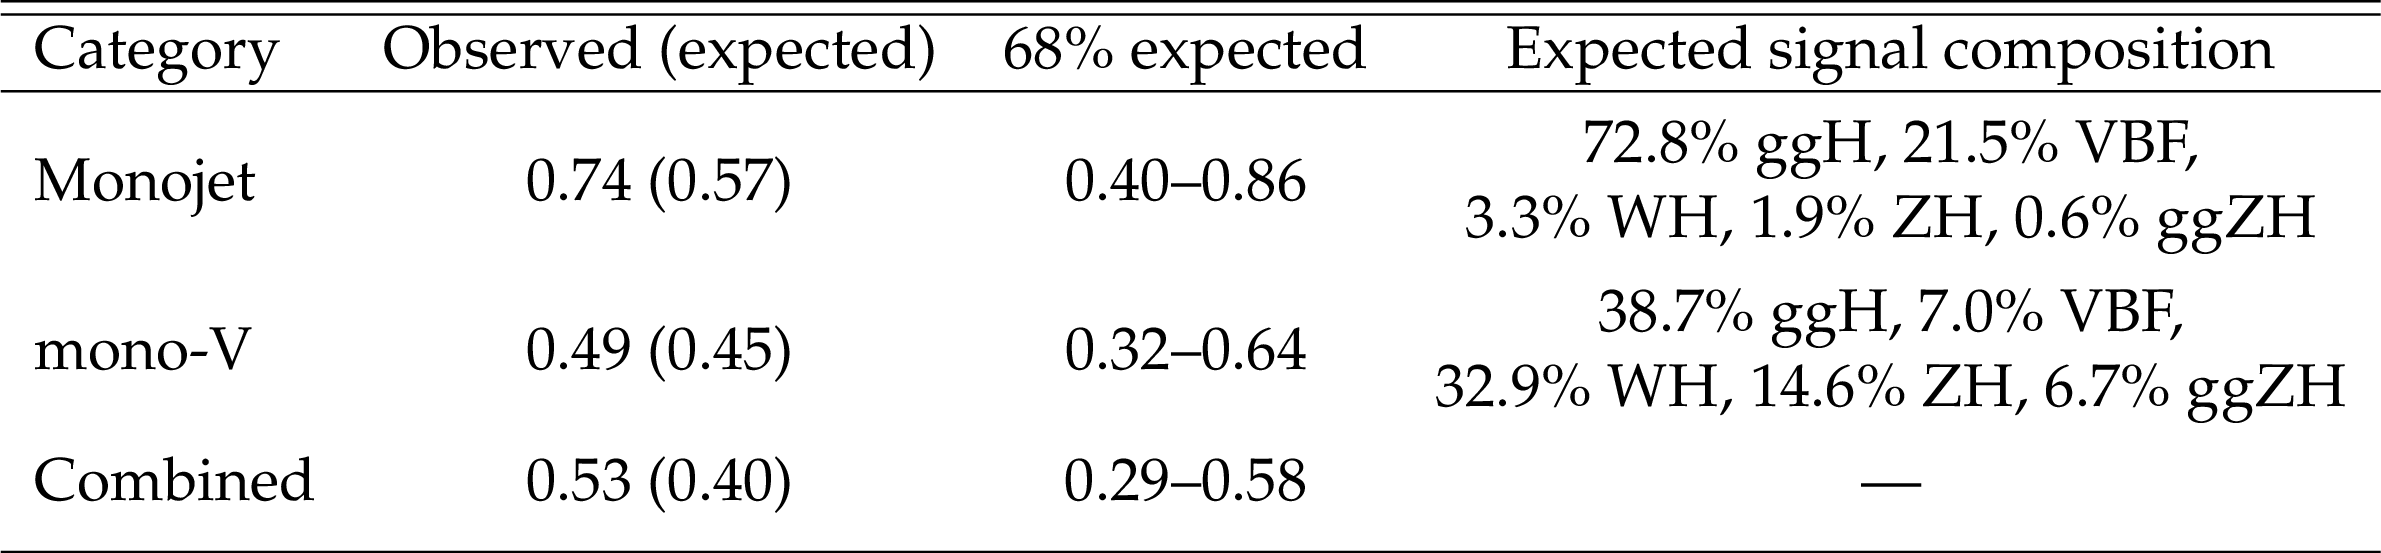
Table 6:
Expected and observed 95%CL upper limits on the invisible branching fraction of the Higgs boson. Limits are tabulated for the monojet and mono-V categories separately, and for their combination. The one standard deviation uncertainty range in the expected limits is listed. The expected composition of the production modes of a Higgs boson with a mass of 125 GeV is summarized, assuming SM production cross sections. |
png pdf |
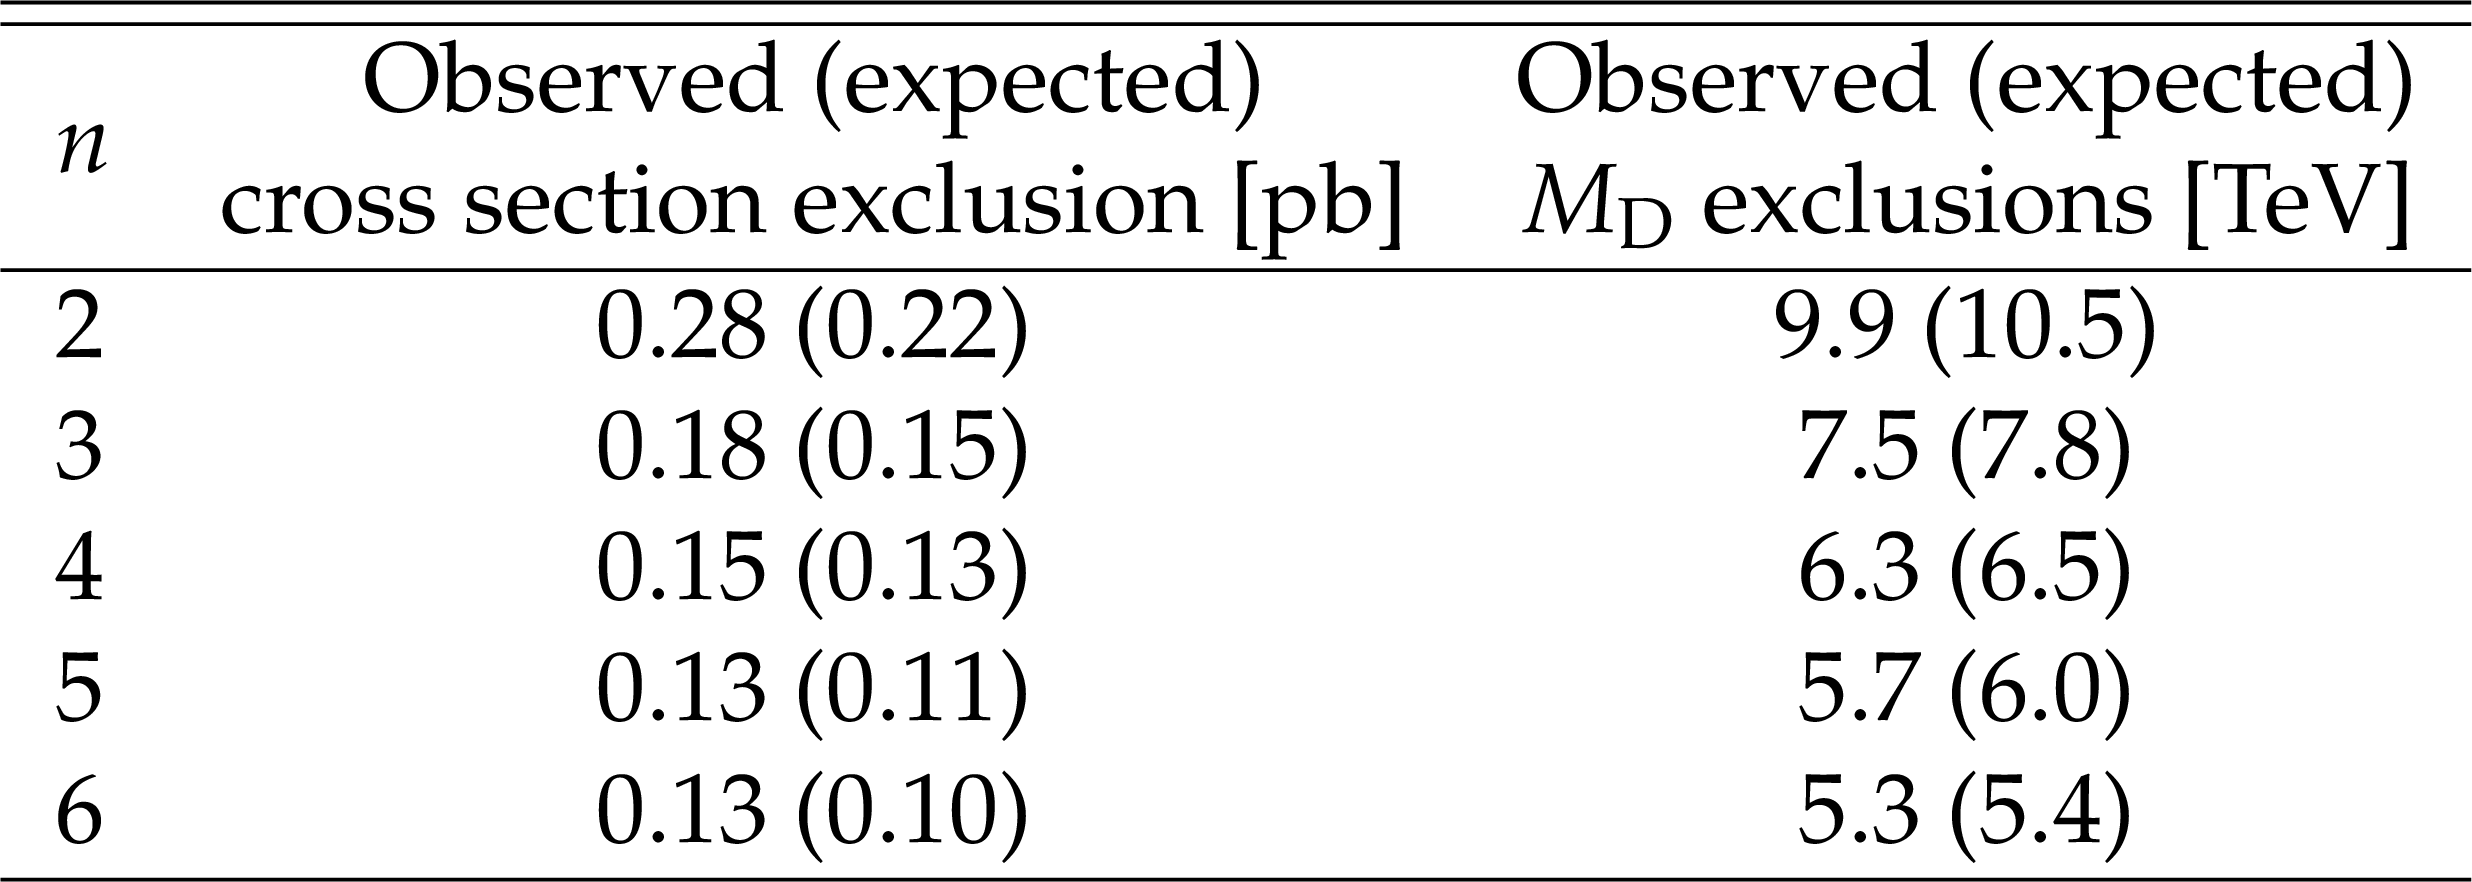
Table 7:
Upper limits on the signal production cross section in the ADD model and lower limits on $M_{\mathrm {D}}$, both as functions of the number of extra spatial dimensions ($n$). |
png pdf |
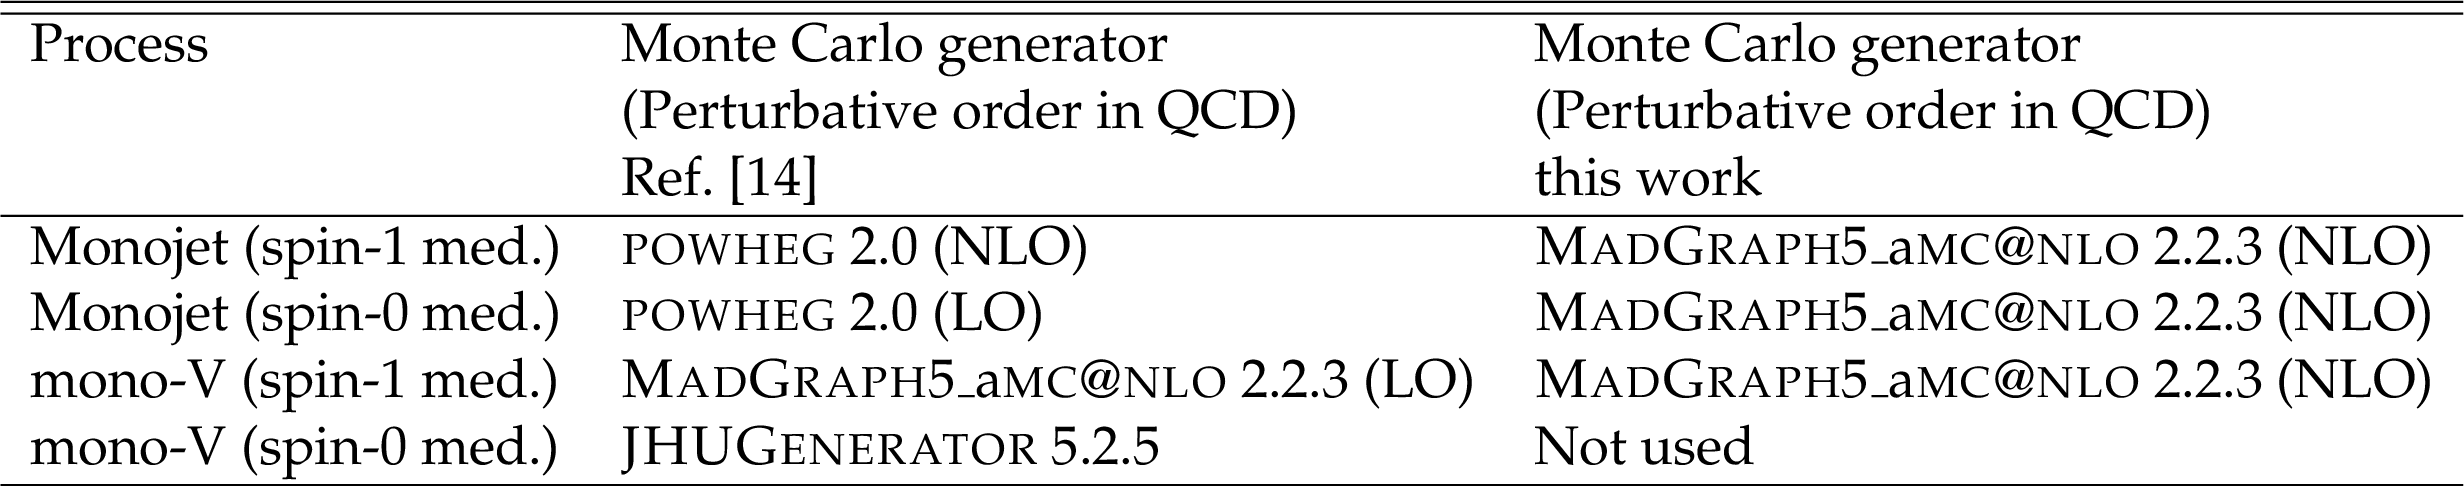
Table 8:
Monte Carlo generators and perturbative order in QCD used for simulating various signal processes studied in this work, and in Ref. [14] |
| Summary |
|
A search for dark matter (DM) particles, invisible decays of a standard-model-like (SM-like) Higgs boson, and extra spatial dimensions is presented using events with one or more energetic jets and large missing transverse momentum in proton-proton collisions recorded at $\sqrt{s} = $ 13 TeV, using a sample of data corresponding to an integrated luminosity of 35.9 fb$^{-1}$. Events are categorized based on whether jets are produced directly in hard scattering as initial-state radiation or originate from merged quarks from a decay of a highly Lorentz-boosted W or Z boson. No excess of events is observed compared to the SM background expectations in either of these two categories. Limits are computed on the DM production cross section using simplified models in which DM production is mediated by spin-1 and spin-0 particles. Vector and axial-vector (pseudoscalar) mediators with masses up to 1.8 (0.4) TeV are excluded at 95% confidence level. Similarly, limits are also presented for the parameters of the fermion portal DM model and an exclusion up to 1.4 TeV on the mediator mass is observed at 95% confidence level. The first limits on the DM production at a particle collider in the nonthermal DM model are obtained and presented in the coupling strength plane. Furthermore, and observed (expected) 95% confidence level upper limit of 0.53 (0.40) is set for the invisible branching fraction of an SM-like 125 GeV Higgs boson, assuming the SM production cross section. Lower limits are also computed on the fundamental Planck scale $M_{\mathrm{D}}$ in the context of the Arkani-Hamed, Dimopoulos, and Dvali model with large extra spatial dimensions, which varies from 9.9 TeV for $n=$ 2 to 5.3 TeV for $n=$ 6 at 95% confidence level, where $n$ is the number of extra spatial dimensions. These limits provide the most stringent direct constraints on the fundamental Planck scale to date. |
| References | ||||
| 1 | G. Bertone, D. Hooper, and J. Silk | Particle dark matter: evidence, candidates and constraints | PR 405 (2005) 279 | hep-ph/0404175 |
| 2 | J. L. Feng | Dark matter candidates from particle physics and methods of detection | Ann. Rev. Astron. Astrophys. 48 (2010) 495 | 1003.0904 |
| 3 | T. A. Porter, R. P. Johnson, and P. W. Graham | Dark matter searches with astroparticle data | Ann. Rev. Astron. Astrophys. 49 (2011) 155 | 1104.2836 |
| 4 | N. Arkani-Hamed, S. Dimopoulos, and G. Dvali | The hierarchy problem and new dimensions at a millimeter | PLB 429 (1998) 263 | hep-ph/9803315 |
| 5 | N. Arkani-Hamed, S. Dimopoulos, and G. R. Dvali | Phenomenology, astrophysics and cosmology of theories with submillimeter dimensions and TeV scale quantum gravity | PRD 59 (1999) 086004 | hep-ph/9807344 |
| 6 | I. Antoniadis, K. Benakli, and M. Quiros | Direct collider signatures of large extra dimensions | PLB 460 (1999) 176 | hep-ph/9905311 |
| 7 | G. Giudice, R. Rattazzi, and J. Wells | Quantum gravity and extra dimensions at high-energy colliders | NPB 544 (1999) 3 | hep-ph/9811291 |
| 8 | E. Mirabelli, M. Perelstein, and M. Peskin | Collider signatures of new large space dimensions | PRL 82 (1999) 2236 | hep-ph/9811337 |
| 9 | ATLAS Collaboration | Search for dark matter in events with a hadronically decaying $ \mathrm{W} $ or $ \mathrm{Z} $ boson and missing transverse momentum in pp collisions at $ \sqrt{s} = $ 8 TeV with the ATLAS detector | PRL 112 (2014) 041802 | 1309.4017 |
| 10 | CMS Collaboration | Search for dark matter, extra dimensions, and unparticles in monojet events in proto-proton collisions at $ \sqrt{s} = $ 8 TeV | EPJC 75 (2015) 235 | CMS-EXO-12-048 1408.3583 |
| 11 | ATLAS Collaboration | Search for new phenomena in final states with an energetic jet and large missing transverse momentum in pp collisions at $ \sqrt{s} = $ 8 TeV with the ATLAS detector | EPJC 75 (2015) 299 | 1502.01518 |
| 12 | CMS Collaboration | Search for dark matter in proton-proton collisions at 8 TeV with missing transverse momentum and vector boson tagged jets | JHEP 12 (2016) 083 | CMS-EXO-12-055 1607.05764 |
| 13 | ATLAS Collaboration | Search for new phenomena in final states with an energetic jet and large missing transverse momentum in pp collisions at $ \sqrt{s} = $ 13 TeV using the ATLAS detector | PRD 94 (2016) 032005 | 1604.07773 |
| 14 | CMS Collaboration | Search for dark matter produced with an energetic jet or a hadronically decaying W or Z boson at $ \sqrt{s} = $ 13 TeV | JHEP 07 (2017) 014 | CMS-EXO-16-037 1703.01651 |
| 15 | ATLAS Collaboration | Search for dark matter and other new phenomena in events with an energetic jet and large missing transverse momentum using the ATLAS detector | 1711.03301 | |
| 16 | J. M. Lindert et al. | Precise predictions for V+jets dark matter backgrounds | 1705.04664 | |
| 17 | G. Busoni, A. De Simone, E. Morgante, and A. Riotto | On the validity of the effective field theory for dark matter searches at the LHC | PLB 728 (2014) 412 | 1307.2253 |
| 18 | O. Buchmueller, M. J. Dolan, and C. McCabe | Beyond effective field theory for dark matter searches at the LHC | JHEP 01 (2014) 025 | 1308.6799 |
| 19 | O. Buchmueller, M. J. Dolan, S. A. Malik, and C. McCabe | Characterising dark matter searches at colliders and direct detection experiments: vector mediators | JHEP 01 (2015) 037 | 1407.8257 |
| 20 | Y. Bai and J. Berger | Fermion portal dark matter | JHEP 11 (2013) 171 | 1308.0612 |
| 21 | B. Dutta, Y. Gao, and T. Kamon | Probing light nonthermal dark matter at the LHC | PRD 89 (2014) 096009 | 1401.1825 |
| 22 | R. Allahverdi and B. Dutta | Natural GeV dark matter and the baryon-dark matter coincidence puzzle | PRD 88 (2013) 023525 | 1304.0711 |
| 23 | J. Alwall, P. Schuster, and N. Toro | Simplified models for a first characterization of new physics at the LHC | PRD 79 (2009) 075020 | 0810.3921 |
| 24 | J. Goodman and W. Shepherd | LHC bounds on UV-complete models of dark matter | 1111.2359 | |
| 25 | LHC New Physics Working Group Collaboration | Simplified models for LHC new physics searches | JPG 39 (2012) 105005 | 1105.2838 |
| 26 | H. An, X. Ji, and L.-T. Wang | Light dark matter and $ Z' $ dark force at colliders | JHEP 07 (2012) 182 | 1202.2894 |
| 27 | H. An, R. Huo, and L.-T. Wang | Searching for low mass dark portal at the LHC | Phys. Dark Univ. 2 (2013) 50 | 1212.2221 |
| 28 | A. DiFranzo, K. I. Nagao, A. Rajaraman, and T. M. P. Tait | Simplified models for dark matter interacting with quarks | JHEP 11 (2013) 014 | 1308.2679 |
| 29 | Y. Bai and J. Berger | Lepton portal dark matter | JHEP 08 (2014) 153 | 1402.6696 |
| 30 | H. An, L.-T. Wang, and H. Zhang | Dark matter with $ t $-channel mediator: a simple step beyond contact interaction | PRD 89 (2014) 115014 | 1308.0592 |
| 31 | J. Abdallah et al. | Simplified models for dark matter and missing energy searches at the LHC | 1409.2893 | |
| 32 | S. A. Malik et al. | Interplay and characterization of dark matter searches at colliders and in direct detection experiments | Phys. Dark Univ. 9-10 (2015) 51 | 1409.4075 |
| 33 | P. Harris, V. V. Khoze, M. Spannowsky, and C. Williams | Constraining dark sectors at colliders: Beyond the effective theory approach | PRD 91 (2015) 055009 | 1411.0535 |
| 34 | M. R. Buckley, D. Feld, and D. Goncalves | Scalar simplified models for dark matter | PRD 91 (2015) 015017 | 1410.6497 |
| 35 | U. Haisch and E. Re | Simplified dark matter top-quark interactions at the LHC | JHEP 06 (2015) 078 | 1503.00691 |
| 36 | P. Harris, V. V. Khoze, M. Spannowsky, and C. Williams | Closing up on dark sectors at colliders: from 14 to 100 TeV | PRD 93 (2016) 054030 | 1509.02904 |
| 37 | L. M. Carpenter et al. | Collider searches for dark matter in events with a Z boson and missing energy | PRD 87 (2013) 074005 | 1212.3352 |
| 38 | N. F. Bell et al. | Searching for dark matter at the LHC with a mono-Z | PRD 86 (2012) 096011 | 1209.0231 |
| 39 | ATLAS Collaboration | Search for invisible decays of a Higgs boson produced in association with a $ \mathrm{Z} $ boson in ATLAS | PRL 112 (2014) 201802 | 1402.3244 |
| 40 | CMS Collaboration | Searches for invisible decays of the Higgs boson in pp collisions at $ \sqrt{s} = $ 7, 8, and 13 TeV | JHEP 02 (2017) 135 | CMS-HIG-16-016 1610.09218 |
| 41 | ATLAS Collaboration | Observation of a new particle in the search for the Standard Model Higgs boson with the ATLAS detector at the LHC | PLB 716 (2012) 1 | 1207.7214 |
| 42 | CMS Collaboration | Observation of a new boson at a mass of 125 GeV with the CMS experiment at the LHC | PLB 716 (2012) 30 | CMS-HIG-12-028 1207.7235 |
| 43 | CMS Collaboration | Observation of a new boson with mass near 125 GeV in pp collisions at $ \sqrt{s} = $ 7 and 8 TeV | JHEP 06 (2013) 081 | CMS-HIG-12-036 1303.4571 |
| 44 | CMS Collaboration | The CMS experiment at the CERN LHC | JINST 3 (2008) S08004 | CMS-00-001 |
| 45 | CMS Collaboration | Particle-flow reconstruction and global event description with the CMS detector | JINST 12 (2017) P10003 | CMS-PRF-14-001 1706.04965 |
| 46 | M. Cacciari, G. P. Salam, and G. Soyez | The anti-$ k_{t} $ jet clustering algorithm | JHEP 04 (2008) 063 | 0802.1189 |
| 47 | M. Cacciari, G. P. Salam, and G. Soyez | FastJet user manual | EPJC 72 (2012) 1896 | 1111.6097 |
| 48 | CMS Collaboration | Jet energy scale and resolution in the CMS experiment in pp collisions at 8 TeV | JINST 12 (2017) P02014 | CMS-JME-13-004 1607.03663 |
| 49 | CMS Collaboration | Performance of missing energy reconstruction in 13 TeV pp collision data using the CMS detector | CMS-PAS-JME-16-004 | CMS-PAS-JME-16-004 |
| 50 | CMS Collaboration | Performance of the CMS missing transverse momentum reconstruction in pp data at $ \sqrt{s} = $ 8 TeV | JINST 10 (2015) P02006 | CMS-JME-13-003 1411.0511 |
| 51 | CMS Collaboration | Performance of CMS muon reconstruction in pp collision events at $ \sqrt{s} = $ 7 TeV | JINST 7 (2012) P10002 | CMS-MUO-10-004 1206.4071 |
| 52 | CMS Collaboration | Performance of electron reconstruction and selection with the CMS detector in proton-proton collisions at $ \sqrt{s} = $ 8 TeV | JINST 10 (2015) P06005 | CMS-EGM-13-001 1502.02701 |
| 53 | CMS Collaboration | Description and performance of track and primary-vertex reconstruction with the CMS tracker | JINST 9 (2014) P10009 | CMS-TRK-11-001 1405.6569 |
| 54 | CMS Collaboration | Performance of photon reconstruction and identification with the CMS detector in proton-proton collisions at $ \sqrt{s} = $ 8 TeV | JINST 10 (2015) P08010 | CMS-EGM-14-001 1502.02702 |
| 55 | CMS Collaboration | Reconstruction and identification of $ \tau $ lepton decays to hadrons and $ \nu_\tau $ at CMS | JINST 11 (2016) P01019 | CMS-TAU-14-001 1510.07488 |
| 56 | J. Alwall et al. | The automated computation of tree-level and next-to-leading order differential cross sections, and their matching to parton shower simulations | JHEP 07 (2014) 079 | 1405.0301 |
| 57 | C. Oleari | The POWHEG-BOX | NPPS 205-206 (2010) 36 | 1007.3893 |
| 58 | S. Alioli, P. Nason, C. Oleari, and E. Re | NLO single-top production matched with shower in POWHEG: $ s $- and $ t $-channel contributions | JHEP 09 (2009) 111 | 0907.4076 |
| 59 | T. Sjostrand et al. | An Introduction to PYTHIA 8.2 | CPC 191 (2015) 159 | 1410.3012 |
| 60 | M. Backovic et al. | Higher-order QCD predictions for dark matter production at the LHC in simplified models with $ s $-channel mediators | EPJC 75 (2015) 482 | 1508.05327 |
| 61 | O. Mattelaer and E. Vryonidou | Dark matter production through loop-induced processes at the LHC: the $ s $-channel mediator case | EPJC 75 (2015) 436 | 1508.00564 |
| 62 | S. Alioli, P. Nason, C. Oleari, and E. Re | NLO Higgs boson production via gluon fusion matched with shower in POWHEG | JHEP 04 (2009) 002 | 0812.0578 |
| 63 | P. Nason and C. Oleari | NLO Higgs boson production via vector-boson fusion matched with shower in POWHEG | JHEP 02 (2010) 037 | 0911.5299 |
| 64 | I. Anderson et al. | Constraining anomalous HVV interactions at proton and lepton colliders | PRD 89 (2014) 035007 | 1309.4819 |
| 65 | CMS Collaboration | Event generator tunes obtained from underlying event and multiparton scattering measurements | EPJC 76 (2016) 155 | CMS-GEN-14-001 1512.00815 |
| 66 | M. L. Mangano, M. Moretti, F. Piccinini, and M. Treccani | Matching matrix elements and shower evolution for top-quark production in hadronic collisions | JHEP 01 (2007) 013 | hep-ph/0611129 |
| 67 | R. Frederix and S. Frixione | Merging meets matching in MC@NLO | JHEP 12 (2012) 061 | 1209.6215 |
| 68 | NNPDF Collaboration | Parton distributions for the LHC Run II | JHEP 04 (2015) 040 | 1410.8849 |
| 69 | GEANT4 Collaboration | GEANT4---a simulation toolkit | NIMA 506 (2003) 250 | |
| 70 | CMS Collaboration | CMS luminosity measurements for the 2016 data taking period | CMS-PAS-LUM-17-001 | CMS-PAS-LUM-17-001 |
| 71 | CMS Collaboration | Identification of b-quark jets with the CMS experiment | JINST 8 (2013) P04013 | CMS-BTV-12-001 1211.4462 |
| 72 | CMS Collaboration | Identification of b quark jets at the CMS experiment in the LHC Run 2 | CMS-PAS-BTV-15-001 | CMS-PAS-BTV-15-001 |
| 73 | CMS Collaboration | Jet algorithms performance in 13 TeV data | CMS-PAS-JME-16-003 | CMS-PAS-JME-16-003 |
| 74 | S. D. Ellis, C. K. Vermilion, and J. R. Walsh | Recombination algorithms and jet substructure: Pruning as a tool for heavy particle searches | PRD 81 (2010) 094023 | 0912.0033 |
| 75 | S. D. Ellis, C. K. Vermilion, and J. R. Walsh | Techniques for improved heavy particle searches with jet substructure | PRD 80 (2009) 051501 | 0903.5081 |
| 76 | Yu. L. Dokshitzer, G. D. Leder, S. Moretti, and B. R. Webber | Better jet clustering algorithms | JHEP 08 (1997) 001 | hep-ph/9707323 |
| 77 | J. Thaler and K. Van Tilburg | Identifying boosted objects with N-subjettiness | JHEP 03 (2011) 015 | 1011.2268 |
| 78 | A. Denner, S. Dittmaier, T. Kasprzik, and A. Muck | Electroweak corrections to W+jet hadroproduction including leptonic W-boson decays | JHEP 08 (2009) 075 | 0906.1656 |
| 79 | A. Denner, S. Dittmaier, T. Kasprzik, and A. Muck | Electroweak corrections to dilepton+jet production at hadron colliders | JHEP 06 (2011) 069 | 1103.0914 |
| 80 | A. Denner, S. Dittmaier, T. Kasprzik, and A. Maeck | Electroweak corrections to monojet production at the LHC | EPJC 73 (2013) 2297 | 1211.5078 |
| 81 | J. H. Kuhn, A. Kulesza, S. Pozzorini, and M. Schulze | Electroweak corrections to hadronic photon production at large transverse momenta | JHEP 03 (2006) 059 | hep-ph/0508253 |
| 82 | S. Kallweit et al. | NLO electroweak automation and precise predictions for W+multijet production at the LHC | JHEP 04 (2015) 012 | 1412.5157 |
| 83 | S. Kallweit et al. | NLO QCD+EW predictions for V+jets including off-shell vector-boson decays and multijet merging | JHEP 04 (2016) 021 | 1511.08692 |
| 84 | CMS Collaboration | Search for new physics with jets and missing transverse momentum in pp collisions at $ \sqrt{s} = $ 7 TeV | JHEP 08 (2011) 155 | CMS-SUS-10-005 1106.4503 |
| 85 | J. H. Kuhn, A. Kulesza, S. Pozzorini, and M. Schulze | Logarithmic electroweak corrections to hadronic Z+1 jet production at large transverse momentum | PLB 609 (2005) 277 | hep-ph/0408308 |
| 86 | J. H. Kuhn, A. Kulesza, S. Pozzorini, and M. Schulze | One-loop weak corrections to hadronic production of Z bosons at large transverse momenta | NPB 727 (2005) 368 | hep-ph/0507178 |
| 87 | J. H. Kuhn, A. Kulesza, S. Pozzorini, and M. Schulze | Electroweak corrections to hadronic production of W bosons at large transverse momenta | NPB 797 (2008) 27 | 0708.0476 |
| 88 | CMS Collaboration | Measurement of differential cross sections for top quark pair production using the lepton+jets final state in proton-proton collisions at 13 TeV | PRD 95 (2017) | CMS-TOP-16-008 1610.04191 |
| 89 | CMS Collaboration | Measurement of the top quark pair production cross section in proton-proton collisions at $ \sqrt{s} = $ 13 TeV | PRL 116 (2016) 052002 | CMS-TOP-15-003 1510.05302 |
| 90 | CMS Collaboration | Measurement of the ZZ production cross section and Z $ \to \ell^+\ell^-\ell'^+\ell'^- $ branching fraction in pp collisions at $ \sqrt{s} = $ 13 TeV | PLB 763 (2016) 280 | CMS-SMP-16-001 1607.08834 |
| 91 | CMS Collaboration | Measurement of the WZ production cross section in pp collisions at $ \sqrt{s} = $ 13 TeV | PLB 766 (2017) 268 | CMS-SMP-16-002 1607.06943 |
| 92 | CMS Collaboration | Simplified likelihood for the re-interpretation of public CMS results | CDS | |
| 93 | D. Abercrombie et al. | Dark matter benchmark models for early LHC Run-2 searches: Report of the ATLAS/CMS dark matter forum | 1507.00966 | |
| 94 | T. Junk | Confidence level computation for combining searches with small statistics | NIMA 434 (1999) 435 | hep-ex/9902006 |
| 95 | A. L. Read | Presentation of search results: the CLs technique | JPG 28 (2002) 2693 | |
| 96 | G. Cowan, K. Cranmer, E. Gross, and O. Vitells | Asymptotic formulae for likelihood-based tests of new physics | EPJC 71 (2011) 1554 | 1007.1727 |
| 97 | Planck Collaboration | Planck 2015 results. XIII. Cosmological parameters | Astron. Astrophys. 594 (2016) A13 | 1502.01589 |
| 98 | M. Backovic, K. Kong, and M. McCaskey | MadDM v.1.0: Computation of dark matter relic abundance using MadGraph5 | Phys. Dark Univ. 5-6 (2014) 18 | 1308.4955 |
| 99 | Planck Collaboration | Planck 2013 results. XVI. Cosmological parameters | Astron. Astrophys. 571 (2014) A16 | 1303.5076 |
| 100 | G. Busoni et al. | Recommendations on presenting LHC searches for missing transverse energy signals using simplified $ s $-channel models of dark matter | 1603.04156 | |
| 101 | Fermi-LAT Collaboration | Searching for dark matter annihilation from Milky Way dwarf spheroidal galaxies with six years of Fermi Large Area Telescope data | PRL 115 (2015) 231301 | 1503.02641 |
| 102 | SuperCDMS Collaboration | New results from the search for low-mass weakly interacting massive particles with the CDMS low ionization threshold experiment | PRL 116 (2016) 071301 | 1509.02448 |
| 103 | LUX Collaboration | Results from a search for dark matter in the complete LUX exposure | PRL 118 (2017) 021303 | 1608.07648 |
| 104 | XENON Collaboration | First dark matter search results from the XENON1T experiment | PRL 119 (2017) 181301 | 1705.06655 |
| 105 | CRESST Collaboration | Results on light dark matter particles with a low-threshold CRESST-II detector | EPJC 76 (2016) 25 | 1509.01515 |
| 106 | E. Behnke et al. | Final results of the PICASSO dark matter search experiment | Astropart. Phys. 90 (2017) 85 | 1611.01499 |
| 107 | PICO Collaboration | Dark matter search results from the PICO-60 CF$ _3 $I bubble chamber | PRD 93 (2016) 052014 | 1510.07754 |
| 108 | IceCube Collaboration | Improved limits on dark matter annihilation in the Sun with the 79-string IceCube detector and implications for supersymmetry | JCAP 04 (2016) 022 | 1601.00653 |
| 109 | Super-Kamiokande Collaboration | Search for neutrinos from annihilation of captured low-mass dark matter particles in the Sun by Super-Kamiokande | PRL 114 (2015) 141301 | 1503.04858 |
| 110 | U. Haisch, F. Kahlhoefer, and J. Unwin | The impact of heavy-quark loops on LHC dark matter searches | JHEP 07 (2013) 125 | 1208.4605 |
| 111 | A. Berlin, D. Hooper, and S. D. McDermott | Simplified dark matter models for the galactic center gamma-ray excess | PRD 89 (2014) 115022 | 1404.0022 |
| 112 | LHC Higgs Cross Section Working Group Collaboration | Handbook of LHC Higgs cross sections: 3. Higgs properties | 1307.1347 | |
|
|
Compact Muon Solenoid LHC, CERN |
|

|

|

|

|

|