

Compact Muon Solenoid
LHC, CERN
| CMS-EXO-17-024 ; CERN-EP-2018-204 | ||
| Search for low-mass resonances decaying into bottom quark-antiquark pairs in proton-proton collisions at $\sqrt{s} = $ 13 TeV | ||
| CMS Collaboration | ||
| 28 October 2018 | ||
| Phys. Rev. D 99 (2019) 012005 | ||
| Abstract: A search for narrow, low-mass, scalar and pseudoscalar resonances decaying to bottom quark-antiquark pairs is presented. The search is based on events recorded in $\sqrt{s} = $ 13 TeV proton-proton collisions with the CMS detector at the LHC, collected in 2016, and corresponding to an integrated luminosity of 35.9 fb$^{-1}$. The search selects events in which the resonance would be produced with high transverse momentum because of the presence of initial- or final-state radiation. In such events, the decay products of the resonance would be reconstructed as a single large-radius jet with high mass and two-prong substructure. A potential signal would be identified as a narrow excess in the jet invariant mass spectrum. No evidence for such a resonance is observed within the mass range from 50 to 350 GeV, and upper limits at 95% confidence level are set on the product of the cross section and branching fraction to a bottom quark-antiquark pair. These constitute the first constraints from the LHC on exotic bottom quark-antiquark resonances with masses below 325 GeV. | ||
| Links: e-print arXiv:1810.11822 [hep-ex] (PDF) ; CDS record ; inSPIRE record ; CADI line (restricted) ; | ||
| Figures | |
png pdf |
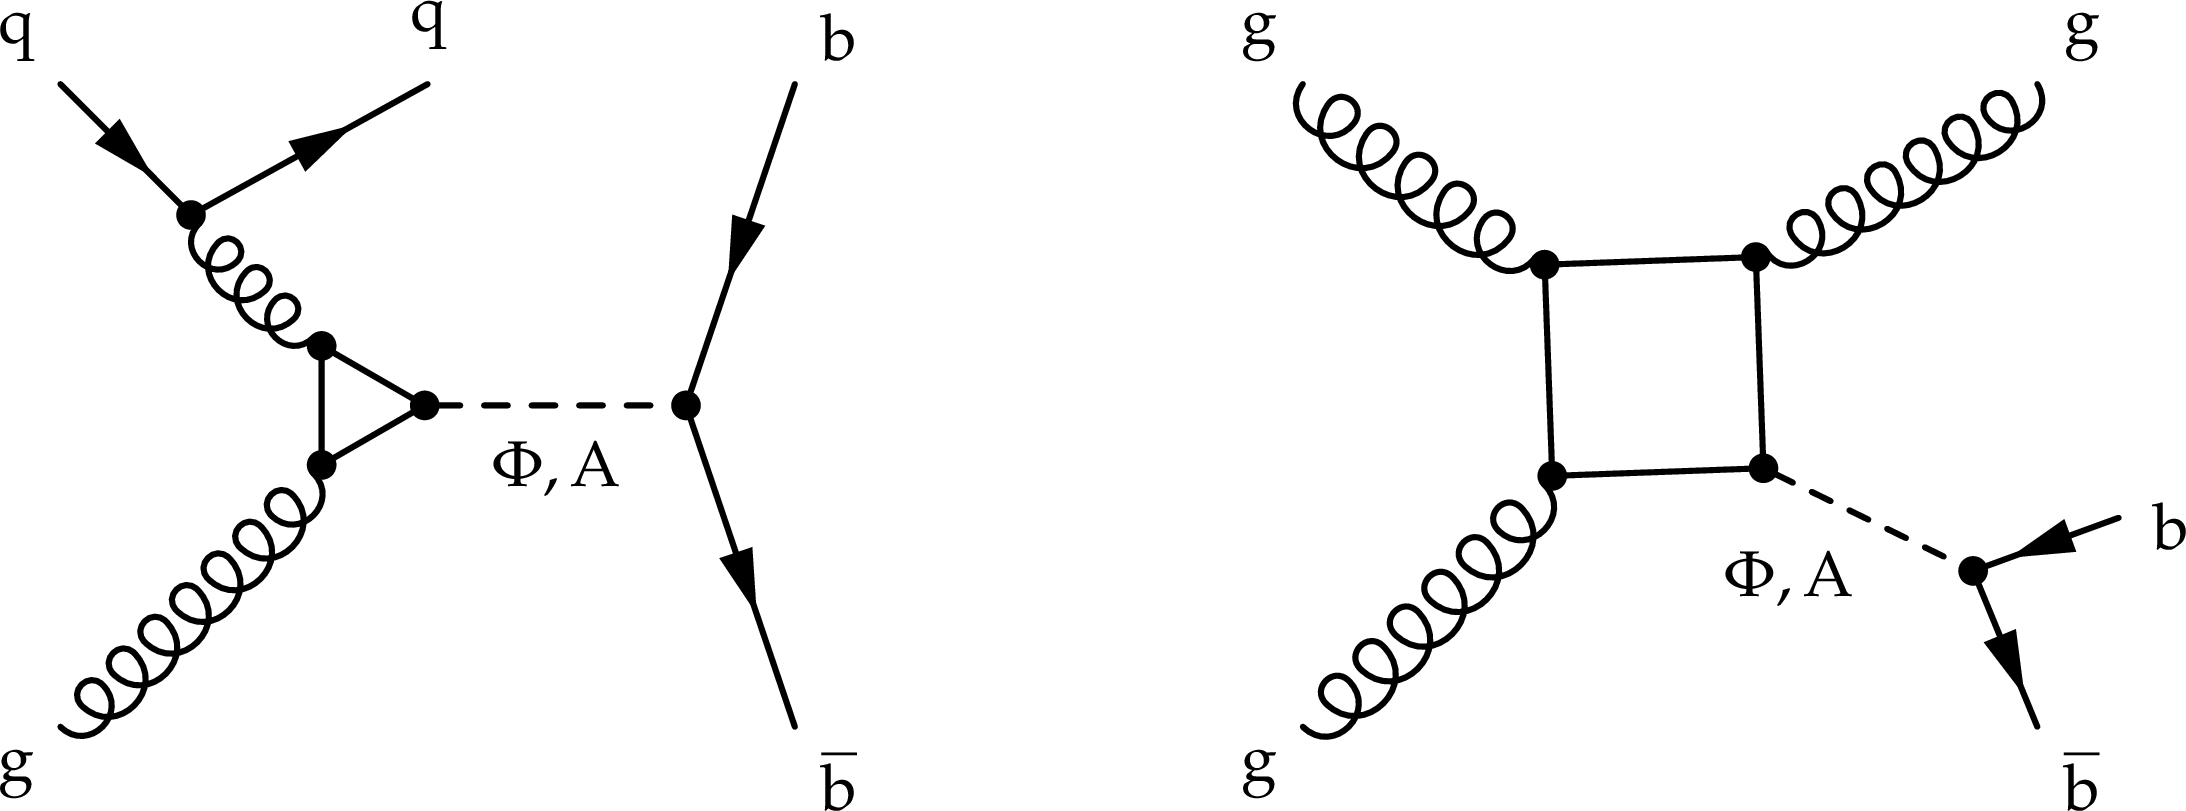
Figure 1:
One-loop Feynman diagrams of processes exchanging a scalar $\phi $ (left) or pseudoscalar A (right) mediator, leading to a boosted double-b jet signature. |
png pdf |
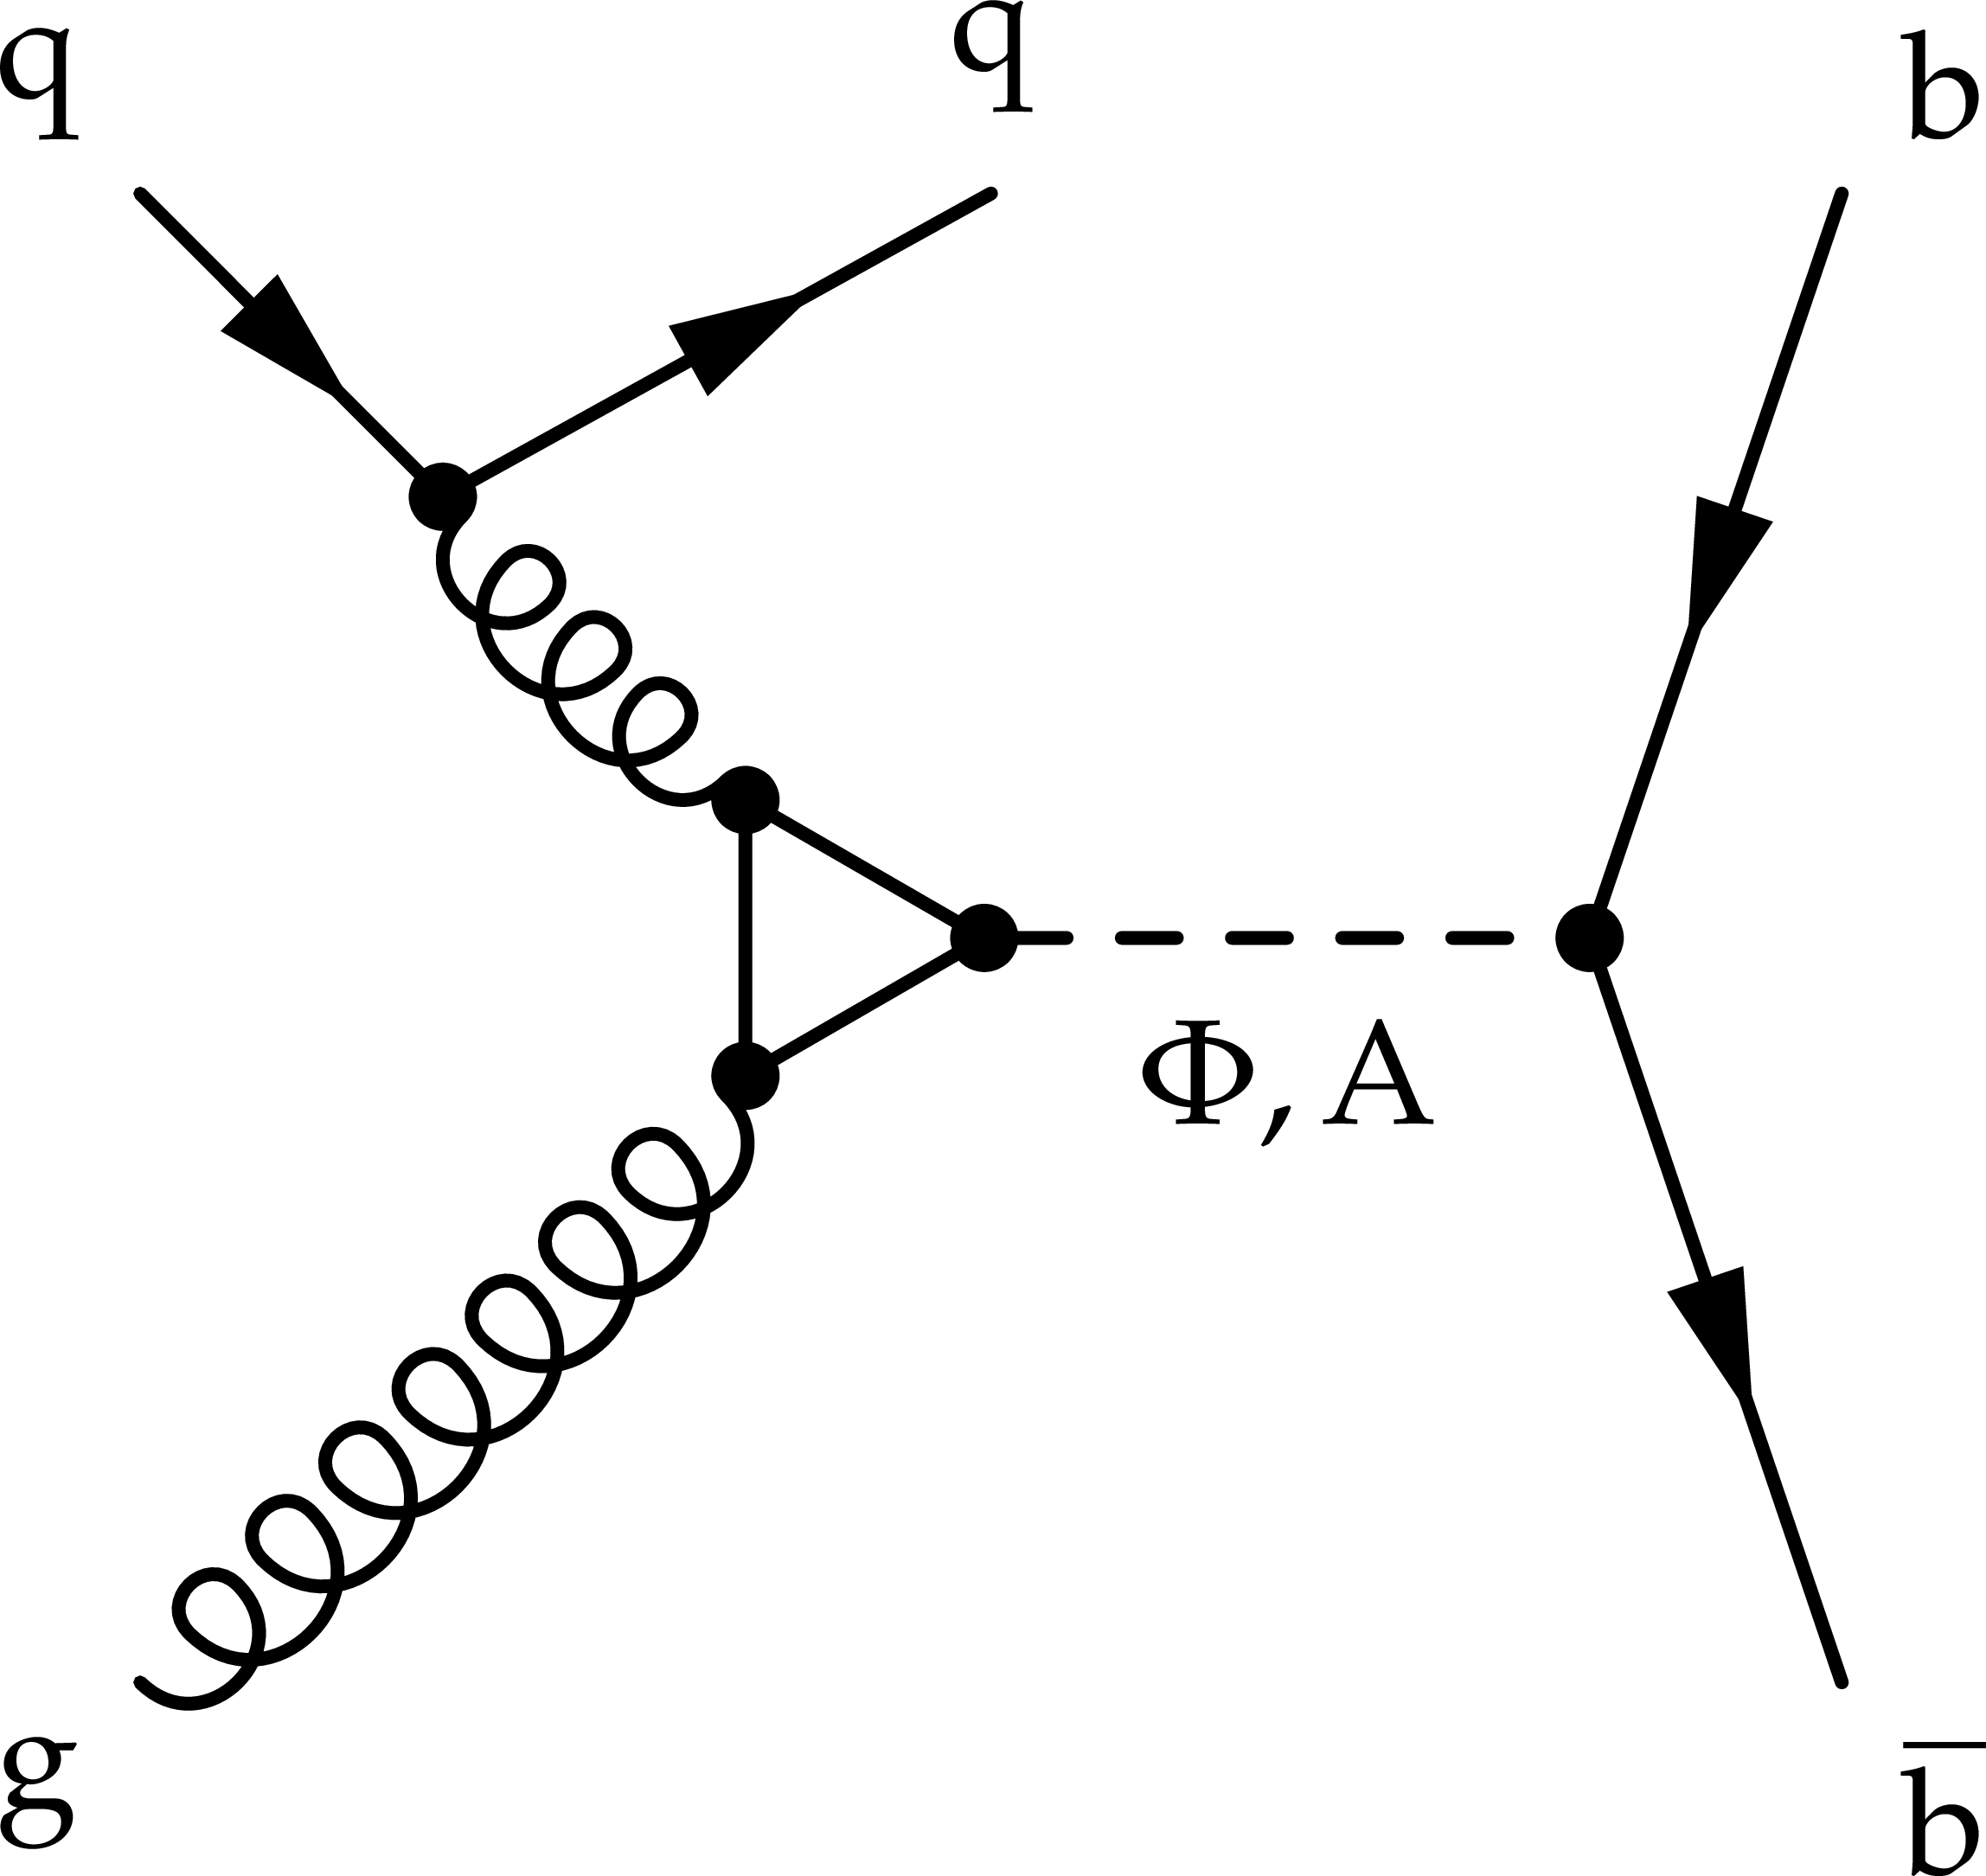
Figure 1-a:
One-loop Feynman diagram of the process exchanging a scalar $\phi $ mediator, leading to a boosted double-b jet signature. |
png pdf |
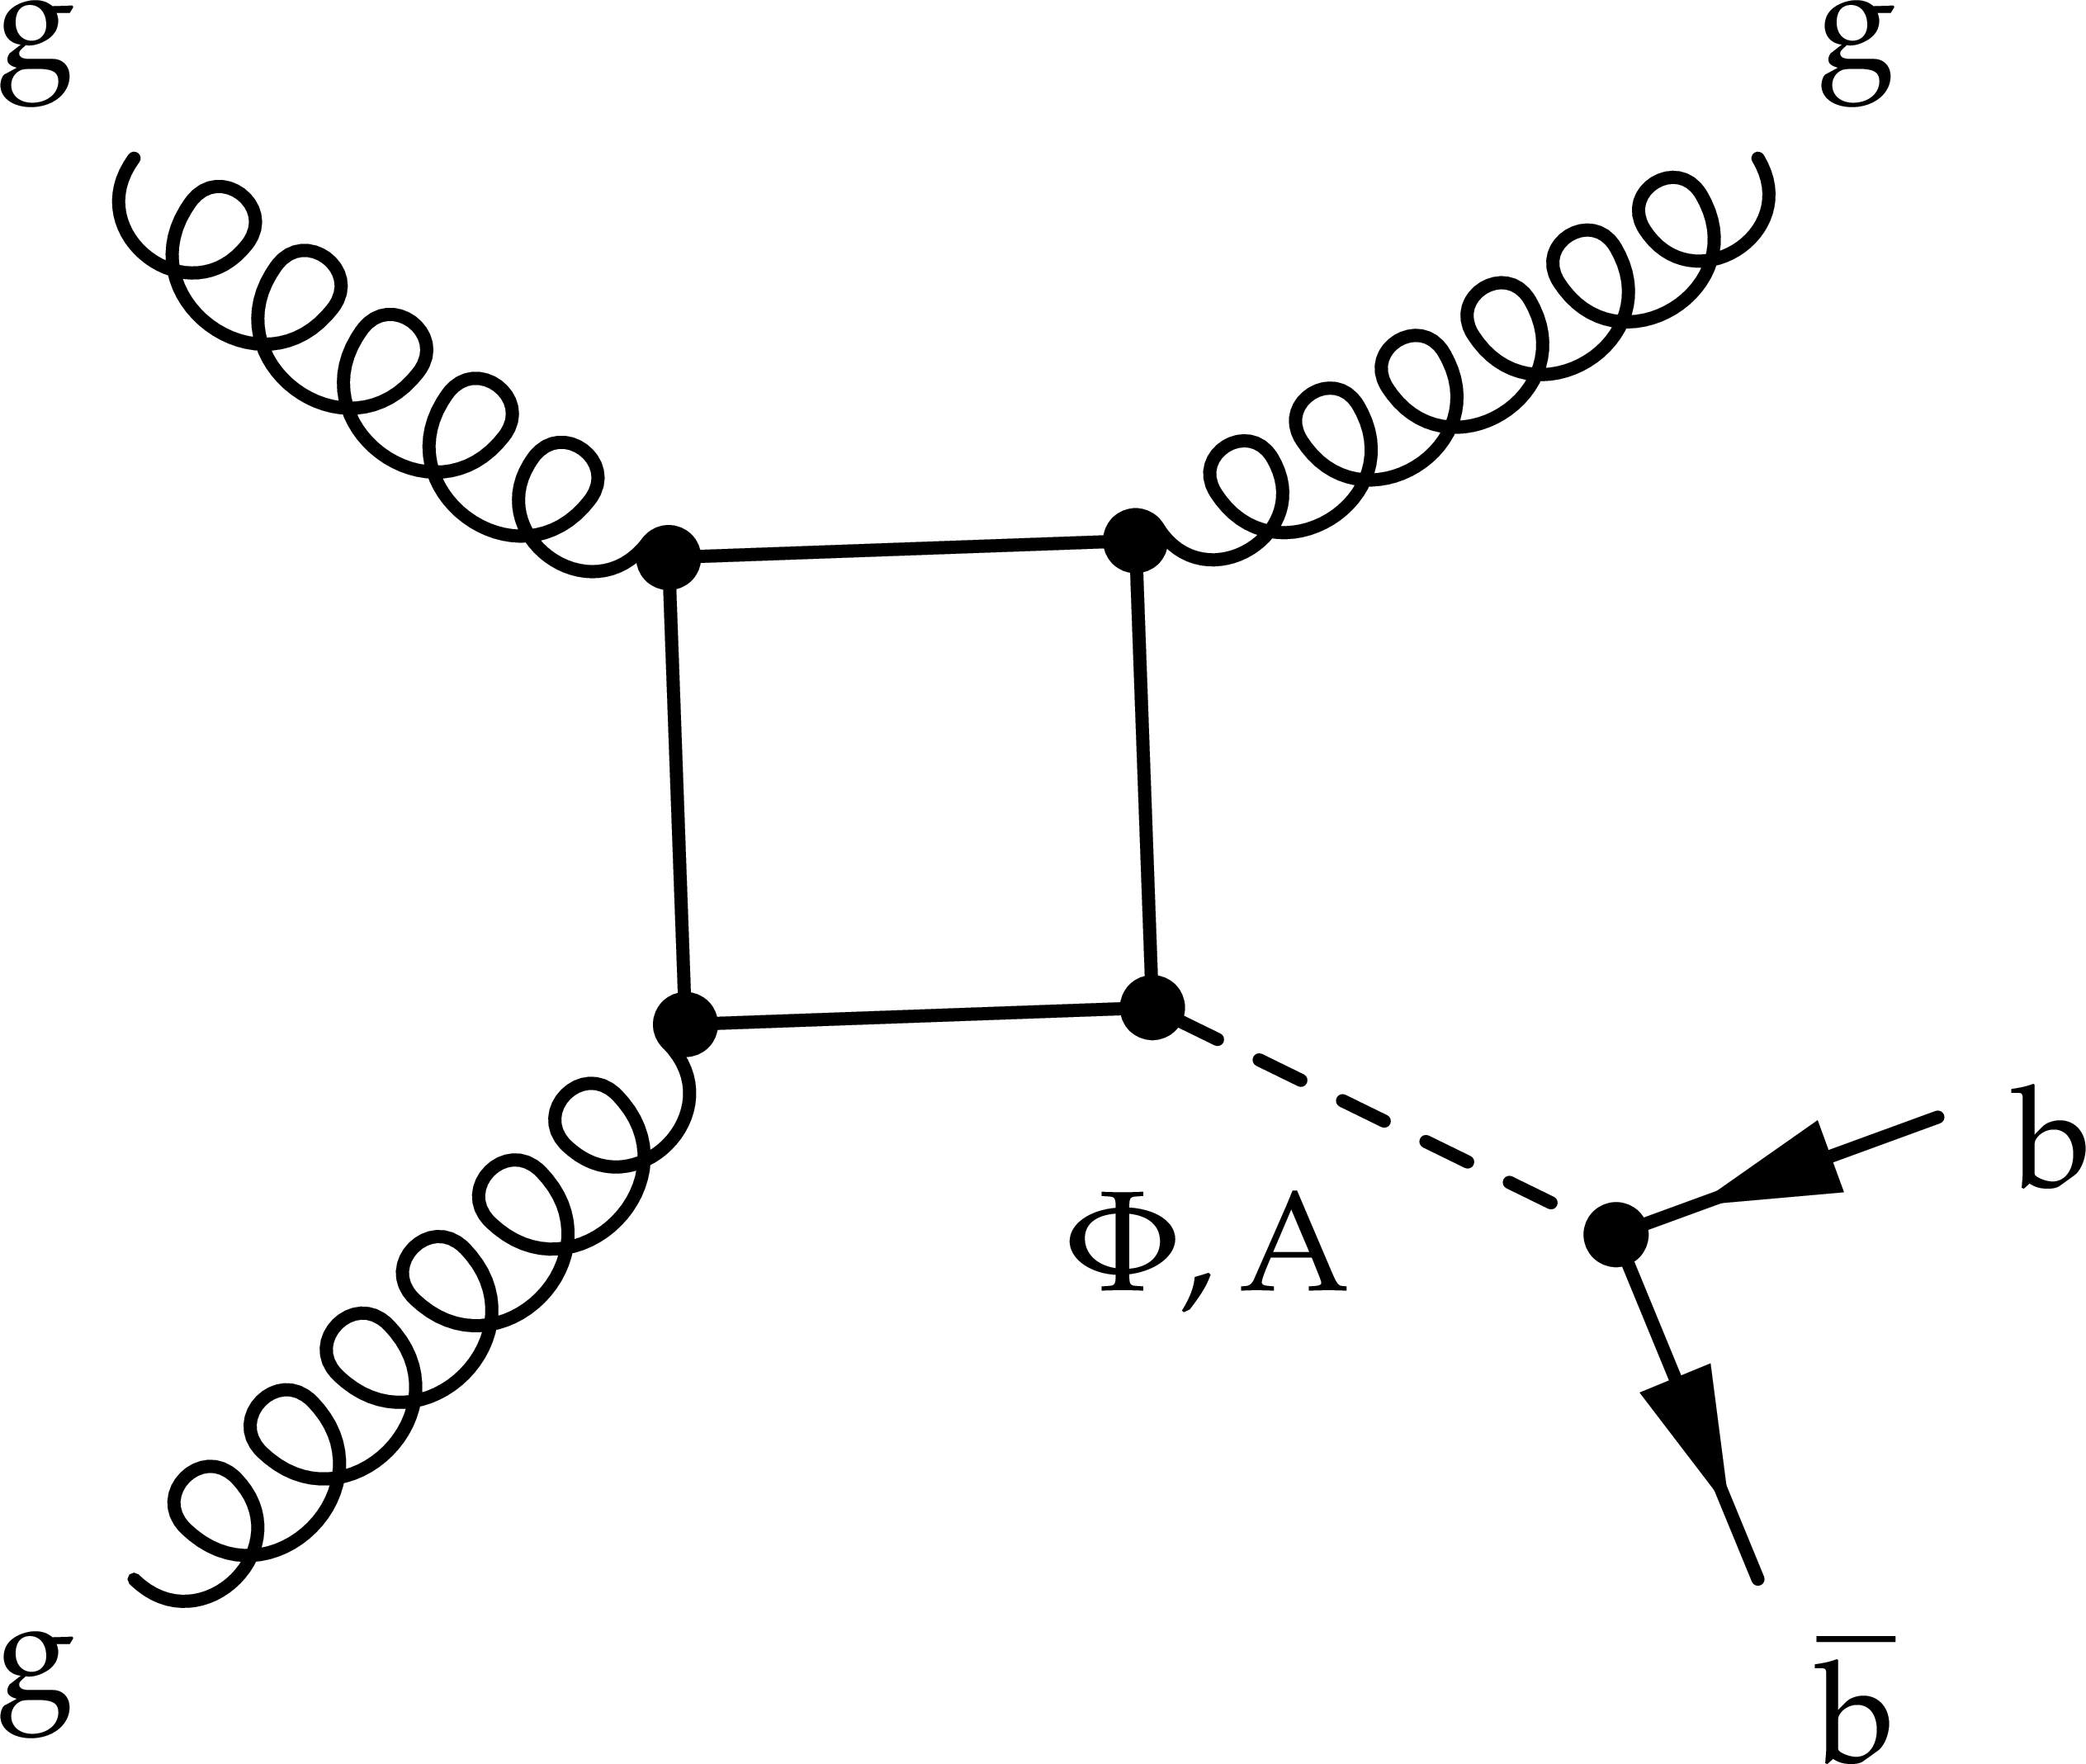
Figure 1-b:
One-loop Feynman diagram of the process exchanging a pseudoscalar A mediator, leading to a boosted double-b jet signature. |
png pdf |
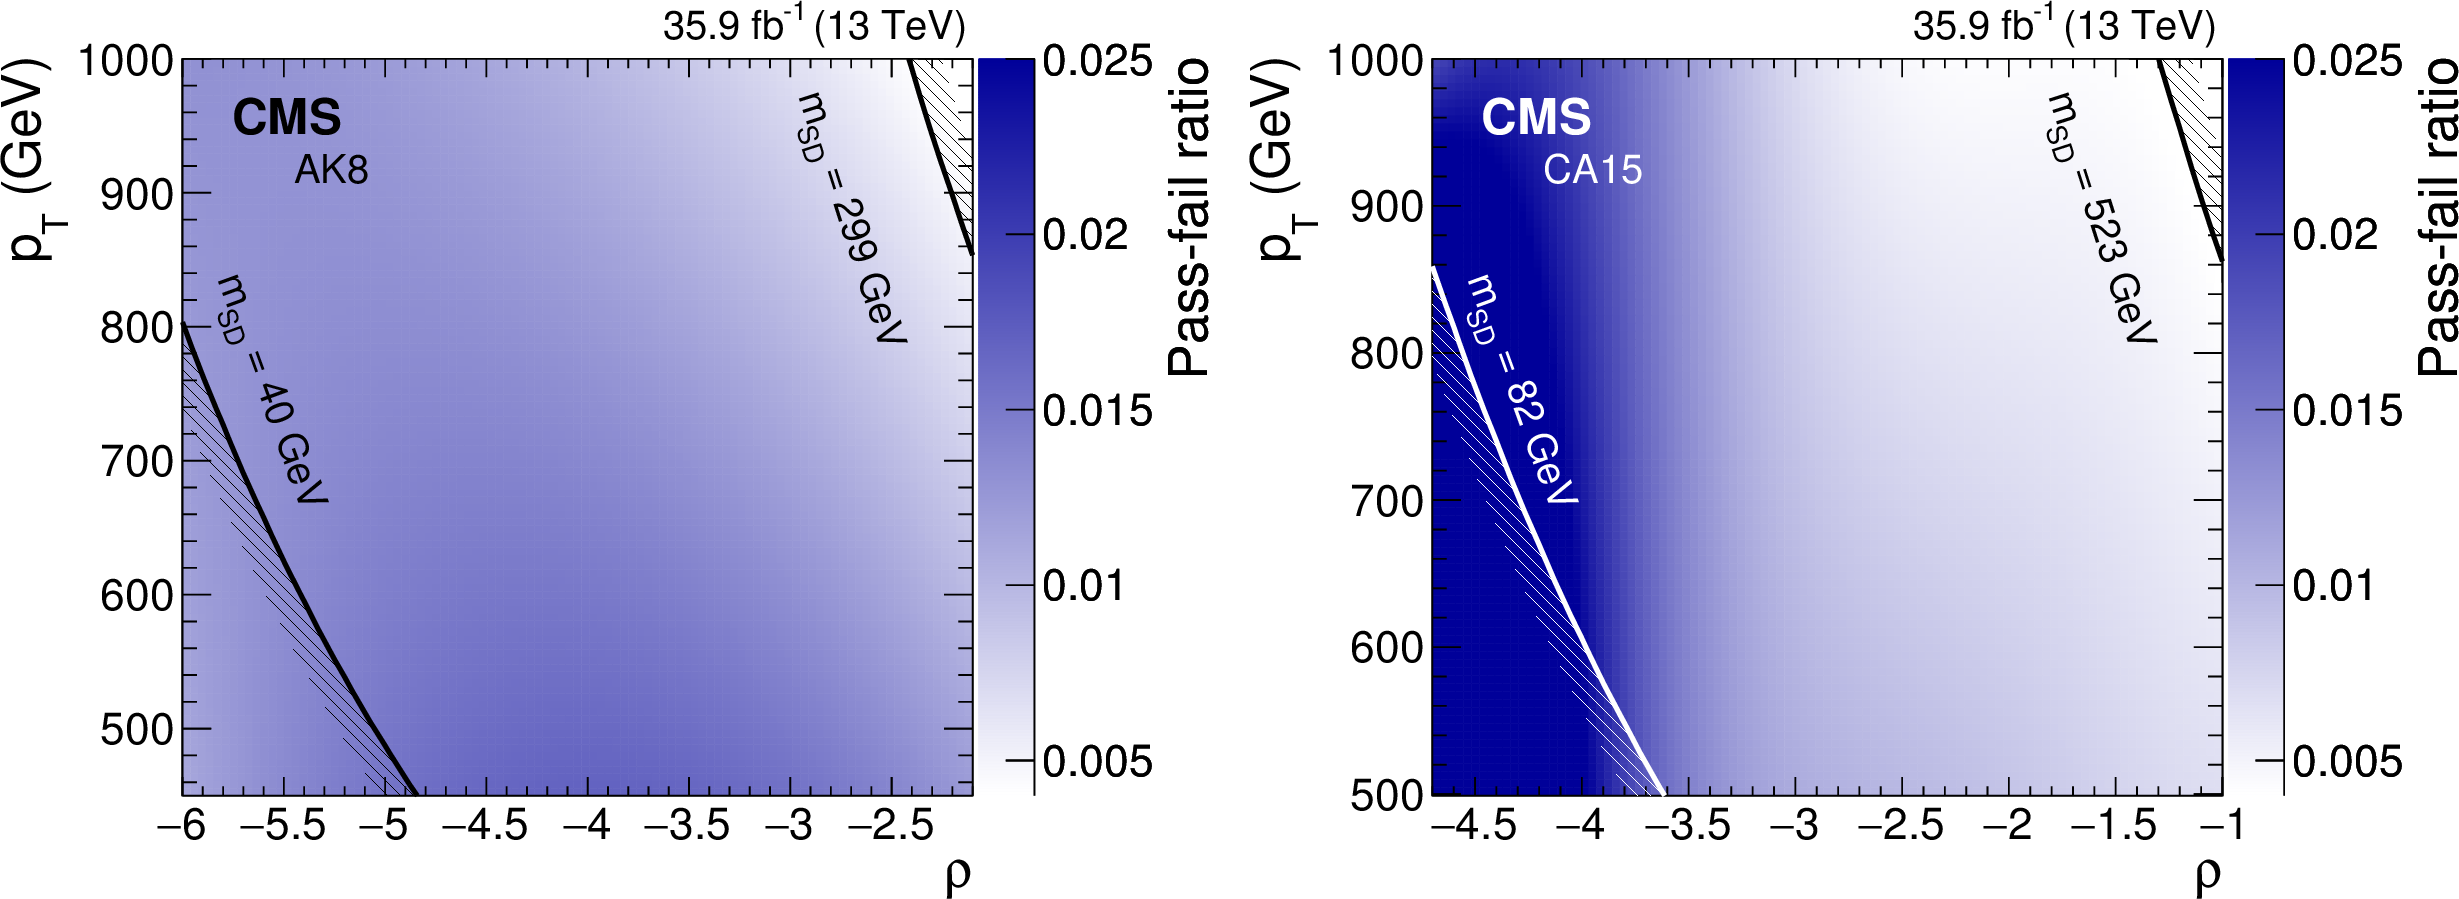
Figure 2:
The fitted pass-fail ratio $ {R_{\mathrm {p}/\mathrm {f}}} $ as a function of $ {p_{\mathrm {T}}} $ and $\rho $ for the AK8 selection (left) and the CA15 selection (right). |

png pdf |
Figure 2-a:
The fitted pass-fail ratio $ {R_{\mathrm {p}/\mathrm {f}}} $ as a function of $ {p_{\mathrm {T}}} $ and $\rho $ for the AK8 selection. |
png pdf |
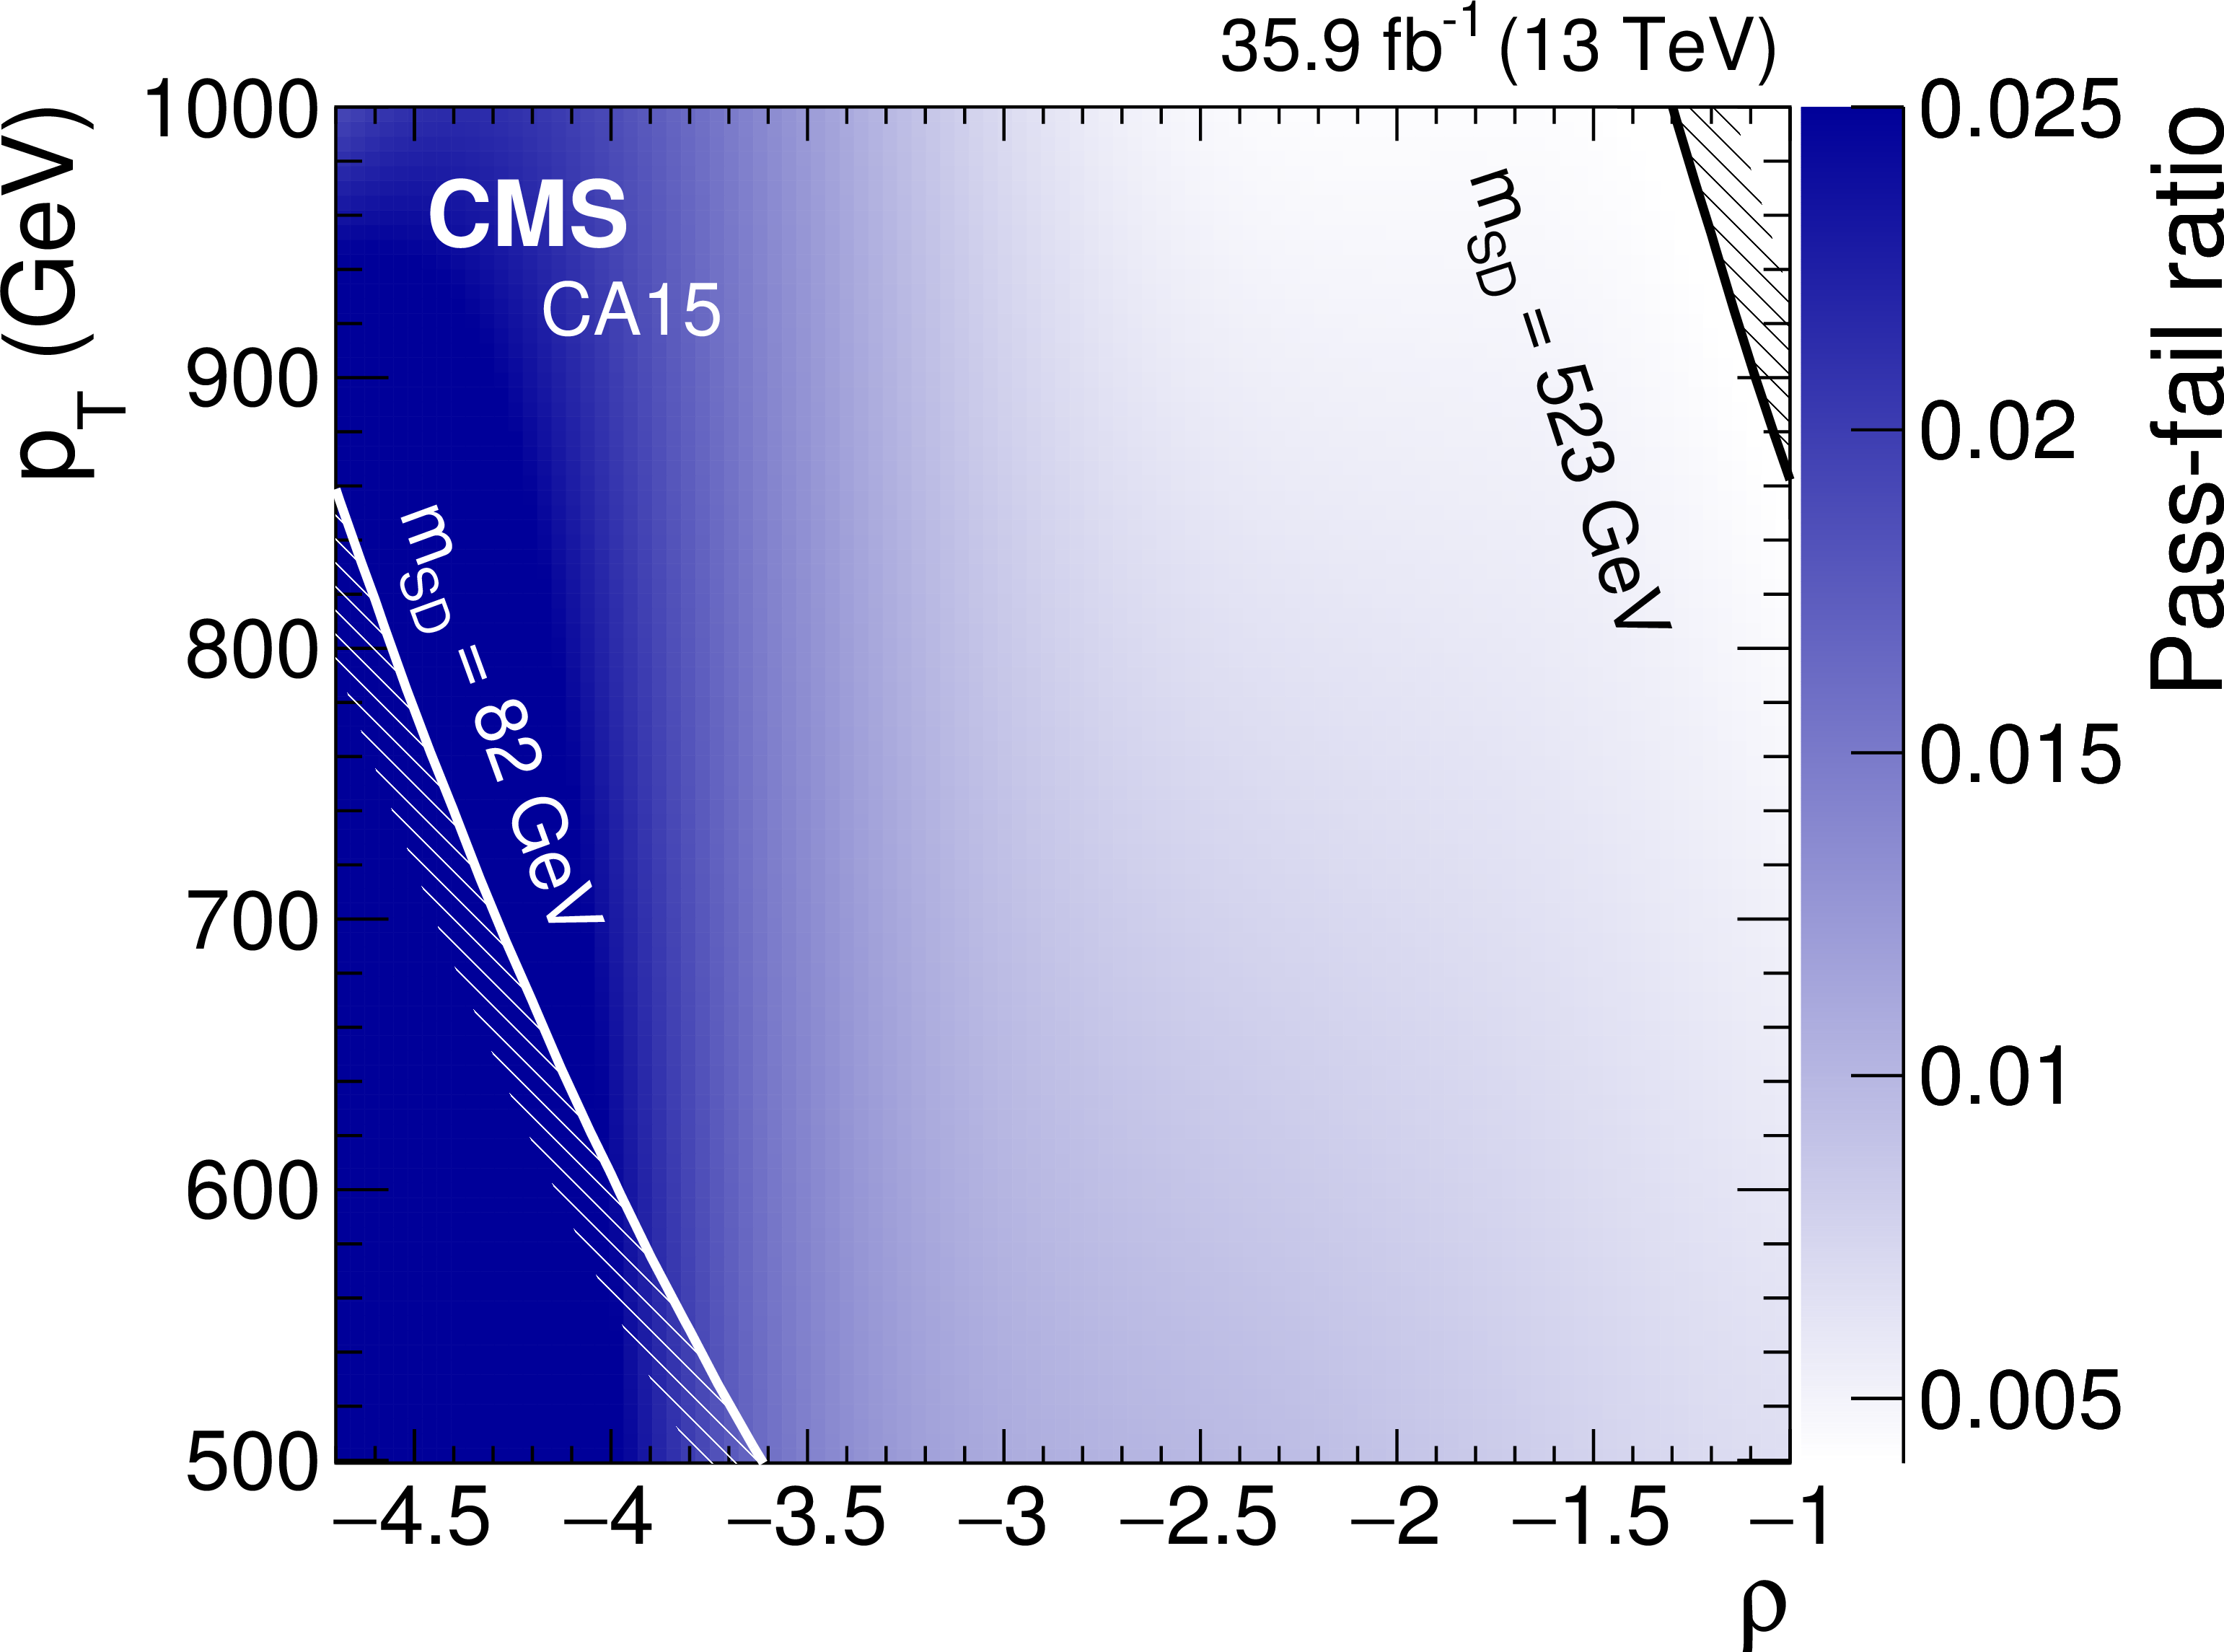
Figure 2-b:
The fitted pass-fail ratio $ {R_{\mathrm {p}/\mathrm {f}}} $ as a function of $ {p_{\mathrm {T}}} $ and $\rho $ for the CA15 selection. |

png pdf |
Figure 3:
The observed and fitted background $ {m_{\mathrm {SD}}} $ distributions for the AK8 selection for the failing (left) and passing (right) regions, combining all the $ {p_{\mathrm {T}}} $ categories. The background fit is performed under the background-only hypothesis. A hypothetical $\phi ({{\mathrm {b}} {\overline {\mathrm {b}}}})$ signal at a mass of 140 GeV is also indicated. The features at 166, 180, 201, 215, and 250 GeV in the $ {m_{\mathrm {SD}}} $ distribution are due to the $\rho $ boundaries, which define different $ {m_{\mathrm {SD}}} $ ranges for each $ {p_{\mathrm {T}}} $ category. The shaded blue band shows the systematic uncertainty in the total background prediction. The bottom panel shows the difference between the data and the nonresonant background prediction, divided by the statistical uncertainty in the data. |
png pdf |
Figure 3-a:
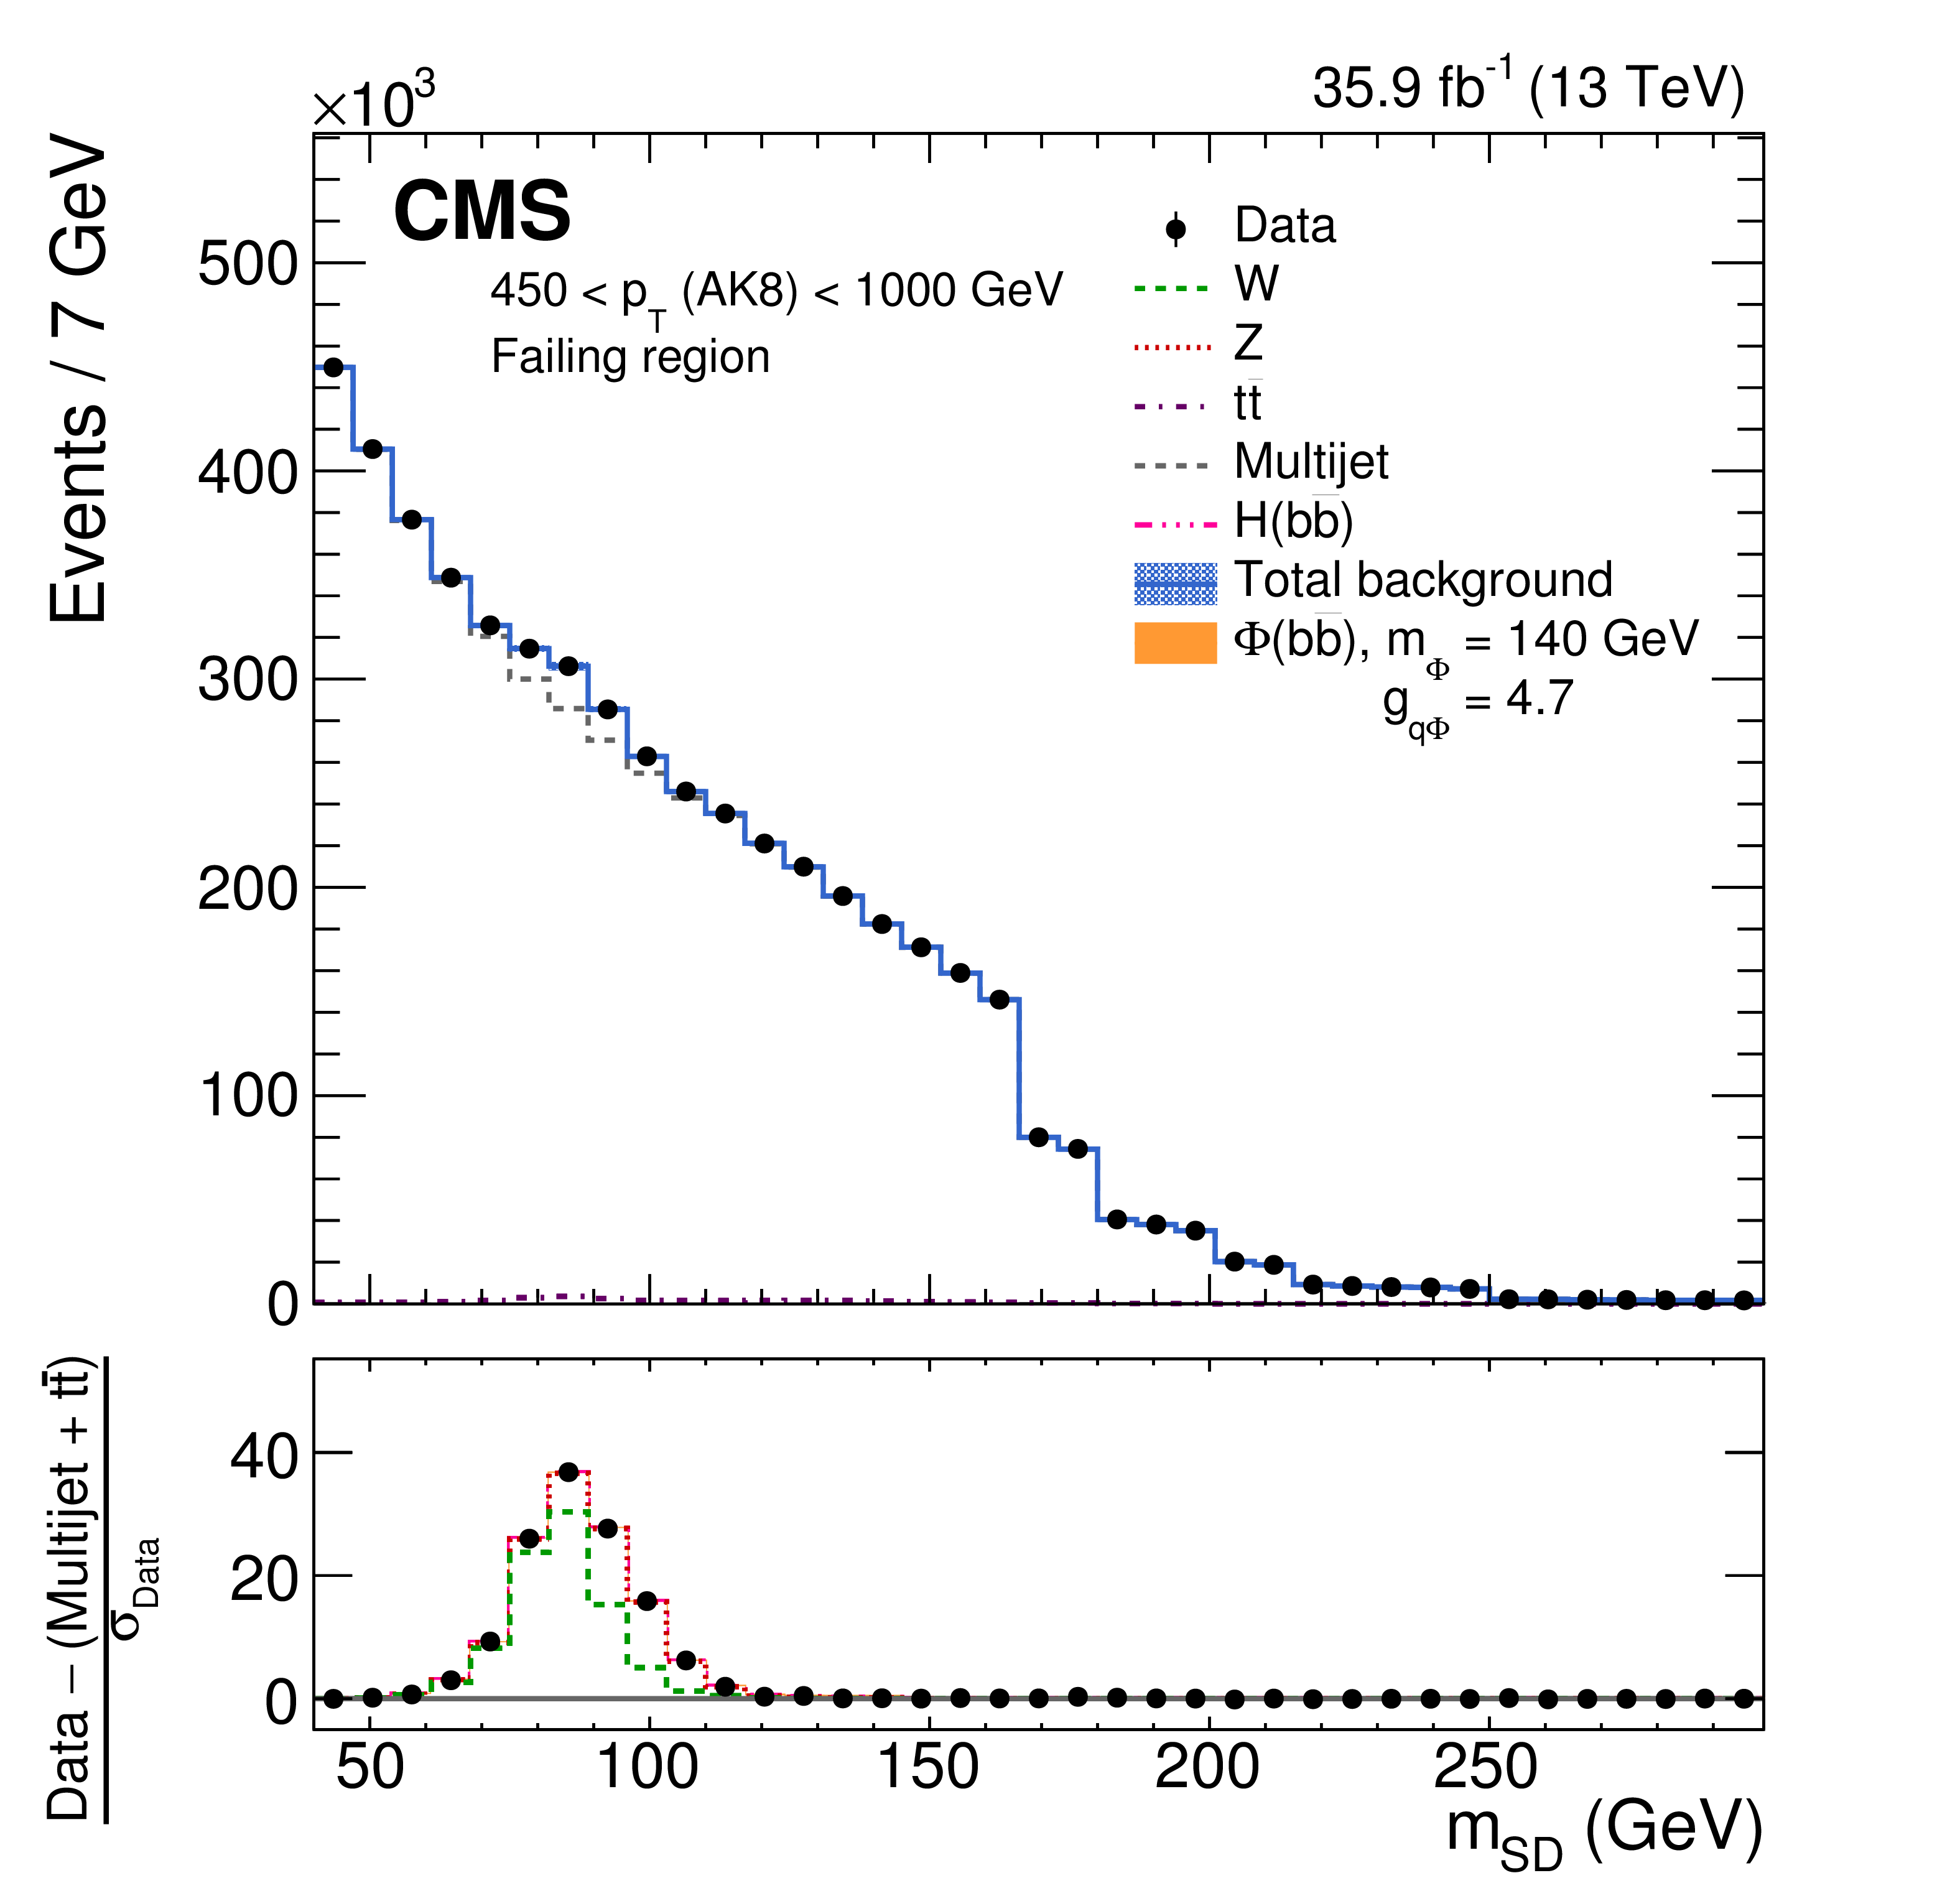
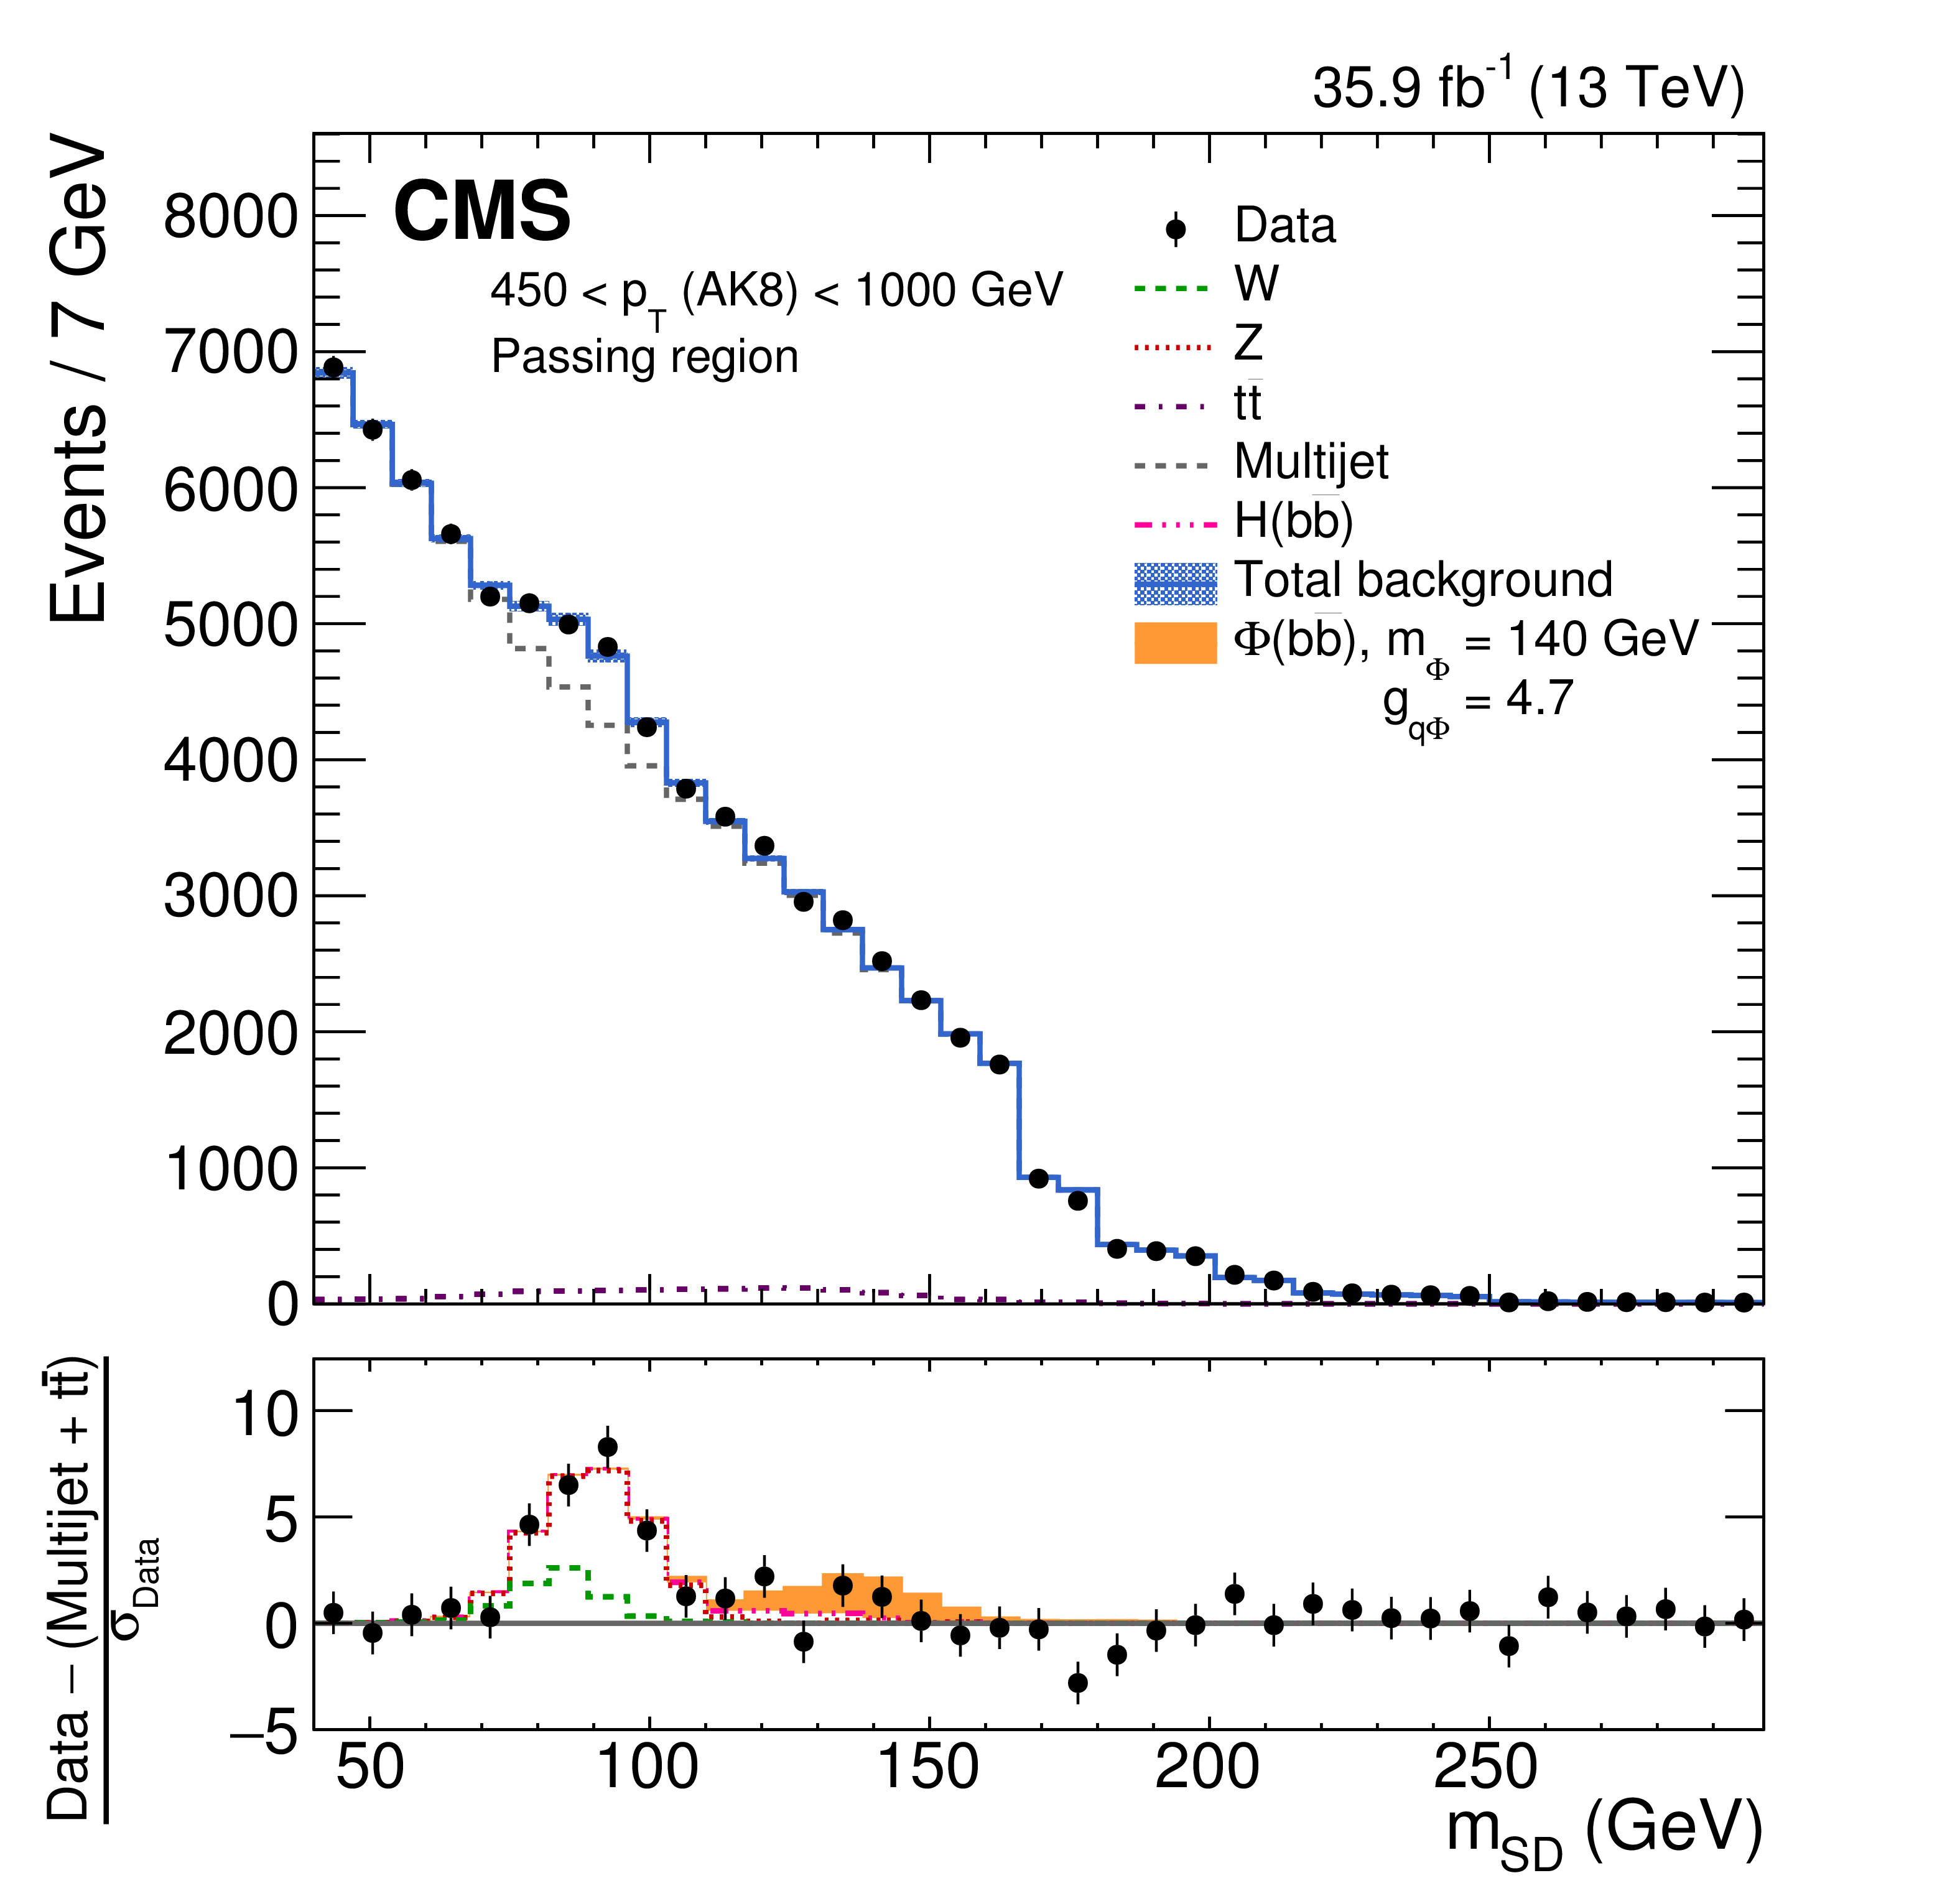
The observed and fitted background $ {m_{\mathrm {SD}}} $ distributions for the AK8 selection for the failing region, combining all the $ {p_{\mathrm {T}}} $ categories. The background fit is performed under the background-only hypothesis. A hypothetical $\phi ({{\mathrm {b}} {\overline {\mathrm {b}}}})$ signal at a mass of 140 GeV is also indicated. The features at 166, 180, 201, 215, and 250 GeV in the $ {m_{\mathrm {SD}}} $ distribution are due to the $\rho $ boundaries, which define different $ {m_{\mathrm {SD}}} $ ranges for each $ {p_{\mathrm {T}}} $ category. The shaded blue band shows the systematic uncertainty in the total background prediction. The bottom panel shows the difference between the data and the nonresonant background prediction, divided by the statistical uncertainty in the data. |
png pdf |
Figure 3-b:
The observed and fitted background $ {m_{\mathrm {SD}}} $ distributions for the AK8 selection for the passing region, combining all the $ {p_{\mathrm {T}}} $ categories. The background fit is performed under the background-only hypothesis. A hypothetical $\phi ({{\mathrm {b}} {\overline {\mathrm {b}}}})$ signal at a mass of 140 GeV is also indicated. The features at 166, 180, 201, 215, and 250 GeV in the $ {m_{\mathrm {SD}}} $ distribution are due to the $\rho $ boundaries, which define different $ {m_{\mathrm {SD}}} $ ranges for each $ {p_{\mathrm {T}}} $ category. The shaded blue band shows the systematic uncertainty in the total background prediction. The bottom panel shows the difference between the data and the nonresonant background prediction, divided by the statistical uncertainty in the data. |
png pdf |
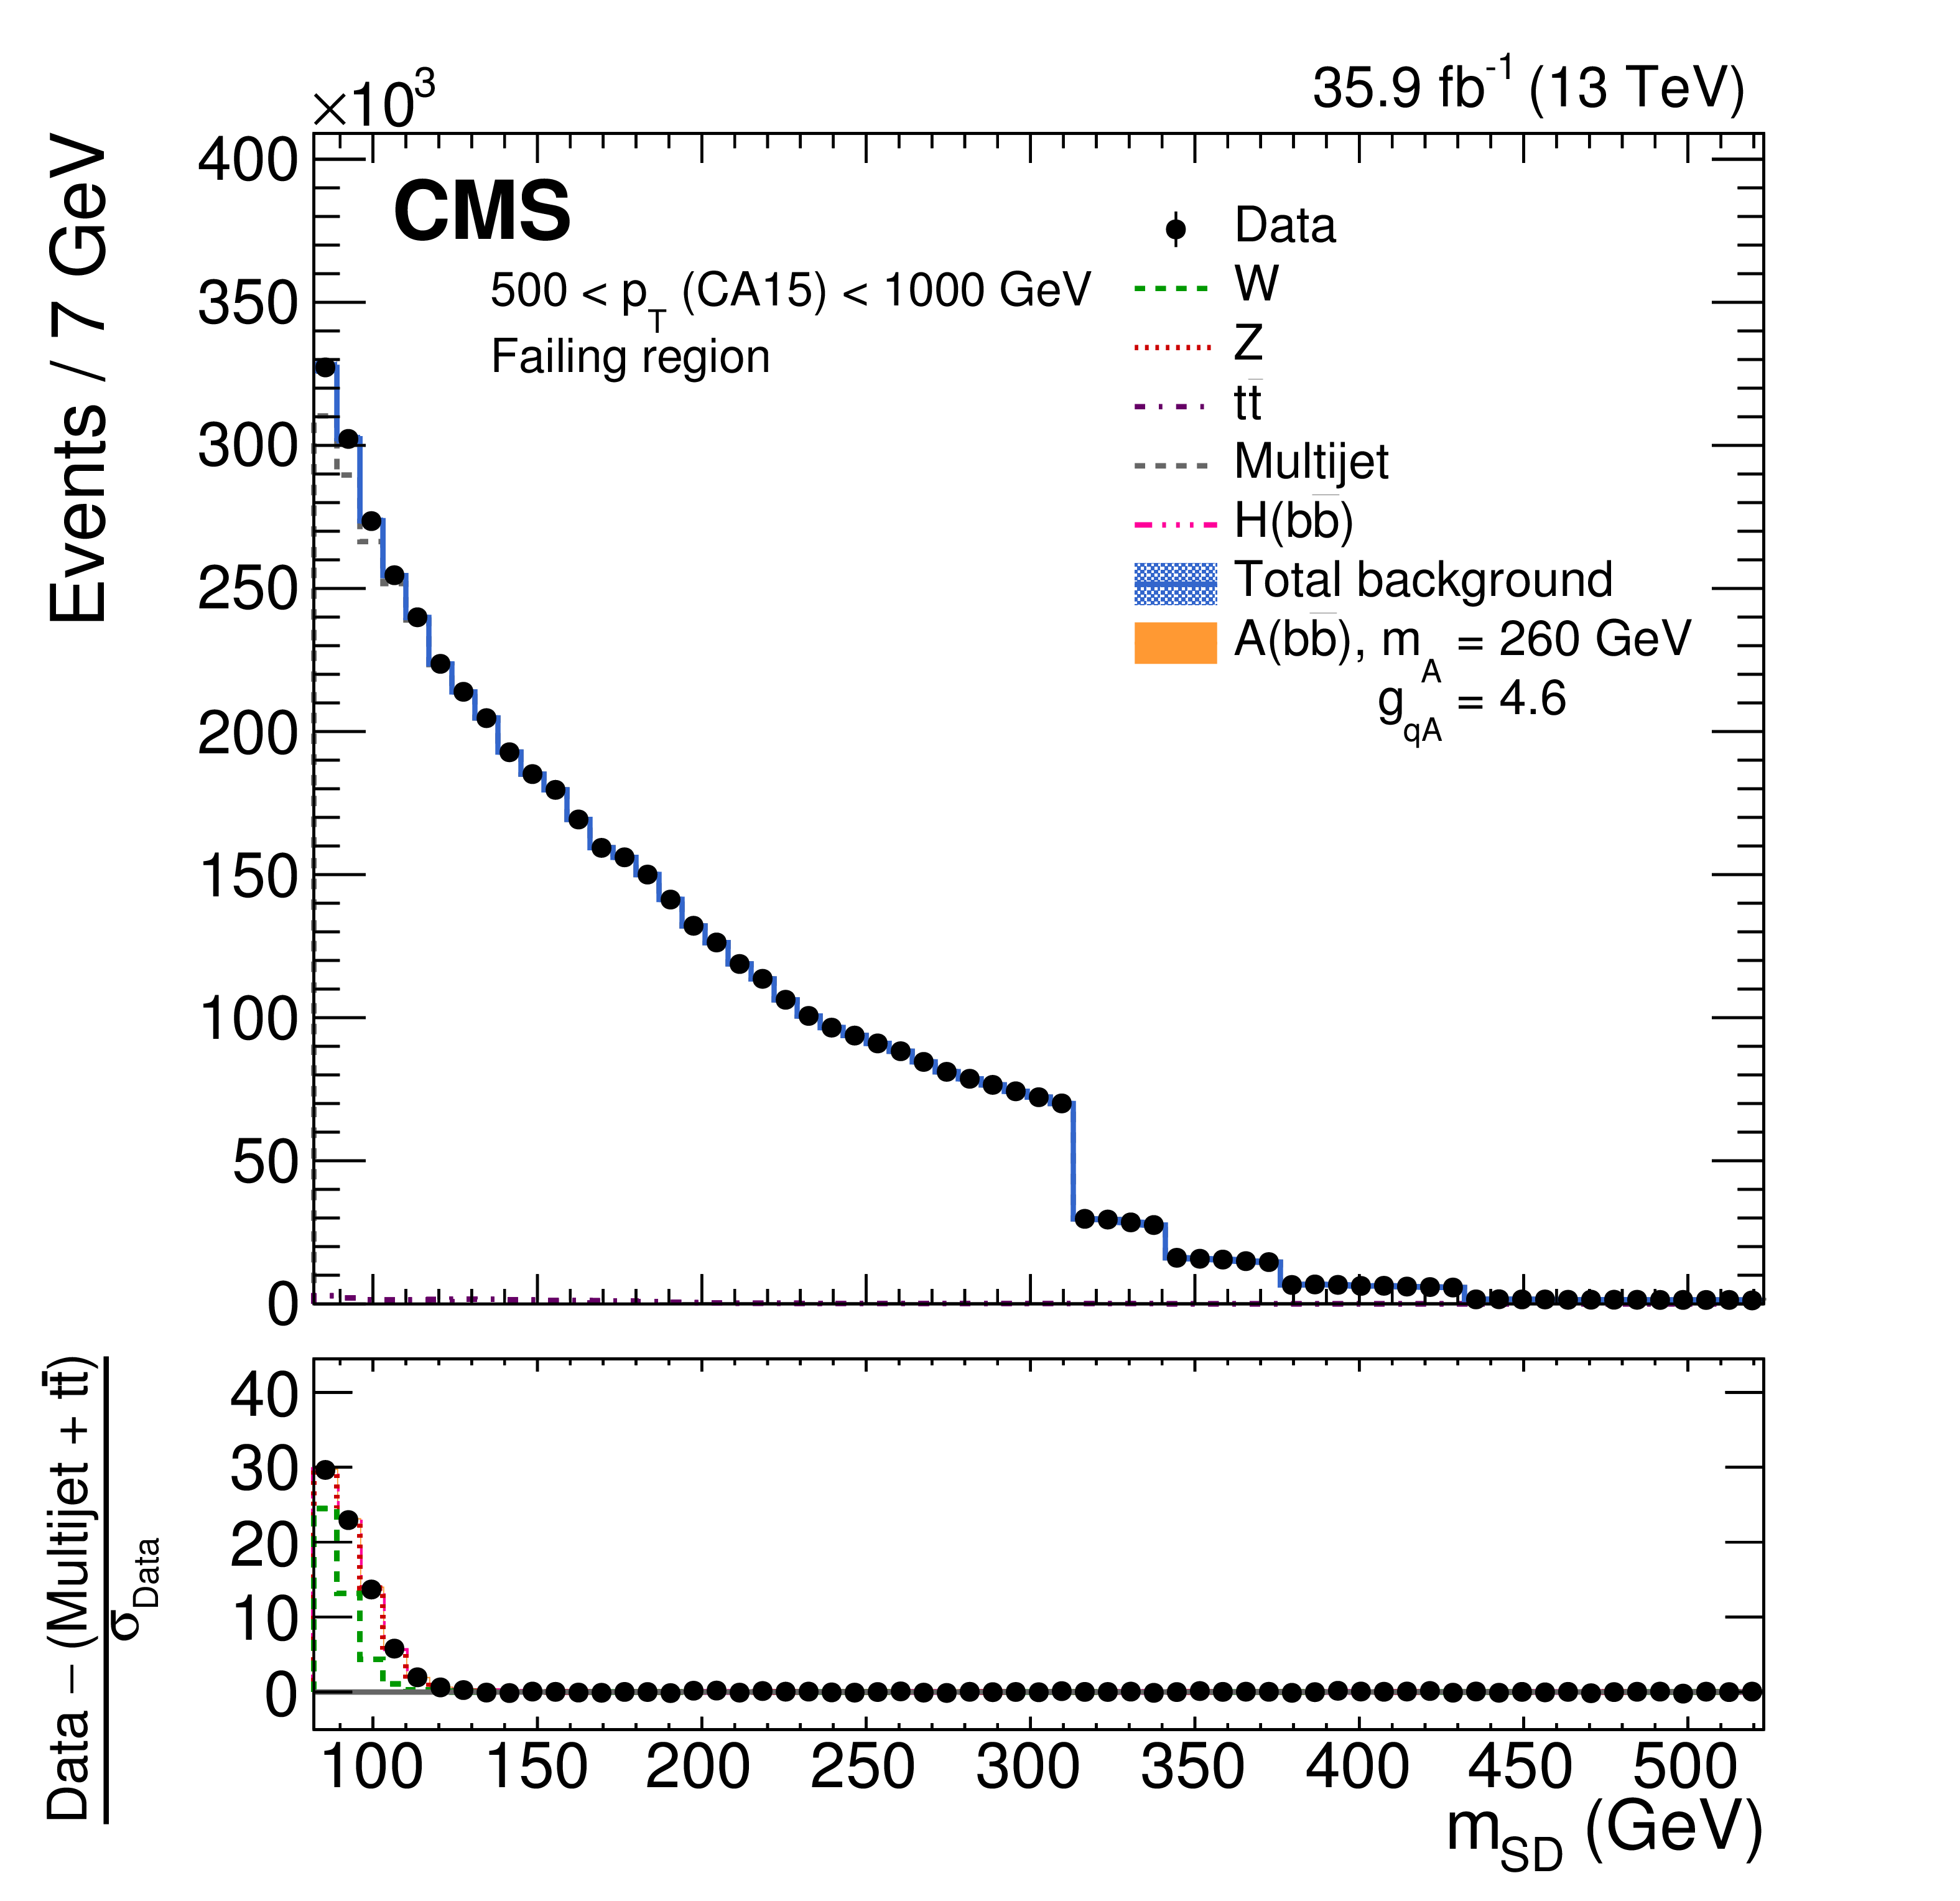
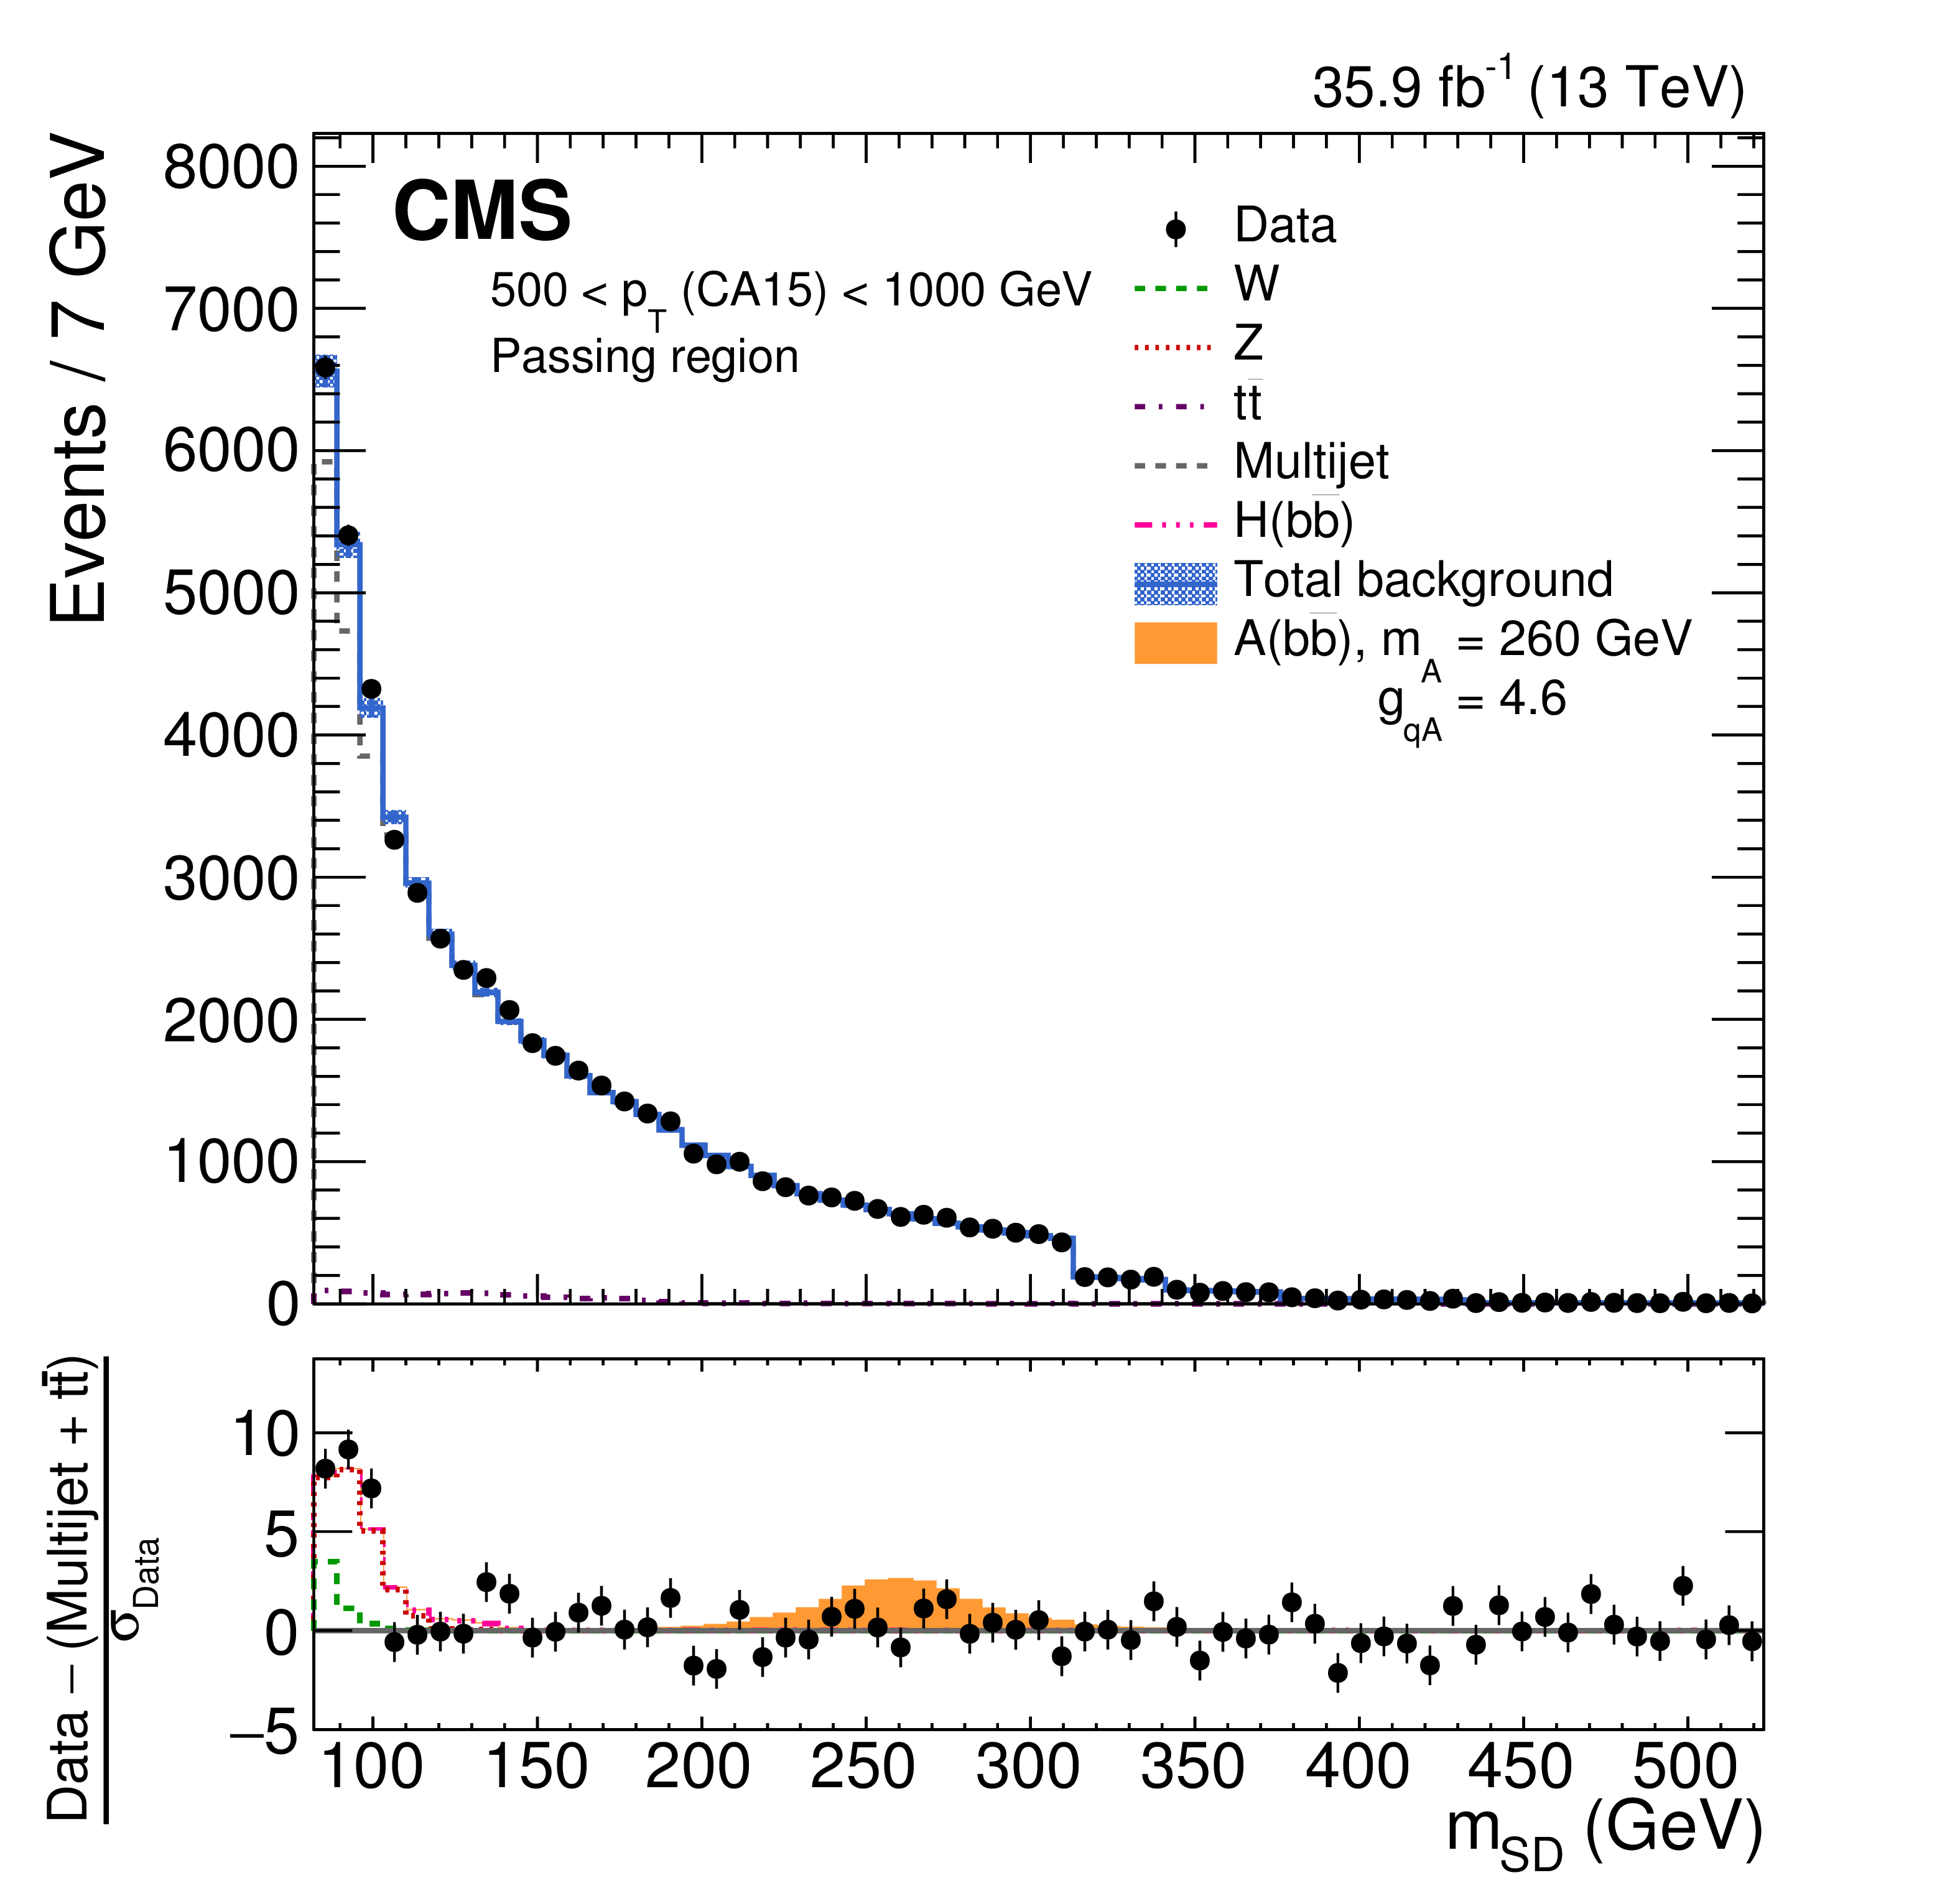
Figure 4:
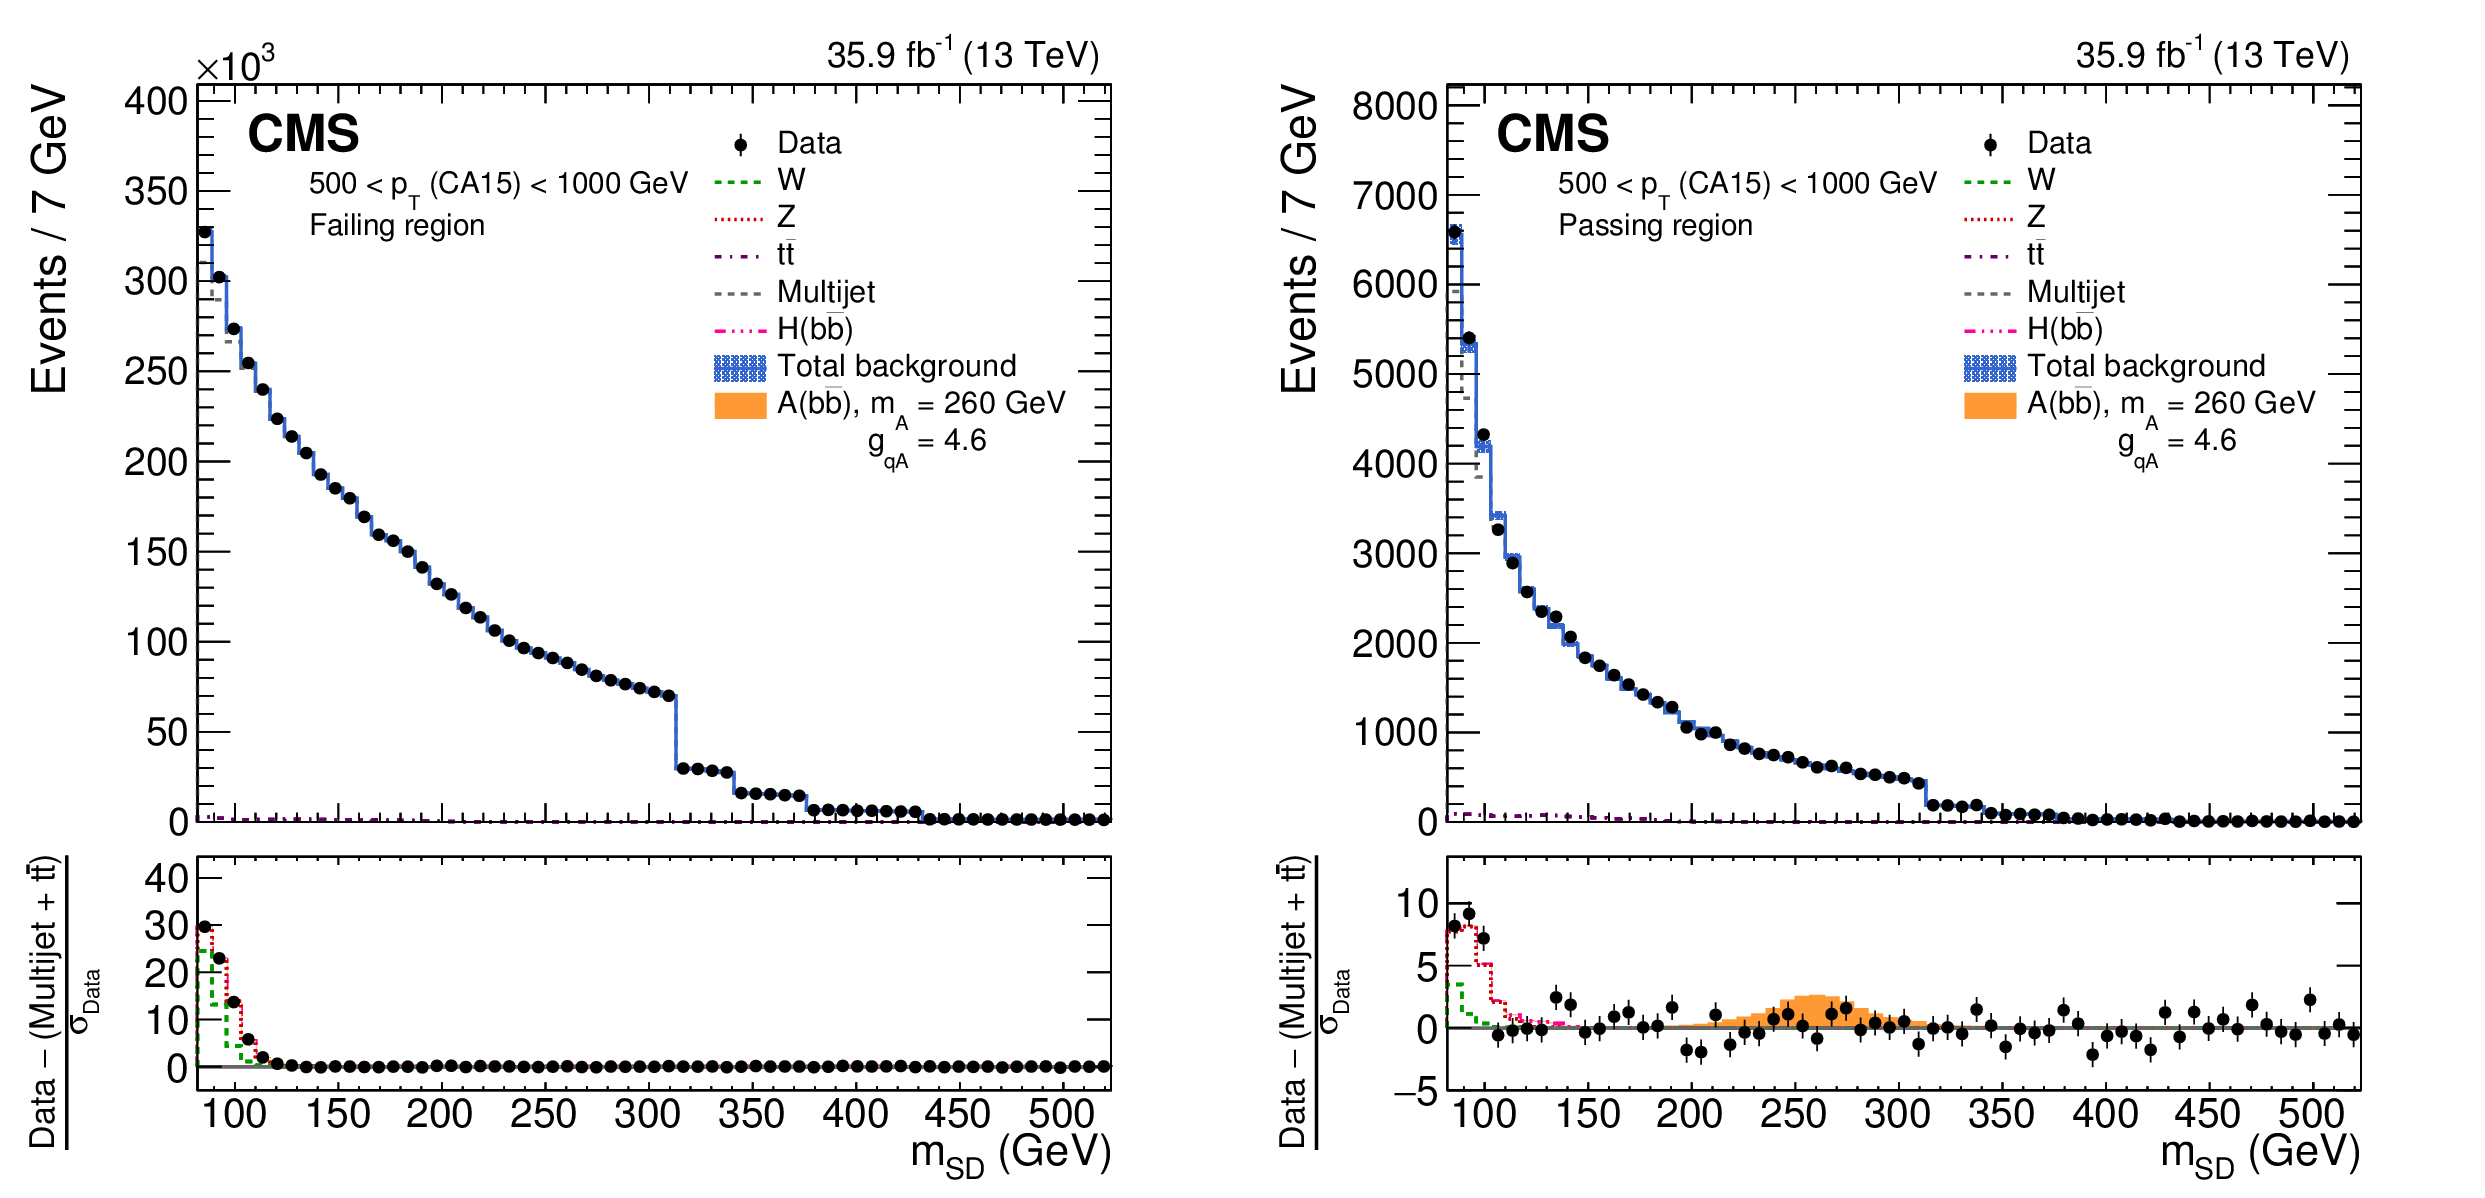
The observed and fitted background $ {m_{\mathrm {SD}}} $ distributions for the CA15 selection for the failing (left) and passing (right) regions, combining all the $ {p_{\mathrm {T}}} $ categories. The background fit is performed under the background-only hypothesis. A hypothetical $ {\mathrm {A}}({{\mathrm {b}} {\overline {\mathrm {b}}}})$ signal at a mass of 260 GeV is also indicated. The features at 285, 313, 341, 376, and 432 GeV in the $ {m_{\mathrm {SD}}} $ distribution are due to the $\rho $ boundaries, which define different $ {m_{\mathrm {SD}}} $ ranges for each $ {p_{\mathrm {T}}} $ category. The shaded blue band shows the systematic uncertainty in the total background prediction. The bottom panel shows the difference between the data and the nonresonant background prediction, divided by the statistical uncertainty in the data. |
png pdf |
Figure 4-a:
The observed and fitted background $ {m_{\mathrm {SD}}} $ distributions for the CA15 selection for the failing regions, combining all the $ {p_{\mathrm {T}}} $ categories. The background fit is performed under the background-only hypothesis. A hypothetical $ {\mathrm {A}}({{\mathrm {b}} {\overline {\mathrm {b}}}})$ signal at a mass of 260 GeV is also indicated. The features at 285, 313, 341, 376, and 432 GeV in the $ {m_{\mathrm {SD}}} $ distribution are due to the $\rho $ boundaries, which define different $ {m_{\mathrm {SD}}} $ ranges for each $ {p_{\mathrm {T}}} $ category. The shaded blue band shows the systematic uncertainty in the total background prediction. The bottom panel shows the difference between the data and the nonresonant background prediction, divided by the statistical uncertainty in the data. |
png pdf |
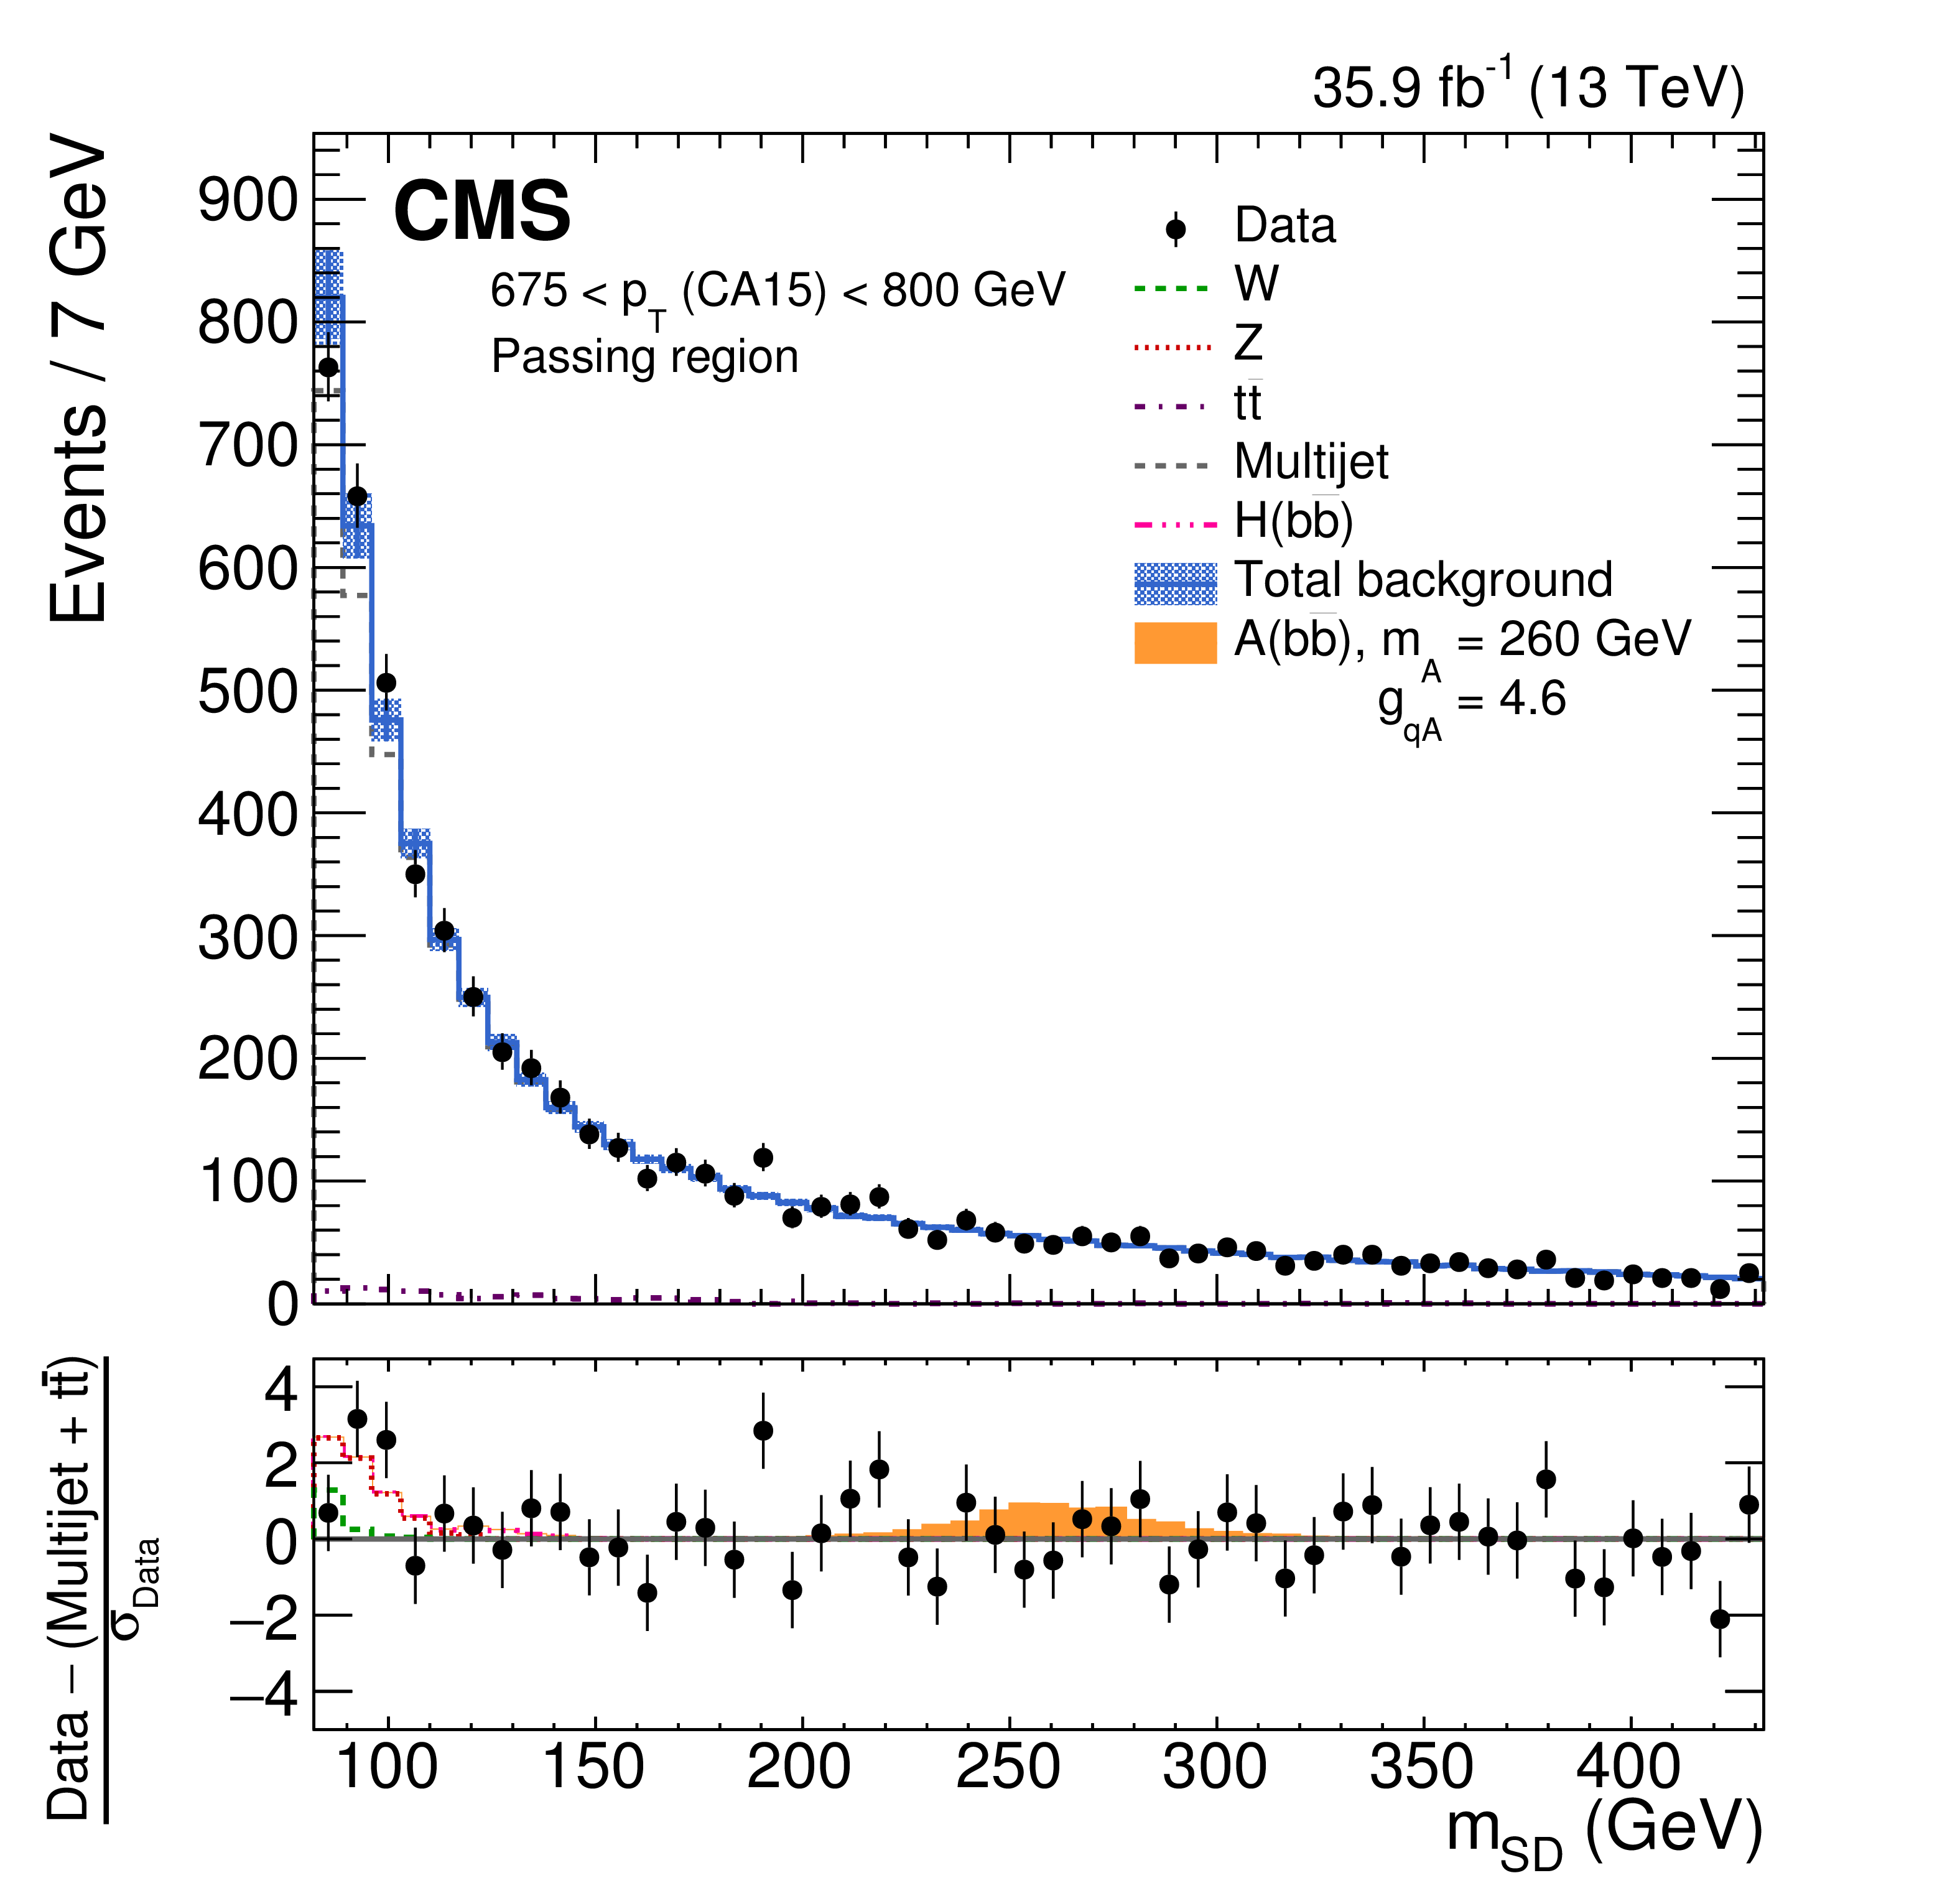
Figure 4-b:
The observed and fitted background $ {m_{\mathrm {SD}}} $ distributions for the CA15 selection for the passing regions, combining all the $ {p_{\mathrm {T}}} $ categories. The background fit is performed under the background-only hypothesis. A hypothetical $ {\mathrm {A}}({{\mathrm {b}} {\overline {\mathrm {b}}}})$ signal at a mass of 260 GeV is also indicated. The features at 285, 313, 341, 376, and 432 GeV in the $ {m_{\mathrm {SD}}} $ distribution are due to the $\rho $ boundaries, which define different $ {m_{\mathrm {SD}}} $ ranges for each $ {p_{\mathrm {T}}} $ category. The shaded blue band shows the systematic uncertainty in the total background prediction. The bottom panel shows the difference between the data and the nonresonant background prediction, divided by the statistical uncertainty in the data. |
png pdf |
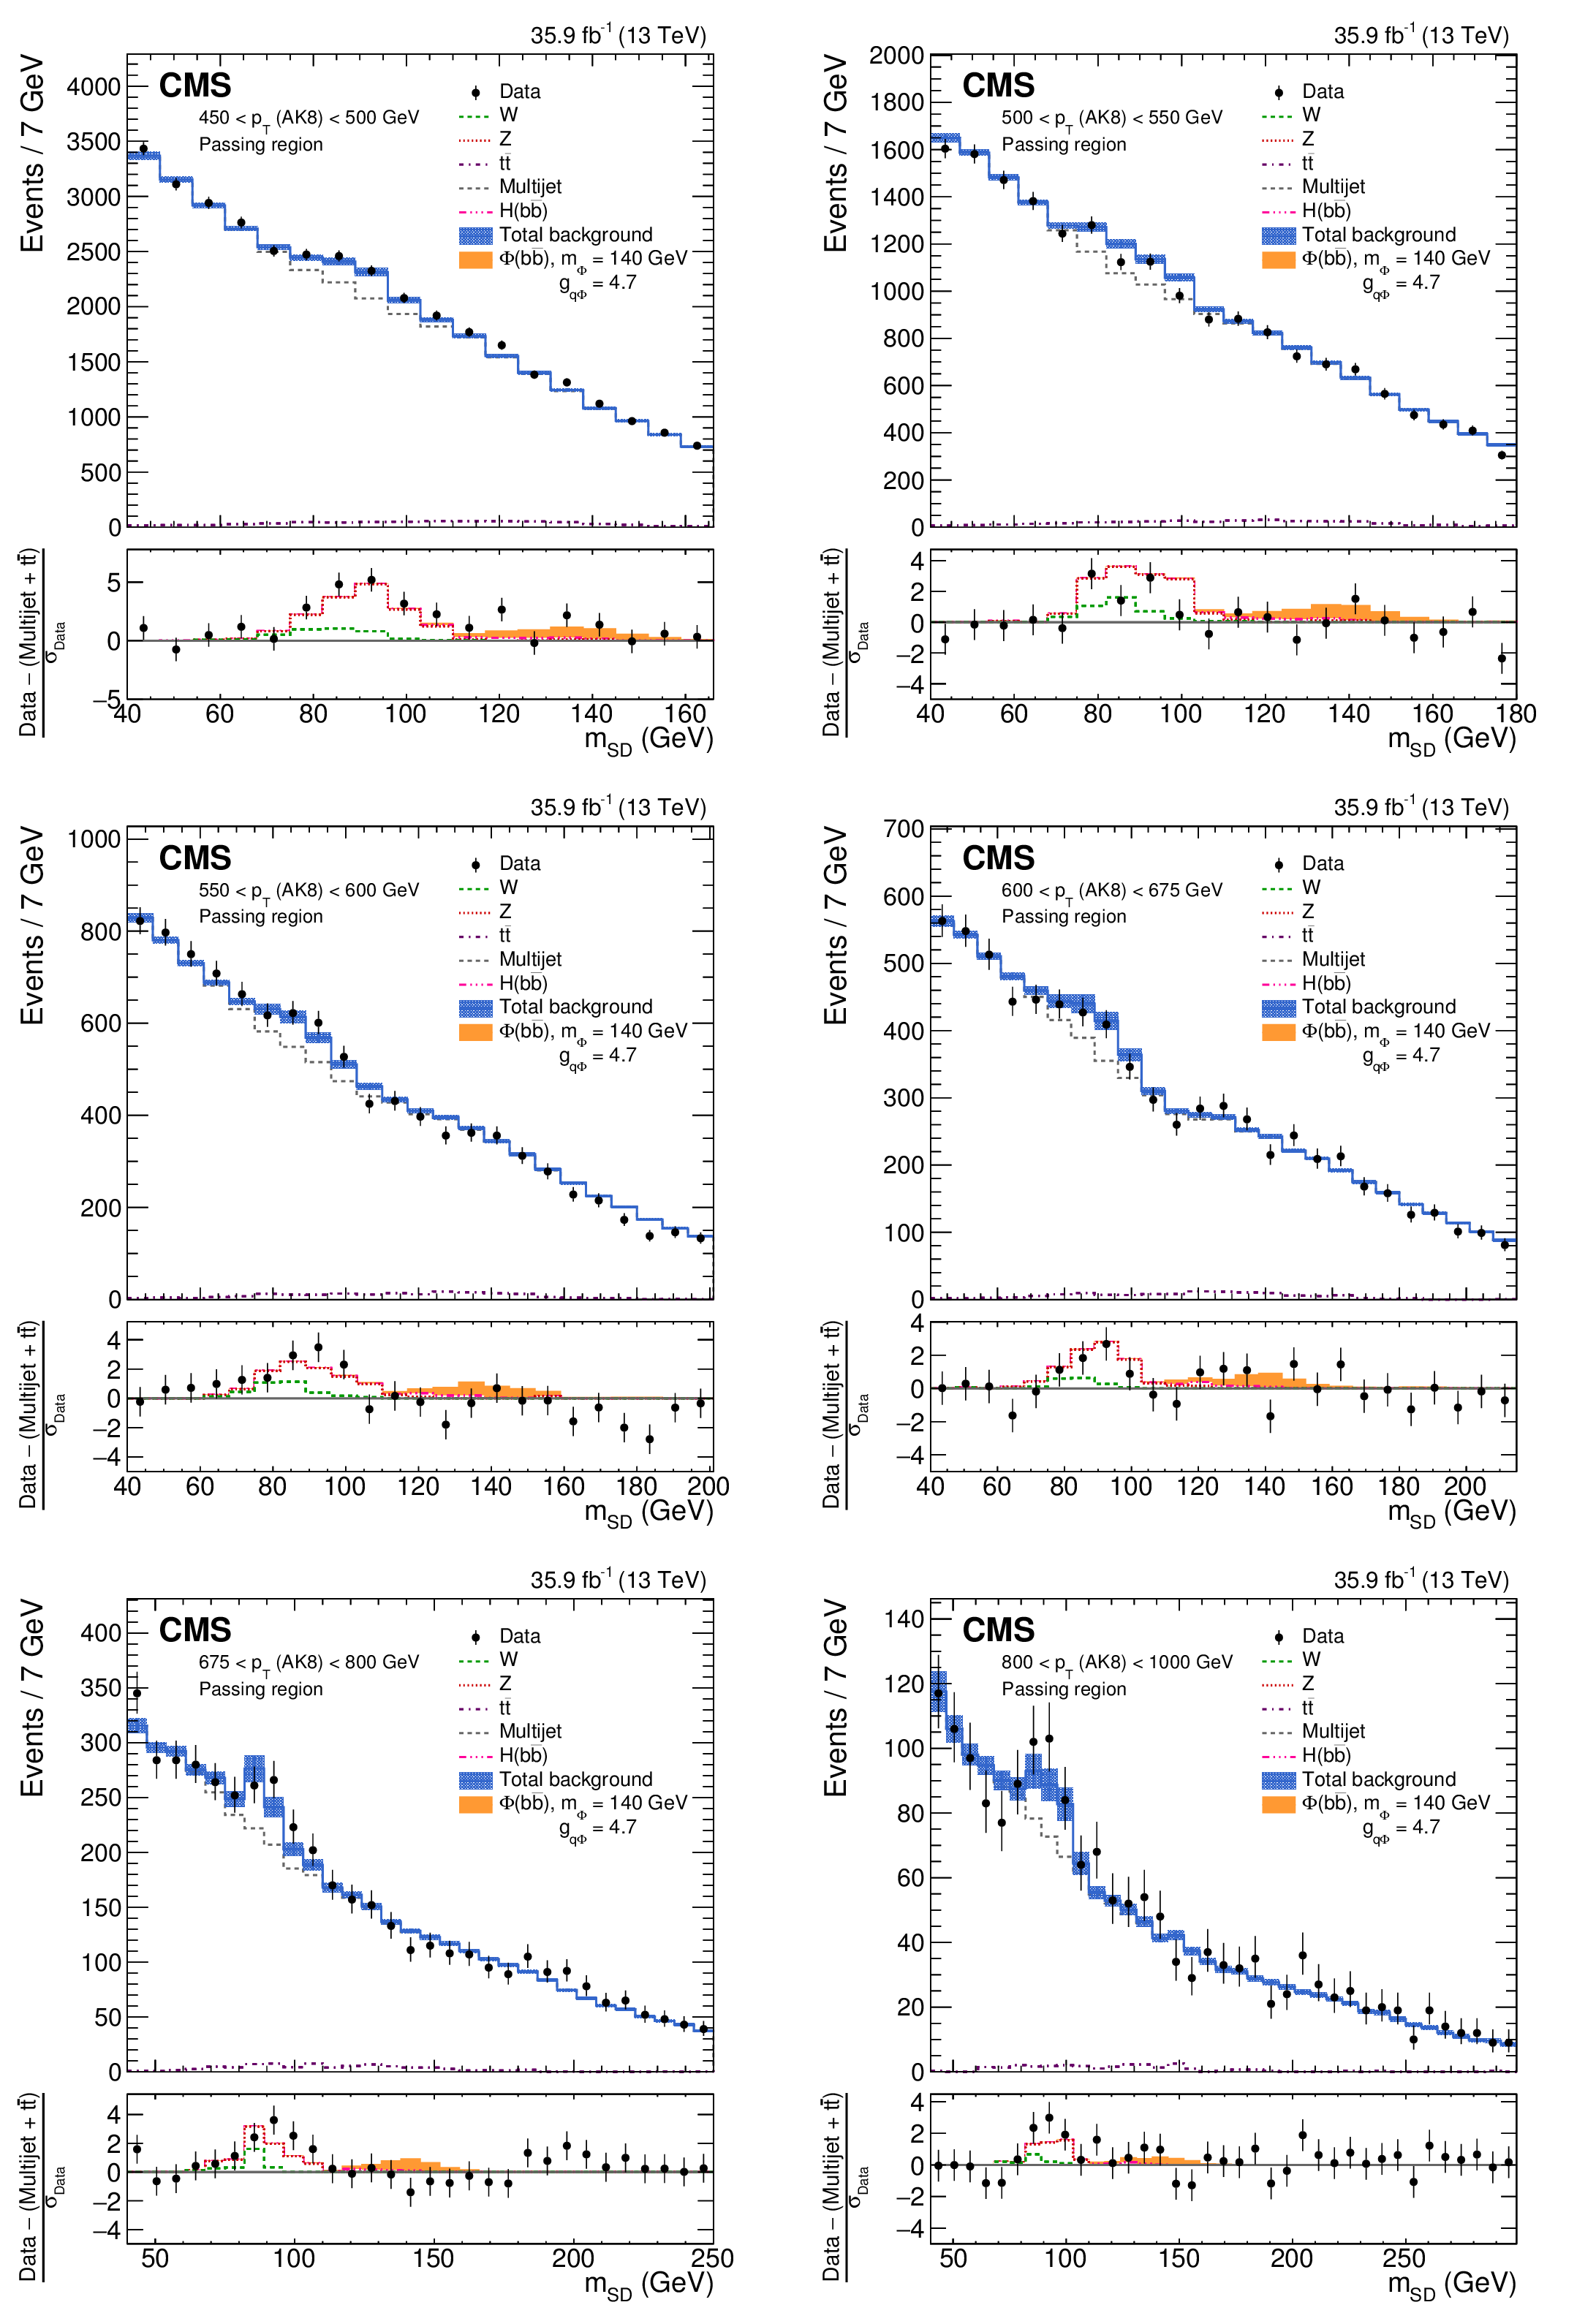
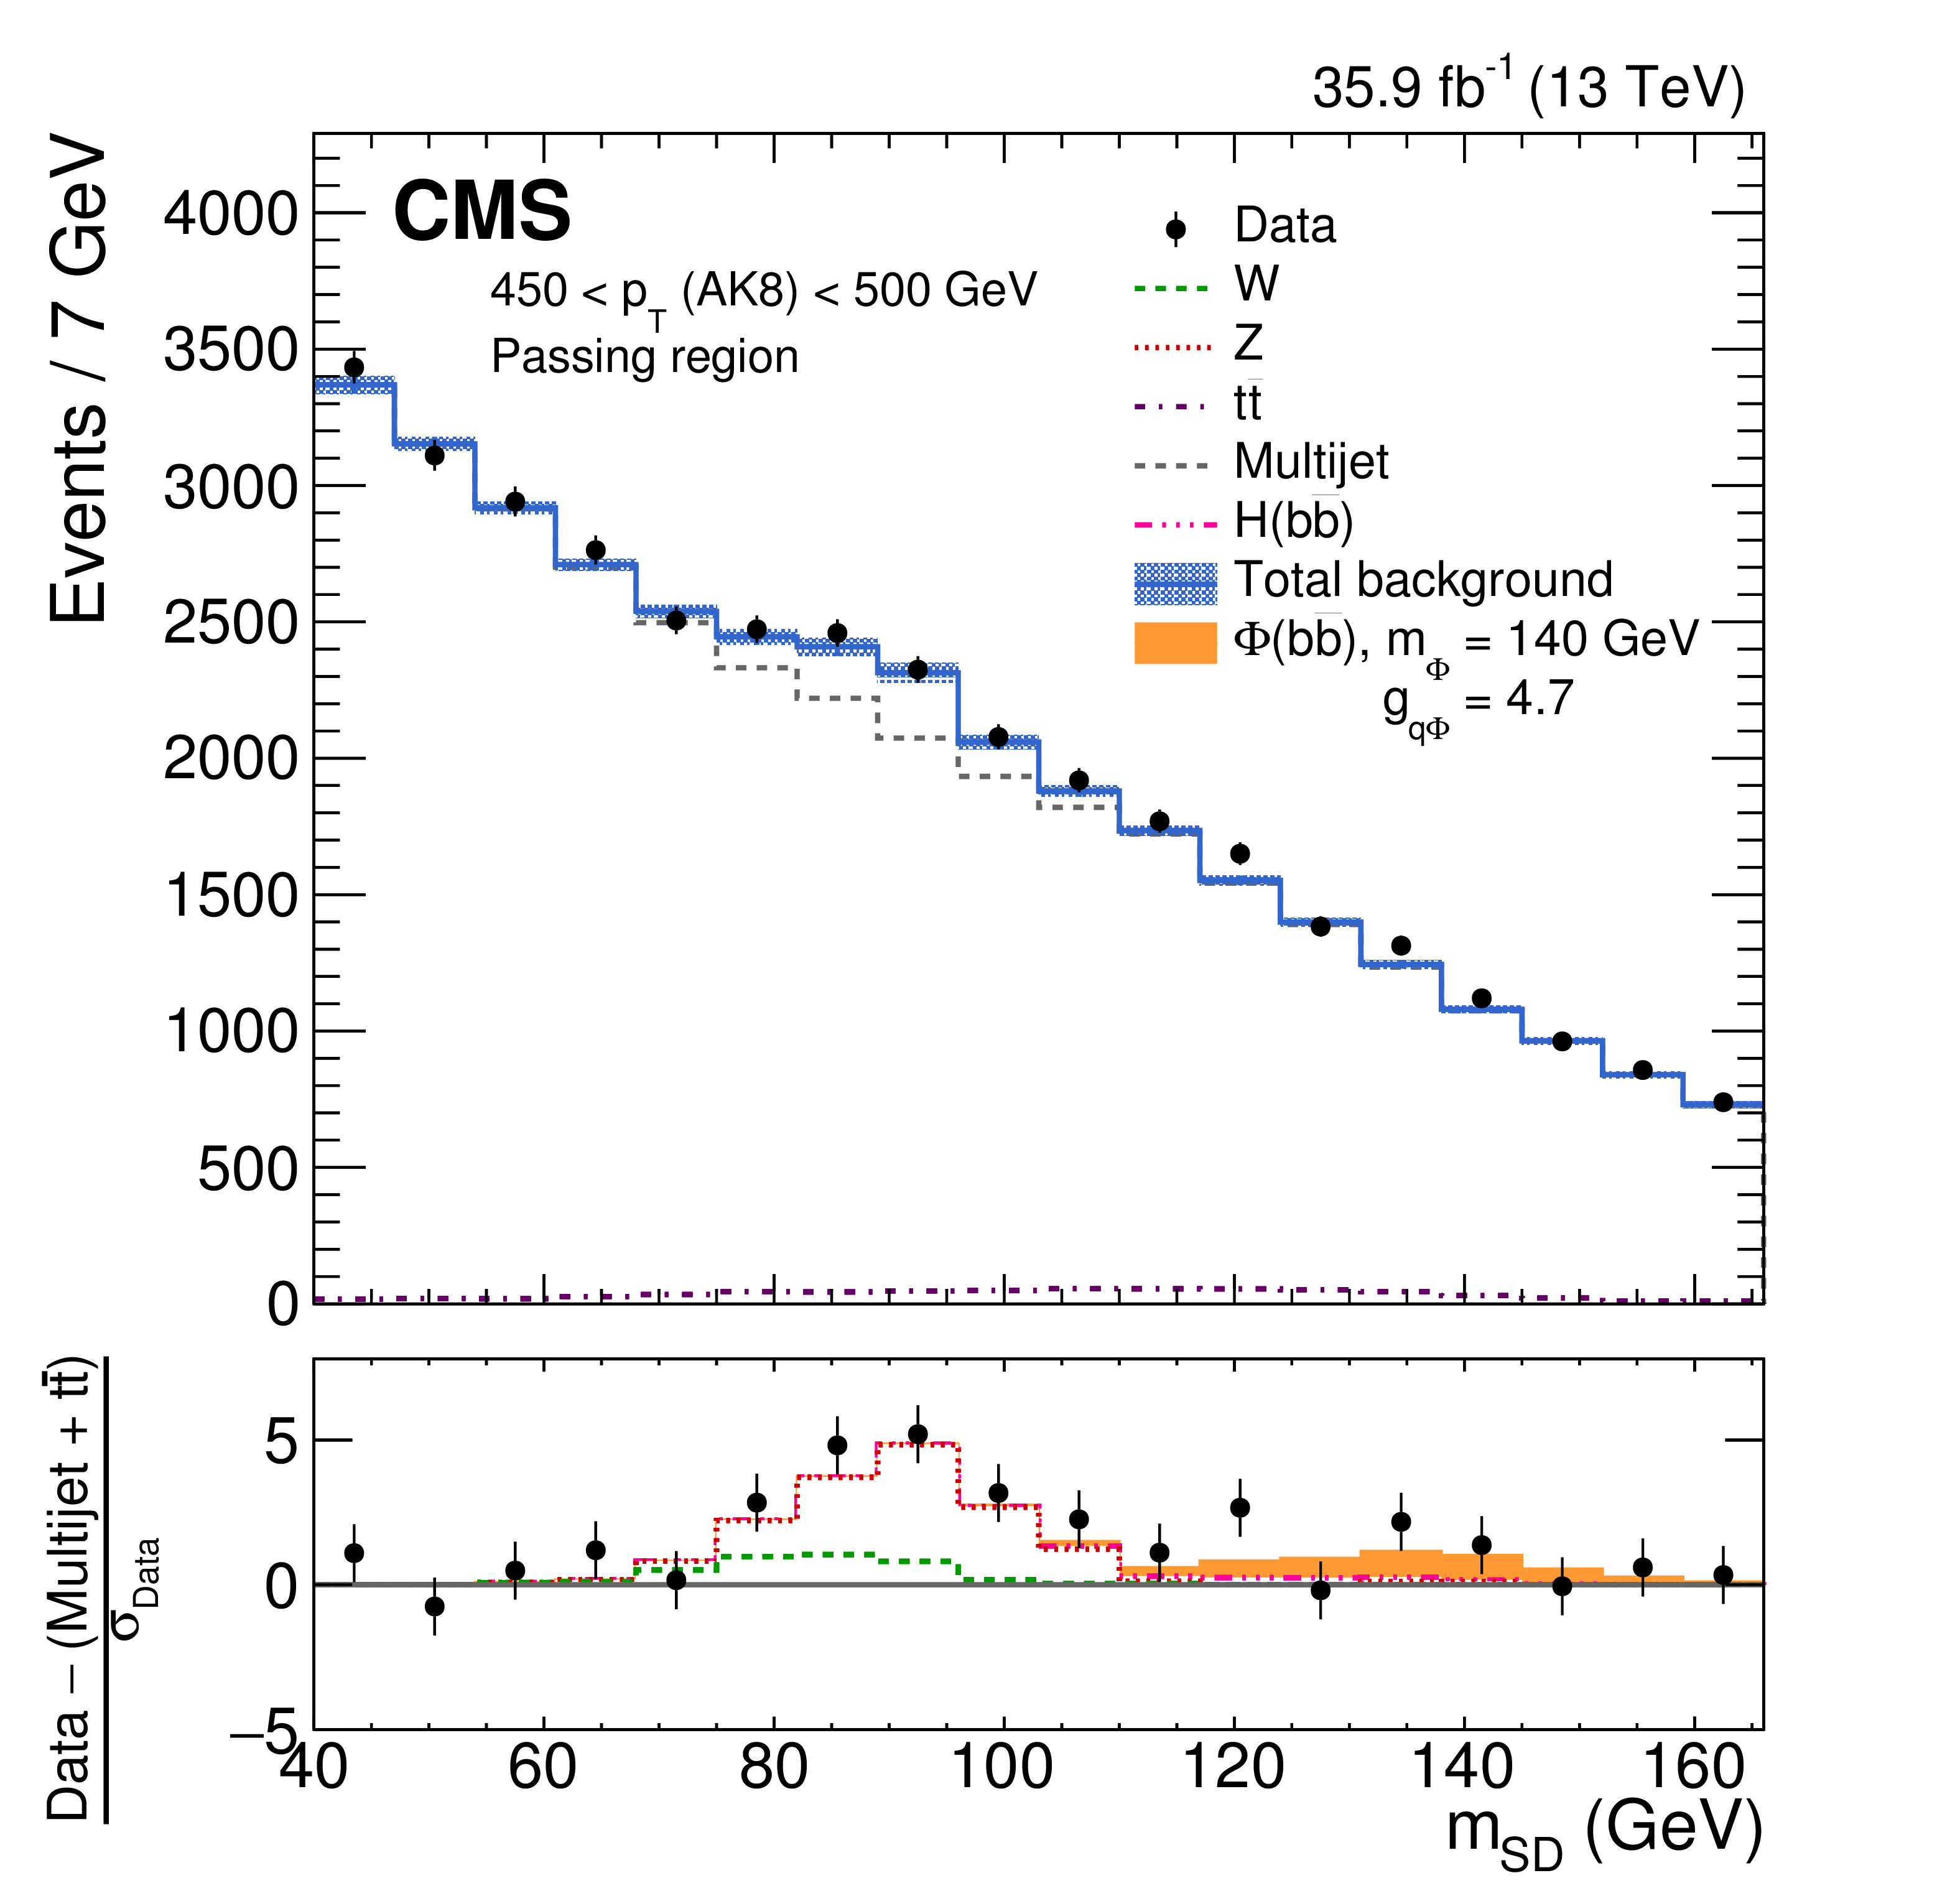
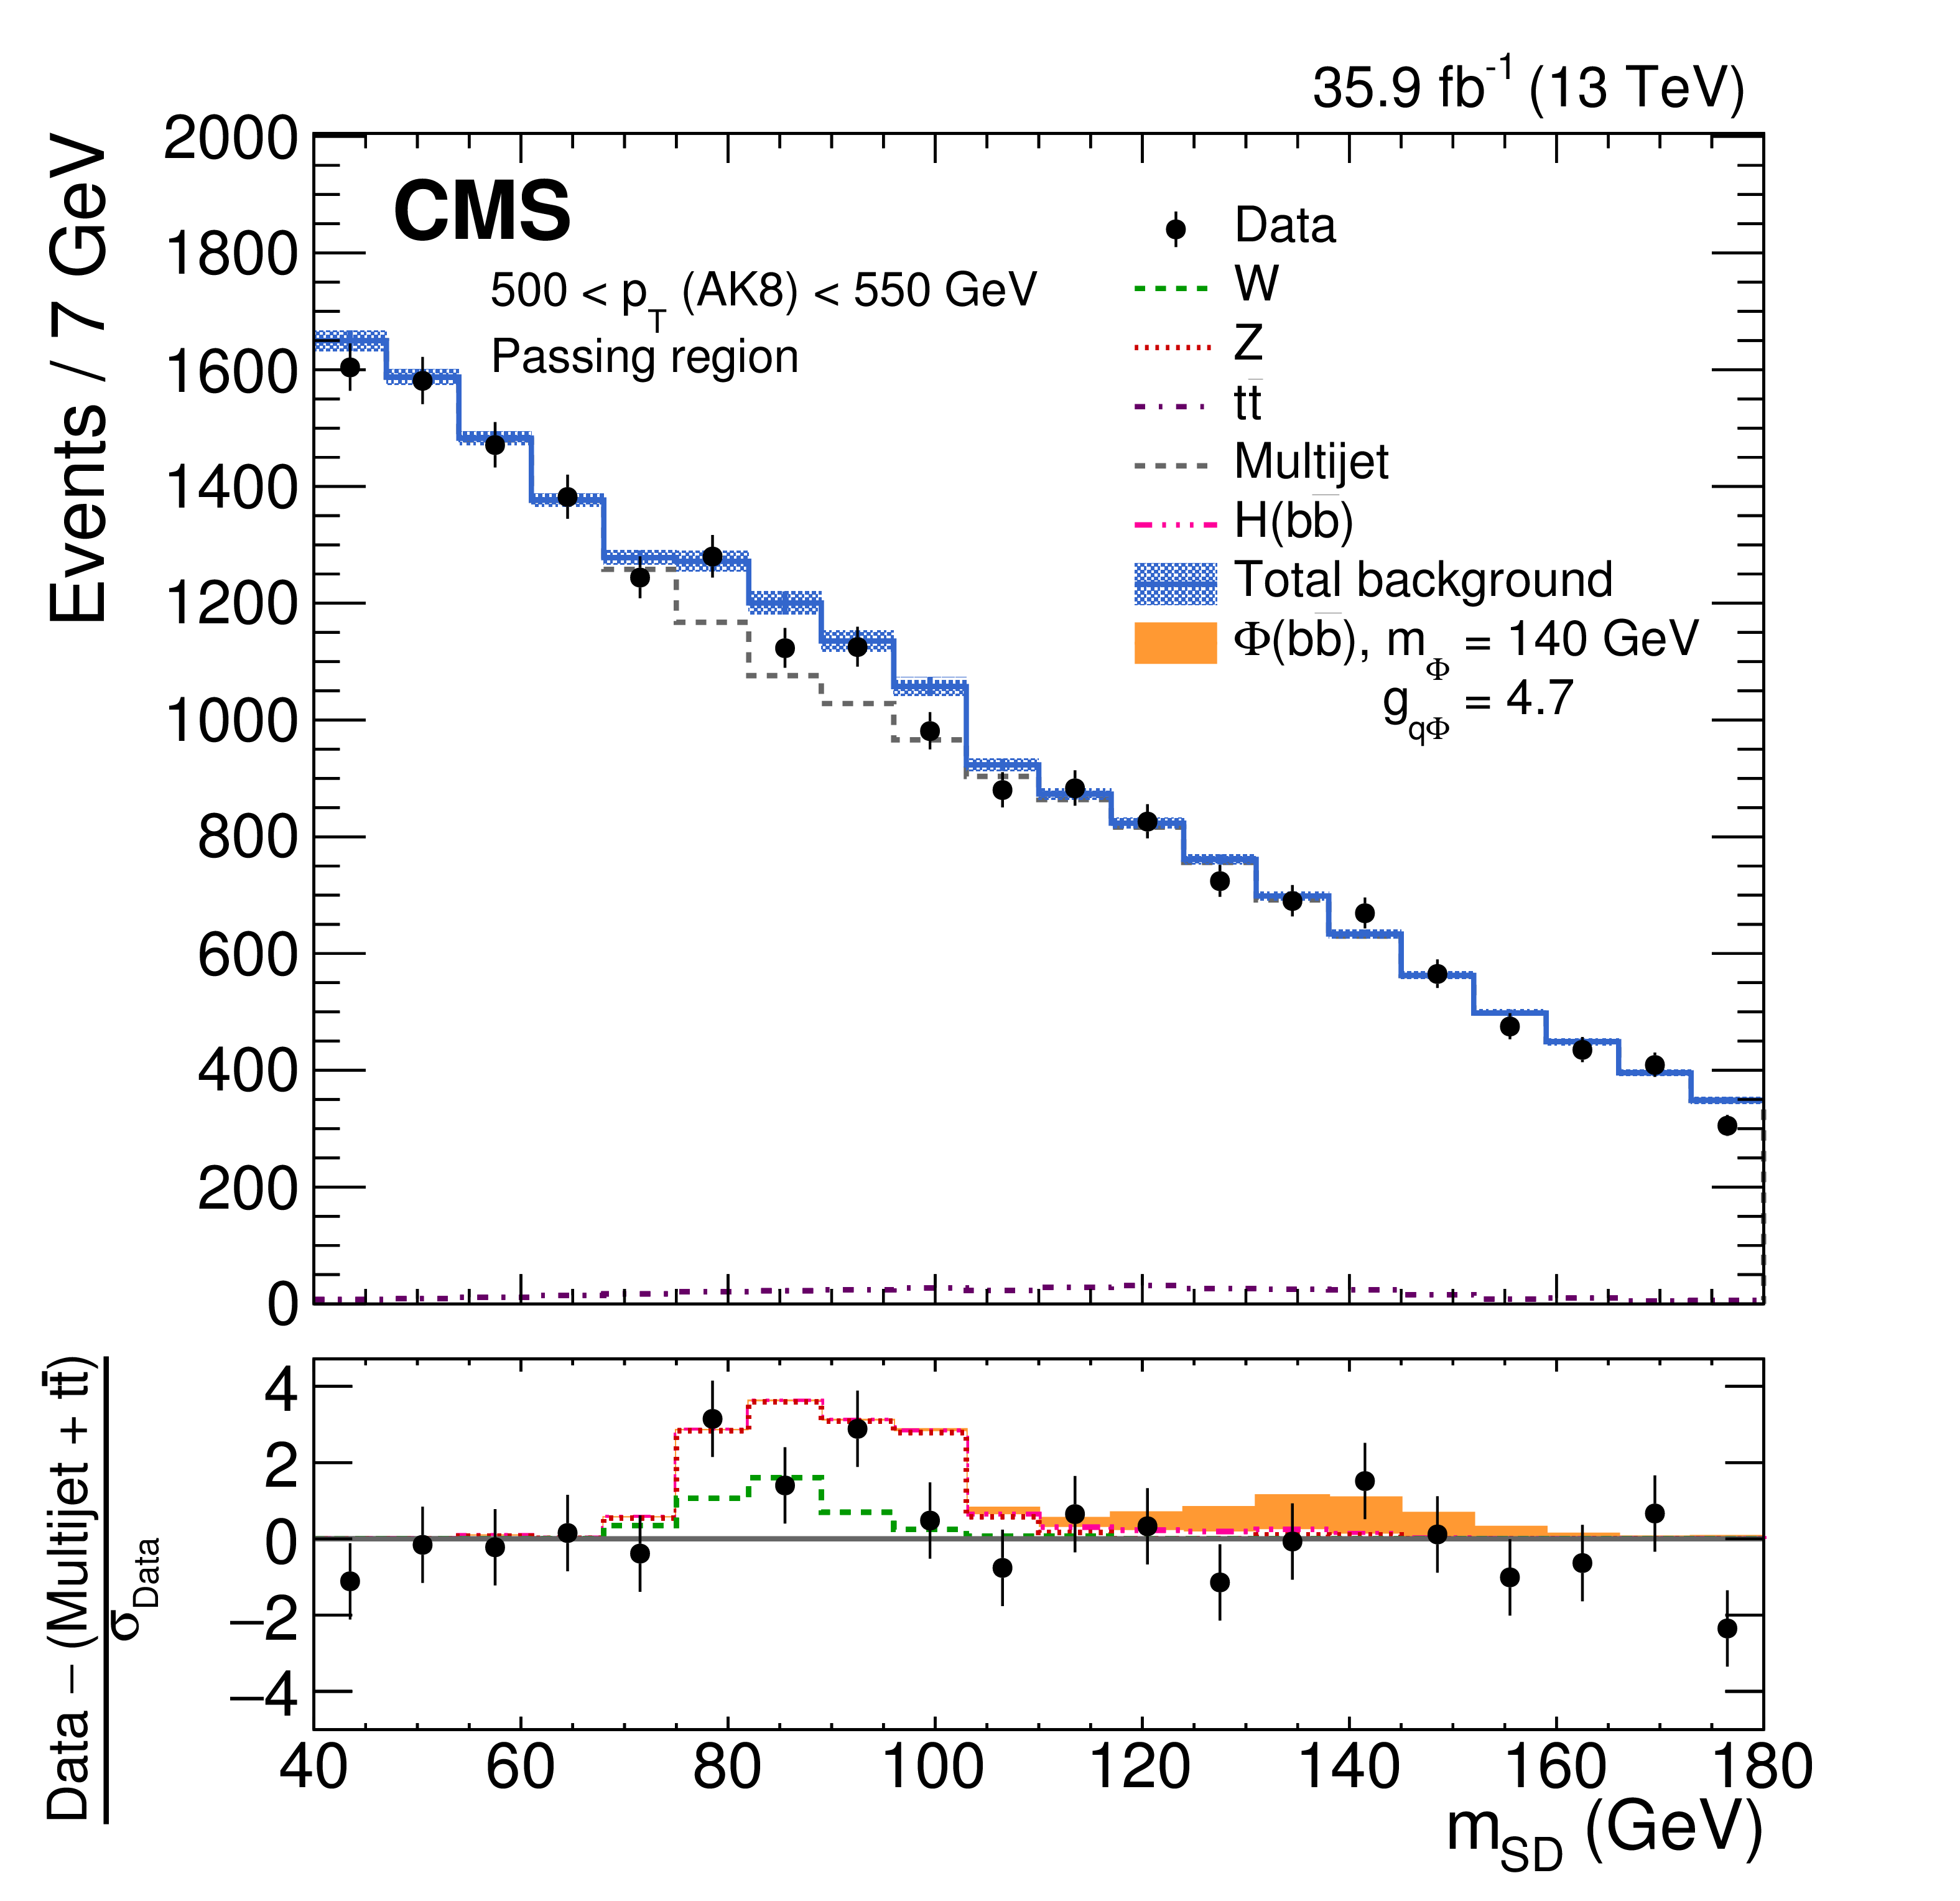
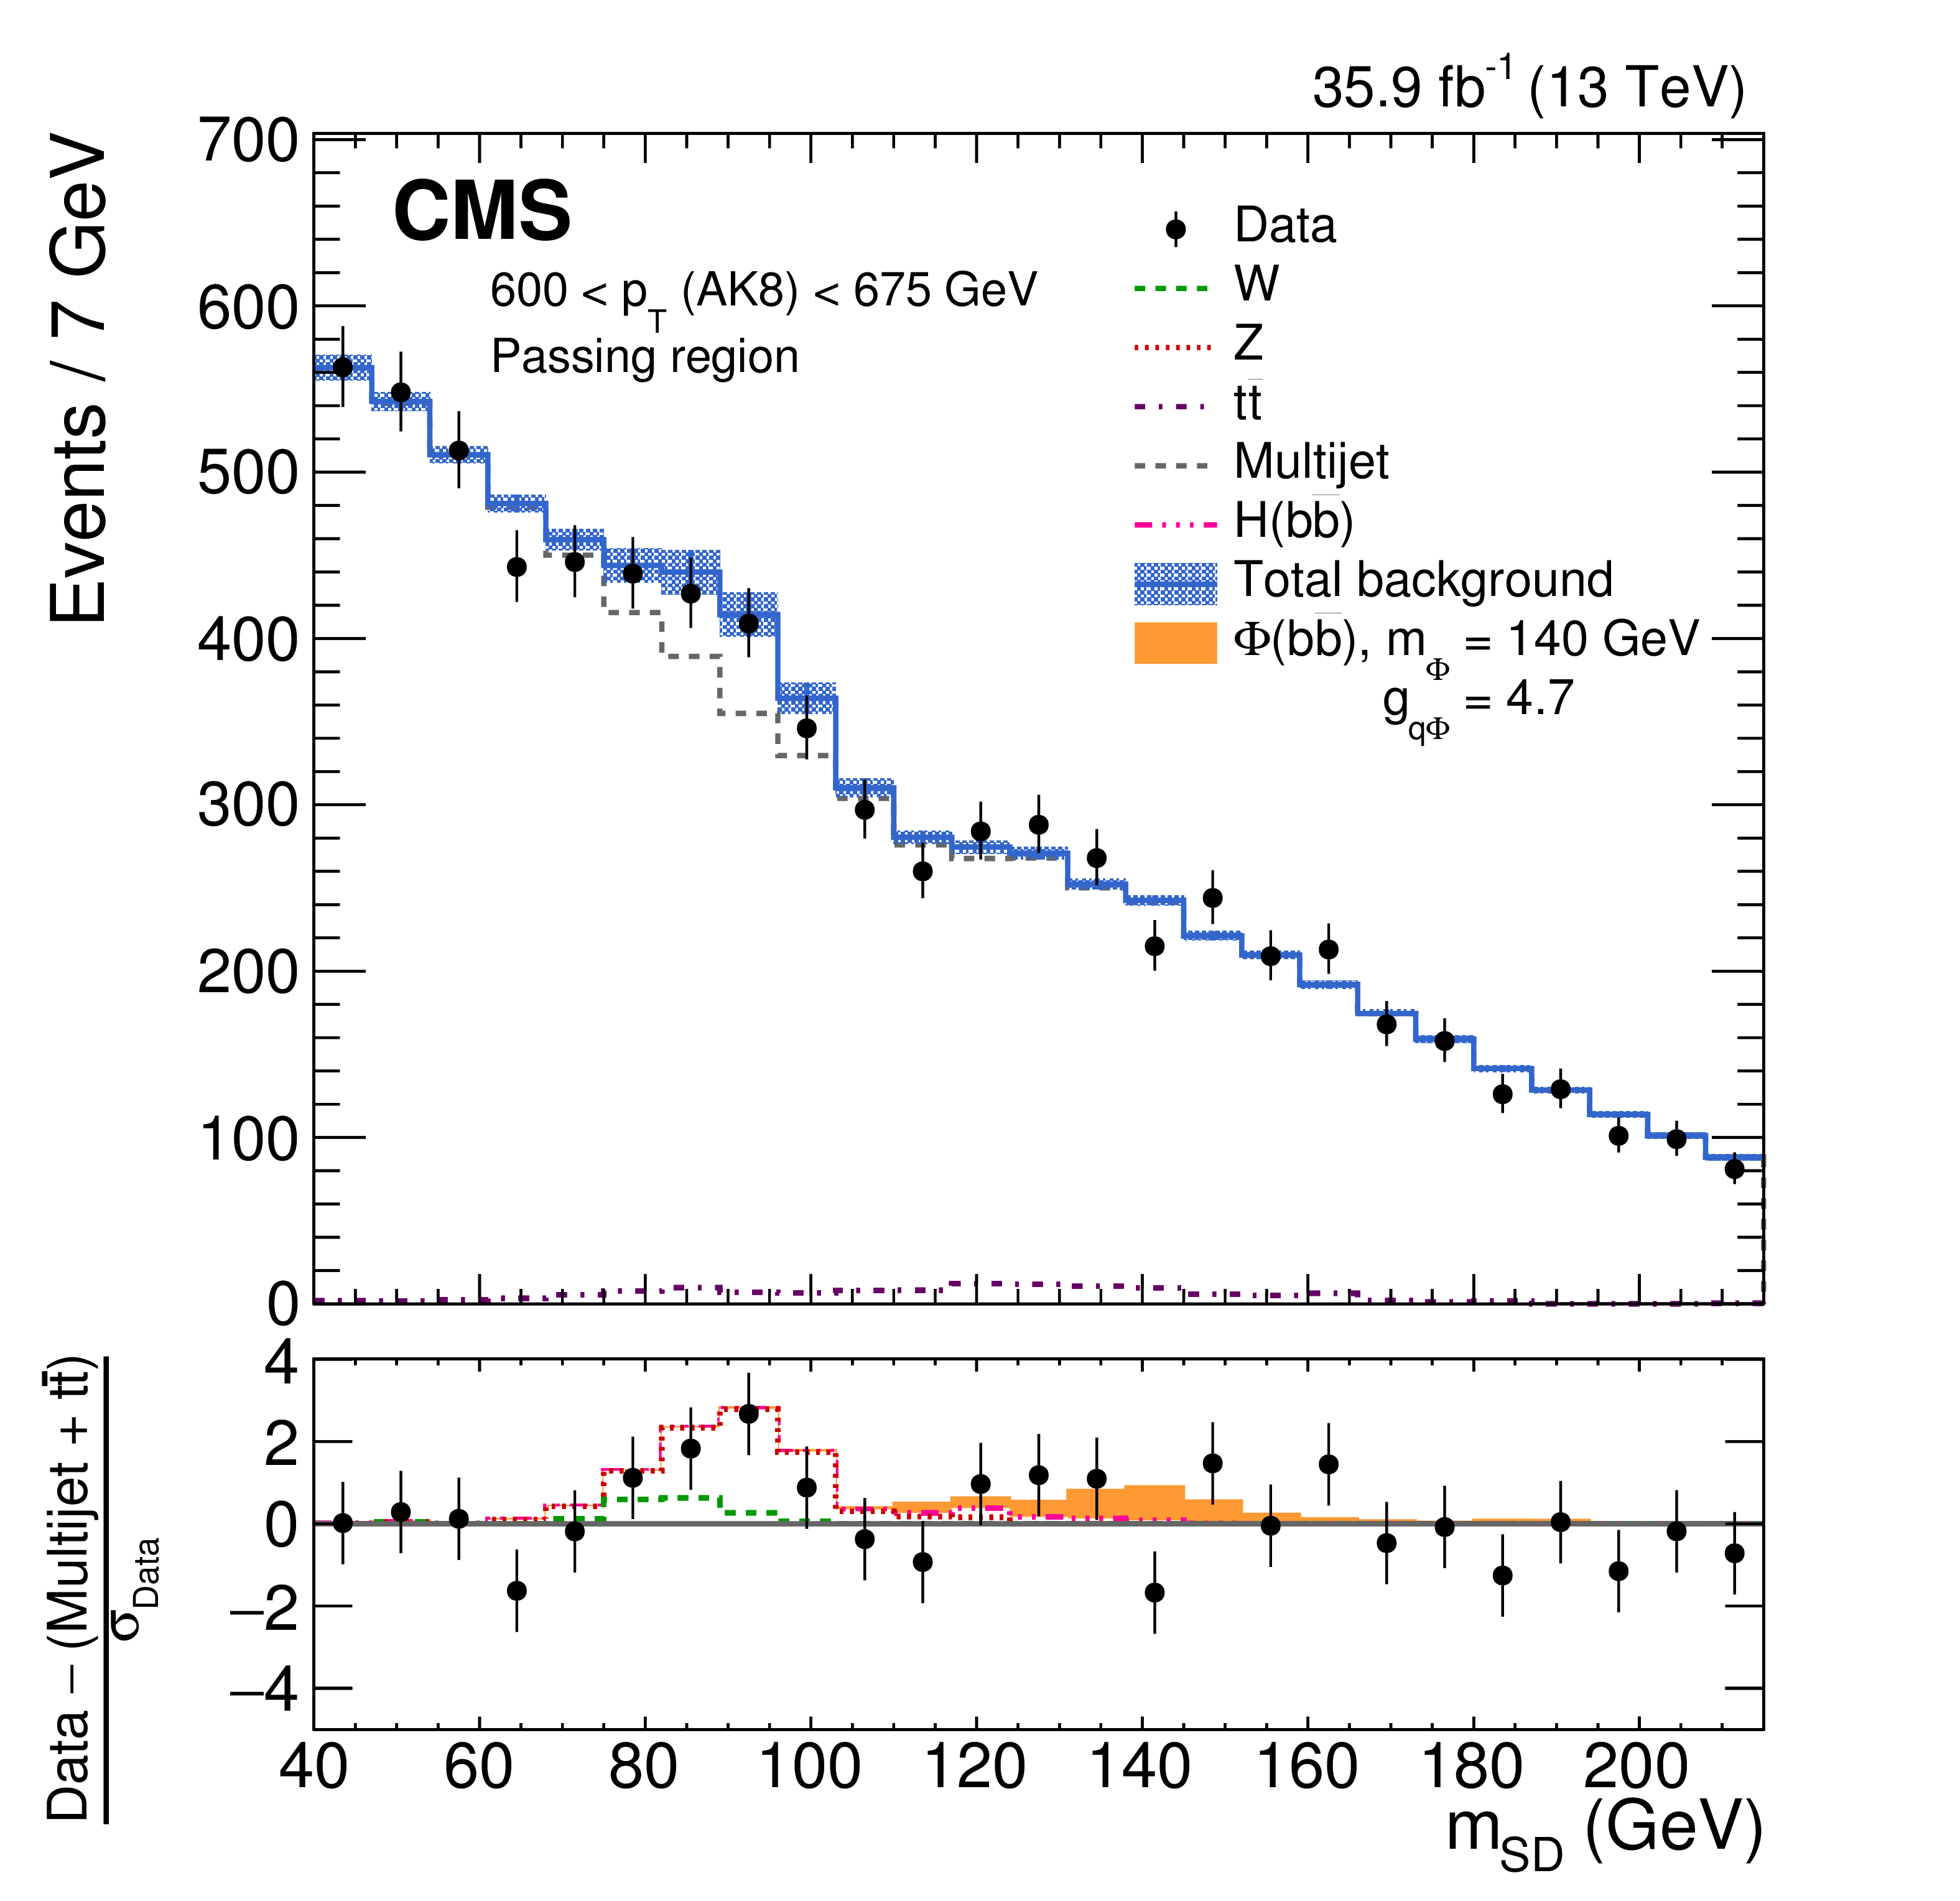
Figure 5:
The observed and fitted background $ {m_{\mathrm {SD}}} $ distributions in each $ {p_{\mathrm {T}}} $ category for the AK8 selection in the passing regions. The fit is performed under the background-only hypothesis. A hypothetical $\phi ({{\mathrm {b}} {\overline {\mathrm {b}}}})$ signal at a mass of 140 GeV is also indicated. The shaded blue band shows the systematic uncertainty in the total background prediction. The bottom panel shows the difference between the data and the nonresonant background prediction, divided by the statistical uncertainty in the data. |
png pdf |
Figure 5-a:
The observed and fitted background $ {m_{\mathrm {SD}}} $ distributions in the 400 $ < {p_{\mathrm {T}}} < $ 450 GeV category for the AK8 selection in the passing regions. The fit is performed under the background-only hypothesis. A hypothetical $\phi ({{\mathrm {b}} {\overline {\mathrm {b}}}})$ signal at a mass of 140 GeV is also indicated. The shaded blue band shows the systematic uncertainty in the total background prediction. The bottom panel shows the difference between the data and the nonresonant background prediction, divided by the statistical uncertainty in the data. |
png pdf |
Figure 5-b:
The observed and fitted background $ {m_{\mathrm {SD}}} $ distributions in the 400 $ < {p_{\mathrm {T}}} < $ 450 GeV category for the AK8 selection in the passing regions. The fit is performed under the background-only hypothesis. A hypothetical $\phi ({{\mathrm {b}} {\overline {\mathrm {b}}}})$ signal at a mass of 140 GeV is also indicated. The shaded blue band shows the systematic uncertainty in the total background prediction. The bottom panel shows the difference between the data and the nonresonant background prediction, divided by the statistical uncertainty in the data. |
png pdf |
Figure 5-c:
The observed and fitted background $ {m_{\mathrm {SD}}} $ distributions in the 450 $ < {p_{\mathrm {T}}} < $ 500 GeV category for the AK8 selection in the passing regions. The fit is performed under the background-only hypothesis. A hypothetical $\phi ({{\mathrm {b}} {\overline {\mathrm {b}}}})$ signal at a mass of 140 GeV is also indicated. The shaded blue band shows the systematic uncertainty in the total background prediction. The bottom panel shows the difference between the data and the nonresonant background prediction, divided by the statistical uncertainty in the data. |
png pdf |
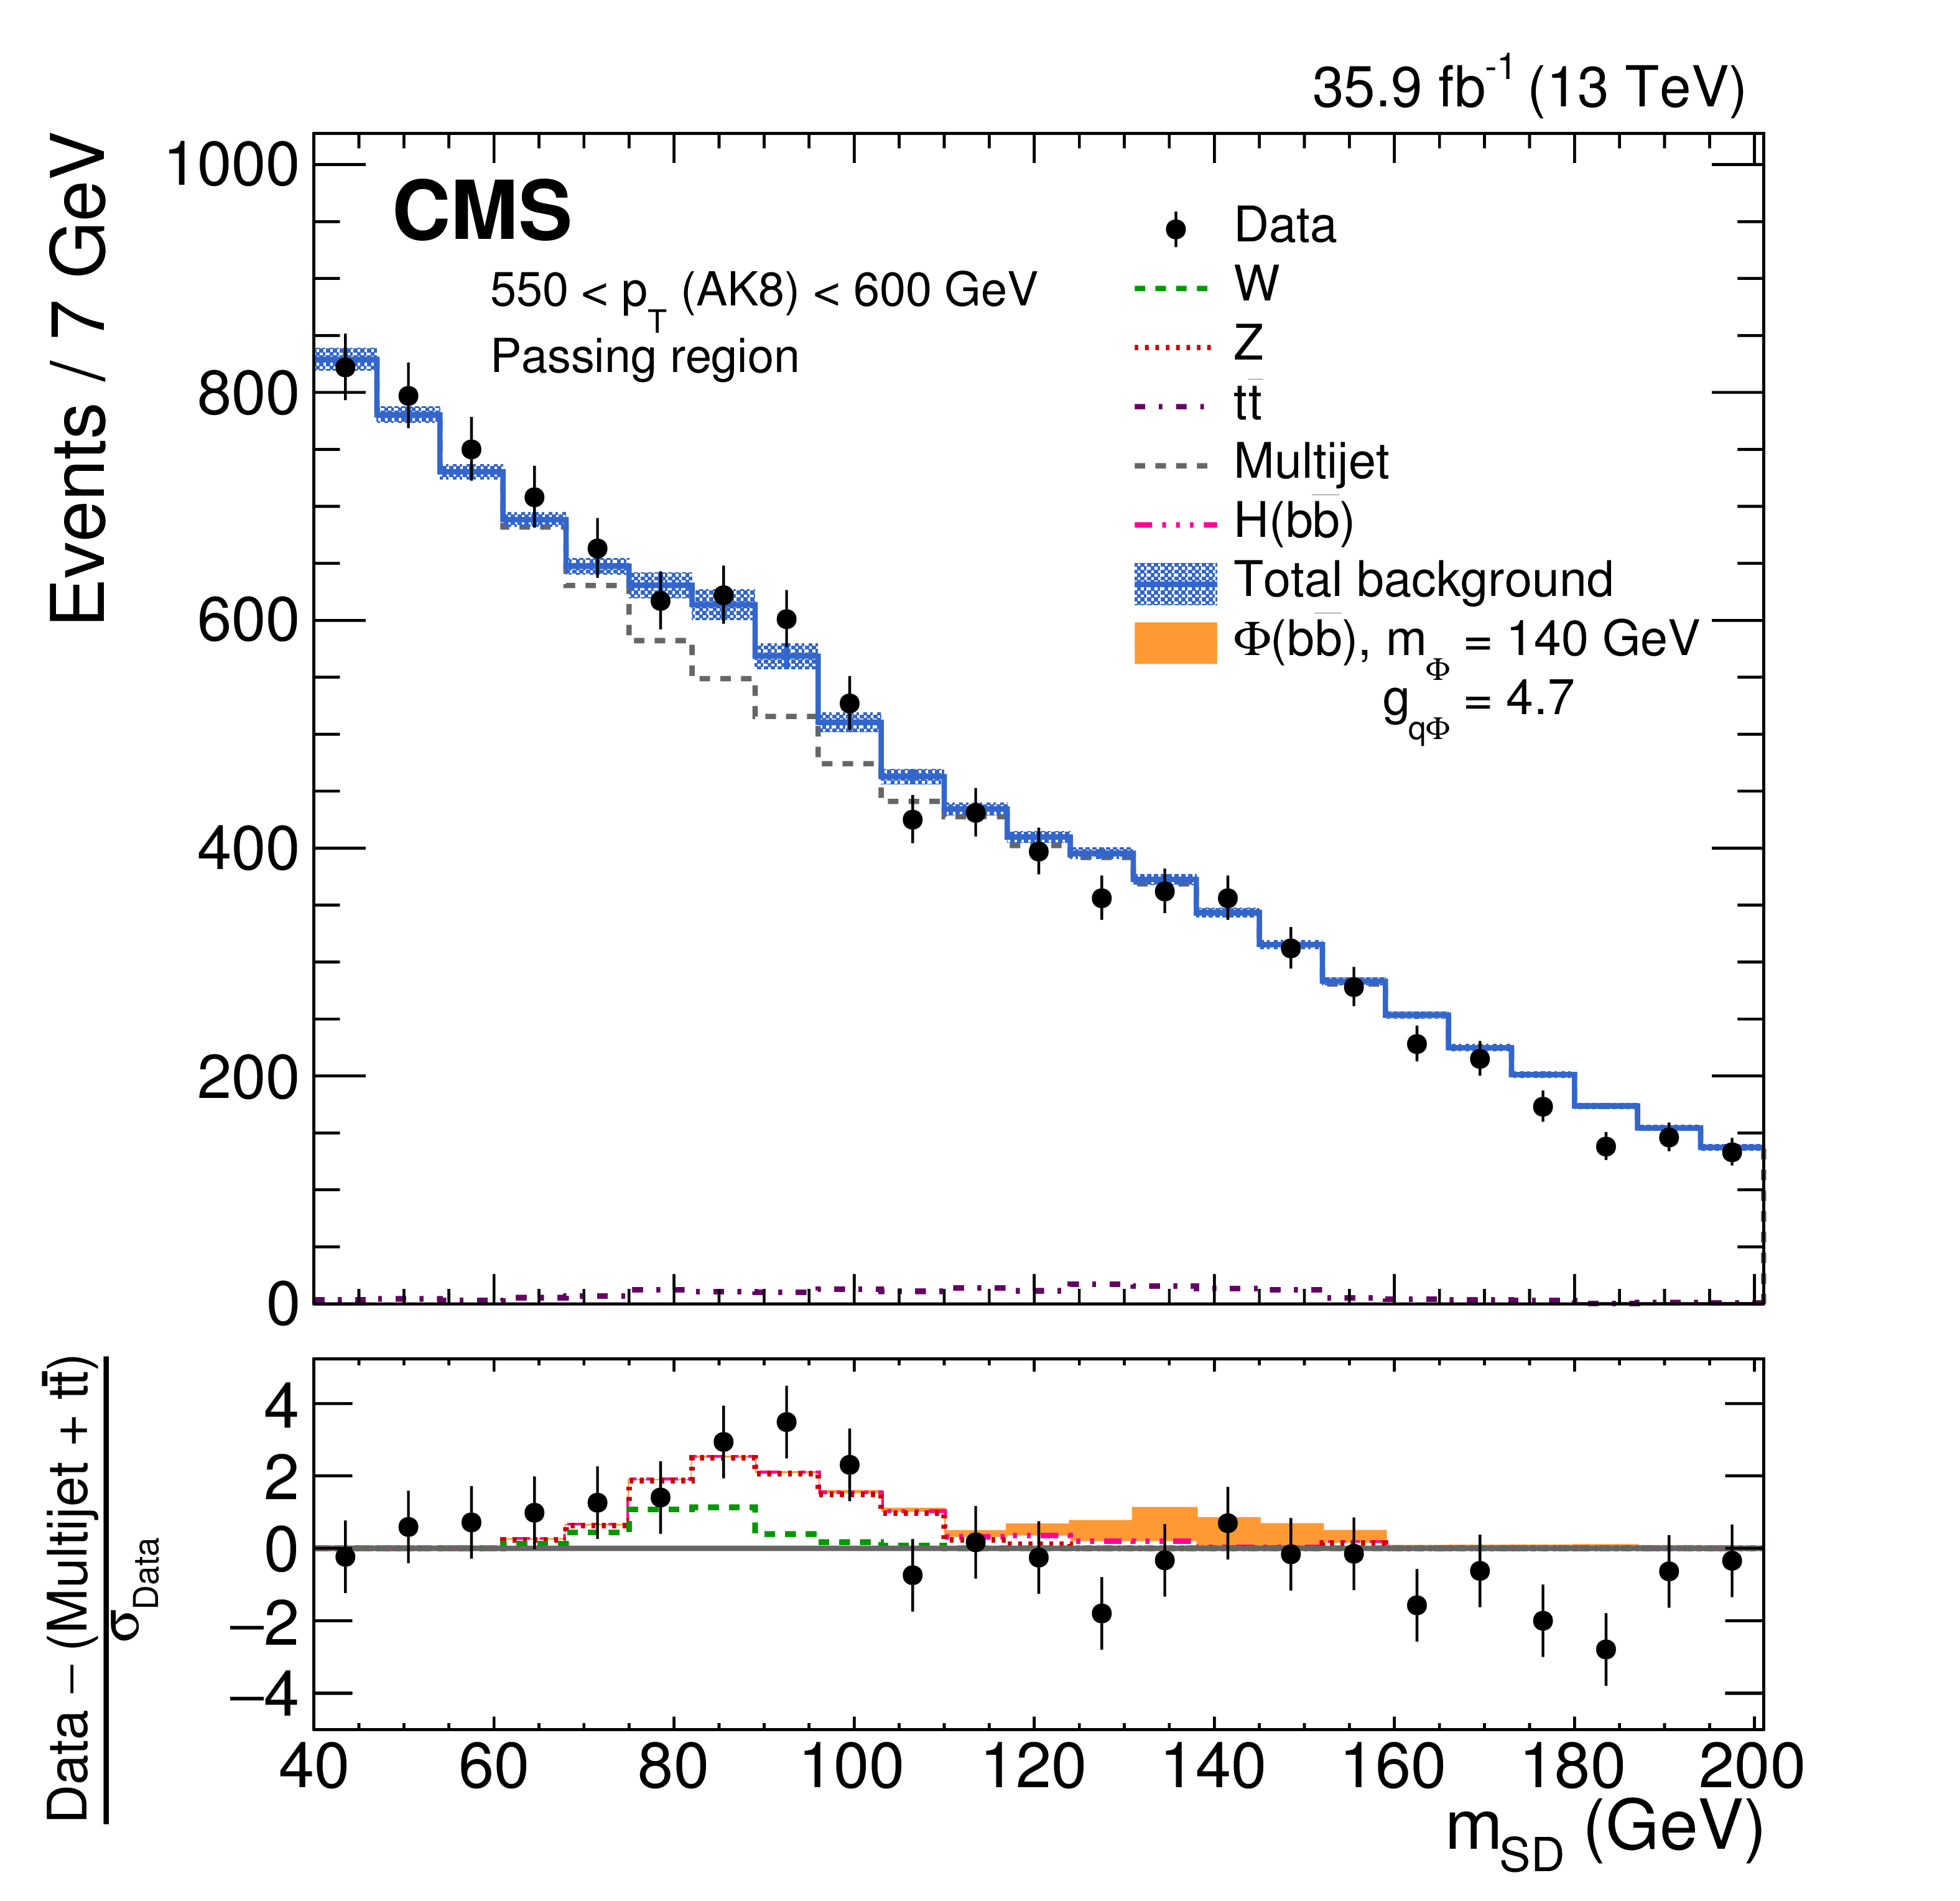
Figure 5-d:
The observed and fitted background $ {m_{\mathrm {SD}}} $ distributions in the 550 $ < {p_{\mathrm {T}}} < $ 600 GeV category for the AK8 selection in the passing regions. The fit is performed under the background-only hypothesis. A hypothetical $\phi ({{\mathrm {b}} {\overline {\mathrm {b}}}})$ signal at a mass of 140 GeV is also indicated. The shaded blue band shows the systematic uncertainty in the total background prediction. The bottom panel shows the difference between the data and the nonresonant background prediction, divided by the statistical uncertainty in the data. |
png pdf |
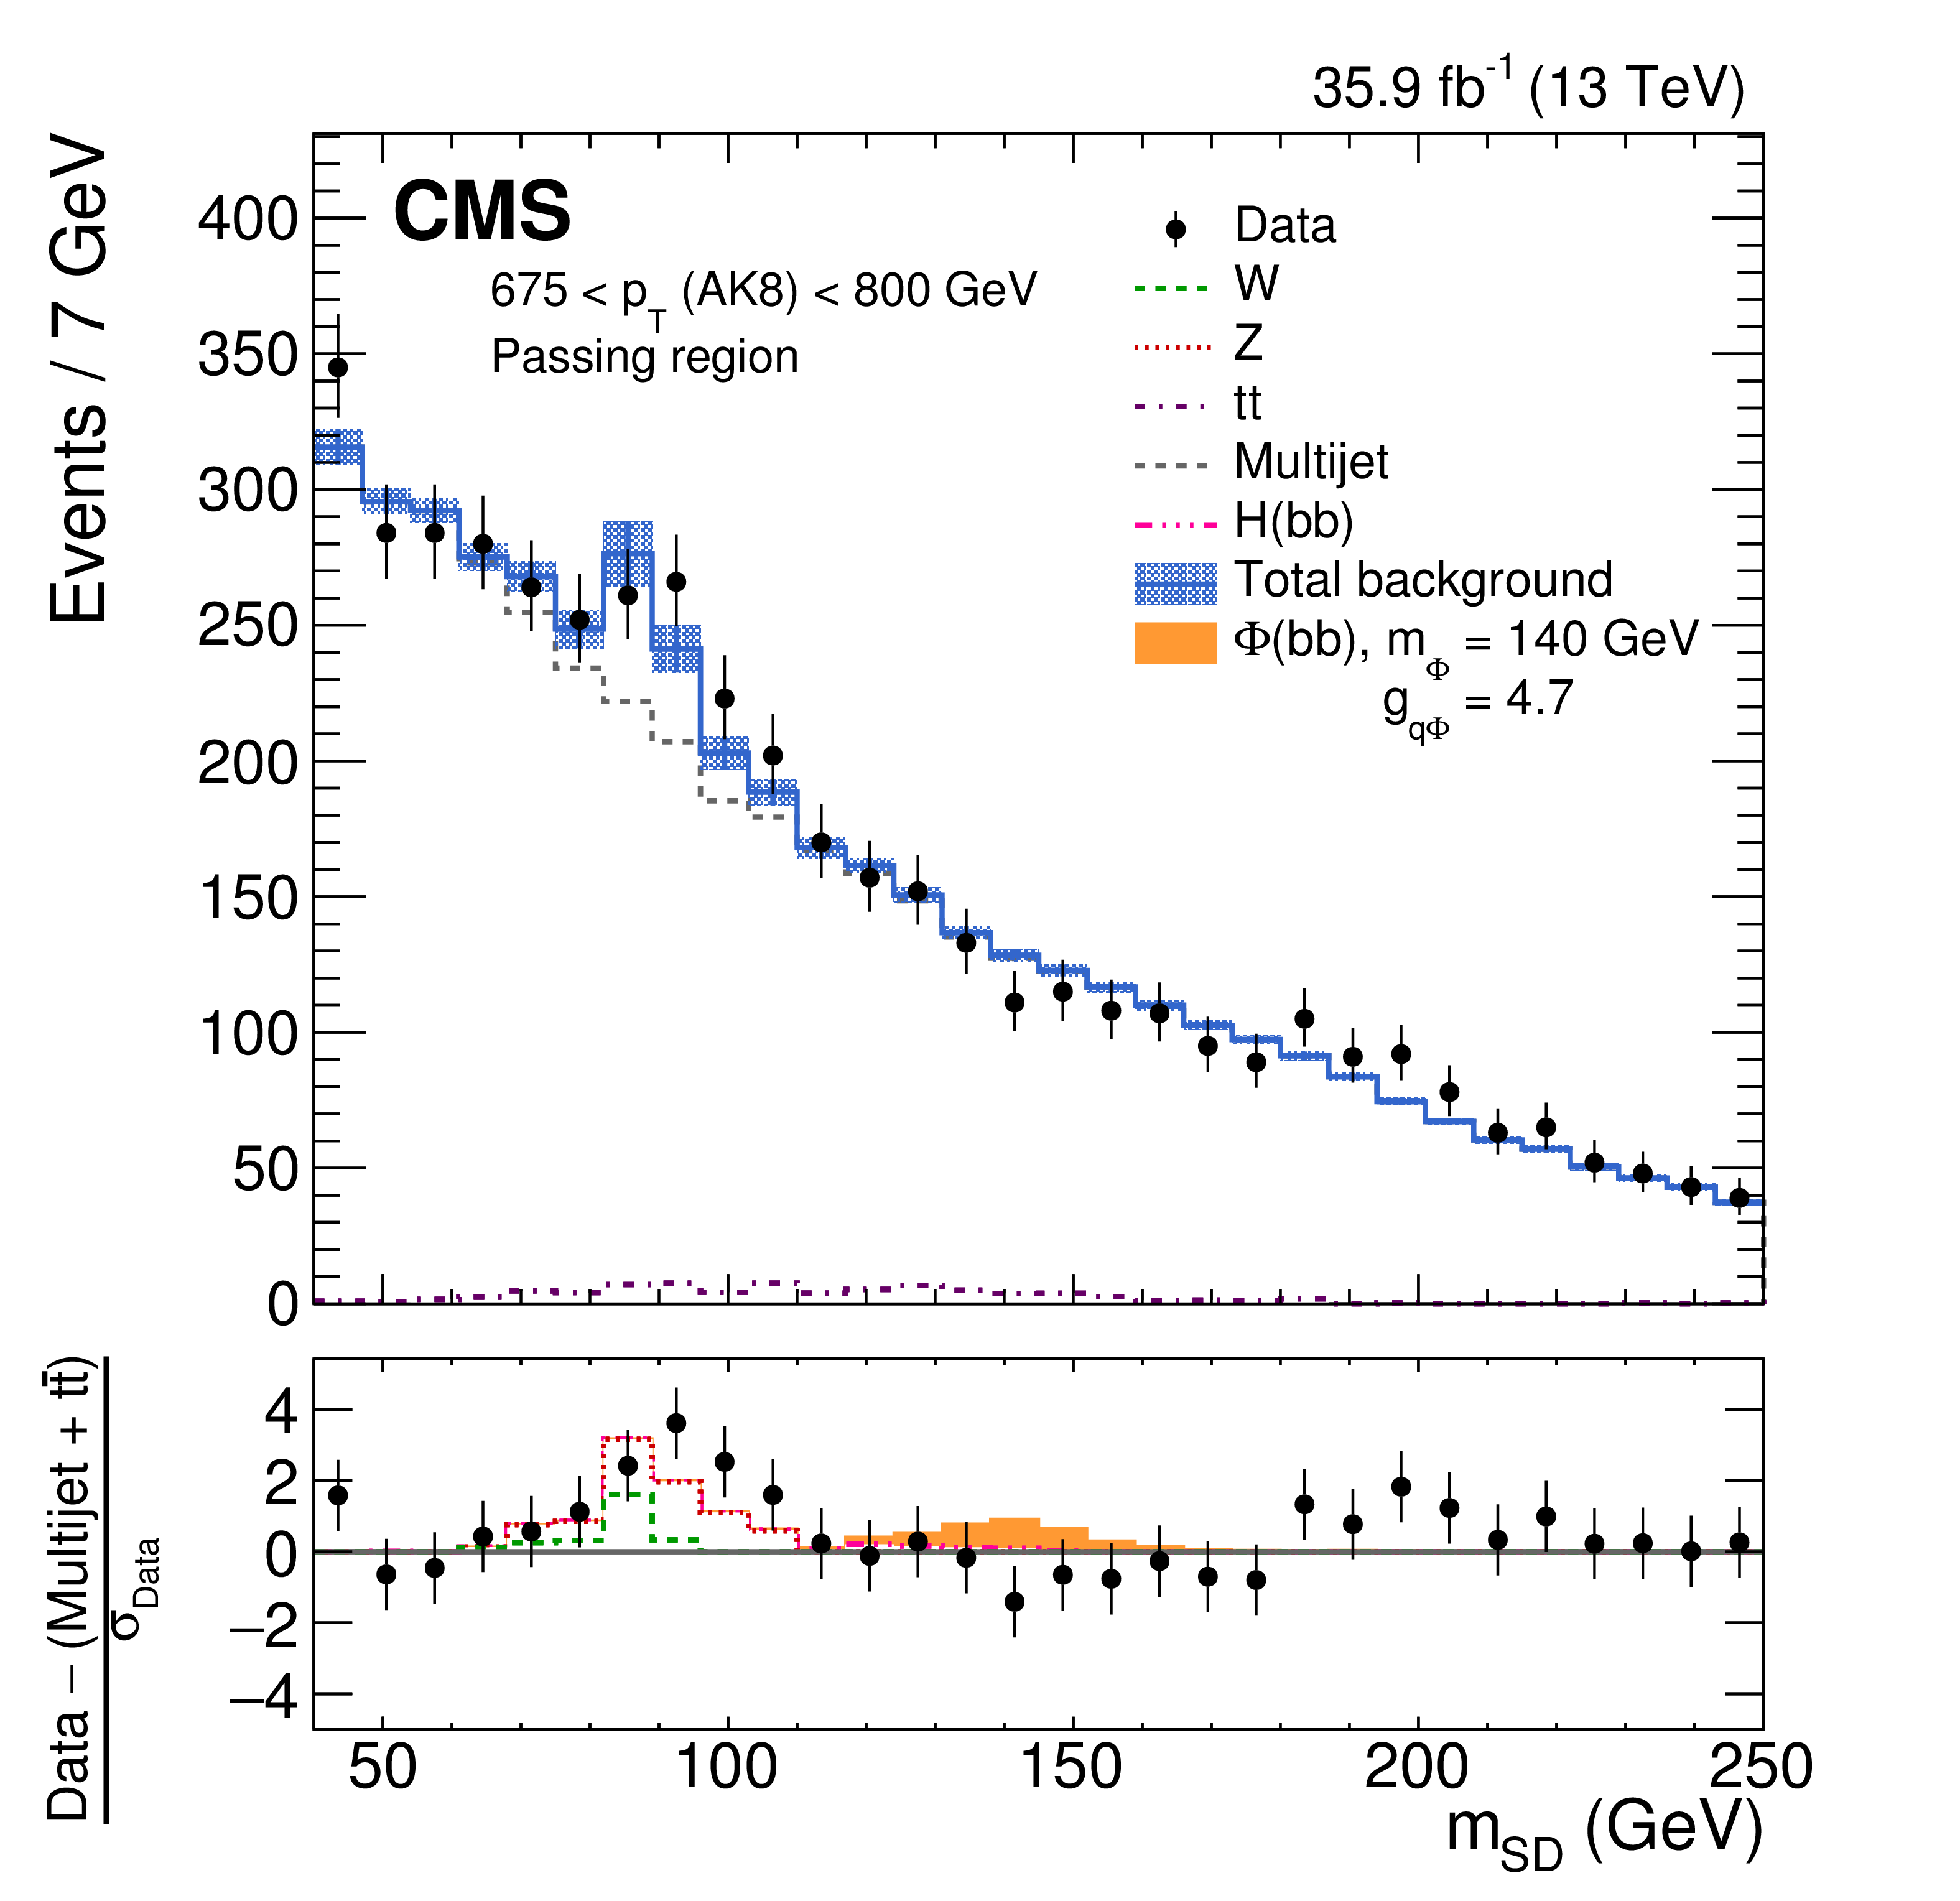
Figure 5-e:
The observed and fitted background $ {m_{\mathrm {SD}}} $ distributions in the 675 $ < {p_{\mathrm {T}}} < $ 800 GeV category for the AK8 selection in the passing regions. The fit is performed under the background-only hypothesis. A hypothetical $\phi ({{\mathrm {b}} {\overline {\mathrm {b}}}})$ signal at a mass of 140 GeV is also indicated. The shaded blue band shows the systematic uncertainty in the total background prediction. The bottom panel shows the difference between the data and the nonresonant background prediction, divided by the statistical uncertainty in the data. |

png pdf |
Figure 5-f:
The observed and fitted background $ {m_{\mathrm {SD}}} $ distributions in the 800 $ < {p_{\mathrm {T}}} < $ 1000 GeV category for the AK8 selection in the passing regions. The fit is performed under the background-only hypothesis. A hypothetical $\phi ({{\mathrm {b}} {\overline {\mathrm {b}}}})$ signal at a mass of 140 GeV is also indicated. The shaded blue band shows the systematic uncertainty in the total background prediction. The bottom panel shows the difference between the data and the nonresonant background prediction, divided by the statistical uncertainty in the data. |
png pdf |
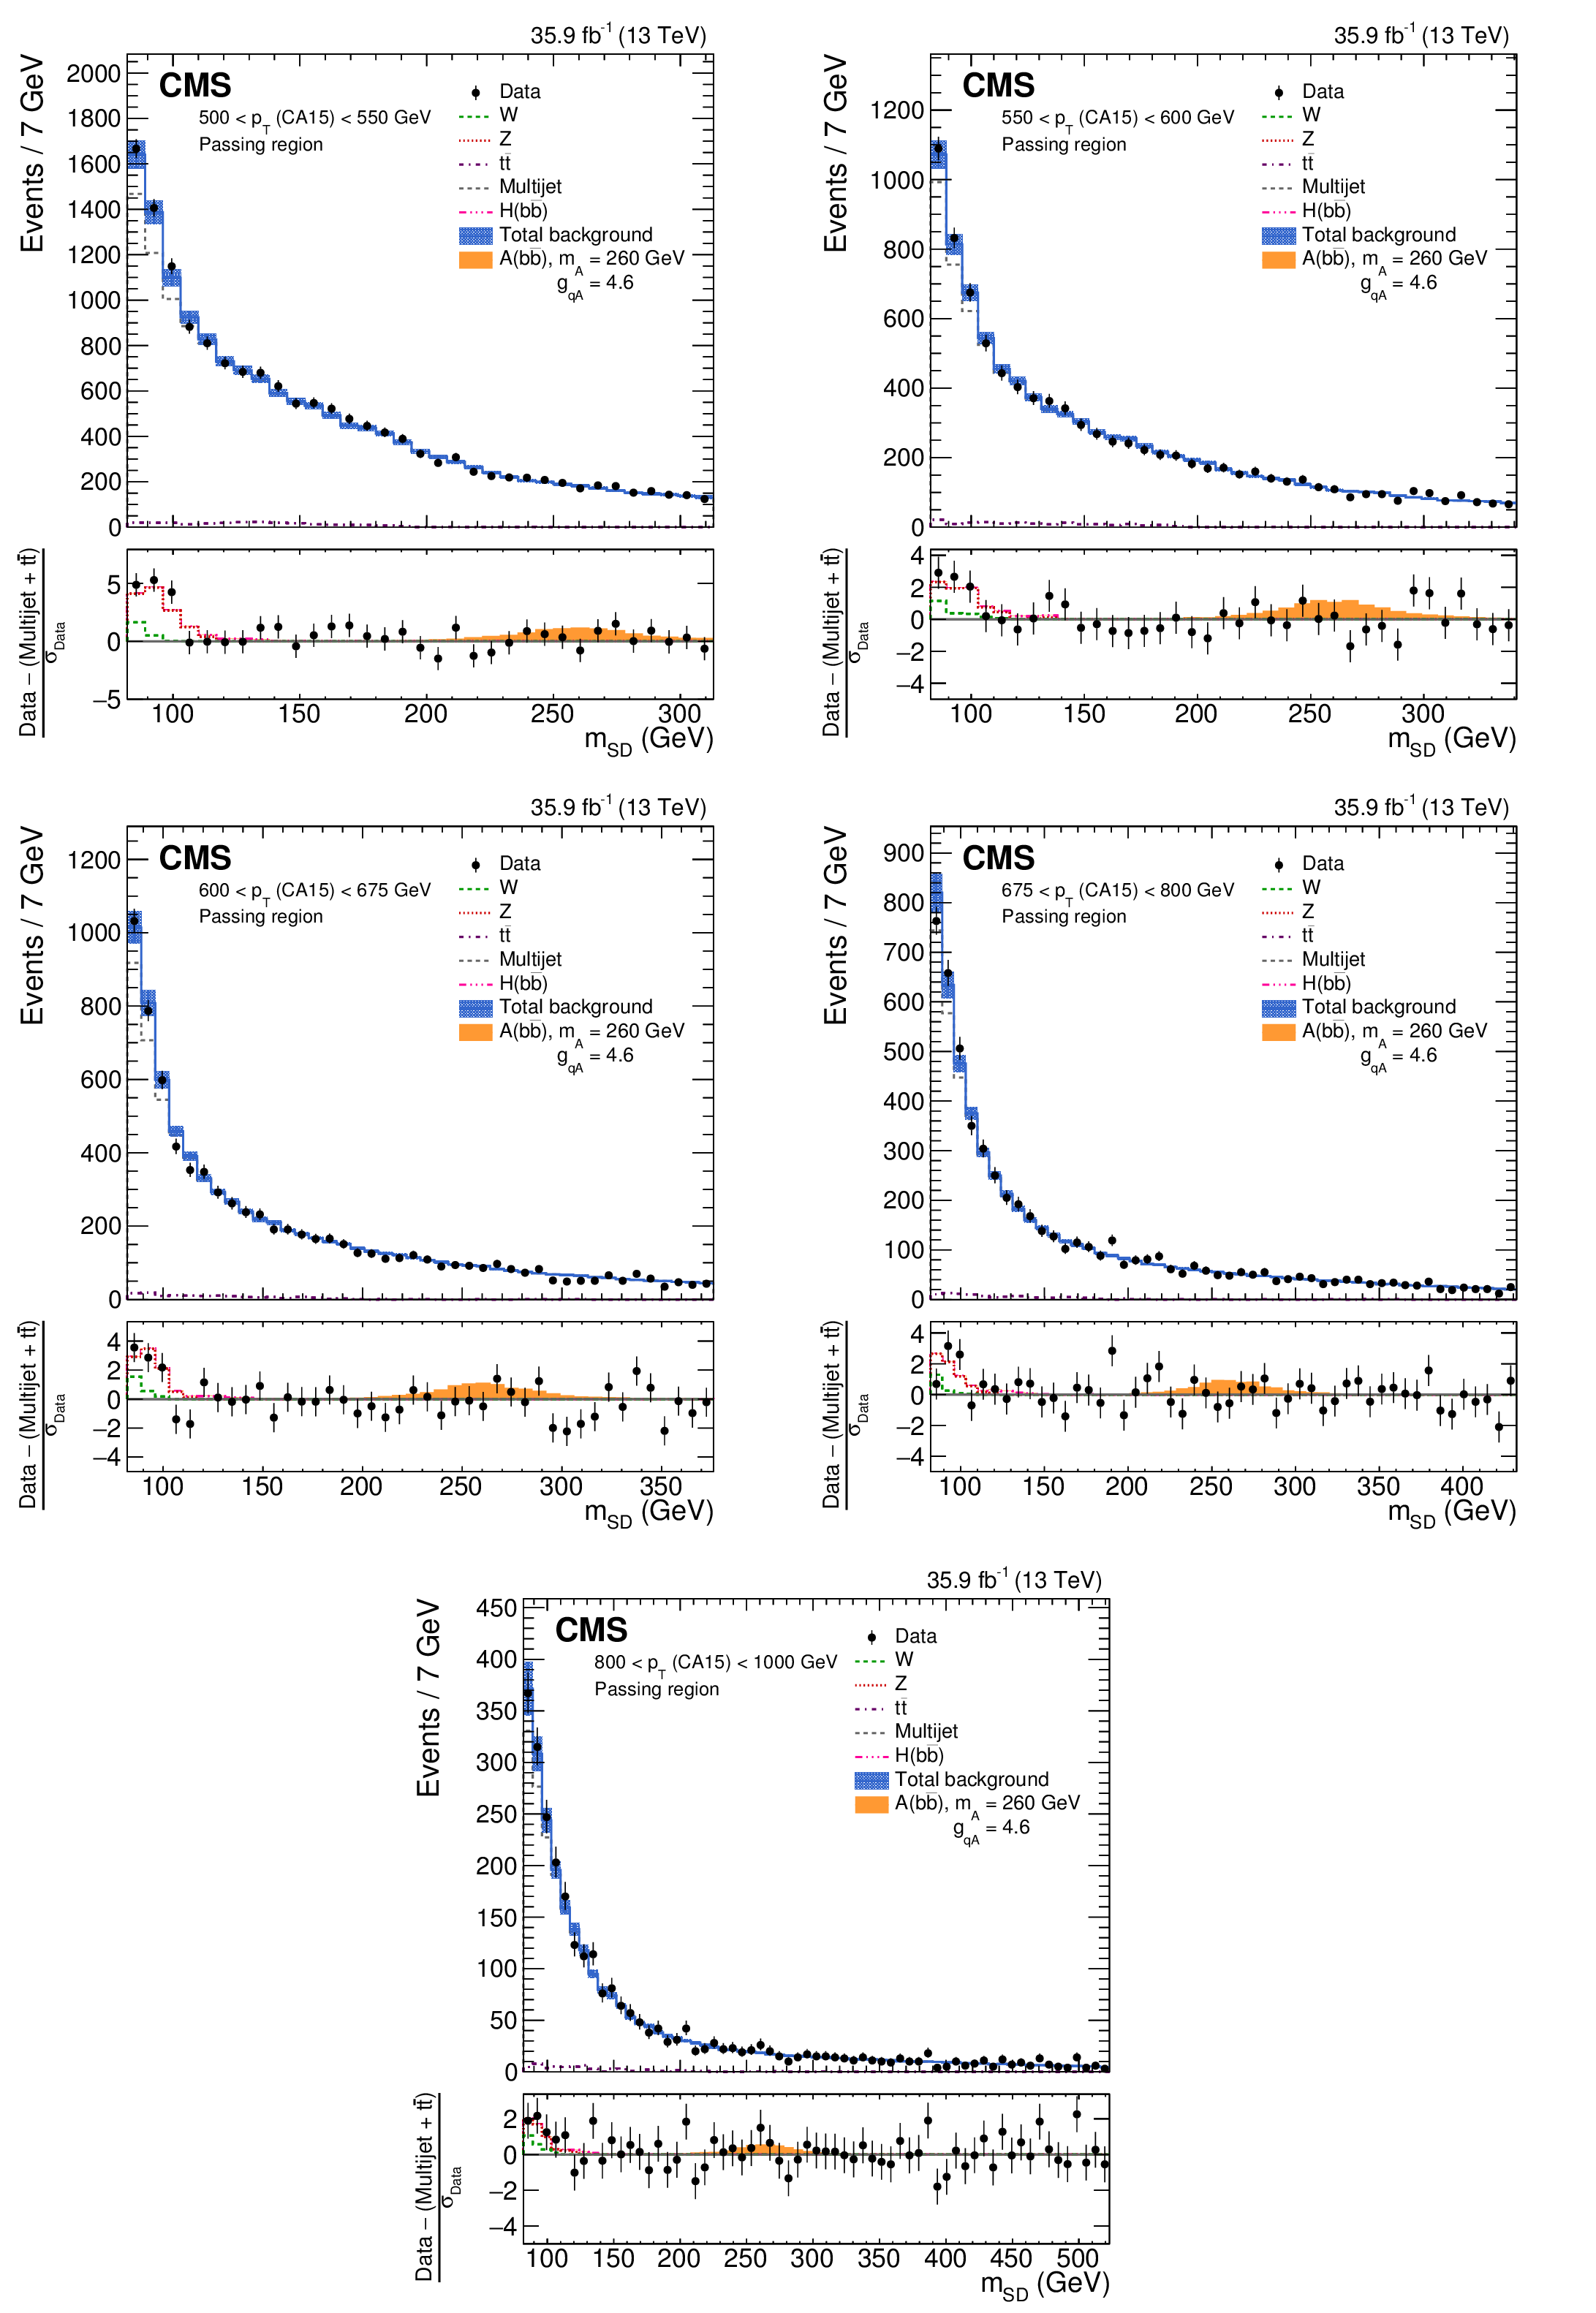
Figure 6:
The observed and fitted background $ {m_{\mathrm {SD}}} $ distributions in each $ {p_{\mathrm {T}}} $ category for the CA15 selection in the passing regions. The fit is performed under the background-only hypothesis. A hypothetical $ {\mathrm {A}}({{\mathrm {b}} {\overline {\mathrm {b}}}})$ signal at a mass of 260 GeV is also indicated. The shaded blue band shows the systematic uncertainty in the total background prediction. The bottom panel shows the difference between the data and the nonresonant background prediction, divided by the statistical uncertainty in the data. |
png pdf |
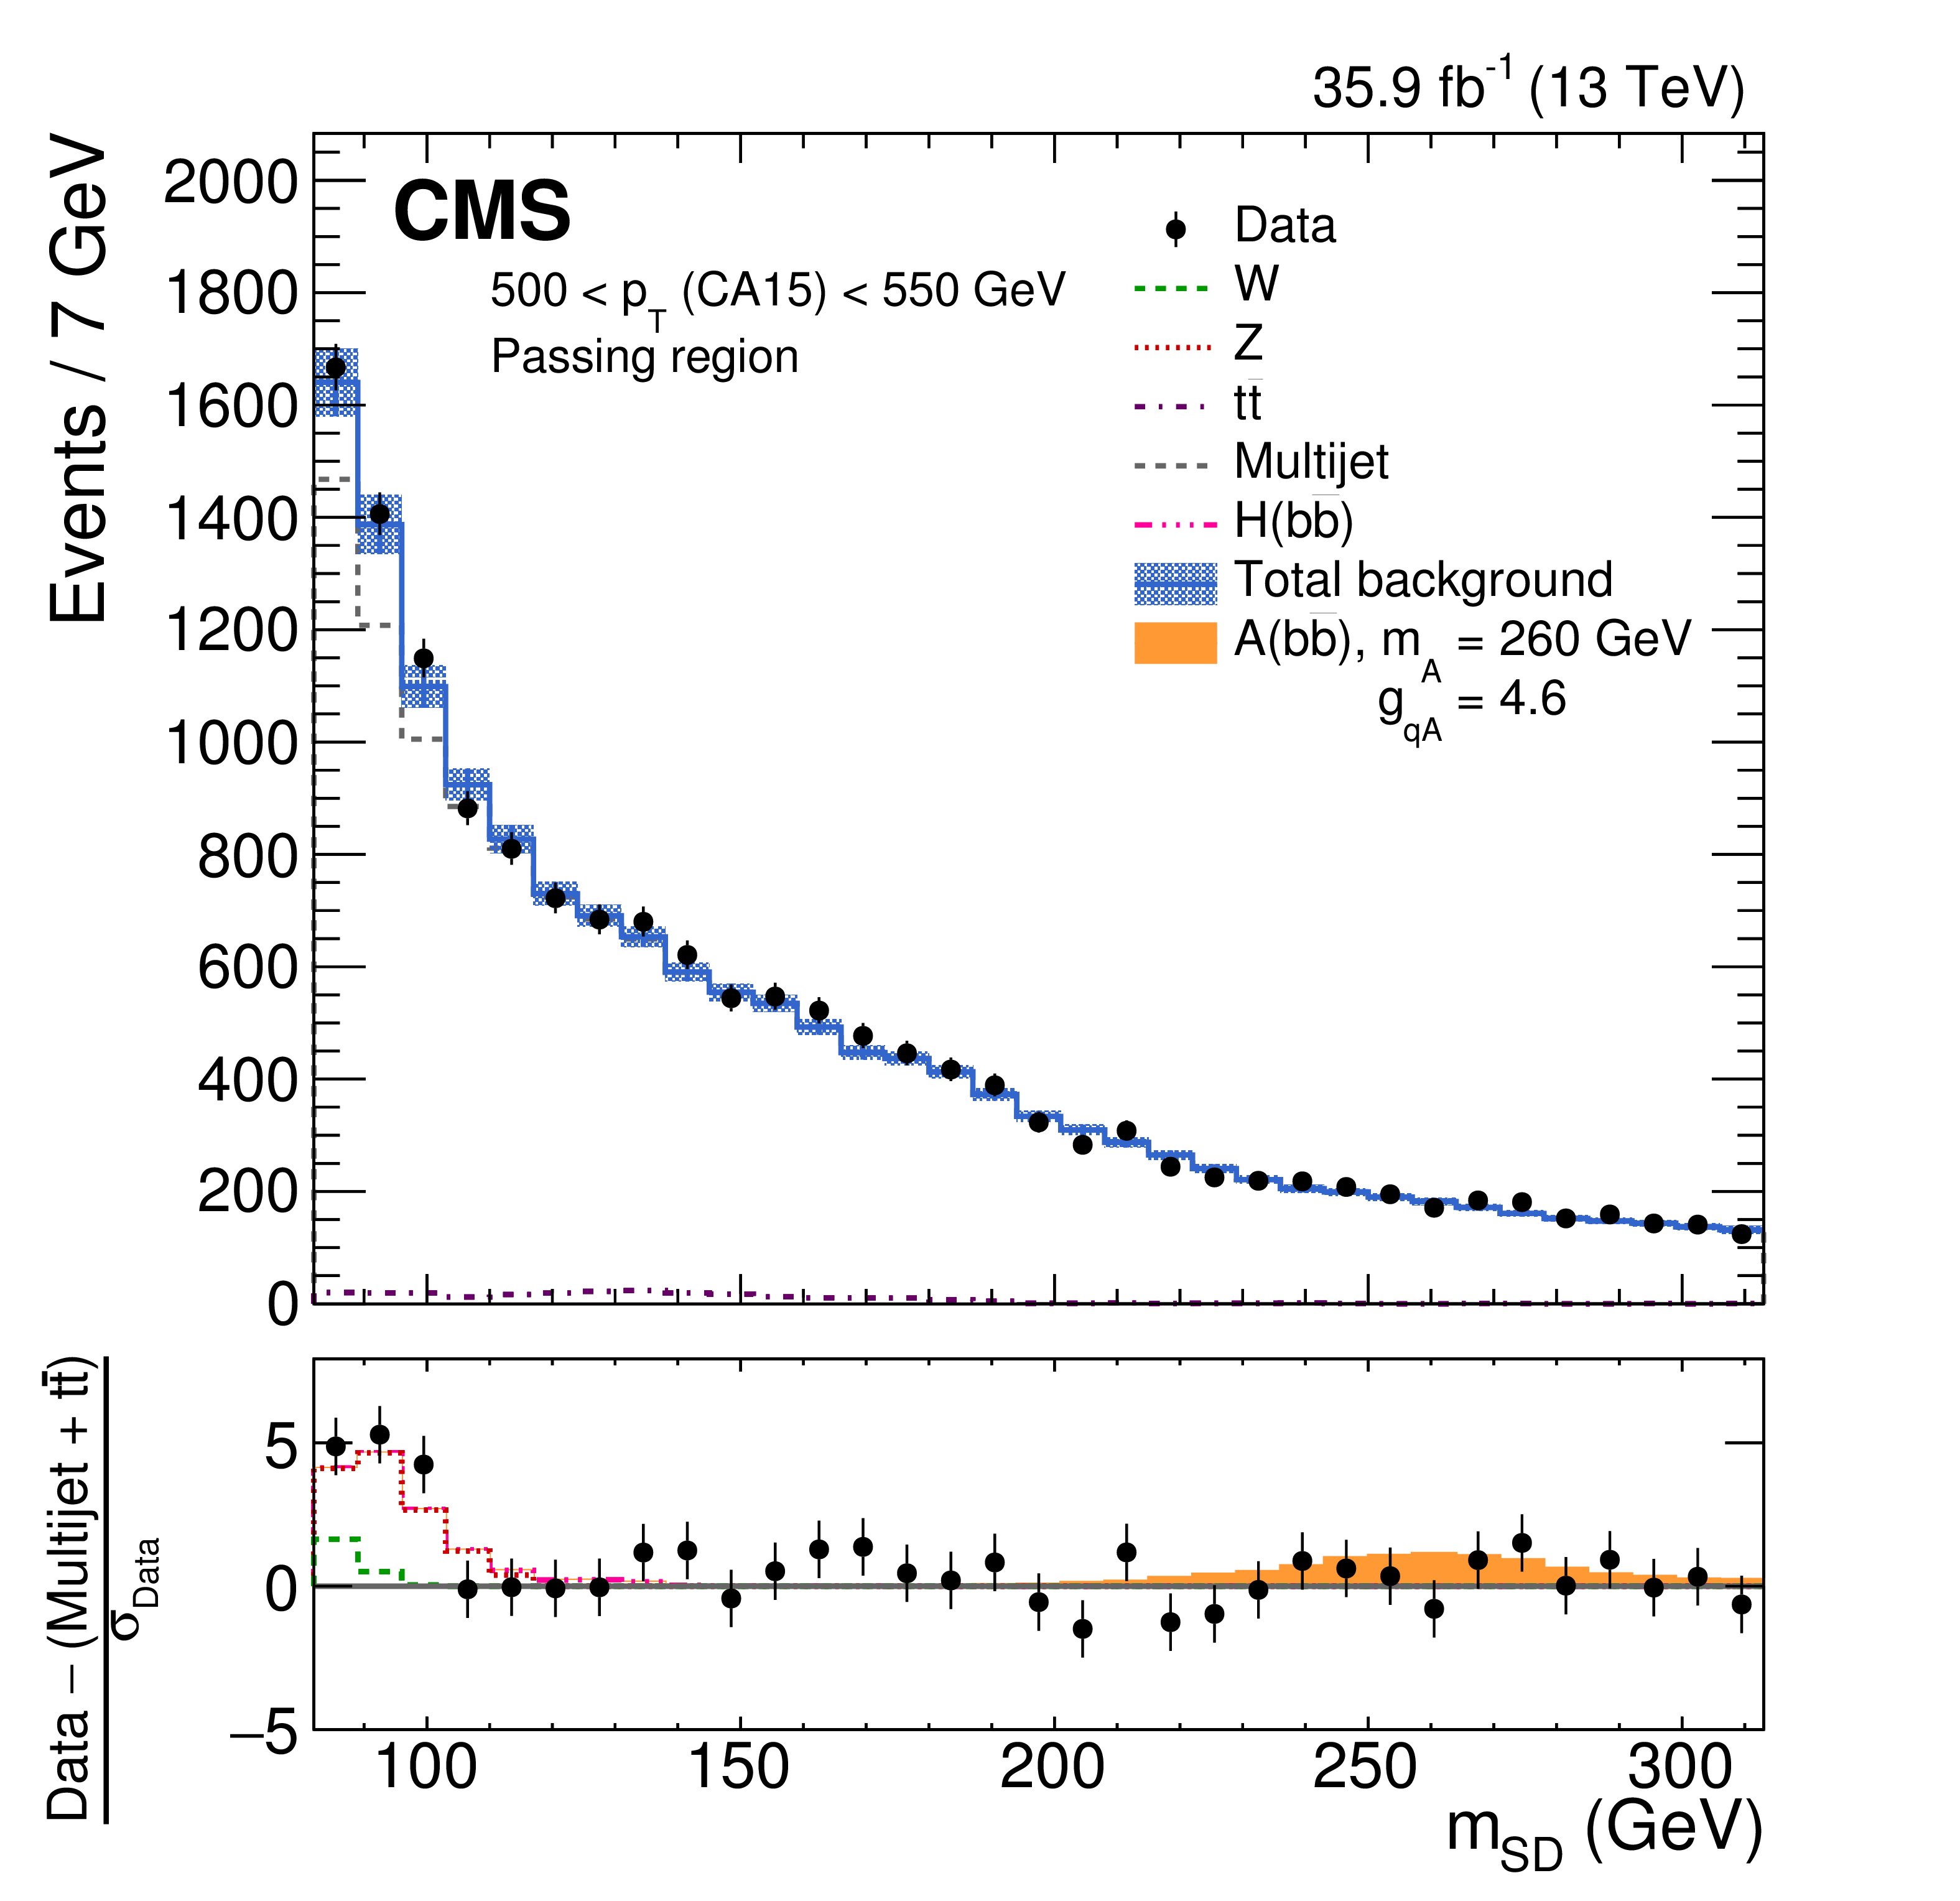
Figure 6-a:
The observed and fitted background $ {m_{\mathrm {SD}}} $ distributions in the 500 $ < {p_{\mathrm {T}}} < $ 550 GeV category for the CA15 selection in the passing regions. The fit is performed under the background-only hypothesis. A hypothetical $ {\mathrm {A}}({{\mathrm {b}} {\overline {\mathrm {b}}}})$ signal at a mass of 260 GeV is also indicated. The shaded blue band shows the systematic uncertainty in the total background prediction. The bottom panel shows the difference between the data and the nonresonant background prediction, divided by the statistical uncertainty in the data. |
png pdf |
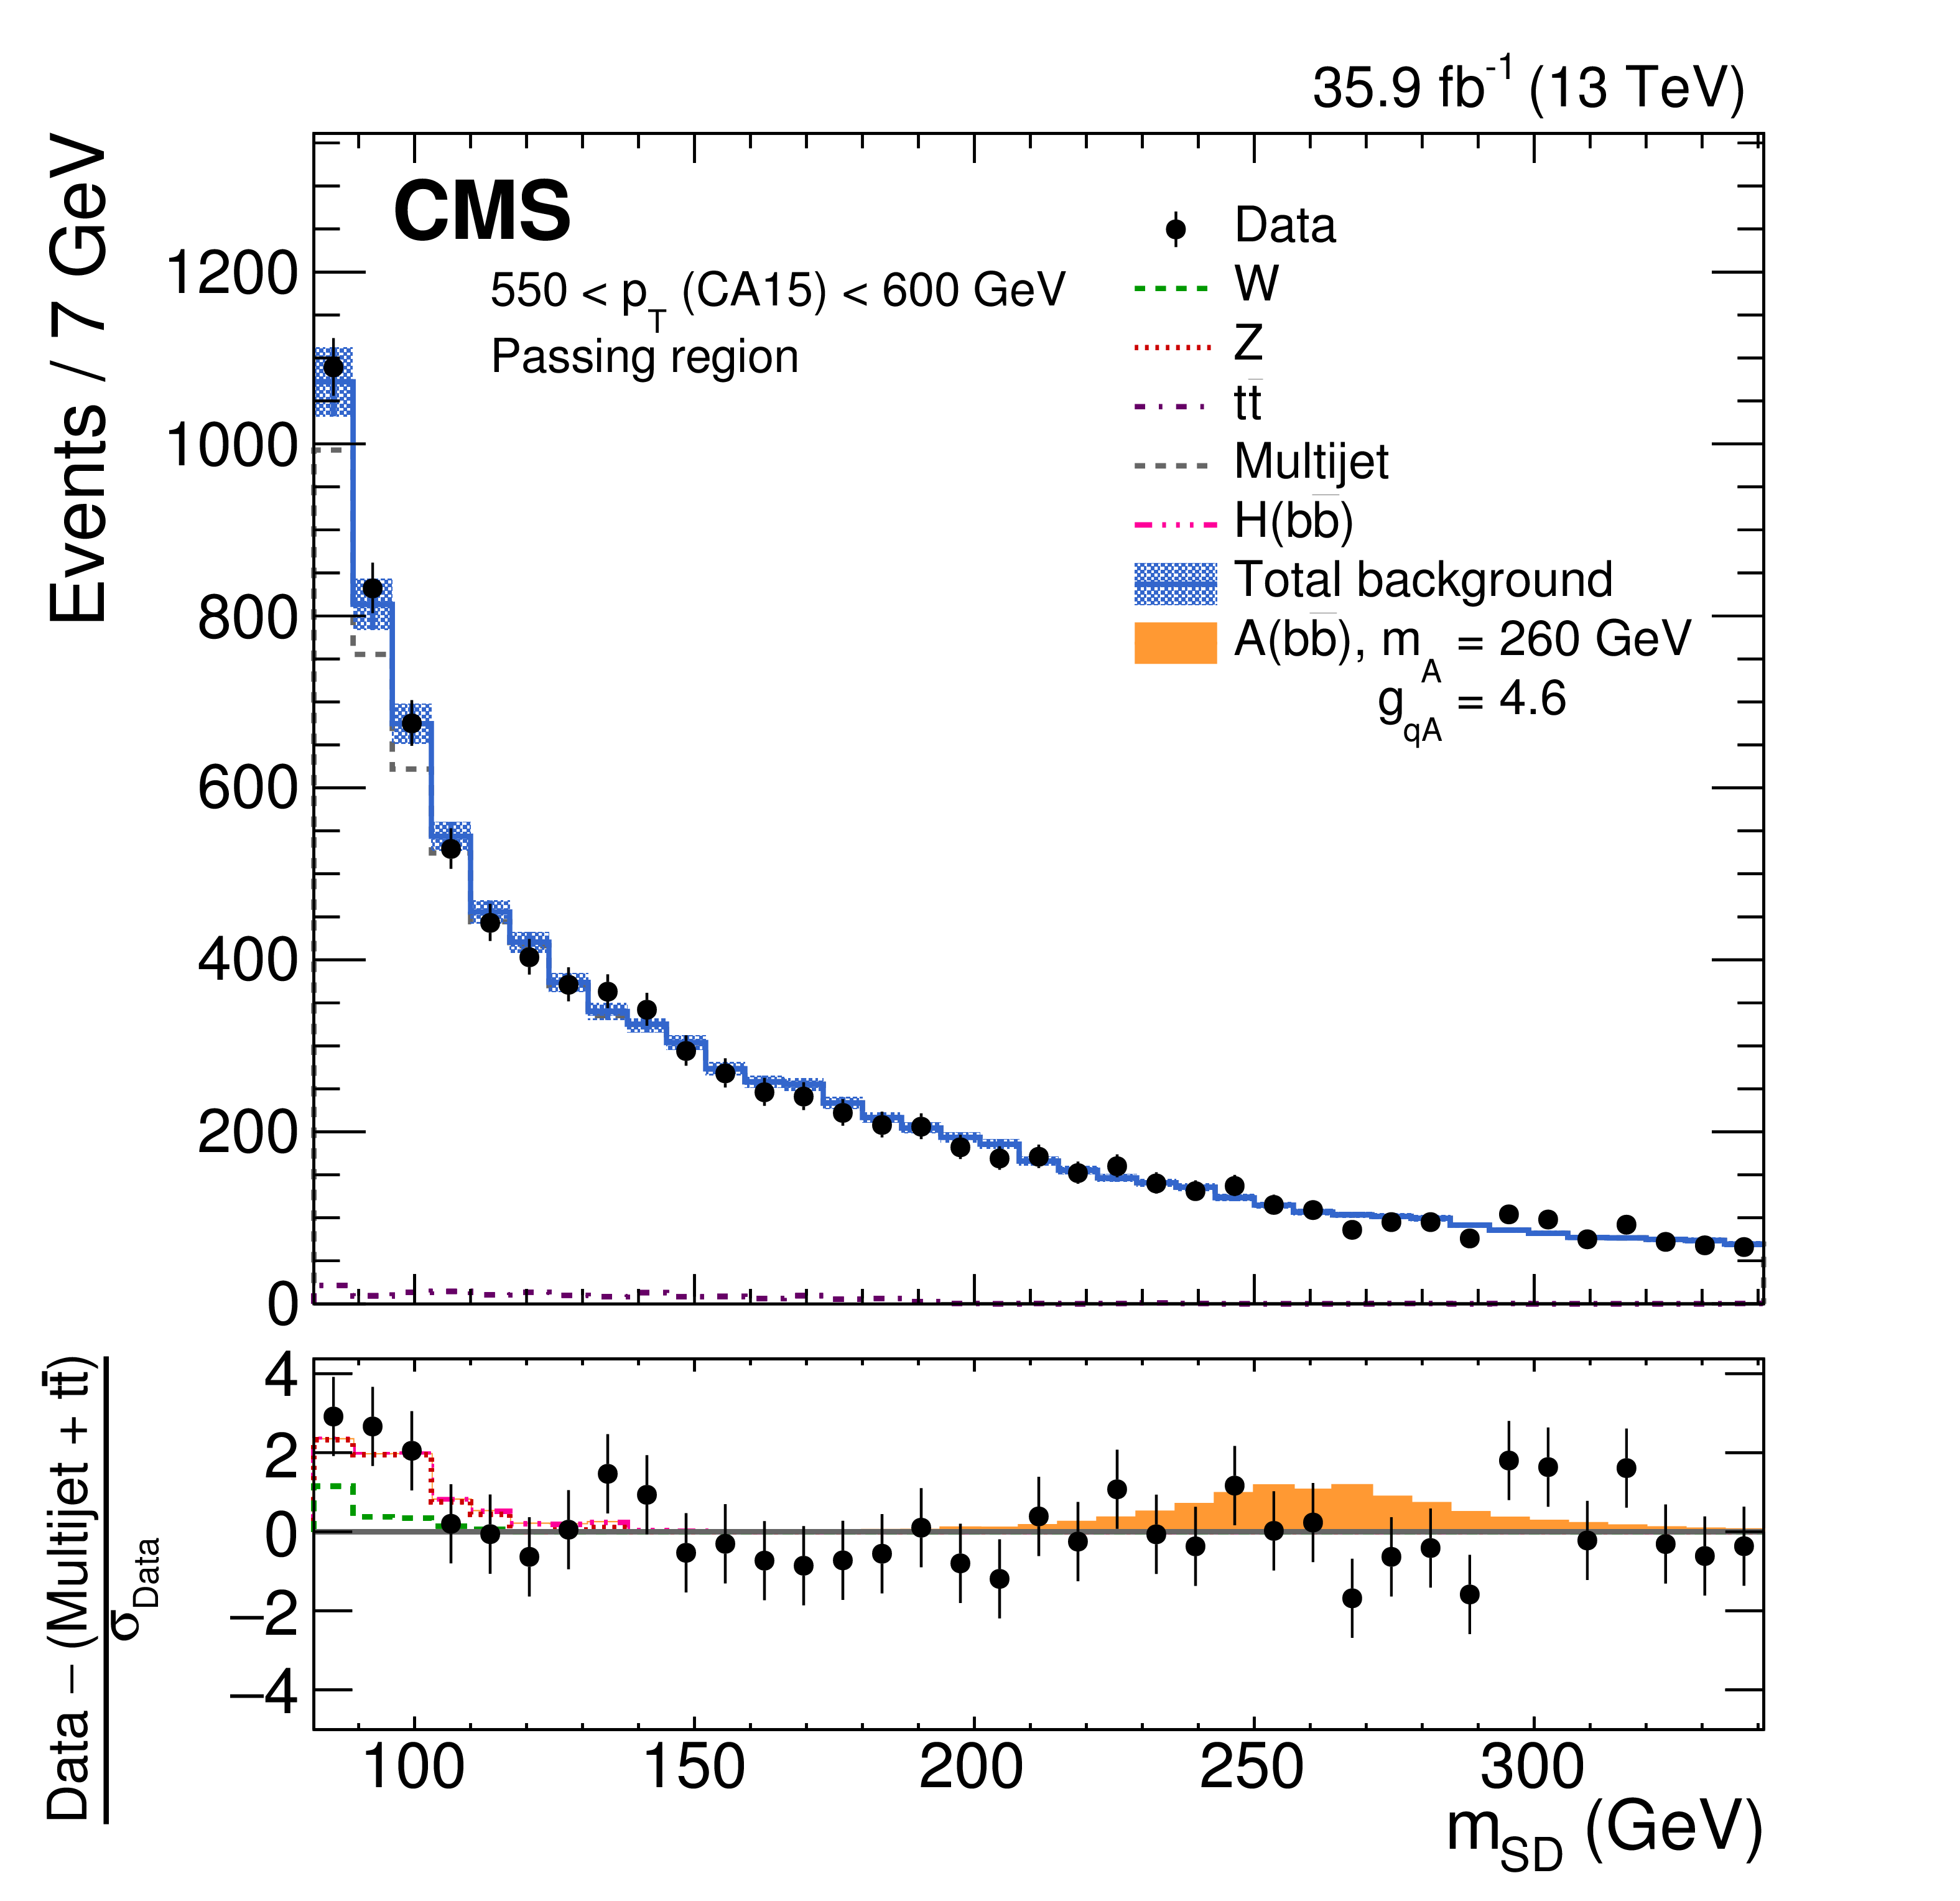
Figure 6-b:
The observed and fitted background $ {m_{\mathrm {SD}}} $ distributions in the 550 $ < {p_{\mathrm {T}}} < $ 600 GeV category for the CA15 selection in the passing regions. The fit is performed under the background-only hypothesis. A hypothetical $ {\mathrm {A}}({{\mathrm {b}} {\overline {\mathrm {b}}}})$ signal at a mass of 260 GeV is also indicated. The shaded blue band shows the systematic uncertainty in the total background prediction. The bottom panel shows the difference between the data and the nonresonant background prediction, divided by the statistical uncertainty in the data. |
png pdf |
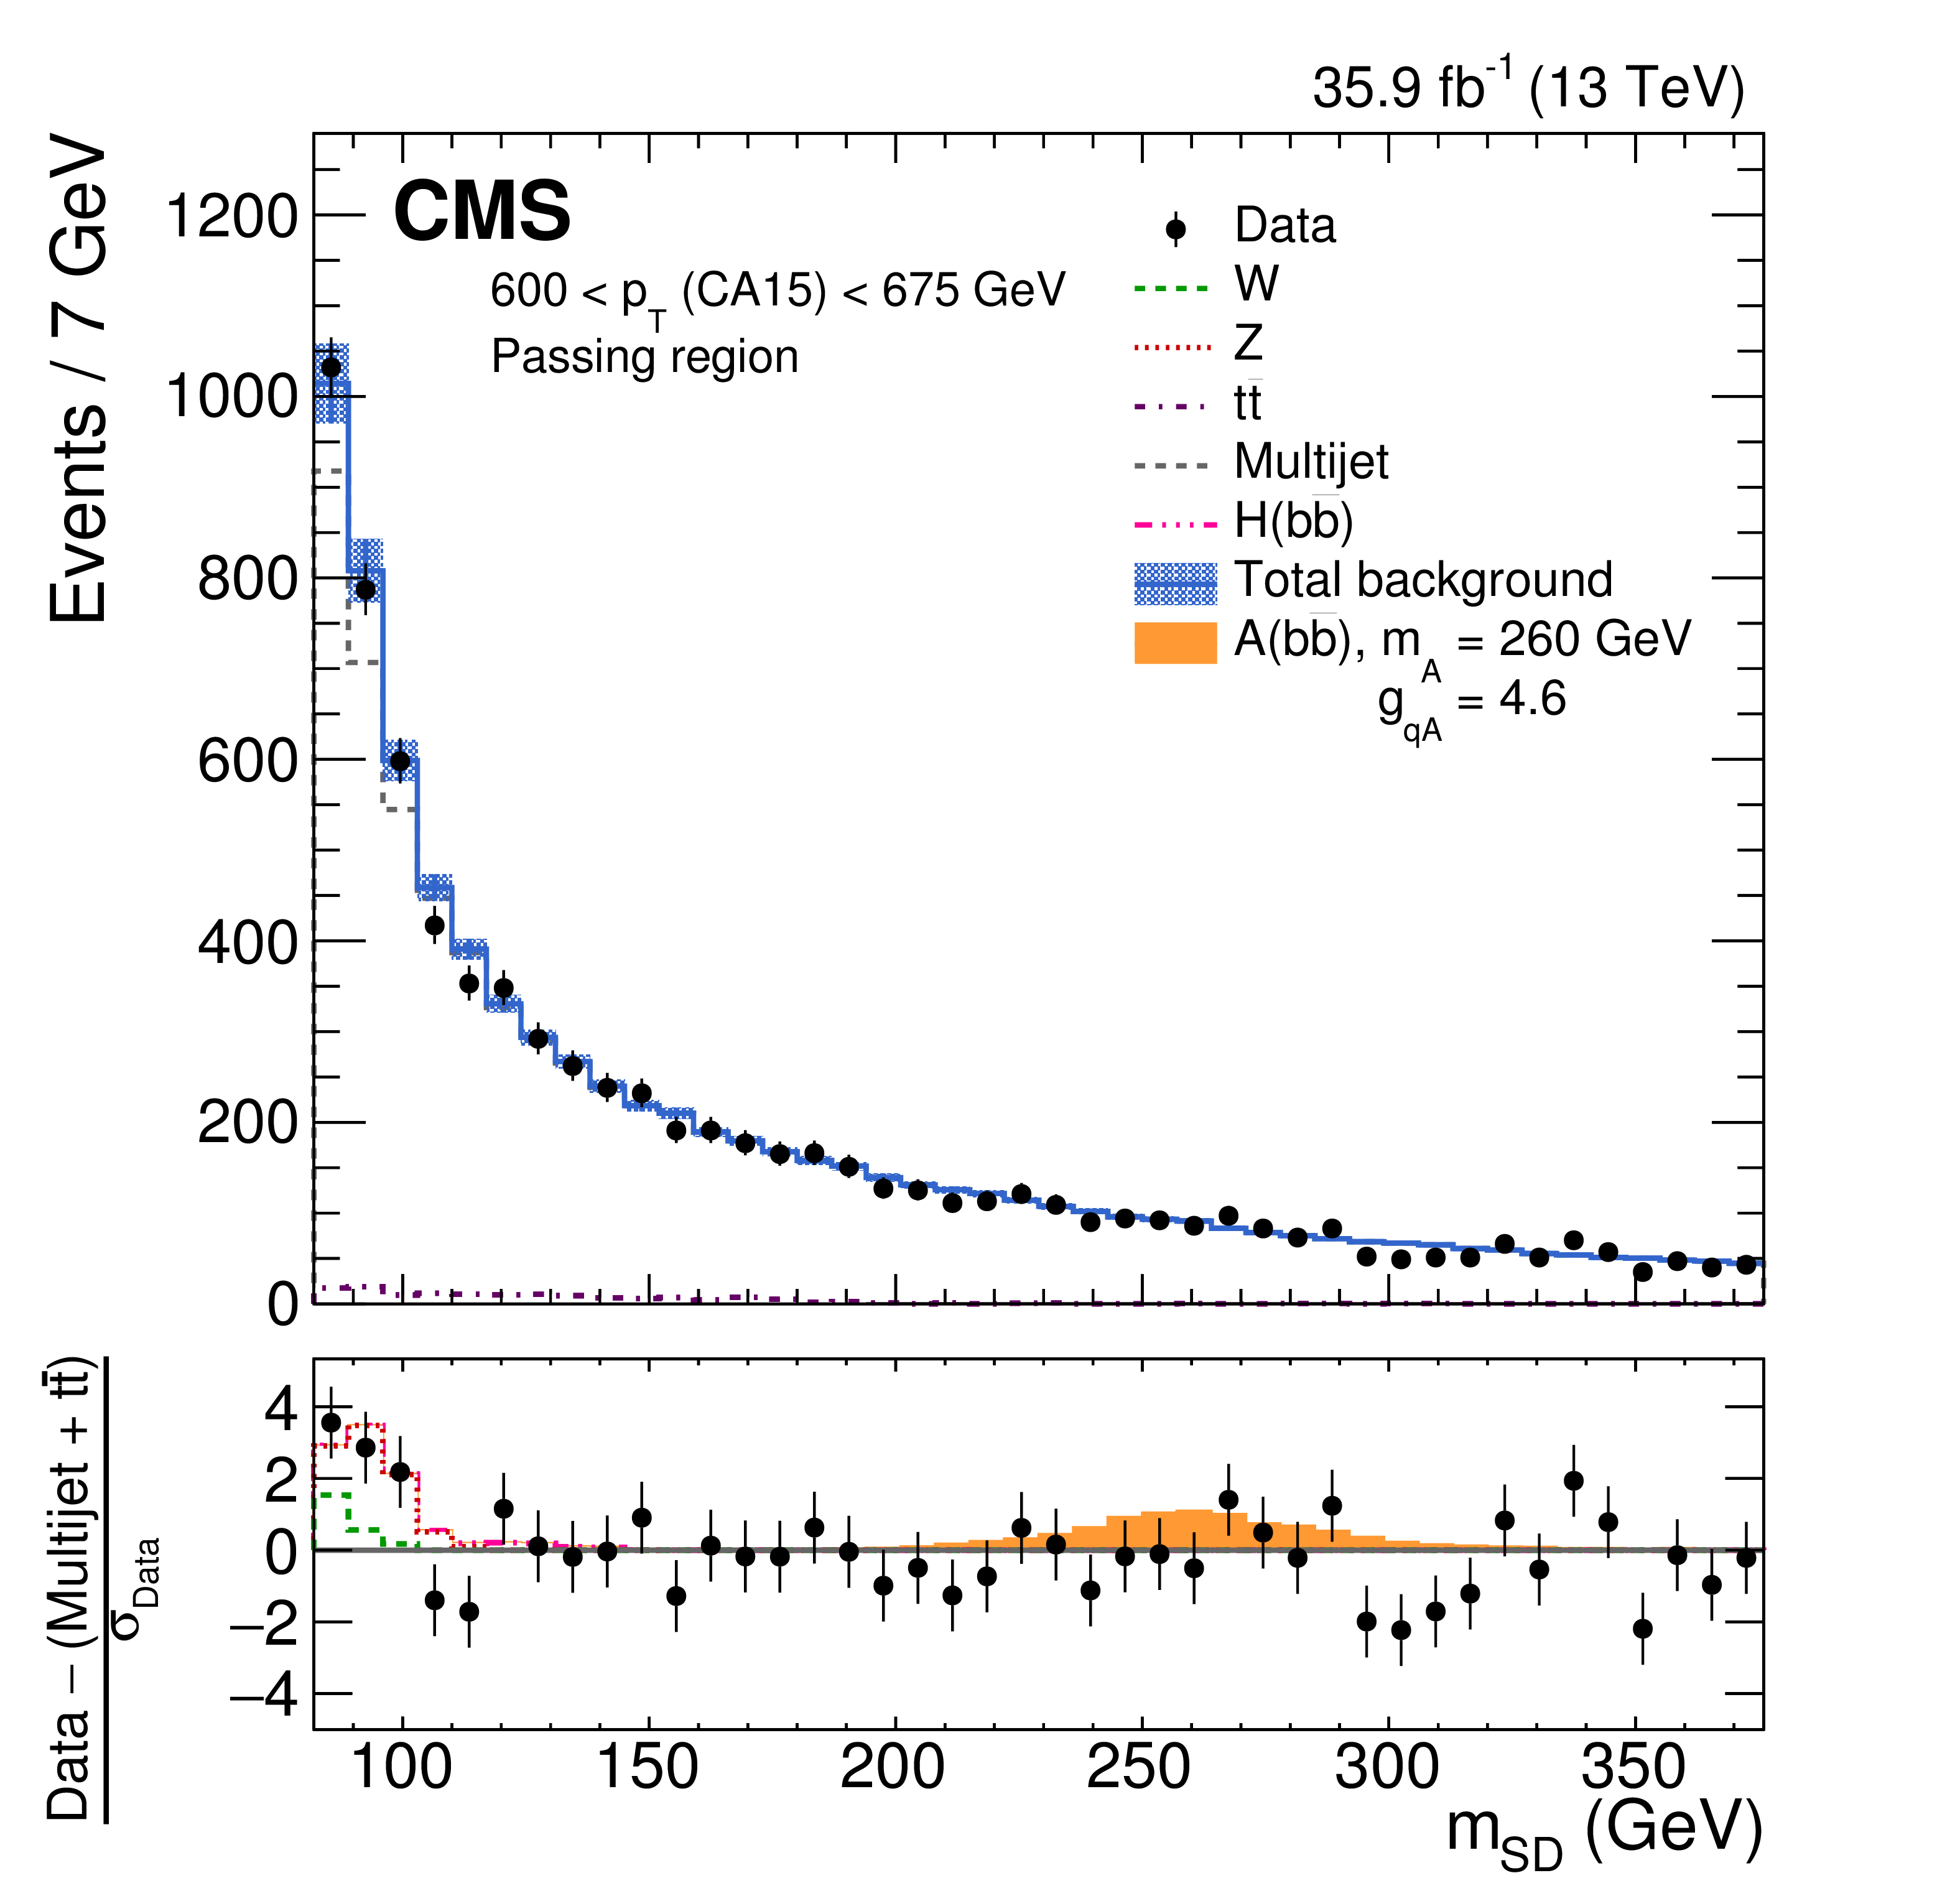
Figure 6-c:
The observed and fitted background $ {m_{\mathrm {SD}}} $ distributions in the 600 $ < {p_{\mathrm {T}}} < $ 675 GeV category for the CA15 selection in the passing regions. The fit is performed under the background-only hypothesis. A hypothetical $ {\mathrm {A}}({{\mathrm {b}} {\overline {\mathrm {b}}}})$ signal at a mass of 260 GeV is also indicated. The shaded blue band shows the systematic uncertainty in the total background prediction. The bottom panel shows the difference between the data and the nonresonant background prediction, divided by the statistical uncertainty in the data. |
png pdf |
Figure 6-d:
The observed and fitted background $ {m_{\mathrm {SD}}} $ distributions in the 675 $ < {p_{\mathrm {T}}} < $ 800 GeV category for the CA15 selection in the passing regions. The fit is performed under the background-only hypothesis. A hypothetical $ {\mathrm {A}}({{\mathrm {b}} {\overline {\mathrm {b}}}})$ signal at a mass of 260 GeV is also indicated. The shaded blue band shows the systematic uncertainty in the total background prediction. The bottom panel shows the difference between the data and the nonresonant background prediction, divided by the statistical uncertainty in the data. |

png pdf |
Figure 6-e:
The observed and fitted background $ {m_{\mathrm {SD}}} $ distributions in the 800 $ < {p_{\mathrm {T}}} < $ 1000 GeV category for the CA15 selection in the passing regions. The fit is performed under the background-only hypothesis. A hypothetical $ {\mathrm {A}}({{\mathrm {b}} {\overline {\mathrm {b}}}})$ signal at a mass of 260 GeV is also indicated. The shaded blue band shows the systematic uncertainty in the total background prediction. The bottom panel shows the difference between the data and the nonresonant background prediction, divided by the statistical uncertainty in the data. |
png pdf |
Figure 7:
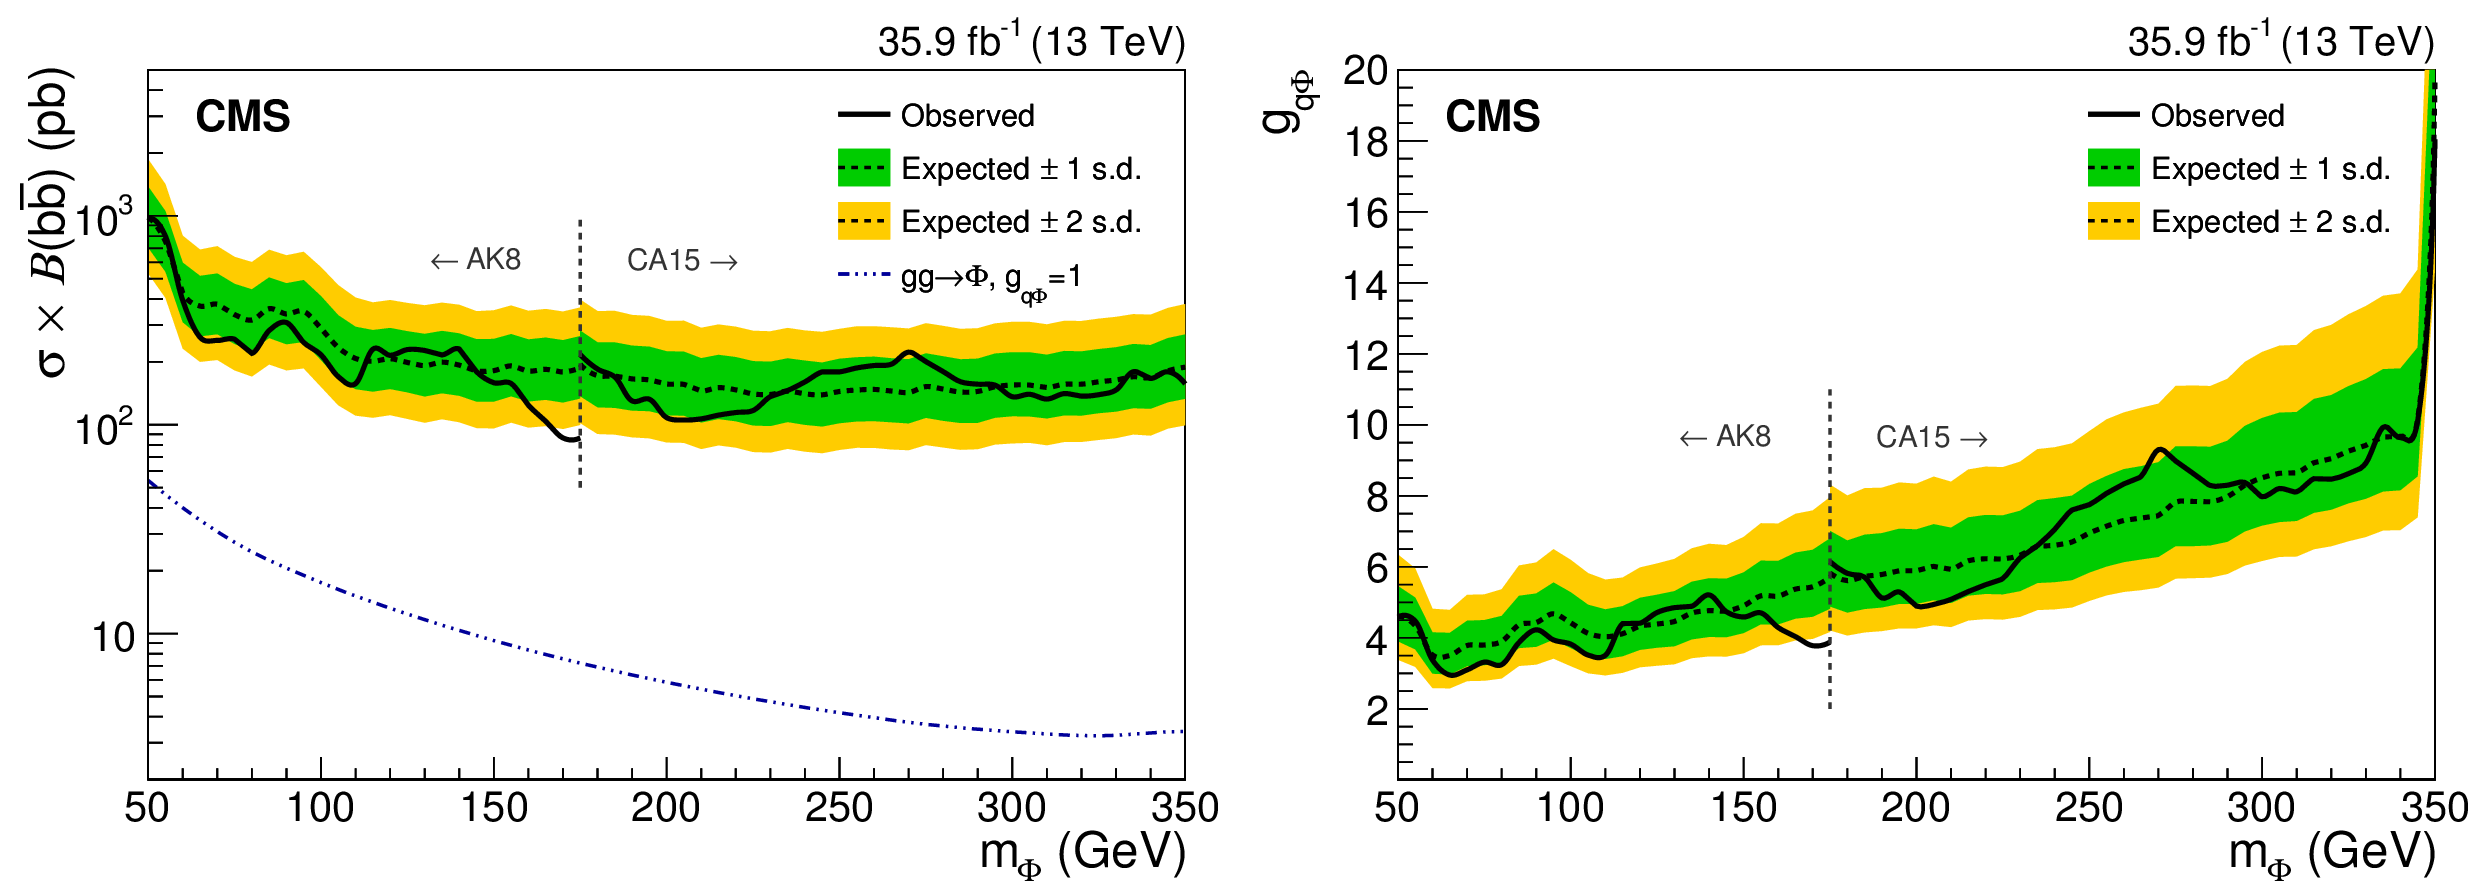
Upper limits at 95% CL on the product of the $\phi $ production cross section and the branching fraction to $ {{\mathrm {b}} {\overline {\mathrm {b}}}} $ (left) and on $ {g_{{\mathrm {q}}\phi}} $ (right), as a function of the resonance mass $m_{\phi}$. The blue dash-dotted line indicates the theoretical scalar production cross section assuming $ {g_{{\mathrm {q}}\phi}} = $ 1 as a chosen benchmark [5]. The vertical line at 175 GeV corresponds to the transition between the AK8 and CA15 jet selections. |
png pdf |
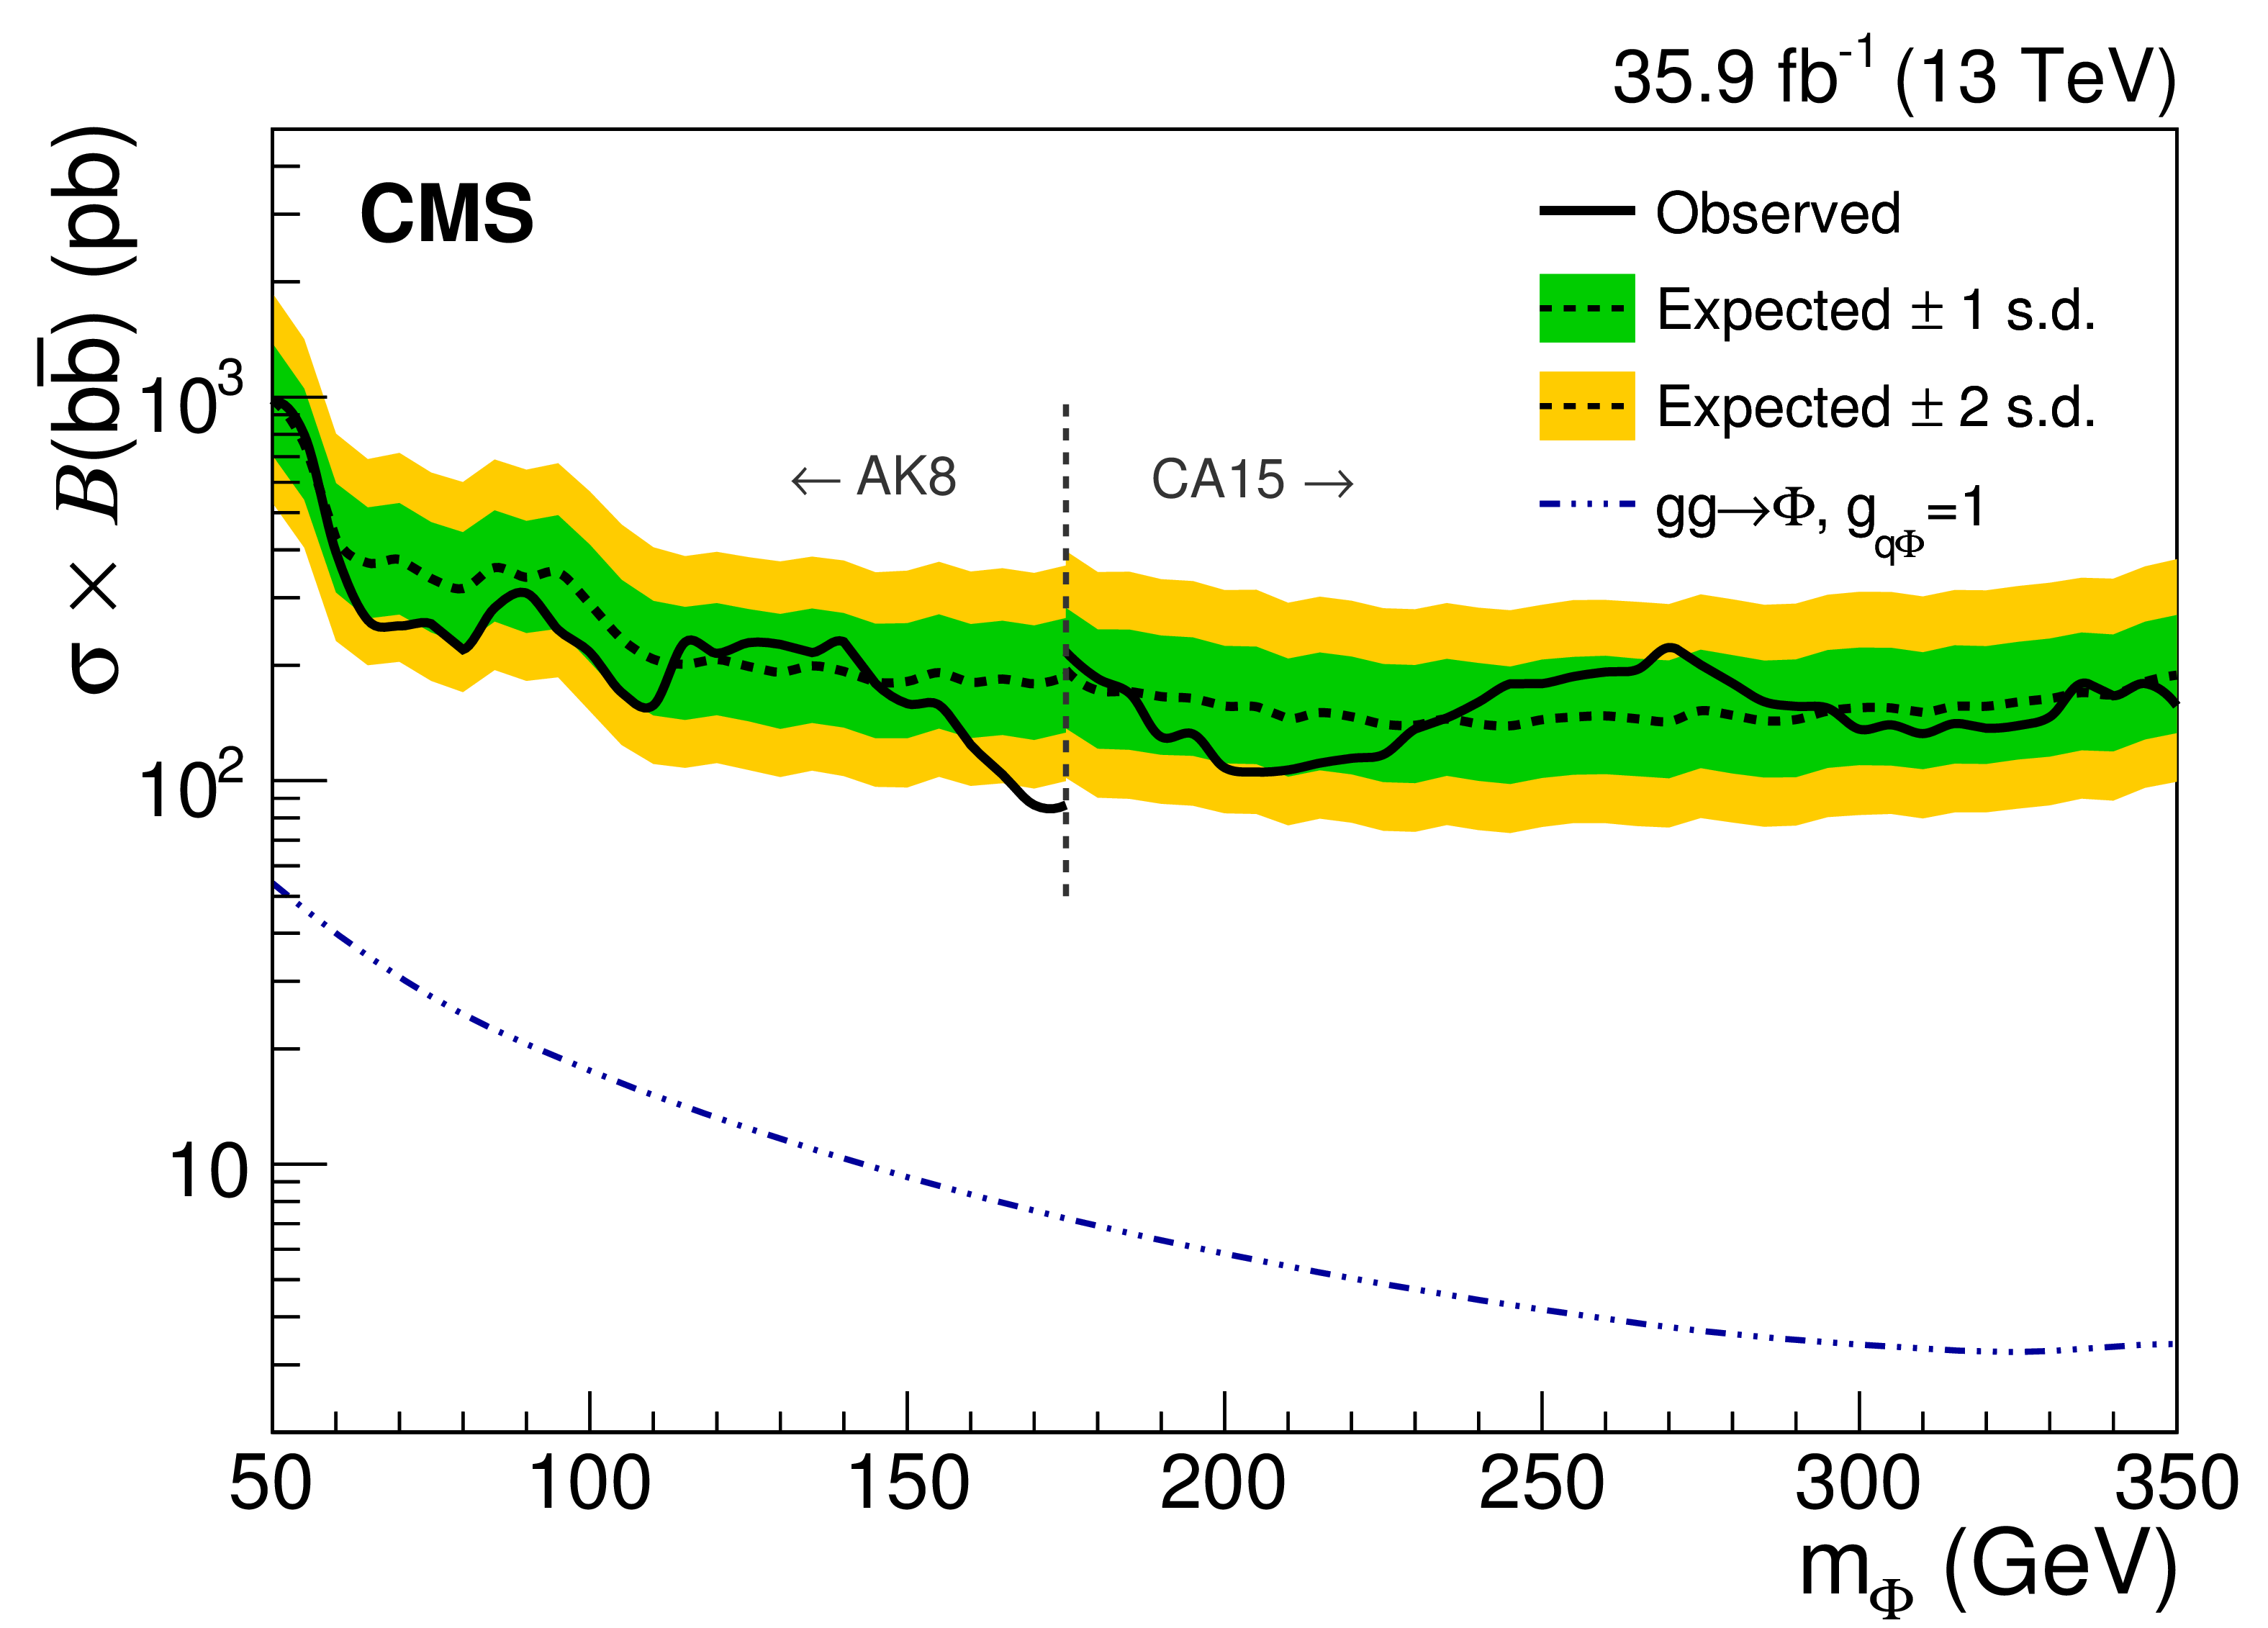
Figure 7-a:
Upper limits at 95% CL on the product of the $\phi $ production cross section and the branching fraction to $ {{\mathrm {b}} {\overline {\mathrm {b}}}} $, as a function of the resonance mass $m_{\phi}$. The blue dash-dotted line indicates the theoretical scalar production cross section assuming $ {g_{{\mathrm {q}}\phi}} = $ 1 as a chosen benchmark [5]. The vertical line at 175 GeV corresponds to the transition between the AK8 and CA15 jet selections. |
png pdf |
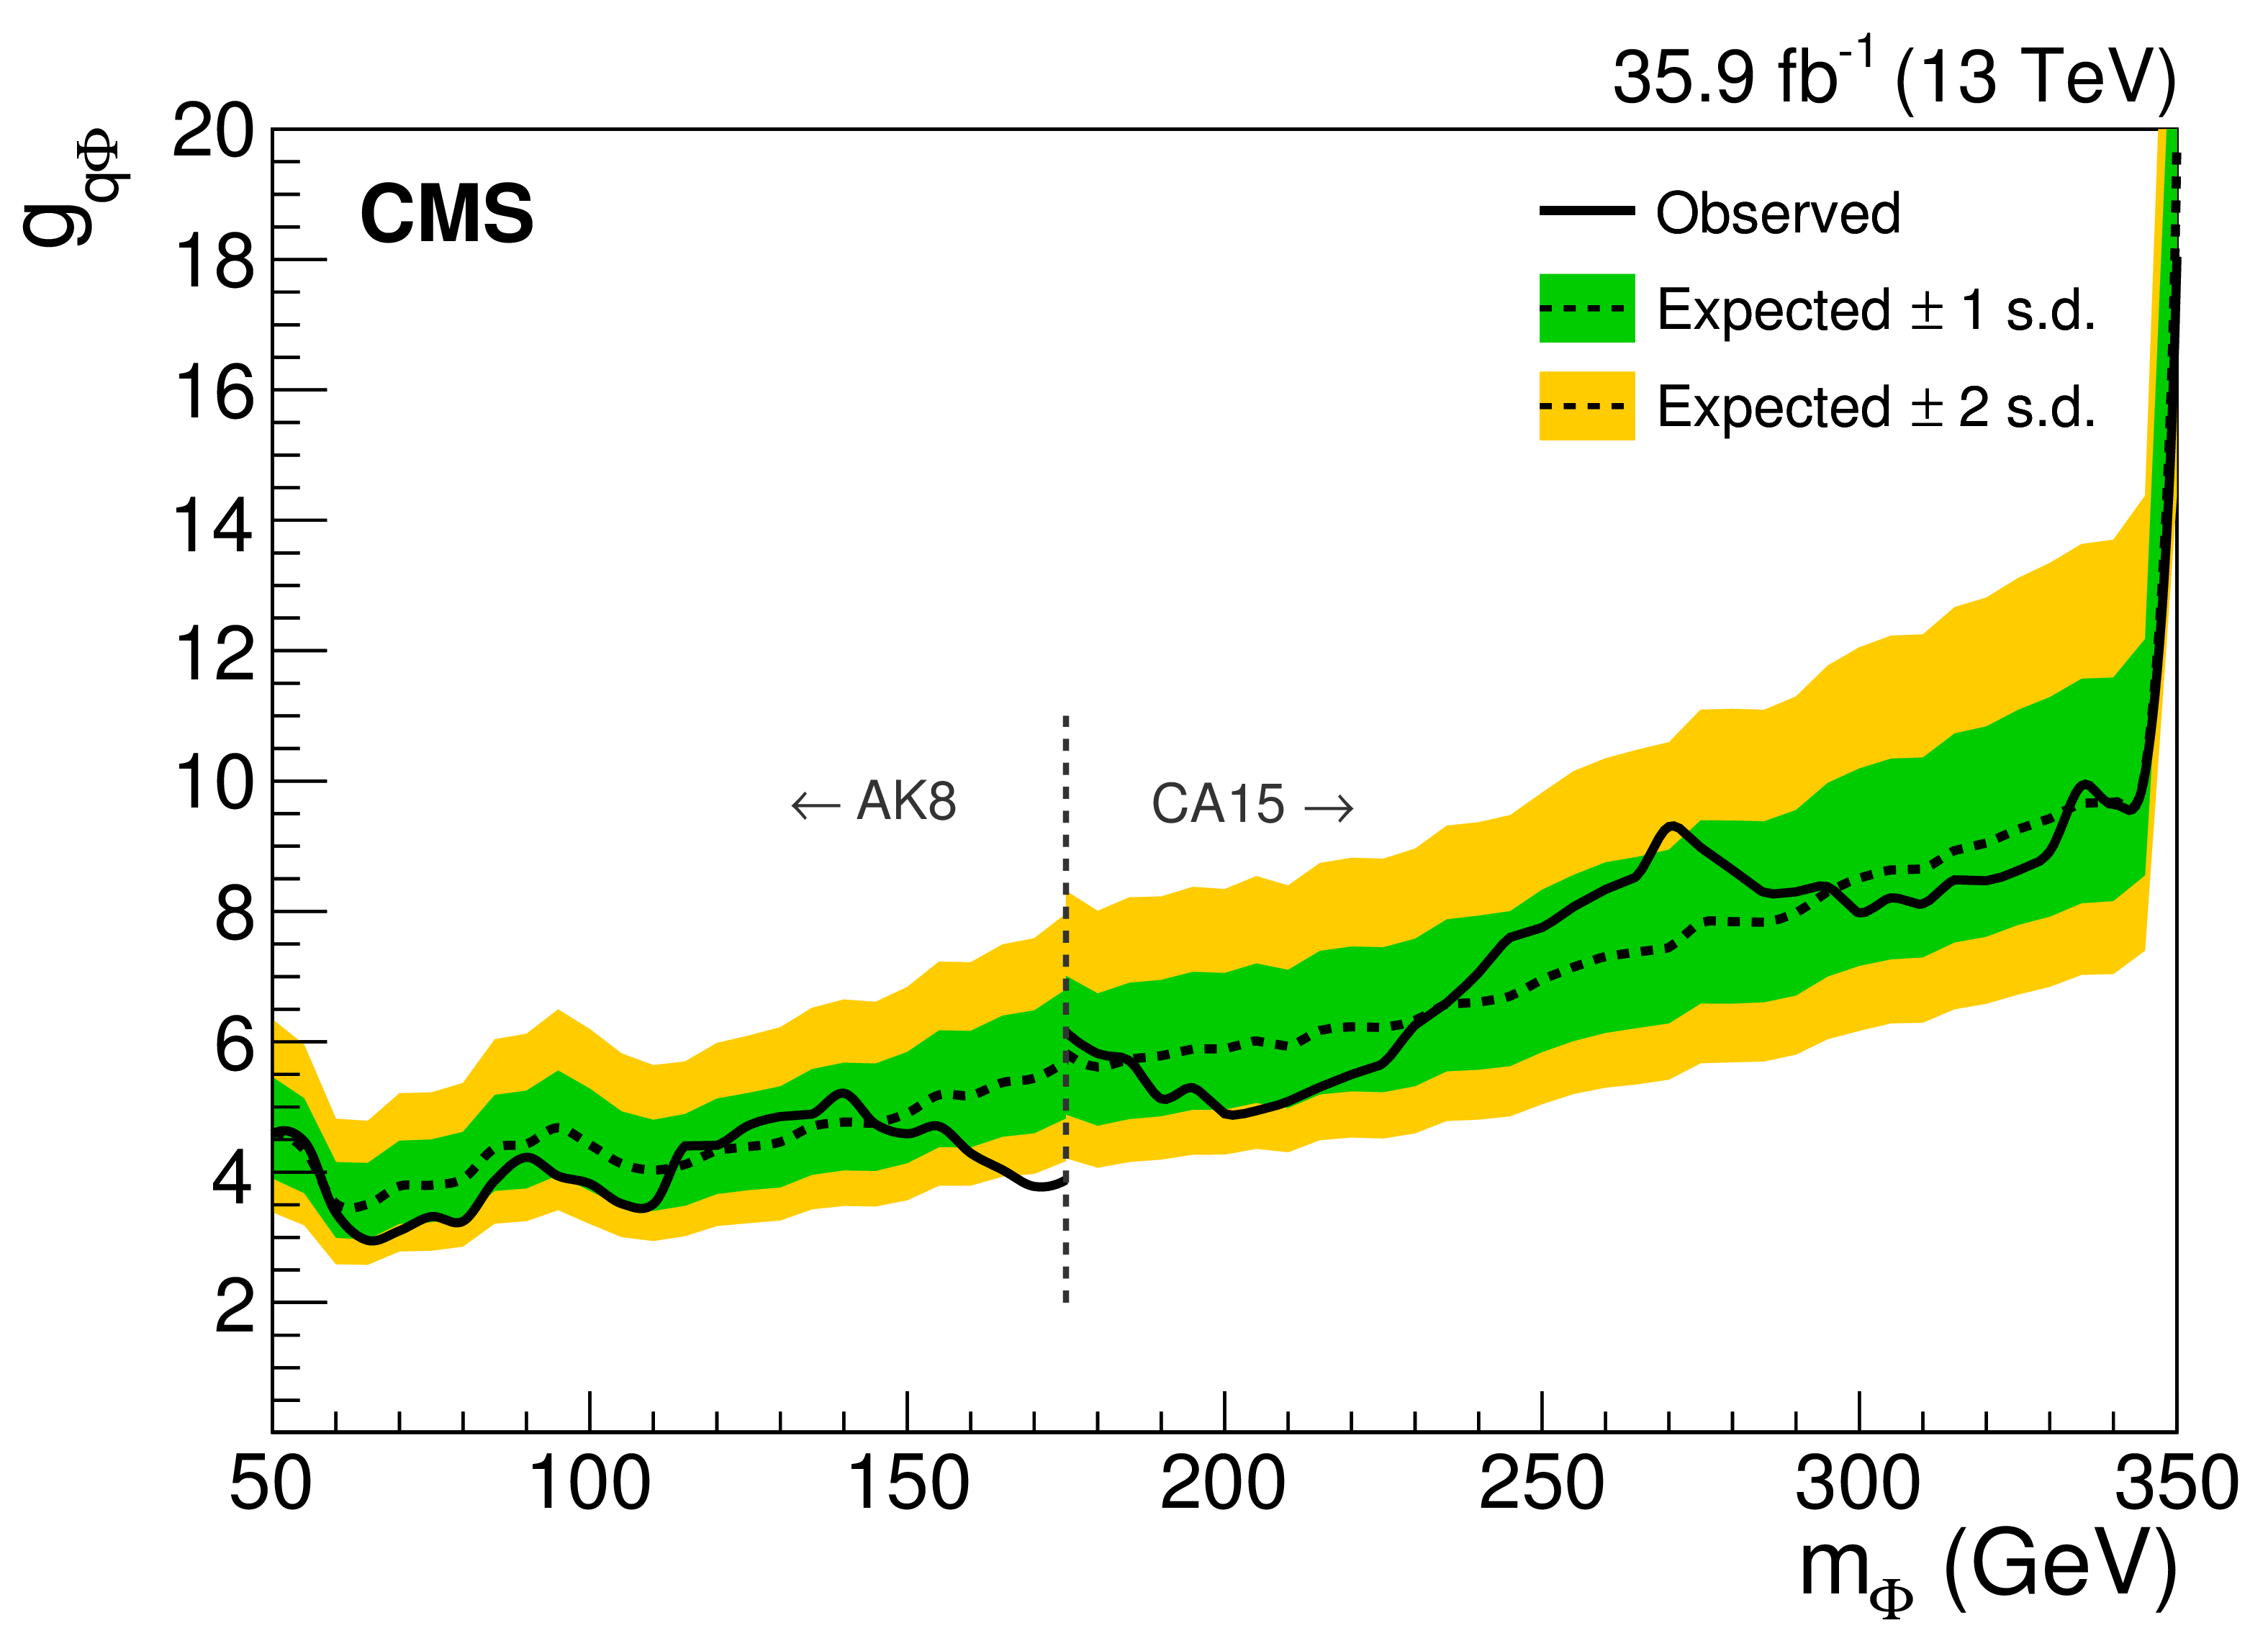
Figure 7-b:
Upper limits at 95% CL on $ {g_{{\mathrm {q}}\phi}} $, as a function of the resonance mass $m_{\phi}$. The blue dash-dotted line indicates the theoretical scalar production cross section assuming $ {g_{{\mathrm {q}}\phi}} = $ 1 as a chosen benchmark [5]. The vertical line at 175 GeV corresponds to the transition between the AK8 and CA15 jet selections. |
png pdf |
Figure 8:
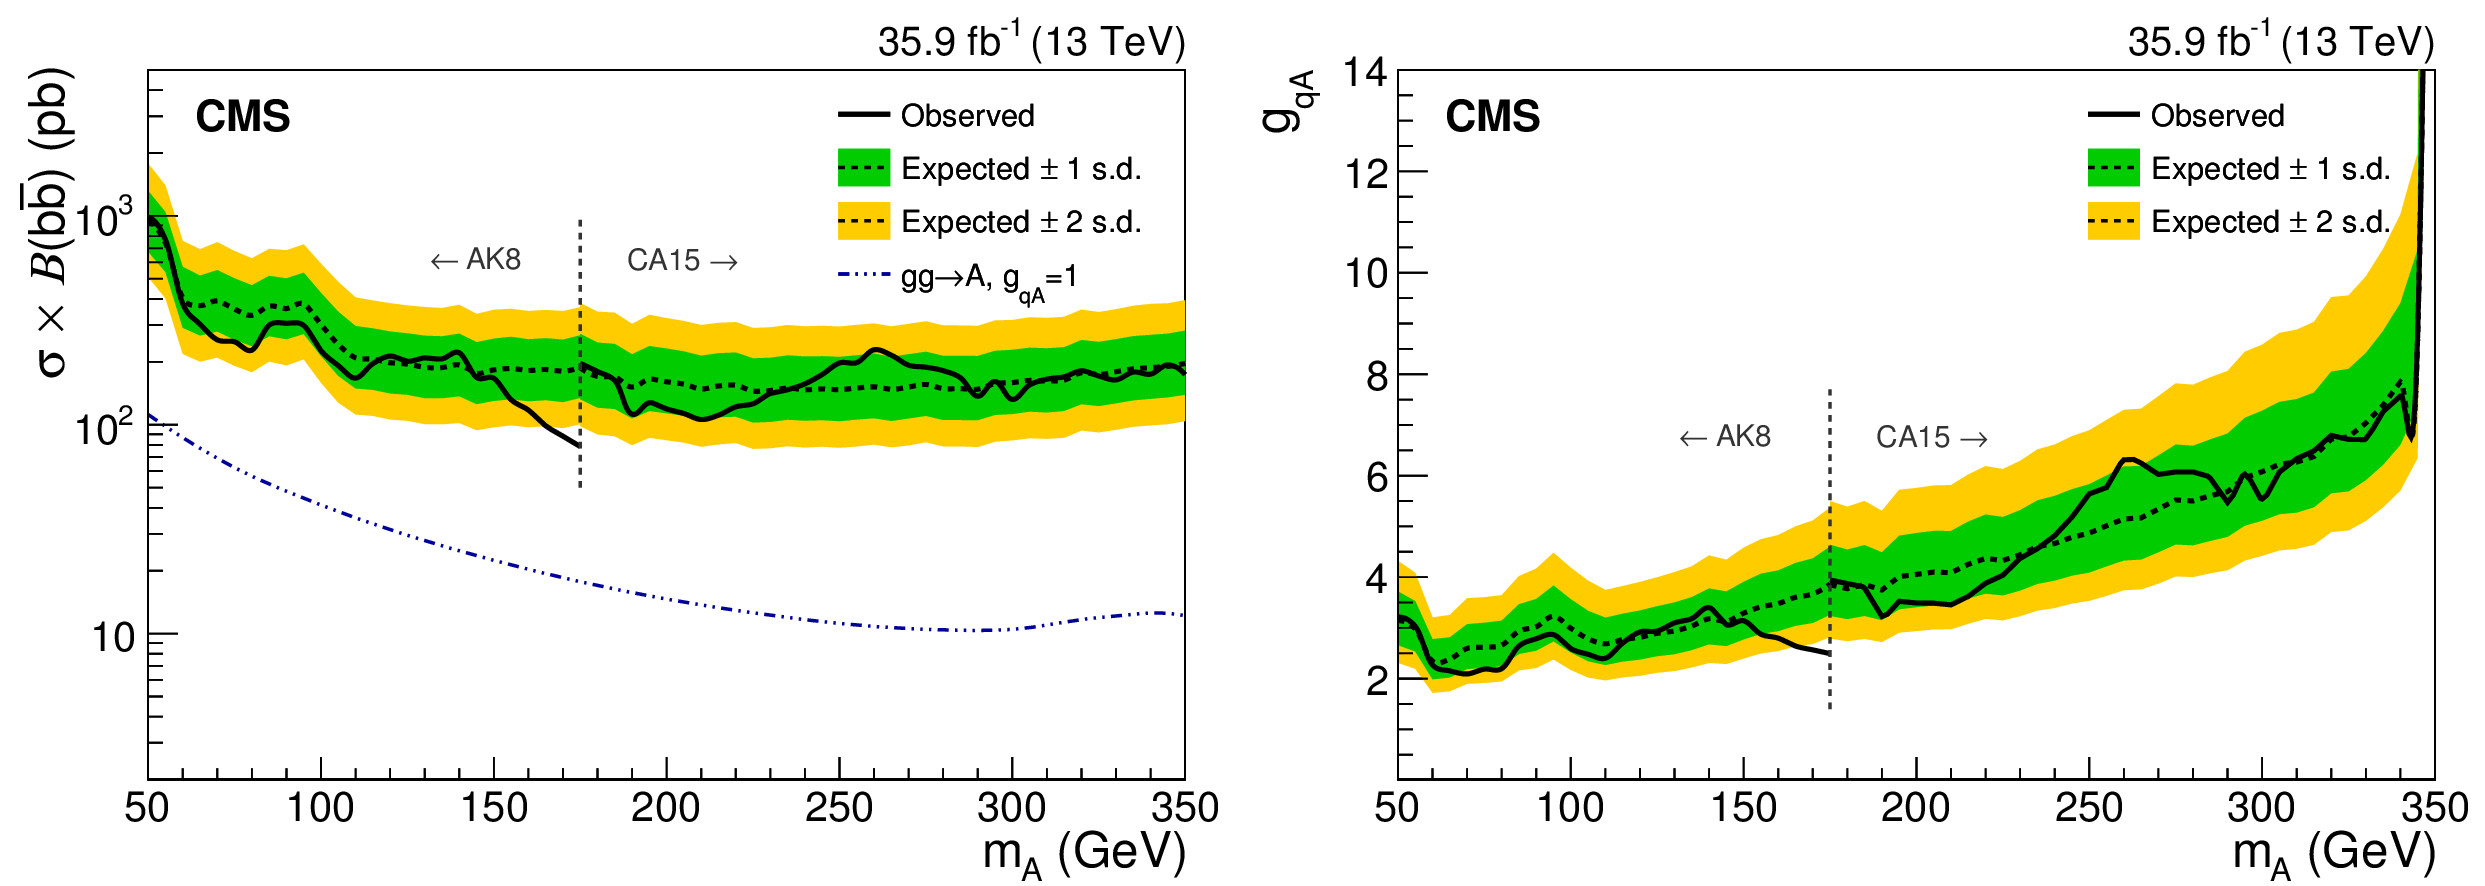
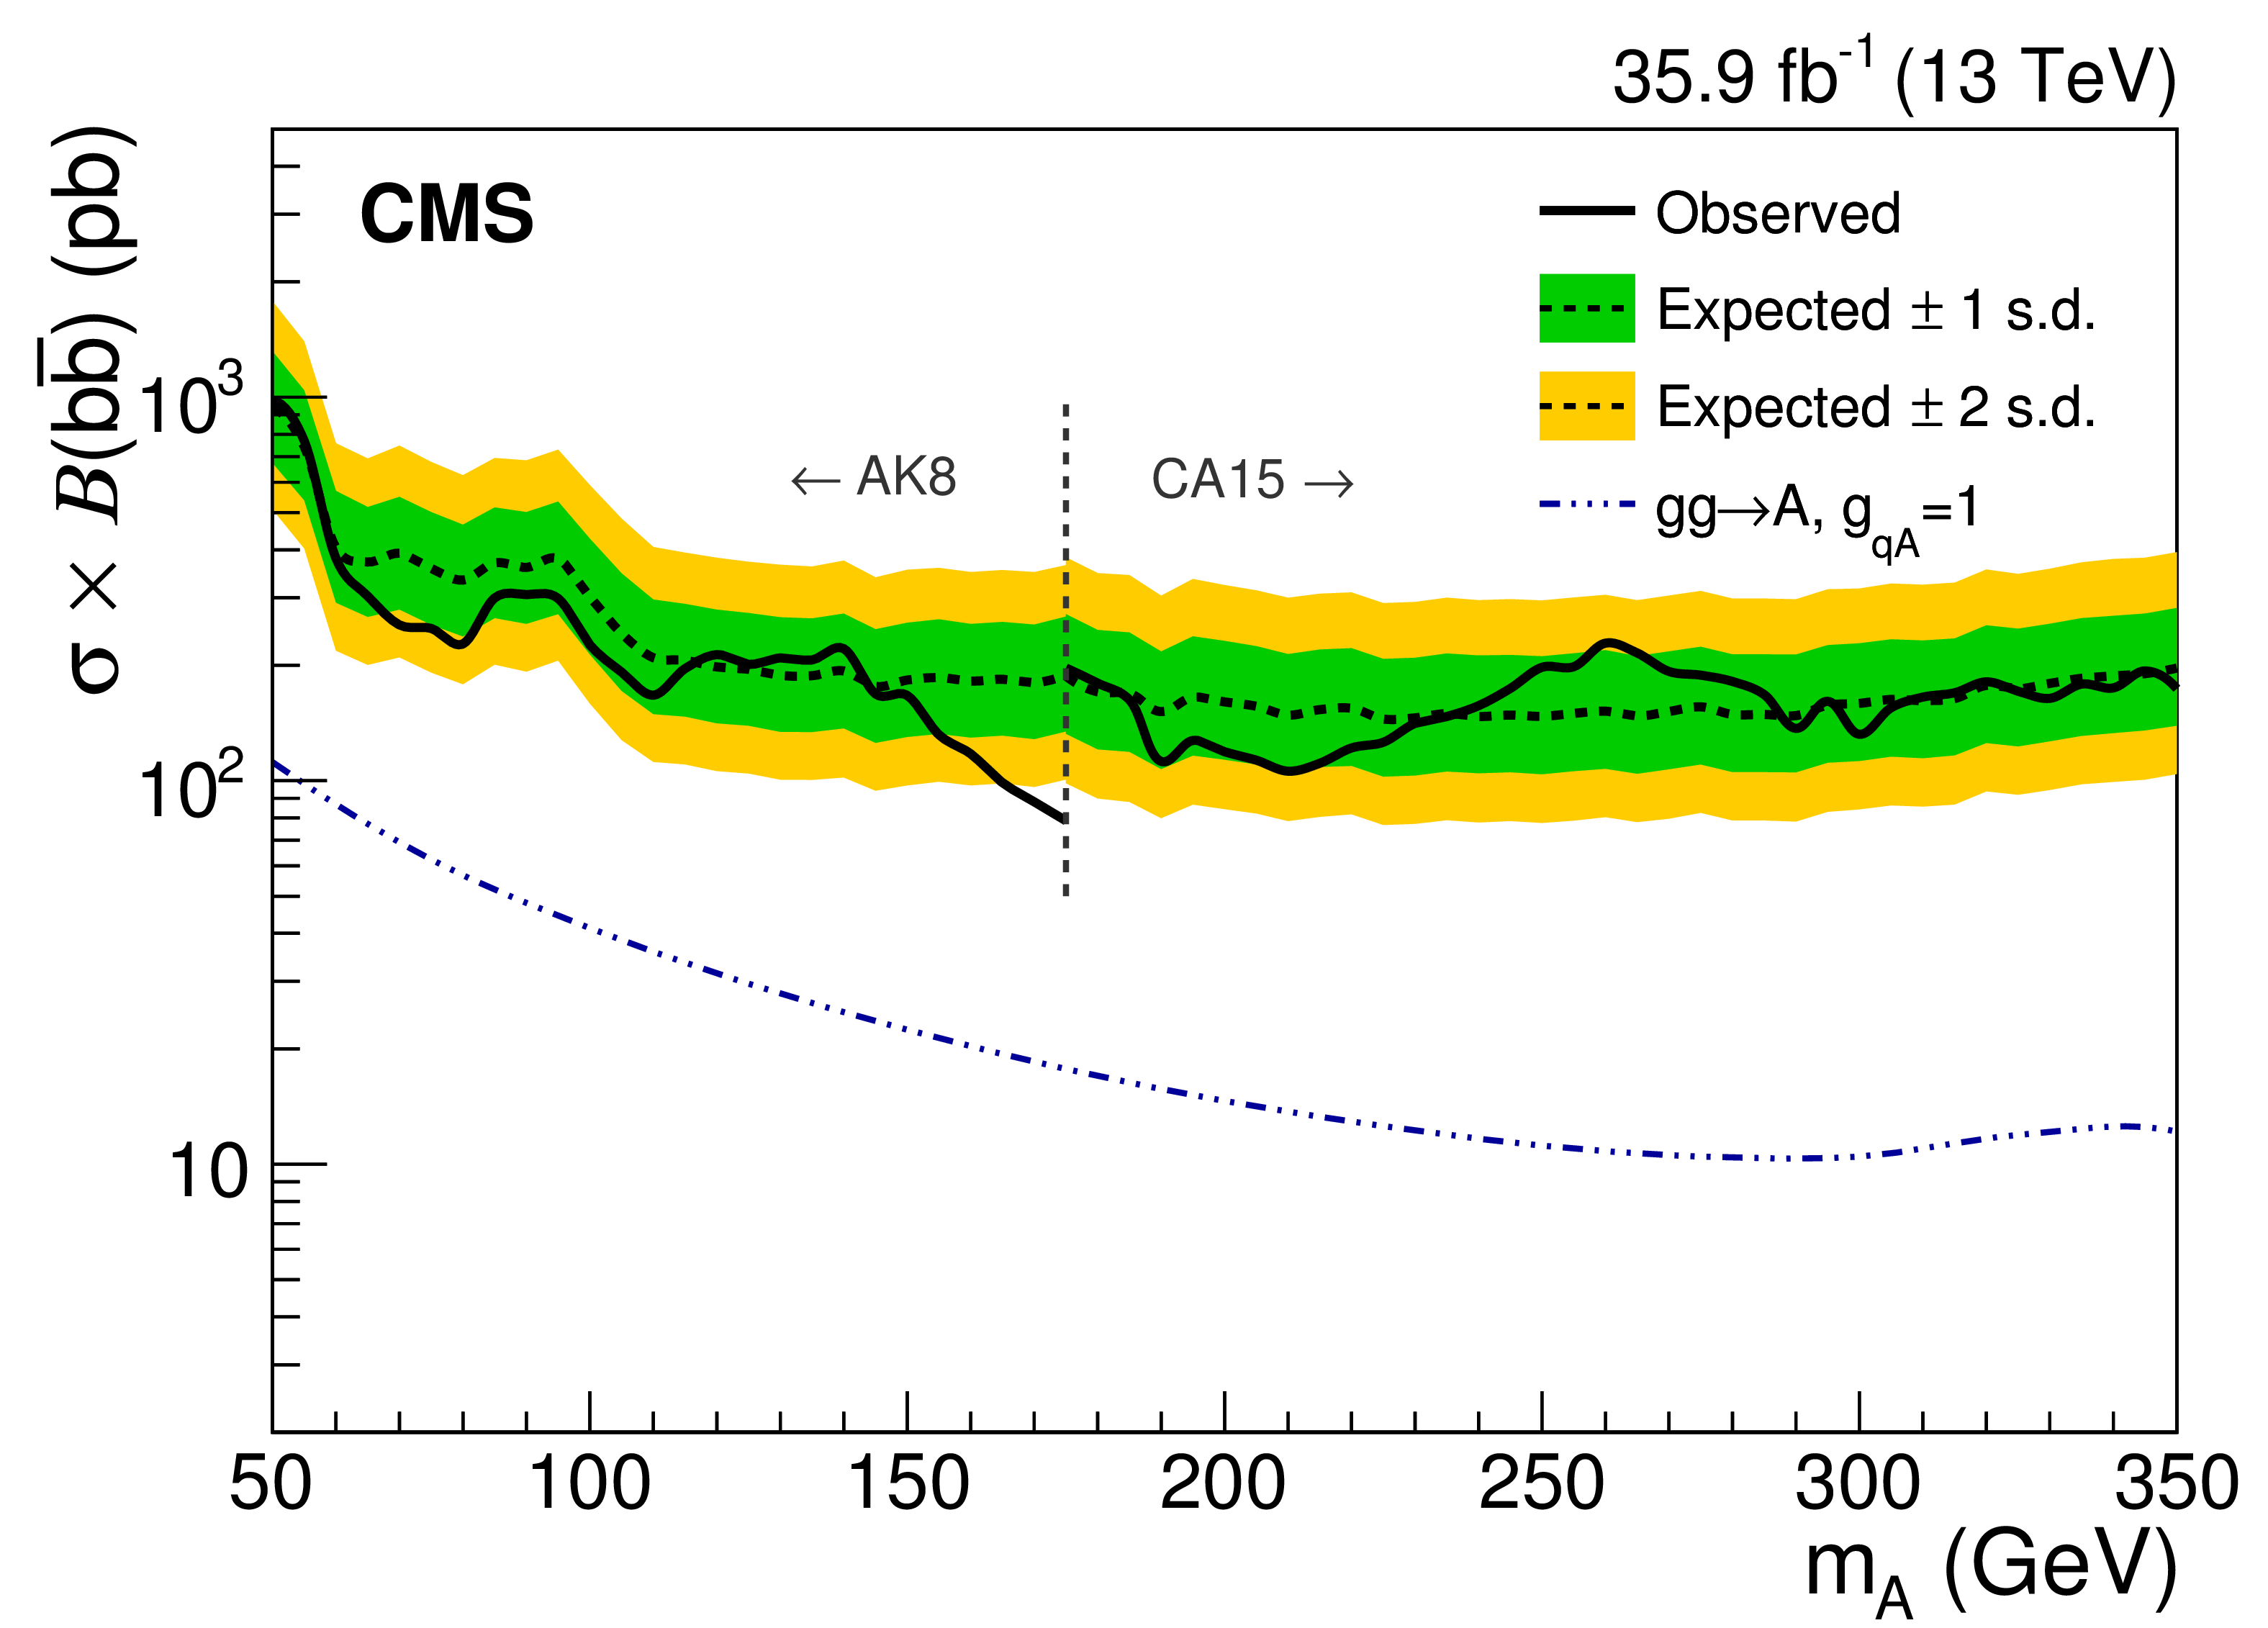
Upper limits at 95% CL on the product of the A production cross section and the branching fraction to $ {{\mathrm {b}} {\overline {\mathrm {b}}}} $ (left) and on $ {g_{{\mathrm {q}} {\mathrm {A}}}} $ (right), as a function of the resonance mass $m_{{\mathrm {A}}}$. The blue dash-dotted line indicates the theoretical pseudoscalar production cross section assuming $ {g_{{\mathrm {q}} {\mathrm {A}}}} = $ 1 as a chosen benchmark [5]. The vertical line at 175 GeV corresponds to the transition between the AK8 and CA15 jet selections. |
png pdf |
Figure 8-a:
Upper limits at 95% CL on the product of the A production cross section and the branching fraction to $ {{\mathrm {b}} {\overline {\mathrm {b}}}} $, as a function of the resonance mass $m_{{\mathrm {A}}}$. The blue dash-dotted line indicates the theoretical pseudoscalar production cross section assuming $ {g_{{\mathrm {q}} {\mathrm {A}}}} = $ 1 as a chosen benchmark [5]. The vertical line at 175 GeV corresponds to the transition between the AK8 and CA15 jet selections. |
png pdf |
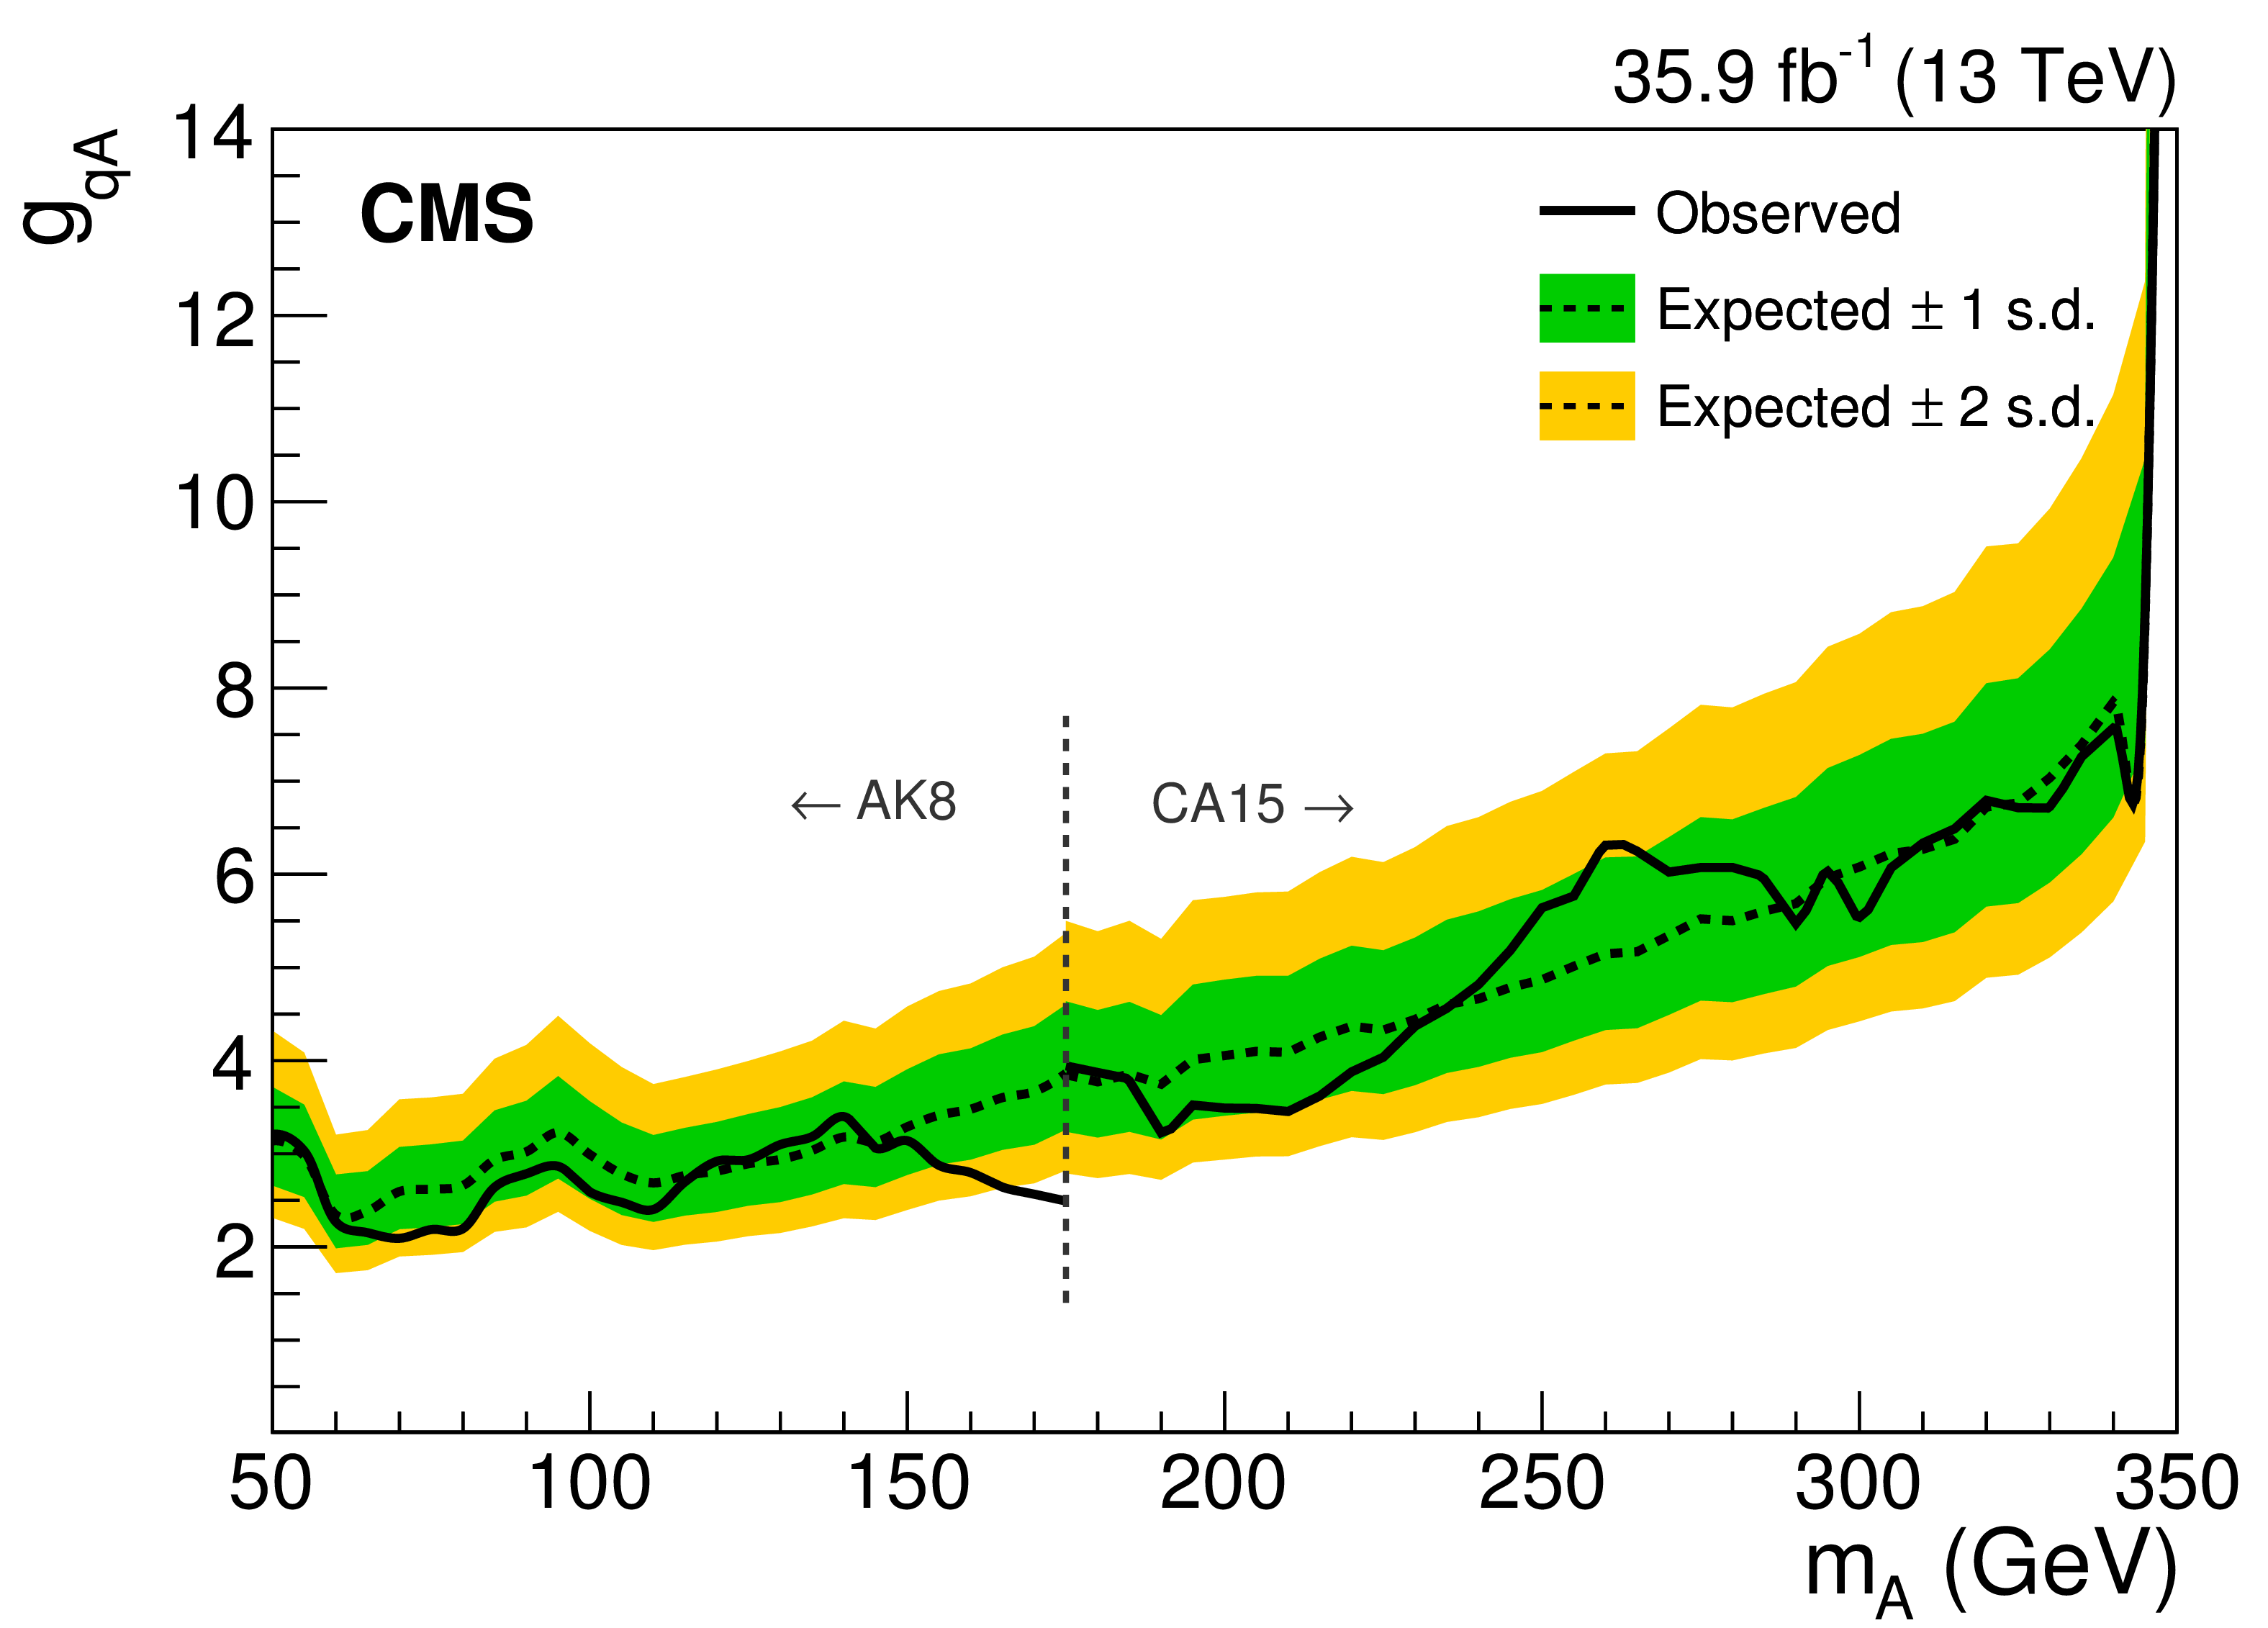
Figure 8-b:
Upper limits at 95% CL on $ {g_{{\mathrm {q}} {\mathrm {A}}}} $, as a function of the resonance mass $m_{{\mathrm {A}}}$. The blue dash-dotted line indicates the theoretical pseudoscalar production cross section assuming $ {g_{{\mathrm {q}} {\mathrm {A}}}} = $ 1 as a chosen benchmark [5]. The vertical line at 175 GeV corresponds to the transition between the AK8 and CA15 jet selections. |
| Tables | |
png pdf |
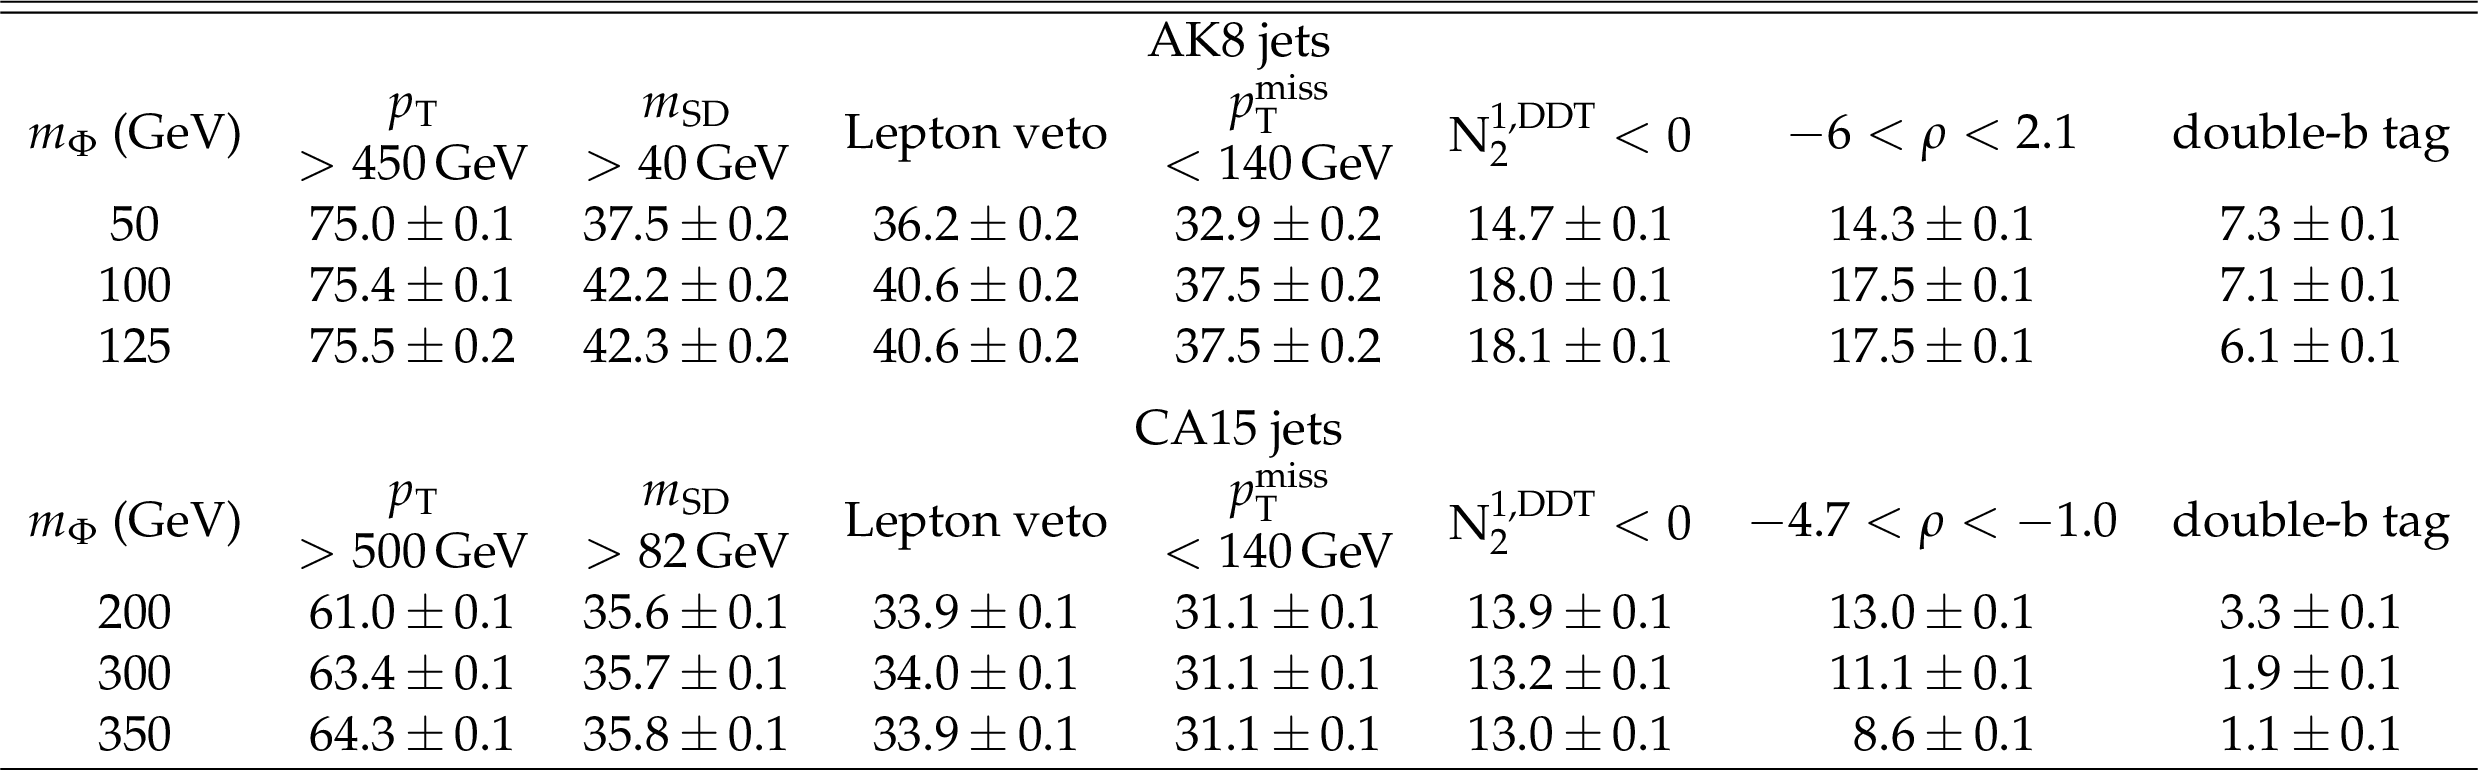
Table 1:
The selection efficiencies in percent for simulated $\phi ({{\mathrm {b}} {\overline {\mathrm {b}}}})$ signal events with parton-level $ {H_{\mathrm {T}}} > $ 400 GeV, at different stages of the event selection, shown for different mass hypotheses and for AK8 and CA15 jets. The statistical uncertainties due to the simulated sample size are also shown. |

png pdf |
Table 2:
Summary of the systematic uncertainties affecting the signal, W and Z+jets processes. Instances where the uncertainty does not apply are indicated by a dash. The reported percentages reflect a one standard deviation effect on the product of acceptance and efficiency of each process. For the uncertainties related to the jet mass scale and resolution, which affect the mass distribution shapes, the reported percentages reflect a one standard deviation effect on the nominal jet mass. |
| Summary |
| A search for a low-mass resonance decaying into a bottom quark-antiquark pair and reconstructed as a single wide jet has been presented, using a data set of proton-proton collisions at $\sqrt{s} = $ 13 TeV corresponding to an integrated luminosity of 35.9 fb$^{-1}$. Dedicated substructure and double-b tagging techniques were employed to identify jets containing a resonance candidate over a smoothly falling soft-drop jet mass distribution in data. No significant excess above the standard model prediction was observed for signal masses between 50-350 GeV. Upper limits at 95% confidence level are set on the product of the resonance production cross section and the branching fraction to bottom quark-antiquark pairs, as well as on the coupling ${g_{\mathrm{q}\phi}} $ (${g_{\mathrm{q}\mathrm{A}}} $) of a scalar (pseudoscalar) boson decaying to quarks. The search excludes the production through gluon fusion of a scalar (pseudoscalar) decaying to $\mathrm{b\bar{b}}$ with a product of the cross section and branching fraction as low as 79 (86) pb at a resonance mass of 175 GeV, corresponding to an upper limit on ${g_{\mathrm{q}\phi}} $ (${g_{\mathrm{q}\mathrm{A}}} $) of 3.9 (2.5). This constitutes the first LHC constraint on exotic bottom quark-antiquark resonances below 325 GeV. |
| References | ||||
| 1 | Abercrombie et al. | Dark matter benchmark models for early LHC Run-2 searches: Report of the ATLAS/CMS dark matter forum | 1507.00966 | |
| 2 | M. R. Buckley, D. Feld, and D. Goncalves | Scalar simplified models for dark matter | PRD 91 (2015) 015017 | 1410.6497 |
| 3 | P. Harris, V. V. Khoze, M. Spannowsky, and C. Williams | Constraining dark sectors at colliders: Beyond the effective theory approach | PRD 91 (2015) 055009 | 1411.0535 |
| 4 | U. Haisch and E. Re | Simplified dark matter top-quark interactions at the LHC | JHEP 06 (2015) 078 | 1503.00691 |
| 5 | G. Busoni et al. | Recommendations on presenting LHC searches for missing transverse energy signals using simplified $ s $-channel models of dark matter | 1603.04156 | |
| 6 | CMS Collaboration | Search for narrow resonances in dijet final states at $ \sqrt{s}= $ 8 TeV with the novel CMS technique of data scouting | PRL 117 (2016) 031802 | CMS-EXO-14-005 1604.08907 |
| 7 | CMS Collaboration | Search for dijet resonances in proton-proton collisions at $ \sqrt{s} = $ 13 TeV and constraints on dark matter and other models | PLB 769 (2017) 520 | CMS-EXO-16-032 1611.03568 |
| 8 | CMS Collaboration | Search for narrow and broad dijet resonances in proton-proton collisions at $ \sqrt{s}= $ 13 TeV and constraints on dark matter mediators and other new particles | JHEP 08 (2018) 130 | CMS-EXO-16-056 1806.00843 |
| 9 | ATLAS Collaboration | Search for low-mass dijet resonances using trigger-level jets with the ATLAS detector in $ pp $ collisions at $ \sqrt{s}= $ 13 TeV | PRL 121 (2018) 081801 | 1804.03496 |
| 10 | CMS Collaboration | Search for narrow resonances in the b-tagged dijet mass spectrum in proton-proton collisions at $ \sqrt{s} = $ 8 TeV | PRL 120 (2018) 201801 | CMS-EXO-16-057 1802.06149 |
| 11 | ATLAS Collaboration | Search for resonances in the mass distribution of jet pairs with one or two jets identified as $ b $-jets in proton-proton collisions at $ \sqrt{s}= $ 13 TeV with the ATLAS detector | PRD 98 (2018) 032016 | 1805.09299 |
| 12 | CMS Collaboration | Search for low mass vector resonances decaying to quark-antiquark pairs in proton-proton collisions at $ \sqrt{s}=13\text{}\text{}\mathrm{TeV} $ | PRL 119 (2017) 111802 | CMS-EXO-16-030 1705.10532 |
| 13 | CMS Collaboration | Search for low mass vector resonances decaying into quark-antiquark pairs in proton-proton collisions at $ \sqrt{s}=13\text{}\text{}\mathrm{TeV} $ | JHEP 01 (2018) 097 | CMS-EXO-17-001 1710.00159 |
| 14 | ATLAS Collaboration | Search for light resonances decaying to boosted quark pairs and produced in association with a photon or a jet in proton-proton collisions at $ \sqrt{s}= $ 13 TeV with the ATLAS detector | Submitted to PLB | 1801.08769 |
| 15 | CMS Collaboration | Inclusive search for a highly boosted Higgs boson decaying to a bottom quark-antiquark pair | PRL 120 (2018) 071802 | CMS-HIG-17-010 1709.05543 |
| 16 | D. Liu, J. Liu, C. E. M. Wagner, and X.-P. Wang | Bottom-quark forward-backward asymmetry, dark matter and the LHC | PRD 97 (2018) 055021 | 1712.05802 |
| 17 | M. Cacciari, G. P. Salam, and G. Soyez | The anti-$ {k_{\mathrm{T}}} $ jet clustering algorithm | JHEP 04 (2008) 063 | 0802.1189 |
| 18 | Y. L. Dokshitzer, G. D. Leder, S. Moretti, and B. R. Webber | Better jet clustering algorithms | JHEP 08 (1997) 001 | hep-ph/9707323 |
| 19 | M. Wobisch and T. Wengler | Hadronization corrections to jet cross-sections in deep inelastic scattering | in Proceedings of the Workshop on Monte Carlo Generators for HERA Physics, Hamburg, Germany, p. 270 1998 | hep-ph/9907280 |
| 20 | J. M. Butterworth, A. R. Davison, M. Rubin, and G. P. Salam | Jet substructure as a new Higgs search channel at the LHC | PRL 100 (2008) 242001 | 0802.2470 |
| 21 | I. Moult, L. Necib, and J. Thaler | New angles on energy correlation functions | JHEP 12 (2016) 153 | 1609.07483 |
| 22 | CMS Collaboration | Identification of heavy-flavour jets with the CMS detector in pp collisions at 13 TeV | JINST 13 (2018) P05011 | CMS-BTV-16-002 1712.07158 |
| 23 | CMS Collaboration | The CMS trigger system | JINST 12 (2017) P01020 | CMS-TRG-12-001 1609.02366 |
| 24 | CMS Collaboration | The CMS experiment at the CERN LHC | JINST 3 (2008) S08004 | CMS-00-001 |
| 25 | GEANT4 Collaboration | GEANT4--a simulation toolkit | NIMA 506 (2003) 250 | |
| 26 | J. Alwall et al. | The automated computation of tree-level and next-to-leading order differential cross sections, and their matching to parton shower simulations | JHEP 07 (2014) 079 | 1405.0301 |
| 27 | O. Mattelaer and E. Vryonidou | Dark matter production through loop-induced processes at the LHC: the $ s $-channel mediator case | EPJC 75 (2015) 436 | 1508.00564 |
| 28 | S. P. Jones, M. Kerner, and G. Luisoni | Next-to-Leading-Order QCD Corrections to Higgs Boson Plus Jet Production with Full Top-Quark Mass Dependence | PRL 120 (2018) 162001 | 1802.00349 |
| 29 | J. Alwall et al. | Comparative study of various algorithms for the merging of parton showers and matrix elements in hadronic collisions | EPJC 53 (2008) 473 | 0706.2569 |
| 30 | P. Nason | A new method for combining NLO QCD with shower Monte Carlo algorithms | JHEP 11 (2004) 040 | hep-ph/0409146 |
| 31 | S. Frixione, P. Nason, and C. Oleari | Matching NLO QCD computations with parton shower simulations: the POWHEG method | JHEP 11 (2007) 070 | 0709.2092 |
| 32 | S. Alioli, P. Nason, C. Oleari, and E. Re | A general framework for implementing NLO calculations in shower monte carlo programs: the POWHEG BOX | JHEP 06 (2010) 043 | 1002.2581 |
| 33 | G. Luisoni, P. Nason, C. Oleari, and F. Tramontano | $ \mathrm{H}\mathrm{W}^{\pm} $/$ \mathrm{H}\mathrm{Z} $ + 0 and 1 jet at NLO with the POWHEG BOX interfaced to GoSam and their merging within MiNLO | JHEP 10 (2013) 083 | 1306.2542 |
| 34 | D. de Florian, G. Ferrera, M. Grazzini, and D. Tommasini | Higgs boson production at the LHC: transverse momentum resummation effects in the $ \mathrm{H}\to 2\gamma $, $ \mathrm{H}\to\mathrm{W}\mathrm{W}\to \ell\nu\ell\nu $ and $ \mathrm{H}\to\mathrm{Z}\mathrm{Z}\to 4\ell $ decay modes | JHEP 06 (2012) 132 | 1203.6321 |
| 35 | M. Grazzini and H. Sargsyan | Heavy-quark mass effects in Higgs boson production at the LHC | JHEP 09 (2013) 129 | 1306.4581 |
| 36 | E. Bagnaschi, G. Degrassi, P. Slavich, and A. Vicini | Higgs production via gluon fusion in the POWHEG approach in the SM and in the MSSM | JHEP 02 (2012) 088 | 1111.2854 |
| 37 | E. Bagnaschi and A. Vicini | The Higgs transverse momentum distribution in gluon fusion as a multiscale problem | JHEP 01 (2016) 056 | 1505.00735 |
| 38 | T. Sjostrand et al. | An introduction to PYTHIA 8.2 | CPC 191 (2015) 159 | 1410.3012 |
| 39 | CMS Collaboration | Event generator tunes obtained from underlying event and multiparton scattering measurements | EPJC 76 (2016) 155 | CMS-GEN-14-001 1512.00815 |
| 40 | J. M. Campbell and R. K. Ellis | MCFM for the Tevatron and the LHC | NPPS 205-206 (2010) 10 | 1007.3492 |
| 41 | M. Czakon, P. Fiedler, and A. Mitov | Total top quark pair-production cross section at hadron colliders through $ \mathcal{O}(\alpha_s^4) $ | PRL 110 (2013) 252004 | 1303.6254 |
| 42 | S. Kallweit et al. | NLO electroweak automation and precise predictions for $ \mathrm{W} $+multijet production at the LHC | JHEP 04 (2015) 012 | 1412.5157 |
| 43 | S. Kallweit et al. | NLO QCD+EW predictions for V + jets including off-shell vector-boson decays and multijet merging | JHEP 04 (2016) 021 | 1511.08692 |
| 44 | S. Kallweit et al. | NLO QCD+EW automation and precise predictions for V+multijet production | in Proceedings, 50th Rencontres de Moriond, QCD and high energy interactions, p. 121 2015 | 1505.05704 |
| 45 | J. M. Lindert et al. | Precise predictions for $ \mathrm{V} $+jets dark matter backgrounds | EPJC 77 (2017) 829 | 1705.04664 |
| 46 | NNPDF Collaboration | Parton distributions for the LHC run II | JHEP 04 (2015) 040 | 1410.8849 |
| 47 | CMS Collaboration | Particle-flow reconstruction and global event description with the CMS detector | JINST 12 (2017) P10003 | CMS-PRF-14-001 1706.04965 |
| 48 | M. Cacciari, G. P. Salam, and G. Soyez | Fastjet user manual | EPJC 72 (2012) 1896 | 1111.6097 |
| 49 | D. Bertolini, P. Harris, M. Low, and N. Tran | Pileup Per Particle Identification | JHEP 10 (2014) 059 | 1407.6013 |
| 50 | CMS Collaboration | Jet energy scale and resolution in the CMS experiment in pp collisions at 8 TeV | JINST 12 (2017) P02014 | CMS-JME-13-004 1607.03663 |
| 51 | D. Krohn, J. Thaler, and L.-T. Wang | Jet trimming | JHEP 02 (2010) 084 | 0912.1342 |
| 52 | CMS Collaboration | Performance of electron reconstruction and selection with the CMS detector in proton-proton collisions at $ \sqrt{s}= $ 8 TeV | JINST 10 (2015) P06005 | CMS-EGM-13-001 1502.02701 |
| 53 | CMS Collaboration | Performance of the CMS muon detector and muon reconstruction with proton-proton collisions at $ \sqrt{s}= $ 13 TeV | JINST 13 (2018) P06015 | CMS-MUO-16-001 1804.04528 |
| 54 | A. J. Larkoski, S. Marzani, G. Soyez, and J. Thaler | Soft drop | JHEP 05 (2014) 146 | 1402.2657 |
| 55 | M. Dasgupta, A. Fregoso, S. Marzani, and G. P. Salam | Towards an understanding of jet substructure | JHEP 09 (2013) 029 | 1307.0007 |
| 56 | CMS Collaboration | Jet algorithms performance in 13 TeV data | CMS-PAS-JME-16-003 | CMS-PAS-JME-16-003 |
| 57 | J. Dolen et al. | Thinking outside the ROCs: Designing decorrelated taggers (DDT) for jet substructure | JHEP 05 (2016) 156 | 1603.00027 |
| 58 | A. J. Larkoski, G. P. Salam, and J. Thaler | Energy correlation functions for jet substructure | JHEP 06 (2013) 108 | 1305.0007 |
| 59 | J. Thaler and K. Van Tilburg | Identifying boosted objects with N-subjettiness | JHEP 03 (2011) 015 | 1011.2268 |
| 60 | R. A. Fisher | On the interpretation of $ \chi^{2} $ from contingency tables, and the calculation of P | J. Royal Stat. Soc. 85 (1922) 87 | |
| 61 | CMS Collaboration | Search for new physics in final states with an energetic jet or a hadronically decaying $ \mathrm{W} $ or $ \mathrm{Z} $ boson and transverse momentum imbalance at $ \sqrt{s} = $ 13 TeV | PRD 97 (2018) 092005 | CMS-EXO-16-048 1712.02345 |
| 62 | A. Denner, S. Dittmaier, T. Kasprzik, and A. Muck | Electroweak corrections to $ \mathrm{W} $+jet hadroproduction including leptonic $ \mathrm{W} $-boson decays | JHEP 08 (2009) 075 | 0906.1656 |
| 63 | A. Denner, S. Dittmaier, T. Kasprzik, and A. Muck | Electroweak corrections to dilepton+jet production at hadron colliders | JHEP 06 (2011) 069 | 1103.0914 |
| 64 | A. Denner, S. Dittmaier, T. Kasprzik, and A. Maeck | Electroweak corrections to monojet production at the LHC | EPJC 73 (2013) 2297 | 1211.5078 |
| 65 | J. H. Kuhn, A. Kulesza, S. Pozzorini, and M. Schulze | Electroweak corrections to hadronic photon production at large transverse momenta | JHEP 03 (2006) 059 | hep-ph/0508253 |
| 66 | CMS Collaboration | Determination of jet energy calibration and transverse momentum resolution in CMS | JINST 6 (2011) 11002 | CMS-JME-10-011 1107.4277 |
| 67 | CMS Collaboration | CMS luminosity measurements for the 2016 data taking period | CMS-PAS-LUM-17-001 | CMS-PAS-LUM-17-001 |
| 68 | ATLAS and CMS Collaborations | Procedure for the LHC Higgs boson search combination in Summer 2011 | CMS-NOTE-2011-005 | |
| 69 | A. L. Read | Presentation of search results: the CL$ _s $ technique | JPG 28 (2002) 2693 | |
| 70 | T. Junk | Confidence level computation for combining searches with small statistics | NIMA 434 (1999) 435 | hep-ex/9902006 |
| 71 | CMS Collaboration | Precise determination of the mass of the Higgs boson and tests of compatibility of its couplings with the standard model predictions using proton collisions at 7 and 8 TeV | EPJC 75 (2015) 212 | CMS-HIG-14-009 1412.8662 |
| 72 | G. Cowan, K. Cranmer, E. Gross, and O. Vitells | Asymptotic formulae for likelihood-based tests of new physics | EPJC 71 (2011) 1554 | 1007.1727 |
| 73 | L. Demortier | P values and nuisance parameters | in Statistical issues for LHC physics. Proceedings, Workshop, PHYSTAT-LHC, Geneva, Switzerland, June 27-29, 2007, p. 23 2008 | |
|
|
Compact Muon Solenoid LHC, CERN |
|

|

|

|

|

|