

Compact Muon Solenoid
LHC, CERN
| CMS-EXO-19-019 ; CERN-EP-2021-026 | ||
| Search for resonant and nonresonant new phenomena in high-mass dilepton final states at $\sqrt{s} = $ 13 TeV | ||
| CMS Collaboration | ||
| 4 March 2021 | ||
| JHEP 07 (2021) 208 | ||
| Abstract: A search is presented for physics beyond the standard model (SM) using electron or muon pairs with high invariant mass. A data set of proton-proton collisions collected by the CMS experiment at the LHC at $\sqrt{s} = $ 13 TeV from 2016 to 2018 corresponding to a total integrated luminosity of up to 140 fb$^{-1}$ is analyzed. No significant deviation is observed with respect to the SM background expectations. Upper limits are presented on the ratio of the product of the production cross section and the branching fraction to dileptons of a new narrow resonance to that of the Z boson. These provide the most stringent lower limits to date on the masses for various spin-1 particles, spin-2 gravitons in the Randall-Sundrum model, as well as spin-1 mediators between the SM and dark matter particles. Lower limits on the ultraviolet cutoff parameter are set both for four-fermion contact interactions and for the Arkani-Hamed, Dimopoulos, and Dvali model with large extra dimensions. Lepton flavor universality is tested at the TeV scale for the first time by comparing the dimuon and dielectron mass spectra. No significant deviation from the SM expectation of unity is observed. | ||
| Links: e-print arXiv:2103.02708 [hep-ex] (PDF) ; CDS record ; inSPIRE record ; HepData record ; CADI line (restricted) ; | ||
| Figures & Tables | Summary | Additional Figures | References | CMS Publications |
|---|
| Figures | |
png pdf |
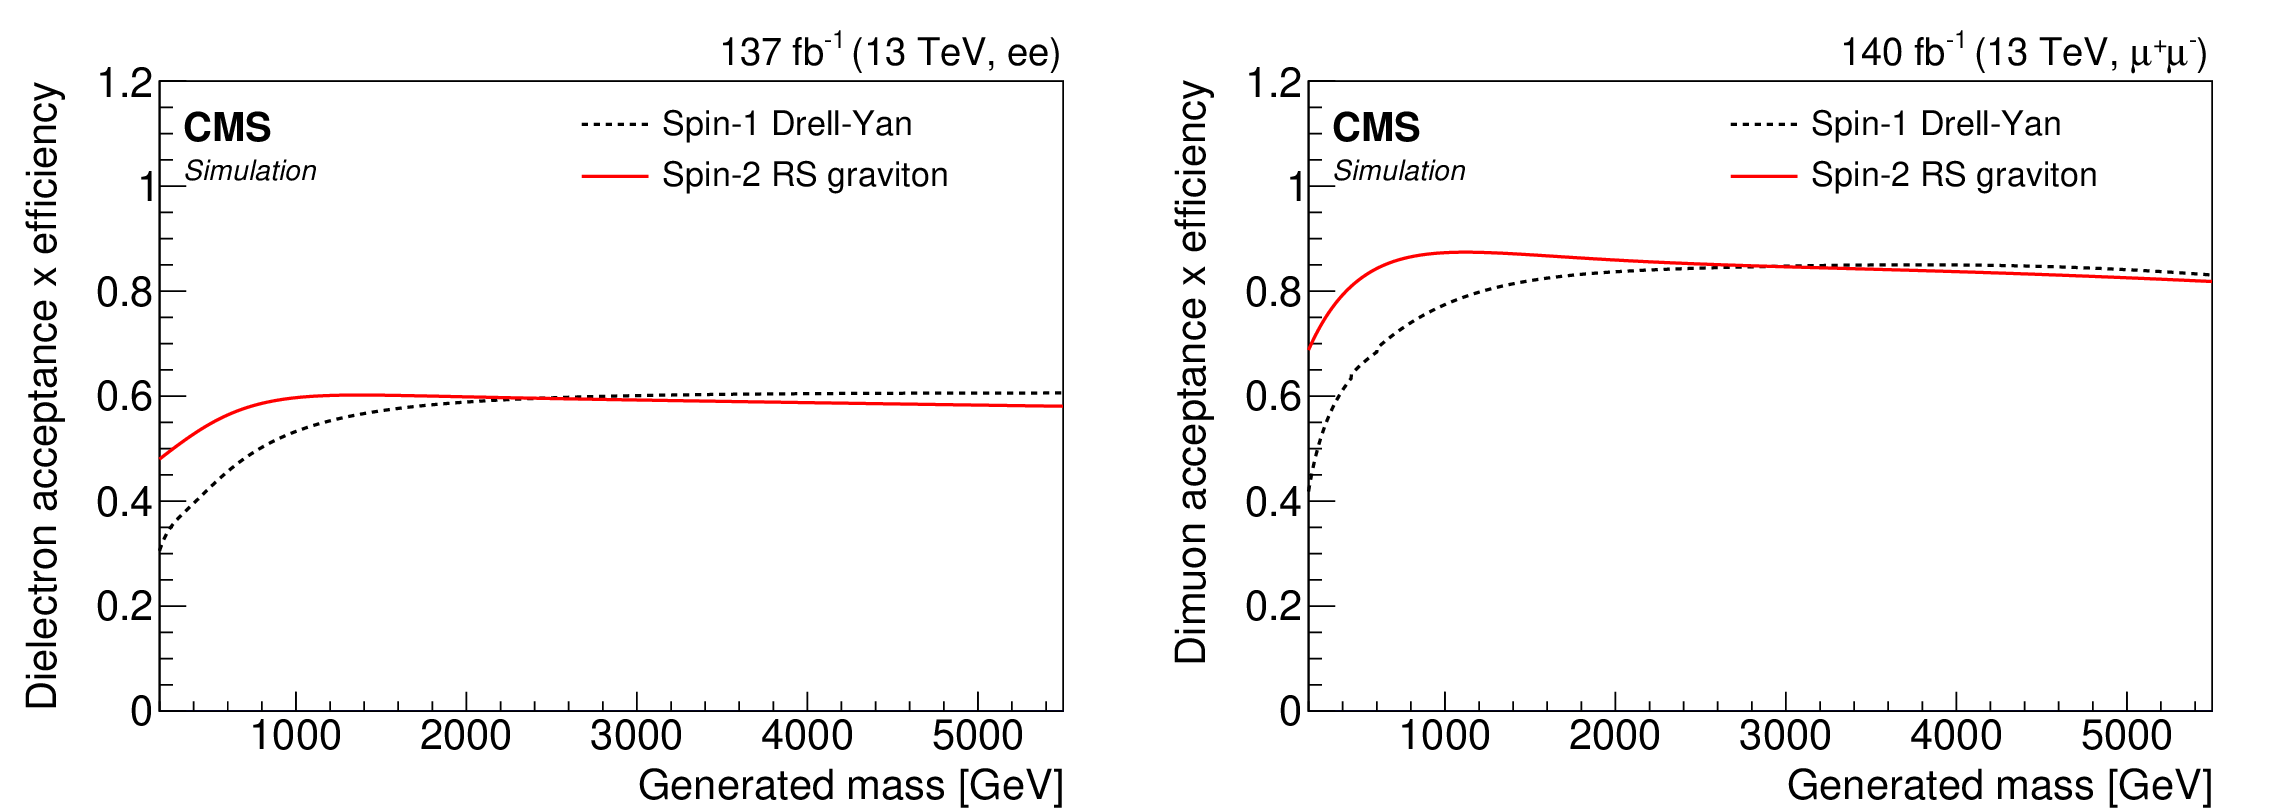
Figure 1:
Product of the acceptance and the efficiency for (left) dielectron and (right) dimuon pairs as a function of generated mass in simulated events. The DY samples are used to represent spin-1 particles, and RS graviton samples are used for spin-2 particles. |
png pdf |
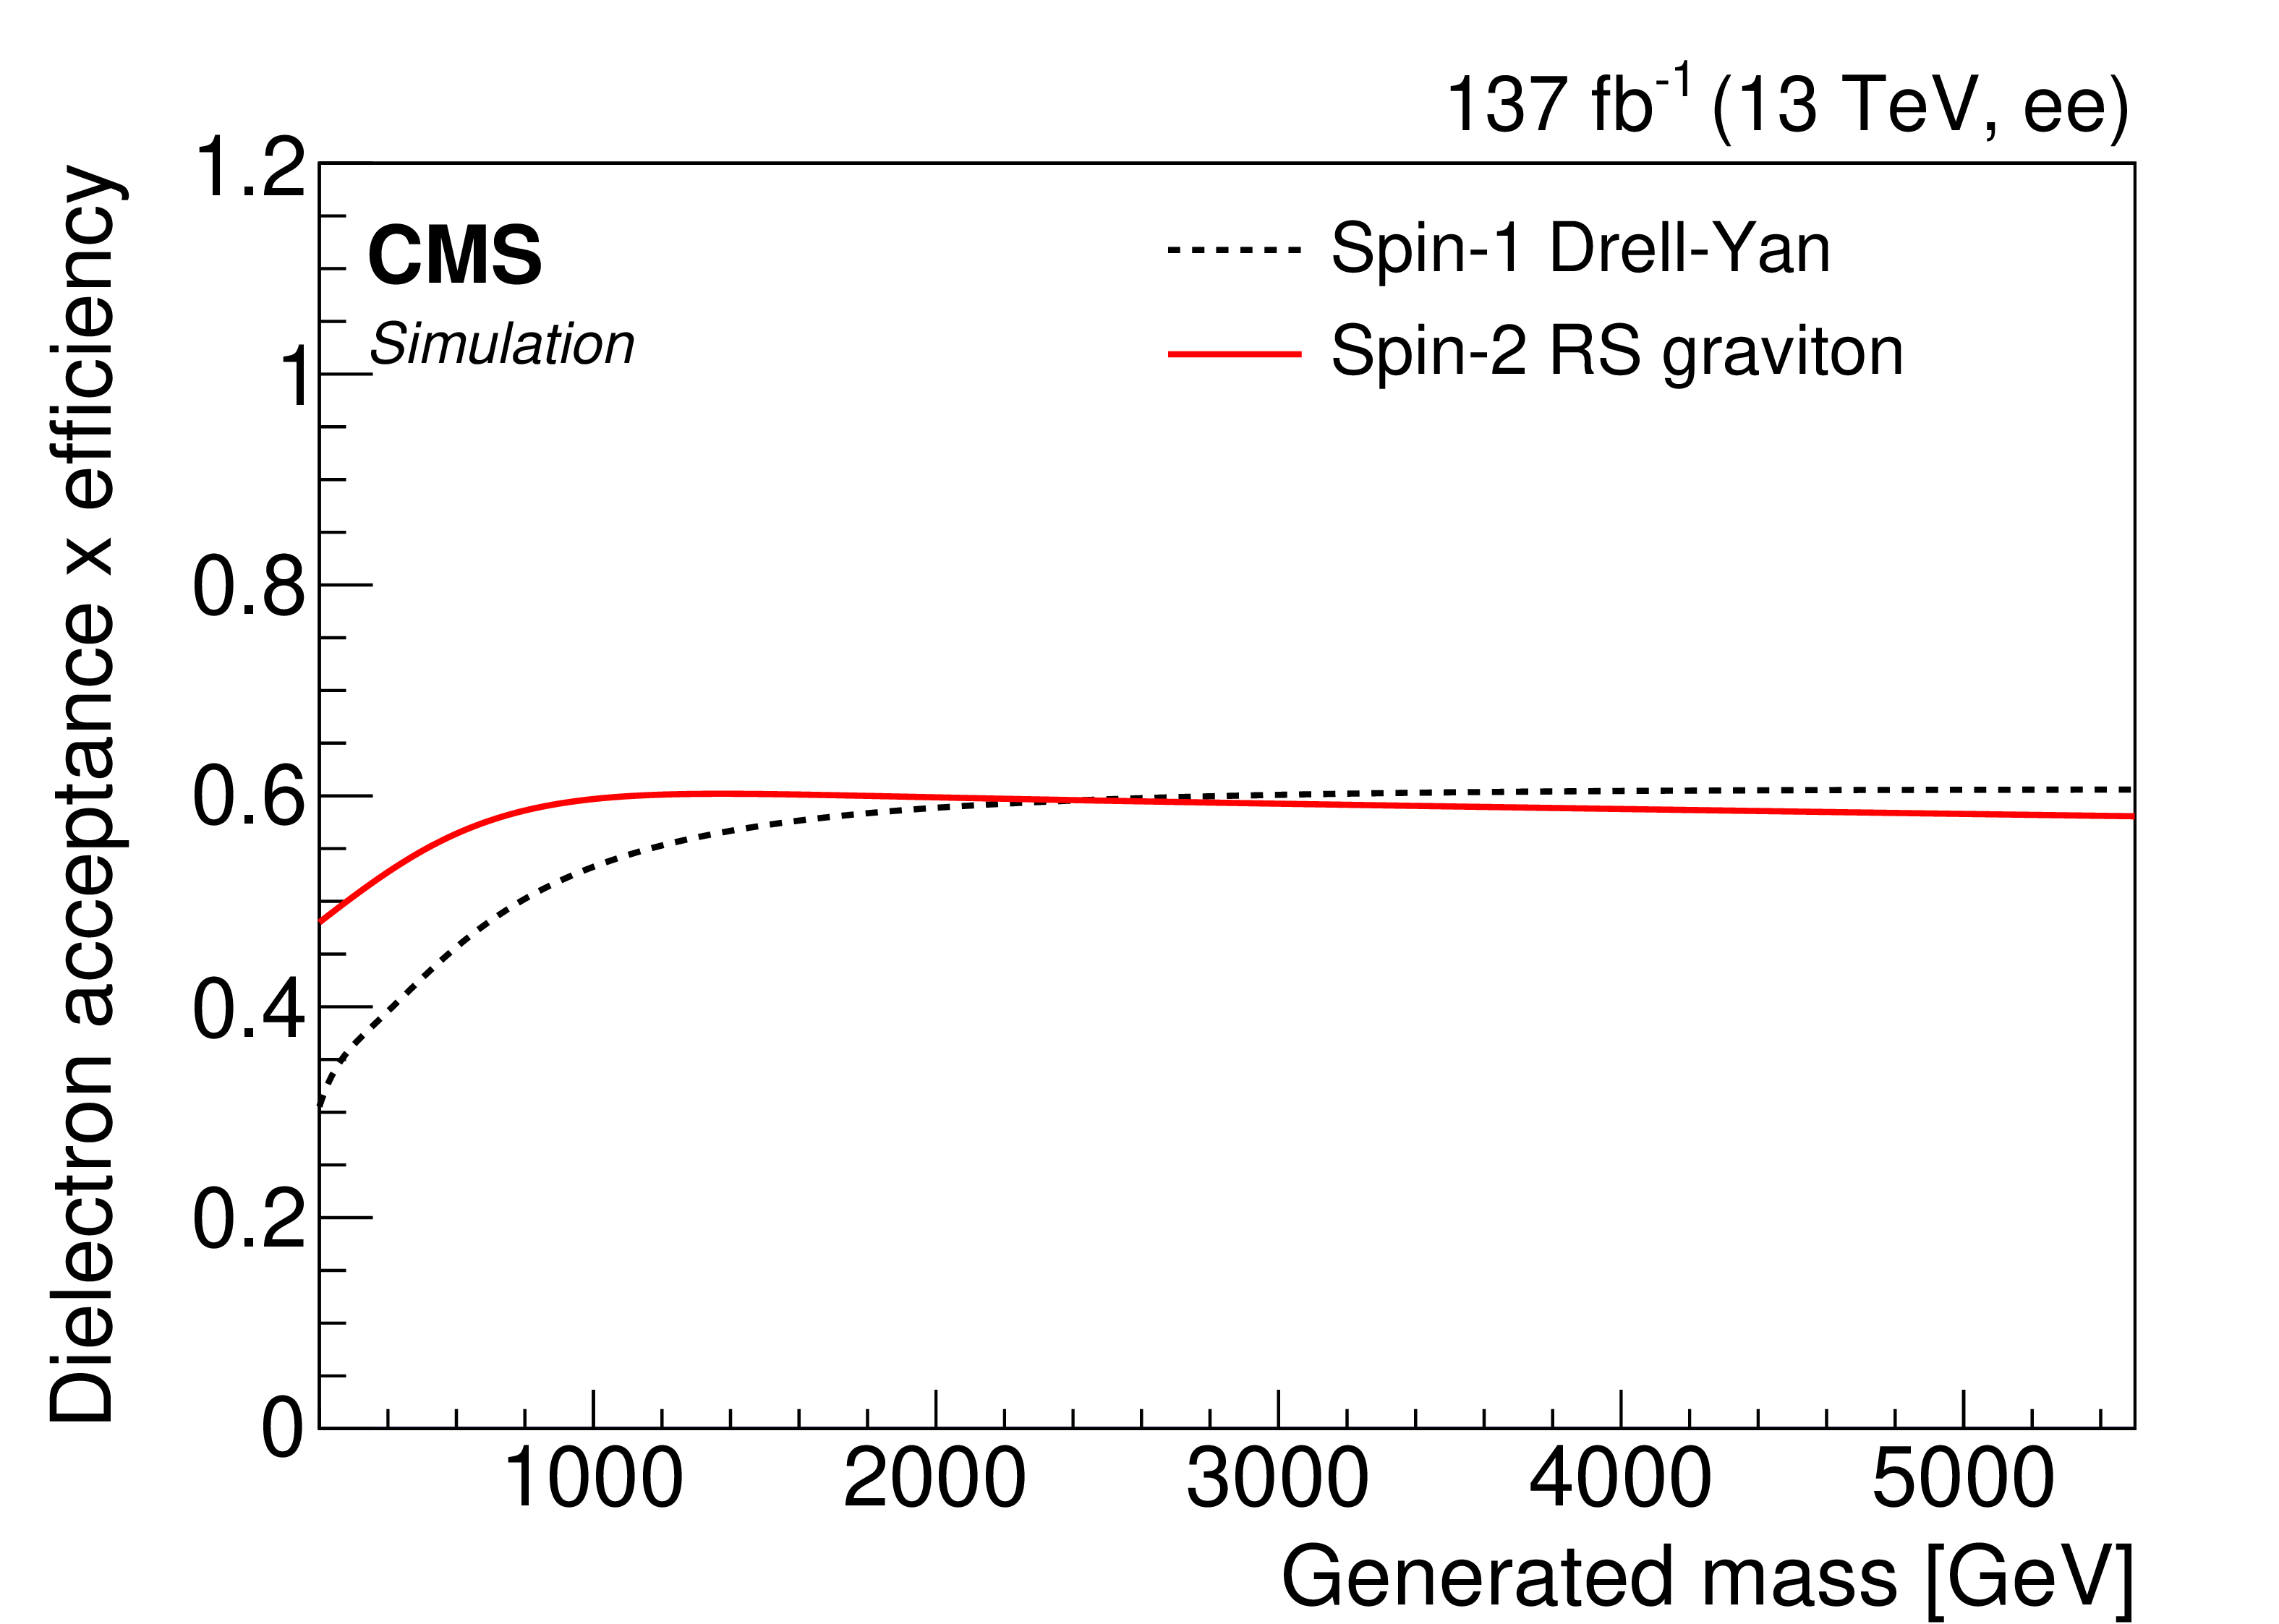
Figure 1-a:
Product of the acceptance and the efficiency for dielectron pairs as a function of generated mass in simulated events. The DY samples are used to represent spin-1 particles, and RS graviton samples are used for spin-2 particles. |
png pdf |
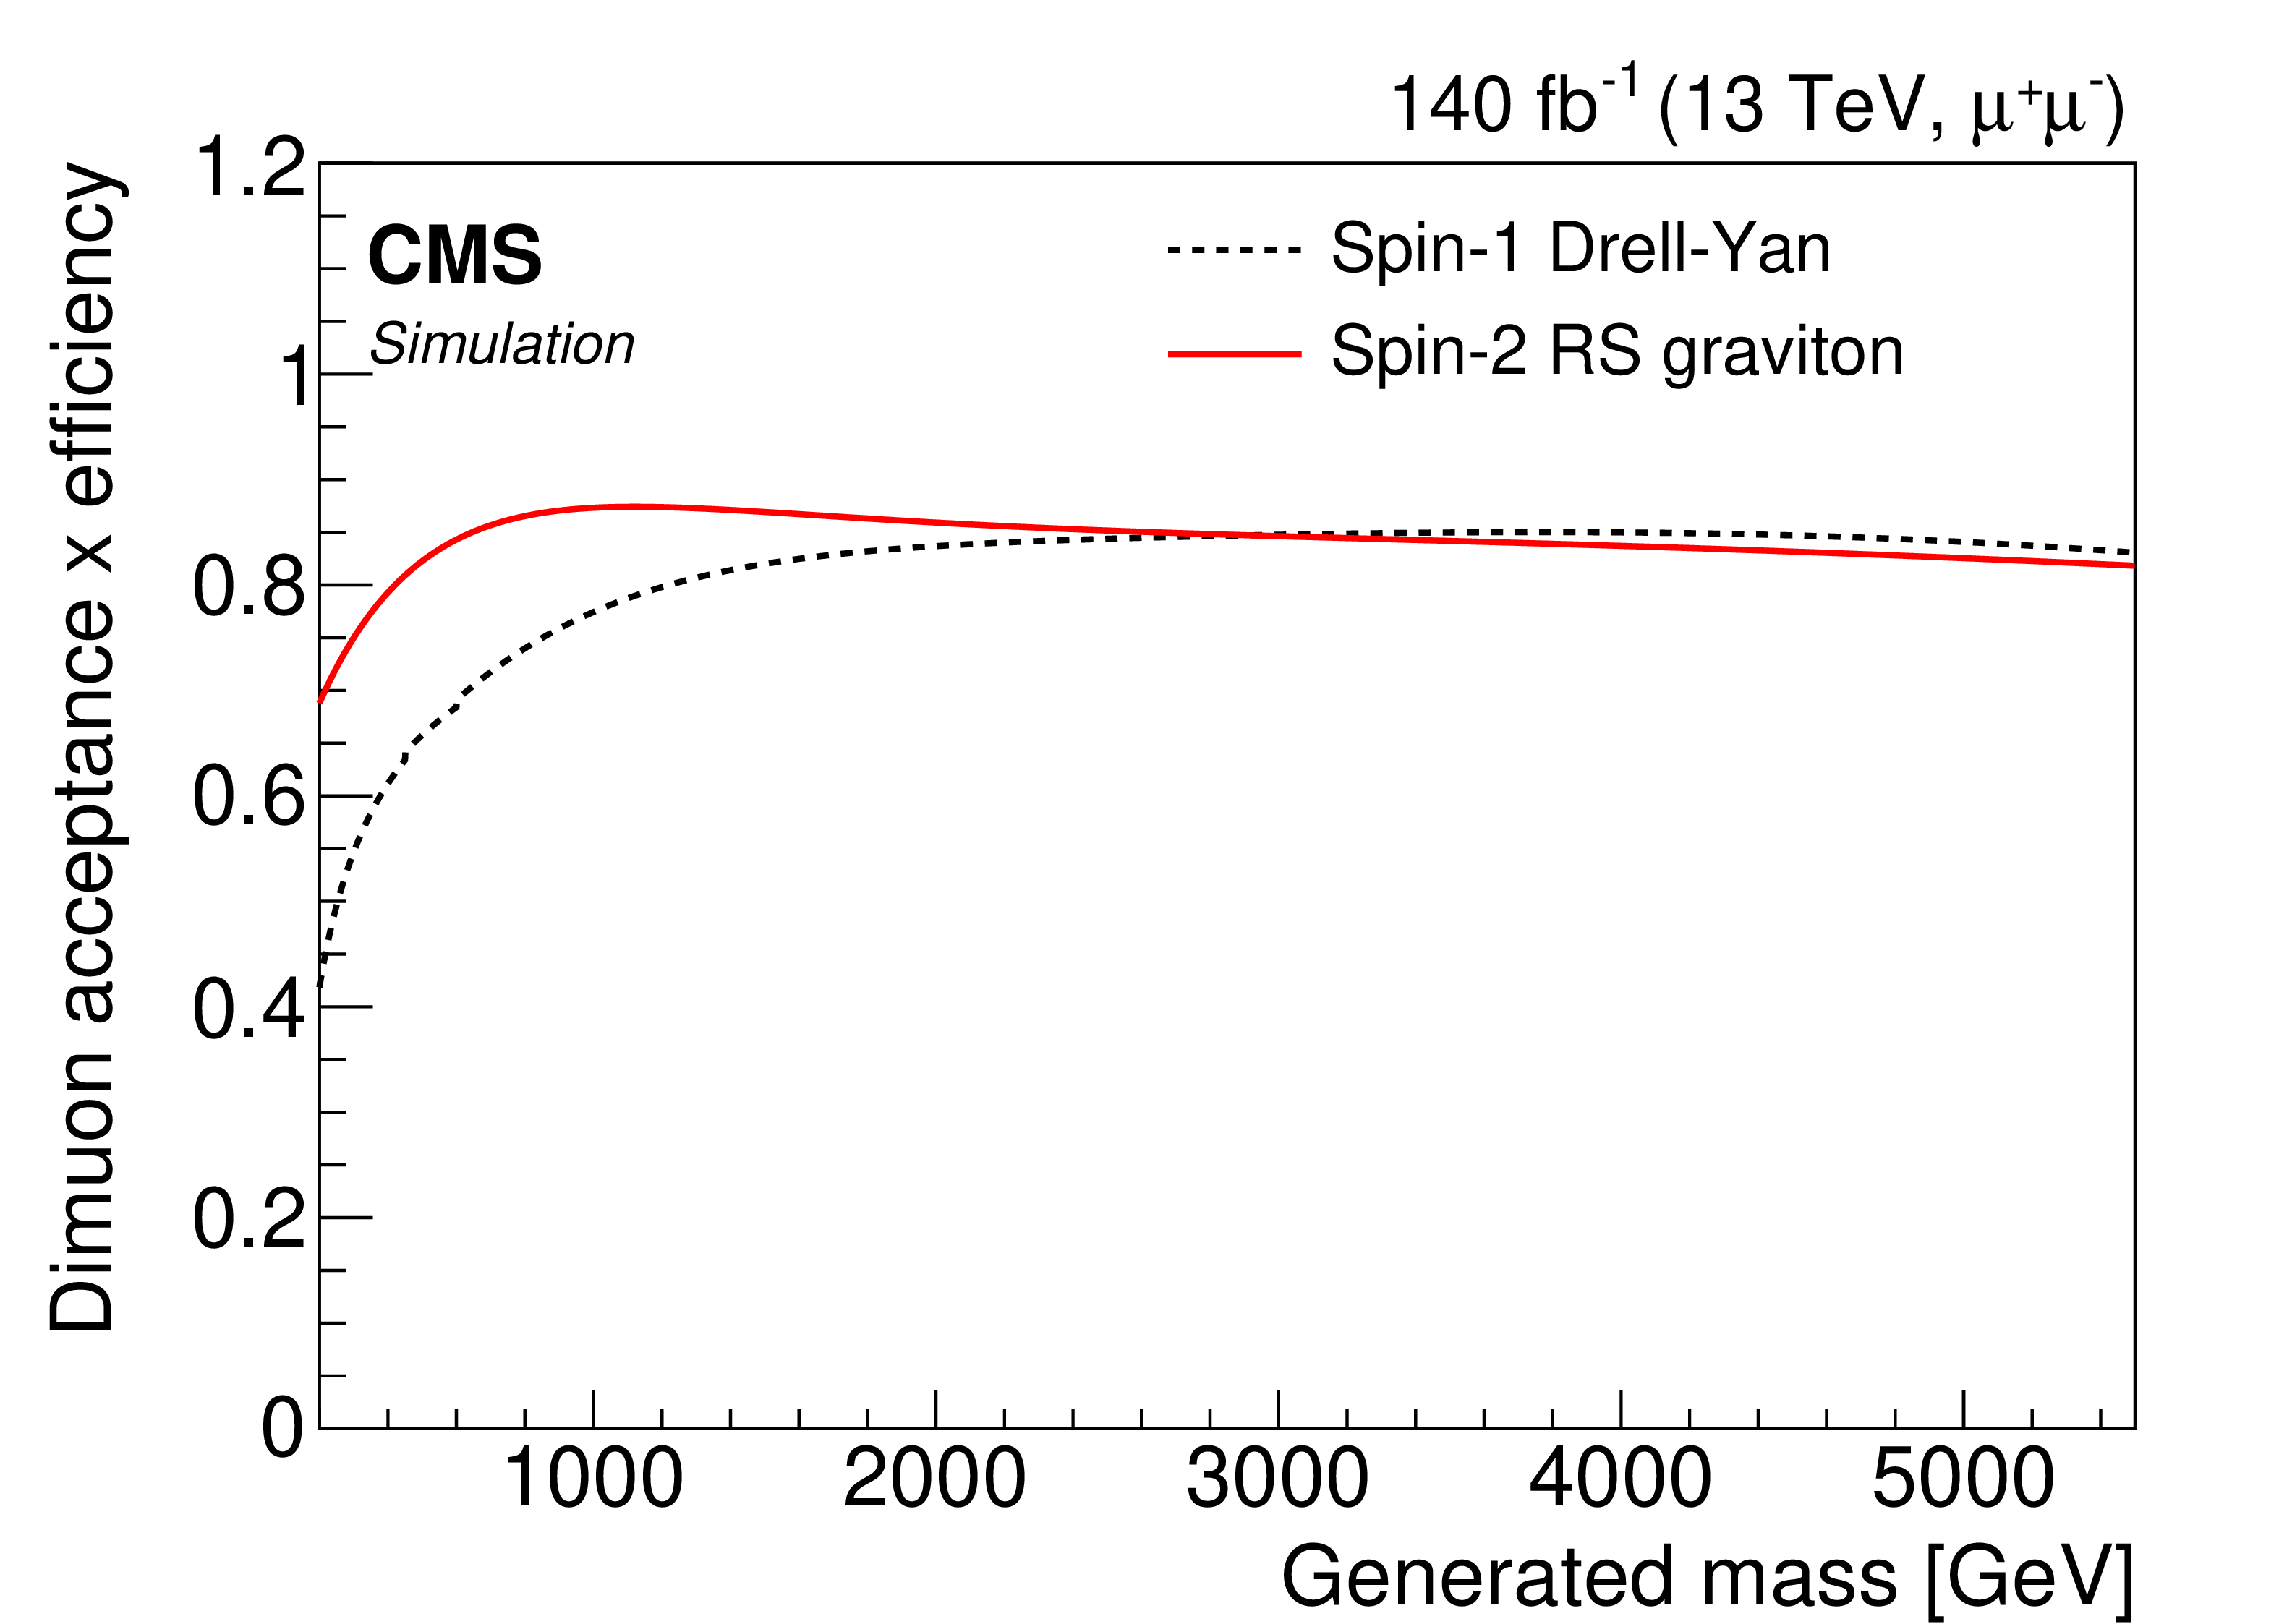
Figure 1-b:
Product of the acceptance and the efficiency for dimuon pairs as a function of generated mass in simulated events. The DY samples are used to represent spin-1 particles, and RS graviton samples are used for spin-2 particles. |

png pdf |
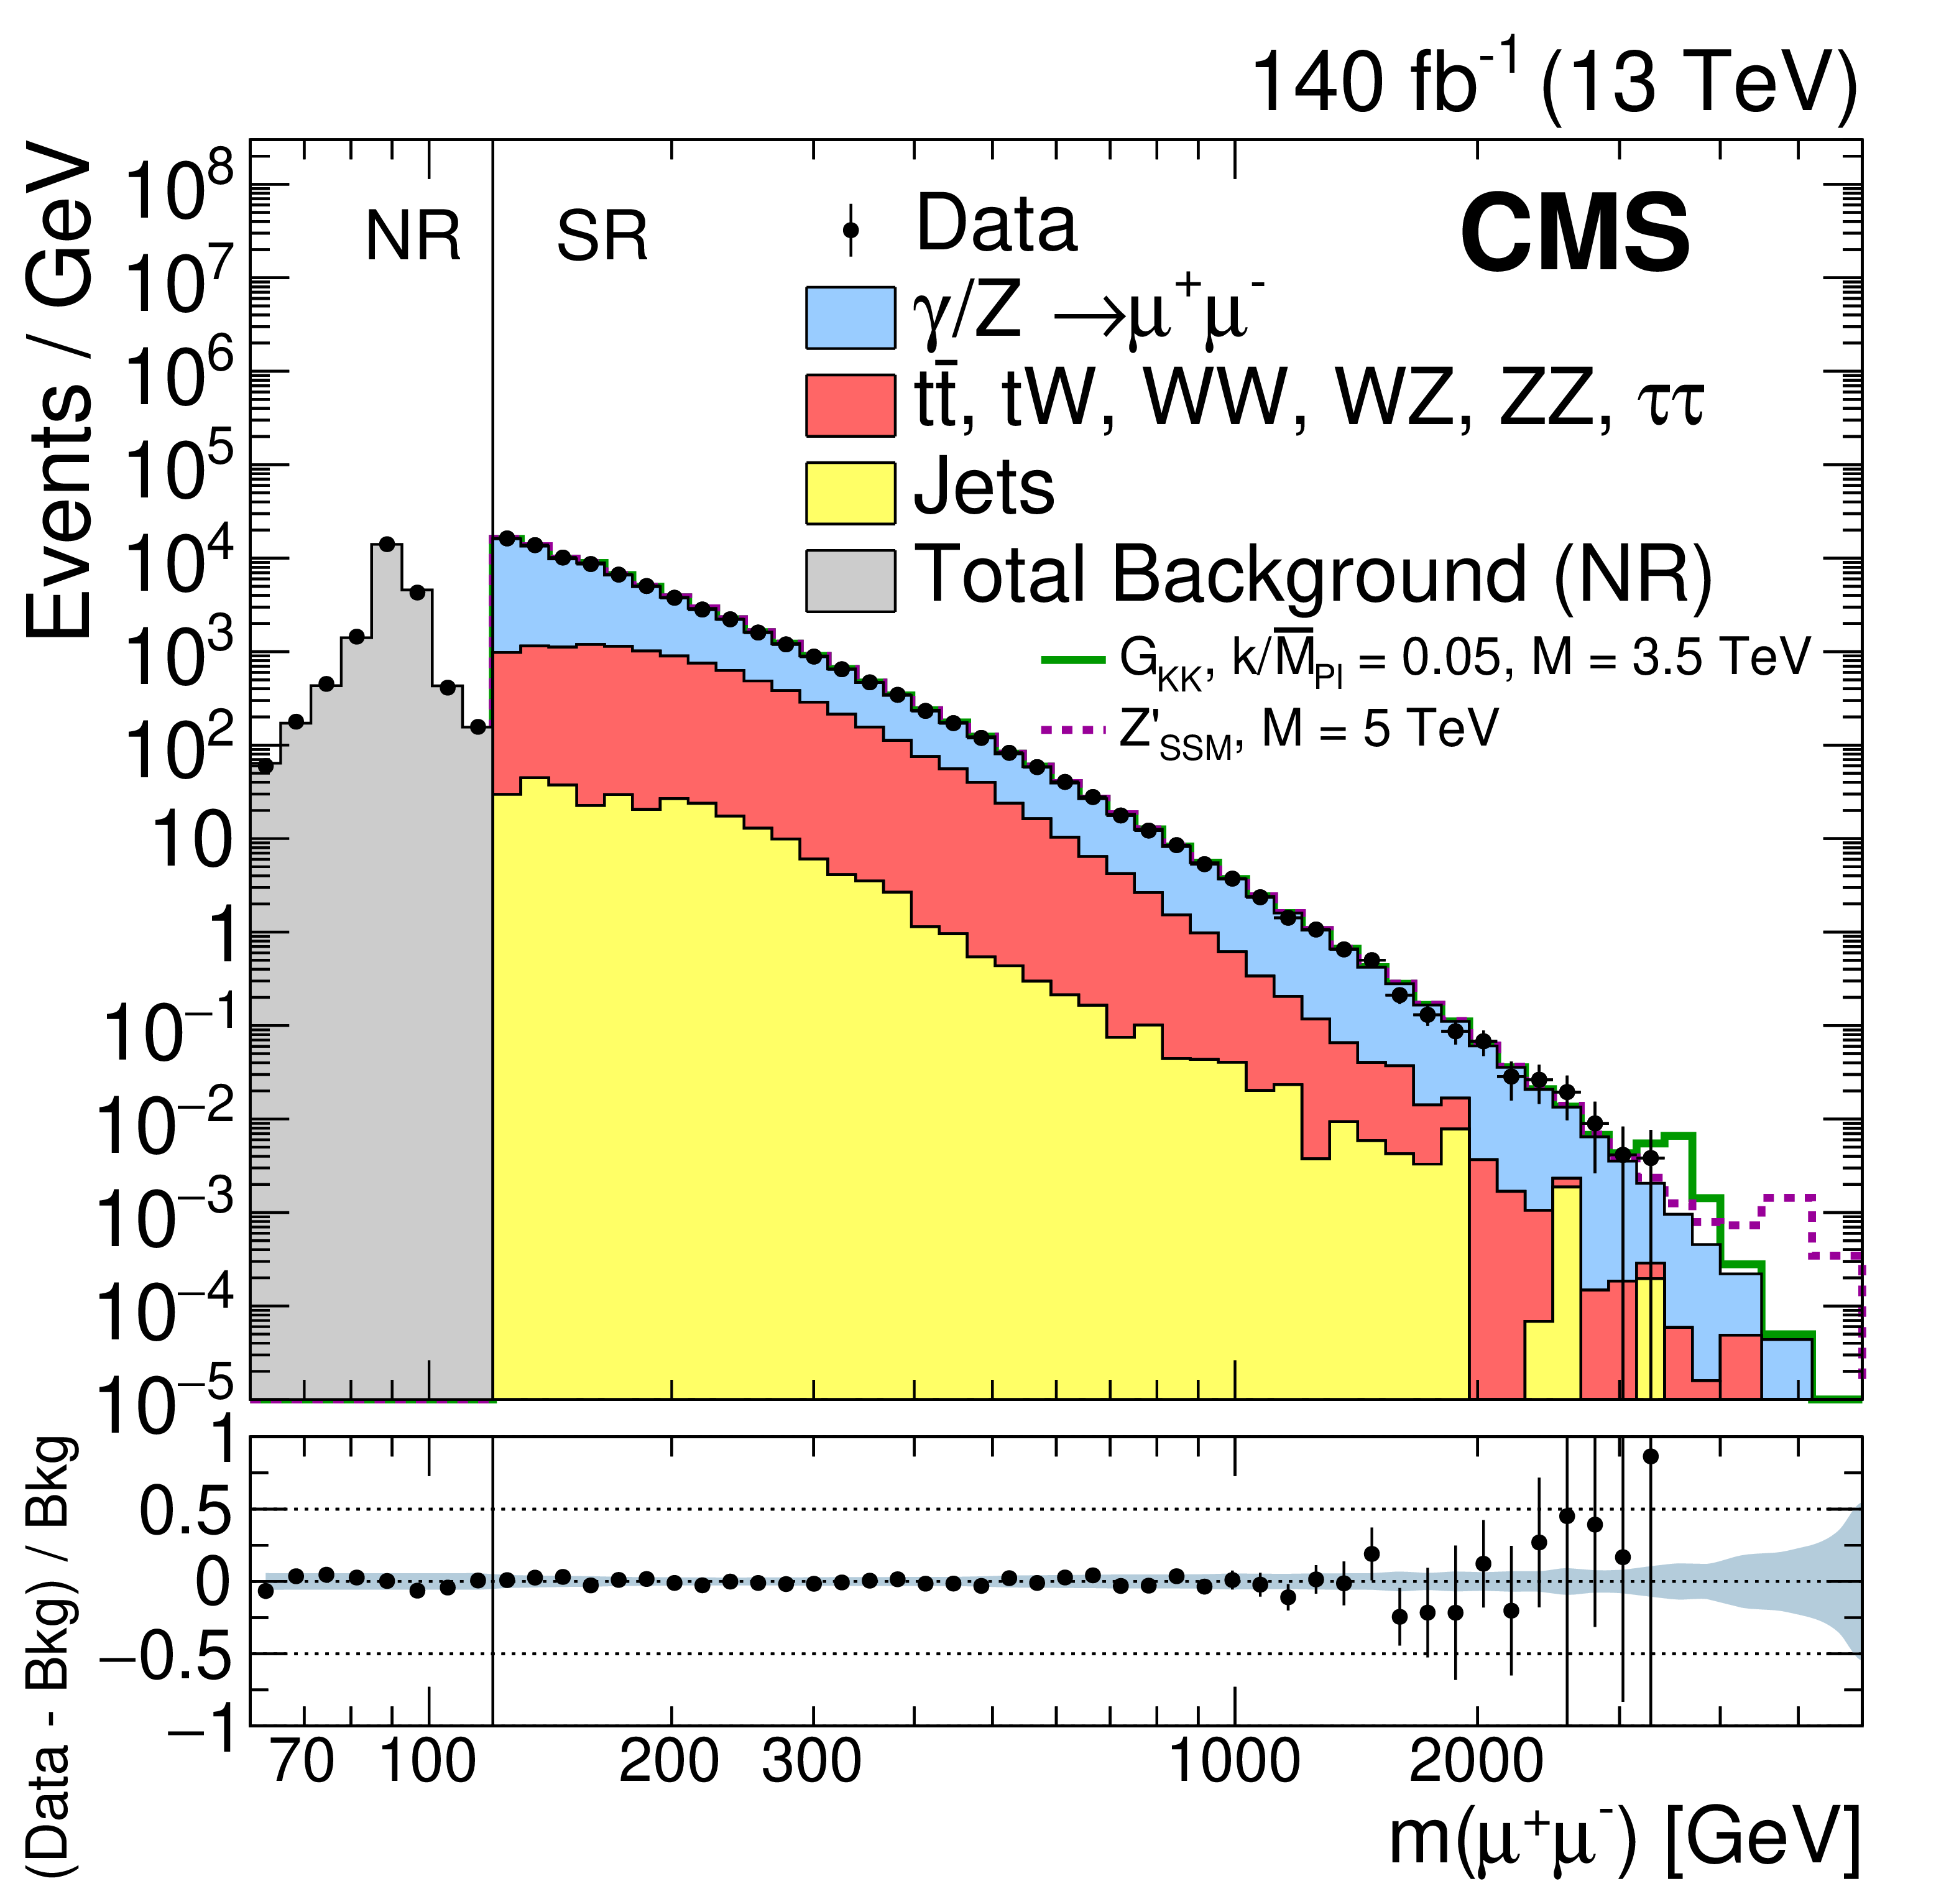
Figure 2:
The invariant mass distribution of pairs of (left) electrons and (right) muons observed in data (black dots with statistical uncertainties) and expected from the SM processes (stacked histograms). For the dimuon channel, a prescaled trigger with a ${p_{\mathrm {T}}}$ threshold of 27 GeV was used to collect events in the normalization region (NR) with $ {m_{\mu \mu}} < $ 120 GeV. The corresponding offline threshold is 30 GeV. Events in the signal region (SR) corresponding to masses above 120 GeV are collected using an unprescaled single-muon trigger. The bin width gradually increases with mass. The ratios of the data yields after background subtraction to the expected background yields are shown in the lower plots. The blue shaded band represents the combined statistical and systematic uncertainties in the background. Signal contributions expected from simulated ${\mathrm {G}_\mathrm {KK}}$ and ${\mathrm{Z'} _\mathrm {SSM}}$ resonances with masses of 3.5 and 5 TeV, respectively, are shown. |
png pdf |
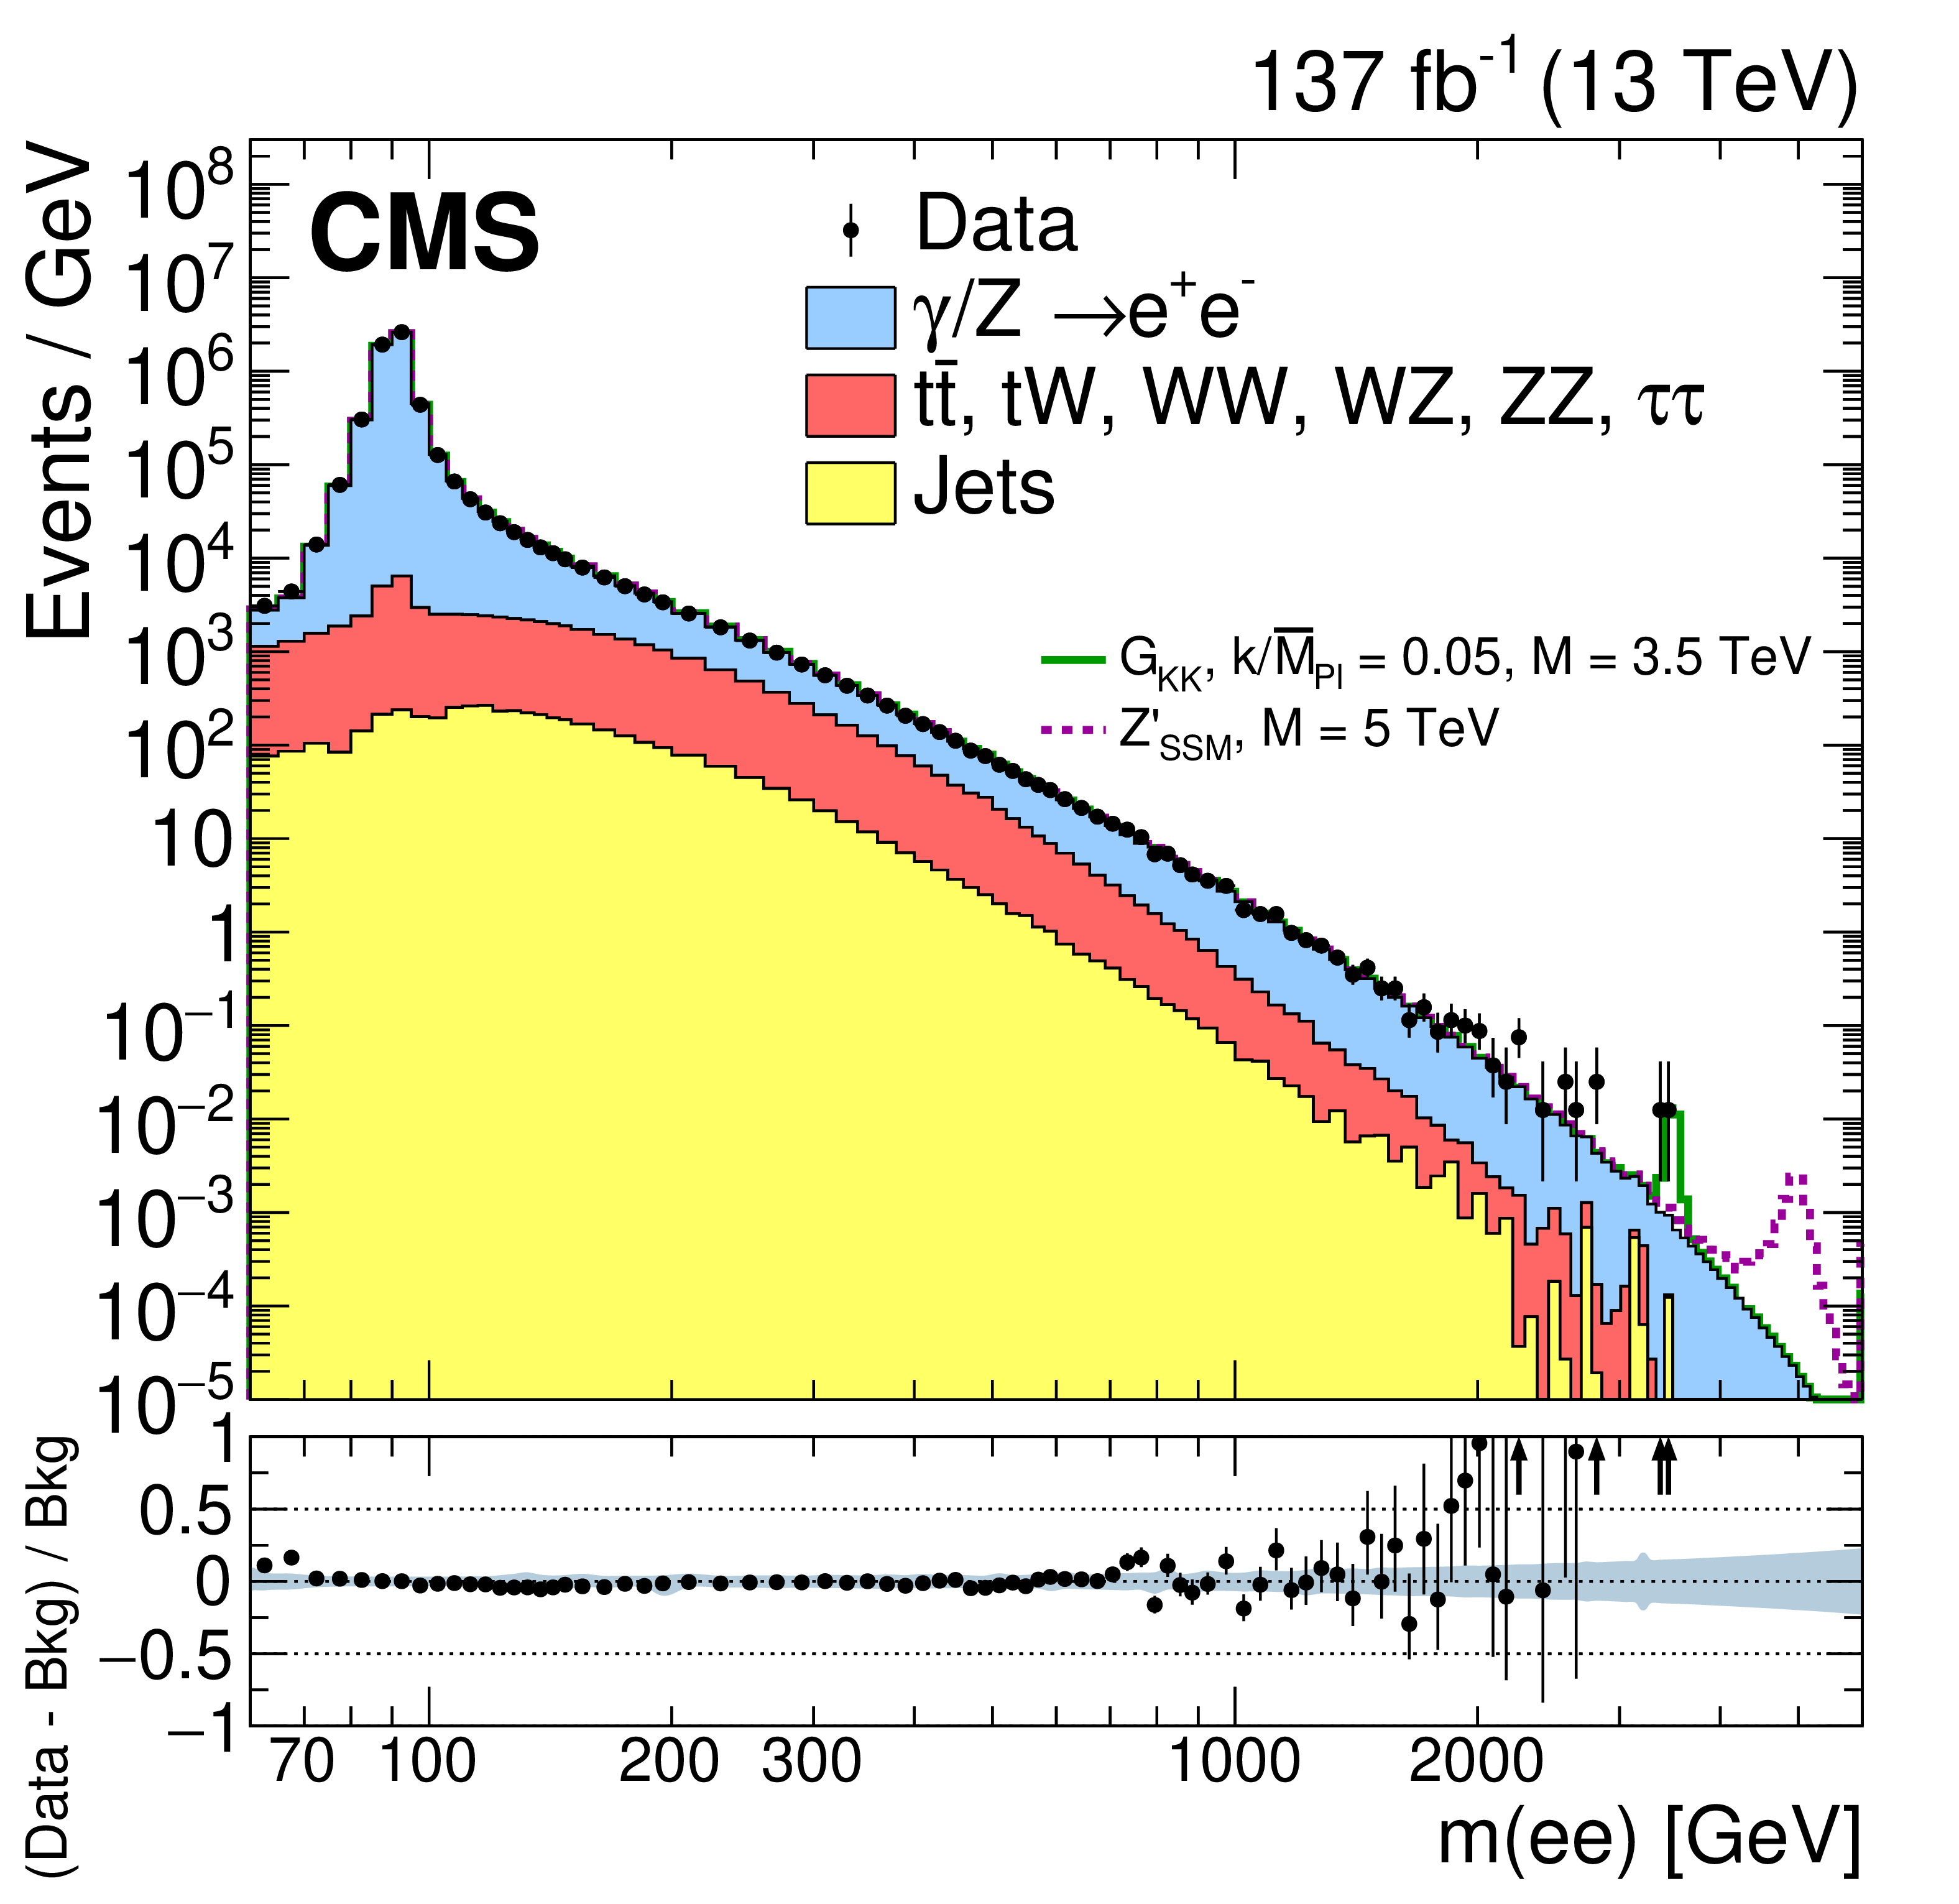
Figure 2-a:
The invariant mass distribution of pairs of electrons observed in data (black dots with statistical uncertainties) and expected from the SM processes (stacked histograms). The bin width gradually increases with mass. The ratios of the data yields after background subtraction to the expected background yields are shown in the lower plot. The blue shaded band represents the combined statistical and systematic uncertainties in the background. Signal contributions expected from simulated ${\mathrm {G}_\mathrm {KK}}$ and ${\mathrm{Z'} _\mathrm {SSM}}$ resonances with masses of 3.5 and 5 TeV, respectively, are shown. |
png pdf |
Figure 2-b:
The invariant mass distribution of pairs of electrons muons observed in data (black dots with statistical uncertainties) and expected from the SM processes (stacked histograms). A prescaled trigger with a ${p_{\mathrm {T}}}$ threshold of 27 GeV was used to collect events in the normalization region (NR) with $ {m_{\mu \mu}} < $ 120 GeV. The corresponding offline threshold is 30 GeV. Events in the signal region (SR) corresponding to masses above 120 GeV are collected using an unprescaled single-muon trigger. The bin width gradually increases with mass. The ratios of the data yields after background subtraction to the expected background yields are shown in the lower plot. The blue shaded band represents the combined statistical and systematic uncertainties in the background. Signal contributions expected from simulated ${\mathrm {G}_\mathrm {KK}}$ and ${\mathrm{Z'} _\mathrm {SSM}}$ resonances with masses of 3.5 and 5 TeV, respectively, are shown. |
png pdf |
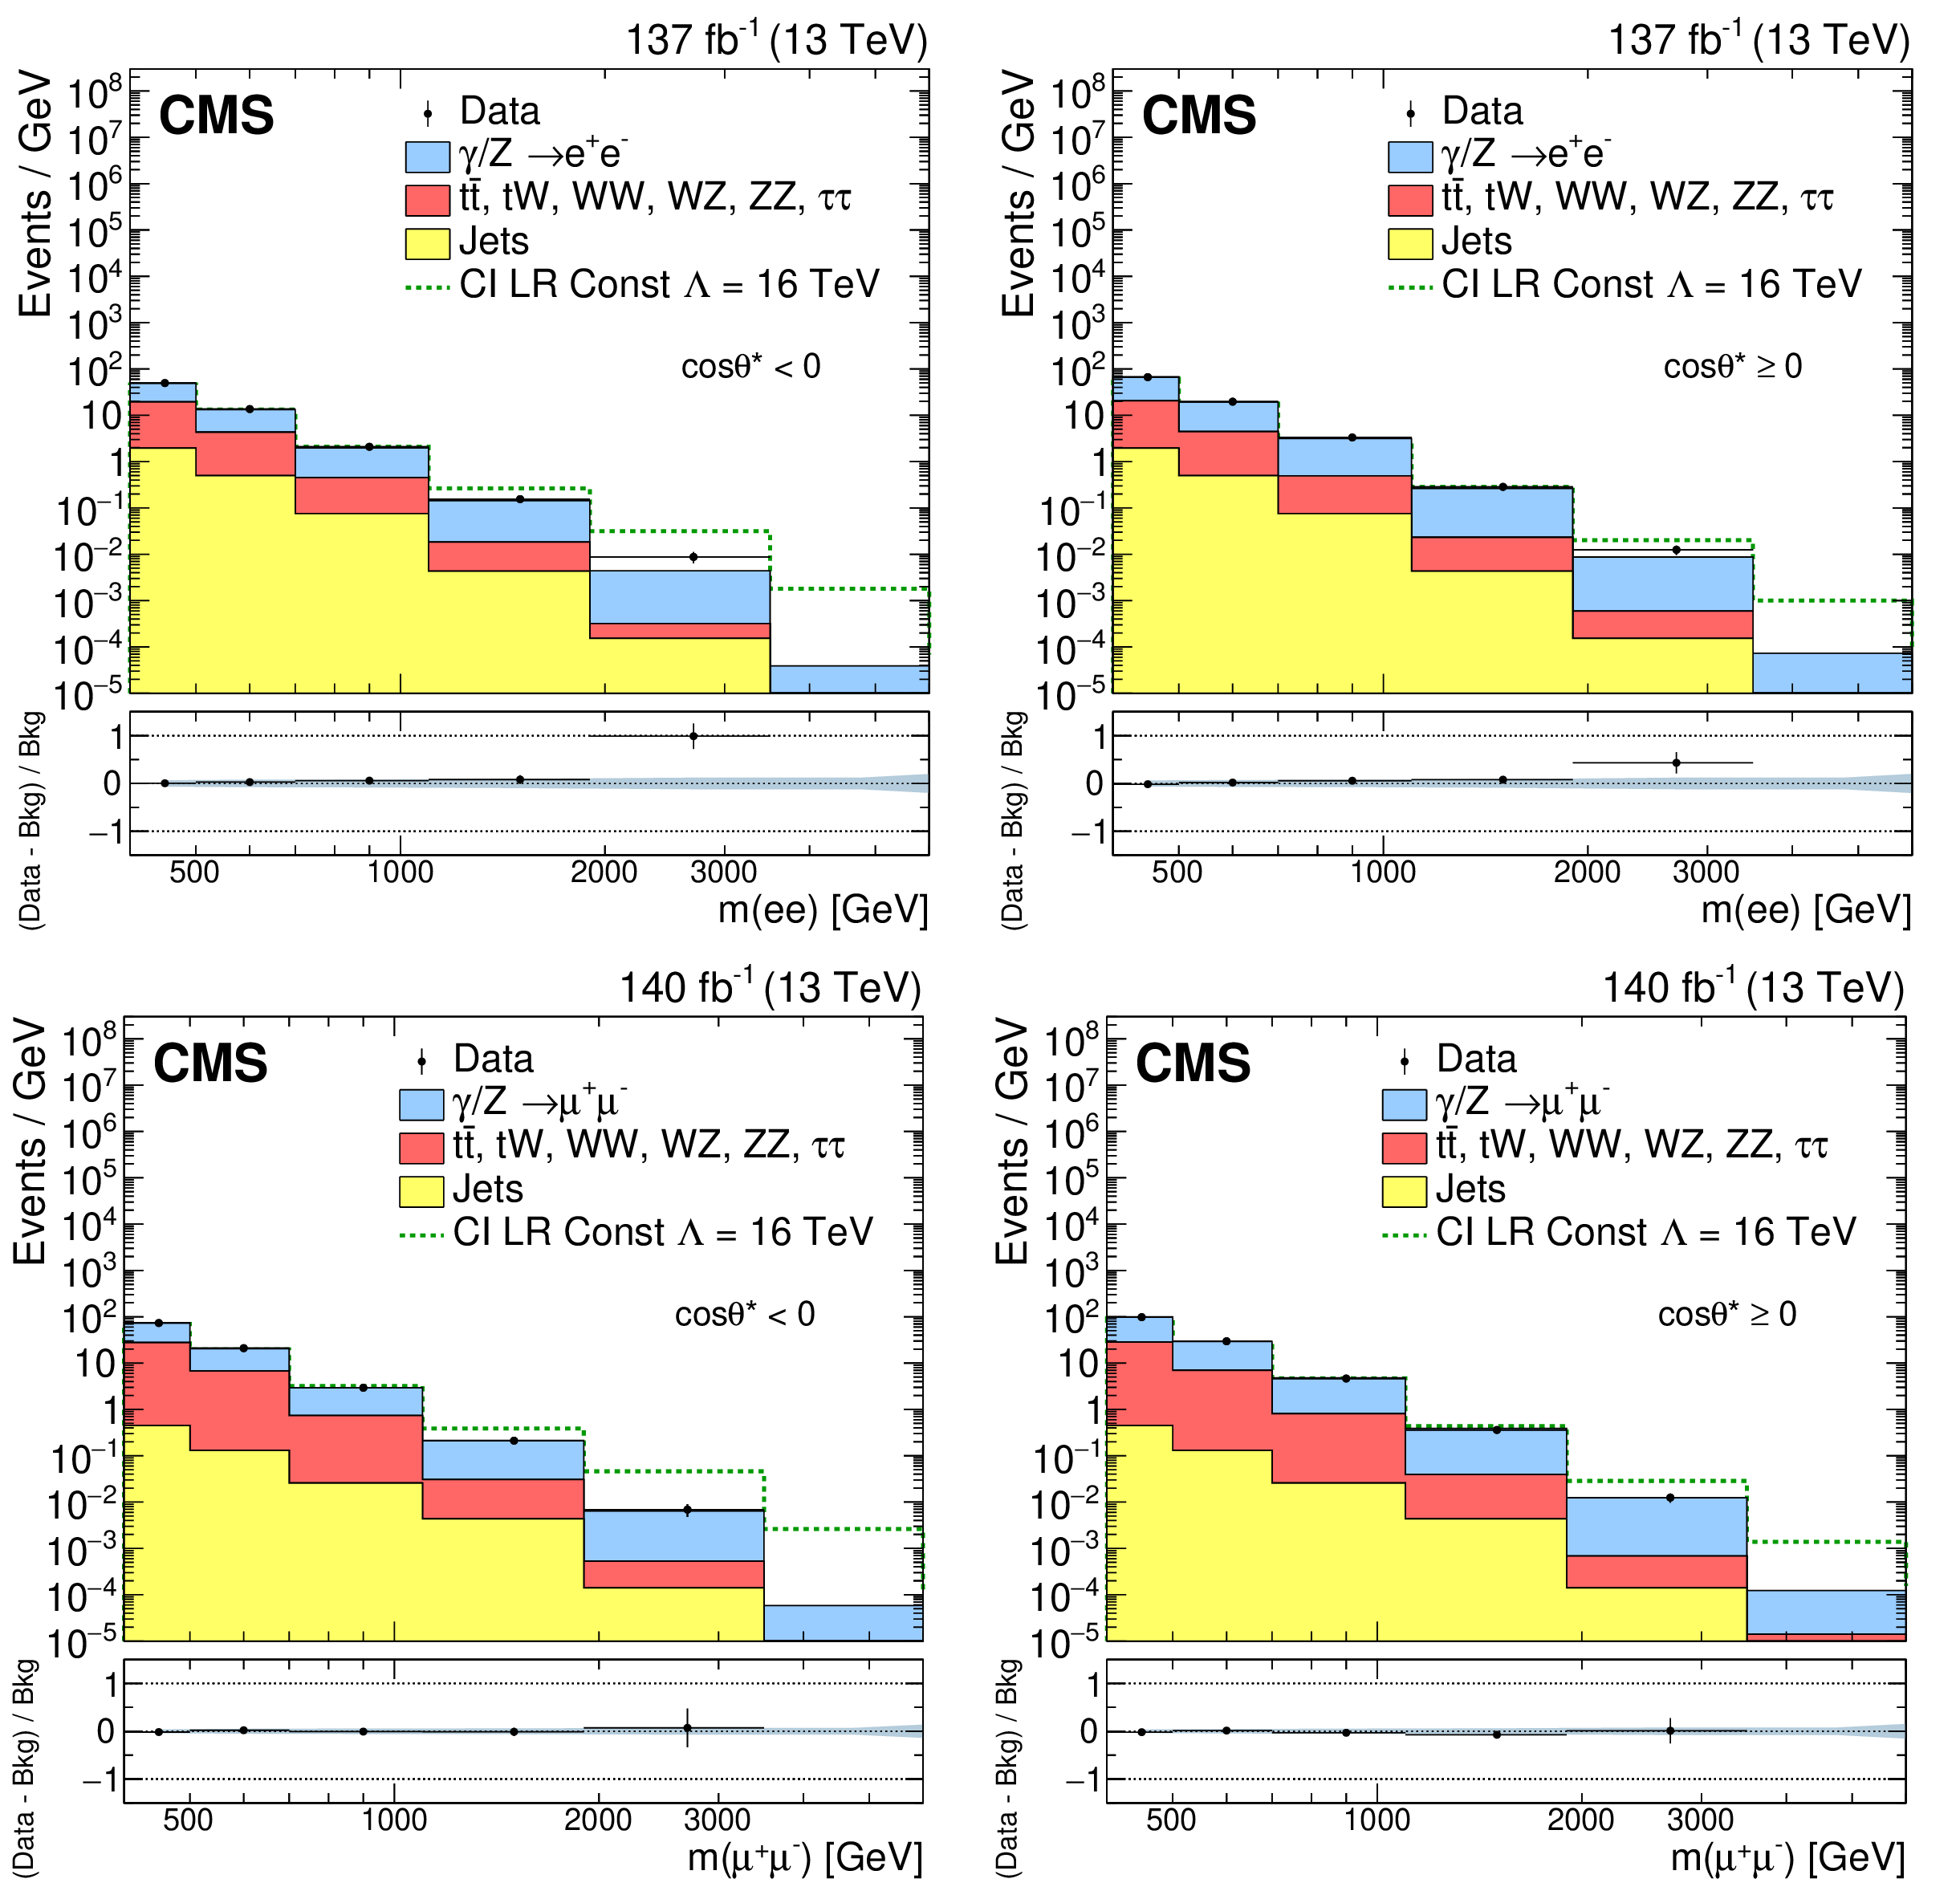
Figure 3:
The invariant mass distribution of pairs of (upper) electrons and (lower) muons observed in data (black dots with statistical uncertainties) and expected from simulated SM processes (stacked histograms) for (left) $ \cos\theta ^\ast < $ 0 and (right) $ \cos\theta ^\ast \geq $ 0. The bin width gradually increases with mass. The ratios of the data yields after background subtraction to the expected background yields are shown in the lower plots. The blue band represents the combined statistical and systematic uncertainties in the background. The signal contributions expected from the constructive LL CI model with $\Lambda = $ 16 TeV are shown as dashed green lines. |
png pdf |
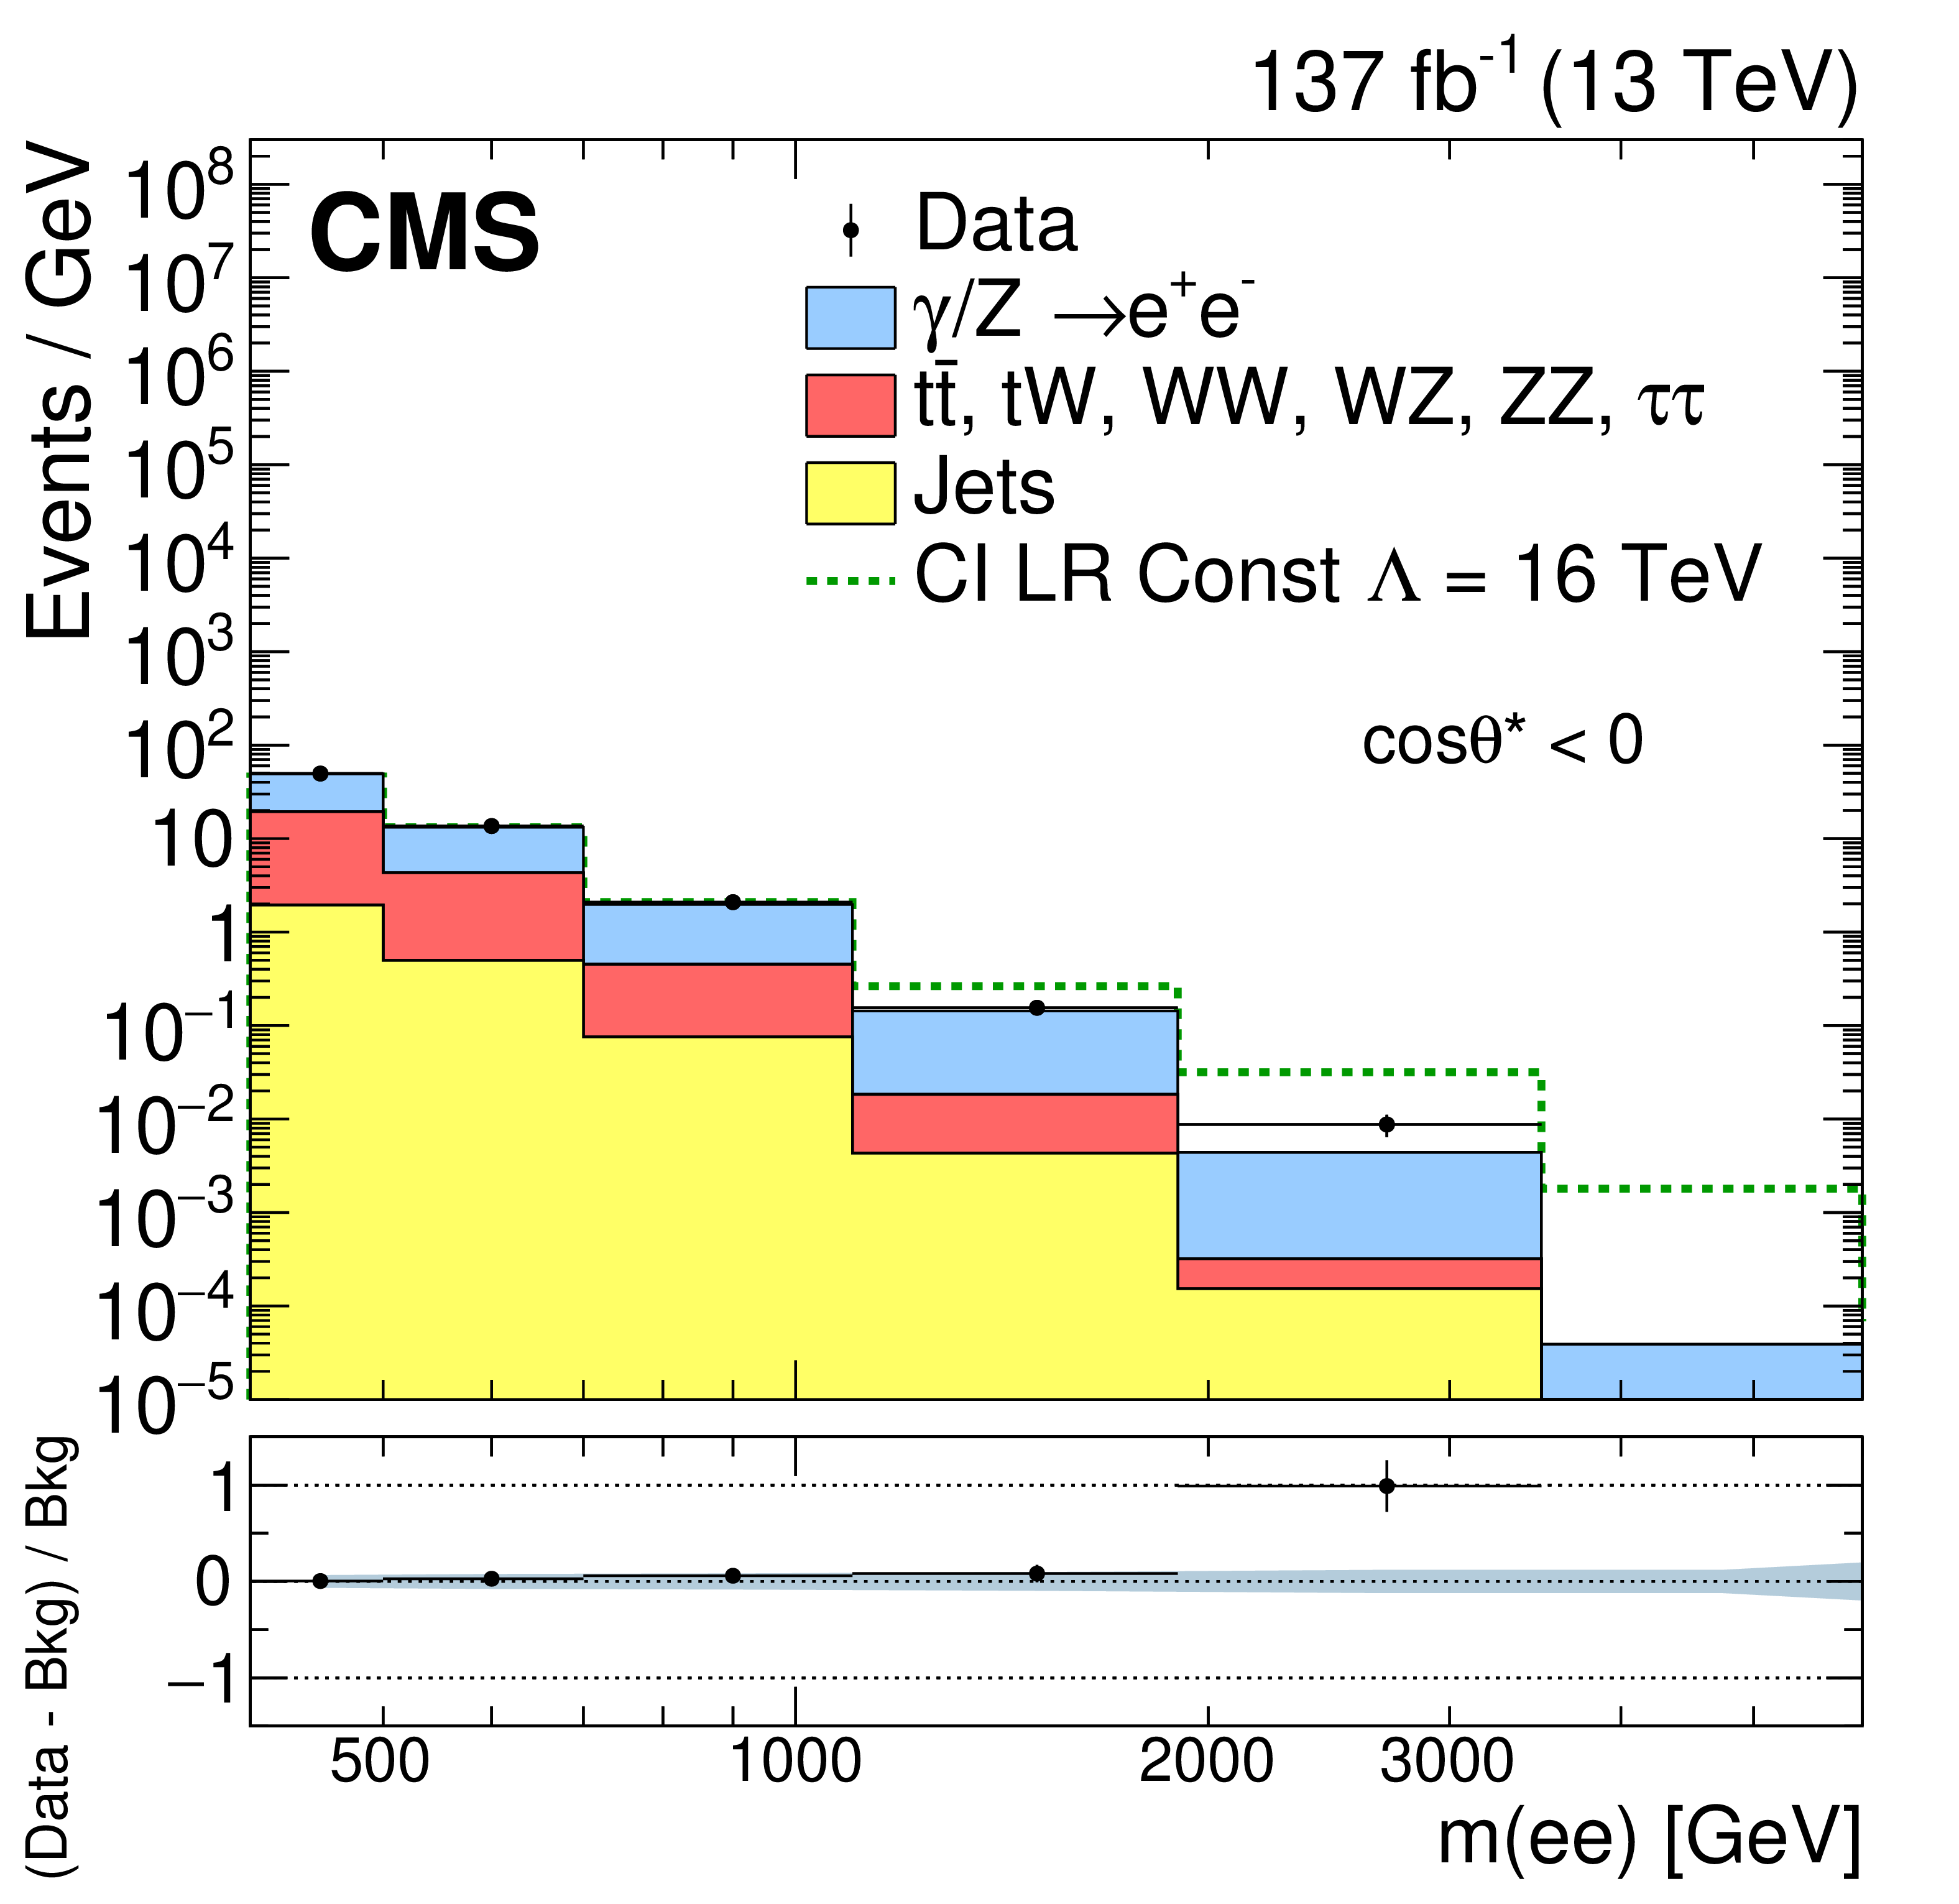
Figure 3-a:
The invariant mass distribution of pairs of electrons observed in data (black dots with statistical uncertainties) and expected from simulated SM processes (stacked histograms) for $ \cos\theta ^\ast < $ 0. The bin width gradually increases with mass. The ratios of the data yields after background subtraction to the expected background yields are shown in the lower plot. The blue band represents the combined statistical and systematic uncertainties in the background. The signal contribution expected from the constructive LL CI model with $\Lambda = $ 16 TeV is shown as a dashed green line. |

png pdf |
Figure 3-b:
The invariant mass distribution of pairs of electrons observed in data (black dots with statistical uncertainties) and expected from simulated SM processes (stacked histograms) for $ \cos\theta ^\ast \geq $ 0. The bin width gradually increases with mass. The ratios of the data yields after background subtraction to the expected background yields are shown in the lower plot. The blue band represents the combined statistical and systematic uncertainties in the background. The signal contribution expected from the constructive LL CI model with $\Lambda = $ 16 TeV is shown as a dashed green line. |

png pdf |
Figure 3-c:
The invariant mass distribution of pairs of muons observed in data (black dots with statistical uncertainties) and expected from simulated SM processes (stacked histograms) for $ \cos\theta ^\ast < $ 0. The bin width gradually increases with mass. The ratios of the data yields after background subtraction to the expected background yields are shown in the lower plot. The blue band represents the combined statistical and systematic uncertainties in the background. The signal contribution expected from the constructive LL CI model with $\Lambda = $ 16 TeV is shown as a dashed green line. |
png pdf |
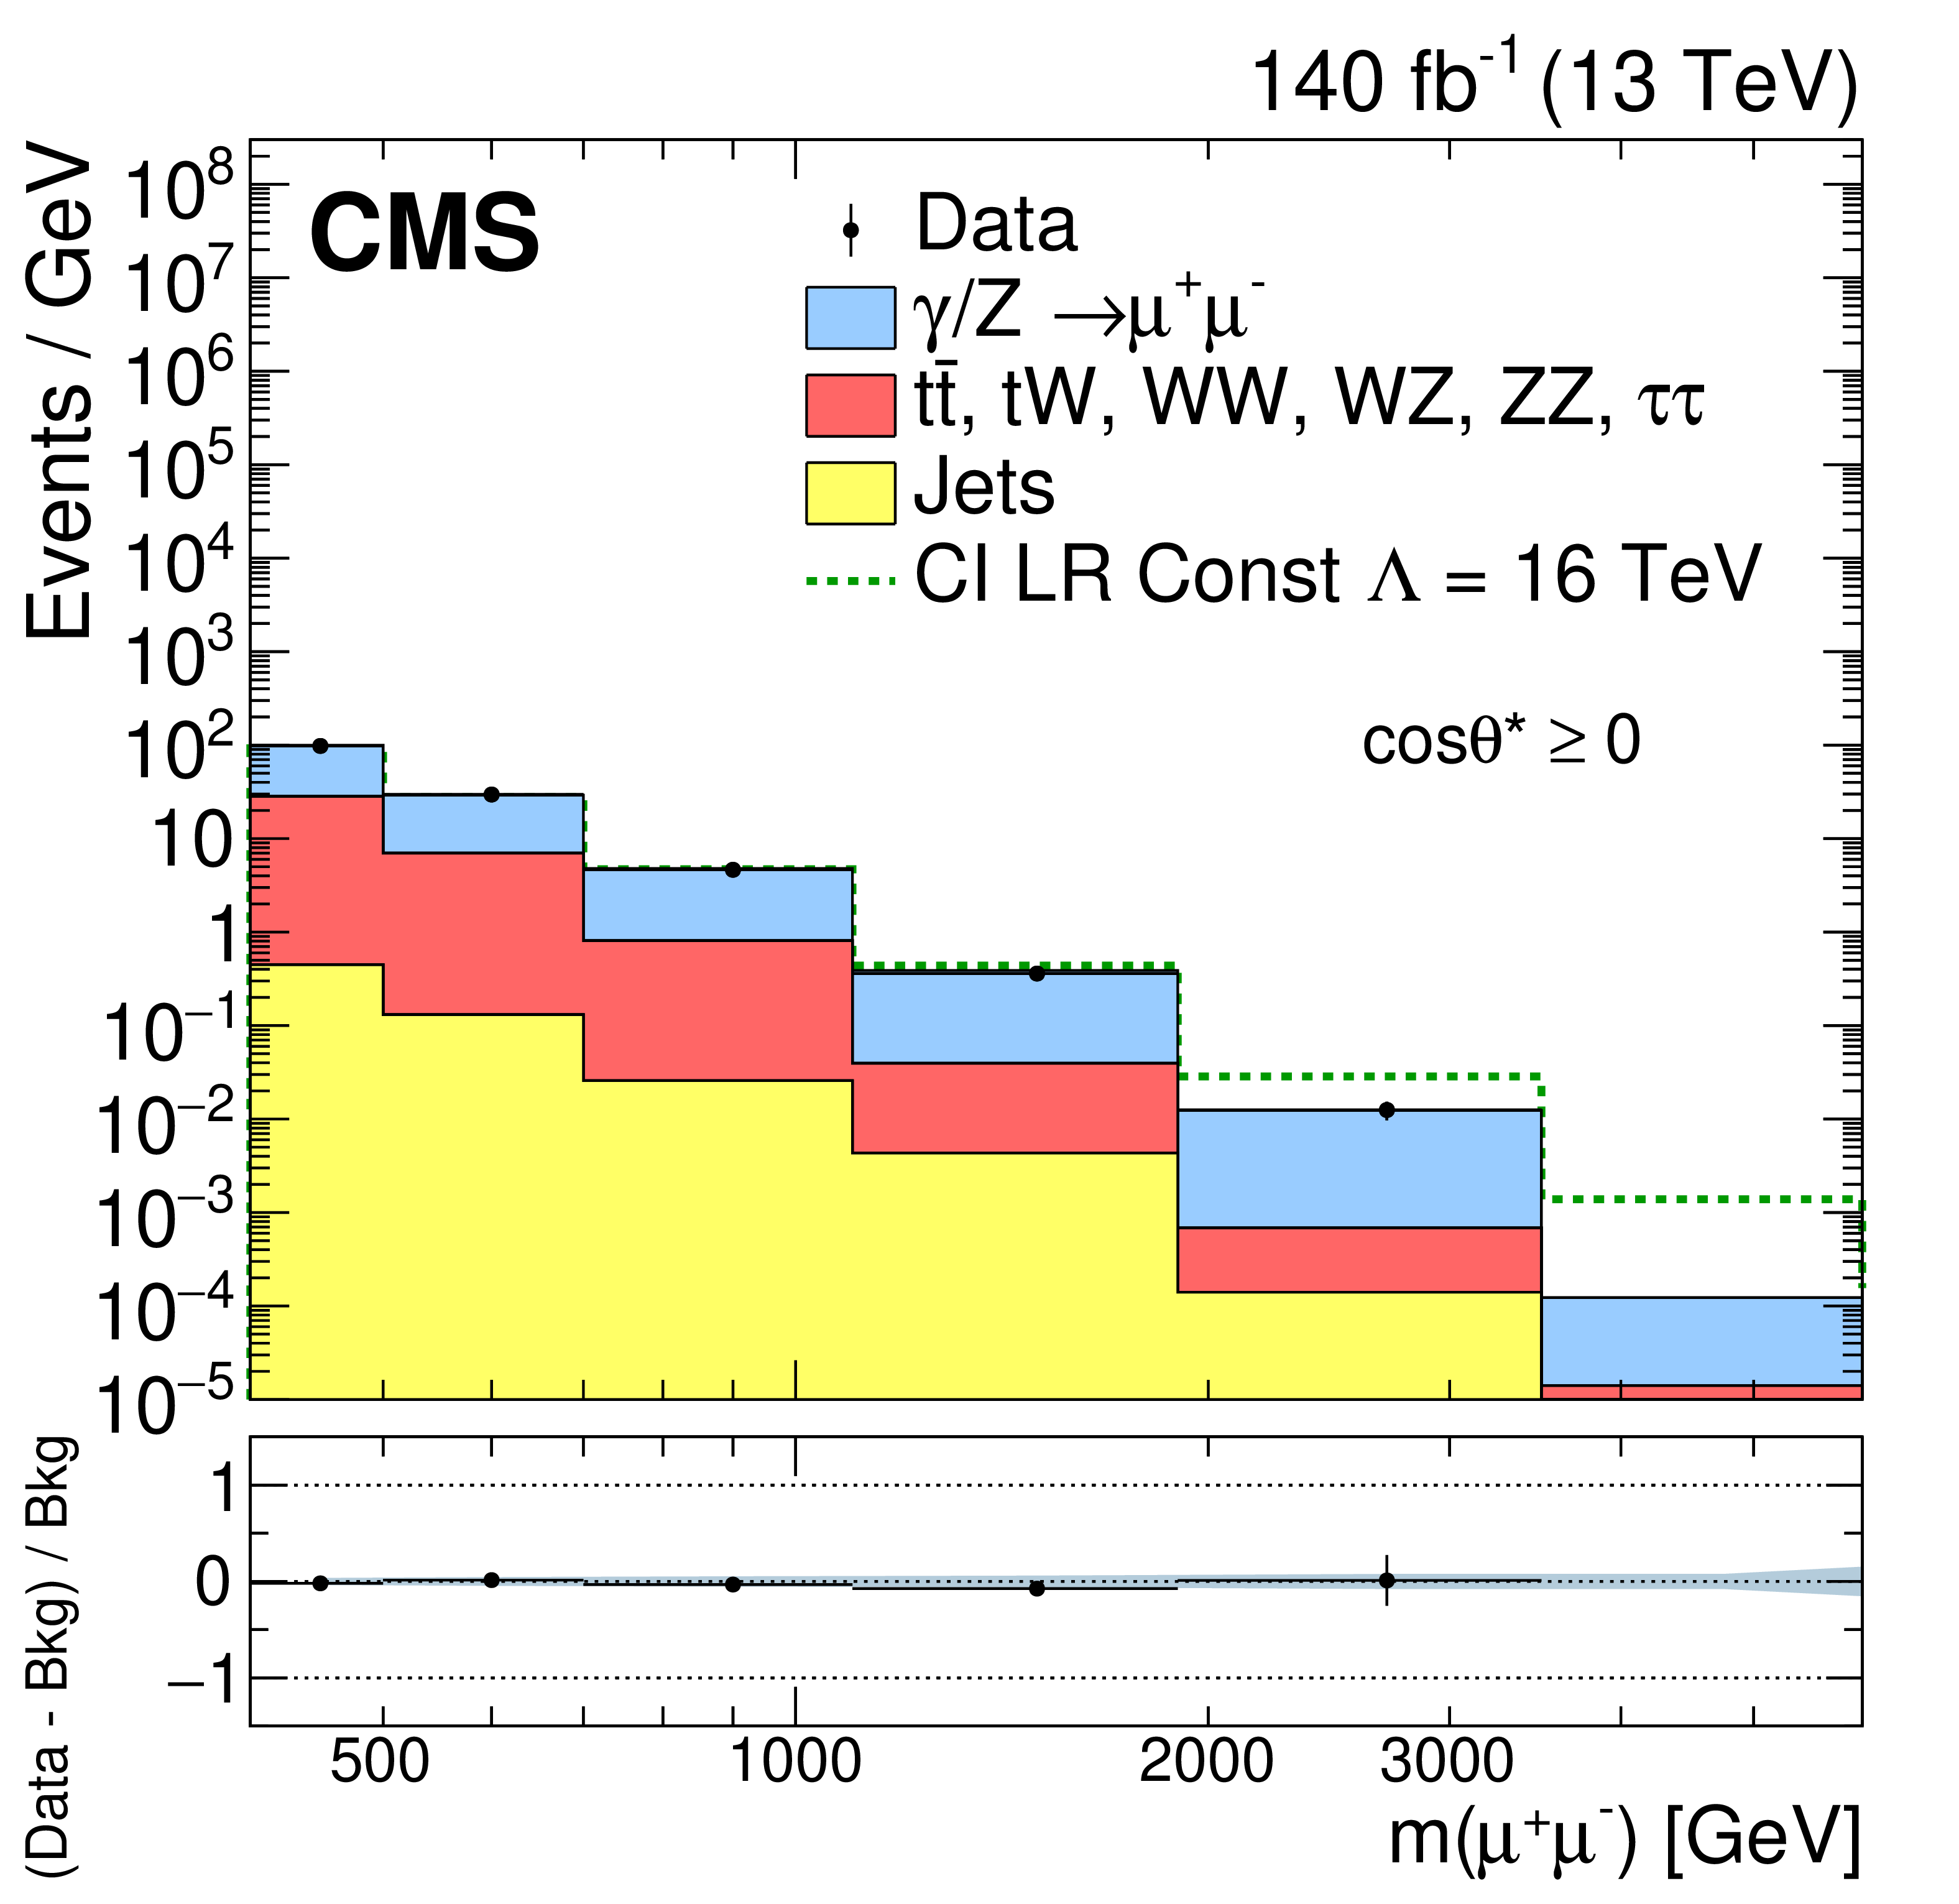
Figure 3-d:
The invariant mass distribution of pairs of muons observed in data (black dots with statistical uncertainties) and expected from simulated SM processes (stacked histograms) for $ \cos\theta ^\ast \geq $ 0. The bin width gradually increases with mass. The ratios of the data yields after background subtraction to the expected background yields are shown in the lower plot. The blue band represents the combined statistical and systematic uncertainties in the background. The signal contribution expected from the constructive LL CI model with $\Lambda = $ 16 TeV is shown as a dashed green line. |
png pdf |
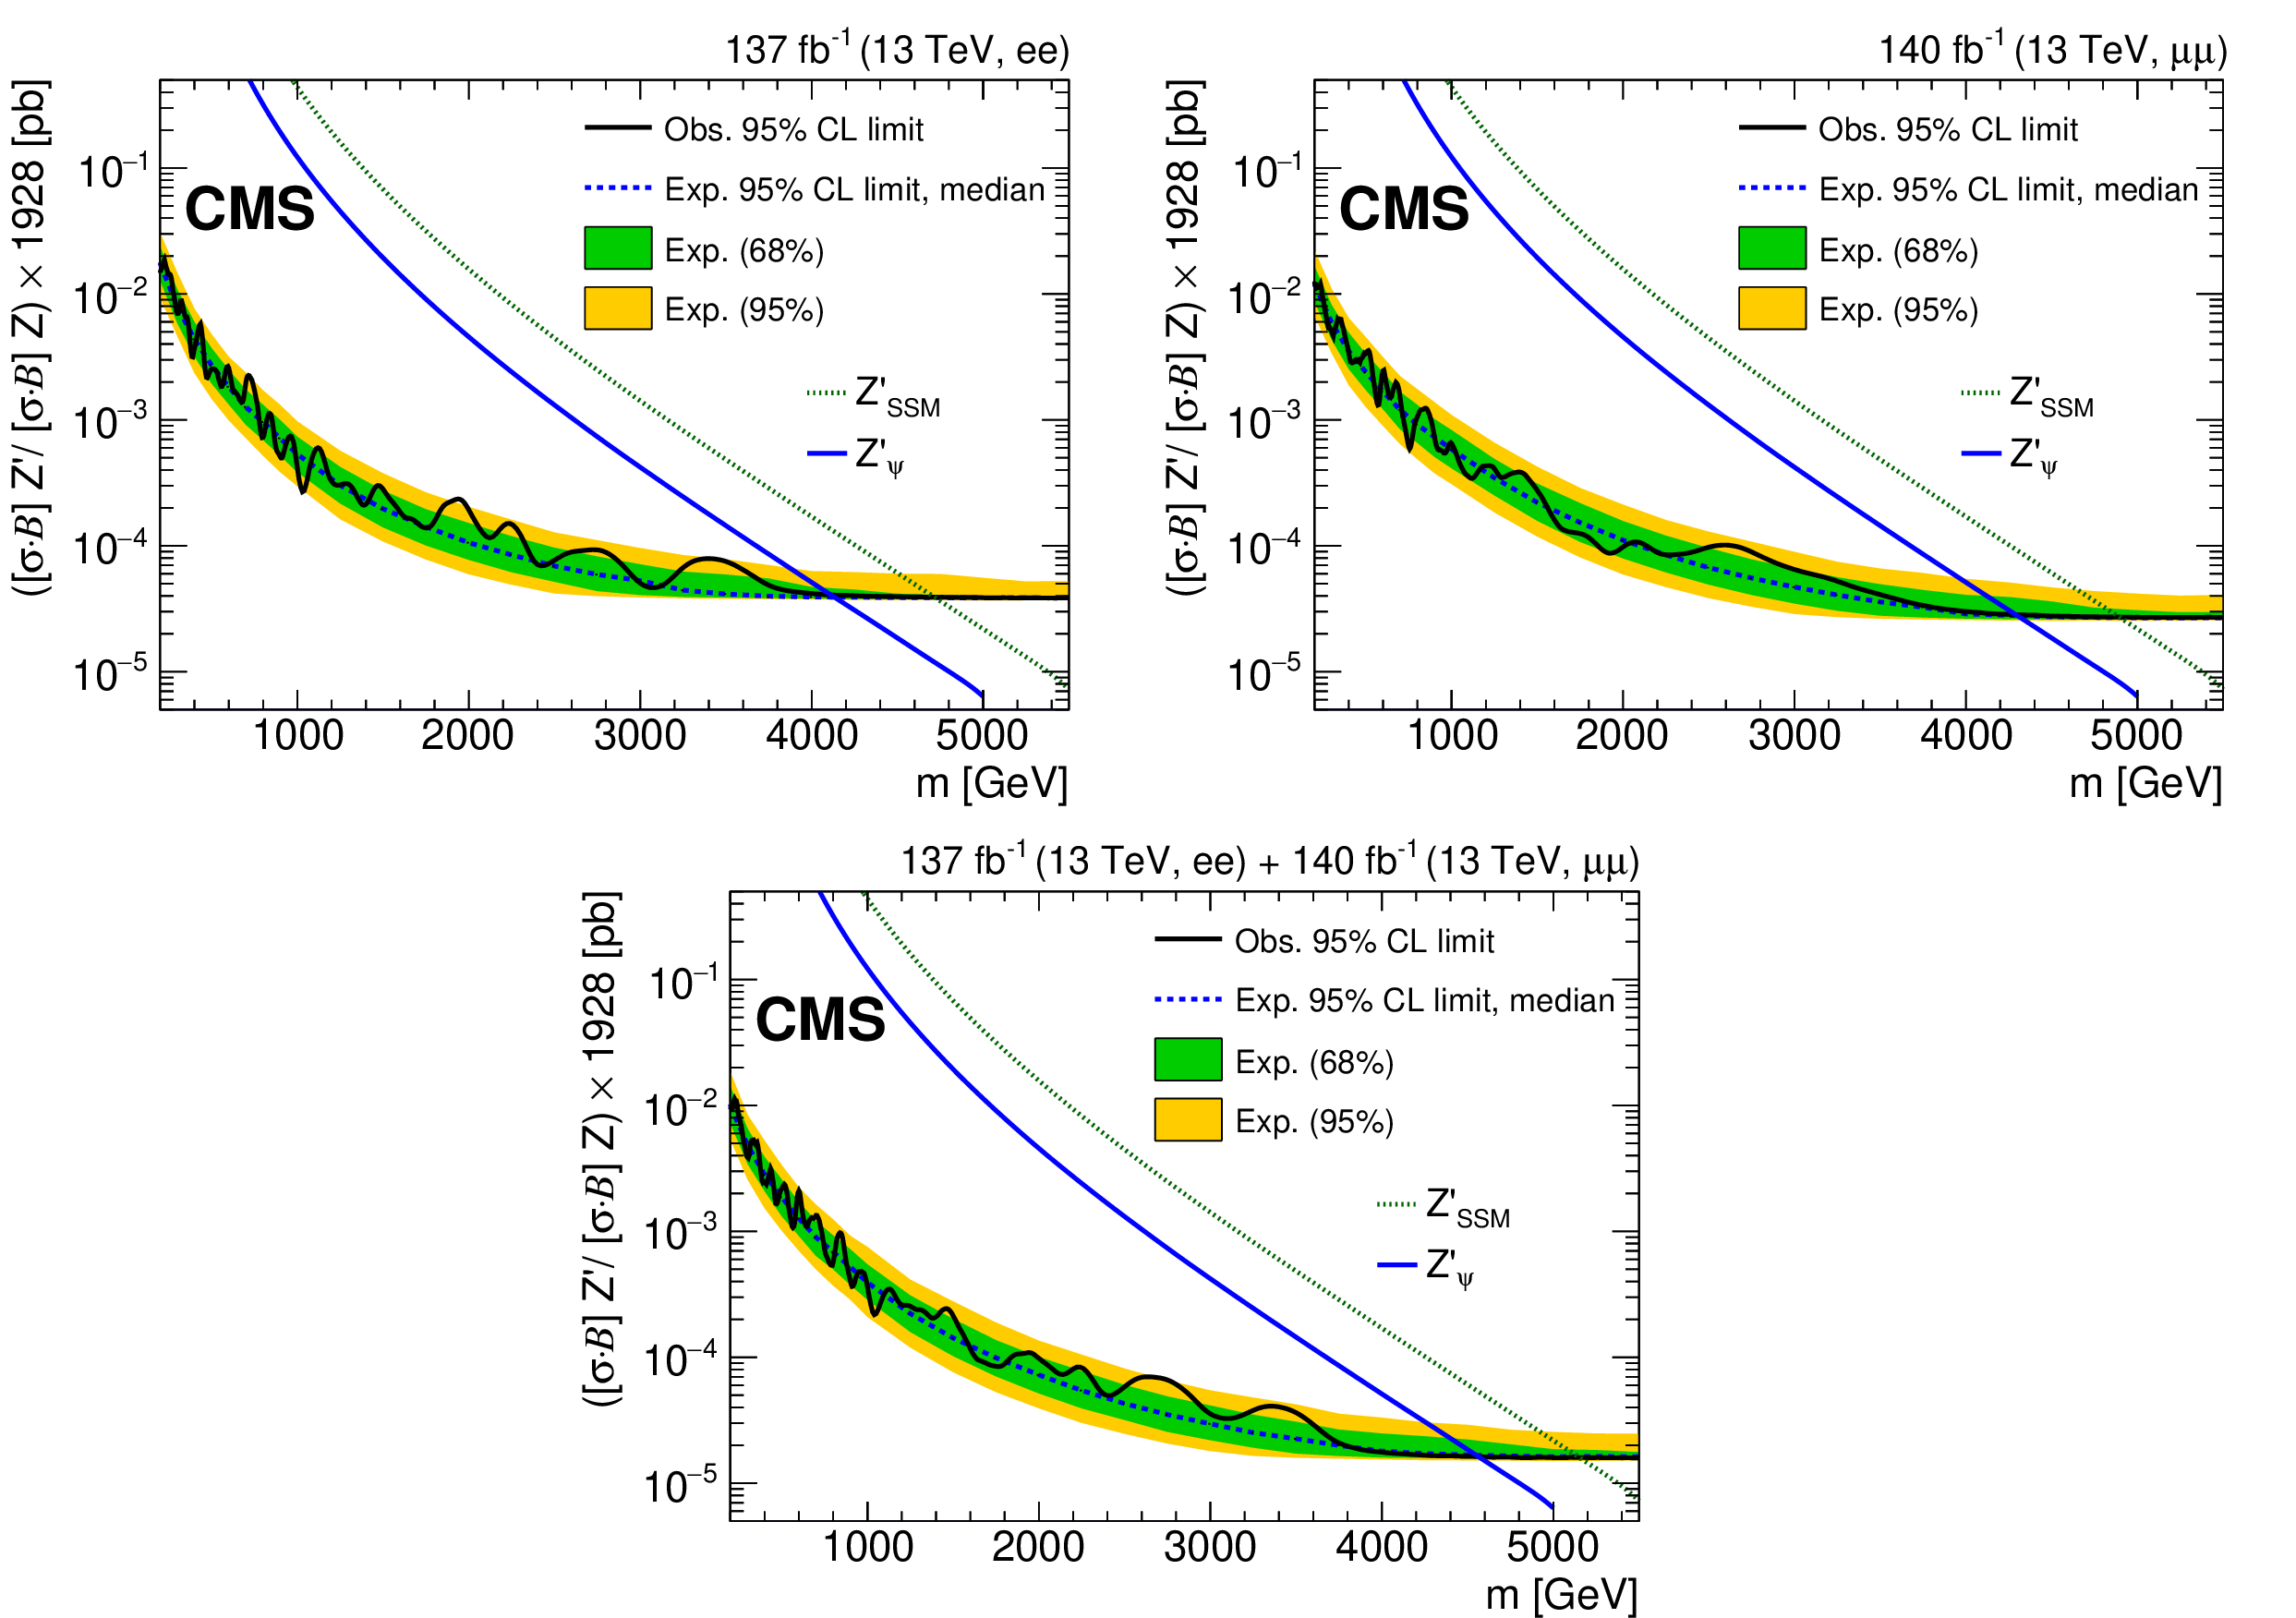
Figure 4:
The upper limits at 95% CL on the product of the production cross section and the branching fraction for a spin-1 resonance with a width equal to 0.6% of the resonance mass, relative to the product of the production cross section and the branching fraction of a Z boson, multiplied by the theoretical value of $\sigma ({\mathrm{p}} {\mathrm{p}} \to \mathrm{Z} +\mathrm{X}\to \ell \ell +\mathrm{X})$ of 1928 pb, for (top left) the dielectron channel, (top right) the dimuon channel, and (bottom) their combination. The shaded bands correspond to the 68 and 95% quantiles for the expected limits. Simulated predictions for the spin-1 ${\mathrm{Z'} _\mathrm {SSM}}$ and ${\mathrm{Z'} _\psi}$ resonances are shown for comparison. |
png pdf |
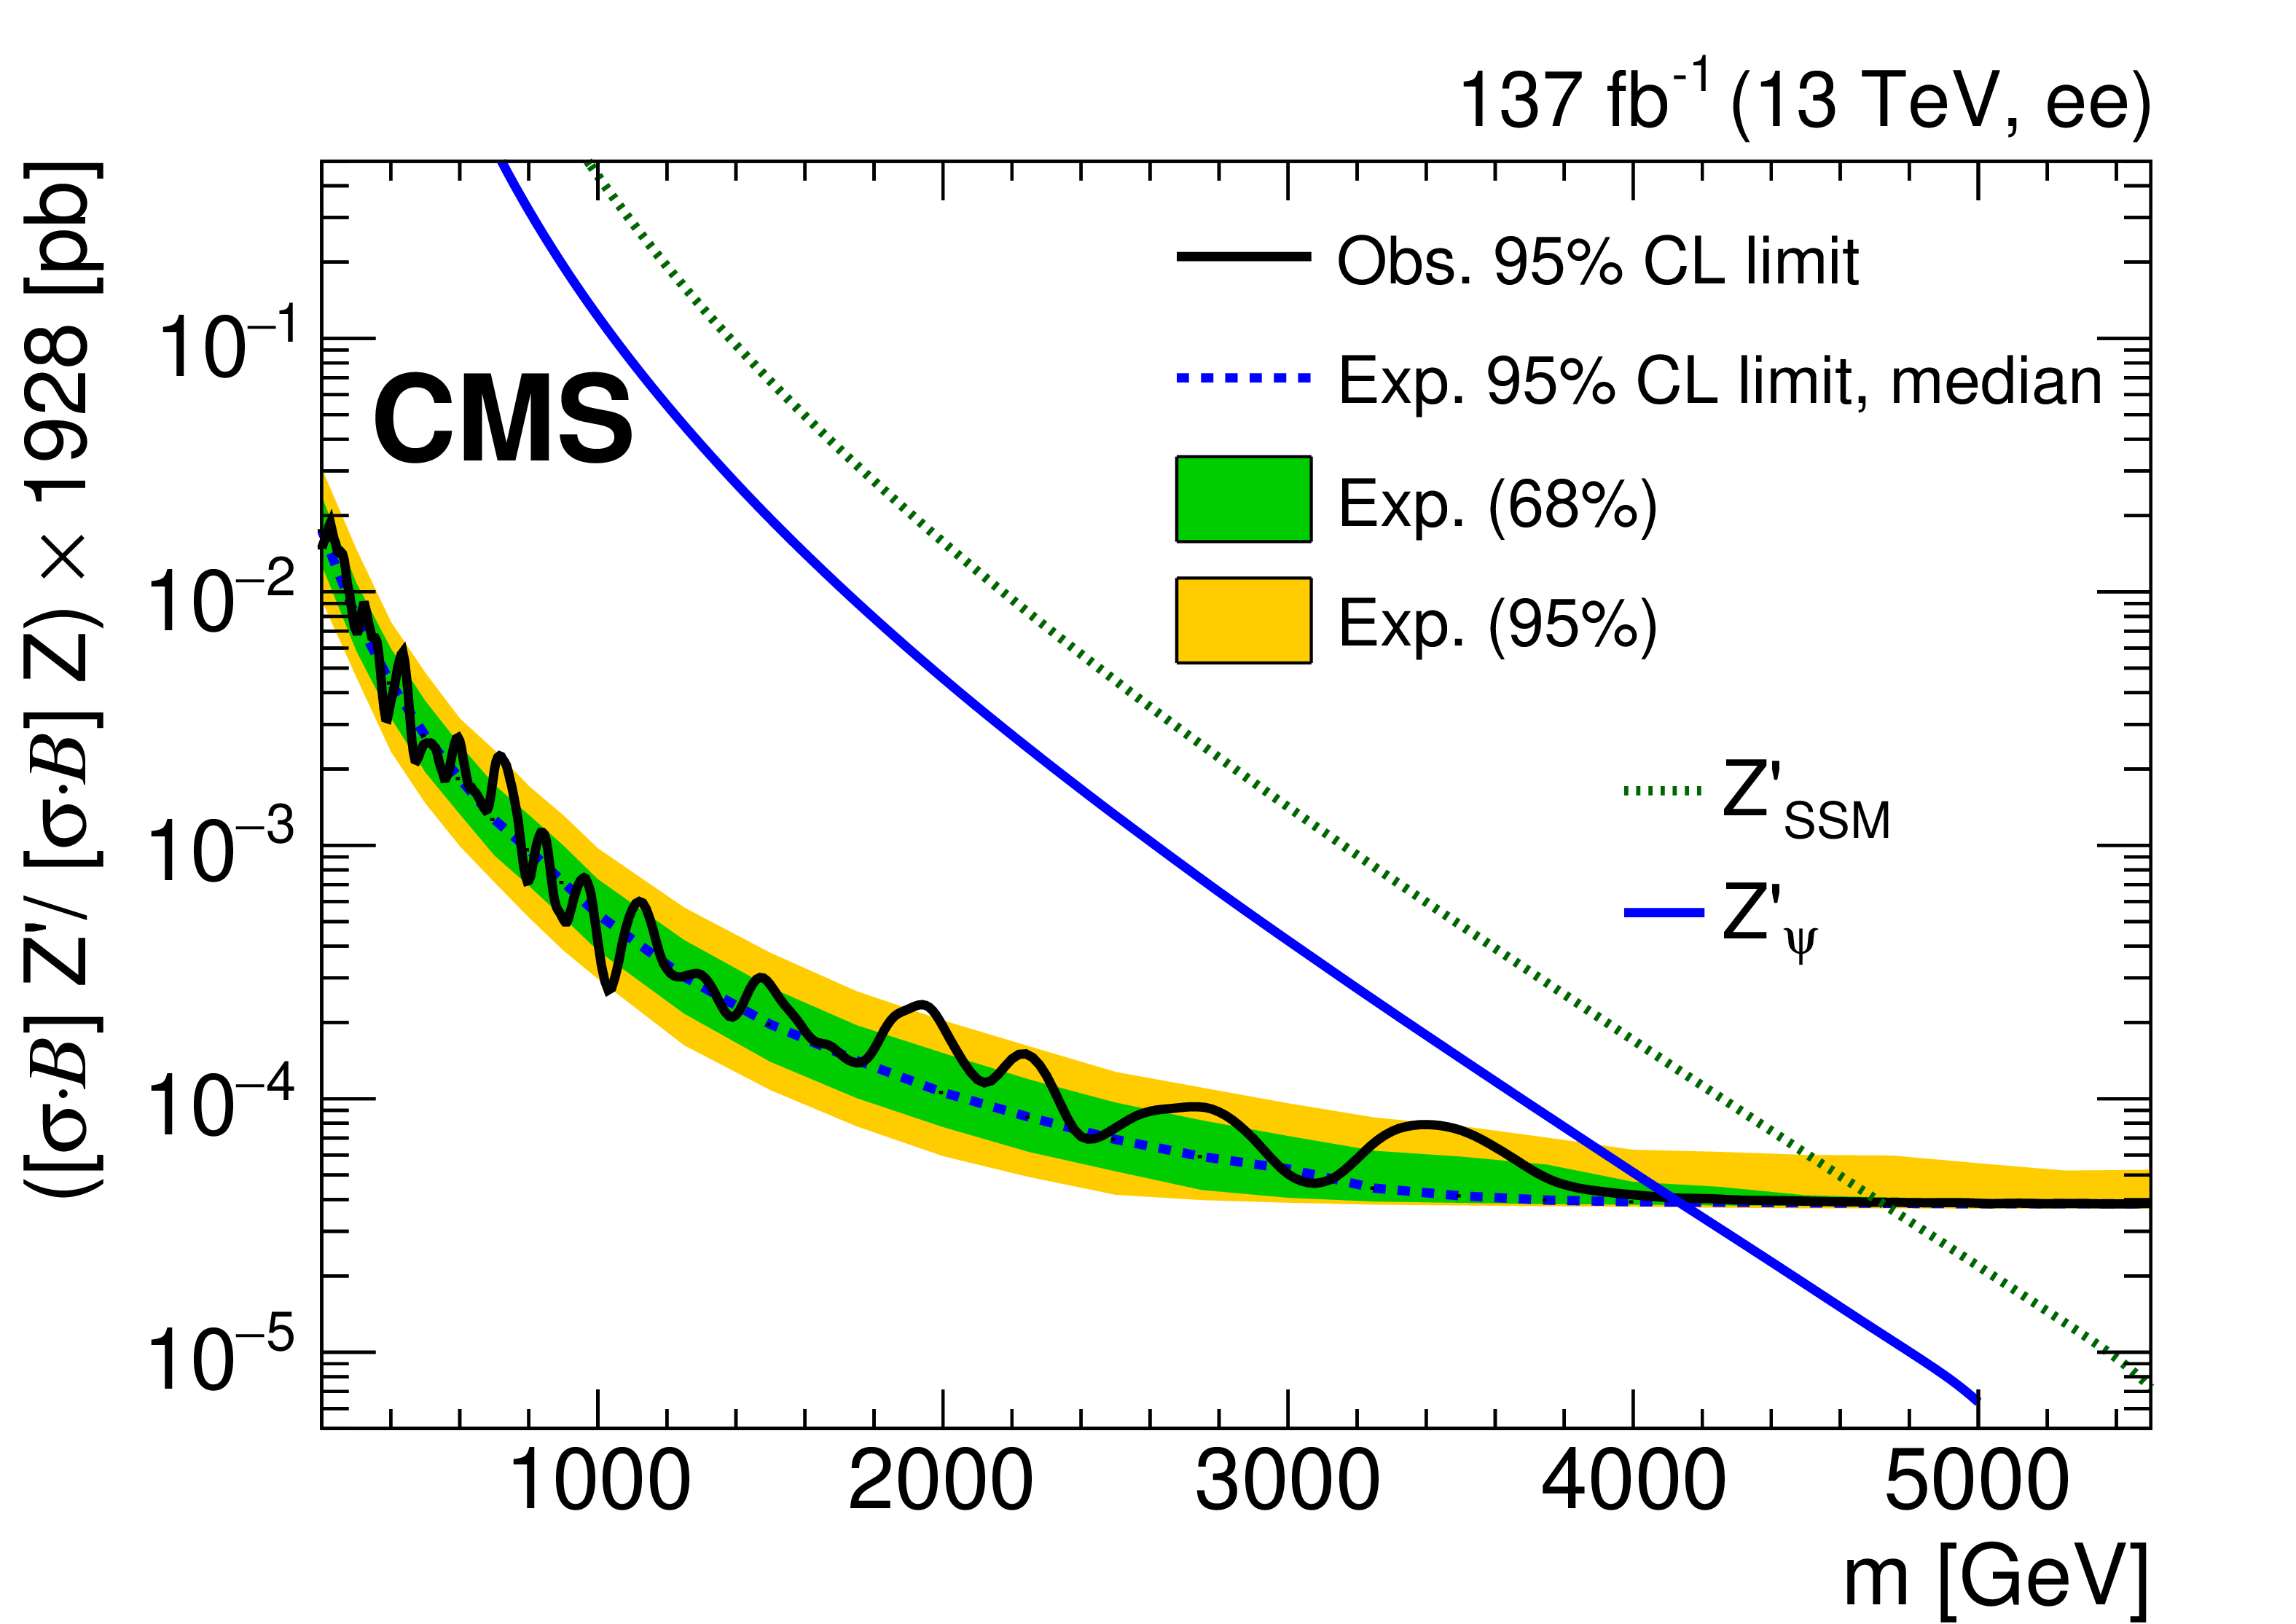
Figure 4-a:
The upper limits at 95% CL on the product of the production cross section and the branching fraction for a spin-1 resonance with a width equal to 0.6% of the resonance mass, relative to the product of the production cross section and the branching fraction of a Z boson, multiplied by the theoretical value of $\sigma ({\mathrm{p}} {\mathrm{p}} \to \mathrm{Z} +\mathrm{X}\to \ell \ell +\mathrm{X})$ of 1928 pb, for the dielectron channel. The shaded band corresponda to the 68 and 95% quantiles for the expected limits. Simulated predictions for the spin-1 ${\mathrm{Z'} _\mathrm {SSM}}$ and ${\mathrm{Z'} _\psi}$ resonances are shown for comparison. |
png pdf |
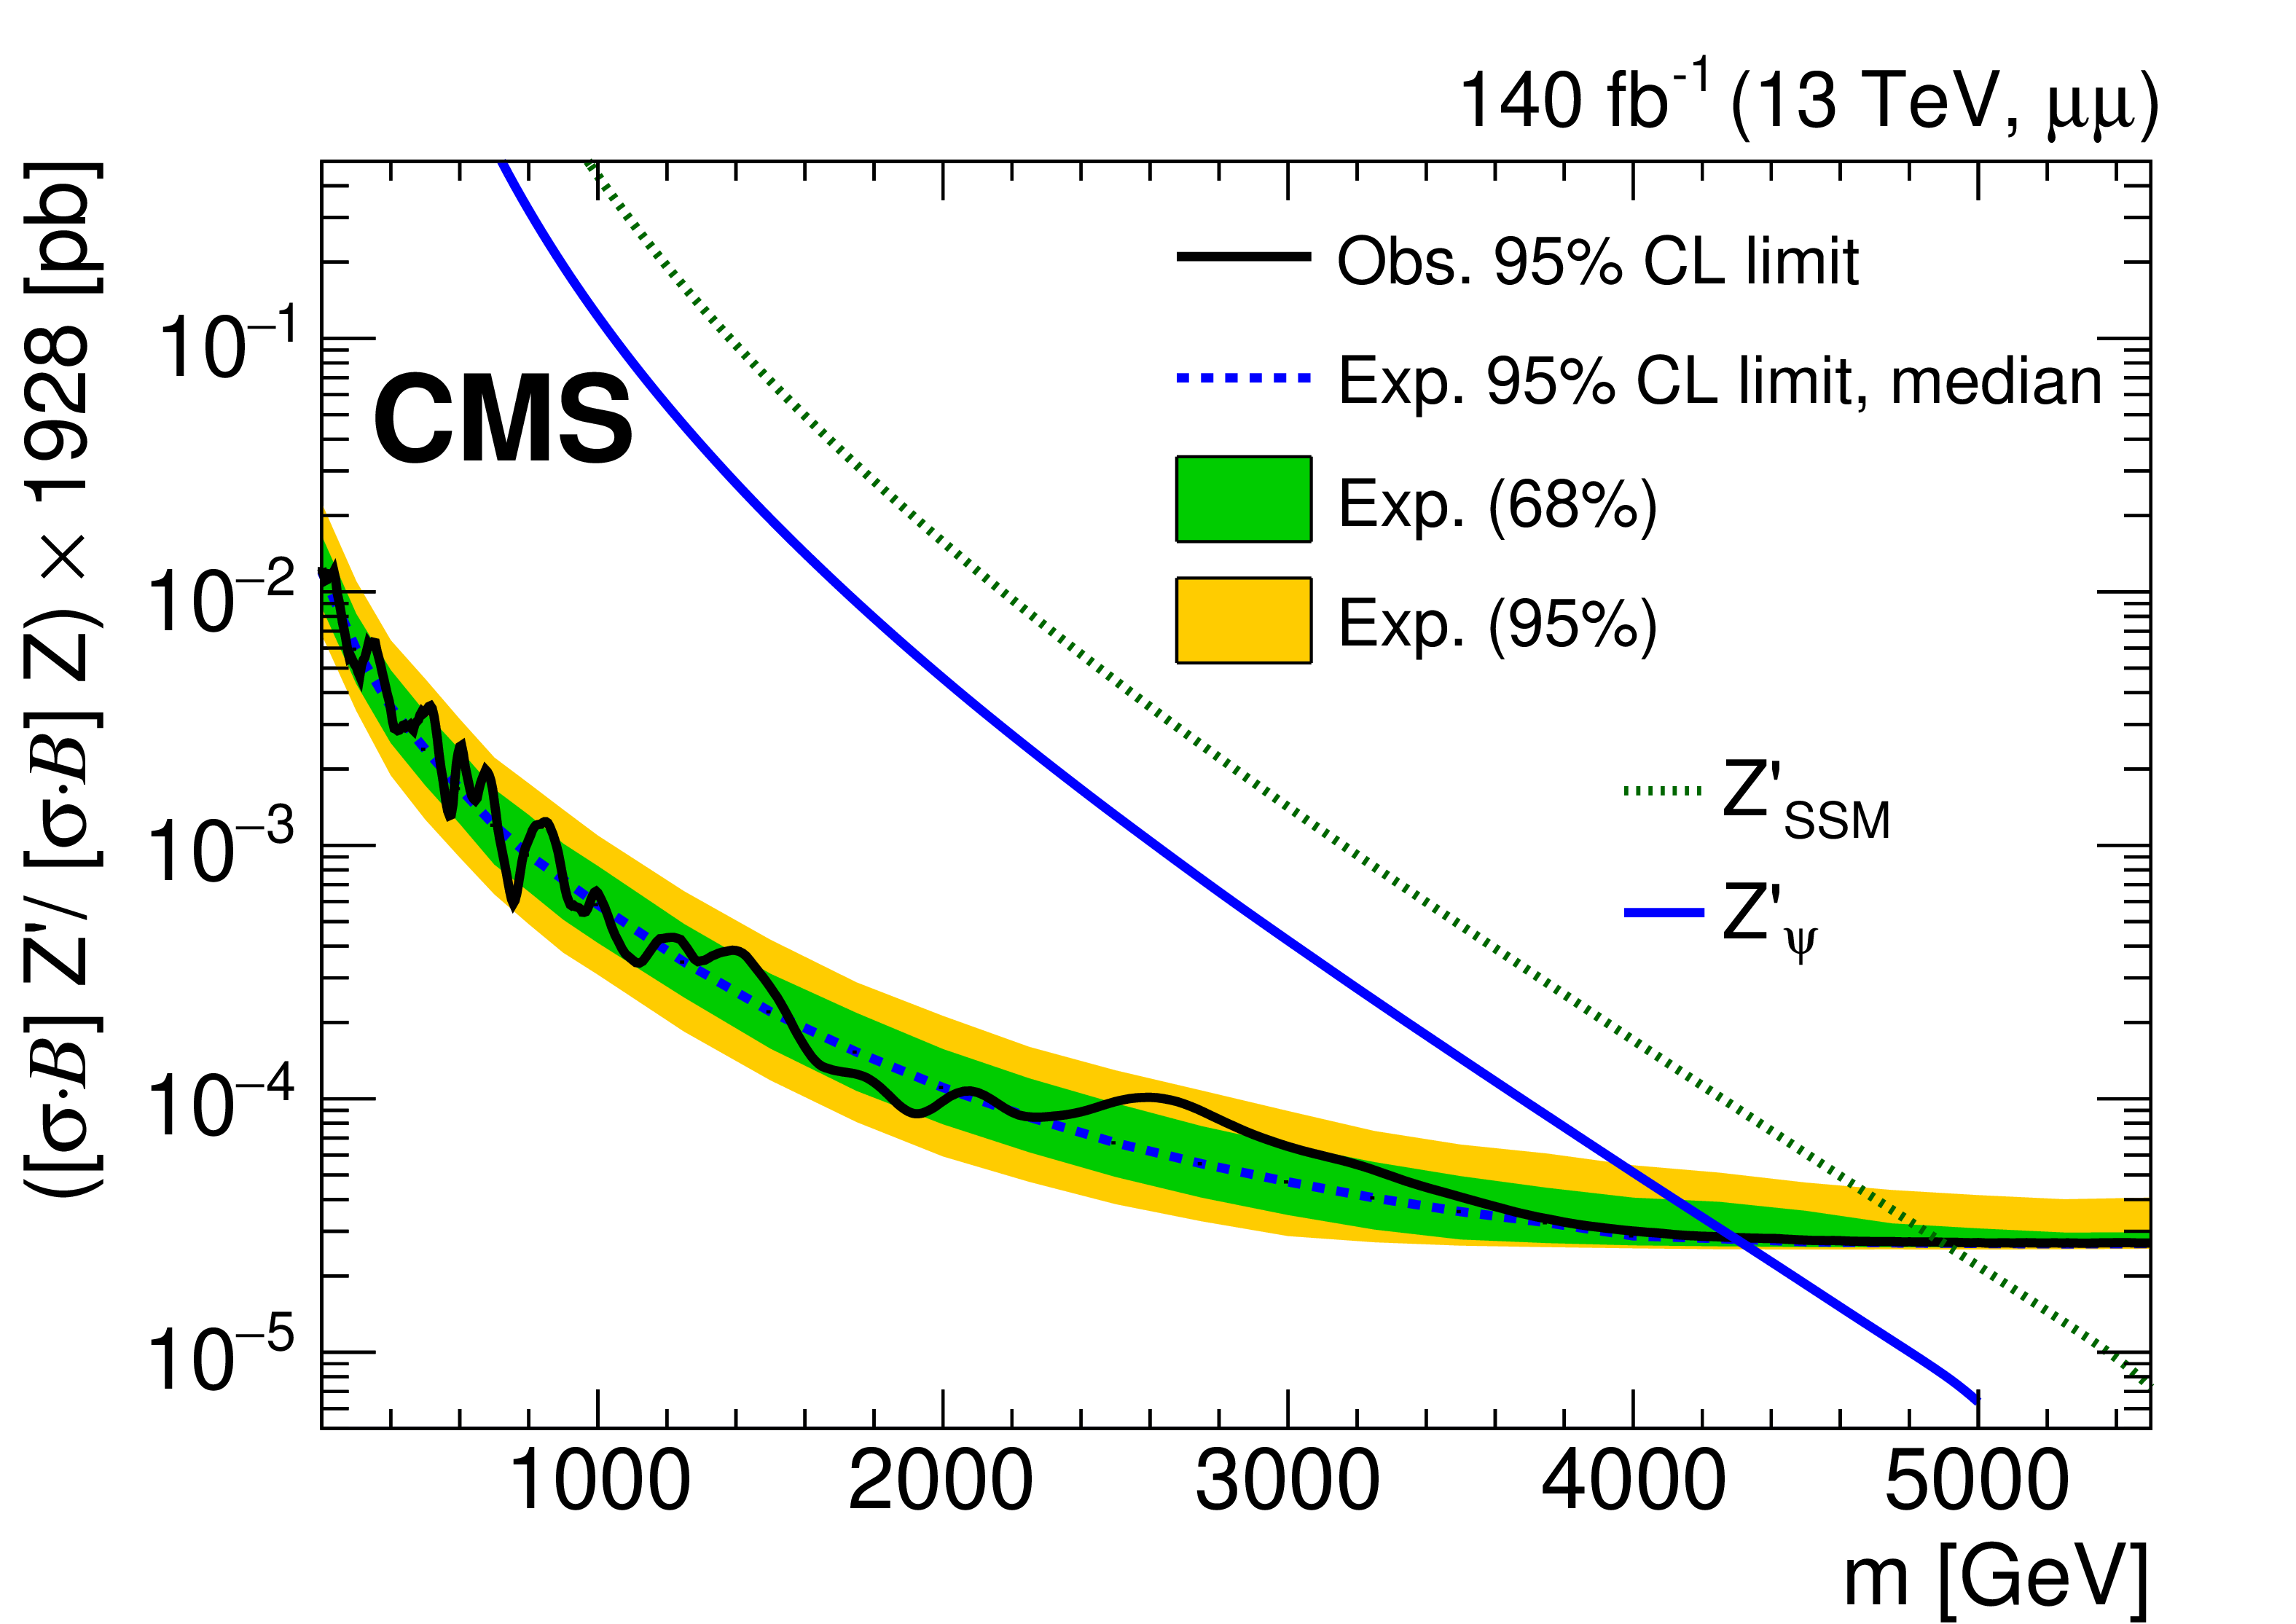
Figure 4-b:
The upper limits at 95% CL on the product of the production cross section and the branching fraction for a spin-1 resonance with a width equal to 0.6% of the resonance mass, relative to the product of the production cross section and the branching fraction of a Z boson, multiplied by the theoretical value of $\sigma ({\mathrm{p}} {\mathrm{p}} \to \mathrm{Z} +\mathrm{X}\to \ell \ell +\mathrm{X})$ of 1928 pb, for the dimuon channel. The shaded band corresponda to the 68 and 95% quantiles for the expected limits. Simulated predictions for the spin-1 ${\mathrm{Z'} _\mathrm {SSM}}$ and ${\mathrm{Z'} _\psi}$ resonances are shown for comparison. |

png pdf |
Figure 4-c:
The upper limits at 95% CL on the product of the production cross section and the branching fraction for a spin-1 resonance with a width equal to 0.6% of the resonance mass, relative to the product of the production cross section and the branching fraction of a Z boson, multiplied by the theoretical value of $\sigma ({\mathrm{p}} {\mathrm{p}} \to \mathrm{Z} +\mathrm{X}\to \ell \ell +\mathrm{X})$ of 1928 pb, for the combination of dielecton and dimuon channels. The shaded band corresponda to the 68 and 95% quantiles for the expected limits. Simulated predictions for the spin-1 ${\mathrm{Z'} _\mathrm {SSM}}$ and ${\mathrm{Z'} _\psi}$ resonances are shown for comparison. |
png pdf |
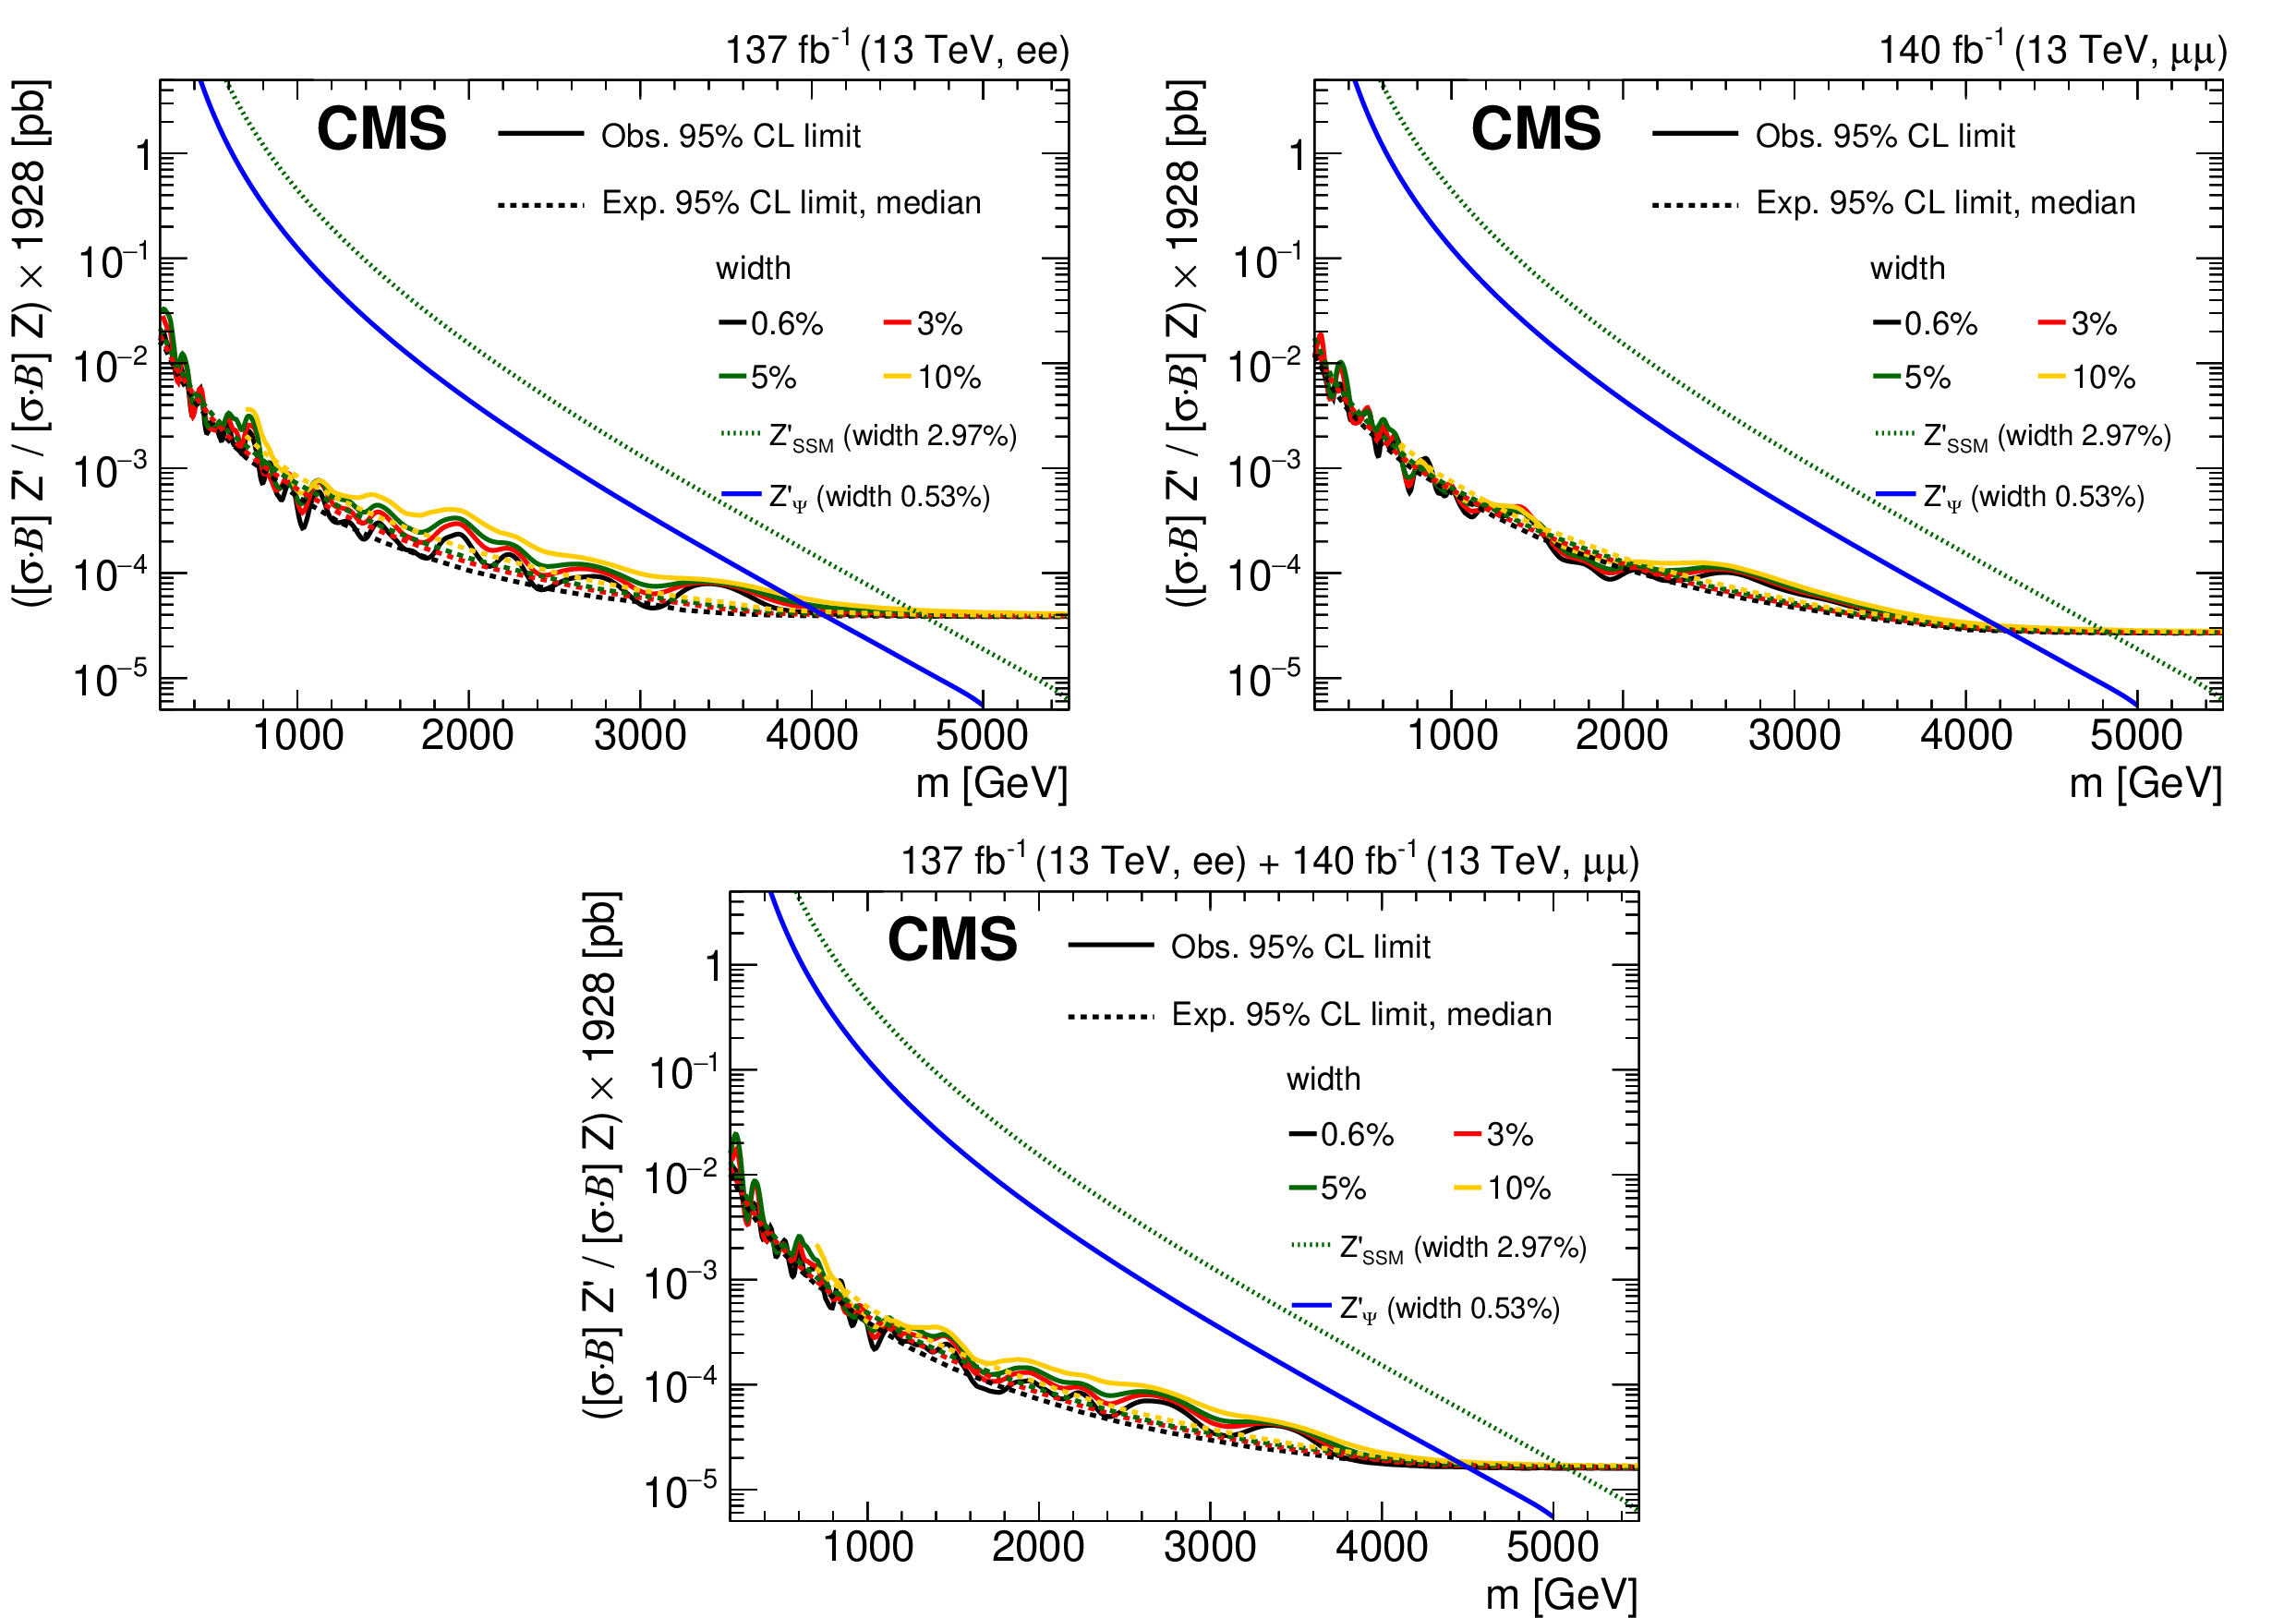
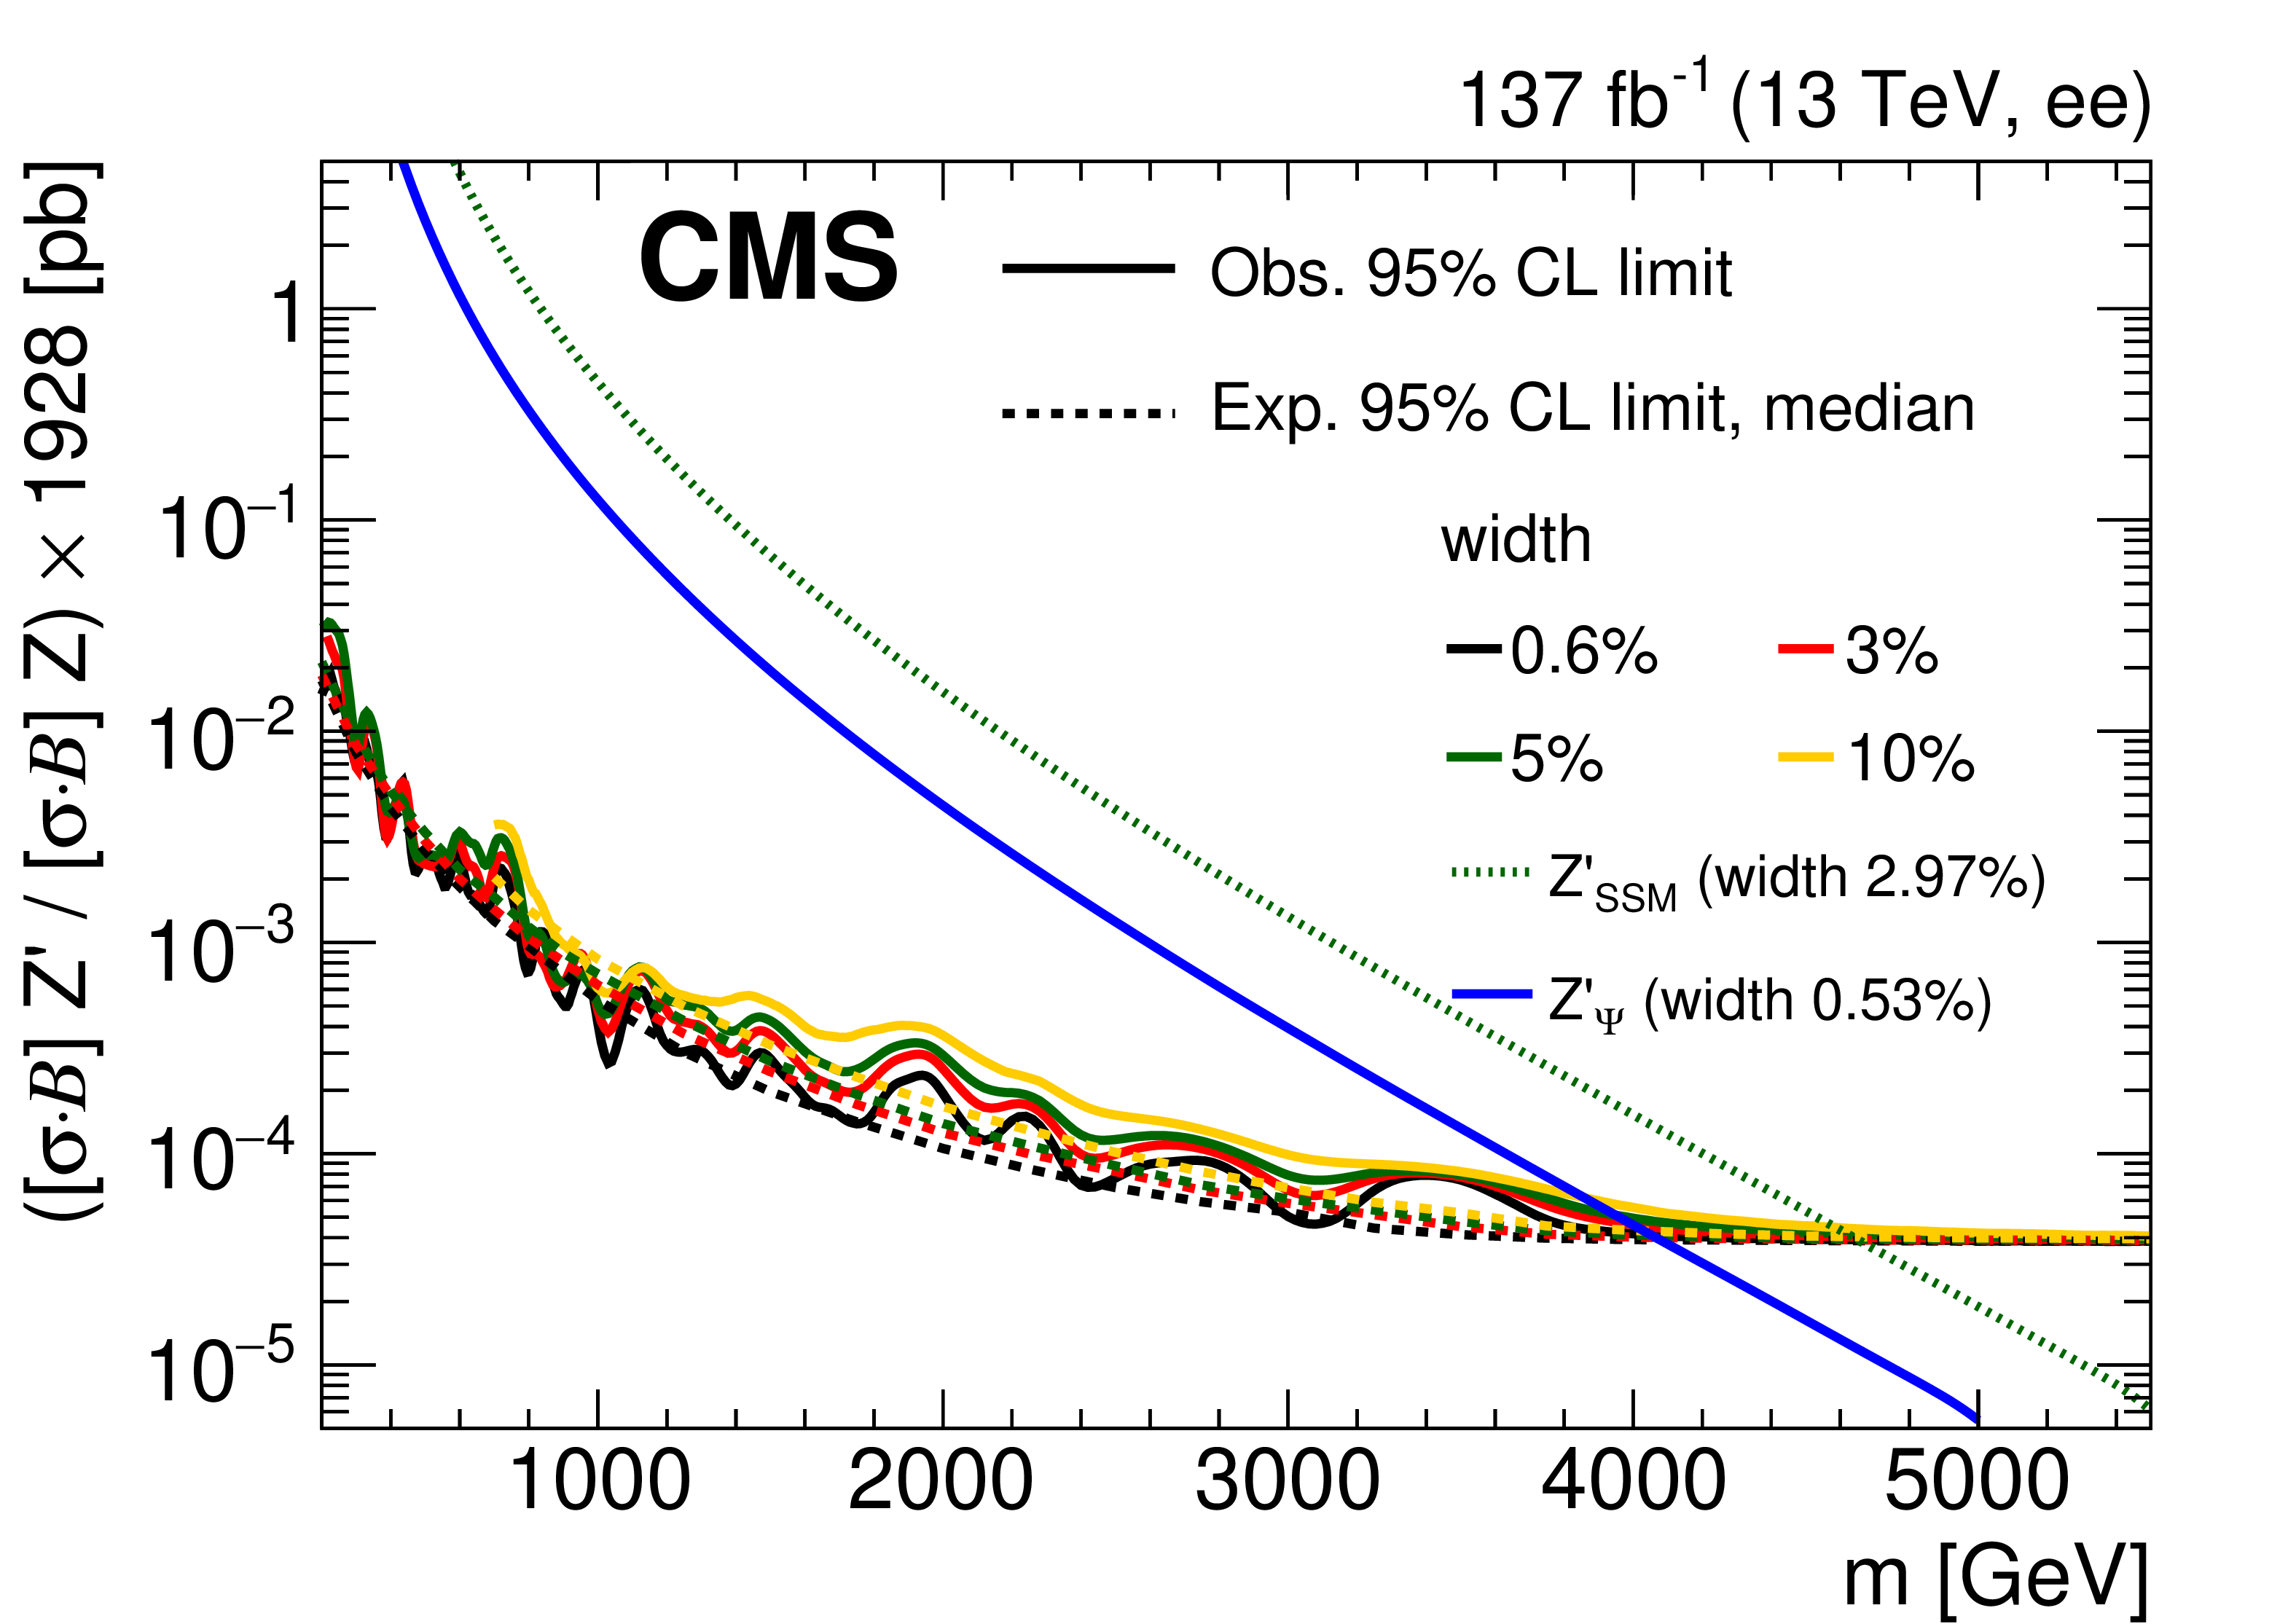
Figure 5:
The upper limits at 95% CL on the product of the production cross section and the branching fraction for a spin-1 resonance, for widths equal to 0.6, 3, 5, and 10% of the resonance mass, relative to the product of the production cross section and the branching fraction for a Z boson, multiplied by the theoretical value of $\sigma ({\mathrm{p}} {\mathrm{p}} \to \mathrm{Z} +\mathrm{X}\to \ell \ell +\mathrm{X})$ of 1928 pb, for (upper left) the dielectron channel, (upper right) the dimuon channel, and (lower) their combination. Theoretical predictions for the spin-1 ${\mathrm{Z'} _\mathrm {SSM}}$ and ${\mathrm{Z'} _\psi}$ resonances are also shown. |
png pdf |
Figure 5-a:
The upper limits at 95% CL on the product of the production cross section and the branching fraction for a spin-1 resonance, for widths equal to 0.6, 3, 5, and 10% of the resonance mass, relative to the product of the production cross section and the branching fraction for a Z boson, multiplied by the theoretical value of $\sigma ({\mathrm{p}} {\mathrm{p}} \to \mathrm{Z} +\mathrm{X}\to \ell \ell +\mathrm{X})$ of 1928 pb, for the dielectron channel. Theoretical predictions for the spin-1 ${\mathrm{Z'} _\mathrm {SSM}}$ and ${\mathrm{Z'} _\psi}$ resonances are also shown. |
png pdf |
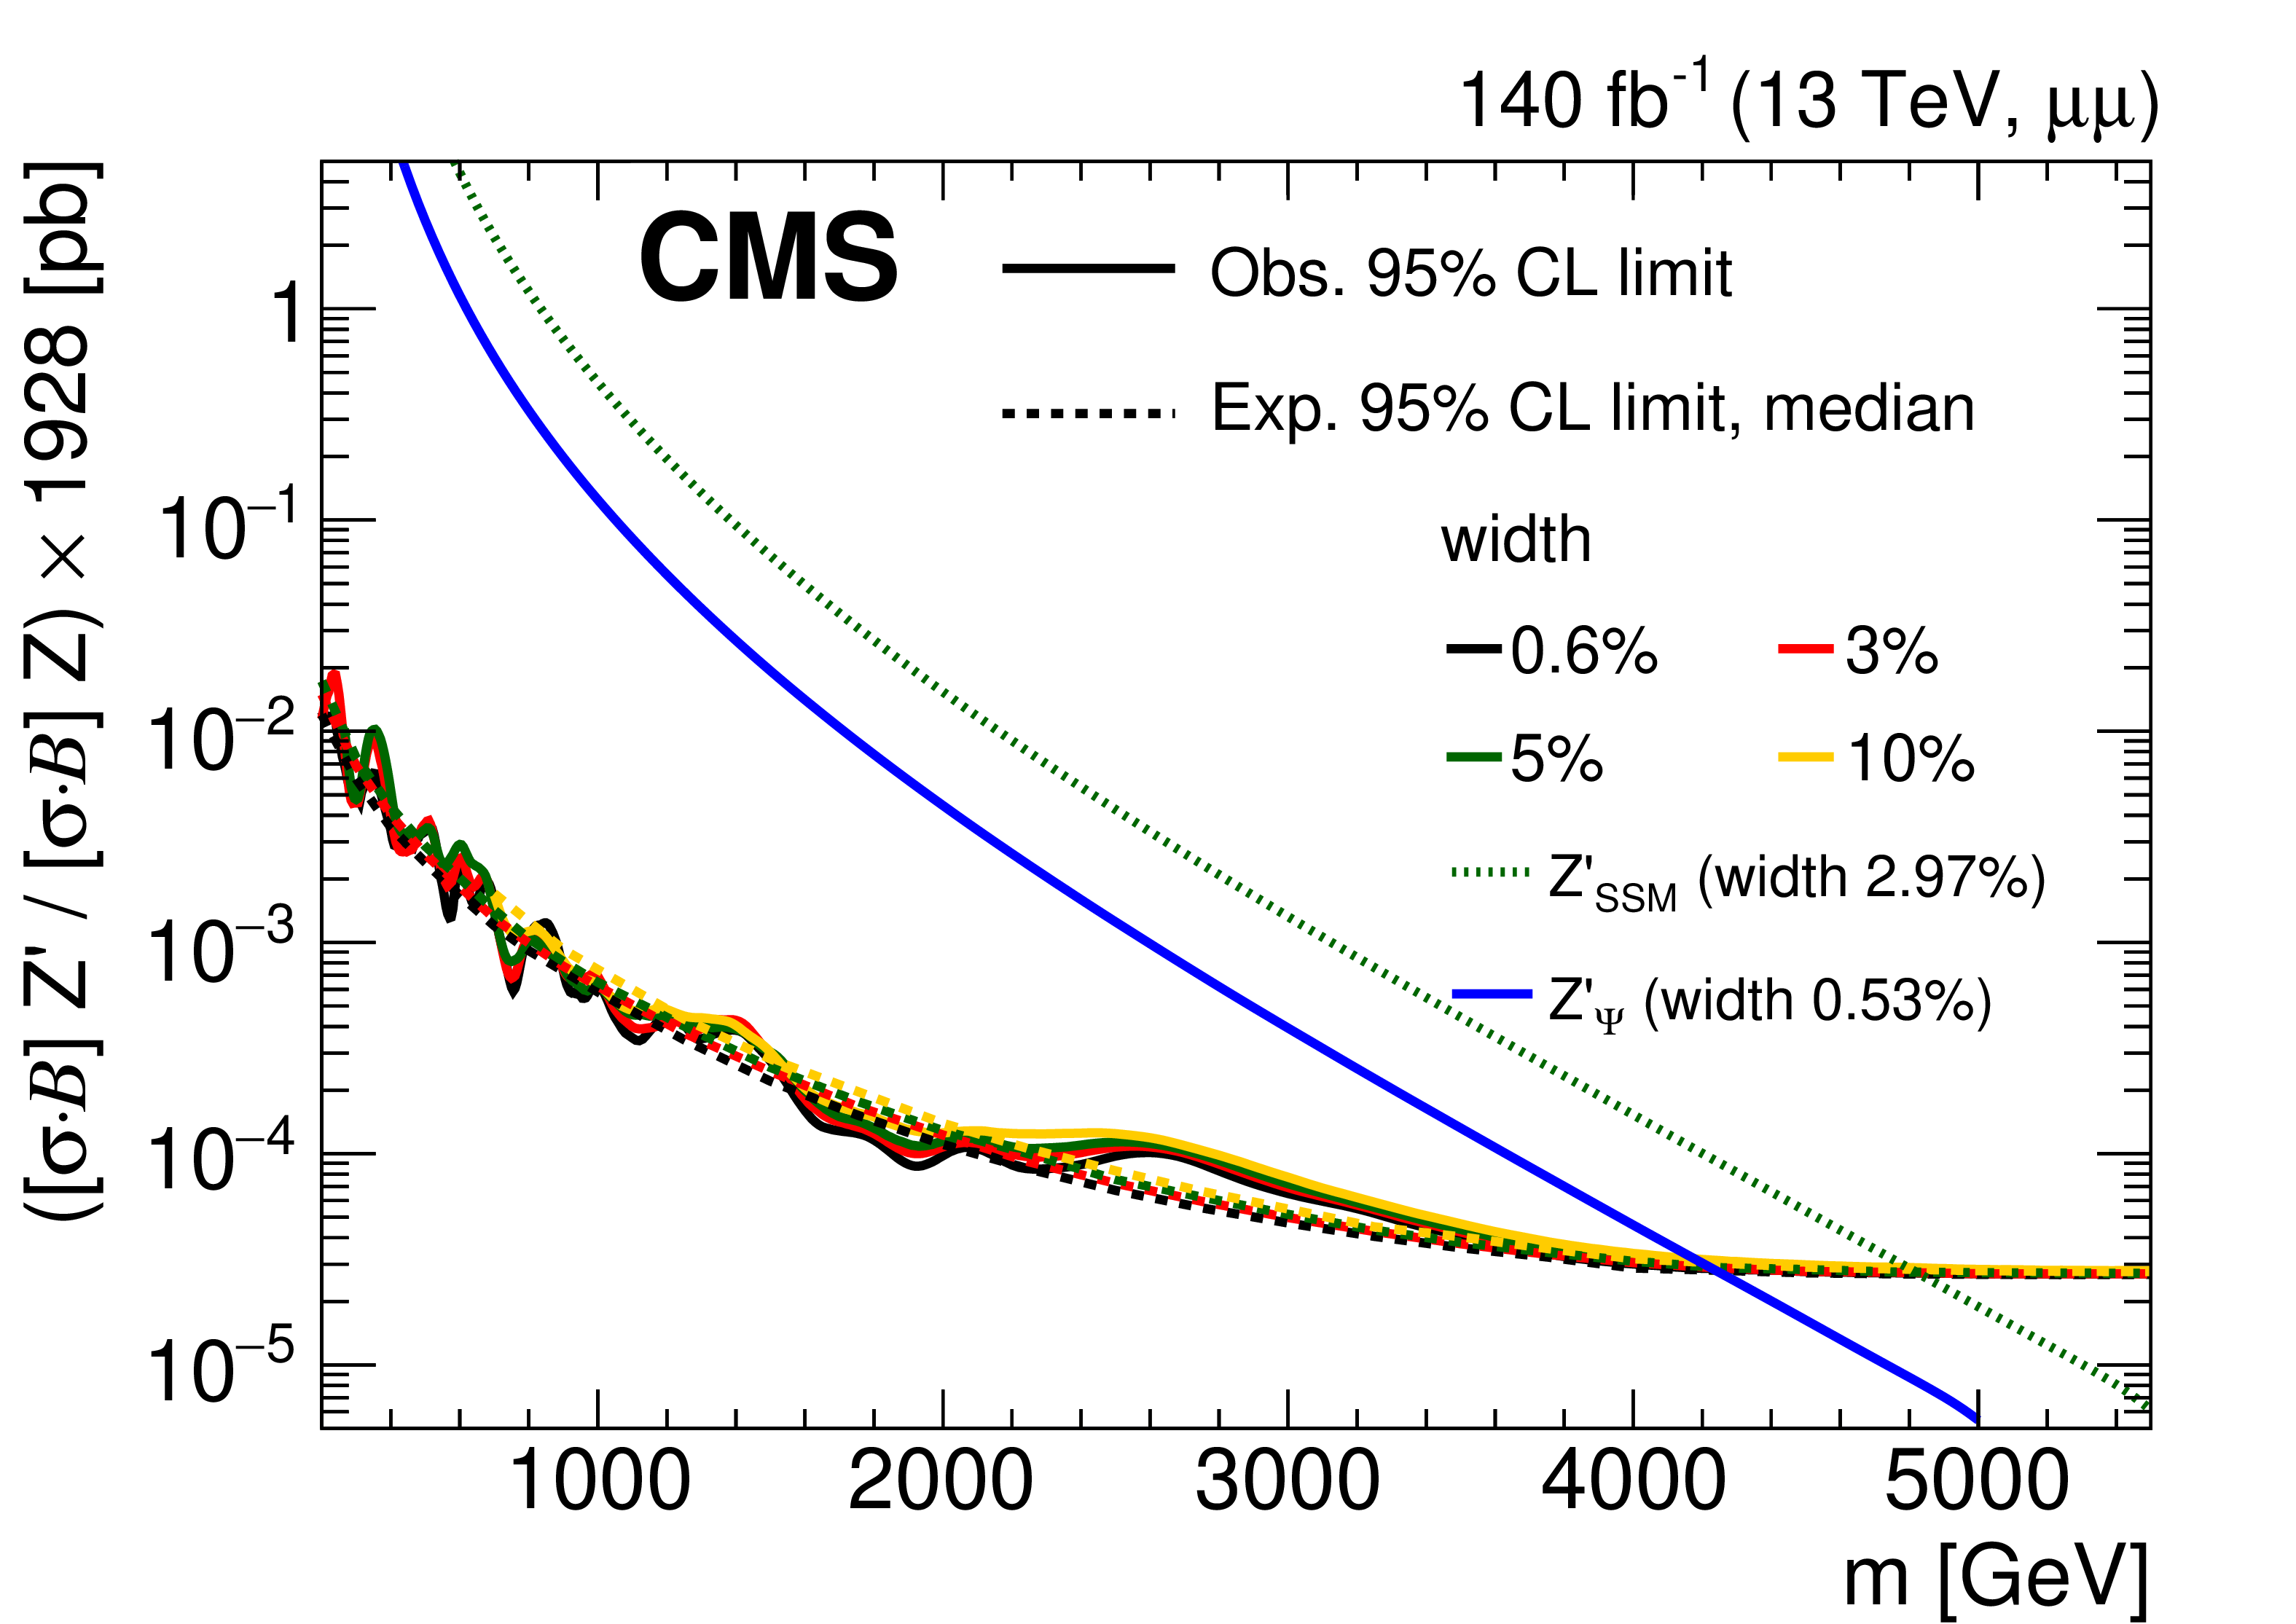
Figure 5-b:
The upper limits at 95% CL on the product of the production cross section and the branching fraction for a spin-1 resonance, for widths equal to 0.6, 3, 5, and 10% of the resonance mass, relative to the product of the production cross section and the branching fraction for a Z boson, multiplied by the theoretical value of $\sigma ({\mathrm{p}} {\mathrm{p}} \to \mathrm{Z} +\mathrm{X}\to \ell \ell +\mathrm{X})$ of 1928 pb, for the dimuon channel. Theoretical predictions for the spin-1 ${\mathrm{Z'} _\mathrm {SSM}}$ and ${\mathrm{Z'} _\psi}$ resonances are also shown. |
png pdf |
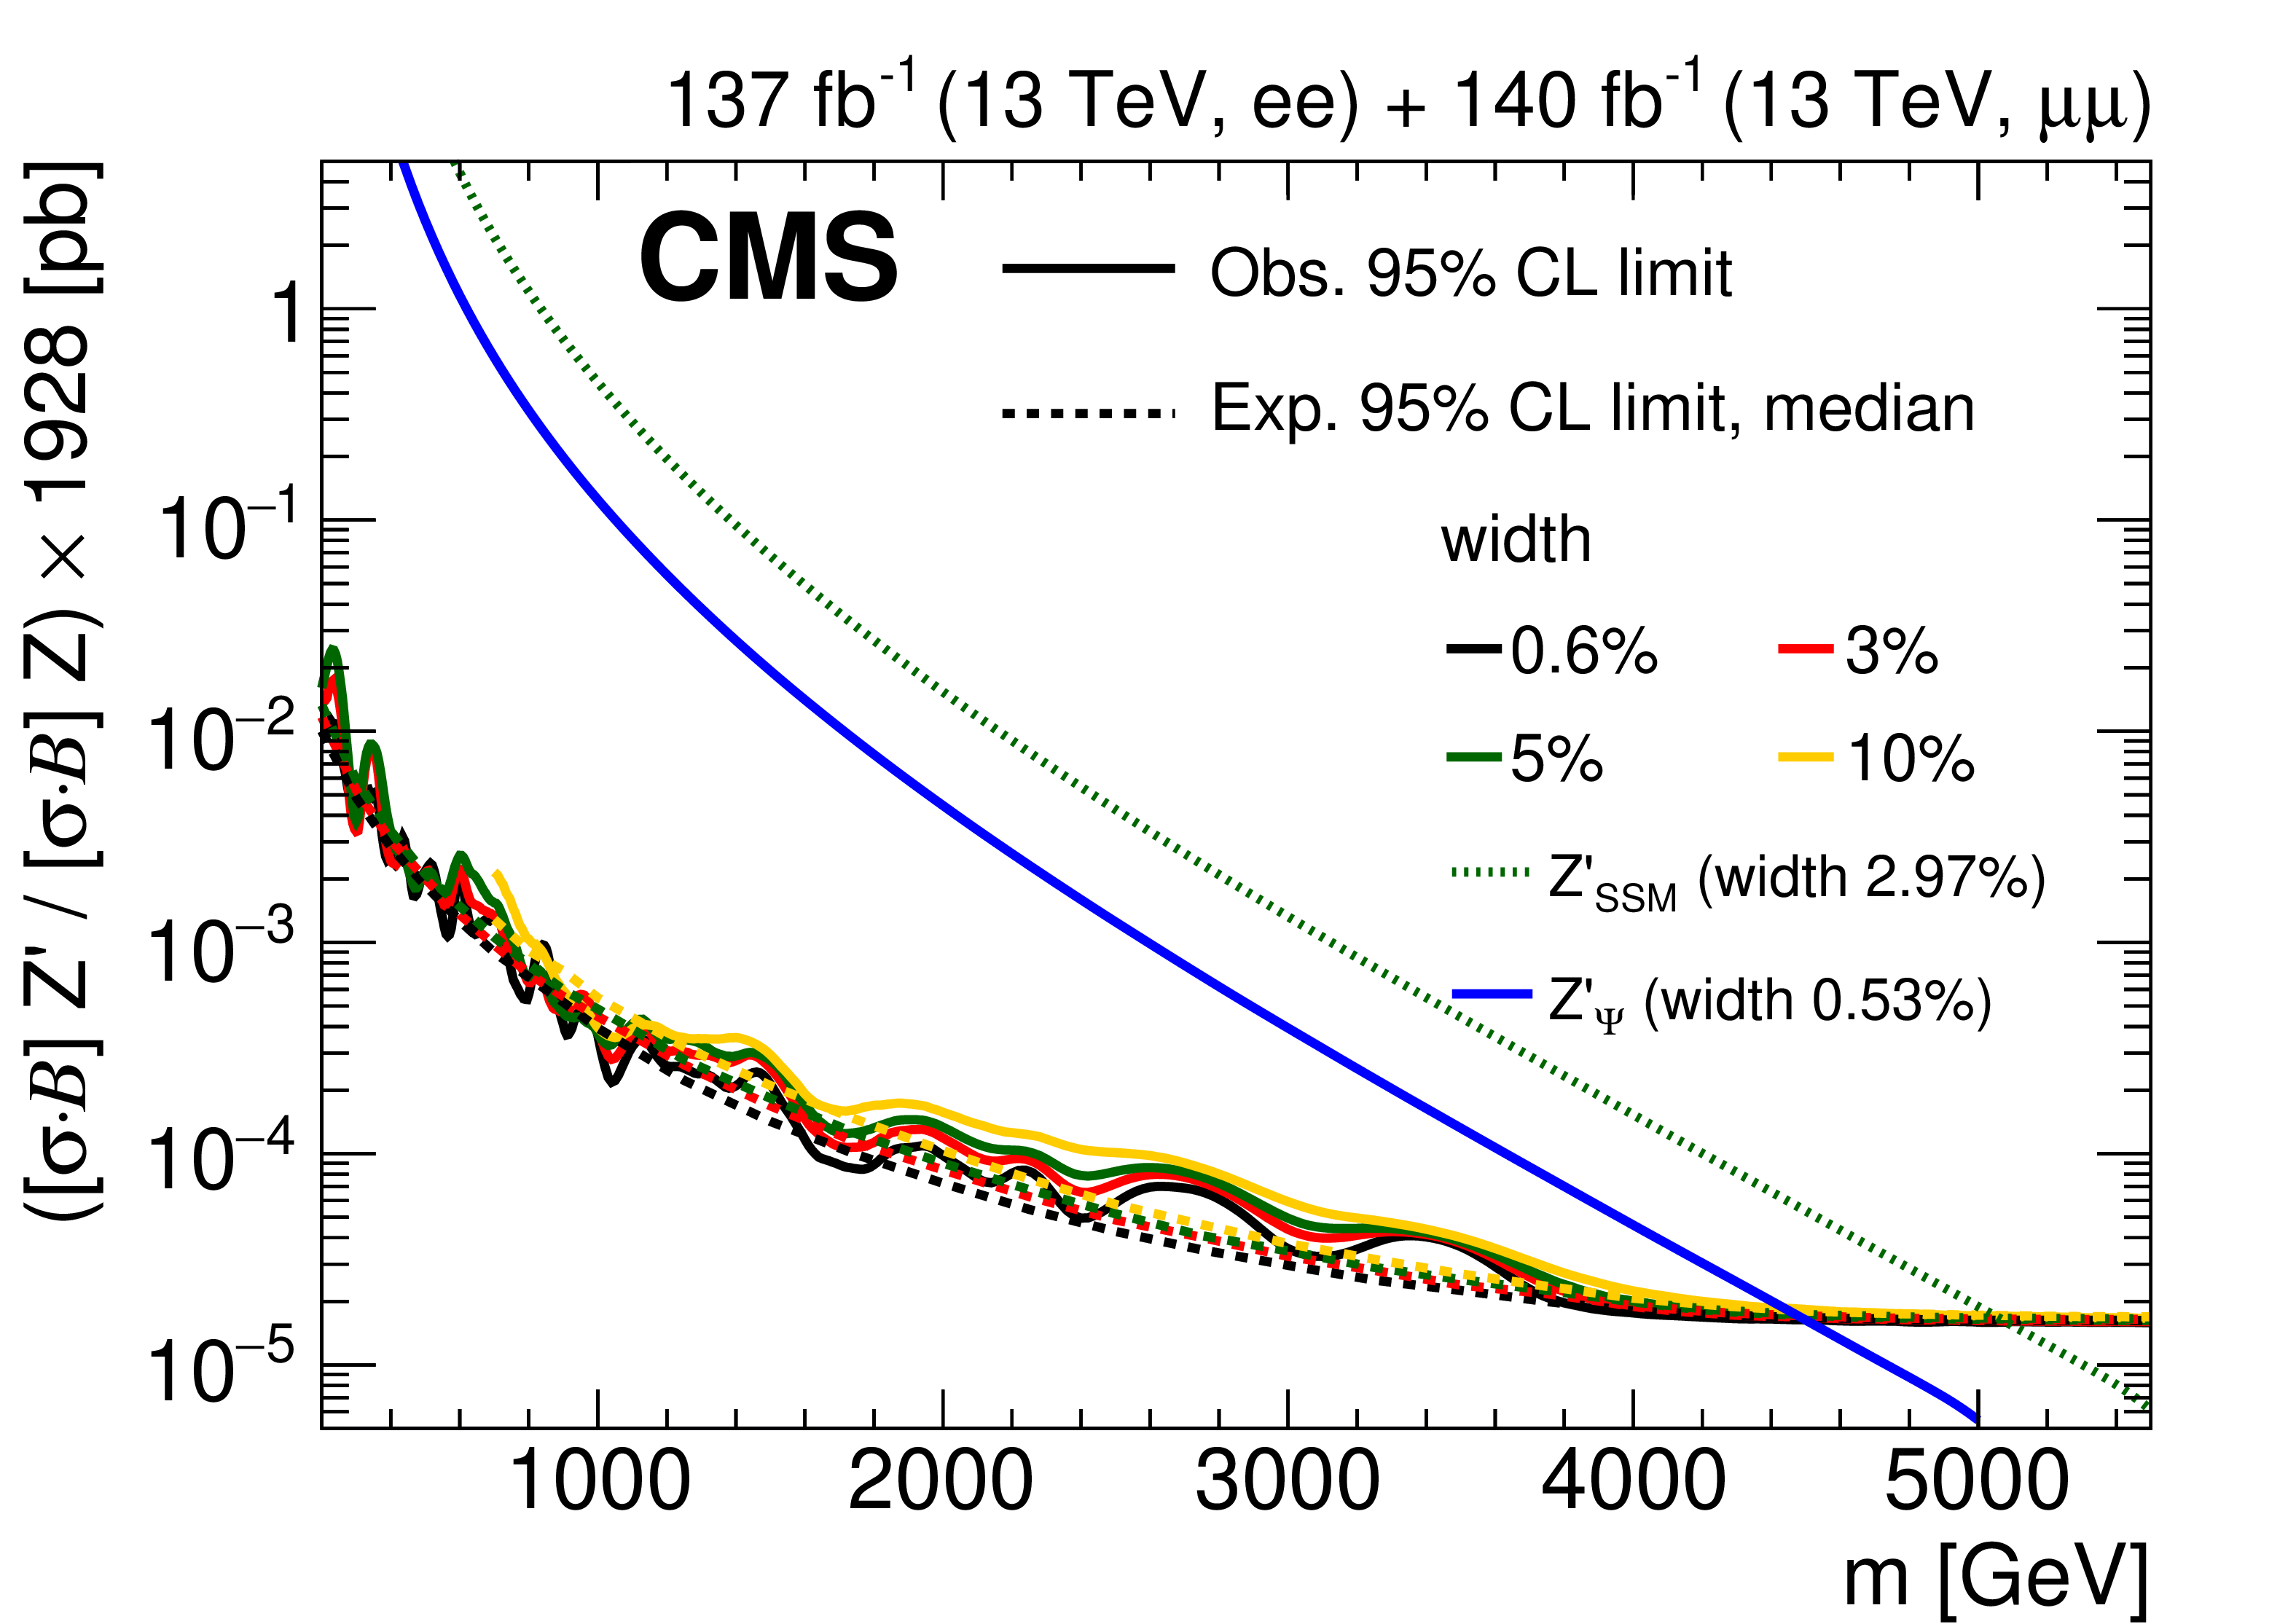
Figure 5-c:
The upper limits at 95% CL on the product of the production cross section and the branching fraction for a spin-1 resonance, for widths equal to 0.6, 3, 5, and 10% of the resonance mass, relative to the product of the production cross section and the branching fraction for a Z boson, multiplied by the theoretical value of $\sigma ({\mathrm{p}} {\mathrm{p}} \to \mathrm{Z} +\mathrm{X}\to \ell \ell +\mathrm{X})$ of 1928 pb, for the combination of dielecton and dimuon channels. Theoretical predictions for the spin-1 ${\mathrm{Z'} _\mathrm {SSM}}$ and ${\mathrm{Z'} _\psi}$ resonances are also shown. |

png pdf |
Figure 6:
Lower limits in the $(c_{\mathrm{d}},c_{\mathrm{u}})$ plane obtained by recasting the combined limit at 95% CL on the Z' boson cross section for narrow resonances from dielectron and dimuon channels. For a given Z' boson mass, the cross section limit results in a solid thin black line. These lines are labeled with the relevant Z' boson masses. The closed contours representing the GSM, LRS, and E$_6$ model classes are composed of thick curve segments. Each point on a segment corresponds to a particular model, and the location of the point gives the mass limit on the relevant Z' boson. As indicated in the lower left legend, the curve segment styles correspond to ranges of the particular mixing angle, for each considered model. The lower right legend indicates constituents of each model class. |
png pdf |
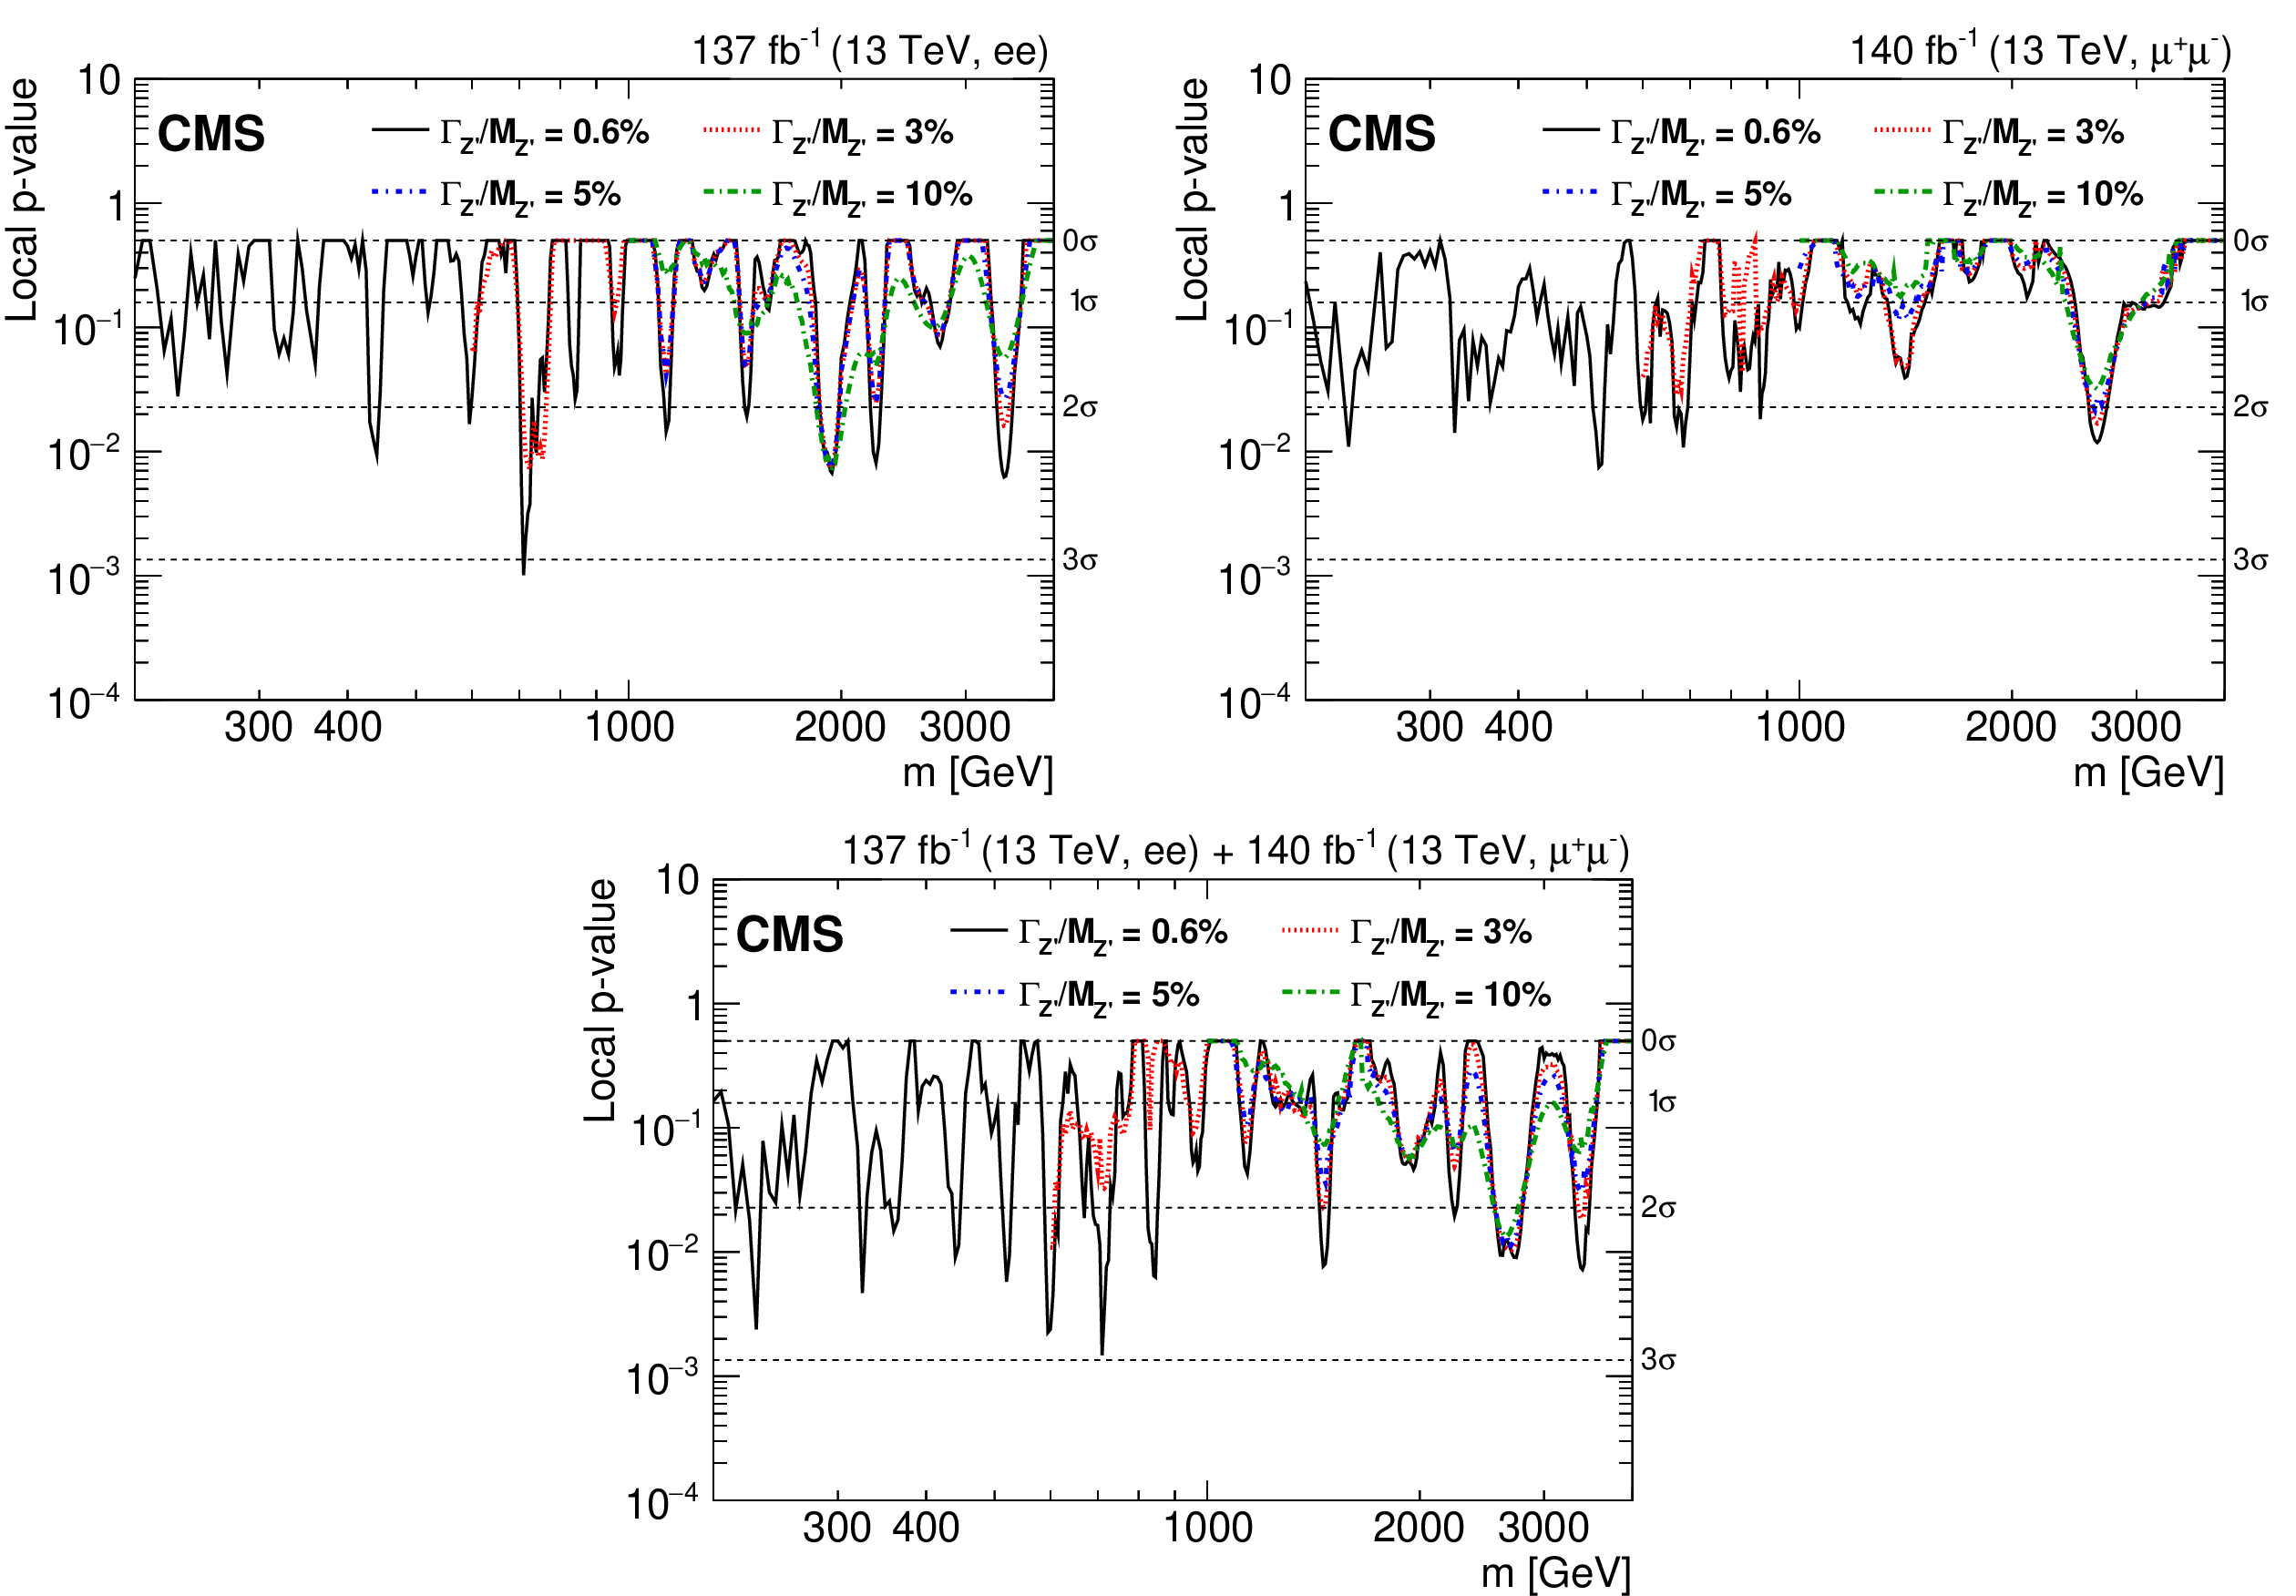
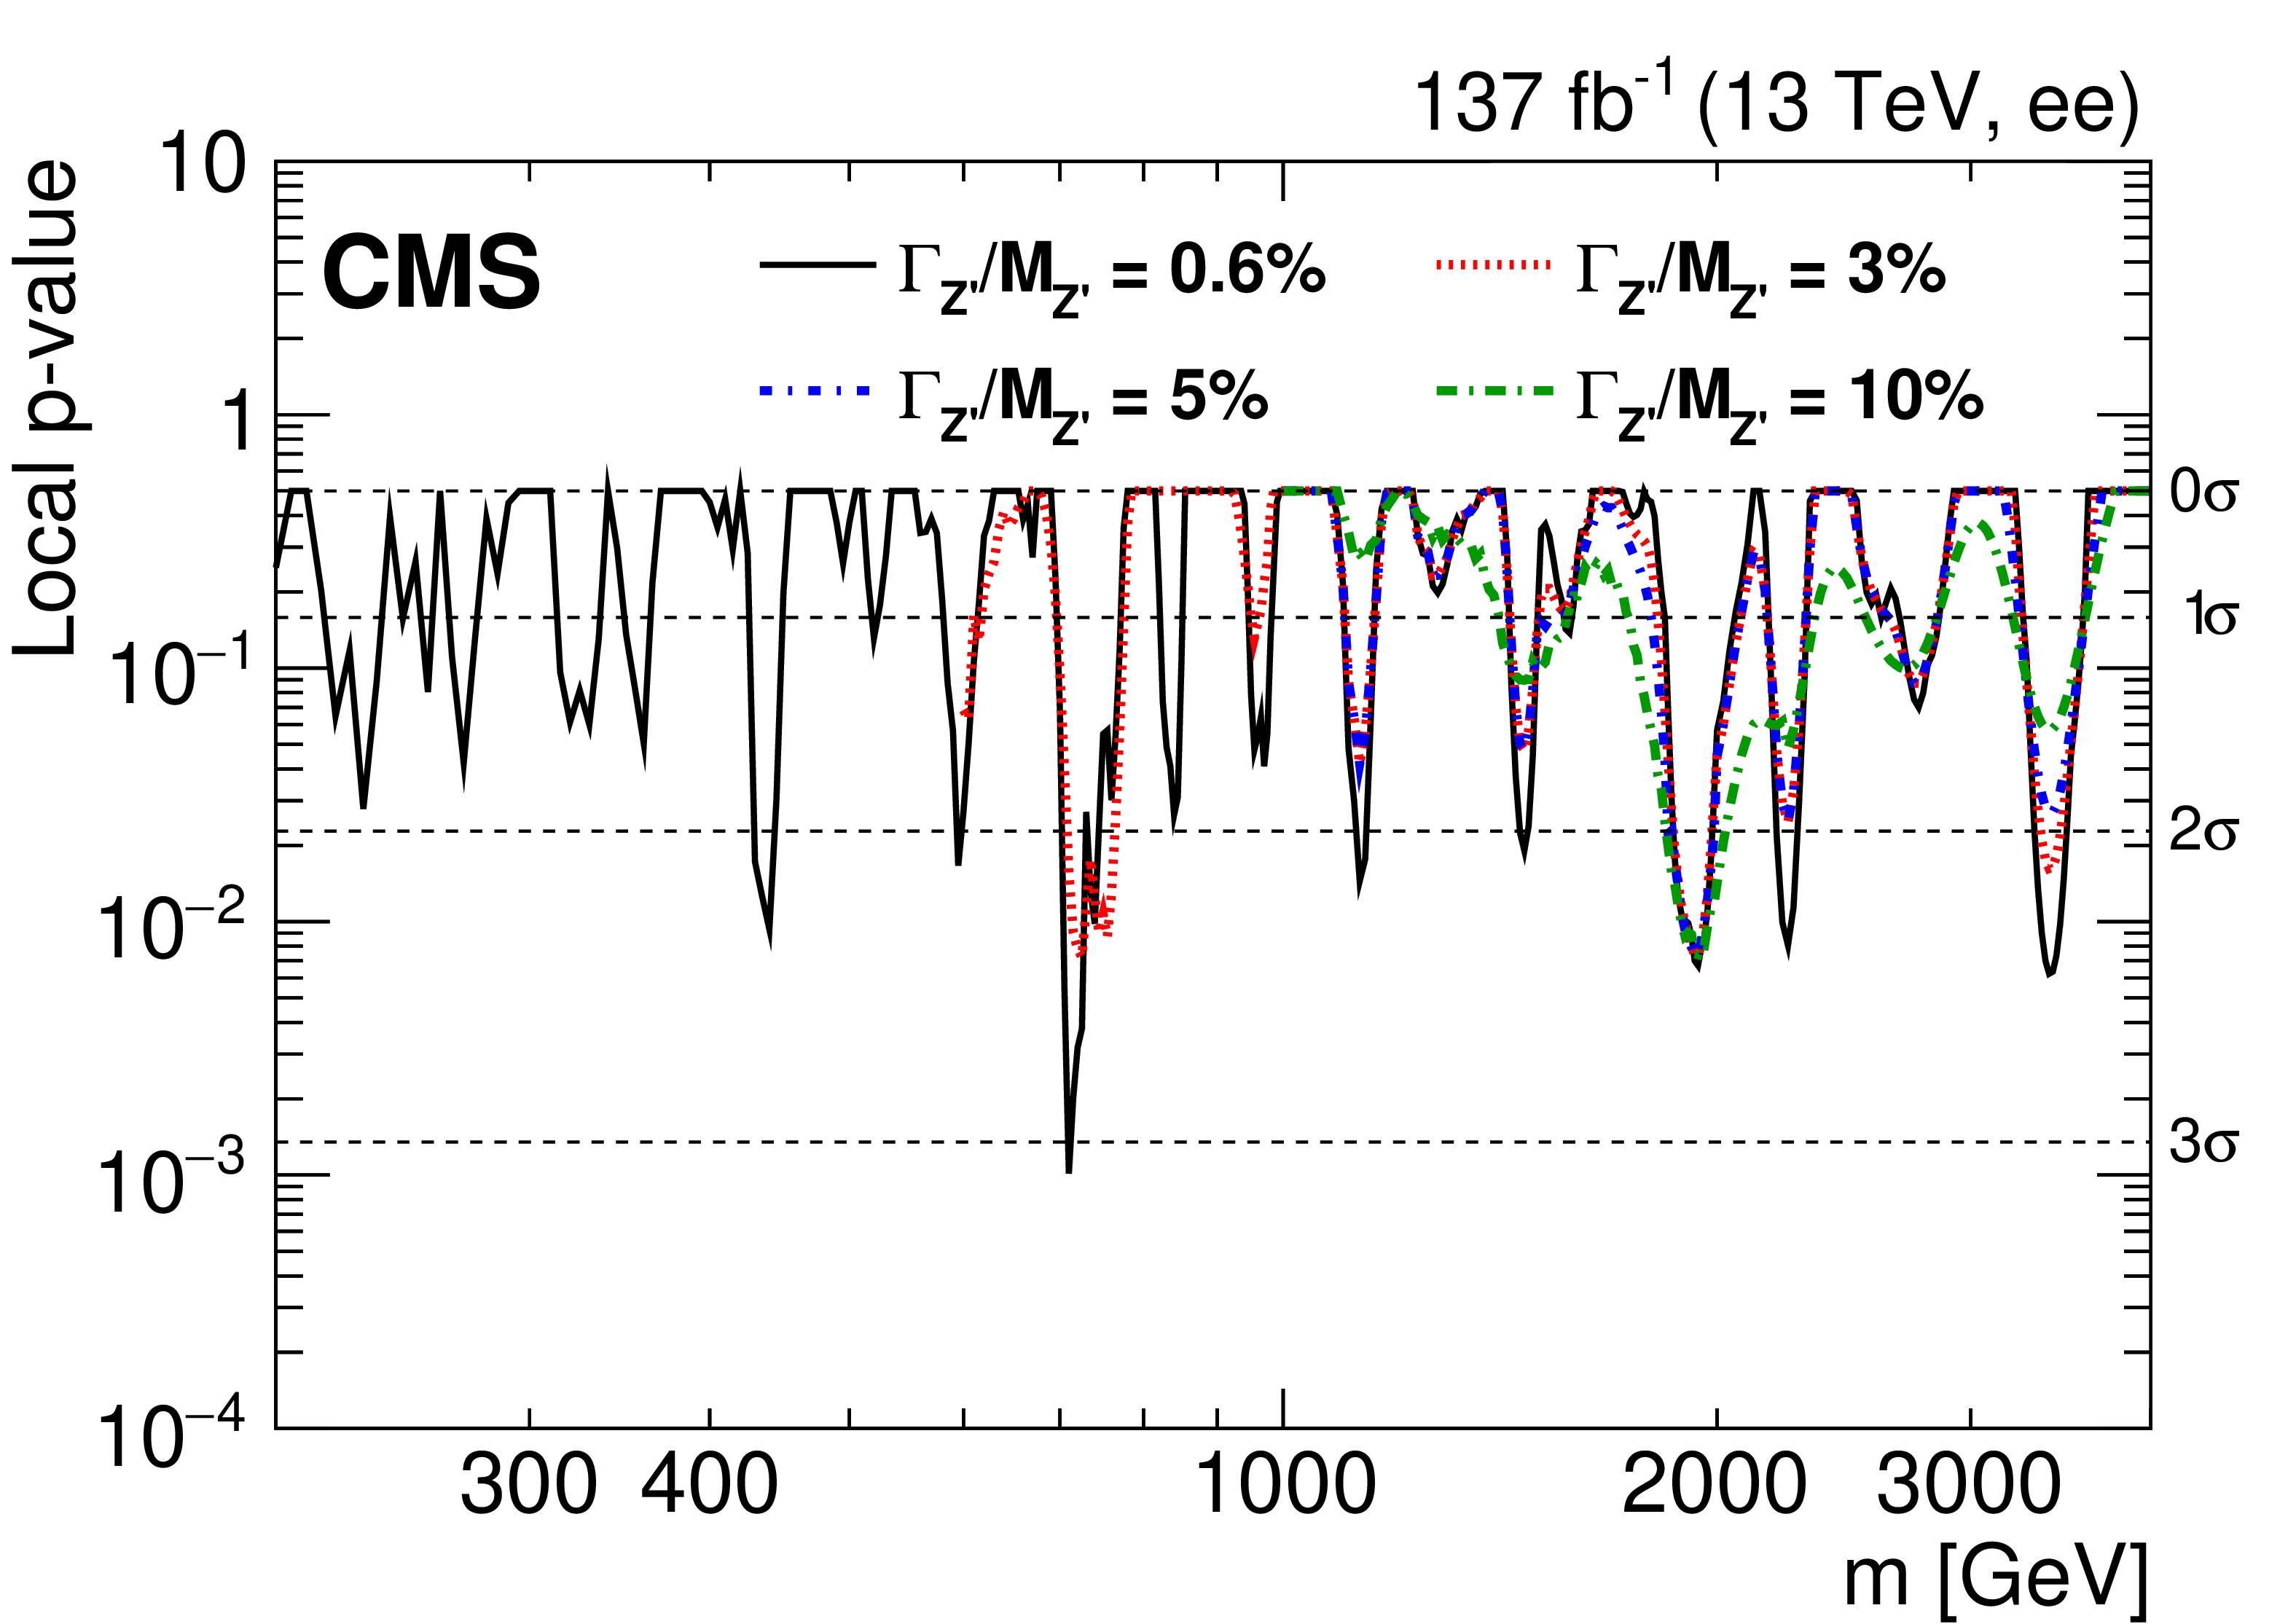
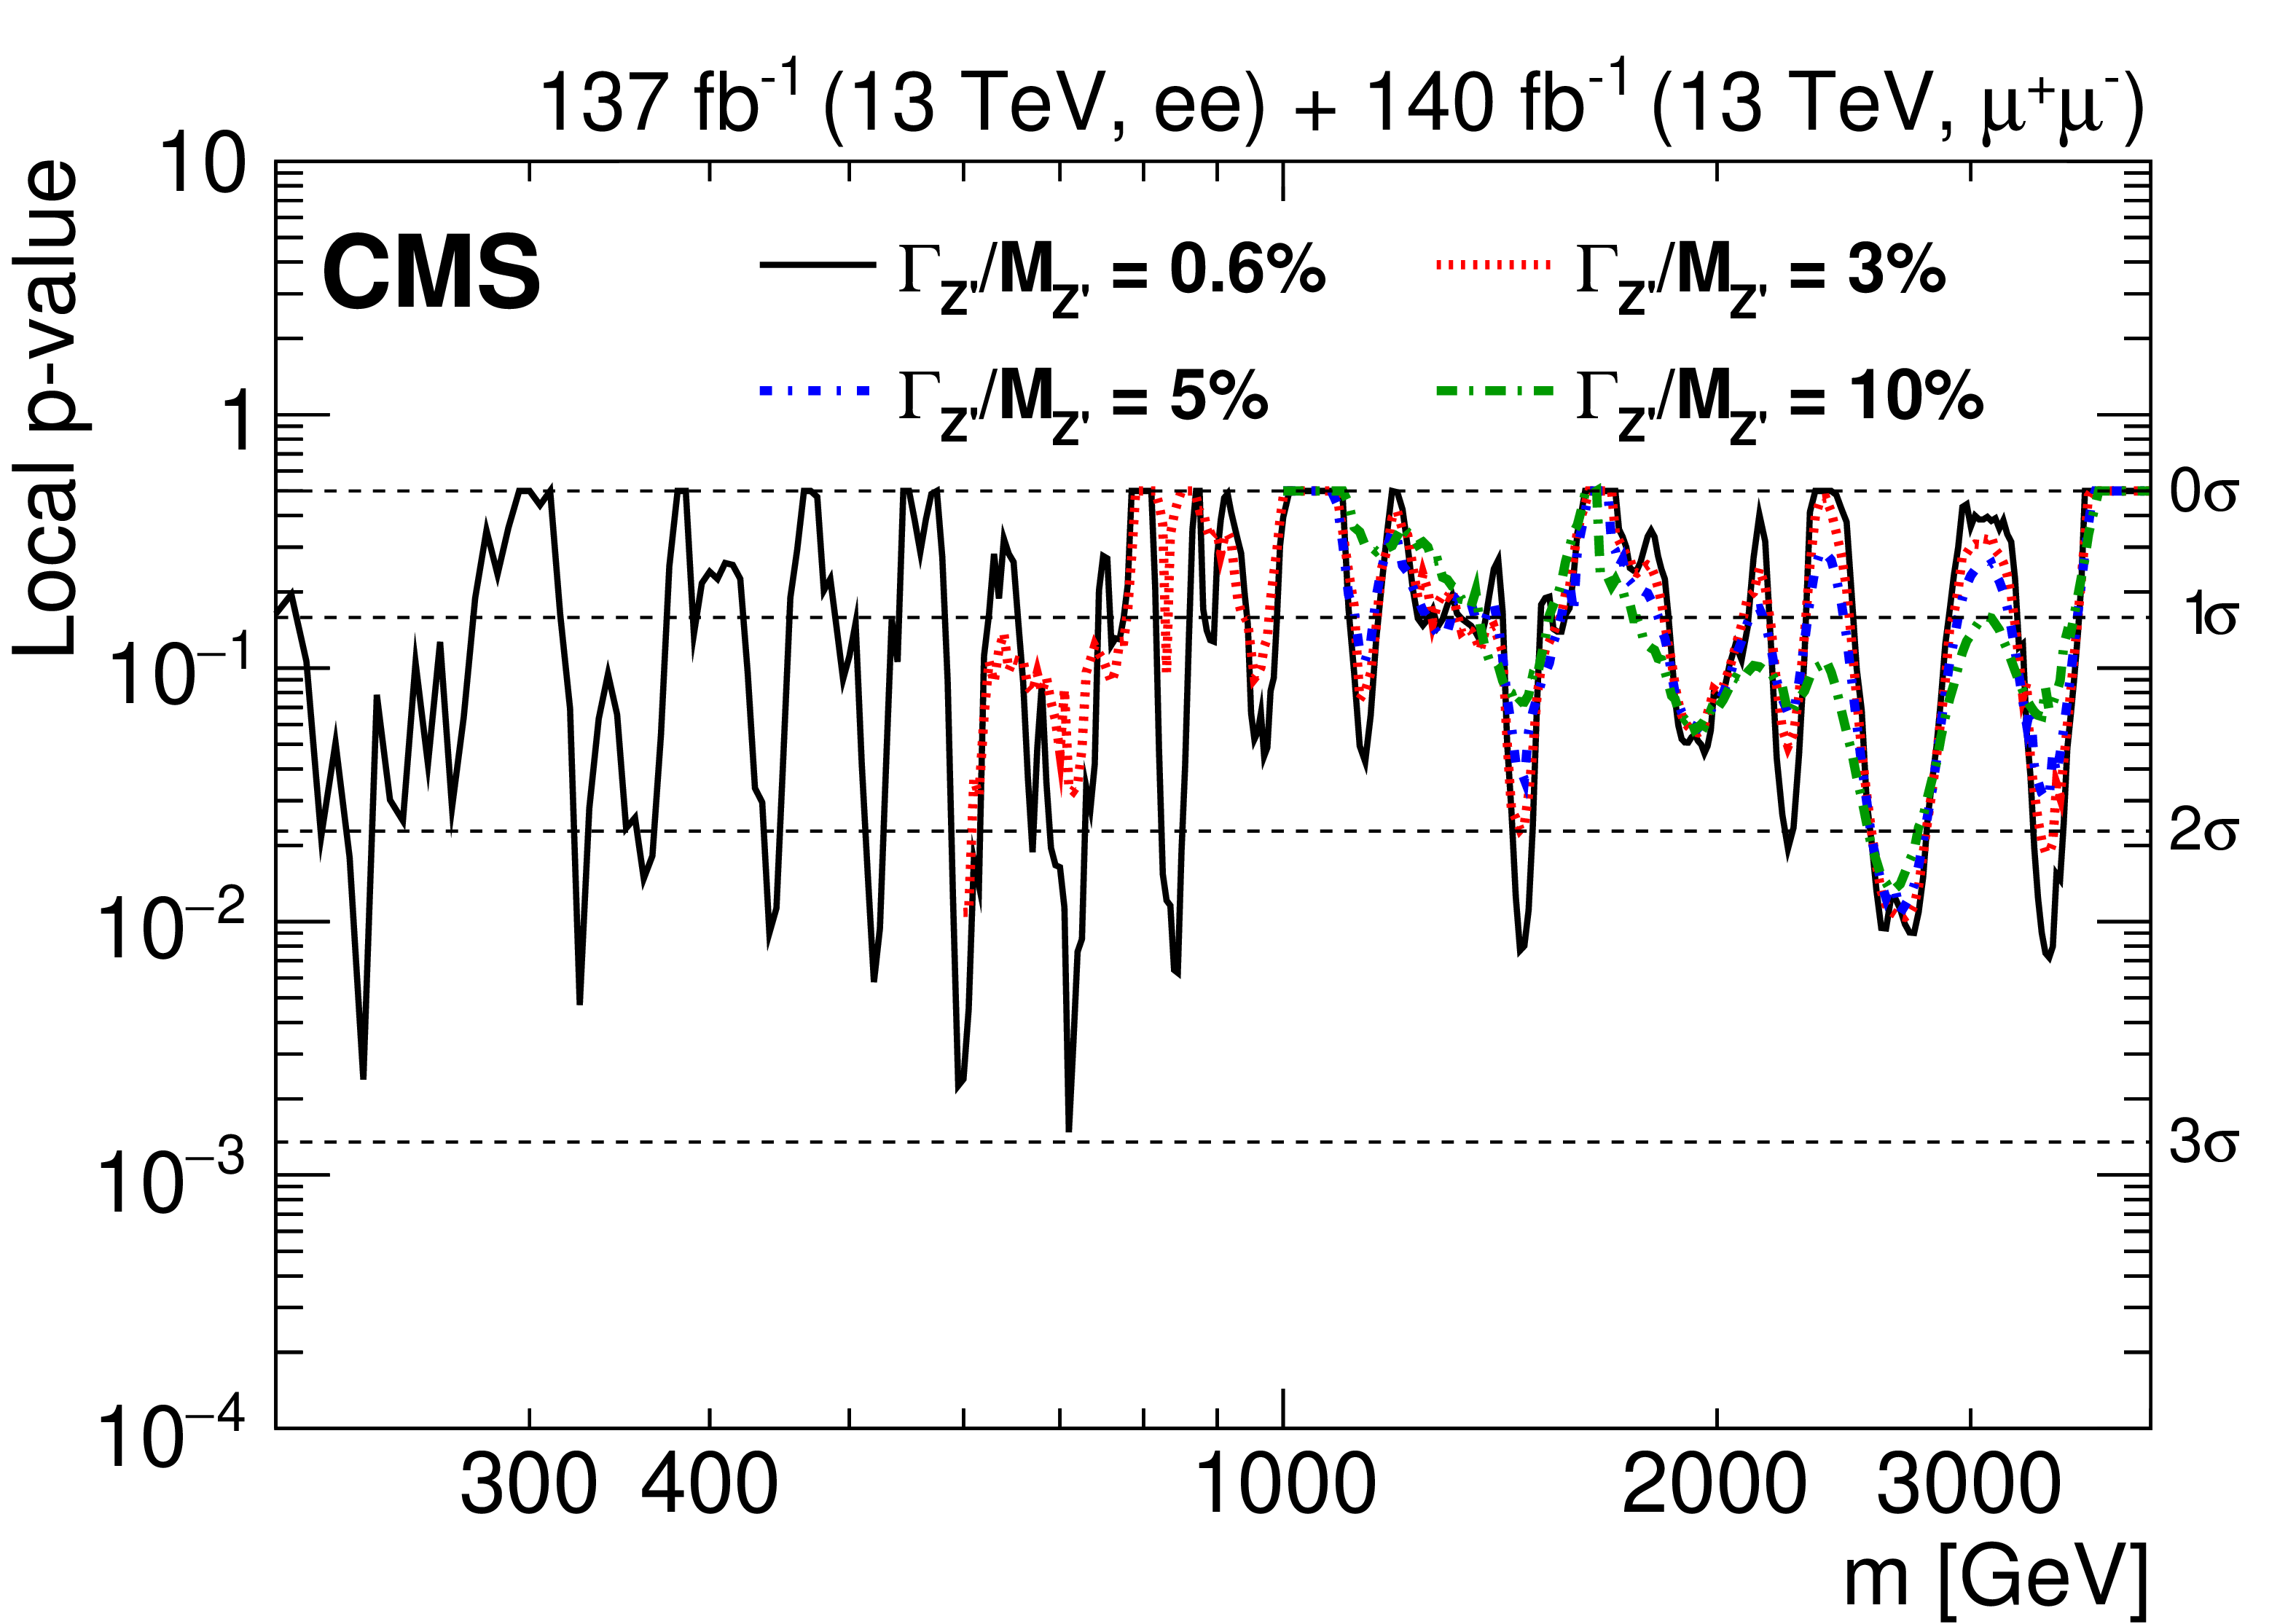
Figure 7:
The observed local $p$-value for a given resonance mass hypothesis for (upper left) the dielectron channel, (upper right) the dimuon channel, and (lower) their combination, as a function of the dilepton invariant mass. The four different lines correspond to different signal width hypotheses. |
png pdf |
Figure 7-a:
The observed local $p$-value for a given resonance mass hypothesis for the dielectron channel, (as a function of the dilepton invariant mass. The four different lines correspond to different signal width hypotheses. |

png pdf |
Figure 7-b:
The observed local $p$-value for a given resonance mass hypothesis for the dimuon channel, as a function of the dilepton invariant mass. The four different lines correspond to different signal width hypotheses. |
png pdf |
Figure 7-c:
The observed local $p$-value for a given resonance mass hypothesis for the combination of dielectron and dimuon channels, as a function of the dilepton invariant mass. The four different lines correspond to different signal width hypotheses. |

png pdf |
Figure 8:
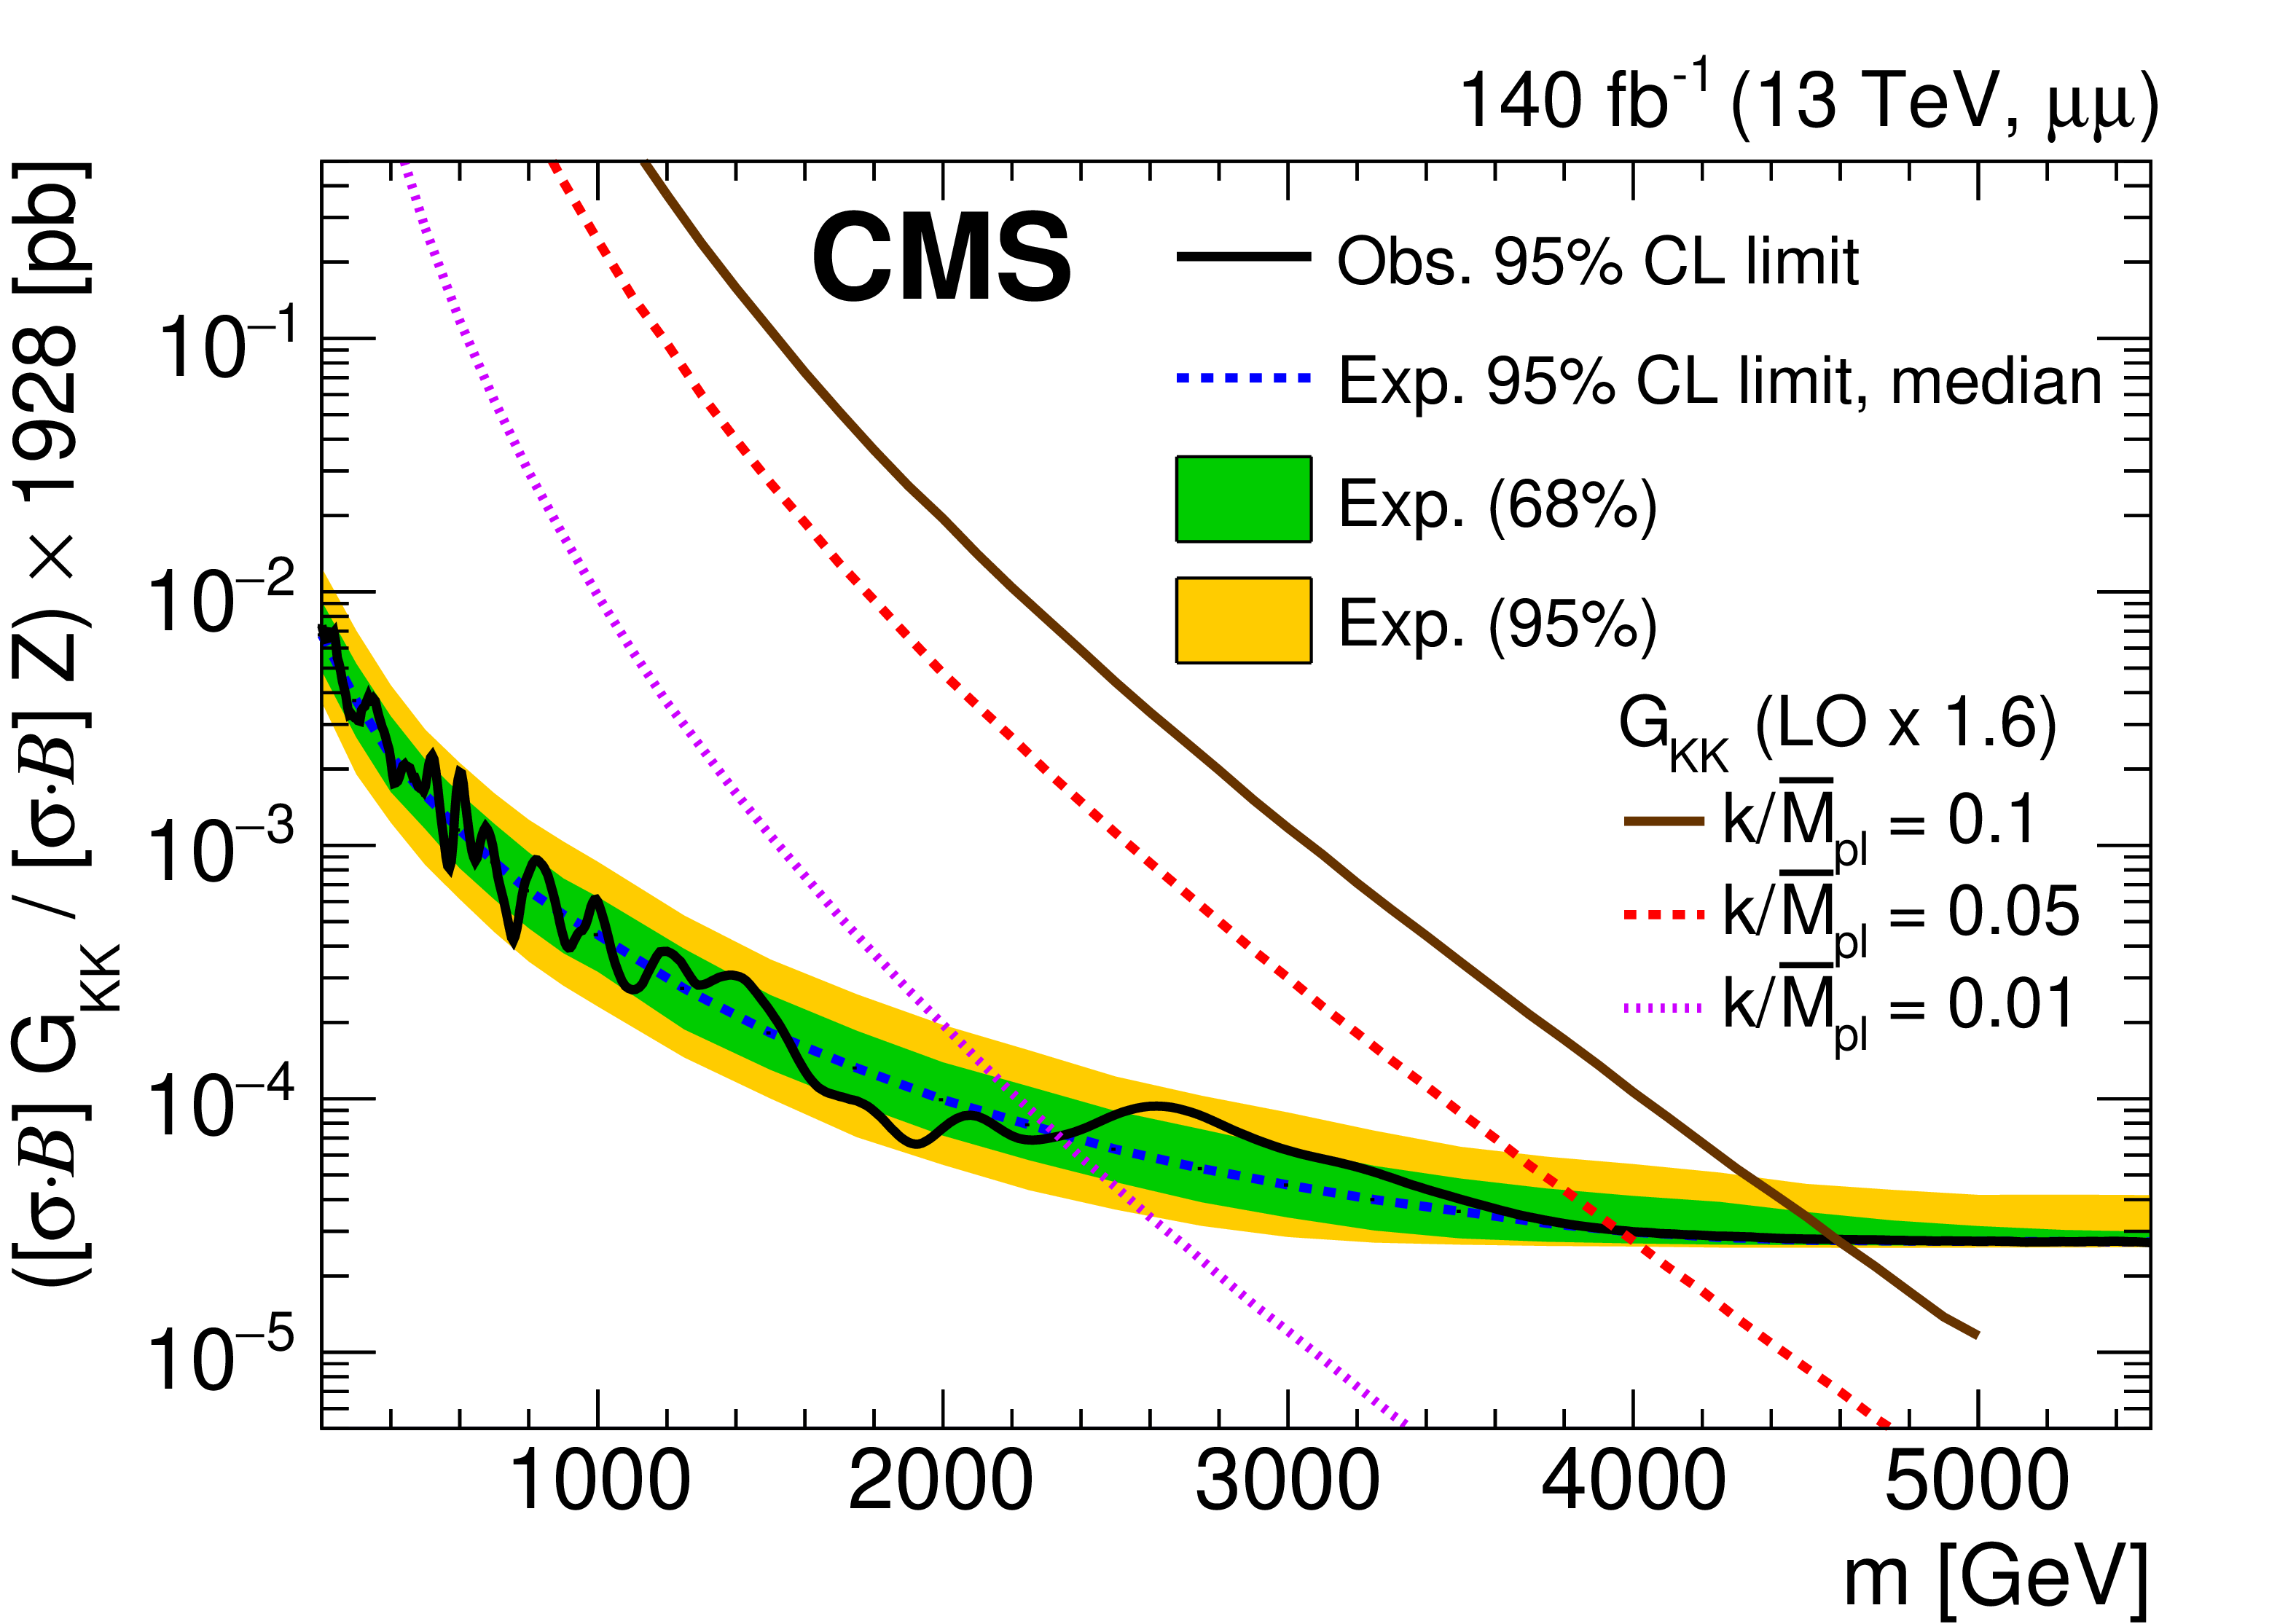
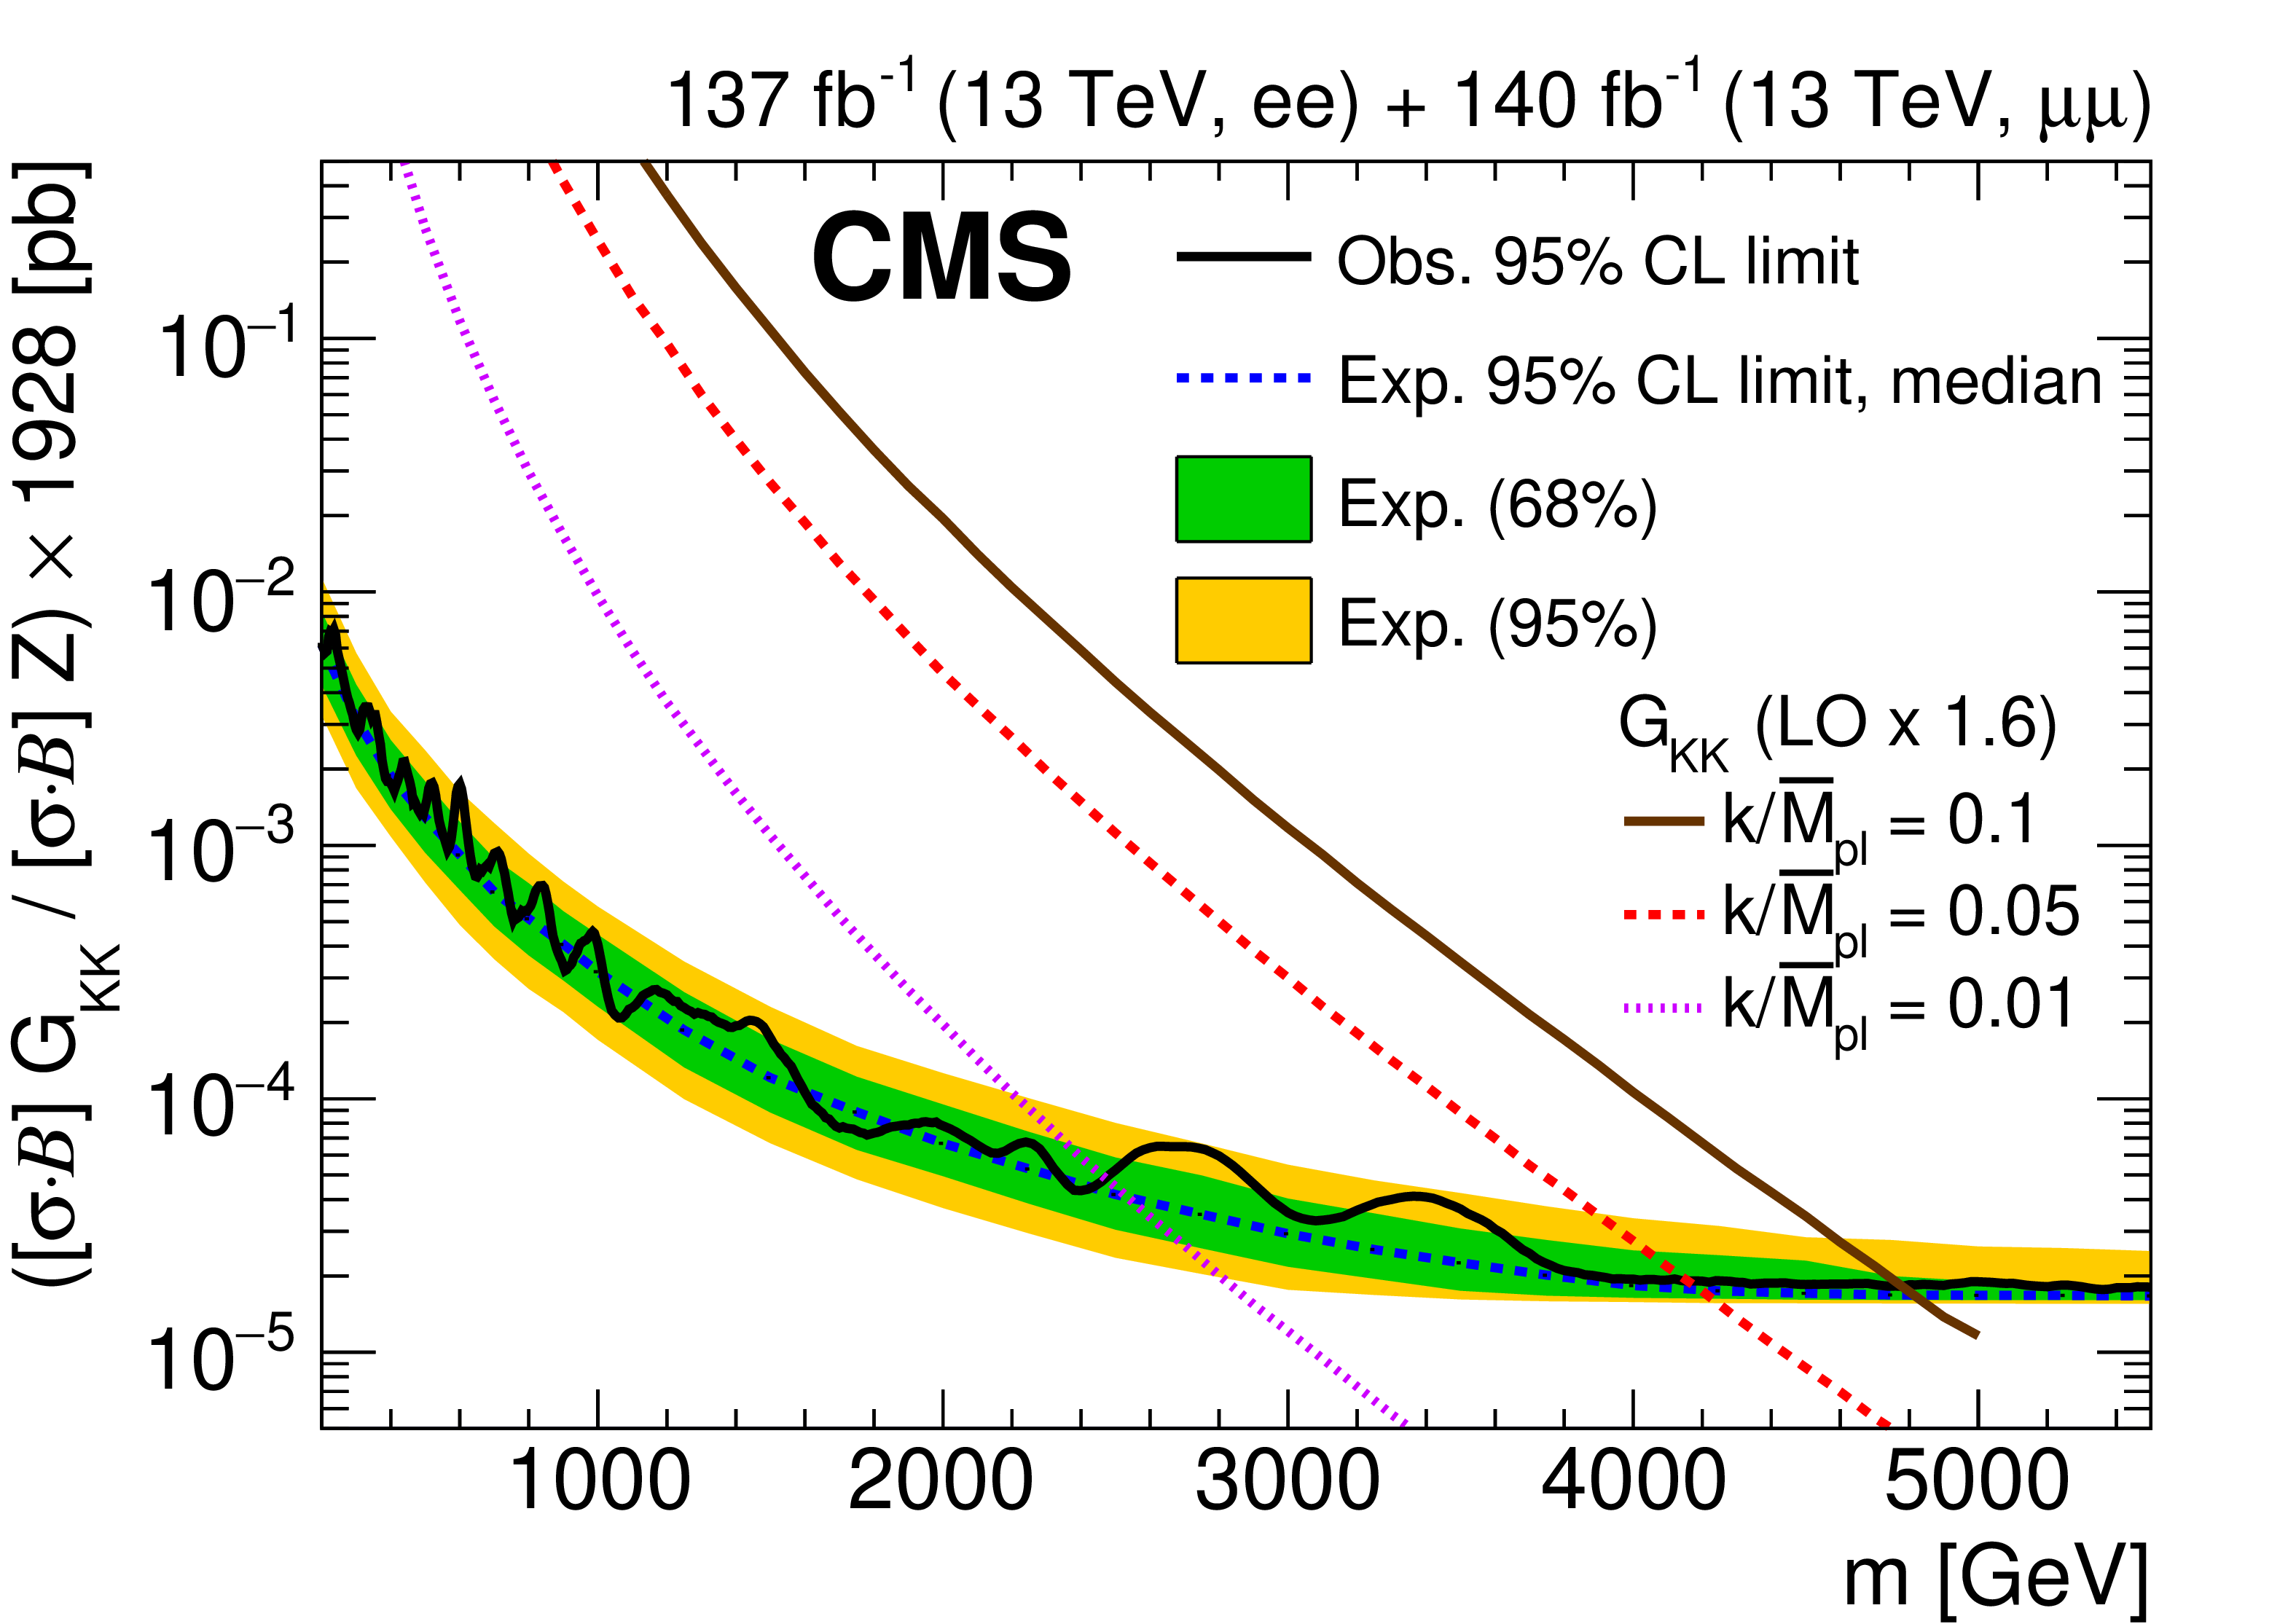
The upper limits at 95% CL on the product of the production cross section and the branching fraction for a spin-2 resonance, relative to the product of the production cross section and the branching fraction of a Z boson, multiplied by the theoretical value of $\sigma ({\mathrm{p}} {\mathrm{p}} \to \mathrm{Z} +\mathrm{X}\to \ell \ell +\mathrm{X})$ of 1928 pb, for (upper left) the dielectron channel, (upper right) the dimuon channel, and (lower) their combination. The shaded bands correspond to the 68 and 95% quantiles for the expected limits. Theoretical predictions for the spin-2 resonances for widths equal to 0.01, 0.36, and 1.42 GeV corresponding to coupling parameters $k/\overline {M}_\mathrm {Pl}$ of 0.01, 0.05, and 0.10, respectively, are shown for comparison. |

png pdf |
Figure 8-a:
The upper limits at 95% CL on the product of the production cross section and the branching fraction for a spin-2 resonance, relative to the product of the production cross section and the branching fraction of a Z boson, multiplied by the theoretical value of $\sigma ({\mathrm{p}} {\mathrm{p}} \to \mathrm{Z} +\mathrm{X}\to \ell \ell +\mathrm{X})$ of 1928 pb, for the dielectron channel. The shaded bands correspond to the 68 and 95% quantiles for the expected limits. Theoretical predictions for the spin-2 resonances for widths equal to 0.01, 0.36, and 1.42 GeV corresponding to coupling parameters $k/\overline {M}_\mathrm {Pl}$ of 0.01, 0.05, and 0.10, respectively, are shown for comparison. |
png pdf |
Figure 8-b:
The upper limits at 95% CL on the product of the production cross section and the branching fraction for a spin-2 resonance, relative to the product of the production cross section and the branching fraction of a Z boson, multiplied by the theoretical value of $\sigma ({\mathrm{p}} {\mathrm{p}} \to \mathrm{Z} +\mathrm{X}\to \ell \ell +\mathrm{X})$ of 1928 pb, for the dimuon channel. The shaded bands correspond to the 68 and 95% quantiles for the expected limits. Theoretical predictions for the spin-2 resonances for widths equal to 0.01, 0.36, and 1.42 GeV corresponding to coupling parameters $k/\overline {M}_\mathrm {Pl}$ of 0.01, 0.05, and 0.10, respectively, are shown for comparison. |
png pdf |
Figure 8-c:
The upper limits at 95% CL on the product of the production cross section and the branching fraction for a spin-2 resonance, relative to the product of the production cross section and the branching fraction of a Z boson, multiplied by the theoretical value of $\sigma ({\mathrm{p}} {\mathrm{p}} \to \mathrm{Z} +\mathrm{X}\to \ell \ell +\mathrm{X})$ of 1928 pb, for the combination of the dielectron and dimuon channels. The shaded bands correspond to the 68 and 95% quantiles for the expected limits. Theoretical predictions for the spin-2 resonances for widths equal to 0.01, 0.36, and 1.42 GeV corresponding to coupling parameters $k/\overline {M}_\mathrm {Pl}$ of 0.01, 0.05, and 0.10, respectively, are shown for comparison. |
png pdf |
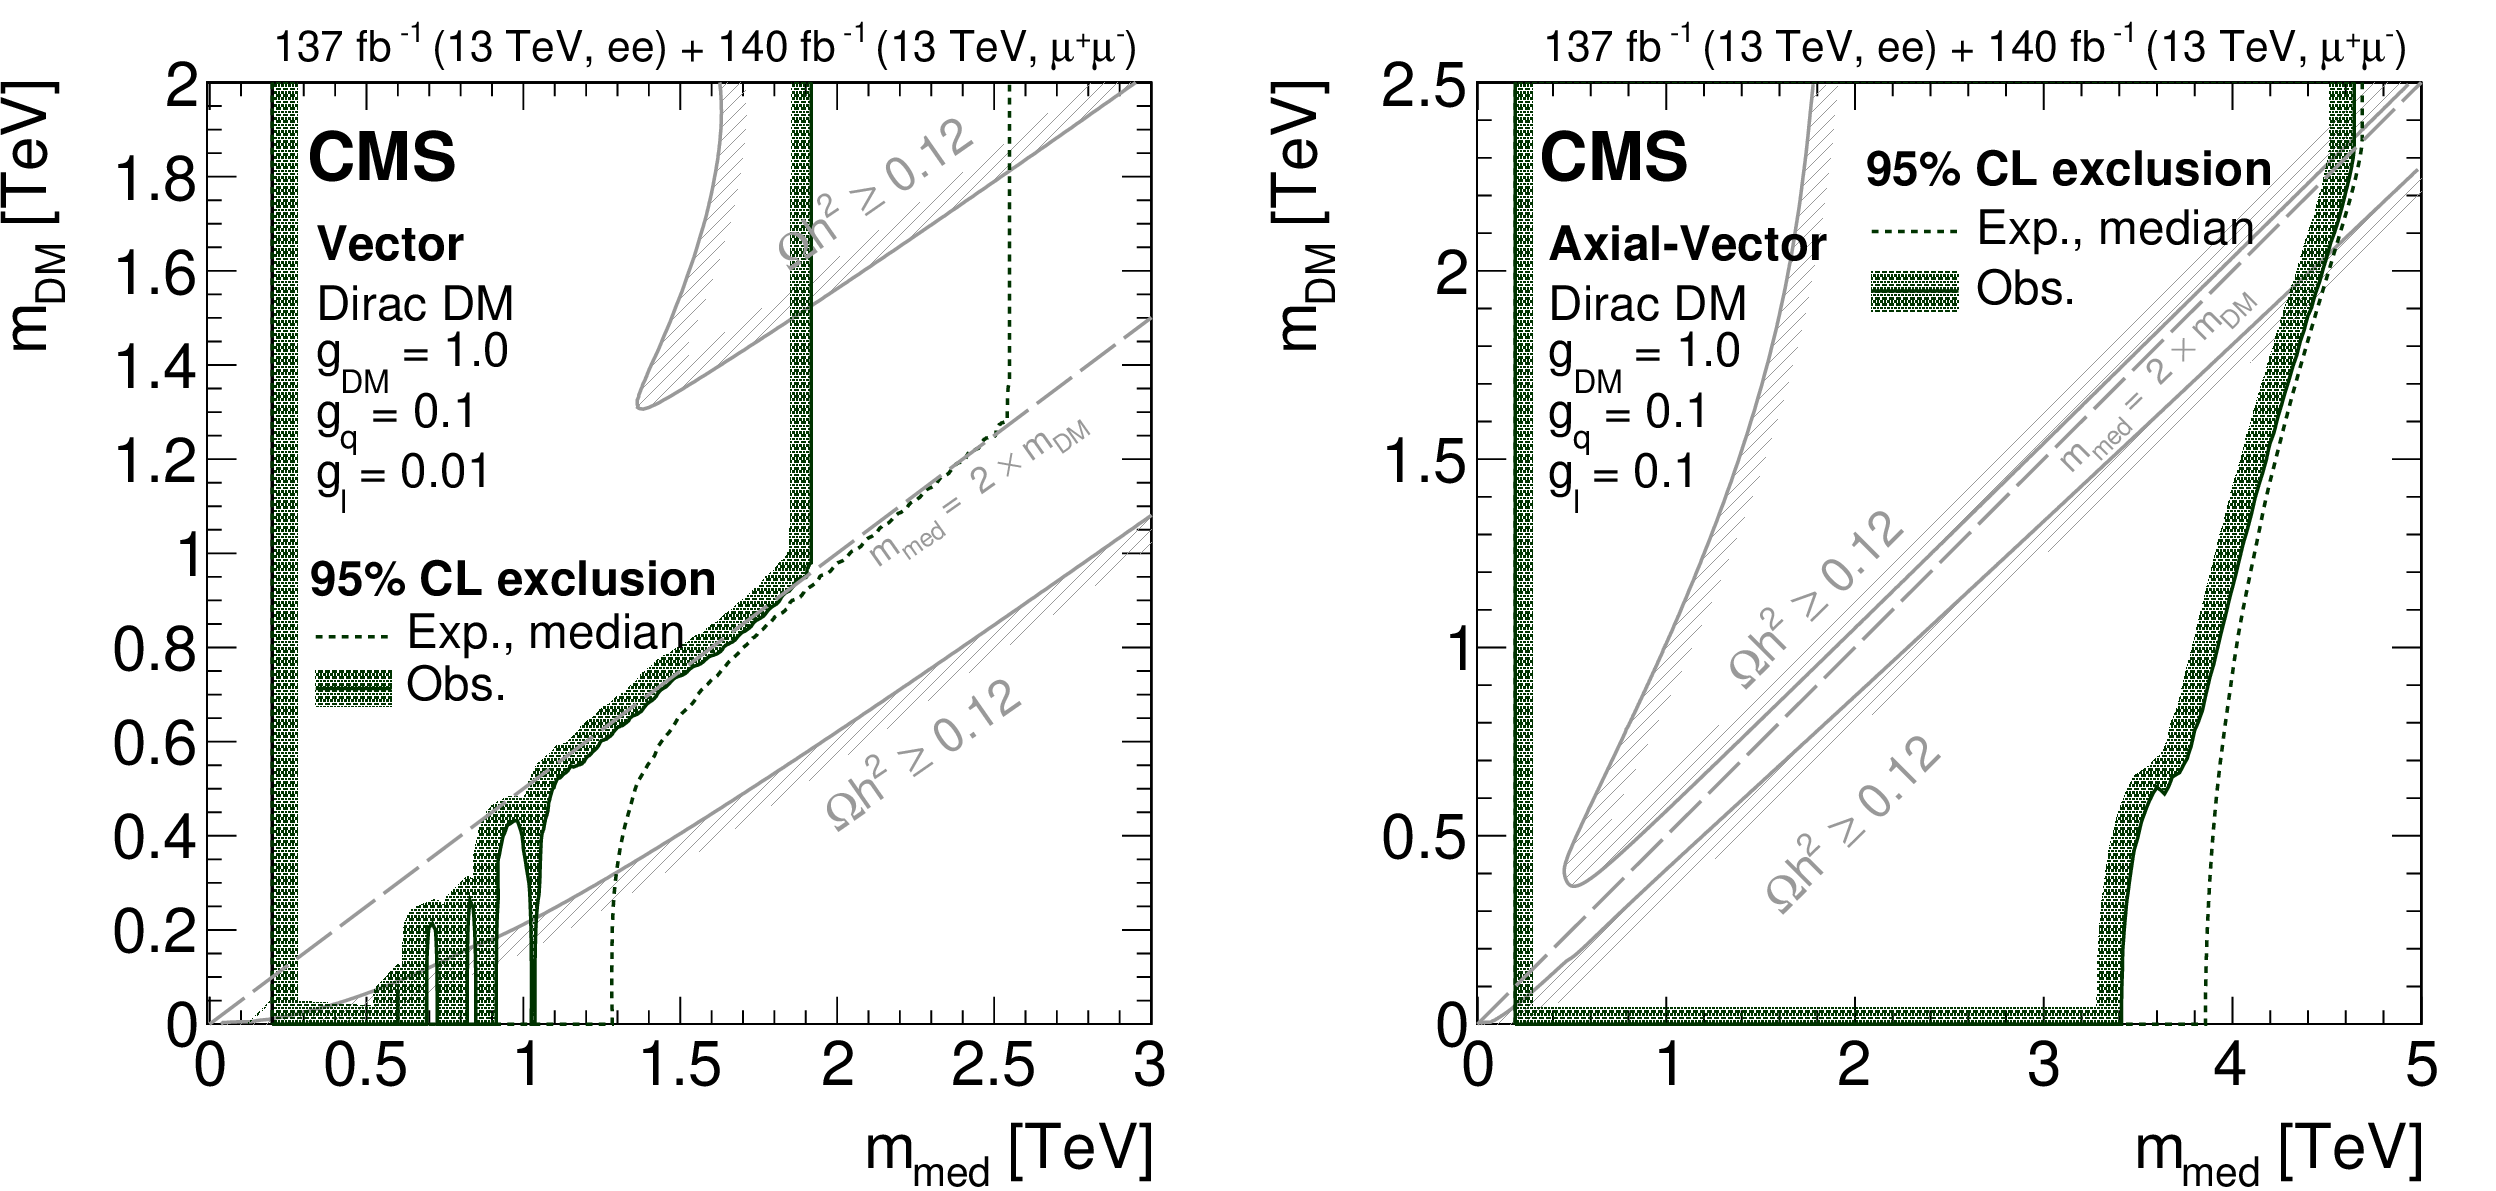
Figure 9:
Summary of upper limits at 95% CL on the masses of the DM particle, which is assumed to be a Dirac fermion, and its associated mediator, in a simplified model of DM production via a (left) vector or (right) axial-vector mediator. The parameter exclusion regions are obtained by comparing the limits on the product of the production cross section and the branching fraction for decay to a Z boson with the values obtained from calculations in the simplified model. For each combination of the DM particle and mediator mass values, the width of the mediator is taken into account in the limit calculation. The curves with the hatching represent the excluded regions. The solid gray curves, marked as "$\Omega h^{2} \ge $ 0.12'', correspond to parameter regions that reproduce the observed DM relic density in the universe [95,96,6,47], with the hatched area indicating the region where the DM relic abundance exceeds the observed value. |

png pdf |
Figure 9-a:
Summary of upper limits at 95% CL on the masses of the DM particle, which is assumed to be a Dirac fermion, and its associated mediator, in a simplified model of DM production via a vector mediator. The parameter exclusion regions are obtained by comparing the limits on the product of the production cross section and the branching fraction for decay to a Z boson with the values obtained from calculations in the simplified model. For each combination of the DM particle and mediator mass values, the width of the mediator is taken into account in the limit calculation. The curves with the hatching represent the excluded regions. The solid gray curves, marked as "$\Omega h^{2} \ge $ 0.12'', correspond to parameter regions that reproduce the observed DM relic density in the universe [95,96,6,47], with the hatched area indicating the region where the DM relic abundance exceeds the observed value. |
png pdf |
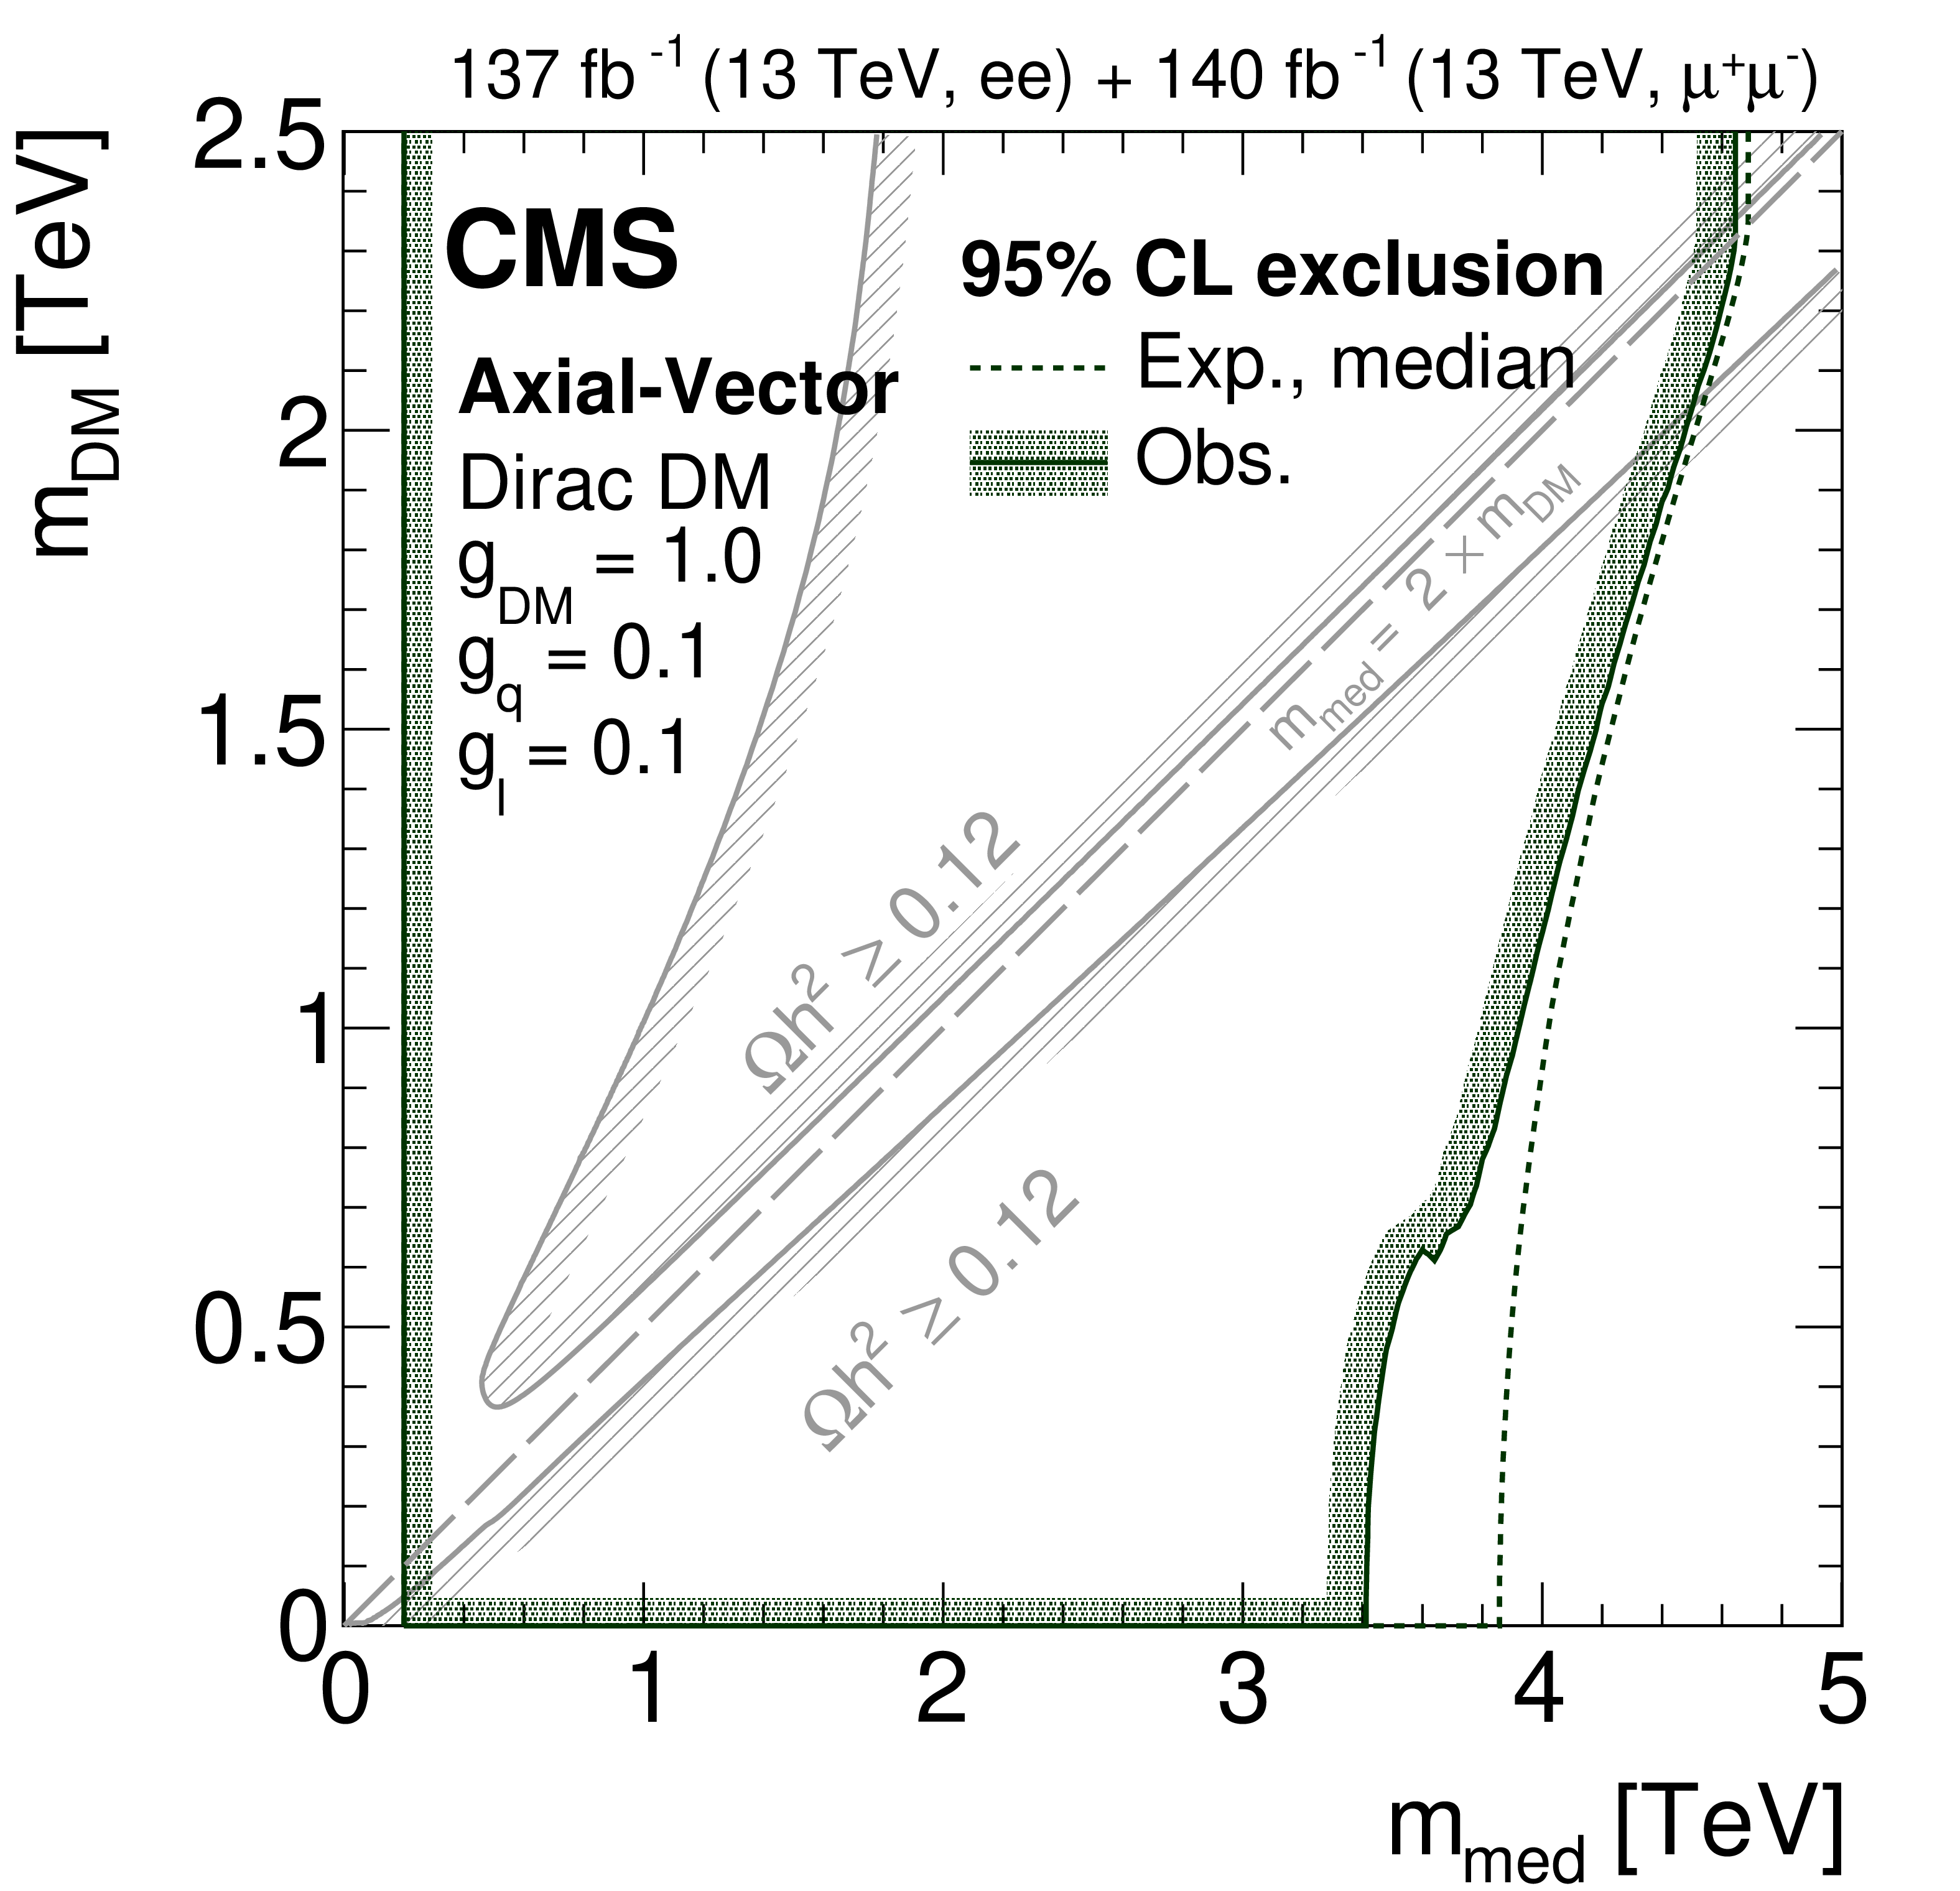
Figure 9-b:
Summary of upper limits at 95% CL on the masses of the DM particle, which is assumed to be a Dirac fermion, and its associated mediator, in a simplified model of DM production via an axial-vector mediator. The parameter exclusion regions are obtained by comparing the limits on the product of the production cross section and the branching fraction for decay to a Z boson with the values obtained from calculations in the simplified model. For each combination of the DM particle and mediator mass values, the width of the mediator is taken into account in the limit calculation. The curves with the hatching represent the excluded regions. The solid gray curves, marked as "$\Omega h^{2} \ge $ 0.12'', correspond to parameter regions that reproduce the observed DM relic density in the universe [95,96,6,47], with the hatched area indicating the region where the DM relic abundance exceeds the observed value. |
png pdf |
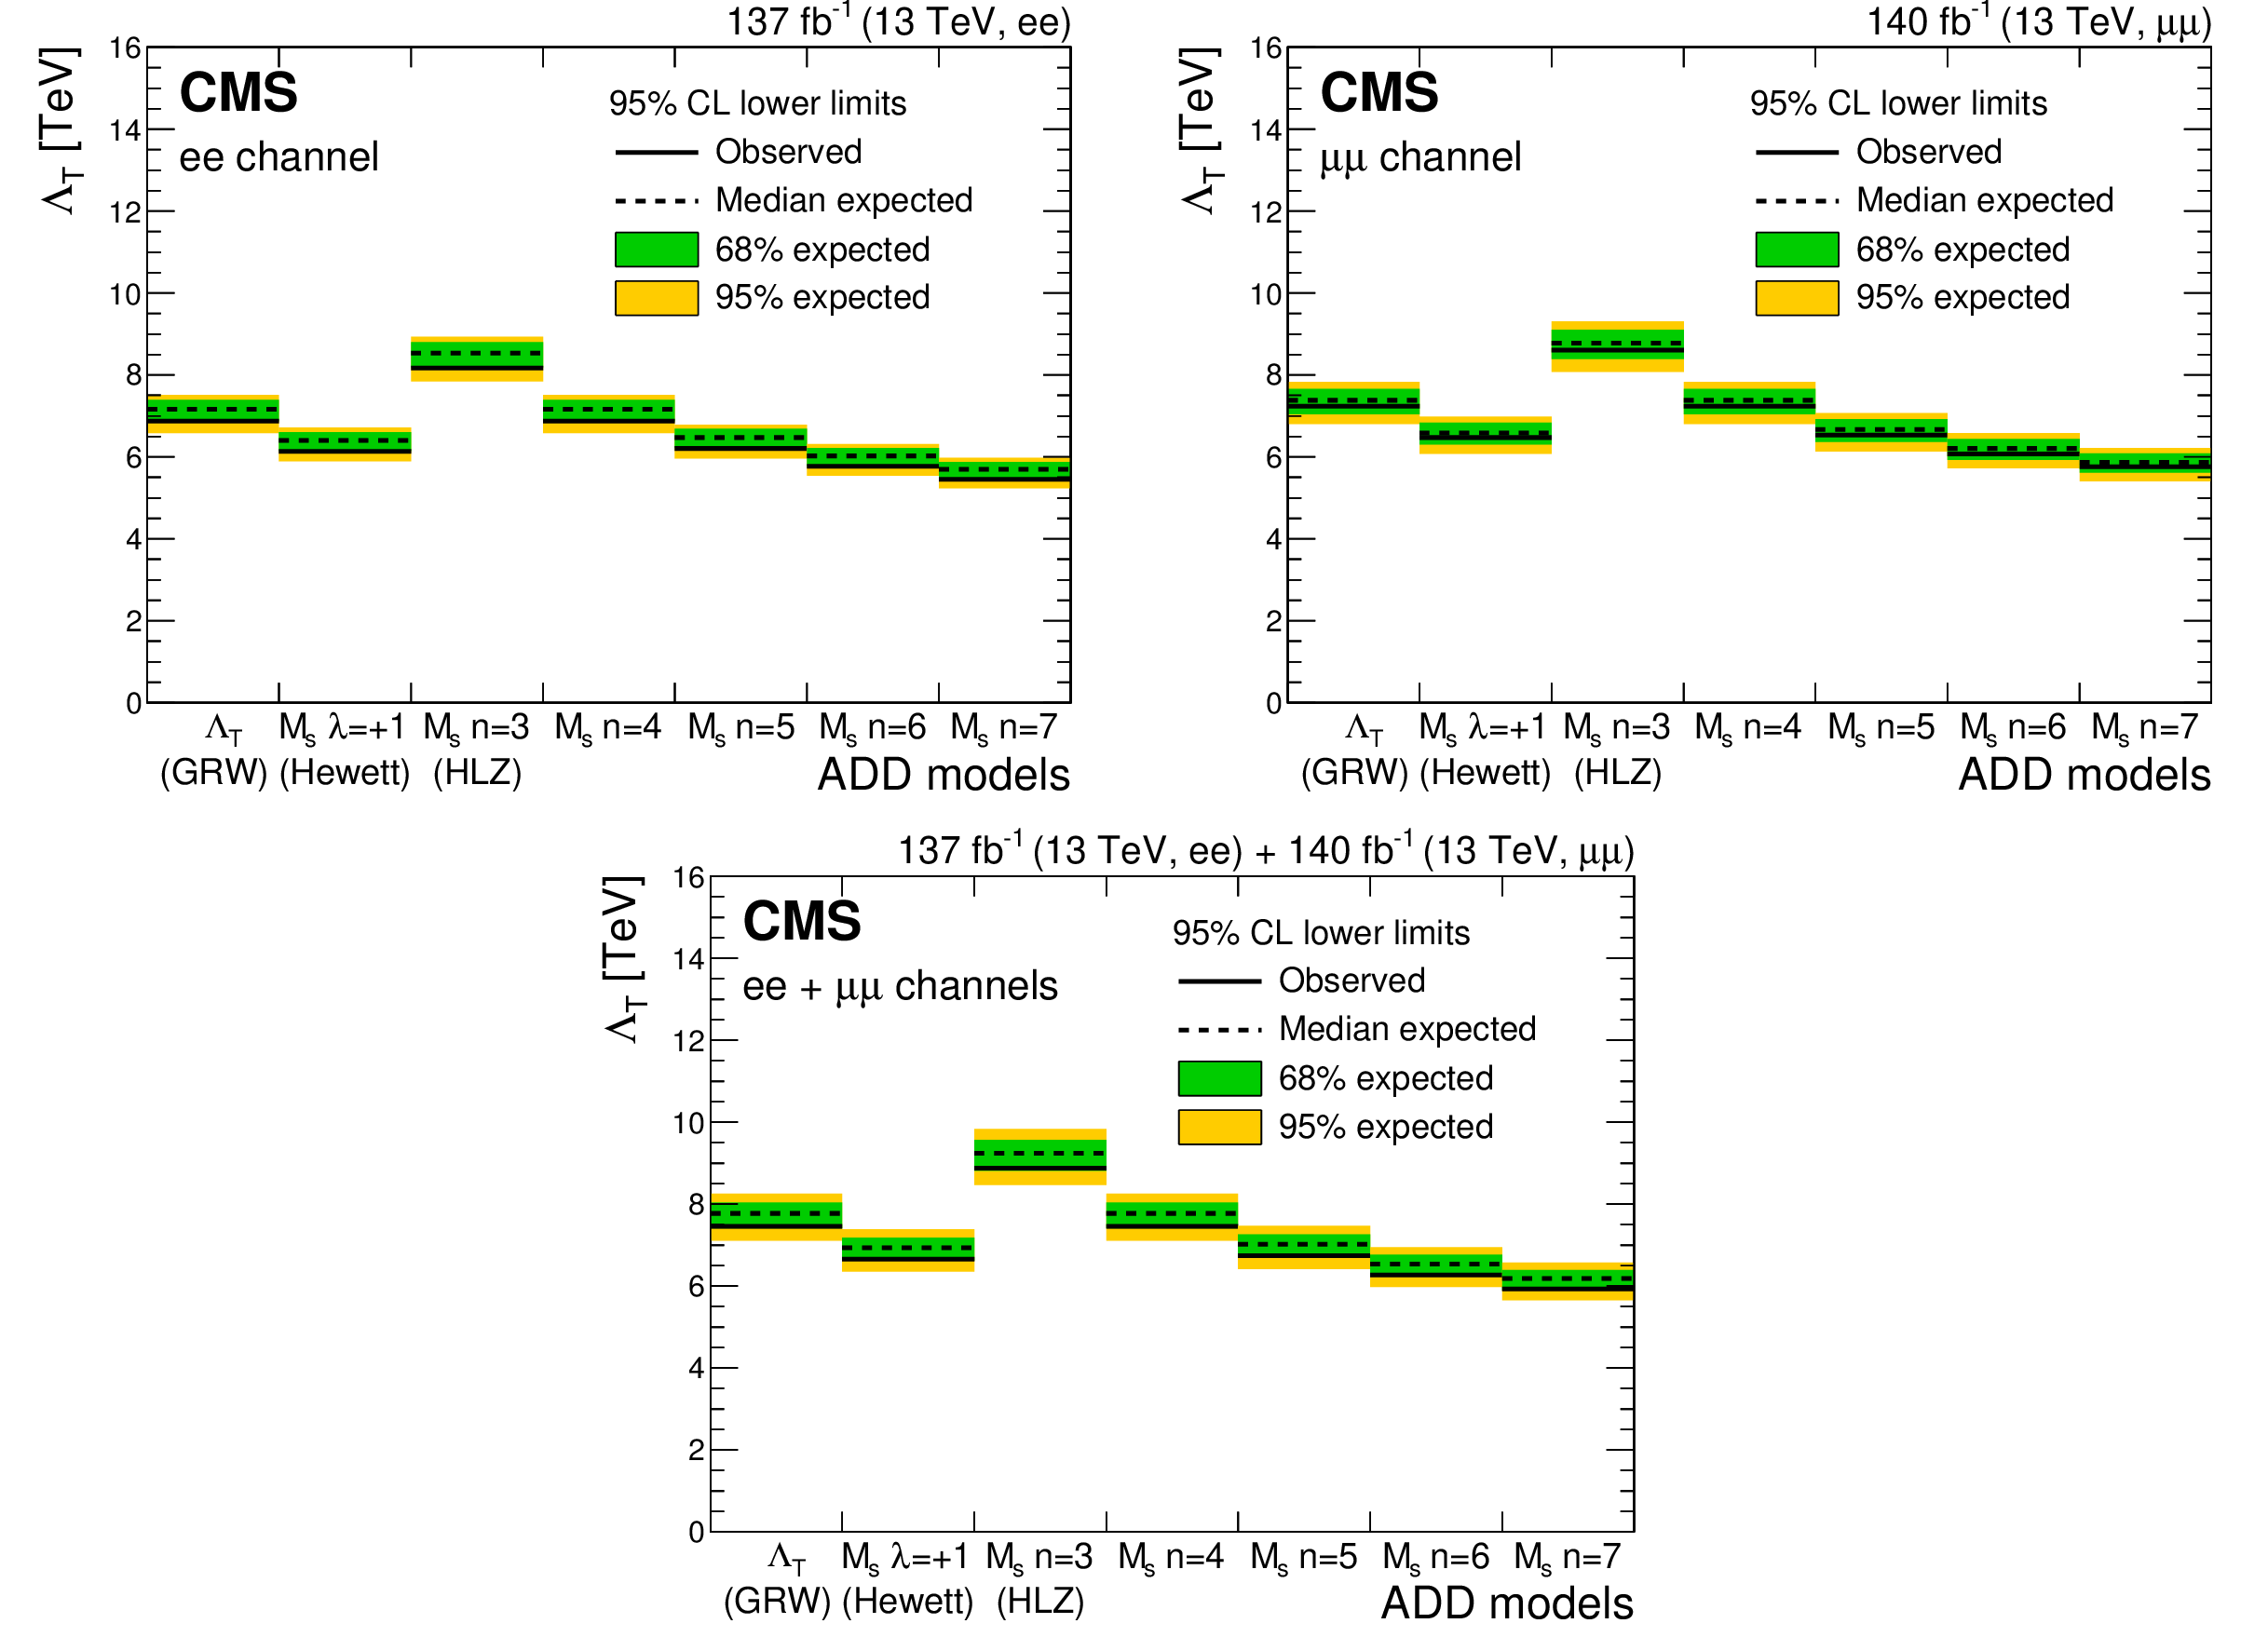
Figure 10:
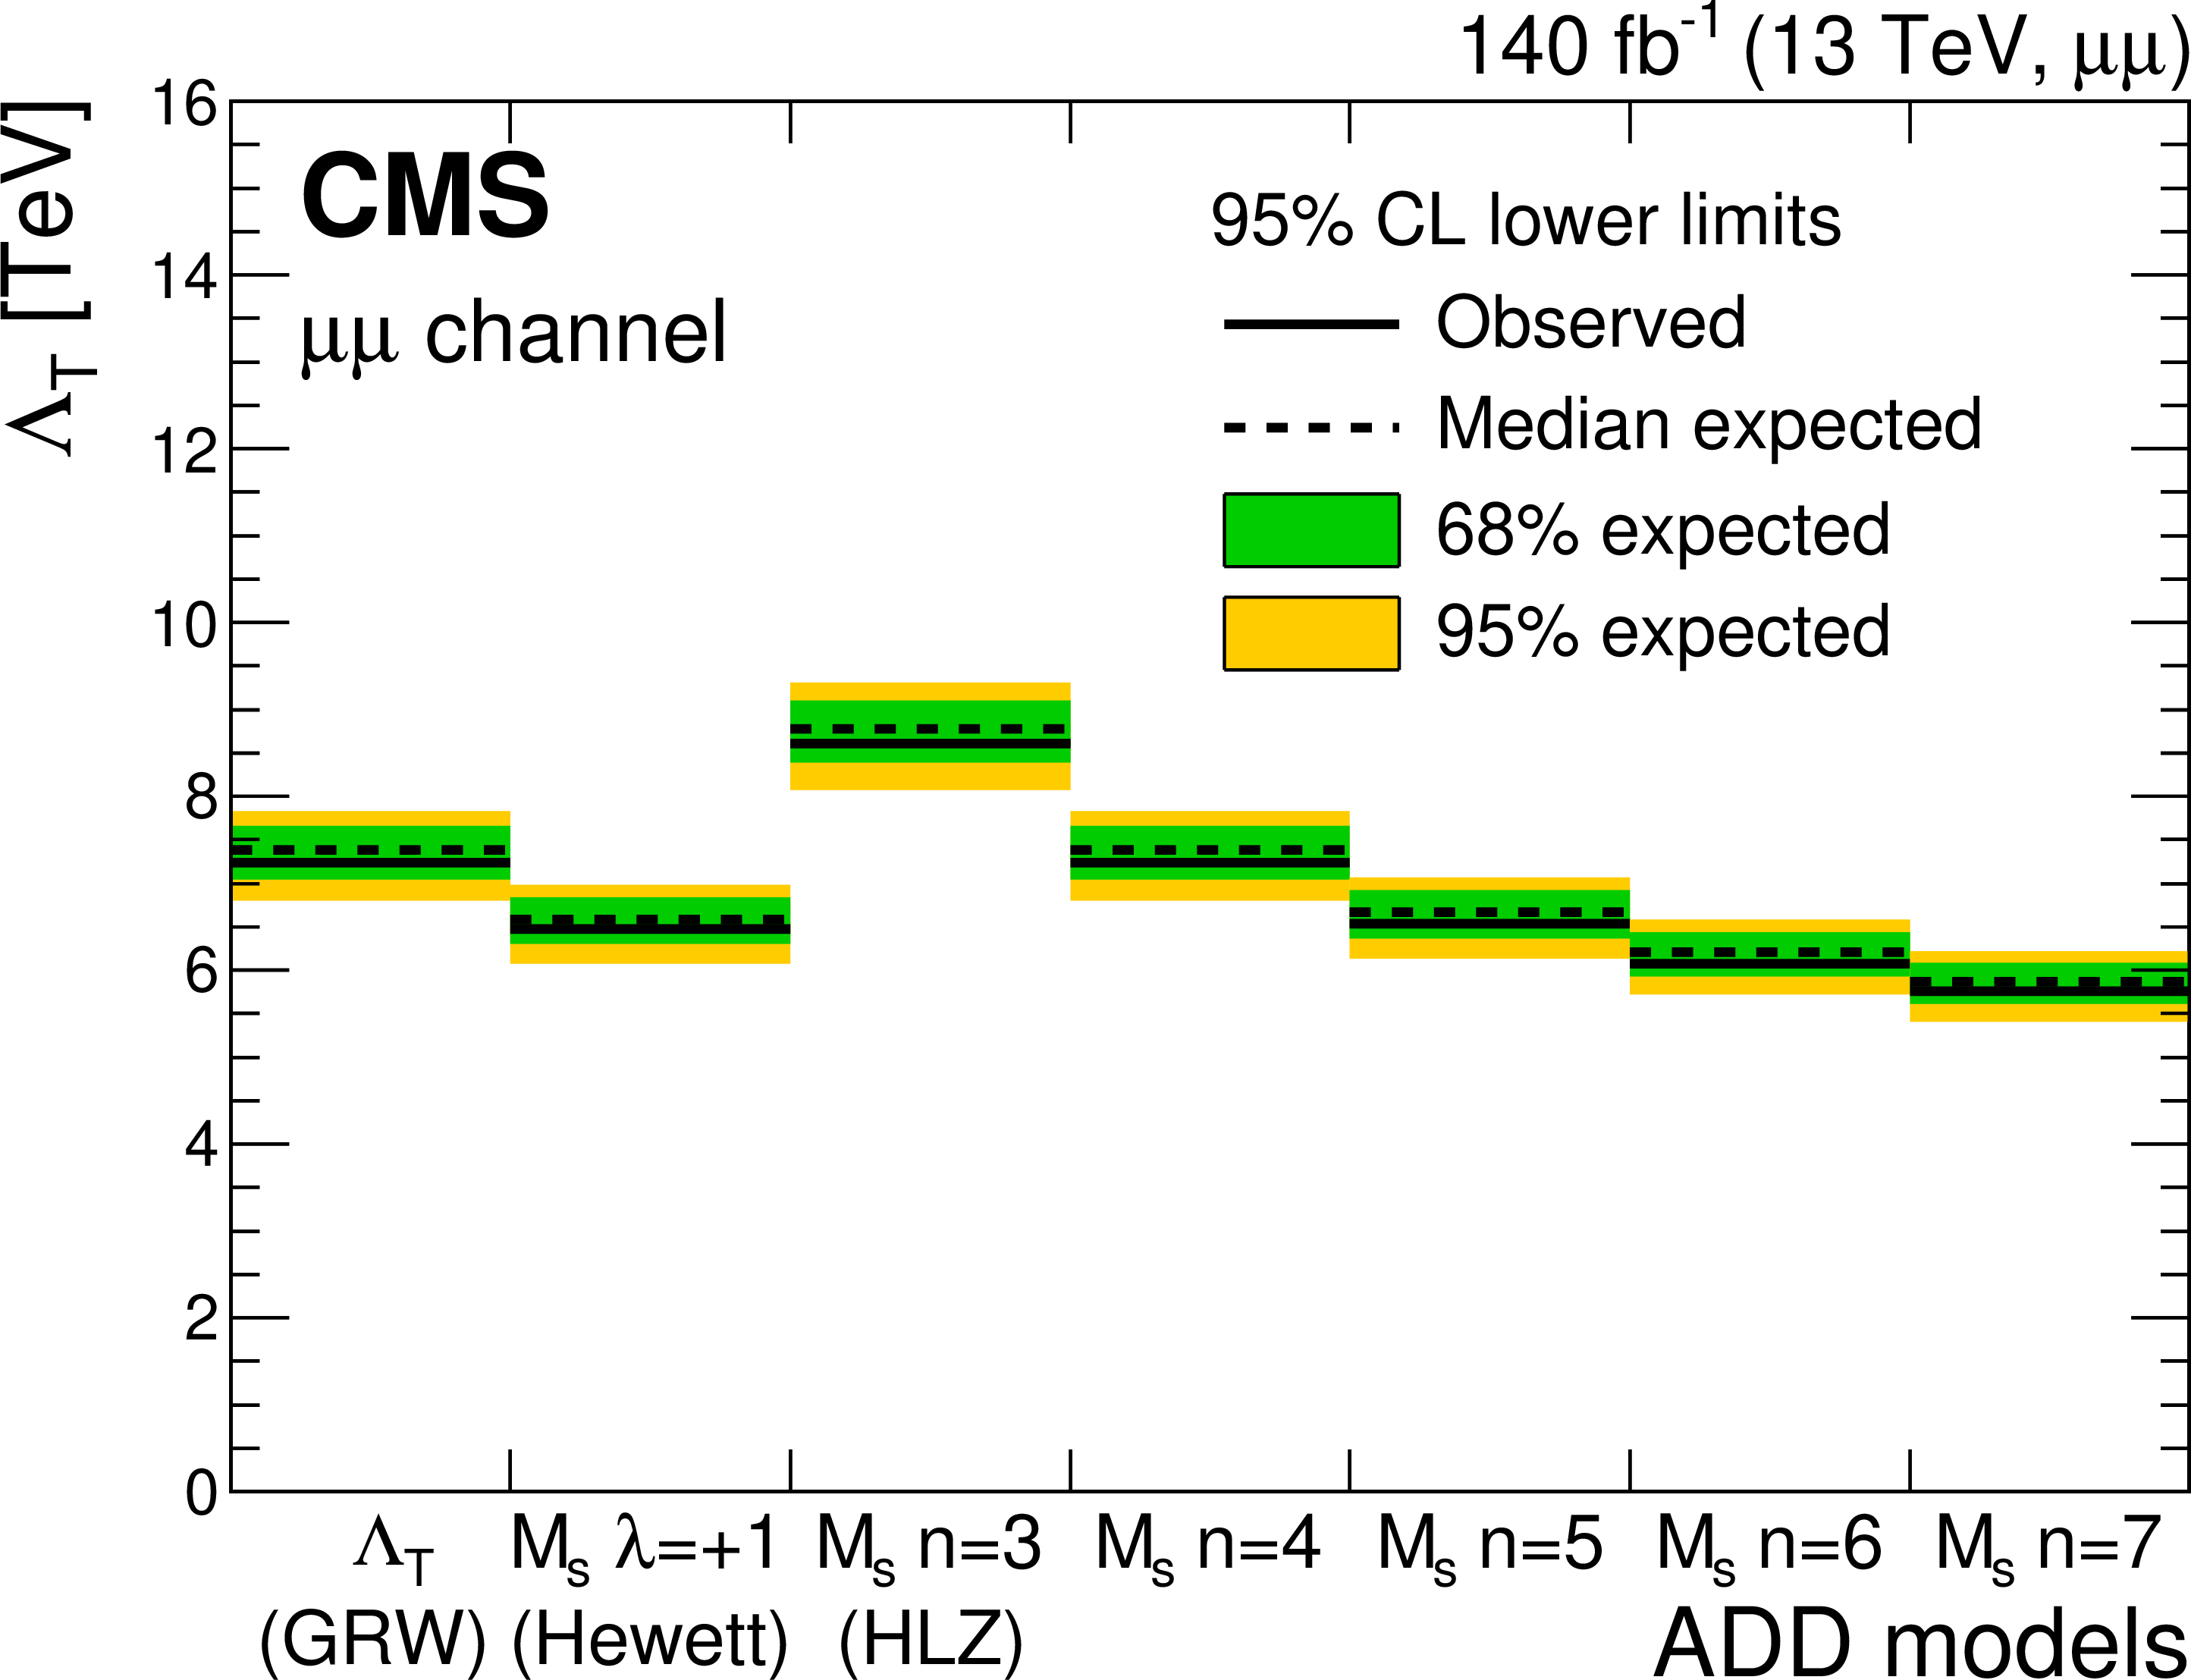
Exclusion limits at 95% CL on the ultraviolet cutoff for (upper left) the dielectron channel, (upper right) the dimuon channel, and (lower) their combination, with $ {m_{\ell \ell}} > $ 1.8 TeV ($ {m_{\ell \ell}} > $ 1.9 TeV for 2016) in the GRW (first bin), Hewett (second bin), and HLZ conventions (third to seventh bin) for the ADD model. Signal model cross sections are calculated up to LO, and an NNLO correction factor of 1.3 is applied. |
png pdf |
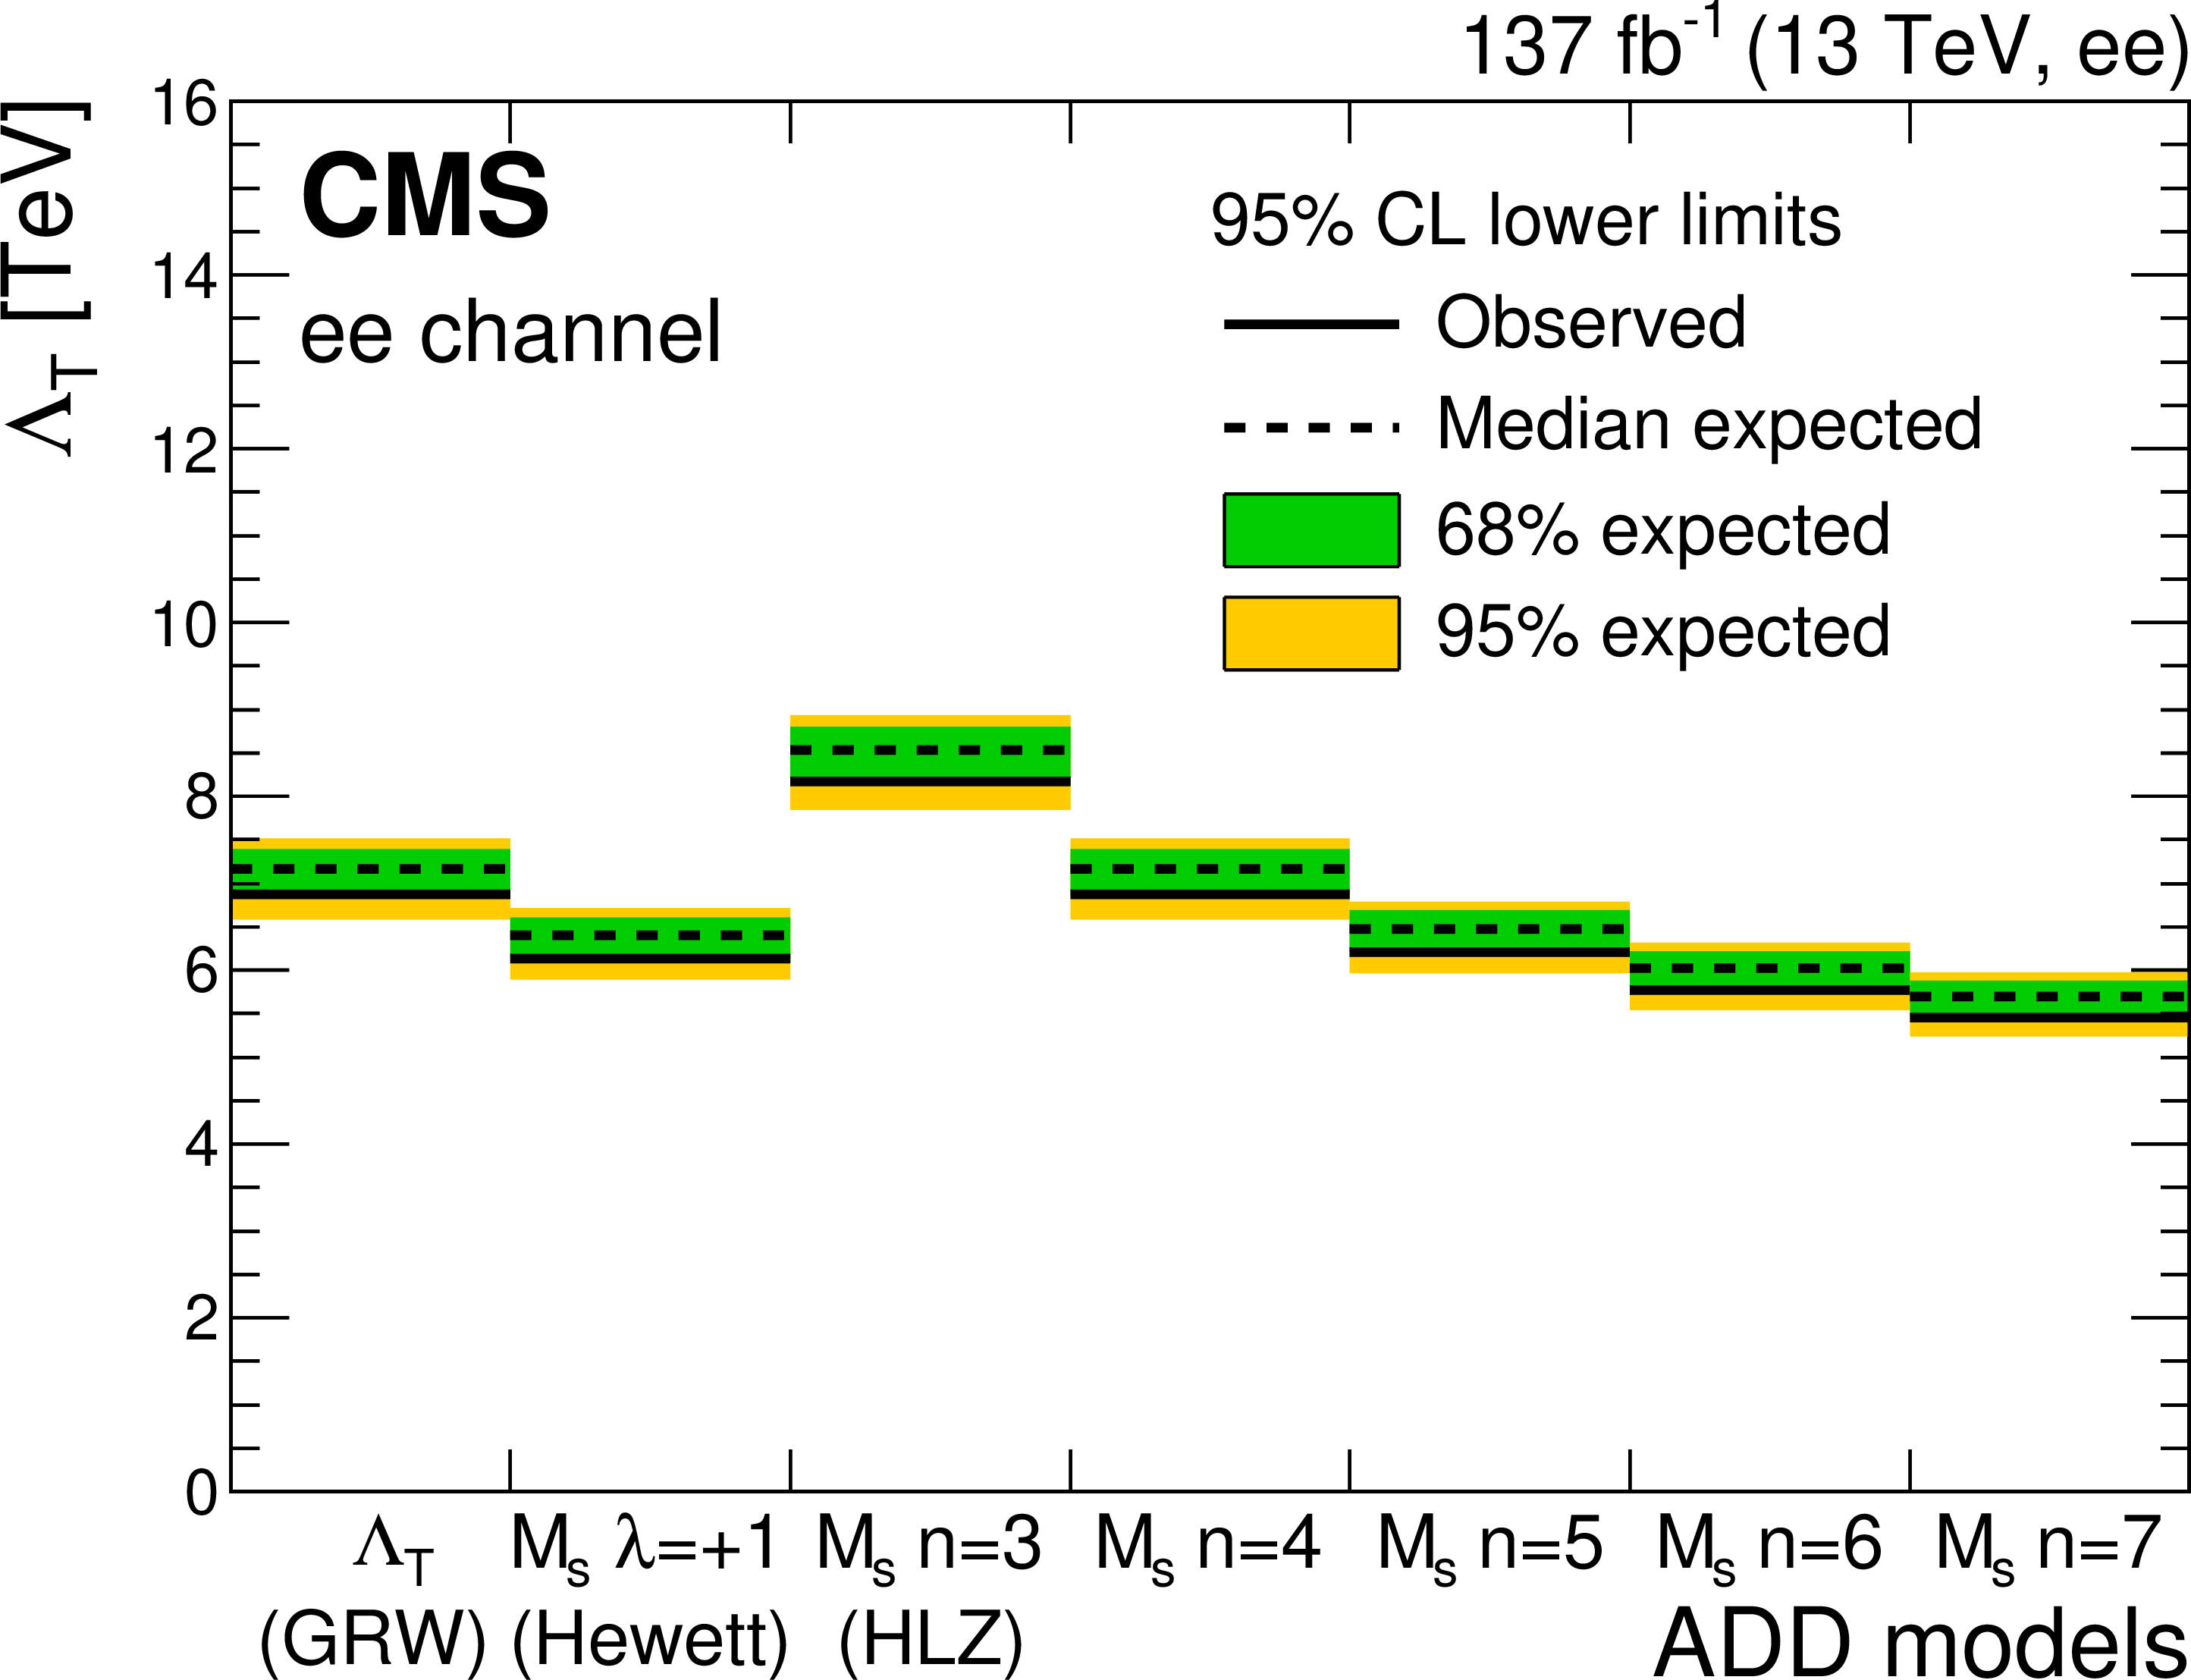
Figure 10-a:
Exclusion limits at 95% CL on the ultraviolet cutoff for the dielectron channel, with $ {m_{\ell \ell}} > $ 1.8 TeV ($ {m_{\ell \ell}} > $ 1.9 TeV for 2016) in the GRW (first bin), Hewett (second bin), and HLZ conventions (third to seventh bin) for the ADD model. Signal model cross sections are calculated up to LO, and an NNLO correction factor of 1.3 is applied. |
png pdf |
Figure 10-b:
Exclusion limits at 95% CL on the ultraviolet cutoff for the dimuon channel, with $ {m_{\ell \ell}} > $ 1.8 TeV ($ {m_{\ell \ell}} > $ 1.9 TeV for 2016) in the GRW (first bin), Hewett (second bin), and HLZ conventions (third to seventh bin) for the ADD model. Signal model cross sections are calculated up to LO, and an NNLO correction factor of 1.3 is applied. |
png pdf |
Figure 10-c:
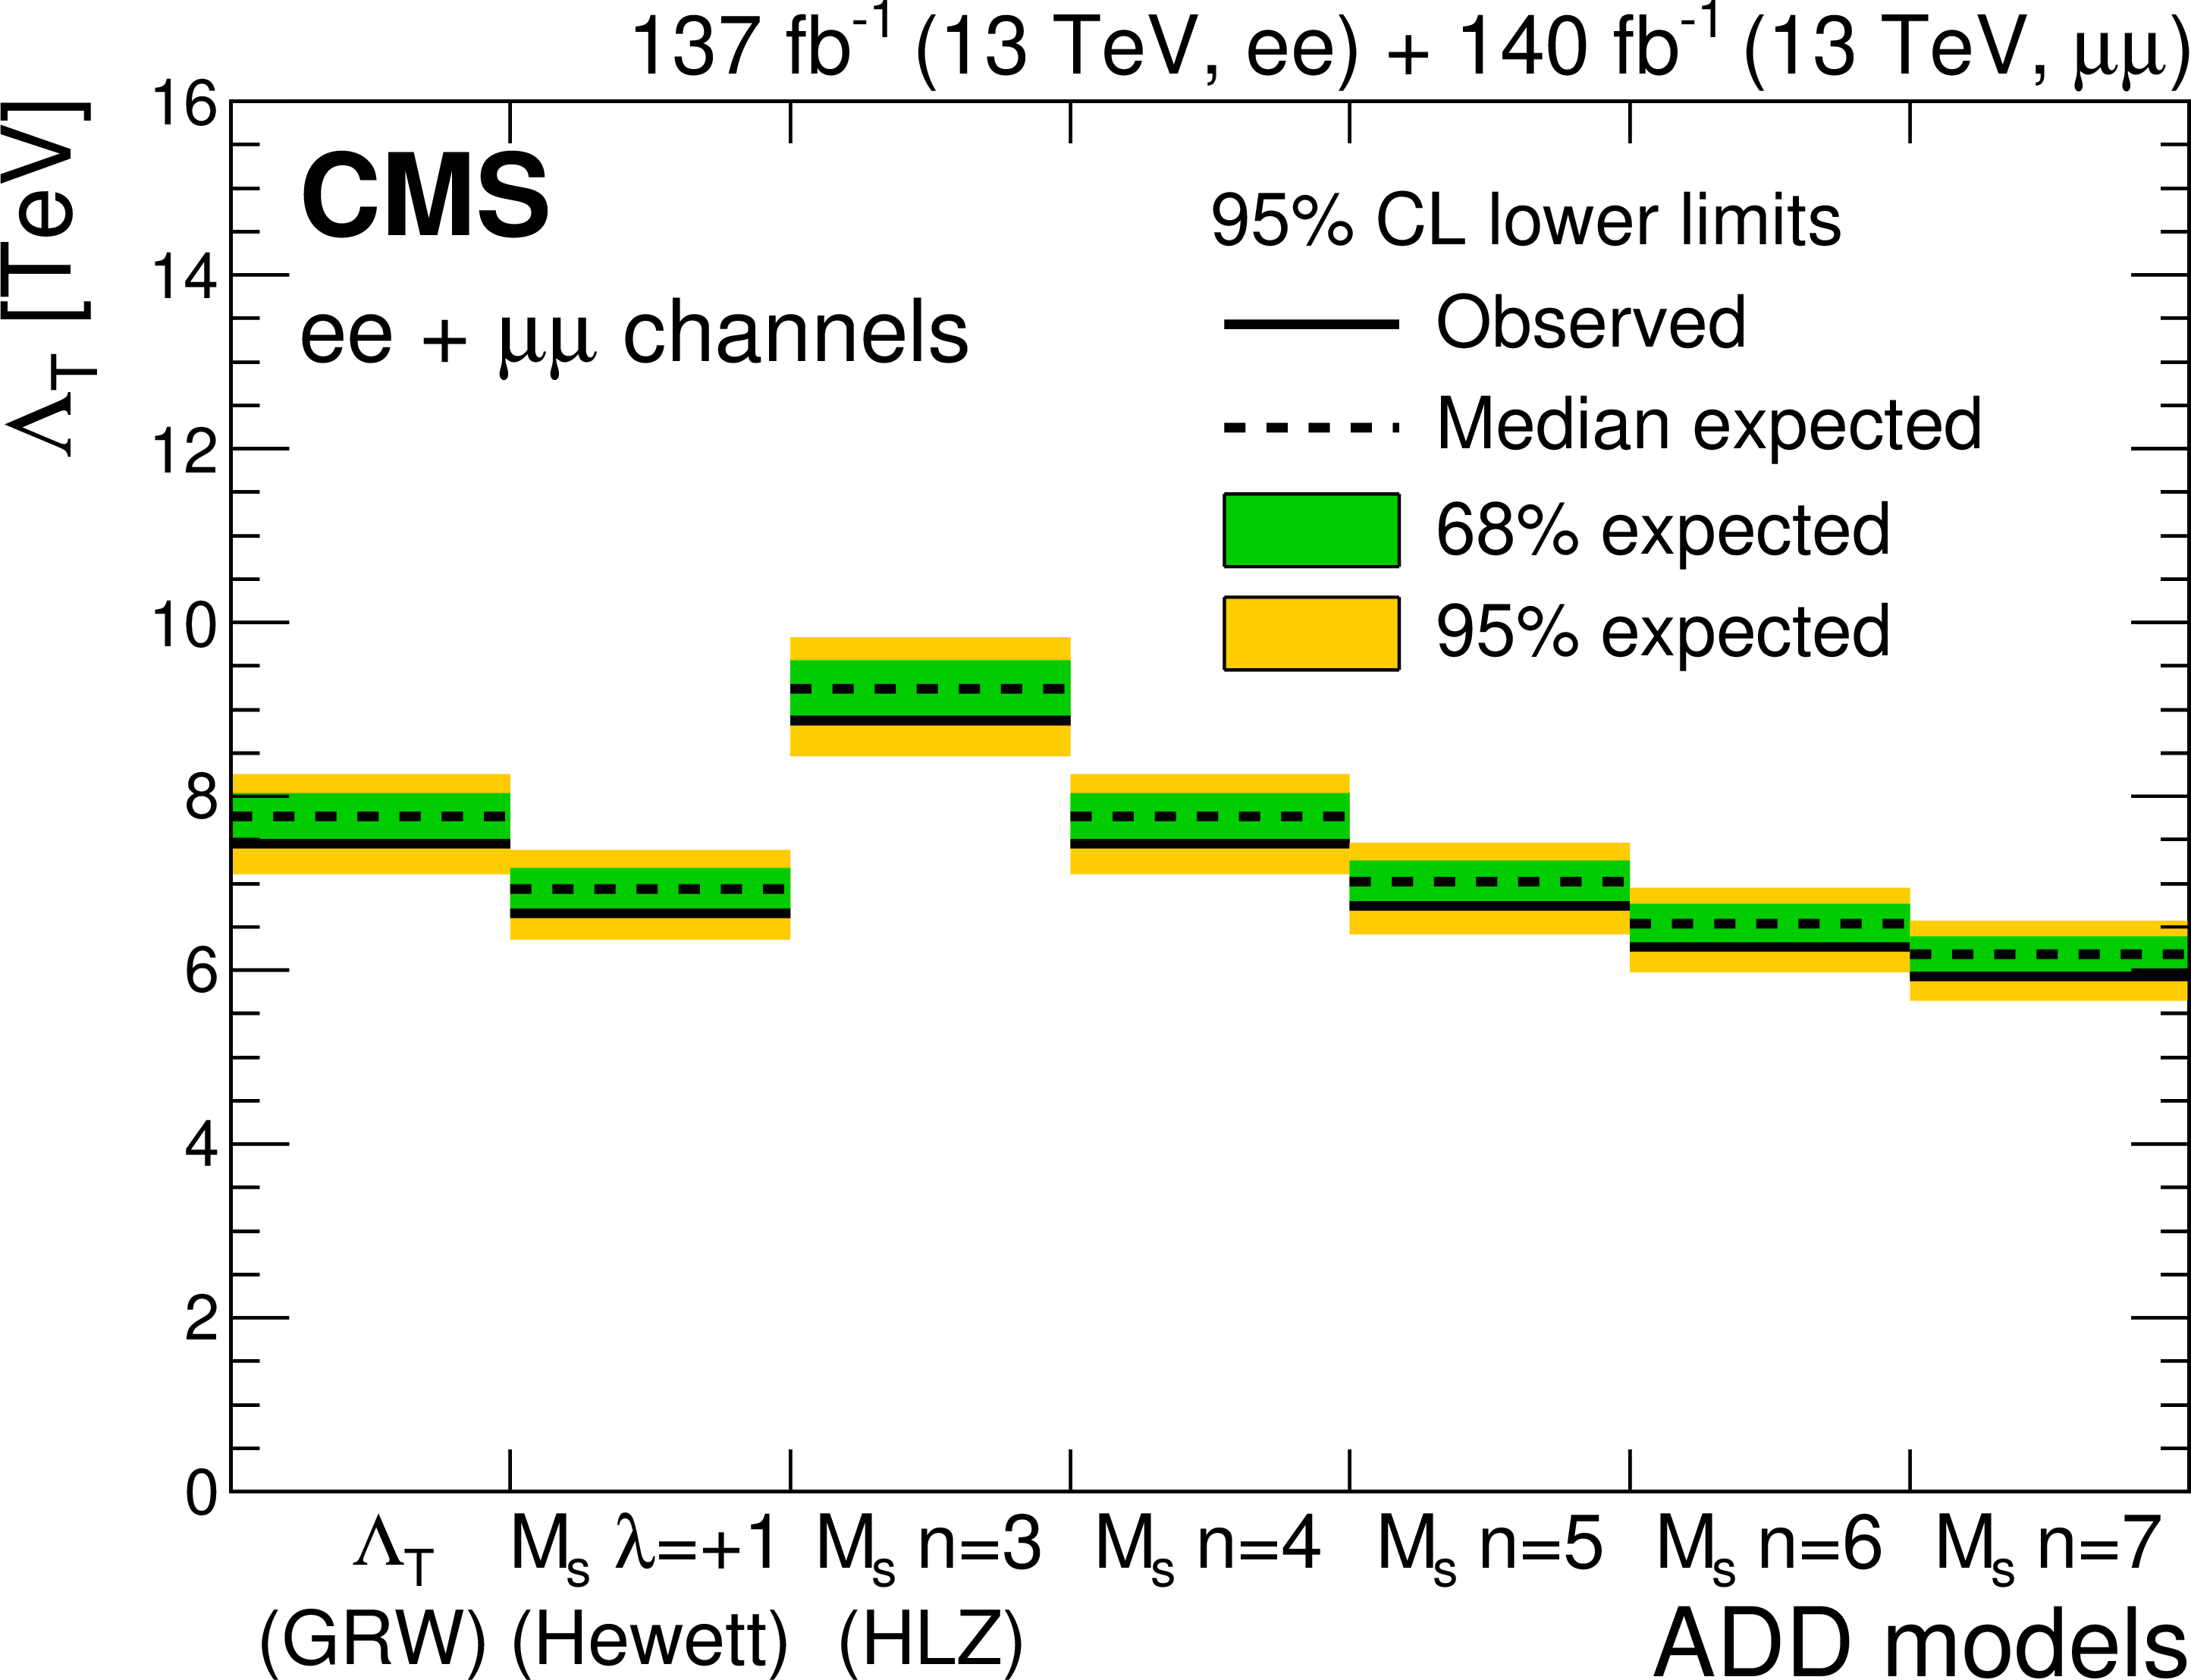
Exclusion limits at 95% CL on the ultraviolet cutoff for the combination of dielectron and dimuon channels, with $ {m_{\ell \ell}} > $ 1.8 TeV ($ {m_{\ell \ell}} > $ 1.9 TeV for 2016) in the GRW (first bin), Hewett (second bin), and HLZ conventions (third to seventh bin) for the ADD model. Signal model cross sections are calculated up to LO, and an NNLO correction factor of 1.3 is applied. |
png pdf |
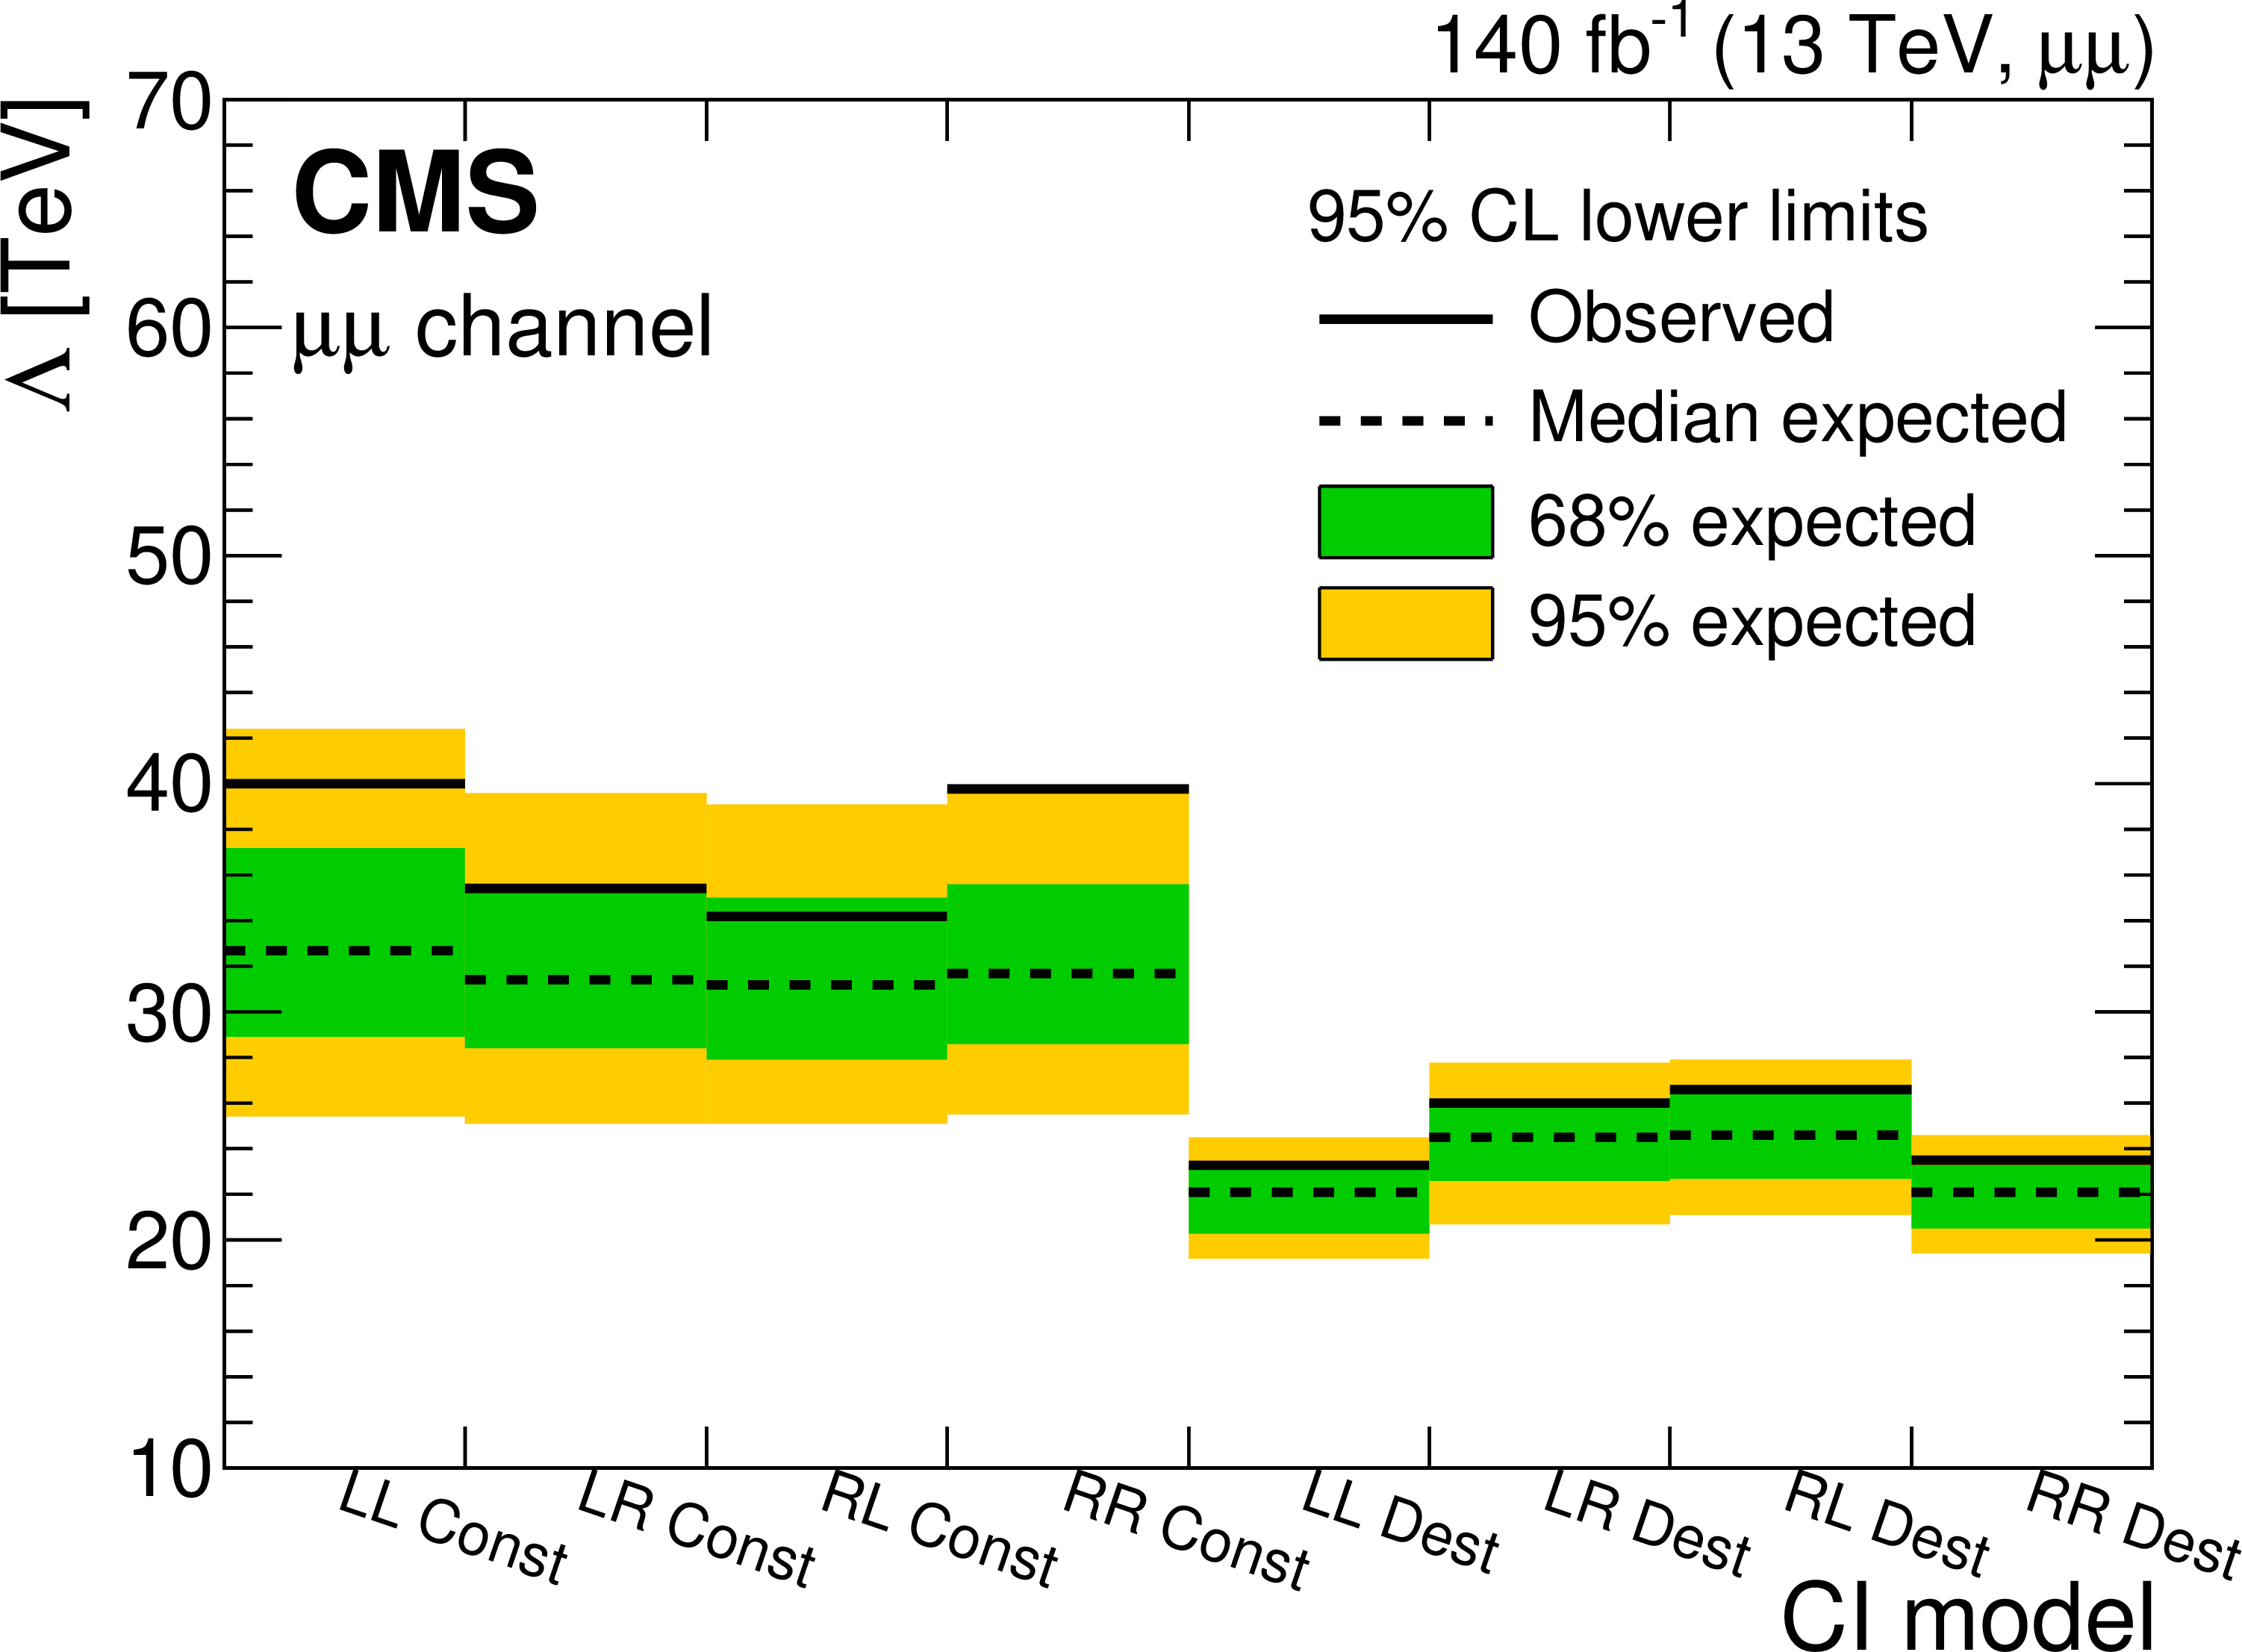
Figure 11:
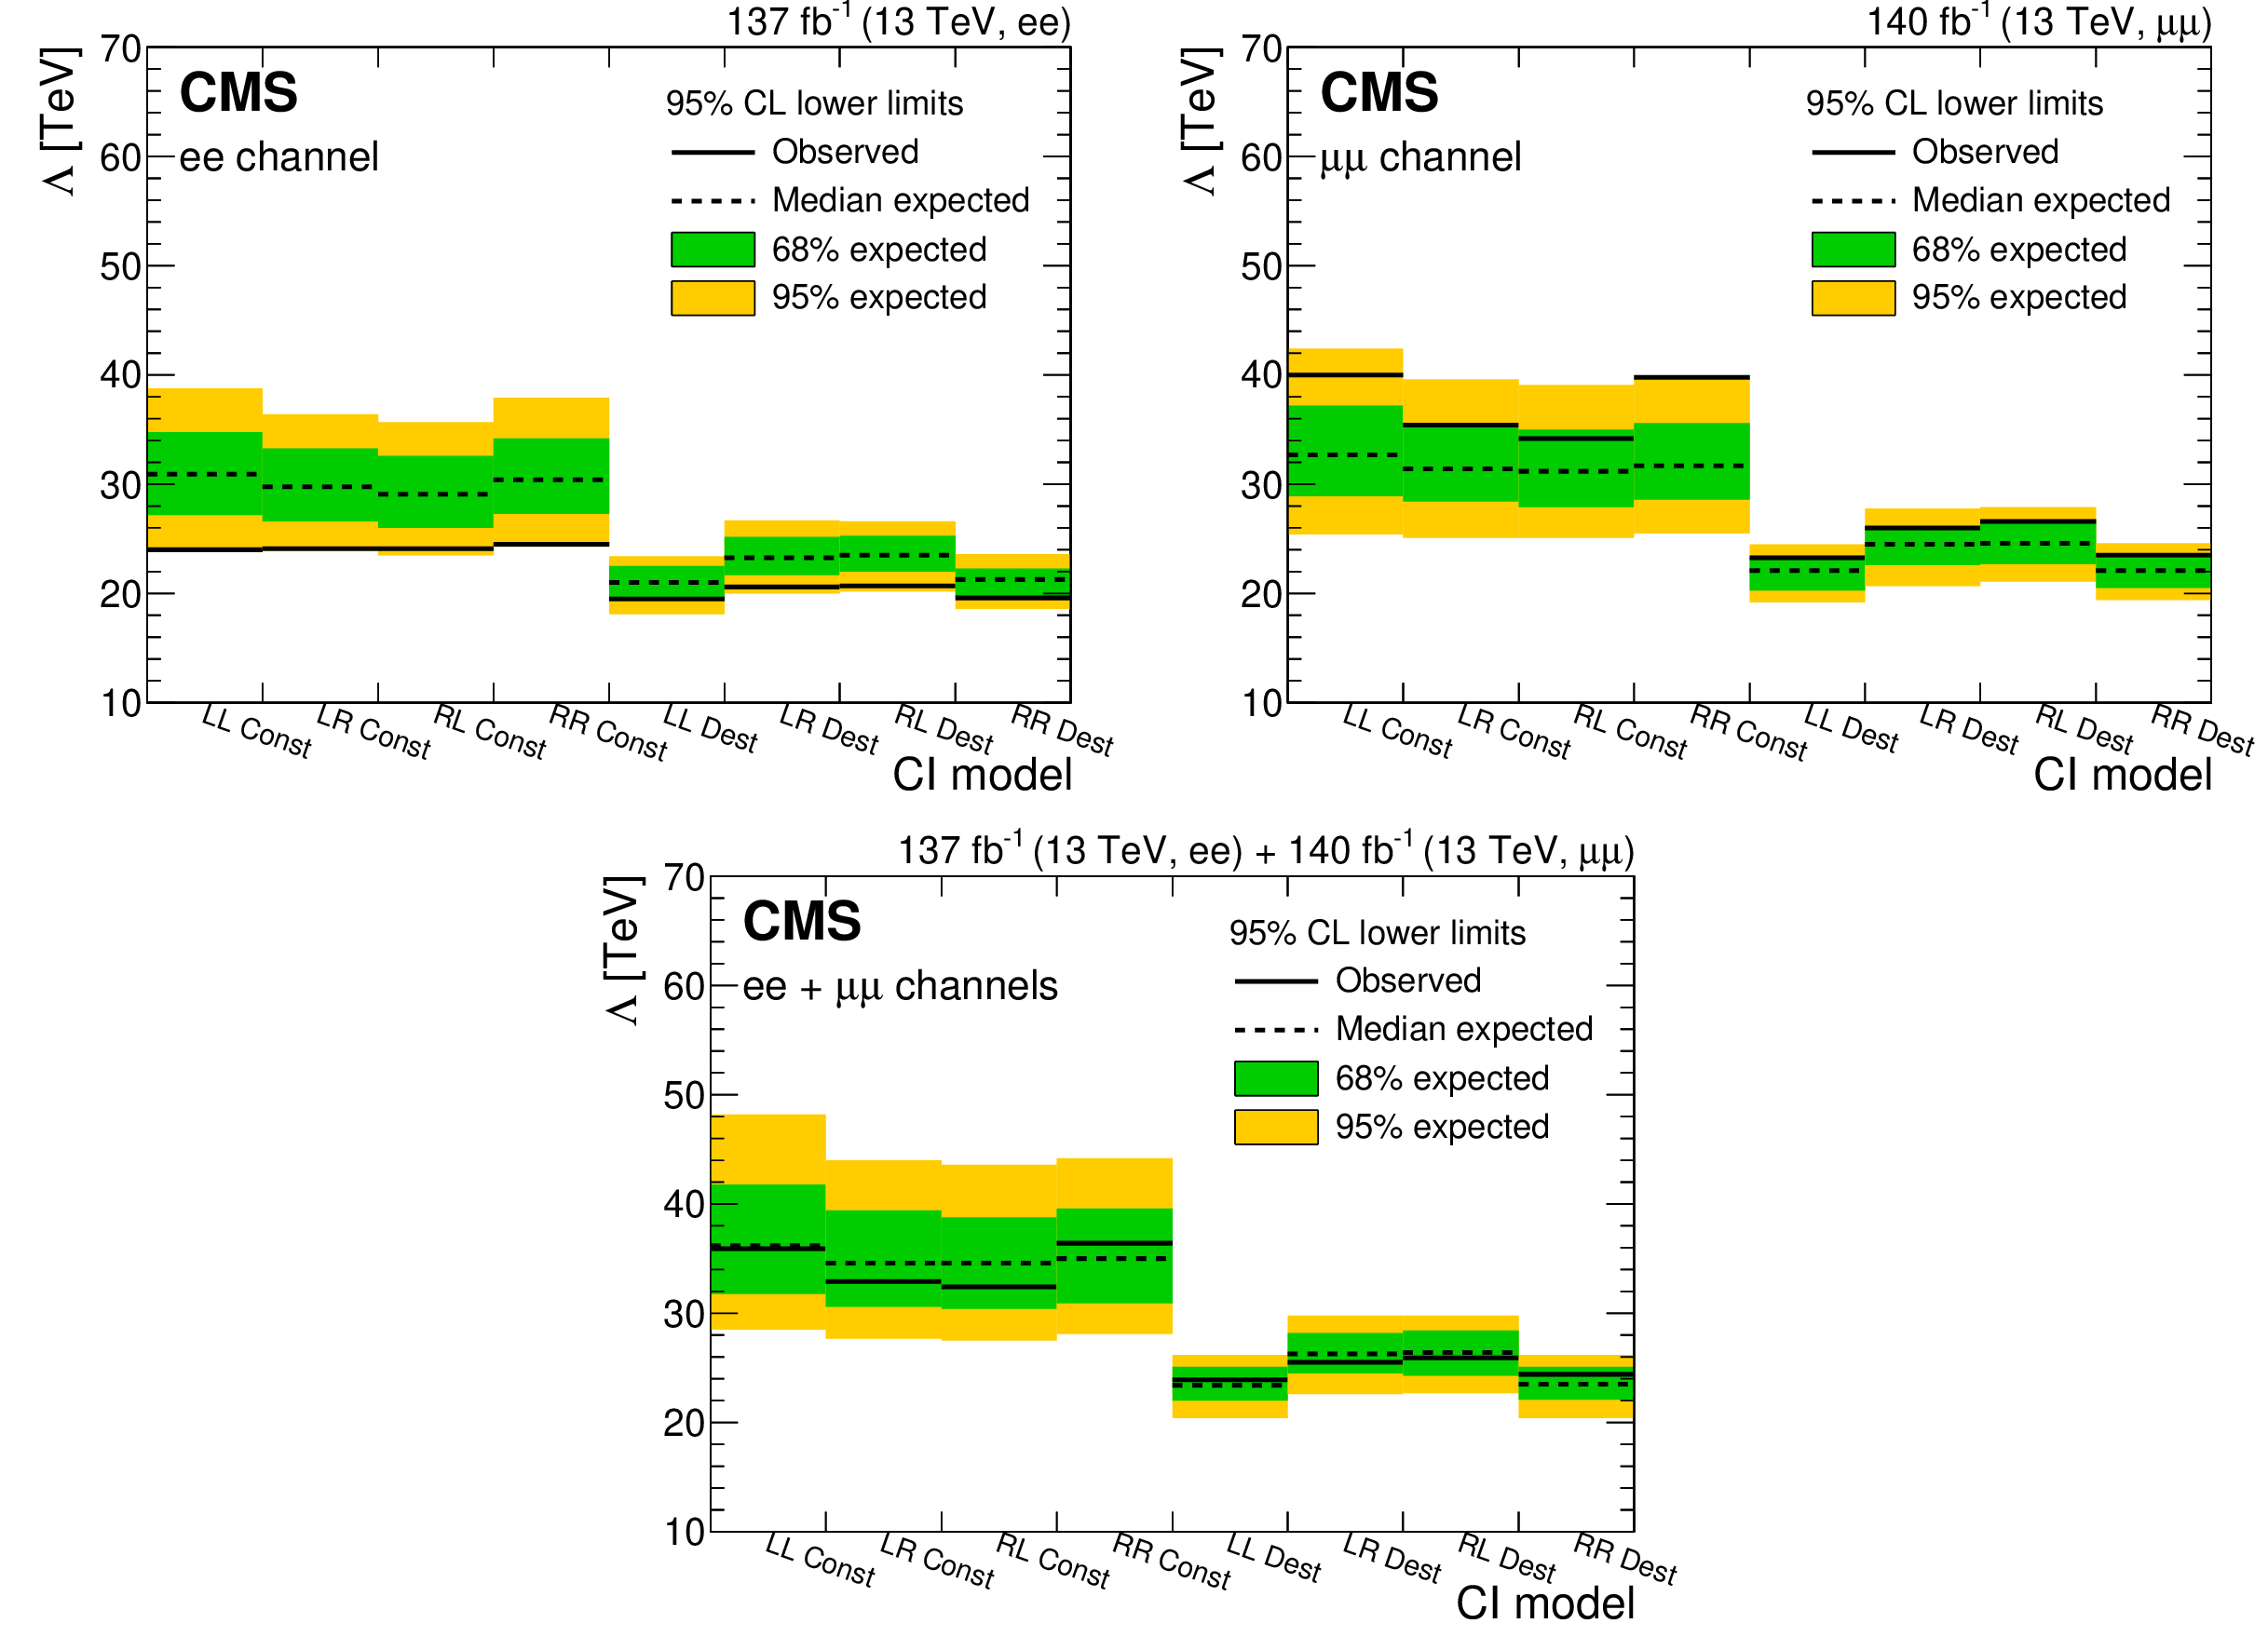
Dilepton lower exclusion limits at 95% CL on the CI scale ($\Lambda $) for the eight CI models considered, for (upper left) the dielectron channel, (upper right) the dimuon channel, and (lower) their combination. The limits are obtained for $ {m_{\ell \ell}} > $ 400 GeV. |
png pdf |
Figure 11-a:
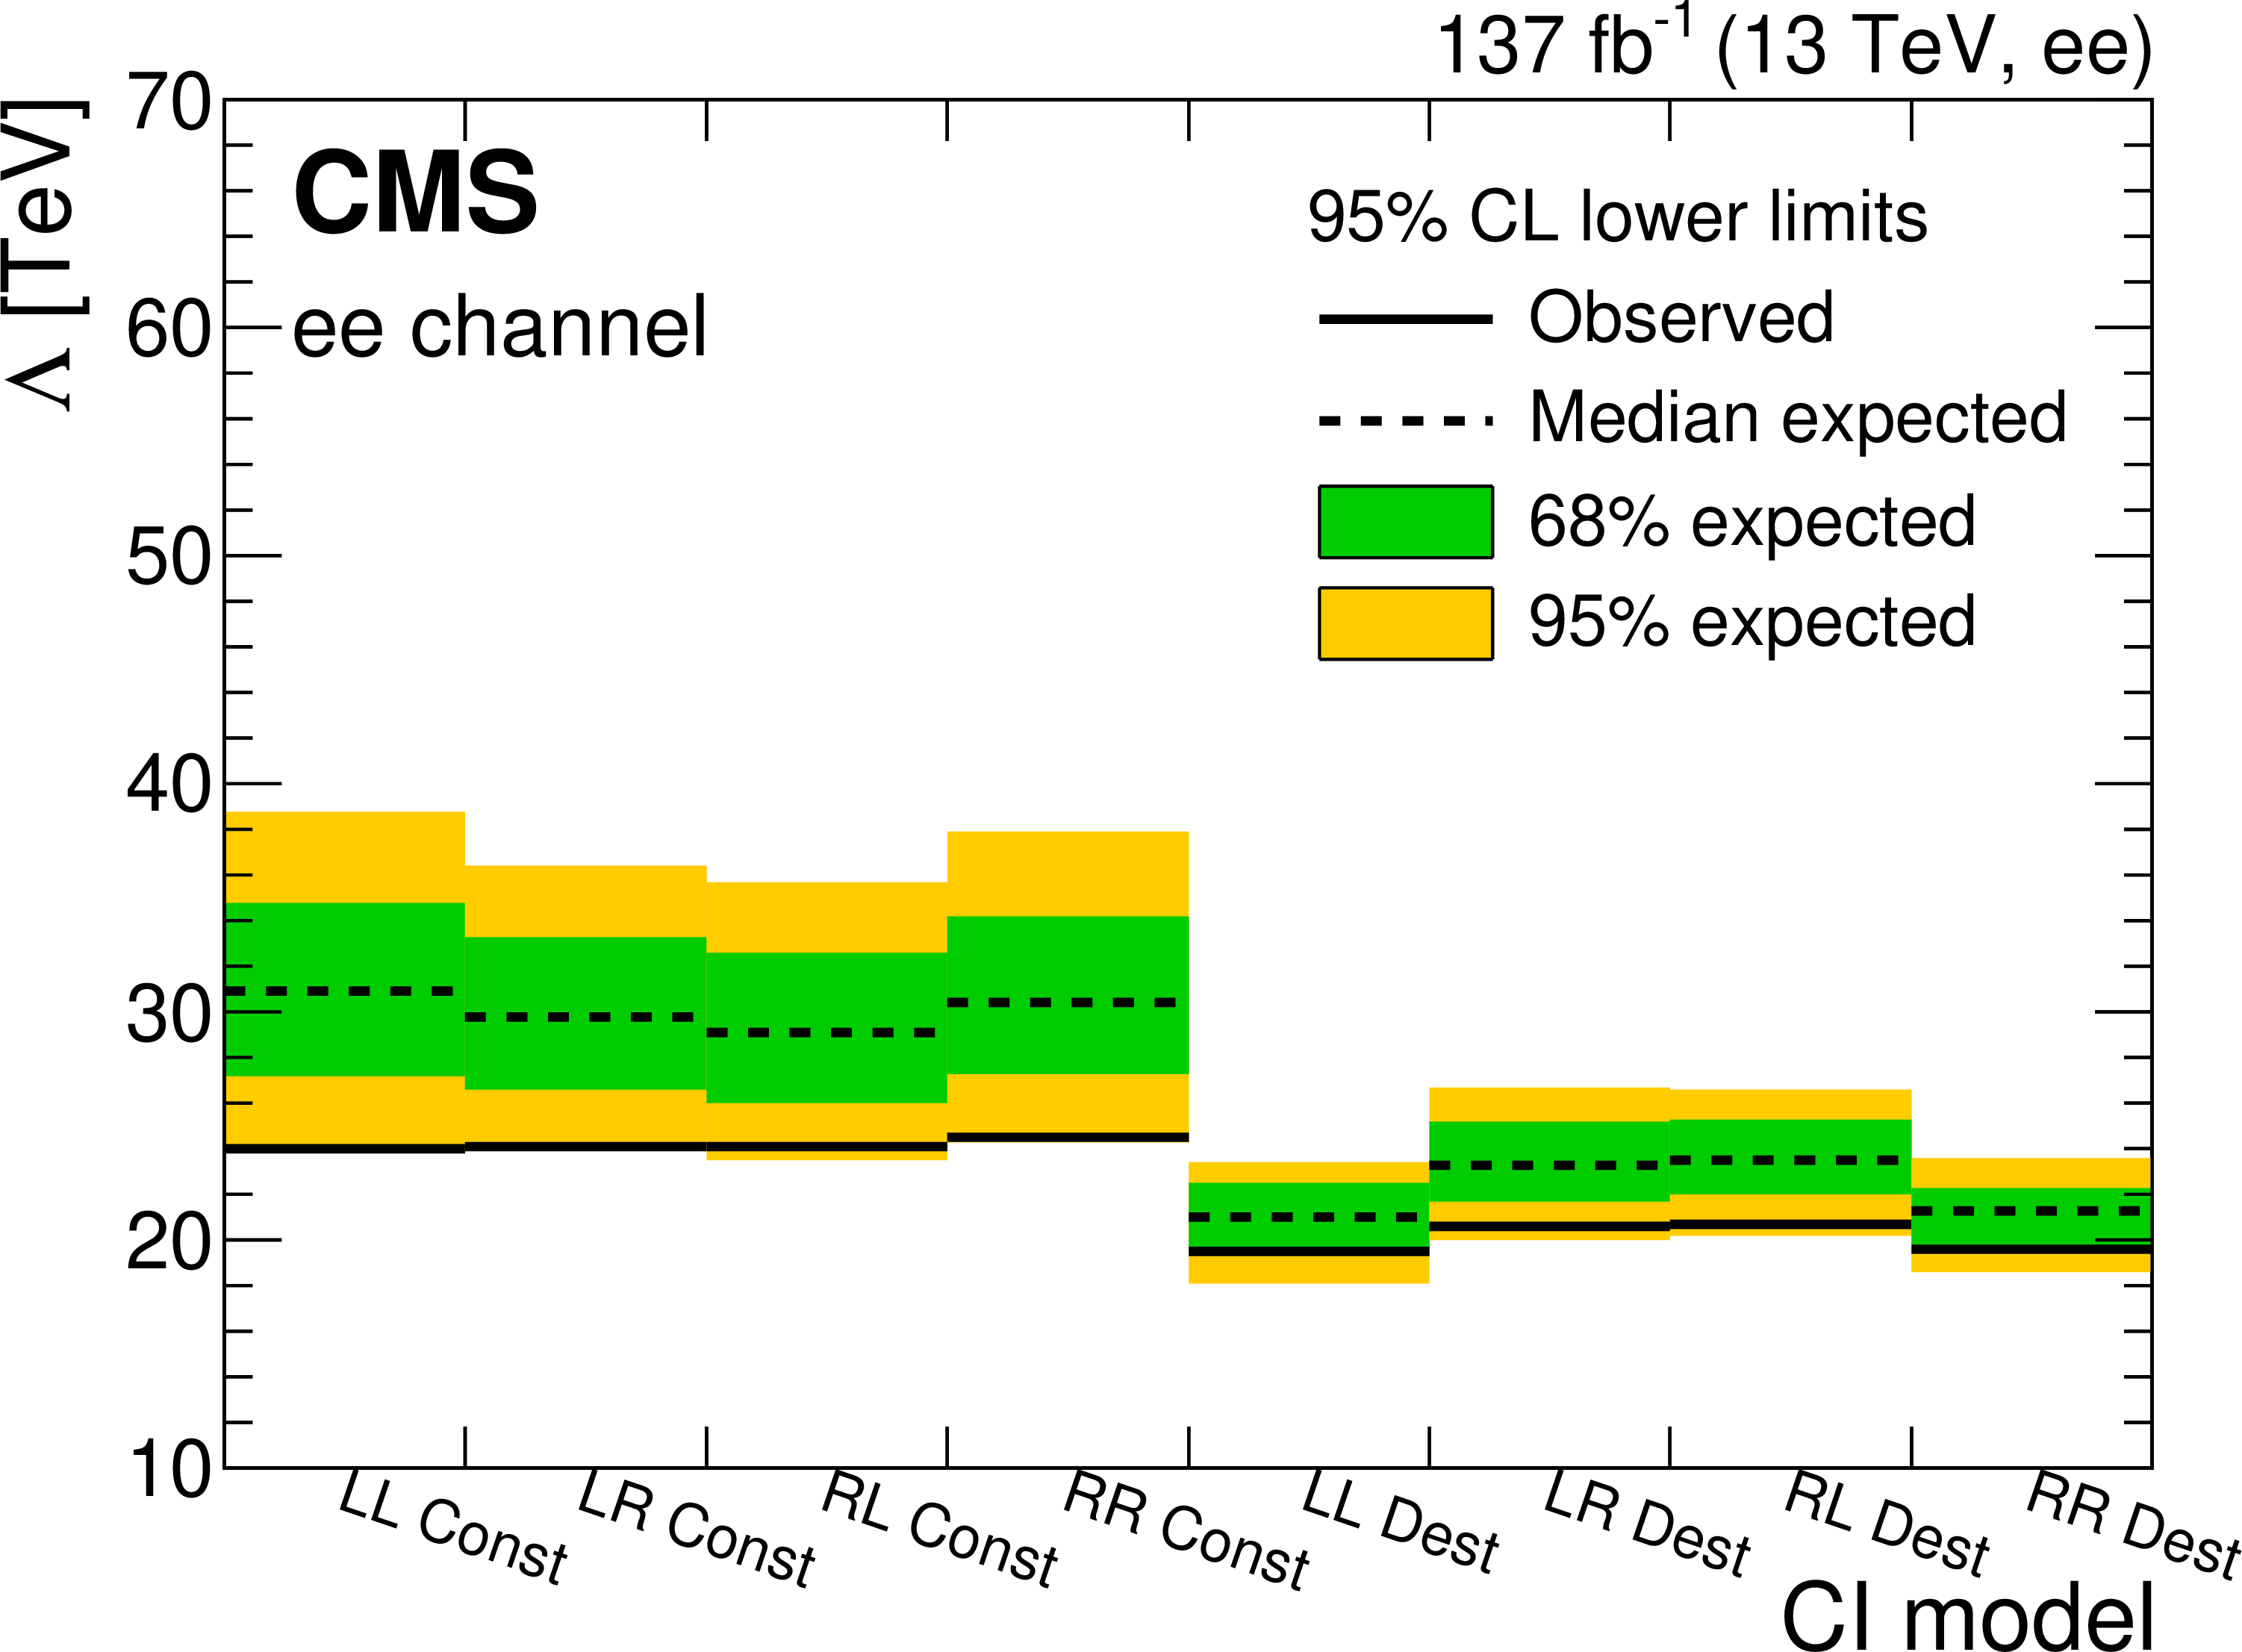
Dilepton lower exclusion limits at 95% CL on the CI scale ($\Lambda $) for the eight CI models considered, for the dielectron channel. The limits are obtained for $ {m_{\ell \ell}} > $ 400 GeV. |
png pdf |
Figure 11-b:
Dilepton lower exclusion limits at 95% CL on the CI scale ($\Lambda $) for the eight CI models considered, for the dimuon channel. The limits are obtained for $ {m_{\ell \ell}} > $ 400 GeV. |

png pdf |
Figure 11-c:
Dilepton lower exclusion limits at 95% CL on the CI scale ($\Lambda $) for the eight CI models considered, for the combination of dielectron and dimuon channels. The limits are obtained for $ {m_{\ell \ell}} > $ 400 GeV. |
png pdf |
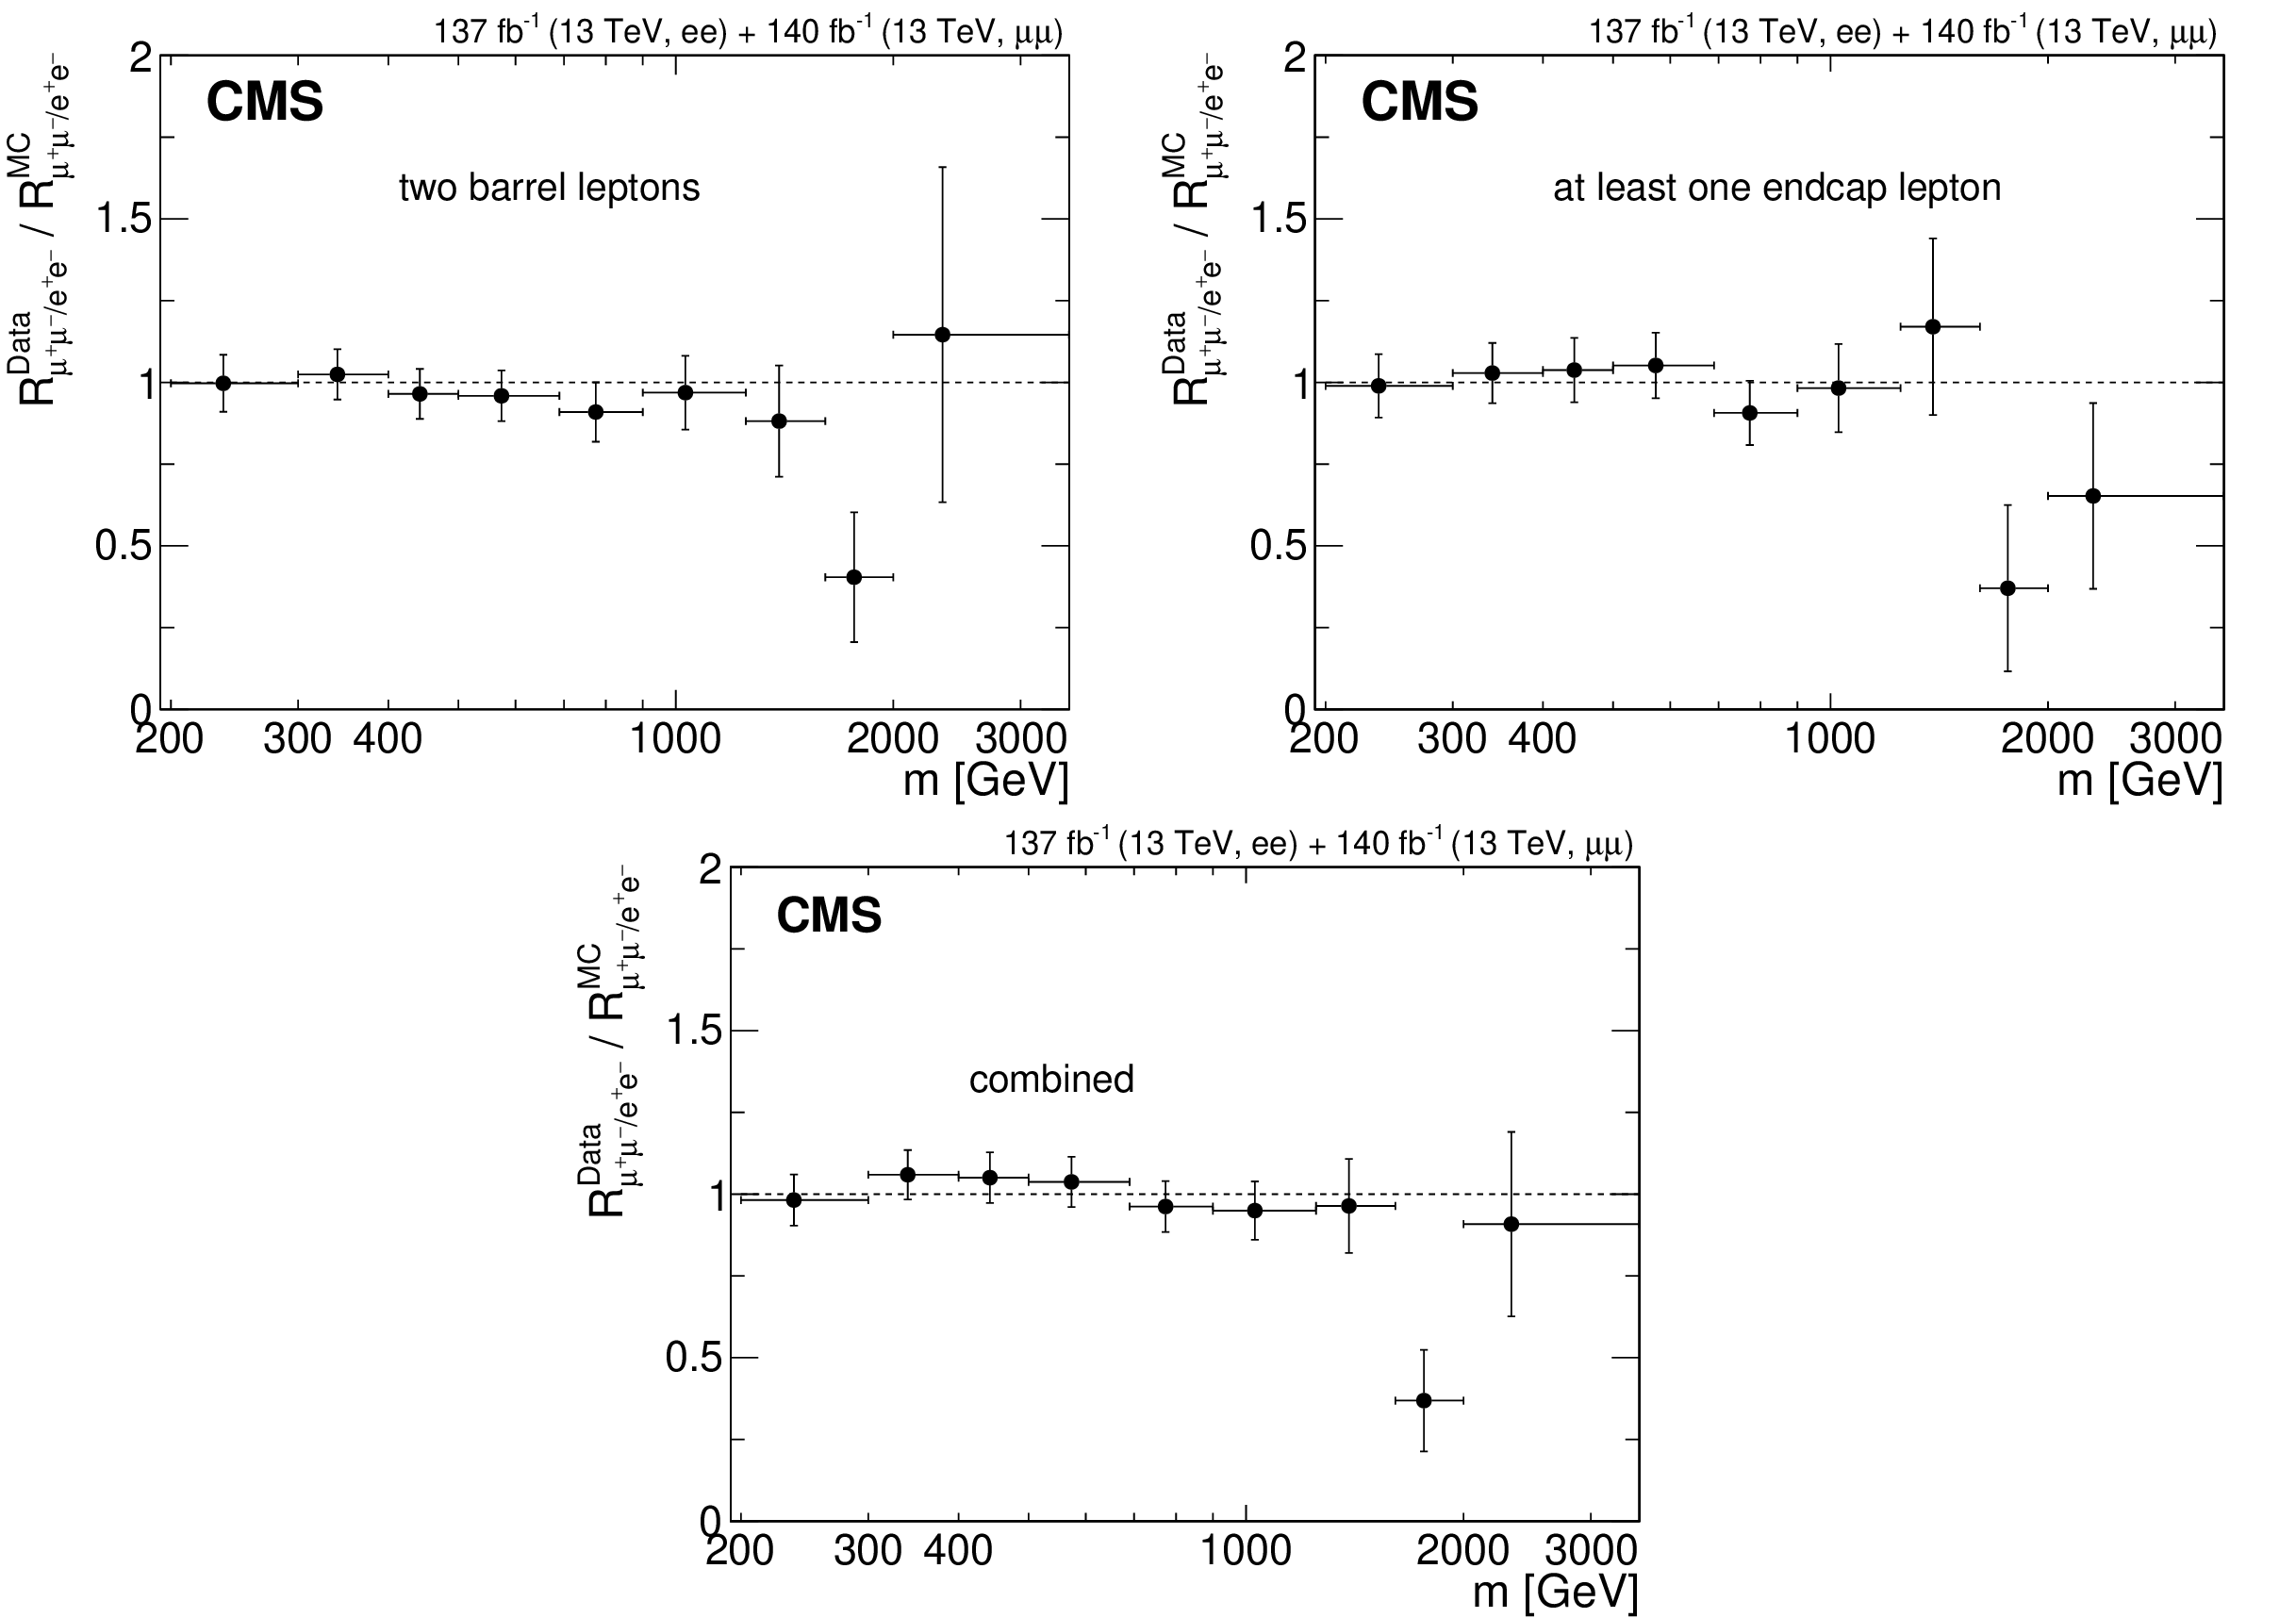
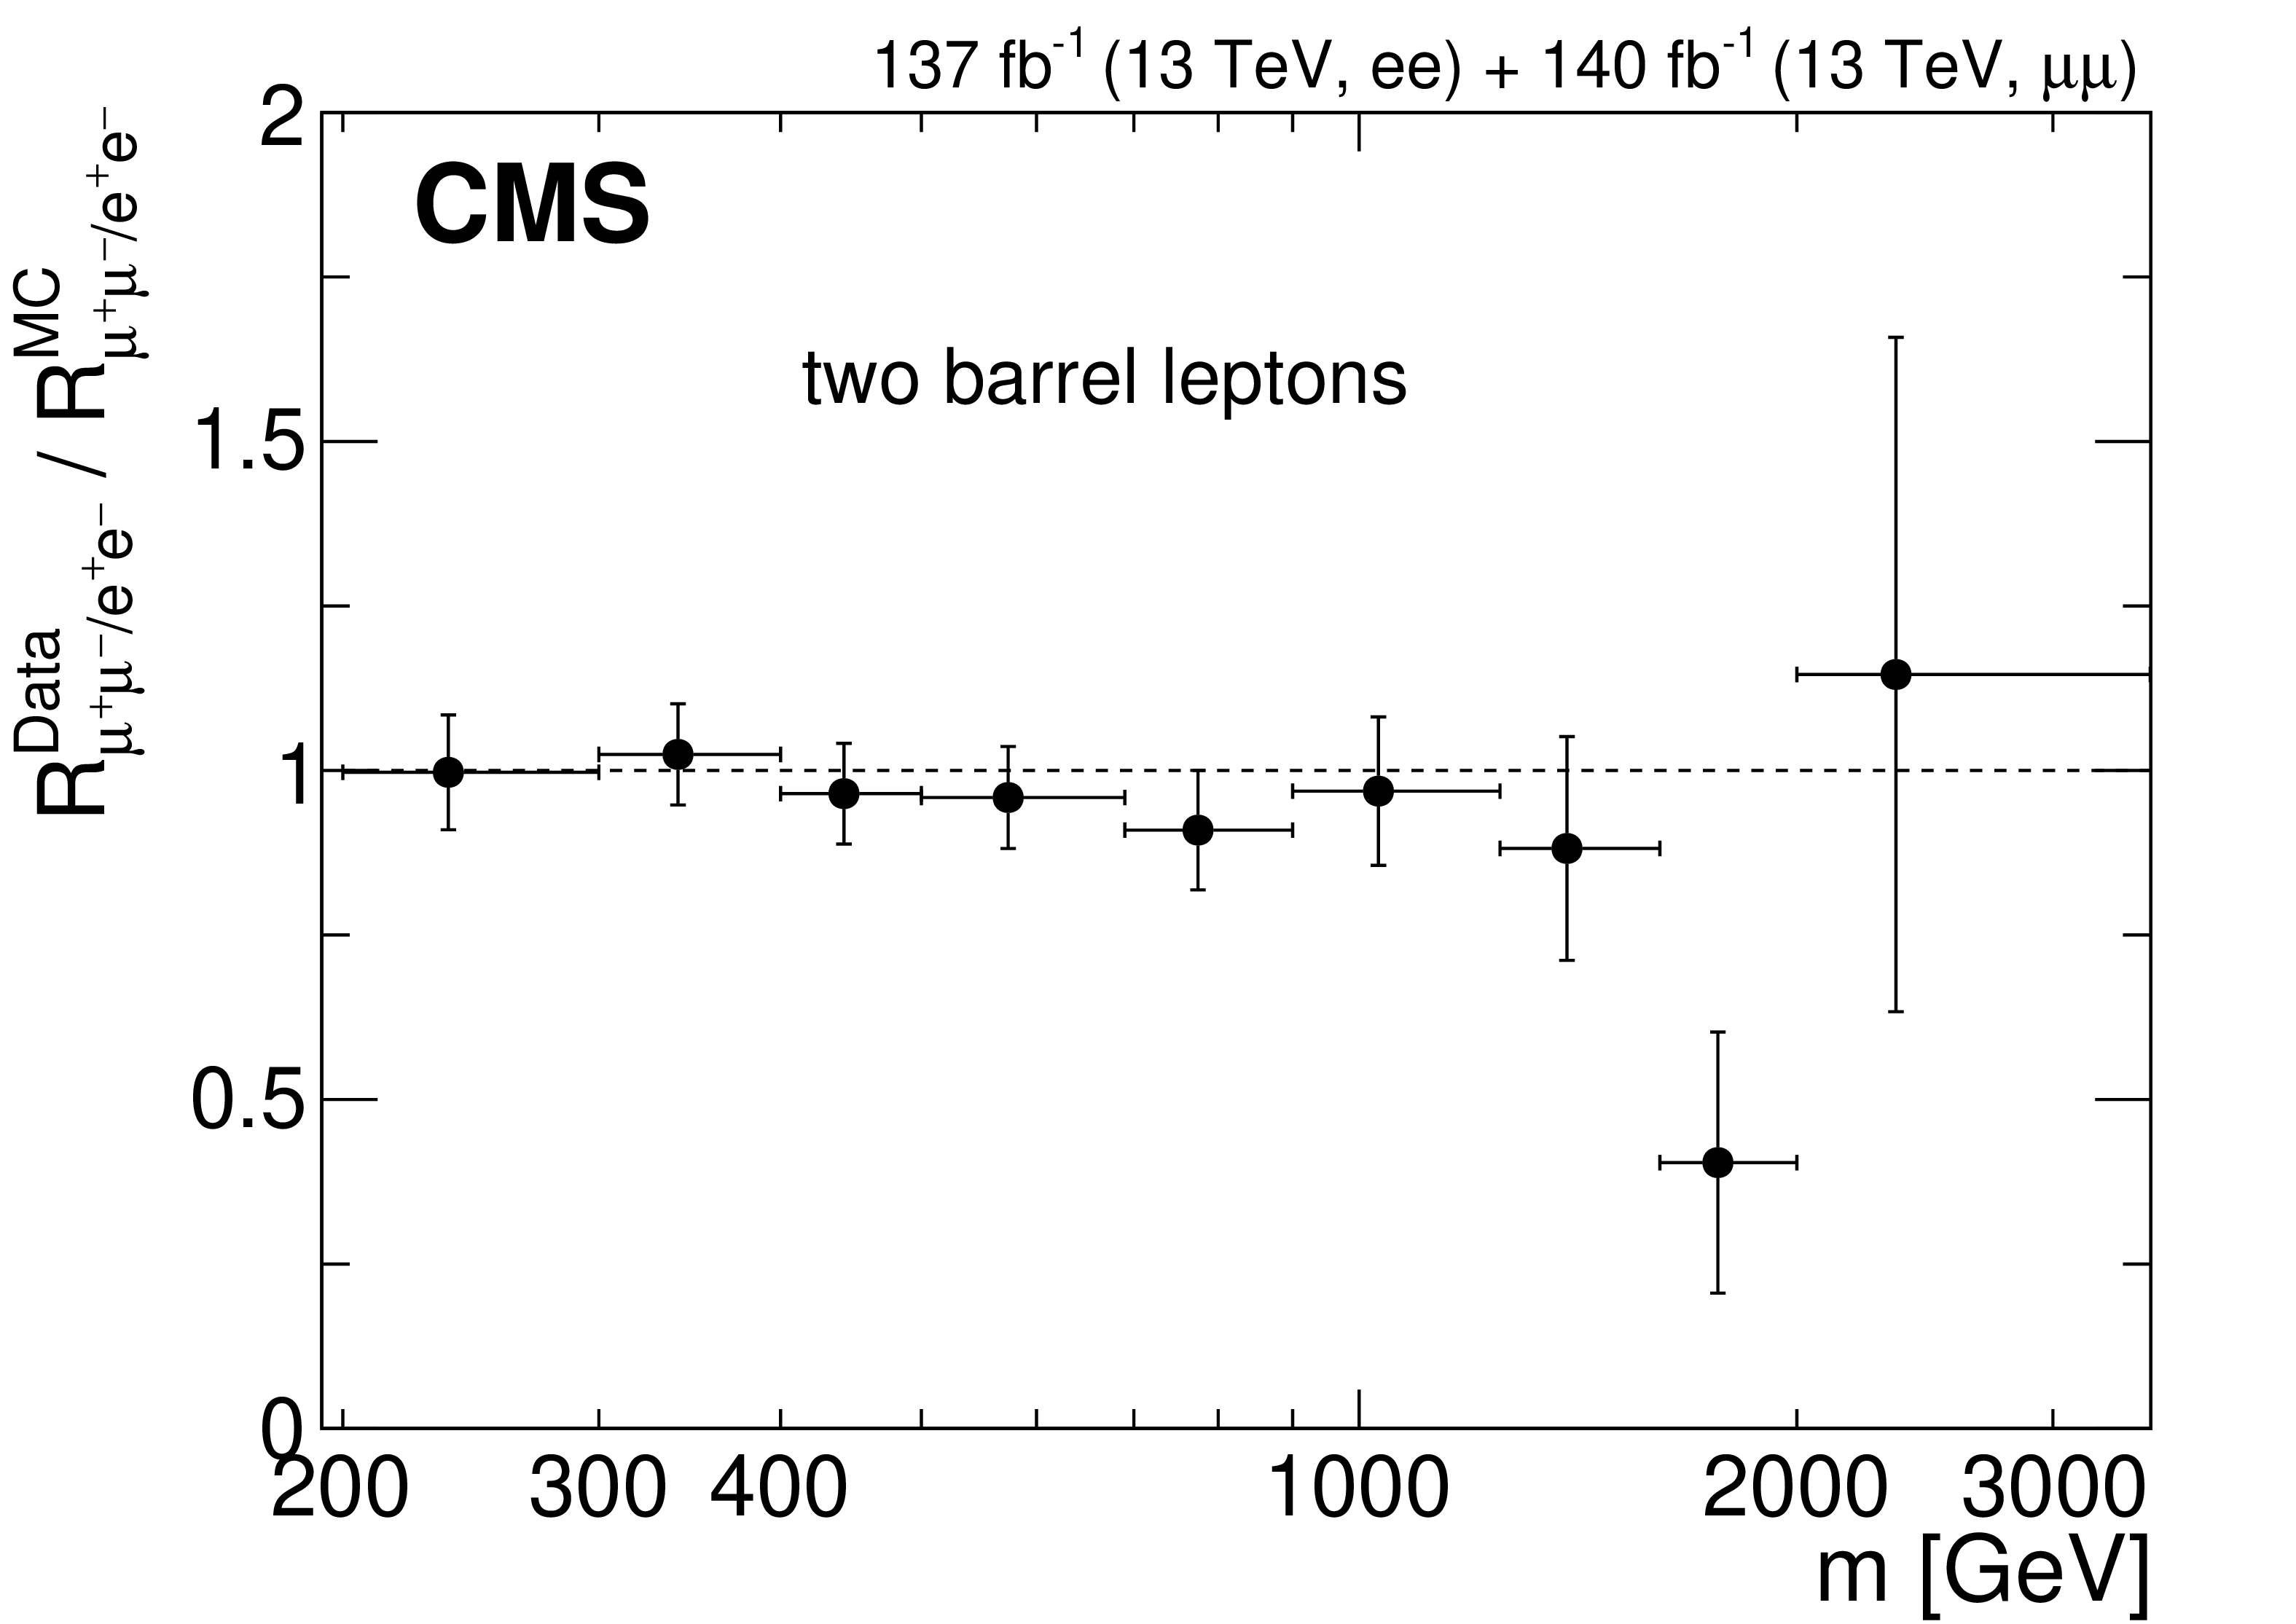
Figure 12:
Ratio of the differential dilepton production cross section in the dimuon and dielectron channels ${R_{\mu^{+} {}\mu^{-} /\mathrm{e^{+}} {}\mathrm{e^{-}}}}$, as a function of ${m_{\ell \ell}}$ for (upper left) events with two barrel leptons, (upper right) at least one lepton in the endcaps, and (lower) their combination. The ratio is obtained after correcting the reconstructed mass spectra to particle level. The error bars include both statistical and systematic uncertainties. |
png pdf |
Figure 12-a:
Ratio of the differential dilepton production cross section in the dimuon and dielectron channels ${R_{\mu^{+} {}\mu^{-} /\mathrm{e^{+}} {}\mathrm{e^{-}}}}$, as a function of ${m_{\ell \ell}}$ for events with two barrel leptons. The ratio is obtained after correcting the reconstructed mass spectra to particle level. The error bars include both statistical and systematic uncertainties. |
png pdf |
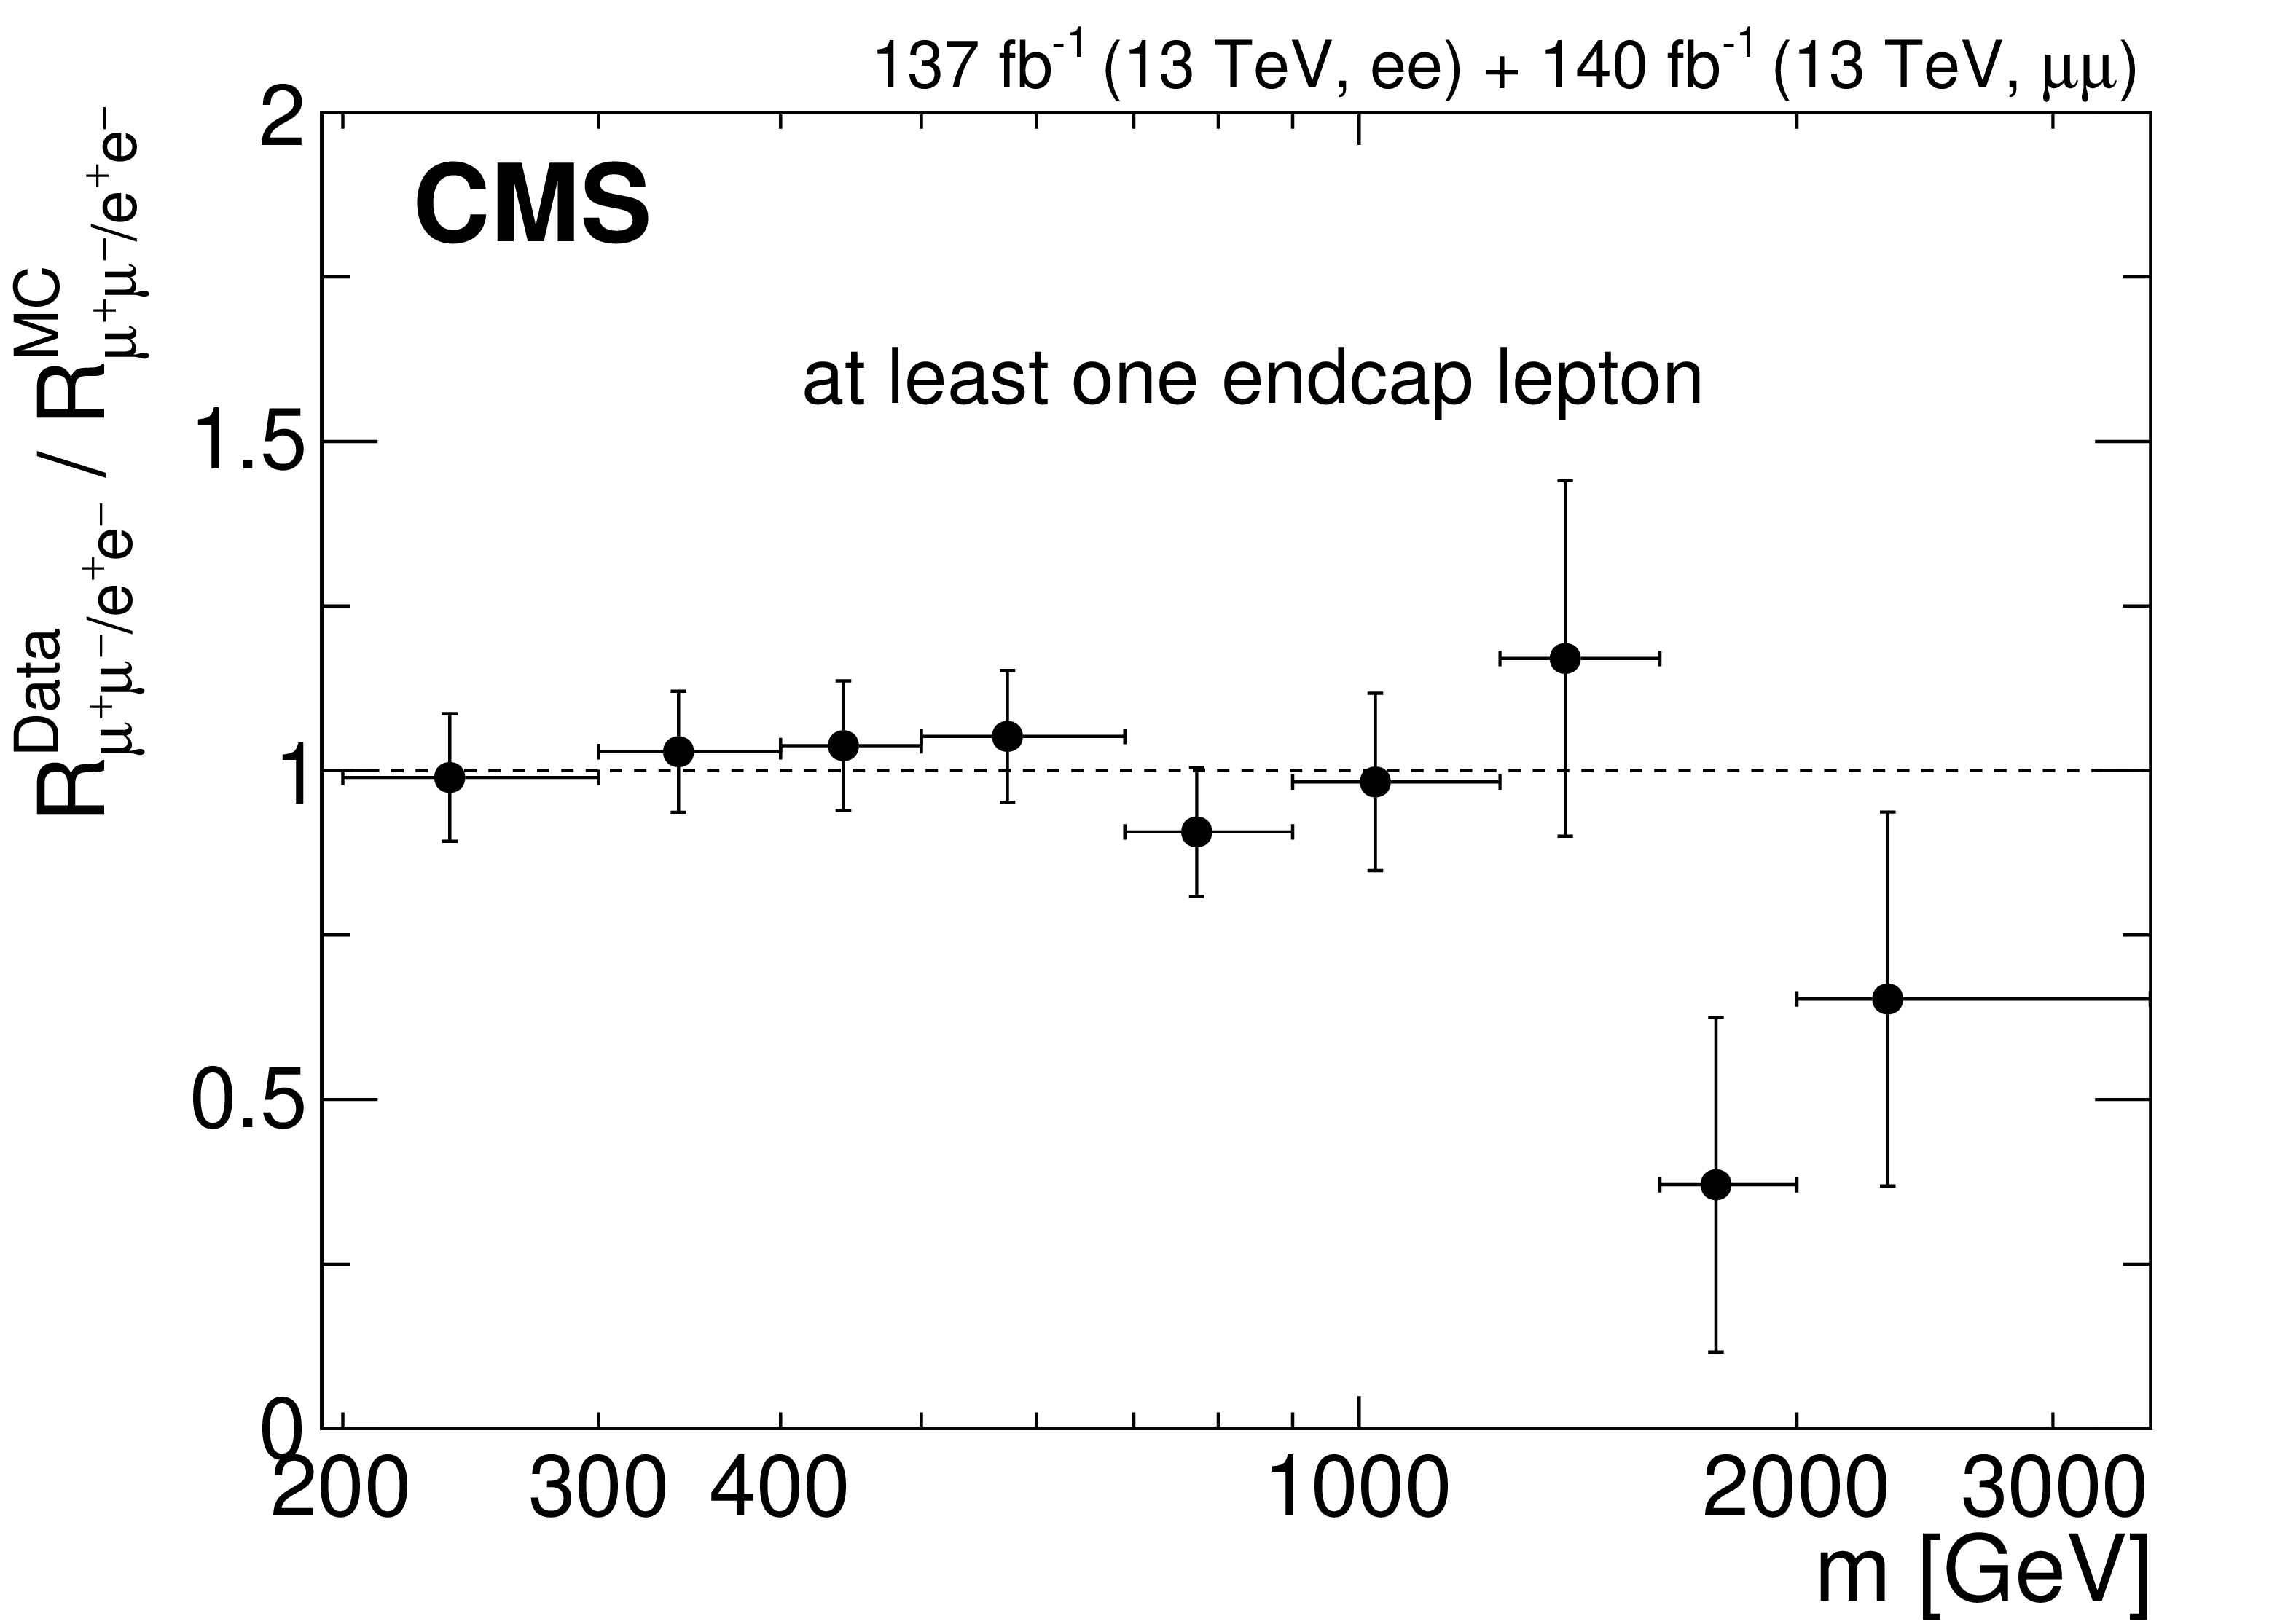
Figure 12-b:
Ratio of the differential dilepton production cross section in the dimuon and dielectron channels ${R_{\mu^{+} {}\mu^{-} /\mathrm{e^{+}} {}\mathrm{e^{-}}}}$, as a function of ${m_{\ell \ell}}$ for events with at least one lepton in the endcaps. The ratio is obtained after correcting the reconstructed mass spectra to particle level. The error bars include both statistical and systematic uncertainties. |
png pdf |
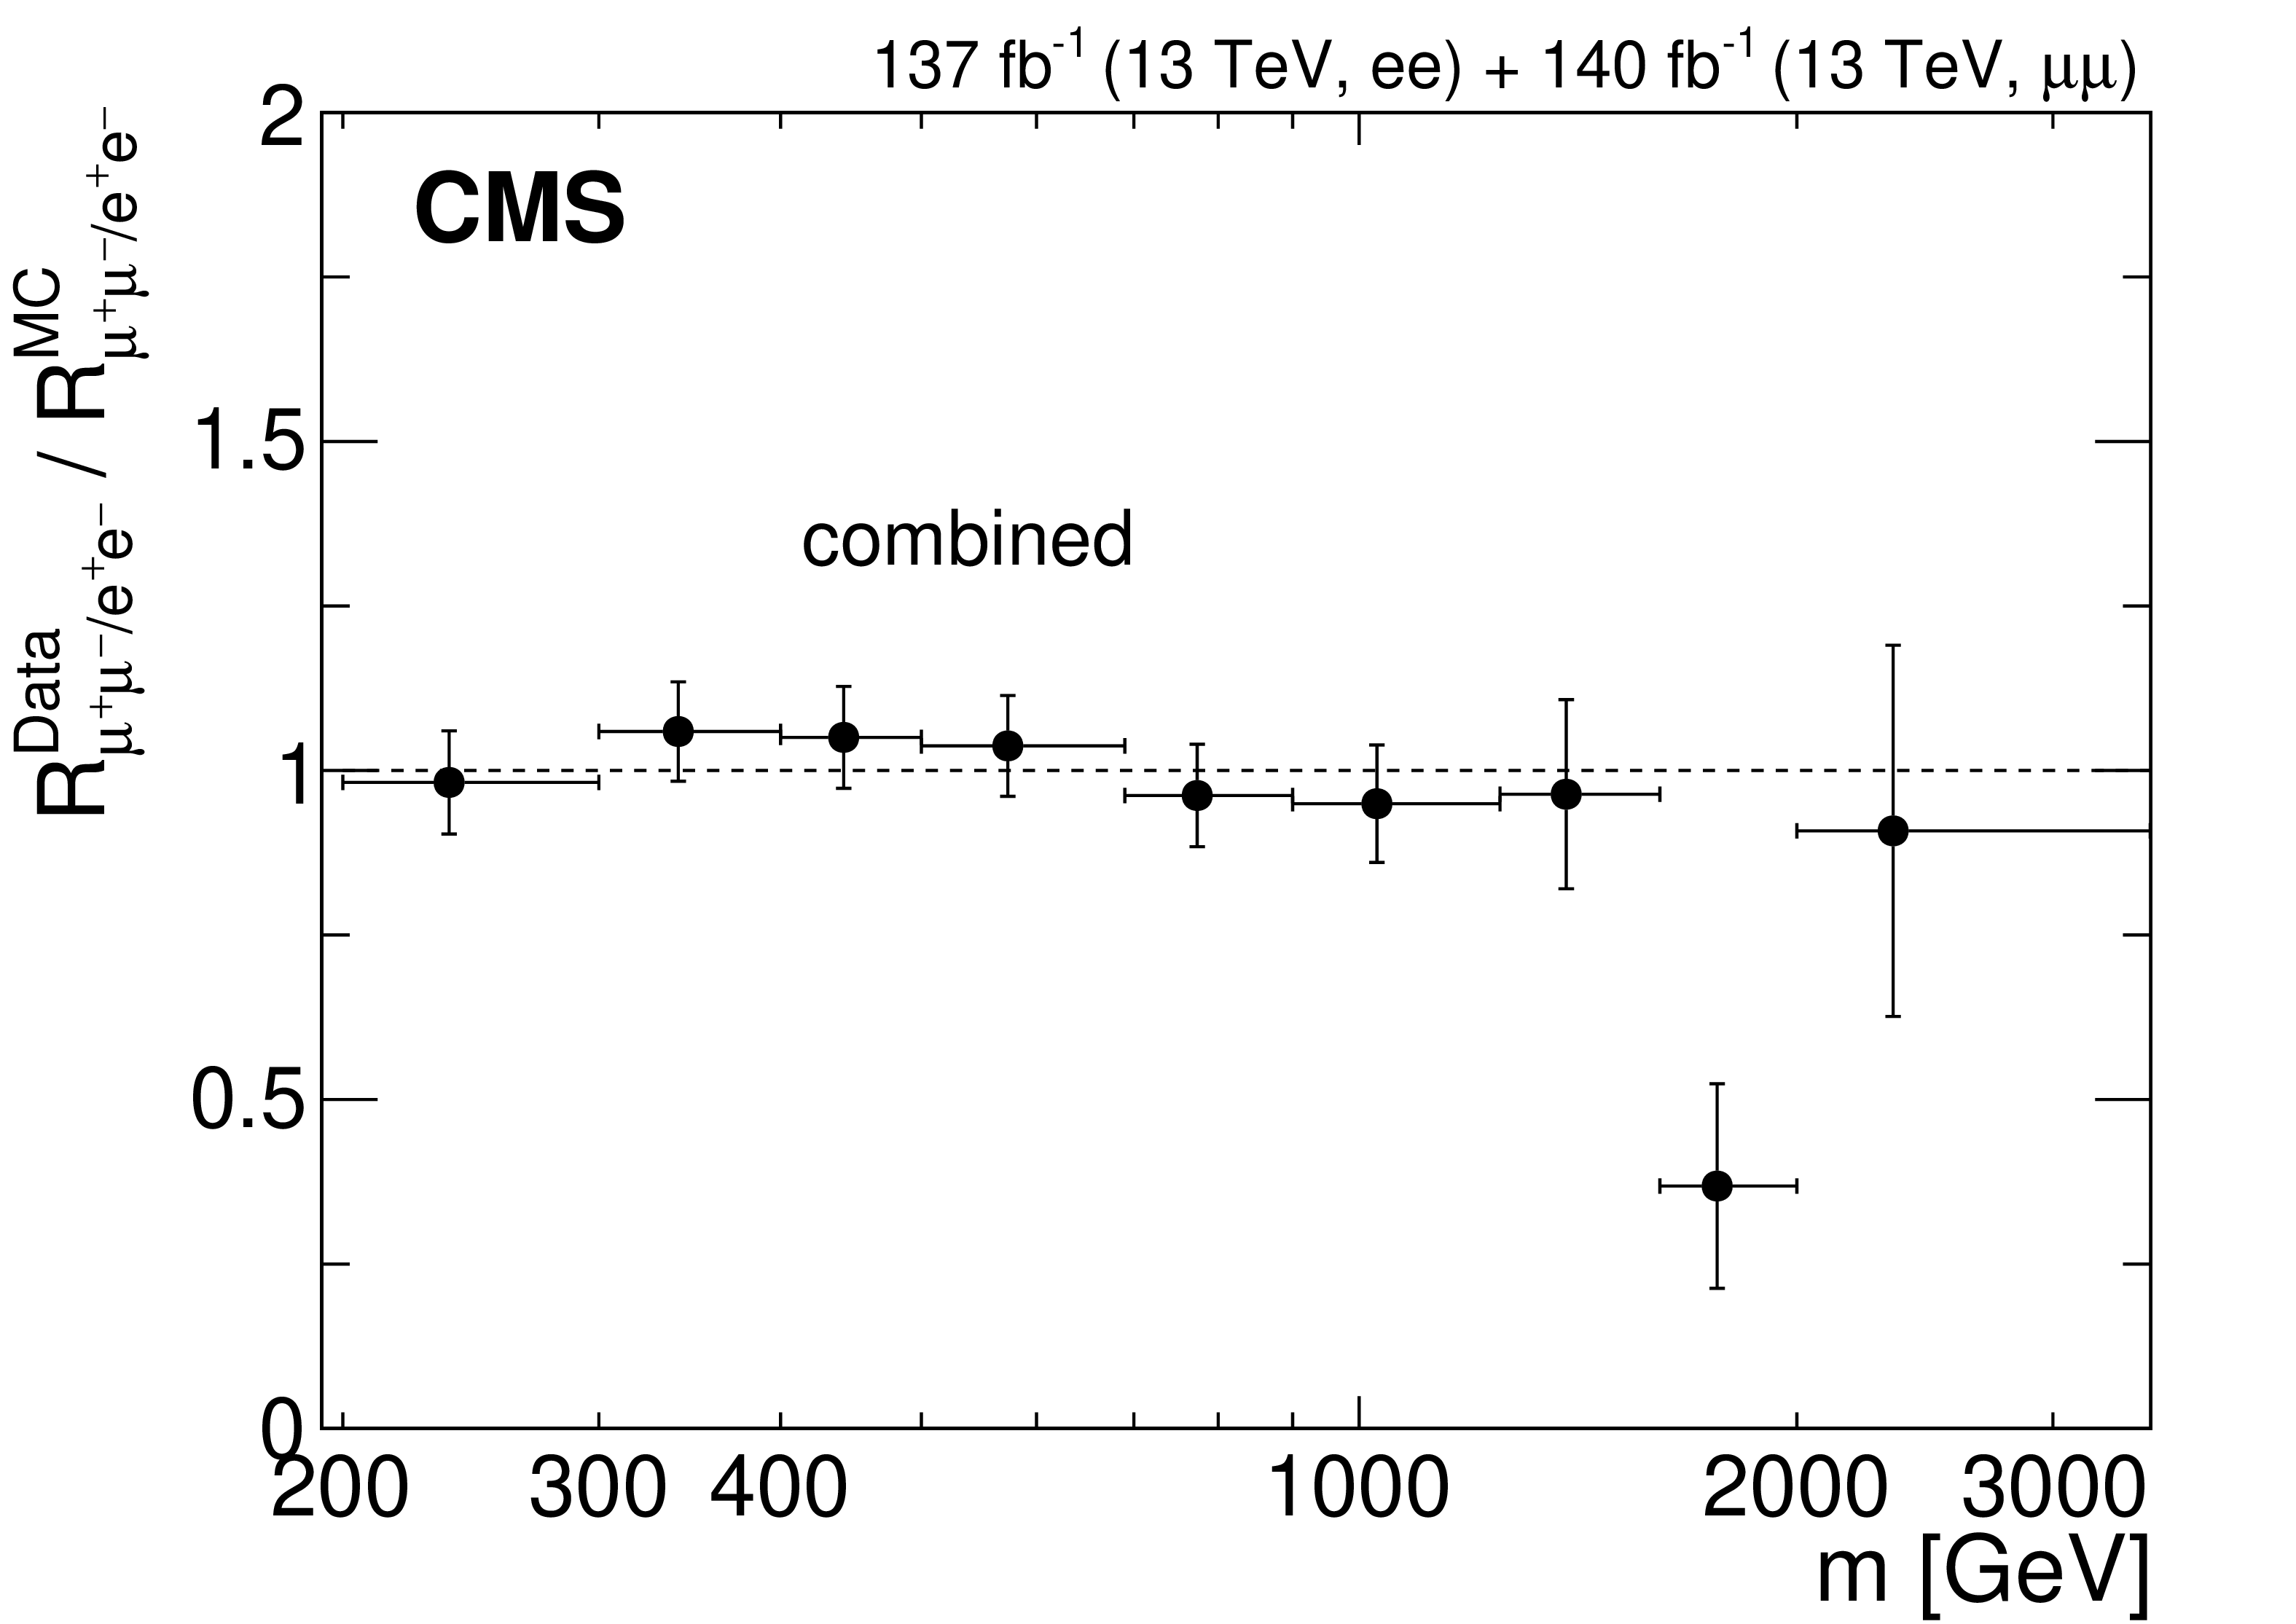
Figure 12-c:
Ratio of the differential dilepton production cross section in the dimuon and dielectron channels ${R_{\mu^{+} {}\mu^{-} /\mathrm{e^{+}} {}\mathrm{e^{-}}}}$, as a function of ${m_{\ell \ell}}$ for all events. The ratio is obtained after correcting the reconstructed mass spectra to particle level. The error bars include both statistical and systematic uncertainties. |
| Tables | |
png pdf |
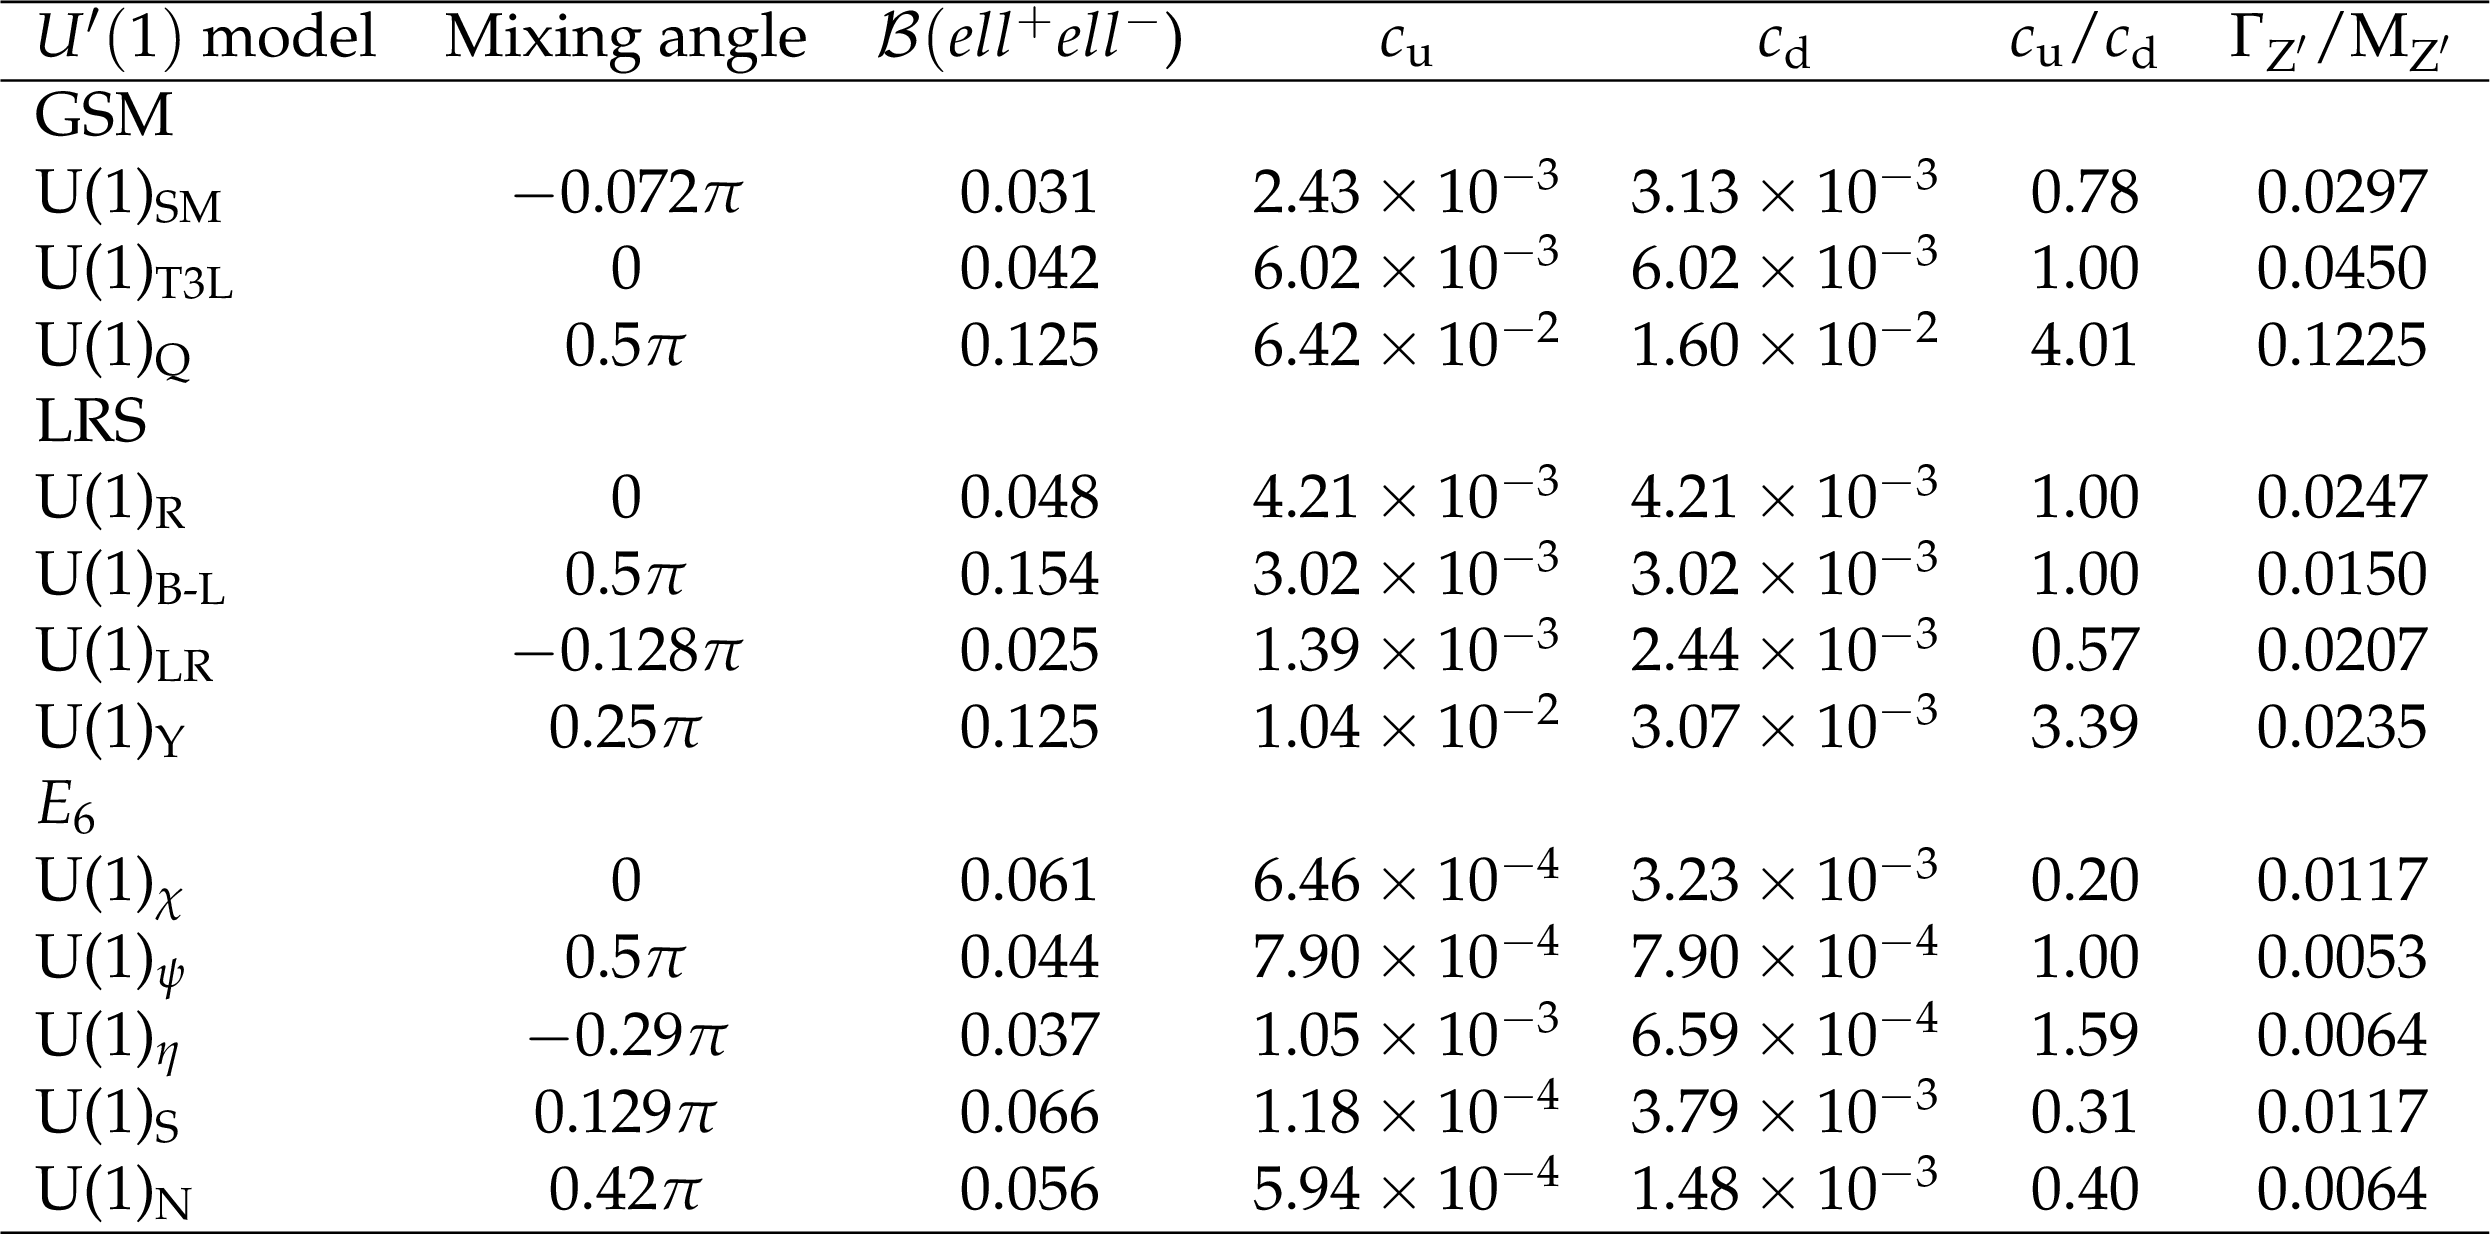
Table 1:
Various benchmark models in the GSM [41], LRS [41], and $E_\text {6}$ [1,43] model classes, with their corresponding mixing angles, their branching fraction ($\mathcal {B}$) to dileptons, the $c_{\mathrm{u}}$, $c_{\mathrm{d}}$ parameters and their ratio, and the width-to-mass ratio of the associated Z' boson. |

png pdf |
Table 2:
Sources of systematic uncertainties considered in the search for resonant signals and their relative magnitude. |

png pdf |
Table 3:
Systematic uncertainties considered in the search for nonresonant signals. The relative impact of the uncertainties on the background yield estimates is shown for two dilepton invariant mass thresholds, 1 and 3 TeV. The uncertainty in the jet misidentification background has a negligible effect on the overall background estimate and is not listed. |
png pdf |
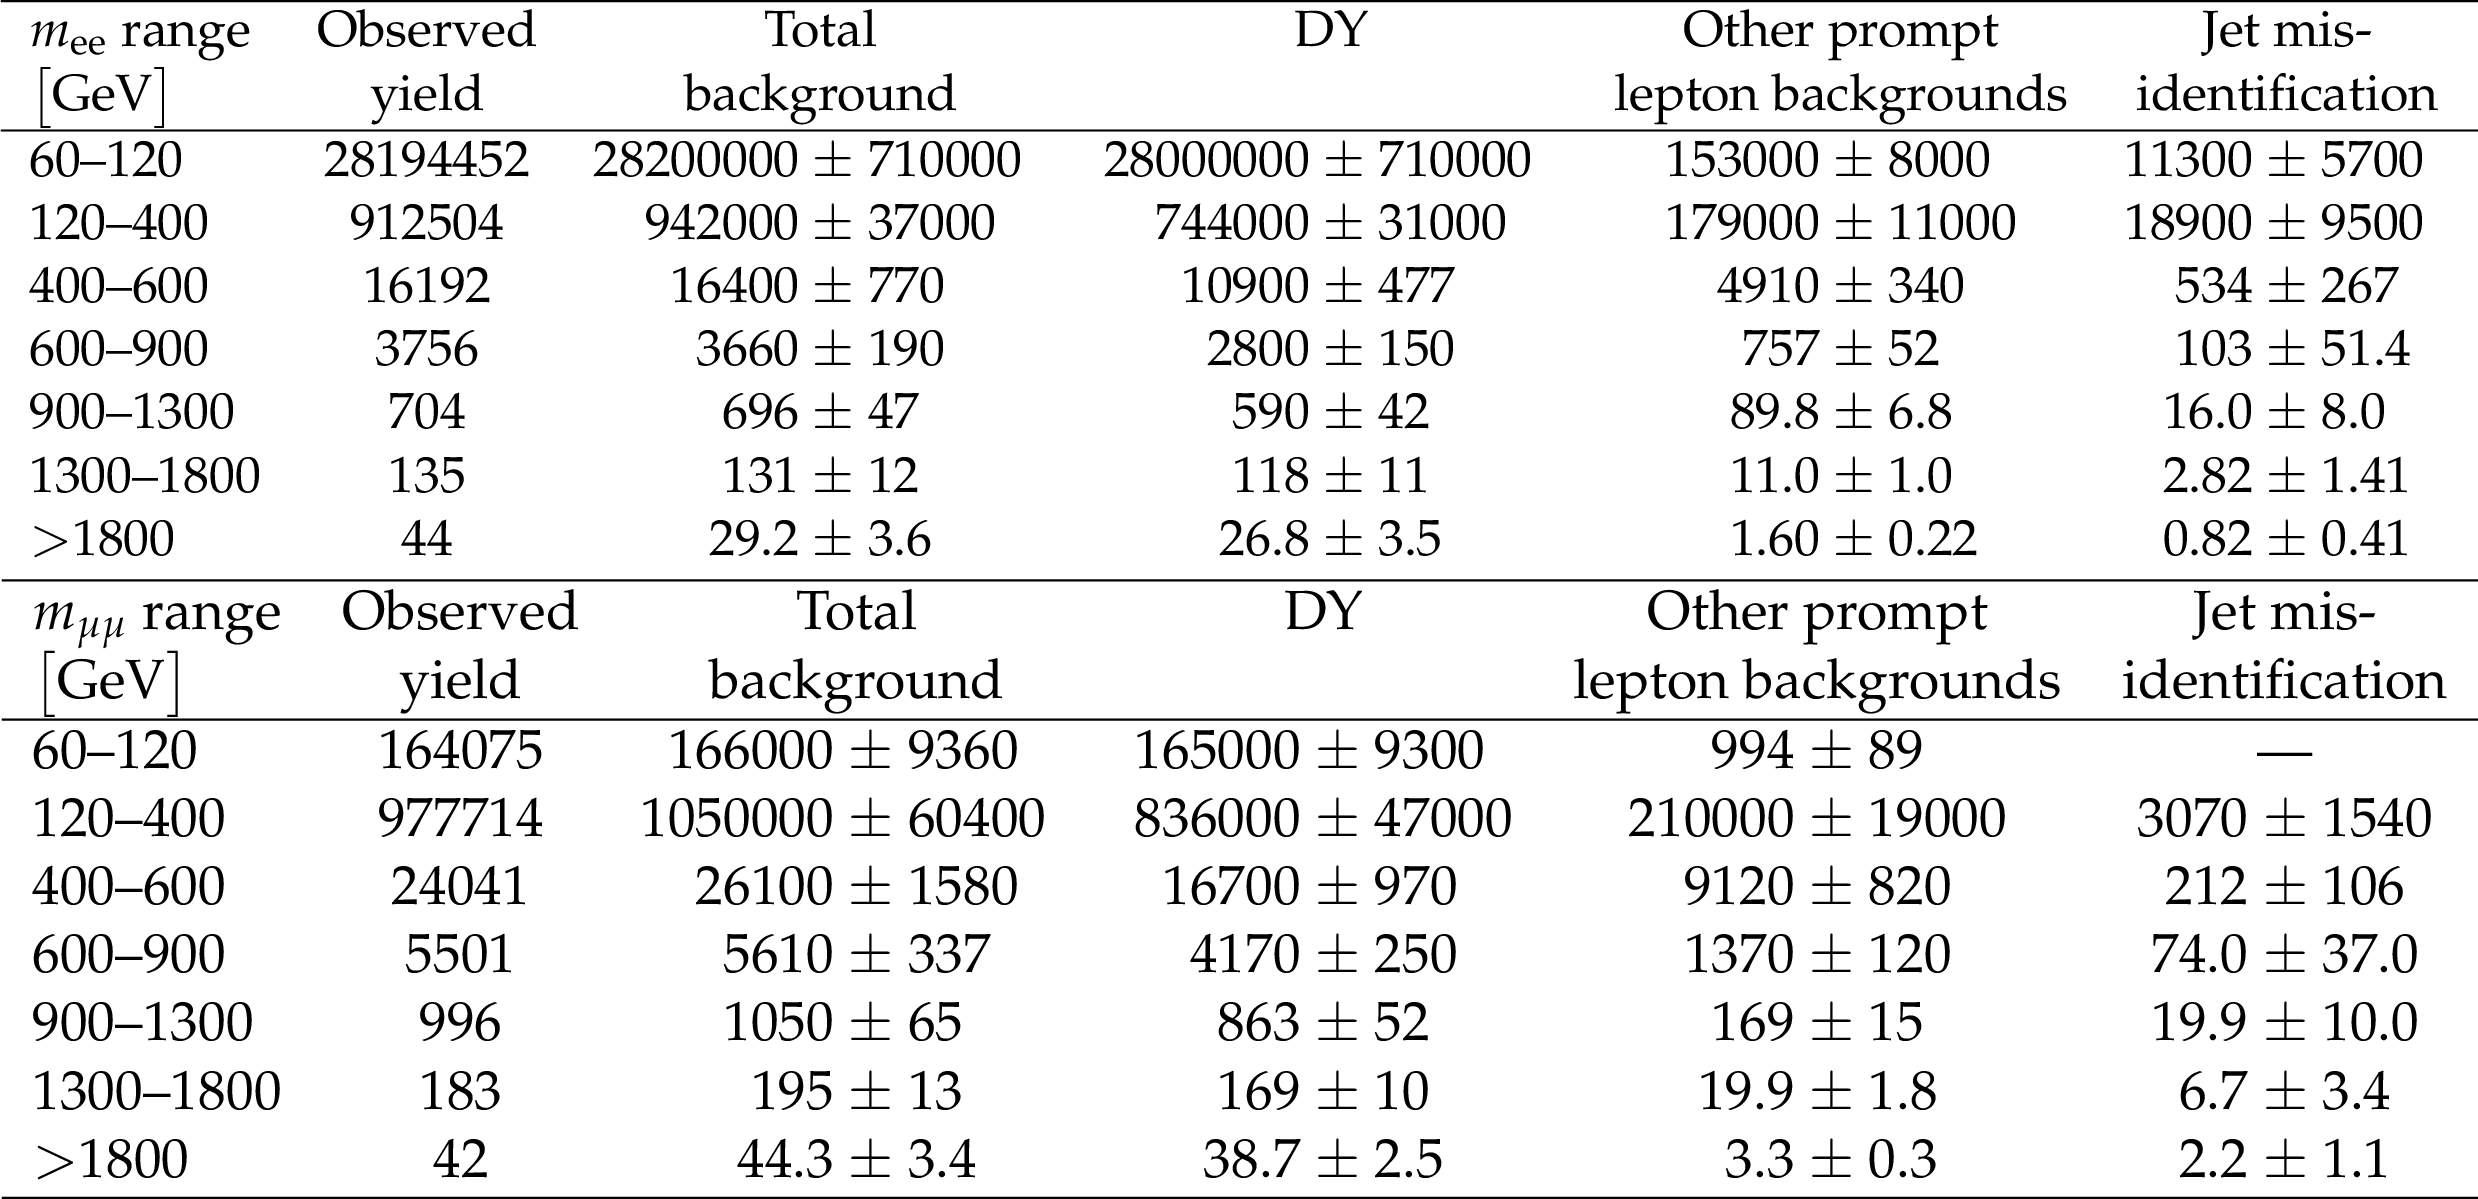
Table 4:
Observed and expected background yields for different mass ranges in the (upper) dielectron channel and (lower) dimuon channel. The sum of all background contributions is shown as well as a breakdown into the three main categories. The quoted uncertainties include both the statistical and the systematic components. |
png pdf |
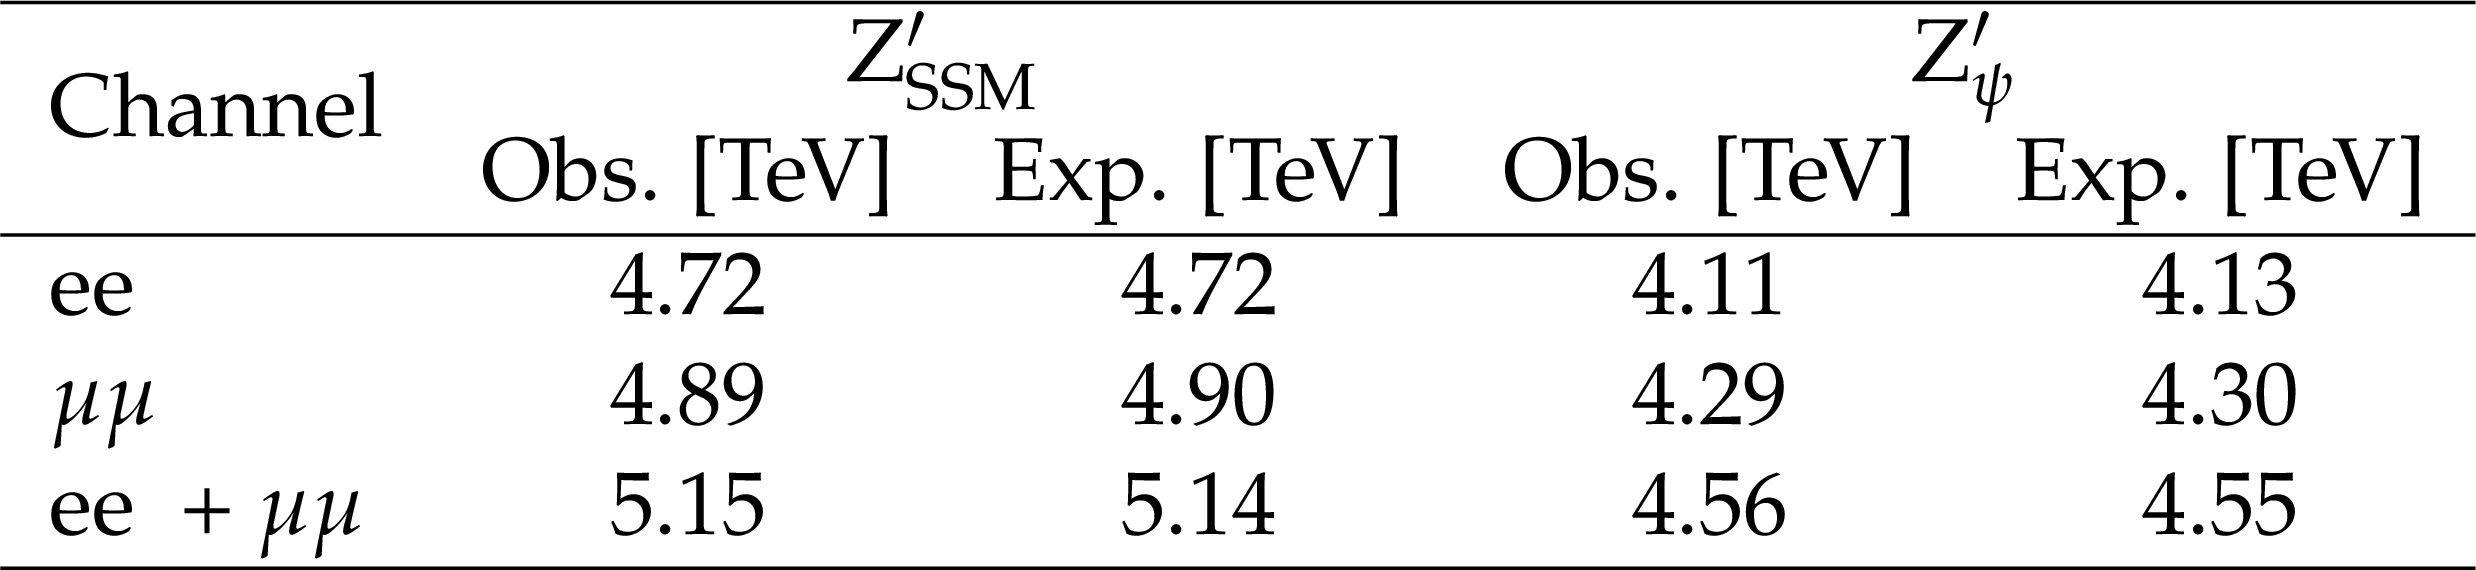
Table 5:
The observed (Obs.) and expected (Exp.) 95% CL lower limits on the masses of spin-1 ${\mathrm{Z'} _\mathrm {SSM}}$ and ${\mathrm{Z'} _\psi}$ bosons, assuming a signal width of 0.6 (3.0)% of the resonance mass for ${\mathrm{Z'} _\psi}$ (${\mathrm{Z'} _\mathrm {SSM}}$). |

png pdf |
Table 6:
The observed and expected 95% CL lower limits on the masses of spin-2 resonances for widths equal to 0.01, 0.36, and 1.42 GeV, corresponding to coupling parameters $k/\overline {M}_\mathrm {Pl}$ of 0.01, 0.05, and 0.10. |
png pdf |
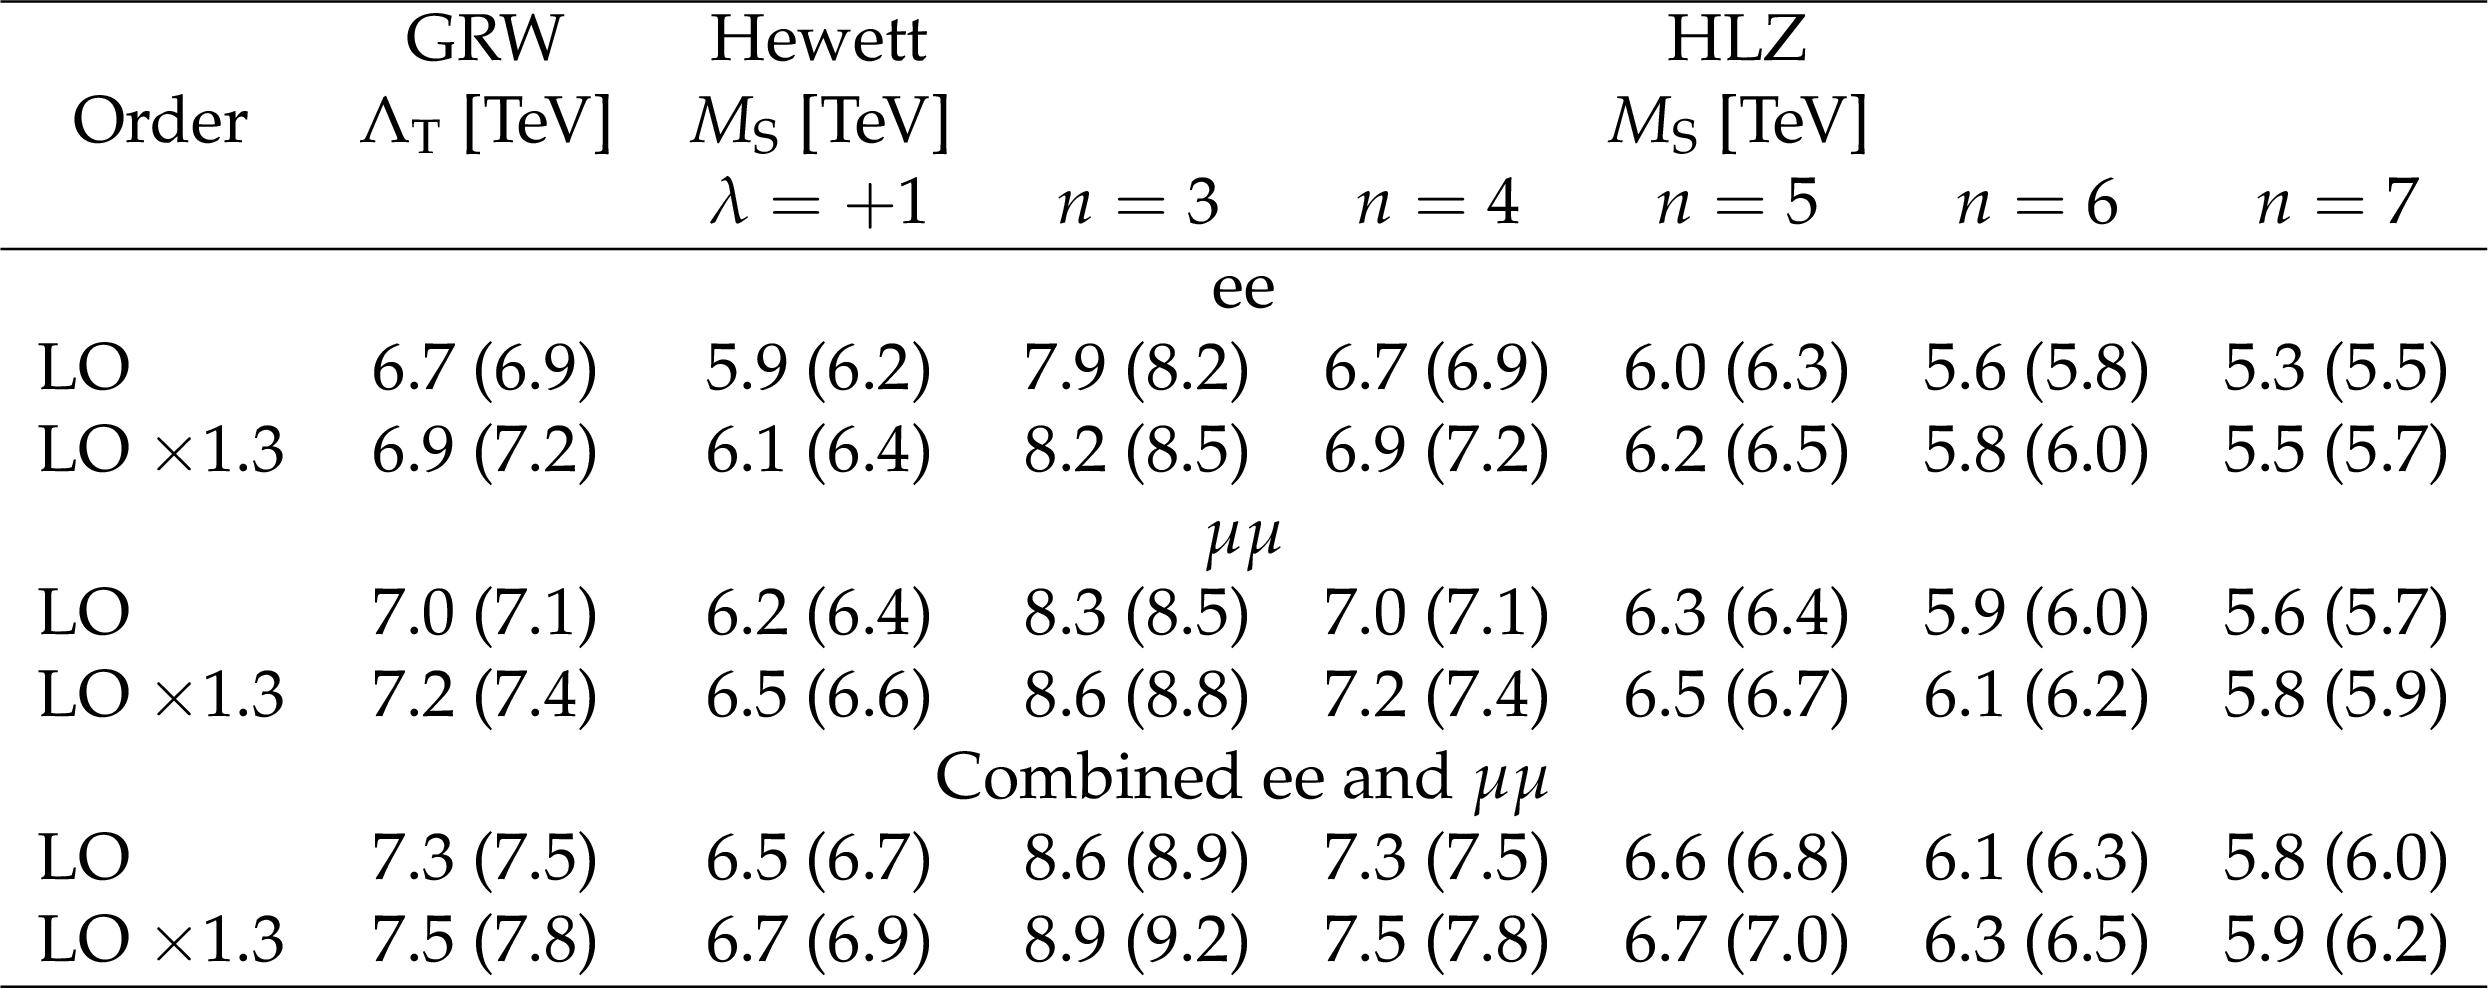
Table 7:
Exclusion limits at 95% CL for the electron and muon channels, and their combination, for various parameter conventions of the ADD model. Signal model cross sections are calculated up to LO and the NNLO correction factor of 1.3 is applied. For each of the model parameters, the observed limit is shown first, followed by the expected limit in parentheses. |
| Summary |
|
A search for resonant and nonresonant new phenomena in the dilepton invariant mass spectrum in proton-proton collisions at $\sqrt{s} = $ 13 TeV corresponding to an integrated luminosity of up to 140 fb$^{-1}$ has been presented. High-mass dielectron and dimuon events were reconstructed and selected with algorithms optimized for electrons and muons with high transverse momenta. Standard model (SM) backgrounds were primarily estimated from simulation, with the dominant Drell-Yan background corrected to the highest order calculations available, including the contribution from photon-induced processes. When searching for resonant signals, the background normalizations were obtained from sidebands in the data, while for non-resonant signals, the background was normalized to the data in a control region around the Z boson peak. No significant deviation from SM expectation is observed. Upper limits are set on the ratio of the product of the production cross section and the branching fraction in a dilepton channel of a new resonance with an intrinsic width of up to 10% to that of the SM Z boson at 95% confidence level. The limits are interpreted in the context of a sequential SM (SSM) and a superstring-inspired model that predict spin-1 resonances. Lower mass limits of 5.15 (4.56) TeV are set in the $\mathrm{Z}'_{\text{SSM}}$ ($\mathrm{Z}'_{\psi}$) models. The observed limit on narrow spin-1 resonances is translated into limits on generalized couplings of the Z' to up and down quarks in several classes of new physics models. For spin-2 graviton resonances in the Randall-Sundrum model of extra dimensions, lower limits on the graviton mass of 2.47-4.78 TeV are set for values of the coupling parameter $k/\overline{M}_{\mathrm{Pl}}$ between 0.01 and 0.1. The lower mass limits for spin-1 and spin-2 resonances are the most stringent to date. For spin-1 resonances that act as a mediator between SM particles and dark matter (DM), exclusion limits are set in the mass plane of the mediator and DM particles. For large values of $m_{\mathrm{DM}}$, mediator masses below 1.92 (4.64) TeV are excluded in a model where the mediator is a vector (axial vector) with small (large) coupling to leptons. For $m_{\mathrm{DM}} = $ 0, these limits are reduced to 1.04 and 3.41 TeV, respectively. Two models of nonresonant signatures have been considered. In case of a four-fermion contact interaction, lower limits on the ultraviolet cutoff parameter $\Lambda$ range from 23.8 to 36.4 TeV depending on the helicity structure of the interaction and the sign of its interference with the SM Drell-Yan background. In the Arkani-Hamed, Dimopoulos, and Dvali model of large extra dimensions, lower limits on the ultraviolet cutoff ranging from 5.9 to 8.9 TeV are set, depending on the parameter convention. For the first time in this kind of analysis, the dimuon and dielectron invariant mass spectra are corrected for the detector effects and compared at the TeV scale. No significant deviation from lepton flavor universality is observed. |
| Additional Figures | |
png pdf |
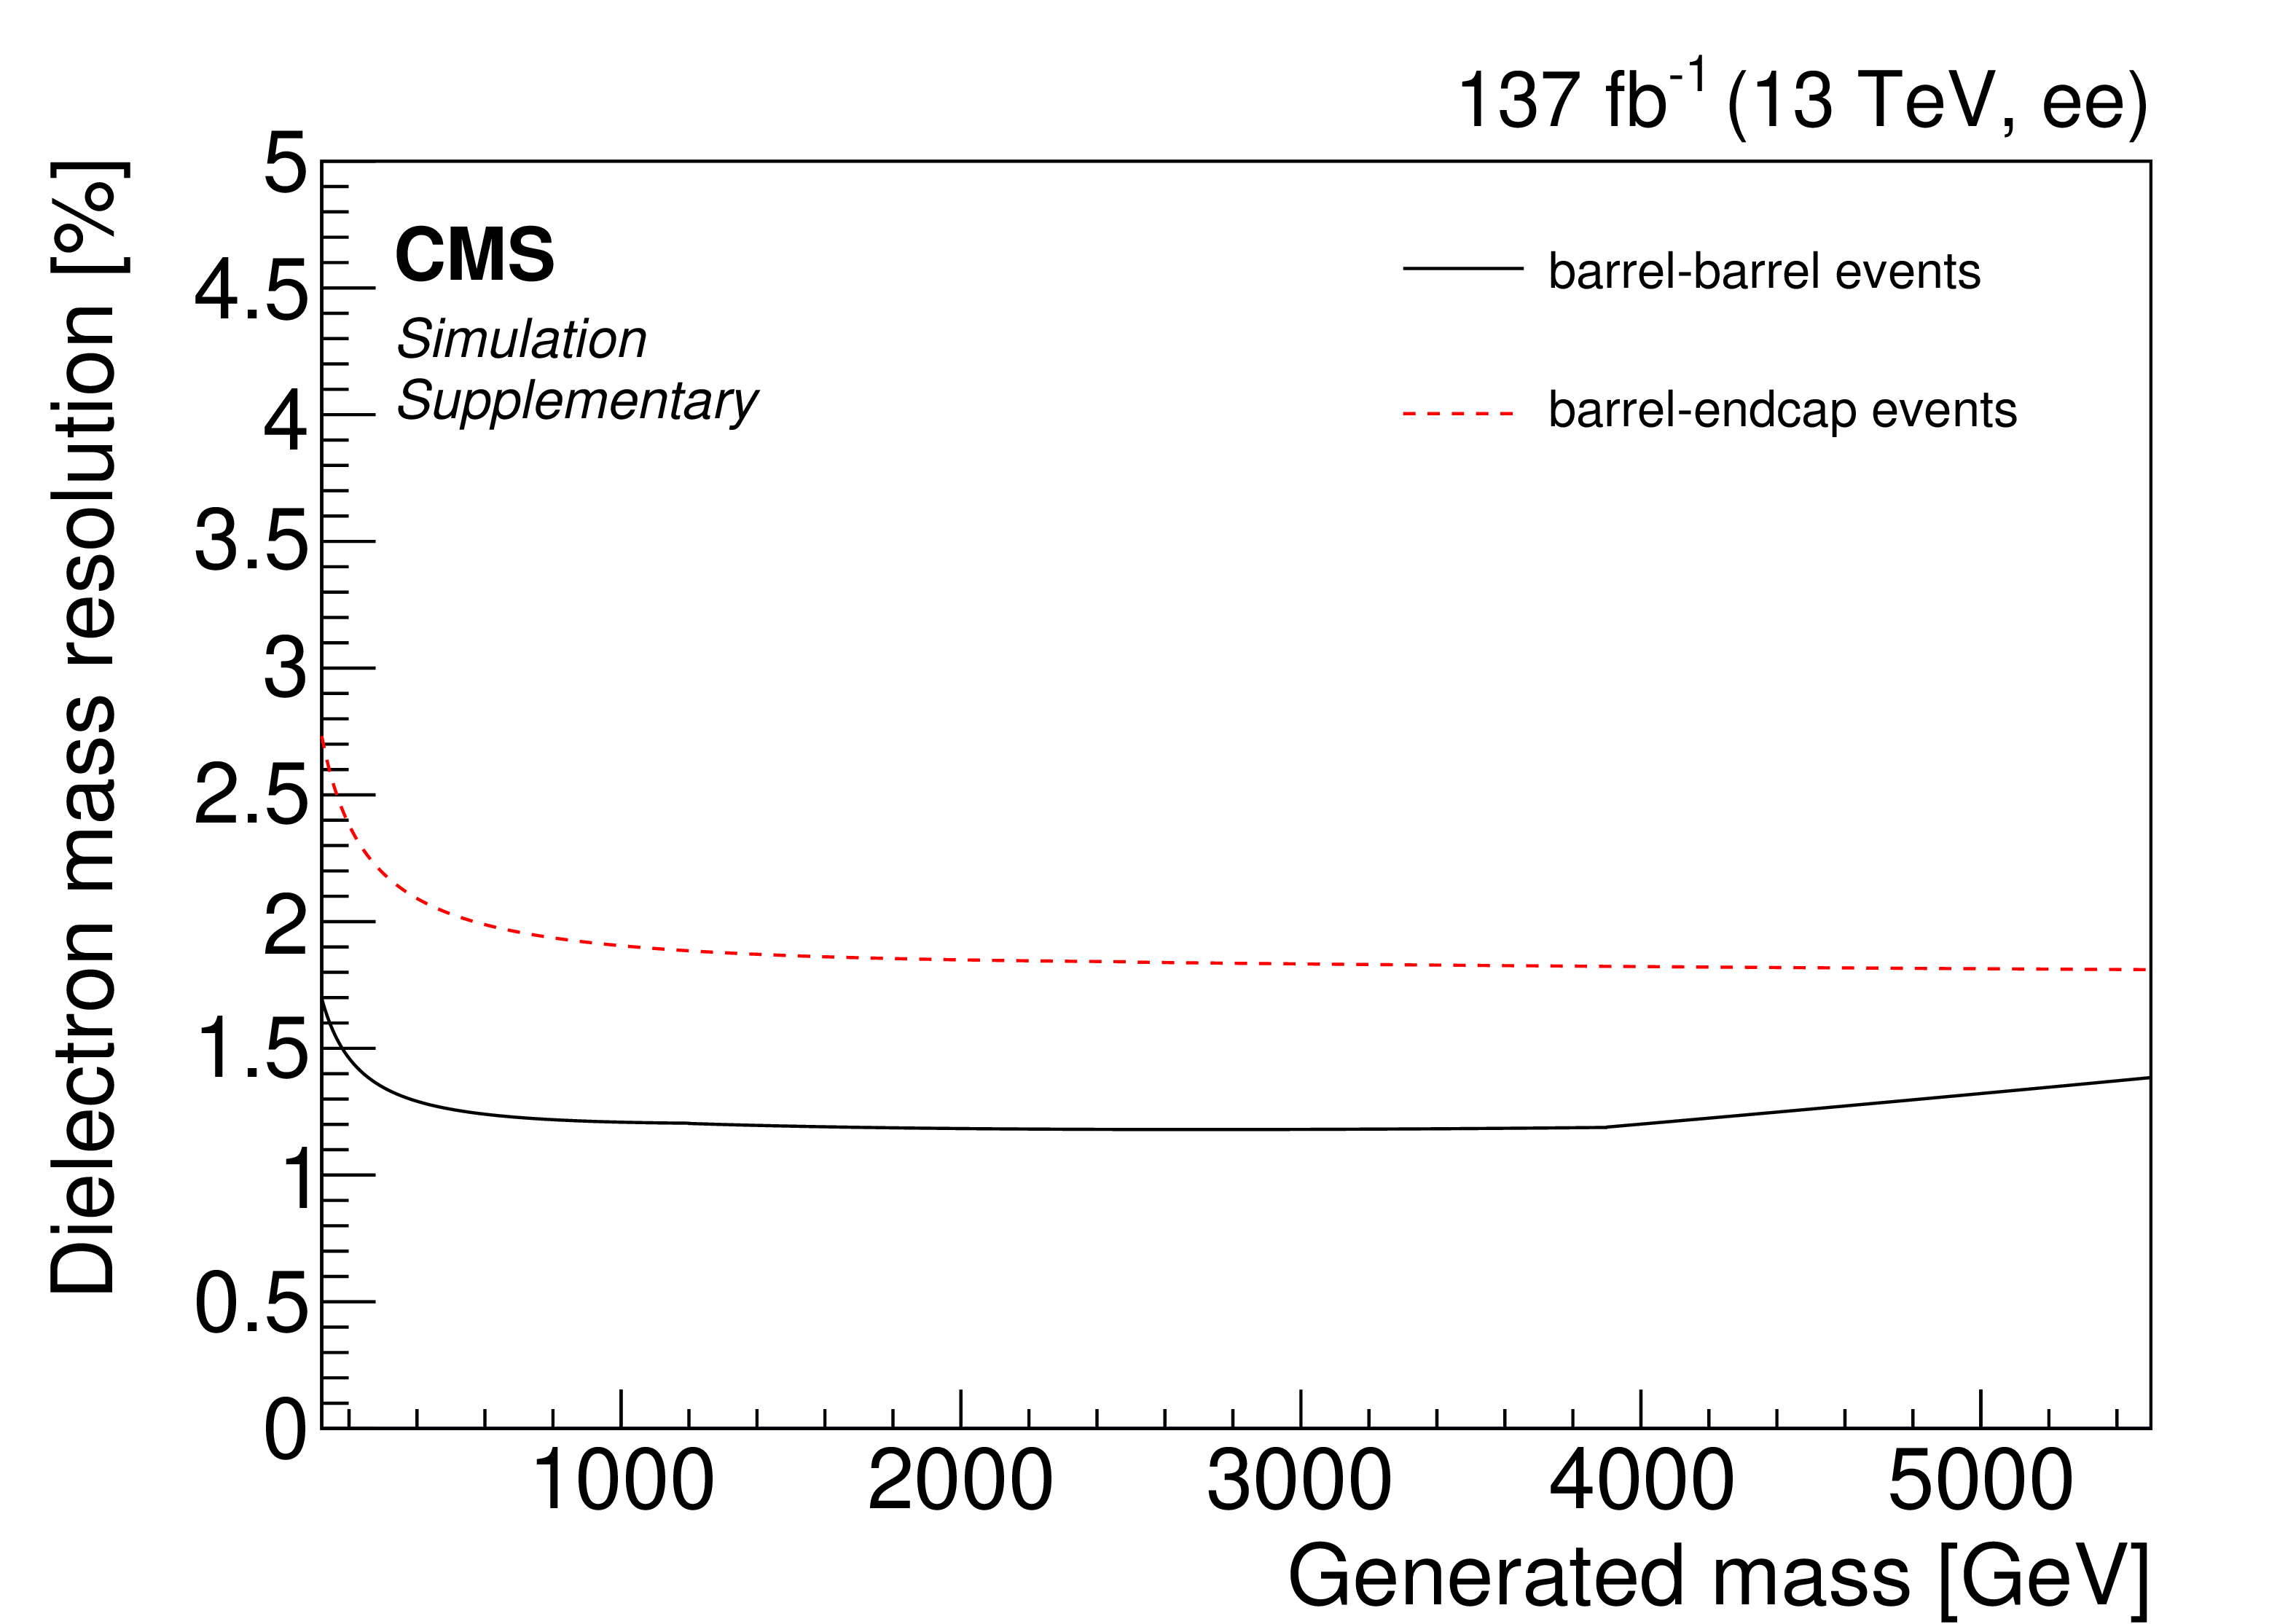
Additional Figure 1:
Invariant mass resolution for dielectron pairs as obtained from simulated DY samples as a function of generated mass. The resolution for events with two electrons in the barrel (one electron in the barrel and one in the endcaps) is shown as a black line (dashed red line). |

png pdf |
Additional Figure 2:
Invariant mass resolution for dimuon pairs as obtained from simulated DY samples as a function of generated mass. The resolution for events with two muons in the barrel (at least one muon in the endcaps) is shown as a black line (dashed red line). |
png pdf |
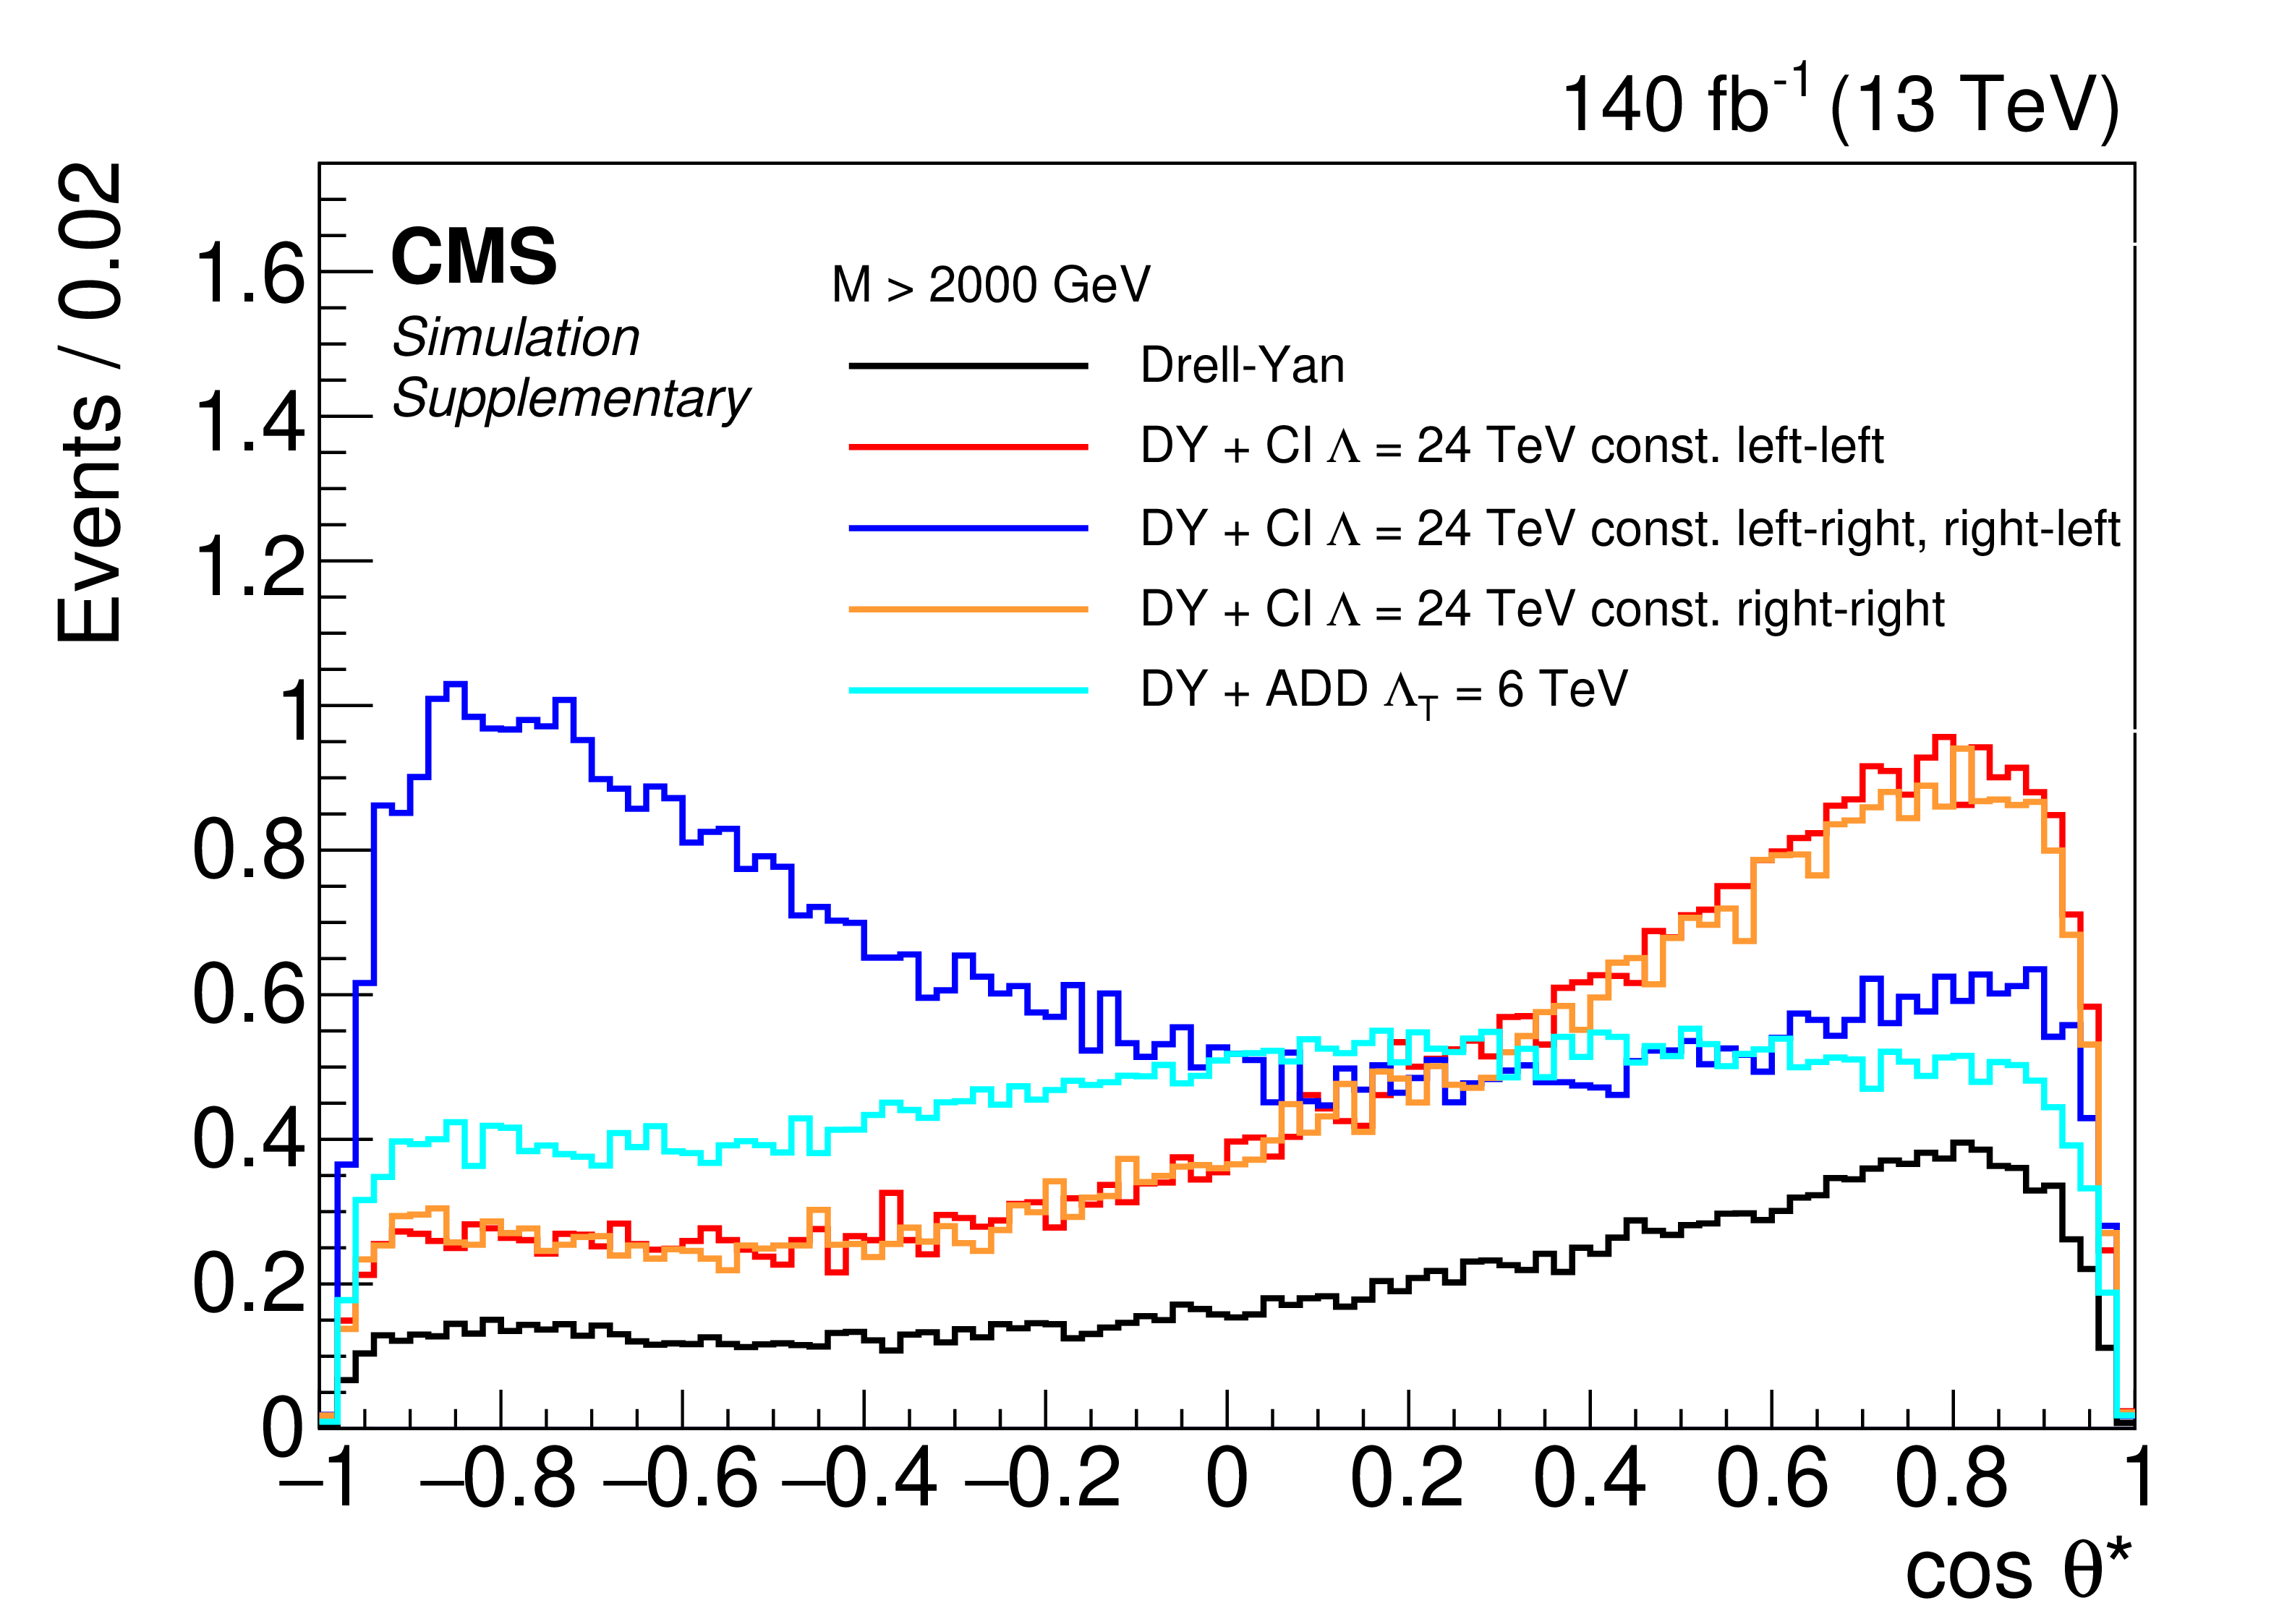
Additional Figure 3:
Distribution of $\cos\theta ^\ast $ in dimuon events for invariant masses above 2000 GeV as obtained from DY and signal simulation. The DY background is shown in black. The signal MC samples contain the DY contribution to model interference between signal and background. Four CI signals with $\Lambda = $ 24 TeV and constructive interference are shown, differing by the helicity configuration of the interaction. The left-left model shown in red, the left-right and right-left model in blue, and the right-right model in orange. An ADD sample with $\Lambda _{\mathrm {T}} = $ 6 TeV is shown in cyan. |
| References | ||||
| 1 | A. Leike | The phenomenology of extra neutral gauge bosons | PR 317 (1999) 143 | hep-ph/9805494 |
| 2 | P. Langacker | The physics of heavy Z' gauge bosons | Rev. Mod. Phys. 81 (2009) 1199 | 0801.1345 |
| 3 | N. Arkani-Hamed, S. Dimopoulos, and G. Dvali | The hierarchy problem and new dimensions at a millimeter | PLB 429 (1998) 263 | hep-ph/9803315 |
| 4 | N. Arkani-Hamed, S. Dimopoulos, and G. Dvali | Phenomenology, astrophysics and cosmology of theories with sub-millimeter dimensions and TeV scale quantum gravity | PRD 59 (1999) 086004 | hep-ph/9807344 |
| 5 | L. Randall and R. Sundrum | A large mass hierarchy from a small extra dimension | PRL 83 (1999) 3370 | hep-ph/9905221 |
| 6 | Planck Collaboration | Planck 2015 results. XIII. Cosmological parameters | Astron. Astrophys. 594 (2016) A13 | 1502.01589 |
| 7 | LHC New Physics Working Group Collaboration | Simplified models for LHC new physics searches | JPG 39 (2012) 105005 | 1105.2838 |
| 8 | E. Eichten, I. Hinchliffe, K. Lane, and C. Quigg | Supercollider physics | Rev. Mod. Phys. 56 (1984) 579 | |
| 9 | E. Eichten, K. Lane, and M. Peskin | New tests for quark and lepton substructure | PRL 50 (1983) 811 | |
| 10 | LHCb Collaboration | Test of lepton universality with $ b^{0} \rightarrow k^{*0}\ell^{+}\ell^{-} $ decays | JHEP 08 (2017) 055 | 1705.05802 |
| 11 | LHCb Collaboration | Search for lepton-universality violation in $ B^+\to K^+\ell^+\ell^- $ decays | PRL 122 (2019) 191801 | 1903.09252 |
| 12 | S. Bifani, S. Descotes-Genon, A. Romero Vidal, and M.-H. Schune | Review of lepton universality tests in $ b $ decays | JPG 46 (2019) 023001 | 1809.06229 |
| 13 | D. Be\vcirević, N. Ko\vsnik, O. Sumensari, and R. Zukanovich Funchal | Palatable leptoquark scenarios for lepton flavor violation in exclusive $ b\to s\ell_1\ell_2 $ modes | JHEP 11 (2016) 035 | 1608.07583 |
| 14 | A. Greljo and D. Marzocca | High-$ p_{\mathrm{T}} $ dilepton tails and flavor physics | EPJC 77 (2017) 548 | 1704.09015 |
| 15 | CMS Collaboration | Search for resonances in the dilepton mass distribution in $ {\mathrm{p}}{\mathrm{p}} $ collisions at $ \sqrt{s}= $ 7 TeV | JHEP 05 (2011) 093 | CMS-EXO-10-013 1103.0981 |
| 16 | CMS Collaboration | Search for narrow resonances in dilepton mass spectra in $ {\mathrm{p}}{\mathrm{p}} $ collisions at $ \sqrt{s}= $ 7 TeV | PLB 714 (2012) 158 | CMS-EXO-11-019 1206.1849 |
| 17 | CMS Collaboration | Search for heavy narrow dilepton resonances in $ {\mathrm{p}}{\mathrm{p}} $ collisions at $ \sqrt{s}= $ 7 TeV and $ \sqrt{s}= $ 8 TeV | PLB 720 (2013) 63 | CMS-EXO-12-015 1212.6175 |
| 18 | CMS Collaboration | Search for physics beyond the standard model in dilepton mass spectra in proton-proton collisions at $ \sqrt{s}= $ 8 TeV | JHEP 04 (2015) 025 | CMS-EXO-12-061 1412.6302 |
| 19 | CMS Collaboration | Search for narrow resonances in dilepton mass spectra in proton-proton collisions at $ \sqrt{s} = $ 13 TeV and combination with 8 TeV data | PLB 768 (2017) 57 | CMS-EXO-15-005 1609.05391 |
| 20 | CMS Collaboration | Search for high-mass resonances in dilepton final states in proton-proton collisions at $ \sqrt{s}= $ 13 TeV | JHEP 06 (2018) 120 | CMS-EXO-16-047 1803.06292 |
| 21 | ATLAS Collaboration | Search for high mass dilepton resonances in $ {\mathrm{p}}{\mathrm{p}} $ collisions at $ \sqrt{s}= $ 7 TeV with the ATLAS experiment | PLB 700 (2011) 163 | 1103.6218 |
| 22 | ATLAS Collaboration | Search for high-mass resonances decaying to dilepton final states in $ {\mathrm{p}}{\mathrm{p}} $ collisions at $ \sqrt{s} = $ 7 TeV with the ATLAS detector | JHEP 11 (2012) 138 | 1209.2535 |
| 23 | ATLAS Collaboration | Search for high-mass dilepton resonances in pp collisions at $ \sqrt{s}= $ 8 TeV with the ATLAS detector | PRD 90 (2014) 052005 | 1405.4123 |
| 24 | ATLAS Collaboration | Search for new high-mass phenomena in the dilepton final state using 36.1 fb$ ^{-1} $ of proton-proton collision data at $ \sqrt{s} = $ 13 TeV with the ATLAS detector | JHEP 10 (2017) 182 | 1707.02424 |
| 25 | ATLAS Collaboration | Search for high-mass dilepton resonances using 139 fb$ ^{-1} $ of $ pp $ collision data collected at $ \sqrt{s}= $ 13 TeV with the ATLAS detector | PLB 796 (2019) 68 | 1903.06248 |
| 26 | ATLAS Collaboration | Constraints on mediator-based dark matter and scalar dark energy models using $ \sqrt{s} = 13 TeV pp $ collision data collected by the ATLAS detector | JHEP 05 (2019) 142 | 1903.01400 |
| 27 | CMS Collaboration | Search for contact interactions and large extra dimensions in the dilepton mass spectra from proton-proton collisions at $ \sqrt{s} = $ 13 TeV | JHEP 04 (2019) 114 | CMS-EXO-17-025 1812.10443 |
| 28 | CMS Collaboration | Search for physics beyond the standard model in high-mass diphoton events from proton-proton collisions at $ \sqrt{s}= $ 13 TeV | PRD 98 (2018) 092001 | CMS-EXO-17-017 1809.00327 |
| 29 | CMS Collaboration | Search for new physics in dijet angular distributions using proton-proton collisions at $ \sqrt{s}= $ 13 TeV and constraints on dark matter and other models | EPJC 78 (2018) 789 | CMS-EXO-16-046 1803.08030 |
| 30 | ATLAS Collaboration | Search for new phenomena in dijet events using 37 fb$ ^{-1} $ of $ pp $ collision data collected at $ \sqrt{s}= $ 13 TeV with the ATLAS detector | PRD 96 (2017) 052004 | 1703.09127 |
| 31 | ATLAS Collaboration | Search for contact interactions and large extra dimensions in the dilepton channel using proton-proton collisions at $ \sqrt{s}= $ 8 TeV with the ATLAS detector | EPJC 74 (2014) 3134 | 1407.2410 |
| 32 | ATLAS Collaboration | Search for new non-resonant phenomena in high-mass dilepton final states with the ATLAS detector | JHEP 11 (2020) 005 | 2006.12946 |
| 33 | CMS Collaboration | CMS Luminosity Measurements for the 2016 Data Taking Period | CMS-PAS-LUM-17-001 | CMS-PAS-LUM-17-001 |
| 34 | CMS Collaboration | CMS luminosity measurement for the 2017 data-taking period at $ \sqrt{s} = $ 13 TeV | CMS-PAS-LUM-17-004 | CMS-PAS-LUM-17-004 |
| 35 | CMS Collaboration | CMS luminosity measurement for the 2018 data-taking period at $ \sqrt{s} = $ 13 TeV | CMS-PAS-LUM-18-002 | CMS-PAS-LUM-18-002 |
| 36 | J. C. Collins and D. E. Soper | Angular distribution of dileptons in high-energy hadron collisions | PRD 16 (1977) 2219 | |
| 37 | CMS Collaboration | HEPDATA record for this analysis | to be released | |
| 38 | CMS Collaboration | CMS technical design report for the pixel detector upgrade | CDS | |
| 39 | CMS Collaboration | The CMS experiment at the CERN LHC | JINST 3 (2008) S08004 | CMS-00-001 |
| 40 | CMS Collaboration | The CMS trigger system | JINST 12 (2017) P01020 | CMS-TRG-12-001 1609.02366 |
| 41 | E. Accomando et al. | Z' physics with early LHC data | PRD 83 (2011) 075012 | 1010.6058 |
| 42 | G. Altarelli, B. Mele, and M. Ruiz-Altaba | Searching for new heavy vector bosons in $ {\mathrm{p}}\mathrm{\bar{p}} $ colliders | Z. Phys. C 45 (1989) 109 | |
| 43 | J. L. Hewett and T. G. Rizzo | Low-energy phenomenology of superstring-inspired E$ _6 $ models | PR 183 (1989) 193 | |
| 44 | E. Accomando et al. | Z' at the LHC: Interference and finite width effects in Drell-Yan | JHEP 10 (2013) 153 | 1304.6700 |
| 45 | M. S. Carena, A. Daleo, B. A. Dobrescu, and T. M. P. Tait | Z' gauge bosons at the Tevatron | PRD 70 (2004) 093009 | hep-ph/0408098 |
| 46 | L. Randall and R. Sundrum | An alternative to compactification | PRL 83 (1999) 4690 | hep-th/9906064 |
| 47 | A. Albert et al. | Recommendations of the LHC Dark Matter Working Group: Comparing LHC searches for dark matter mediators in visible and invisible decay channels and calculations of the thermal relic density | Phys. Dark Univ. 26 (2019) 100377 | 1703.05703 |
| 48 | M. Backović et al. | Higher-order QCD predictions for dark matter production at the LHC in simplified models with $ s $ channel mediators | EPJC 75 (2015) 482 | 1508.05327 |
| 49 | G. F. Giudice, R. Rattazzi, and J. D. Wells | Quantum gravity and extra dimensions at high-energy colliders | NPB 544 (1999) 3 | hep-ph/9811291 |
| 50 | J. L. Hewett | Indirect collider signals for extra dimensions | PRL 82 (1999) 4765 | hep-ph/9811356 |
| 51 | T. Han, J. D. Lykken, and R.-J. Zhang | Kaluza--Klein states from large extra dimensions | PRD 59 (1999) 105006 | hep-ph/9811350 |
| 52 | P. Nason | A new method for combining NLO QCD with shower Monte Carlo algorithms | JHEP 11 (2004) 040 | hep-ph/0409146 |
| 53 | S. Frixione, P. Nason, and C. Oleari | Matching NLO QCD computations with parton shower simulations: the POWHEG method | JHEP 11 (2007) 070 | 0709.2092 |
| 54 | S. Alioli, P. Nason, C. Oleari, and E. Re | A general framework for implementing NLO calculations in shower Monte Carlo programs: the POWHEG BOX | JHEP 06 (2010) 043 | 1002.2581 |
| 55 | S. Alioli, P. Nason, C. Oleari, and E. Re | NLO vector-boson production matched with shower in POWHEG | JHEP 07 (2008) 060 | 0805.4802 |
| 56 | S. Frixione, P. Nason, and G. Ridolfi | A positive-weight next-to-leading-order Monte Carlo for heavy flavour hadroproduction | JHEP 09 (2007) 126 | 0707.3088 |
| 57 | E. Re | Single-top Wt-channel production matched with parton showers using the POWHEG method | EPJC 71 (2011) 1547 | 1009.2450 |
| 58 | M. R. Whalley, D. Bourilkov, and R. C. Group | The Les Houches accord PDFs (LHAPDF) and LHAGLUE | in HERA and the LHC: A Workshop on the implications of HERA for LHC physics. Proceedings, Part B 2005 | hep-ph/0508110 |
| 59 | D. Bourilkov, R. C. Group, and M. R. Whalley | LHAPDF: PDF use from the Tevatron to the LHC | in TeV4LHC Workshop - 4th meeting Batavia, Illinois, October 20-22, 2005 (2006) | hep-ph/0605240 |
| 60 | A. Buckley et al. | LHAPDF6: parton density access in the LHC precision era | EPJC 75 (2015) 132 | 1412.7420 |
| 61 | NNPDF Collaboration | Parton distributions for the LHC Run II | JHEP 04 (2015) 040 | 1410.8849 |
| 62 | NNPDF Collaboration | Parton distributions from high-precision collider data | EPJC 77 (2017) 663 | 1706.00428 |
| 63 | T. Sjostrand et al. | An Introduction to PYTHIA 8.2 | CPC 191 (2015) 159 | 1410.3012 |
| 64 | CMS Collaboration | Event generator tunes obtained from underlying event and multiparton scattering measurements | EPJC 76 (2016) 155 | CMS-GEN-14-001 1512.00815 |
| 65 | CMS Collaboration | Extraction and validation of a new set of CMS PYTHIA8 tunes from underlying-event measurements | EPJC 80 (2020) 4 | CMS-GEN-17-001 1903.12179 |
| 66 | Y. Li and F. Petriello | Combining QCD and electroweak corrections to dilepton production in FEWZ | PRD 86 (2012) 094034 | 1208.5967 |
| 67 | A. Manohar, P. Nason, G. P. Salam, and G. Zanderighi | How bright is the proton? A precise determination of the photon parton distribution function | PRL 117 (2016) 242002 | 1607.04266 |
| 68 | J. Butterworth et al. | PDF4LHC recommendations for LHC Run II | JPG 43 (2016) 023001 | 1510.03865 |
| 69 | D. Bourilkov | Photon-induced background for dilepton searches and measurements in pp collisions at 13 TeV | 1606.00523 | |
| 70 | D. Bourilkov | Exploring the LHC landscape with dileptons | 1609.08994 | |
| 71 | M. Czakon and A. Mitov | Top++: a program for the calculation of the top-pair cross-section at hadron colliders | CPC 185 (2014) 2930 | 1112.5675 |
| 72 | N. Kidonakis | Two-loop soft anomalous dimensions for single top quark associated production with a W$ ^{-} $ or H$ ^{-} $ | PRD 82 (2010) 054018 | 1005.4451 |
| 73 | J. Alwall et al. | The automated computation of tree-level and next-to-leading order differential cross sections and their matching to parton shower simulations | JHEP 07 (2014) 079 | 1405.0301 |
| 74 | R. Boughezal et al. | Color-singlet production at NNLO in MCFM | EPJC 77 (2016) 7 | 1605.08011 |
| 75 | J. M. Campbell, R. K. Ellis, and W. T. Giele | A multi-threaded version of MCFM | EPJC 75 (2015) 246 | 1503.06182 |
| 76 | J. M. Campbell, R. K. Ellis, and C. Williams | Vector boson pair production at the LHC | JHEP 07 (2011) 018 | 1105.0020 |
| 77 | J. M. Campbell and R. K. Ellis | Update on vector boson pair production at hadron colliders | PRD 60 (1999) 113006 | hep-ph/9905386 |
| 78 | T. Ahmed et al. | NNLO QCD corrections to the Drell--Yan cross section in models of TeV-scale gravity | EPJC 77 (2017) 22 | 1606.08454 |
| 79 | CMS Collaboration | Performance of the CMS Level-1 trigger in proton-proton collisions at $ \sqrt{s} = $ 13 TeV | JINST 15 (2020) P10017 | CMS-TRG-17-001 2006.10165 |
| 80 | GEANT4 Collaboration | GEANT4--a simulation toolkit | NIMA 506 (2003) 250 | |
| 81 | CMS Collaboration | Performance of electron reconstruction and selection with the CMS detector in proton-proton collisions at $ \sqrt{s}= $ 8 TeV | JINST 10 (2015) P06005 | CMS-EGM-13-001 1502.02701 |
| 82 | CMS Collaboration | Electron and photon reconstruction and identification with the CMS experiment at the CERN LHC | Submitted to JINST | CMS-EGM-17-001 2012.06888 |
| 83 | CMS Collaboration | Performance of the CMS muon trigger system in proton-proton collisions at $ \sqrt{s} = $ 13 TeV | Submitted to JINST | CMS-MUO-19-001 2102.04790 |
| 84 | CMS Collaboration | Performance of CMS muon reconstruction in $ {\mathrm{p}}{\mathrm{p}} $ collision events at $ \sqrt{s} = $ 7 TeV | JINST 7 (2012) P10002 | CMS-MUO-10-004 1206.4071 |
| 85 | CMS Collaboration | Performance of the reconstruction and identification of high-momentum muons in proton-proton collisions at $ \sqrt{s} = $ 13 TeV | JINST 15 (2020) P02027 | CMS-MUO-17-001 1912.03516 |
| 86 | CMS Collaboration | Measurement of the inelastic proton-proton cross section at $ \sqrt{s}= $ 13 TeV | JHEP 07 (2018) 161 | CMS-FSQ-15-005 1802.02613 |
| 87 | Particle Data Group, P. A. Zyla et al. | Review of particle physics | Prog. Theor. Exp. Phys | |
| 88 | The ATLAS Collaboration, The CMS Collaboration, The LHC Higgs Combination Group | Procedure for the LHC Higgs boson search combination in Summer 2011 | CMS-NOTE-2011-005 | |
| 89 | L. Moneta et al. | The RooStats project | in 13th International Workshop on Advanced Computing and Analysis Techniques in Physics Research (ACAT2010) SISSA, 2010 | 1009.1003 |
| 90 | M. J. Oreglia | A study of the reactions $\psi' \to \gamma\gamma \psi$ | PhD thesis, Stanford University, 1980 SLAC Report SLAC-R-236, see A | |
| 91 | BaBar Collaboration | Study of $ B \to X\gamma $ decays and determination of $ |V_{td}/V_{ts}| $ | PRD 82 (2010) 051101 | 1005.4087 |
| 92 | CMS Collaboration | Observation of a new boson at a mass of 125 GeV with the CMS experiment at the LHC | PLB 716 (2012) 30 | CMS-HIG-12-028 1207.7235 |
| 93 | J. Alwall et al. | Computing decay rates for new physics theories with FeynRules and MadGraph5_aMCatNLO | CPC 197 (2015) 312 | 1402.1178 |
| 94 | ATLAS Collaboration | Dark matter summary plots for s-channel mediators | ATL-PHYS-PUB-2020-021, CERN | |
| 95 | M. Backović et al. | MadDM: New dark matter tool in the LHC era | AIP Conf. Proc. 1743 (2016) 060001 | 1509.03683 |
| 96 | M. Backović, K. Kong, and M. McCaskey | MadDM v.1.0: Computation of dark matter relic abundance using MadGraph5 | Phys. Dark Univ. 5-6 (2014) 18 | 1308.4955 |
| 97 | E. Adelberger et al. | Torsion balance experiments: A low-energy frontier of particle physics | Prog. Part. NP 62 (2009) 102 | |
| 98 | S. Hannestad and G. G. Raffelt | Supernova and neutron star limits on large extra dimensions reexamined | PRD 67 (2003) 125008 | hep-ph/0304029 |
| 99 | T. Adye | Unfolding algorithms and tests using RooUnfold | in Proceedings, PHYSTAT 2011 workshop on statistical issues related to discovery claims in search experiments and unfolding, p. 313 2011 | 1105.1160 |
|
|
Compact Muon Solenoid LHC, CERN |
|

|

|

|

|

|