

Compact Muon Solenoid
LHC, CERN
| CMS-EXO-20-007 ; CERN-EP-2021-238 | ||
| Search for high-mass resonances decaying to a jet and a Lorentz-boosted resonance in proton-proton collisions at $\sqrt{s} = $ 13 TeV | ||
| CMS Collaboration | ||
| 6 January 2022 | ||
| Phys. Lett. B 832 (2022) 137263 | ||
| Abstract: A search is reported for high-mass hadronic resonances that decay to a parton and a Lorentz-boosted resonance, which in turn decays into a pair of partons. The search is based on data collected with the CMS detector at the LHC in proton-proton collisions at $\sqrt{s} = $ 13 TeV, corresponding to an integrated luminosity of 138 fb$^{-1}$. The boosted resonance is reconstructed as a single wide jet with substructure consistent with a two-body decay. The high-mass resonance is thus considered as a dijet system. The jet substructure information and the kinematic properties of cascade resonance decays are exploited to disentangle the signal from the large quantum chromodynamics multijet background. The dijet mass spectrum is analyzed for the presence of new high-mass resonances, and is found to be consistent with the standard model background predictions. Results are interpreted in a warped extra dimension model where the high-mass resonance is a Kaluza-Klein gluon, the boosted resonance is a radion, and the final state partons are all gluons. Limits on the production cross section are set as a function of the Kaluza-Klein gluon and radion masses. These limits exclude at 95% confidence level models with Kaluza-Klein gluon masses in the range from 2.0 to 4.3 TeV and radion masses in the range from 0.20 to 0.74 TeV. By exploring a novel experimental signature, the observed limits on the Kaluza-Klein gluon mass are extended by up to about 1 TeV compared to previous searches. | ||
| Links: e-print arXiv:2201.02140 [hep-ex] (PDF) ; CDS record ; inSPIRE record ; HepData record ; CADI line (restricted) ; | ||
| Figures | Summary | Additional Figures | References | CMS Publications |
|---|
| Figures | |
png pdf |
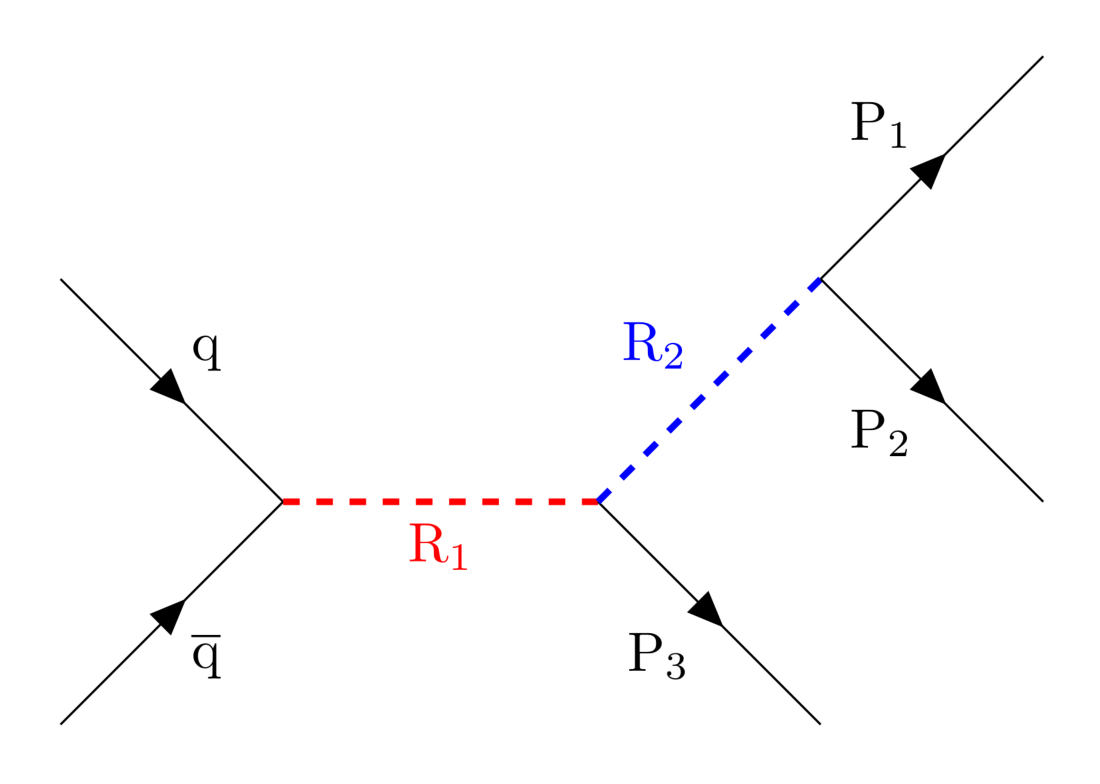
Figure 1:
Feynman diagram of leading order production of the process $ {\mathrm {R}_1} \to {\mathrm {R}_2} + {\mathrm {P}_3} \to ({\mathrm {P}_1} + {\mathrm {P}_2}) + {\mathrm {P}_3} $ involving cascade decays of two new massive resonances ${\mathrm {R}_1}$ and ${\mathrm {R}_2}$ to partons ${\mathrm {P}_1}$, ${\mathrm {P}_2}$, and ${\mathrm {P}_3}$ in the final state. |

png pdf |
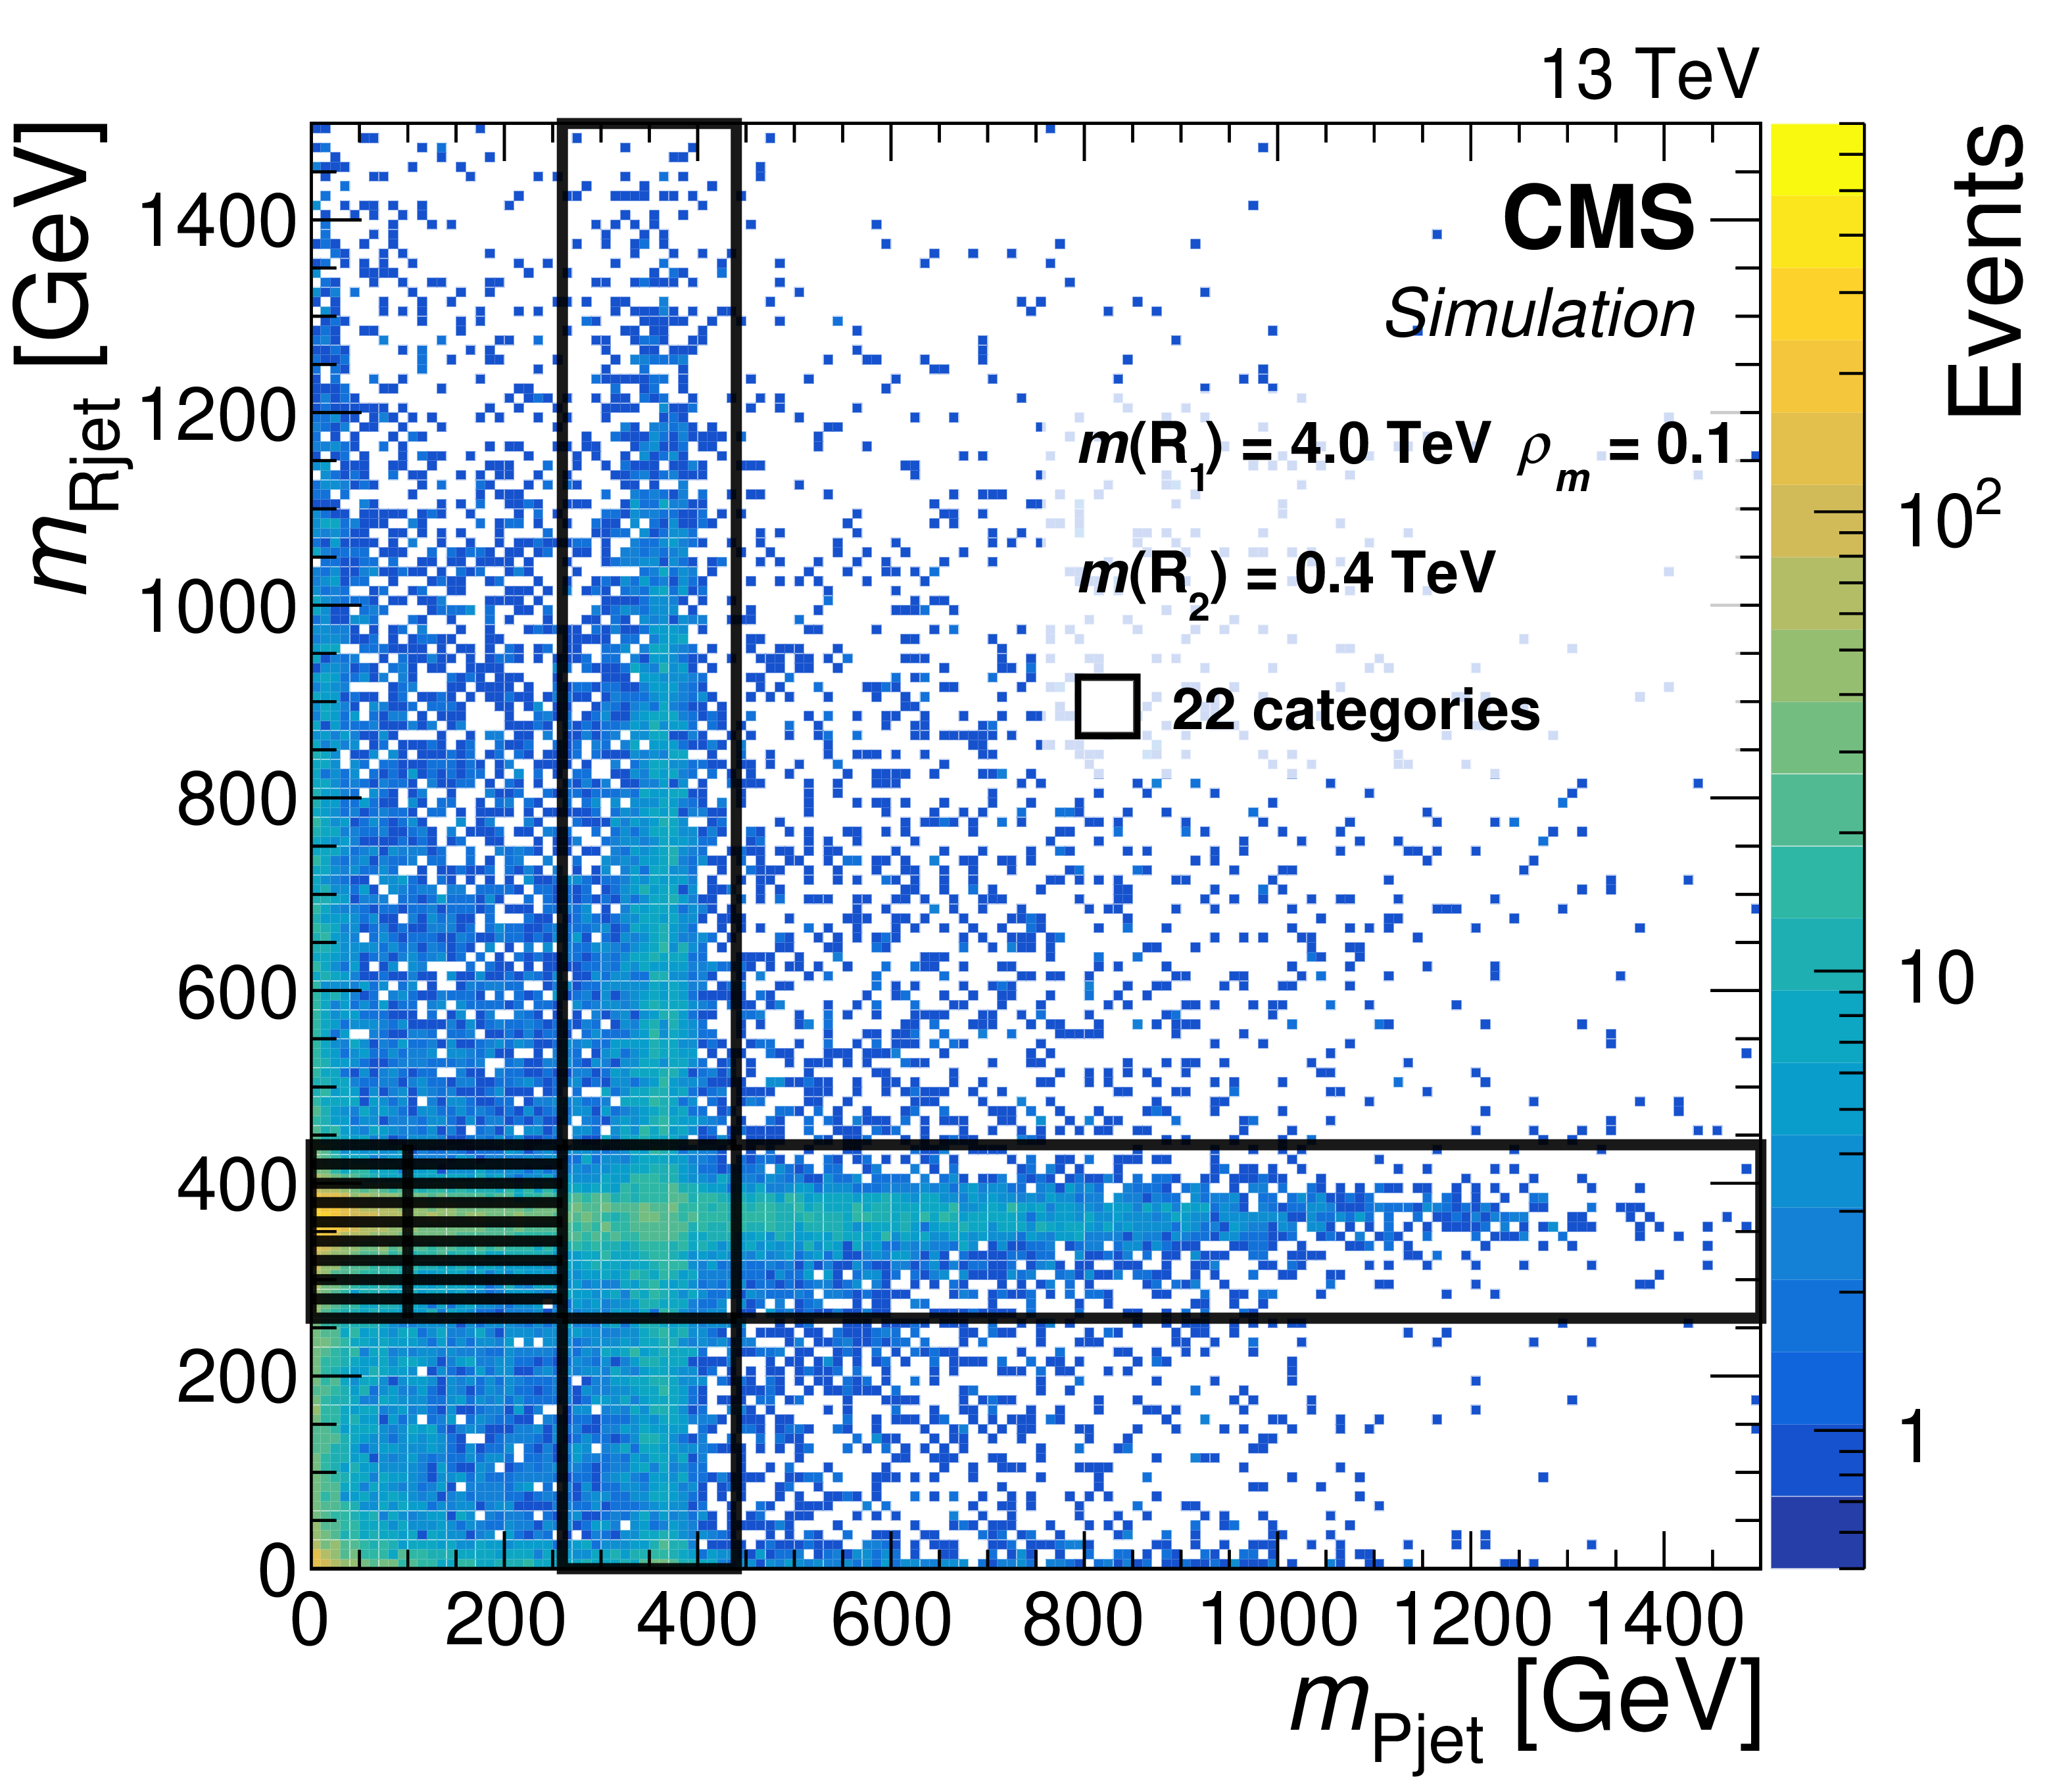
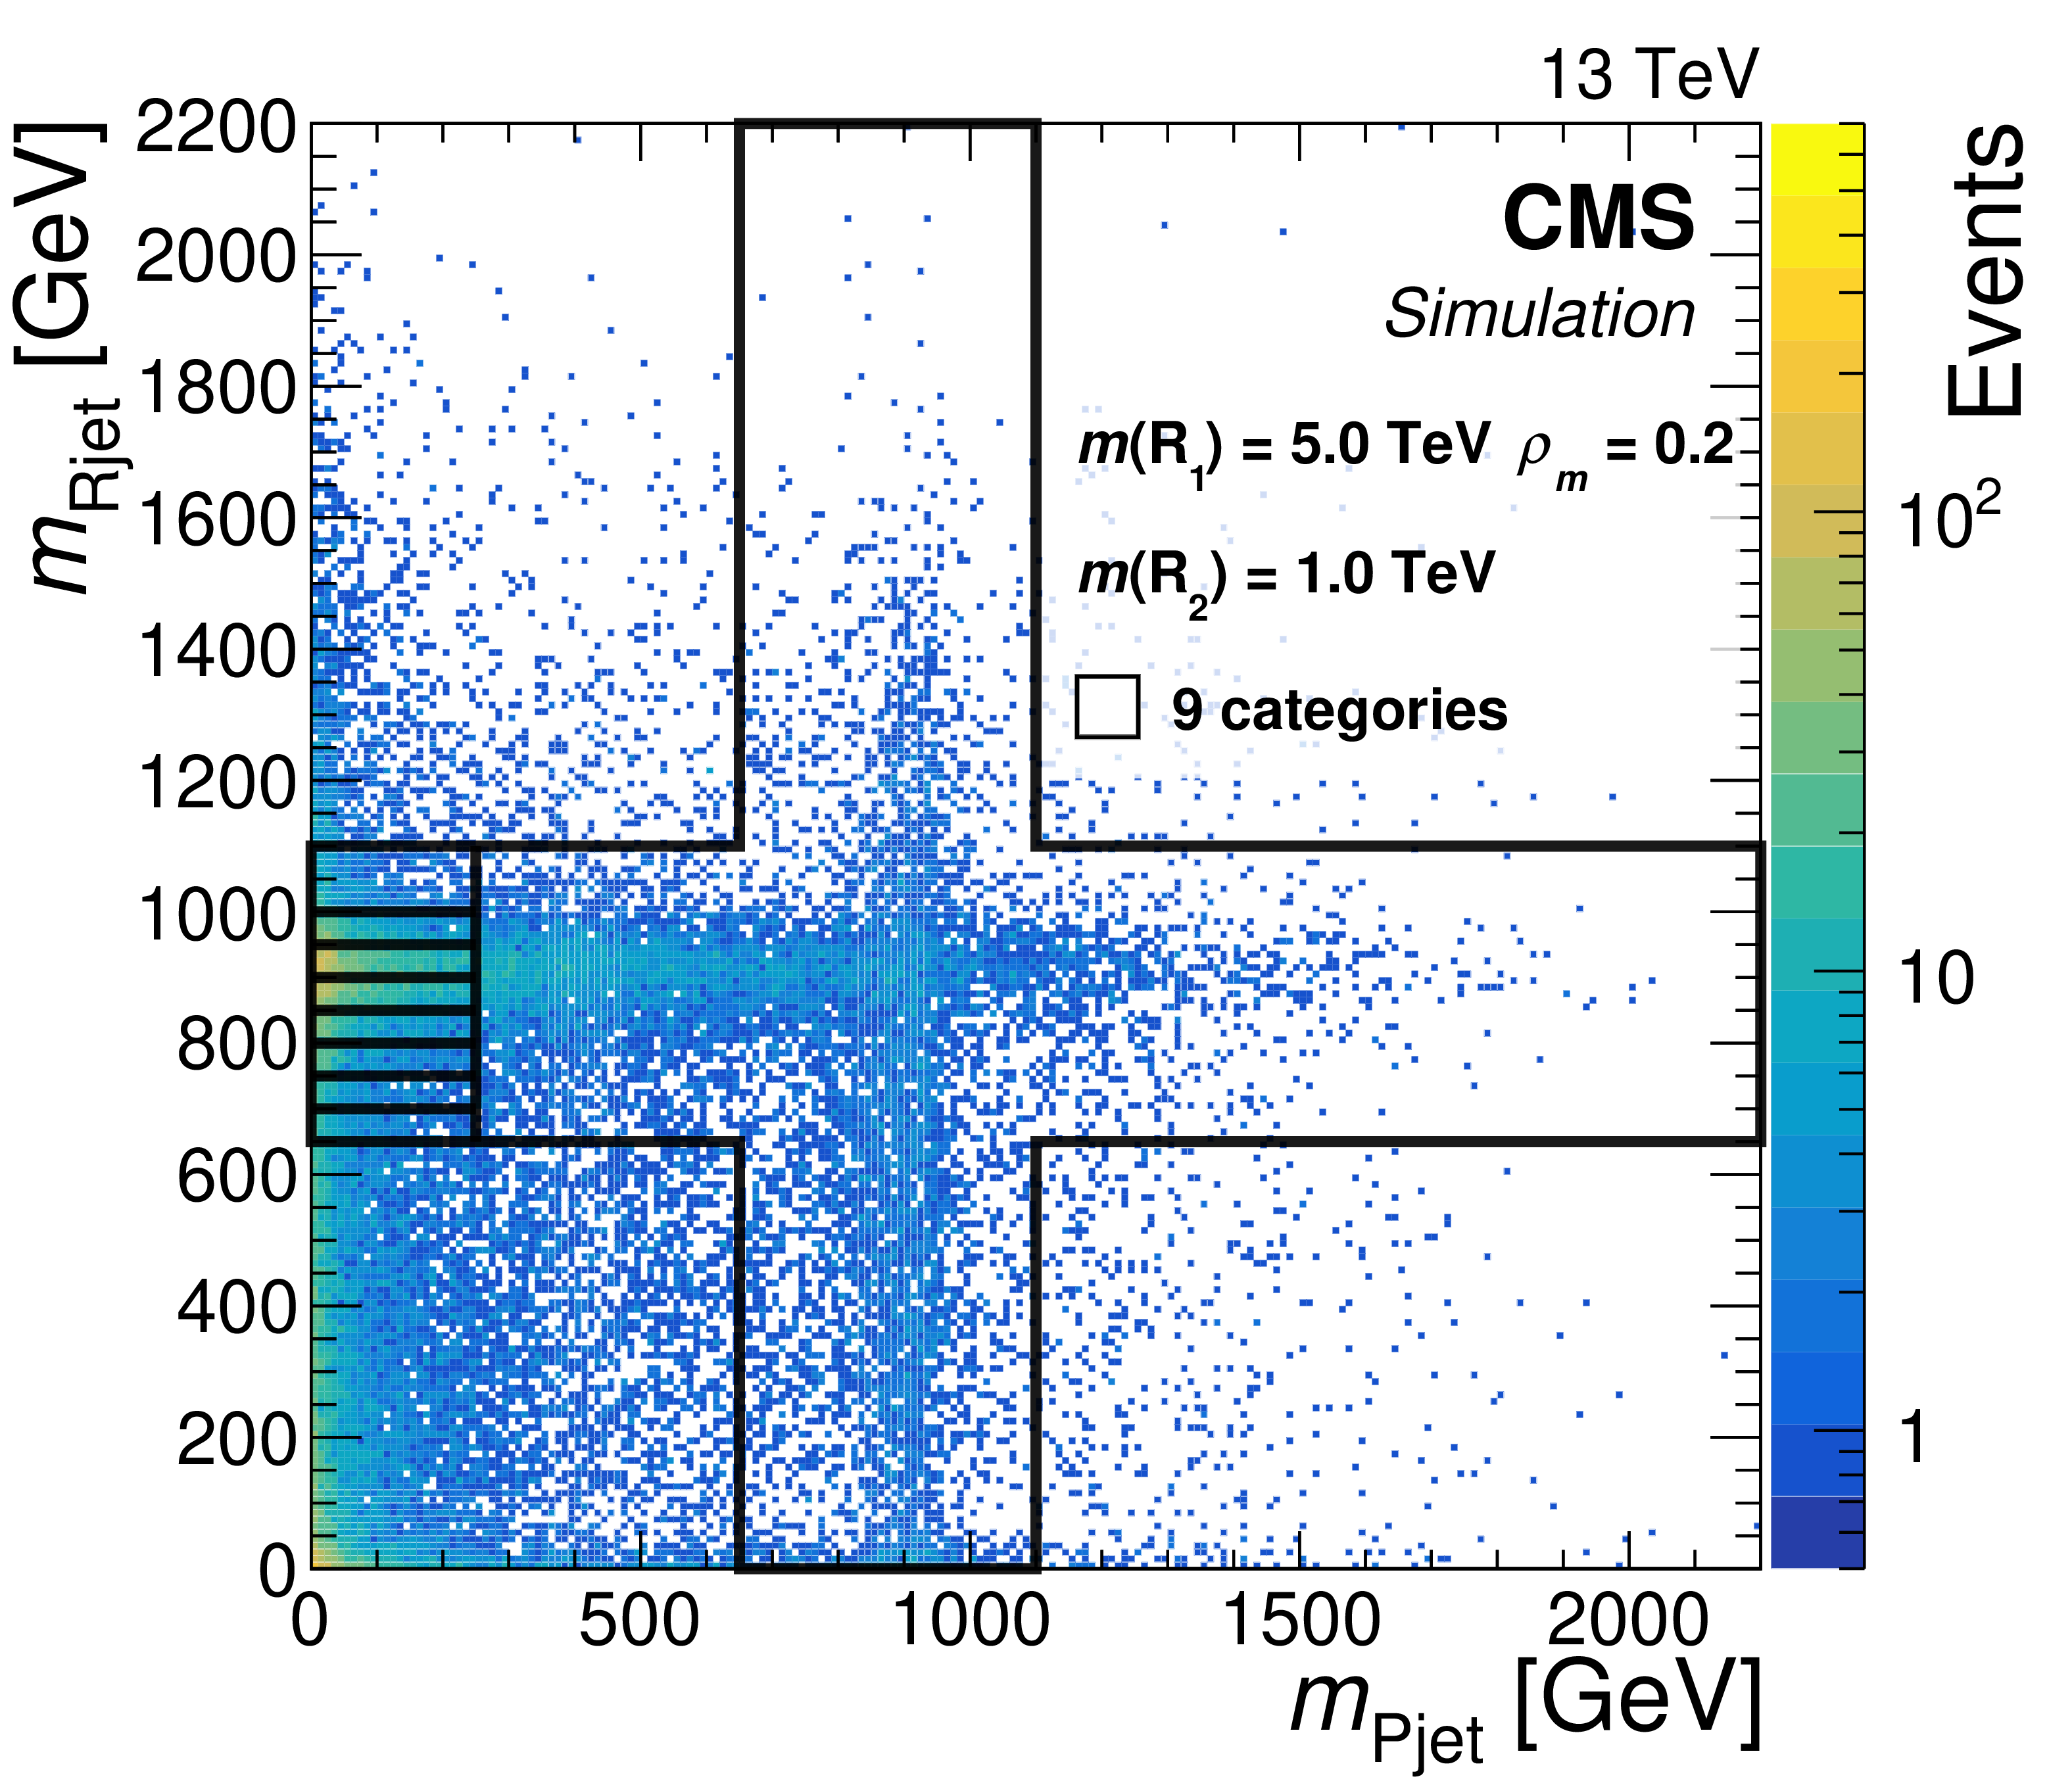
Figure 2:
In the simulation, reconstructed mass of the ${\mathrm {R}_2}$ jet candidate vs. the reconstructed mass of the ${\mathrm {P}_3}$ jet candidate (points) for ${\mathrm {R}_1}$ resonance events originating from two different mass hypotheses. The left plot is for a ${\mathrm {G}_{\mathrm {KK}}}$ with a mass $ {m\, ( {\mathrm {G}_{\mathrm {KK}}} ) } = {m\, ( {\mathrm {R}_1} ) } = $ 4 TeV, decaying to a radion with a mass $ {m\, ( \phi ) } = {m\, ( {\mathrm {R}_2} ) } = $ 0.4 TeV and a gluon. The 22 event categories in this plane, within which the search in the dijet mass distribution is conducted, are shown with red boxes. The right plot is for the same decay sequence, with masses $ {m\, ( {\mathrm {G}_{\mathrm {KK}}} ) } = $ 5 TeV and $ {m\, ( \phi ) } = $ 1 TeV, for which the number of event categories is 9. For both plots, the cross-like shape is approximately centered on the second resonance pole mass ${m\, ( {\mathrm {R}_2} ) }$ for both the horizontal and the vertical axes. |
png pdf |
Figure 2-a:
In the simulation, reconstructed mass of the ${\mathrm {R}_2}$ jet candidate vs. the reconstructed mass of the ${\mathrm {P}_3}$ jet candidate (points) for ${\mathrm {R}_1}$ resonance events originating from two different mass hypotheses. The left plot is for a ${\mathrm {G}_{\mathrm {KK}}}$ with a mass $ {m\, ( {\mathrm {G}_{\mathrm {KK}}} ) } = {m\, ( {\mathrm {R}_1} ) } = $ 4 TeV, decaying to a radion with a mass $ {m\, ( \phi ) } = {m\, ( {\mathrm {R}_2} ) } = $ 0.4 TeV and a gluon. The 22 event categories in this plane, within which the search in the dijet mass distribution is conducted, are shown with red boxes. The right plot is for the same decay sequence, with masses $ {m\, ( {\mathrm {G}_{\mathrm {KK}}} ) } = $ 5 TeV and $ {m\, ( \phi ) } = $ 1 TeV, for which the number of event categories is 9. For both plots, the cross-like shape is approximately centered on the second resonance pole mass ${m\, ( {\mathrm {R}_2} ) }$ for both the horizontal and the vertical axes. |
png pdf |
Figure 2-b:
In the simulation, reconstructed mass of the ${\mathrm {R}_2}$ jet candidate vs. the reconstructed mass of the ${\mathrm {P}_3}$ jet candidate (points) for ${\mathrm {R}_1}$ resonance events originating from two different mass hypotheses. The left plot is for a ${\mathrm {G}_{\mathrm {KK}}}$ with a mass $ {m\, ( {\mathrm {G}_{\mathrm {KK}}} ) } = {m\, ( {\mathrm {R}_1} ) } = $ 4 TeV, decaying to a radion with a mass $ {m\, ( \phi ) } = {m\, ( {\mathrm {R}_2} ) } = $ 0.4 TeV and a gluon. The 22 event categories in this plane, within which the search in the dijet mass distribution is conducted, are shown with red boxes. The right plot is for the same decay sequence, with masses $ {m\, ( {\mathrm {G}_{\mathrm {KK}}} ) } = $ 5 TeV and $ {m\, ( \phi ) } = $ 1 TeV, for which the number of event categories is 9. For both plots, the cross-like shape is approximately centered on the second resonance pole mass ${m\, ( {\mathrm {R}_2} ) }$ for both the horizontal and the vertical axes. |
png pdf |
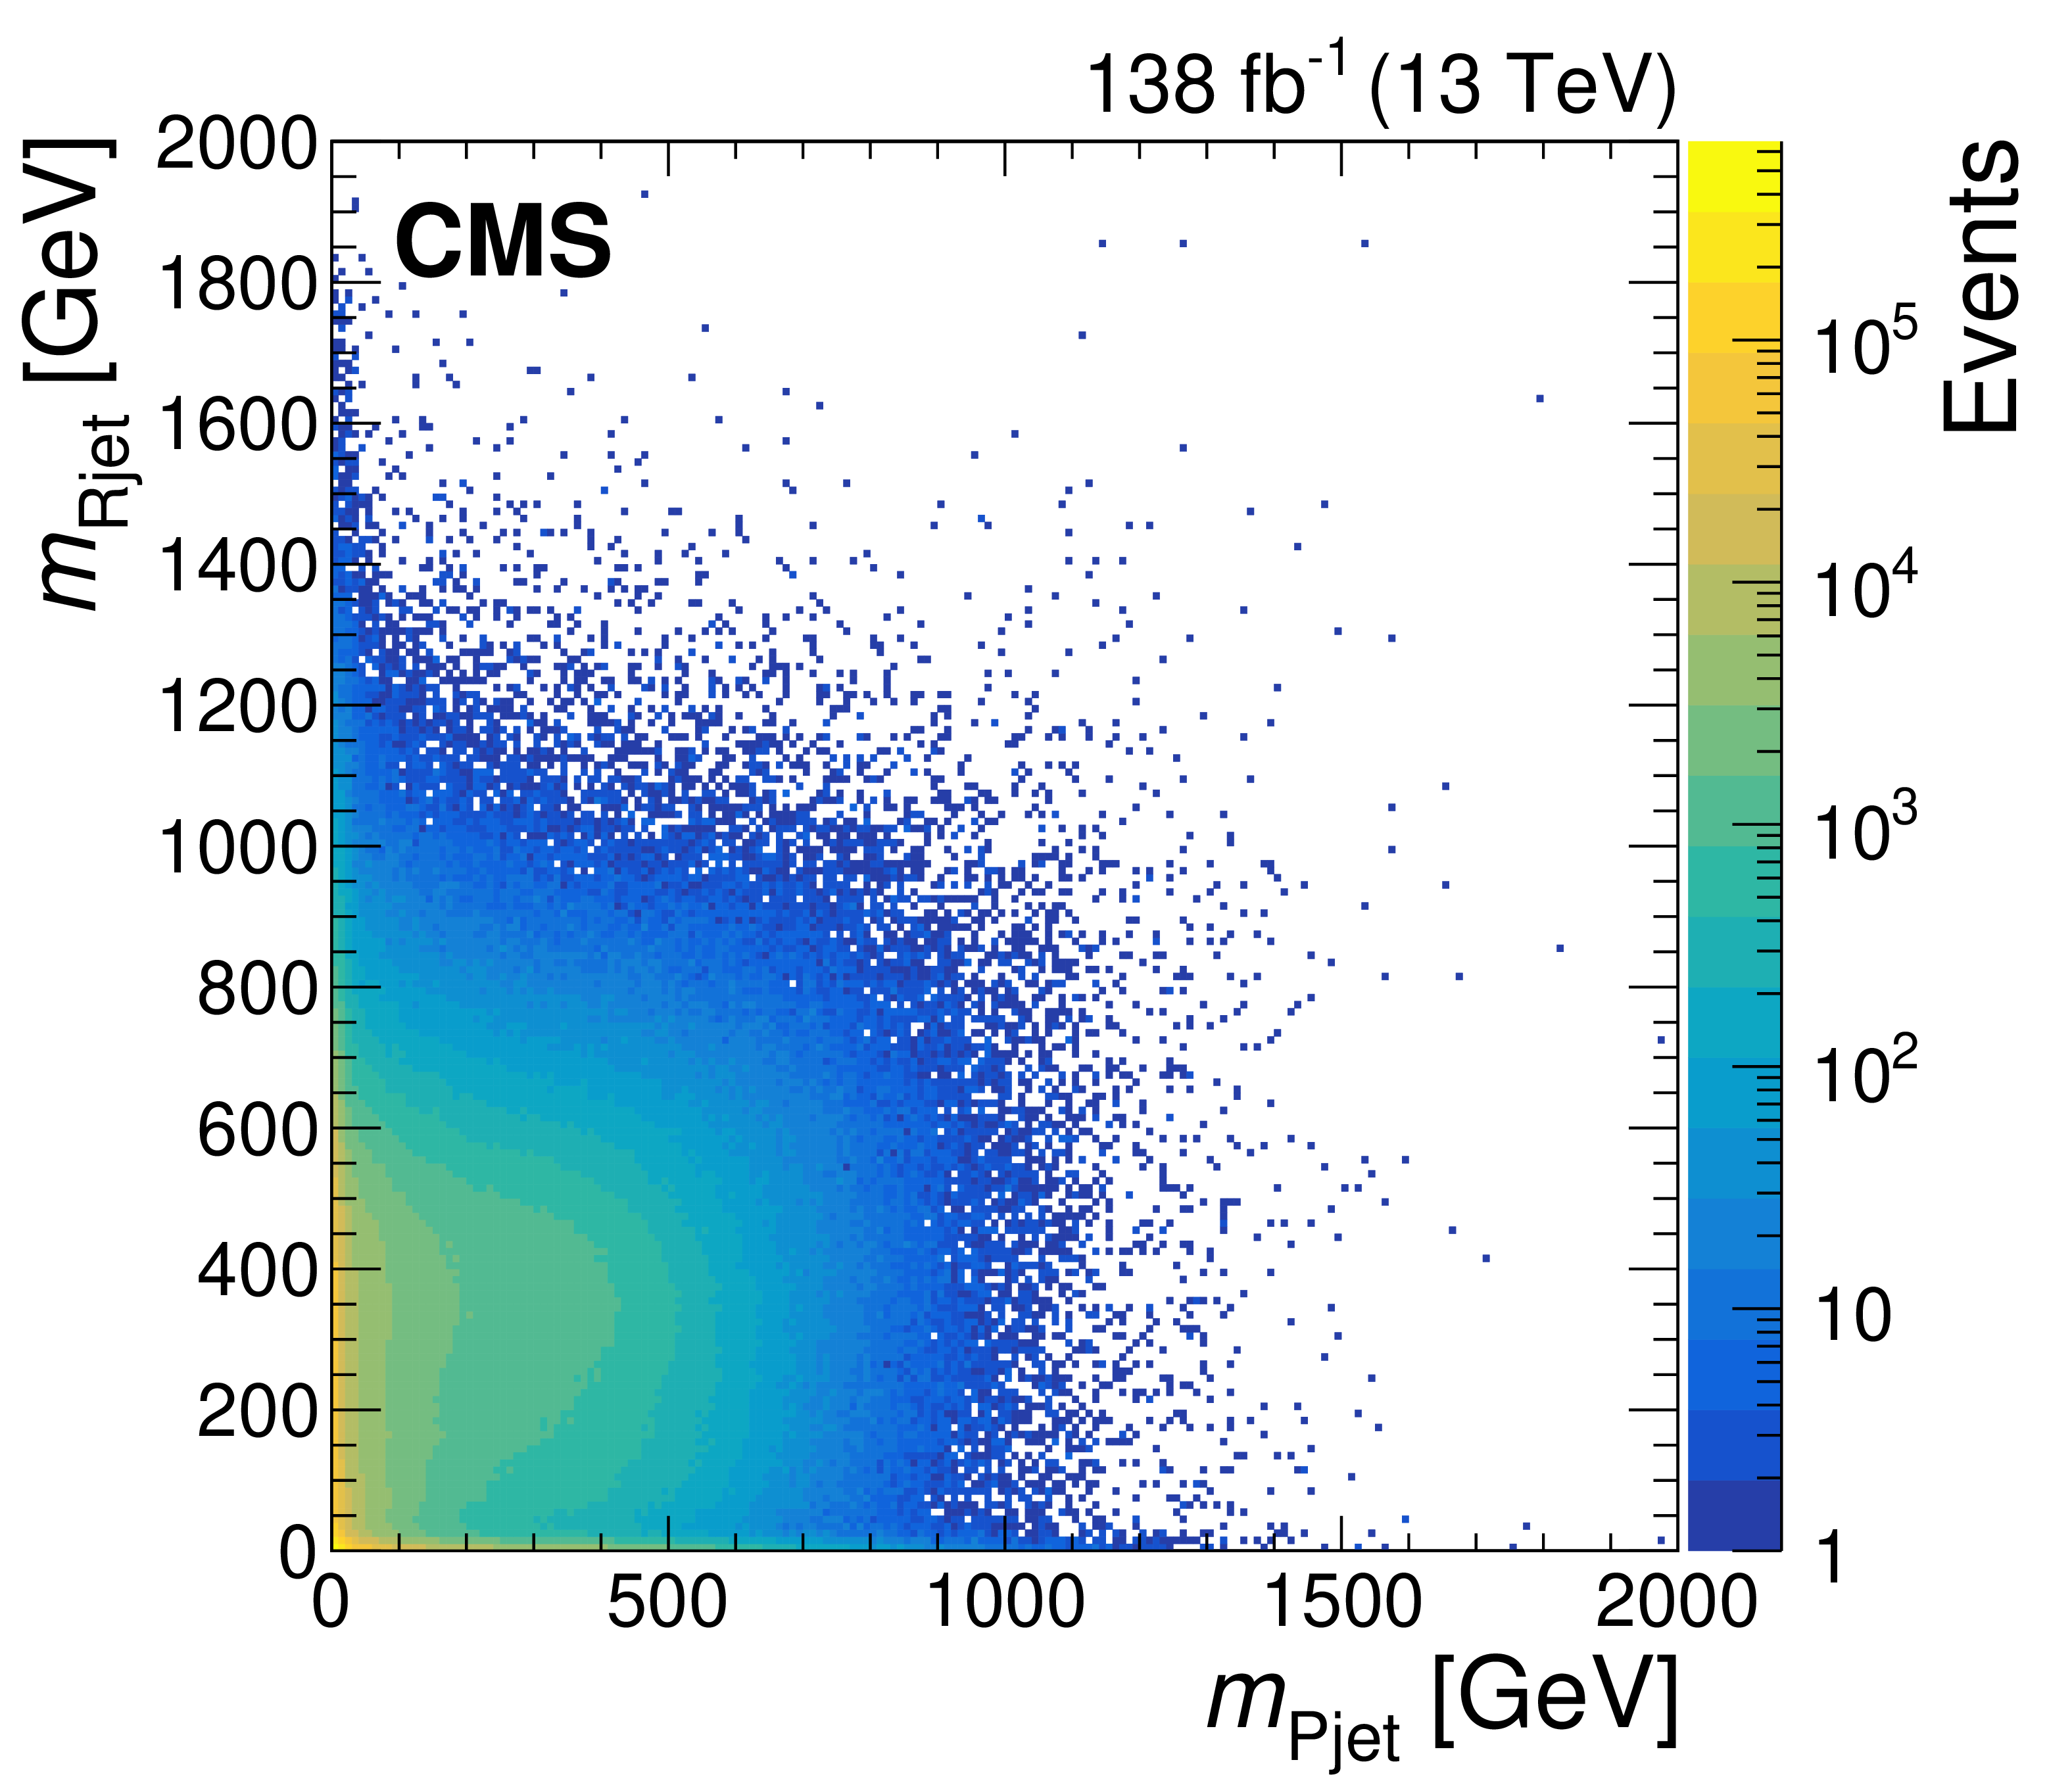
Figure 3:
Distribution of the reconstructed mass of the ${\mathrm {R}_2}$ jet candidate vs. the reconstructed mass of the ${\mathrm {P}_3}$ jet candidate for events in data, which are expected to arise primarily from QCD multijet events. |

png pdf |
Figure 4:
Dijet mass spectrum, from the combination of the spectra within 22 categories, from the search for a resonance with mass $ {m\, ( {\mathrm {R}_1} ) } = {m\, ( {\mathrm {G}_{\mathrm {KK}}} ) } = $ 2.9 TeV decaying to a second resonance with mass $ {m\, ( {\mathrm {R}_2} ) } = {m\, ( \phi ) } = $ 0.4 TeV and a gluon. The figure shows the data (black points), the resulting background-only fit (solid line) and its uncertainty (barely visible gray hatched area), and the signal normalized to a cross section equal to the 95% CL observed limit (dashed line). The data shown in each bin are the weighted sum of the number of events within each category, divided by the bin width, as a function of the dijet mass, with vertical bars representing the statistical uncertainty ($\sigma _{\text {stat}}$). The weights are the signal event fraction for each category, assuming a signal cross section equal to the 95% CL observed upper limit. The same quantities are also shown for the background-only fits in each category, and for the signal. The lower panel shows the difference between the data and the background prediction (points), and the background uncertainty (hatched gray area), divided by the statistical uncertainty. |
png pdf |
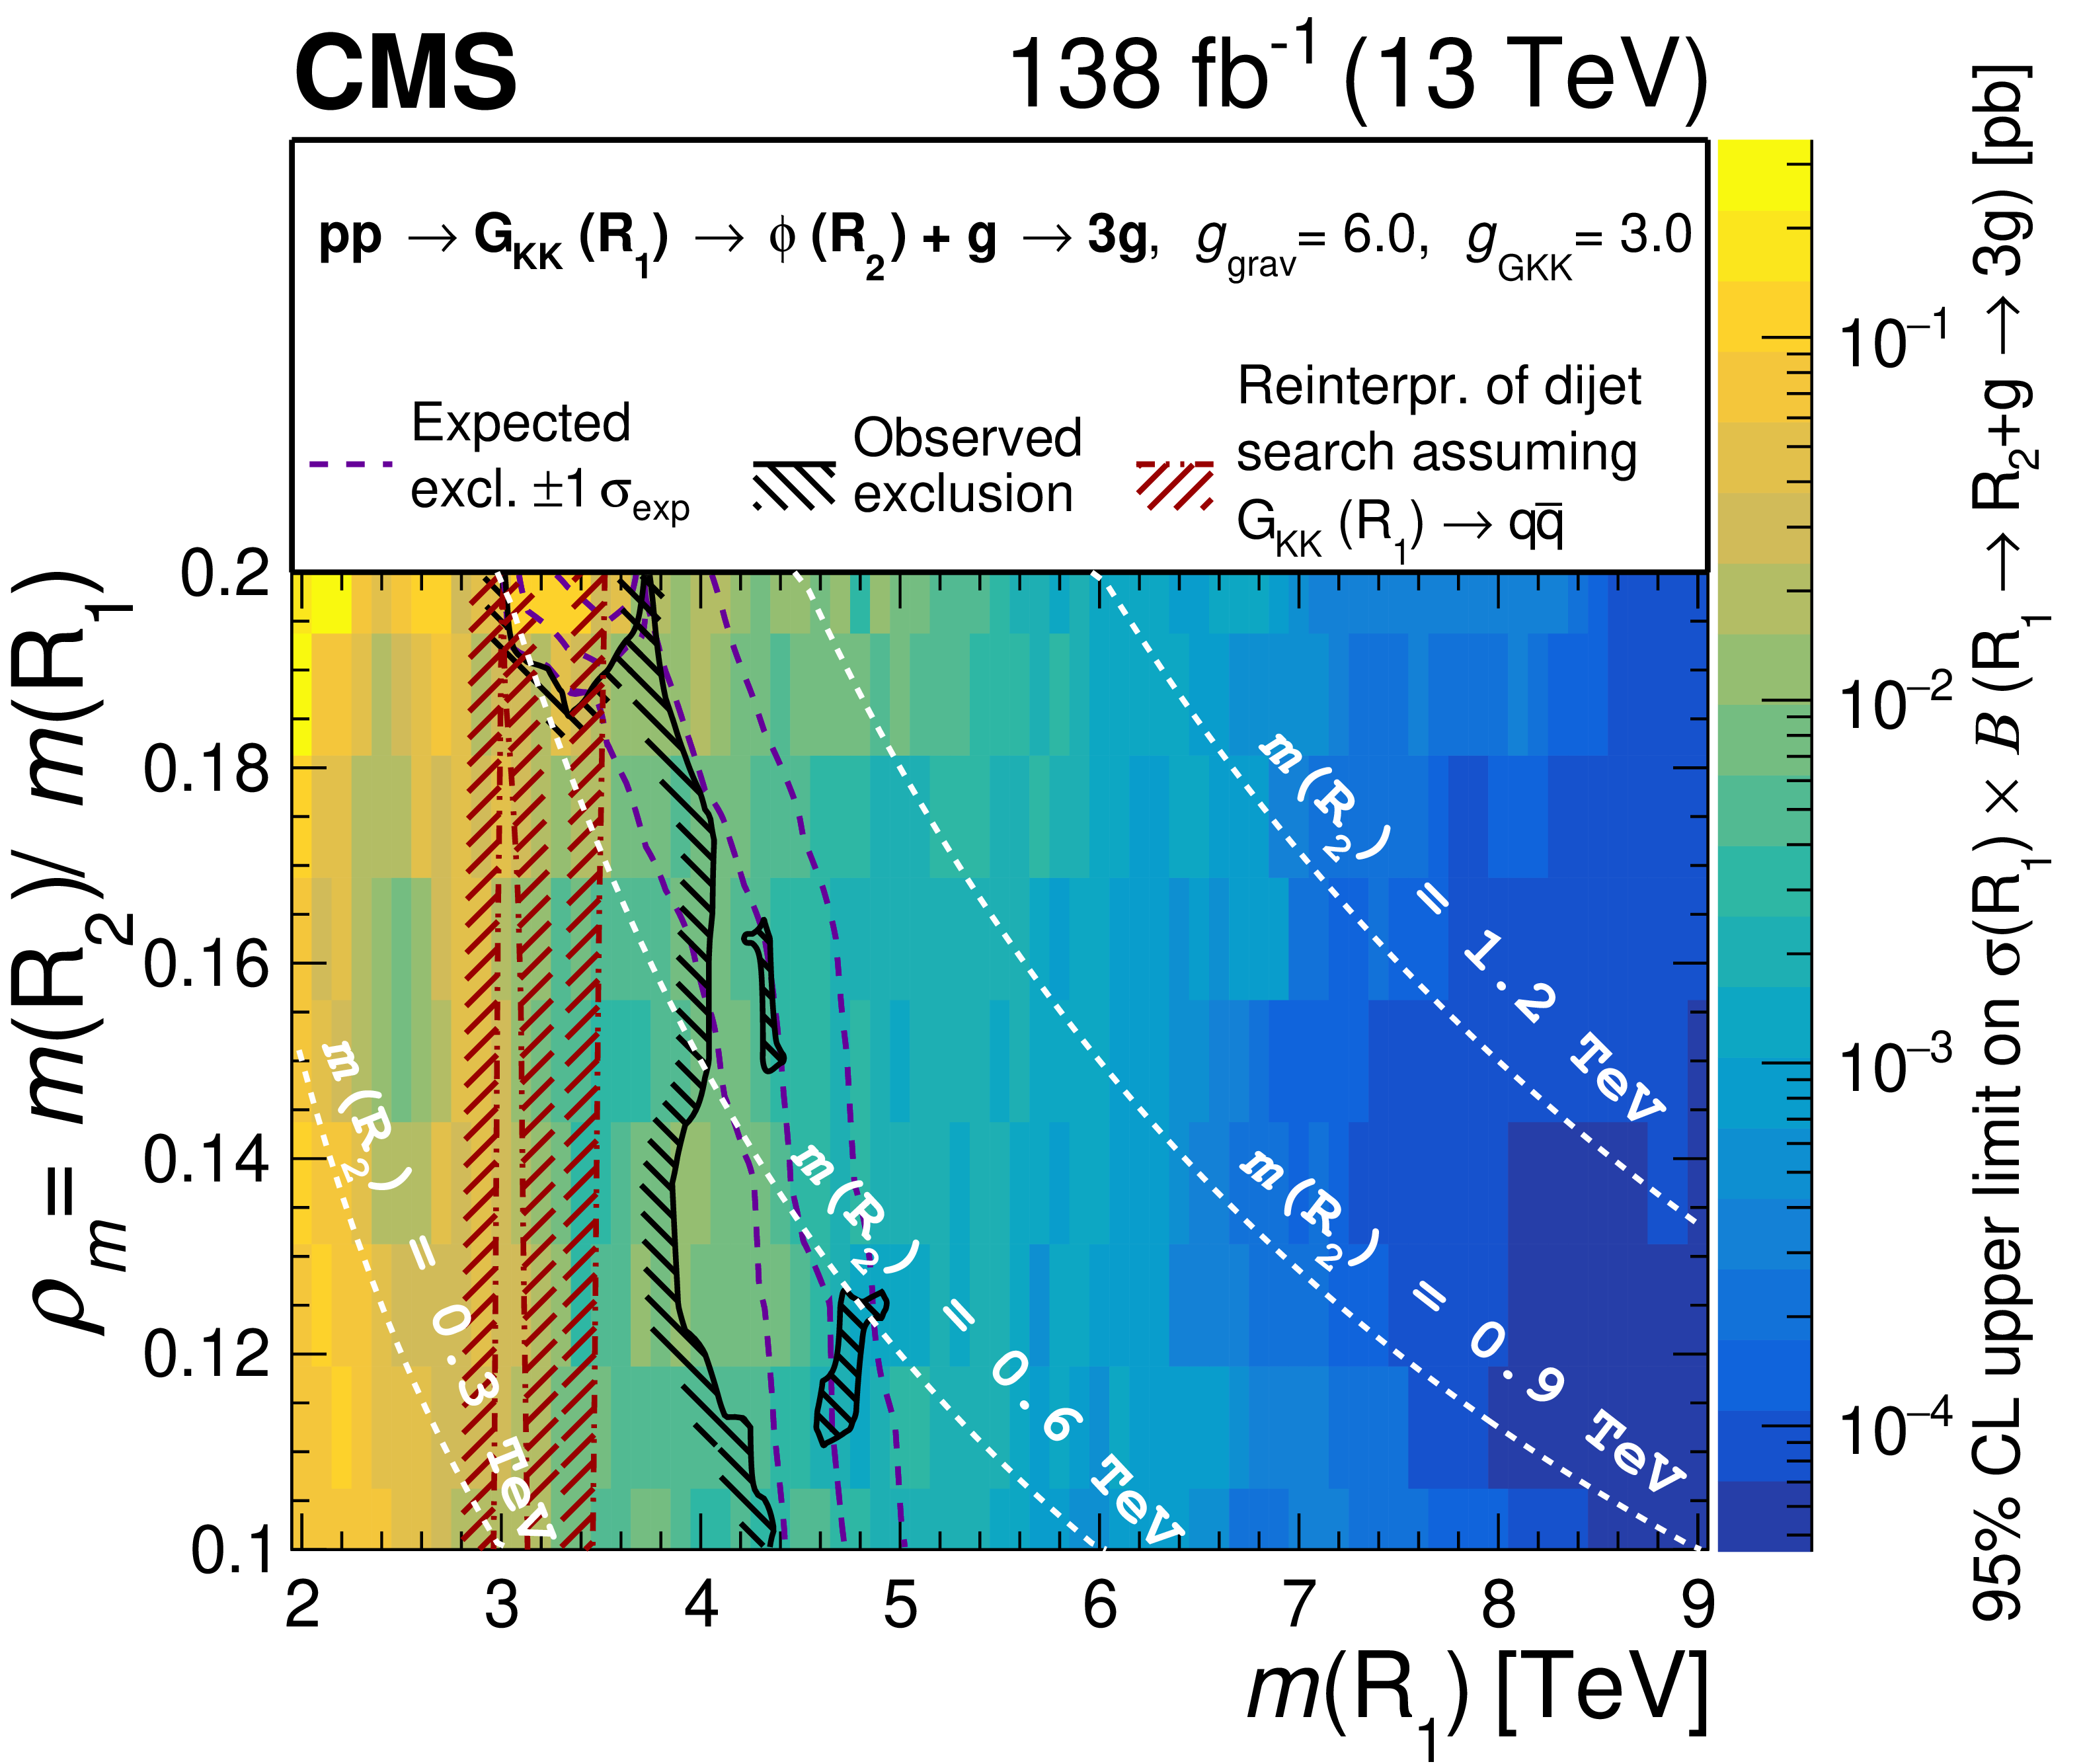
Figure 5:
Observed upper limits on the product of signal cross section and branching fraction, as a function of ${\rho _{m}}$ vs. ${m\, ( {\mathrm {R}_1} ) }$, for a resonance model with three gluons in the final state. The excluded regions from this search (black hatched) are optimized for the $ {\mathrm {G}_{\mathrm {KK}}} \to \phi + \mathrm{g} \to \mathrm{g} \mathrm{g} \mathrm{g} $ decay with $ {g_{\text {grav}}} = $ 6.0 and $ {g_{\mathrm {GKK}}} = $ 3.0. These excluded regions are compared with those obtained from a reinterpretation of the inclusive CMS dijet resonance search (JHEP 05 (2020) 033, [2]), which is more sensitive to the decay channel $ {\mathrm {G}_{\mathrm {KK}}} \to \mathrm{q} \mathrm{\bar{q}} $ (red hatched). The vertical band between the ${m\, ( {\mathrm {R}_1} ) }$ values of $\approx $3.0 and $\approx $3.1 TeV, for $ {\rho _{m}} \lesssim $0.19, is not excluded by the dijet search because of an upward statistical fluctuation in the observed limit. The white, dashed lines represent a sample of curves corresponding to fixed ${m\, ( {\mathrm {R}_2} ) }$ values. |
| Summary |
| A search for high-mass hadronic resonances that decay to a parton and a Lorentz-boosted resonance, which in turn decays into a pair of partons, has been presented. This is the first dedicated search for resonances decaying into three final state partons at the LHC in events with a boosted resonance. No statistically significant excess above the background predictions is observed. Results are interpreted in a model with a warped extra dimension where the high-mass resonance is a Kaluza-Klein gluon, the boosted resonance is a radion, and the final-state partons are all gluons. By exploring a novel experimental signature, we significantly extend the excluded region in the parameter space of this benchmark model of new physics. In particular, the observed limits on the Kaluza-Klein gluon mass are extended by up to about 1 TeV compared to previous searches for dijet resonances. |
| Additional Figures | |
png pdf |
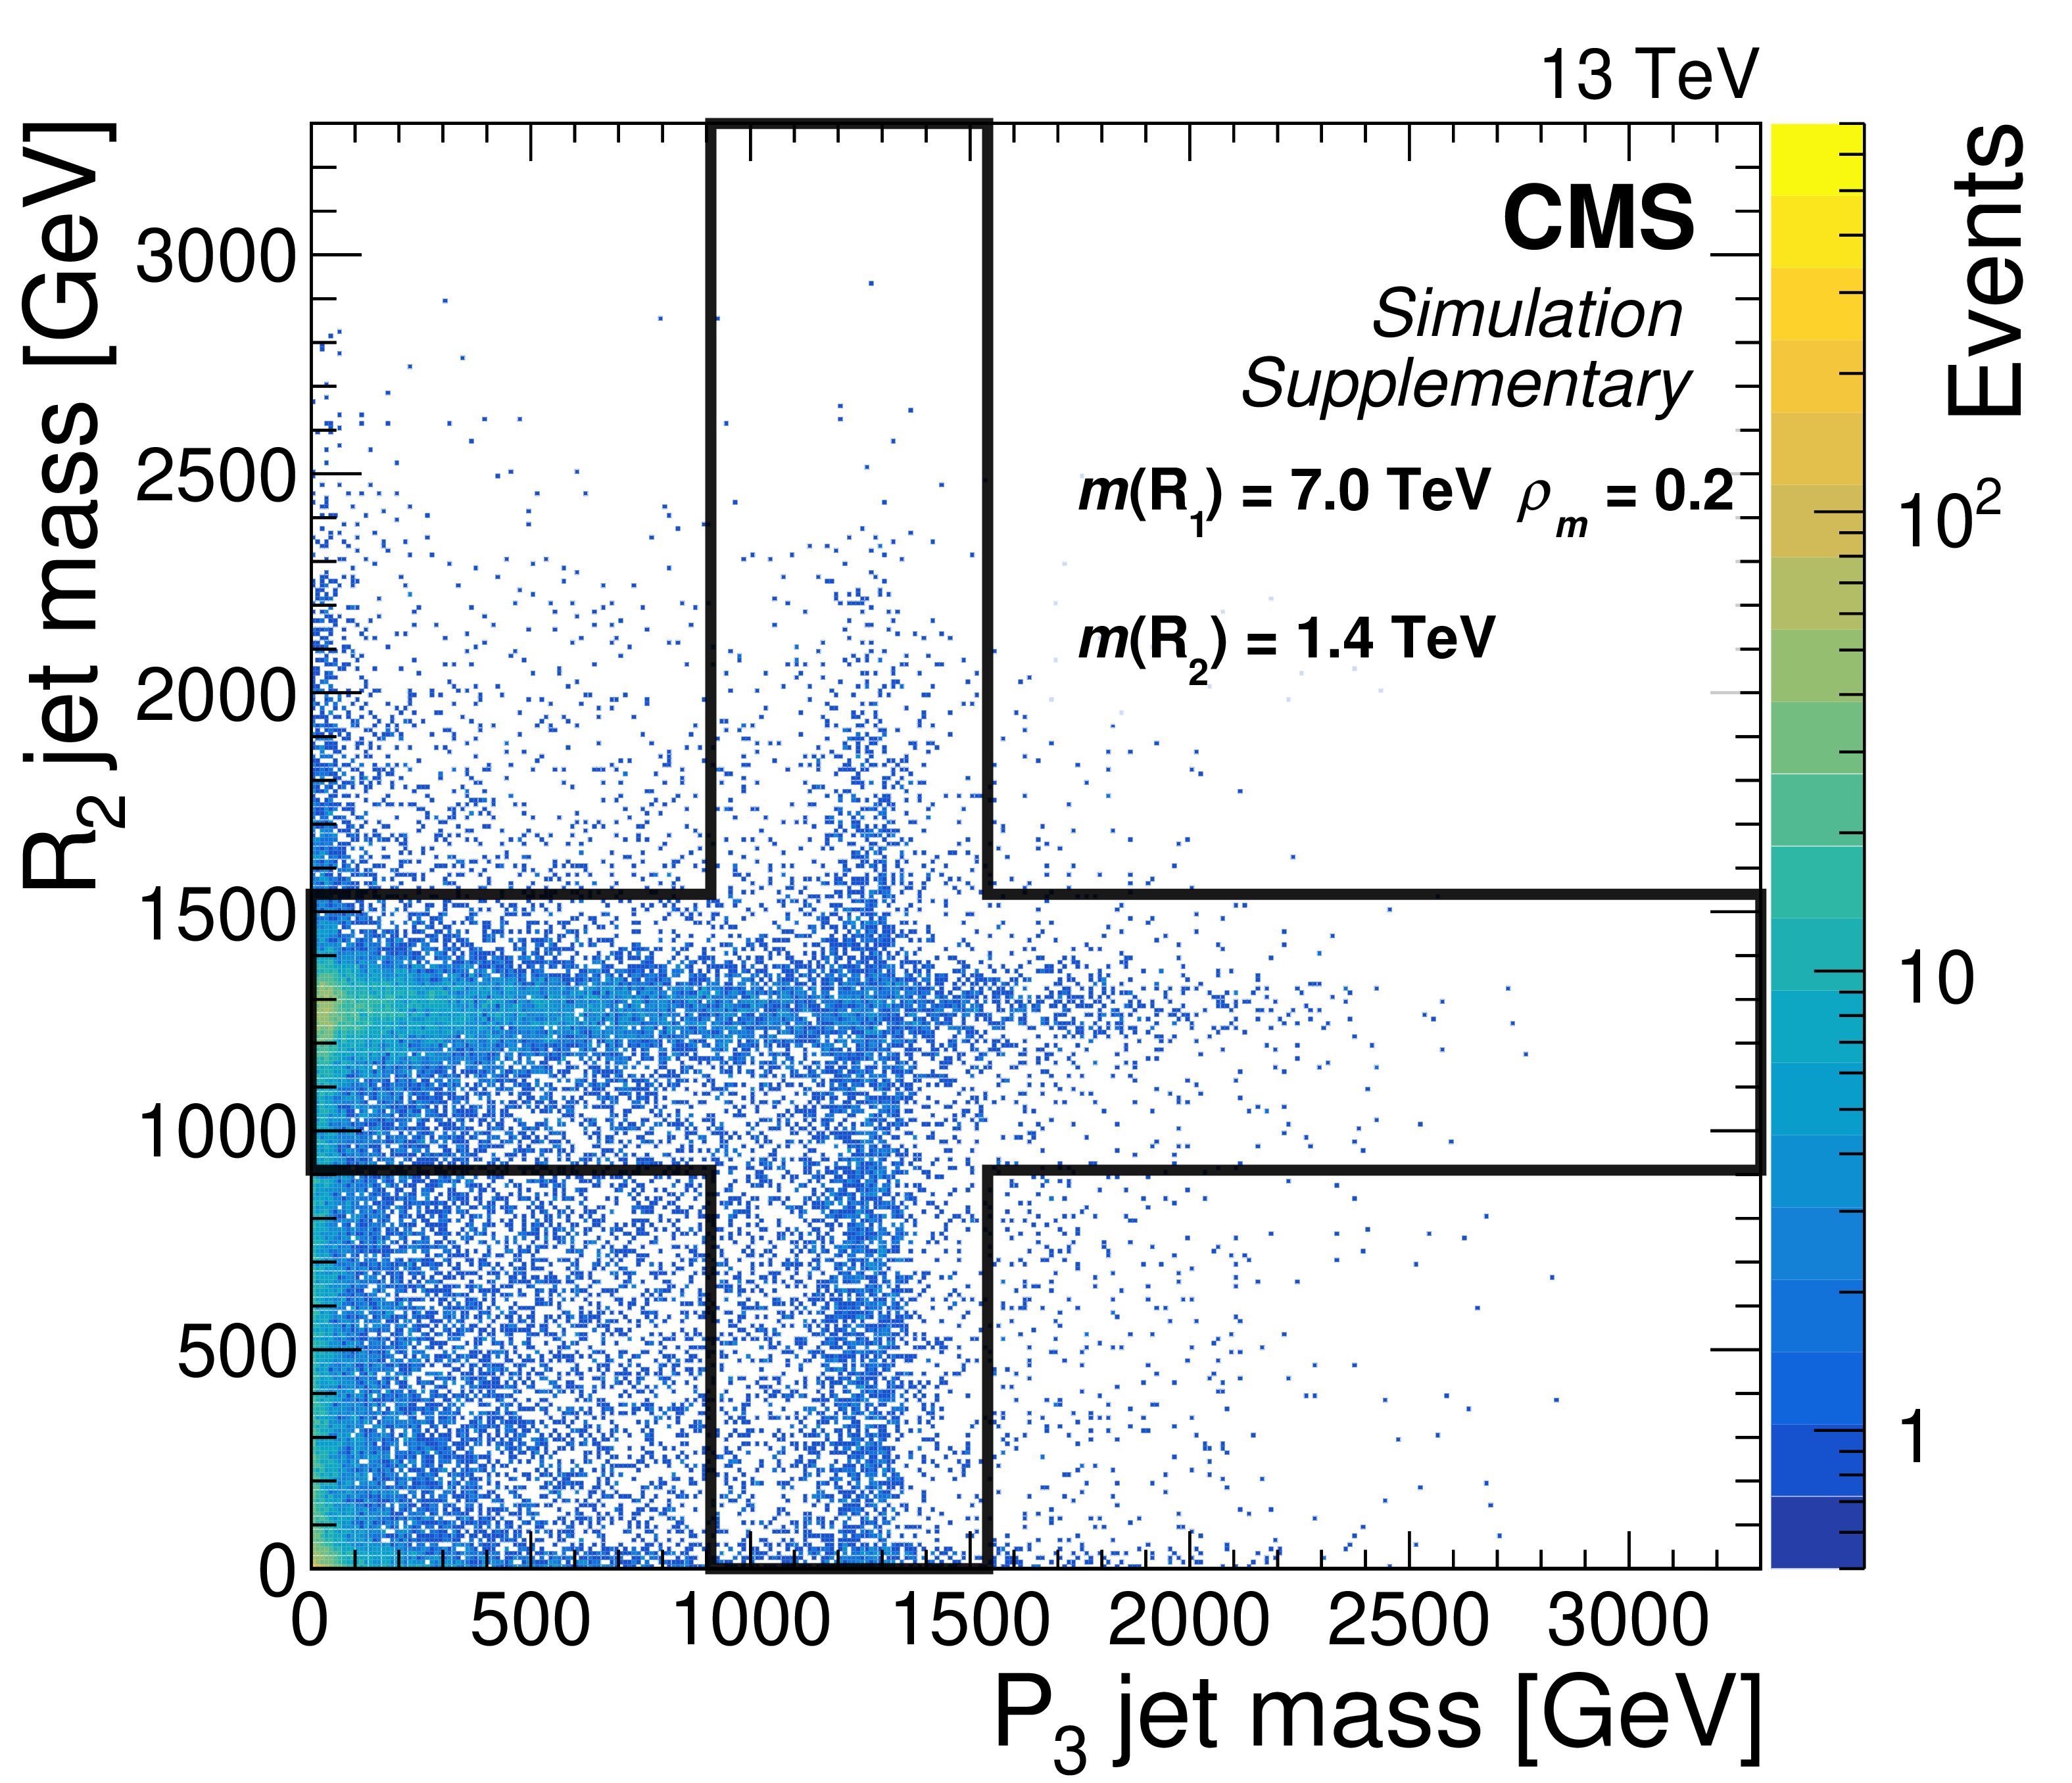
Additional Figure 1:
In the simulation, reconstructed mass of the $\mathrm {R}_2$ jet candidate vs. the reconstructed mass of the $\mathrm {P}_3$ jet candidate (points) for $\mathrm {R}_1$ resonance events originating from a $\mathrm {G}_{\text {KK}}$ with a mass $m\, (\mathrm {G}_{\text {KK}} )=m\, (\mathrm {R}_1 ) = $ 7 TeV, decaying to a radion with a mass $m\, (\phi )=m\, (\mathrm {R}_2 ) = $ 1.4 TeV and a gluon. The event category in this plane, within which the search in the dijet mass distribution is conducted, is delimited by black lines. The cross-like shape is approximately centered on the second resonance pole mass $m\, (\mathrm {R}_2 )$ for both the horizontal and the vertical axes. |
png pdf |
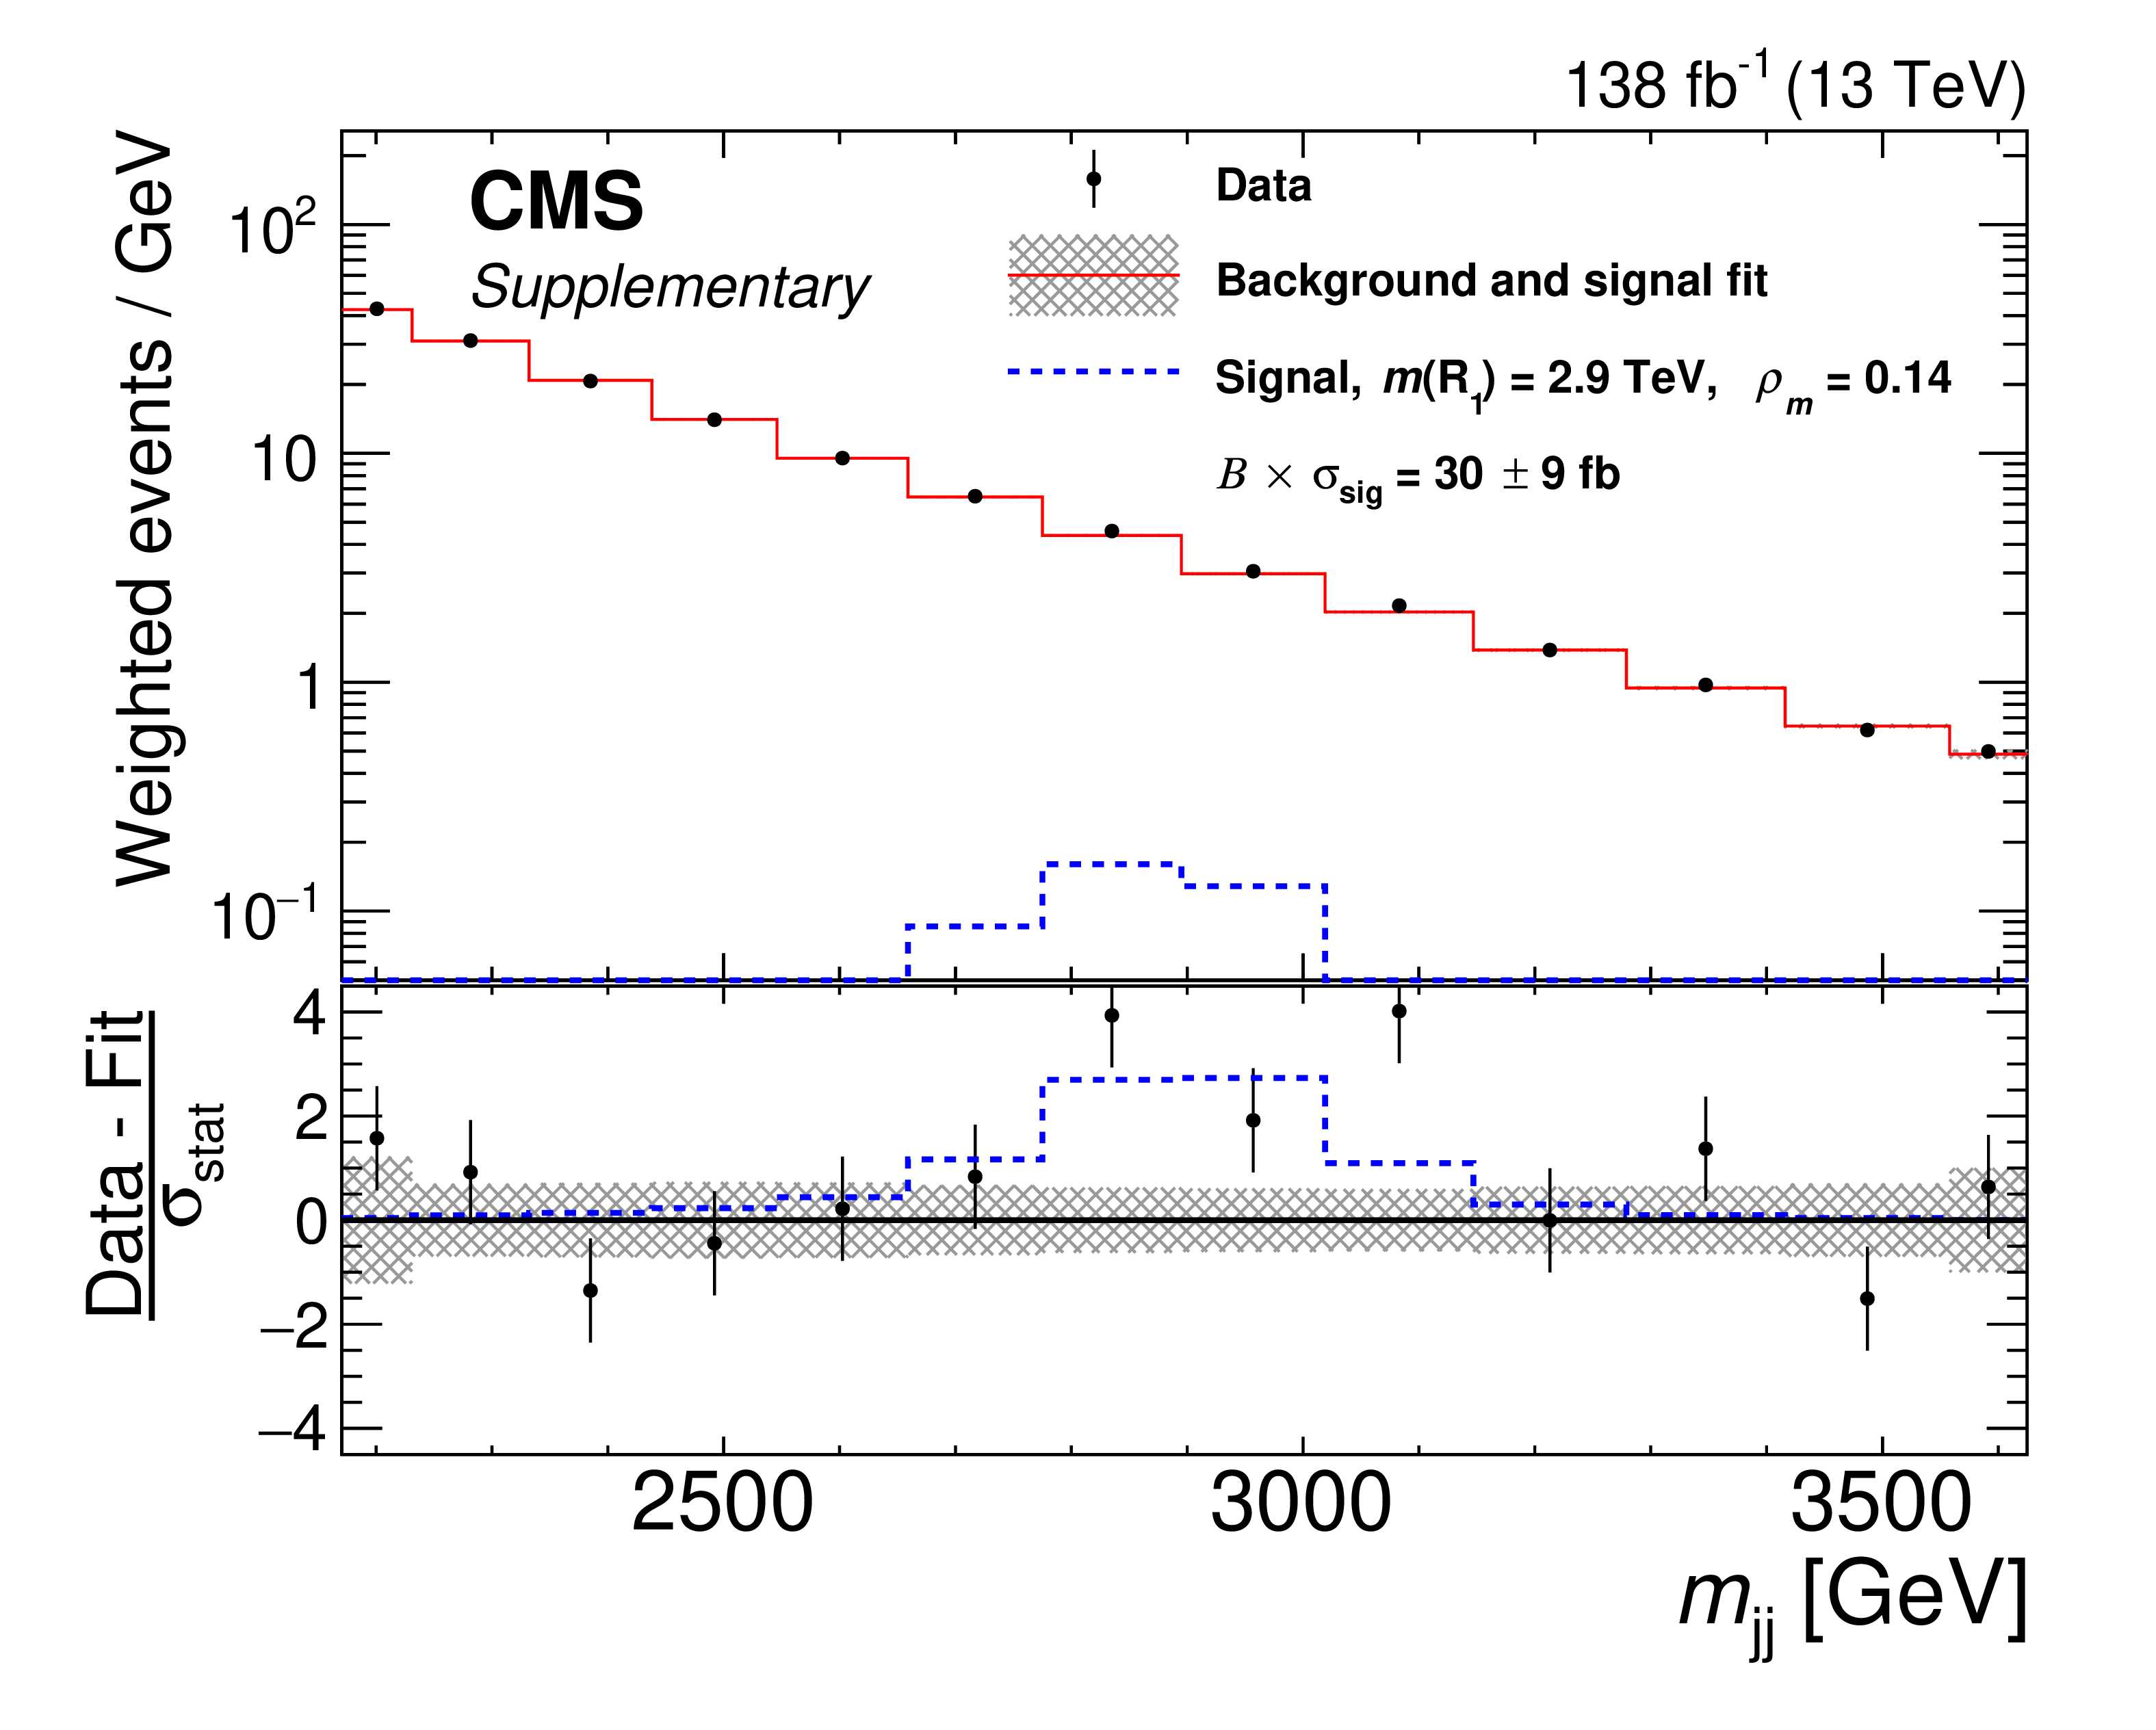
Additional Figure 2:
Dijet mass spectrum, from the combination of the spectra within 22 categories, from the search for a resonance with mass $m\, (\mathrm {R}_1 ) = m\, (\mathrm {G}_{\text {KK}} ) = $ 2.9 TeV decaying to a second resonance with mass $m\, (\mathrm {R}_2 ) = m\, (\phi ) = $ 0.4 TeV and a gluon. This mass hypothesis corresponds to the largest excess observed, with a local significance of 3.2 standard deviations, and a global significance of 1.8 standard deviations. The figure shows the data (black points), the resulting background component of the signal+background fit (solid line) and its uncertainty (barely visible gray hatched area), and the signal normalized to the cross section resulting from the fit (dashed line). The data shown in each bin are the weighted sum of the number of events within each category, divided by the bin width, as a function of the dijet mass, with vertical bars representing the statistical uncertainty ($\sigma _{\text {stat}}$). The weights are the signal event fraction for each category, assuming a signal cross section equal to the 95% CL observed upper limit. The same quantities are also shown for the background and signal component of the fit. The lower panel shows the difference between the data and the background prediction (points), and the background uncertainty (hatched gray area), divided by the statistical uncertainty. |
png pdf |
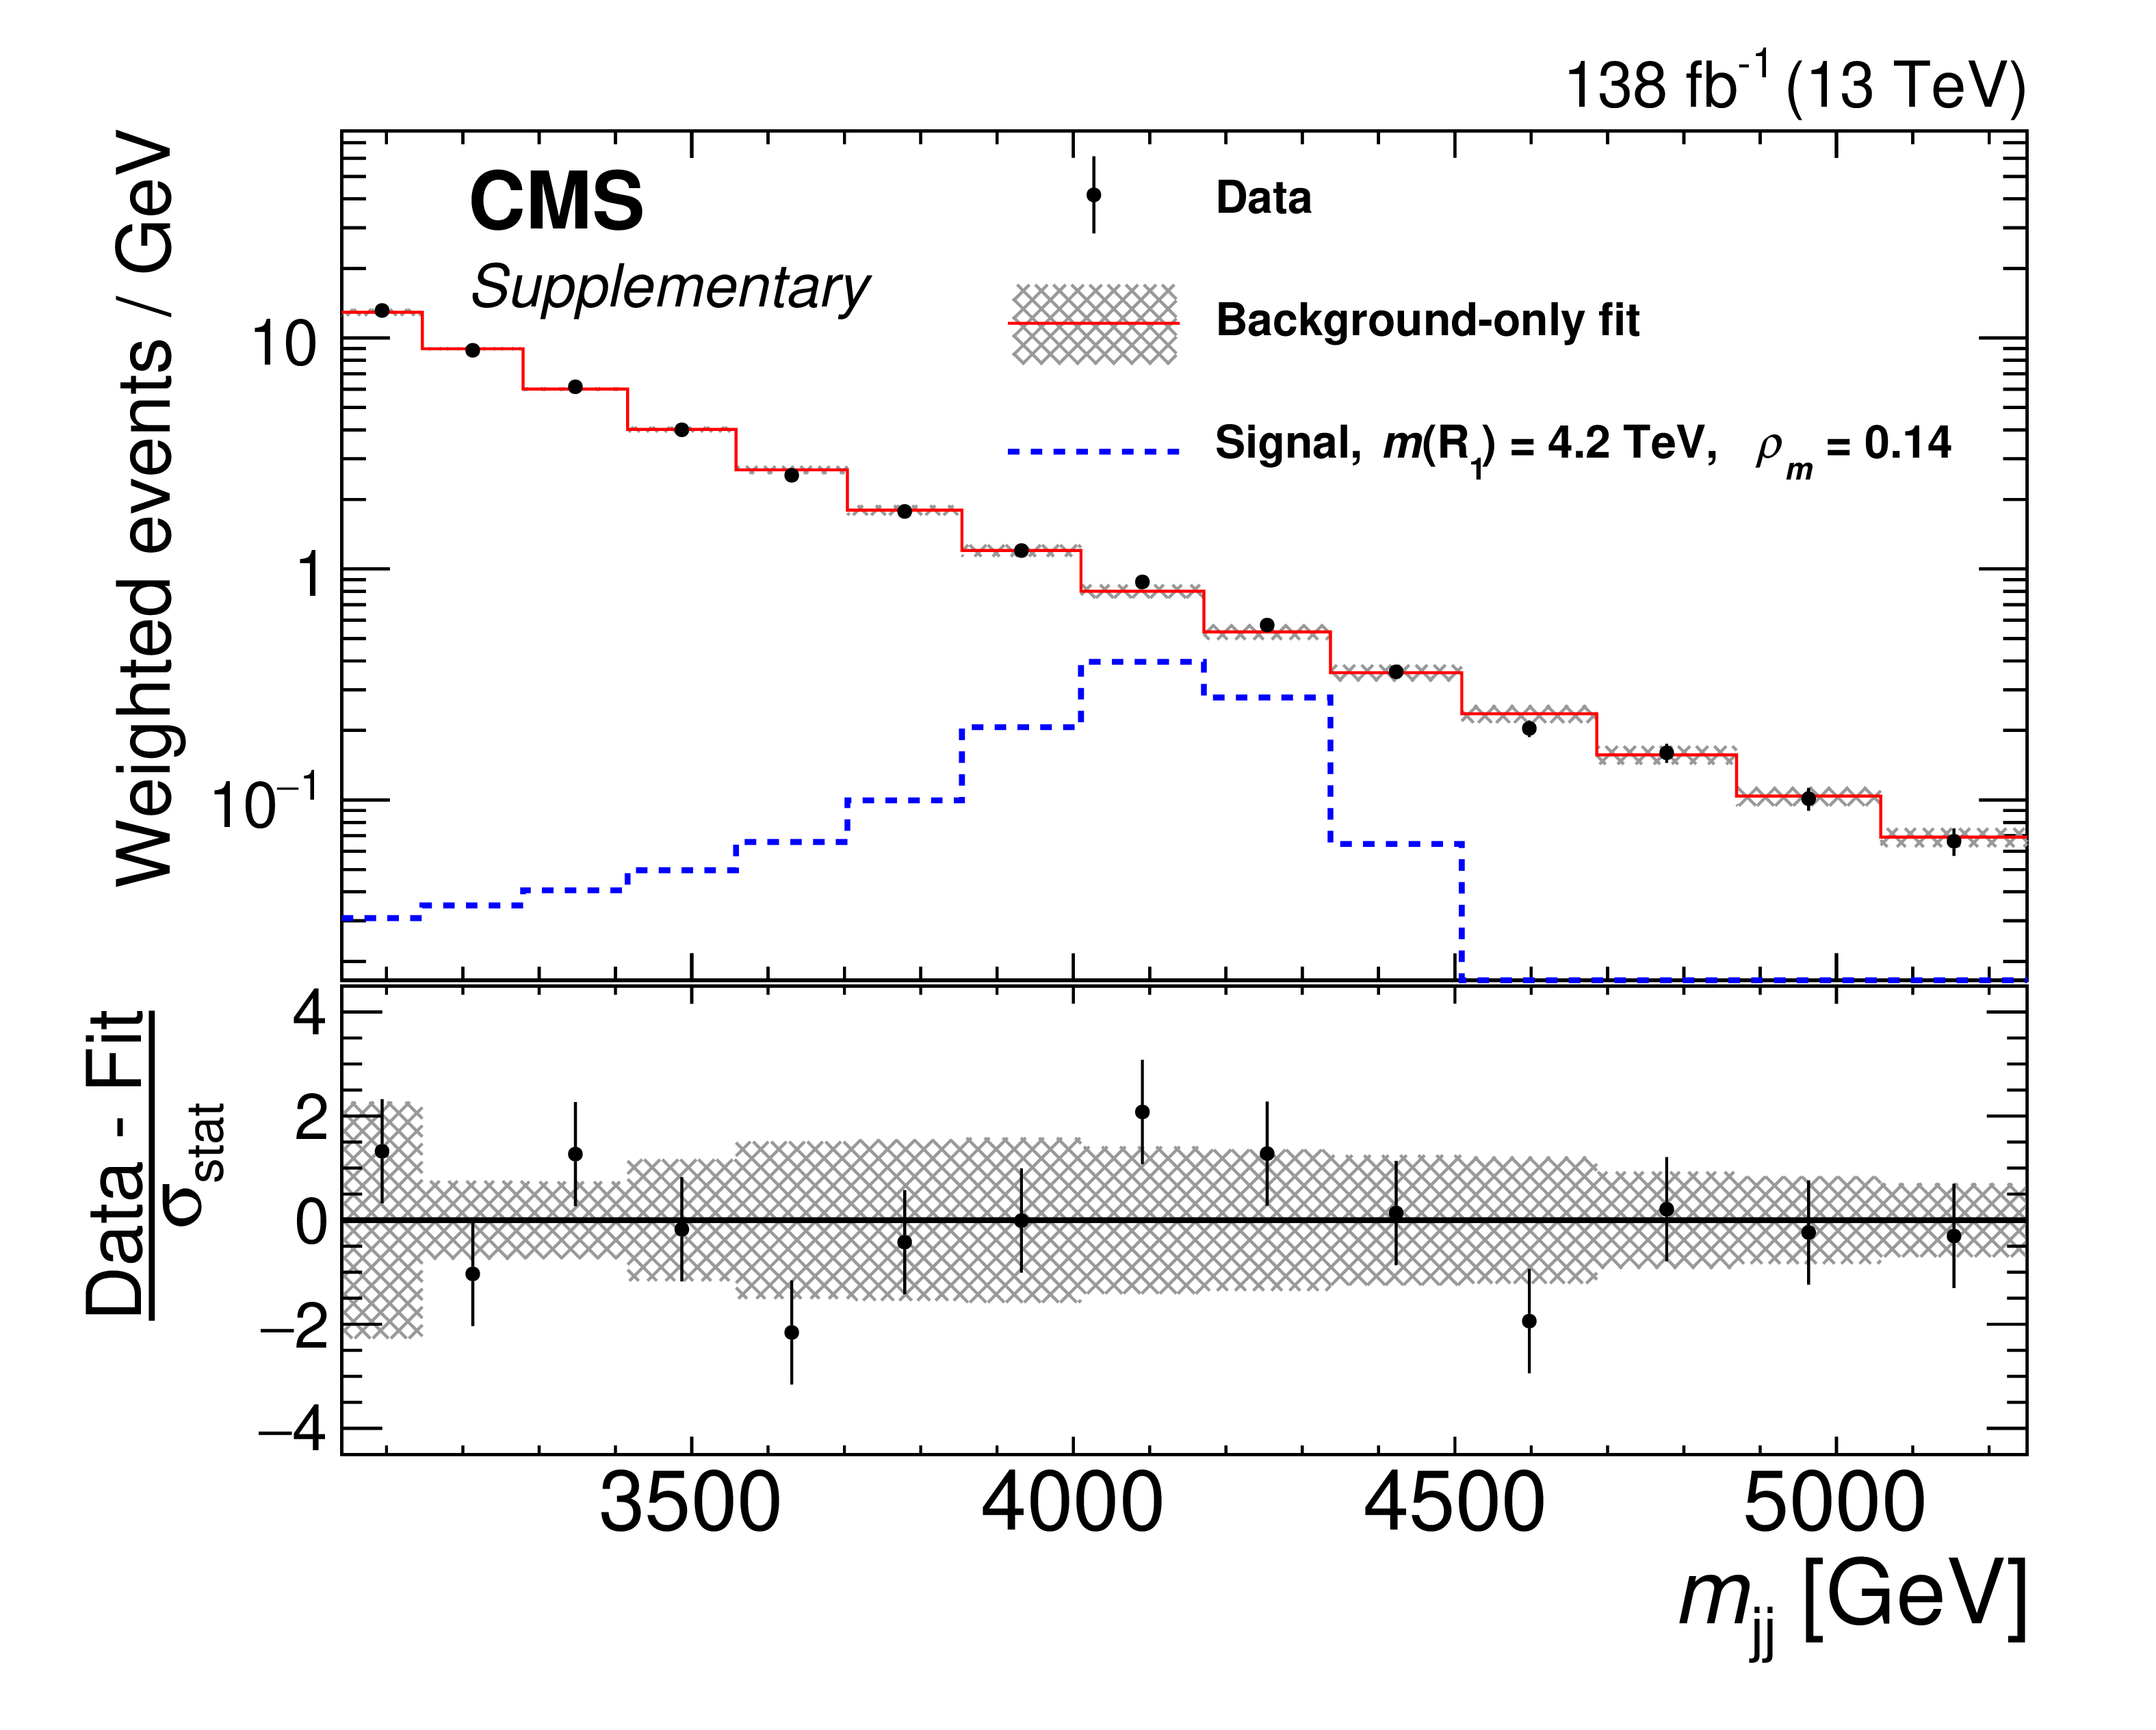
Additional Figure 3:
Dijet mass spectrum, from the combination of the spectra within 22 categories, from the search for a resonance with mass $m\, (\mathrm {R}_1 ) = m\, (\mathrm {G}_{\text {KK}} ) = $ 4.2 TeV decaying to a second resonance with mass $m\, (\mathrm {R}_2 ) = m\, (\phi ) = $ 0.6 TeV and a gluon. This mass hypothesis corresponds to the second largest excess observed, with a local significance of 2.6 standard deviations, and a global significance below 1 standard deviation. The figure shows the data (black points), the resulting background-only fit (solid line) and its uncertainty (barely visible gray hatched area), and the signal normalized to a cross section equal to the 95% CL observed limit (dashed line). The data shown in each bin are the weighted sum of the number of events within each category, divided by the bin width, as a function of the dijet mass, with vertical bars representing the statistical uncertainty ($\sigma _{\text {stat}}$). The weights are the signal event fraction for each category, assuming a signal cross section equal to the 95% CL observed upper limit. The same quantities are also shown for the background-only fits in each category, and for the signal. The lower panel shows the difference between the data and the background prediction (points), and the background uncertainty (hatched gray area), divided by the statistical uncertainty. |

png pdf |
Additional Figure 4:
Dijet mass spectrum, from the combination of the spectra within 22 categories, from the search for a resonance with mass $m\, (\mathrm {R}_1 ) = m\, (\mathrm {G}_{\text {KK}} ) = $ 4.2 TeV decaying to a second resonance with mass $m\, (\mathrm {R}_2 ) = m\, (\phi ) = $ 0.6 TeV and a gluon. This mass hypothesis corresponds to the second largest excess observed, with a local significance of 2.6 standard deviations, and a global significance below 1 standard deviation. The figure shows the data (black points), the resulting background component of the signal+backgound fit (solid line) and its uncertainty (barely visible gray hatched area), and the signal normalized to the cross section resulting from the fit (dashed line). The data shown in each bin are the weighted sum of the number of events within each category, divided by the bin width, as a function of the dijet mass, with vertical bars representing the statistical uncertainty ($\sigma _{\text {stat}}$). The weights are the signal event fraction for each category, assuming a signal cross section equal to the 95% CL observed upper limit. The same quantities are also shown for the background and signal components of the fit. The lower panel shows the difference between the data and the background prediction (points), and the background uncertainty (hatched gray area), divided by the statistical uncertainty. |
png pdf |
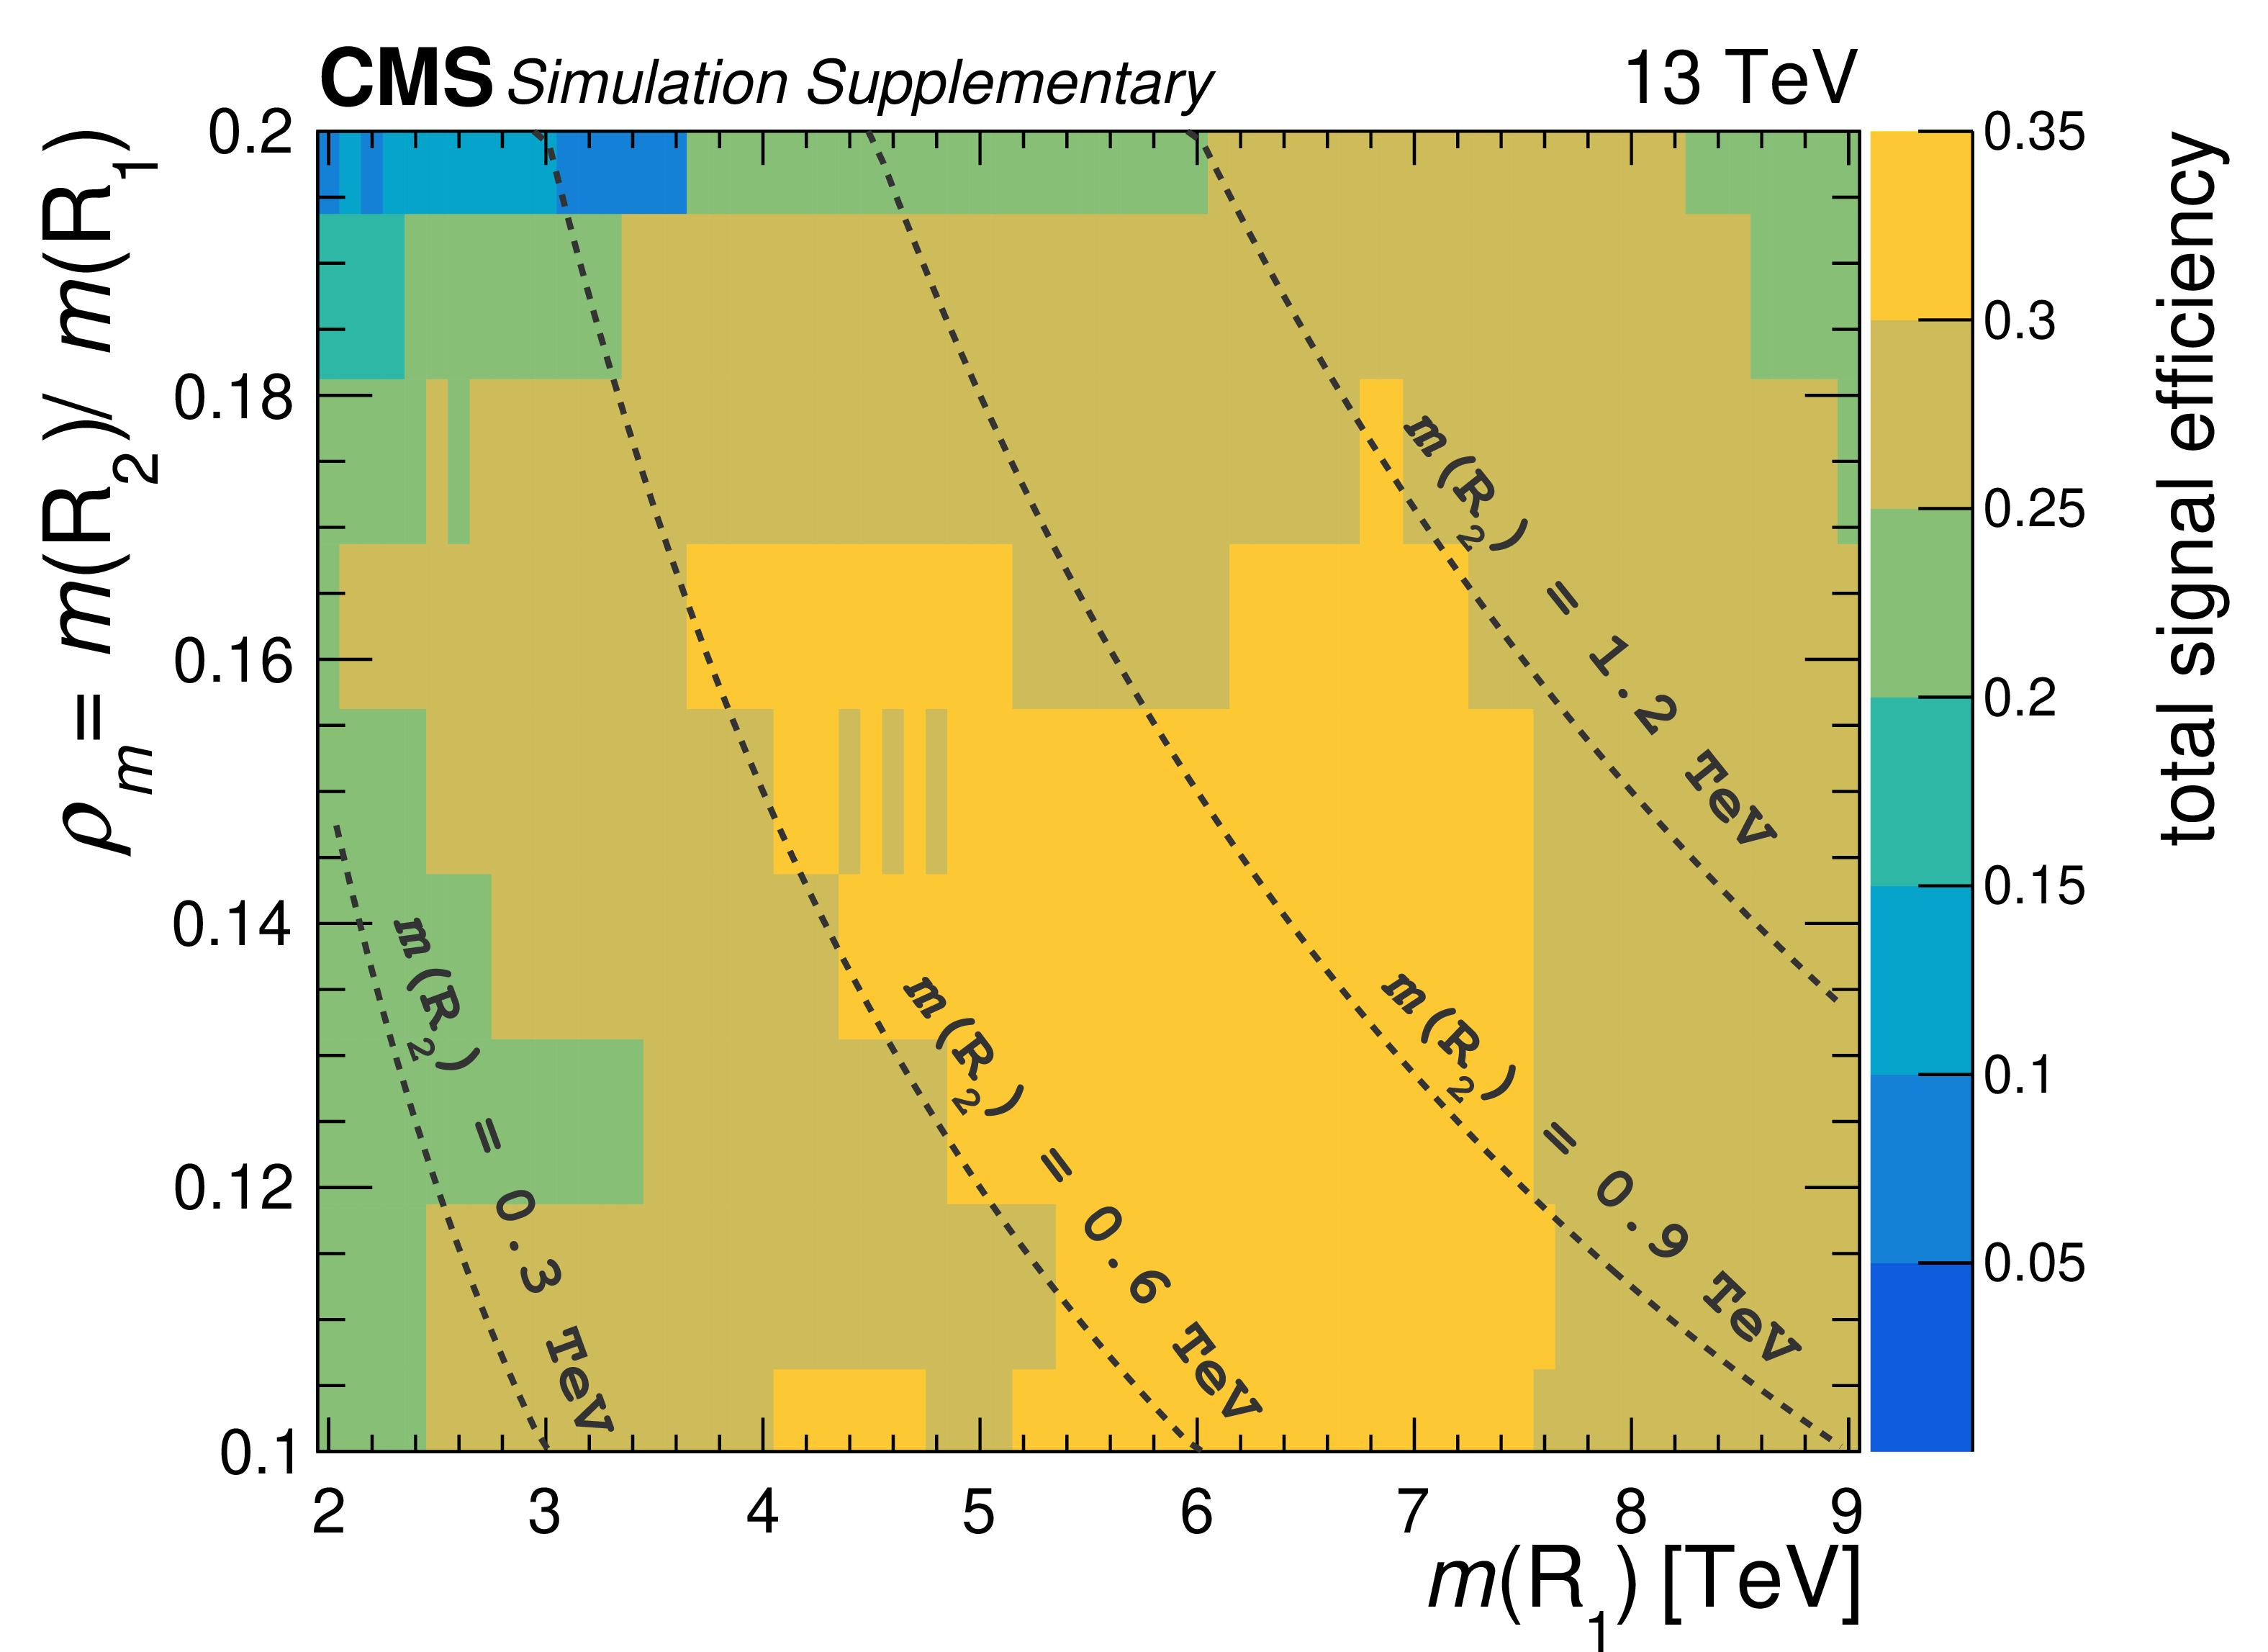
Additional Figure 5:
Total signal efficiency for each signal hypothesis tested plotted as a function of the ratio between the masses of the two resonances $\rho _{m} = m\, (\mathrm {R}_2 )/m\, (\mathrm {R}_1 )$ and the mass of the first resonance $m\, (\mathrm {R}_1 )$. The total signal efficiency is defined as the total number of signal events that falls inside the event categories defined in the analysis, divided by the number of generated signal events. |

png pdf |
Additional Figure 6:
Expected 95% CL upper limits on signal cross section times branching fraction, as a function of the ratio $m\, (\mathrm {R}_2 )\, /\, m\, (\mathrm {R}_1 )$ vs. $m\, (\mathrm {R}_1 )$, for a trijet resonance model with 3 gluons in the final state. The limits are optimized for the decay of a Kaluza-Klein gluon ($\mathrm {G}_{\text {KK}}$) to a radion ($\phi $) and a gluon ($\mathrm {g}$) where the radion itself decays to 2 gluons, leading to a final state with 3 gluons ($\mathrm {ggg}$). The coupling parameters of the graviton and of the KK gluon (which are free paremeter of the theory) are respectively set to $g_{\text {grav}} = $ 6.0 and $g_{\mathrm {GKK}} = $ 3.0. |
| References | ||||
| 1 | A. Arbey and F. Mahmoudi | Dark matter and the early Universe: A review | Prog. Part. NP 119 (2021) 103865 | 2104.11488 |
| 2 | CMS Collaboration | Search for high mass dijet resonances with a new background prediction method in proton-proton collisions at $ \sqrt{s} = $ 13 TeV | JHEP 05 (2020) 033 | CMS-EXO-19-012 1911.03947 |
| 3 | ATLAS Collaboration | Search for new resonances in mass distributions of jet pairs using 139 fb$ ^{-1} $ of pp collisions at $ \sqrt{s} = $ 13 TeV with the ATLAS detector | JHEP 03 (2020) 145 | 1910.08447 |
| 4 | CMS Collaboration | Search for dijet resonances using events with three jets in proton-proton collisions at $ \sqrt{s} = $ 13 TeV | PLB 805 (2020) 135448 | CMS-EXO-19-004 1911.03761 |
| 5 | CMS Collaboration | Search for low mass vector resonances decaying into quark-antiquark pairs in proton-proton collisions at $ \sqrt{s} = $ 13 TeV | PRD 100 (2019) 112007 | CMS-EXO-18-012 1909.04114 |
| 6 | ATLAS Collaboration | Search for light resonances decaying to boosted quark pairs and produced in association with a photon or a jet in proton-proton collisions at $ \sqrt{s} = $ 13 TeV with the ATLAS detector | PLB 788 (2019) 316 | 1801.08769 |
| 7 | CMS Collaboration | Search for low-mass quark-antiquark resonances produced in association with a photon at $ \sqrt{s} = $ 13 TeV | PRL 123 (2019) 231803 | CMS-EXO-17-027 1905.10331 |
| 8 | ATLAS Collaboration | Search for low-mass resonances decaying into two jets and produced in association with a photon using pp collisions at $ \sqrt{s} = $ 13 TeV with the ATLAS detector | PLB 795 (2019) 56 | 1901.10917 |
| 9 | ATLAS Collaboration | Search for dijet resonances in events with an isolated charged lepton using $ \sqrt{s} = $ 13 TeV proton$ - $proton collision data collected by the ATLAS detector | JHEP 06 (2020) 151 | 2002.11325 |
| 10 | ATLAS Collaboration | A search for pair-produced resonances in four-jet final states at $ \sqrt{s} = $ 13 TeV with the ATLAS detector | EPJC 78 (2018) 250 | 1710.07171 |
| 11 | CMS Collaboration | Search for pair-produced resonances decaying to quark pairs in proton-proton collisions at $ \sqrt{s}= $ 13 TeV | PRD 98 (2018) 112014 | CMS-EXO-17-021 1808.03124 |
| 12 | CMS Collaboration | Search for pair-produced resonances each decaying into at least four quarks in proton-proton collisions at $ \sqrt{s} = $ 13 TeV | PRL 121 (2018) 141802 | CMS-EXO-17-022 1806.01058 |
| 13 | ATLAS Collaboration | Search for R-parity-violating supersymmetric particles in multi-jet final states produced in pp collisions at $ \sqrt{s} = $ 13 TeV using the ATLAS detector at the LHC | PLB 785 (2018) 136 | 1804.03568 |
| 14 | CMS Collaboration | Search for pair-produced three-jet resonances in proton-proton collisions at $ \sqrt{s} = $ 13 TeV | PRD 99 (2019) 012010 | CMS-EXO-17-030 1810.10092 |
| 15 | K. S. Agashe et al. | LHC signals from cascade decays of warped vector resonances | JHEP 05 (2017) 078 | 1612.00047 |
| 16 | K. Agashe et al. | Dedicated strategies for triboson signals from cascade decays of vector resonances | PRD 99 (2019) 075016 | 1711.09920 |
| 17 | K. Agashe, M. Ekhterachian, D. Kim, and D. Sathyan | LHC signals for KK graviton from an extended warped extra dimension | JHEP 11 (2020) 109 | 2008.06480 |
| 18 | M. Redi, V. Sanz, M. de Vries, and A. Weiler | Strong signatures of right-handed compositeness | JHEP 08 (2013) 008 | 1305.3818 |
| 19 | CMS Collaboration | Search for narrow and broad dijet resonances in proton-proton collisions at $ \sqrt{s} = $ 13 TeV and constraints on dark matter mediators and other new particles | JHEP 08 (2018) 130 | CMS-EXO-16-056 1806.00843 |
| 20 | CMS Collaboration | HEPData record for this analysis | link | |
| 21 | CMS Collaboration | The CMS experiment at the CERN LHC | JINST 3 (2008) S08004 | CMS-00-001 2012.06888 |
| 22 | CMS Collaboration | Performance of the CMS level-1 trigger in proton-proton collisions at $ \sqrt{s} = $ 13 TeV | JINST 15 (2020) P10017 | CMS-TRG-17-001 2006.10165 |
| 23 | CMS Collaboration | The CMS trigger system | JINST 12 (2017) P01020 | CMS-TRG-12-001 1609.02366 |
| 24 | J. Alwall et al. | The automated computation of tree-level and next-to-leading order differential cross sections, and their matching to parton shower simulations | JHEP 07 (2014) 079 | 1405.0301 |
| 25 | Sjostrand, Torbjorn et al. | An introduction to PYTHIA 8.2 | CPC 191 (2015) 159 | 1410.3012 |
| 26 | NNPDF Collaboration | Parton distributions from high-precision collider data | EPJC 77 (2017) 663 | 1706.00428 |
| 27 | CMS Collaboration | Extraction and validation of a new set of CMS pythia 8 tunes from underlying-event measurements | EPJC 80 (2020) 4 | CMS-GEN-17-001 1903.12179 |
| 28 | GEANT4 Collaboration | GEANT4--a simulation toolkit | NIMA 506 (2003) 250 | |
| 29 | CMS Collaboration | Particle-flow reconstruction and global event description with the CMS detector | JINST 12 (2017) P10003 | CMS-PRF-14-001 1706.04965 |
| 30 | D. Bertolini, P. Harris, M. Low, and N. Tran | Pileup per particle identification | JHEP 10 (2014) 59 | 1407.6013 |
| 31 | CMS Collaboration | Pileup mitigation at CMS in 13 TeV data | JINST 15 (2020) P09018 | CMS-JME-18-001 2003.00503 |
| 32 | M. Cacciari, G. P. Salam, and G. Soyez | FastJet user manual | EPJC 72 (2012) 1896 | 1111.6097 |
| 33 | M. Cacciari, G. P. Salam, and G. Soyez | The anti-$ {k_{\mathrm{T}}} $ jet clustering algorithm | JHEP 04 (2008) 63 | 0802.1189 |
| 34 | CMS Collaboration | Jet algorithms performance in 13 TeV data | CMS-PAS-JME-16-003 | CMS-PAS-JME-16-003 |
| 35 | A. J. Larkoski, S. Marzani, G. Soyez, and J. Thaler | Soft drop | JHEP 05 (2014) 053002 | 1402.2657 |
| 36 | CMS Collaboration | Search for dijet resonances in proton-proton collisions at $ \sqrt{s} = $ 13 TeV and constraints on dark matter and other models | PLB 769 (2016) 520 | CMS-EXO-16-032 1611.03568 |
| 37 | J. Thaler and K. Van Tilburg | Identifying boosted objects with N-subjettiness | JHEP 03 (2011) 015 | 1011.2268 |
| 38 | M. J. Oreglia | A study of the reactions $\psi' \to \gamma\gamma \psi$ | PhD thesis, Stanford University, 1980 SLAC Report SLAC-R-236, see Appendix D | |
| 39 | J. Gaiser | Charmonium Spectroscopy From Radiative Decays of the $\mathrm{J}/\psi$ and $\psi'$ | PhD thesis, SLAC | |
| 40 | CMS Collaboration | Precision luminosity measurement in proton-proton collisions at $ \sqrt{s} = $ 13 TeV in 2015 and 2016 at CMS | EPJC 81 (2021) 800 | CMS-LUM-17-003 2104.01927 |
| 41 | CMS Collaboration | CMS luminosity measurement for the 2017 data-taking period at $ \sqrt{s} = $ 13 TeV | CMS-PAS-LUM-17-004 | CMS-PAS-LUM-17-004 |
| 42 | CMS Collaboration | CMS luminosity measurement for the 2018 data-taking period at $ \sqrt{s} = $ 13 TeV | CMS-PAS-LUM-18-002 | CMS-PAS-LUM-18-002 |
| 43 | L. Demortier | P values and nuisance parameters | in Statistical issues for LHC physics. Proceedings, PHYSTAT-LHC, Geneva 2008 | |
| 44 | R. Barlow | Event classification using weighting methods | J. Comp. Phys. 72 (1987) 202 | |
| 45 | T. Junk | Confidence level computation for combining searches with small statistics | Nucl. Instr. Meth. A 434 (1999) 435 | hep-ex/9902006 |
| 46 | A. L. Read | Presentation of search results: the CL$ _\text{s} $ technique | JPG 28 (2002) 2693 | |
| 47 | ATLAS and CMS Collaborations, and the LHC Higgs Combination Group | Procedure for the LHC Higgs boson search combination in Summer 2011 | CMS-NOTE-2011-005 | |
| 48 | G. Cowan, K. Cranmer, E. Gross, and O. Vitells | Asymptotic formulae for likelihood-based tests of new physics | EPJC 71 (2011) 1554 | 1007.1727 |
| 49 | CMS Collaboration | Search for resonant $ \mathrm{t}\overline{\mathrm{t}} $ production in proton-proton collisions at $ \sqrt{s}= $ 13 TeV | JHEP 04 (2019) 031 | CMS-B2G-17-017 1810.05905 |
| 50 | ATLAS Collaboration | Search for $ t\overline{t} $ resonances in fully hadronic final states in pp collisions at $ \sqrt{s} = $ 13 TeV with the ATLAS detector | JHEP 10 (2020) 061 | 2005.05138 |
|
|
Compact Muon Solenoid LHC, CERN |
|

|

|

|

|

|