

Compact Muon Solenoid
LHC, CERN
| CMS-HIG-16-042 ; CERN-EP-2018-141 | ||
| Measurements of properties of the Higgs boson decaying to a W boson pair in pp collisions at $\sqrt{s} = $ 13 TeV | ||
| CMS Collaboration | ||
| 14 June 2018 | ||
| Phys. Lett. B 791 (2019) 96 | ||
| Abstract: Measurements of the production of the standard model Higgs boson decaying to a W boson pair are reported. The $\mathrm{W^{+}}\mathrm{W^{-}}$ candidates are selected in events with an oppositely charged lepton pair, large missing transverse momentum, and various numbers of jets. To select Higgs bosons produced via vector boson fusion and associated production with a W or Z boson, events with two jets and three or four leptons are also selected. The event sample corresponds to an integrated luminosity of 35.9 fb$^{-1}$ , collected in pp collisions at $\sqrt{s} = $ 13 TeV by the CMS detector at the LHC during 2016. Combining all channels, the observed cross section times branching fraction is 1.28$^{+0.18}_{-0.17}$ times the standard model prediction for the Higgs boson with a mass of 125.09 GeV. The probability of observing a signal at least as large as the one seen, under the background-only hypothesis, corresponds to an observed significance of 9.1 standard deviations, to be compared with the expected value of 7.1 standard deviations. | ||
| Links: e-print arXiv:1806.05246 [hep-ex] (PDF) ; CDS record ; inSPIRE record ; CADI line (restricted) ; | ||
| Figures | |
png pdf |
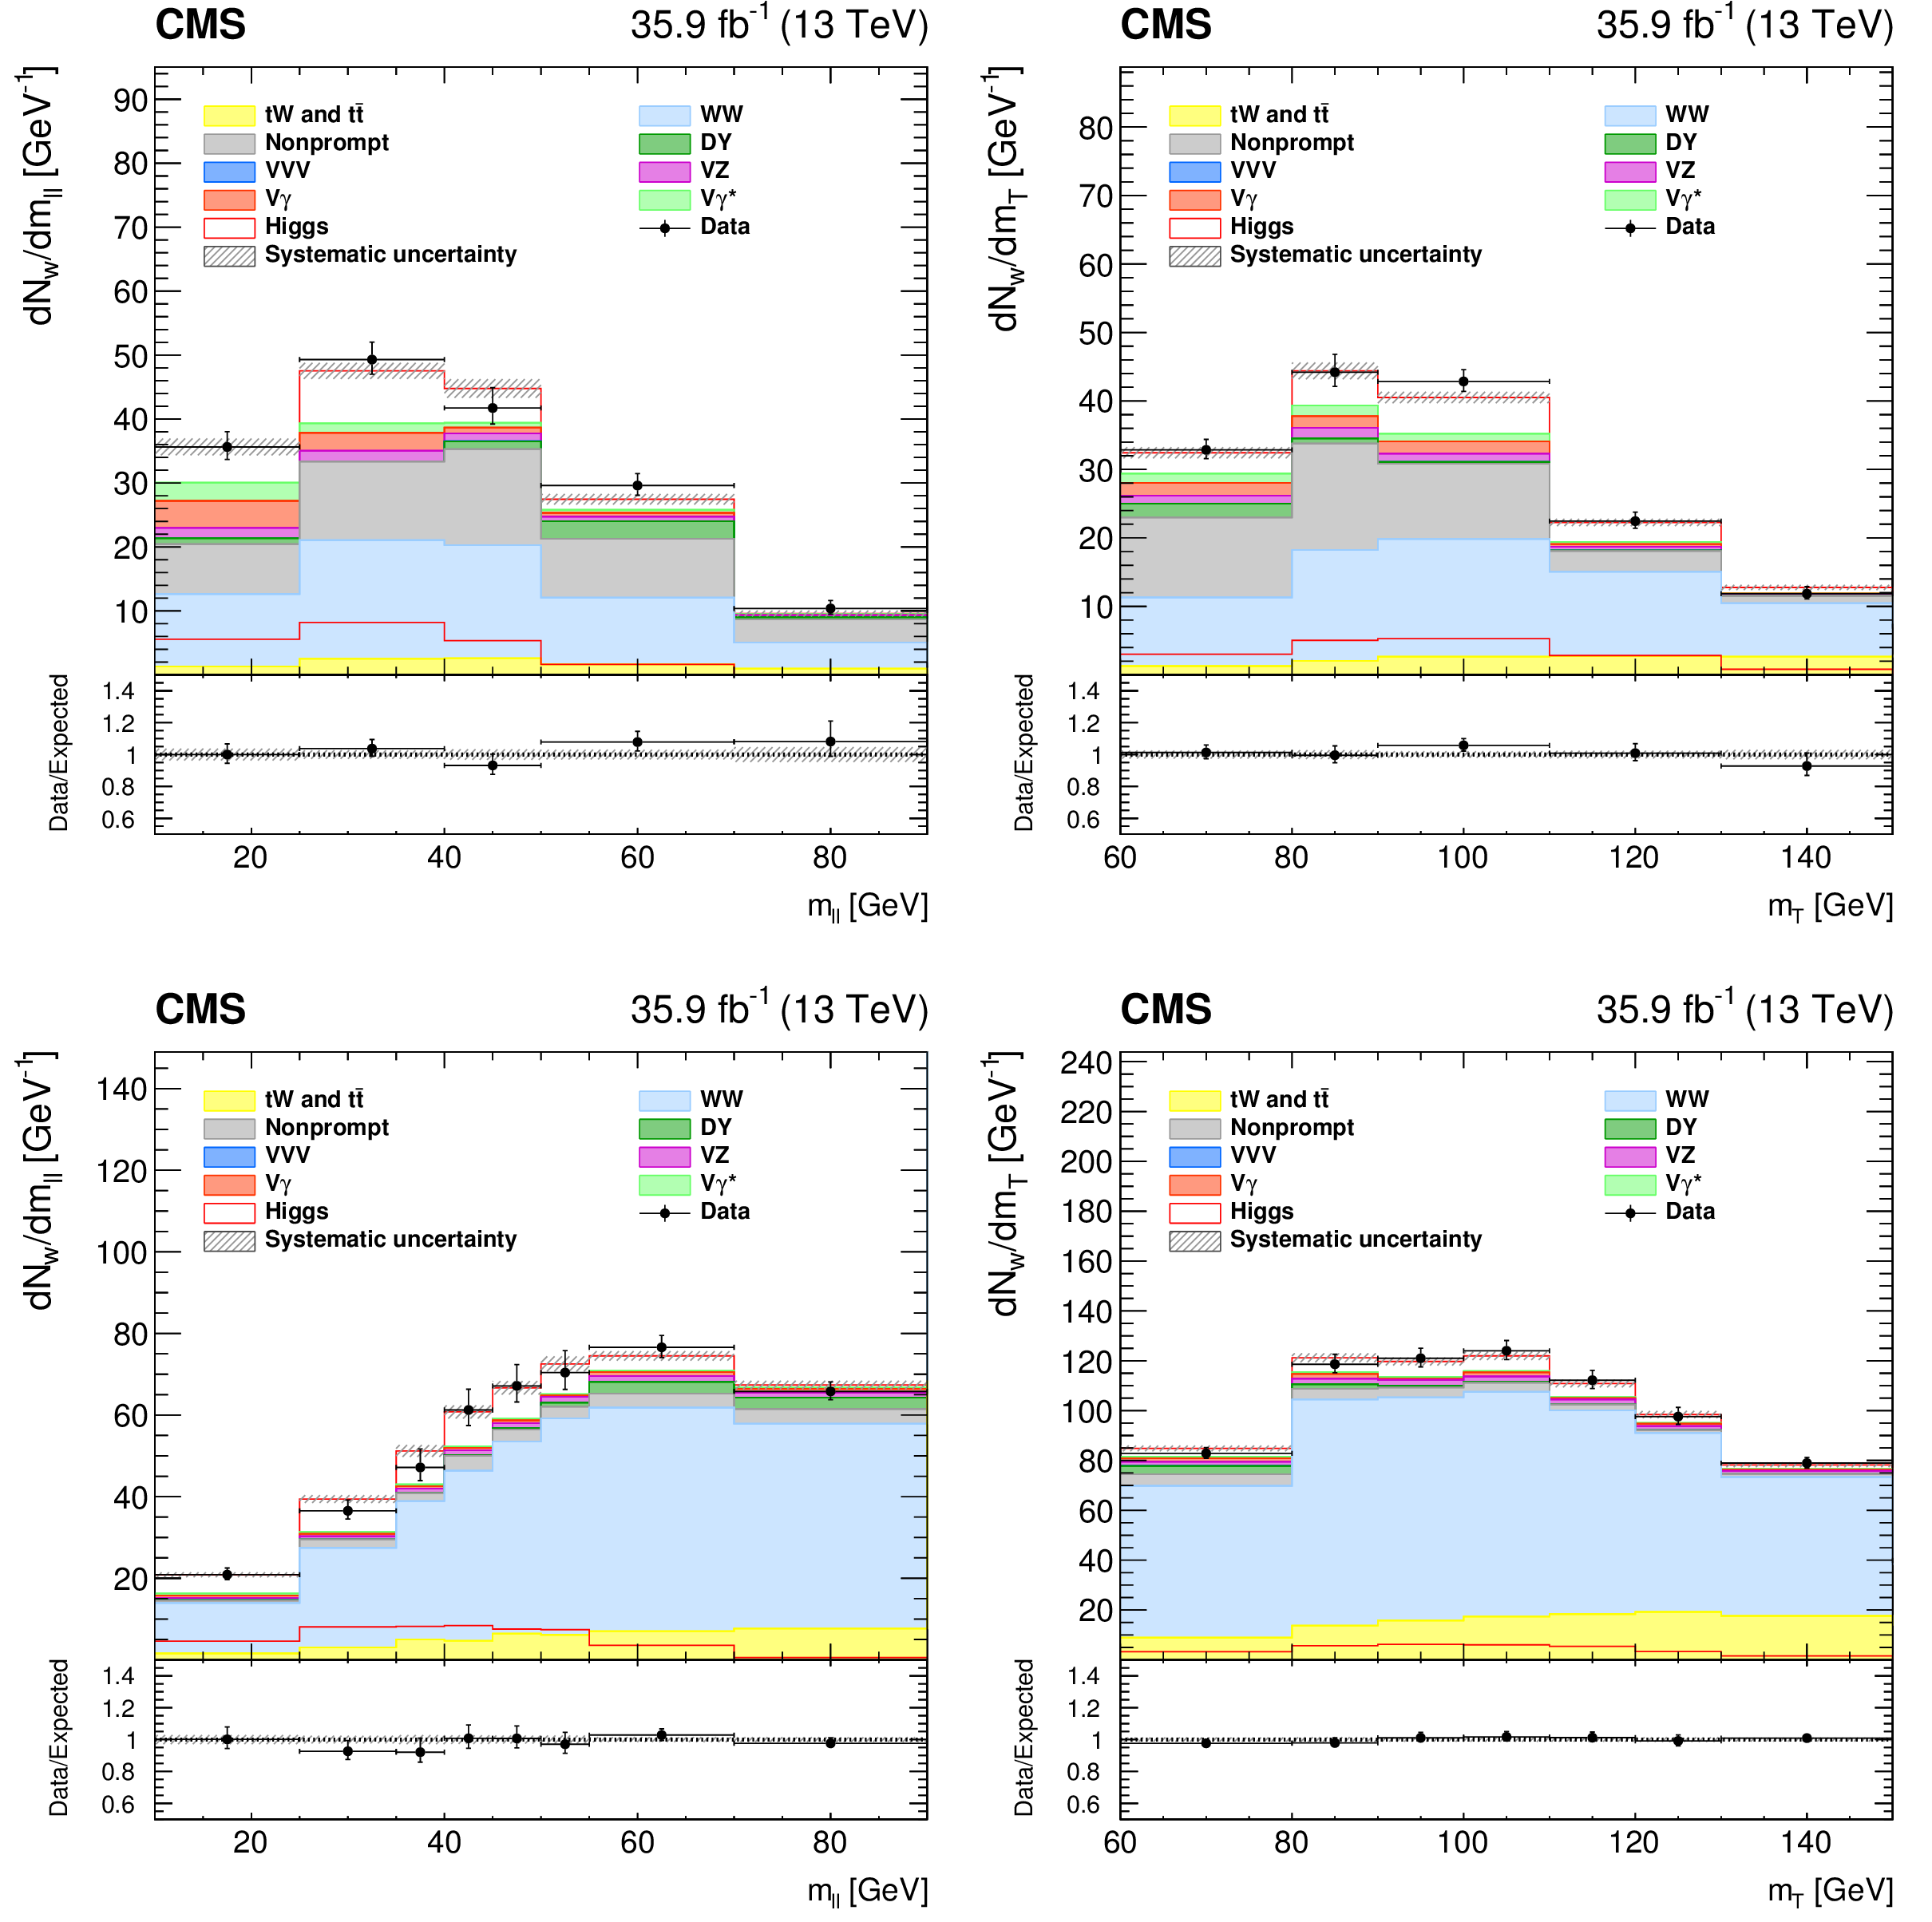
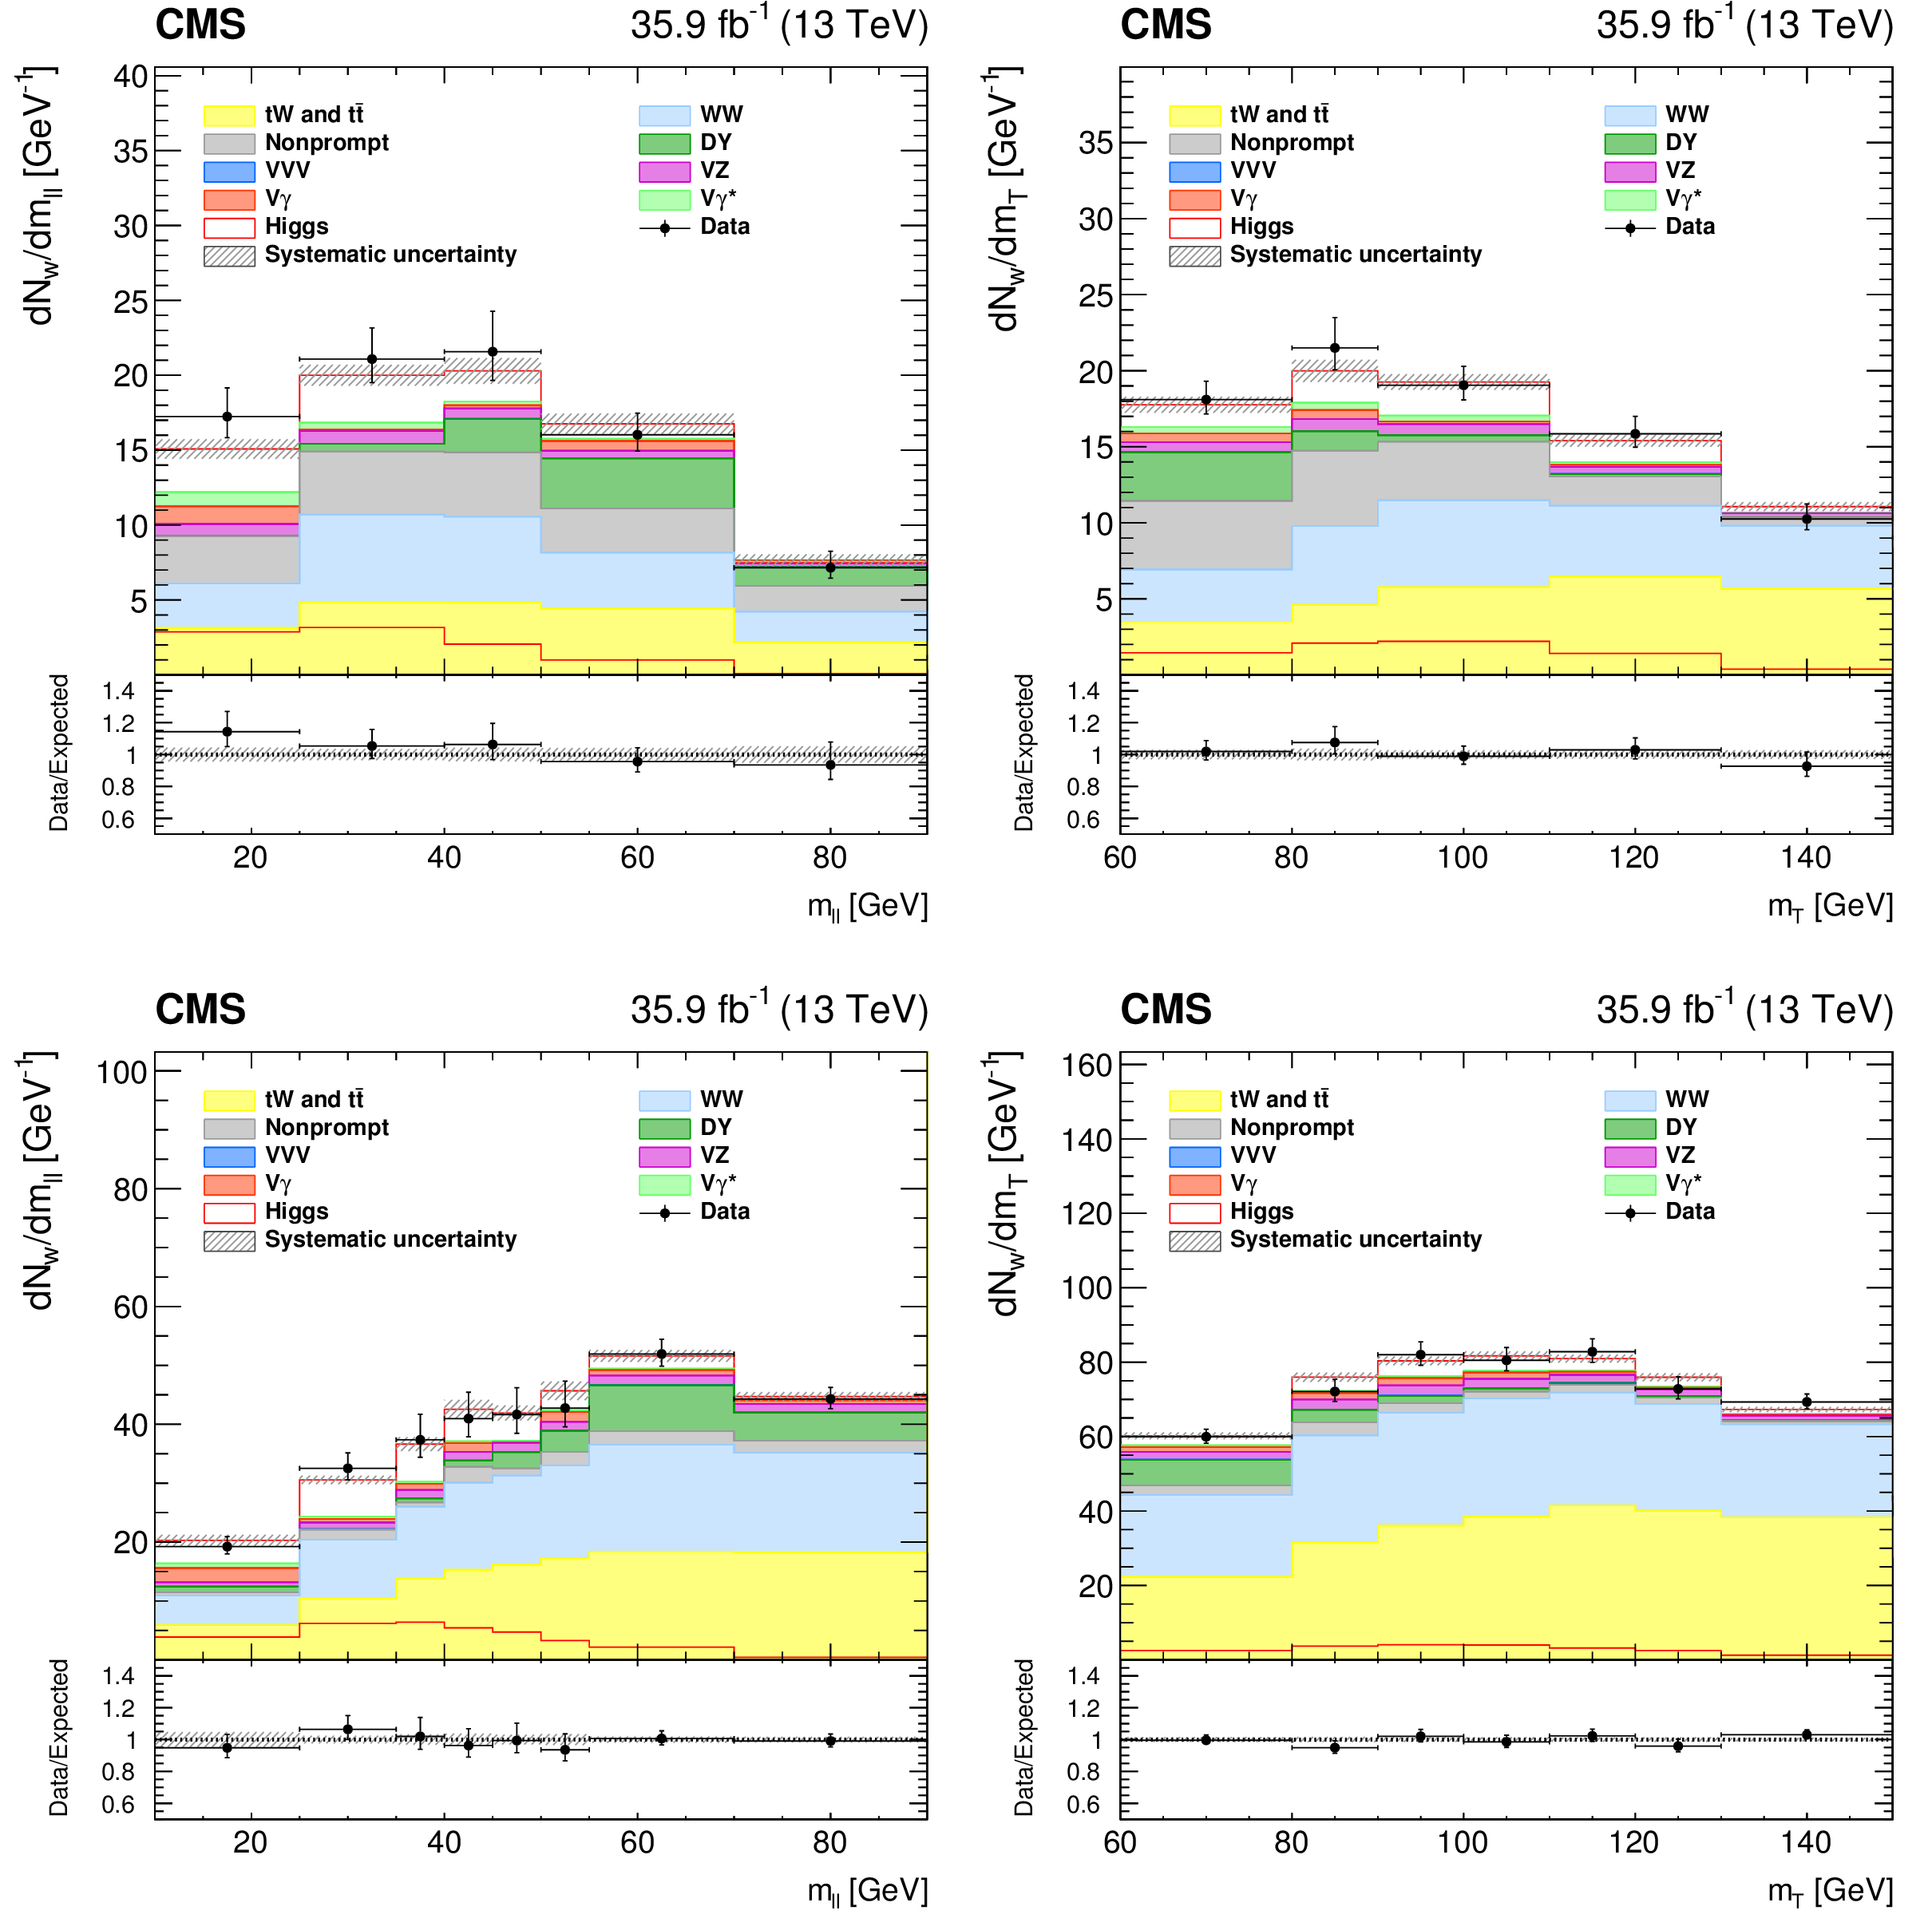
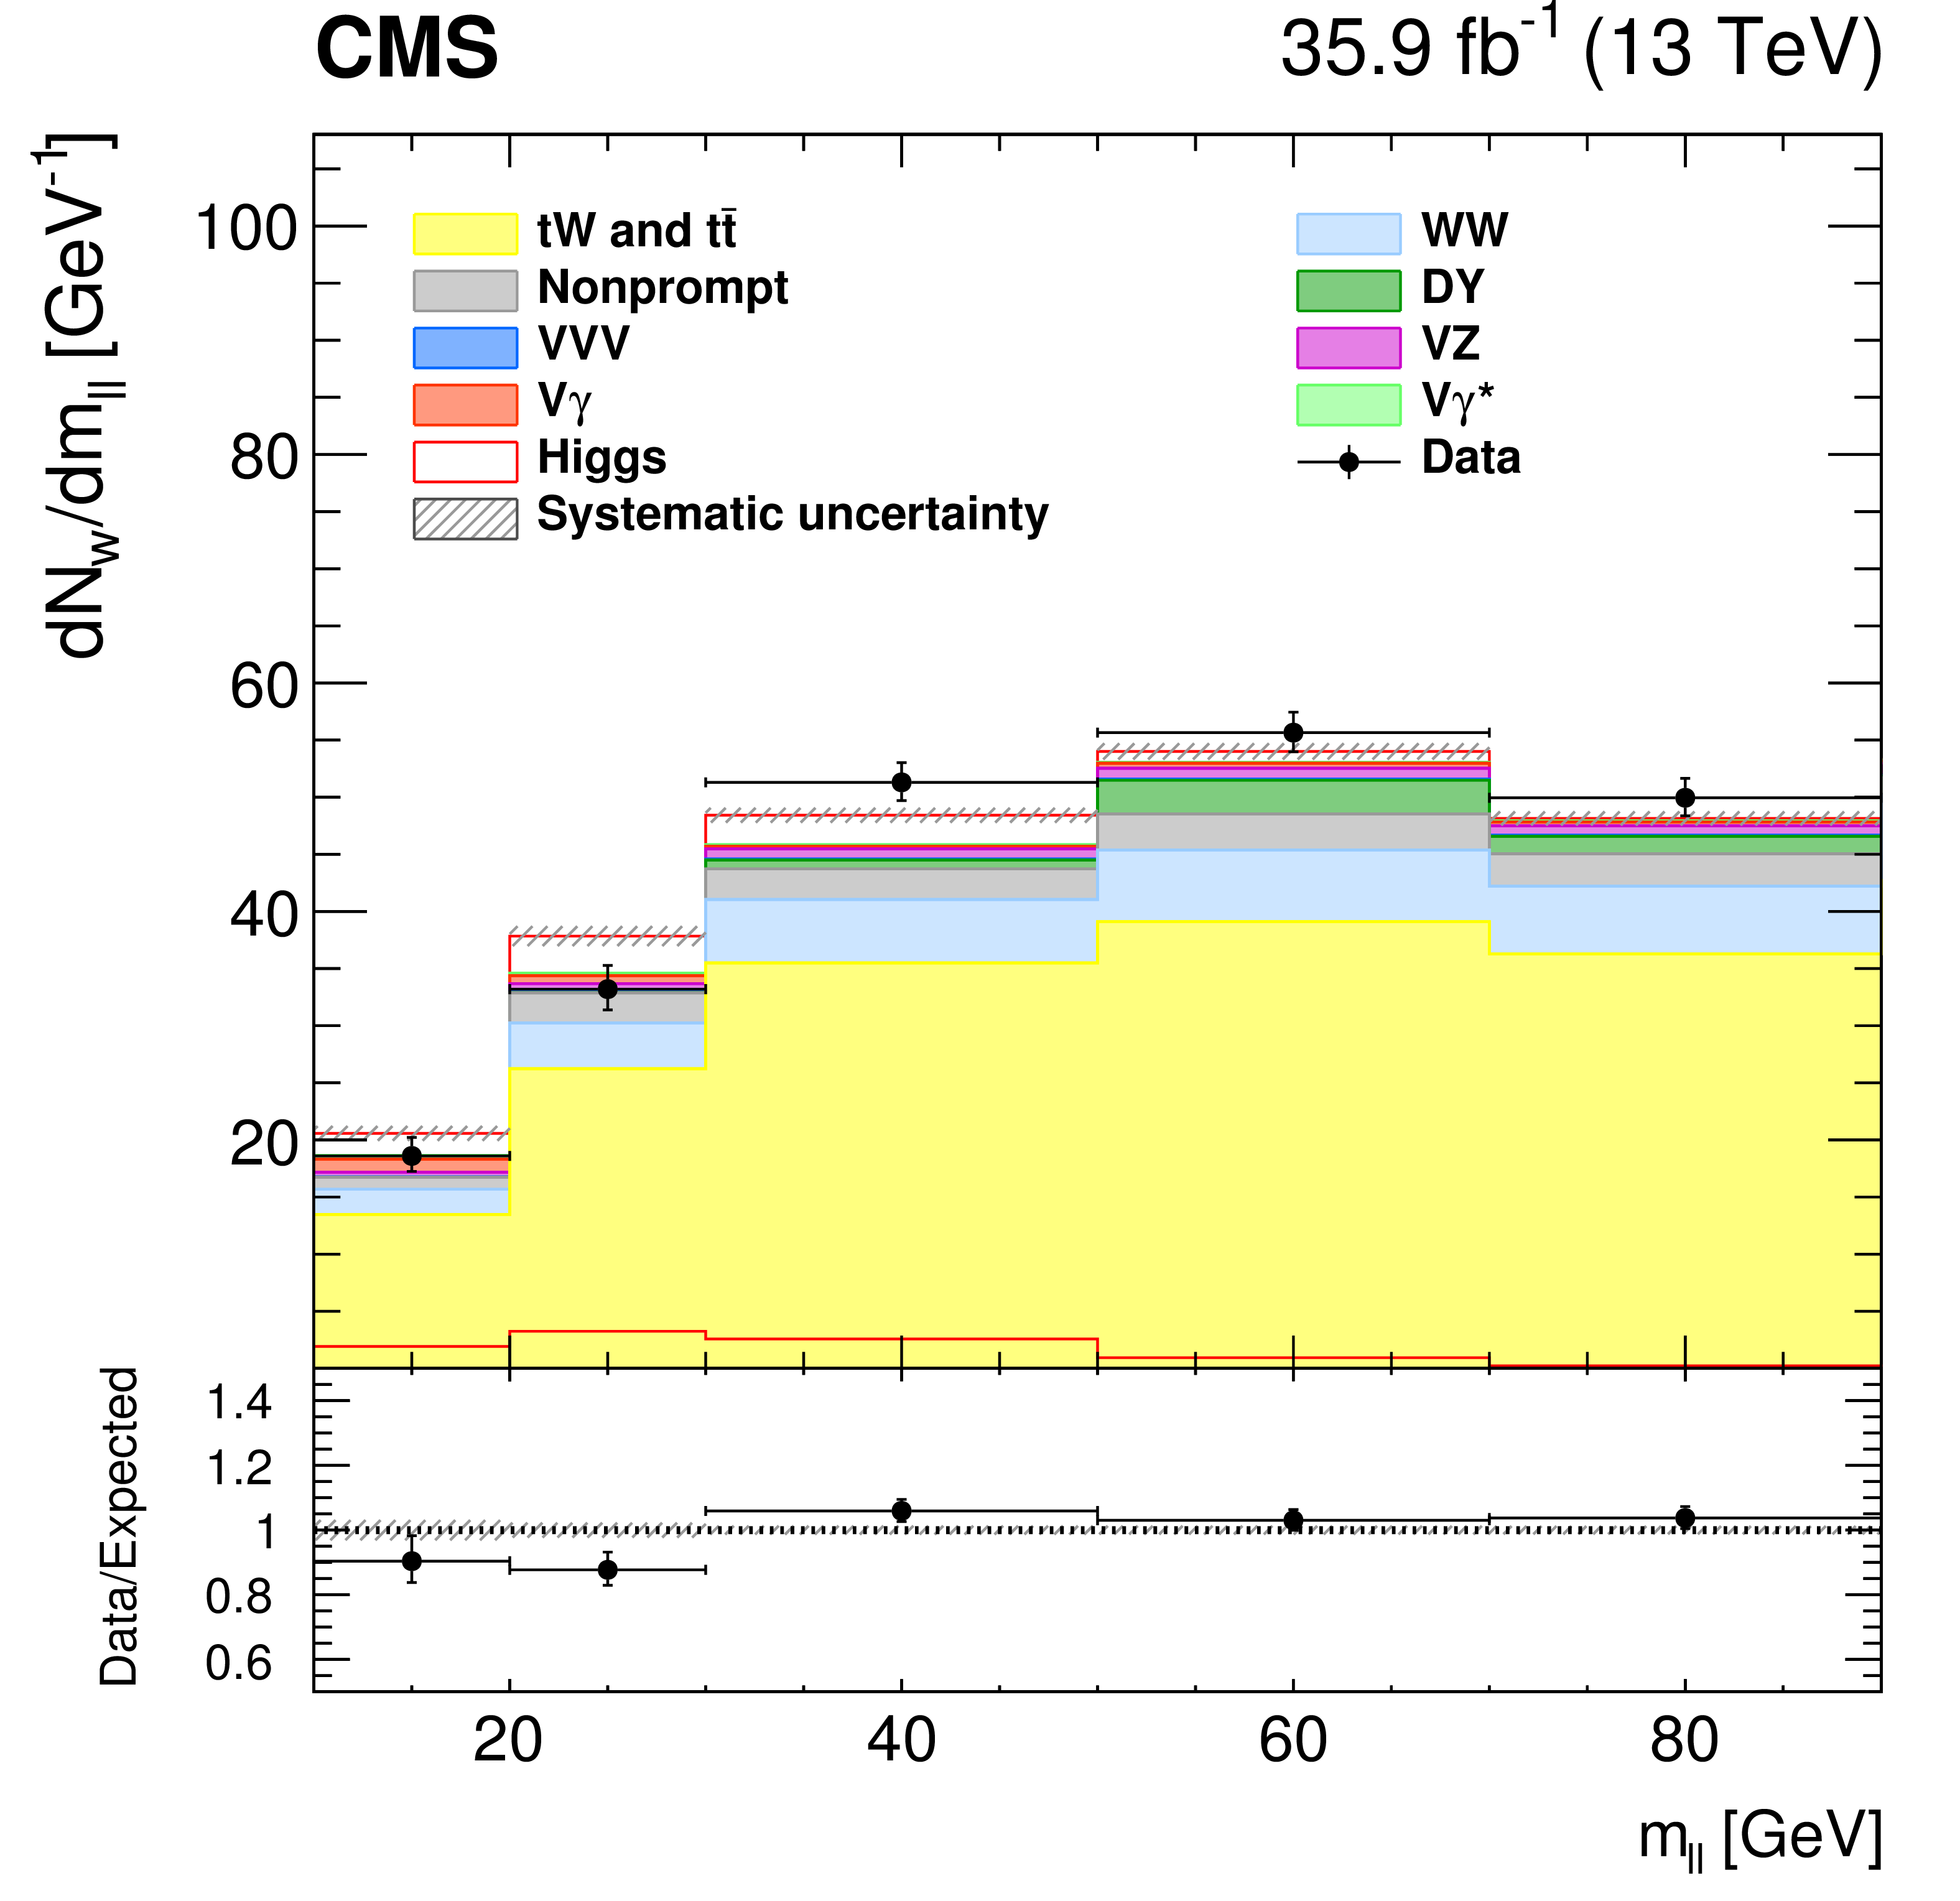
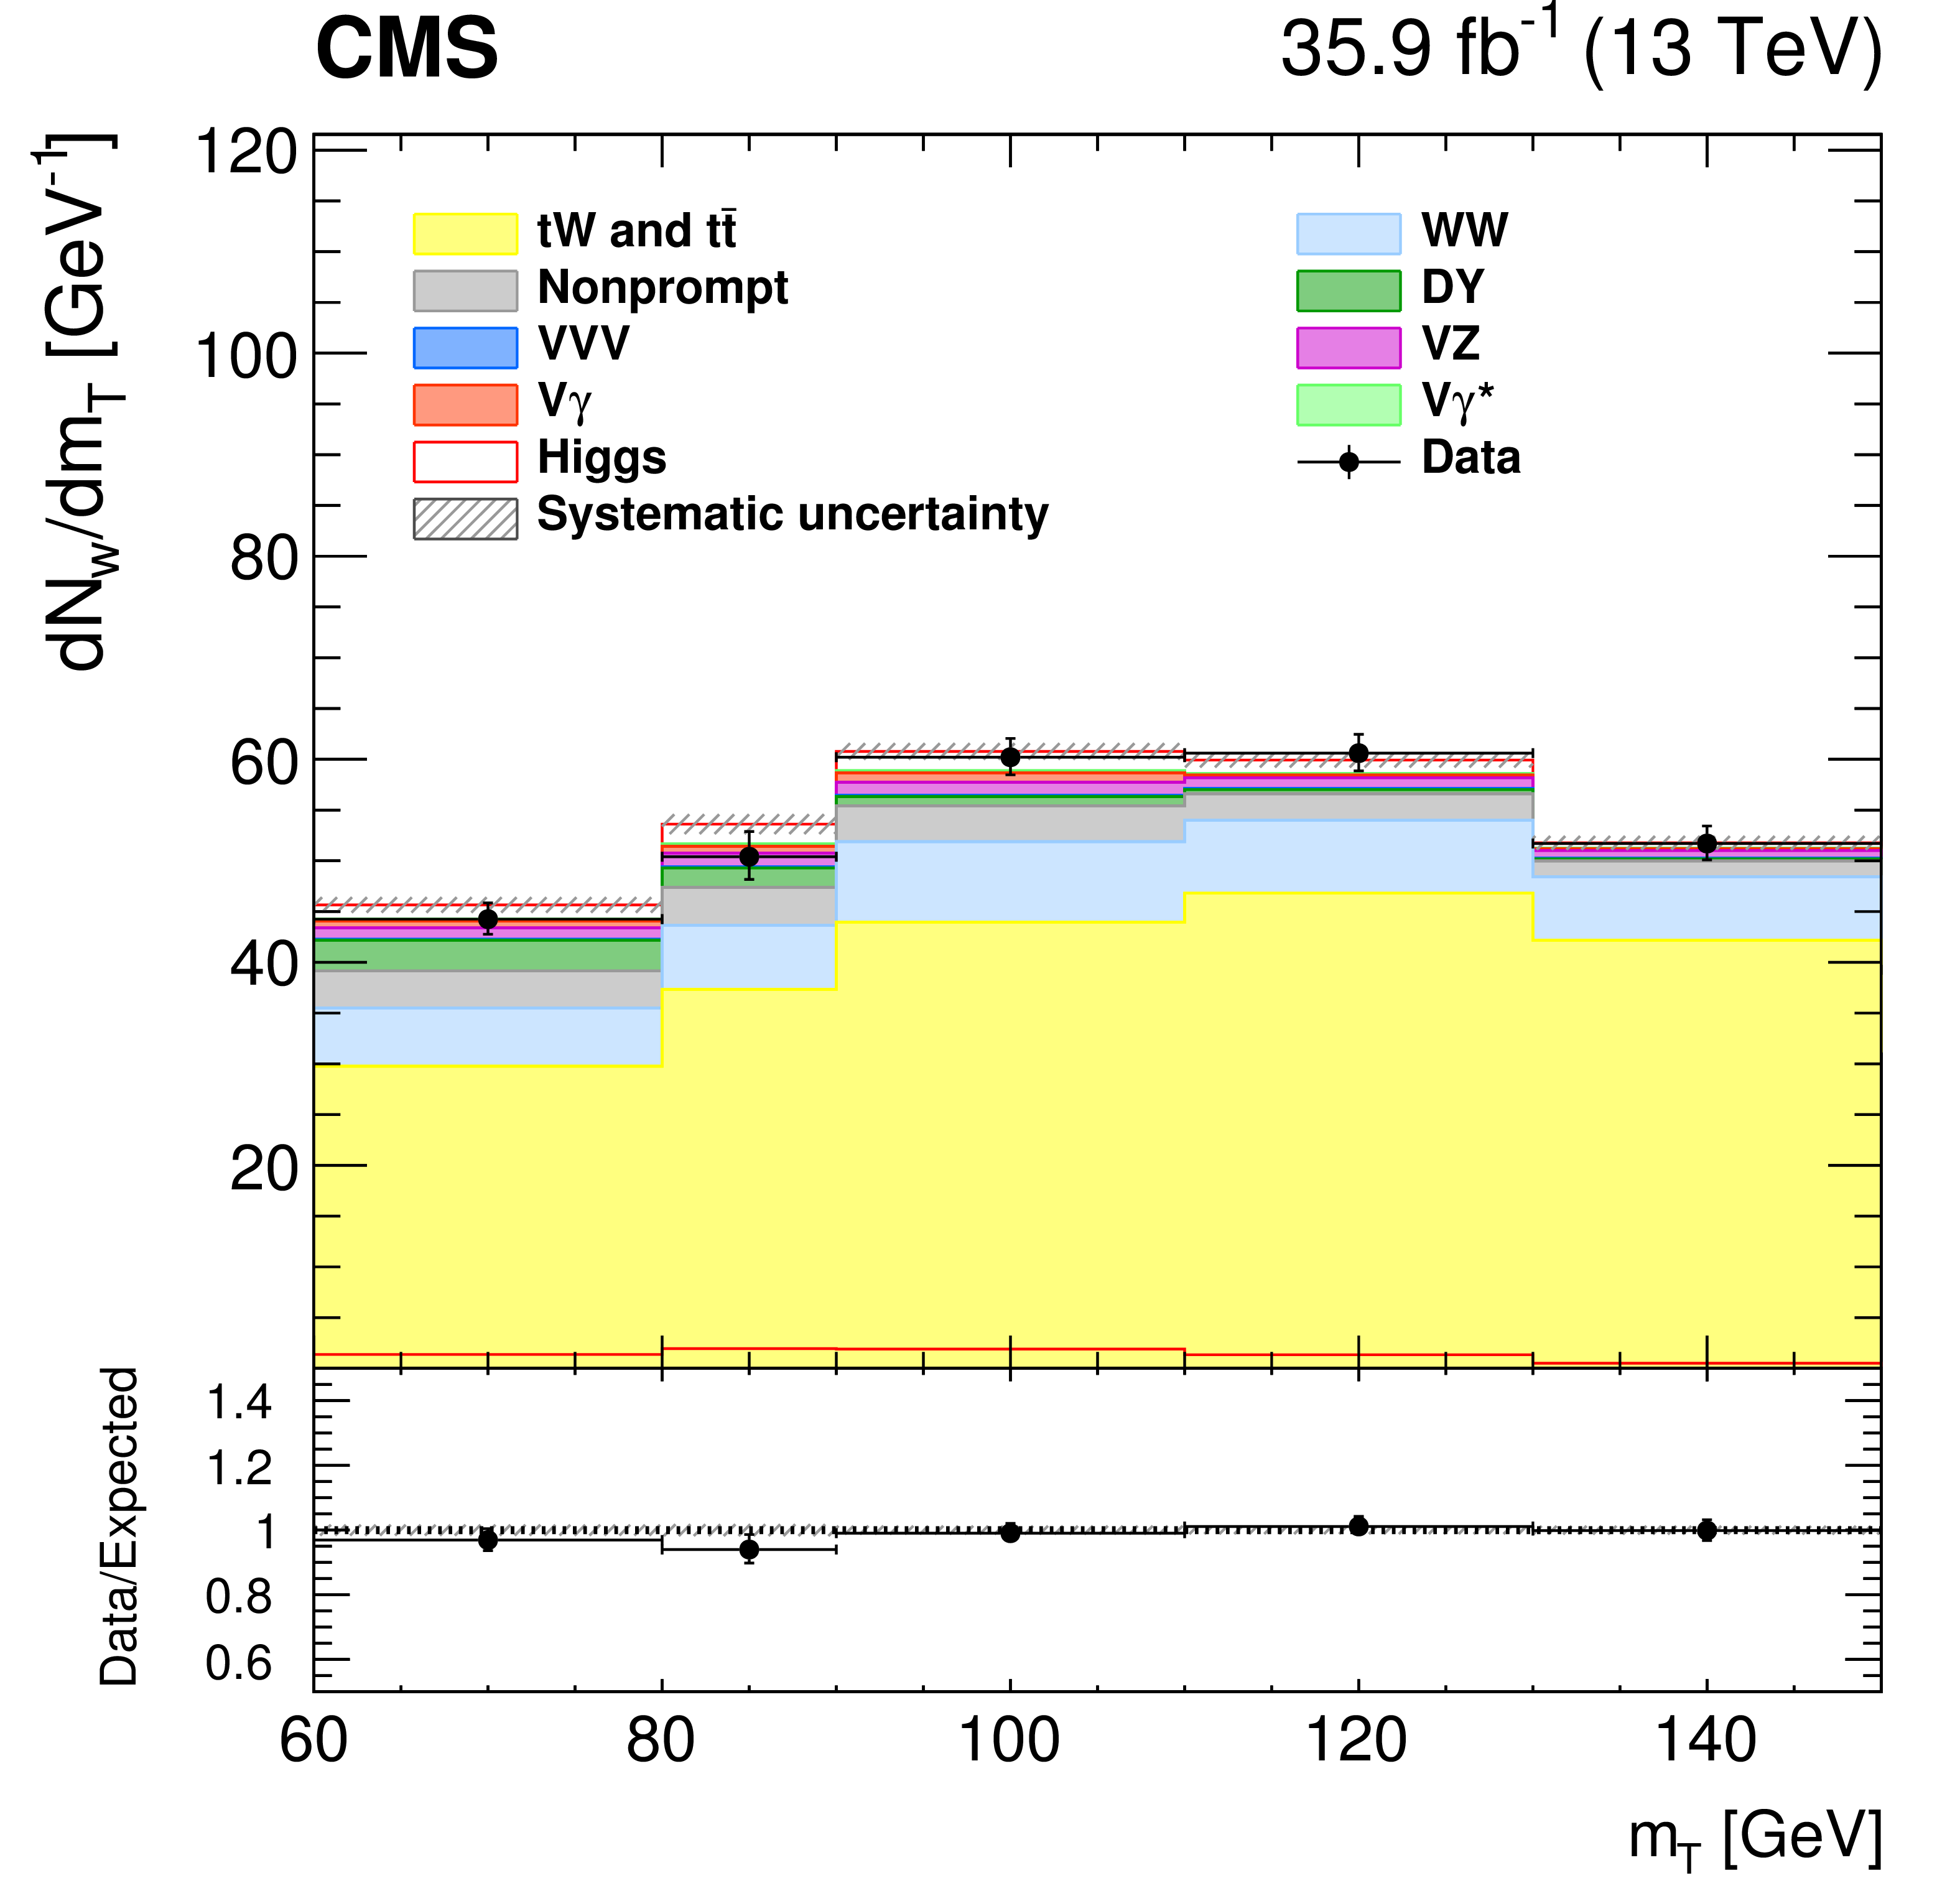
Figure 1:
Postfit number of weighted events ($N_\mathrm {w}$) as a function of $ {m_{\ell \ell}} $ and $ {m_\mathrm {T}} $ for DF events with 0 jets and $ {p_{\mathrm {T}}} {_{2}} < $ 20 GeV (upper row) or $ {p_{\mathrm {T}}} {_{2}} > $ 20 GeV (lower row). The number of events is weighted according to the $\mathrm {S/(S+B)}$ ratio in each bin of one of the two variables, integrating over the other one. The various lepton flavor and charge subcategories are also merged and weighted according to their $\mathrm {S/(S+B)}$ value. The contributions of the main background processes (stacked histograms) and the SM Higgs boson signal (superimposed and stacked red histograms) remaining after all selection criteria are shown. The dashed gray band accounts for all systematic uncertainties relative to signal and background yields after the fit. |
png pdf |
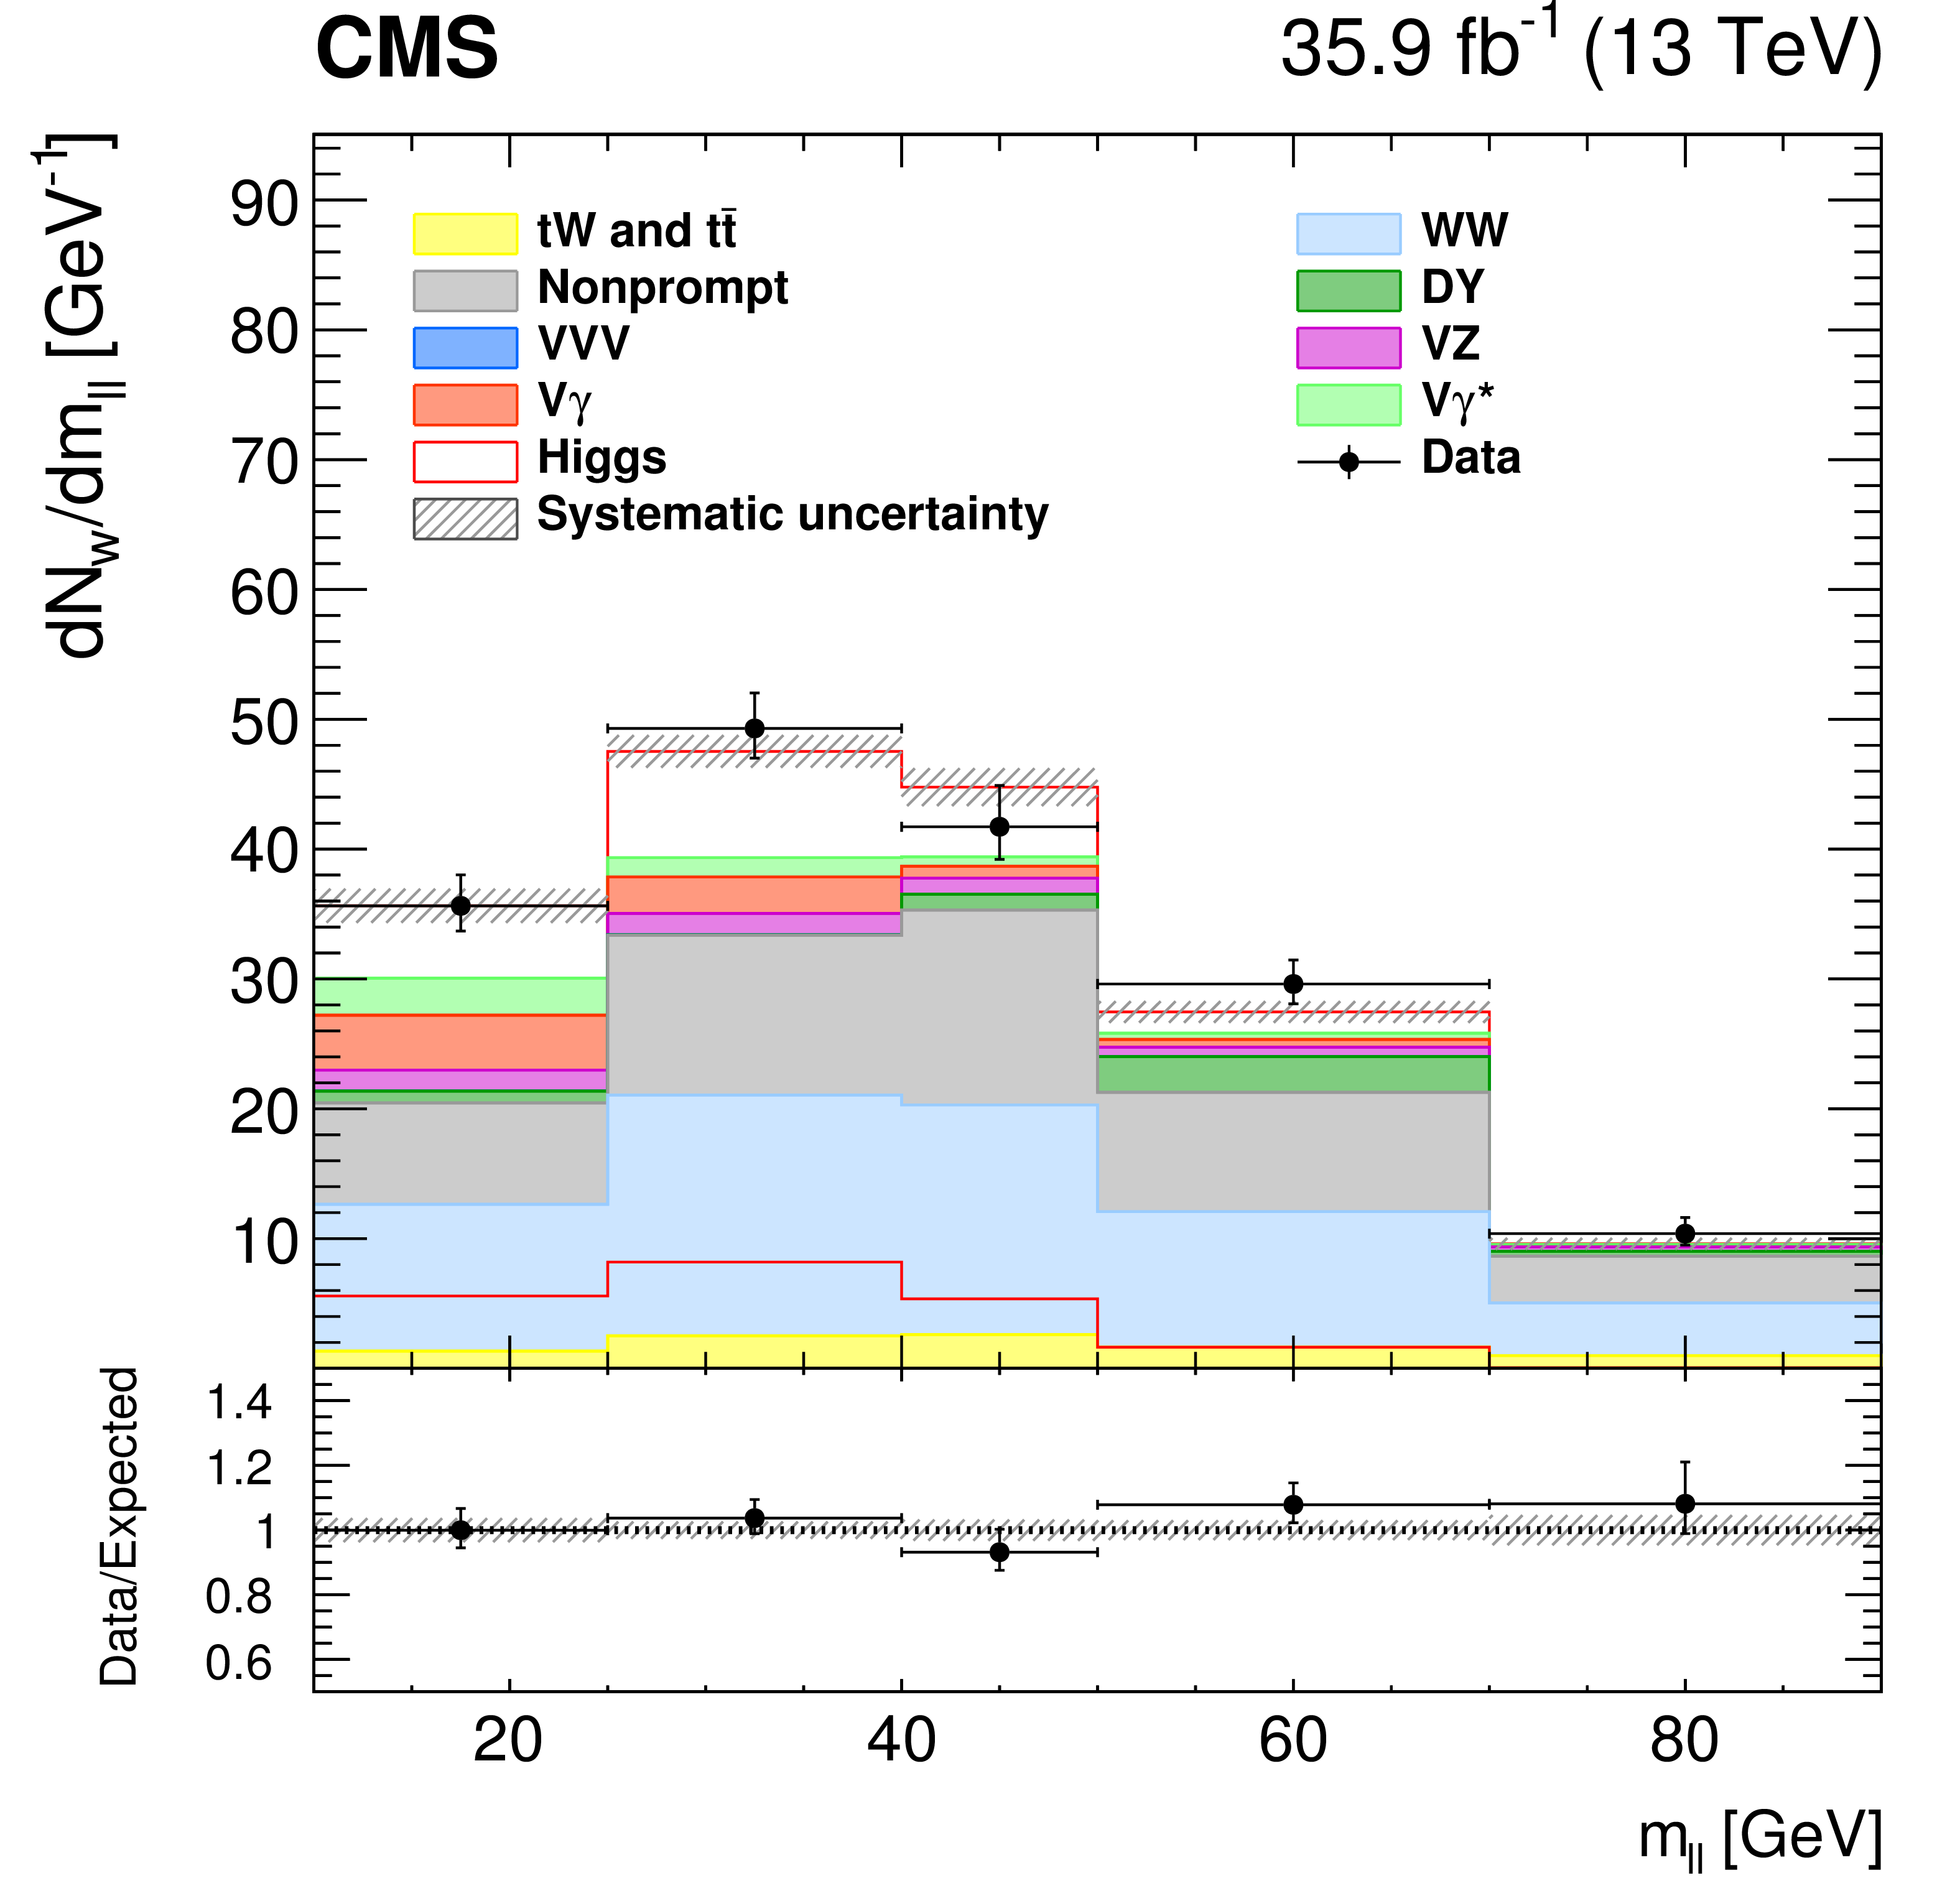
Figure 1-a:
Postfit number of weighted events ($N_\mathrm {w}$) as a function of $ {m_{\ell \ell}} $ for DF events with 0 jets and $ {p_{\mathrm {T}}} {_{2}} < $ 20 GeV. The number of events is weighted according to the $\mathrm {S/(S+B)}$ ratio in each bin of one of the two variables, integrating over the other one. The various lepton flavor and charge subcategories are also merged and weighted according to their $\mathrm {S/(S+B)}$ value. The contributions of the main background processes (stacked histograms) and the SM Higgs boson signal (superimposed and stacked red histograms) remaining after all selection criteria are shown. The dashed gray band accounts for all systematic uncertainties relative to signal and background yields after the fit. |
png pdf |
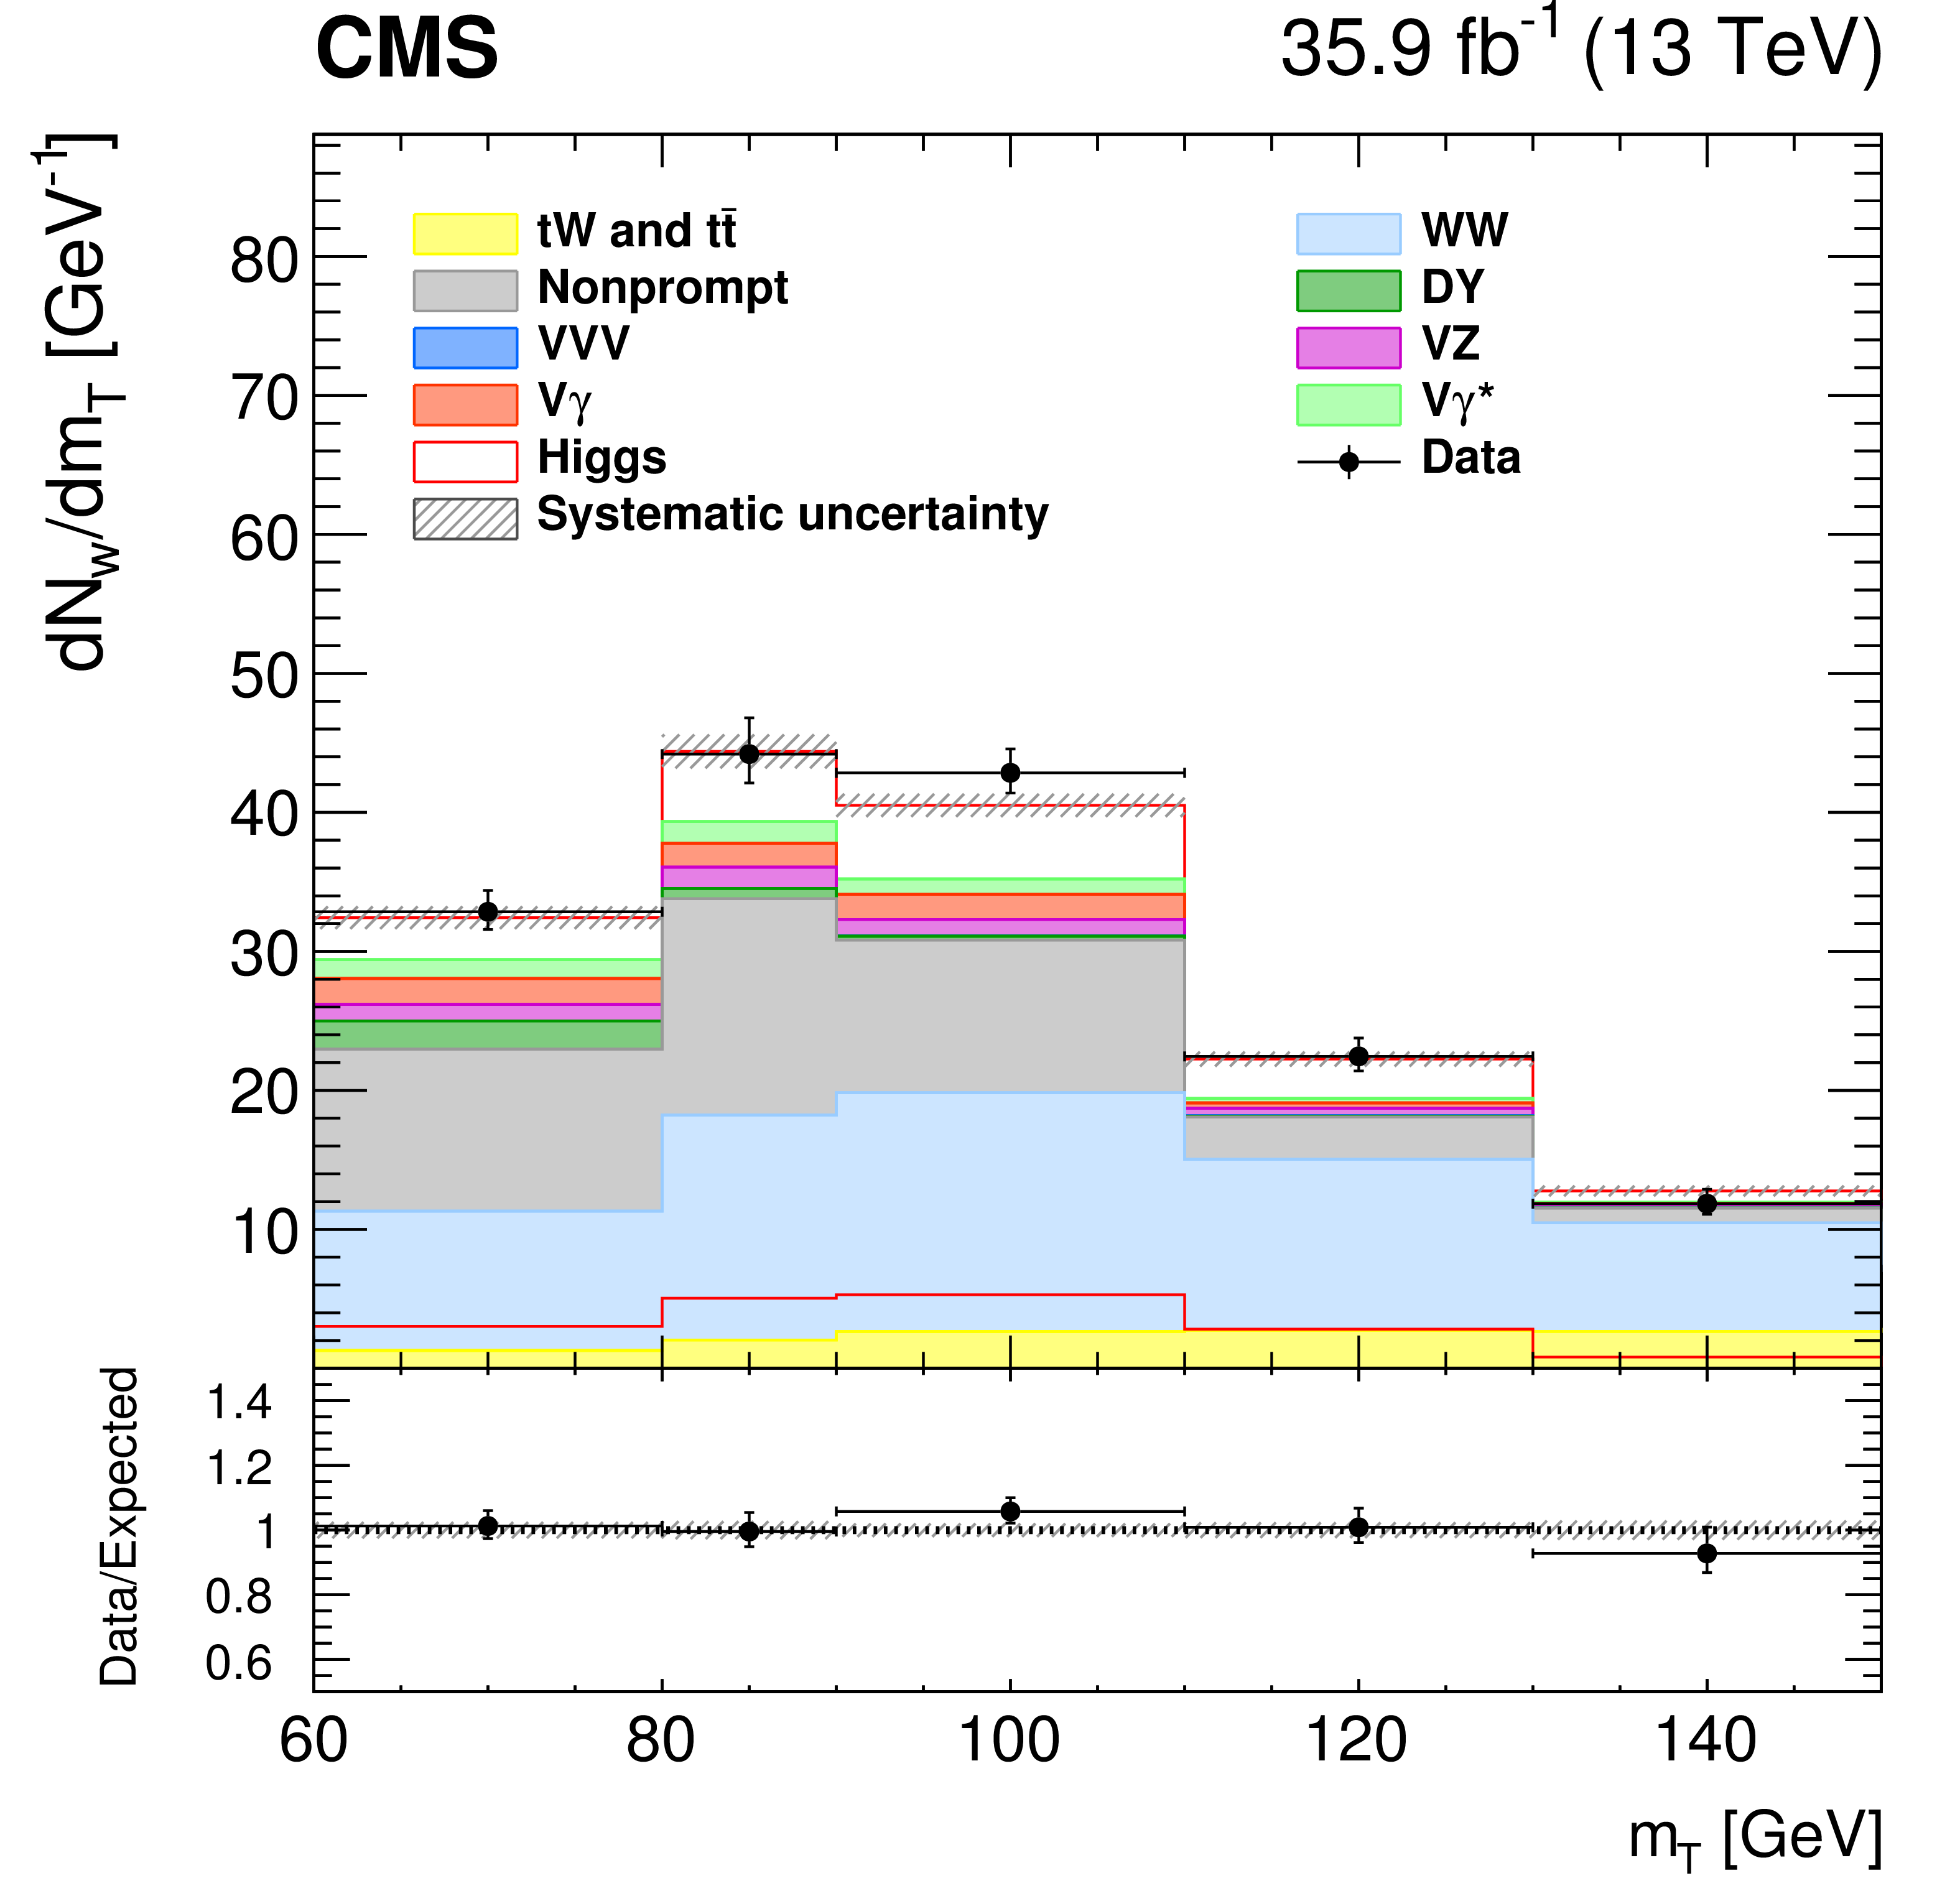
Figure 1-b:
Postfit number of weighted events ($N_\mathrm {w}$) as a function of $ {m_\mathrm {T}} $ for DF events with 0 jets and $ {p_{\mathrm {T}}} {_{2}} < $ 20 GeV. The number of events is weighted according to the $\mathrm {S/(S+B)}$ ratio in each bin of one of the two variables, integrating over the other one. The various lepton flavor and charge subcategories are also merged and weighted according to their $\mathrm {S/(S+B)}$ value. The contributions of the main background processes (stacked histograms) and the SM Higgs boson signal (superimposed and stacked red histograms) remaining after all selection criteria are shown. The dashed gray band accounts for all systematic uncertainties relative to signal and background yields after the fit. |

png pdf |
Figure 1-c:
Postfit number of weighted events ($N_\mathrm {w}$) as a function of $ {m_{\ell \ell}} $ for DF events with 0 jets and $ {p_{\mathrm {T}}} {_{2}} > $ 20 GeV. The number of events is weighted according to the $\mathrm {S/(S+B)}$ ratio in each bin of one of the two variables, integrating over the other one. The various lepton flavor and charge subcategories are also merged and weighted according to their $\mathrm {S/(S+B)}$ value. The contributions of the main background processes (stacked histograms) and the SM Higgs boson signal (superimposed and stacked red histograms) remaining after all selection criteria are shown. The dashed gray band accounts for all systematic uncertainties relative to signal and background yields after the fit. |
png pdf |
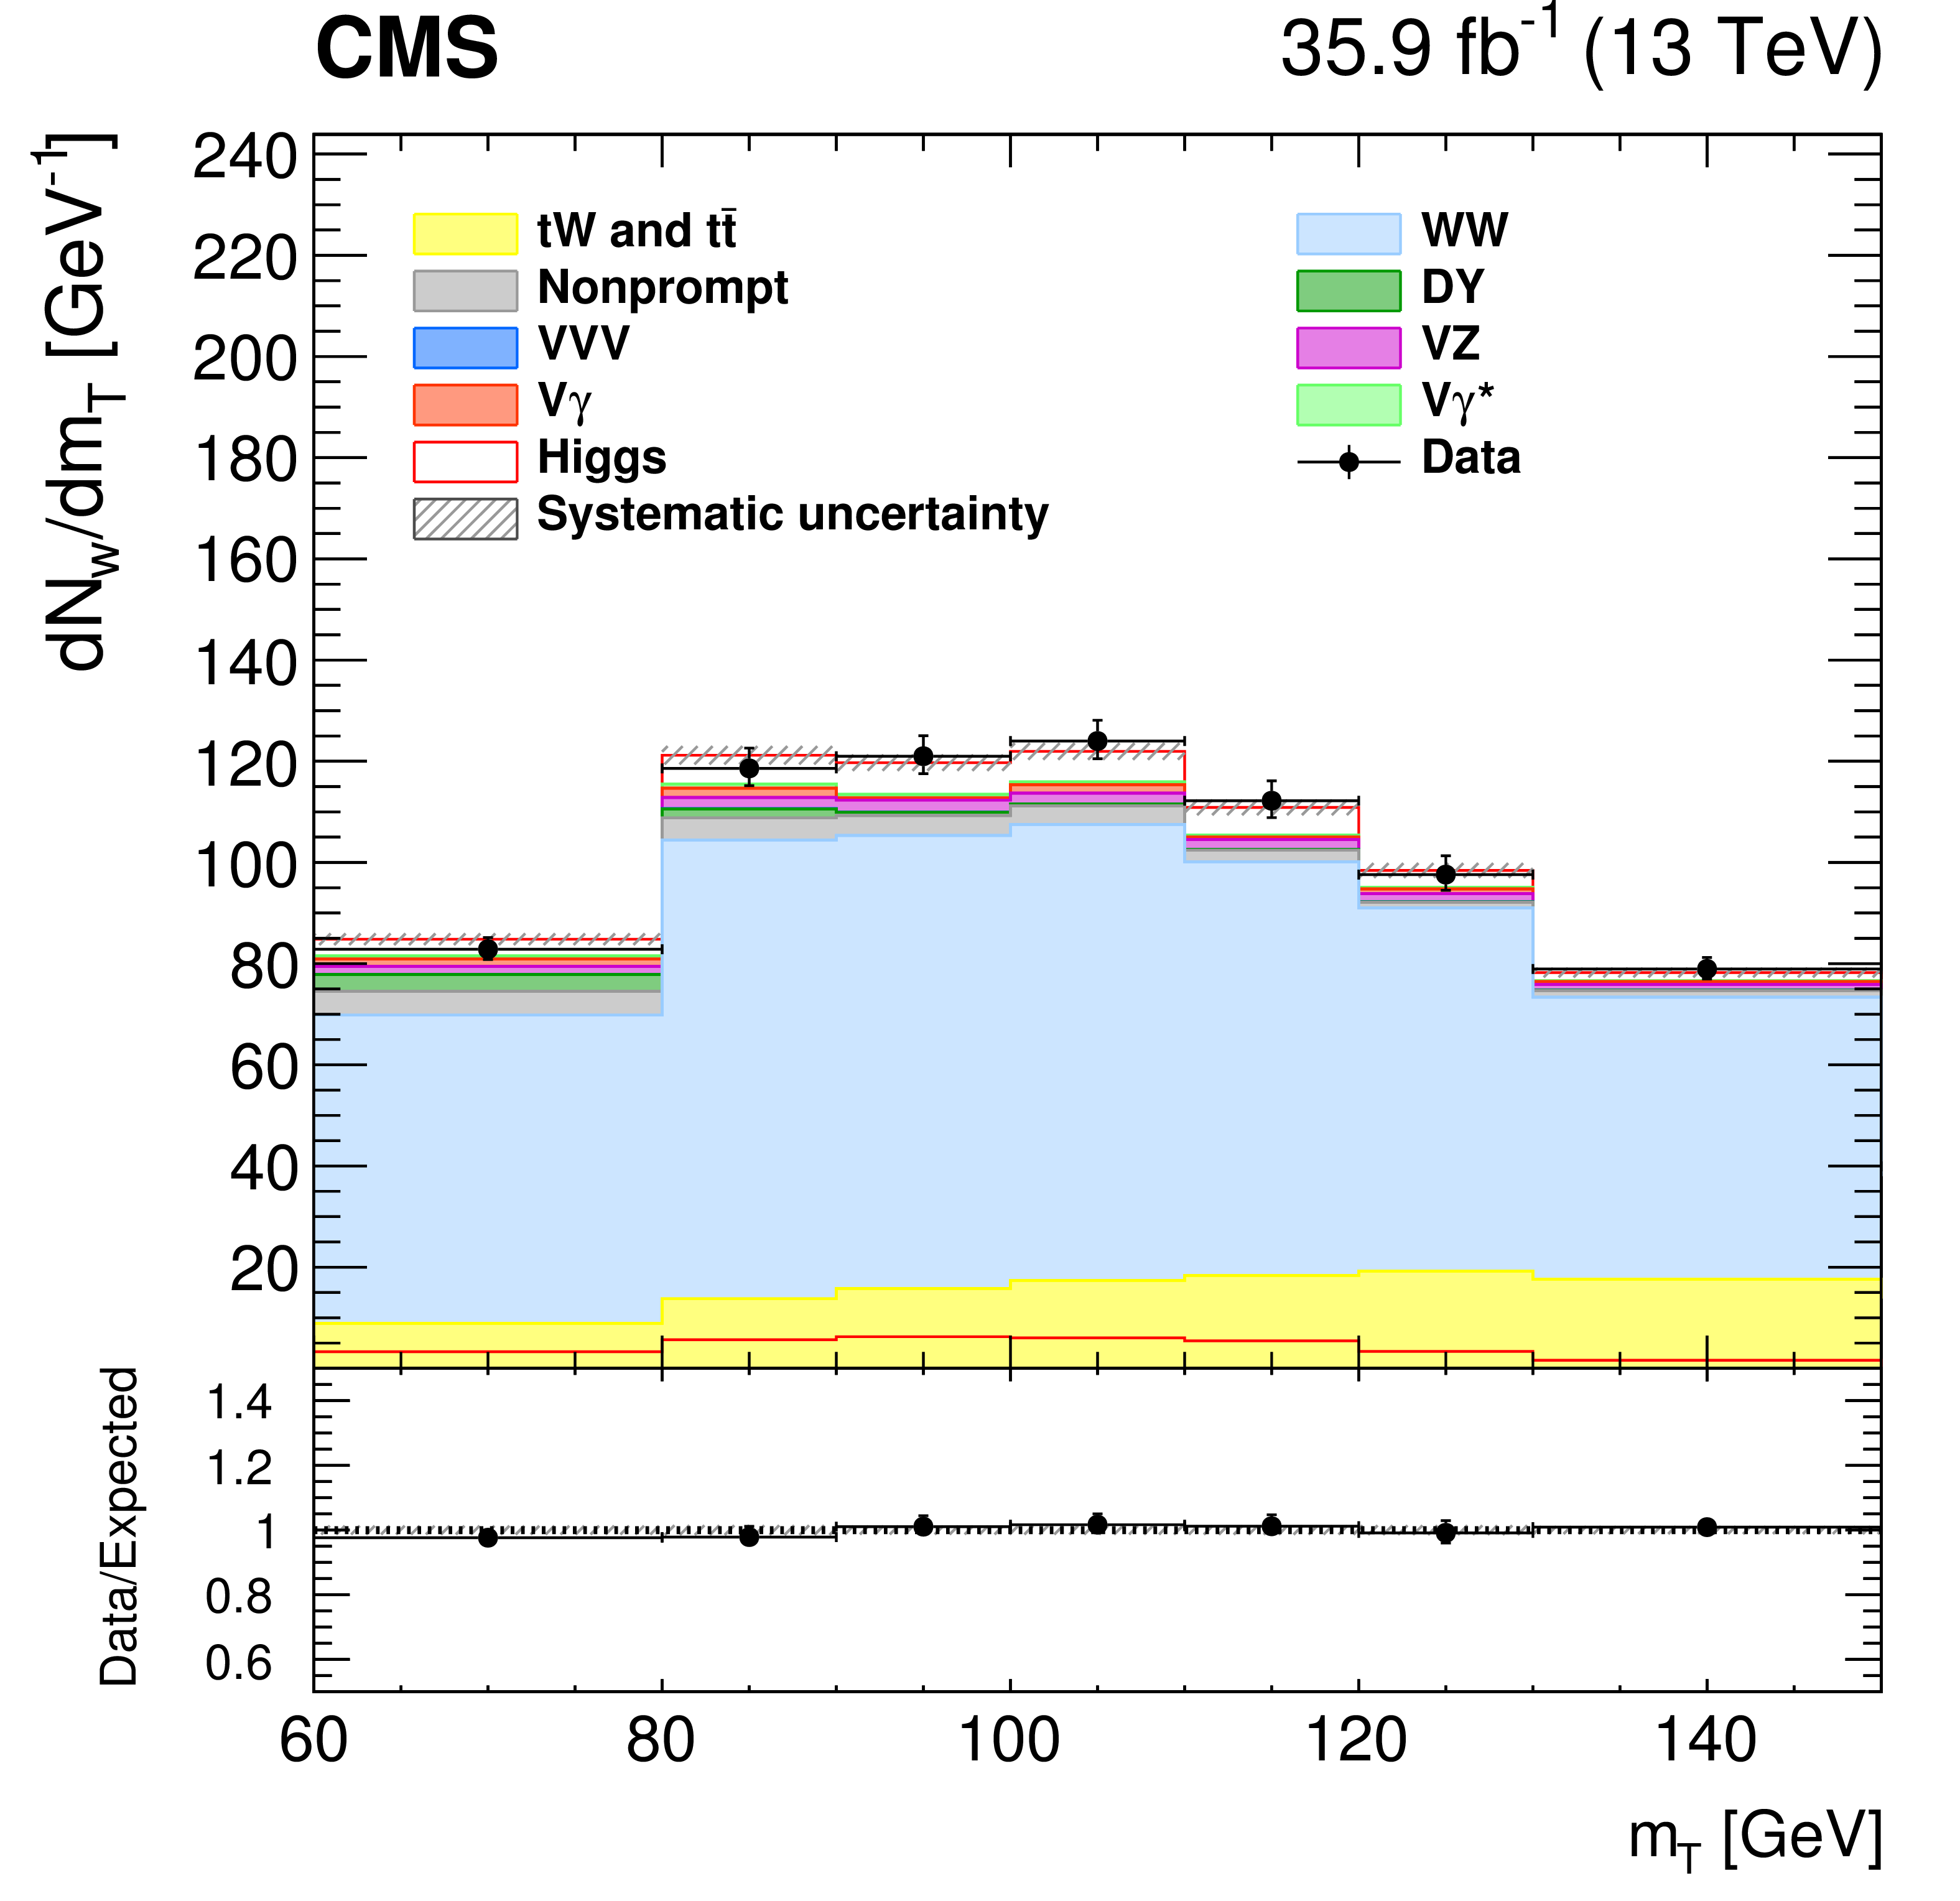
Figure 1-d:
Postfit number of weighted events ($N_\mathrm {w}$) as a function of $ {m_\mathrm {T}} $ for DF events with 0 jets and $ {p_{\mathrm {T}}} {_{2}} > $ 20 GeV. The number of events is weighted according to the $\mathrm {S/(S+B)}$ ratio in each bin of one of the two variables, integrating over the other one. The various lepton flavor and charge subcategories are also merged and weighted according to their $\mathrm {S/(S+B)}$ value. The contributions of the main background processes (stacked histograms) and the SM Higgs boson signal (superimposed and stacked red histograms) remaining after all selection criteria are shown. The dashed gray band accounts for all systematic uncertainties relative to signal and background yields after the fit. |
png pdf |
Figure 2:
Postfit number of weighted events ($N_\mathrm {w}$) as a function of $ {m_{\ell \ell}} $ and $ {m_\mathrm {T}} $ for DF events with 1 jet and $ {p_{\mathrm {T}}} {_{2}} < $ 20 GeV (upper row) or $ {p_{\mathrm {T}}} {_{2}} > $ 20 GeV (lower row). The number of events is weighted according to the $\mathrm {S/(S+B)}$ ratio in each bin of one of the two variables, integrating over the other one. The various lepton flavor and charge subcategories are also merged and weighted according to their $\mathrm {S/(S+B)}$ value. The contributions of the main background processes (stacked histograms) and the SM Higgs boson signal (superimposed and stacked red histograms) remaining after all selection criteria are shown. The dashed gray band accounts for all systematic uncertainties relative to signal and background yields after the fit. |

png pdf |
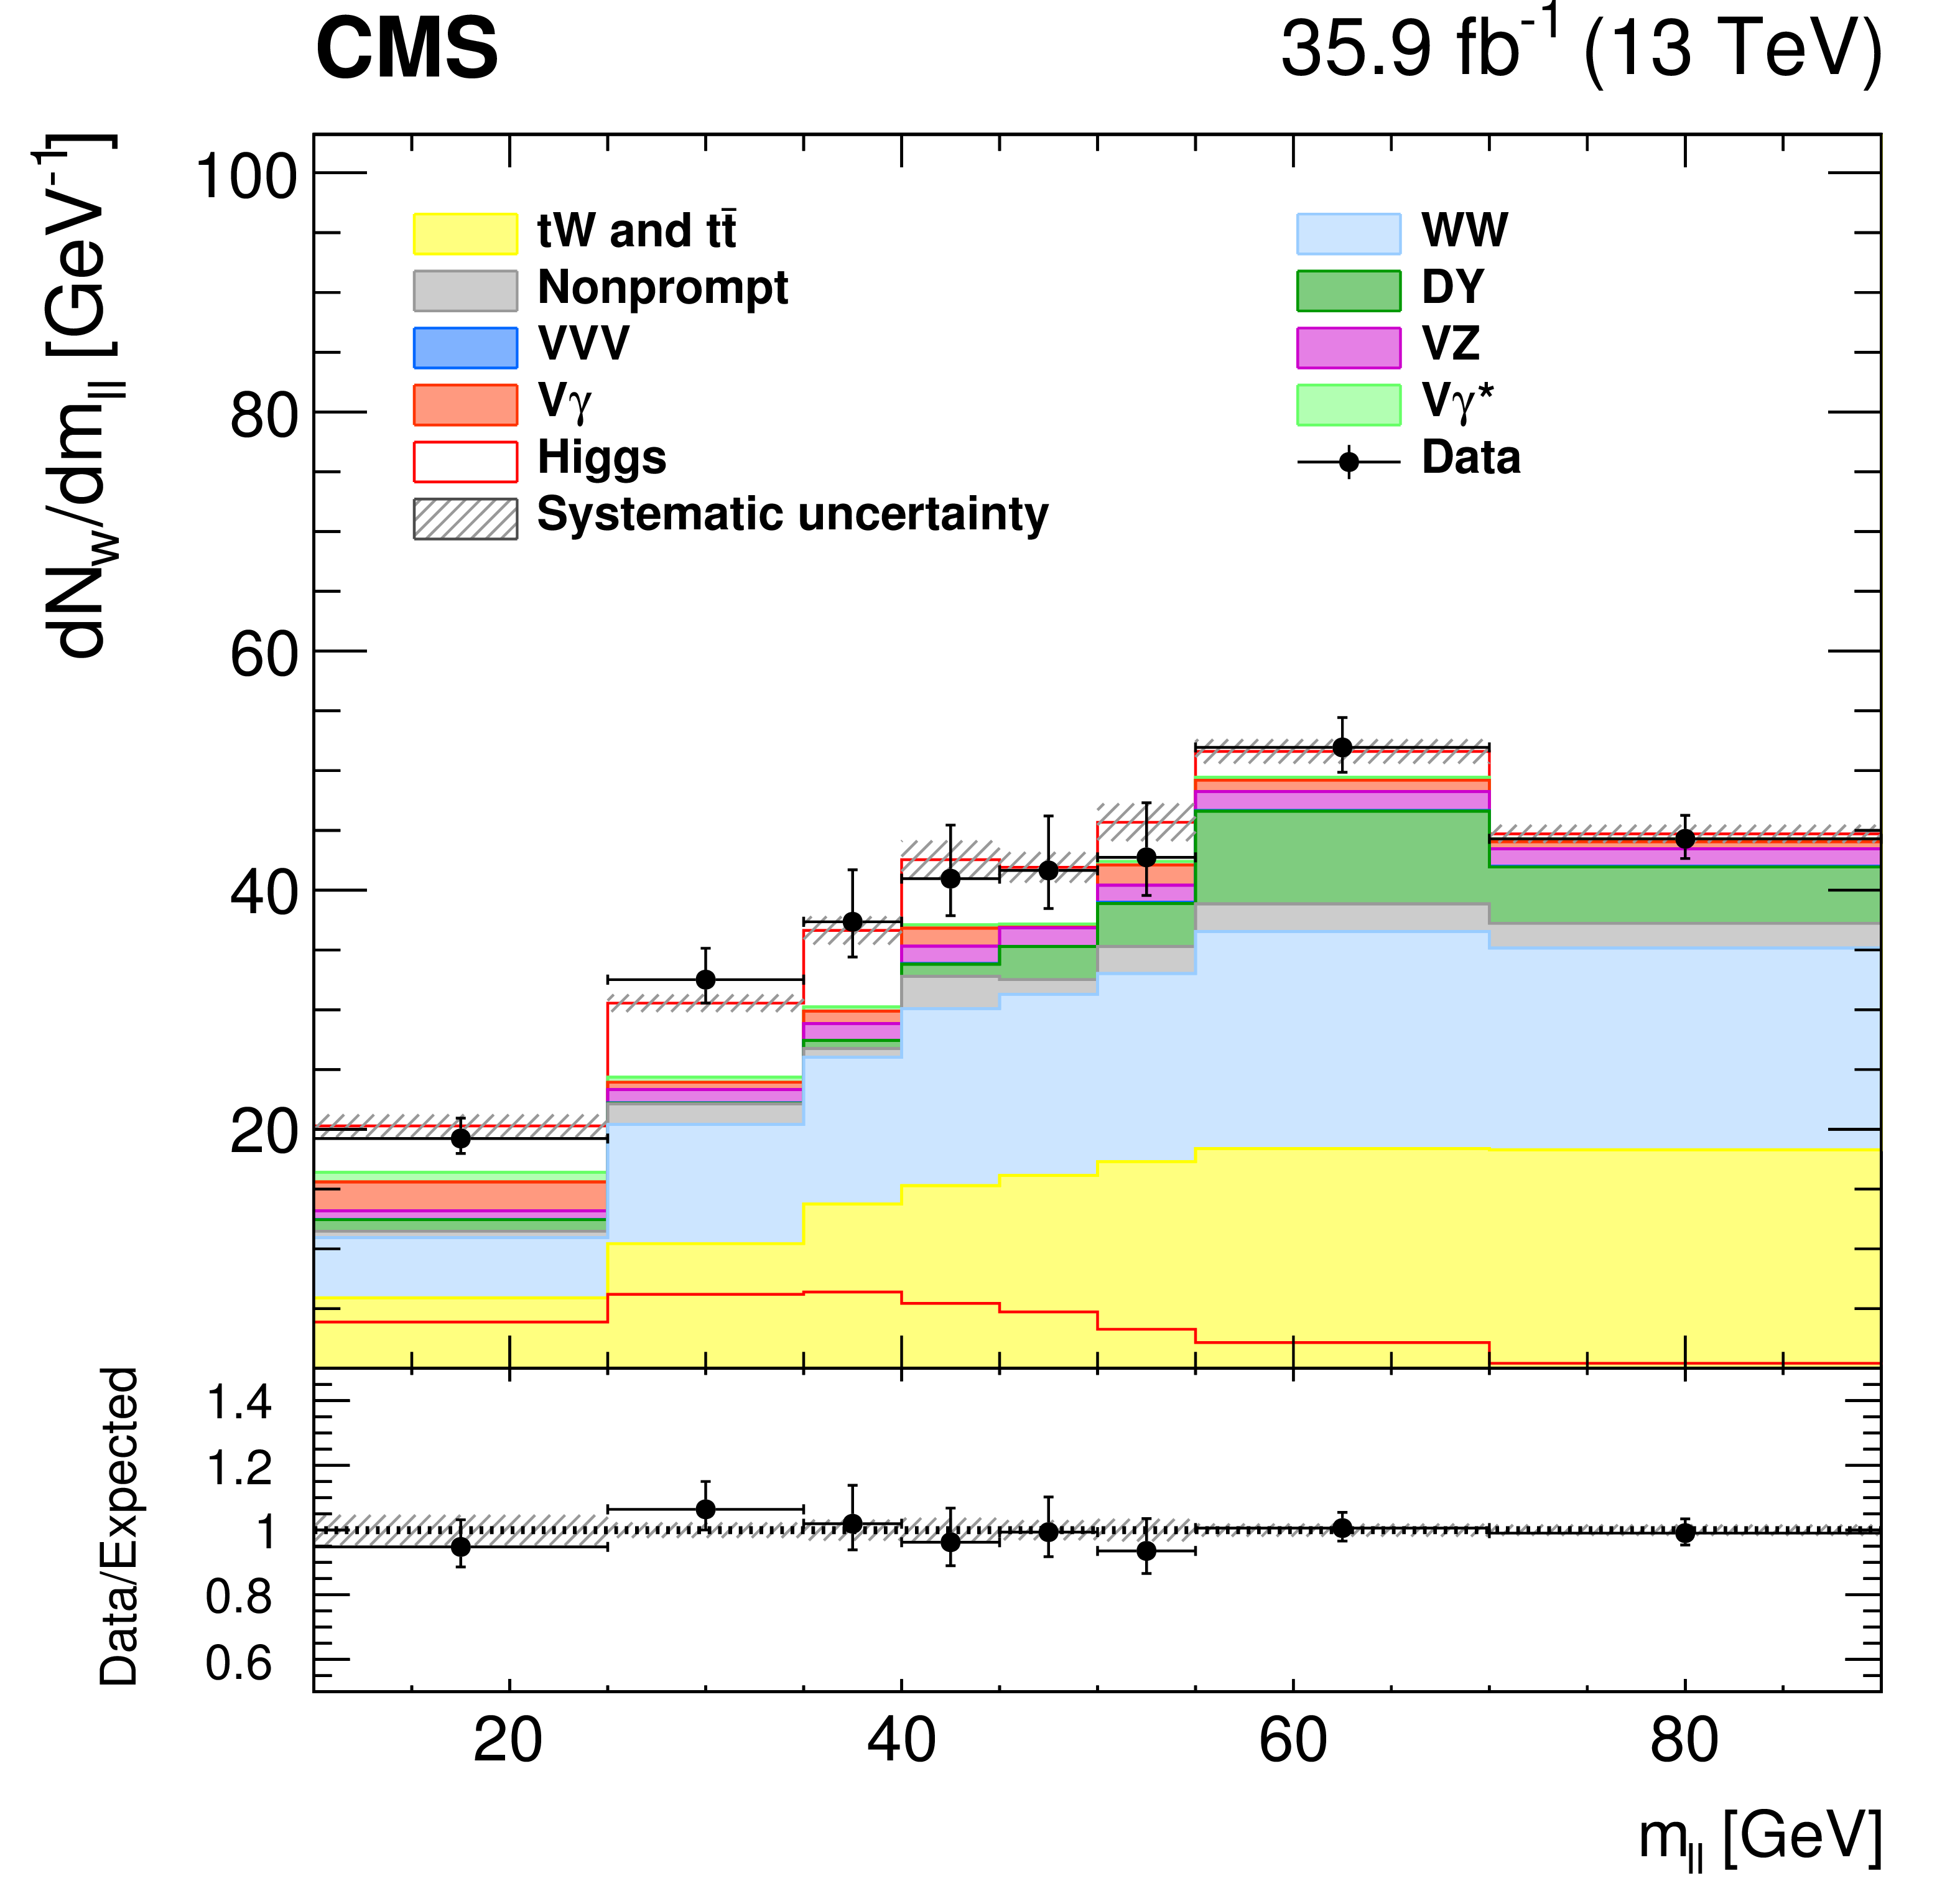
Figure 2-a:
Postfit number of weighted events ($N_\mathrm {w}$) as a function of $ {m_{\ell \ell}} $ for DF events with 1 jet and $ {p_{\mathrm {T}}} {_{2}} < $ 20 GeV. The number of events is weighted according to the $\mathrm {S/(S+B)}$ ratio in each bin of one of the two variables, integrating over the other one. The various lepton flavor and charge subcategories are also merged and weighted according to their $\mathrm {S/(S+B)}$ value. The contributions of the main background processes (stacked histograms) and the SM Higgs boson signal (superimposed and stacked red histograms) remaining after all selection criteria are shown. The dashed gray band accounts for all systematic uncertainties relative to signal and background yields after the fit. |

png pdf |
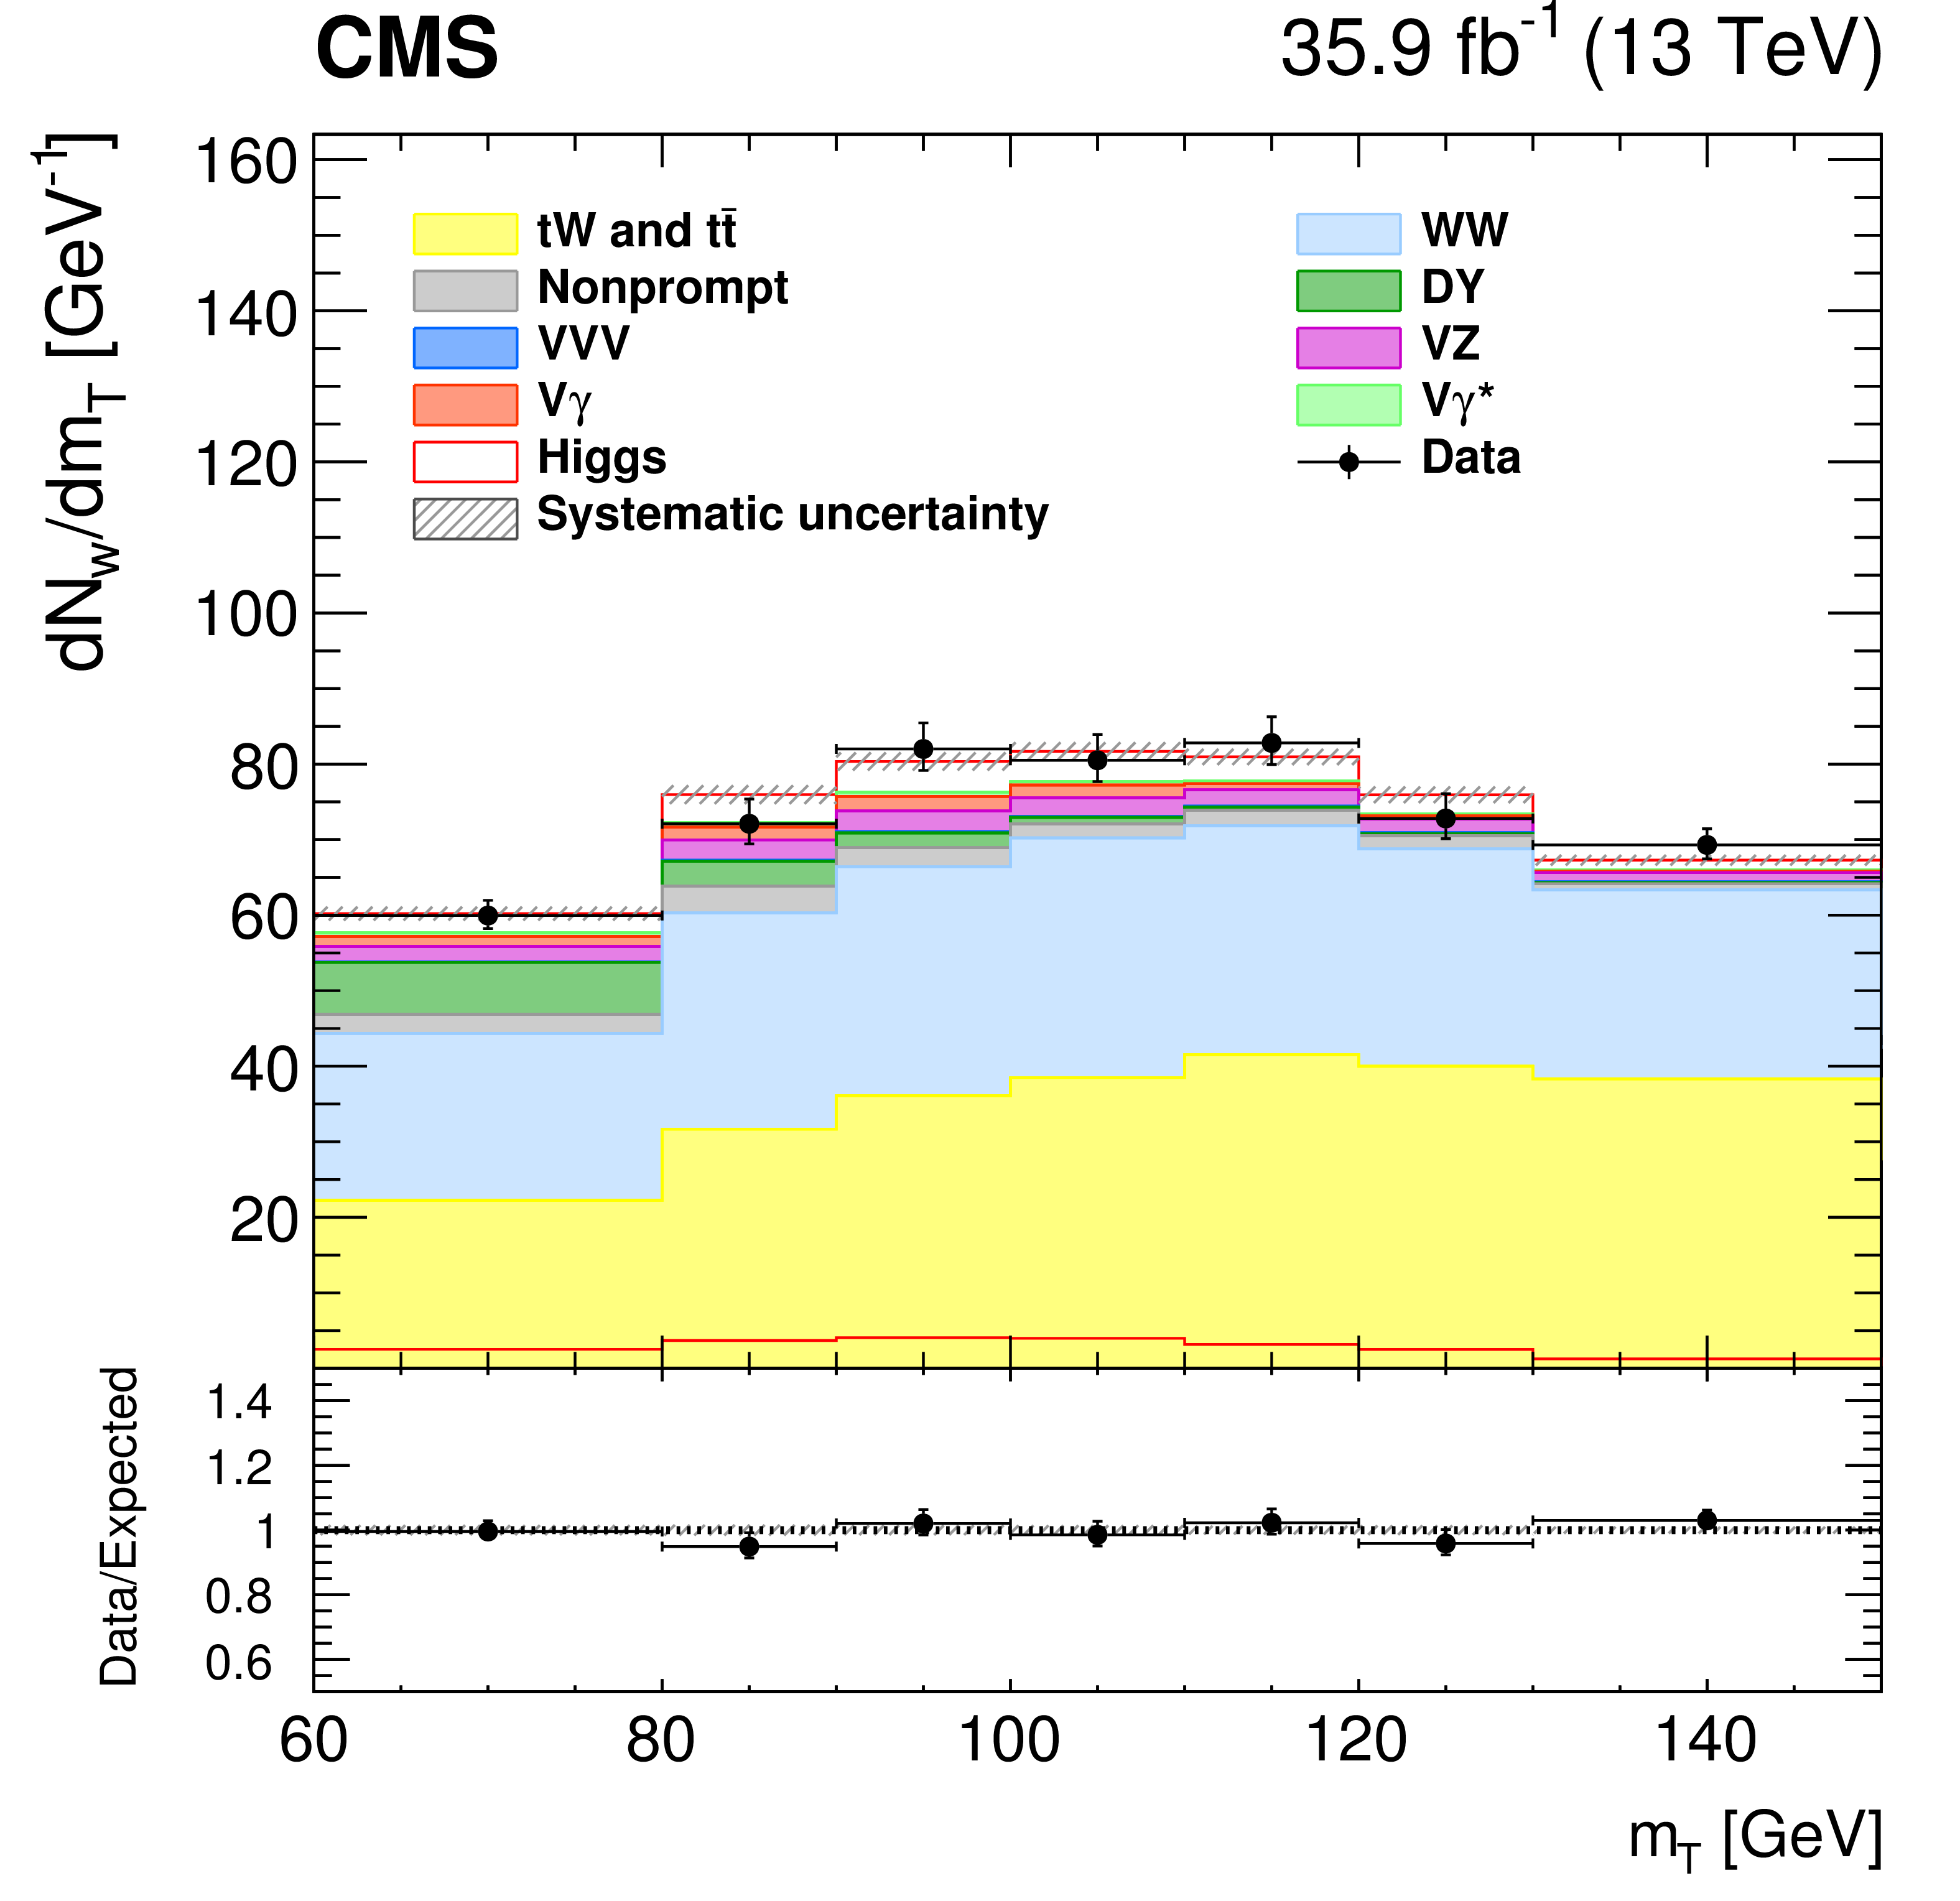
Figure 2-b:
Postfit number of weighted events ($N_\mathrm {w}$) as a function of $ {m_\mathrm {T}} $ for DF events with 1 jet and $ {p_{\mathrm {T}}} {_{2}} < $ 20 GeV. The number of events is weighted according to the $\mathrm {S/(S+B)}$ ratio in each bin of one of the two variables, integrating over the other one. The various lepton flavor and charge subcategories are also merged and weighted according to their $\mathrm {S/(S+B)}$ value. The contributions of the main background processes (stacked histograms) and the SM Higgs boson signal (superimposed and stacked red histograms) remaining after all selection criteria are shown. The dashed gray band accounts for all systematic uncertainties relative to signal and background yields after the fit. |
png pdf |
Figure 2-c:
Postfit number of weighted events ($N_\mathrm {w}$) as a function of $ {m_{\ell \ell}} $ for DF events with 1 jet and $ {p_{\mathrm {T}}} {_{2}} > $ 20 GeV. The number of events is weighted according to the $\mathrm {S/(S+B)}$ ratio in each bin of one of the two variables, integrating over the other one. The various lepton flavor and charge subcategories are also merged and weighted according to their $\mathrm {S/(S+B)}$ value. The contributions of the main background processes (stacked histograms) and the SM Higgs boson signal (superimposed and stacked red histograms) remaining after all selection criteria are shown. The dashed gray band accounts for all systematic uncertainties relative to signal and background yields after the fit. |
png pdf |
Figure 2-d:
Postfit number of weighted events ($N_\mathrm {w}$) as a function of $ {m_\mathrm {T}} $ for DF events with 1 jet and $ {p_{\mathrm {T}}} {_{2}} > $ 20 GeV. The number of events is weighted according to the $\mathrm {S/(S+B)}$ ratio in each bin of one of the two variables, integrating over the other one. The various lepton flavor and charge subcategories are also merged and weighted according to their $\mathrm {S/(S+B)}$ value. The contributions of the main background processes (stacked histograms) and the SM Higgs boson signal (superimposed and stacked red histograms) remaining after all selection criteria are shown. The dashed gray band accounts for all systematic uncertainties relative to signal and background yields after the fit. |
png pdf |
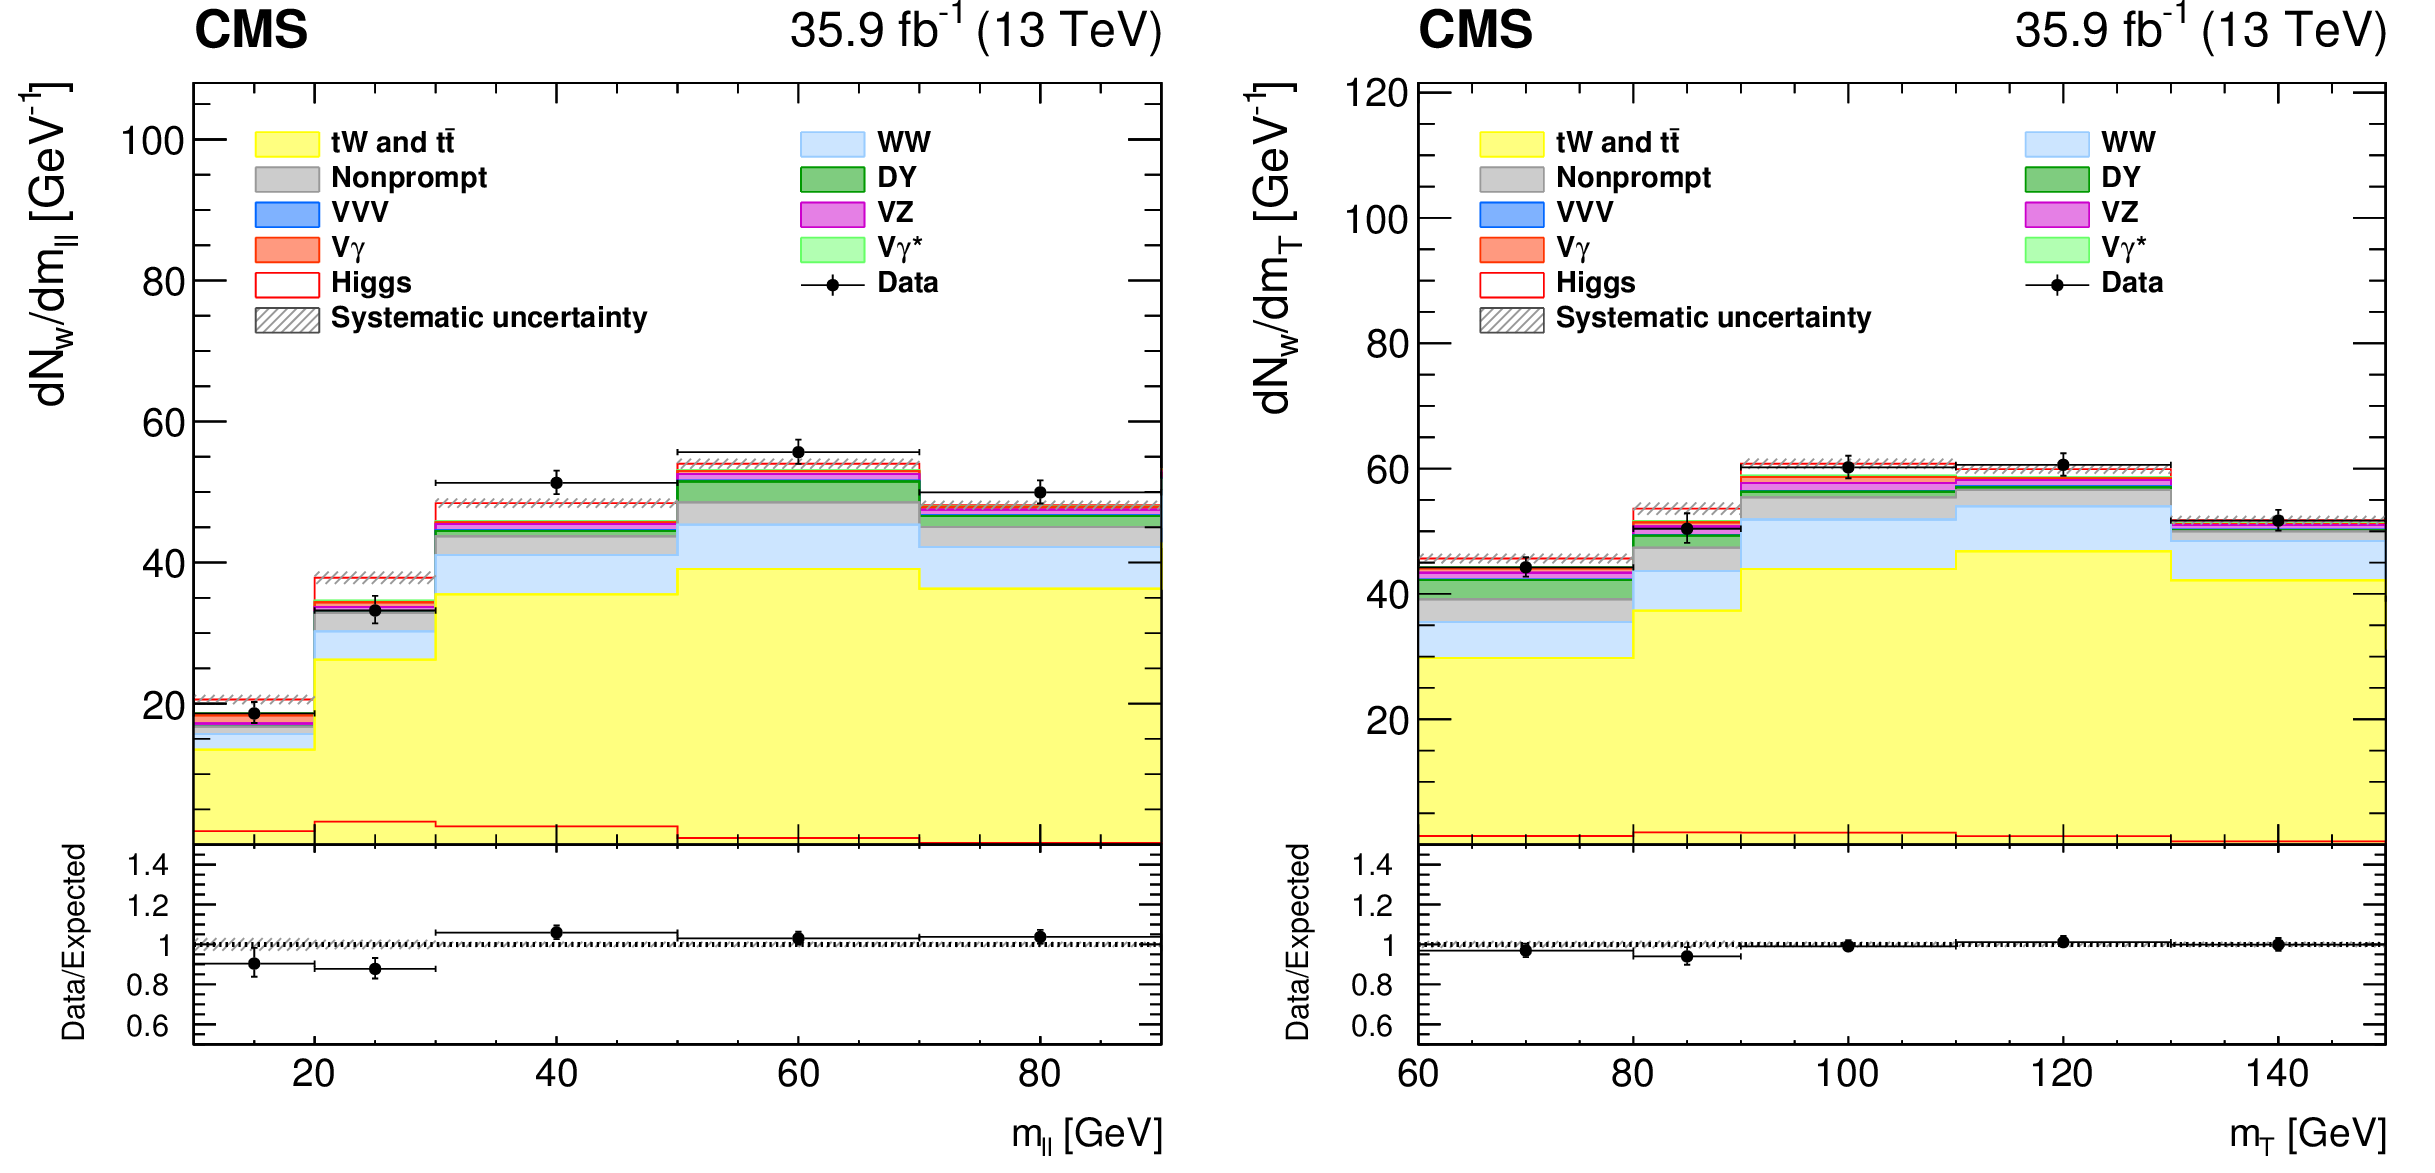
Figure 3:
Postfit number of weighted events ($N_\mathrm {w}$) as a function of $ {m_{\ell \ell}} $ and $ {m_\mathrm {T}} $ for DF events with at least 2 jets. The number of events is weighted according to the $\mathrm {S/(S+B)}$ ratio in each bin of one of the two variables, integrating over the other one. The contributions of the main background processes (stacked histograms) and the SM Higgs boson signal (superimposed and stacked red histograms) remaining after all selection criteria are shown. The dashed gray band accounts for all systematic uncertainties relative to signal and background yields after the fit. |
png pdf |
Figure 3-a:
Postfit number of weighted events ($N_\mathrm {w}$) as a function of $ {m_{\ell \ell}} $ for DF events with at least 2 jets. The number of events is weighted according to the $\mathrm {S/(S+B)}$ ratio in each bin of one of the two variables, integrating over the other one. The contributions of the main background processes (stacked histograms) and the SM Higgs boson signal (superimposed and stacked red histograms) remaining after all selection criteria are shown. The dashed gray band accounts for all systematic uncertainties relative to signal and background yields after the fit. |
png pdf |
Figure 3-b:
Postfit number of weighted events ($N_\mathrm {w}$) as a function of $ {m_\mathrm {T}} $ for DF events with at least 2 jets. The number of events is weighted according to the $\mathrm {S/(S+B)}$ ratio in each bin of one of the two variables, integrating over the other one. The contributions of the main background processes (stacked histograms) and the SM Higgs boson signal (superimposed and stacked red histograms) remaining after all selection criteria are shown. The dashed gray band accounts for all systematic uncertainties relative to signal and background yields after the fit. |
png pdf |
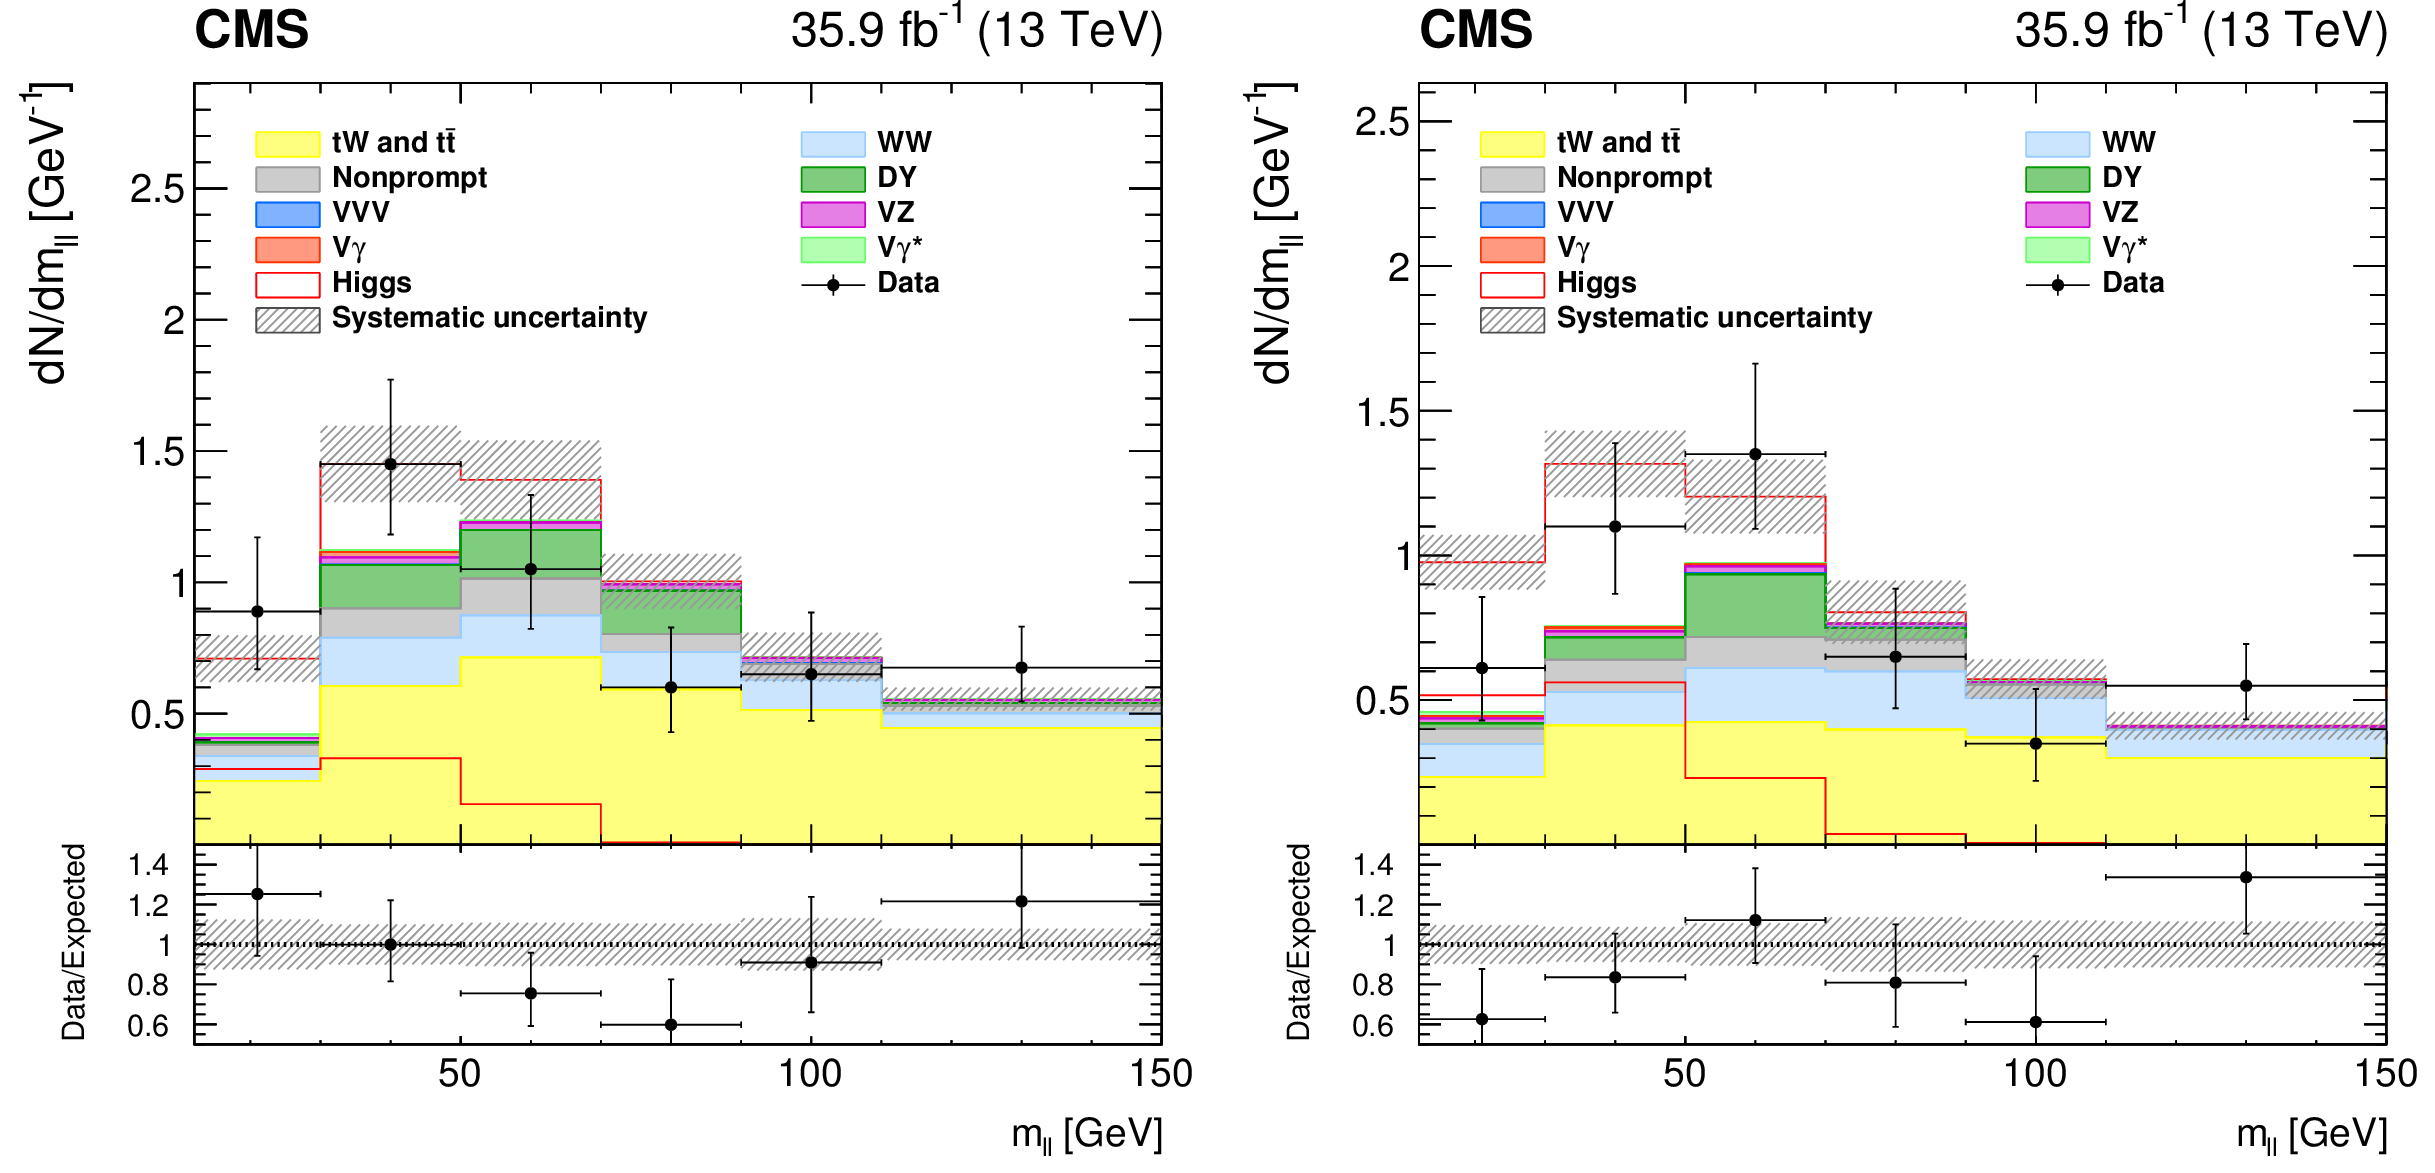
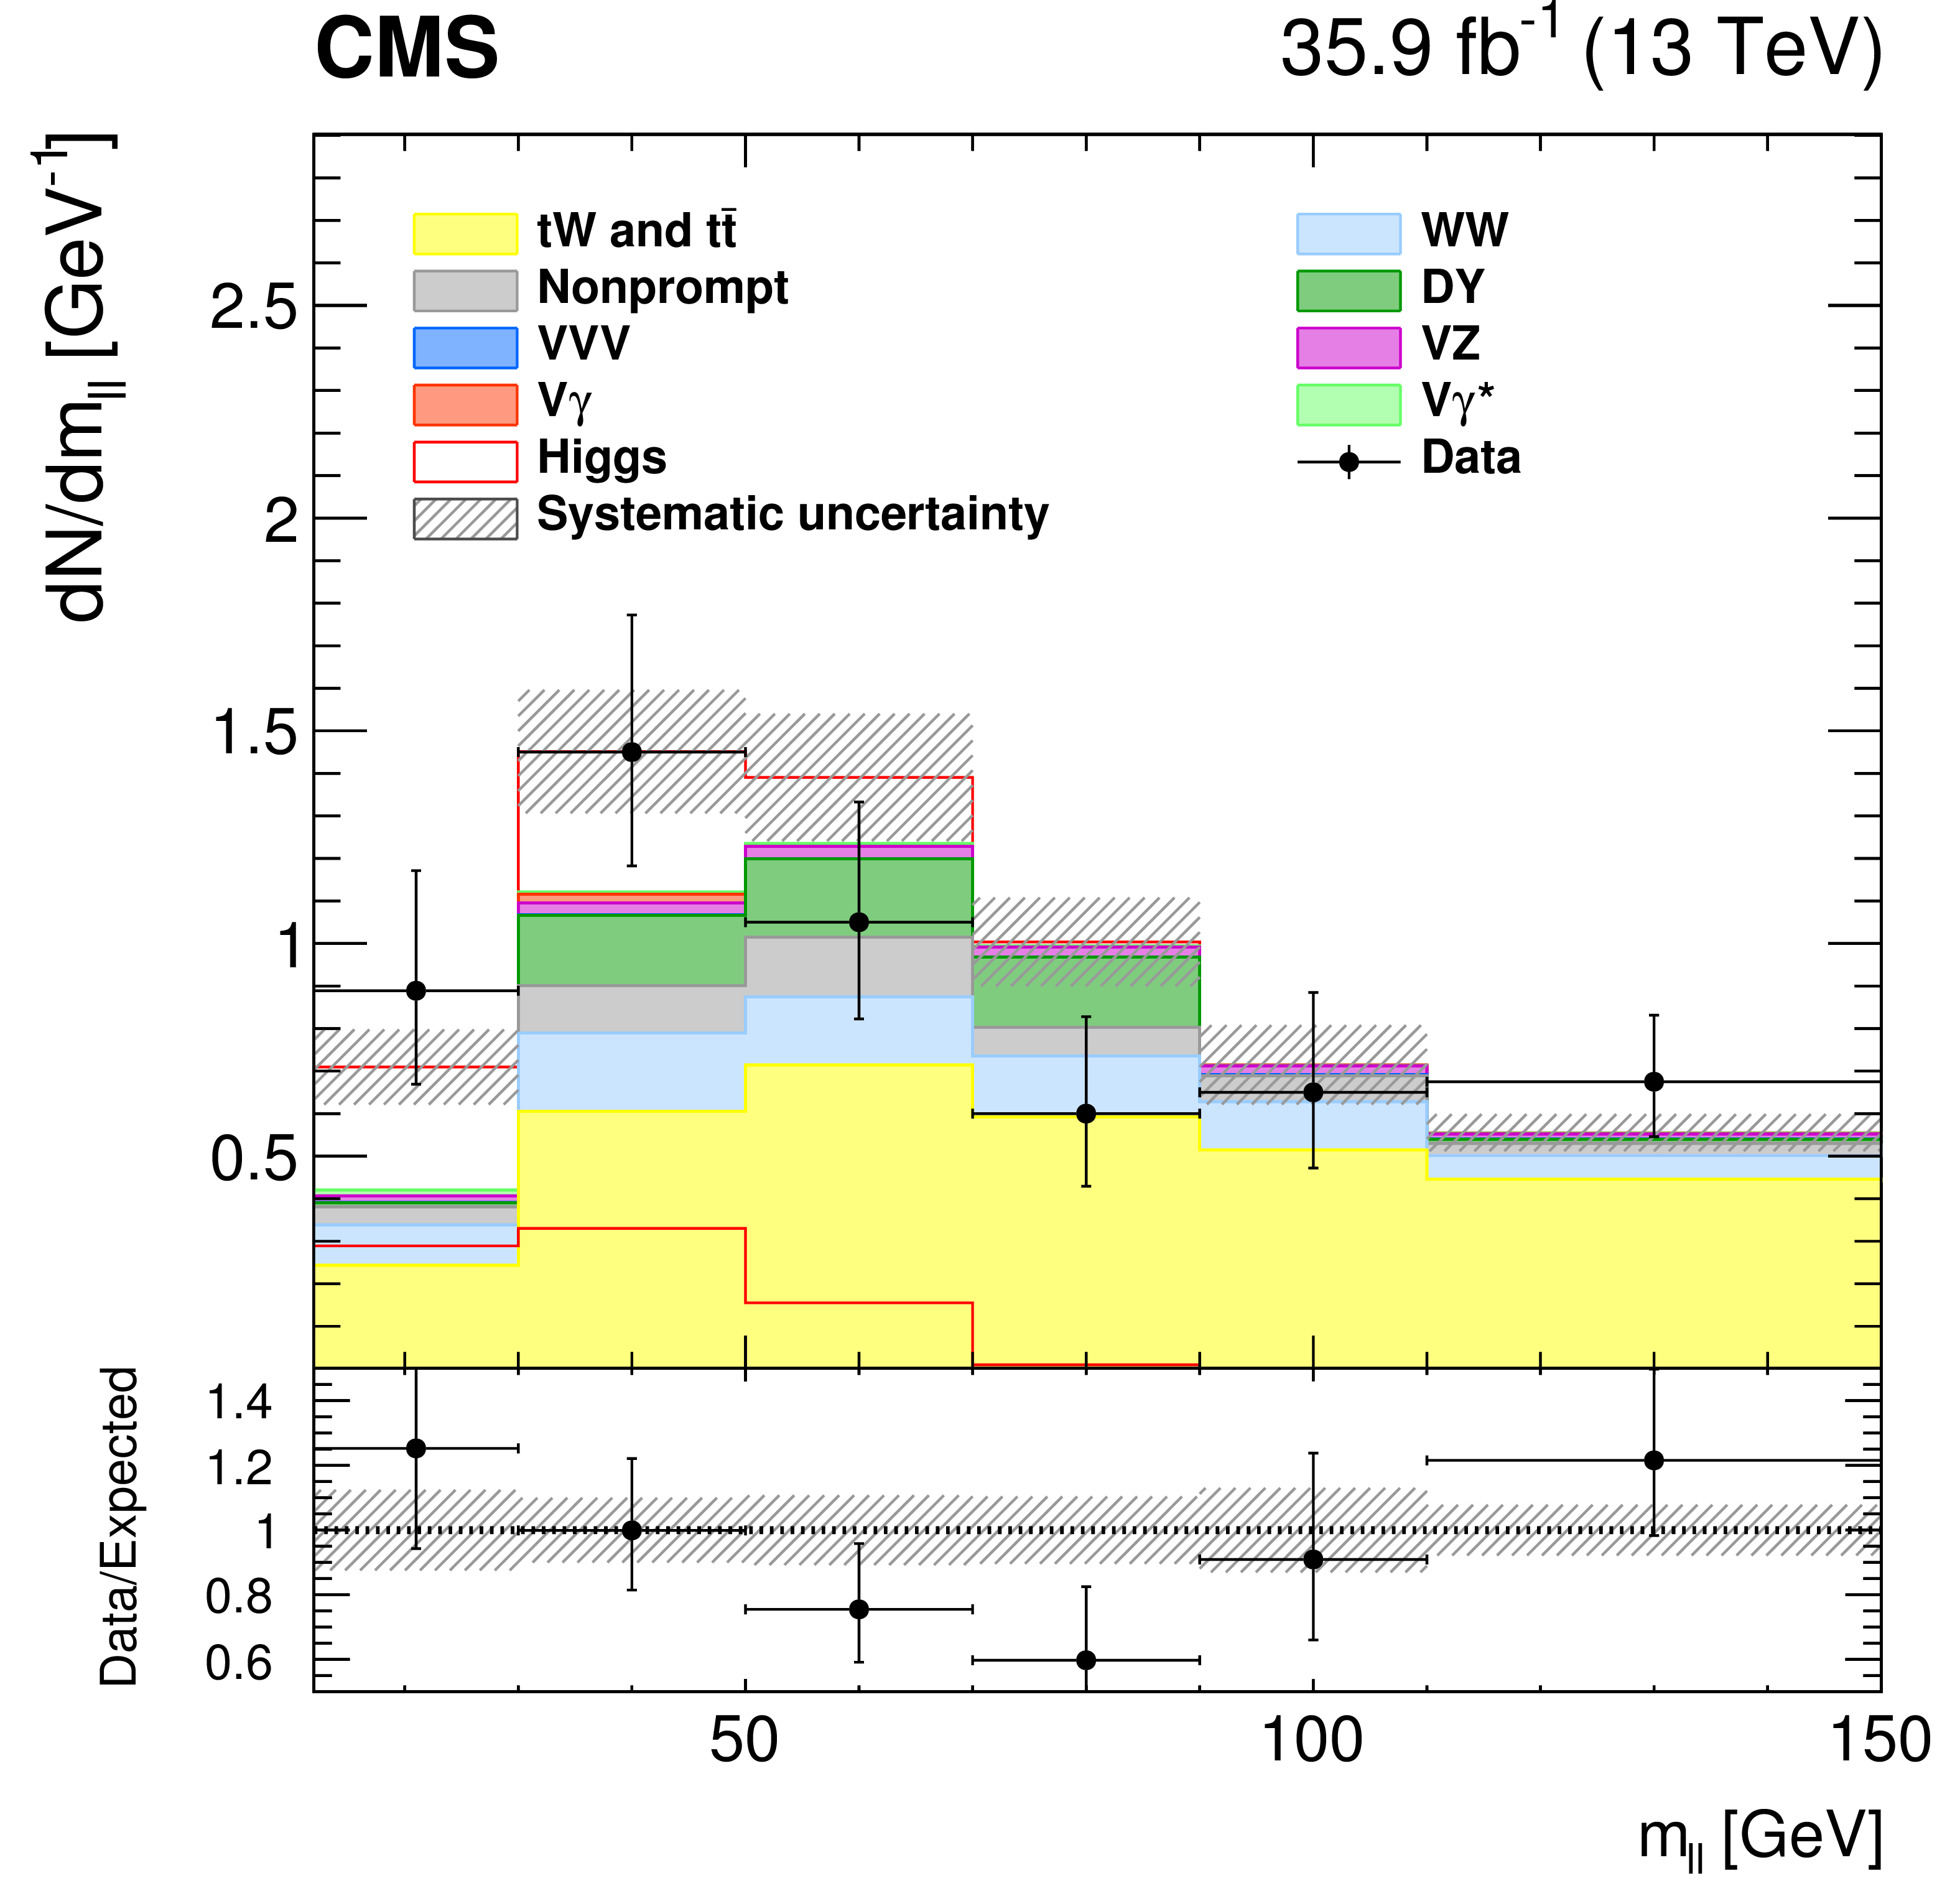
Figure 4:
Postfit number of events as a function of $ {m_{\ell \ell}} $ with VBF topology, for 400 $ < {m_{jj}} < $ 700 GeV (left) and $ {m_{jj}} > $ 700 GeV (right). The contributions of the main background processes (stacked histograms) and the SM Higgs boson signal (superimposed and stacked red histograms) remaining after all selection criteria are shown. The dashed gray band accounts for all systematic uncertainties relative to signal and background yields after the fit. |
png pdf |
Figure 4-a:
Postfit number of events as a function of $ {m_{\ell \ell}} $ with VBF topology, for 400 $ < {m_{jj}} < $ 700 GeV. The contributions of the main background processes (stacked histograms) and the SM Higgs boson signal (superimposed and stacked red histograms) remaining after all selection criteria are shown. The dashed gray band accounts for all systematic uncertainties relative to signal and background yields after the fit. |
png pdf |
Figure 4-b:
Postfit number of events as a function of $ {m_{\ell \ell}} $ with VBF topology, for $ {m_{jj}} > $ 700 GeV (right). The contributions of the main background processes (stacked histograms) and the SM Higgs boson signal (superimposed and stacked red histograms) remaining after all selection criteria are shown. The dashed gray band accounts for all systematic uncertainties relative to signal and background yields after the fit. |

png pdf |
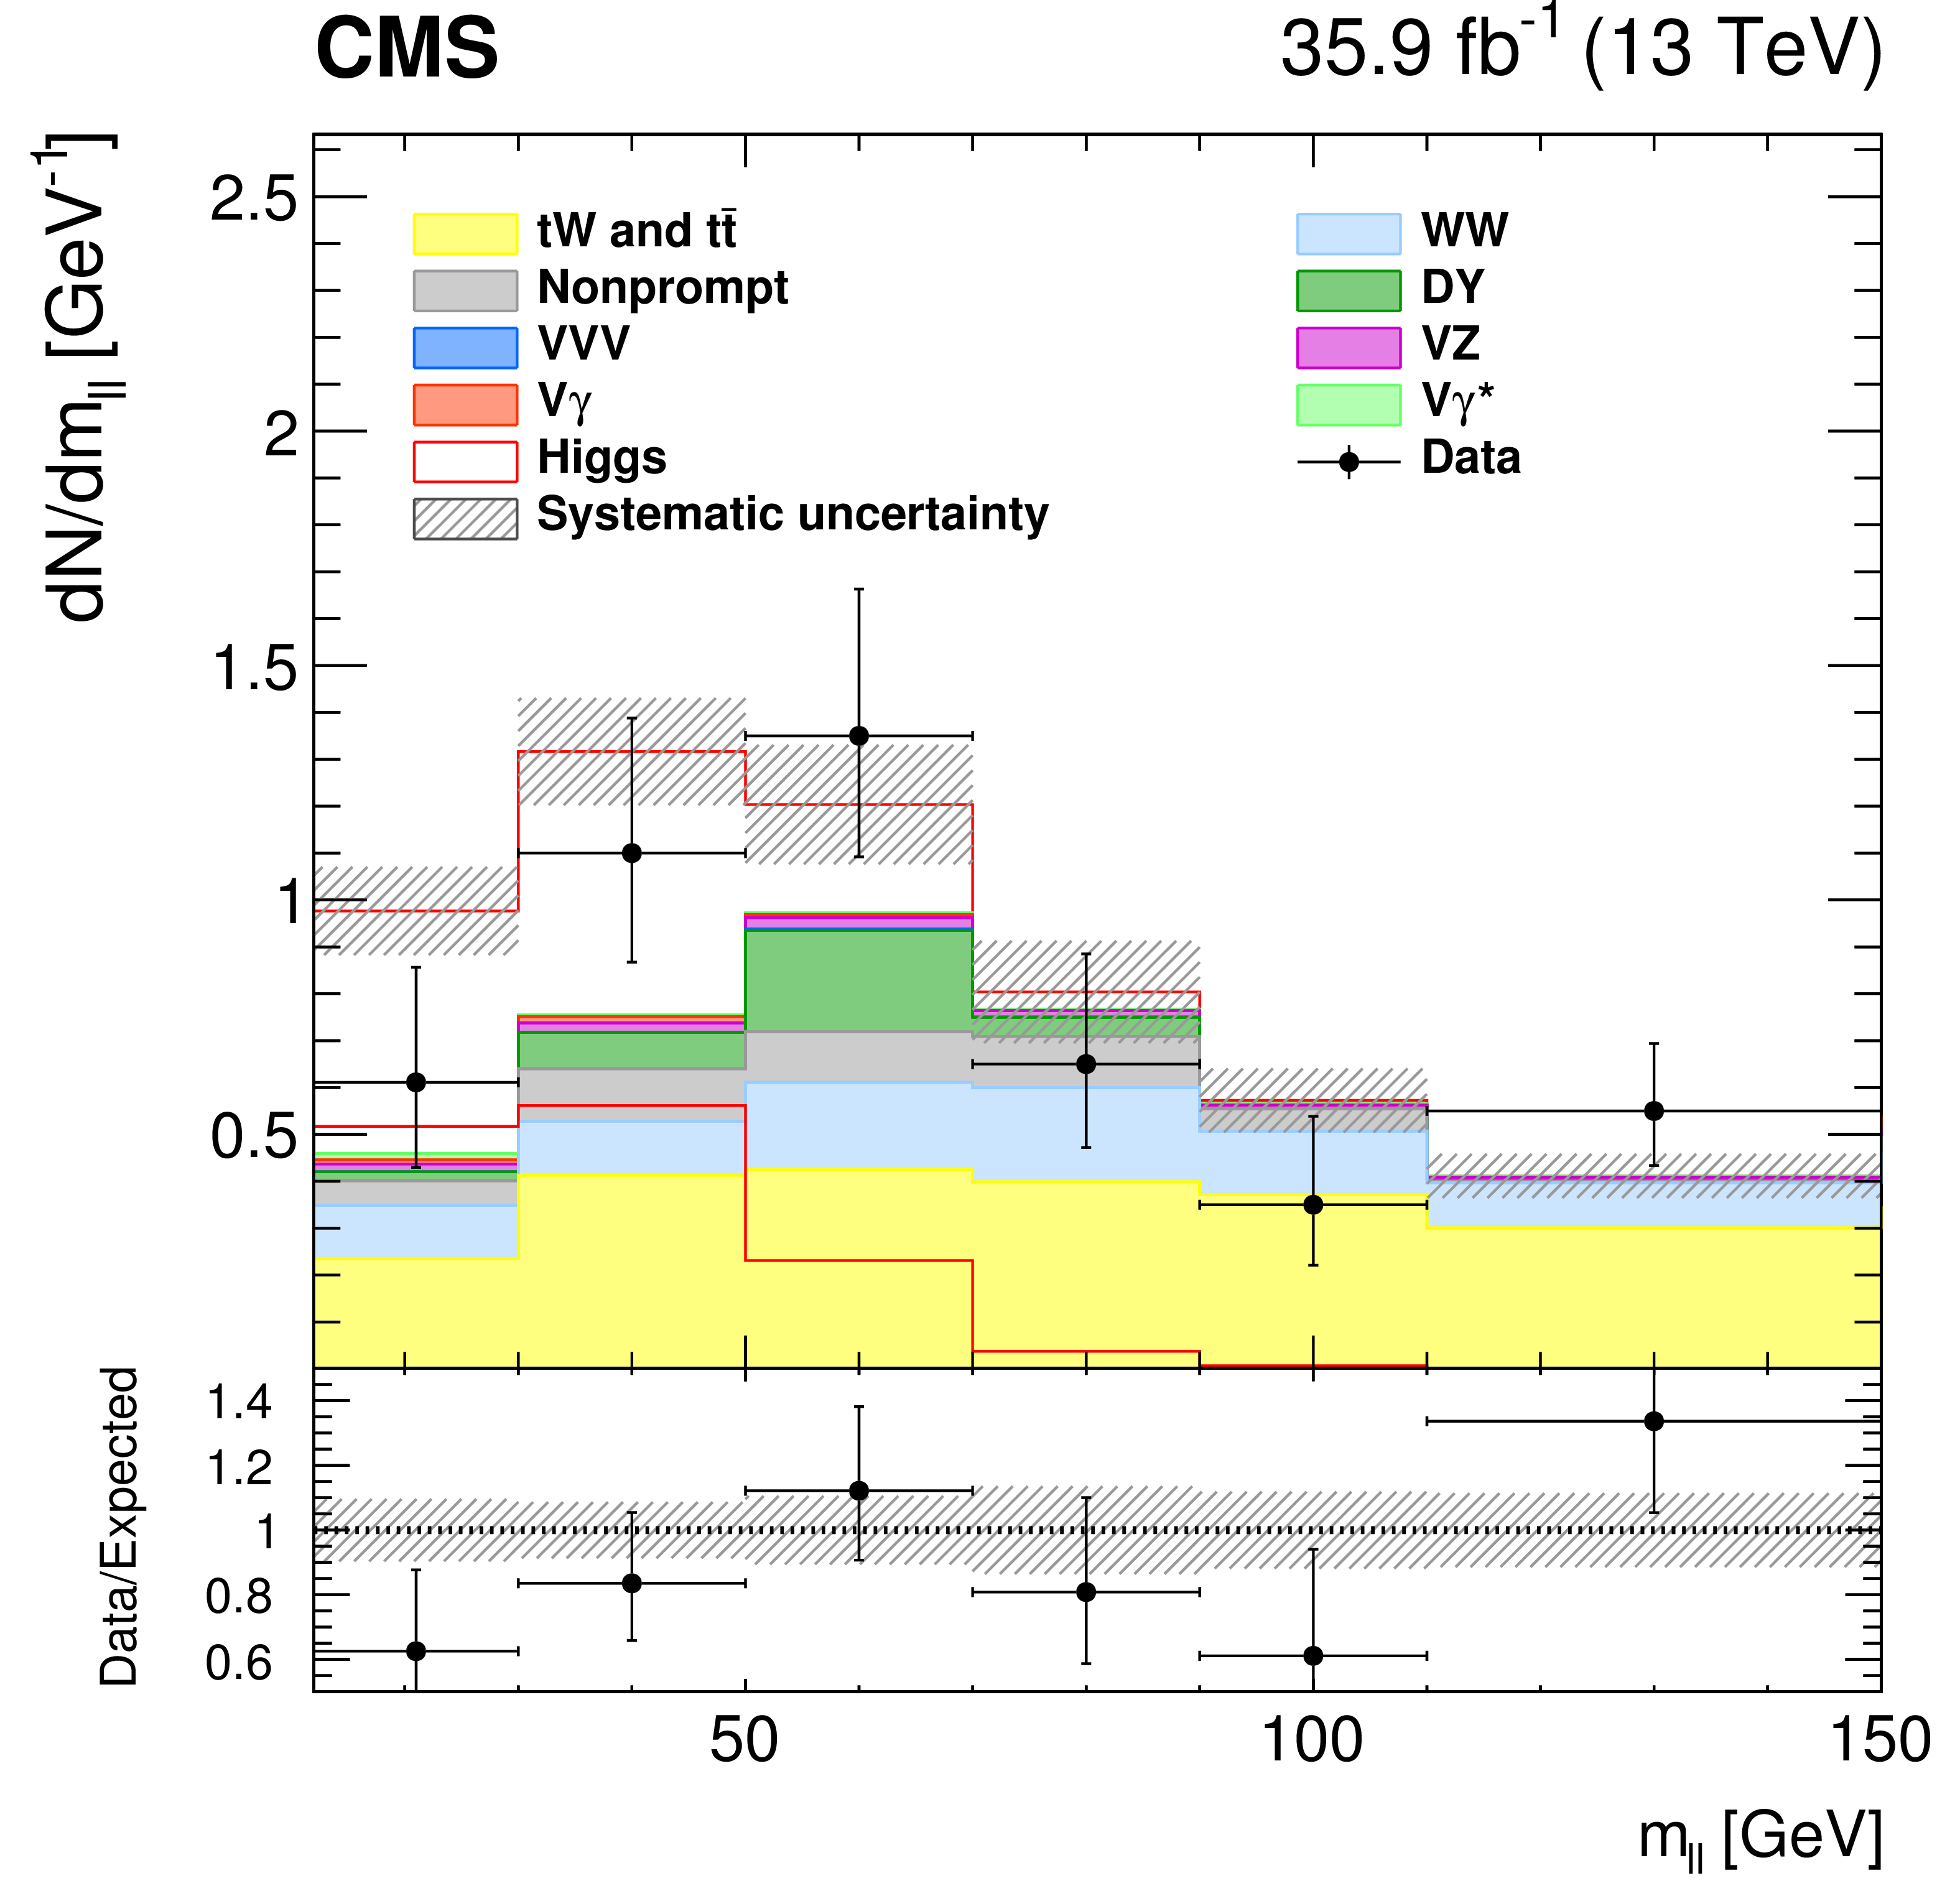
Figure 5:
Postfit number of events as a function of $ {m_{\ell \ell}} $ for DF events in the 2-jets VH-tagged category. The contributions of the main background processes (stacked histograms) and the SM Higgs boson signal (superimposed and stacked red histograms) remaining after all selection criteria are shown. The dashed gray band accounts for all systematic uncertainties relative to signal and background yields after the fit. |
png pdf |
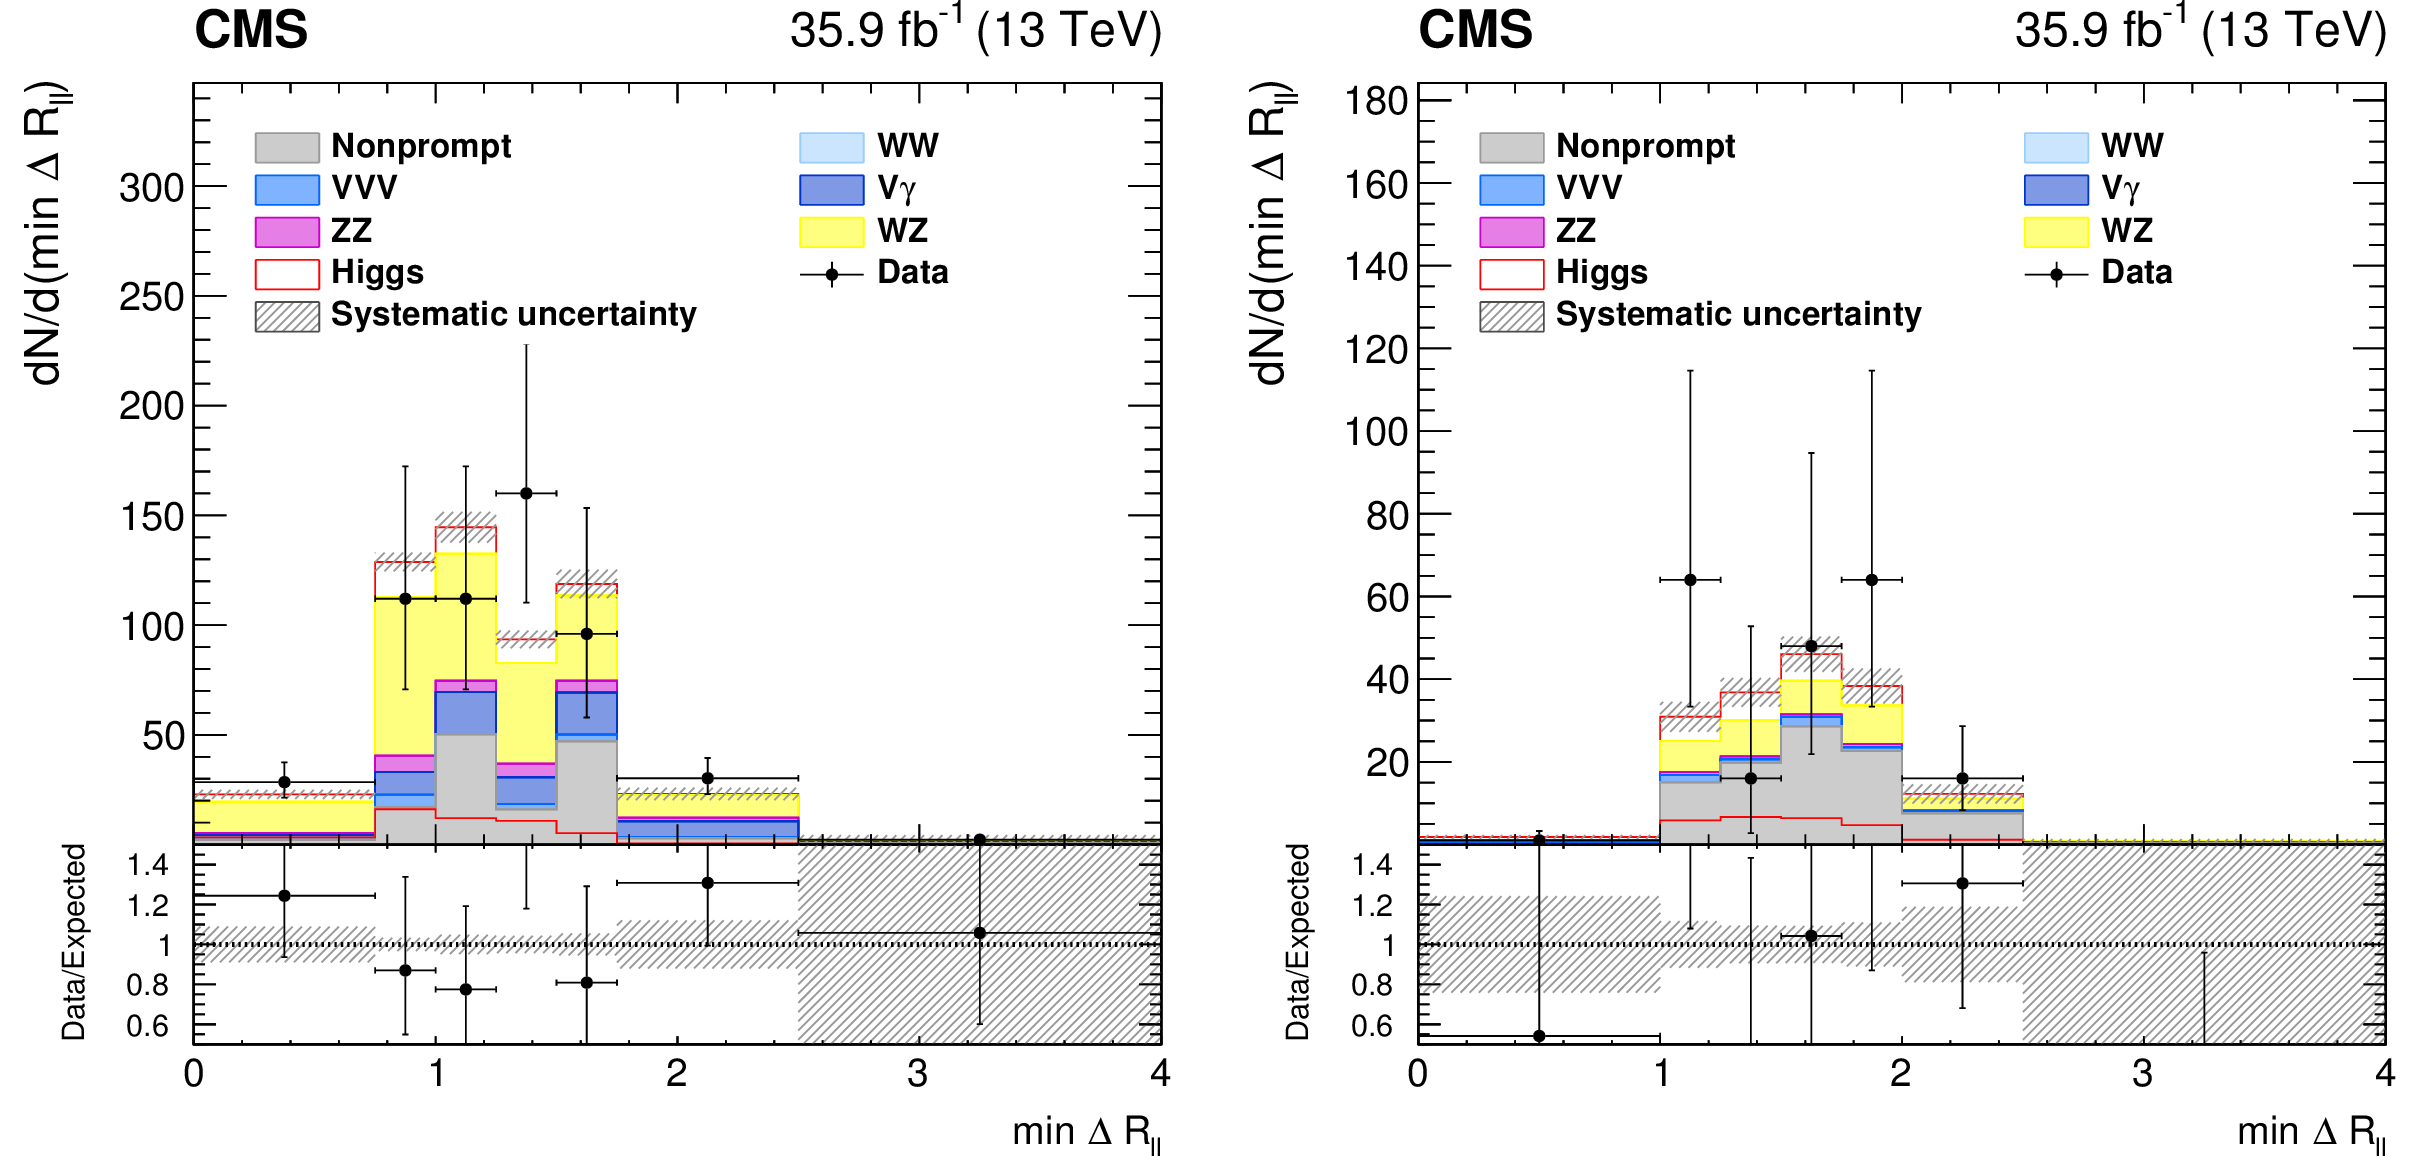
Figure 6:
Postfit $\Delta R_{\ell \ell}$ distribution for events in the three-lepton WH-tagged category, split in the OSSF (left) and SSSF (right) subcategories. The contributions of the main background processes (stacked histograms) and the SM Higgs boson signal (superimposed and stacked red histograms) remaining after all selection criteria are shown. The dashed gray band accounts for all systematic uncertainties relative to signal and background yields after the fit. |
png pdf |
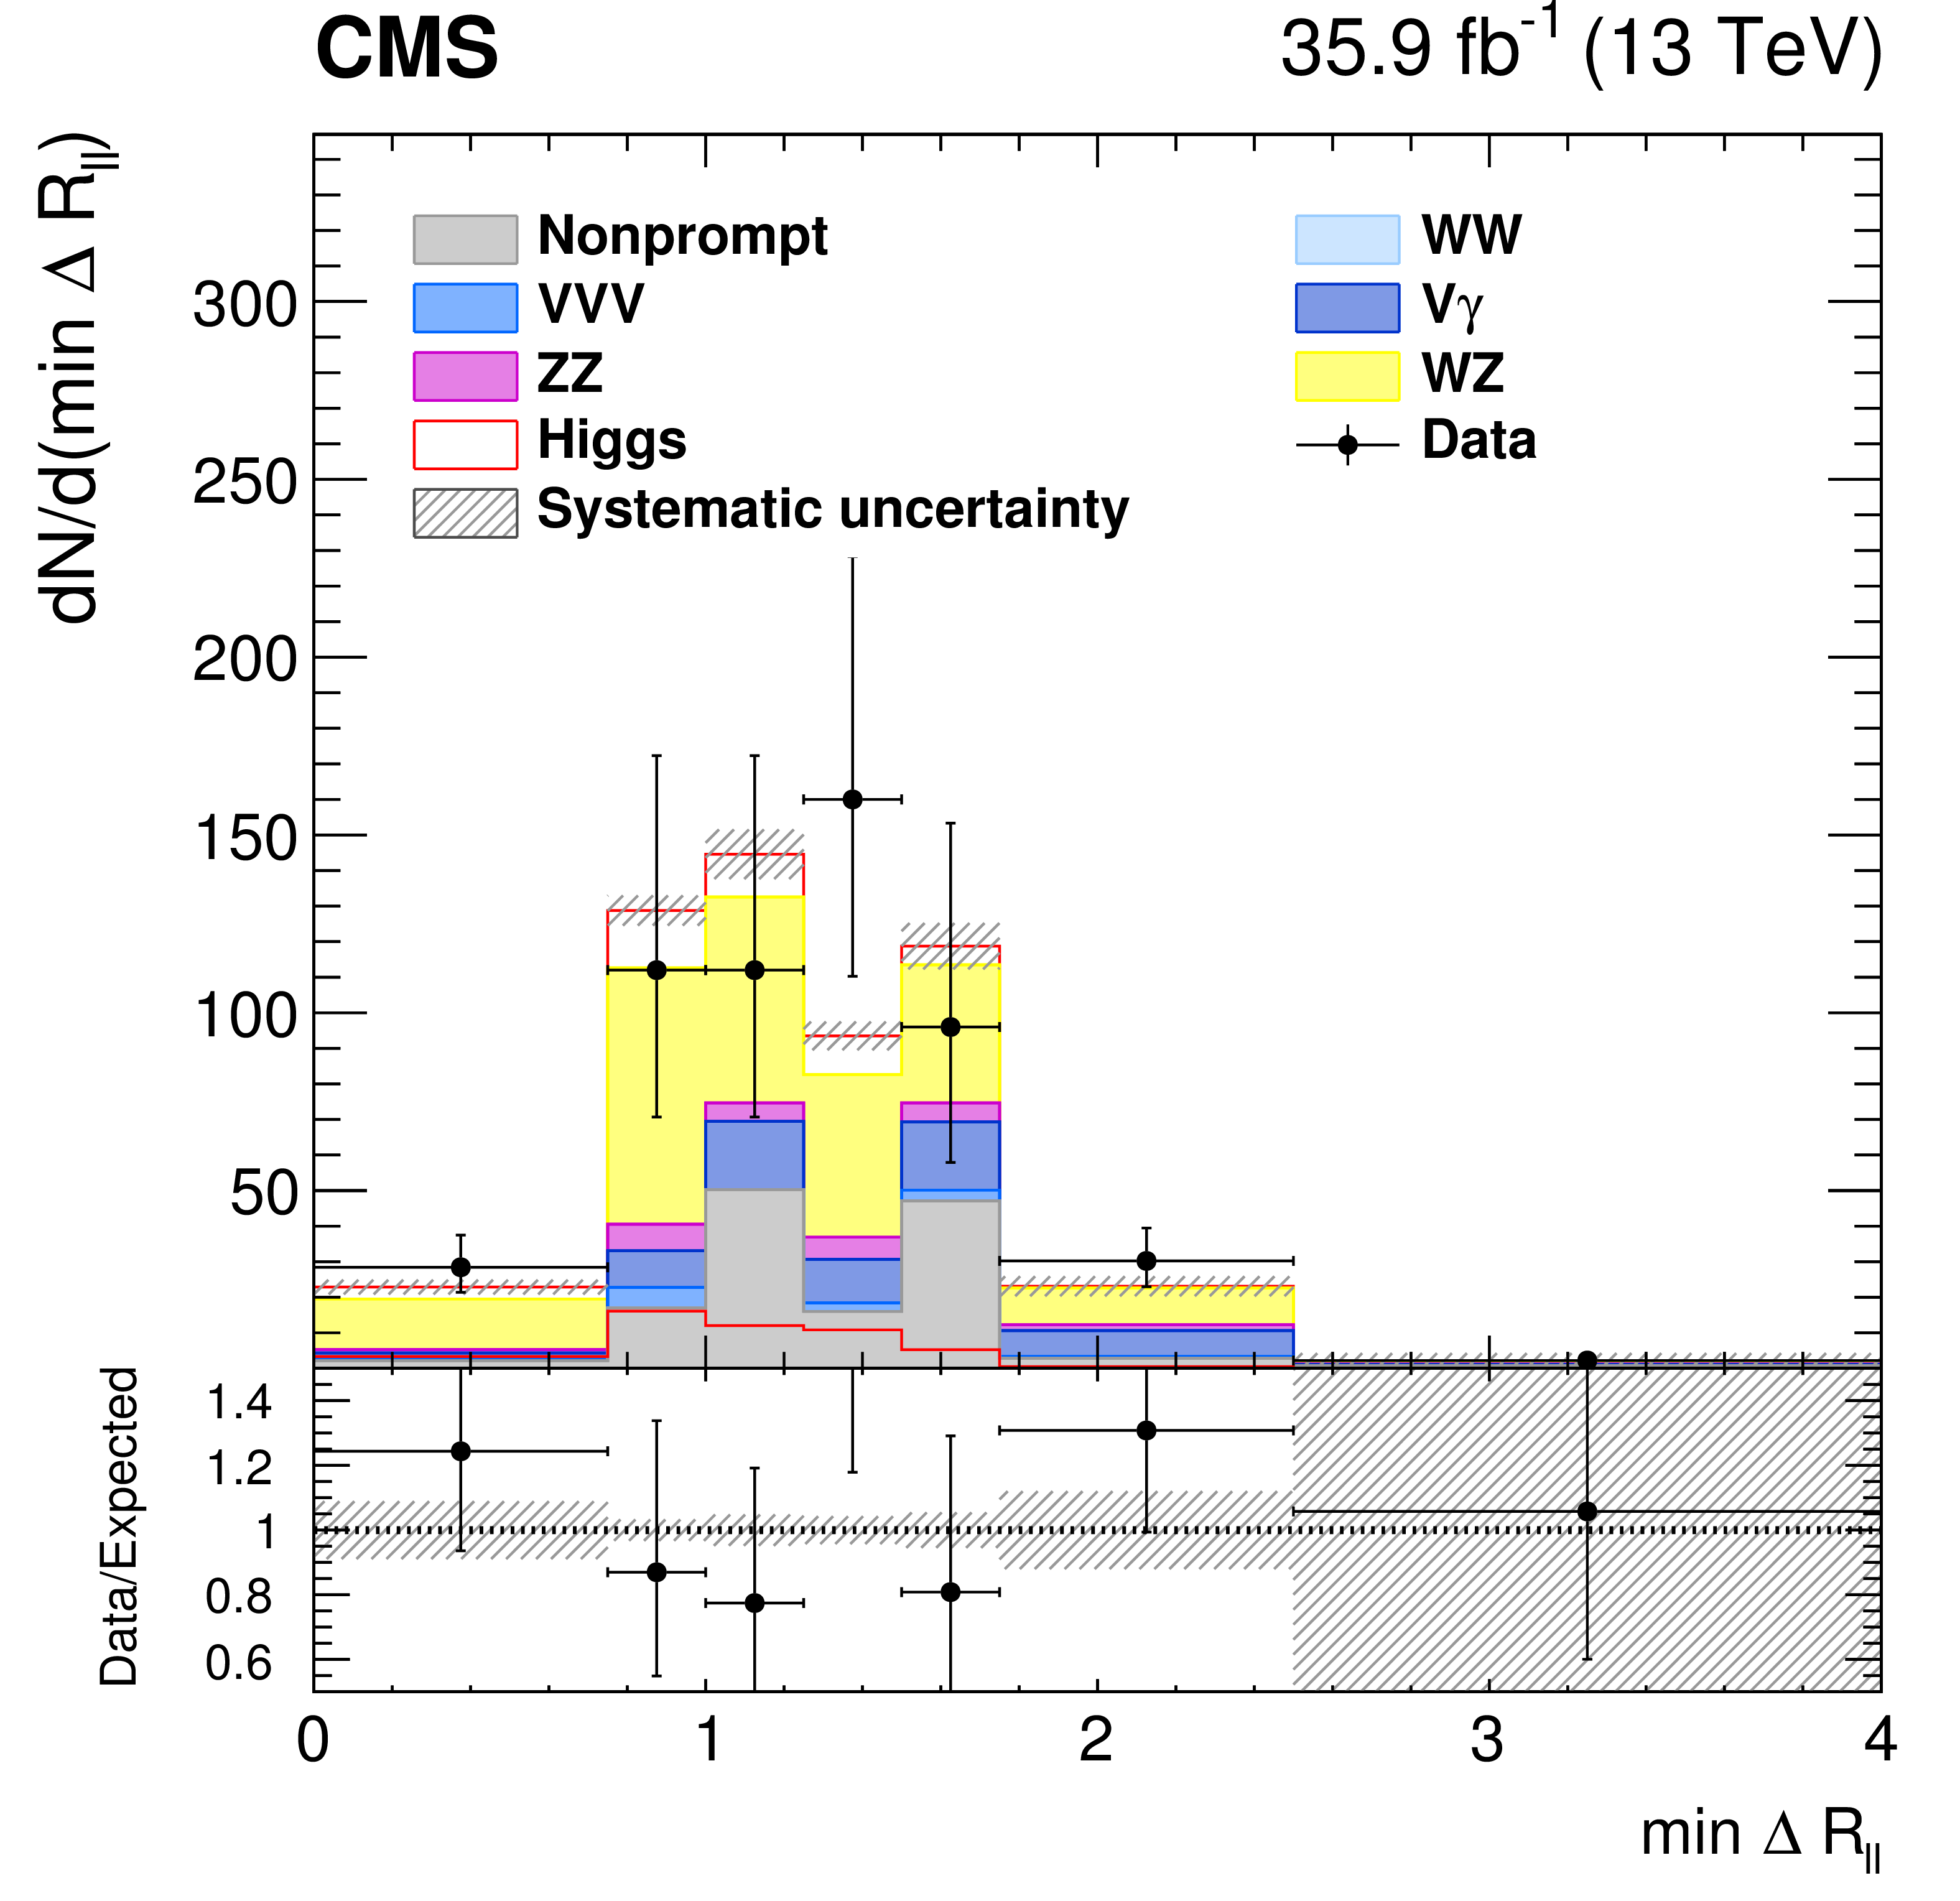
Figure 6-a:
Postfit $\Delta R_{\ell \ell}$ distribution for events in the three-lepton WH-tagged category, in the OSSF subcategory. The contributions of the main background processes (stacked histograms) and the SM Higgs boson signal (superimposed and stacked red histograms) remaining after all selection criteria are shown. The dashed gray band accounts for all systematic uncertainties relative to signal and background yields after the fit. |
png pdf |
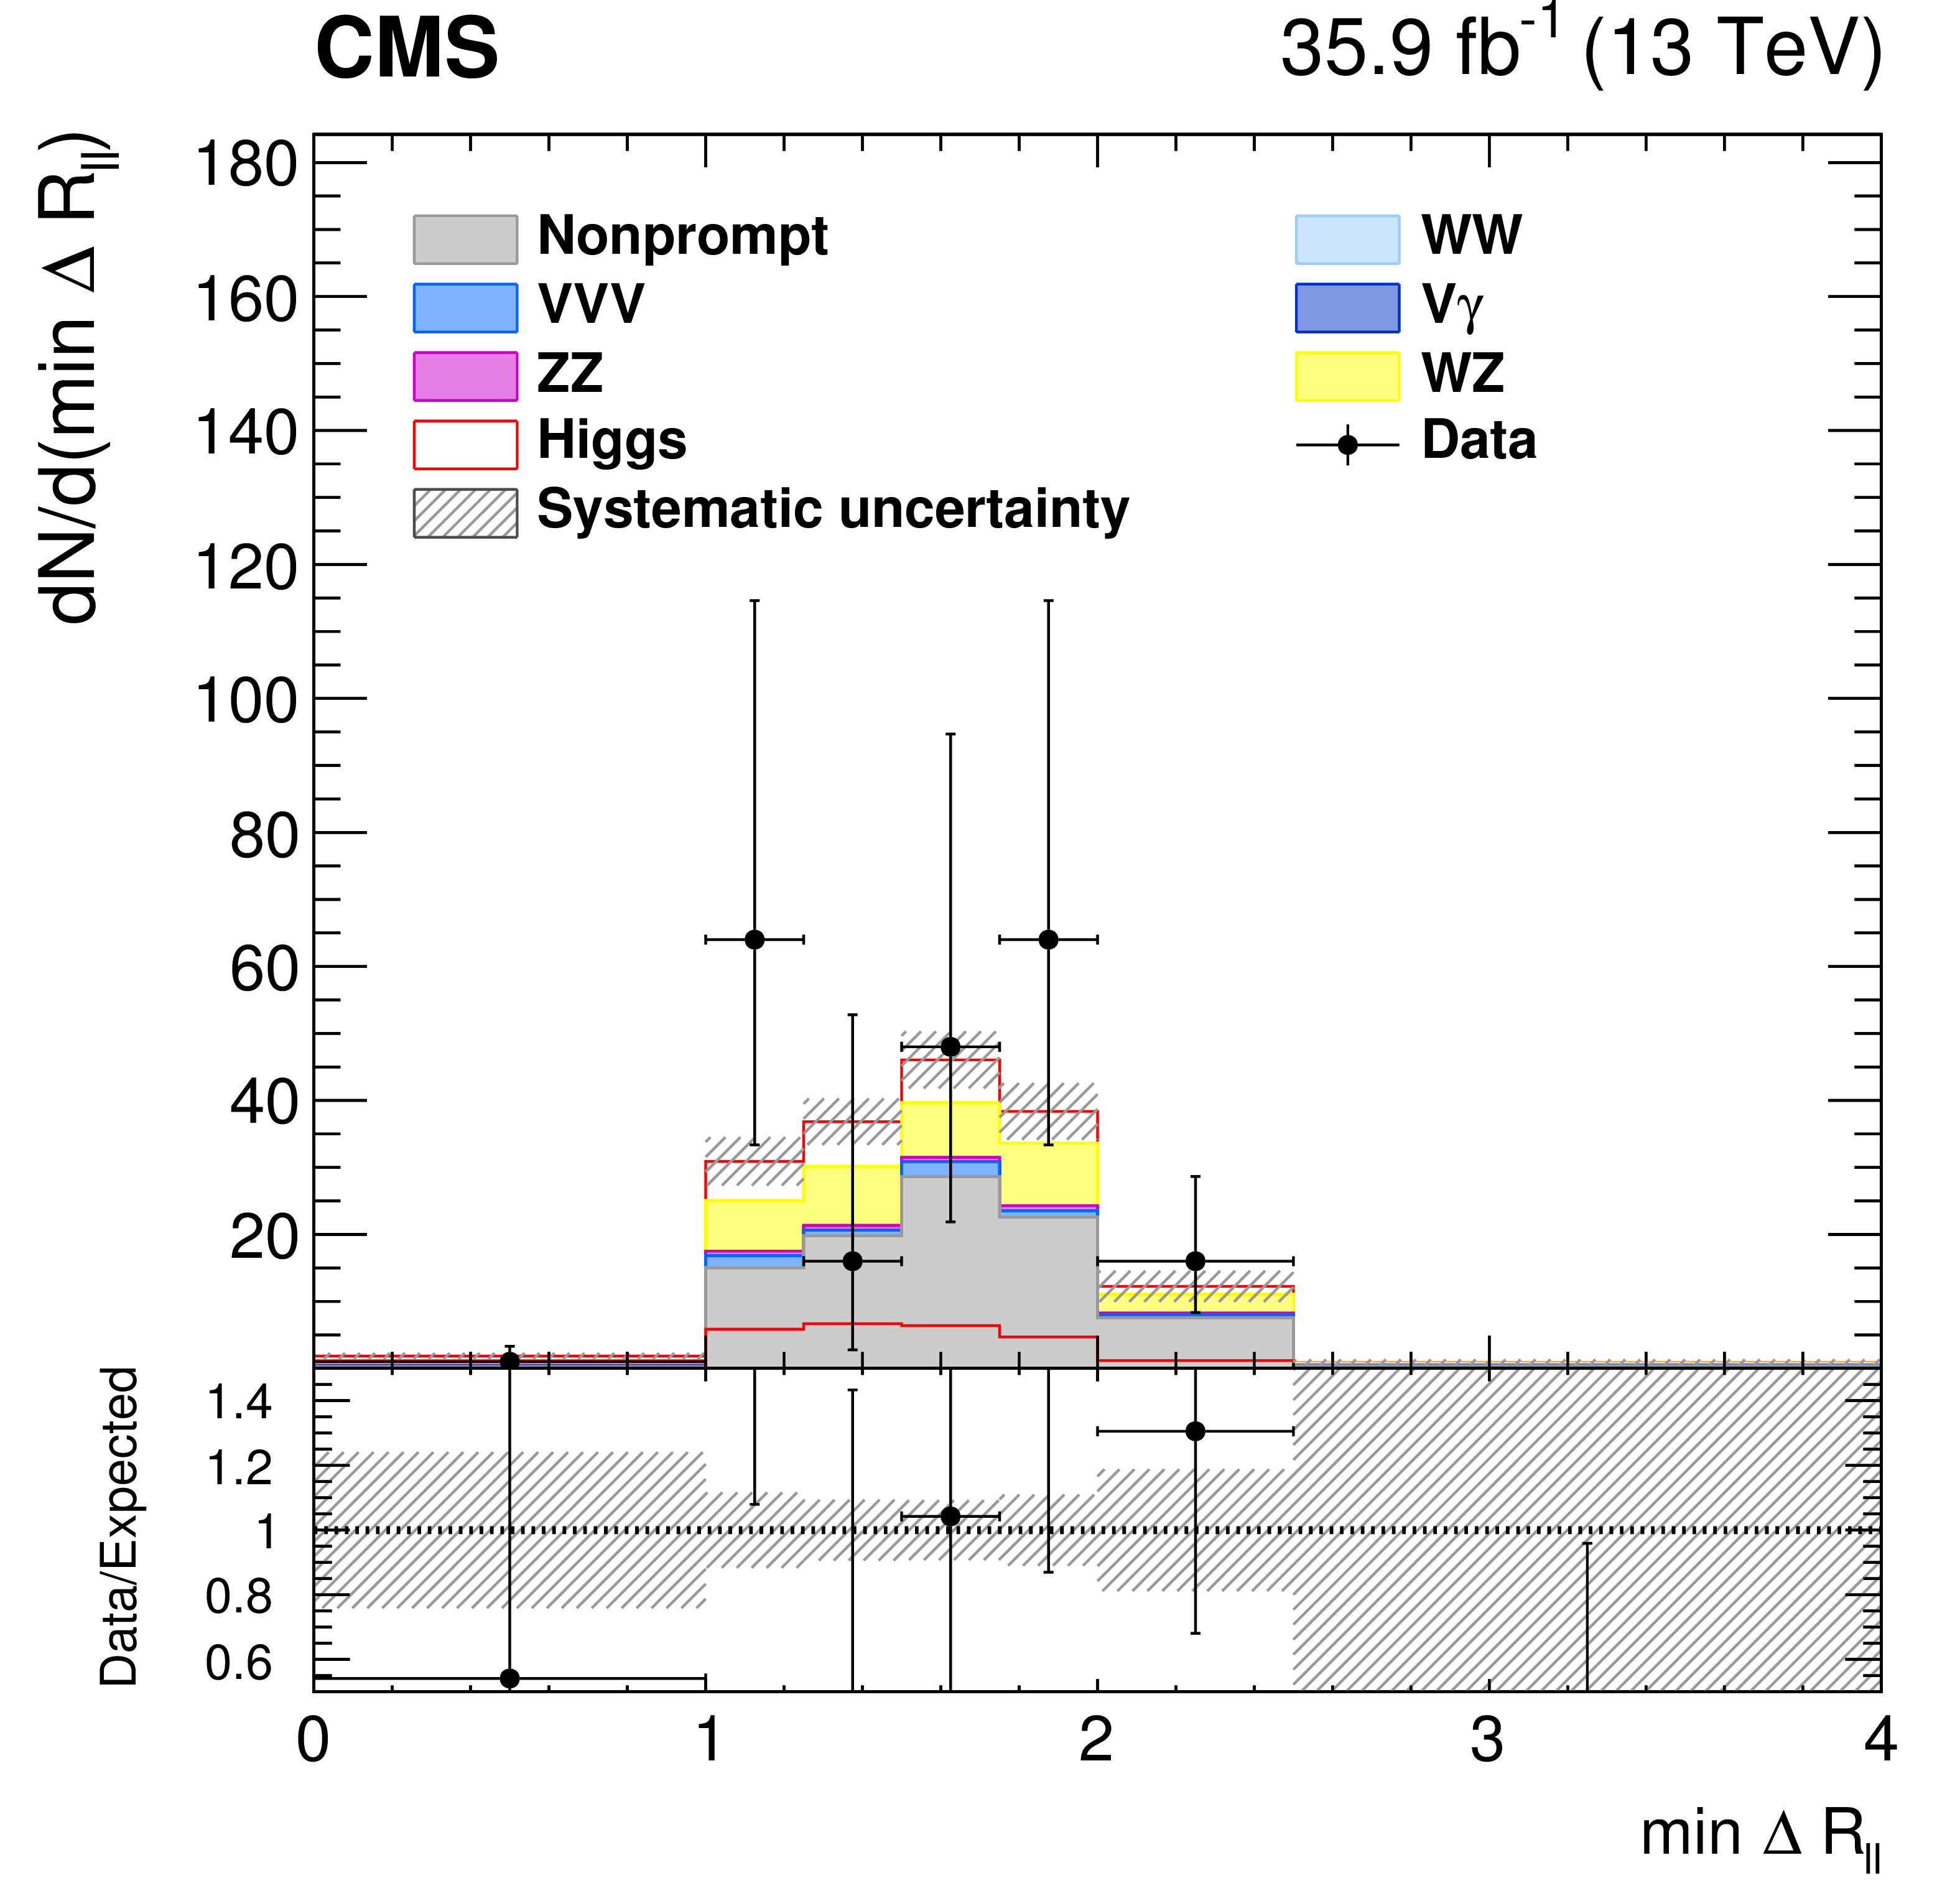
Figure 6-b:
Postfit $\Delta R_{\ell \ell}$ distribution for events in the three-lepton WH-tagged category, in the SSSF subcategory. The contributions of the main background processes (stacked histograms) and the SM Higgs boson signal (superimposed and stacked red histograms) remaining after all selection criteria are shown. The dashed gray band accounts for all systematic uncertainties relative to signal and background yields after the fit. |
png pdf |
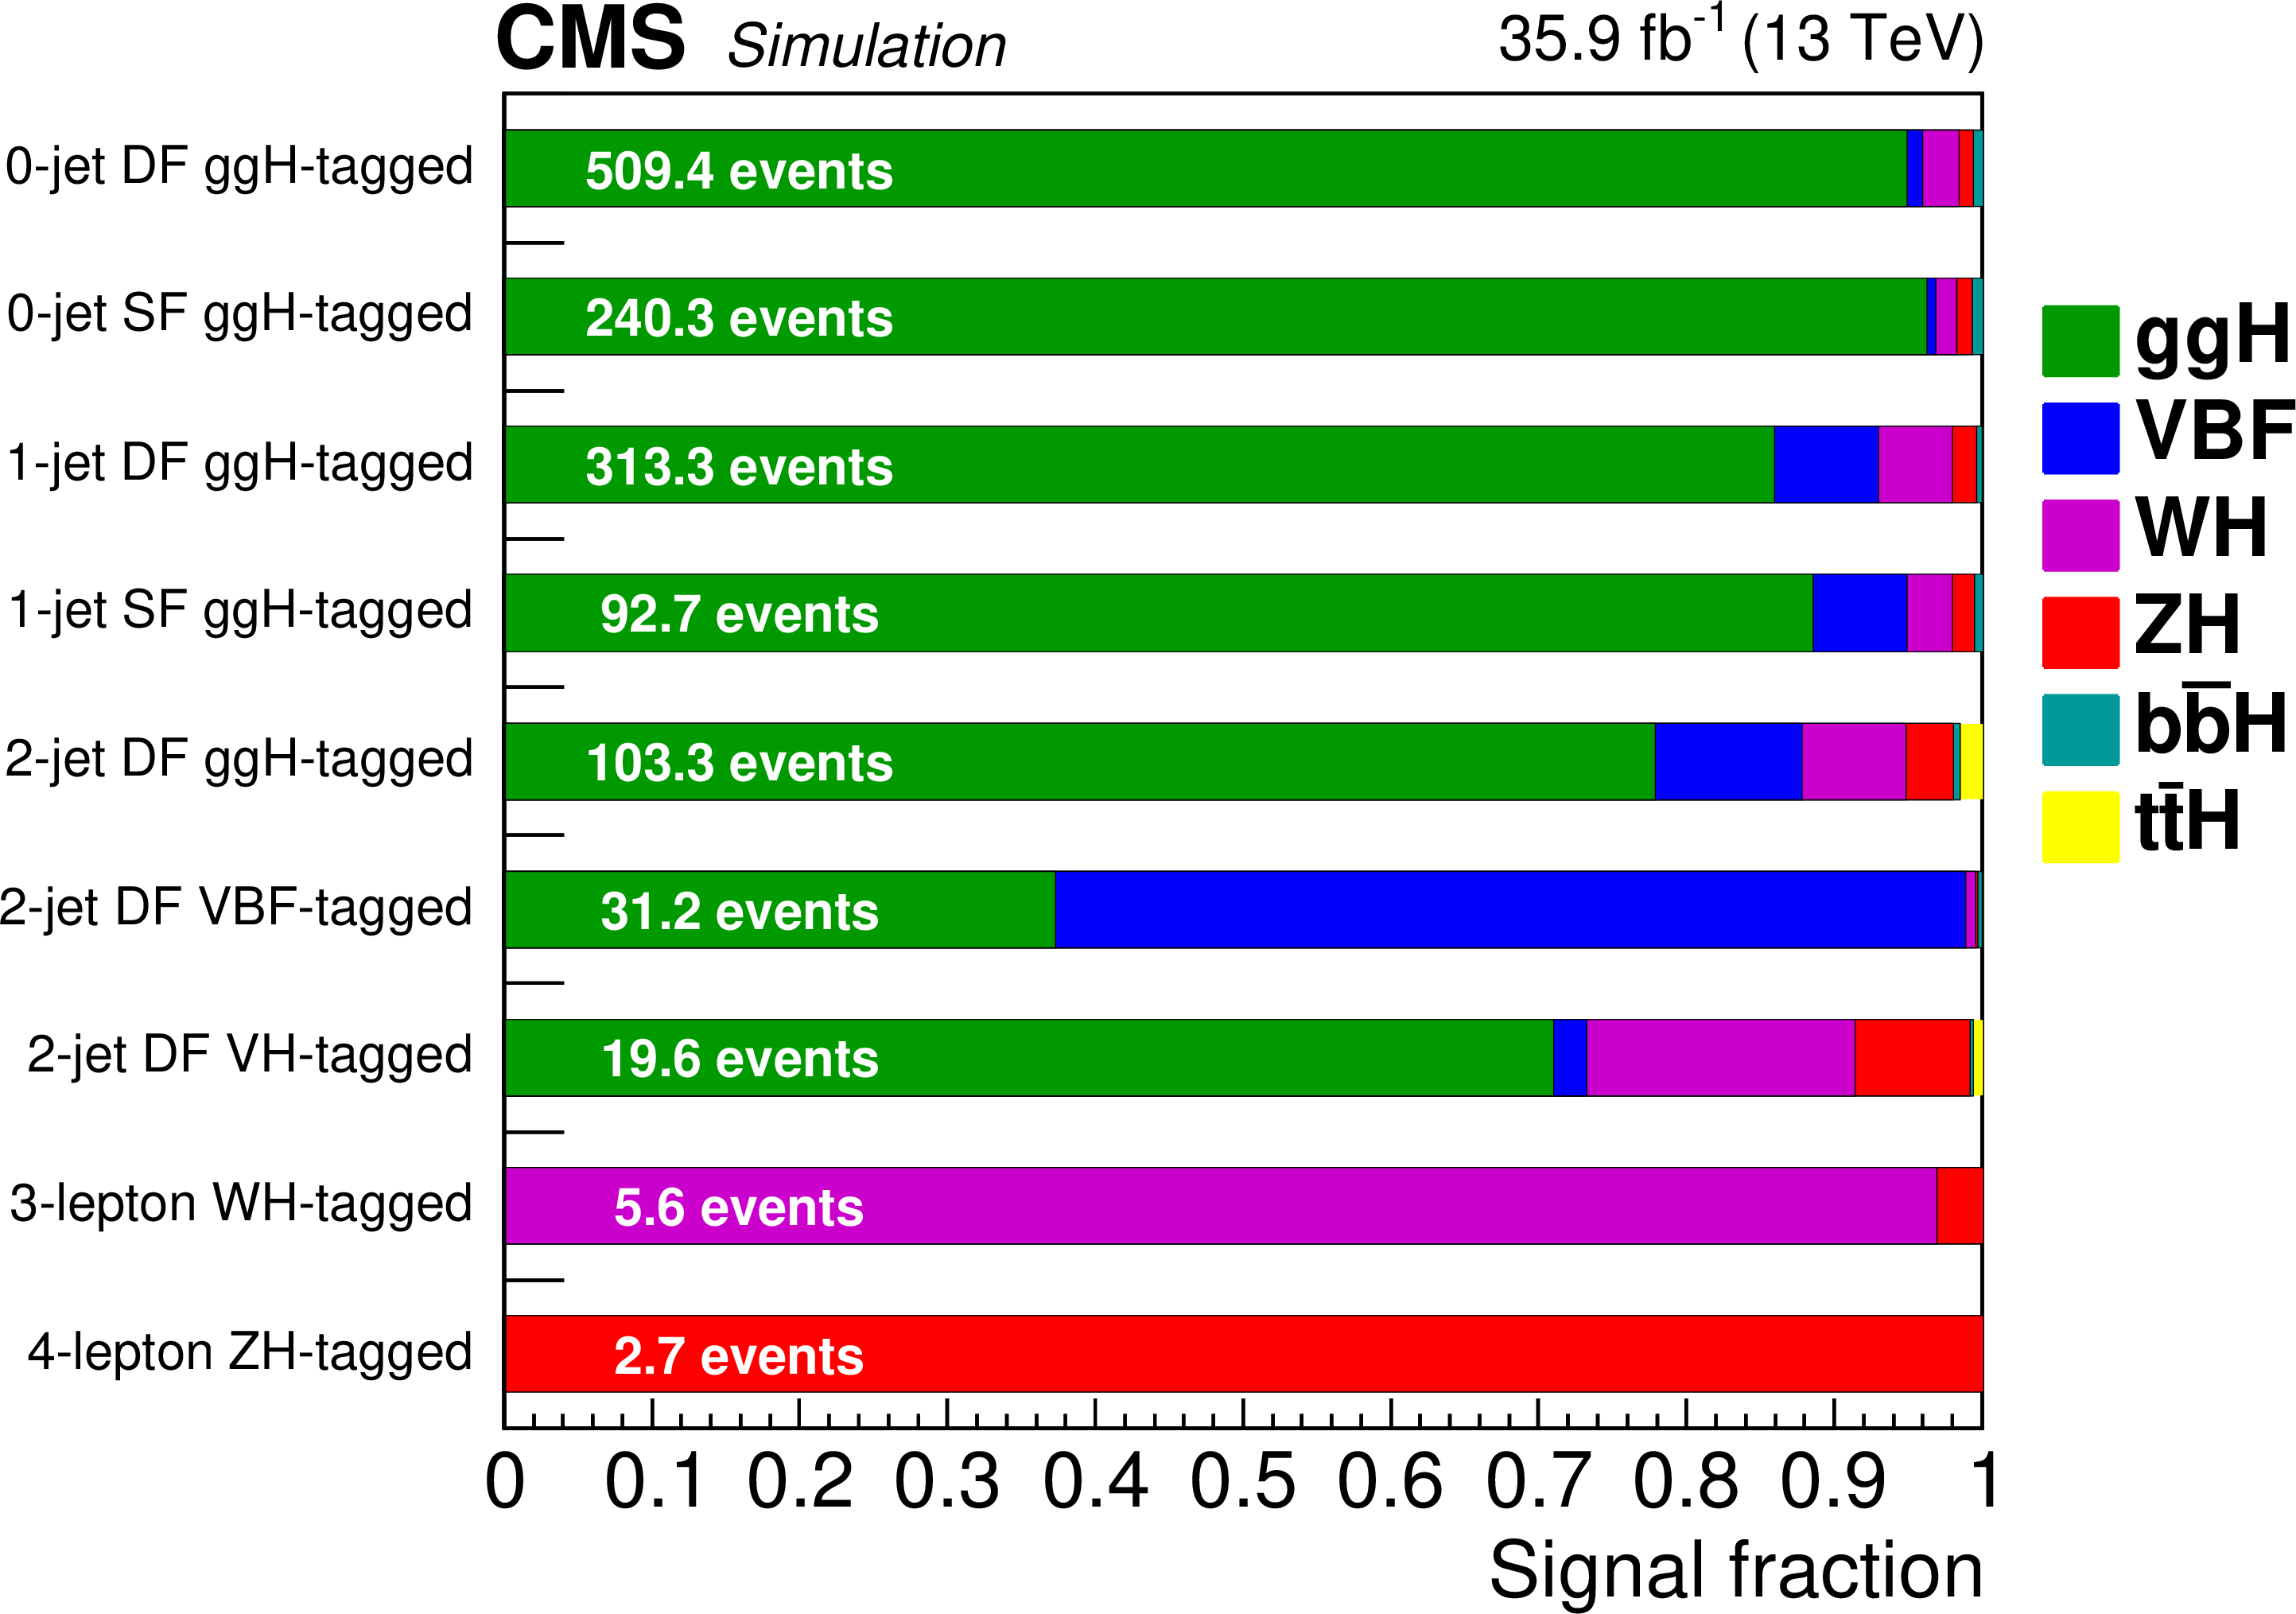
Figure 7:
Expected relative fraction of different Higgs boson production mechanisms in each category included in the combination, together with the expected signal yield. |
png pdf |
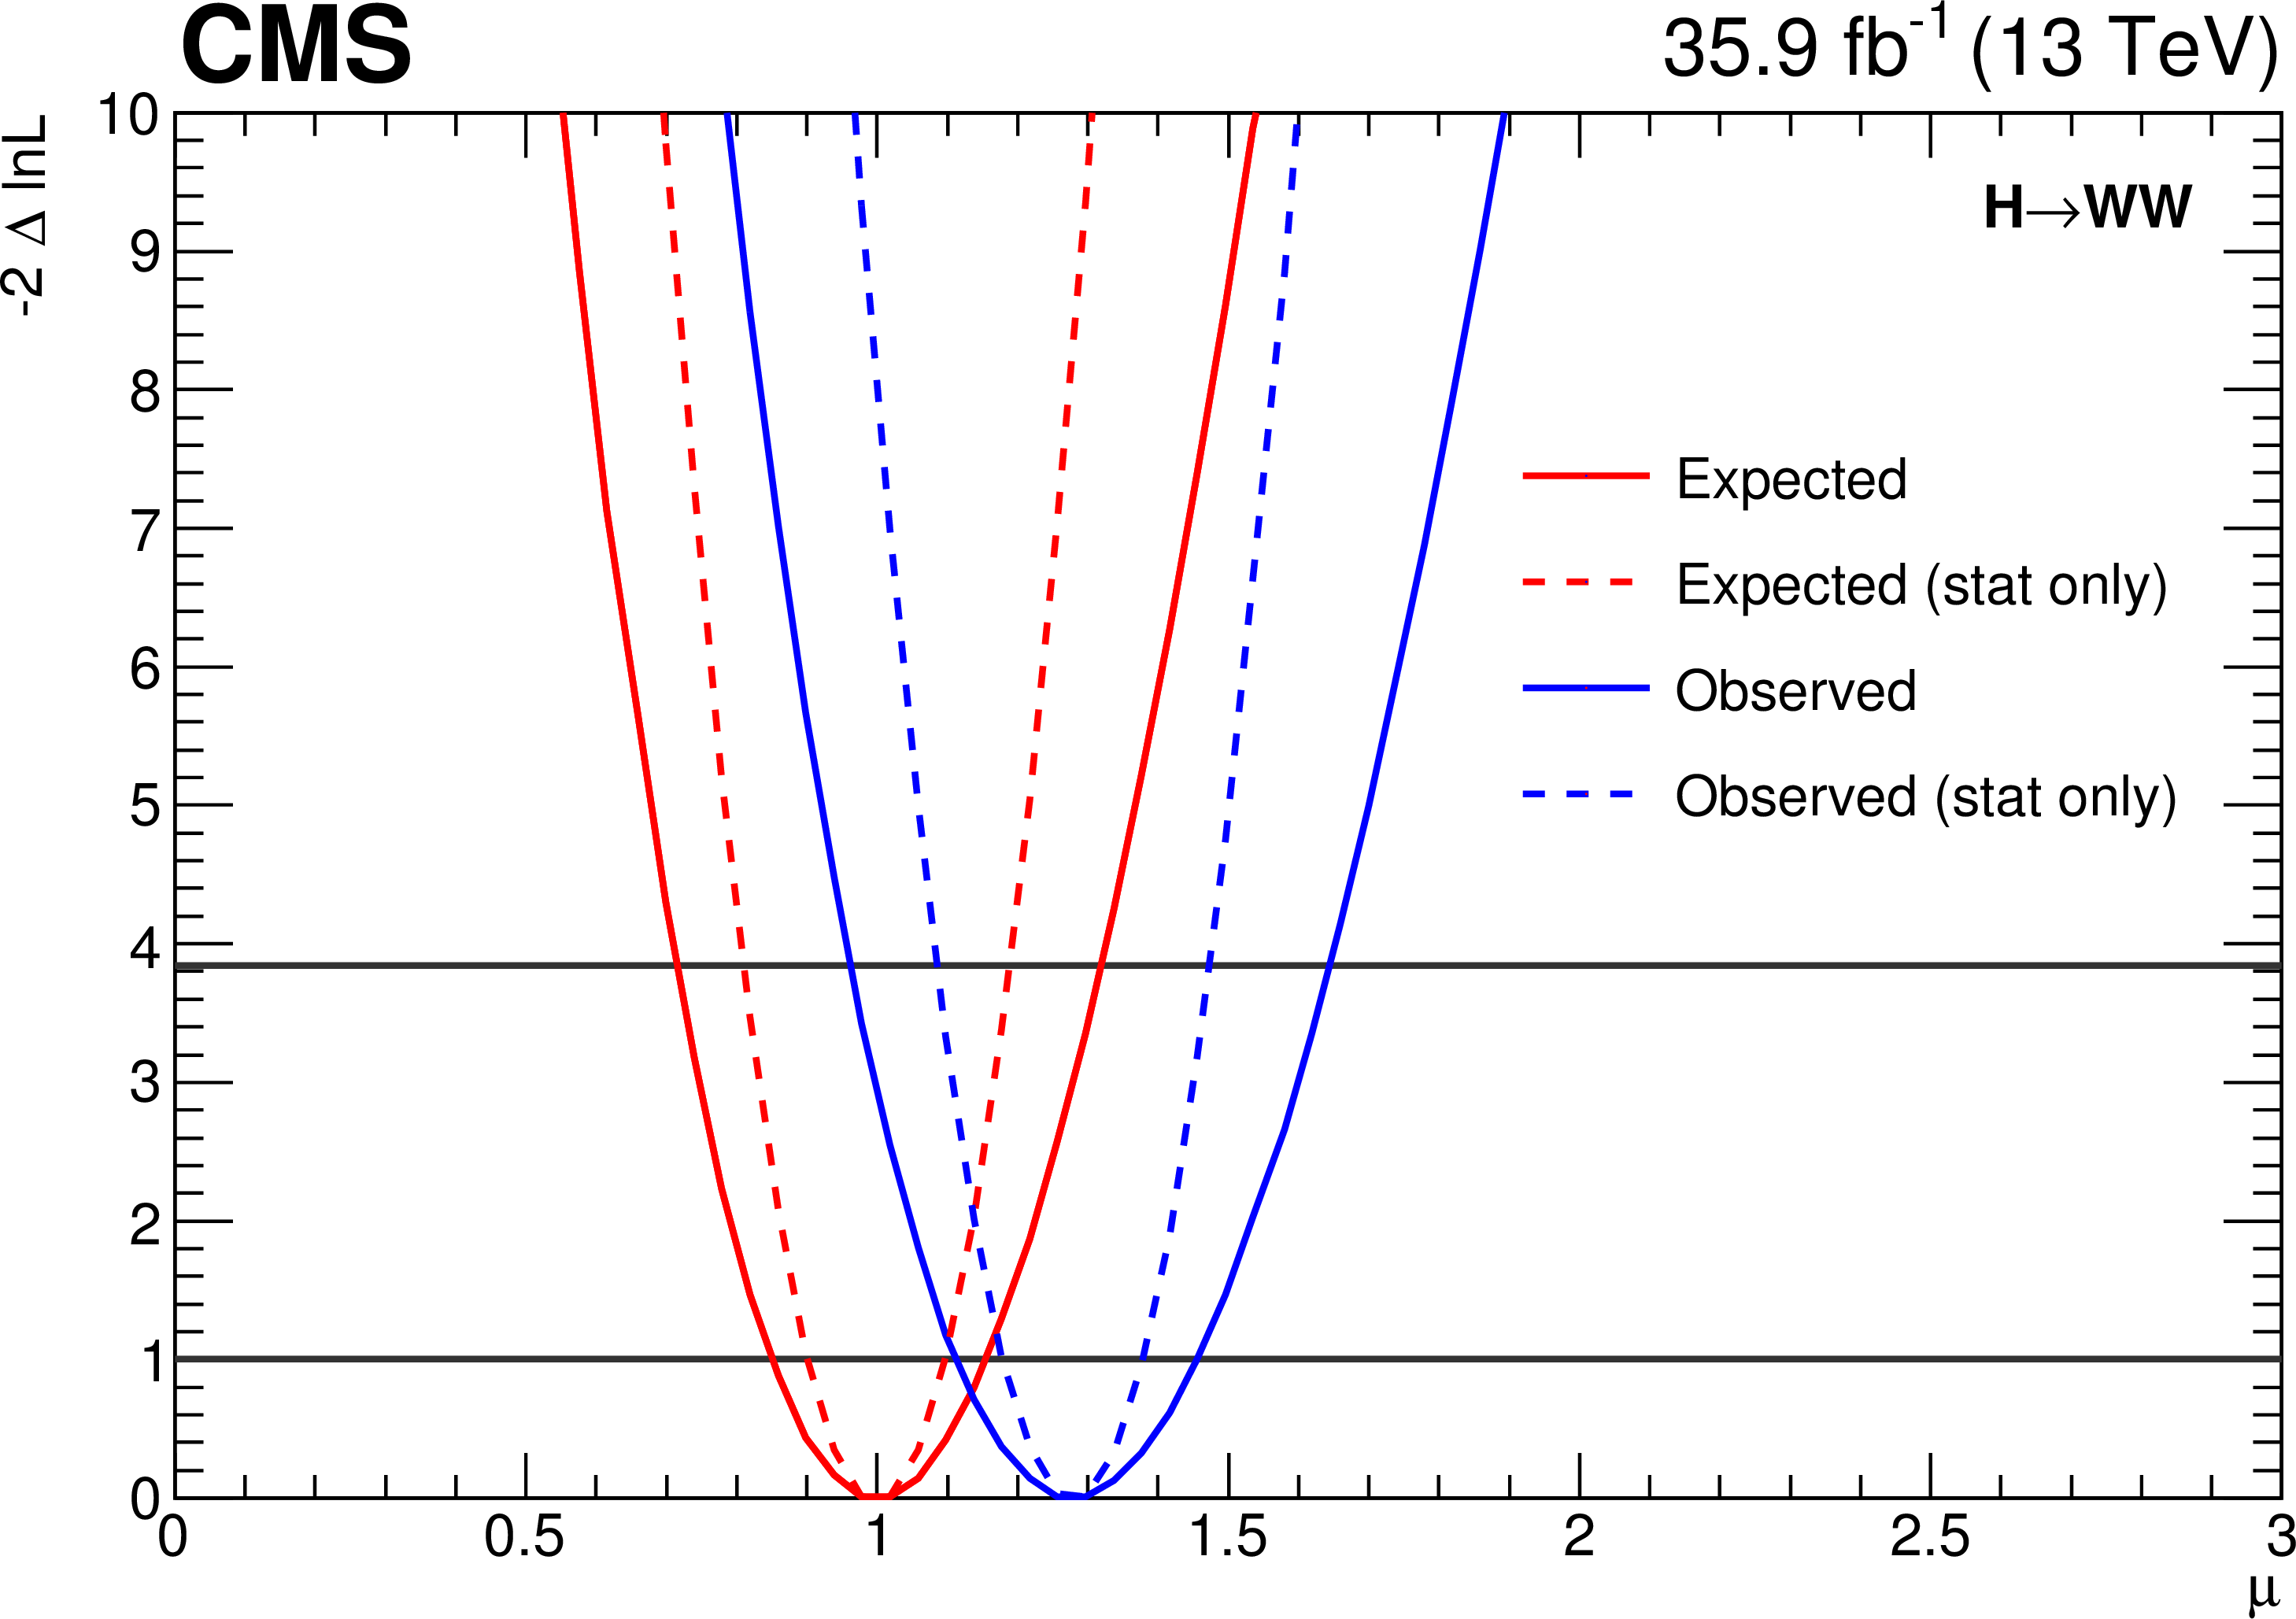
Figure 8:
Observed and expected likelihood profiles for the global signal strength modifier. Dashed curves correspond to the likelihood profiles obtained including only the statistical uncertainty. The crossings with the horizontal line at $-2\Delta {\mathrm{ln}} L = $ 1 (3.84) define the 68 (95)% {\text {CL}} interval. |
png pdf |
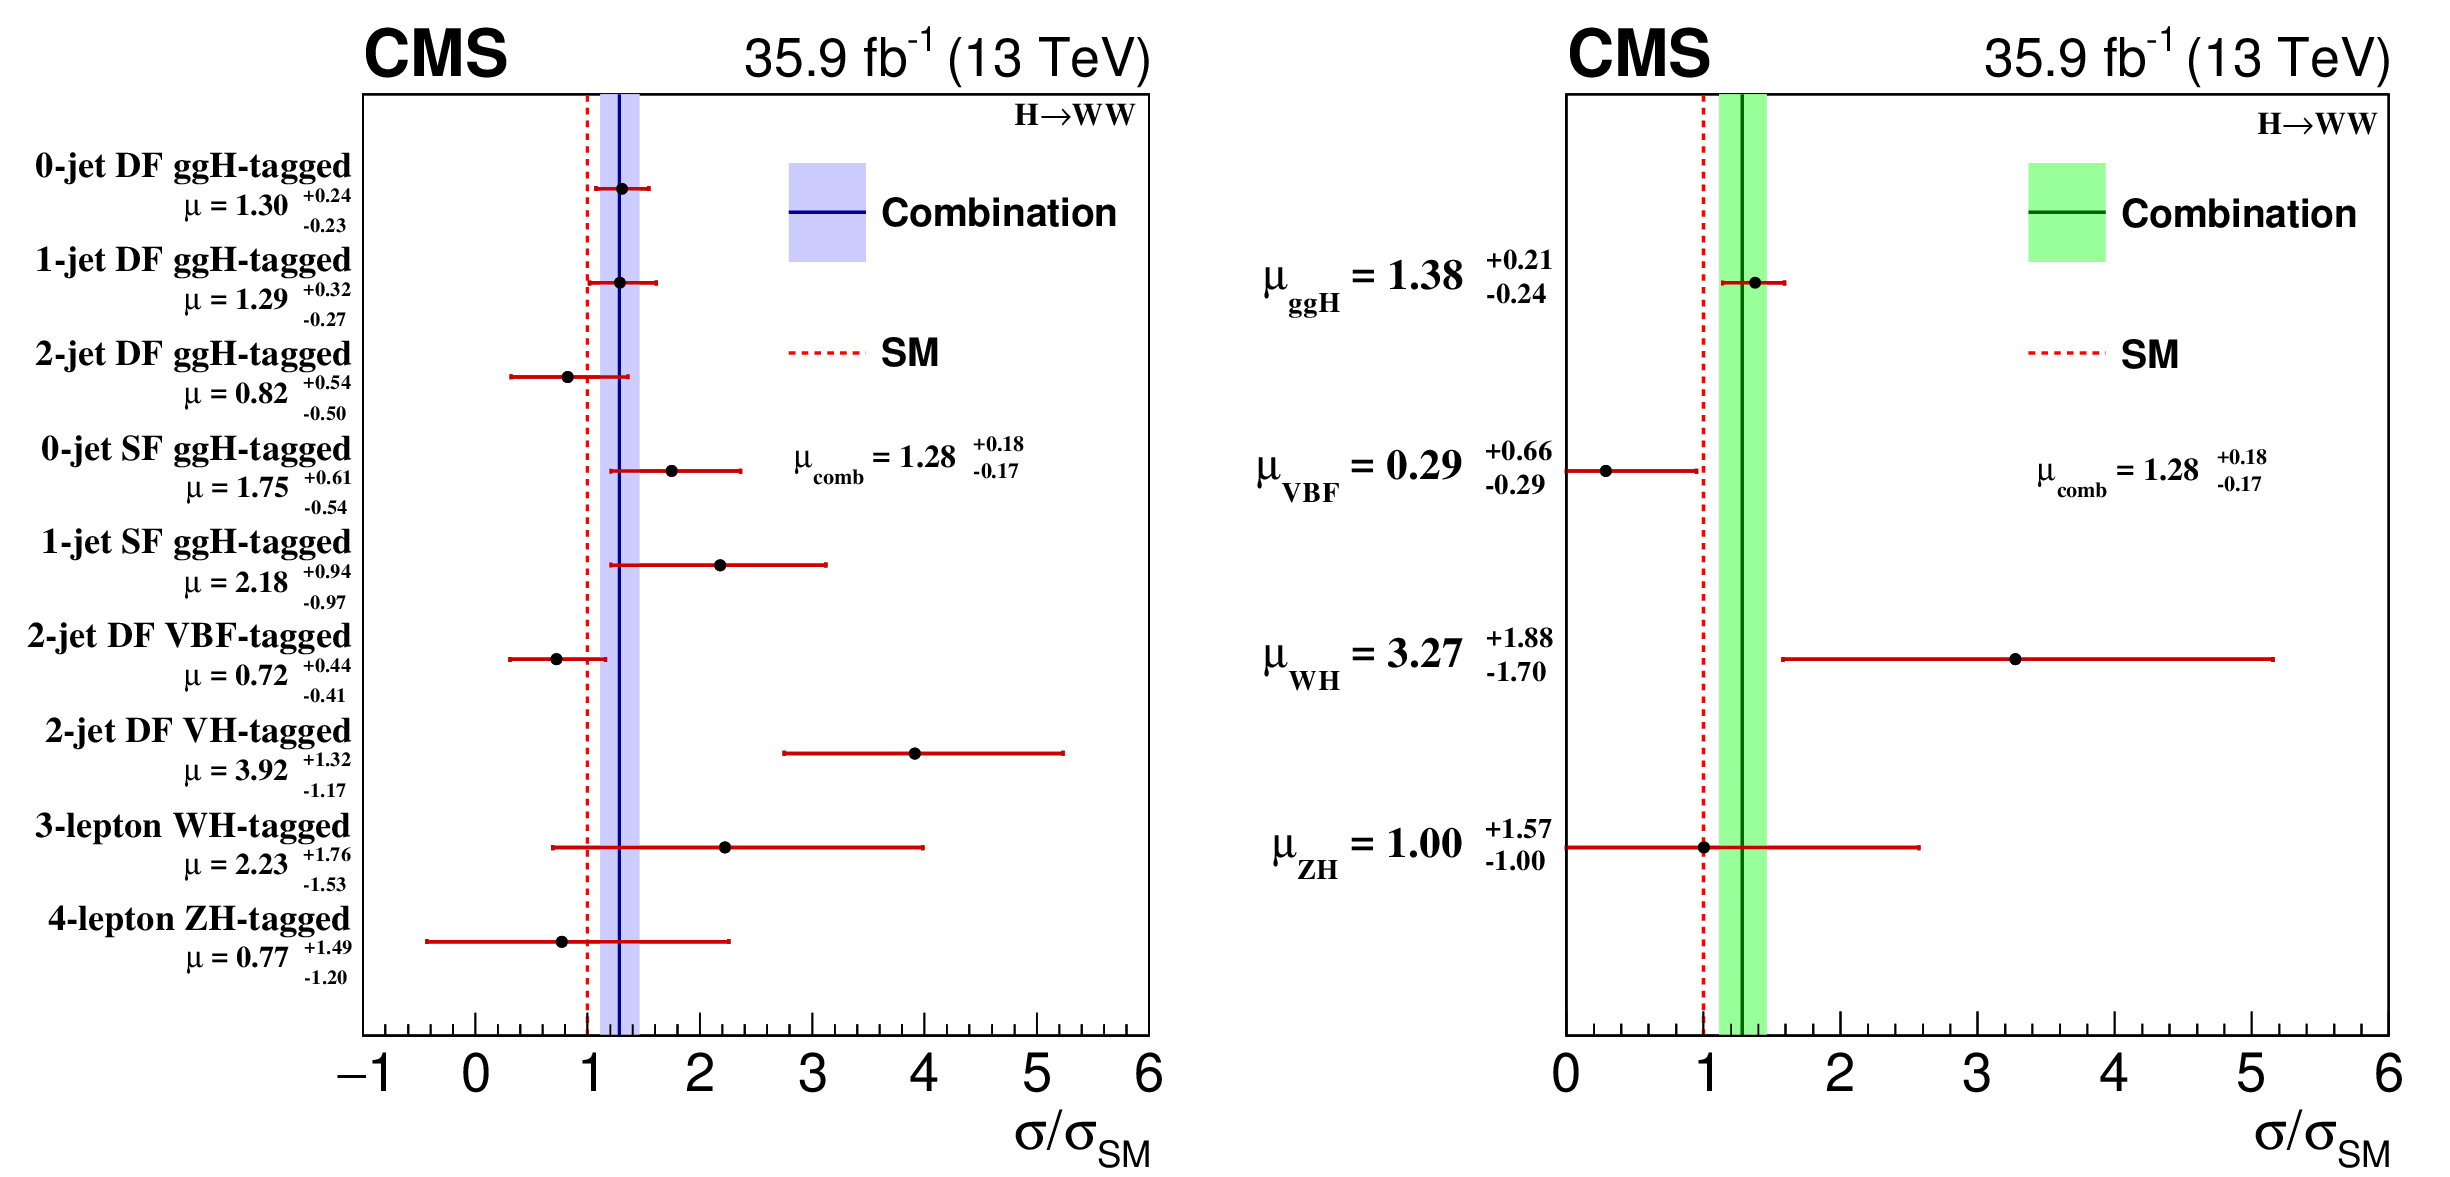
Figure 9:
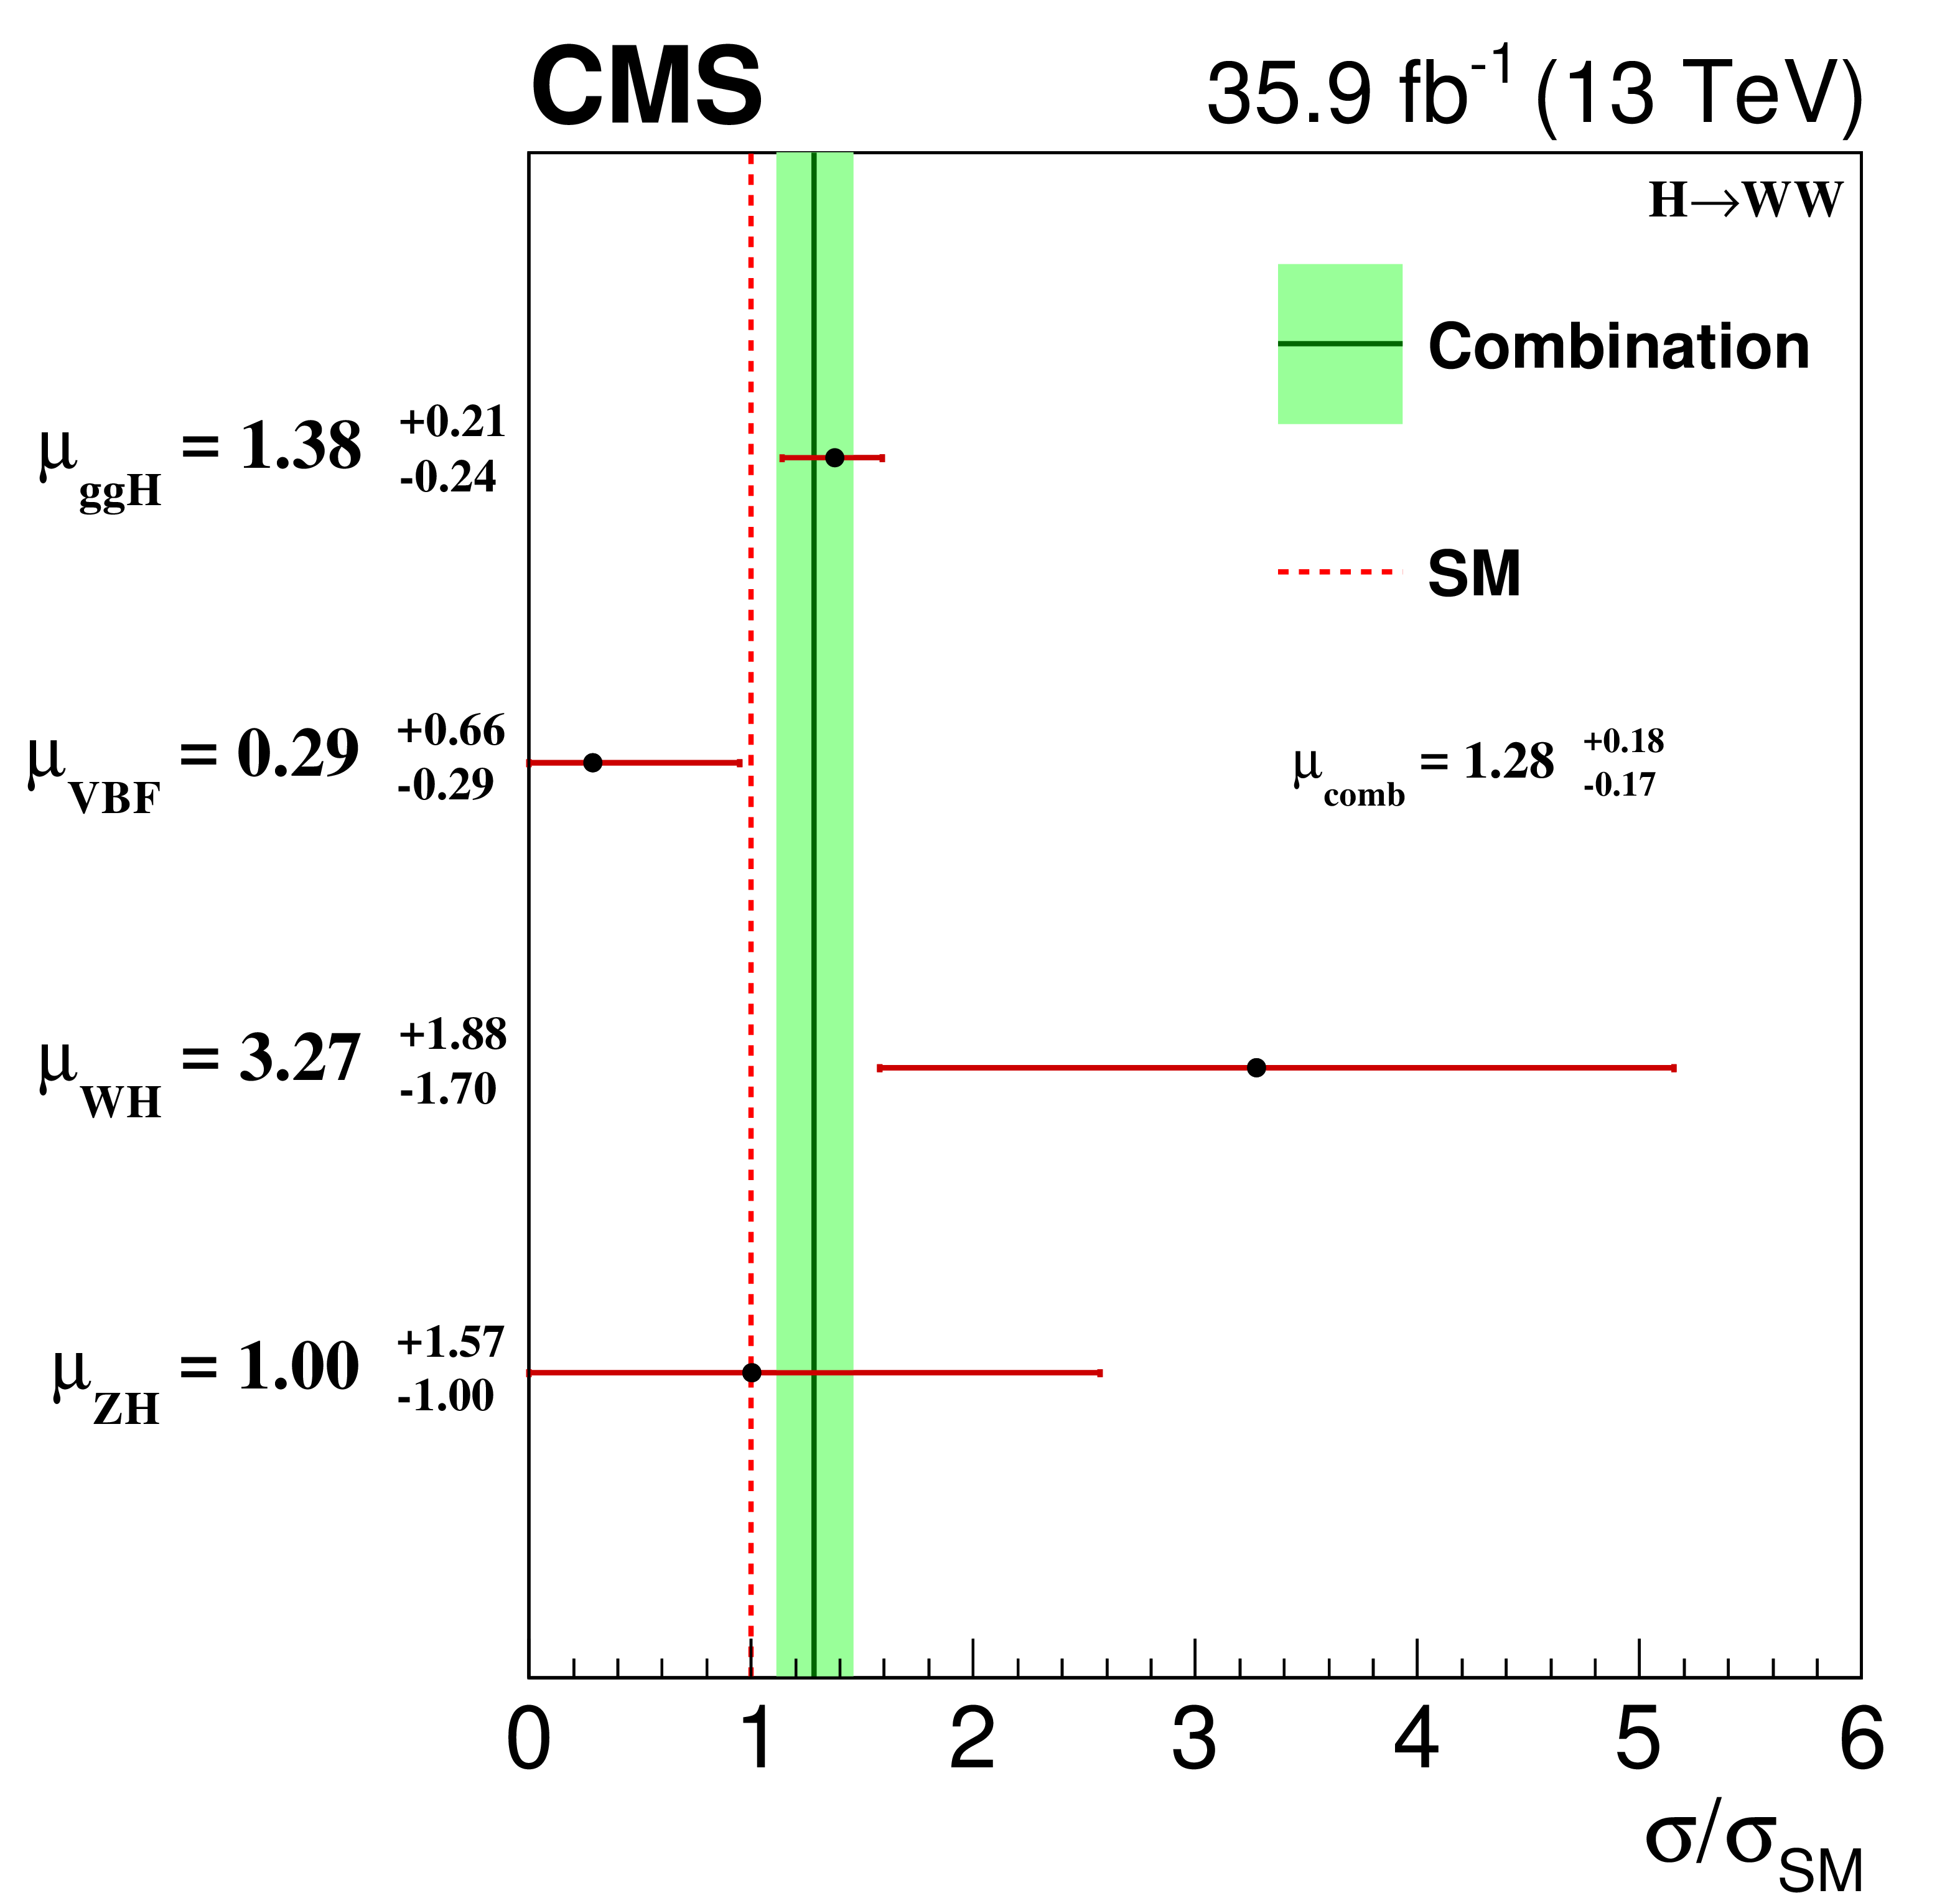
(Left) Observed signal strength modifiers for each category used in the combination. (Right) Observed signal strength modifiers corresponding to the main SM Higgs boson production mechanisms, for a Higgs boson with a mass of 125.09 GeV. The vertical continuous line represents the combined signal strength best fit value, while the horizontal bars and the filled area show the 68% confidence intervals. The vertical dashed line corresponds to the SM expectation. |
png pdf |
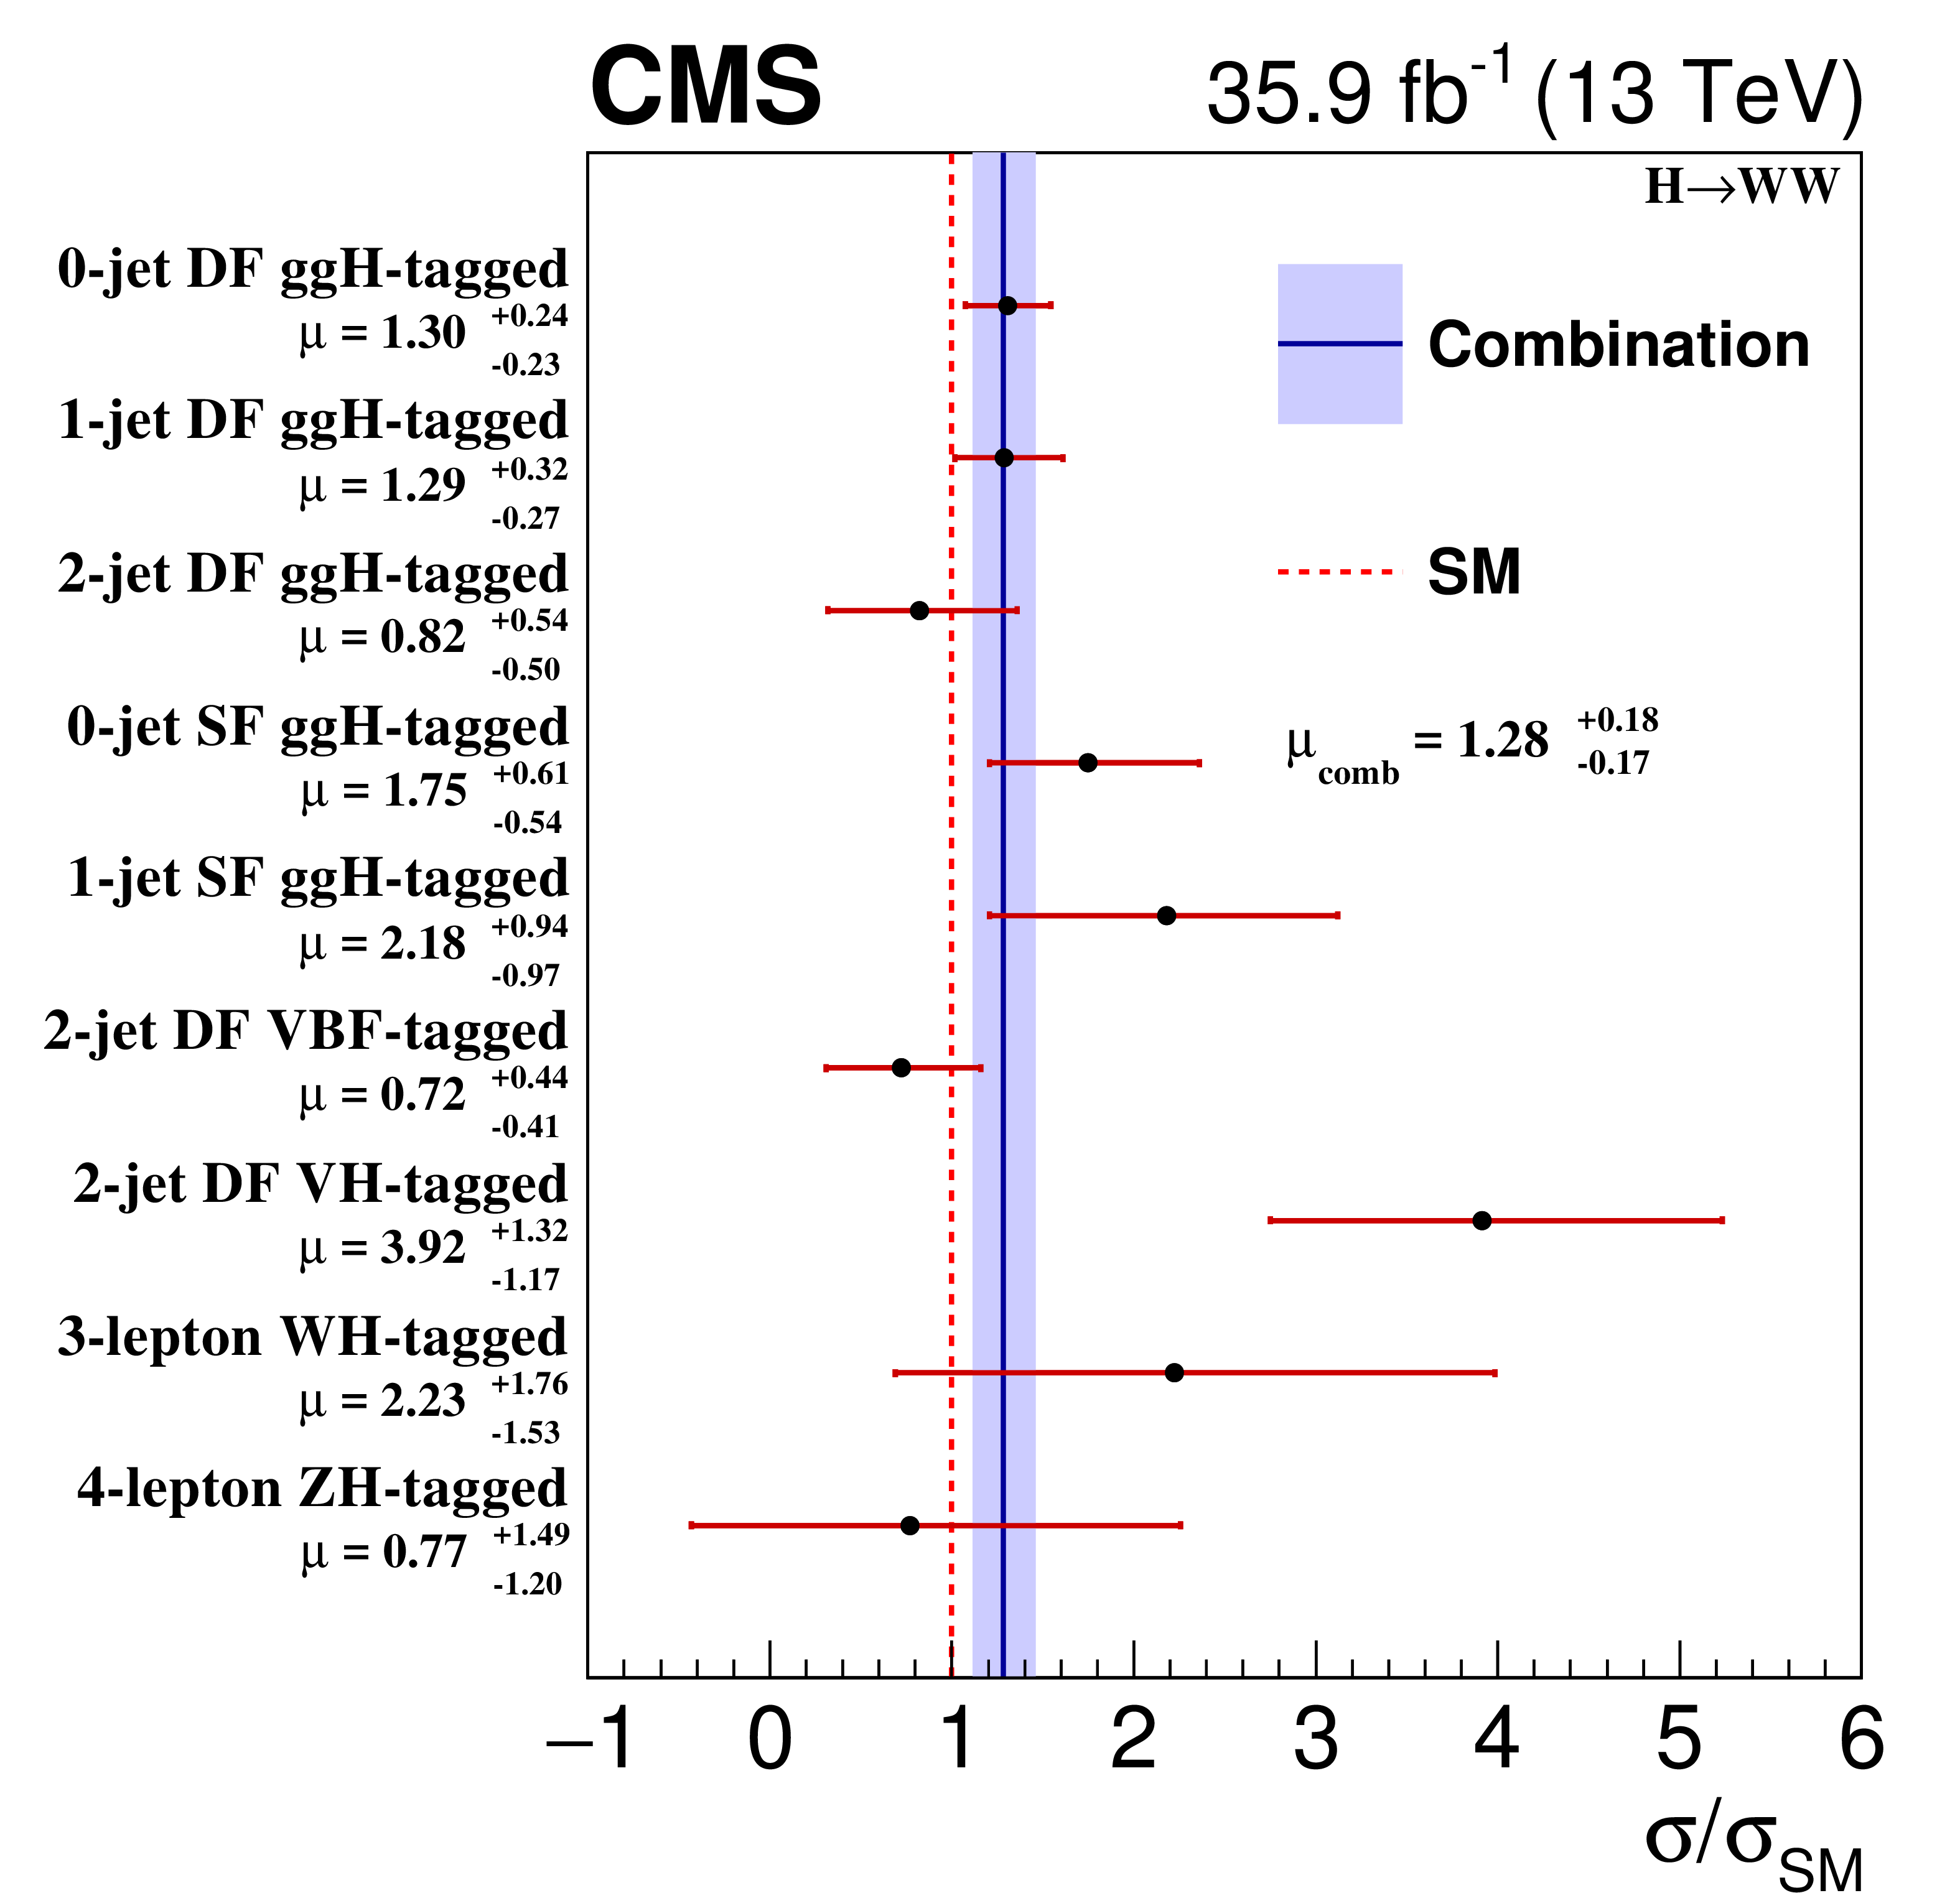
Figure 9-a:
Observed signal strength modifiers for each category used in the combination. The vertical continuous line represents the combined signal strength best fit value, while the horizontal bars and the filled area show the 68% confidence intervals. The vertical dashed line corresponds to the SM expectation. |
png pdf |
Figure 9-b:
Observed signal strength modifiers corresponding to the main SM Higgs boson production mechanisms, for a Higgs boson with a mass of 125.09 GeV. The vertical continuous line represents the combined signal strength best fit value, while the horizontal bars and the filled area show the 68% confidence intervals. The vertical dashed line corresponds to the SM expectation. |
png pdf |
Figure 10:
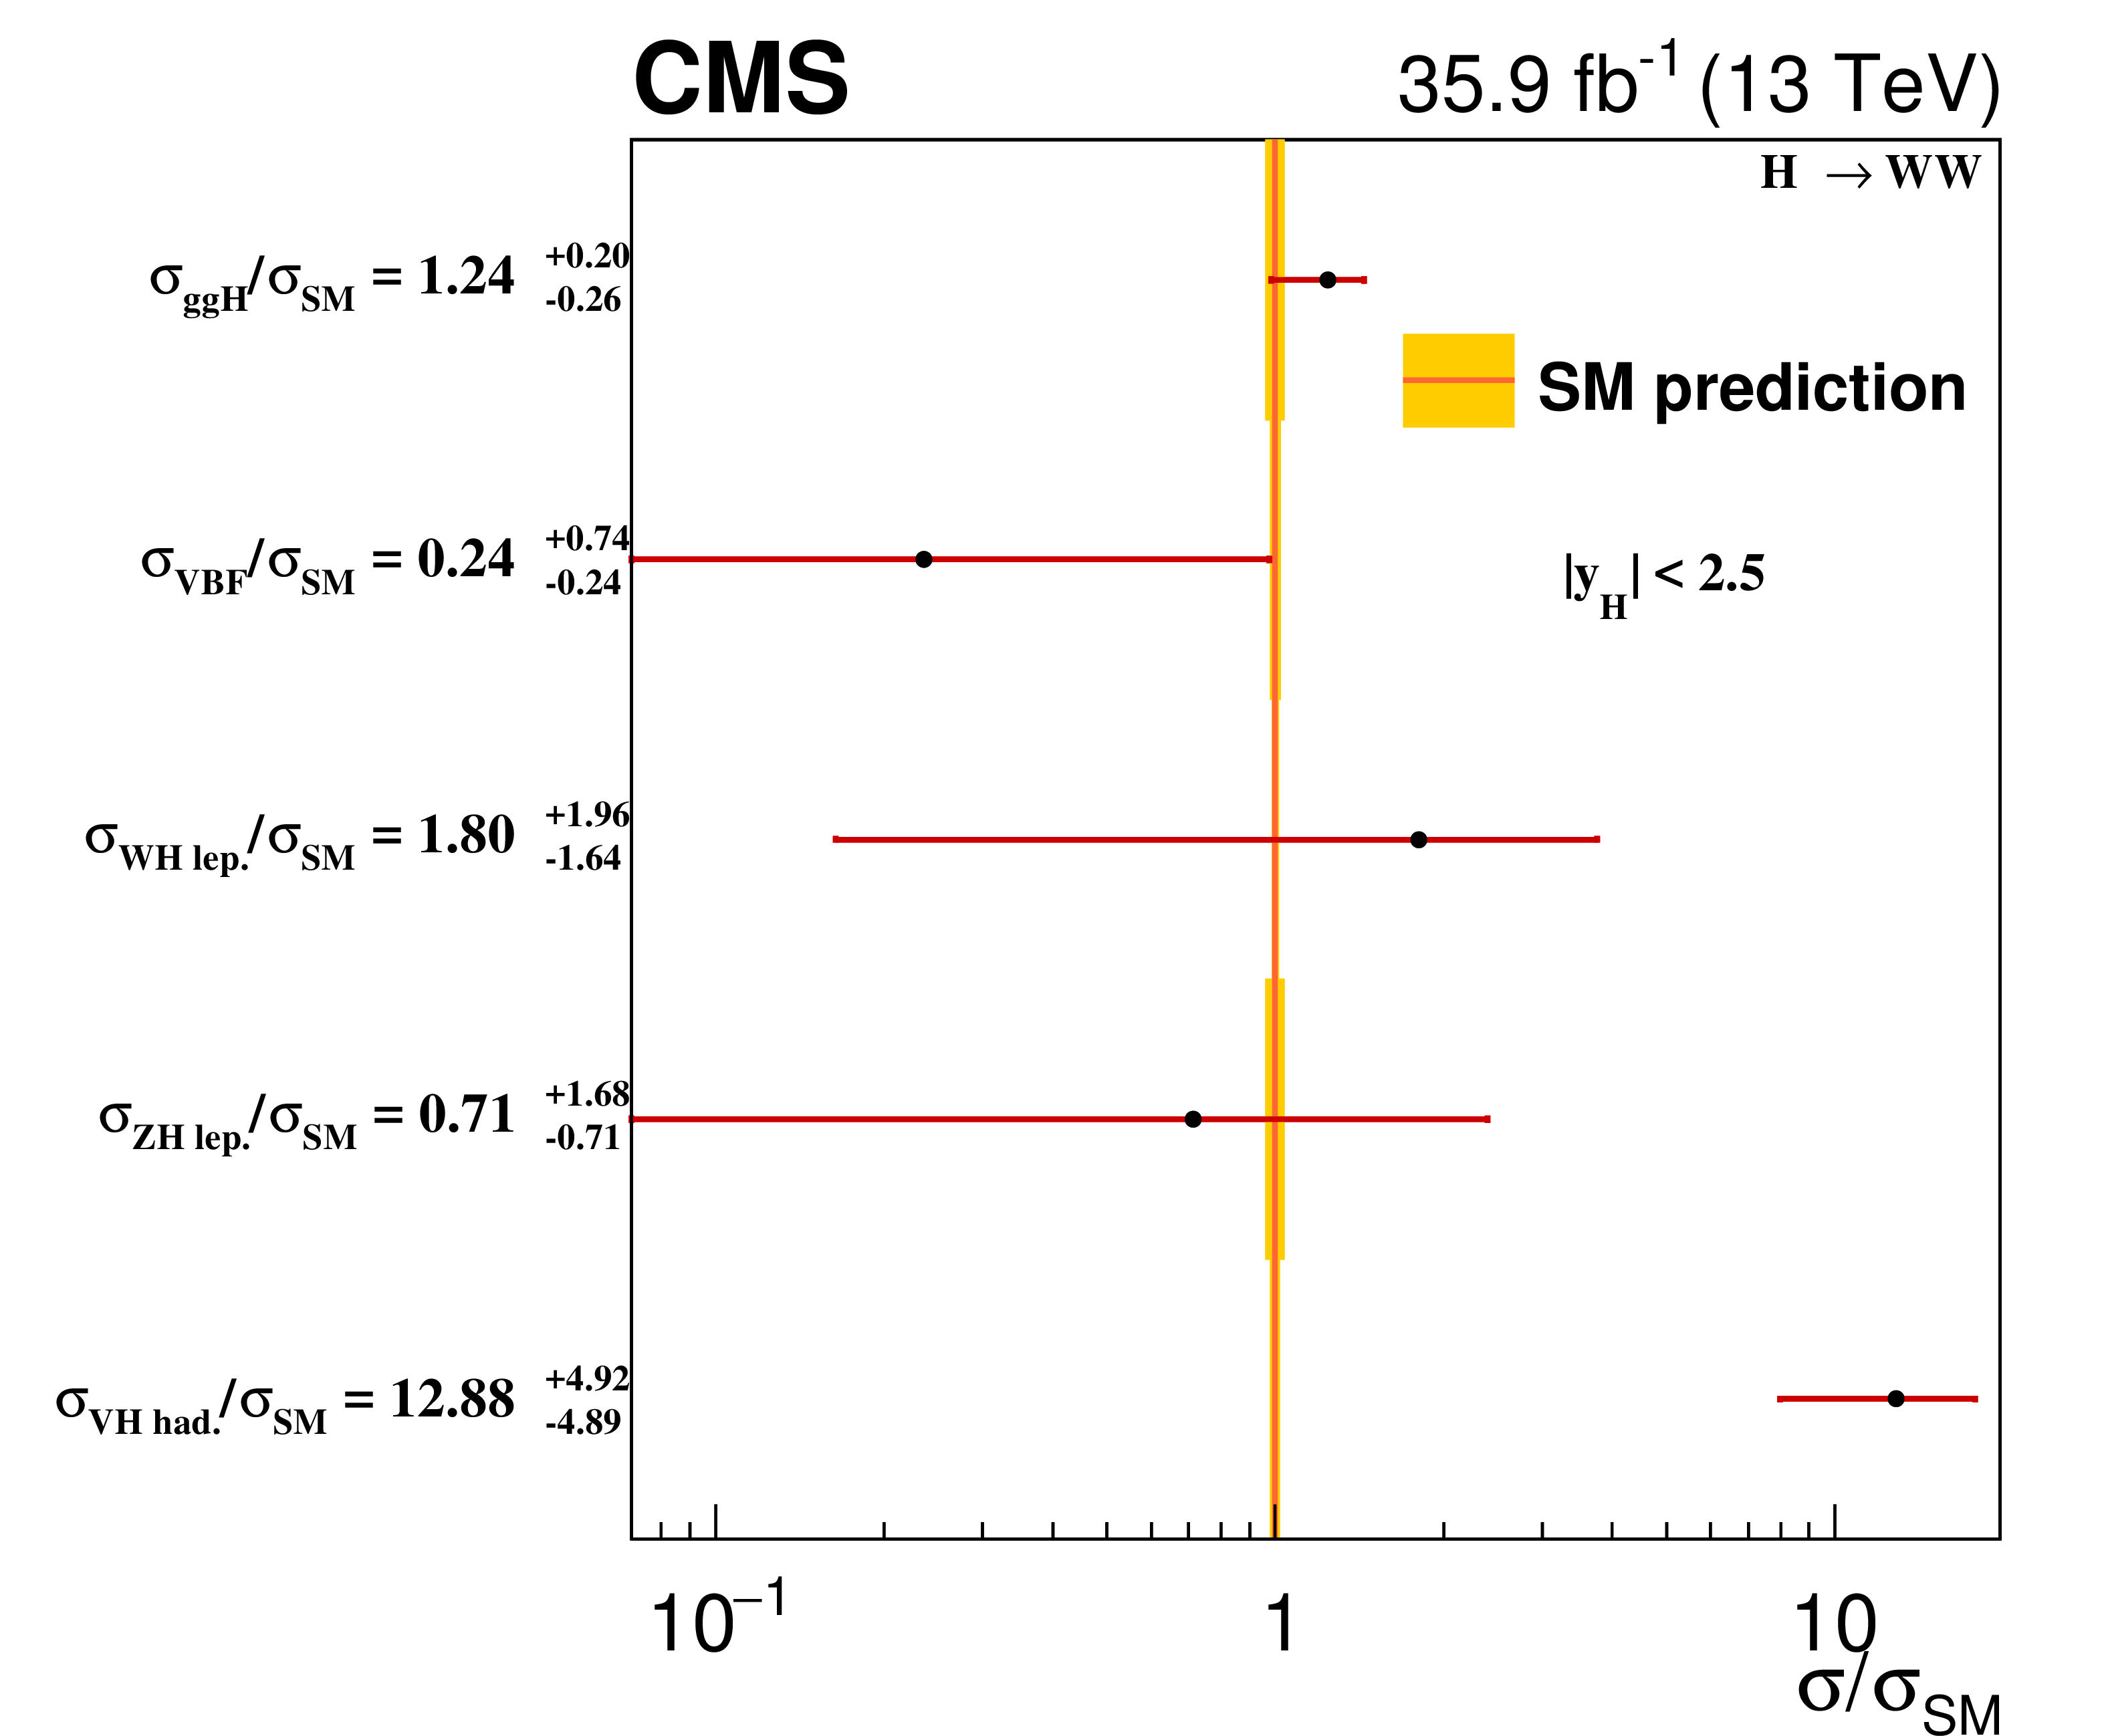
Observed cross sections for the main Higgs boson production modes, normalized to the SM predictions. Cross section ratios are measured in a simplified fiducial phase space defined requiring $y_{{\mathrm {H}}} < 2.5$, as specified in the "stage-0'' simplified template cross section framework. The vertical line and band correspond to the SM prediction and associated theoretical uncertainty. |
png pdf |
Figure 11:
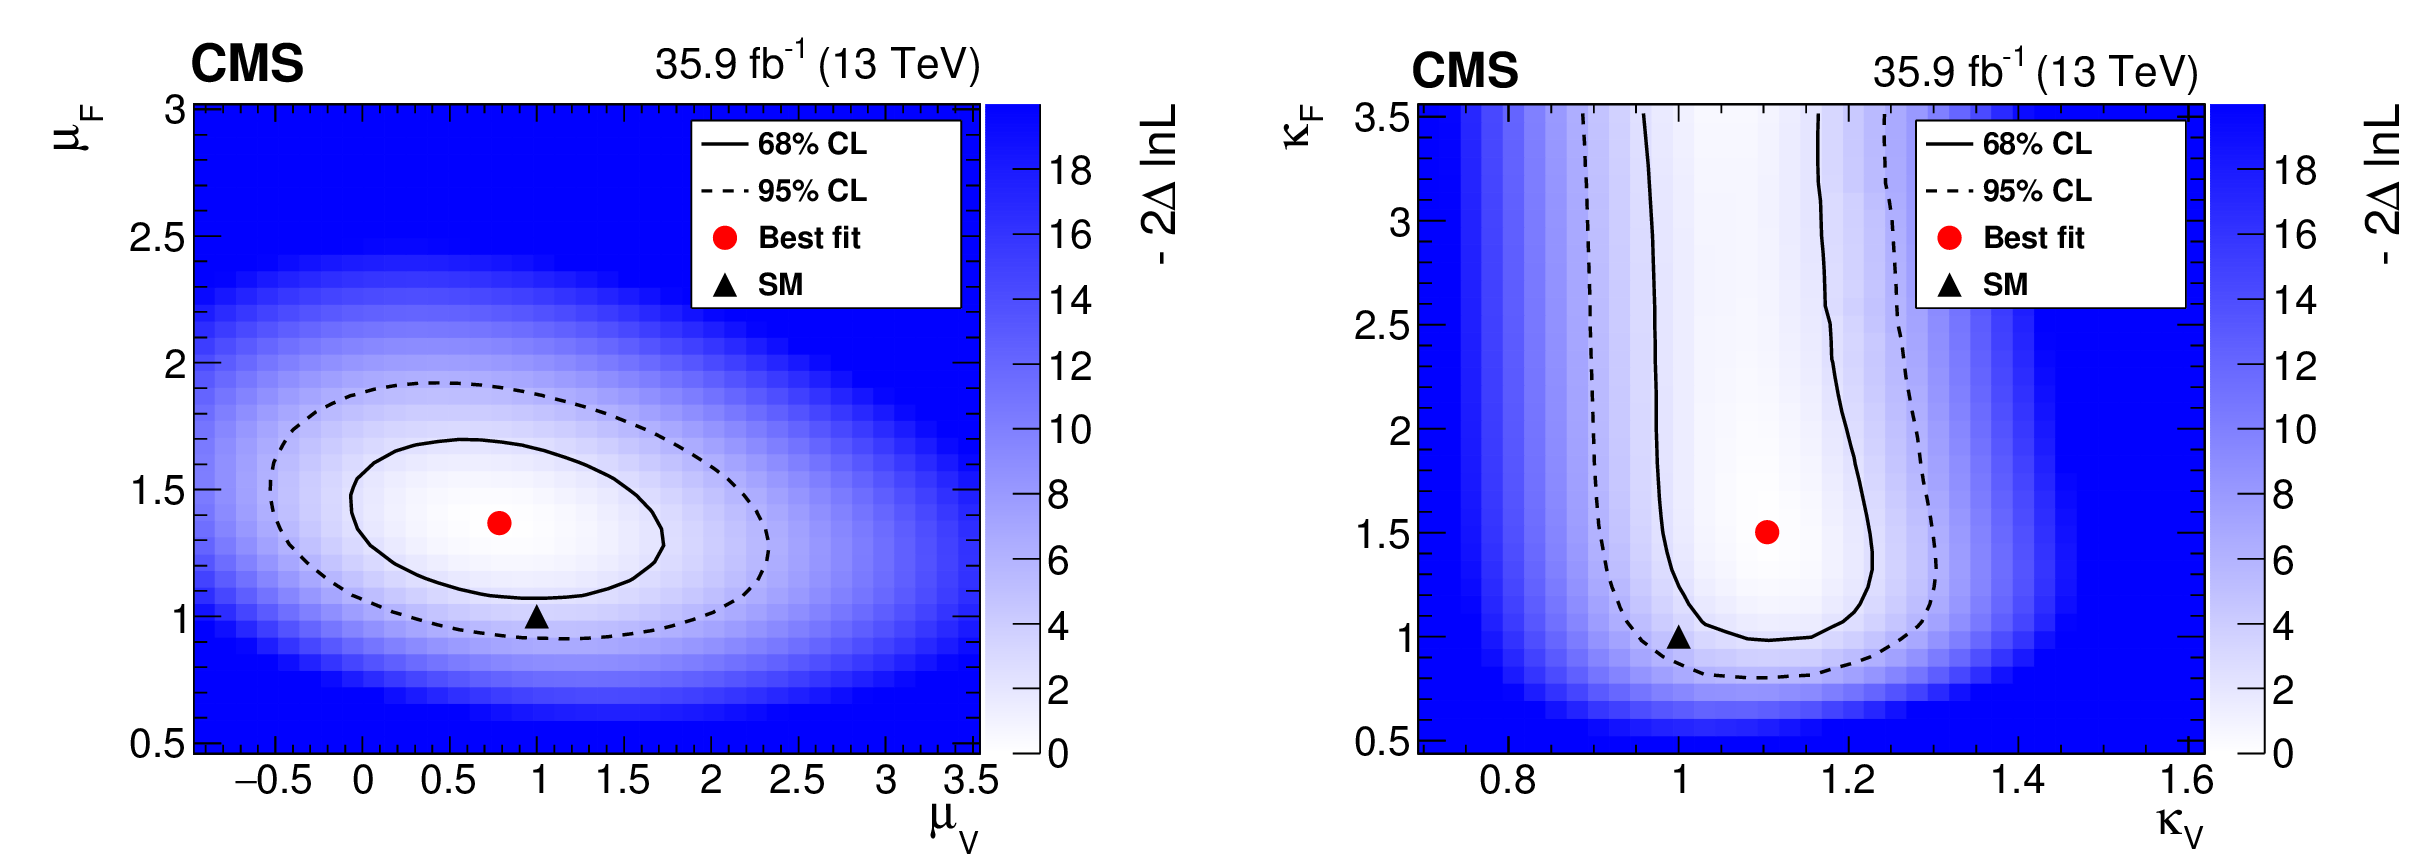
Two-dimensional likelihood profile as a function of (left) the signal strength modifiers associated with either fermion ($\mu {_\mathrm {F}}$) or vector boson ($\mu {_\mathrm {V}}$) couplings, and (right) the coupling modifiers associated with either fermion ($\kappa {_\mathrm {F}}$) or vector boson ($\kappa {_\mathrm {V}}$) vertices, using the $\kappa $-framework parametrization. The 68% and 95% {\text {CL}} contours are shown as continuous and dashed lines, respectively. The red circle represents the best fit value, while the black triangle corresponds to the SM prediction. |

png pdf |
Figure 11-a:
Two-dimensional likelihood profile as a function of the signal strength modifiers associated with either fermion ($\mu {_\mathrm {F}}$) or vector boson ($\mu {_\mathrm {V}}$) couplings. The 68% and 95% {\text {CL}} contours are shown as continuous and dashed lines, respectively. The red circle represents the best fit value, while the black triangle corresponds to the SM prediction. |
png pdf |
Figure 11-b:
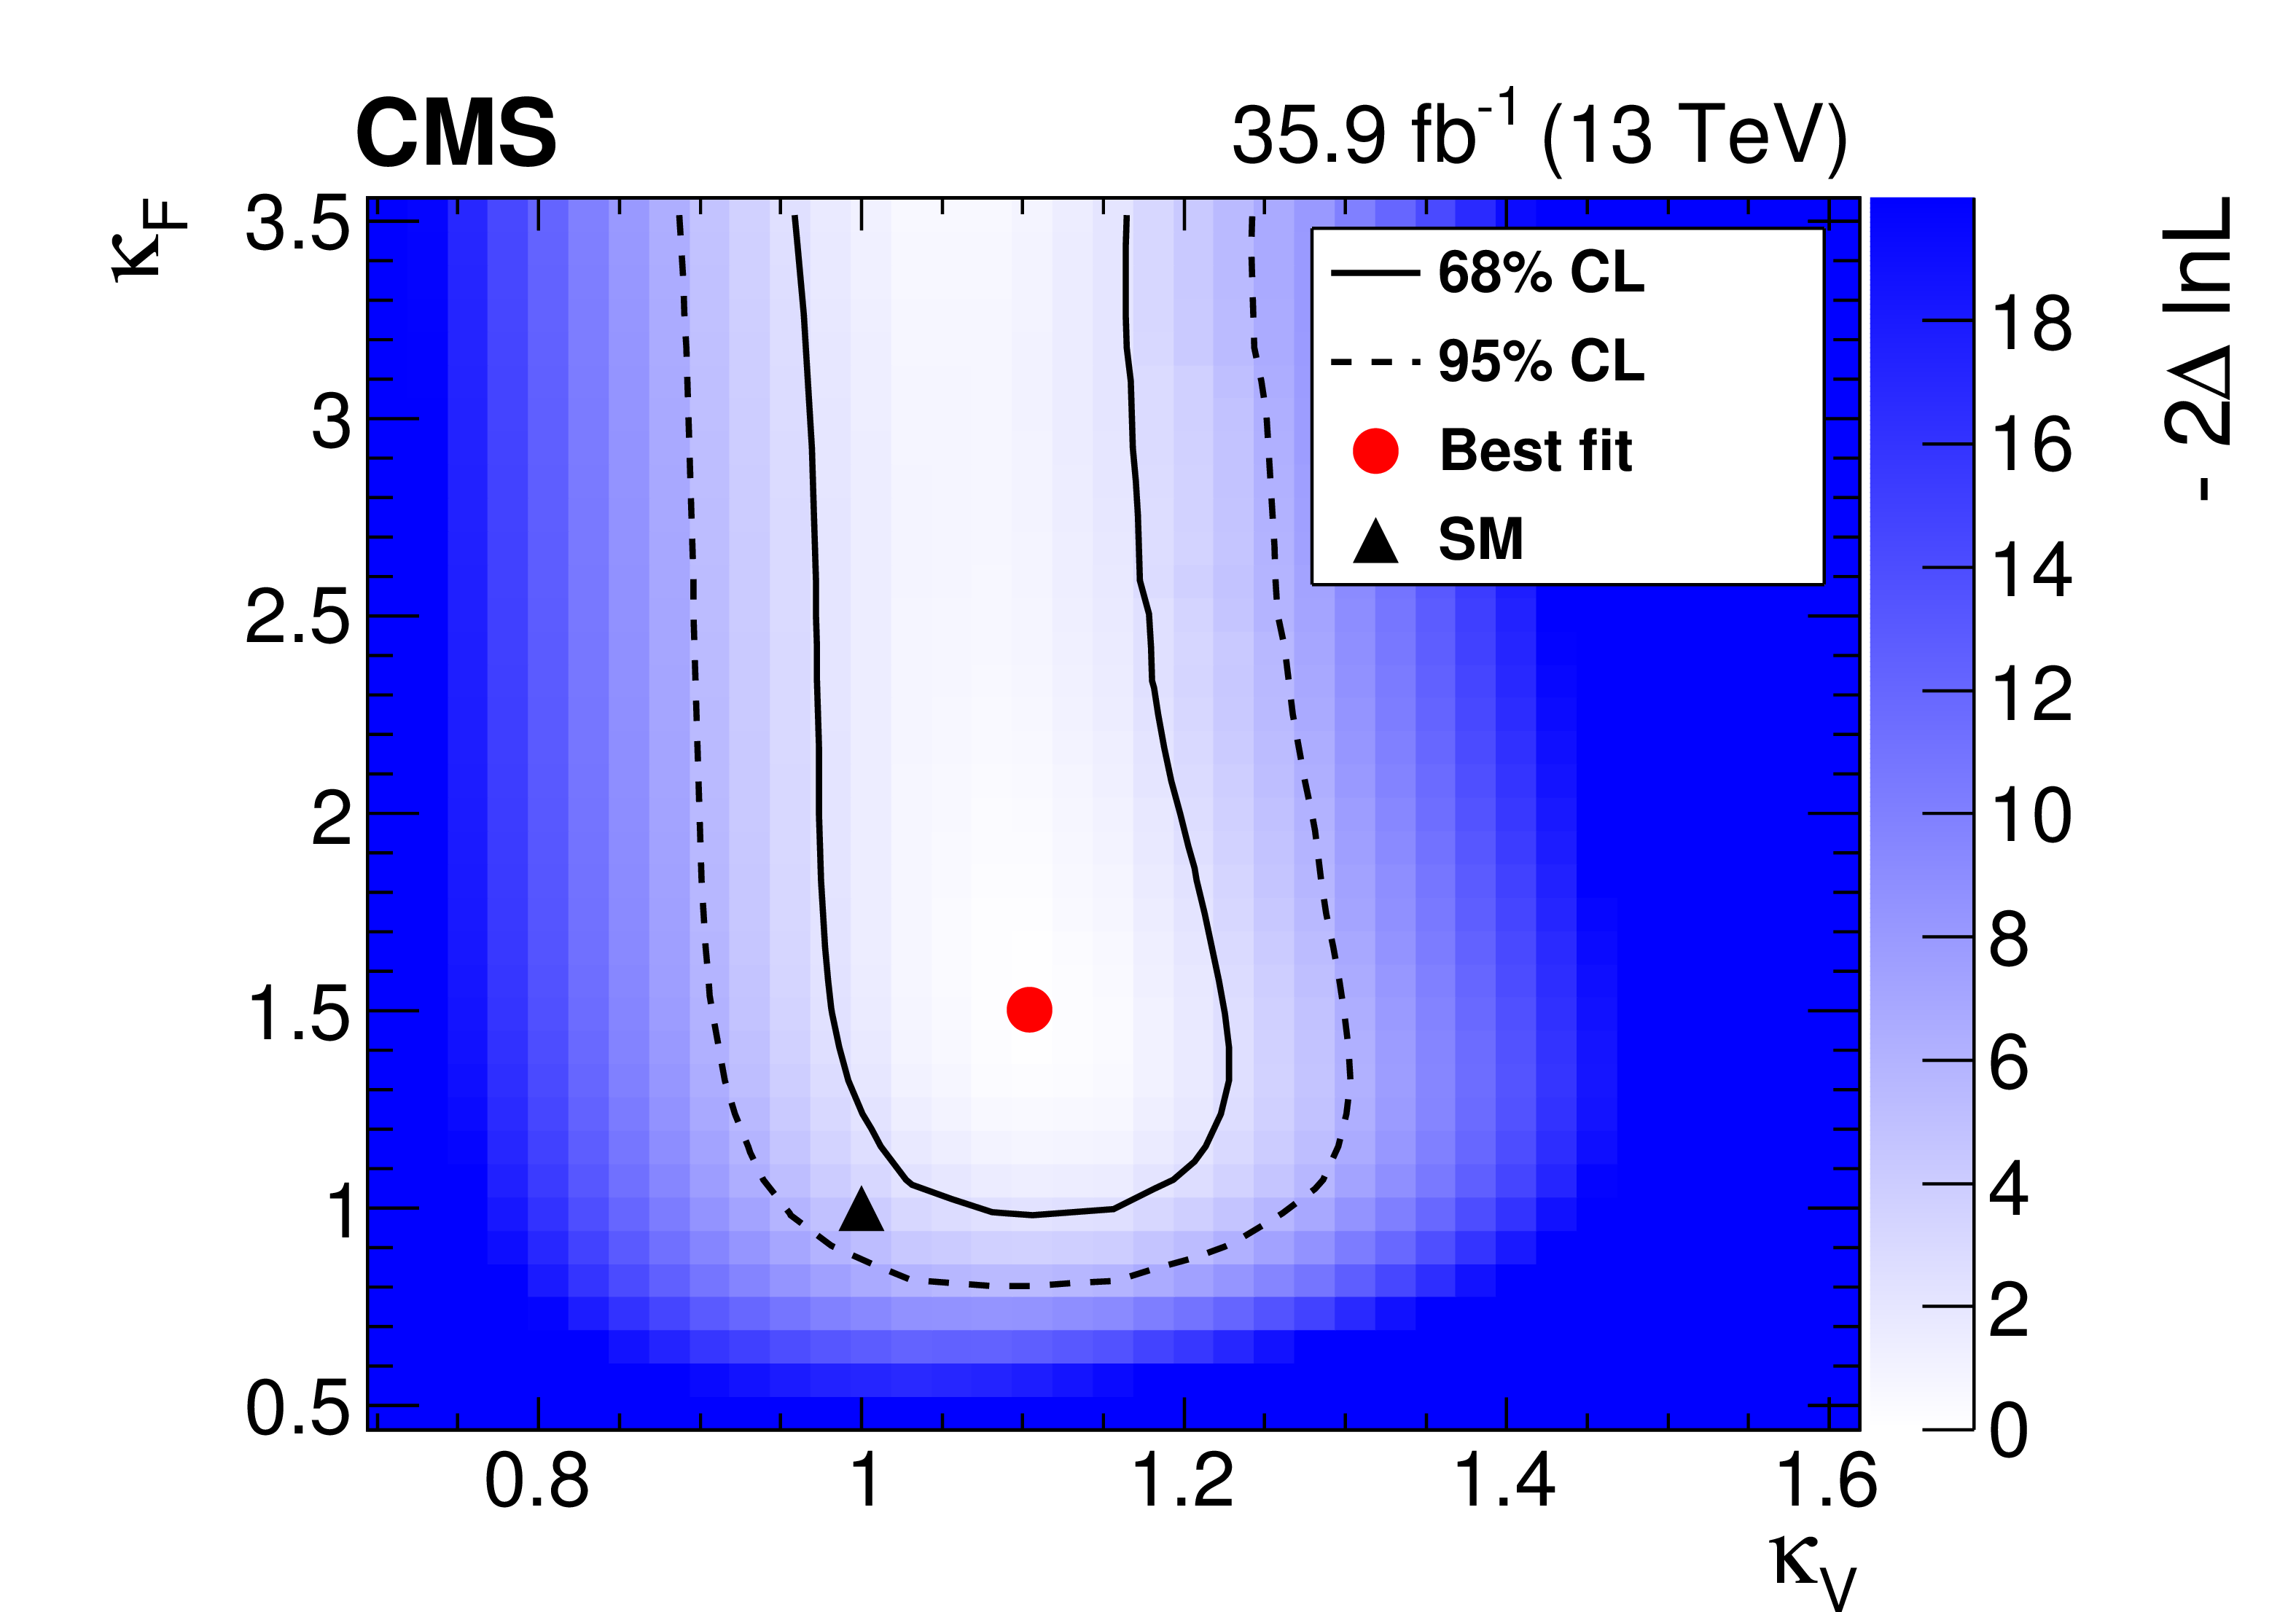
Two-dimensional likelihood profile as a function of the coupling modifiers associated with either fermion ($\kappa {_\mathrm {F}}$) or vector boson ($\kappa {_\mathrm {V}}$) vertices, using the $\kappa $-framework parametrization. |
| Tables | |
png pdf |
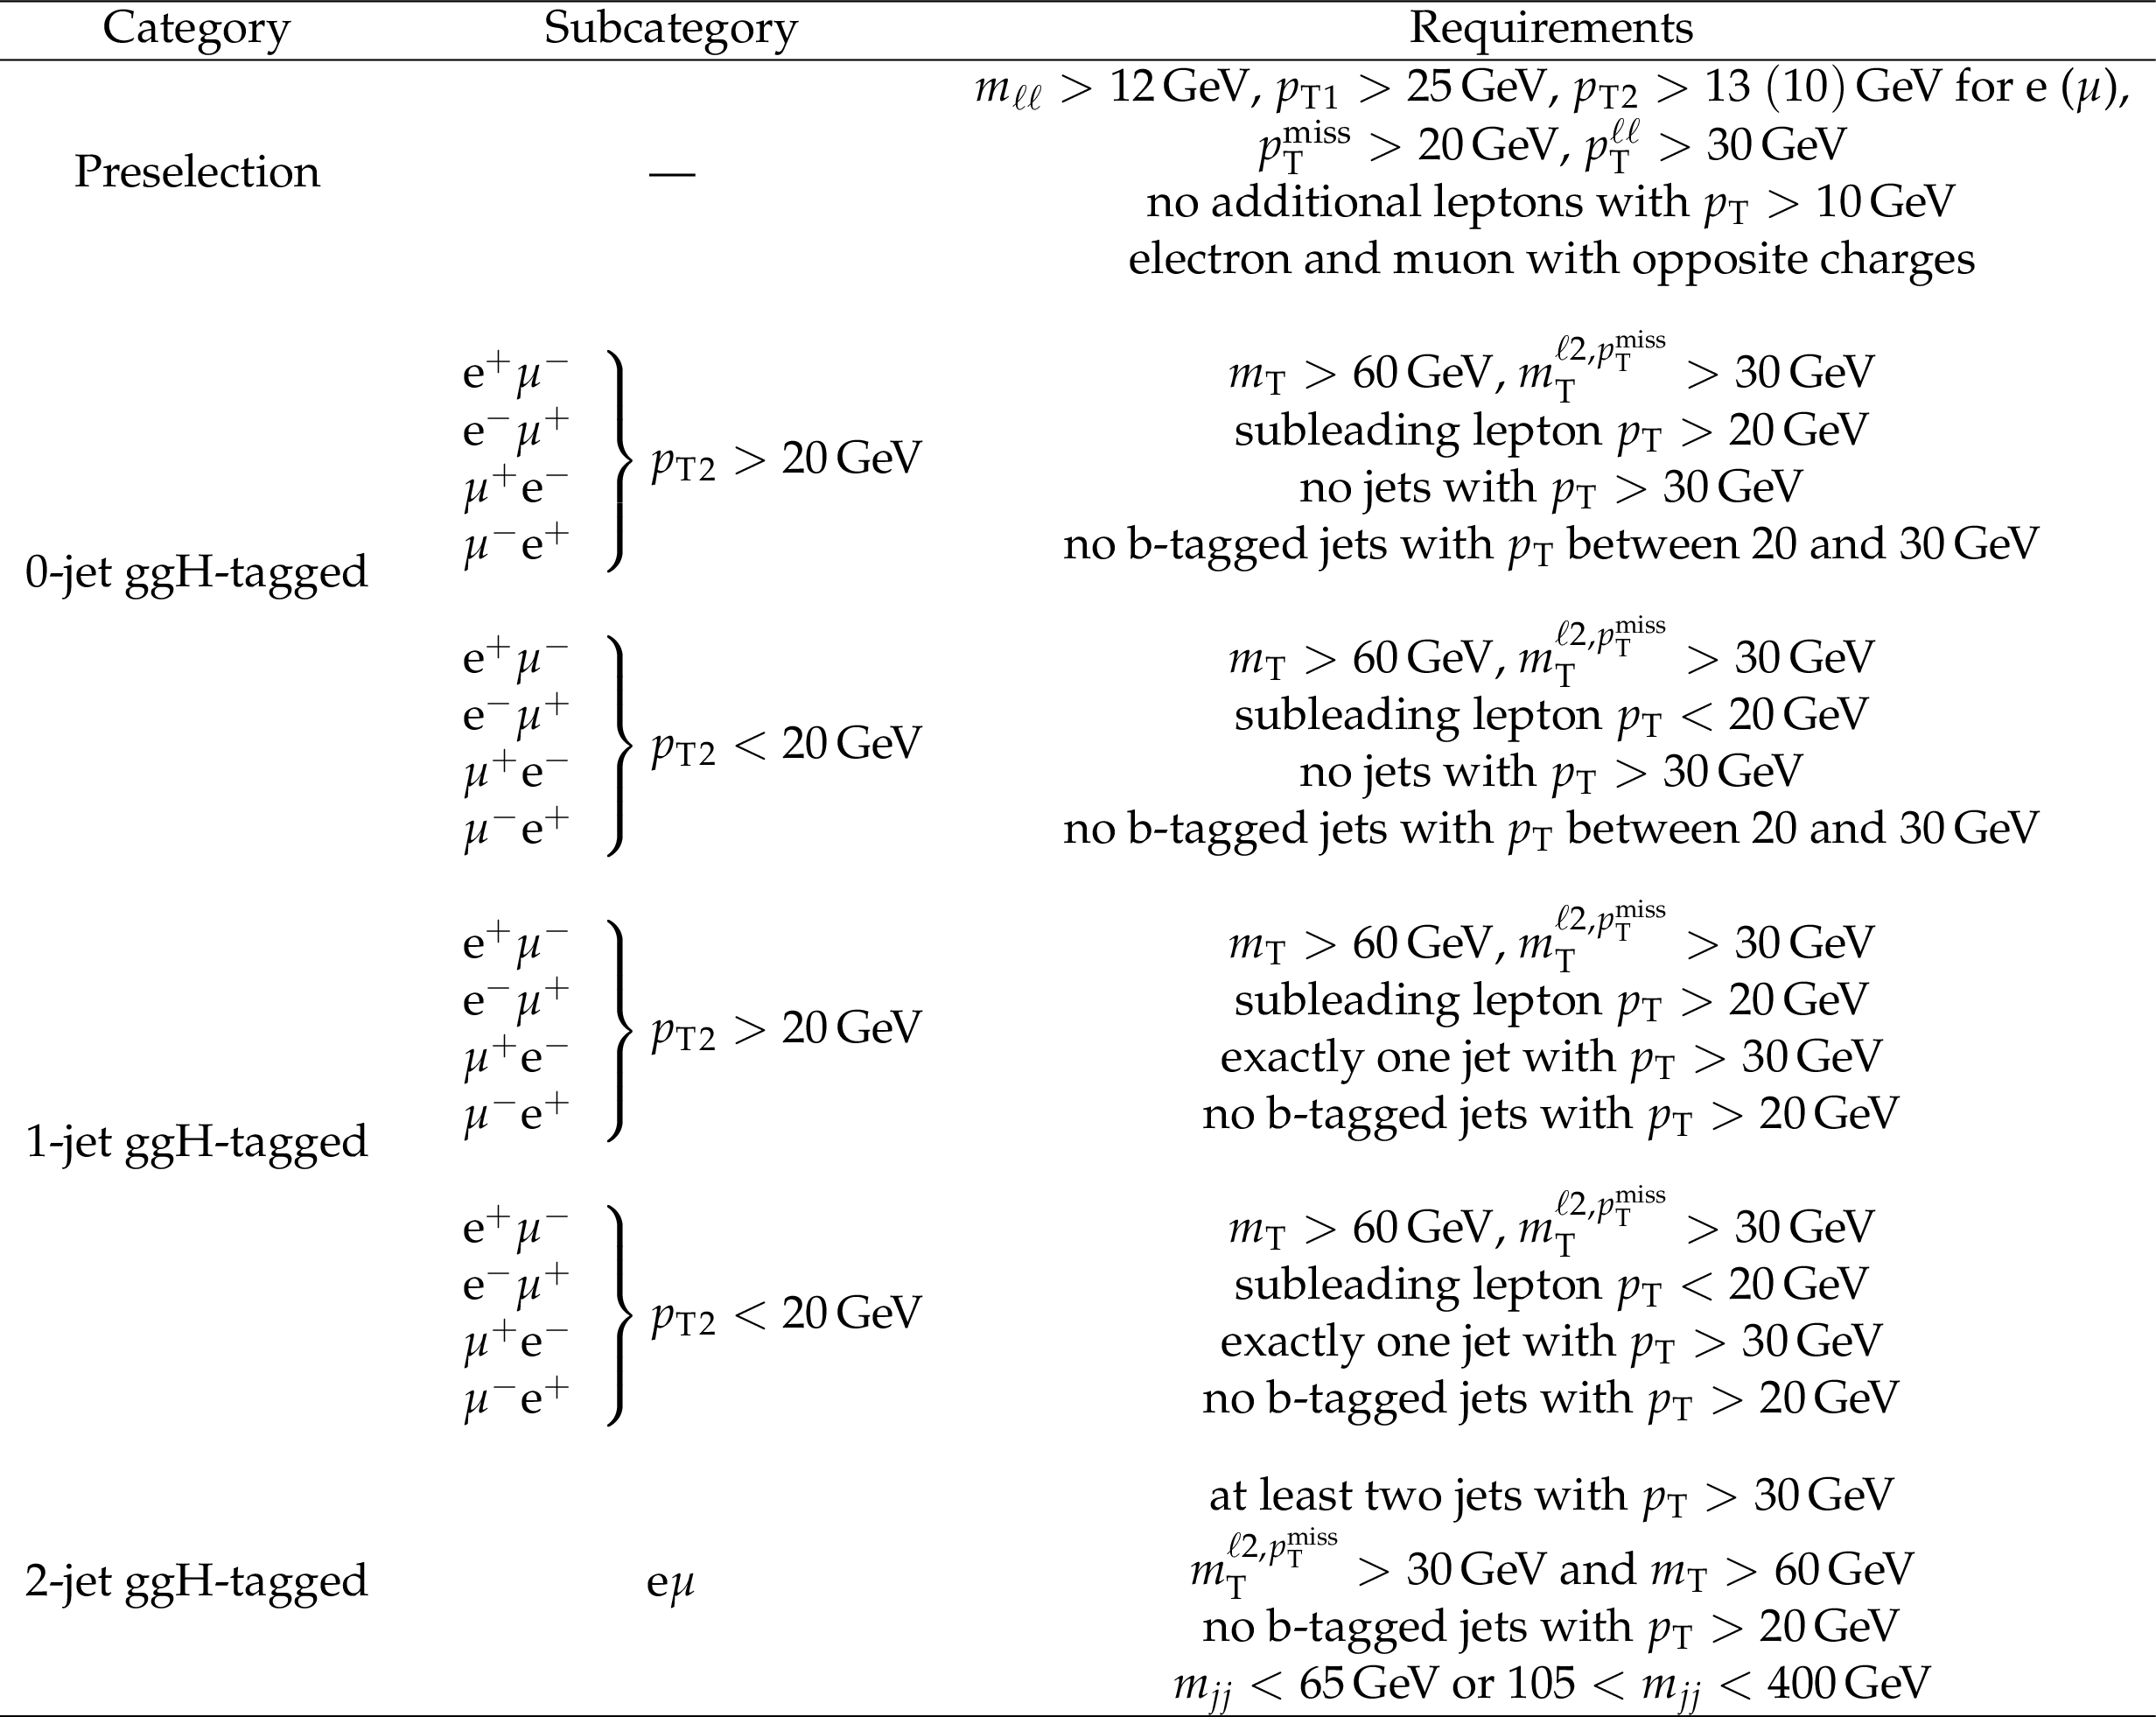
Table 1:
Analysis categorization and event requirements for the 0-, 1-, and 2-jet ggH-tagged categories in the DF dilepton final state. The phase spaces defined by the 0-, 1-, and 2-jet ggH-tagged requirements correspond to the events shown in Figs. 1, 2, and 3, respectively. |
png pdf |
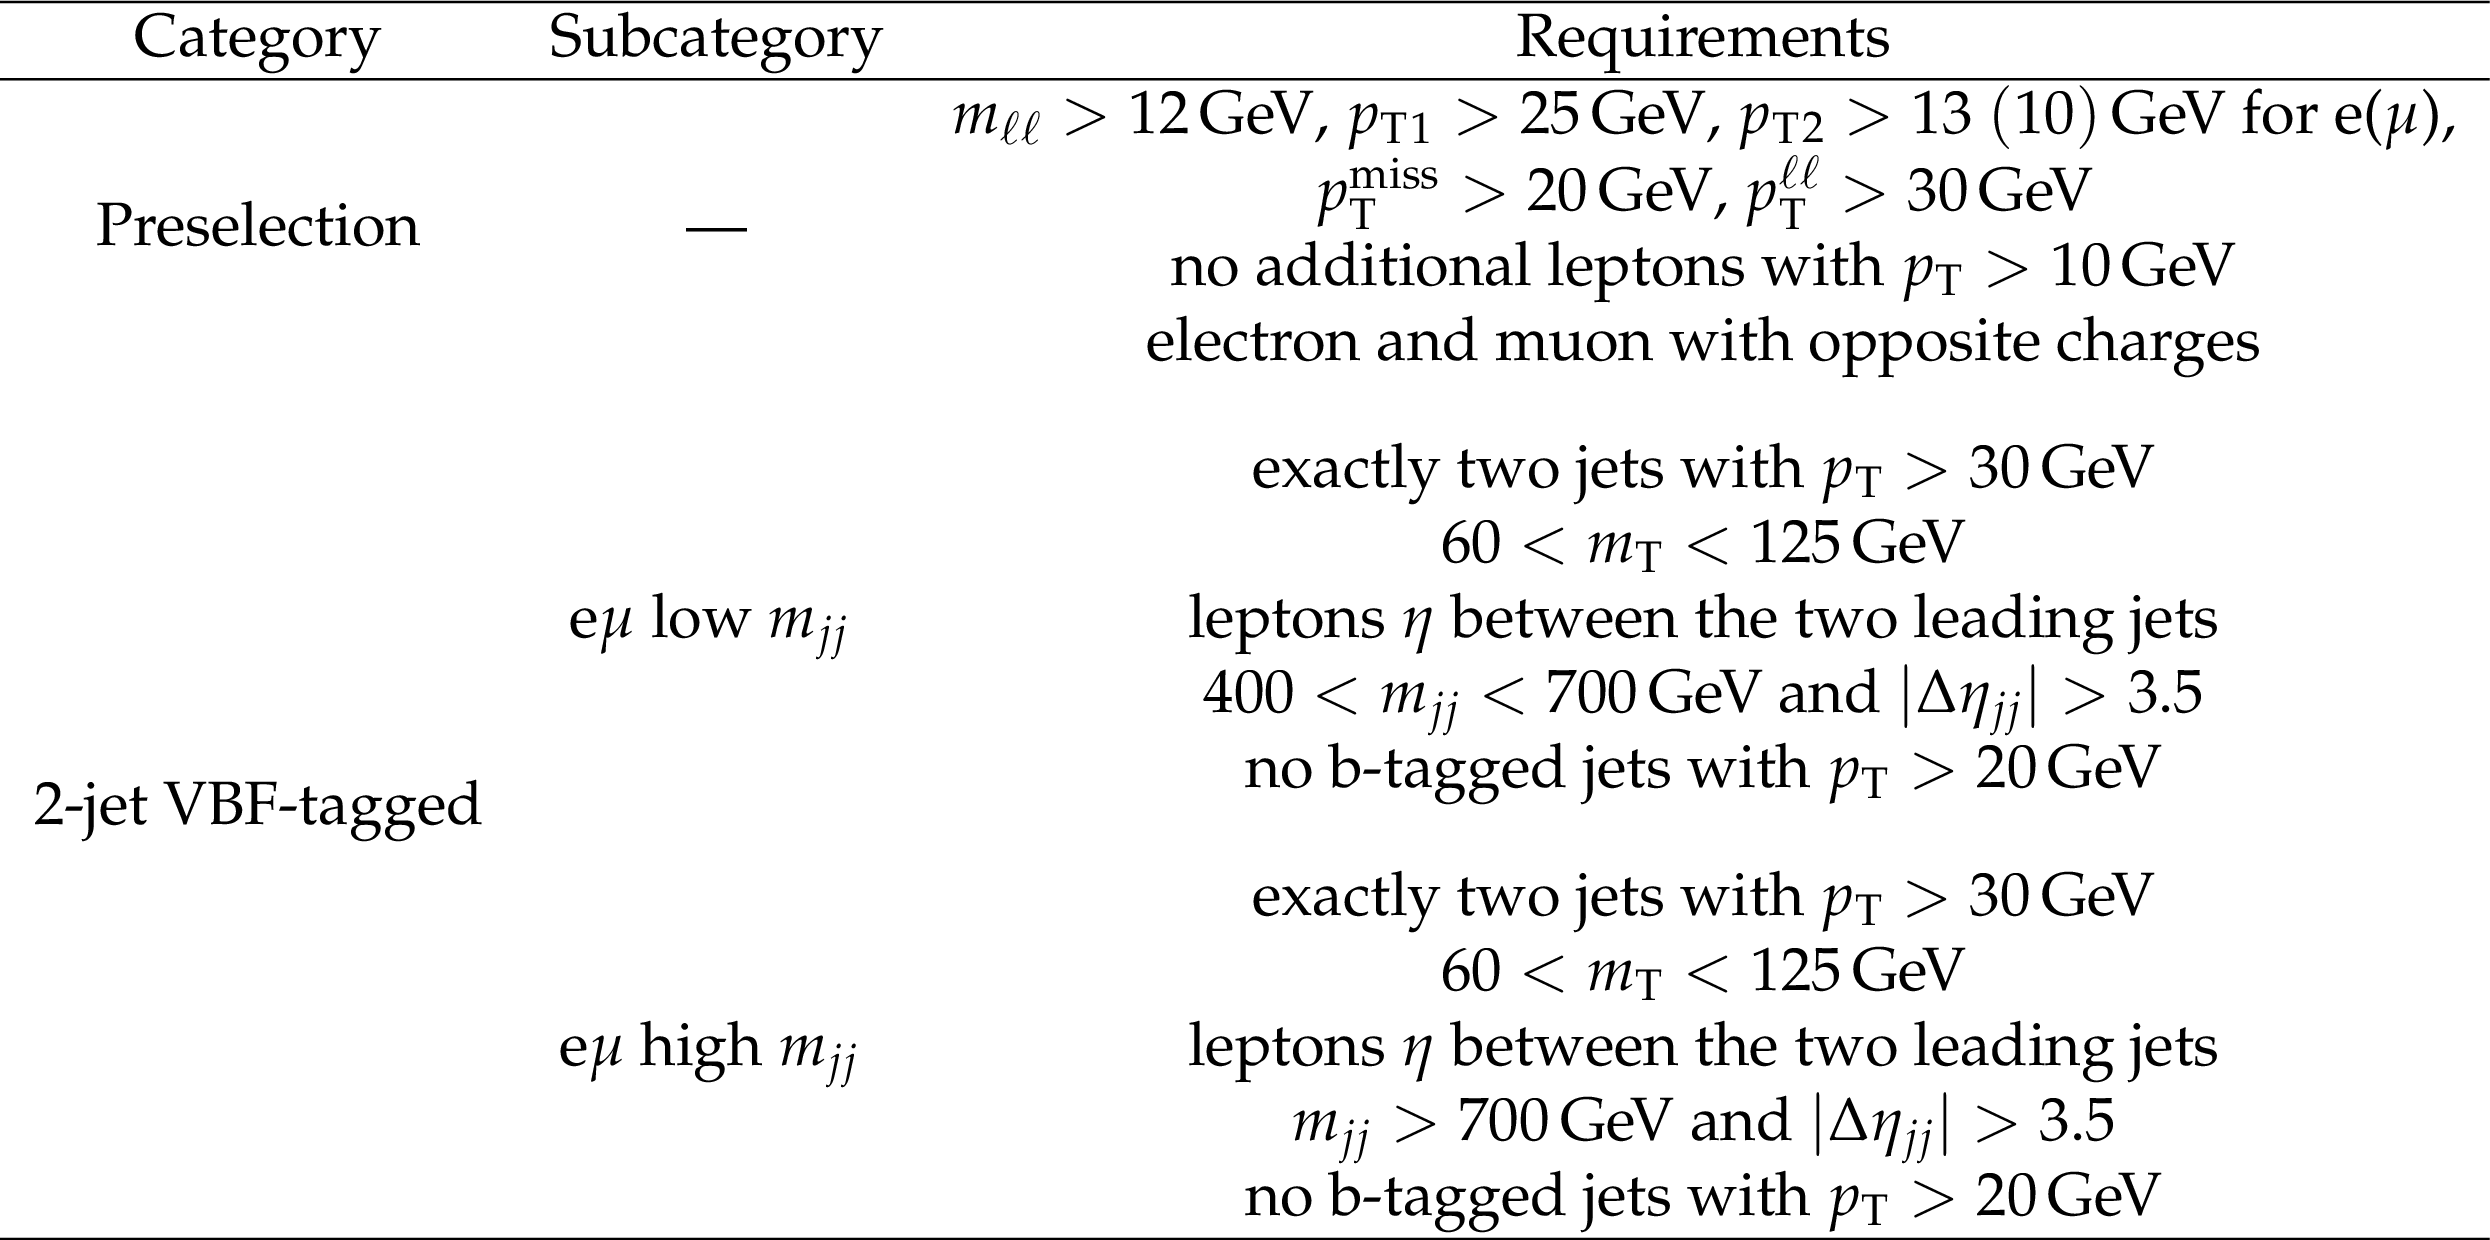
Table 2:
Analysis categorization and event requirements for the 2-jet VBF-tagged category, in the DF dilepton final state. The phase spaces defined by the 2-jet VBF-tagged requirements correspond to the events shown in Fig. 4. |
png pdf |
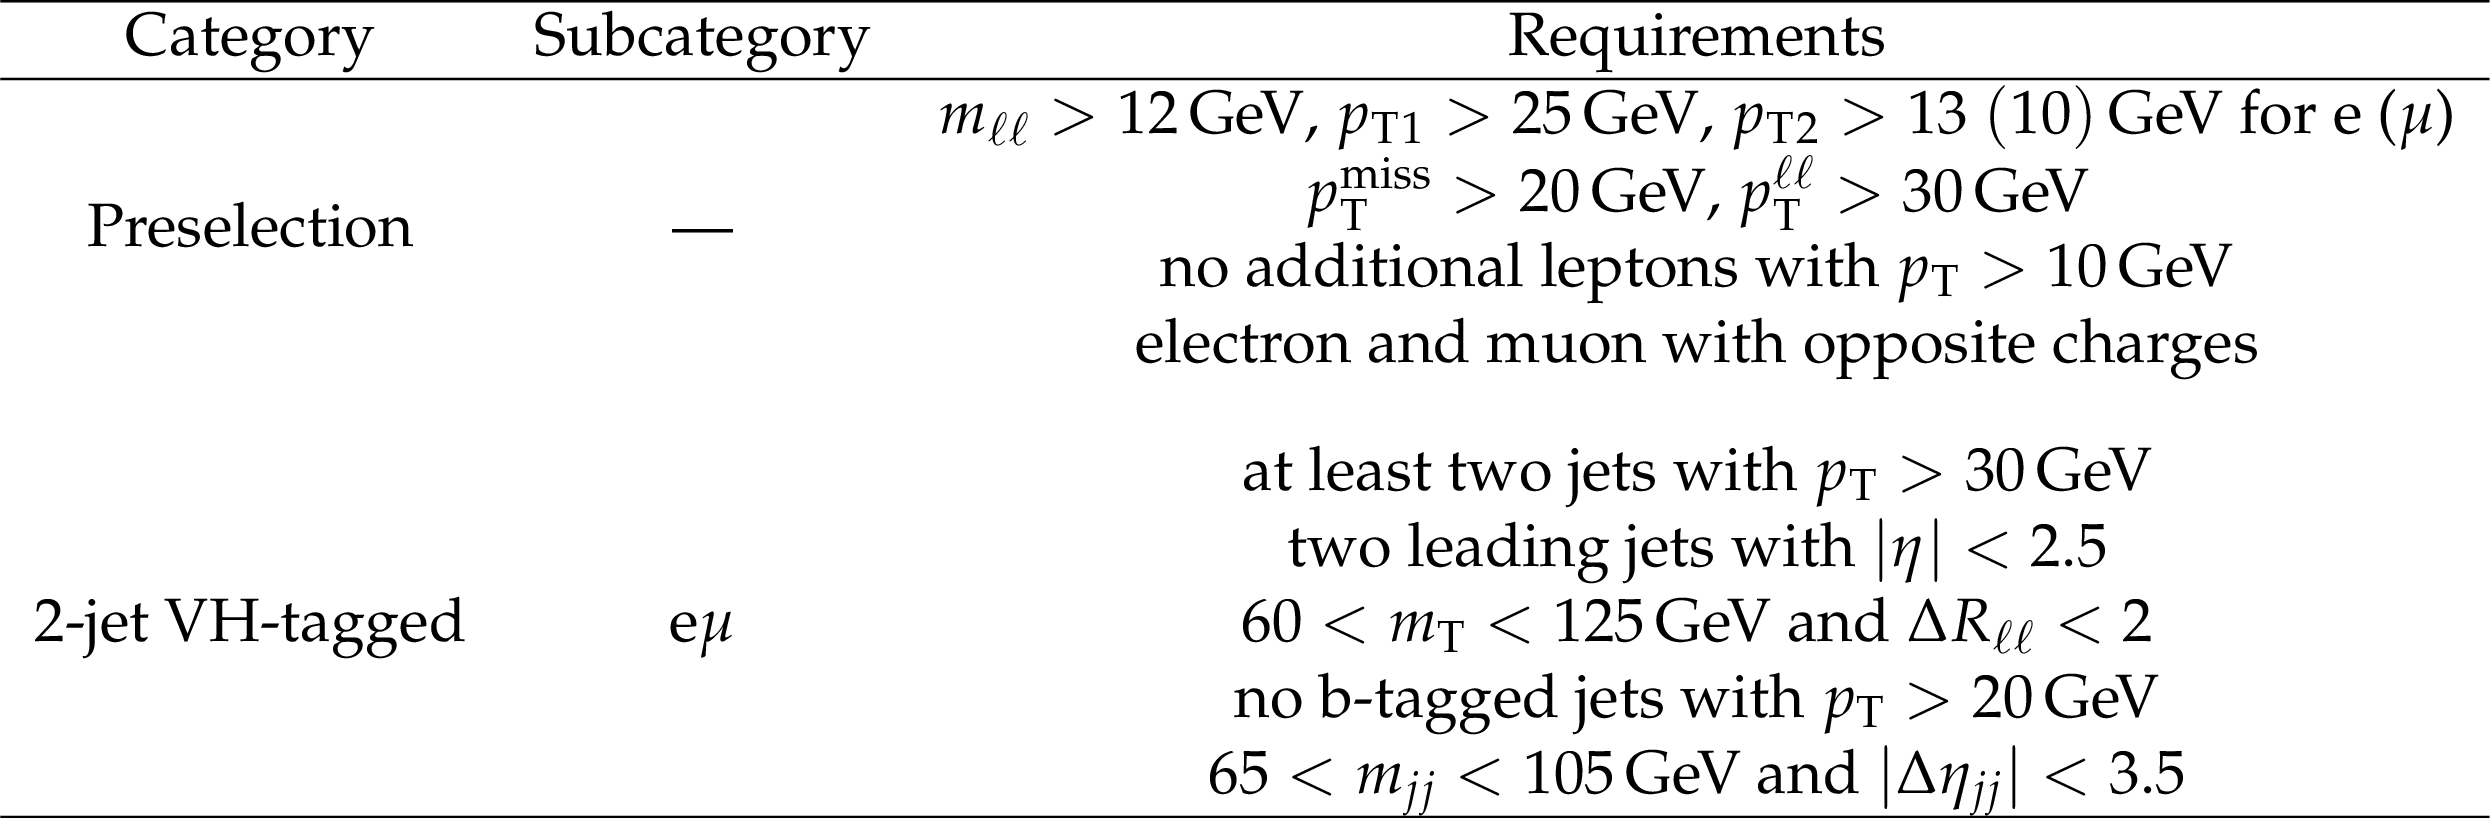
Table 3:
Analysis categorization and event requirements for the 2-jet VH-tagged category, in the DF dilepton final state. The phase space defined by the 2-jet VH-tagged requirements corresponds to the events shown in Fig. 5. |
png pdf |
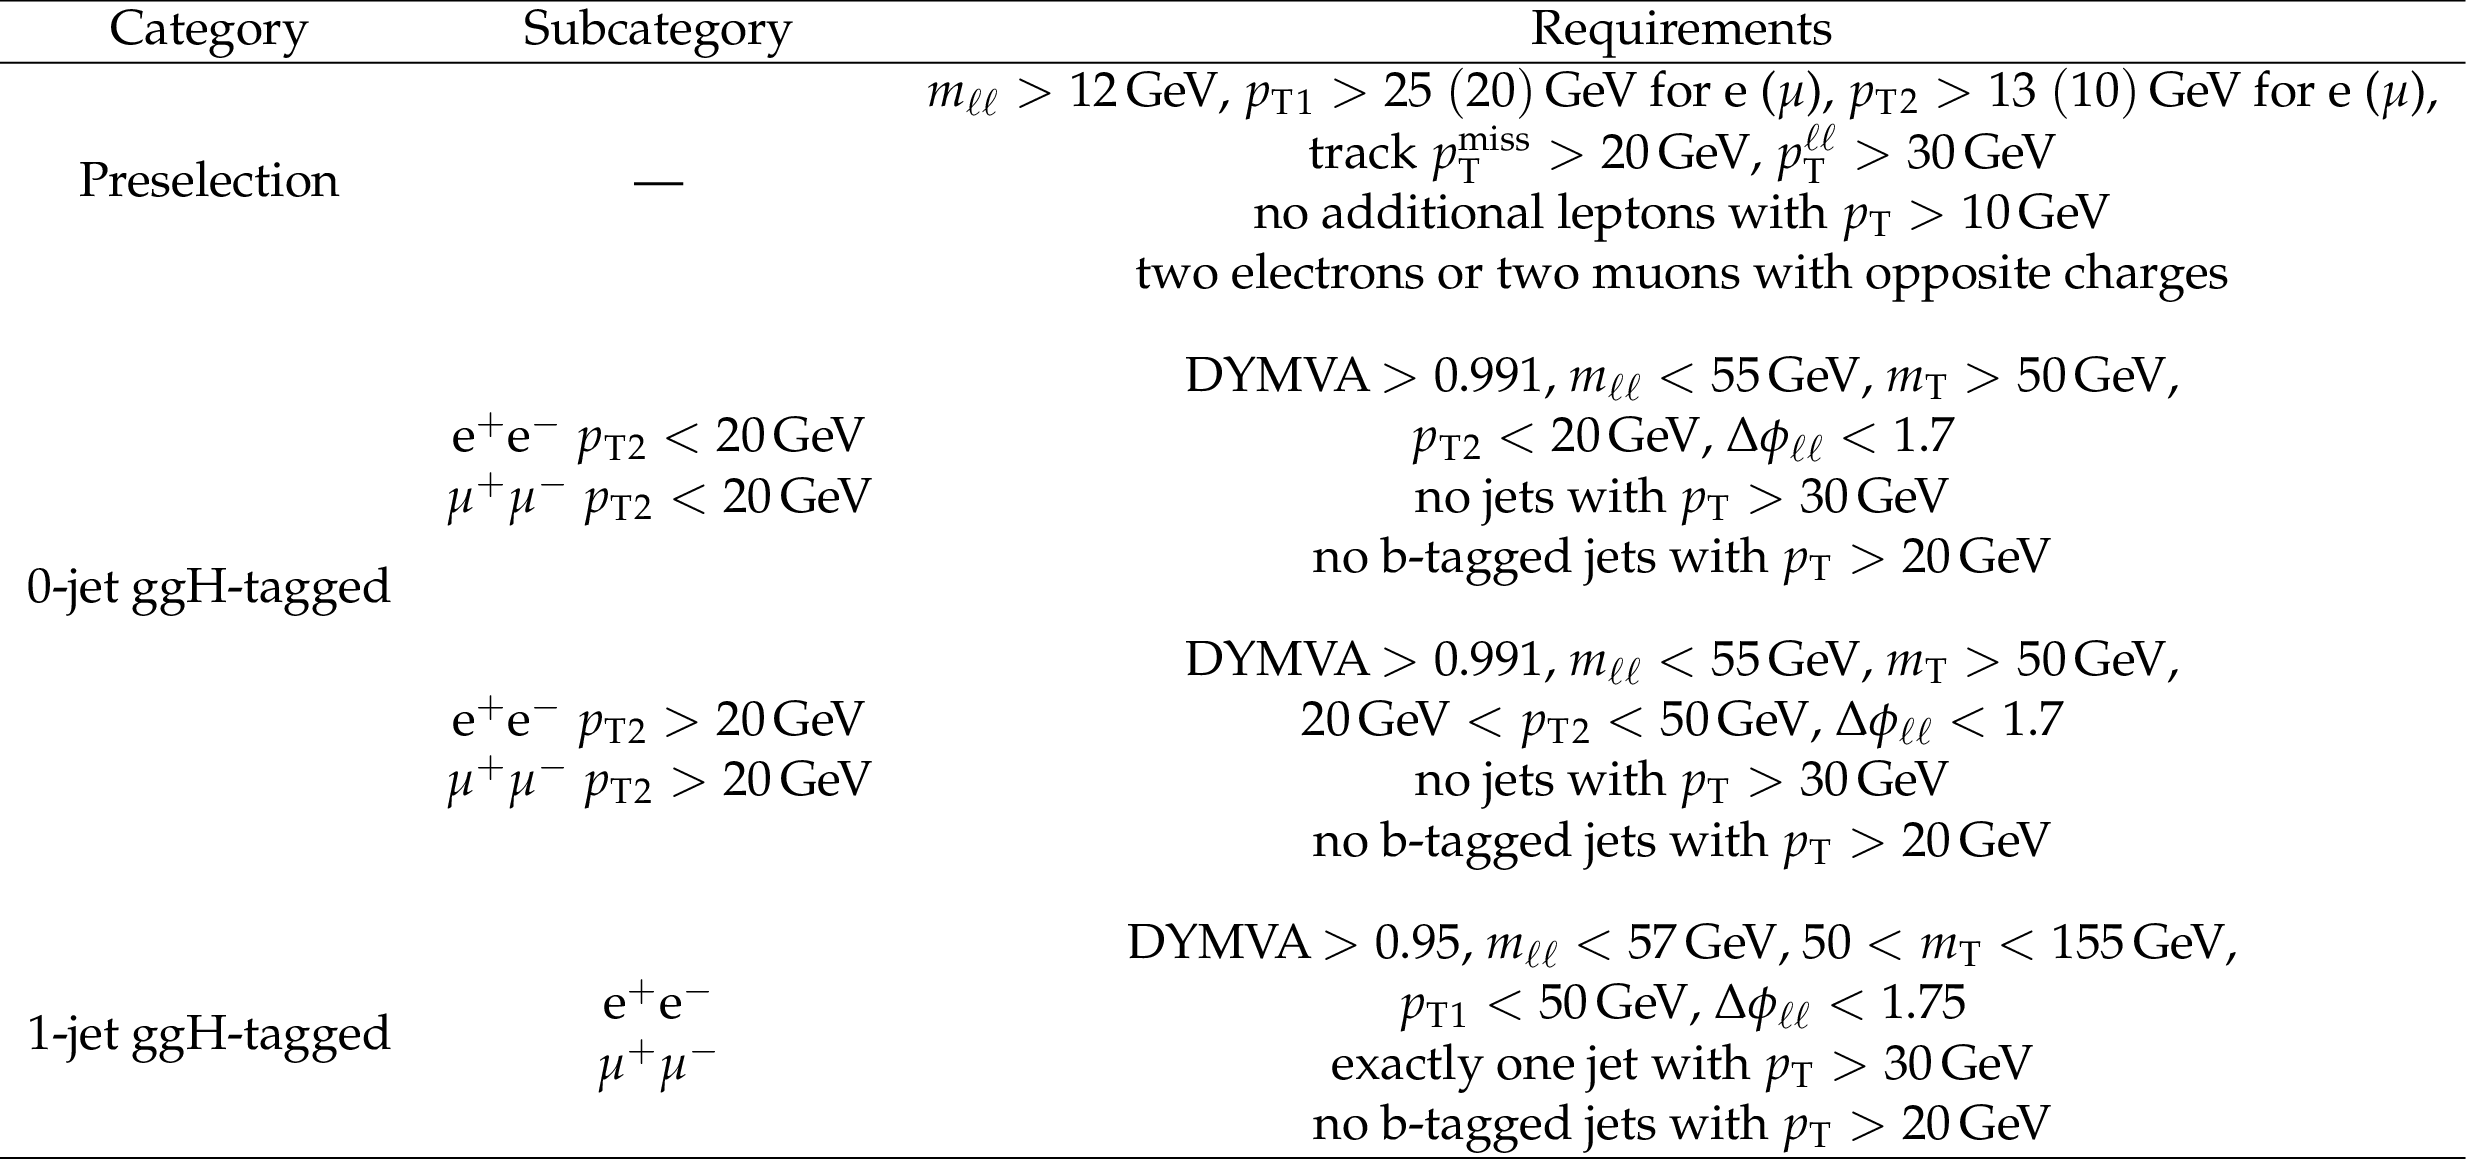
Table 4:
Analysis categorization and selections for the 0- and 1- jet ggH-tagged categories in the SF dilepton final state. |
png pdf |
Table 5:
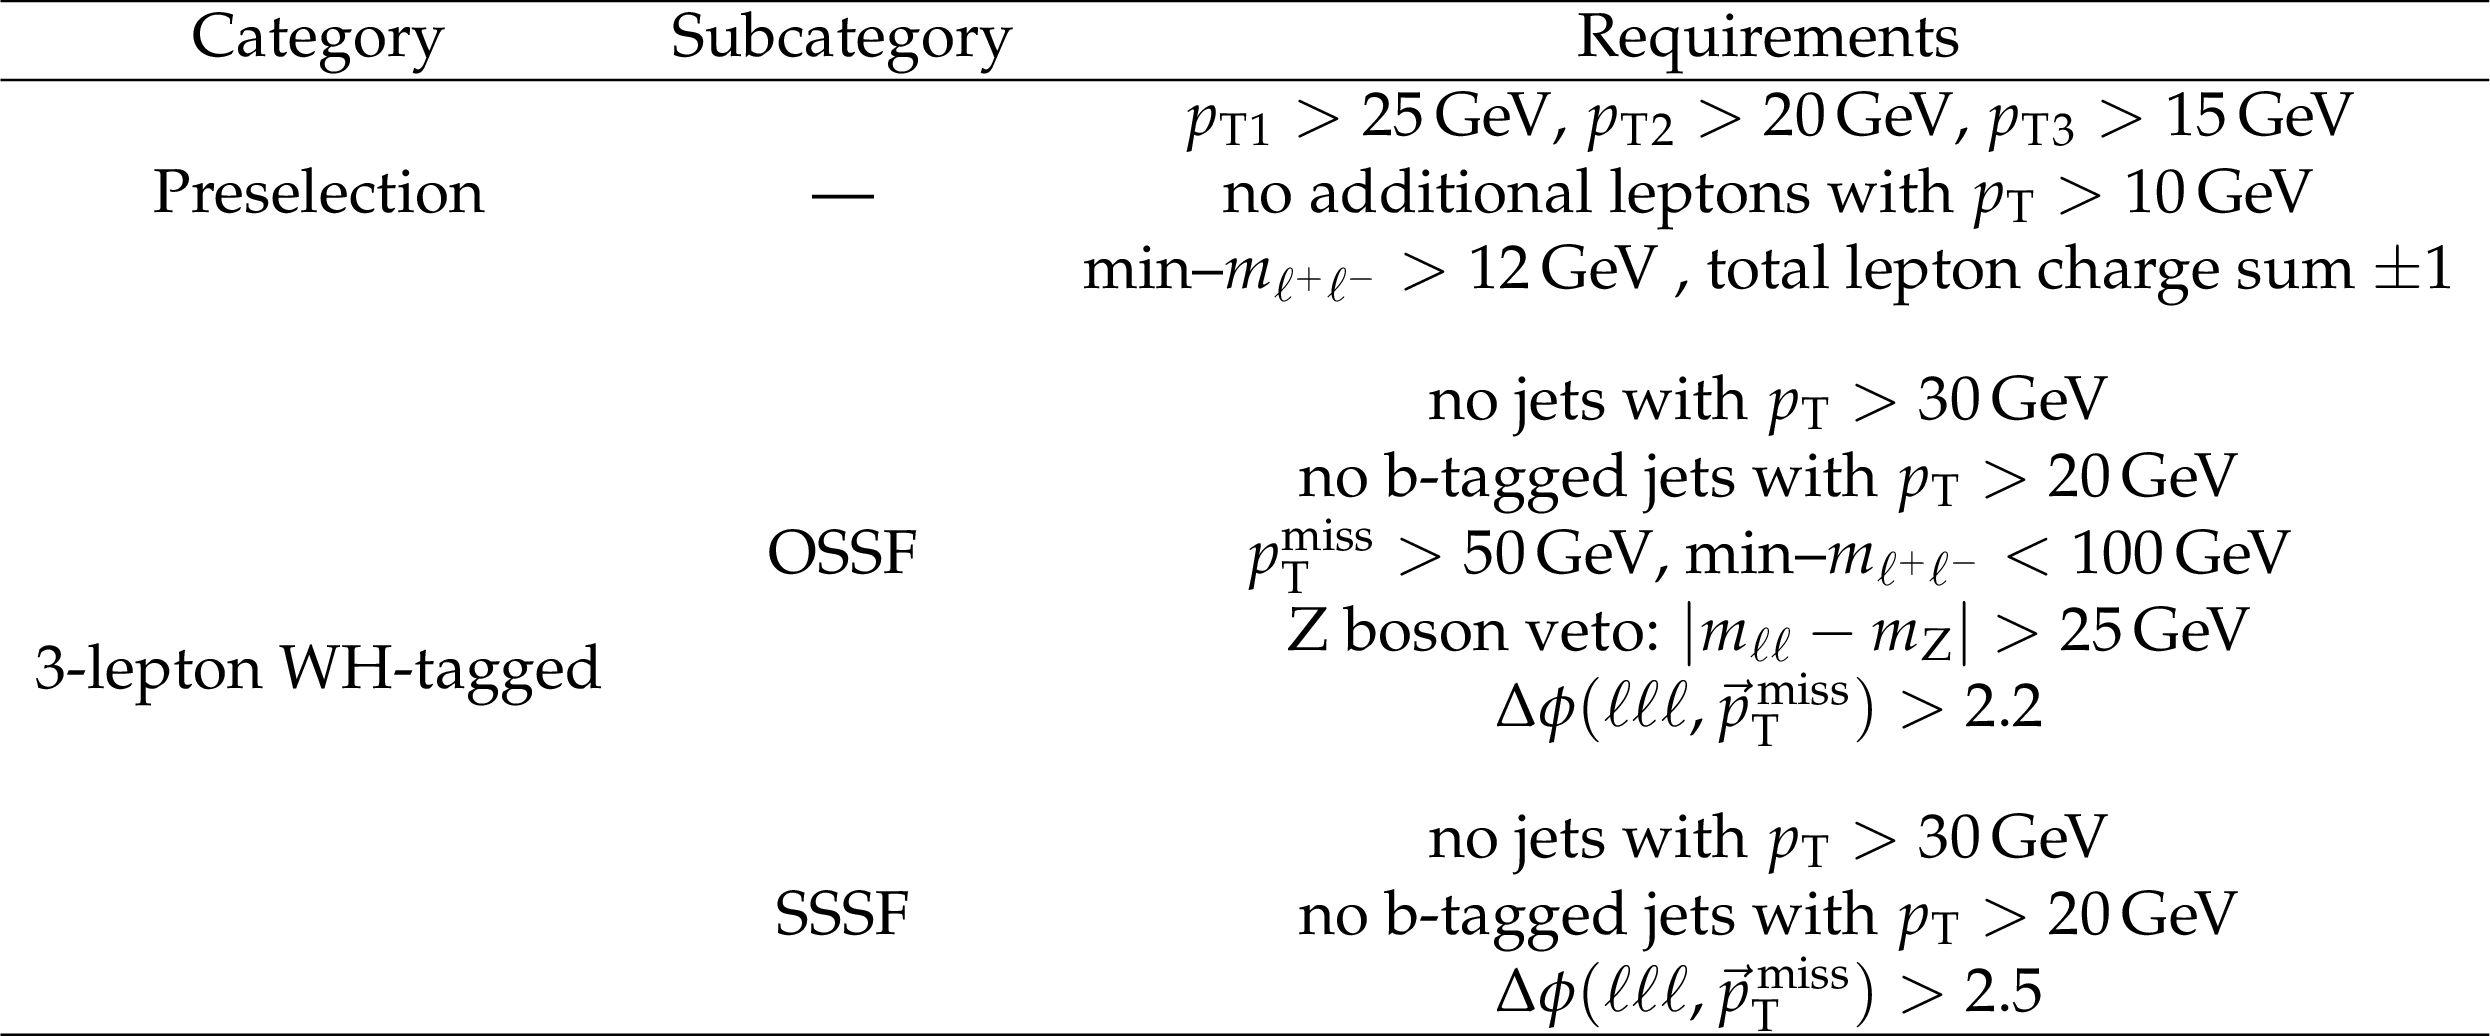
Analysis categorization and event requirements for the WH-tagged category, in the three-lepton final state. Here, $ {\text {min-}m_{\ell ^+\ell ^-}} $ is the minimum $ {m_{\ell \ell}} $ between the oppositely charged leptons. For the Z boson veto, the pair with the $ {m_{\ell \ell}} $ closest to the Z boson mass is considered. Events that fulfill the three-lepton WH-tagged requirements correspond to the signal phase space shown in Fig. 6. |
png pdf |
Table 6:
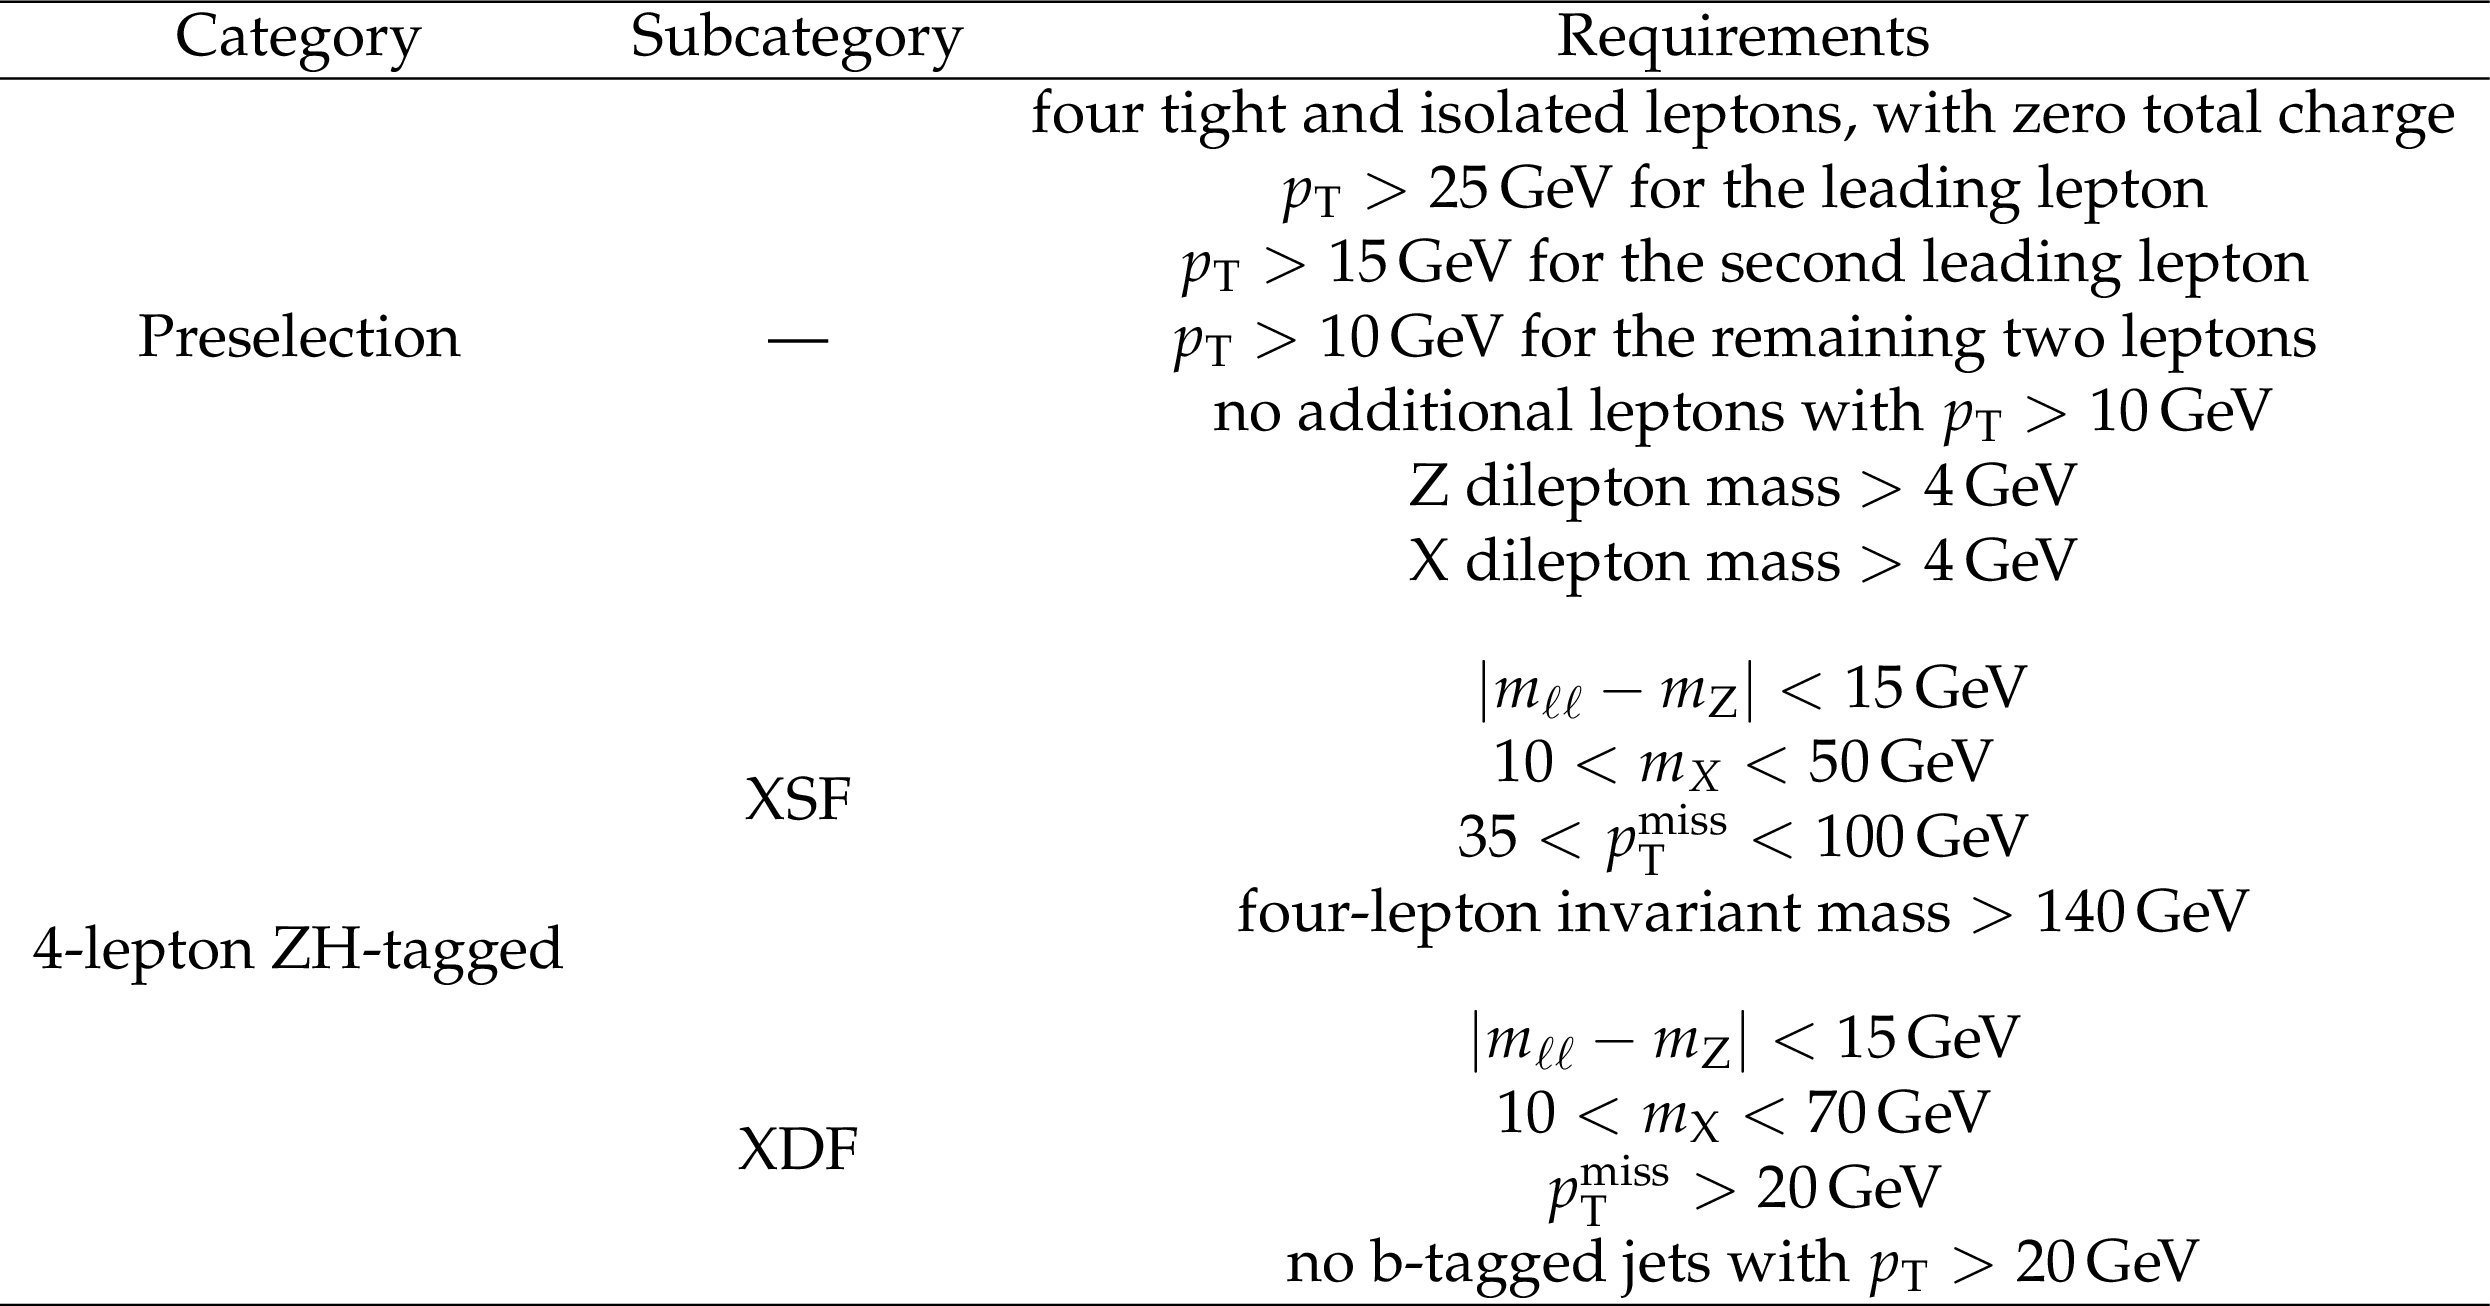
Analysis categorization and event requirements for the ZH-tagged category, in the four-lepton final state. Here, X is defined as the remaining lepton pair after the Z boson candidate is chosen. The component leptons of X can be either same-flavor (XSF) or different-flavor (XDF). |
png pdf |
Table 7:
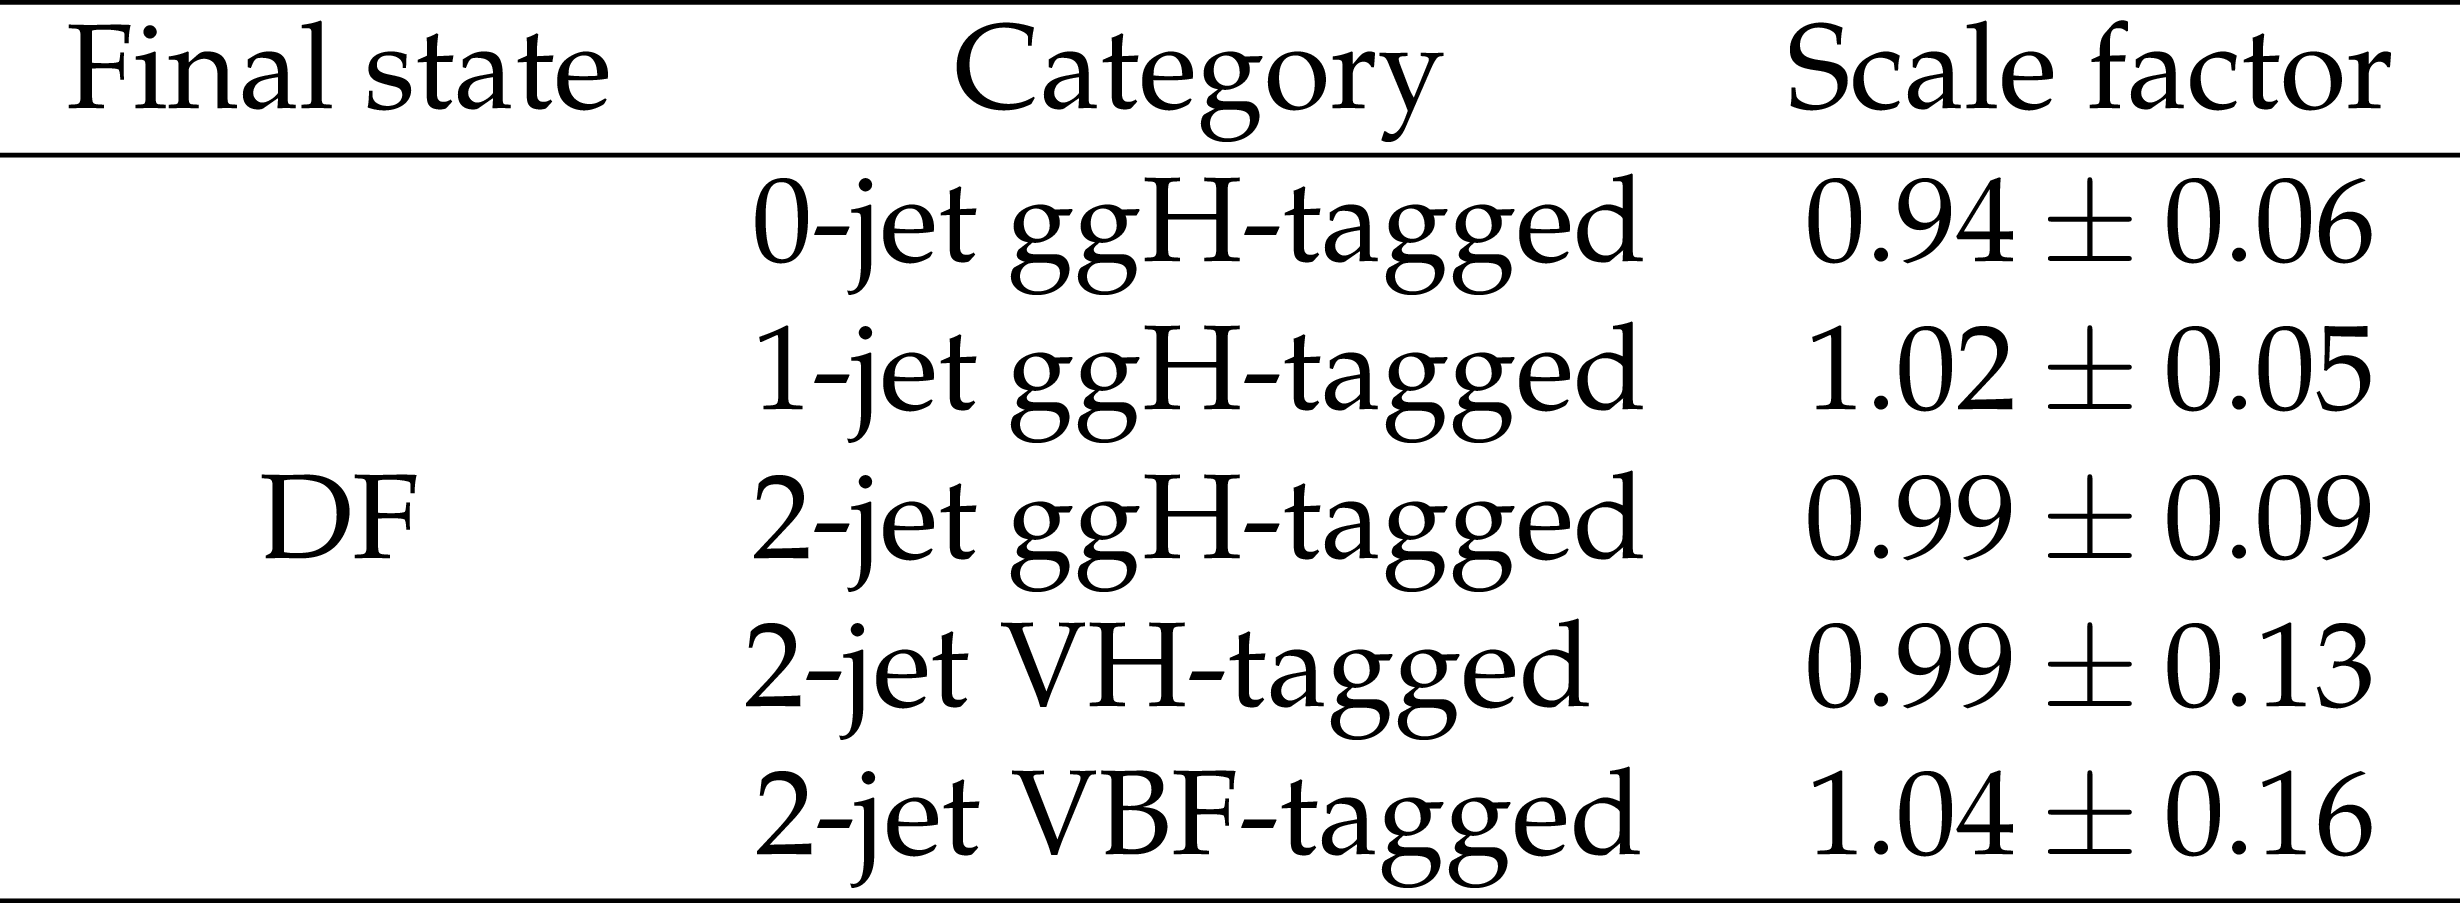
Data-to-simulation scale factors for the top quark background normalization in seven different control regions. |
png pdf |
Table 8:
Data-to-simulation scale factors for the $\mathrm {DY}\to {{\tau}^{+} {\tau}^{-}} $ background normalization in DF control regions. |
png pdf |
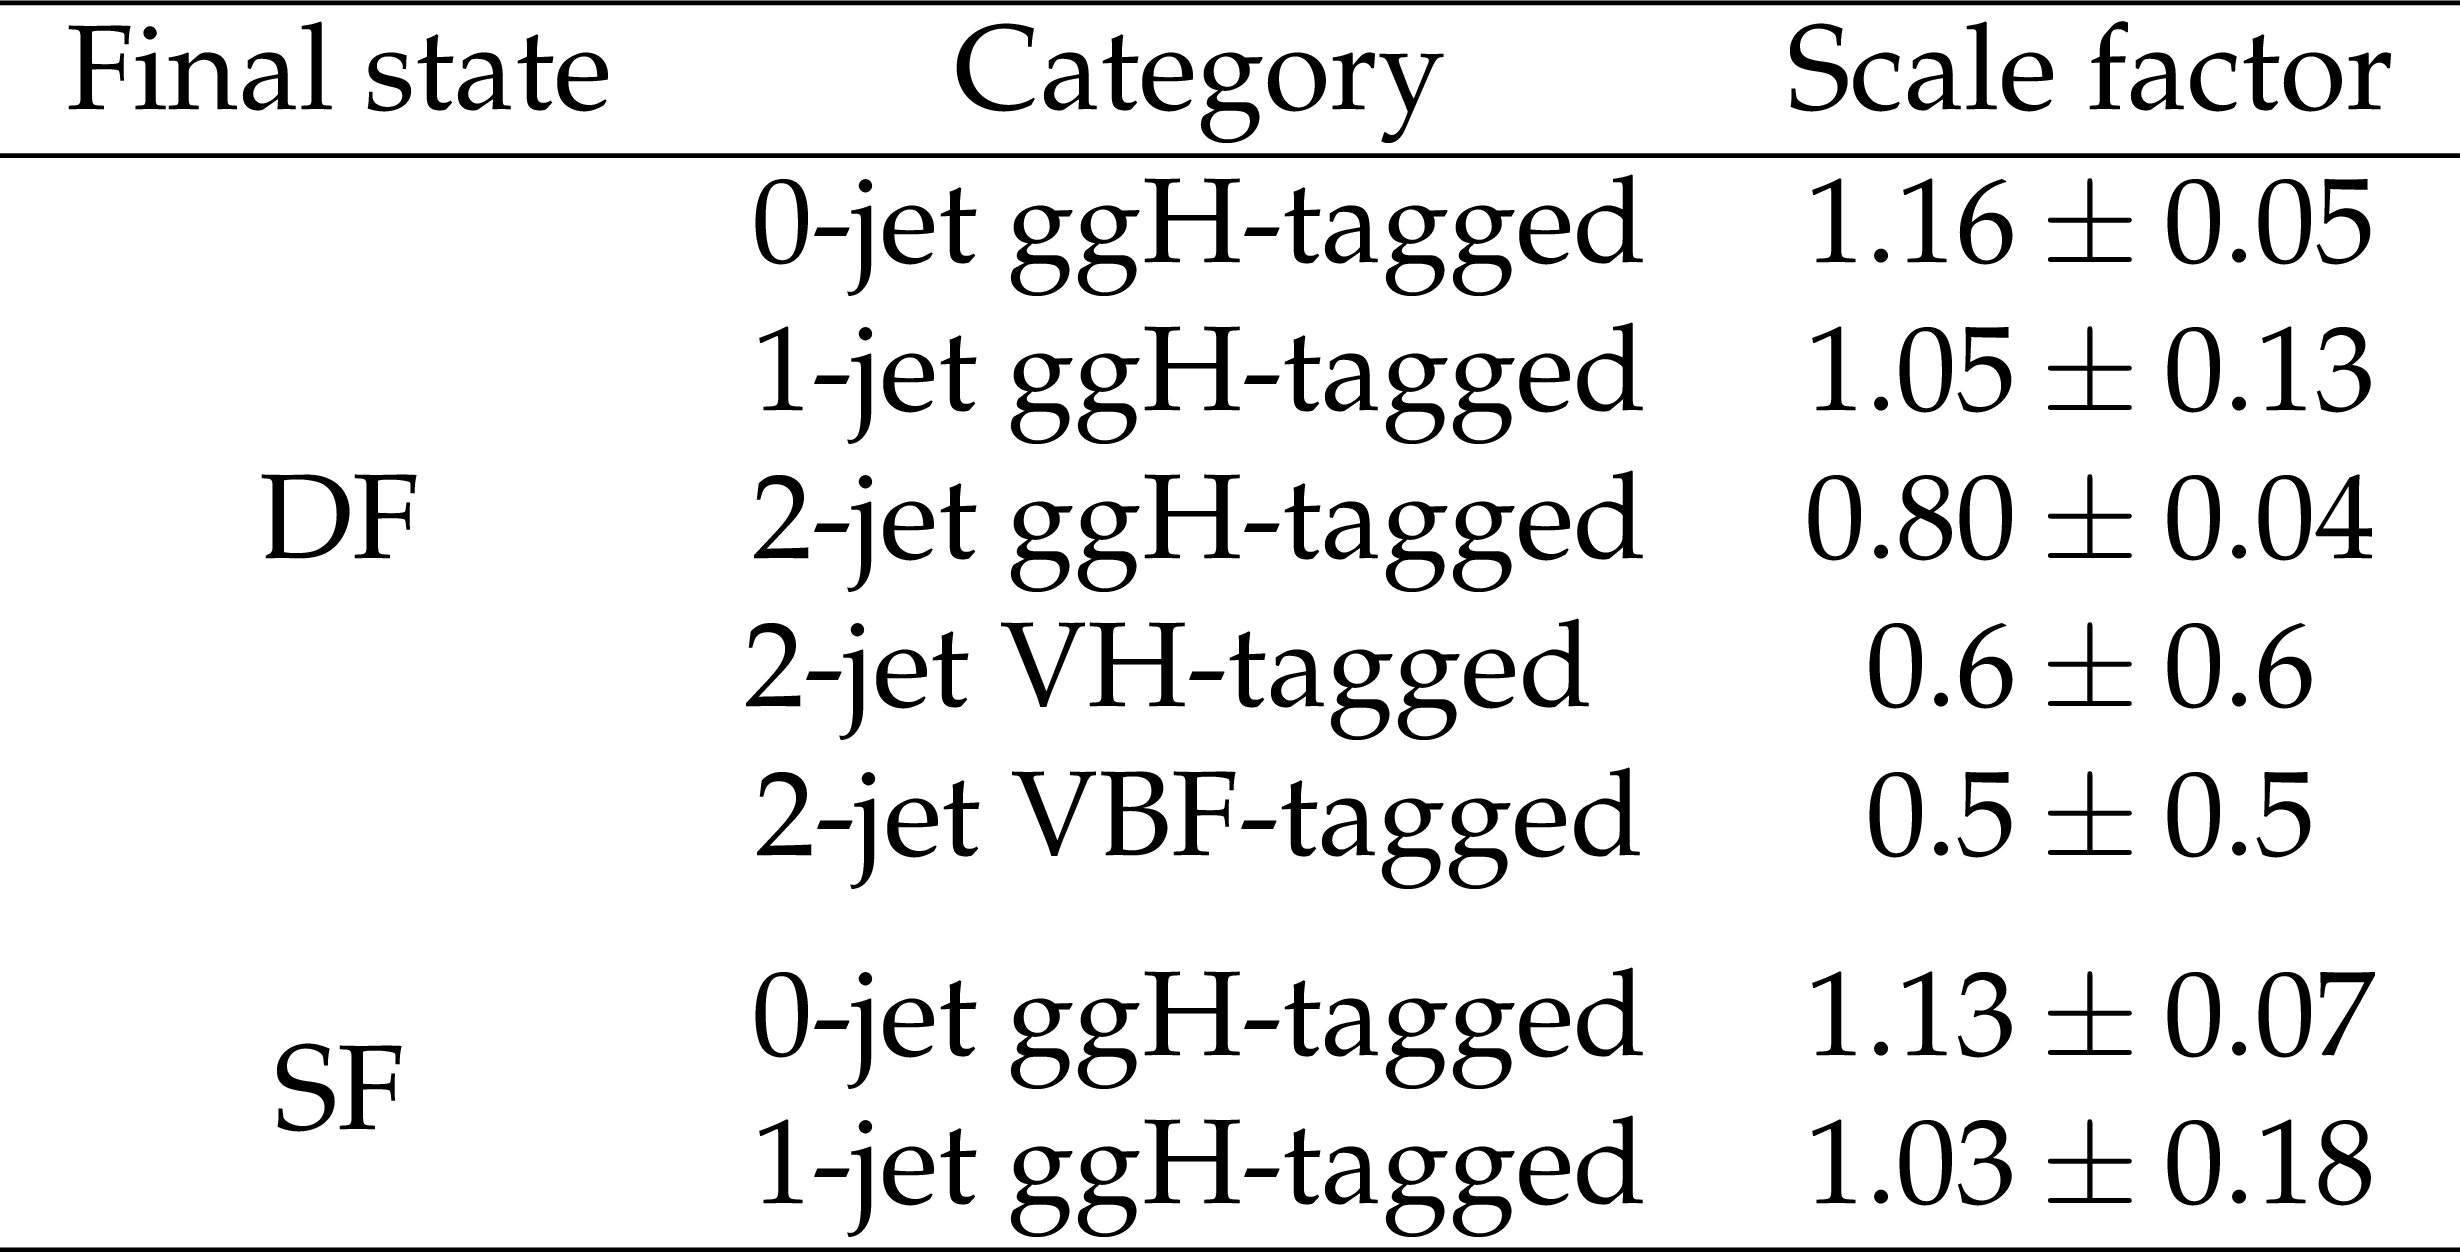
Table 9:
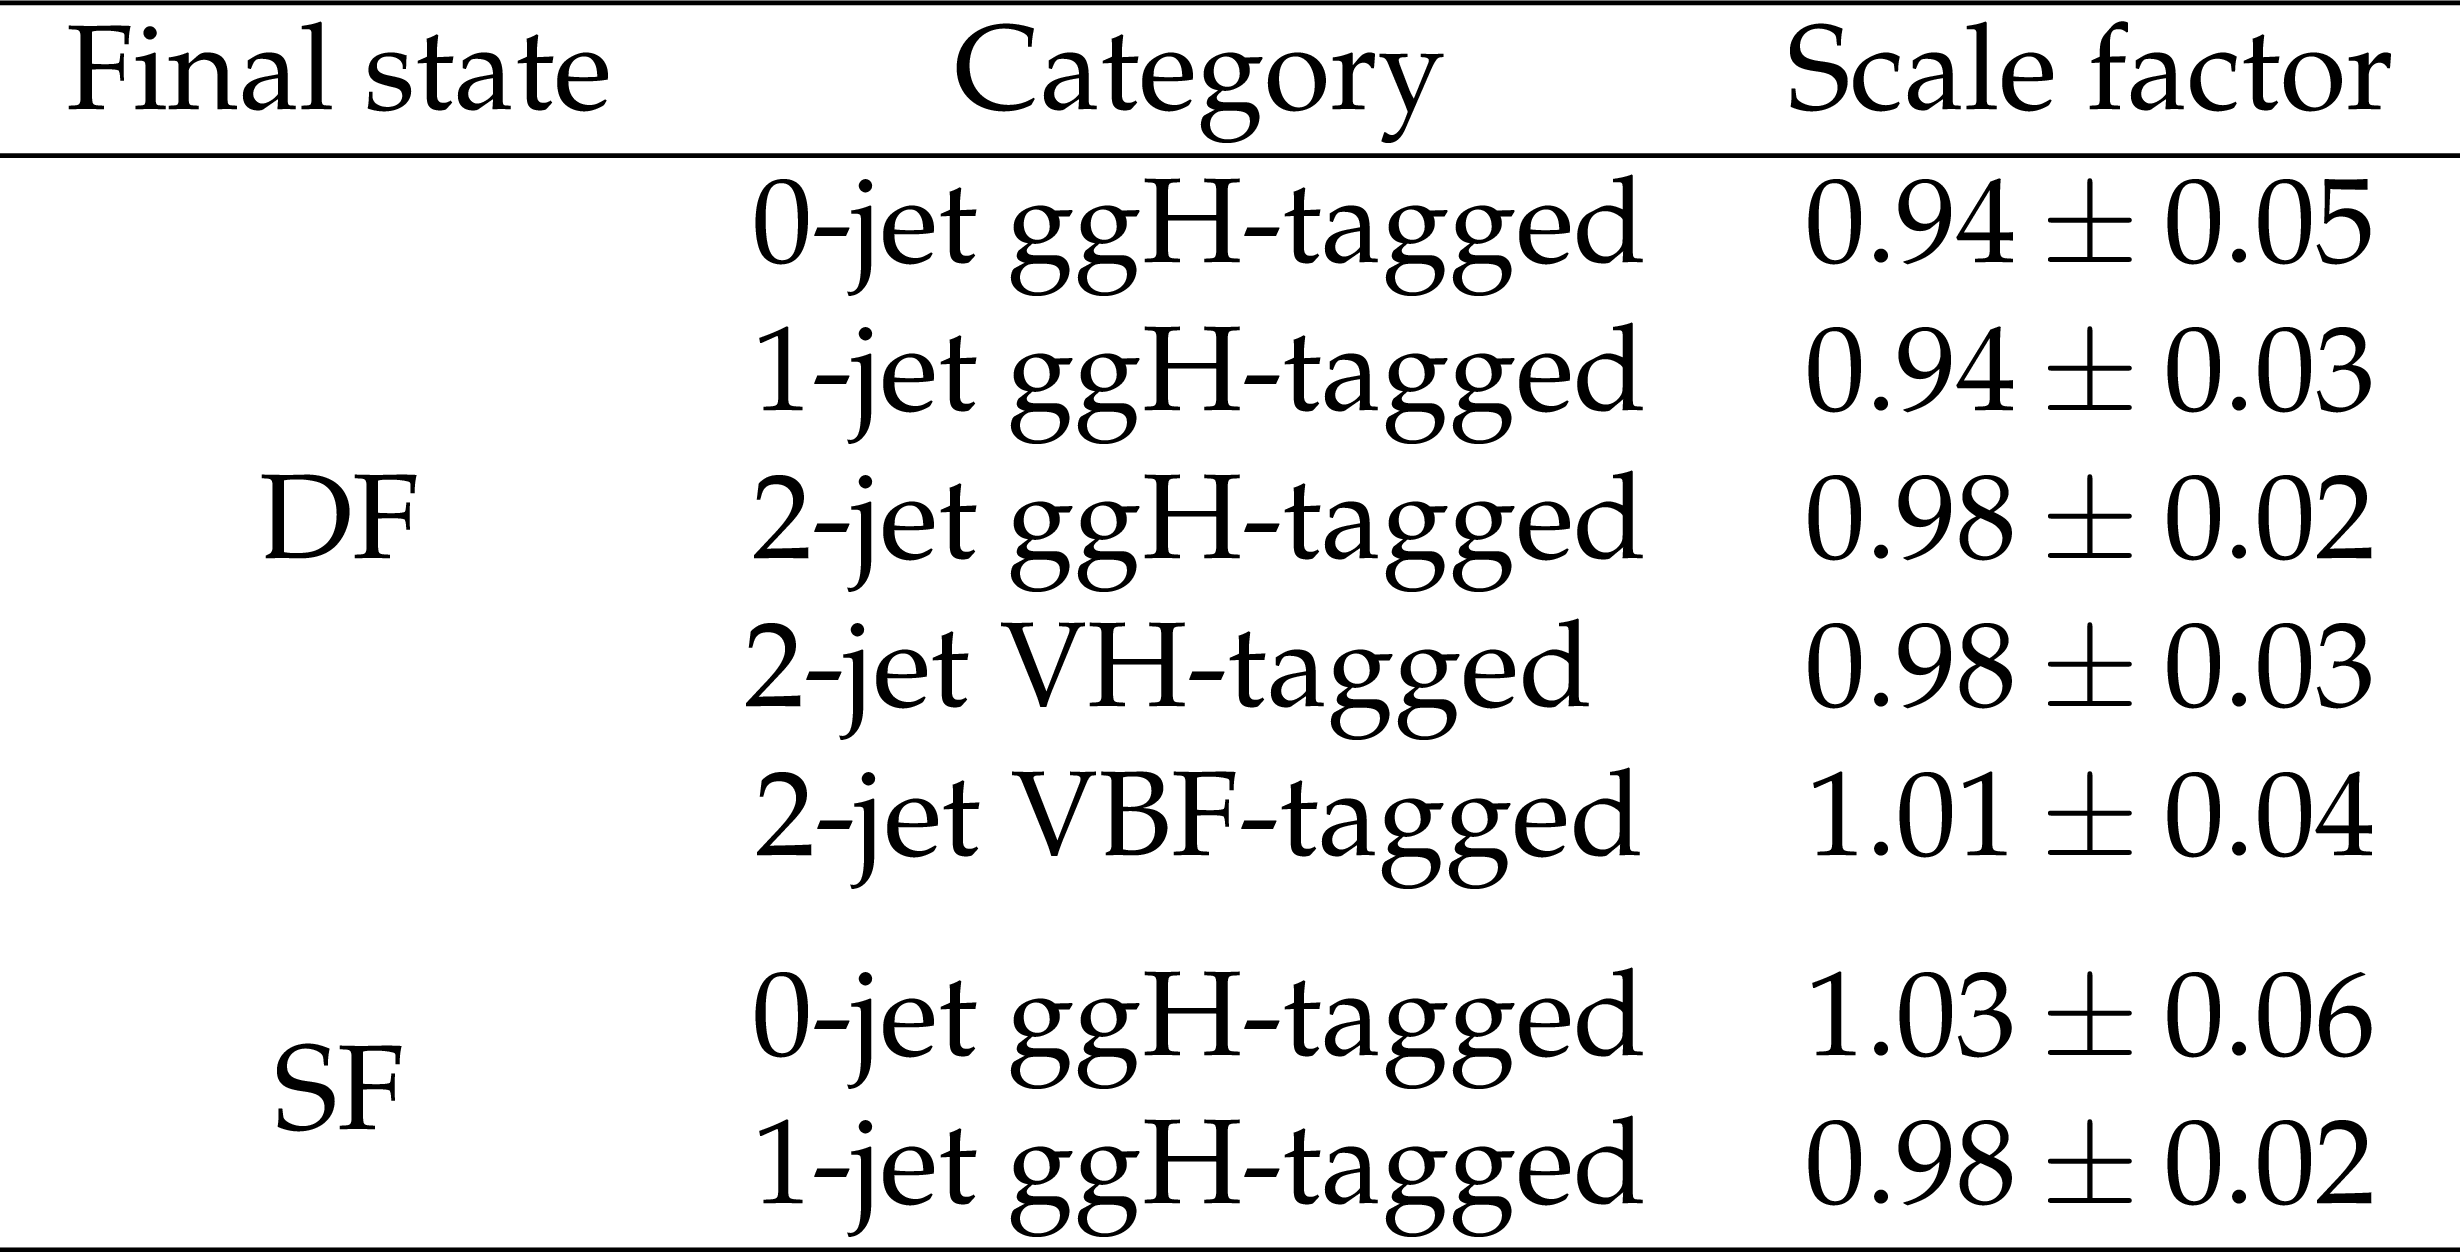
Scale factors for the nonresonant WW background normalization. |
png pdf |
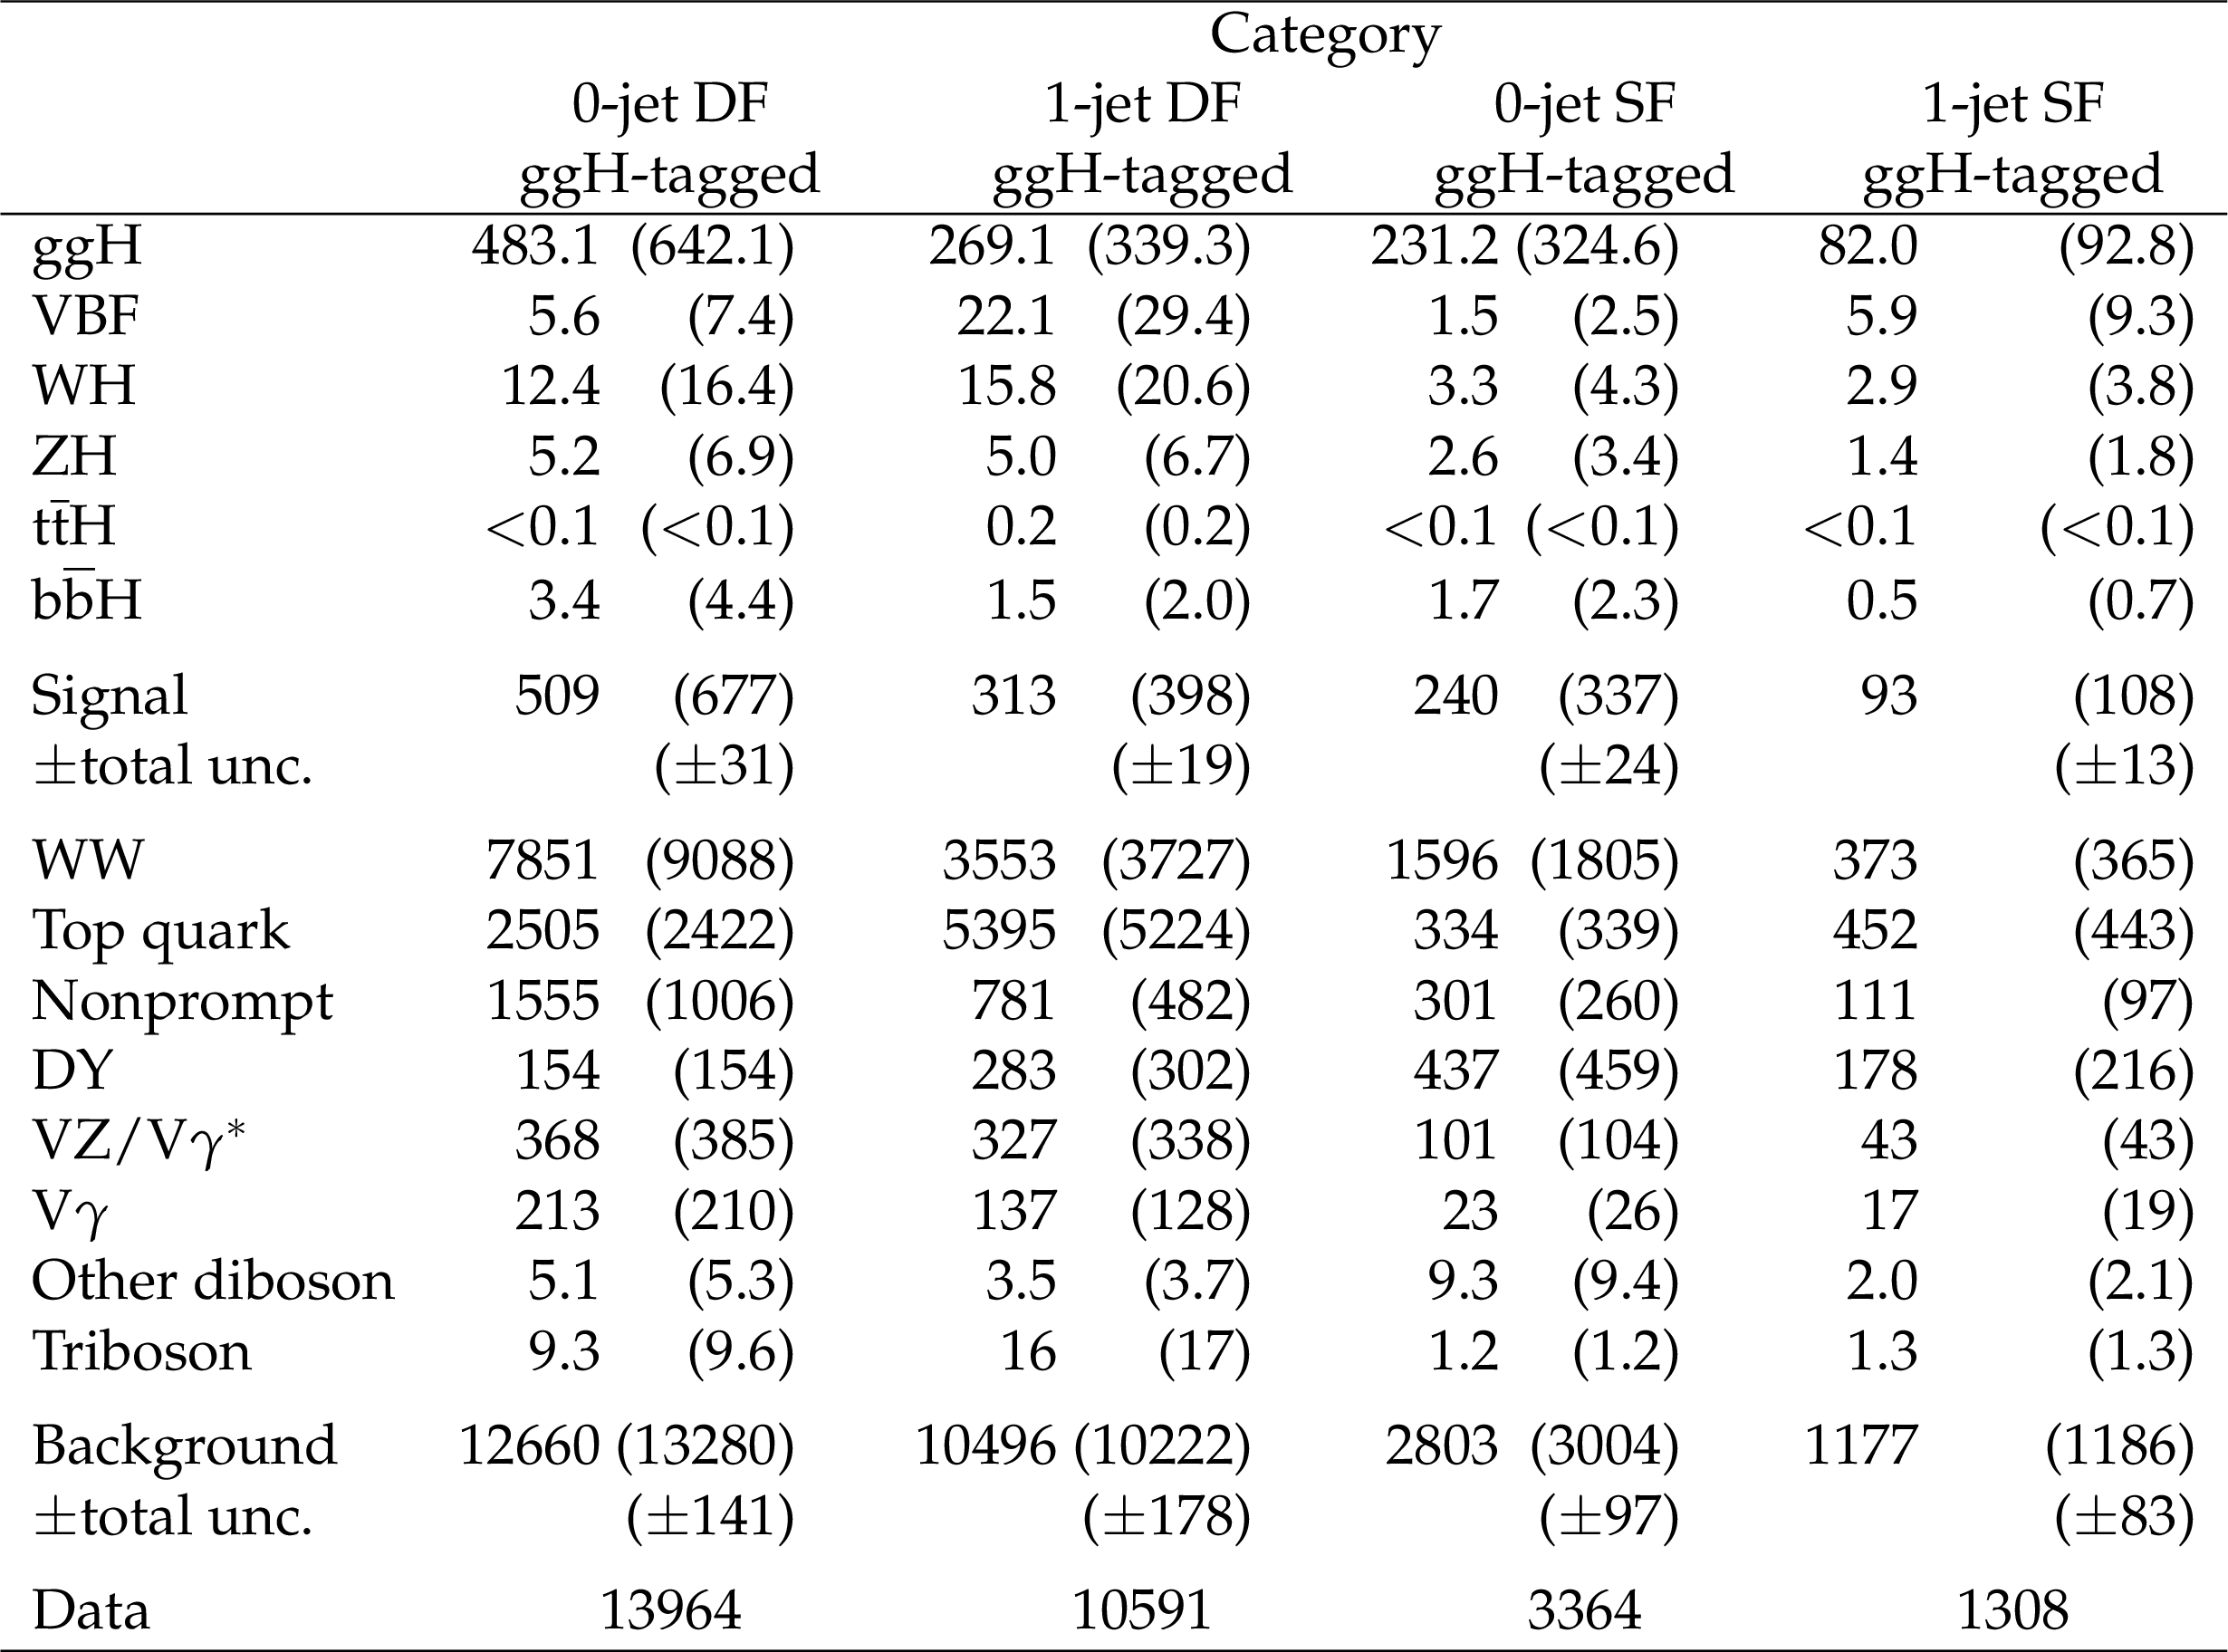
Table 10:
Number of expected signal and background events and number of observed events in the 0- and 1-jet categories after the full event selection. Postfit event yields are also shown in parentheses, corresponding to the result of a simultaneous fit to all categories assuming that the relative proportions for the different production mechanisms are those predicted by the SM. The individual signal yields are given for different production mechanisms. The total uncertainty accounts for all sources of uncertainty in signal and background yields after the fit. |
png pdf |
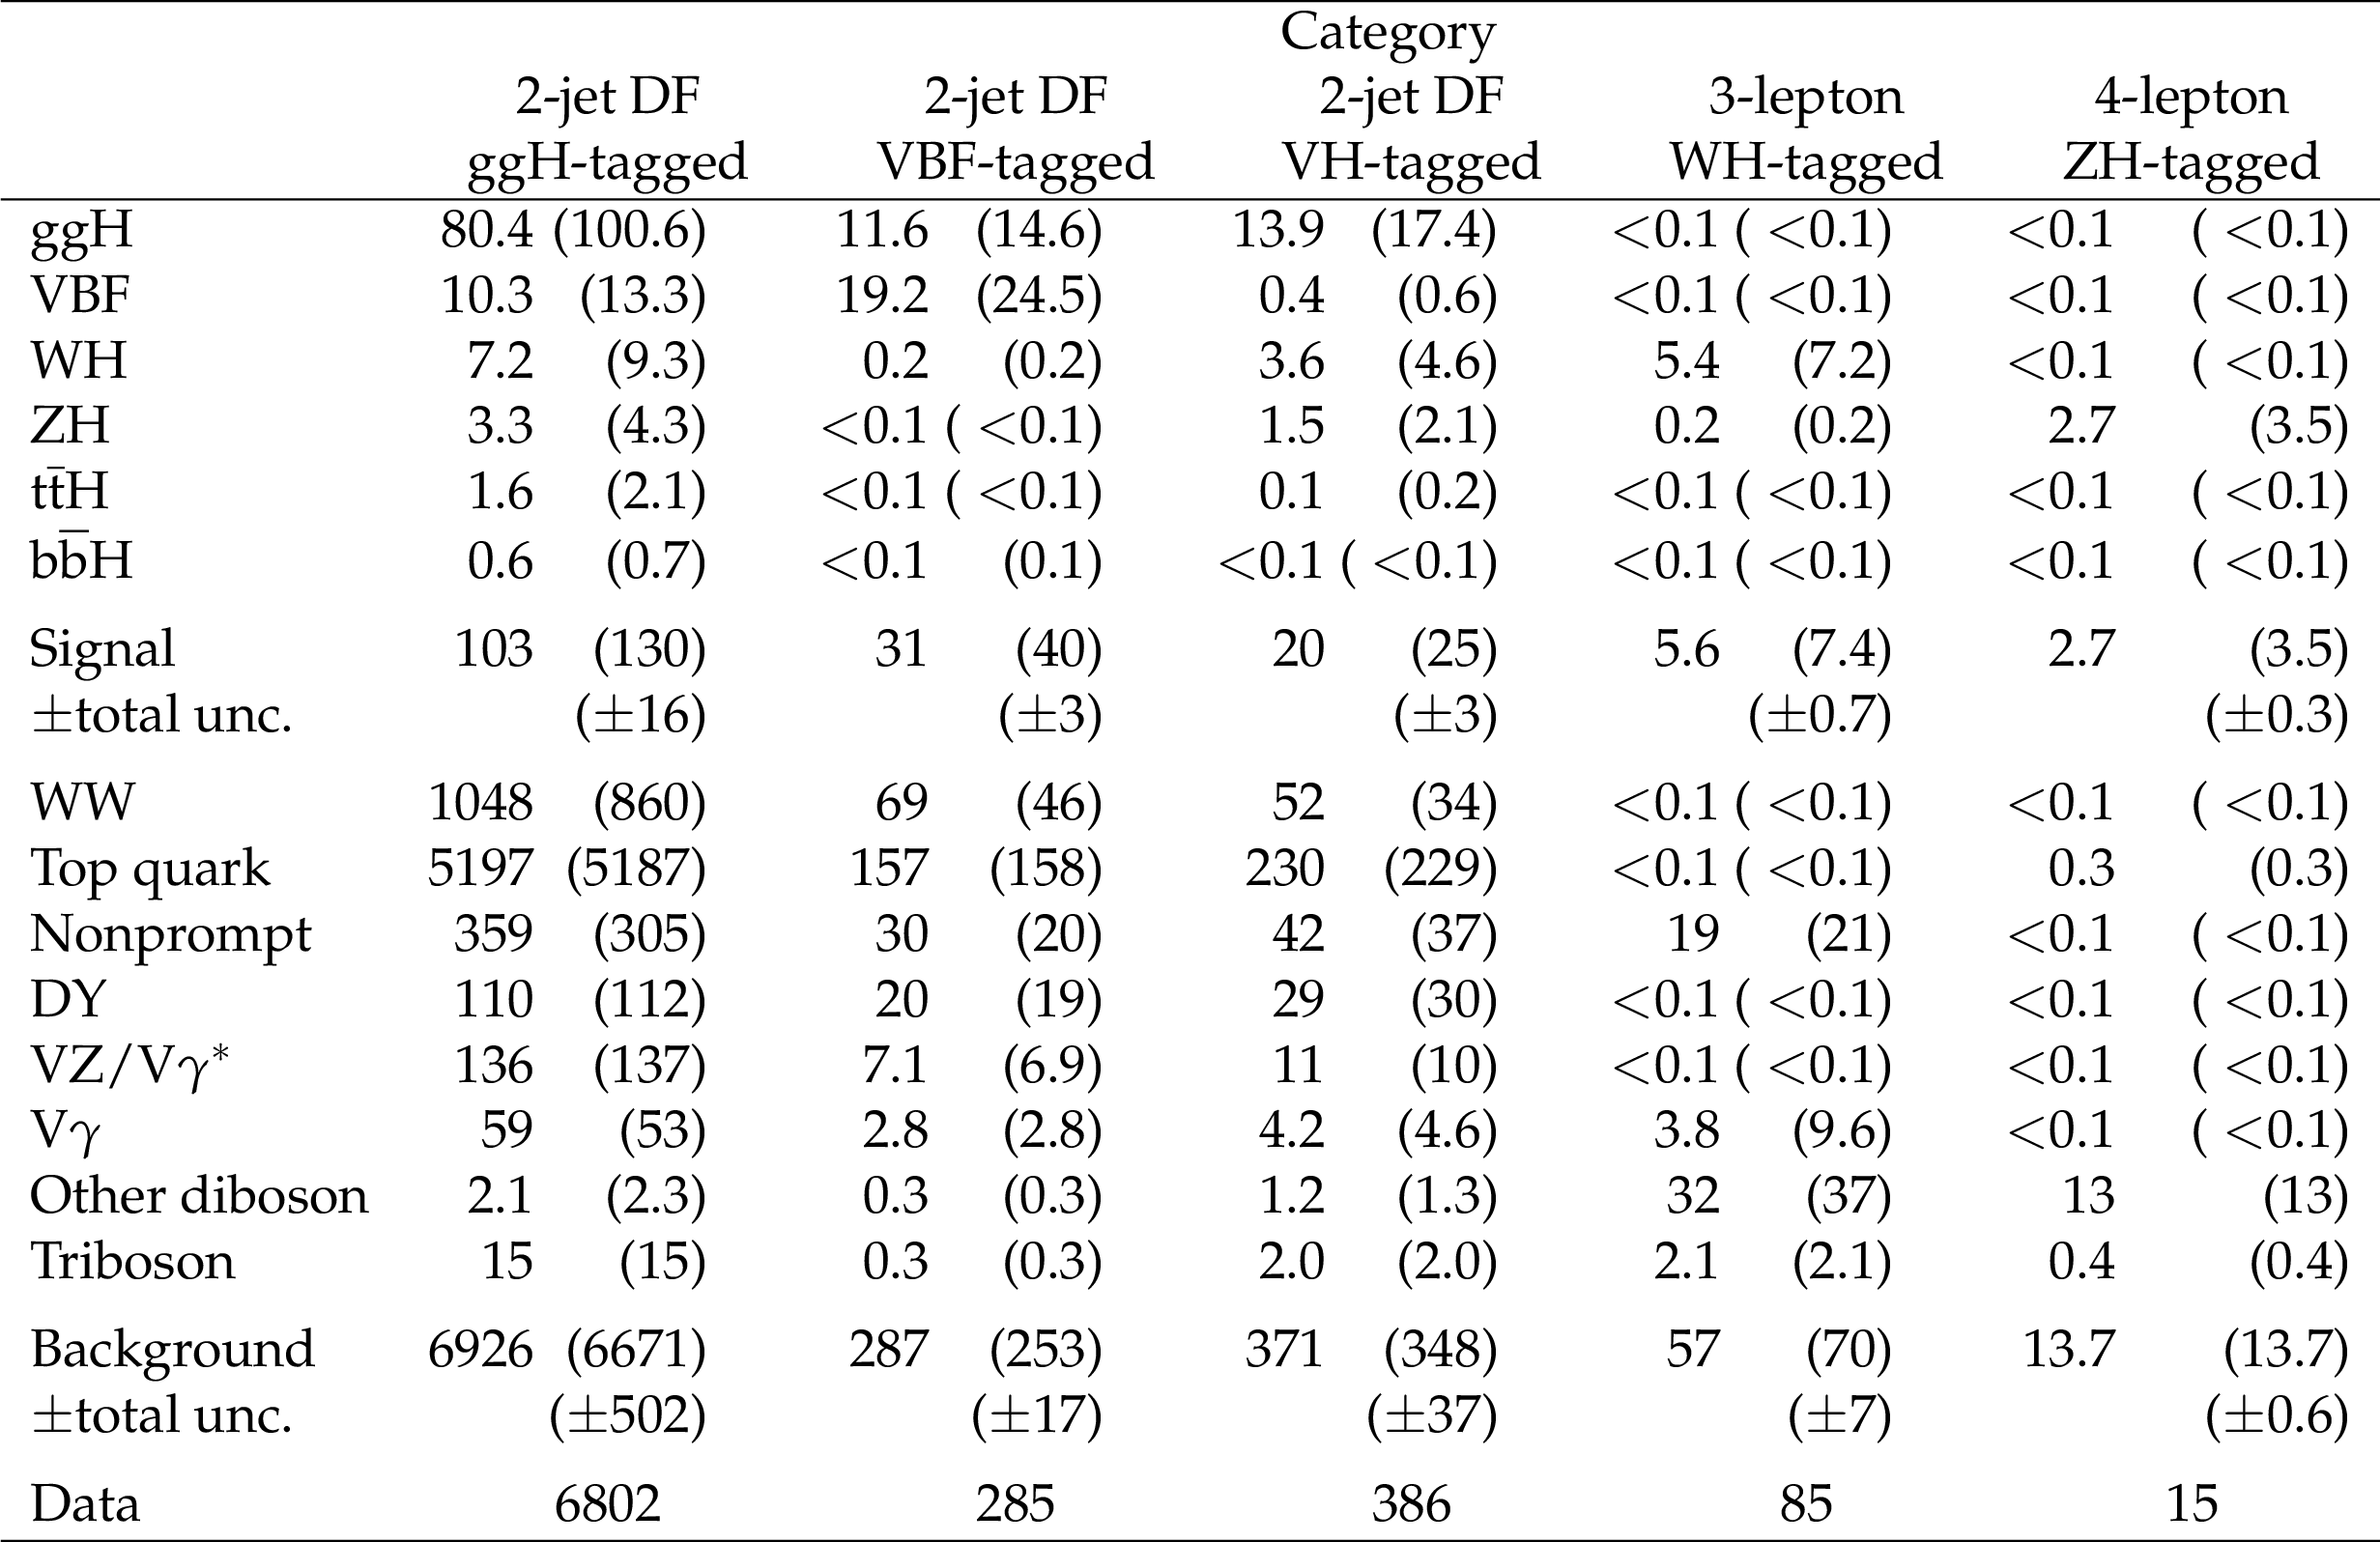
Table 11:
Number of expected signal and background events and number of observed events in the 2-jet, 3-lepton, and 4-lepton categories after the full event selection. Postfit event yields are also shown in parentheses, corresponding to the result of a simultaneous fit to all categories assuming that the relative proportions for the different production mechanisms are those predicted by the SM. The individual signal yields are given for different production mechanisms. For the 3-lepton WH-tagged category, the "Other diboson'' background includes mainly WZ production, with a 10% contribution from ZZ events. For the 4-lepton ZH-tagged category, $ {{\mathrm {t}\overline {\mathrm {t}}}} {\mathrm {W}}$ and $ {{\mathrm {t}\overline {\mathrm {t}}}} {\mathrm {Z}} $ are included in the top quark process, while the "Other diboson'' background mainly comes from ZZ production. The total uncertainty accounts for all sources of uncertainty in signal and background yields after the fit. |
| Summary |
|
Measurements of the properties of the SM Higgs boson decaying to a W boson pair at the LHC have been reported. The data samples used in the analysis correspond to an integrated luminosity of 35.9 fb$^{-1}$ collected by the CMS detector in proton-proton collisions at $\sqrt{s} = $ 13 TeV. The $\mathrm{W^{+}}\mathrm{W^{-}}$ candidates are selected in events with large missing transverse momentum and exactly two, three, or four leptons. In the case of events with two leptons, different categories are defined according to the lepton pair flavor, $\mathrm{e}\mu$, $\mathrm{e}\mathrm{e}$, or $\mu\mathrm{e}$. The analysis has specific categories for gluon fusion production, vector boson fusion, and vector boson associated production, with up to two jets in the final state. The probability of observing a signal at least as large as the one seen by combining all channels, under the background-only hypothesis, corresponds to an observed significance of 9.1 standard deviations for $m_{\mathrm{H}} = $ 125.09 GeV, to be compared with the expected value of 7.1 standard deviations. The observed global signal strength modifier is $\sigma/\sigma{_\mathrm{SM}} = \mu = $ 1.28 $^{+0.18}_{-0.17}$ $=$ 1.28 $\pm$ 0.10 (stat) $\pm$ 0.11 (syst) $^{+0.10}_{-0.07}$ (theo). Measurements of the signal strength modifiers associated with the main Higgs boson production mechanisms are also performed, as well as measurements of the Higgs boson couplings to fermions and vector bosons. The measured Higgs boson production and decay properties are found to be consistent, within their uncertainties, with the SM expectation. |
| References | ||||
| 1 | F. Englert and R. Brout | Broken symmetry and the mass of gauge vector mesons | PRL 13 (1964) 321 | |
| 2 | P. W. Higgs | Broken symmetries, massless particles and gauge fields | PL12 (1964) 132 | |
| 3 | P. W. Higgs | Broken symmetries and the masses of gauge bosons | PRL 13 (1964) 508 | |
| 4 | G. S. Guralnik, C. R. Hagen, and T. W. B. Kibble | Global conservation laws and massless particles | PRL 13 (1964) 585 | |
| 5 | P. W. Higgs | Spontaneous symmetry breakdown without massless bosons | PR145 (1966) 1156 | |
| 6 | T. W. B. Kibble | Symmetry breaking in non-Abelian gauge theories | PR155 (1967) 1554 | |
| 7 | ATLAS Collaboration | Observation of a new particle in the search for the standard model Higgs boson with the ATLAS detector at the LHC | PLB 716 (2012) 1 | 1207.7214 |
| 8 | CMS Collaboration | Observation of a new boson at a mass of 125 GeV with the CMS experiment at the LHC | PLB 716 (2012) 30 | CMS-HIG-12-028 1207.7235 |
| 9 | CMS Collaboration | Observation of a new boson with mass near 125 GeV in pp collisions at $ \sqrt{s} = $ 7 and 8 TeV | JHEP 06 (2013) 081 | CMS-HIG-12-036 1303.4571 |
| 10 | ATLAS Collaboration | Measurements of the Higgs boson production and decay rates and coupling strengths using pp collision data at $ \sqrt{s}= $ 7 and 8 TeV in the ATLAS experiment | EPJC 76 (2016) 6 | 1507.04548 |
| 11 | ATLAS Collaboration | Evidence for the spin-0 nature of the Higgs boson using ATLAS data | PLB 726 (2013) 120 | 1307.1432 |
| 12 | CMS Collaboration | Precise determination of the mass of the Higgs boson and tests of compatibility of its couplings with the standard model predictions using proton collisions at 7 and 8 TeV | EPJC 75 (2015) 212 | CMS-HIG-14-009 1412.8662 |
| 13 | CMS Collaboration | Constraints on the spin-parity and anomalous HVV couplings of the Higgs boson in proton collisions at 7 and 8 TeV | PRD 92 (2015) 012004 | CMS-HIG-14-018 1411.3441 |
| 14 | ATLAS and CMS Collaborations | Combined measurement of the Higgs boson mass in $ pp $ collisions at $ \sqrt{s}= $ 7 and 8 TeV with the ATLAS and CMS experiments | PRL 114 (2015) 191803 | 1503.07589 |
| 15 | ATLAS and CMS Collaborations | Measurements of the Higgs boson production and decay rates and constraints on its couplings from a combined ATLAS and CMS analysis of the LHC pp collision data at $ \sqrt{s}= $ 7 and 8 TeV | JHEP 08 (2016) 045 | 1606.02266 |
| 16 | ATLAS Collaboration | Observation and measurement of Higgs boson decays to WW$ ^* $ with the ATLAS detector | PRD 92 (2015) 012006 | 1412.2641 |
| 17 | CMS Collaboration | Measurement of Higgs boson production and properties in the WW decay channel with leptonic final states | JHEP 01 (2014) 096 | CMS-HIG-13-023 1312.1129 |
| 18 | ATLAS Collaboration | Constraints on the off-shell Higgs boson signal strength in the high-mass $ ZZ $ and $ WW $ final states with the ATLAS detector | EPJC 75 (2015) 335 | 1503.01060 |
| 19 | CMS Collaboration | Search for Higgs boson off-shell production in proton-proton collisions at 7 and 8 TeV and derivation of constraints on its total decay width | JHEP 09 (2016) 051 | CMS-HIG-14-032 1605.02329 |
| 20 | ATLAS Collaboration | Measurement of fiducial differential cross sections of gluon-fusion production of Higgs bosons decaying to $ WW^{*}\rightarrow e\nu\mu\nu $ with the ATLAS detector at $ \sqrt{s} = $ 8 TeV | JHEP 08 (2016) 104 | 1604.02997 |
| 21 | CMS Collaboration | Measurement of the transverse momentum spectrum of the Higgs boson produced in pp collisions at $ \sqrt{s}= $ 8 TeV using $ {\rm H \to WW} $ decays | JHEP 03 (2017) 032 | CMS-HIG-15-010 1606.01522 |
| 22 | CMS Collaboration | The CMS experiment at the CERN LHC | JINST 3 (2008) S08004 | |
| 23 | P. Nason | A new method for combining NLO QCD with shower Monte Carlo algorithms | JHEP 11 (2004) 040 | hep-ph/0409146 |
| 24 | S. Frixione, P. Nason, and C. Oleari | Matching NLO QCD computations with parton shower simulations: the POWHEG method | JHEP 11 (2007) 070 | 0709.2092 |
| 25 | S. Alioli, P. Nason, C. Oleari, and E. Re | A general framework for implementing NLO calculations in shower Monte Carlo programs: the POWHEG BOX | JHEP 06 (2010) 043 | 1002.2581 |
| 26 | E. Bagnaschi, G. Degrassi, P. Slavich, and A. Vicini | Higgs production via gluon fusion in the POWHEG approach in the SM and in the MSSM | JHEP 02 (2012) 088 | 1111.2854 |
| 27 | K. Hamilton, P. Nason, E. Re, and G. Zanderighi | NNLOPS simulation of Higgs boson production | JHEP 10 (2013) 222 | 1309.0017 |
| 28 | G. Luisoni, P. Nason, C. Oleari, and F. Tramontano | $ \mathrm{HW^{\pm}} $/HZ + 0 and 1 jet at NLO with the POWHEG BOX interfaced to GoSam and their merging within MiNLO | JHEP 10 (2013) 083 | 1306.2542 |
| 29 | J. Alwall et al. | The automated computation of tree-level and next-to-leading order differential cross sections, and their matching to parton shower simulations | JHEP 07 (2014) 079 | 1405.0301 |
| 30 | S. Alioli, P. Nason, C. Oleari, and E. Re | NLO Higgs boson production via gluon fusion matched with shower in POWHEG | JHEP 04 (2009) 002 | 0812.0578 |
| 31 | P. Nason and C. Oleari | NLO Higgs boson production via vector-boson fusion matched with shower in POWHEG | JHEP 02 (2010) 037 | 0911.5299 |
| 32 | Y. Gao et al. | Spin determination of single-produced resonances at hadron colliders | PRD 81 (2010) 075022 | 1001.3396 |
| 33 | S. Bolognesi et al. | On the spin and parity of a single-produced resonance at the LHC | PRD 86 (2012) 095031 | 1208.4018 |
| 34 | T. Sjostrand, S. Mrenna, and P. Z. Skands | A brief introduction to PYTHIA 8.1 | CPC 178 (2008) 852 | 0710.3820 |
| 35 | LHC Higgs Cross Section Working Group Collaboration | Handbook of LHC Higgs cross sections: 4. Deciphering the nature of the Higgs sector | 1610.07922 | |
| 36 | LHC Higgs Cross Section Working Group Collaboration | Handbook of LHC Higgs cross sections: 3. Higgs properties | 1307.1347 | |
| 37 | T. Melia, P. Nason, R. Rontsch, and G. Zanderighi | $ {\rm W^{+}W^{-}} $, WZ and ZZ production in the POWHEG BOX | JHEP 11 (2011) 078 | 1107.5051 |
| 38 | J. M. Campbell, R. K. Ellis, and C. Williams | Bounding the Higgs width at the LHC: Complementary results from $ H \to WW $ | PRD 89 (2014) 053011 | 1312.1628 |
| 39 | P. Meade, H. Ramani, and M. Zeng | Transverse momentum resummation effects in $ W^+W^- $ measurements | PRD 90 (2014) 114006 | 1407.4481 |
| 40 | P. Jaiswal and T. Okui | Explanation of the $ WW $ excess at the LHC by jet-veto resummation | PRD 90 (2014) 073009 | 1407.4537 |
| 41 | F. Caola, K. Melnikov, R. Rontsch, and L. Tancredi | QCD corrections to $ W^+W^- $ production through gluon fusion | PLB 754 (2016) 275 | 1511.08617 |
| 42 | P. Kant et al. | HatHor for single top-quark production: Updated predictions and uncertainty estimates for single top-quark production in hadronic collisions | CPC 191 (2015) 74 | 1406.4403 |
| 43 | M. Czakon and A. Mitov | Top++: a program for the calculation of the top-pair cross-section at hadron colliders | CPC 185 (2014) 2930 | 1112.5675 |
| 44 | R. Frederix and S. Frixione | Merging meets matching in MC@NLO | JHEP 12 (2012) 061 | 1209.6215 |
| 45 | NNPDF Collaboration | Parton distributions with QED corrections | NPB 877 (2013) 290 | 1308.0598 |
| 46 | NNPDF Collaboration | Unbiased global determination of parton distributions and their uncertainties at NNLO and at LO | NPB 855 (2012) 153 | 1107.2652 |
| 47 | CMS Collaboration | Event generator tunes obtained from underlying event and multiparton scattering measurements | EPJC 76 (2016) 155 | CMS-GEN-14-001 1512.00815 |
| 48 | P. Richardson and A. Wilcock | Monte Carlo simulation of hard radiation in decays in beyond the standard model physics in Herwig++ | EPJC 74 (2014) 2713 | 1303.4563 |
| 49 | J. Bellm et al. | Herwig++ 2.7 release note | 1310.6877 | |
| 50 | GEANT4 Collaboration | $ GEANT4--a $ simulation toolkit | NIMA 506 (2003) 250 | |
| 51 | CMS Collaboration | Particle-flow reconstruction and global event description with the CMS detector | JINST 12 (2017) P10003 | CMS-PRF-14-001 1706.04965 |
| 52 | M. Cacciari, G. P. Salam, and G. Soyez | The anti-$ {k_{\mathrm{T}}} $ jet clustering algorithm | JHEP 04 (2008) 063 | 0802.1189 |
| 53 | M. Cacciari, G. P. Salam, and G. Soyez | FastJet user manual | EPJC 72 (2012) 1896 | 1111.6097 |
| 54 | CMS Collaboration | Performance of electron reconstruction and selection with the CMS detector in proton-proton collisions at $ \sqrt{s} = $ 8 TeV | JINST 10 (2015) P06005 | CMS-EGM-13-001 1502.02701 |
| 55 | M. Cacciari and G. P. Salam | Pileup subtraction using jet areas | PLB 659 (2008) 119 | 0707.1378 |
| 56 | CMS Collaboration | Determination of jet energy calibration and transverse momentum resolution in CMS | JINST 6 (2011) P11002 | CMS-JME-10-011 1107.4277 |
| 57 | CMS Collaboration | Identification of heavy-flavour jets with the CMS detector in pp collisions at 13 TeV | JINST 13 (2018) P05011 | CMS-BTV-16-002 1712.07158 |
| 58 | CMS Collaboration | Measurement of differential cross sections for top quark pair production using the lepton+jets final state in proton-proton collisions at 13 TeV | PRD 95 (2017) 092001 | CMS-TOP-16-008 1610.04191 |
| 59 | G. Passarino | Higgs CAT | EPJC 74 (2014) 2866 | 1312.2397 |
| 60 | ATLAS and CMS Collaborations, LHC Higgs Combination Group | Procedure for the LHC Higgs boson search combination in Summer 2011 | ATL-PHYS-PUB 2011-11, CMS NOTE 2011/005, CERN | |
| 61 | CMS Collaboration | CMS luminosity measurements for the 2016 data taking period | CMS-PAS-LUM-17-001 | CMS-PAS-LUM-17-001 |
| 62 | CMS Collaboration | The CMS trigger system | JINST 12 (2017) P01020 | CMS-TRG-12-001 1609.02366 |
| 63 | CMS Collaboration | Performance of CMS muon reconstruction in pp collision events at $ \sqrt{s}= $ 7 TeV | JINST 7 (2012) P10002 | CMS-MUO-10-004 1206.4071 |
| 64 | CMS Collaboration | Jet energy scale and resolution in the CMS experiment in pp collisions at 8 TeV | JINST 12 (2017) P02014 | CMS-JME-13-004 1607.03663 |
| 65 | J. Butterworth et al. | PDF4LHC recommendations for LHC Run II | JPG 43 (2016) 023001 | 1510.03865 |
| 66 | G. Cowan, K. Cranmer, E. Gross, and O. Vitells | Asymptotic formulae for likelihood-based tests of new physics | EPJC 71 (2011) 1 | 1007.1727 |
|
|
Compact Muon Solenoid LHC, CERN |
|

|

|

|

|

|