

Compact Muon Solenoid
LHC, CERN
| CMS-SMP-17-010 ; CERN-EP-2019-175 | ||
| Measurements of differential Z boson production cross sections in proton-proton collisions at $\sqrt{s} = $ 13 TeV | ||
| CMS Collaboration | ||
| 9 September 2019 | ||
| JHEP 12 (2019) 061 | ||
| Abstract: Measurements are presented of the differential cross sections for Z bosons produced in proton-proton collisions at $\sqrt{s} = $ 13 TeV and decaying to muons and electrons. The data analyzed were collected in 2016 with the CMS detector at the LHC and correspond to an integrated luminosity of 35.9 fb$^{-1}$ . The measured fiducial inclusive product of cross section and branching fraction agrees with next-to-next-to-leading order quantum chromodynamics calculations. Differential cross sections of the transverse momentum ${p_{\mathrm{T}}}$, the optimized angular variable ${\phi^{ *}_\eta}$, and the rapidity of lepton pairs are measured. The data are corrected for detector effects and compared to theoretical predictions using fixed order, resummed, and parton shower calculations. The uncertainties of the measured normalized cross sections are smaller than 0.5% for ${\phi^{ *}_\eta} < $ 0.5 and for ${p_{\mathrm{T}}}^{\mathrm{Z}} < $ 50 GeV. | ||
| Links: e-print arXiv:1909.04133 [hep-ex] (PDF) ; CDS record ; inSPIRE record ; HepData record ; CADI line (restricted) ; | ||
| Figures & Tables | Summary | Additional Figures | References | CMS Publications |
|---|
| Figures | |

png pdf |
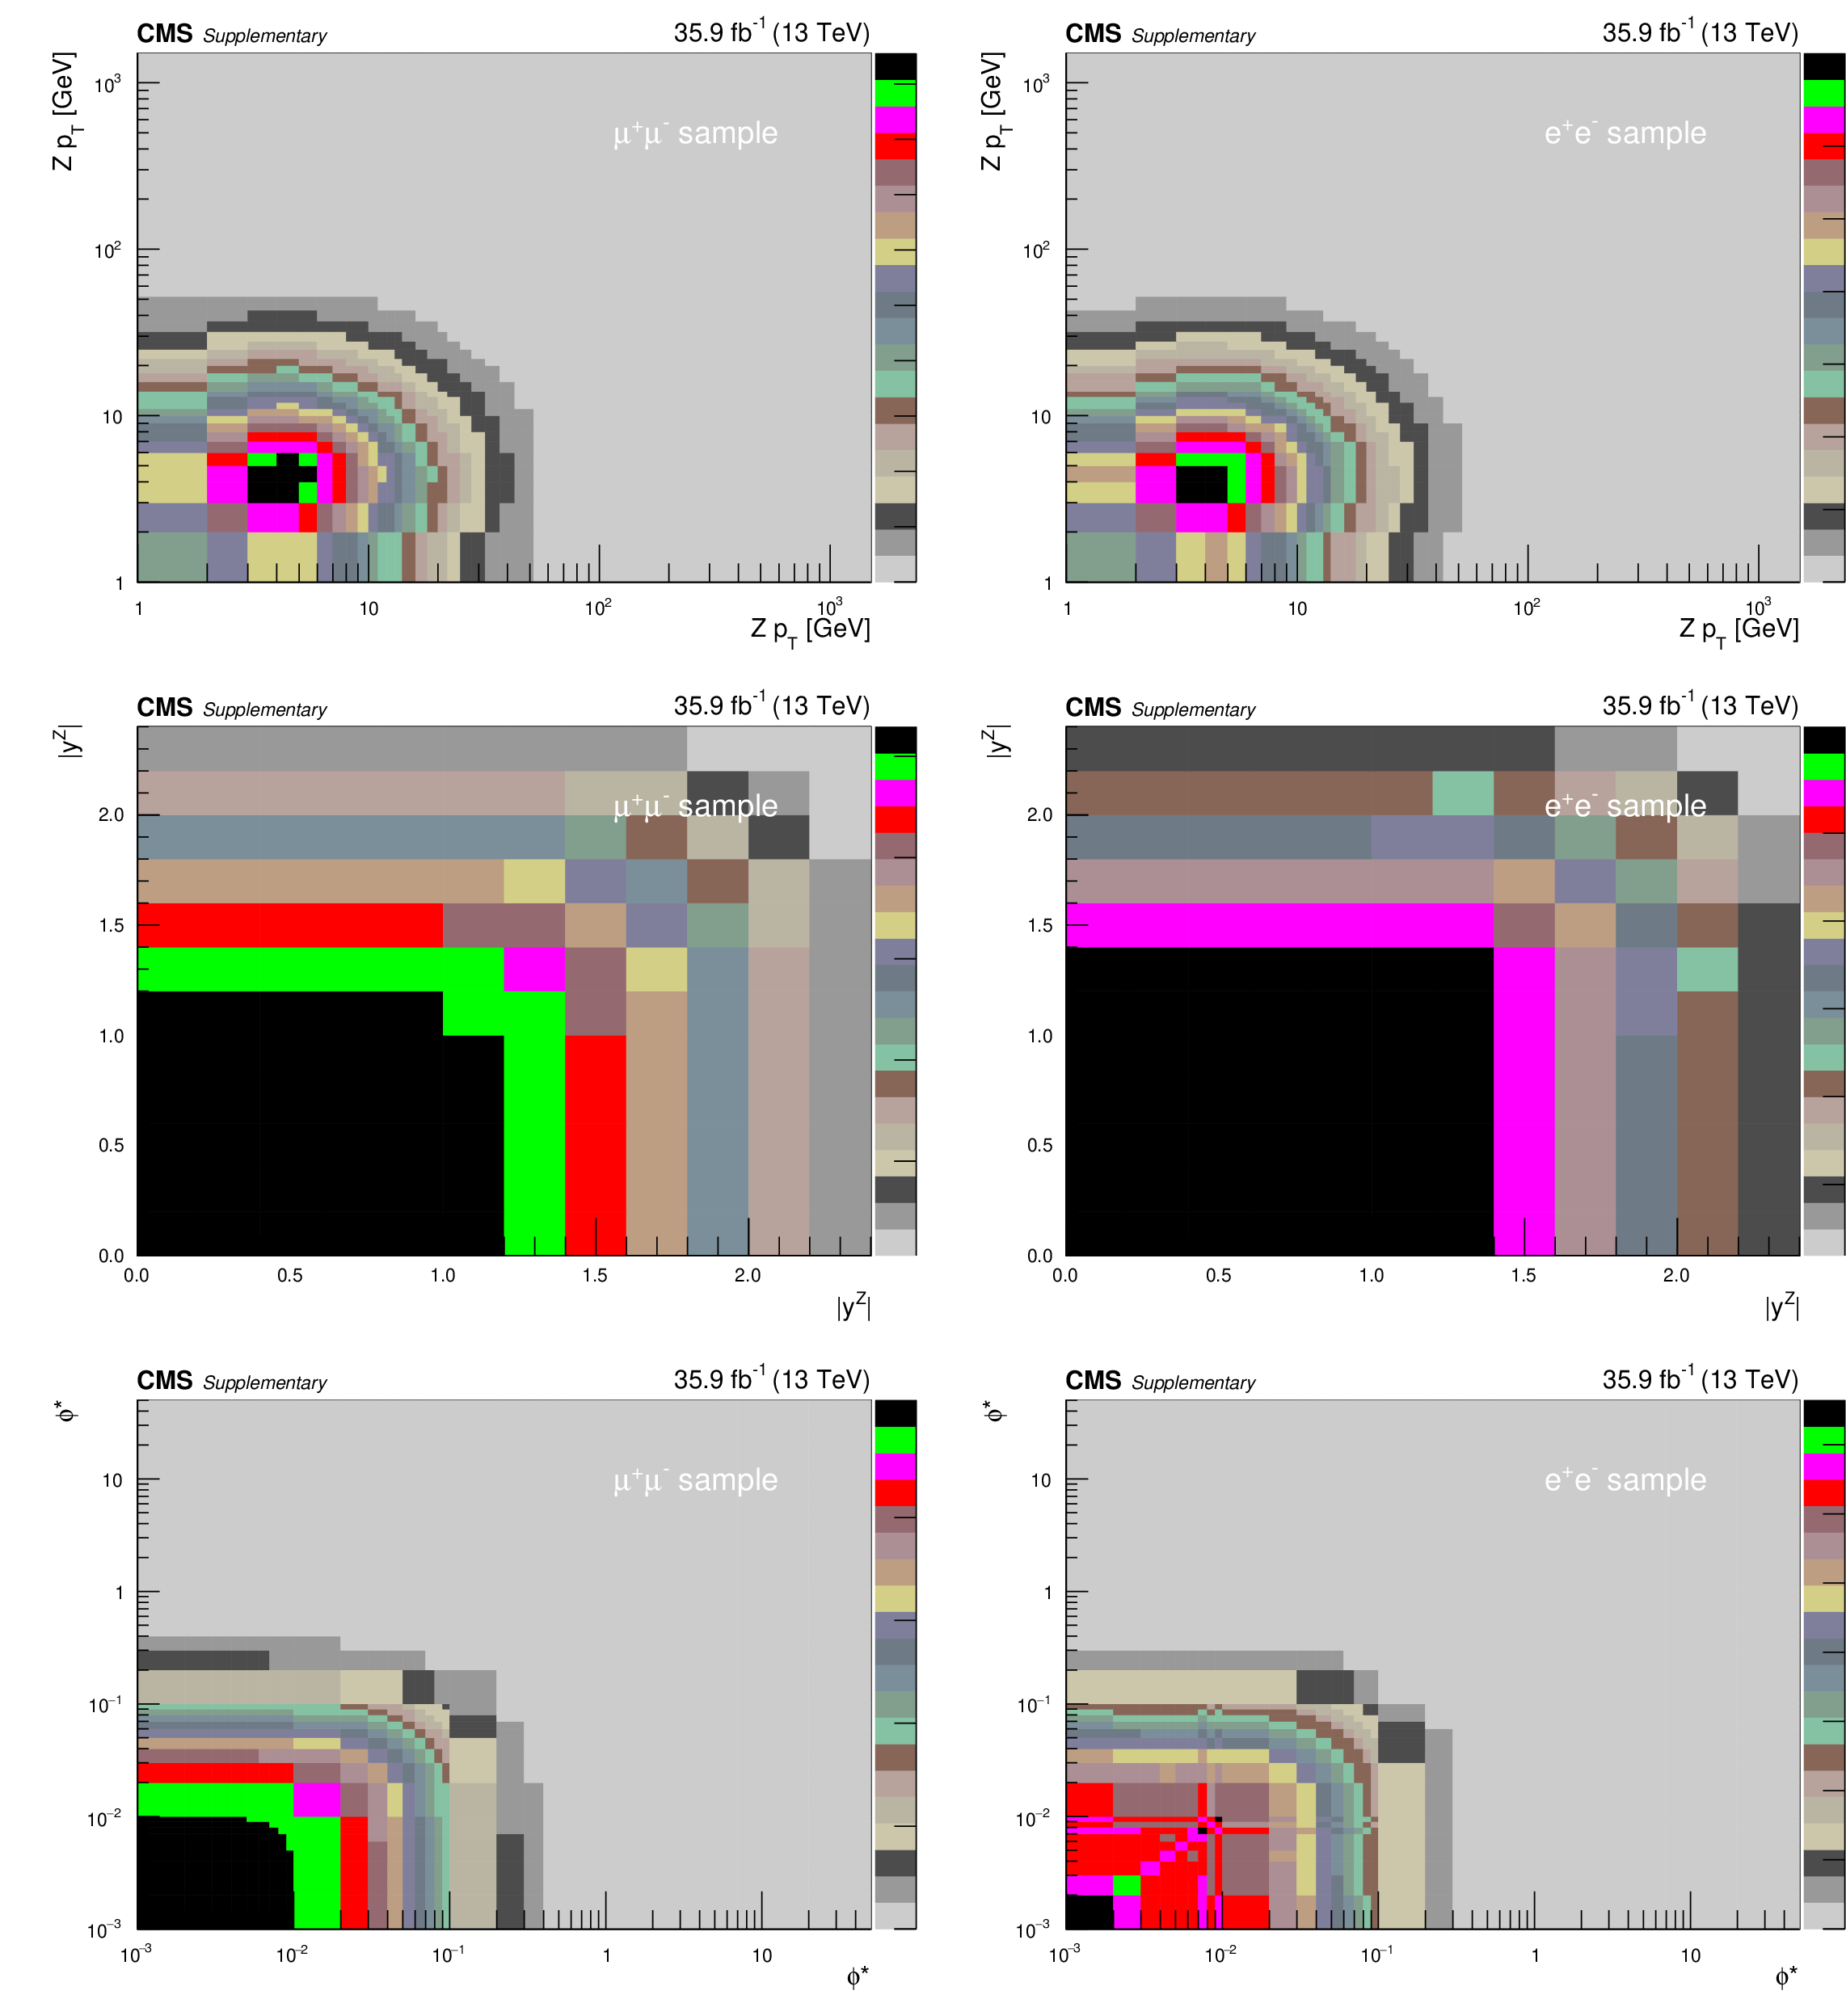
Figure 1:
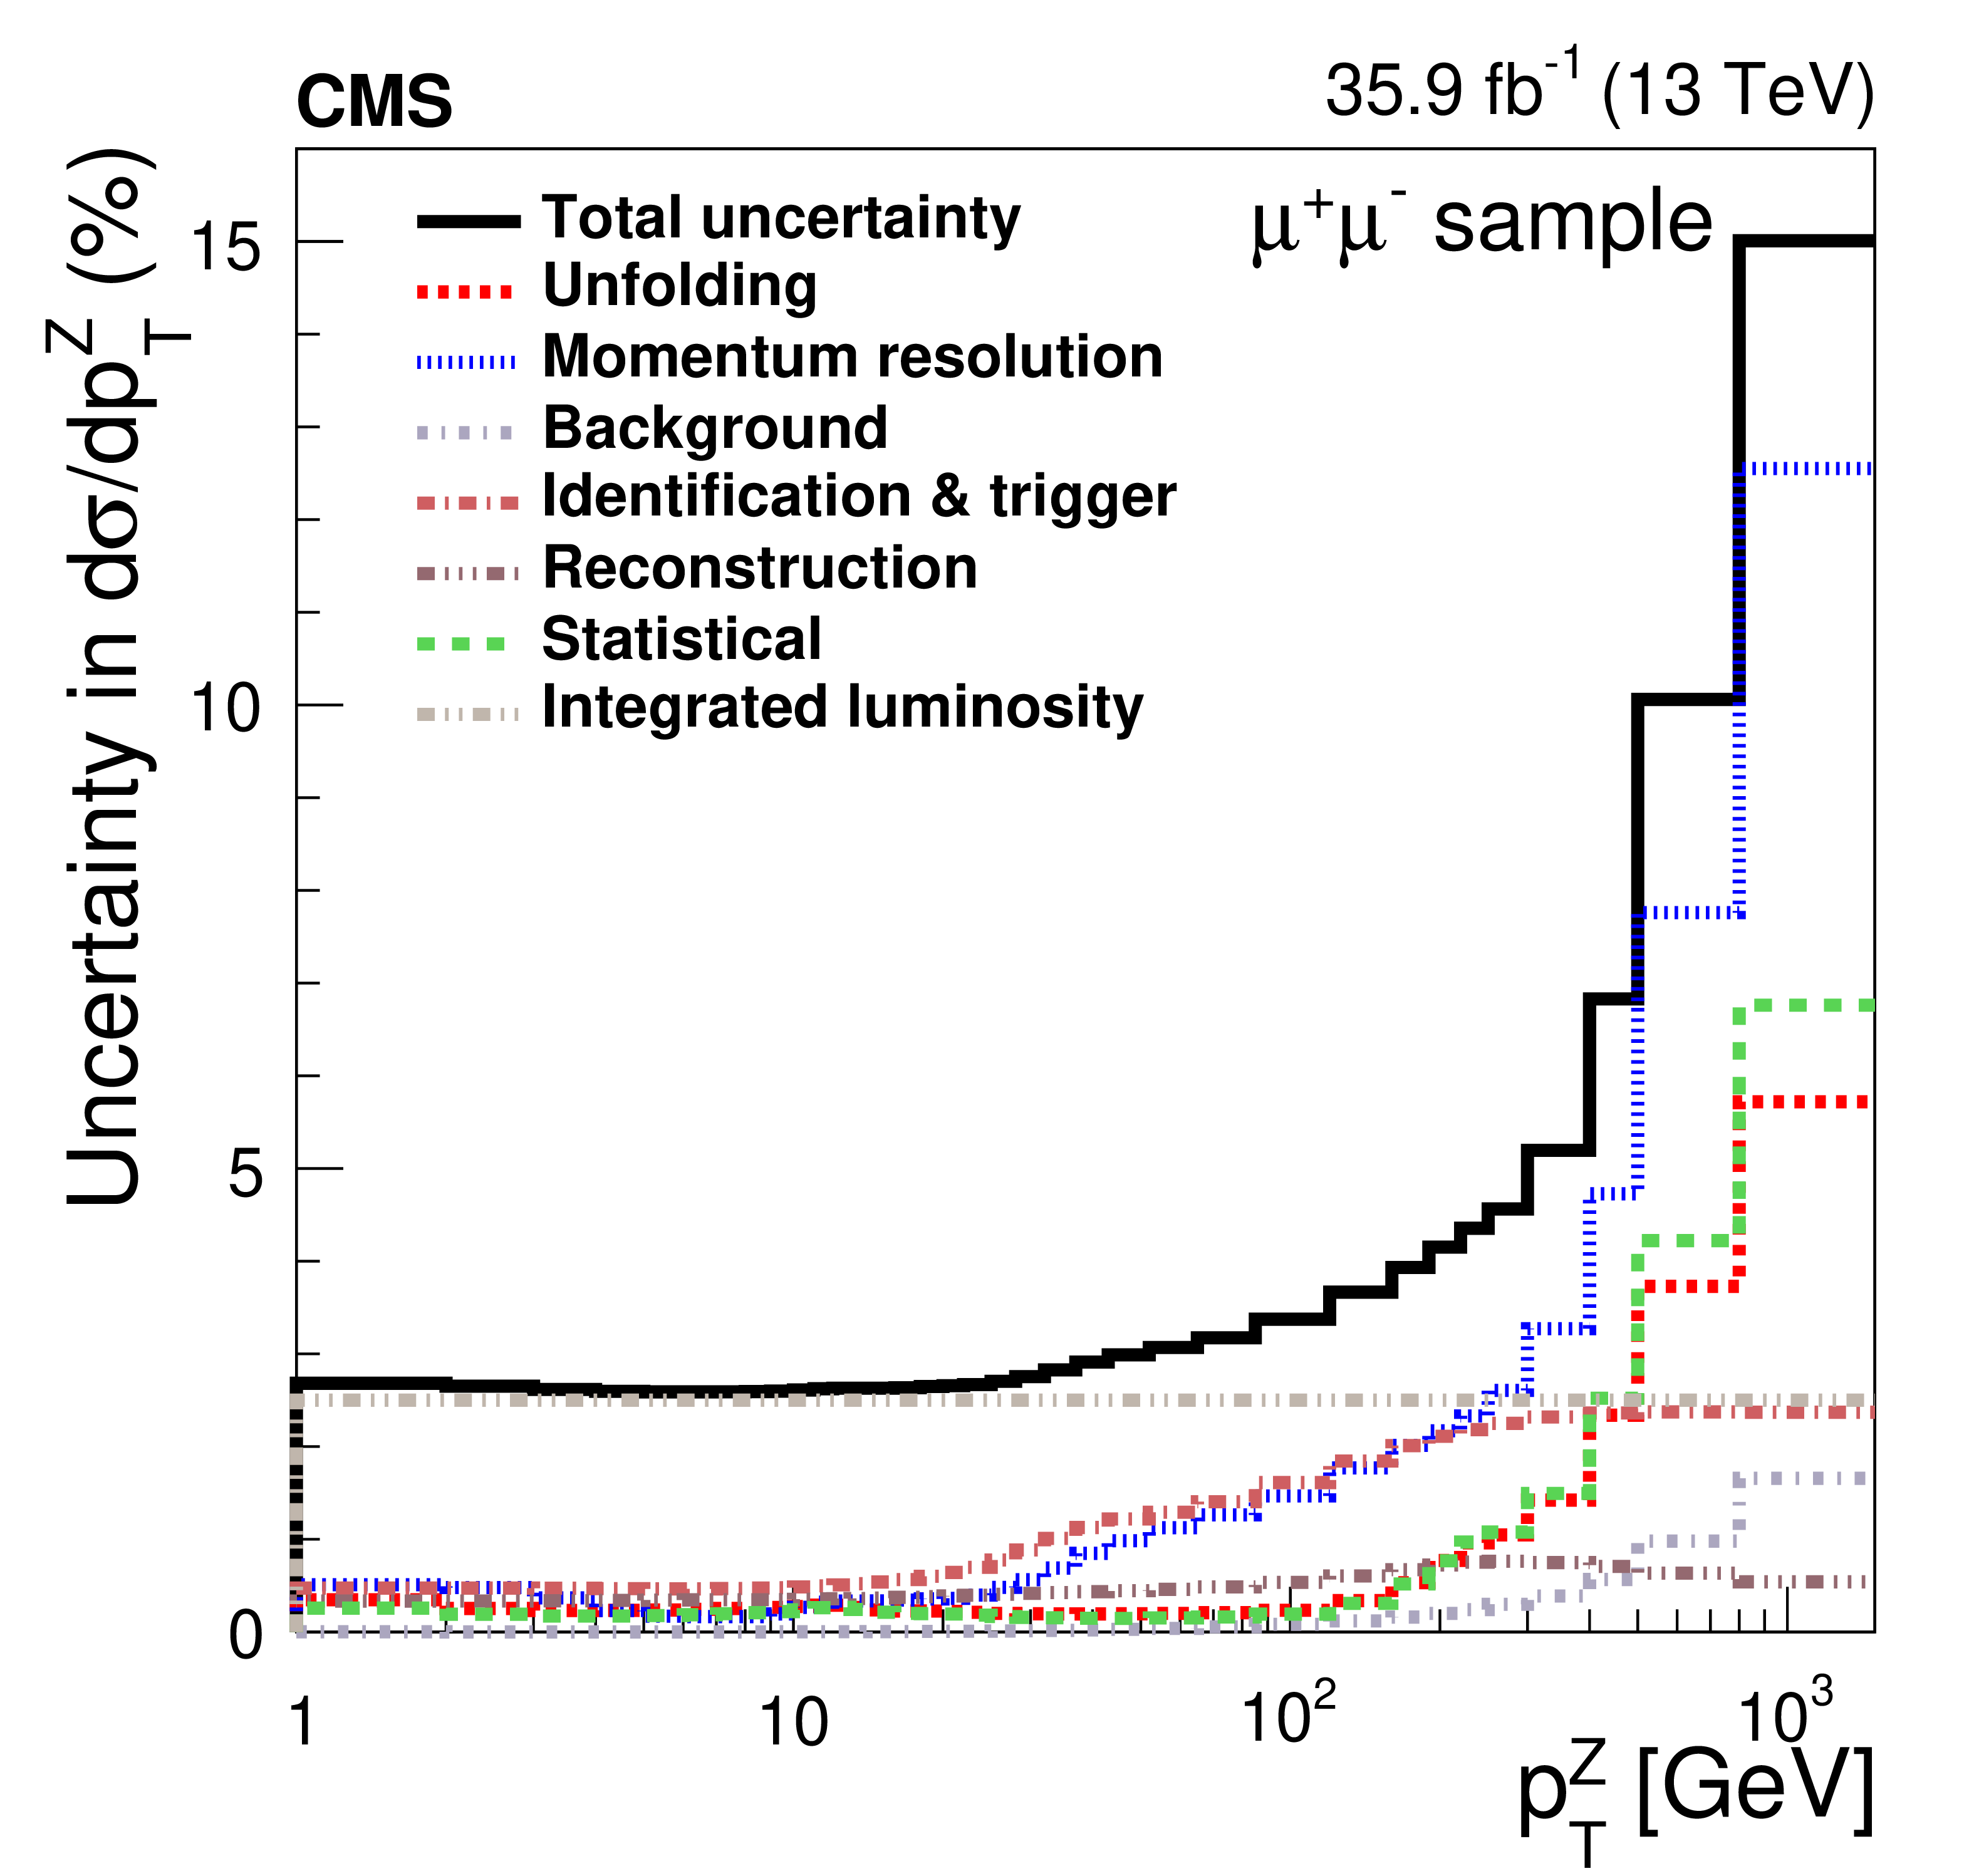
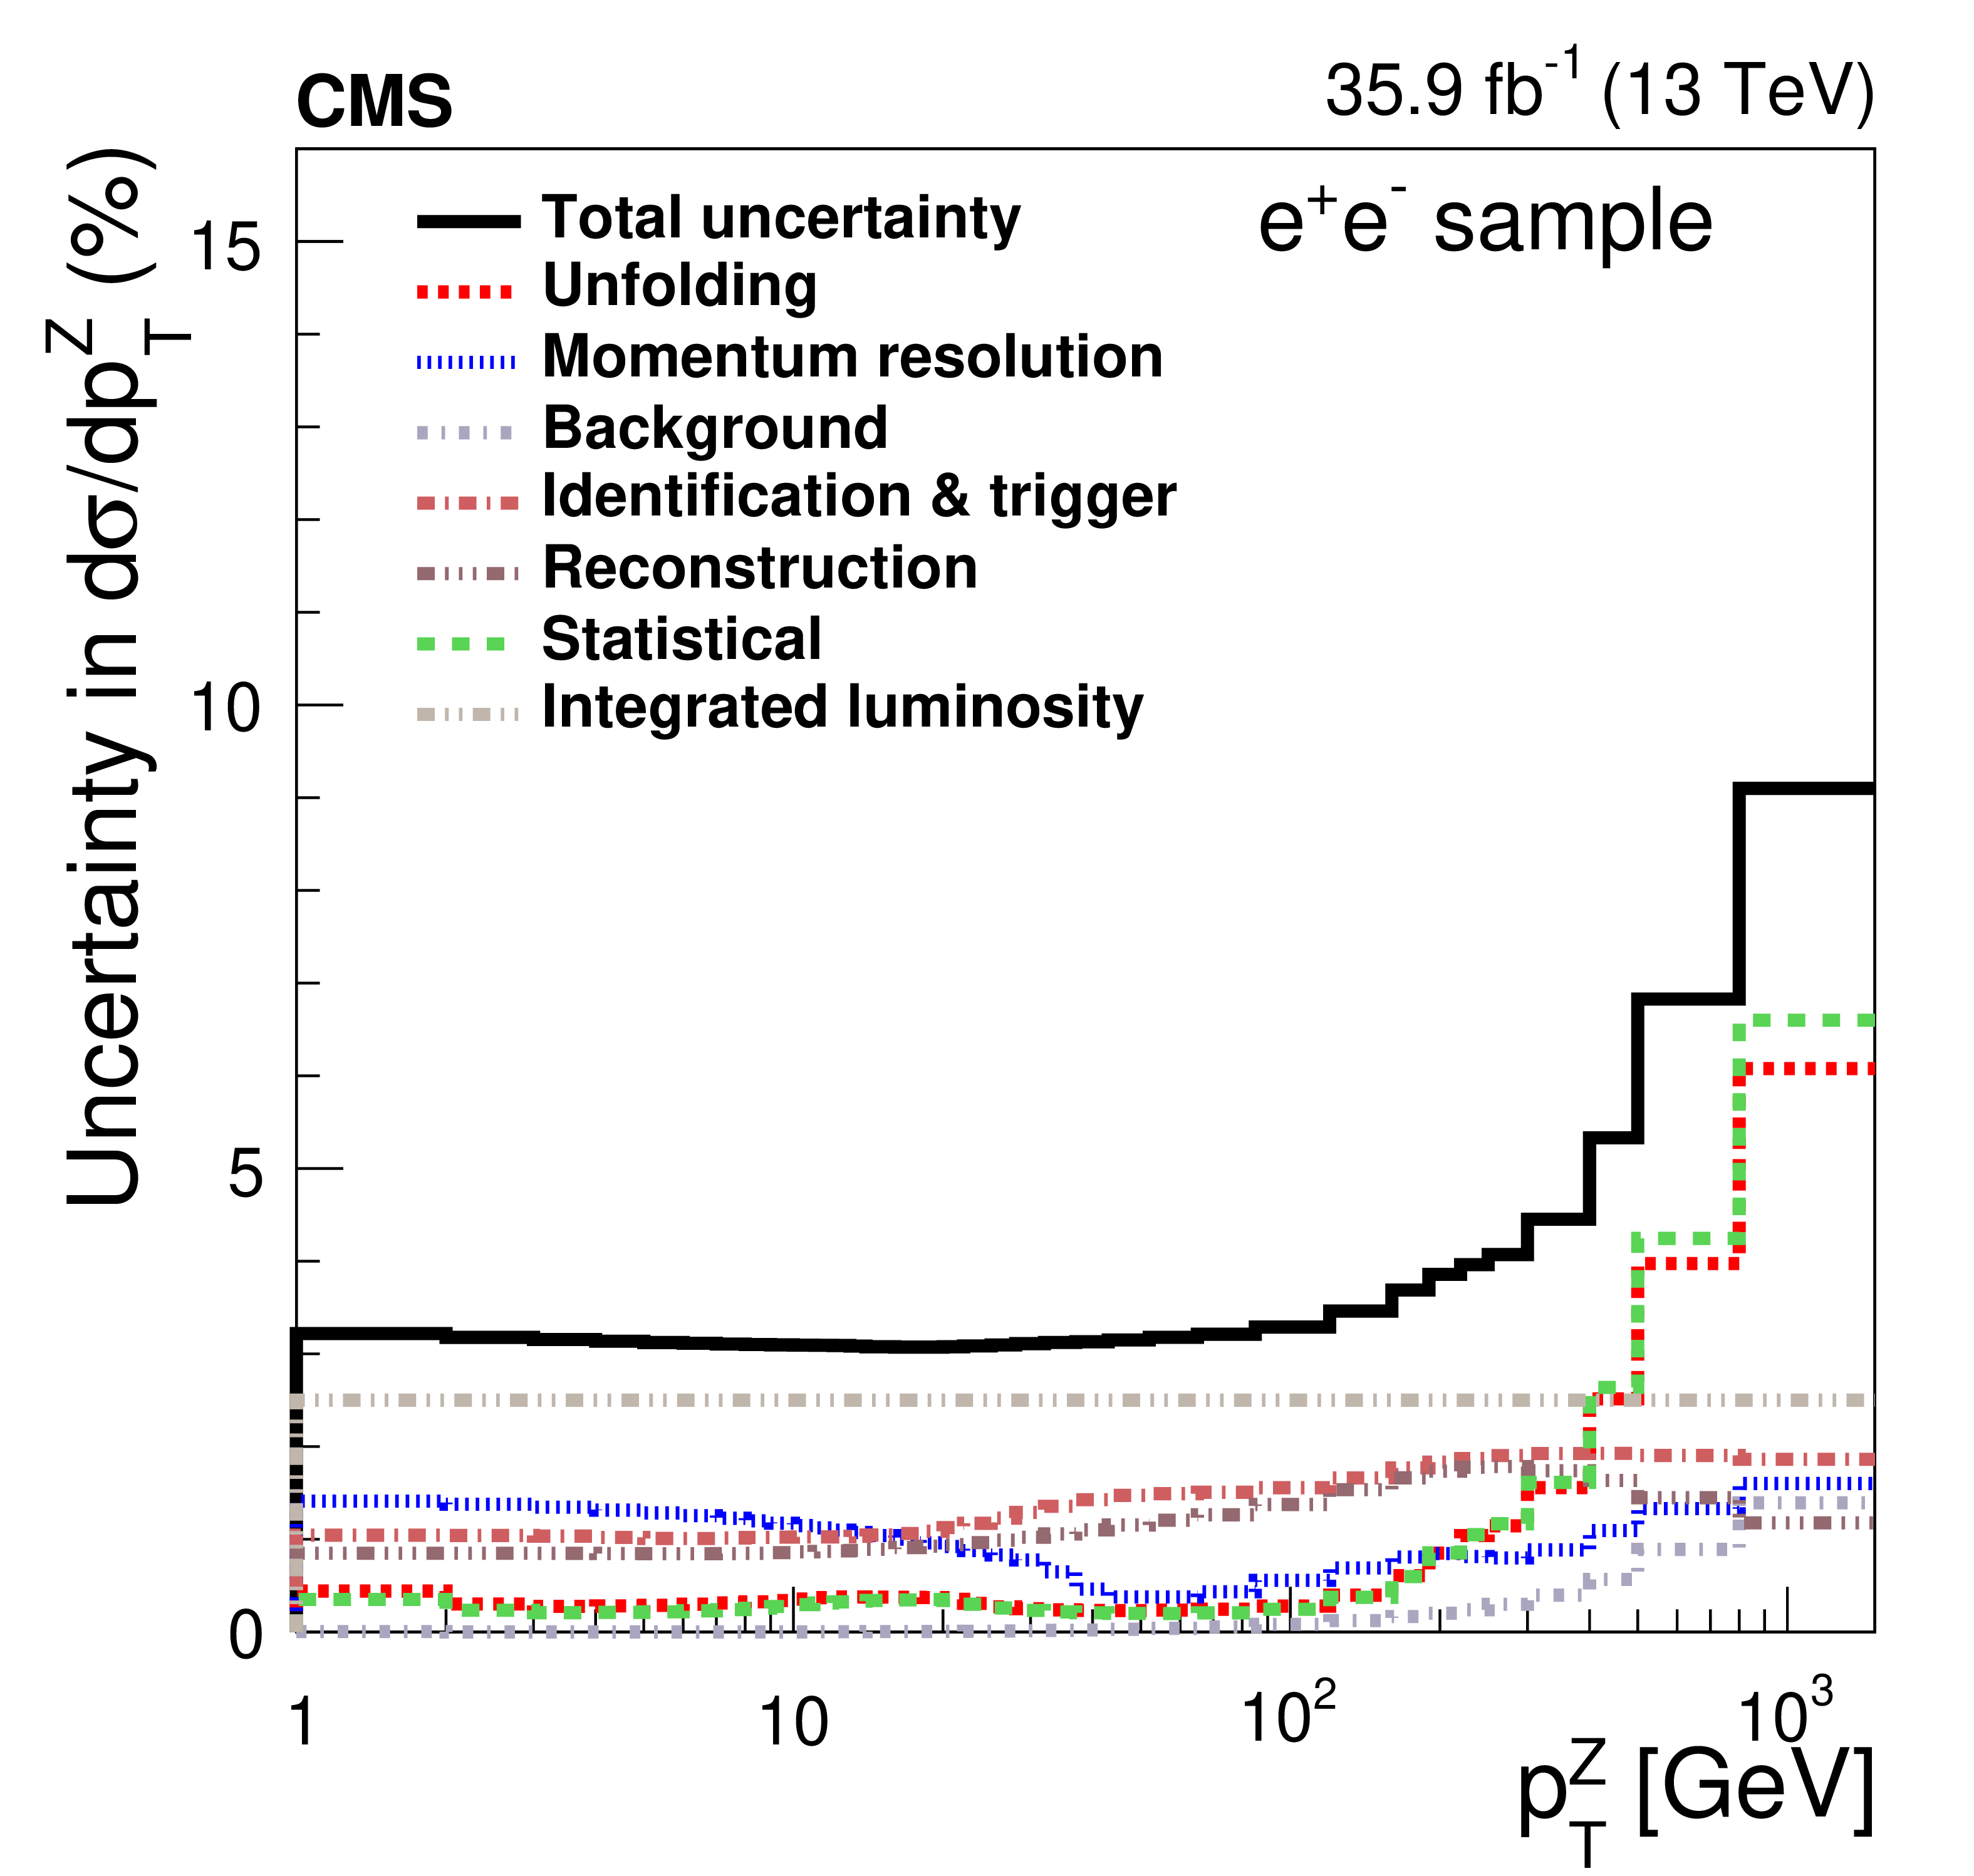
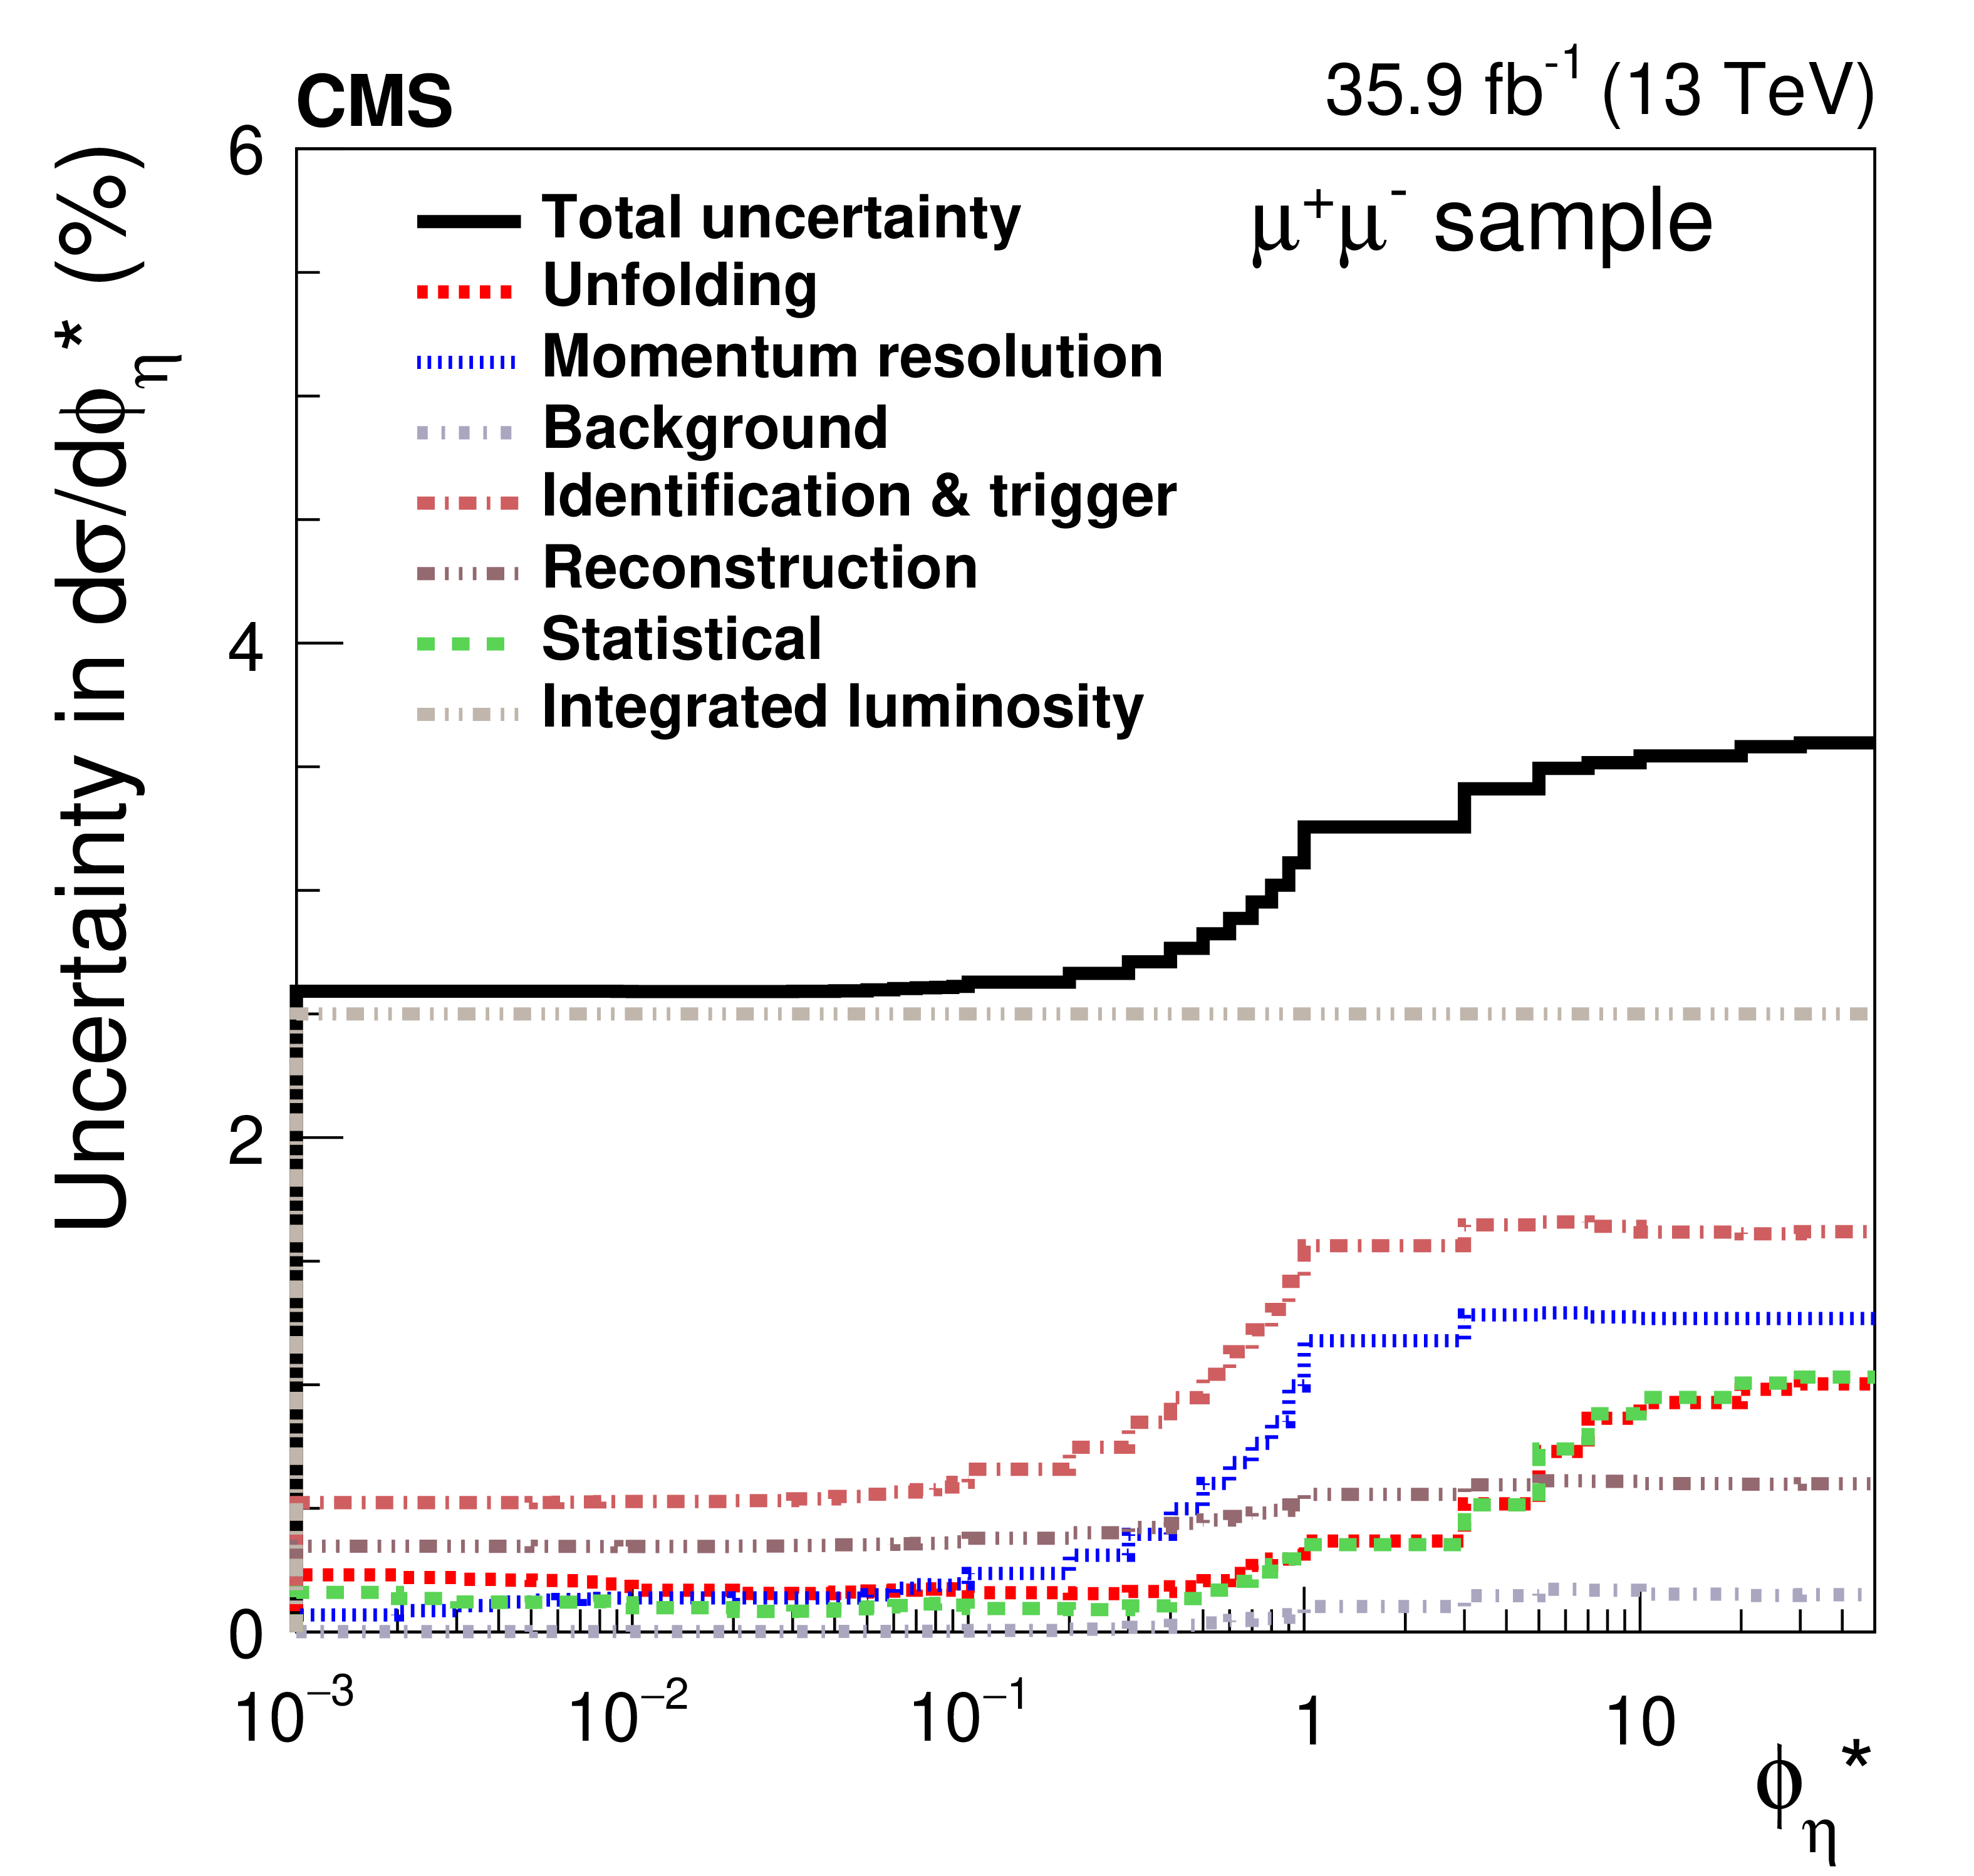
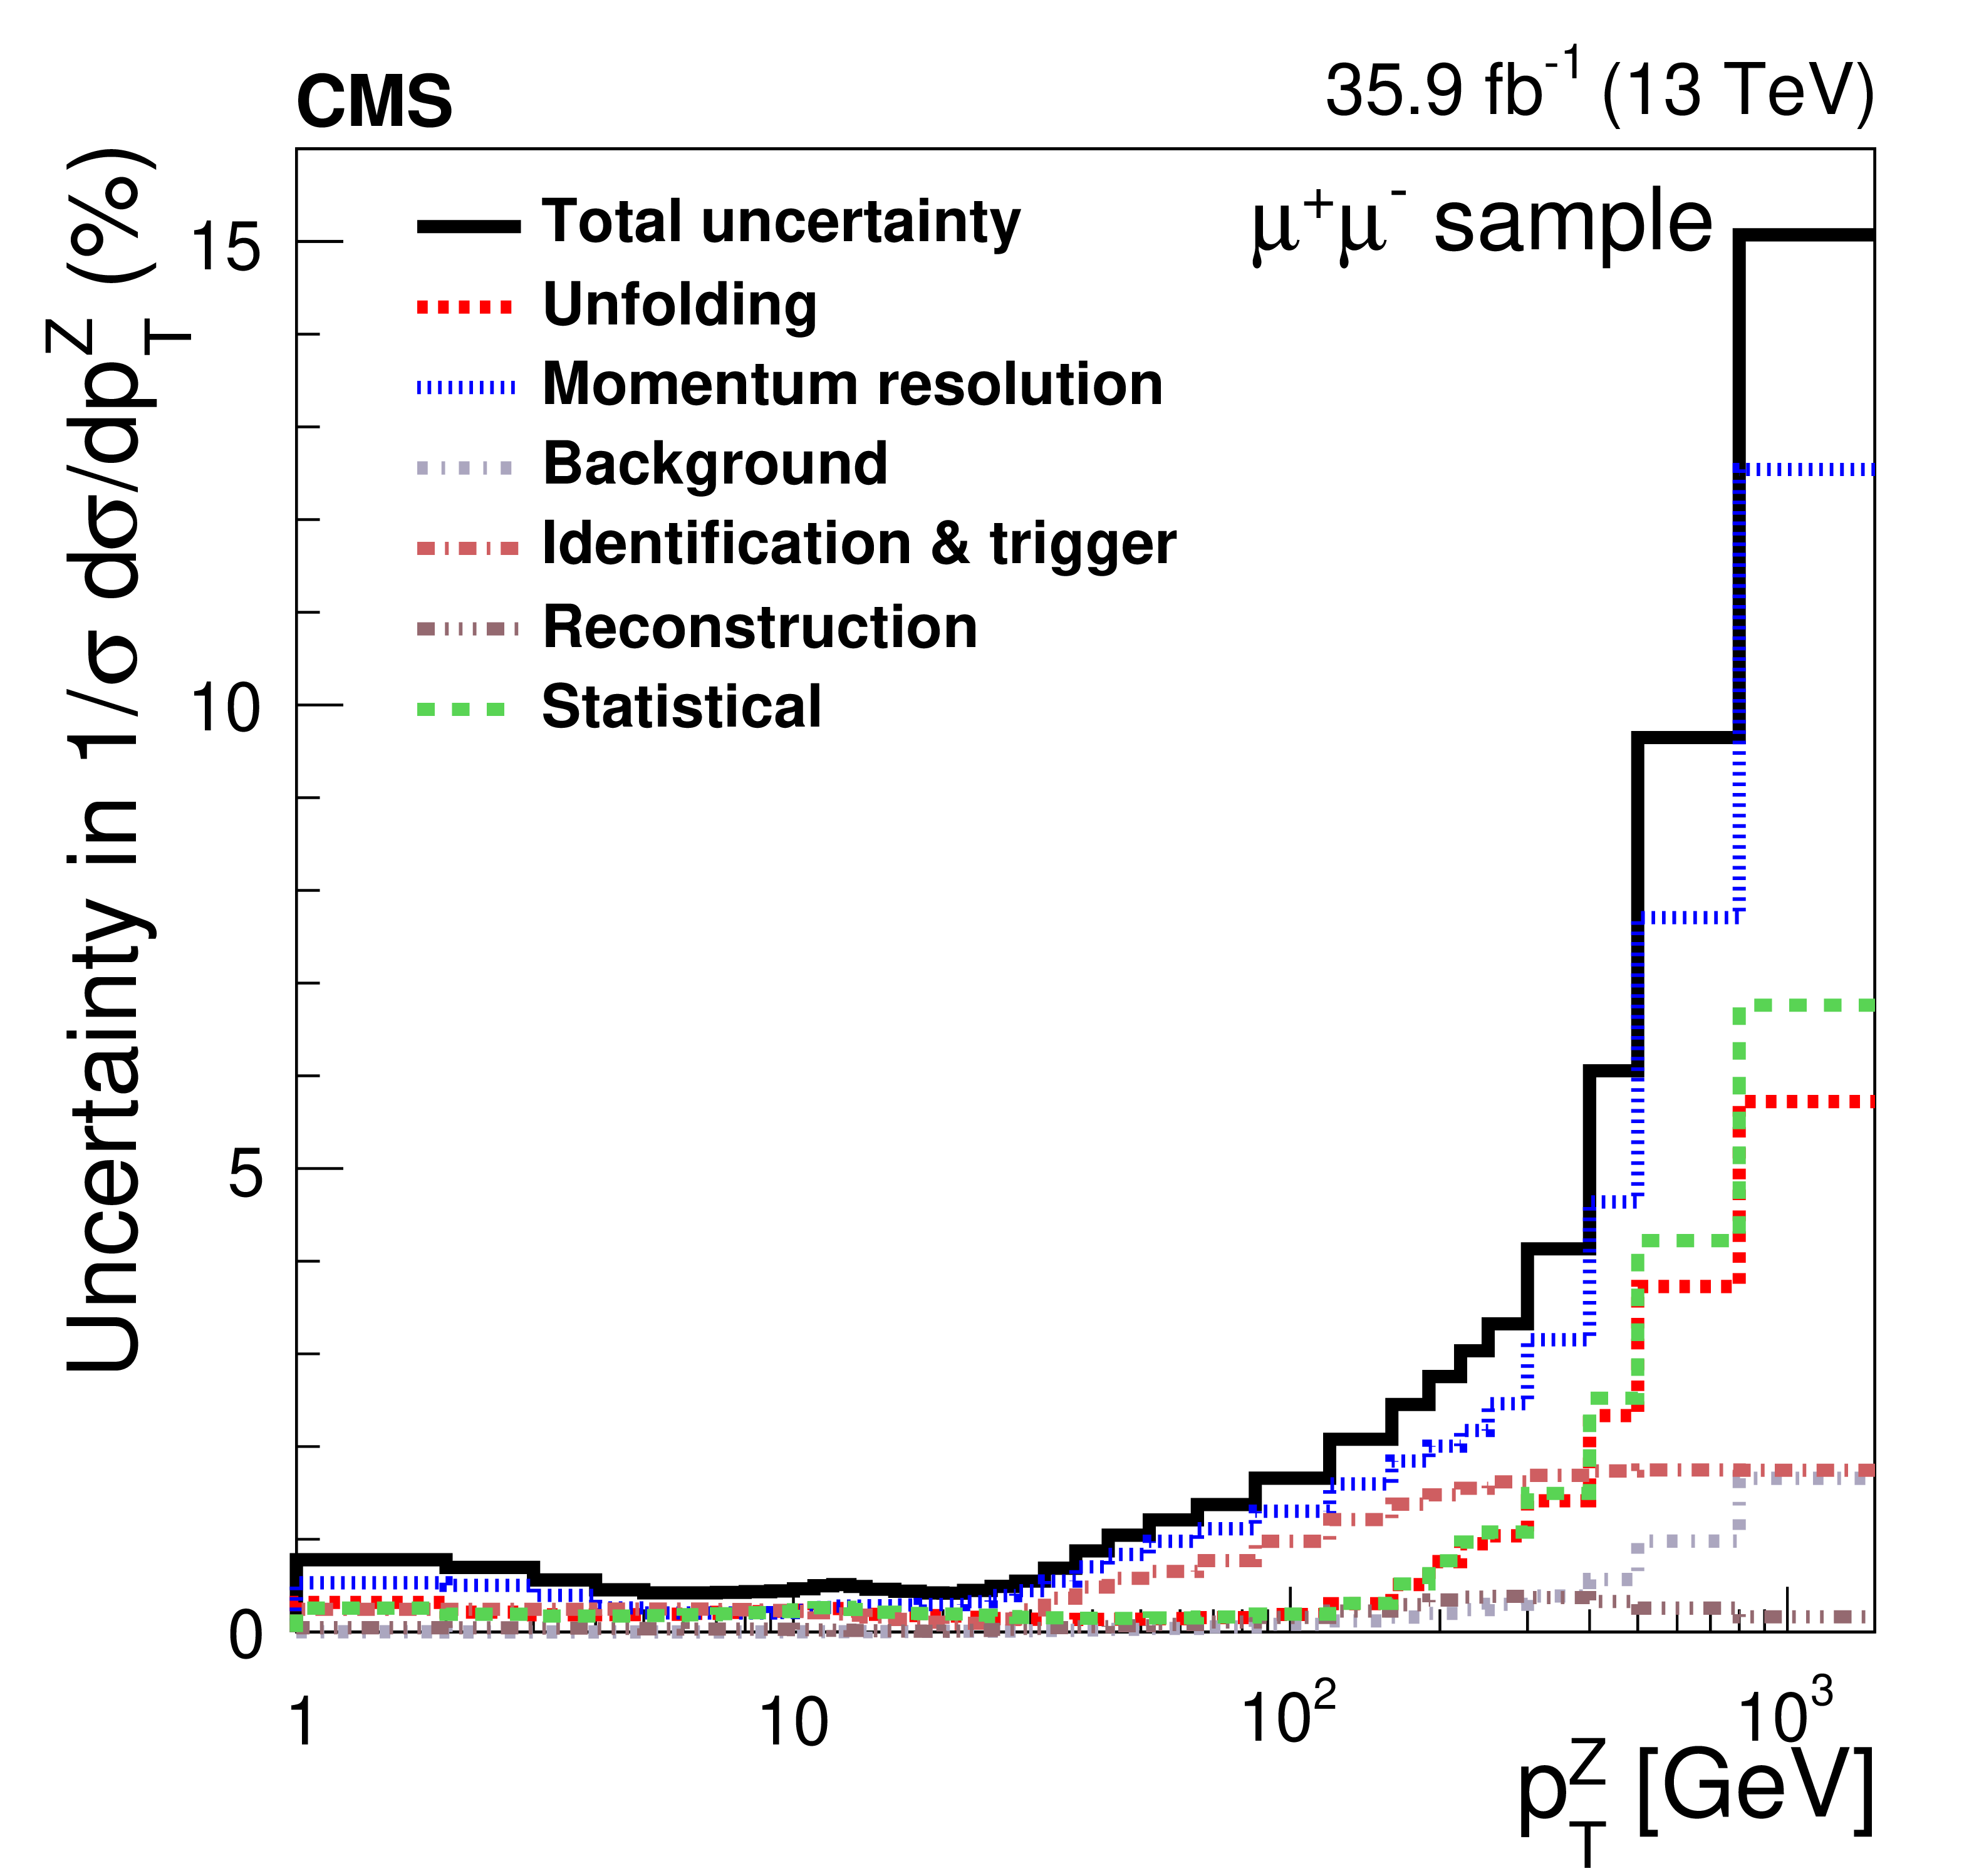
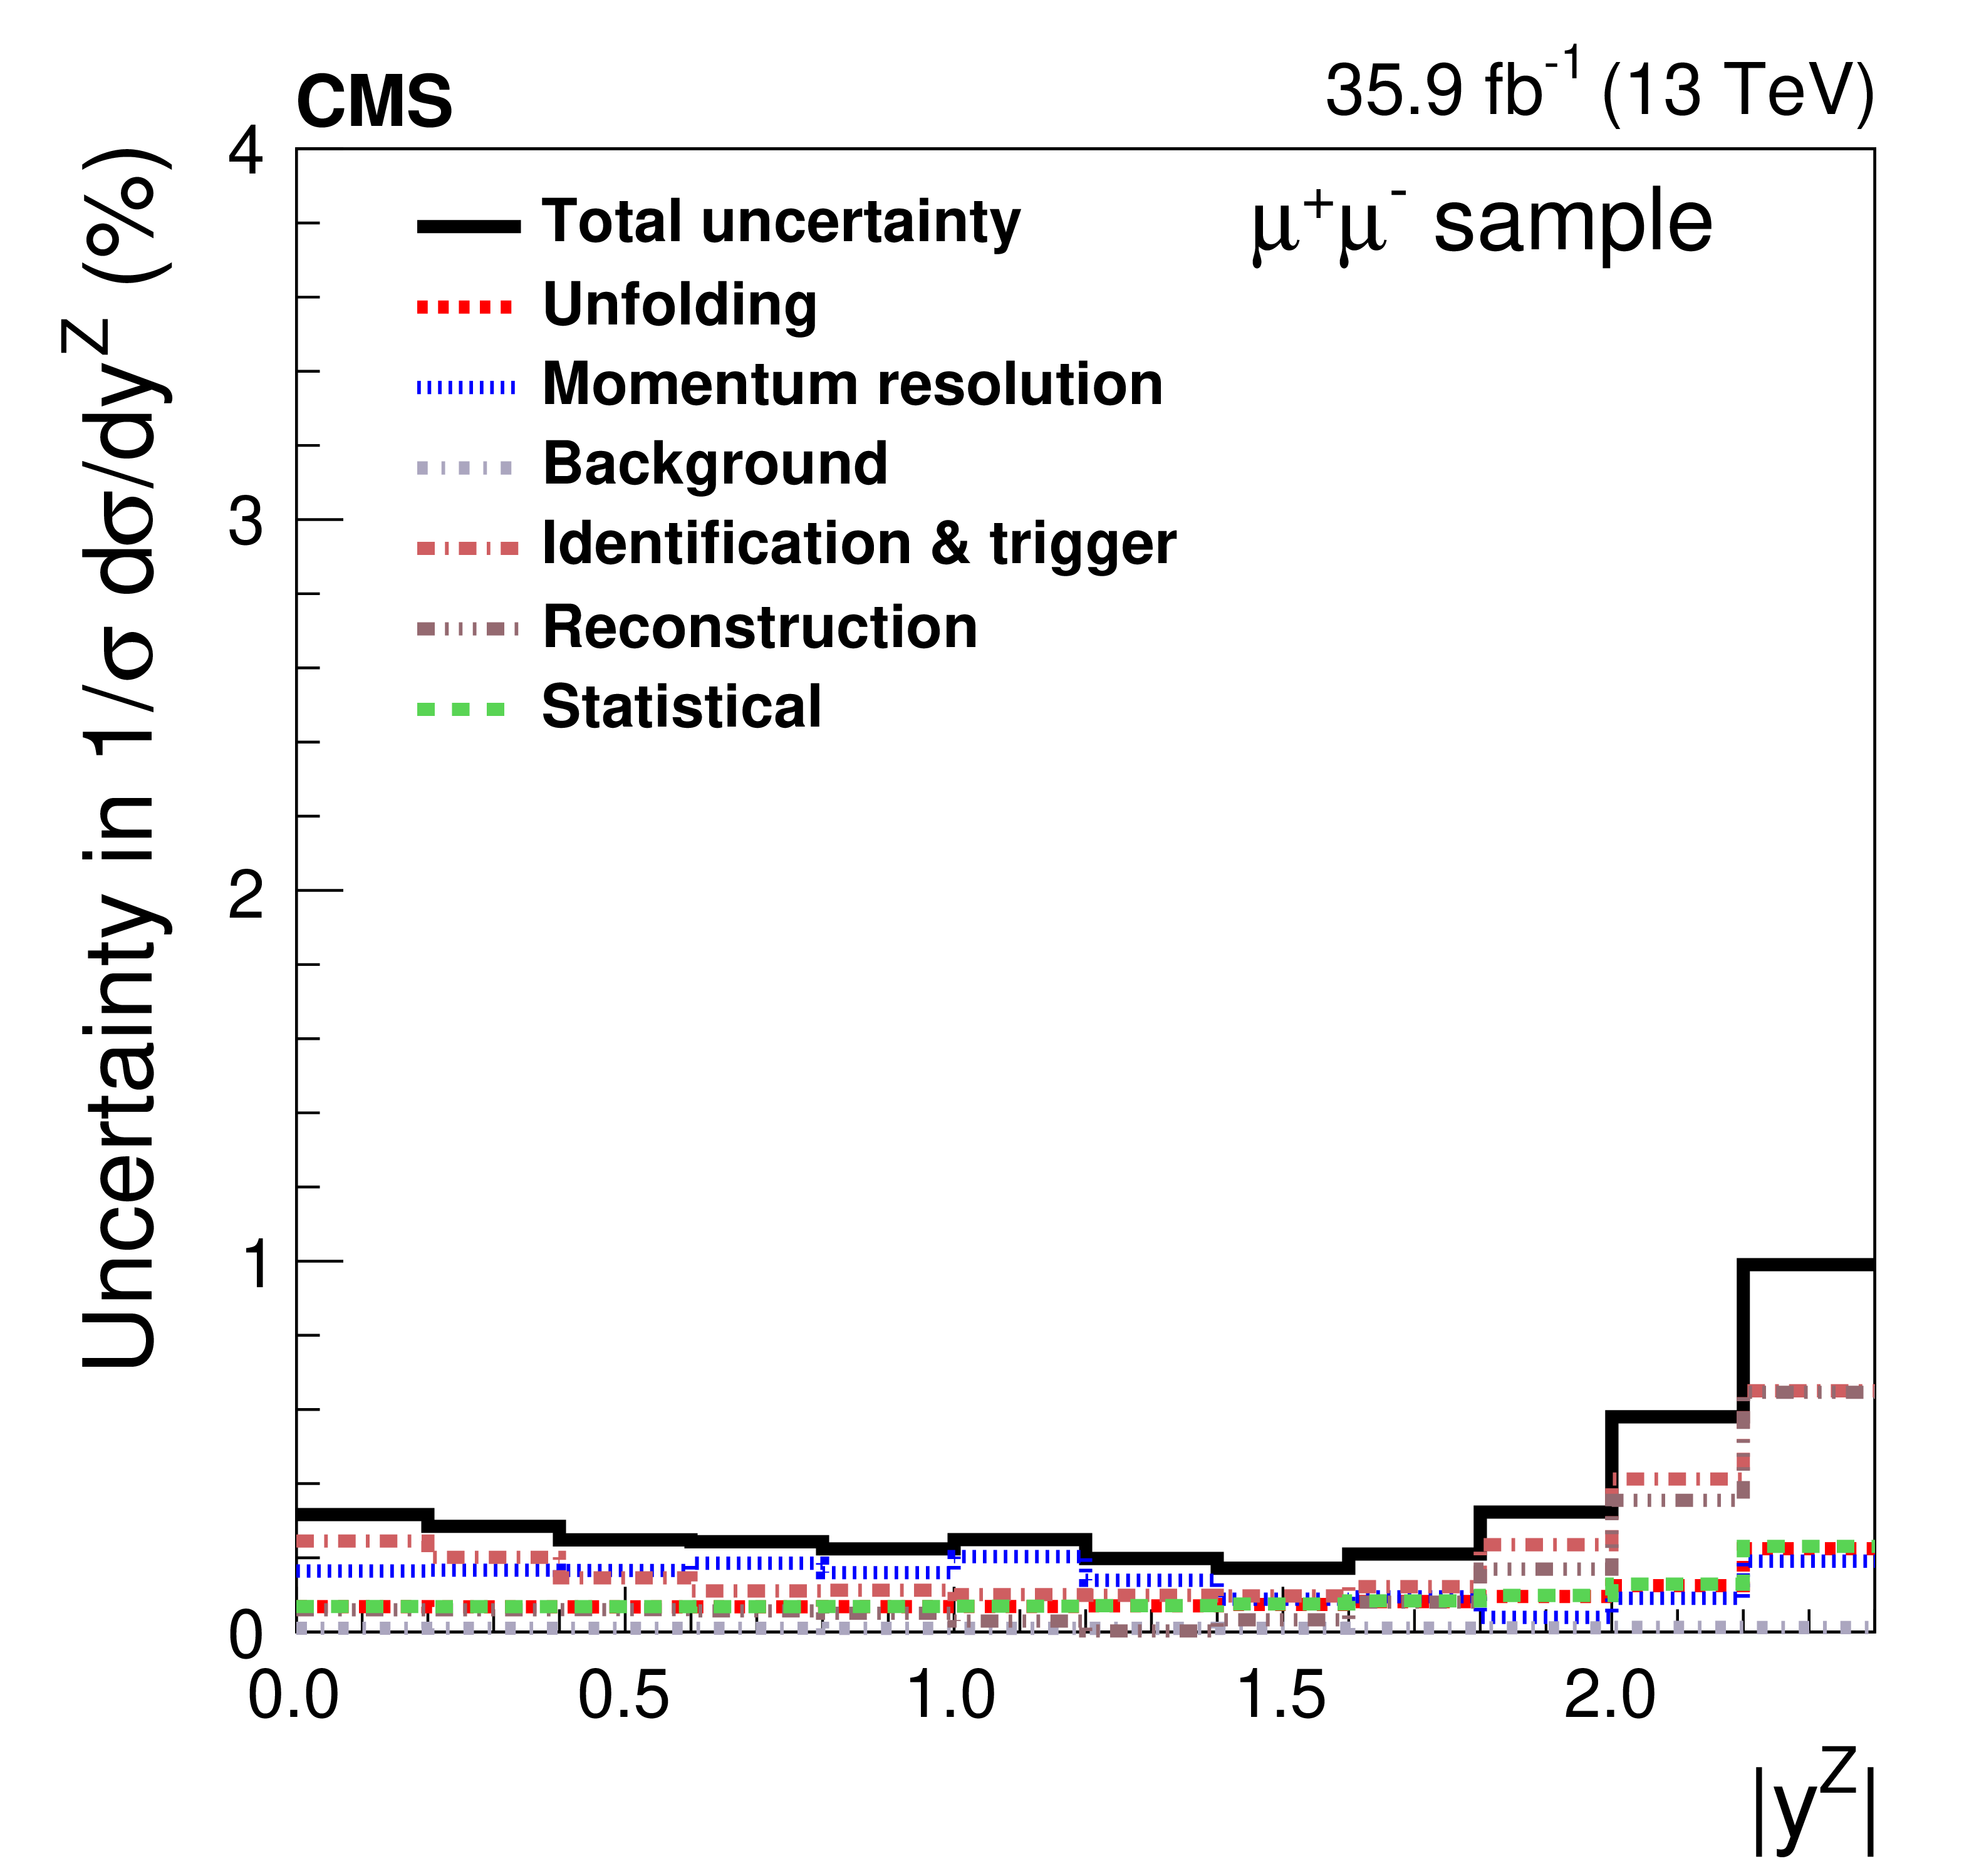
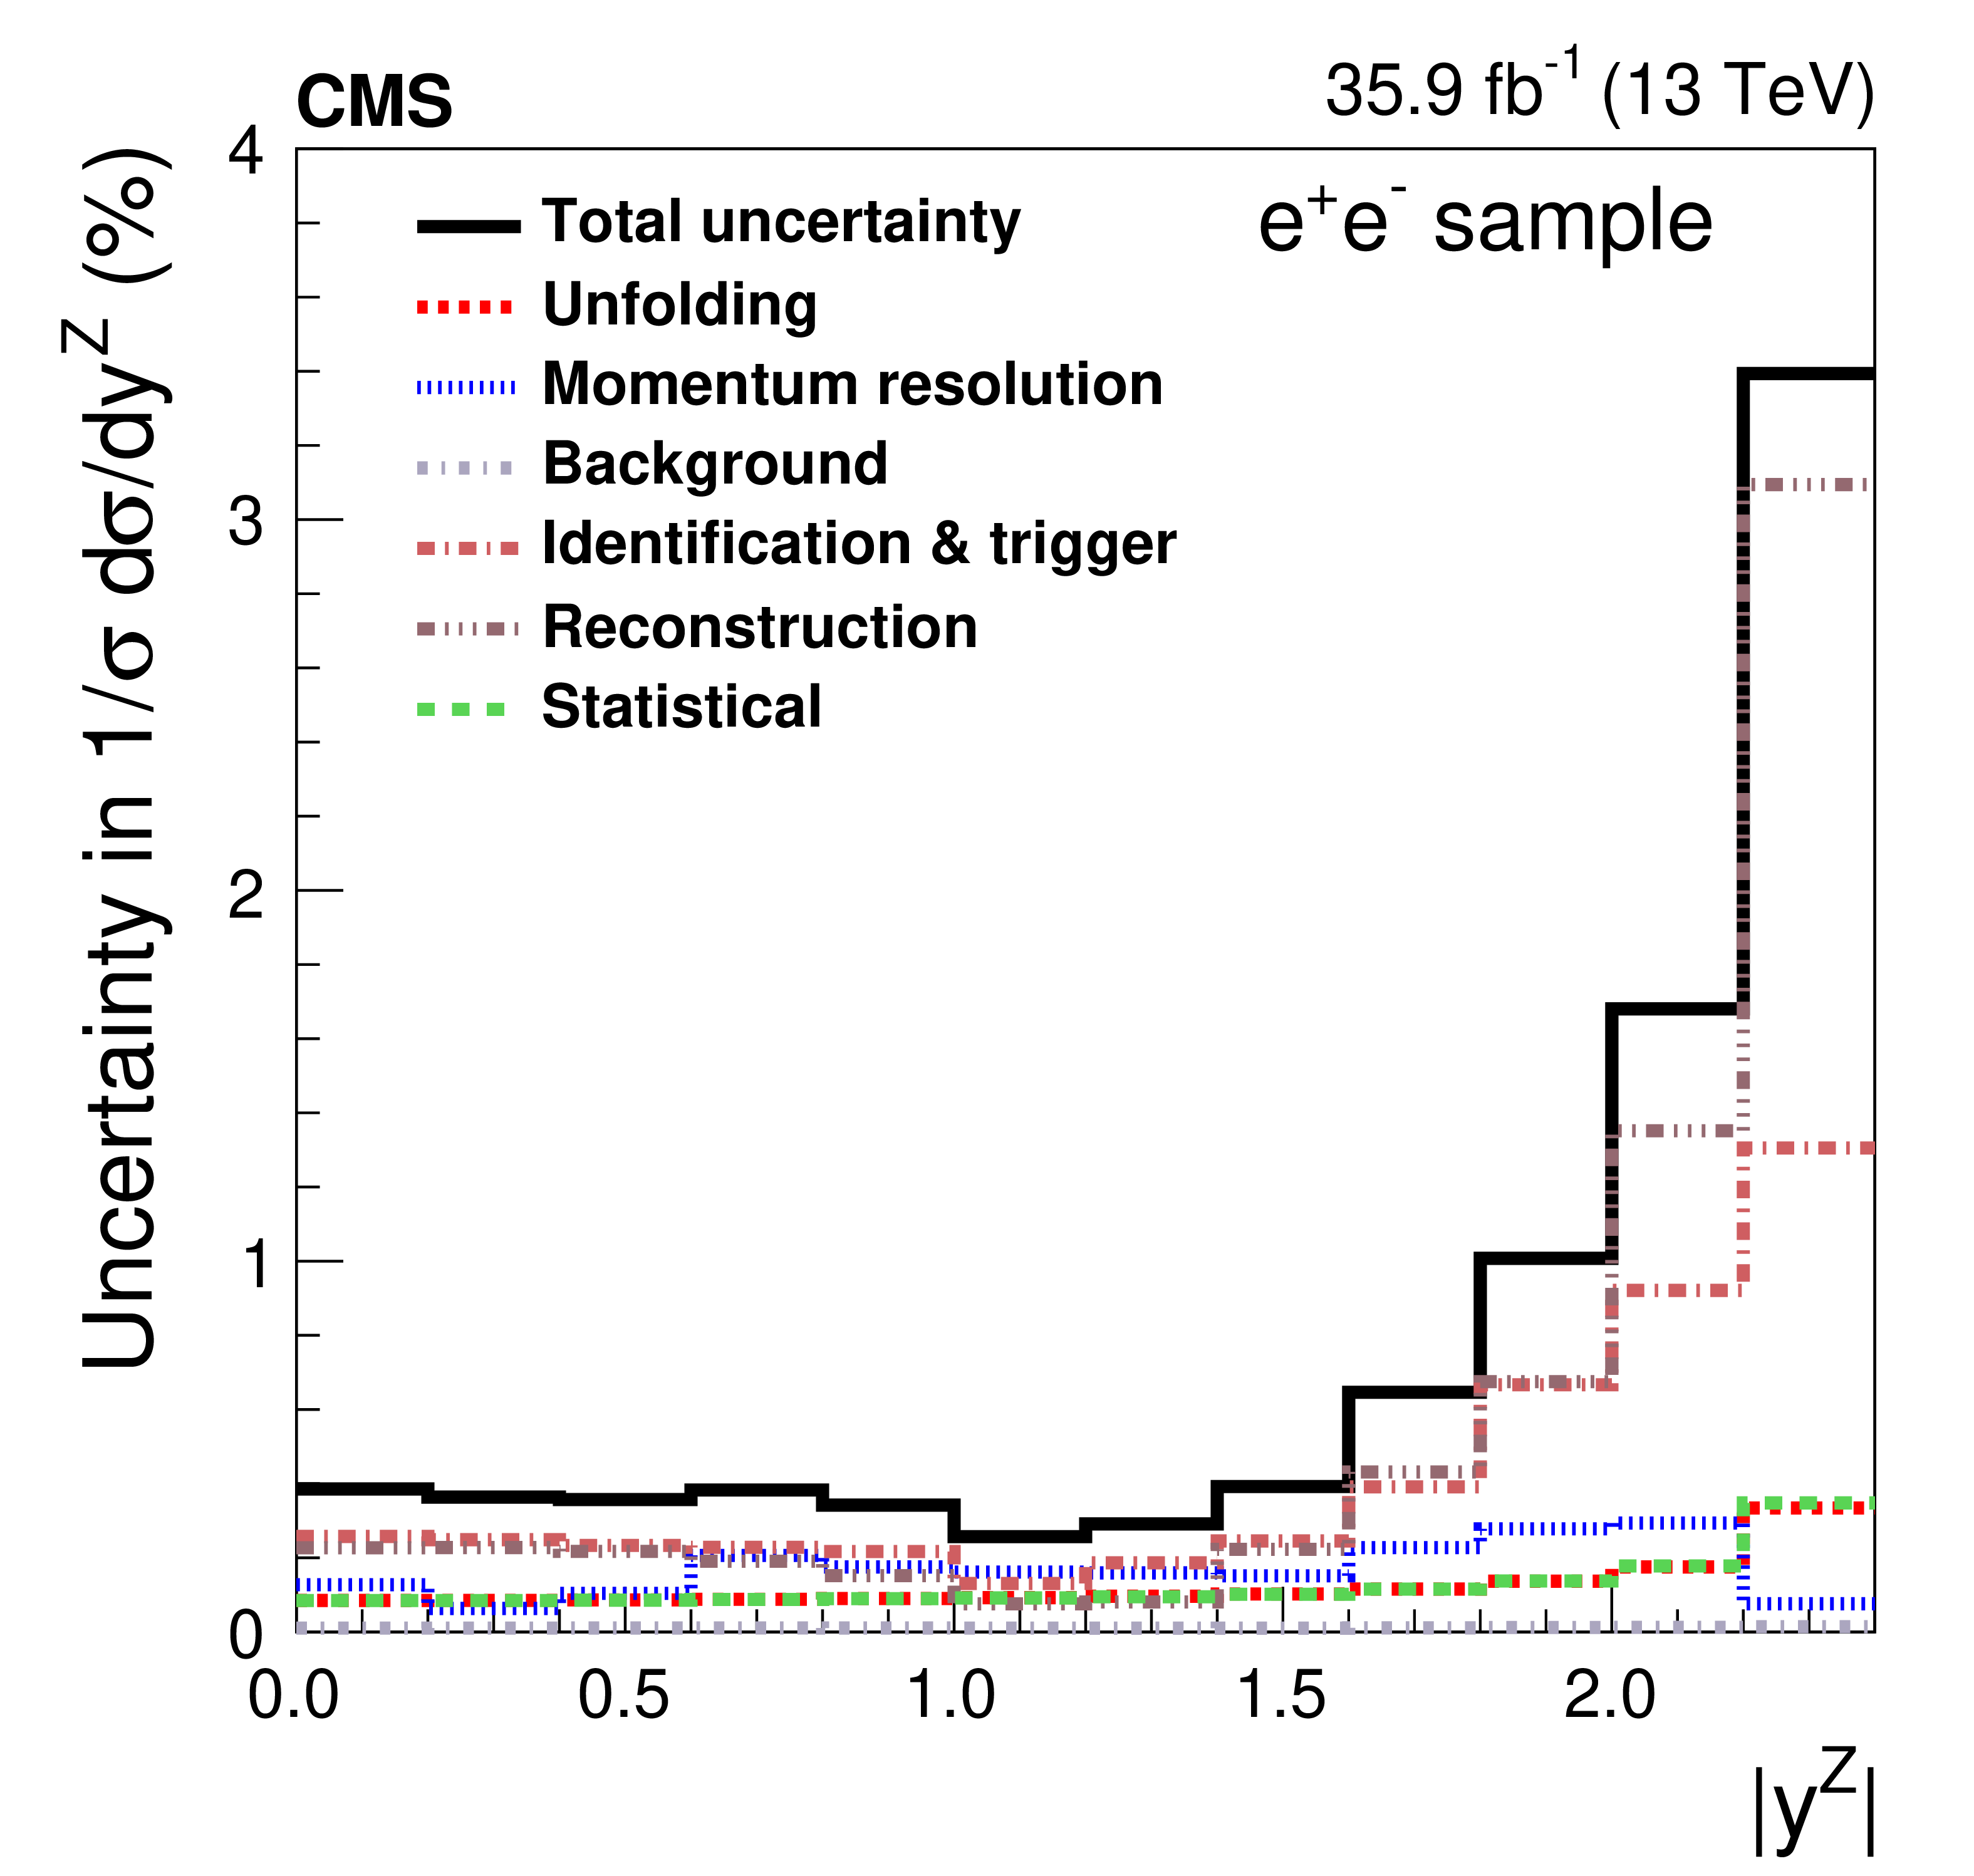
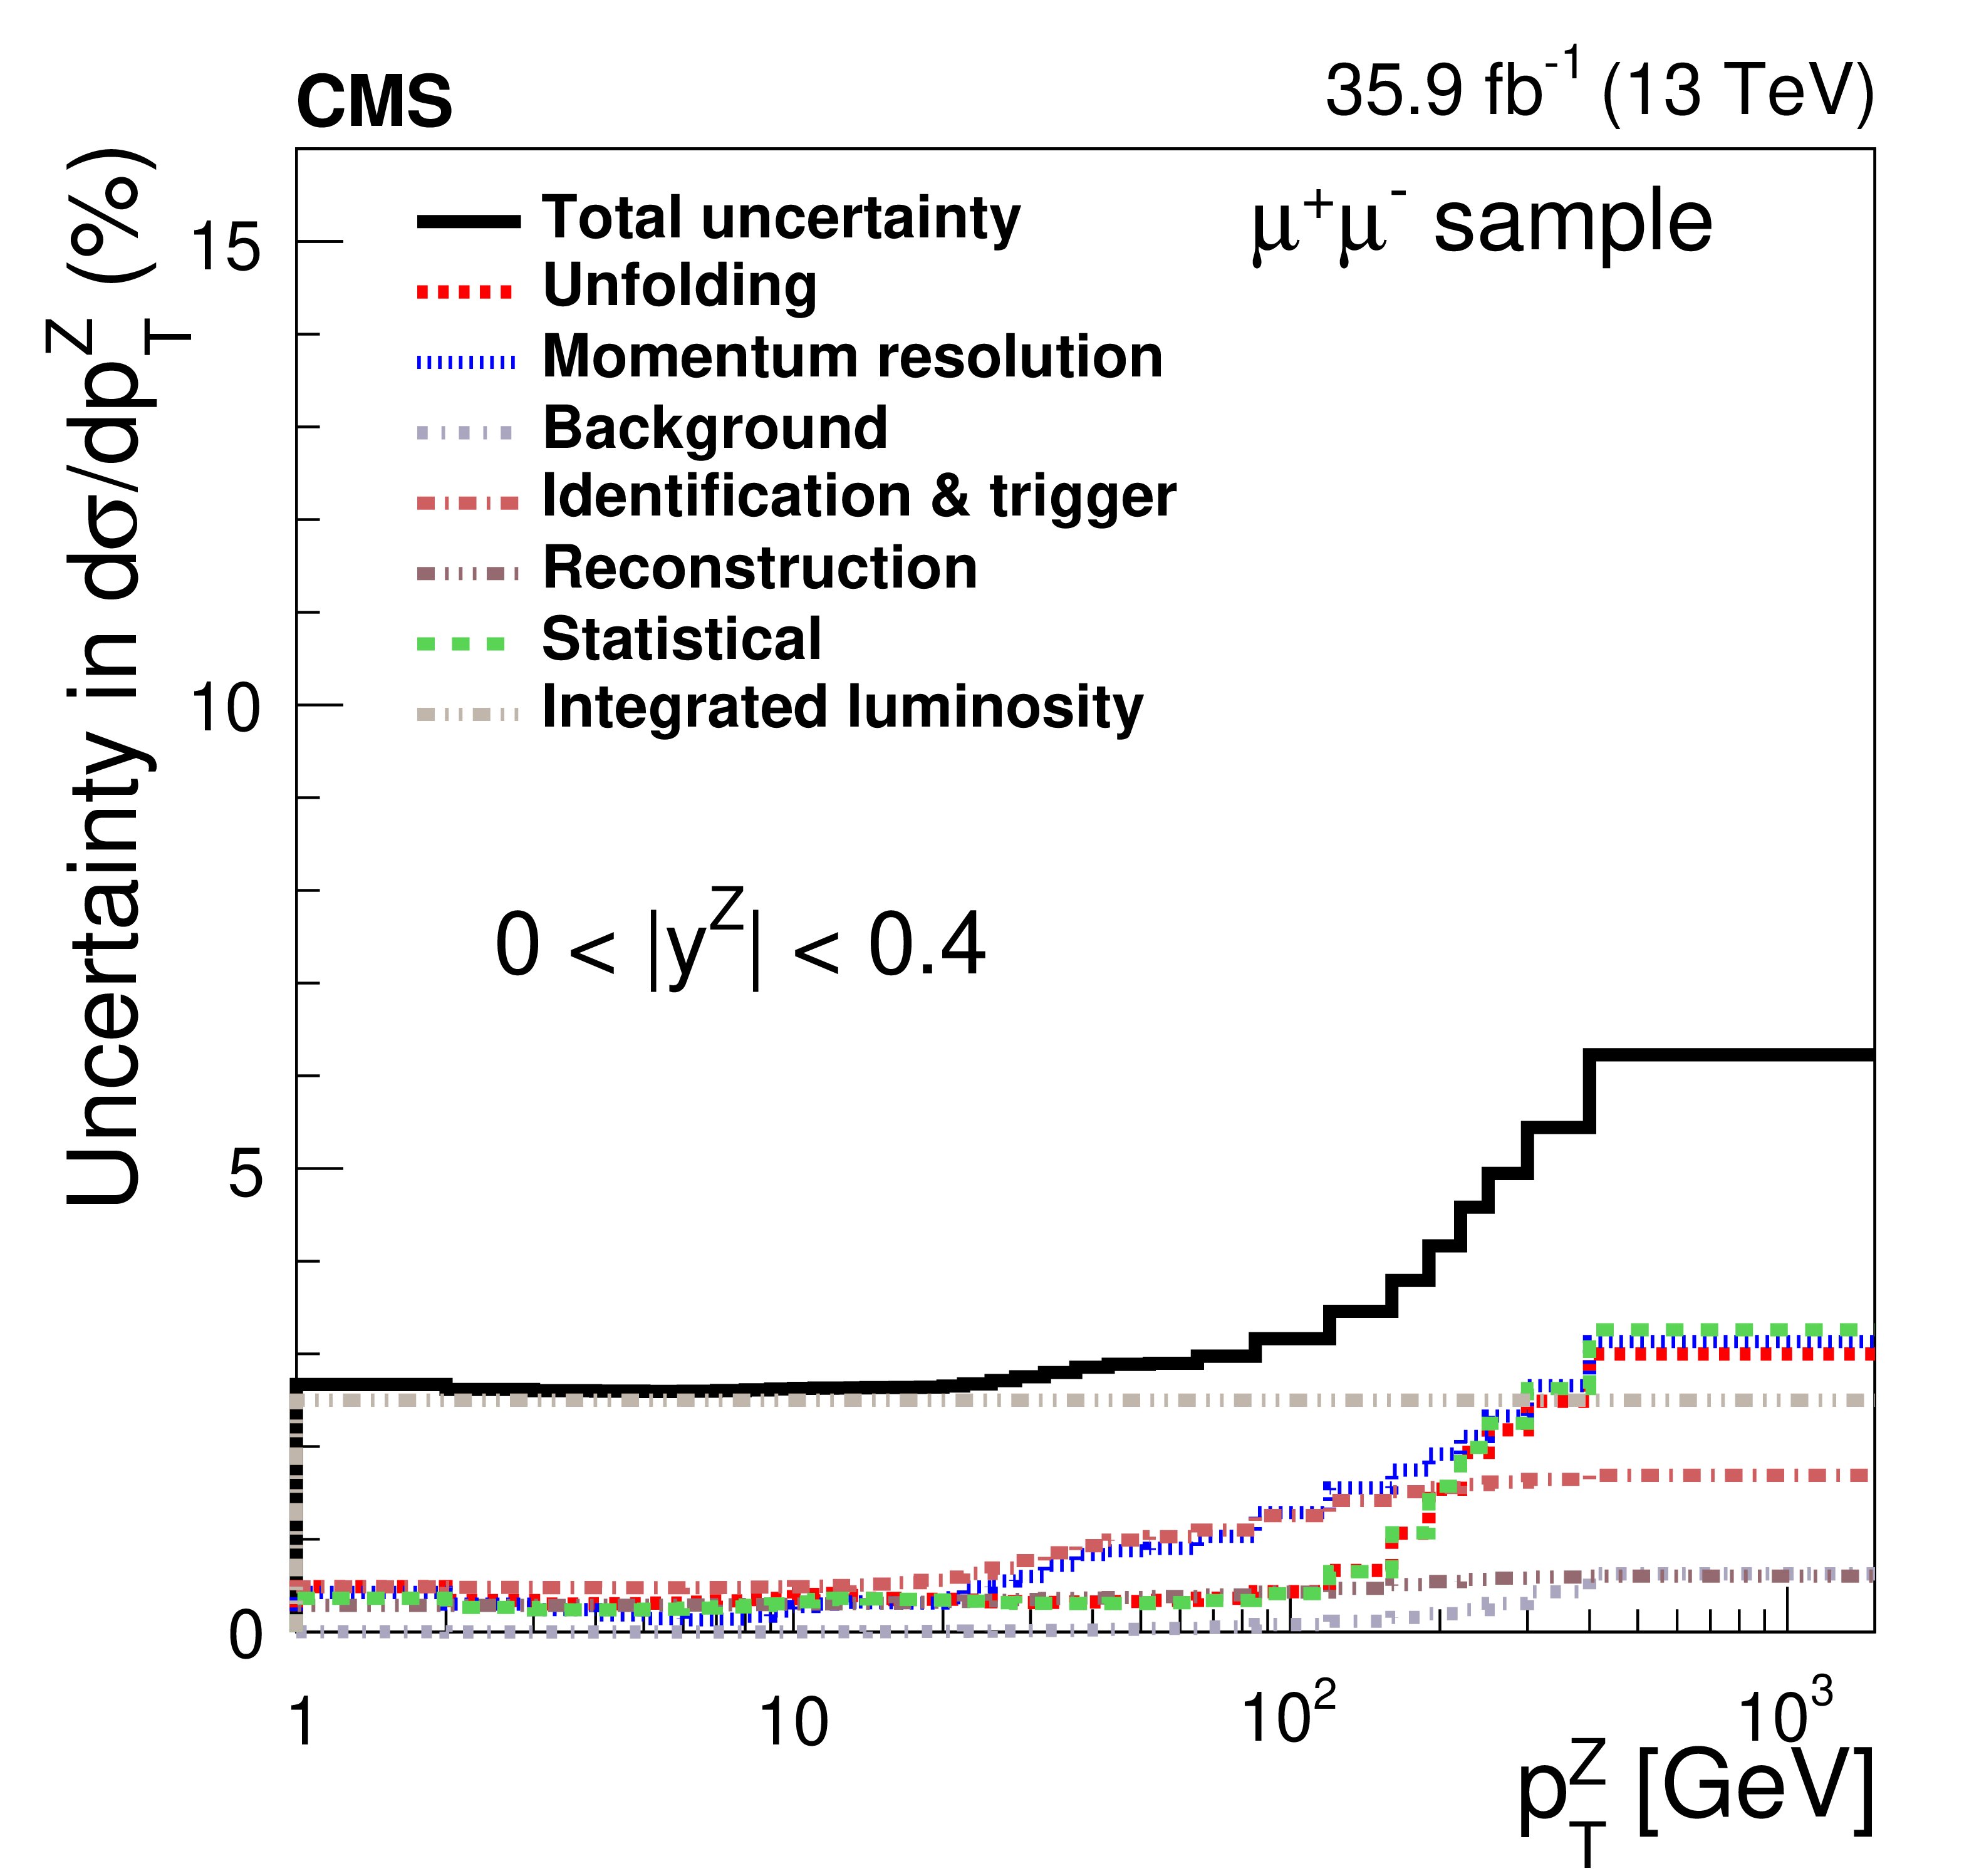
The relative statistical and systematic uncertainties from various sources for the absolute cross section measurements in bins of $ {p_{\mathrm {T}}} ^{\mathrm{Z}}$ (upper), $ {| {y}^{\mathrm{Z}} |}$ (middle), and $ {\phi ^{ *}_\eta}$ (lower). The left plots correspond to the dimuon final state and the right plots correspond to the dielectron final state. The uncertainty in the trigger efficiency is included as part of the lepton identification uncertainty. |
png pdf |
Figure 1-a:
The relative statistical and systematic uncertainties from various sources for the absolute cross section measurements in bins of $ {p_{\mathrm {T}}} ^{\mathrm{Z}}$, in the dimuon final state. The uncertainty in the trigger efficiency is included as part of the lepton identification uncertainty. |
png pdf |
Figure 1-b:
The relative statistical and systematic uncertainties from various sources for the absolute cross section measurements in bins of $ {p_{\mathrm {T}}} ^{\mathrm{Z}}$, in the dielectron final state. The uncertainty in the trigger efficiency is included as part of the lepton identification uncertainty. |
png pdf |
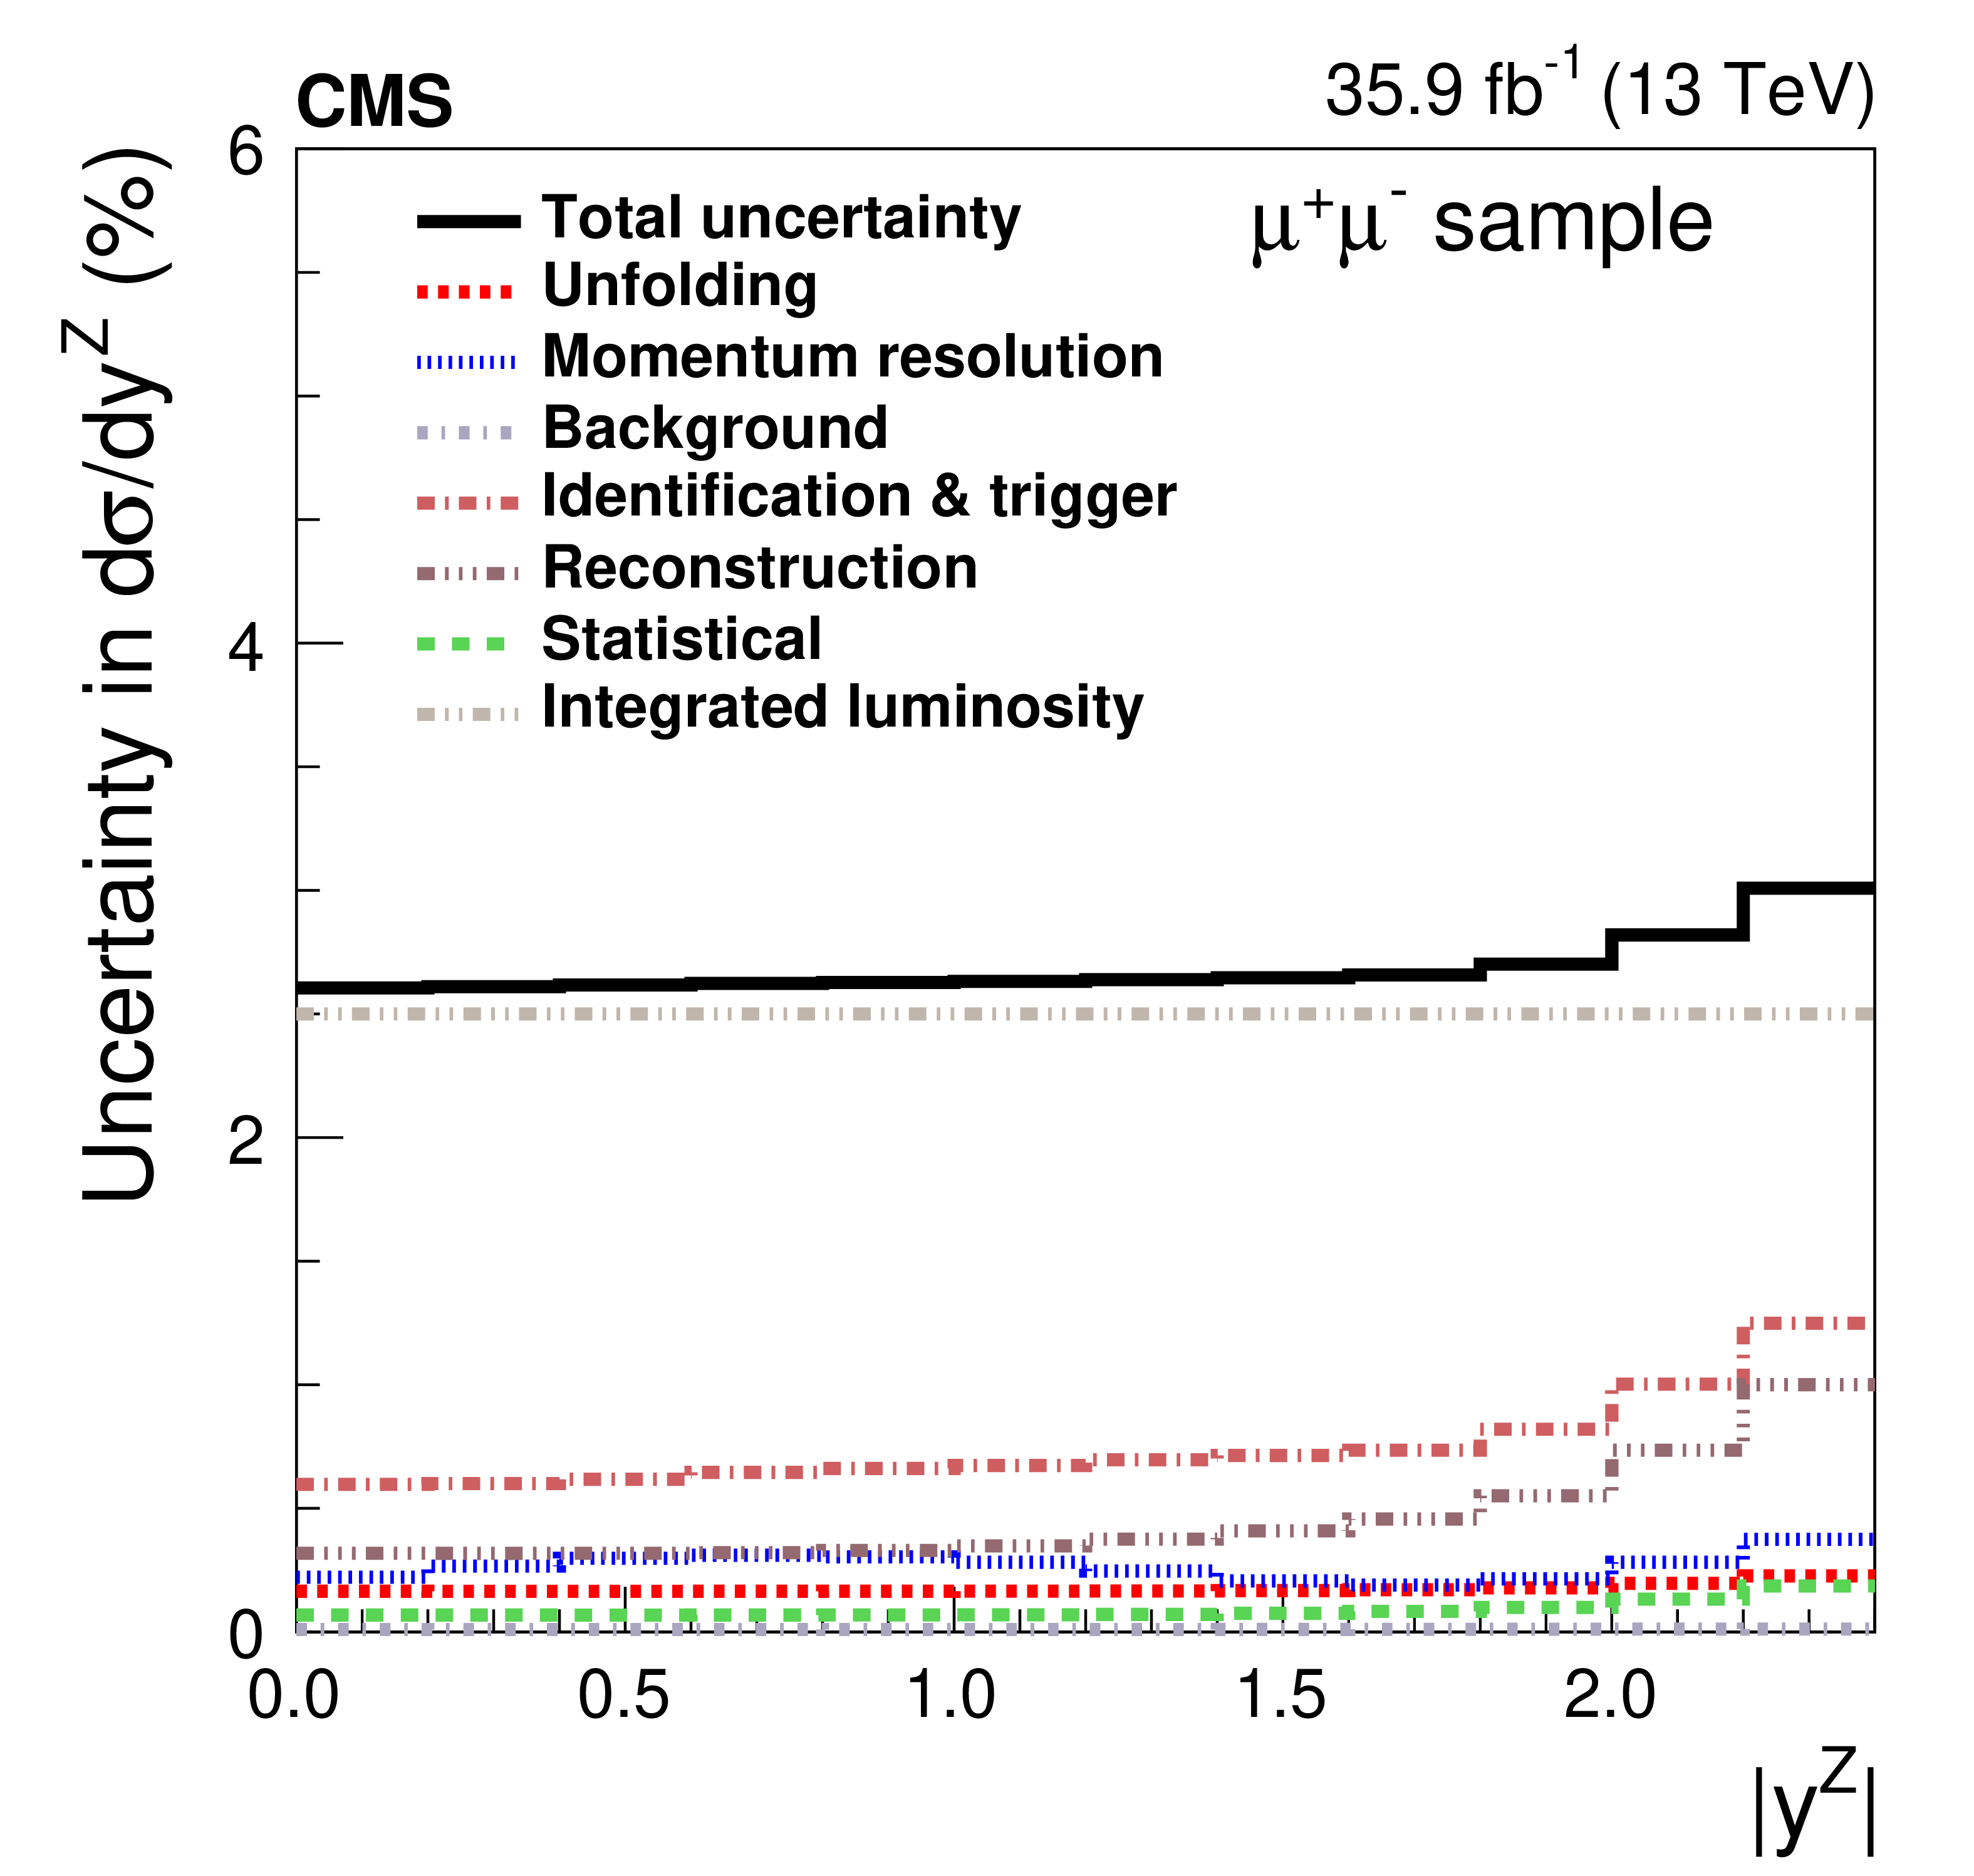
Figure 1-c:
The relative statistical and systematic uncertainties from various sources for the absolute cross section measurements in bins of $ {| {y}^{\mathrm{Z}} |}$, in the dimuon final state. The uncertainty in the trigger efficiency is included as part of the lepton identification uncertainty. |
png pdf |
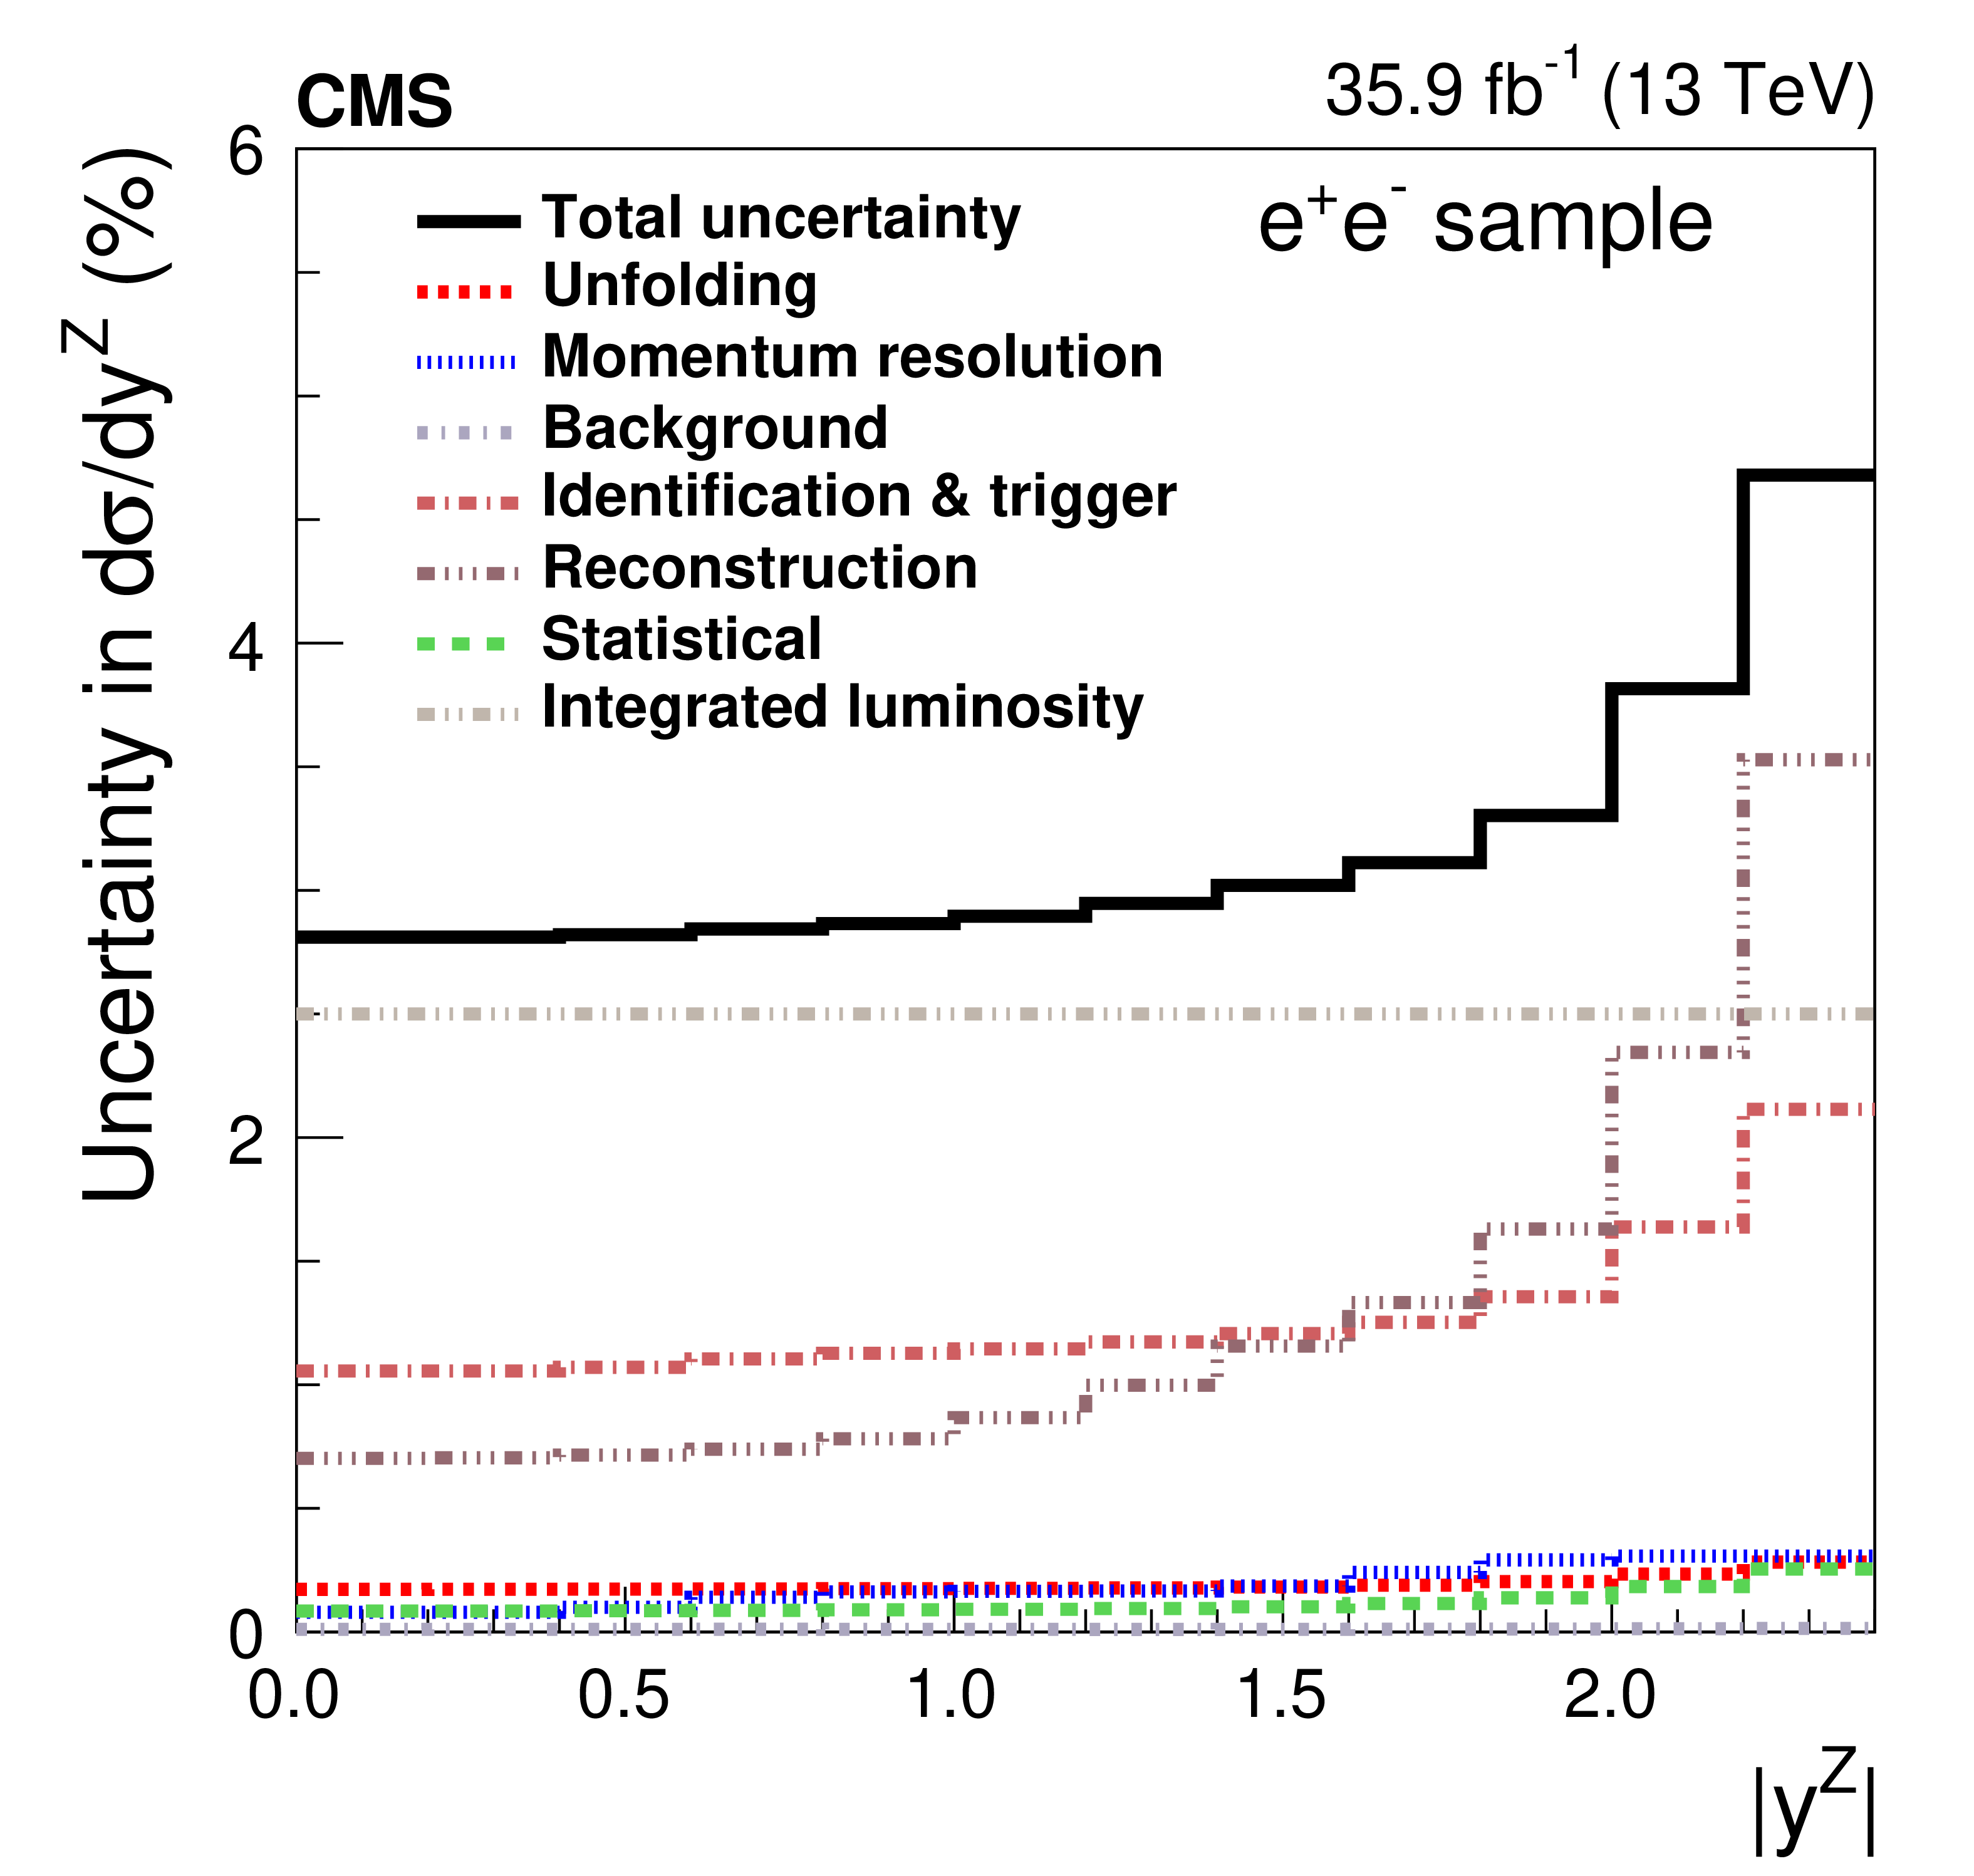
Figure 1-d:
The relative statistical and systematic uncertainties from various sources for the absolute cross section measurements in bins of $ {| {y}^{\mathrm{Z}} |}$,in the dielectron final state. The uncertainty in the trigger efficiency is included as part of the lepton identification uncertainty. |
png pdf |
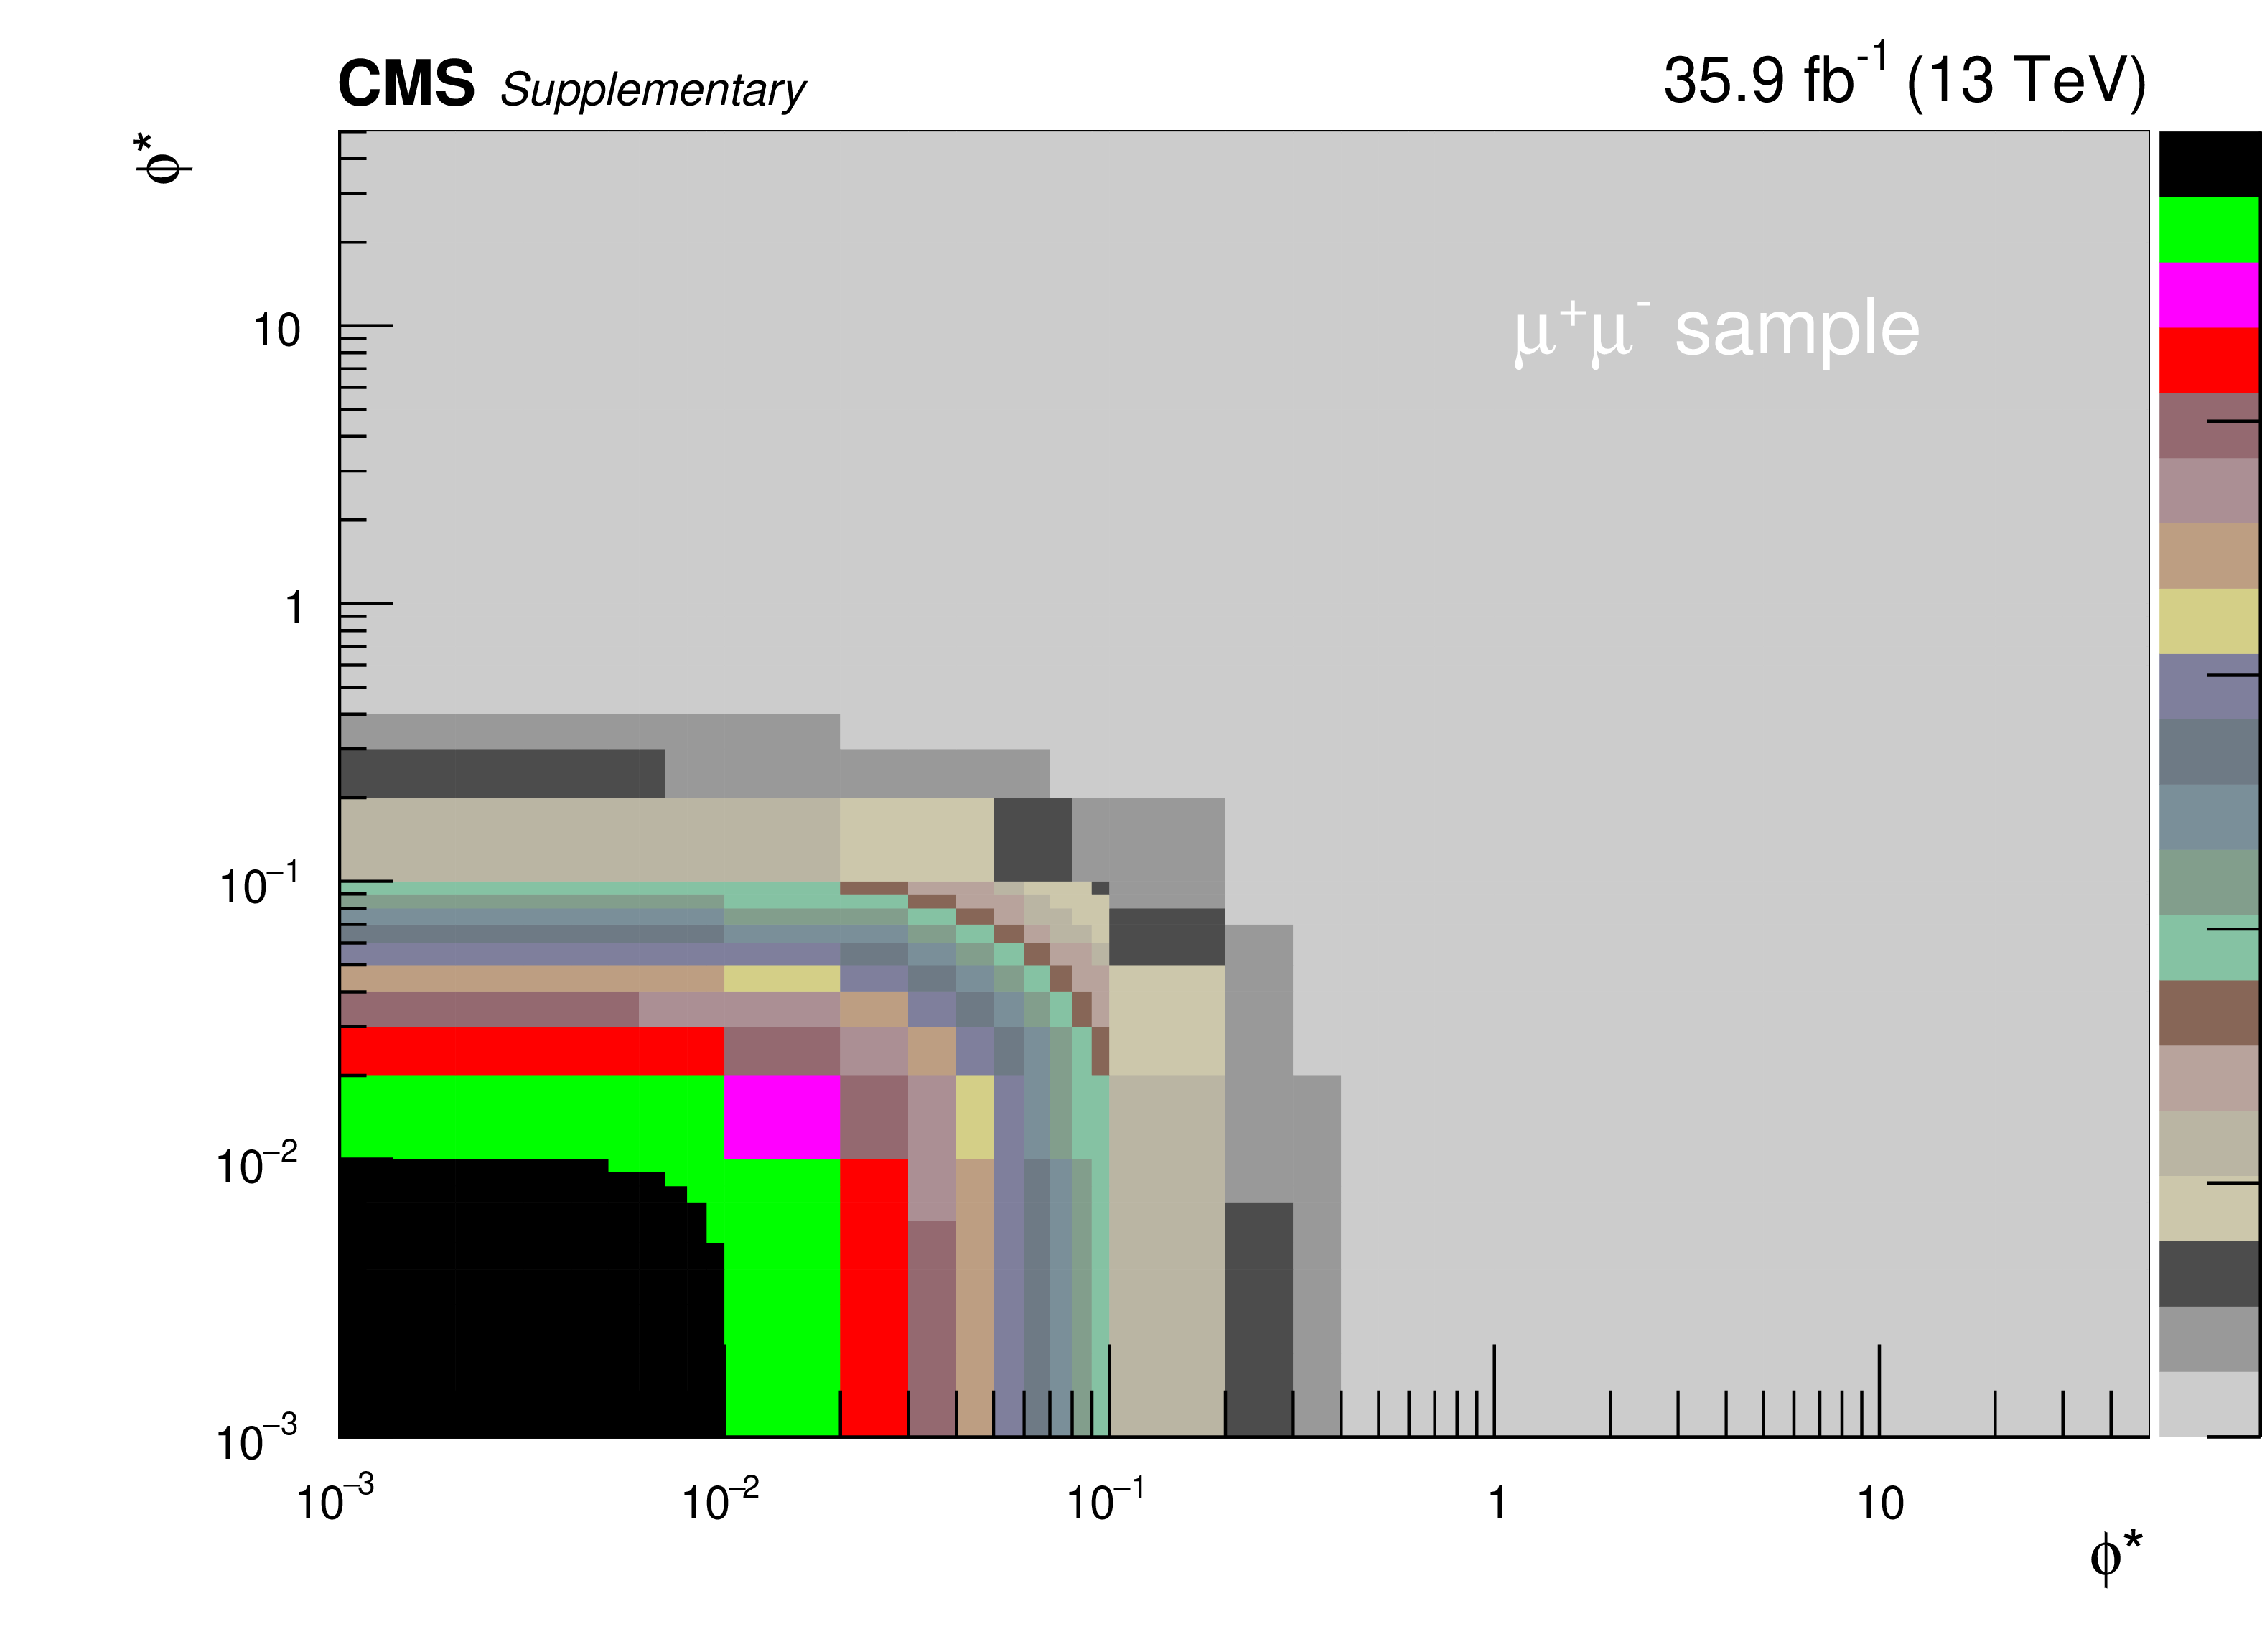
Figure 1-e:
The relative statistical and systematic uncertainties from various sources for the absolute cross section measurements in bins of $ {\phi ^{ *}_\eta}$, in the dimuon final state. The uncertainty in the trigger efficiency is included as part of the lepton identification uncertainty. |

png pdf |
Figure 1-f:
The relative statistical and systematic uncertainties from various sources for the absolute cross section measurements in bins of $ {\phi ^{ *}_\eta}$, in the dielectron final state. The uncertainty in the trigger efficiency is included as part of the lepton identification uncertainty. |

png pdf |
Figure 2:
The relative statistical and systematic uncertainties from various sources for the normalized cross section measurements in bins of $ {p_{\mathrm {T}}} ^{\mathrm{Z}}$ (upper), $ {| {y}^{\mathrm{Z}} |}$ (middle), and $ {\phi ^{ *}_\eta}$ (lower). The left plots correspond to the dimuon final state and the right plots correspond to the dielectron final state. |
png pdf |
Figure 2-a:
The relative statistical and systematic uncertainties from various sources for the normalized cross section measurements in bins of $ {p_{\mathrm {T}}} ^{\mathrm{Z}}$, in the dimuon final state. |

png pdf |
Figure 2-b:
The relative statistical and systematic uncertainties from various sources for the normalized cross section measurements in bins of $ {p_{\mathrm {T}}} ^{\mathrm{Z}}$, in the dielectron final state. |
png pdf |
Figure 2-c:
The relative statistical and systematic uncertainties from various sources for the normalized cross section measurements in bins of $ {| {y}^{\mathrm{Z}} |}$, in the dimuon final state. |
png pdf |
Figure 2-d:
The relative statistical and systematic uncertainties from various sources for the normalized cross section measurements in bins of $ {| {y}^{\mathrm{Z}} |}$, in the dielectron final state. |

png pdf |
Figure 2-e:
The relative statistical and systematic uncertainties from various sources for the normalized cross section measurements in bins of $ {\phi ^{ *}_\eta}$, in the dimuon final state. |

png pdf |
Figure 2-f:
The relative statistical and systematic uncertainties from various sources for the normalized cross section measurements in bins of $ {\phi ^{ *}_\eta}$, in the dielectron final state. |

png pdf |
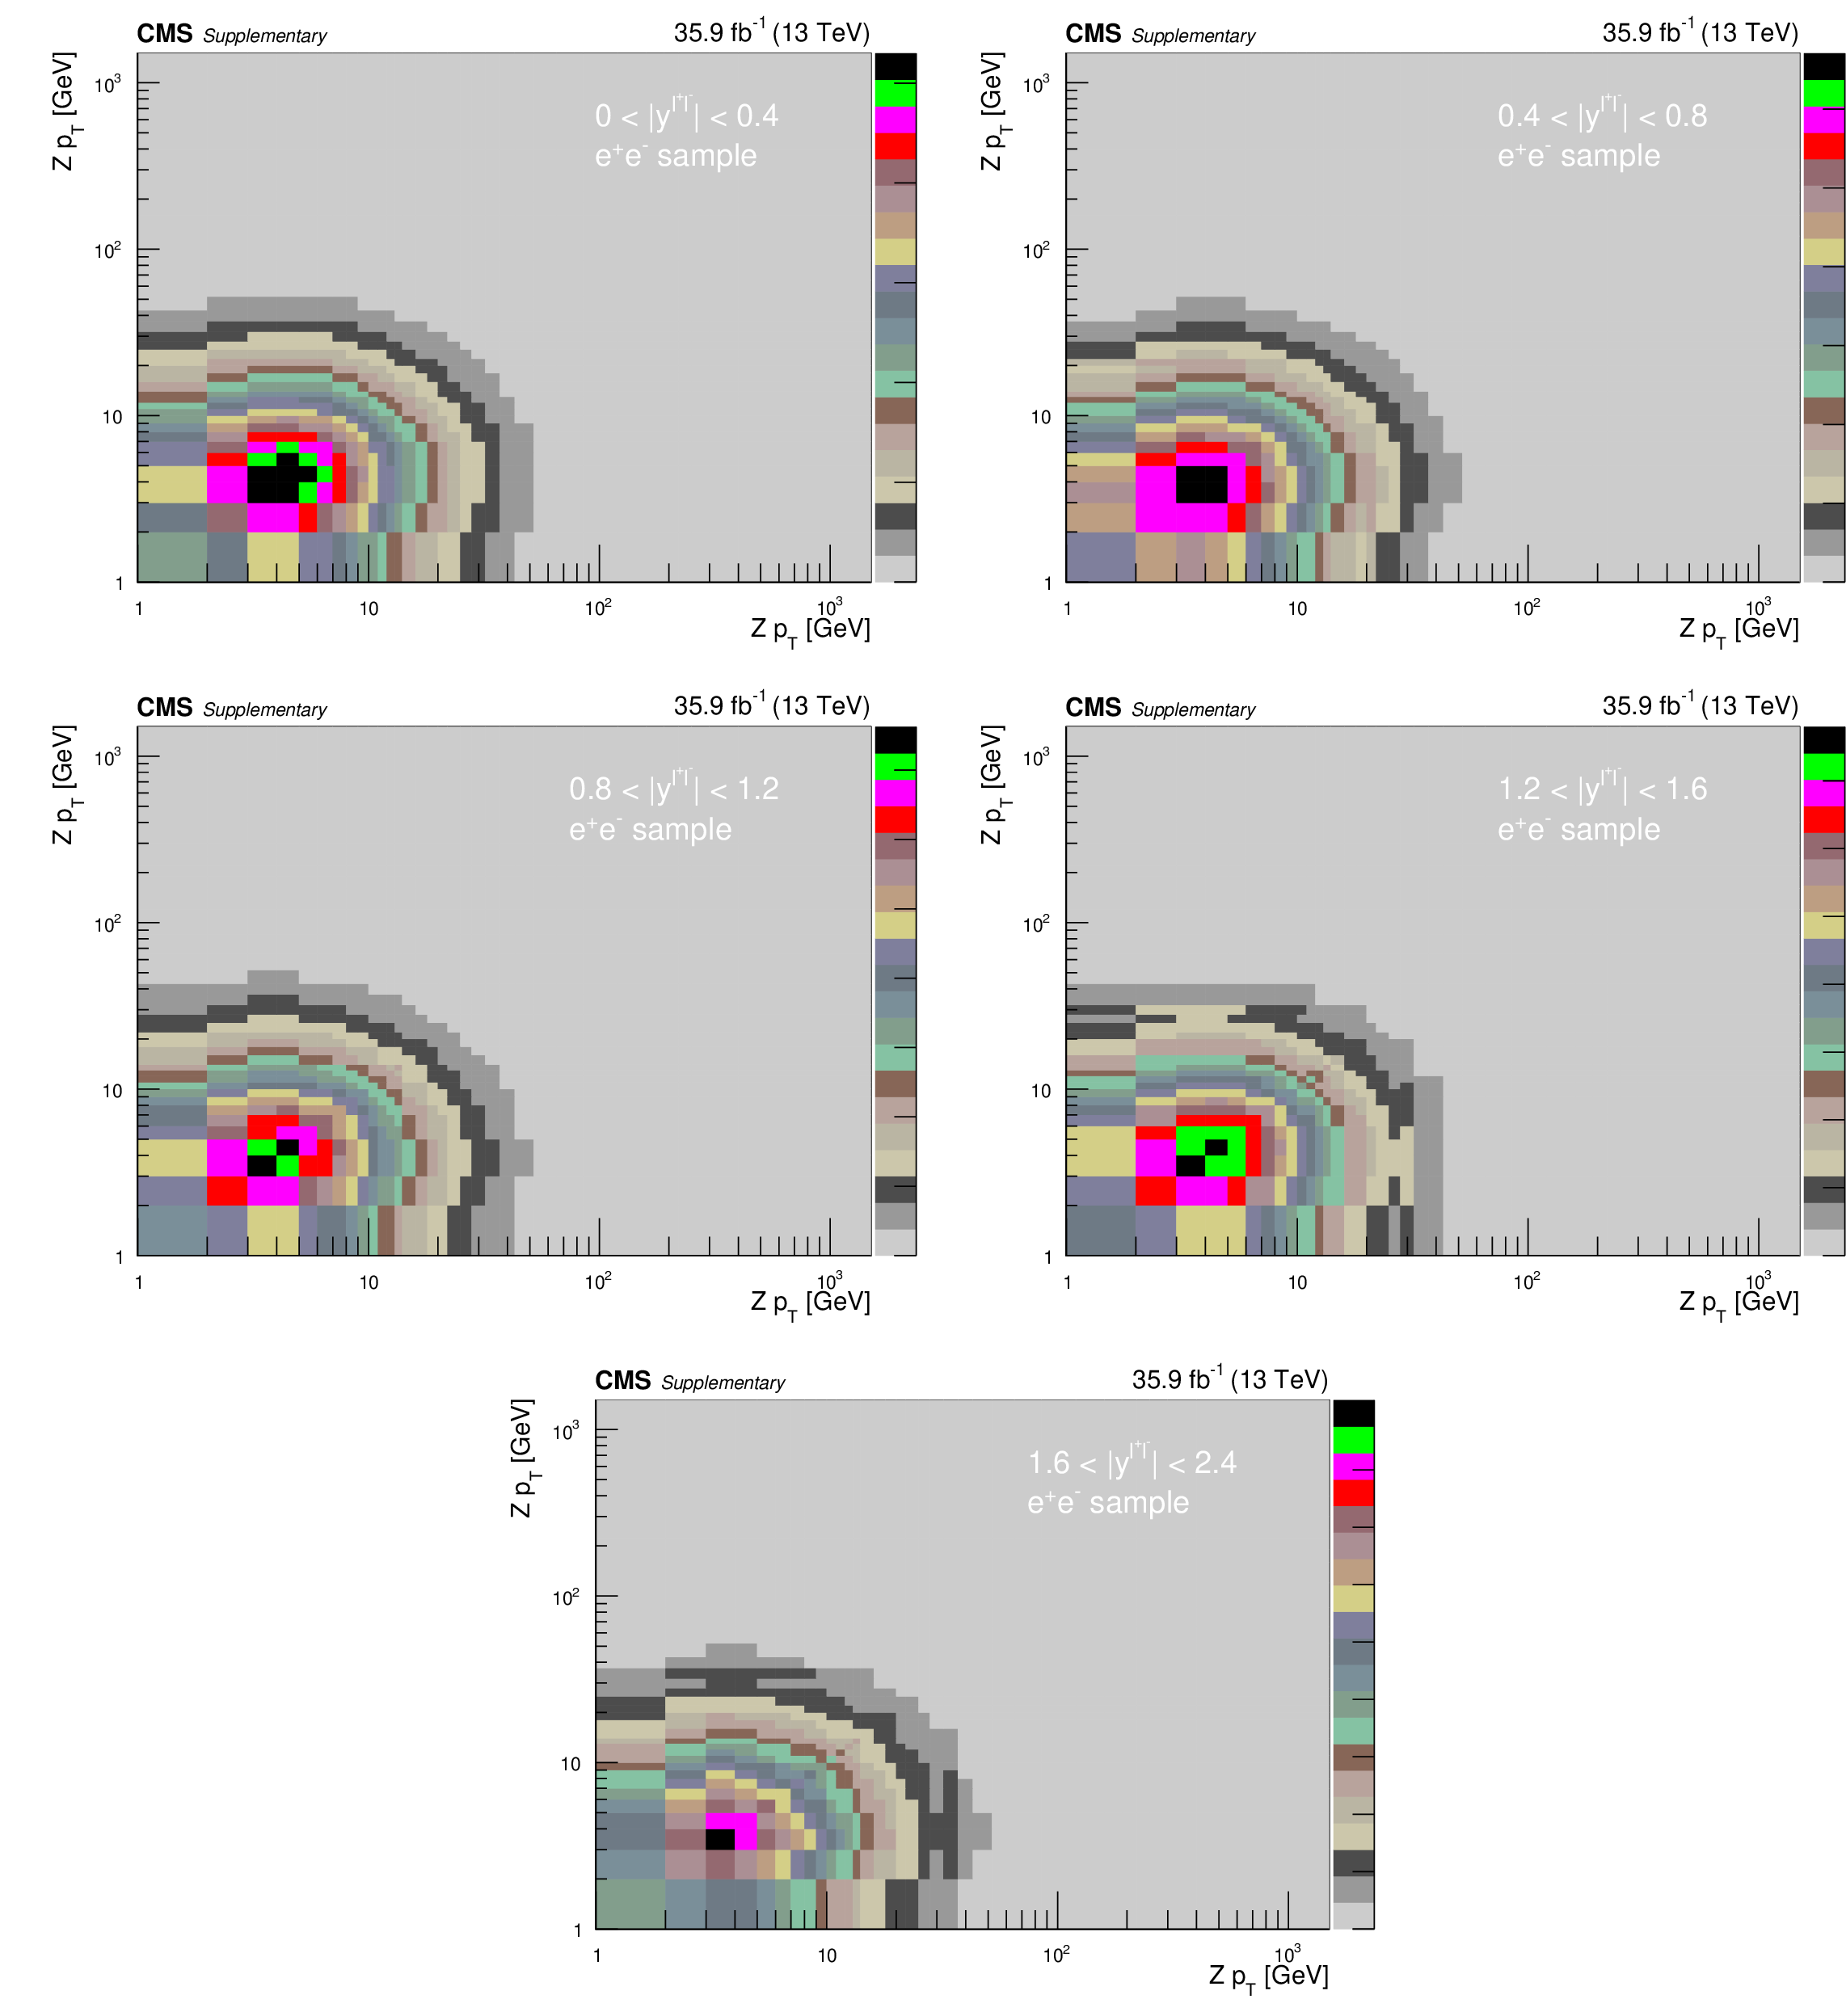
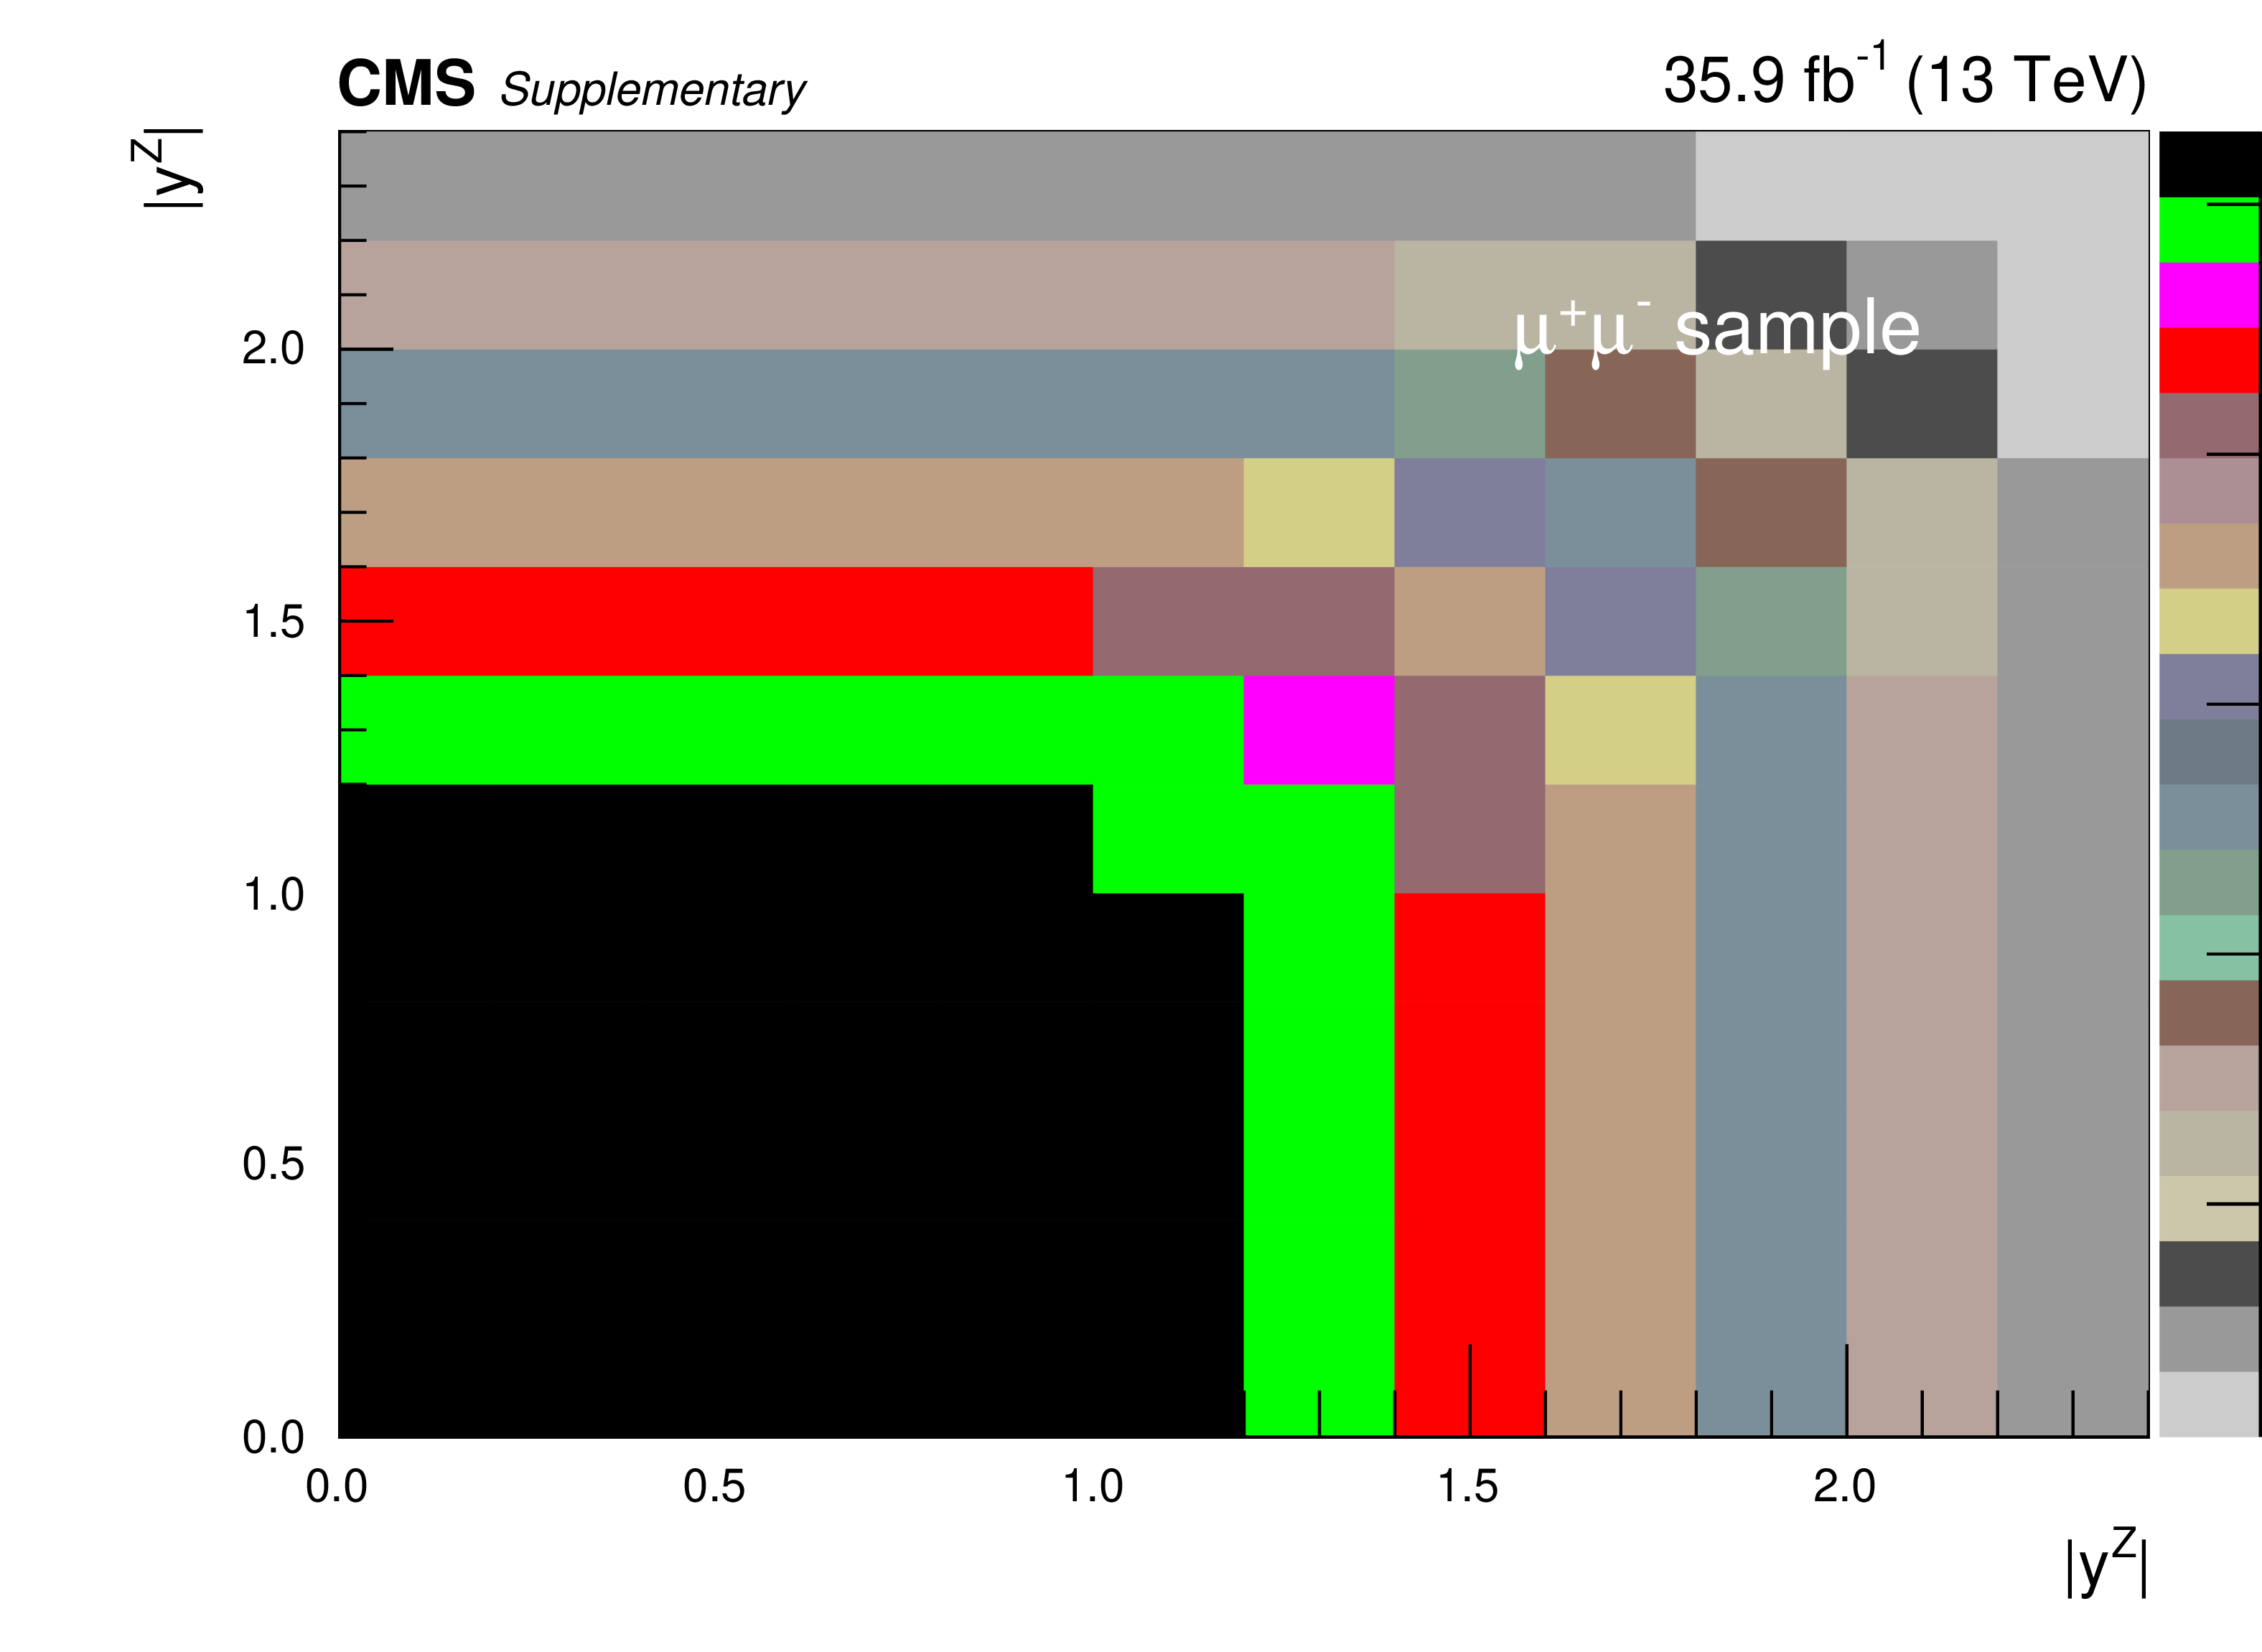
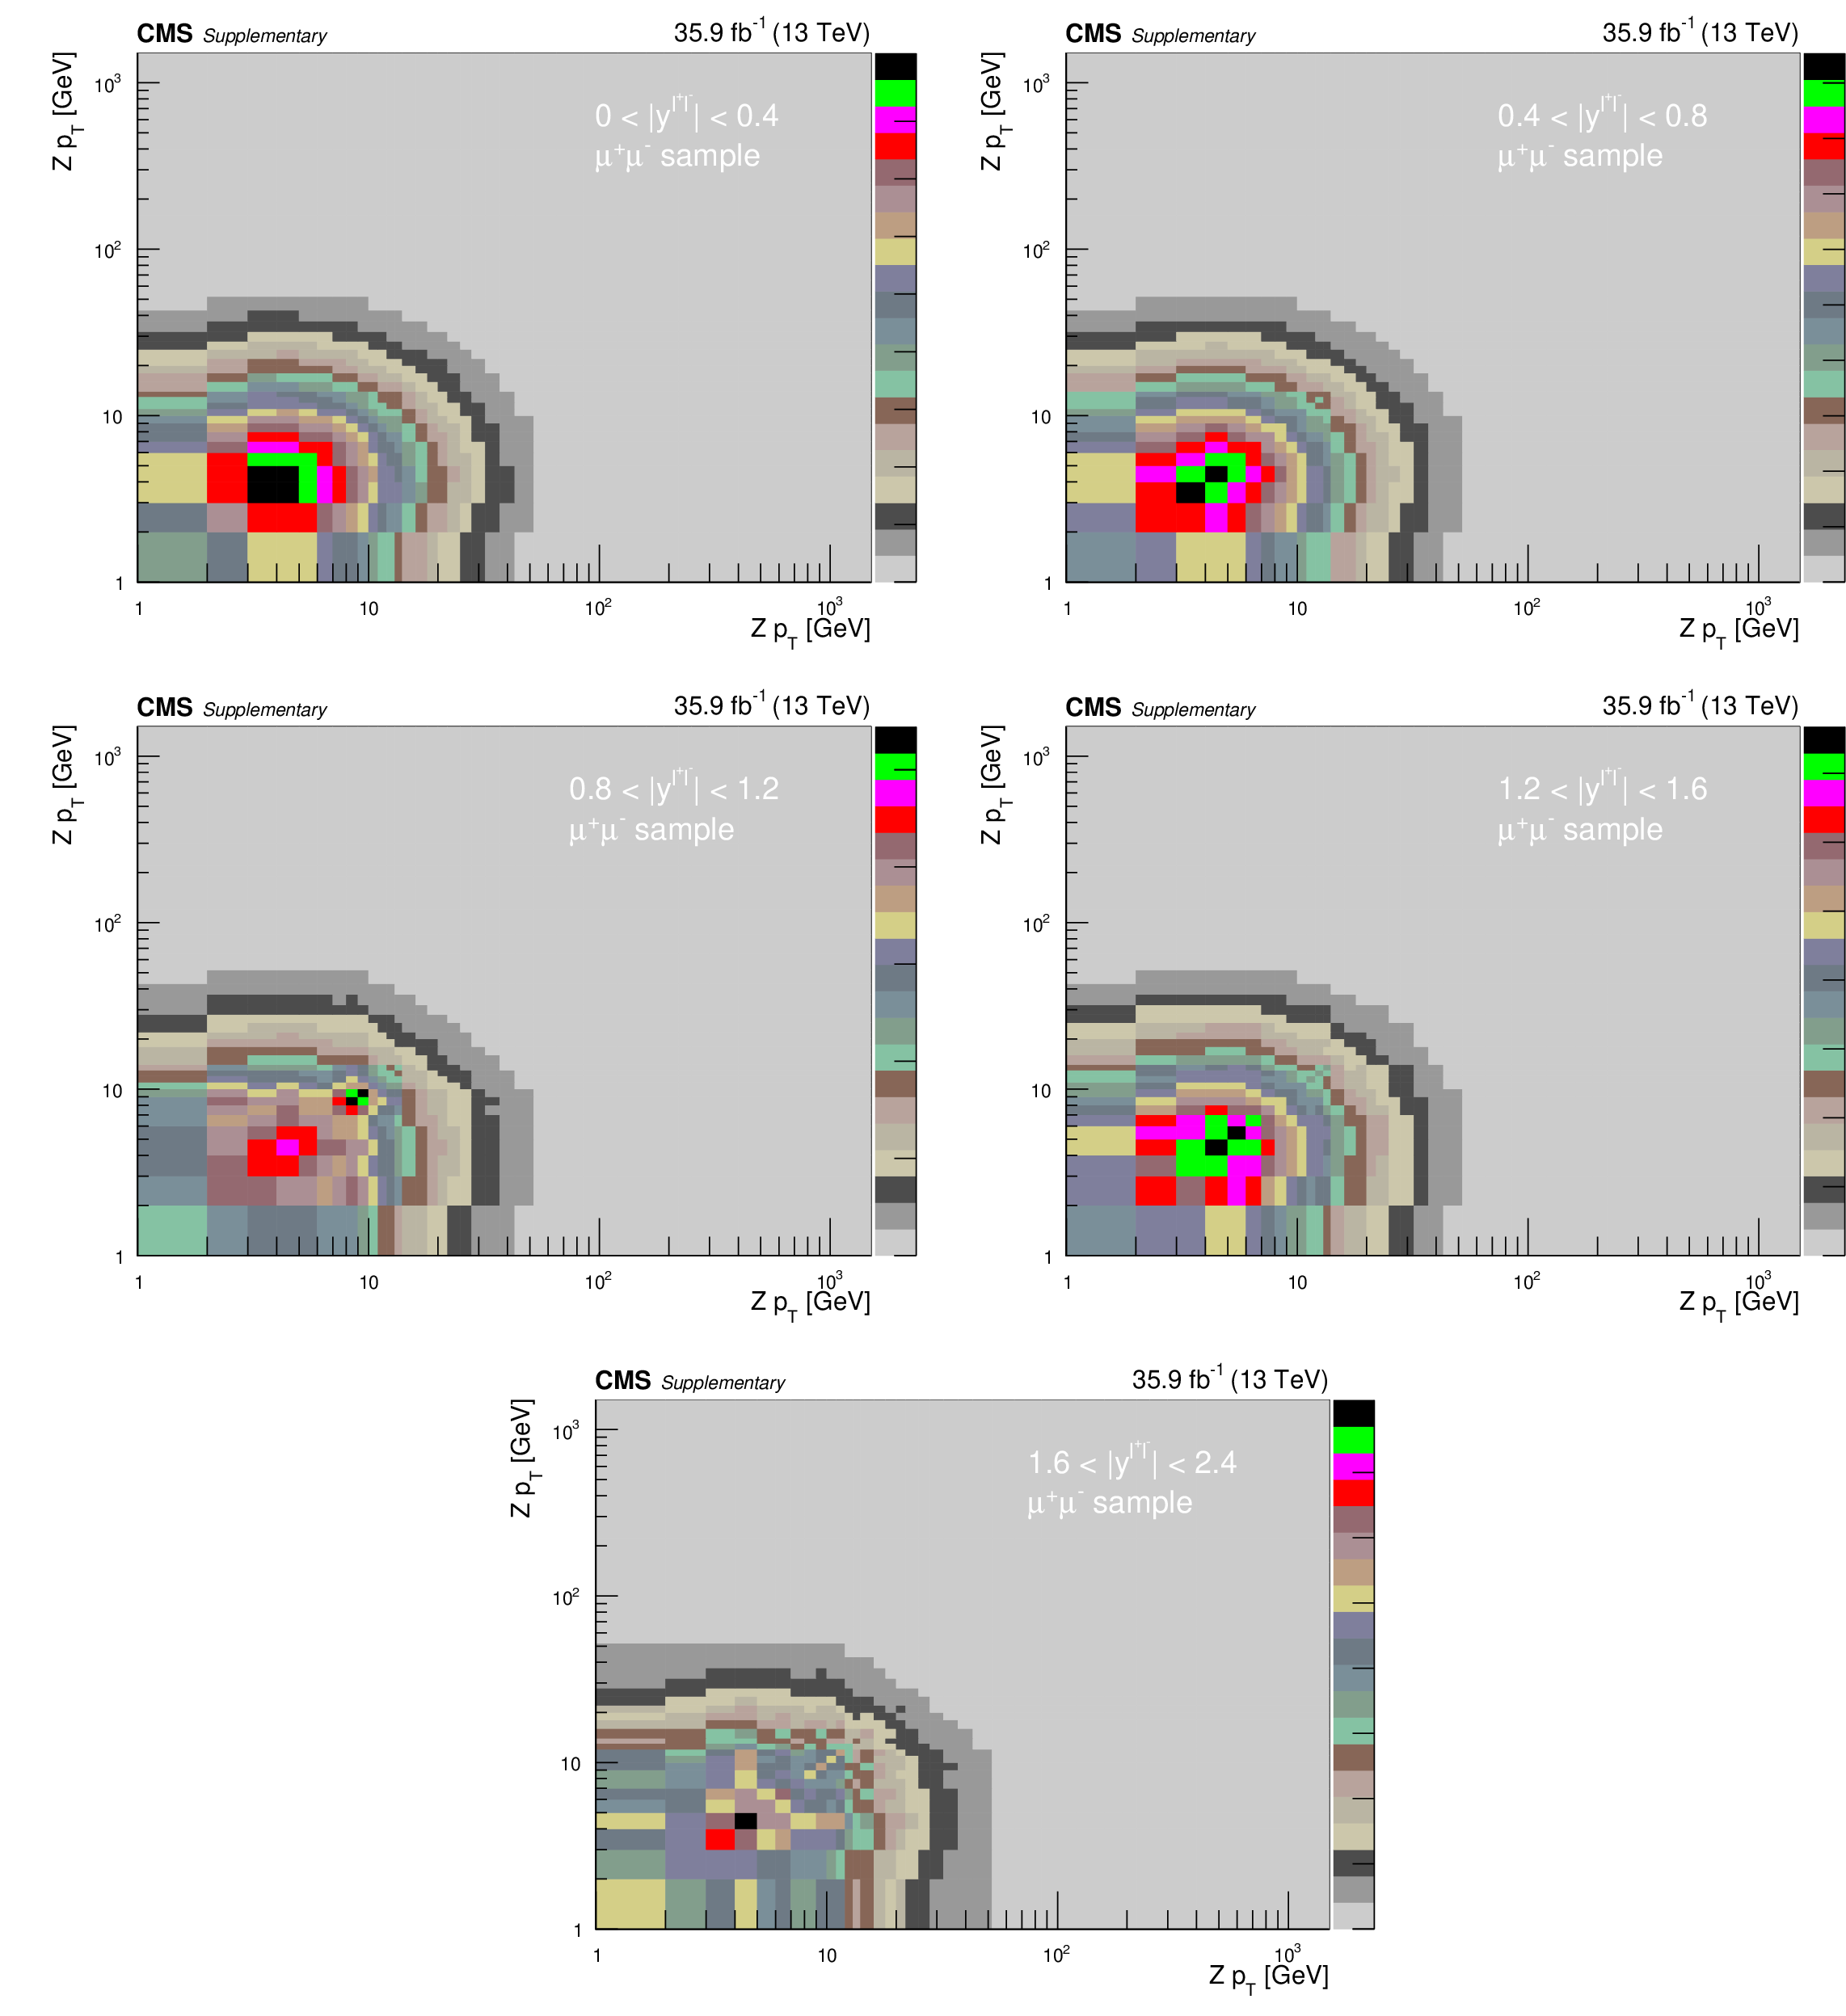
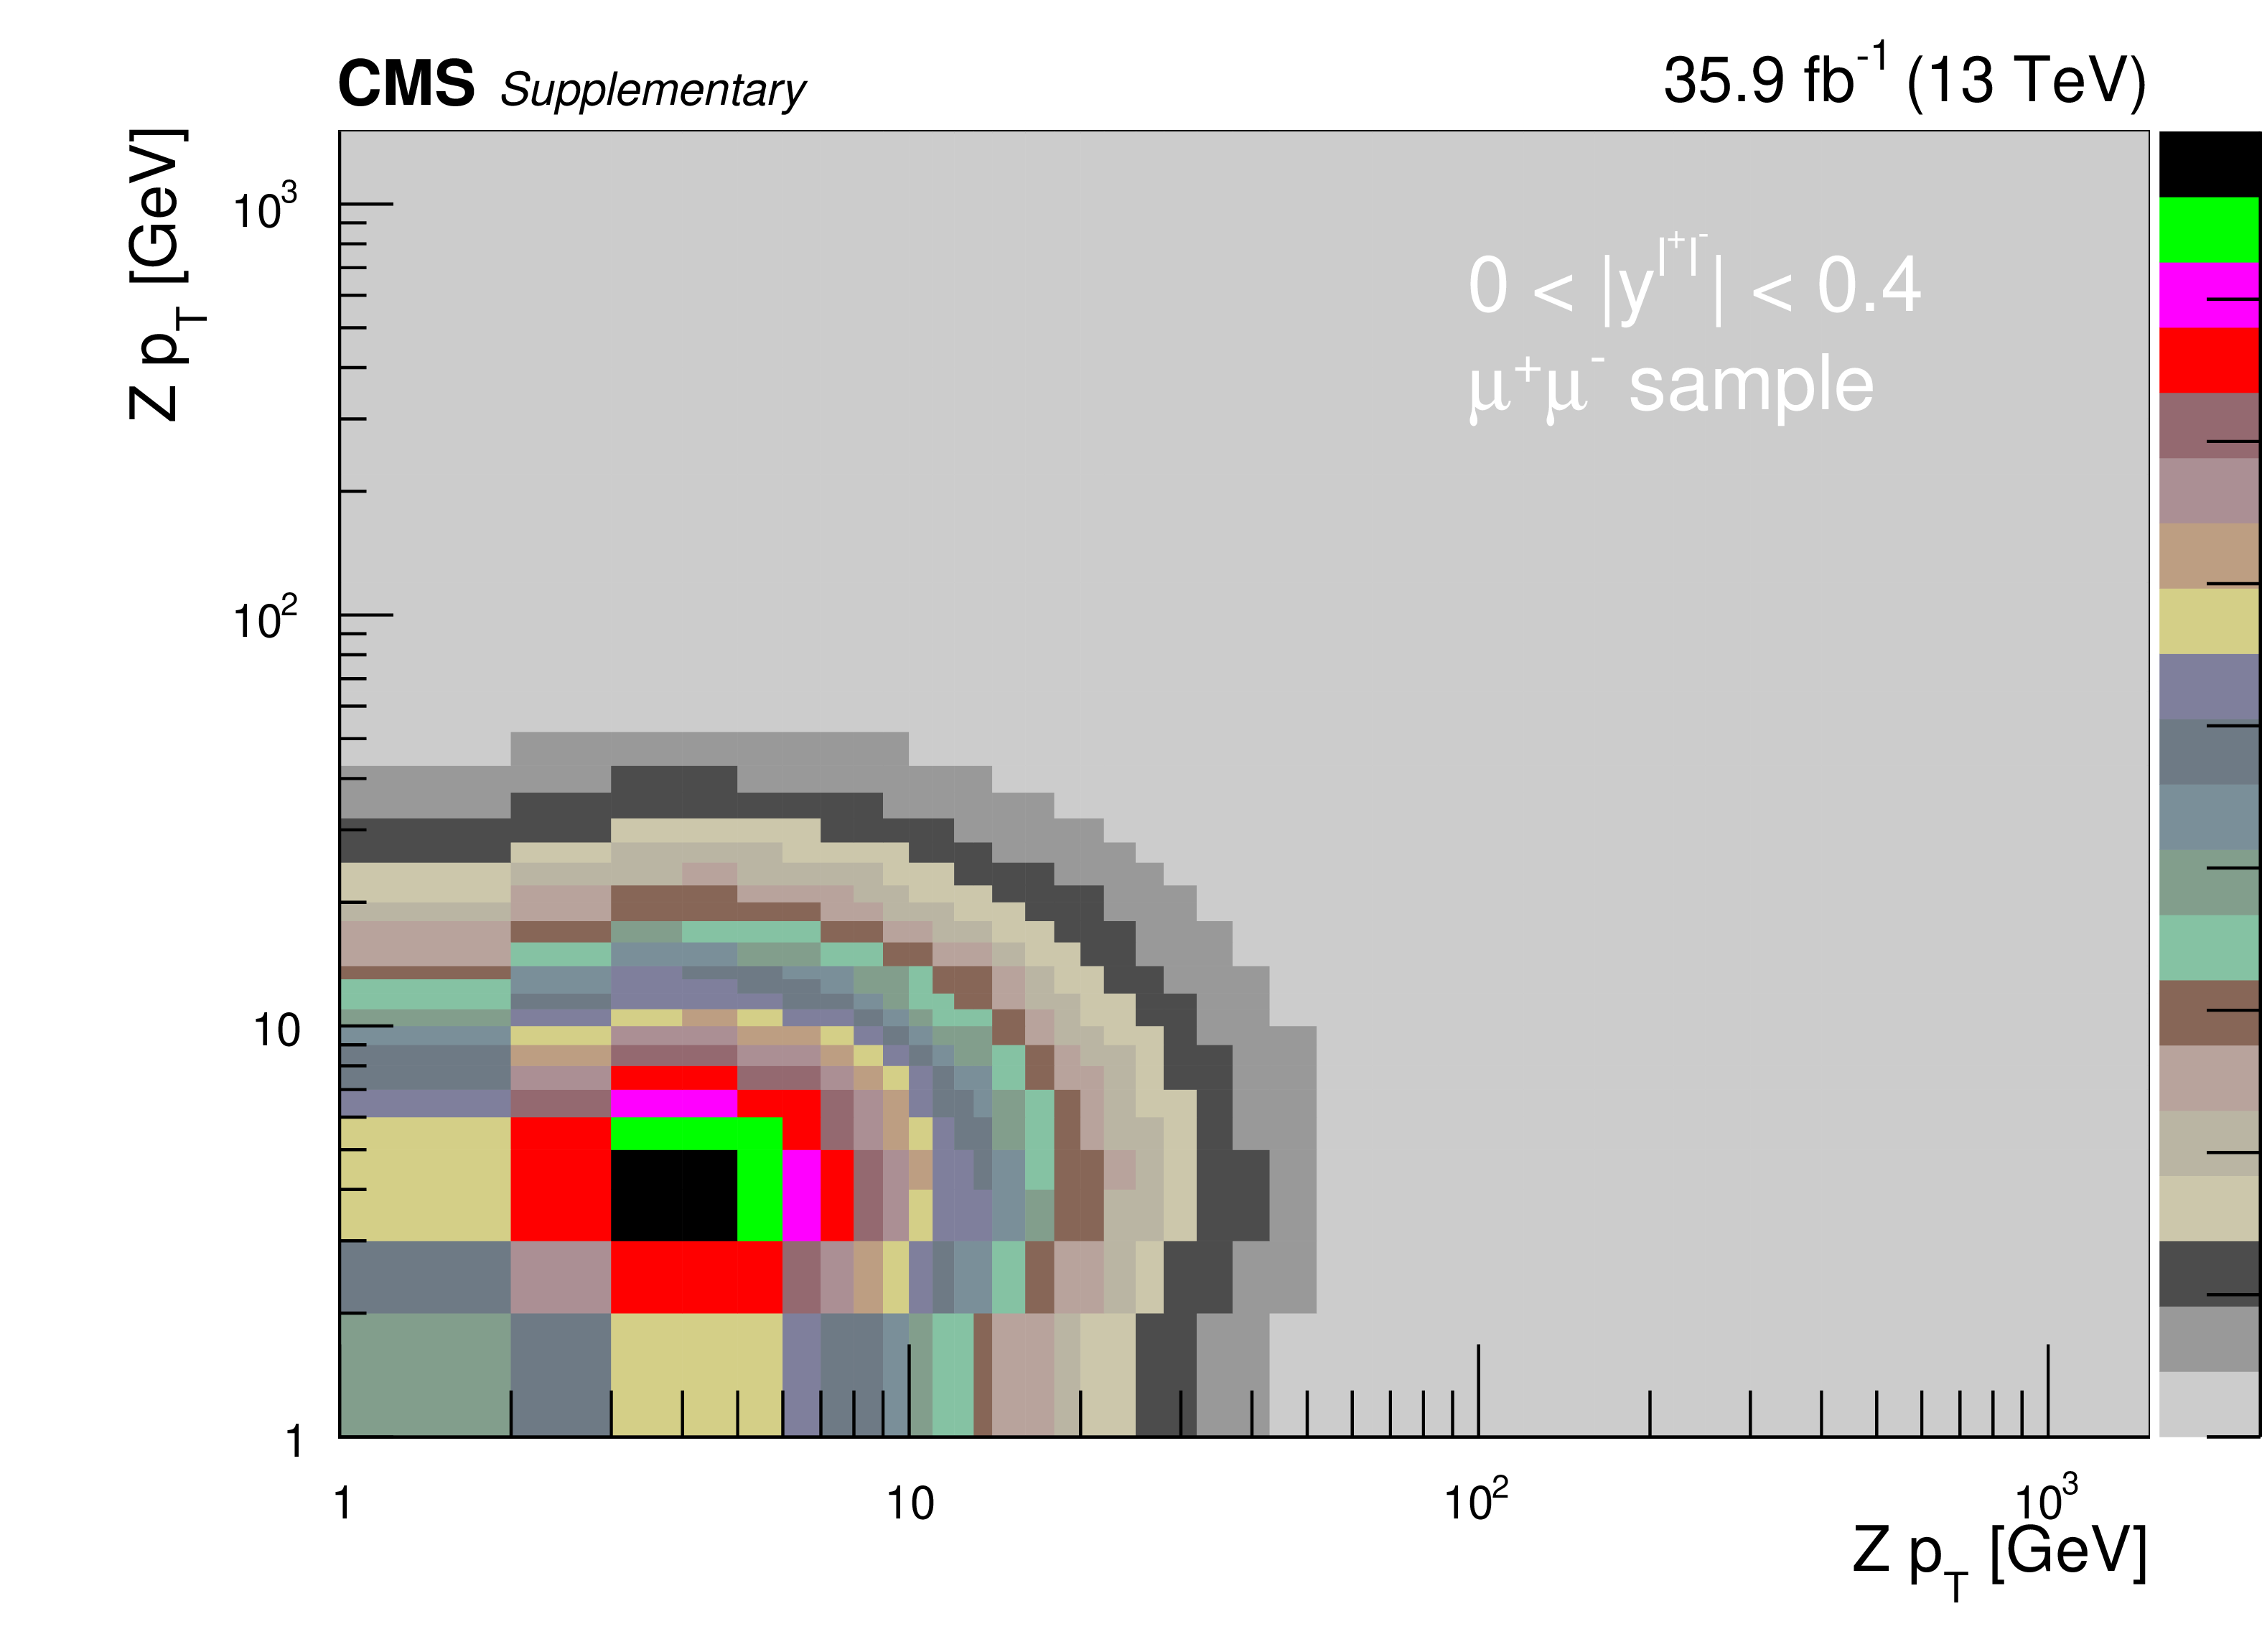
Figure 3:
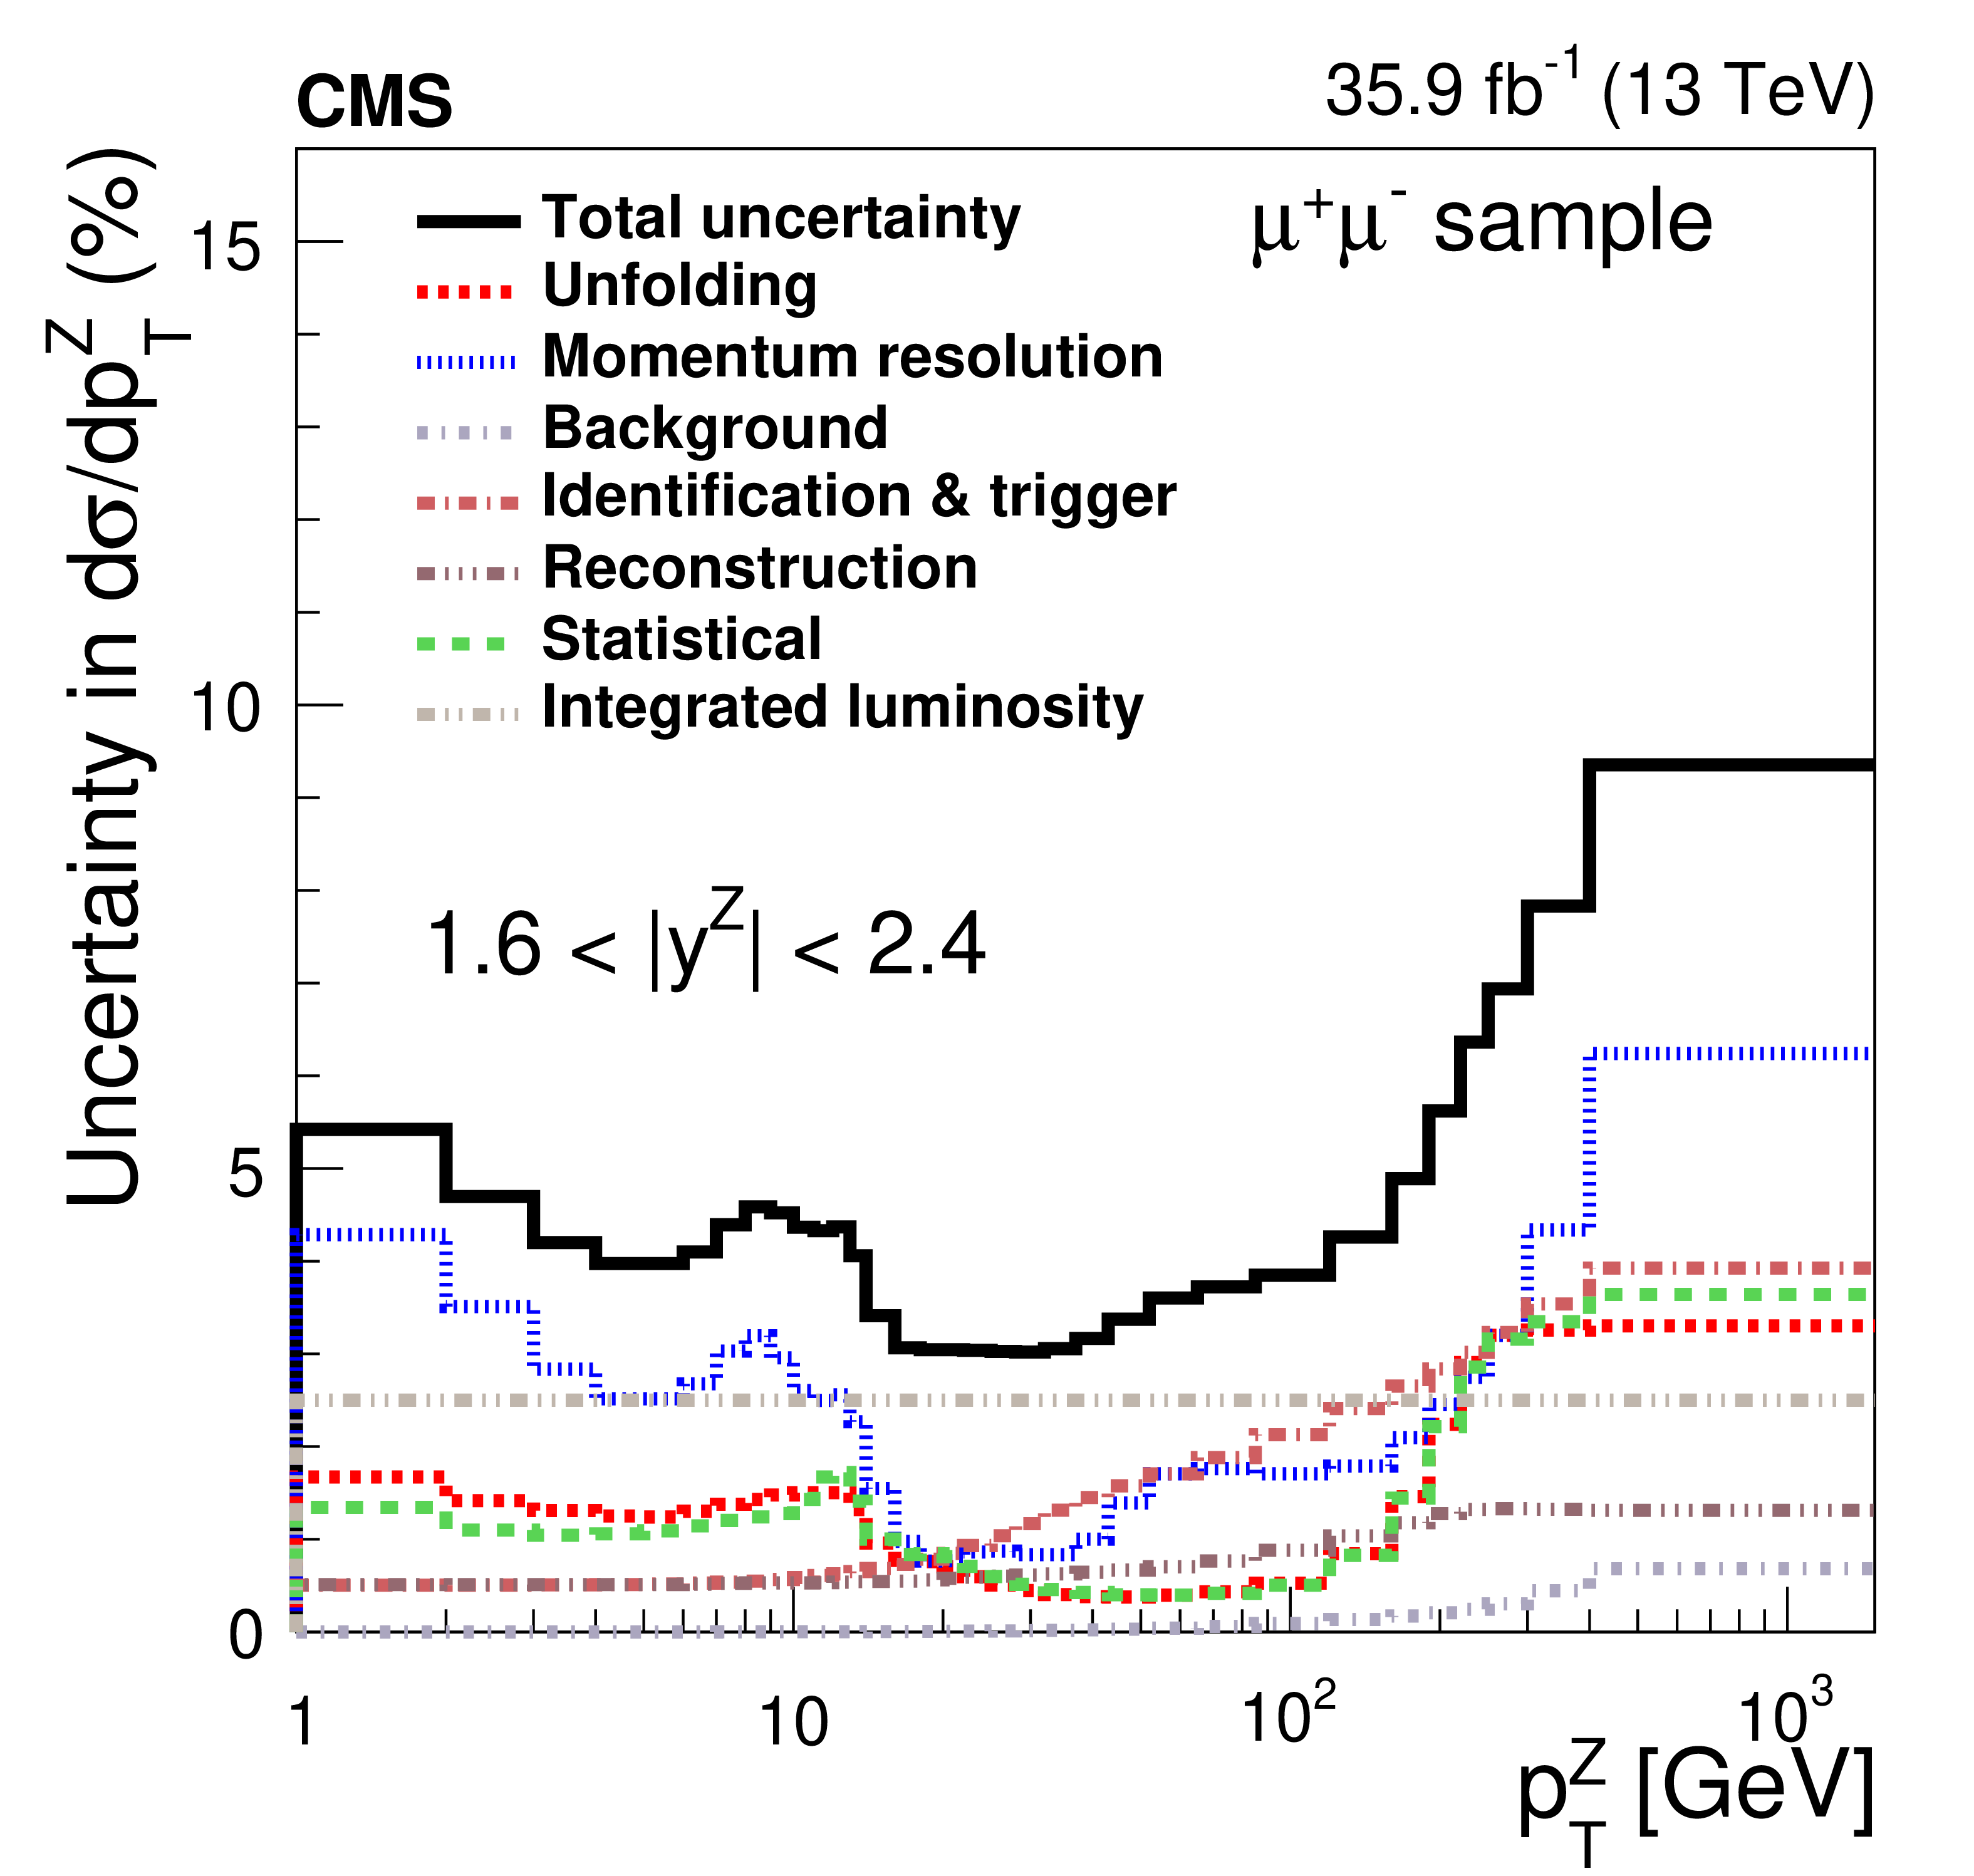
The relative statistical and systematic uncertainties from various sources for the absolute double-differential cross section measurements in bins of $ {p_{\mathrm {T}}} ^{\mathrm{Z}}$ for the 0.0 $ < {| {y}^{\mathrm{Z}} |} < $ 0.4 bin (upper left), 0.4 $ < {| {y}^{\mathrm{Z}} |} < $ 0.8 bin (upper right), 0.8 $ < {| {y}^{\mathrm{Z}} |} < $ 1.2 bin (middle left), 1.2 $ < {| {y}^{\mathrm{Z}} |} < $ 1.6 bin (middle right), and 1.6 $ < {| {y}^{\mathrm{Z}} |} < $ 2.4 bin (lower) in the dimuon final state. |
png pdf |
Figure 3-a:
The relative statistical and systematic uncertainties from various sources for the absolute double-differential cross section measurements in bins of $ {p_{\mathrm {T}}} ^{\mathrm{Z}}$ for the 0.0 $ < {| {y}^{\mathrm{Z}} |} < $ 0.4 bin, in the dimuon final state. |

png pdf |
Figure 3-b:
The relative statistical and systematic uncertainties from various sources for the absolute double-differential cross section measurements in bins of $ {p_{\mathrm {T}}} ^{\mathrm{Z}}$ for the 0.4 $ < {| {y}^{\mathrm{Z}} |} < $ 0.8 bin, in the dimuon final state. |

png pdf |
Figure 3-c:
The relative statistical and systematic uncertainties from various sources for the absolute double-differential cross section measurements in bins of $ {p_{\mathrm {T}}} ^{\mathrm{Z}}$ for the 0.8 $ < {| {y}^{\mathrm{Z}} |} < $ 1.2 bin, in the dimuon final state. |

png pdf |
Figure 3-d:
The relative statistical and systematic uncertainties from various sources for the absolute double-differential cross section measurements in bins of $ {p_{\mathrm {T}}} ^{\mathrm{Z}}$ for the 1.2 $ < {| {y}^{\mathrm{Z}} |} < $ 1.6 bin, in the dimuon final state. |
png pdf |
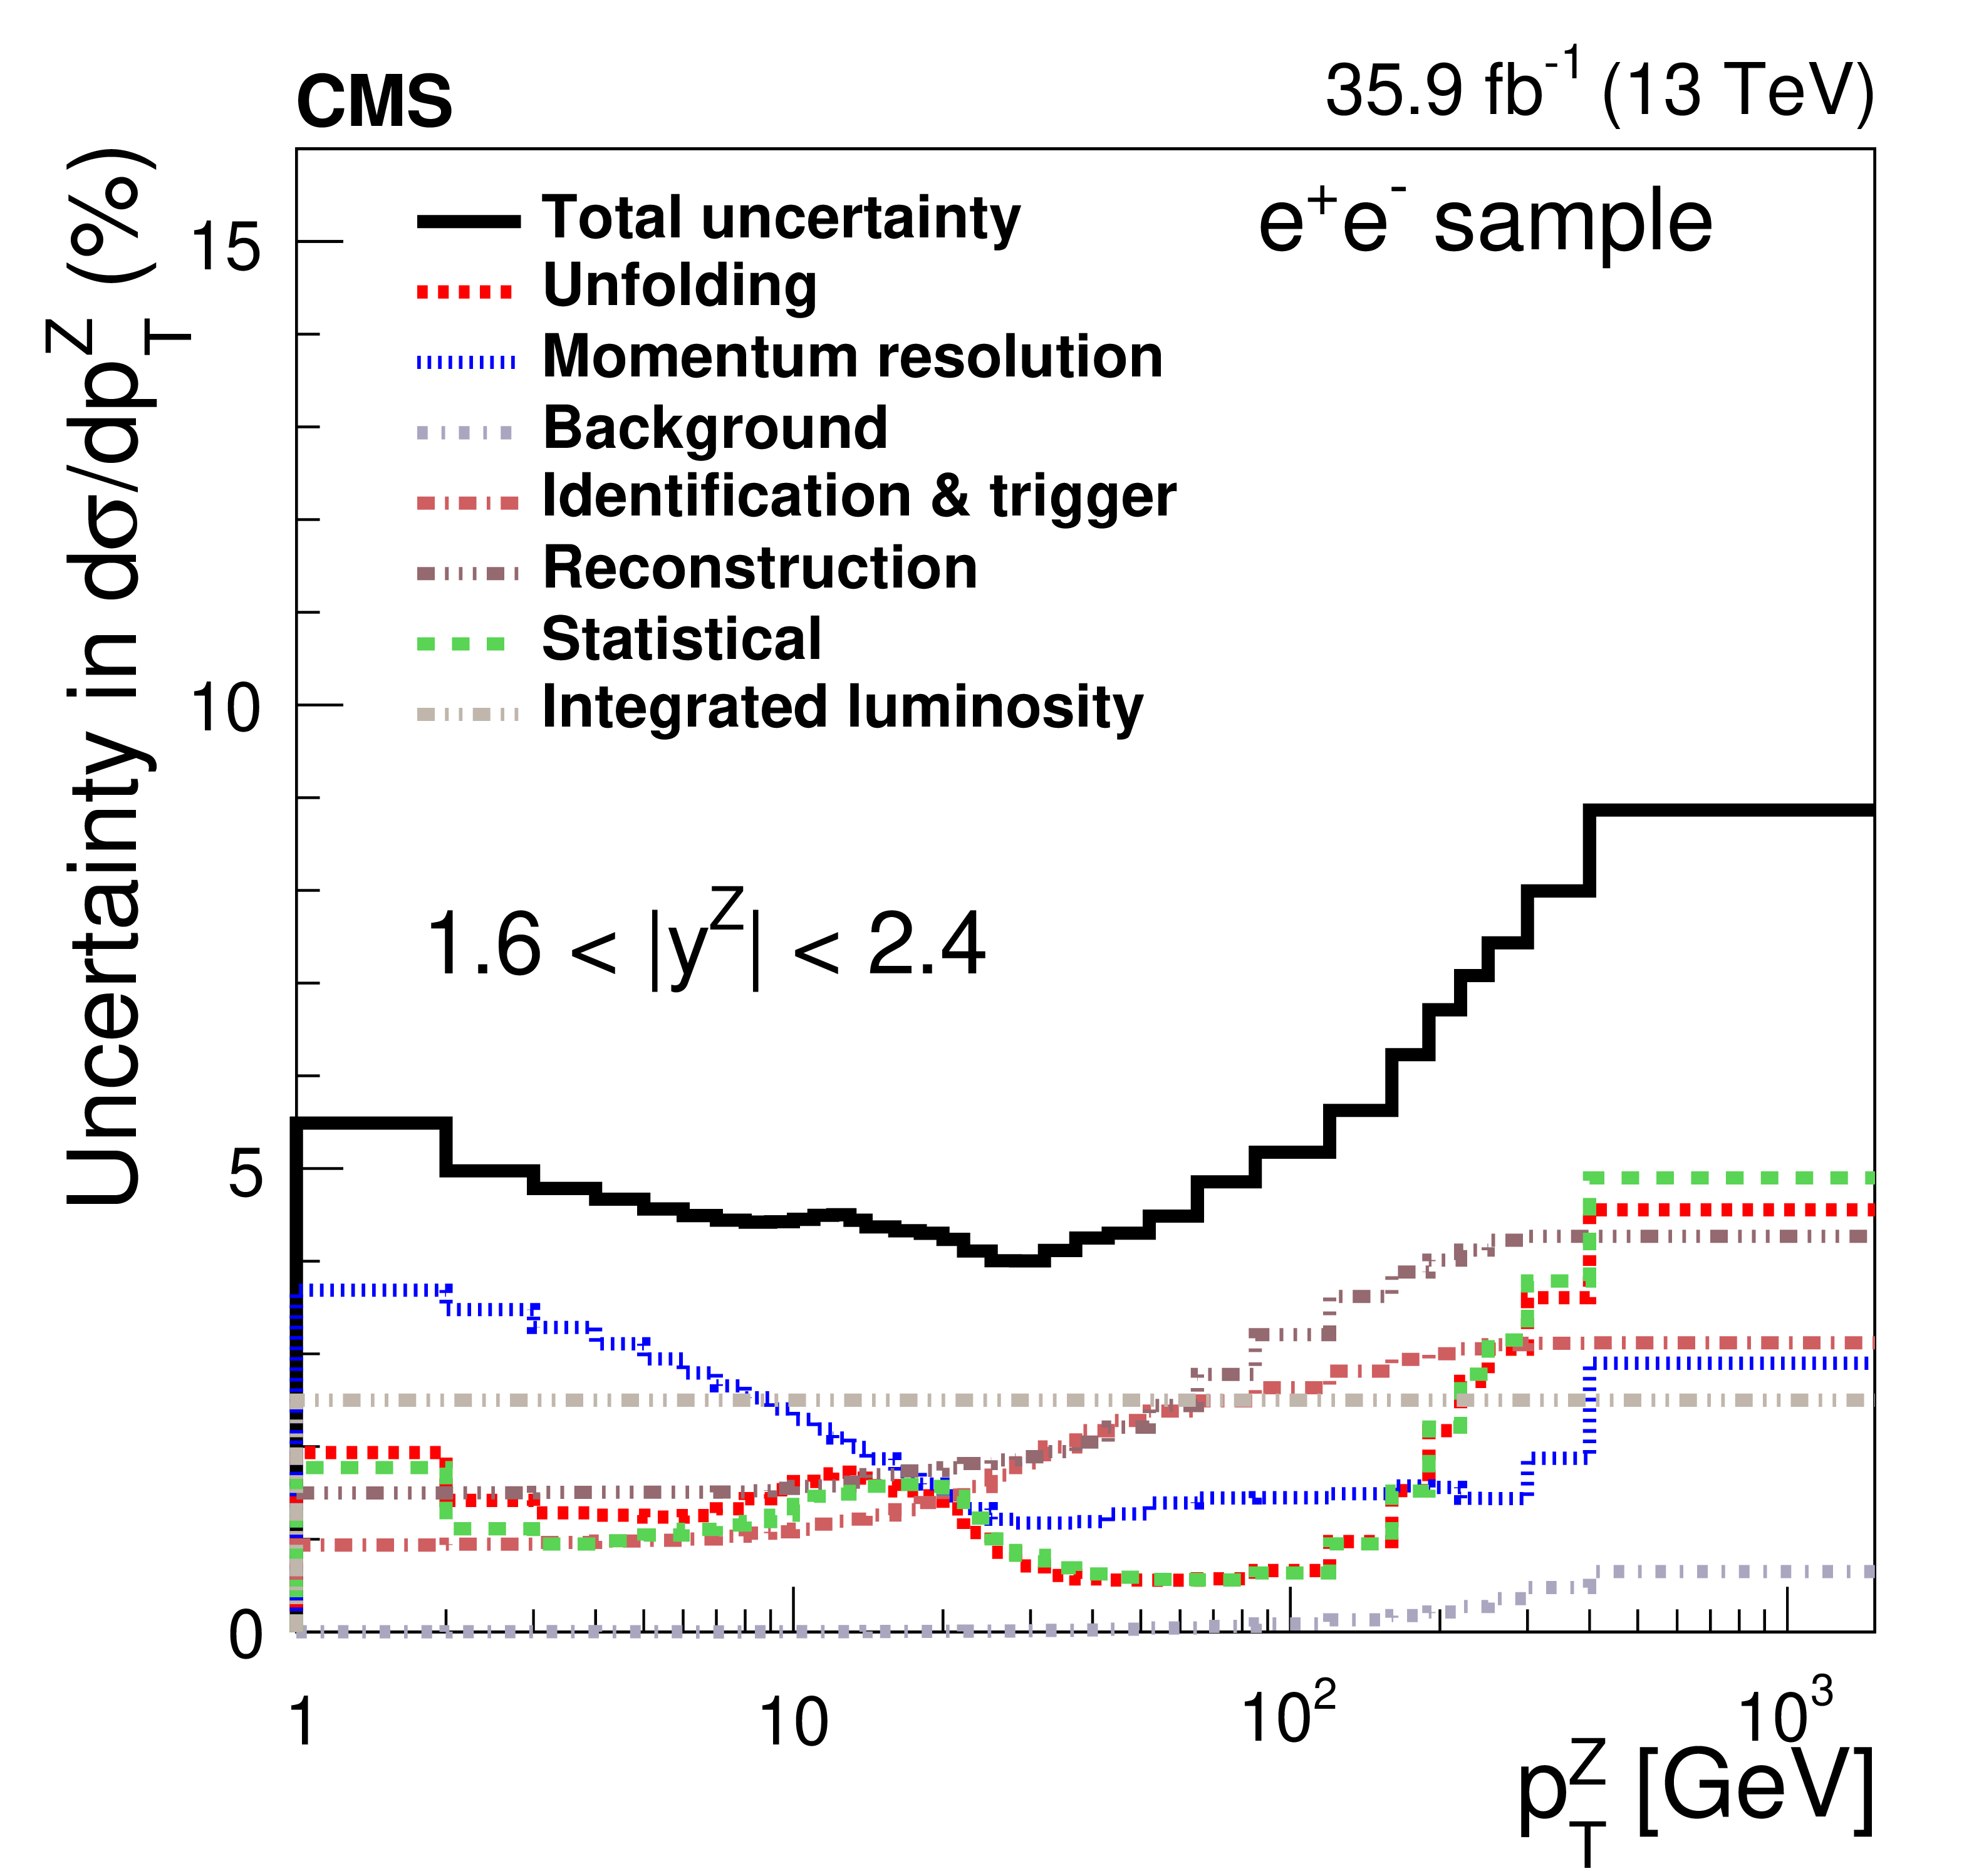
Figure 3-e:
The relative statistical and systematic uncertainties from various sources for the absolute double-differential cross section measurements in bins of $ {p_{\mathrm {T}}} ^{\mathrm{Z}}$ for the 1.6 $ < {| {y}^{\mathrm{Z}} |} < $ 2.4 bin, in the dimuon final state. |

png pdf |
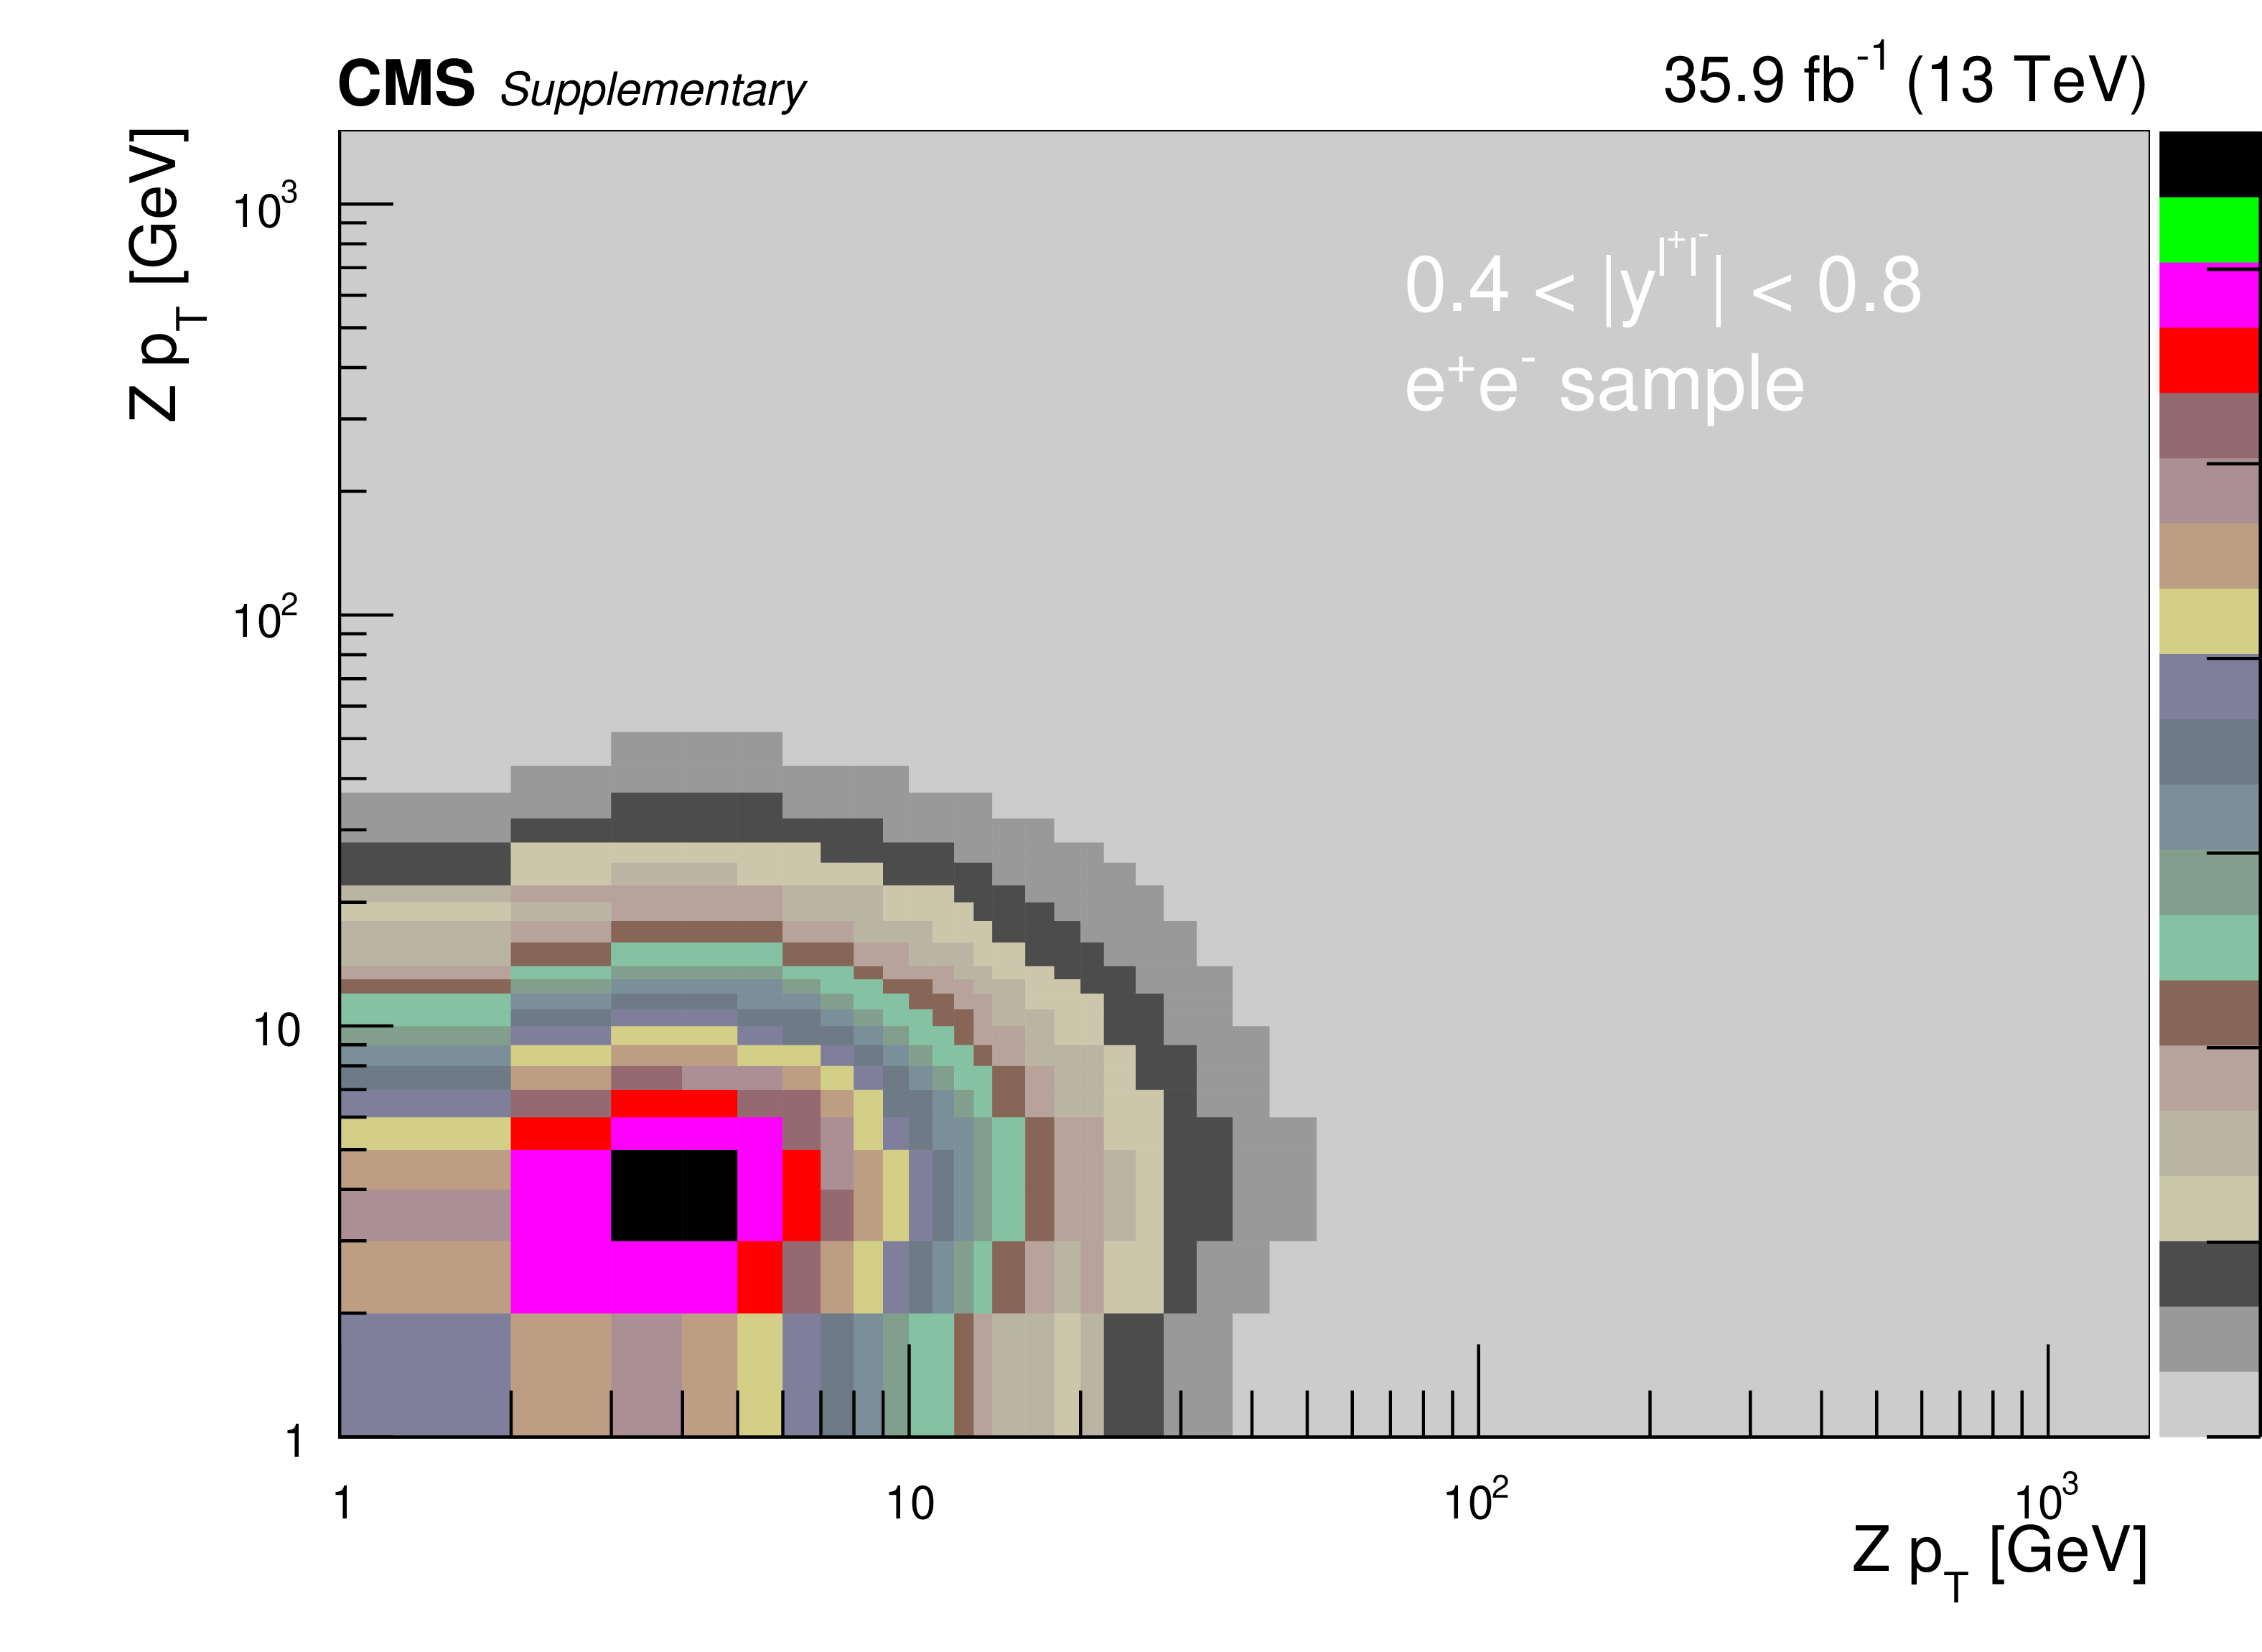
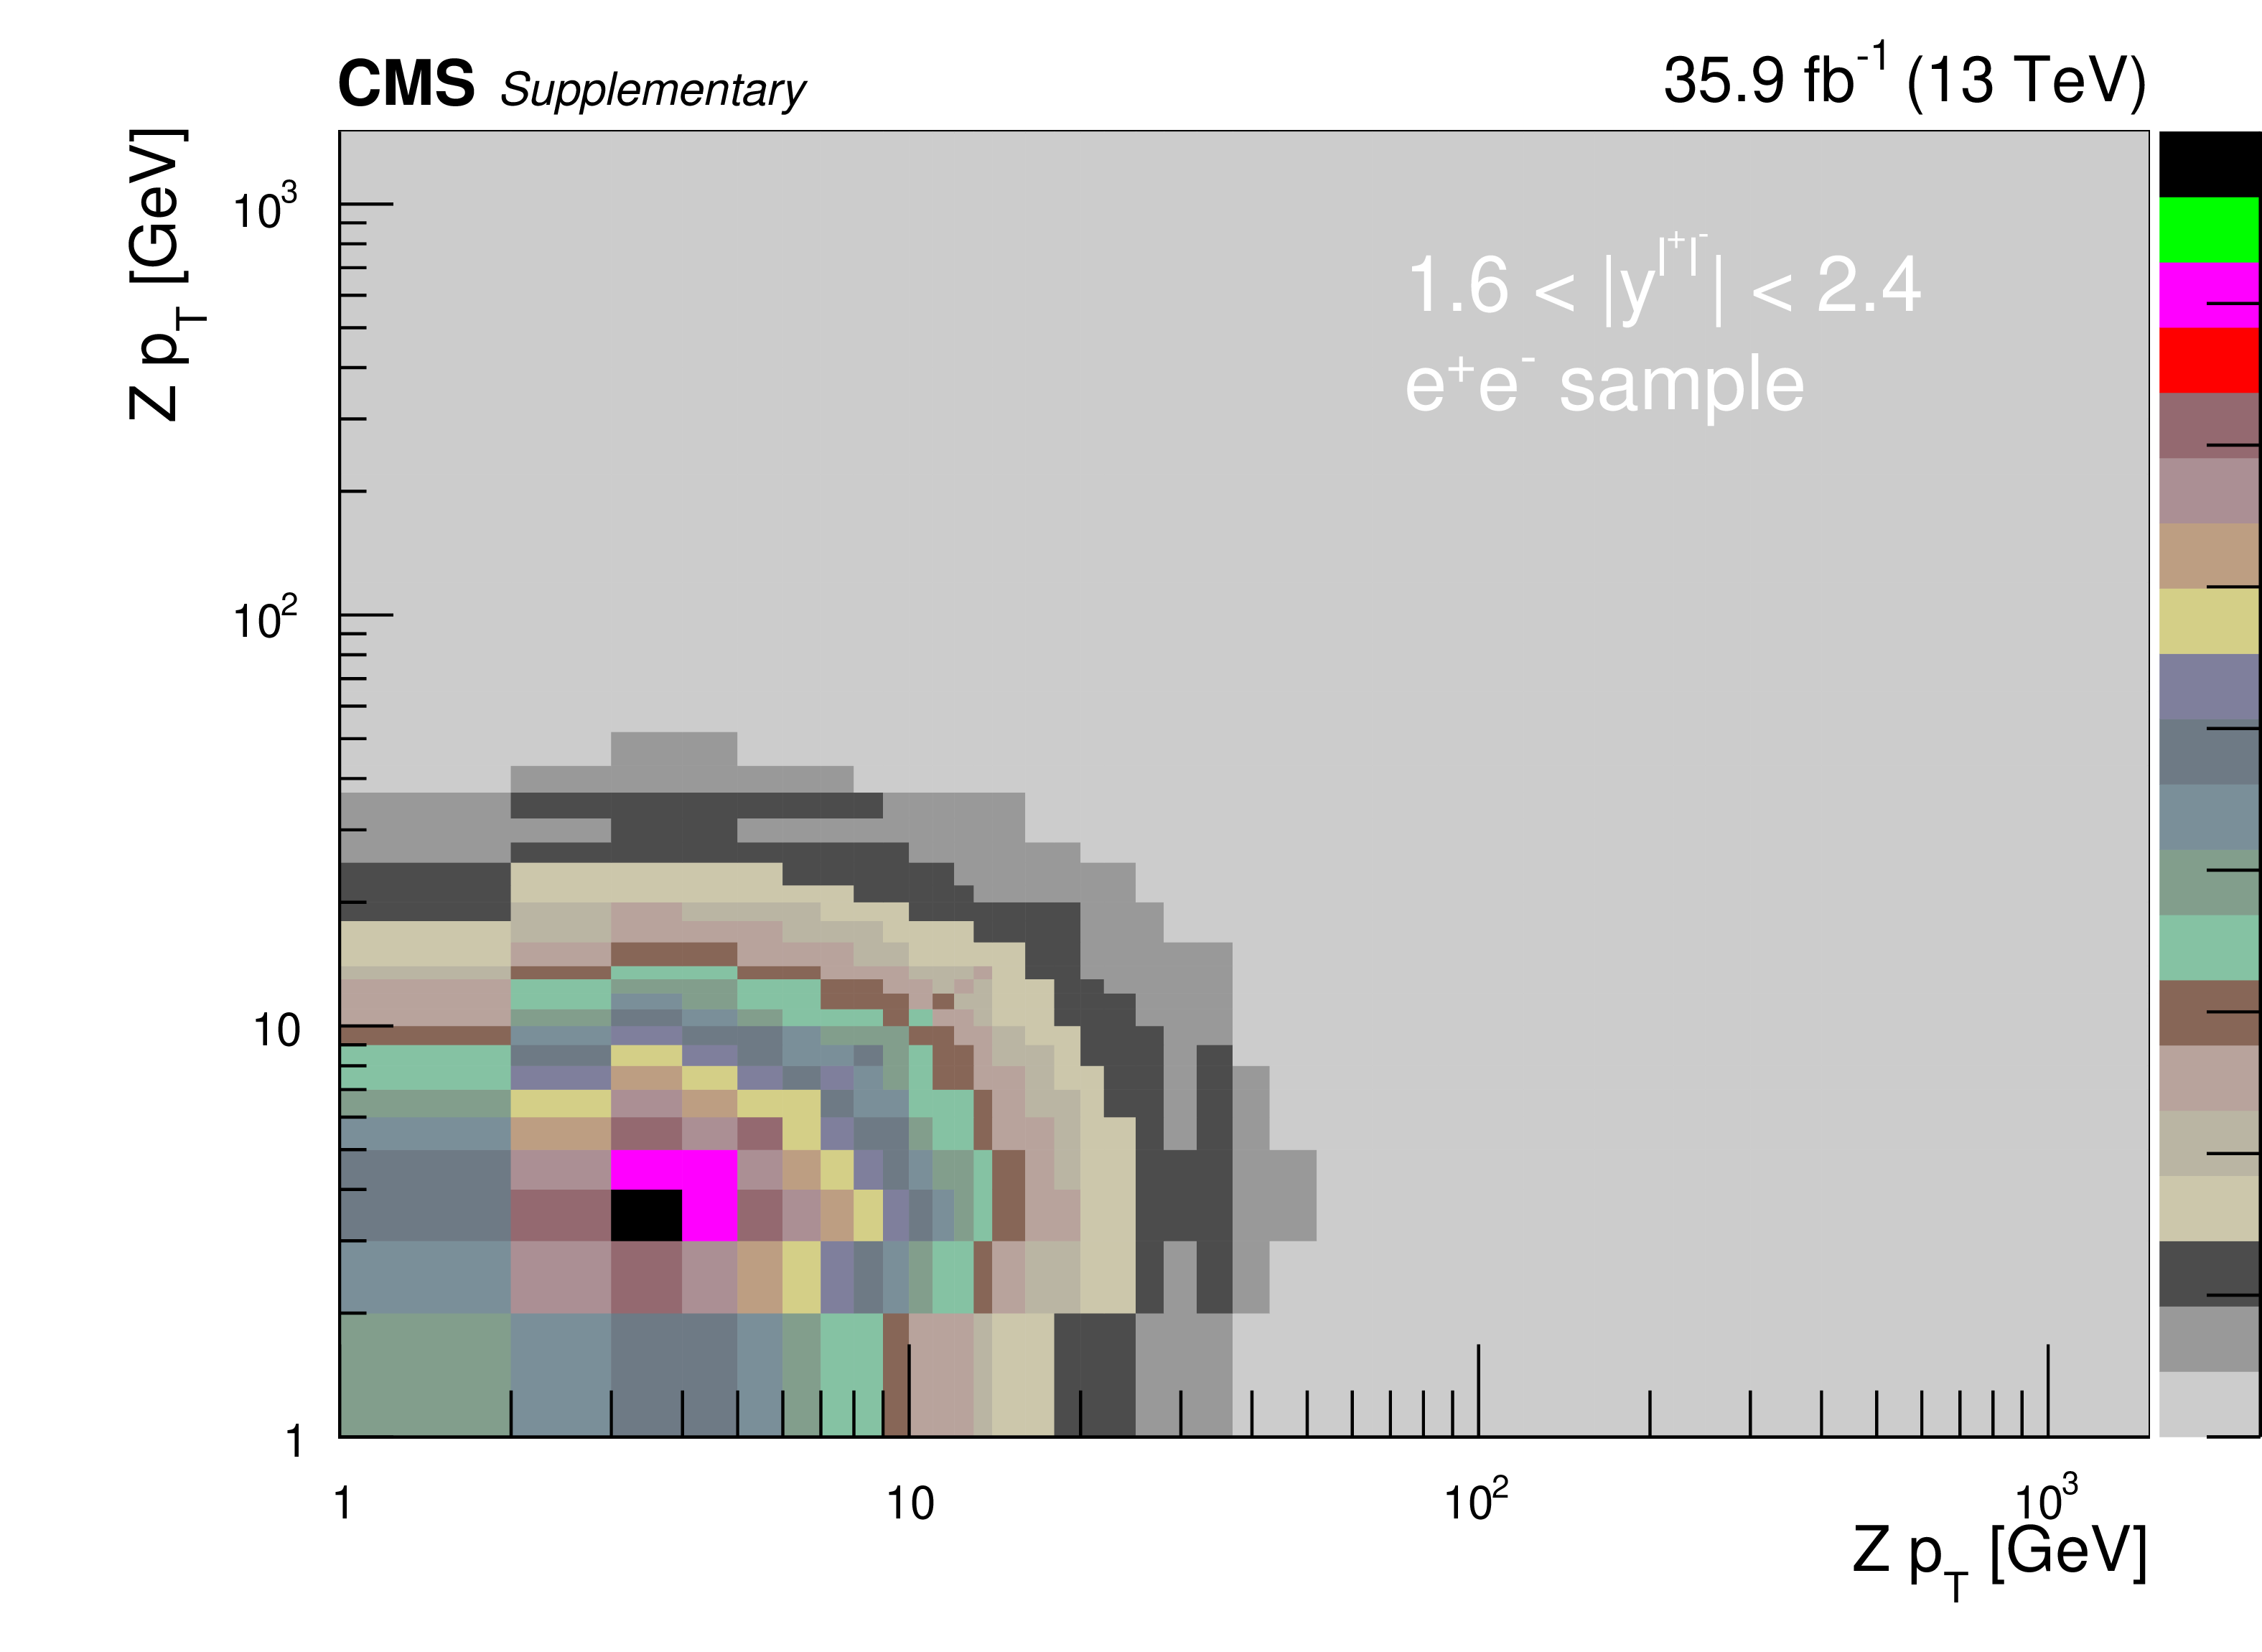
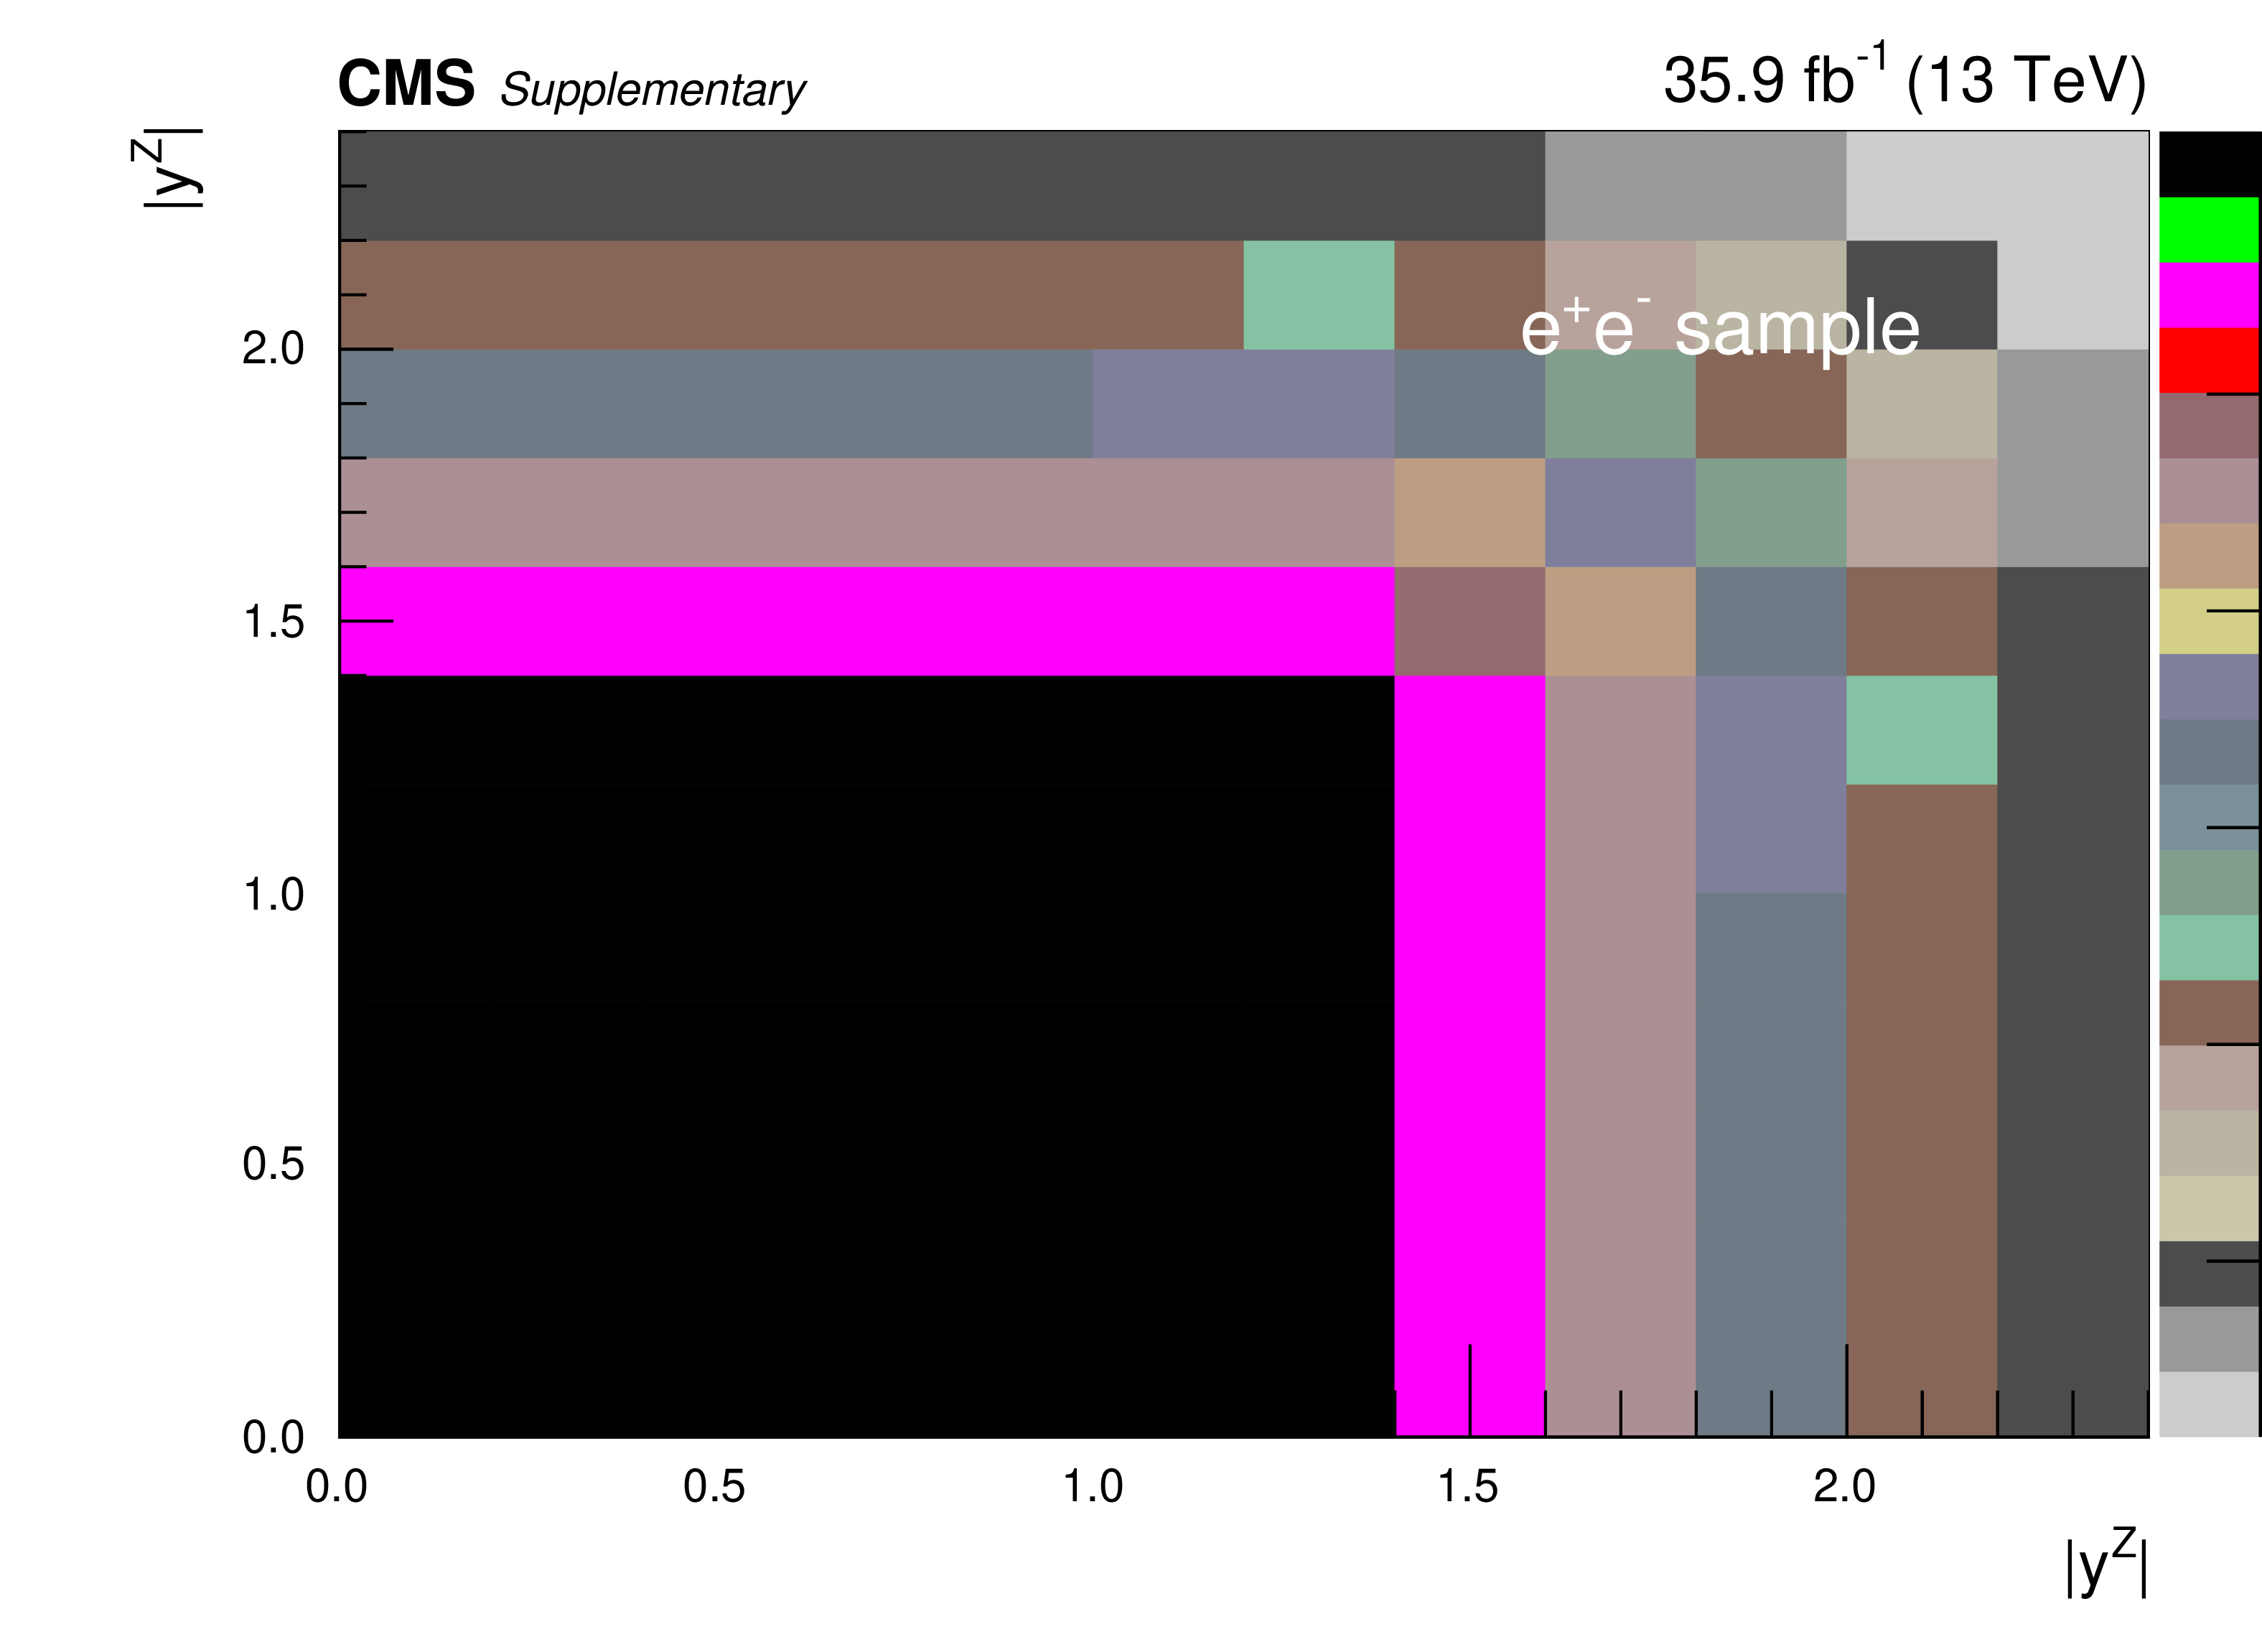
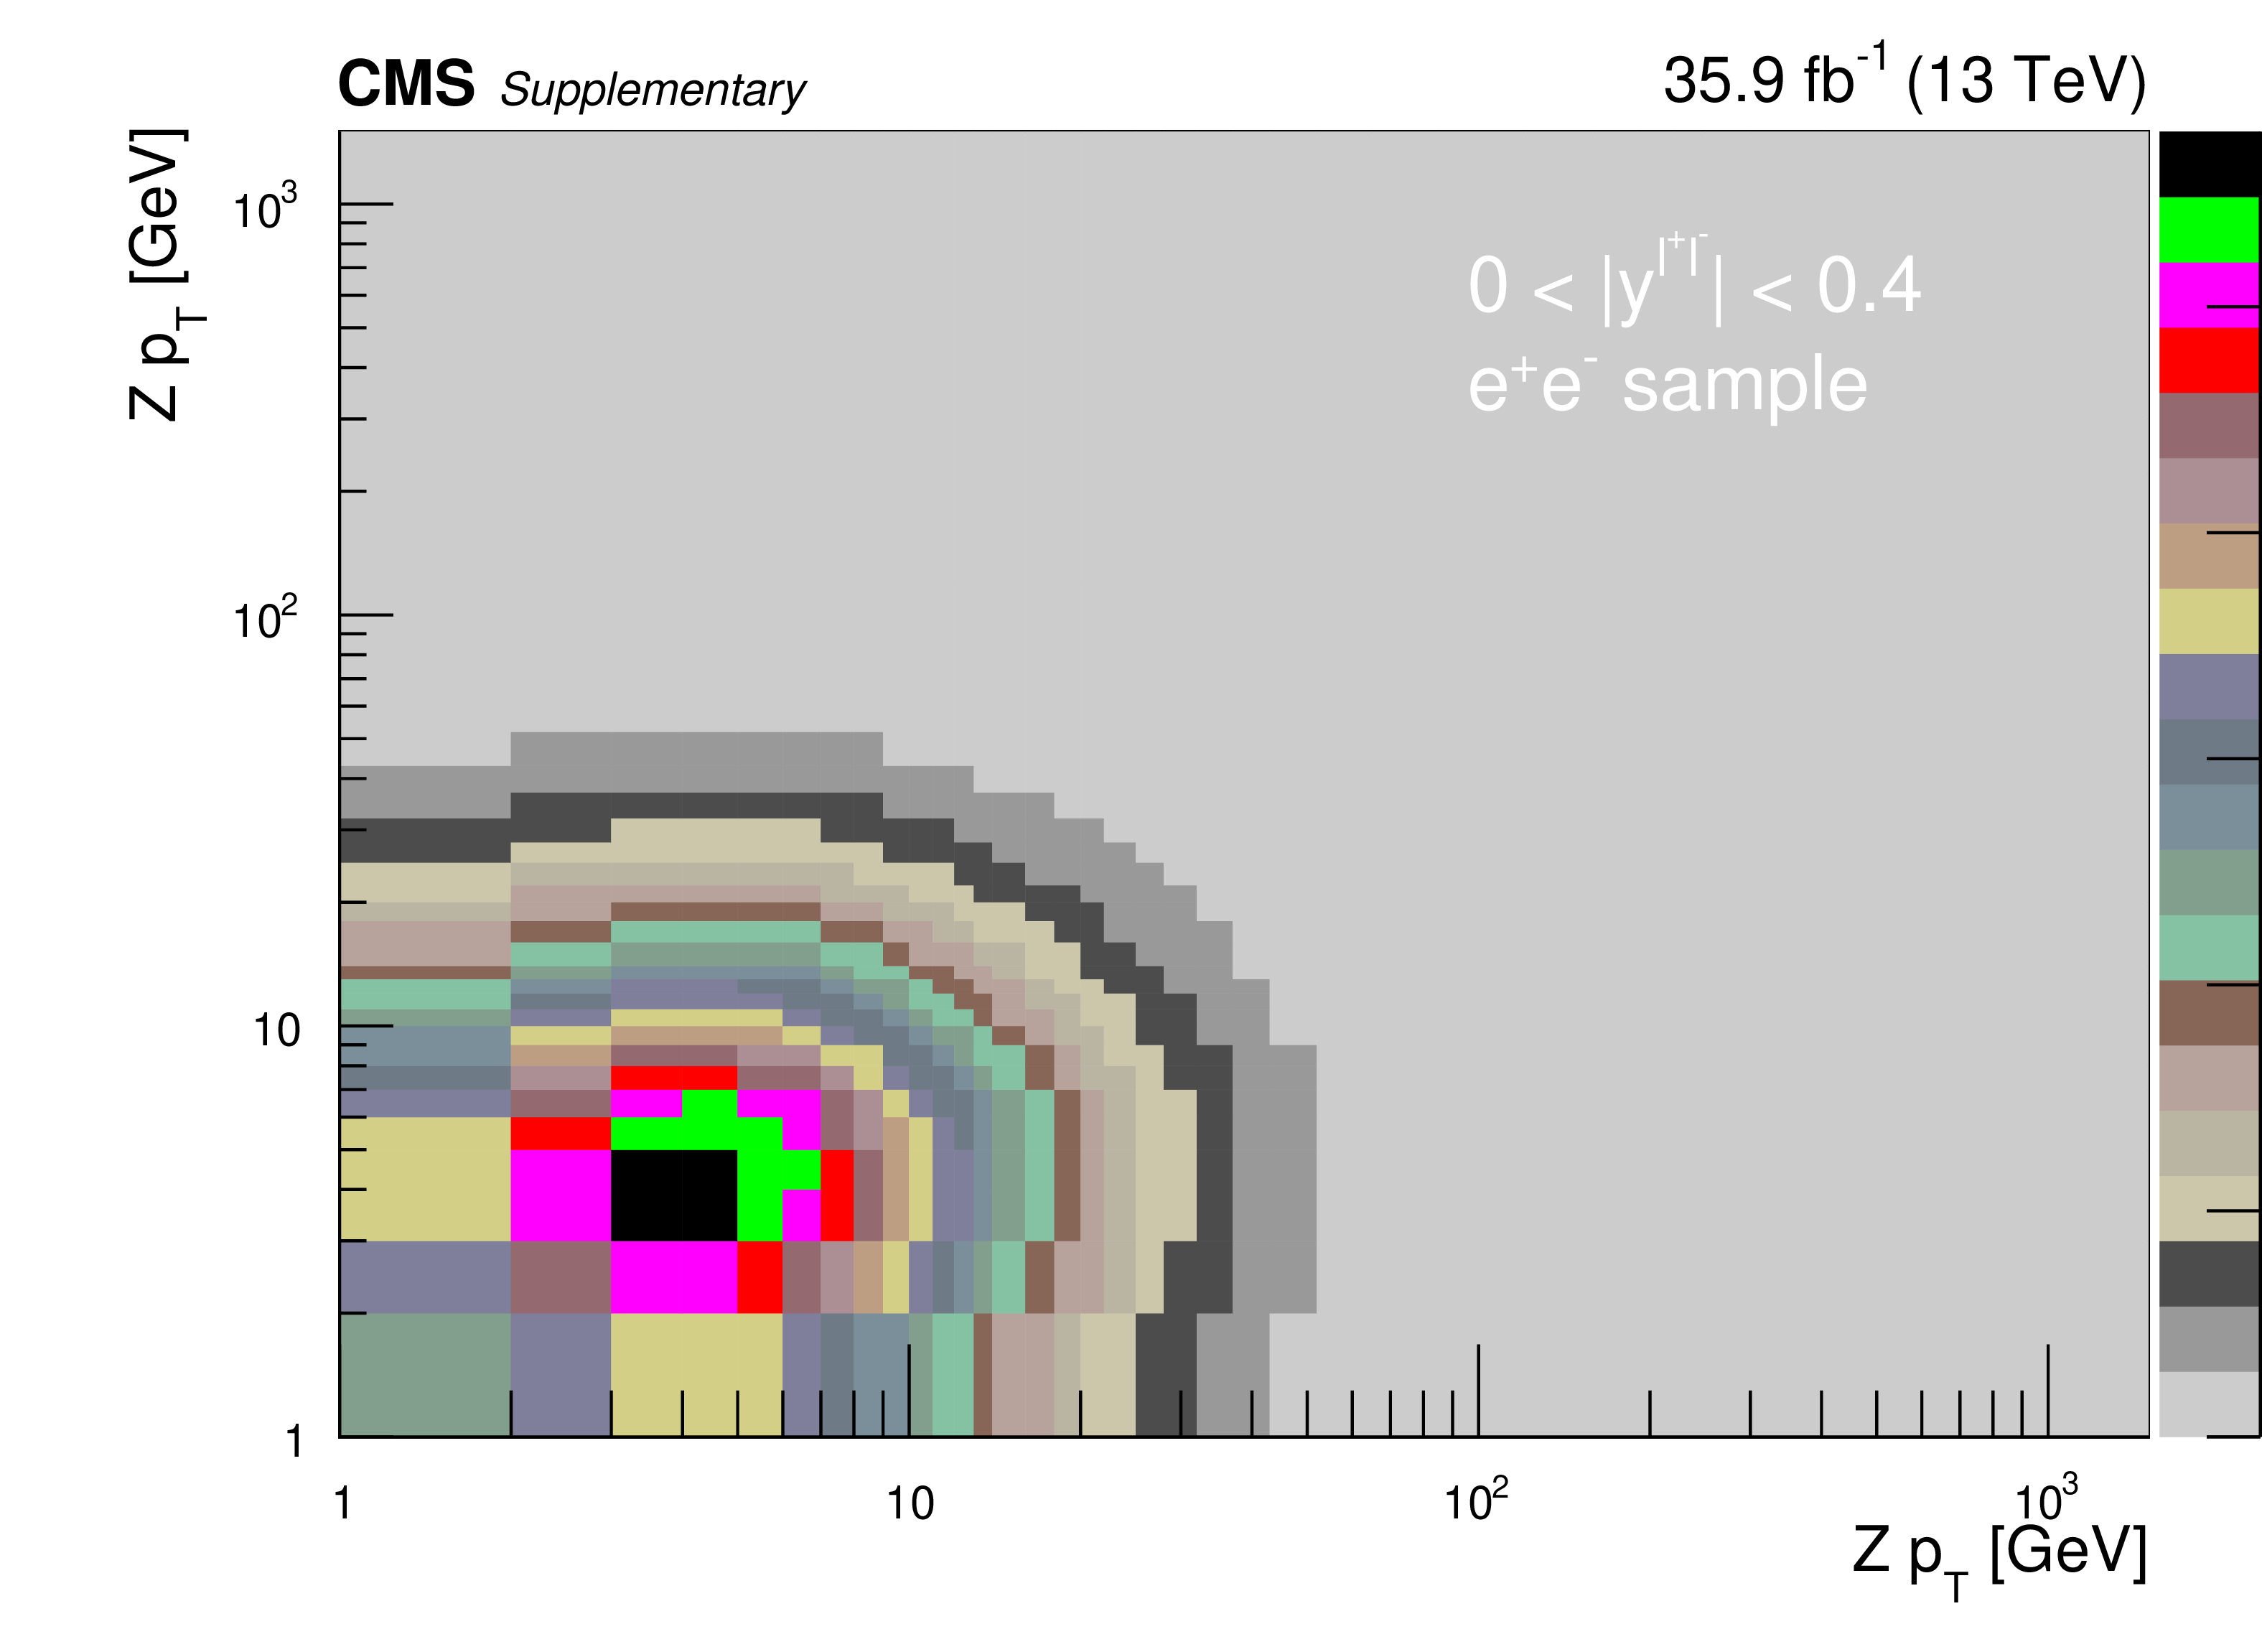
Figure 4:
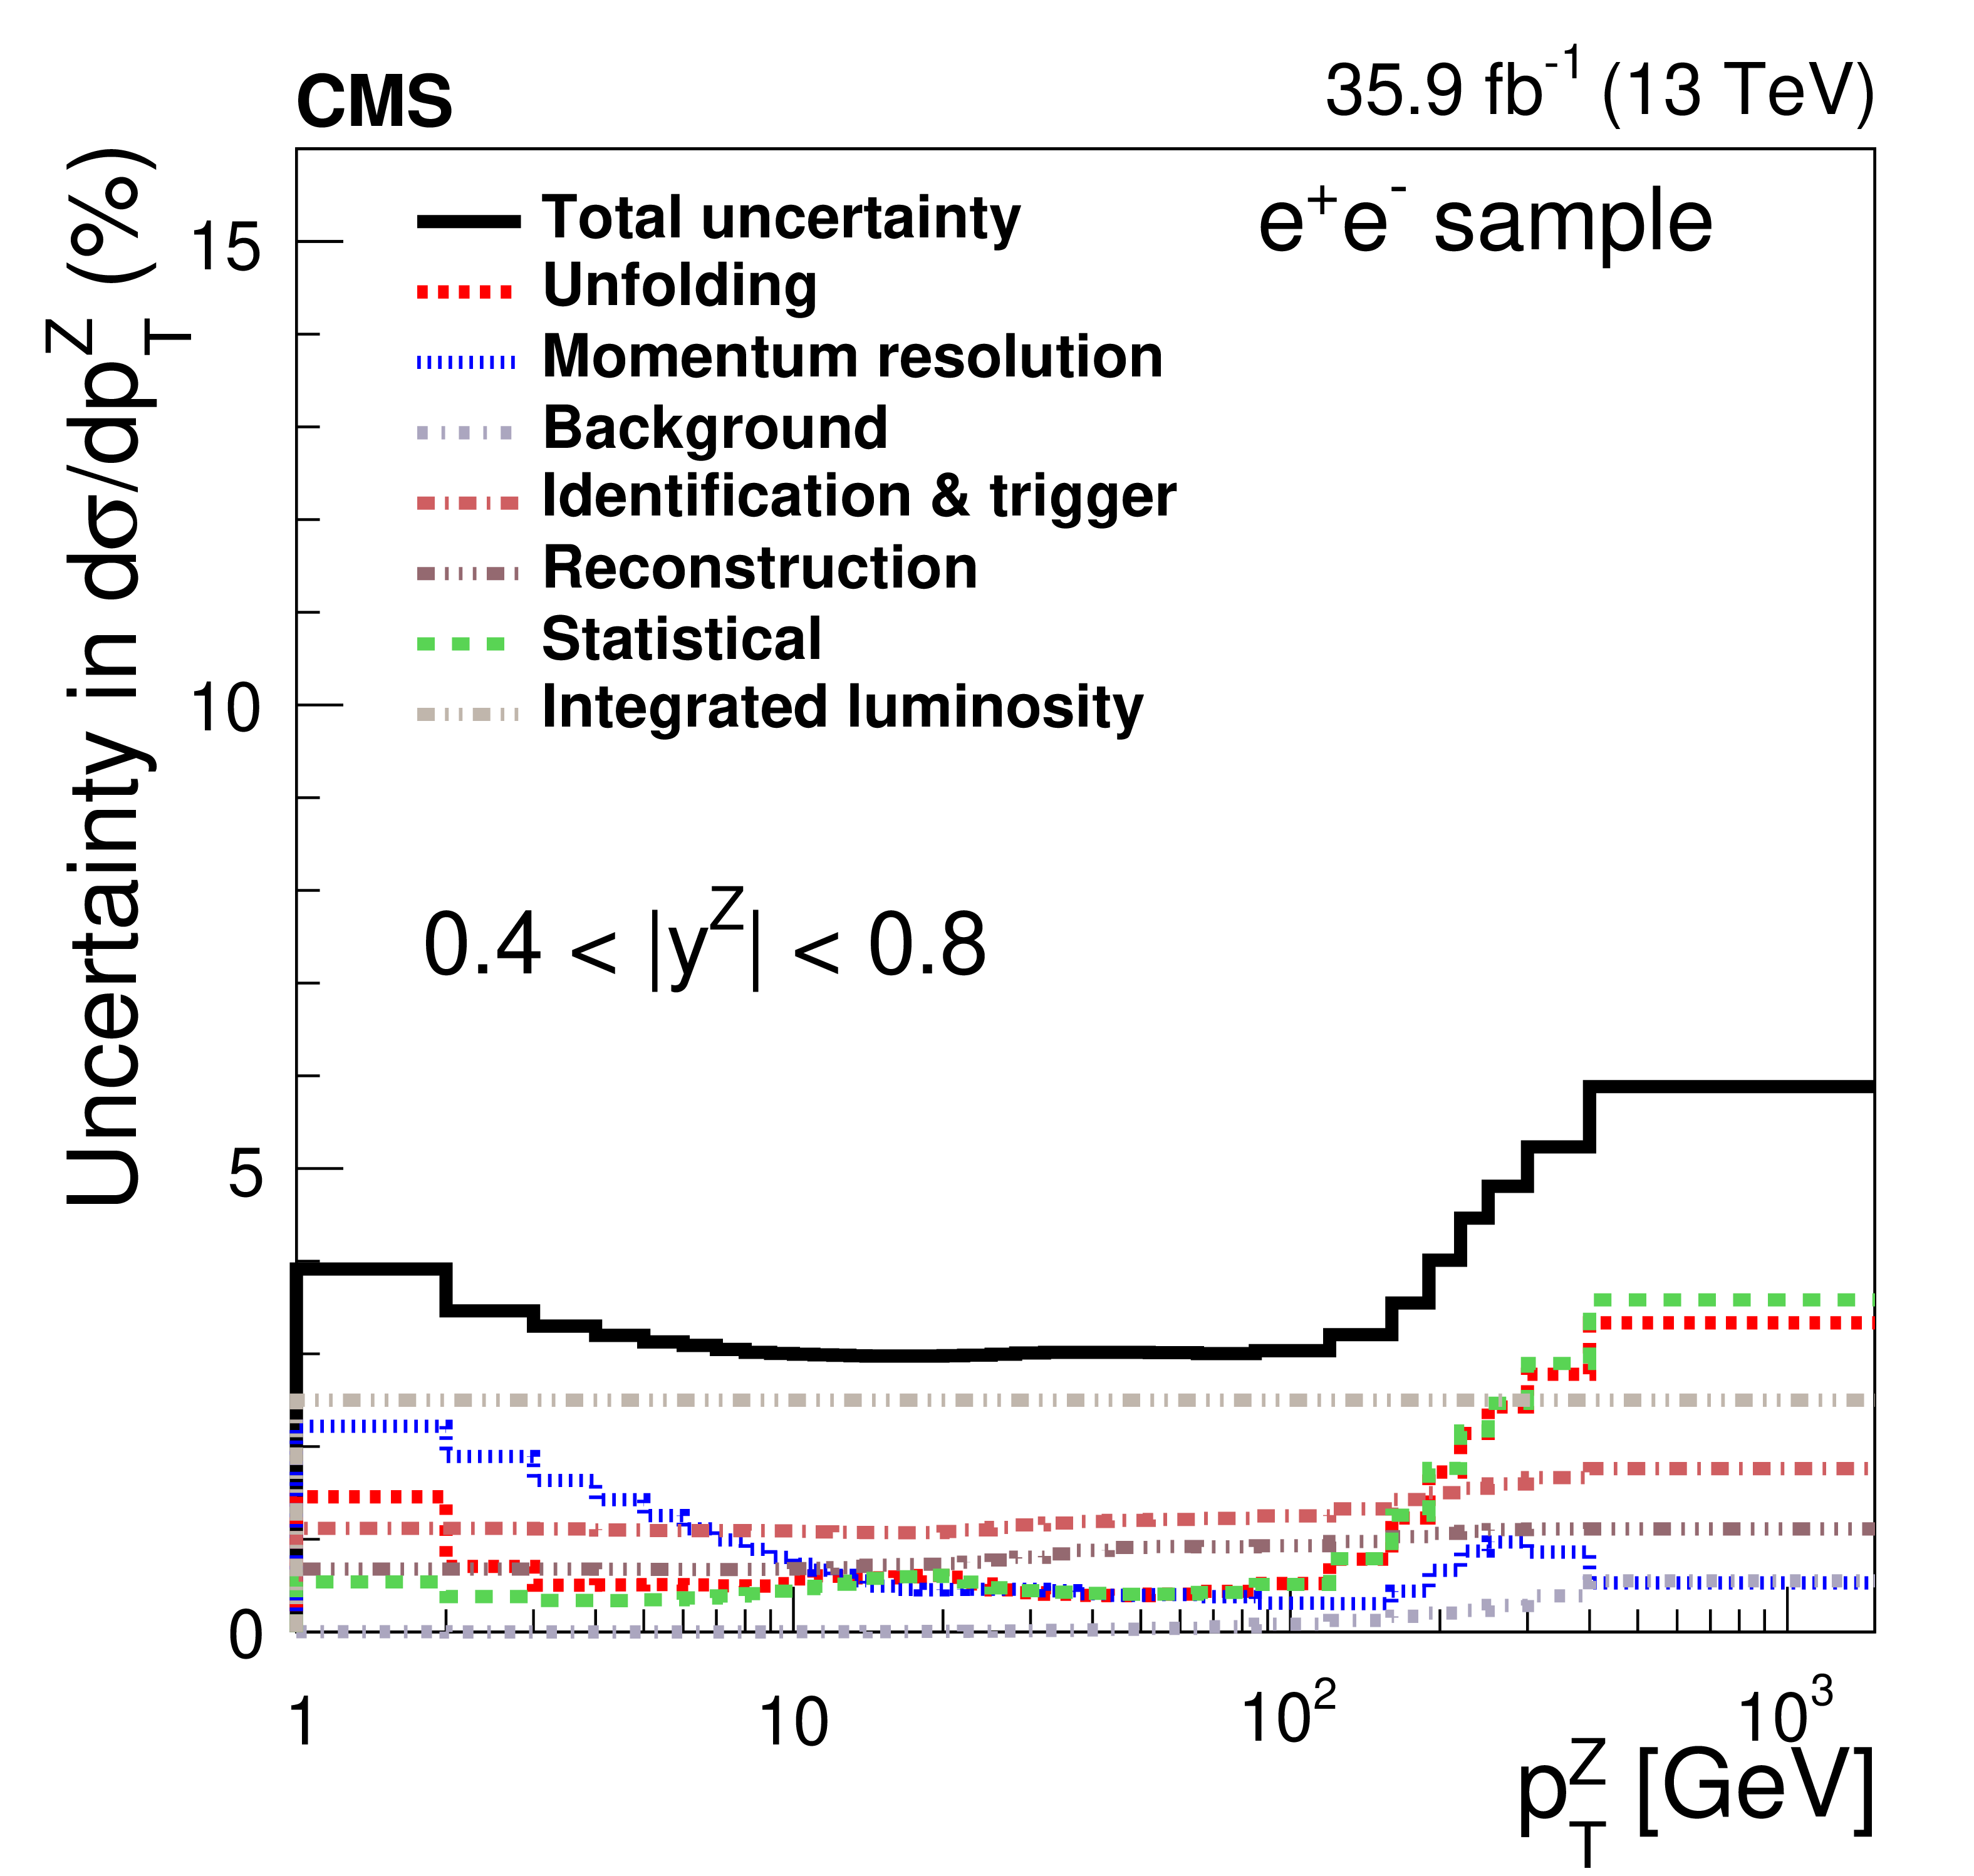
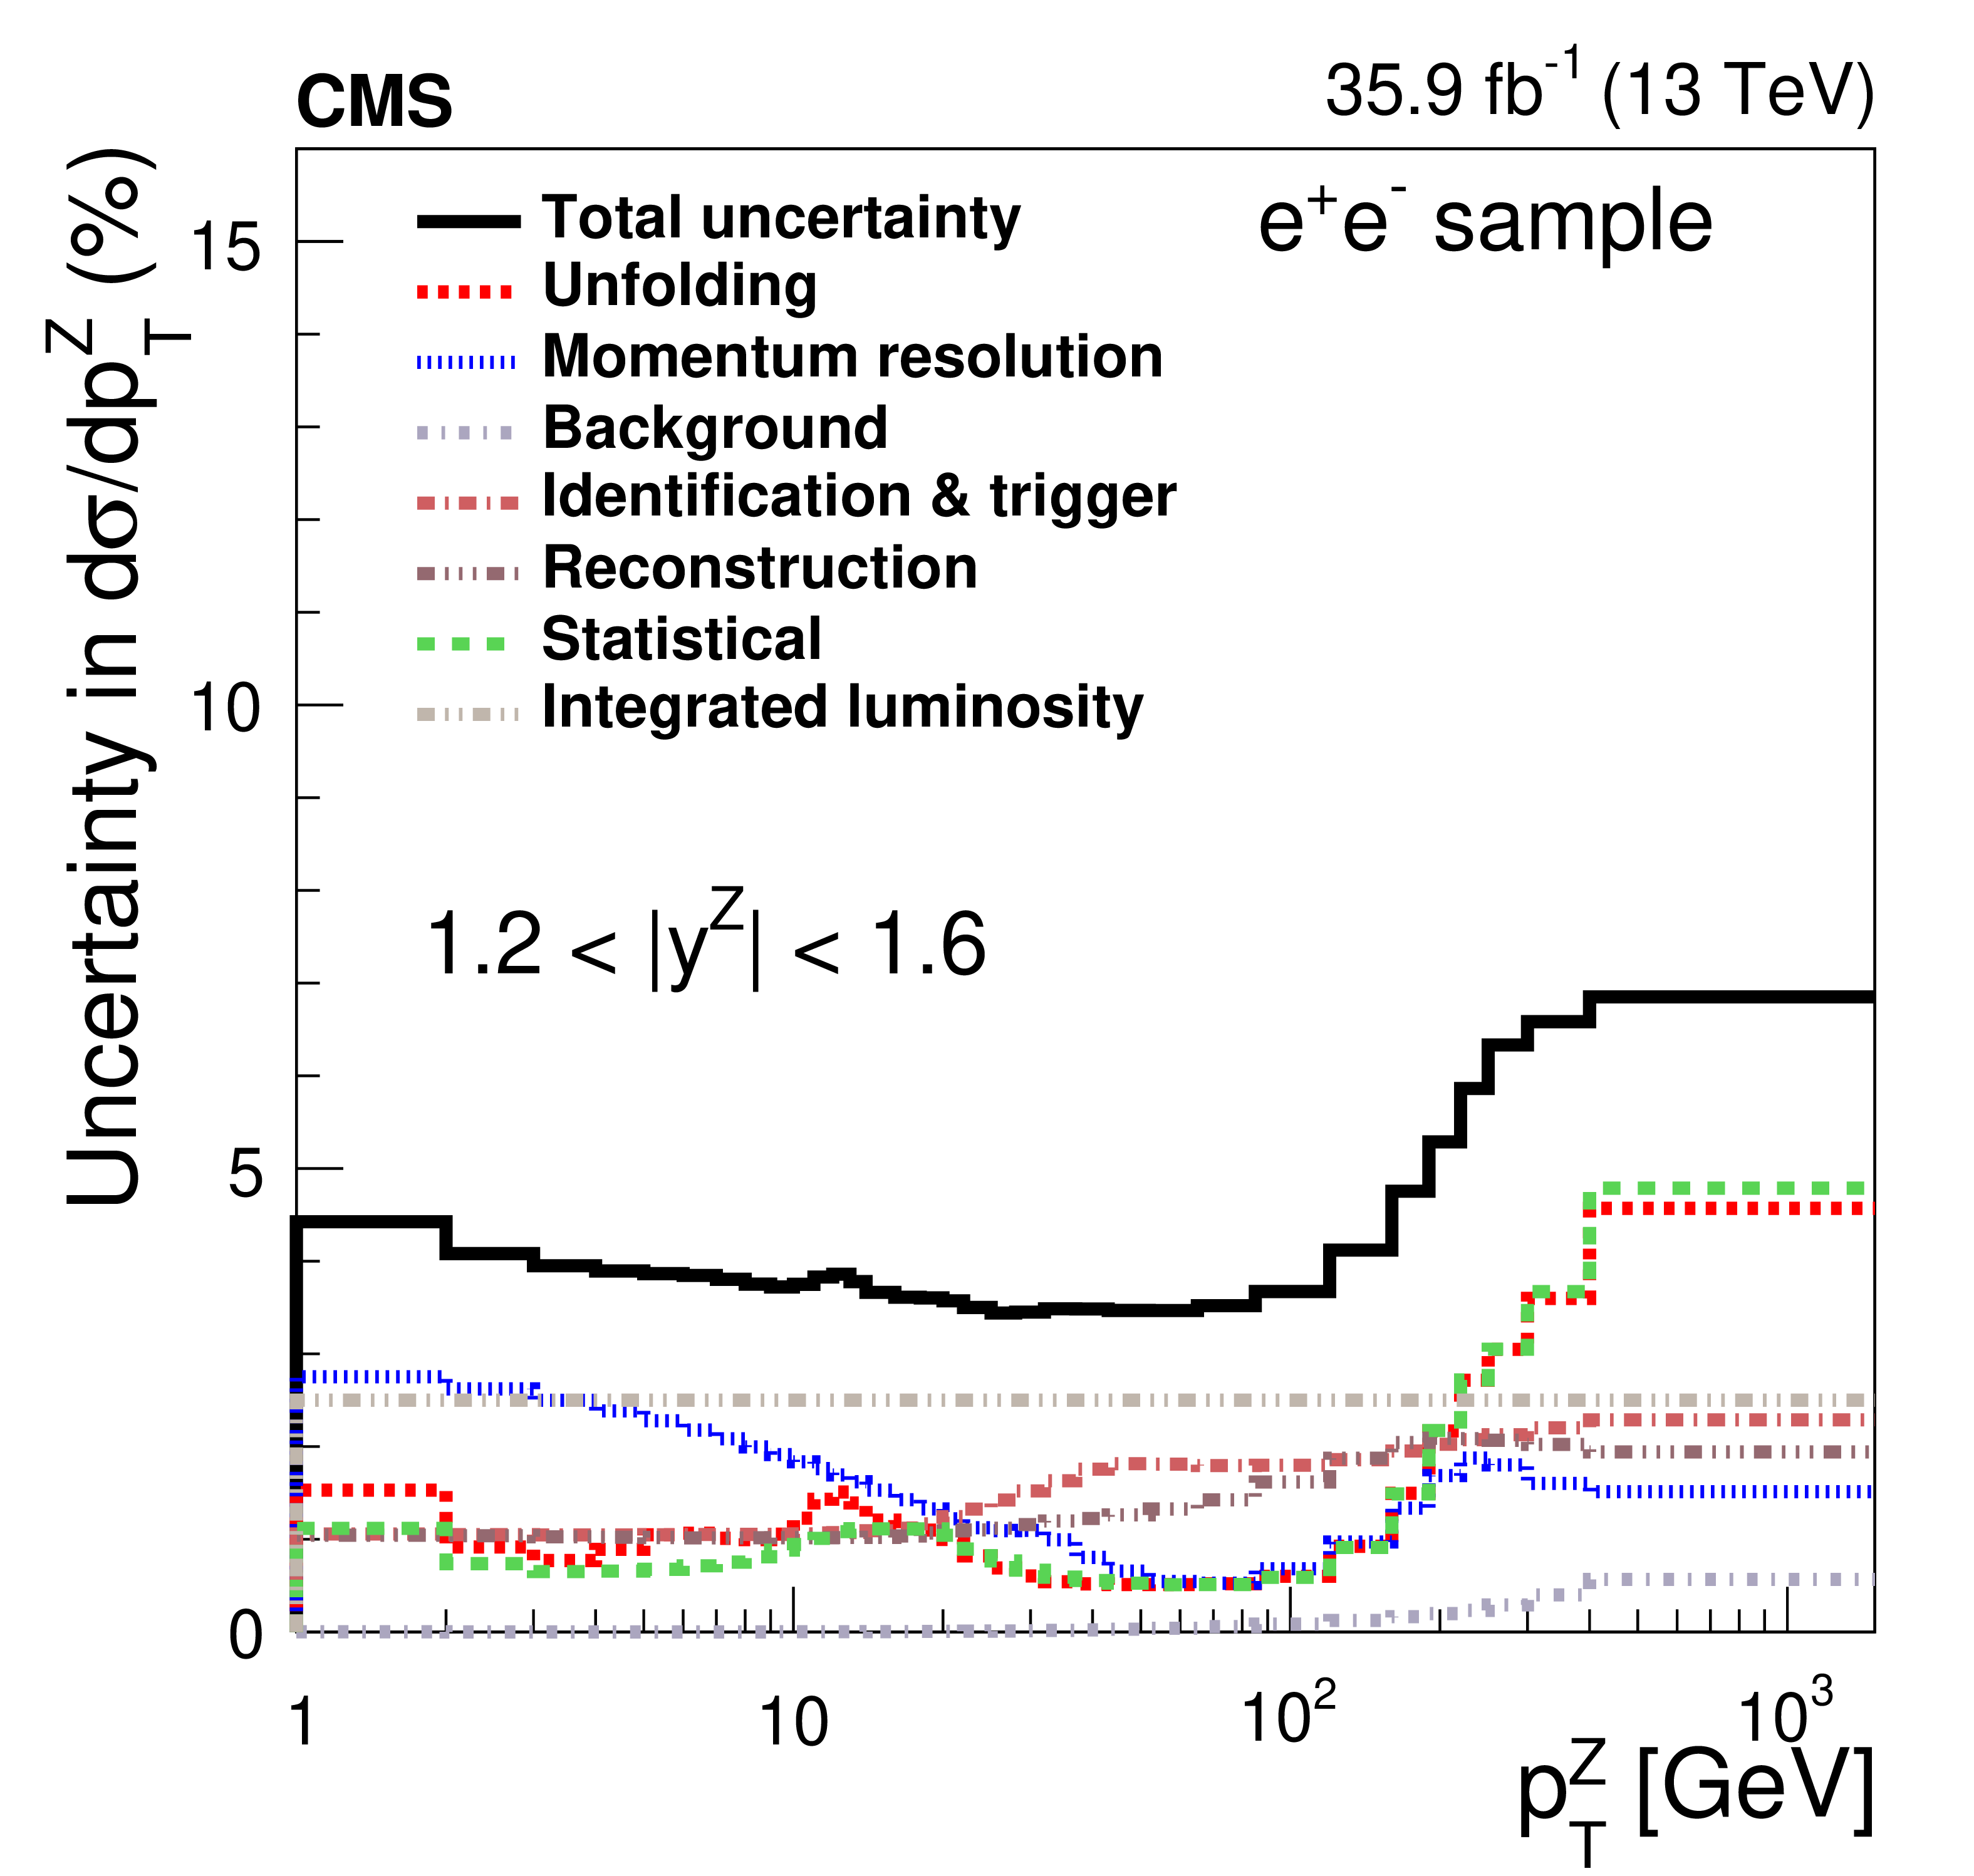
The relative statistical and systematic uncertainties from various sources for the absolute double-differential cross section measurements in bins of $ {p_{\mathrm {T}}} ^{\mathrm{Z}}$ for the 0.0 $ < {| {y}^{\mathrm{Z}} |} < $ 0.4 bin (upper left), 0.4 $ < {| {y}^{\mathrm{Z}} |} < $ 0.8 bin (upper right), 0.8 $ < {| {y}^{\mathrm{Z}} |} < $ 1.2 bin (middle left), 1.2 $ < {| {y}^{\mathrm{Z}} |} < $ 1.6 bin (middle right), and 1.6 $ < {| {y}^{\mathrm{Z}} |} < $ 2.4 bin (lower) in the dielectron final state. |

png pdf |
Figure 4-a:
The relative statistical and systematic uncertainties from various sources for the absolute double-differential cross section measurements in bins of $ {p_{\mathrm {T}}} ^{\mathrm{Z}}$ for the 0.0 $ < {| {y}^{\mathrm{Z}} |} < $ 0.4 bin. in the dielectron final state. |
png pdf |
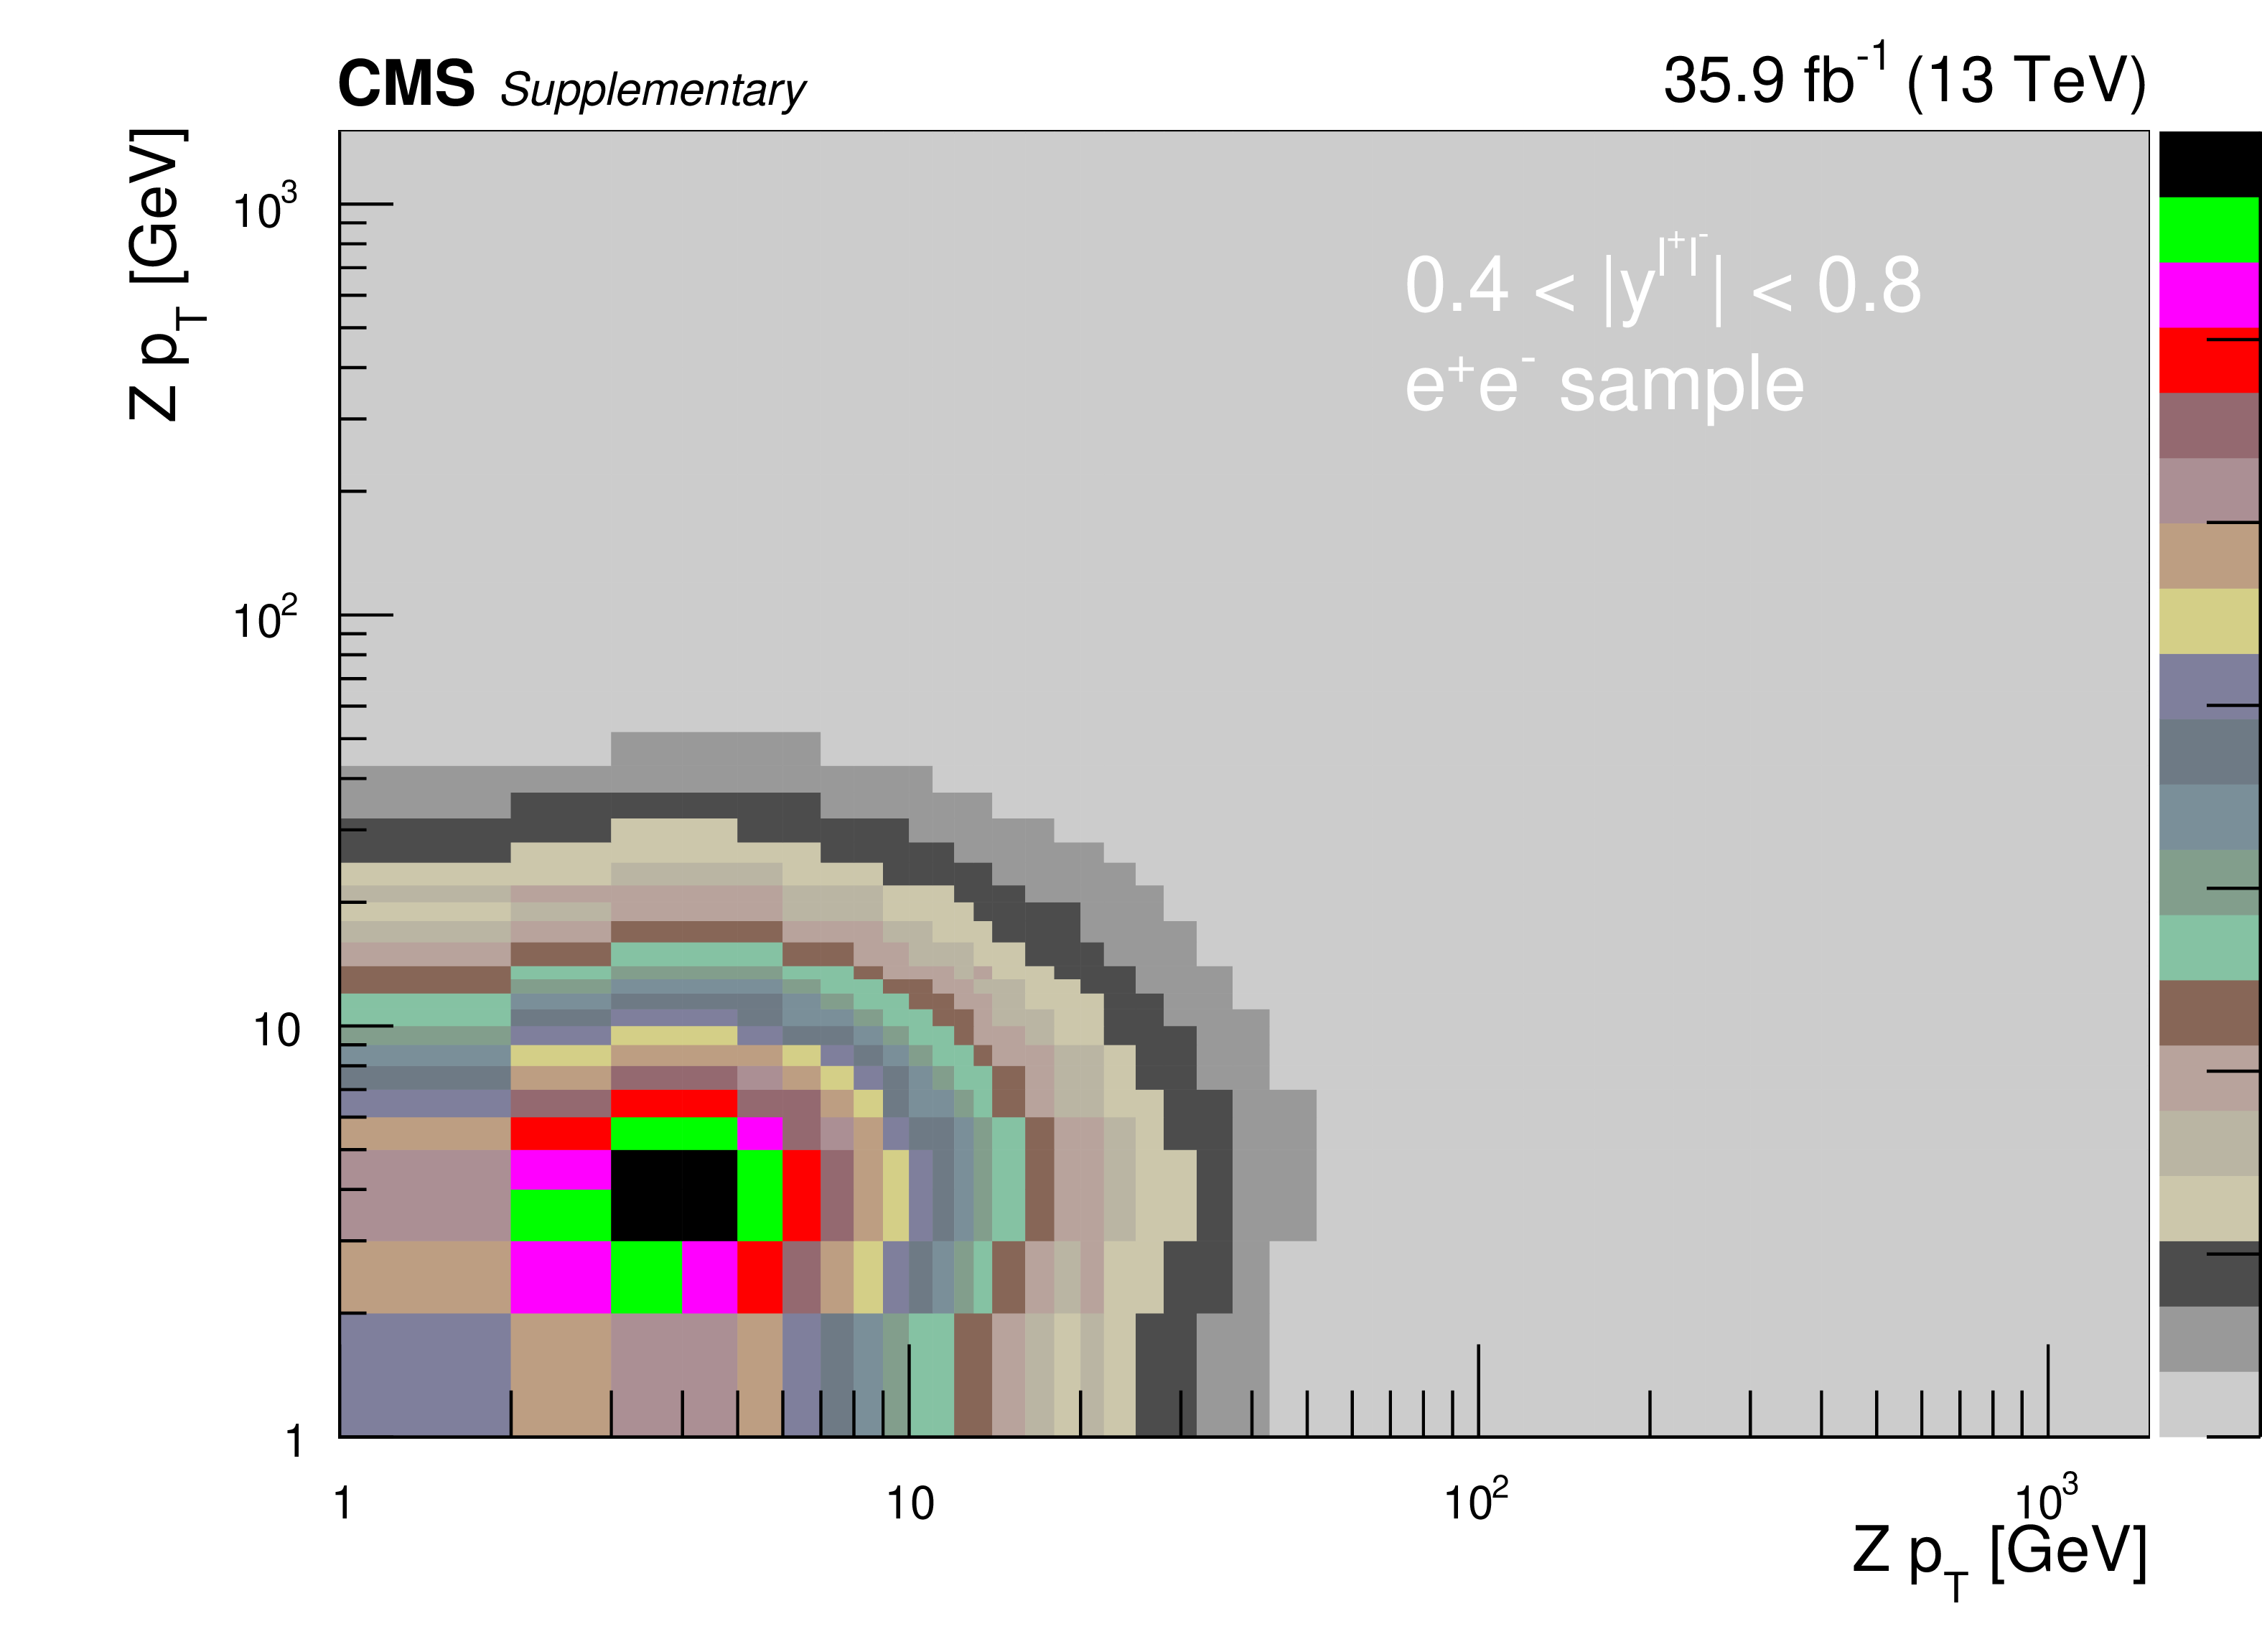
Figure 4-b:
The relative statistical and systematic uncertainties from various sources for the absolute double-differential cross section measurements in bins of $ {p_{\mathrm {T}}} ^{\mathrm{Z}}$ for the 0.4 $ < {| {y}^{\mathrm{Z}} |} < $ 0.8 bin. in the dielectron final state. |

png pdf |
Figure 4-c:
The relative statistical and systematic uncertainties from various sources for the absolute double-differential cross section measurements in bins of $ {p_{\mathrm {T}}} ^{\mathrm{Z}}$ for the 0.8 $ < {| {y}^{\mathrm{Z}} |} < $ 1.2 bin. in the dielectron final state. |
png pdf |
Figure 4-d:
The relative statistical and systematic uncertainties from various sources for the absolute double-differential cross section measurements in bins of $ {p_{\mathrm {T}}} ^{\mathrm{Z}}$ for the 1.2 $ < {| {y}^{\mathrm{Z}} |} < $ 1.6 bin. in the dielectron final state. |
png pdf |
Figure 4-e:
The relative statistical and systematic uncertainties from various sources for the absolute double-differential cross section measurements in bins of $ {p_{\mathrm {T}}} ^{\mathrm{Z}}$ for the 1.6 $ < {| {y}^{\mathrm{Z}} |} < $ 2.4 bin. in the dielectron final state. |

png pdf |
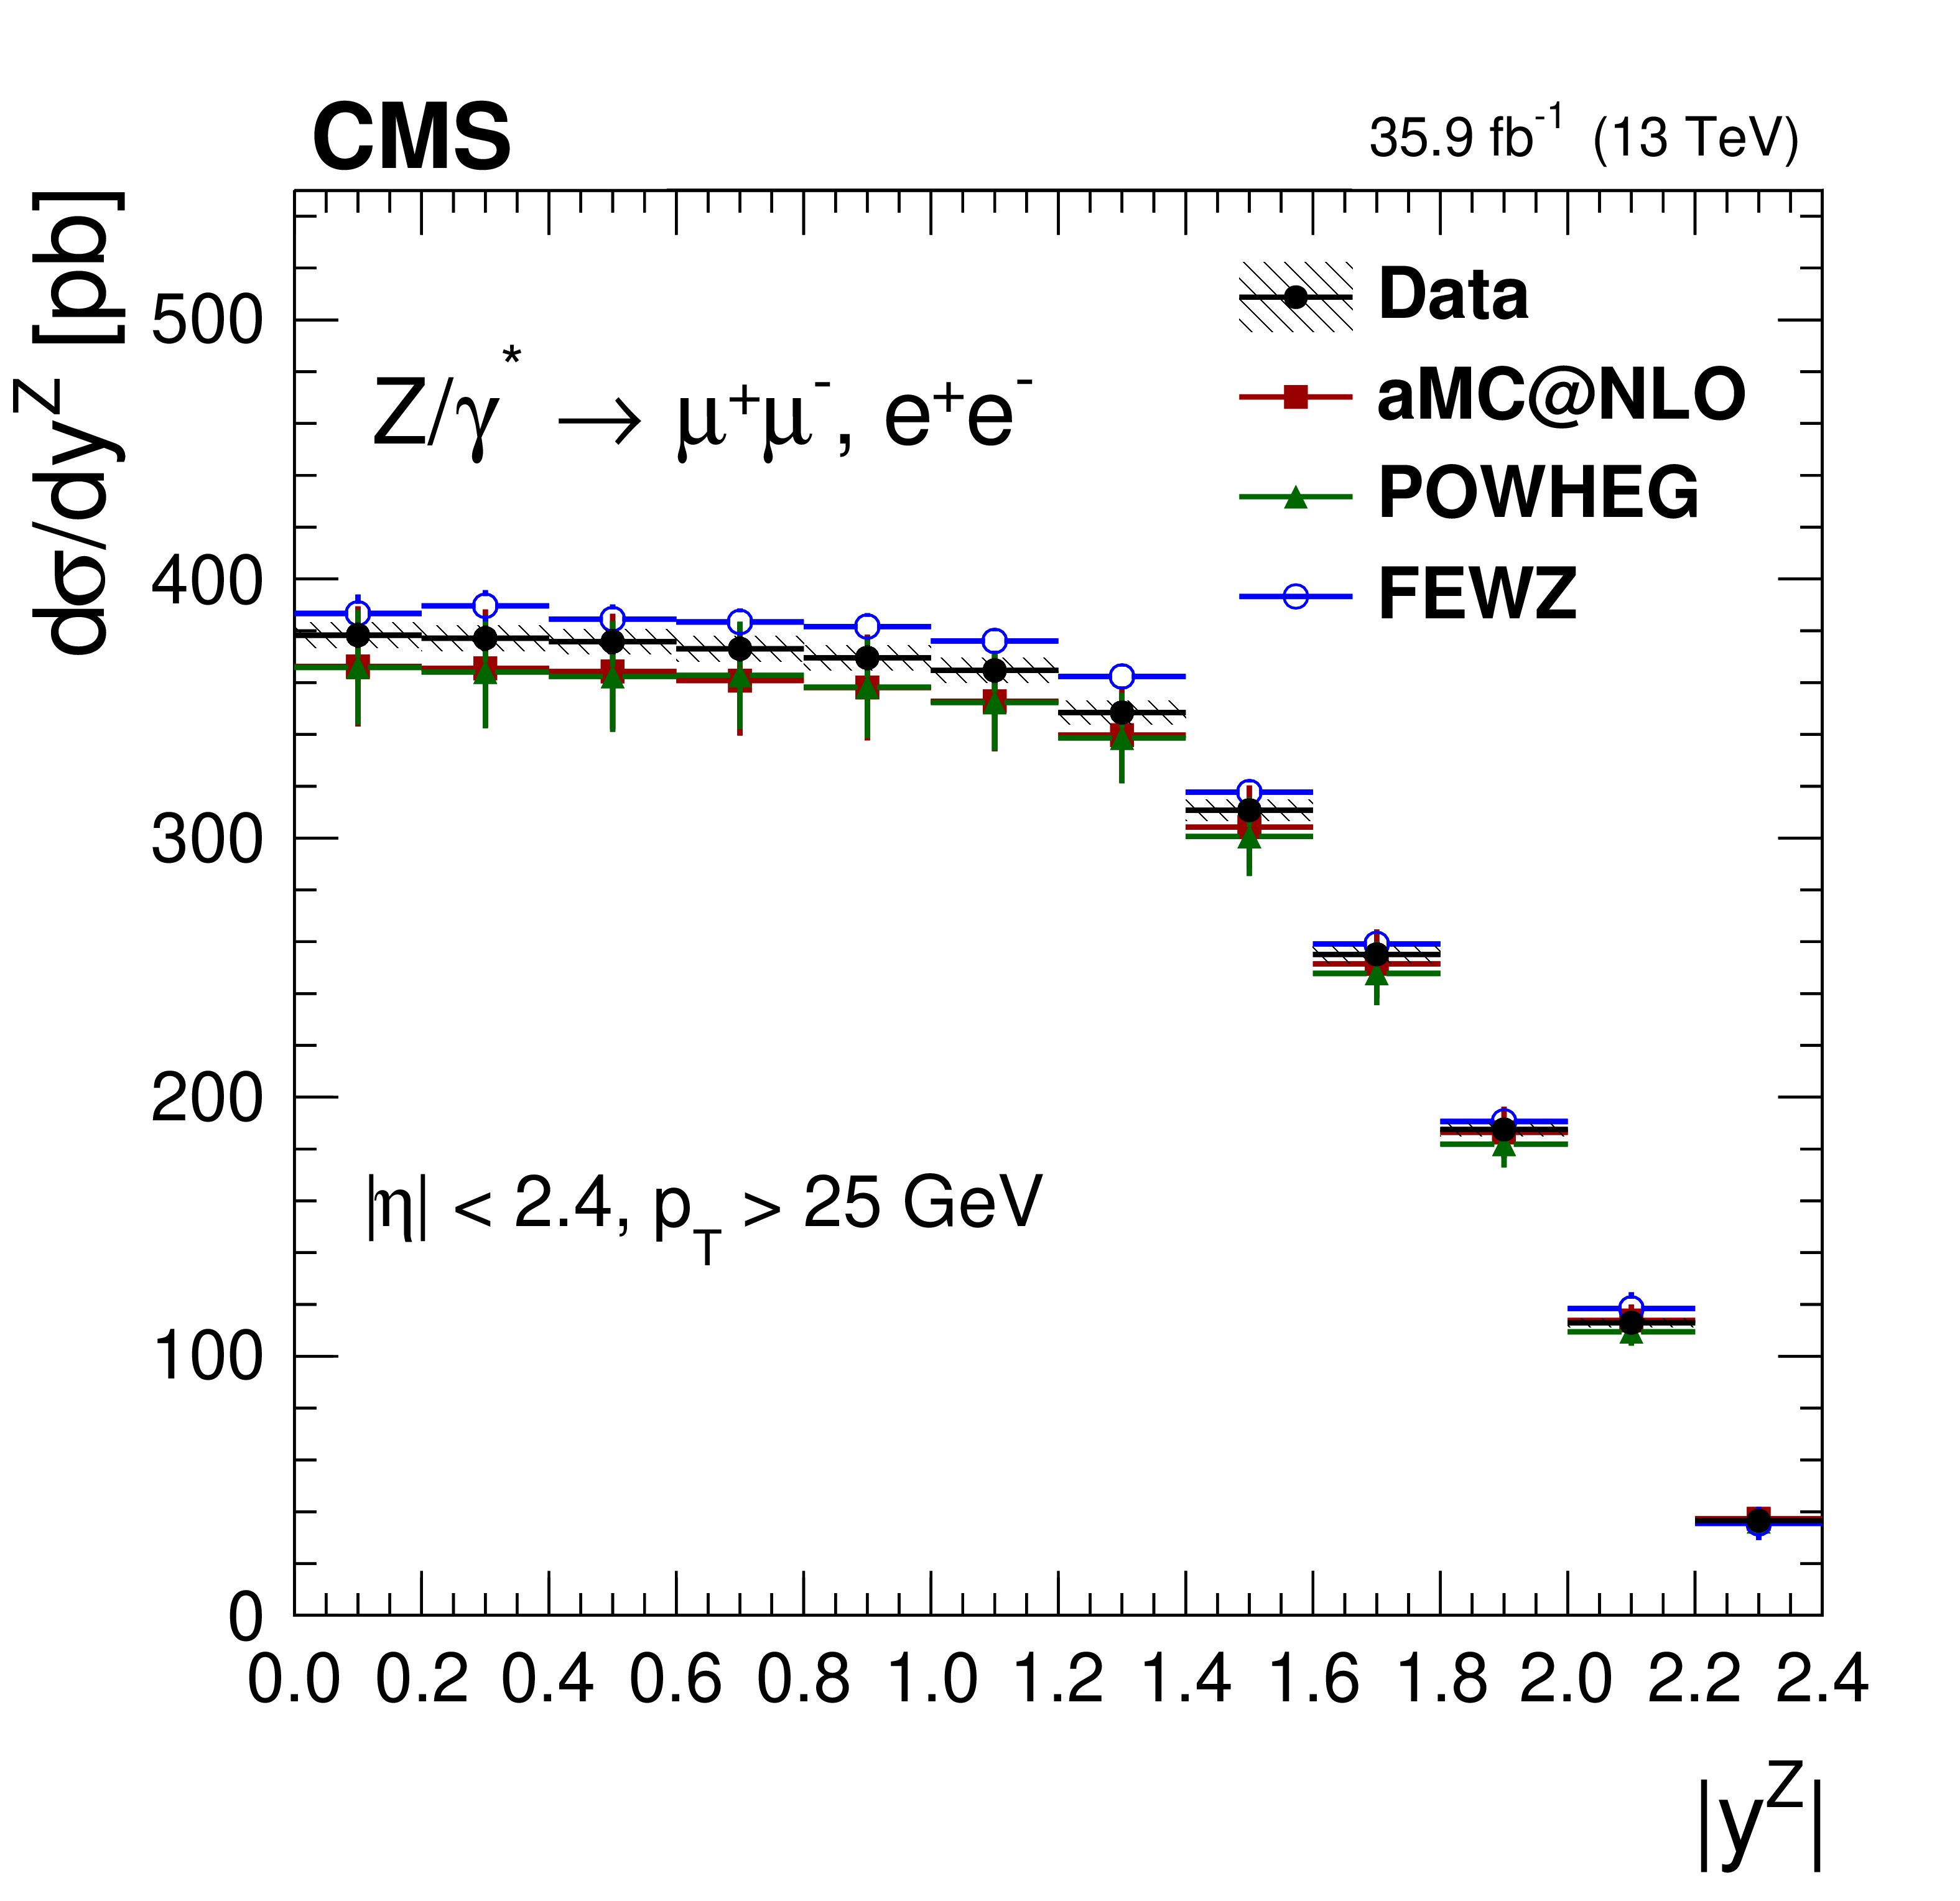
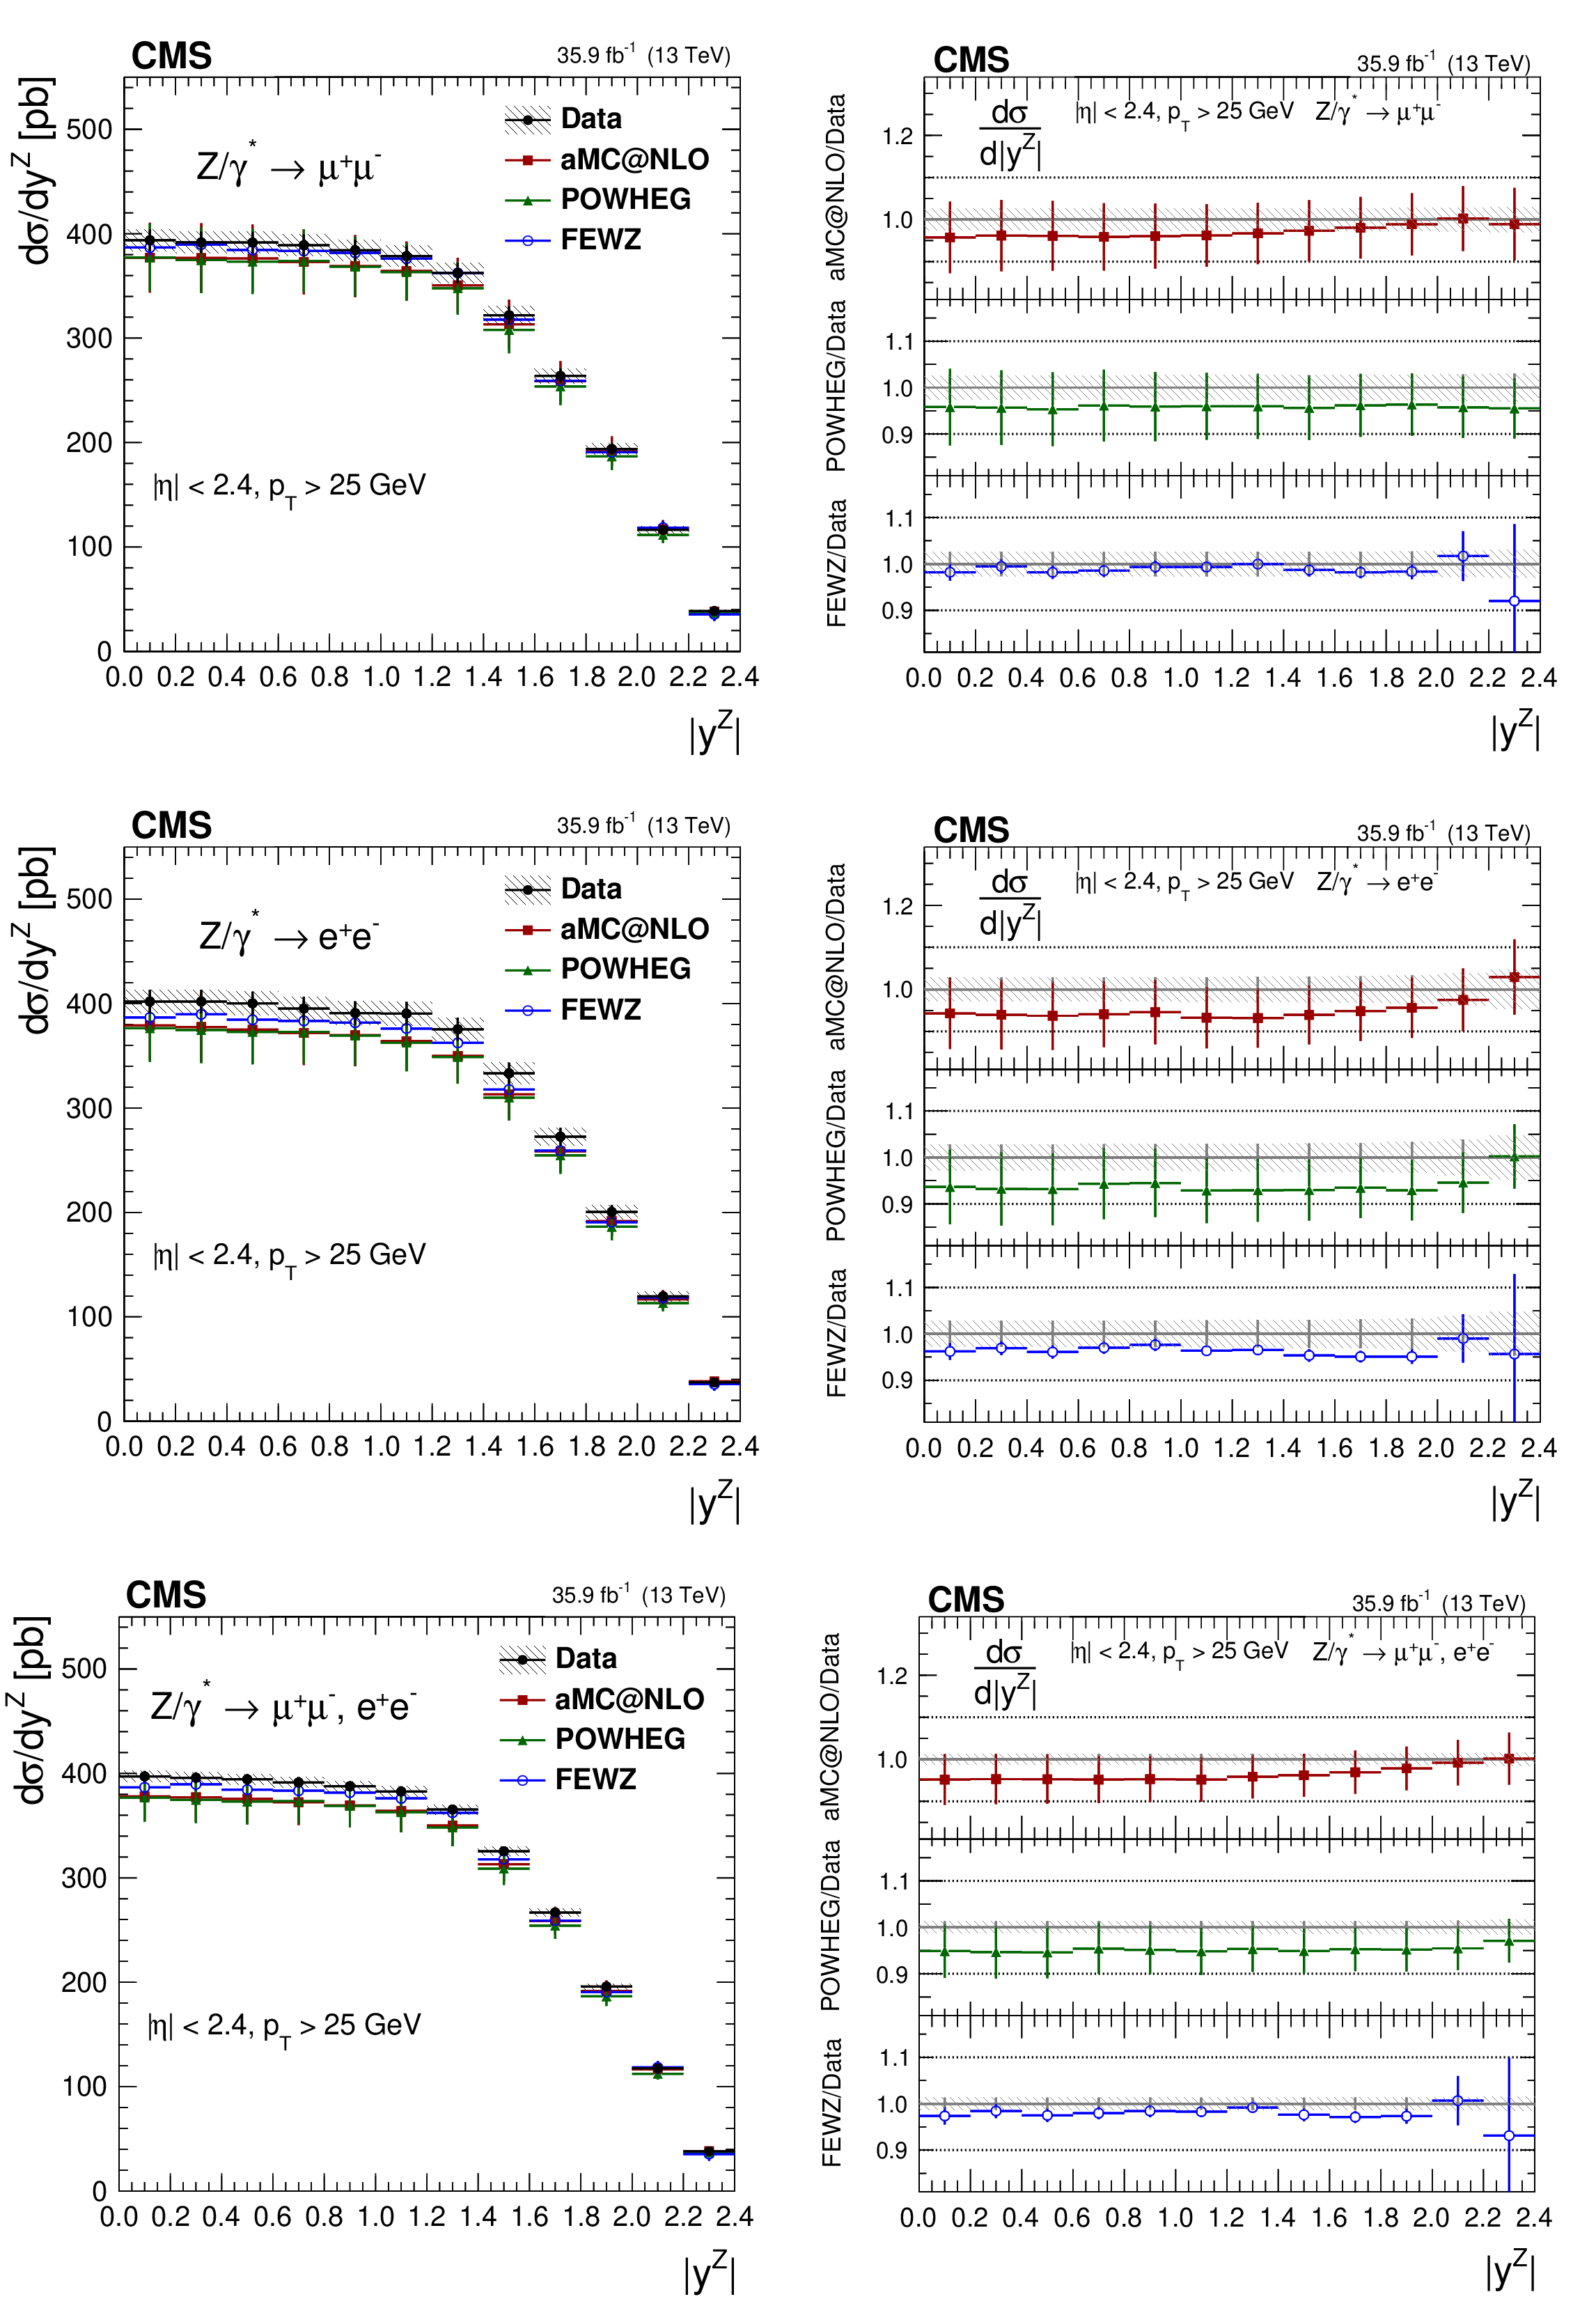
Figure 5:
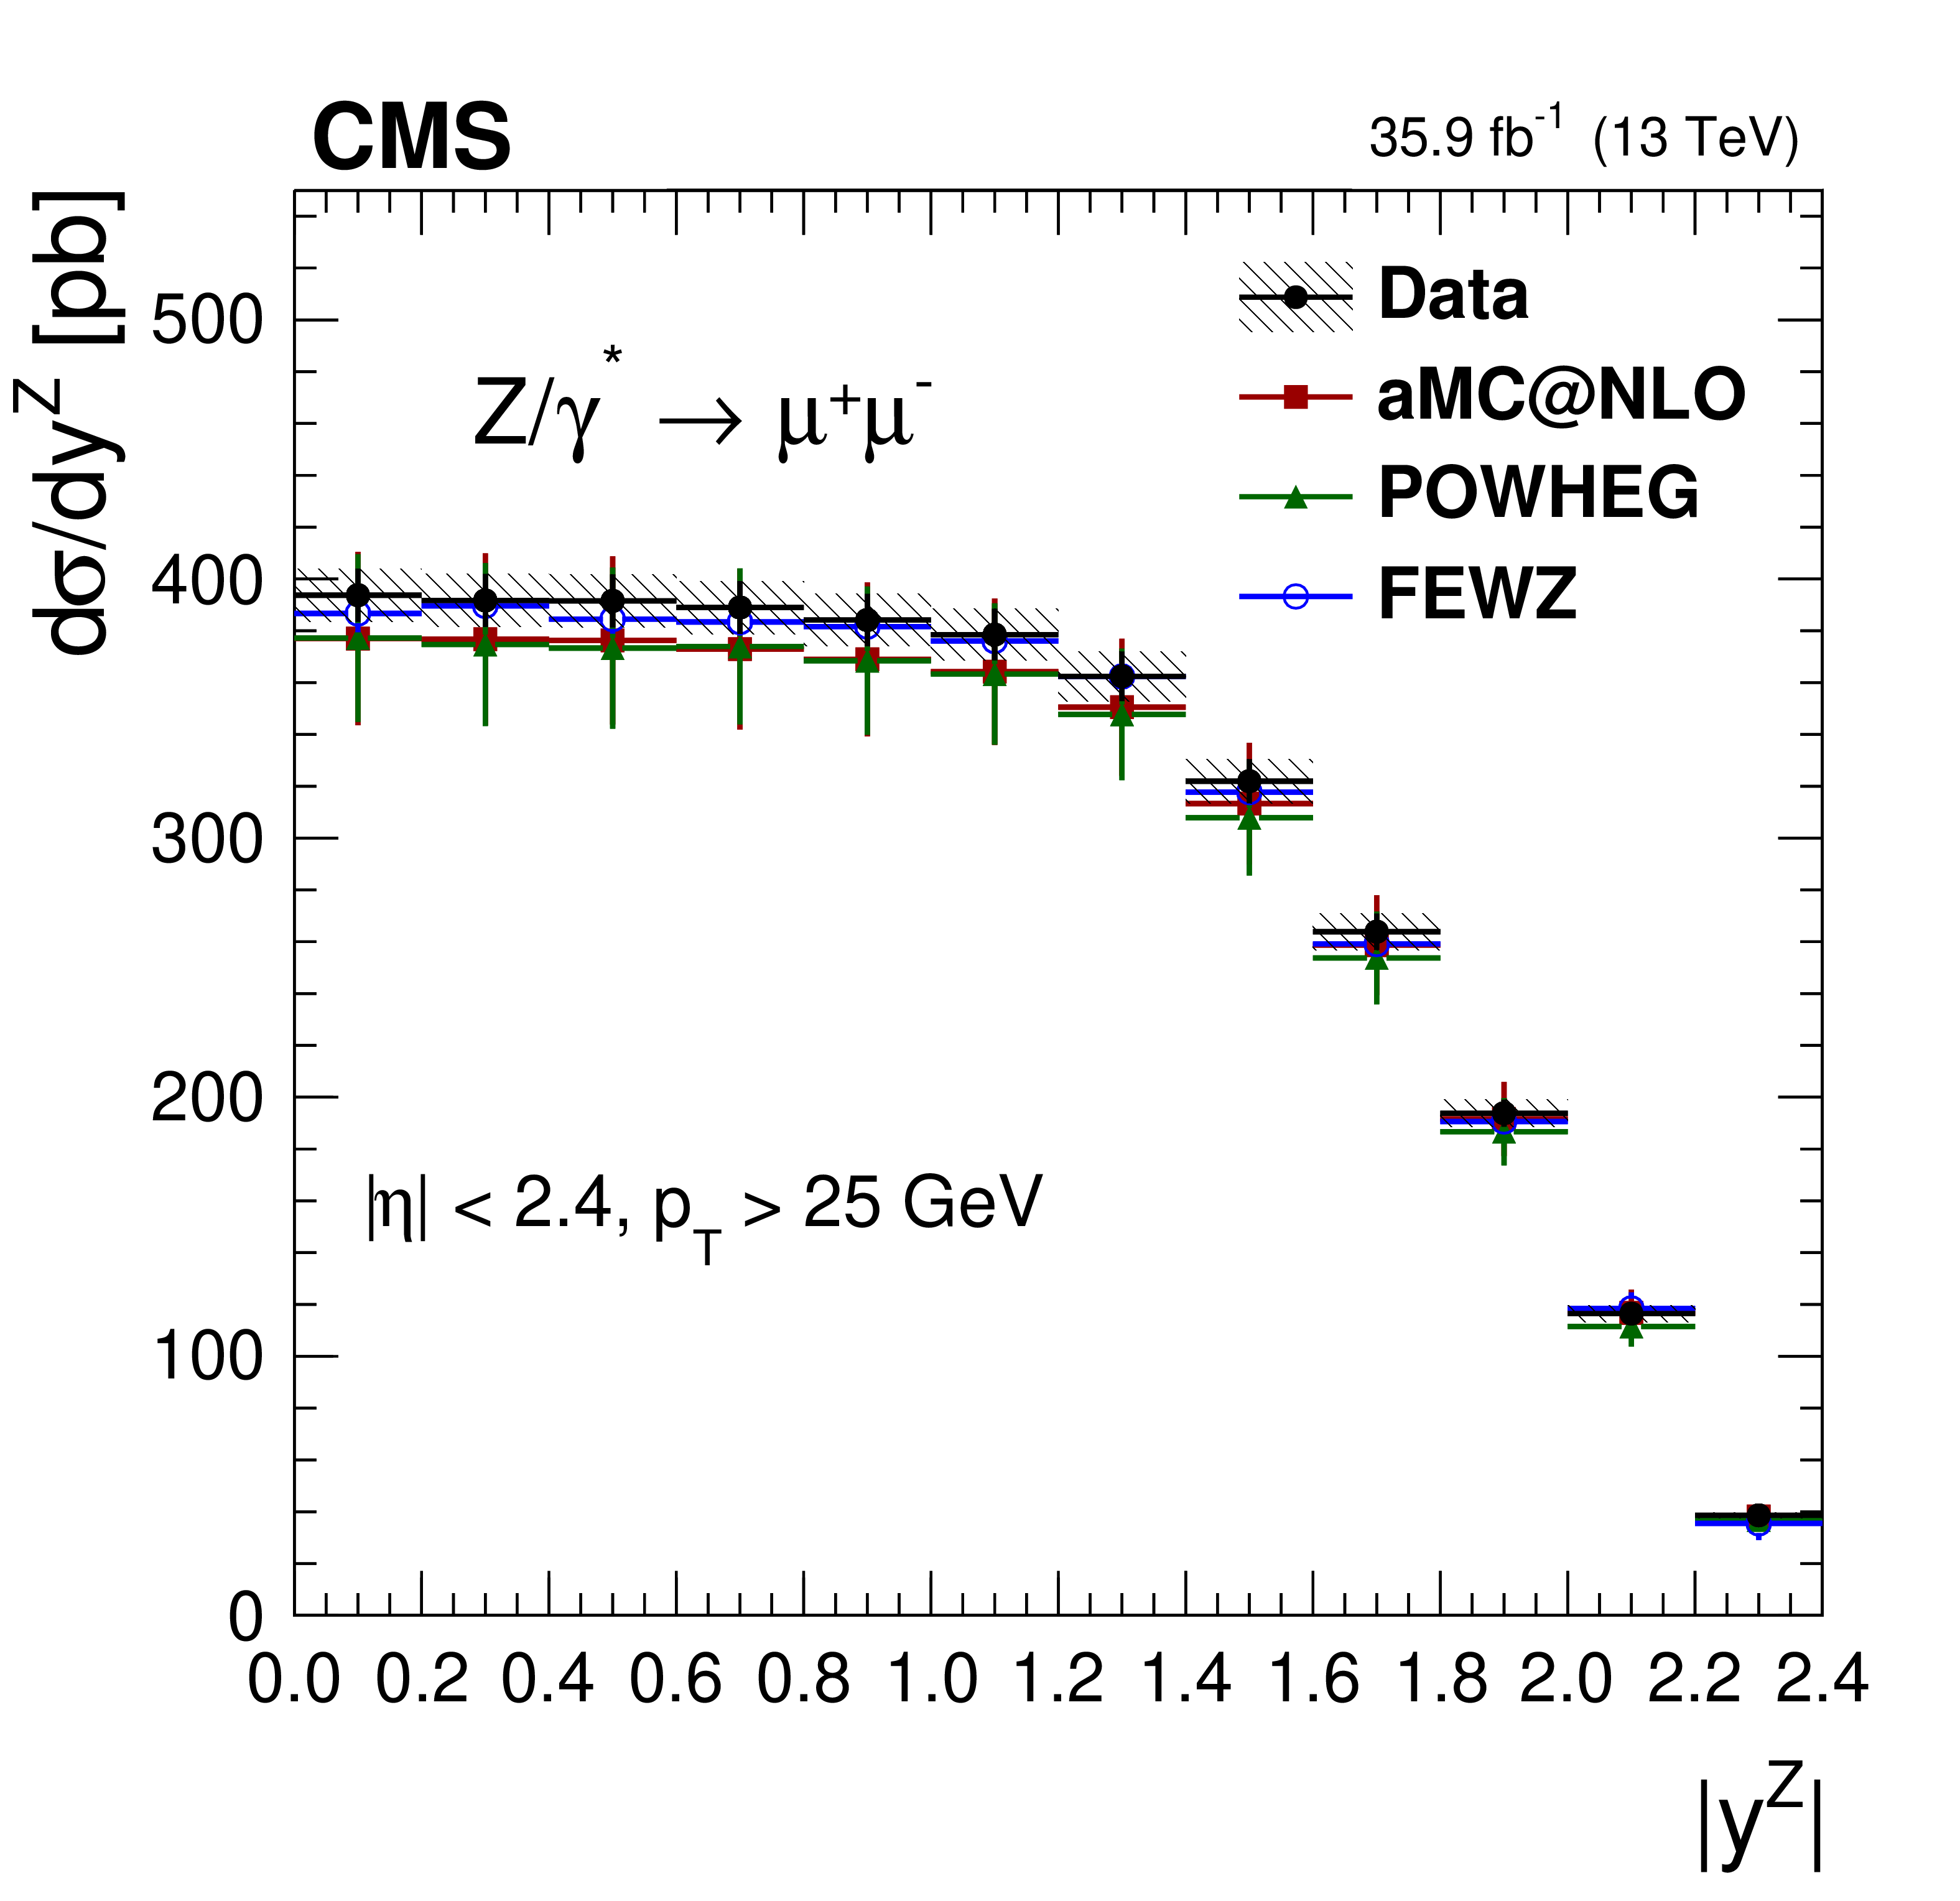
The measured absolute cross sections (left) in bins of $ {| {y}^{\mathrm{Z}} |}$ for the dimuon (upper) and dielectron (middle) final states, and for the combination (lower). The ratios of the predictions to the data are also shown (right). The shaded bands around the data points (black) correspond to the total experimental uncertainty. The measurement is compared to the predictions with MadGraph 5_aMC@NLO (square red markers), POWHEG (green triangles), and FEWZ (blue circles). The error bars around the predictions correspond to the combined statistical, PDF, and scale uncertainties. |
png pdf |
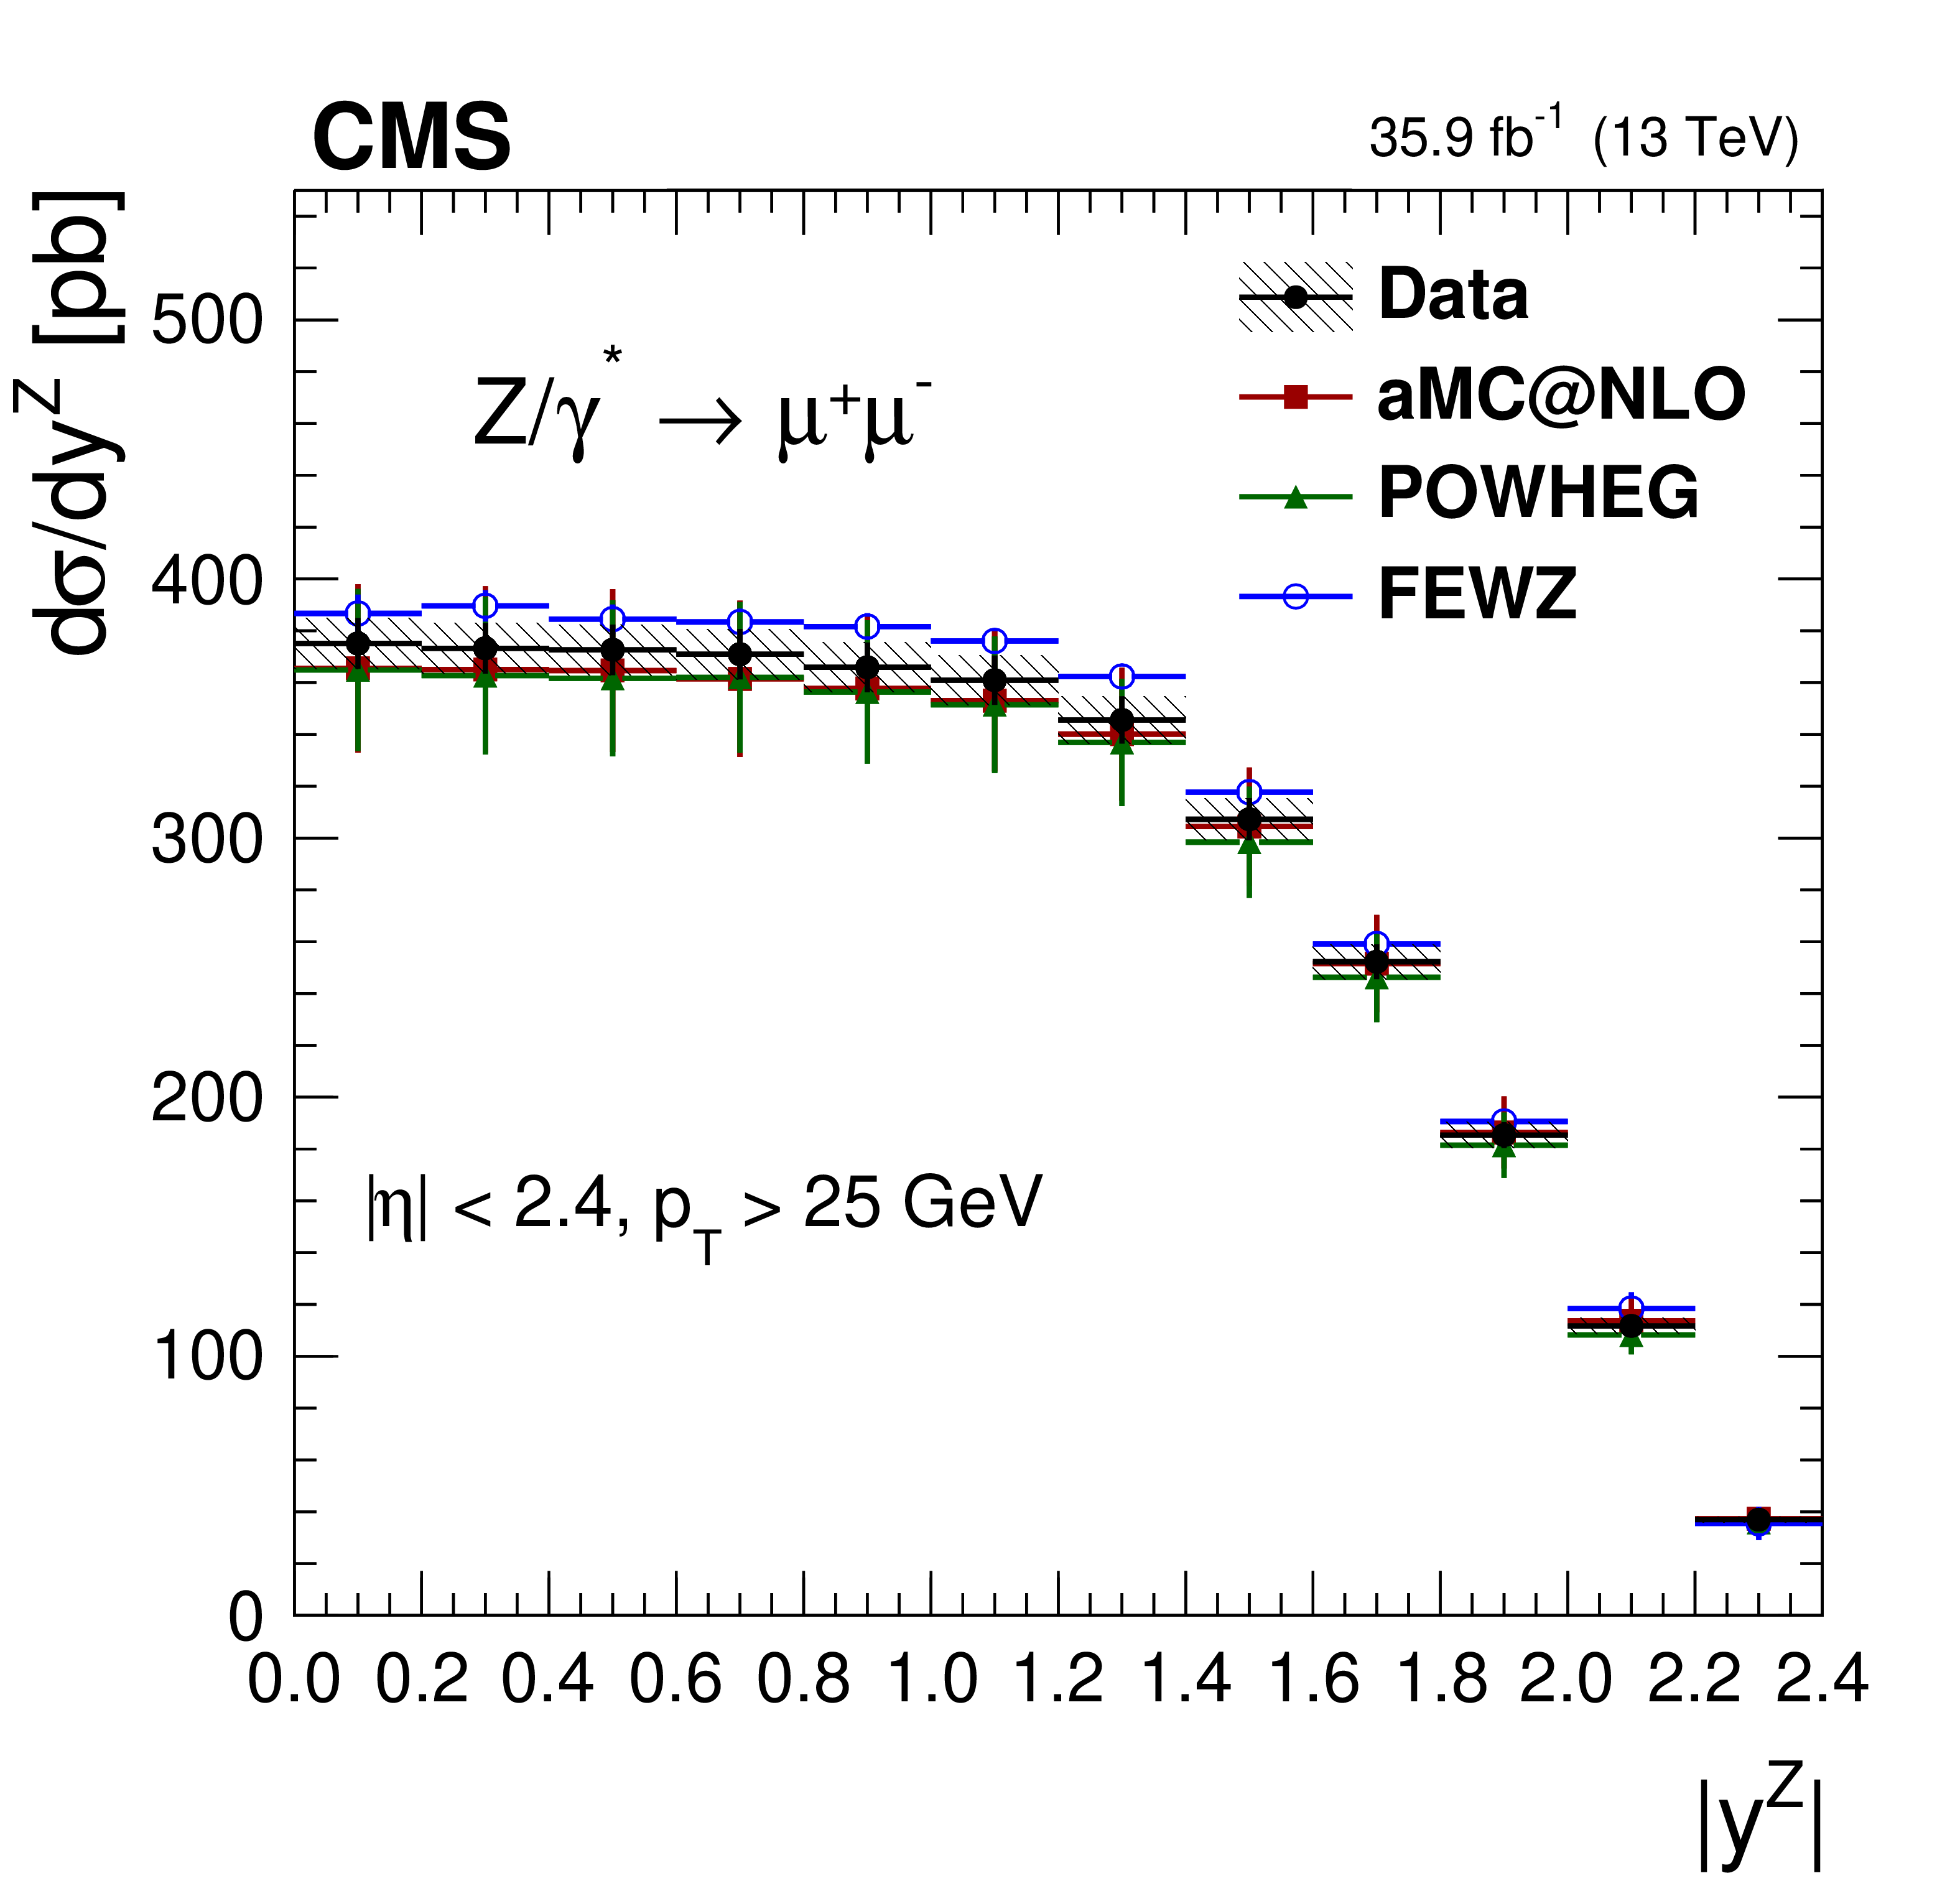
Figure 5-a:
The measured absolute cross section in bins of $ {| {y}^{\mathrm{Z}} |}$ for the dimuon final state. The shaded bands around the data points (black) correspond to the total experimental uncertainty. The measurement is compared to the predictions with MadGraph 5_aMC@NLO (square red markers), POWHEG (green triangles), and FEWZ (blue circles). The error bars around the predictions correspond to the combined statistical, PDF, and scale uncertainties. |
png pdf |
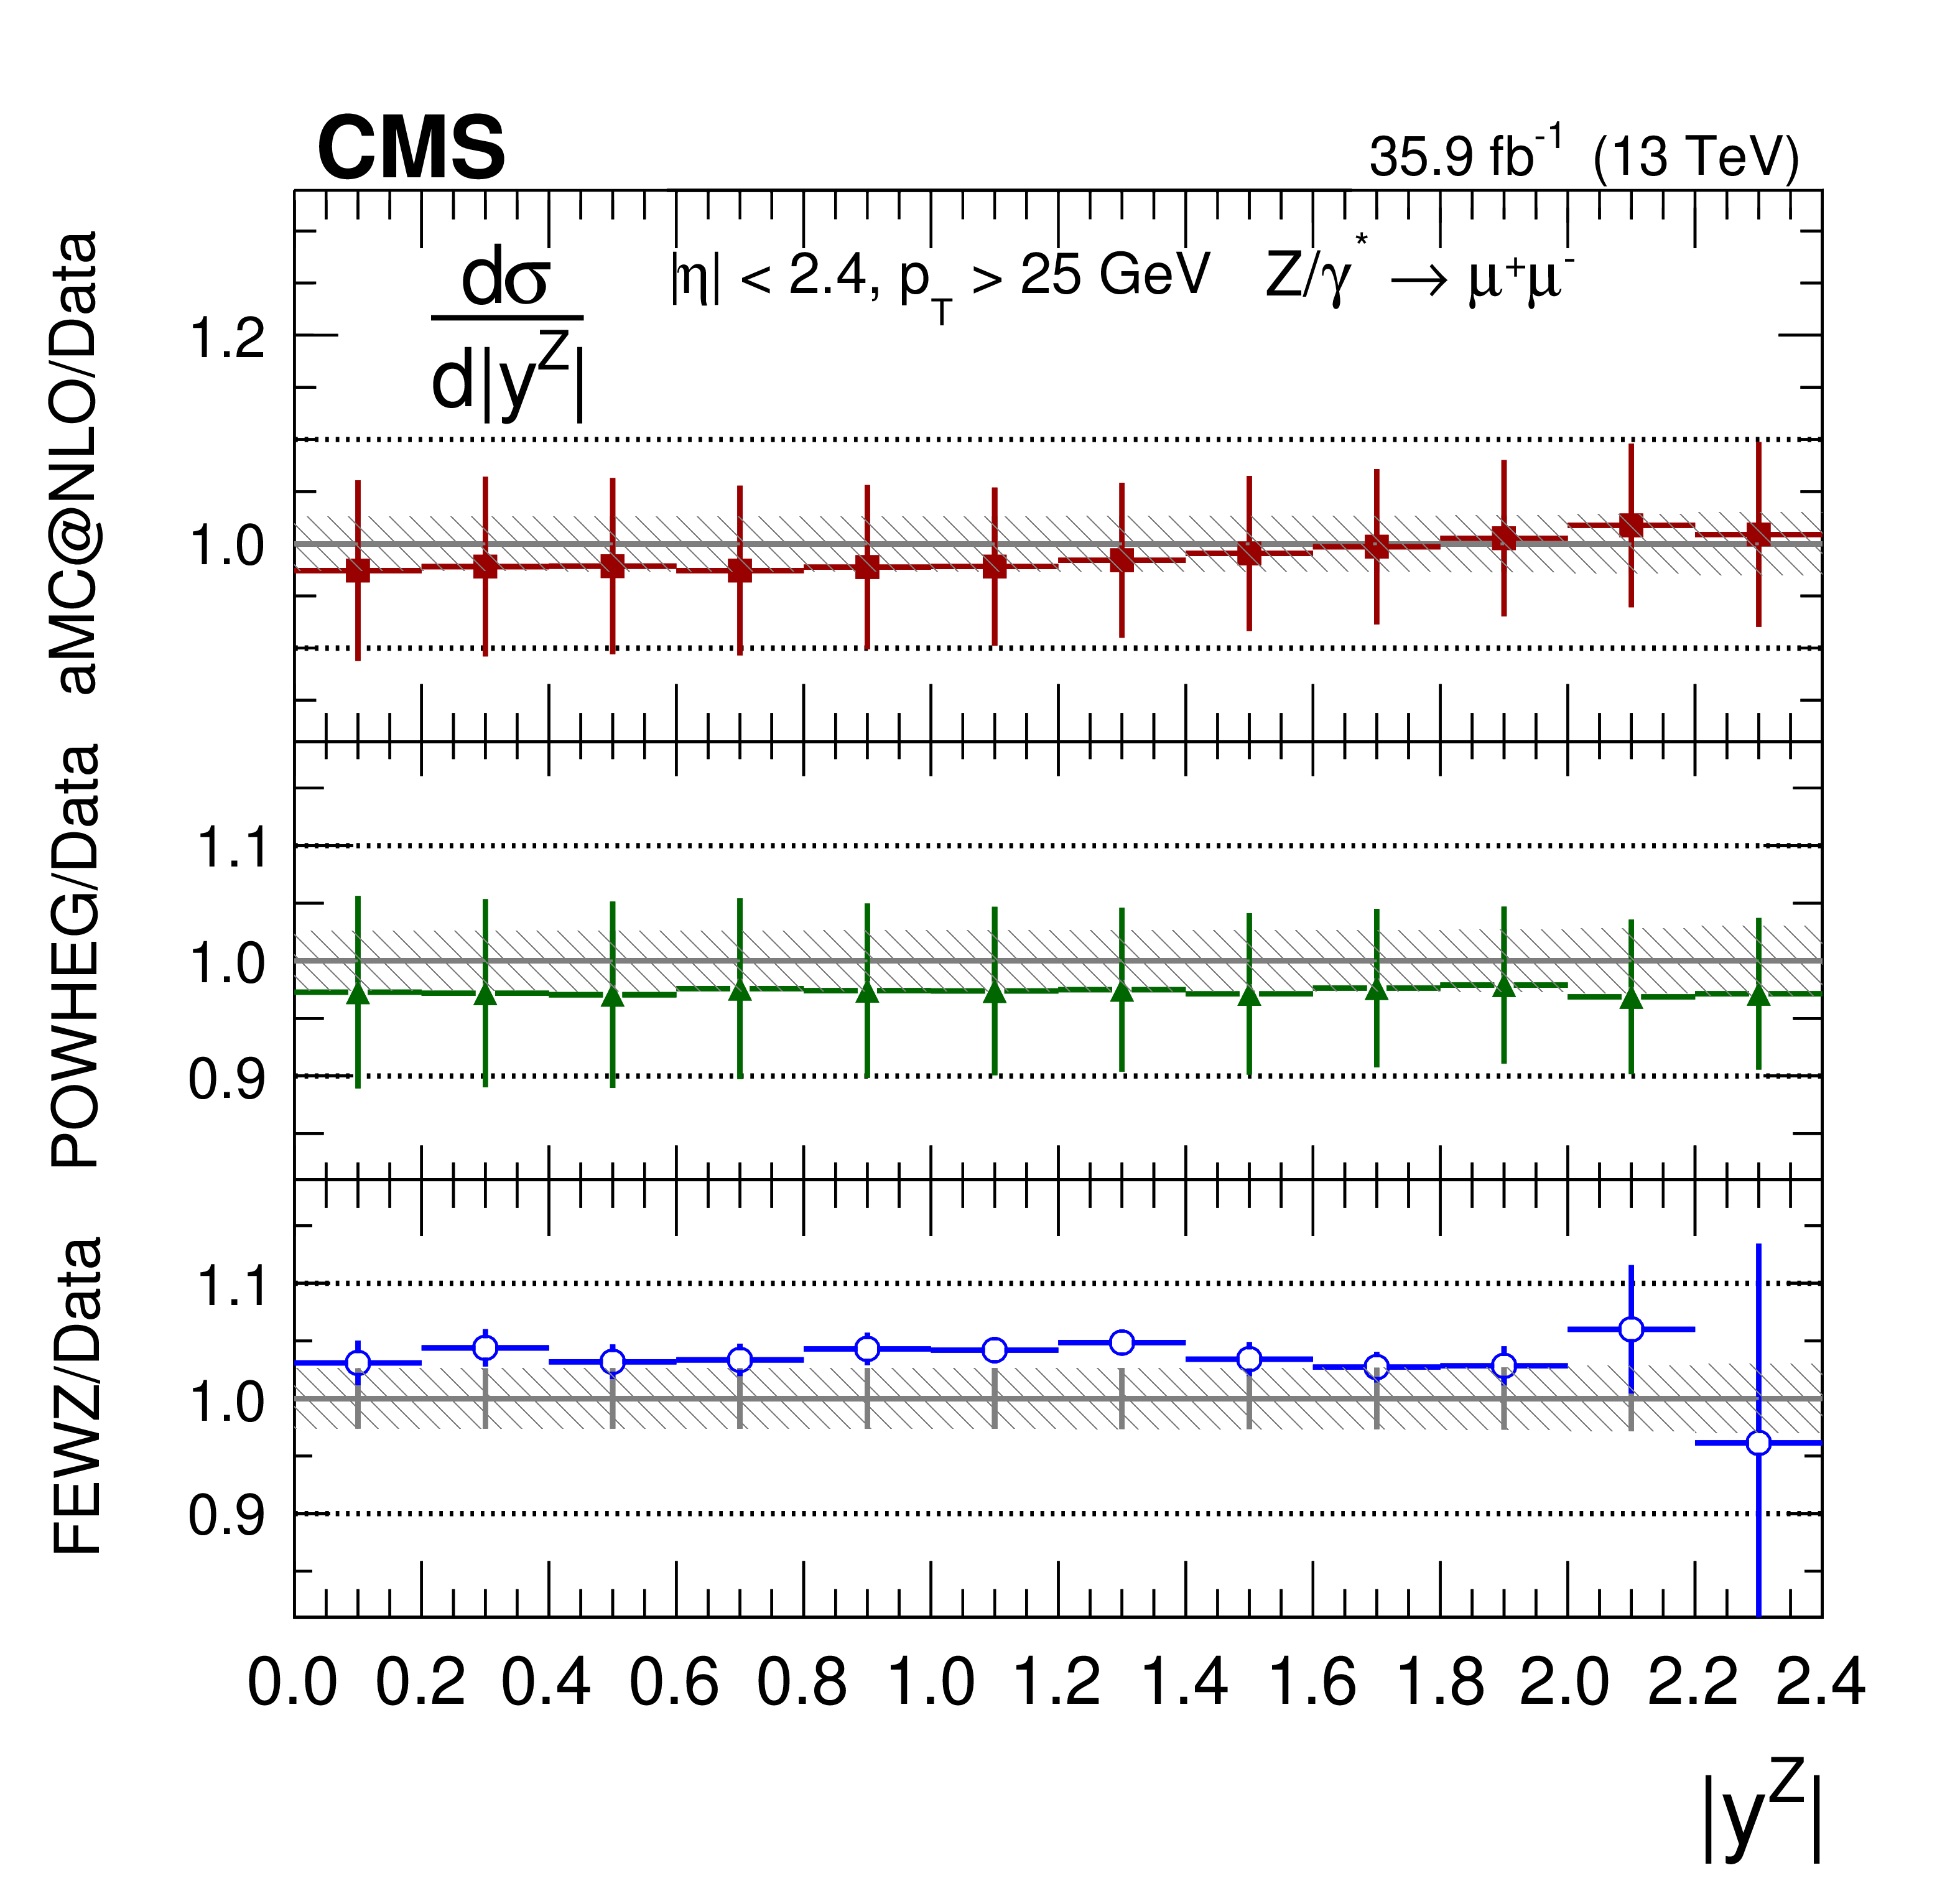
Figure 5-b:
The ratios of the absolute cross section predictions to the data in bins of $ {| {y}^{\mathrm{Z}} |}$ for the dimuon final state. The shaded bands around the data points (black) correspond to the total experimental uncertainty. The measurement is compared to the predictions with MadGraph 5_aMC@NLO (square red markers), POWHEG (green triangles), and FEWZ (blue circles). The error bars around the predictions correspond to the combined statistical, PDF, and scale uncertainties. |

png pdf |
Figure 5-c:
The measured absolute cross section in bins of $ {| {y}^{\mathrm{Z}} |}$ for the dielectron final state. The shaded bands around the data points (black) correspond to the total experimental uncertainty. The measurement is compared to the predictions with MadGraph 5_aMC@NLO (square red markers), POWHEG (green triangles), and FEWZ (blue circles). The error bars around the predictions correspond to the combined statistical, PDF, and scale uncertainties. |
png pdf |
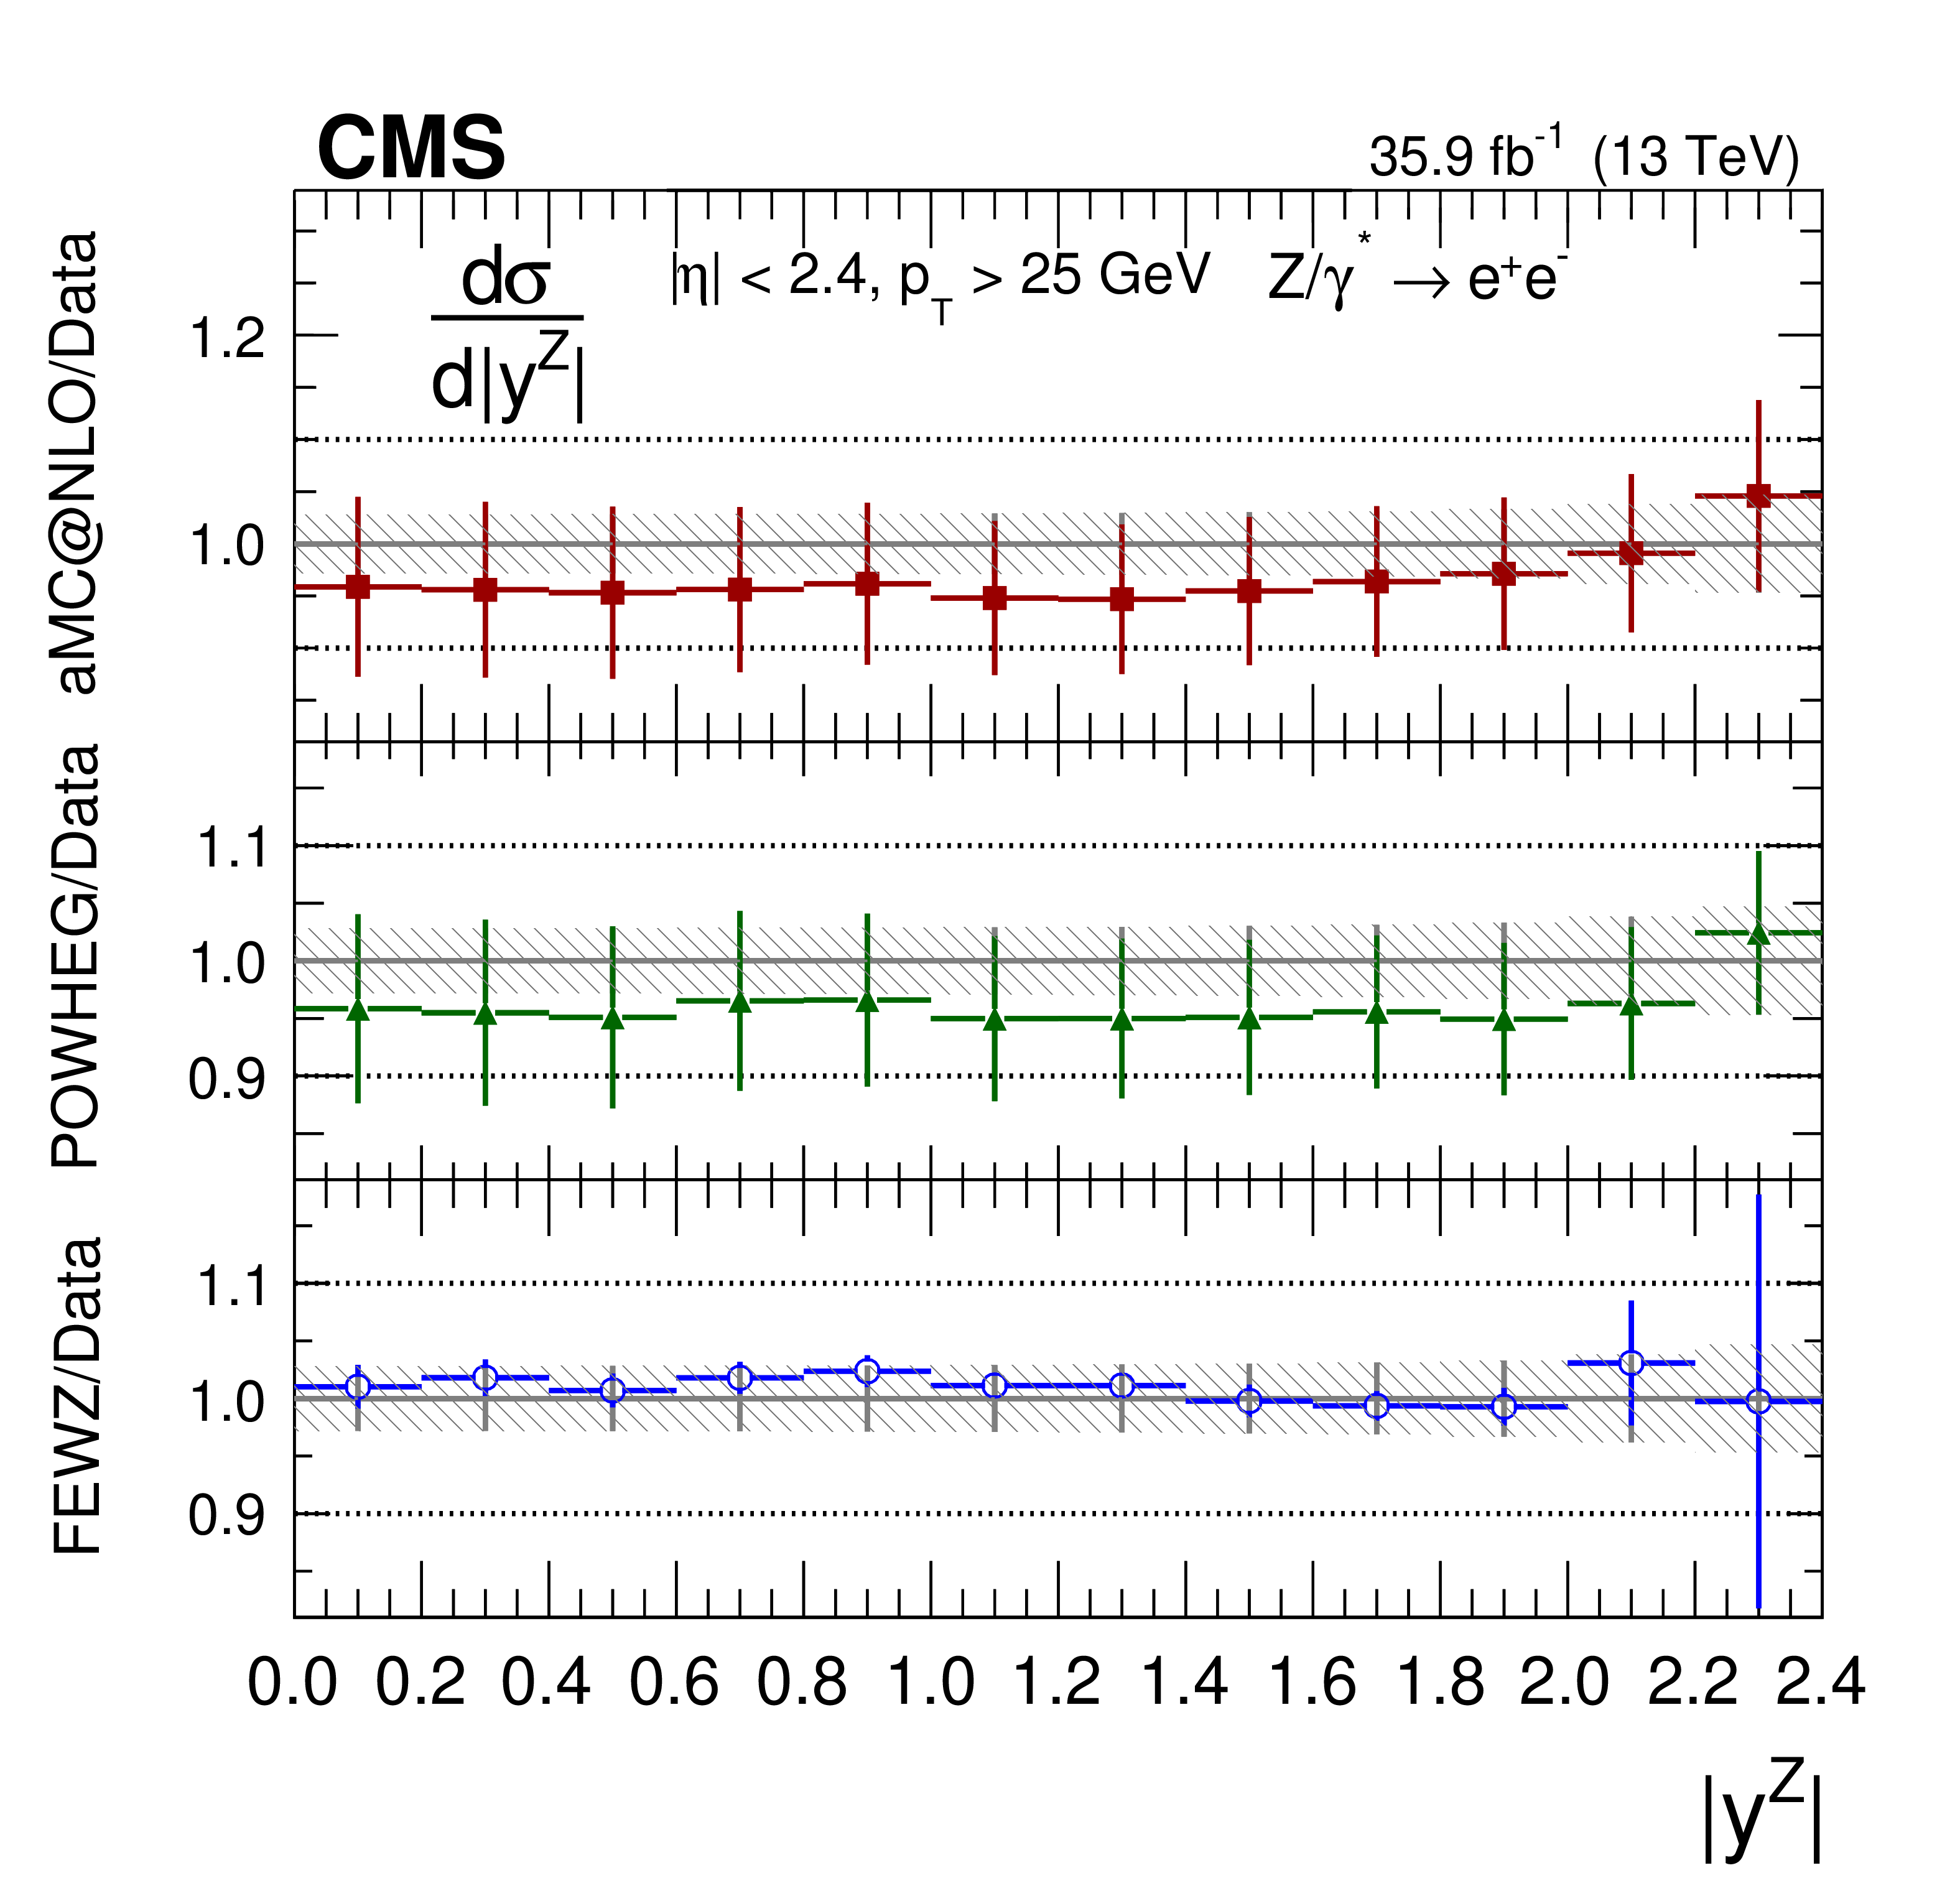
Figure 5-d:
The ratios of the absolute cross section predictions to the data in bins of $ {| {y}^{\mathrm{Z}} |}$ for the dielectron final state. The shaded bands around the data points (black) correspond to the total experimental uncertainty. The measurement is compared to the predictions with MadGraph 5_aMC@NLO (square red markers), POWHEG (green triangles), and FEWZ (blue circles). The error bars around the predictions correspond to the combined statistical, PDF, and scale uncertainties. |
png pdf |
Figure 5-e:
The measured absolute cross section in bins of $ {| {y}^{\mathrm{Z}} |}$ for the combination of dimuon and dielectron final states. The shaded bands around the data points (black) correspond to the total experimental uncertainty. The measurement is compared to the predictions with MadGraph 5_aMC@NLO (square red markers), POWHEG (green triangles), and FEWZ (blue circles). The error bars around the predictions correspond to the combined statistical, PDF, and scale uncertainties. |

png pdf |
Figure 5-f:
The ratios of the absolute cross section predictions to the data in bins of $ {| {y}^{\mathrm{Z}} |}$ for the combination of dimuon and dielectron final states. The shaded bands around the data points (black) correspond to the total experimental uncertainty. The measurement is compared to the predictions with MadGraph 5_aMC@NLO (square red markers), POWHEG (green triangles), and FEWZ (blue circles). The error bars around the predictions correspond to the combined statistical, PDF, and scale uncertainties. |

png pdf |
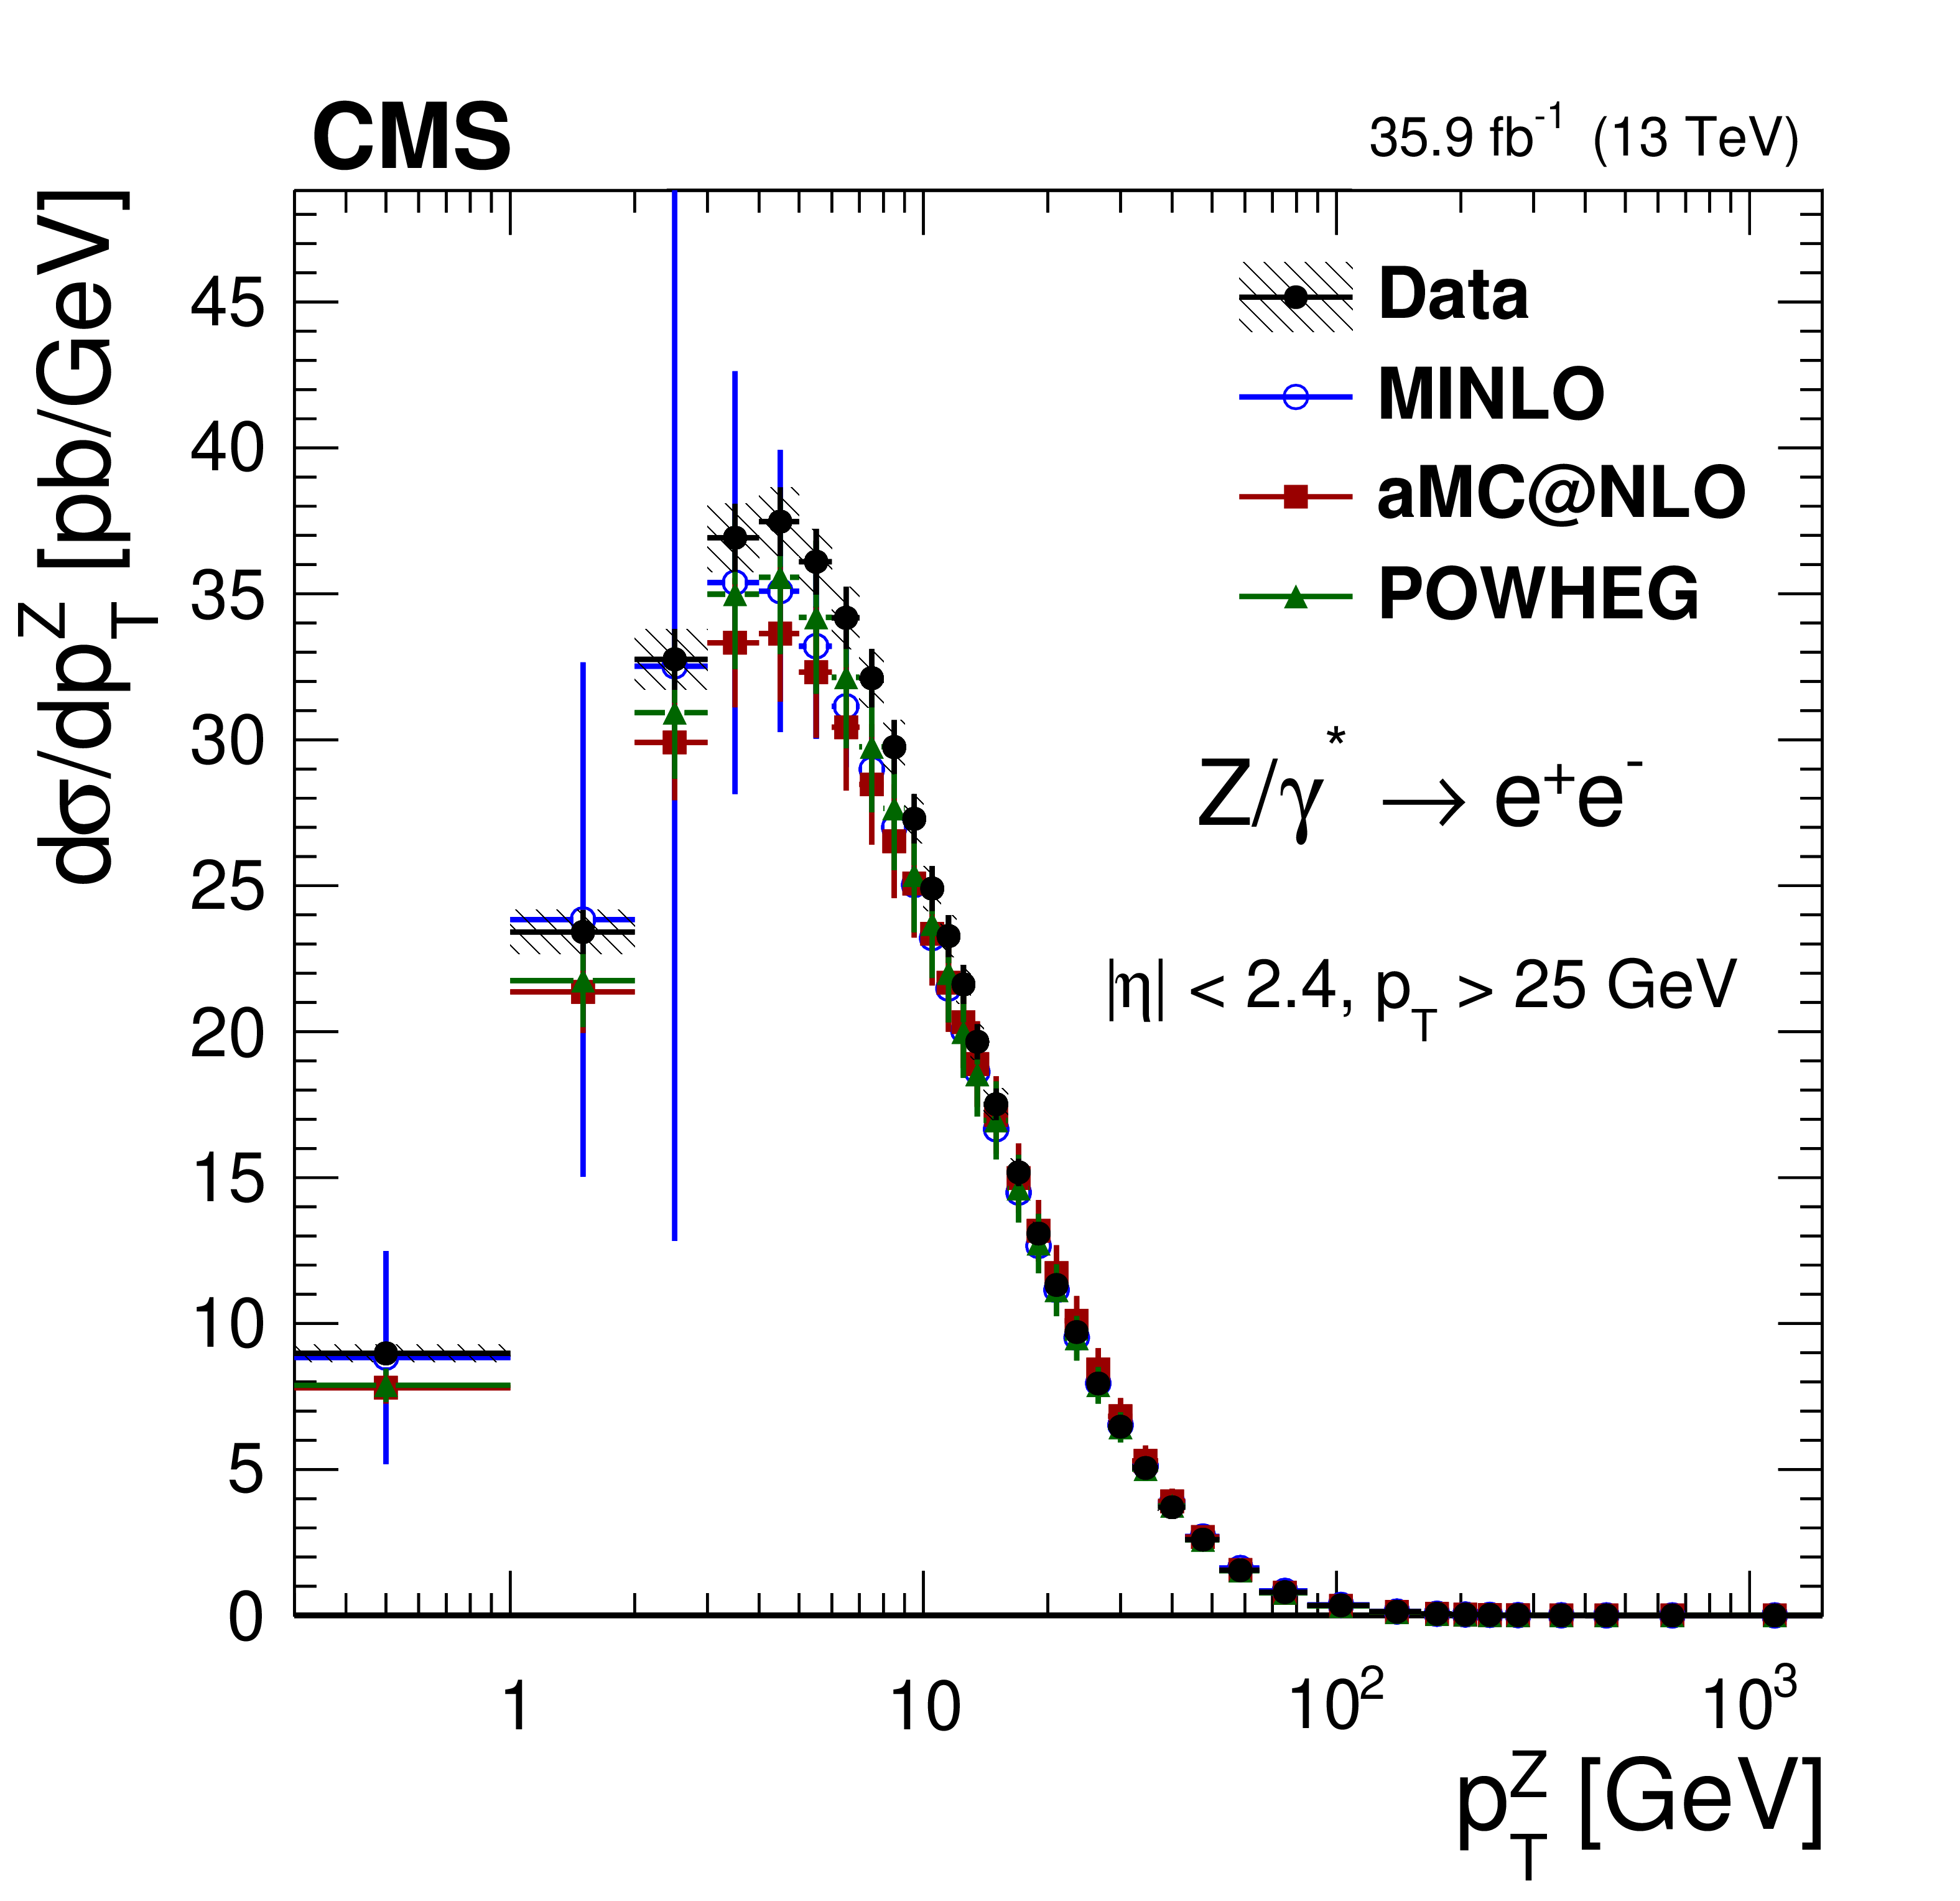
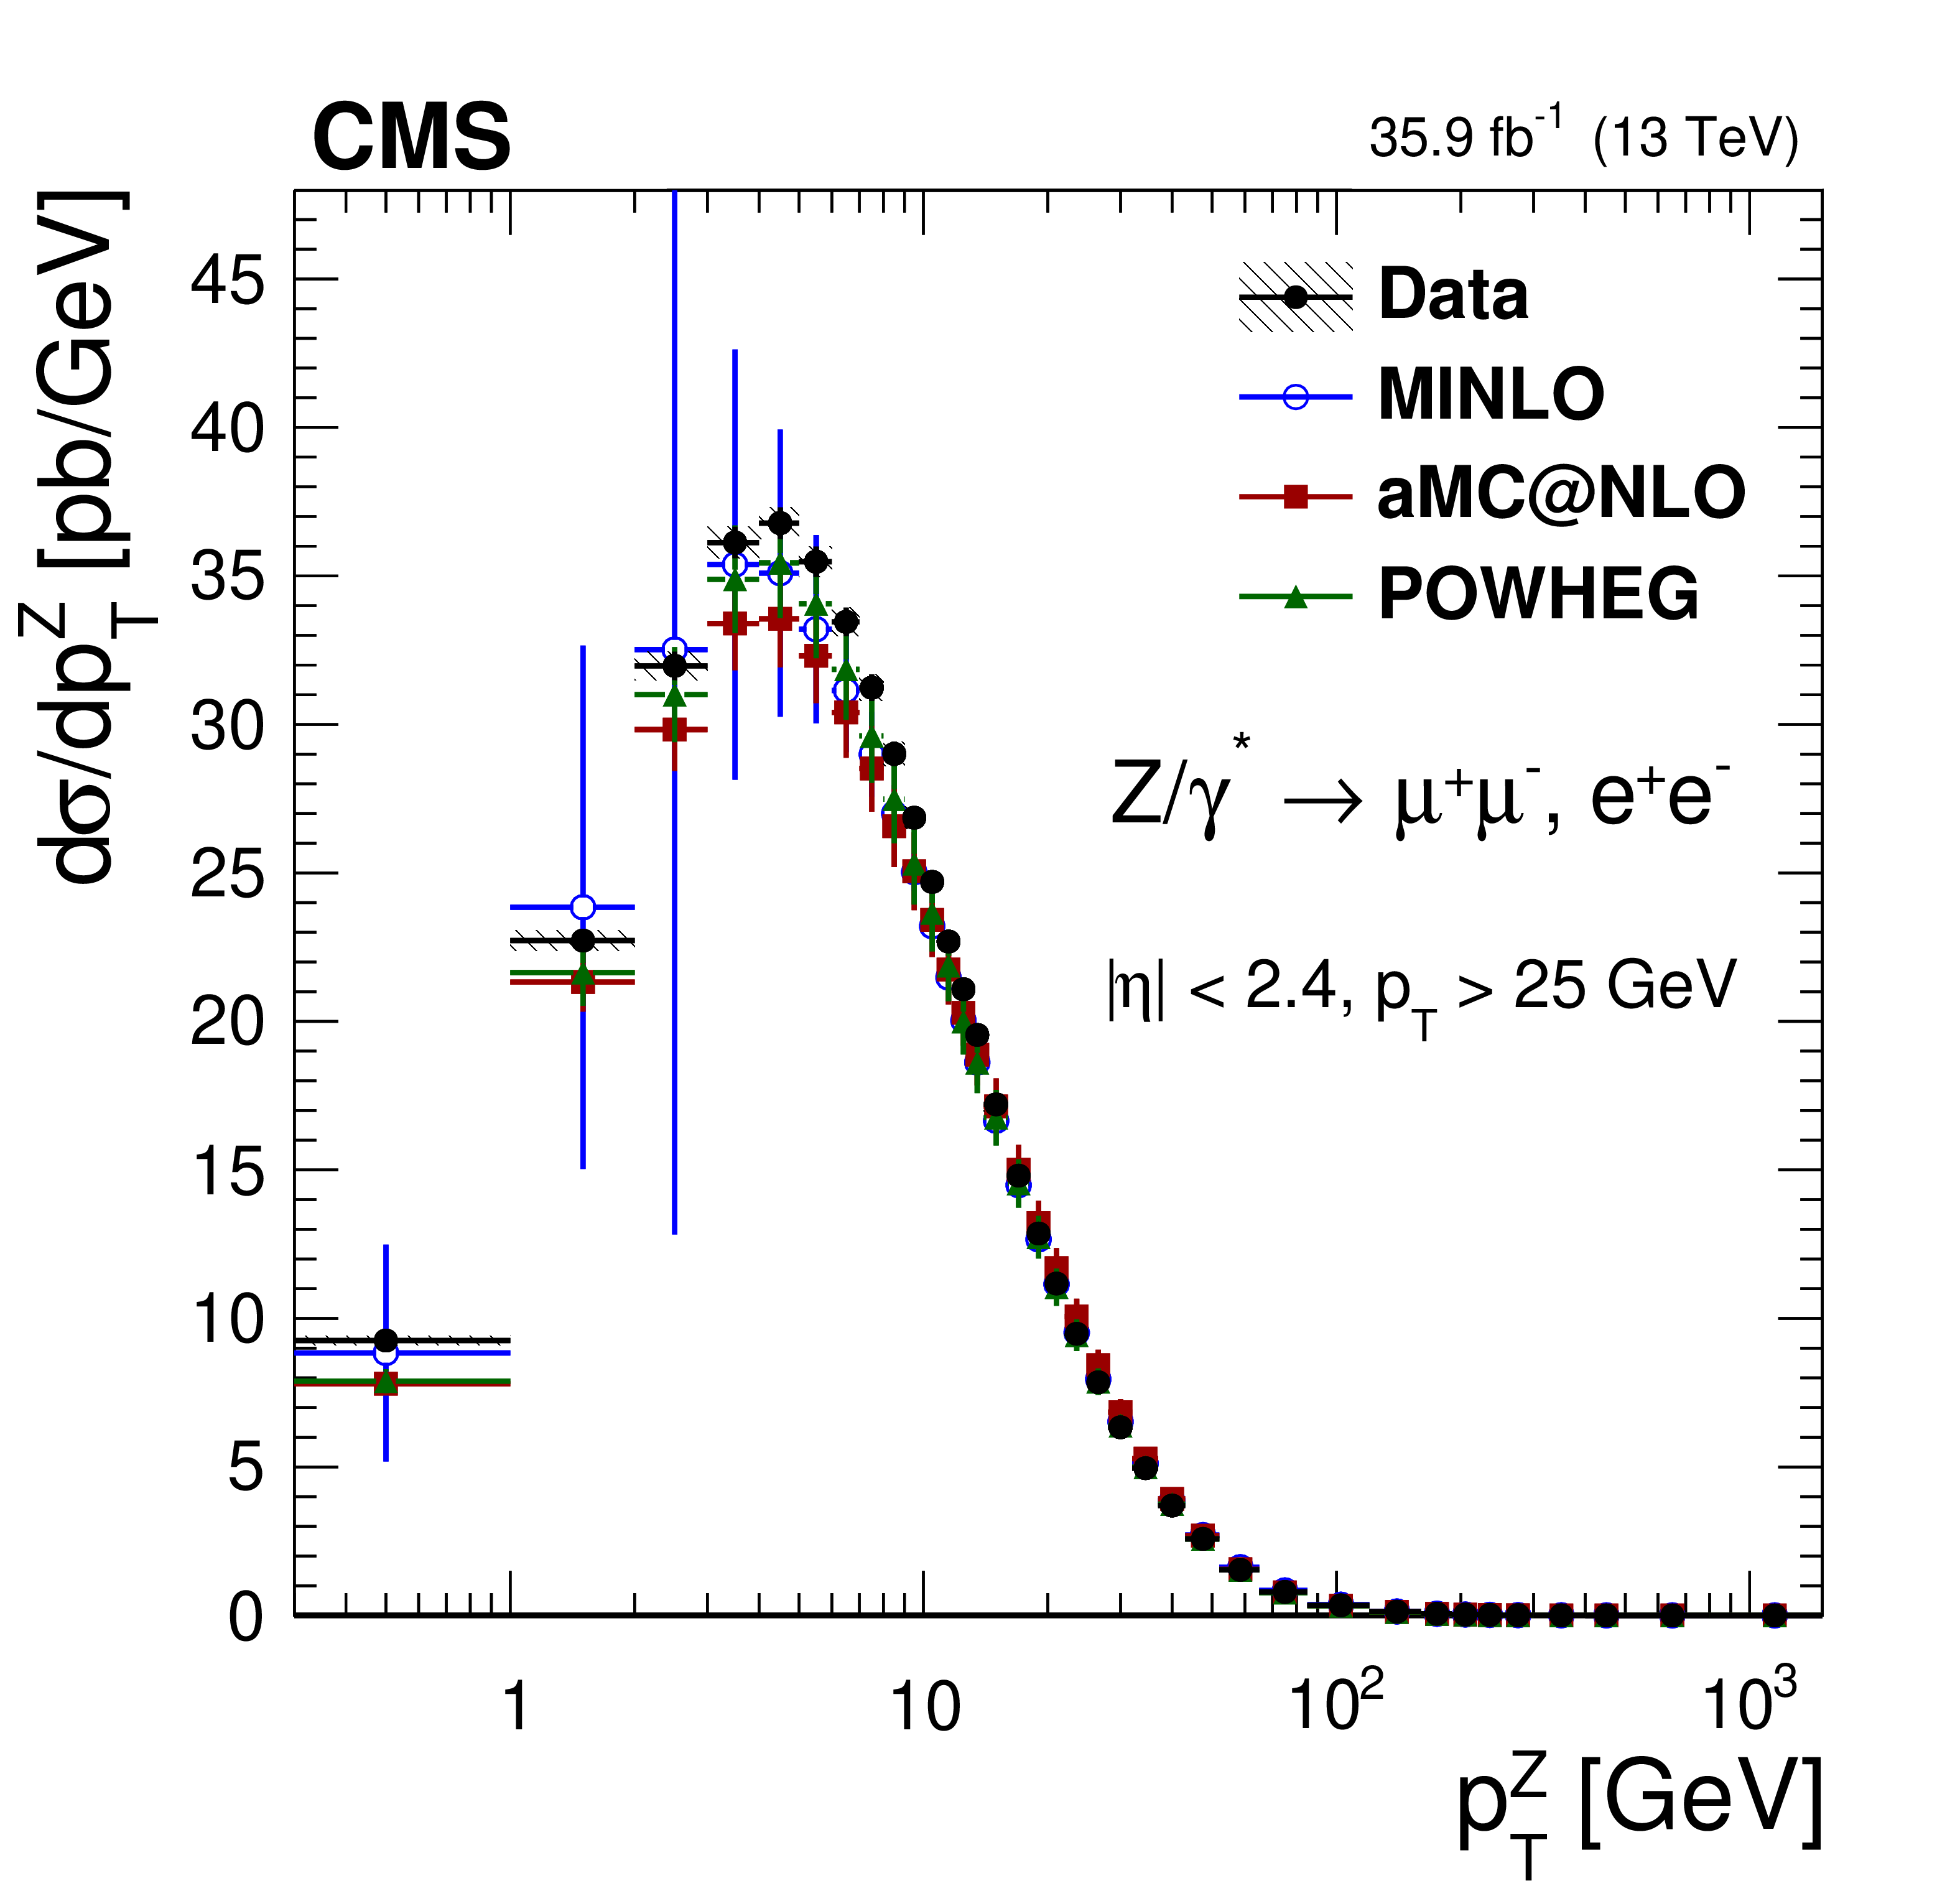
Figure 6:
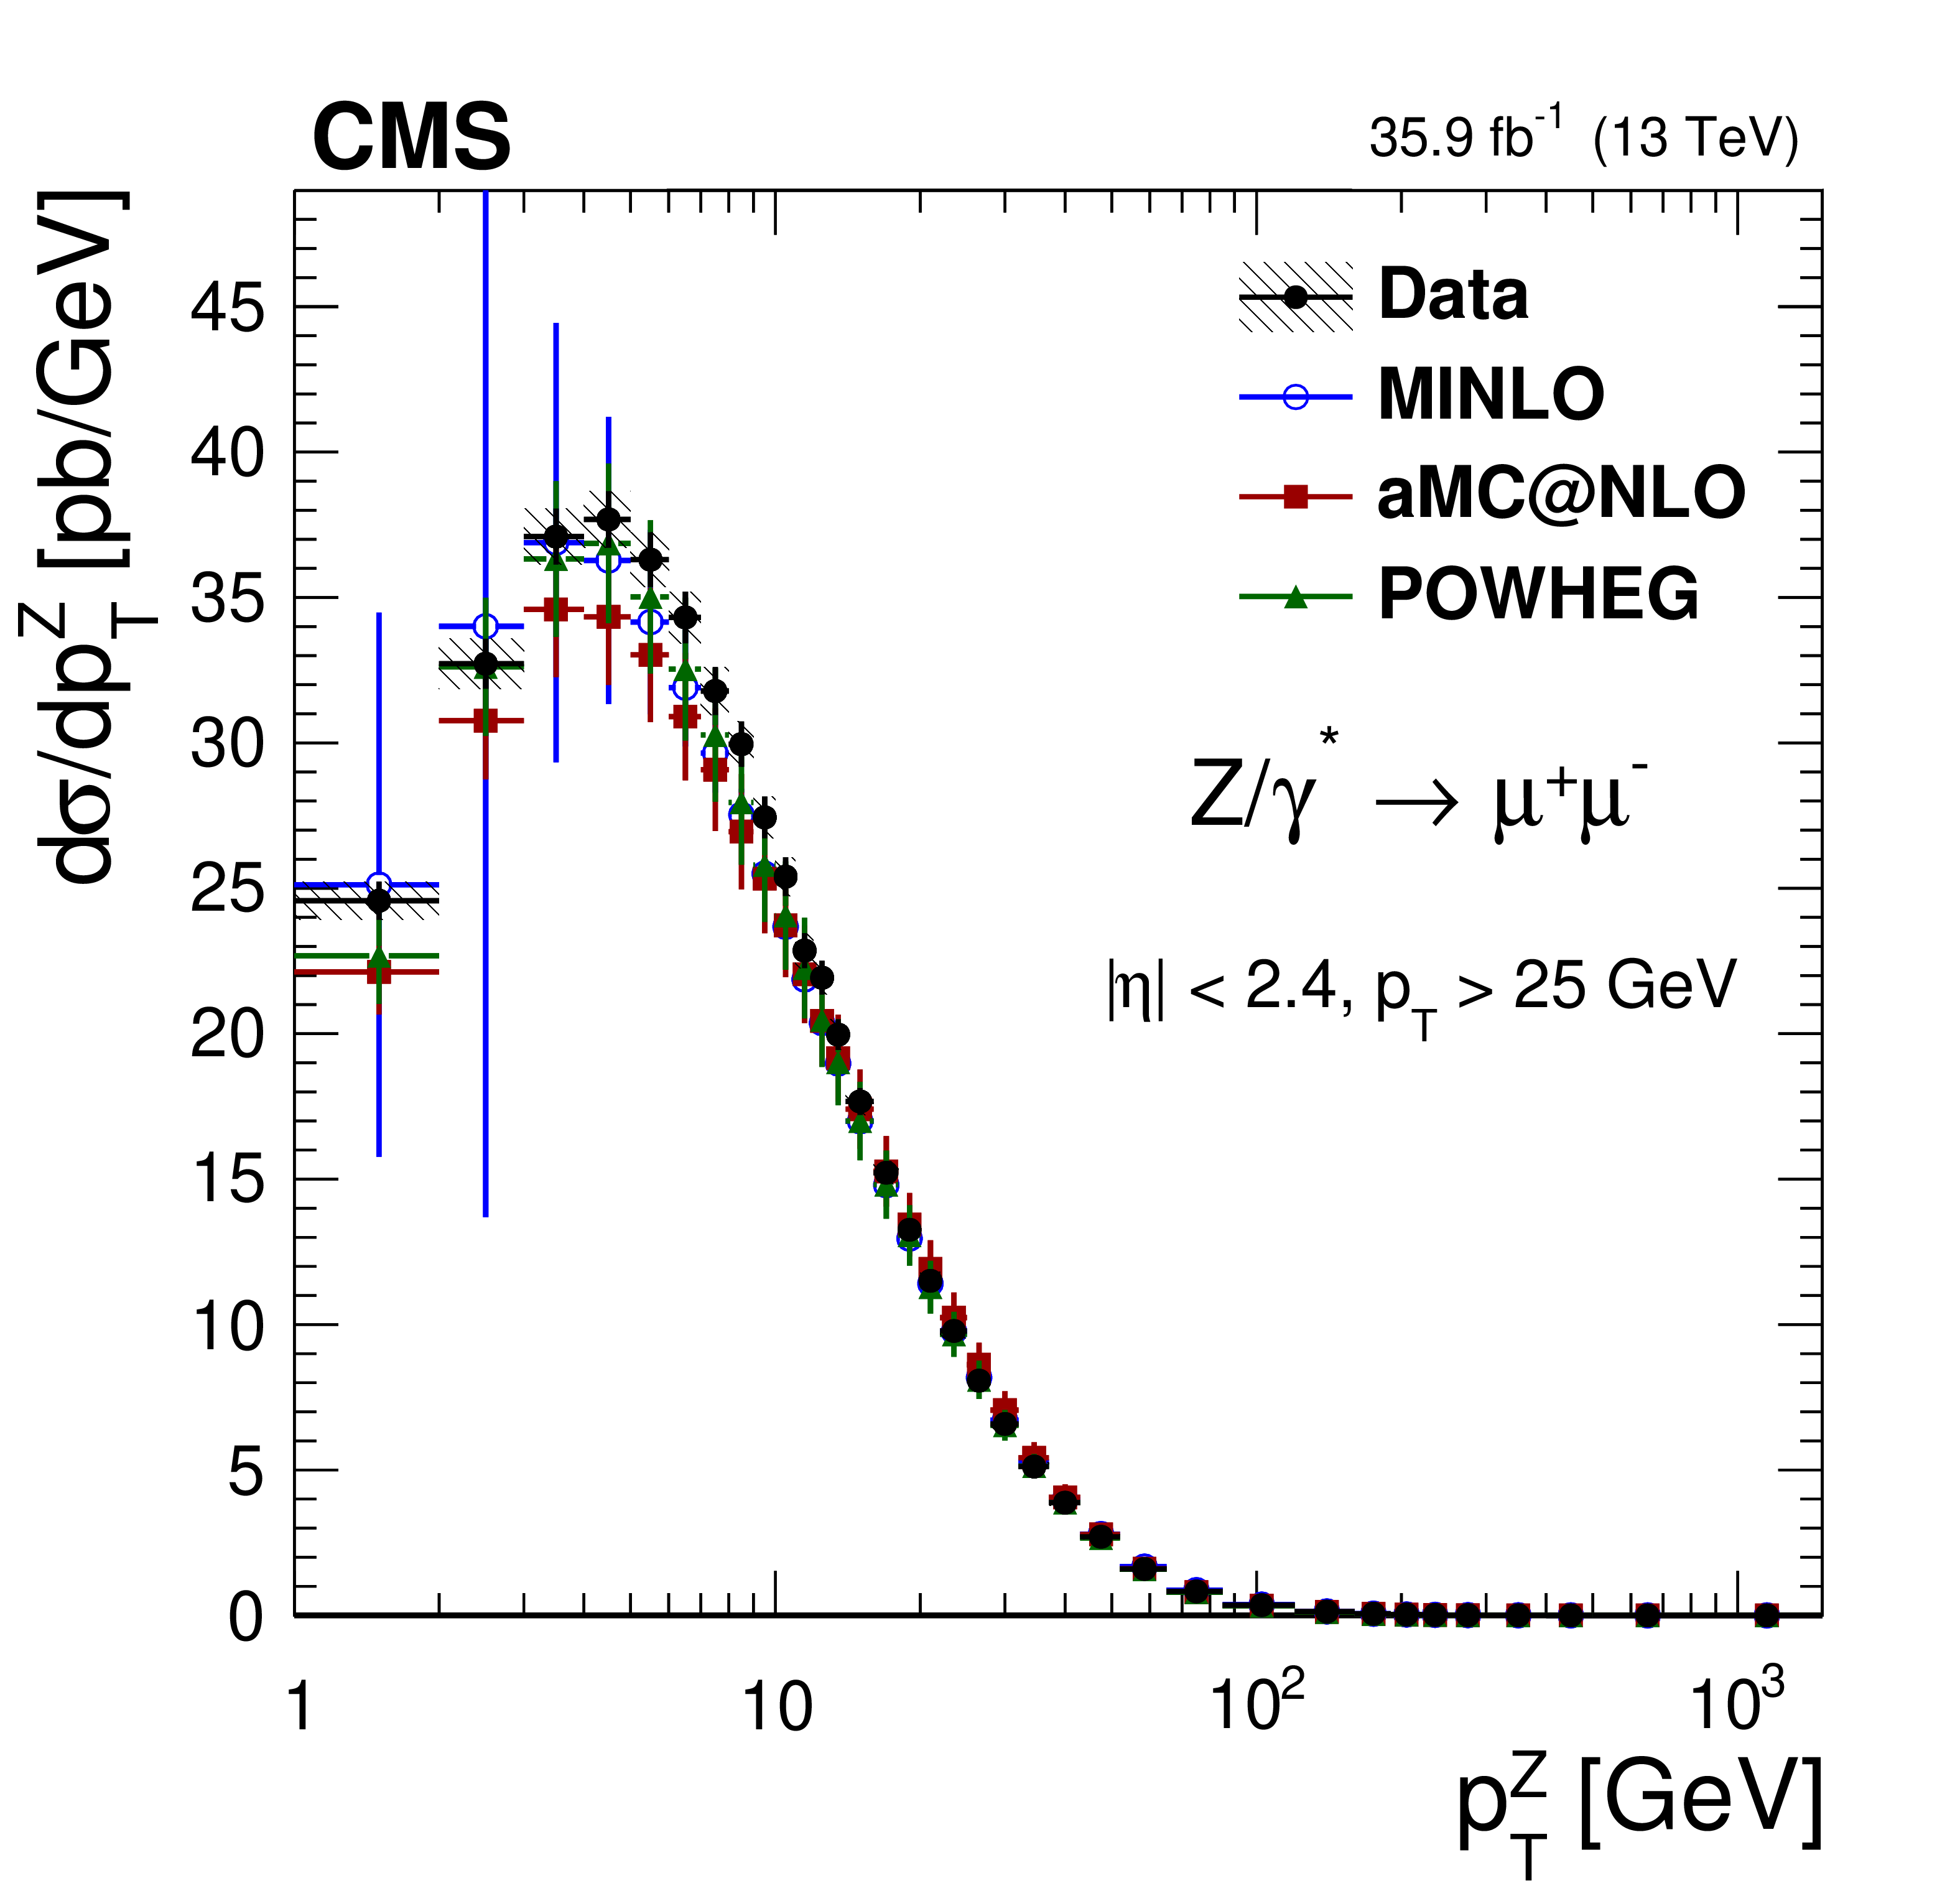
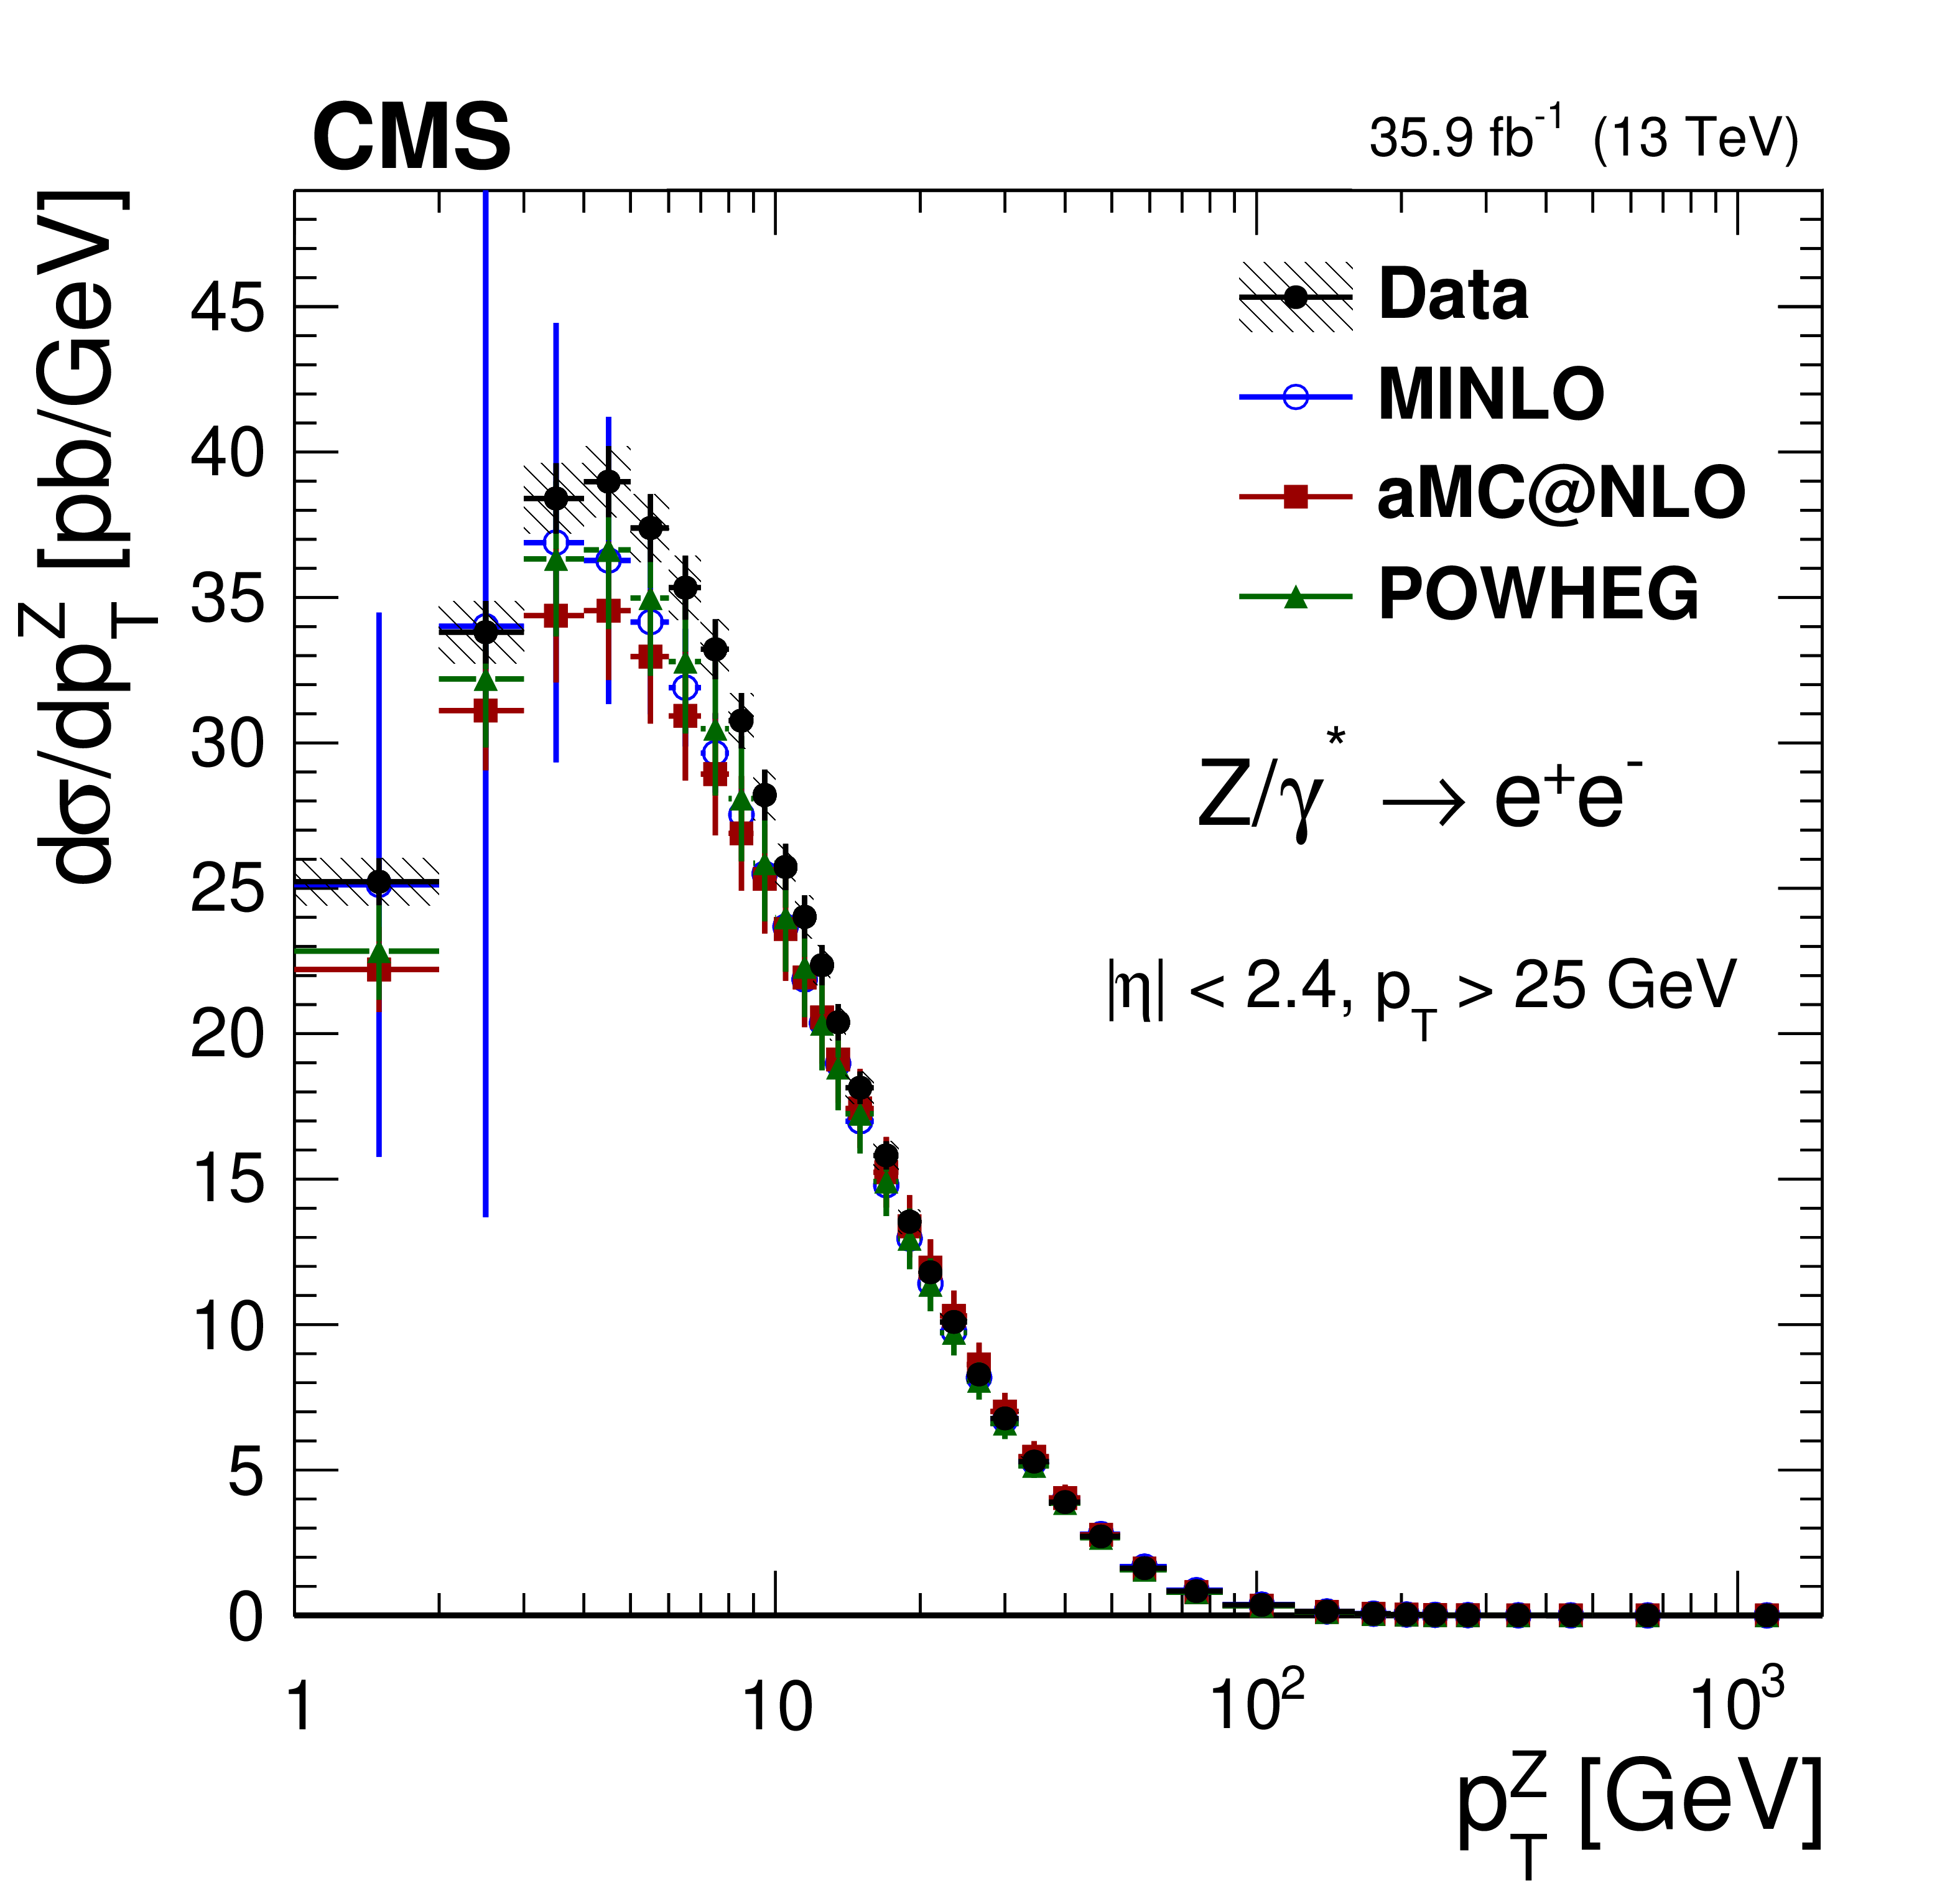
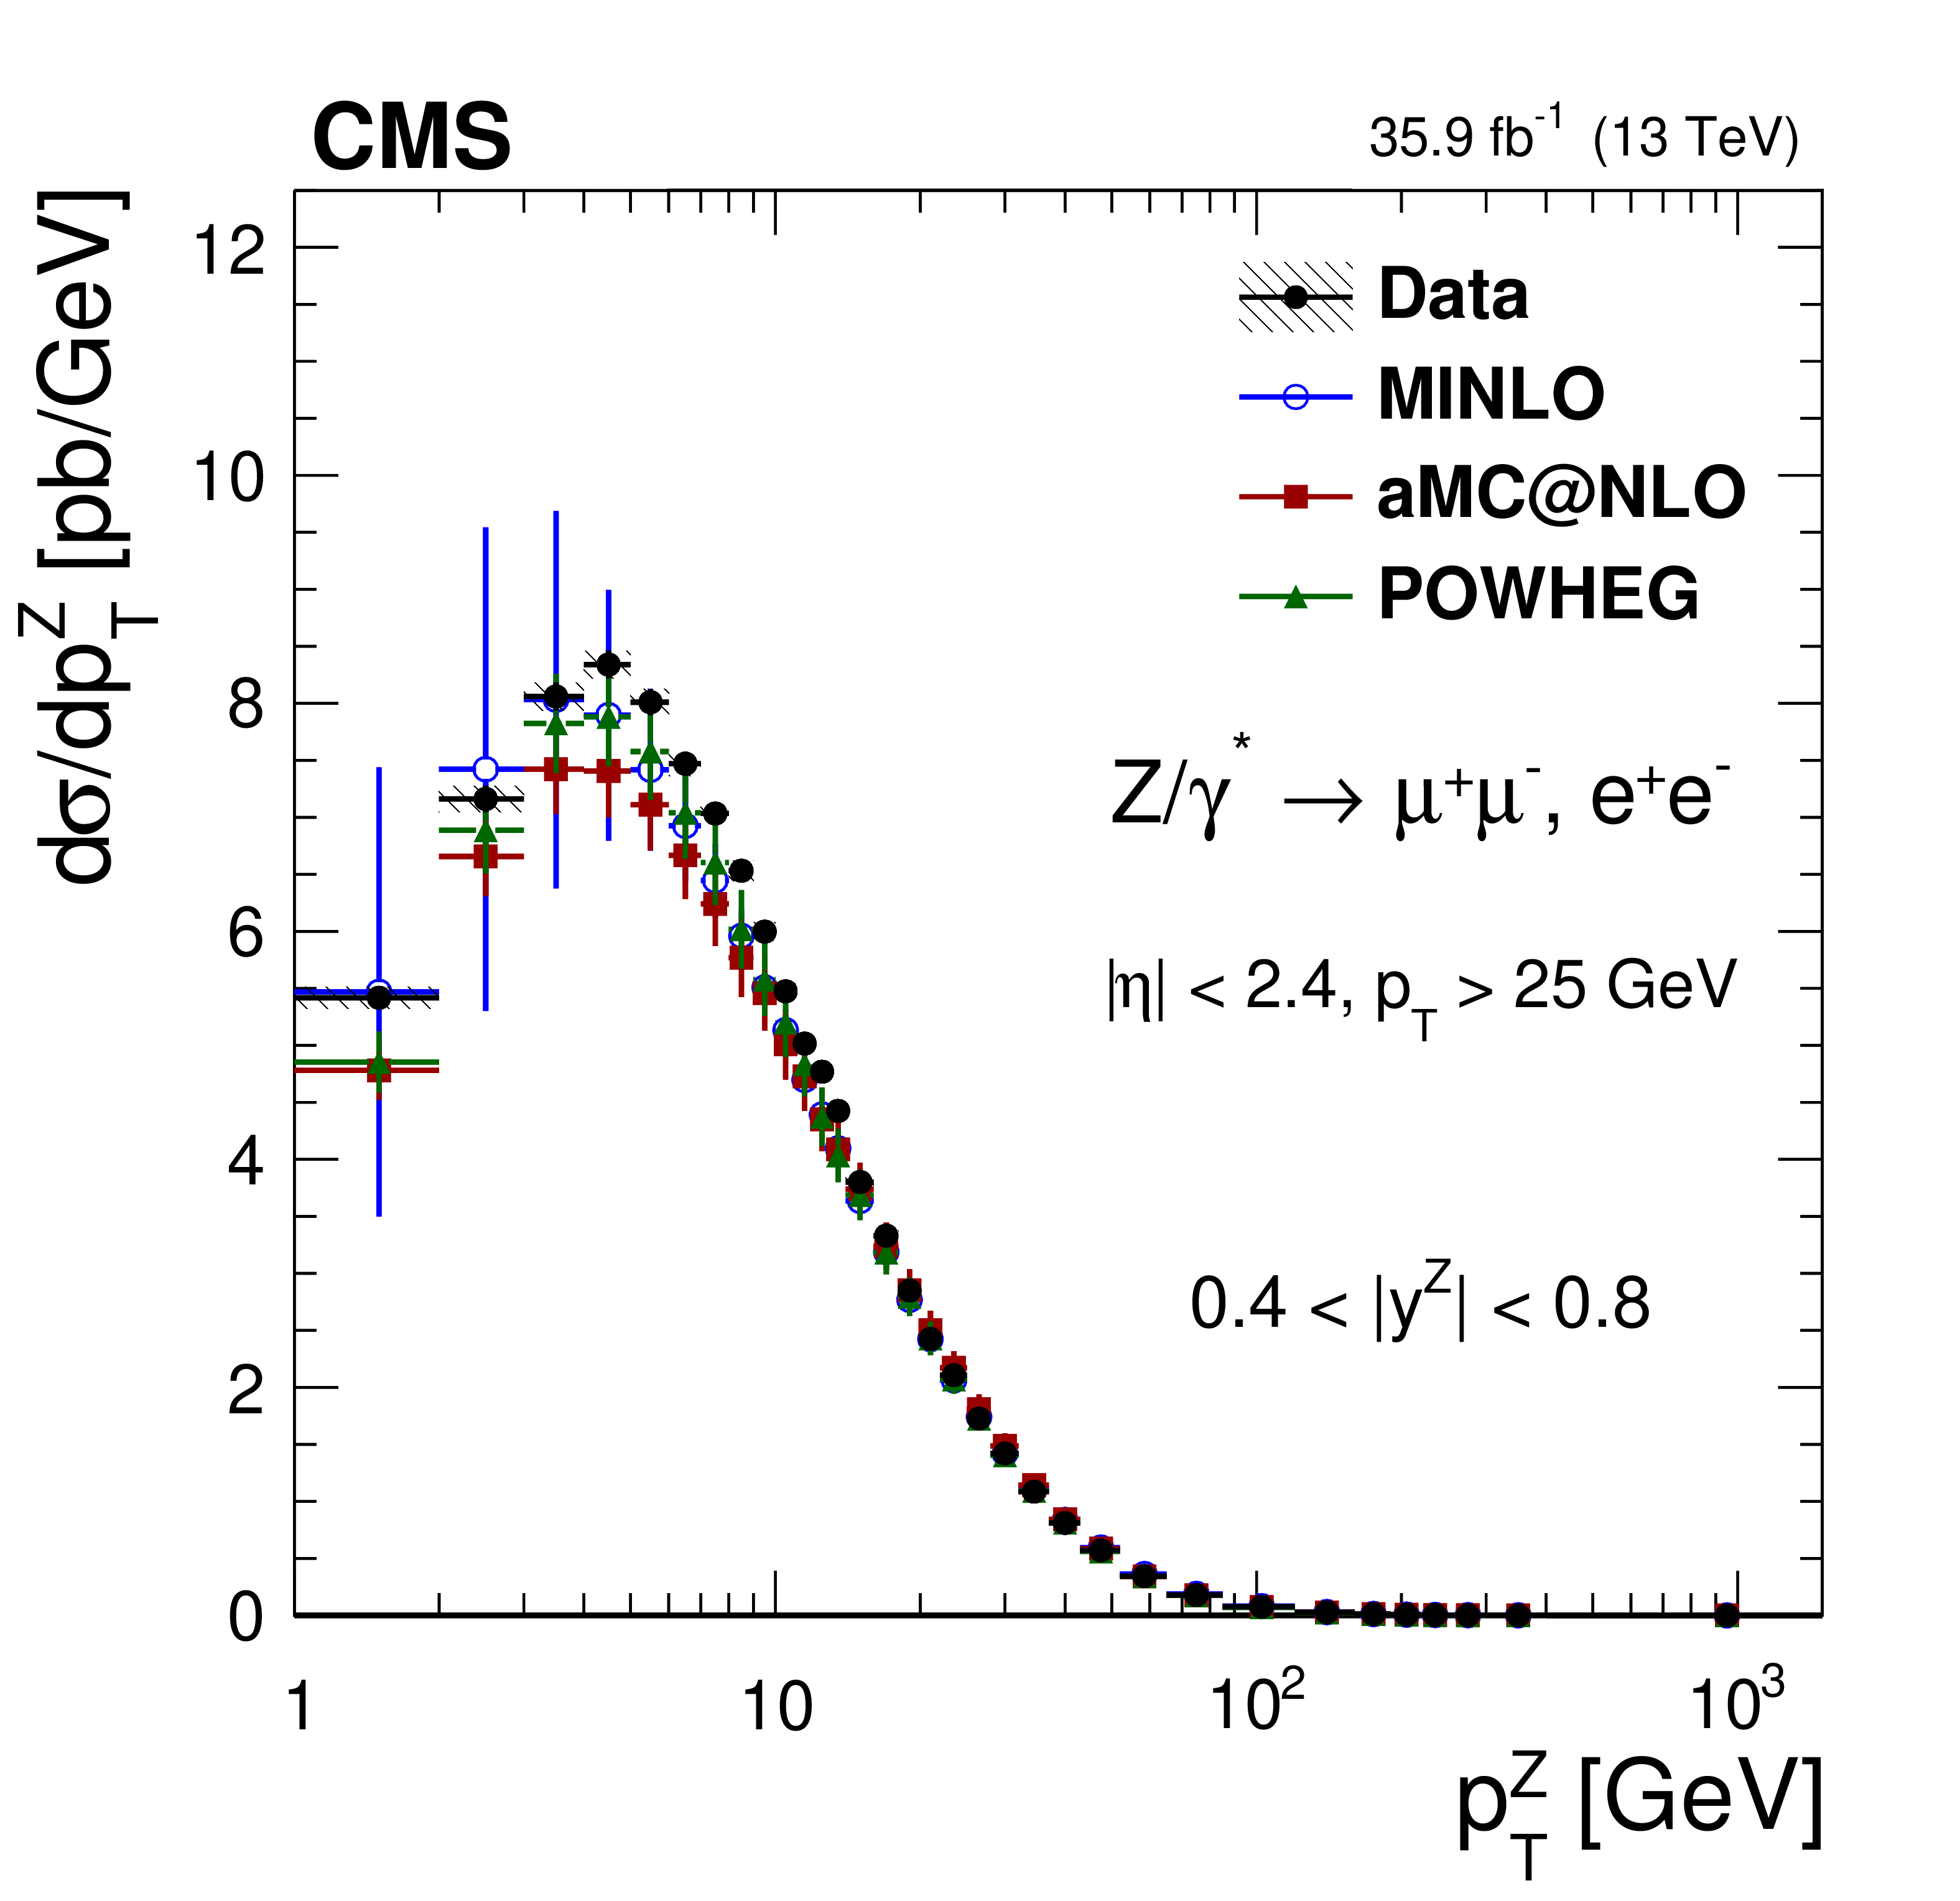
The measured absolute cross sections (left) in bins of $ {p_{\mathrm {T}}} ^{\mathrm{Z}}$ for the dimuon (upper) and dielectron (middle) final states, and for the combination (lower). The ratios of the predictions to the data are also shown (right). The shaded bands around the data points (black) correspond to the total experimental uncertainty. The measurement is compared to the predictions with MadGraph 5_aMC@NLO (square red markers), POWHEG (green triangles), and POWHEG-MINLO (blue circles). The error bars around the predictions correspond to the combined statistical, PDF, and scale uncertainties. |

png pdf |
Figure 6-a:
The measured absolute cross sections in bins of $ {p_{\mathrm {T}}} ^{\mathrm{Z}}$ for the dimuon final state. The shaded bands around the data points (black) correspond to the total experimental uncertainty. The measurement is compared to the predictions with MadGraph 5_aMC@NLO (square red markers), POWHEG (green triangles), and POWHEG-MINLO (blue circles). The error bars around the predictions correspond to the combined statistical, PDF, and scale uncertainties. |

png pdf |
Figure 6-b:
The ratios of the absolute cross sections predictions to the data in bins of $ {p_{\mathrm {T}}} ^{\mathrm{Z}}$ for the dimuon final state. The shaded bands around the data points (black) correspond to the total experimental uncertainty. The measurement is compared to the predictions with MadGraph 5_aMC@NLO (square red markers), POWHEG (green triangles), and POWHEG-MINLO (blue circles). The error bars around the predictions correspond to the combined statistical, PDF, and scale uncertainties. |
png pdf |
Figure 6-c:
The measured absolute cross sections in bins of $ {p_{\mathrm {T}}} ^{\mathrm{Z}}$ for the dielectron final state. The shaded bands around the data points (black) correspond to the total experimental uncertainty. The measurement is compared to the predictions with MadGraph 5_aMC@NLO (square red markers), POWHEG (green triangles), and POWHEG-MINLO (blue circles). The error bars around the predictions correspond to the combined statistical, PDF, and scale uncertainties. |

png pdf |
Figure 6-d:
The ratios of the absolute cross sections predictions to the data in bins of $ {p_{\mathrm {T}}} ^{\mathrm{Z}}$ for the dielectron final state. The shaded bands around the data points (black) correspond to the total experimental uncertainty. The measurement is compared to the predictions with MadGraph 5_aMC@NLO (square red markers), POWHEG (green triangles), and POWHEG-MINLO (blue circles). The error bars around the predictions correspond to the combined statistical, PDF, and scale uncertainties. |
png pdf |
Figure 6-e:
The measured absolute cross sections in bins of $ {p_{\mathrm {T}}} ^{\mathrm{Z}}$ for the combination of dimuon and dielectron final states. The shaded bands around the data points (black) correspond to the total experimental uncertainty. The measurement is compared to the predictions with MadGraph 5_aMC@NLO (square red markers), POWHEG (green triangles), and POWHEG-MINLO (blue circles). The error bars around the predictions correspond to the combined statistical, PDF, and scale uncertainties. |

png pdf |
Figure 6-f:
The ratios of the absolute cross sections predictions to the data in bins of $ {p_{\mathrm {T}}} ^{\mathrm{Z}}$ for the combination of dimuon and dielectron final states. The shaded bands around the data points (black) correspond to the total experimental uncertainty. The measurement is compared to the predictions with MadGraph 5_aMC@NLO (square red markers), POWHEG (green triangles), and POWHEG-MINLO (blue circles). The error bars around the predictions correspond to the combined statistical, PDF, and scale uncertainties. |
png pdf |
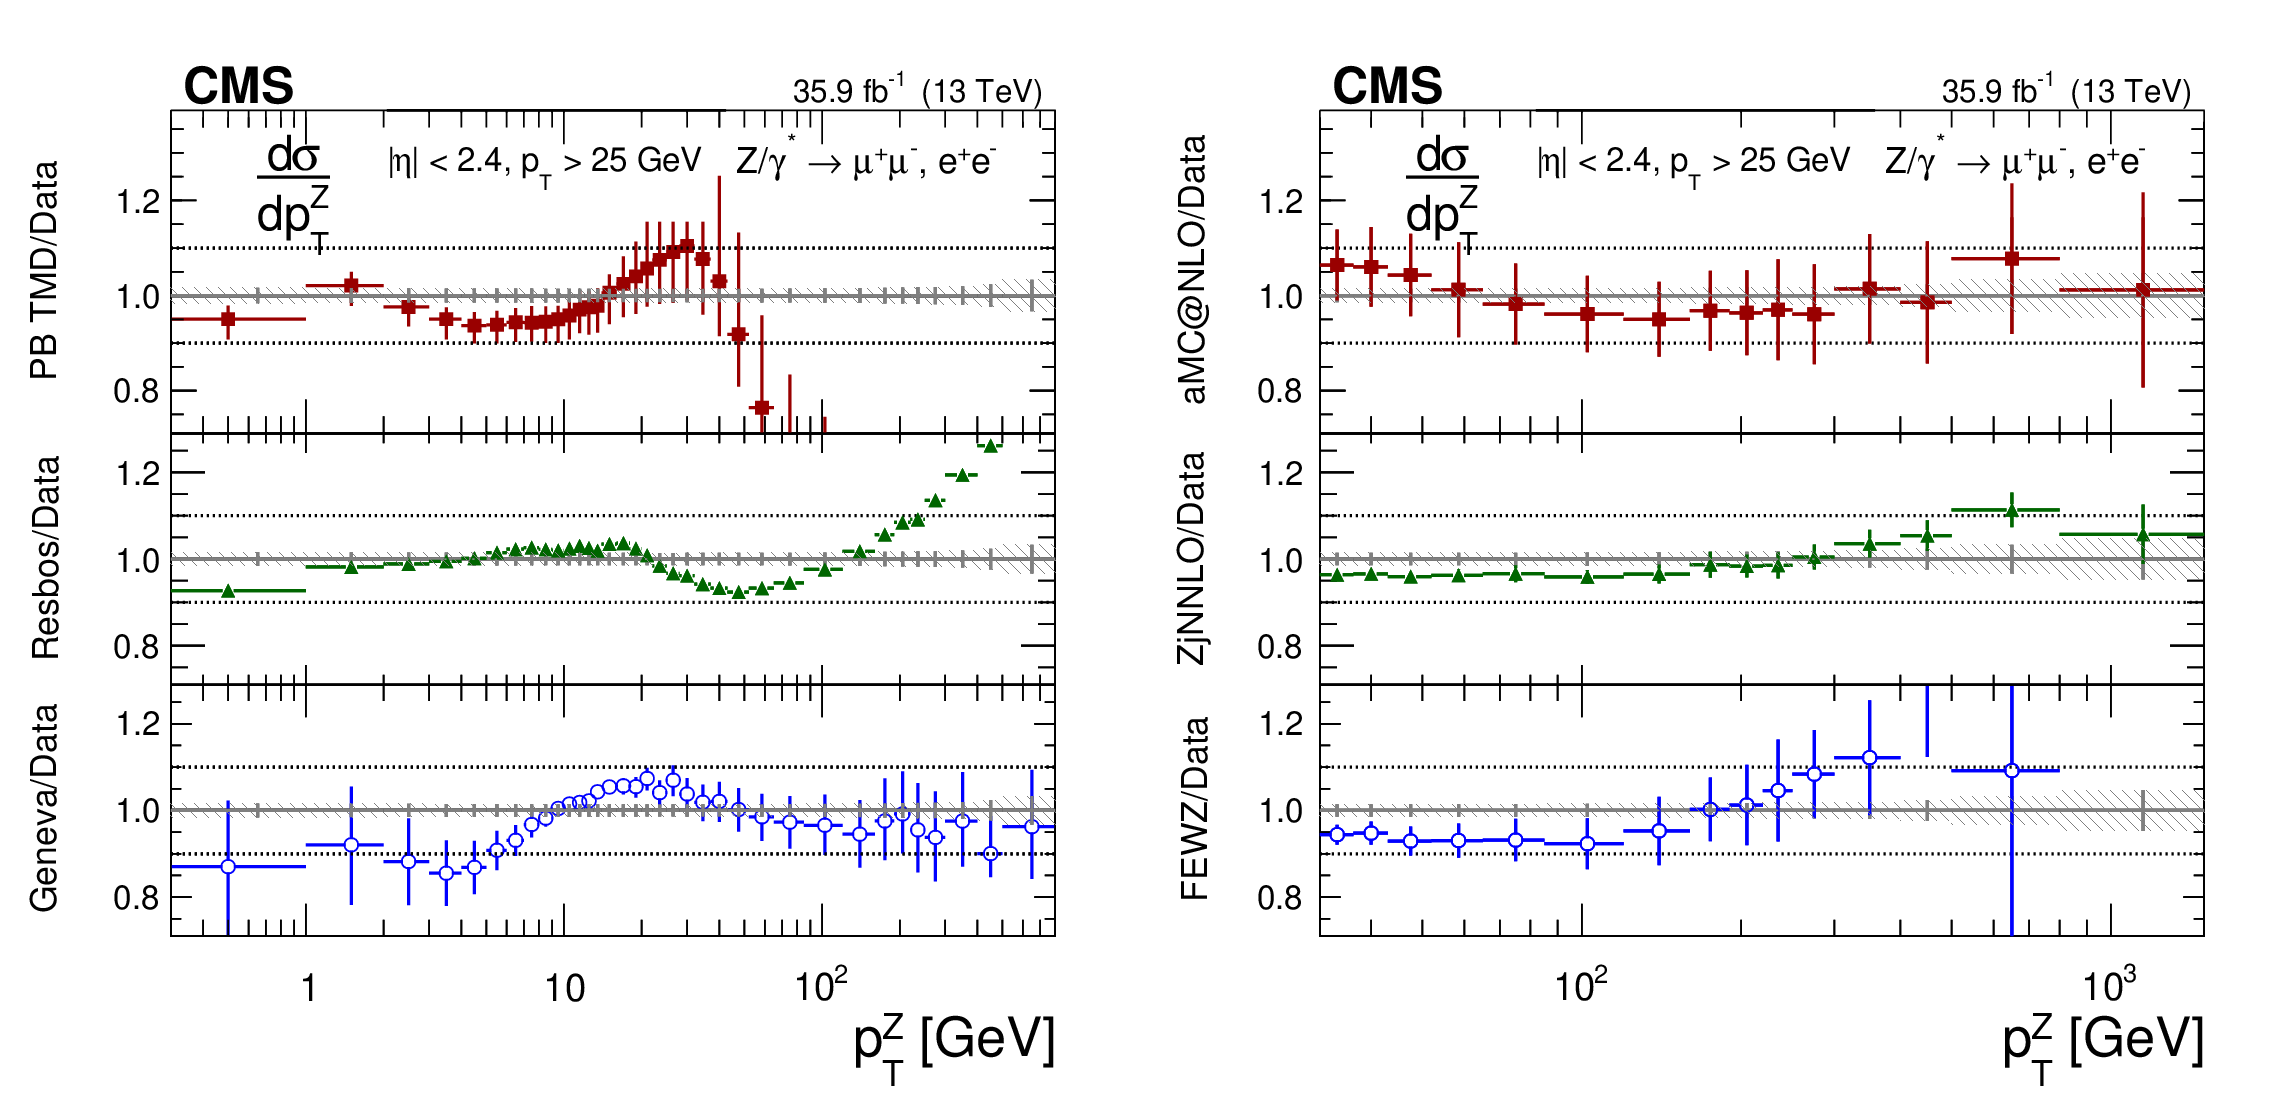
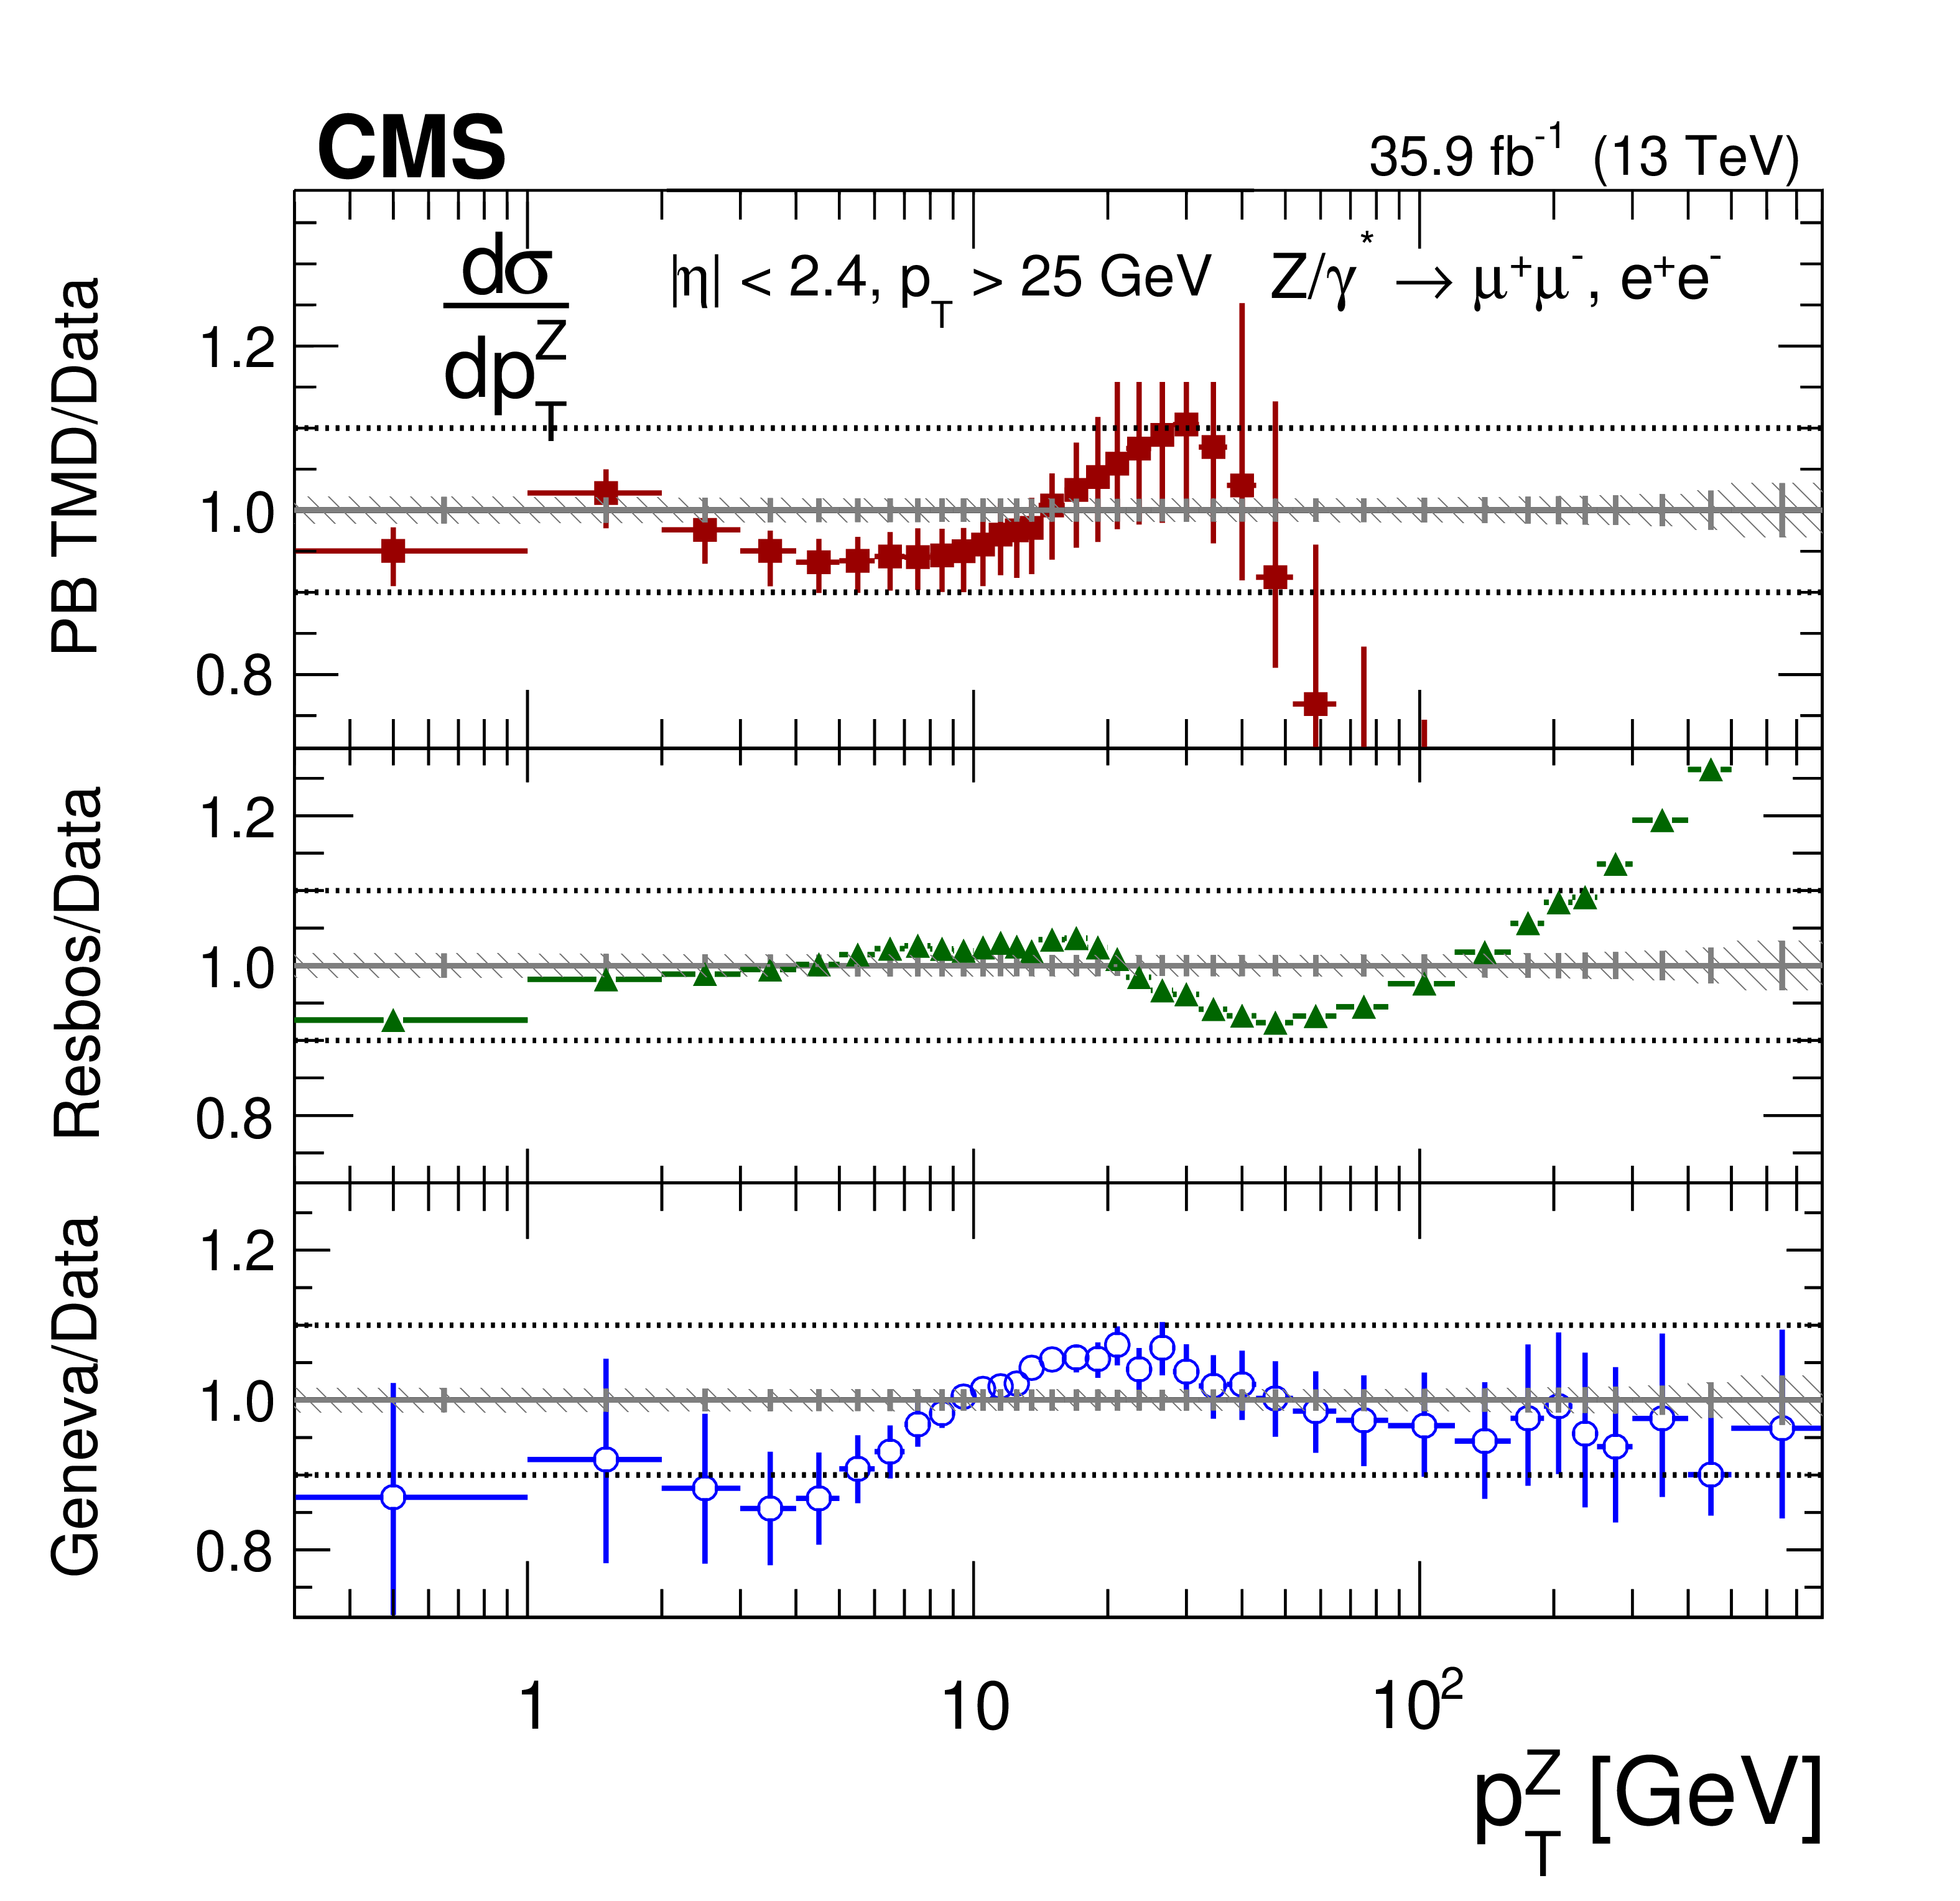
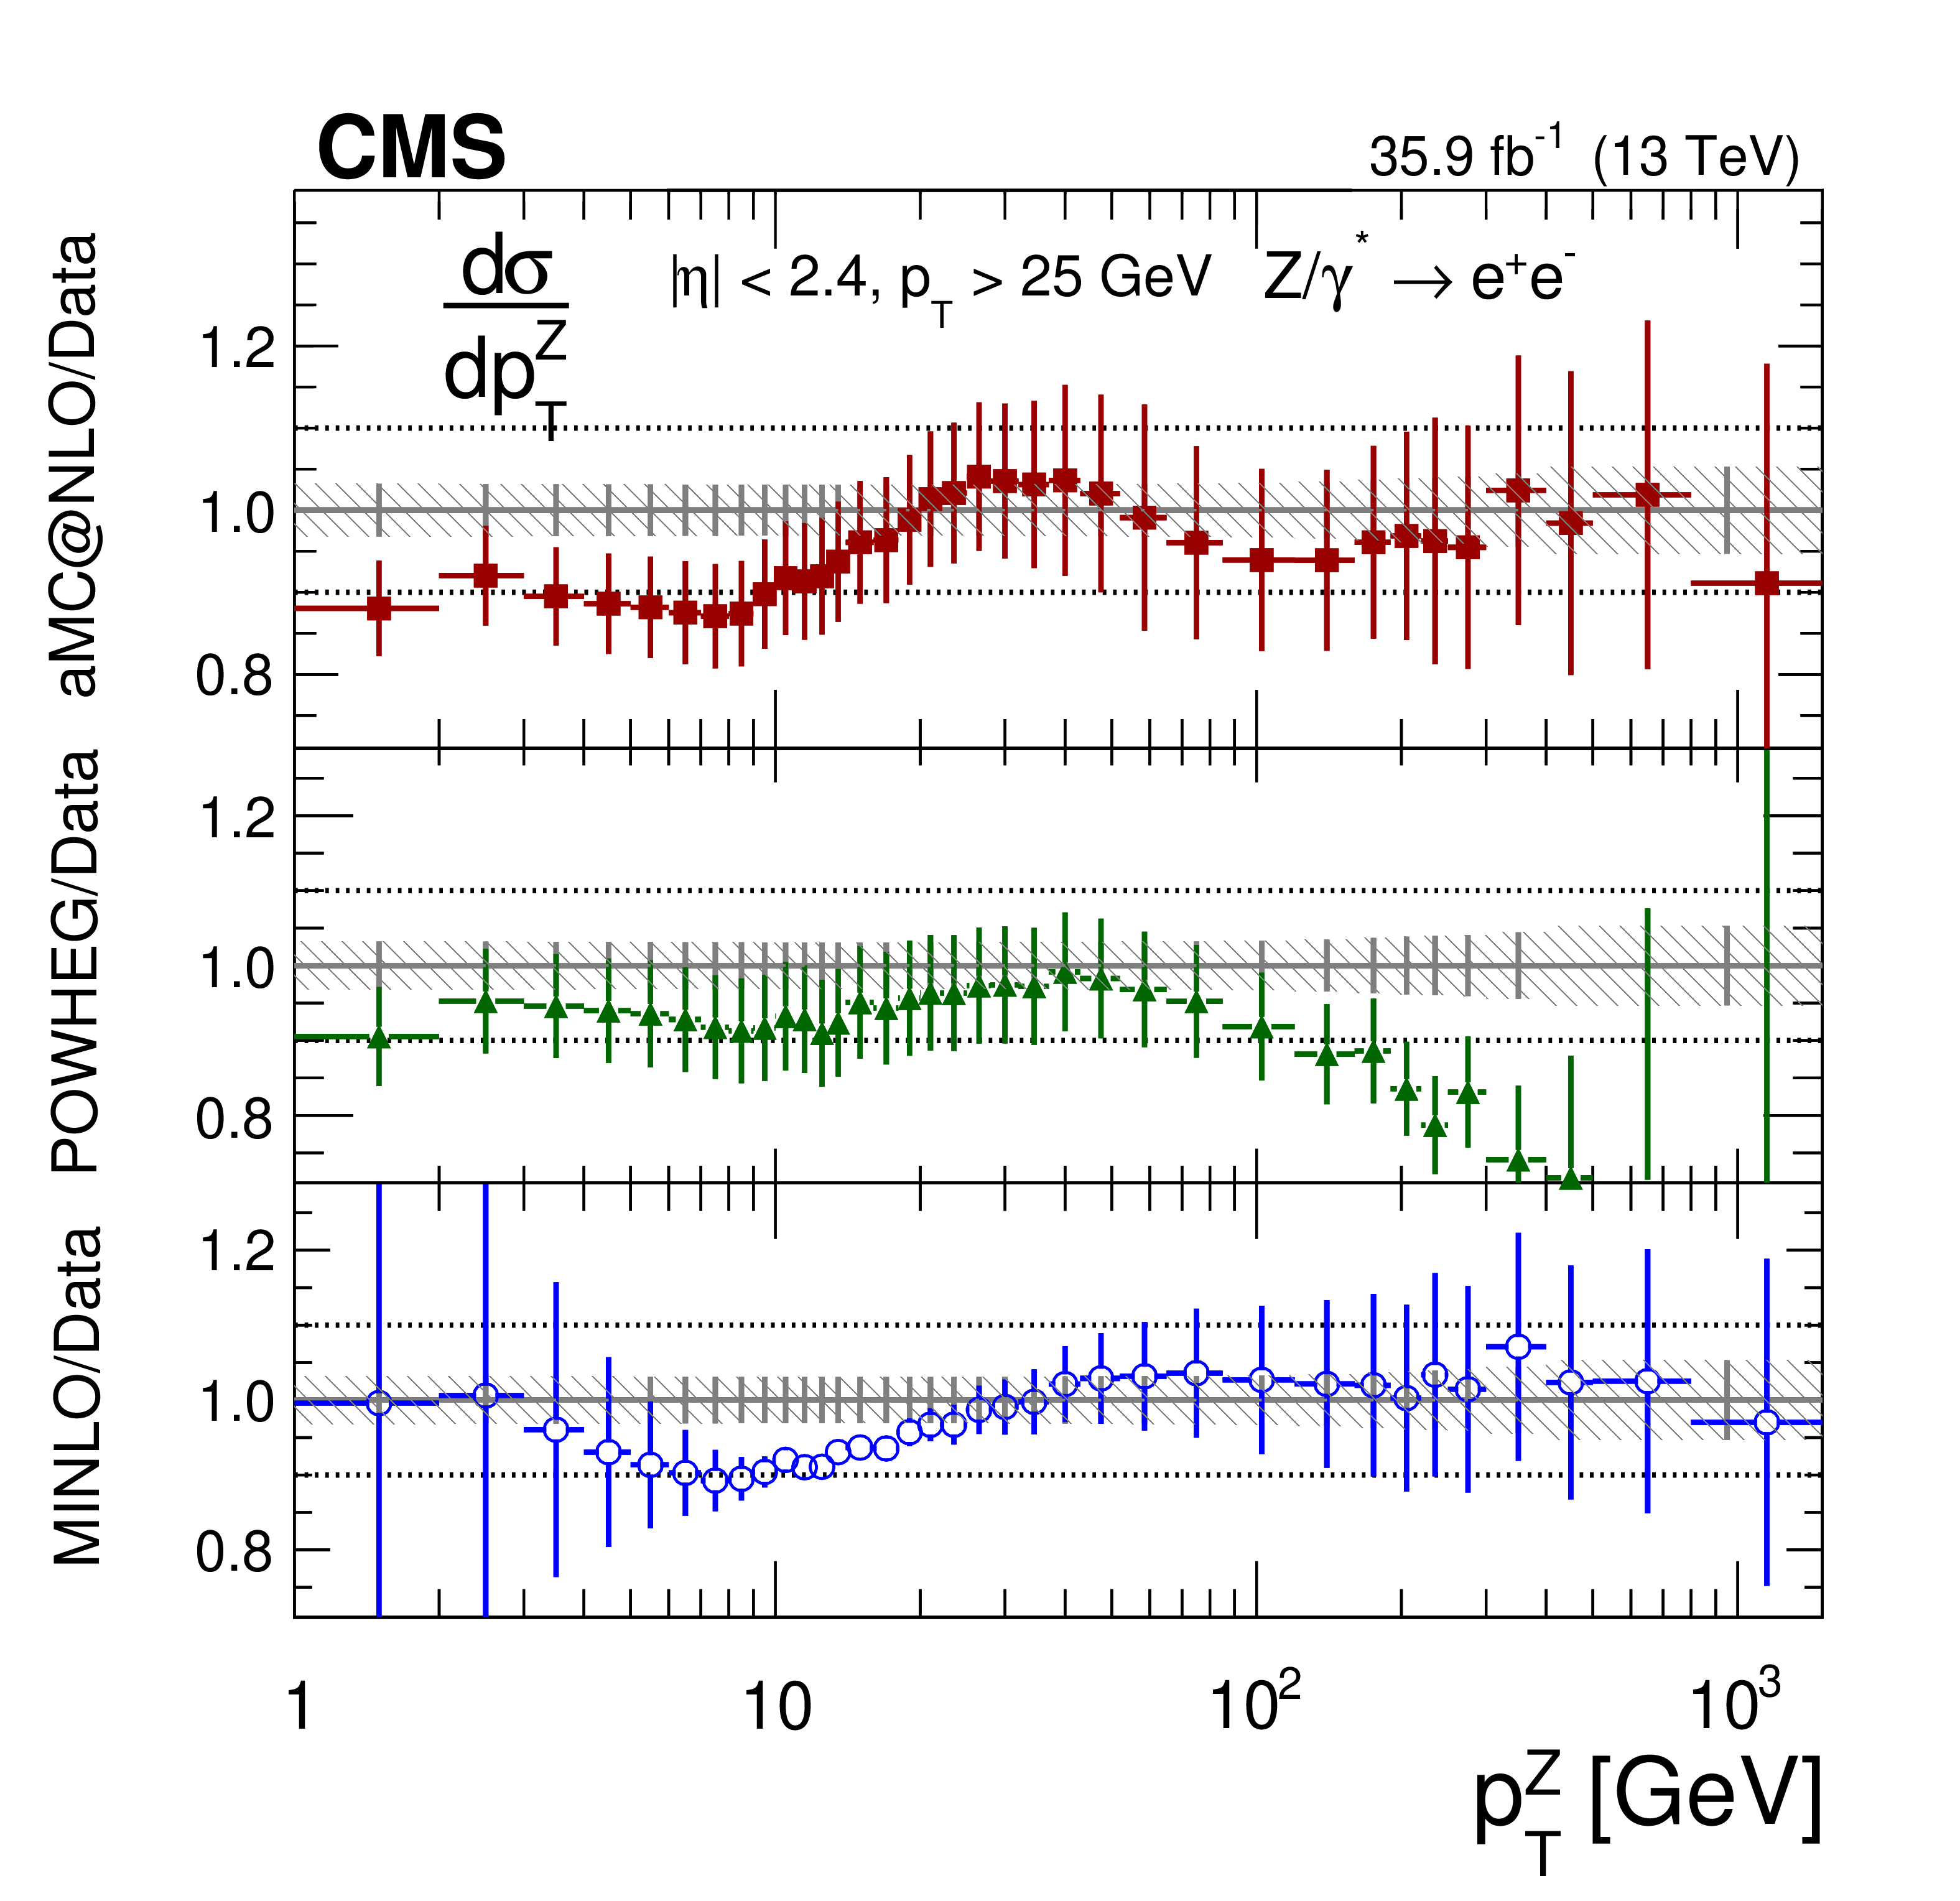
Figure 7:
The ratios of the predictions to the data in bins of $ {p_{\mathrm {T}}} ^{\mathrm{Z}}$ for the combination of the dimuon and dielectron final states. The shaded bands around the data points (black) correspond to the total experimental uncertainty. The left plot shows comparisons to the predictions with PB TMD (square red markers), RESBOS (green triangles), and GENEVA (blue circles). The right plot shows the $ {p_{\mathrm {T}}} ^{\mathrm{Z}}$ distribution for $ {p_{\mathrm {T}}} > $ 32 GeV compared to the predictions with MadGraph 5_aMC@NLO (square red markers), $\mathrm{Z} $+1 jet at NNLO (green triangles), and FEWZ (blue circles). The error bars around the predictions correspond to the combined statistical, PDF, and scale uncertainties. Only the statistical uncertainties are shown for the predictions with RESBOS. |
png pdf |
Figure 7-a:
The ratios of the predictions to the data in bins of $ {p_{\mathrm {T}}} ^{\mathrm{Z}}$ for the combination of the dimuon and dielectron final states. The shaded bands around the data points (black) correspond to the total experimental uncertainty. The plot shows comparisons to the predictions with PB TMD (square red markers), RESBOS (green triangles), and GENEVA (blue circles). The error bars around the predictions correspond to the combined statistical, PDF, and scale uncertainties. Only the statistical uncertainties are shown for the predictions with RESBOS. |

png pdf |
Figure 7-b:
The ratios of the predictions to the data in bins of $ {p_{\mathrm {T}}} ^{\mathrm{Z}}$ for the combination of the dimuon and dielectron final states. The shaded bands around the data points (black) correspond to the total experimental uncertainty. The plot shows the $ {p_{\mathrm {T}}} ^{\mathrm{Z}}$ distribution for $ {p_{\mathrm {T}}} > $ 32 GeV compared to the predictions with MadGraph 5_aMC@NLO (square red markers), $\mathrm{Z} $+1 jet at NNLO (green triangles), and FEWZ (blue circles). The error bars around the predictions correspond to the combined statistical, PDF, and scale uncertainties. |

png pdf |
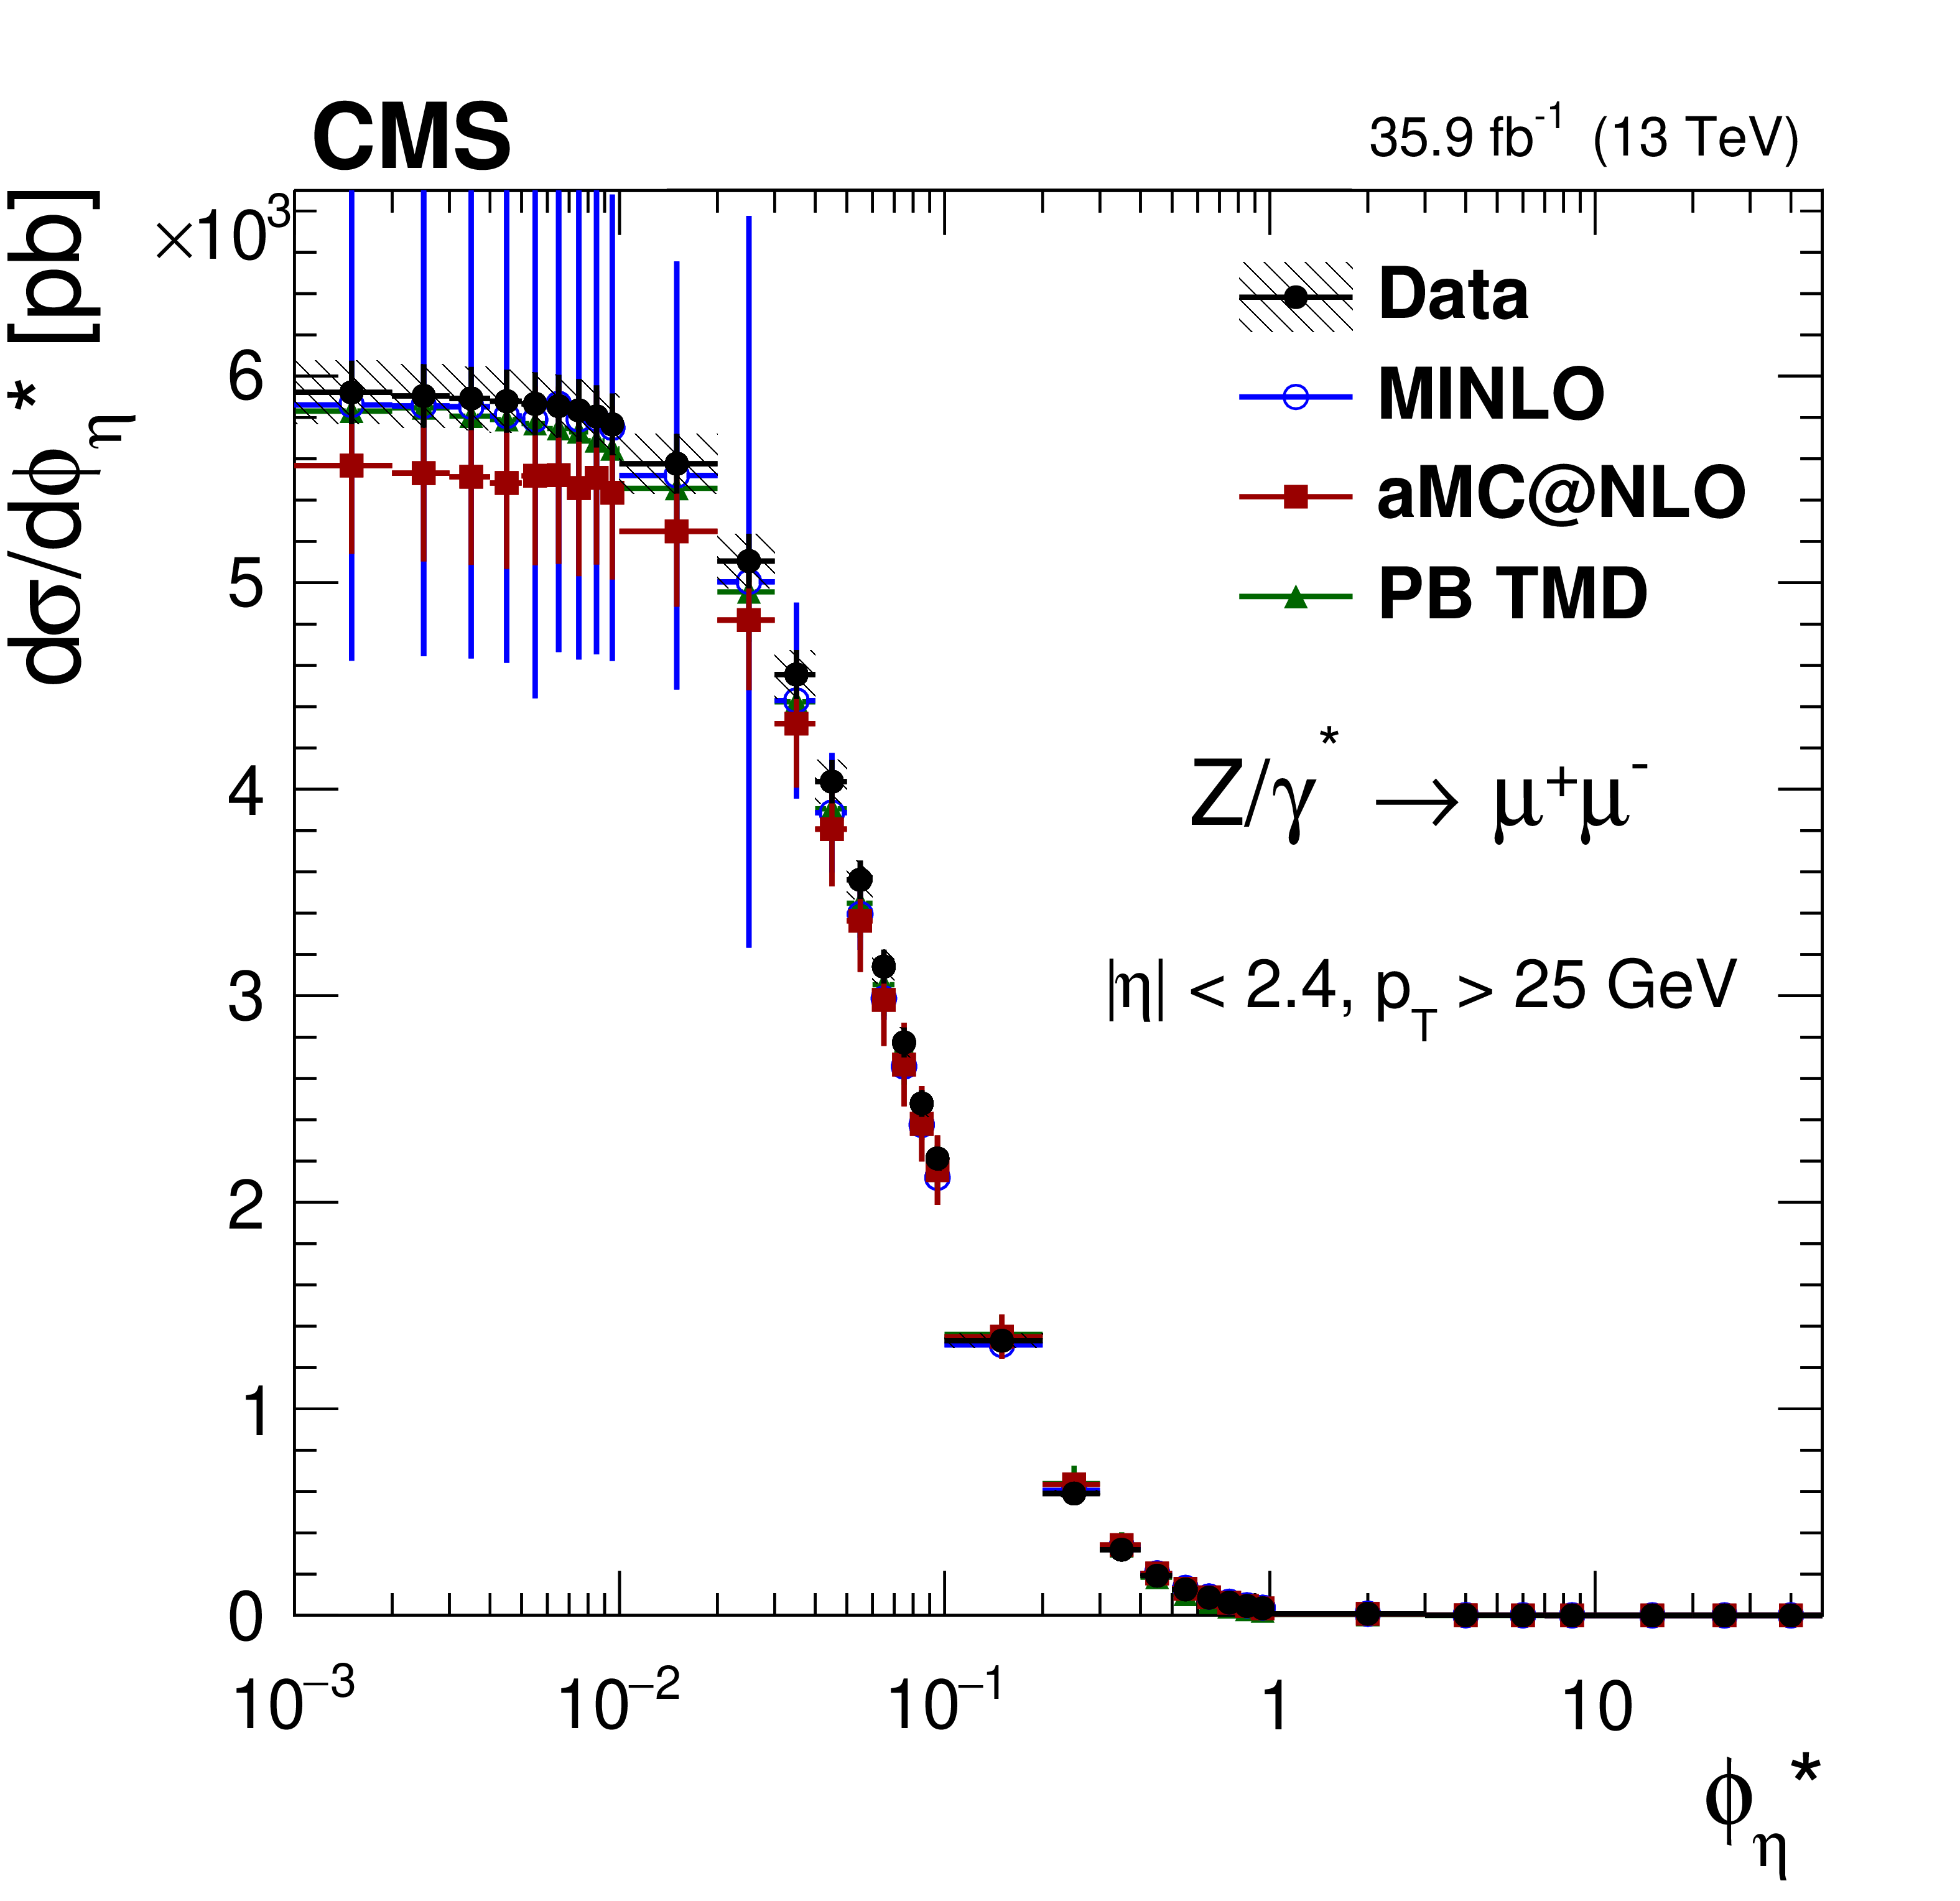
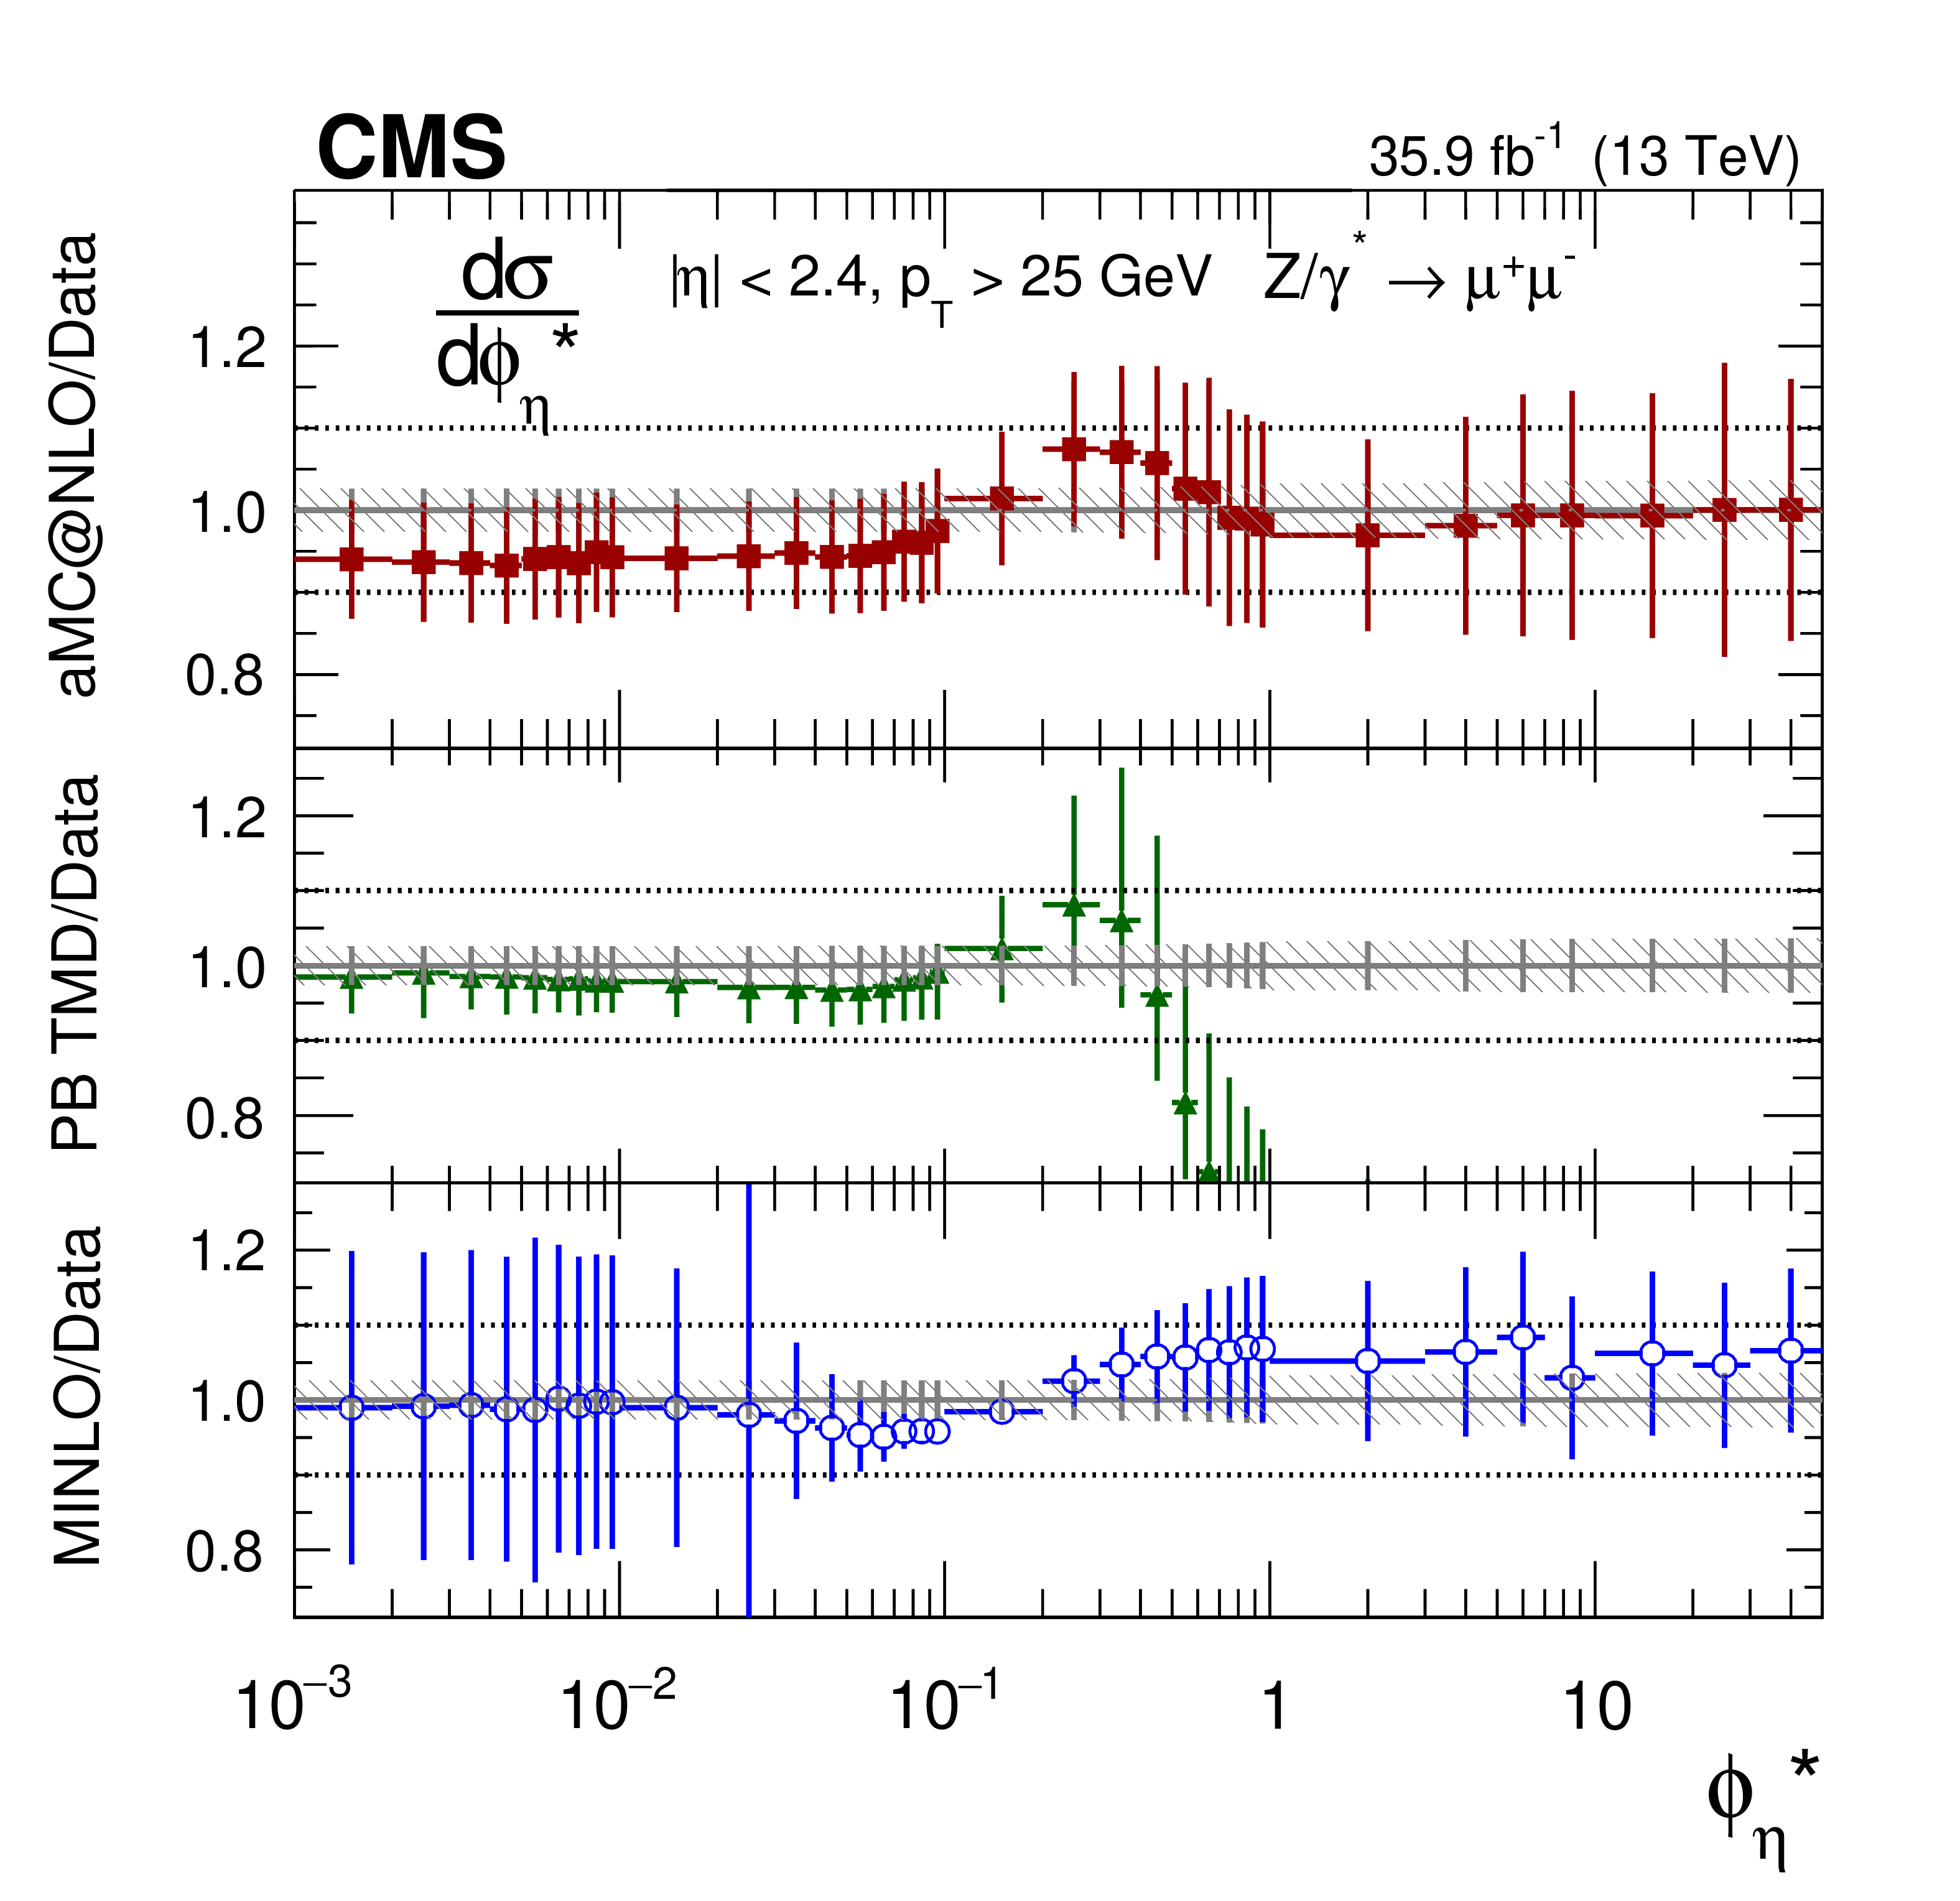
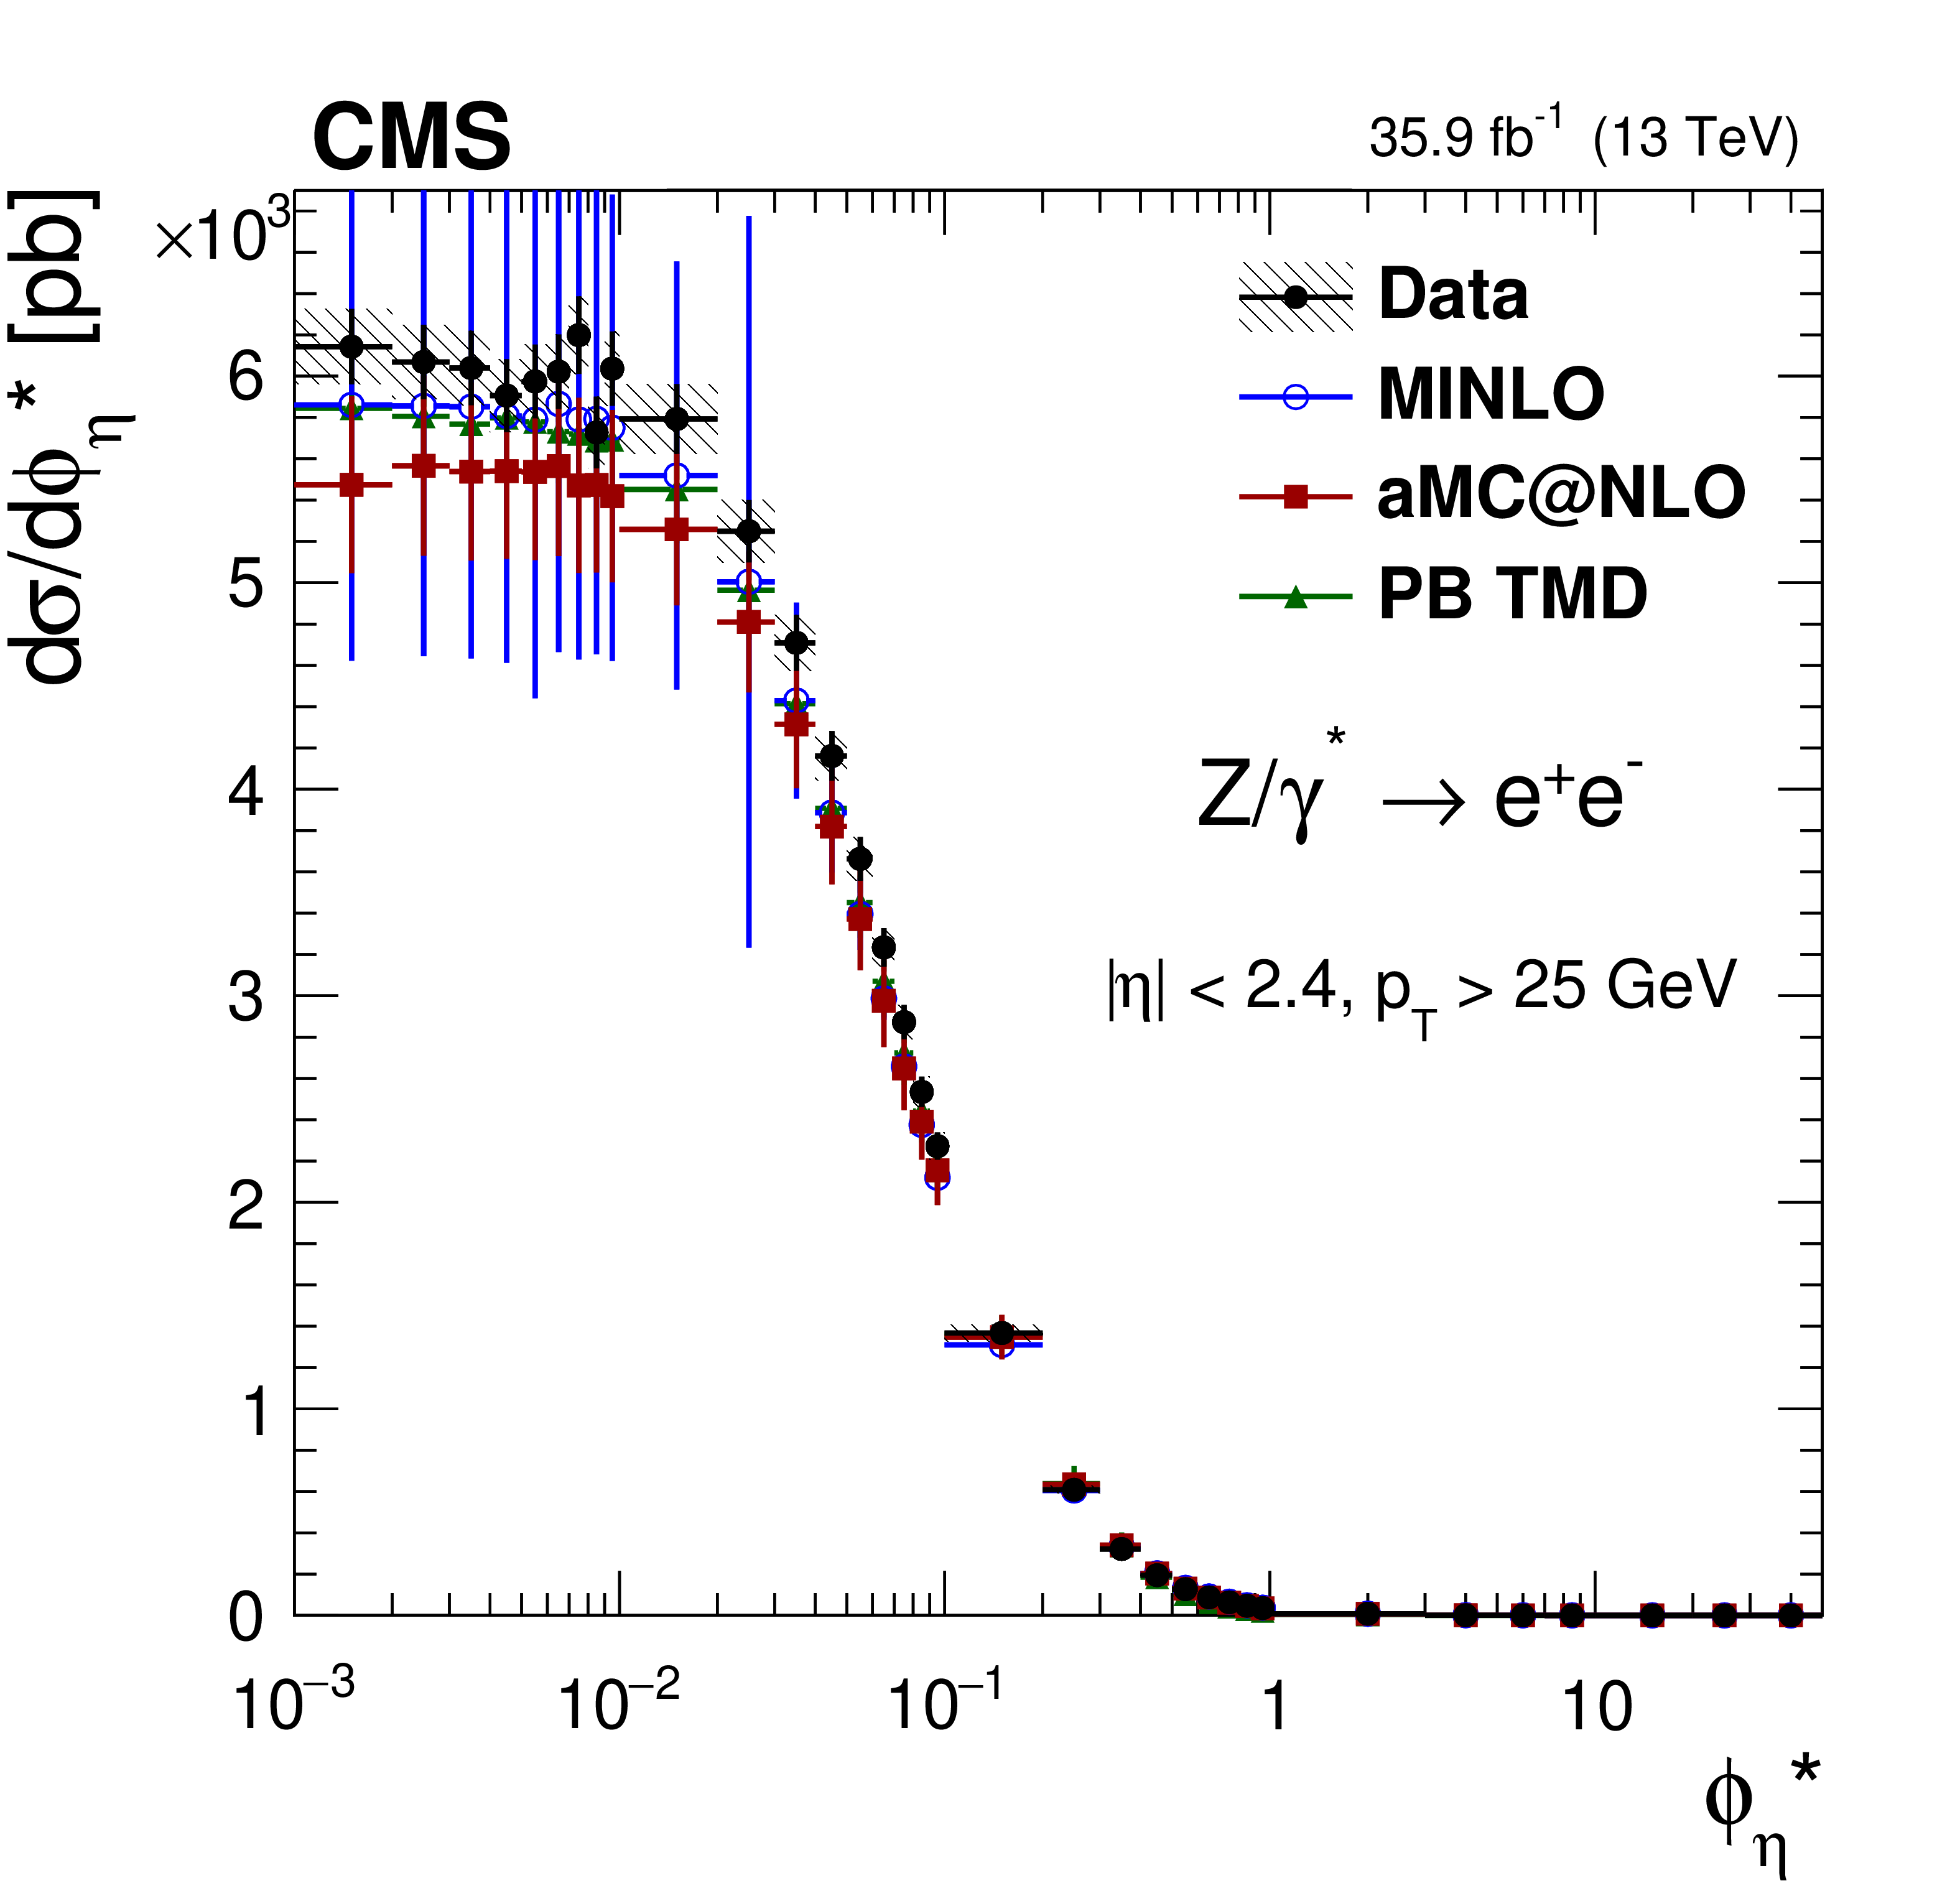
Figure 8:
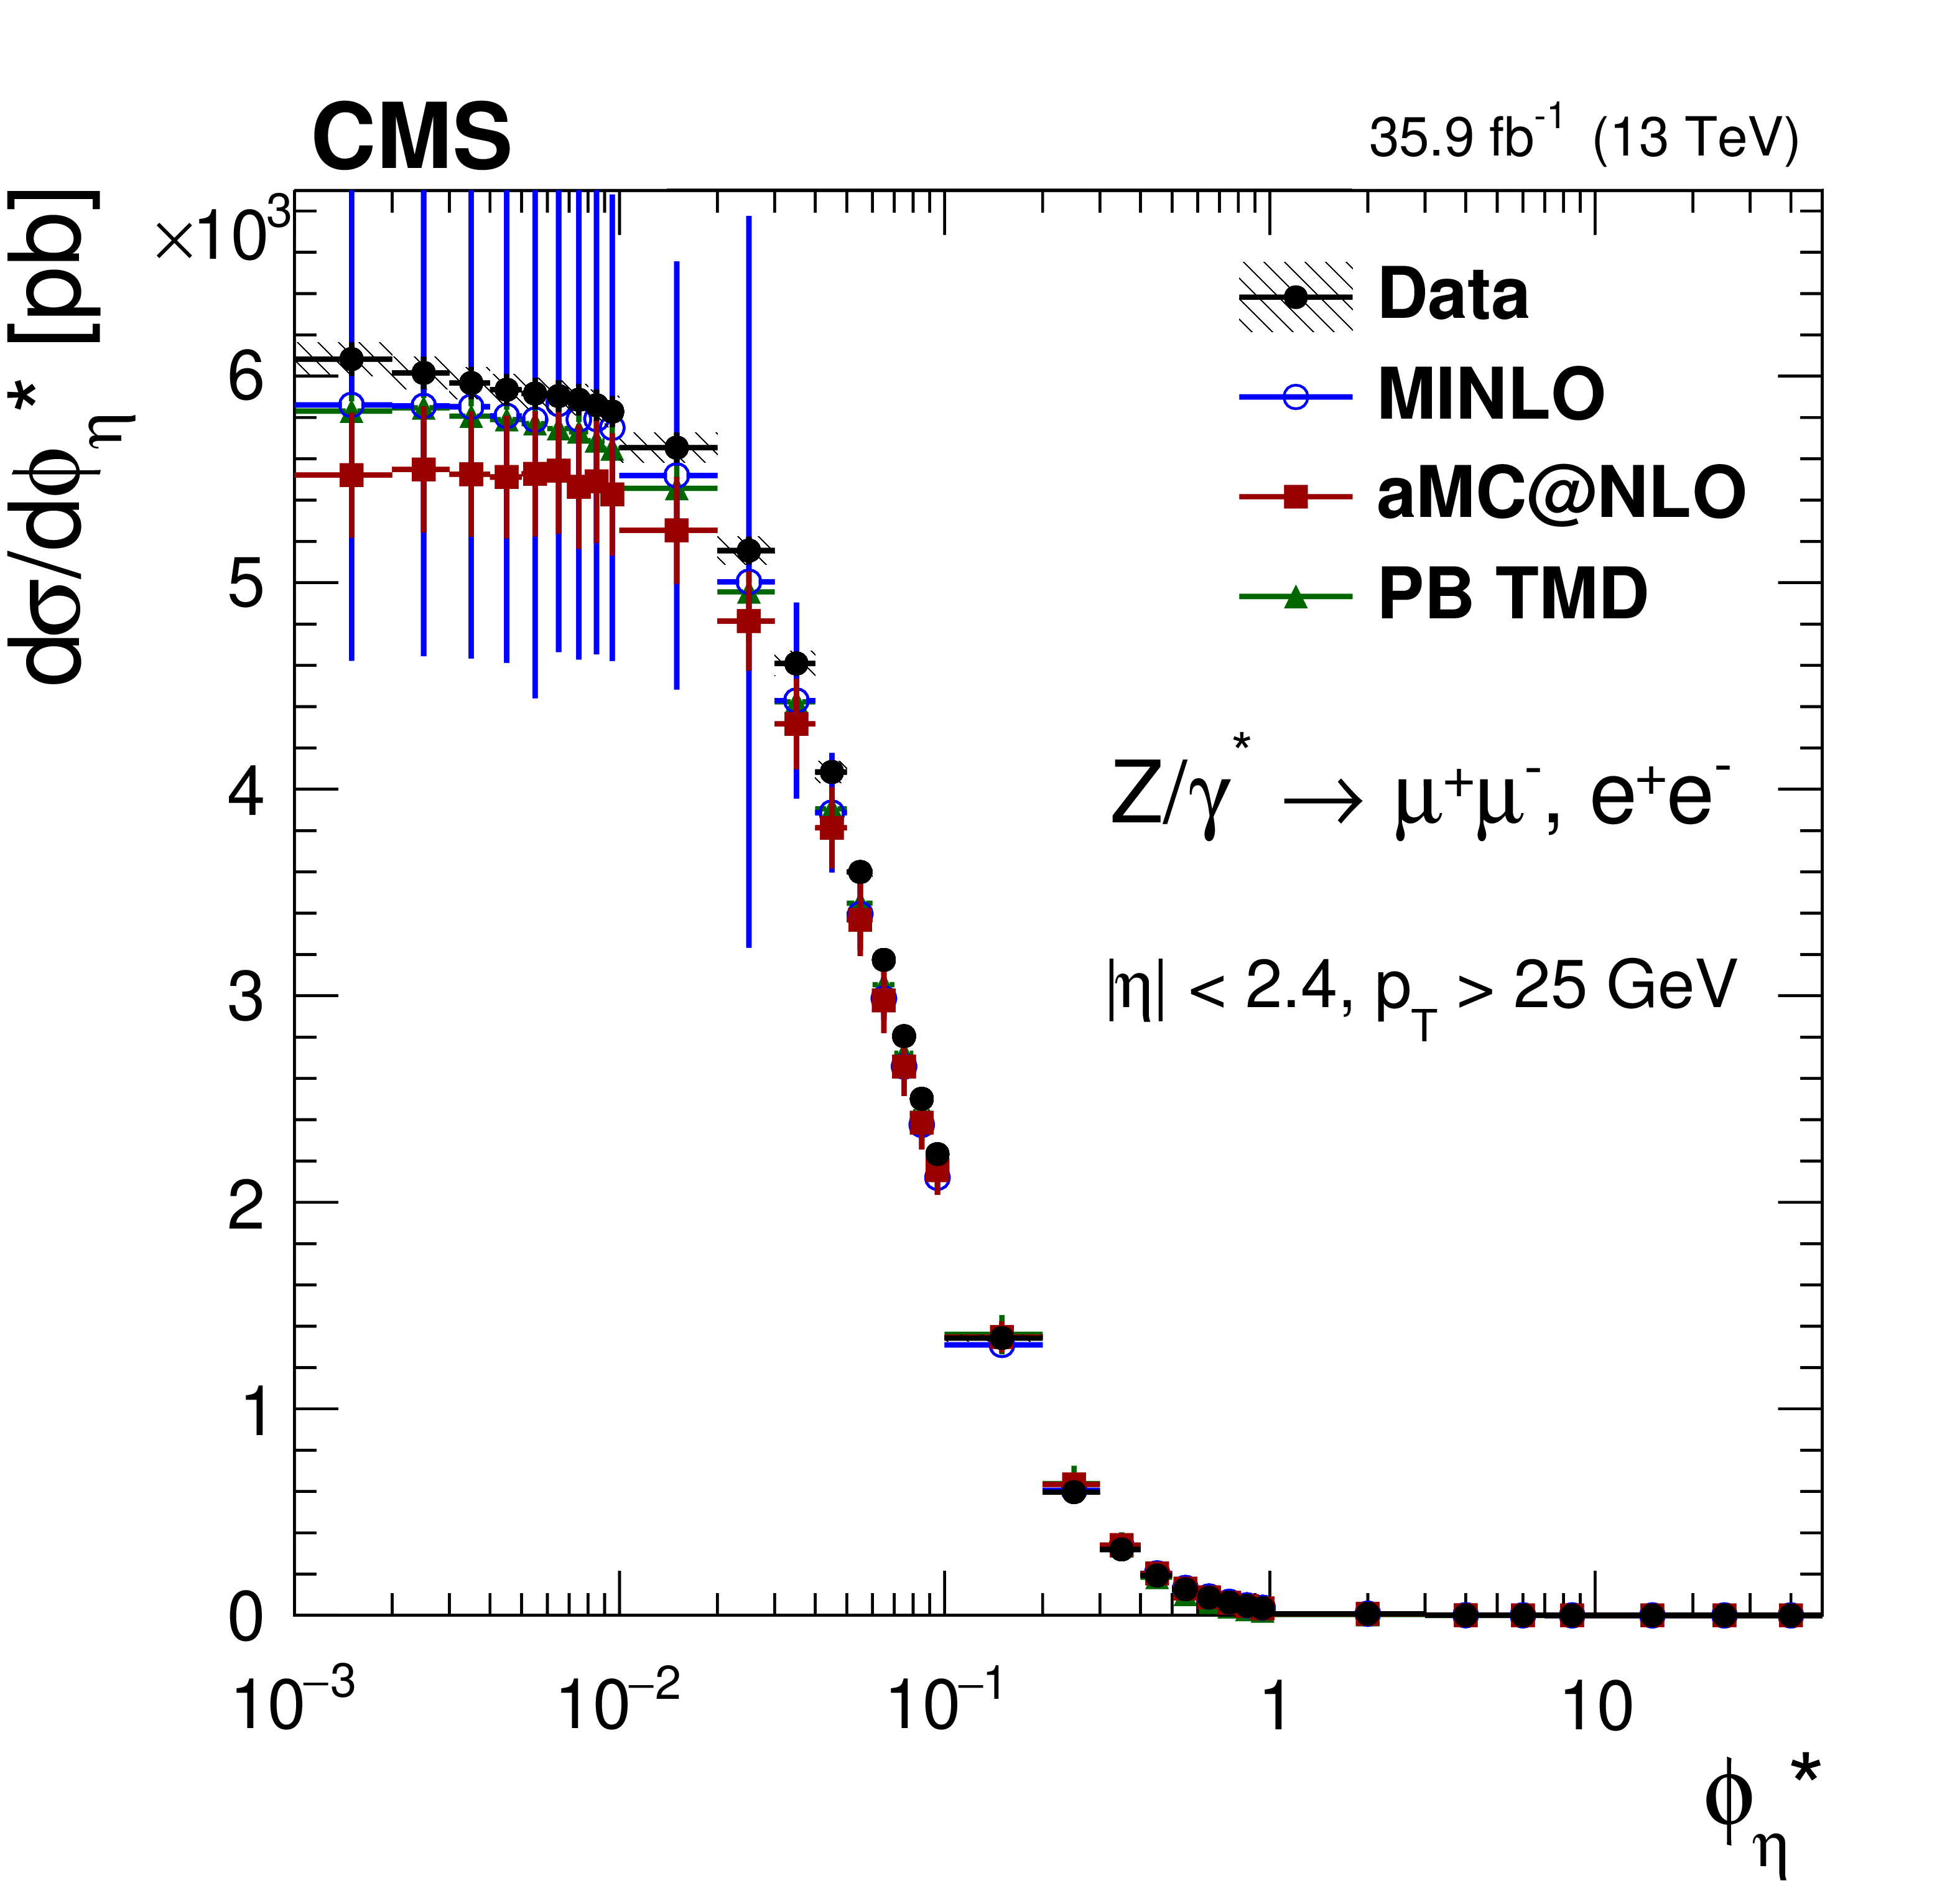
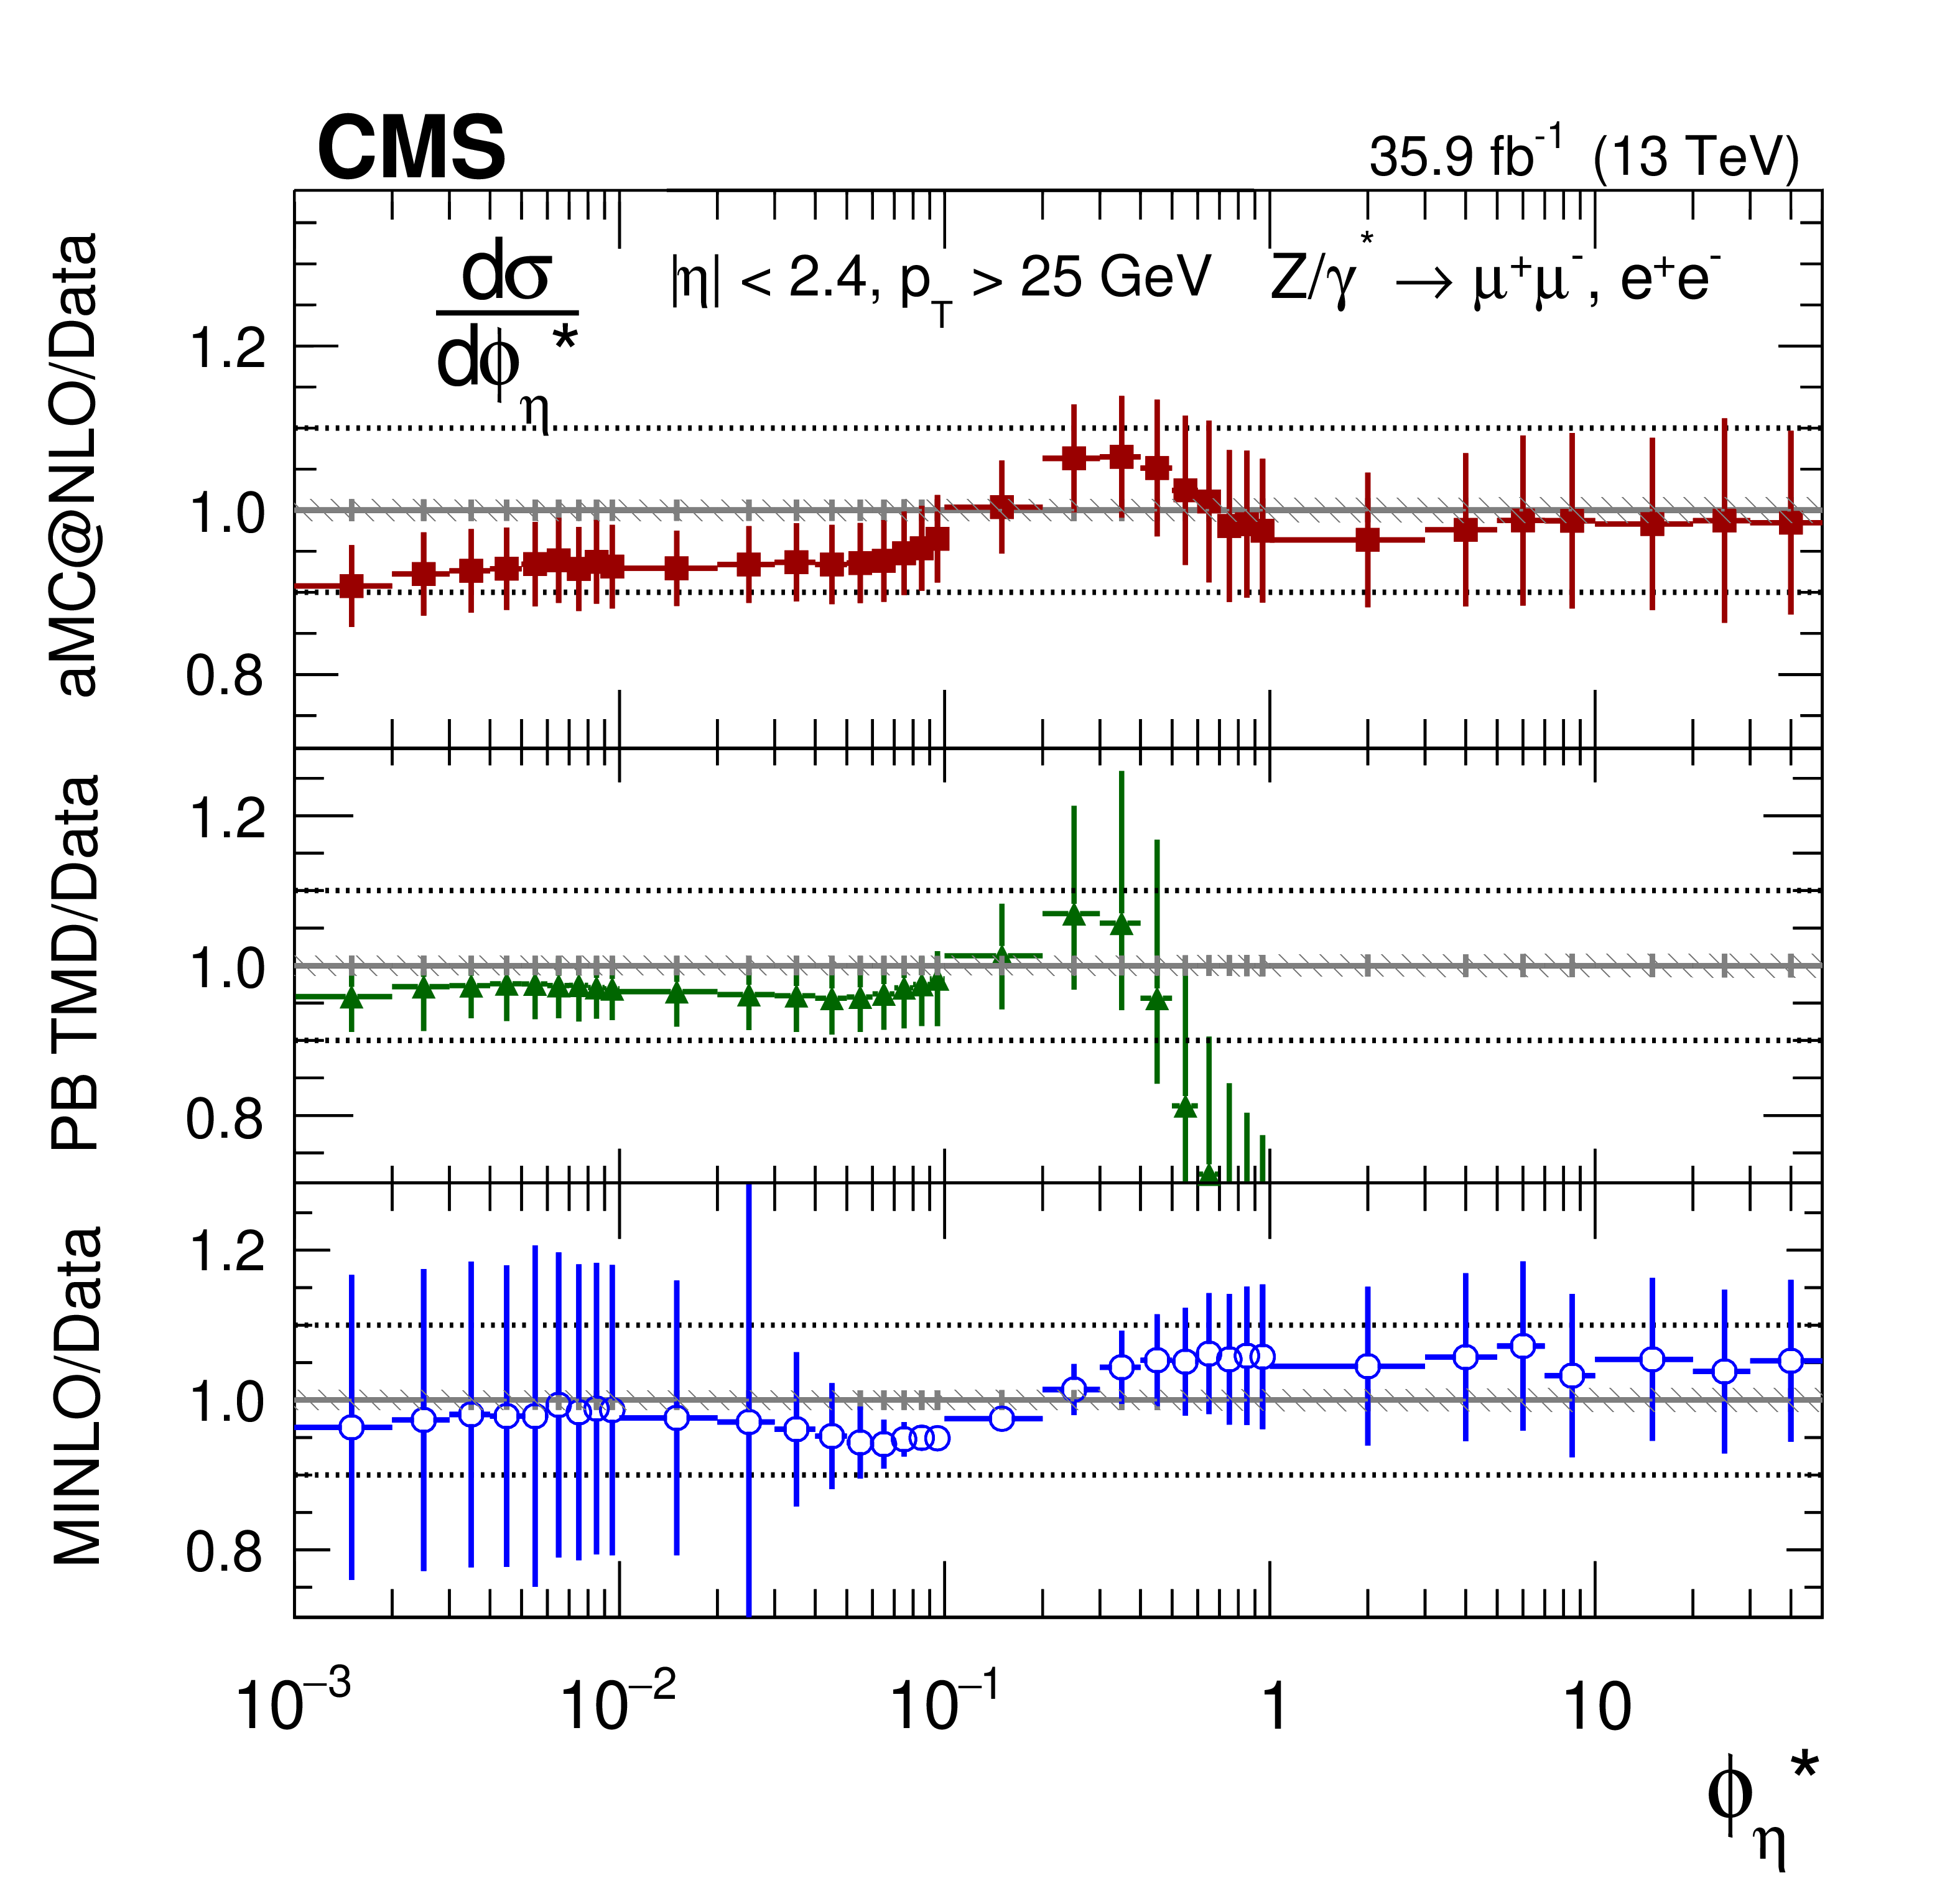
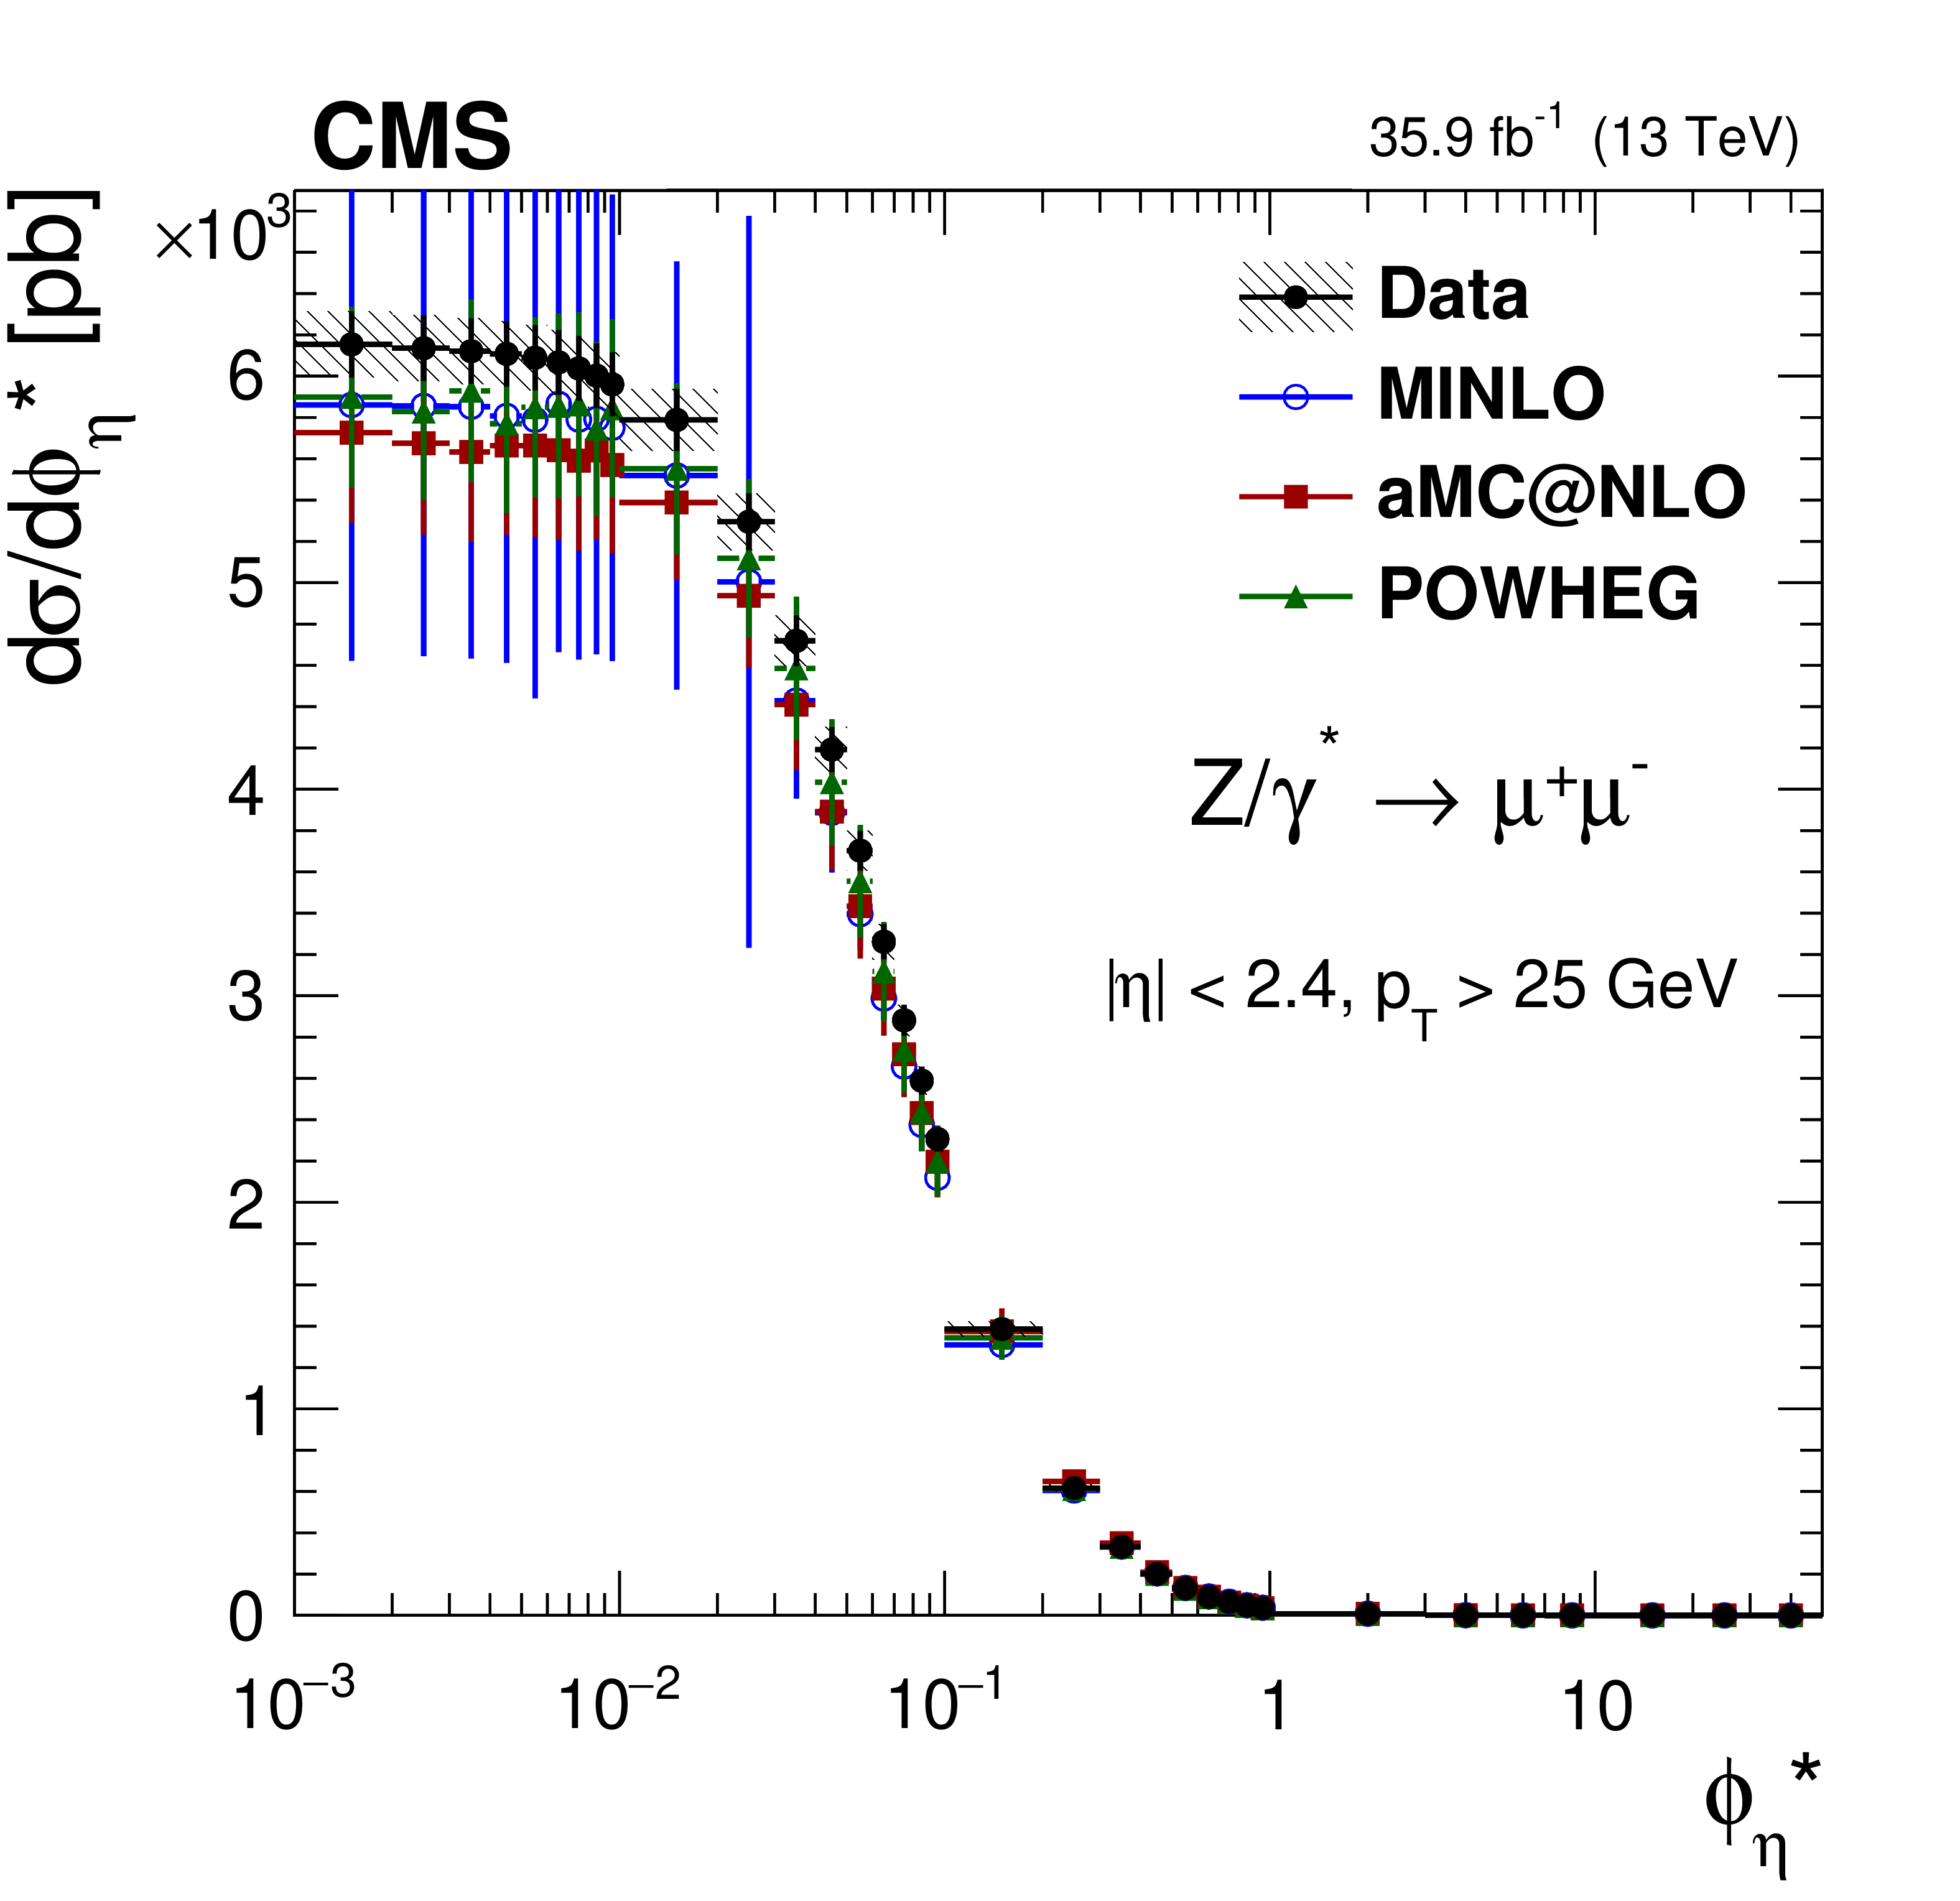
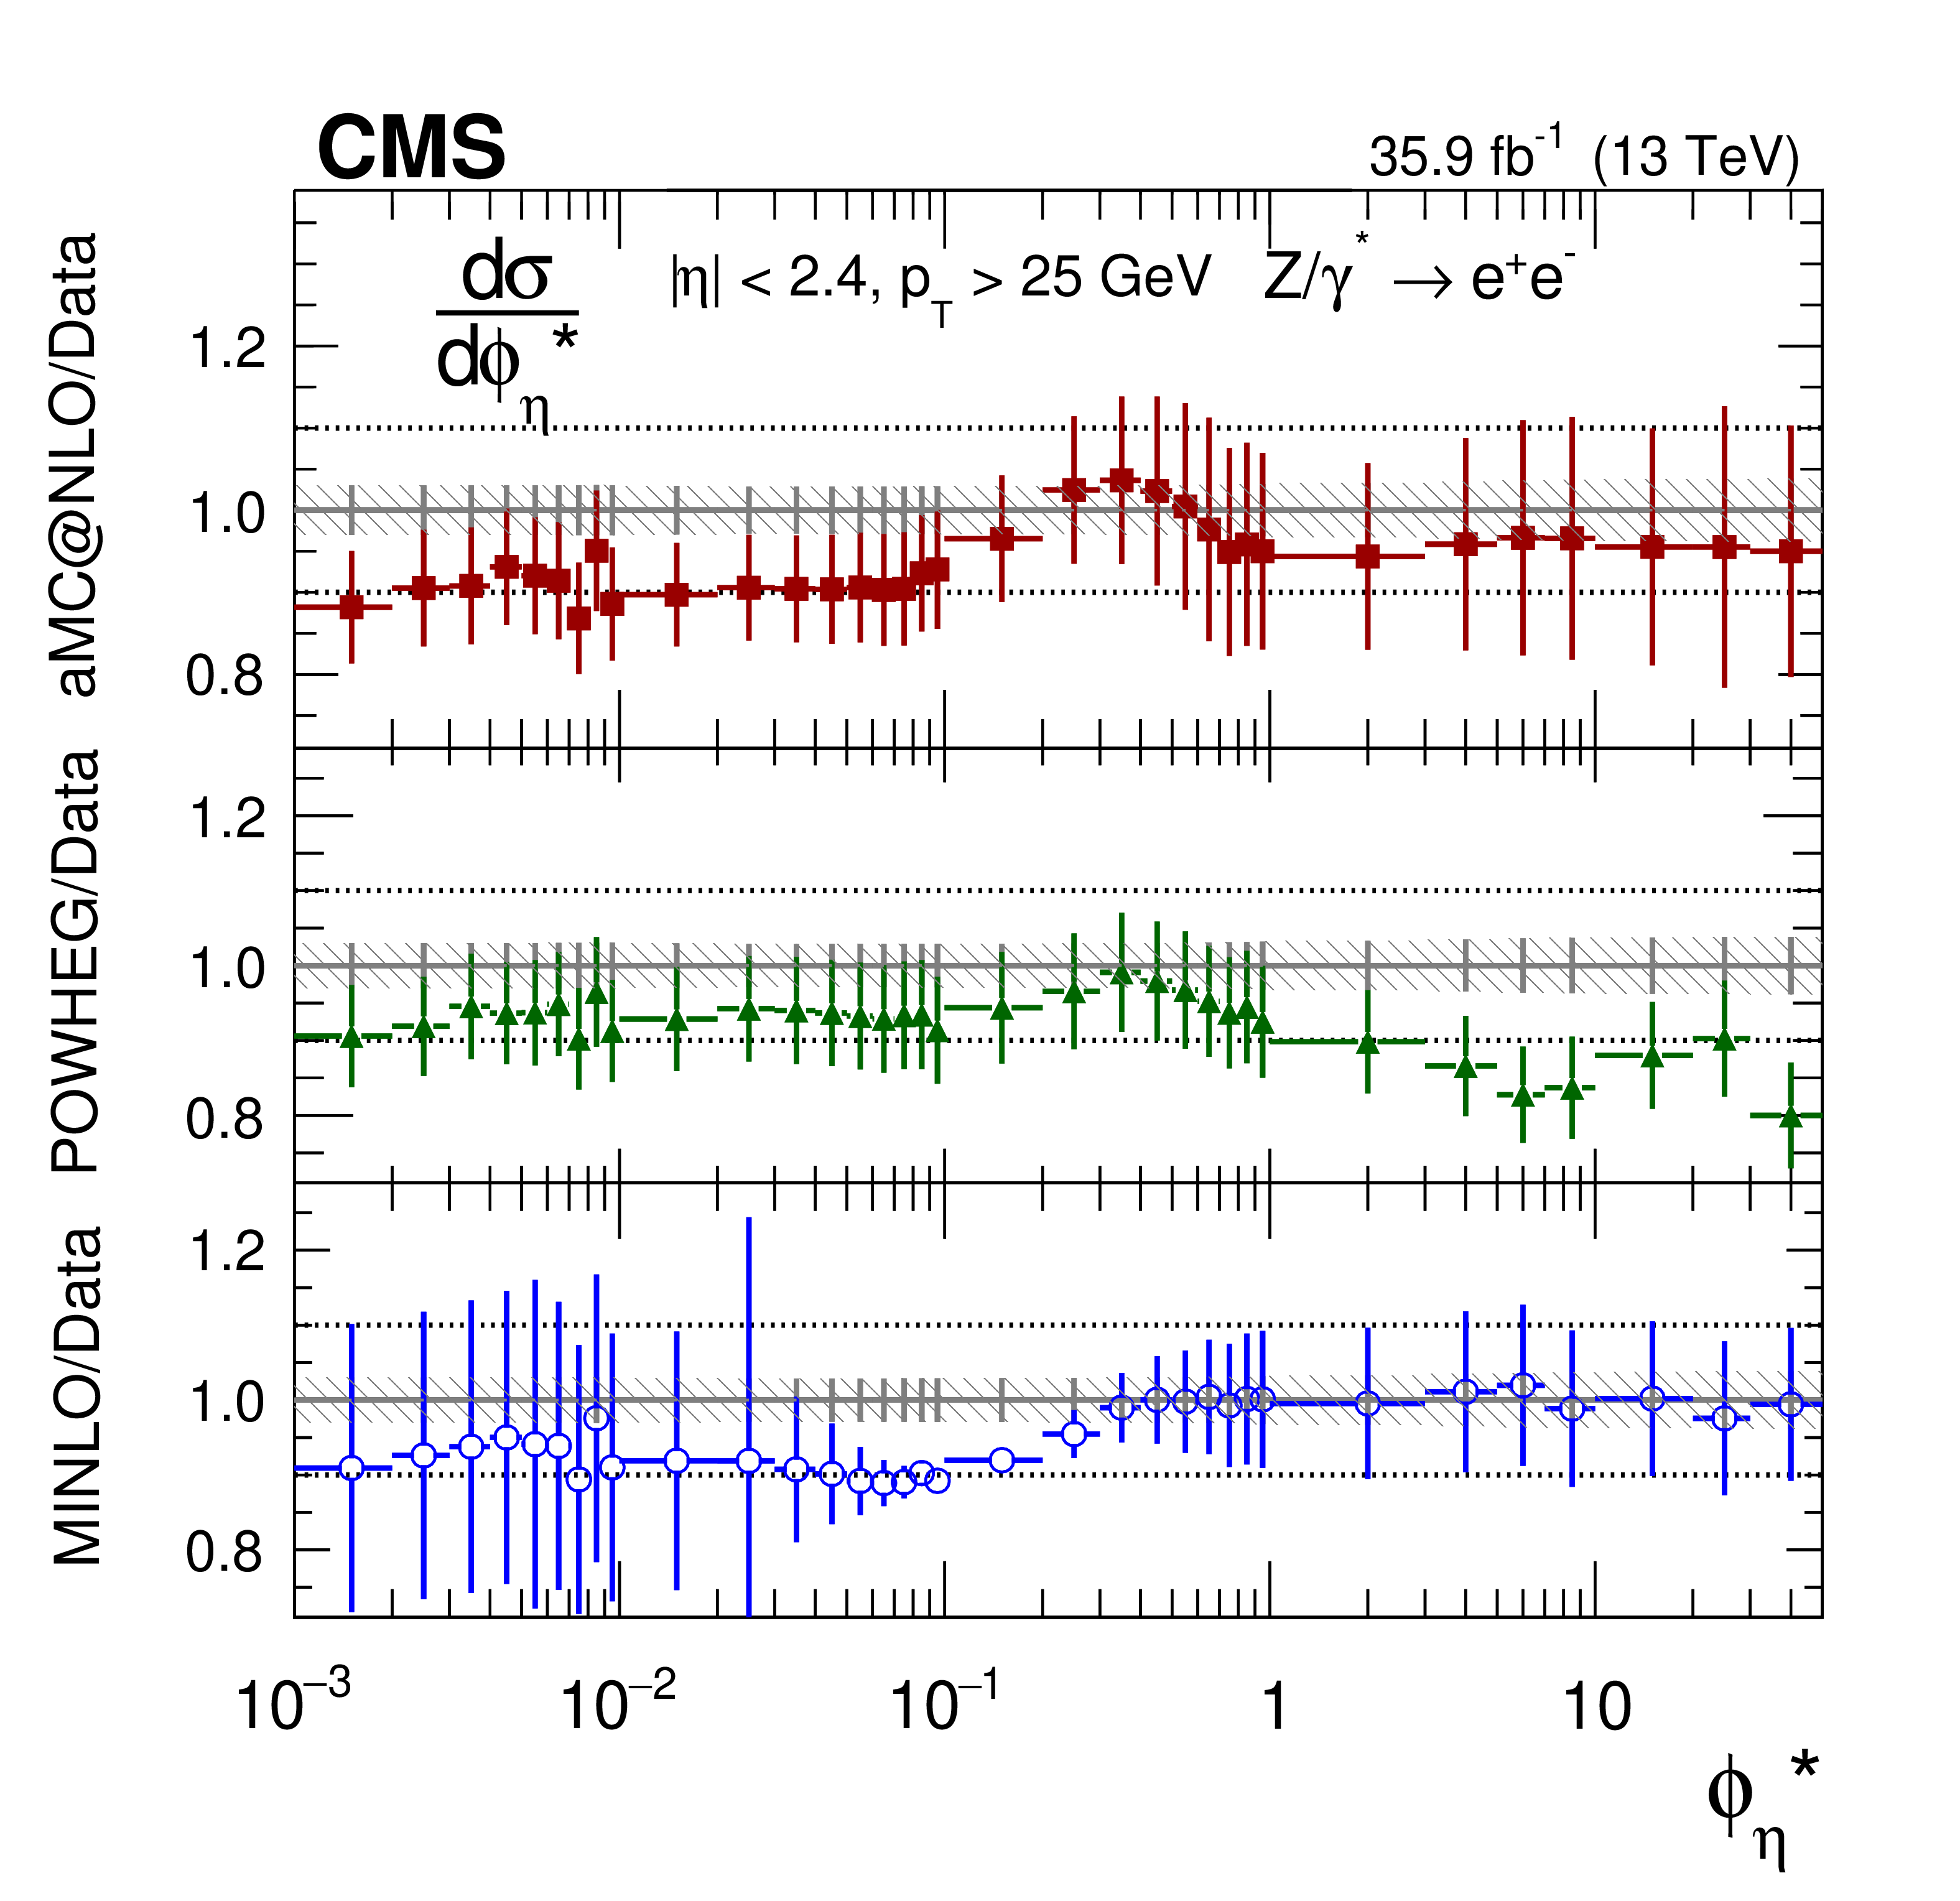
The measured absolute cross sections (left) in bins of $ {\phi ^{ *}_\eta}$ for the dimuon (upper) and dielectron (middle) final states, and for the combination (lower). The ratios of the predictions to the data are also shown (right). The shaded bands around the data points (black) correspond to the total experimental uncertainty. The measurement is compared to the predictions with MadGraph 5_aMC@NLO (square red markers), PB TMD (green triangles), and POWHEG-MINLO (blue circles). The error bars around the predictions correspond to the combined statistical, PDF, and scale uncertainties. |
png pdf |
Figure 8-a:
The measured absolute cross sections in bins of $ {\phi ^{ *}_\eta}$ for the dimuon final state. The shaded bands around the data points (black) correspond to the total experimental uncertainty. The measurement is compared to the predictions with MadGraph 5_aMC@NLO (square red markers), PB TMD (green triangles), and POWHEG-MINLO (blue circles). The error bars around the predictions correspond to the combined statistical, PDF, and scale uncertainties. |
png pdf |
Figure 8-b:
The ratios of absolute cross section predictions to the data in bins of $ {\phi ^{ *}_\eta}$ for the dimuon final state. The shaded bands around the data points (black) correspond to the total experimental uncertainty. The measurement is compared to the predictions with MadGraph 5_aMC@NLO (square red markers), PB TMD (green triangles), and POWHEG-MINLO (blue circles). The error bars around the predictions correspond to the combined statistical, PDF, and scale uncertainties. |
png pdf |
Figure 8-c:
The measured absolute cross sections in bins of $ {\phi ^{ *}_\eta}$ for the dielectron final state. The shaded bands around the data points (black) correspond to the total experimental uncertainty. The measurement is compared to the predictions with MadGraph 5_aMC@NLO (square red markers), PB TMD (green triangles), and POWHEG-MINLO (blue circles). The error bars around the predictions correspond to the combined statistical, PDF, and scale uncertainties. |

png pdf |
Figure 8-d:
The ratios of absolute cross section predictions to the data in bins of $ {\phi ^{ *}_\eta}$ for the dielectron final state. The shaded bands around the data points (black) correspond to the total experimental uncertainty. The measurement is compared to the predictions with MadGraph 5_aMC@NLO (square red markers), PB TMD (green triangles), and POWHEG-MINLO (blue circles). The error bars around the predictions correspond to the combined statistical, PDF, and scale uncertainties. |
png pdf |
Figure 8-e:
The measured absolute cross sections in bins of $ {\phi ^{ *}_\eta}$ for of combination of dimuon and dielectron final states. The shaded bands around the data points (black) correspond to the total experimental uncertainty. The measurement is compared to the predictions with MadGraph 5_aMC@NLO (square red markers), PB TMD (green triangles), and POWHEG-MINLO (blue circles). The error bars around the predictions correspond to the combined statistical, PDF, and scale uncertainties. |
png pdf |
Figure 8-f:
The ratios of absolute cross section predictions to the data in bins of $ {\phi ^{ *}_\eta}$ for the combination of dimuon and dielectron final states. The shaded bands around the data points (black) correspond to the total experimental uncertainty. The measurement is compared to the predictions with MadGraph 5_aMC@NLO (square red markers), PB TMD (green triangles), and POWHEG-MINLO (blue circles). The error bars around the predictions correspond to the combined statistical, PDF, and scale uncertainties. |
png pdf |
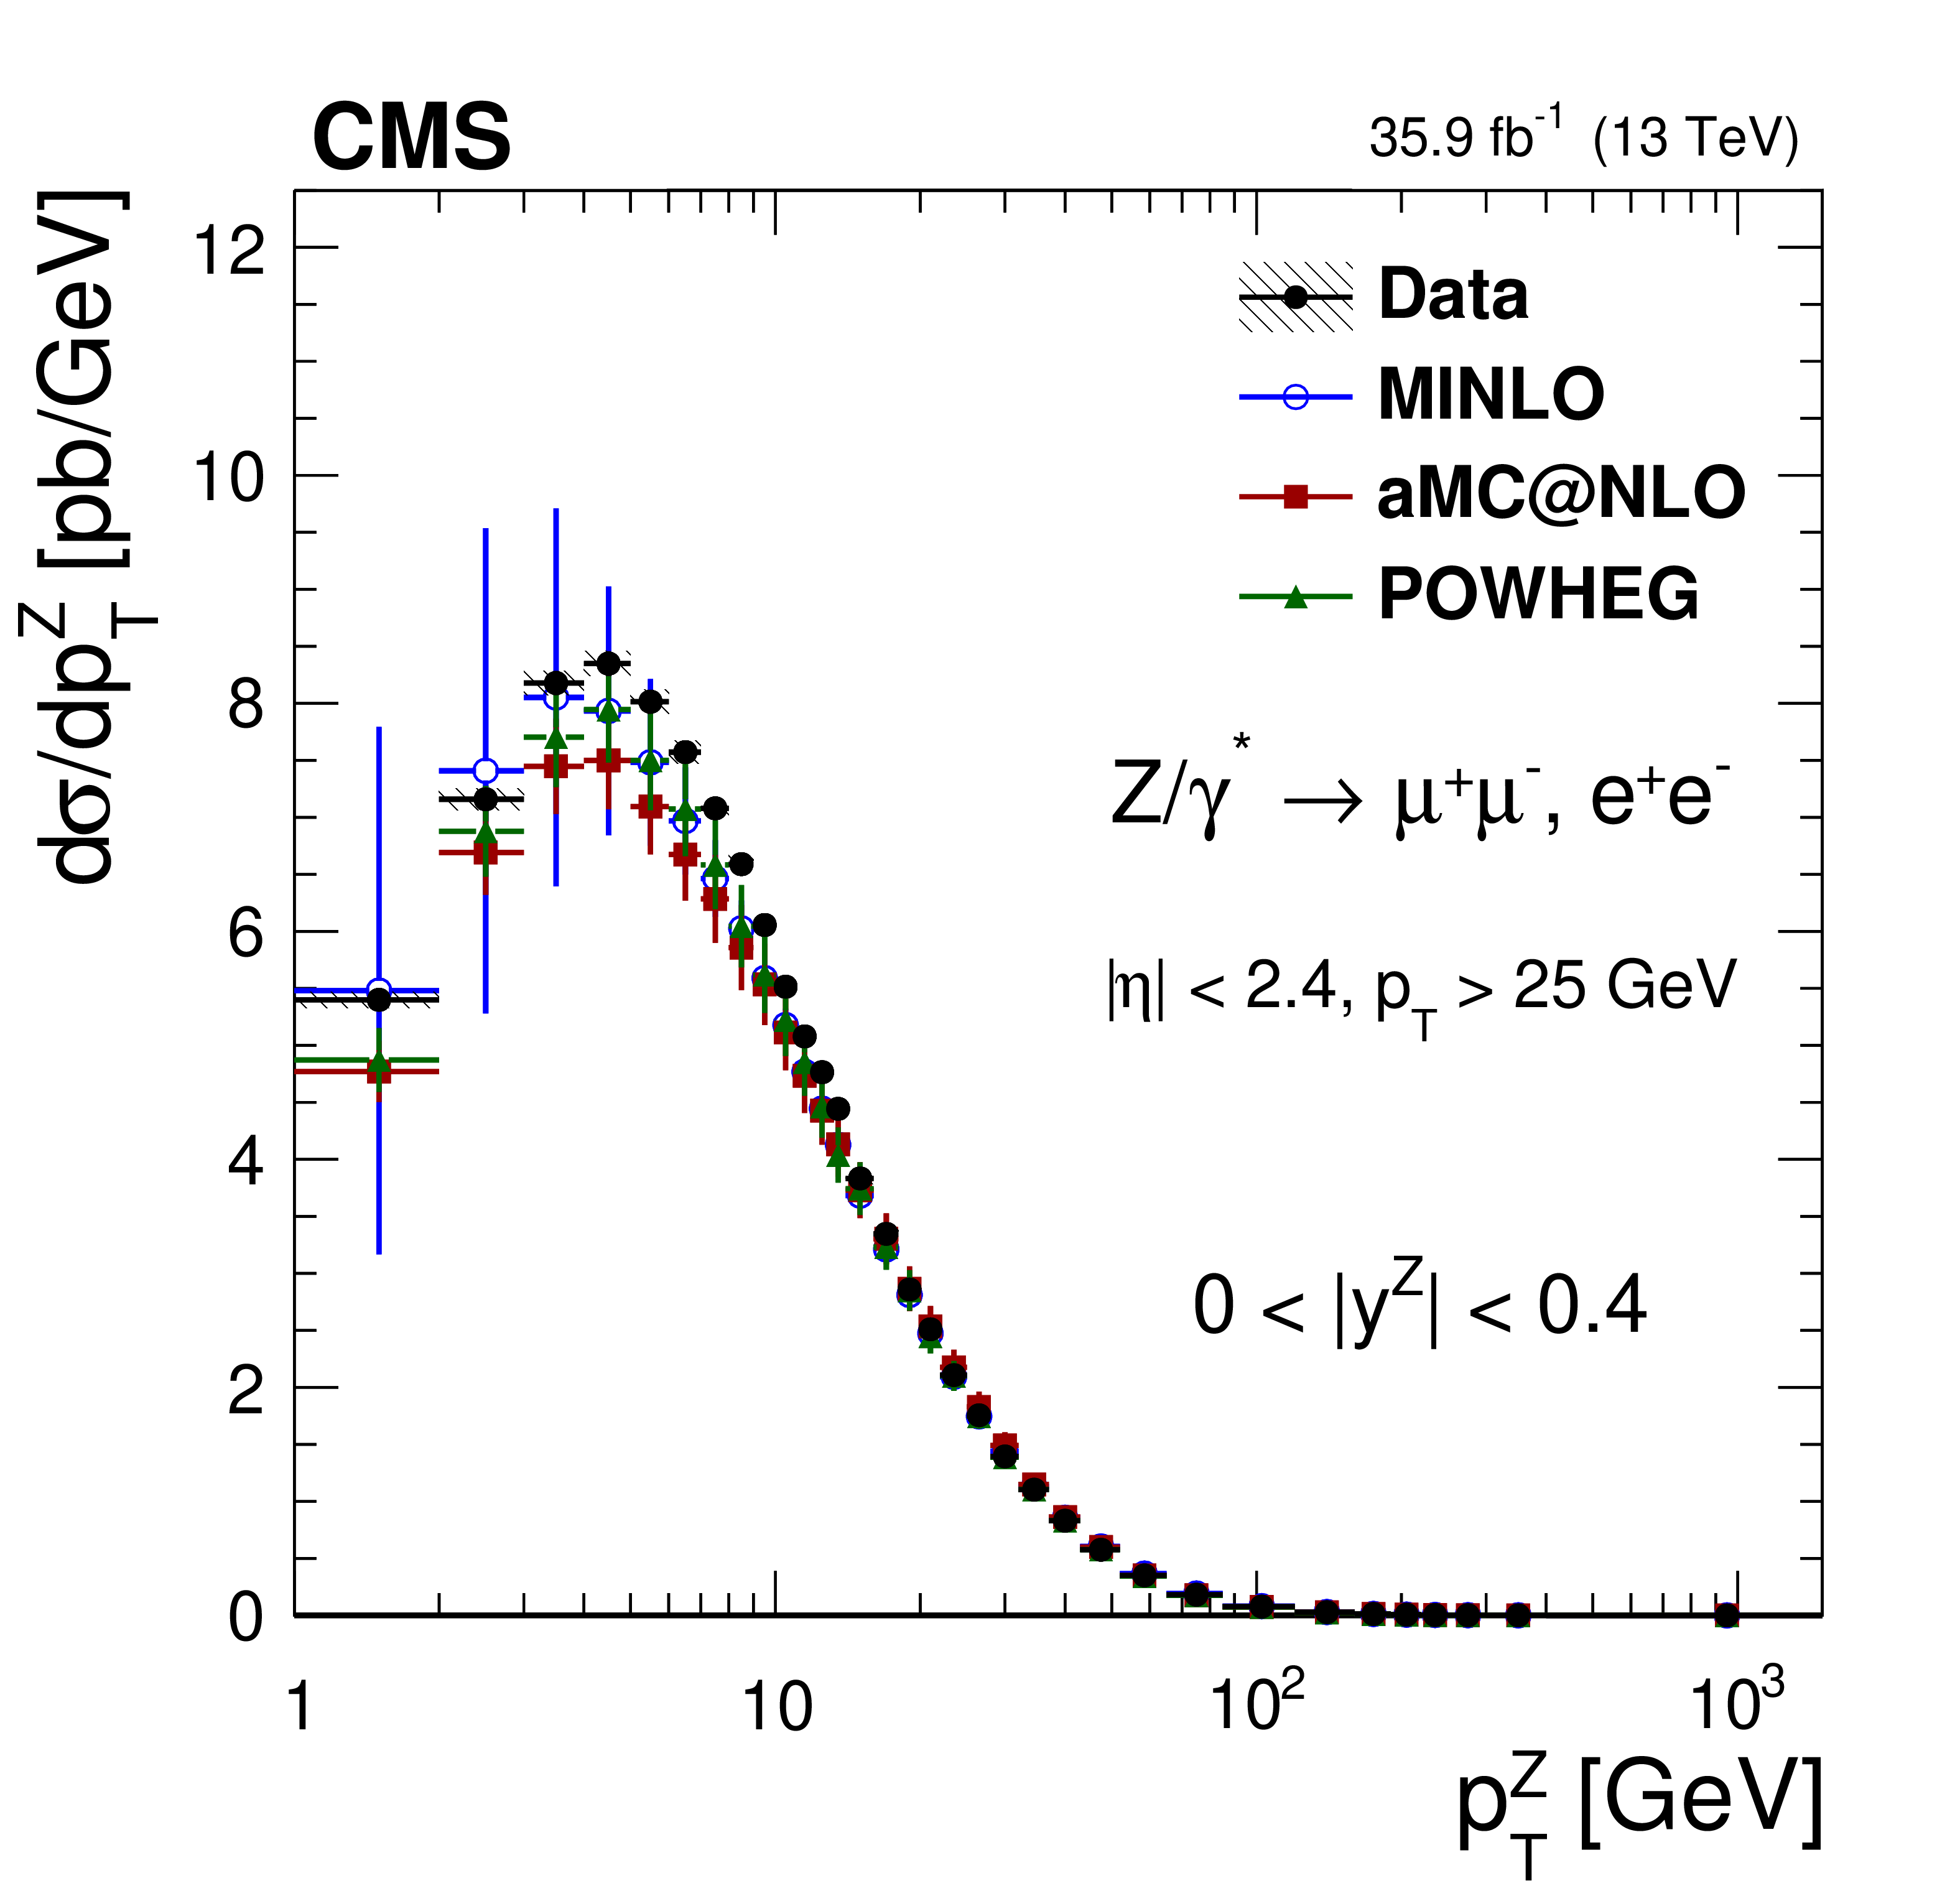
Figure 9:
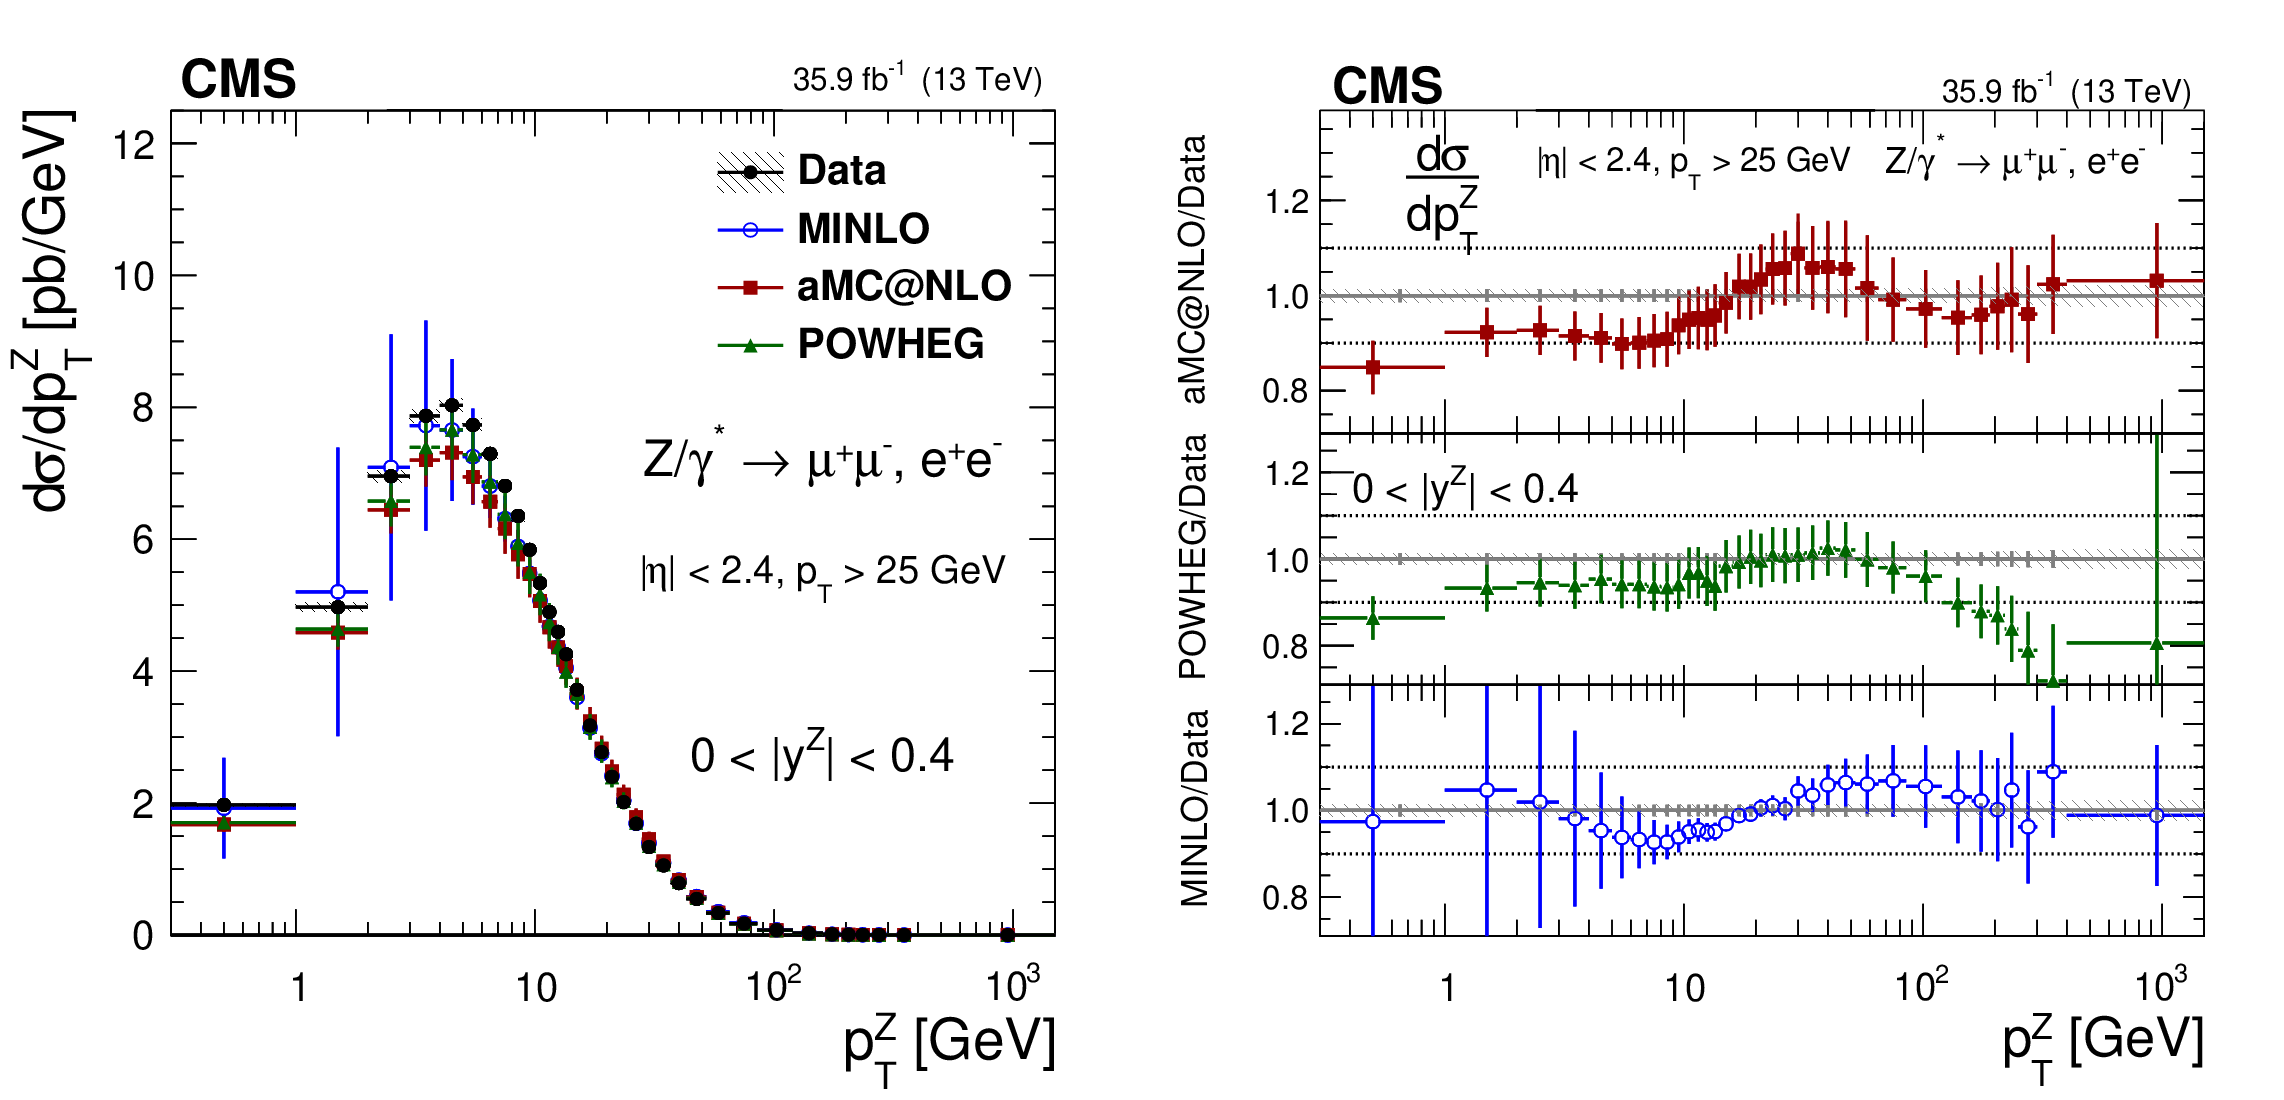
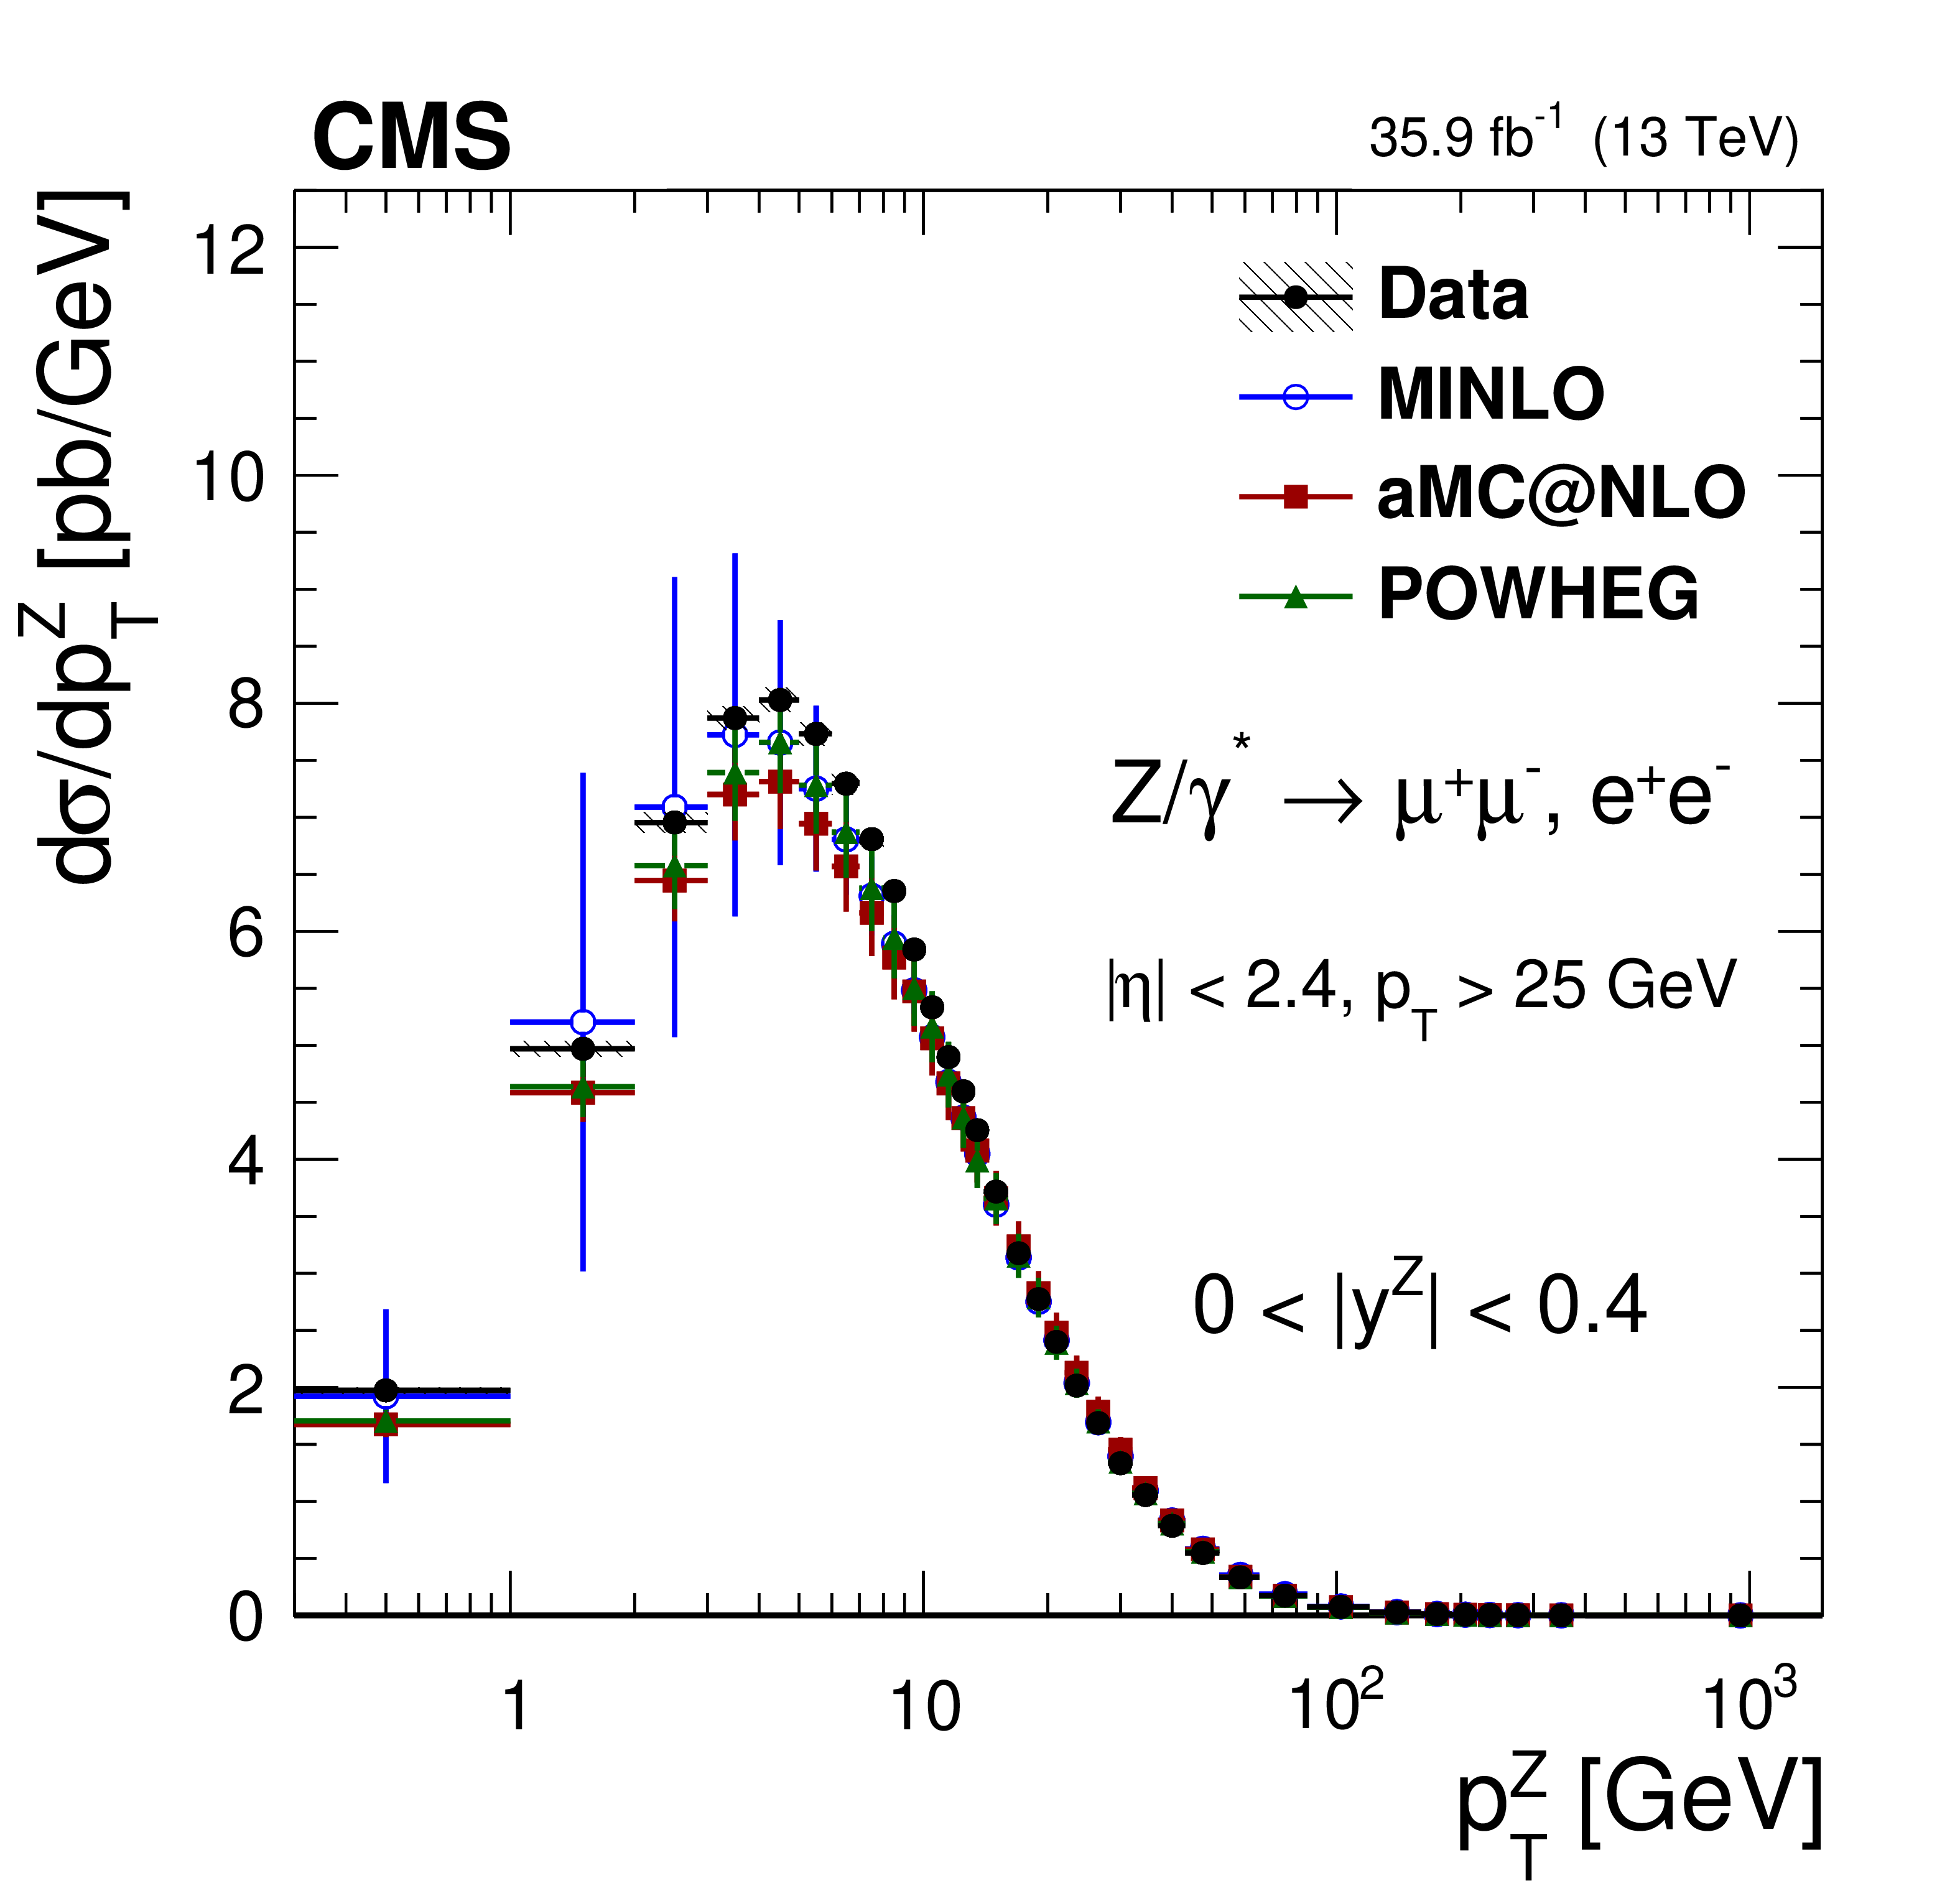
The measured absolute cross sections (left) in bins of $ {p_{\mathrm {T}}} ^{\mathrm{Z}}$ for the 0.0 $ < {| {y}^{\mathrm{Z}} |} < $ 0.4 region. The ratios of the predictions to the data are also shown (right). The shaded bands around the data points (black) correspond to the total experimental uncertainty. The measurement is compared to the predictions with MadGraph 5_aMC@NLO (square red markers), POWHEG (green triangles), and POWHEG-MINLO (blue circles). The error bands around the predictions correspond to the combined statistical, PDF, and scale uncertainties. |
png pdf |
Figure 9-a:
The measured absolute cross sections in bins of $ {p_{\mathrm {T}}} ^{\mathrm{Z}}$ for the 0.0 $ < {| {y}^{\mathrm{Z}} |} < $ 0.4 region. The shaded bands around the data points (black) correspond to the total experimental uncertainty. The measurement is compared to the predictions with MadGraph 5_aMC@NLO (square red markers), POWHEG (green triangles), and POWHEG-MINLO (blue circles). The error bands around the predictions correspond to the combined statistical, PDF, and scale uncertainties. |

png pdf |
Figure 9-b:
The ratios of absolute cross section predictions to the data in bins of $ {p_{\mathrm {T}}} ^{\mathrm{Z}}$ for the 0.0 $ < {| {y}^{\mathrm{Z}} |} < $ 0.4 region. The shaded bands around the data points (black) correspond to the total experimental uncertainty. The measurement is compared to the predictions with MadGraph 5_aMC@NLO (square red markers), POWHEG (green triangles), and POWHEG-MINLO (blue circles). The error bands around the predictions correspond to the combined statistical, PDF, and scale uncertainties. |
png pdf |
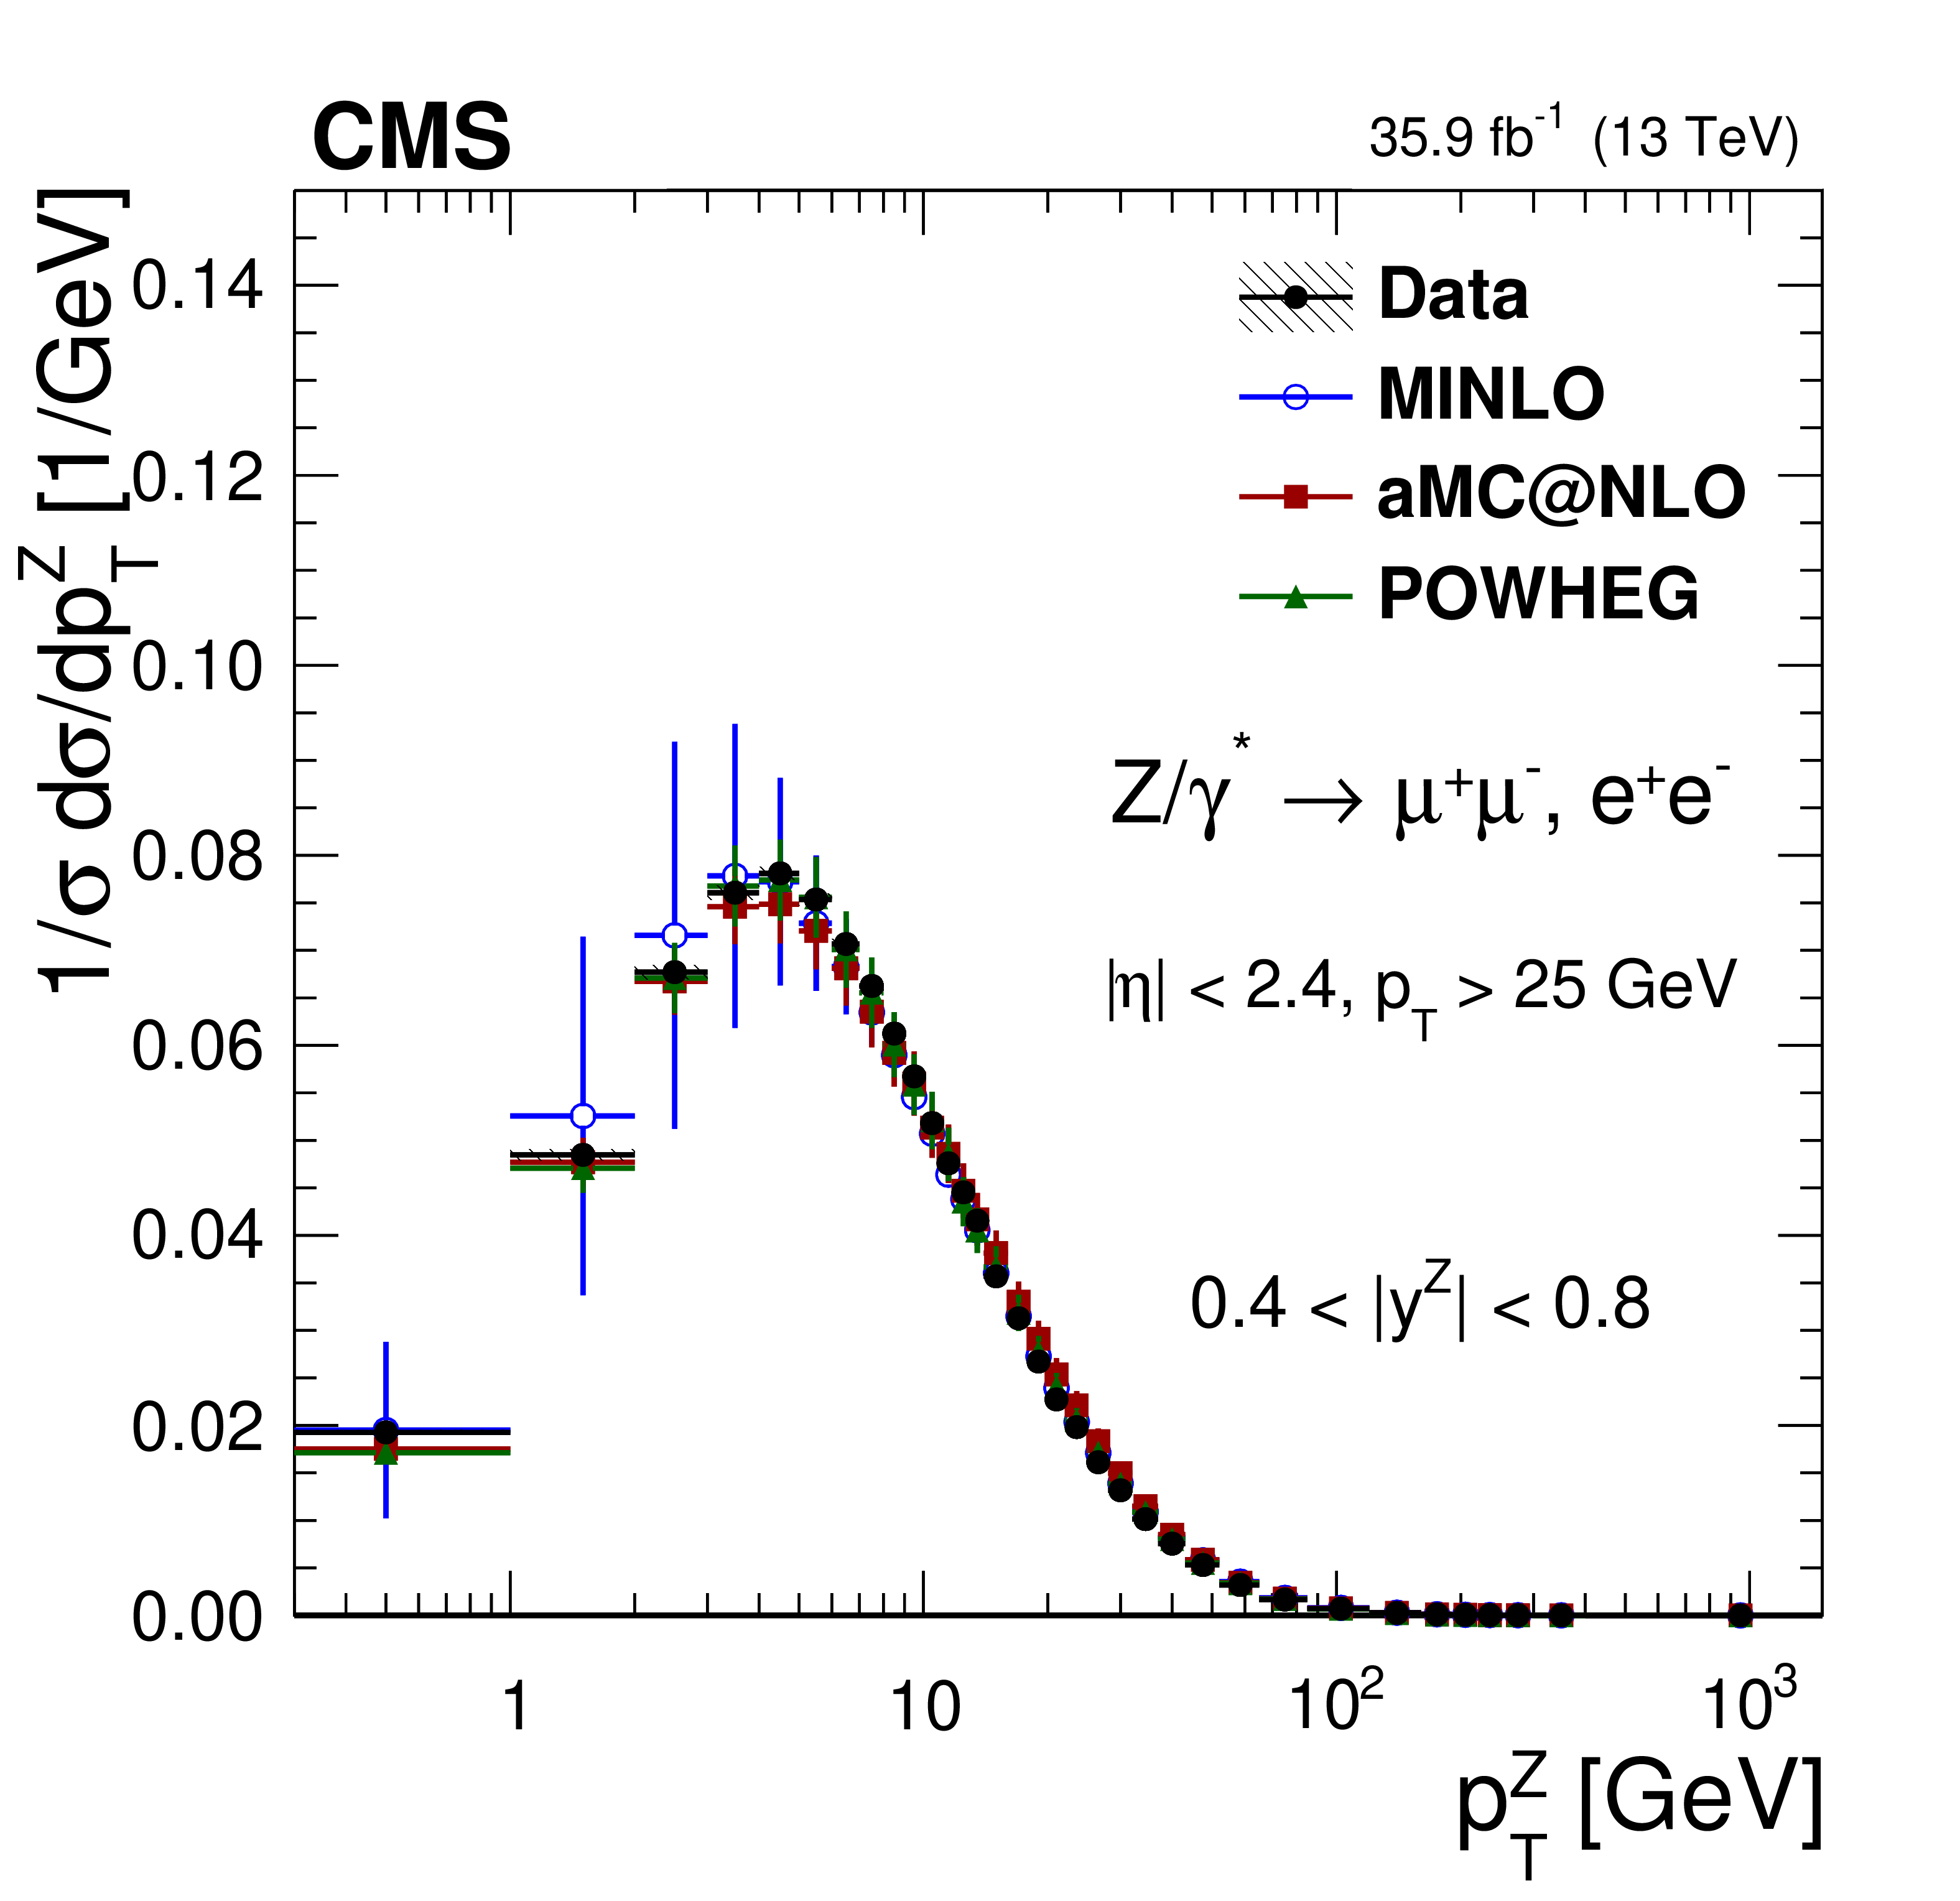
Figure 10:
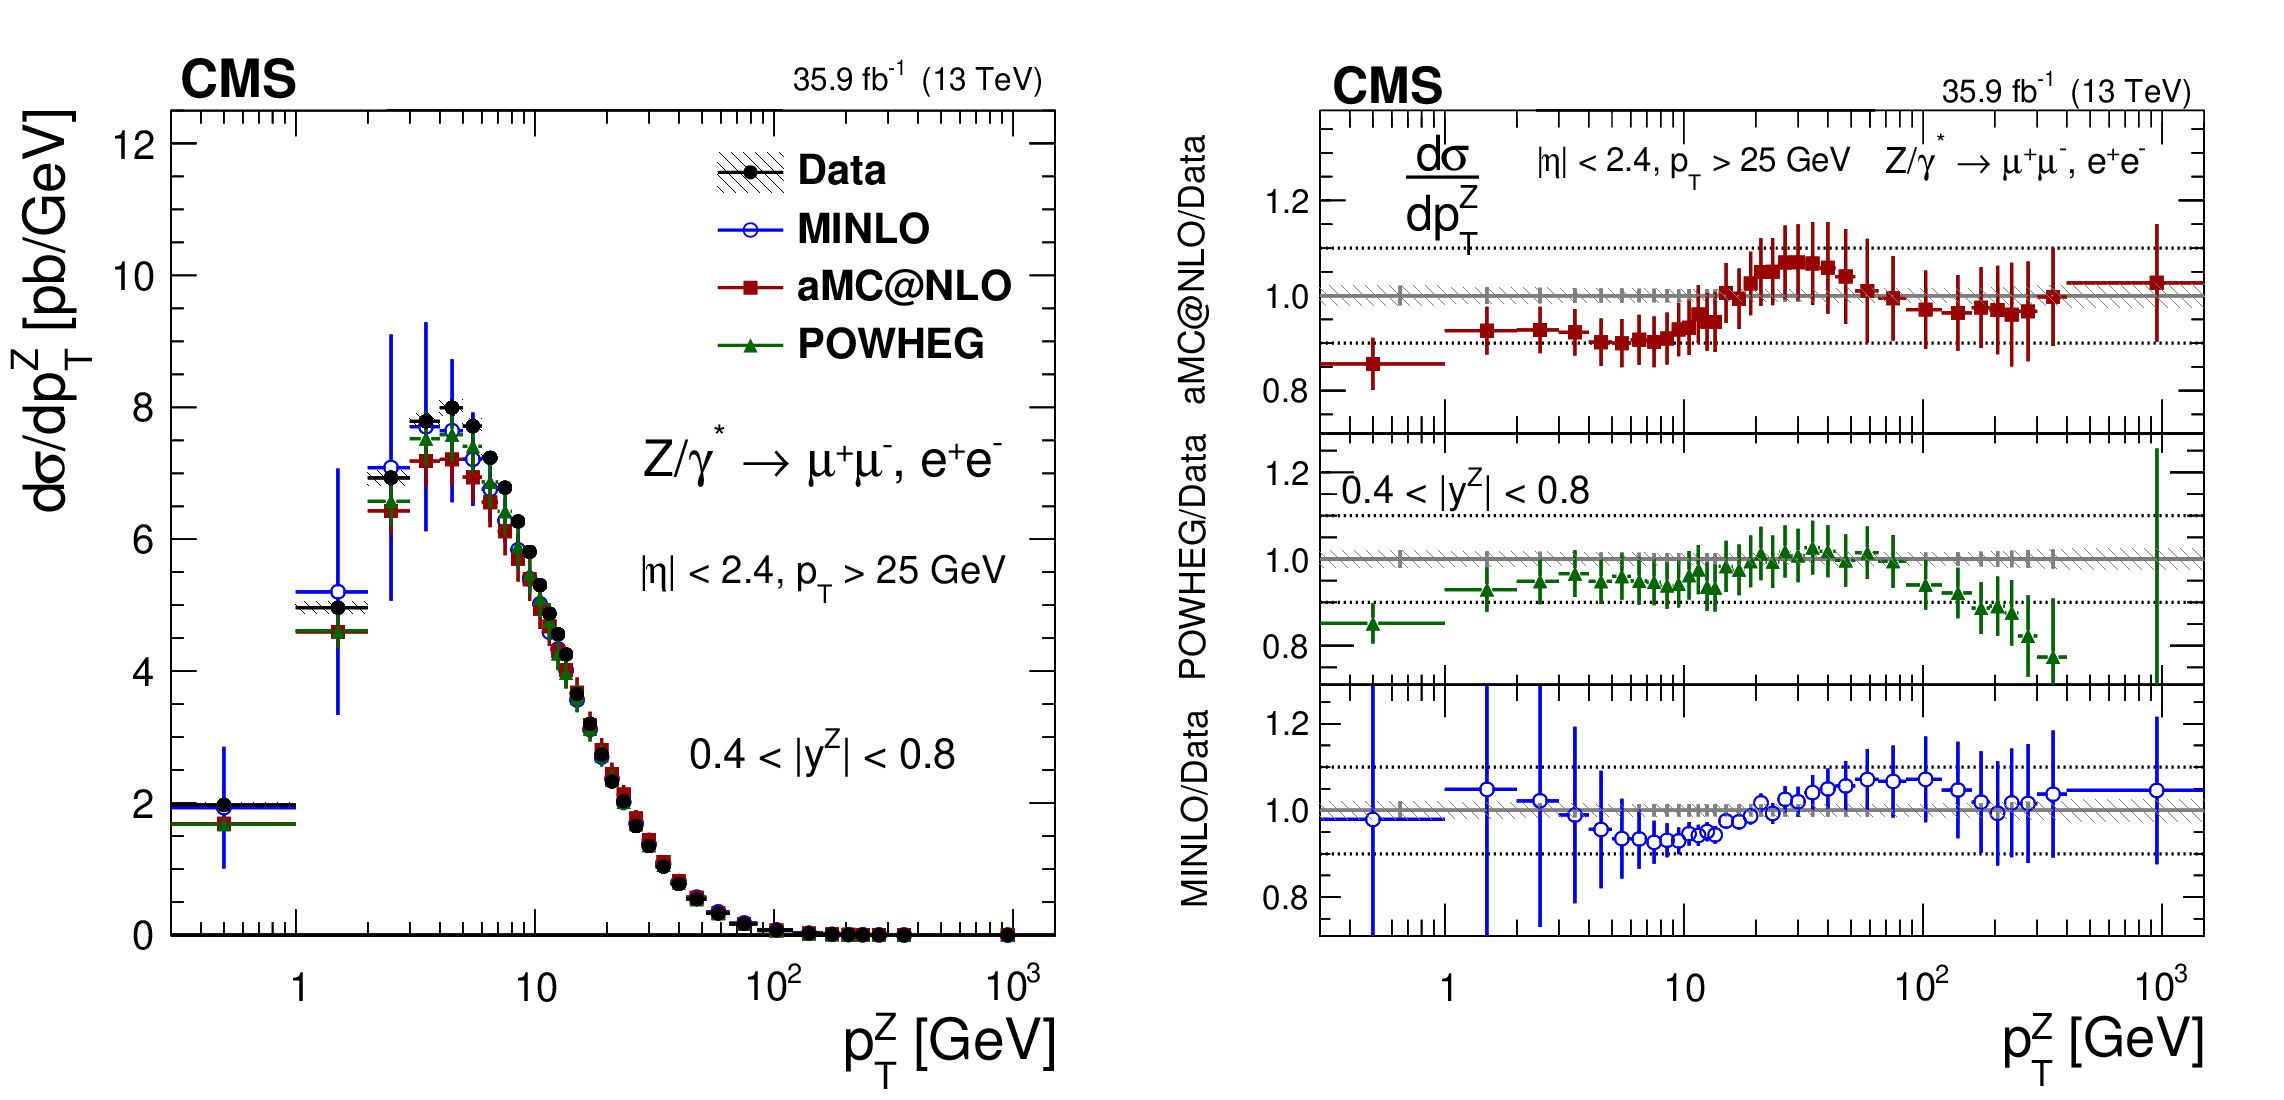
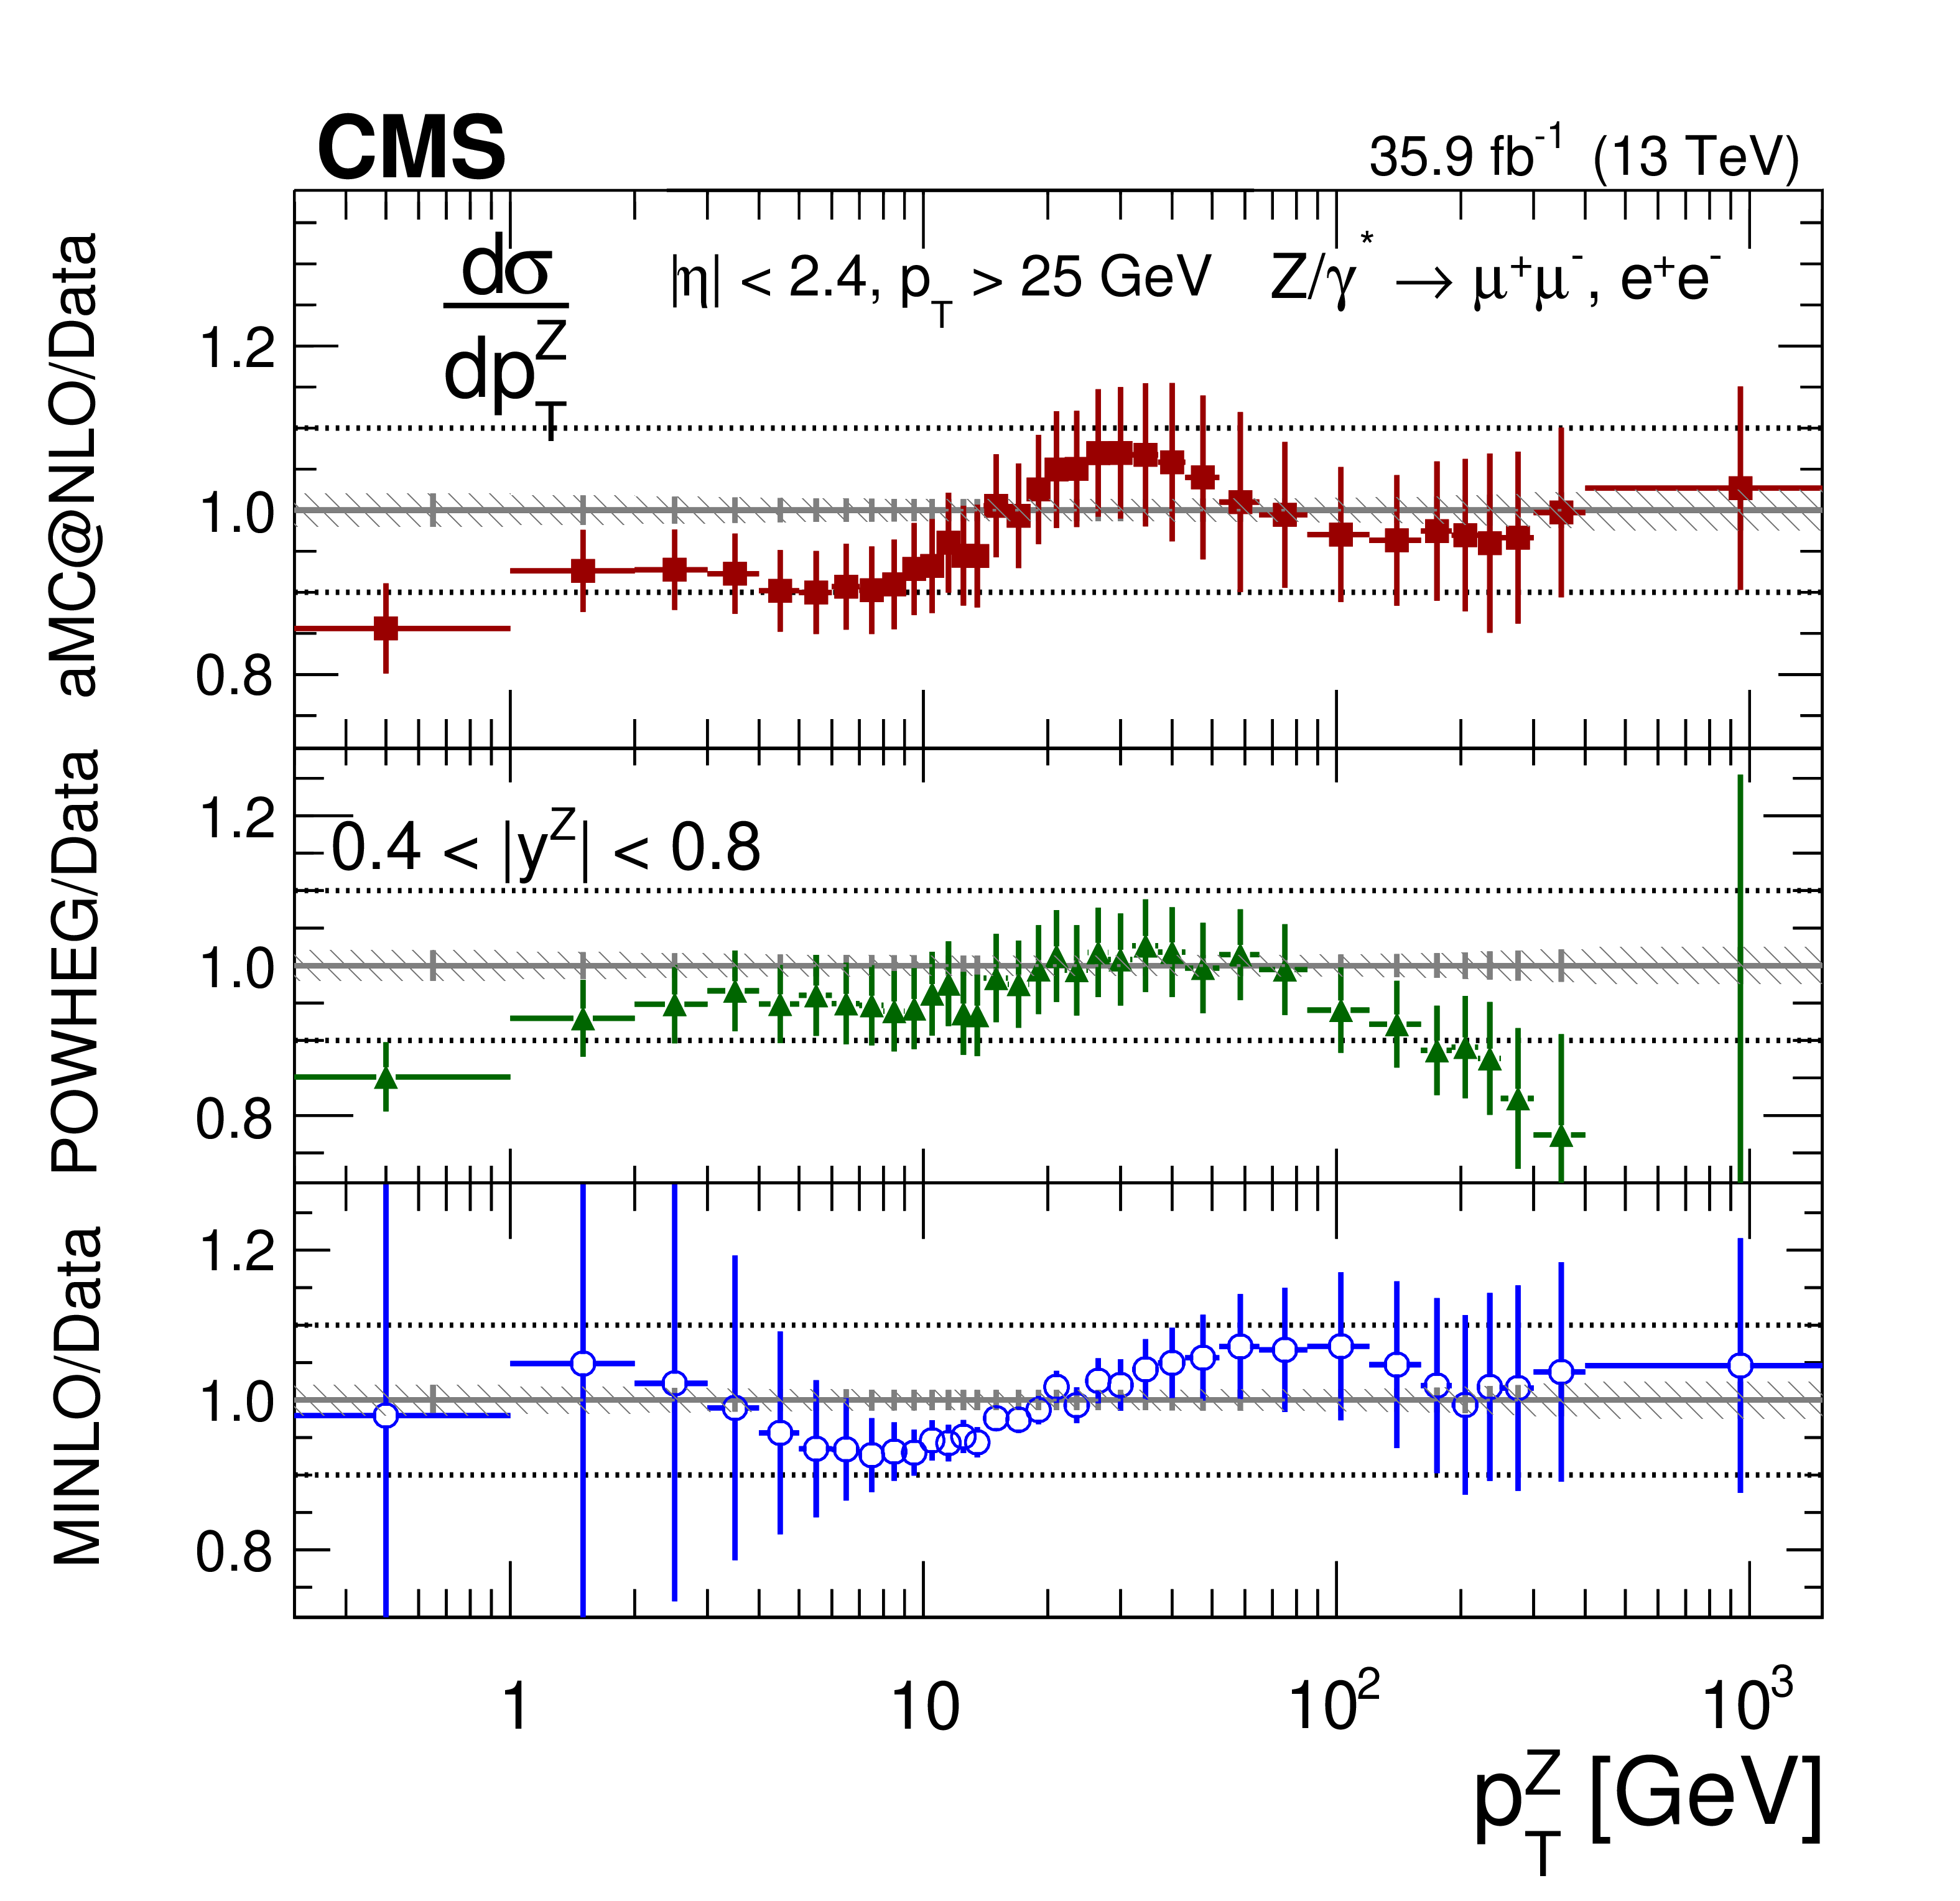
The measured absolute cross sections (left) in bins of $ {p_{\mathrm {T}}} ^{\mathrm{Z}}$ for the 0.4 $ < {| {y}^{\mathrm{Z}} |} < $ 0.8 region. The ratios of the predictions to the data are also shown (right). The shaded bands around the data points (black) correspond to the total experimental uncertainty. The measurement is compared to the predictions with MadGraph 5_aMC@NLO (square red markers), POWHEG (green triangles), and POWHEG-MINLO (blue circles). The error bands around the predictions correspond to the combined statistical, PDF, and scale uncertainties. |

png pdf |
Figure 10-a:
The measured absolute cross sections in bins of $ {p_{\mathrm {T}}} ^{\mathrm{Z}}$ for the 0.4 $ < {| {y}^{\mathrm{Z}} |} < $ 0.8 region. The shaded bands around the data points (black) correspond to the total experimental uncertainty. The measurement is compared to the predictions with MadGraph 5_aMC@NLO (square red markers), POWHEG (green triangles), and POWHEG-MINLO (blue circles). The error bands around the predictions correspond to the combined statistical, PDF, and scale uncertainties. |
png pdf |
Figure 10-b:
The ratio of absolute cross section predictions to the data in bins of $ {p_{\mathrm {T}}} ^{\mathrm{Z}}$ for the 0.4 $ < {| {y}^{\mathrm{Z}} |} < $ 0.8 region. The shaded bands around the data points (black) correspond to the total experimental uncertainty. The measurement is compared to the predictions with MadGraph 5_aMC@NLO (square red markers), POWHEG (green triangles), and POWHEG-MINLO (blue circles). The error bands around the predictions correspond to the combined statistical, PDF, and scale uncertainties. |

png pdf |
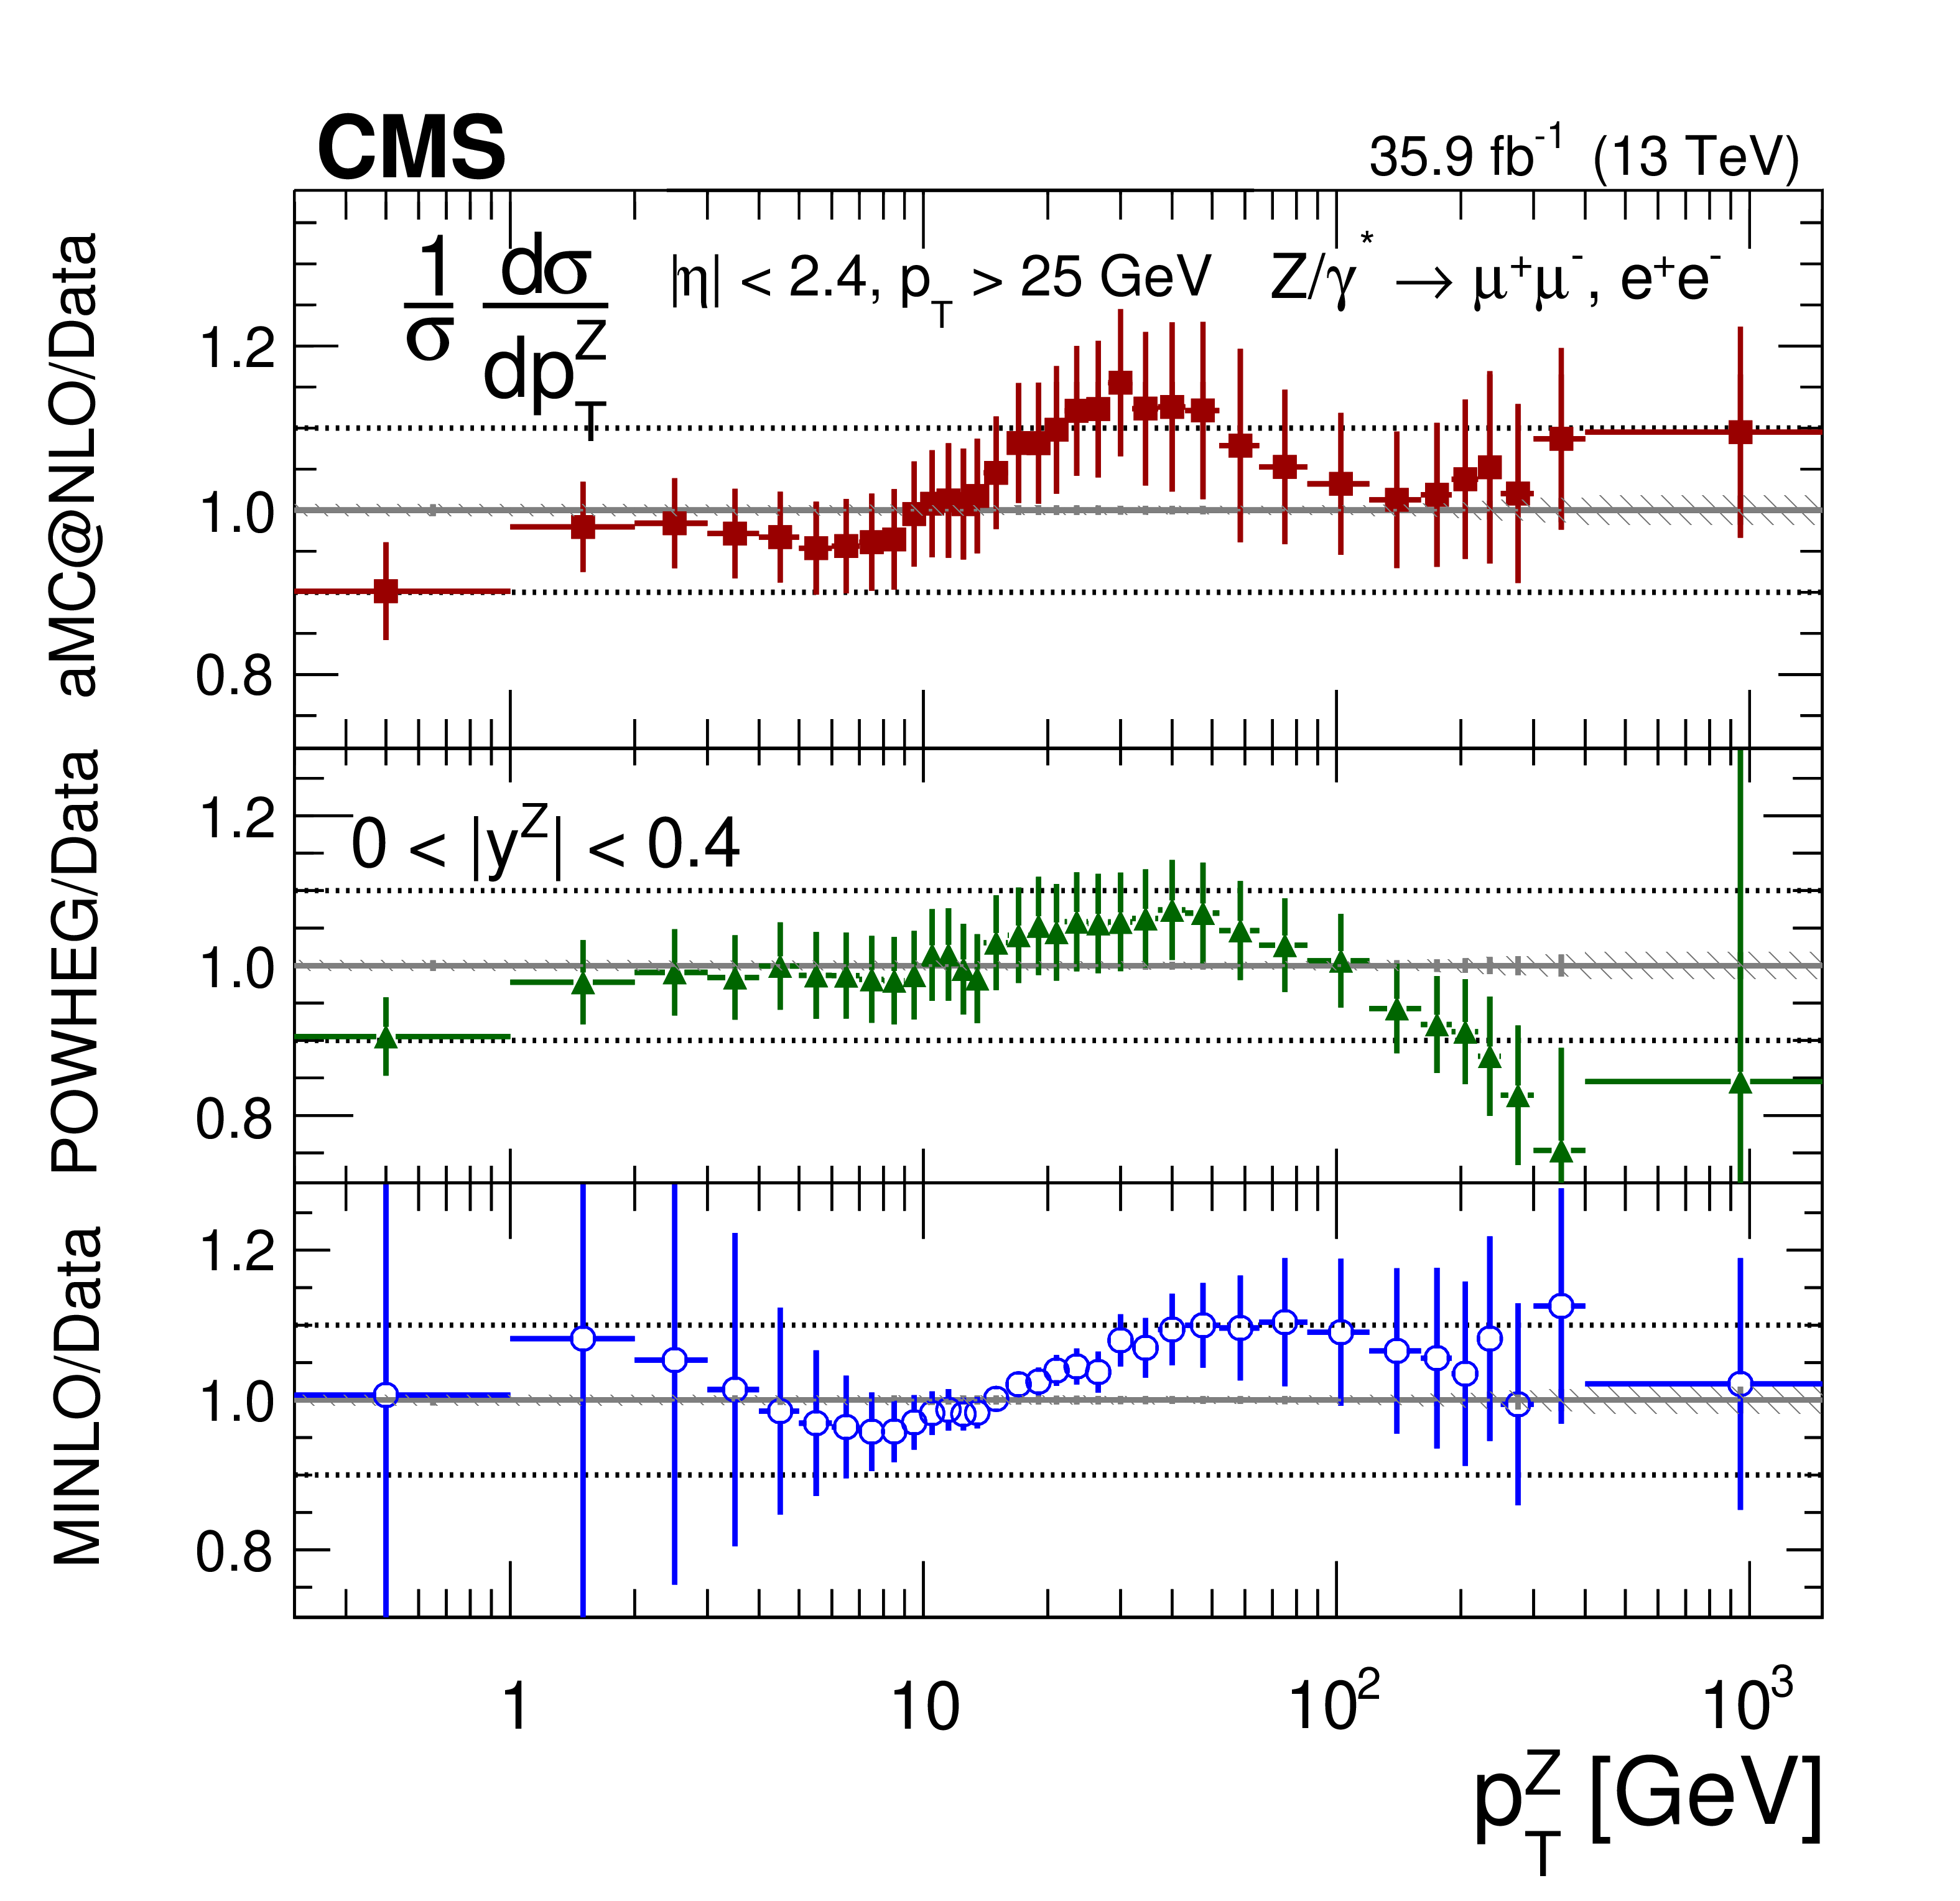
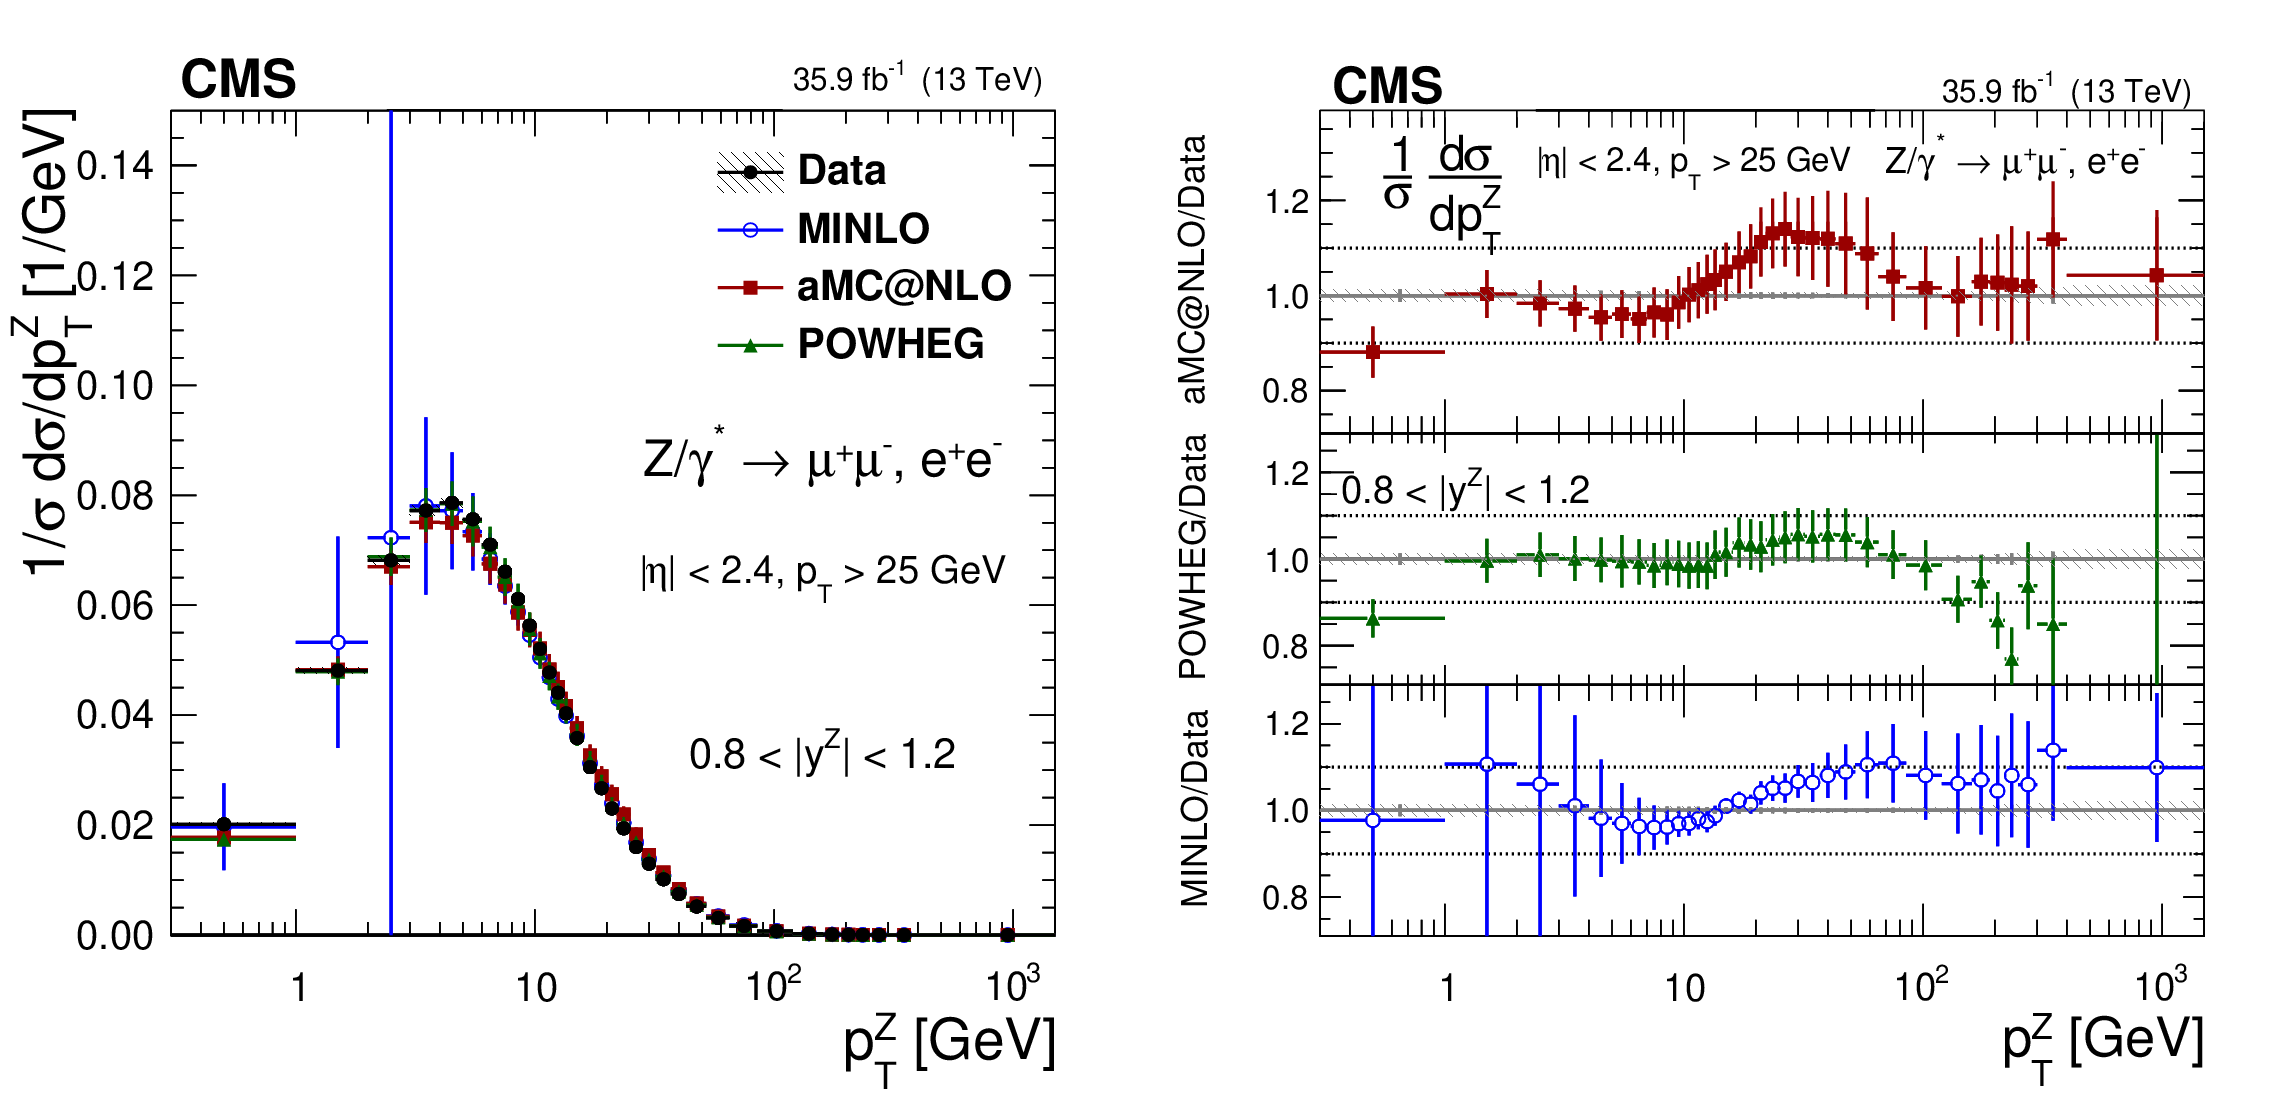
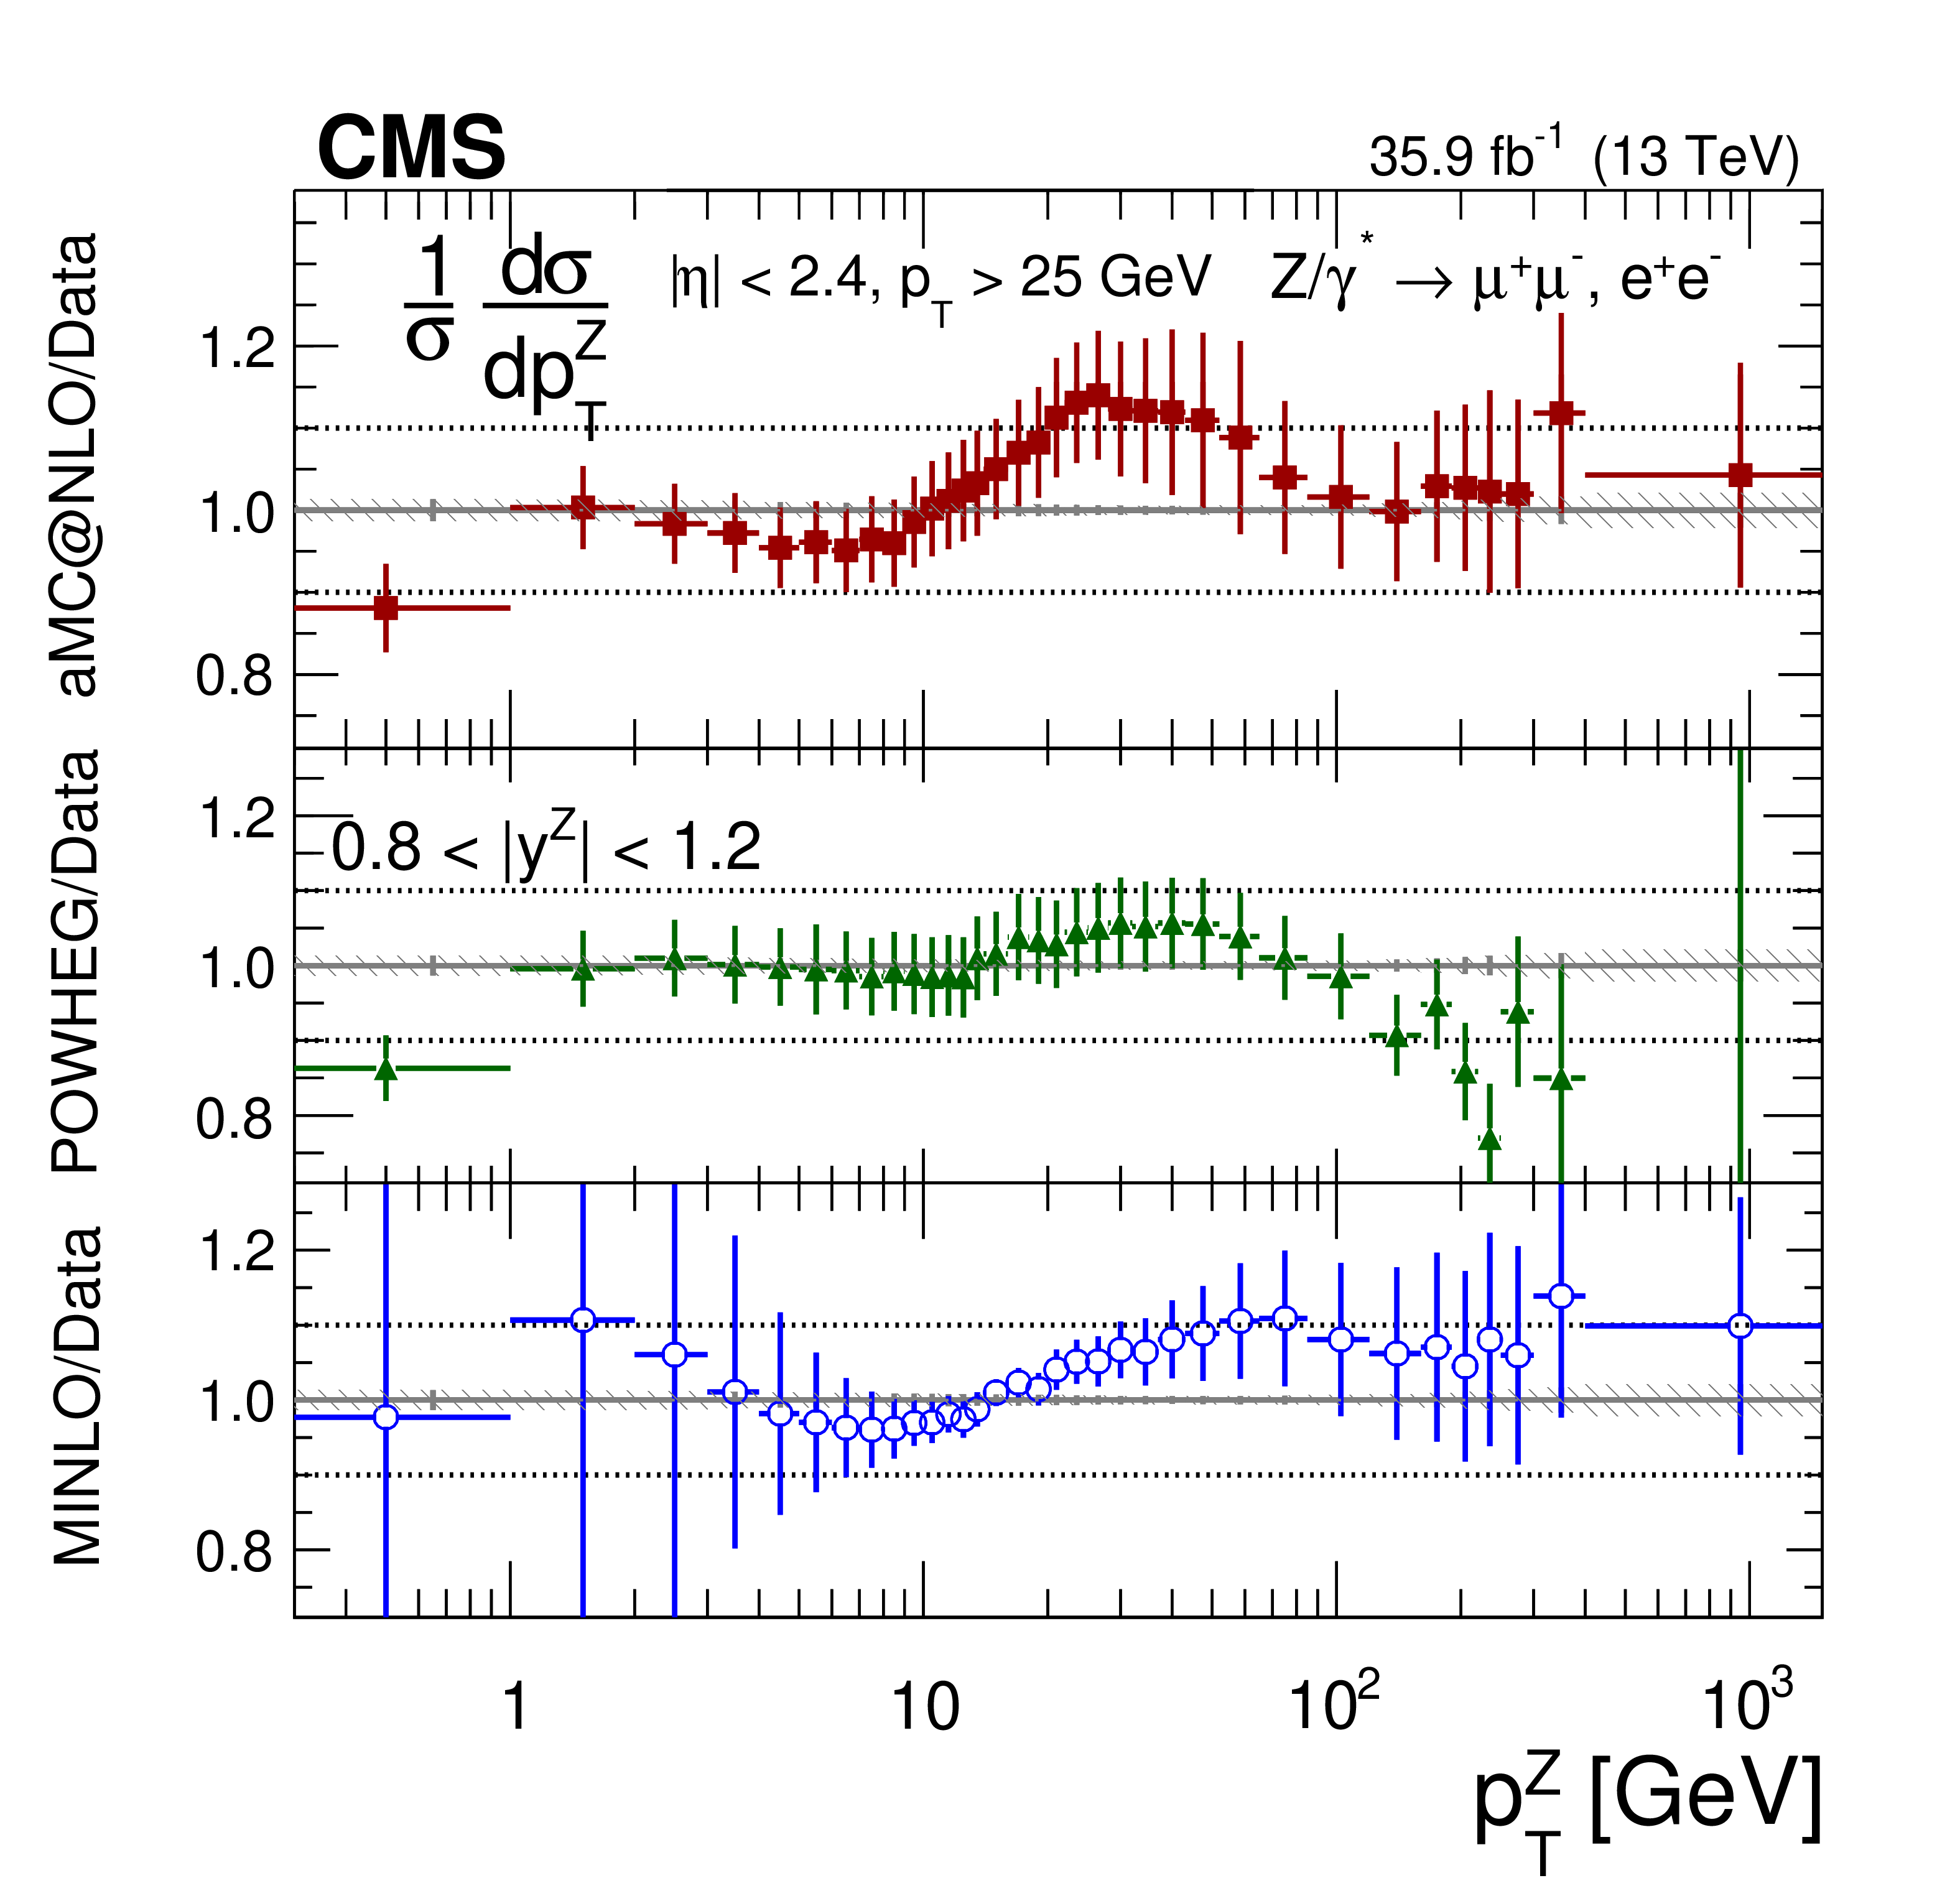
Figure 11:
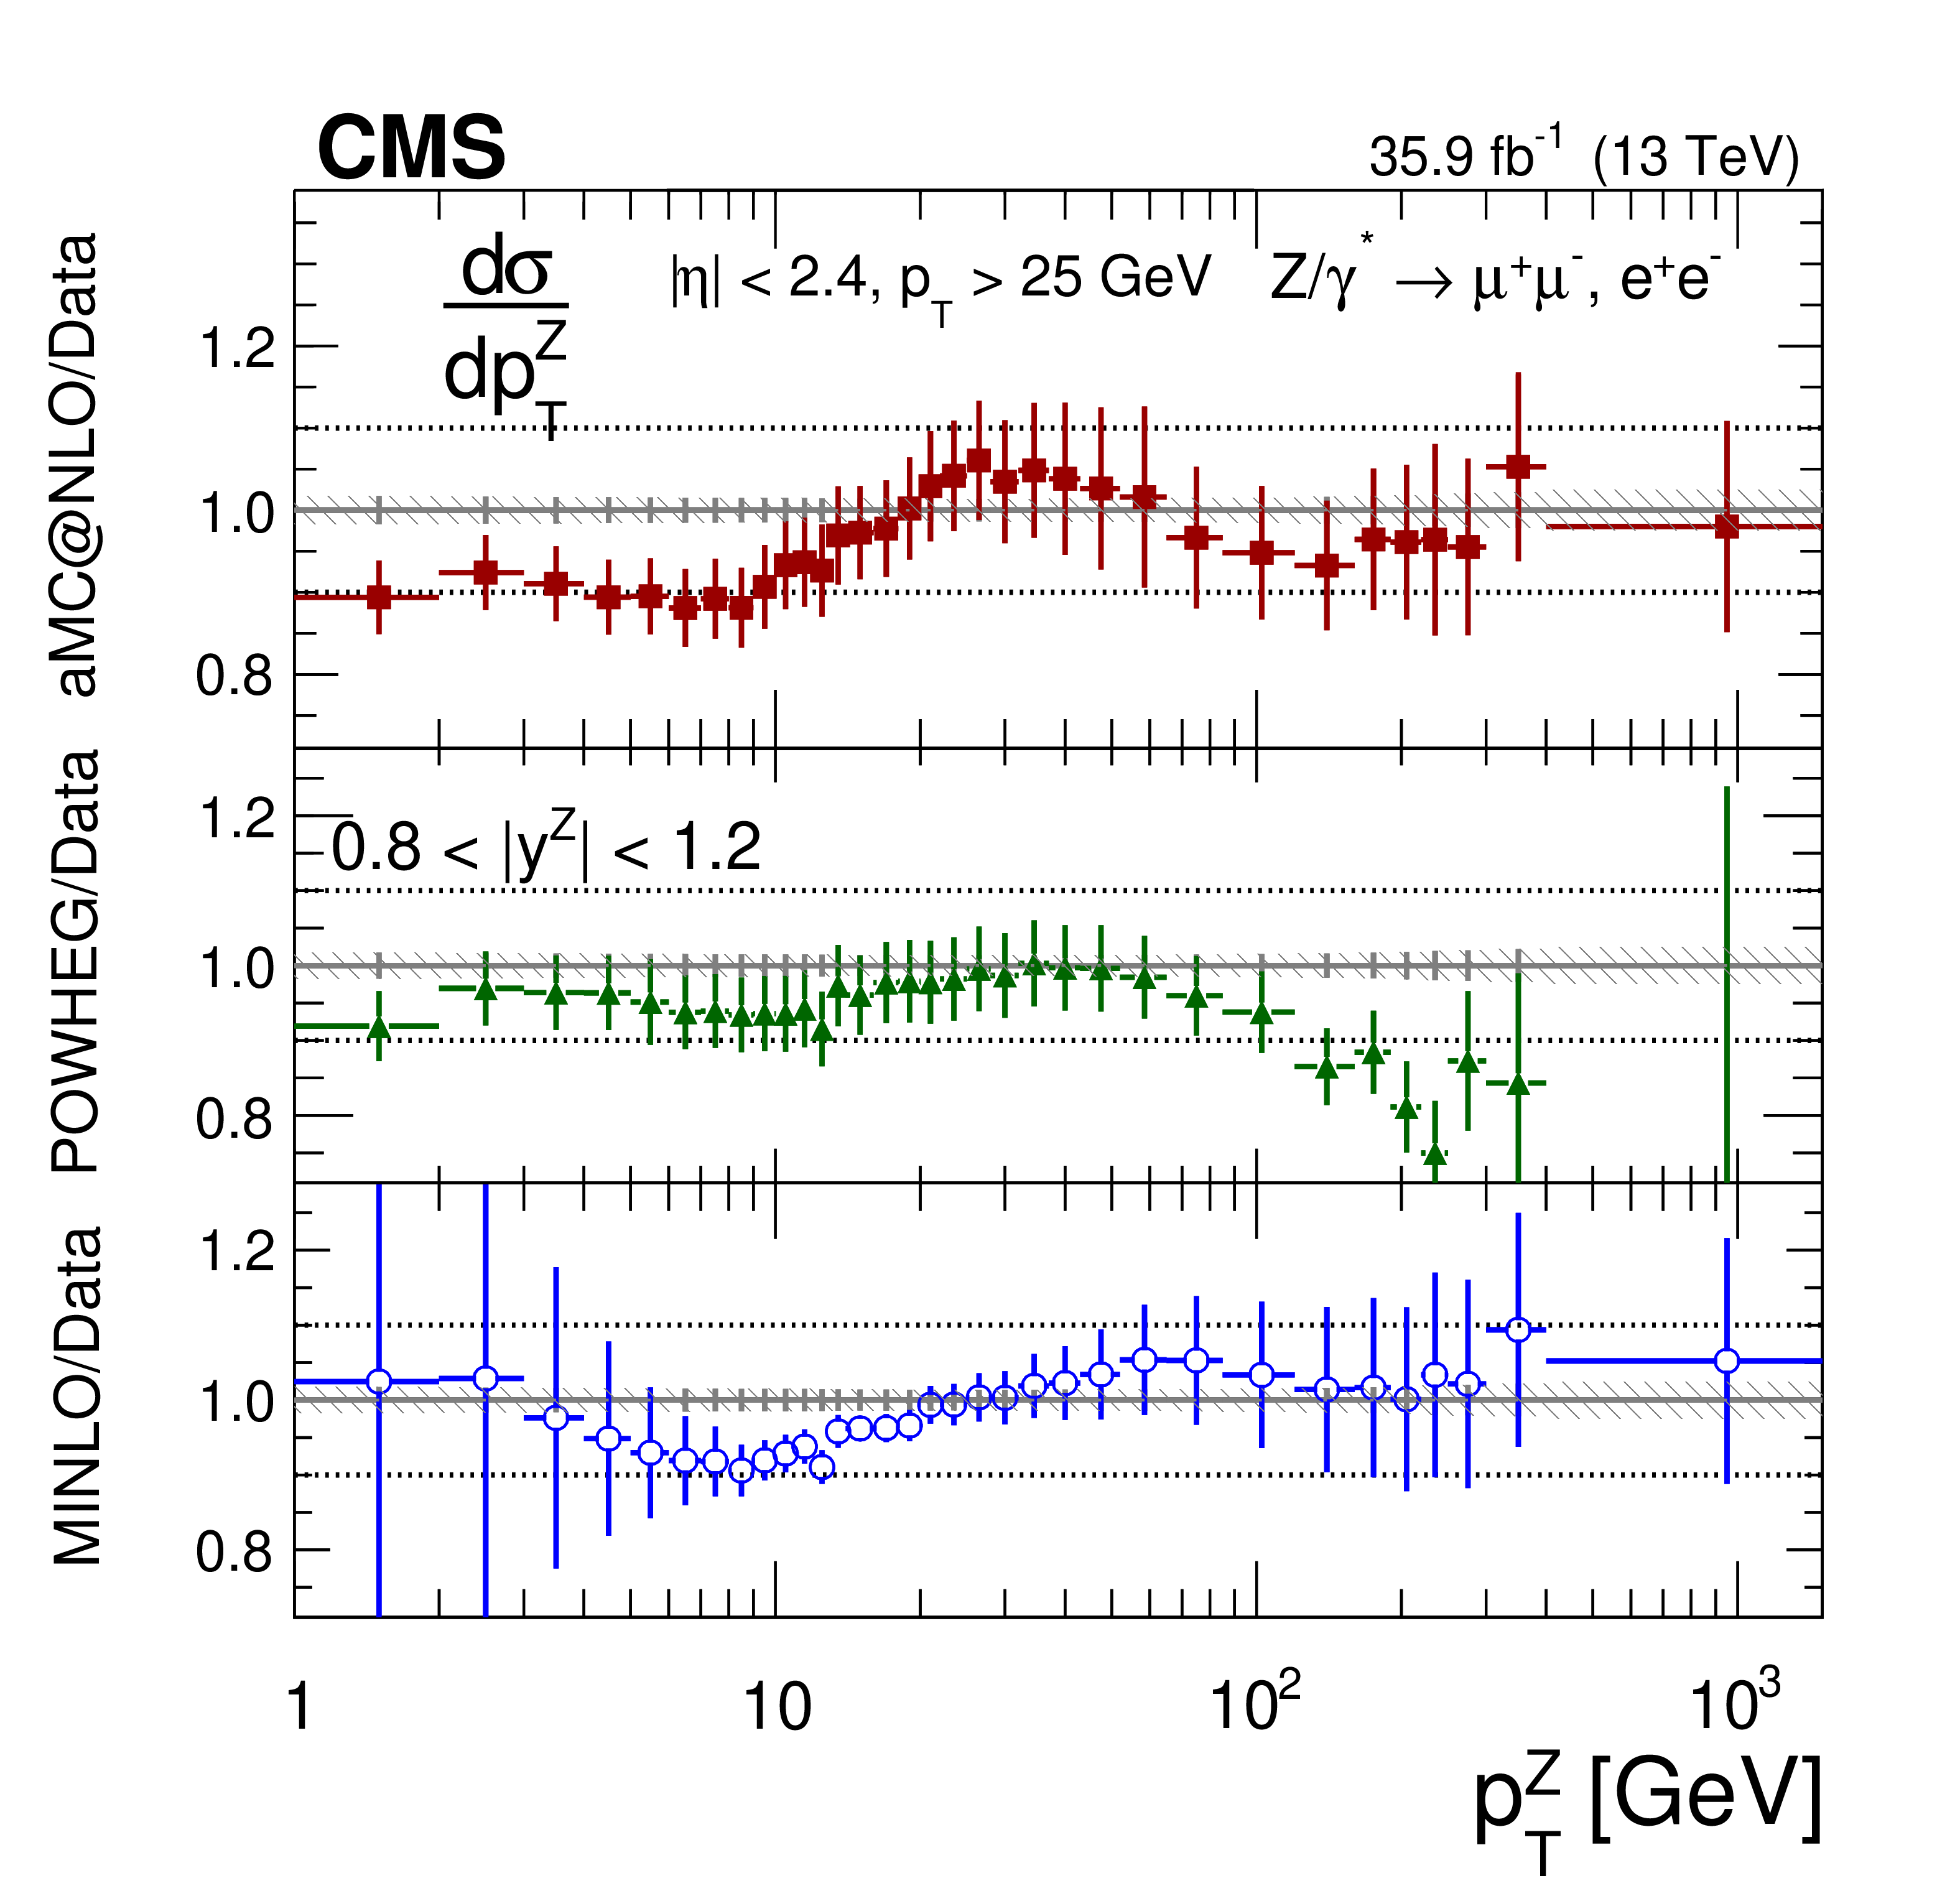
The measured absolute cross sections (left) in bins of $ {p_{\mathrm {T}}} ^{\mathrm{Z}}$ for the 0.8 $ < {| {y}^{\mathrm{Z}} |} < $ 1.2 region. The ratios of the predictions to the data are also shown (right). The shaded bands around the data points (black) correspond to the total experimental uncertainty. The measurement is compared to the predictions with MadGraph 5_aMC@NLO (square red markers), POWHEG (green triangles), and POWHEG-MINLO (blue circles). The error bands around the predictions correspond to the combined statistical, PDF, and scale uncertainties. |

png pdf |
Figure 11-a:
The measured absolute cross sections in bins of $ {p_{\mathrm {T}}} ^{\mathrm{Z}}$ for the 0.8 $ < {| {y}^{\mathrm{Z}} |} < $ 1.2 region. The shaded bands around the data points (black) correspond to the total experimental uncertainty. The measurement is compared to the predictions with MadGraph 5_aMC@NLO (square red markers), POWHEG (green triangles), and POWHEG-MINLO (blue circles). The error bands around the predictions correspond to the combined statistical, PDF, and scale uncertainties. |

png pdf |
Figure 11-b:
The ratio of absolute cross section predictions to the data in bins of $ {p_{\mathrm {T}}} ^{\mathrm{Z}}$ for the 0.8 $ < {| {y}^{\mathrm{Z}} |} < $ 1.2 region. The shaded bands around the data points (black) correspond to the total experimental uncertainty. The measurement is compared to the predictions with MadGraph 5_aMC@NLO (square red markers), POWHEG (green triangles), and POWHEG-MINLO (blue circles). The error bands around the predictions correspond to the combined statistical, PDF, and scale uncertainties. |

png pdf |
Figure 12:
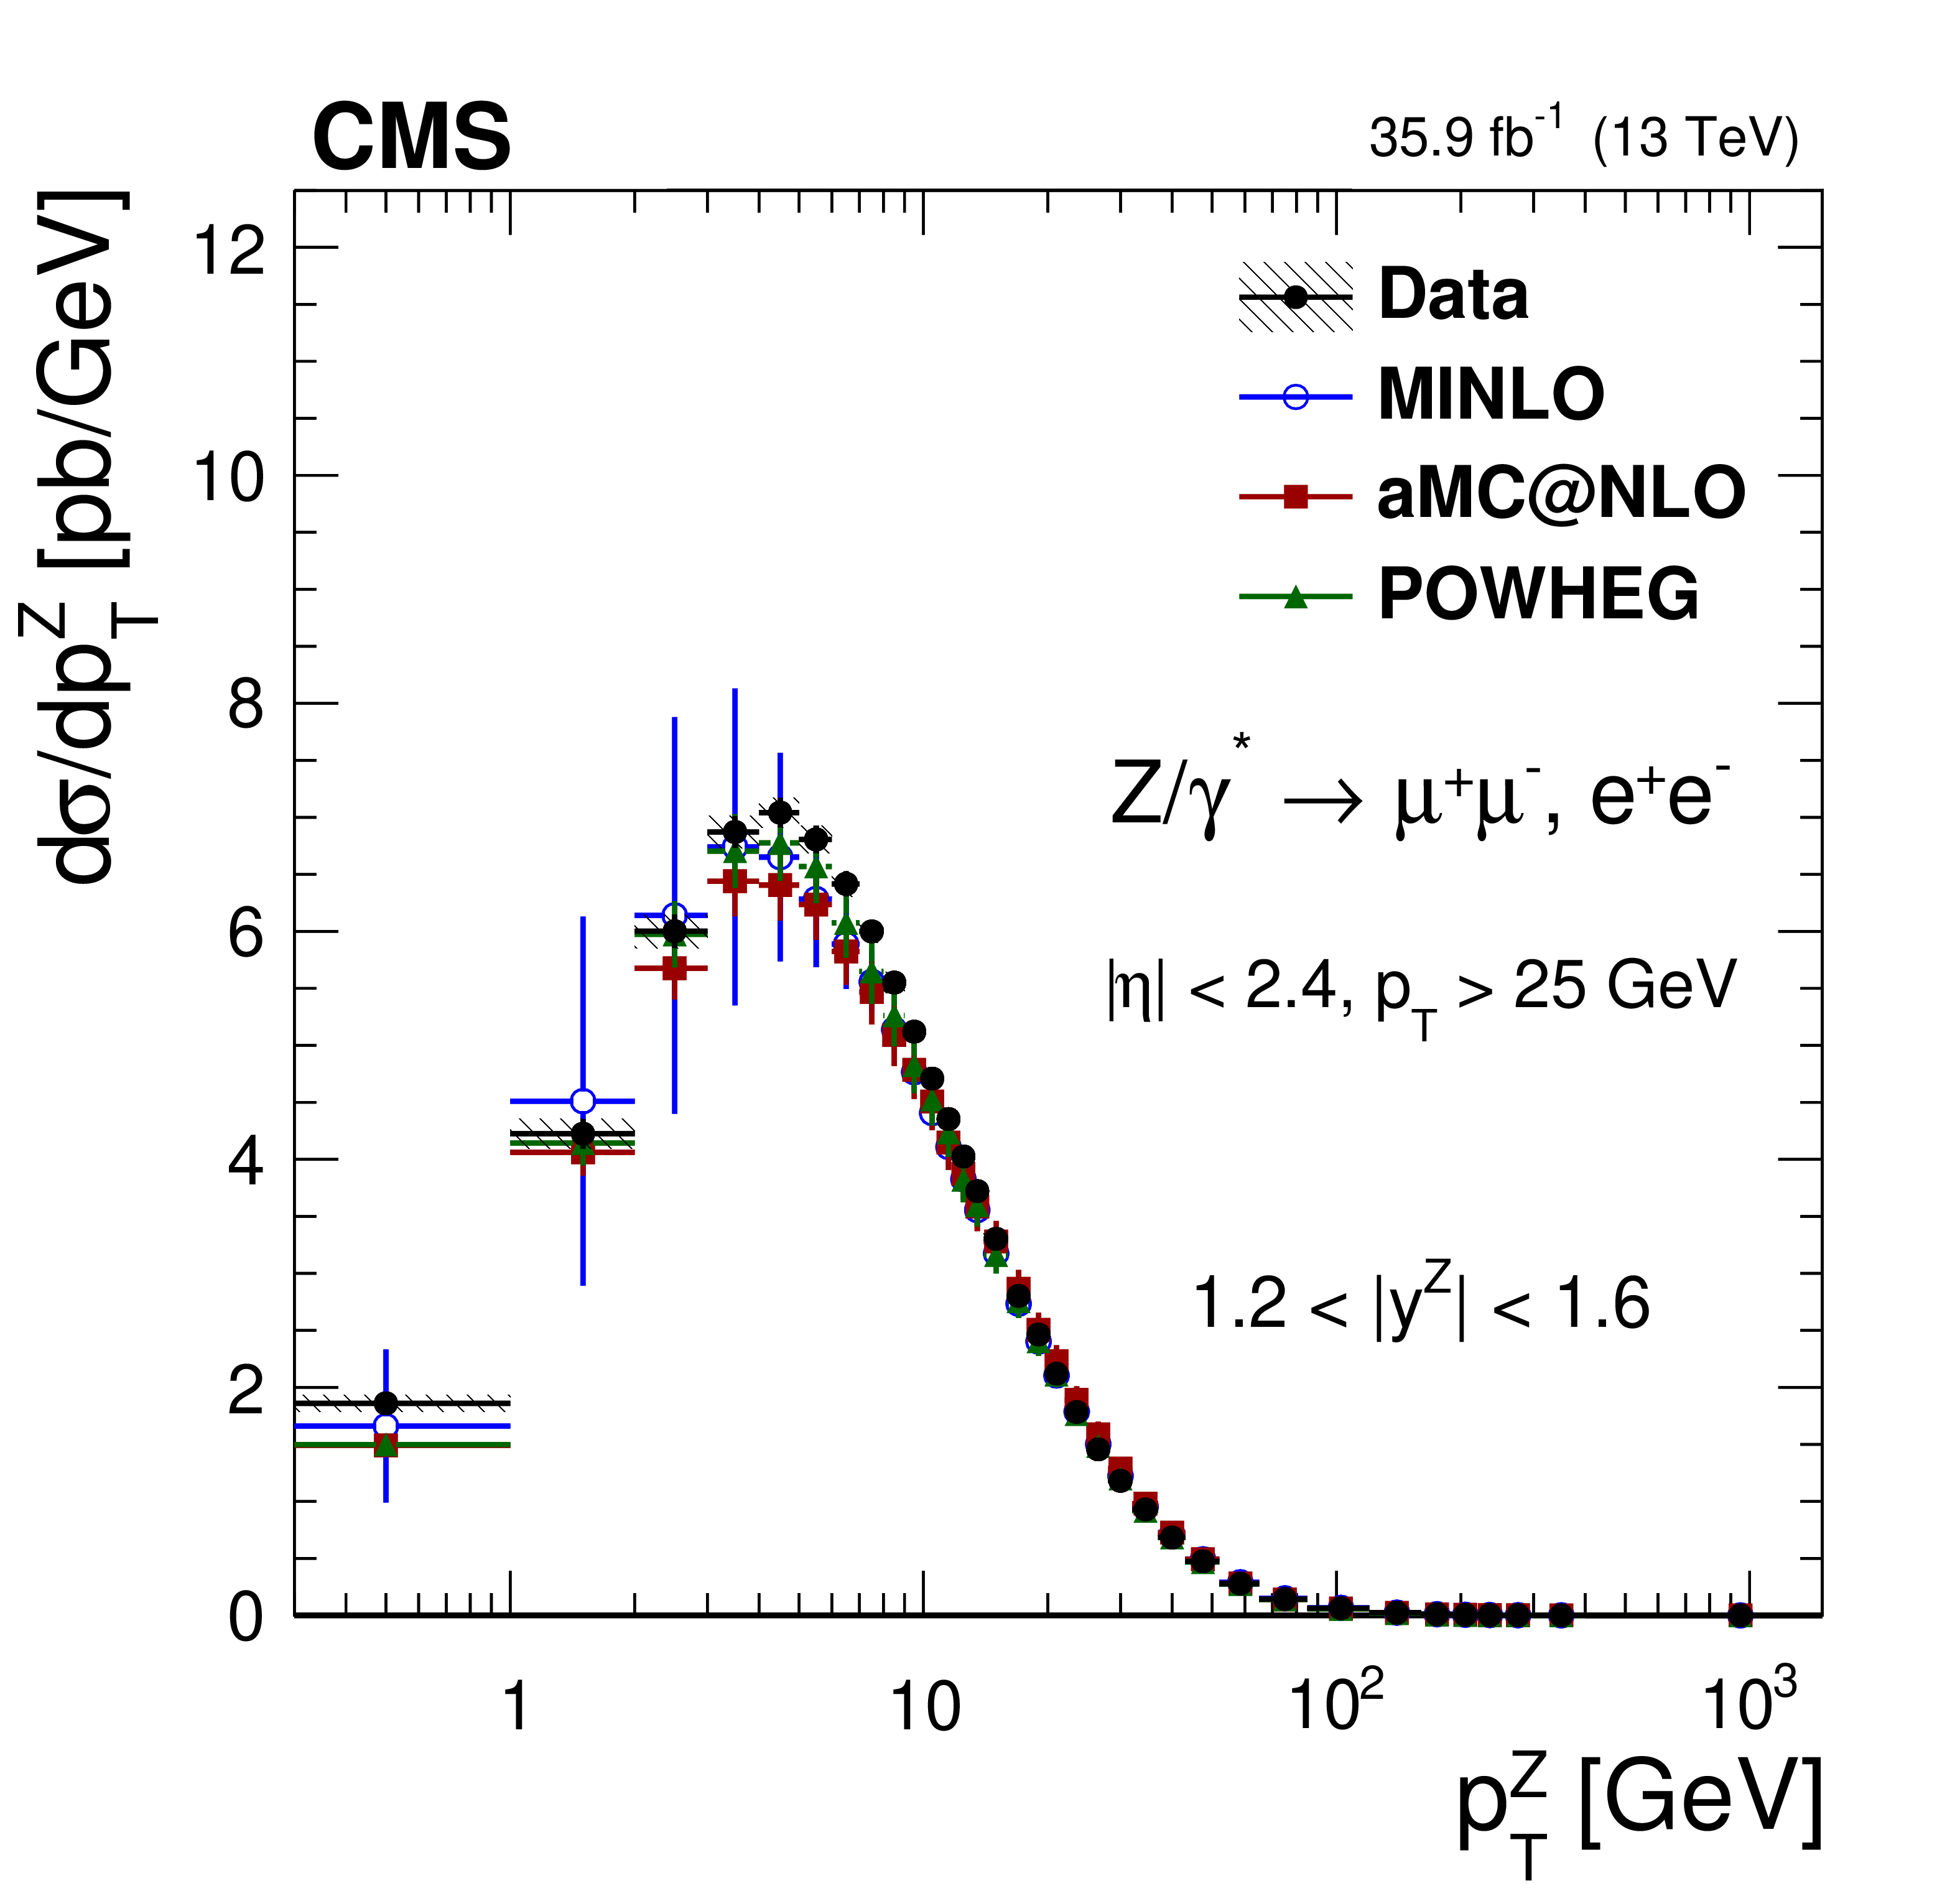
The measured absolute cross sections (left) in bins of $ {p_{\mathrm {T}}} ^{\mathrm{Z}}$ for the 1.2 $ < {| {y}^{\mathrm{Z}} |} < $ 1.6 region. The ratios of the predictions to the data are also shown (right). The shaded bands around the data points (black) correspond to the total experimental uncertainty. The measurement is compared to the predictions with MadGraph 5_aMC@NLO (square red markers), POWHEG (green triangles), and POWHEG-MINLO (blue circles). The error bands around the predictions correspond to the combined statistical, PDF, and scale uncertainties. |
png pdf |
Figure 12-a:
The measured absolute cross sections in bins of $ {p_{\mathrm {T}}} ^{\mathrm{Z}}$ for the 1.2 $ < {| {y}^{\mathrm{Z}} |} < $ 1.6 region. The shaded bands around the data points (black) correspond to the total experimental uncertainty. The measurement is compared to the predictions with MadGraph 5_aMC@NLO (square red markers), POWHEG (green triangles), and POWHEG-MINLO (blue circles). The error bands around the predictions correspond to the combined statistical, PDF, and scale uncertainties. |

png pdf |
Figure 12-b:
The ratio of absolute cross section predictions to the data in bins of $ {p_{\mathrm {T}}} ^{\mathrm{Z}}$ for the 1.2 $ < {| {y}^{\mathrm{Z}} |} < $ 1.6 region. The shaded bands around the data points (black) correspond to the total experimental uncertainty. The measurement is compared to the predictions with MadGraph 5_aMC@NLO (square red markers), POWHEG (green triangles), and POWHEG-MINLO (blue circles). The error bands around the predictions correspond to the combined statistical, PDF, and scale uncertainties. |
png pdf |
Figure 13:
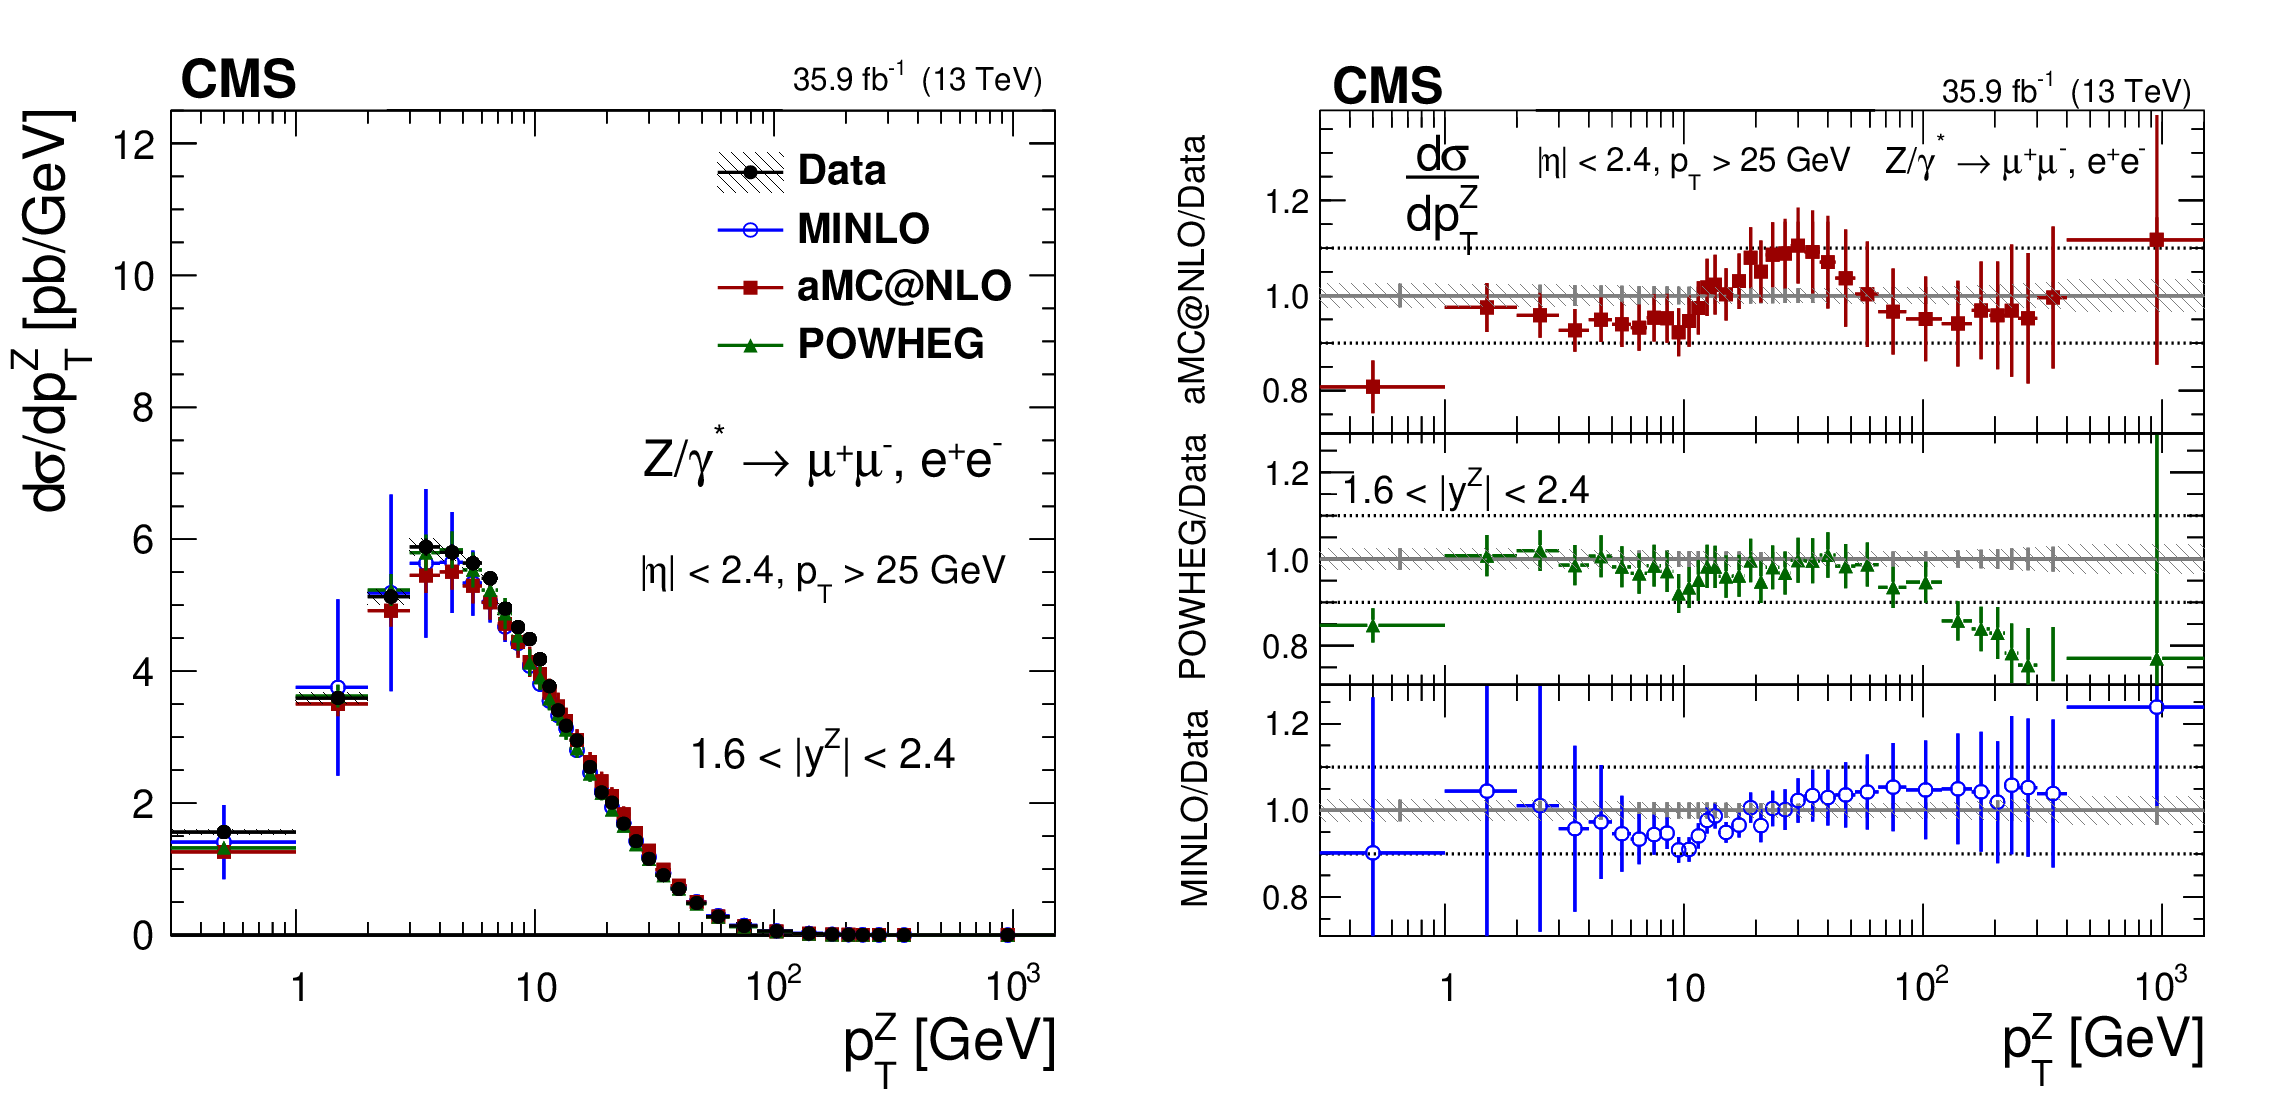
The measured absolute cross sections (left) in bins of $ {p_{\mathrm {T}}} ^{\mathrm{Z}}$ for the 1.6 $ < {| {y}^{\mathrm{Z}} |} < $ 2.4 region. The ratios of the predictions to the data are also shown (right). The shaded bands around the data points (black) correspond to the total experimental uncertainty. The measurement is compared to the predictions with MadGraph 5_aMC@NLO (square red markers), POWHEG (green triangles), and POWHEG-MINLO (blue circles). The error bands around the predictions correspond to the combined statistical, PDF, and scale uncertainties. |

png pdf |
Figure 13-a:
The measured absolute cross sections in bins of $ {p_{\mathrm {T}}} ^{\mathrm{Z}}$ for the 1.6 $ < {| {y}^{\mathrm{Z}} |} < $ 2.4 region. The shaded bands around the data points (black) correspond to the total experimental uncertainty. The measurement is compared to the predictions with MadGraph 5_aMC@NLO (square red markers), POWHEG (green triangles), and POWHEG-MINLO (blue circles). The error bands around the predictions correspond to the combined statistical, PDF, and scale uncertainties. |

png pdf |
Figure 13-b:
The ratio of absolute cross section predictions to the data in bins of $ {p_{\mathrm {T}}} ^{\mathrm{Z}}$ for the 1.6 $ < {| {y}^{\mathrm{Z}} |} < $ 2.4 region. The shaded bands around the data points (black) correspond to the total experimental uncertainty. The measurement is compared to the predictions with MadGraph 5_aMC@NLO (square red markers), POWHEG (green triangles), and POWHEG-MINLO (blue circles). The error bands around the predictions correspond to the combined statistical, PDF, and scale uncertainties. |
png pdf |
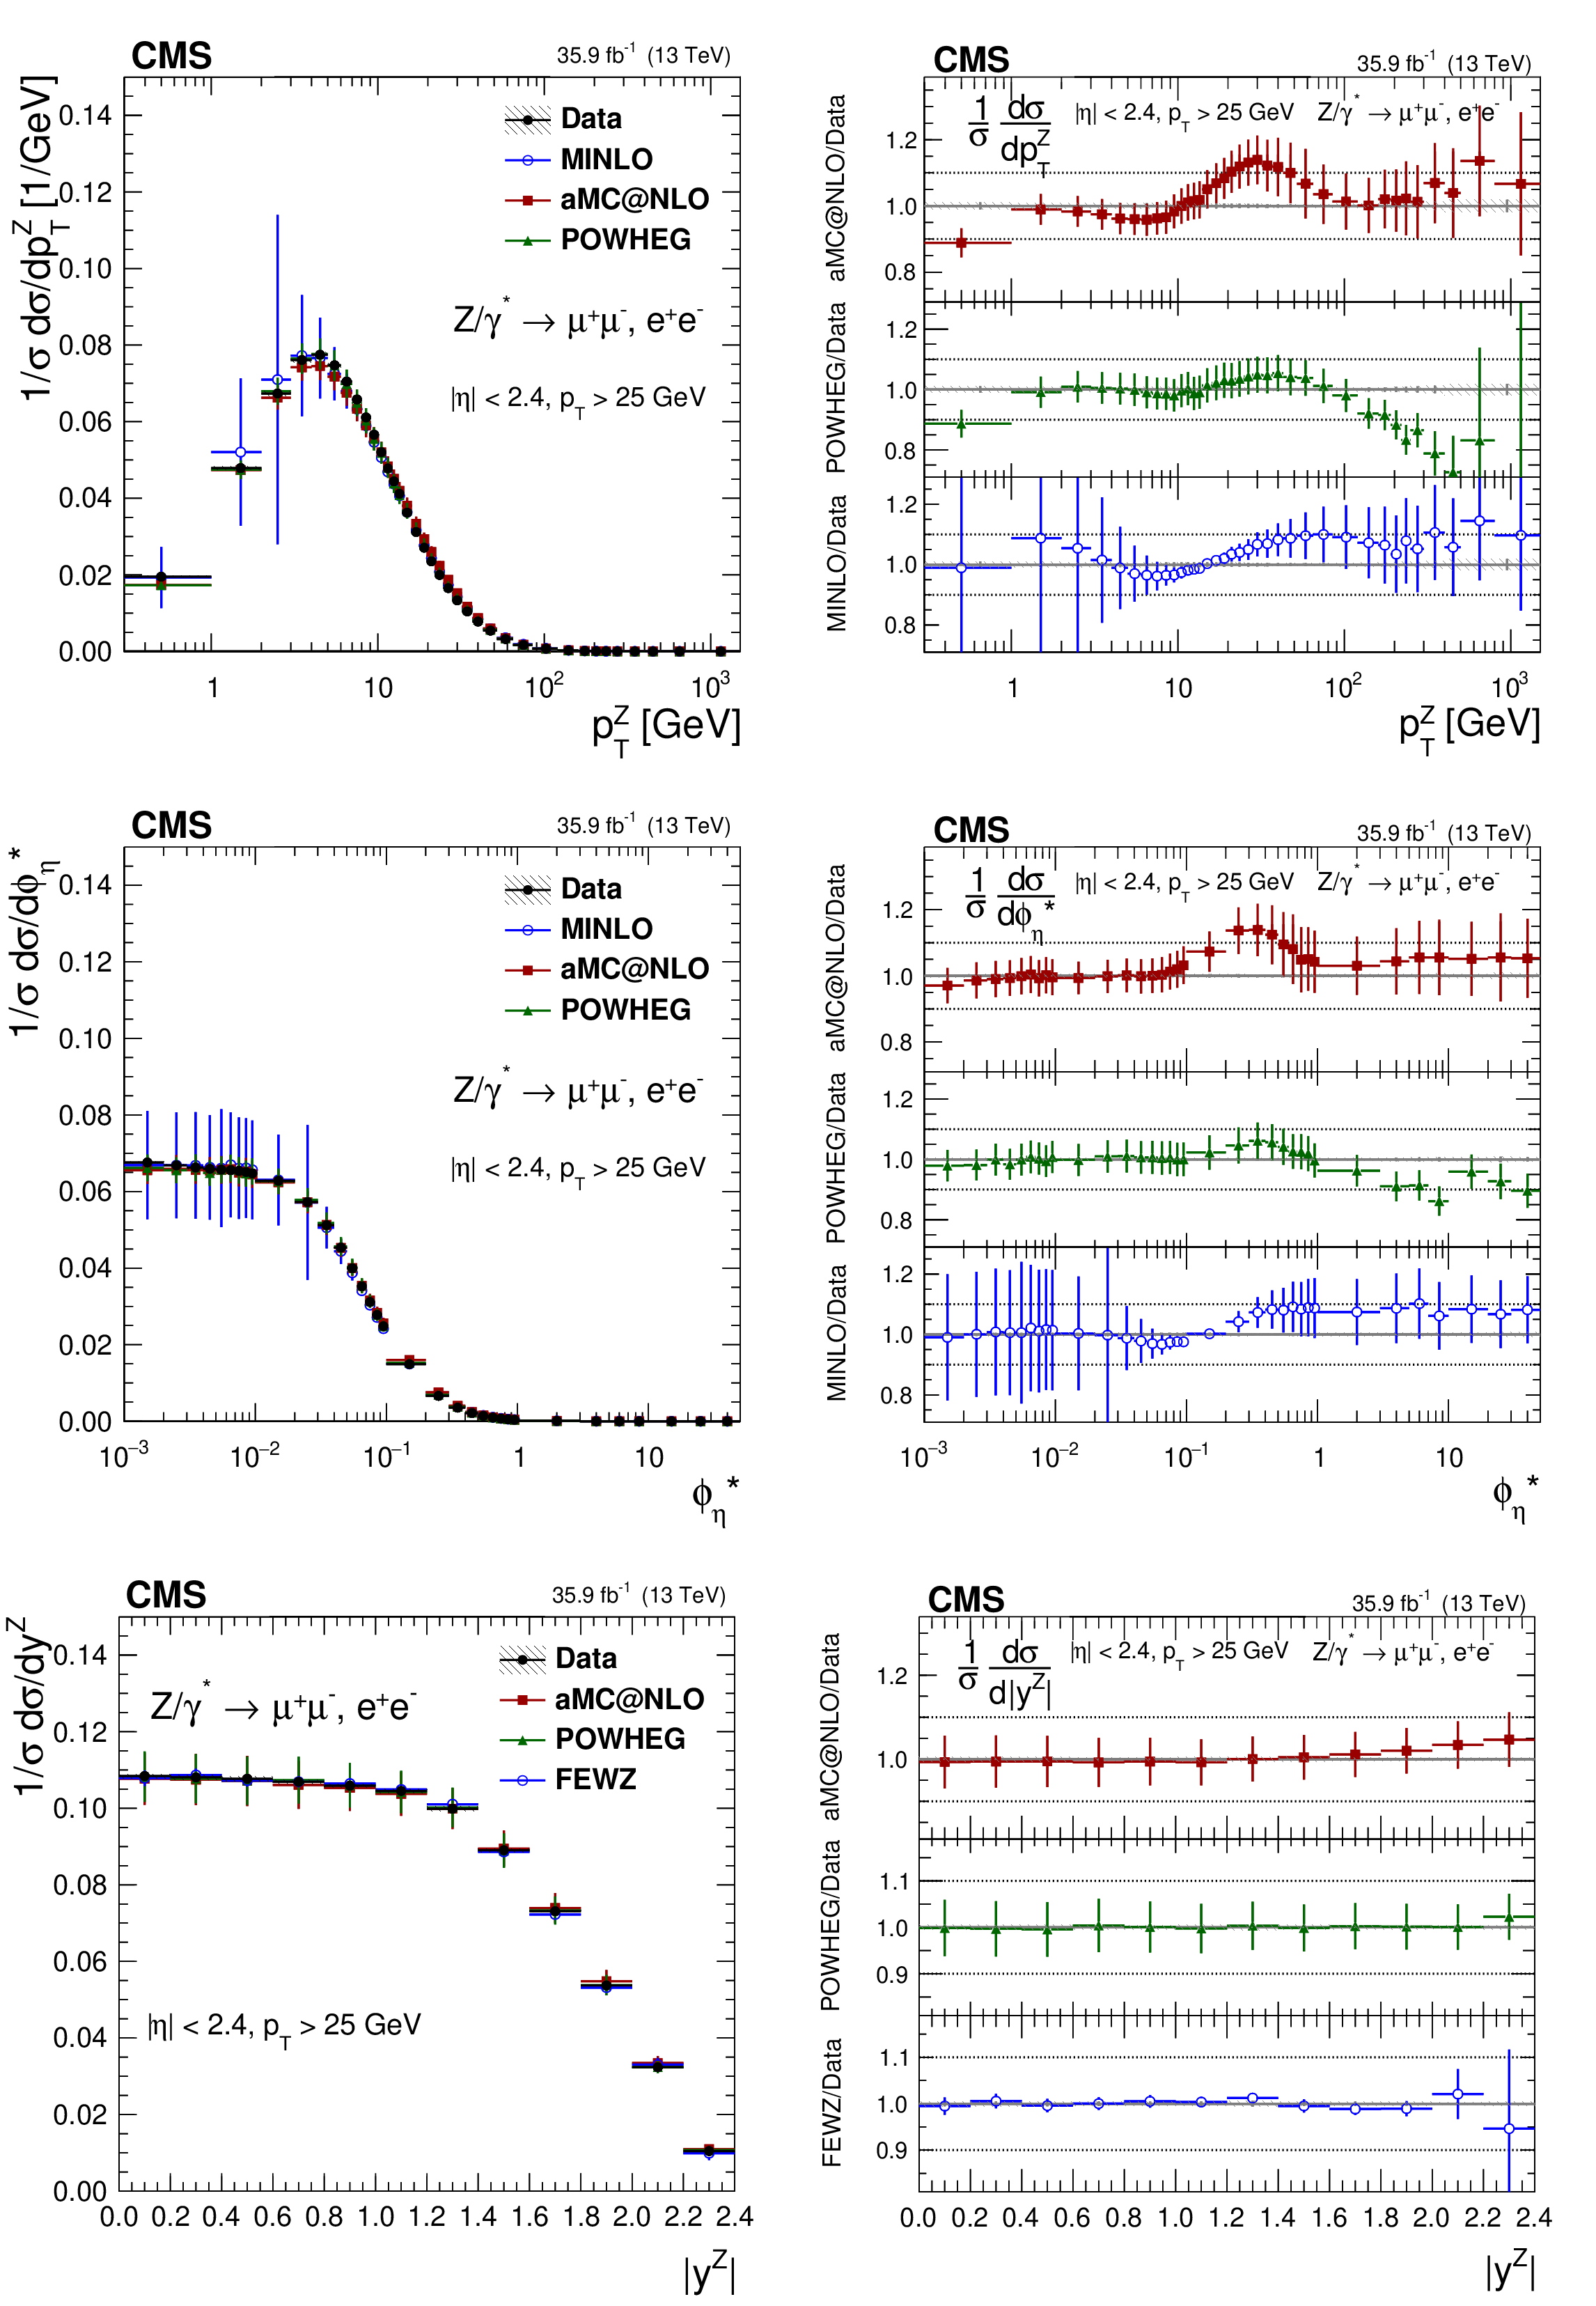
Figure 14:
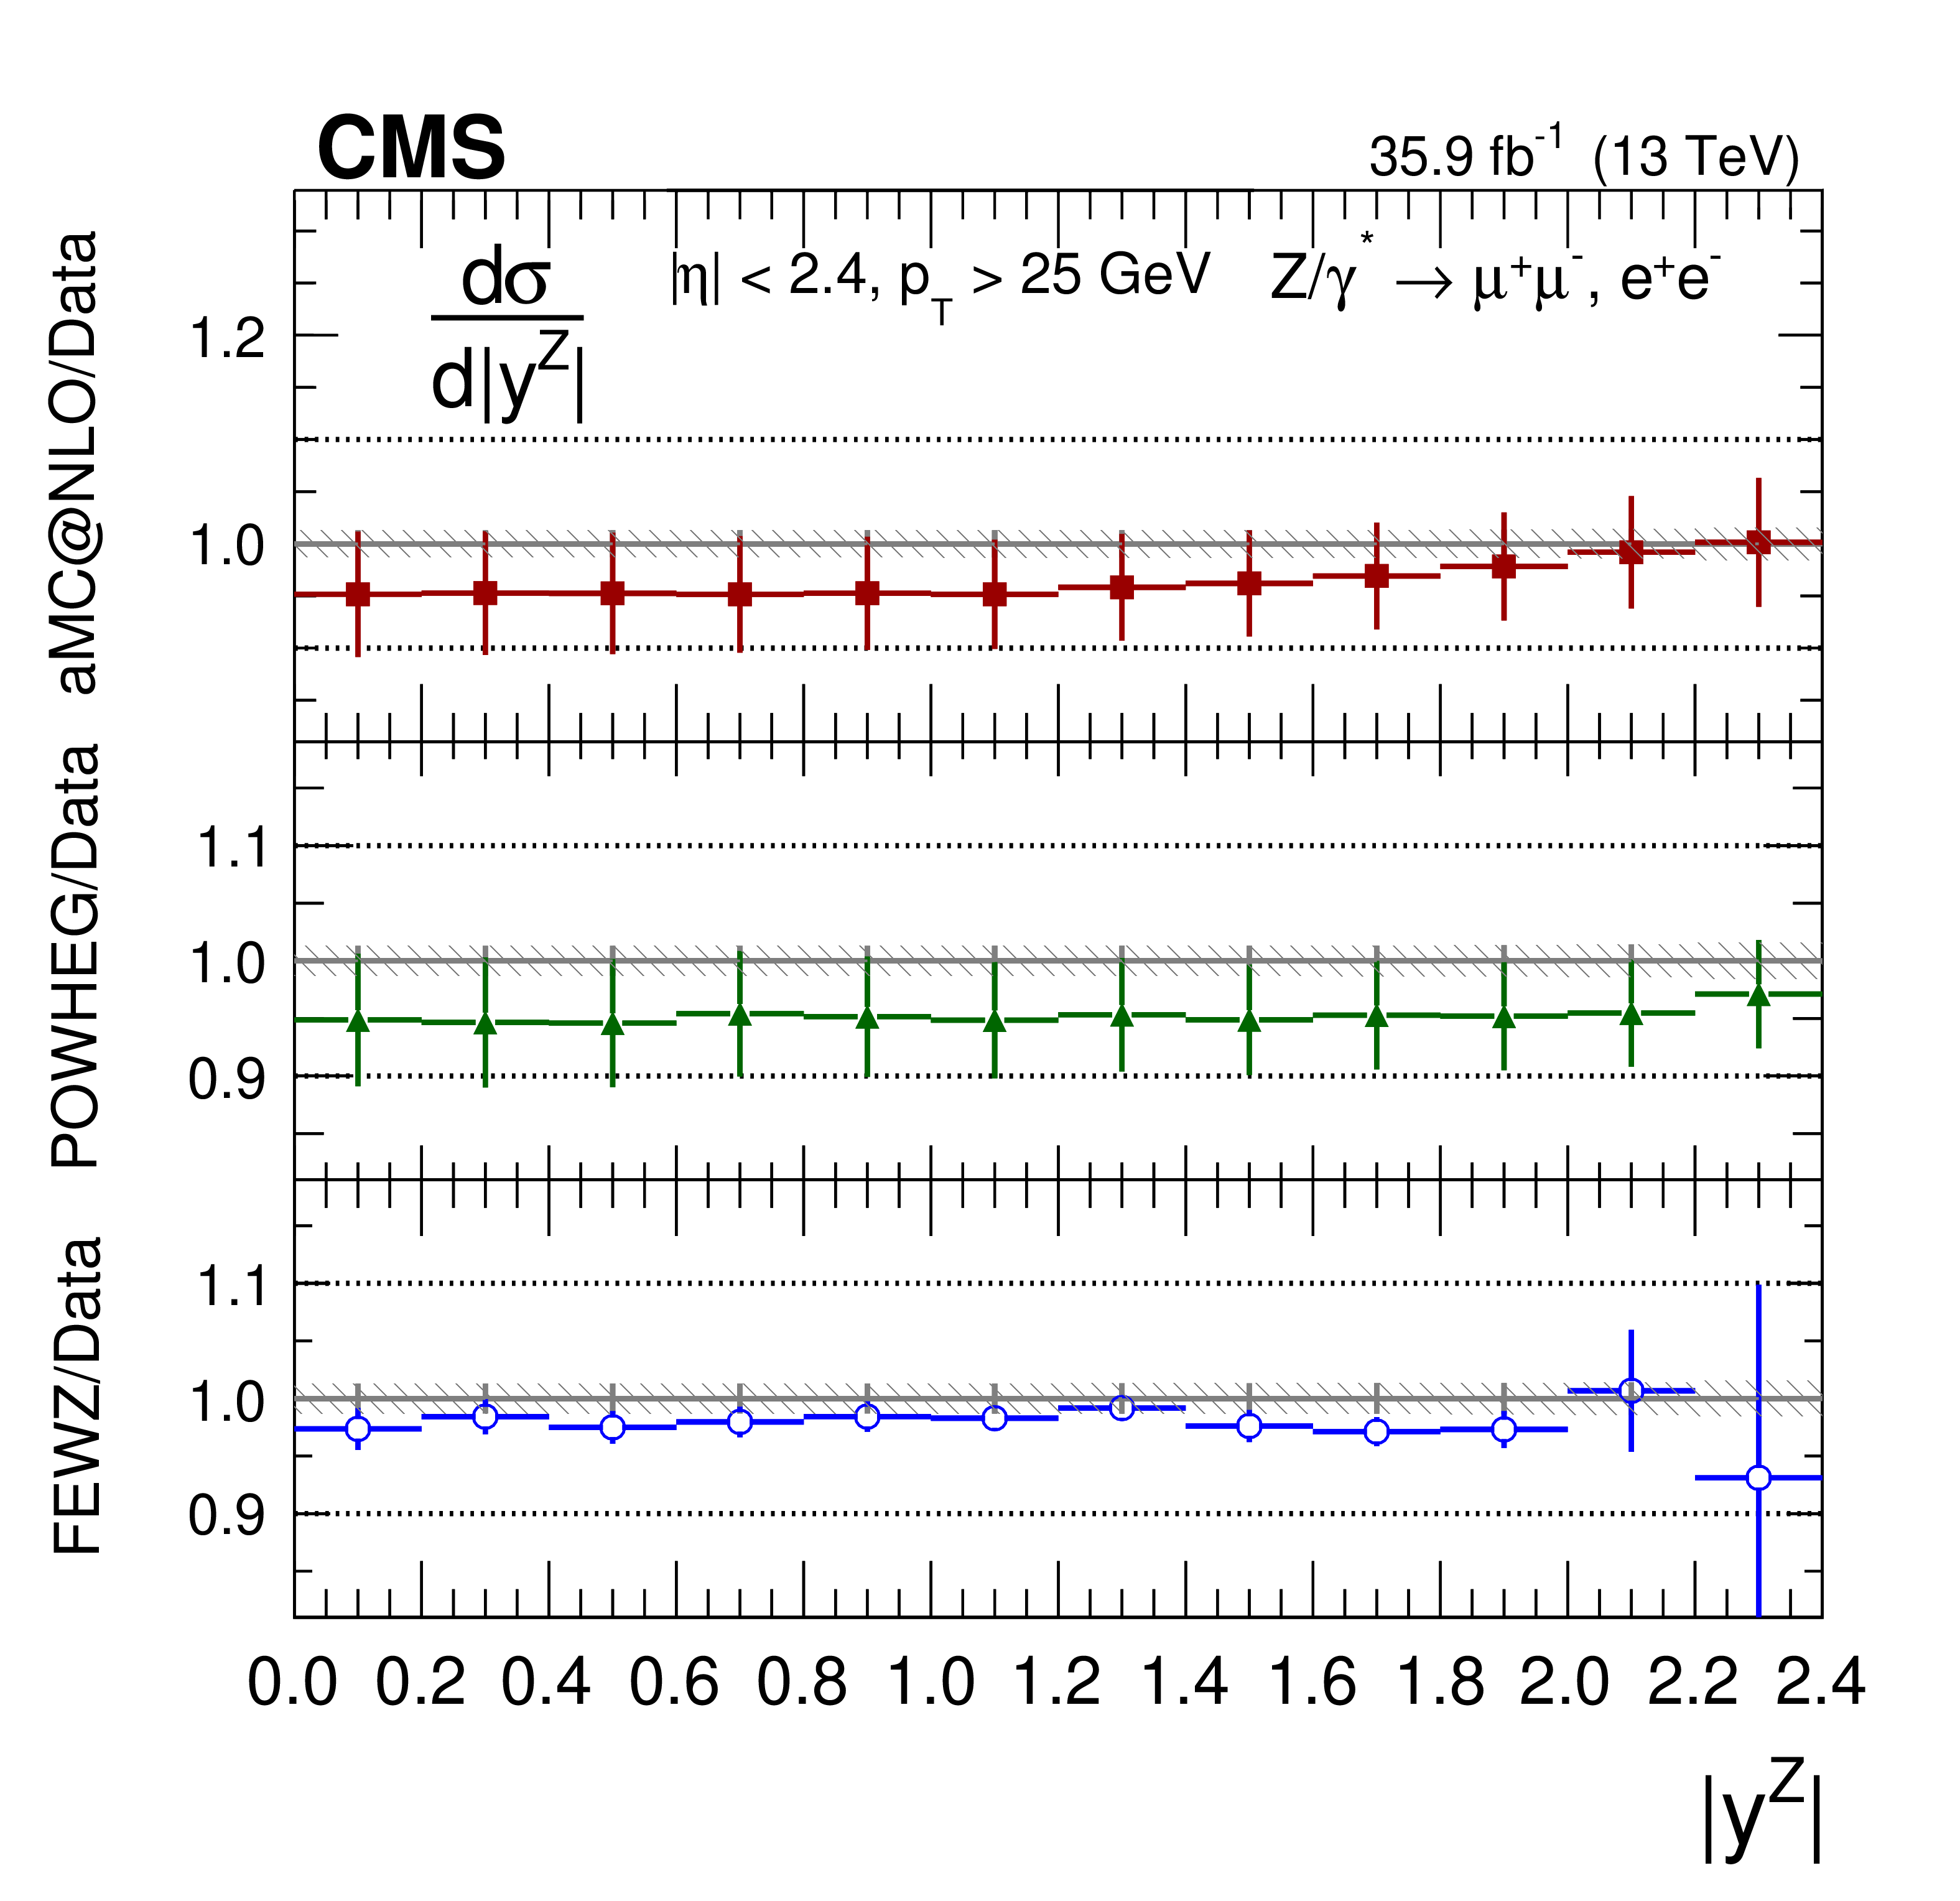
The measured normalized cross sections (left) in bins of $ {p_{\mathrm {T}}} ^{\mathrm{Z}}$ (upper), $ {\phi ^{ *}_\eta}$ (middle), and $ {| {y}^{\mathrm{Z}} |}$ (lower) for the combined measurement. The ratios of the predictions to the data are also shown (right). The shaded bands around the data points (black) correspond to the total experimental uncertainty. The $ {p_{\mathrm {T}}} ^{\mathrm{Z}}$ and $ {\phi ^{ *}_\eta}$ measurements are compared to the predictions with MadGraph 5_aMC@NLO (square red markers), POWHEG (green triangles), and POWHEG-MINLO (blue circles). The $ {| {y}^{\mathrm{Z}} |}$ measurement is compared to the predictions with MadGraph 5_aMC@NLO (square red markers), POWHEG (green triangles), and FEWZ (blue circles). The error bars around the predictions correspond to the combined statistical, PDF, and scale uncertainties. |

png pdf |
Figure 14-a:
The measured normalized cross sections in bins of $ {p_{\mathrm {T}}} ^{\mathrm{Z}}$ for the combined measurement. The shaded bands around the data points (black) correspond to the total experimental uncertainty. The $ {p_{\mathrm {T}}} ^{\mathrm{Z}}$ and $ {\phi ^{ *}_\eta}$ measurements are compared to the predictions with MadGraph 5_aMC@NLO (square red markers), POWHEG (green triangles), and POWHEG-MINLO (blue circles). The $ {| {y}^{\mathrm{Z}} |}$ measurement is compared to the predictions with MadGraph 5_aMC@NLO (square red markers), POWHEG (green triangles), and FEWZ (blue circles). The error bars around the predictions correspond to the combined statistical, PDF, and scale uncertainties. |

png pdf |
Figure 14-b:
The ratio of normalized cross section predictions to the data in bins of $ {p_{\mathrm {T}}} ^{\mathrm{Z}}$ for the combined measurement. The shaded bands around the data points (black) correspond to the total experimental uncertainty. The $ {p_{\mathrm {T}}} ^{\mathrm{Z}}$ and $ {\phi ^{ *}_\eta}$ measurements are compared to the predictions with MadGraph 5_aMC@NLO (square red markers), POWHEG (green triangles), and POWHEG-MINLO (blue circles). The $ {| {y}^{\mathrm{Z}} |}$ measurement is compared to the predictions with MadGraph 5_aMC@NLO (square red markers), POWHEG (green triangles), and FEWZ (blue circles). The error bars around the predictions correspond to the combined statistical, PDF, and scale uncertainties. |

png pdf |
Figure 14-c:
The measured normalized cross sections in bins of $ {\phi ^{ *}_\eta}$ for the combined measurement. The shaded bands around the data points (black) correspond to the total experimental uncertainty. The $ {p_{\mathrm {T}}} ^{\mathrm{Z}}$ and $ {\phi ^{ *}_\eta}$ measurements are compared to the predictions with MadGraph 5_aMC@NLO (square red markers), POWHEG (green triangles), and POWHEG-MINLO (blue circles). The $ {| {y}^{\mathrm{Z}} |}$ measurement is compared to the predictions with MadGraph 5_aMC@NLO (square red markers), POWHEG (green triangles), and FEWZ (blue circles). The error bars around the predictions correspond to the combined statistical, PDF, and scale uncertainties. |
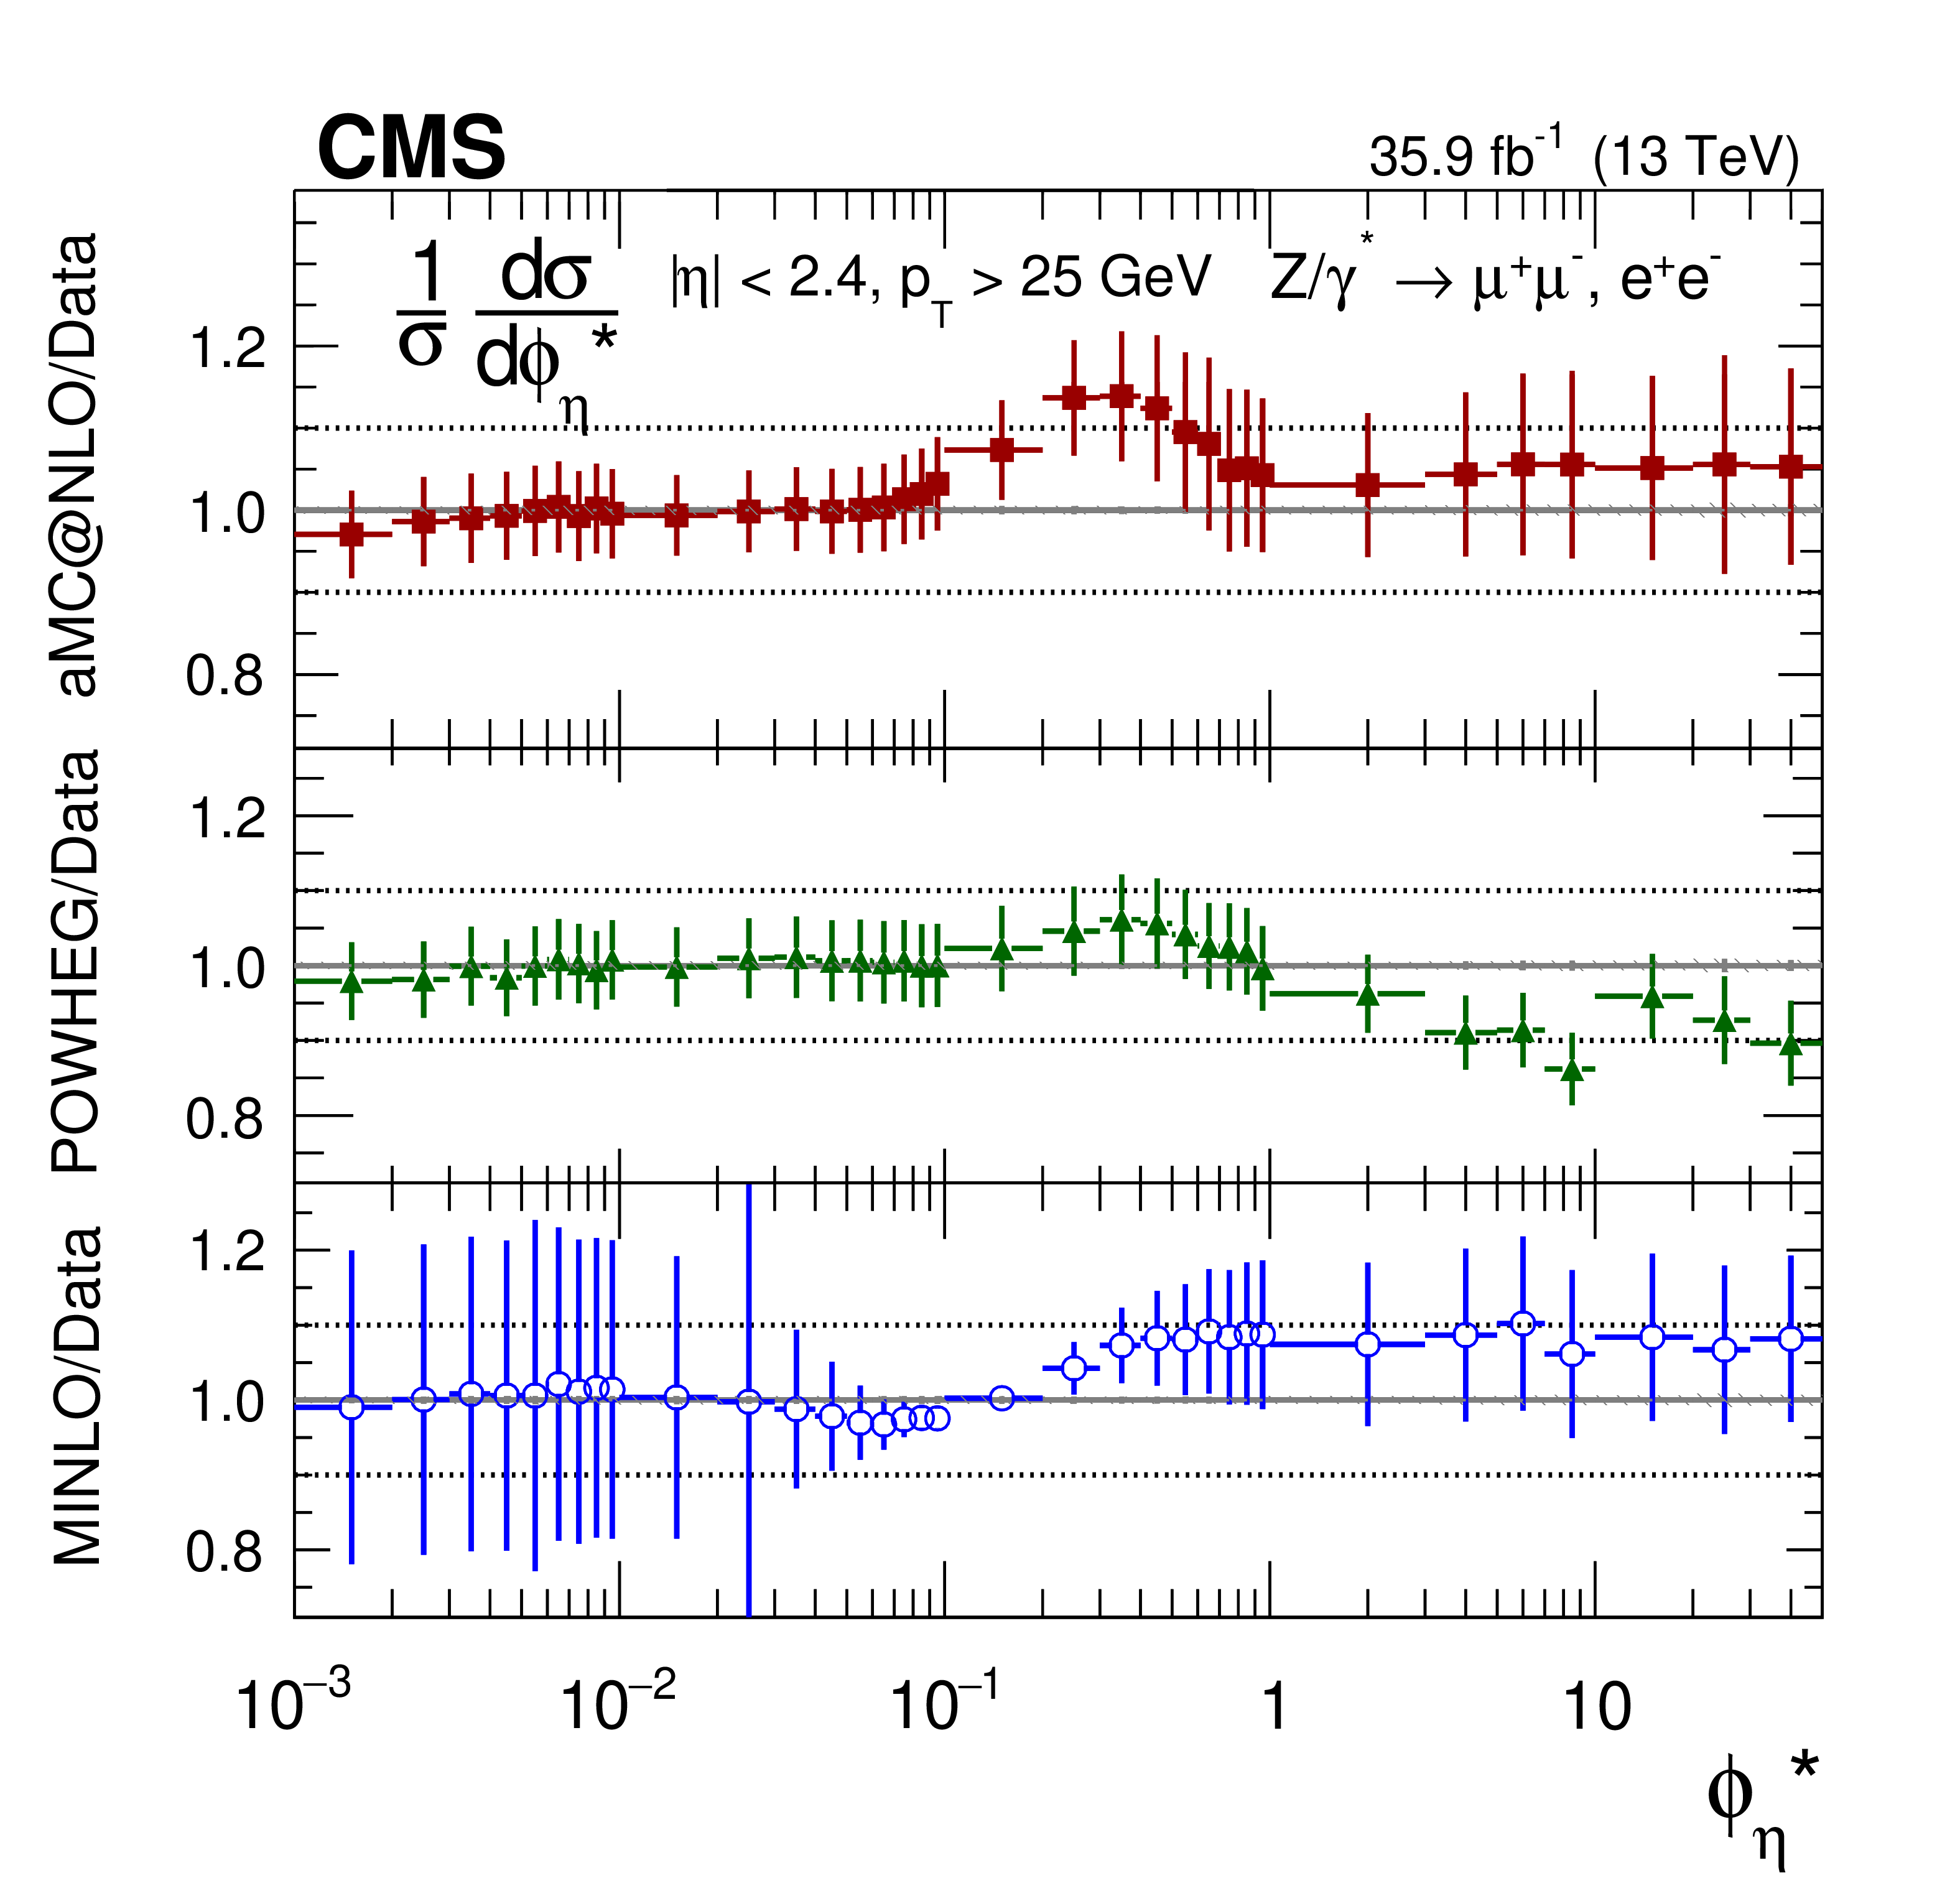
png pdf |
Figure 14-d:
The ratio of normalized cross section predictions to the data in bins of $ {\phi ^{ *}_\eta}$ for the combined measurement. The shaded bands around the data points (black) correspond to the total experimental uncertainty. The $ {p_{\mathrm {T}}} ^{\mathrm{Z}}$ and $ {\phi ^{ *}_\eta}$ measurements are compared to the predictions with MadGraph 5_aMC@NLO (square red markers), POWHEG (green triangles), and POWHEG-MINLO (blue circles). The $ {| {y}^{\mathrm{Z}} |}$ measurement is compared to the predictions with MadGraph 5_aMC@NLO (square red markers), POWHEG (green triangles), and FEWZ (blue circles). The error bars around the predictions correspond to the combined statistical, PDF, and scale uncertainties. |
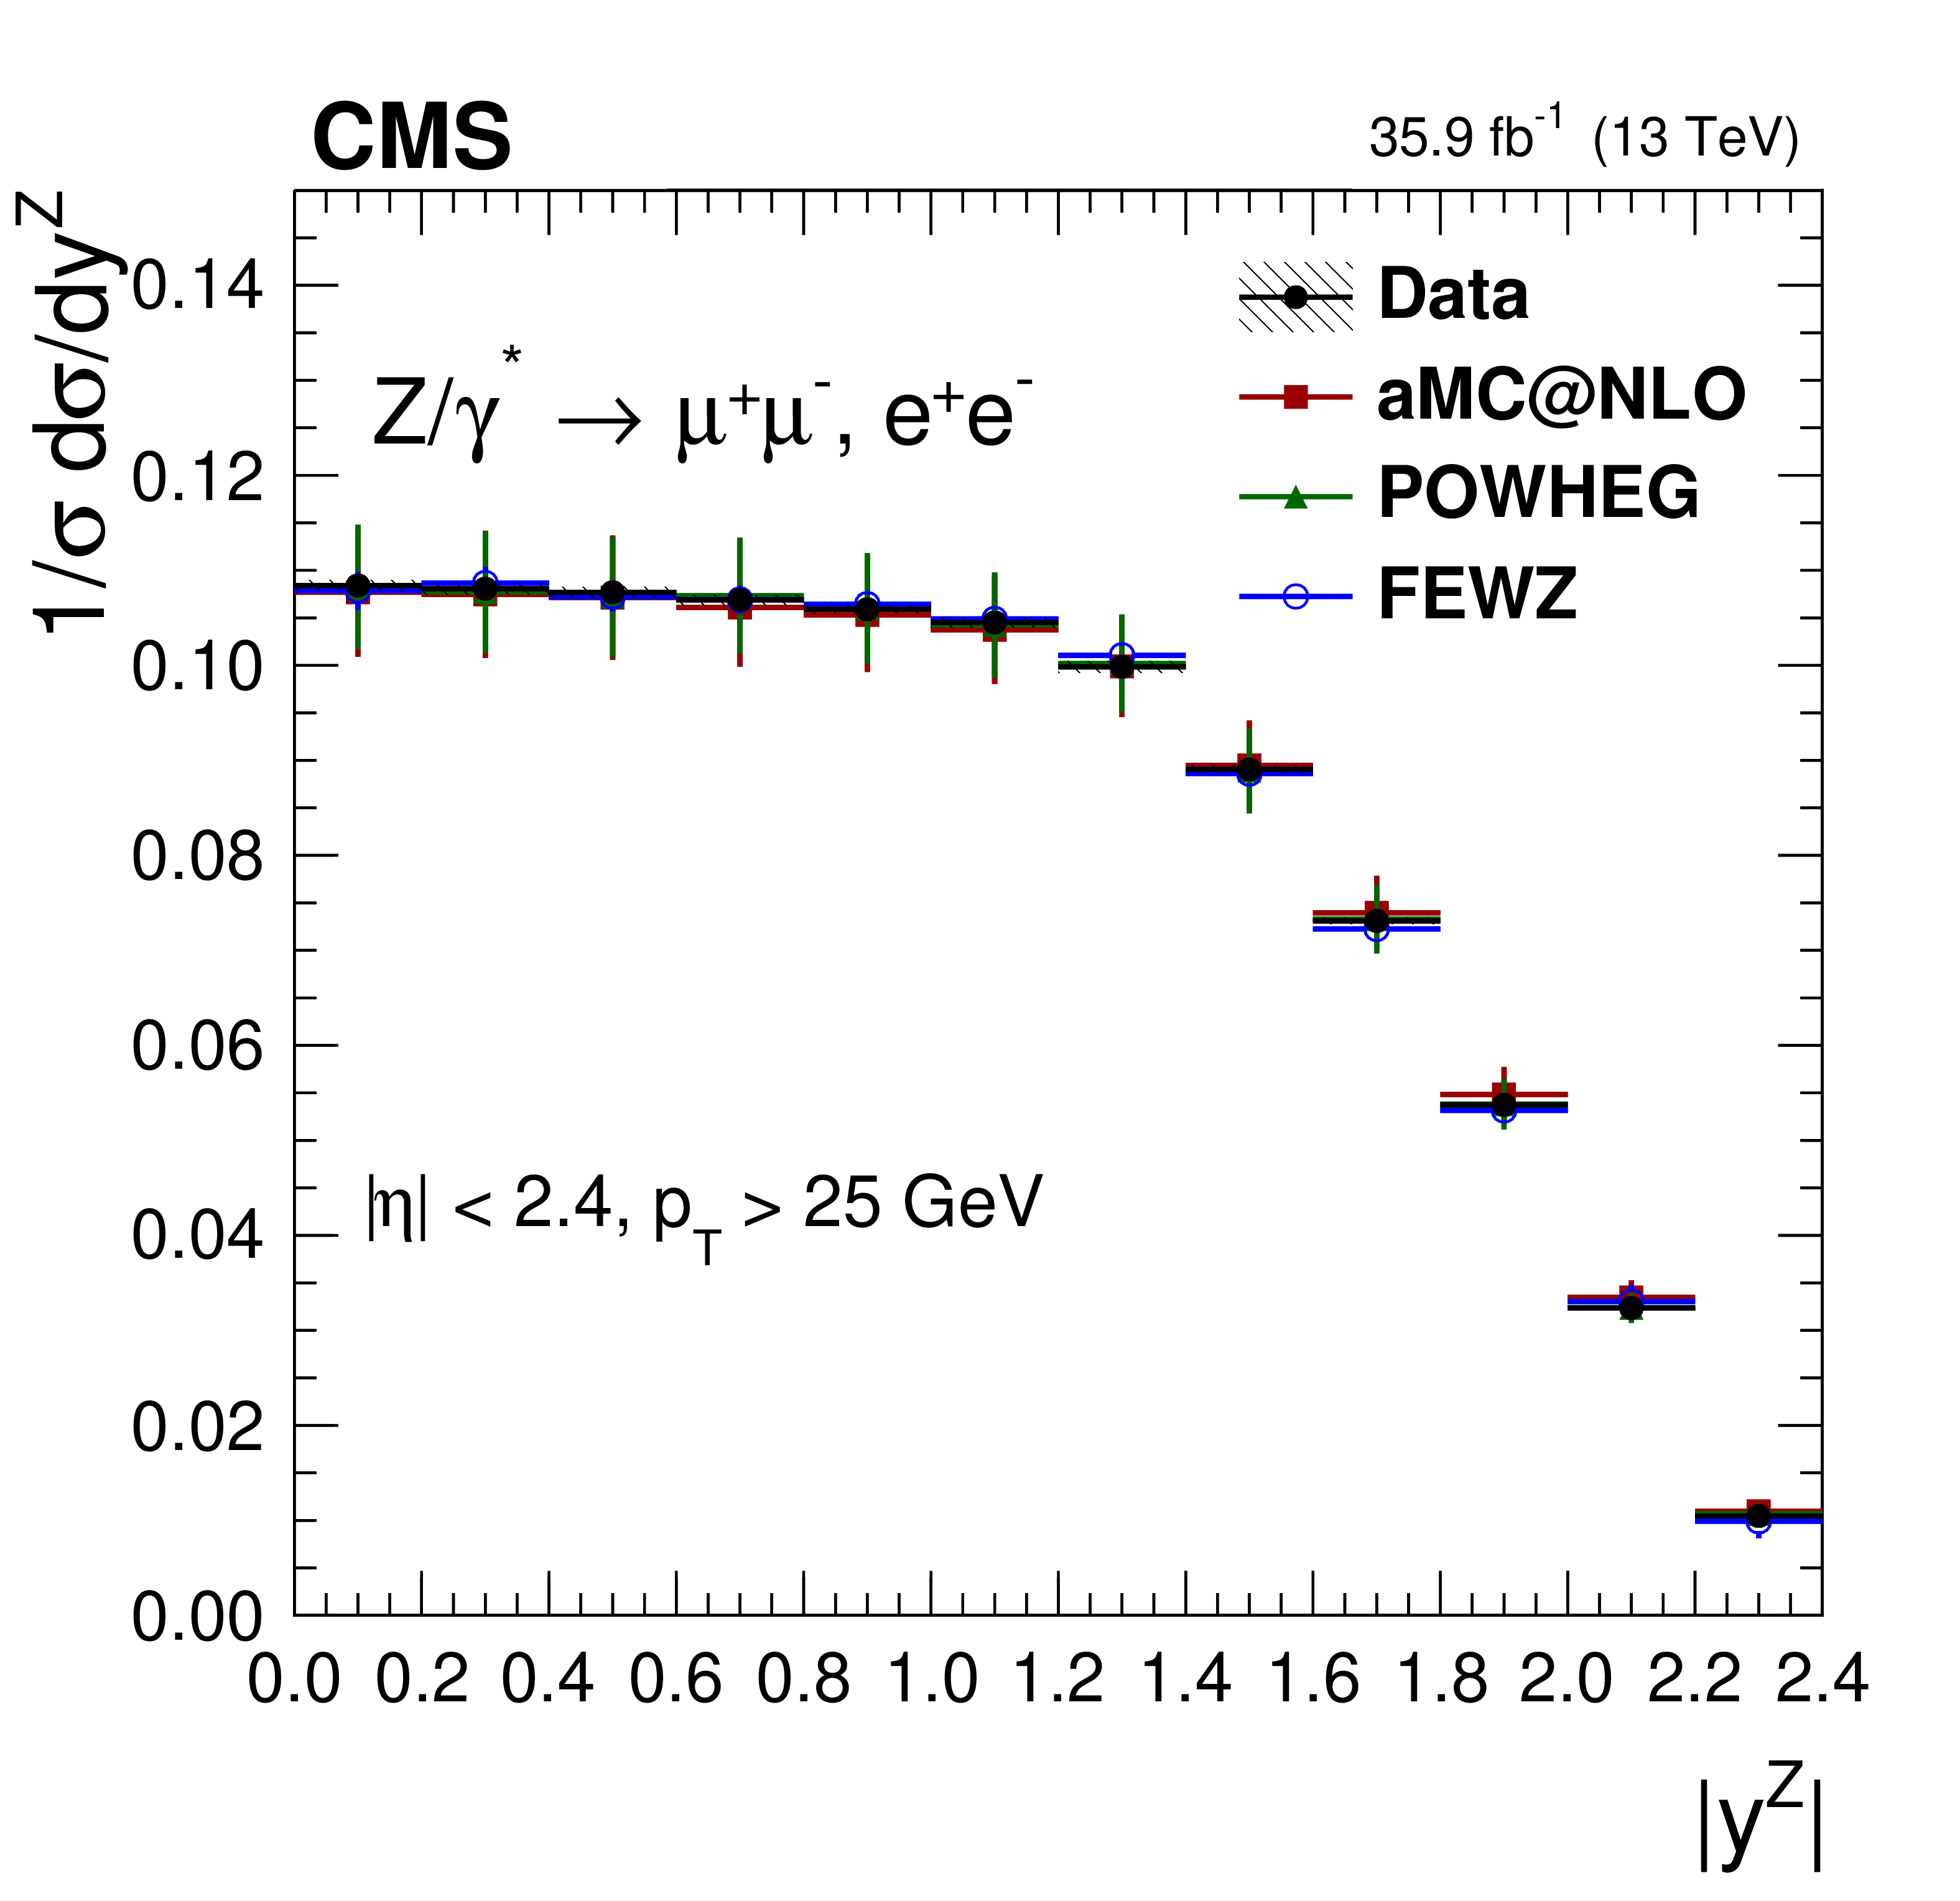
png pdf |
Figure 14-e:
The measured normalized cross sections in bins of $ {| {y}^{\mathrm{Z}} |}$ for the combined measurement. The shaded bands around the data points (black) correspond to the total experimental uncertainty. The $ {p_{\mathrm {T}}} ^{\mathrm{Z}}$ and $ {\phi ^{ *}_\eta}$ measurements are compared to the predictions with MadGraph 5_aMC@NLO (square red markers), POWHEG (green triangles), and POWHEG-MINLO (blue circles). The $ {| {y}^{\mathrm{Z}} |}$ measurement is compared to the predictions with MadGraph 5_aMC@NLO (square red markers), POWHEG (green triangles), and FEWZ (blue circles). The error bars around the predictions correspond to the combined statistical, PDF, and scale uncertainties. |
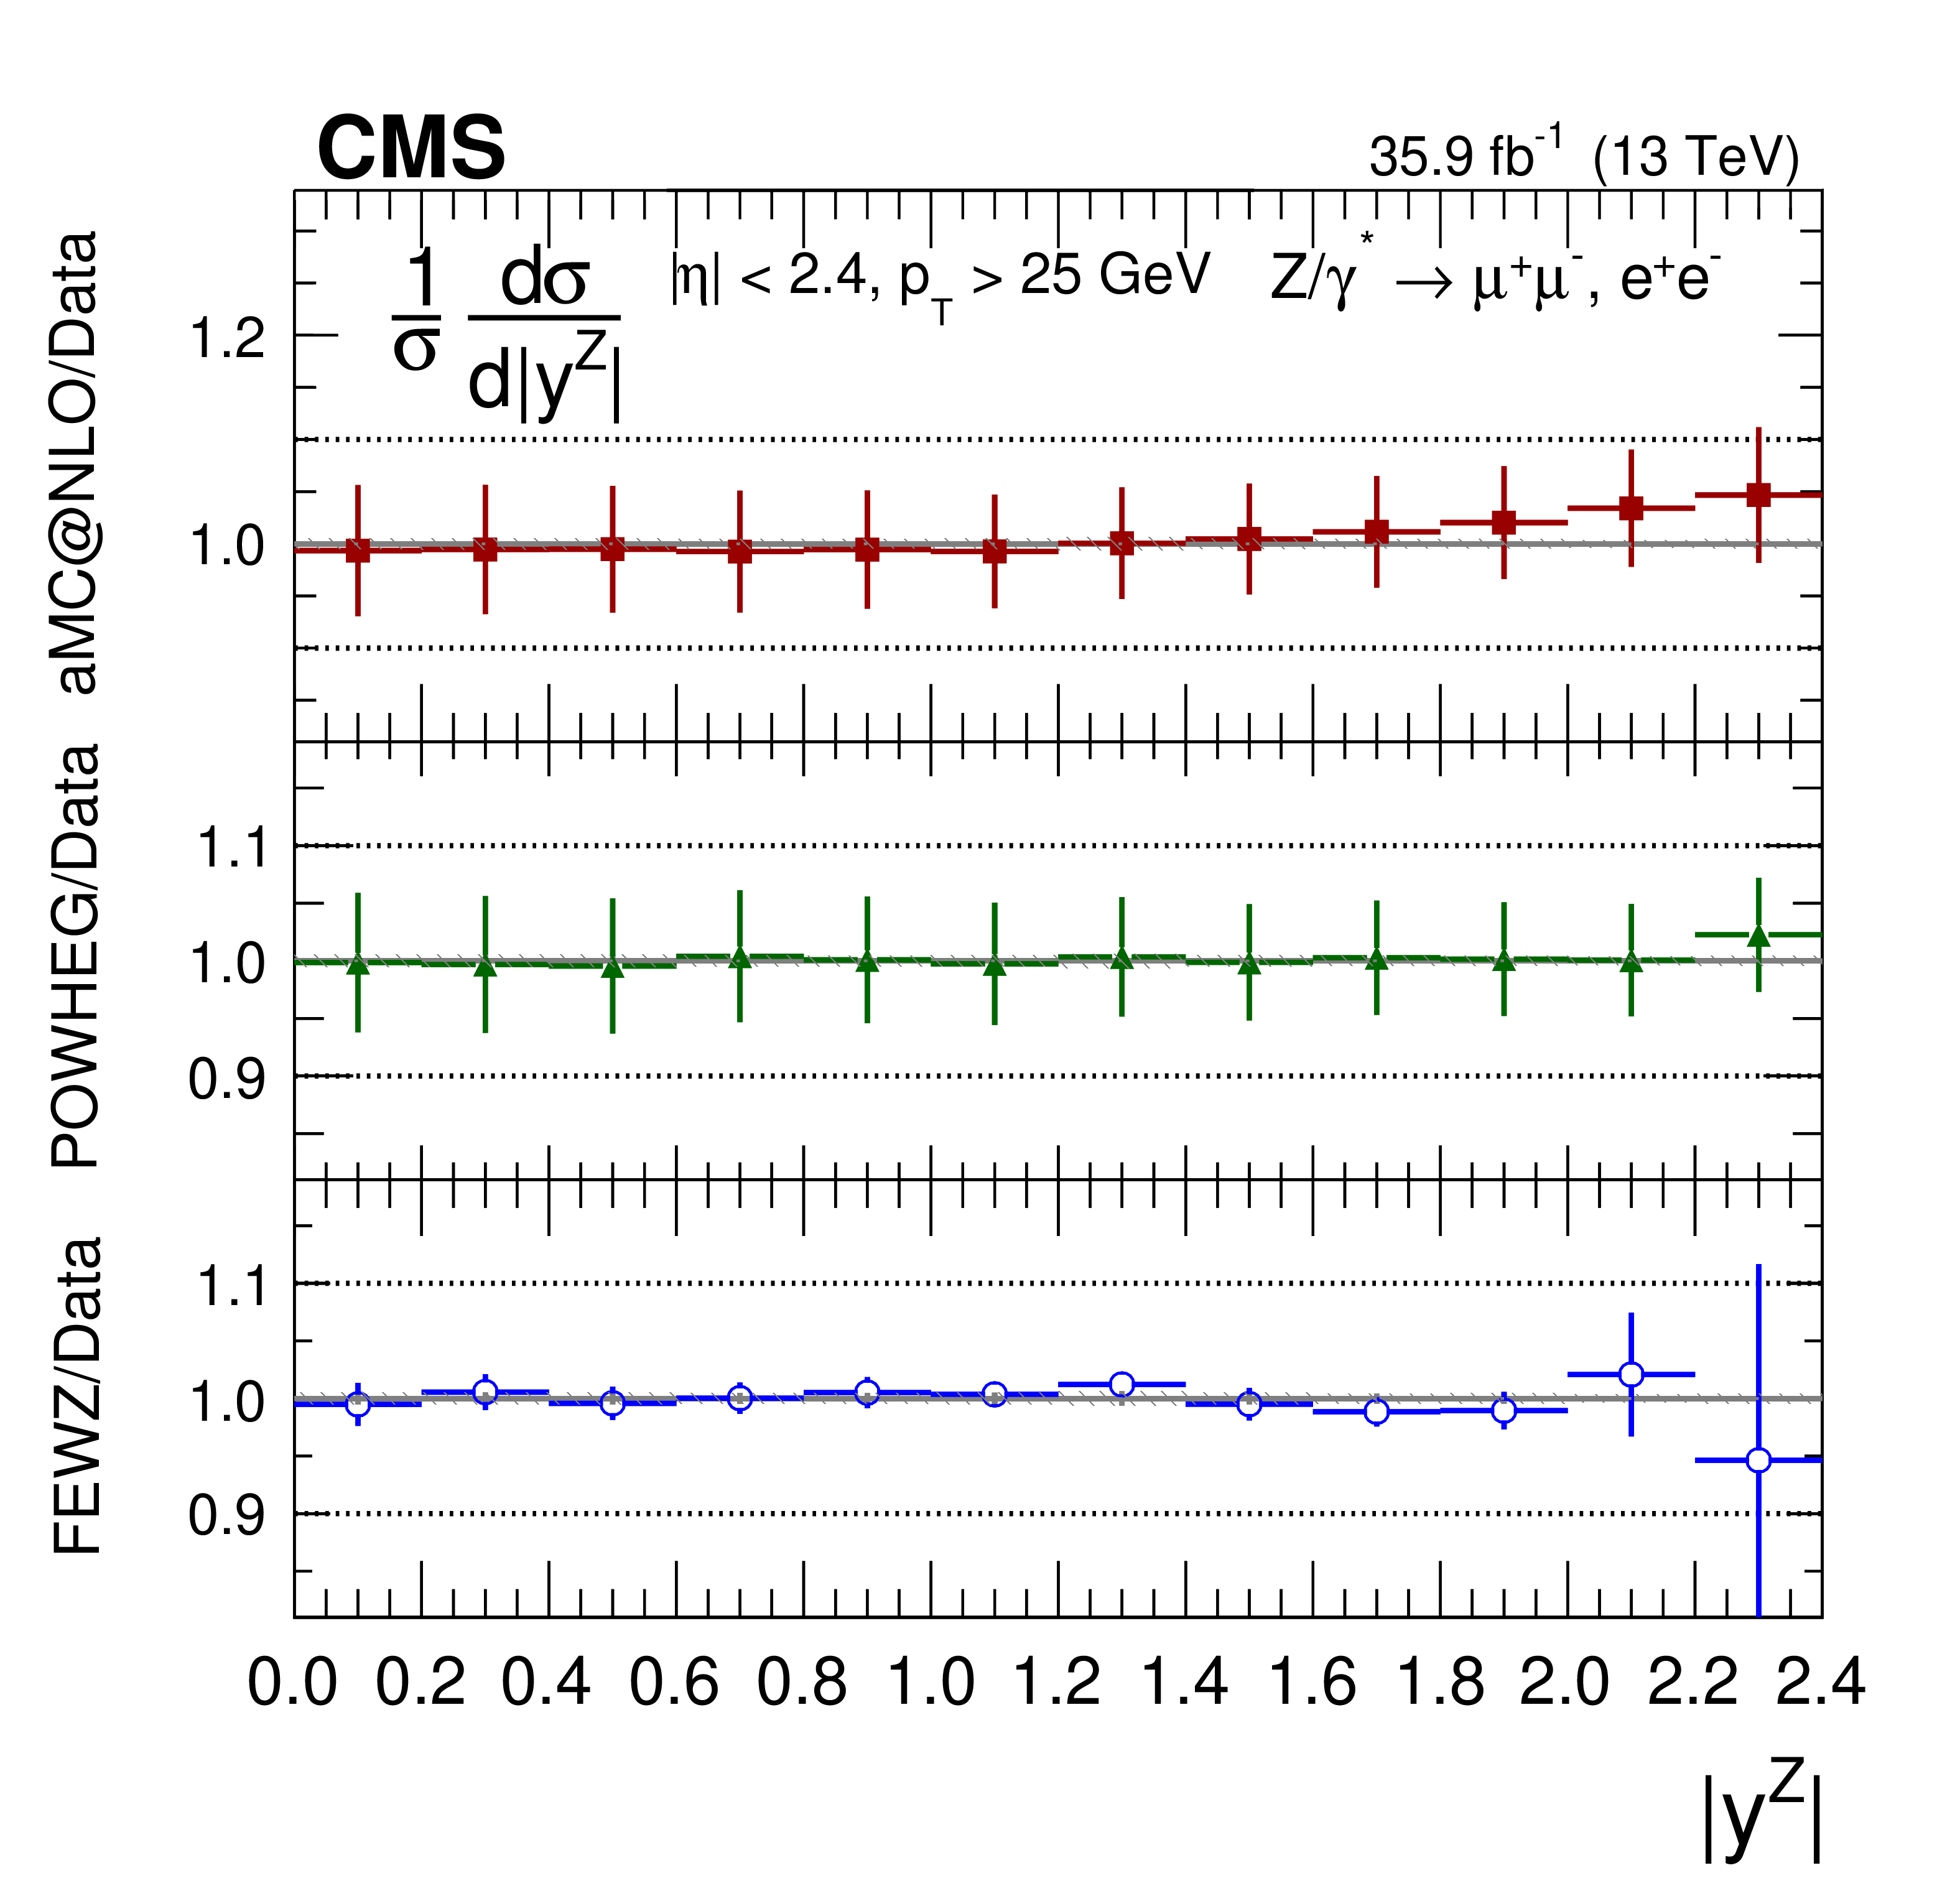
png pdf |
Figure 14-f:
The ratio of normalized cross section predictions to the data in bins of $ {| {y}^{\mathrm{Z}} |}$ for the combined measurement. The shaded bands around the data points (black) correspond to the total experimental uncertainty. The $ {p_{\mathrm {T}}} ^{\mathrm{Z}}$ and $ {\phi ^{ *}_\eta}$ measurements are compared to the predictions with MadGraph 5_aMC@NLO (square red markers), POWHEG (green triangles), and POWHEG-MINLO (blue circles). The $ {| {y}^{\mathrm{Z}} |}$ measurement is compared to the predictions with MadGraph 5_aMC@NLO (square red markers), POWHEG (green triangles), and FEWZ (blue circles). The error bars around the predictions correspond to the combined statistical, PDF, and scale uncertainties. |

png pdf |
Figure 15:
The measured normalized cross sections (left) in bins of $ {p_{\mathrm {T}}} ^{\mathrm{Z}}$ for the 0.0 $ < {| {y}^{\mathrm{Z}} |} < $ 0.4 region. The ratios of the predictions to the data are also shown (right). The shaded bands around the data points (black) correspond to the total experimental uncertainty. The measurement is compared to the predictions with MadGraph 5_aMC@NLO (square red markers), POWHEG (green triangles), and POWHEG-MINLO (blue circles). The error bands around the predictions correspond to the combined statistical, PDF, and scale uncertainties. |

png pdf |
Figure 15-a:
The measured normalized cross sections in bins of $ {p_{\mathrm {T}}} ^{\mathrm{Z}}$ for the 0.0 $ < {| {y}^{\mathrm{Z}} |} < $ 0.4 region. The shaded bands around the data points (black) correspond to the total experimental uncertainty. The measurement is compared to the predictions with MadGraph 5_aMC@NLO (square red markers), POWHEG (green triangles), and POWHEG-MINLO (blue circles). The error bands around the predictions correspond to the combined statistical, PDF, and scale uncertainties. |
png pdf |
Figure 15-b:
The ratios of normalized cross section predictions to the data in bins of $ {p_{\mathrm {T}}} ^{\mathrm{Z}}$ for the 0.0 $ < {| {y}^{\mathrm{Z}} |} < $ 0.4 region. The shaded bands around the data points (black) correspond to the total experimental uncertainty. The measurement is compared to the predictions with MadGraph 5_aMC@NLO (square red markers), POWHEG (green triangles), and POWHEG-MINLO (blue circles). The error bands around the predictions correspond to the combined statistical, PDF, and scale uncertainties. |

png pdf |
Figure 16:
The measured normalized cross sections (left) in bins of $ {p_{\mathrm {T}}} ^{\mathrm{Z}}$ for the 0.4 $ < {| {y}^{\mathrm{Z}} |} < $ 0.8 region. The ratios of the predictions to the data are also shown (right). The shaded bands around the data points (black) correspond to the total experimental uncertainty. The measurement is compared to the predictions with MadGraph 5_aMC@NLO (square red markers), POWHEG (green triangles), and POWHEG-MINLO (blue circles). The error bands around the predictions correspond to the combined statistical, PDF, and scale uncertainties. |
png pdf |
Figure 16-a:
The measured normalized cross sections in bins of $ {p_{\mathrm {T}}} ^{\mathrm{Z}}$ for the 0.4 $ < {| {y}^{\mathrm{Z}} |} < $ 0.8 region. The shaded bands around the data points (black) correspond to the total experimental uncertainty. The measurement is compared to the predictions with MadGraph 5_aMC@NLO (square red markers), POWHEG (green triangles), and POWHEG-MINLO (blue circles). The error bands around the predictions correspond to the combined statistical, PDF, and scale uncertainties. |

png pdf |
Figure 16-b:
The ratio of normalized cross section predictions to the data in bins of $ {p_{\mathrm {T}}} ^{\mathrm{Z}}$ for the 0.4 $ < {| {y}^{\mathrm{Z}} |} < $ 0.8 region. The shaded bands around the data points (black) correspond to the total experimental uncertainty. The measurement is compared to the predictions with MadGraph 5_aMC@NLO (square red markers), POWHEG (green triangles), and POWHEG-MINLO (blue circles). The error bands around the predictions correspond to the combined statistical, PDF, and scale uncertainties. |
png pdf |
Figure 17:
The measured normalized cross sections (left) in bins of $ {p_{\mathrm {T}}} ^{\mathrm{Z}}$ for the 0.8 $ < {| {y}^{\mathrm{Z}} |} < $ 1.2 region. The ratios of the predictions to the data are also shown (right). The shaded bands around the data points (black) correspond to the total experimental uncertainty. The measurement is compared to the predictions with MadGraph 5_aMC@NLO (square red markers), POWHEG (green triangles), and POWHEG-MINLO (blue circles). The error bands around the predictions correspond to the combined statistical, PDF, and scale uncertainties. |

png pdf |
Figure 17-a:
The measured normalized cross sections in bins of $ {p_{\mathrm {T}}} ^{\mathrm{Z}}$ for the 0.8 $ < {| {y}^{\mathrm{Z}} |} < $ 1.2 region. The shaded bands around the data points (black) correspond to the total experimental uncertainty. The measurement is compared to the predictions with MadGraph 5_aMC@NLO (square red markers), POWHEG (green triangles), and POWHEG-MINLO (blue circles). The error bands around the predictions correspond to the combined statistical, PDF, and scale uncertainties. |
png pdf |
Figure 17-b:
The ratio of normalized cross section predictions to the data in bins of $ {p_{\mathrm {T}}} ^{\mathrm{Z}}$ for the 0.8 $ < {| {y}^{\mathrm{Z}} |} < $ 1.2 region. The shaded bands around the data points (black) correspond to the total experimental uncertainty. The measurement is compared to the predictions with MadGraph 5_aMC@NLO (square red markers), POWHEG (green triangles), and POWHEG-MINLO (blue circles). The error bands around the predictions correspond to the combined statistical, PDF, and scale uncertainties. |

png pdf |
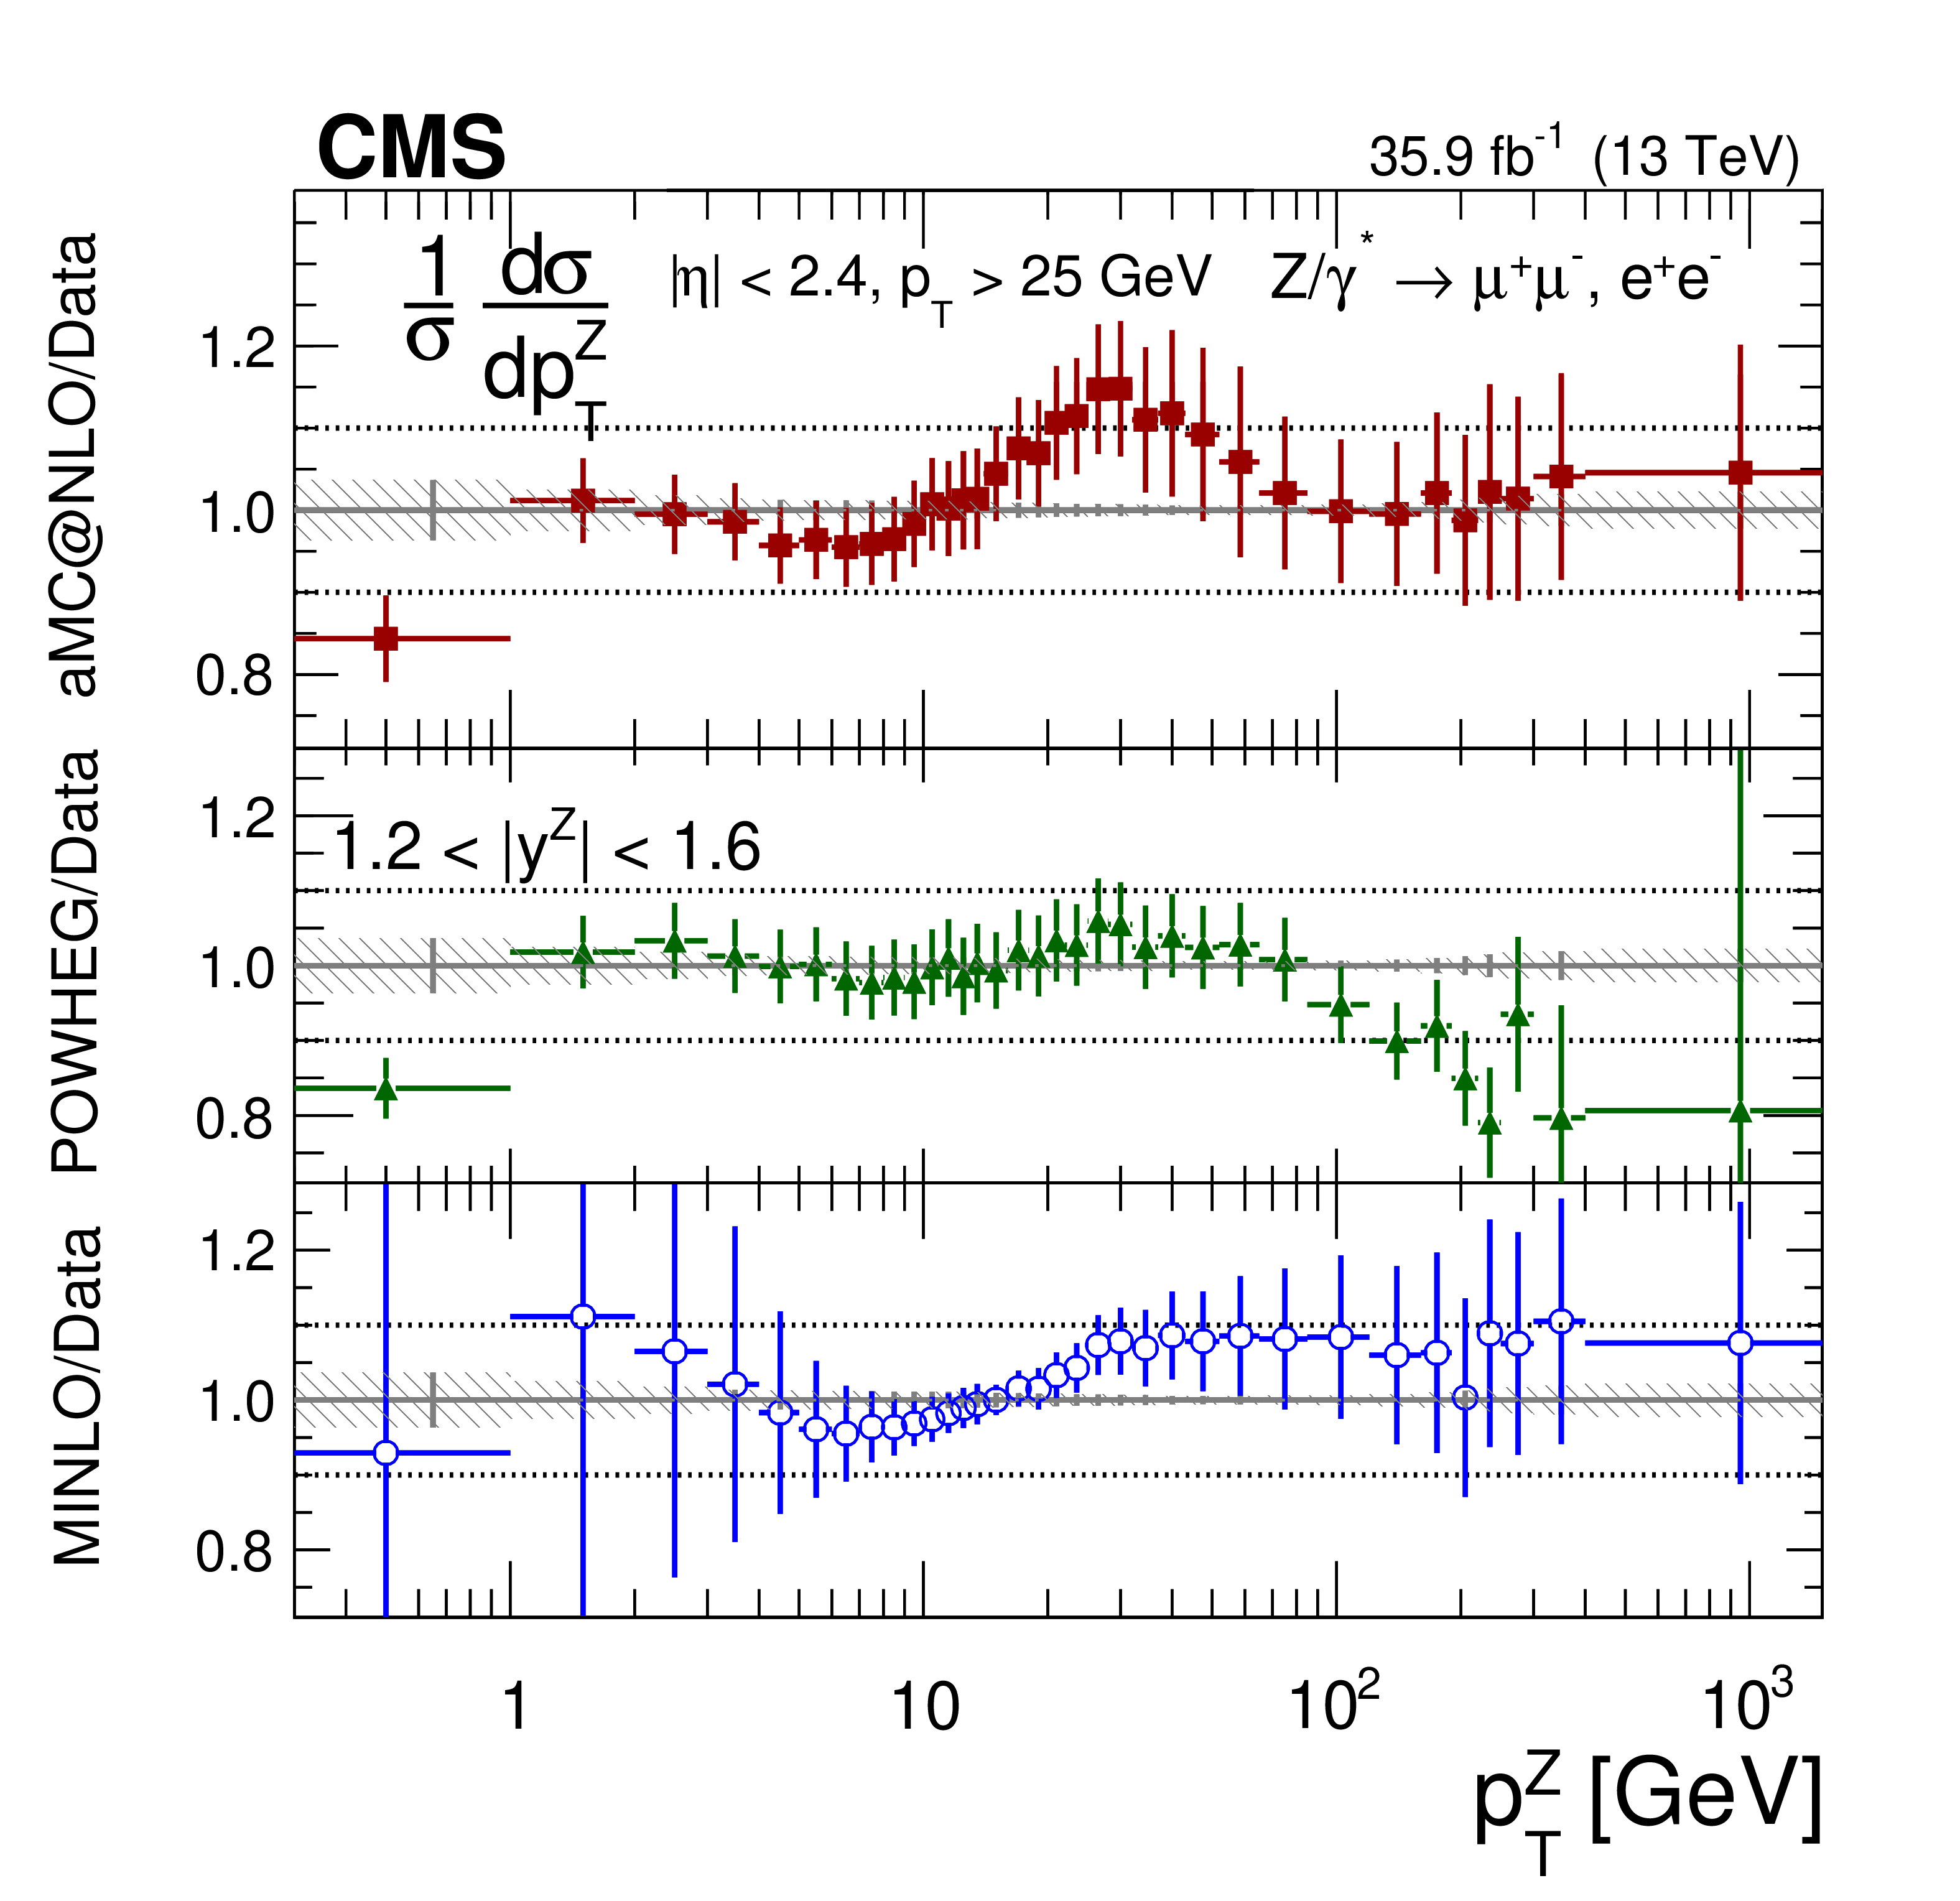
Figure 18:
The measured normalized cross sections (left) in bins of $ {p_{\mathrm {T}}} ^{\mathrm{Z}}$ for the 1.2 $ < {| {y}^{\mathrm{Z}} |} < $ 1.6 region. The ratios of the predictions to the data are also shown (right). The shaded bands around the data points (black) correspond to the total experimental uncertainty. The measurement is compared to the predictions with MadGraph 5_aMC@NLO (square red markers), POWHEG (green triangles), and POWHEG-MINLO (blue circles). The error bands around the predictions correspond to the combined statistical, PDF, and scale uncertainties. |

png pdf |
Figure 18-a:
The measured normalized cross sections in bins of $ {p_{\mathrm {T}}} ^{\mathrm{Z}}$ for the 1.2 $ < {| {y}^{\mathrm{Z}} |} < $ 1.6 region. The shaded bands around the data points (black) correspond to the total experimental uncertainty. The measurement is compared to the predictions with MadGraph 5_aMC@NLO (square red markers), POWHEG (green triangles), and POWHEG-MINLO (blue circles). The error bands around the predictions correspond to the combined statistical, PDF, and scale uncertainties. |
png pdf |
Figure 18-b:
The ratio of normalized cross section predictions to the data in bins of $ {p_{\mathrm {T}}} ^{\mathrm{Z}}$ for the 1.2 $ < {| {y}^{\mathrm{Z}} |} < $ 1.6 region. The shaded bands around the data points (black) correspond to the total experimental uncertainty. The measurement is compared to the predictions with MadGraph 5_aMC@NLO (square red markers), POWHEG (green triangles), and POWHEG-MINLO (blue circles). The error bands around the predictions correspond to the combined statistical, PDF, and scale uncertainties. |
png pdf |
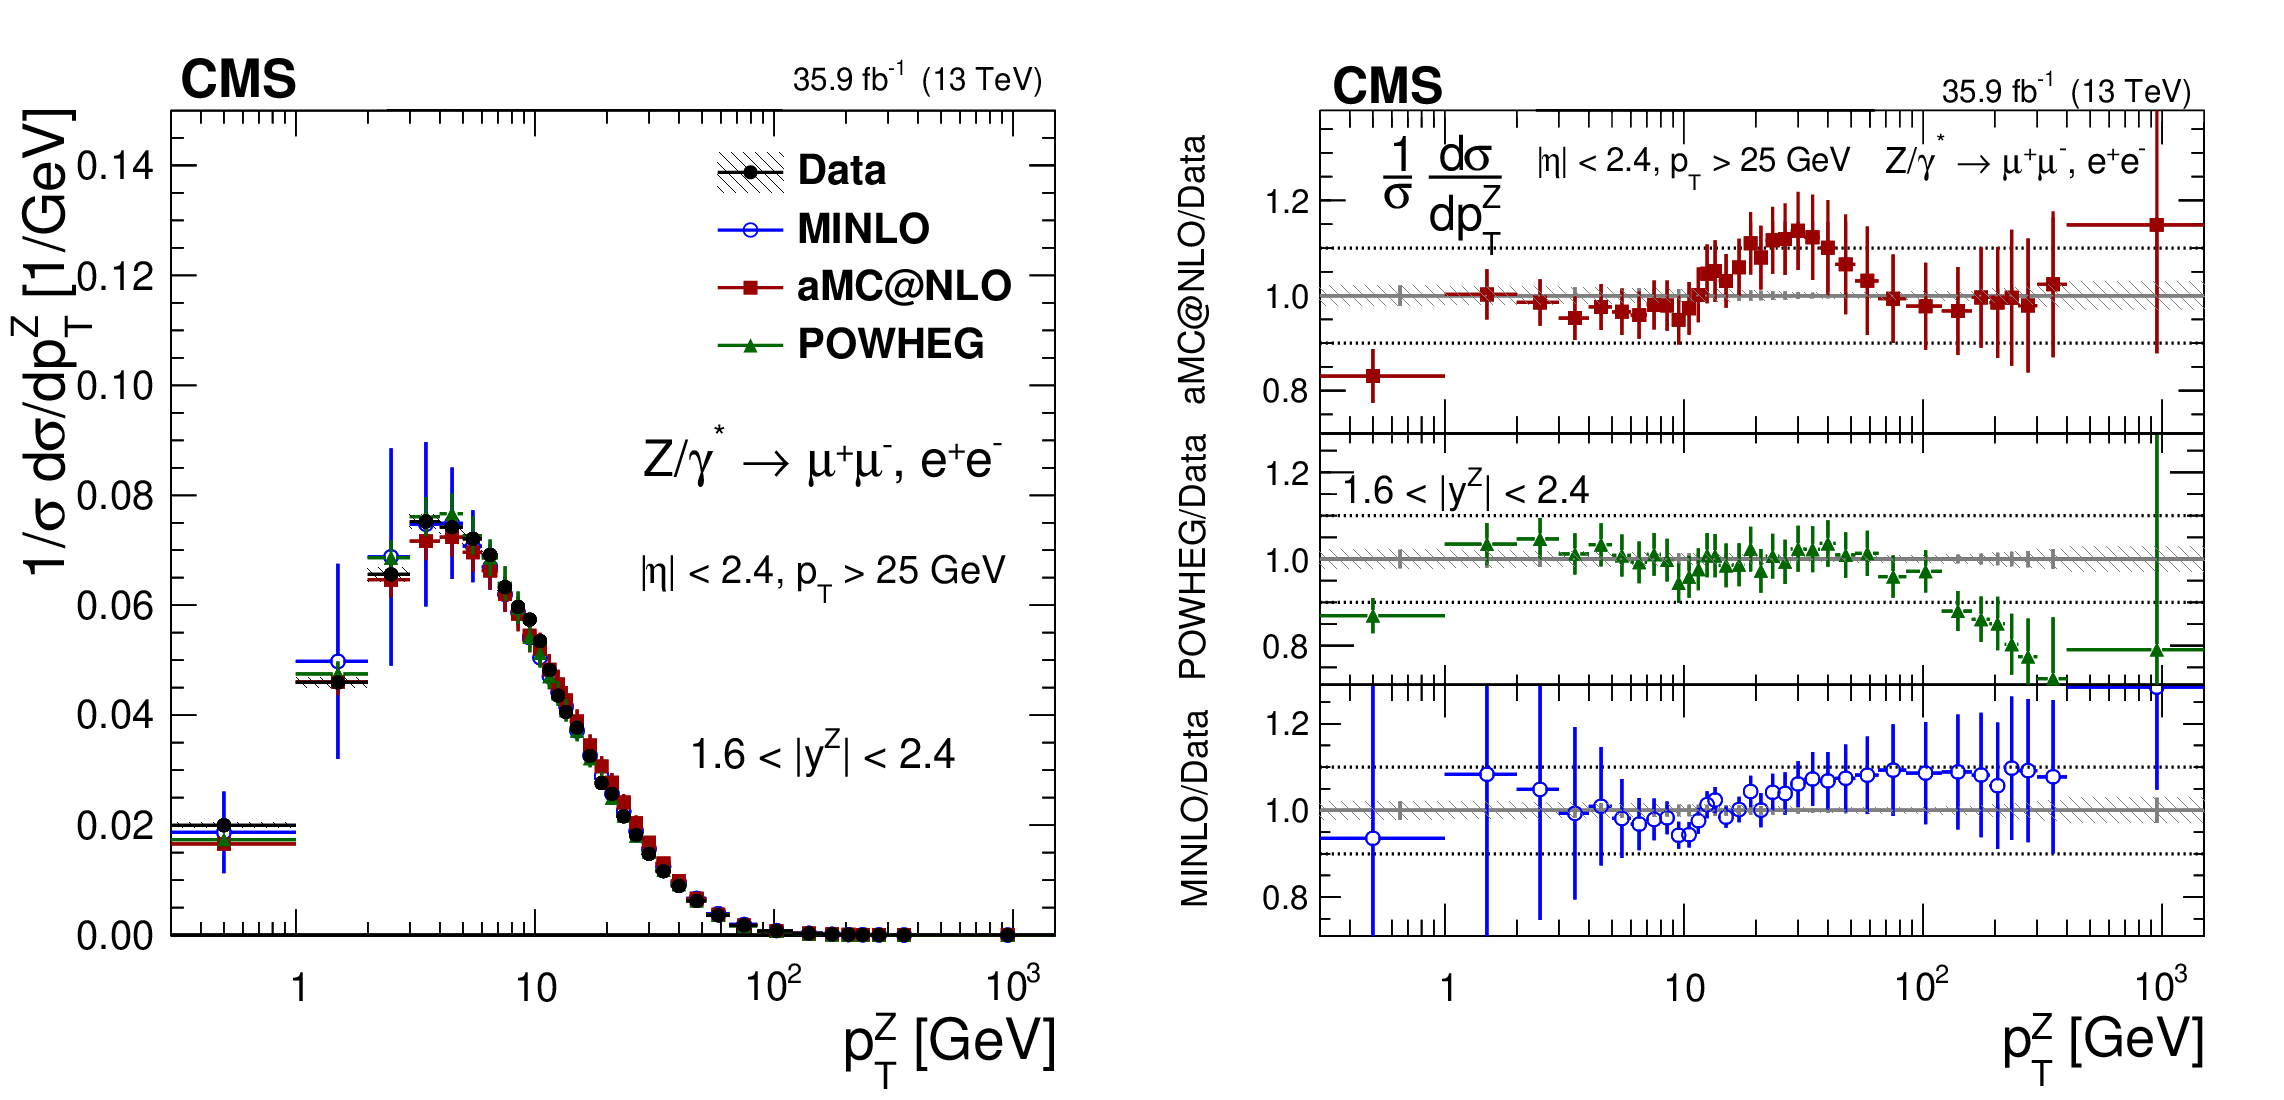
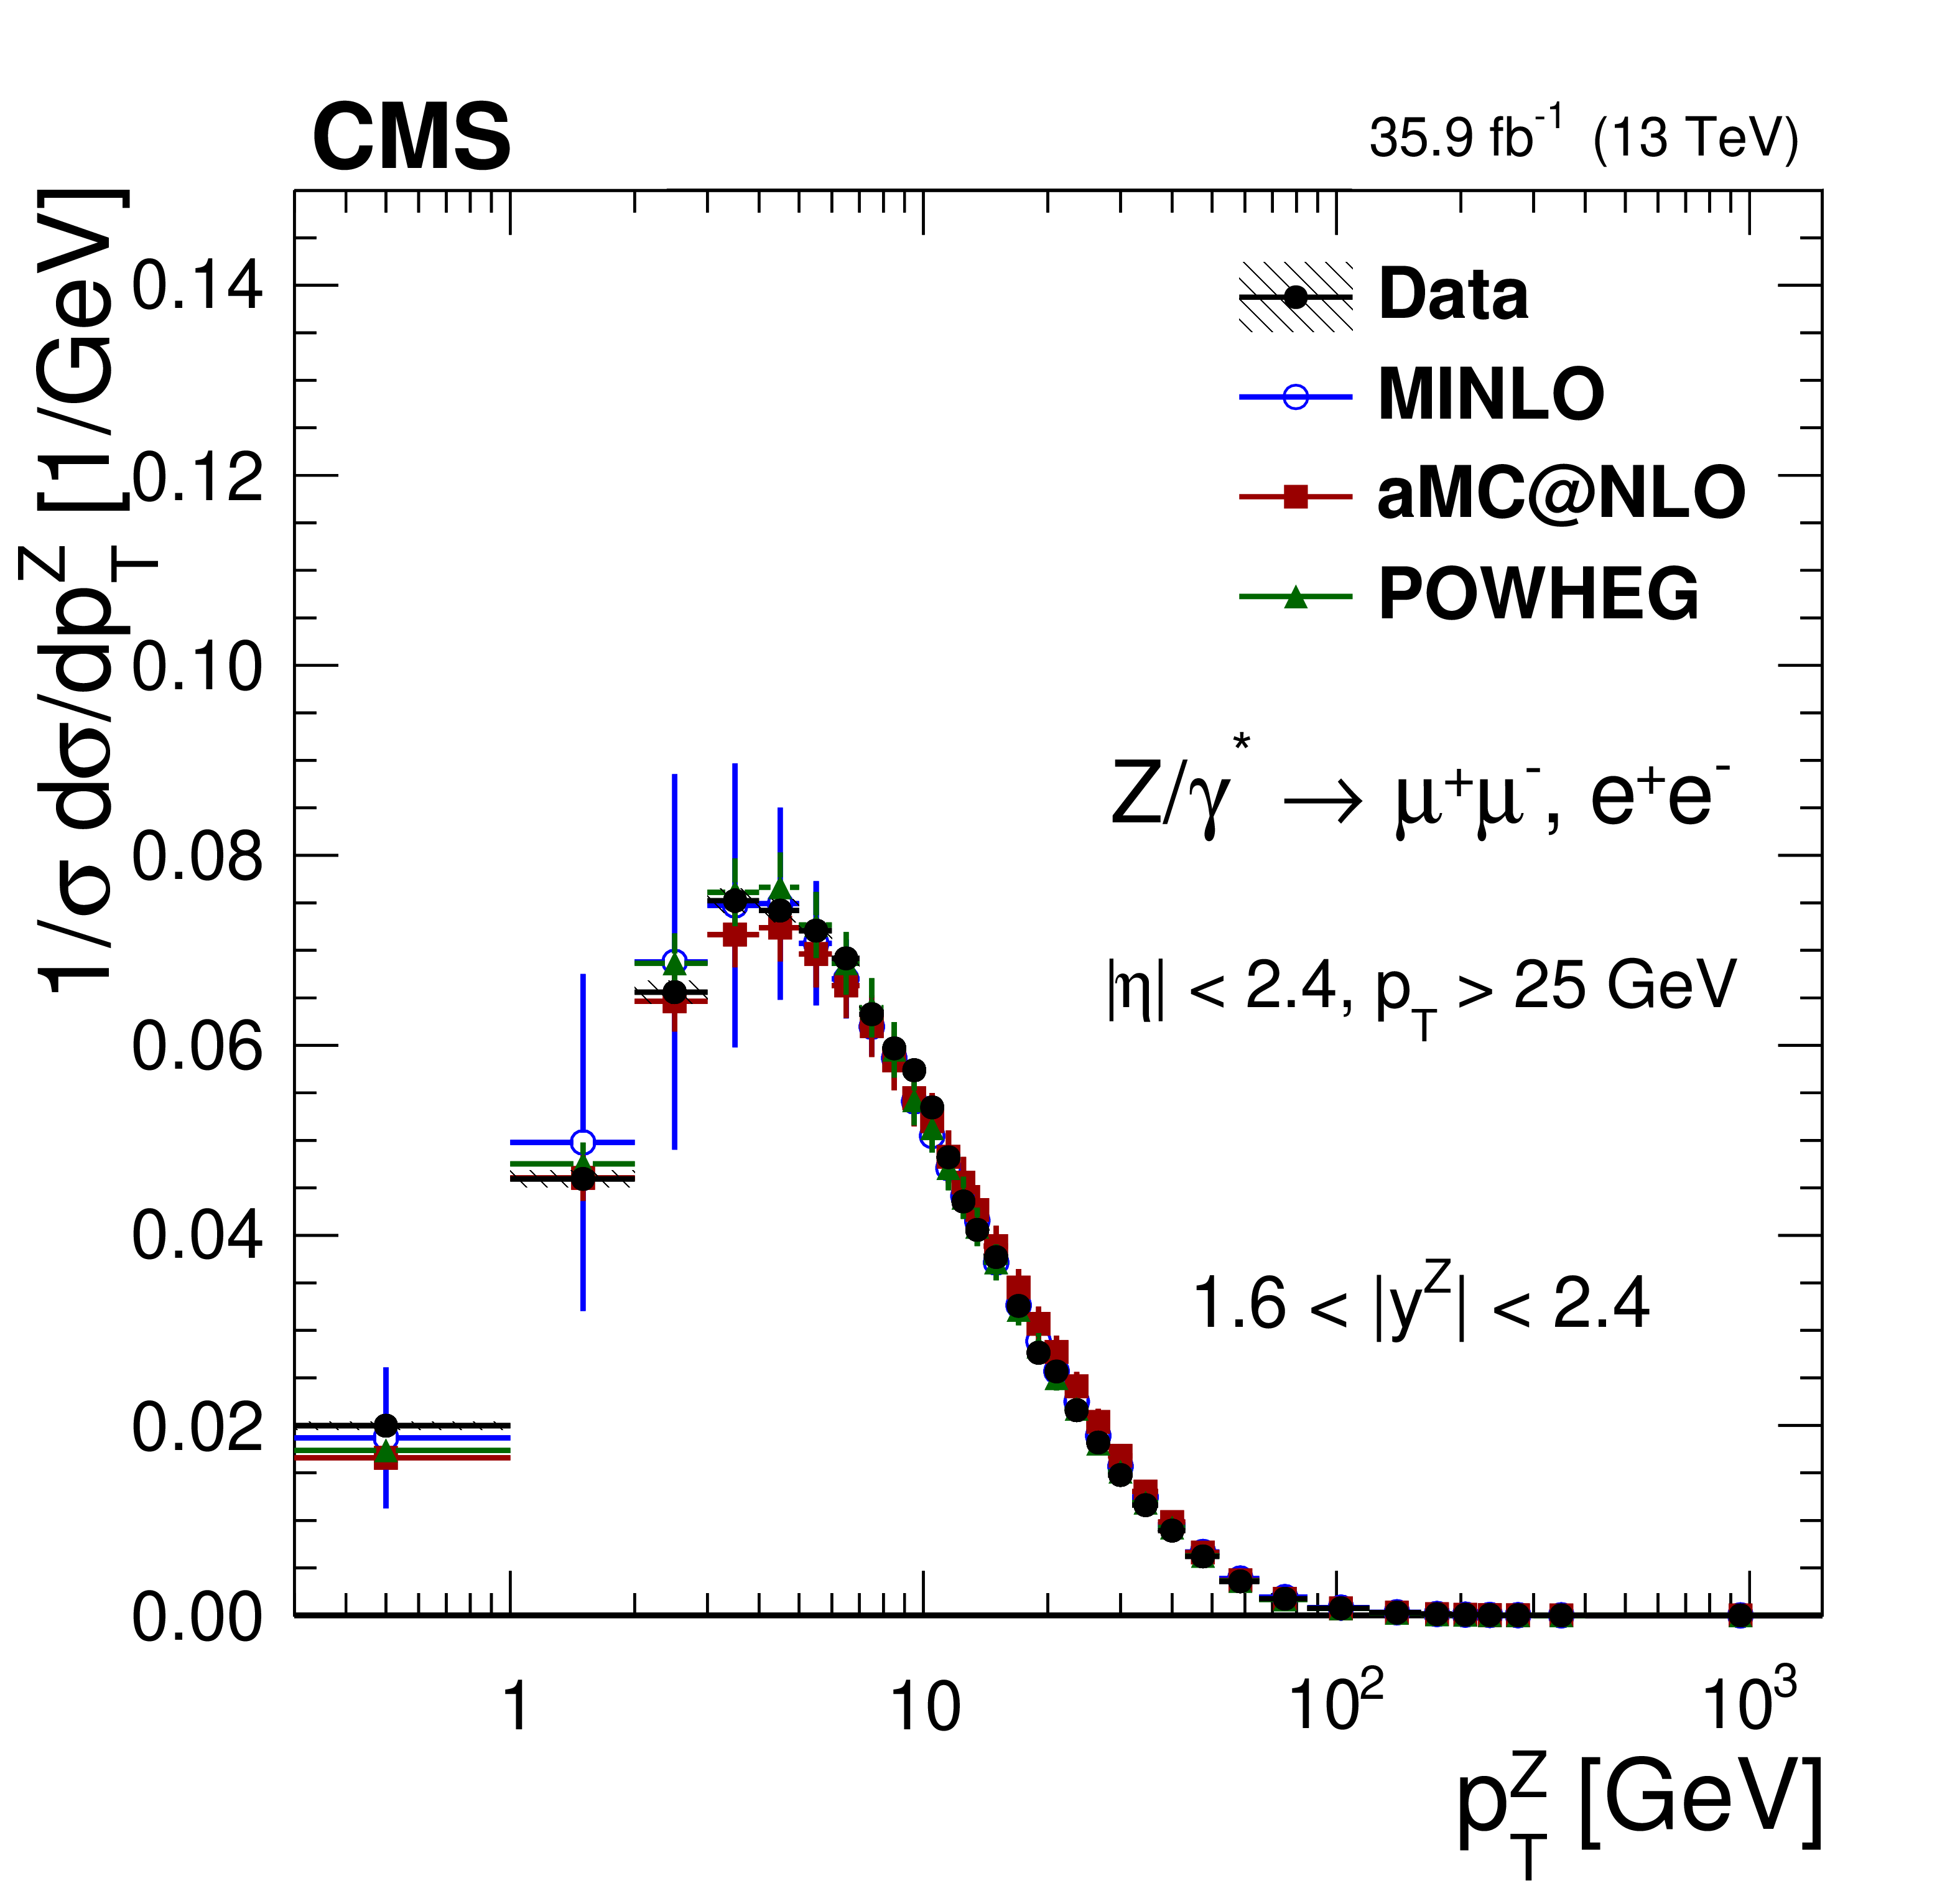
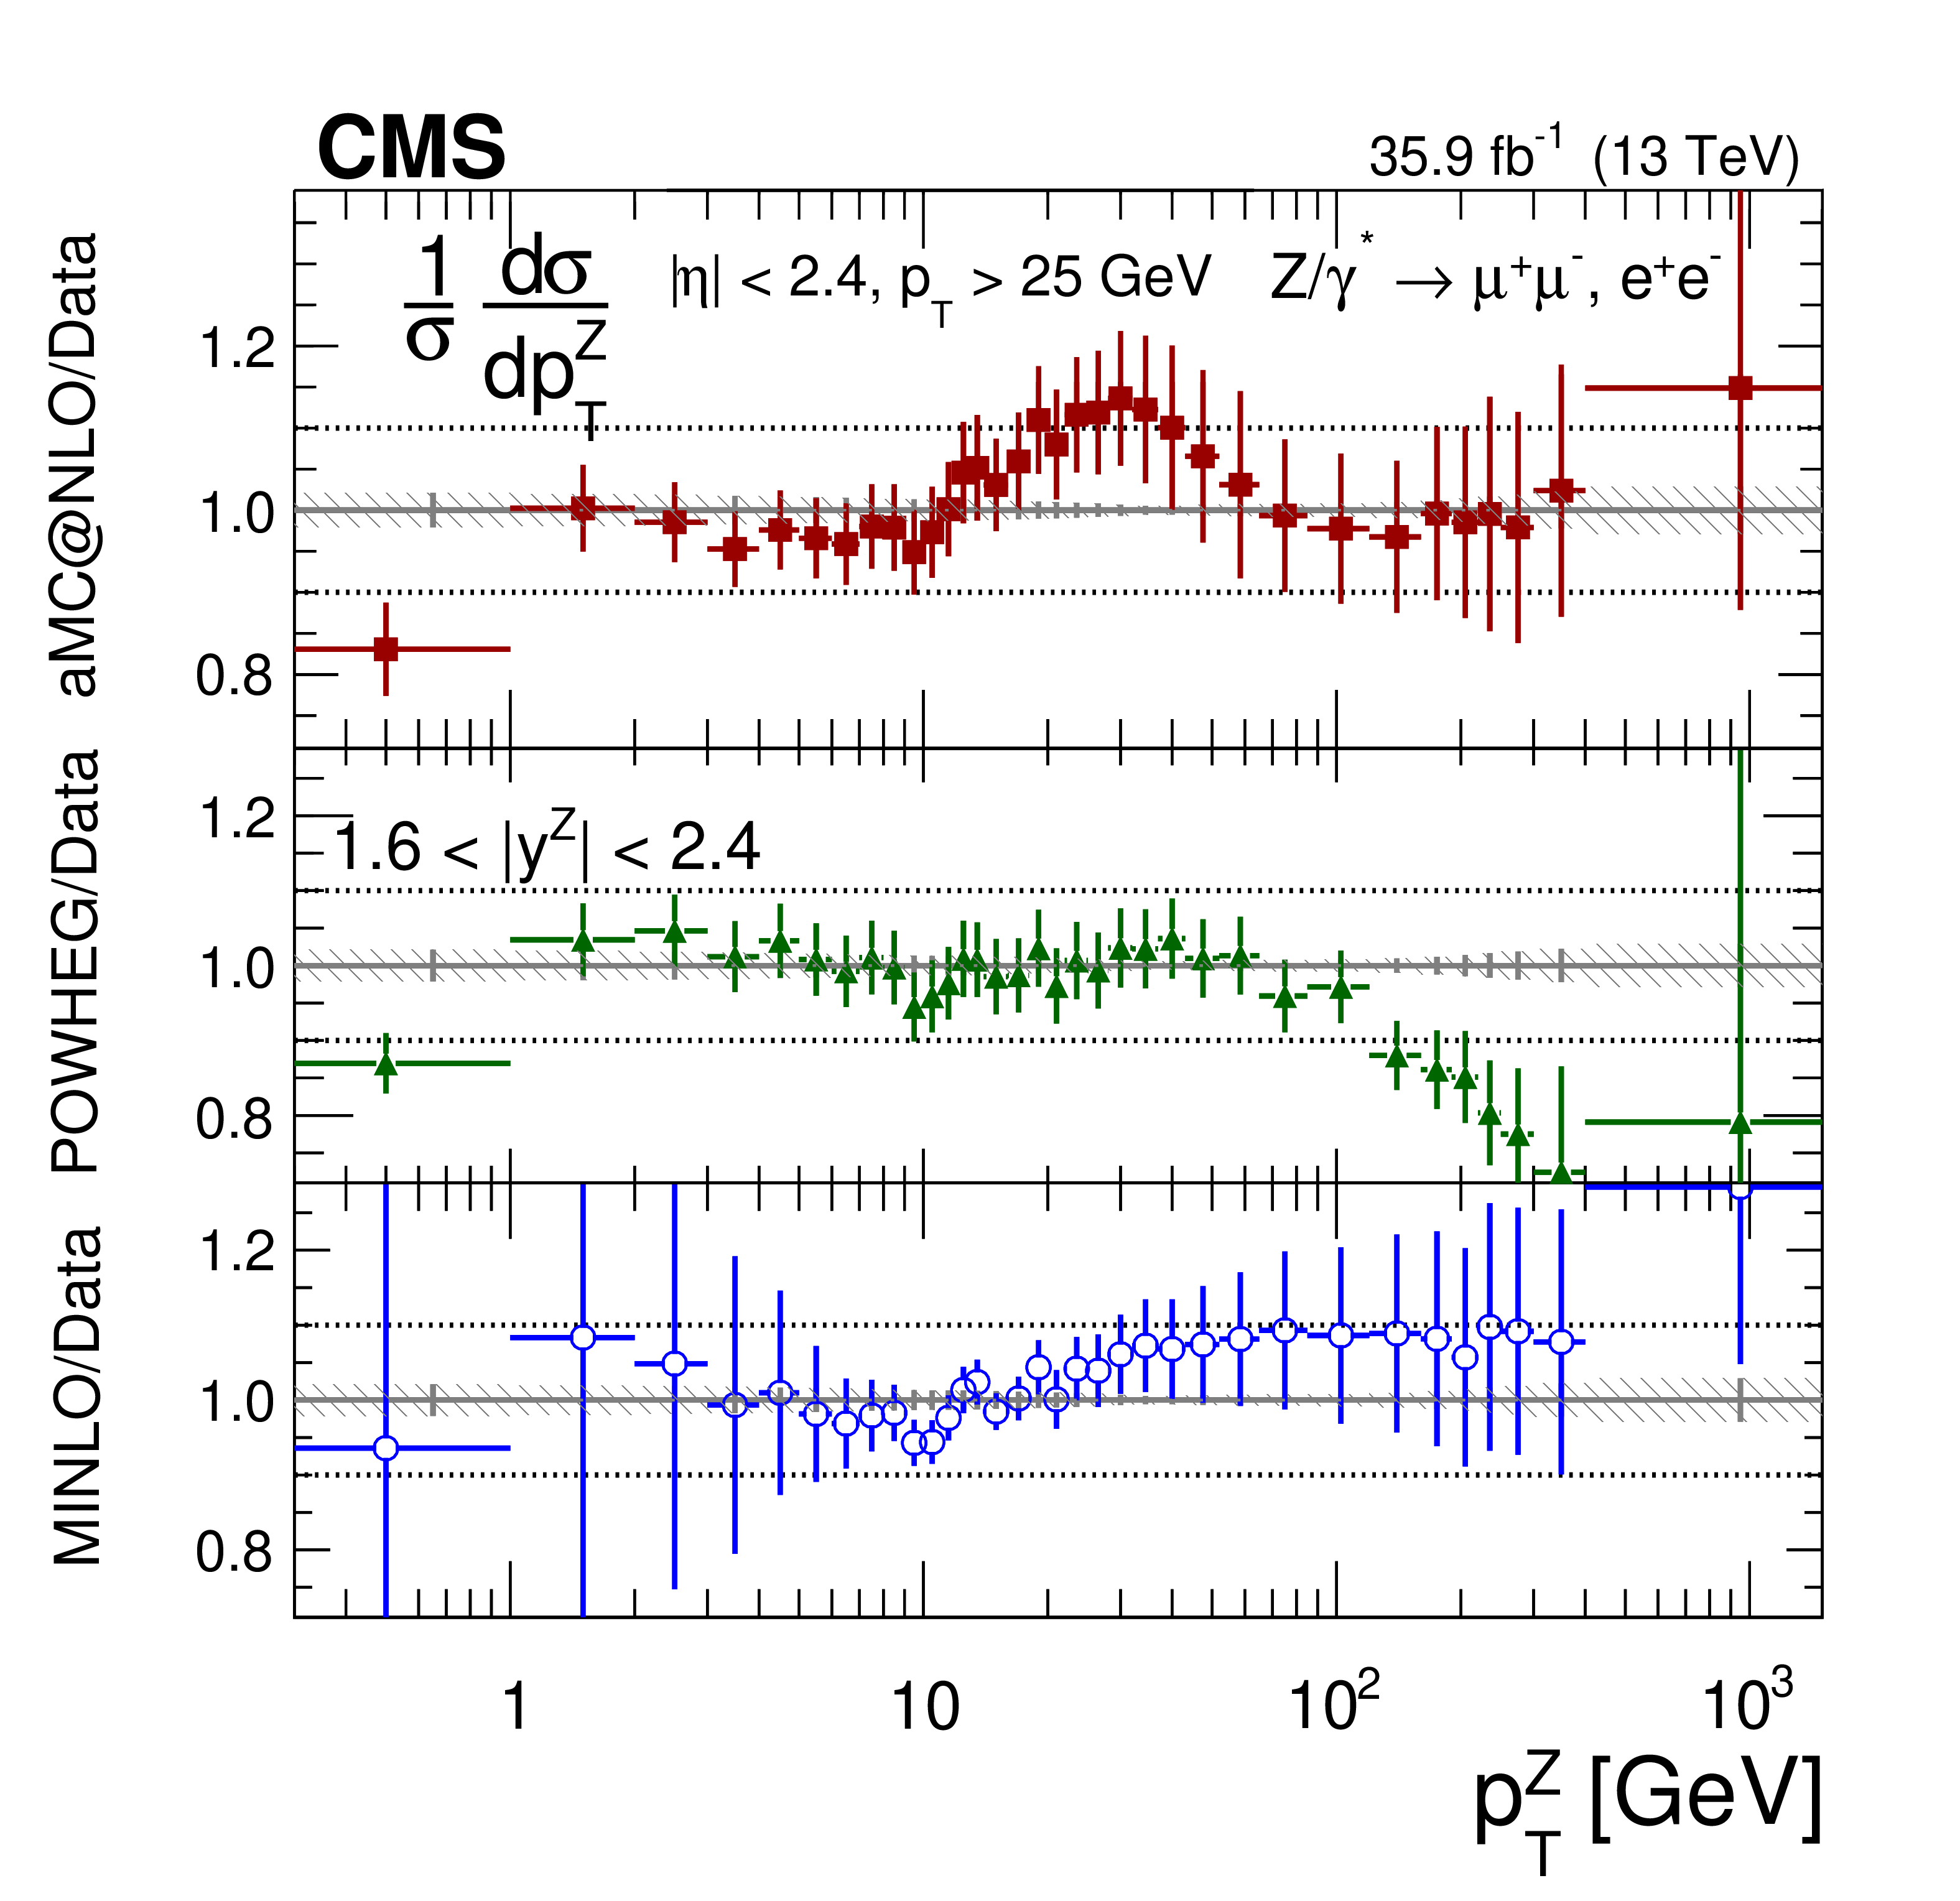
Figure 19:
The measured normalized cross sections (left) in bins of $ {p_{\mathrm {T}}} ^{\mathrm{Z}}$ for the 1.6 $ < {| {y}^{\mathrm{Z}} |} < $ 2.4 region. The ratios of the predictions to the data are also shown (right). The shaded bands around the data points (black) correspond to the total experimental uncertainty. The measurement is compared to the predictions with MadGraph 5_aMC@NLO (square red markers), POWHEG (green triangles), and POWHEG-MINLO (blue circles). The error bands around the predictions correspond to the combined statistical, PDF, and scale uncertainties. |
png pdf |
Figure 19-a:
The measured normalized cross sections in bins of $ {p_{\mathrm {T}}} ^{\mathrm{Z}}$ for the 1.6 $ < {| {y}^{\mathrm{Z}} |} < $ 2.4 region. The shaded bands around the data points (black) correspond to the total experimental uncertainty. The measurement is compared to the predictions with MadGraph 5_aMC@NLO (square red markers), POWHEG (green triangles), and POWHEG-MINLO (blue circles). The error bands around the predictions correspond to the combined statistical, PDF, and scale uncertainties. |
png pdf |
Figure 19-b:
The ratio of normalized cross section predictions to the data in bins of $ {p_{\mathrm {T}}} ^{\mathrm{Z}}$ for the 1.6 $ < {| {y}^{\mathrm{Z}} |} < $ 2.4 region. The shaded bands around the data points (black) correspond to the total experimental uncertainty. The measurement is compared to the predictions with MadGraph 5_aMC@NLO (square red markers), POWHEG (green triangles), and POWHEG-MINLO (blue circles). The error bands around the predictions correspond to the combined statistical, PDF, and scale uncertainties. |
| Tables | |

png pdf |
Table 1:
Summary of data, expected signal, and background yields after the full selection. The predicted signal yields are quoted using MadGraph 5_aMC@NLO. The statistical uncertainties in the simulated samples are below 0.1%. |

png pdf |
Table 2:
Summary of the systematic uncertainties for the inclusive fiducial cross section measurements. |
png pdf |
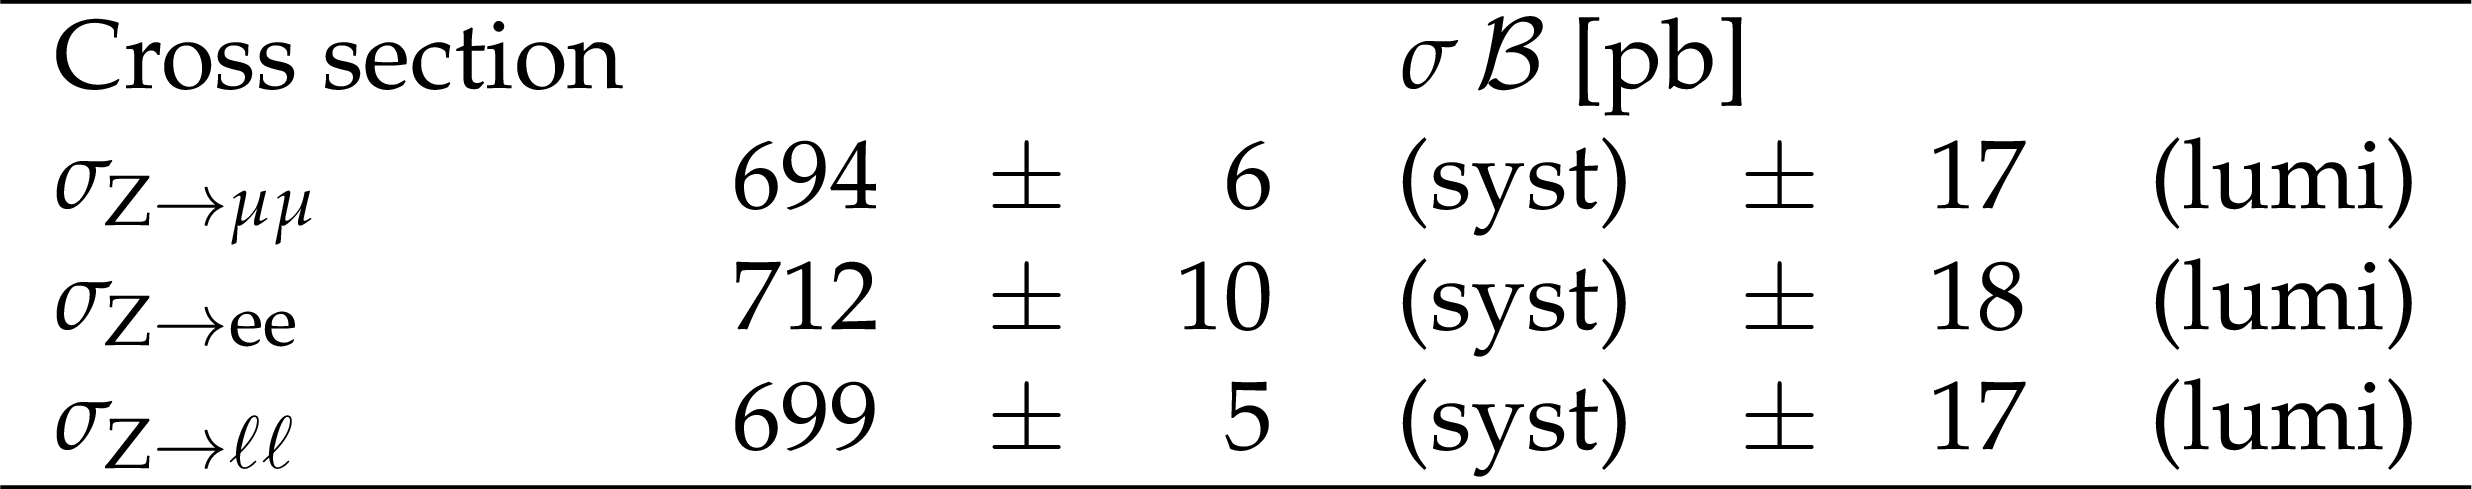
Table 3:
The measured inclusive fiducial cross sections in the dimuon and dielectron final states. The combined measurement is also shown. $\mathcal {B}$ is the $\mathrm{Z} \to \ell \ell $ branching fraction. |
| Summary |
| Measurements are reported of the differential cross sections for Z bosons produced in proton-proton collisions at $\sqrt{s}$ = 13 TeV and decaying to muons and electrons. The data set used corresponds to an integrated luminosity of 35.9 fb$^{-1}$ . Distributions of the transverse momentum ${p_{\mathrm{T}}}$, the angular variable $\phi^{*}$, and the rapidity of lepton pairs are measured. The results are corrected for detector effects and compared to various theoretical predictions. The measurements provide sensitive tests of theoretical predictions using fixed-order, resummed, and parton shower calculations. The uncertainties in the normalized cross section measurements are smaller than 0.5% for ${\phi^{ *}_\eta} < $ 0.5 and for ${p_{\mathrm{T}}}^{\mathrm{Z}} < $ 50 GeV. |
| Additional Figures | |
png pdf |
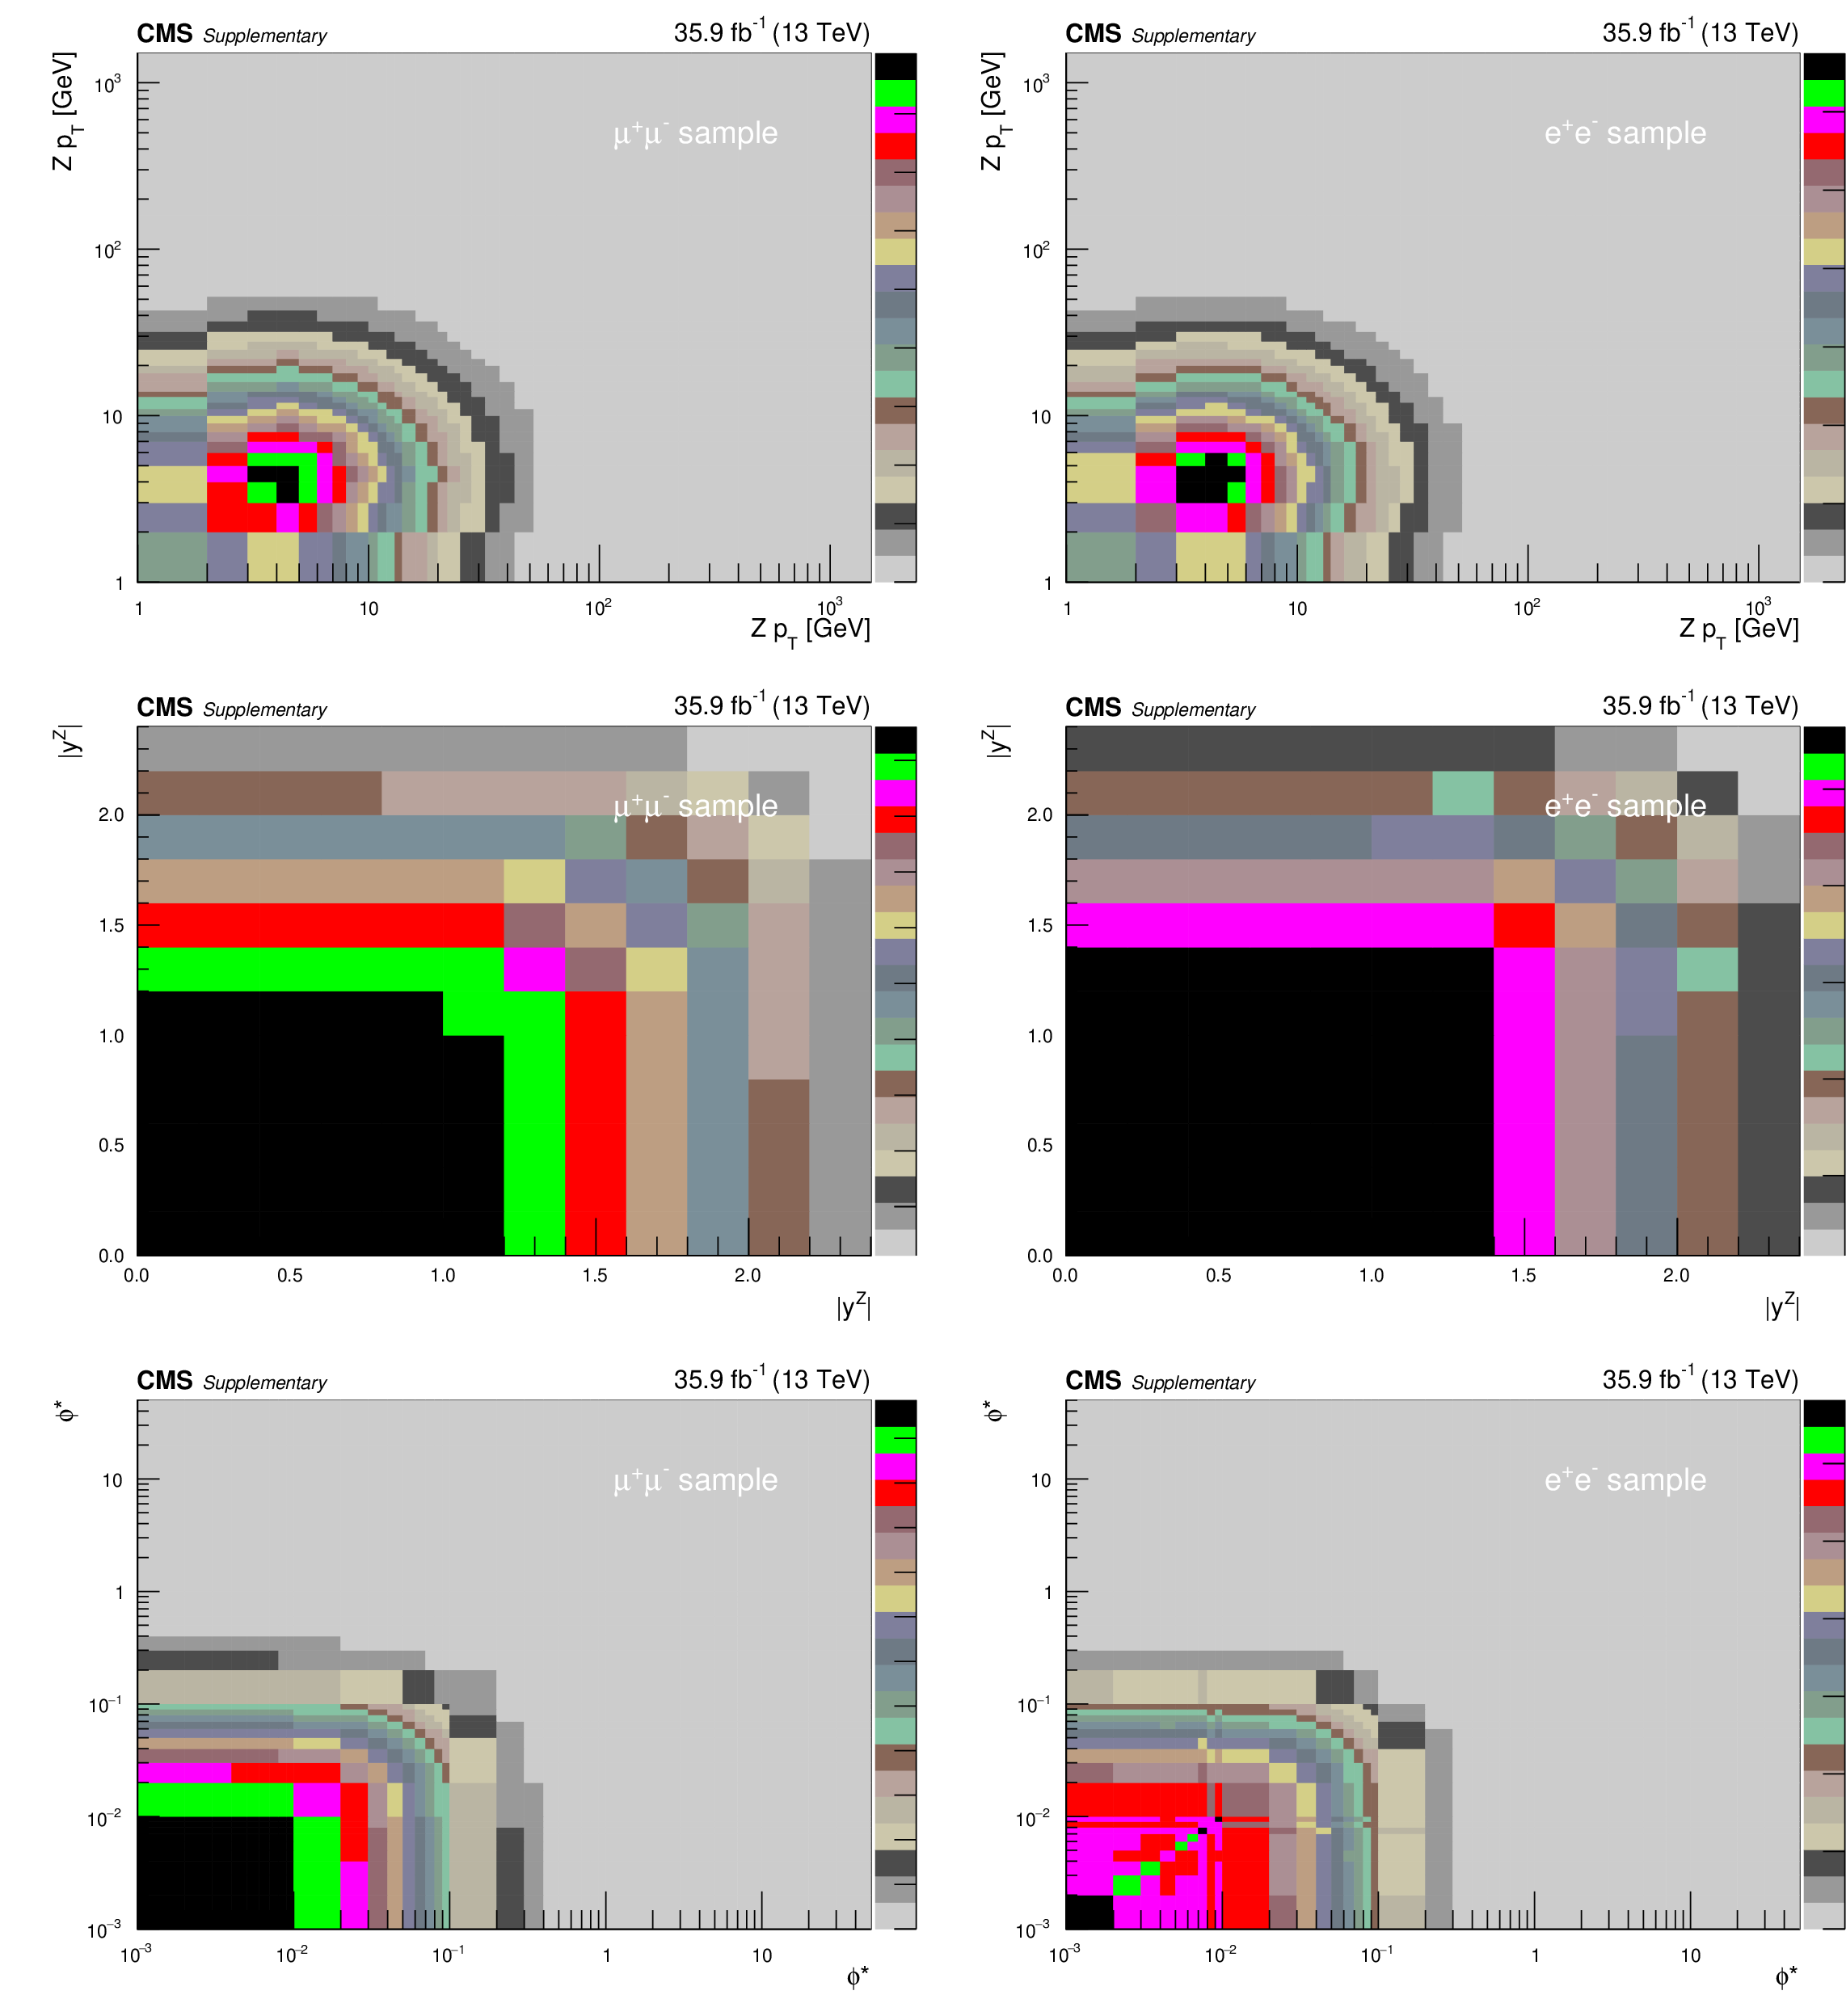
Additional Figure 1:
Covariance matrix for the absolute cross section measurements using dressed leptons in bins of $ {p_{\mathrm {T}}} ^{{\mathrm {Z}}}$ (upper), $ {| {y}^{{\mathrm {Z}}} |}$ (middle), and $ {\phi ^{\scriptscriptstyle *}_\eta}$ (lower). The left plots correspond to the dimuon final state and the right plots correspond to the dielectron final state. |

png pdf |
Additional Figure 1-a:
Covariance matrix for the absolute cross section measurements using dressed leptons in bins of $ {p_{\mathrm {T}}} ^{{\mathrm {Z}}}$. The plot corresponds to the dimuon final state. |
png pdf |
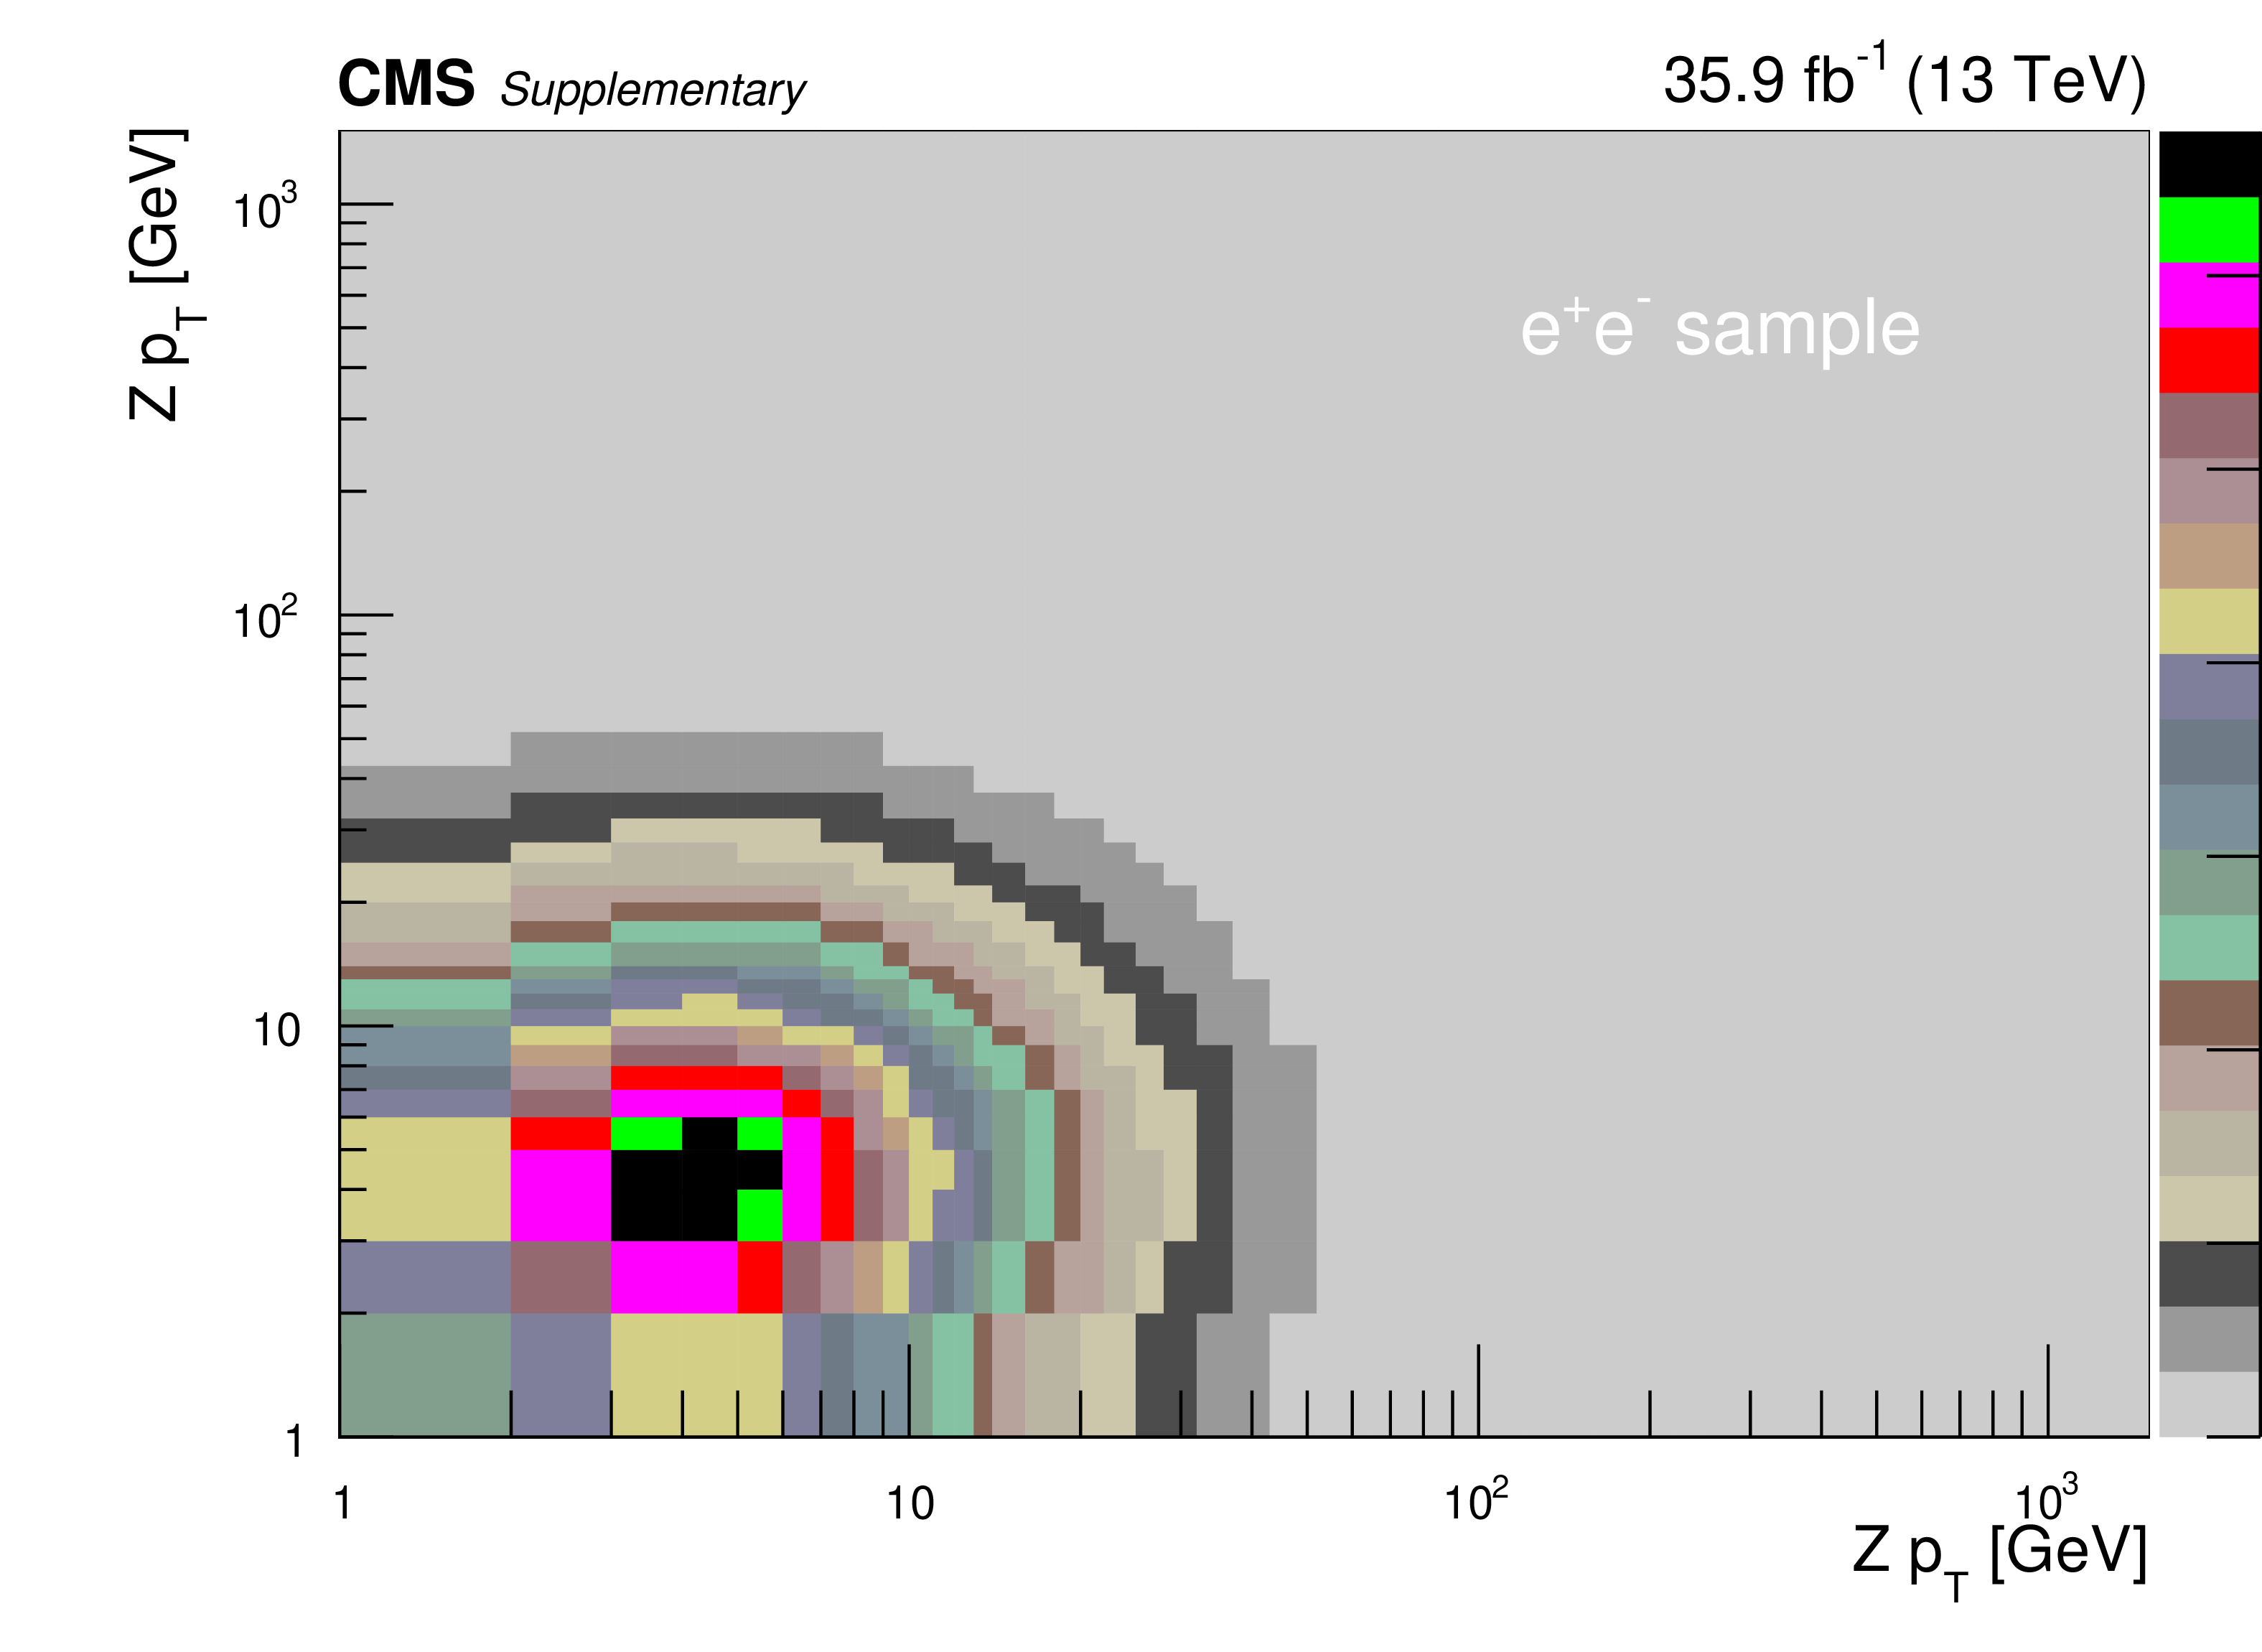
Additional Figure 1-b:
Covariance matrix for the absolute cross section measurements using dressed leptons in bins of $ {p_{\mathrm {T}}} ^{{\mathrm {Z}}}$. The plot corresponds to the dielectron final state. |

png pdf |
Additional Figure 1-c:
Covariance matrix for the absolute cross section measurements using dressed leptons in bins of $ {| {y}^{{\mathrm {Z}}} |}$. The plot corresponds to the dimuon final state. |

png pdf |
Additional Figure 1-d:
Covariance matrix for the absolute cross section measurements using dressed leptons in bins of $ {| {y}^{{\mathrm {Z}}} |}$. The plot corresponds to the dielectron final state. |
png pdf |
Additional Figure 1-e:
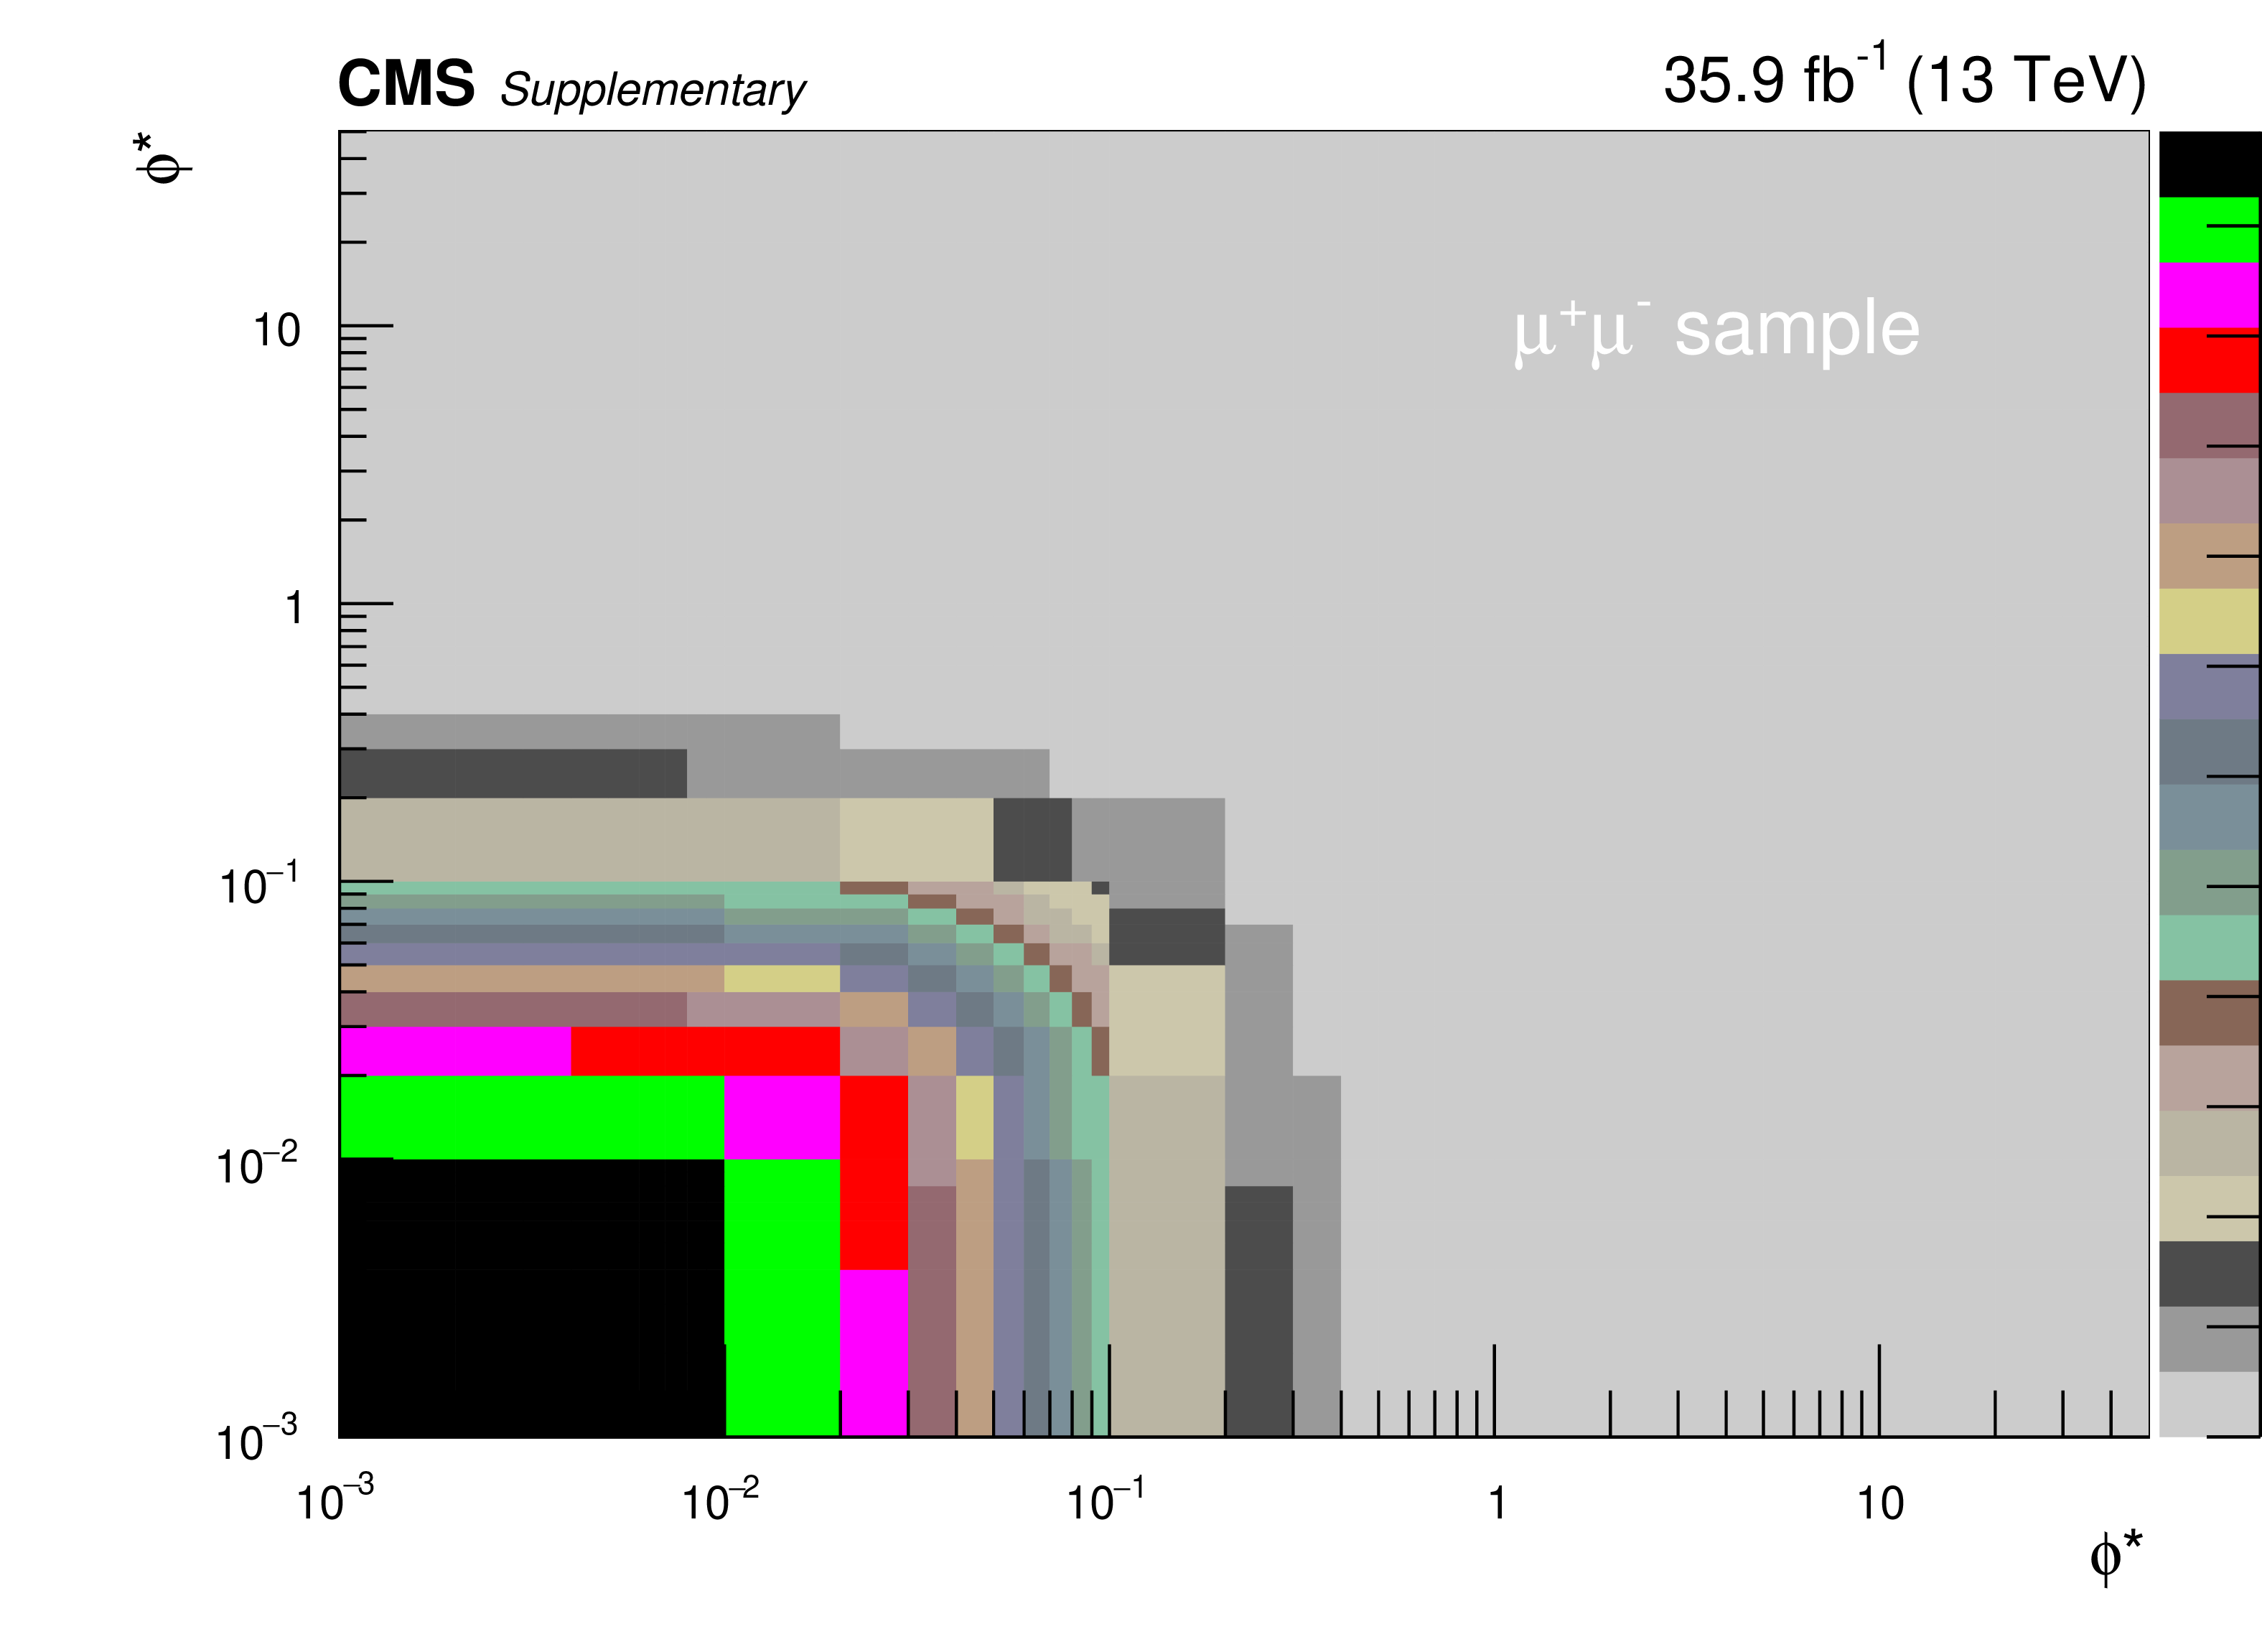
Covariance matrix for the absolute cross section measurements using dressed leptons in bins of $ {\phi ^{\scriptscriptstyle *}_\eta}$. The plot corresponds to the dimuon final state. |
png pdf |
Additional Figure 1-f:
Covariance matrix for the absolute cross section measurements using dressed leptons in bins of $ {\phi ^{\scriptscriptstyle *}_\eta}$. The plot corresponds to the dielectron final state. |
png pdf |
Additional Figure 2:
Covariance matrix for the absolute double-differential cross section measurements using dressed leptons in bins of $ {p_{\mathrm {T}}} ^{{\mathrm {Z}}}$ for the 0.0 $ < {| {y}^{{\mathrm {Z}}} |} < $ 0.4 bin (upper left), 0.4 $ < {| {y}^{{\mathrm {Z}}} |} < $ 0.8 bin (upper right), 0.8 $ < {| {y}^{{\mathrm {Z}}} |} < $ 1.2 bin (middle left), 1.2 $ < {| {y}^{{\mathrm {Z}}} |} < $ 1.6 bin (middle right), and 1.6 $ < {| {y}^{{\mathrm {Z}}} |} < $ 2.4 bin (lower) in the dimuon final state. |

png pdf |
Additional Figure 2-a:
Covariance matrix for the absolute double-differential cross section measurements using dressed leptons in bins of $ {p_{\mathrm {T}}} ^{{\mathrm {Z}}}$ for the 0.0 $ < {| {y}^{{\mathrm {Z}}} |} < $ 0.4 bin in the dimuon final state. |
png pdf |
Additional Figure 2-b:
Covariance matrix for the absolute double-differential cross section measurements using dressed leptons in bins of $ {p_{\mathrm {T}}} ^{{\mathrm {Z}}}$ for the 0.4 $ < {| {y}^{{\mathrm {Z}}} |} < $ 0.8 bin in the dimuon final state. |

png pdf |
Additional Figure 2-c:
Covariance matrix for the absolute double-differential cross section measurements using dressed leptons in bins of $ {p_{\mathrm {T}}} ^{{\mathrm {Z}}}$ for the 0.8 $ < {| {y}^{{\mathrm {Z}}} |} < $ 1.2 bin in the dimuon final state. |
png pdf |
Additional Figure 2-d:
Covariance matrix for the absolute double-differential cross section measurements using dressed leptons in bins of $ {p_{\mathrm {T}}} ^{{\mathrm {Z}}}$ for the 1.2 $ < {| {y}^{{\mathrm {Z}}} |} < $ 1.6 bin in the dimuon final state. |

png pdf |
Additional Figure 2-e:
Covariance matrix for the absolute double-differential cross section measurements using dressed leptons in bins of $ {p_{\mathrm {T}}} ^{{\mathrm {Z}}}$ for the 1.6 $ < {| {y}^{{\mathrm {Z}}} |} < $ 2.4 bin in the dimuon final state. |
png pdf |
Additional Figure 3:
Covariance matrix for the absolute double-differential cross section measurements using dressed leptons in bins of $ {p_{\mathrm {T}}} ^{{\mathrm {Z}}}$ for the 0.0 $ < {| {y}^{{\mathrm {Z}}} |} < $ 0.4 bin (upper left), 0.4 $ < {| {y}^{{\mathrm {Z}}} |} < $ 0.8 bin (upper right), 0.8 $ < {| {y}^{{\mathrm {Z}}} |} < $ 1.2 bin (middle left), 1.2 $ < {| {y}^{{\mathrm {Z}}} |} < $ 1.6 bin (middle right), and 1.6 $ < {| {y}^{{\mathrm {Z}}} |} < $ 2.4 bin (lower) in the dielectron final state. |

png pdf |
Additional Figure 3-a:
Covariance matrix for the absolute double-differential cross section measurements using dressed leptons in bins of $ {p_{\mathrm {T}}} ^{{\mathrm {Z}}}$ for the 0.0 $ < {| {y}^{{\mathrm {Z}}} |} < $ 0.4 bin in the dielectron final state. |
png pdf |
Additional Figure 3-b:
Covariance matrix for the absolute double-differential cross section measurements using dressed leptons in bins of $ {p_{\mathrm {T}}} ^{{\mathrm {Z}}}$ for the 0.4 $ < {| {y}^{{\mathrm {Z}}} |} < $ 0.8 bin in the dielectron final state. |

png pdf |
Additional Figure 3-c:
Covariance matrix for the absolute double-differential cross section measurements using dressed leptons in bins of $ {p_{\mathrm {T}}} ^{{\mathrm {Z}}}$ for the 0.8 $ < {| {y}^{{\mathrm {Z}}} |} < $ 1.2 bin in the dielectron final state. |

png pdf |
Additional Figure 3-d:
Covariance matrix for the absolute double-differential cross section measurements using dressed leptons in bins of $ {p_{\mathrm {T}}} ^{{\mathrm {Z}}}$ for the 1.2 $ < {| {y}^{{\mathrm {Z}}} |} < $ 1.6 bin in the dielectron final state. |
png pdf |
Additional Figure 3-e:
Covariance matrix for the absolute double-differential cross section measurements using dressed leptons in bins of $ {p_{\mathrm {T}}} ^{{\mathrm {Z}}}$ for the 1.6 $ < {| {y}^{{\mathrm {Z}}} |} < $ 2.4 bin in the dielectron final state. |
png pdf |
Additional Figure 4:
Covariance matrix for the absolute cross section measurements using Born level (before FSR) leptons in bins of $ {p_{\mathrm {T}}} ^{{\mathrm {Z}}}$ (upper), $ {| {y}^{{\mathrm {Z}}} |}$ (middle), and $ {\phi ^{\scriptscriptstyle *}_\eta}$ (lower). The left plots correspond to the dimuon final state and the right plots correspond to the dielectron final state. |

png pdf |
Additional Figure 4-a:
Covariance matrix for the absolute cross section measurements using Born level (before FSR) leptons in bins of $ {p_{\mathrm {T}}} ^{{\mathrm {Z}}}$. The plot corresponds to the dimuon final state. |

png pdf |
Additional Figure 4-b:
Covariance matrix for the absolute cross section measurements using Born level (before FSR) leptons in bins of $ {p_{\mathrm {T}}} ^{{\mathrm {Z}}}$. The plot corresponds to the dielectron final state. |
png pdf |
Additional Figure 4-c:
Covariance matrix for the absolute cross section measurements using Born level (before FSR) leptons in bins of $ {| {y}^{{\mathrm {Z}}} |}$. The plot corresponds to the dimuon final state. |
png pdf |
Additional Figure 4-d:
Covariance matrix for the absolute cross section measurements using Born level (before FSR) leptons in bins of $ {| {y}^{{\mathrm {Z}}} |}$. The plot corresponds to the dielectron final state. |
png pdf |
Additional Figure 4-e:
Covariance matrix for the absolute cross section measurements using Born level (before FSR) leptons in bins of $ {\phi ^{\scriptscriptstyle *}_\eta}$. The plot corresponds to the dimuon final state. |

png pdf |
Additional Figure 4-f:
Covariance matrix for the absolute cross section measurements using Born level (before FSR) leptons in bins of $ {\phi ^{\scriptscriptstyle *}_\eta}$. The plot corresponds to the dielectron final state. |
png pdf |
Additional Figure 5:
Covariance matrix for the absolute double-differential cross section measurements using Born level (before FSR) leptons in bins of $ {p_{\mathrm {T}}} ^{{\mathrm {Z}}}$ for the 0.0 $ < {| {y}^{{\mathrm {Z}}} |} < $ 0.4 bin (upper left), 0.4 $ < {| {y}^{{\mathrm {Z}}} |} < $ 0.8 bin (upper right), 0.8 $ < {| {y}^{{\mathrm {Z}}} |} < $ 1.2 bin (middle left), 1.2 $ < {| {y}^{{\mathrm {Z}}} |} < $ 1.6 bin (middle right), and 1.6 $ < {| {y}^{{\mathrm {Z}}} |} < $ 2.4 bin (lower) in the dimuon final state. |
png pdf |
Additional Figure 5-a:
Covariance matrix for the absolute double-differential cross section measurements using Born level (before FSR) leptons in bins of $ {p_{\mathrm {T}}} ^{{\mathrm {Z}}}$ for the 0.0 $ < {| {y}^{{\mathrm {Z}}} |} < $ 0.4 bin in the dimuon final state. |

png pdf |
Additional Figure 5-b:
Covariance matrix for the absolute double-differential cross section measurements using Born level (before FSR) leptons in bins of $ {p_{\mathrm {T}}} ^{{\mathrm {Z}}}$ for the 0.4 $ < {| {y}^{{\mathrm {Z}}} |} < $ 0.8 bin in the dimuon final state. |

png pdf |
Additional Figure 5-c:
Covariance matrix for the absolute double-differential cross section measurements using Born level (before FSR) leptons in bins of $ {p_{\mathrm {T}}} ^{{\mathrm {Z}}}$ for the 0.8 $ < {| {y}^{{\mathrm {Z}}} |} < $ 1.2 bin in the dimuon final state. |

png pdf |
Additional Figure 5-d:
Covariance matrix for the absolute double-differential cross section measurements using Born level (before FSR) leptons in bins of $ {p_{\mathrm {T}}} ^{{\mathrm {Z}}}$ for the 1.2 $ < {| {y}^{{\mathrm {Z}}} |} < $ 1.6 bin in the dimuon final state. |

png pdf |
Additional Figure 5-e:
Covariance matrix for the absolute double-differential cross section measurements using Born level (before FSR) leptons in bins of $ {p_{\mathrm {T}}} ^{{\mathrm {Z}}}$ for the 1.6 $ < {| {y}^{{\mathrm {Z}}} |} < $ 2.4 bin in the dimuon final state. |

png pdf |
Additional Figure 6:
Covariance matrix for the absolute double-differential cross section measurements using Born level (before FSR) leptons in bins of $ {p_{\mathrm {T}}} ^{{\mathrm {Z}}}$ for the 0.0 $ < {| {y}^{{\mathrm {Z}}} |} < $ 0.4 bin (upper left), 0.4 $ < {| {y}^{{\mathrm {Z}}} |} < $ 0.8 bin (upper right), 0.8 $ < {| {y}^{{\mathrm {Z}}} |} < $ 1.2 bin (middle left), 1.2 $ < {| {y}^{{\mathrm {Z}}} |} < $ 1.6 bin (middle right), and 1.6 $ < {| {y}^{{\mathrm {Z}}} |} < $ 2.4 bin (lower) in the dielectron final state. |
png pdf |
Additional Figure 6-a:
Covariance matrix for the absolute double-differential cross section measurements using Born level (before FSR) leptons in bins of $ {p_{\mathrm {T}}} ^{{\mathrm {Z}}}$ for the 0.0 $ < {| {y}^{{\mathrm {Z}}} |} < $ 0.4 bin in the dielectron final state. |
png pdf |
Additional Figure 6-b:
Covariance matrix for the absolute double-differential cross section measurements using Born level (before FSR) leptons in bins of $ {p_{\mathrm {T}}} ^{{\mathrm {Z}}}$ for the 0.4 $ < {| {y}^{{\mathrm {Z}}} |} < $ 0.8 bin in the dielectron final state. |

png pdf |
Additional Figure 6-c:
Covariance matrix for the absolute double-differential cross section measurements using Born level (before FSR) leptons in bins of $ {p_{\mathrm {T}}} ^{{\mathrm {Z}}}$ for the 0.8 $ < {| {y}^{{\mathrm {Z}}} |} < $ 1.2 bin in the dielectron final state. |

png pdf |
Additional Figure 6-d:
Covariance matrix for the absolute double-differential cross section measurements using Born level (before FSR) leptons in bins of $ {p_{\mathrm {T}}} ^{{\mathrm {Z}}}$ for the 1.2 $ < {| {y}^{{\mathrm {Z}}} |} < $ 1.6 bin in the dielectron final state. |

png pdf |
Additional Figure 6-e:
Covariance matrix for the absolute double-differential cross section measurements using Born level (before FSR) leptons in bins of $ {p_{\mathrm {T}}} ^{{\mathrm {Z}}}$ for the 1.6 $ < {| {y}^{{\mathrm {Z}}} |} < $ 2.4 binin the dielectron final state. |
png pdf |
Additional Figure 7:
The measured absolute Born level (before FSR) cross sections (left) in bins of $ {| {y}^{{\mathrm {Z}}} |}$ for the dimuon (upper) and dielectron (middle) final states, and for the combination (lower). The ratios of the predictions to the data are also shown (right). The shaded bands around the data points (black) correspond to the total experimental uncertainty. The measurement is compared to the predictions with MadGraph 5_aMC@NLO (square red markers), POWHEG (green triangles), and FEWZ (blue circles). The error bars around the predictions correspond to the combined statistical, PDF, and scale uncertainties. |
png pdf |
Additional Figure 7-a:
The measured absolute Born level (before FSR) cross sections in bins of $ {| {y}^{{\mathrm {Z}}} |}$ for the dimuon final states. The shaded bands around the data points (black) correspond to the total experimental uncertainty. The measurement is compared to the predictions with MadGraph 5_aMC@NLO (square red markers), POWHEG (green triangles), and FEWZ (blue circles). The error bars around the predictions correspond to the combined statistical, PDF, and scale uncertainties. |

png pdf |
Additional Figure 7-b:
The ratios of the predictions to the data for the measured absolute Born level (before FSR) cross sections in bins of $ {| {y}^{{\mathrm {Z}}} |}$ for the dimuon final states. The shaded bands around the data points (black) correspond to the total experimental uncertainty. The measurement is compared to the predictions with MadGraph 5_aMC@NLO (square red markers), POWHEG (green triangles), and FEWZ (blue circles). The error bars around the predictions correspond to the combined statistical, PDF, and scale uncertainties. |

png pdf |
Additional Figure 7-c:
The measured absolute Born level (before FSR) cross sections in bins of $ {| {y}^{{\mathrm {Z}}} |}$ for the dielectron final states. The shaded bands around the data points (black) correspond to the total experimental uncertainty. The measurement is compared to the predictions with MadGraph 5_aMC@NLO (square red markers), POWHEG (green triangles), and FEWZ (blue circles). The error bars around the predictions correspond to the combined statistical, PDF, and scale uncertainties. |

png pdf |
Additional Figure 7-d:
The ratios of the predictions to the data for the measured absolute Born level (before FSR) cross sections in bins of $ {| {y}^{{\mathrm {Z}}} |}$ for the dielectron final states. The shaded bands around the data points (black) correspond to the total experimental uncertainty. The measurement is compared to the predictions with MadGraph 5_aMC@NLO (square red markers), POWHEG (green triangles), and FEWZ (blue circles). The error bars around the predictions correspond to the combined statistical, PDF, and scale uncertainties. |

png pdf |
Additional Figure 7-e:
The measured absolute Born level (before FSR) cross sections in bins of $ {| {y}^{{\mathrm {Z}}} |}$ for the combination of dimuon and dielectron final states. The shaded bands around the data points (black) correspond to the total experimental uncertainty. The measurement is compared to the predictions with MadGraph 5_aMC@NLO (square red markers), POWHEG (green triangles), and FEWZ (blue circles). The error bars around the predictions correspond to the combined statistical, PDF, and scale uncertainties. |
png pdf |
Additional Figure 7-f:
The ratios of the predictions to the data for the measured absolute Born level (before FSR) cross sections in bins of $ {| {y}^{{\mathrm {Z}}} |}$ for the combination of dimuon and dielectron final states. The shaded bands around the data points (black) correspond to the total experimental uncertainty. The measurement is compared to the predictions with MadGraph 5_aMC@NLO (square red markers), POWHEG (green triangles), and FEWZ (blue circles). The error bars around the predictions correspond to the combined statistical, PDF, and scale uncertainties. |

png pdf |
Additional Figure 8:
The measured absolute Born level (before FSR) cross sections (left) in bins of $ {p_{\mathrm {T}}} ^{{\mathrm {Z}}}$ for the dimuon (upper) and dielectron (middle) final states, and for the combination (lower). The ratios of the predictions to the data are also shown (right). The shaded bands around the data points (black) correspond to the total experimental uncertainty. The measurement is compared to the predictions with MadGraph 5_aMC@NLO (square red markers), POWHEG (green triangles), and POWHEG-MINLO (blue circles). The error bars around the predictions correspond to the combined statistical, PDF, and scale uncertainties. The first $ {p_{\mathrm {T}}} ^{{\mathrm {Z}}}$ bin (0-1 GeV) is not shown as large differences were observed in MadGraph 5_aMC@NLO and POWHEG predictions at Born level. |
png pdf |
Additional Figure 8-a:
The measured absolute Born level (before FSR) cross sections in bins of $ {p_{\mathrm {T}}} ^{{\mathrm {Z}}}$ for the dimuon final state. The shaded bands around the data points (black) correspond to the total experimental uncertainty. The measurement is compared to the predictions with MadGraph 5_aMC@NLO (square red markers), POWHEG (green triangles), and POWHEG-MINLO (blue circles). The error bars around the predictions correspond to the combined statistical, PDF, and scale uncertainties. The first $ {p_{\mathrm {T}}} ^{{\mathrm {Z}}}$ bin (0-1 GeV) is not shown as large differences were observed in MadGraph 5_aMC@NLO and POWHEG predictions at Born level. |

png pdf |
Additional Figure 8-b:
The ratios of the predictions to the data for the measured absolute Born level (before FSR) cross sections in bins of $ {p_{\mathrm {T}}} ^{{\mathrm {Z}}}$ for the dimuon final state. The shaded bands around the data points (black) correspond to the total experimental uncertainty. The measurement is compared to the predictions with MadGraph 5_aMC@NLO (square red markers), POWHEG (green triangles), and POWHEG-MINLO (blue circles). The error bars around the predictions correspond to the combined statistical, PDF, and scale uncertainties. The first $ {p_{\mathrm {T}}} ^{{\mathrm {Z}}}$ bin (0-1 GeV) is not shown as large differences were observed in MadGraph 5_aMC@NLO and POWHEG predictions at Born level. |
png pdf |
Additional Figure 8-c:
The measured absolute Born level (before FSR) cross sections in bins of $ {p_{\mathrm {T}}} ^{{\mathrm {Z}}}$ for the dielectron final state. The shaded bands around the data points (black) correspond to the total experimental uncertainty. The measurement is compared to the predictions with MadGraph 5_aMC@NLO (square red markers), POWHEG (green triangles), and POWHEG-MINLO (blue circles). The error bars around the predictions correspond to the combined statistical, PDF, and scale uncertainties. The first $ {p_{\mathrm {T}}} ^{{\mathrm {Z}}}$ bin (0-1 GeV) is not shown as large differences were observed in MadGraph 5_aMC@NLO and POWHEG predictions at Born level. |
png pdf |
Additional Figure 8-d:
The ratios of the predictions to the data for the measured absolute Born level (before FSR) cross sections in bins of $ {p_{\mathrm {T}}} ^{{\mathrm {Z}}}$ for the dielectron final state. The shaded bands around the data points (black) correspond to the total experimental uncertainty. The measurement is compared to the predictions with MadGraph 5_aMC@NLO (square red markers), POWHEG (green triangles), and POWHEG-MINLO (blue circles). The error bars around the predictions correspond to the combined statistical, PDF, and scale uncertainties. The first $ {p_{\mathrm {T}}} ^{{\mathrm {Z}}}$ bin (0-1 GeV) is not shown as large differences were observed in MadGraph 5_aMC@NLO and POWHEG predictions at Born level. |

png pdf |
Additional Figure 8-e:
The measured absolute Born level (before FSR) cross sections in bins of $ {p_{\mathrm {T}}} ^{{\mathrm {Z}}}$ for the combination of dimuon and dielectron final states. The shaded bands around the data points (black) correspond to the total experimental uncertainty. The measurement is compared to the predictions with MadGraph 5_aMC@NLO (square red markers), POWHEG (green triangles), and POWHEG-MINLO (blue circles). The error bars around the predictions correspond to the combined statistical, PDF, and scale uncertainties. The first $ {p_{\mathrm {T}}} ^{{\mathrm {Z}}}$ bin (0-1 GeV) is not shown as large differences were observed in MadGraph 5_aMC@NLO and POWHEG predictions at Born level. |

png pdf |
Additional Figure 8-f:
The ratios of the predictions to the data for the measured absolute Born level (before FSR) cross sections in bins of $ {p_{\mathrm {T}}} ^{{\mathrm {Z}}}$ for the combination of dimuon and dielectron final states. The shaded bands around the data points (black) correspond to the total experimental uncertainty. The measurement is compared to the predictions with MadGraph 5_aMC@NLO (square red markers), POWHEG (green triangles), and POWHEG-MINLO (blue circles). The error bars around the predictions correspond to the combined statistical, PDF, and scale uncertainties. The first $ {p_{\mathrm {T}}} ^{{\mathrm {Z}}}$ bin (0-1 GeV) is not shown as large differences were observed in MadGraph 5_aMC@NLO and POWHEG predictions at Born level. |

png pdf |
Additional Figure 9:
The measured absolute Born level (before FSR) cross sections (left) in bins of $ {\phi ^{\scriptscriptstyle *}_\eta}$ for the dimuon (upper) and dielectron (middle) final states, and for the combination (lower). The ratios of the predictions to the data are also shown (right). The shaded bands around the data points (black) correspond to the total experimental uncertainty. The measurement is compared to the predictions with MadGraph 5_aMC@NLO (square red markers), POWHEG (green triangles), and POWHEG-MINLO (blue circles). The error bars around the predictions correspond to the combined statistical, PDF, and scale uncertainties. |
png pdf |
Additional Figure 9-a:
The measured absolute Born level (before FSR) cross sections (left) in bins of $ {\phi ^{\scriptscriptstyle *}_\eta}$ for the dimuon final state. The shaded bands around the data points (black) correspond to the total experimental uncertainty. The measurement is compared to the predictions with MadGraph 5_aMC@NLO (square red markers), POWHEG (green triangles), and POWHEG-MINLO (blue circles). The error bars around the predictions correspond to the combined statistical, PDF, and scale uncertainties. |

png pdf |
Additional Figure 9-b:
The ratios of the predictions to the data for the measured absolute Born level (before FSR) cross sections (left) in bins of $ {\phi ^{\scriptscriptstyle *}_\eta}$ for the dimuon final state. The shaded bands around the data points (black) correspond to the total experimental uncertainty. The measurement is compared to the predictions with MadGraph 5_aMC@NLO (square red markers), POWHEG (green triangles), and POWHEG-MINLO (blue circles). The error bars around the predictions correspond to the combined statistical, PDF, and scale uncertainties. |

png pdf |
Additional Figure 9-c:
The measured absolute Born level (before FSR) cross sections (left) in bins of $ {\phi ^{\scriptscriptstyle *}_\eta}$ for the dielectron final state. The shaded bands around the data points (black) correspond to the total experimental uncertainty. The measurement is compared to the predictions with MadGraph 5_aMC@NLO (square red markers), POWHEG (green triangles), and POWHEG-MINLO (blue circles). The error bars around the predictions correspond to the combined statistical, PDF, and scale uncertainties. |
png pdf |
Additional Figure 9-d:
The ratios of the predictions to the data for the measured absolute Born level (before FSR) cross sections (left) in bins of $ {\phi ^{\scriptscriptstyle *}_\eta}$ for the dielectron final state. The shaded bands around the data points (black) correspond to the total experimental uncertainty. The measurement is compared to the predictions with MadGraph 5_aMC@NLO (square red markers), POWHEG (green triangles), and POWHEG-MINLO (blue circles). The error bars around the predictions correspond to the combined statistical, PDF, and scale uncertainties. |

png pdf |
Additional Figure 9-e:
The measured absolute Born level (before FSR) cross sections (left) in bins of $ {\phi ^{\scriptscriptstyle *}_\eta}$ for the combination of dimuon and dielectron final states. The shaded bands around the data points (black) correspond to the total experimental uncertainty. The measurement is compared to the predictions with MadGraph 5_aMC@NLO (square red markers), POWHEG (green triangles), and POWHEG-MINLO (blue circles). The error bars around the predictions correspond to the combined statistical, PDF, and scale uncertainties. |

png pdf |
Additional Figure 9-f:
The ratios of the predictions to the data for the measured absolute Born level (before FSR) cross sections (left) in bins of $ {\phi ^{\scriptscriptstyle *}_\eta}$ for the combination of dimuon and dielectron final states. The shaded bands around the data points (black) correspond to the total experimental uncertainty. The measurement is compared to the predictions with MadGraph 5_aMC@NLO (square red markers), POWHEG (green triangles), and POWHEG-MINLO (blue circles). The error bars around the predictions correspond to the combined statistical, PDF, and scale uncertainties. |

png pdf |
Additional Figure 10:
The measured absolute Born level (before FSR) cross sections (left) in bins of $ {p_{\mathrm {T}}} ^{{\mathrm {Z}}}$ for the 0.0 $ < {| {y}^{{\mathrm {Z}}} |} < $ 0.4 region. The ratios of the predictions to the data are also shown (right). The shaded bands around the data points (black) correspond to the total experimental uncertainty. The measurement is compared to the predictions with MadGraph 5_aMC@NLO (square red markers), POWHEG (green triangles), and POWHEG-MINLO (blue circles). The error bands around the predictions correspond to the combined statistical, PDF, and scale uncertainties. The first $ {p_{\mathrm {T}}} ^{{\mathrm {Z}}}$ bin (0-1 GeV) is not shown as large differences were observed in MadGraph 5_aMC@NLO and POWHEG predictions at Born level. |
png pdf |
Additional Figure 10-a:
The measured absolute Born level (before FSR) cross sections in bins of $ {p_{\mathrm {T}}} ^{{\mathrm {Z}}}$ for the 0.0 $ < {| {y}^{{\mathrm {Z}}} |} < $ 0.4 region. The shaded bands around the data points (black) correspond to the total experimental uncertainty. The measurement is compared to the predictions with MadGraph 5_aMC@NLO (square red markers), POWHEG (green triangles), and POWHEG-MINLO (blue circles). The error bands around the predictions correspond to the combined statistical, PDF, and scale uncertainties. The first $ {p_{\mathrm {T}}} ^{{\mathrm {Z}}}$ bin (0-1 GeV) is not shown as large differences were observed in MadGraph 5_aMC@NLO and POWHEG predictions at Born level. |

png pdf |
Additional Figure 10-b:
The ratios of the predictions to the data for the measured absolute Born level (before FSR) cross sections in bins of $ {p_{\mathrm {T}}} ^{{\mathrm {Z}}}$ for the 0.0 $ < {| {y}^{{\mathrm {Z}}} |} < $ 0.4 region. The shaded bands around the data points (black) correspond to the total experimental uncertainty. The measurement is compared to the predictions with MadGraph 5_aMC@NLO (square red markers), POWHEG (green triangles), and POWHEG-MINLO (blue circles). The error bands around the predictions correspond to the combined statistical, PDF, and scale uncertainties. The first $ {p_{\mathrm {T}}} ^{{\mathrm {Z}}}$ bin (0-1 GeV) is not shown as large differences were observed in MadGraph 5_aMC@NLO and POWHEG predictions at Born level. |

png pdf |
Additional Figure 11:
The measured absolute Born level (before FSR) cross sections (left) in bins of $ {p_{\mathrm {T}}} ^{{\mathrm {Z}}}$ for the 0.4 $ < {| {y}^{{\mathrm {Z}}} |} < $ 0.8 region. The ratios of the predictions to the data are also shown (right). The shaded bands around the data points (black) correspond to the total experimental uncertainty. The measurement is compared to the predictions with MadGraph 5_aMC@NLO (square red markers), POWHEG (green triangles), and POWHEG-MINLO (blue circles). The error bands around the predictions correspond to the combined statistical, PDF, and scale uncertainties. The first $ {p_{\mathrm {T}}} ^{{\mathrm {Z}}}$ bin (0-1 GeV) is not shown as large differences were observed in MadGraph 5_aMC@NLO and POWHEG predictions at Born level. |
png pdf |
Additional Figure 11-a:
The measured absolute Born level (before FSR) cross sections in bins of $ {p_{\mathrm {T}}} ^{{\mathrm {Z}}}$ for the 0.4 $ < {| {y}^{{\mathrm {Z}}} |} < $ 0.8 region. The shaded bands around the data points (black) correspond to the total experimental uncertainty. The measurement is compared to the predictions with MadGraph 5_aMC@NLO (square red markers), POWHEG (green triangles), and POWHEG-MINLO (blue circles). The error bands around the predictions correspond to the combined statistical, PDF, and scale uncertainties. The first $ {p_{\mathrm {T}}} ^{{\mathrm {Z}}}$ bin (0-1 GeV) is not shown as large differences were observed in MadGraph 5_aMC@NLO and POWHEG predictions at Born level. |

png pdf |
Additional Figure 11-b:
The ratios of the predictions to the data for the measured absolute Born level (before FSR) cross sections in bins of $ {p_{\mathrm {T}}} ^{{\mathrm {Z}}}$ for the 0.4 $ < {| {y}^{{\mathrm {Z}}} |} < $ 0.8 region. The shaded bands around the data points (black) correspond to the total experimental uncertainty. The measurement is compared to the predictions with MadGraph 5_aMC@NLO (square red markers), POWHEG (green triangles), and POWHEG-MINLO (blue circles). The error bands around the predictions correspond to the combined statistical, PDF, and scale uncertainties. The first $ {p_{\mathrm {T}}} ^{{\mathrm {Z}}}$ bin (0-1 GeV) is not shown as large differences were observed in MadGraph 5_aMC@NLO and POWHEG predictions at Born level. |

png pdf |
Additional Figure 12:
The measured absolute Born level (before FSR) cross sections (left) in bins of $ {p_{\mathrm {T}}} ^{{\mathrm {Z}}}$ for the 0.8 $ < {| {y}^{{\mathrm {Z}}} |} < $ 1.2 region. The ratios of the predictions to the data are also shown (right). The shaded bands around the data points (black) correspond to the total experimental uncertainty. The measurement is compared to the predictions with MadGraph 5_aMC@NLO (square red markers), POWHEG (green triangles), and POWHEG-MINLO (blue circles). The error bands around the predictions correspond to the combined statistical, PDF, and scale uncertainties. The first $ {p_{\mathrm {T}}} ^{{\mathrm {Z}}}$ bin (0-1 GeV) is not shown as large differences were observed in MadGraph 5_aMC@NLO and POWHEG predictions at Born level. |

png pdf |
Additional Figure 12-a:
The measured absolute Born level (before FSR) cross sections in bins of $ {p_{\mathrm {T}}} ^{{\mathrm {Z}}}$ for the 0.8 $ < {| {y}^{{\mathrm {Z}}} |} < $ 1.2 region. The shaded bands around the data points (black) correspond to the total experimental uncertainty. The measurement is compared to the predictions with MadGraph 5_aMC@NLO (square red markers), POWHEG (green triangles), and POWHEG-MINLO (blue circles). The error bands around the predictions correspond to the combined statistical, PDF, and scale uncertainties. The first $ {p_{\mathrm {T}}} ^{{\mathrm {Z}}}$ bin (0-1 GeV) is not shown as large differences were observed in MadGraph 5_aMC@NLO and POWHEG predictions at Born level. |
png pdf |
Additional Figure 12-b:
The ratios of the predictions to the data of the measured absolute Born level (before FSR) cross sections in bins of $ {p_{\mathrm {T}}} ^{{\mathrm {Z}}}$ for the 0.8 $ < {| {y}^{{\mathrm {Z}}} |} < $ 1.2 region. The shaded bands around the data points (black) correspond to the total experimental uncertainty. The measurement is compared to the predictions with MadGraph 5_aMC@NLO (square red markers), POWHEG (green triangles), and POWHEG-MINLO (blue circles). The error bands around the predictions correspond to the combined statistical, PDF, and scale uncertainties. The first $ {p_{\mathrm {T}}} ^{{\mathrm {Z}}}$ bin (0-1 GeV) is not shown as large differences were observed in MadGraph 5_aMC@NLO and POWHEG predictions at Born level. |

png pdf |
Additional Figure 13:
The measured absolute Born level (before FSR) cross sections (left) in bins of $ {p_{\mathrm {T}}} ^{{\mathrm {Z}}}$ for the 1.2 $ < {| {y}^{{\mathrm {Z}}} |} < $ 1.6 region. The ratios of the predictions to the data are also shown (right). The shaded bands around the data points (black) correspond to the total experimental uncertainty. The measurement is compared to the predictions with MadGraph 5_aMC@NLO (square red markers), POWHEG (green triangles), and POWHEG-MINLO (blue circles). The error bands around the predictions correspond to the combined statistical, PDF, and scale uncertainties. The first $ {p_{\mathrm {T}}} ^{{\mathrm {Z}}}$ bin (0-1 GeV) is not shown as large differences were observed in MadGraph 5_aMC@NLO and POWHEG predictions at Born level. |
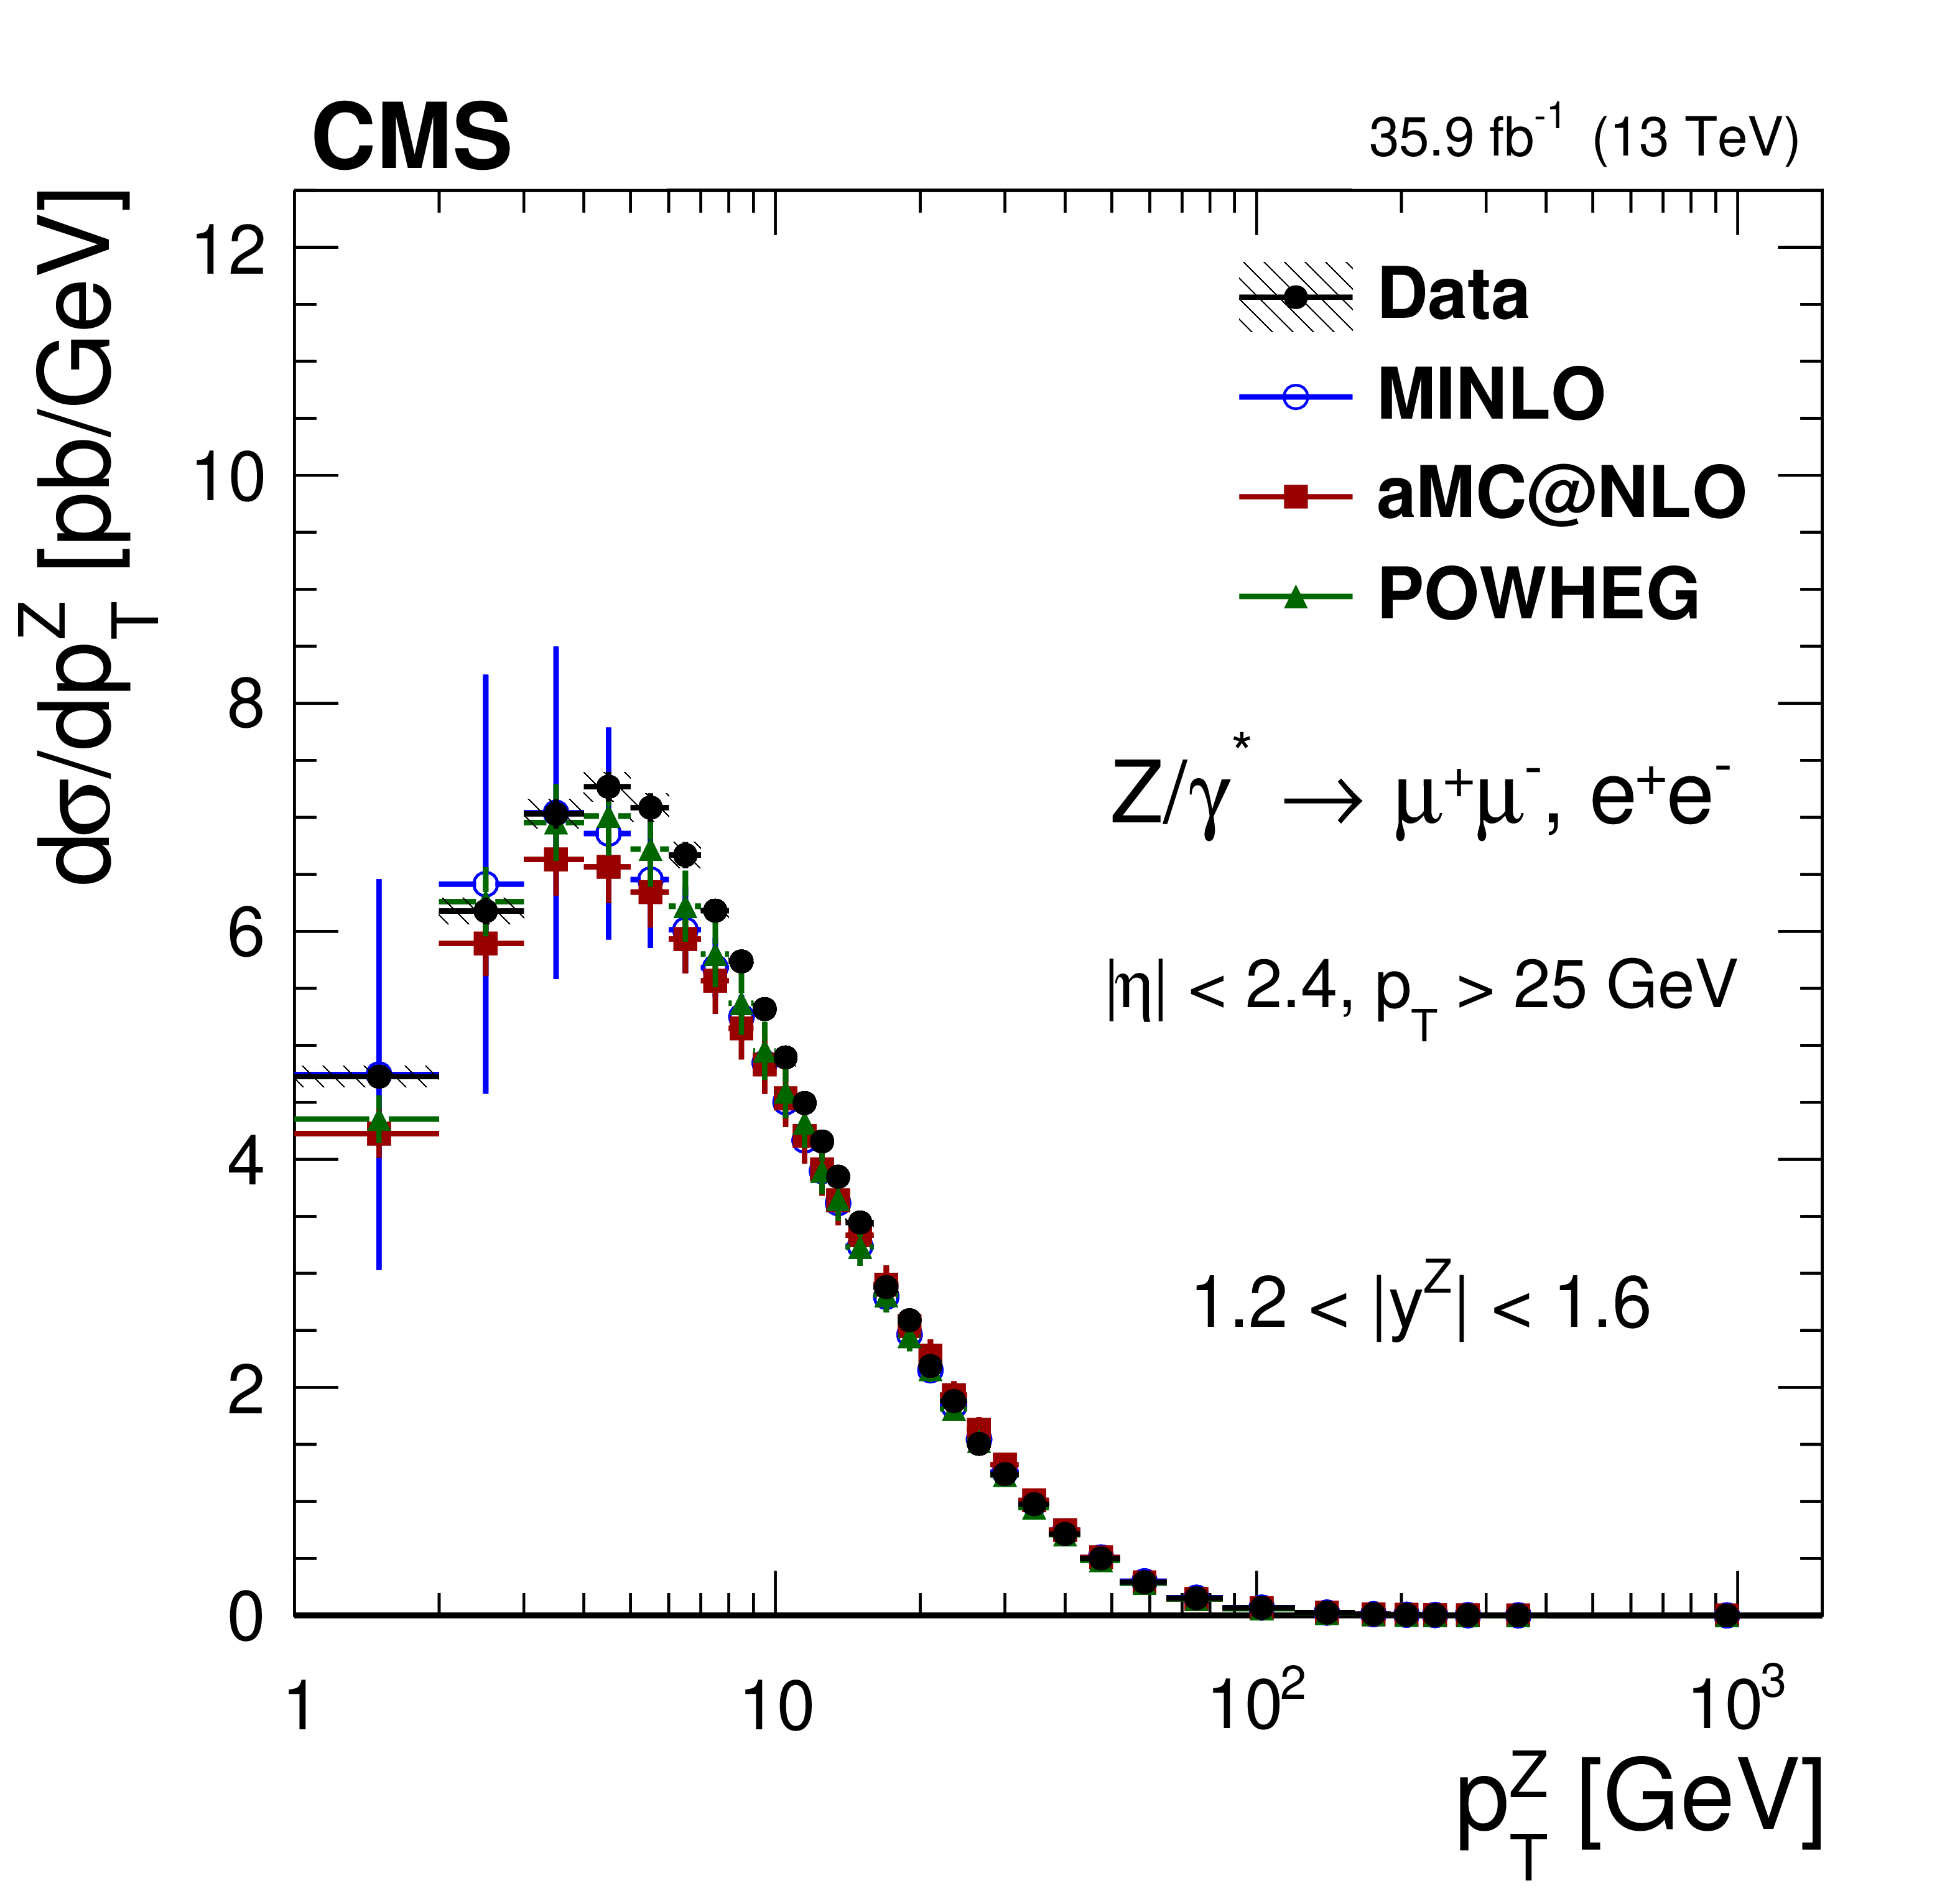
png pdf |
Additional Figure 13-a:
The measured absolute Born level (before FSR) cross sections (left) in bins of $ {p_{\mathrm {T}}} ^{{\mathrm {Z}}}$ for the 1.2 $ < {| {y}^{{\mathrm {Z}}} |} < $ 1.6 region. The ratios of the predictions to the data are also shown (right). The shaded bands around the data points (black) correspond to the total experimental uncertainty. The measurement is compared to the predictions with MadGraph 5_aMC@NLO (square red markers), POWHEG (green triangles), and POWHEG-MINLO (blue circles). The error bands around the predictions correspond to the combined statistical, PDF, and scale uncertainties. The first $ {p_{\mathrm {T}}} ^{{\mathrm {Z}}}$ bin (0-1 GeV) is not shown as large differences were observed in MadGraph 5_aMC@NLO and POWHEG predictions at Born level. |
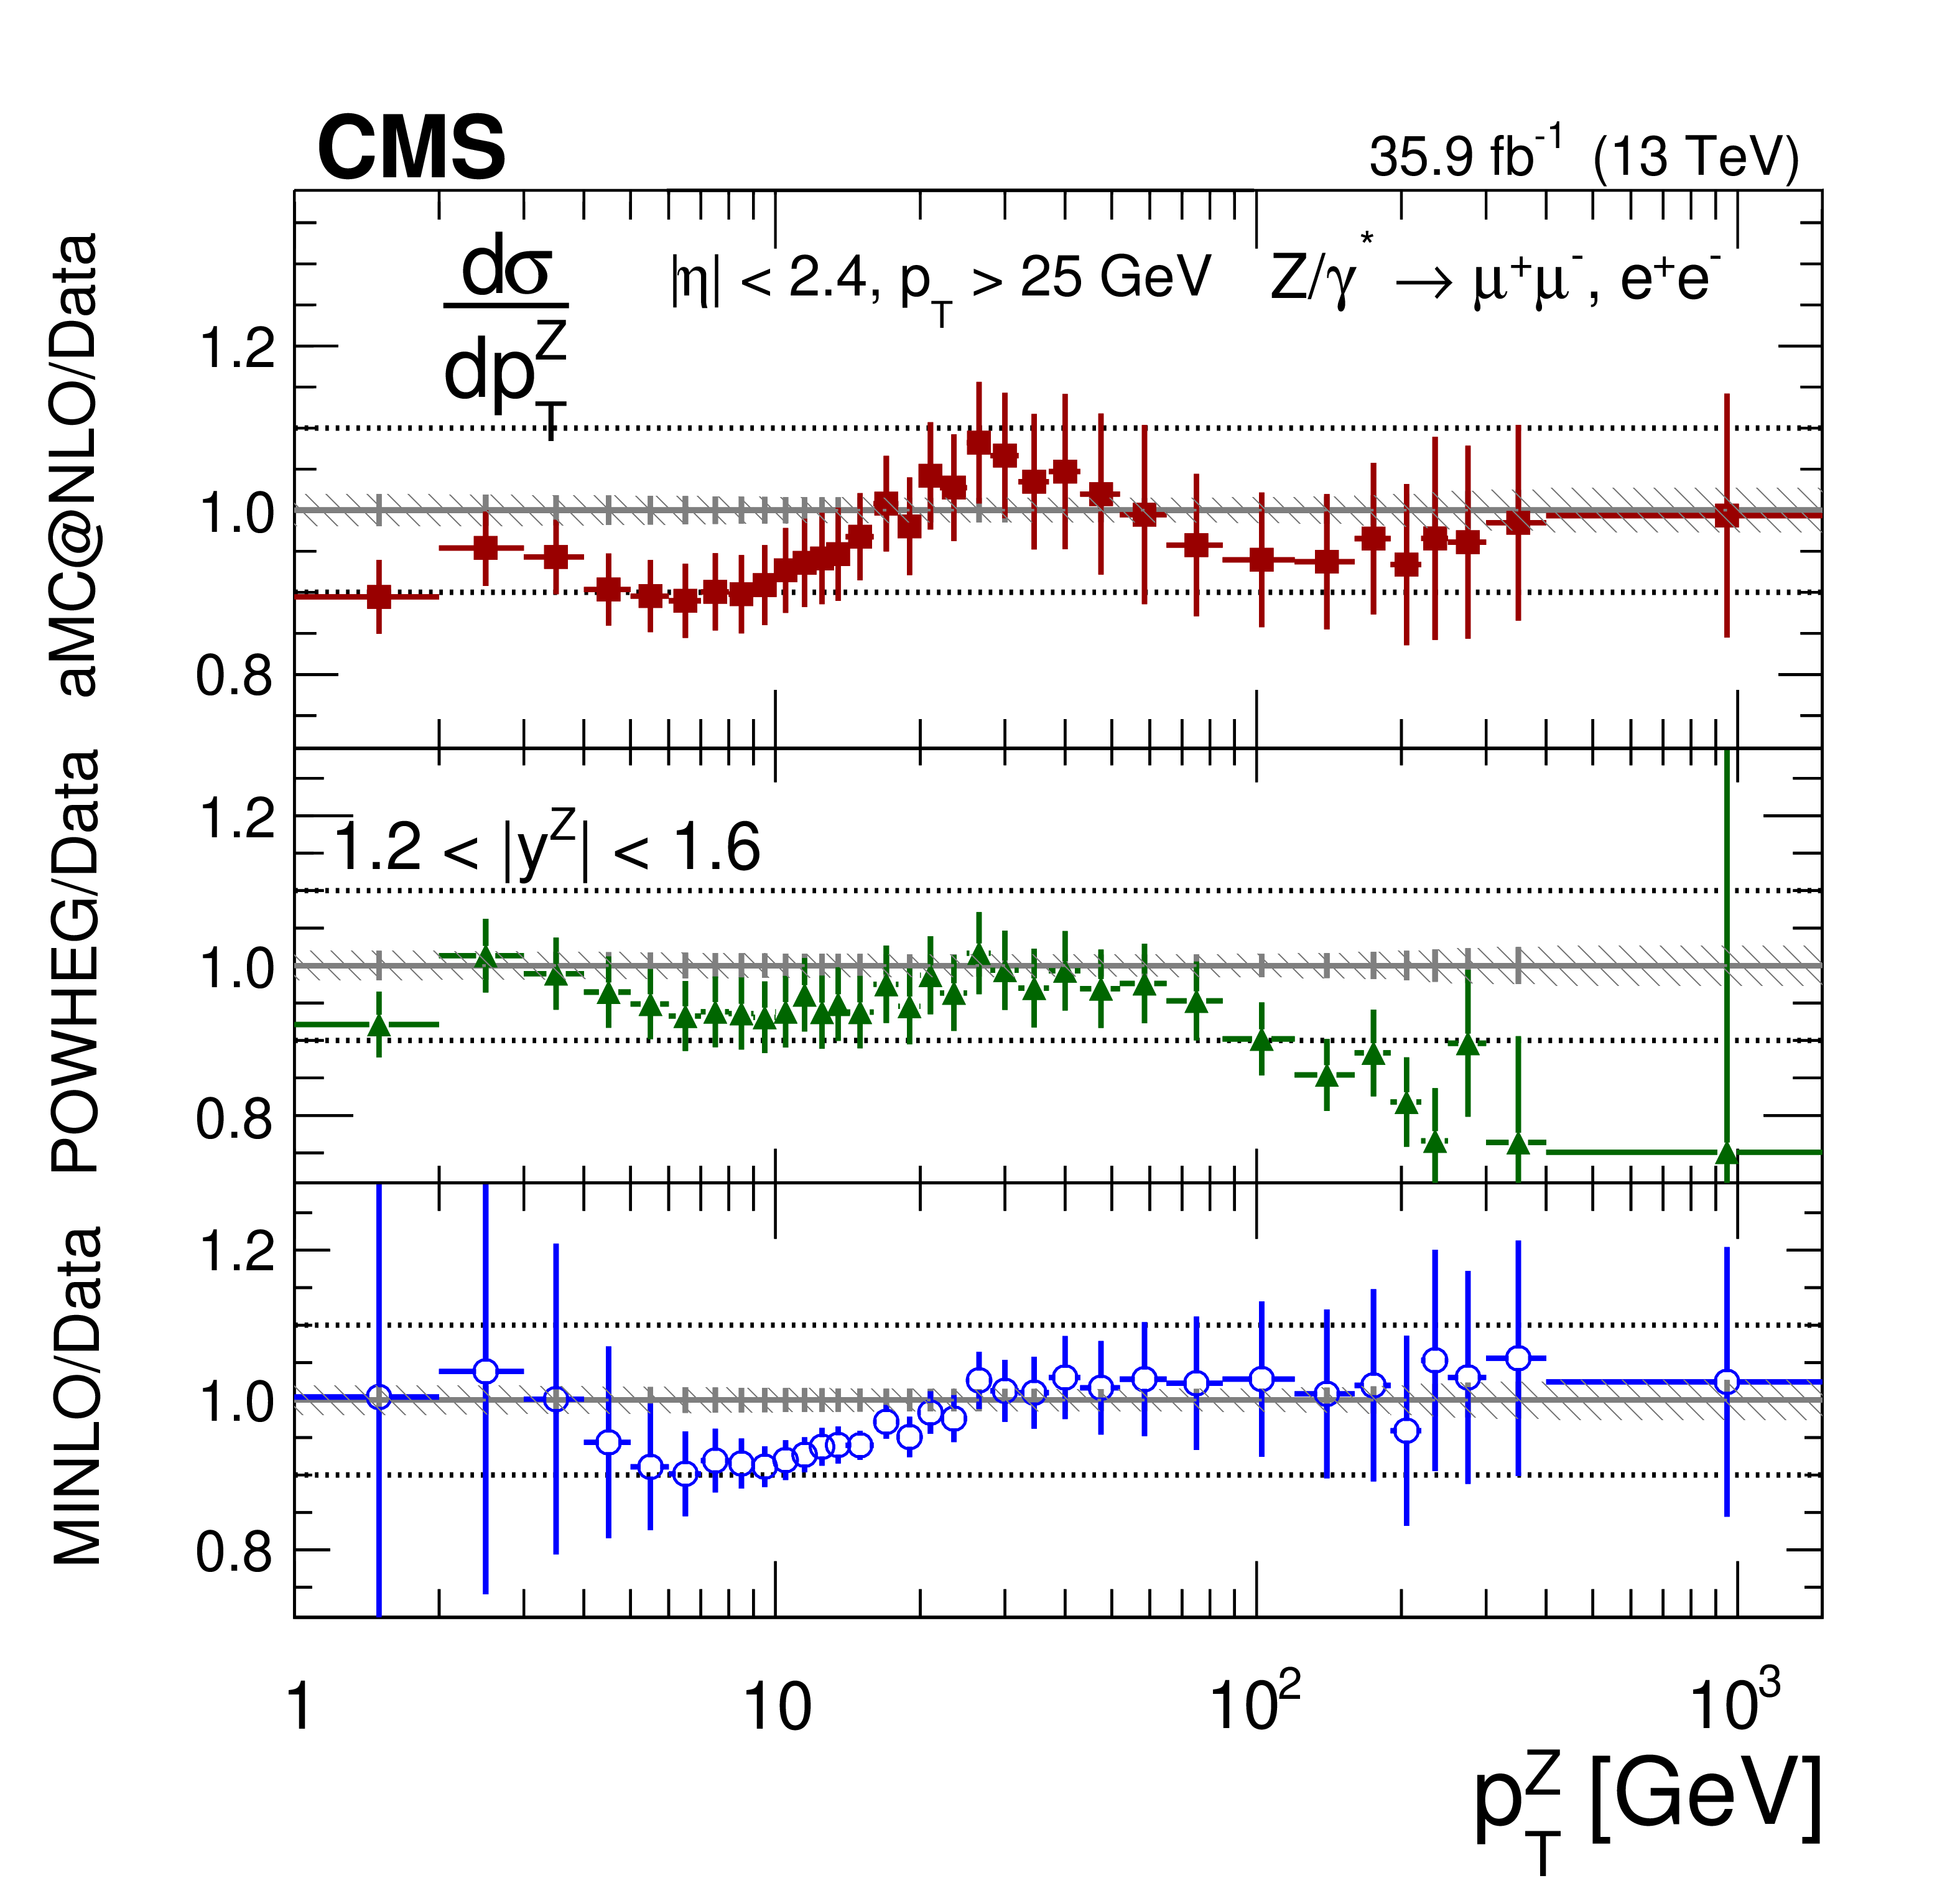
png pdf |
Additional Figure 13-b:
The ratios of the predictions to the data of the measured absolute Born level (before FSR) cross sections in bins of $ {p_{\mathrm {T}}} ^{{\mathrm {Z}}}$ for the 1.2 $ < {| {y}^{{\mathrm {Z}}} |} < $ 1.6 region. The shaded bands around the data points (black) correspond to the total experimental uncertainty. The measurement is compared to the predictions with MadGraph 5_aMC@NLO (square red markers), POWHEG (green triangles), and POWHEG-MINLO (blue circles). The error bands around the predictions correspond to the combined statistical, PDF, and scale uncertainties. The first $ {p_{\mathrm {T}}} ^{{\mathrm {Z}}}$ bin (0-1 GeV) is not shown as large differences were observed in MadGraph 5_aMC@NLO and POWHEG predictions at Born level. |
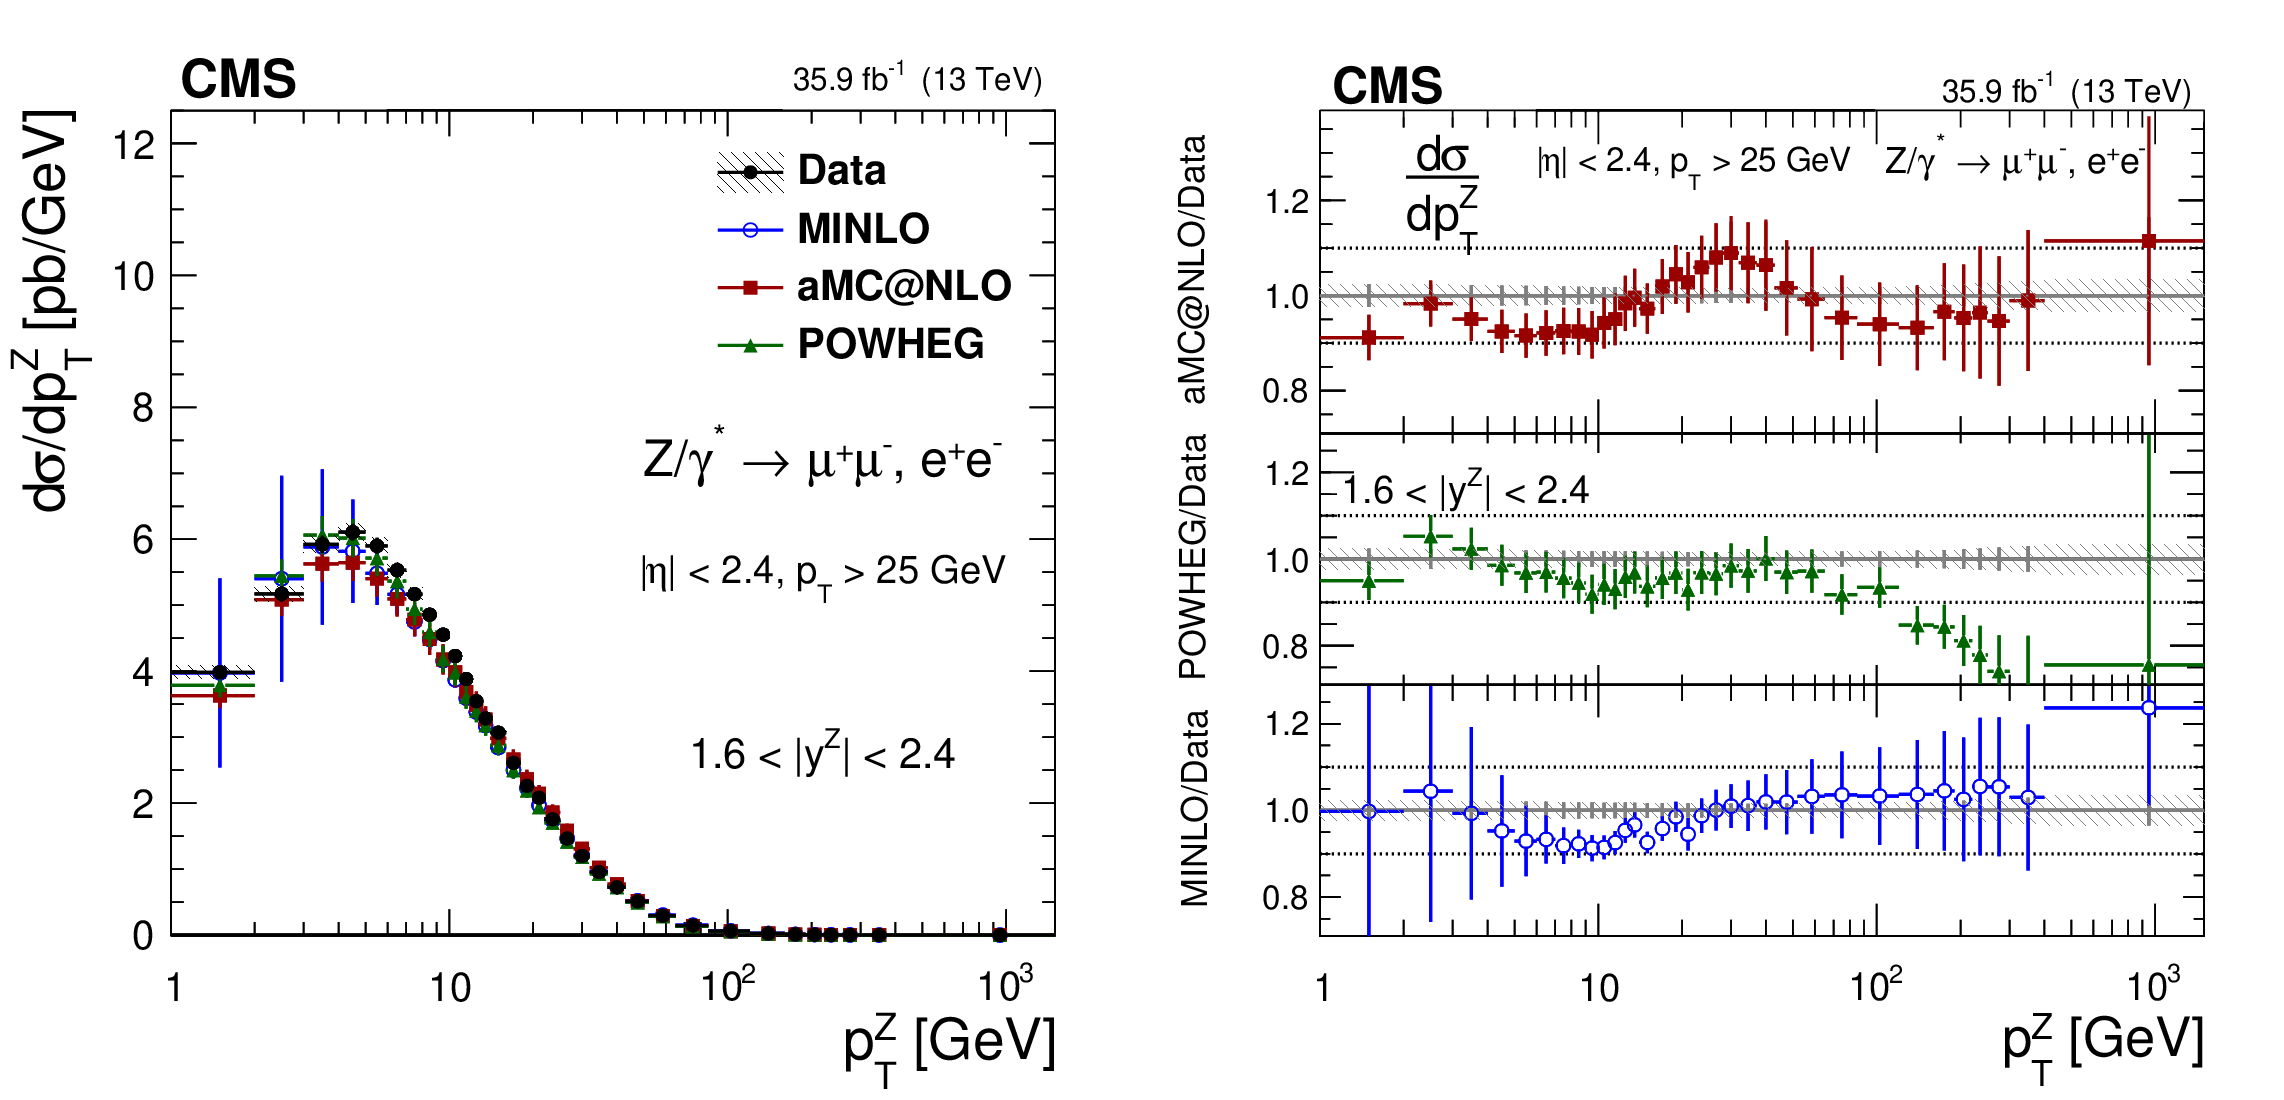
png pdf |
Additional Figure 14:
The measured absolute Born level (before FSR) cross sections (left) in bins of $ {p_{\mathrm {T}}} ^{{\mathrm {Z}}}$ for the 1.6 $ < {| {y}^{{\mathrm {Z}}} |} < $ 2.4 region. The ratios of the predictions to the data are also shown (right). The shaded bands around the data points (black) correspond to the total experimental uncertainty. The measurement is compared to the predictions with MadGraph 5_aMC@NLO (square red markers), POWHEG (green triangles), and POWHEG-MINLO (blue circles). The error bands around the predictions correspond to the combined statistical, PDF, and scale uncertainties. The first $ {p_{\mathrm {T}}} ^{{\mathrm {Z}}}$ bin (0-1 GeV) is not shown as large differences were observed in MadGraph 5_aMC@NLO and POWHEG predictions at Born level. |
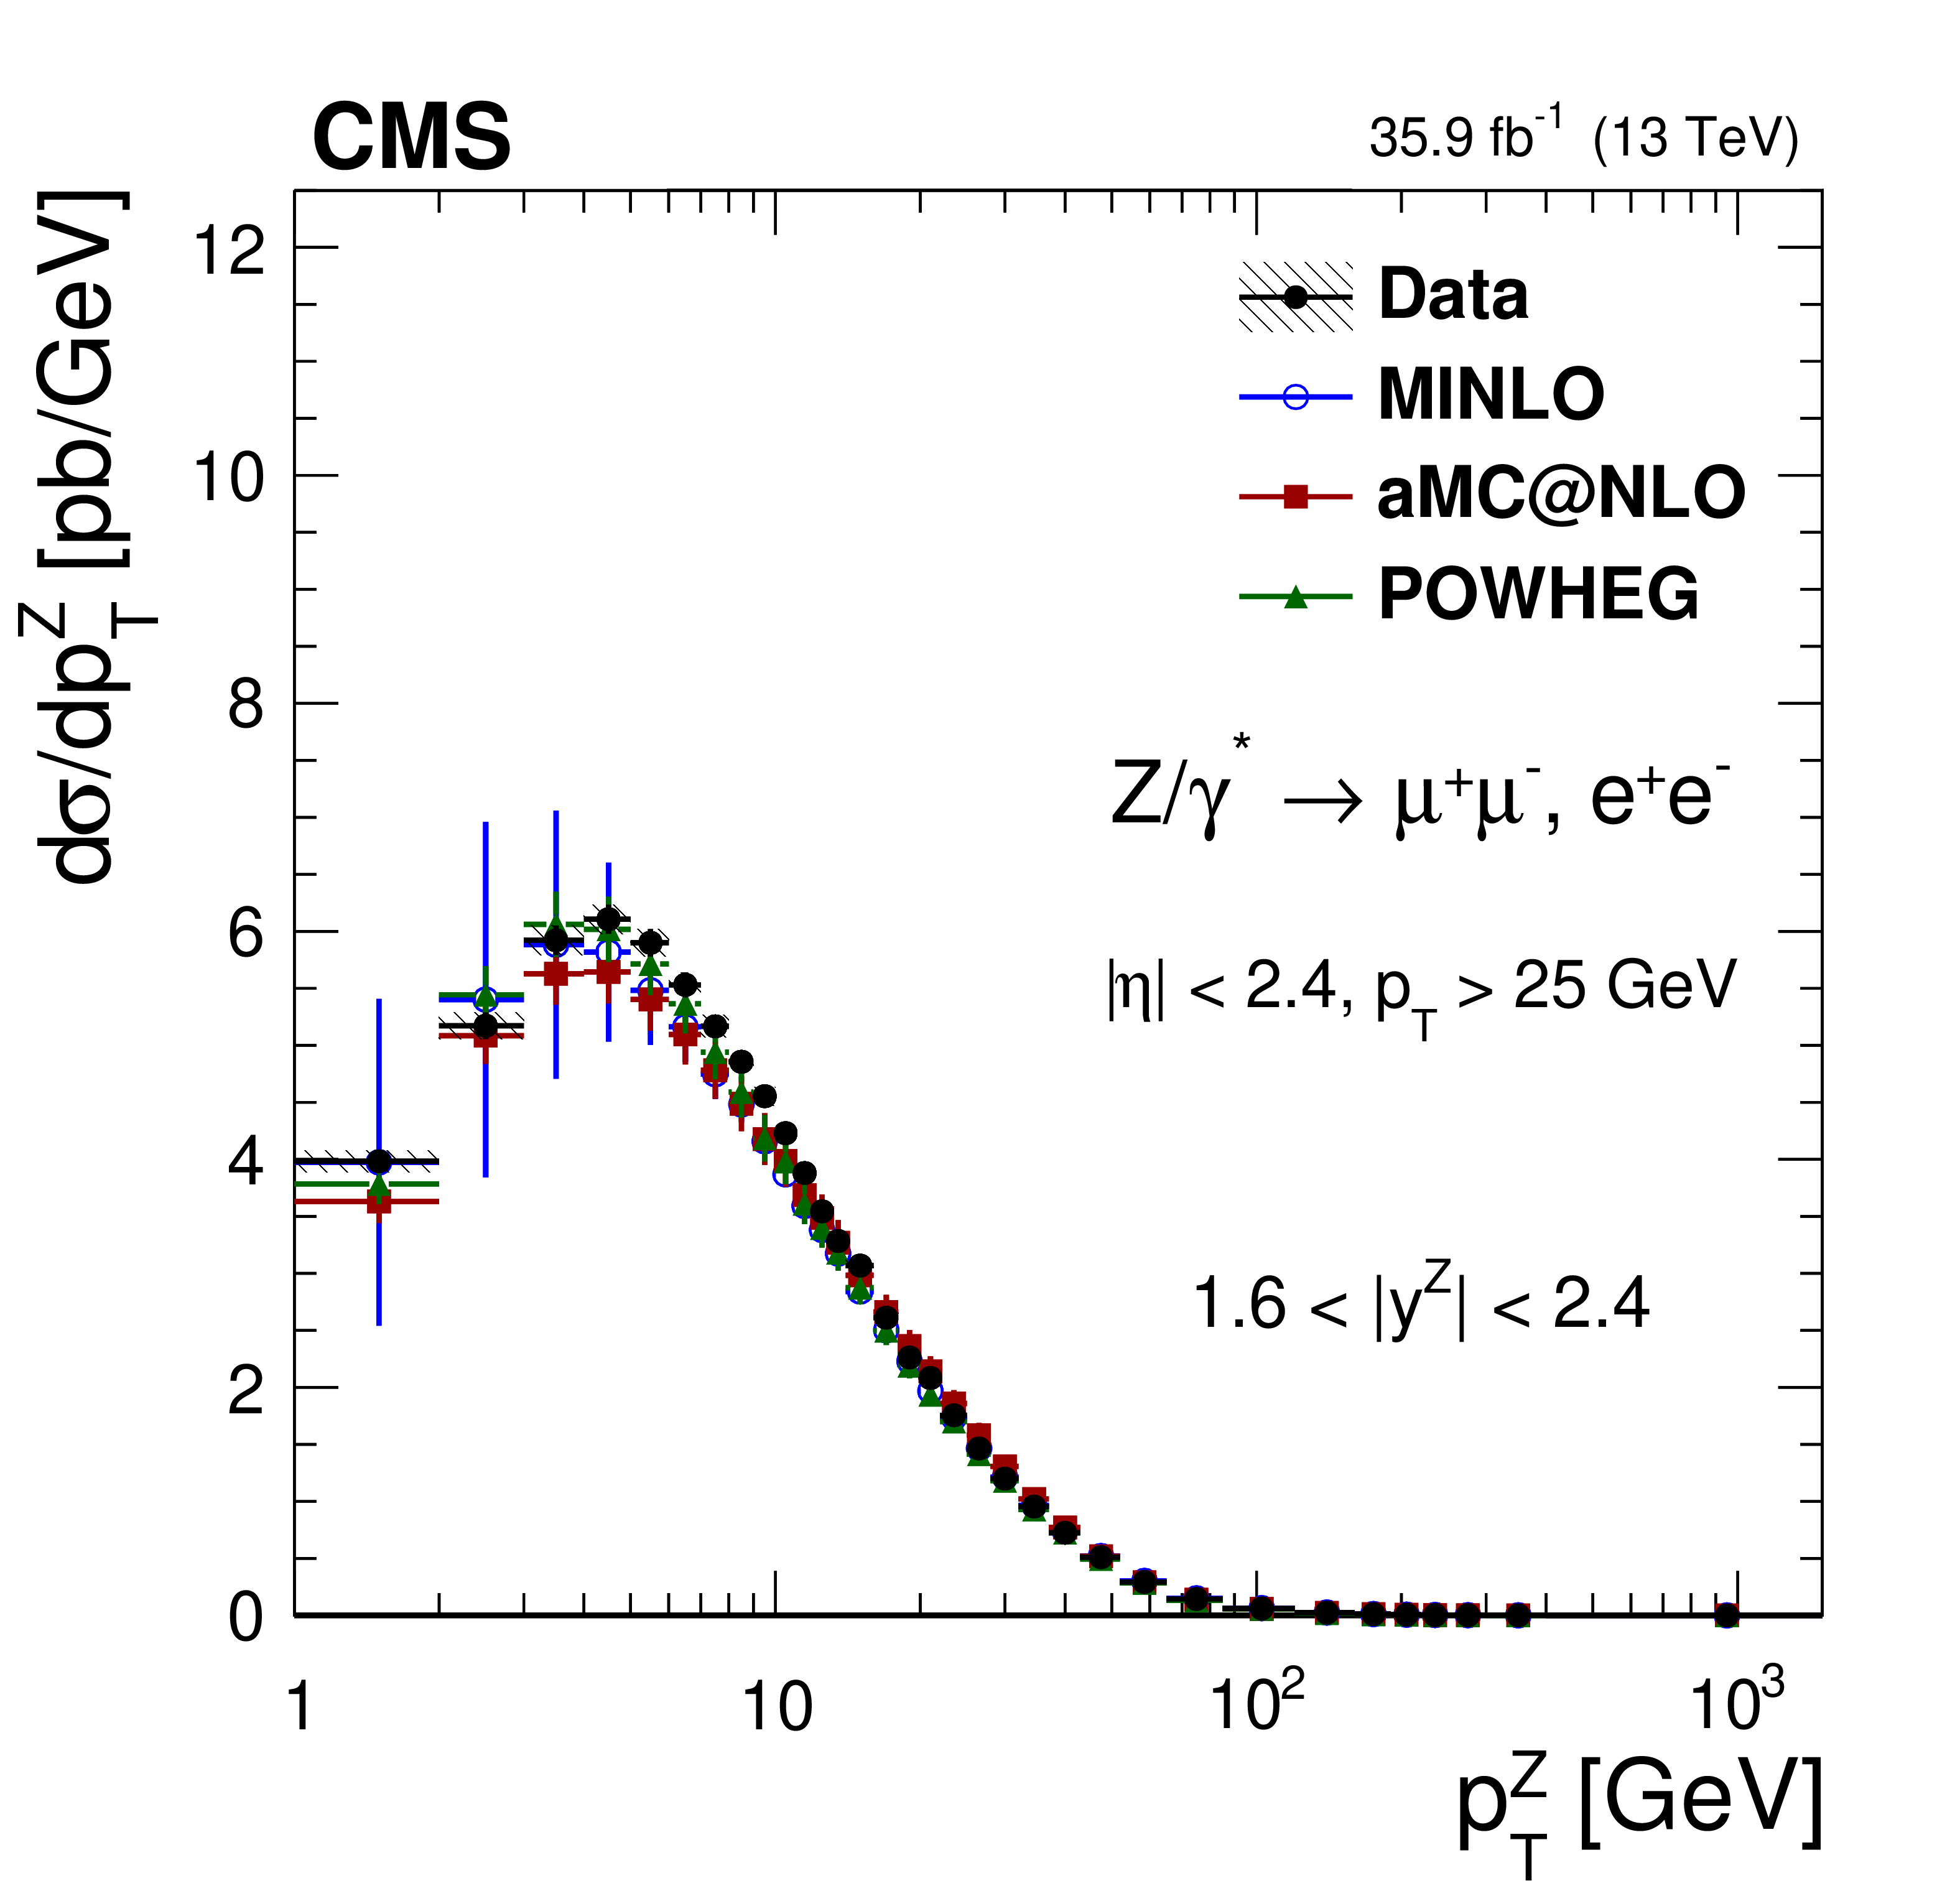
png pdf |
Additional Figure 14-a:
The measured absolute Born level (before FSR) cross sections in bins of $ {p_{\mathrm {T}}} ^{{\mathrm {Z}}}$ for the 1.6 $ < {| {y}^{{\mathrm {Z}}} |} < $ 2.4 region. The shaded bands around the data points (black) correspond to the total experimental uncertainty. The measurement is compared to the predictions with MadGraph 5_aMC@NLO (square red markers), POWHEG (green triangles), and POWHEG-MINLO (blue circles). The error bands around the predictions correspond to the combined statistical, PDF, and scale uncertainties. The first $ {p_{\mathrm {T}}} ^{{\mathrm {Z}}}$ bin (0-1 GeV) is not shown as large differences were observed in MadGraph 5_aMC@NLO and POWHEG predictions at Born level. |

png pdf |
Additional Figure 14-b:
The ratios of the predictions to the data of the measured absolute Born level (before FSR) cross sections in bins of $ {p_{\mathrm {T}}} ^{{\mathrm {Z}}}$ for the 1.6 $ < {| {y}^{{\mathrm {Z}}} |} < $ 2.4 region. The shaded bands around the data points (black) correspond to the total experimental uncertainty. The measurement is compared to the predictions with MadGraph 5_aMC@NLO (square red markers), POWHEG (green triangles), and POWHEG-MINLO (blue circles). The error bands around the predictions correspond to the combined statistical, PDF, and scale uncertainties. The first $ {p_{\mathrm {T}}} ^{{\mathrm {Z}}}$ bin (0-1 GeV) is not shown as large differences were observed in MadGraph 5_aMC@NLO and POWHEG predictions at Born level. |
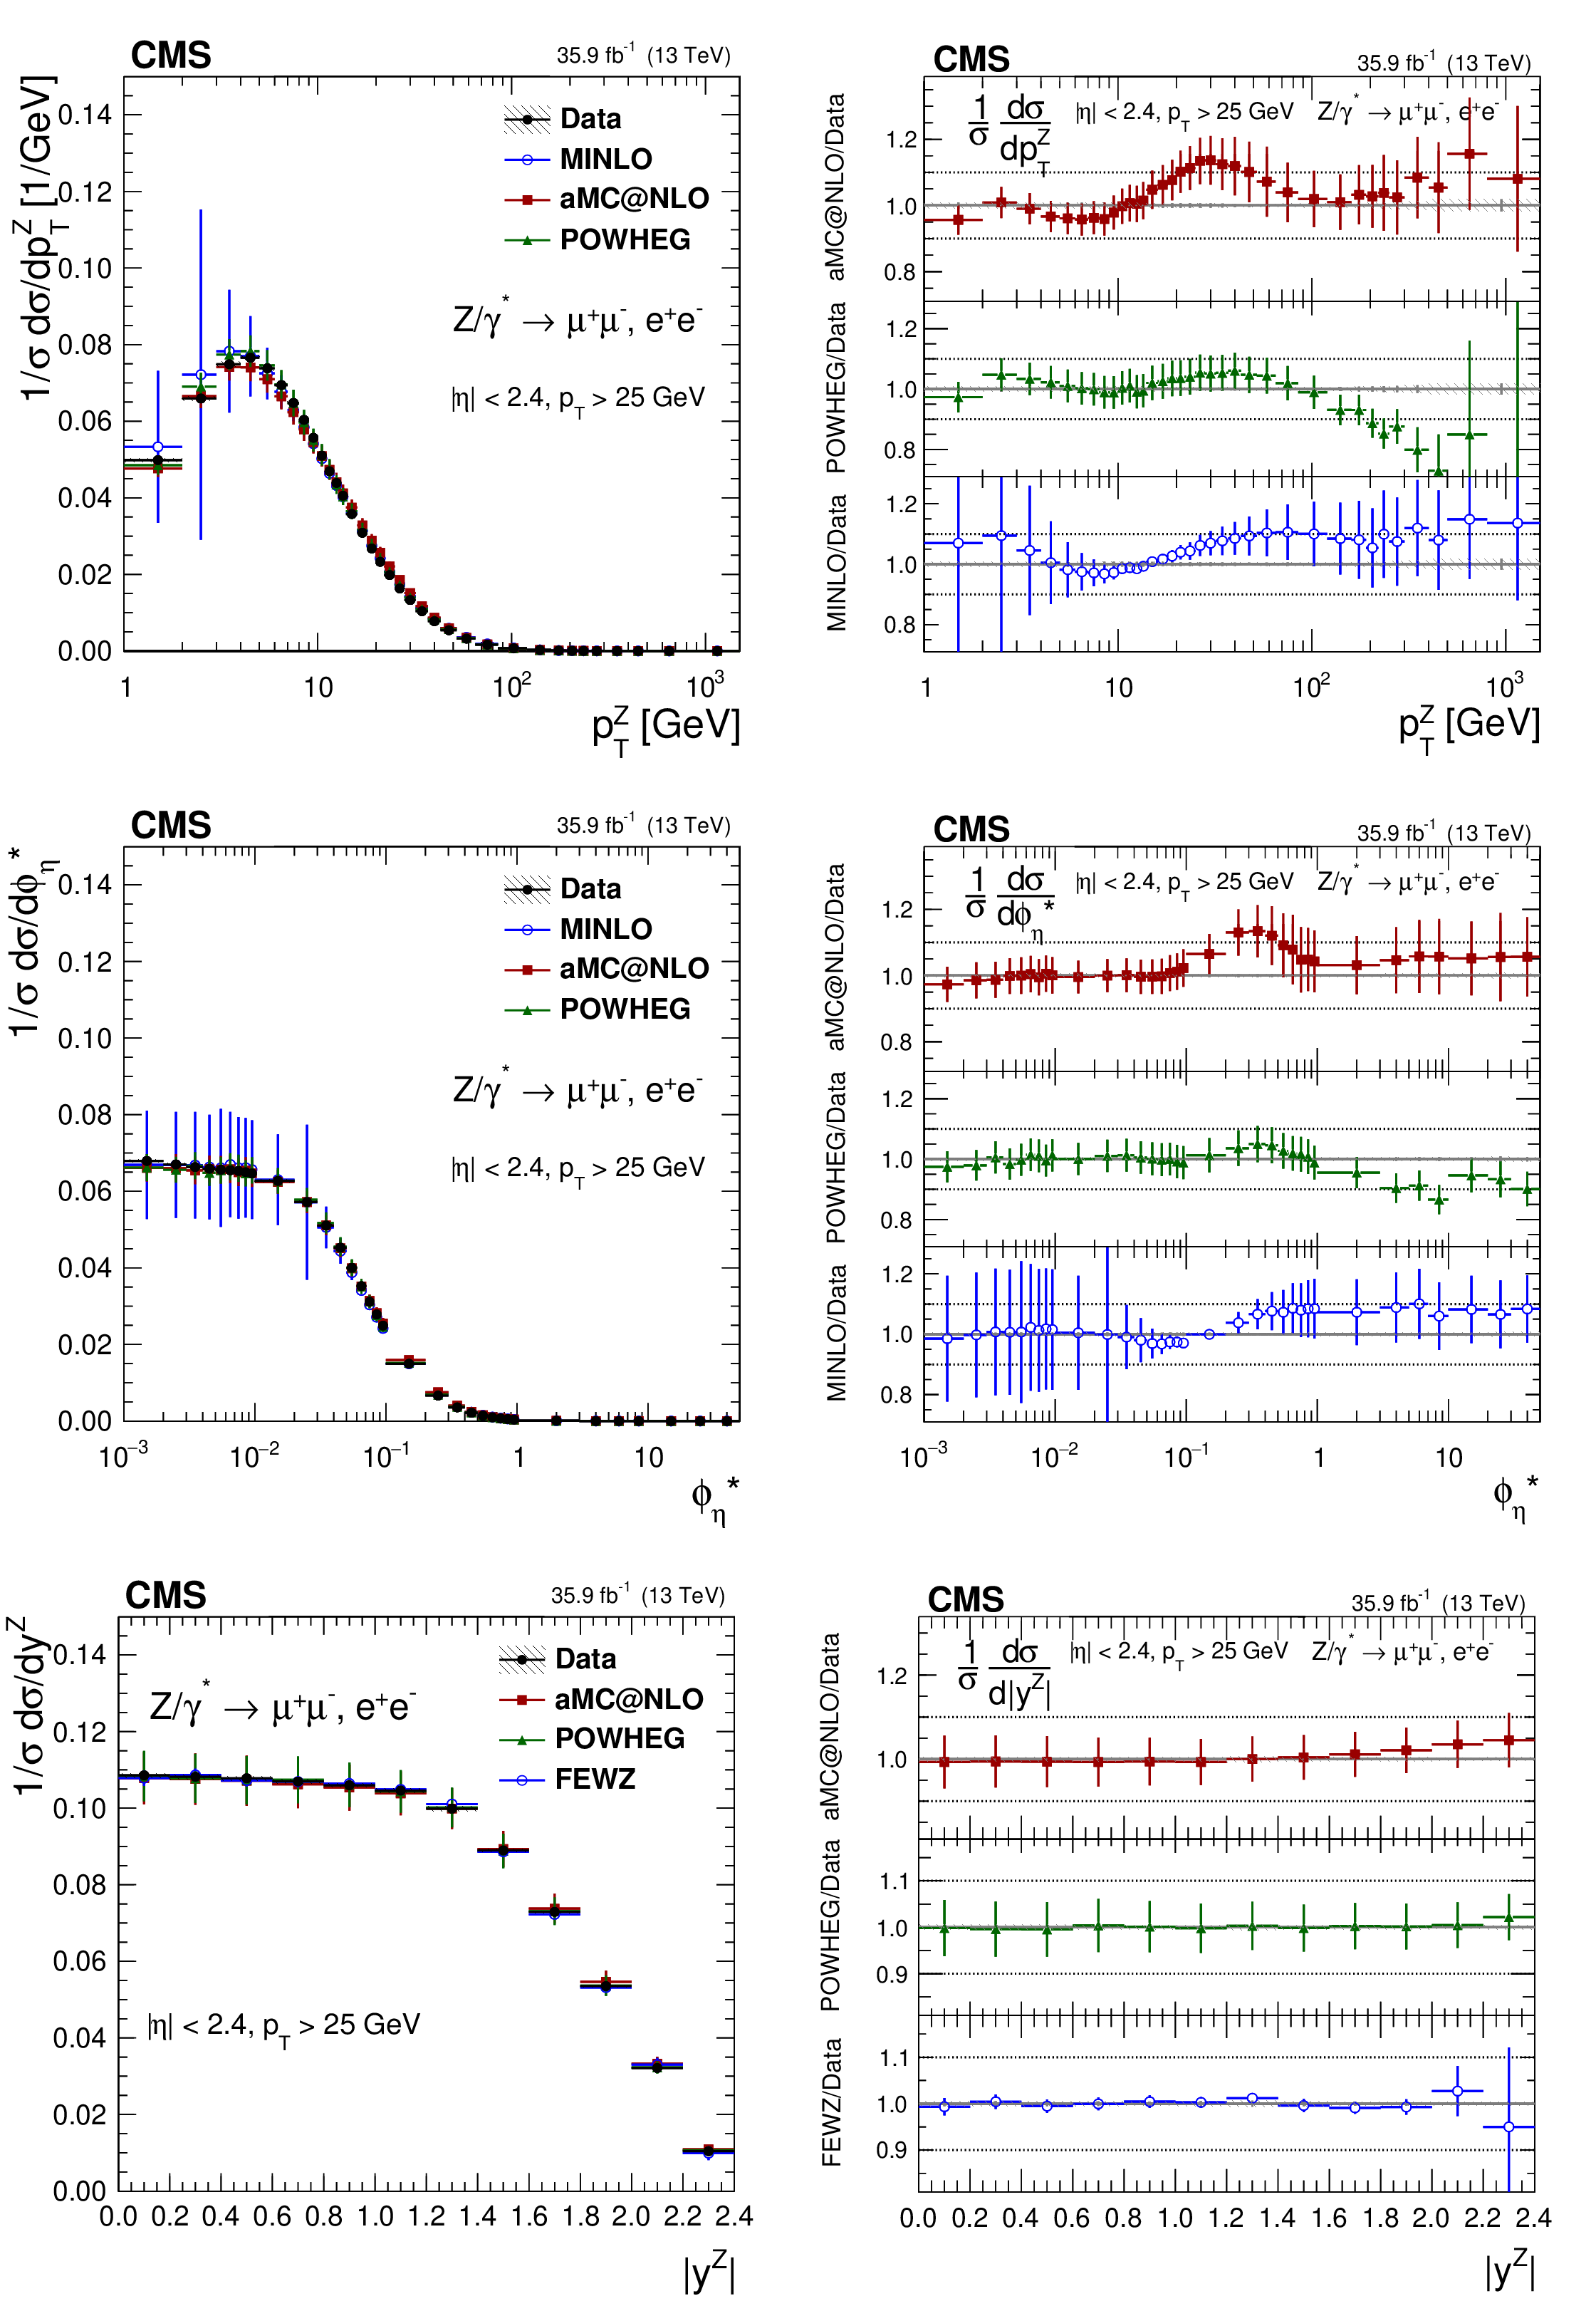
png pdf |
Additional Figure 15:
The measured normalized Born level (before FSR) cross sections (left) in bins of $ {p_{\mathrm {T}}} ^{{\mathrm {Z}}}$ (upper), $ {\phi ^{\scriptscriptstyle *}_\eta}$ (middle), and $ {| {y}^{{\mathrm {Z}}} |}$ (lower) for the combined measurement. The ratios of the predictions to the data are also shown (right). The shaded bands around the data points (black) correspond to the total experimental uncertainty. The $ {p_{\mathrm {T}}} ^{{\mathrm {Z}}}$ and $ {\phi ^{\scriptscriptstyle *}_\eta}$ measurements are compared to the predictions with MadGraph 5_aMC@NLO (square red markers), POWHEG (green triangles), and POWHEG-MINLO (blue circles). The $ {| {y}^{{\mathrm {Z}}} |}$ measurement is compared to the predictions with MadGraph 5_aMC@NLO (square red markers), POWHEG (green triangles), and FEWZ (blue circles). The error bars around the predictions correspond to the combined statistical, PDF, and scale uncertainties. The first $ {p_{\mathrm {T}}} ^{{\mathrm {Z}}}$ bin (0-1 GeV) is not shown as large differences were observed in MadGraph 5_aMC@NLO and POWHEG predictions at Born level. |
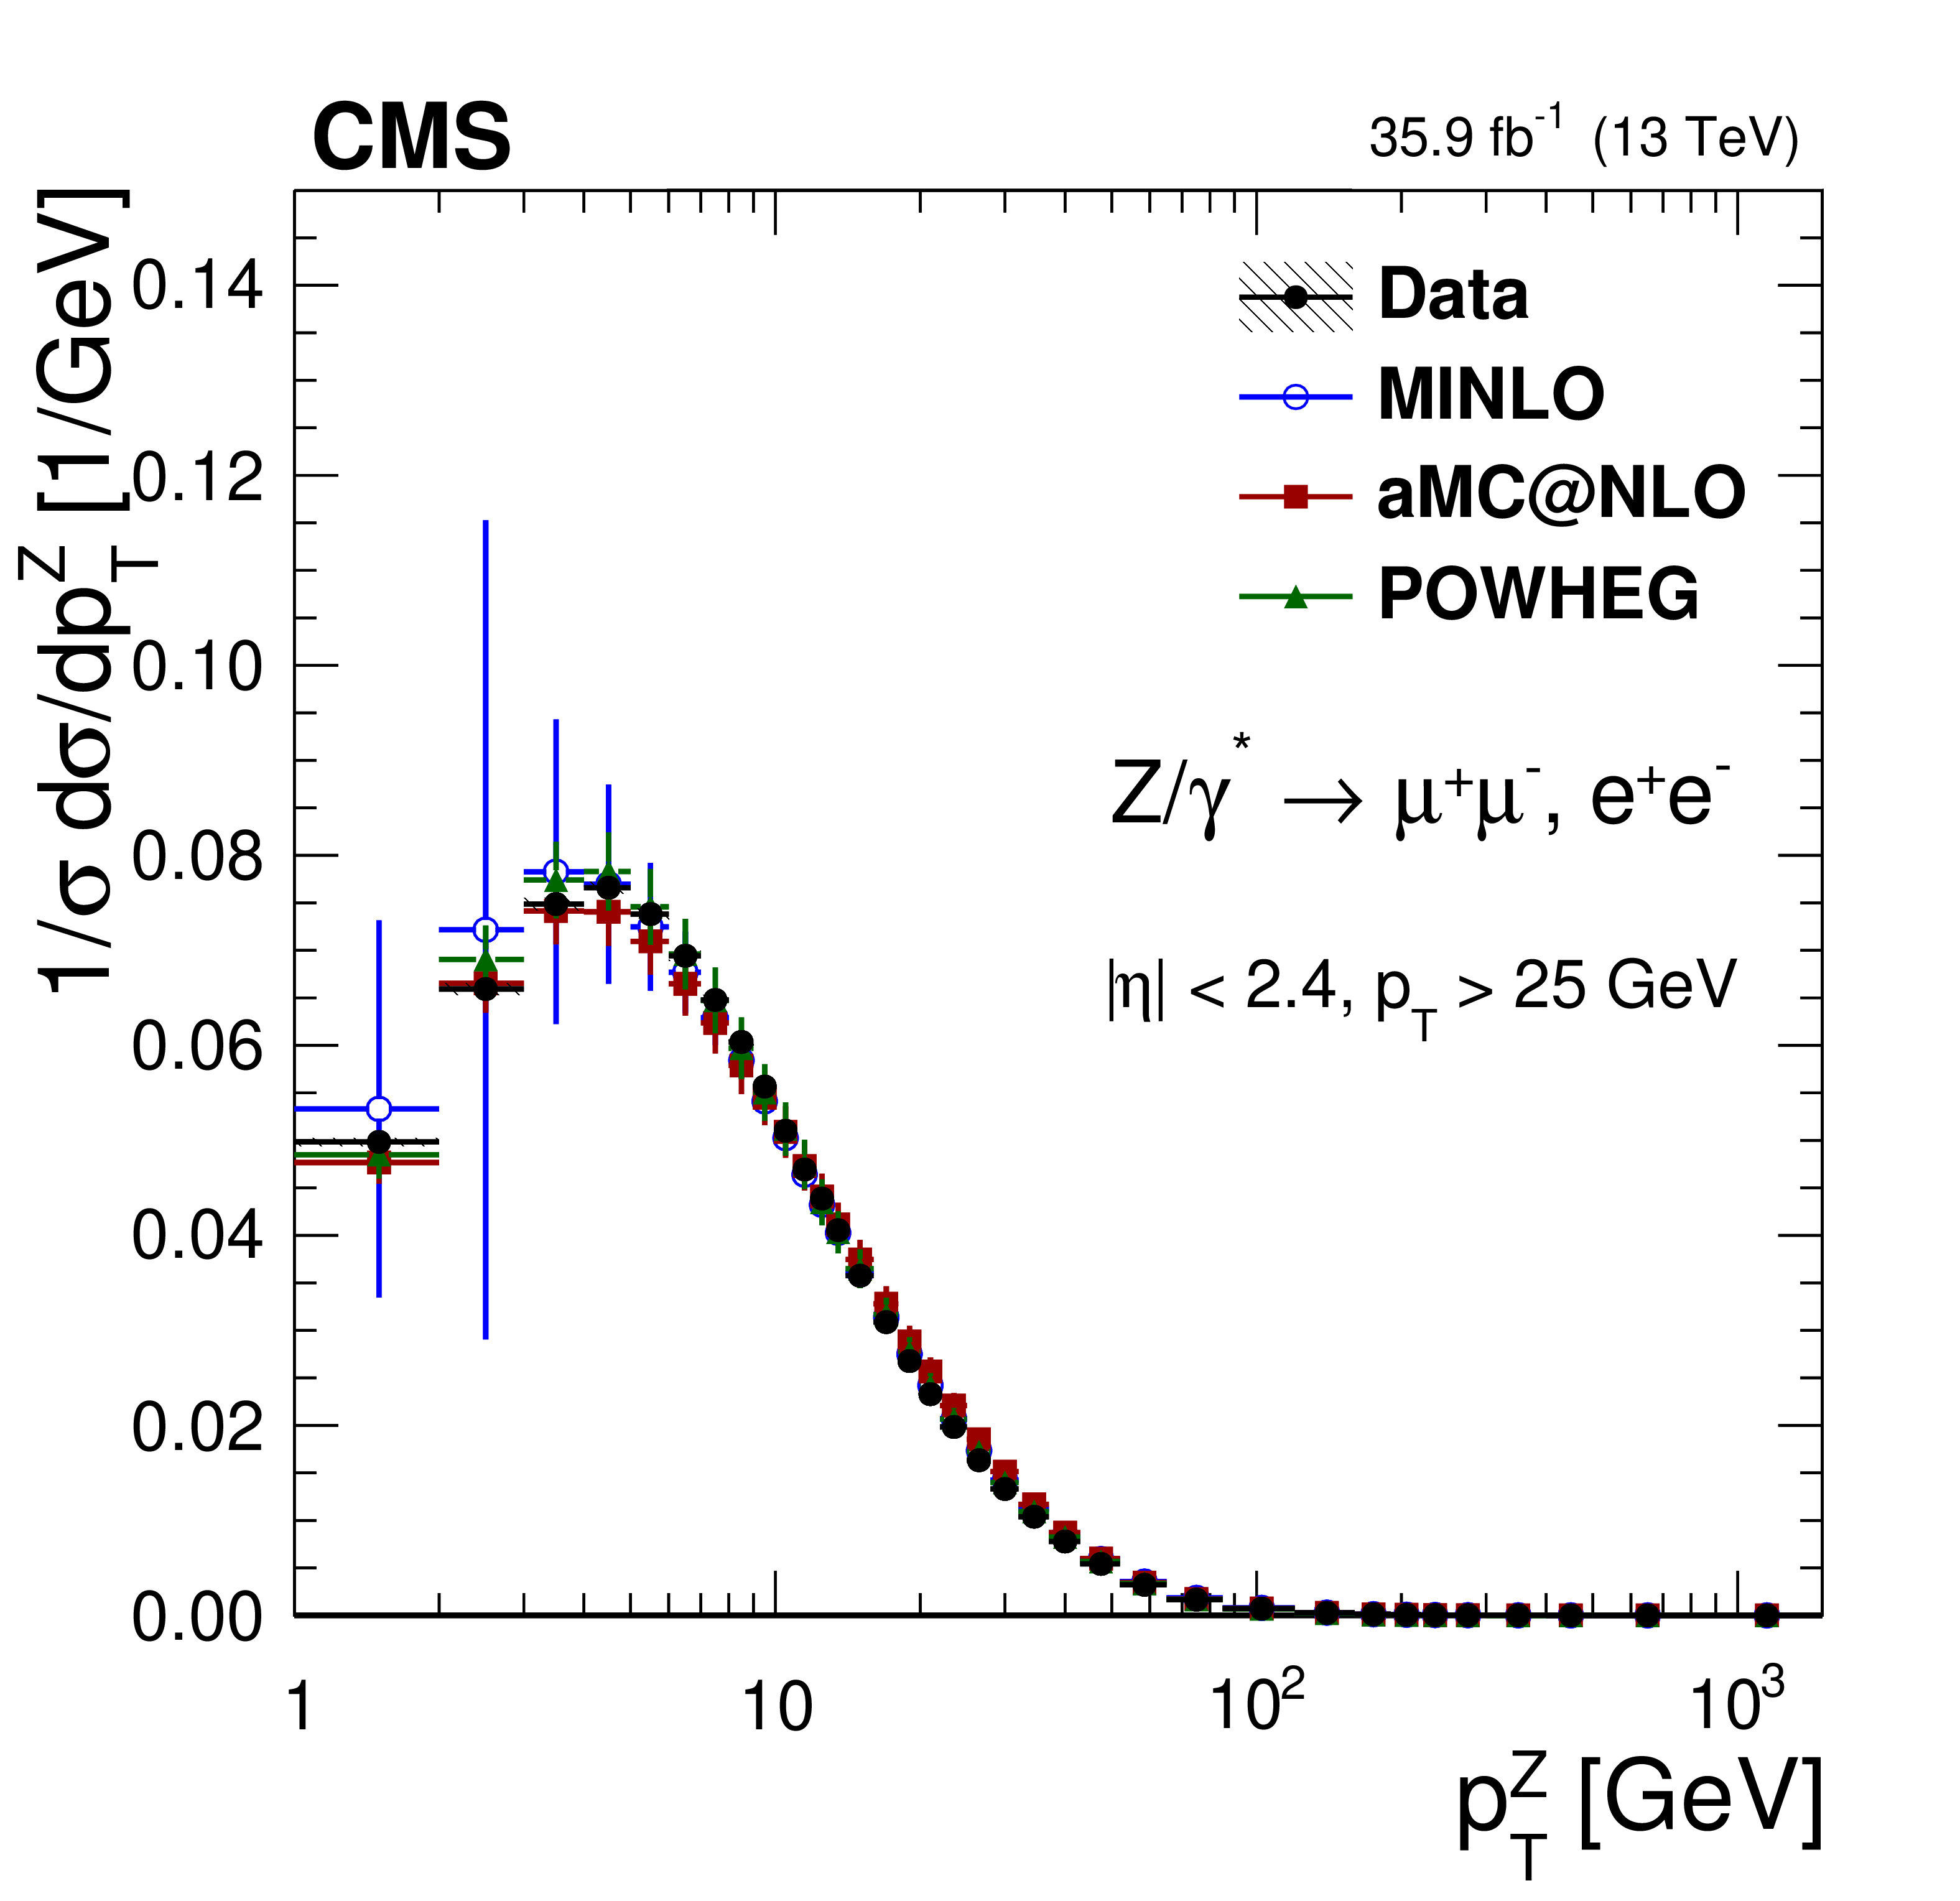
png pdf |
Additional Figure 15-a:
The measured normalized Born level (before FSR) cross sections in bins of $ {p_{\mathrm {T}}} ^{{\mathrm {Z}}}$ for the combined measurement. The shaded bands around the data points (black) correspond to the total experimental uncertainty. The measurements are compared to the predictions with MadGraph 5_aMC@NLO (square red markers), POWHEG (green triangles), and POWHEG-MINLO (blue circles). The error bars around the predictions correspond to the combined statistical, PDF, and scale uncertainties. The first bin (0-1 GeV) is not shown as large differences were observed in MadGraph 5_aMC@NLO and POWHEG predictions at Born level. |

png pdf |
Additional Figure 15-b:
The ratios of the predictions to the data of the measured normalized Born level (before FSR) cross sections in bins of $ {p_{\mathrm {T}}} ^{{\mathrm {Z}}}$ for the combined measurement. The shaded bands around the data points (black) correspond to the total experimental uncertainty. The measurements are compared to the predictions with MadGraph 5_aMC@NLO (square red markers), POWHEG (green triangles), and POWHEG-MINLO (blue circles). The error bars around the predictions correspond to the combined statistical, PDF, and scale uncertainties. The first bin (0-1 GeV) is not shown as large differences were observed in MadGraph 5_aMC@NLO and POWHEG predictions at Born level. |

png pdf |
Additional Figure 15-c:
The measured normalized Born level (before FSR) cross sections in bins of $ {\phi ^{\scriptscriptstyle *}_\eta}$ for the combined measurement. The shaded bands around the data points (black) correspond to the total experimental uncertainty. The measurements are compared to the predictions with MadGraph 5_aMC@NLO (square red markers), POWHEG (green triangles), and POWHEG-MINLO (blue circles). The error bars around the predictions correspond to the combined statistical, PDF, and scale uncertainties. |

png pdf |
Additional Figure 15-d:
The ratios of the predictions to the data of the measured normalized Born level (before FSR) cross sections in bins of $ {\phi ^{\scriptscriptstyle *}_\eta}$ for the combined measurement. The shaded bands around the data points (black) correspond to the total experimental uncertainty. The measurements are compared to the predictions with MadGraph 5_aMC@NLO (square red markers), POWHEG (green triangles), and POWHEG-MINLO (blue circles). The error bars around the predictions correspond to the combined statistical, PDF, and scale uncertainties. |

png pdf |
Additional Figure 15-e:
The measured normalized Born level (before FSR) cross sections in bins of $ {| {y}^{{\mathrm {Z}}} |}$ for the combined measurement. The shaded bands around the data points (black) correspond to the total experimental uncertainty. The measurement is compared to the predictions with MadGraph 5_aMC@NLO (square red markers), POWHEG (green triangles), and FEWZ (blue circles). The error bars around the predictions correspond to the combined statistical, PDF, and scale uncertainties. |

png pdf |
Additional Figure 15-f:
The ratios of the predictions to the data of the measured normalized Born level (before FSR) cross sections in bins of $ {| {y}^{{\mathrm {Z}}} |}$ for the combined measurement. The shaded bands around the data points (black) correspond to the total experimental uncertainty. The measurement is compared to the predictions with MadGraph 5_aMC@NLO (square red markers), POWHEG (green triangles), and FEWZ (blue circles). The error bars around the predictions correspond to the combined statistical, PDF, and scale uncertainties. |
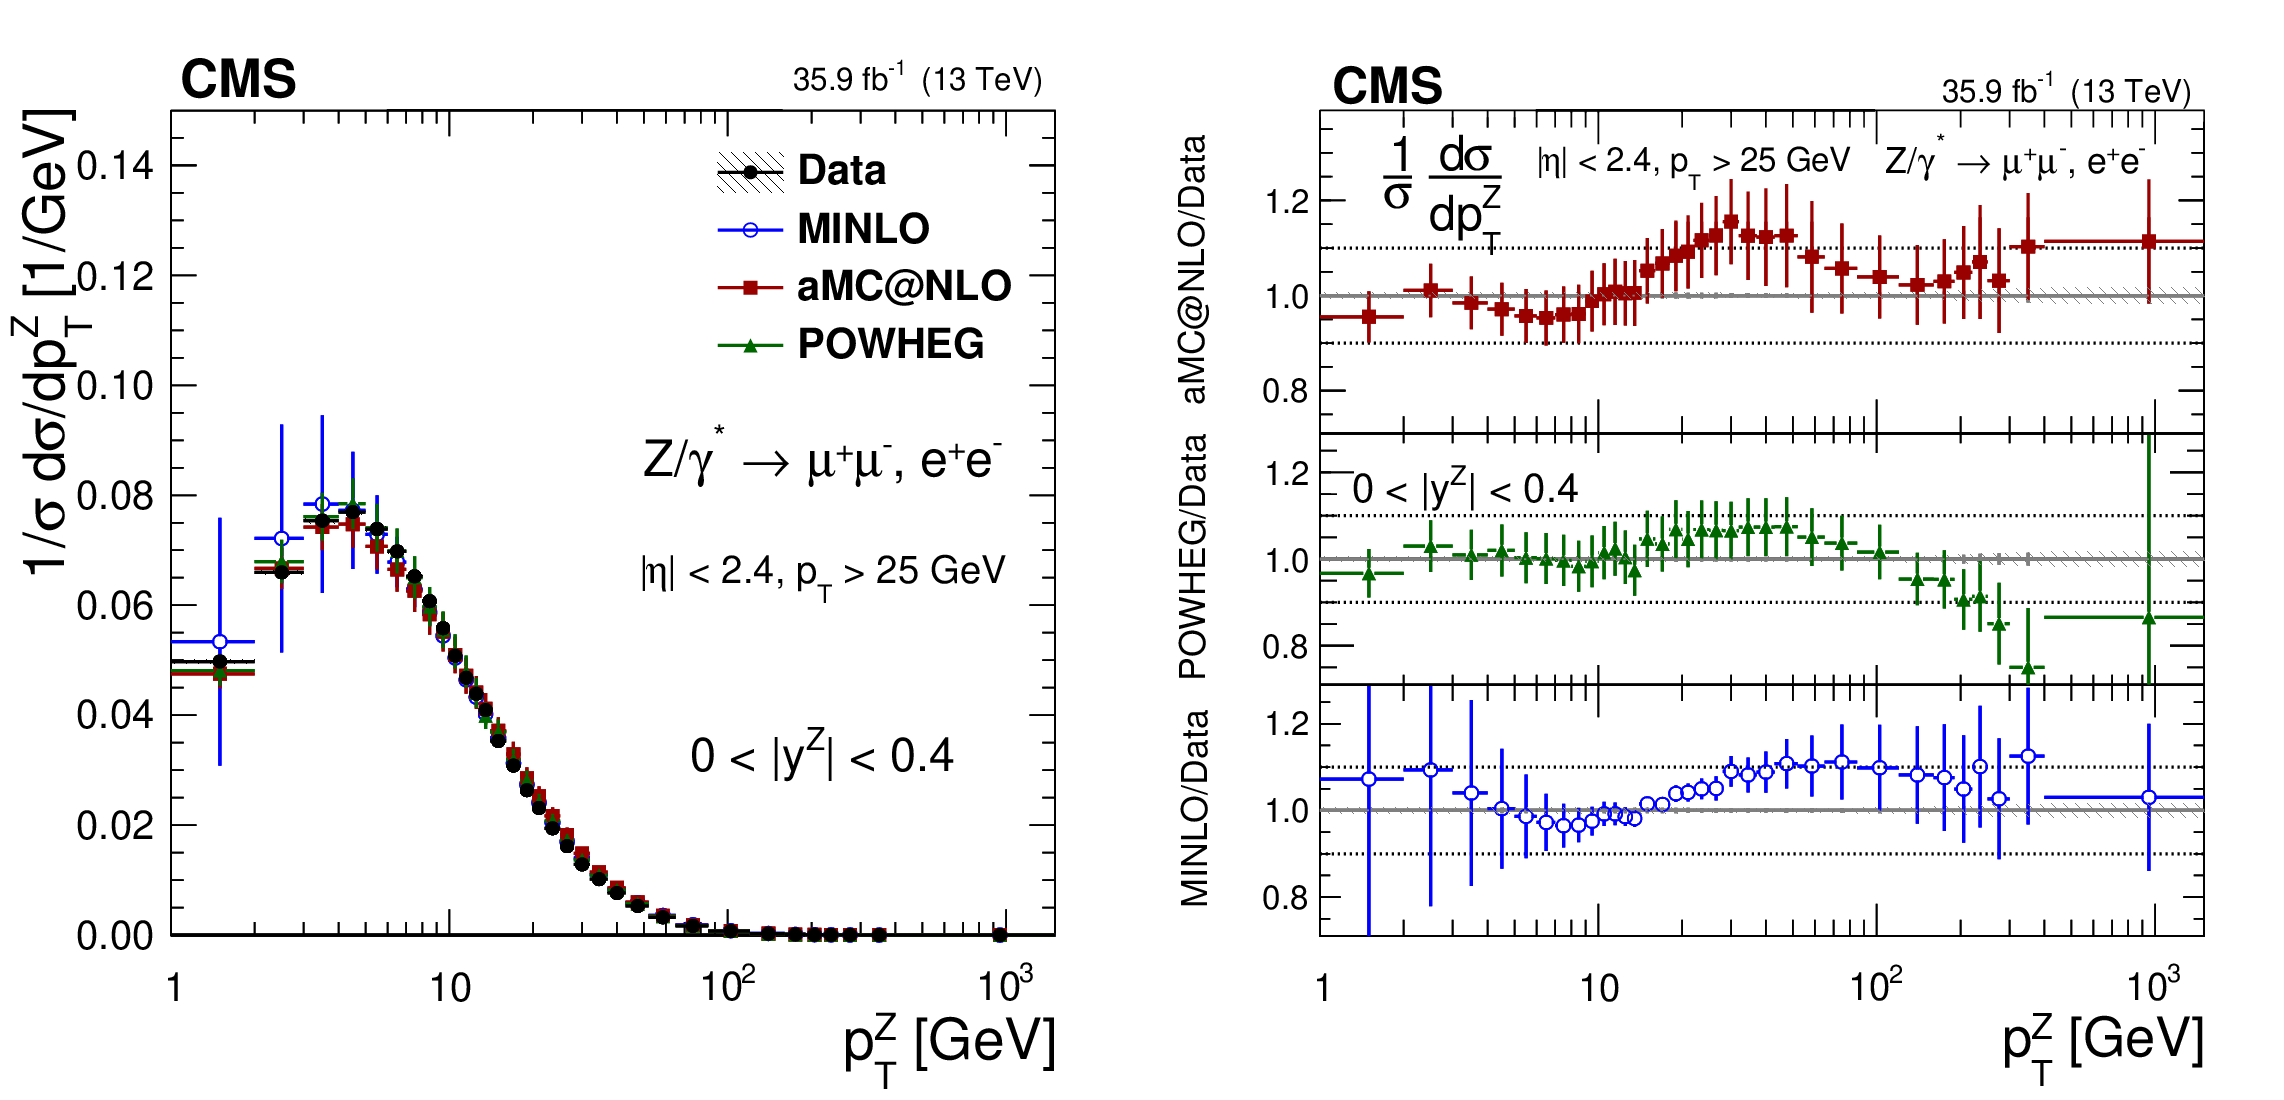
png pdf |
Additional Figure 16:
The measured normalized Born level (before FSR) cross sections (left) in bins of $ {p_{\mathrm {T}}} ^{{\mathrm {Z}}}$ for the 0.0 $ < {| {y}^{{\mathrm {Z}}} |} < $ 0.4 region. The ratios of the predictions to the data are also shown (right). The shaded bands around the data points (black) correspond to the total experimental uncertainty. The measurement is compared to the predictions with MadGraph 5_aMC@NLO (square red markers), POWHEG (green triangles), and POWHEG-MINLO (blue circles). The error bands around the predictions correspond to the combined statistical, PDF, and scale uncertainties. The first $ {p_{\mathrm {T}}} ^{{\mathrm {Z}}}$ bin (0-1 GeV) is not shown as large differences were observed in MadGraph 5_aMC@NLO and POWHEG predictions at Born level. |

png pdf |
Additional Figure 16-a:
The measured normalized Born level (before FSR) cross sections in bins of $ {p_{\mathrm {T}}} ^{{\mathrm {Z}}}$ for the 0.0 $ < {| {y}^{{\mathrm {Z}}} |} < $ 0.4 region. The shaded bands around the data points (black) correspond to the total experimental uncertainty. The measurement is compared to the predictions with MadGraph 5_aMC@NLO (square red markers), POWHEG (green triangles), and POWHEG-MINLO (blue circles). The error bands around the predictions correspond to the combined statistical, PDF, and scale uncertainties. The first $ {p_{\mathrm {T}}} ^{{\mathrm {Z}}}$ bin (0-1 GeV) is not shown as large differences were observed in MadGraph 5_aMC@NLO and POWHEG predictions at Born level. |

png pdf |
Additional Figure 16-b:
The ratios of the predictions to the data of the measured normalized Born level (before FSR) cross sections in bins of $ {p_{\mathrm {T}}} ^{{\mathrm {Z}}}$ for the 0.0 $ < {| {y}^{{\mathrm {Z}}} |} < $ 0.4 region. The shaded bands around the data points (black) correspond to the total experimental uncertainty. The measurement is compared to the predictions with MadGraph 5_aMC@NLO (square red markers), POWHEG (green triangles), and POWHEG-MINLO (blue circles). The error bands around the predictions correspond to the combined statistical, PDF, and scale uncertainties. The first $ {p_{\mathrm {T}}} ^{{\mathrm {Z}}}$ bin (0-1 GeV) is not shown as large differences were observed in MadGraph 5_aMC@NLO and POWHEG predictions at Born level. |
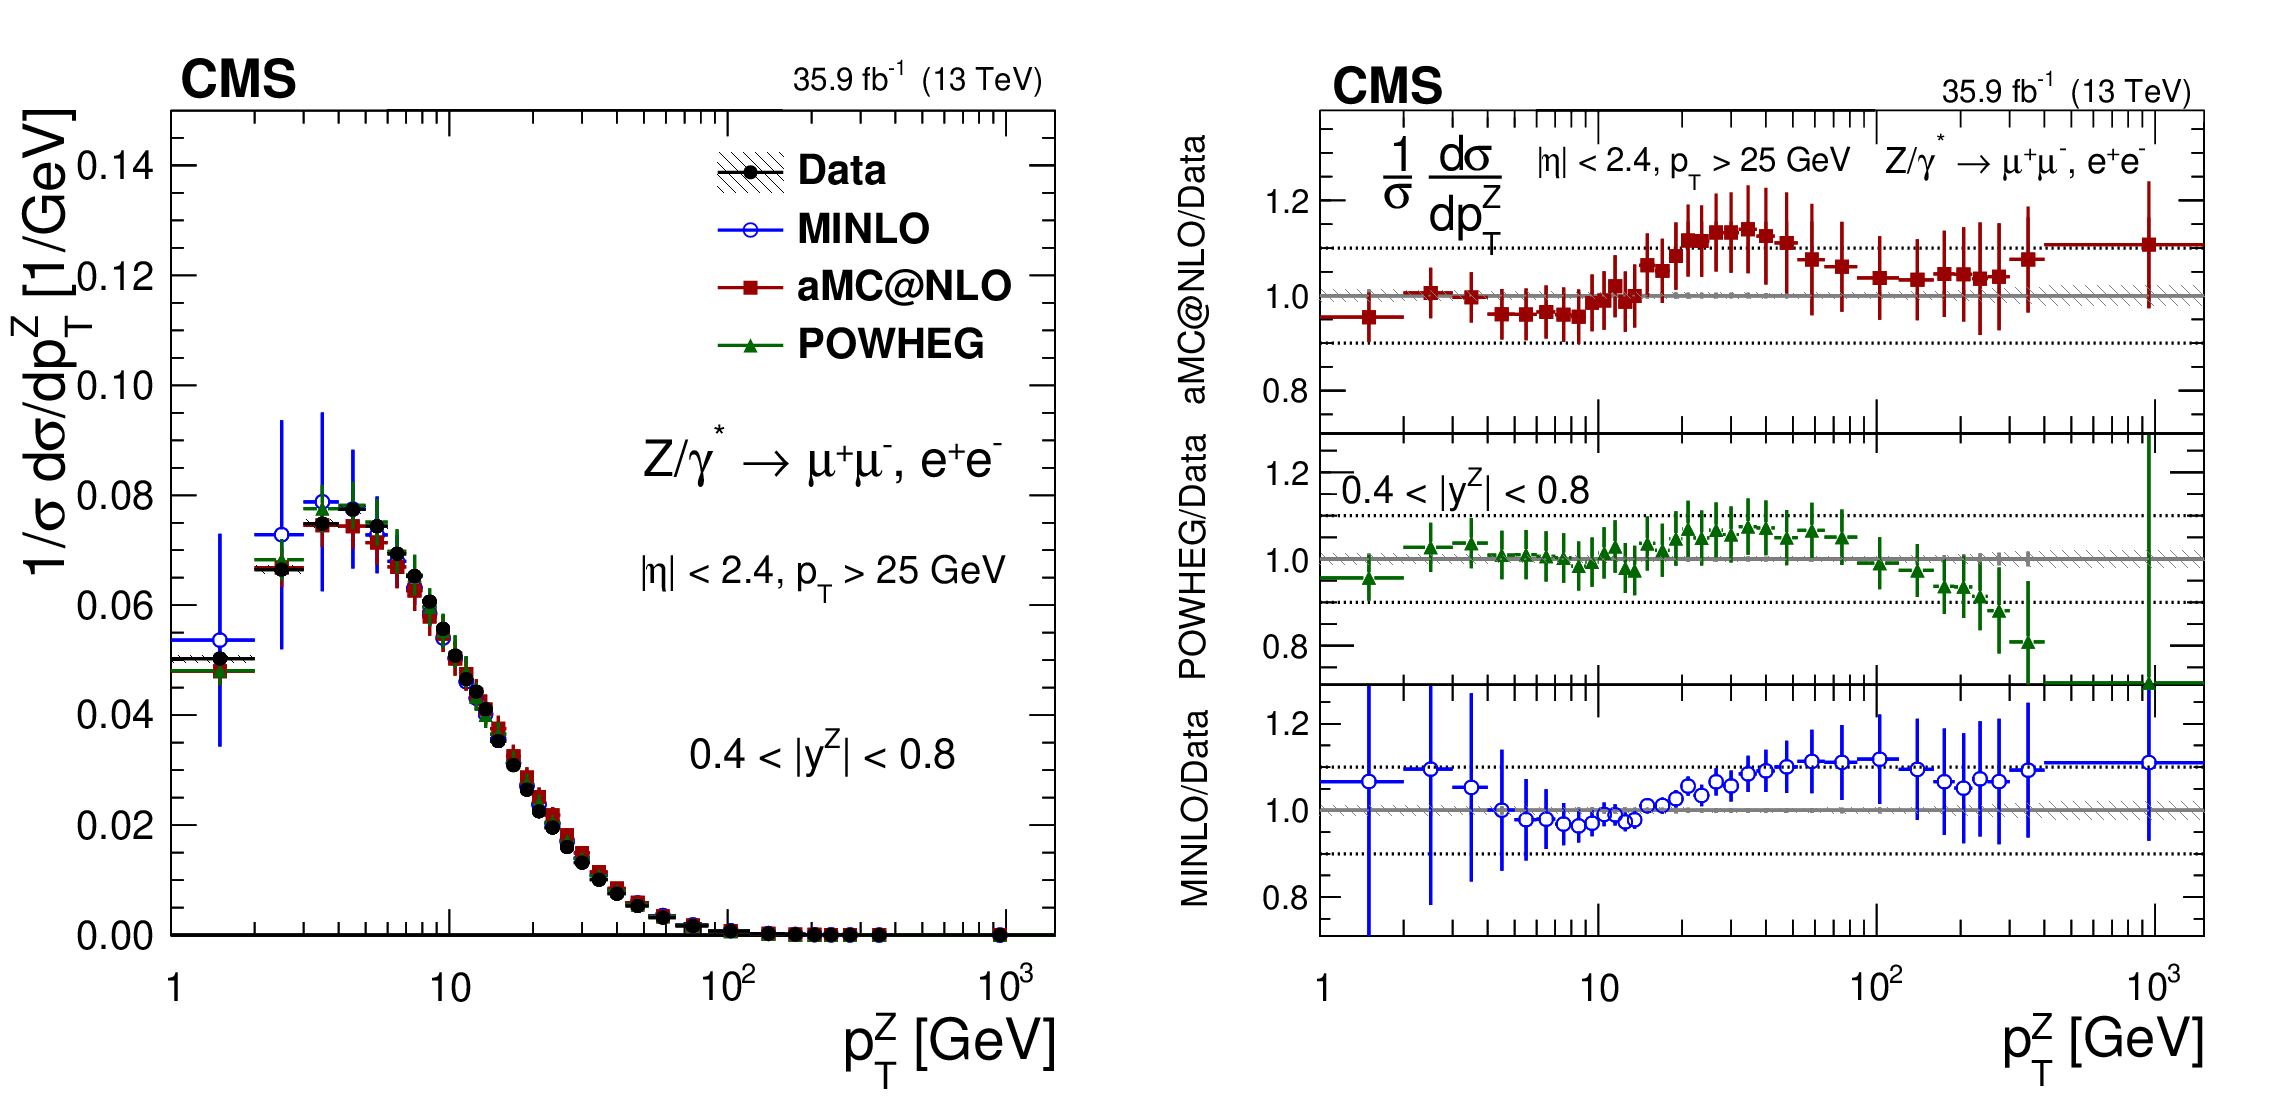
png pdf |
Additional Figure 17:
The measured normalized Born level (before FSR) cross sections (left) in bins of $ {p_{\mathrm {T}}} ^{{\mathrm {Z}}}$ for the 0.4 $ < {| {y}^{{\mathrm {Z}}} |} < $ 0.8 region. The ratios of the predictions to the data are also shown (right). The shaded bands around the data points (black) correspond to the total experimental uncertainty. The measurement is compared to the predictions with MadGraph 5_aMC@NLO (square red markers), POWHEG (green triangles), and POWHEG-MINLO (blue circles). The error bands around the predictions correspond to the combined statistical, PDF, and scale uncertainties. The first $ {p_{\mathrm {T}}} ^{{\mathrm {Z}}}$ bin (0-1 GeV) is not shown as large differences were observed in MadGraph 5_aMC@NLO and POWHEG predictions at Born level. |
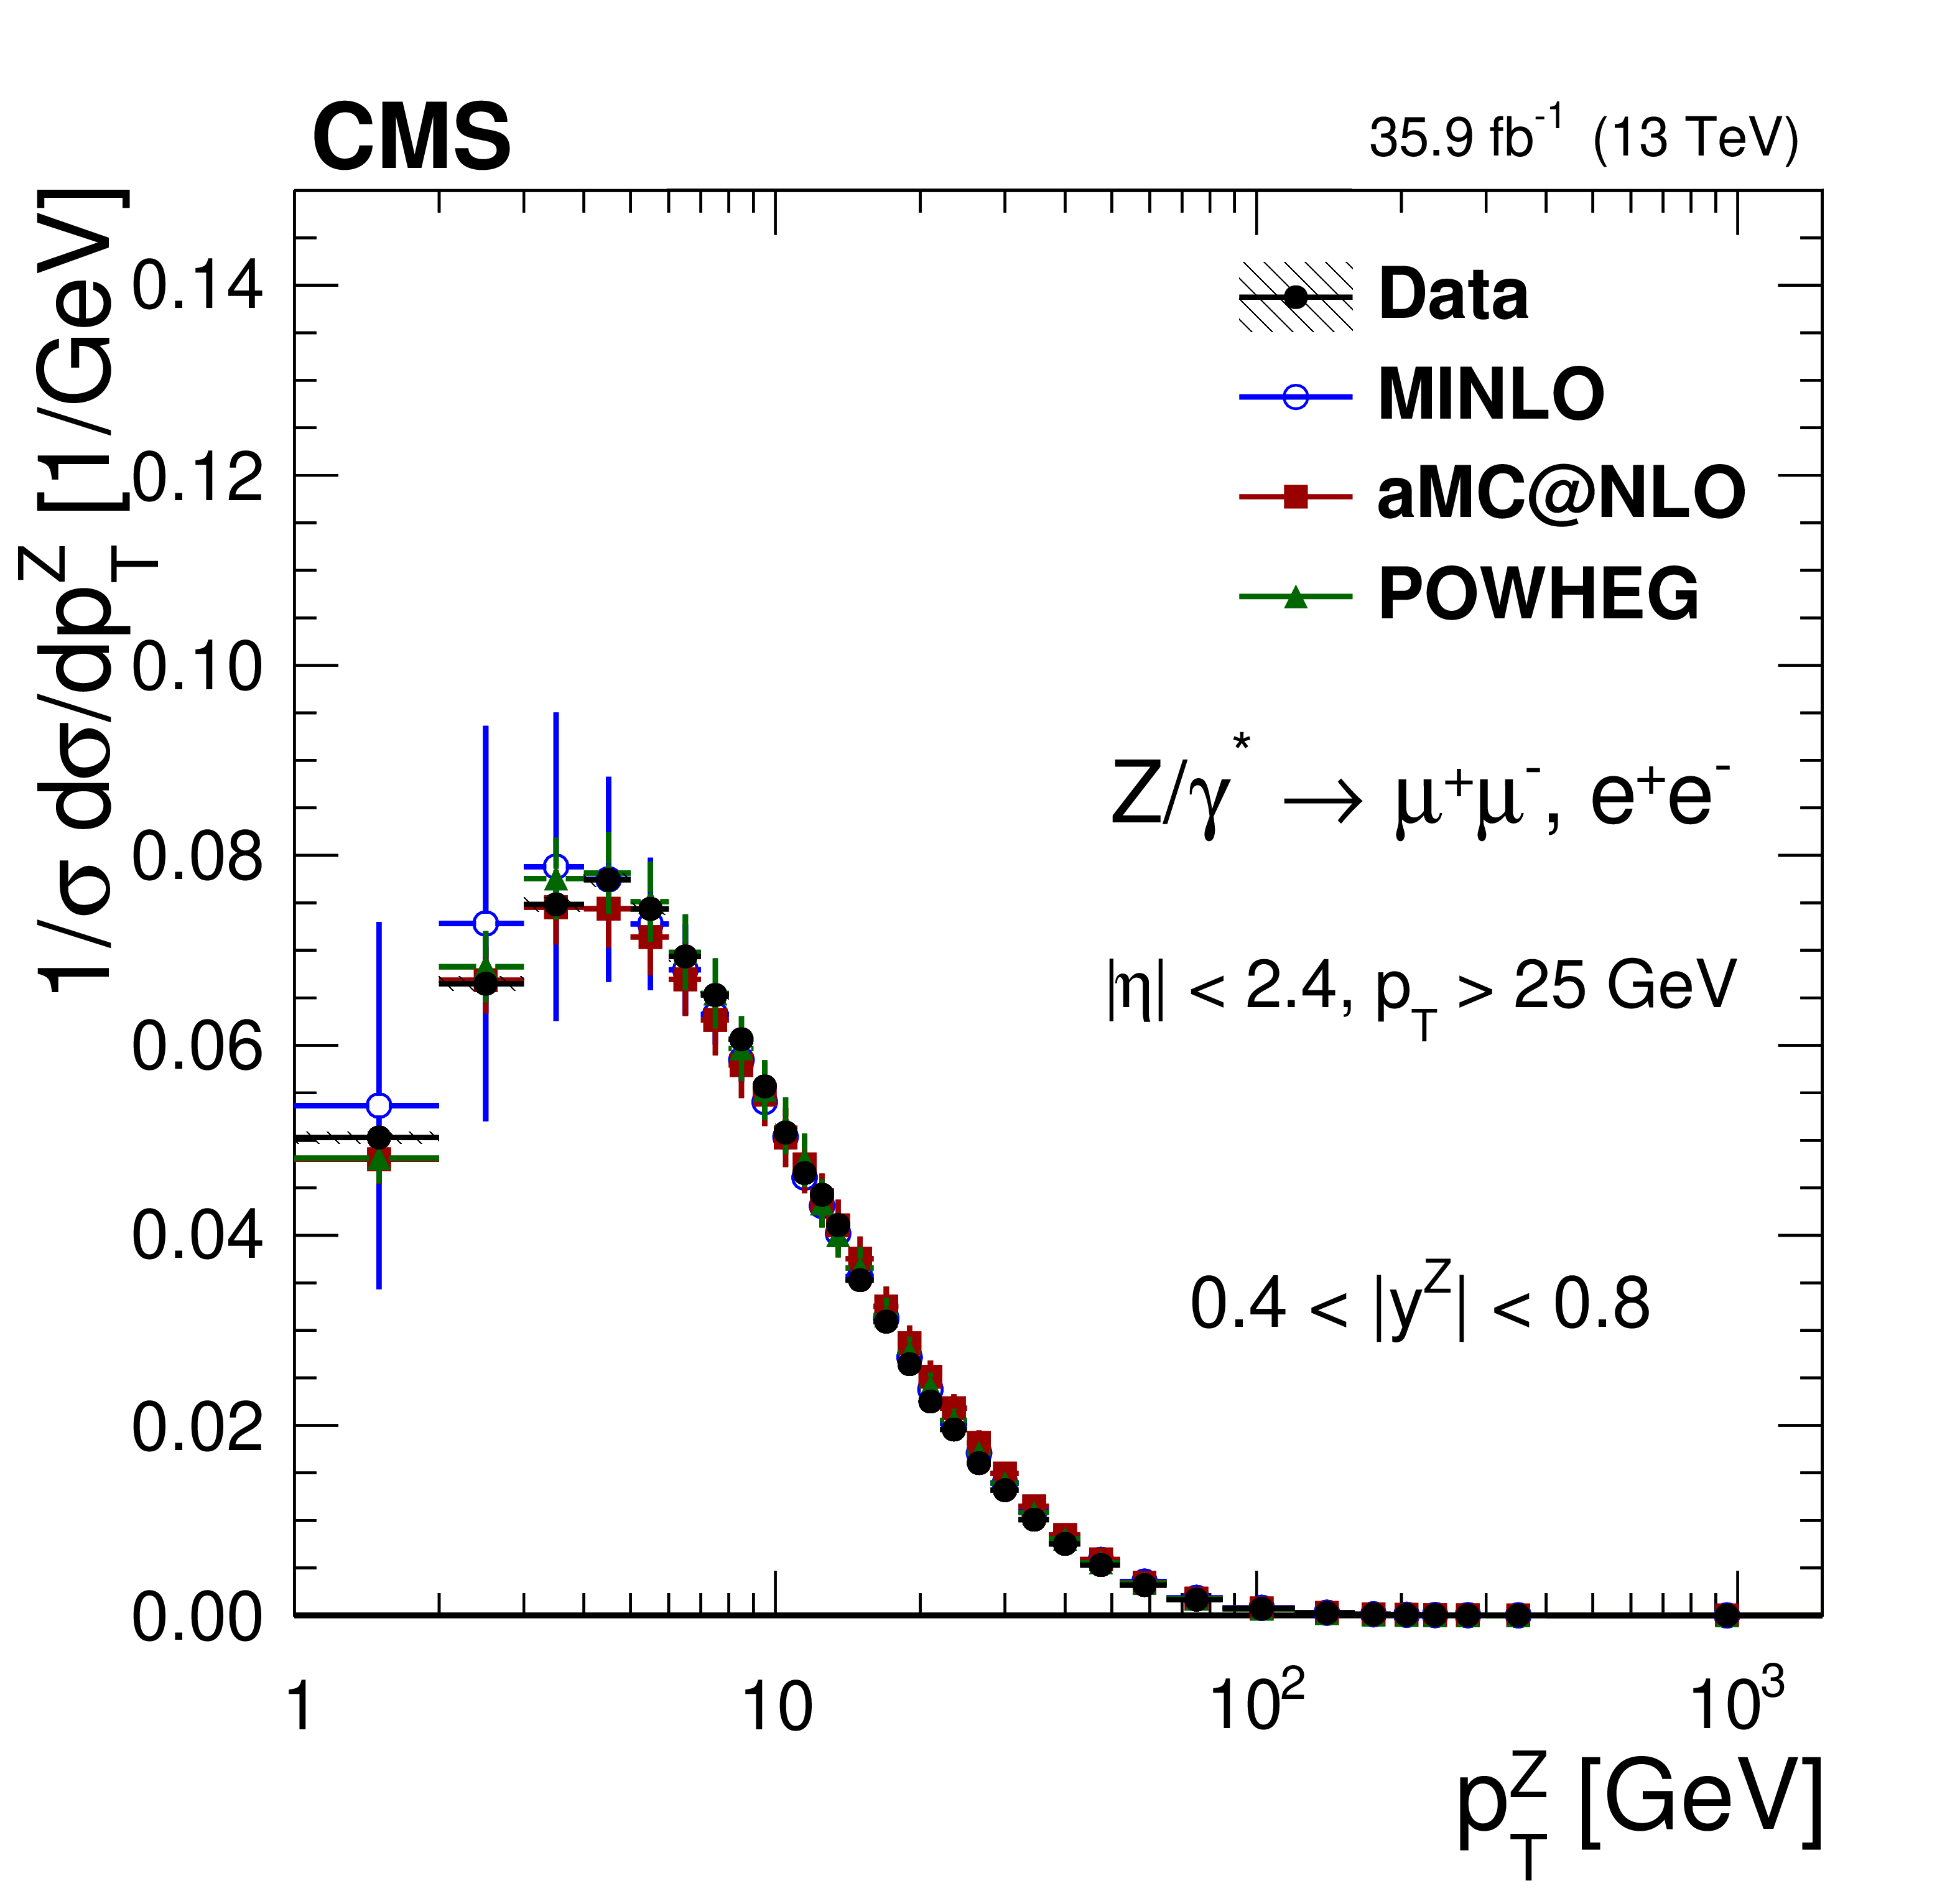
png pdf |
Additional Figure 17-a:
The measured normalized Born level (before FSR) cross sections in bins of $ {p_{\mathrm {T}}} ^{{\mathrm {Z}}}$ for the 0.4 $ < {| {y}^{{\mathrm {Z}}} |} < $ 0.8 region. The shaded bands around the data points (black) correspond to the total experimental uncertainty. The measurement is compared to the predictions with MadGraph 5_aMC@NLO (square red markers), POWHEG (green triangles), and POWHEG-MINLO (blue circles). The error bands around the predictions correspond to the combined statistical, PDF, and scale uncertainties. The first $ {p_{\mathrm {T}}} ^{{\mathrm {Z}}}$ bin (0-1 GeV) is not shown as large differences were observed in MadGraph 5_aMC@NLO and POWHEG predictions at Born level. |
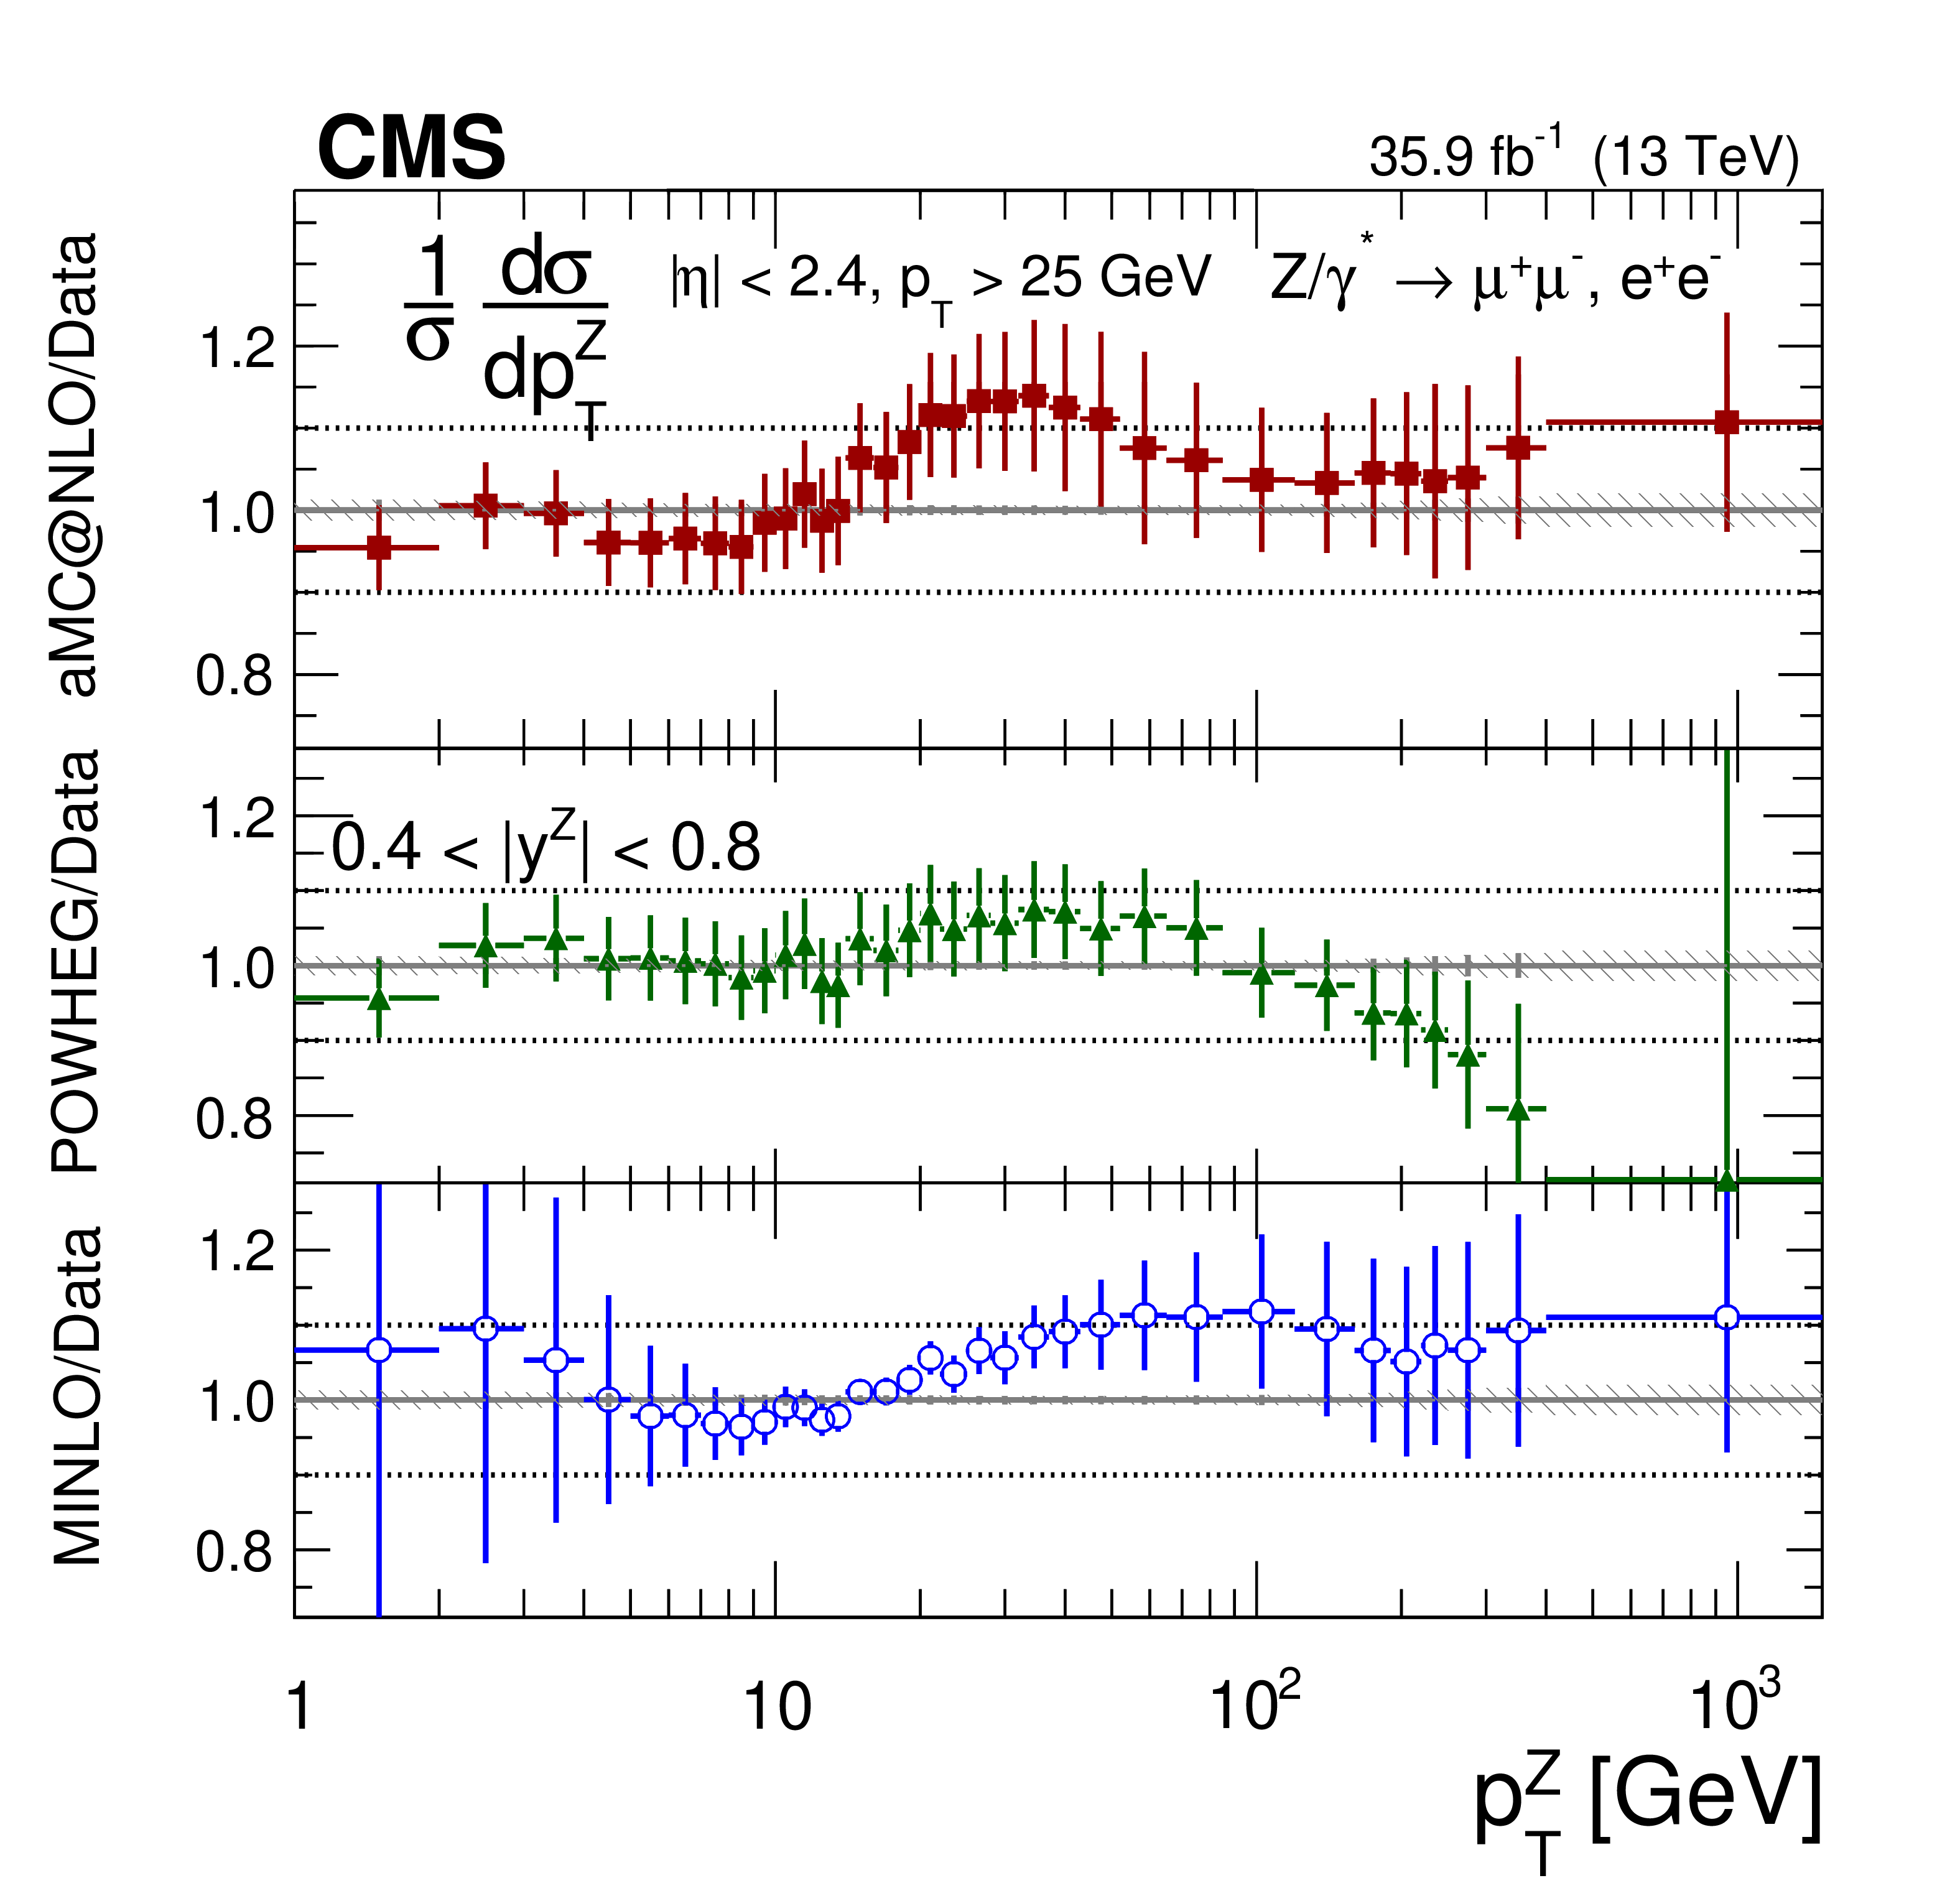
png pdf |
Additional Figure 17-b:
The ratios of the predictions to the data of the measured normalized Born level (before FSR) cross sections in bins of $ {p_{\mathrm {T}}} ^{{\mathrm {Z}}}$ for the 0.4 $ < {| {y}^{{\mathrm {Z}}} |} < $ 0.8 region. The shaded bands around the data points (black) correspond to the total experimental uncertainty. The measurement is compared to the predictions with MadGraph 5_aMC@NLO (square red markers), POWHEG (green triangles), and POWHEG-MINLO (blue circles). The error bands around the predictions correspond to the combined statistical, PDF, and scale uncertainties. The first $ {p_{\mathrm {T}}} ^{{\mathrm {Z}}}$ bin (0-1 GeV) is not shown as large differences were observed in MadGraph 5_aMC@NLO and POWHEG predictions at Born level. |
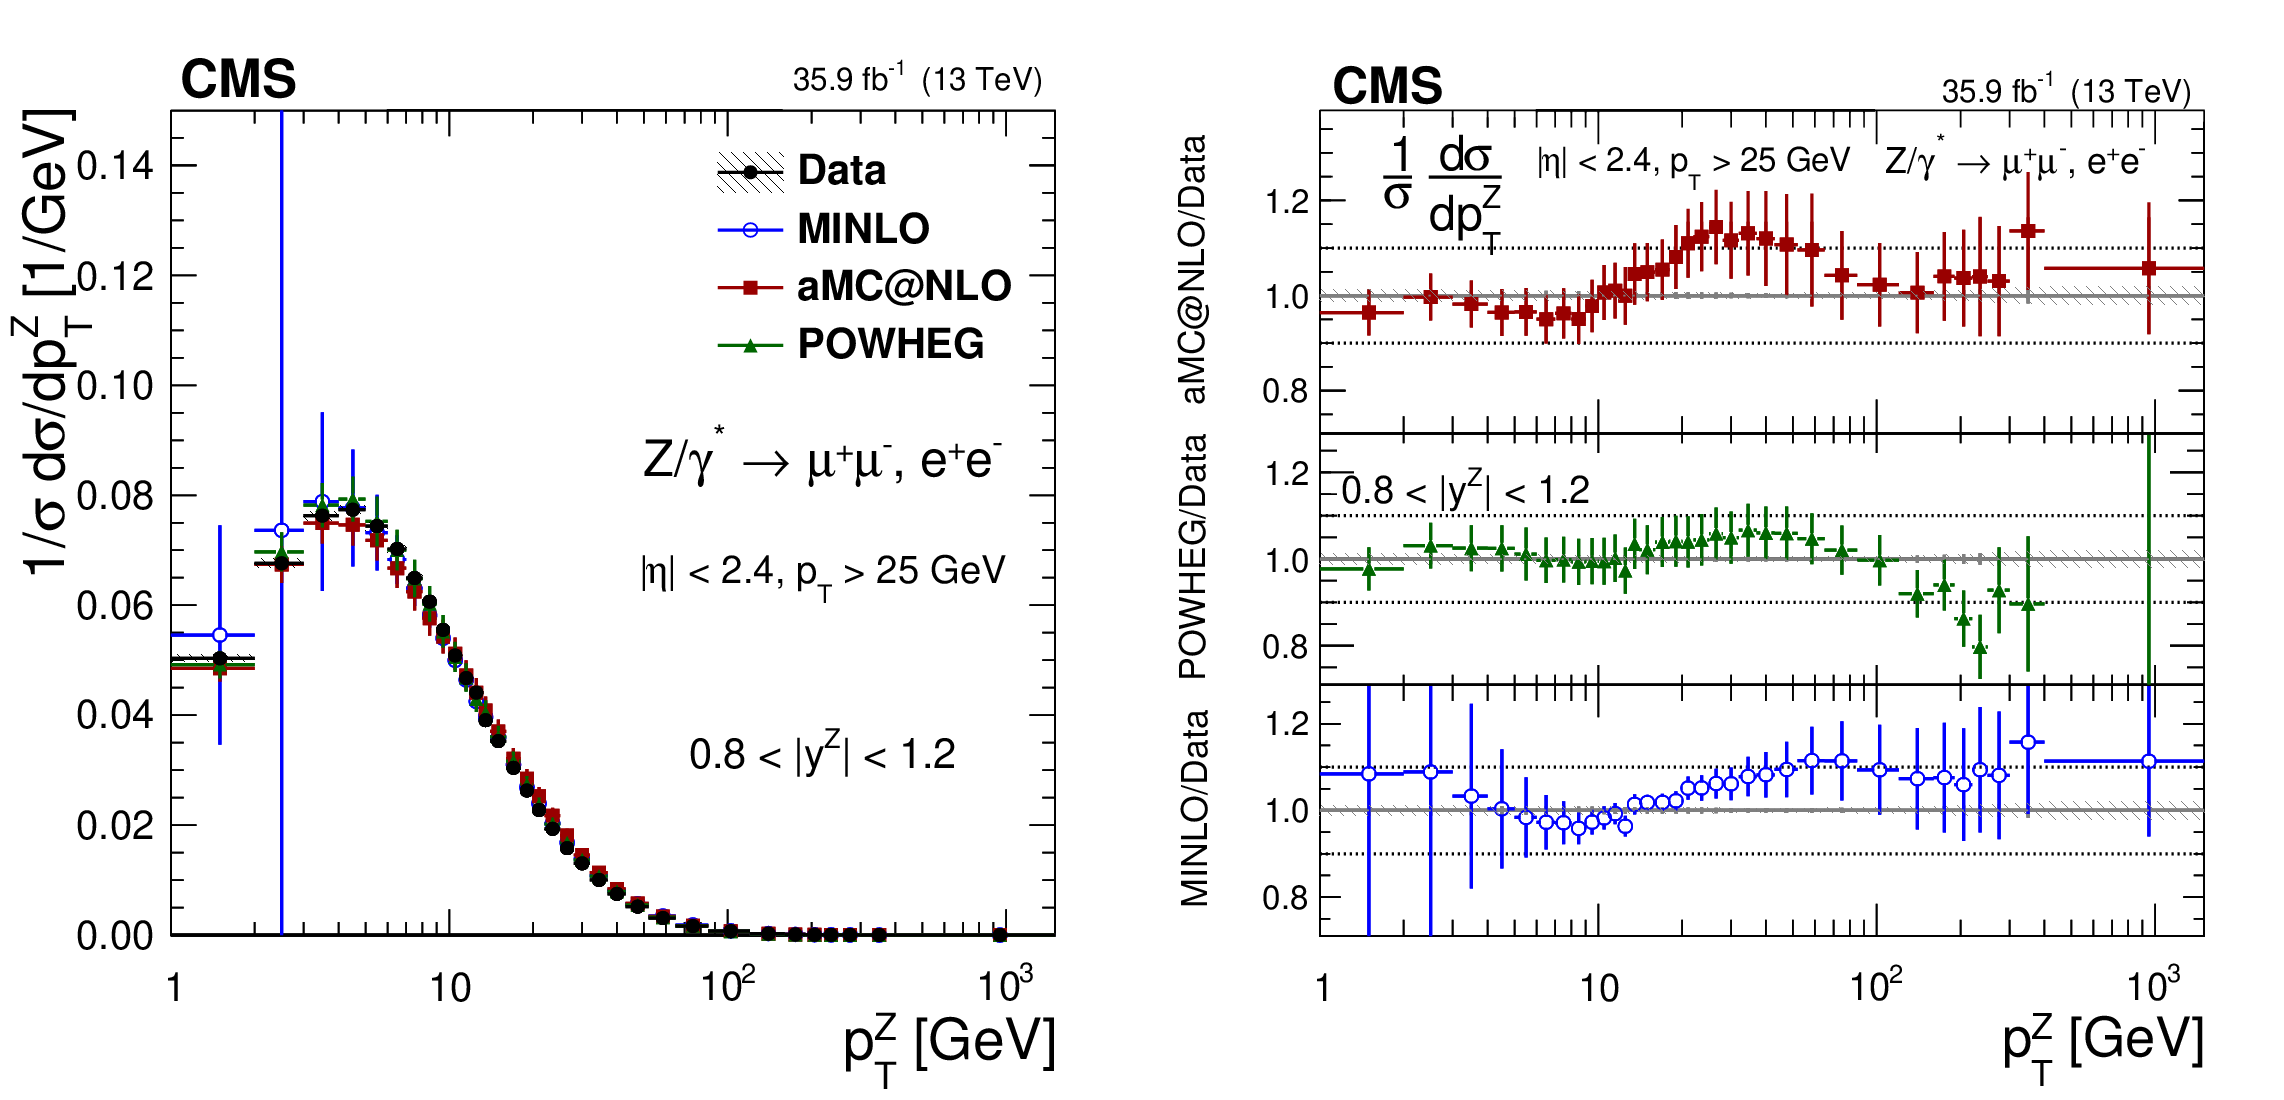
png pdf |
Additional Figure 18:
The measured normalized Born level (before FSR) cross sections (left) in bins of $ {p_{\mathrm {T}}} ^{{\mathrm {Z}}}$ for the 0.8 $ < {| {y}^{{\mathrm {Z}}} |} < $ 1.2 region. The ratios of the predictions to the data are also shown (right). The shaded bands around the data points (black) correspond to the total experimental uncertainty. The measurement is compared to the predictions with MadGraph 5_aMC@NLO (square red markers), POWHEG (green triangles), and POWHEG-MINLO (blue circles). The error bands around the predictions correspond to the combined statistical, PDF, and scale uncertainties. The first $ {p_{\mathrm {T}}} ^{{\mathrm {Z}}}$ bin (0-1 GeV) is not shown as large differences were observed in MadGraph 5_aMC@NLO and POWHEG predictions at Born level. |

png pdf |
Additional Figure 18-a:
The measured normalized Born level (before FSR) cross sections in bins of $ {p_{\mathrm {T}}} ^{{\mathrm {Z}}}$ for the 0.8 $ < {| {y}^{{\mathrm {Z}}} |} < $ 1.2 region. The shaded bands around the data points (black) correspond to the total experimental uncertainty. The measurement is compared to the predictions with MadGraph 5_aMC@NLO (square red markers), POWHEG (green triangles), and POWHEG-MINLO (blue circles). The error bands around the predictions correspond to the combined statistical, PDF, and scale uncertainties. The first $ {p_{\mathrm {T}}} ^{{\mathrm {Z}}}$ bin (0-1 GeV) is not shown as large differences were observed in MadGraph 5_aMC@NLO and POWHEG predictions at Born level. |
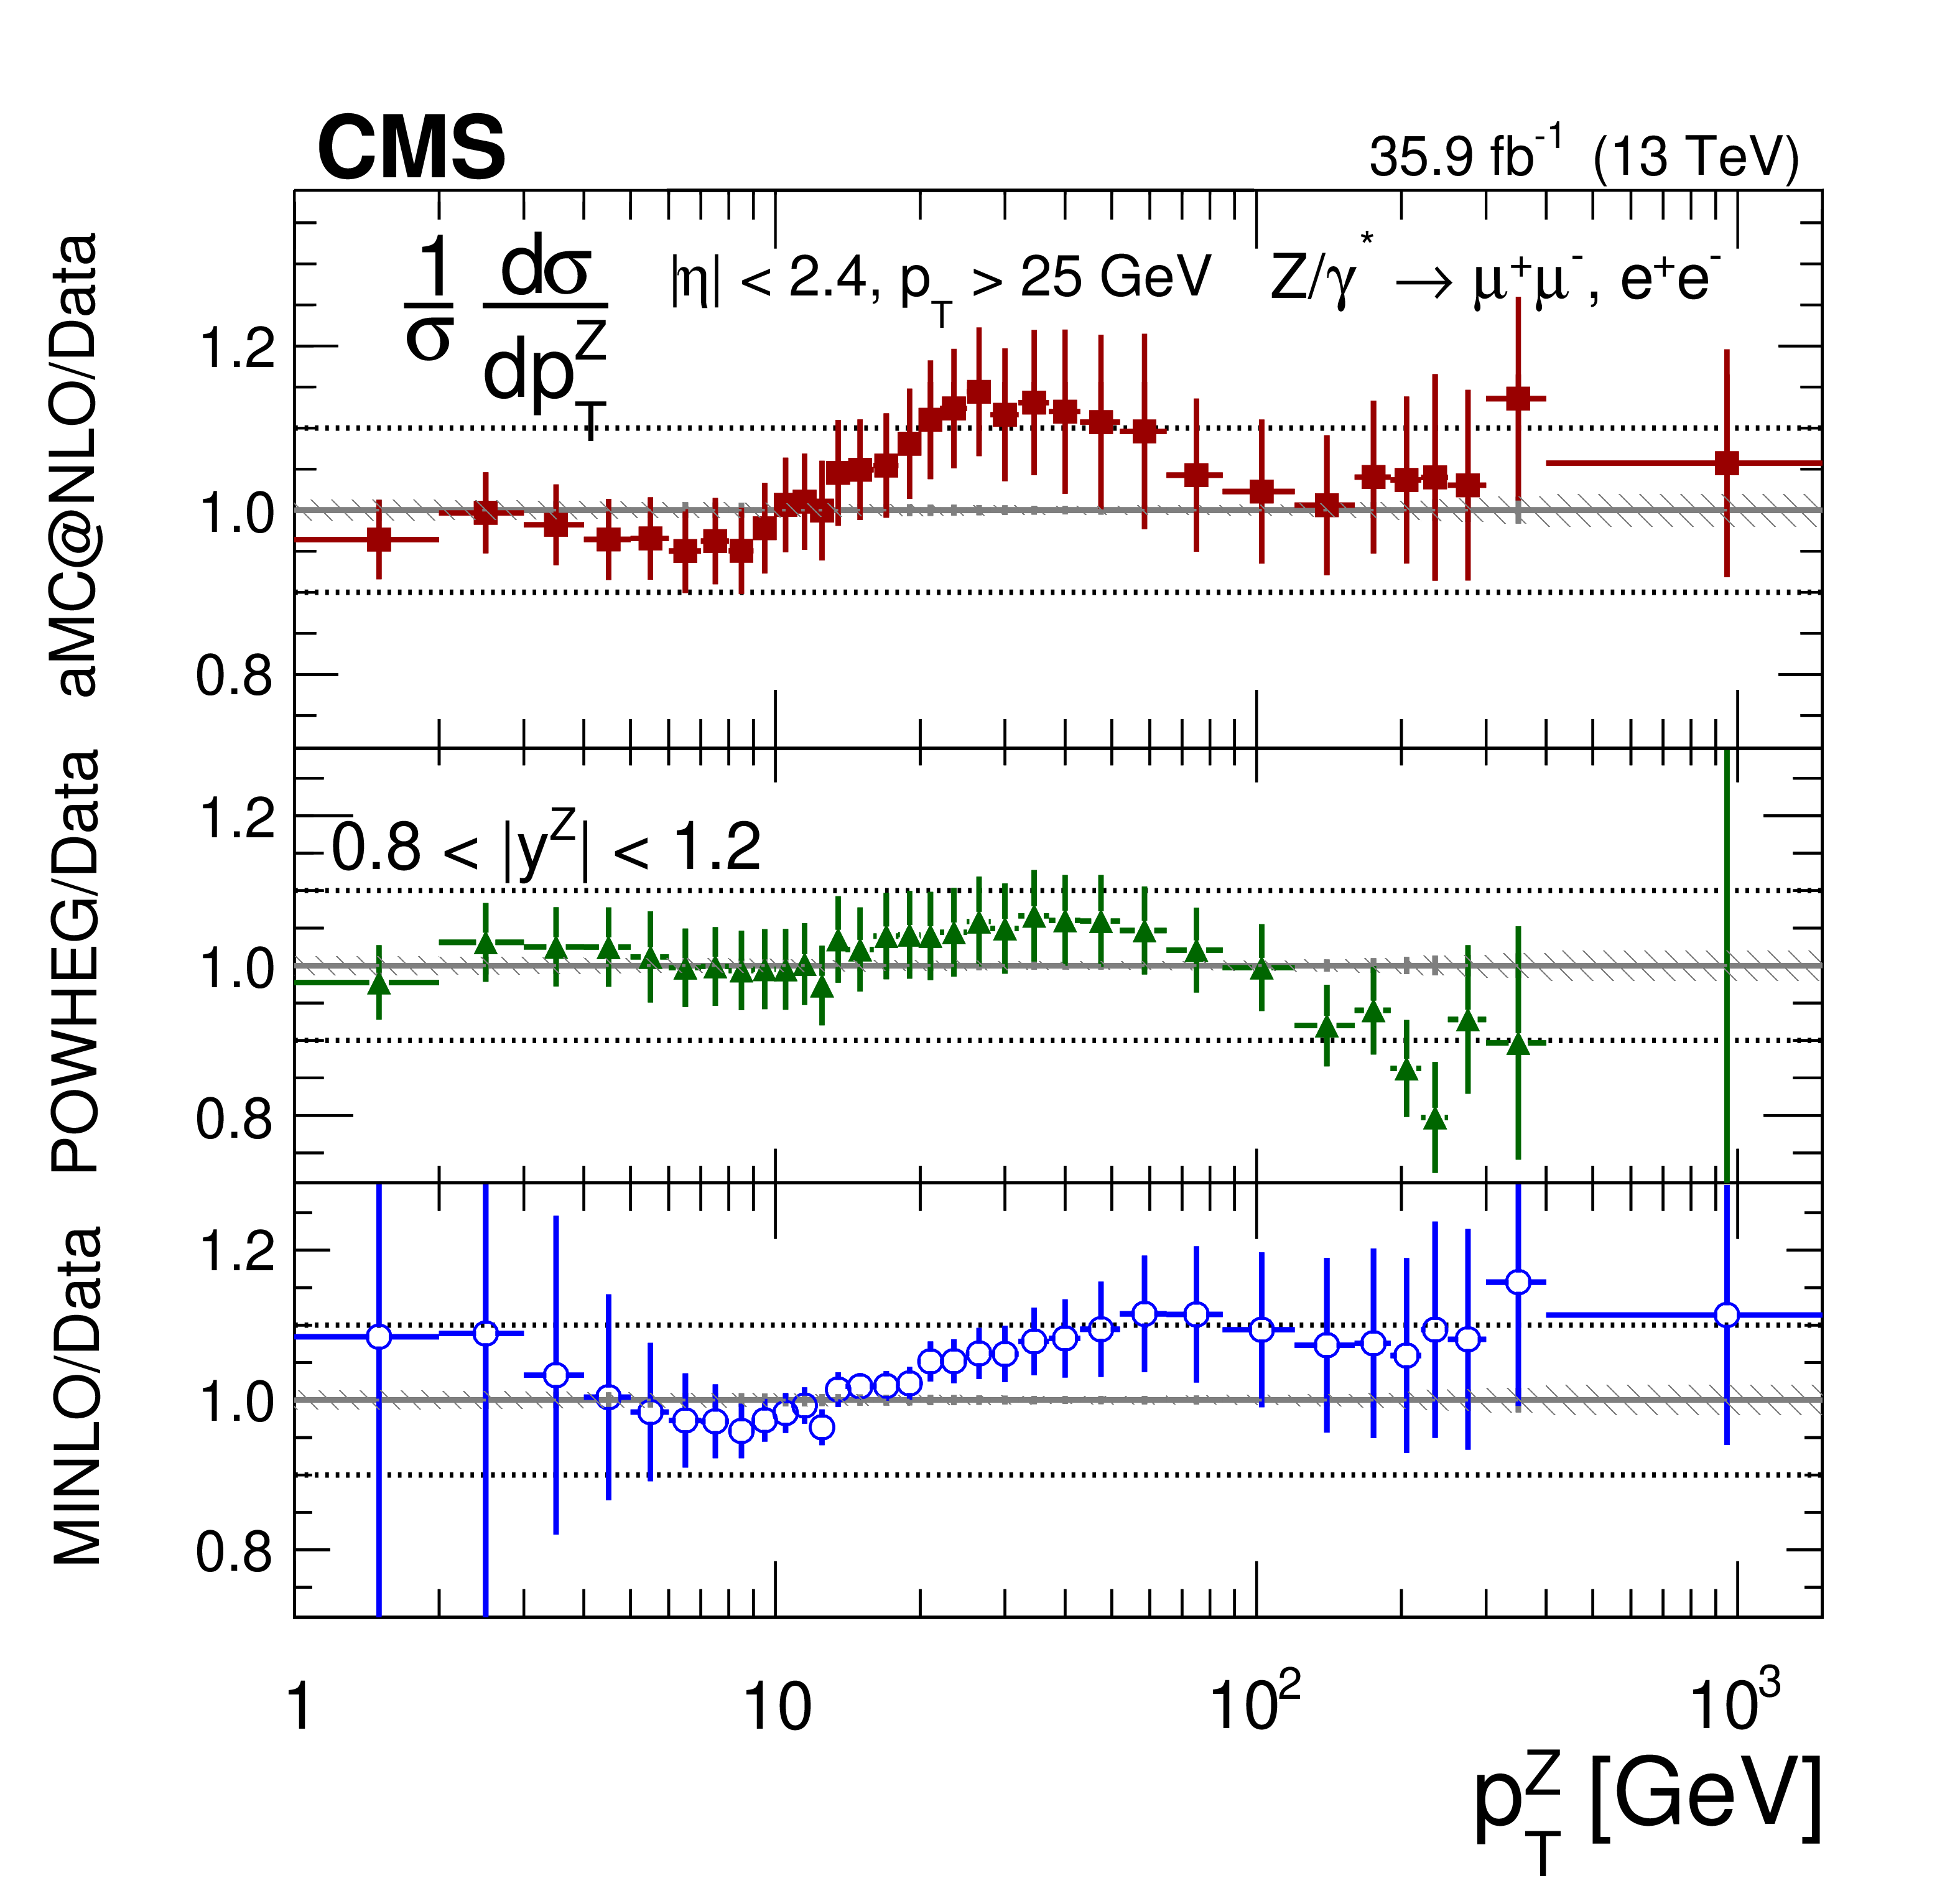
png pdf |
Additional Figure 18-b:
The ratios of the predictions to the dataof the measured normalized Born level (before FSR) cross sections in bins of $ {p_{\mathrm {T}}} ^{{\mathrm {Z}}}$ for the 0.8 $ < {| {y}^{{\mathrm {Z}}} |} < $ 1.2 region. The shaded bands around the data points (black) correspond to the total experimental uncertainty. The measurement is compared to the predictions with MadGraph 5_aMC@NLO (square red markers), POWHEG (green triangles), and POWHEG-MINLO (blue circles). The error bands around the predictions correspond to the combined statistical, PDF, and scale uncertainties. The first $ {p_{\mathrm {T}}} ^{{\mathrm {Z}}}$ bin (0-1 GeV) is not shown as large differences were observed in MadGraph 5_aMC@NLO and POWHEG predictions at Born level. |

png pdf |
Additional Figure 19:
The measured normalized Born level (before FSR) cross sections (left) in bins of $ {p_{\mathrm {T}}} ^{{\mathrm {Z}}}$ for the 1.2 $ < {| {y}^{{\mathrm {Z}}} |} < $ 1.6 region. The ratios of the predictions to the data are also shown (right). The shaded bands around the data points (black) correspond to the total experimental uncertainty. The measurement is compared to the predictions with MadGraph 5_aMC@NLO (square red markers), POWHEG (green triangles), and POWHEG-MINLO (blue circles). The error bands around the predictions correspond to the combined statistical, PDF, and scale uncertainties. The first $ {p_{\mathrm {T}}} ^{{\mathrm {Z}}}$ bin (0-1 GeV) is not shown as large differences were observed in MadGraph 5_aMC@NLO and POWHEG predictions at Born level. |

png pdf |
Additional Figure 19-a:
The ratios of the predictions to the data of the measured normalized Born level (before FSR) cross sections in bins of $ {p_{\mathrm {T}}} ^{{\mathrm {Z}}}$ for the 1.2 $ < {| {y}^{{\mathrm {Z}}} |} < $ 1.6 region. The shaded bands around the data points (black) correspond to the total experimental uncertainty. The measurement is compared to the predictions with MadGraph 5_aMC@NLO (square red markers), POWHEG (green triangles), and POWHEG-MINLO (blue circles). The error bands around the predictions correspond to the combined statistical, PDF, and scale uncertainties. The first $ {p_{\mathrm {T}}} ^{{\mathrm {Z}}}$ bin (0-1 GeV) is not shown as large differences were observed in MadGraph 5_aMC@NLO and POWHEG predictions at Born level. |
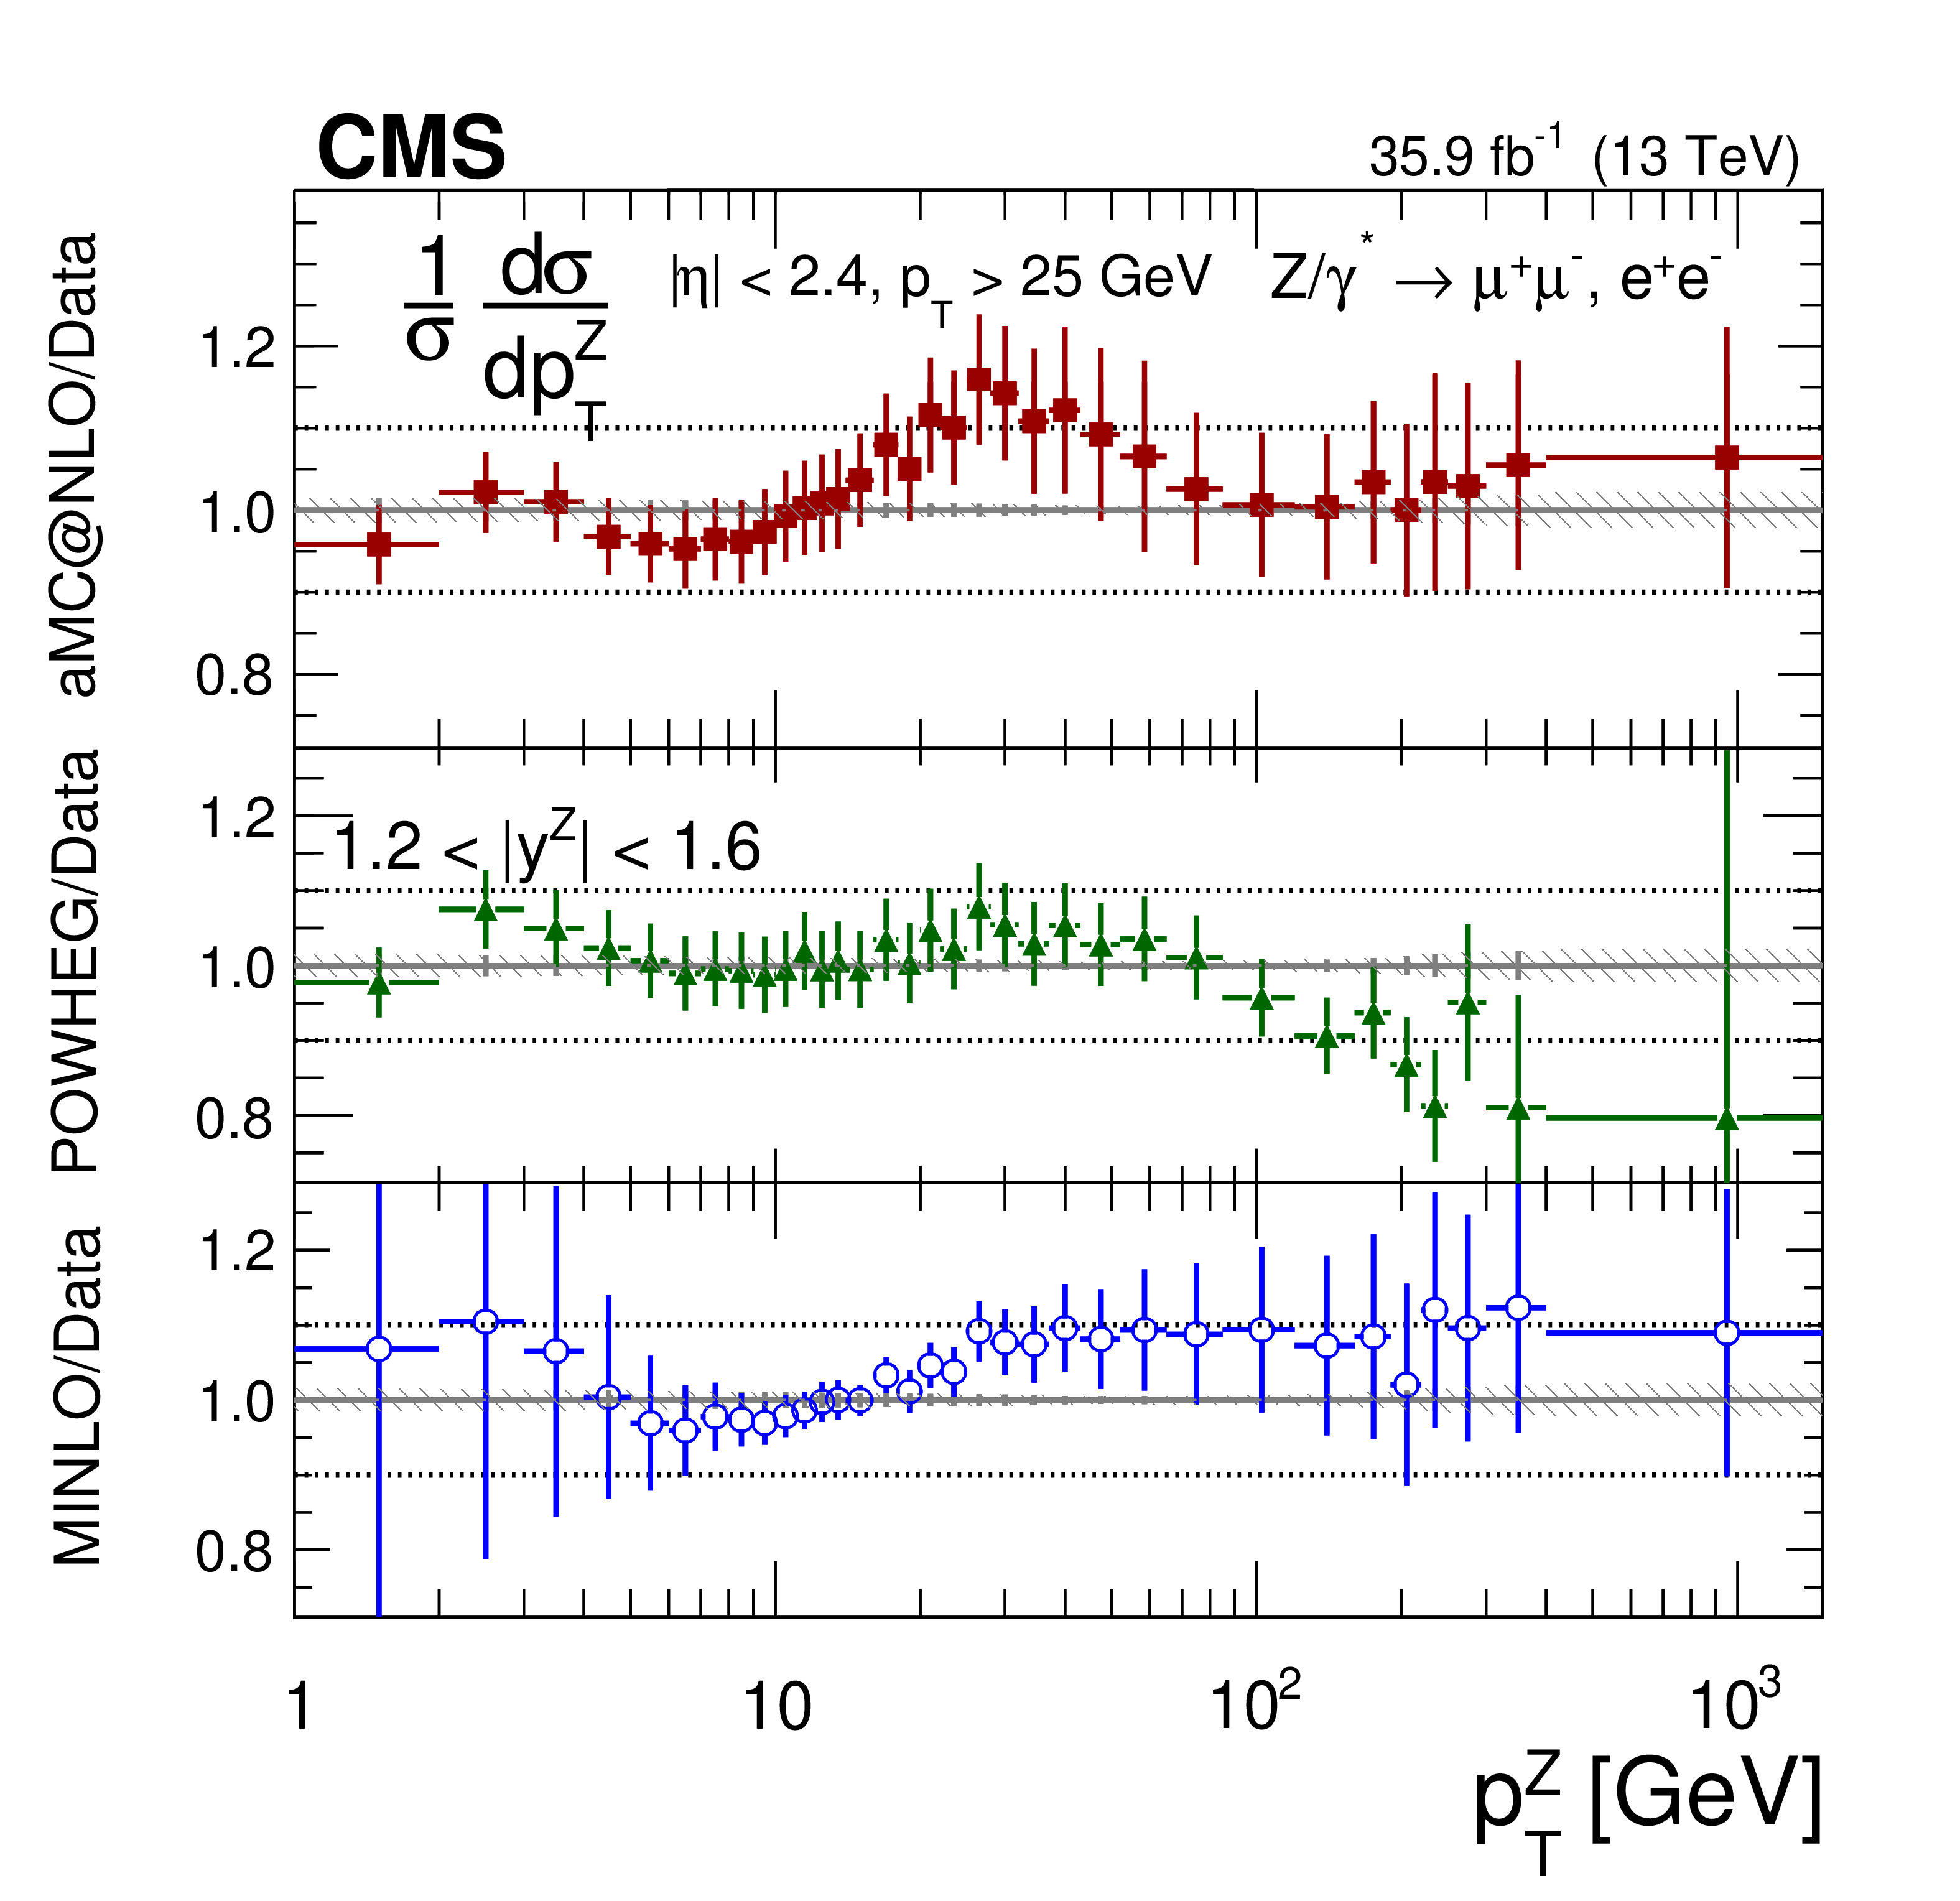
png pdf |
Additional Figure 19-b:
The measured normalized Born level (before FSR) cross sections (left) in bins of $ {p_{\mathrm {T}}} ^{{\mathrm {Z}}}$ for the 1.2 $ < {| {y}^{{\mathrm {Z}}} |} < $ 1.6 region. The ratios of the predictions to the data are also shown (right). The shaded bands around the data points (black) correspond to the total experimental uncertainty. The measurement is compared to the predictions with MadGraph 5_aMC@NLO (square red markers), POWHEG (green triangles), and POWHEG-MINLO (blue circles). The error bands around the predictions correspond to the combined statistical, PDF, and scale uncertainties. The first $ {p_{\mathrm {T}}} ^{{\mathrm {Z}}}$ bin (0-1 GeV) is not shown as large differences were observed in MadGraph 5_aMC@NLO and POWHEG predictions at Born level. |
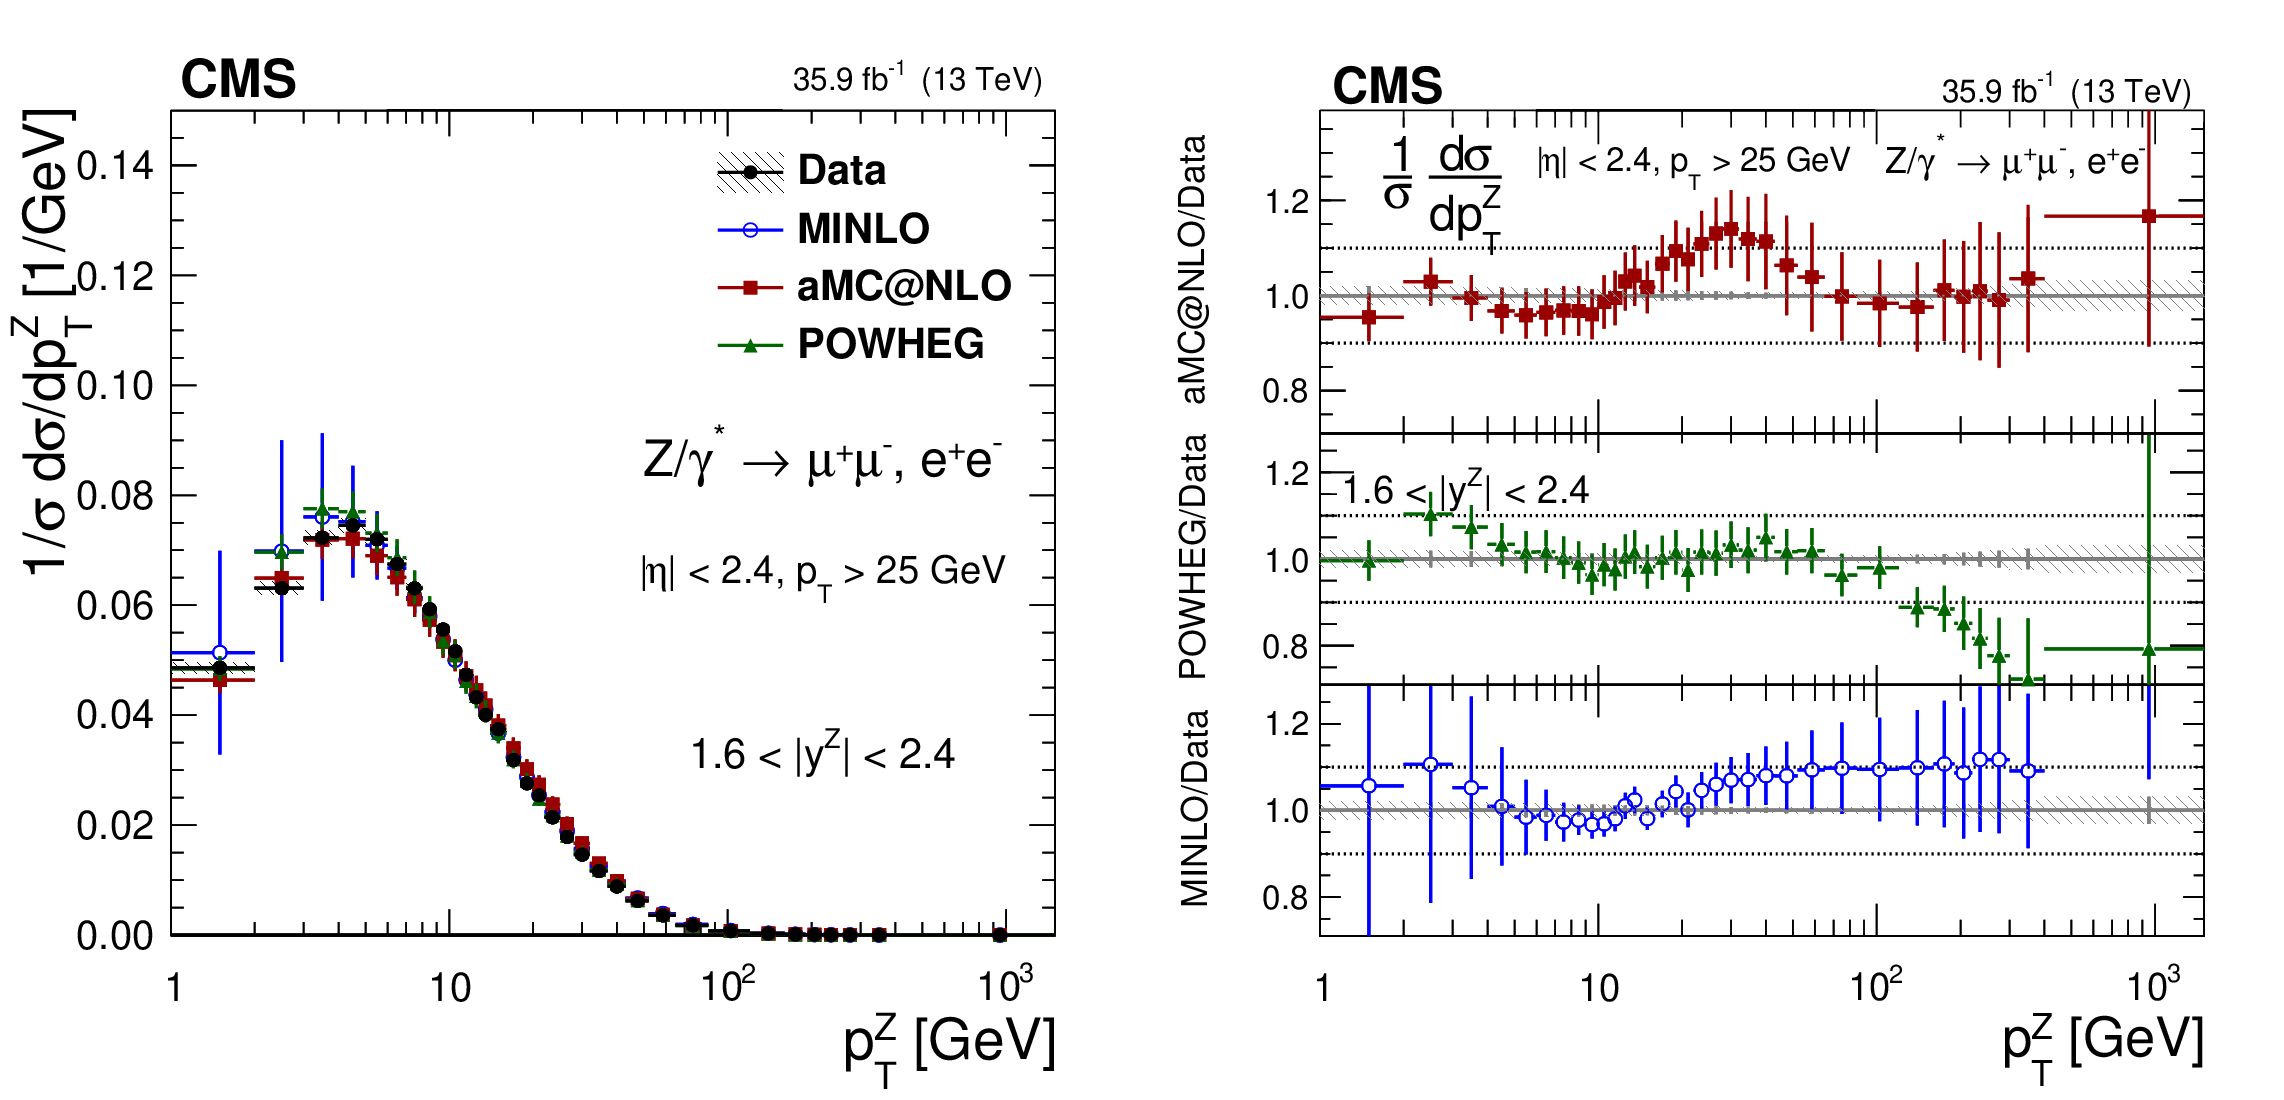
png pdf |
Additional Figure 20:
The measured normalized Born level (before FSR) cross sections (left) in bins of $ {p_{\mathrm {T}}} ^{{\mathrm {Z}}}$ for the 1.6 $ < {| {y}^{{\mathrm {Z}}} |} < $ 2.4 region. The ratios of the predictions to the data are also shown (right). The shaded bands around the data points (black) correspond to the total experimental uncertainty. The measurement is compared to the predictions with MadGraph 5_aMC@NLO (square red markers), POWHEG (green triangles), and POWHEG-MINLO (blue circles). The error bands around the predictions correspond to the combined statistical, PDF, and scale uncertainties. The first $ {p_{\mathrm {T}}} ^{{\mathrm {Z}}}$ bin (0-1 GeV) is not shown as large differences were observed in MadGraph 5_aMC@NLO and POWHEG predictions at Born level. |
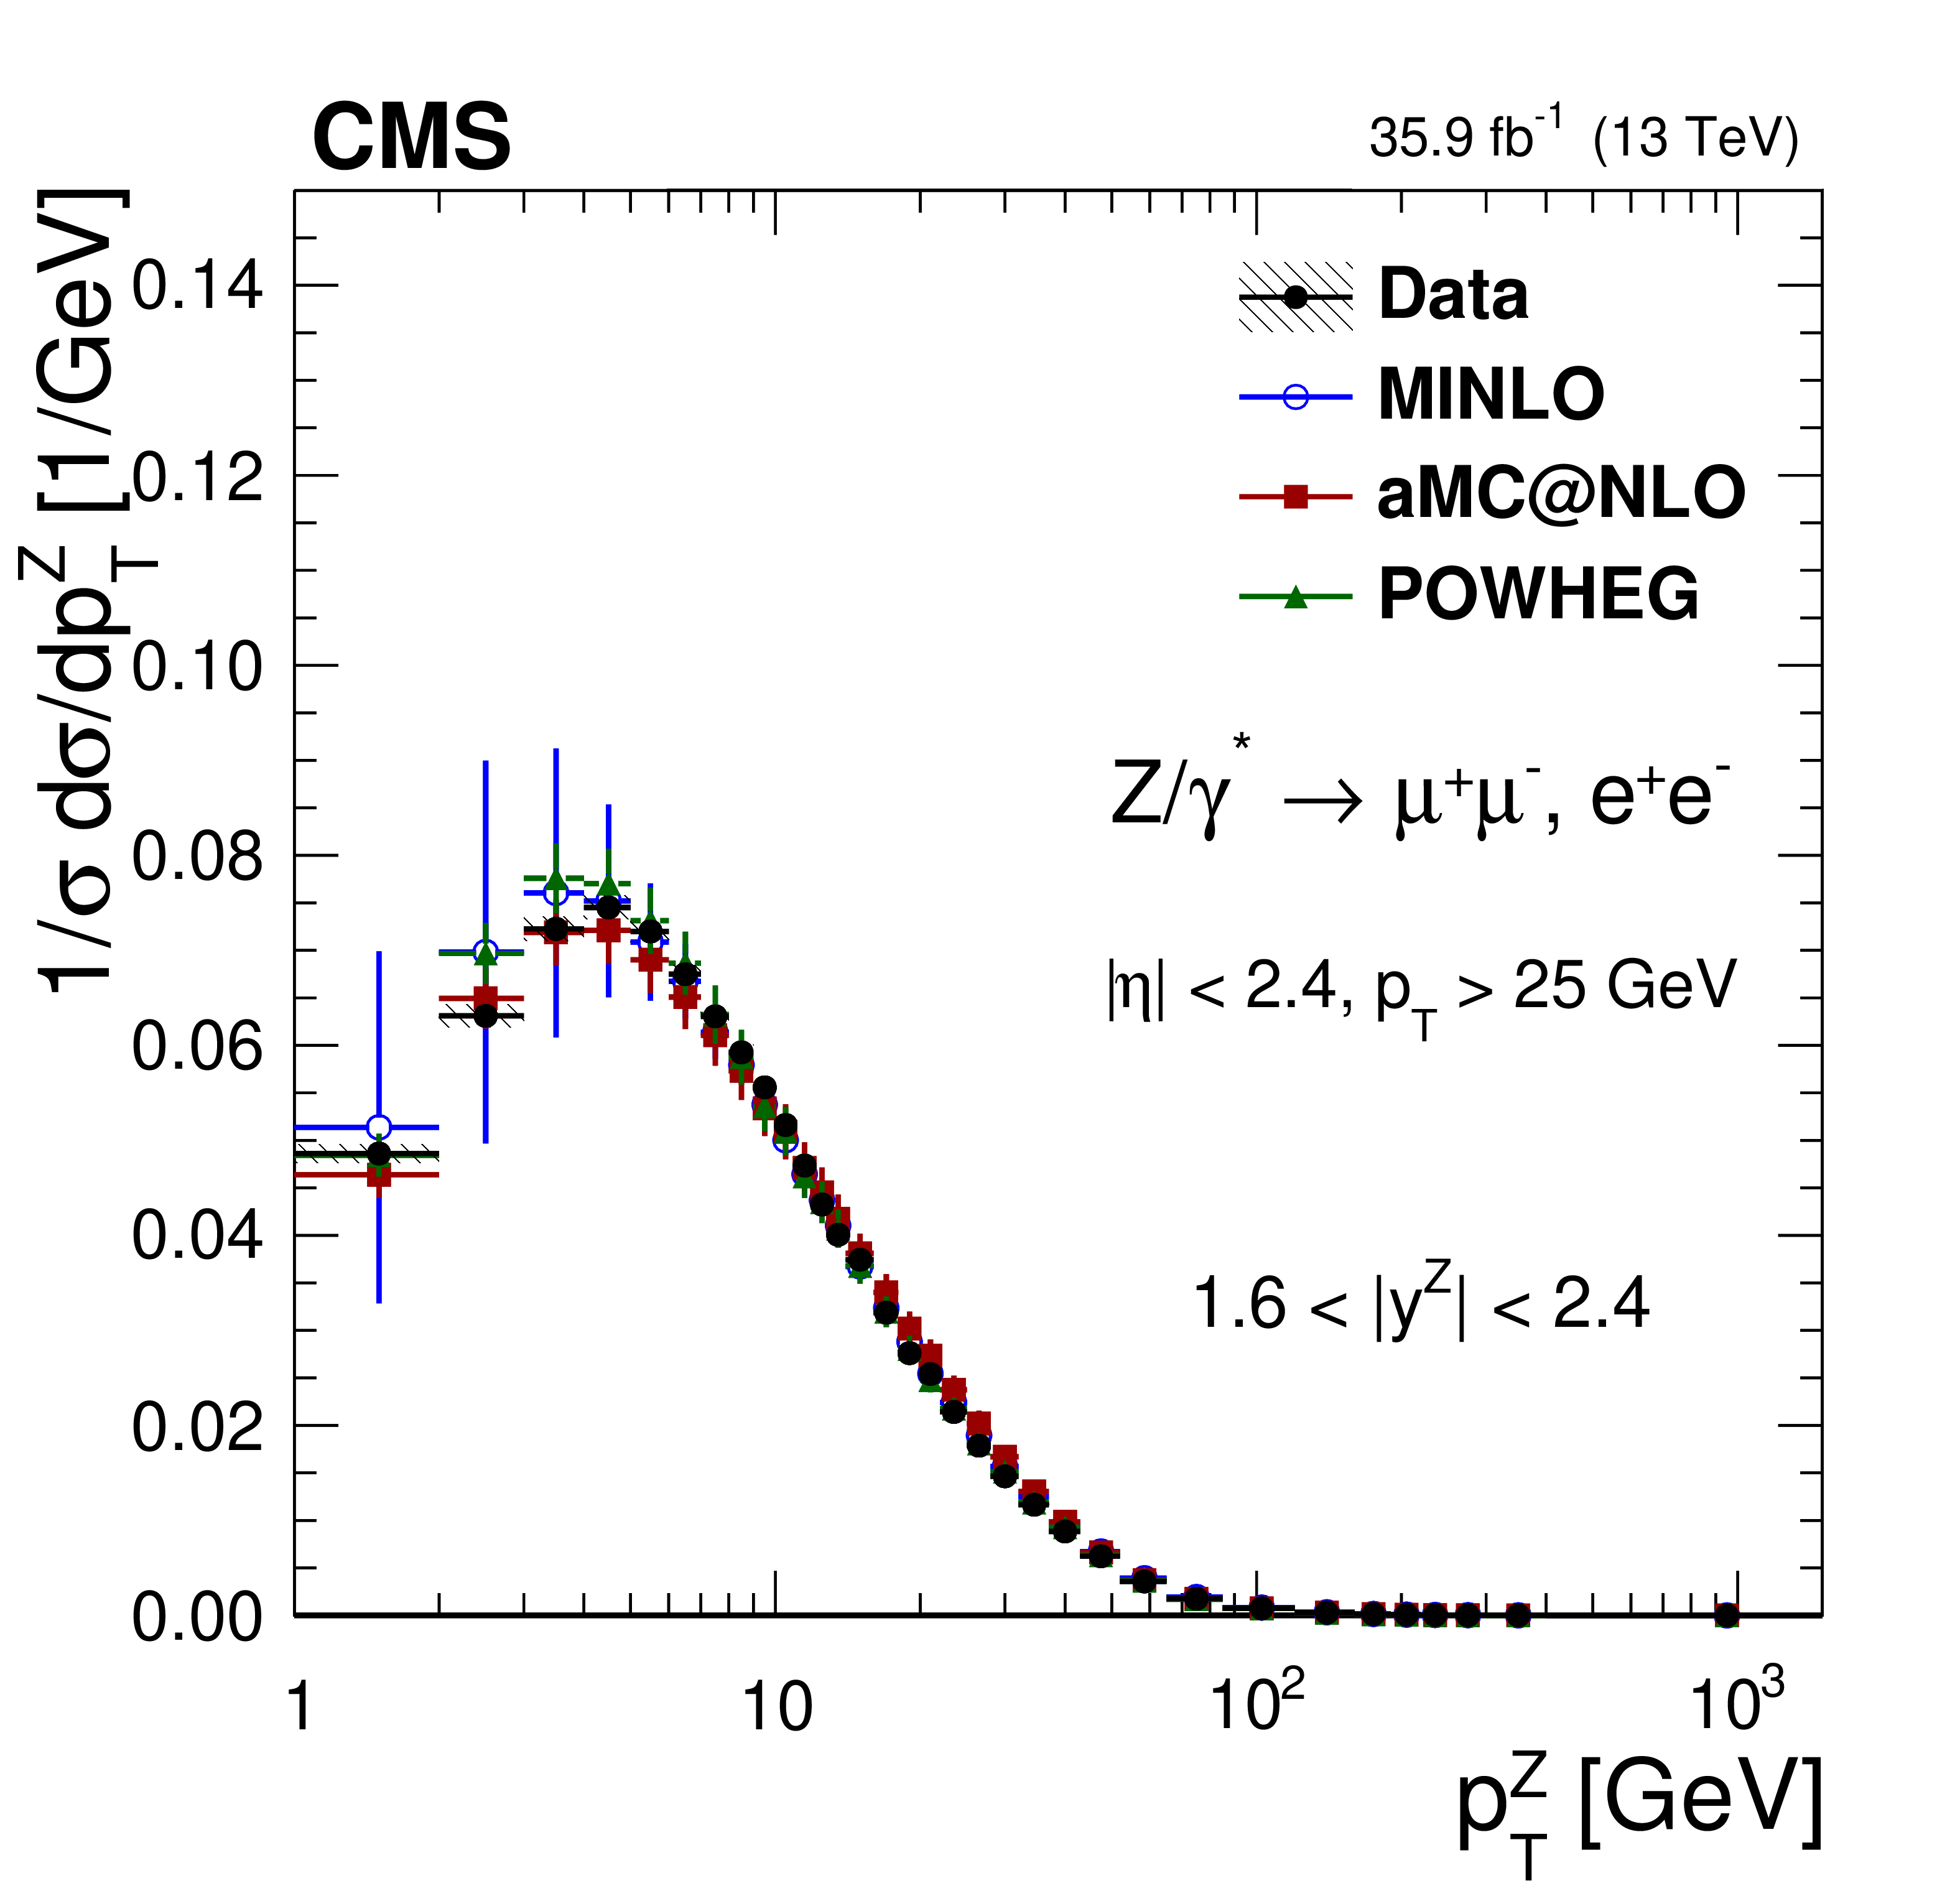
png pdf |
Additional Figure 20-a:
The measured normalized Born level (before FSR) cross sections in bins of $ {p_{\mathrm {T}}} ^{{\mathrm {Z}}}$ for the 1.6 $ < {| {y}^{{\mathrm {Z}}} |} < $ 2.4 region. The shaded bands around the data points (black) correspond to the total experimental uncertainty. The measurement is compared to the predictions with MadGraph 5_aMC@NLO (square red markers), POWHEG (green triangles), and POWHEG-MINLO (blue circles). The error bands around the predictions correspond to the combined statistical, PDF, and scale uncertainties. The first $ {p_{\mathrm {T}}} ^{{\mathrm {Z}}}$ bin (0-1 GeV) is not shown as large differences were observed in MadGraph 5_aMC@NLO and POWHEG predictions at Born level. |

png pdf |
Additional Figure 20-b:
The ratios of the predictions to the data of the measured normalized Born level (before FSR) cross sections in bins of $ {p_{\mathrm {T}}} ^{{\mathrm {Z}}}$ for the 1.6 $ < {| {y}^{{\mathrm {Z}}} |} < $ 2.4 region. The shaded bands around the data points (black) correspond to the total experimental uncertainty. The measurement is compared to the predictions with MadGraph 5_aMC@NLO (square red markers), POWHEG (green triangles), and POWHEG-MINLO (blue circles). The error bands around the predictions correspond to the combined statistical, PDF, and scale uncertainties. The first $ {p_{\mathrm {T}}} ^{{\mathrm {Z}}}$ bin (0-1 GeV) is not shown as large differences were observed in MadGraph 5_aMC@NLO and POWHEG predictions at Born level. |
| References | ||||
| 1 | K. Melnikov and F. Petriello | Electroweak gauge boson production at hadron colliders through $ \mathcal{O}(\alpha_{\mathrm{s}}^2) $ | PRD 74 (2006) 114017 | hep-ph/0609070 |
| 2 | S. Catani et al. | Vector boson production at hadron colliders: a fully exclusive QCD calculation at NNLO | PRL 103 (2009) 082001 | 0903.2120 |
| 3 | A. Gehrmann-De Ridder et al. | Precise QCD predictions for the production of a Z boson in association with a hadronic jet | PRL 117 (2016) 022001 | 1507.02850 |
| 4 | R. Boughezal et al. | Z-boson production in association with a jet at next-to-next-to-leading order in perturbative QCD | PRL 116 (2016) 152001 | 1512.01291 |
| 5 | R. Boughezal, C. Focke, X. Liu, and F. Petriello | $ W $-boson production in association with a jet at next-to-next-to-leading order in perturbative QCD | PRL 115 (2015) 062002 | 1504.02131 |
| 6 | S. Dittmaier, A. Huss, and C. Schwinn | Mixed QCD-electroweak $ \mathcal{O}(\alpha_s\alpha) $ corrections to Drell-Yan processes in the resonance region: pole approximation and non-factorizable corrections | NPB 885 (2014) 318 | 1403.3216 |
| 7 | J. M. Lindert et al. | Precise predictions for V+jets dark matter backgrounds | EPJC 77 (2017) 829 | 1705.04664 |
| 8 | J. C. Collins, D. E. Soper, and G. F. Sterman | Transverse momentum distribution in Drell-Yan pair and W and Z boson production | NPB 250 (1985) | |
| 9 | C. Balazs, J-W. Qiu, and C.P. Yuan | Effects of QCD resummation on distributions of leptons from the decay of electroweak vector bosons | PLB 355 (1995) 548 | hep-ph/9505203 |
| 10 | S. Catani, D. de Florian, G. Ferrera, and M. Grazzini | Vector boson production at hadron colliders: transverse-momentum resummation and leptonic decay | JHEP 12 (2015) 047 | 1507.06937 |
| 11 | T. Sjostrand et al. | An introduction to PYTHIA 8.2 | CPC 191 (2015) 159 | 1410.3012 |
| 12 | T. Gleisberg et al. | Event generation with SHERPA 1.1 | JHEP 02 (2009) 007 | 0811.4622 |
| 13 | M. Bahr et al. | Herwig++ physics and manual | EPJC 58 (2008) | 0803.0883 |
| 14 | P. Nason | A new method for combining NLO QCD with shower Monte Carlo algorithms | JHEP 11 (2004) 040 | hep-ph/0409146 |
| 15 | S. Frixione and B. R. Webber | Matching NLO QCD computations and parton shower simulations | JHEP 06 (2002) 029 | hep-ph/0204244 |
| 16 | S. Alioli, P. Nason, C. Oleari, and E. Re | A general framework for implementing NLO calculations in shower Monte Carlo programs: the POWHEG BOX | JHEP 06 (2010) 043 | 1002.2581 |
| 17 | J. Alwall et al. | The automated computation of tree-level and next-to-leading order differential cross sections, and their matching to parton shower simulations | JHEP 07 (2014) 079 | 1405.0301 |
| 18 | R. Angeles-Martinez et al. | Transverse momentum dependent (TMD) parton distribution functions: status and prospects | Acta Phys. Polon. B 46 (2015) 2501 | 1507.05267 |
| 19 | ATLAS Collaboration | Measurement of the transverse momentum distribution of Z$ /\gamma^* $ bosons in proton-proton collisions at $ \sqrt{s} = $ 7 TeV with the ATLAS detector | PLB 705 (2011) 415 | 1107.2381 |
| 20 | ATLAS Collaboration | Measurement of the Z$ /\gamma^* $ boson transverse momentum distribution in $ {\mathrm{p}}{\mathrm{p}} $ collisions at $ \sqrt{s} = $ 7 TeV with the ATLAS detector | JHEP 09 (2014) 145 | 1406.3660 |
| 21 | ATLAS Collaboration | Measurement of the transverse momentum and $ \phi ^*_{\eta} $ distributions of Drell-Yan lepton pairs in proton-proton collisions at $ \sqrt{s}= $ 8 TeV with the ATLAS detector | EPJC 76 (2016) 291 | 1512.02192 |
| 22 | ATLAS Collaboration | Precision measurement and interpretation of inclusive $ W^+ $ , $ W^- $ and $ Z/\gamma ^* $ production cross sections with the ATLAS detector | EPJC 77 (2017) 367 | 1612.03016 |
| 23 | CMS Collaboration | Measurement of the differential Drell-Yan cross section in proton-proton collisions at $ \sqrt{s} = $ 13 TeV | Submitted to \textscJHEP | CMS-SMP-17-001 1812.10529 |
| 24 | CMS Collaboration | Measurement of the rapidity and transverse momentum distributions of Z bosons in $ {\mathrm{p}}{\mathrm{p}} $ collisions at $ \sqrt{s} = $ 7 TeV | PRD 85 (2012) 032002 | CMS-EWK-10-010 1110.4973 |
| 25 | CMS Collaboration | Measurement of the Z boson differential cross section in transverse momentum and rapidity in proton-proton collisions at 8 TeV | PLB 749 (2015) 187 | CMS-SMP-13-013 1504.03511 |
| 26 | CMS Collaboration | Measurements of differential and double-differential Drell-Yan cross sections in proton-proton collisions at $ \sqrt{s}= $ 8 TeV | EPJC 75 (2015) 147 | CMS-SMP-14-003 1412.1115 |
| 27 | CMS Collaboration | Measurement of the transverse momentum spectra of weak vector bosons produced in proton-proton collisions at $ \sqrt{s}= $ 8 TeV | JHEP 02 (2017) 096 | CMS-SMP-14-012 1606.05864 |
| 28 | LHCb Collaboration | Inclusive $ \mathrm{W} $ and Z production in the forward region at $ \sqrt{s} = $ 7 TeV | JHEP 06 (2012) 058 | 1204.1620 |
| 29 | LHCb Collaboration | Measurement of the cross-section for Z$ \rightarrow \rm{e^+e^-} $ production in pp collisions at $ \sqrt{s} = $ 7 TeV | JHEP 02 (2013) 106 | 1212.4620 |
| 30 | LHCb Collaboration | Measurement of the forward Z boson production cross-section in pp collisions at $ \sqrt{s} = $ 7 TeV | JHEP 08 (2015) 039 | 1505.07024 |
| 31 | LHCb Collaboration | Measurement of forward W and Z boson production in pp collisions at $ \sqrt{s} = $ 8 TeV | JHEP 01 (2016) 155 | 1511.08039 |
| 32 | LHCb Collaboration | Measurement of the forward Z boson production cross-section in pp collisions at $ \sqrt{s} = $ 13 TeV | JHEP 09 (2016) 136 | 1607.06495 |
| 33 | CDF Collaboration | The transverse momentum and total cross section of $ \rm{e^+e^-} $ pairs in the Z boson region from $ {\mathrm{p}}\bar{{\mathrm{p}}} $ collisions at $ \sqrt{s} = $ 1.8 TeV | PRL 84 (2000) 845 | hep-ex/0001021 |
| 34 | D0 Collaboration | Differential production cross section of Z bosons as a function of transverse momentum at $ \sqrt{s} = $ 1.8 TeV | PRL 84 (2000) 2792 | hep-ex/9909020 |
| 35 | D0 Collaboration | Measurement of the shape of the boson transverse momentum distribution in $ {\mathrm{p}} \bar{{\mathrm{p}}} \to \mathrm{Z} / \gamma^{*} \to \mathrm{e^{+}e^{-}} + X $ events produced at $ \sqrt{s} = $ 1.96 TeV | PRL 100 (2008) 102002 | 0712.0803 |
| 36 | D0 Collaboration | Measurement of the normalized $ \mathrm{Z}/\gamma^* \to \mu^+\mu^- $ transverse momentum distribution in $ {\mathrm{p}}\bar{{\mathrm{p}}} $ collisions at $ \sqrt{s}= $ 1.96 TeV | PLB 693 (2010) 522 | 1006.0618 |
| 37 | D0 Collaboration | Precise study of the $ \mathrm{Z}/\gamma^* $ boson transverse momentum distribution in $ {\mathrm{p}}\bar{{\mathrm{p}}} $ collisions using a novel technique | PRL 106 (2011) 122001 | 1010.0262 |
| 38 | A. Banfi et al. | Optimisation of variables for studying dilepton transverse momentum distributions at hadron colliders | EPJC 71 (2011) 1600 | 1009.1580 |
| 39 | A. Banfi, M. Dasgupta, S. Marzani, and L. Tomlinson | Predictions for Drell-Yan $ \phi^* $ and $ \mathrm{Q_T} $ observables at the LHC | PLB 715 (2012) 152 | 1205.4760 |
| 40 | CMS Collaboration | Measurement of differential cross sections in the kinematic angular variable $ \phi^* $ for inclusive Z boson production in pp collisions at $ \sqrt{s}= $ 8 TeV | JHEP 03 (2018) 172 | CMS-SMP-17-002 1710.07955 |
| 41 | CMS Collaboration | The CMS experiment at the CERN LHC | JINST 3 (2008) S08004 | CMS-00-001 |
| 42 | CMS Collaboration | The CMS trigger system | JINST 12 (2017) P01020 | CMS-TRG-12-001 1609.02366 |
| 43 | GEANT4 Collaboration | GEANT4--a simulation toolkit | NIMA 506 (2003) 250 | |
| 44 | S. Alioli, P. Nason, C. Oleari, and E. Re | NLO vector boson production matched with shower in POWHEG | JHEP 07 (2008) 060 | 0805.4802 |
| 45 | J. M. Campbell and R. K. Ellis | MCFM for the Tevatron and the LHC | NPPS 205-206 (2010) 10 | 1007.3492 |
| 46 | P. Skands, S. Carrazza, and J. Rojo | Tuning PYTHIA 8.1: the Monash 2013 tune | EPJC 74 (2014) 3024 | 1404.5630 |
| 47 | CMS Collaboration | Event generator tunes obtained from underlying event and multiparton scattering measurements | EPJC 76 (2016) 155 | CMS-GEN-14-001 1512.00815 |
| 48 | NNPDF Collaboration | Parton distributions for the LHC Run II | JHEP 04 (2015) 040 | 1410.8849 |
| 49 | CMS Collaboration | Particle-flow reconstruction and global event description with the CMS detector | JINST 12 (2017) P10003 | CMS-PRF-14-001 1706.04965 |
| 50 | M. Cacciari, G. P. Salam, and G. Soyez | The anti-$ {k_{\mathrm{T}}} $ jet clustering algorithm | JHEP 04 (2008) 063 | 0802.1189 |
| 51 | M. Cacciari, G. P. Salam, and G. Soyez | FastJet user manual | EPJC 72 (2012) 1896 | 1111.6097 |
| 52 | CMS Collaboration | Performance of CMS muon reconstruction in pp collision events at $ \sqrt{s} = $ 7 TeV | JINST 7 (2012) P10002 | CMS-MUO-10-004 1206.4071 |
| 53 | CMS Collaboration | Performance of the CMS muon detector and muon reconstruction with proton-proton collisions at $ \sqrt{s}= $ 13 TeV | JINST 13 (2018) P06015 | CMS-MUO-16-001 1804.04528 |
| 54 | CMS Collaboration | Performance of electron reconstruction and selection with the CMS detector in proton-proton collisions at $ \sqrt{s} = $ 8 TeV | JINST 10 (2015) P06005 | CMS-EGM-13-001 1502.02701 |
| 55 | CMS Collaboration | Description and performance of track and primary-vertex reconstruction with the CMS tracker | JINST 9 (2014) P10009 | CMS-TRK-11-001 1405.6569 |
| 56 | Particle Data Group, M. Tanabashi et al. | Review of particle physics | PRD 98 (2018) 030001 | |
| 57 | CMS Collaboration | Search for invisible decays of Higgs bosons in the vector boson fusion and associated ZH production modes | EPJC 74 (2014) 2980 | CMS-HIG-13-030 1404.1344 |
| 58 | CMS Collaboration | Measurement of the Drell--Yan cross section in $ {\mathrm{p}}{\mathrm{p}} $ collisions at $ \sqrt{s} = $ 7 TeV | JHEP 10 (2011) 132 | CMS-EWK-10-005 1107.4789 |
| 59 | A. Bodek et al. | Extracting muon momentum scale corrections for hadron collider experiments | EPJC 72 (2012) 2194 | 1208.3710 |
| 60 | S. Schmitt | TUnfold: an algorithm for correcting migration effects in high energy physics | JINST 7 (2012) T10003 | 1205.6201 |
| 61 | S. Schmitt | Data unfolding methods in high energy physics | EPJWeb Conf. 137 (2017) 11008 | 1611.01927 |
| 62 | CMS Collaboration | CMS luminosity measurements for the 2016 data taking period | CMS-PAS-LUM-17-001 | CMS-PAS-LUM-17-001 |
| 63 | P. Golonka and Z. Was | PHOTOS Monte Carlo: A precision tool for QED corrections in $ Z $ and $ W $ decays | EPJC 45 (2006) 97 | hep-ph/0506026 |
| 64 | J. Butterworth et al. | PDF4LHC recommendations for LHC Run II | JPG 43 (2016) 023001 | 1510.03865 |
| 65 | H.-L. Lai et al. | New parton distributions for collider physics | PRD 82 (2010) 074024 | 1007.2241 |
| 66 | A. D. Martin et al. | Parton distributions for the LHC | EPJC 63 (2009) 189 | 0901.0002 |
| 67 | R. D. Ball et al. | Impact of heavy quark masses on parton distributions and LHC phenomenology | NPB 849 (2011) 296 | 1101.1300 |
| 68 | K. Melnikov and F. Petriello | The $ W $ boson production cross section at the LHC through $ O(\alpha^2_s) $ | PRL 96 (2006) 231803 | hep-ph/0603182 |
| 69 | R. Gavin, Y. Li, F. Petriello, and S. Quackenbush | FEWZ 2.0: A code for hadronic Z production at next-to-next-to-leading order | CPC 182 (2011) 2388 | 1011.3540 |
| 70 | R. Gavin, Y. Li, F. Petriello, and S. Quackenbush | W physics at the LHC with FEWZ 2.1 | CPC 184 (2013) 208 | 1201.5896 |
| 71 | Y. Li and F. Petriello | Combining QCD and electroweak corrections to dilepton production in FEWZ | PRB 86 (2012) 094034 | 1208.5967 |
| 72 | NNPDF Collaboration | Parton distributions from high-precision collider data | EPJC 77 (2017) 663 | 1706.00428 |
| 73 | R. Frederix and S. Frixione | Merging meets matching in MC@NLO | JHEP 12 (2012) 061 | 1209.6215 |
| 74 | K. Hamilton, P. Nason, C. Oleari, and G. Zanderighi | Merging H/W/Z + 0 and 1 jet at NLO with no merging scale: a path to parton shower + NNLO matching | JHEP 05 (2013) 082 | 1212.4504 |
| 75 | G. A. Ladinsky and C. P. Yuan | The nonperturbative regime in QCD resummation for gauge boson production at hadron colliders | PRD 50 (1994) R4239 | hep-ph/9311341 |
| 76 | C. Balazs and C. P. Yuan | Soft gluon effects on lepton pairs at hadron colliders | PRD 56 (1997) 5558 | hep-ph/9704258 |
| 77 | F. Landry, R. Brock, P. M. Nadolsky, and C. P. Yuan | Tevatron Run-1 $ Z $ boson data and Collins-Soper-Sterman resummation formalism | PRD 67 (2003) 073016 | hep-ph/0212159 |
| 78 | S. Alioli et al. | Drell-Yan production at NNLL'+NNLO matched to parton showers | PRD 92 (2015) 094020 | 1508.01475 |
| 79 | A. Bermudez Martinez et al. | Collinear and TMD parton densities from fits to precision DIS measurements in the parton branching method | PRD 99 (2019) 074008 | 1804.11152 |
| 80 | F. Hautmann et al. | Collinear and TMD quark and gluon densities from parton branching solution of QCD evolution equations | JHEP 01 (2018) 070 | 1708.03279 |
| 81 | F. Hautmann et al. | Soft-gluon resolution scale in QCD evolution equations | PLB 772 (2017) 446 | 1704.01757 |
| 82 | A. Bermudez Martinez et al. | Production of Z bosons in the parton branching method | Submitted to \textscPRD | 1906.00919 |
| 83 | S. Dulat et al. | New parton distribution functions from a global analysis of quantum chromodynamics | PRD 93 (2016) 033006 | 1506.07443 |
|
|
Compact Muon Solenoid LHC, CERN |
|

|

|

|

|

|