

Compact Muon Solenoid
LHC, CERN
| CMS-SMP-18-013 ; CERN-EP-2021-206 | ||
| Measurements of the associated production of a W boson and a charm quark in proton-proton collisions at $ \sqrt{s}= $ 8 TeV | ||
| CMS Collaboration | ||
| 2 December 2021 | ||
| Eur. Phys. J. C 82 (2022) 1094 | ||
| Abstract: Measurements of the associated production of a W boson and a charm (c) quark in proton-proton collisions at a centre-of-mass energy of 8 TeV are reported. The analysis uses a data sample corresponding to a total integrated luminosity of 19.7 fb$ ^{-1} $ collected by the CMS detector at the LHC. The W bosons are identified through their leptonic decays to an electron or a muon, and a neutrino. Charm quark jets are selected using distinctive signatures of charm hadron decays. The product of the cross section and branching fraction $ \sigma(\mathrm{p}\mathrm{p} \to \mathrm{W} + \mathrm{c} + \mathrm{X}) \mathcal {B}(\mathrm{W} \to \ell \nu) $, where $ \ell = \mathrm{e} $ or $ \mu $, and the cross section ratio $ \sigma(\mathrm{p}\mathrm{p} \to {\mathrm{W^+} + \overline{\mathrm{c}} + \mathrm{X}}) / \sigma(\mathrm{p}\mathrm{p} \to {\mathrm{W^-} + \mathrm{c} + \mathrm{X}}) $ are measured in a fiducial volume and differentially as functions of the pseudorapidity and of the transverse momentum of the lepton from the W boson decay. The results are compared with theoretical predictions. The impact of these measurements on the determination of the strange quark distribution is assessed. | ||
| Links: e-print arXiv:2112.00895 [hep-ex] (PDF) ; CDS record ; inSPIRE record ; HepData record ; CADI line (restricted) ; | ||
| Figures & Tables | Summary | Additional Figures | References | CMS Publications |
|---|
| Figures | |
png pdf |
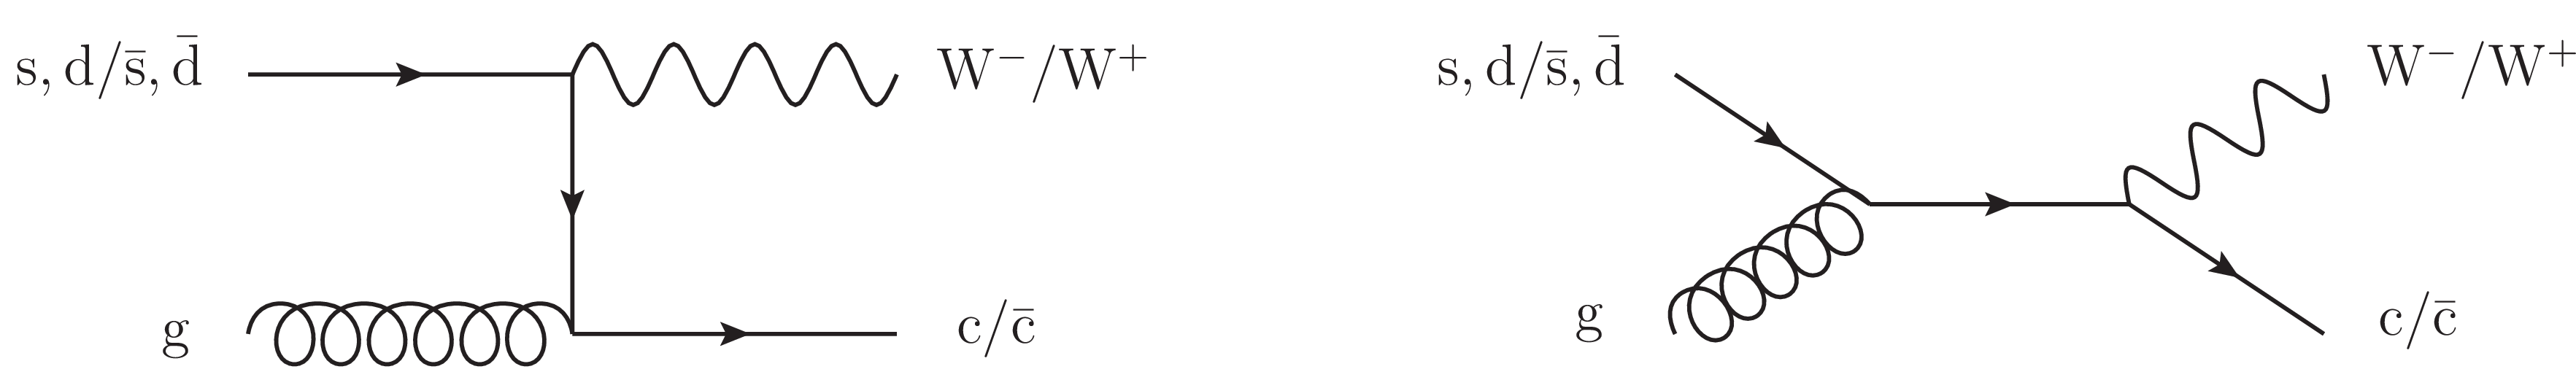
Figure 1:
Leading order diagrams for the associated production of a W boson and a charm (anti)quark. |
png pdf |
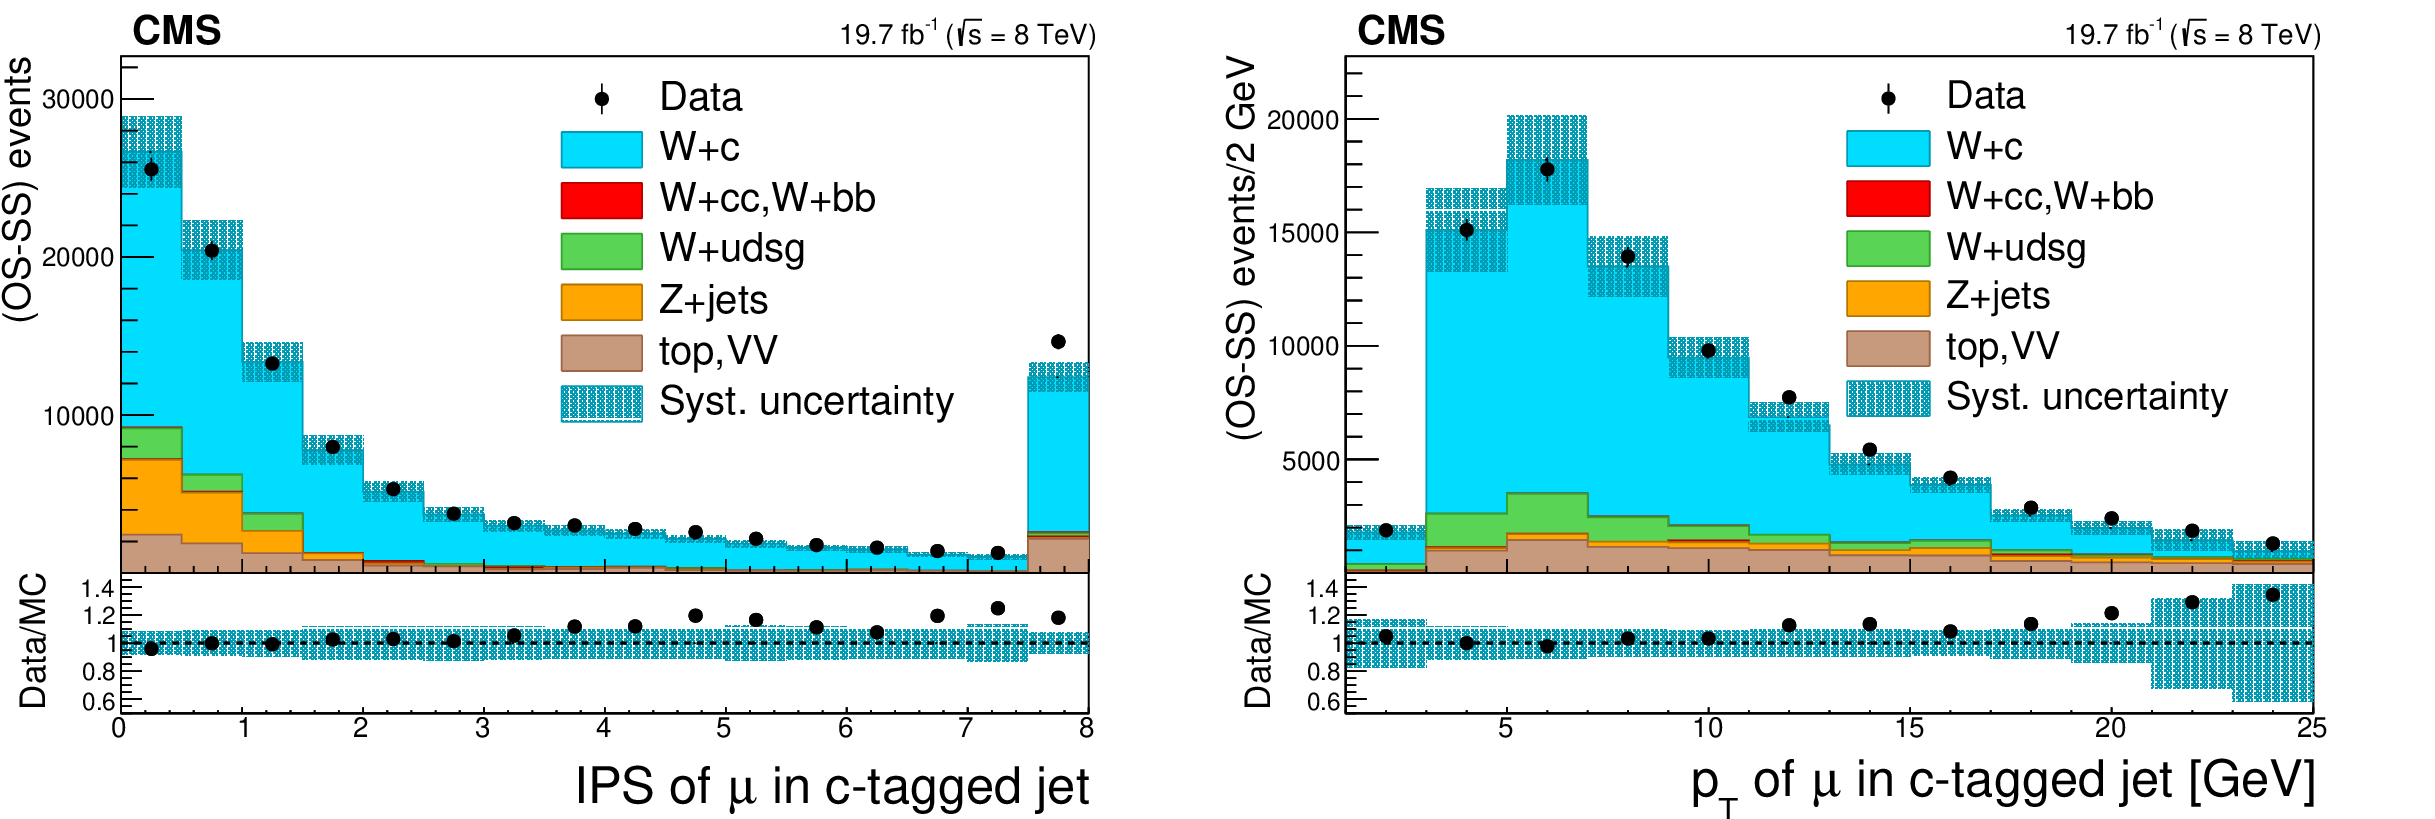
Figure 2:
Distributions after OS-SS subtraction of the impact parameter significance, IPS, (left) and $ p_{\mathrm{T}} $ (right), of the muon inside the $ \mathrm{c}\text{ jet} $ for events in the SL sample, summing up the contributions of the two W boson decay channels. The IPS distribution is shown after all selection requirements except the one on this variable. The last bin of the distribution includes all events with $ \text{IPS} > $ 7.5. The $ p_{\mathrm{T}} $ distribution includes the selection requirement $ \text{IPS} > $ 1.0 for the $ \mathrm{W} \to \mu\nu $ channel. The contributions of the various processes are estimated with the simulated samples. Vertical bars on data points represent statistical uncertainty in the data. The hatched areas represent the sum in quadrature of statistical and systematic uncertainties in the MC simulation. The ratio of data to simulation is shown in the lower panels. The uncertainty band in the ratio includes the statistical uncertainty in the data, and the statistical and systematic uncertainties in the MC simulation. |
png pdf |
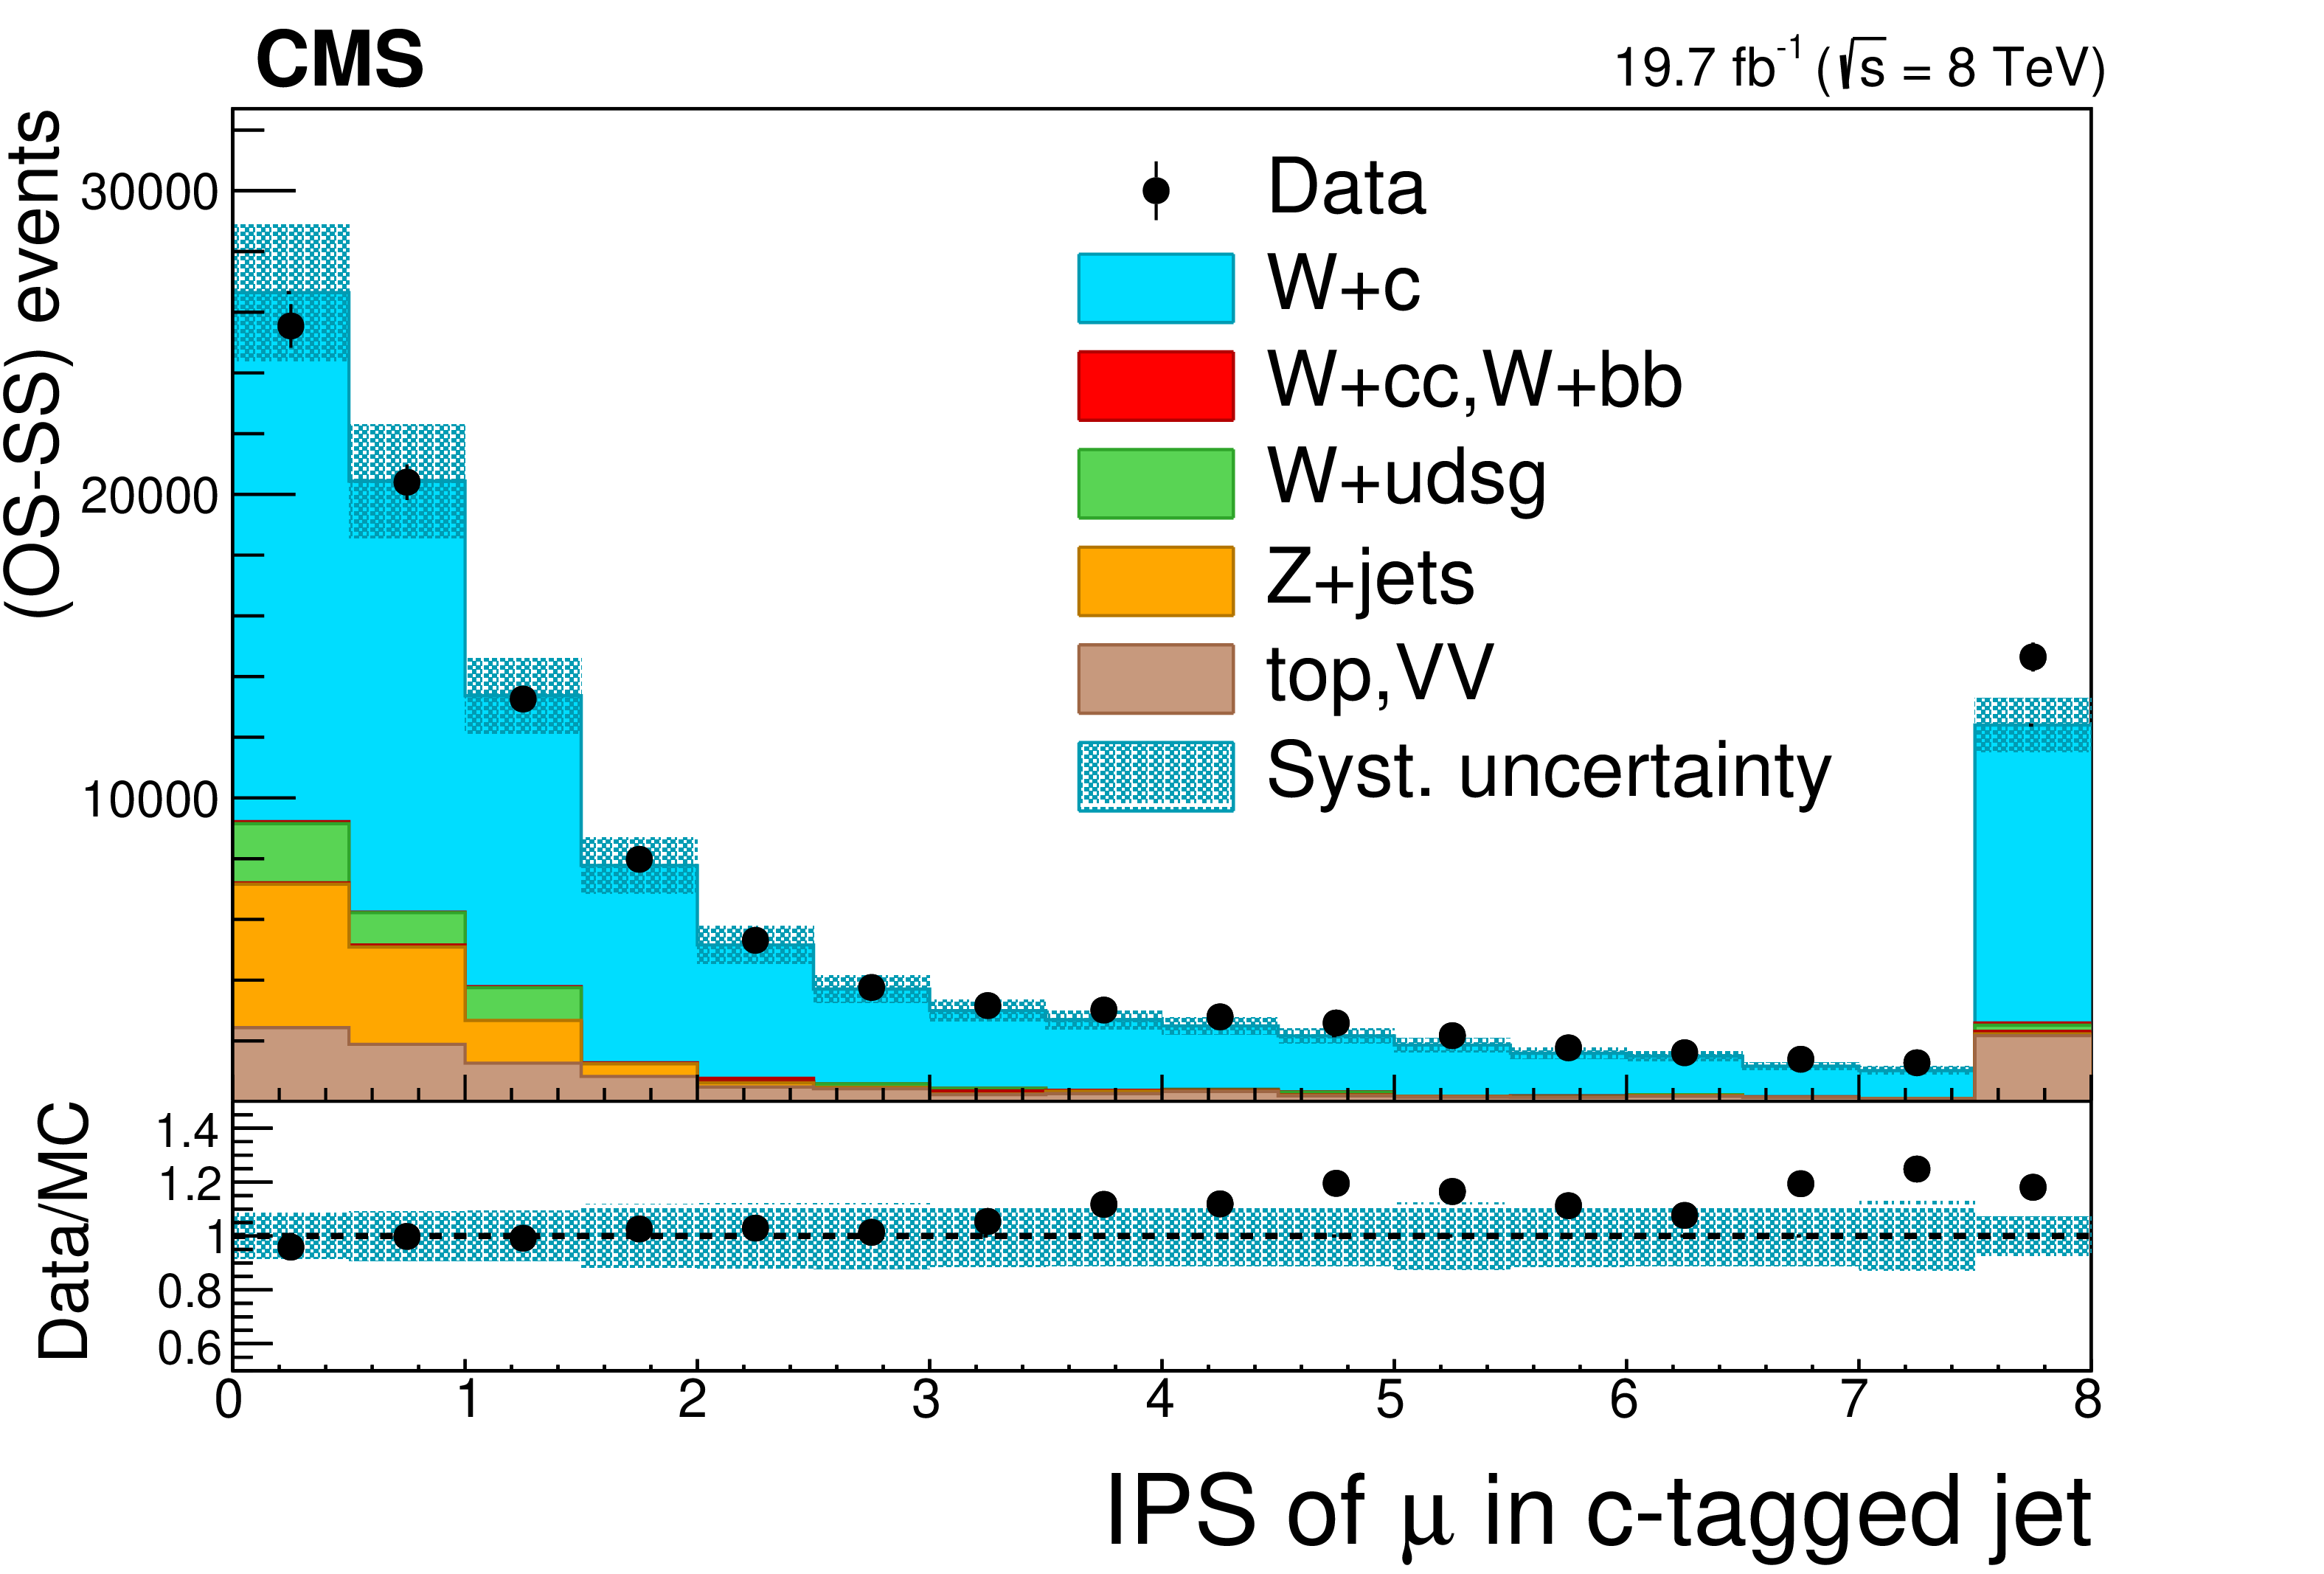
Figure 2-a:
Distributions after OS-SS subtraction of the impact parameter significance, IPS, (left) and $ p_{\mathrm{T}} $ (right), of the muon inside the $ \mathrm{c}\text{ jet} $ for events in the SL sample, summing up the contributions of the two W boson decay channels. The IPS distribution is shown after all selection requirements except the one on this variable. The last bin of the distribution includes all events with $ \text{IPS} > $ 7.5. The $ p_{\mathrm{T}} $ distribution includes the selection requirement $ \text{IPS} > $ 1.0 for the $ \mathrm{W} \to \mu\nu $ channel. The contributions of the various processes are estimated with the simulated samples. Vertical bars on data points represent statistical uncertainty in the data. The hatched areas represent the sum in quadrature of statistical and systematic uncertainties in the MC simulation. The ratio of data to simulation is shown in the lower panels. The uncertainty band in the ratio includes the statistical uncertainty in the data, and the statistical and systematic uncertainties in the MC simulation. |
png pdf |
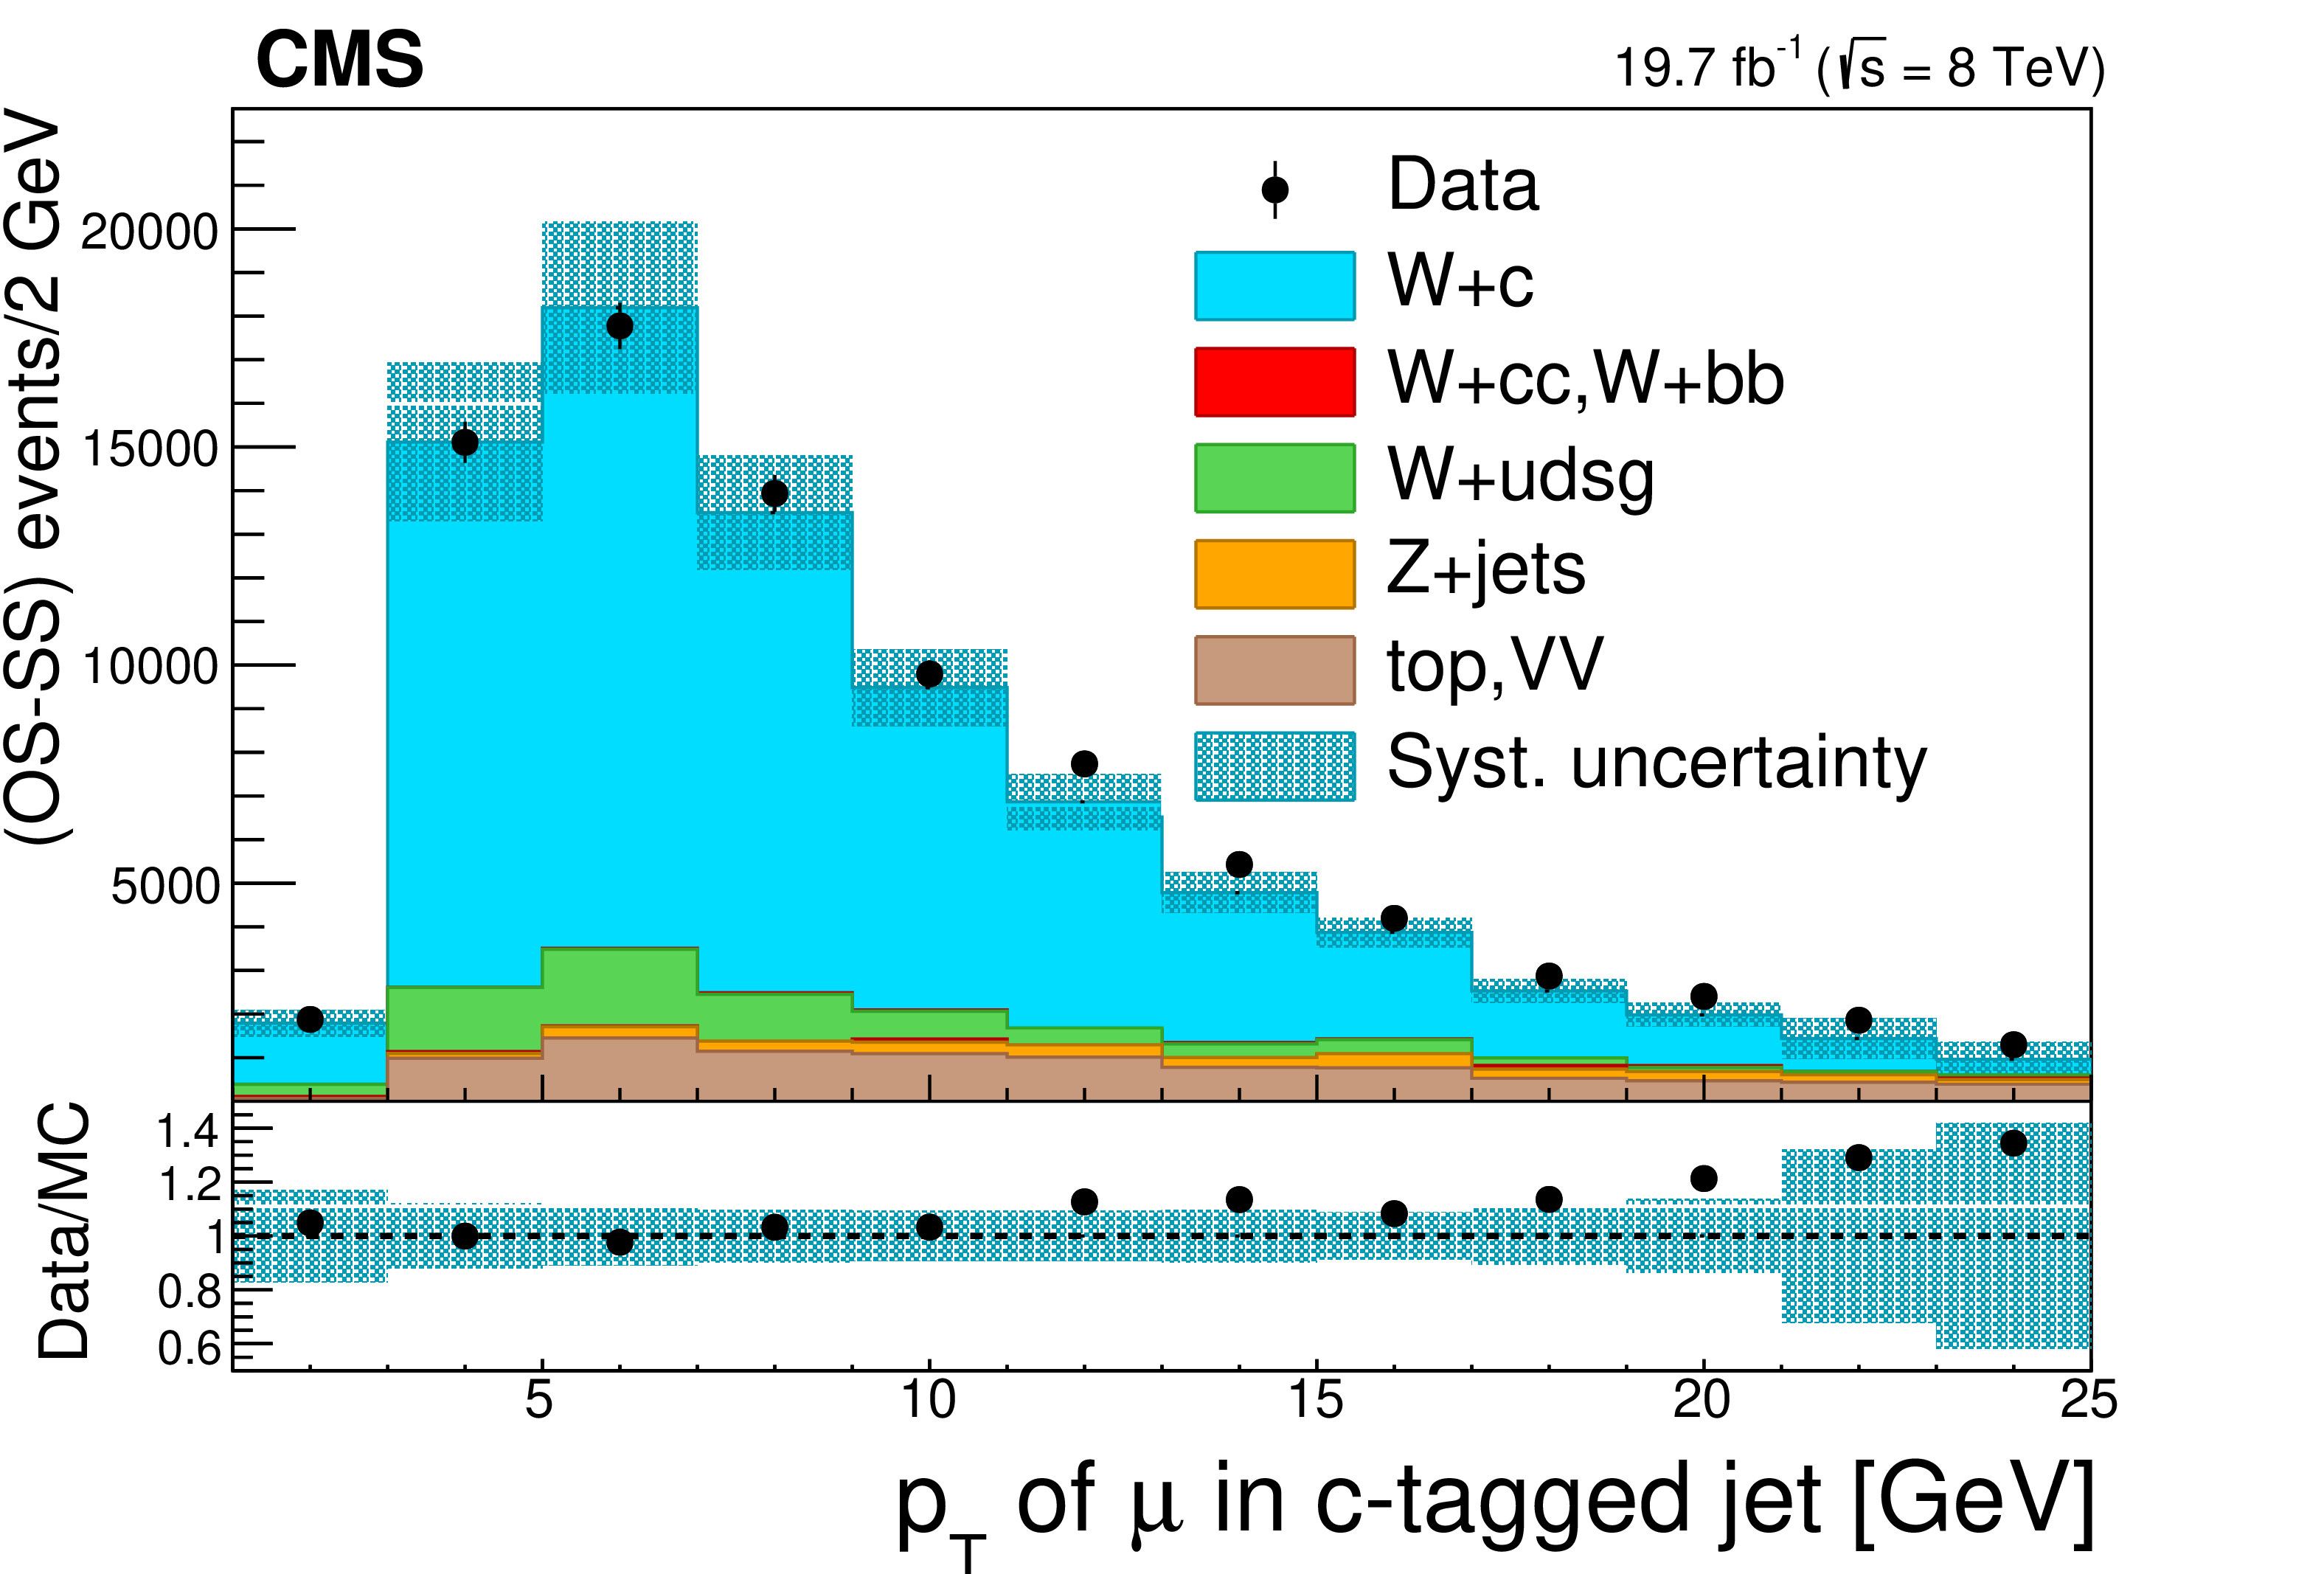
Figure 2-b:
Distributions after OS-SS subtraction of the impact parameter significance, IPS, (left) and $ p_{\mathrm{T}} $ (right), of the muon inside the $ \mathrm{c}\text{ jet} $ for events in the SL sample, summing up the contributions of the two W boson decay channels. The IPS distribution is shown after all selection requirements except the one on this variable. The last bin of the distribution includes all events with $ \text{IPS} > $ 7.5. The $ p_{\mathrm{T}} $ distribution includes the selection requirement $ \text{IPS} > $ 1.0 for the $ \mathrm{W} \to \mu\nu $ channel. The contributions of the various processes are estimated with the simulated samples. Vertical bars on data points represent statistical uncertainty in the data. The hatched areas represent the sum in quadrature of statistical and systematic uncertainties in the MC simulation. The ratio of data to simulation is shown in the lower panels. The uncertainty band in the ratio includes the statistical uncertainty in the data, and the statistical and systematic uncertainties in the MC simulation. |

png pdf |
Figure 3:
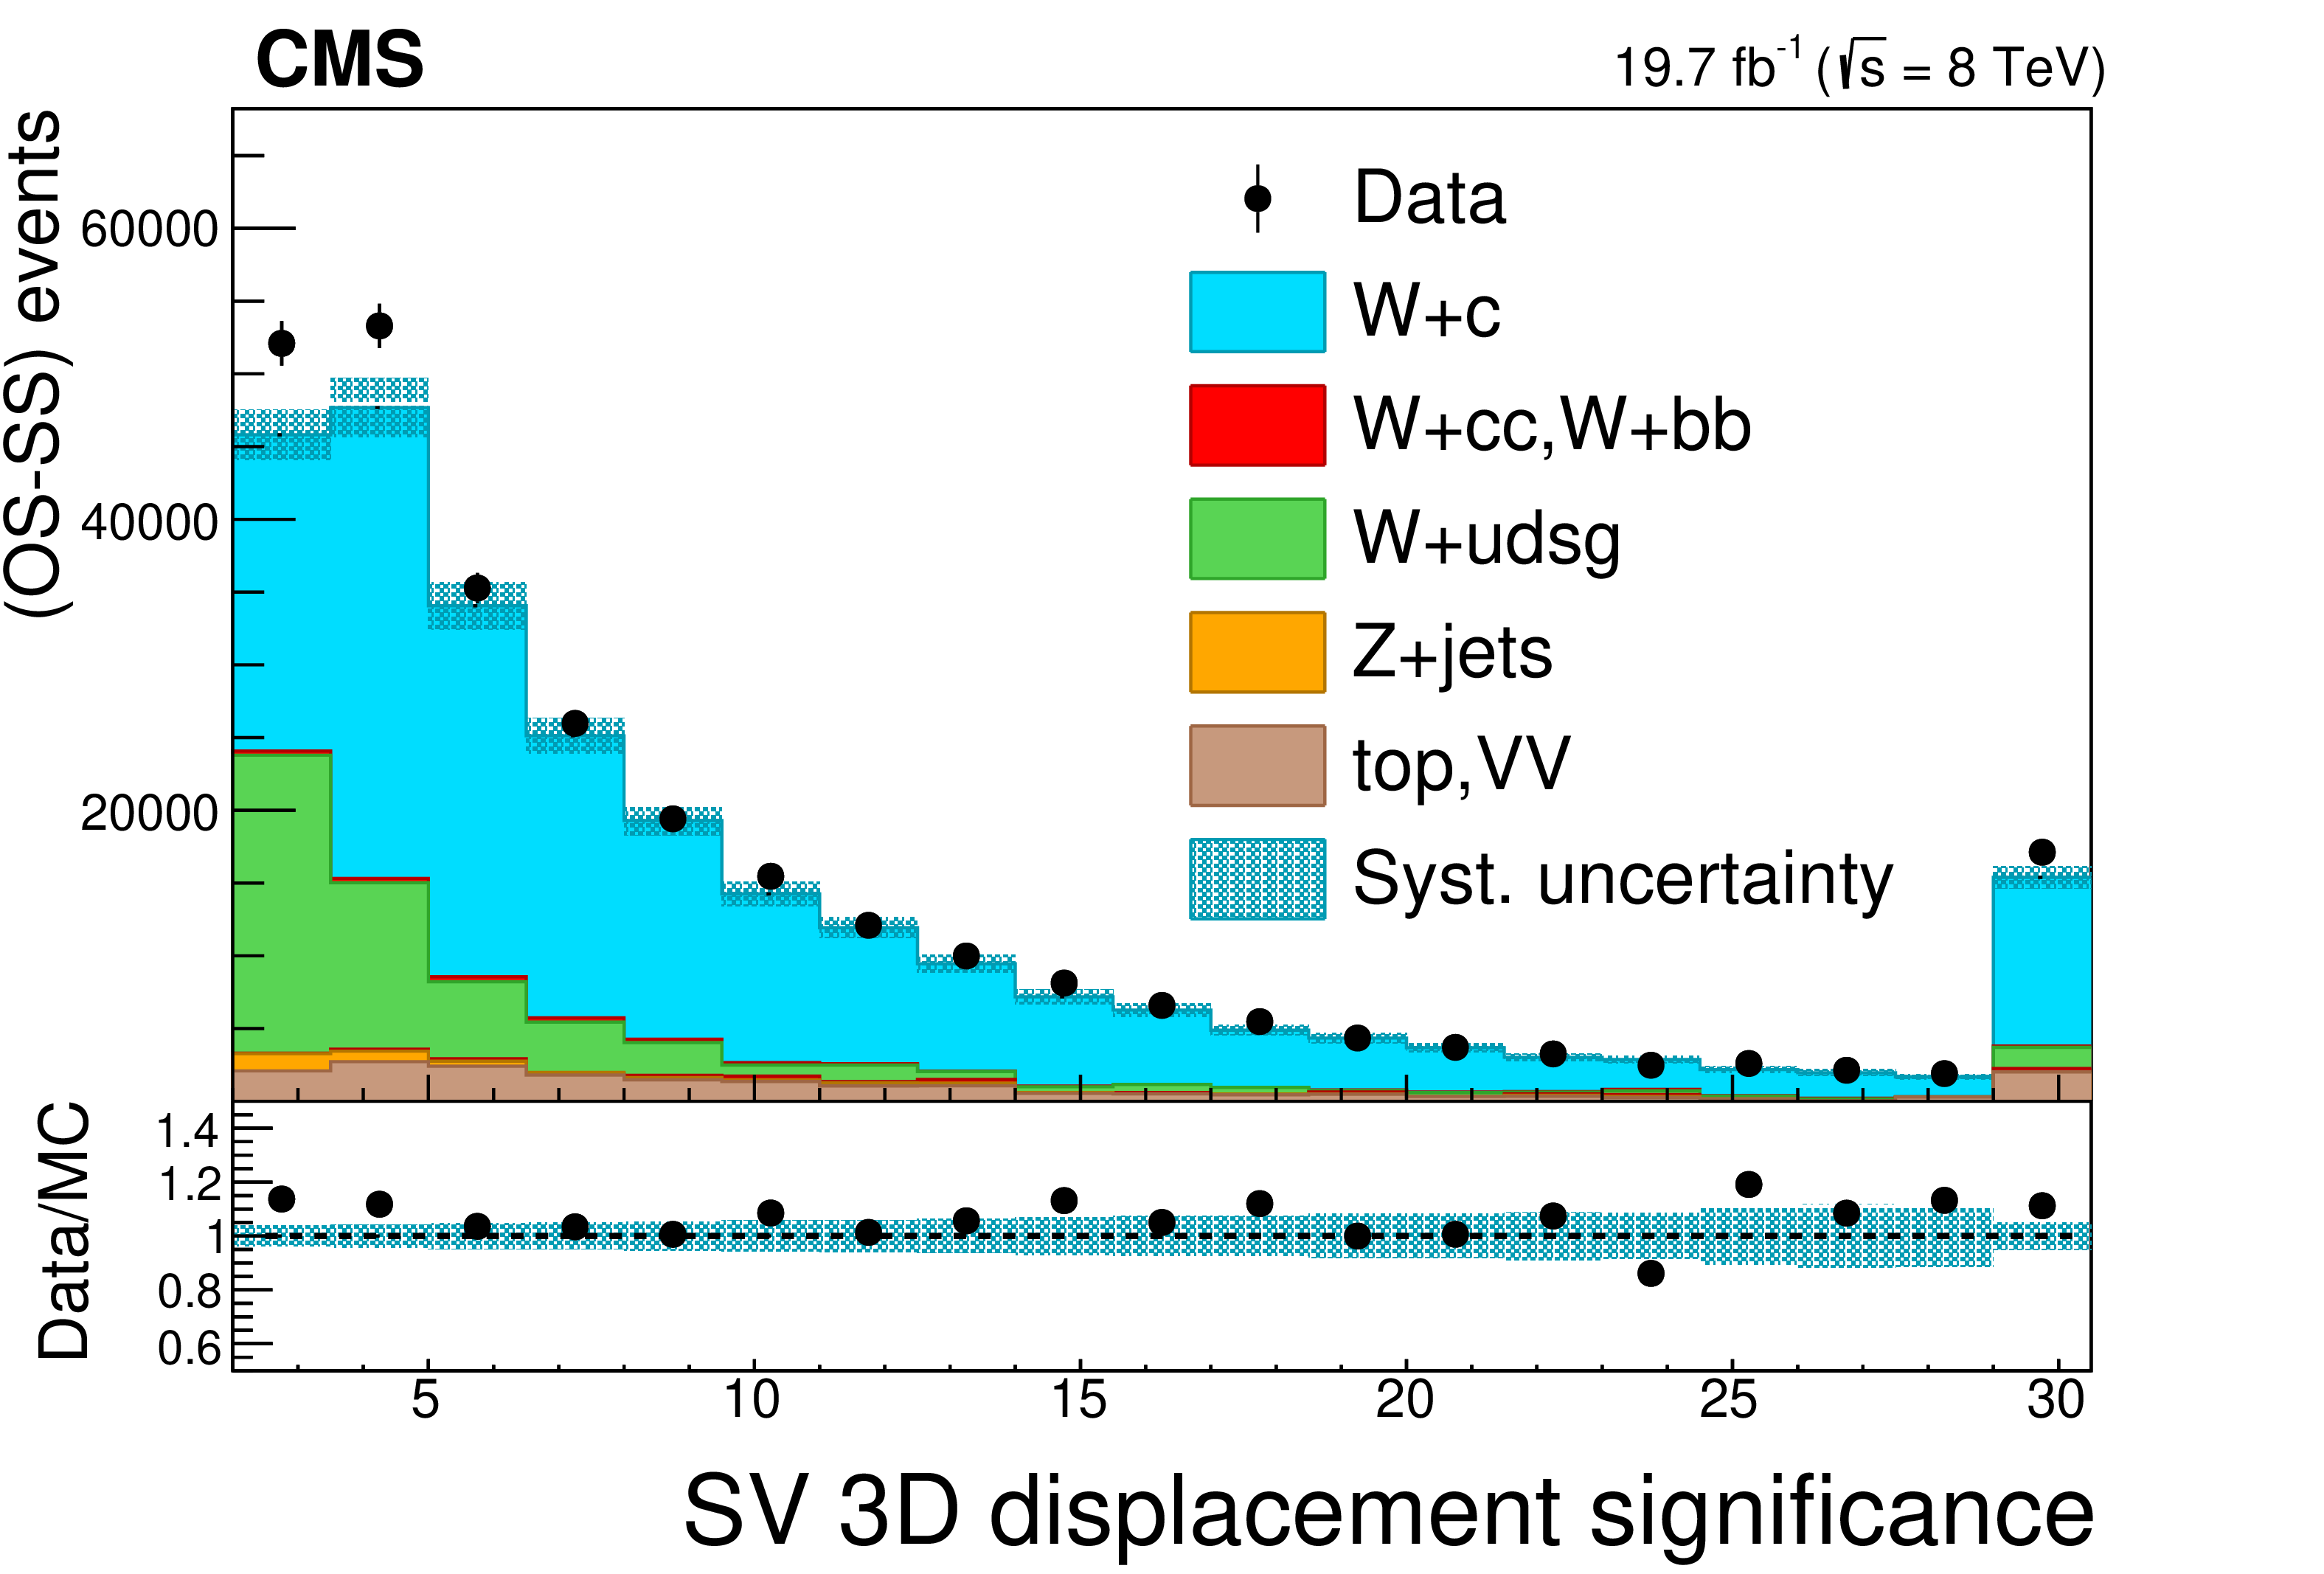
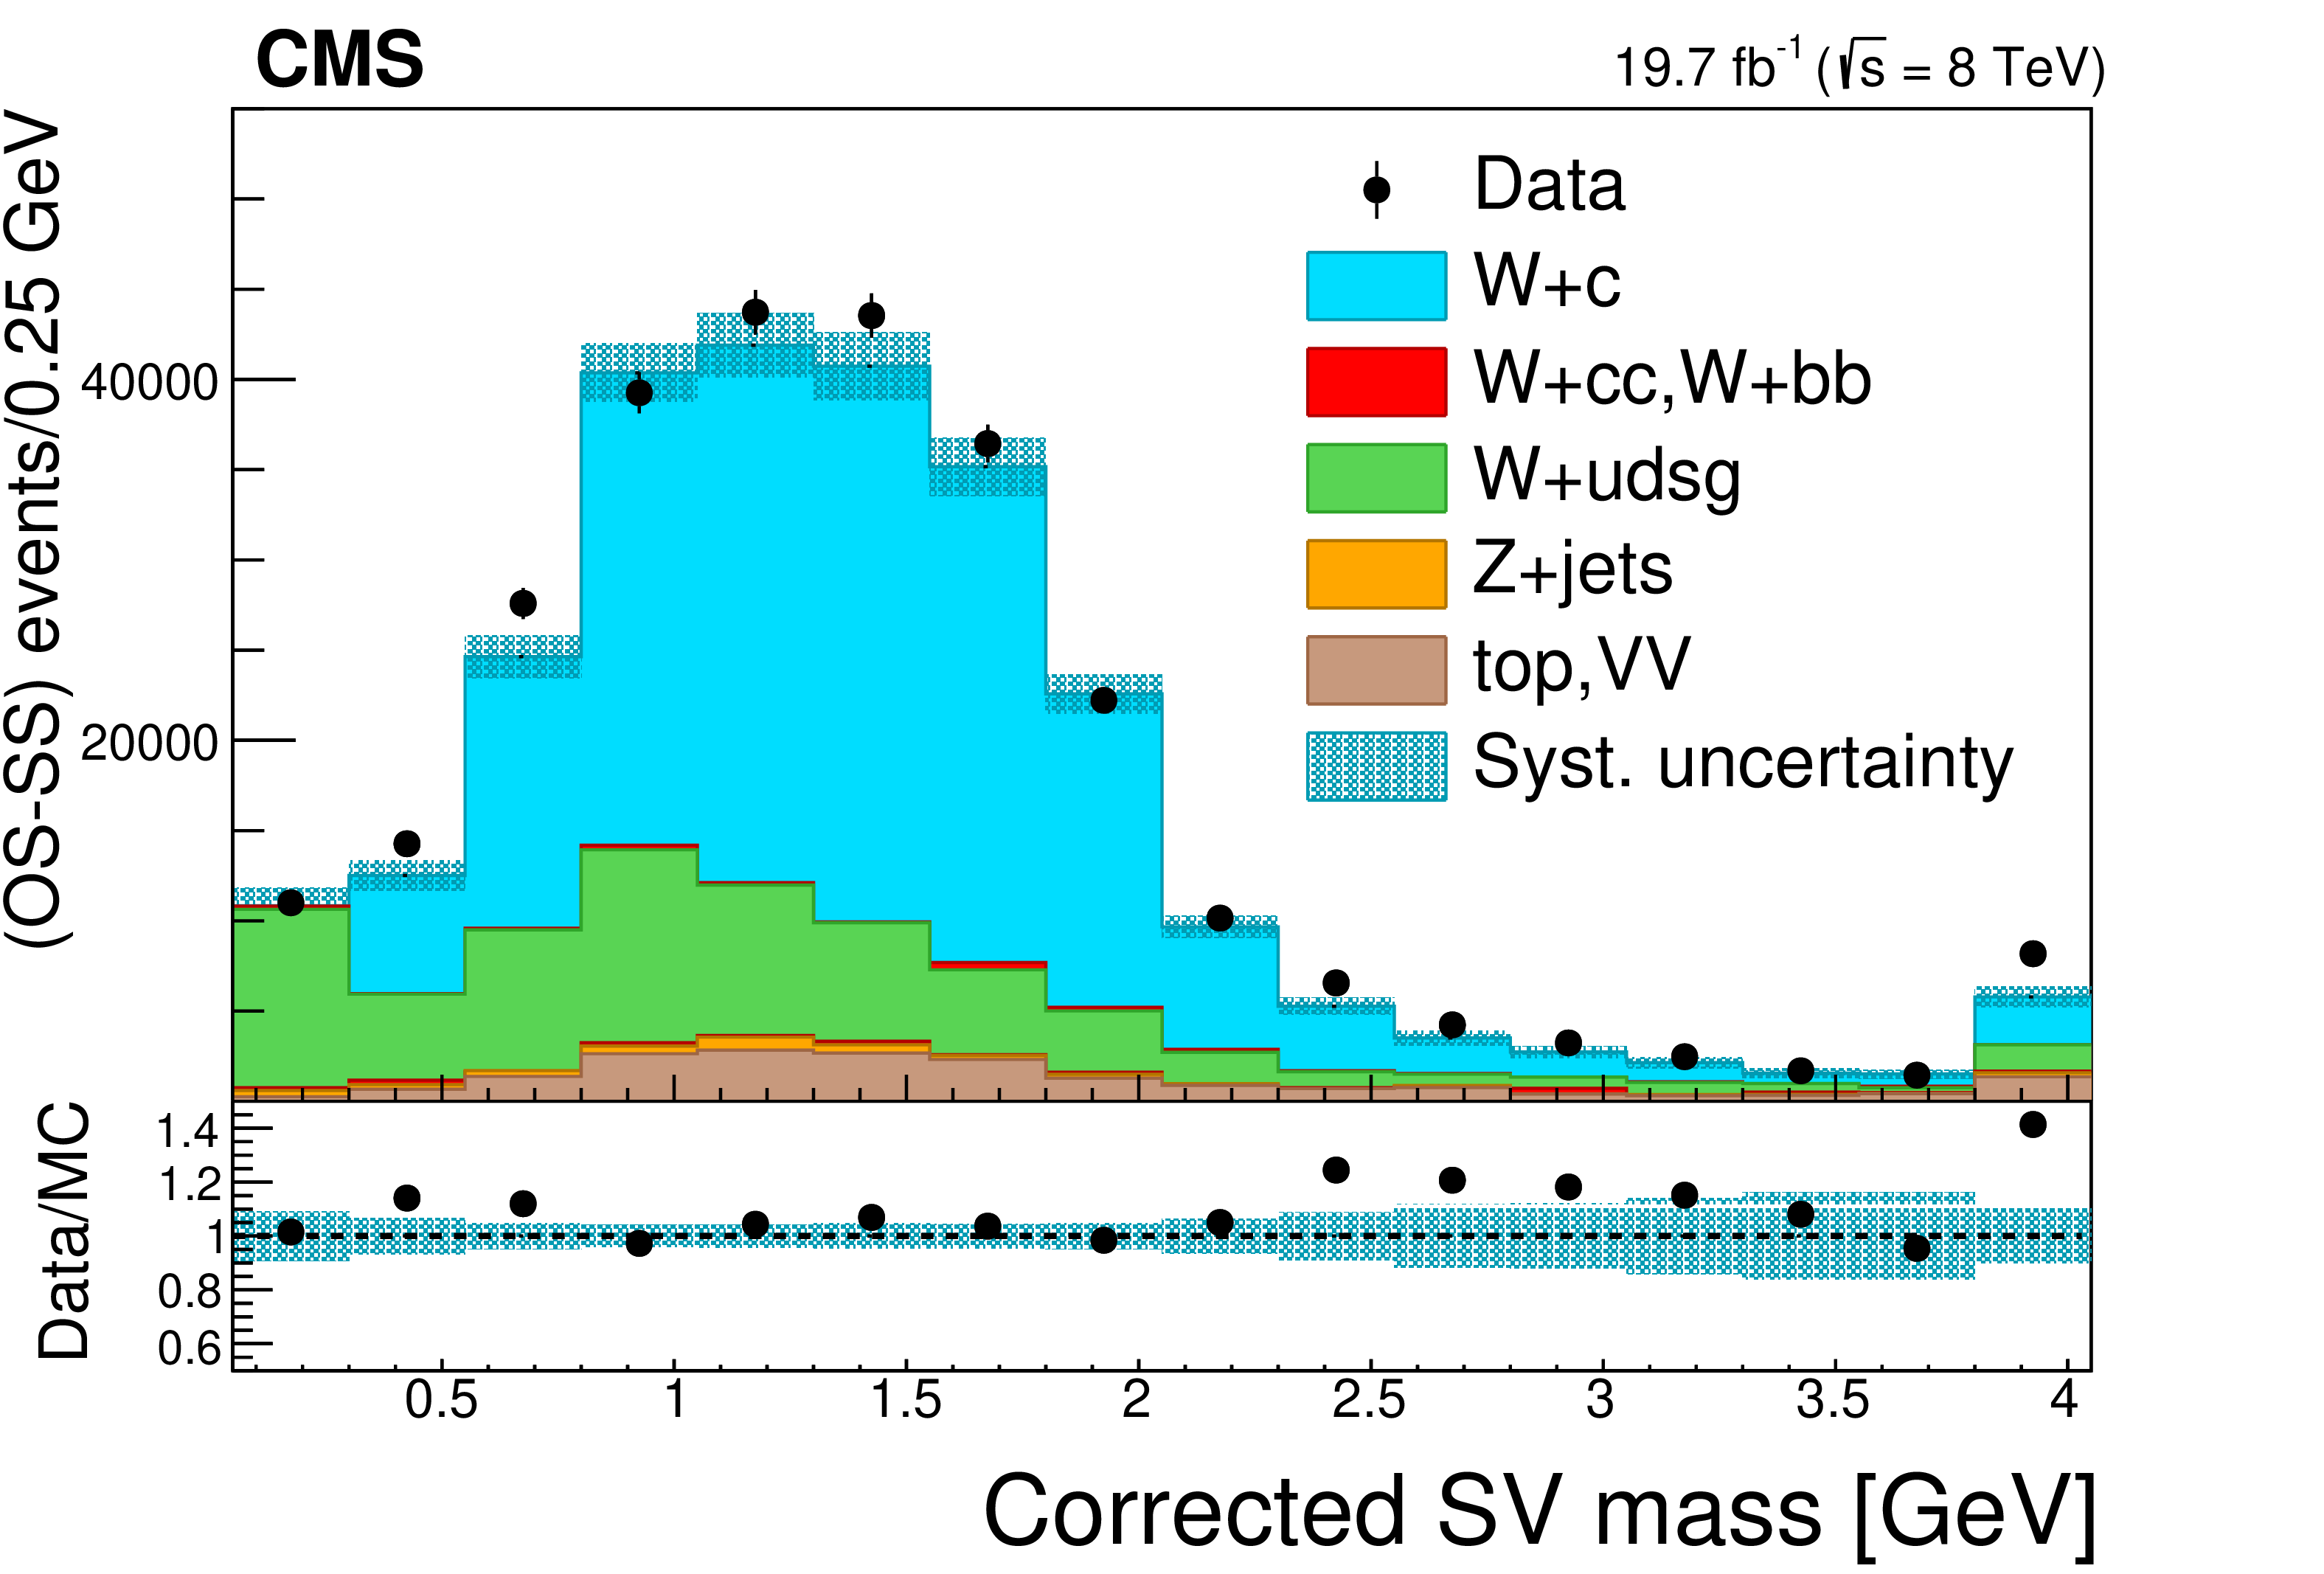
Distributions after OS-SS subtraction of the secondary-vertex displacement significance (left) and corrected secondary-vertex mass (right). For each distribution all selection requirements are applied except the one on the displayed variable. The last bin of each plot includes all events beyond the bin. The contributions from all processes are estimated with the simulated samples. Vertical bars on data points represent the statistical uncertainty in the data. The hatched areas represent the sum in quadrature of statistical and systematic uncertainties in the MC simulation. The ratio of data to simulation is shown in the lower panels. The uncertainty band in the ratio includes the statistical uncertainty in the data, and the statistical and systematic uncertainties in the MC simulation. |
png pdf |
Figure 3-a:
Distributions after OS-SS subtraction of the secondary-vertex displacement significance (left) and corrected secondary-vertex mass (right). For each distribution all selection requirements are applied except the one on the displayed variable. The last bin of each plot includes all events beyond the bin. The contributions from all processes are estimated with the simulated samples. Vertical bars on data points represent the statistical uncertainty in the data. The hatched areas represent the sum in quadrature of statistical and systematic uncertainties in the MC simulation. The ratio of data to simulation is shown in the lower panels. The uncertainty band in the ratio includes the statistical uncertainty in the data, and the statistical and systematic uncertainties in the MC simulation. |
png pdf |
Figure 3-b:
Distributions after OS-SS subtraction of the secondary-vertex displacement significance (left) and corrected secondary-vertex mass (right). For each distribution all selection requirements are applied except the one on the displayed variable. The last bin of each plot includes all events beyond the bin. The contributions from all processes are estimated with the simulated samples. Vertical bars on data points represent the statistical uncertainty in the data. The hatched areas represent the sum in quadrature of statistical and systematic uncertainties in the MC simulation. The ratio of data to simulation is shown in the lower panels. The uncertainty band in the ratio includes the statistical uncertainty in the data, and the statistical and systematic uncertainties in the MC simulation. |
png pdf |
Figure 4:
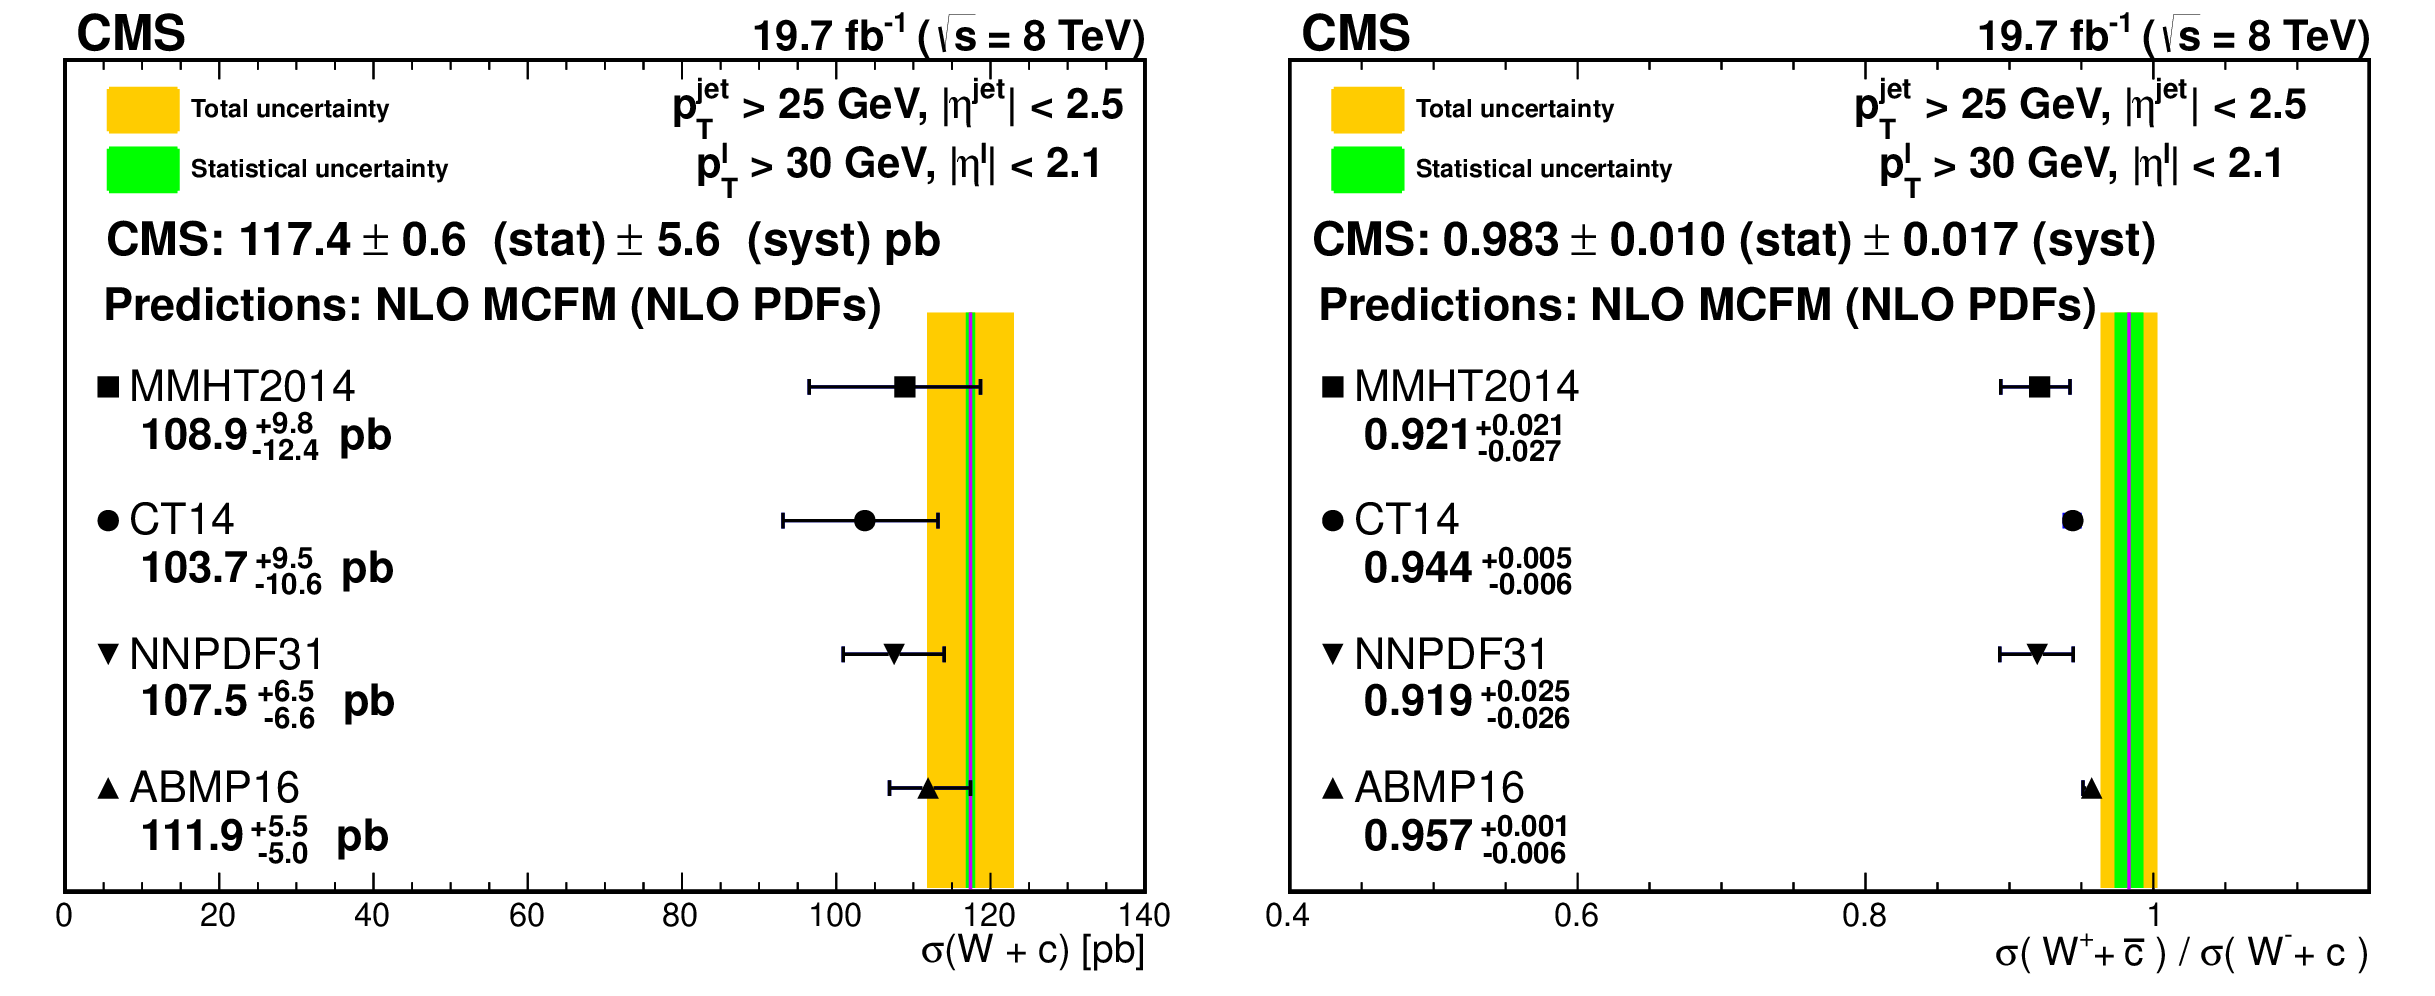
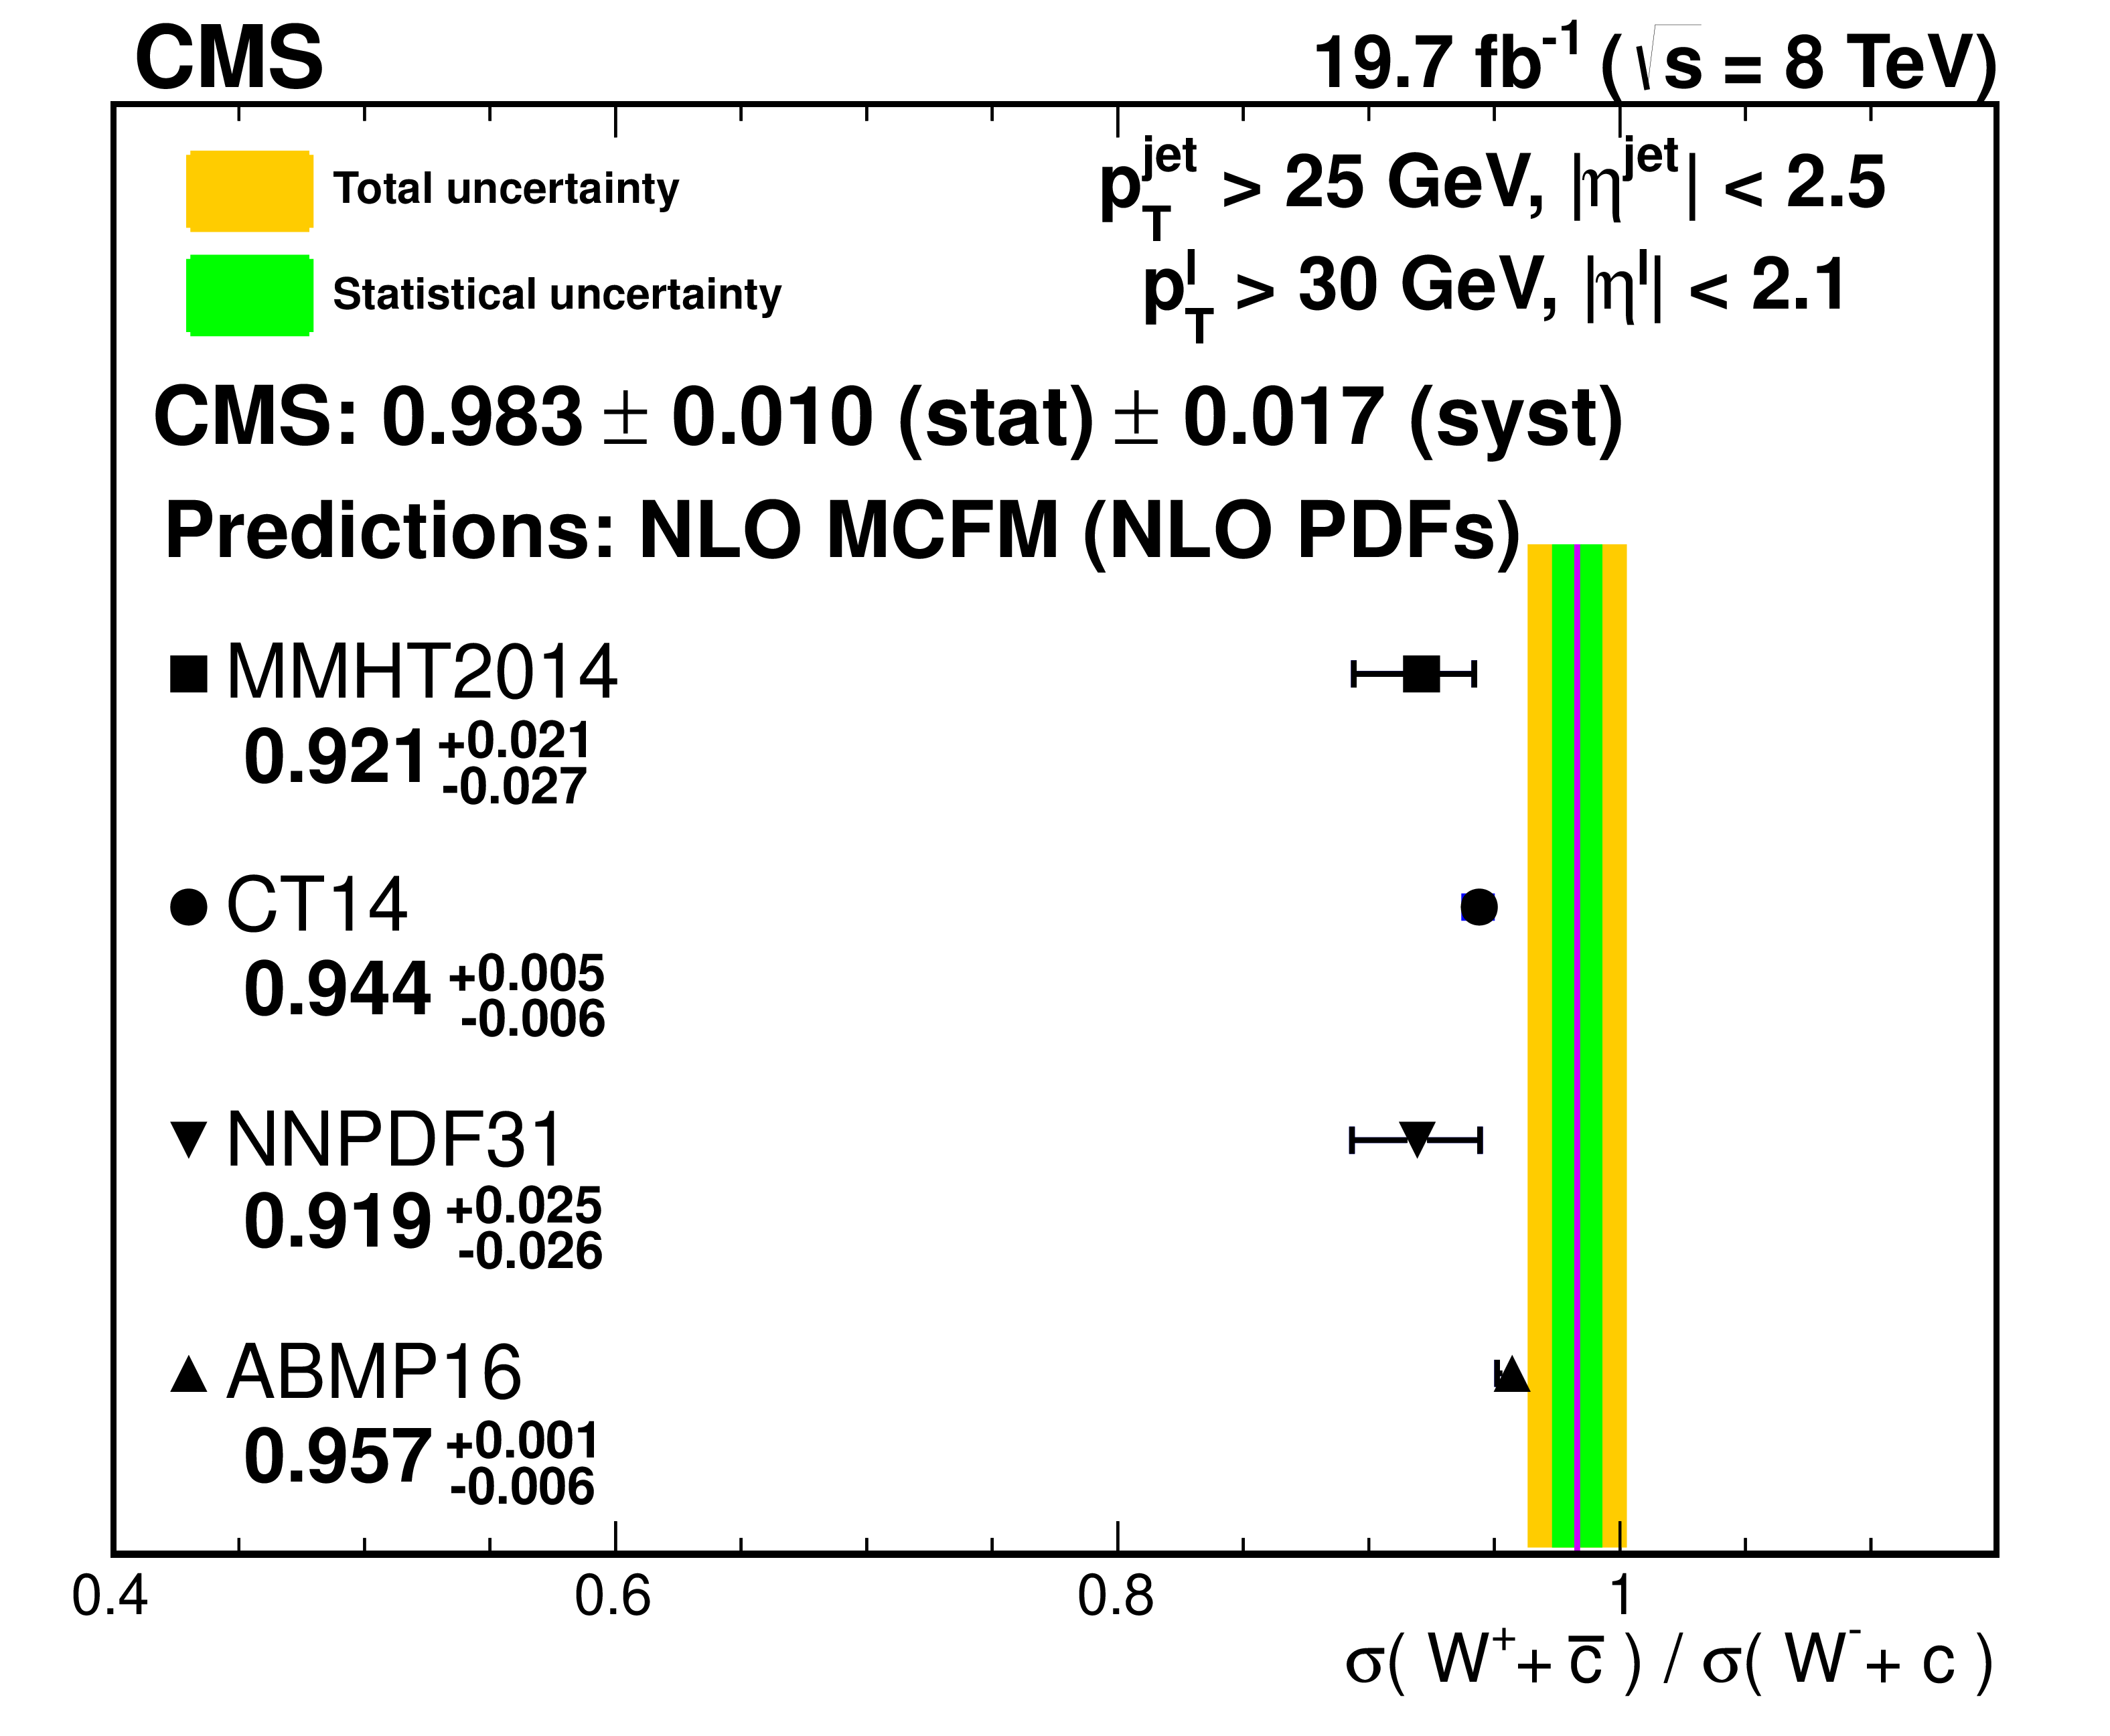
Comparison of the theoretical predictions for $ \sigma(\mathrm{W}\,\mathrm{c}) $ (left) and $ \sigma(\mathrm{W^+}\,\overline{\mathrm{c}})/\sigma(\mathrm{W^-}\,\mathrm{c}) $ (right) computed with MCFM and several sets of PDFs with the current experimental measurements. |

png pdf |
Figure 4-a:
Comparison of the theoretical predictions for $ \sigma(\mathrm{W}\,\mathrm{c}) $ (left) and $ \sigma(\mathrm{W^+}\,\overline{\mathrm{c}})/\sigma(\mathrm{W^-}\,\mathrm{c}) $ (right) computed with MCFM and several sets of PDFs with the current experimental measurements. |
png pdf |
Figure 4-b:
Comparison of the theoretical predictions for $ \sigma(\mathrm{W}\,\mathrm{c}) $ (left) and $ \sigma(\mathrm{W^+}\,\overline{\mathrm{c}})/\sigma(\mathrm{W^-}\,\mathrm{c}) $ (right) computed with MCFM and several sets of PDFs with the current experimental measurements. |
png pdf |
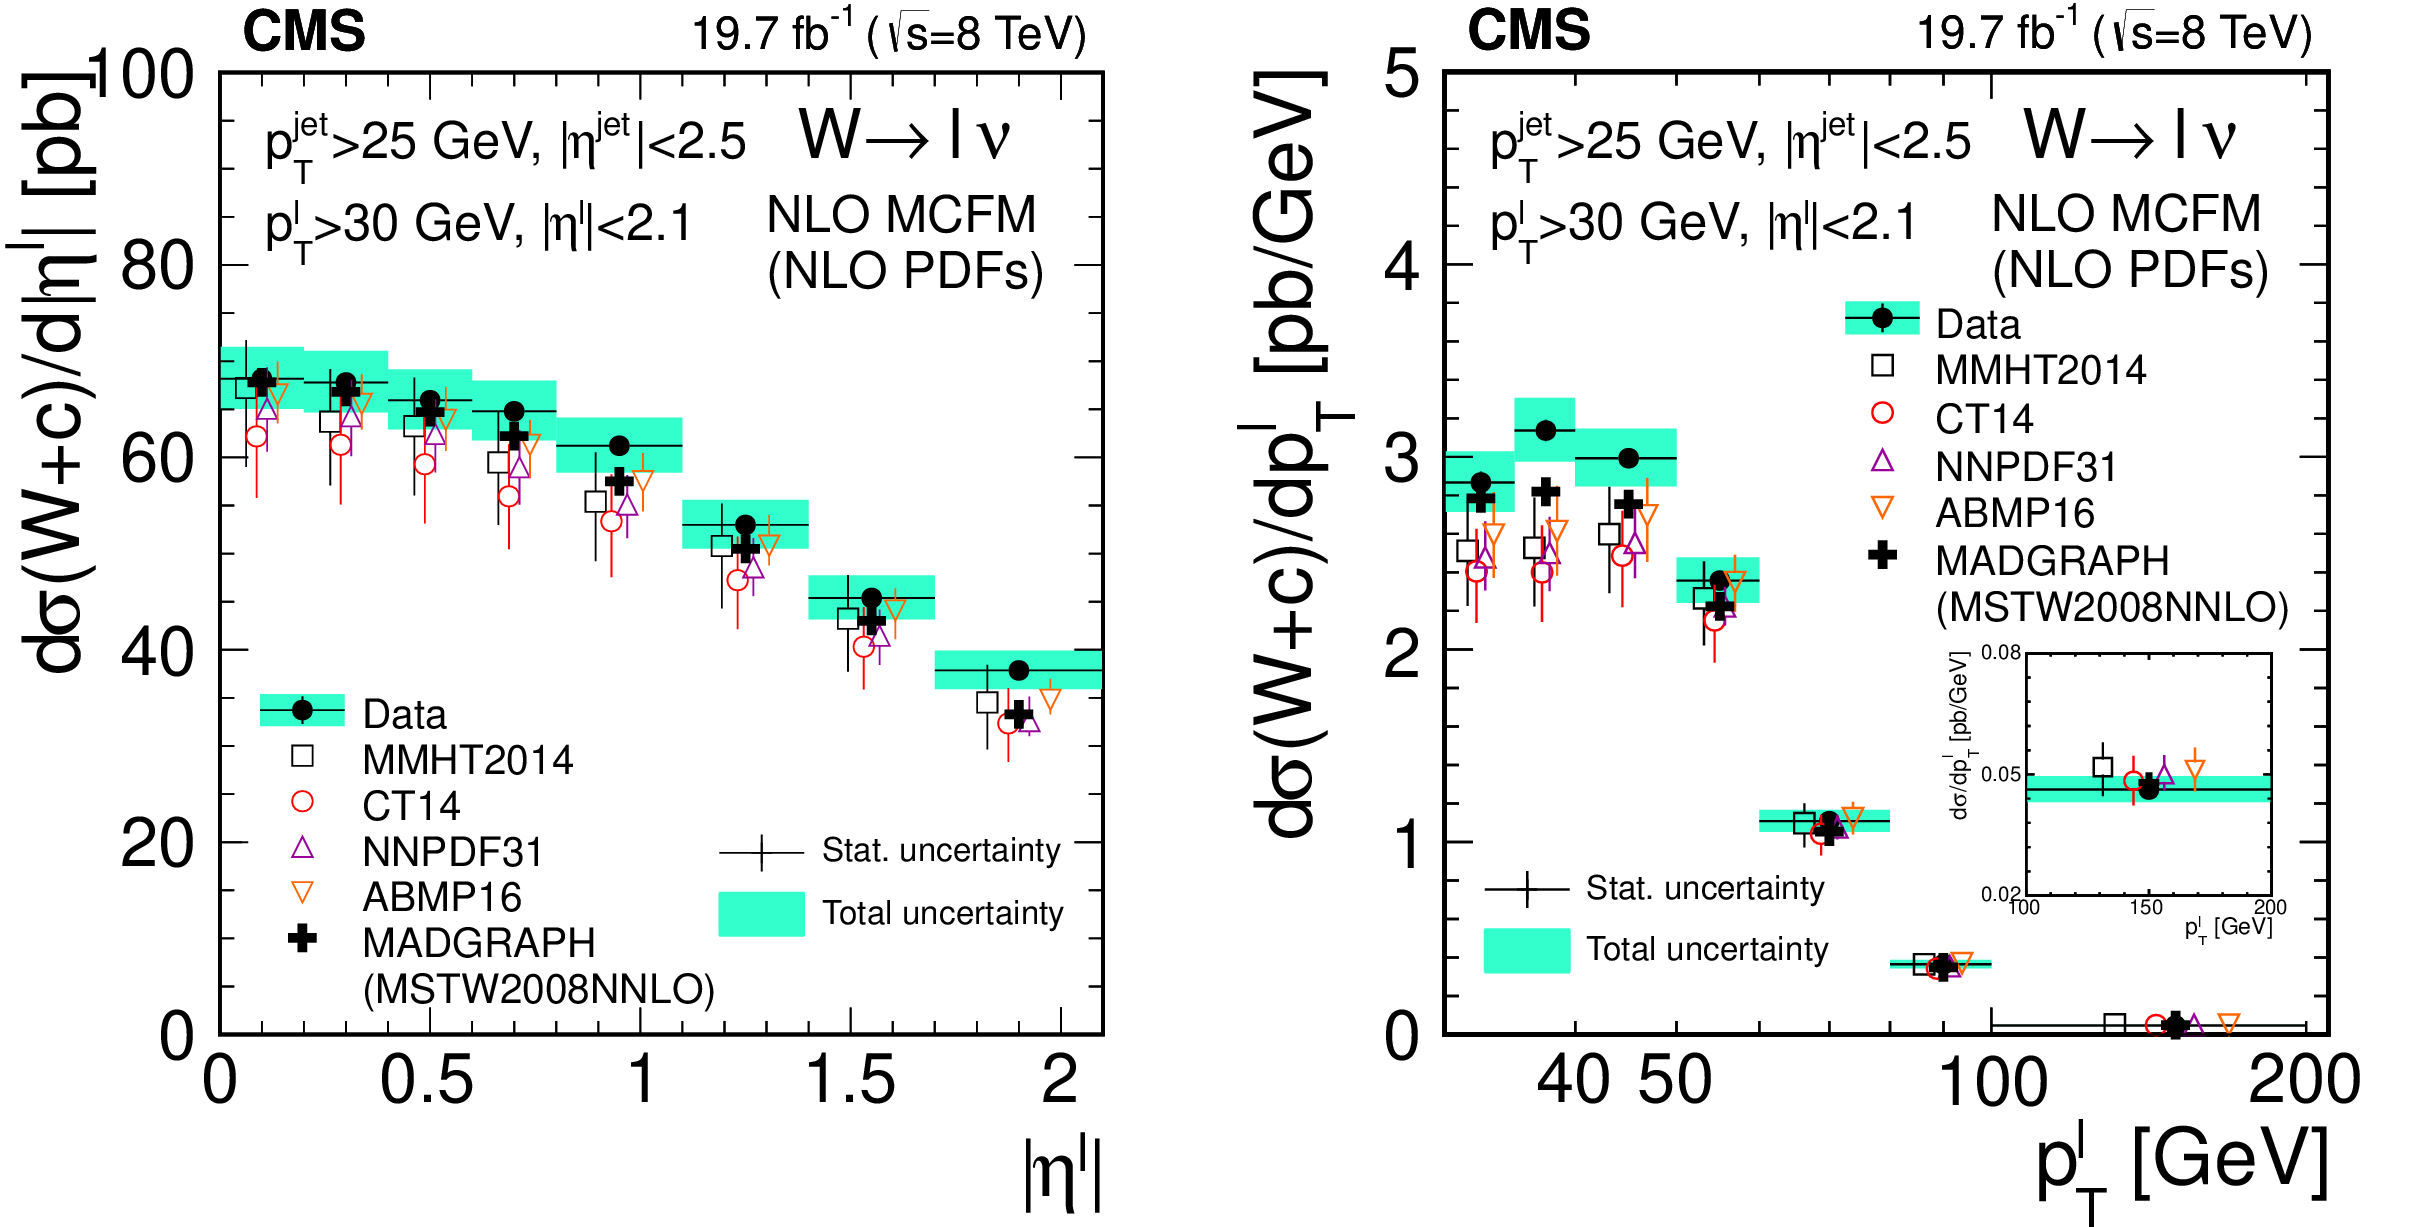
Figure 5:
Differential cross sections, $ \mathrm{d}\sigma(\mathrm{W}\,\mathrm{c})/\mathrm{d}|\eta^\ell| $ (left) and $ \mathrm{d}\sigma(\mathrm{W}\,\mathrm{c})/\mathrm{d}{p_{\mathrm{T}}^\ell} $ (right). The data points are the combination of the results with the four different samples: SL and SV samples in $ \mathrm{W} \to \mathrm{e}\nu $ and $ \mathrm{W} \to \mu\nu $ events. Theoretical predictions at NLO computed with MCFM and four different NLO PDF sets are also shown. Symbols showing the theoretical expectations are slightly displaced in the horizontal axis for better visibility. The error bars in the MCFM predictions include PDF, $ \alpha_\mathrm{S} $, and scale uncertainties. The inset in the right plot, $ \mathrm{d}\sigma(\mathrm{W}\,\mathrm{c})/\mathrm{d}{p_{\mathrm{T}}^\ell} $, zooms into the measurement-prediction comparison for the last bin, 100 $ < p_{\mathrm{T}}^{\ell} < $ 200 GeV. Predictions from MADGRAPH using the PDF set MSTW2008NNLO are also presented. |
png pdf |
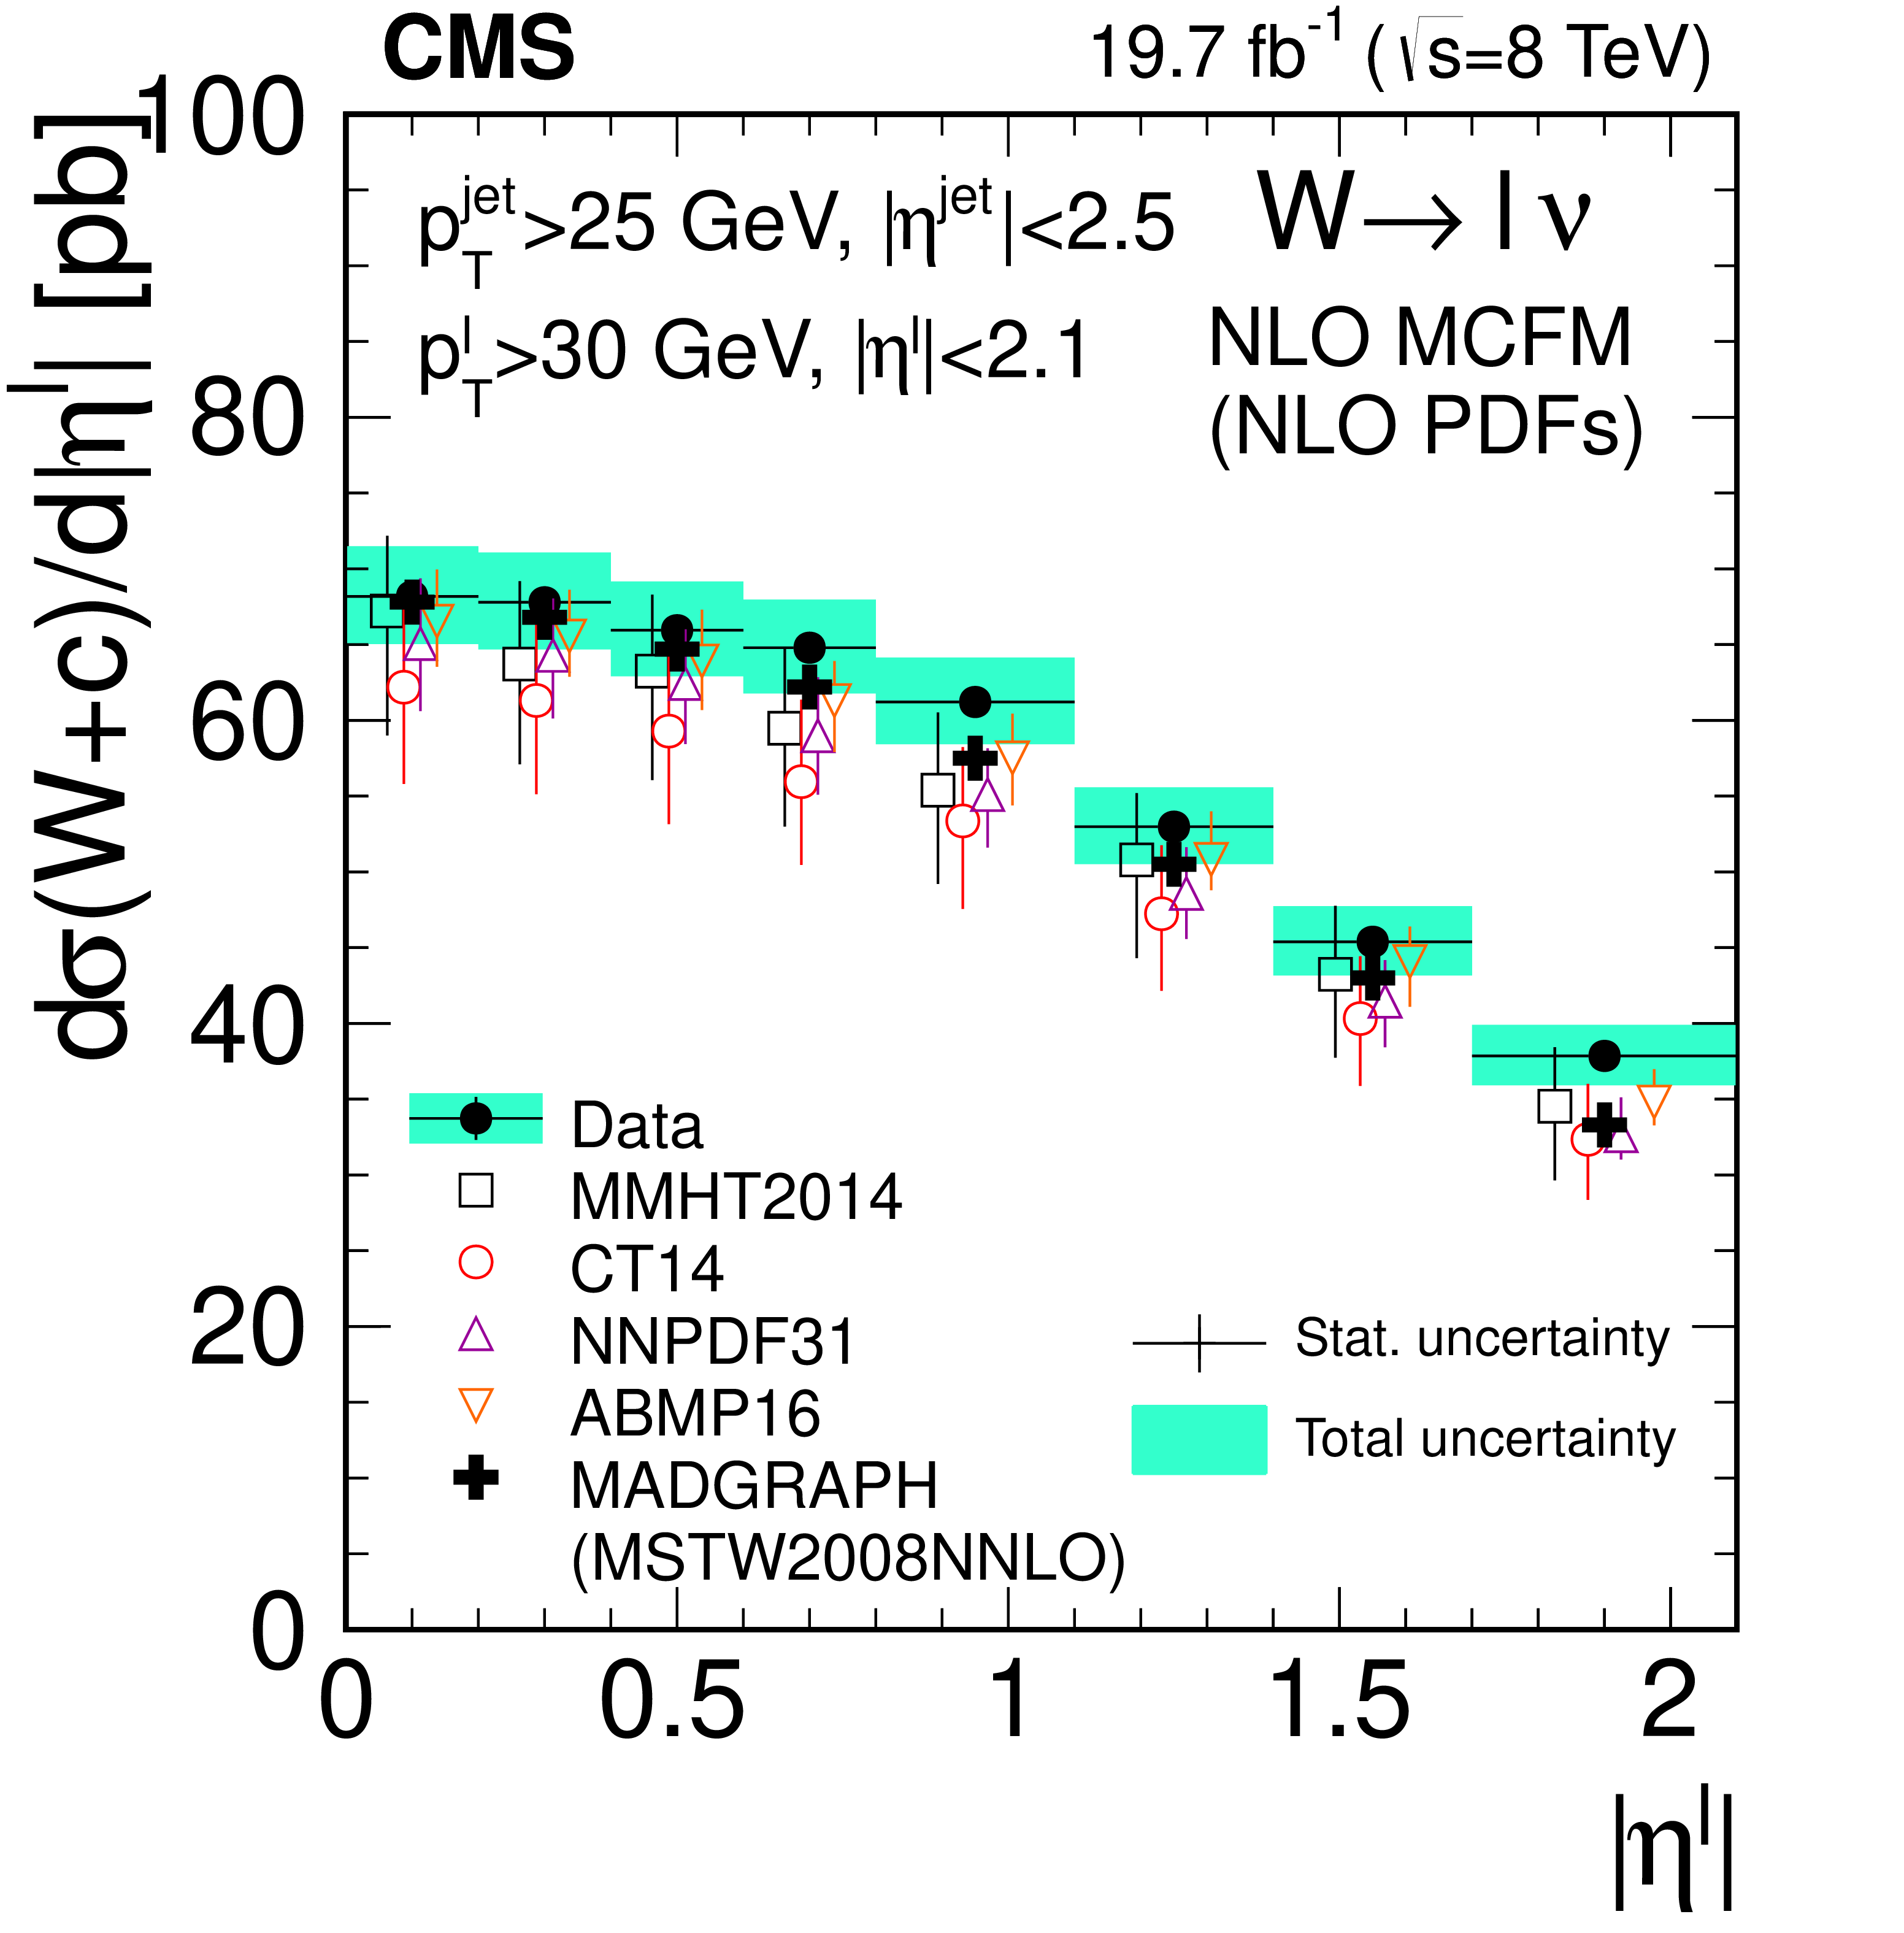
Figure 5-a:
Differential cross sections, $ \mathrm{d}\sigma(\mathrm{W}\,\mathrm{c})/\mathrm{d}|\eta^\ell| $ (left) and $ \mathrm{d}\sigma(\mathrm{W}\,\mathrm{c})/\mathrm{d}{p_{\mathrm{T}}^\ell} $ (right). The data points are the combination of the results with the four different samples: SL and SV samples in $ \mathrm{W} \to \mathrm{e}\nu $ and $ \mathrm{W} \to \mu\nu $ events. Theoretical predictions at NLO computed with MCFM and four different NLO PDF sets are also shown. Symbols showing the theoretical expectations are slightly displaced in the horizontal axis for better visibility. The error bars in the MCFM predictions include PDF, $ \alpha_\mathrm{S} $, and scale uncertainties. The inset in the right plot, $ \mathrm{d}\sigma(\mathrm{W}\,\mathrm{c})/\mathrm{d}{p_{\mathrm{T}}^\ell} $, zooms into the measurement-prediction comparison for the last bin, 100 $ < p_{\mathrm{T}}^{\ell} < $ 200 GeV. Predictions from MADGRAPH using the PDF set MSTW2008NNLO are also presented. |
png pdf |
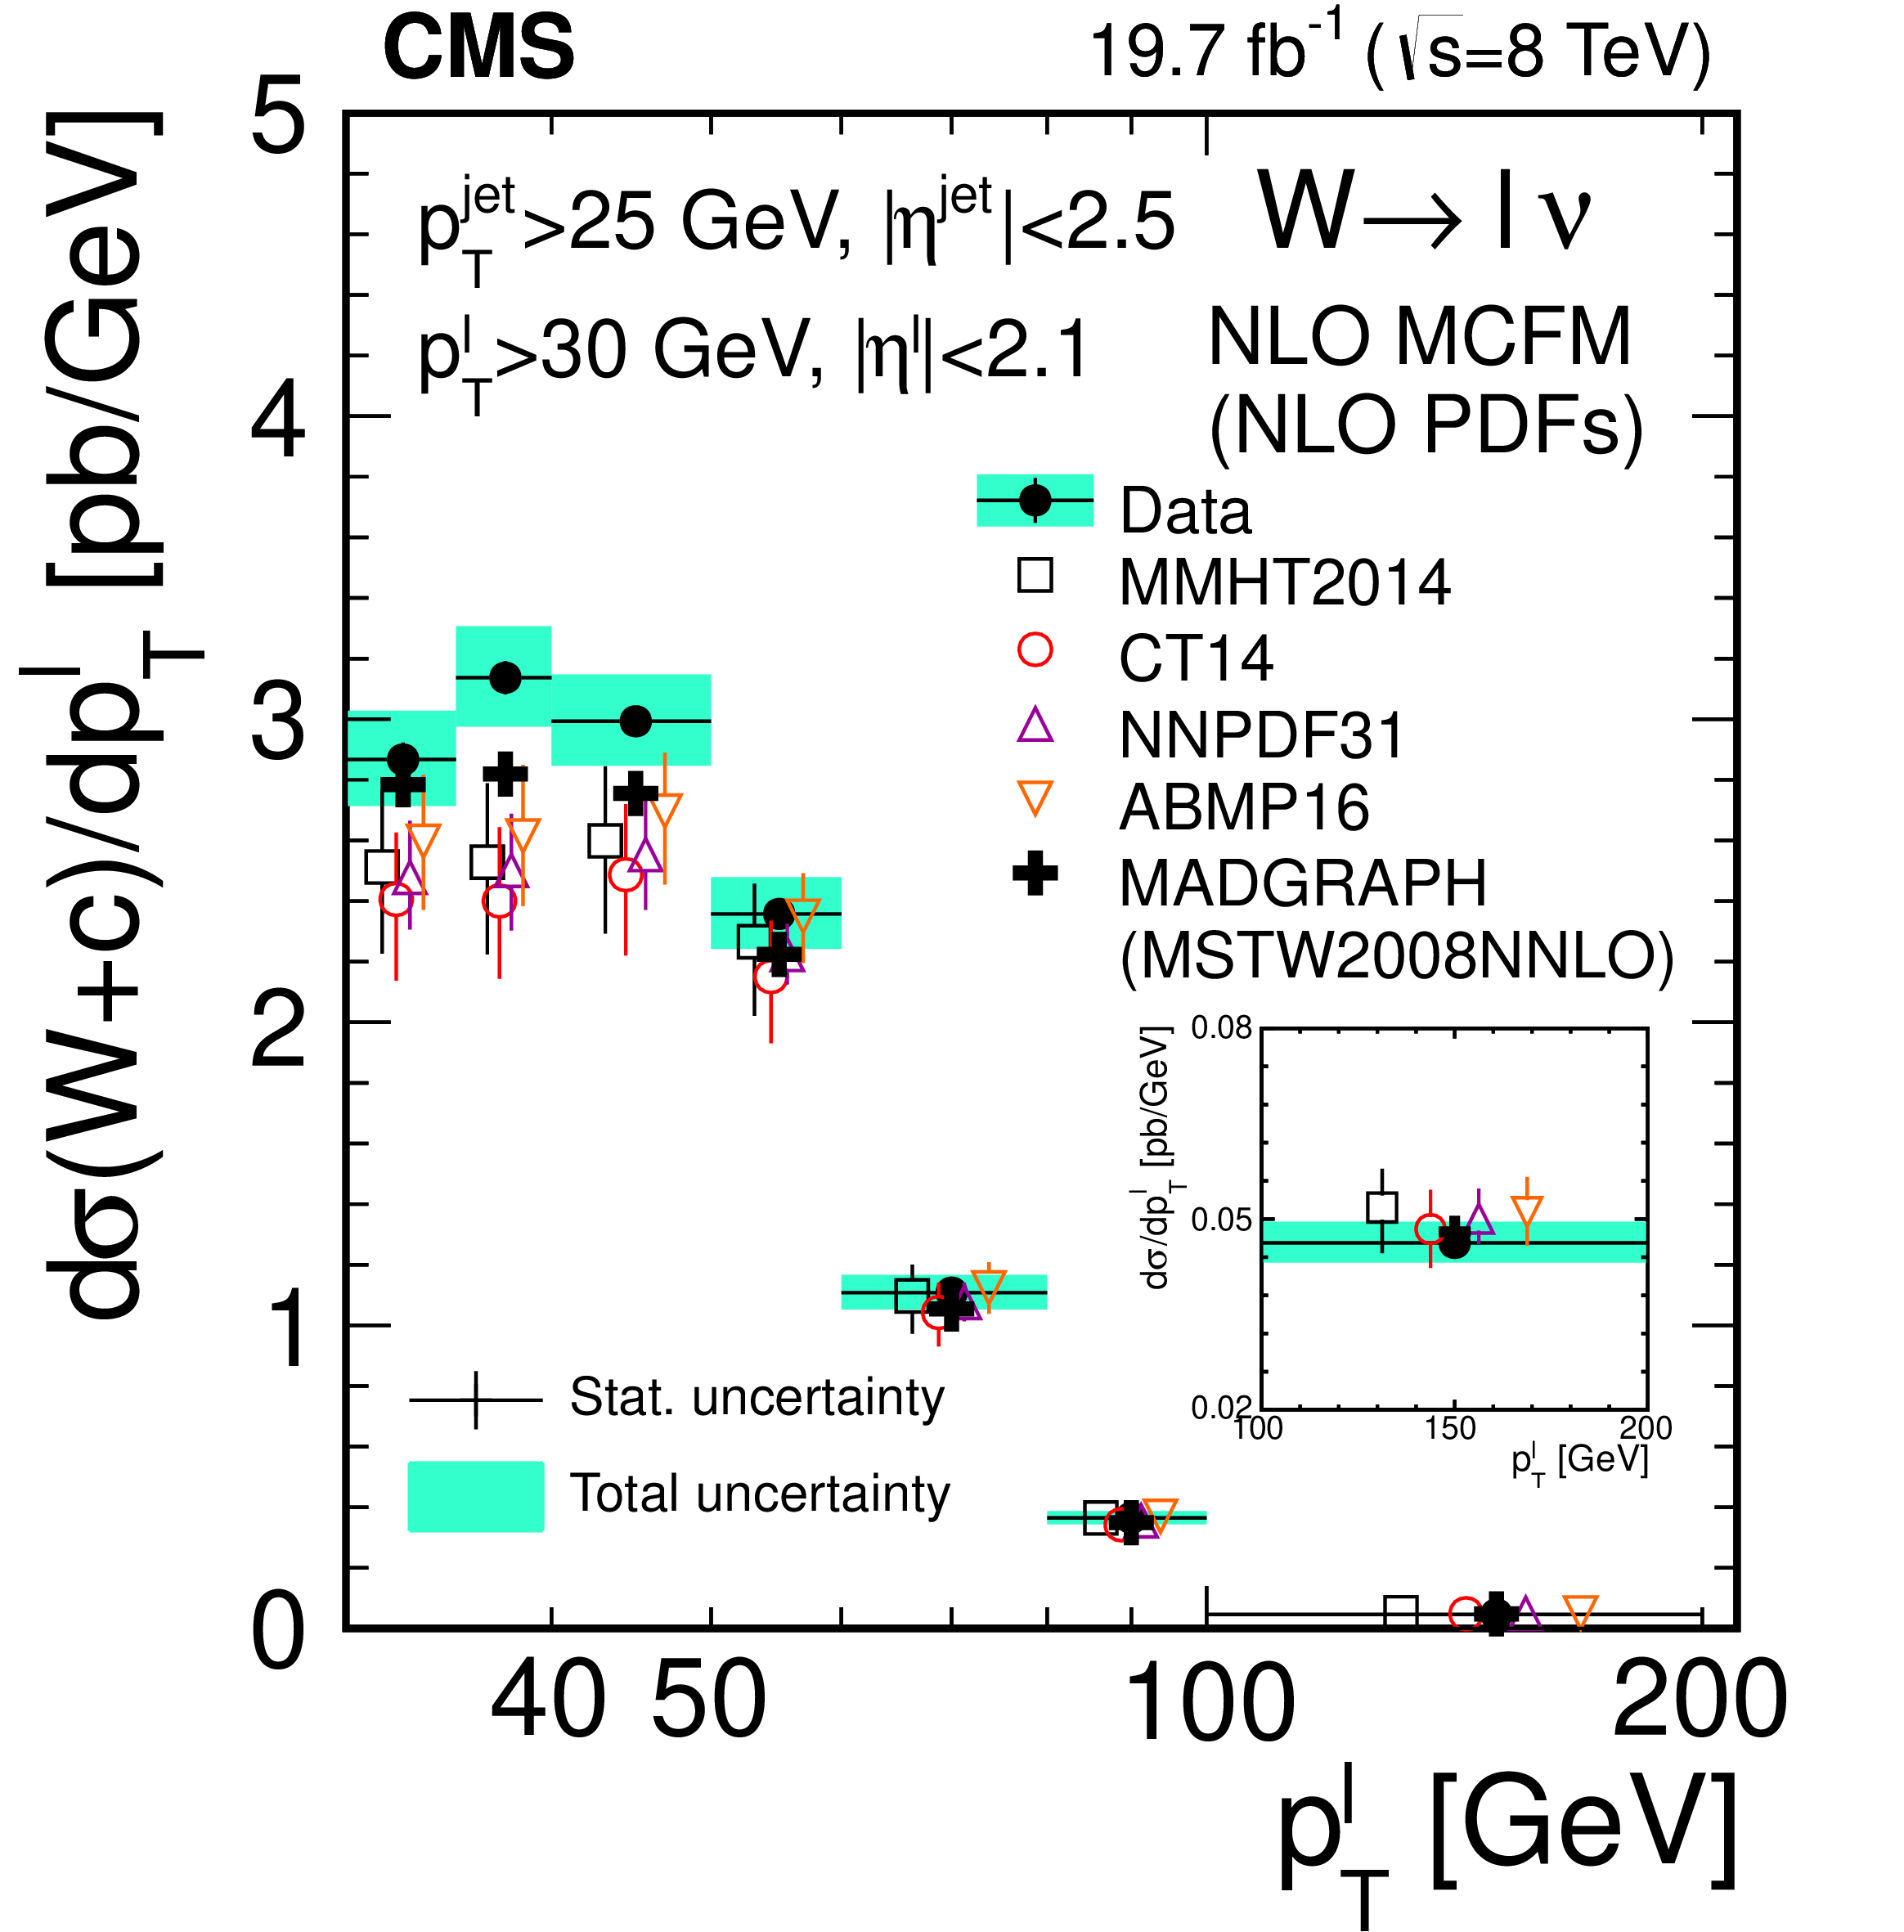
Figure 5-b:
Differential cross sections, $ \mathrm{d}\sigma(\mathrm{W}\,\mathrm{c})/\mathrm{d}|\eta^\ell| $ (left) and $ \mathrm{d}\sigma(\mathrm{W}\,\mathrm{c})/\mathrm{d}{p_{\mathrm{T}}^\ell} $ (right). The data points are the combination of the results with the four different samples: SL and SV samples in $ \mathrm{W} \to \mathrm{e}\nu $ and $ \mathrm{W} \to \mu\nu $ events. Theoretical predictions at NLO computed with MCFM and four different NLO PDF sets are also shown. Symbols showing the theoretical expectations are slightly displaced in the horizontal axis for better visibility. The error bars in the MCFM predictions include PDF, $ \alpha_\mathrm{S} $, and scale uncertainties. The inset in the right plot, $ \mathrm{d}\sigma(\mathrm{W}\,\mathrm{c})/\mathrm{d}{p_{\mathrm{T}}^\ell} $, zooms into the measurement-prediction comparison for the last bin, 100 $ < p_{\mathrm{T}}^{\ell} < $ 200 GeV. Predictions from MADGRAPH using the PDF set MSTW2008NNLO are also presented. |
png pdf |
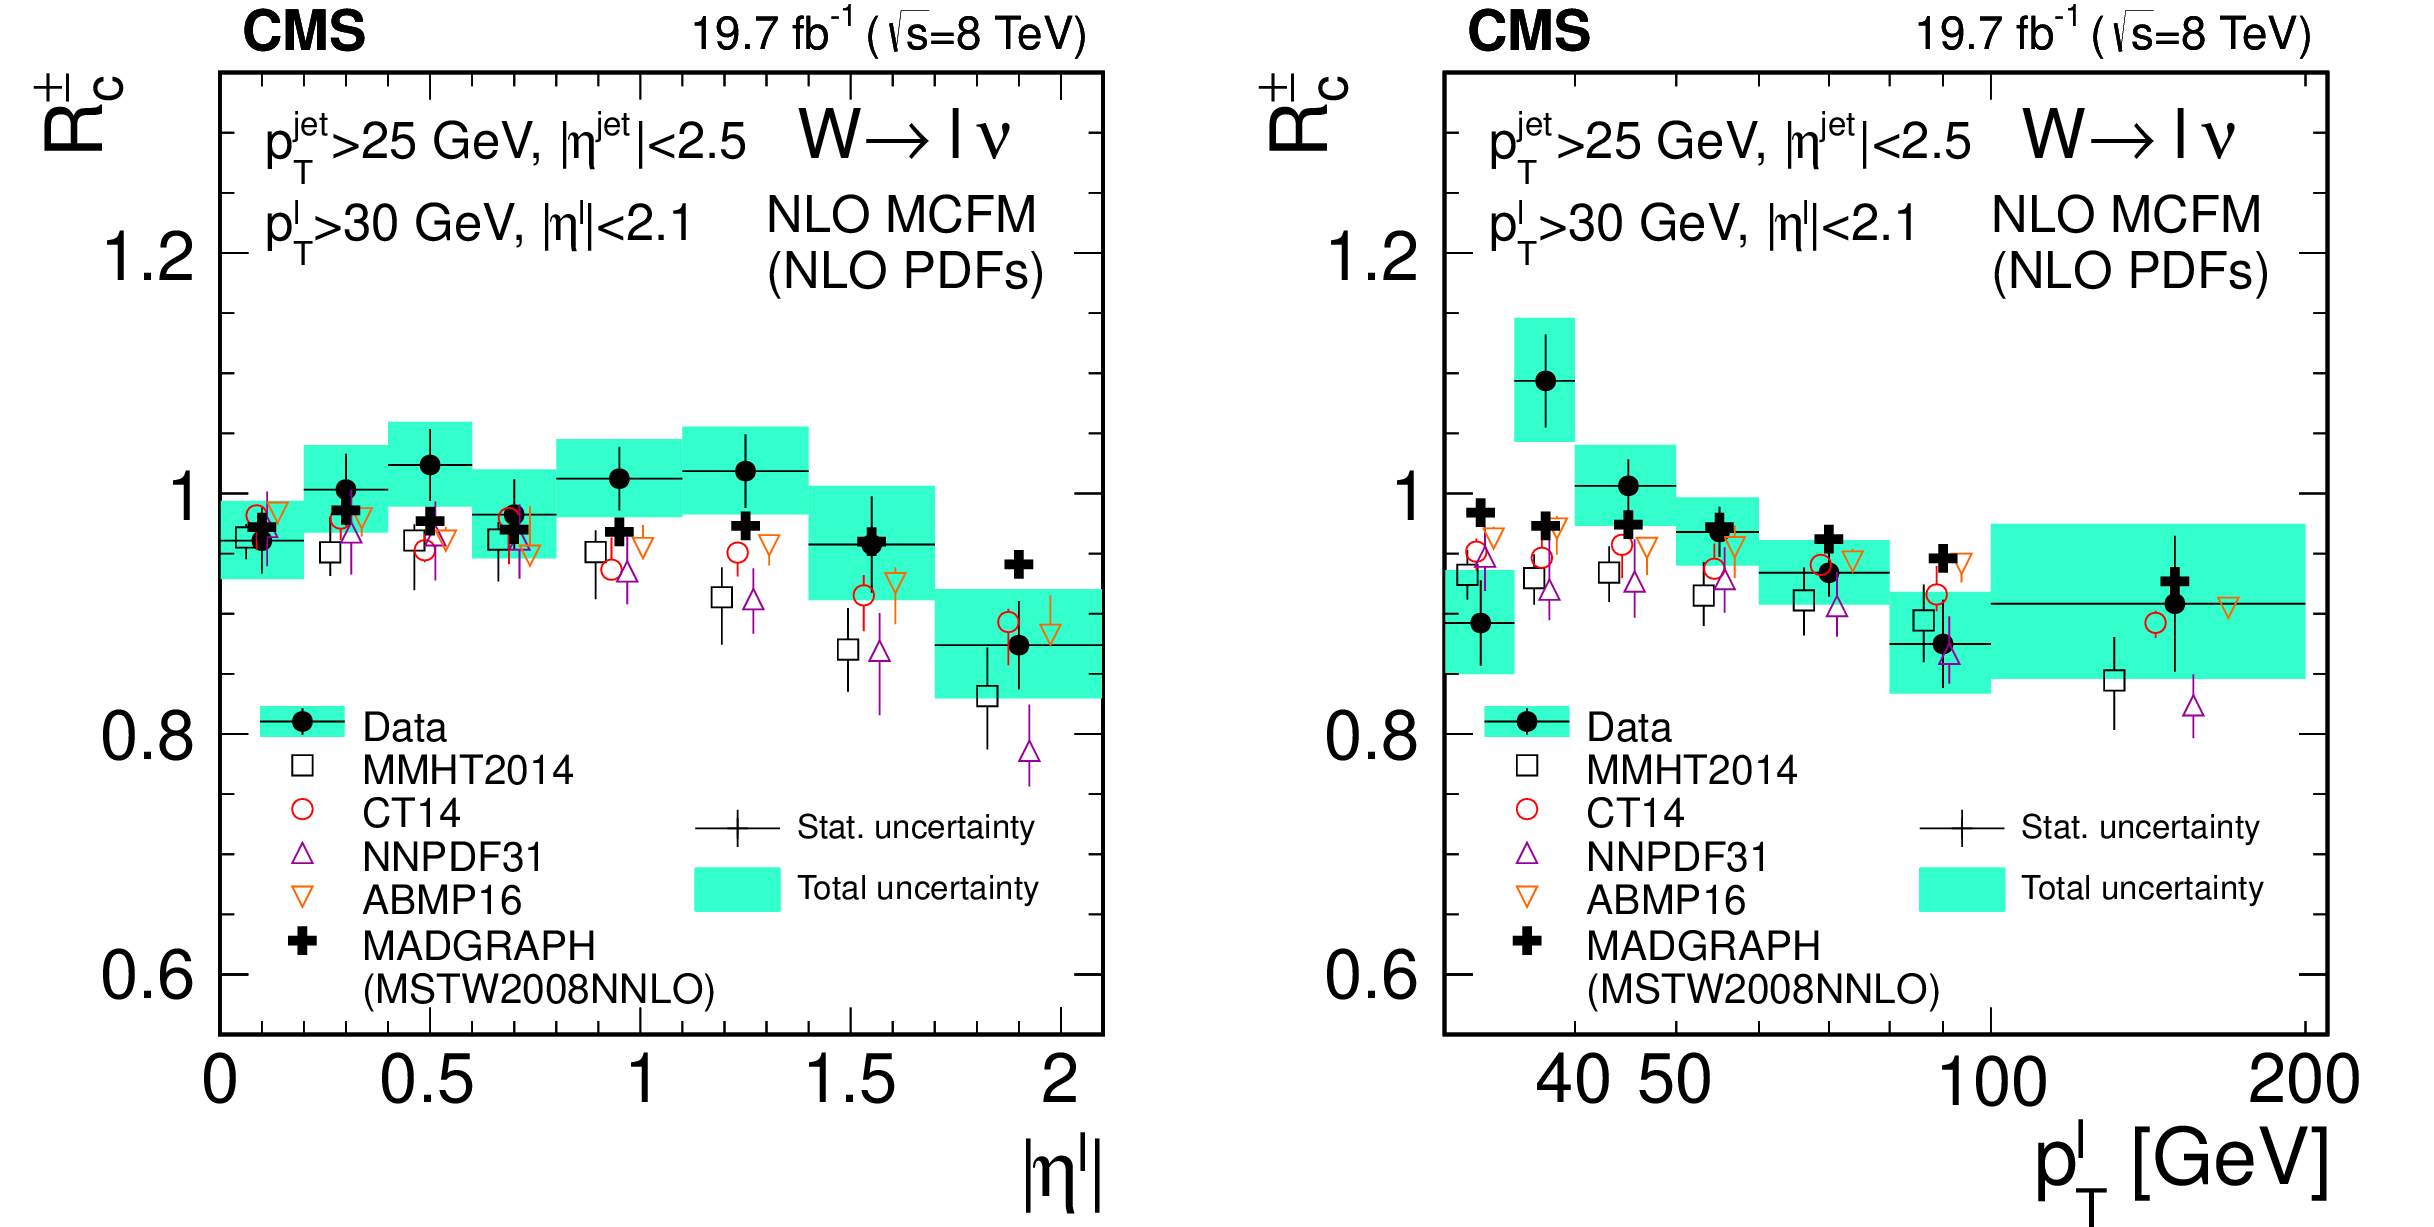
Figure 6:
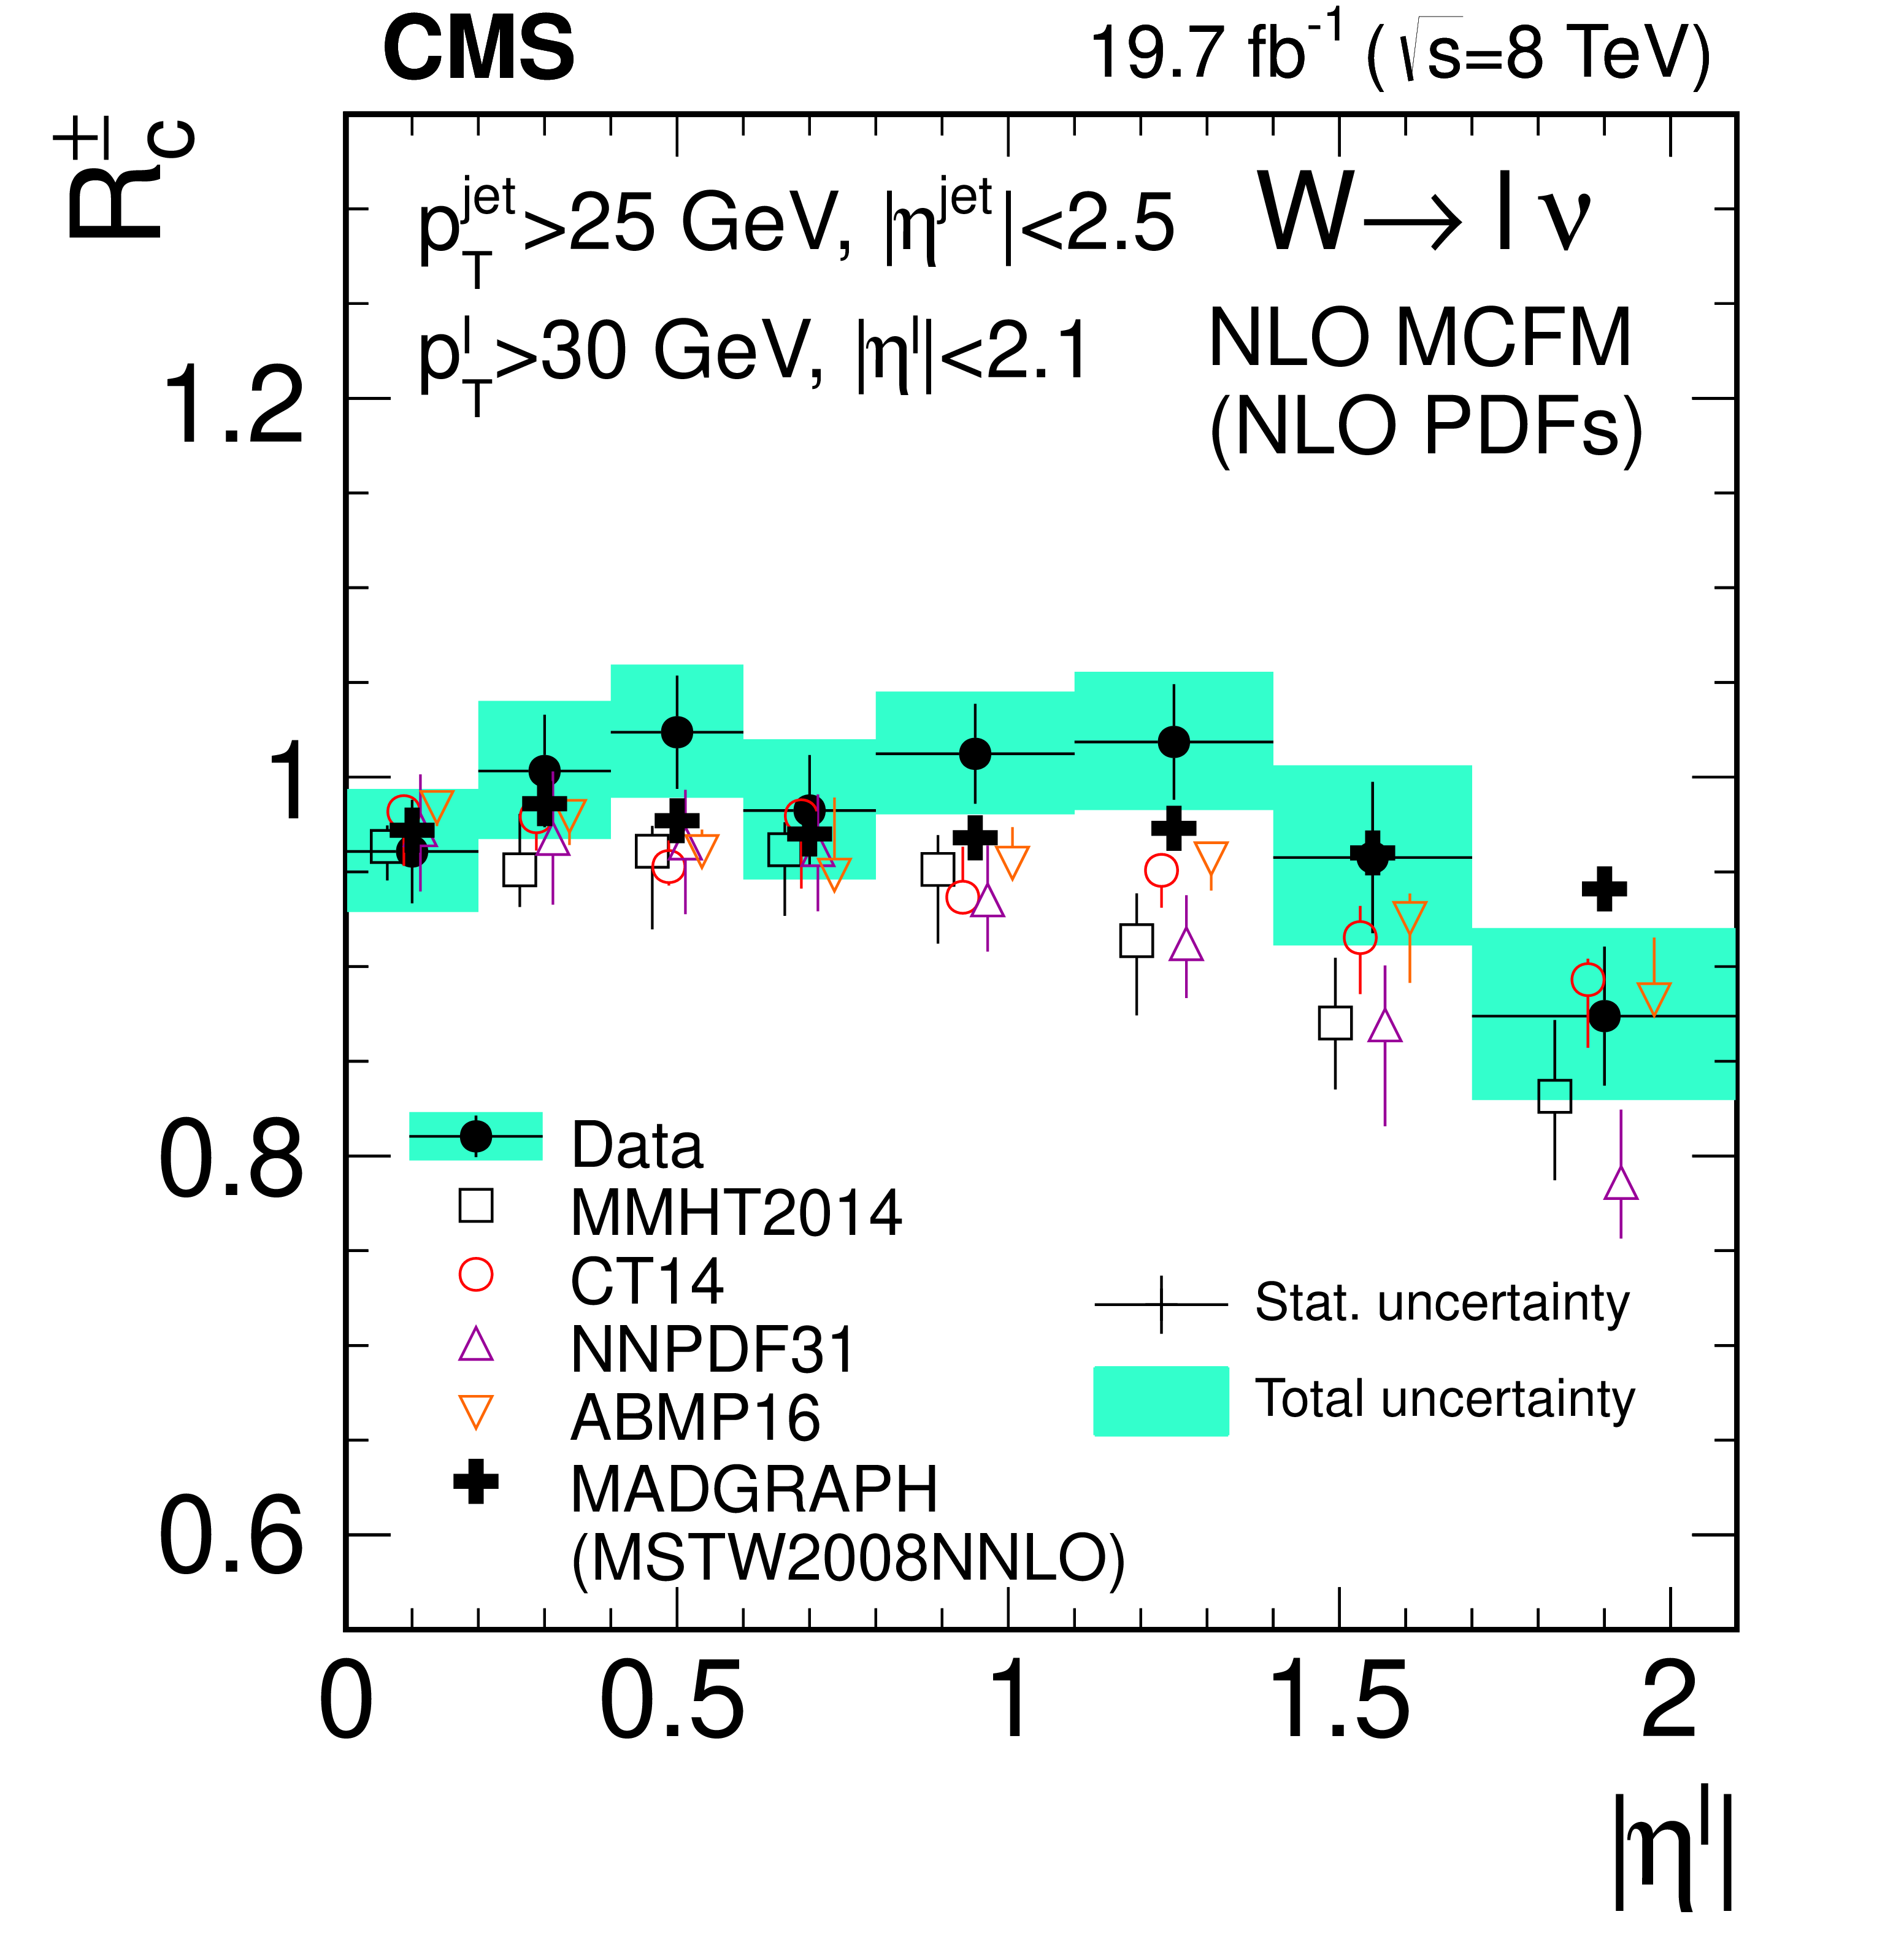
Cross section ratio, $ R_{\mathrm{c}}^{\pm} $, as functions of $ |\eta^{\ell}| $ (left) and $ p_{\mathrm{T}}^{\ell} $ (right). The data points are the combination of the results from the SL and SV samples in $ \mathrm{W} \to \mathrm{e}\nu $ and $ \mathrm{W} \to \mu\nu $ events. Theoretical predictions at NLO computed with MCFM and four different NLO PDF sets are also shown. Symbols showing the theoretical expectations are slightly displaced in the horizontal axis for better visibility. The error bars in the MCFM predictions include PDF, $ \alpha_\mathrm{S} $, and scale uncertainties. Predictions from MADGRAPH using the PDF set MSTW2008NNLO are also presented. |
png pdf |
Figure 6-a:
Cross section ratio, $ R_{\mathrm{c}}^{\pm} $, as functions of $ |\eta^{\ell}| $ (left) and $ p_{\mathrm{T}}^{\ell} $ (right). The data points are the combination of the results from the SL and SV samples in $ \mathrm{W} \to \mathrm{e}\nu $ and $ \mathrm{W} \to \mu\nu $ events. Theoretical predictions at NLO computed with MCFM and four different NLO PDF sets are also shown. Symbols showing the theoretical expectations are slightly displaced in the horizontal axis for better visibility. The error bars in the MCFM predictions include PDF, $ \alpha_\mathrm{S} $, and scale uncertainties. Predictions from MADGRAPH using the PDF set MSTW2008NNLO are also presented. |

png pdf |
Figure 6-b:
Cross section ratio, $ R_{\mathrm{c}}^{\pm} $, as functions of $ |\eta^{\ell}| $ (left) and $ p_{\mathrm{T}}^{\ell} $ (right). The data points are the combination of the results from the SL and SV samples in $ \mathrm{W} \to \mathrm{e}\nu $ and $ \mathrm{W} \to \mu\nu $ events. Theoretical predictions at NLO computed with MCFM and four different NLO PDF sets are also shown. Symbols showing the theoretical expectations are slightly displaced in the horizontal axis for better visibility. The error bars in the MCFM predictions include PDF, $ \alpha_\mathrm{S} $, and scale uncertainties. Predictions from MADGRAPH using the PDF set MSTW2008NNLO are also presented. |
png pdf |
Figure 7:
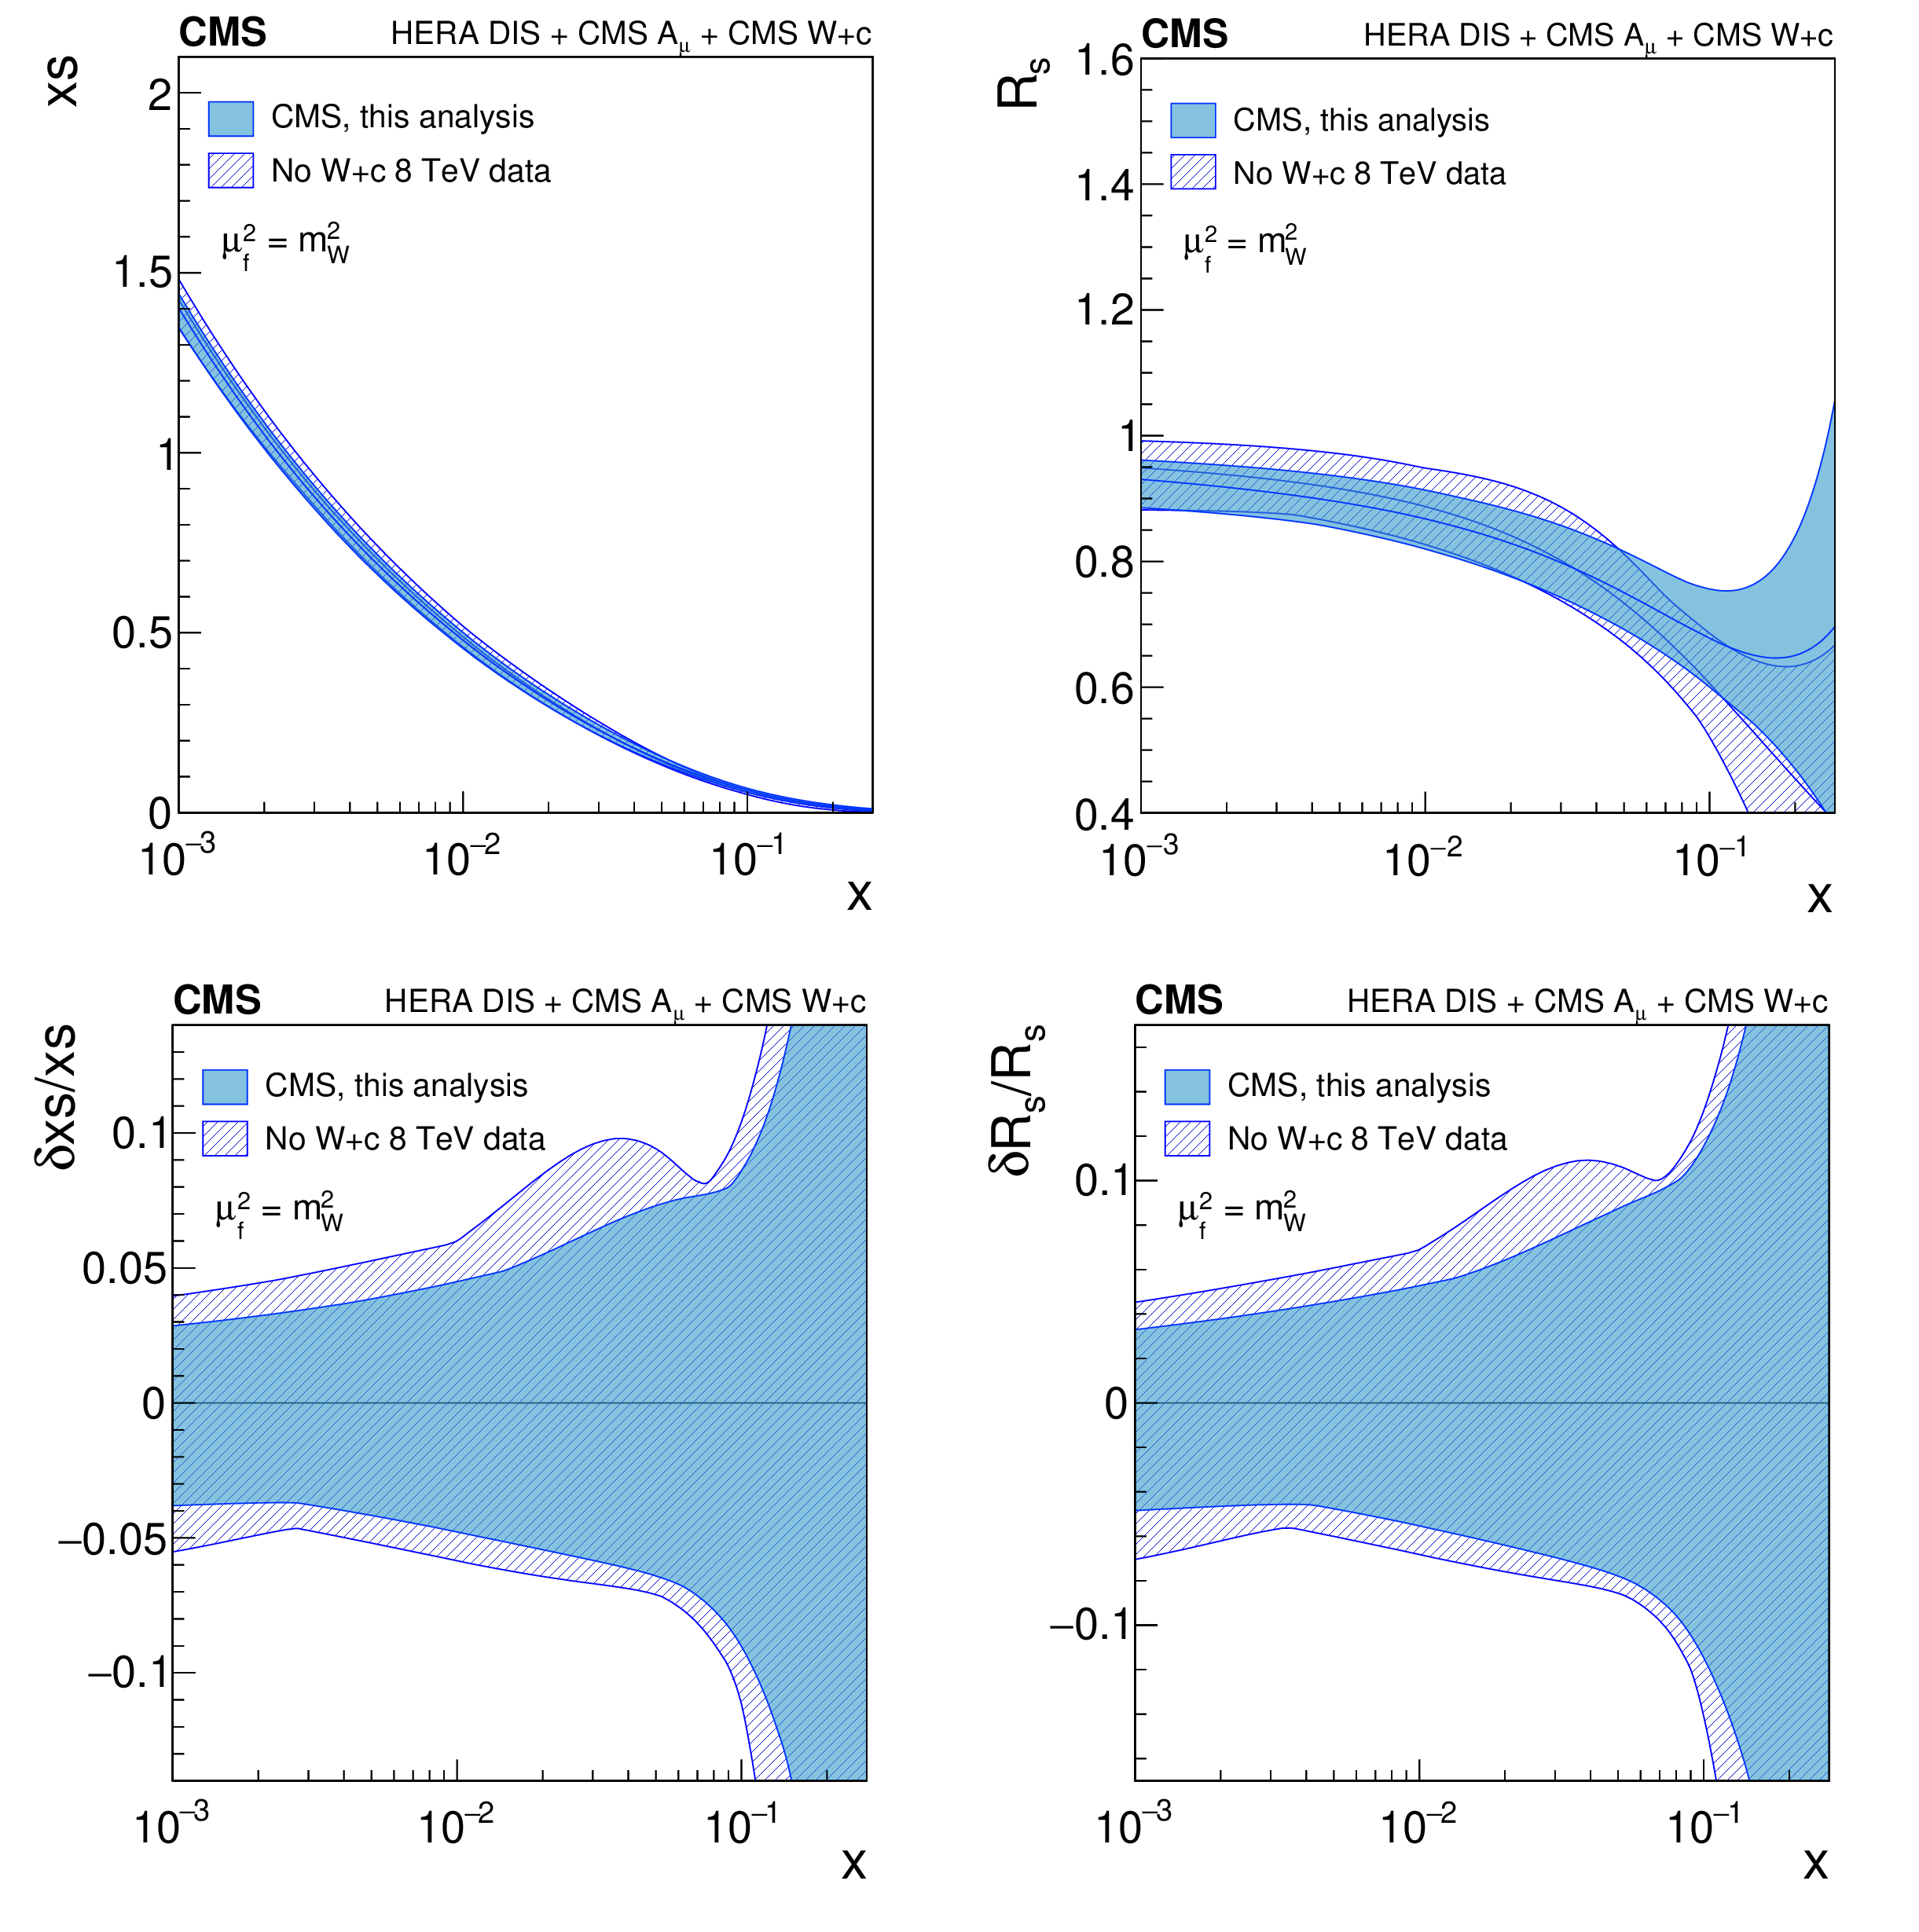
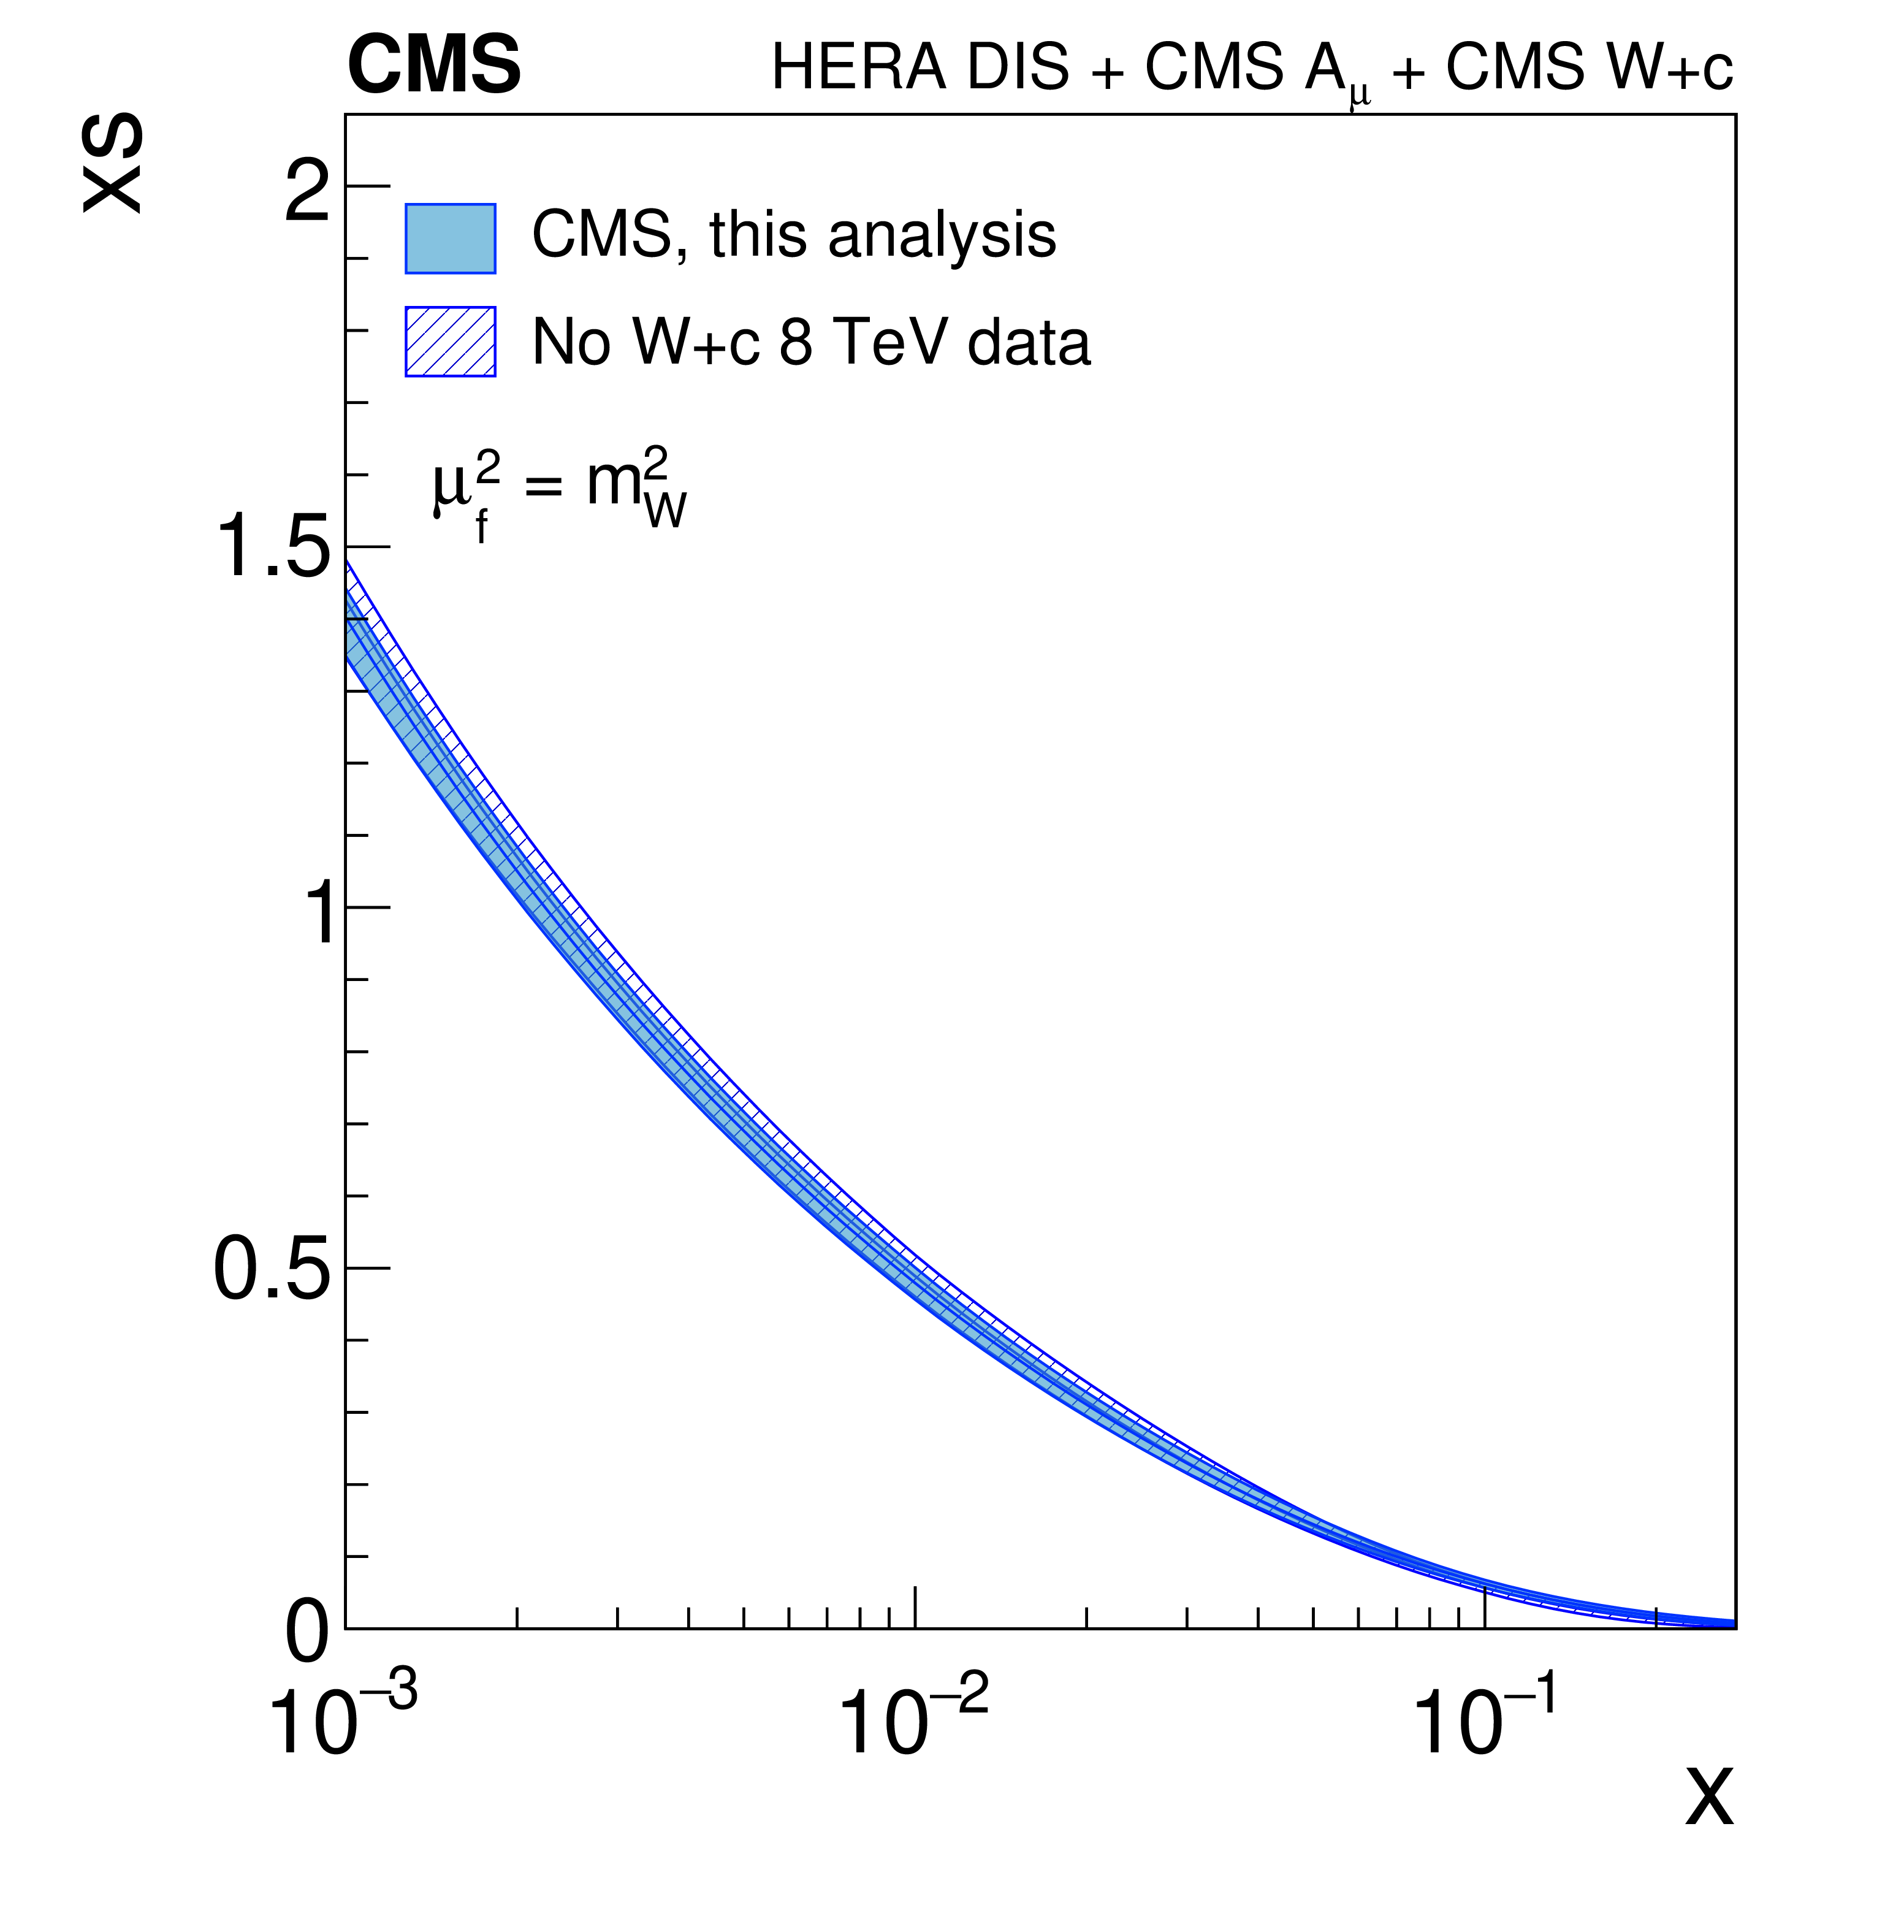
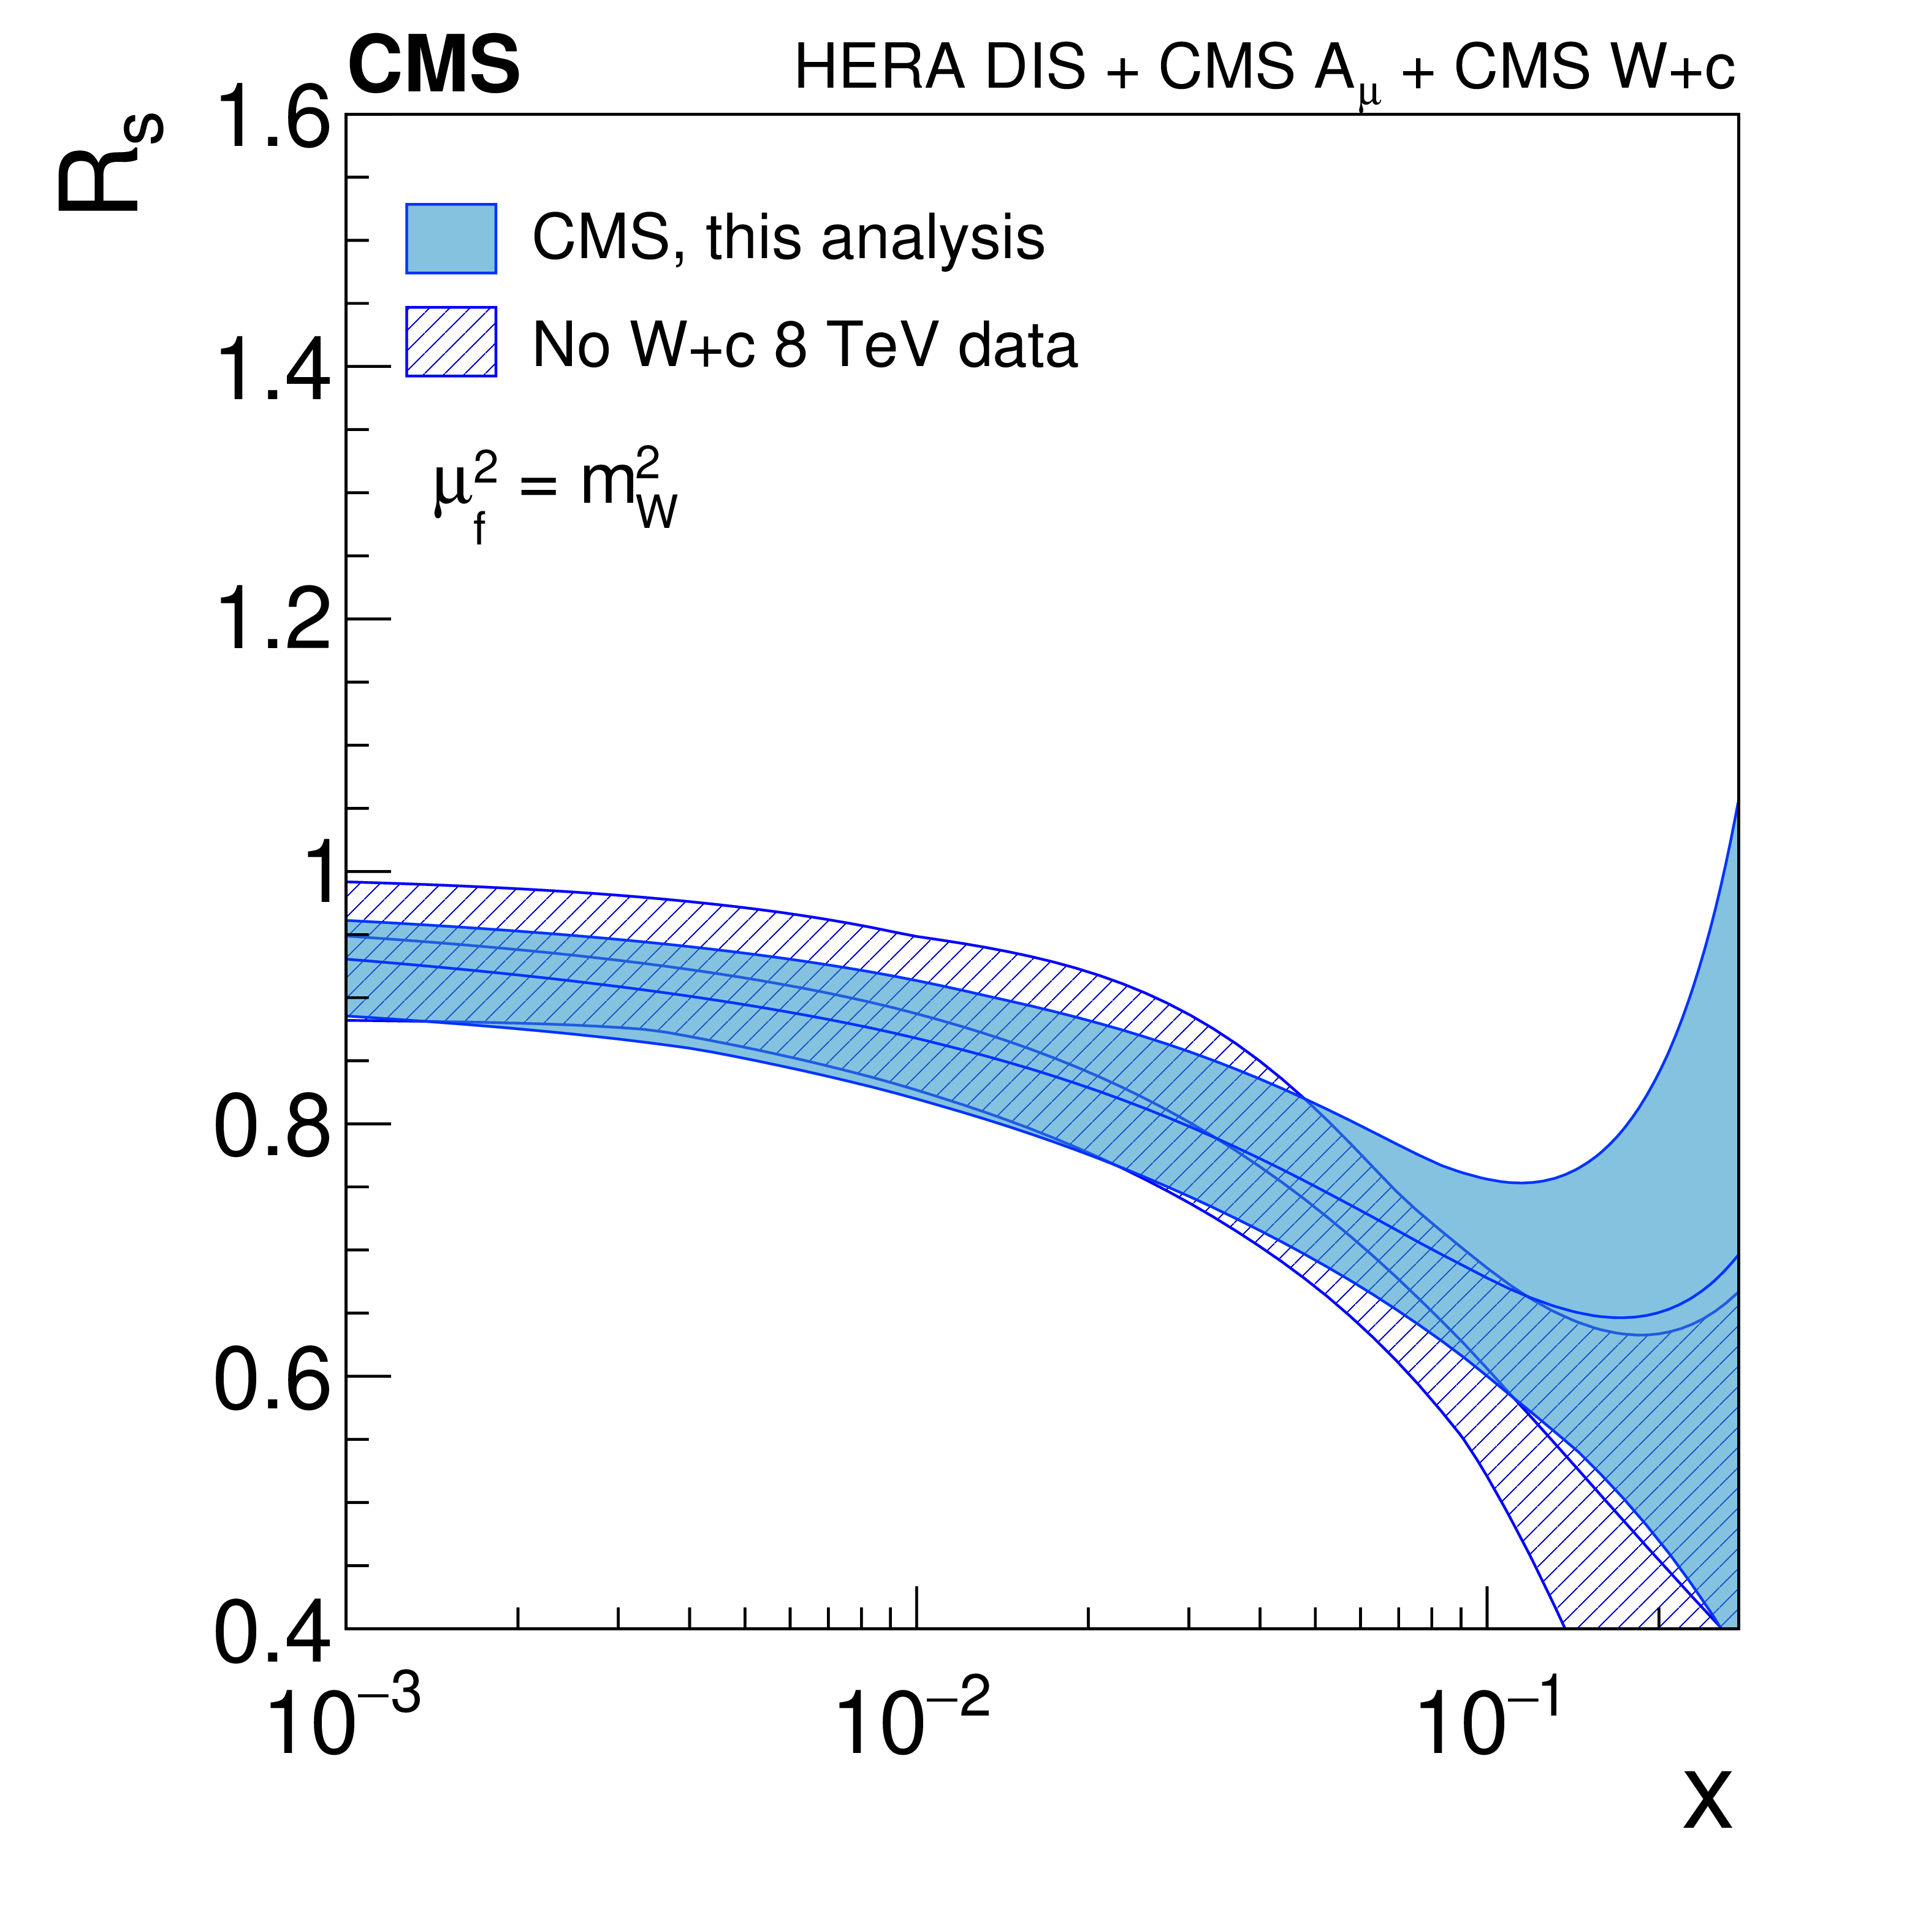
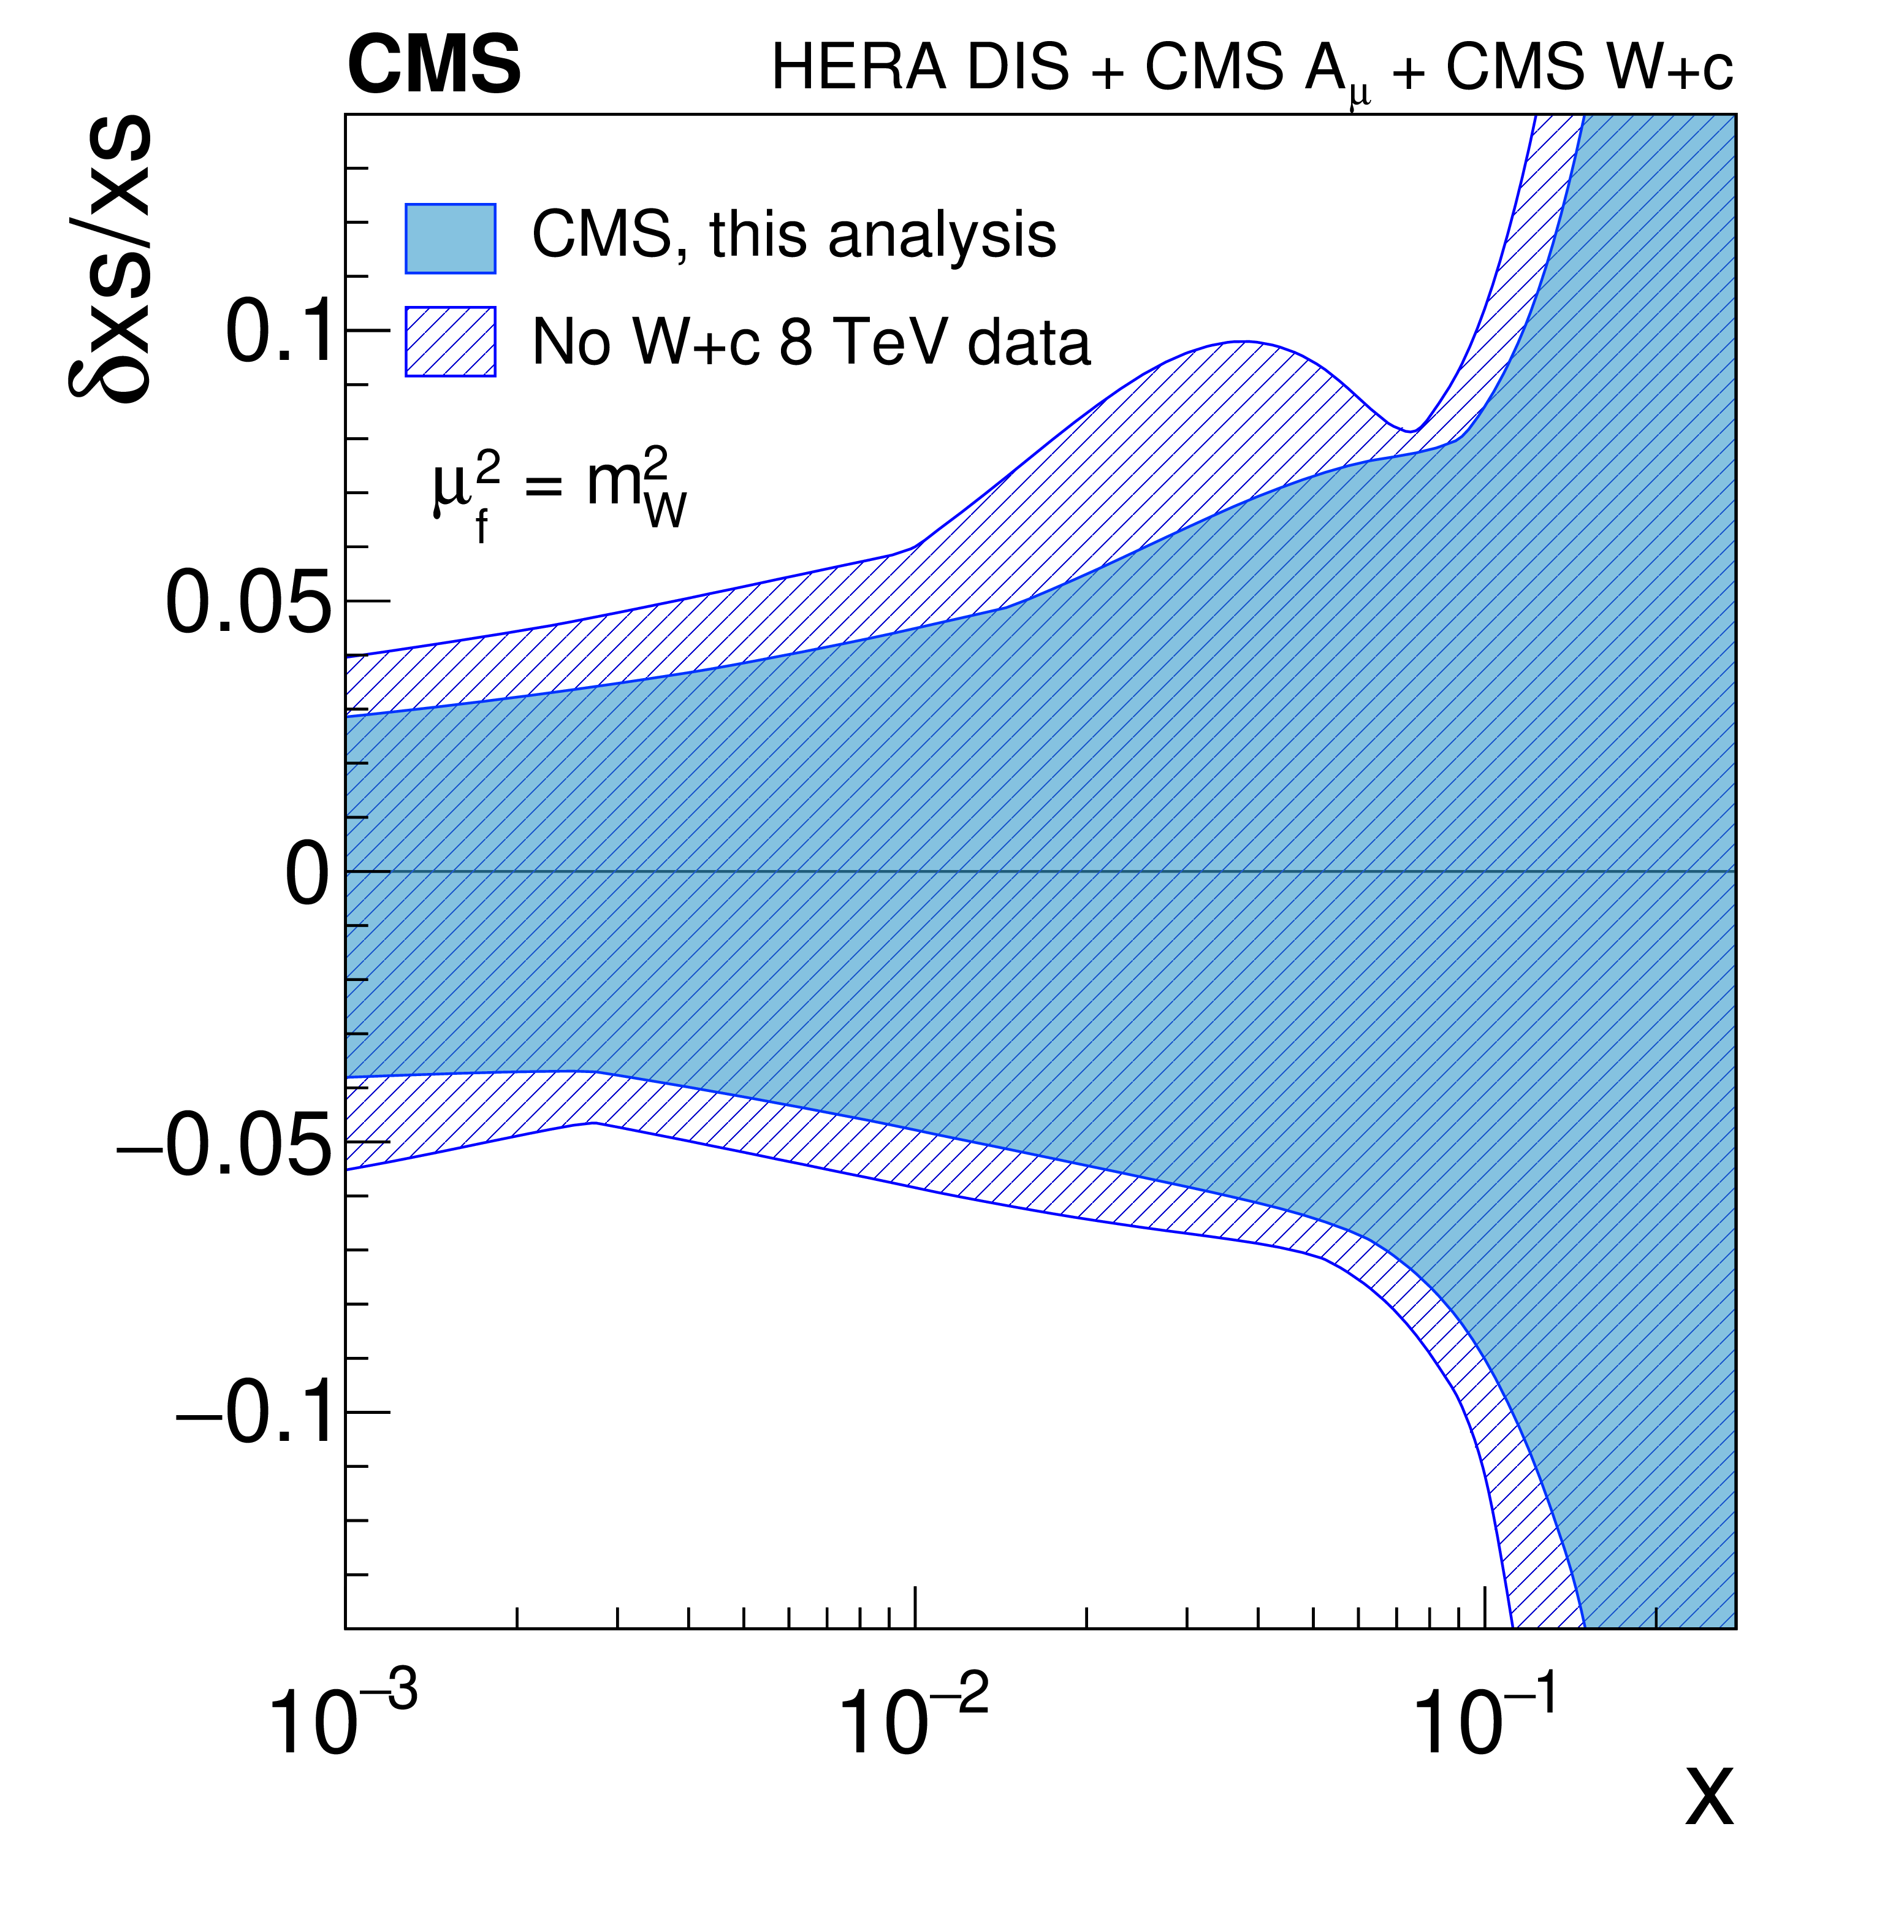
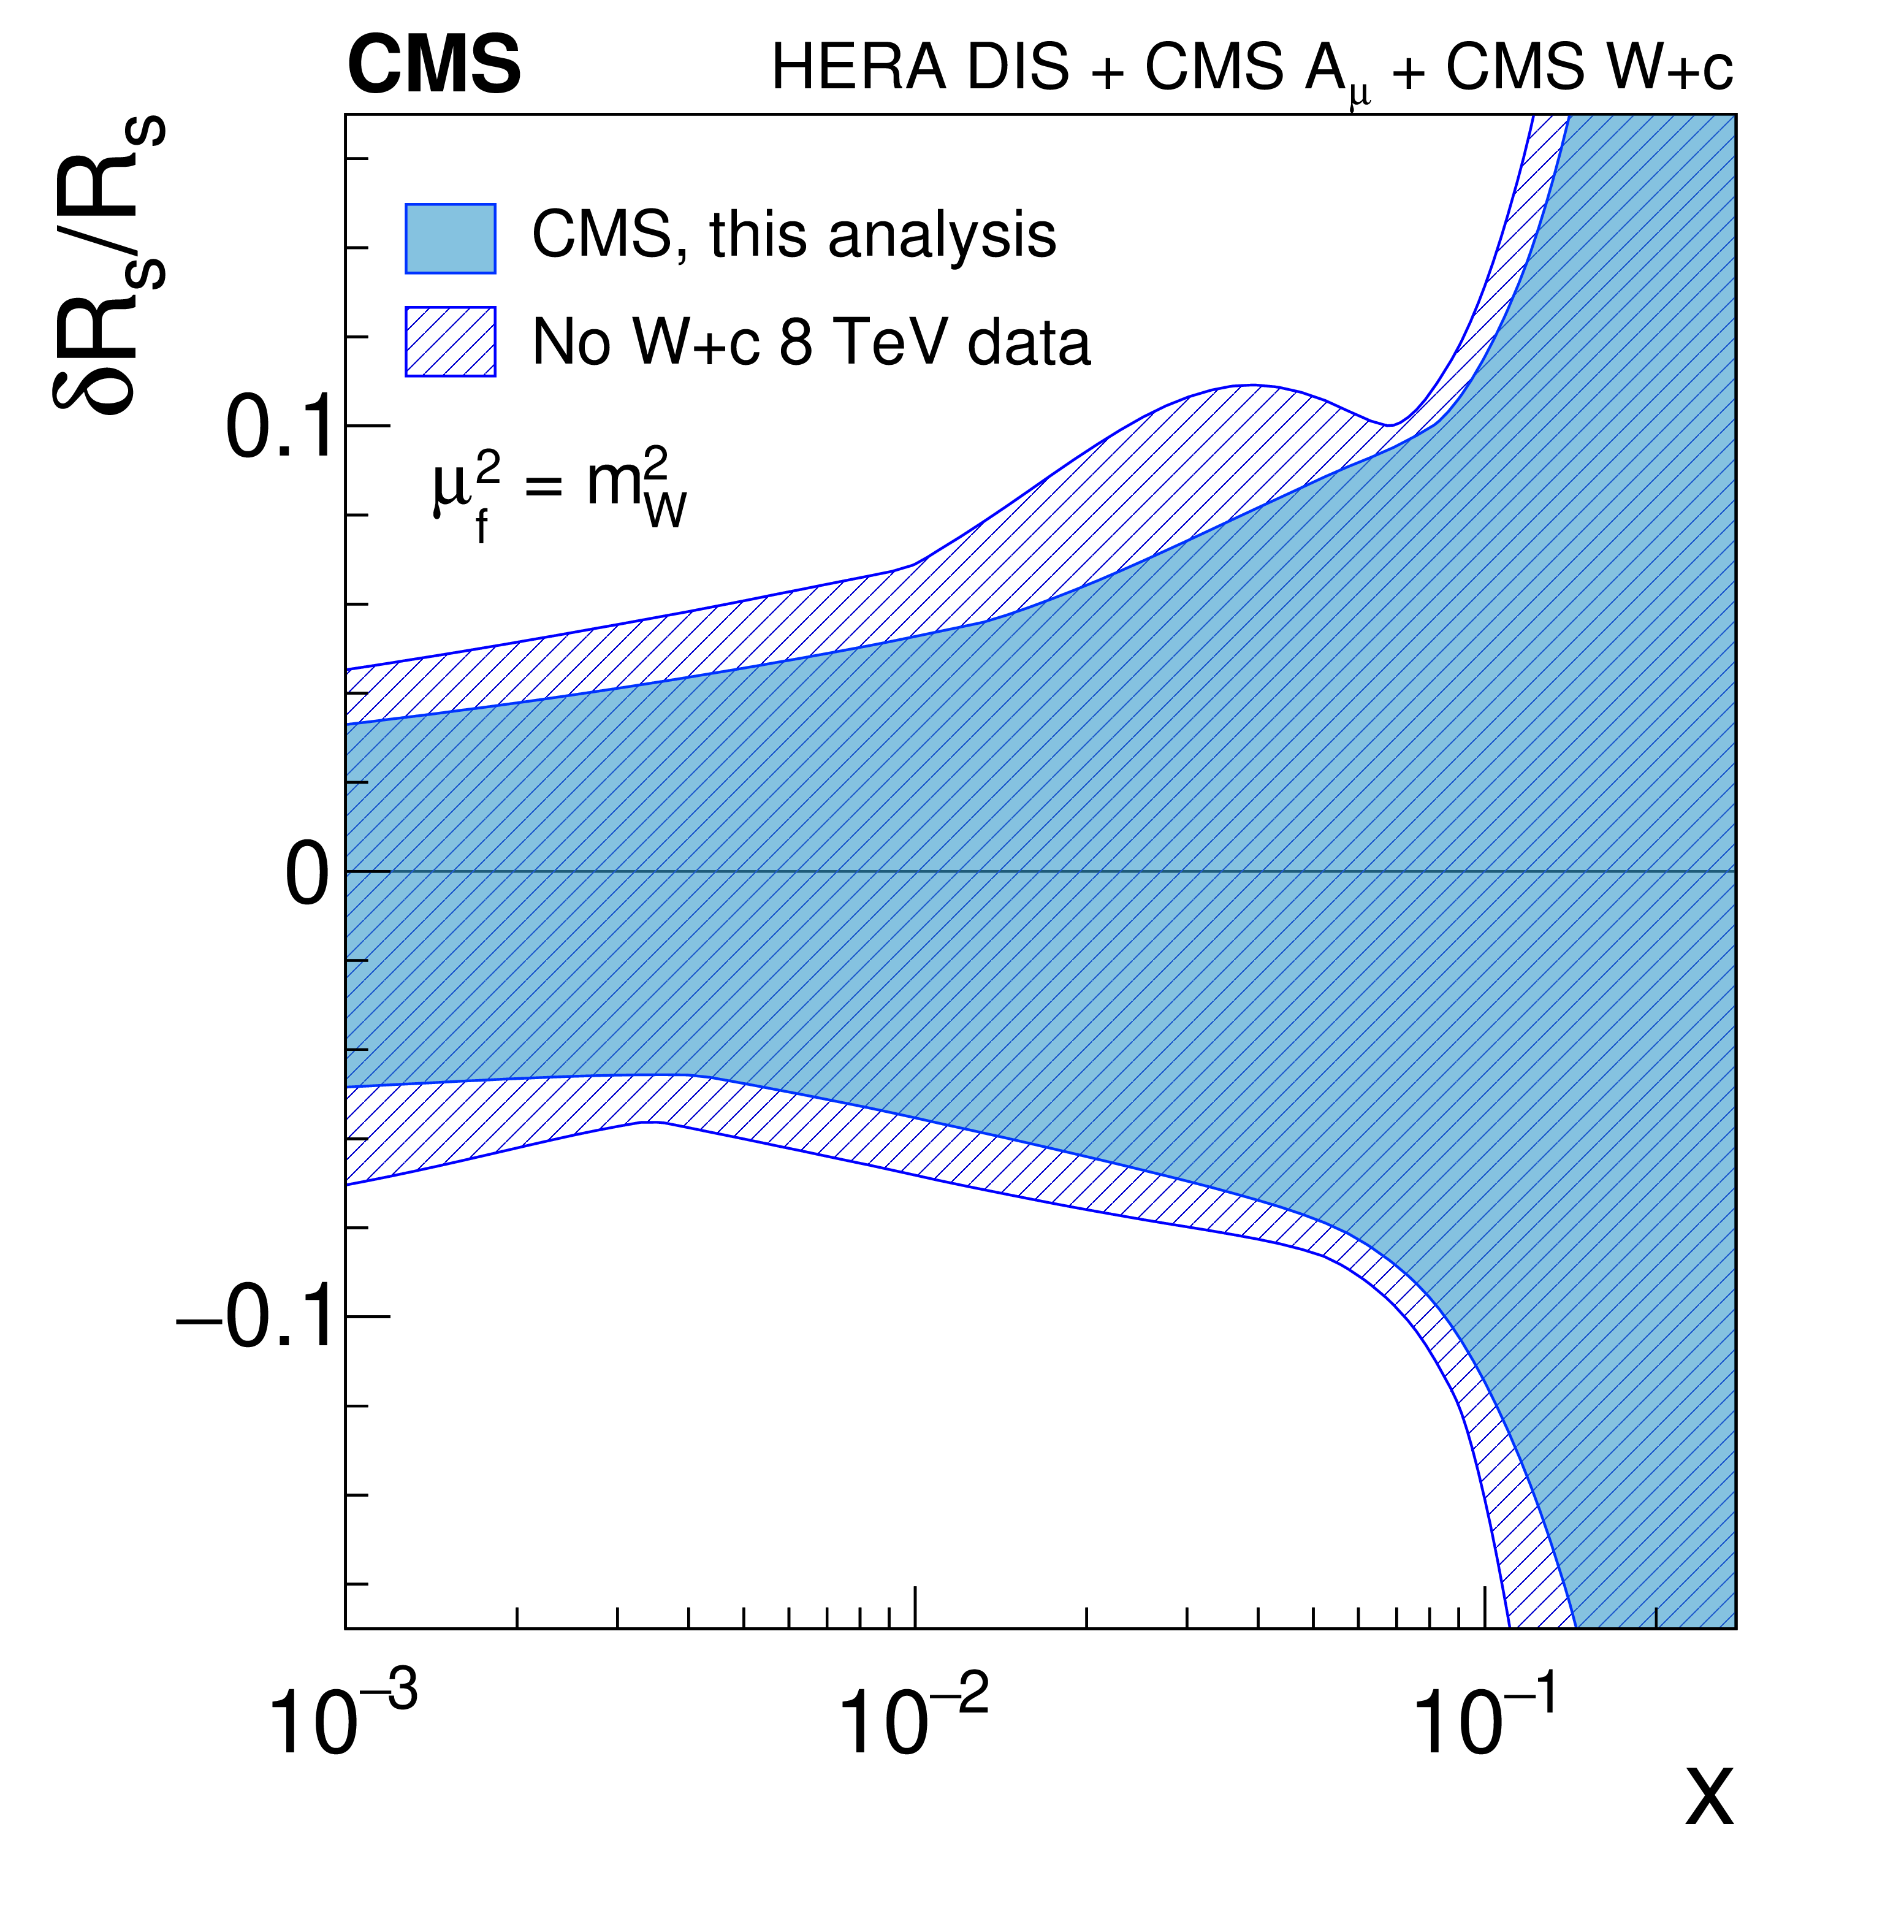
The strange quark distribution (upper left) and the strangeness suppression factor (upper right) as a function of $ x $ at the factorization scale of $ m^2_{\mathrm{W}} $. The corresponding relative total uncertainties are compared in the lower plots (strange quark distribution, lower left, and strangeness suppression factor, lower right). The results from the QCD analysis, shown as a filled area, use as input the combination of the inclusive deep inelastic scattering (DIS) cross sections [71], the CMS measurements of the lepton charge asymmetry in W boson production at $ \sqrt{s}= $ 7 and 8 TeV [72,73], and the CMS measurements of $ \mathrm{W}\,\mathrm{c} $ production at $ \sqrt{s}= $ 7 [5], 8 (this analysis) and 13 TeV [6]. The $ \mathrm{W}\,\mathrm{c} $ measurement at $ \sqrt{s}= $ 8 TeV is not used for the fit shown in hatched style. |
png pdf |
Figure 7-a:
The strange quark distribution (upper left) and the strangeness suppression factor (upper right) as a function of $ x $ at the factorization scale of $ m^2_{\mathrm{W}} $. The corresponding relative total uncertainties are compared in the lower plots (strange quark distribution, lower left, and strangeness suppression factor, lower right). The results from the QCD analysis, shown as a filled area, use as input the combination of the inclusive deep inelastic scattering (DIS) cross sections [71], the CMS measurements of the lepton charge asymmetry in W boson production at $ \sqrt{s}= $ 7 and 8 TeV [72,73], and the CMS measurements of $ \mathrm{W}\,\mathrm{c} $ production at $ \sqrt{s}= $ 7 [5], 8 (this analysis) and 13 TeV [6]. The $ \mathrm{W}\,\mathrm{c} $ measurement at $ \sqrt{s}= $ 8 TeV is not used for the fit shown in hatched style. |
png pdf |
Figure 7-b:
The strange quark distribution (upper left) and the strangeness suppression factor (upper right) as a function of $ x $ at the factorization scale of $ m^2_{\mathrm{W}} $. The corresponding relative total uncertainties are compared in the lower plots (strange quark distribution, lower left, and strangeness suppression factor, lower right). The results from the QCD analysis, shown as a filled area, use as input the combination of the inclusive deep inelastic scattering (DIS) cross sections [71], the CMS measurements of the lepton charge asymmetry in W boson production at $ \sqrt{s}= $ 7 and 8 TeV [72,73], and the CMS measurements of $ \mathrm{W}\,\mathrm{c} $ production at $ \sqrt{s}= $ 7 [5], 8 (this analysis) and 13 TeV [6]. The $ \mathrm{W}\,\mathrm{c} $ measurement at $ \sqrt{s}= $ 8 TeV is not used for the fit shown in hatched style. |
png pdf |
Figure 7-c:
The strange quark distribution (upper left) and the strangeness suppression factor (upper right) as a function of $ x $ at the factorization scale of $ m^2_{\mathrm{W}} $. The corresponding relative total uncertainties are compared in the lower plots (strange quark distribution, lower left, and strangeness suppression factor, lower right). The results from the QCD analysis, shown as a filled area, use as input the combination of the inclusive deep inelastic scattering (DIS) cross sections [71], the CMS measurements of the lepton charge asymmetry in W boson production at $ \sqrt{s}= $ 7 and 8 TeV [72,73], and the CMS measurements of $ \mathrm{W}\,\mathrm{c} $ production at $ \sqrt{s}= $ 7 [5], 8 (this analysis) and 13 TeV [6]. The $ \mathrm{W}\,\mathrm{c} $ measurement at $ \sqrt{s}= $ 8 TeV is not used for the fit shown in hatched style. |
png pdf |
Figure 7-d:
The strange quark distribution (upper left) and the strangeness suppression factor (upper right) as a function of $ x $ at the factorization scale of $ m^2_{\mathrm{W}} $. The corresponding relative total uncertainties are compared in the lower plots (strange quark distribution, lower left, and strangeness suppression factor, lower right). The results from the QCD analysis, shown as a filled area, use as input the combination of the inclusive deep inelastic scattering (DIS) cross sections [71], the CMS measurements of the lepton charge asymmetry in W boson production at $ \sqrt{s}= $ 7 and 8 TeV [72,73], and the CMS measurements of $ \mathrm{W}\,\mathrm{c} $ production at $ \sqrt{s}= $ 7 [5], 8 (this analysis) and 13 TeV [6]. The $ \mathrm{W}\,\mathrm{c} $ measurement at $ \sqrt{s}= $ 8 TeV is not used for the fit shown in hatched style. |
png pdf |
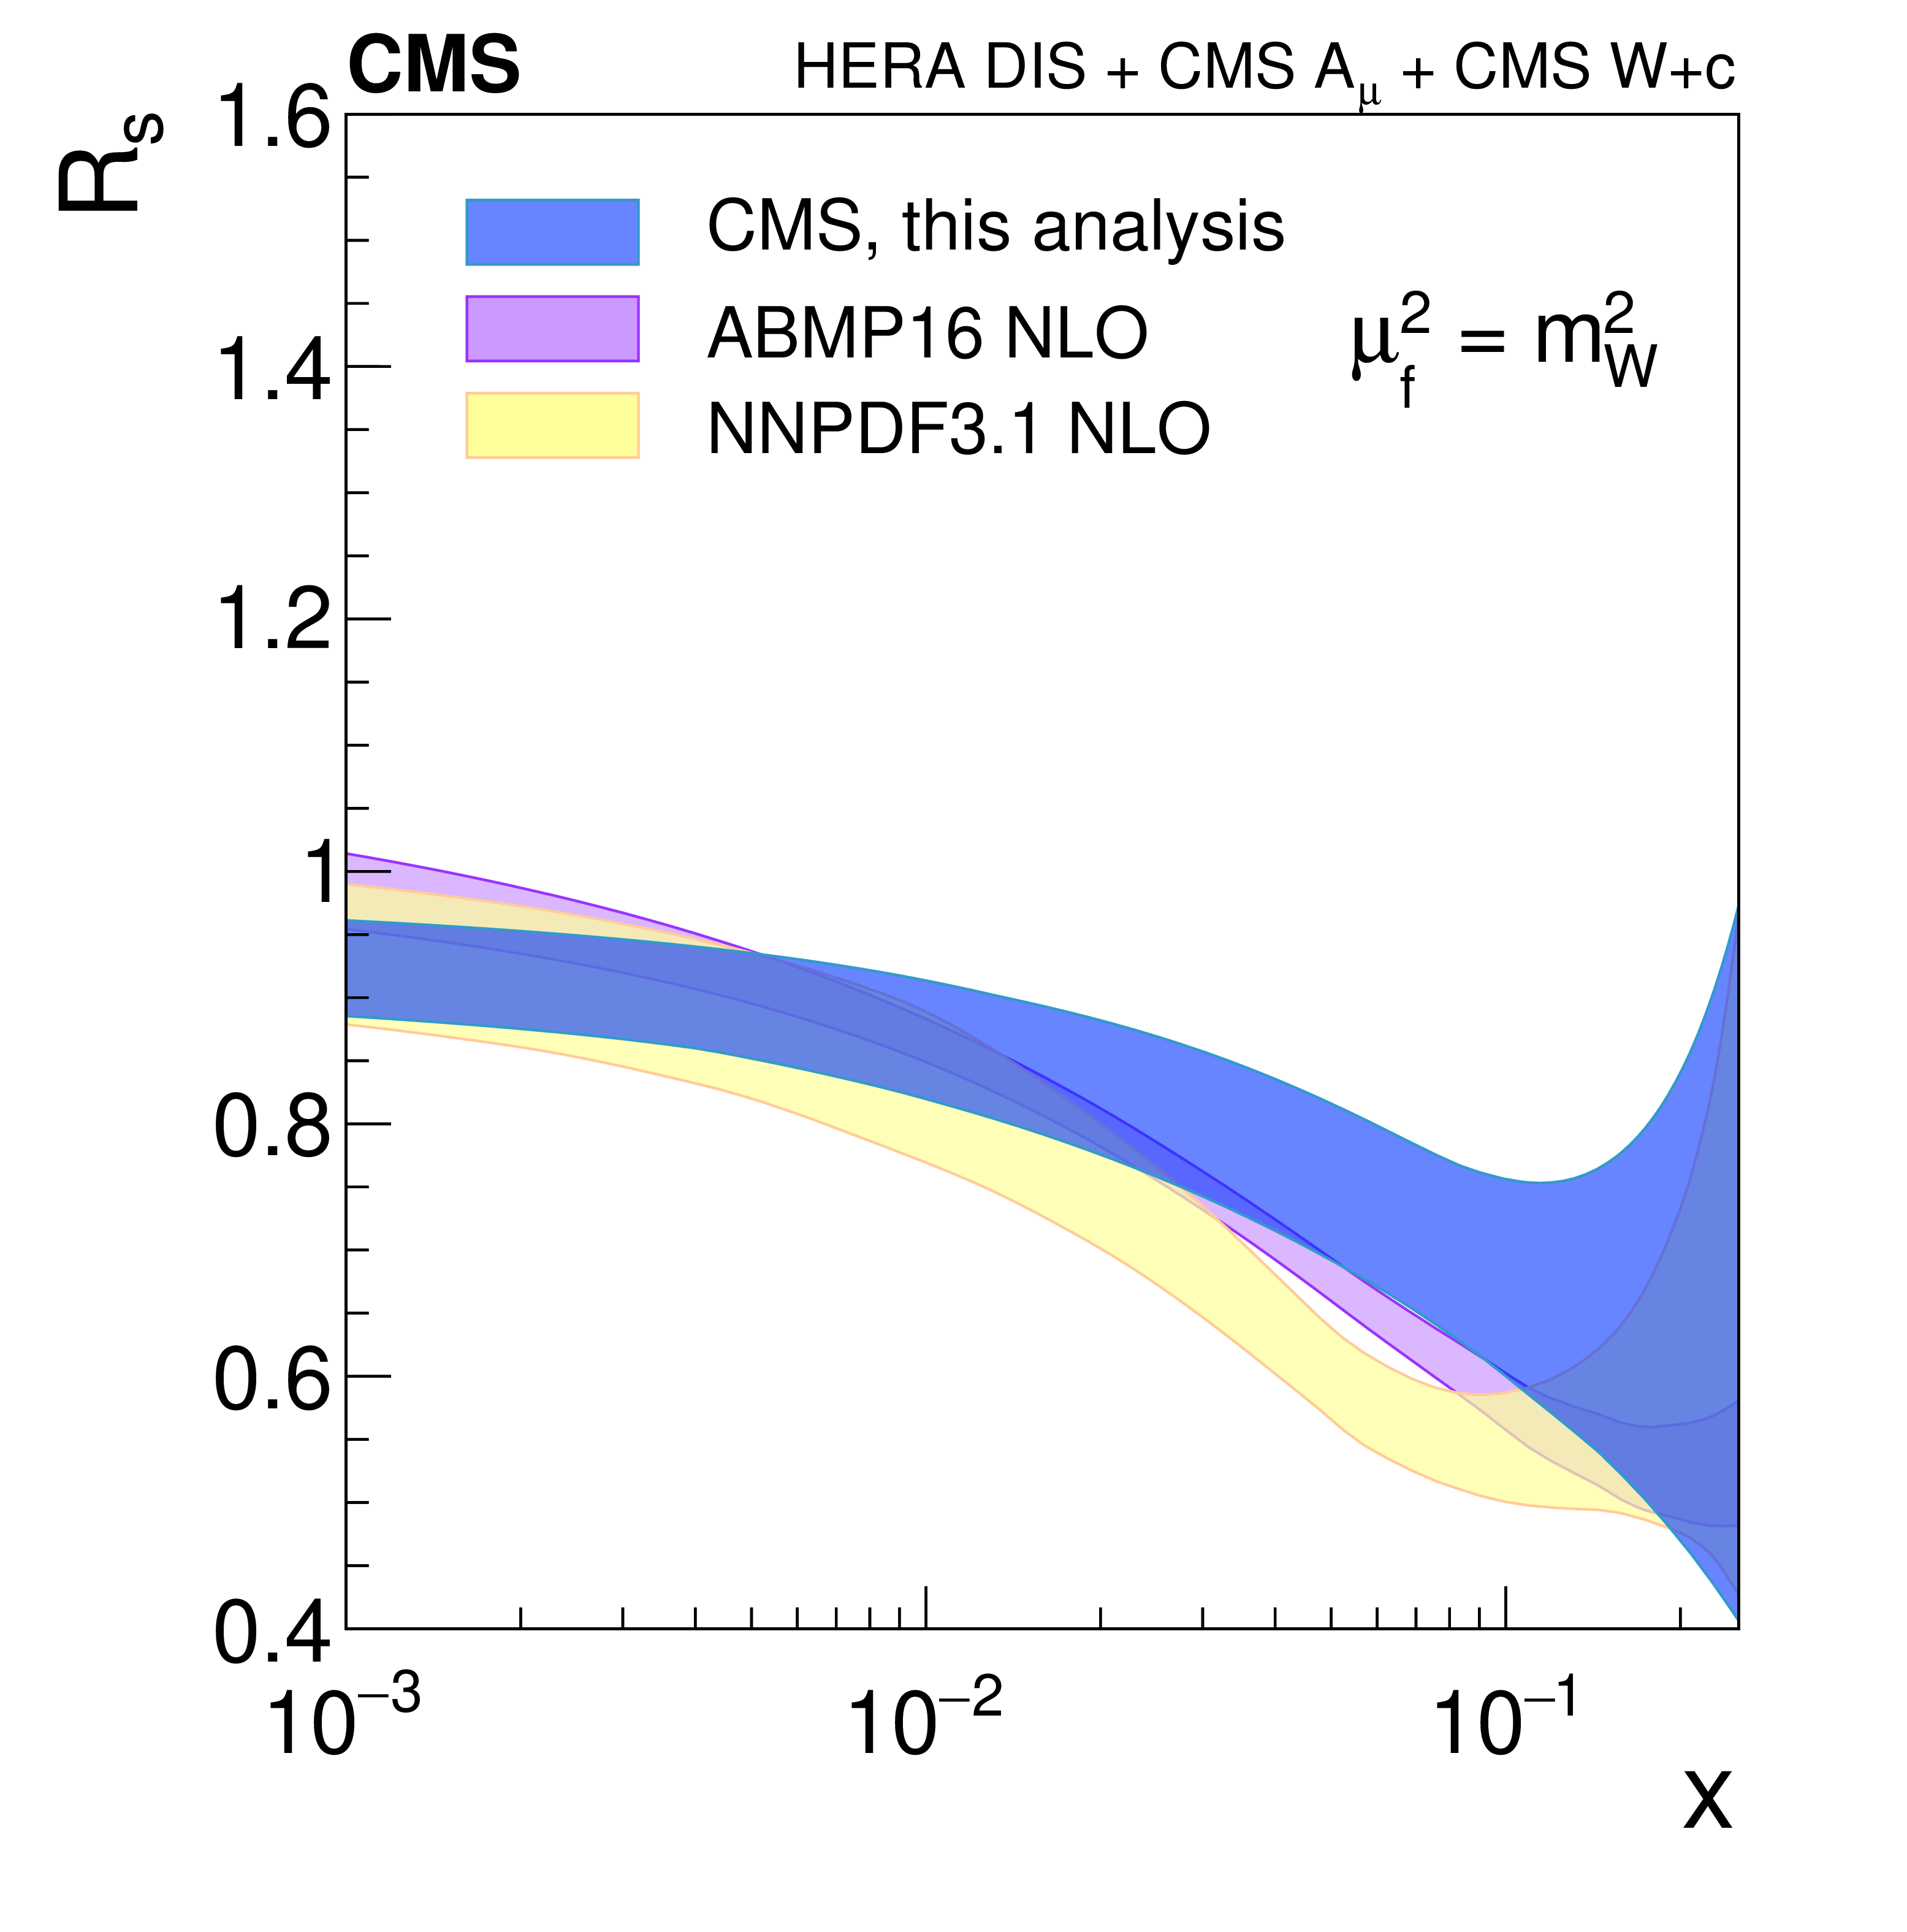
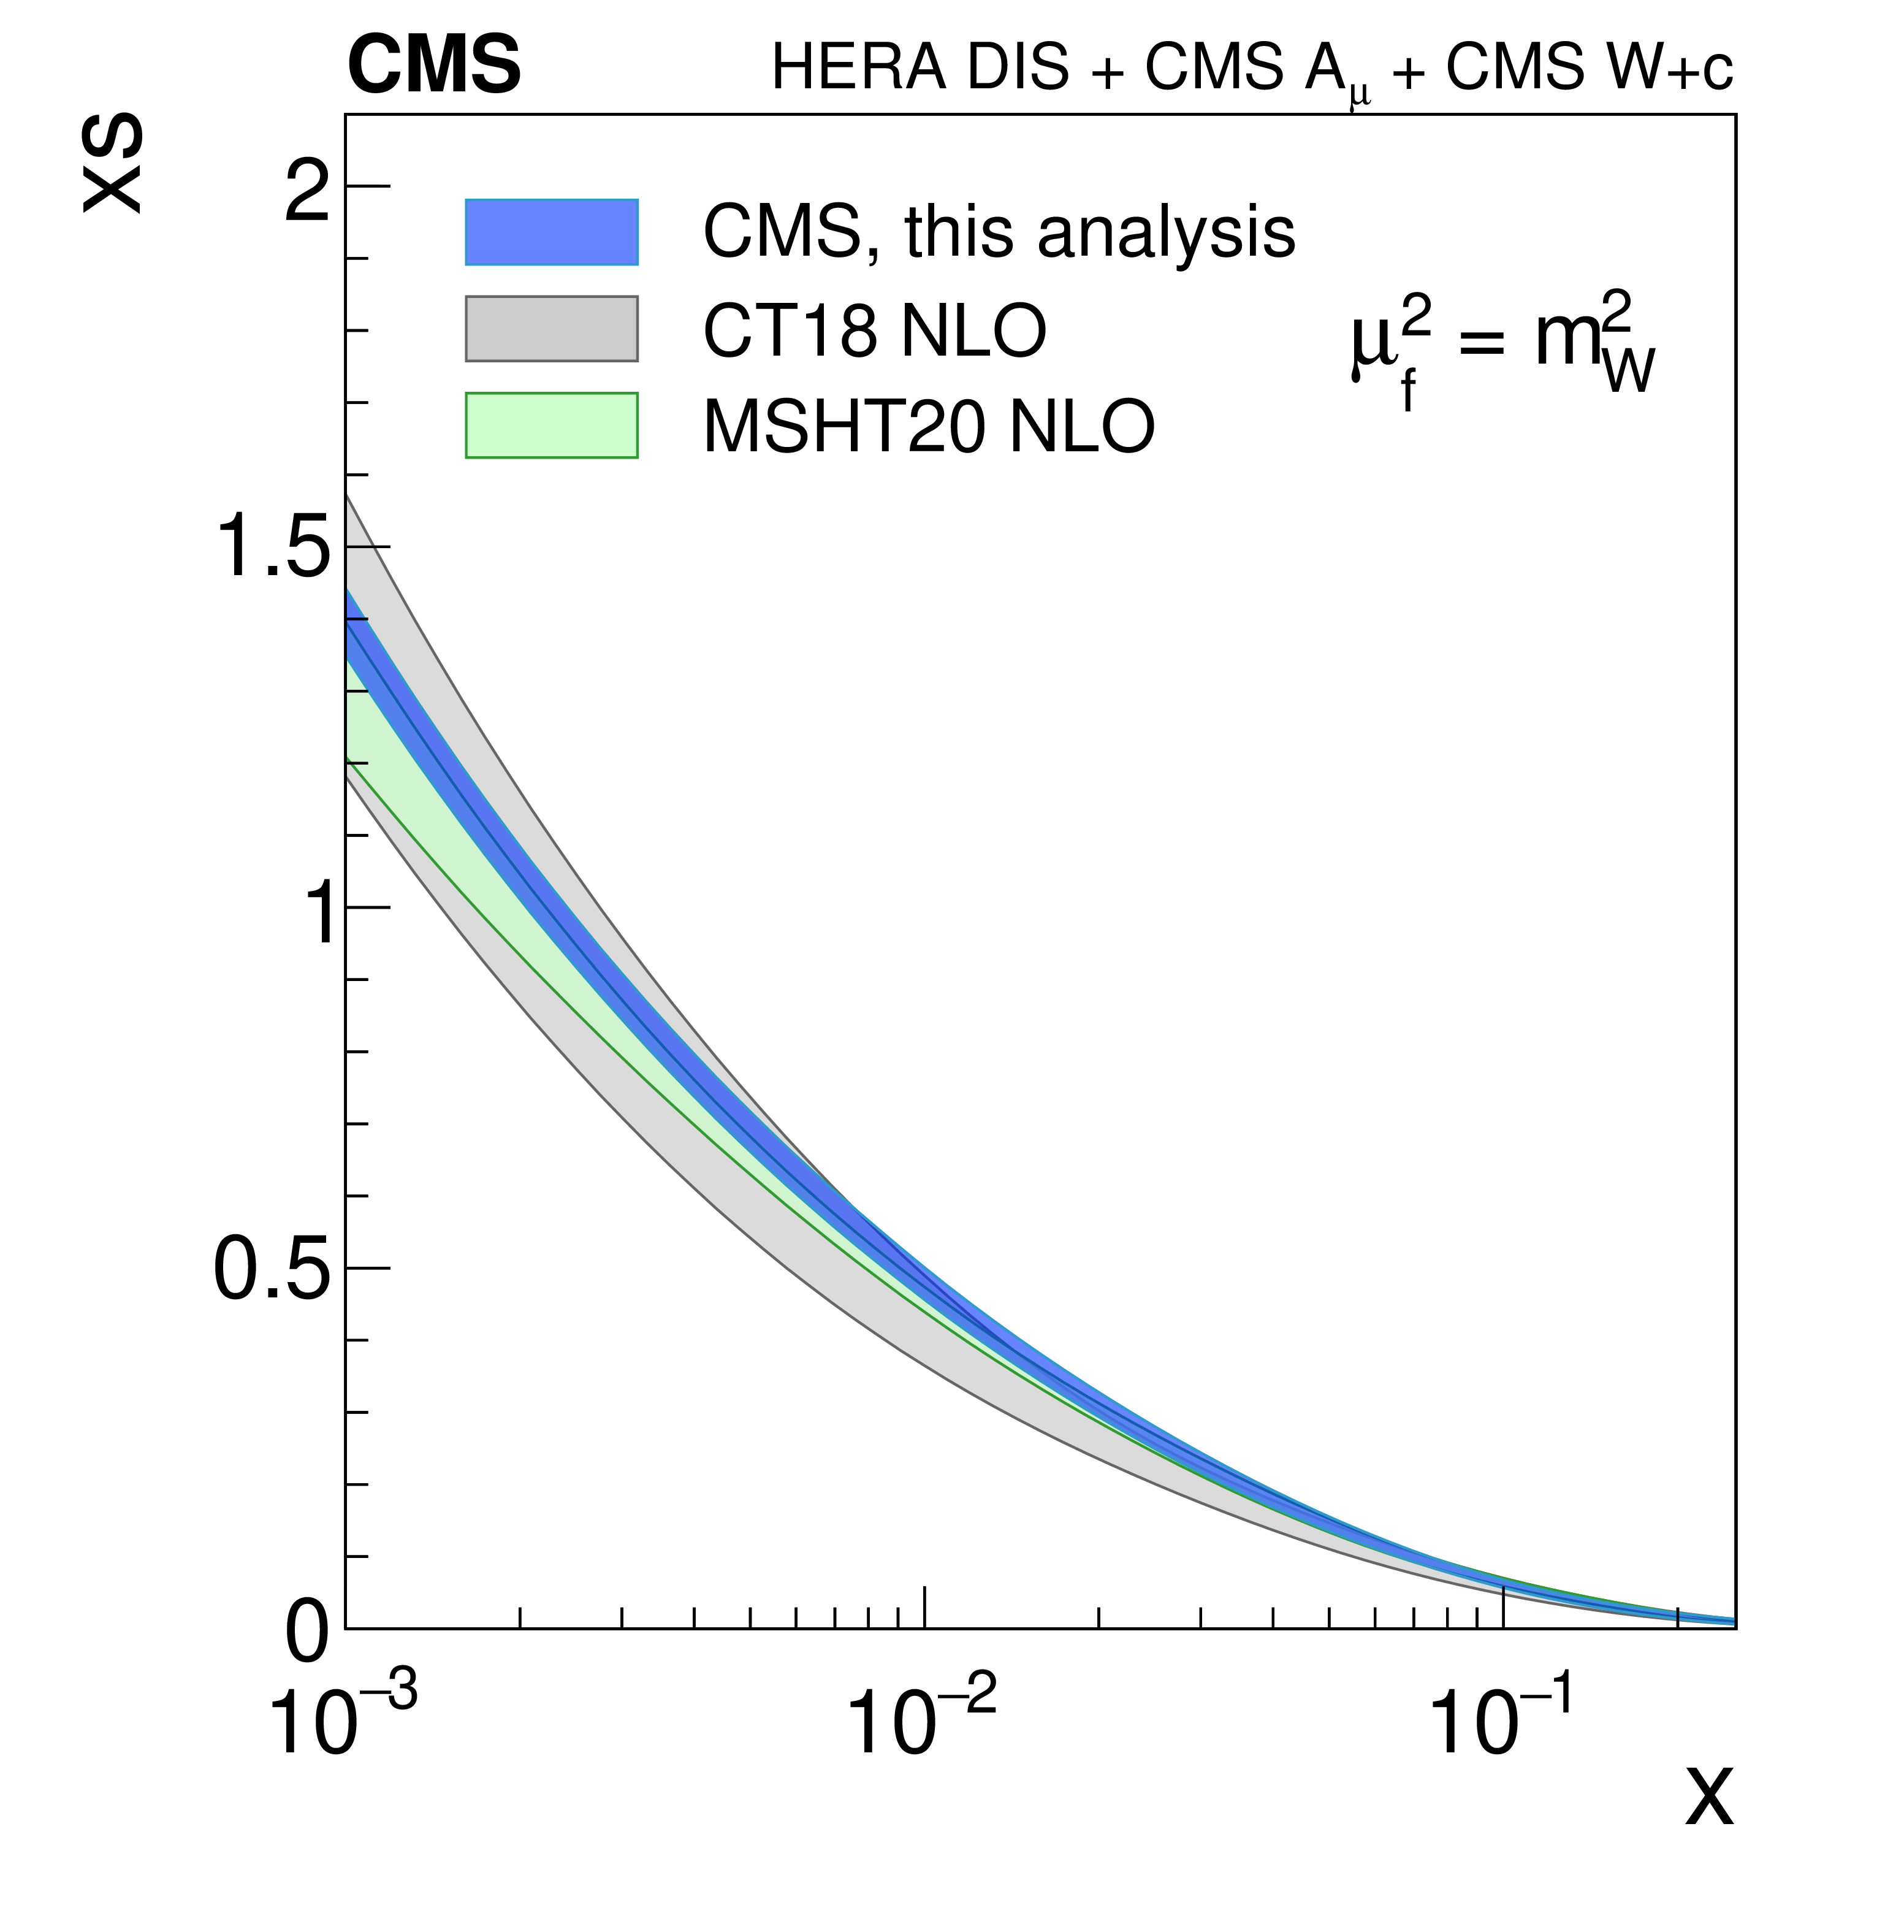
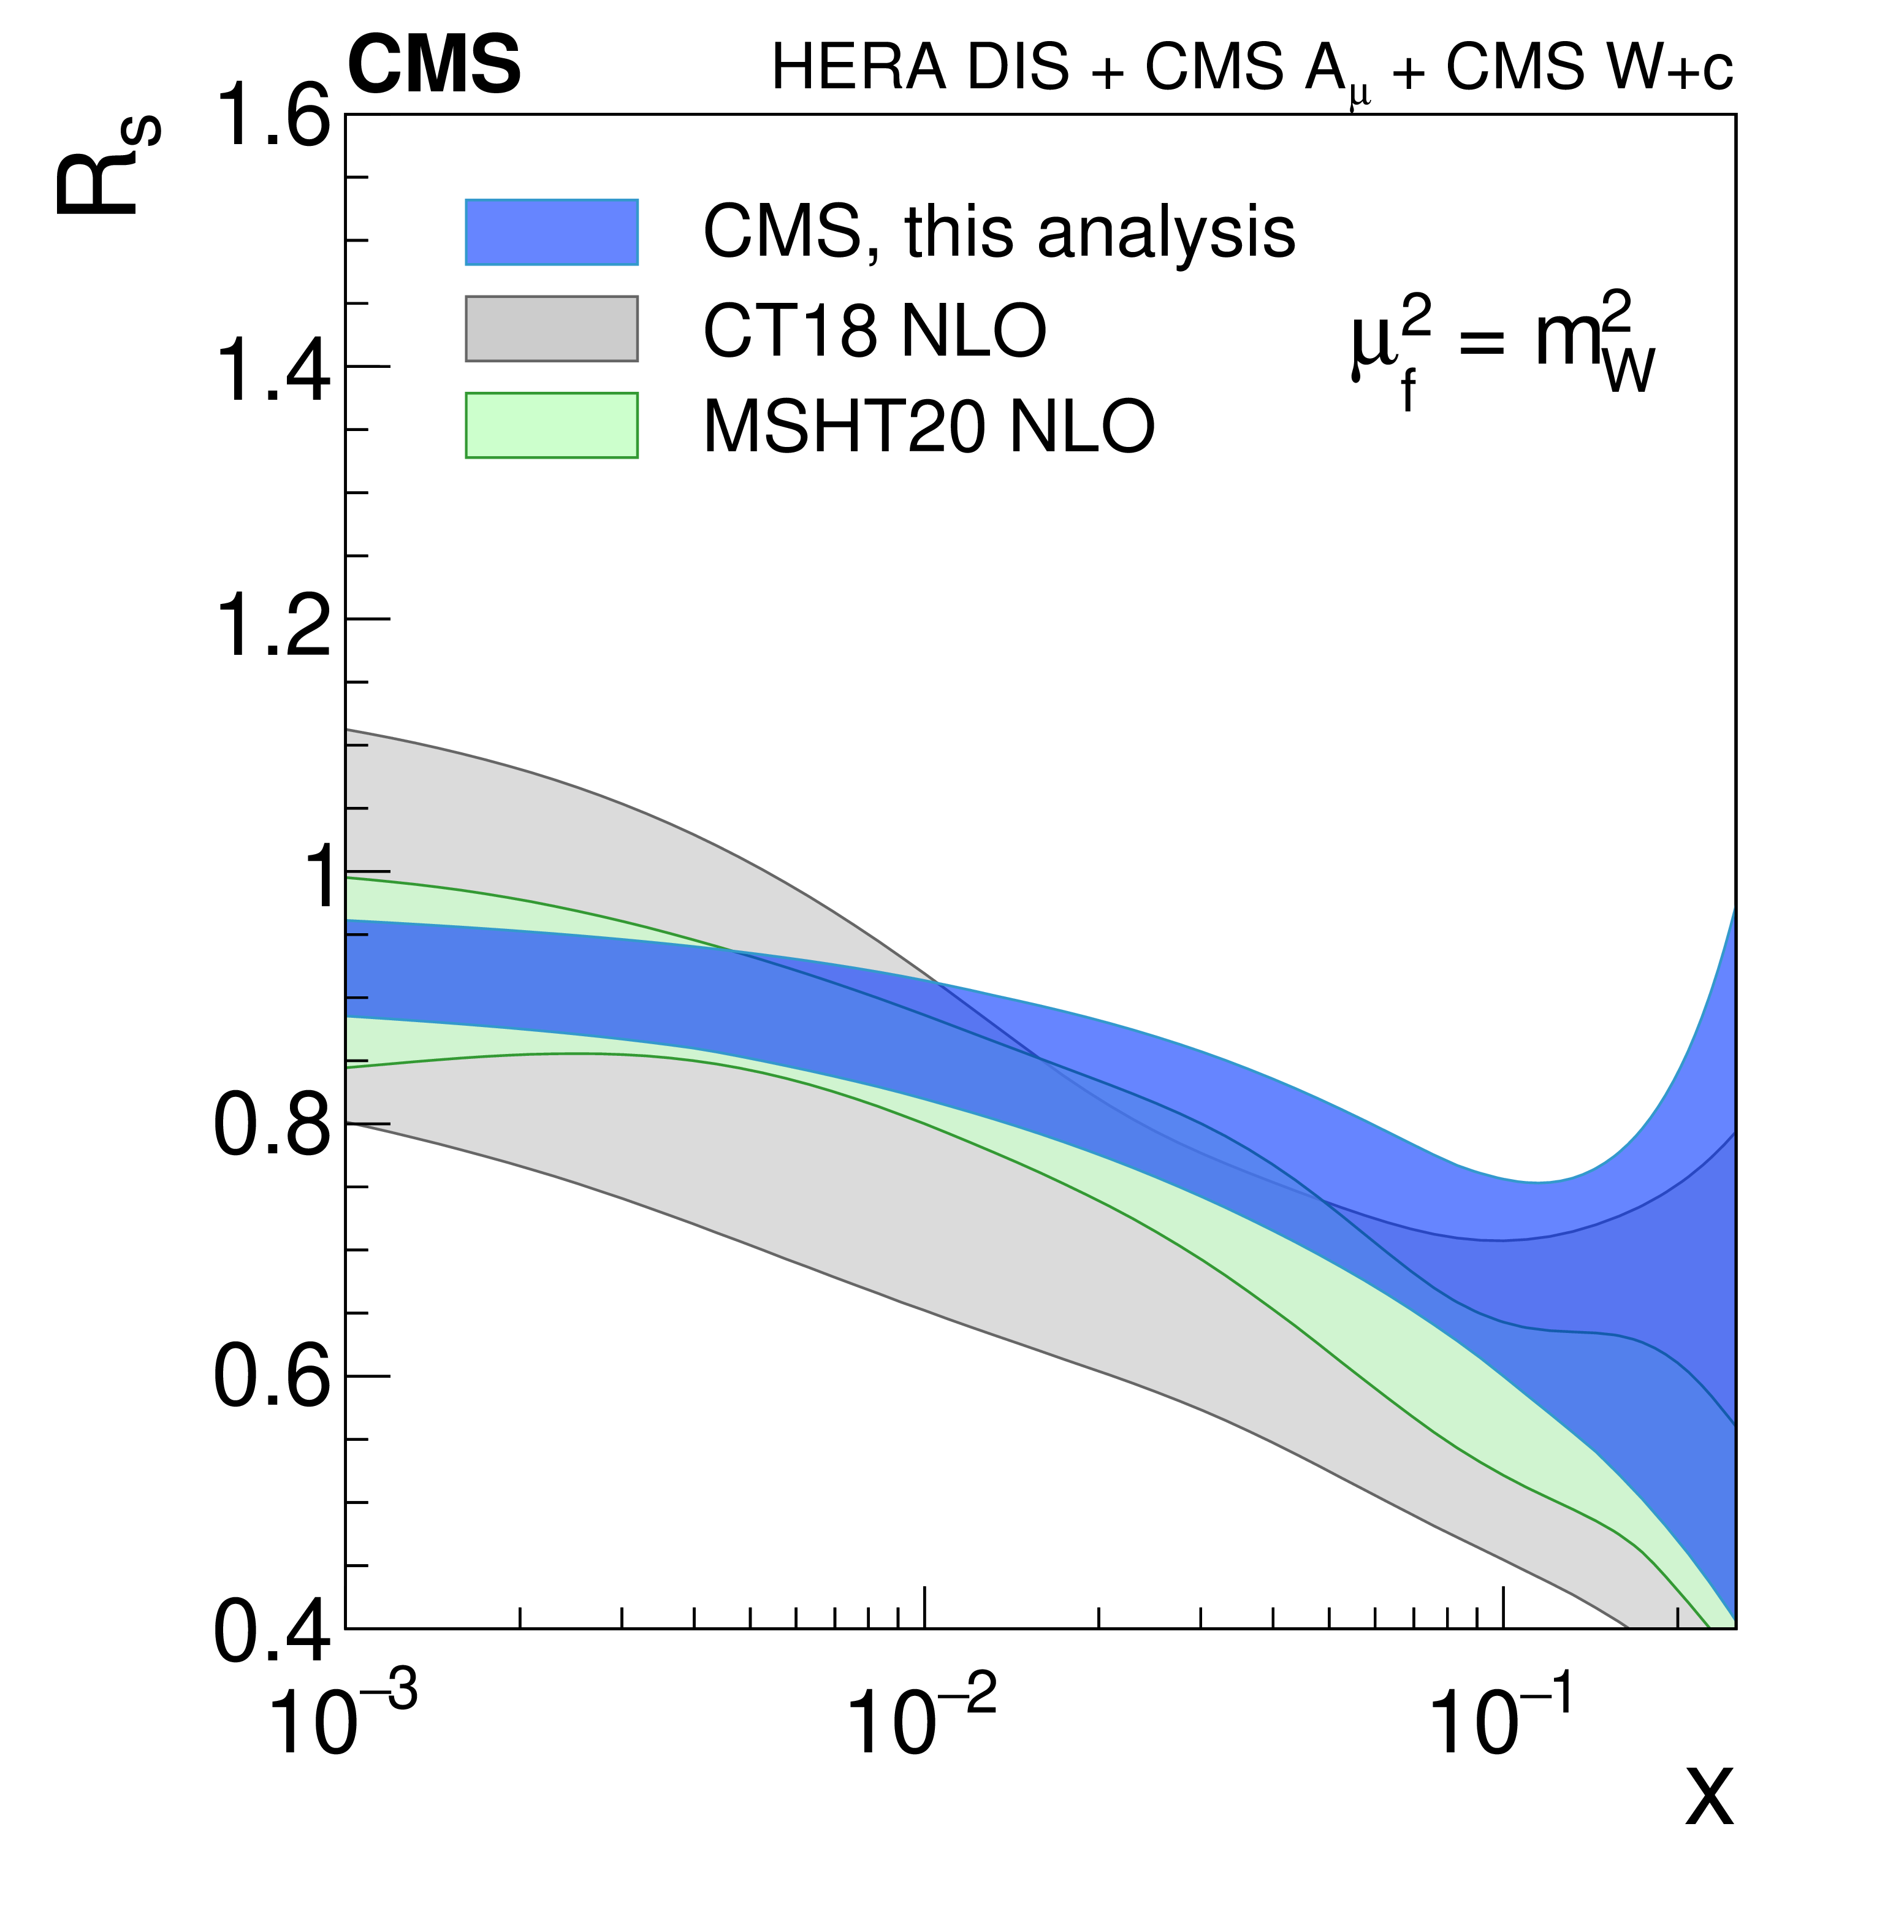
Figure 8:
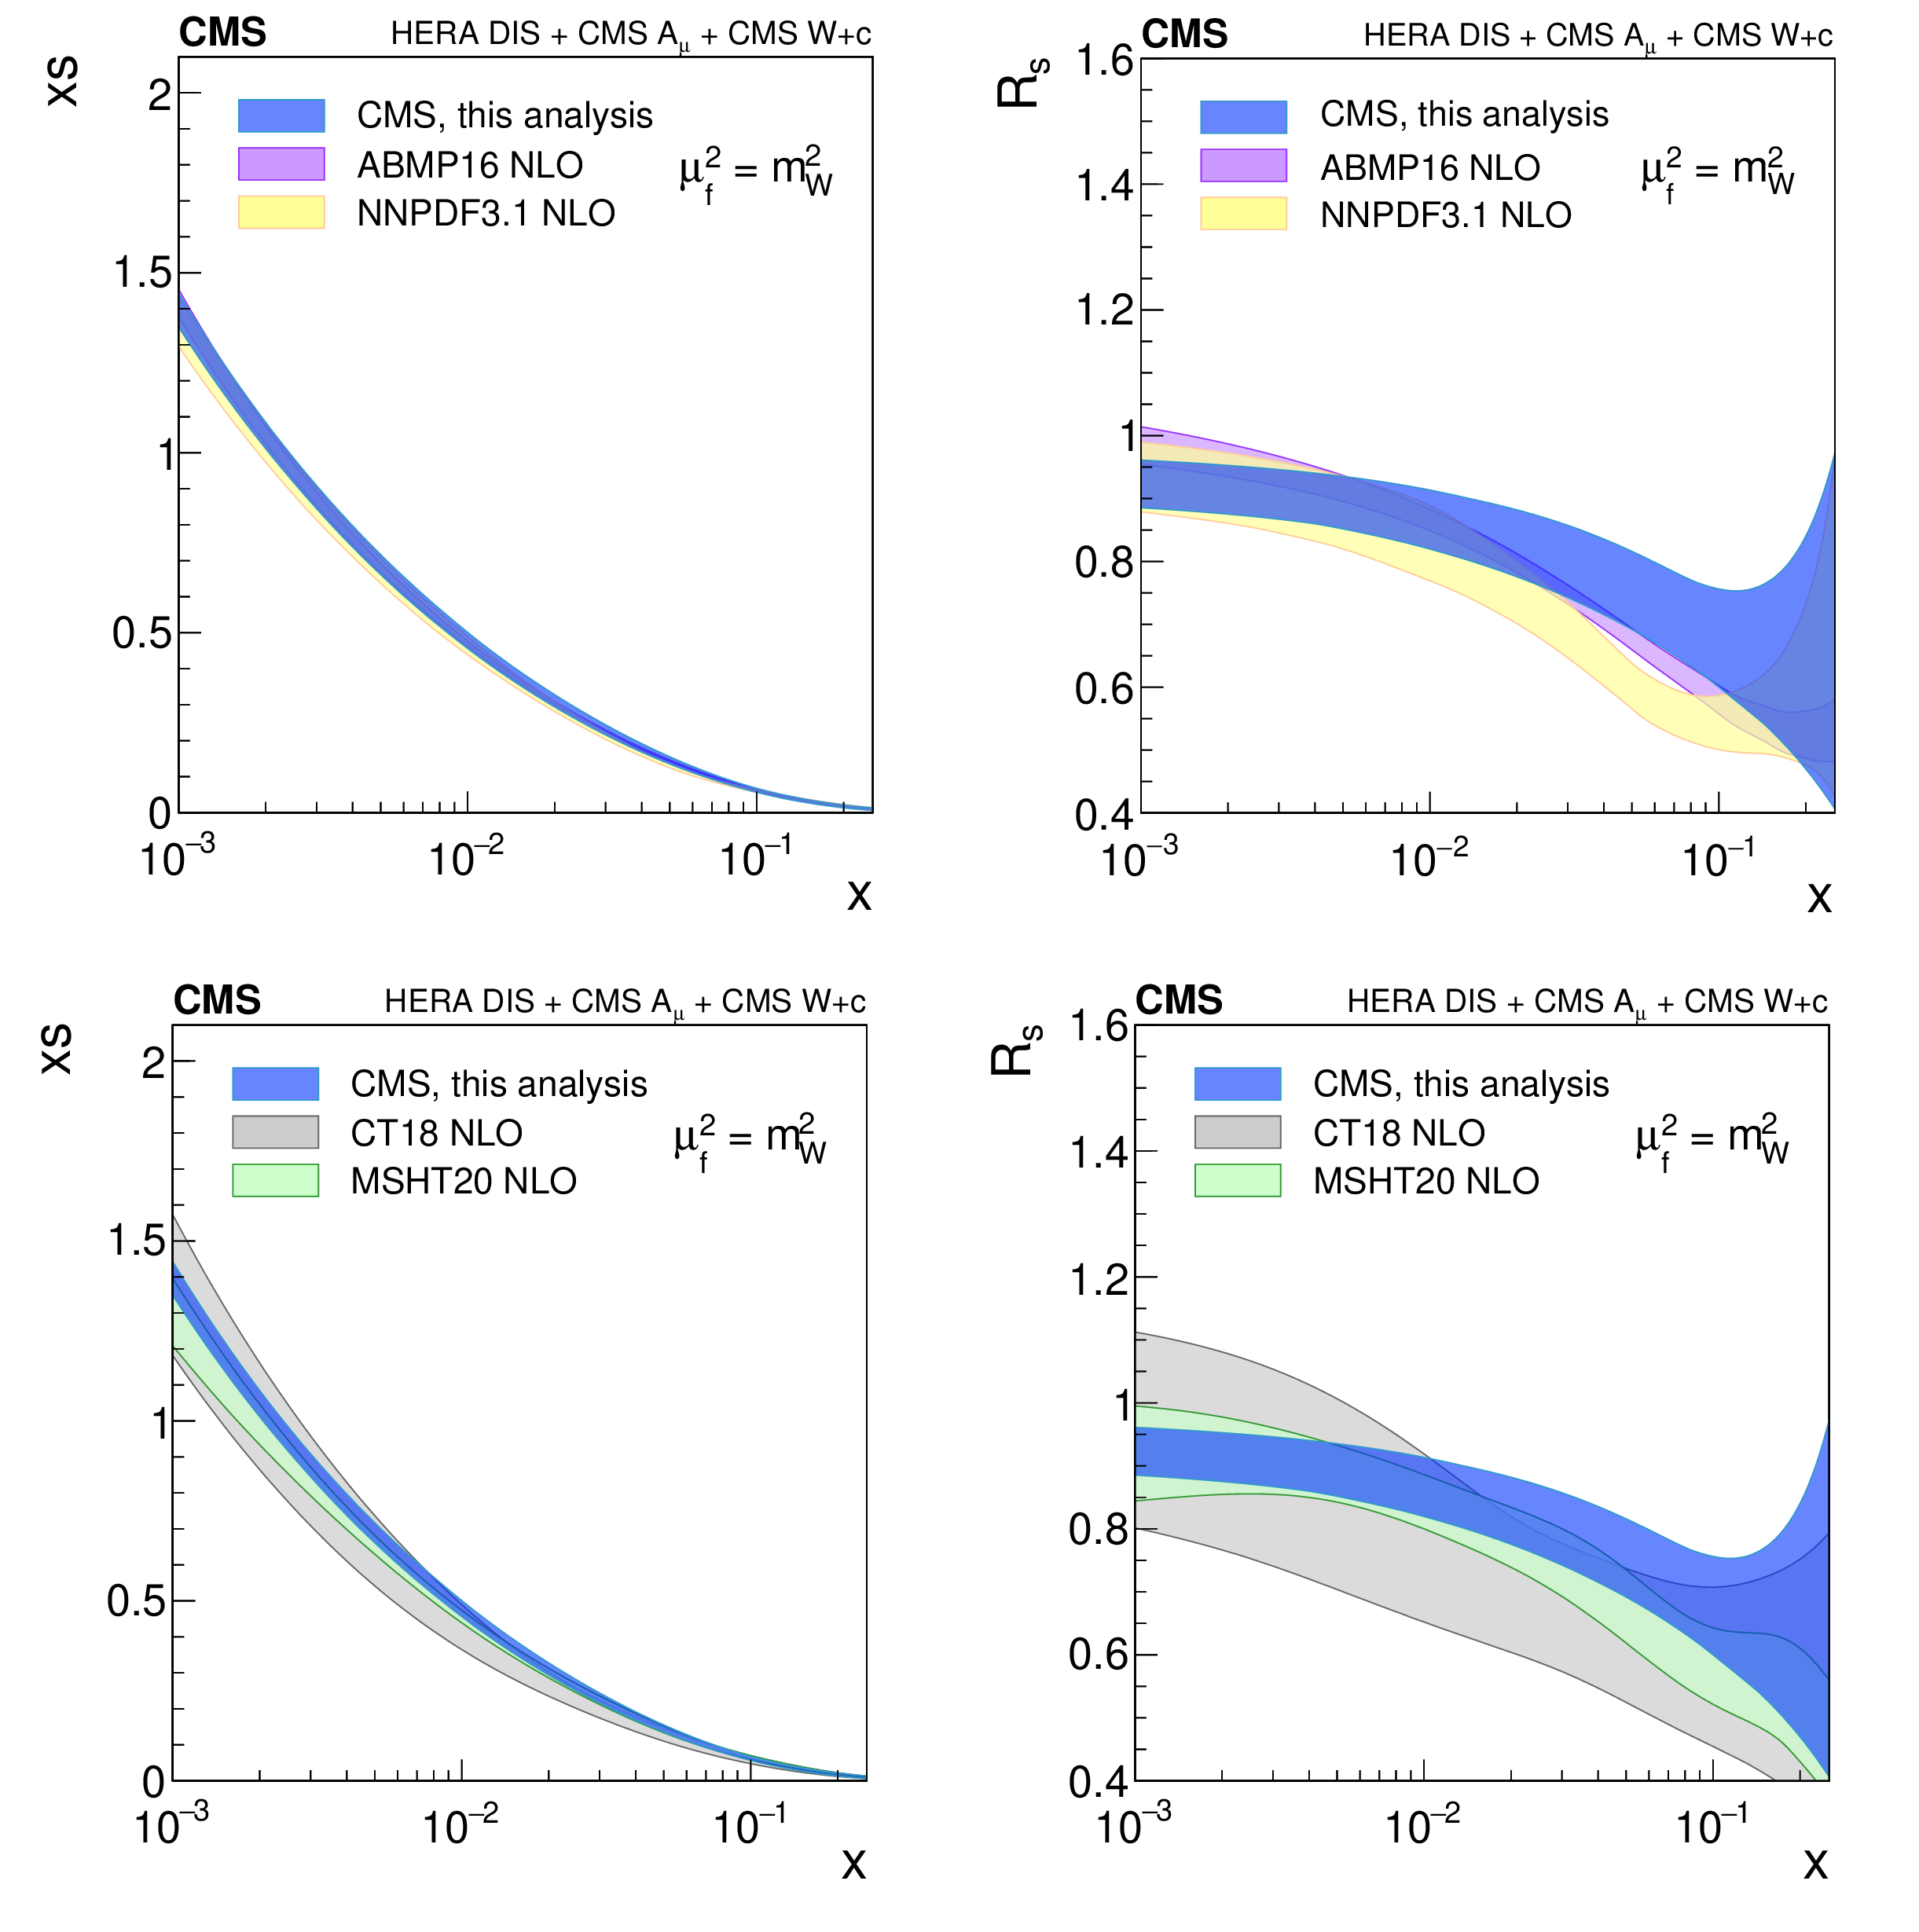
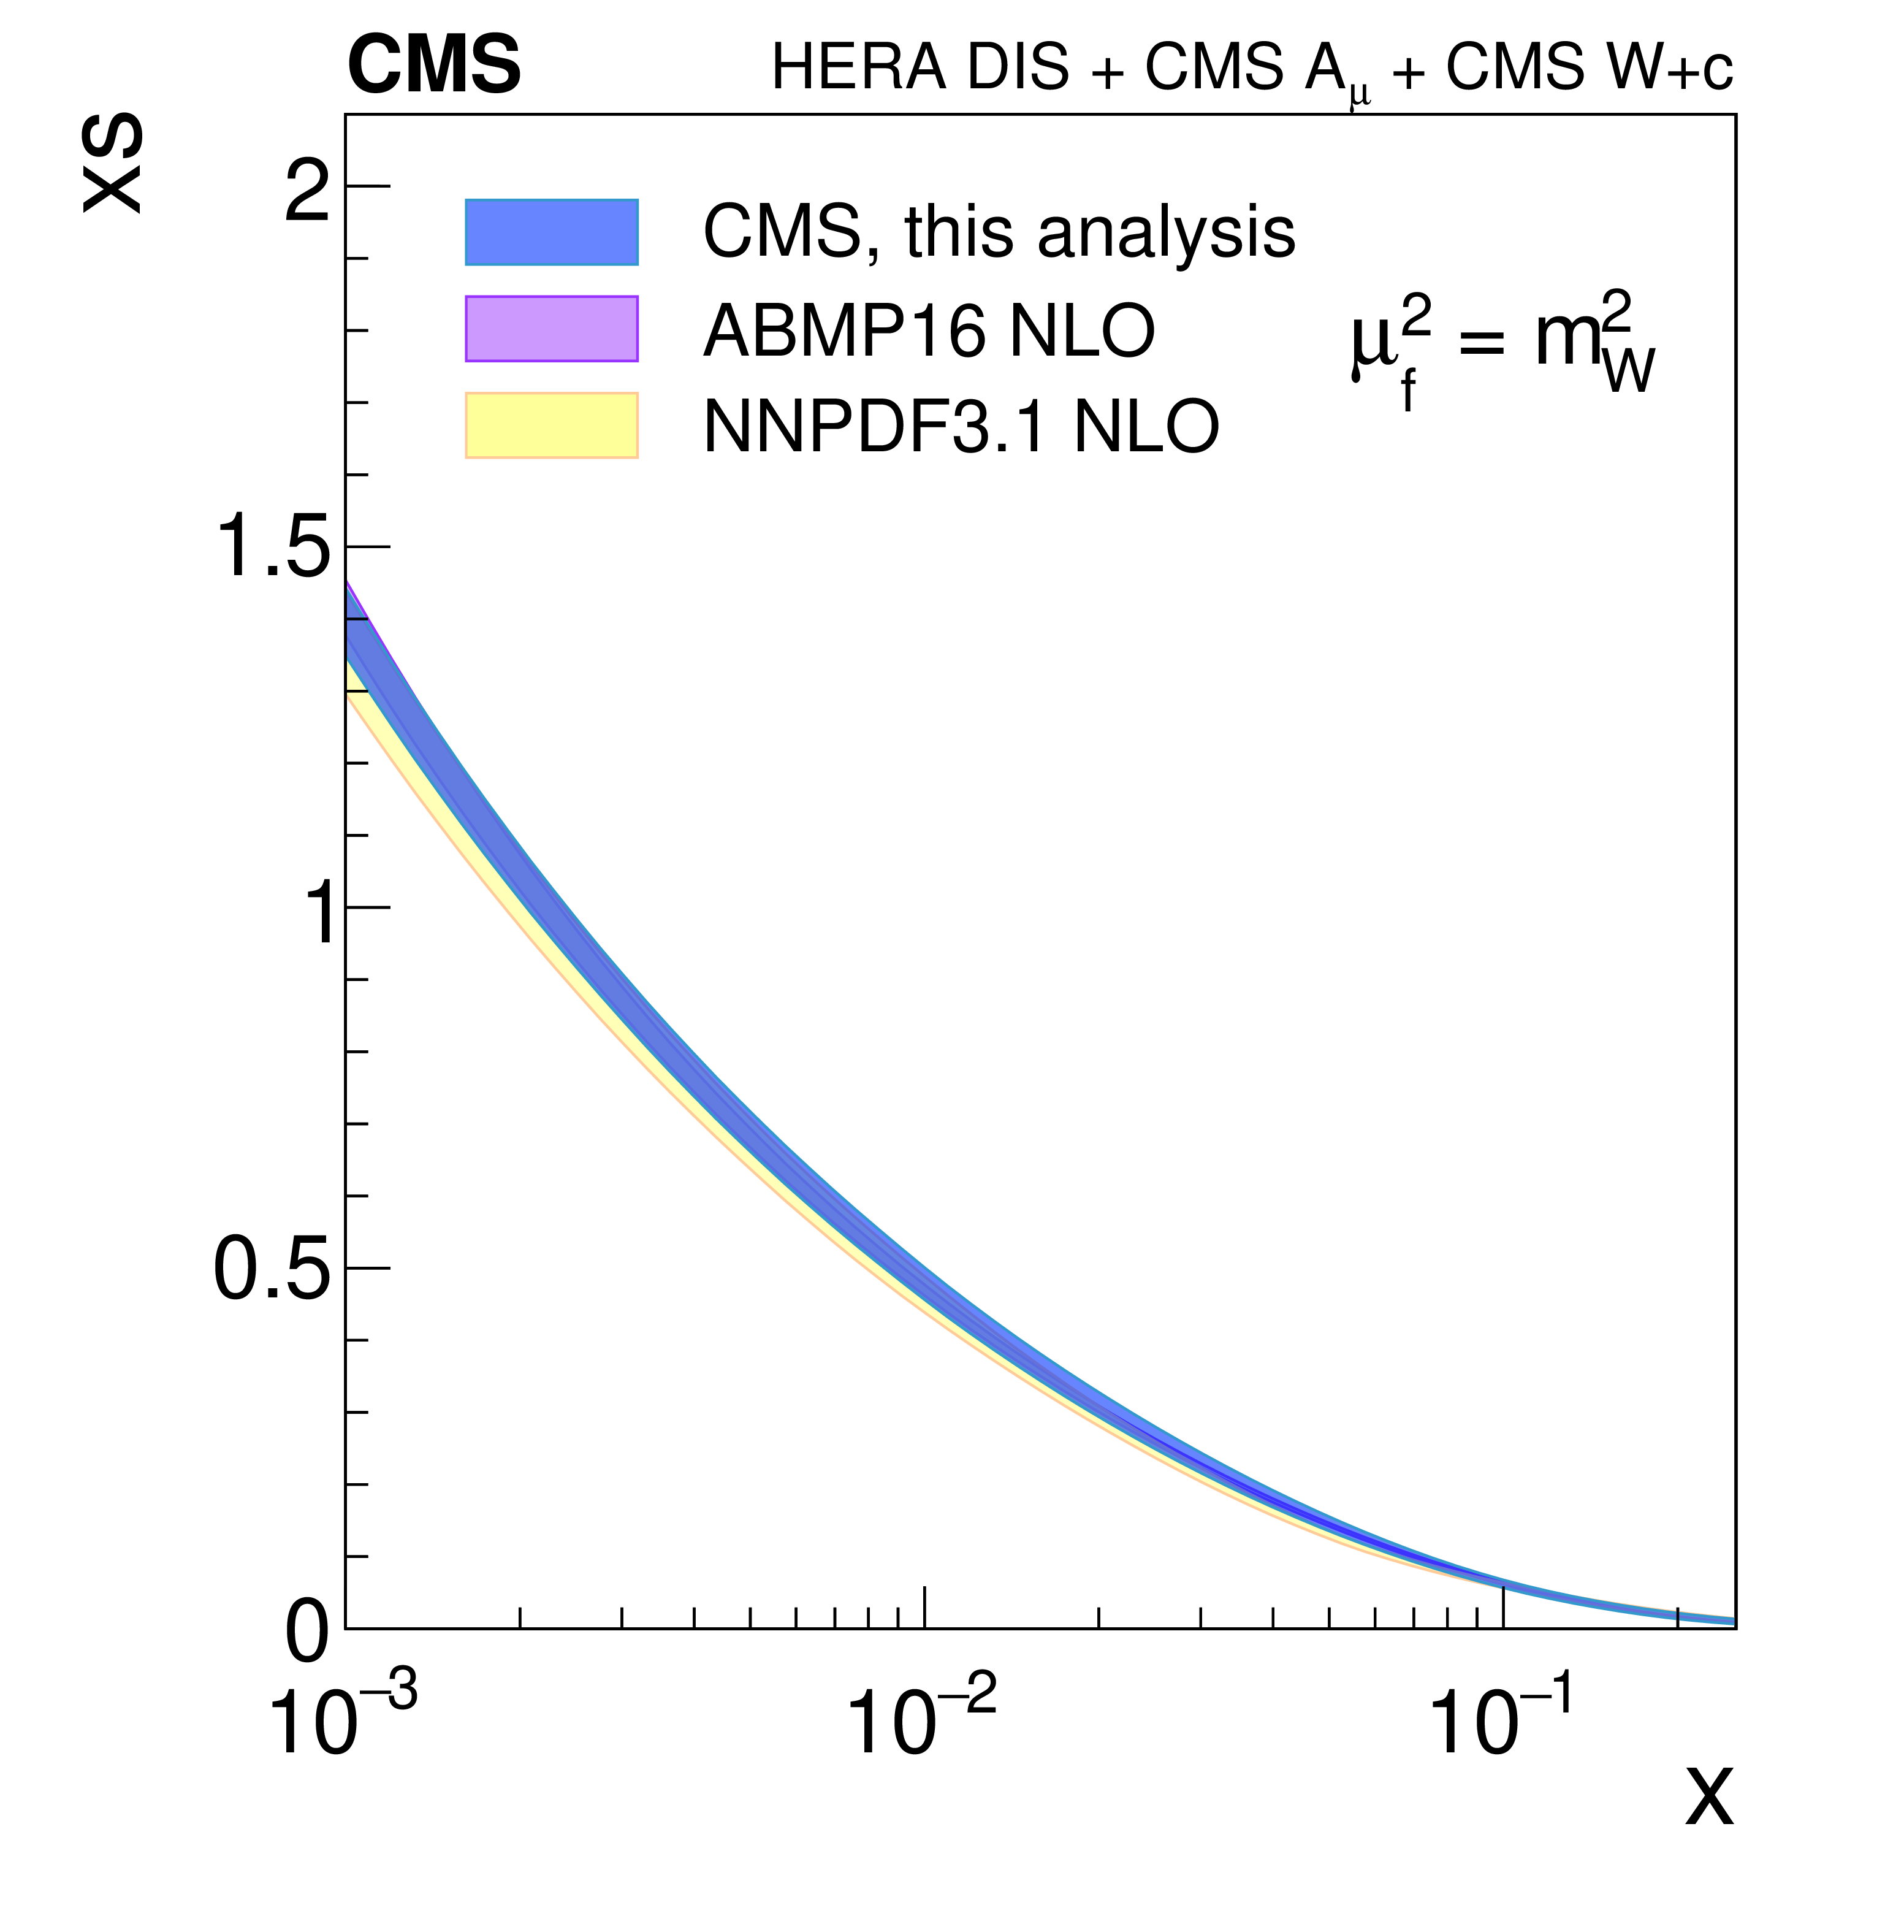
The strange quark distribution (left) and the strangeness suppression factor (right) as a function of $ x $ at the factorization scale of $ m^2_{\mathrm{W}} $. The results of the current analysis are shown together with those from the global NLO PDFs, ABMP16 and NNPDF3.1 in the upper plot, and CT18 and MSHT20 in the lower one. This QCD analysis uses as input the combination of the inclusive deep inelastic scattering (DIS) cross sections [71], the CMS measurements of the lepton charge asymmetry in W boson production at $ \sqrt{s}= $ 7 and 8 TeV [72,73], and the CMS measurements of $ \mathrm{W}\,\mathrm{c} $ production at $ \sqrt{s}= $ 7 [5], 8 (this analysis) and 13 TeV [6]. |
png pdf |
Figure 8-a:
The strange quark distribution (left) and the strangeness suppression factor (right) as a function of $ x $ at the factorization scale of $ m^2_{\mathrm{W}} $. The results of the current analysis are shown together with those from the global NLO PDFs, ABMP16 and NNPDF3.1 in the upper plot, and CT18 and MSHT20 in the lower one. This QCD analysis uses as input the combination of the inclusive deep inelastic scattering (DIS) cross sections [71], the CMS measurements of the lepton charge asymmetry in W boson production at $ \sqrt{s}= $ 7 and 8 TeV [72,73], and the CMS measurements of $ \mathrm{W}\,\mathrm{c} $ production at $ \sqrt{s}= $ 7 [5], 8 (this analysis) and 13 TeV [6]. |
png pdf |
Figure 8-b:
The strange quark distribution (left) and the strangeness suppression factor (right) as a function of $ x $ at the factorization scale of $ m^2_{\mathrm{W}} $. The results of the current analysis are shown together with those from the global NLO PDFs, ABMP16 and NNPDF3.1 in the upper plot, and CT18 and MSHT20 in the lower one. This QCD analysis uses as input the combination of the inclusive deep inelastic scattering (DIS) cross sections [71], the CMS measurements of the lepton charge asymmetry in W boson production at $ \sqrt{s}= $ 7 and 8 TeV [72,73], and the CMS measurements of $ \mathrm{W}\,\mathrm{c} $ production at $ \sqrt{s}= $ 7 [5], 8 (this analysis) and 13 TeV [6]. |
png pdf |
Figure 8-c:
The strange quark distribution (left) and the strangeness suppression factor (right) as a function of $ x $ at the factorization scale of $ m^2_{\mathrm{W}} $. The results of the current analysis are shown together with those from the global NLO PDFs, ABMP16 and NNPDF3.1 in the upper plot, and CT18 and MSHT20 in the lower one. This QCD analysis uses as input the combination of the inclusive deep inelastic scattering (DIS) cross sections [71], the CMS measurements of the lepton charge asymmetry in W boson production at $ \sqrt{s}= $ 7 and 8 TeV [72,73], and the CMS measurements of $ \mathrm{W}\,\mathrm{c} $ production at $ \sqrt{s}= $ 7 [5], 8 (this analysis) and 13 TeV [6]. |
png pdf |
Figure 8-d:
The strange quark distribution (left) and the strangeness suppression factor (right) as a function of $ x $ at the factorization scale of $ m^2_{\mathrm{W}} $. The results of the current analysis are shown together with those from the global NLO PDFs, ABMP16 and NNPDF3.1 in the upper plot, and CT18 and MSHT20 in the lower one. This QCD analysis uses as input the combination of the inclusive deep inelastic scattering (DIS) cross sections [71], the CMS measurements of the lepton charge asymmetry in W boson production at $ \sqrt{s}= $ 7 and 8 TeV [72,73], and the CMS measurements of $ \mathrm{W}\,\mathrm{c} $ production at $ \sqrt{s}= $ 7 [5], 8 (this analysis) and 13 TeV [6]. |
| Tables | |
png pdf |
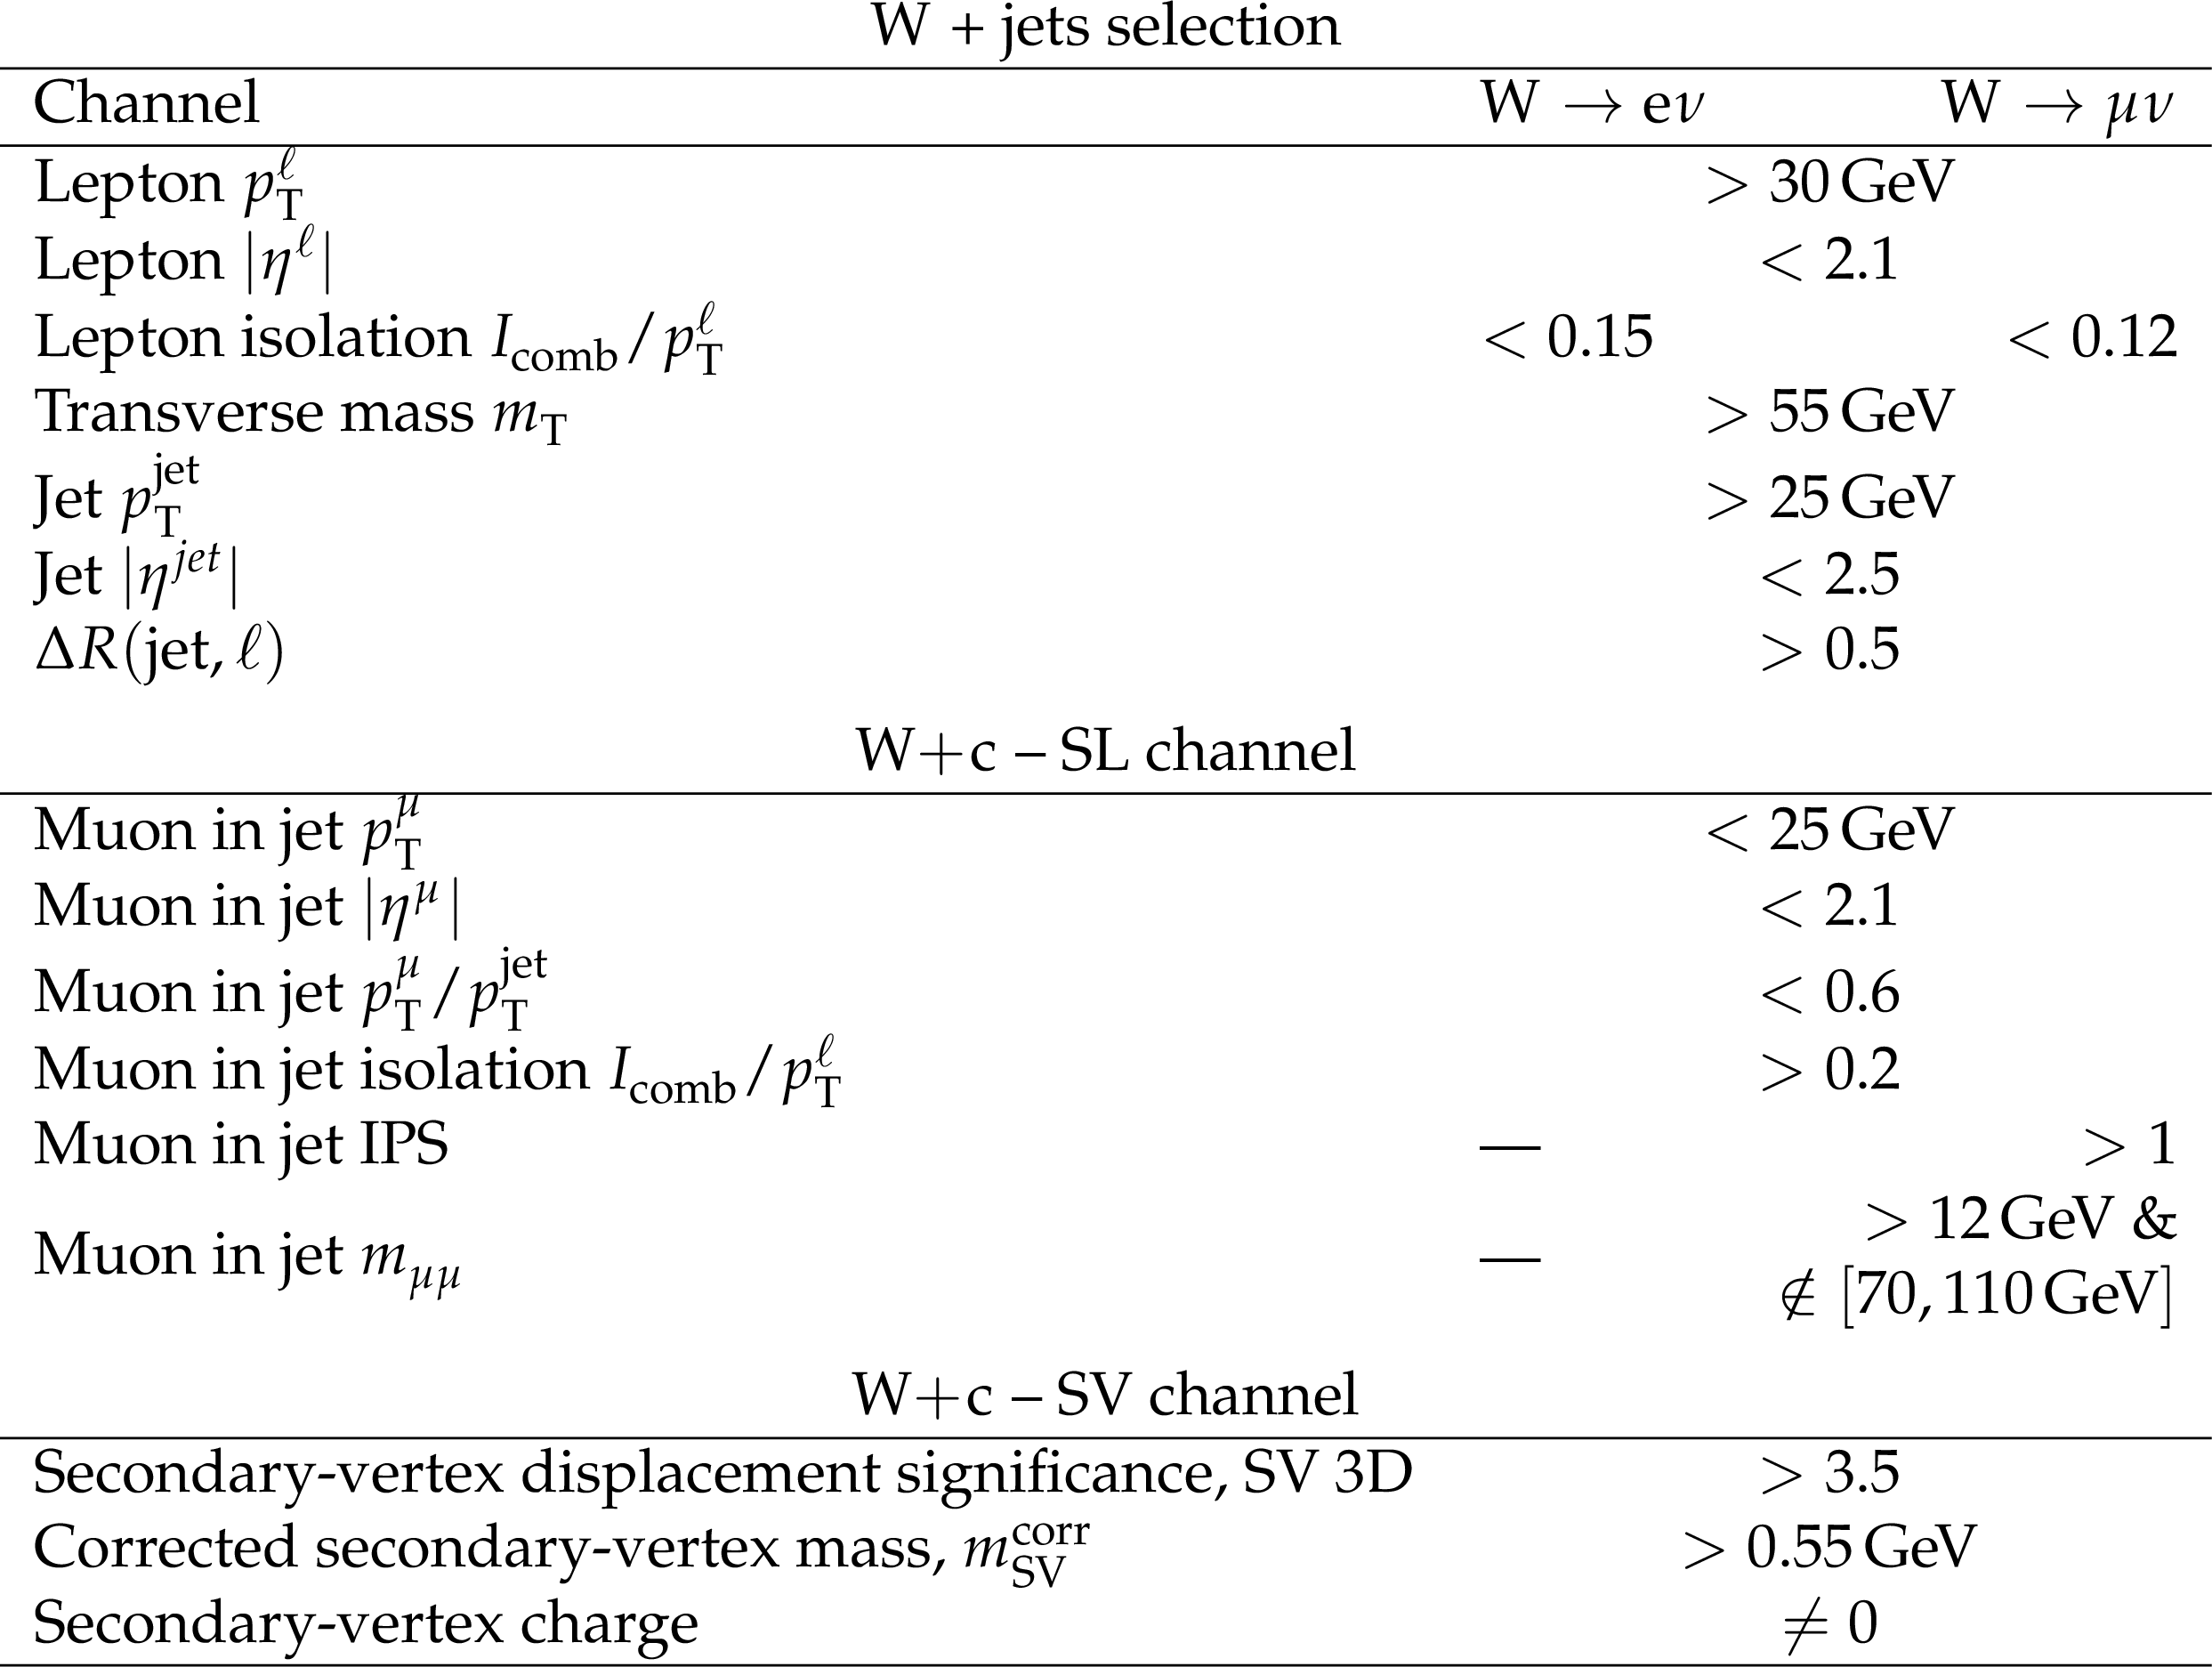
Table 1:
Summary of the selection requirements for the four analysis categories. |

png pdf |
Table 2:
Simulated flavour composition (in %) of the SL sample after the selection summarized in Table 1 and OS-SS subtraction, for the electron and muon decay channels of the W boson. $ \mathrm{W} + {\mathrm{Q} \overline{\mathrm{Q}} } $ is the sum of the contributions of $ \mathrm{W} + \mathrm{c}\overline{\mathrm{c}} $ and $ \mathrm{W} + \mathrm{b}\overline{\mathrm{b}} $; its negative value is an effect of the OS-SS subtraction. Quoted uncertainties are statistical only. |
png pdf |
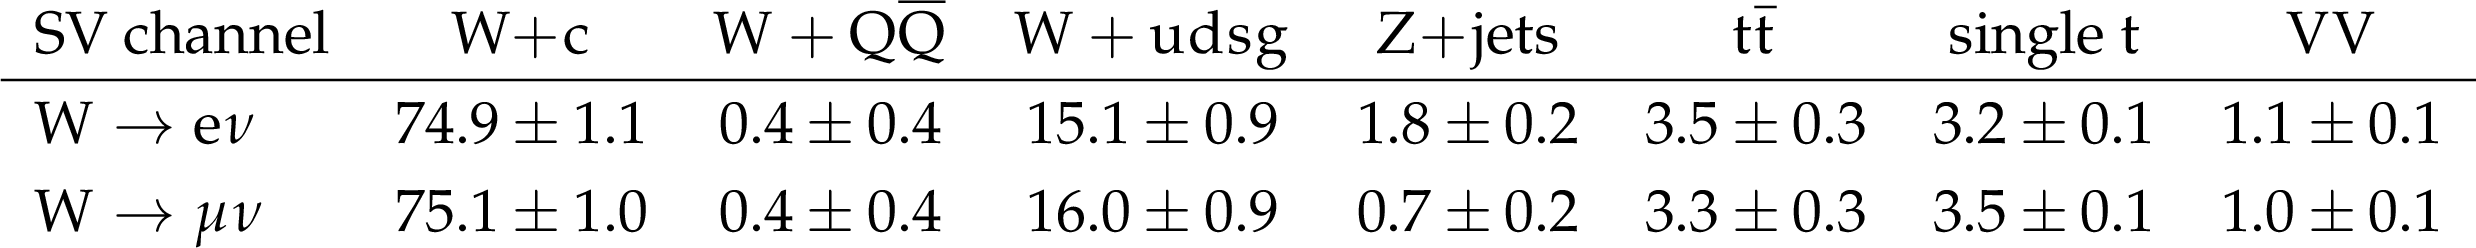
Table 3:
Simulated flavour composition (in %) of the SV sample after the selection summarized in Table 1, including OS-SS subtraction, for the electron and muon W boson decay channels. $ \mathrm{W} + {\mathrm{Q} \overline{\mathrm{Q}} } $ is the sum of the contributions of $ \mathrm{W} + \mathrm{c}\overline{\mathrm{c}} $ and $ \mathrm{W} + \mathrm{b}\overline{\mathrm{b}} $. Quoted uncertainties are statistical only. |
png pdf |
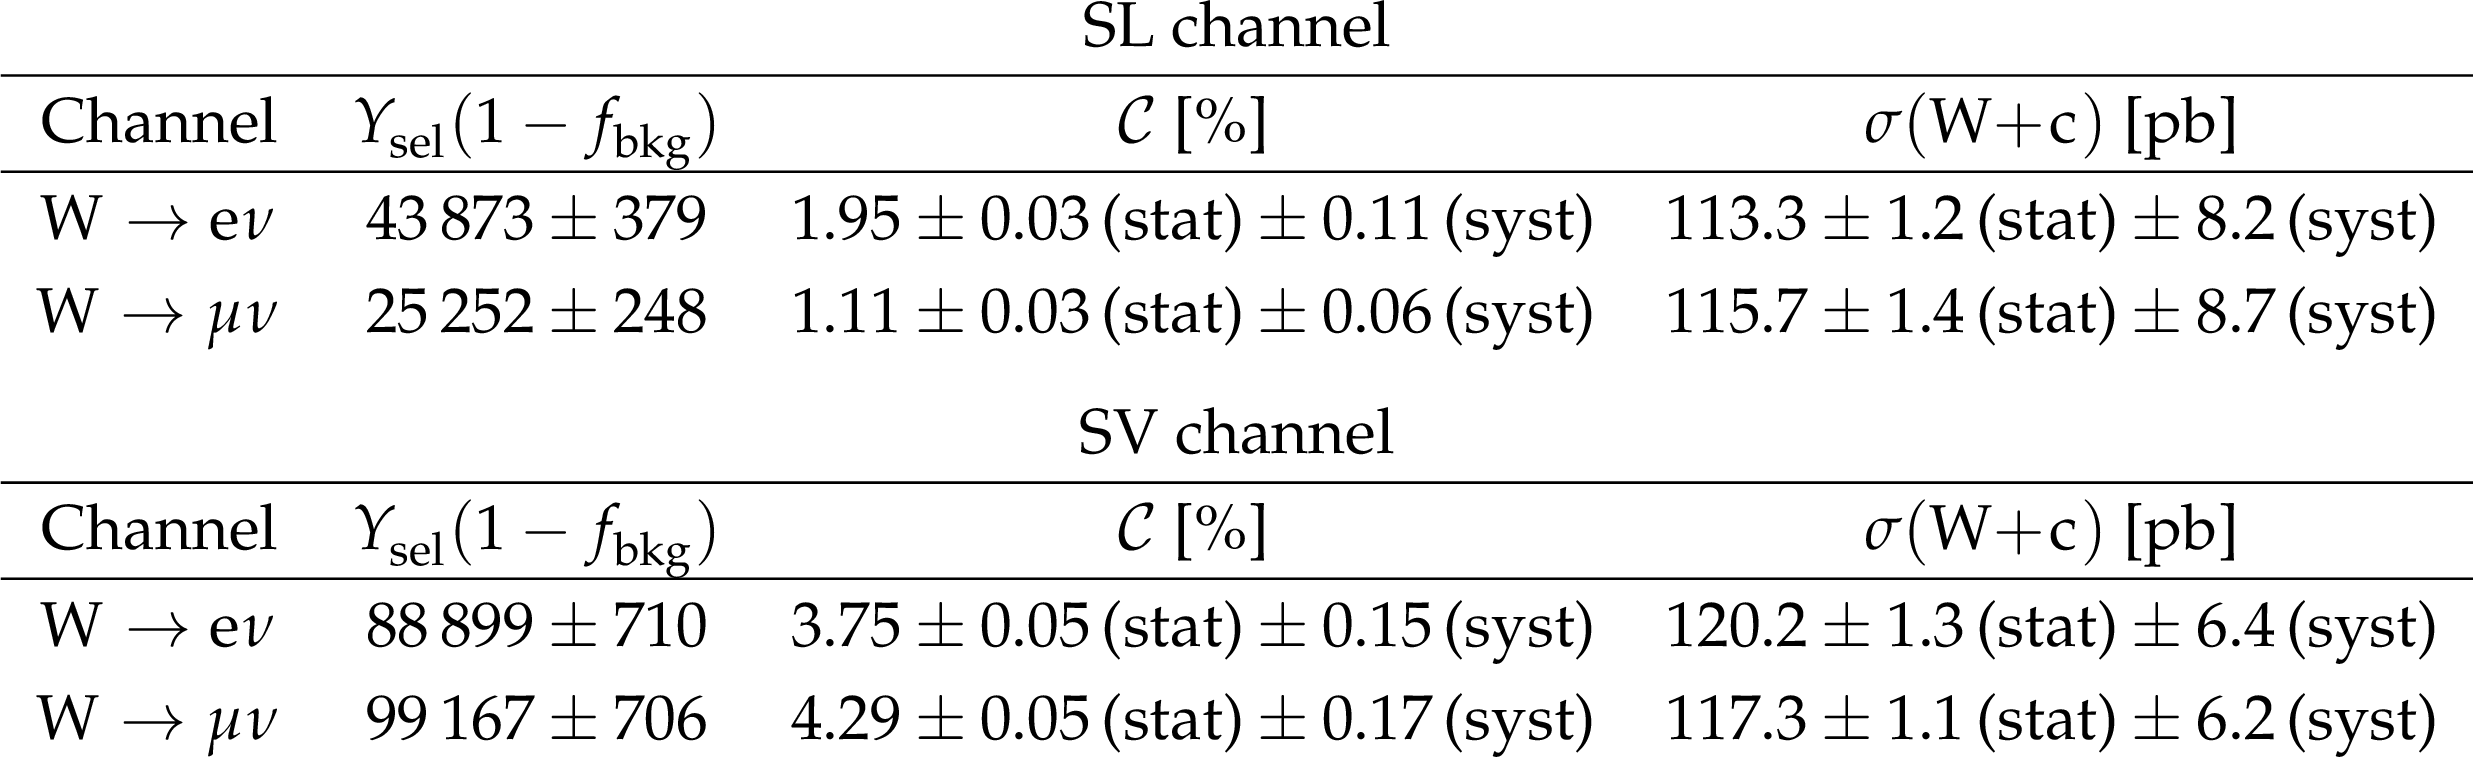
Table 4:
Results in the SL (upper) and SV (lower) channels for the $ \mathrm{W} \to \mathrm{e}\nu $ and $ \mathrm{W} \to \mu\nu $ decays separately. Here $ Y_{\text{sel}}(1-f_{\text{bkg}}) $ is the estimate for the signal event yield after background subtraction, $ \mathcal{C} $ is the acceptance times efficiency correction factor, and $ \sigma(\mathrm{W}\,\mathrm{c}) $ is the measured production cross section. |

png pdf |
Table 5:
Measured production cross sections $ \sigma(\mathrm{W^+}\,\overline{\mathrm{c}}) $, $ \sigma(\mathrm{W^-}\,\mathrm{c}) $, and their ratio, $ R_{\mathrm{c}}^{\pm} $, in the SL (upper) and SV (lower) channels for the electron and muon W boson decay modes. |
png pdf |
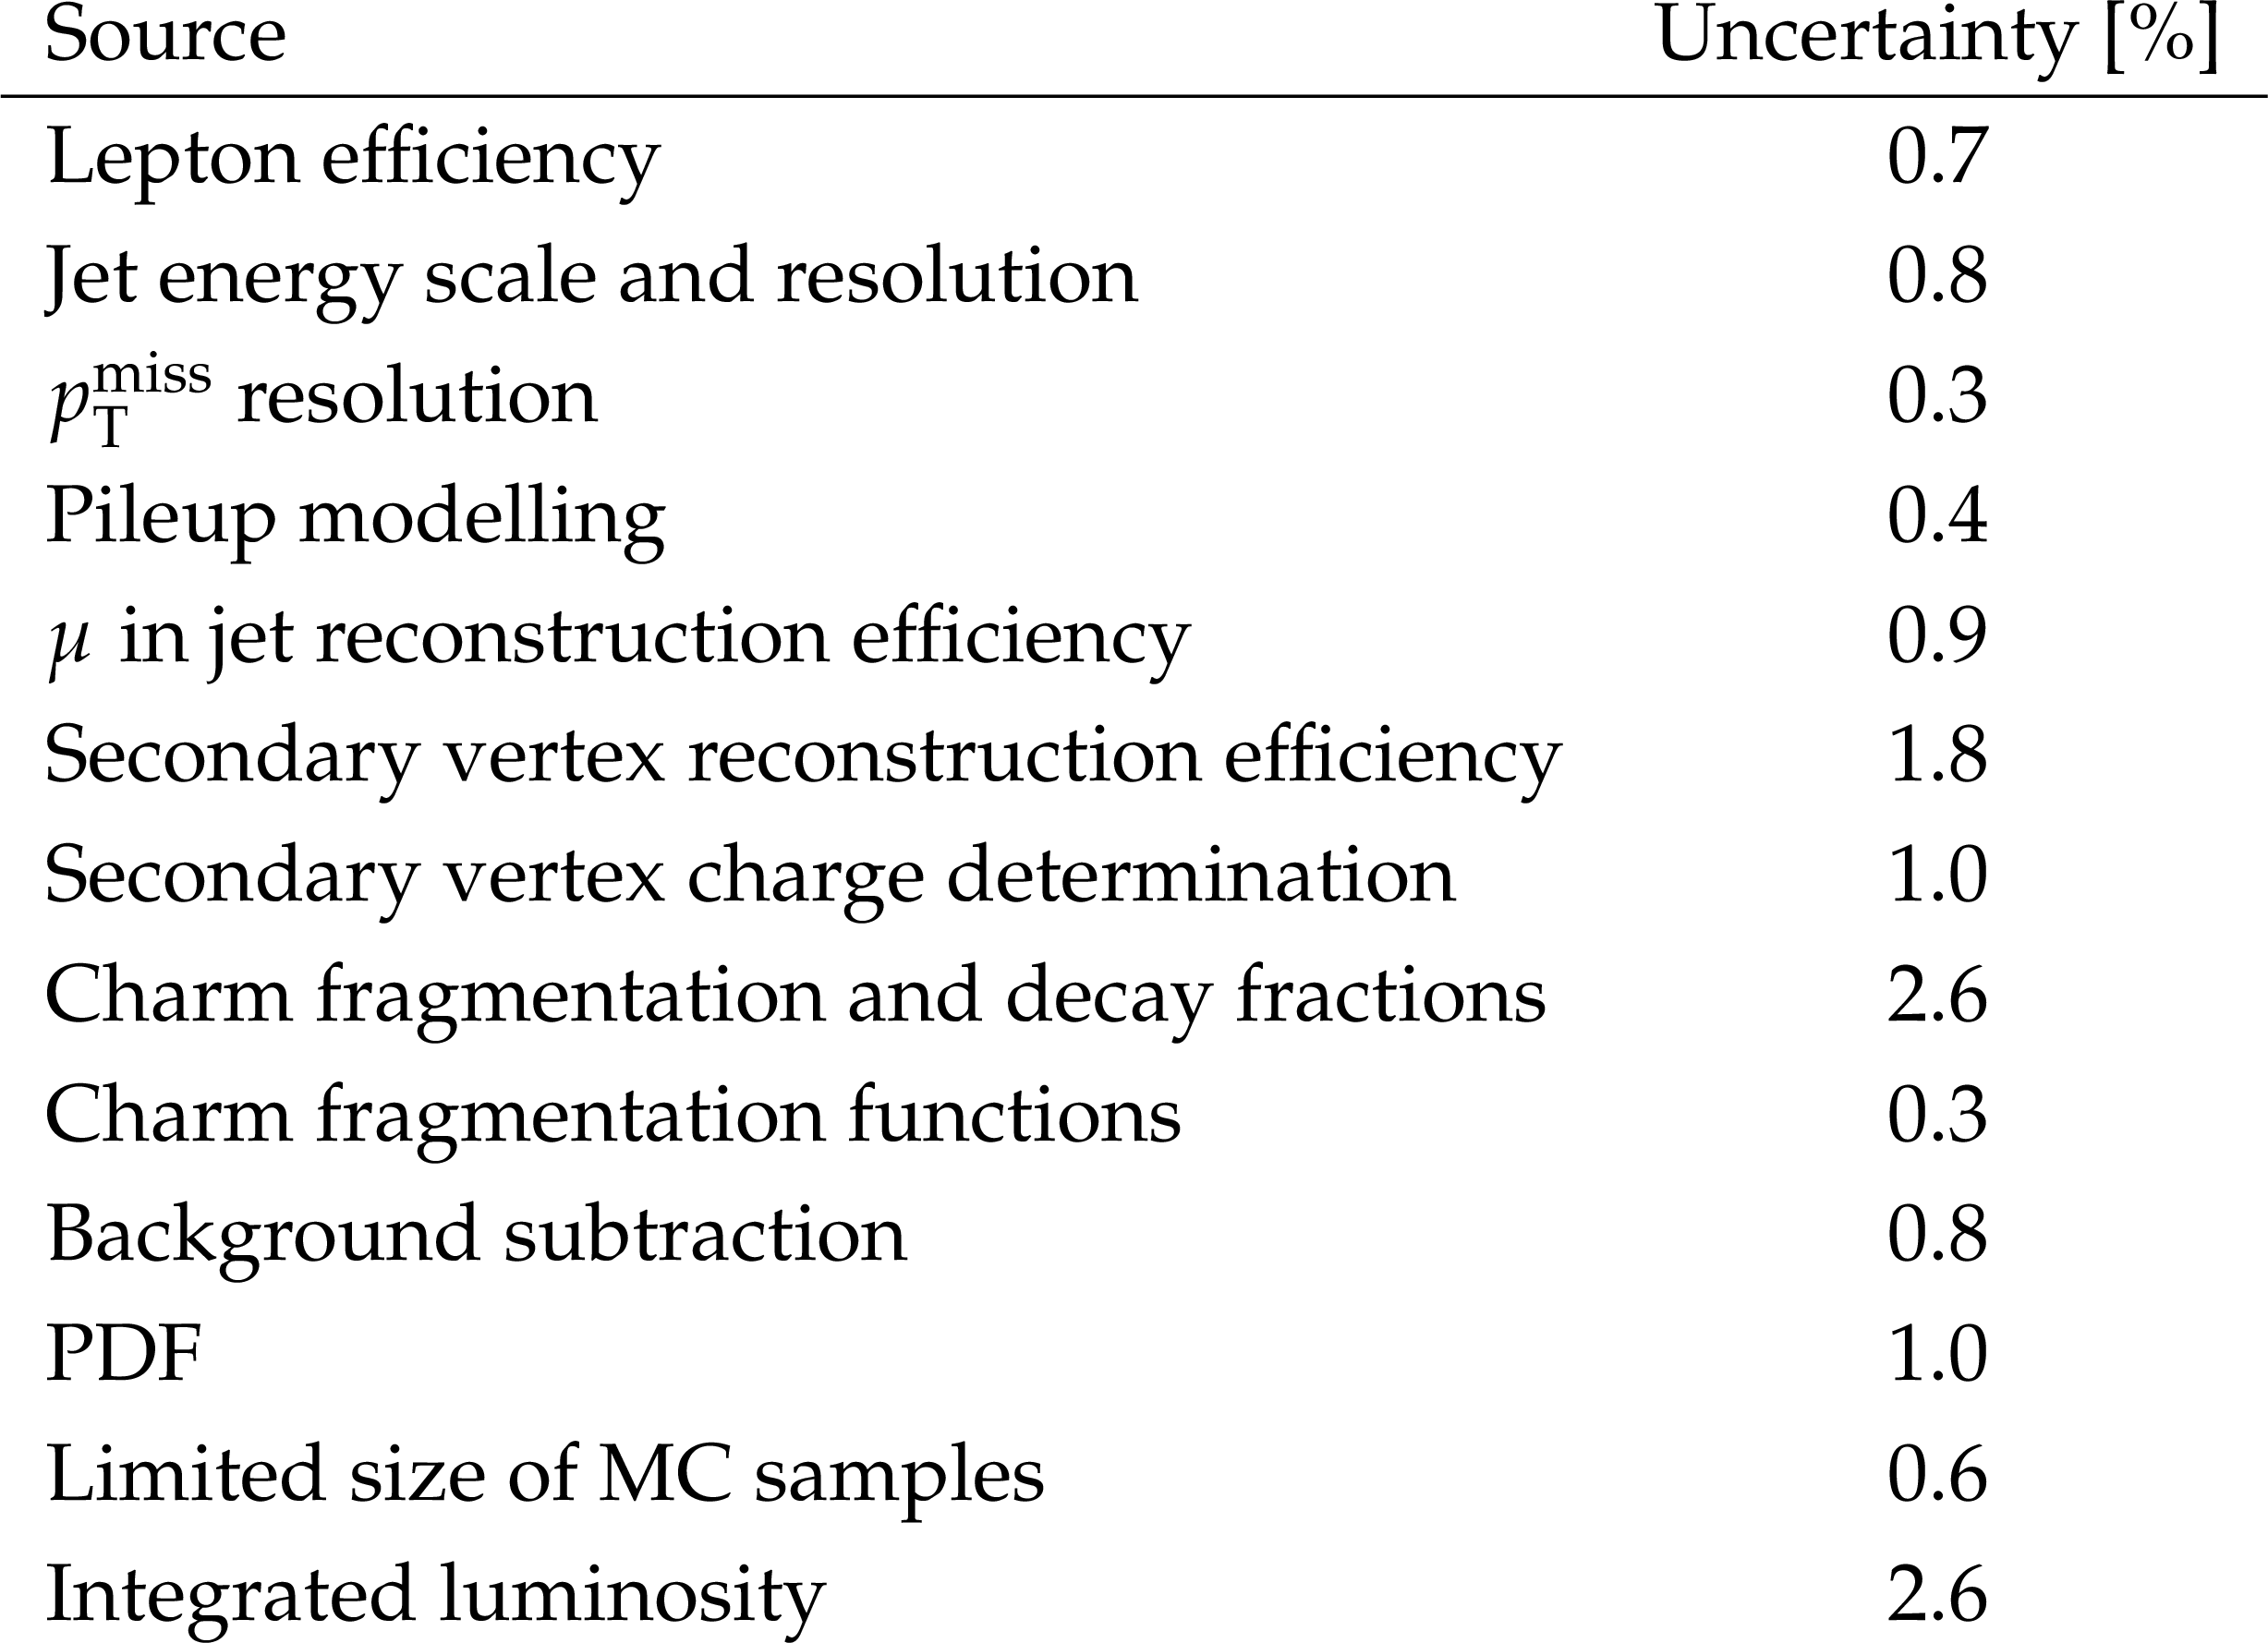
Table 6:
Impact of the sources of systematic uncertainty in the combined $ \sigma(\mathrm{W}\,\mathrm{c}) $ measurement. |
png pdf |
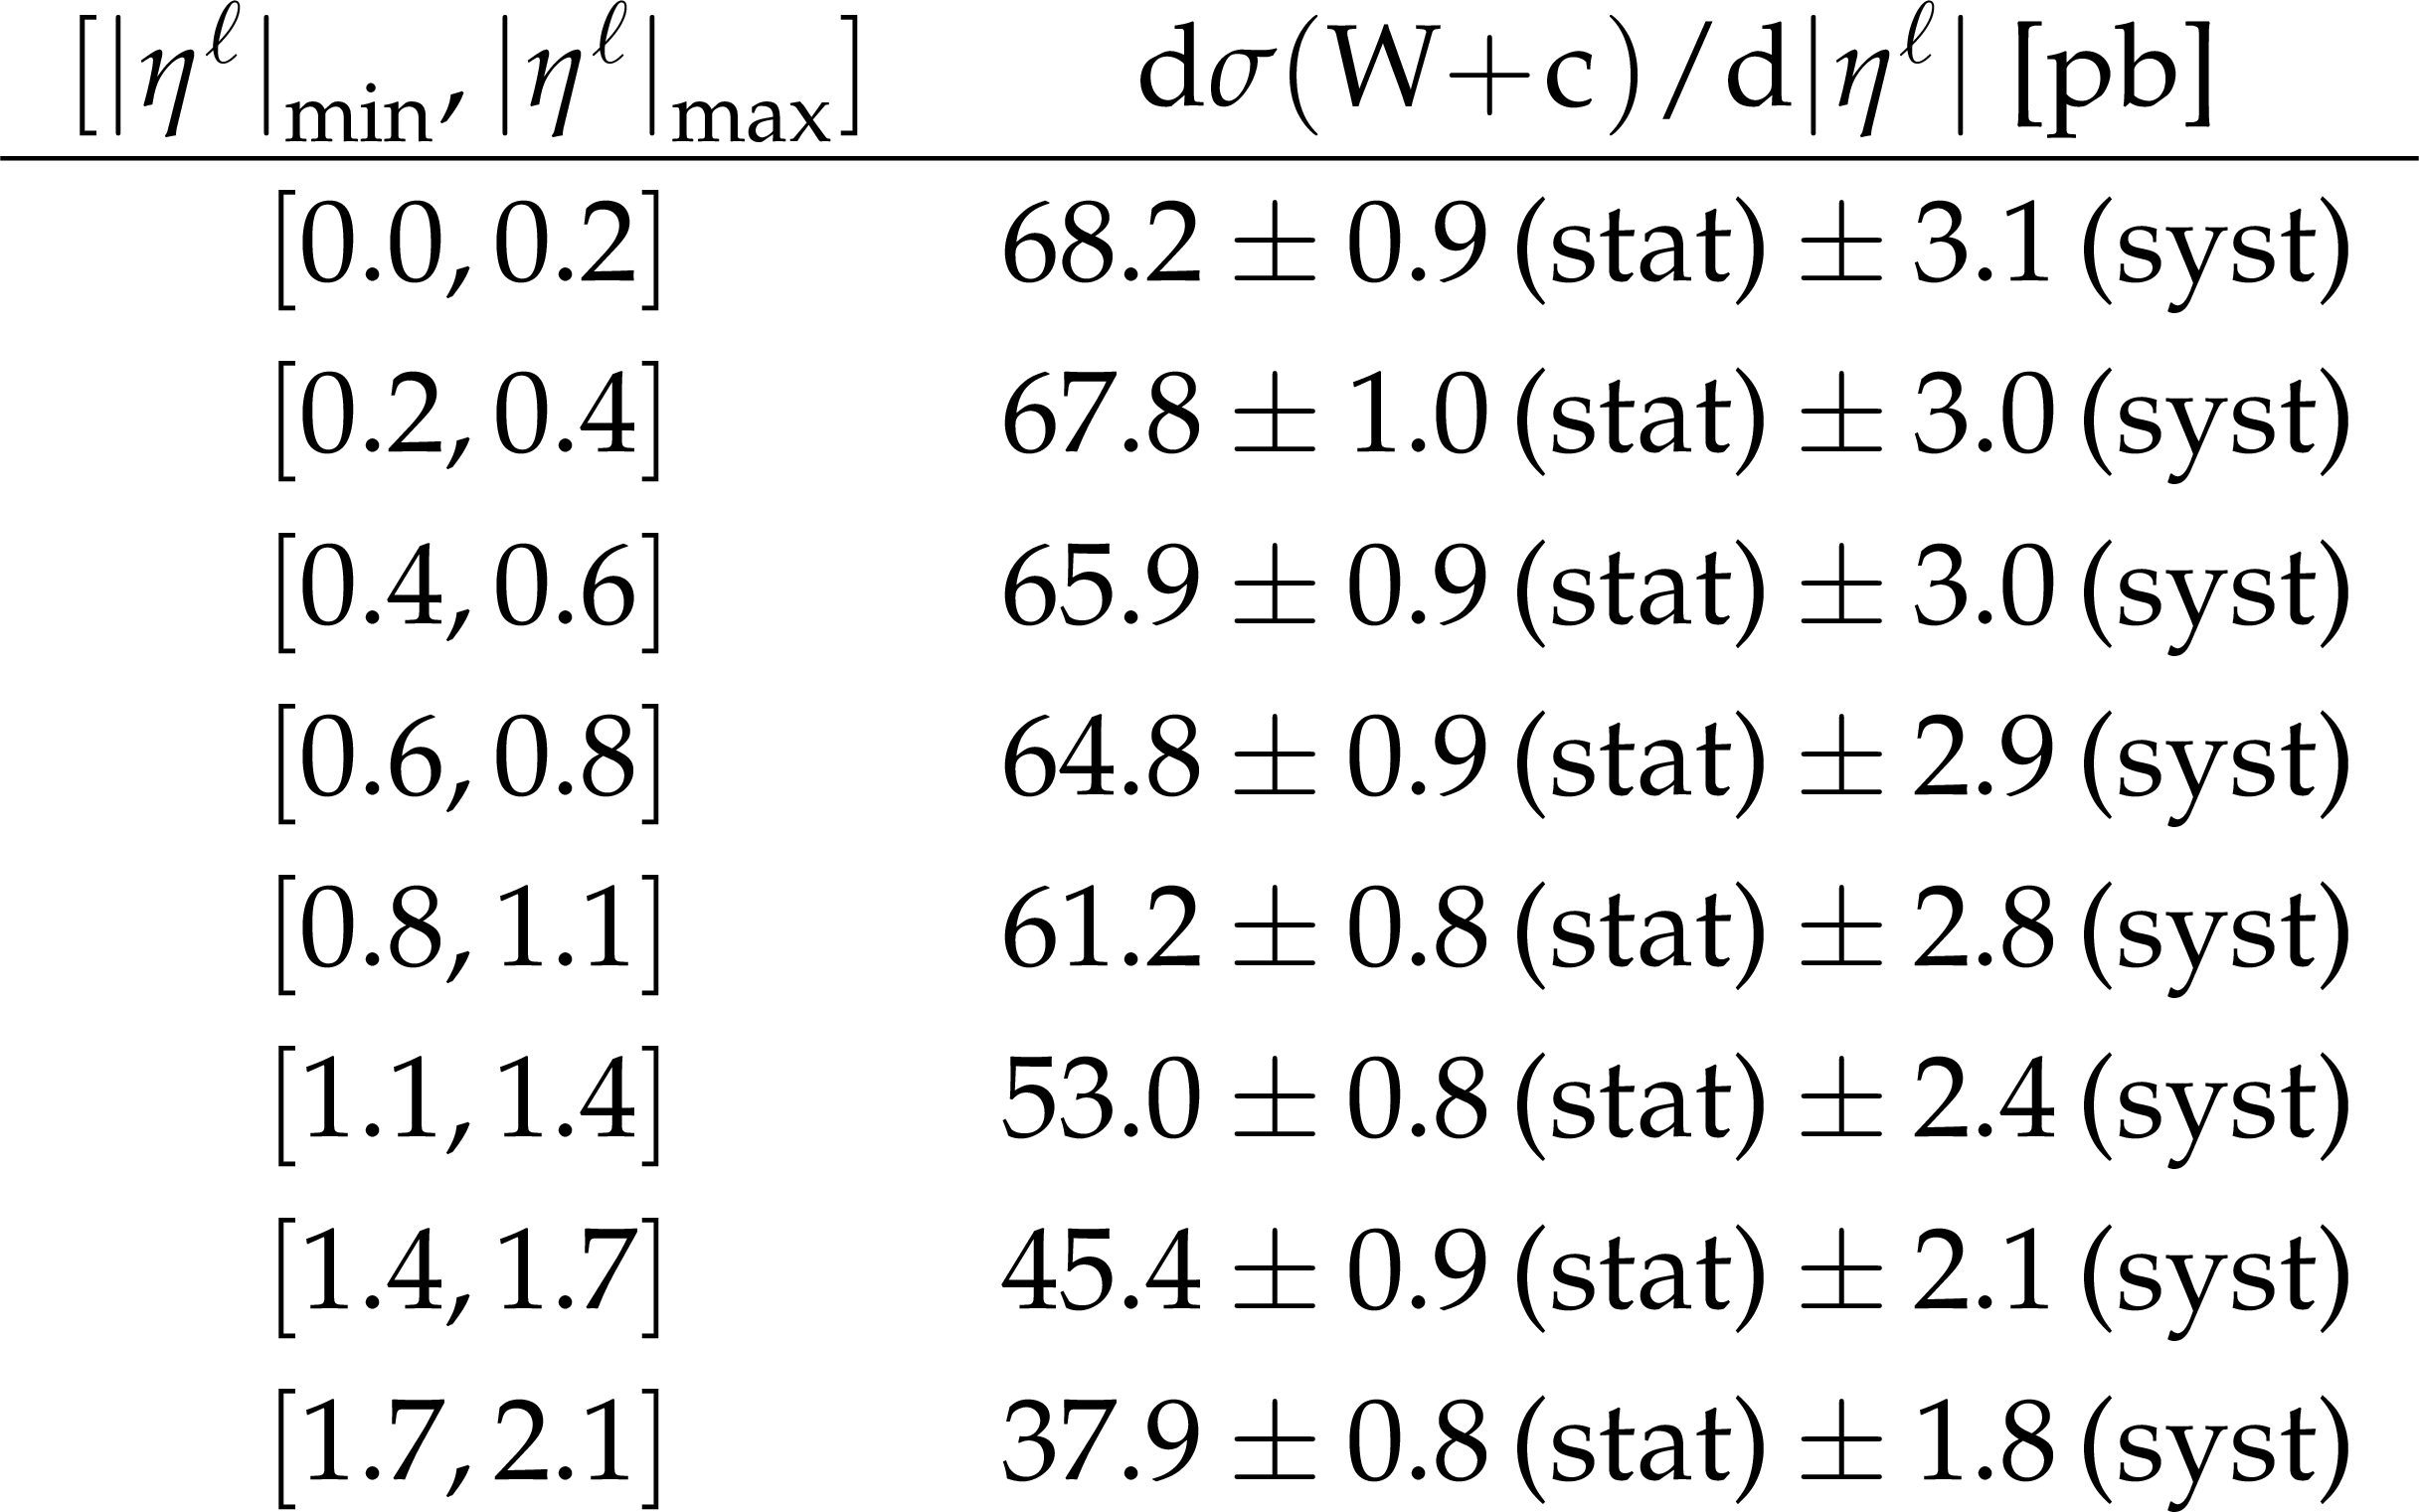
Table 7:
Measured differential cross section as a function of $ |\eta^{\ell}| $, $ \mathrm{d}\sigma(\mathrm{W}\,\mathrm{c})/\mathrm{d}|\eta^\ell| $ from the combination of all four channels. |
png pdf |
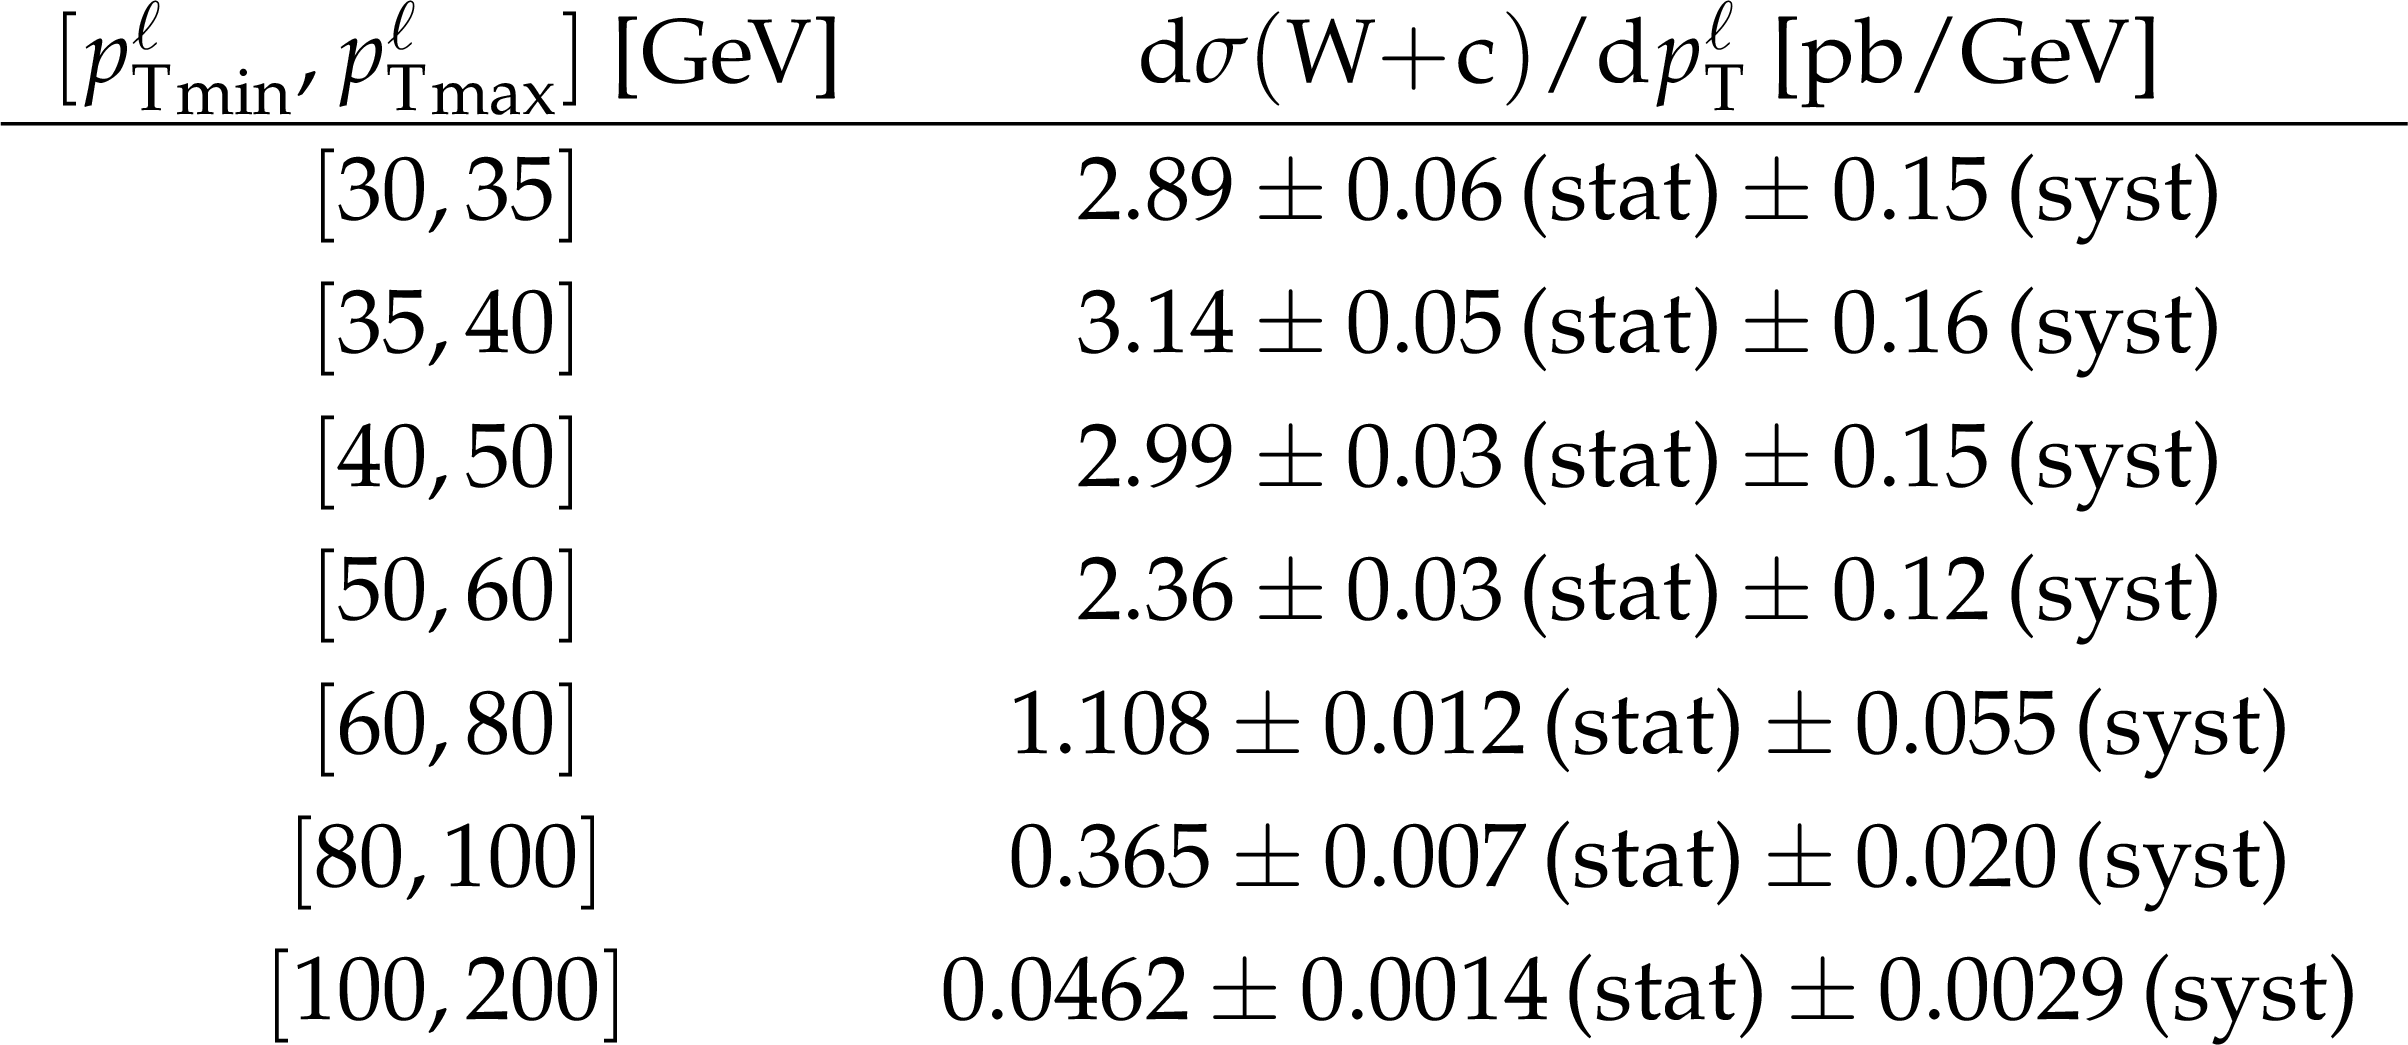
Table 8:
Measured differential cross section as a function of $ p_{\mathrm{T}}^{\ell} $, $ \mathrm{d}\sigma(\mathrm{W}\,\mathrm{c})/\mathrm{d}{p_{\mathrm{T}}^\ell} $ from the combination of all four channels. |
png pdf |
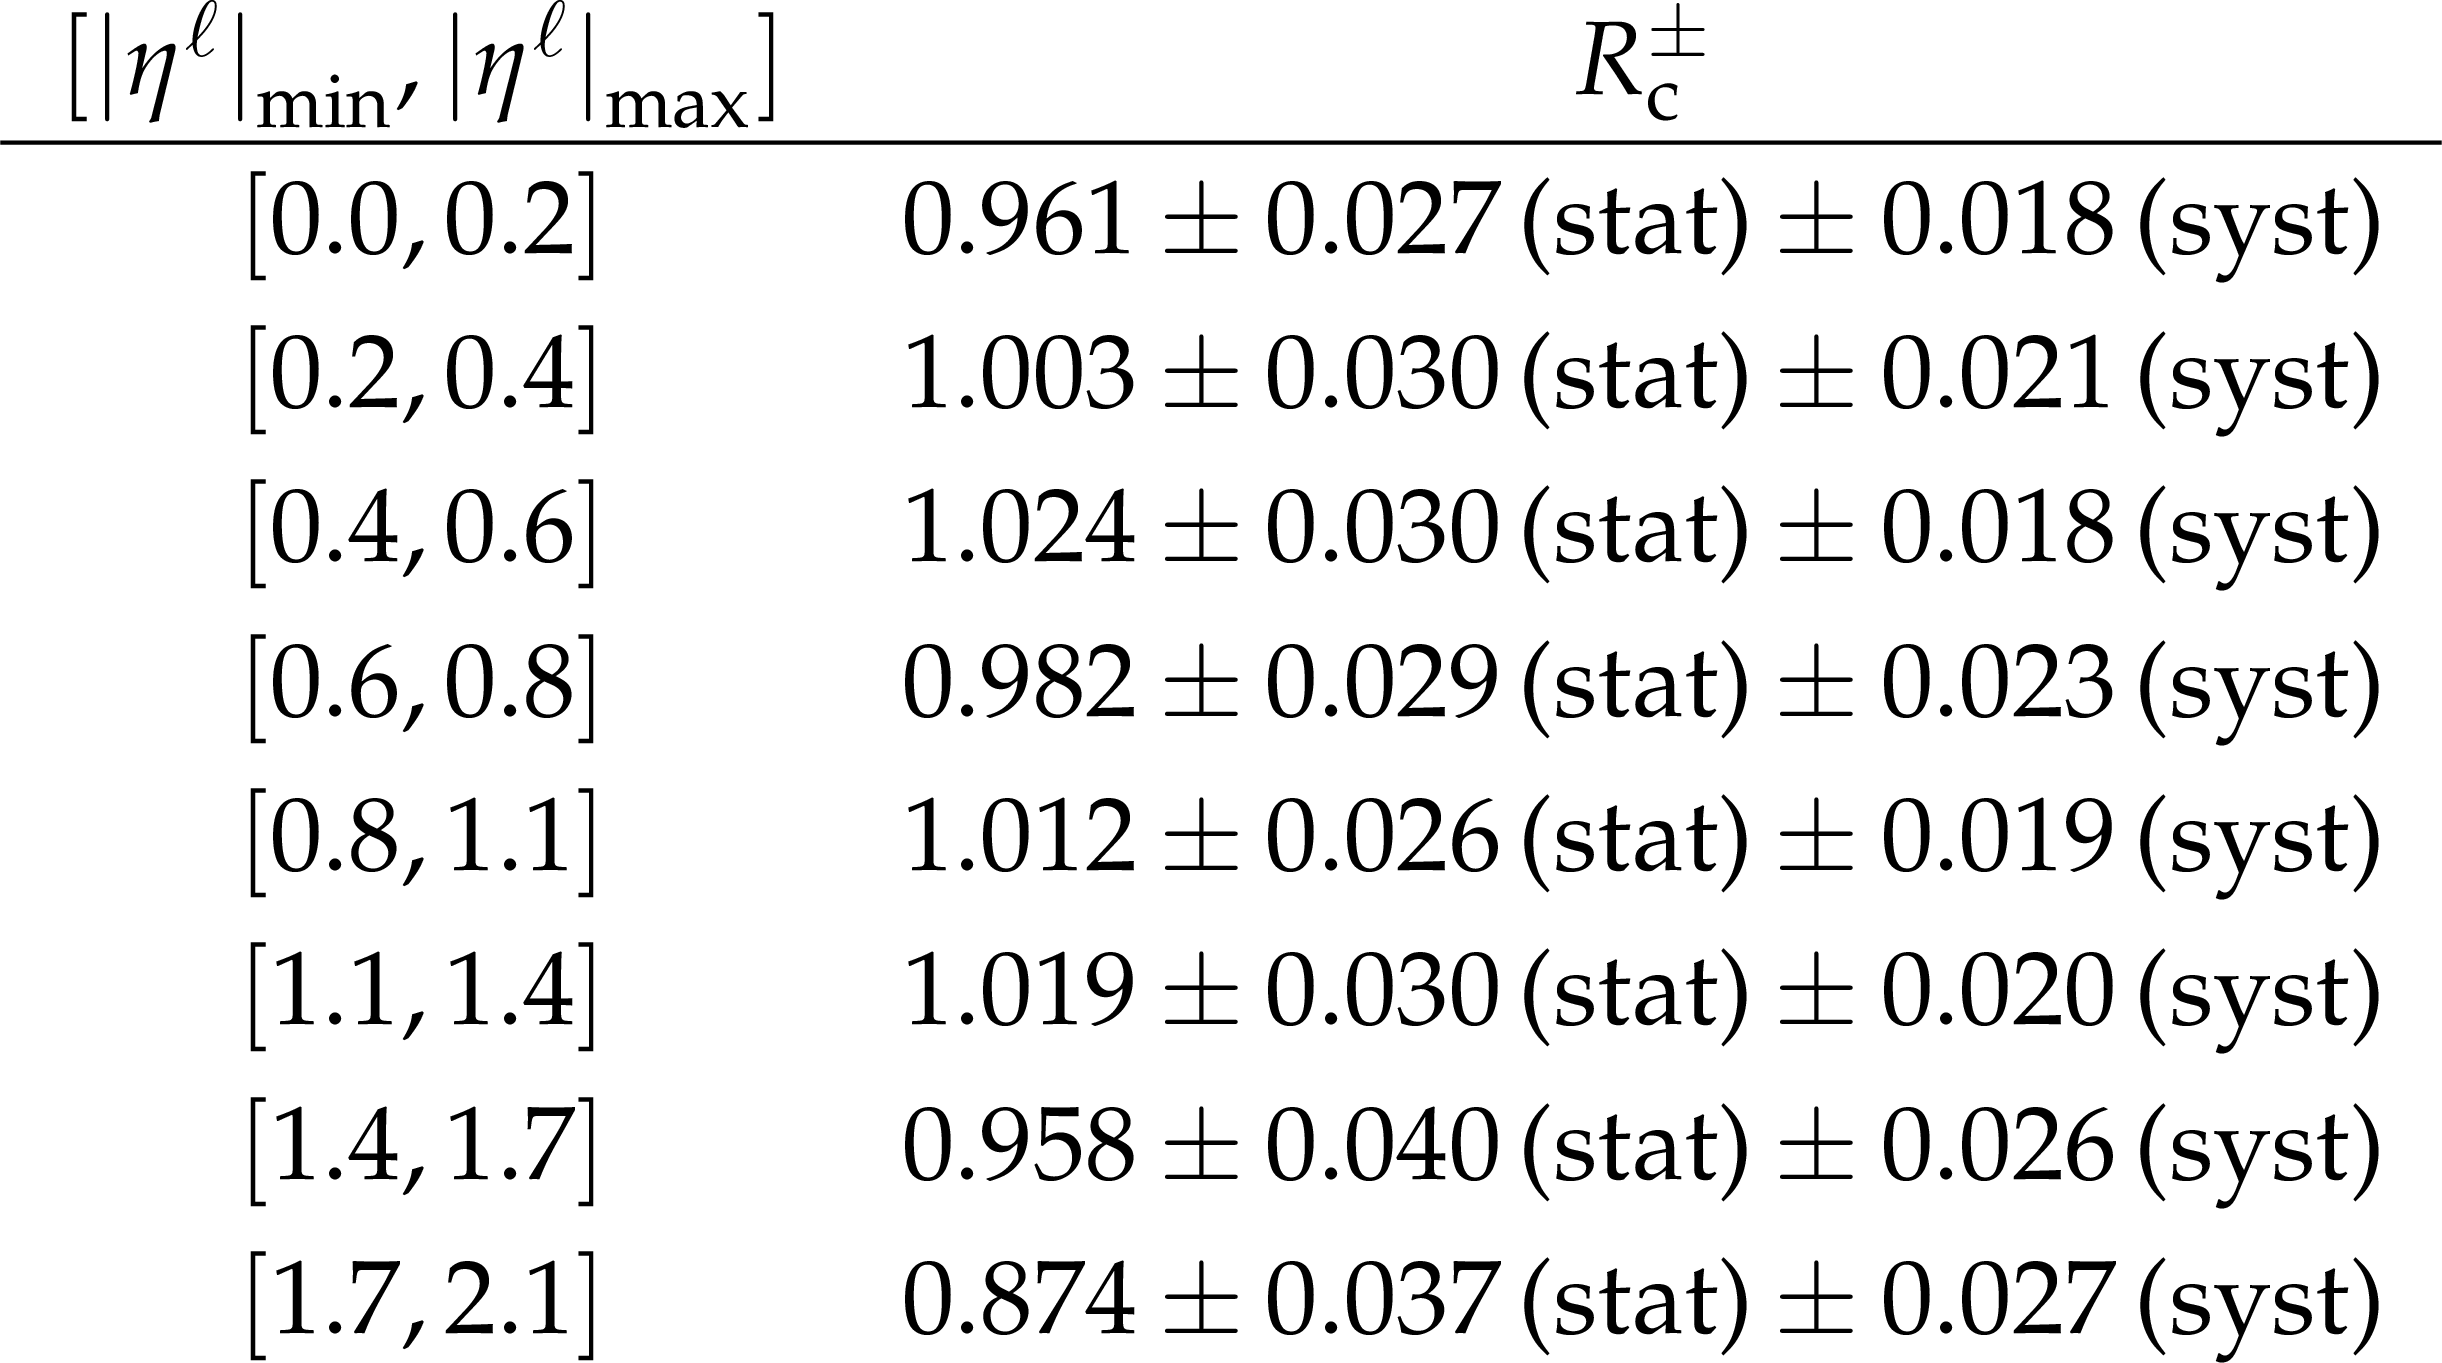
Table 9:
Measured cross section ratio $ R_{\mathrm{c}}^{\pm} $ as a function of $ |\eta^{\ell}| $, from the combination of all four channels. |
png pdf |
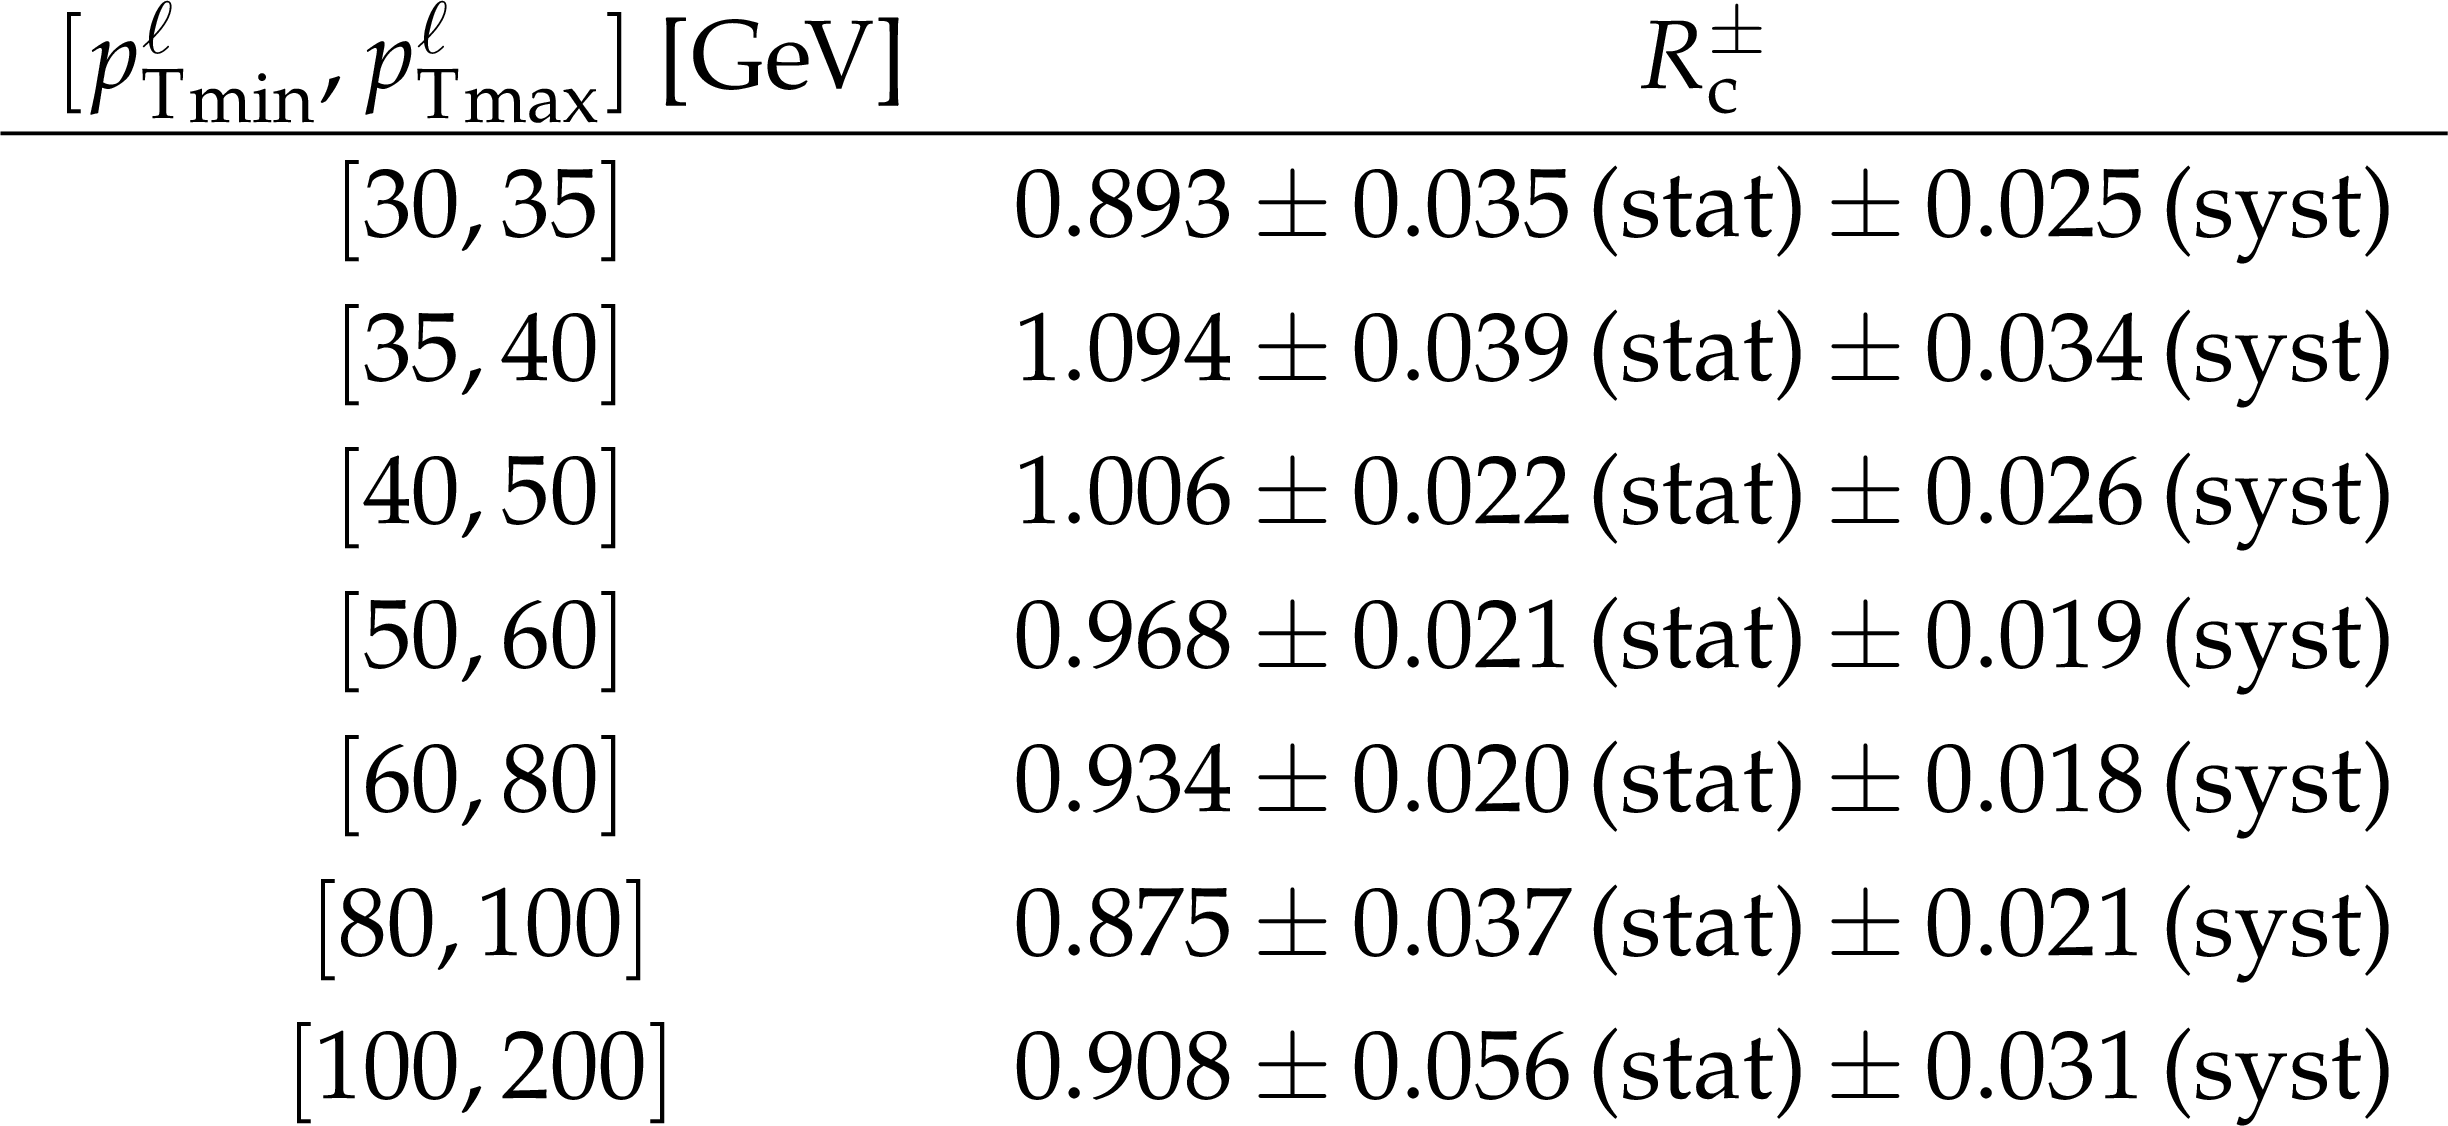
Table 10:
Measured cross section ratio $ R_{\mathrm{c}}^{\pm} $ as a function of $ p_{\mathrm{T}}^{\ell} $, from the combination of all four channels. |
png pdf |
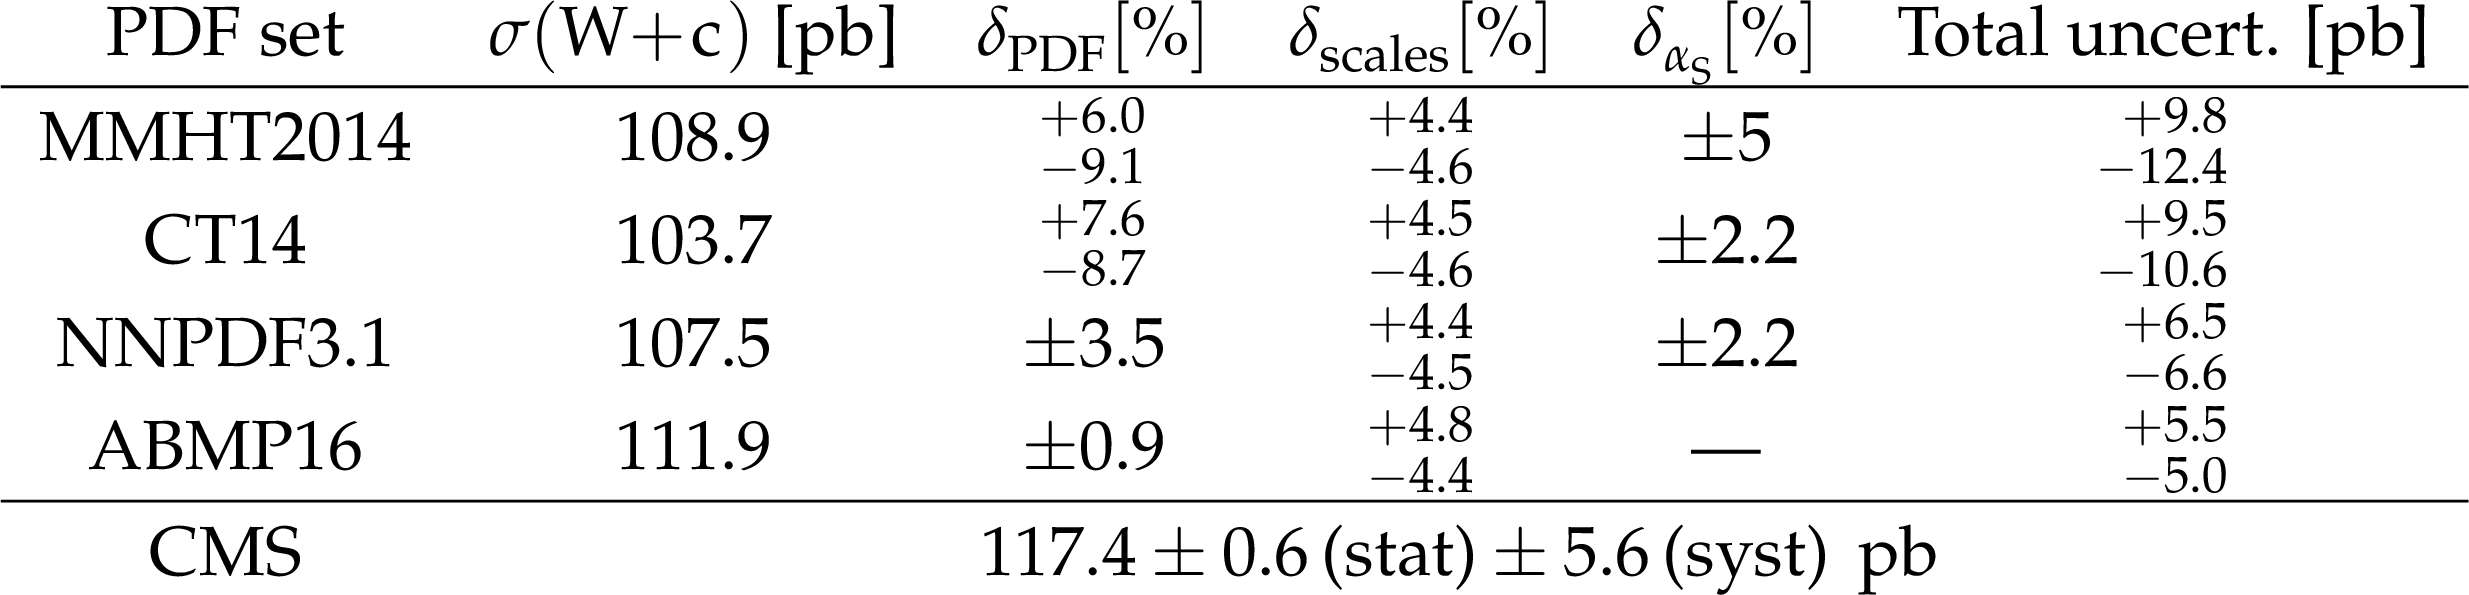
Table 11:
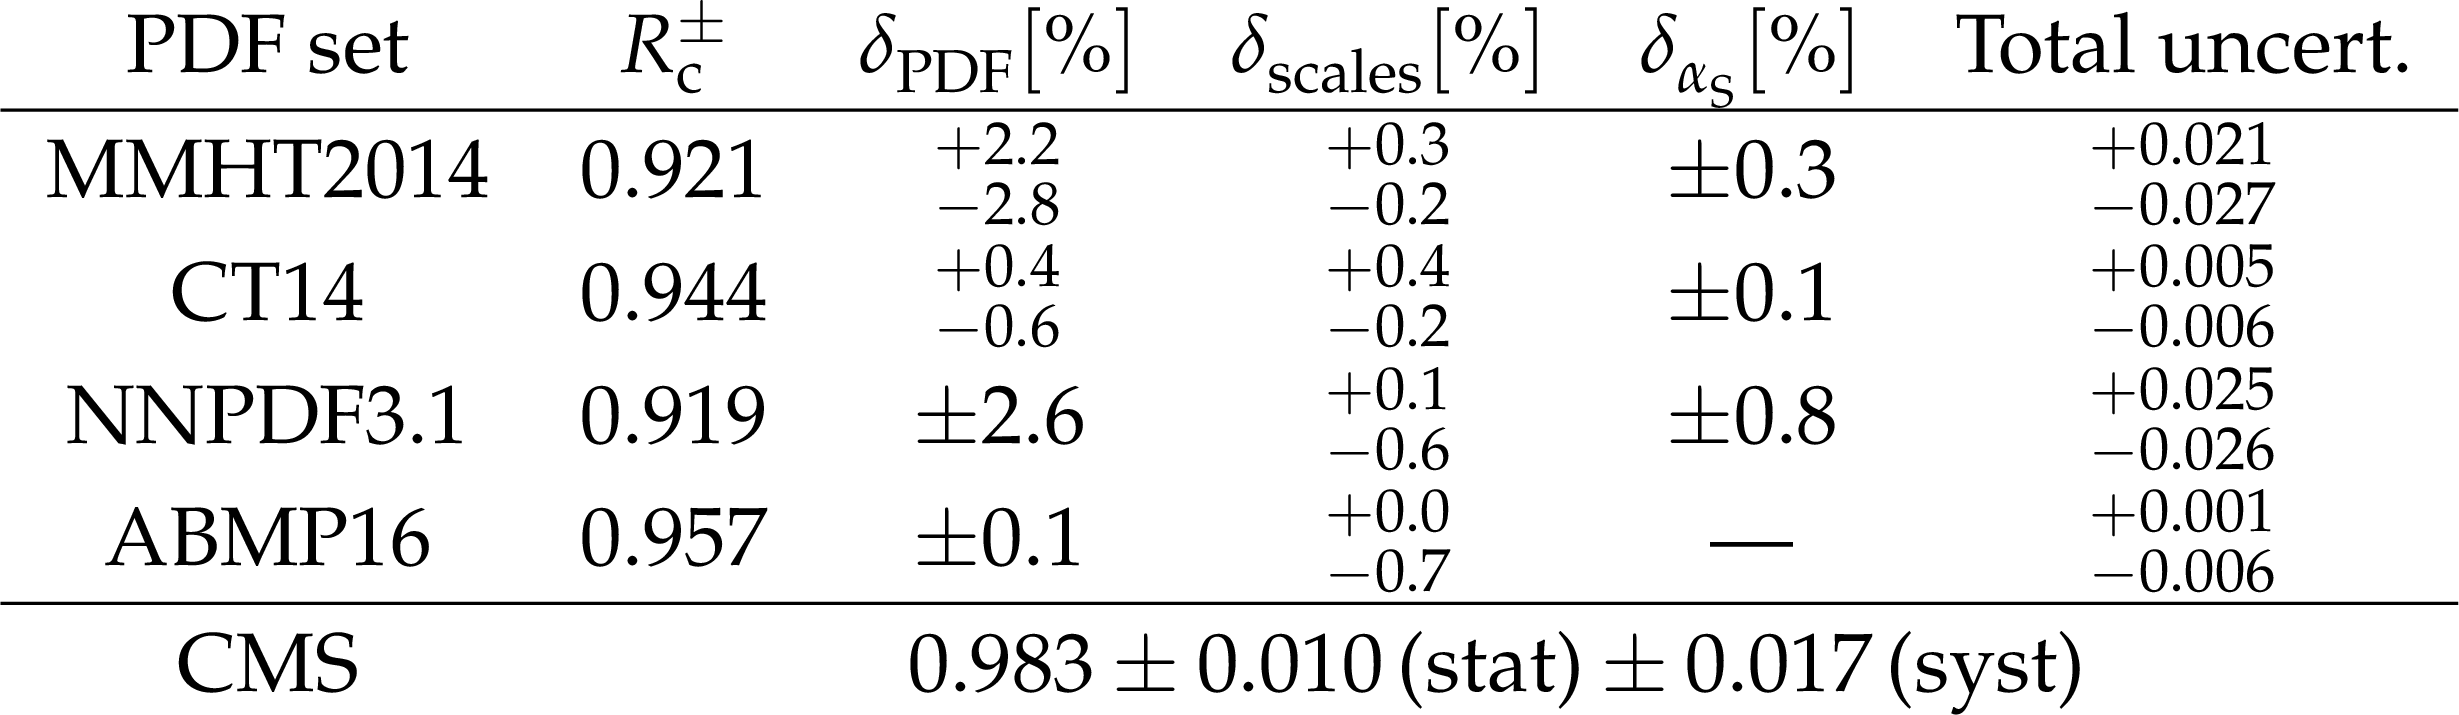
Theoretical predictions for $ \sigma(\mathrm{W}\,\mathrm{c}) $ from MCFM at NLO. The kinematic selection follows the fiducial phase space definition: $ p_{\mathrm{T}}^{\ell} > $ 30 GeV, $ |\eta^{\ell}| < $ 2.1, $ p_{\mathrm{T}}^{\mathrm{c}} > $ 25 GeV, $ |\eta^{\mathrm{c}}| < $ 2.5, and $ \Delta R(\mathrm{c},\ell) > $ 0.5. For each PDF set, the central value of the prediction is given, together with the relative uncertainty as prescribed from the PDF set, and the uncertainties associated with the scale variations and with the value of $ \alpha_\mathrm{S} $. The total uncertainty is given in the last column. The last row in the table gives the experimental results presented in this paper. |
png pdf |
Table 12:
Theoretical predictions for $ R_{\mathrm{c}}^{\pm} $ calculated with MCFM at NLO. The kinematic selection follows the experimental requirements: $ p_{\mathrm{T}}^{\ell} > $ 30 GeV, $ |\eta^{\ell}| < $ 2.1, $ p_{\mathrm{T}}^{\mathrm{c}} > $ 25 GeV, $ |\eta^{\mathrm{c}}| < $ 2.5, and $ \Delta R(\mathrm{c},\ell) > $ 0.5. For each PDF set, the central value of the prediction is given, together with the relative uncertainty as prescribed from the PDF set, and the uncertainties associated with the scale variations and with the value of $ \alpha_\mathrm{S} $. The total uncertainty is given in the last column. The last row in the table gives the experimental results presented in this paper. |
png pdf |
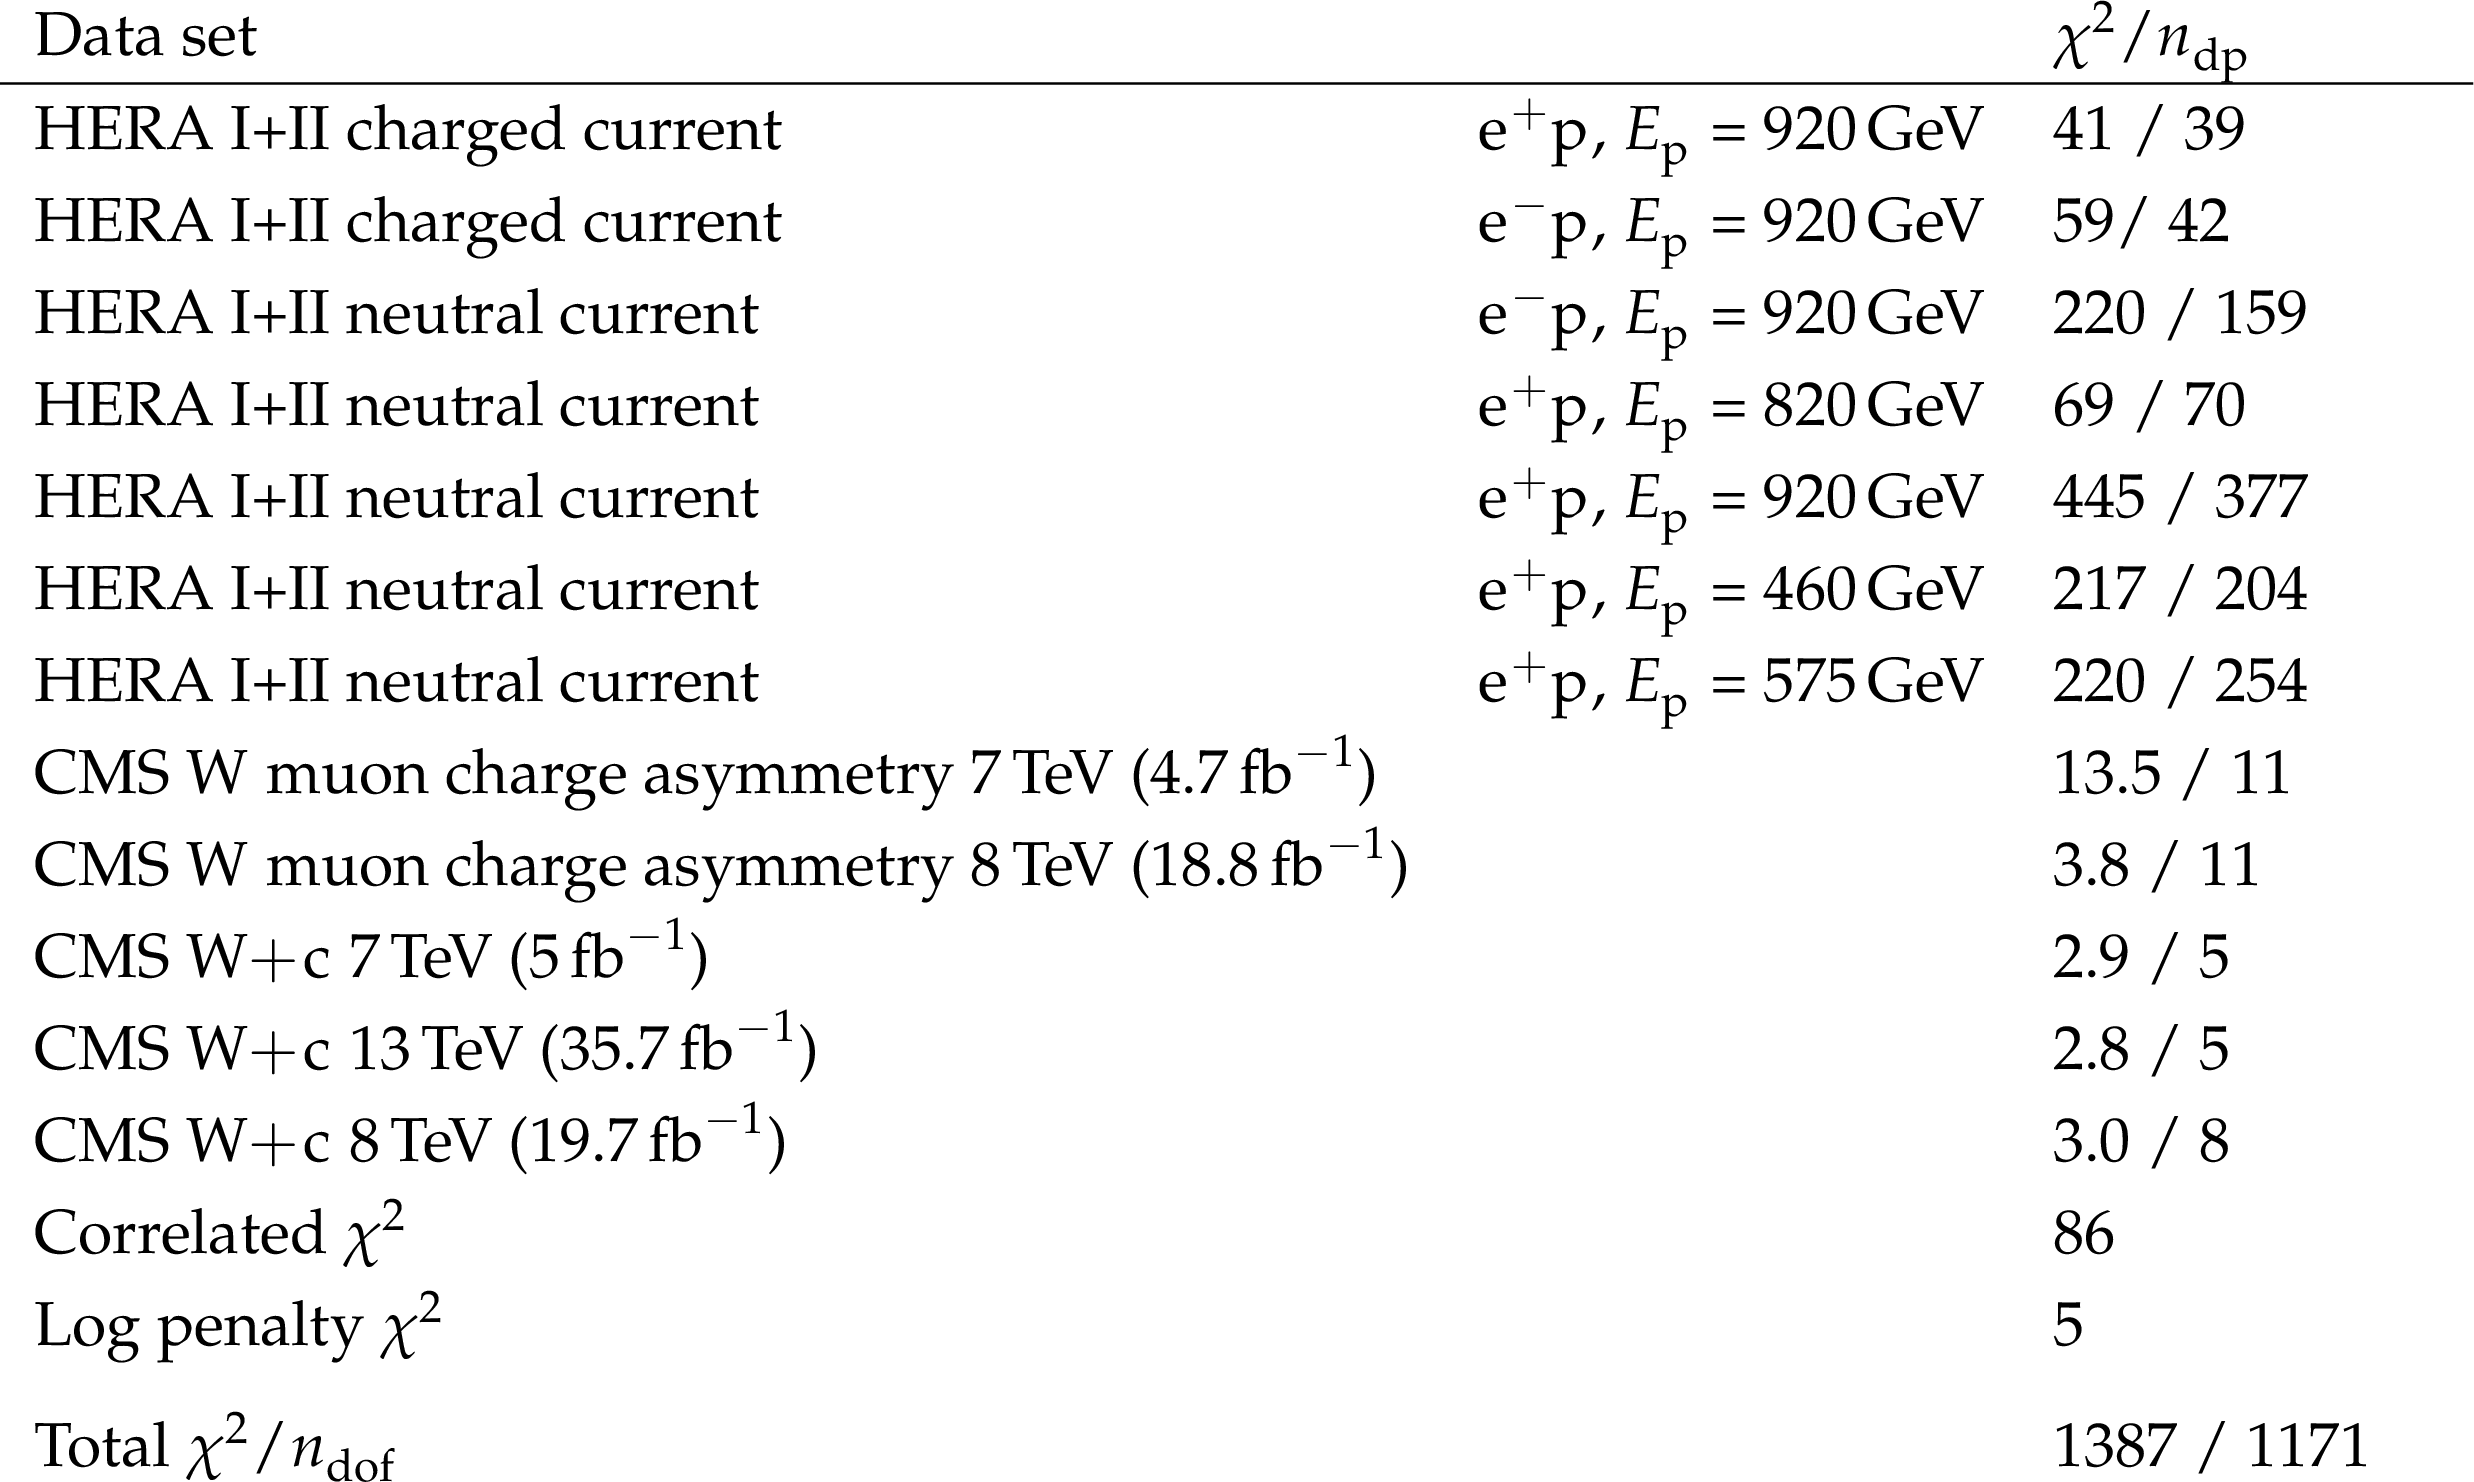
Table 13:
The partial $ \chi^2 $ per number of data points, $ n_{\mathrm{dp}} $, and the global $ \chi^2 $ per number of degrees of freedom, $ n_{\mathrm{dof}} $, resulting from the PDF fit. |
| Summary |
| The associated production of a W boson with a charm quark ($ \mathrm{W}\,\mathrm{c} $) in proton-proton (pp) collisions at a centre-of-mass energy of 8 TeV is studied with a data sample collected by the CMS experiment corresponding to an integrated luminosity of 19.7 fb$ ^{-1} $. The $ \mathrm{W}\,\mathrm{c} $ process is selected based on the presence of a high transverse momentum lepton (electron or muon) coming from a W boson decay and a charm hadron decay. Charm hadron decays are identified either by the presence of a muon inside a jet or by reconstructing a secondary decay vertex within a jet. Inclusive and differential fiducial cross section measurements are performed with four different data samples (electron and muon W boson decay channels and reconstruction of semileptonic and inclusive decays of charm hadrons). Cross section measurements are unfolded to the parton level. The ratio of the cross sections of $ \mathrm{W^+}\,\overline{\mathrm{c}} $ and $ \mathrm{W^-}\,\mathrm{c} $ is also measured. The results from the four different channels are consistent and are combined. <\b><\b>The measurements are compared with the predictions of the MADGRAPH MC simulation normalized to the NNLO cross section prediction of inclusive W production from FEWZ. They are consistent within uncertainties. The measurements are also compared with analytical NLO calculations from the MCFM program using different NLO PDF sets. A fair agreement is seen in the differential cross section as a function of the absolute value of the pseudorapidity of the lepton from the W boson. Differences of $ {\sim}10% $ occur in the differential cross section as a function of the transverse momentum of the lepton in the 30--50 GeV range. The combined measurement of the $ \mathrm{W}\,\mathrm{c} $ production cross section as a function of the absolute value of the pseudorapidity of the lepton from the W boson decay is used in a QCD analysis at NLO, together with inclusive deep inelastic scattering measurements from HERA and earlier results from CMS on $ \mathrm{W}\,\mathrm{c} $ production and the lepton charge asymmetry in W boson production. The strange quark distribution $ x\mathrm{s}(x,\mu_f^2) $ and the strangeness suppression factor $ R_{\mathrm{s}}(x,\mu_f^2) $ = $ (\mathrm{s}+\overline{\mathrm{s}})/(\overline{\mathrm{u}}+\overline{\mathrm{d}}) $ are determined and agree with other NLO PDF sets such as ABMP16 [69], NNPDF3.1 [68], CT18 [90], and MSHT20 [91]. The inclusion of the present results further constrains the strange quark distribution and the strangeness suppression factor. |
| Additional Figures | |
png pdf |
Additional Figure 1:
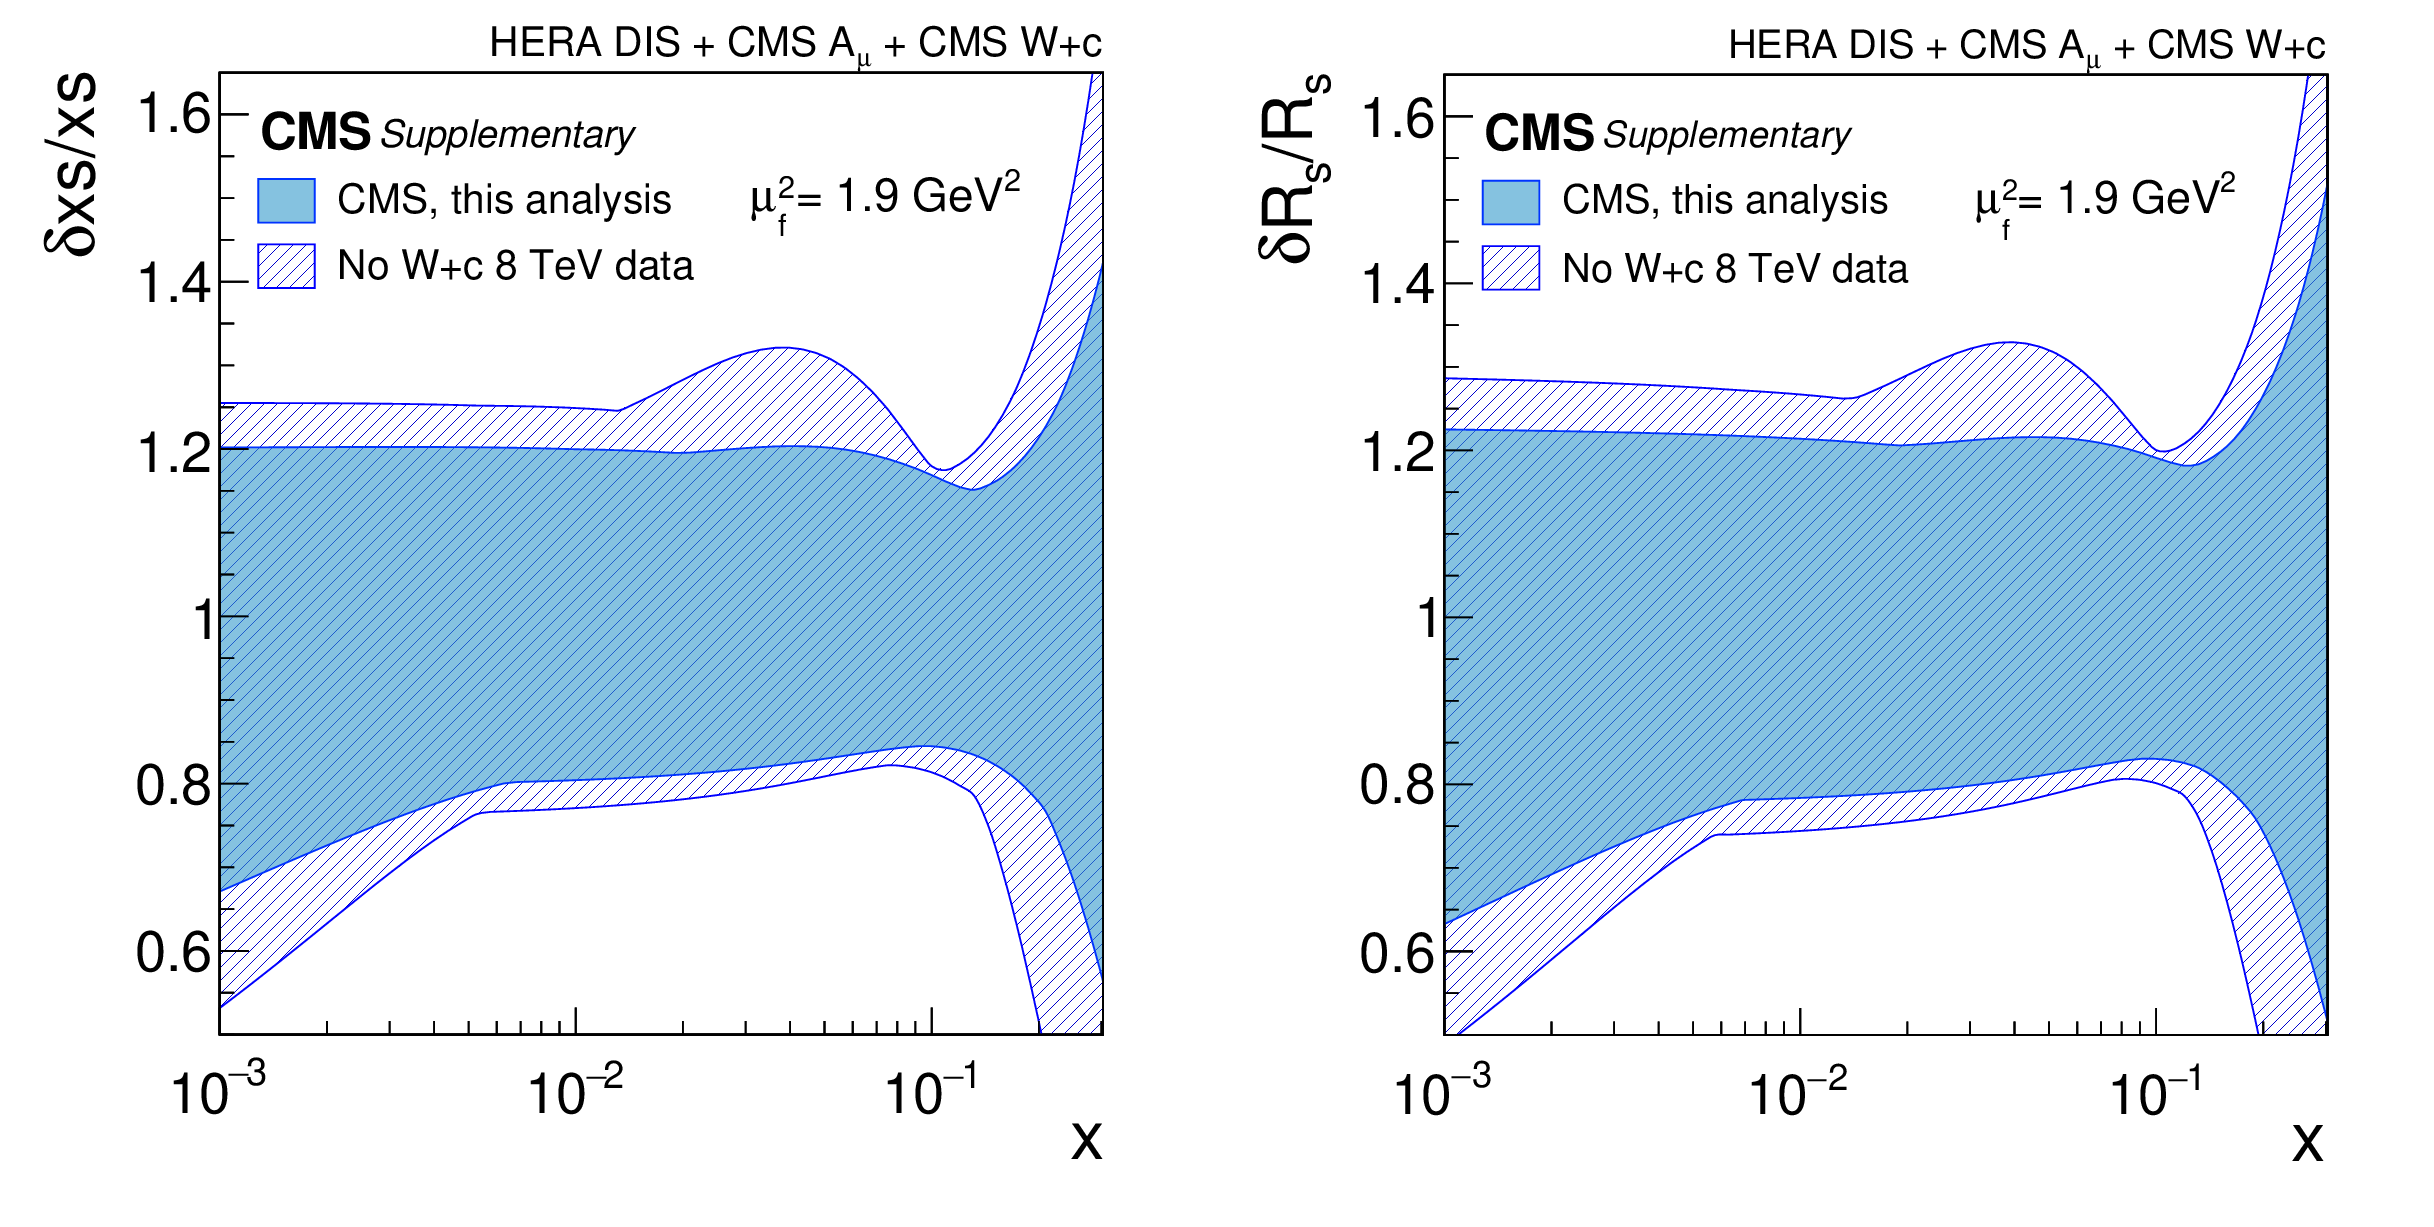
Relative total uncertainties for the strange quark distribution (left) and strangeness suppression factor (right) as functions of $x$ at the factorization scale of 1.9 GeV$ ^2$. |

png pdf |
Additional Figure 1-a:
Relative total uncertainties for the strange quark distribution as functions of $x$ at the factorization scale of 1.9 GeV$ ^2$. |
png pdf |
Additional Figure 1-b:
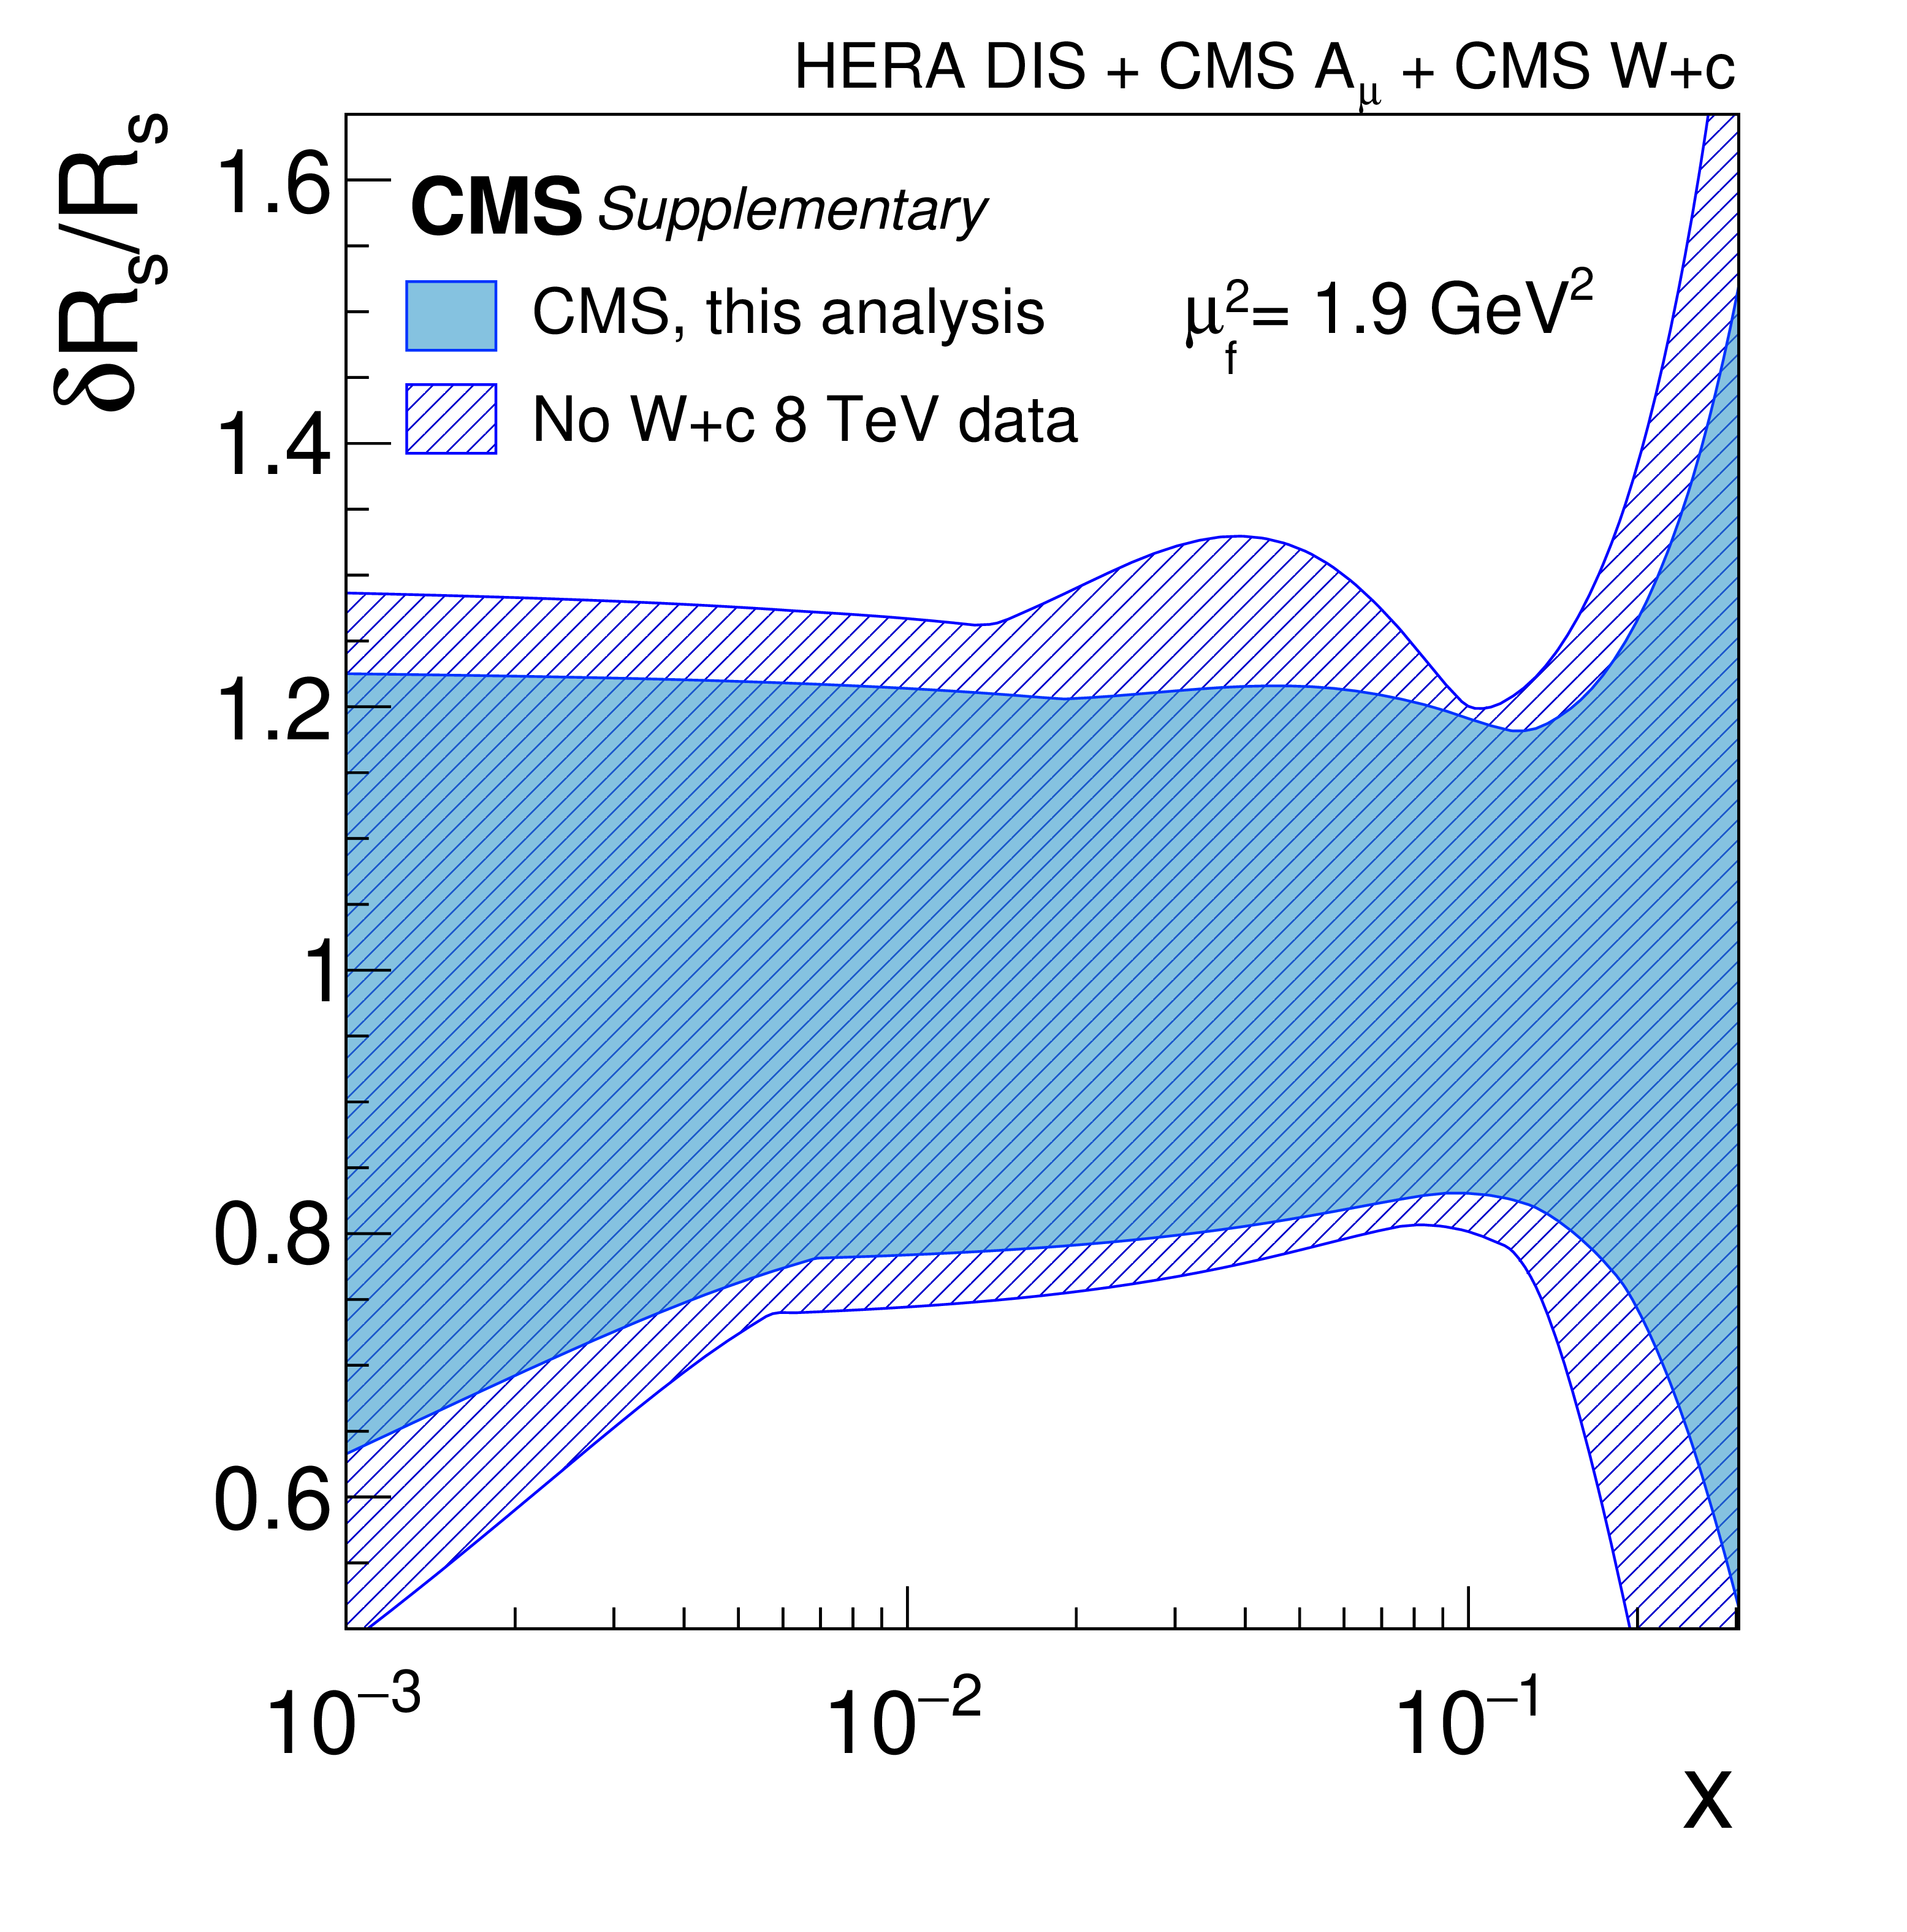
Relative total uncertainties for the strangeness suppression factor as functions of $x$ at the factorization scale of 1.9 GeV$ ^2$. |
png pdf |
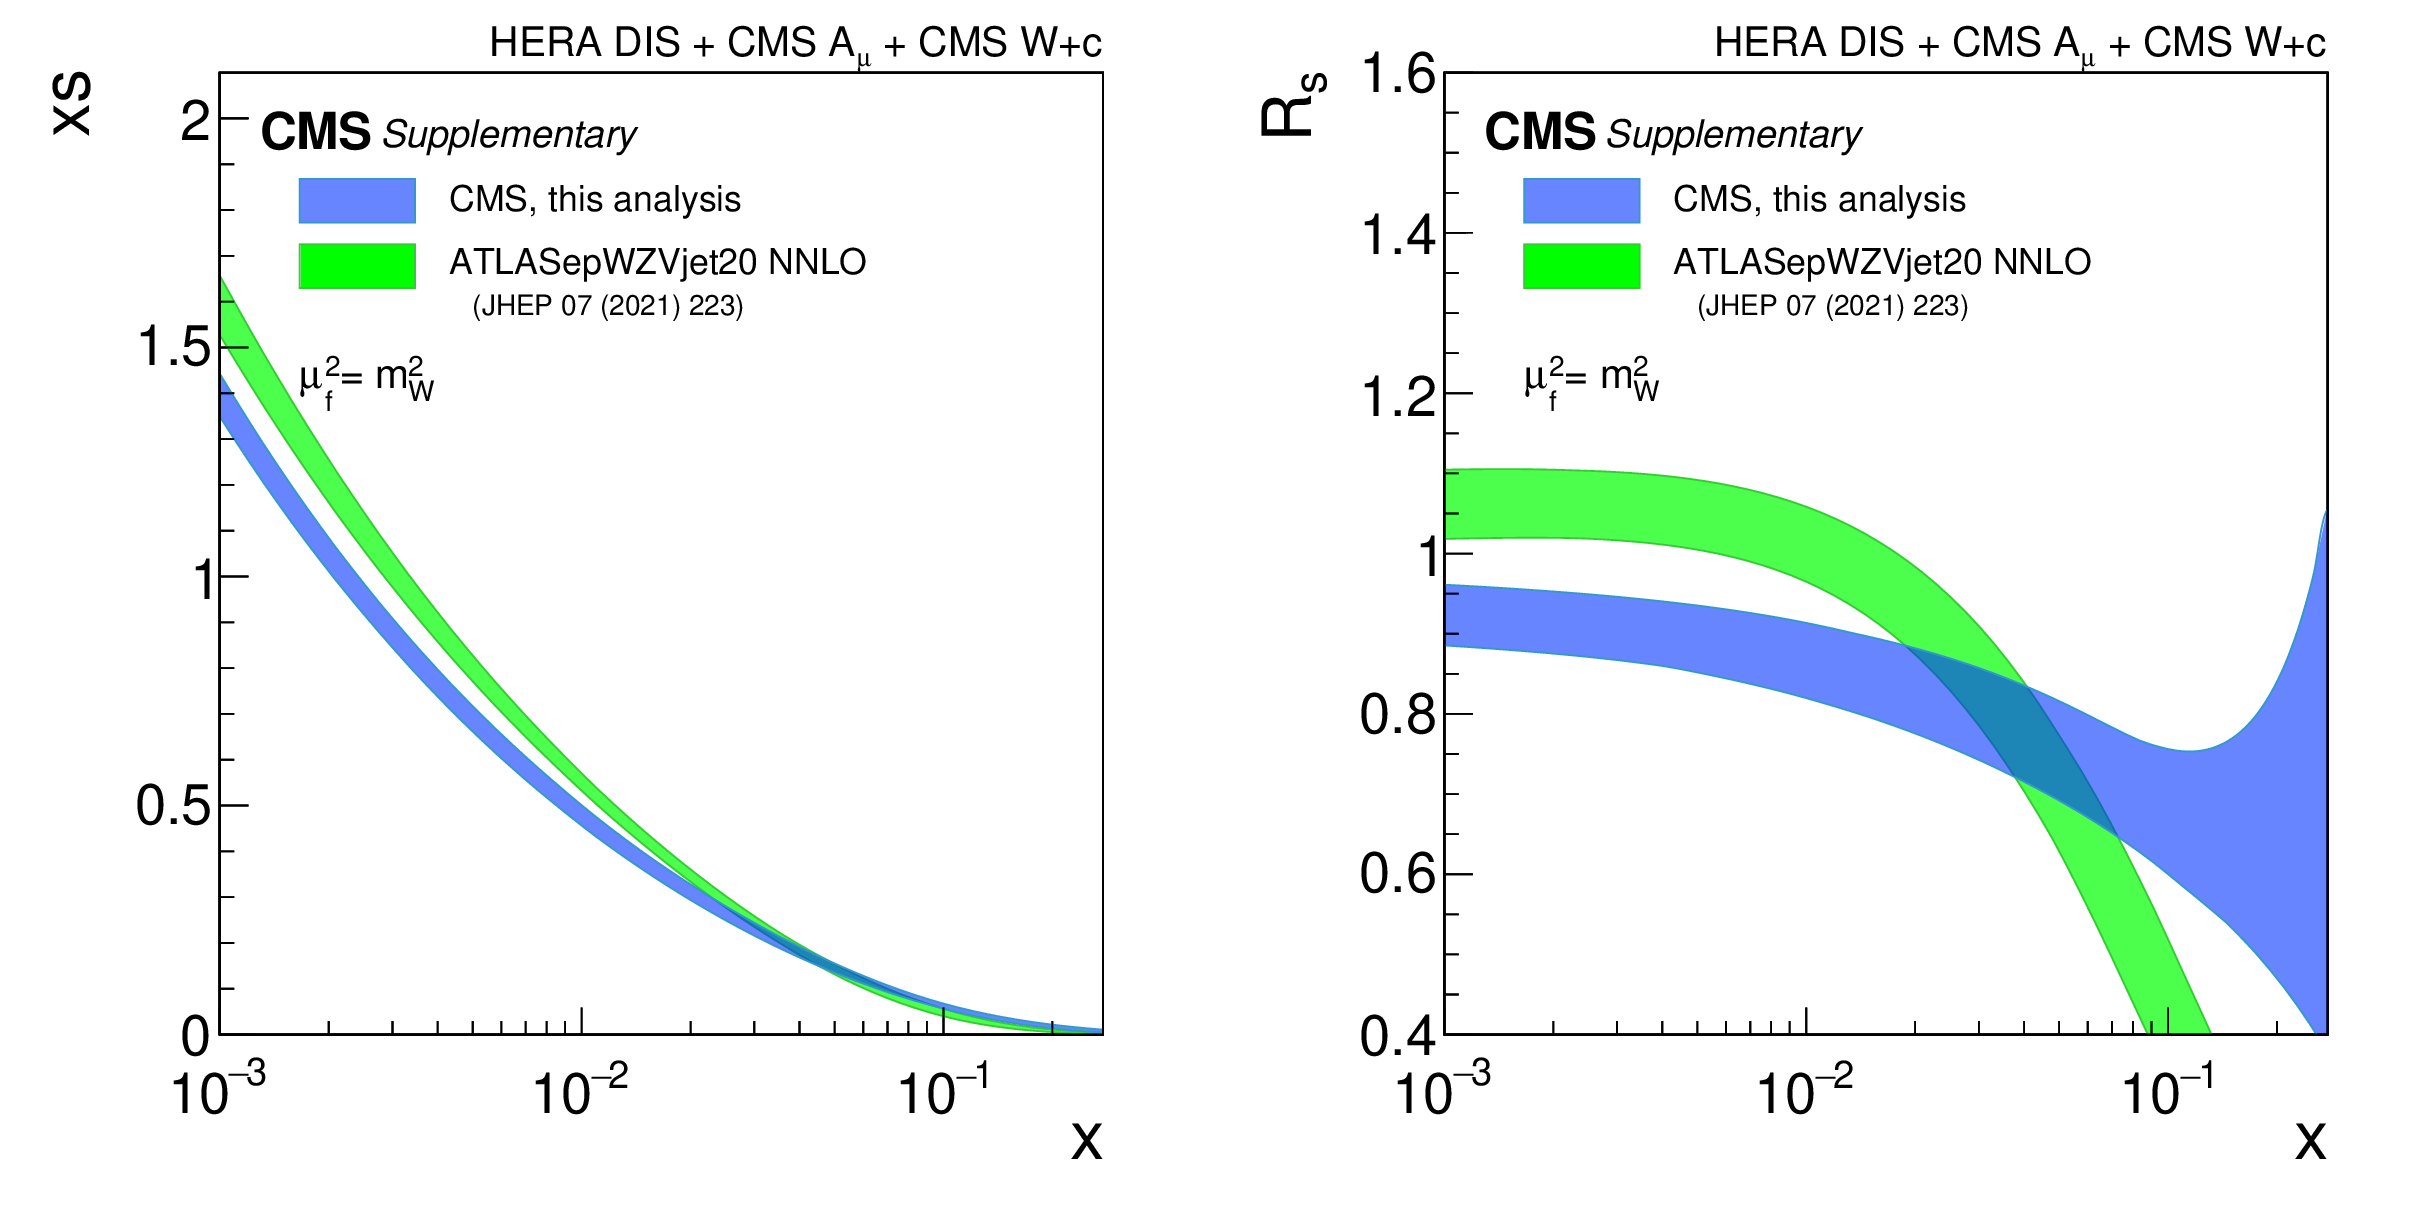
Additional Figure 2:
Comparison of the results of this analysis with the most recent ATLAS next-to-next-to-leading order PDF set ATLASepWZVjet20 for the strange quark distribution (left) and strangeness suppression factor (right) as functions of $x$ at the factorization scale of $m_{\mathrm{W}}^2$. |
png pdf |
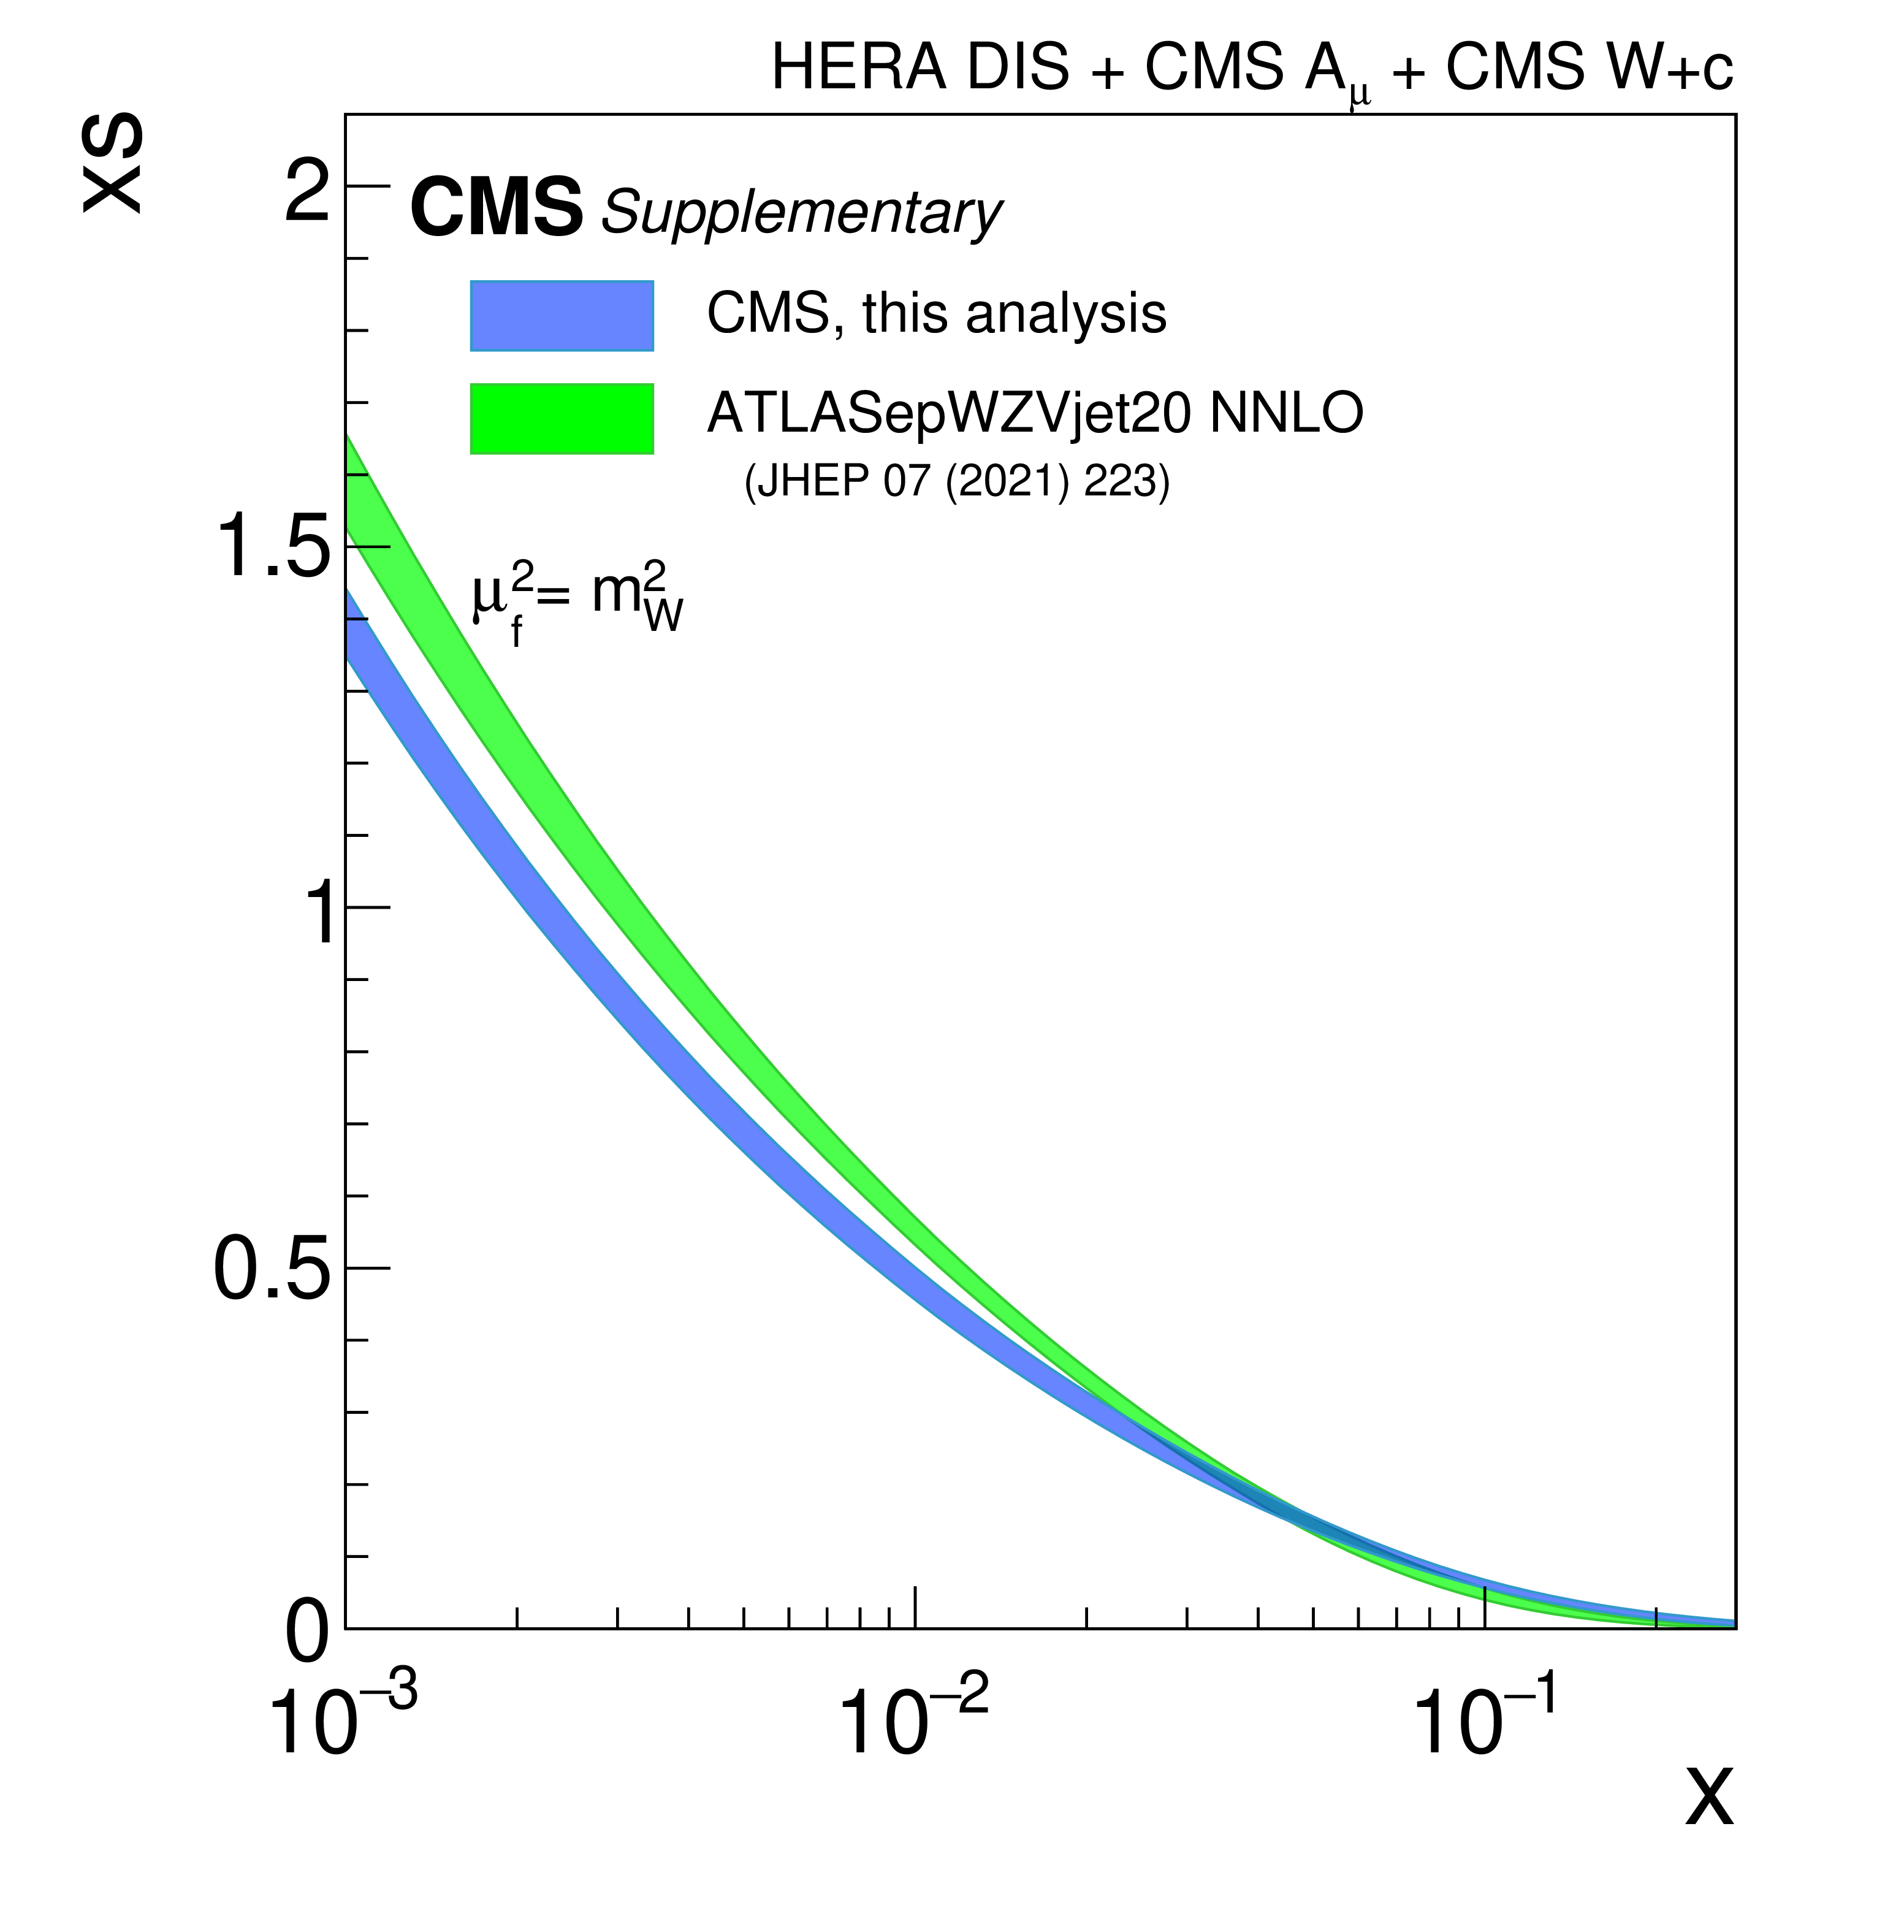
Additional Figure 2-a:
Comparison of the results of this analysis with the most recent ATLAS next-to-next-to-leading order PDF set ATLASepWZVjet20 for the strange quark distribution as functions of $x$ at the factorization scale of $m_{\mathrm{W}}^2$. |
png pdf |
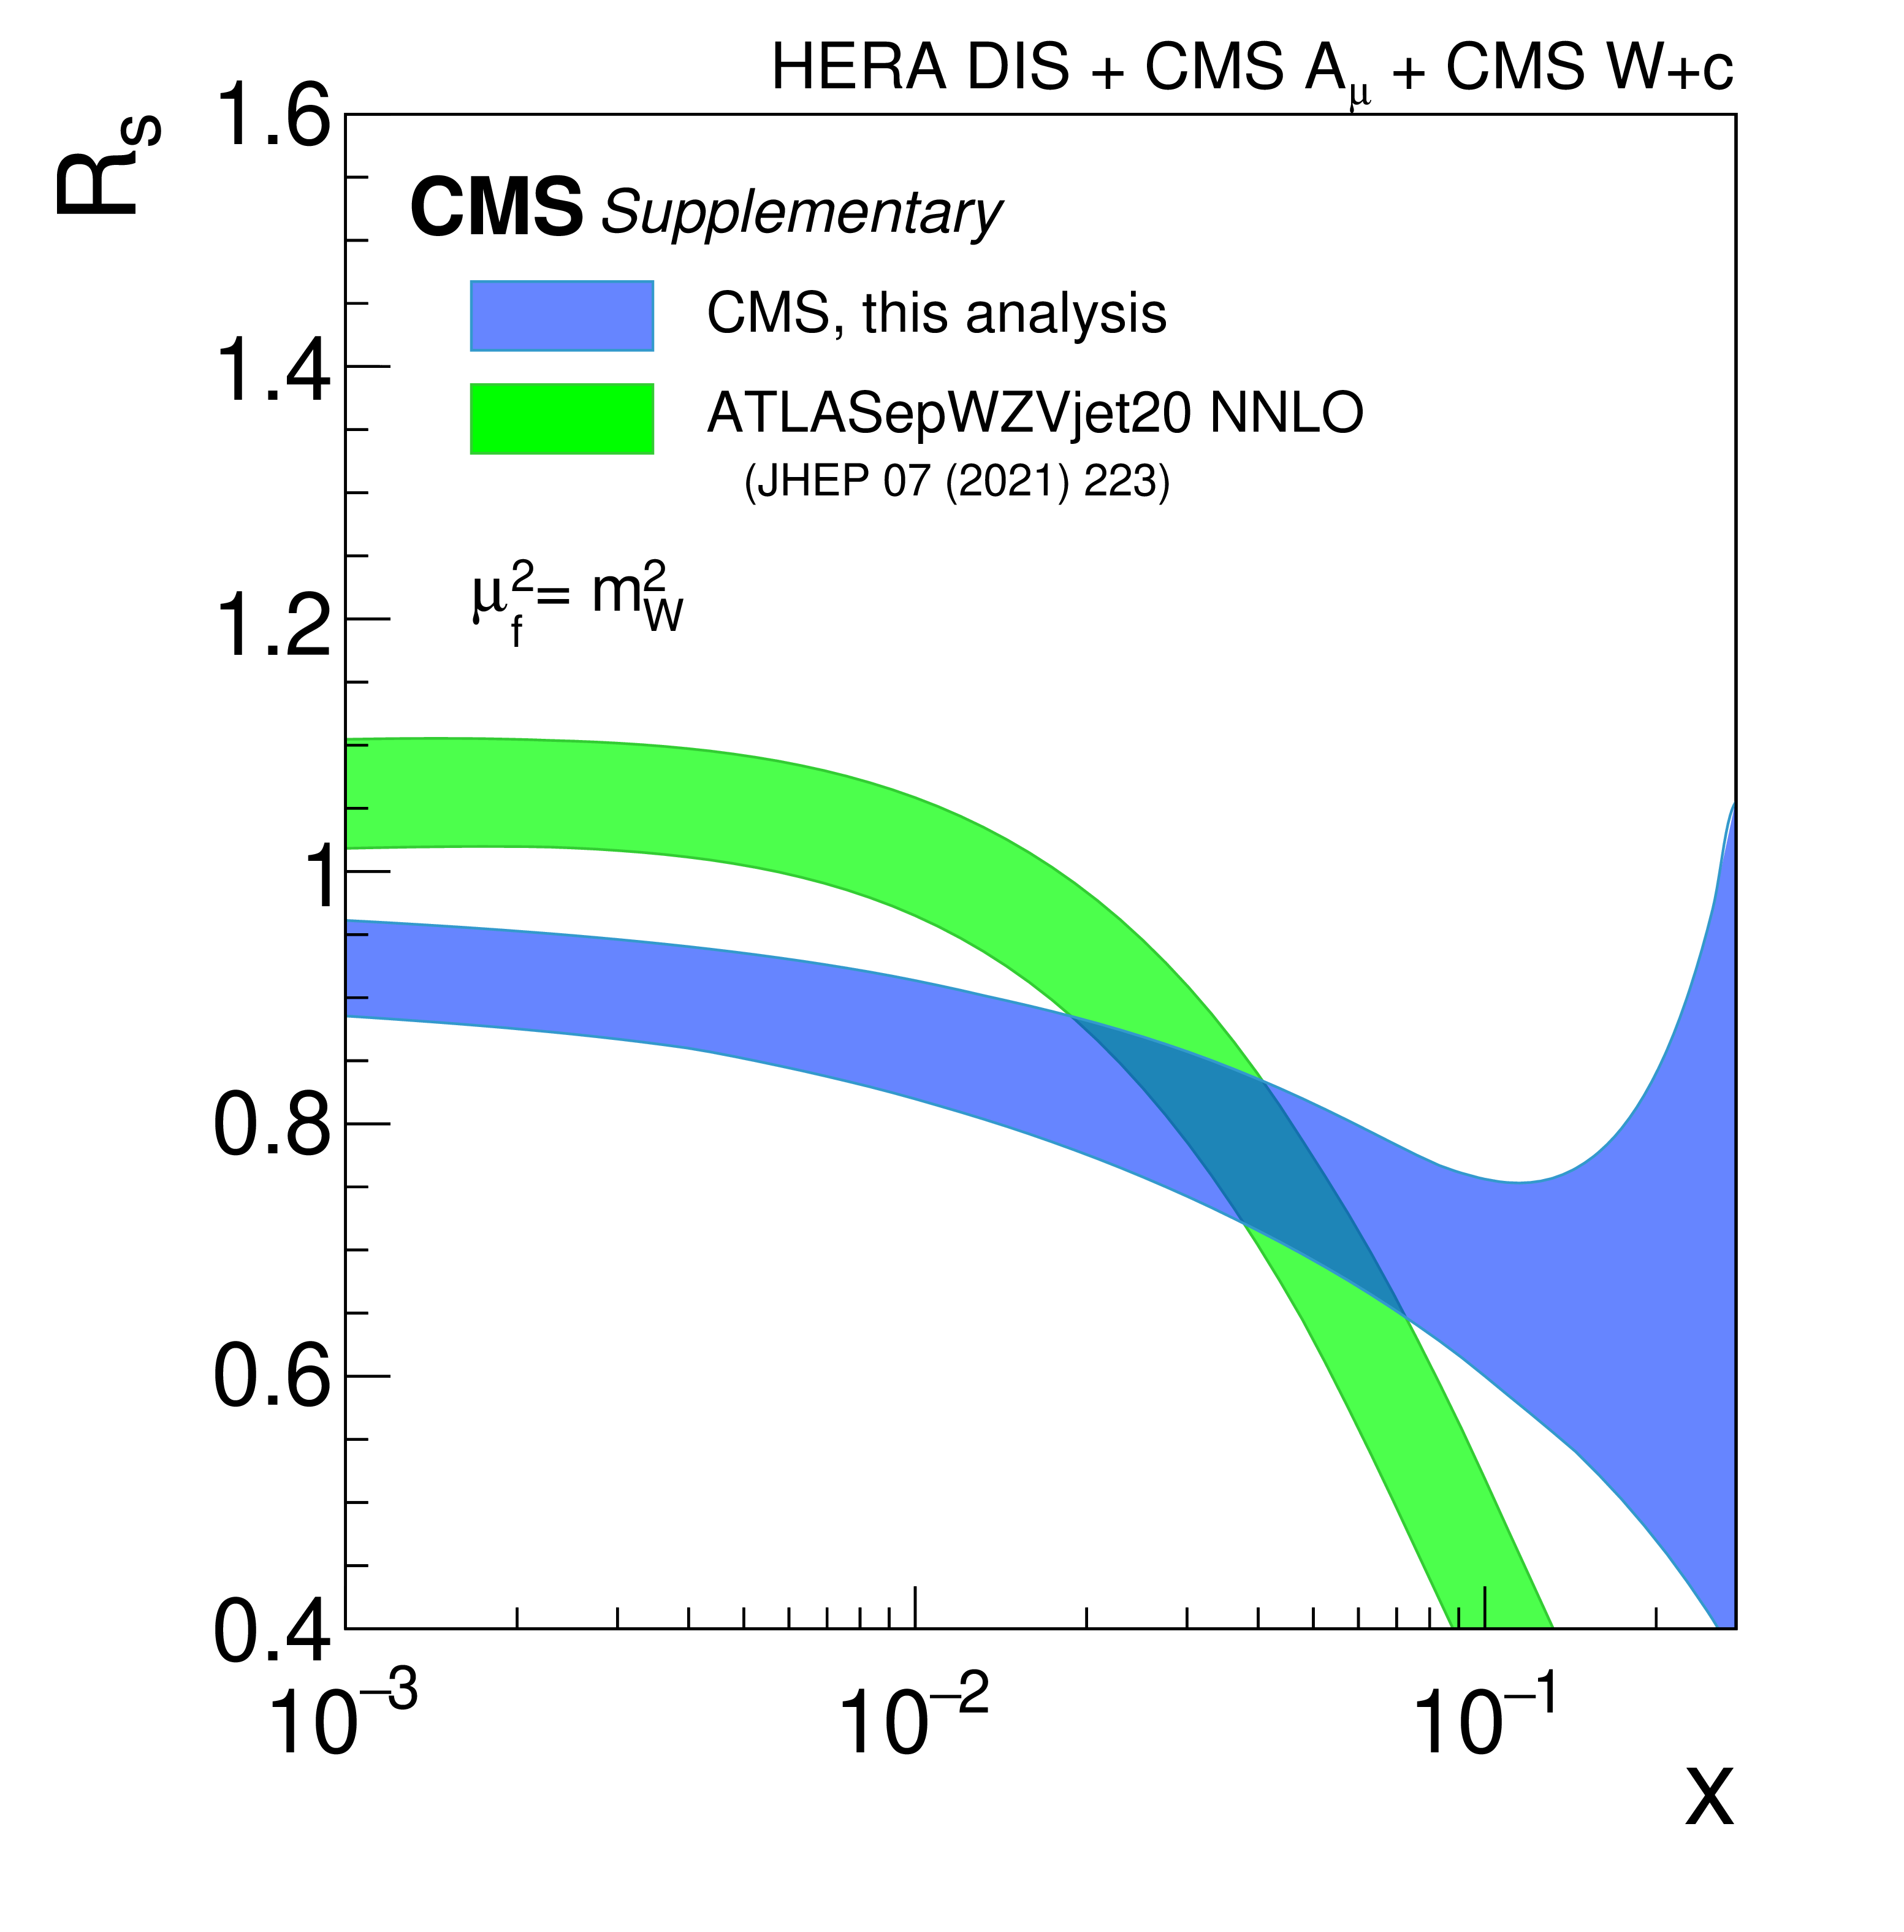
Additional Figure 2-b:
Comparison of the results of this analysis with the most recent ATLAS next-to-next-to-leading order PDF set ATLASepWZVjet20 for the strangeness suppression factor as functions of $x$ at the factorization scale of $m_{\mathrm{W}}^2$. |
| References | ||||
| 1 | P. Azzurri, M. Schönherr, and A. Tricoli | Vector bosons and jets in proton collisions | Rev. Mod. Phys. 93 (2021) 025007 | 2012.13967 |
| 2 | CDF Collaboration | Observation of the Production of a W Boson in Association with a Single Charm Quark | PRL 110 (2013) 071801 | 1209.1921 |
| 3 | CDF Collaboration | Measurement of vector boson plus $ {D}^{*}(2010)^+ $ meson production in $ \bar{\mathrm p}{\mathrm p} $ collisions at $ \sqrt{s}= $ 1.96 TeV | PRD 93 (2016) 052012 | 1508.06980 |
| 4 | D0 Collaboration | Measurement of the ratio of the $ p \bar{p} \to W + c- $jet cross section to the inclusive $ p \bar{p} \to W + $jets cross section | PLB 666 (2008) 23 | 0803.2259 |
| 5 | CMS Collaboration | Measurement of associated W+charm production in pp collisions at $ \sqrt{s}= $ 7 TeV | JHEP 02 (2014) 013 | CMS-SMP-12-002 1310.1138 |
| 6 | CMS Collaboration | Measurement of associated production of a W boson and a charm quark in proton-proton collisions at $ \sqrt{s}= $ 13 TeV | EPJC 79 (2019) 269 | CMS-SMP-17-014 1811.10021 |
| 7 | ATLAS Collaboration | Measurement of the production of a W boson in association with a charm quark in pp collisions at $ \sqrt{s}= $ 7 TeV with the ATLAS detector | JHEP 05 (2014) 068 | 1402.6263 |
| 8 | LHCb Collaboration | Study of $ W $ boson production in association with beauty and charm | PRD 92 (2015) 052001 | 1505.04051 |
| 9 | U. Baur et al. | The charm content of W + 1 jet events as a probe of the strange quark distribution function | PLB 318 (1993) 544 | hep-ph/9308370 |
| 10 | F. Faura et al. | The strangest proton? | EPJC 80 (2020) 1168 | 2009.00014 |
| 11 | CMS Collaboration | HEPData record for this analysis | link | |
| 12 | CMS Collaboration | Description and performance of track and primary-vertex reconstruction with the CMS tracker | JINST 9 (2014) P10009 | CMS-TRK-11-001 1405.6569 |
| 13 | CMS Collaboration | Performance of electron reconstruction and selection with the CMS detector in proton-proton collisions at $ \sqrt{s}= $ 8 TeV | JINST 10 (2015) P06005 | CMS-EGM-13-001 1502.02701 |
| 14 | CMS Collaboration | Performance of CMS muon reconstruction in pp collision events at $ \sqrt{s}= $ 7 TeV | JINST 7 (2012) P10002 | CMS-MUO-10-004 1206.4071 |
| 15 | CMS Collaboration | The CMS trigger system | JINST 12 (2017) P01020 | CMS-TRG-12-001 1609.02366 |
| 16 | CMS Collaboration | The CMS experiment at the CERN LHC | JINST 3 (2008) S08004 | |
| 17 | J. Alwall et al. | Madgraph 5: going beyond | JHEP 06 (2011) 128 | 1106.0522 |
| 18 | T. Sjöstrand, S. Mrenna, and P. Z. Skands | PYTHIA 6.4 physics and manual | JHEP 05 (2006) 026 | hep-ph/0603175 |
| 19 | J. Alwall et al. | Comparative study of various algorithms for the merging of parton showers and matrix elements in hadronic collisions | EPJC 53 (2008) 473 | 0706.2569 |
| 20 | J. Alwall, S. de Visscher, and F. Maltoni | QCD radiation in the production of heavy colored particles at the LHC | JHEP 02 (2009) 017 | 0810.5350 |
| 21 | J. Pumplin et al. | New generation of parton distributions with uncertainties from global QCD analysis | JHEP 07 (2002) 012 | hep-ph/0201195 |
| 22 | A. D. Martin, W. J. Stirling, R. S. Thorne, and G. Watt | Parton distributions for the LHC | EPJC 63 (2009) 189 | 0901.0002 |
| 23 | Y. Li and F. Petriello | Combining QCD and electroweak corrections to dilepton production in the framework of the FEWZ simulation code | PRD 86 (2012) 094034 | 1208.5967 |
| 24 | J. M. Campbell, R. K. Ellis, P. Nason, and E. Re | Top-pair production and decay at NLO matched with parton showers | JHEP 04 (2015) 114 | 1412.1828 |
| 25 | P. Nason | A new method for combining NLO QCD with shower Monte Carlo algorithms | JHEP 11 (2004) 040 | hep-ph/0409146 |
| 26 | S. Frixione, P. Nason, and C. Oleari | Matching NLO QCD computations with parton shower simulations: the POWHEG method | JHEP 11 (2007) 070 | 0709.2092 |
| 27 | S. Alioli, P. Nason, C. Oleari, and E. Re | A general framework for implementing NLO calculations in shower Monte Carlo programs: the POWHEG BOX | JHEP 06 (2010) 043 | 1002.2581 |
| 28 | J. Gao et al. | CT10 next-to-next-to-leading order global analysis of QCD | PRD 89 (2014) 033009 | 1302.6246 |
| 29 | M. Czakon, P. Fiedler, and A. Mitov | Total top-quark pair-production cross-section at hadron colliders through $ {\cal O}(\alpha_{\rm S}^4) $ | PRL 110 (2013) 252004 | 1303.6254 |
| 30 | M. Aliev et al. | HATHOR: HAdronic Top and Heavy quarks crOss section calculatoR | Comput. Phys. Commun. 182 (2011) 1034 | 1007.1327 |
| 31 | P. Kant et al. | HatHor for single top-quark production: Updated predictions and uncertainty estimates for single top-quark production in hadronic collisions | Comput. Phys. Commun. 191 (2015) 74 | 1406.4403 |
| 32 | N. Kidonakis | Top Quark Production | in Helmholtz International Summer School on Physics of Heavy Quarks and Hadrons, 2014 link |
1311.0283 |
| 33 | J. M. Campbell and R. Ellis | MCFM for the Tevatron and the LHC | Nucl. Phys. B 206 (2010) 10 Proc. Suppl. 20 (2010) 5 |
1007.3492 |
| 34 | CMS Collaboration | Study of the underlying event at forward rapidity in pp collisions at $ \sqrt{s}=$ 0.9, 2.76, and 7 TeV | JHEP 04 (2013) 072 | CMS-FWD-11-003 1302.2394 |
| 35 | CMS Collaboration | Event generator tunes obtained from underlying event and multiparton scattering measurements | EPJC 76 (2016) 155 | CMS-GEN-14-001 1512.00815 |
| 36 | M. Lisovyi, A. Verbytskyi, and O. Zenaiev | Combined analysis of charm-quark fragmentation-fraction measurements | EPJC 76 (2016) 397 | 1509.01061 |
| 37 | T. Sjöstrand et al. | An introduction to PYTHIA 8.2 | Comput. Phys. Commun. 191 (2015) 159 | 1410.3012 |
| 38 | Particle Data Group , M. Tanabashi et al. | Review of particle physics | PRD 98 (2018) 030001 | |
| 39 | GEANT 4 Collaboration | GEANT 4 --- a simulation toolkit | NIM A 506 (2003) 250 | |
| 40 | CMS Collaboration | Measurement of the inclusive W and Z production cross sections in pp collisions at $ \sqrt{s}= $ 7 TeV with the CMS experiment | JHEP 10 (2011) 132 | CMS-EWK-10-005 1107.4789 |
| 41 | CMS Collaboration | Particle-flow reconstruction and global event description with the CMS detector | JINST 12 (2017) P10003 | CMS-PRF-14-001 1706.04965 |
| 42 | M. Cacciari, G. P. Salam, and G. Soyez | The anti-$ k_{\mathrm{T}} $ jet clustering algorithm | JHEP 04 (2008) 063 | 0802.1189 |
| 43 | M. Cacciari, G. P. Salam, and G. Soyez | FastJet user manual | EPJC 72 (2012) 1896 | 1111.6097 |
| 44 | CMS Collaboration | Determination of jet energy calibration and transverse momentum resolution in CMS | JINST 6 (2011) P11002 | CMS-JME-10-011 1107.4277 |
| 45 | CMS Collaboration | Jet energy scale and resolution in the CMS experiment in pp collisions at 8 TeV | JINST 12 (2017) P02014 | CMS-JME-13-004 1607.03663 |
| 46 | CMS Collaboration | Performance of the CMS missing transverse momentum reconstruction in pp data at $ \sqrt{s}= $ 8 TeV | JINST 10 (2015) P02006 | CMS-JME-13-003 1411.0511 |
| 47 | CMS Collaboration | Measurement of the production cross section of a W boson in association with two b jets in pp collisions at $ \sqrt{s} = $ 8 TeV | EPJC 77 (2017) 92 | CMS-SMP-14-020 1608.07561 |
| 48 | M. Cacciari and G. P. Salam | Pileup subtraction using jet areas | PLB 659 (2008) 119 | 0707.1378 |
| 49 | CMS Collaboration | Identification of b-quark jets with the CMS experiment | JINST 8 (2013) P04013 | CMS-BTV-12-001 1211.4462 |
| 50 | CMS Collaboration | Measurement of $ {\mathrm b}\bar{\mathrm b} $ angular correlations based on secondary vertex reconstruction at $ \sqrt{s}= $ 7 TeV | JHEP 03 (2011) 136 | CMS-BPH-10-010 1102.3194 |
| 51 | CMS Collaboration | Measurement of the cross section and angular correlations for associated production of a Z boson with b hadrons in pp collisions at $ \sqrt{s}= $ 7 TeV | JHEP 12 (2013) 039 | CMS-EWK-11-015 1310.1349 |
| 52 | W. Waltenberger, R. Frühwirth, and P. Vanlaer | Adaptive vertex fitting | JPG 34 (2007) N343 | |
| 53 | LHCb Collaboration | Identification of beauty and charm quark jets at LHCb | JINST 10 (2015) P06013 | 1504.07670 |
| 54 | A. Ali and F. Barreiro | The final states $ l^\pm K^\pm K^{*\pm} X $ in jets as signatures of $ {B}^{0}_{s} - \bar{B}^{0}_{s} $ mixings | Z. Phys. C 30 (1986) 635 | |
| 55 | M. Gronau, A. Nippe, and J. L. Rosner | Method for flavor tagging in neutral B meson decays | PRD 47 (1993) 1988 | hep-ph/9211311 |
| 56 | CMS Collaboration | Measurement of associated Z+charm production in proton-proton collisions at $ \sqrt{s}= $ 8 TeV | EPJC 78 (2018) 287 | CMS-SMP-15-009 1711.02143 |
| 57 | CMS Collaboration | Identification of heavy-flavour jets with the CMS detector in pp collisions at 13 TeV | JINST 13 (2018) P05011 | CMS-BTV-16-002 1712.07158 |
| 58 | CMS Collaboration | Performance of b tagging at $ \sqrt{s}= $ 8 TeV in multijet, ttbar and boosted topology events | CMS Physics Analysis Summary, 2013 CMS-PAS-BTV-13-001 |
CMS-PAS-BTV-13-001 |
| 59 | ALEPH Collaboration | A measurement of the gluon splitting rate into $ {\rm c\bar c} $ pairs in hadronic Z decays | PLB 561 (2003) 213 | hep-ex/0302003 |
| 60 | ALEPH Collaboration | A measurement of the gluon splitting rate into $ {\rm b} \bar {\rm b} $ pairs in hadronic Z decays | PLB 434 (1998) 437 | |
| 61 | R. D. Ball et al. | Parton distributions with LHC data | NPB 867 (2013) 244 | 1207.1303 |
| 62 | CMS Collaboration | CMS luminosity based on pixel cluster counting --- summer 2013 update | CMS Physics Analysis Summary, 2013 CMS-PAS-LUM-13-001 |
CMS-PAS-LUM-13-001 |
| 63 | J. Kieseler | A method and tool for combining differential or inclusive measurements obtained with simultaneously constrained uncertainties | EPJC 77 (2017) 792 | 1706.01681 |
| 64 | J. M. Campbell and R. K. Ellis | An update on vector boson pair production at hadron colliders | PRD 60 (1999) 113006 | hep-ph/9905386 |
| 65 | J. M. Campbell and F. Tramontano | Next-to-leading order corrections to Wt production and decay | NPB 726 (2005) 109 | hep-ph/0506289 |
| 66 | L. A. Harland-Lang, A. D. Martin, P. Motylinski, and R. S. Thorne | Parton distributions in the LHC era: MMHT 2014 PDFs | EPJC 75 (2015) 204 | 1412.3989 |
| 67 | S. Dulat et al. | New parton distribution functions from a global analysis of quantum chromodynamics | PRD 93 (2016) 033006 | 1506.07443 |
| 68 | NNPDF Collaboration | Parton distributions from high-precision collider data | EPJC 77 (2017) 663 | 1706.00428 |
| 69 | S. Alekhin, J. Blümlein, and S. Moch | NLO PDFs from the ABMP16 fit | EPJC 78 (2018) 477 | 1803.07537 |
| 70 | M. Czakon, A. Mitov, M. Pellen, and R. Poncelet | NNLO QCD predictions for W+c-jet production at the LHC | JHEP 06 (2021) 100 | 2011.01011 |
| 71 | H1 and ZEUS Collaborations | Combination of measurements of inclusive deep inelastic $ {\mathrm{e}^{\pm }\mathrm{p}} $ scattering cross sections and QCD analysis of HERA data | EPJC 75 (2015) 580 | 1506.06042 |
| 72 | CMS Collaboration | Measurement of the muon charge asymmetry in inclusive $ \mathrm{pp} \to \mathrm{W}+X $ production at $ \sqrt{s}= $ 7 TeV and an improved determination of light parton distribution functions | PRD 90 (2014) 032004 | CMS-SMP-12-021 1312.6283 |
| 73 | CMS Collaboration | Measurement of the differential cross section and charge asymmetry for inclusive $ \mathrm {p}\mathrm {p}\rightarrow \mathrm {W}^{\pm }+X $ production at $ \sqrt{s}= $ 8 TeV | EPJC 76 (2016) 469 | CMS-SMP-14-022 1603.01803 |
| 74 | T. Carli et al. | A posteriori inclusion of parton density functions in NLO QCD final-state calculations at hadron colliders: the APPLGRID project | EPJC 66 (2010) 503 | 0911.2985 |
| 75 | S. Alekhin et al. | HERAFitter | EPJC 75 (2015) 304 | 1410.4412 |
| 76 | HERA Fitter Group | HERA Fitter | link | |
| 77 | V. N. Gribov and L. N. Lipatov | Deep inelastic $ \mathrm{e}-\mathrm{p} $ scattering in perturbation theory | Sov. J. Nucl. Phys. 15 (1972) 438 | |
| 78 | G. Altarelli and G. Parisi | Asymptotic freedom in parton language | NPB 126 (1977) 298 | |
| 79 | G. Curci, W. Furmanski, and R. Petronzio | Evolution of parton densities beyond leading order: The non-singlet case | NPB 175 (1980) 27 | |
| 80 | W. Furmanski and R. Petronzio | Singlet parton densities beyond leading order | PLB 97 (1980) 437 | |
| 81 | S. Moch, J. A. M. Vermaseren, and A. Vogt | The three-loop splitting functions in QCD: the non-singlet case | NPB 688 (2004) 101 | hep-ph/0403192 |
| 82 | A. Vogt, S. Moch, and J. A. M. Vermaseren | The three-loop splitting functions in QCD: the singlet case | NPB 691 (2004) 129 | hep-ph/0404111 |
| 83 | M. Botje | QCDNUM: fast QCD evolution and convolution | Comput. Phys. Commun. 182 (2011) 490 | 1005.1481 |
| 84 | R. S. Thorne | Variable-flavor number scheme for NNLO | PRD 73 (2006) 054019 | hep-ph/0601245 |
| 85 | A. Cooper-Sarkar and R. Devenish | Deep inelastic scattering | Oxford University Press. ISBN 978-0-19-960225-4, 2011. | |
| 86 | H1 and ZEUS Collaborations | Combined measurement and QCD analysis of the inclusive $ \mathrm{e}^\pm \mathrm{p} $ scattering cross sections at HERA | JHEP 01 (2010) 109 | 0911.0884 |
| 87 | W. T. Giele and S. Keller | Implications of hadron collider observables on parton distribution function uncertainties | PRD 58 (1998) 094023 | hep-ph/9803393 |
| 88 | W. T. Giele, S. A. Keller, and D. A. Kosower | Parton distribution function uncertainties | hep-ph/0104052 | |
| 89 | A. L. Kataev | The Gottfried sum rule: Theory versus experiment | in 11th Lomonosov Conference on Elementary Particle Physics, 2003 | hep-ph/0311091 |
| 90 | T.-J. Hou et al. | New CTEQ global analysis of quantum chromodynamics with high-precision data from the LHC | PRD 103 (2021) 014013 | 1912.10053 |
| 91 | S. Bailey et al. | Parton distributions from LHC, HERA, Tevatron and fixed target data: MSHT20 PDFs | EPJC 81 (2021) 341 | 2012.04684 |
|
|
Compact Muon Solenoid LHC, CERN |
|

|

|

|

|

|