

Compact Muon Solenoid
LHC, CERN
| CMS-SMP-19-001 ; CERN-EP-2020-145 | ||
| Measurements of pp $\to$ ZZ production cross sections and constraints on anomalous triple gauge couplings at $\sqrt{s} = $ 13 TeV | ||
| CMS Collaboration | ||
| 2 September 2020 | ||
| EPJC 81 (2021) 200 | ||
| Abstract: The production of Z boson pairs in proton-proton (pp) collisions, $\mathrm{pp} \to (\mathrm{Z}/\gamma^*)(\mathrm{Z}/\gamma^*) \to 2\ell 2\ell'$, where $\ell,\ell'$ = e or $\mu$, is studied at a center-of-mass energy of 13 TeV with the CMS detector at the CERN LHC. The data sample corresponds to an integrated luminosity of 137 fb$^{-1}$, collected during 2016-2018. The ZZ production cross section, $\sigma_{\text{tot}} (\mathrm{pp} \to \mathrm{ZZ}) = $ 17.2 $\pm$ 0.3 (stat) $\pm$ 0.5 (syst) $\pm$ 0.4 (theo) $\pm$ 0.3 (lumi) pb, measured for events with two pairs of opposite-sign, same-flavor leptons produced in the mass region 60 $ < m_{\ell^+\ell^-} < $ 120 GeV is consistent with standard model predictions. Differential cross sections are also measured and agree with theoretical predictions. The invariant mass distribution of the four-lepton system is used to set limits on anomalous ZZZ and ZZ$\gamma$ couplings. | ||
| Links: e-print arXiv:2009.01186 [hep-ex] (PDF) ; CDS record ; inSPIRE record ; HepData record ; CADI line (restricted) ; | ||
| Figures | |
png pdf |
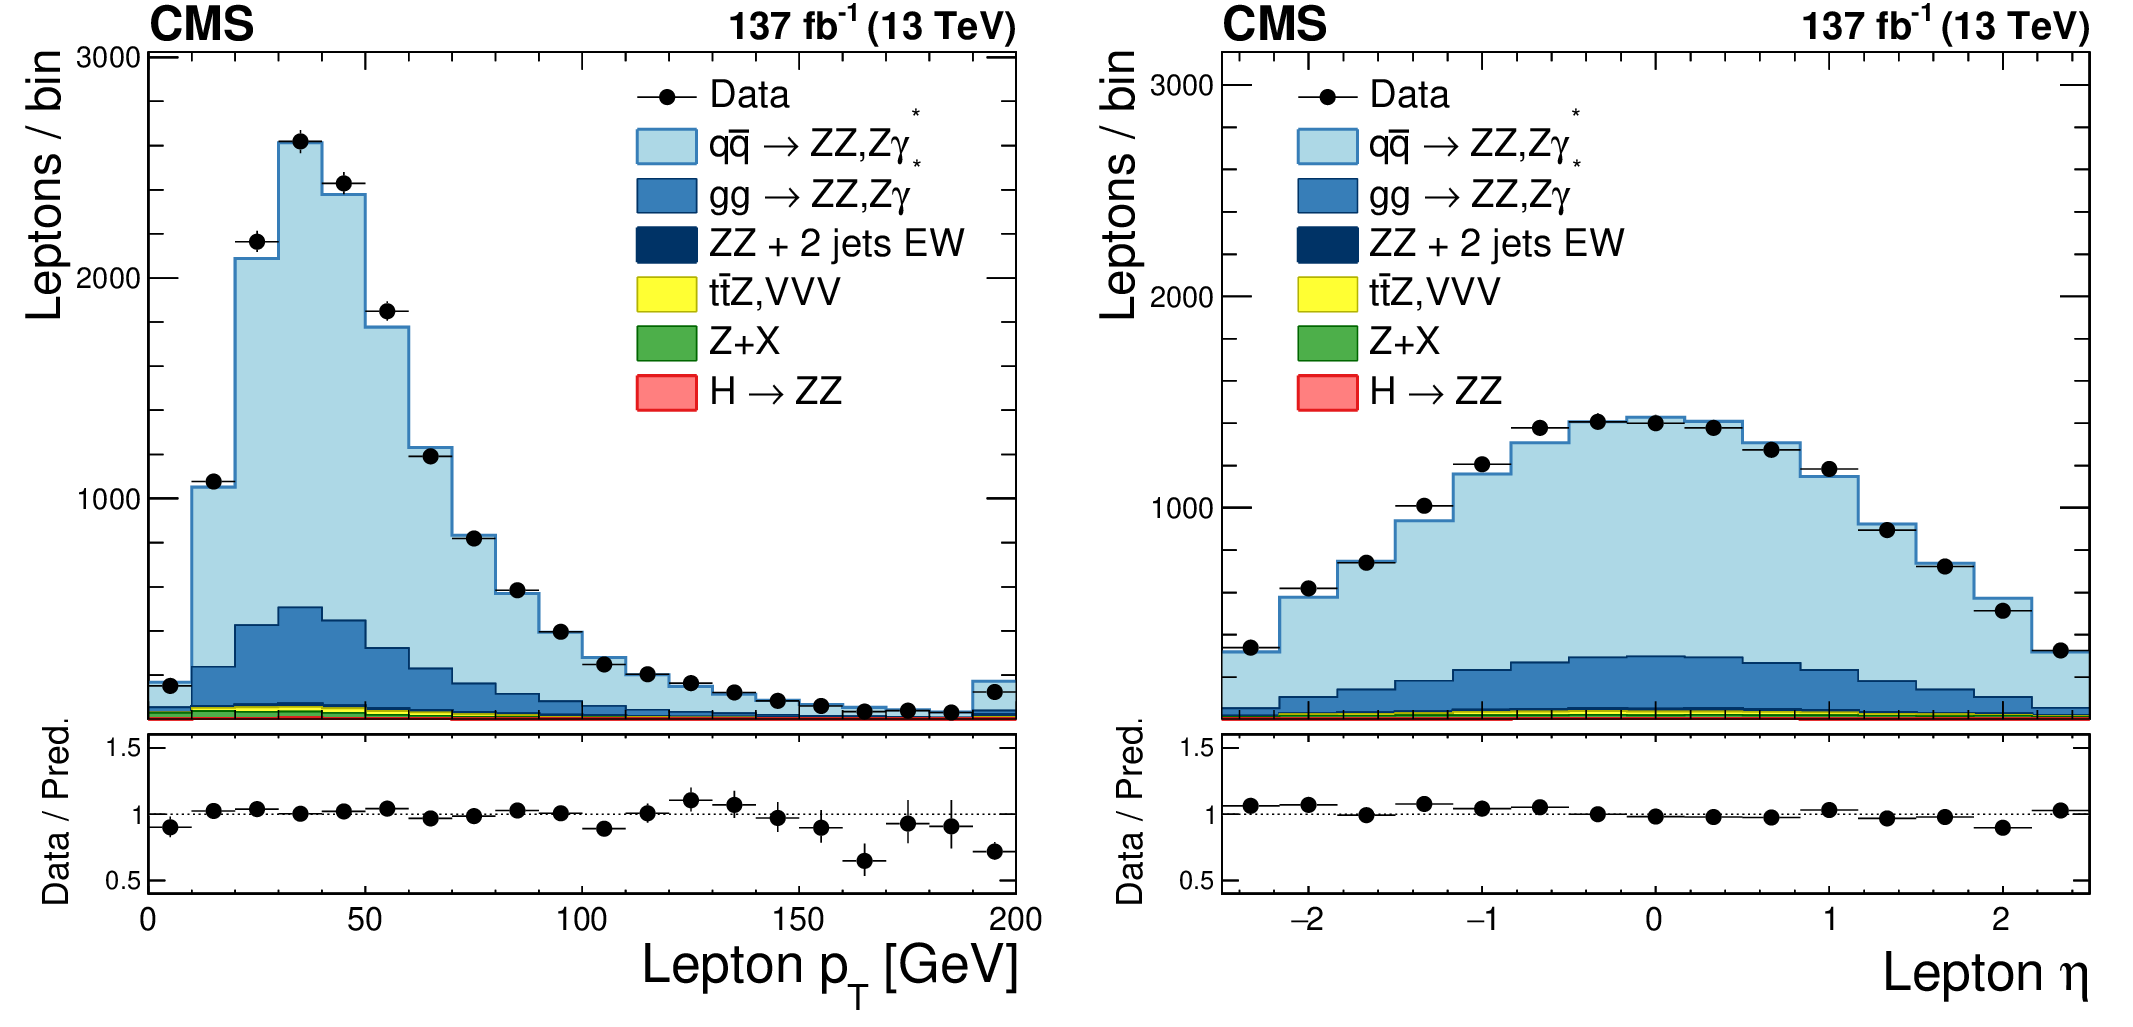
Figure 1:
Distributions of (left) transverse momentum and (right) pseudorapidity for individual leptons. Points represent the data with error bars showing the statistical uncertainties, histograms the expected SM predictions and reducible background estimated from data. |

png pdf |
Figure 1-a:
Distribution of transverse momentum for individual leptons. Points represent the data with error bars showing the statistical uncertainties, histograms the expected SM predictions and reducible background estimated from data. |
png pdf |
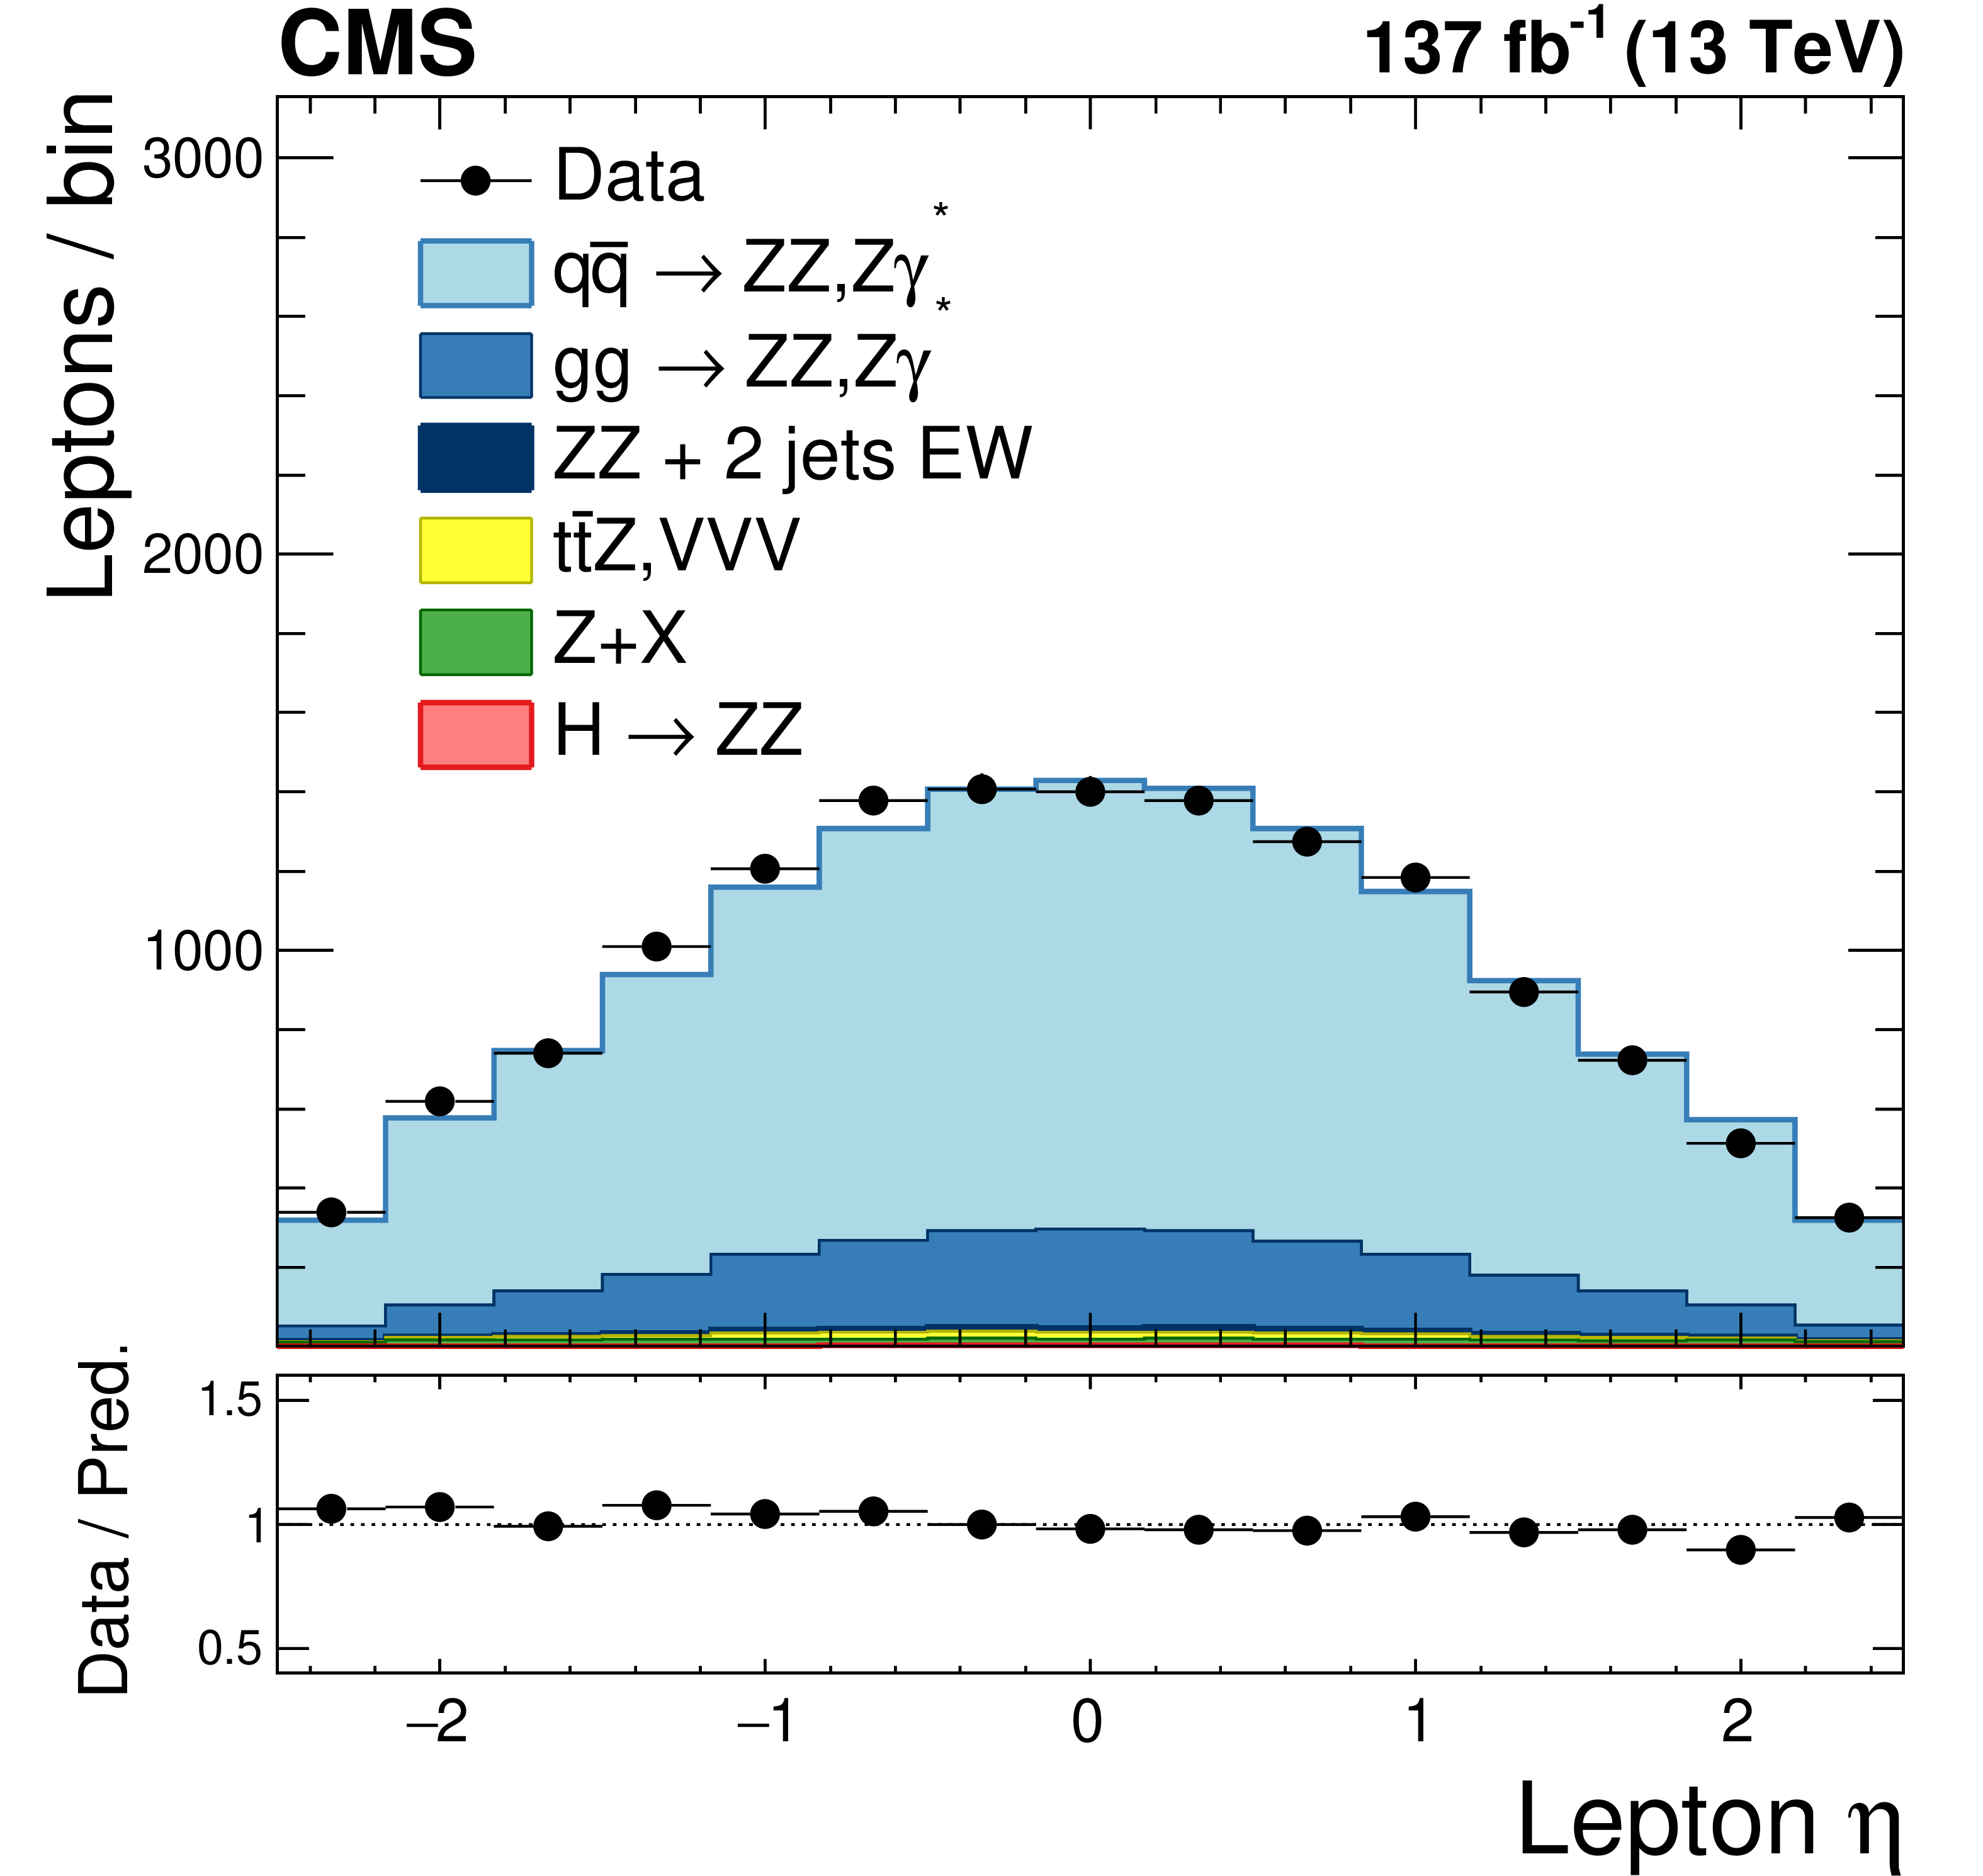
Figure 1-b:
Distribution of pseudorapidity for individual leptons. Points represent the data with error bars showing the statistical uncertainties, histograms the expected SM predictions and reducible background estimated from data. |
png pdf |
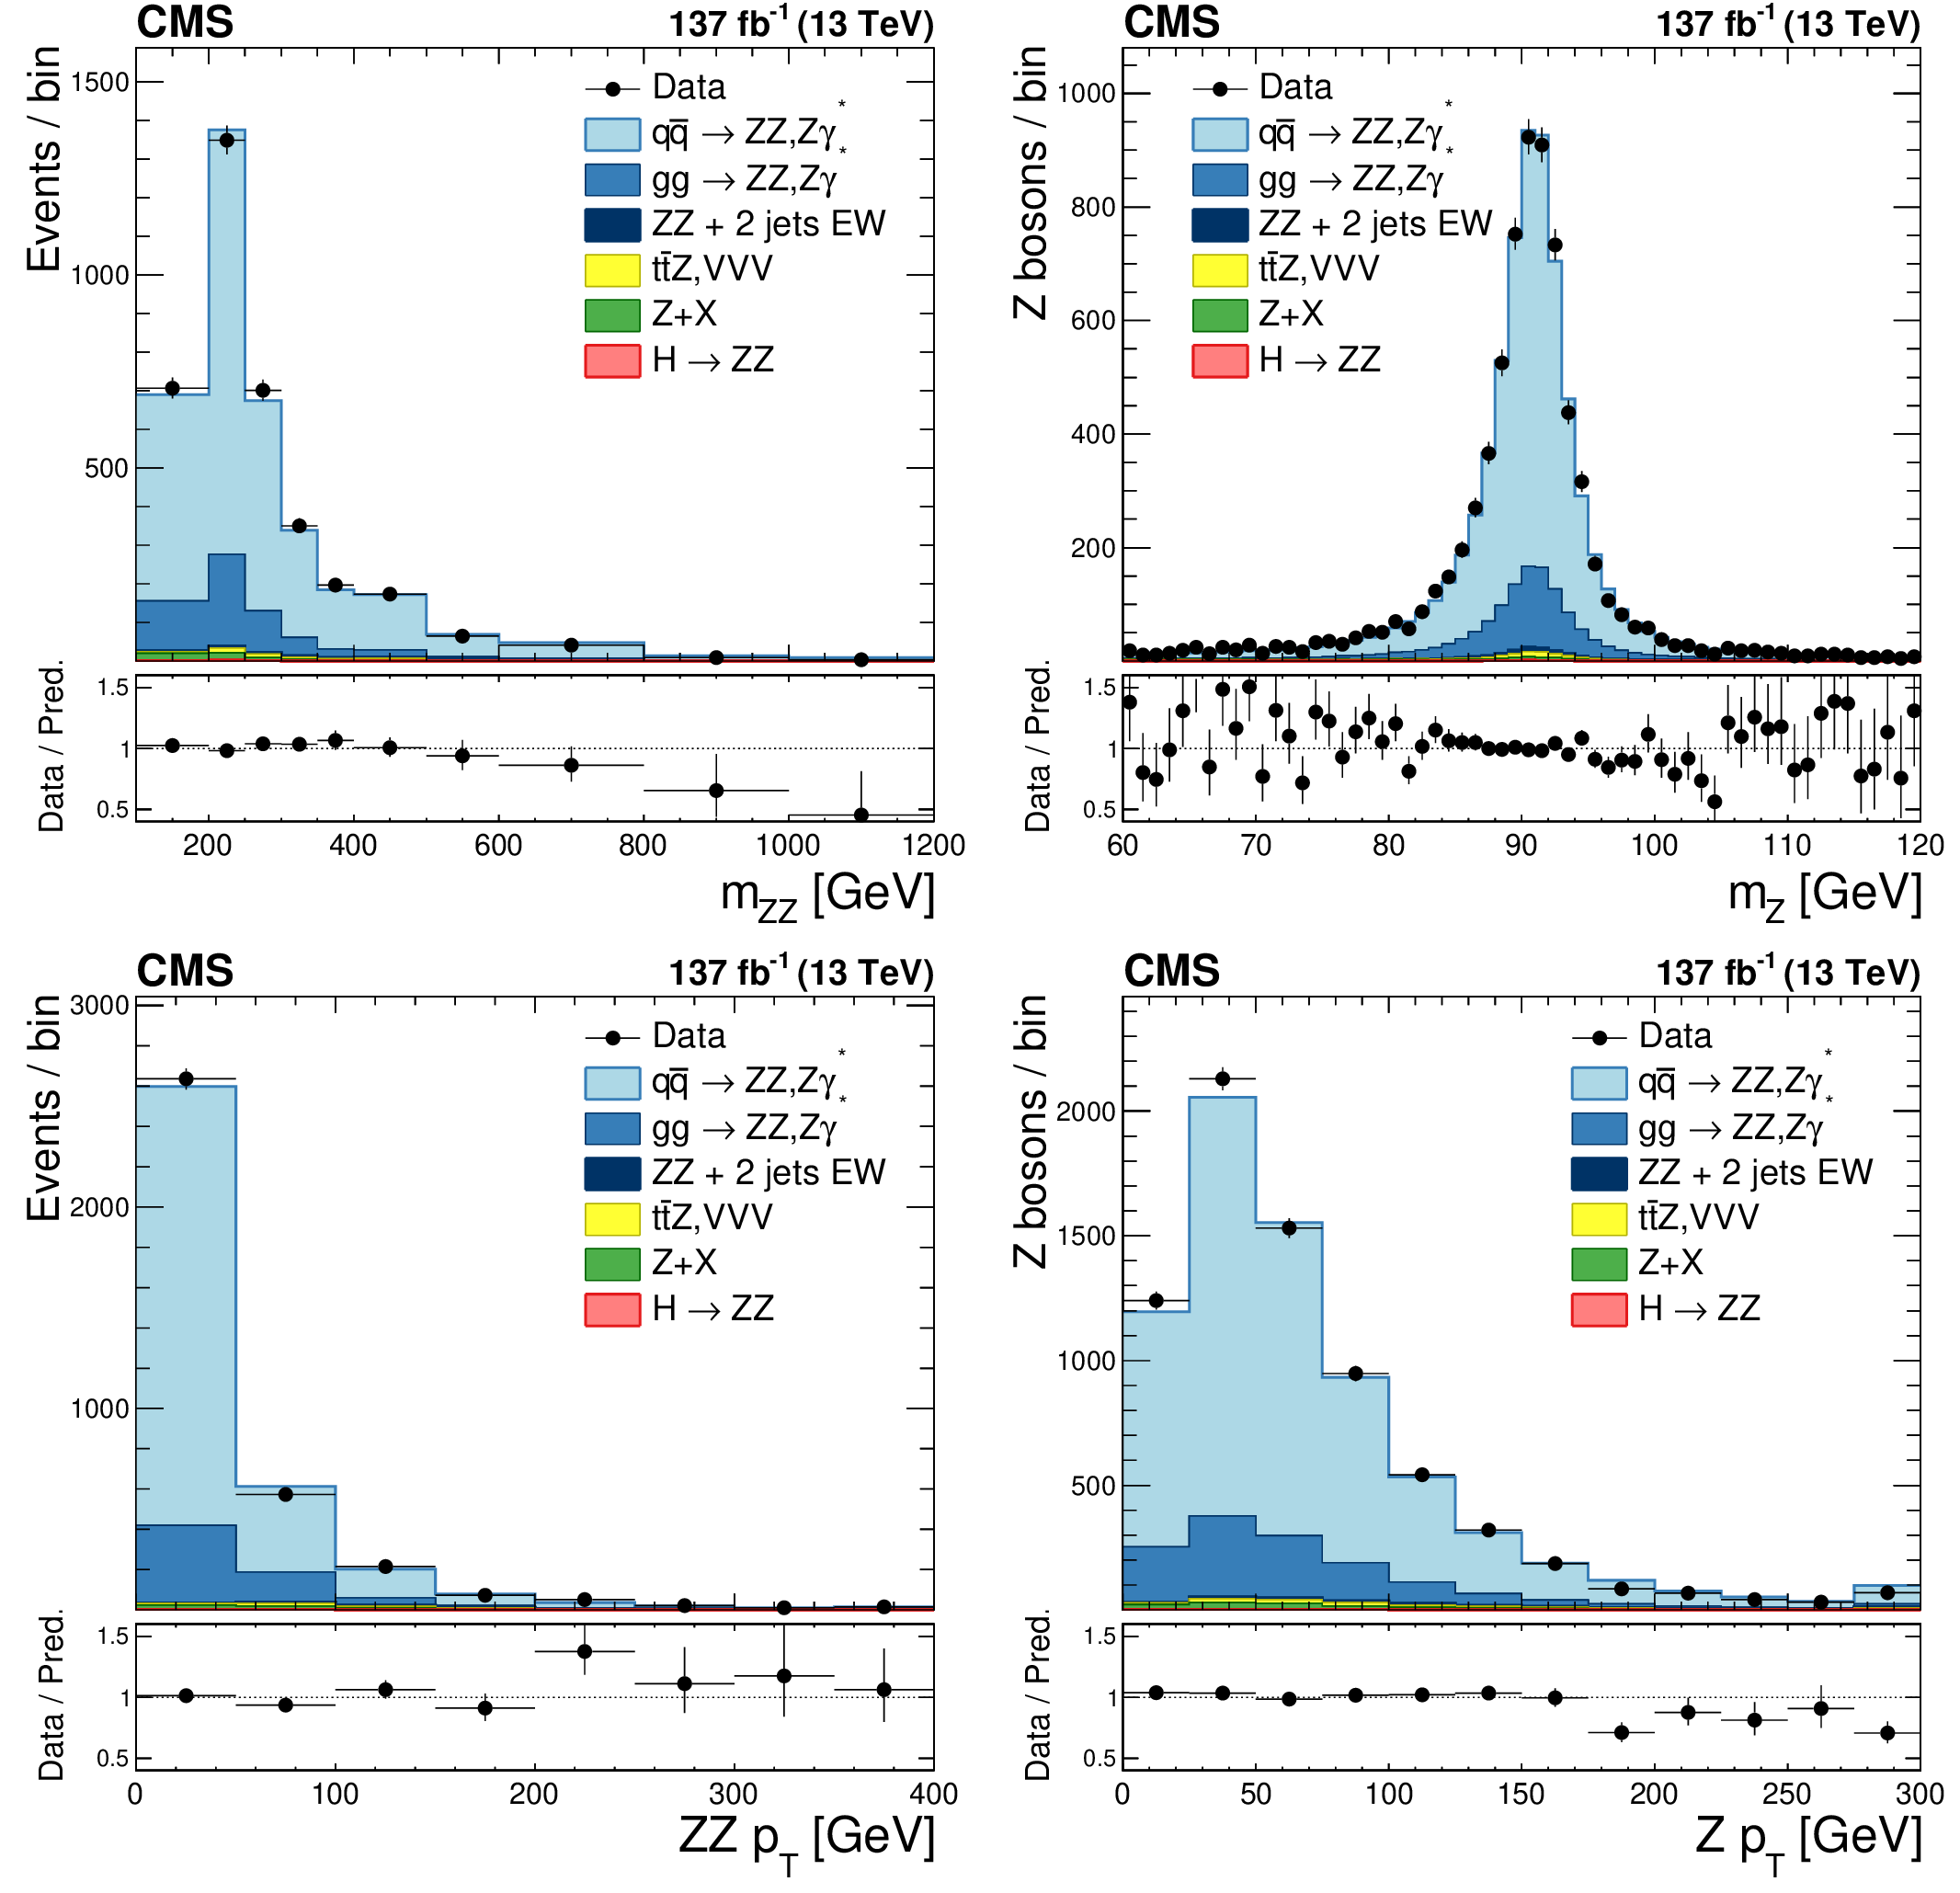
Figure 2:
Distributions of (upper left) $m_{{\mathrm{Z} \mathrm{Z}}}$ for ZZ events with 60 $ < m_{\mathrm{Z} _1, \mathrm{Z} _2} < $ 120 GeV; (upper right) mass of selected Z boson candidates; (lower left) transverse momentum of the ZZ system; (lower right) transverse momentum of individual Z boson candidates. Points represent the data with error bars showing the statistical uncertainties, histograms the expected SM predictions and reducible background estimated from data. |

png pdf |
Figure 2-a:
Distribution of $m_{{\mathrm{Z} \mathrm{Z}}}$ for ZZ events with 60 $ < m_{\mathrm{Z} _1, \mathrm{Z} _2} < $ 120 GeV. Points represent the data with error bars showing the statistical uncertainties, histograms the expected SM predictions and reducible background estimated from data. |

png pdf |
Figure 2-b:
Distribution of the mass of selected Z boson candidates. Points represent the data with error bars showing the statistical uncertainties, histograms the expected SM predictions and reducible background estimated from data. |

png pdf |
Figure 2-c:
Distribution of the transverse momentum of the ZZ system. Points represent the data with error bars showing the statistical uncertainties, histograms the expected SM predictions and reducible background estimated from data. |

png pdf |
Figure 2-d:
Distribution of the transverse momentum of individual Z boson candidates. Points represent the data with error bars showing the statistical uncertainties, histograms the expected SM predictions and reducible background estimated from data. |
png pdf |
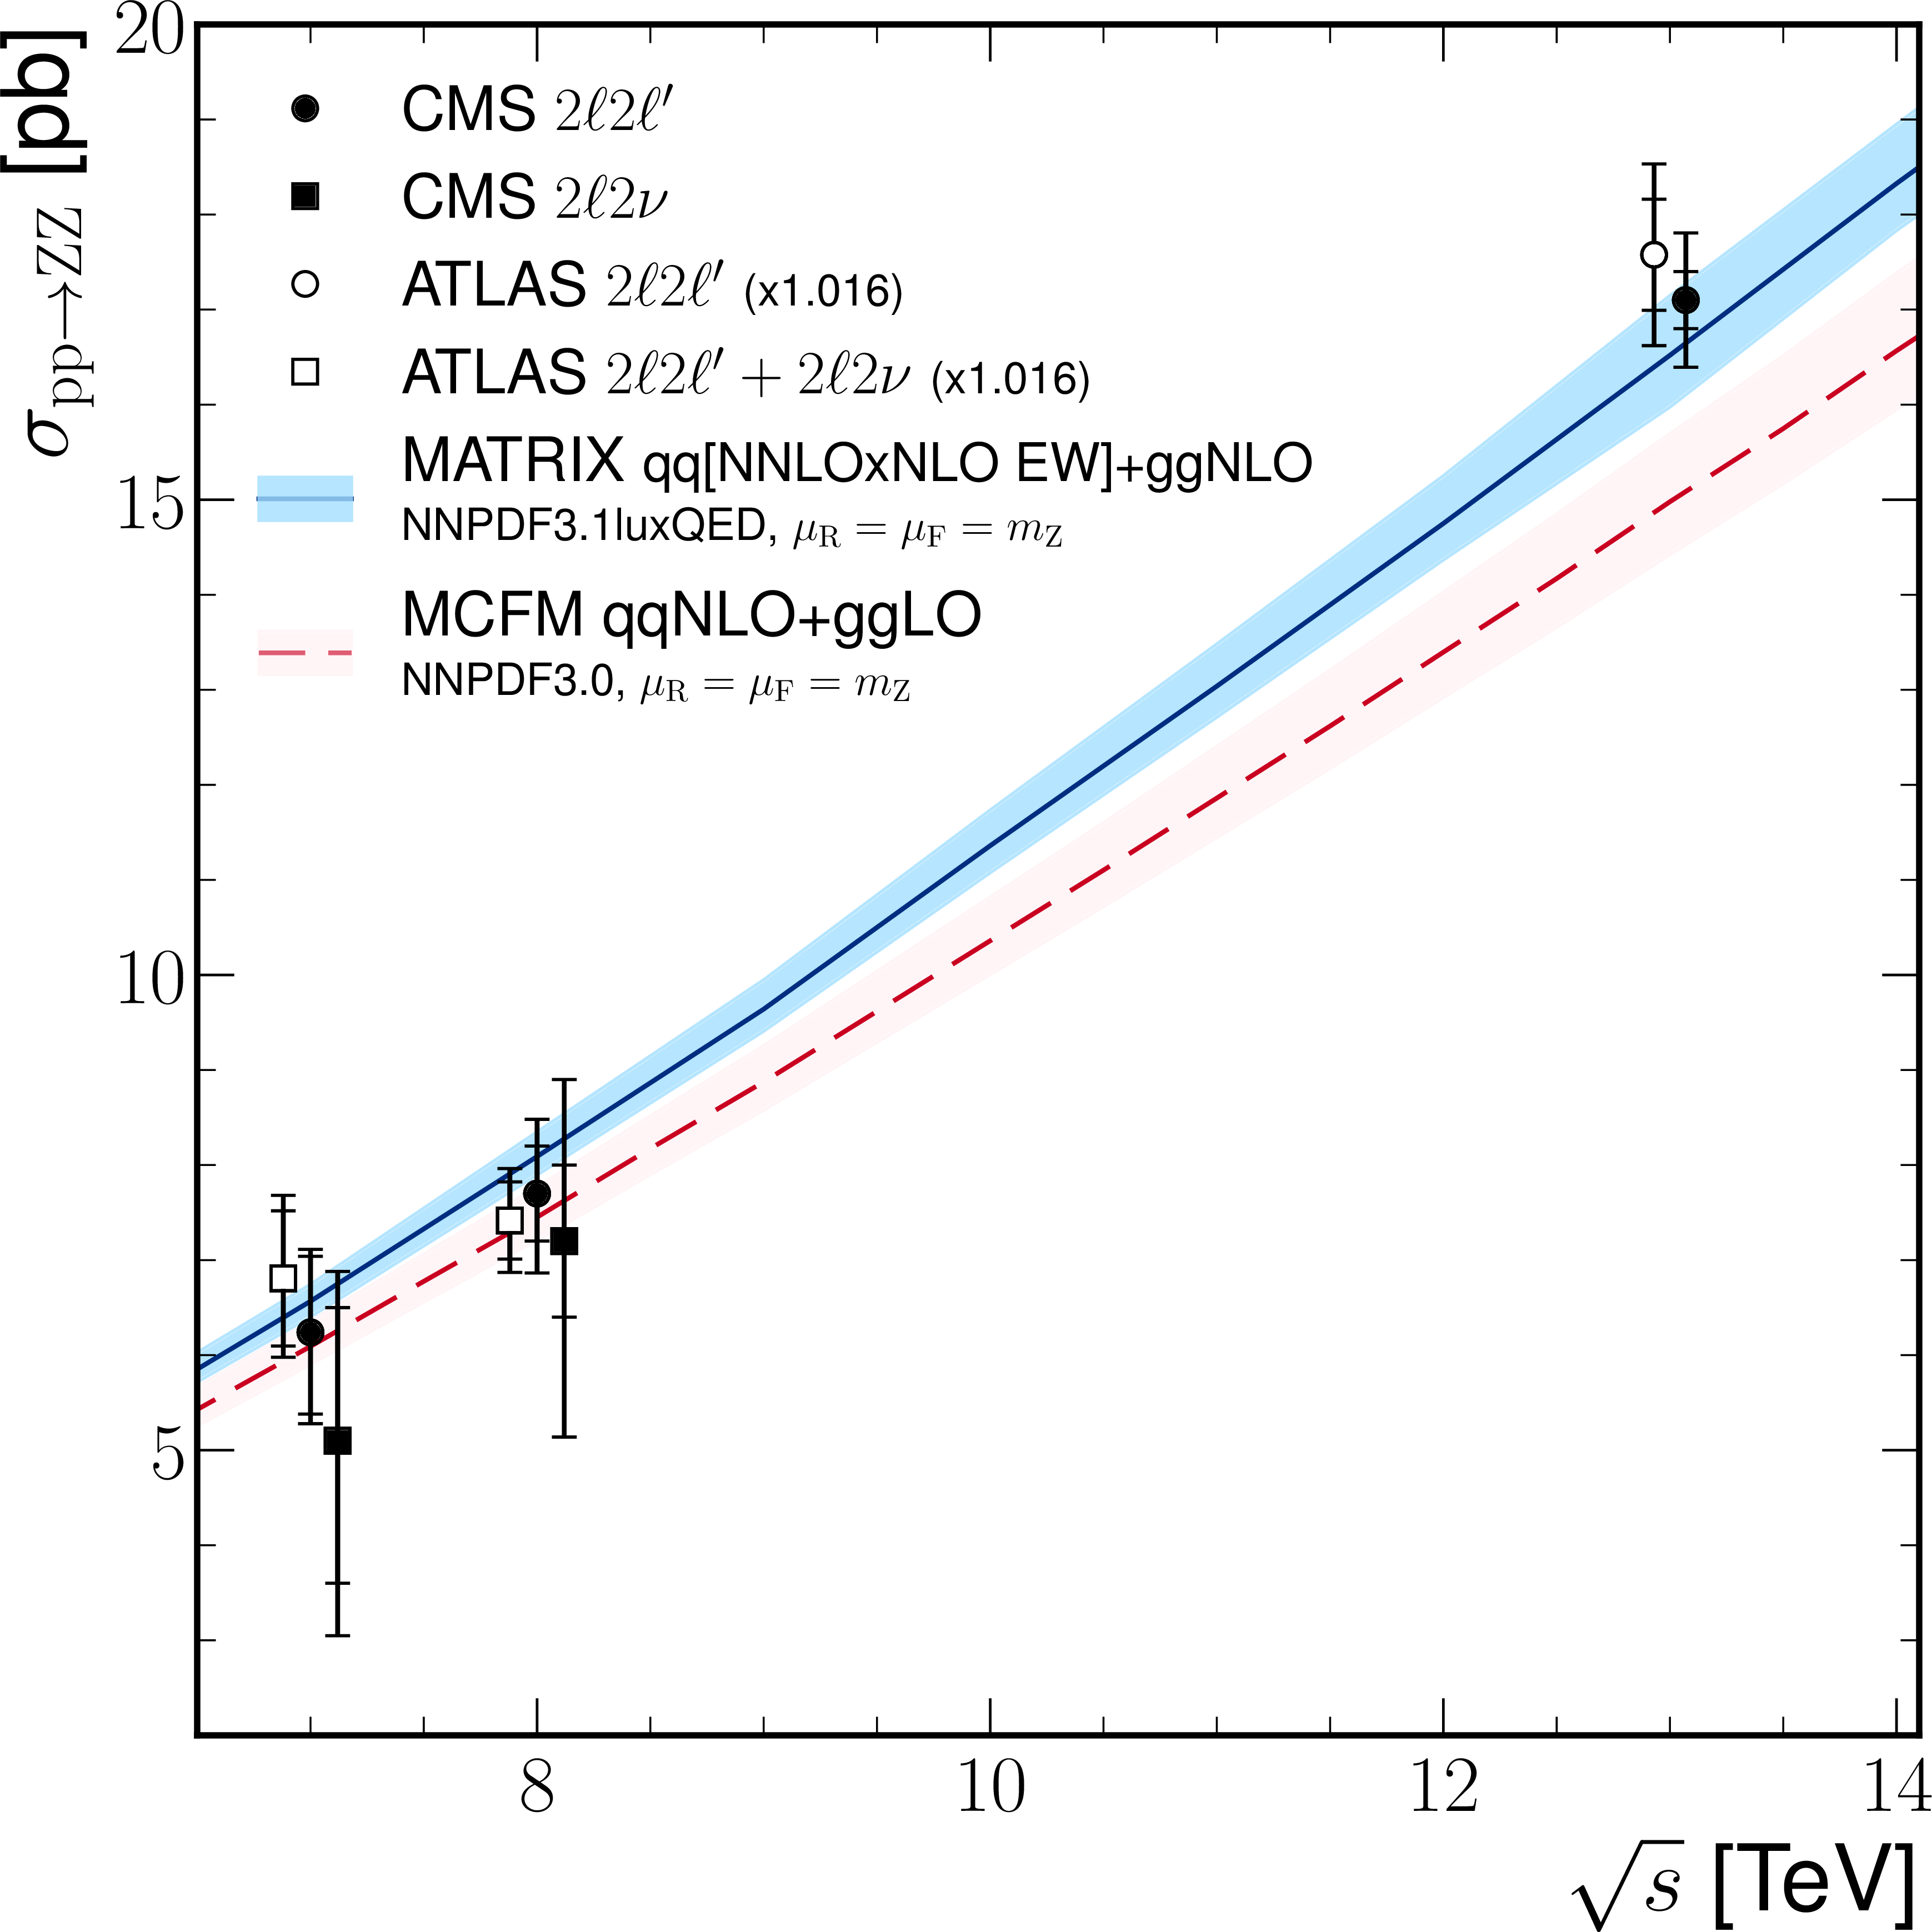
Figure 3:
The total ZZ cross section as a function of the proton-proton center-of-mass energy. Results from the CMS [4,5] and ATLAS [9,10,14] experiments are compared to predictions from Matrix at NNLO in QCD and NLO in EW, and MCFM at NLO in QCD. The MCFM prediction also includes gluon-gluon initiated production at LO in QCD. The predictions use NNPDF31_nnlo_as_0118_luxqed and NNPDF3.0 PDF sets, respectively, and fixed factorization and renormalization scales $\mu _\mathrm {F} = \mu _\mathrm {R} = m_{\mathrm{Z}}$. Details of the calculations and uncertainties are given in the text. The ATLAS measurements were performed with a Z boson mass window of 66-116 GeV, instead of 60-120 GeV used by CMS, and are corrected for the resulting 1.6% difference in acceptance. Measurements at the same center-of-mass energy are shifted slightly along the horizontal axis for clarity. |
png pdf |
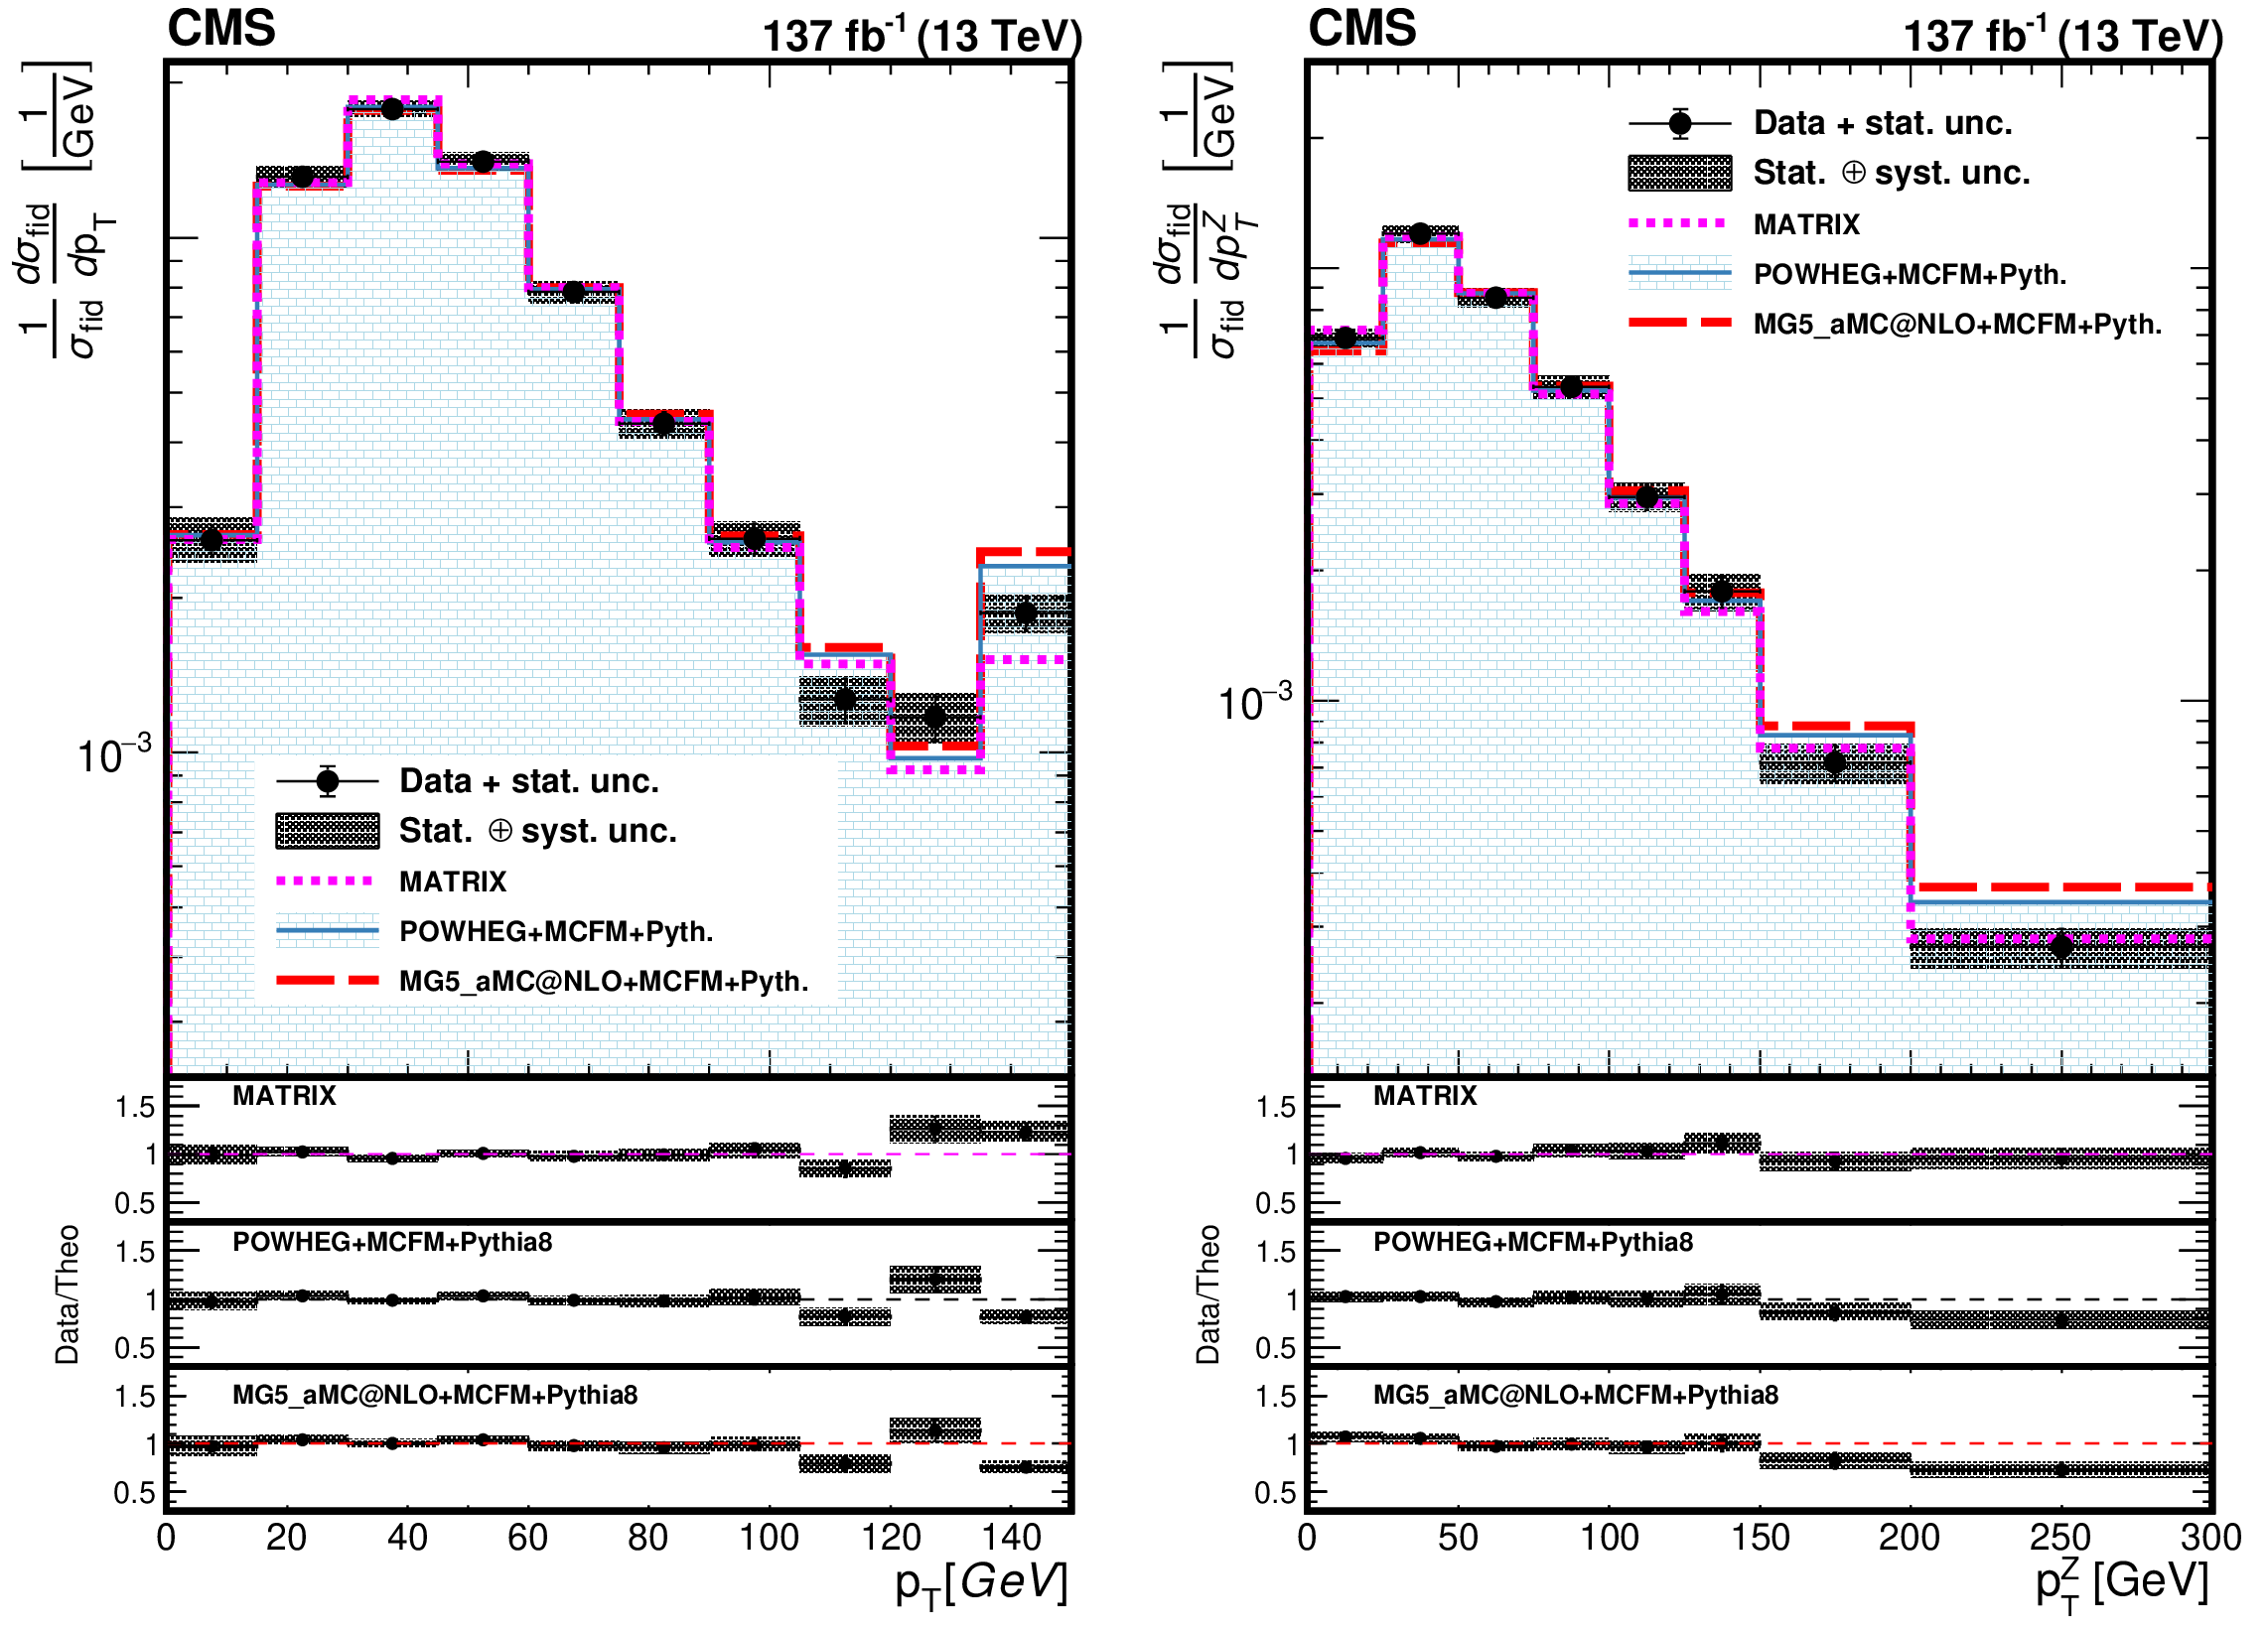
Figure 4:
Differential cross sections normalized to the fiducial cross section for the combined 4e, 2e2$\mu $, and 4$\mu $ decay channels as a function of $ {p_{\mathrm {T}}} $ for (left) all leptons, (right) all Z bosons in the event. The points represent the unfolded data with error bars showing the statistical uncertainties, the shaded histogram the POWHEG+MCFM ZZ predictions, and the dashed curves correspond to the results of the Matrix and MadGraph 5_aMC@NLO+MCFM calculations. The three lower panels represent the ratio of the measured cross section to the expected distributions from Matrix, POWHEG+MCFM and MadGraph 5_aMC@NLO+MCFM. The shaded areas in all the panels represent the full uncertainties calculated as the quadratic sum of the statistical and systematic uncertainties, whereas the crosses represent only the statistical uncertainties. |

png pdf |
Figure 4-a:
Differential cross sections normalized to the fiducial cross section for the combined 4e, 2e2$\mu $, and 4$\mu $ decay channels as a function of $ {p_{\mathrm {T}}} $ for all leptons in the event. The points represent the unfolded data with error bars showing the statistical uncertainties, the shaded histogram the POWHEG+MCFM ZZ predictions, and the dashed curves correspond to the results of the Matrix and MadGraph 5_aMC@NLO+MCFM calculations. The three lower panels represent the ratio of the measured cross section to the expected distributions from Matrix, POWHEG+MCFM and MadGraph 5_aMC@NLO+MCFM. The shaded areas in all the panels represent the full uncertainties calculated as the quadratic sum of the statistical and systematic uncertainties, whereas the crosses represent only the statistical uncertainties. |

png pdf |
Figure 4-b:
Differential cross sections normalized to the fiducial cross section for the combined 4e, 2e2$\mu $, and 4$\mu $ decay channels as a function of $ {p_{\mathrm {T}}} $ for all Z bosons in the event. The points represent the unfolded data with error bars showing the statistical uncertainties, the shaded histogram the POWHEG+MCFM ZZ predictions, and the dashed curves correspond to the results of the Matrix and MadGraph 5_aMC@NLO+MCFM calculations. The three lower panels represent the ratio of the measured cross section to the expected distributions from Matrix, POWHEG+MCFM and MadGraph 5_aMC@NLO+MCFM. The shaded areas in all the panels represent the full uncertainties calculated as the quadratic sum of the statistical and systematic uncertainties, whereas the crosses represent only the statistical uncertainties. |

png pdf |
Figure 5:
Differential cross sections normalized to the fiducial cross section for the combined 4e, 2e2$\mu $, and 4$\mu $ decay channels as a function of (left) $ {p_{\mathrm {T}}} $ of the ZZ system, (right) the invariant mass of the ZZ system. The points represent the unfolded data with error bars showing the statistical uncertainties, shaded histogram the POWHEG+MCFM ZZ predictions, and the dashed curves correspond to the results of the Matrix and MadGraph 5_aMC@NLO+MCFM calculations. The three lower panels represent the ratio of the measured cross section to the expected distributions from Matrix, POWHEG+MCFM and MadGraph 5_aMC@NLO+MCFM. The shaded areas in all the panels represent the full uncertainties calculated as the quadratic sum of the statistical and systematic uncertainties, whereas the crosses represent only the statistical uncertainties. |
png pdf |
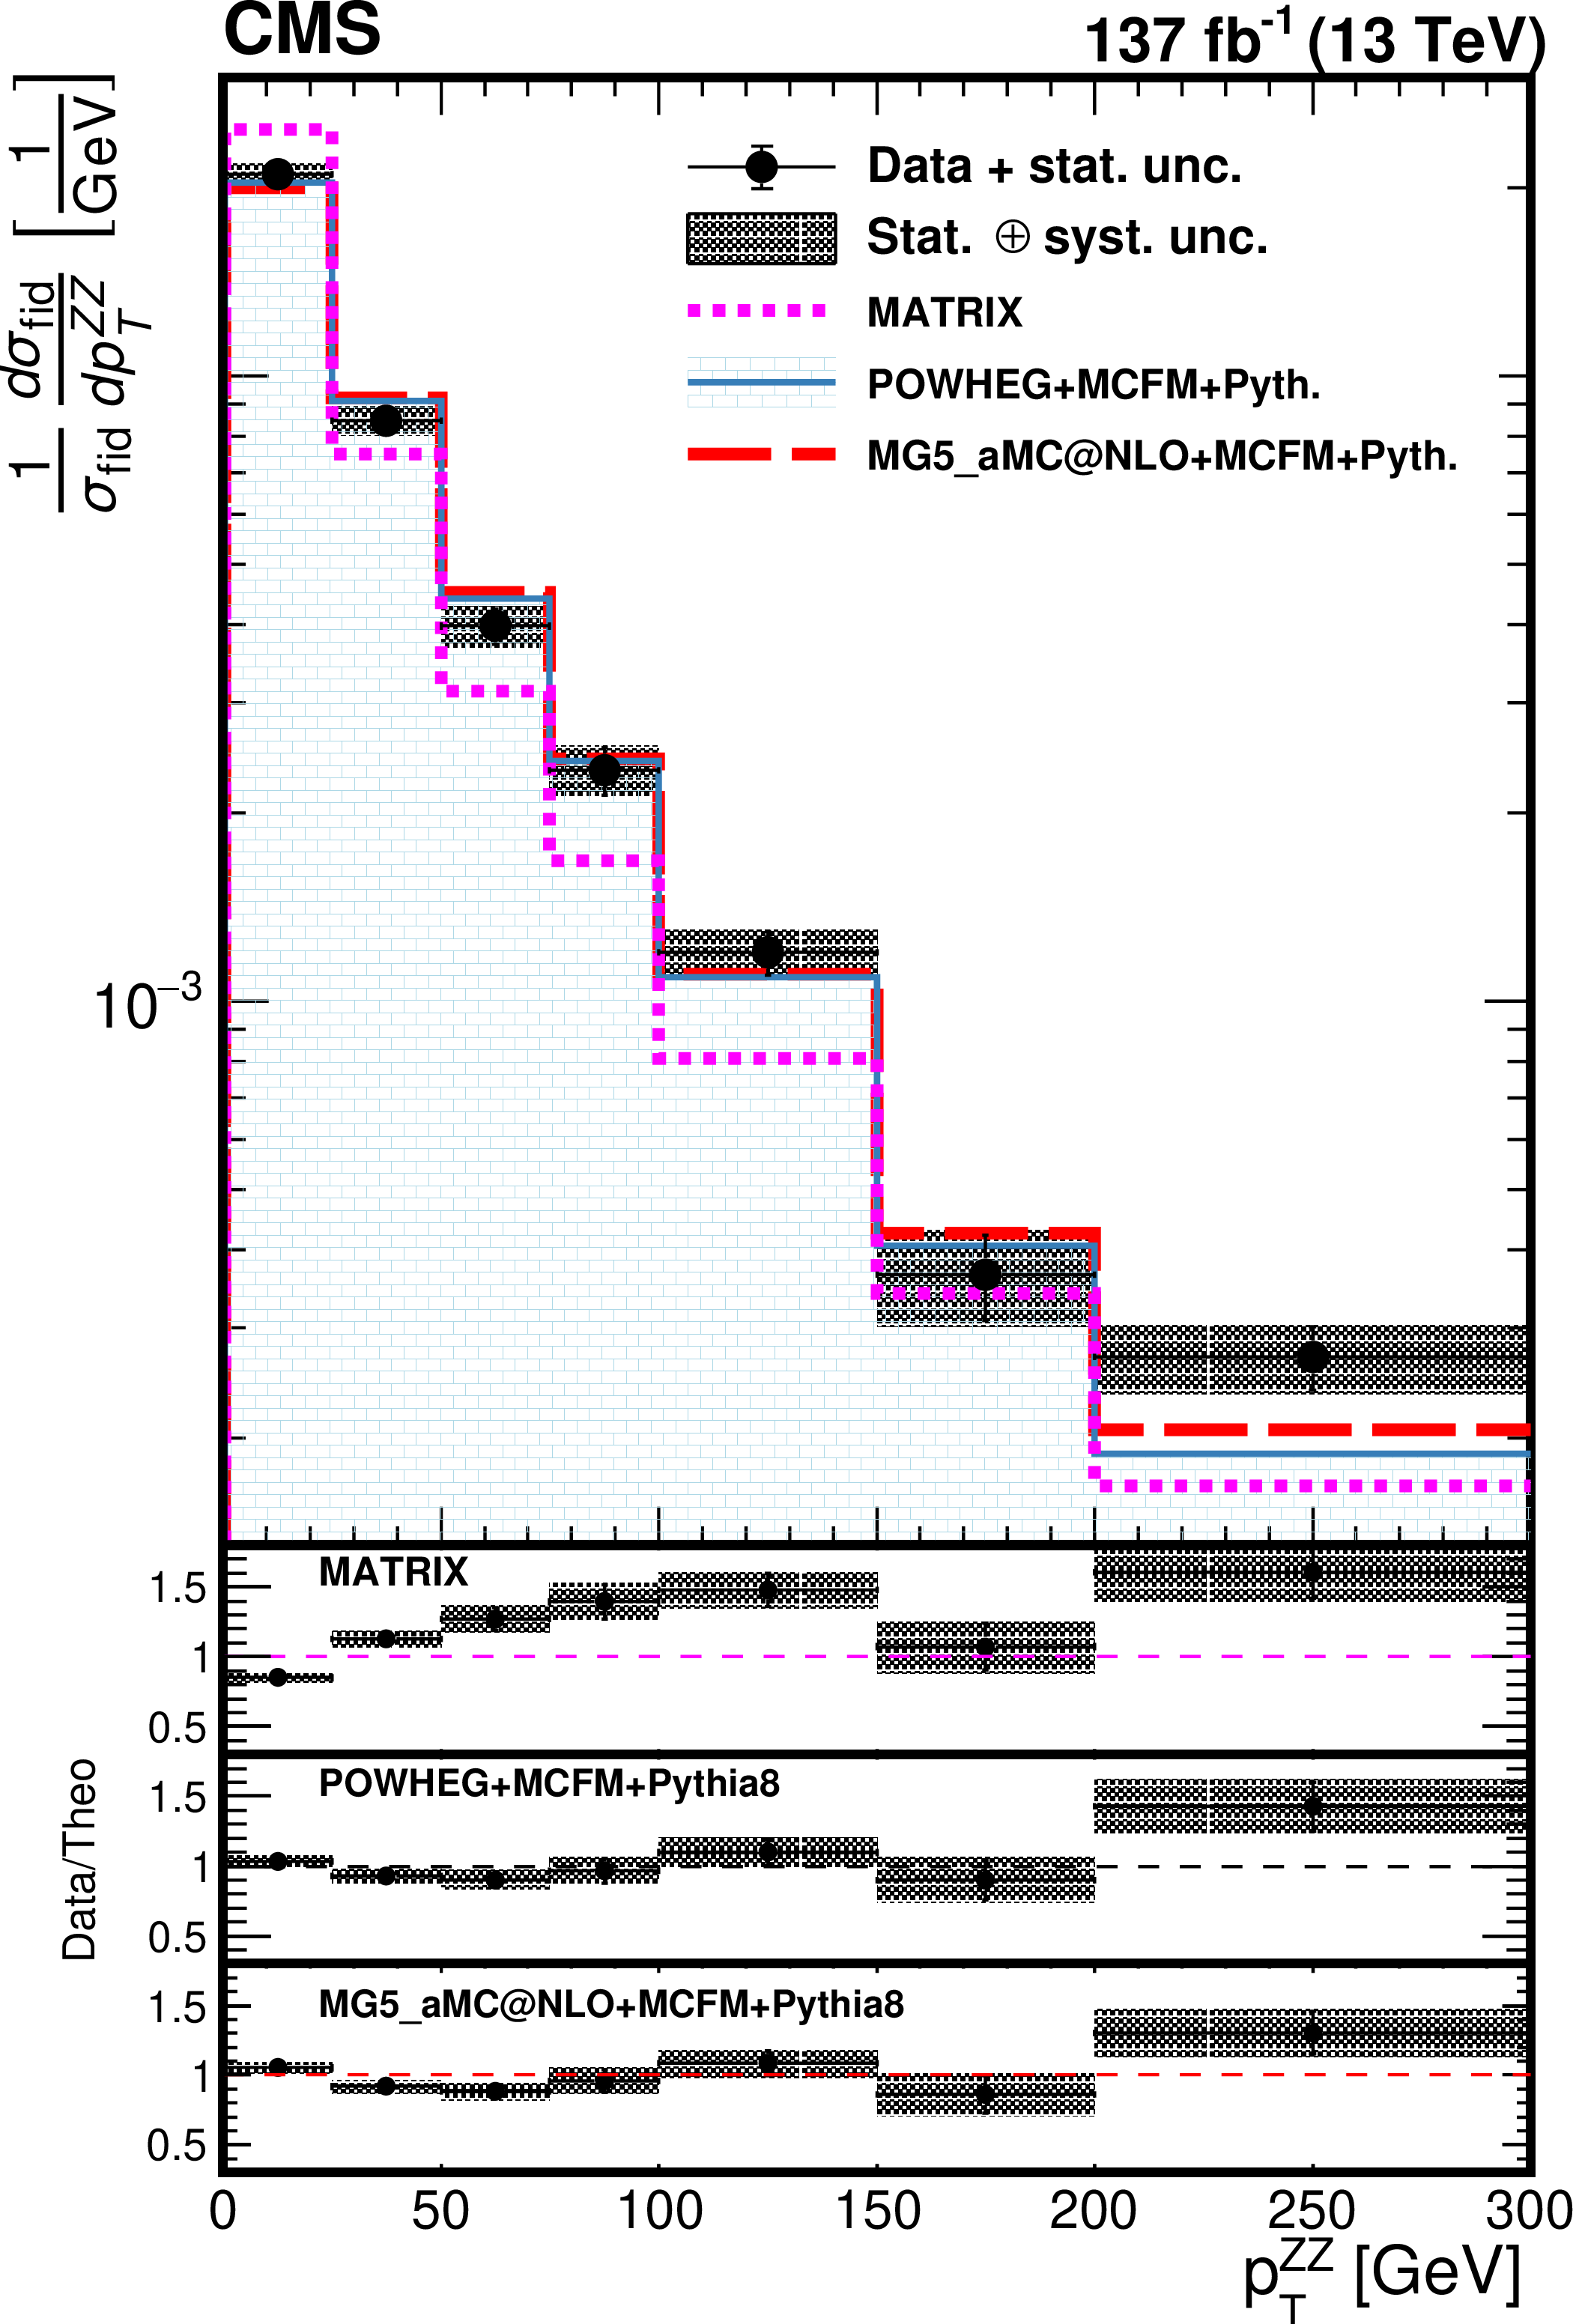
Figure 5-a:
Differential cross sections normalized to the fiducial cross section for the combined 4e, 2e2$\mu $, and 4$\mu $ decay channels as a function of $ {p_{\mathrm {T}}} $ of the ZZ system. The points represent the unfolded data with error bars showing the statistical uncertainties, shaded histogram the POWHEG+MCFM ZZ predictions, and the dashed curves correspond to the results of the Matrix and MadGraph 5_aMC@NLO+MCFM calculations. The three lower panels represent the ratio of the measured cross section to the expected distributions from Matrix, POWHEG+MCFM and MadGraph 5_aMC@NLO+MCFM. The shaded areas in all the panels represent the full uncertainties calculated as the quadratic sum of the statistical and systematic uncertainties, whereas the crosses represent only the statistical uncertainties. |
png pdf |
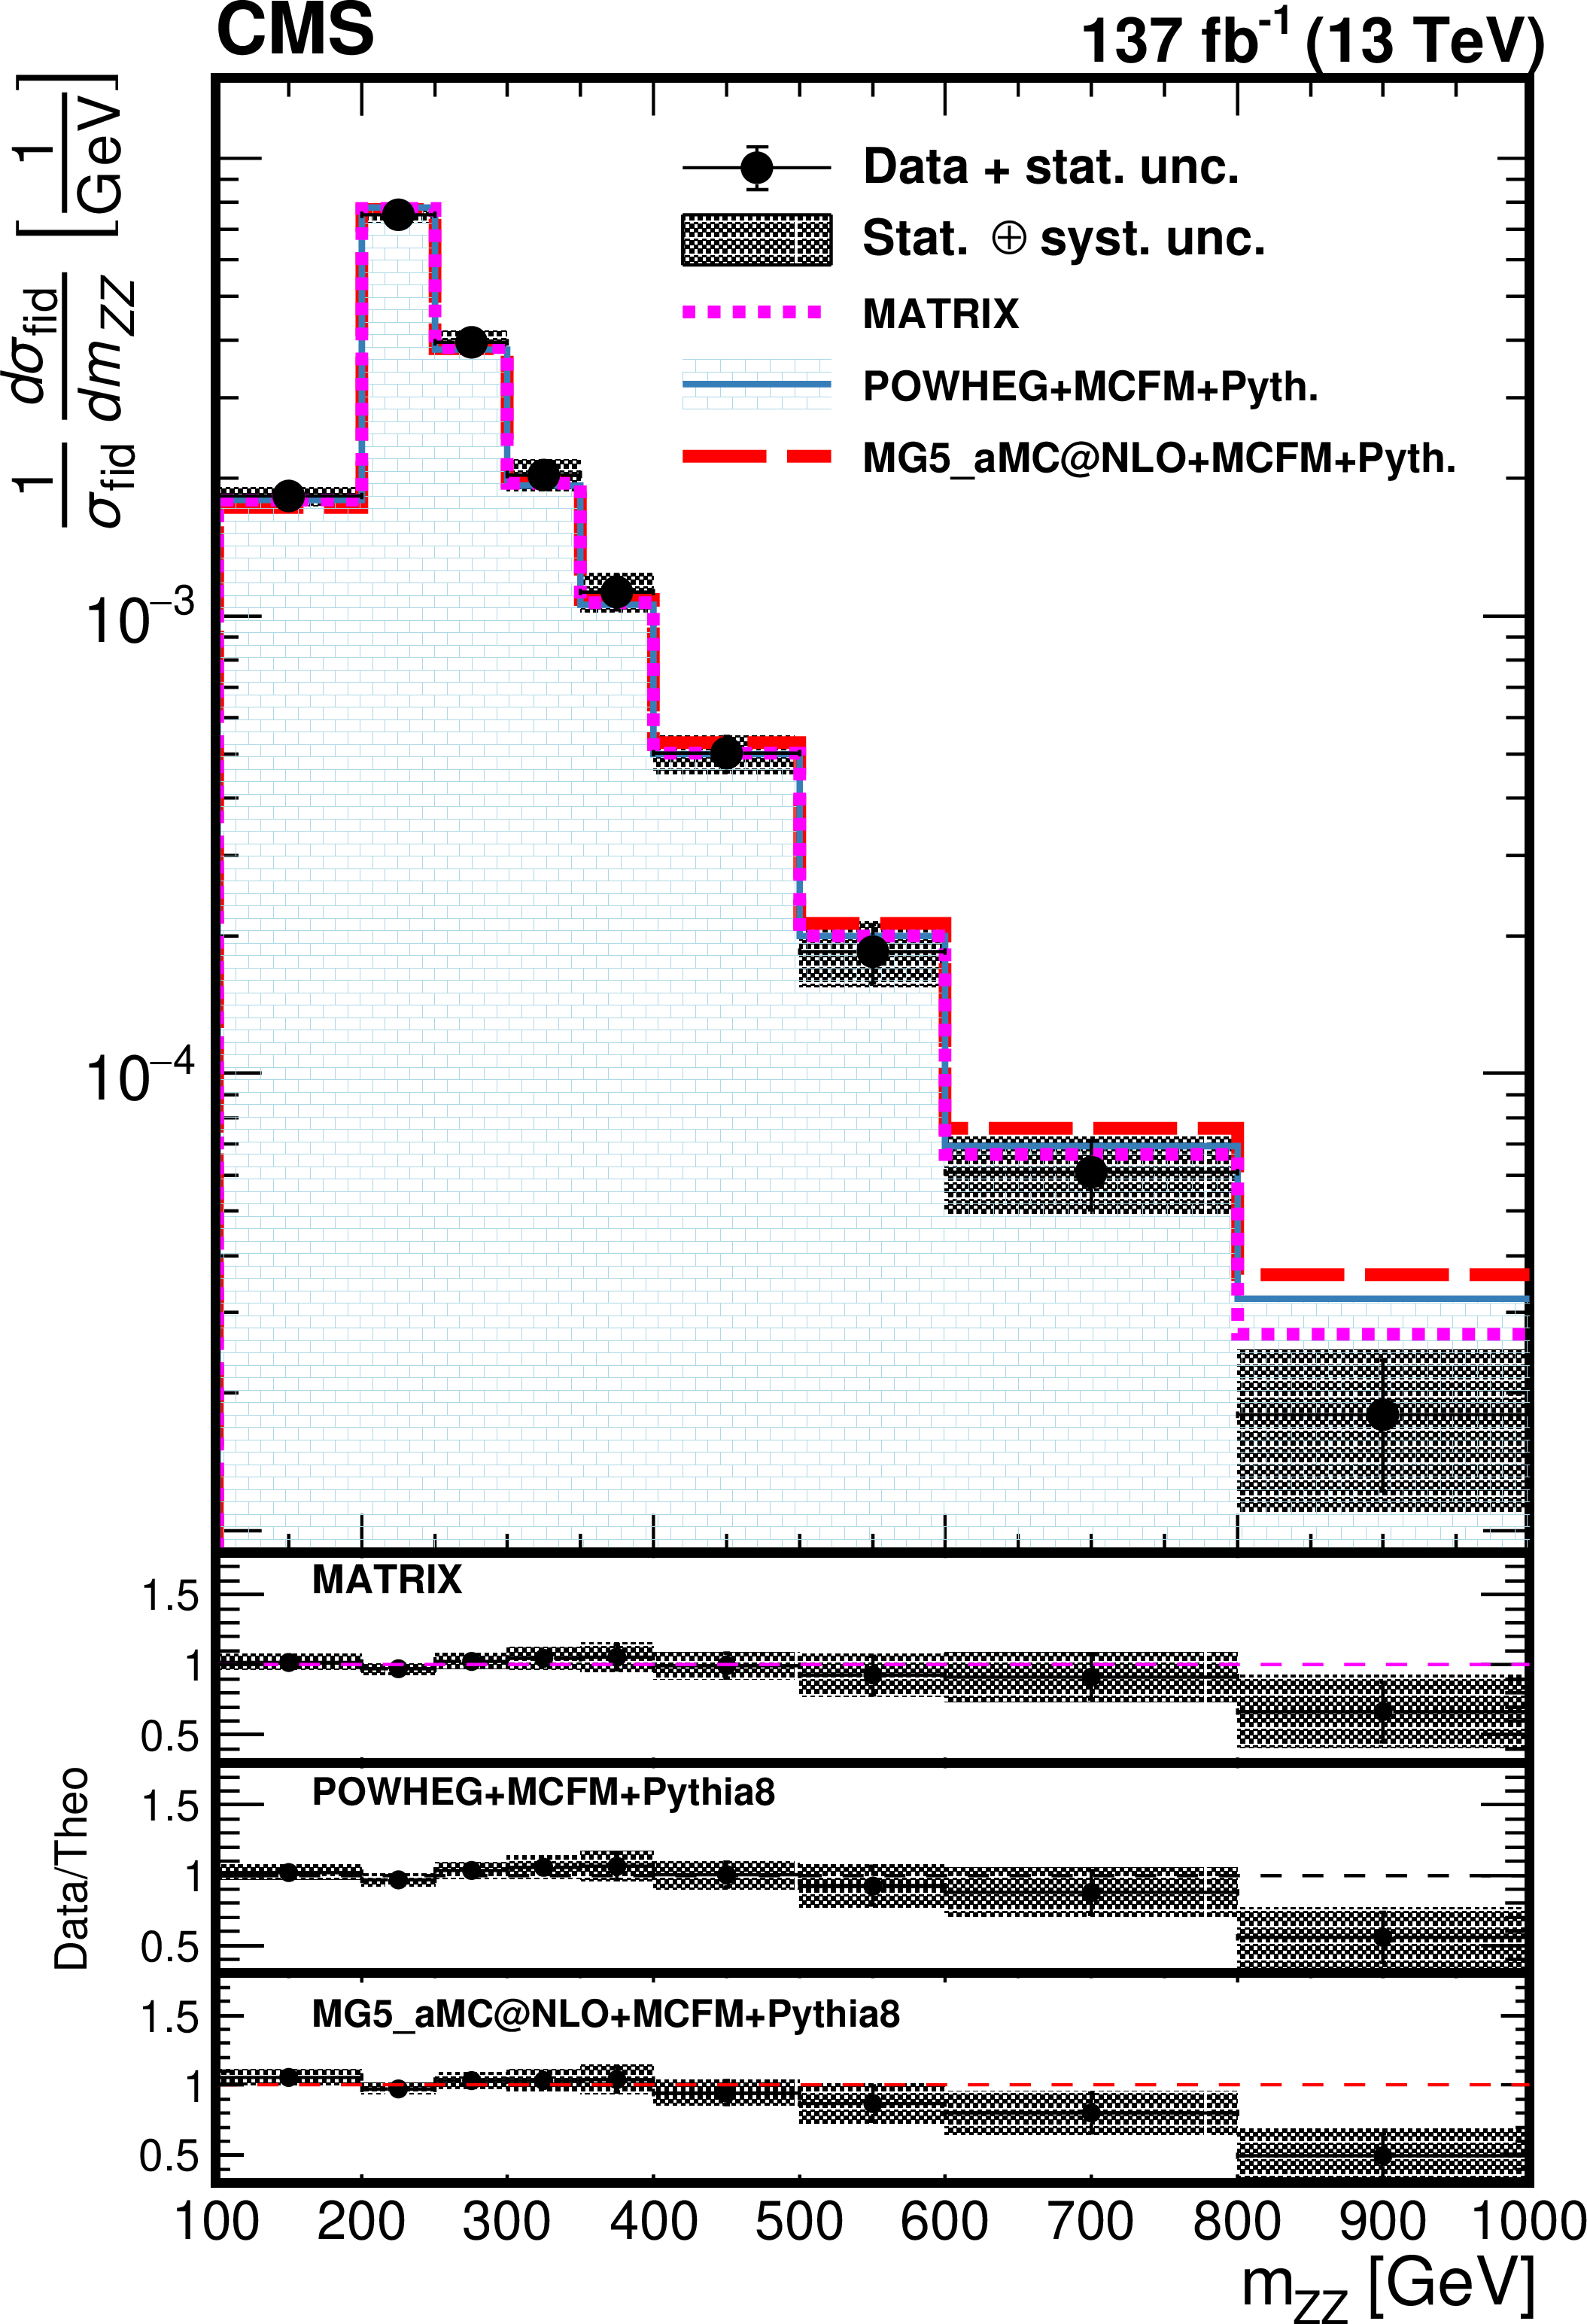
Figure 5-b:
Differential cross sections normalized to the fiducial cross section for the combined 4e, 2e2$\mu $, and 4$\mu $ decay channels as a function of the invariant mass of the ZZ system. The points represent the unfolded data with error bars showing the statistical uncertainties, shaded histogram the POWHEG+MCFM ZZ predictions, and the dashed curves correspond to the results of the Matrix and MadGraph 5_aMC@NLO+MCFM calculations. The three lower panels represent the ratio of the measured cross section to the expected distributions from Matrix, POWHEG+MCFM and MadGraph 5_aMC@NLO+MCFM. The shaded areas in all the panels represent the full uncertainties calculated as the quadratic sum of the statistical and systematic uncertainties, whereas the crosses represent only the statistical uncertainties. |
png pdf |
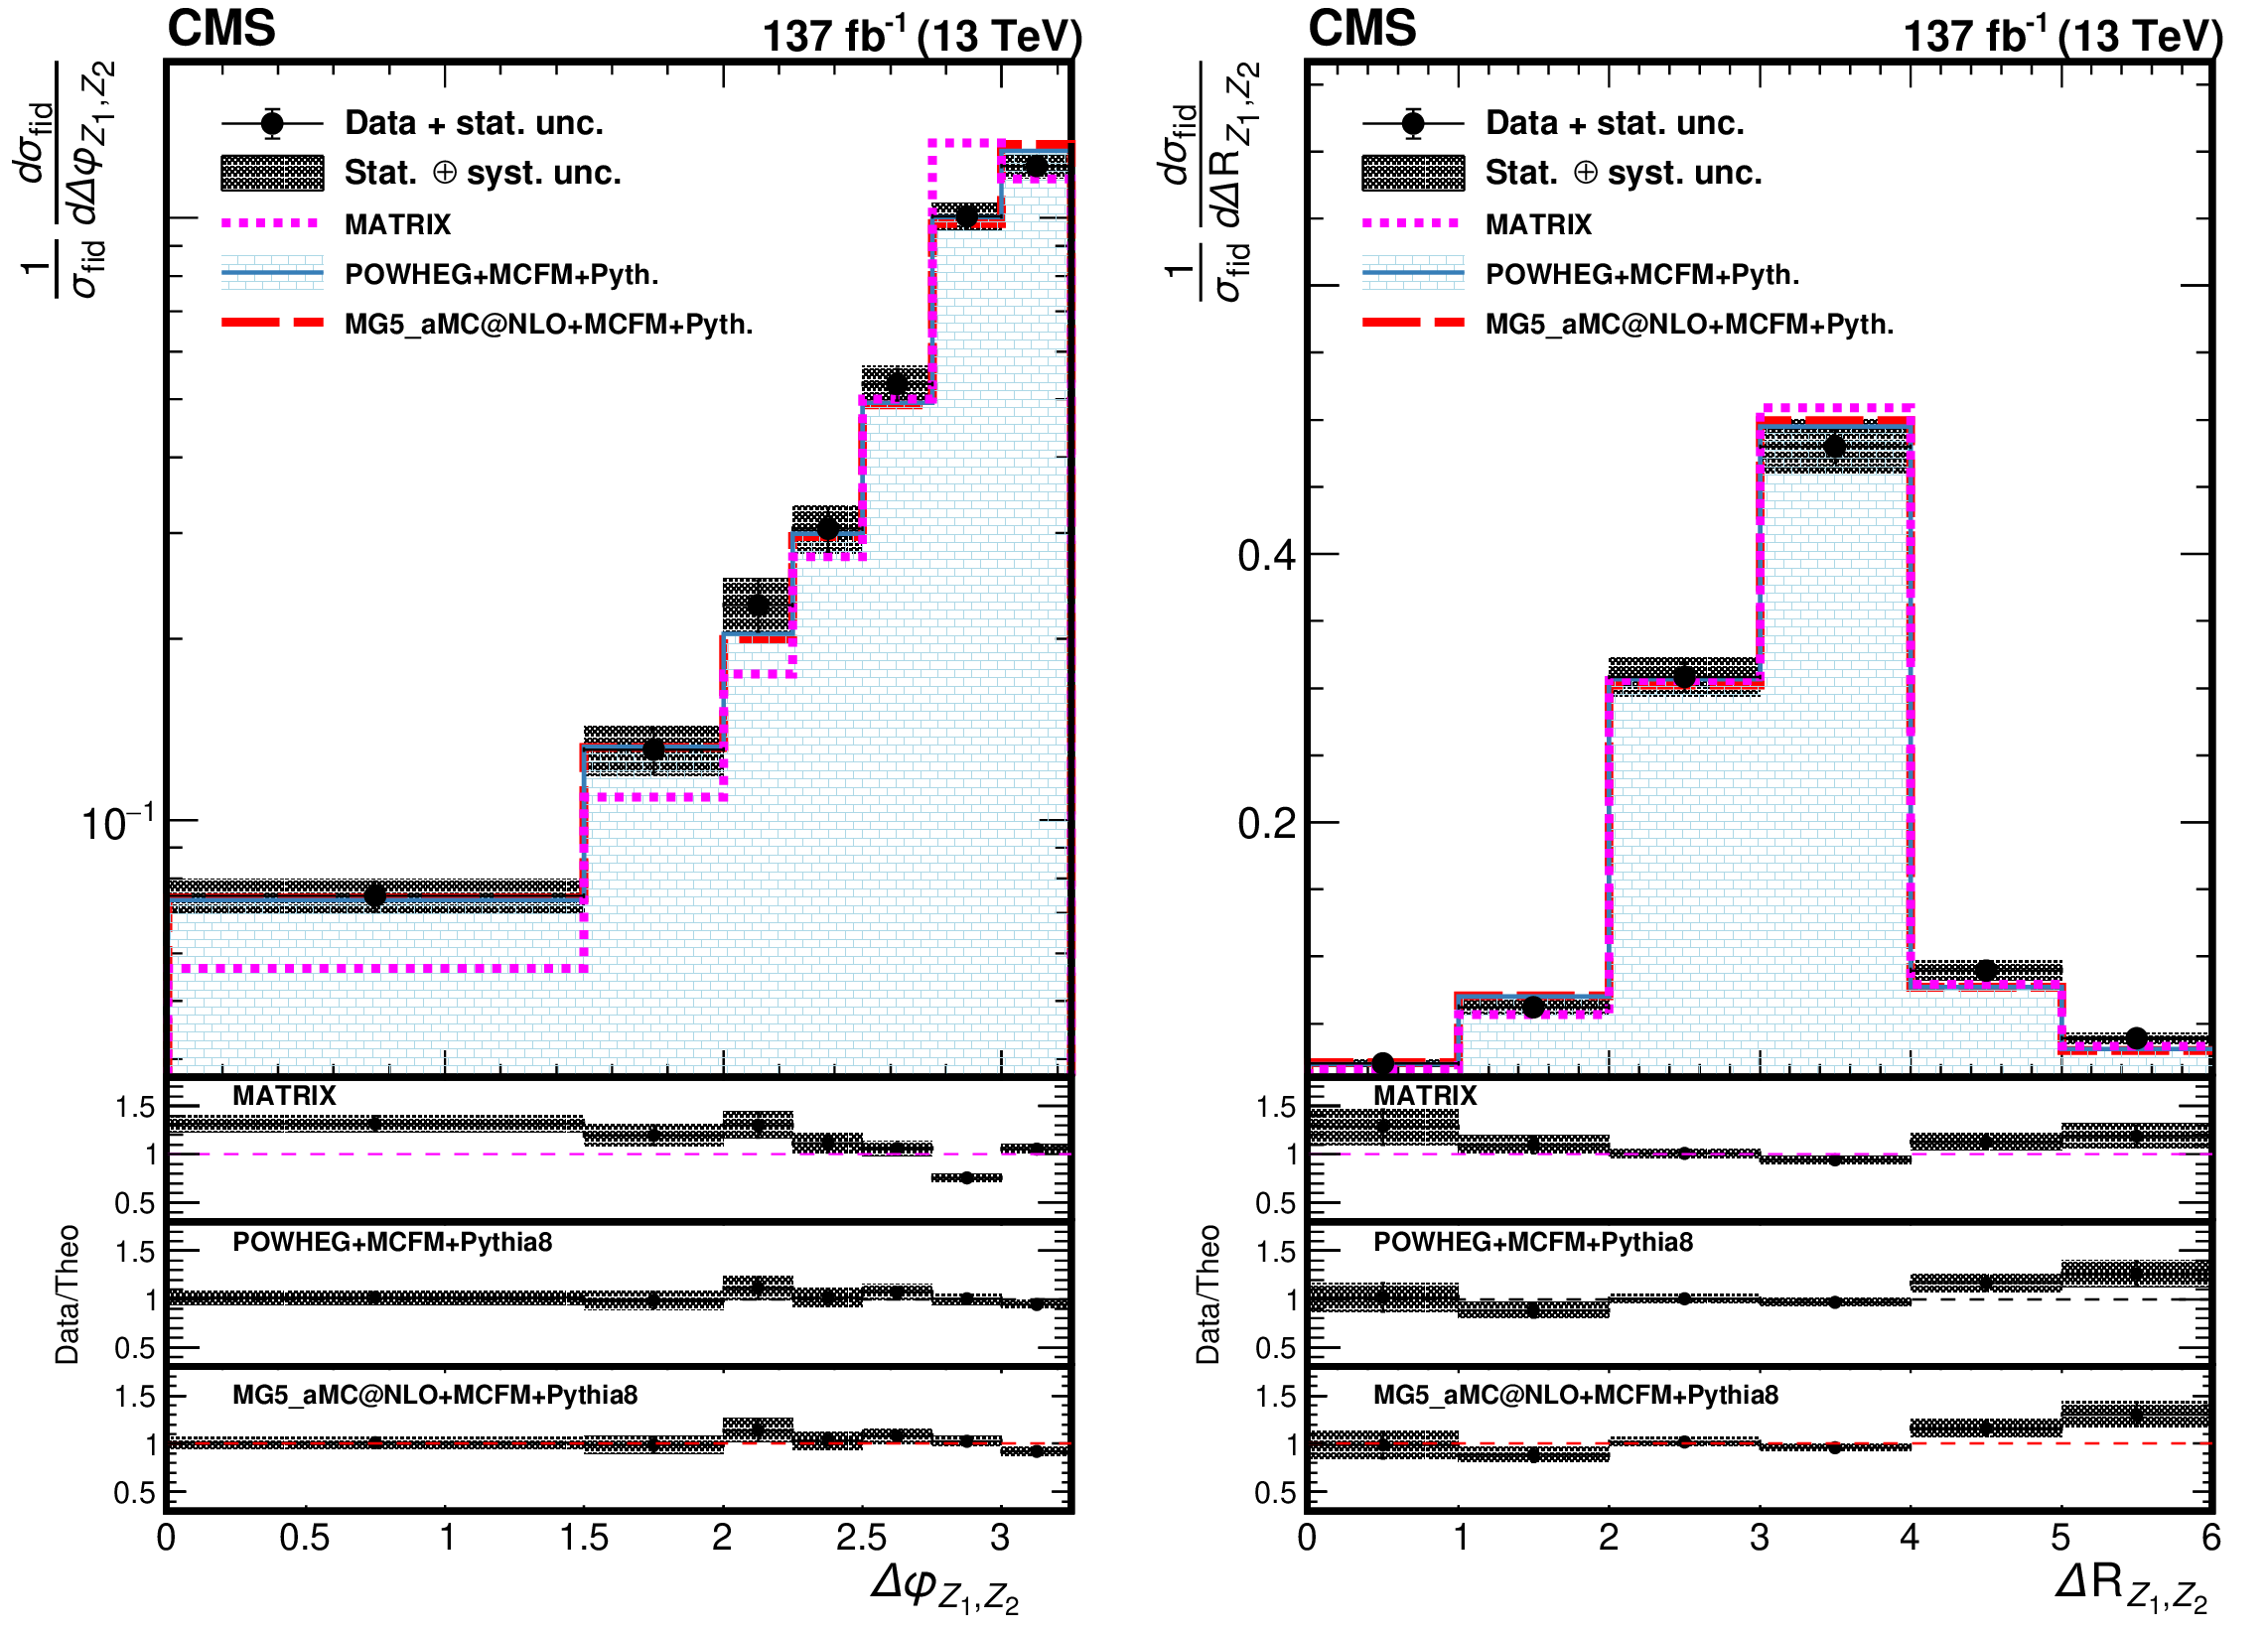
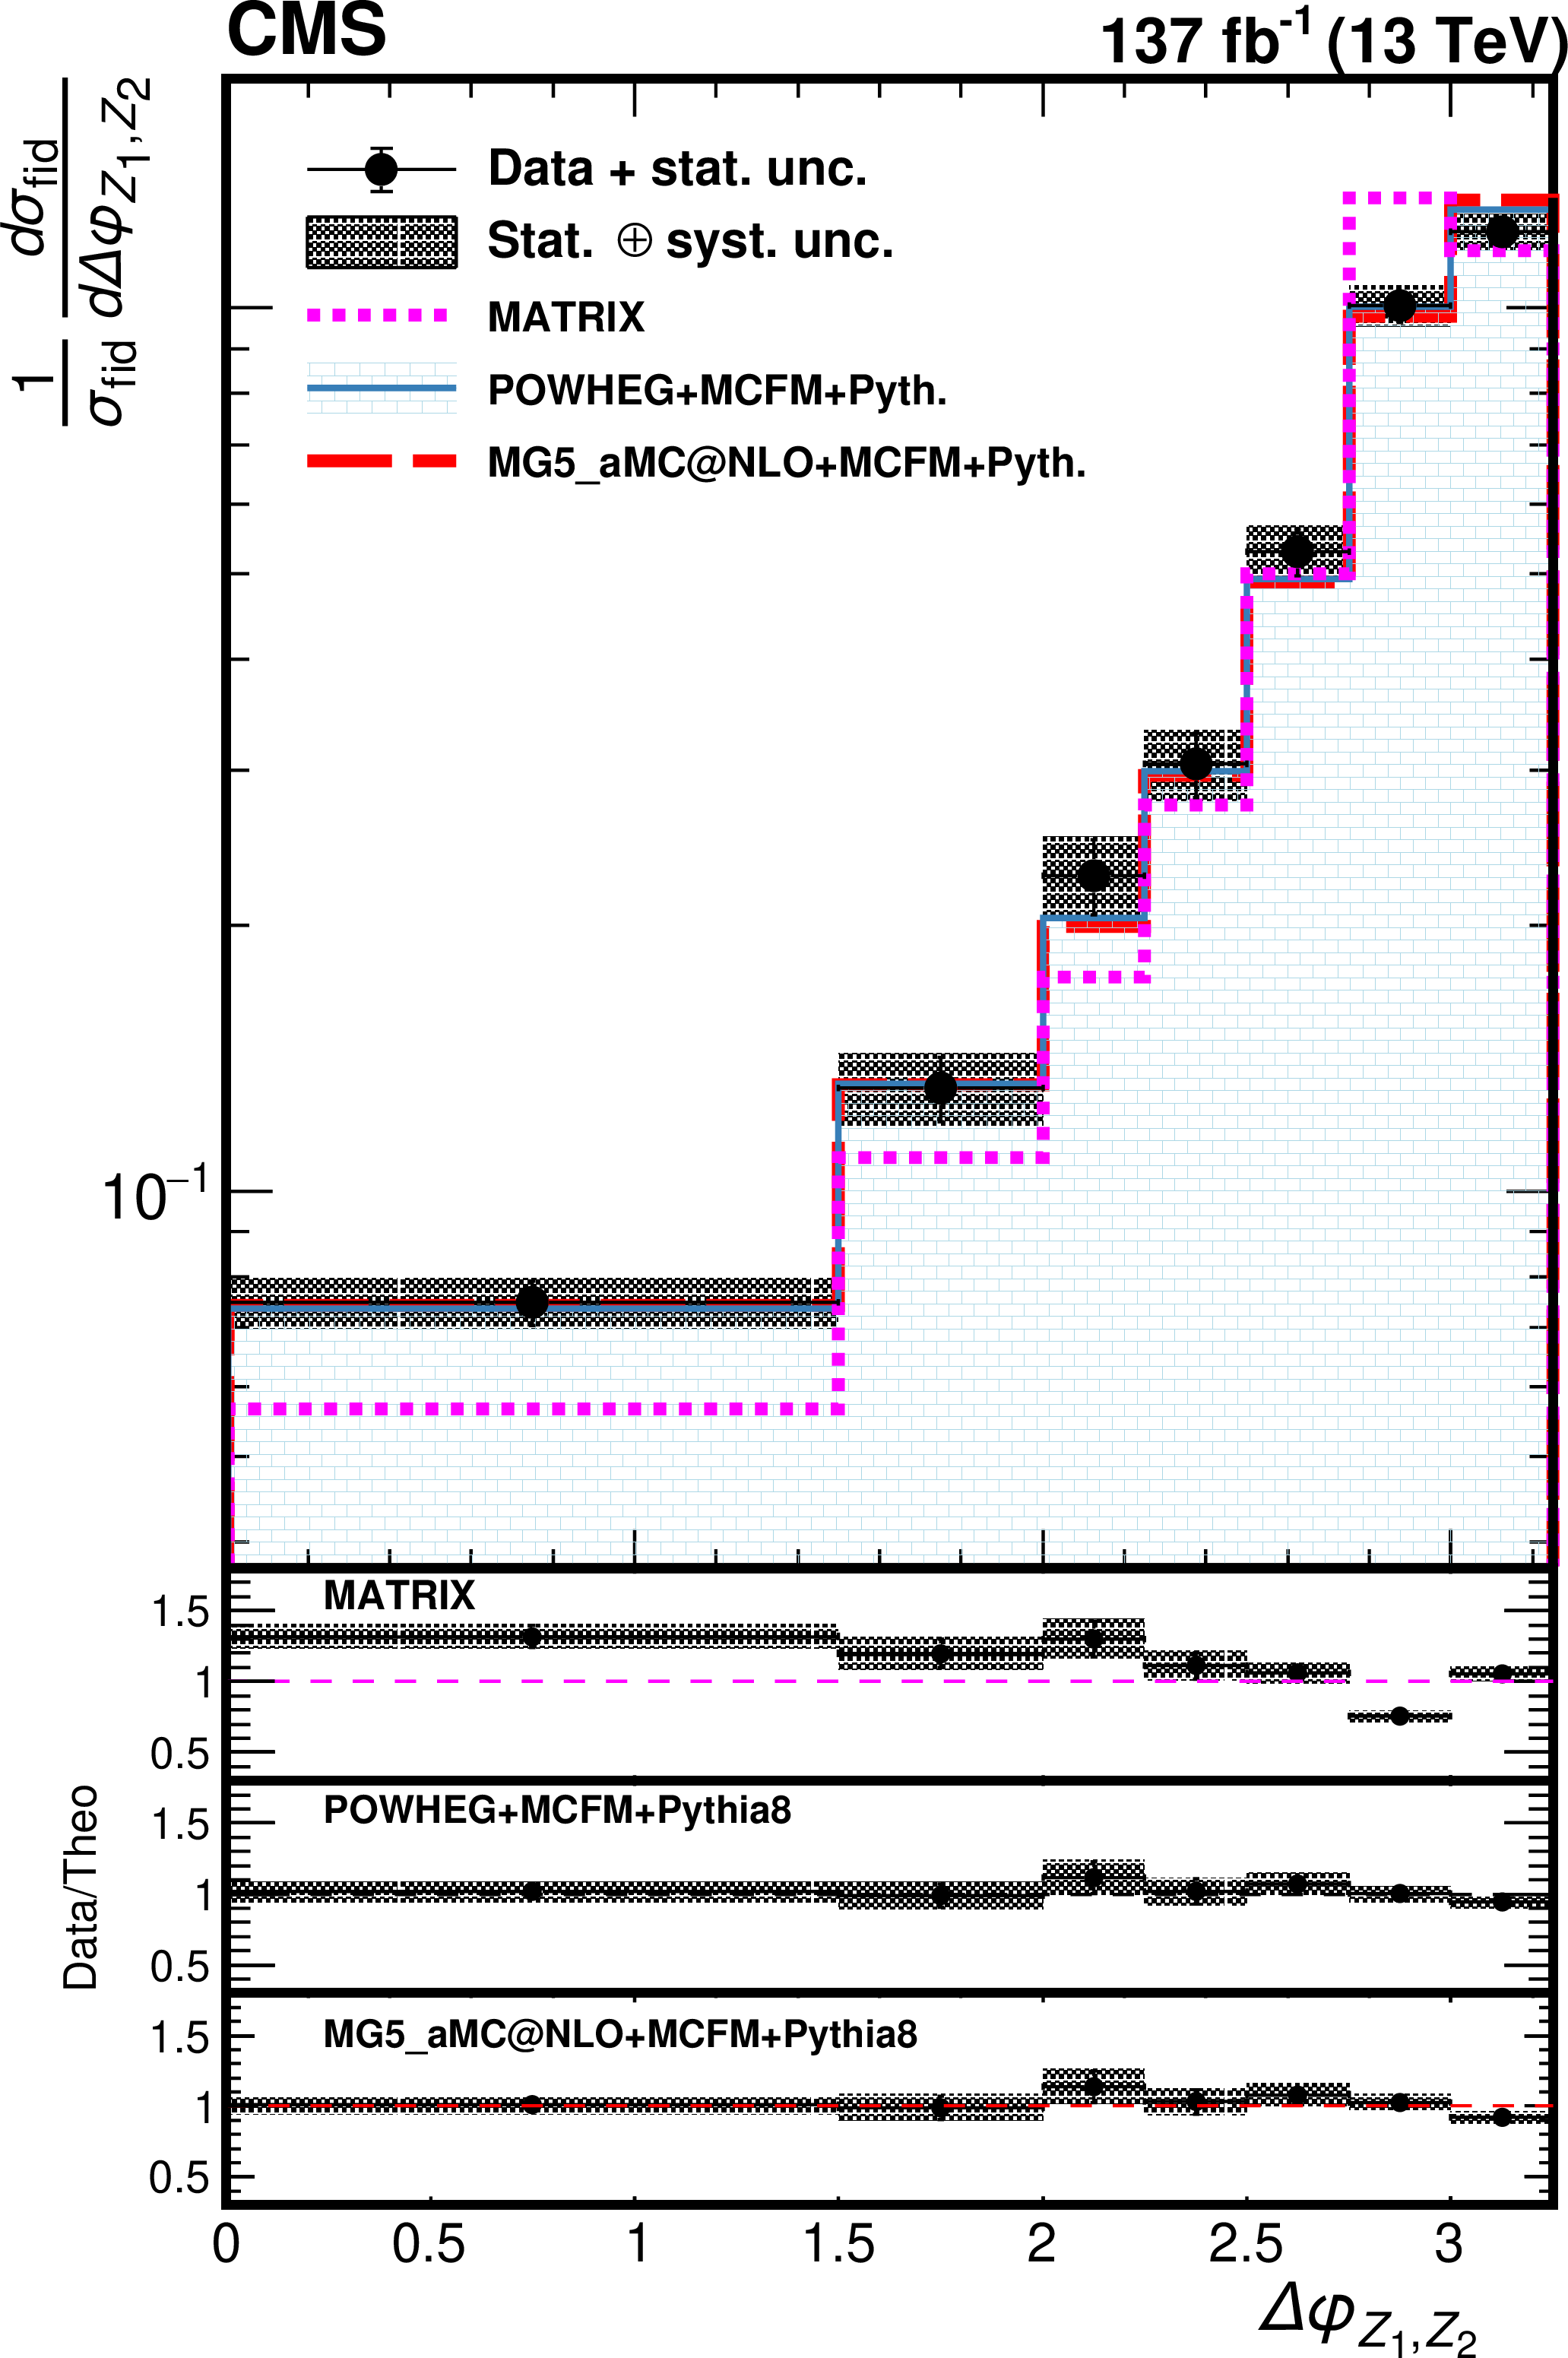
Figure 6:
Differential cross sections normalized to the fiducial cross section for the combined 4e, 2e2$\mu $, and 4$\mu $ decay channels as a function of the azimuthal and $\Delta R$ separation of the two Z bosons. The points represent the unfolded data with error bars showing the statistical uncertainties, the shaded histogram the POWHEG+MCFM ZZ predictions, and the dashed curves correspond to the results of the Matrix and MadGraph 5_aMC@NLO+MCFM calculations. The three lower panels represent the ratio of the measured cross section to the expected distributions from Matrix, POWHEG+MCFM and MadGraph 5_aMC@NLO+MCFM. The shaded areas in all the panels represent the full uncertainties calculated as the quadratic sum of the statistical and systematic uncertainties, whereas the crosses represent only the statistical uncertainties. |
png pdf |
Figure 6-a:
Differential cross sections normalized to the fiducial cross section for the combined 4e, 2e2$\mu $, and 4$\mu $ decay channels as a function of the azimuthal separation of the two Z bosons. The points represent the unfolded data with error bars showing the statistical uncertainties, the shaded histogram the POWHEG+MCFM ZZ predictions, and the dashed curves correspond to the results of the Matrix and MadGraph 5_aMC@NLO+MCFM calculations. The three lower panels represent the ratio of the measured cross section to the expected distributions from Matrix, POWHEG+MCFM and MadGraph 5_aMC@NLO+MCFM. The shaded areas in all the panels represent the full uncertainties calculated as the quadratic sum of the statistical and systematic uncertainties, whereas the crosses represent only the statistical uncertainties. |

png pdf |
Figure 6-b:
Differential cross sections normalized to the fiducial cross section for the combined 4e, 2e2$\mu $, and 4$\mu $ decay channels as a function of the $\Delta R$ separation of the two Z bosons. The points represent the unfolded data with error bars showing the statistical uncertainties, the shaded histogram the POWHEG+MCFM ZZ predictions, and the dashed curves correspond to the results of the Matrix and MadGraph 5_aMC@NLO+MCFM calculations. The three lower panels represent the ratio of the measured cross section to the expected distributions from Matrix, POWHEG+MCFM and MadGraph 5_aMC@NLO+MCFM. The shaded areas in all the panels represent the full uncertainties calculated as the quadratic sum of the statistical and systematic uncertainties, whereas the crosses represent only the statistical uncertainties. |

png pdf |
Figure 7:
Distribution of the reconstructed ZZ mass for the combined 4e, 2e2$\mu $, and 4$\mu $ channels. Points represent the data with error bars showing the statistical uncertainties, the shaded histograms represent the SM prediction including signal and irreducible background from simulation, and the reducible background estimate from data. Dashed histogram represents an example of the aTGC signal. The last bin includes contribution from all events with mass above 1300 GeV. |
png pdf |
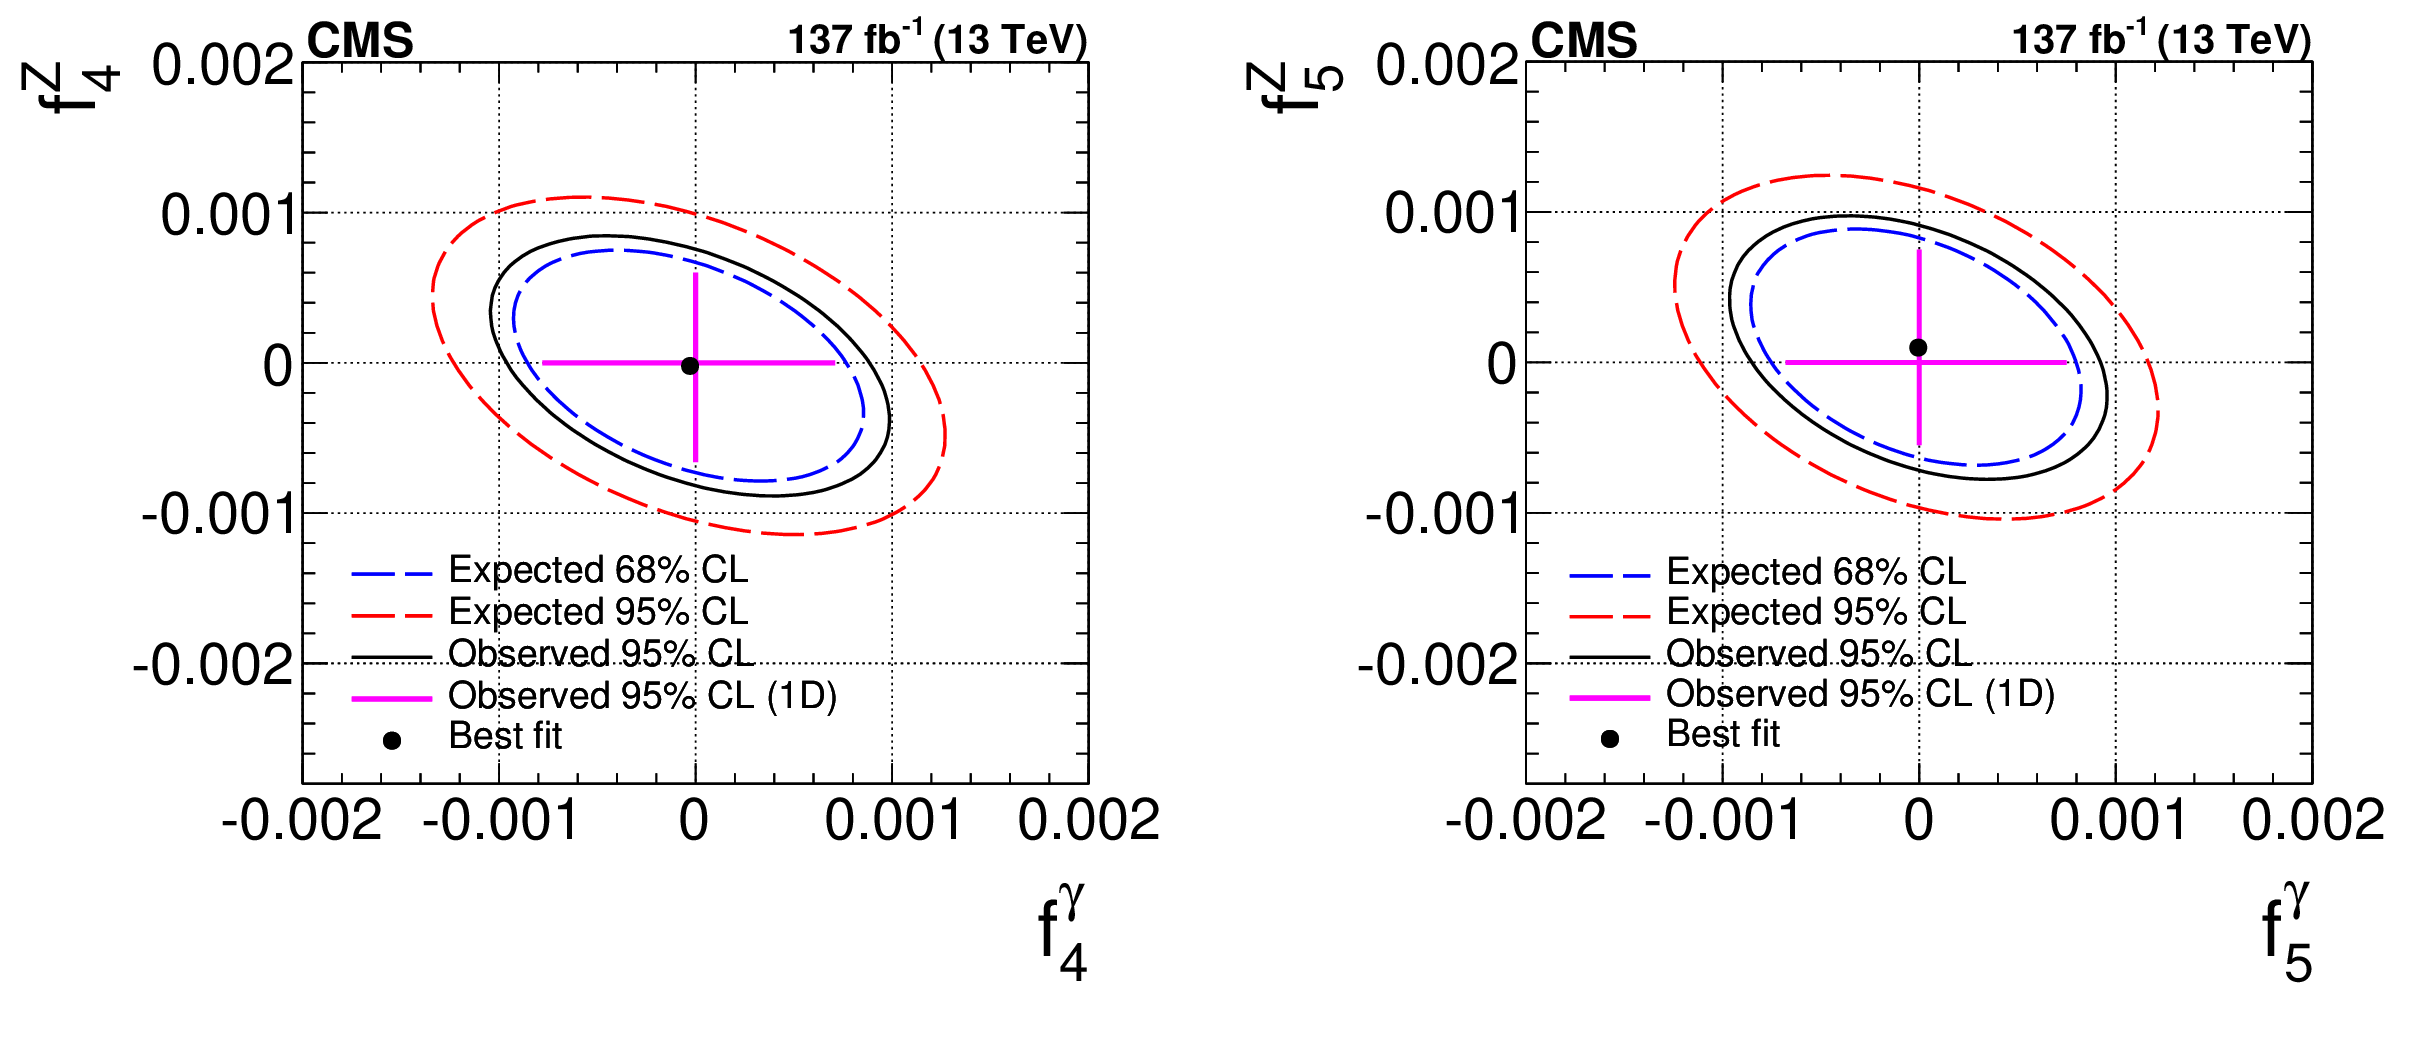
Figure 8:
Two-dimensional observed (solid) and expected (dashed) contours exclusion limits at 95% CL, and at 68 and 95% CL, respectively, on the ZZZ and ZZ$ \gamma $ aTGCs. The plots show the exclusion contours in the $(f_{4(5)}^\mathrm{Z}, f_{4(5)}^\gamma)$ parameter planes. Dots show where the likelihoods reach their maximum. The coupling values outside the contours are excluded at the corresponding confidence level. The crosses in the middle represent the observed 1D limits. No form factor is used. |
png pdf |
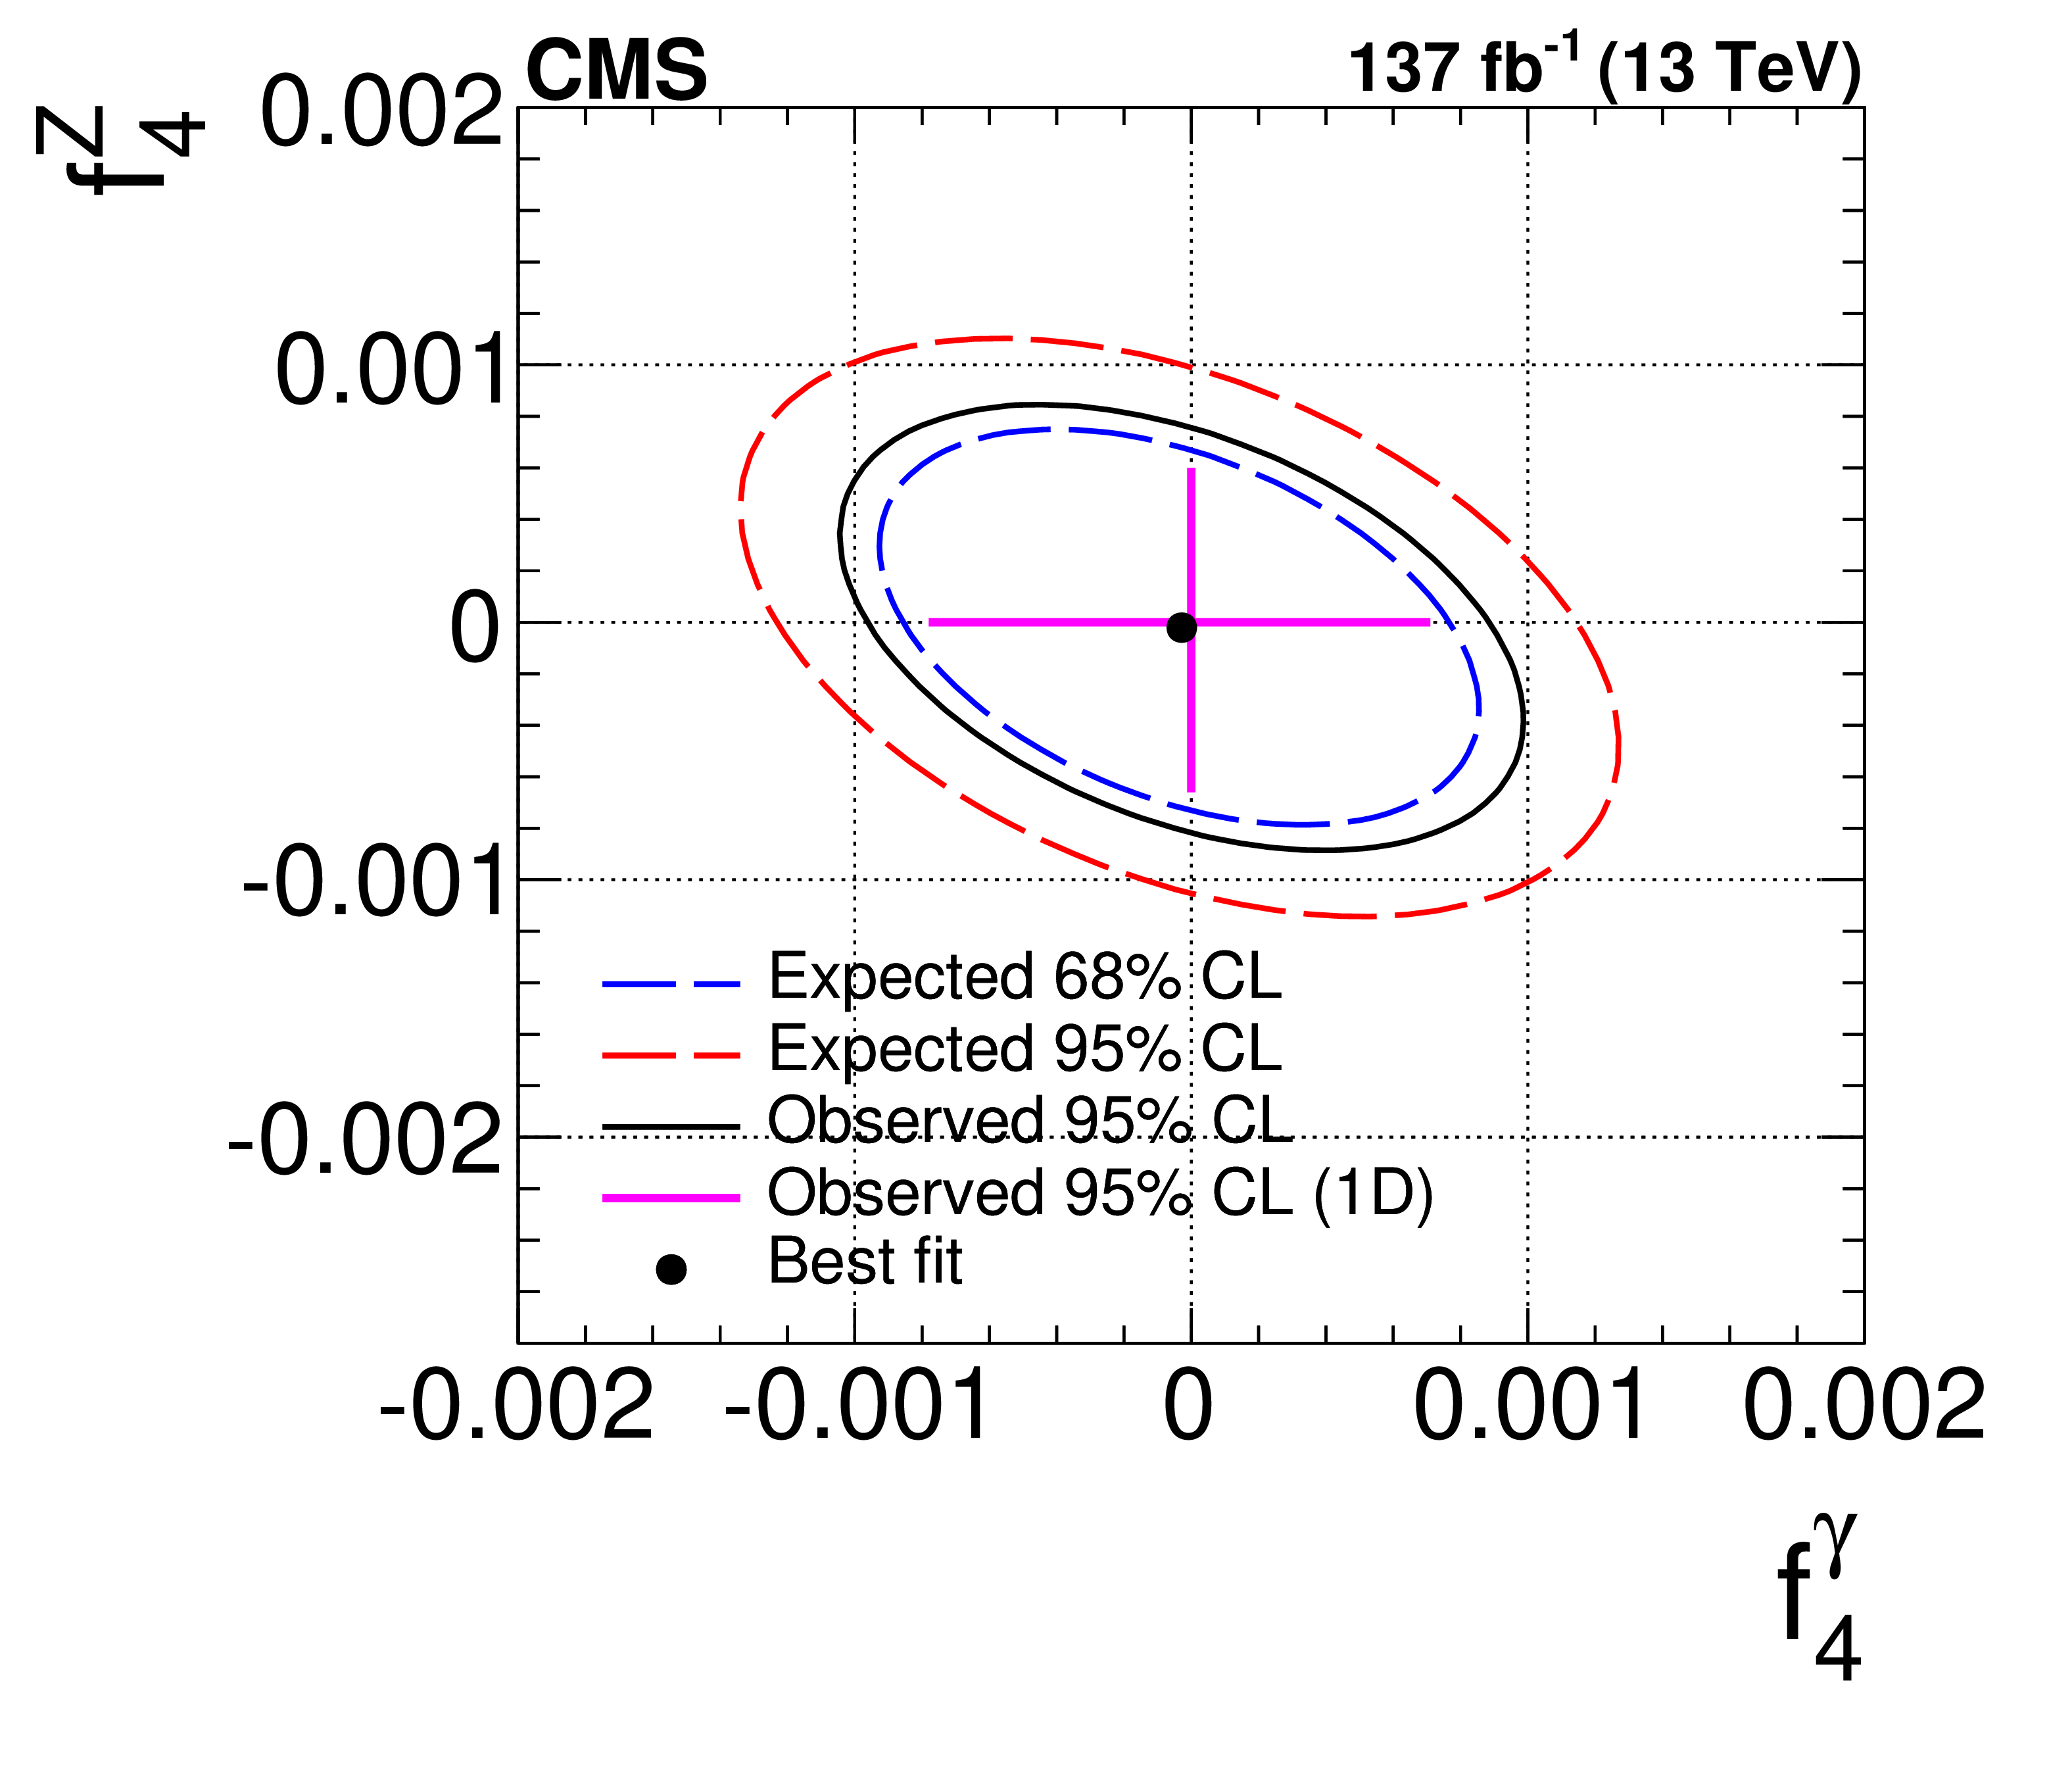
Figure 8-a:
Two-dimensional observed (solid) and expected (dashed) contours exclusion limits at 95% CL, and at 68 and 95% CL, respectively, on the ZZZ and ZZ$ \gamma $ aTGCs. The plots show the exclusion contours in the $(f_{4}^\mathrm{Z}, f_{4}^\gamma)$ parameter planes. Dots show where the likelihoods reach their maximum. The coupling values outside the contours are excluded at the corresponding confidence level. The crosses in the middle represent the observed 1D limits. No form factor is used. |
png pdf |
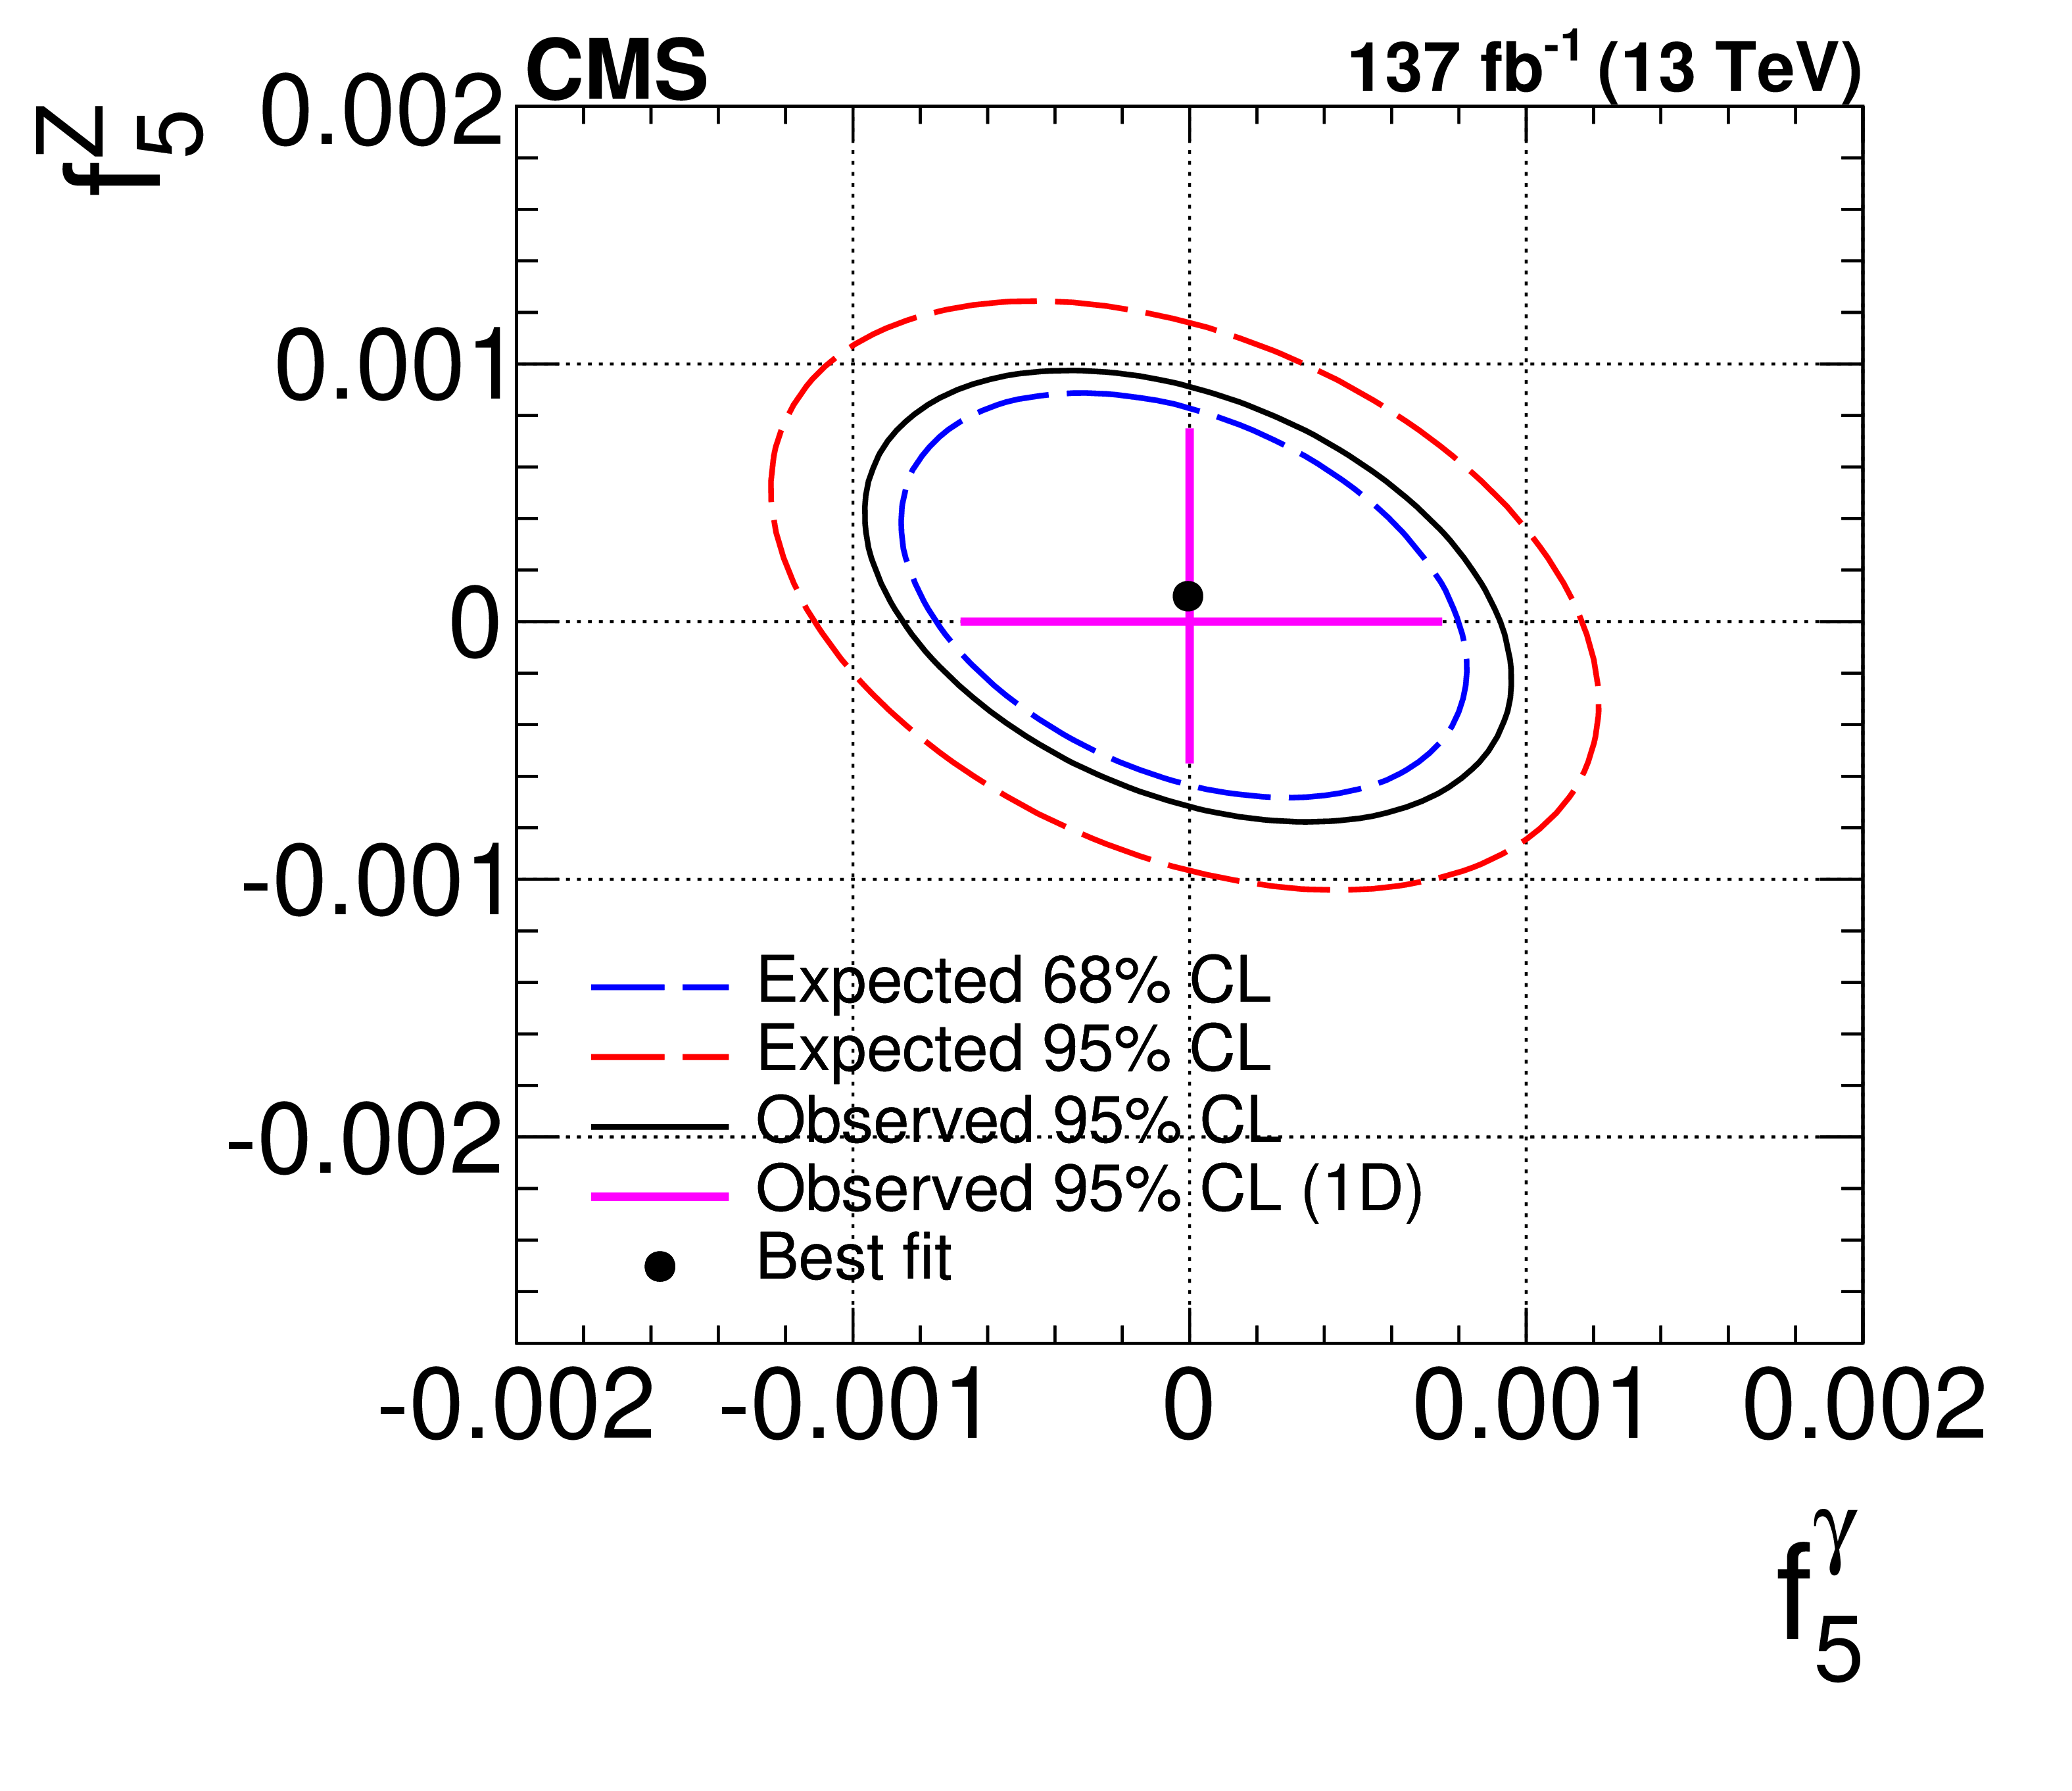
Figure 8-b:
Two-dimensional observed (solid) and expected (dashed) contours exclusion limits at 95% CL, and at 68 and 95% CL, respectively, on the ZZZ and ZZ$ \gamma $ aTGCs. The plots show the exclusion contours in the $(f_{5}^\mathrm{Z}, f_{5}^\gamma)$ parameter planes. Dots show where the likelihoods reach their maximum. The coupling values outside the contours are excluded at the corresponding confidence level. The crosses in the middle represent the observed 1D limits. No form factor is used. |
| Tables | |

png pdf |
Table 1:
The contributions of each source of systematic uncertainty in the cross section measurements. The integrated luminosity uncertainty, and the PDF and scale uncertainties, are considered separately. All other uncertainties are added in quadrature into a single systematic uncertainty. Uncertainties that vary by decay channel are listed as ranges. |

png pdf |
Table 2:
Observed and expected prefit yields of ZZ events, and estimated yields of background events, shown for each final state and combined. The statistical (first) and systematic (second) uncertainties are presented. |
png pdf |
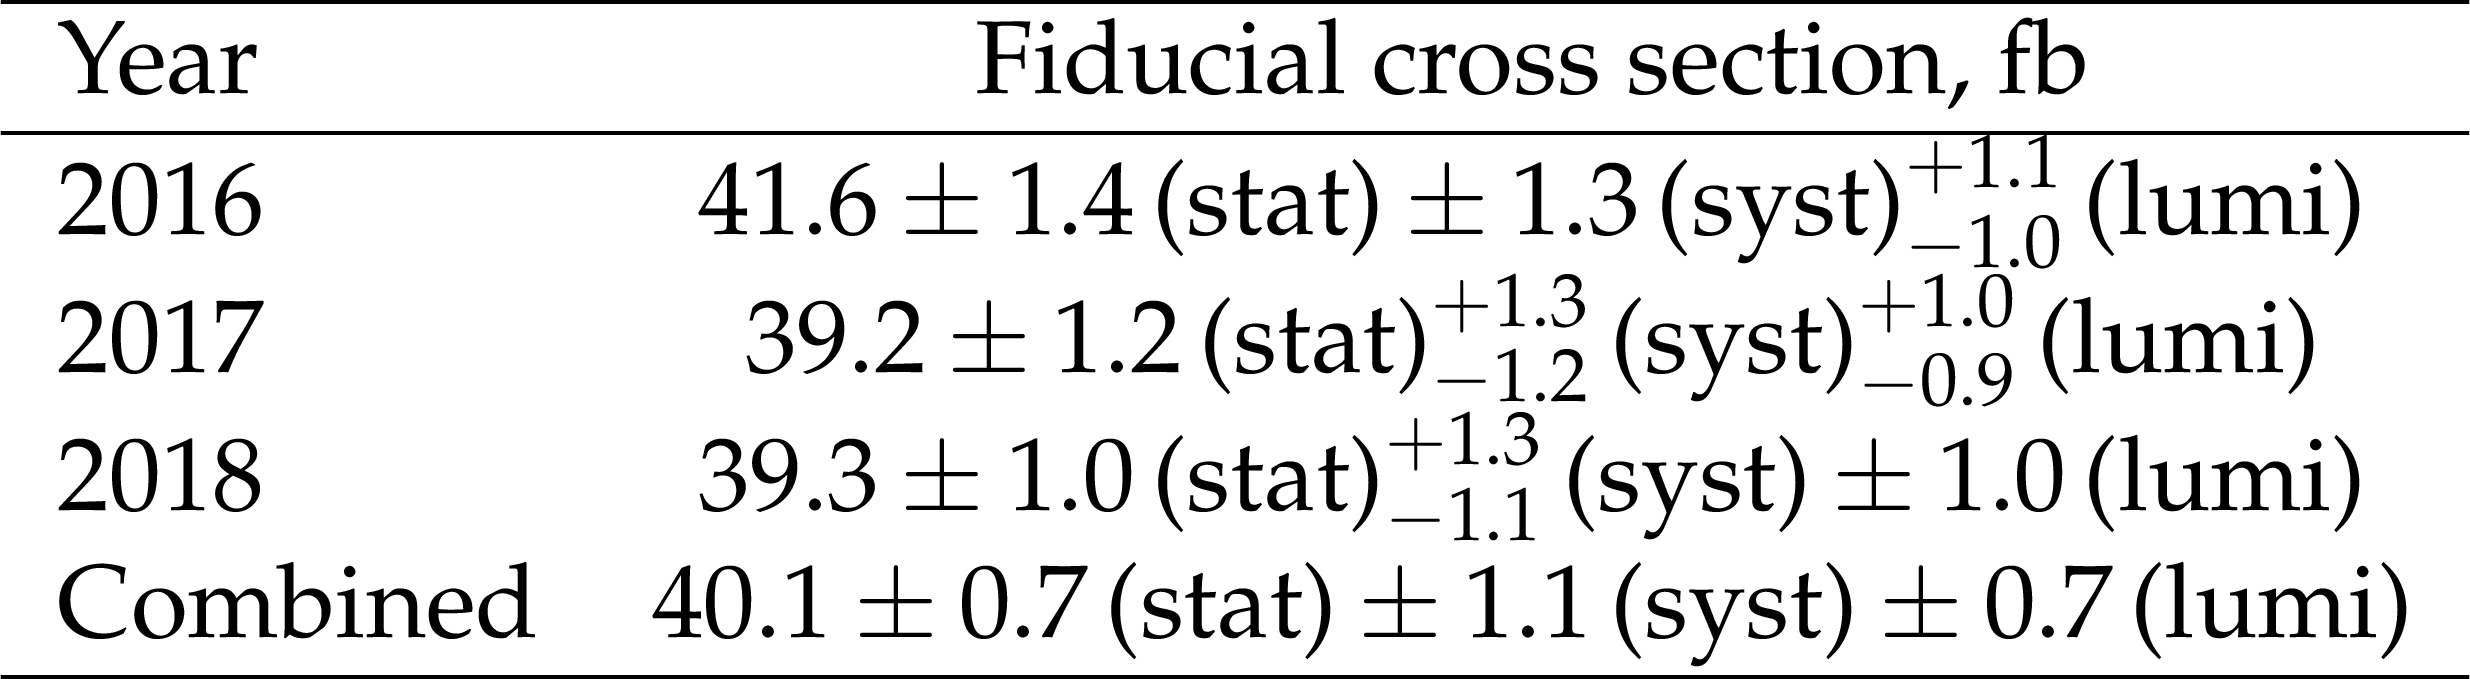
Table 3:
Measured fiducial cross section for each data sample and combined. The first uncertainty is statistical, the second is experimental systematic, and the third is associated with the integrated luminosity. |

png pdf |
Table 4:
Measured total $\sigma ({\mathrm{p}} {\mathrm{p}} \to {\mathrm{Z} \mathrm{Z}})$ cross section for each data sample and combined. The first uncertainty is statistical, the second is experimental systematic, the third is theoretical systematic. The fourth uncertainty is associated with the integrated luminosity. |
png pdf |
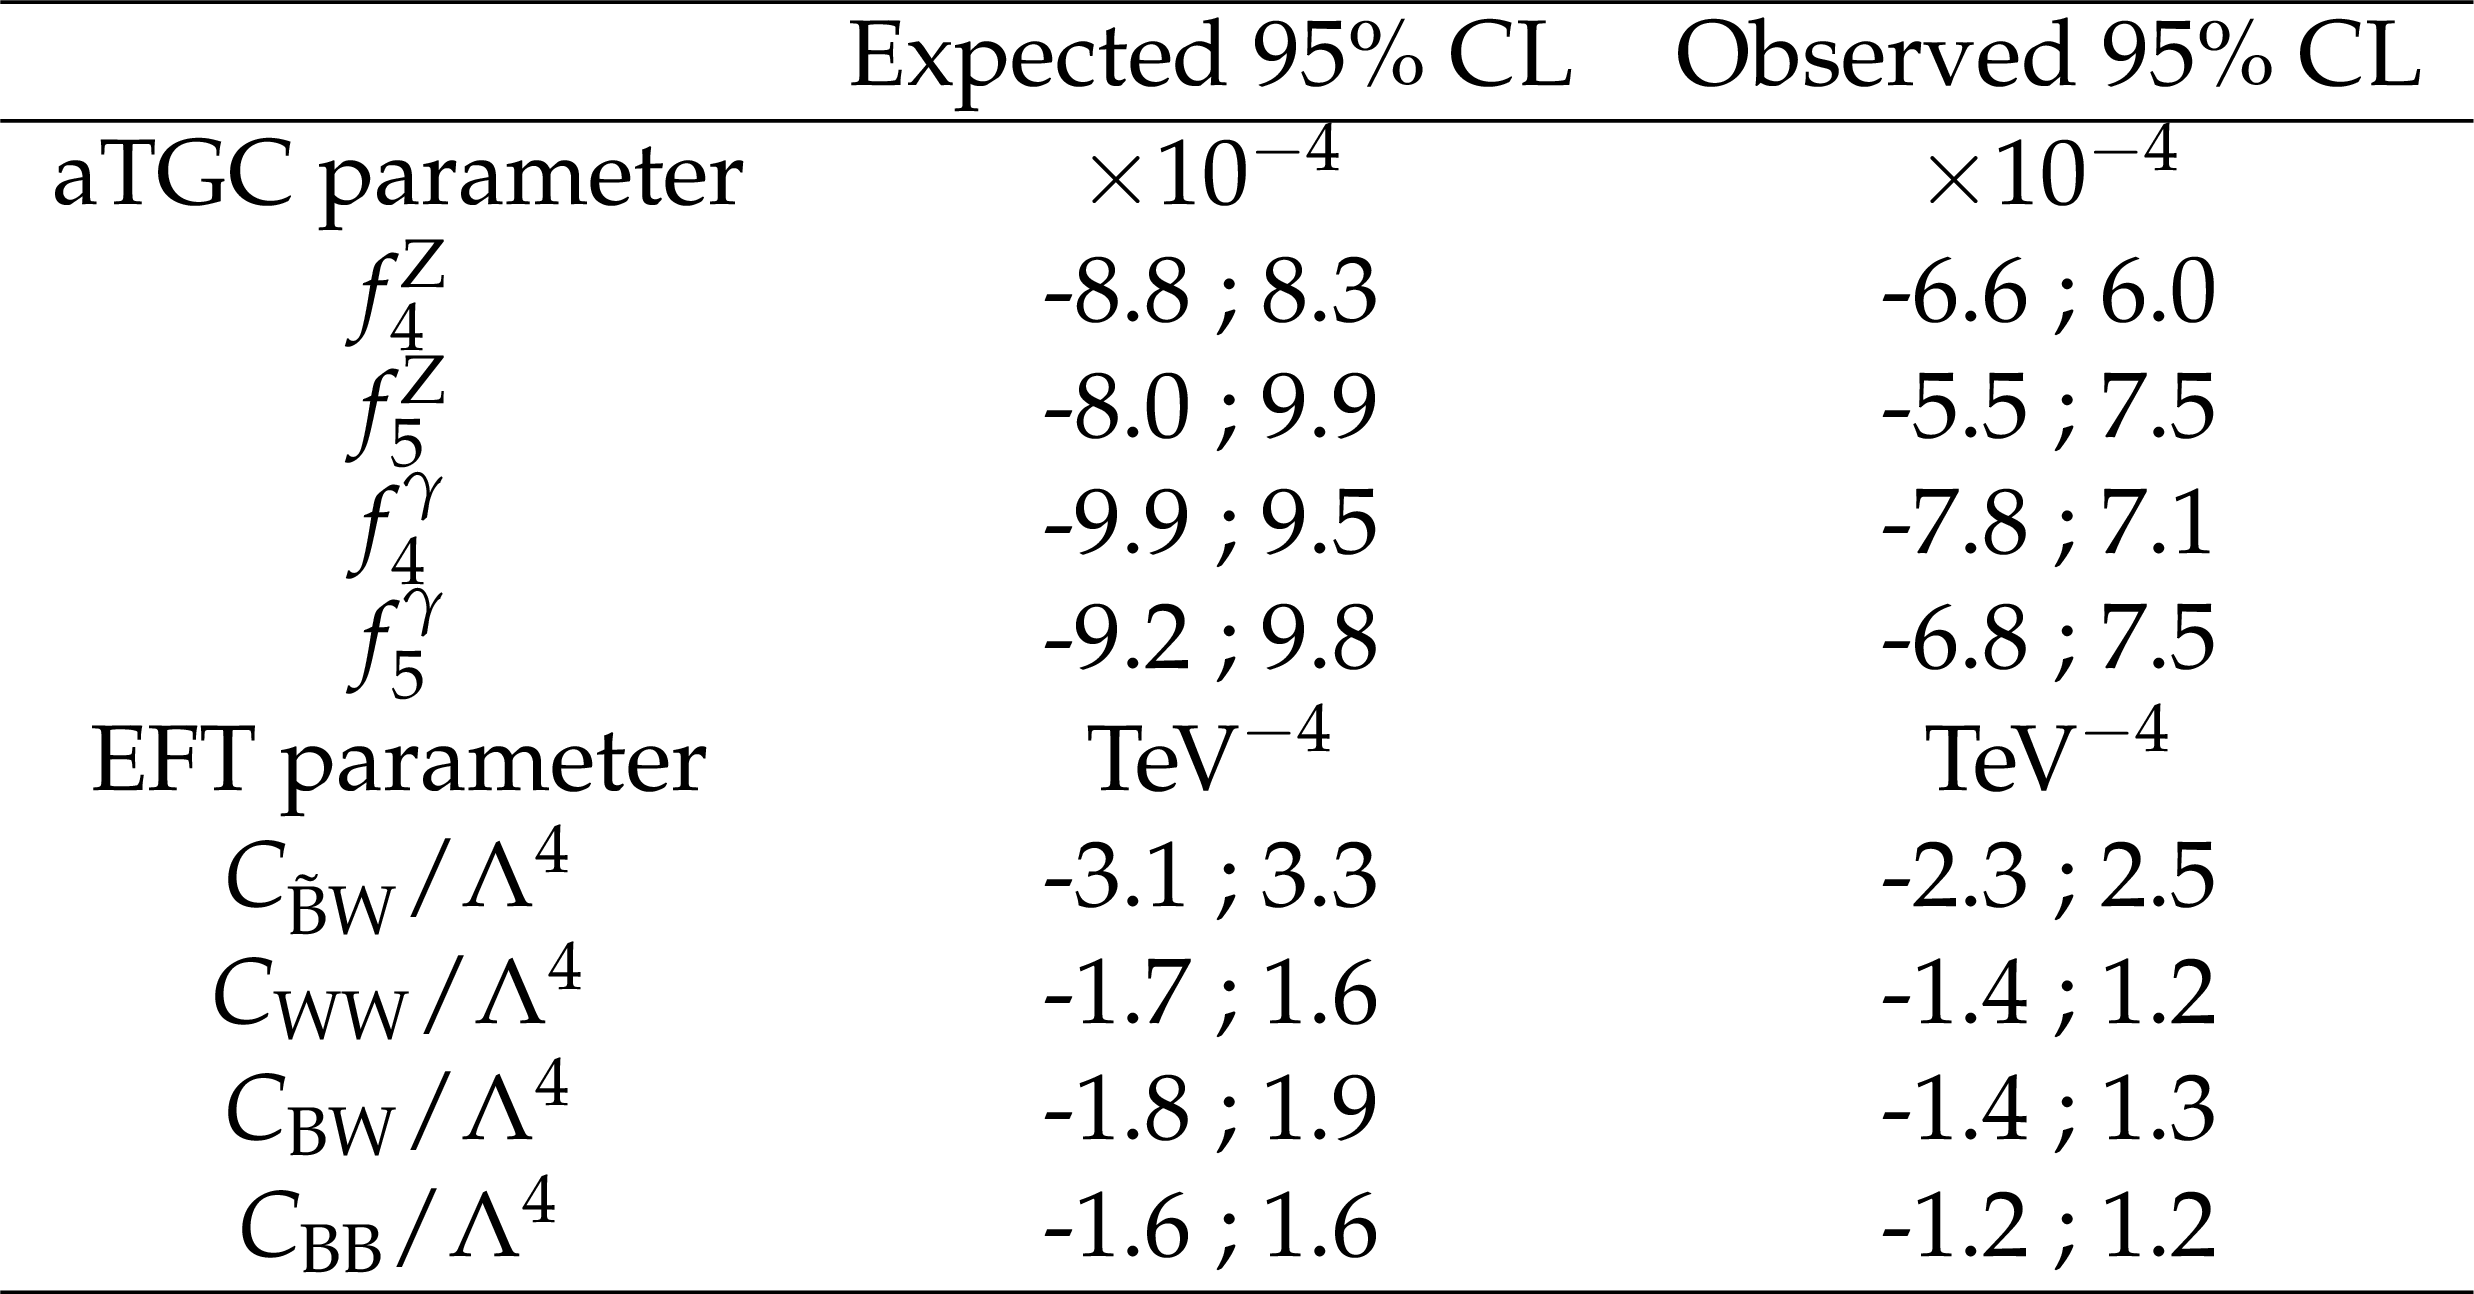
Table 5:
Expected and observed one-dimensional 95% CL limits on aTGC parameters. The corresponding constrains on EFT parameters are estimated using the transformation from Ref. [64]. |
| Summary |
| Four-lepton final states have been studied in proton-proton collisions at $\sqrt{s} = $ 13 TeV with the CMS detector at the CERN LHC. The data sample corresponds to an integrated luminosity of 137 fb$^{-1}$, collected during 2016-2018. The measured $\mathrm{pp} \to \mathrm{ZZ}$ total cross section is $\sigma_{\text{tot}} (\mathrm{pp} \to \mathrm{ZZ}) = $ 17.2 $\pm$ 0.3 (stat) $\pm$ 0.5 (syst) $\pm$ 0.4 (theo) $\pm$ 0.3 (lumi) pb, where the Z boson masses are in the range 60 $ < m_{\mathrm{Z}} < $ 120 GeV. The results agree with the SM predictions, discussed in Section 8. The differential cross sections also agree well with the SM predictions. Improved limits on anomalous ZZZ and ZZ$\gamma$ triple gauge couplings are established. These are the most stringent limits to date on anomalous ZZZ and ZZ$\gamma$ triple gauge couplings and they improve the previous strictest results from CMS by $\approx$30-40%. |
| References | ||||
| 1 | K. Hagiwara, R. D. Peccei, and D. Zeppenfeld | Probing the weak boson sector in $ \mathrm{e^{+}}\mathrm{e^{-}} \to \mathrm{W^{+}}\mathrm{W^{-}} $ | NPB 282 (1987) 253 | |
| 2 | G. J. Gounaris, J. Layssac, and F. M. Renard | New and standard physics contributions to anomalous $ \mathrm{Z} $ and $ \gamma $ self-couplings | PRD 62 (2000) 073013 | hep-ph/0003143 |
| 3 | C. Degrande et al. | Effective field theory: a modern approach to anomalous couplings | Annals Phys. 335 (2013) 21 | 1205.4231 |
| 4 | CMS Collaboration | Measurement of the $ \mathrm{Z}Z $ production cross section and search for anomalous couplings in $ 2\ell 2\ell' $ final states in $ pp $ collisions at $ \sqrt{s} = $ 7 TeV | JHEP 01 (2013) 063 | CMS-SMP-12-007 1211.4890 |
| 5 | CMS Collaboration | Measurement of the $ pp \to \mathrm{Z}Z $ production cross section and constraints on anomalous triple gauge couplings in four-lepton final states at $ \sqrt{s} = $ 8 TeV | PLB 740 (2015) 250 | CMS-SMP-13-005 1406.0113 |
| 6 | CMS Collaboration | Measurements of the $ \mathrm{Z}Z $ production cross sections in the $ 2\ell2\nu $ channel in proton-proton collisions at $ \sqrt{s} = $ 7 and 8 TeV and combined constraints on triple gauge couplings | EPJC 75 (2015) 511 | CMS-SMP-12-016 1503.05467 |
| 7 | CMS Collaboration | Measurement of the ZZ production cross section and $ \mathrm{Z} \to \ell^+\ell^-\ell^{\prime+}\ell^{\prime-} $ branching fraction in $ pp $ collisions at $ \sqrt{s} = $ 13 TeV | PLB 763 (2016) 280 | CMS-SMP-16-001 1607.08834 |
| 8 | CMS Collaboration | Measurements of the $ \mathrm {p}\mathrm {p}\rightarrow \mathrm{Z}\mathrm{Z} $ production cross section and the $ \mathrm{Z}\rightarrow 4\ell $ branching fraction, and constraints on anomalous triple gauge couplings at $ \sqrt{s} = $ 13 TeV | EPJC 78 (2018) 165 | CMS-SMP-16-017 1709.08601 |
| 9 | ATLAS Collaboration | Measurement of $ \mathrm{Z}Z $ production in $ pp $ collisions at $ \sqrt{s} = $ 7 TeV and limits on anomalous $ \mathrm{Z}Z\mathrm{Z} $ and $ \mathrm{Z}Z\gamma $ couplings with the ATLAS detector | JHEP 03 (2013) 128 | 1211.6096 |
| 10 | ATLAS Collaboration | Measurements of four-lepton production in $ pp $ collisions at $ \sqrt{s} = $ 8 TeV with the ATLAS detector | PLB 753 (2016) 552 | 1509.07844 |
| 11 | ATLAS Collaboration | Measurement of the $ \mathrm{Z}Z $ production cross section in $ pp $ collisions at $ \sqrt{s} = $ 13 TeV with the ATLAS detector | PRL 116 (2016) 101801 | 1512.05314 |
| 12 | ATLAS Collaboration | Measurement of the four-lepton invariant mass spectrum in 13 TeV proton-proton collisions with the ATLAS detector | JHEP 04 (2019) 048 | 1902.05892 |
| 13 | ATLAS Collaboration | Measurement of $ ZZ $ production in the $ \ell\ell\nu\nu $ final state with the ATLAS detector in pp collisions at $ \sqrt{s} = $ 13 TeV | JHEP 10 (2019) 127 | 1905.07163 |
| 14 | ATLAS Collaboration | $ ZZ \to \ell^{+}\ell^{-}\ell^{\prime +}\ell^{\prime -} $ cross-section measurements and search for anomalous triple gauge couplings in 13 TeV pp collisions with the ATLAS detector | PRD 97 (2018) 032005 | 1709.07703 |
| 15 | F. Cascioli et al. | $ \mathrm{Z}Z $ production at hadron colliders in NNLO QCD | PLB 735 (2014) 311 | 1405.2219 |
| 16 | M. Grazzini, S. Kallweit, and D. Rathlev | $ \mathrm{Z}Z $ production at the LHC: fiducial cross sections and distributions in NNLO QCD | PLB 750 (2015) 407 | 1507.06257 |
| 17 | S. Kallweit and M. Wiesemann | $ \mathrm{Z}Z $ production at the LHC: NNLO predictions for $ 2\ell2\nu $ and $ 4\ell $ signatures | PLB 786 (2018) 382 | 1806.05941 |
| 18 | CMS Collaboration | The CMS experiment at the CERN LHC | JINST 3 (2008) S08004 | CMS-00-001 |
| 19 | CMS Collaboration | Performance of electron reconstruction and selection with the CMS detector in proton-proton collisions at $ \sqrt{s} = $ 8 TeV | JINST 10 (2015) P06005 | CMS-EGM-13-001 1502.02701 |
| 20 | CMS Collaboration | Performance of CMS muon reconstruction in $ pp $ collision events at $ \sqrt{s} = $ 7 TeV | JINST 7 (2012) P10002 | CMS-MUO-10-004 1206.4071 |
| 21 | CMS Collaboration | Performance of the CMS muon detector and muon reconstruction with proton-proton collisions at $ \sqrt{s}= $ 13 TeV | JINST 13 (2018) P06015 | CMS-MUO-16-001 1804.04528 |
| 22 | CMS Collaboration | The CMS trigger system | JINST 12 (2017) P01020 | CMS-TRG-12-001 1609.02366 |
| 23 | T. Sjostrand et al. | An introduction to PYTHIA 8.2 | CPC 191 (2015) 159 | 1410.3012 |
| 24 | S. Alioli, P. Nason, C. Oleari, and E. Re | A general framework for implementing nlo calculations in shower monte carlo programs: the $ POWHEG $ box | JHEP 06 (2010) 043 | 1002.2581 |
| 25 | CMS Collaboration | Event generator tunes obtained from underlying event and multiparton scattering measurements | EPJC 76 (2016) 155 | CMS-GEN-14-001 1512.00815 |
| 26 | NNPDF Collaboration | Parton distributions from high-precision collider data | EPJC. 77 (2017) 663 | 1706.00428 |
| 27 | CMS Collaboration | Extraction and validation of a new set of CMS PYTHIA8 tunes from underlying-event measurements | EPJC 80 (2020) 4 | CMS-GEN-17-001 1903.12179 |
| 28 | S. Alioli, P. Nason, C. Oleari, and E. Re | NLO vector-boson production matched with shower in $ POWHEG\ $ | JHEP 07 (2008) 060 | 0805.4802 |
| 29 | P. Nason | A new method for combining NLO QCD with shower Monte Carlo algorithms | JHEP 11 (2004) 040 | hep-ph/0409146 |
| 30 | S. Frixione, P. Nason, and C. Oleari | Matching NLO QCD computations with parton shower simulations: the POWHEG method | JHEP 11 (2007) 070 | 0709.2092 |
| 31 | T. Melia, P. Nason, R. Rontsch, and G. Zanderighi | $ \mathrm{W}^+\mathrm{W}^- $, $ \mathrm{W}\mathrm{Z} $ and $ \mathrm{Z}Z $ production in the $ POWHEG $ BOX | JHEP 11 (2011) 078 | 1107.5051 |
| 32 | J. M. Campbell and R. K. Ellis | MCFM for the Tevatron and the LHC | NPB Proc. Suppl. 10 (2010) 205 | 1007.3492 |
| 33 | F. Caola, K. Melnikov, R. Rontsch, and L. Tancredi | QCD corrections to $ \mathrm{Z}Z $ production in gluon fusion at the LHC | PRD 92 (2015) 094028 | 1509.06734 |
| 34 | J. Alwall et al. | The automated computation of tree-level and next-to-leading order differential cross sections, and their matching to parton shower simulations | JHEP 07 (2014) 079 | 1405.0301 |
| 35 | Y. Gao et al. | Spin determination of single-produced resonances at hadron colliders | PRD 81 (2010) 075022 | 1001.3396 |
| 36 | S. Bolognesi et al. | Spin and parity of a single-produced resonance at the LHC | PRD 86 (2012) 095031 | 1208.4018 |
| 37 | I. Anderson et al. | Constraining anomalous HVV interactions at proton and lepton colliders | PRD 89 (2014) 035007 | 1309.4819 |
| 38 | R. Frederix and S. Frixione | Merging meets matching in MC@NLO | JHEP 12 (2012) 061 | 1209.6215 |
| 39 | T. Gleisberg et al. | Event generation with SHERPA 1.1 | JHEP 02 (2009) 007 | 0811.4622 |
| 40 | GEANT4 Collaboration | GEANT4---a simulation toolkit | NIMA 506 (2003) 250 | |
| 41 | M. Grazzini, S. Kallweit, and M. Wiesemann | Fully differential NNLO computations with matrixMC | EPJC 78 (2018) 537 | 1711.06631 |
| 42 | F. Buccioni et al. | Openloops 2 | EPJC 79 (2019) 866 | 1907.1307 |
| 43 | T. Gehrmann, A. von Manteuffel, and L. Tancredi | The two-loop helicity amplitudes for $ {\mathrm{q}}\overline{\mathrm{q}}^{\prime}\to \mathrm{{V}}_1\mathrm{{V}}_2\to 4 $ leptons | JHEP 09 (2015) 128 | 1503.04812 |
| 44 | M. Grazzini et al. | NNLO QCD + NLO EW with matrixMC+OpenLoops: precise predictions for vector-boson pair production | JHEP 02 (2020) 087 | 1912.00068 |
| 45 | V. Bertone, S. Carrazza, N. Hartland, and J. Rojo | Illuminating the photon content of the proton within a global pdf analysis | SciPost Physics 5 (2018) 008 | 1712.07053 |
| 46 | M. Grazzini, S. Kallweit, M. Wiesemann, and J. Y. Yook | $ \mathrm{Z}Z $ production at the LHC: NLO QCD corrections to the loop-induced gluon fusion channel | JHEP 03 (2019) 070 | 1811.09593 |
| 47 | CMS Collaboration | Particle-flow reconstruction and global event description with the CMS detector | JINST 12 (2017) P10003 | CMS-PRF-14-001 1706.04965 |
| 48 | M. Cacciari, G. P. Salam, and G. Soyez | The anti-$ {k_{\mathrm{T}}} $ jet clustering algorithm | JHEP 04 (2008) 063 | 0802.1189 |
| 49 | M. Cacciari, G. P. Salam, and G. Soyez | FastJet user manual | EPJC 72 (2012) 1896 | 1111.6097 |
| 50 | M. Cacciari and G. P. Salam | Pileup subtraction using jet areas | PLB 659 (2008) 119 | 0707.1378 |
| 51 | CMS Collaboration | Measurement of the inclusive $ \mathrm{W} $ and $ \mathrm{Z} $ production cross sections in $ pp $ collisions at $ \sqrt{s} = $ 7 TeV | JHEP 10 (2011) 132 | CMS-EWK-10-005 1107.4789 |
| 52 | CMS Collaboration | Measurement of the properties of a Higgs boson in the four-lepton final state | PRD 89 (2014) 092007 | CMS-HIG-13-002 1312.5353 |
| 53 | Particle Data Group, M. Tanabashi et al. | Review of particle physics | PRD 98 (2018) 030001 | |
| 54 | CMS Collaboration | Measurement of the inelastic proton-proton cross section at $ \sqrt{s}= $ 13 TeV | JHEP 07 (2018) 161 | CMS-FSQ-15-005 1802.02613 |
| 55 | J. Butterworth et al. | PDF4LHC recommendations for LHC Run II | JPG 43 (2016) 023001 | 1510.03865 |
| 56 | NNPDF Collaboration | Parton distributions for the LHC run II | JHEP 04 (2015) 040 | 1410.8849 |
| 57 | CMS Collaboration | CMS luminosity measurements for the 2016 data-taking period | CMS-PAS-LUM-17-001 | CMS-PAS-LUM-17-001 |
| 58 | CMS Collaboration | CMS luminosity measurement for the 2017 data-taking period at $ \sqrt{s} = $ 13 TeV | CMS-PAS-LUM-17-004 | CMS-PAS-LUM-17-004 |
| 59 | CMS Collaboration | CMS luminosity measurement for the 2018 data-taking period at $ \sqrt{s} = $ 13 TeV | CMS-PAS-LUM-18-002 | CMS-PAS-LUM-18-002 |
| 60 | T. Adye | Unfolding algorithms and tests using RooUnfold | in Proceedings, PHYSTAT 2011 Workshop on Statistical Issues Related to Discovery Claims in Search Experiments and Unfolding, H. Prosper and L. Lyons, eds. | 1105.1160 |
| 61 | ATLAS, CMS, and the LHC Higgs Combinaiton Group Collaboration | Procedure for the LHC Higgs boson search combination in summer 2011 | CMS-NOTE-2011-005 | |
| 62 | G. Cowan, K. Cranmer, E. Gross, and O. Vitells | Asymptotic formulae for likelihood-based tests of new physics | EPJC 71 (2011) 1554 | 1007.1727 |
| 63 | U. Baur and D. L. Rainwater | Probing neutral gauge boson selfinteractions in $ ZZ $ production at hadron colliders | PRD 62 (2000) 113011 | hep-ph/0008063 |
| 64 | C. Degrande | A basis of dimension-eight operators for anomalous neutral triple gauge boson interactions | JHEP 02 (2014) 101 | 1308.6323 |
| 65 | A. Bierweiler, T. Kasprzik, and J. H. Kuhn | Vector-boson pair production at the LHC to $ \mathcal{O}(\alpha^3) $ accuracy | JHEP 12 (2013) 071 | 1305.5402 |
| 66 | J. Baglio, L. D. Ninh, and M. M. Weber | Massive gauge boson pair production at the LHC: a next-to-leading order story | PRD 88 (2013) 113005 | 1307.4331 |
|
|
Compact Muon Solenoid LHC, CERN |
|

|

|

|

|

|