

Compact Muon Solenoid
LHC, CERN
| CMS-SMP-19-013 ; CERN-EP-2021-073 | ||
| Measurements of the ${\mathrm{p}}{\mathrm{p}}\to\mathrm{W^{\pm}}\gamma\gamma$ and ${\mathrm{p}}{\mathrm{p}}\to\mathrm{Z}\gamma\gamma$ cross sections at $\sqrt s = $ 13 TeV and limits on anomalous quartic gauge couplings | ||
| CMS Collaboration | ||
| 26 May 2021 | ||
| JHEP 10 (2021) 174 | ||
| Abstract: The cross section for W or Z boson production in association with two photons is measured in proton-proton collisions at a centre-of-mass energy of 13 TeV. The data set corresponds to an integrated luminosity of 137 fb$^{-1}$ collected by the CMS experiment at the LHC. The $\mathrm{W}\to\ell\nu$ and $\mathrm{Z}\to\ell\ell$ decay modes (where $\ell=$ e, $\mu$) are used to extract the W$\gamma\gamma$ and Z$\gamma\gamma$ cross sections in a phase space defined by electron (muon) with transverse momentum larger than 35 (30) GeV and photon transverse momentum larger than 20 GeV. The measured cross sections in this phase space are $\sigma(\mathrm{W}\gamma\gamma)=$ 13.6$^{+1.9}_{-1.9}$ (stat)$^{+4.0}_{-4.0}$ (syst) $\pm$ 0.08 (PDF+scale) fb and $\sigma(\mathrm{Z}\gamma\gamma)=$ 5.41$^{+0.58}_{-0.55}$ (stat)$^{+0.64}_{-0.70}$ (syst) $\pm$ 0.06 (PDF+scale) fb. Limits on anomalous quartic gauge couplings are set in the framework of an effective field theory with dimension-8 operators. | ||
| Links: e-print arXiv:2105.12780 [hep-ex] (PDF) ; CDS record ; inSPIRE record ; HepData record ; CADI line (restricted) ; | ||
| Figures | |
png pdf |
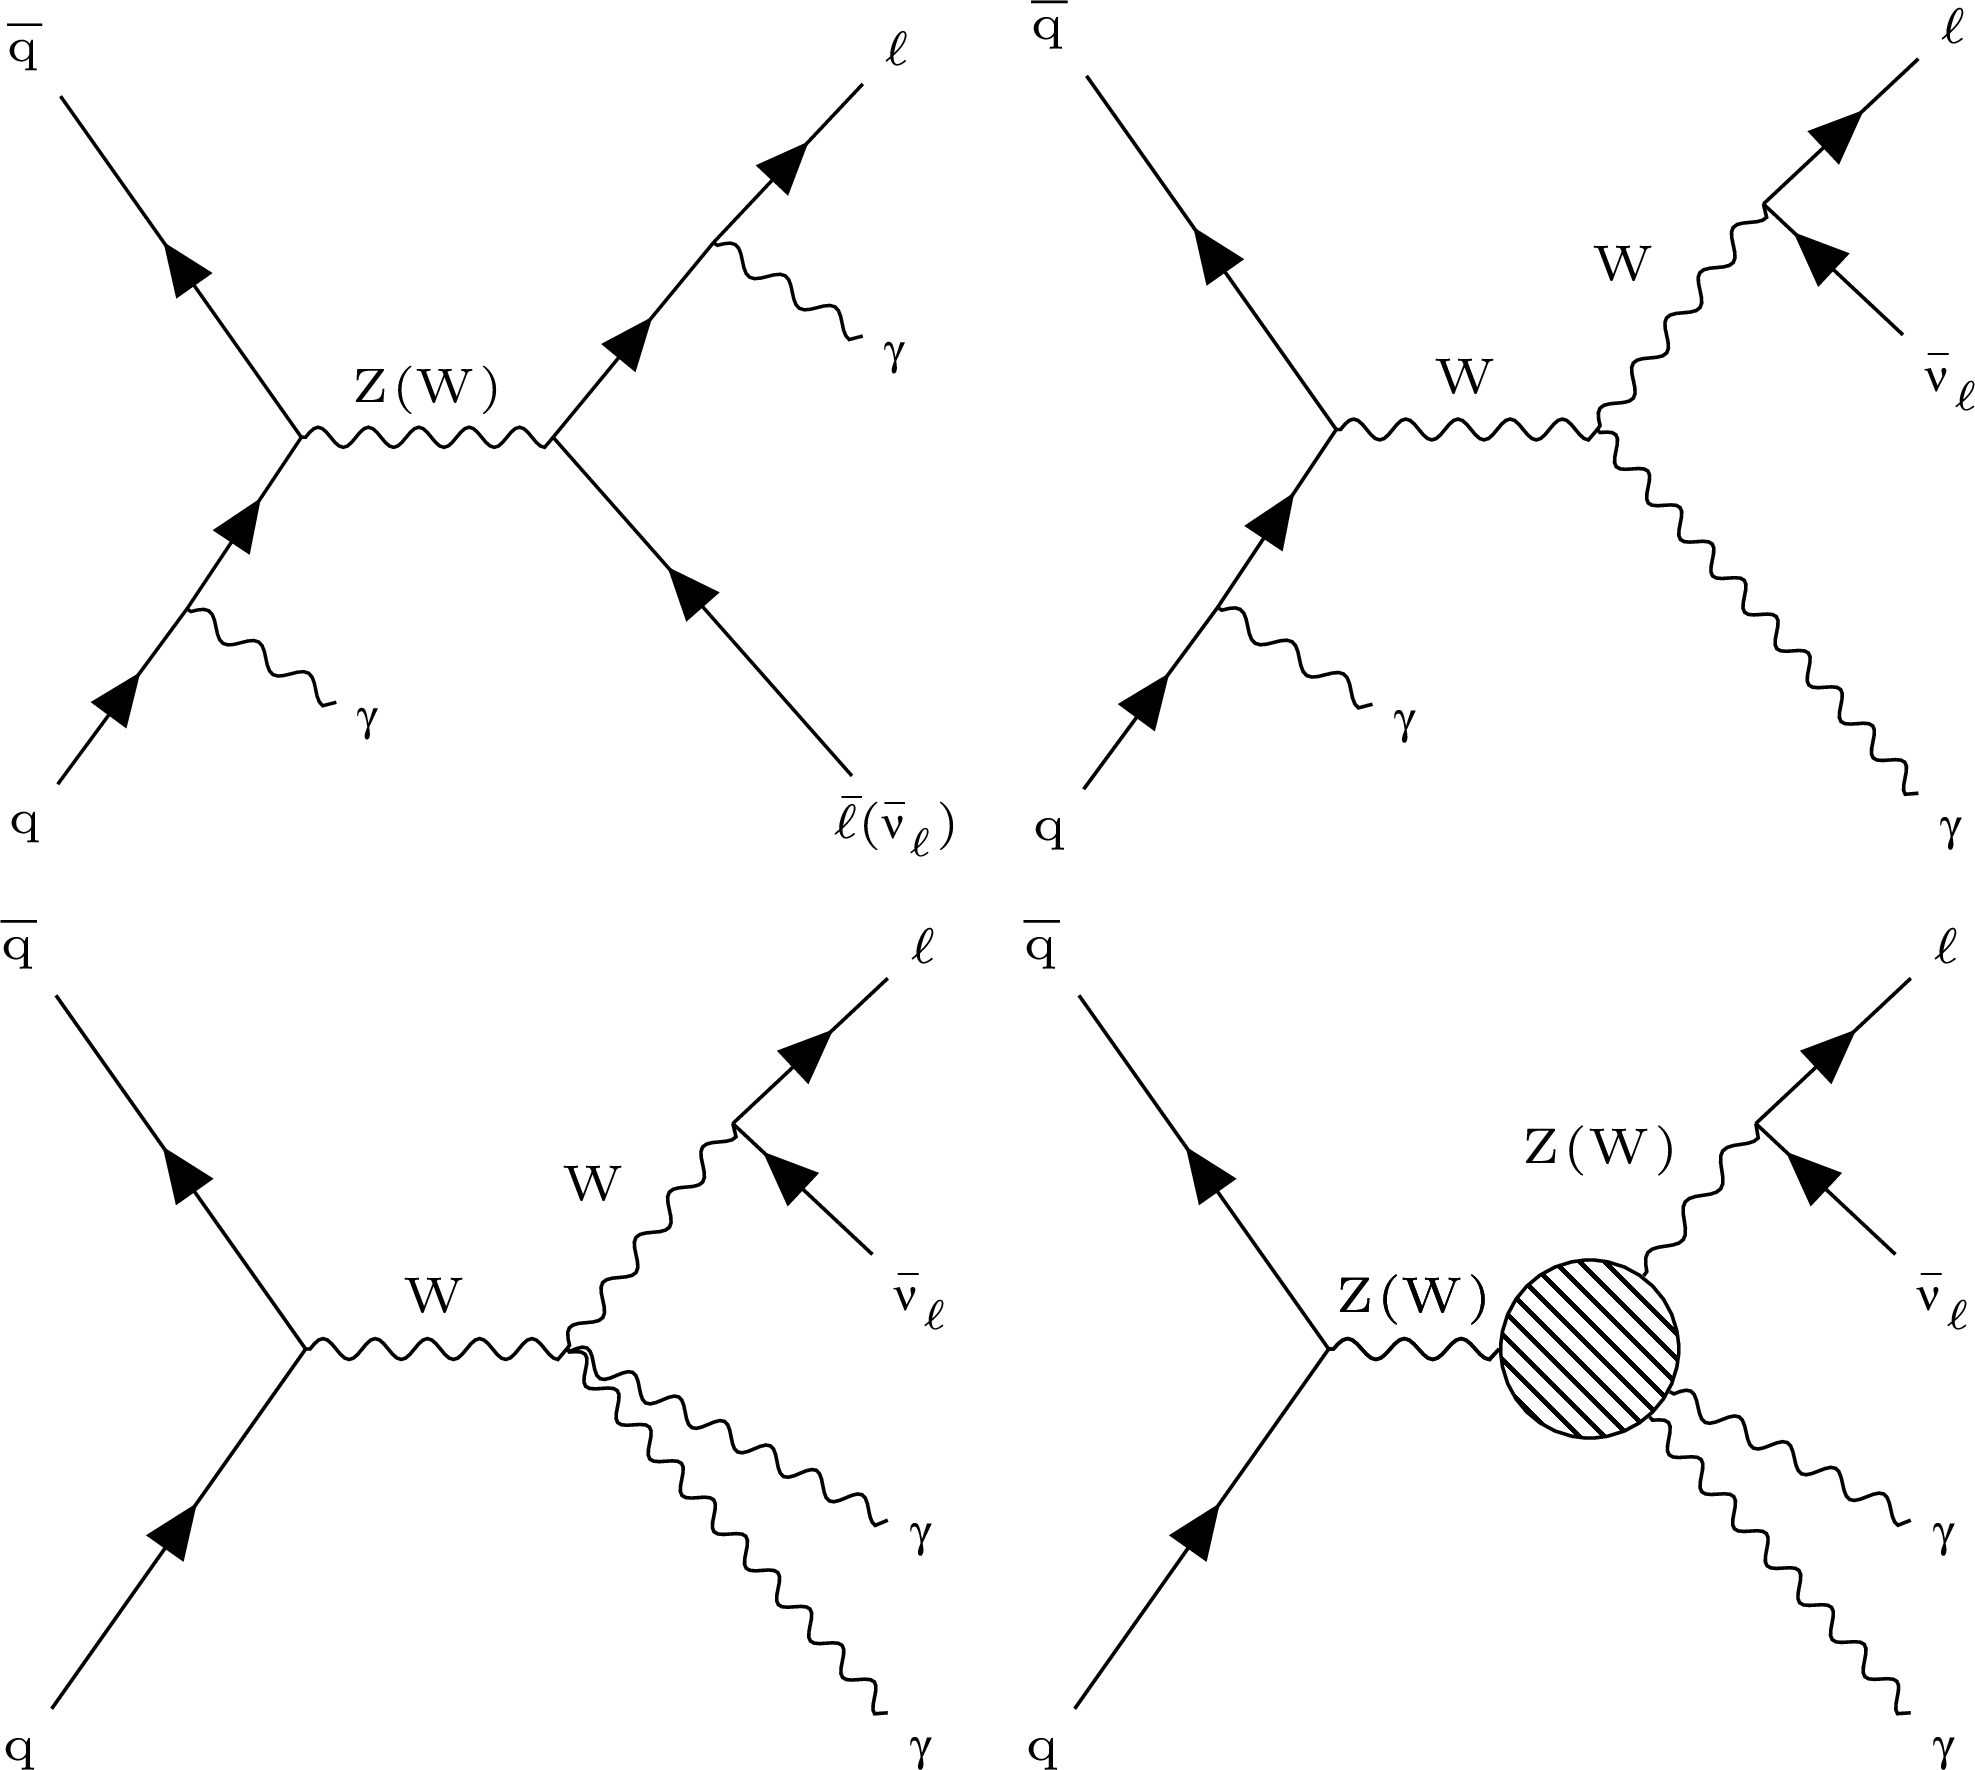
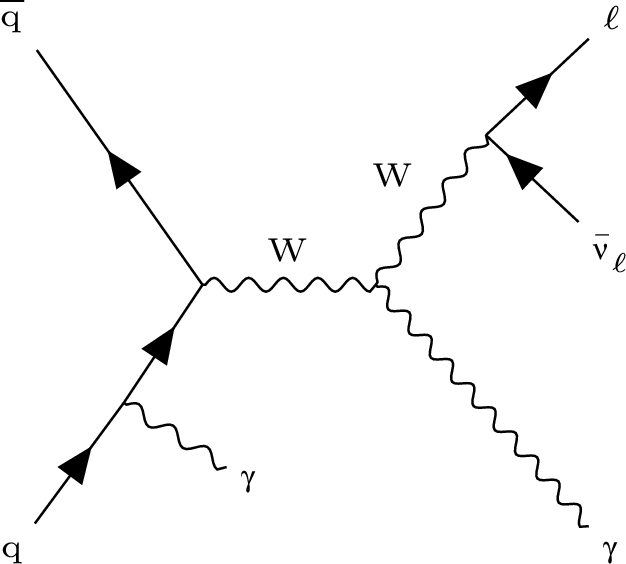
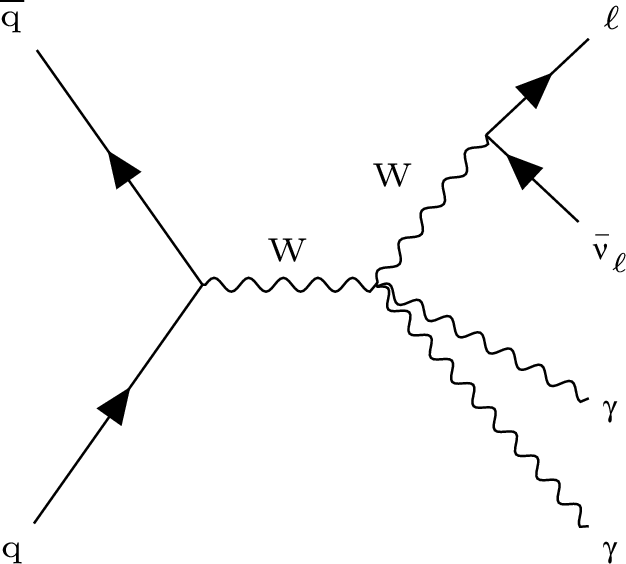
Figure 1:
Representative Feynman diagrams for the V$\gamma \gamma $ production in the SM (left and centre) and beyond the SM (right). |

png pdf |
Figure 1-a:
Representative Feynman diagram for the V$\gamma \gamma $ production in the SM. |
png pdf |
Figure 1-b:
Representative Feynman diagram for the V$\gamma \gamma $ production in the SM. |
png pdf |
Figure 1-c:
Representative Feynman diagram for the V$\gamma \gamma $ production in the SM. |

png pdf |
Figure 1-d:
Representative Feynman diagram for the V$\gamma \gamma $ production beyond the SM. |

png pdf |
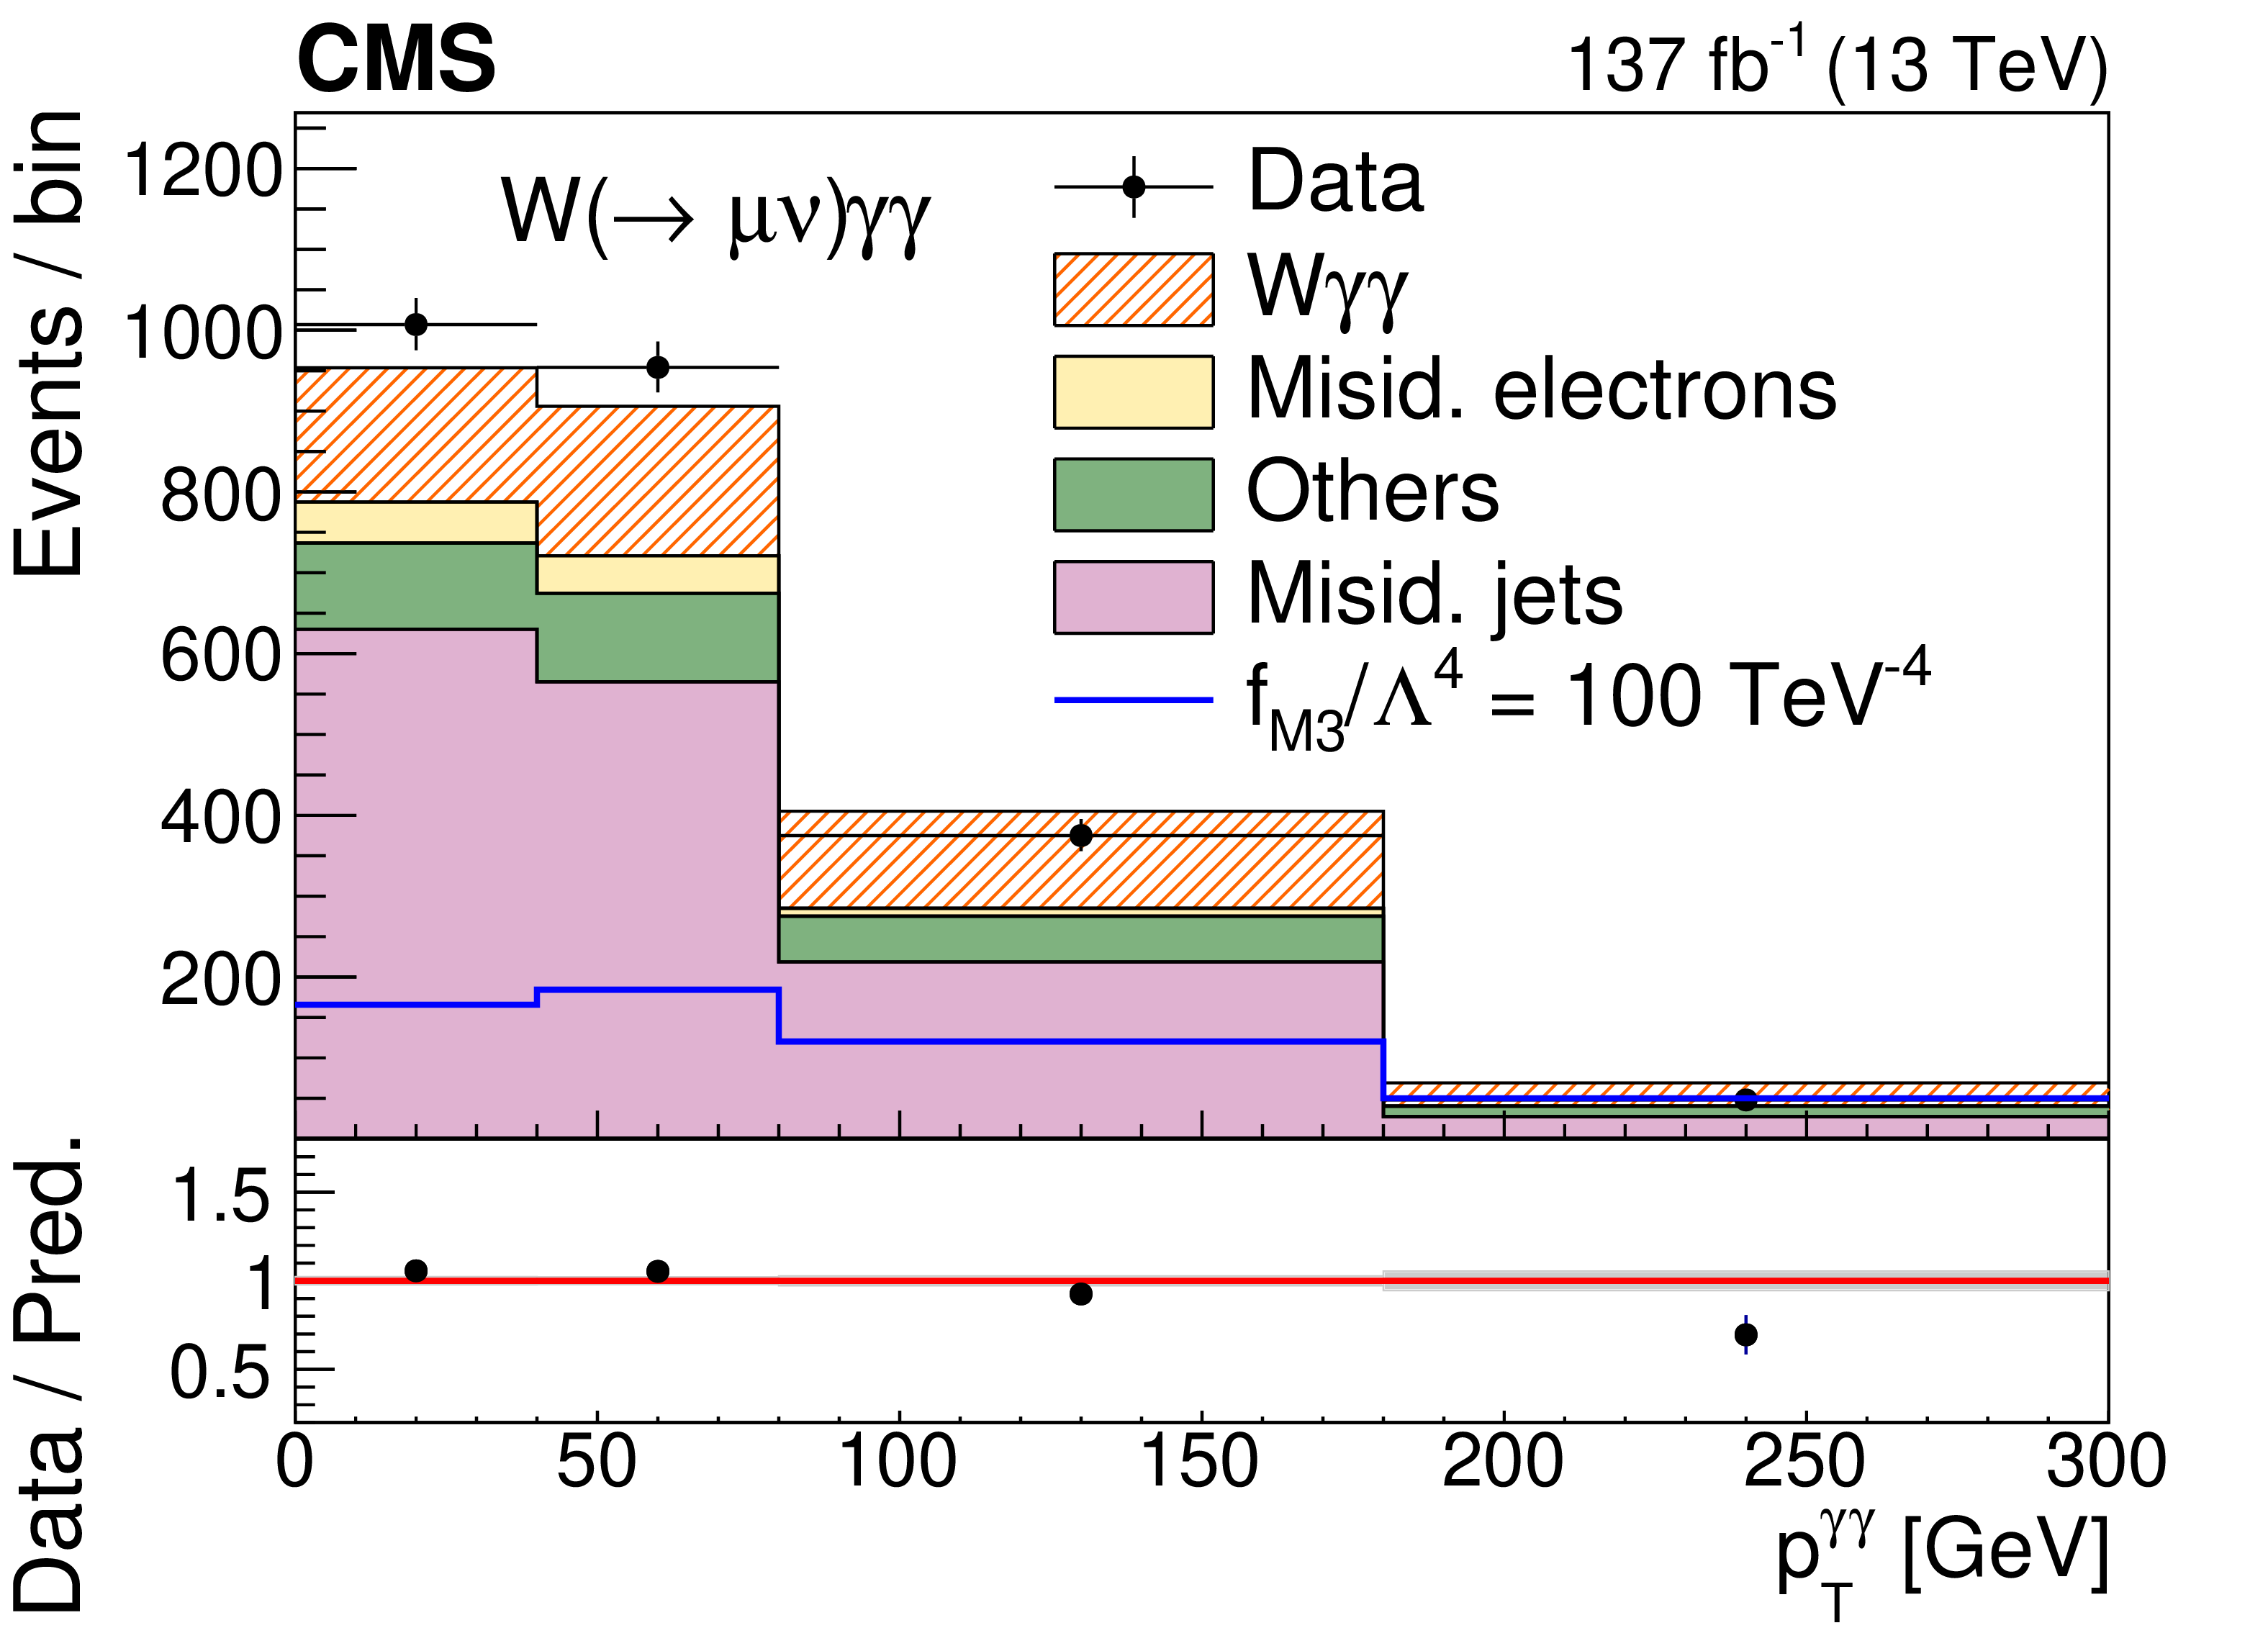
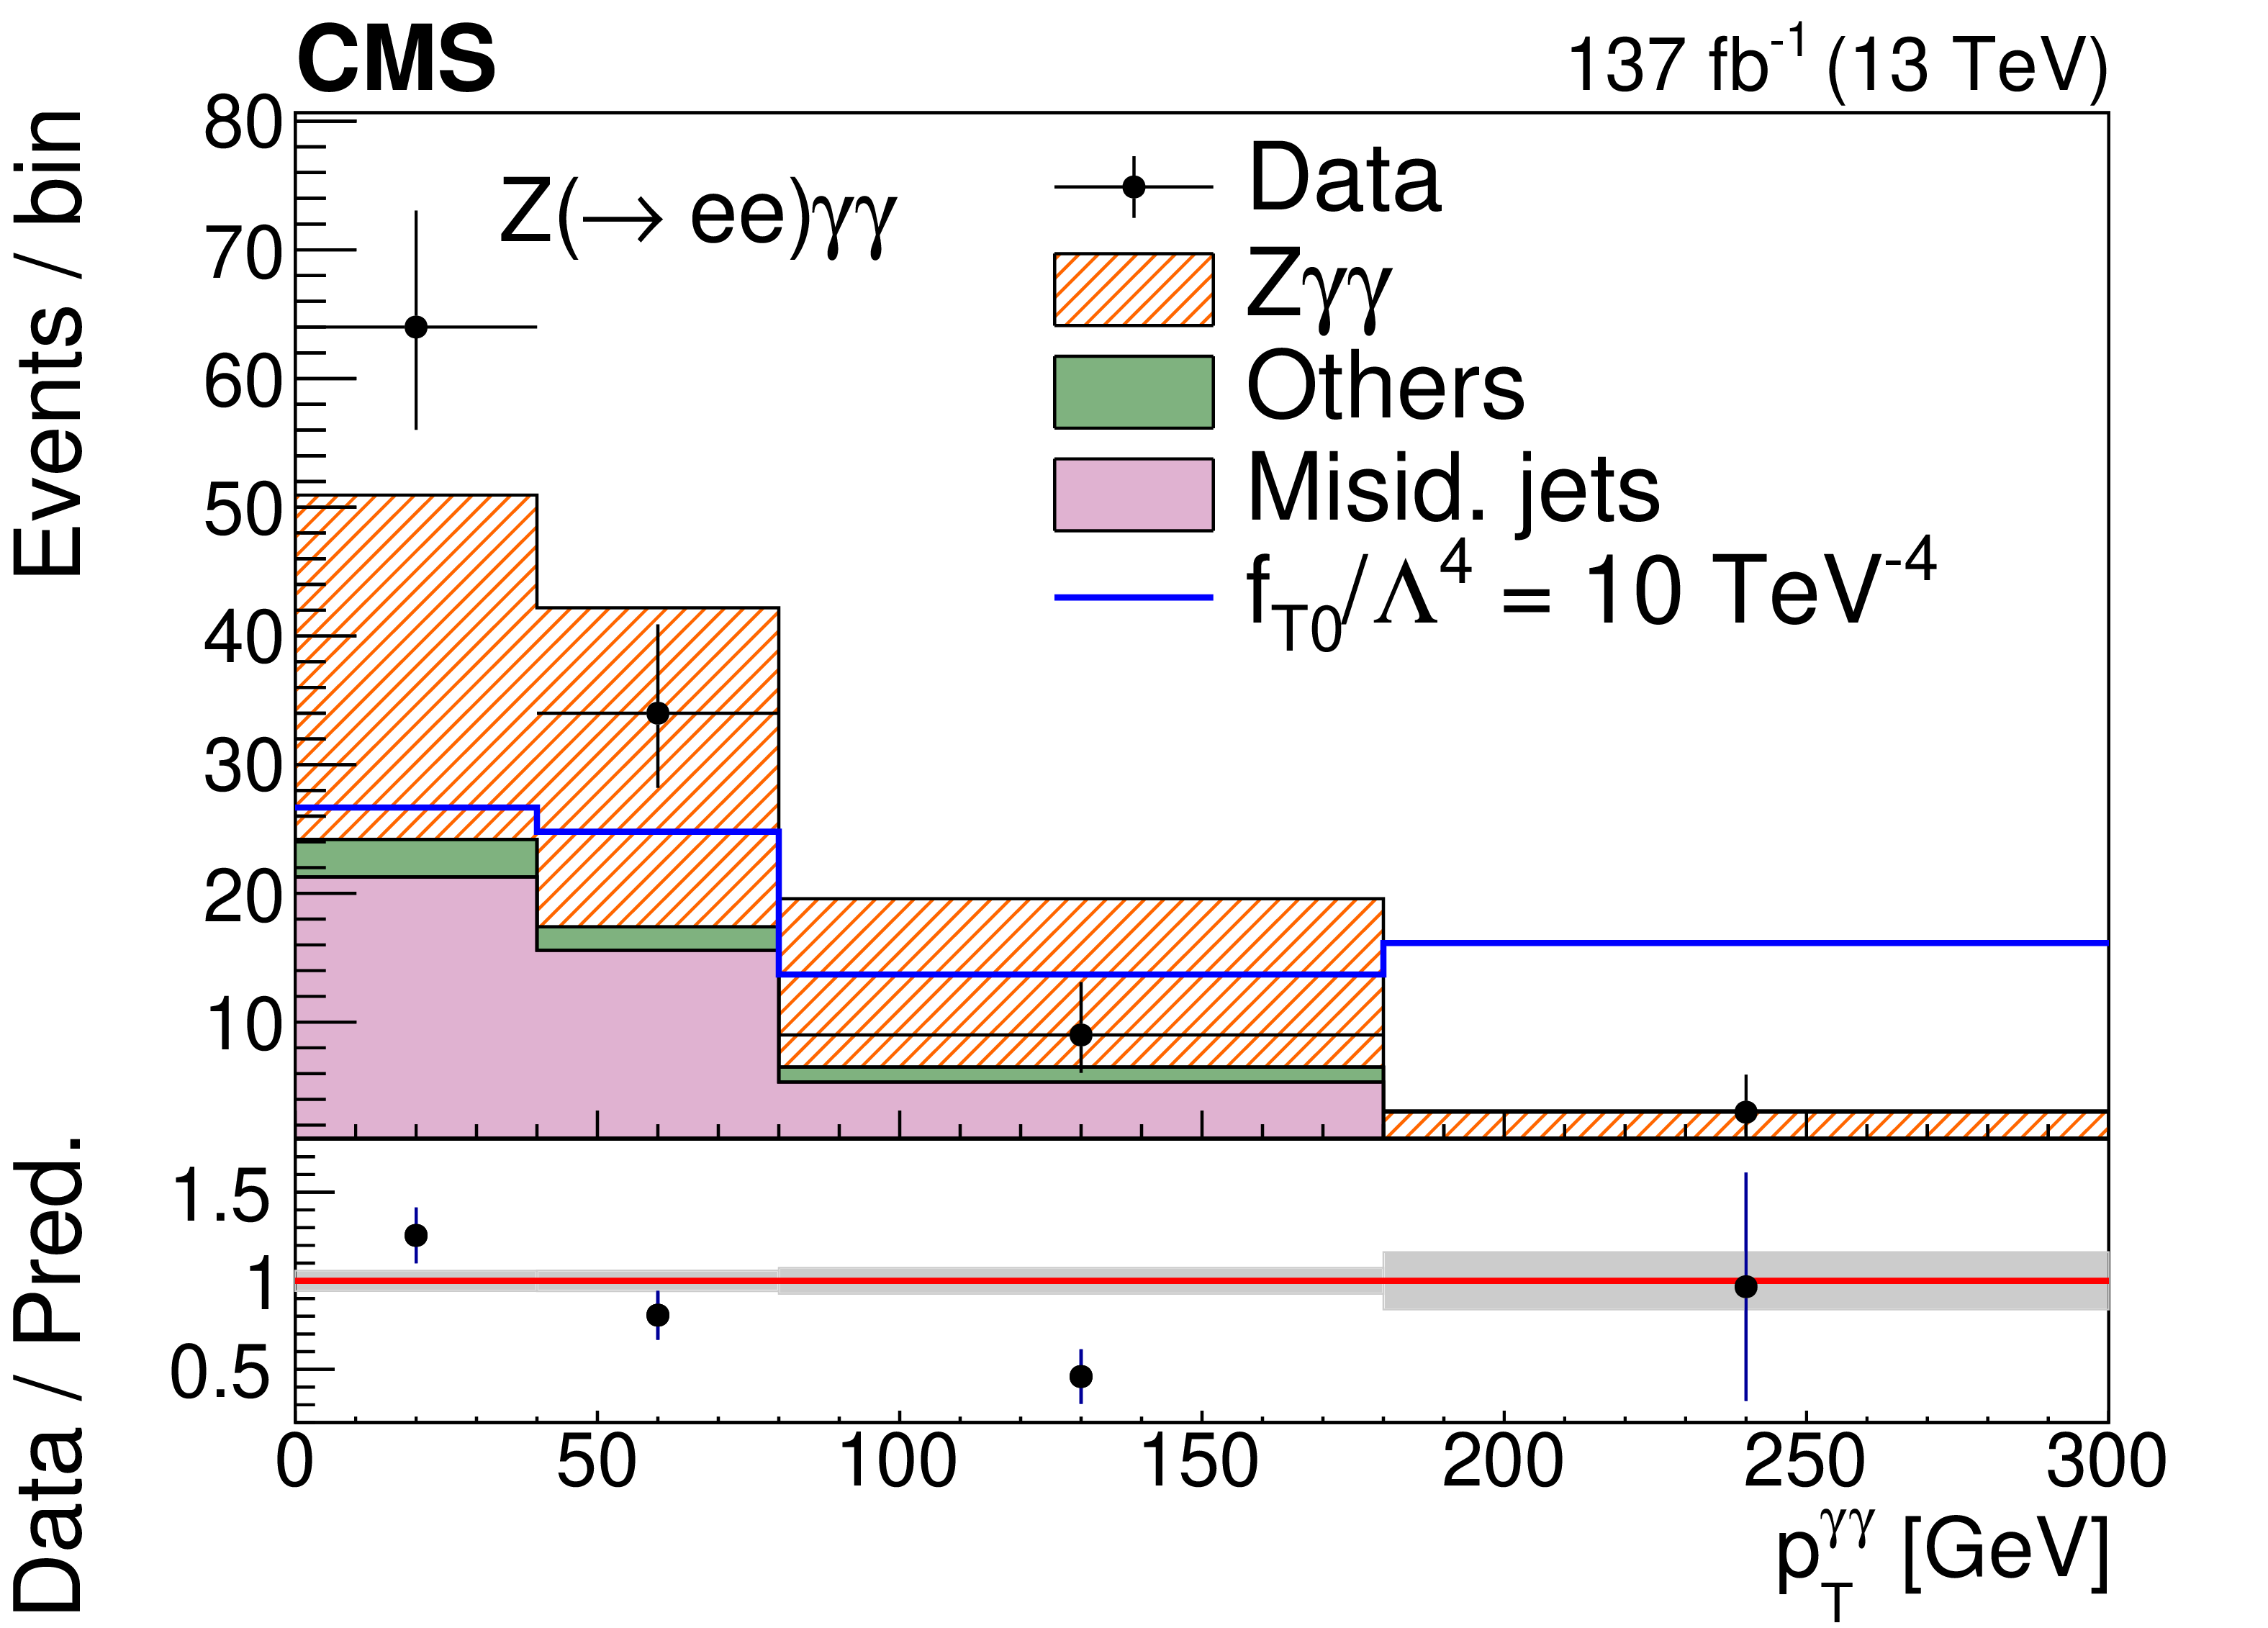
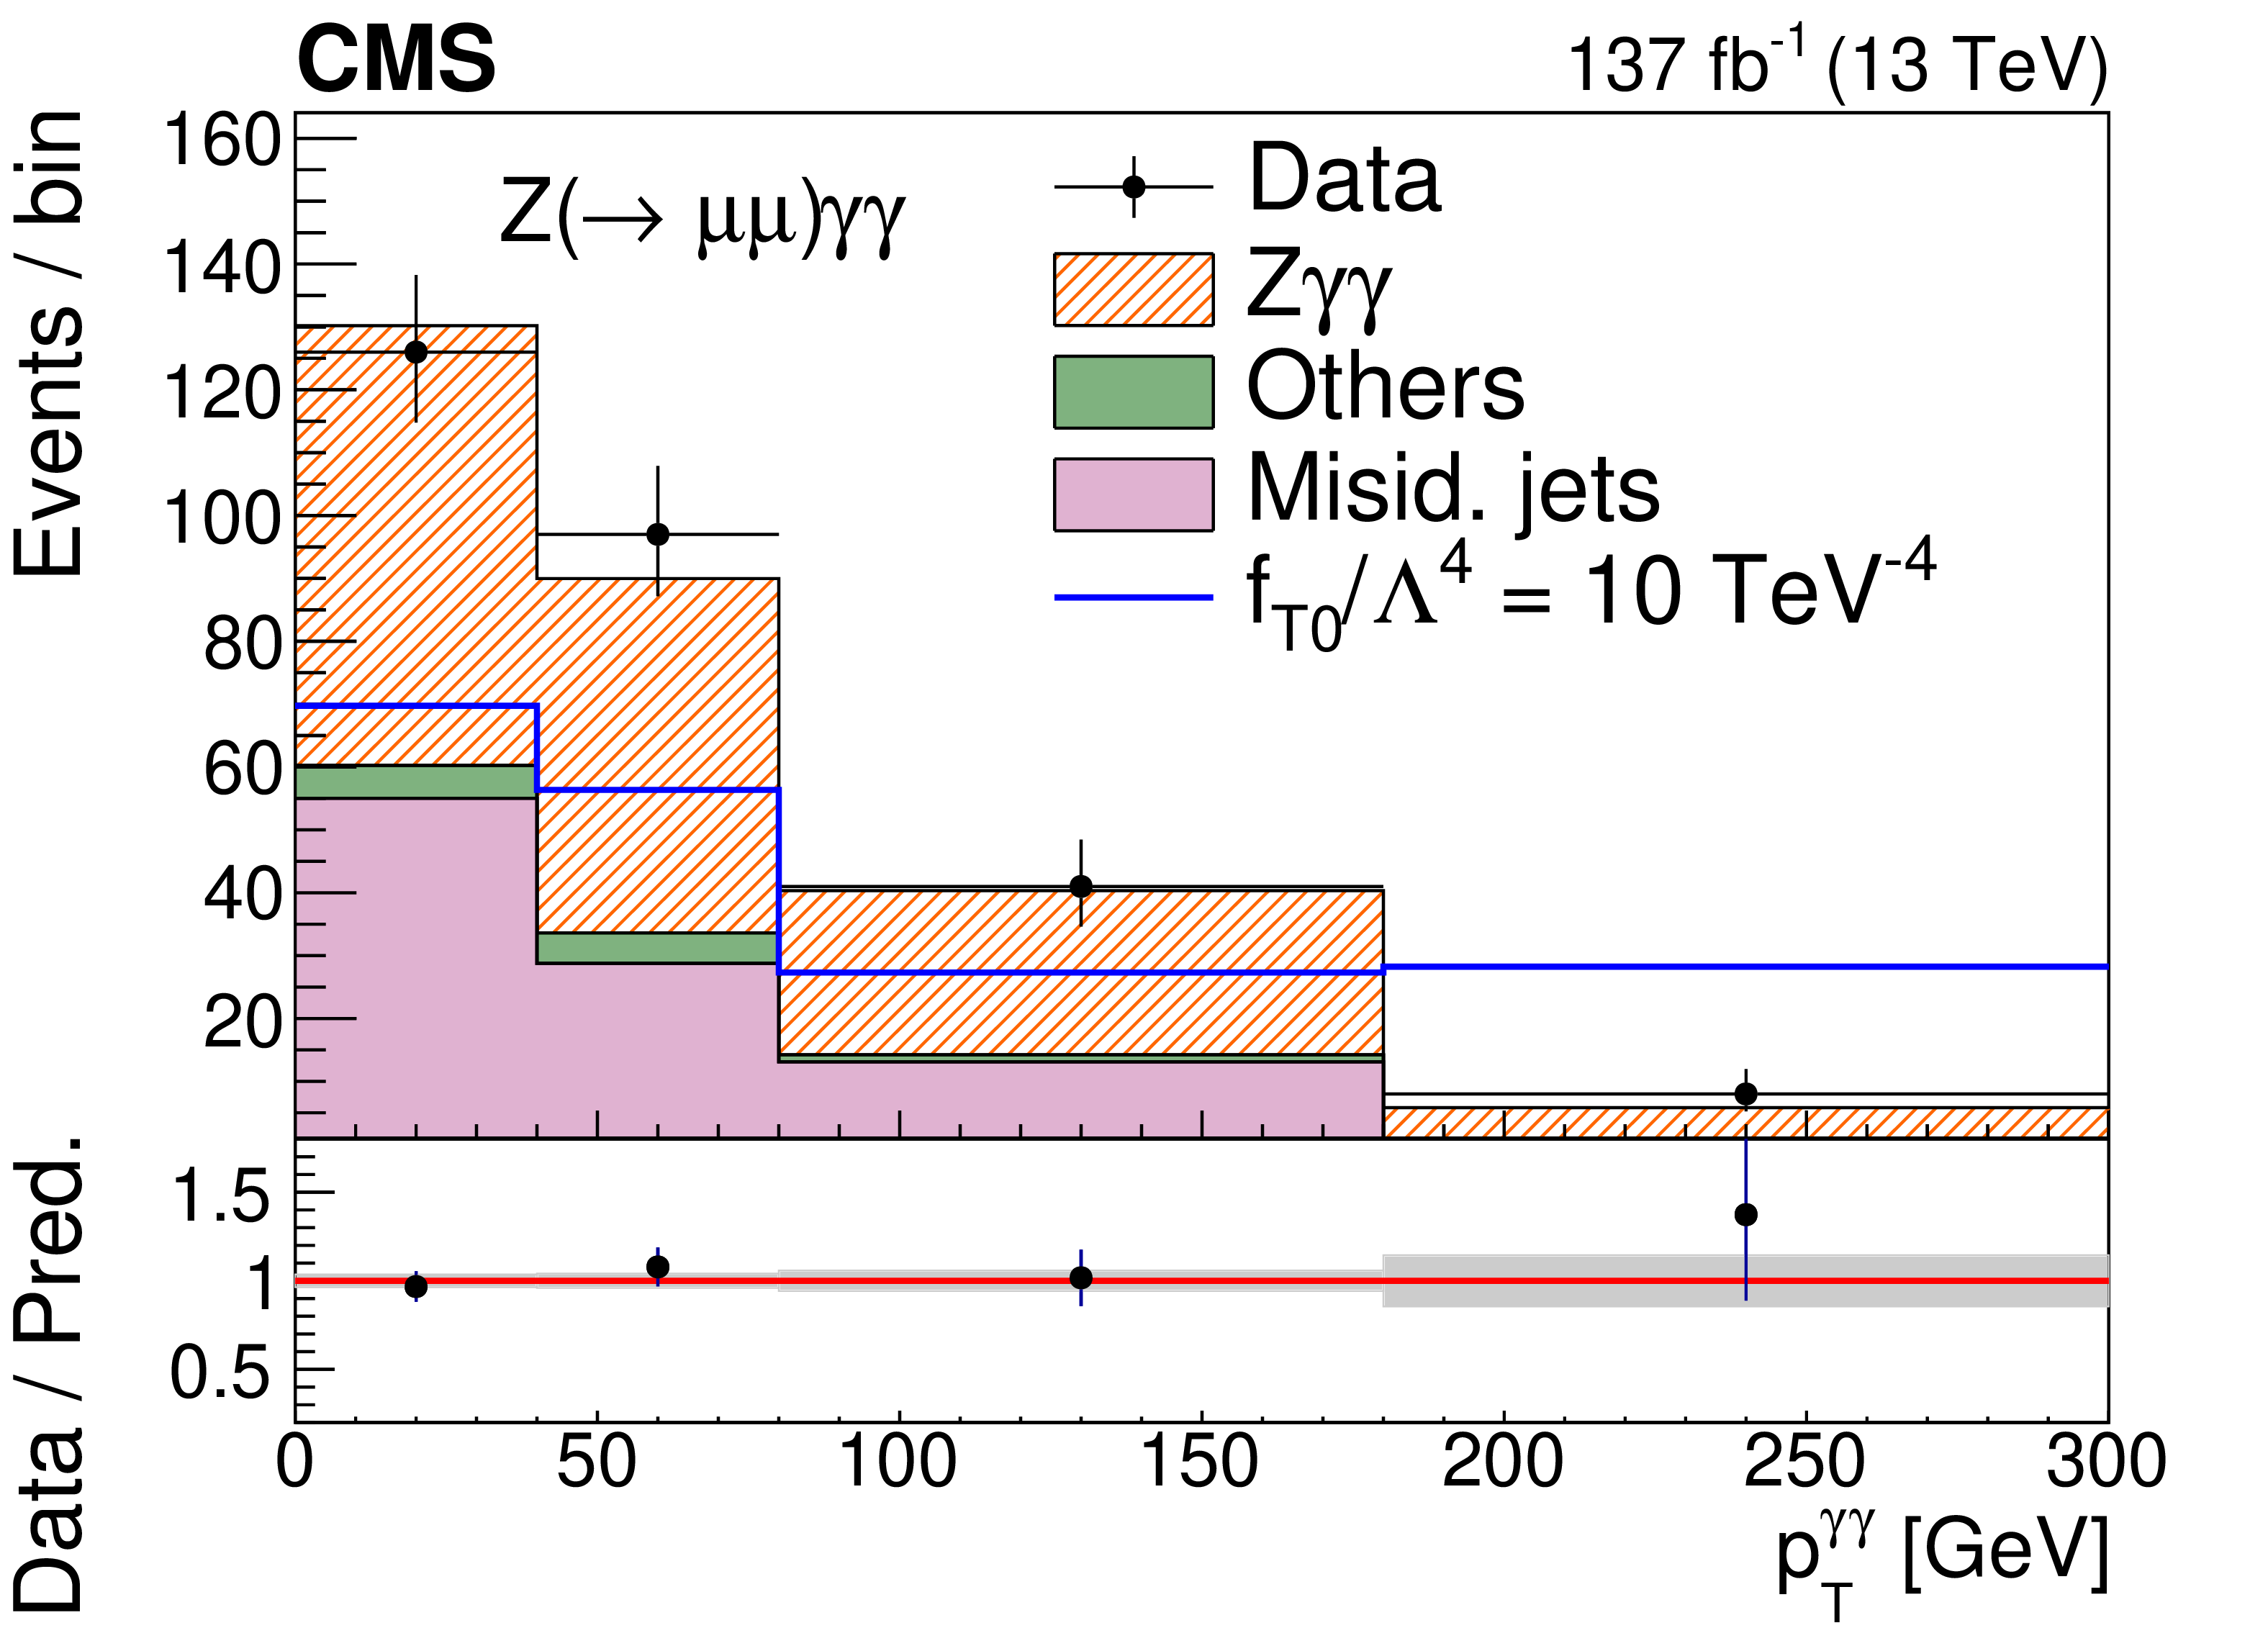
Figure 2:
Distribution of the transverse momentum of the diphoton system for the W$\gamma \gamma $ electron (upper left) and muon (upper right) channels and for the Z$\gamma \gamma $ electron (lower left) and muon (lower right) channels. The predicted yields are shown with their pre-fit normalisations. The black points represent the data with error bars showing the statistical uncertainties. The hatched histogram shows the expected signal contribution. The background estimate for electron (jet) misidentified as photons, obtained from control samples in data, is shown in light brown (purple). The remaining background, derived from MC simulation, is shown in green. In the ratio plots, the grey hashed area is the statistical uncertainty on the sum of signal and backgrounds, while the uncertainty in the black dots is the statistical uncertainty of the data. In blue, the expected distribution for an example value of the anomalous coupling parameters $f_{\mathrm {M}3}/\Lambda ^4$ and $f_{\mathrm {T}0}/\Lambda ^4$ is also shown (see Section 8 for the details). |

png pdf |
Figure 2-a:
Distribution of the transverse momentum of the diphoton system for the W$\gamma \gamma $ electron channel. The predicted yields are shown with their pre-fit normalisations. The black points represent the data with error bars showing the statistical uncertainties. The hatched histogram shows the expected signal contribution. The background estimate for electron (jet) misidentified as photons, obtained from control samples in data, is shown in light brown (purple). The remaining background, derived from MC simulation, is shown in green. In the ratio plot, the grey hashed area is the statistical uncertainty on the sum of signal and backgrounds, while the uncertainty in the black dots is the statistical uncertainty of the data. In blue, the expected distribution for an example value of the anomalous coupling parameters $f_{\mathrm {M}3}/\Lambda ^4$ and $f_{\mathrm {T}0}/\Lambda ^4$ is also shown (see Section 8 for the details). |
png pdf |
Figure 2-b:
Distribution of the transverse momentum of the diphoton system for the W$\gamma \gamma $ muon channel. The predicted yields are shown with their pre-fit normalisations. The black points represent the data with error bars showing the statistical uncertainties. The hatched histogram shows the expected signal contribution. The background estimate for electron (jet) misidentified as photons, obtained from control samples in data, is shown in light brown (purple). The remaining background, derived from MC simulation, is shown in green. In the ratio plot, the grey hashed area is the statistical uncertainty on the sum of signal and backgrounds, while the uncertainty in the black dots is the statistical uncertainty of the data. In blue, the expected distribution for an example value of the anomalous coupling parameters $f_{\mathrm {M}3}/\Lambda ^4$ and $f_{\mathrm {T}0}/\Lambda ^4$ is also shown (see Section 8 for the details). |
png pdf |
Figure 2-c:
Distribution of the transverse momentum of the diphoton system for the Z$\gamma \gamma $ electron channel. The predicted yields are shown with their pre-fit normalisations. The black points represent the data with error bars showing the statistical uncertainties. The hatched histogram shows the expected signal contribution. The background estimate for electron (jet) misidentified as photons, obtained from control samples in data, is shown in light brown (purple). The remaining background, derived from MC simulation, is shown in green. In the ratio plot, the grey hashed area is the statistical uncertainty on the sum of signal and backgrounds, while the uncertainty in the black dots is the statistical uncertainty of the data. In blue, the expected distribution for an example value of the anomalous coupling parameters $f_{\mathrm {M}3}/\Lambda ^4$ and $f_{\mathrm {T}0}/\Lambda ^4$ is also shown (see Section 8 for the details). |
png pdf |
Figure 2-d:
Distribution of the transverse momentum of the diphoton system for the Z$\gamma \gamma $ muon channel. The predicted yields are shown with their pre-fit normalisations. The black points represent the data with error bars showing the statistical uncertainties. The hatched histogram shows the expected signal contribution. The background estimate for electron (jet) misidentified as photons, obtained from control samples in data, is shown in light brown (purple). The remaining background, derived from MC simulation, is shown in green. In the ratio plot, the grey hashed area is the statistical uncertainty on the sum of signal and backgrounds, while the uncertainty in the black dots is the statistical uncertainty of the data. In blue, the expected distribution for an example value of the anomalous coupling parameters $f_{\mathrm {M}3}/\Lambda ^4$ and $f_{\mathrm {T}0}/\Lambda ^4$ is also shown (see Section 8 for the details). |
png pdf |
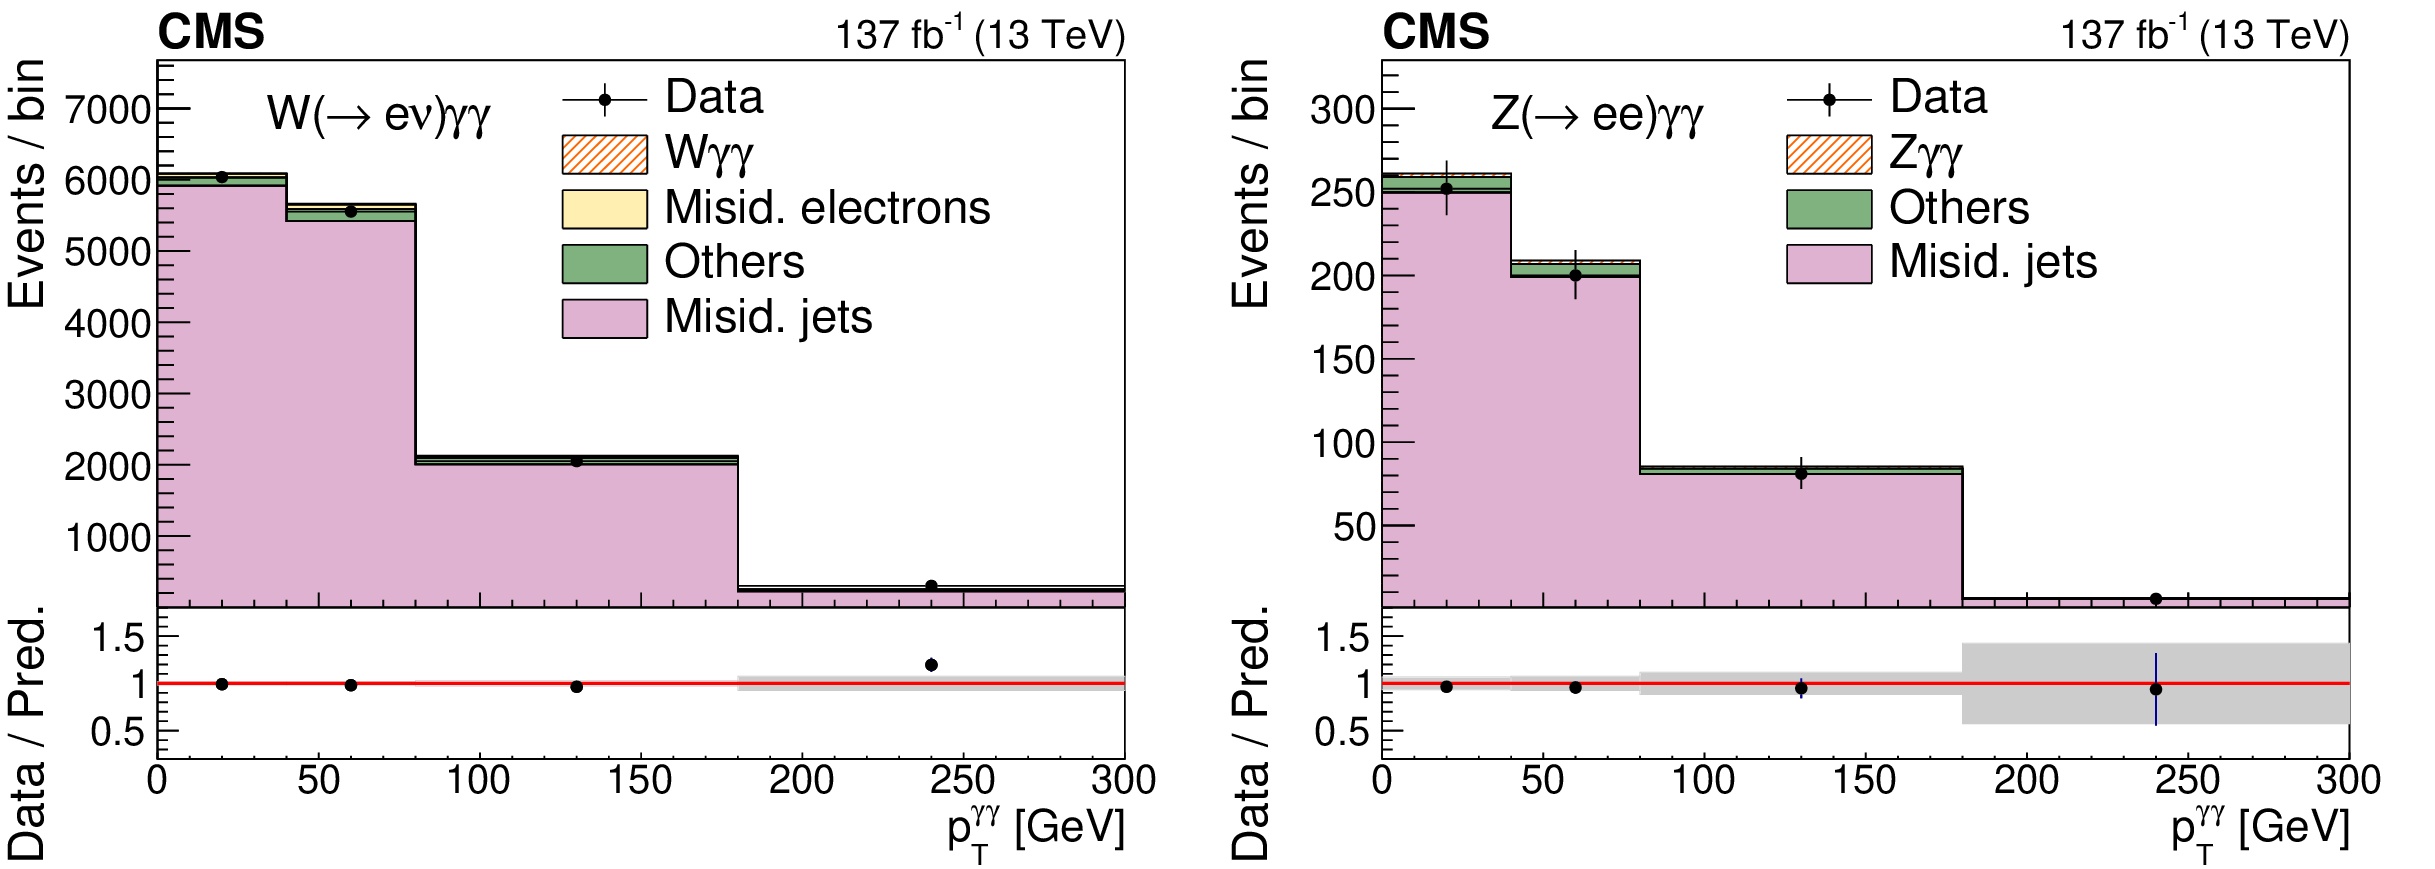
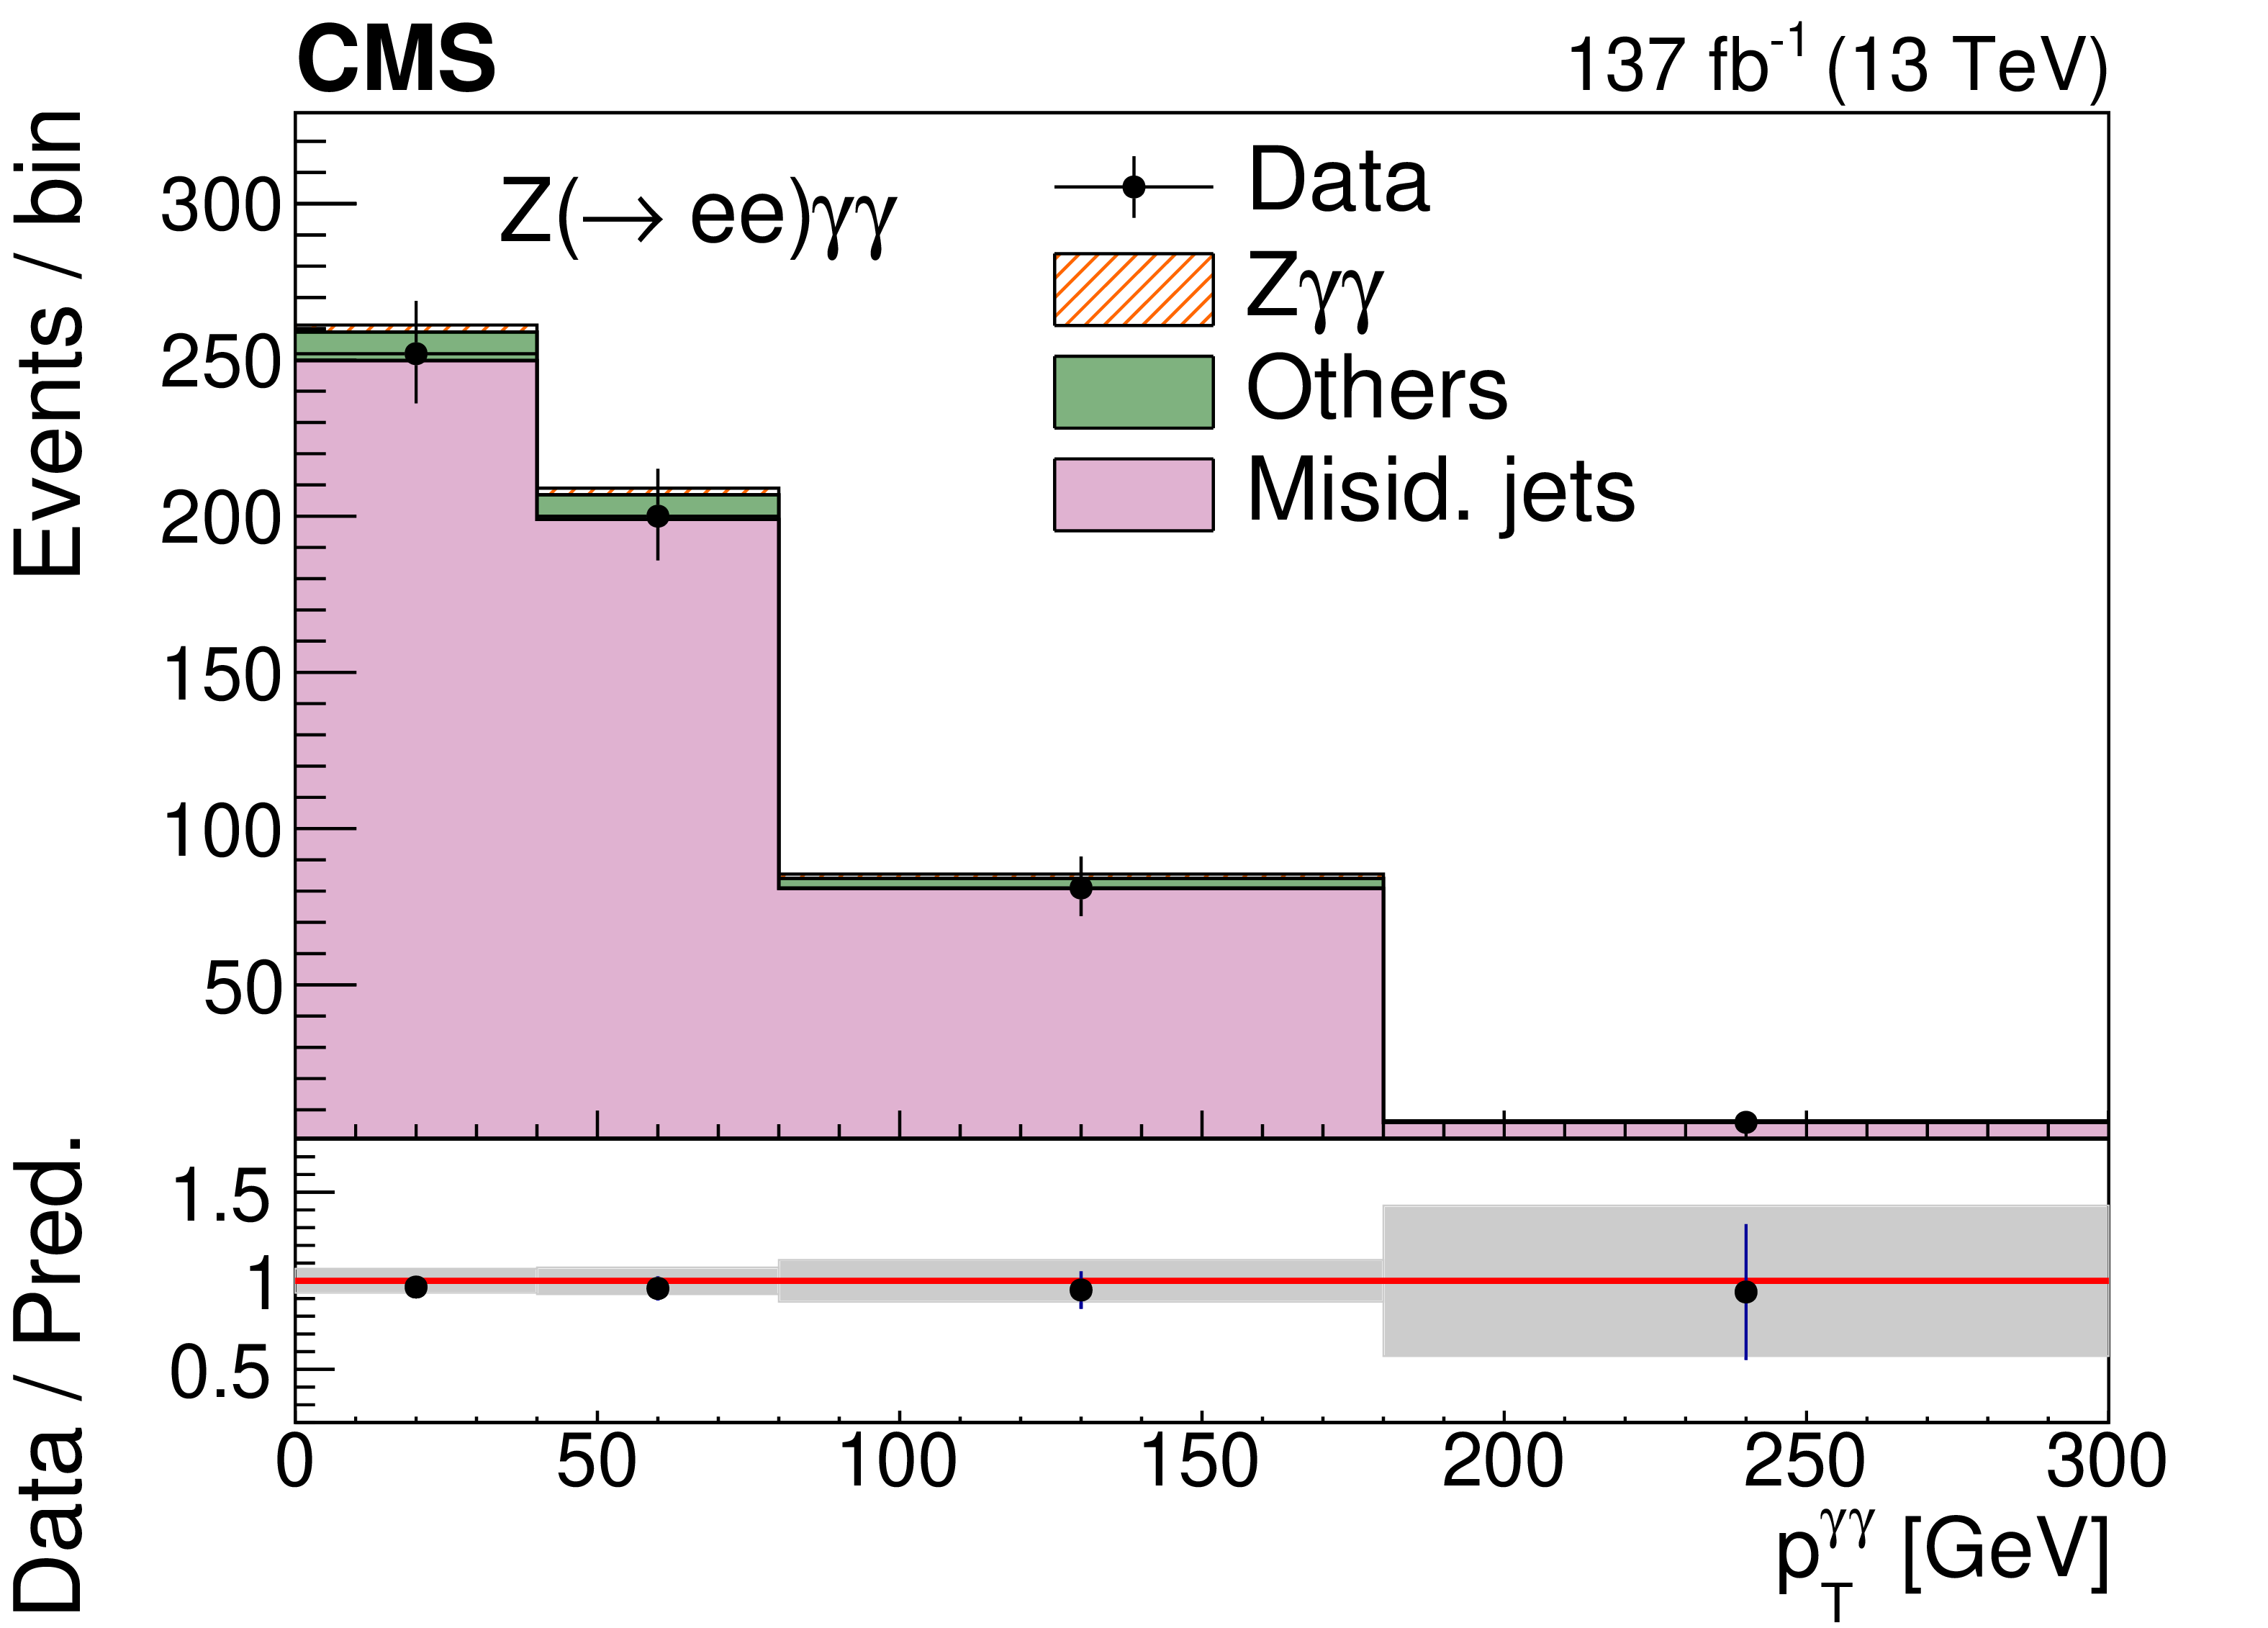
Figure 3:
Distribution of the transverse momentum of the diphoton system, obtained in the control region enriched in misidentified photons, for the W$\gamma \gamma $ and for the Z$\gamma \gamma $ electron channels. The black points represent the data with error bars showing the statistical uncertainties. The hatched histogram shows the expected negligible signal contribution. The background estimate for electron (jet) misidentified as photons, obtained from control samples in data, is shown in light brown (purple). The remaining backgrounds, derived from MC simulation, are shown in green. In the ratio plots, the grey hashed area is the statistical uncertainty on the sum of signal and backgrounds, while the uncertainty in the black dots is the statistical uncertainty of the data. |

png pdf |
Figure 3-a:
Distribution of the transverse momentum of the diphoton system, obtained in the control region enriched in misidentified photons, for the W$\gamma \gamma $ electron channel. The black points represent the data with error bars showing the statistical uncertainties. The hatched histogram shows the expected negligible signal contribution. The background estimate for electron (jet) misidentified as photons, obtained from control samples in data, is shown in light brown (purple). The remaining backgrounds, derived from MC simulation, are shown in green. In the ratio plot, the grey hashed area is the statistical uncertainty on the sum of signal and backgrounds, while the uncertainty in the black dots is the statistical uncertainty of the data. |
png pdf |
Figure 3-b:
Distribution of the transverse momentum of the diphoton system, obtained in the control region enriched in misidentified photons, for the Z$\gamma \gamma $ electron channel. The black points represent the data with error bars showing the statistical uncertainties. The hatched histogram shows the expected negligible signal contribution. The background estimate for electron (jet) misidentified as photons, obtained from control samples in data, is shown in light brown (purple). The remaining backgrounds, derived from MC simulation, are shown in green. In the ratio plot, the grey hashed area is the statistical uncertainty on the sum of signal and backgrounds, while the uncertainty in the black dots is the statistical uncertainty of the data. |
png pdf |
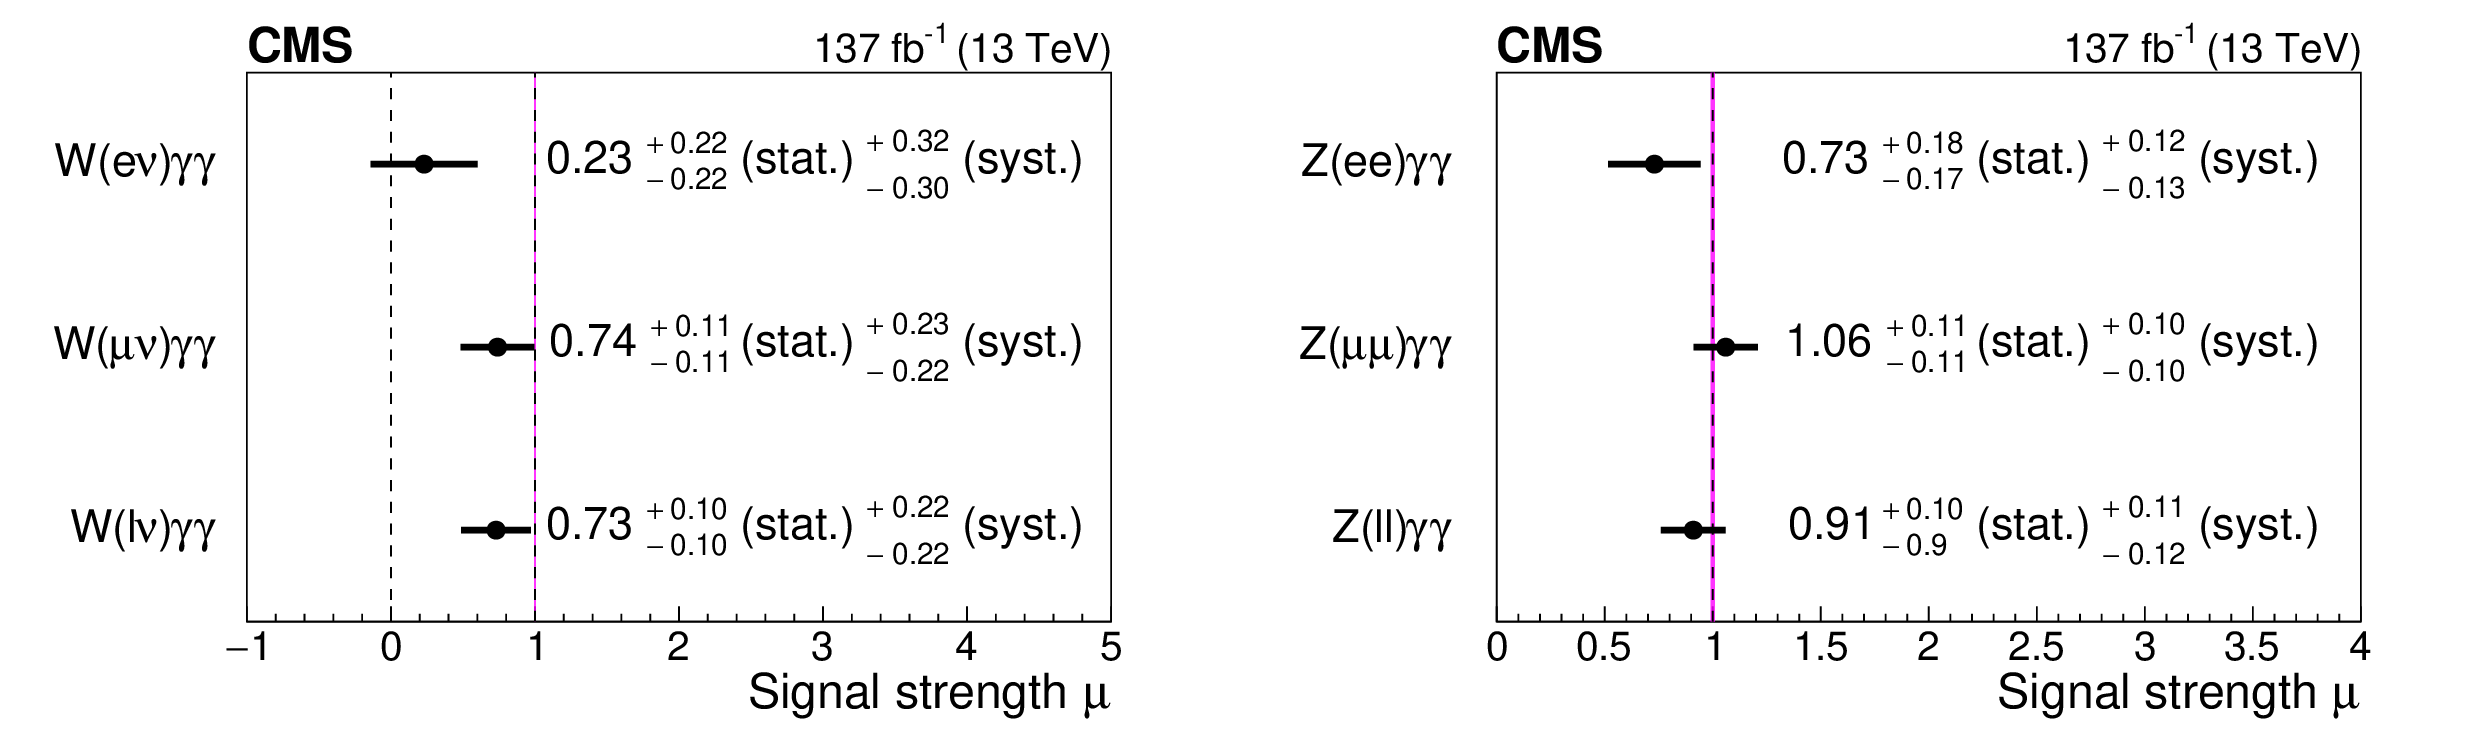
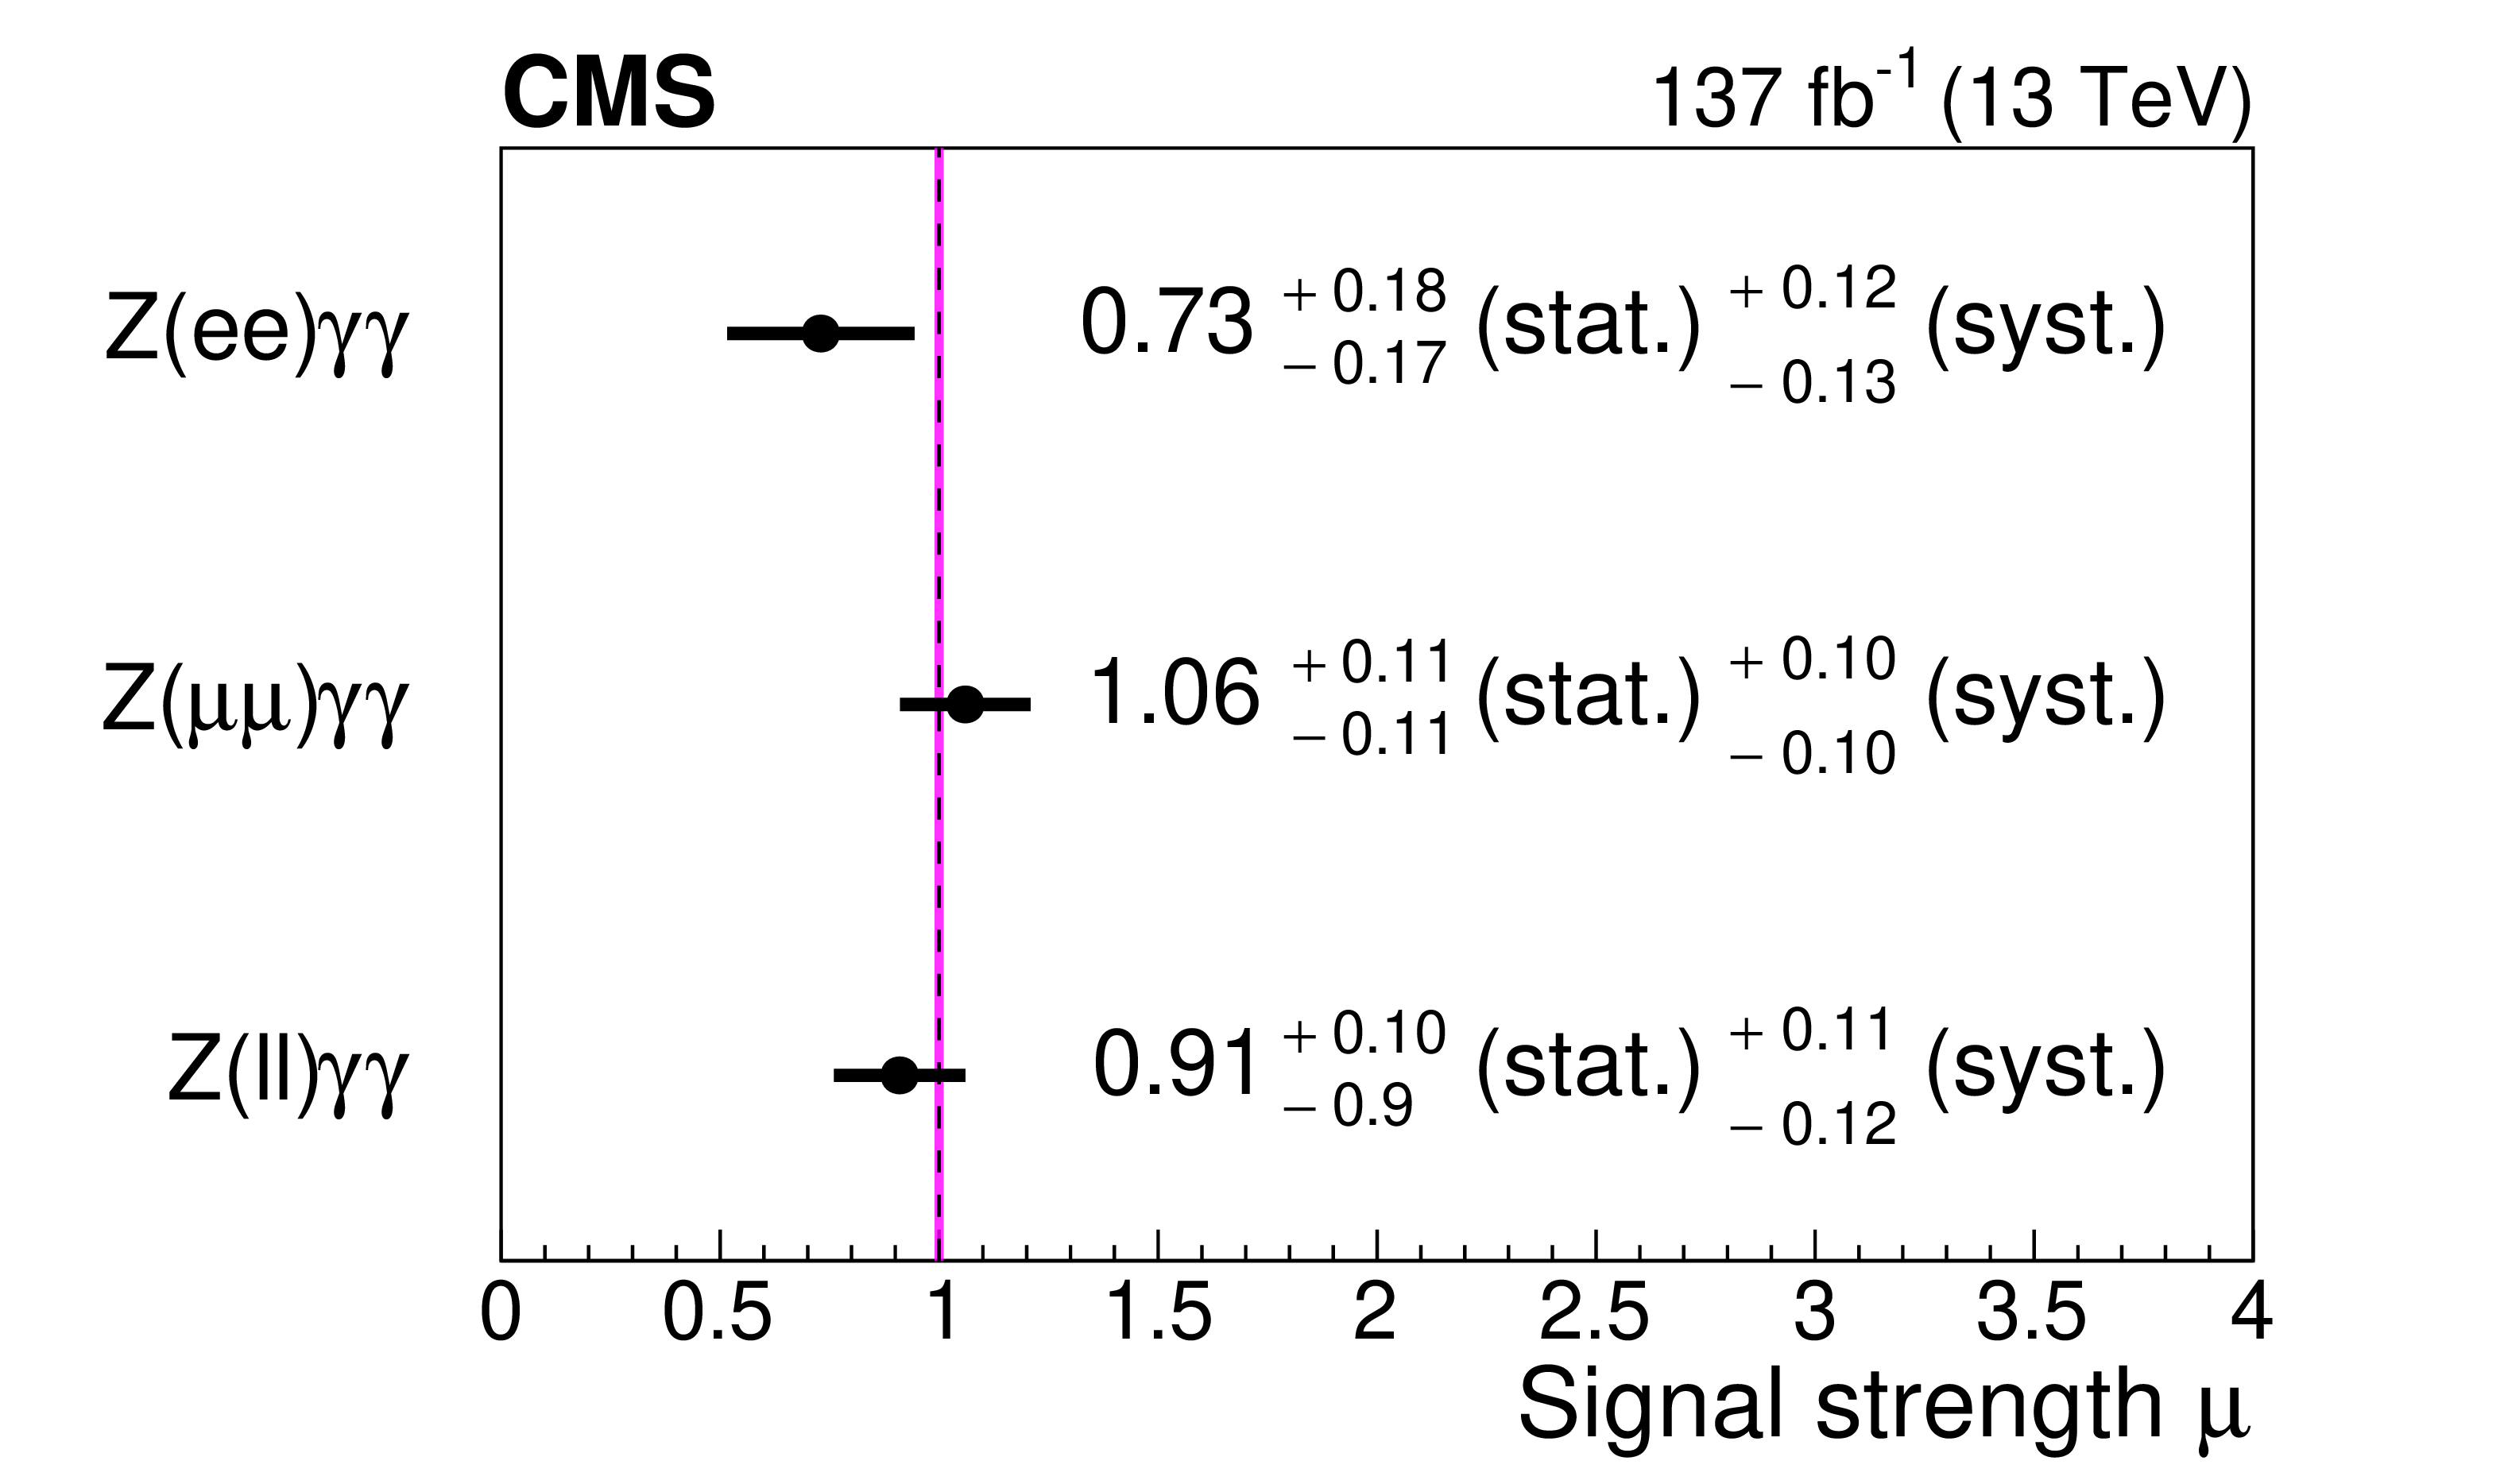
Figure 4:
Best fit values of the signal strengths for the W$\gamma \gamma $ (left) and Z$\gamma \gamma $ (right) channels. The error bars represent the total uncertainty while the magenta bands represent the theoretical uncertainty in the MadGraph 5_aMC@NLO cross section. |

png pdf |
Figure 4-a:
Best fit values of the signal strengths for the W$\gamma \gamma $ channel. The error bars represent the total uncertainty while the magenta bands represent the theoretical uncertainty in the MadGraph 5_aMC@NLO cross section. |
png pdf |
Figure 4-b:
Best fit values of the signal strengths for the Z$\gamma \gamma $ channel. The error bars represent the total uncertainty while the magenta bands represent the theoretical uncertainty in the MadGraph 5_aMC@NLO cross section. |
| Tables | |
png pdf |
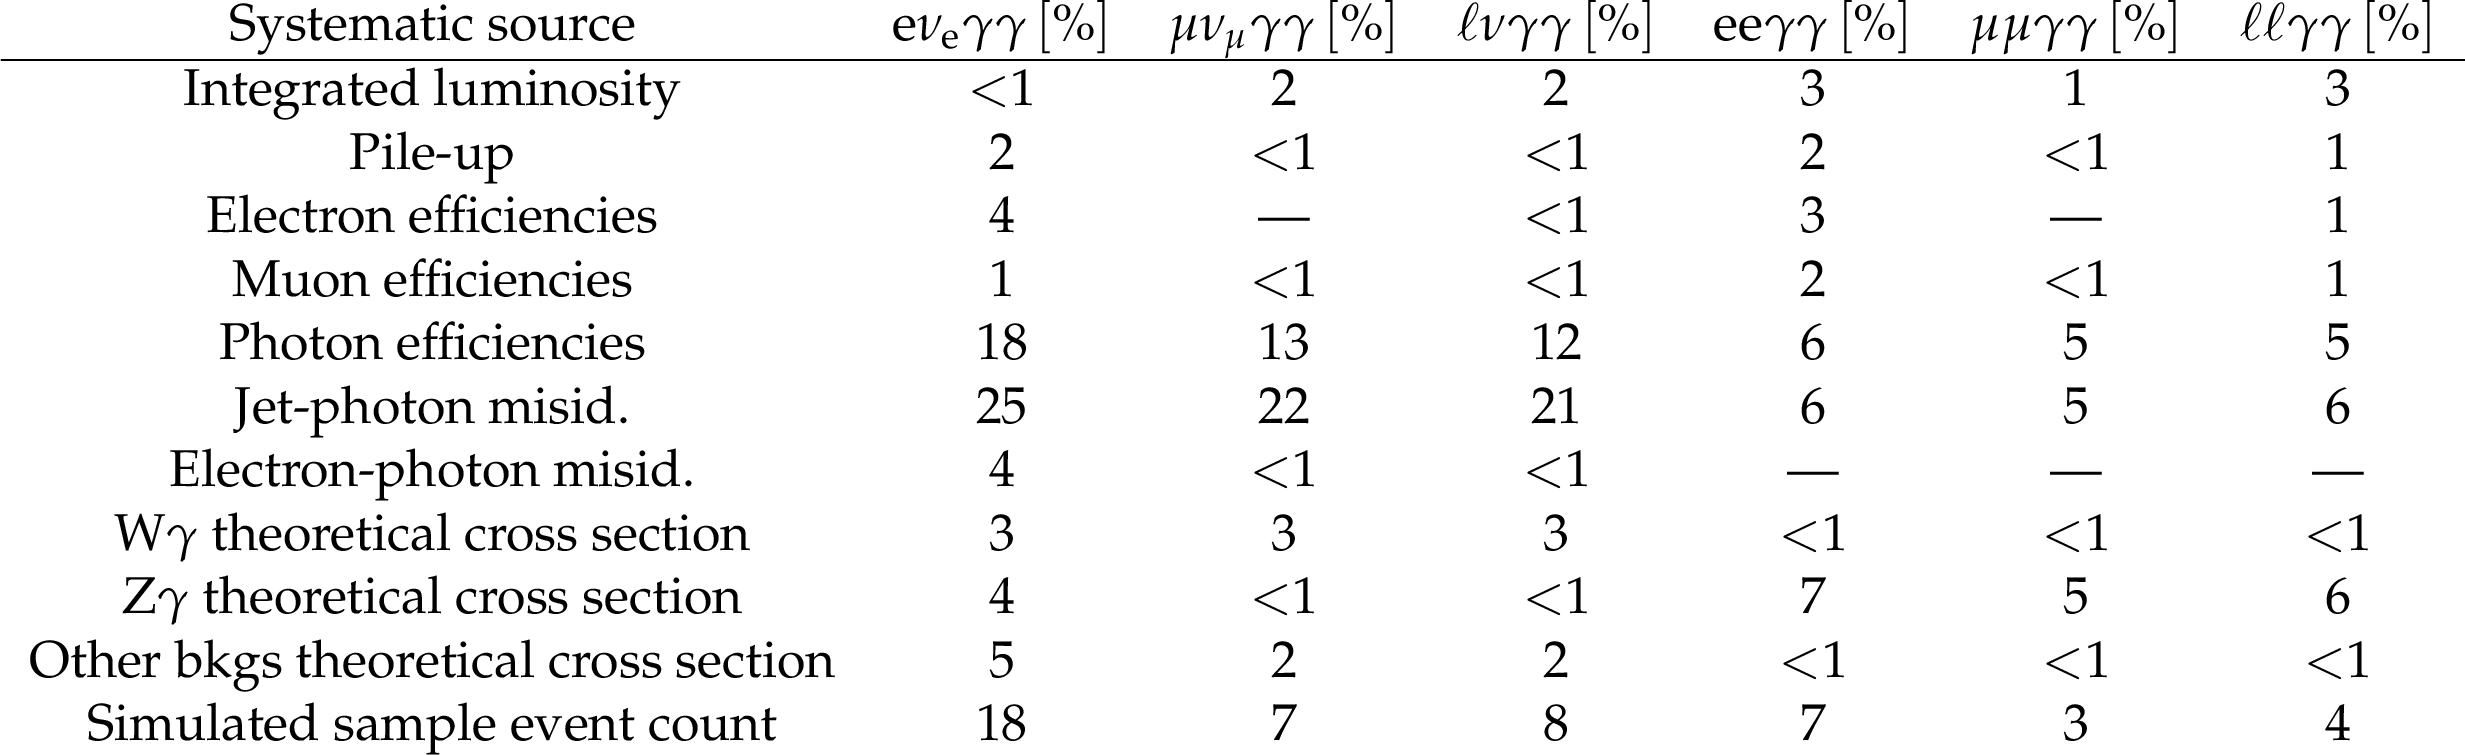
Table 1:
Summary of the systematic uncertainties (in percent) for the W$\gamma \gamma $ and Z$\gamma \gamma $ cross section measurements. The numbers indicate the impact of each systematic uncertainty in the value of the measured cross section in the corresponding channel. |
png pdf |
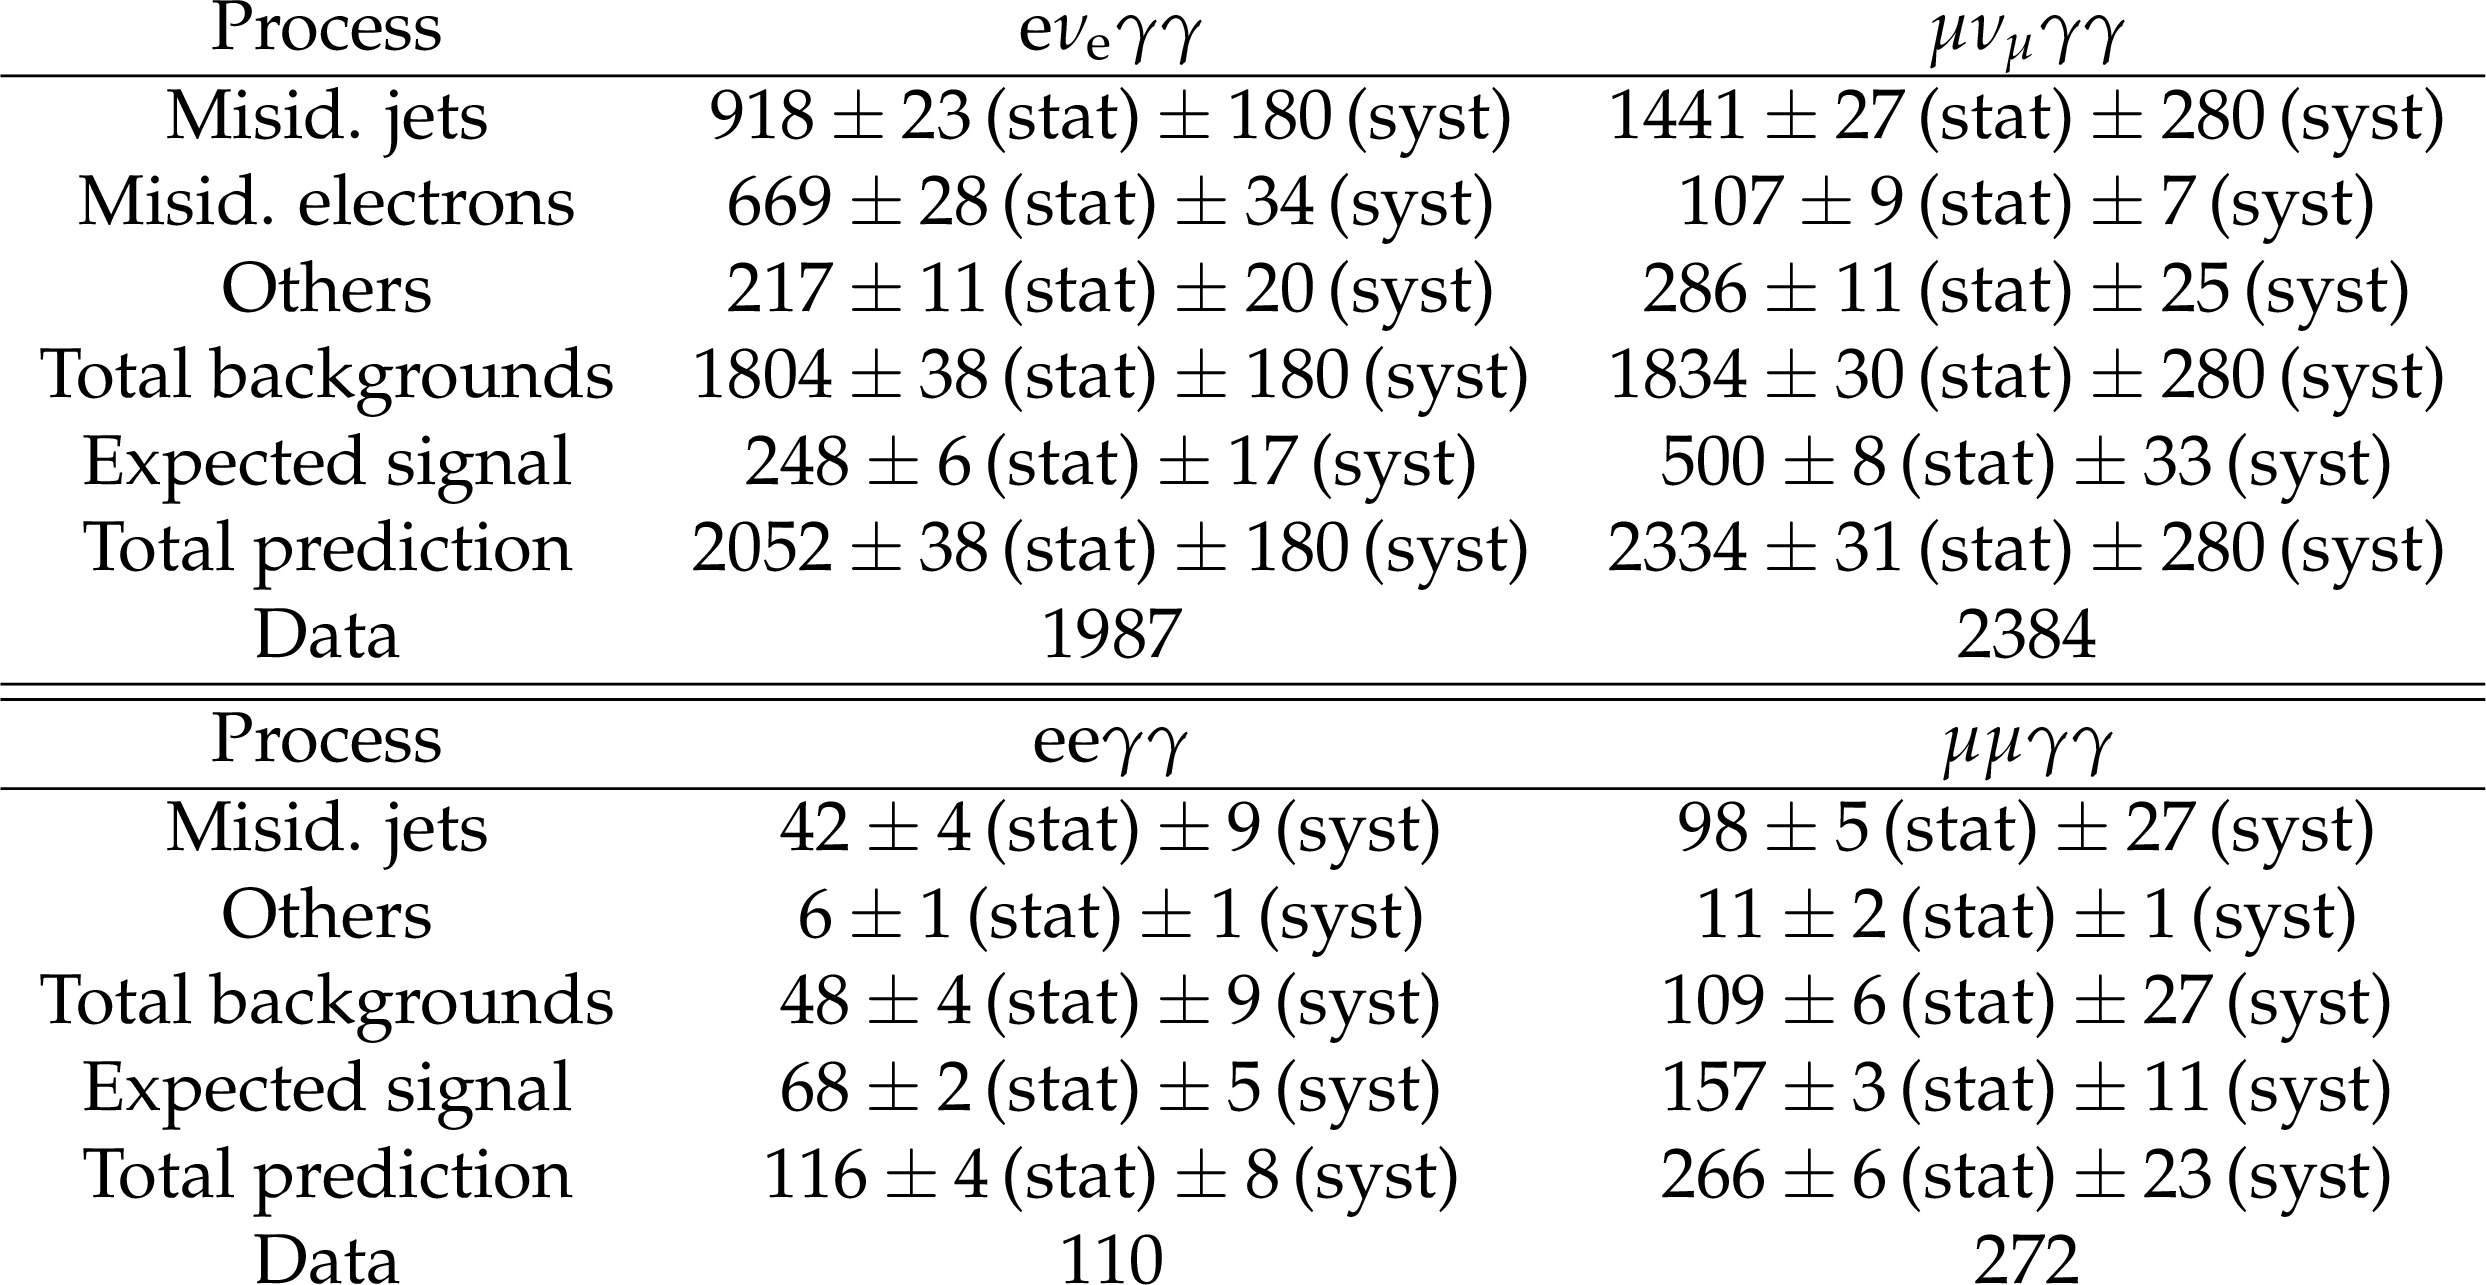
Table 2:
Summary of the pre-fit predicted and observed numbers of events for 137 fb$^{-1}$ for the W$\gamma \gamma $ (upper Table) and Z$\gamma \gamma $ (lower Table) selections in the electron and muon channels. The systematic uncertainties of the individual backgrounds and the total background are obtained by summing the contributions of different systematic uncertainties in quadrature. The statistical uncertainties are those related to the MC event samples and control region statistical uncertainties. |
png pdf |
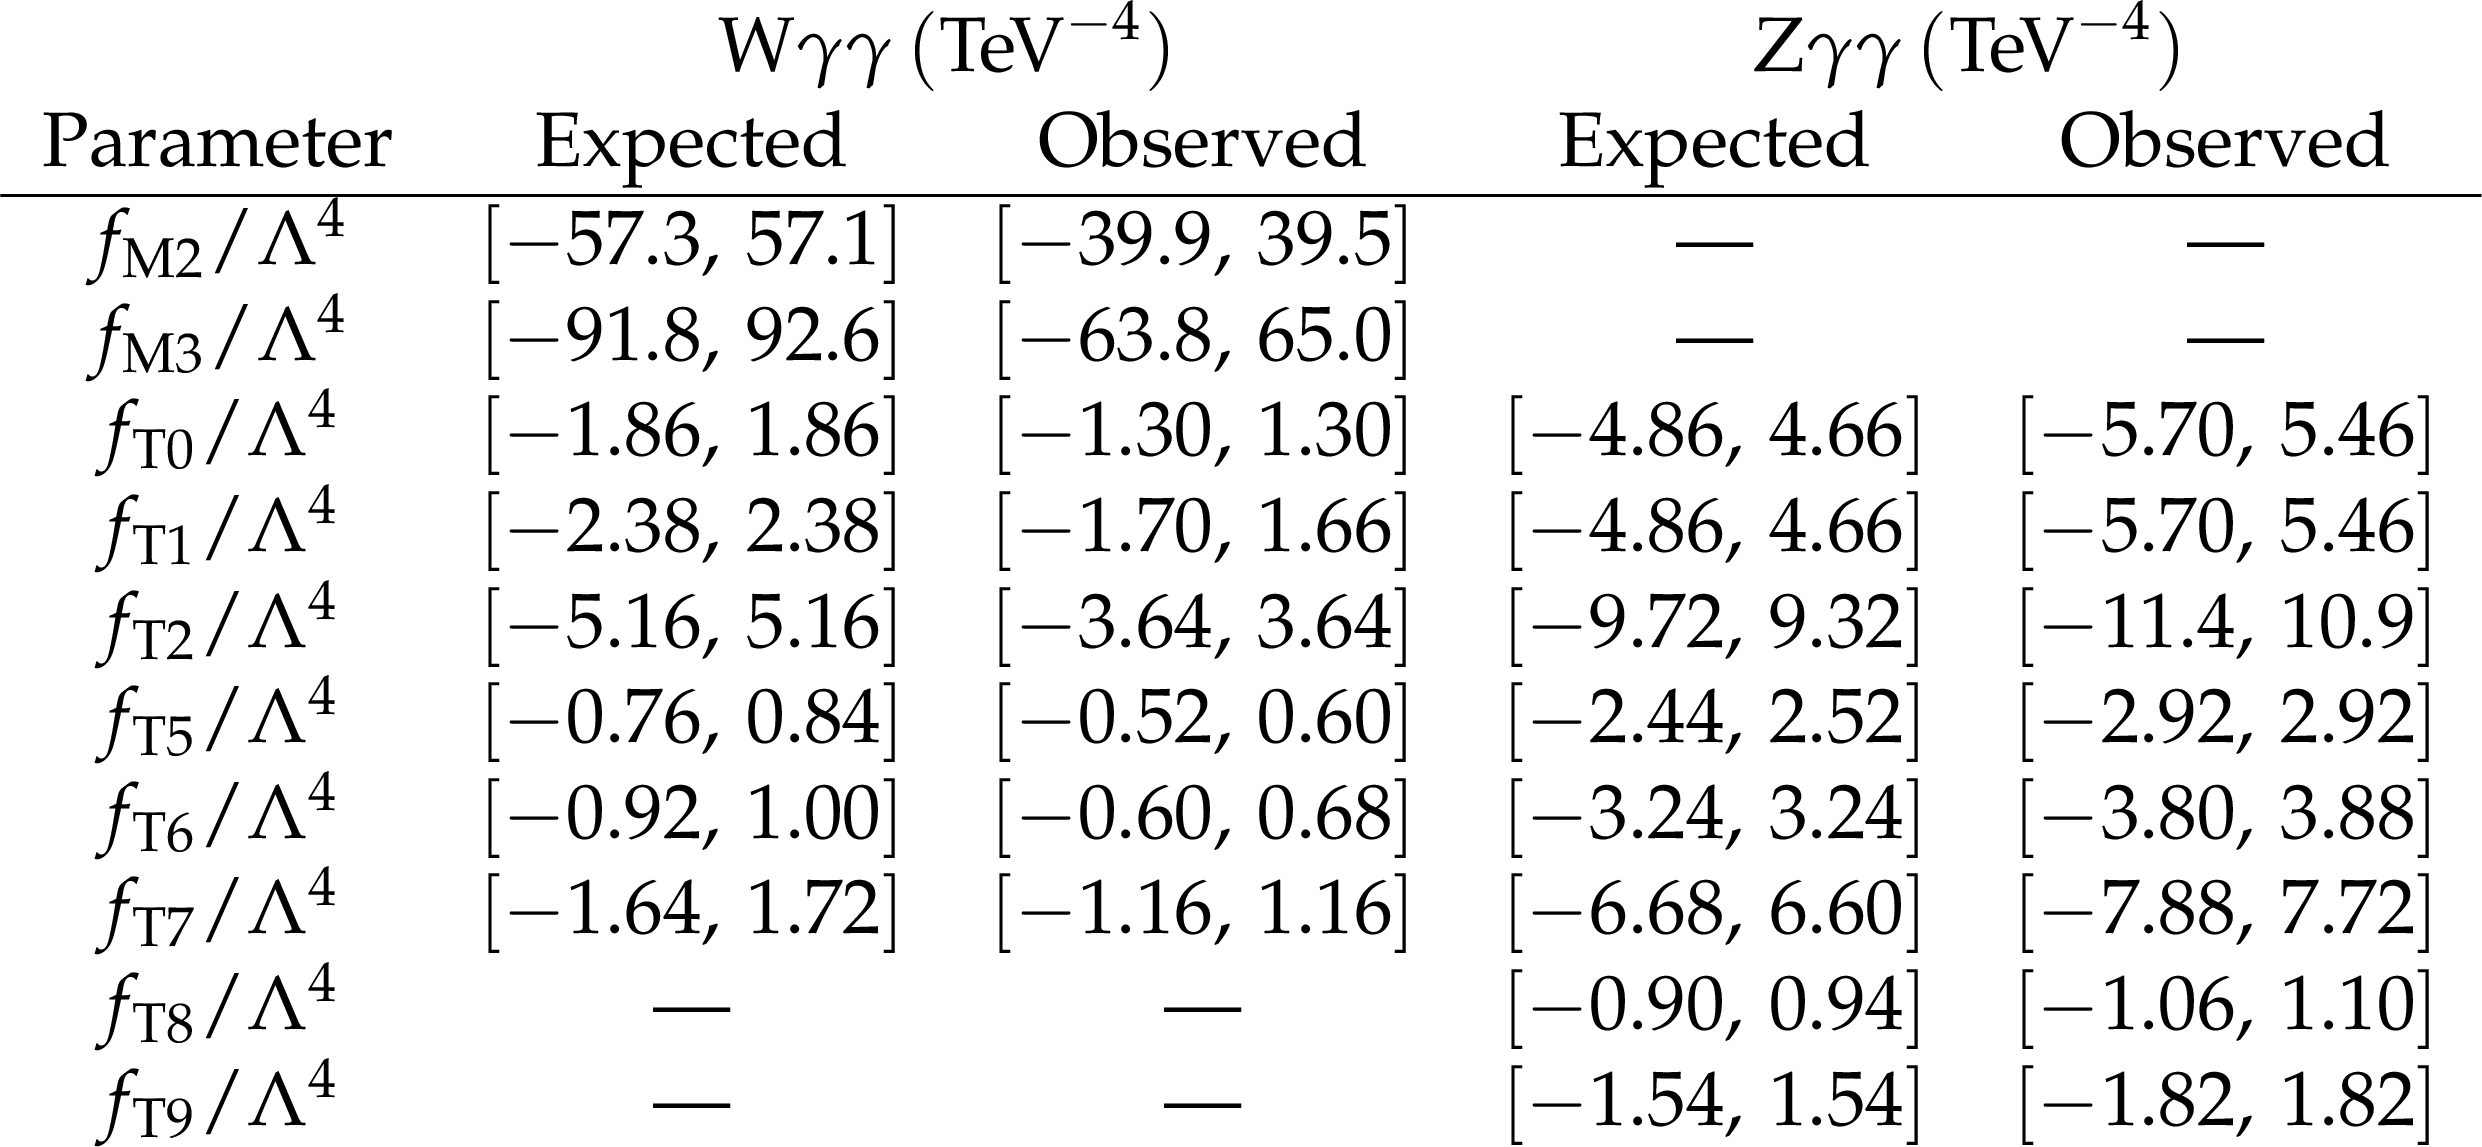
Table 3:
Expected and observed 95% confidence level intervals for the different anomalous couplings in both the W$\gamma \gamma $ and Z$\gamma \gamma $ channels. |
| Summary |
|
The cross sections for both the W$\gamma\gamma$ and Z$\gamma\gamma$ processes are measured in proton-proton collisions by the CMS experiment at a centre-of-mass energy of 13 TeV corresponding to an integrated luminosity of 137 fb$^{-1}$. The cross sections are measured in a fiducial region where simulated signal events are selected at generator level in the W$\gamma\gamma$ channel by requiring exactly one electron or muon with transverse momentum ${p_{\mathrm{T}}} > $ 30 GeV and at least two photons, each with ${p_{\mathrm{T}}} > $ 20 GeV. Events are selected in the Z$\gamma\gamma$ channel by requiring two oppositely charged electrons or muons, at least one of them with ${p_{\mathrm{T}}} > $ 30 GeV, and at least two photons, each with ${p_{\mathrm{T}}} > $ 20 GeV. All leptons and photons are required to have pseudorapidity $|\eta| < $ 2.5. Additionally, the invariant mass of the dilepton system is required to exceed $m_{\ell\ell} > $ 55 GeV. The measured cross sections are 13.6$^{+1.9}_{-1.9}$ (stat)$^{+4.0}_{-4.0}$ (syst) $\pm$ 0.08 (PDF+scale) fb for the W$\gamma\gamma$ channel and 5.41$^{+0.58}_{-0.55}$ (stat)$^{+0.64}_{-0.70}$ (syst) $\pm$ 0.06 (PDF+scale) fb for the Z$\gamma\gamma$ channel. These results are in agreement with the theoretical cross sections computed at next-to-leading order. The corresponding signal significances are 3.1 and 4.8 standard deviations. Limits on anomalous quartic gauge couplings are set using both channels. |
| References | ||||
| 1 | C. Degrande et al. | Effective field theory: A modern approach to anomalous couplings | Annals Phys. 335 (2013) 21 | 1205.4231 |
| 2 | ATLAS Collaboration | Evidence of $ \mathrm{W}\gamma\gamma $ production in $ {\mathrm{p}}{\mathrm{p}} $ collisions at $ \sqrt s= $ 8 TeV and limits on anomalous quartic gauge couplings with the ATLAS detector | PRL 115 (2015) 031802 | 1503.03243 |
| 3 | ATLAS Collaboration | Measurements of $ \mathrm{Z}\gamma $ and $ \mathrm{Z}\gamma\gamma $ production in $ {\mathrm{p}}{\mathrm{p}} $ collisions at $ \sqrt s= $ 8 TeV with the ATLAS detector | PRD 93 (2016) 112002 | 1604.05232 |
| 4 | CMS Collaboration | Measurements of the $ {\mathrm{p}}{\mathrm{p}}\to\mathrm{W}\gamma\gamma $ and $ {\mathrm{p}}{\mathrm{p}}\to\mathrm{Z}\gamma\gamma $ cross sections and limits on anomalous quartic gauge couplings at $ \sqrt s= $ 8 TeV | JHEP 10 (2017) 072 | CMS-SMP-15-008 1704.00366 |
| 5 | G. Bozzi, F. Campanario, M. Rauch, and D. Zeppenfeld | $ \mathrm{W^{\pm}}\gamma\gamma $ production with leptonic decays at NLO QCD | PRD 83 (2011) 114035 | 1103.4613 |
| 6 | U. Baur, D. Wackeroth, and M. M. Weber | Radiative corrections to $ \mathrm{W}\gamma\gamma $ production at the LHC | PoS RADCOR2009 (2010) 067 | 1001.2688 |
| 7 | G. Bozzi, F. Campanario, M. Rauch, and D. Zeppenfeld | $ \mathrm{Z}\gamma\gamma $ production with leptonic decays and triple photon production at next-to-leading order QCD | PRD 84 (2011) 074028 | 1107.3149 |
| 8 | CMS Collaboration | The CMS trigger system | JINST 12 (2017) P01020 | CMS-TRG-12-001 1609.02366 |
| 9 | CMS Collaboration | The CMS experiment at the CERN LHC | JINST 3 (2008) S08004 | CMS-00-001 |
| 10 | J. Alwall et al. | The automated computation of tree-level and next-to-leading order differential cross sections, and their matching to parton shower simulations | JHEP 07 (2014) 079 | 1405.0301 |
| 11 | NNPDF Collaboration | Parton distributions for the LHC Run II | JHEP 04 (2015) 040 | 1410.8849 |
| 12 | NNPDF Collaboration | Parton distributions from high-precision collider data | EPJC 77 (2017) 663 | 1706.00428 |
| 13 | T. Gleisberg et al. | SHERPA 1.$ \alpha $: A proof-of-concept version | JHEP 02 (2004) 056 | hep-ph/0311263 |
| 14 | T. Gleisberg et al. | Event generation with SHERPA 1.1 | JHEP 02 (2009) 007 | 0811.4622 |
| 15 | P. Nason | A new method for combining NLO QCD with shower Monte Carlo algorithms | JHEP 11 (2004) 040 | hep-ph/0409146 |
| 16 | S. Frixione, P. Nason, and C. Oleari | Matching NLO QCD computations with parton shower simulations: the POWHEG method | JHEP 11 (2007) 070 | 0709.2092 |
| 17 | S. Alioli, P. Nason, C. Oleari, and E. Re | A general framework for implementing NLO calculations in shower Monte Carlo programs: the POWHEG BOX | JHEP 06 (2010) 043 | 1002.2581 |
| 18 | S. Alioli, P. Nason, C. Oleari, and E. Re | NLO single-top production matched with shower in POWHEG: s- and t-channel contributions | JHEP 09 (2009) 111 | 0907.4076 |
| 19 | P. Artoisenet, R. Frederix, O. Mattelaer, and R. Rietkerk | Automatic spin-entangled decays of heavy resonances in Monte Carlo simulations | JHEP 03 (2013) 015 | 1212.3460 |
| 20 | T. Sjostrand et al. | An introduction to PYTHIA 8.2 | CPC 191 (2015) 159 | 1410.3012 |
| 21 | CMS Collaboration | Event generator tunes obtained from underlying event and multiparton scattering measurements | EPJC 76 (2016) 155 | CMS-GEN-14-001 1512.00815 |
| 22 | CMS Collaboration | Extraction and validation of a new set of CMS PYTHIA8 tunes from underlying-event measurements | EPJC 80 (2020) 4 | CMS-GEN-17-001 1903.12179 |
| 23 | C. Degrande et al. | UFO---the universal FeynRules output | CPC 183 (2012) 1201 | 1108.2040 |
| 24 | \GEANTfour Collaboration | GEANT4--a simulation toolkit | NIMA 506 (2003) 250 | |
| 25 | CMS Collaboration | Particle-flow reconstruction and global event description with the CMS detector | JINST 12 (2017) P10003 | CMS-PRF-14-001 1706.04965 |
| 26 | CMS Collaboration | Electron and photon reconstruction and identification with the CMS experiment at the CERN LHC | JINST 16 (2021) P05014 | CMS-EGM-17-001 2012.06888 |
| 27 | M. Cacciari and G. P. Salam | Pileup subtraction using jet areas | PLB 659 (2008) 119 | 0707.1378 |
| 28 | CMS Collaboration | Performance of the CMS muon detector and muon reconstruction with proton-proton collisions at $ \sqrt s= $ 13 TeV | JINST 13 (2018) P06015 | CMS-MUO-16-001 1804.04528 |
| 29 | CMS Collaboration | Measurement of the inclusive $ \mathrm{W} $ and $ \mathrm{Z} $ production cross sections in $ {\mathrm{p}}{\mathrm{p}} $ collisions at $ \sqrt{s}= $ 7 TeV with the CMS experiment | JHEP 10 (2011) 132 | CMS-EWK-10-005 1107.4789 |
| 30 | M. J. Oreglia | A study of the reactions $\psi' \to \gamma\gamma \psi$ | PhD thesis, Stanford University, 1980 SLAC Report SLAC-R-236, see Appendix D | |
| 31 | M. Grazzini, S. Kallweit, and M. Wiesemann | Fully differential NNLO computations with MATRIX | EPJC 78 (2018) 537 | 1711.06631 |
| 32 | CMS Collaboration | Measurement of the inelastic proton-proton cross section at $ \sqrt s= $ 13 TeV | JHEP 07 (2018) 161 | CMS-FSQ-15-005 1802.02613 |
| 33 | CMS Collaboration | CMS luminosity measurements for the 2016 data-taking period | CMS-PAS-LUM-17-001 | CMS-PAS-LUM-17-001 |
| 34 | CMS Collaboration | CMS luminosity measurement for the 2017 data-taking period at $ \sqrt s= $ 13 TeV | CMS-PAS-LUM-17-004 | CMS-PAS-LUM-17-004 |
| 35 | CMS Collaboration | CMS luminosity measurement for the 2018 data-taking period at $ \sqrt s= $ 13 TeV | CMS-PAS-LUM-18-002 | CMS-PAS-LUM-18-002 |
| 36 | CMS Collaboration | Precision luminosity measurement in proton-proton collisions at $ \sqrt s= $ 13 TeV in 2015 and 2016 at CMS | 2021. Submitted to EPJC | CMS-LUM-17-003 2104.01927 |
| 37 | H. B. Prosper and L. Lyons, eds. | Proceedings, PHYSTAT 2011Workshop on Statistical Issues Related to Discovery Claims in Search Experiments and Unfolding | CERN CERN, Geneva, (2011) | |
| 38 | ATLAS and CMS Collaborations, and LHC Higgs Combination Group | Procedure for the LHC Higgs boson search combination in Summer 2011 | CMS-NOTE-2011-005 | |
| 39 | CMS Collaboration | Precise determination of the mass of the Higgs boson and tests of compatibility of its couplings with the standard model predictions using proton collisions at 7 and 8 TeV | EPJC 75 (2015) 212 | CMS-HIG-14-009 1412.8662 |
| 40 | G. Cowan, K. Cranmer, E. Gross, and O. Vitells | Asymptotic formulae for likelihood-based tests of new physics | EPJC 71 (2011) 1554 | 1007.1727 |
| 41 | O. J. P. Éboli, M. C. Gonzalez-Garcia, and J. K. Mizukoshi | $ {\mathrm{p}}{\mathrm{p}}\to\mathrm{jj} \mathrm{e^{\pm}}\mu^{\pm}\nu\nu $ and $ \mathrm{jj} \mathrm{e^{\pm}}\mu^{\mp}\nu\nu $ at $ \mathcal{O}(\alpha_\mathrm{em}^6) $ and $ \mathcal{O}(\alpha_\mathrm{em}^4\alpha_\mathrm{s}^2) $ for the study of the quartic electroweak gauge boson vertex at CERN LHC | PRD 74 (2006) 073005 | hep-ph/0606118 |
| 42 | CMS Collaboration | Observation of electroweak production of $ \mathrm{W}\gamma $ with two jets in proton-proton collisions at $ \sqrt s= $ 13 TeV | PLB 811 (2020) 135988 | CMS-SMP-19-008 2008.10521 |
| 43 | ATLAS Collaboration | Studies of $ \mathrm{Z}\gamma $ production in association with a high-mass dijet system in $ {\mathrm{p}}{\mathrm{p}} $ collisions at $ \sqrt s= $ 8 TeV with the ATLAS detector | JHEP 07 (2017) 107 | 1705.01966 |
| 44 | CMS Collaboration | Measurements of $ {\mathrm{p}}{\mathrm{p}}\to\mathrm{Z}\mathrm{Z} $ production cross sections and constraints on anomalous triple gauge couplings at $ \sqrt s= $ 13 TeV | EPJC 81 (2021) 200 | CMS-SMP-19-001 2009.01186 |
|
|
Compact Muon Solenoid LHC, CERN |
|

|

|

|

|

|