

Compact Muon Solenoid
LHC, CERN
| CMS-TOP-17-023 ; CERN-EP-2019-138 | ||
| Measurement of differential cross sections and charge ratios for $t$-channel single top quark production in proton-proton collisions at $\sqrt{s}=$ 13 TeV | ||
| CMS Collaboration | ||
| 19 July 2019 | ||
| Eur. Phys. J. C 80 (2020) 370 | ||
| Abstract: A measurement is presented of differential cross sections for $t$-channel single top quark and antiquark production in proton-proton collisions at a centre-of-mass energy of 13 TeV by the CMS experiment at the LHC. From a data set corresponding to an integrated luminosity of 35.9 fb$^{-1}$, events containing one muon or electron and two or three jets are analysed. The cross section is measured as a function of the top quark transverse momentum (${p_{\mathrm{T}}}$), rapidity, and polarisation angle, the charged lepton ${p_{\mathrm{T}}}$ and rapidity, and the ${p_{\mathrm{T}}}$ of the W boson from the top quark decay. In addition, the charge ratio is measured differentially as a function of the top quark, charged lepton, and W boson kinematic observables. The results are found to be in agreement with standard model predictions using various next-to-leading-order event generators and sets of parton distribution functions. Additionally, the spin asymmetry, sensitive to the top quark polarisation, is determined from the differential distribution of the polarisation angle at parton level to be 0.440 $\pm$ 0.070, in agreement with the standard model prediction. | ||
| Links: e-print arXiv:1907.08330 [hep-ex] (PDF) ; CDS record ; inSPIRE record ; HepData record ; CADI line (restricted) ; | ||
| Figures & Tables | Summary | Additional Figures & Tables | References | CMS Publications |
|---|
| Figures | |
png pdf |
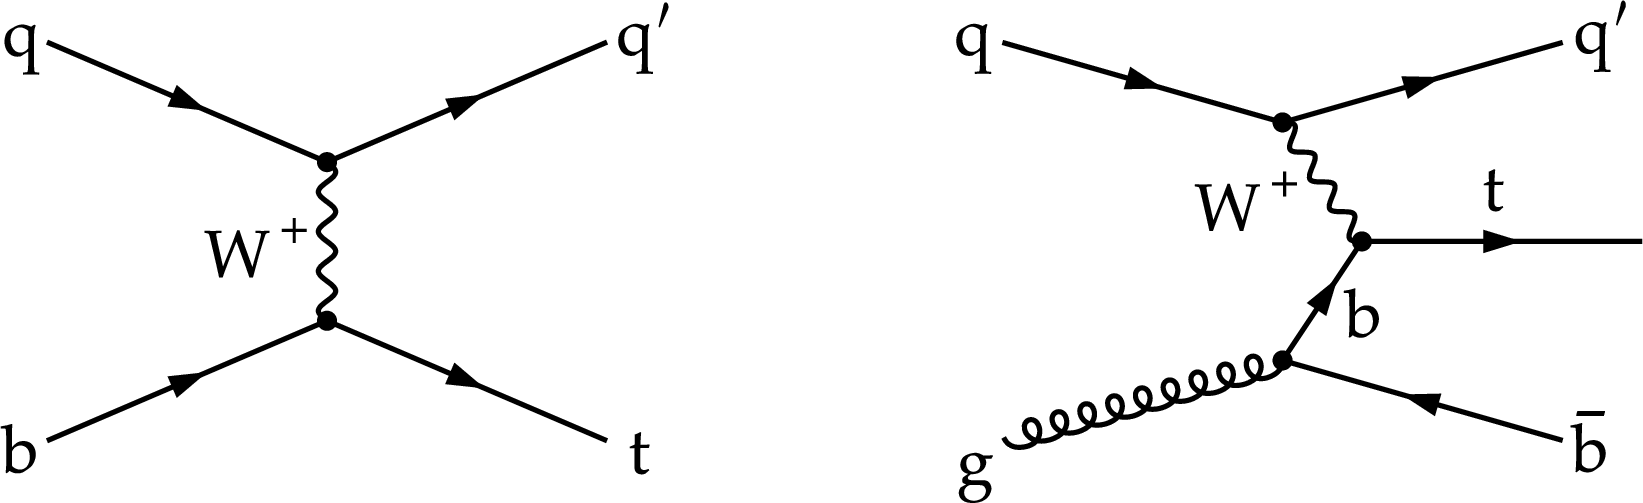
Figure 1:
Born-level Feynman diagrams for single top quark production in the $t$ channel. Corresponding diagrams also exist for single top antiquark production. |
png pdf |
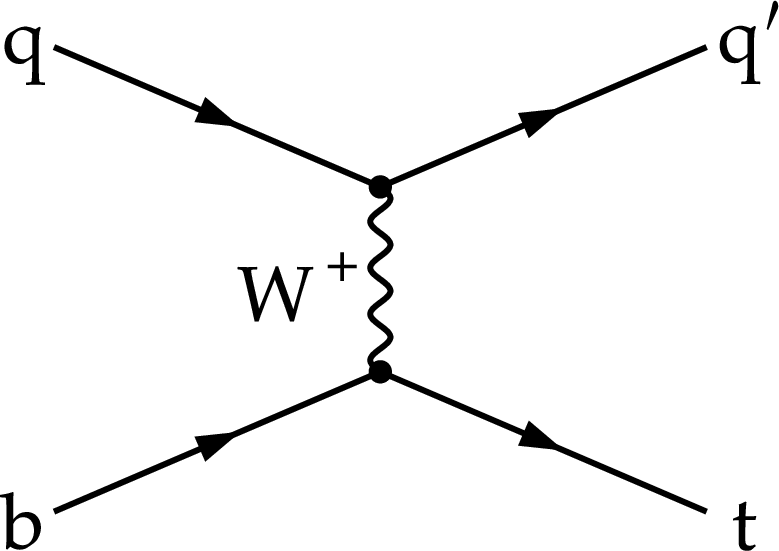
Figure 1-a:
Born-level Feynman diagram for single top quark production in the $t$ channel. Corresponding diagram also exists for single top antiquark production. |
png pdf |
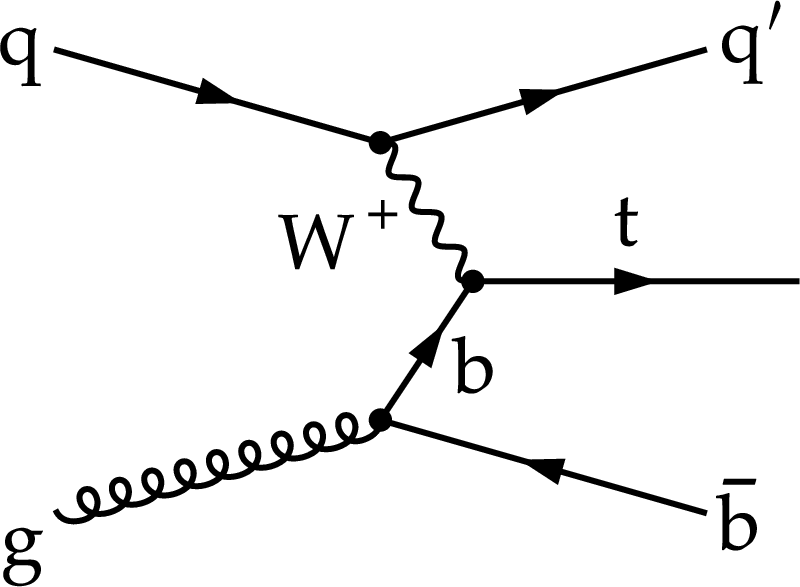
Figure 1-b:
Born-level Feynman diagram for single top quark production in the $t$ channel. Corresponding diagram also exists for single top antiquark production. |
png pdf |
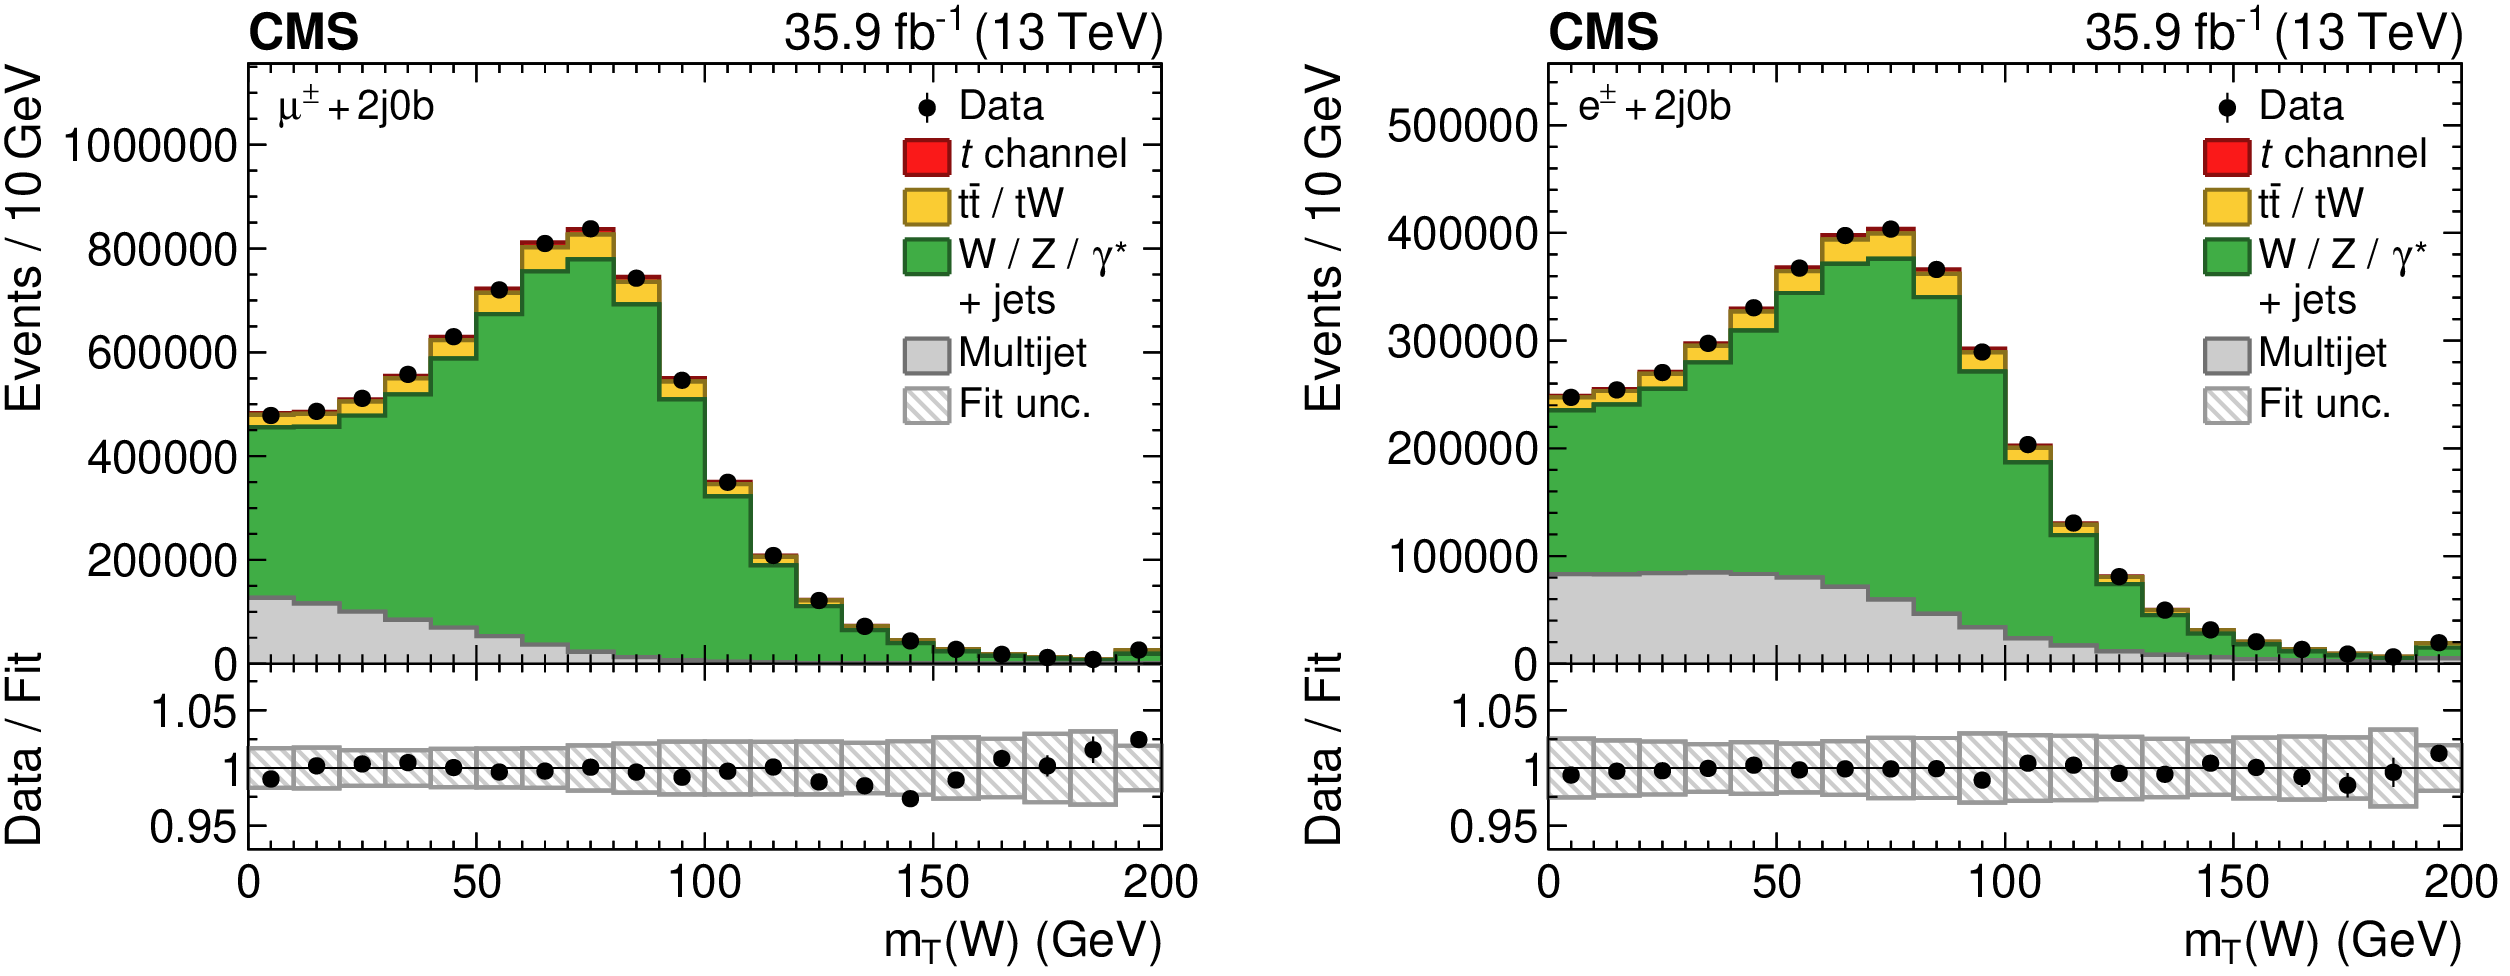
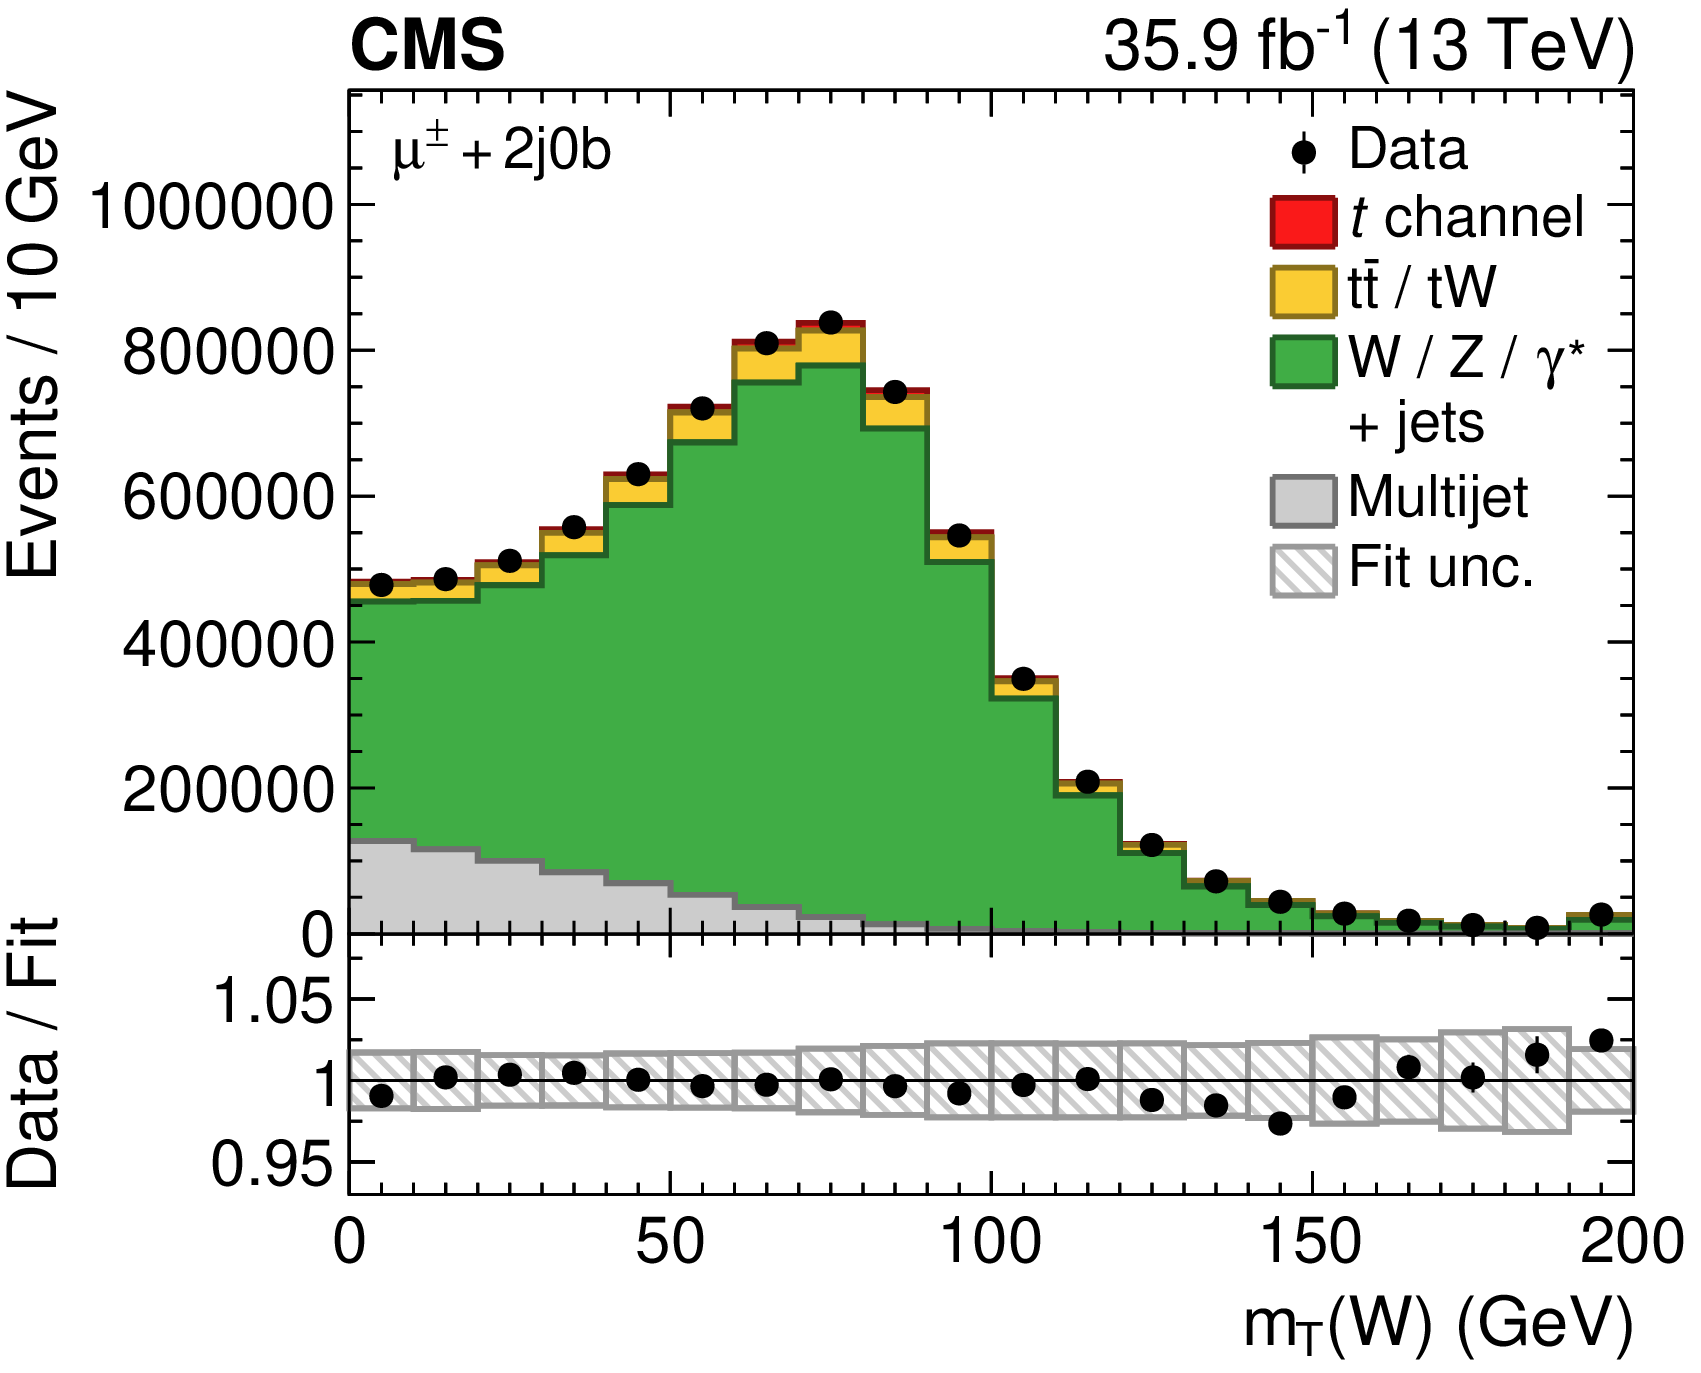
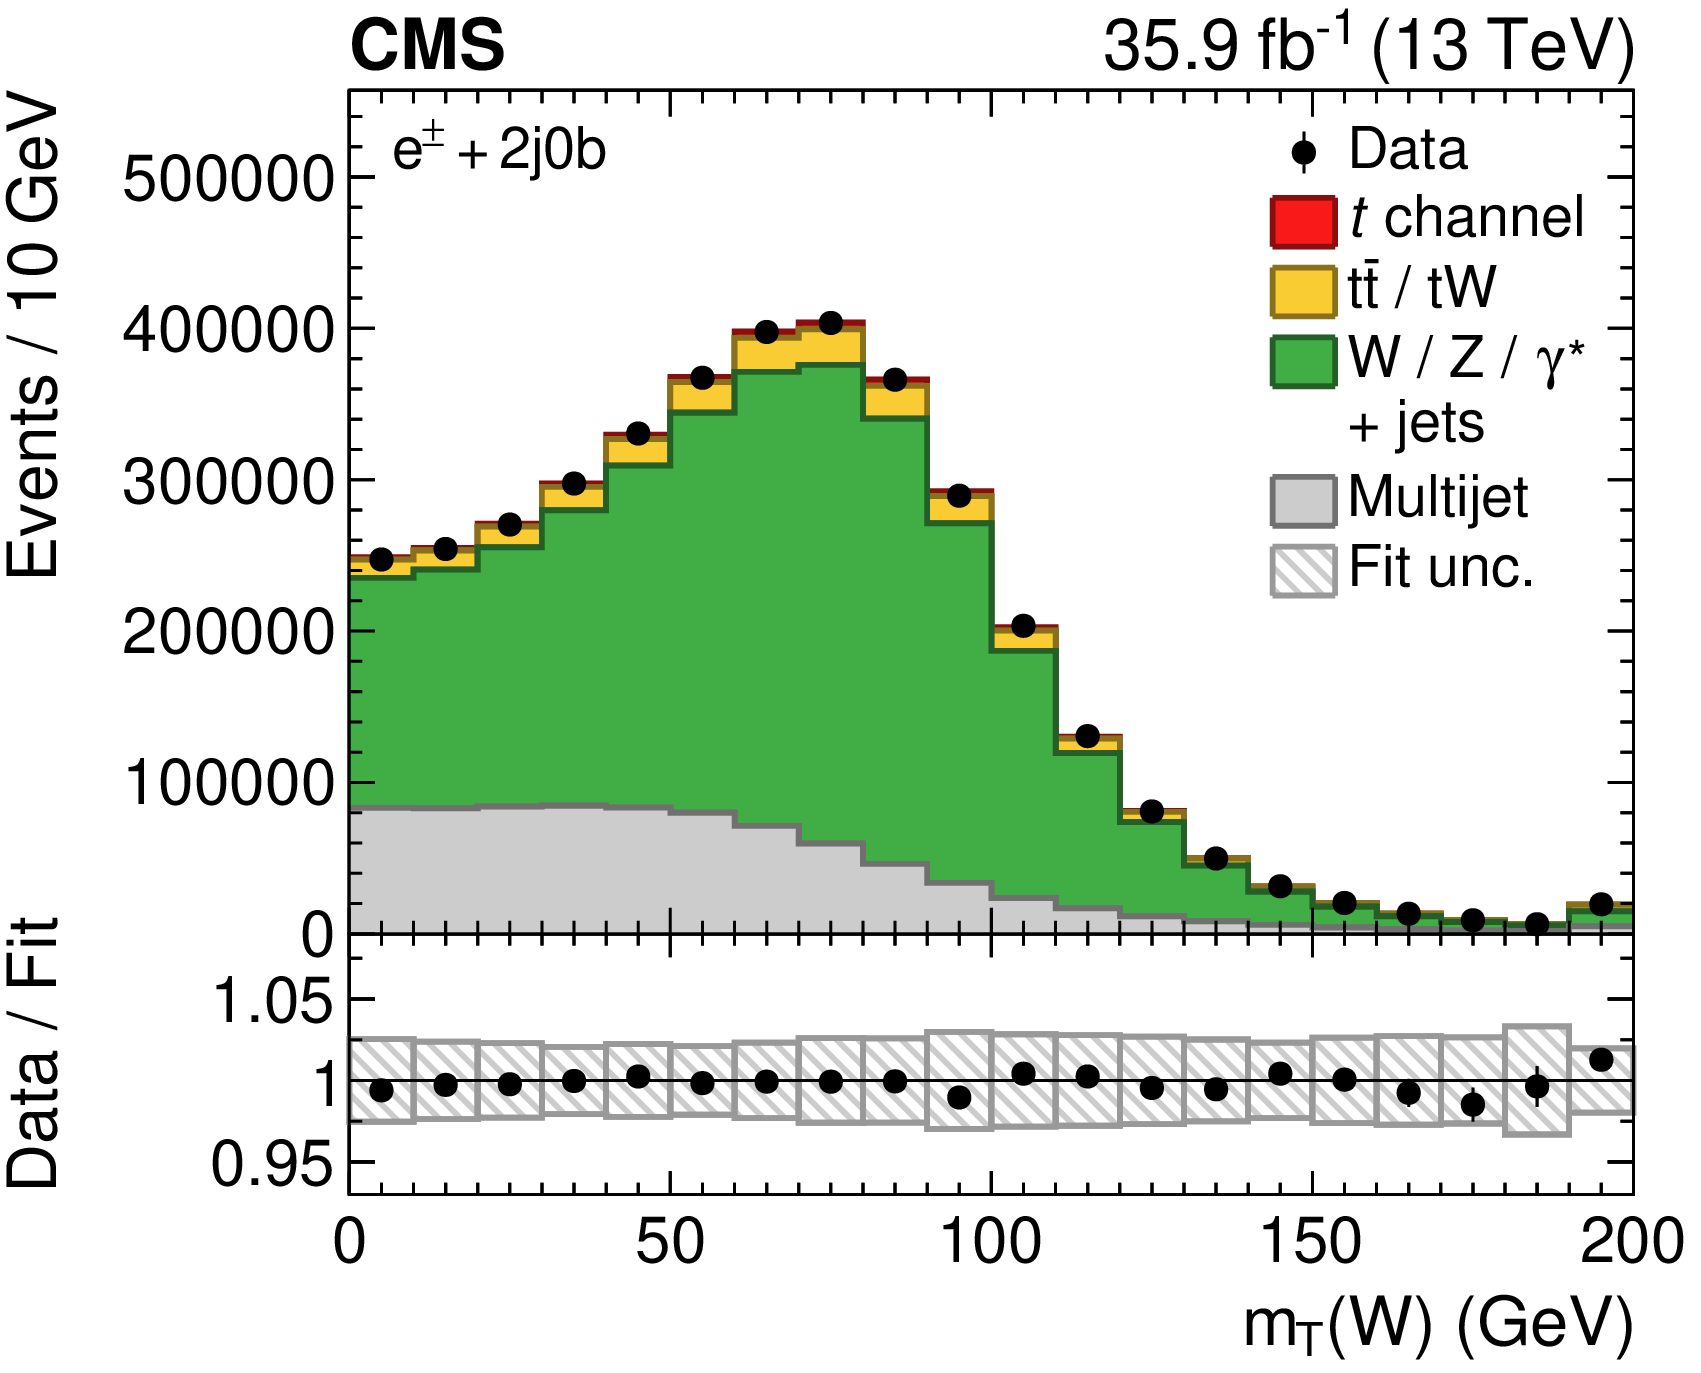
Figure 2:
Distributions of the transverse W boson mass in the 2 jets, 0b tag control category for the (left) muon and (right) electron channels after scaling the simulated and multijet templates to the result of a dedicated ML fit performed on this category of events. The hatched band displays the fit uncertainty. The lower plots give the ratio of the data to the fit results. The right-most bins include the event overflows. |
png pdf |
Figure 2-a:
Distributions of the transverse W boson mass in the 2 jets, 0b tag control category for the muon channel after scaling the simulated and multijet templates to the result of a dedicated ML fit performed on this category of events. The hatched band displays the fit uncertainty. The lower plot gives the ratio of the data to the fit results. The right-most bins include the event overflows. |
png pdf |
Figure 2-b:
Distributions of the transverse W boson mass in the 2 jets, 0b tag control category for the electron channel after scaling the simulated and multijet templates to the result of a dedicated ML fit performed on this category of events. The hatched band displays the fit uncertainty. The lower plot gives the ratio of the data to the fit results. The right-most bins include the event overflows. |

png pdf |
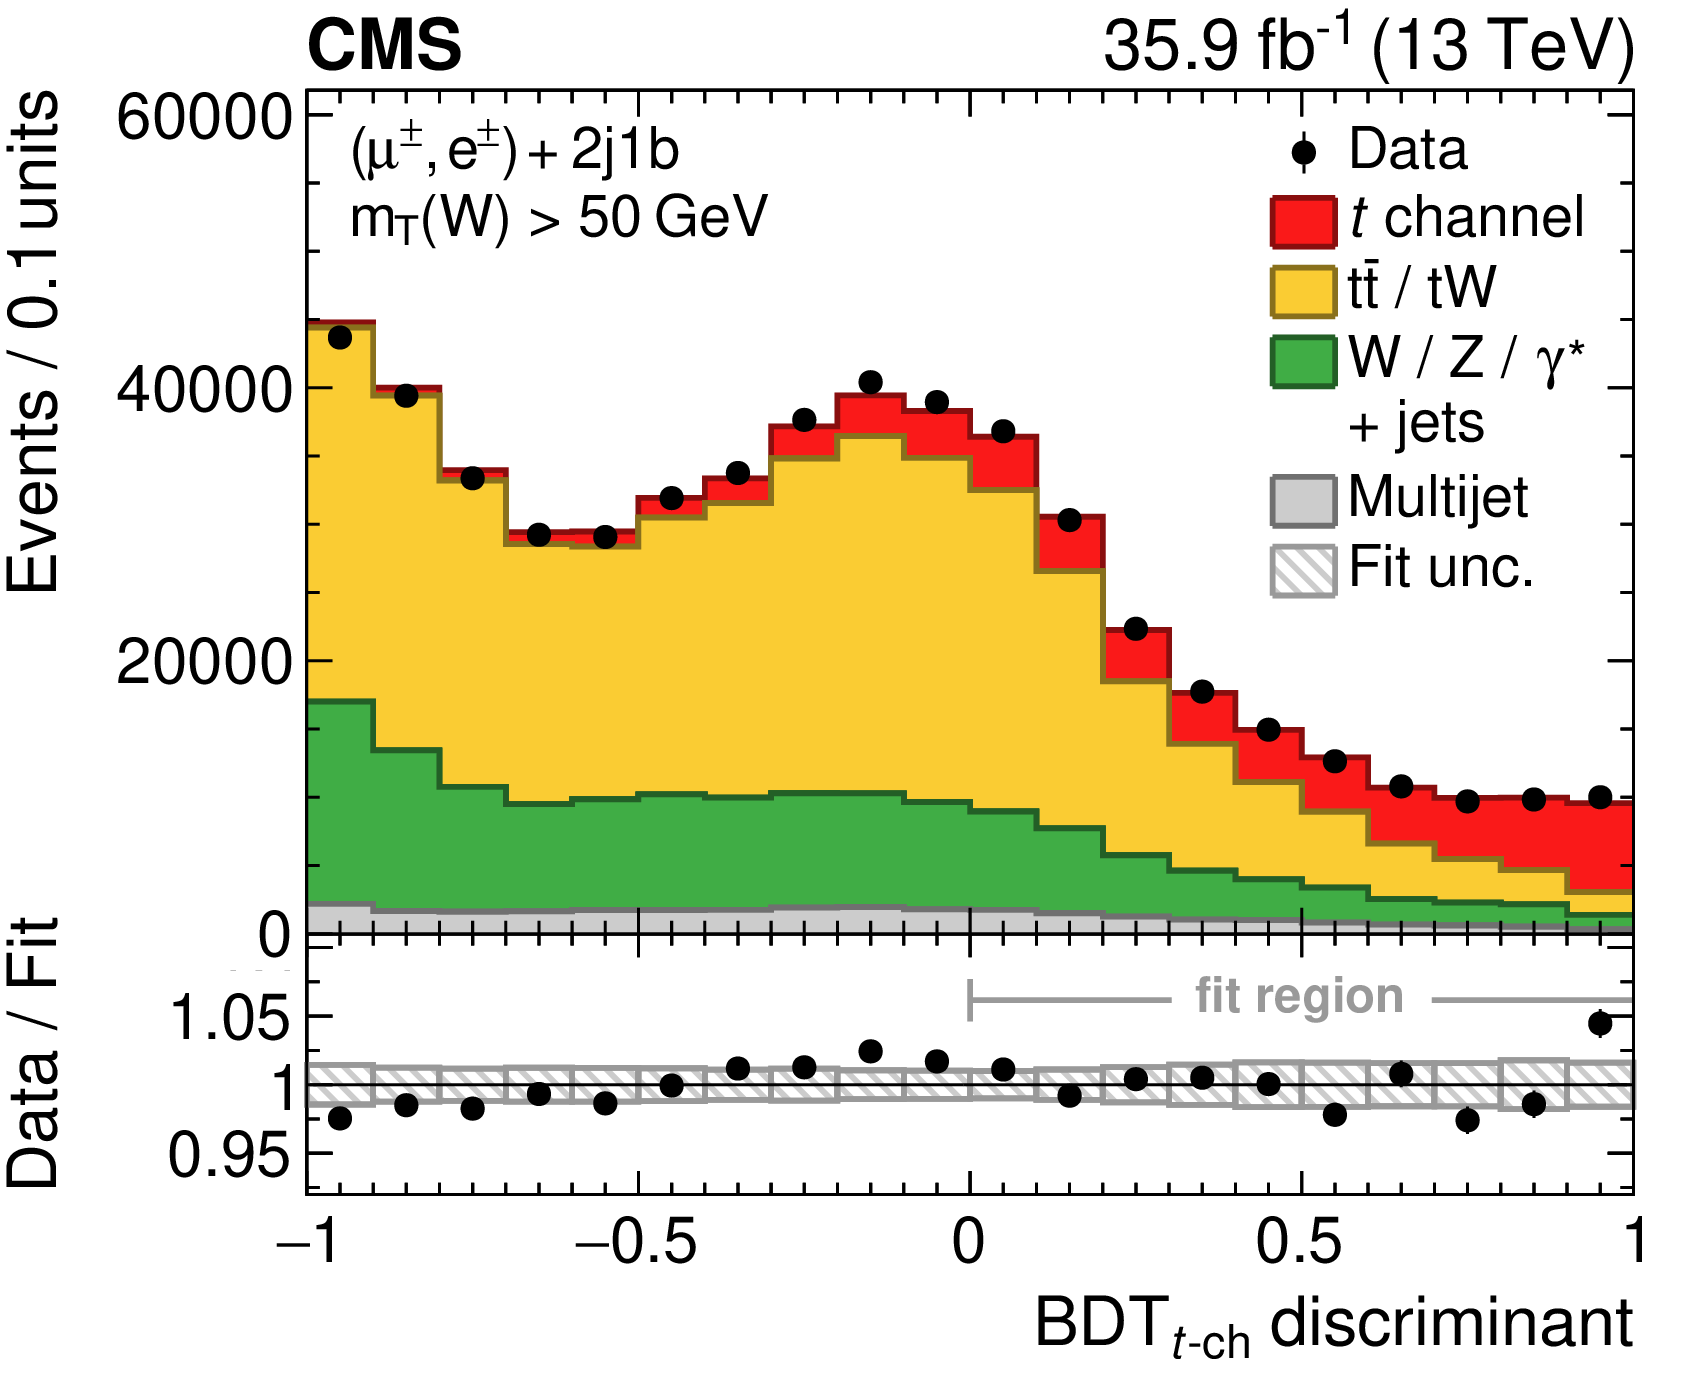
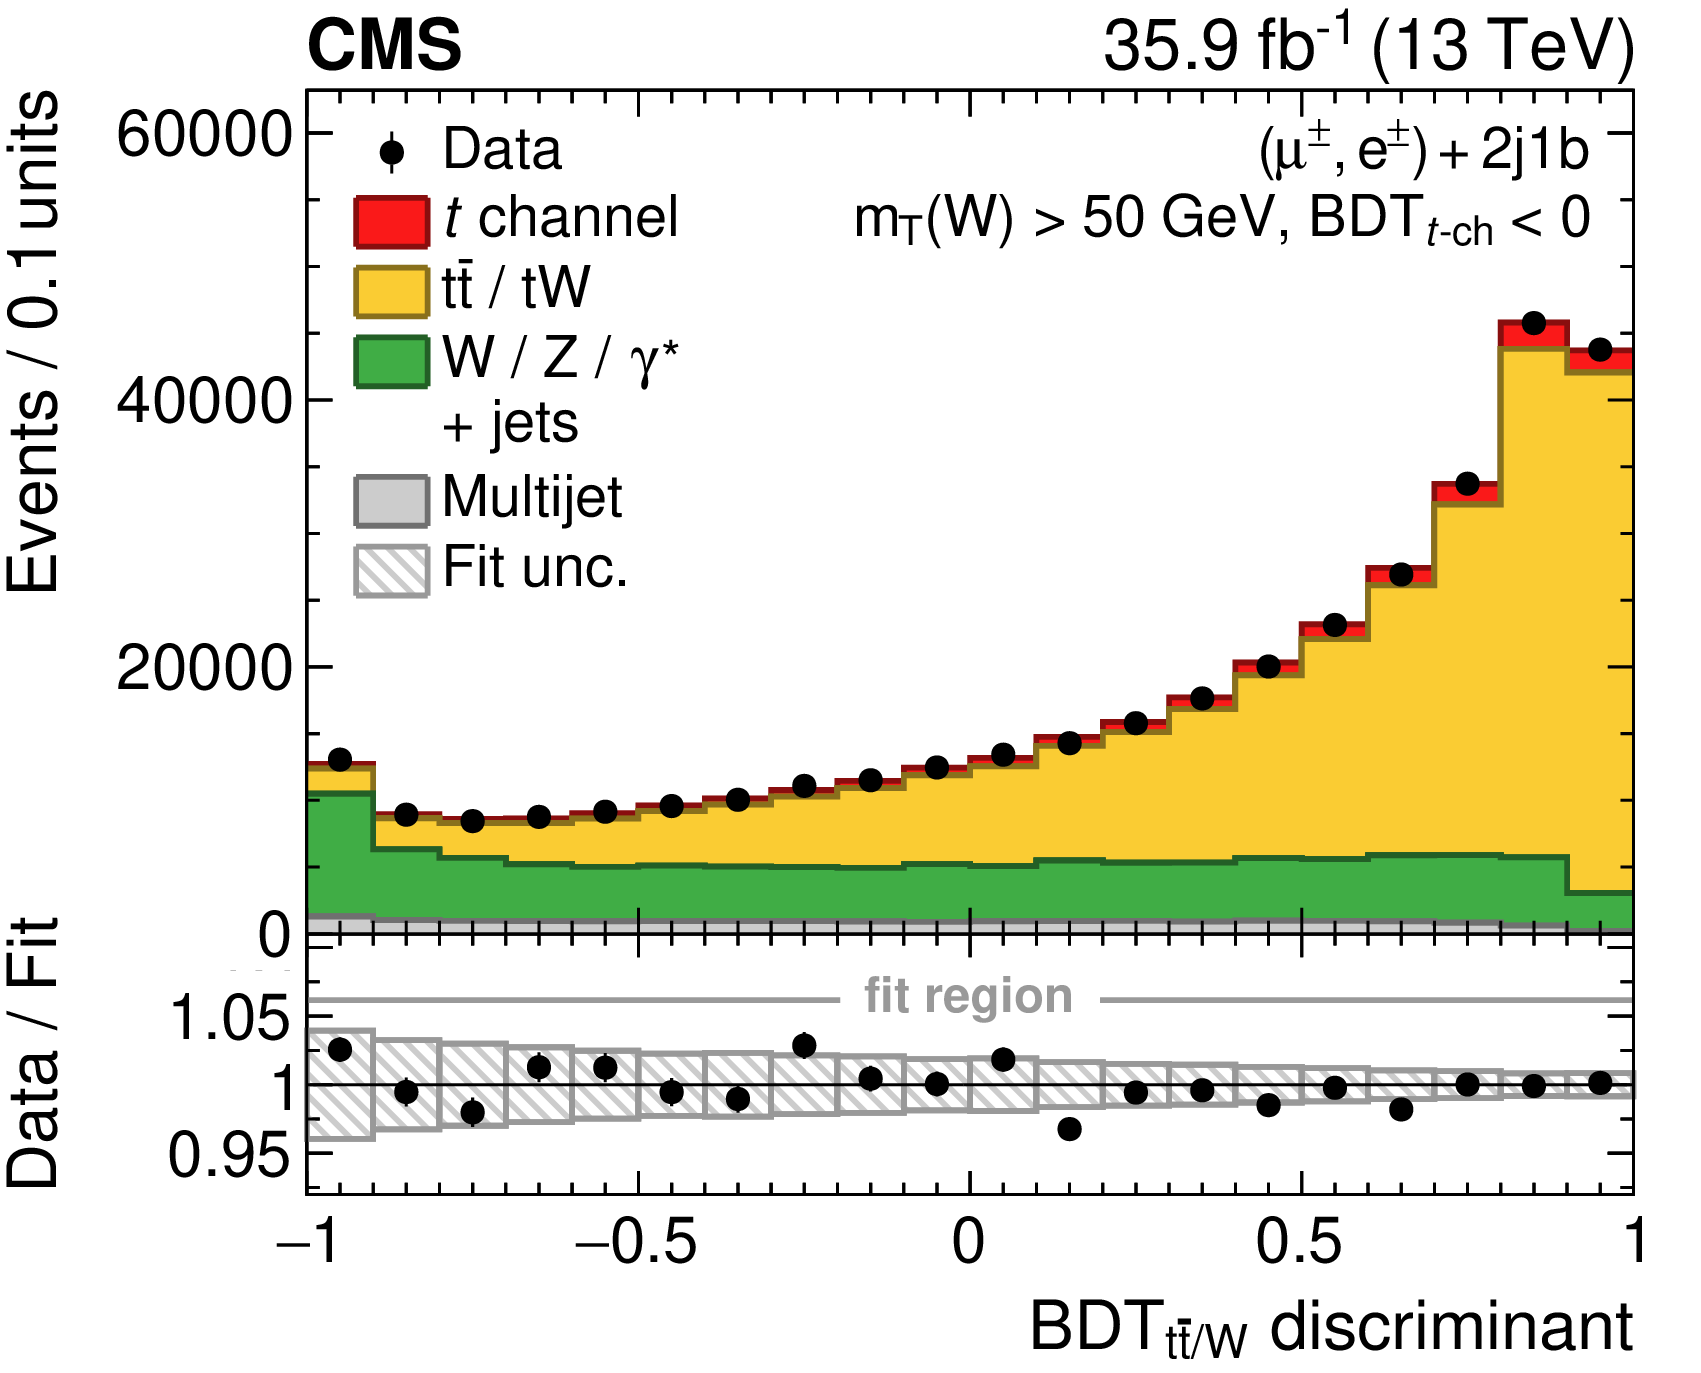
Figure 3:
Distributions of the BDT discriminants in the 2 jets, 1b tag category: (left) ${\mathrm {BDT}_{{t\text {-ch}}}}$ trained to separate signal from background events; (right) ${\mathrm {BDT}_{{\mathrm{t} {}\mathrm{\bar{t}}} /\mathrm{W}}}$ trained to separate ${\mathrm{t} {}\mathrm{\bar{t}}}$ from W+jets events in a background-dominated category. Events in the muon and electron channels have been summed. The predictions have been scaled to the result of the inclusive ML fit and the hatched band displays the fit uncertainty. The regions of the distributions used in the fits are indicated in the lower panels, which show the ratio of the data to the fit result. |
png pdf |
Figure 3-a:
Distribution of the ${\mathrm {BDT}_{{t\text {-ch}}}}$ discriminant trained to separate signal from background events, in the 2 jets, 1b tag category. Events in the muon and electron channels have been summed. The predictions have been scaled to the result of the inclusive ML fit and the hatched band displays the fit uncertainty. The region of the distribution used in the fit is indicated in the lower panel, which shows the ratio of the data to the fit result. |
png pdf |
Figure 3-b:
Distribution of the ${\mathrm {BDT}_{{\mathrm{t} {}\mathrm{\bar{t}}} /\mathrm{W}}}$ trained to separate ${\mathrm{t} {}\mathrm{\bar{t}}}$ from W+jets events in a background-dominated category, in the 2 jets, 1b tag category. Events in the muon and electron channels have been summed. The predictions have been scaled to the result of the inclusive ML fit and the hatched band displays the fit uncertainty. The region of the distribution used in the fit is indicated in the lower panel, which shows the ratio of the data to the fit result. |
png pdf |
Figure 4:
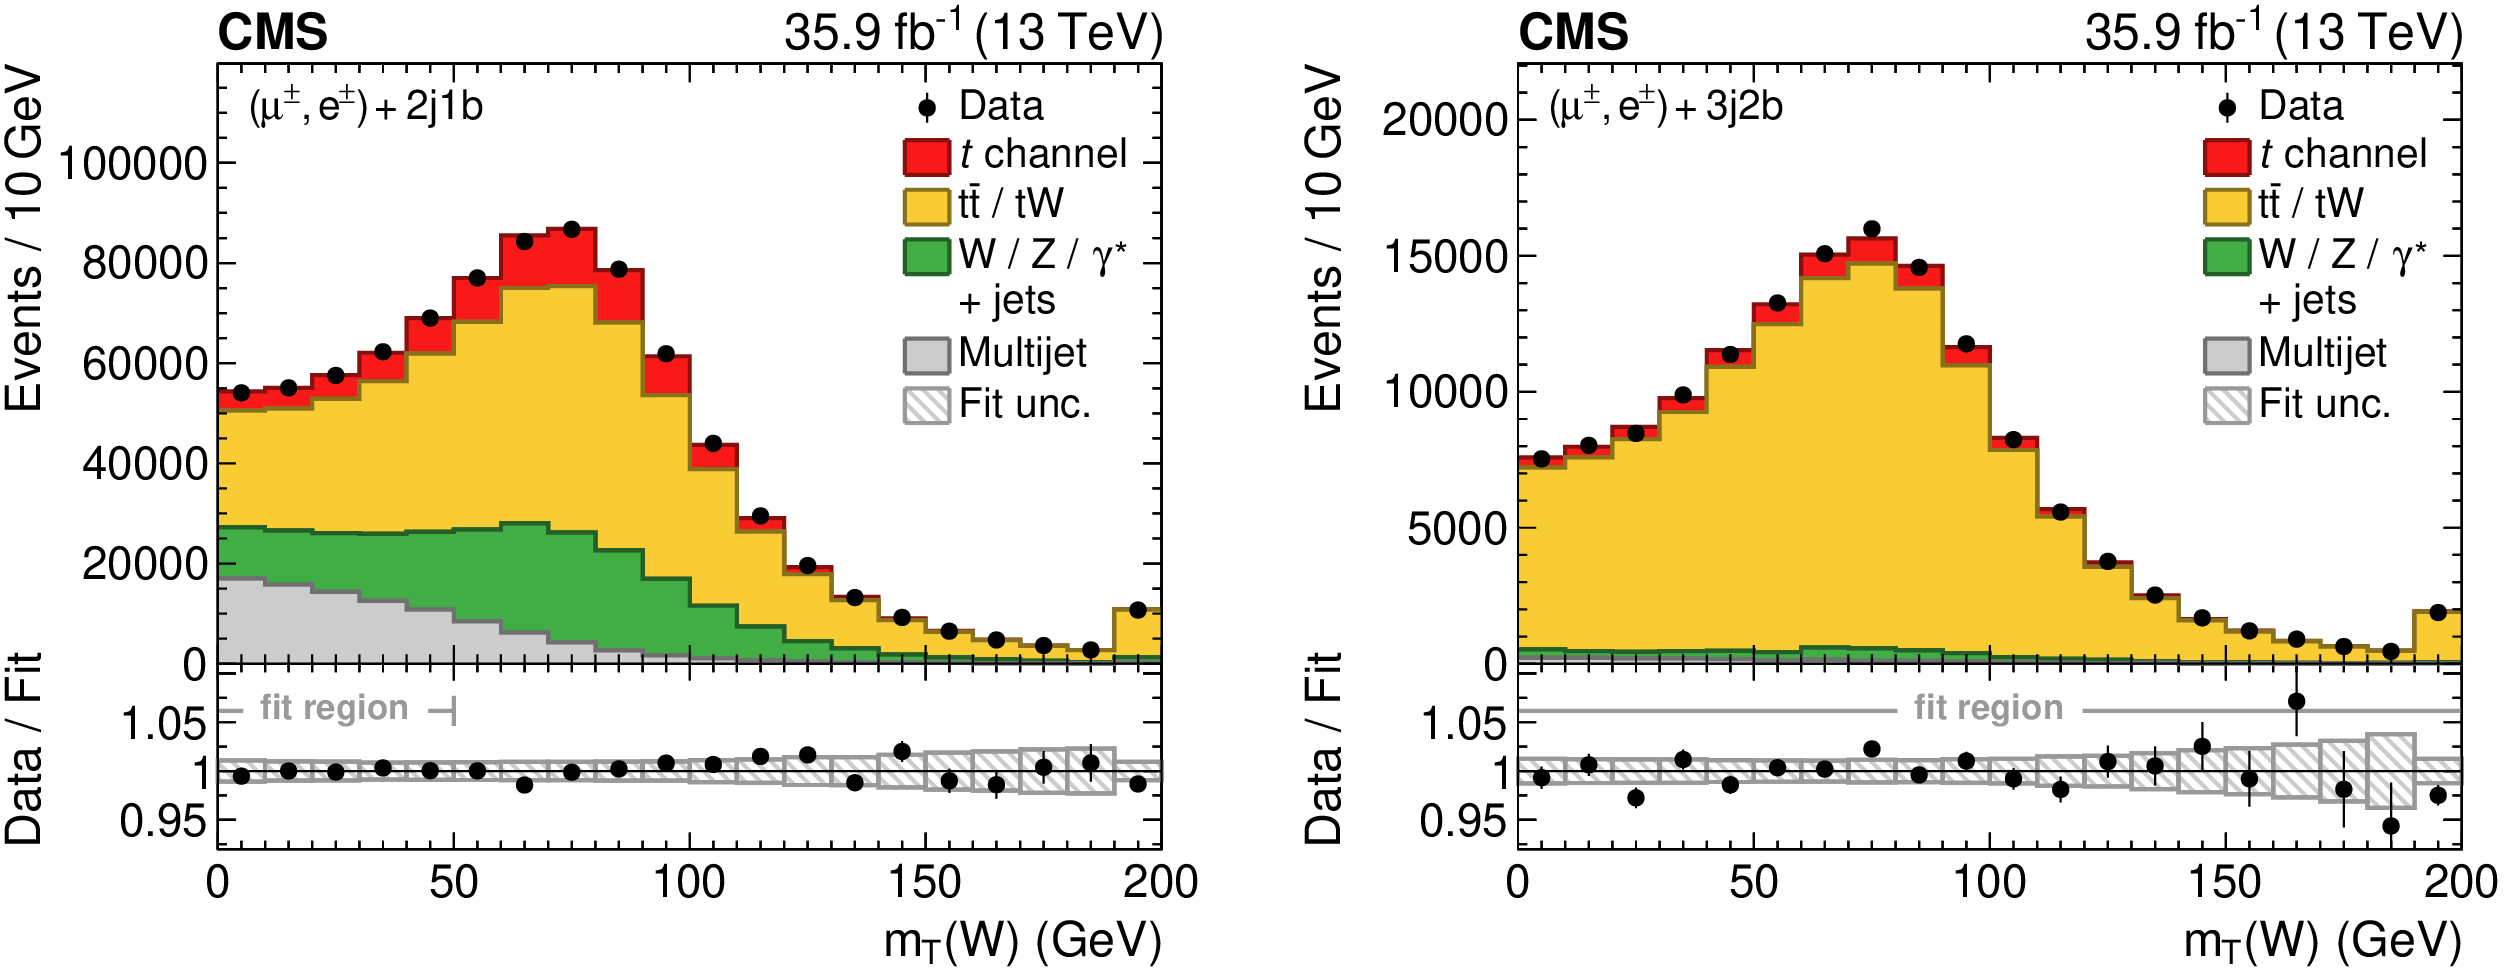
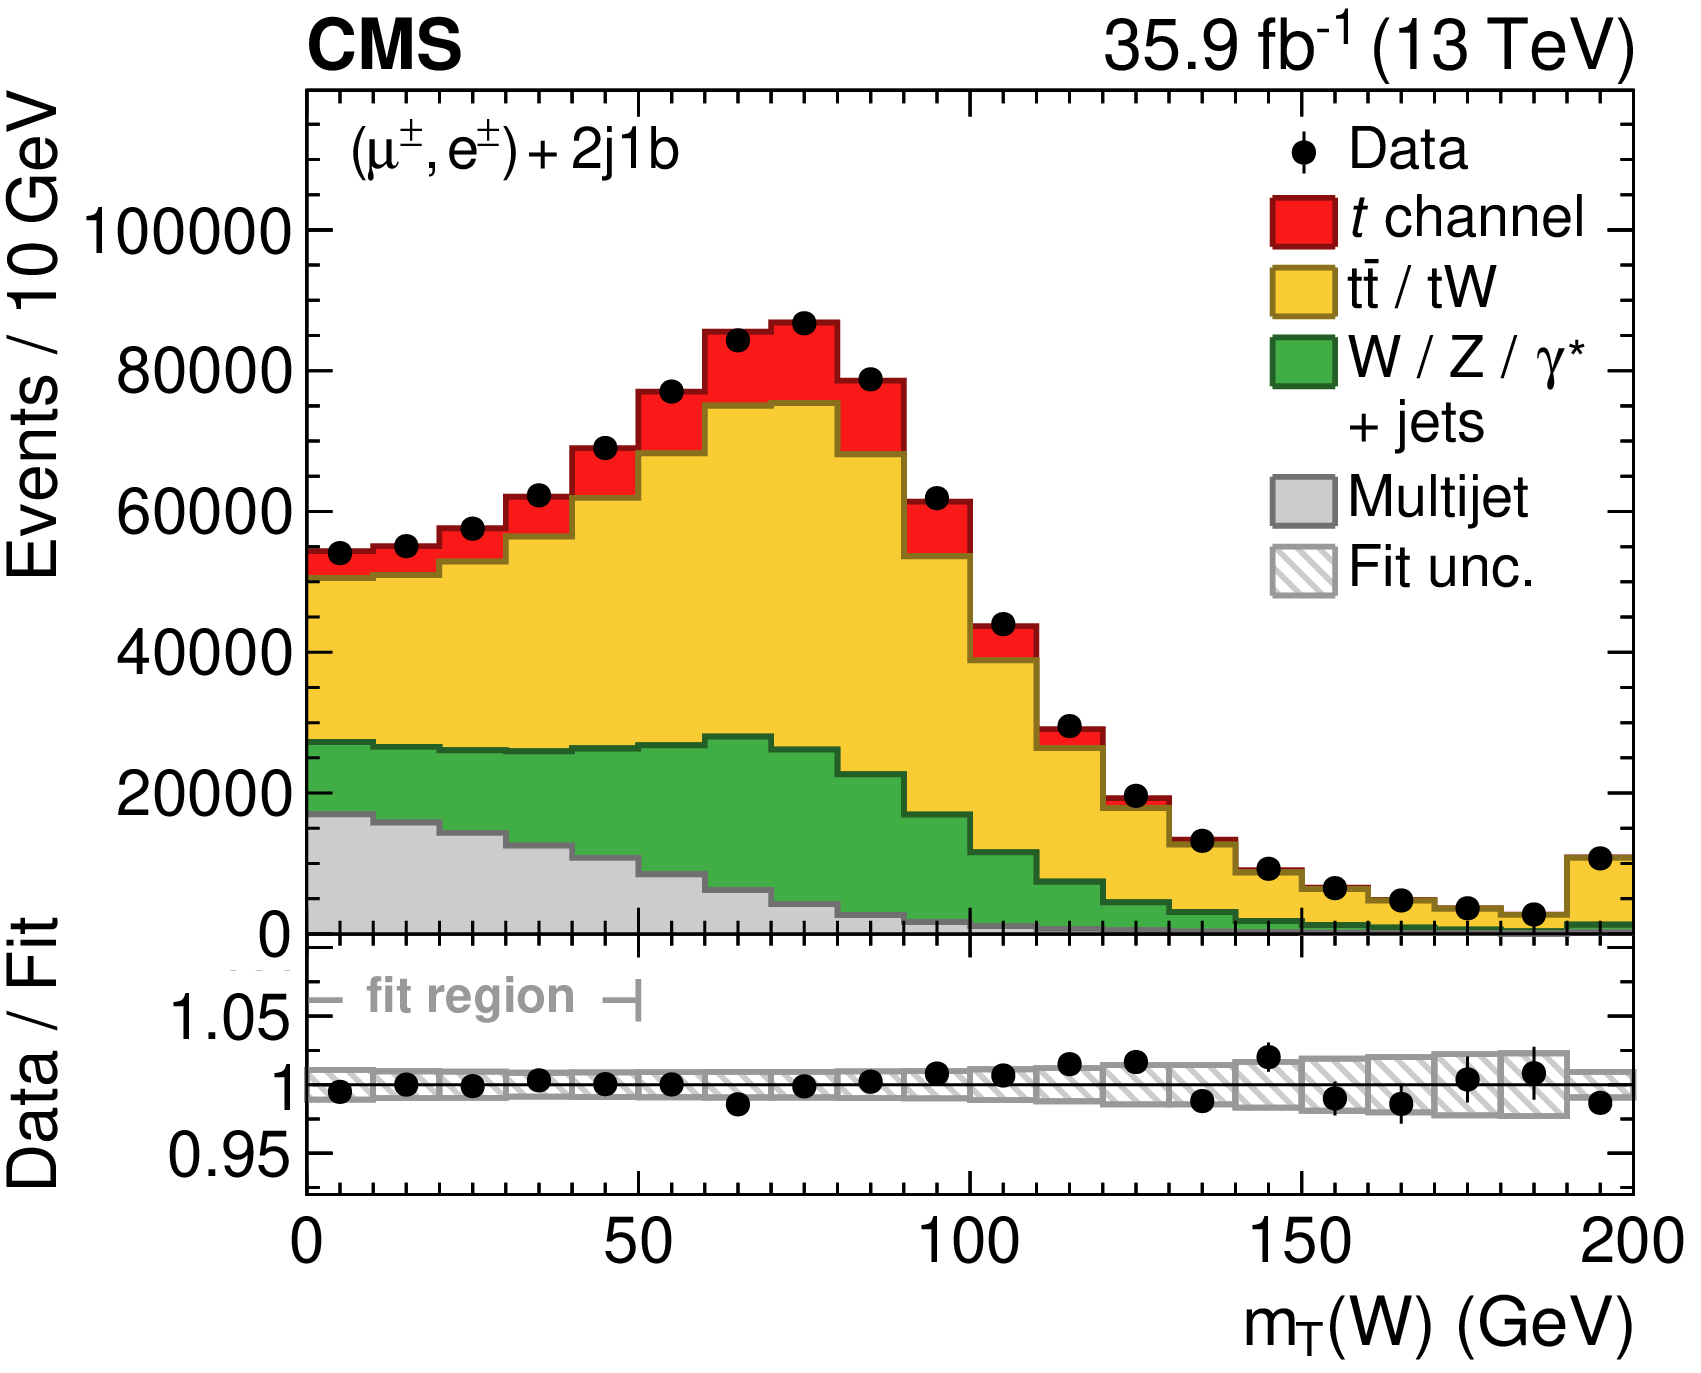
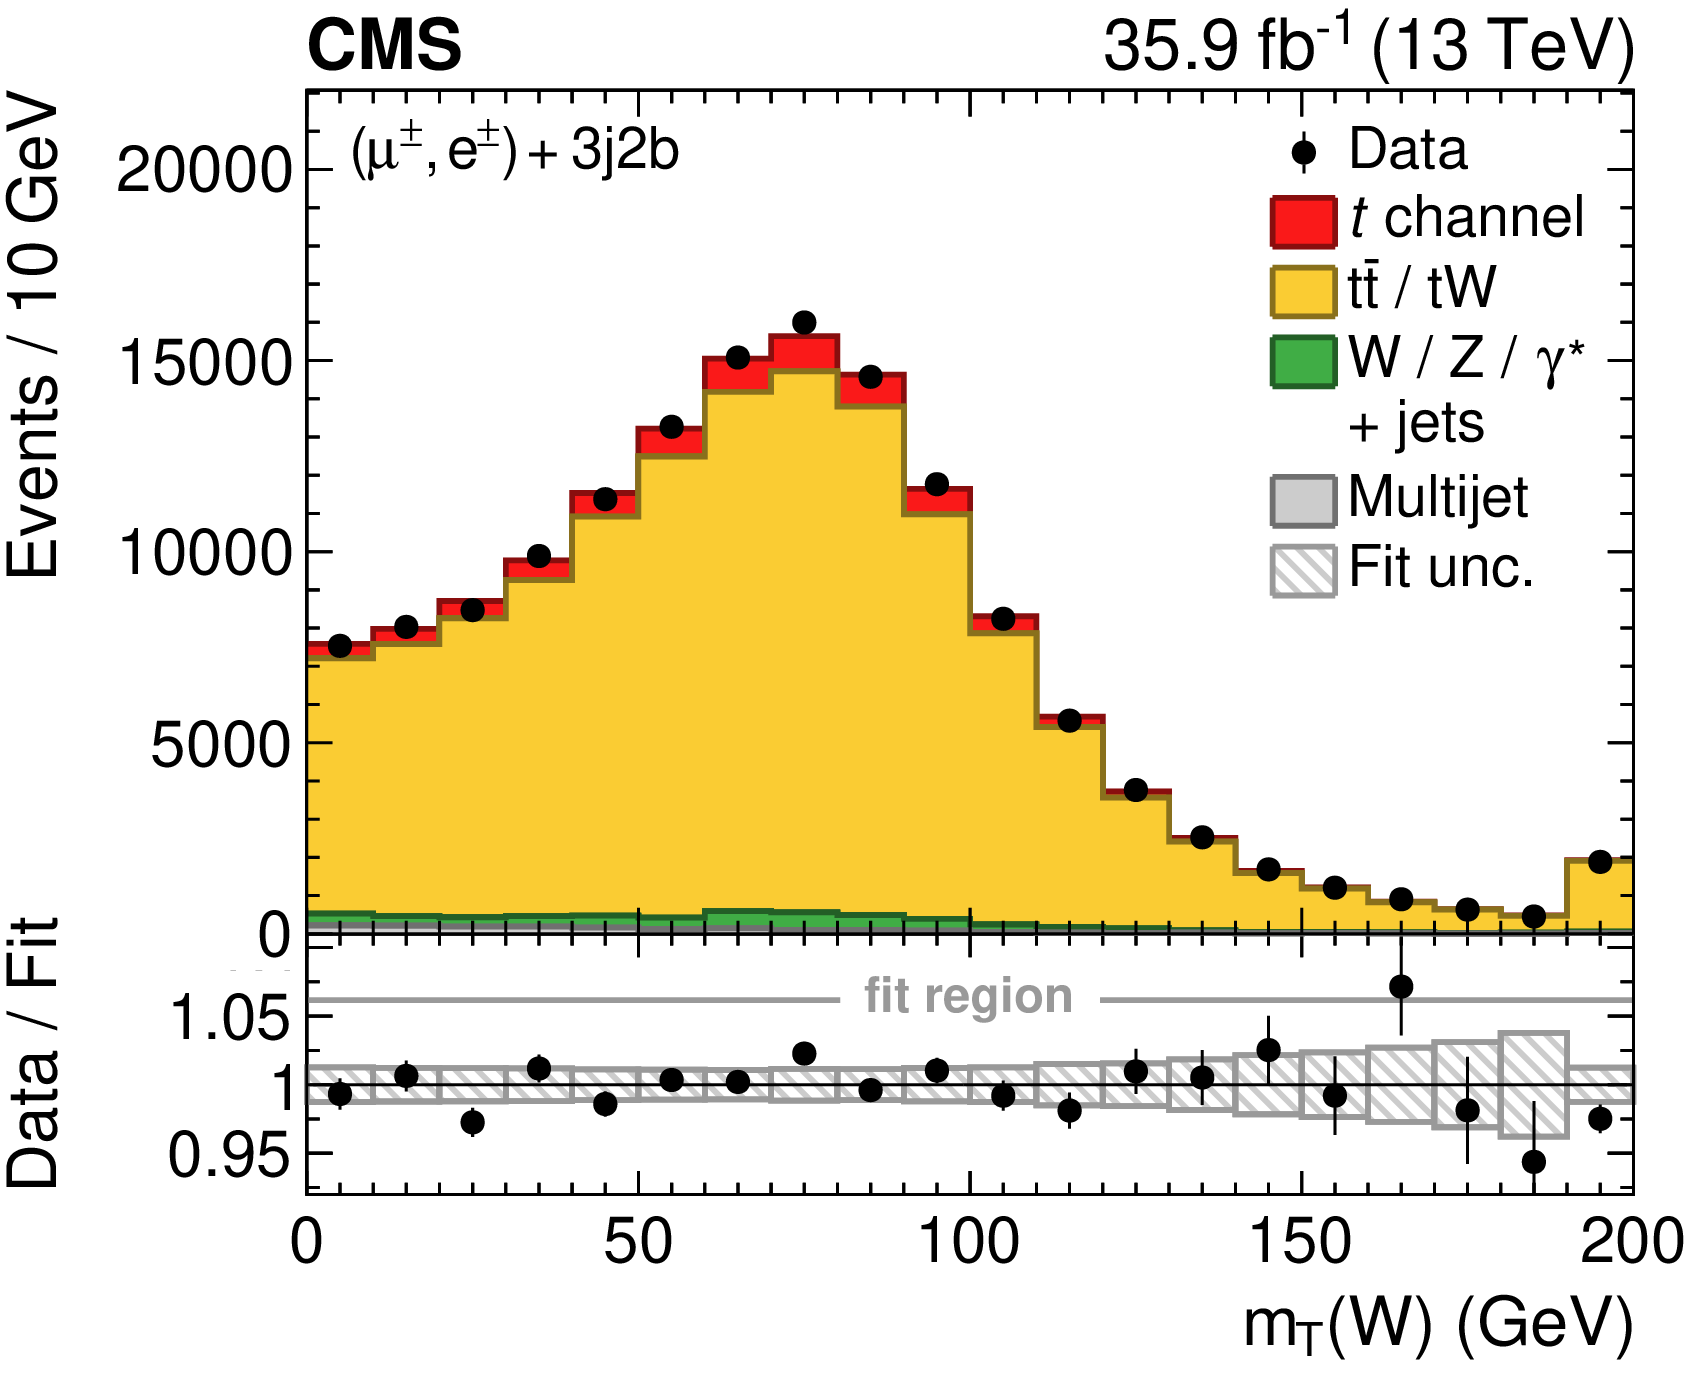
Distributions of the transverse W boson mass for events in the (left) 2 jets, 1b tag and (right) 3 jets, 2b tags categories. Events in the muon and electron channels have been summed. The predictions have been scaled to the result of the inclusive ML fit and the hatched band displays the fit uncertainty. The regions of the distributions used in the fits are indicated in the lower panels, which show the ratio of the data to the fit result. The right-most bins include the event overflows. |
png pdf |
Figure 4-a:
Distribution of the transverse W boson mass for events in the 2 jets, 1b tag category. Events in the muon and electron channels have been summed. The predictions have been scaled to the result of the inclusive ML fit and the hatched band displays the fit uncertainty. The region of the distribution used in the fit is indicated in the lower panel, which shows the ratio of the data to the fit result. The right-most bin includes the event overflow. |
png pdf |
Figure 4-b:
Distribution of the transverse W boson mass for events in the 3 jets, 2b tags category. Events in the muon and electron channels have been summed. The predictions have been scaled to the result of the inclusive ML fit and the hatched band displays the fit uncertainty. The region of the distribution used in the fit is indicated in the lower panel, which shows the ratio of the data to the fit result. The right-most bin includes the event overflow. |
png pdf |
Figure 5:
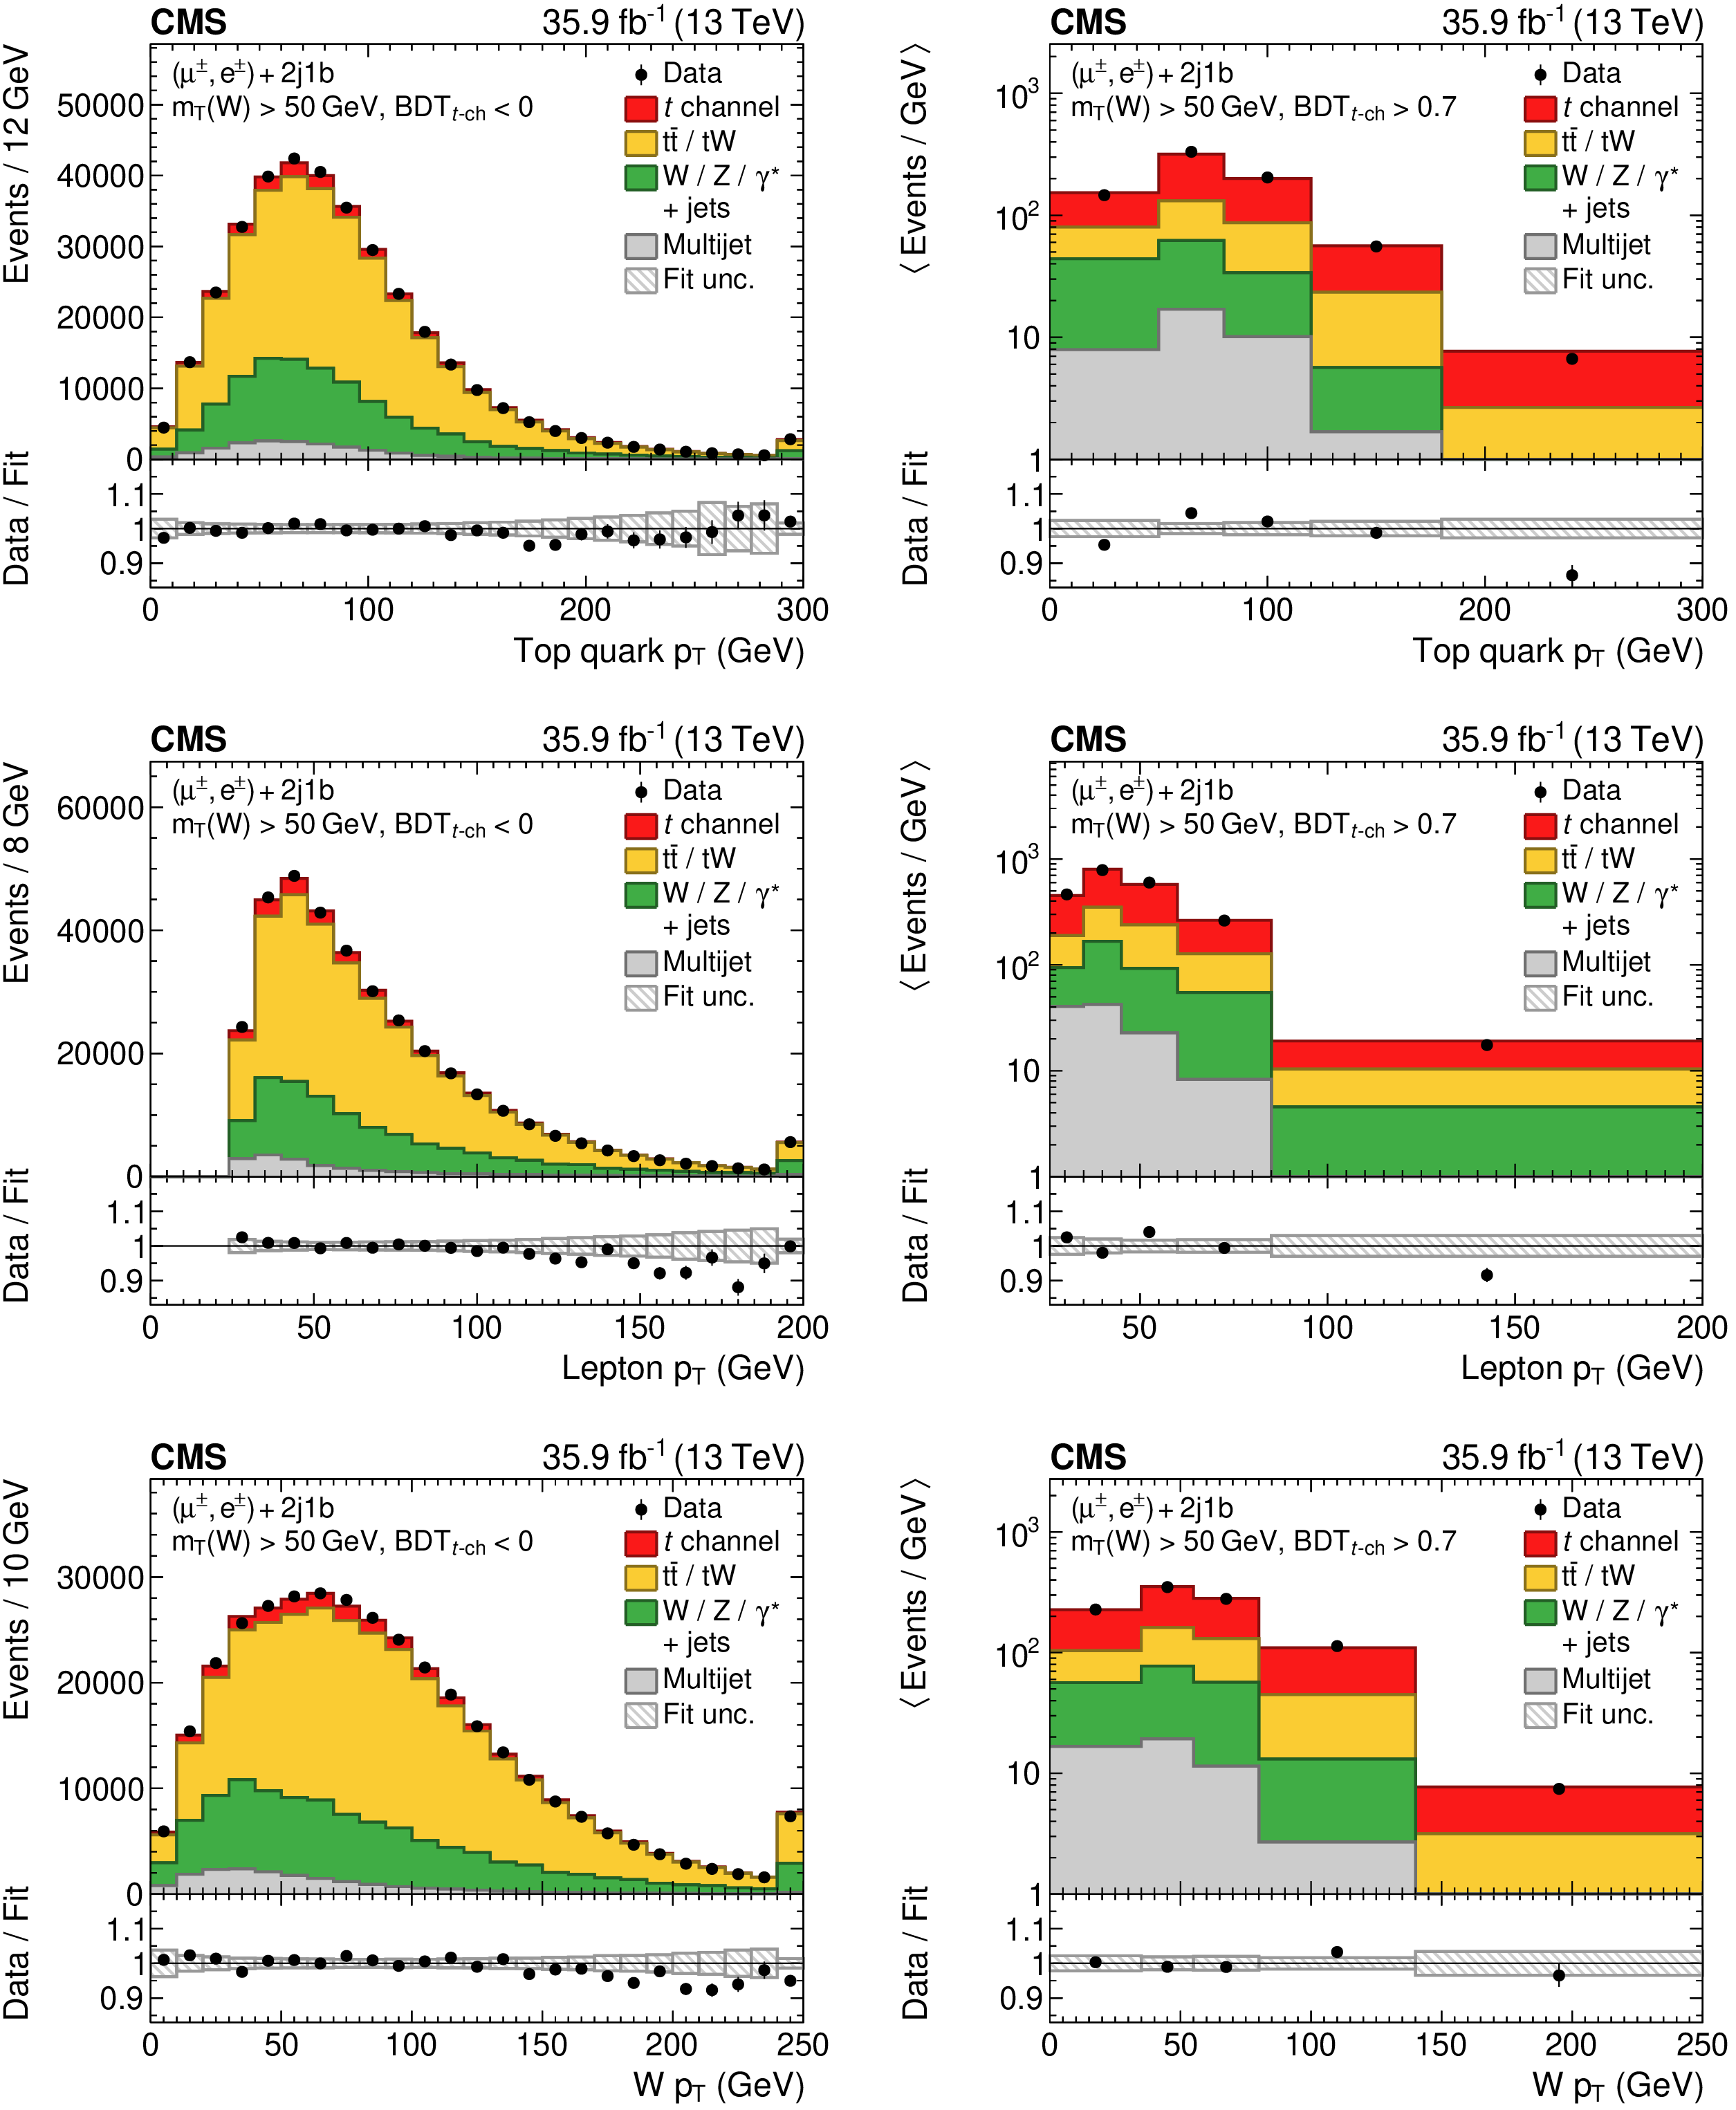
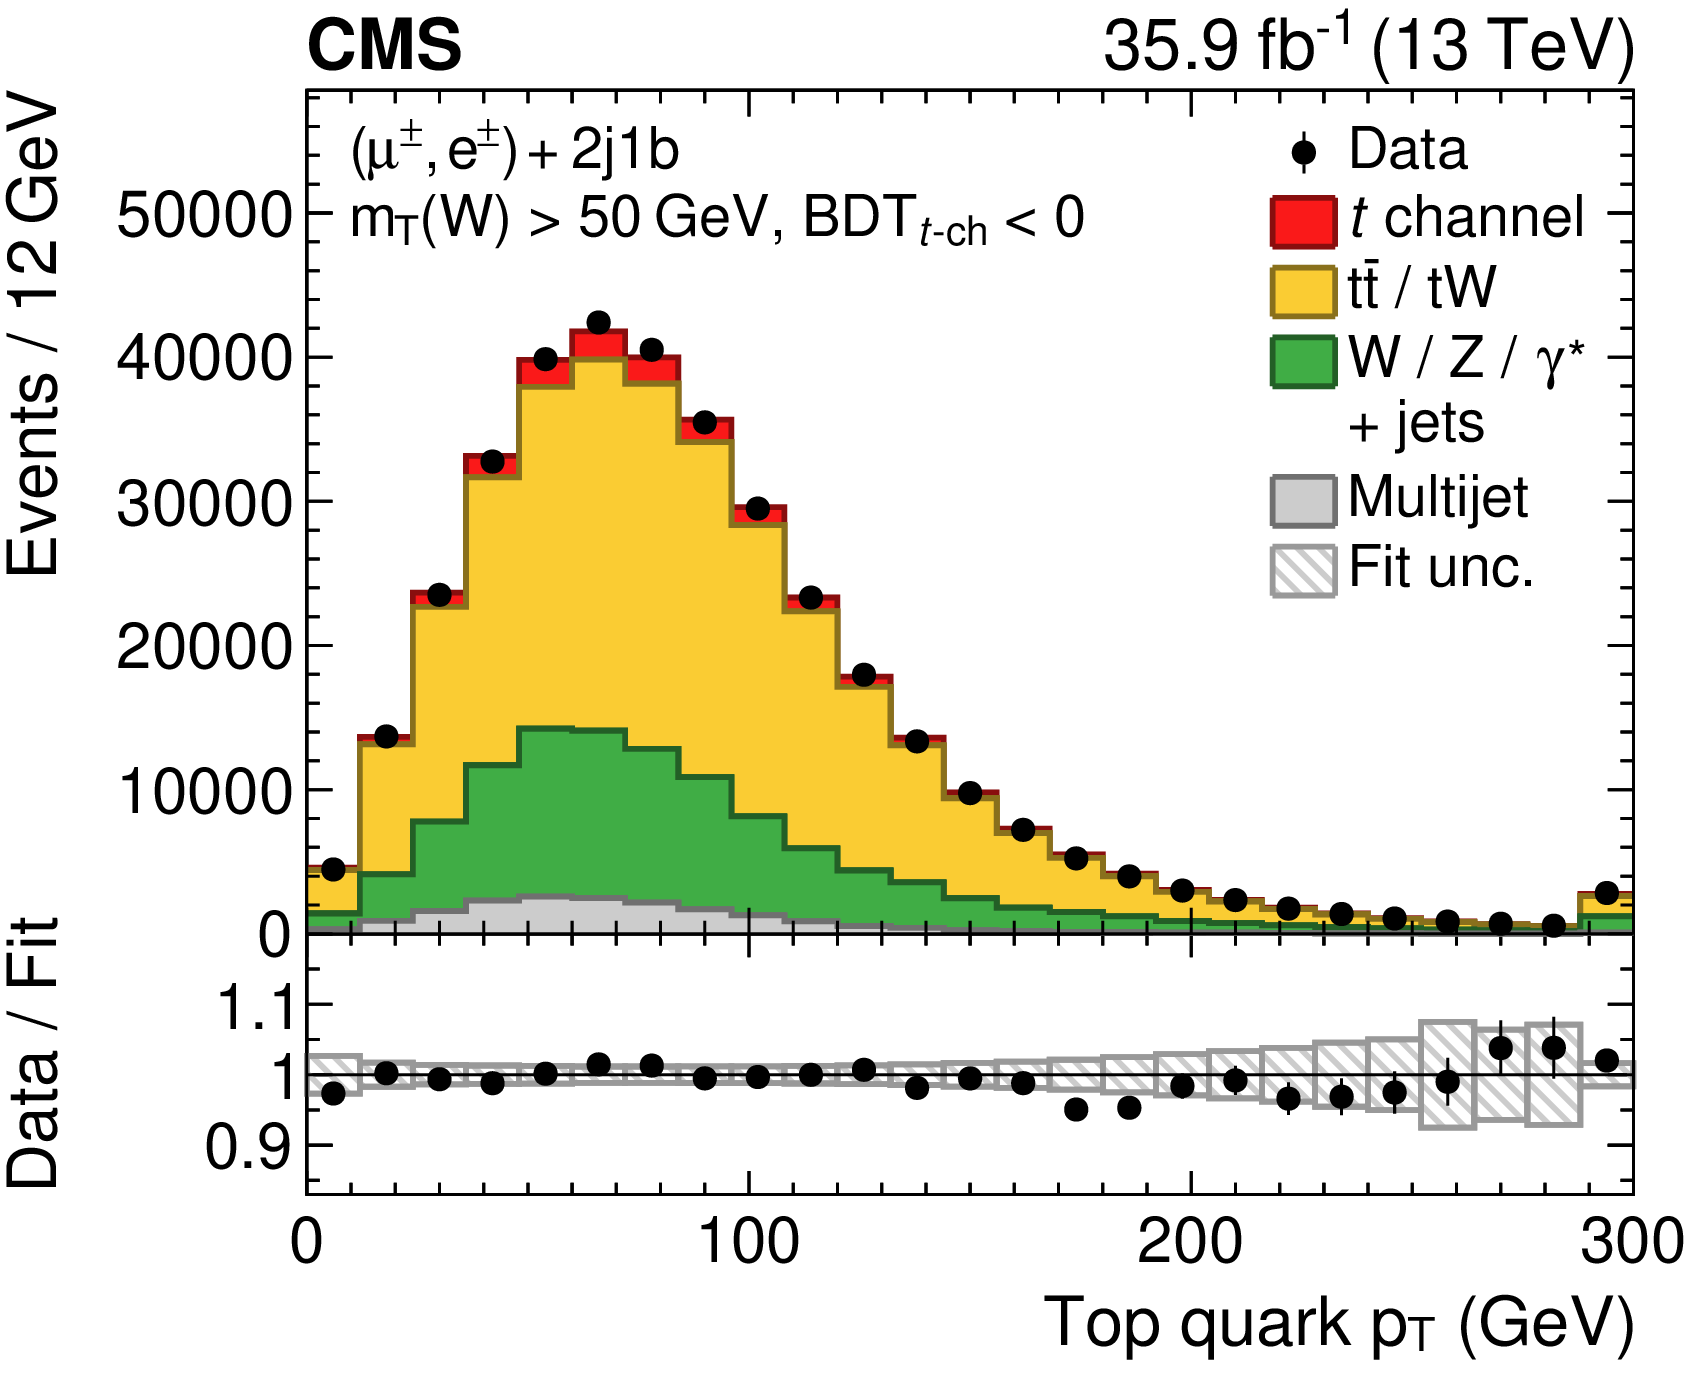
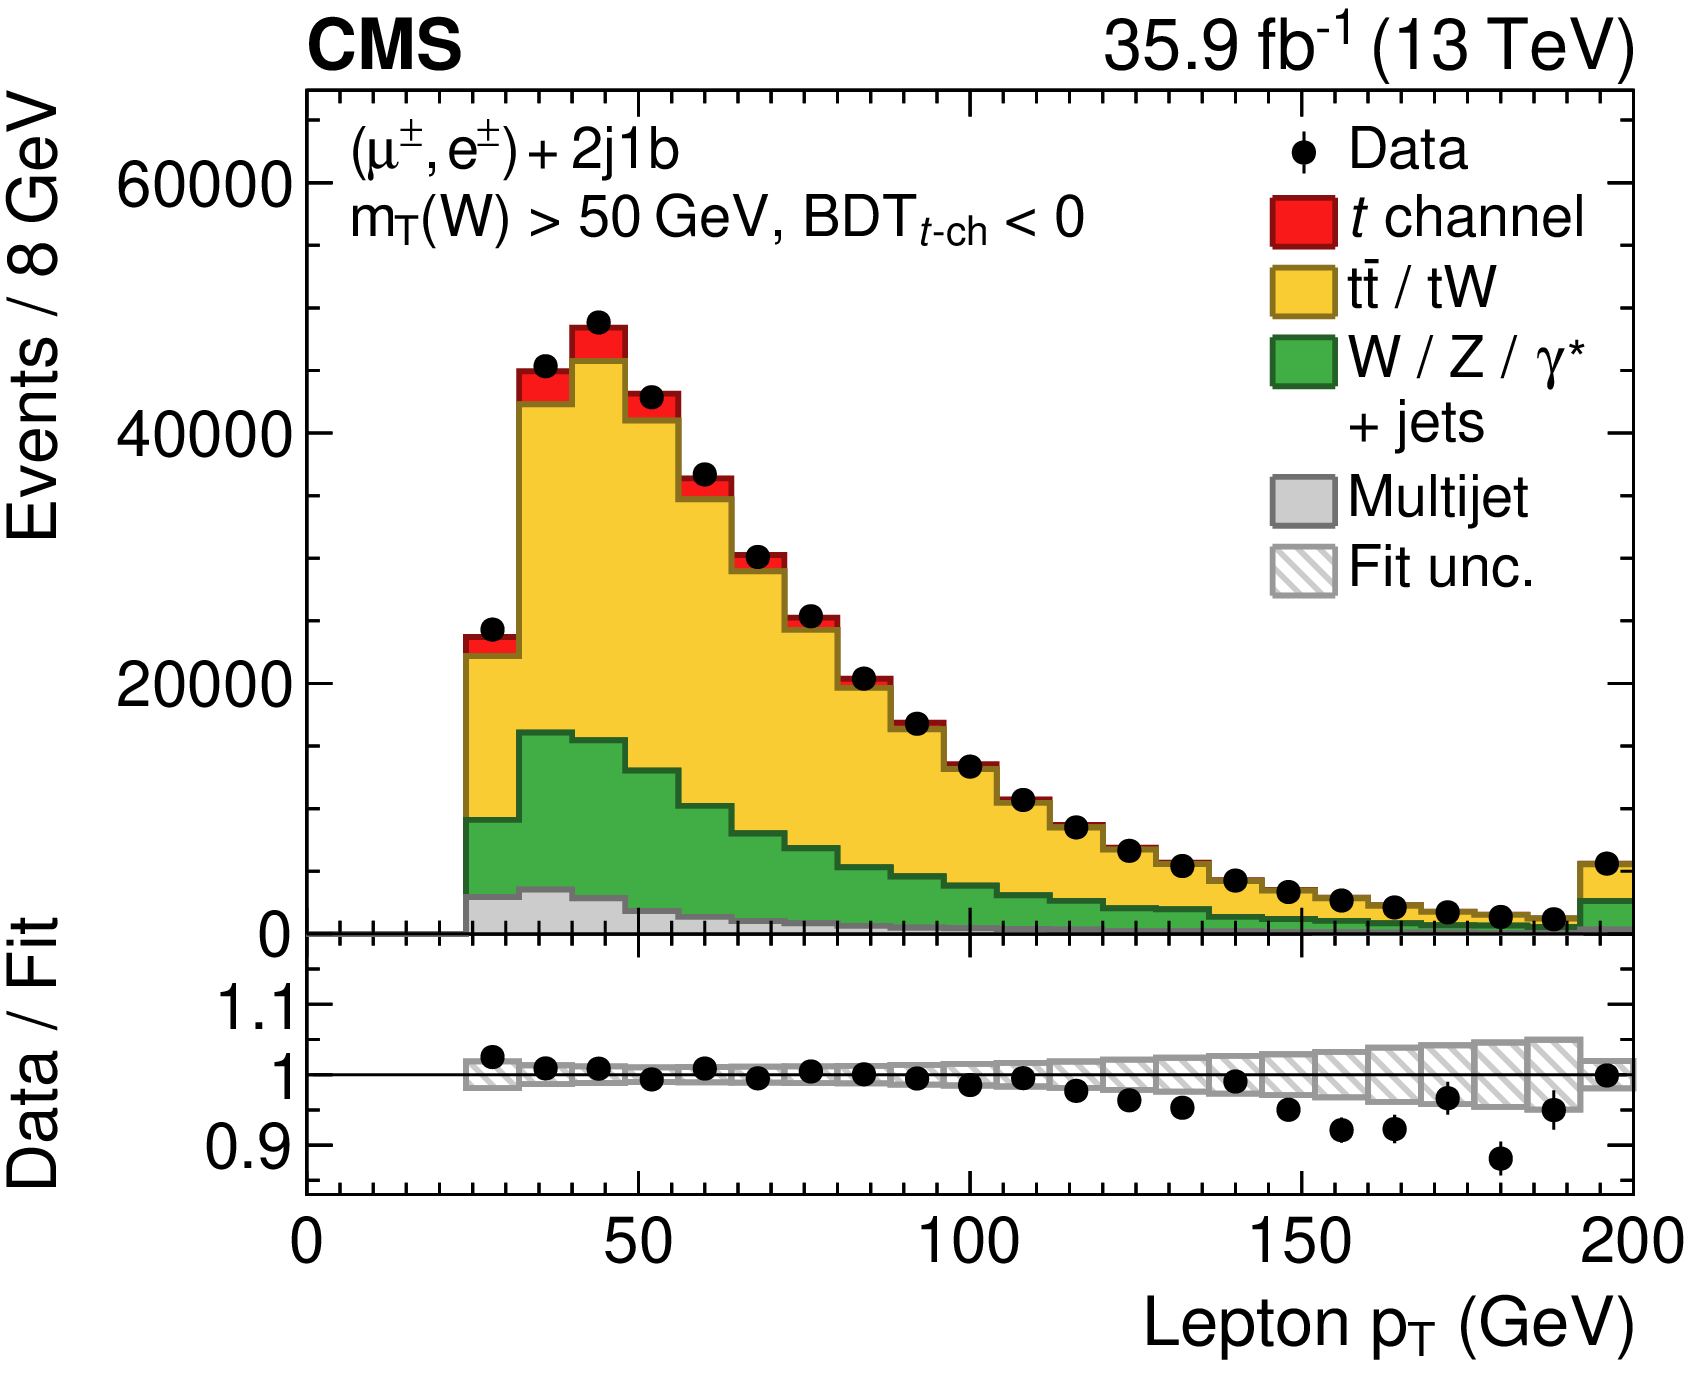
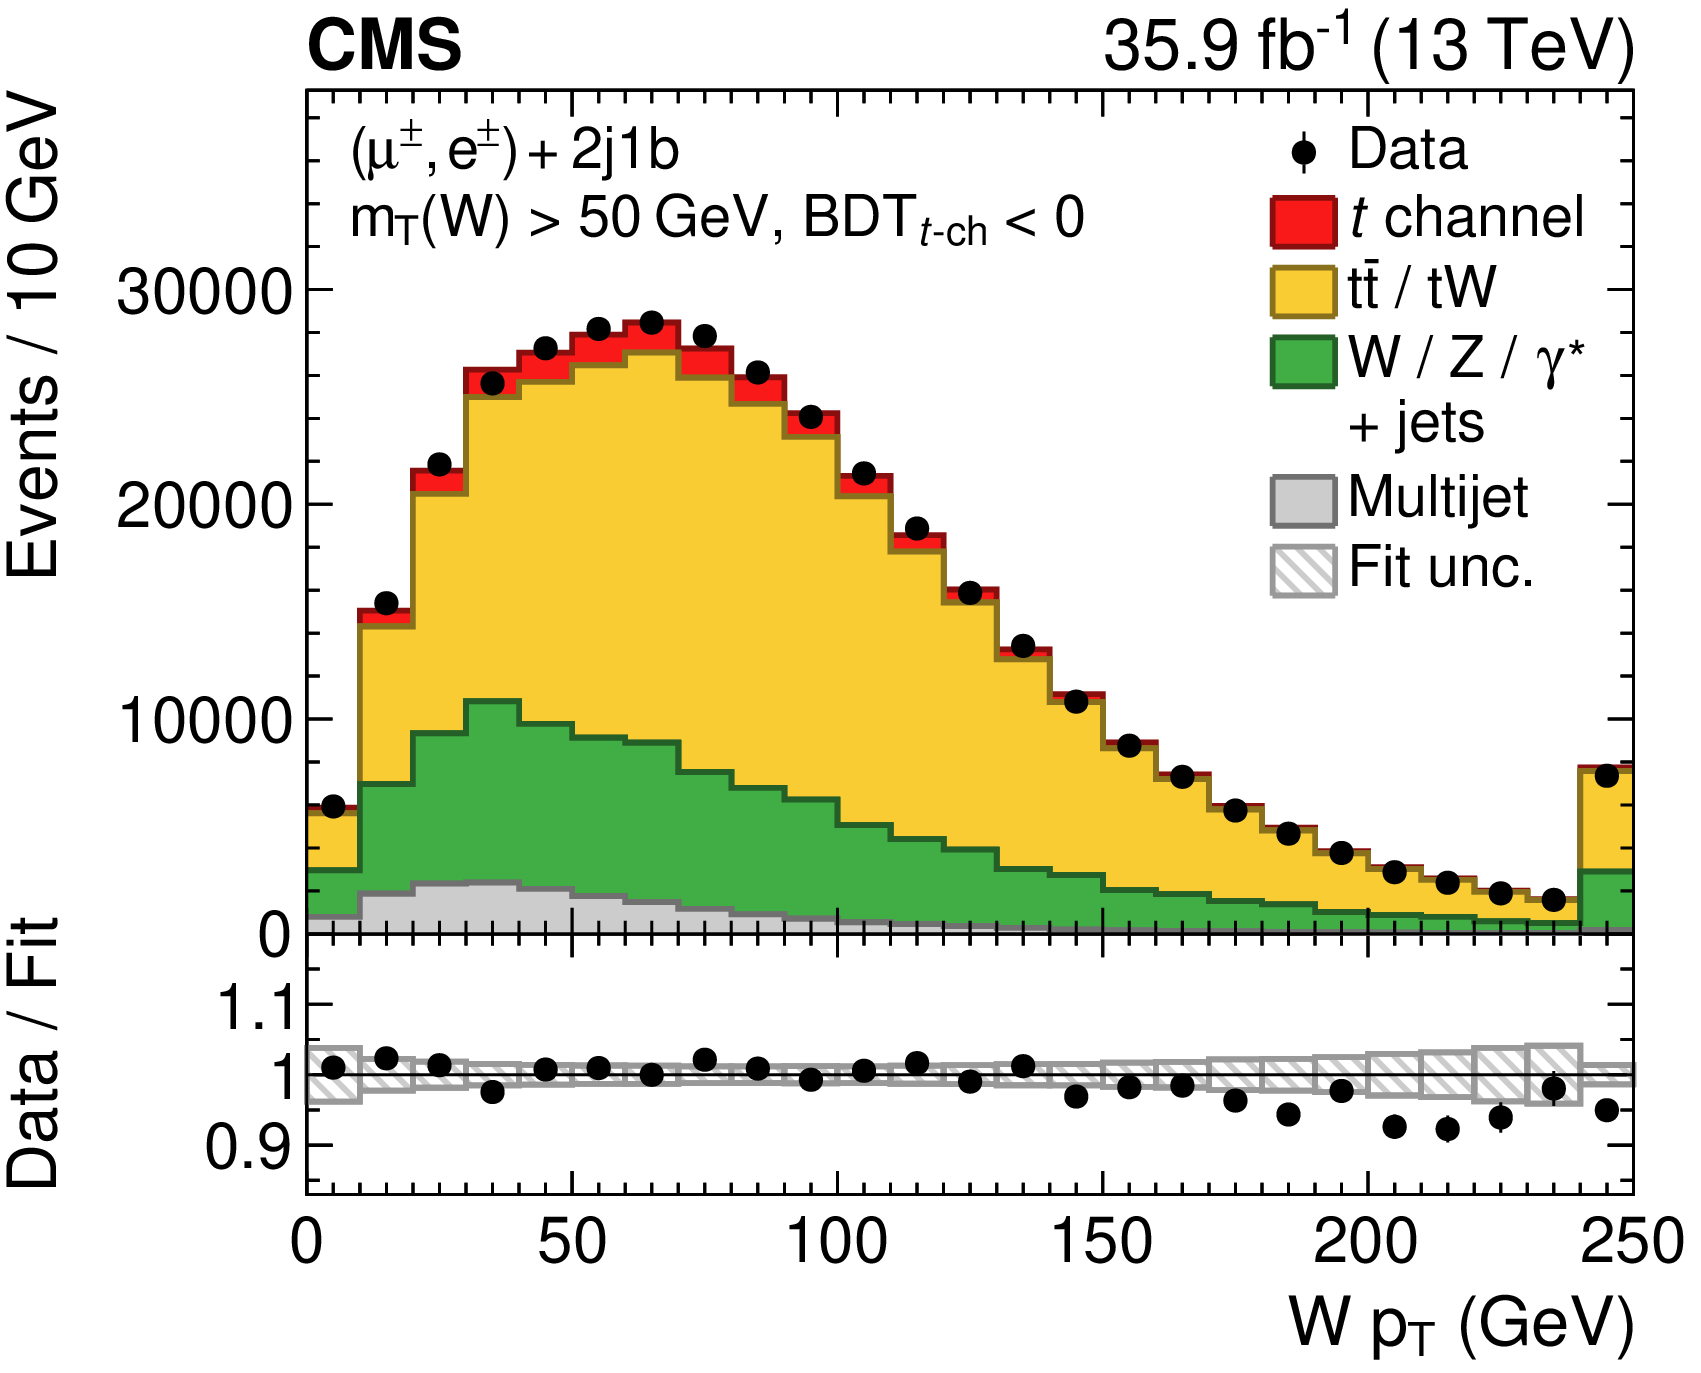
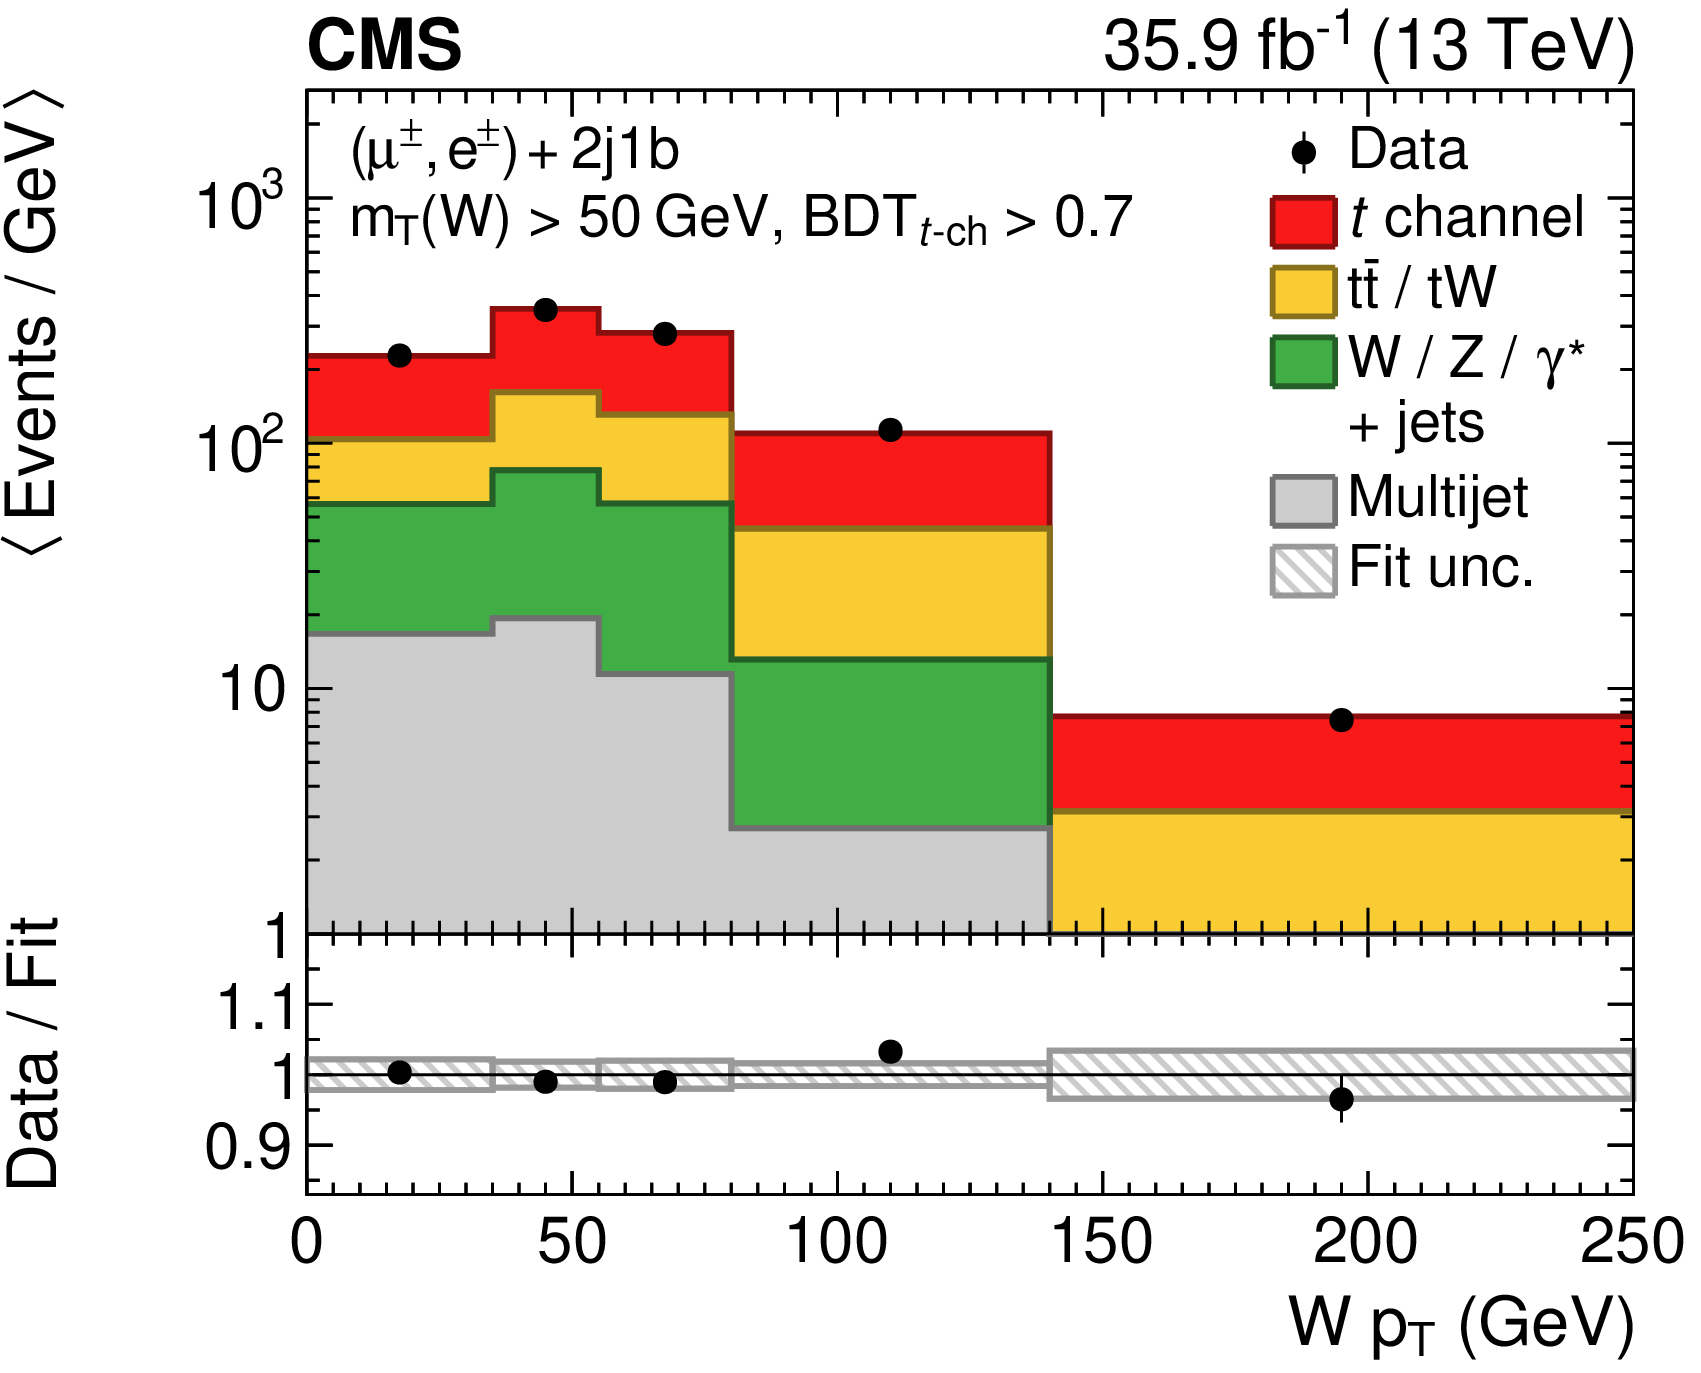
Distributions of the observables in a (left column) background-dominated and a (right column) signal-enriched region for events passing the 2 jets, 1b tag selection: (upper row) top quark ${p_{\mathrm {T}}} $; (middle row) charged lepton ${p_{\mathrm {T}}} $; (lower row) W boson ${p_{\mathrm {T}}}$. Events in the muon and electron channels have been summed. The predictions have been scaled to the result of the inclusive ML fit and the hatched band displays the fit uncertainty. The plots on the left give the number of events per bin, while those on the right show the number of events per bin divided by the bin width. The lower panel in each plot gives the ratio of the data to the fit results. The right-most bins include the event overflows. |
png pdf |
Figure 5-a:
Distribution of the top quark ${p_{\mathrm {T}}}$ in a background-dominated region for events passing the 2 jets, 1b tag selection. Events in the muon and electron channels have been summed. The predictions have been scaled to the result of the inclusive ML fit and the hatched band displays the fit uncertainty. The plot gives the number of events per bin. The lower panel gives the ratio of the data to the fit results. The right-most bin includes the event overflow. |

png pdf |
Figure 5-b:
Distribution of the top quark ${p_{\mathrm {T}}}$ in a signal-enriched region for events passing the 2 jets, 1b tag selection. Events in the muon and electron channels have been summed. The predictions have been scaled to the result of the inclusive ML fit and the hatched band displays the fit uncertainty. The plot shows the number of events per bin divided by the bin width. The lower panel gives the ratio of the data to the fit results. The right-most bin includes the event overflow. |
png pdf |
Figure 5-c:
Distribution of the charged lepton ${p_{\mathrm {T}}}$ in a background-dominated region for events passing the 2 jets, 1b tag selection. Events in the muon and electron channels have been summed. The predictions have been scaled to the result of the inclusive ML fit and the hatched band displays the fit uncertainty. The plot gives the number of events per bin. The lower panel gives the ratio of the data to the fit results. The right-most bin includes the event overflow. |

png pdf |
Figure 5-d:
Distribution of the charged lepton ${p_{\mathrm {T}}}$ in a signal-enriched region for events passing the 2 jets, 1b tag selection. Events in the muon and electron channels have been summed. The predictions have been scaled to the result of the inclusive ML fit and the hatched band displays the fit uncertainty. The plot shows the number of events per bin divided by the bin width. The lower panel gives the ratio of the data to the fit results. The right-most bin includes the event overflow. |
png pdf |
Figure 5-e:
Distribution of the W boson ${p_{\mathrm {T}}}$ in a background-dominated region for events passing the 2 jets, 1b tag selection. Events in the muon and electron channels have been summed. The predictions have been scaled to the result of the inclusive ML fit and the hatched band displays the fit uncertainty. The plot gives the number of events per bin. The lower panel gives the ratio of the data to the fit results. The right-most bin includes the event overflow. |
png pdf |
Figure 5-f:
Distribution of the W boson ${p_{\mathrm {T}}}$ in a signal-enriched region for events passing the 2 jets, 1b tag selection. Events in the muon and electron channels have been summed. The predictions have been scaled to the result of the inclusive ML fit and the hatched band displays the fit uncertainty. The plot shows the number of events per bin divided by the bin width. The lower panel gives the ratio of the data to the fit results. The right-most bin includes the event overflow. |
png pdf |
Figure 6:
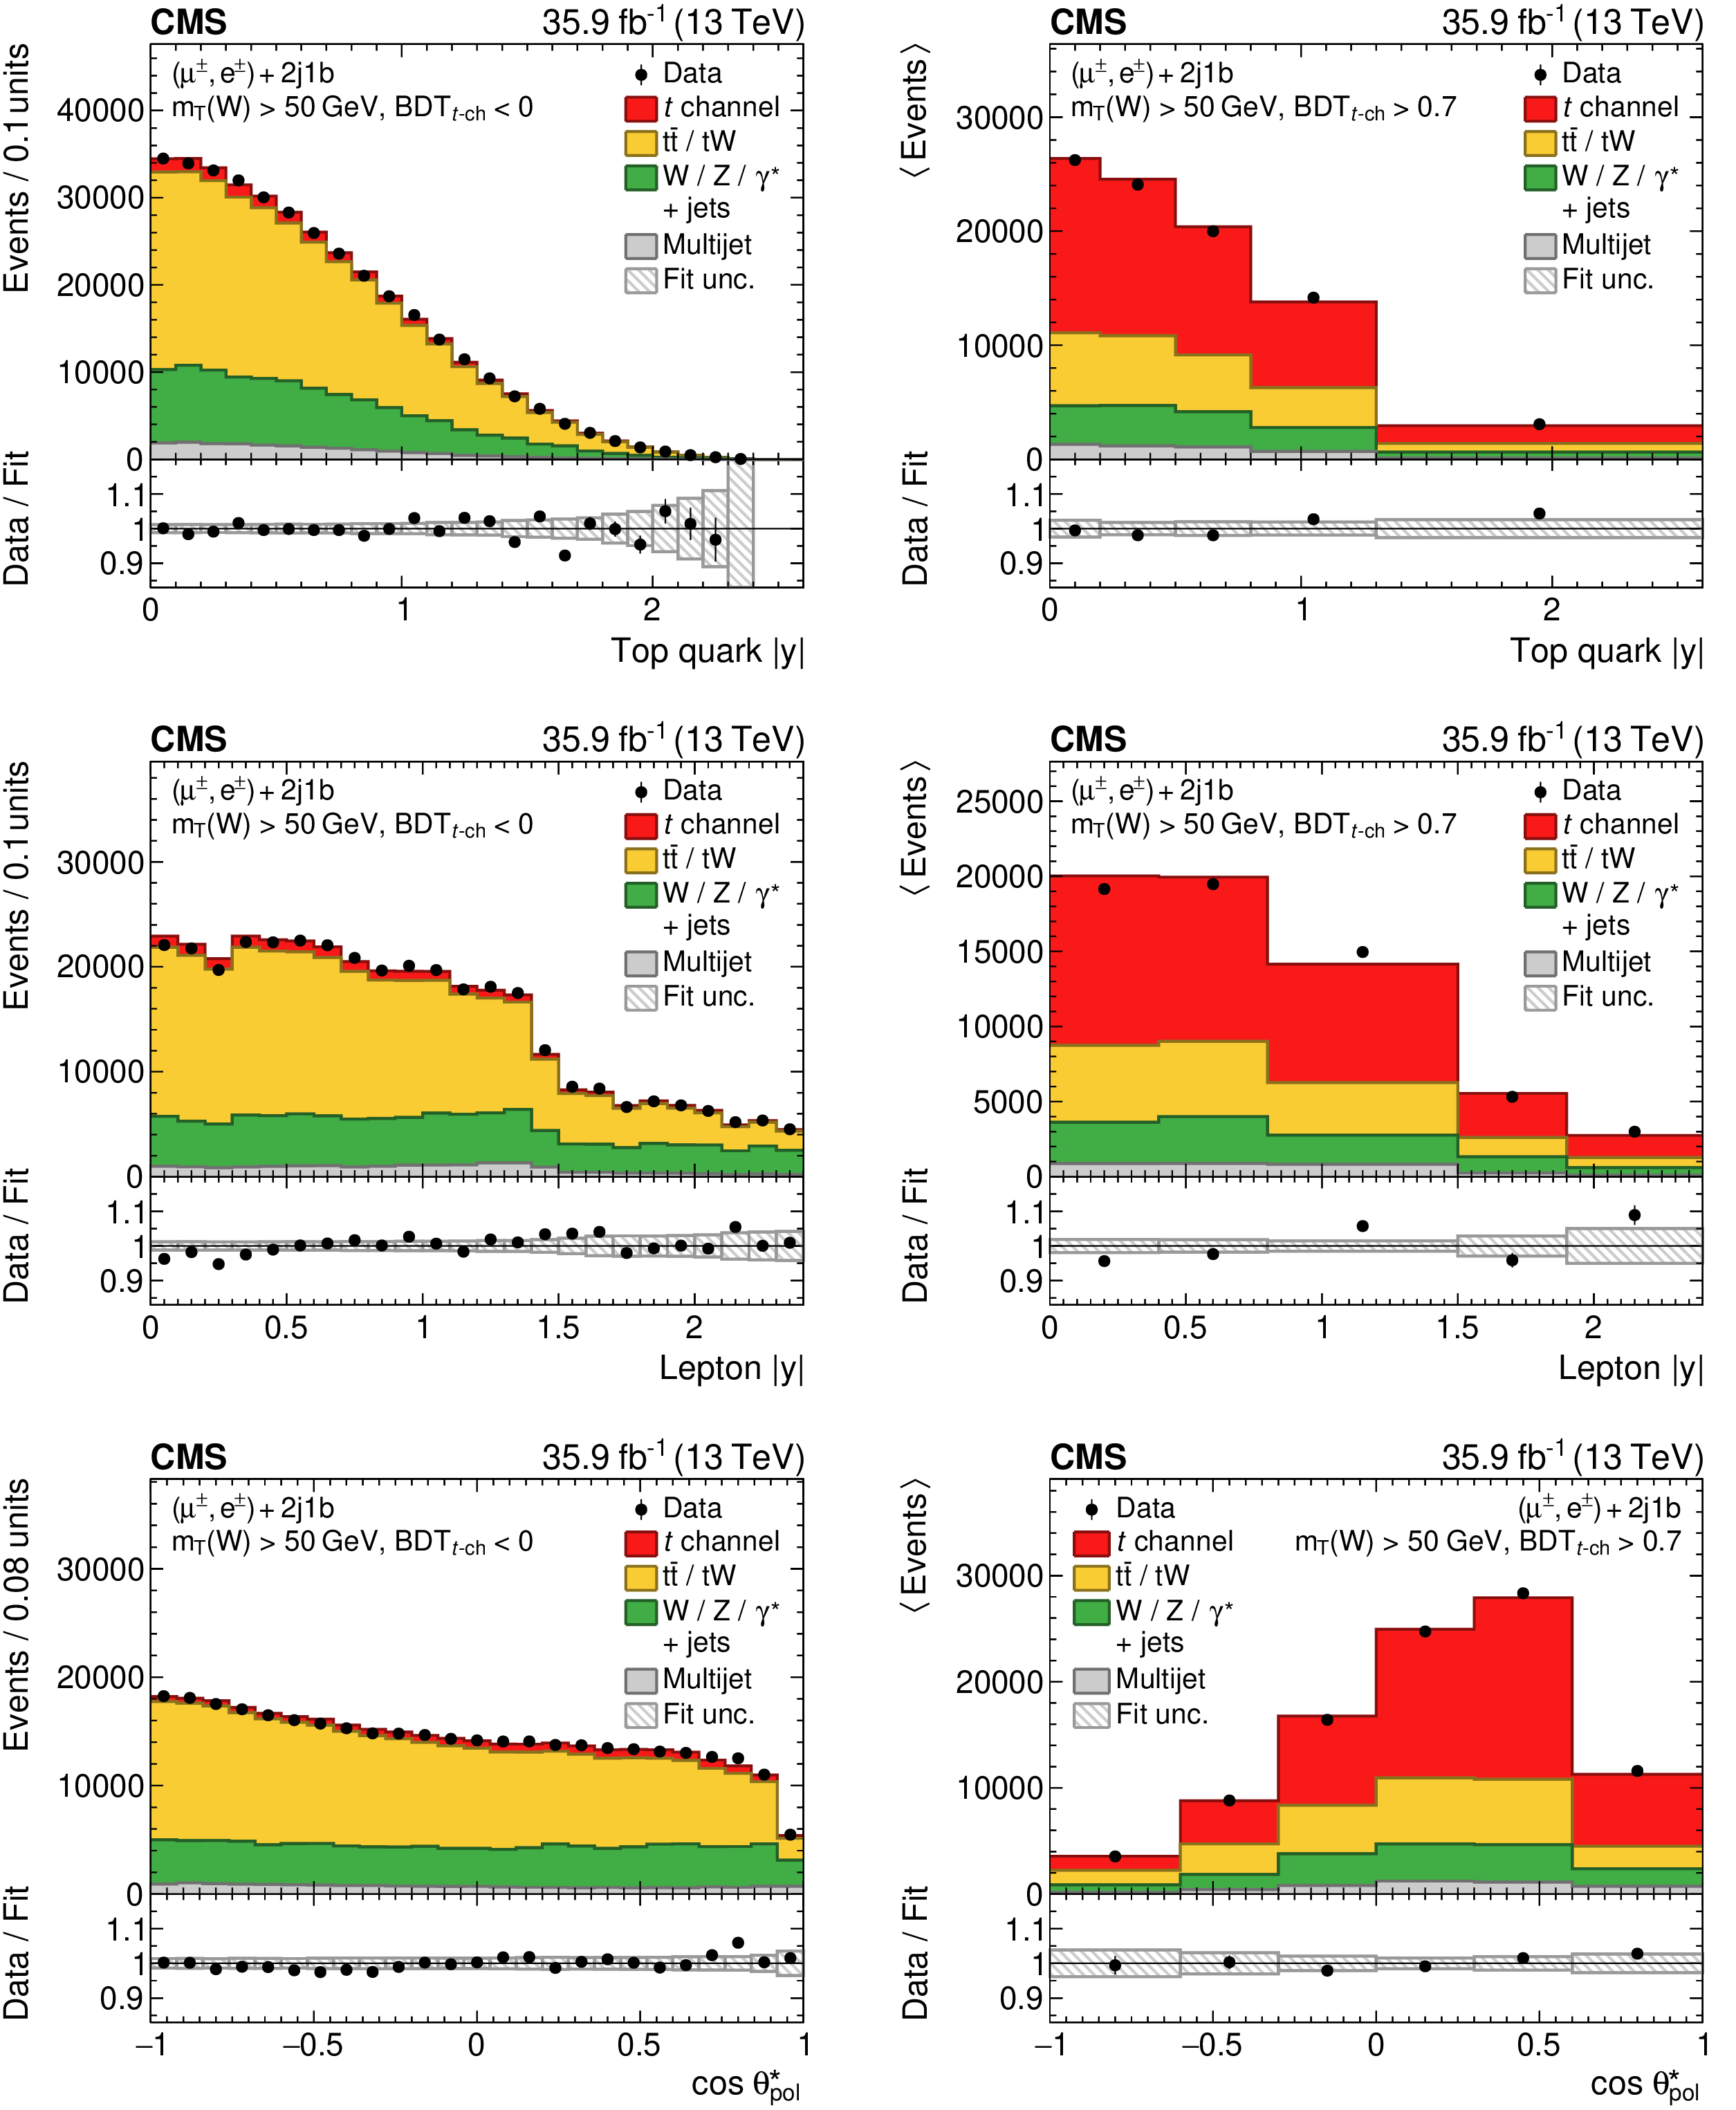
Distributions of the observables in a (left column) background-dominated and a (right column) signal-enriched region for events passing the 2 jets, 1b tag selection: (upper row) top quark rapidity; (middle row) charged lepton rapidity; (lower row) cosine of the top quark polarisation angle. Events in the muon and electron channels have been summed. The predictions have been scaled to the result of the inclusive ML fit and the hatched band displays the fit uncertainty. The plots on the left give the number of events per bin, while those on the right show the number of events per bin divided by the bin width. The lower panel in each plot gives the ratio of the data to the fit results. |
png pdf |
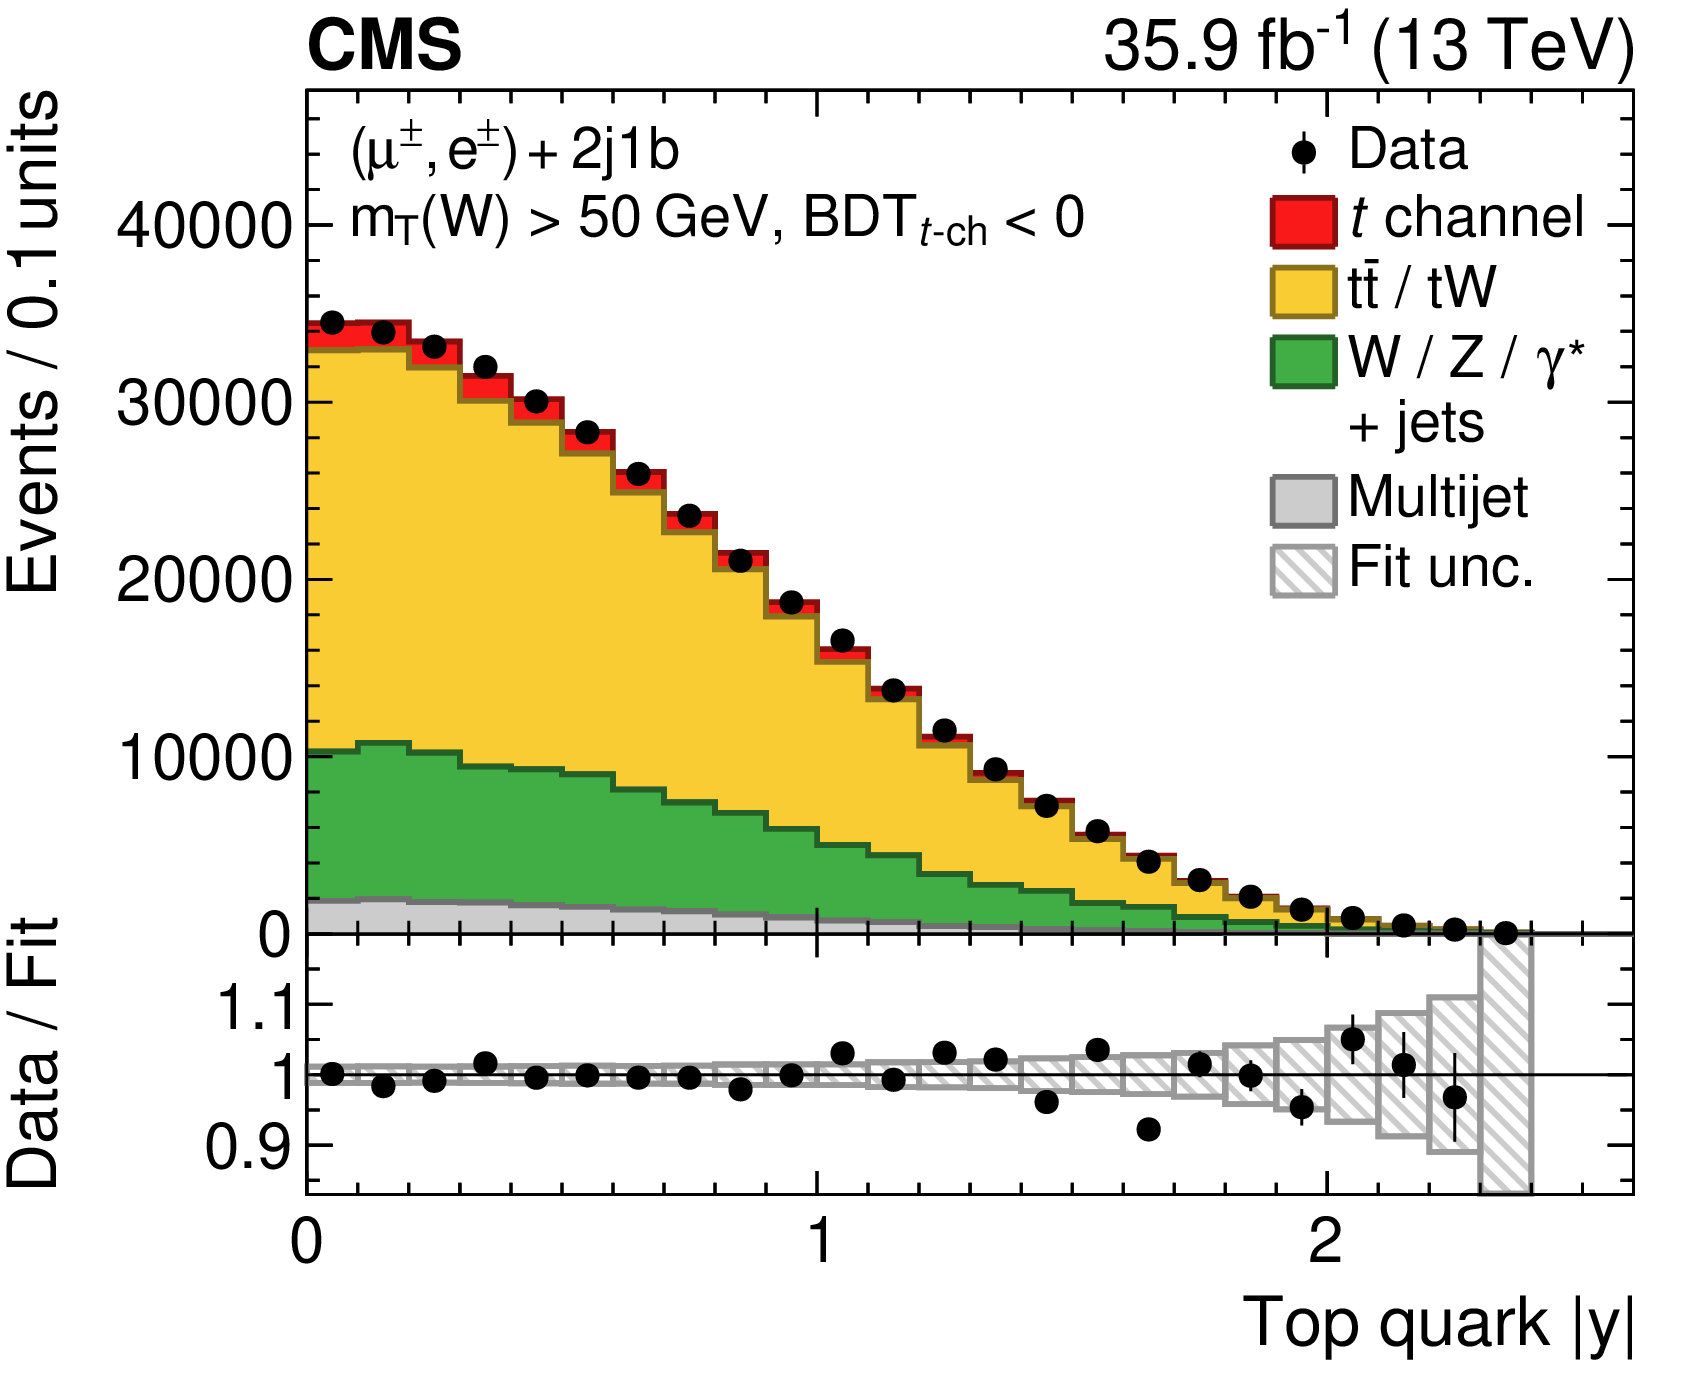
Figure 6-a:
Distribution of the top quark rapidity in a background-dominated egion for events passing the 2 jets, 1b tag selection. Events in the muon and electron channels have been summed. The predictions have been scaled to the result of the inclusive ML fit and the hatched band displays the fit uncertainty. The plot gives the number of events per bin. The lower panel gives the ratio of the data to the fit results. |

png pdf |
Figure 6-b:
Distribution of the top quark rapidity in a signal-enriched region for events passing the 2 jets, 1b tag selection. Events in the muon and electron channels have been summed. The predictions have been scaled to the result of the inclusive ML fit and the hatched band displays the fit uncertainty. The plot shows the number of events per bin divided by the bin width. The lower panel gives the ratio of the data to the fit results. |

png pdf |
Figure 6-c:
Distribution of the charged lepton rapidity in a background-dominated region for events passing the 2 jets, 1b tag selection. Events in the muon and electron channels have been summed. The predictions have been scaled to the result of the inclusive ML fit and the hatched band displays the fit uncertainty. The plot gives the number of events per bin. The lower panel gives the ratio of the data to the fit results. |
png pdf |
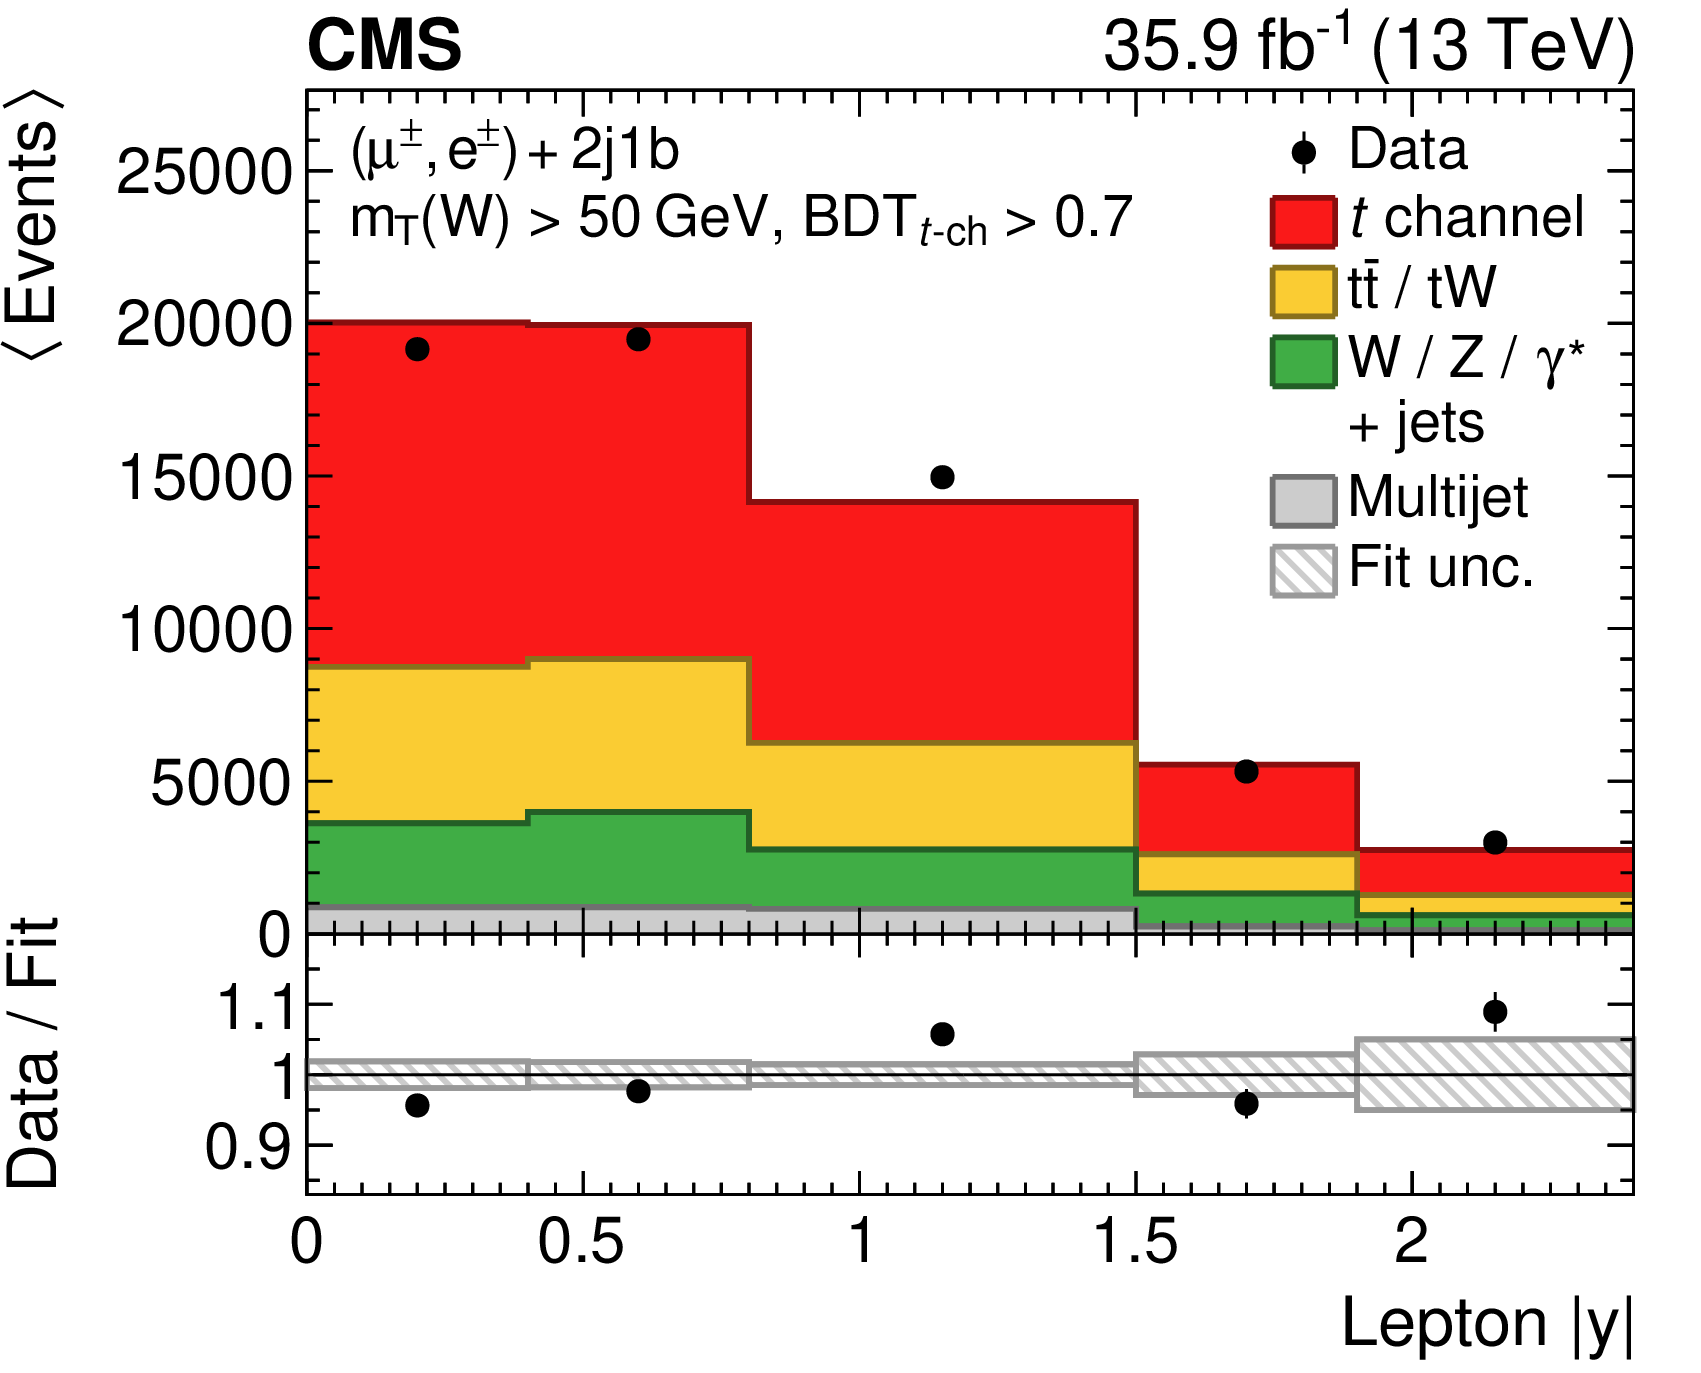
Figure 6-d:
Distribution of the charged lepton rapidity in a signal-enriched region for events passing the 2 jets, 1b tag selection. Events in the muon and electron channels have been summed. The predictions have been scaled to the result of the inclusive ML fit and the hatched band displays the fit uncertainty. The plot shows the number of events per bin divided by the bin width. The lower panel gives the ratio of the data to the fit results. |
png pdf |
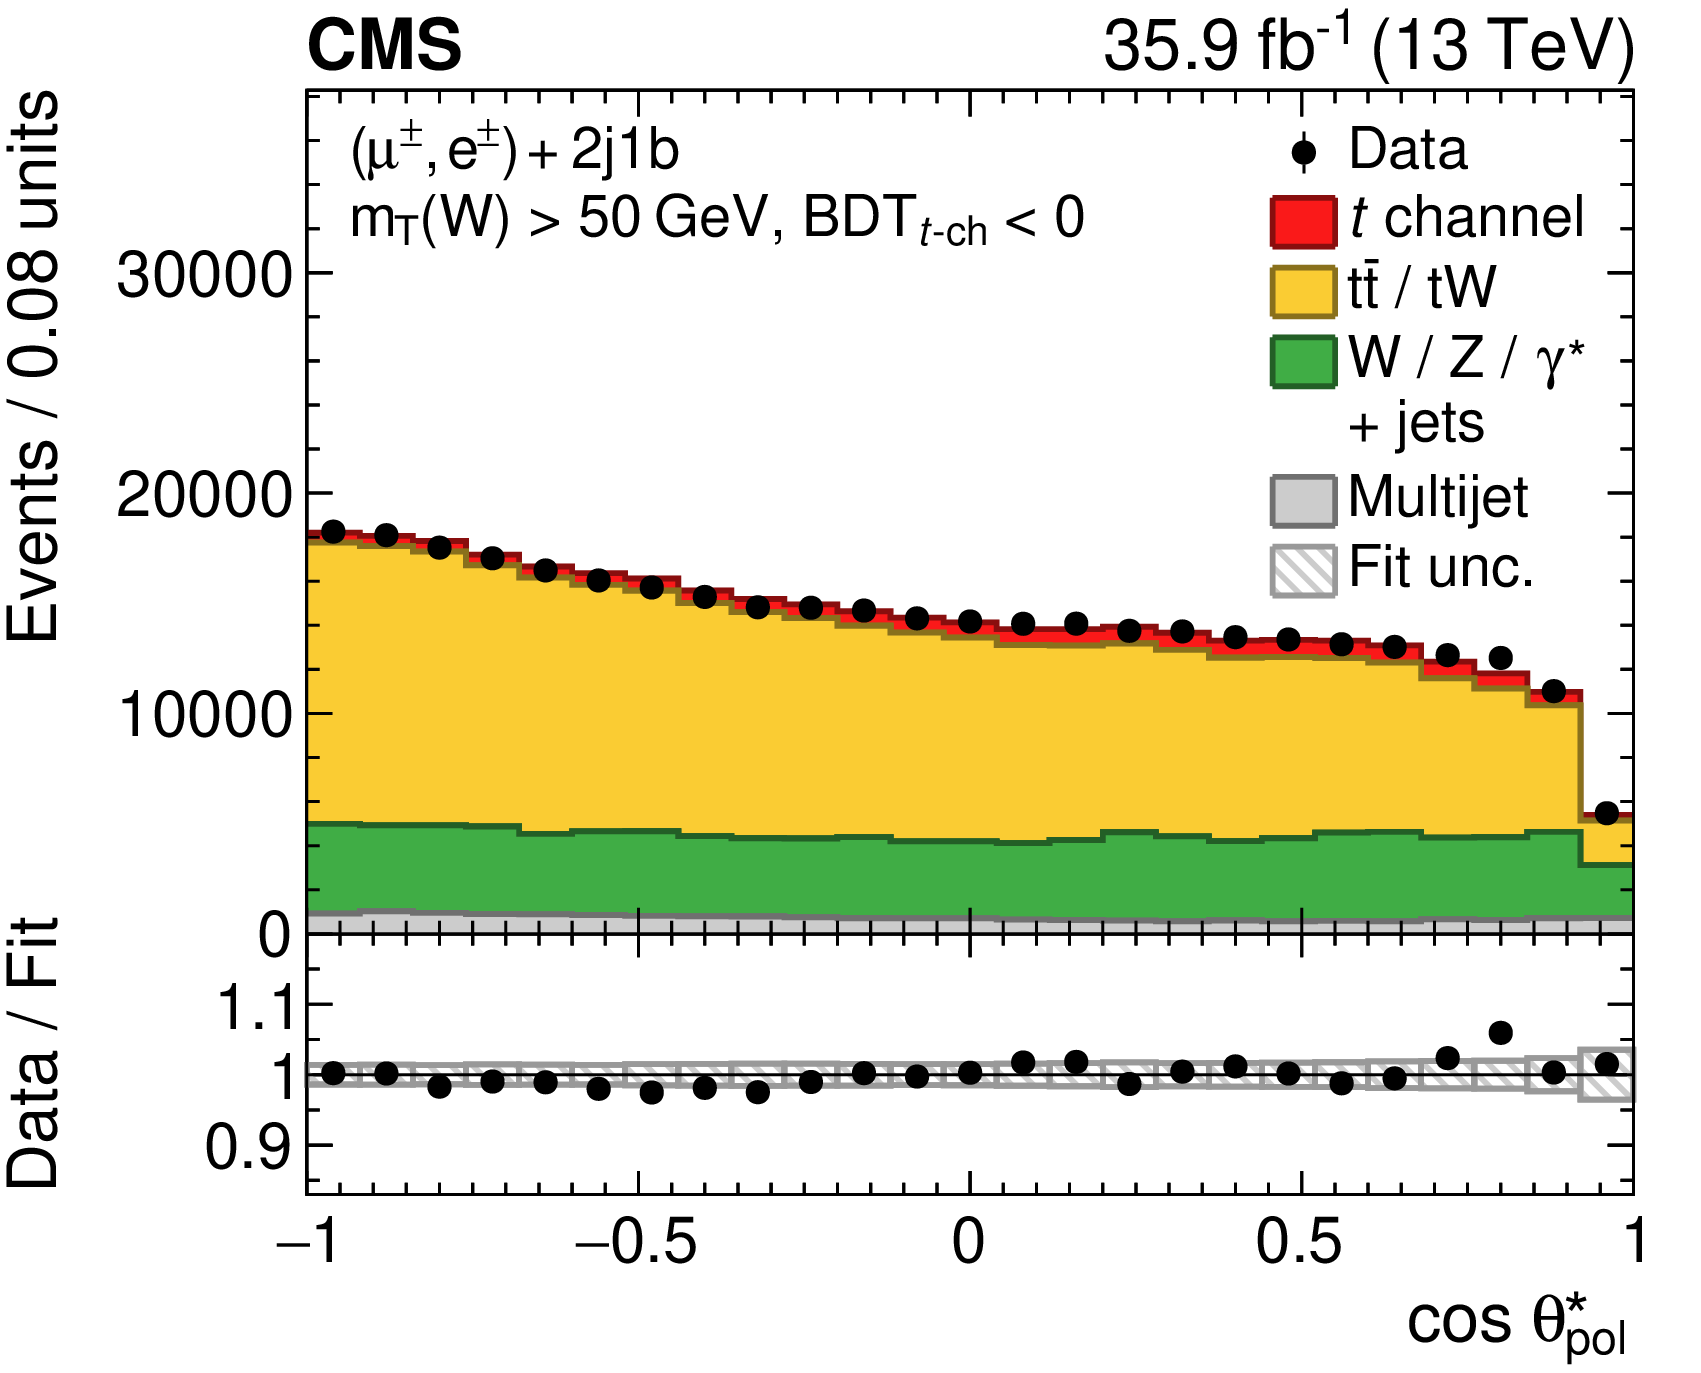
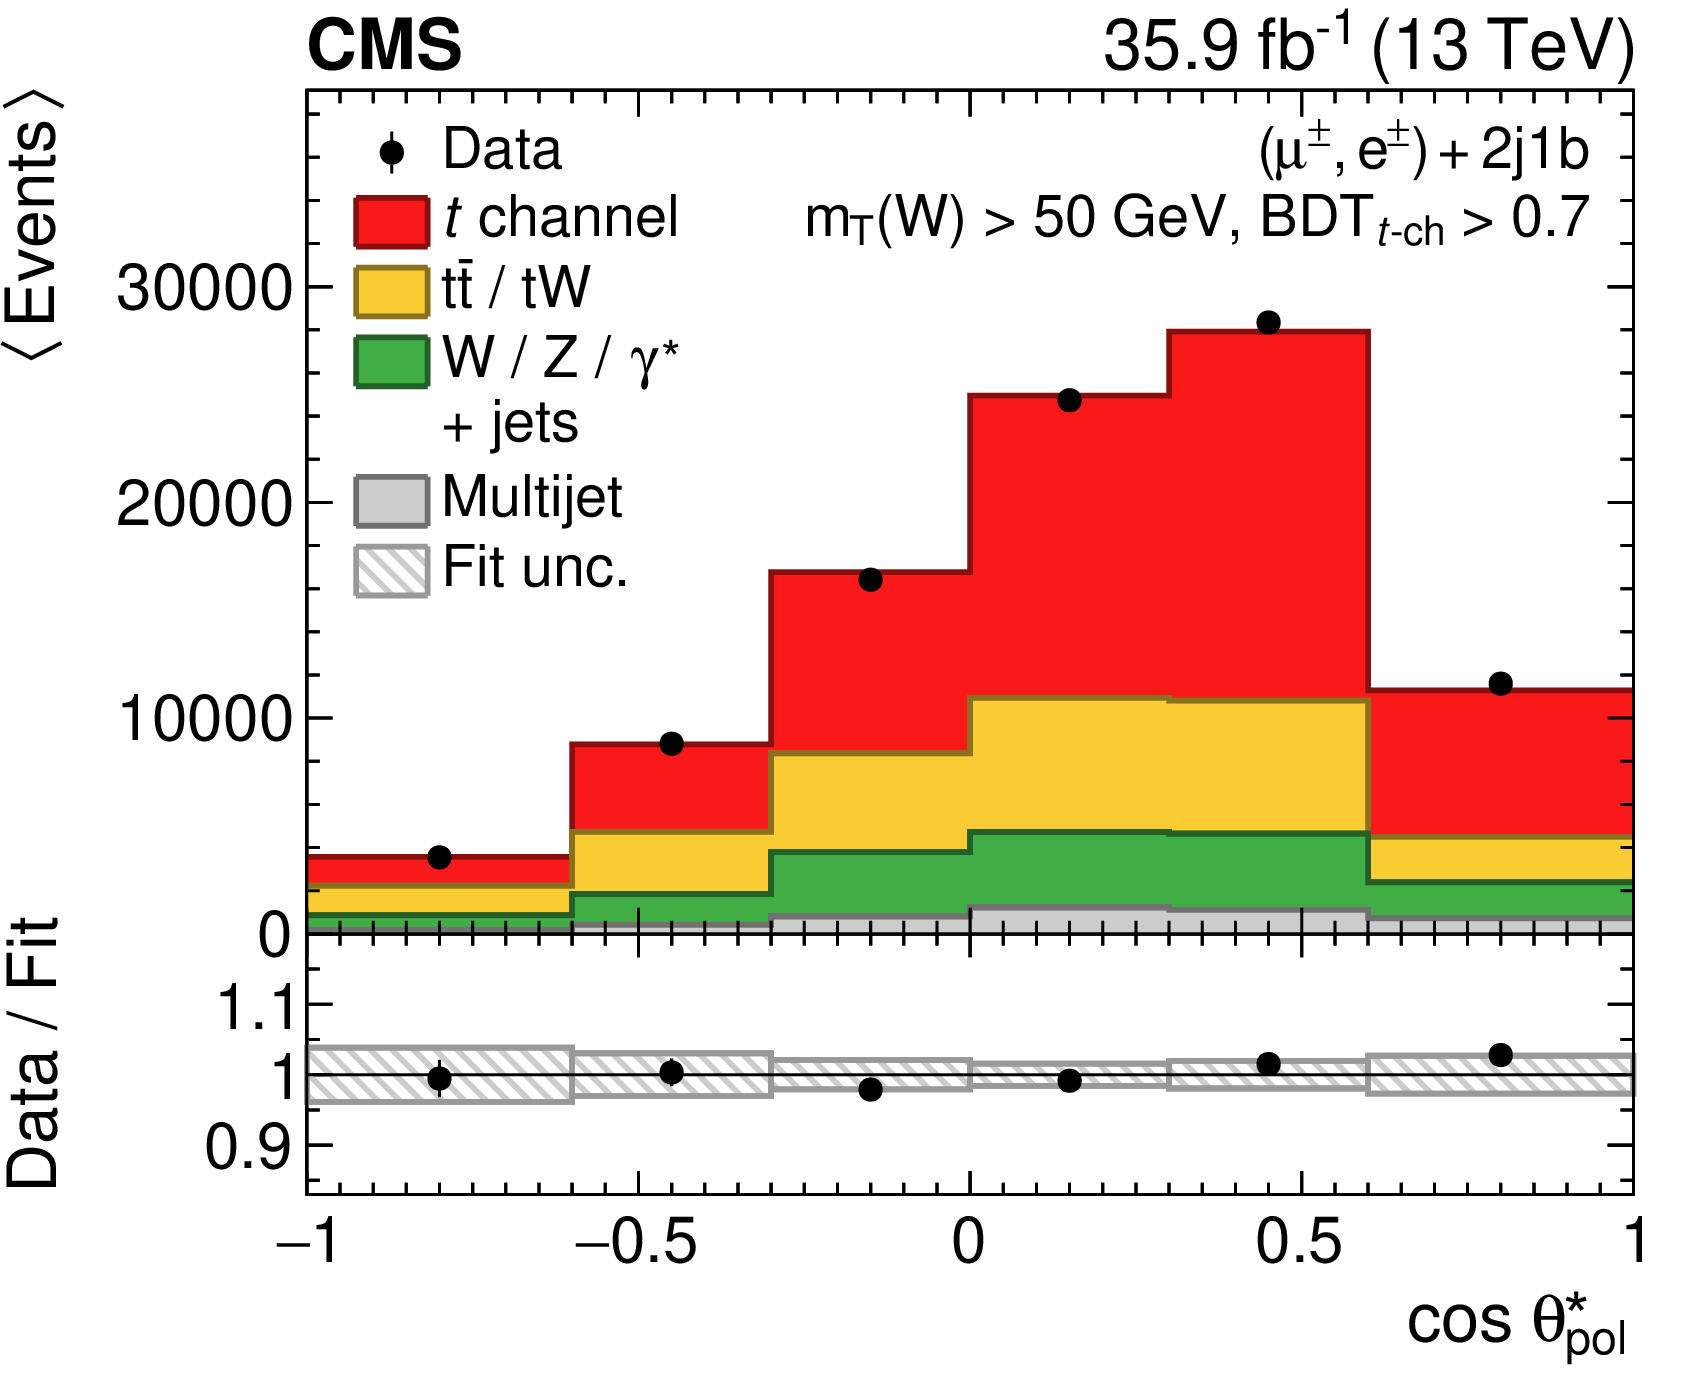
Figure 6-e:
Distribution of the cosine of the top quark polarisation angle in a background-dominated region for events passing the 2 jets, 1b tag selection. Events in the muon and electron channels have been summed. The predictions have been scaled to the result of the inclusive ML fit and the hatched band displays the fit uncertainty. The plot gives the number of events per bin. sThe lower panel gives the ratio of the data to the fit results. |
png pdf |
Figure 6-f:
Distribution of the cosine of the top quark polarisation angle in a signal-enriched region for events passing the 2 jets, 1b tag selection. Events in the muon and electron channels have been summed. The predictions have been scaled to the result of the inclusive ML fit and the hatched band displays the fit uncertainty. The plot shows the number of events per bin divided by the bin width. The lower panel gives the ratio of the data to the fit results. |
png pdf |
Figure 7:
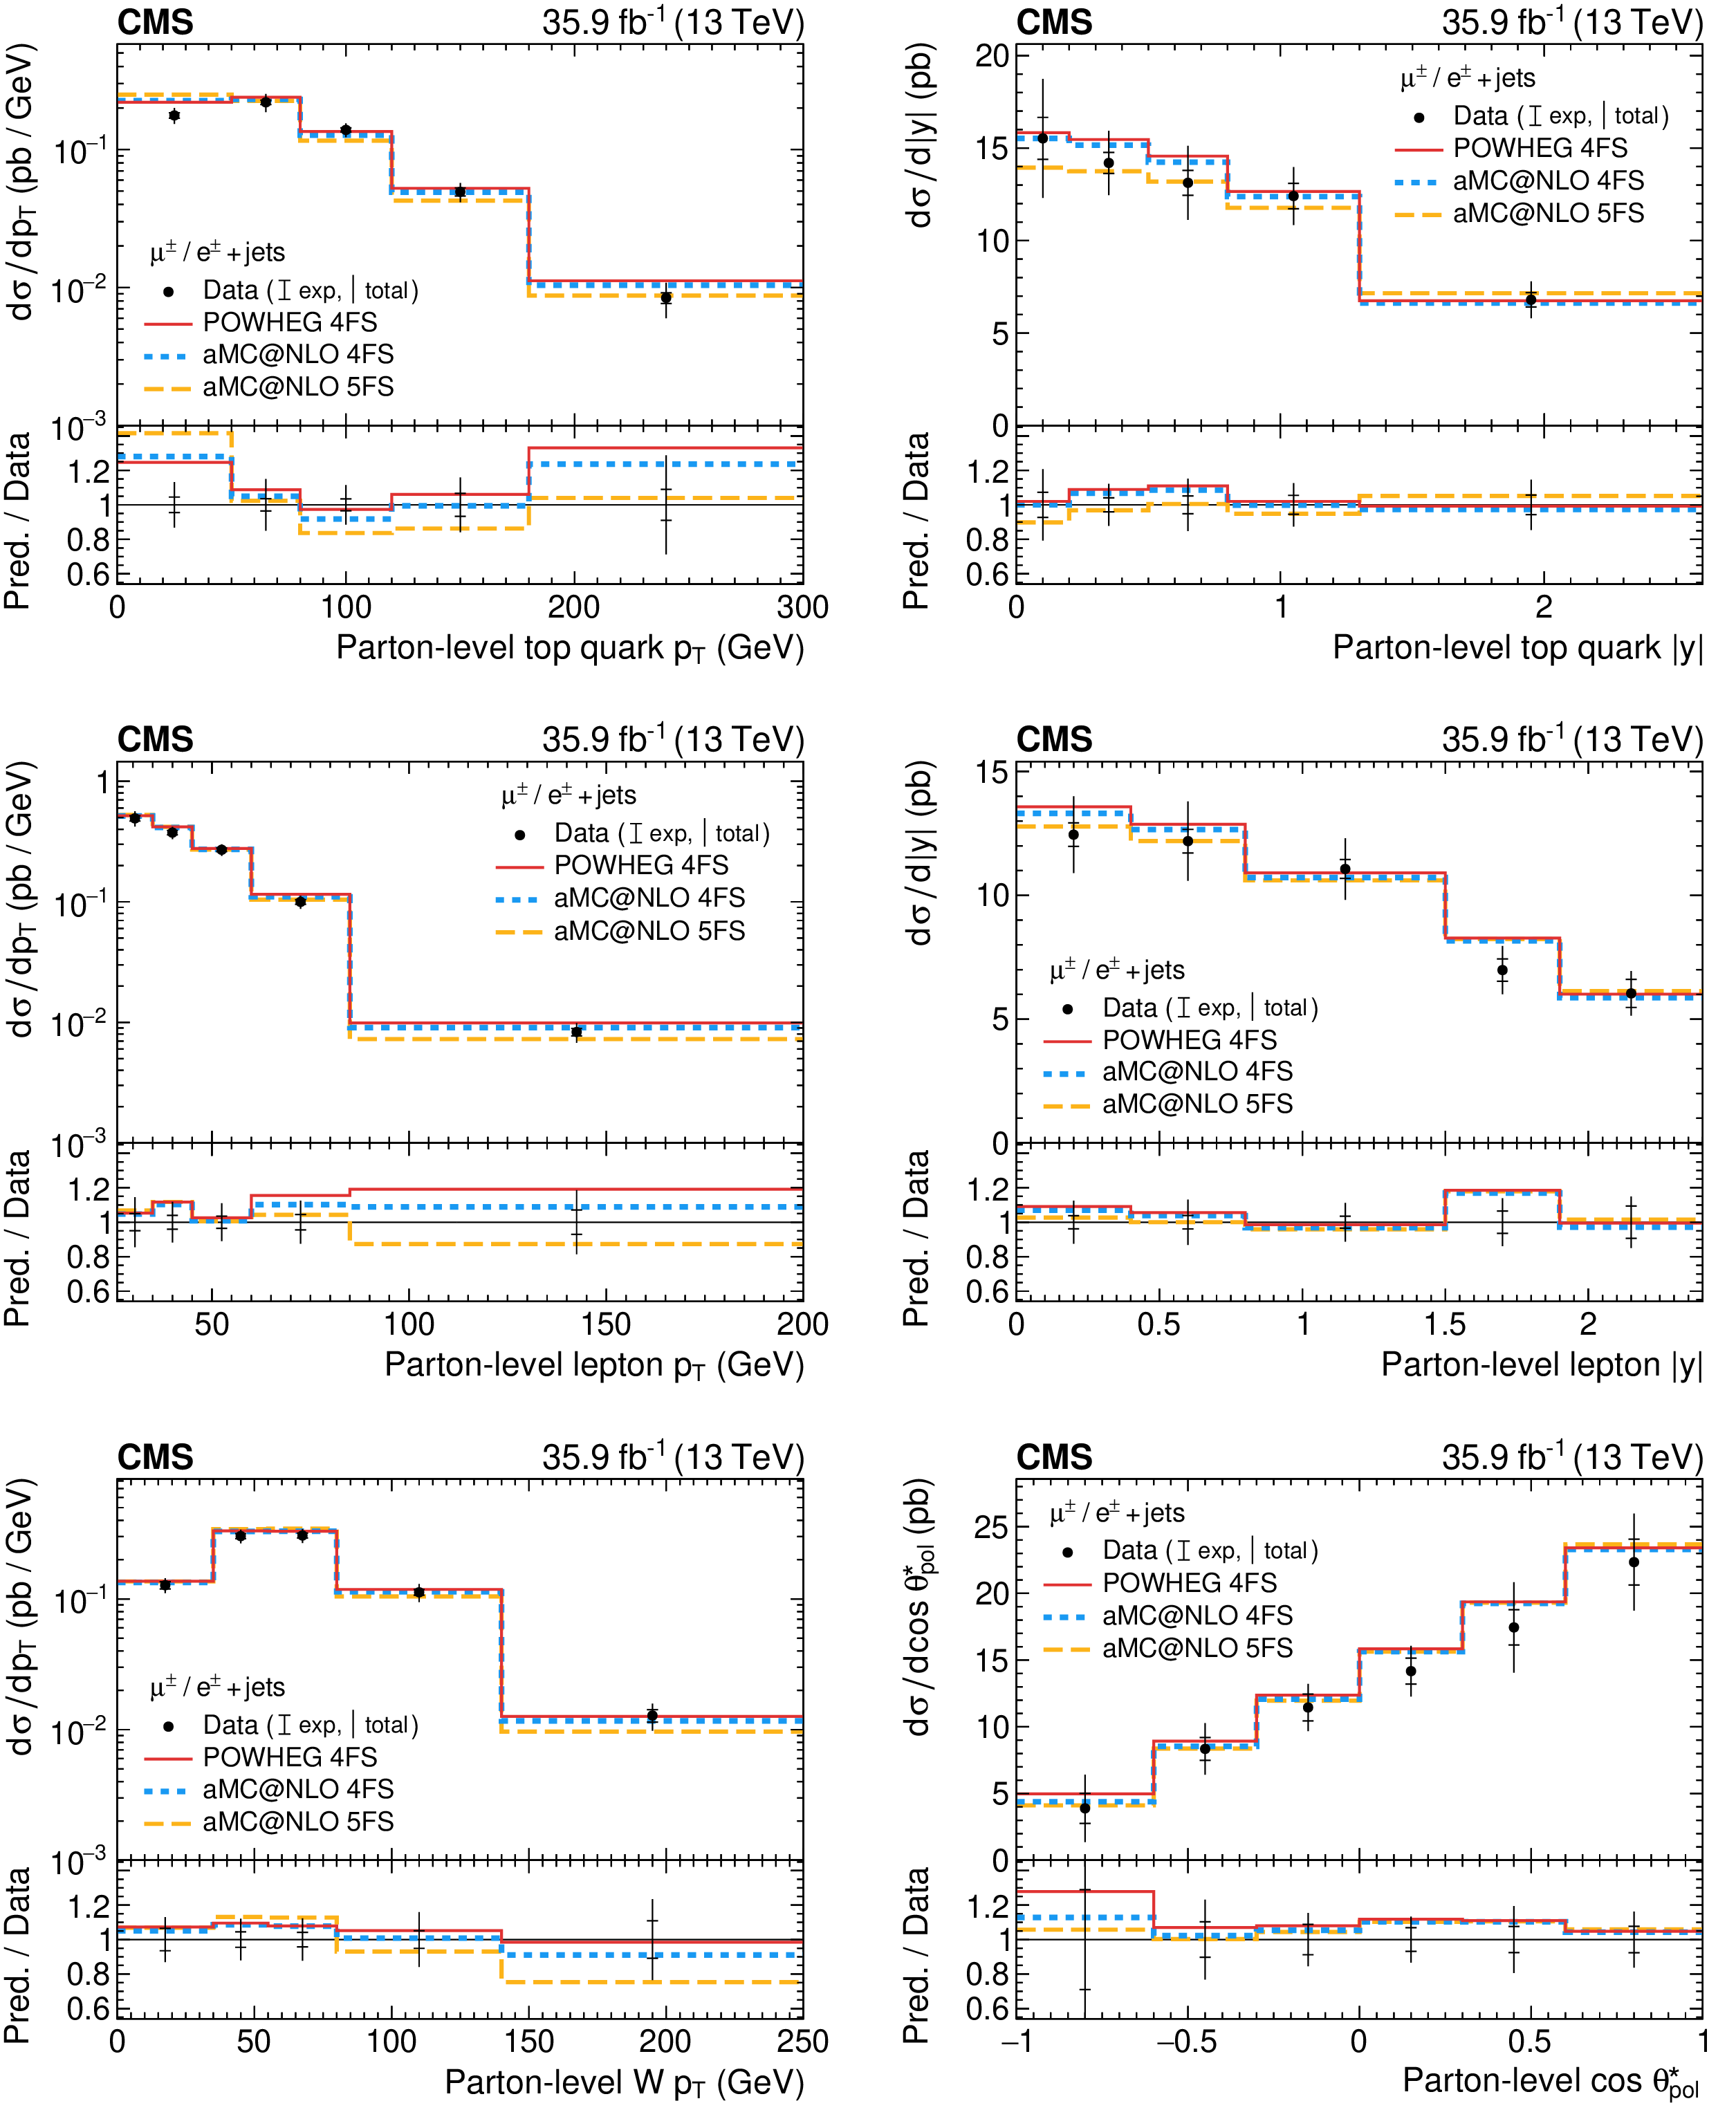
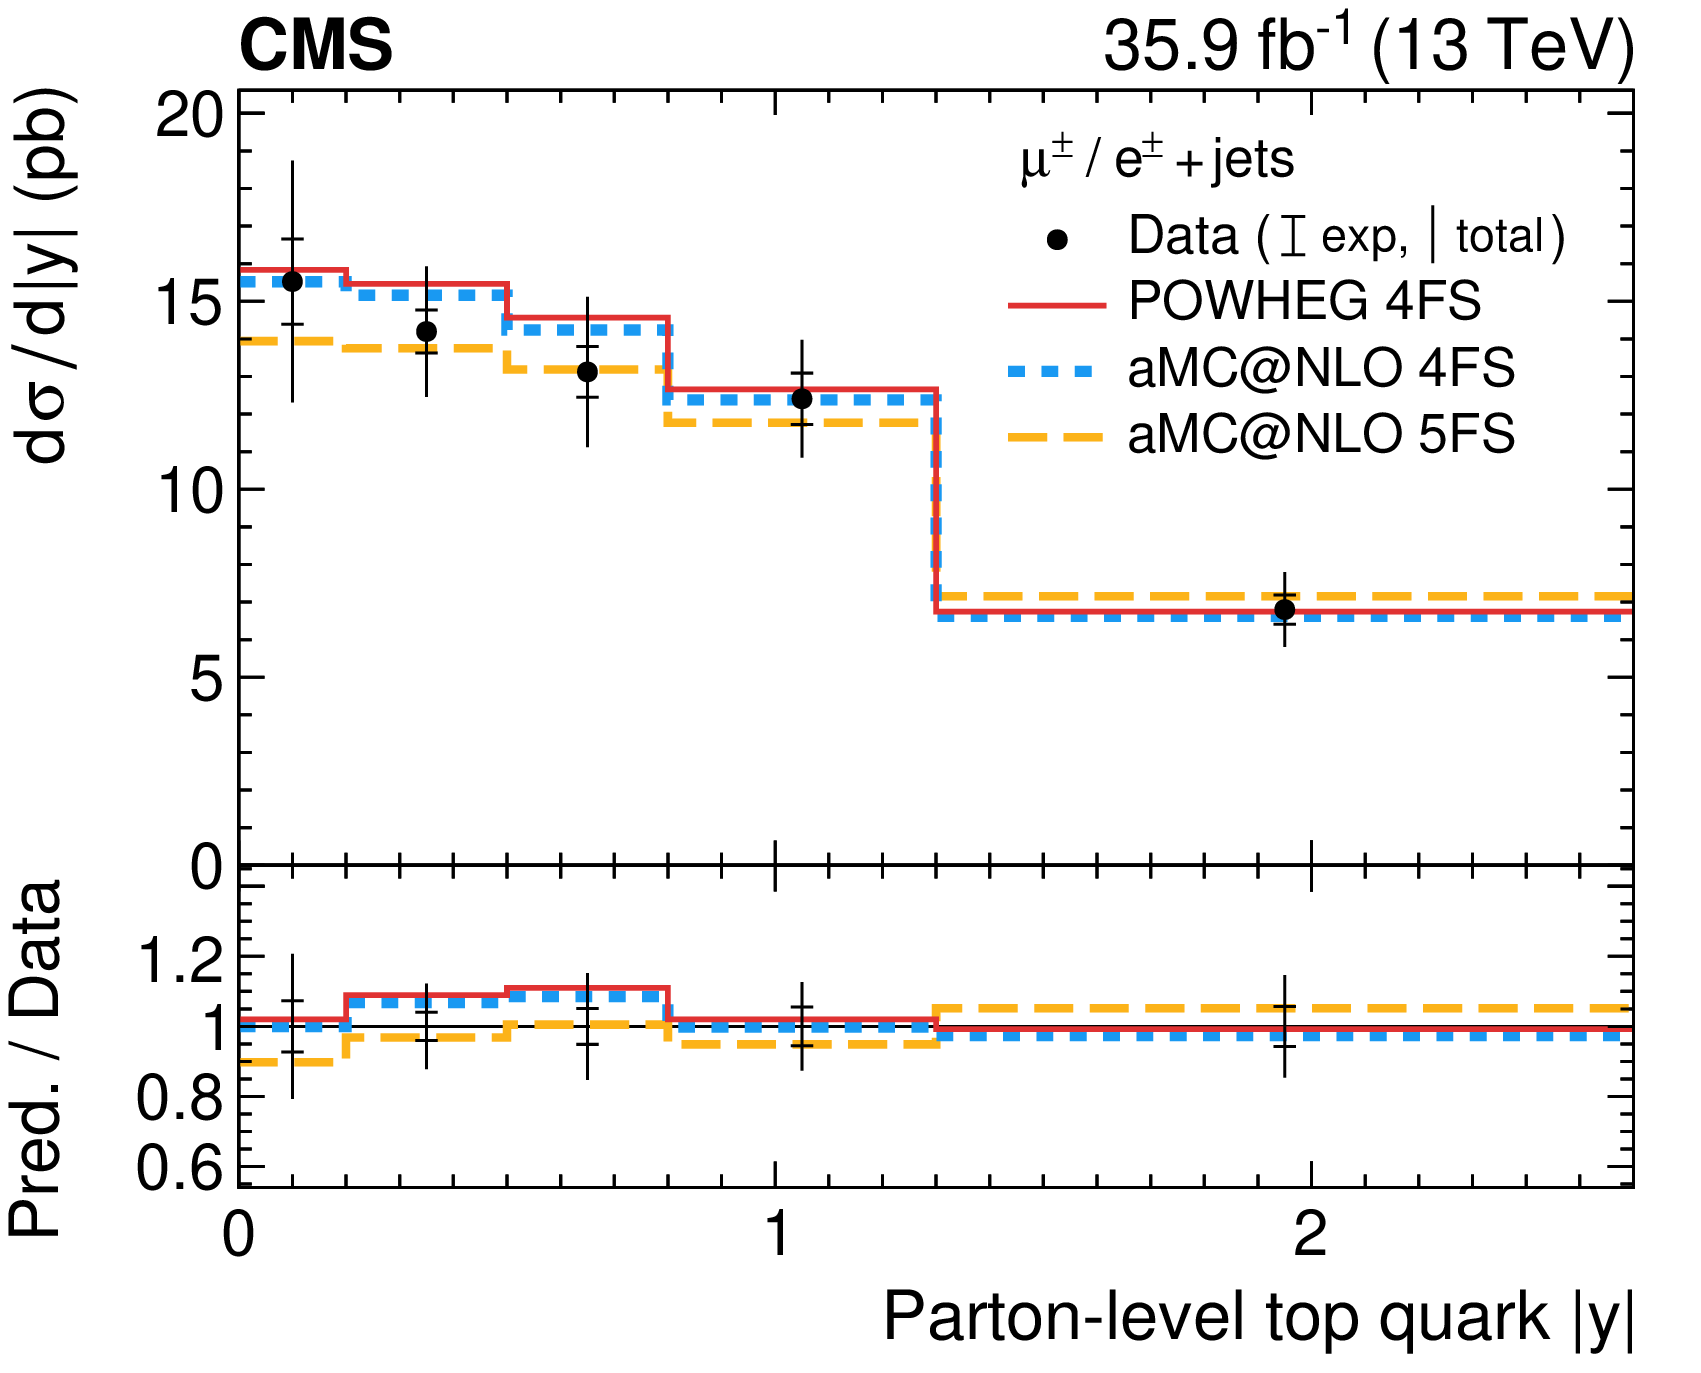
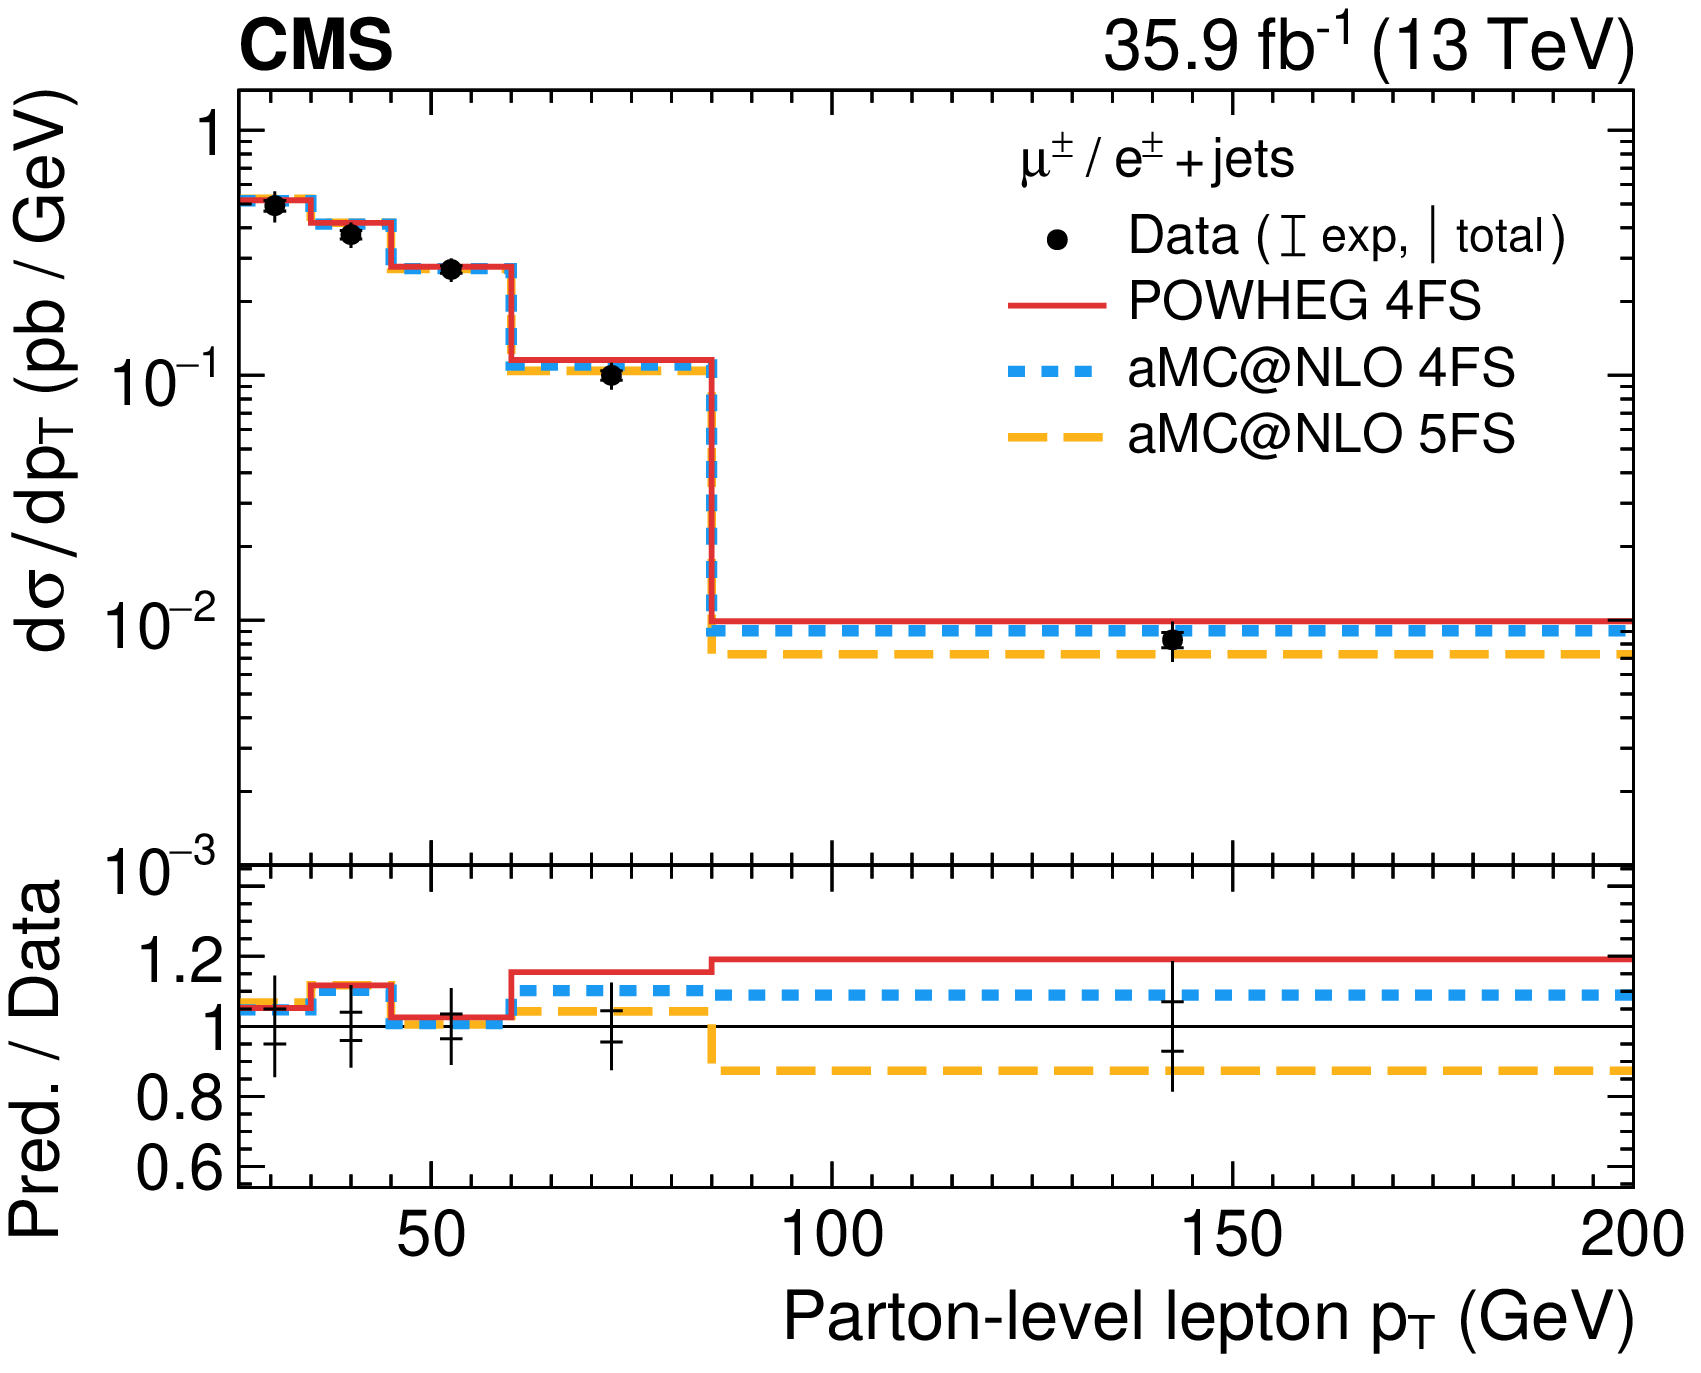
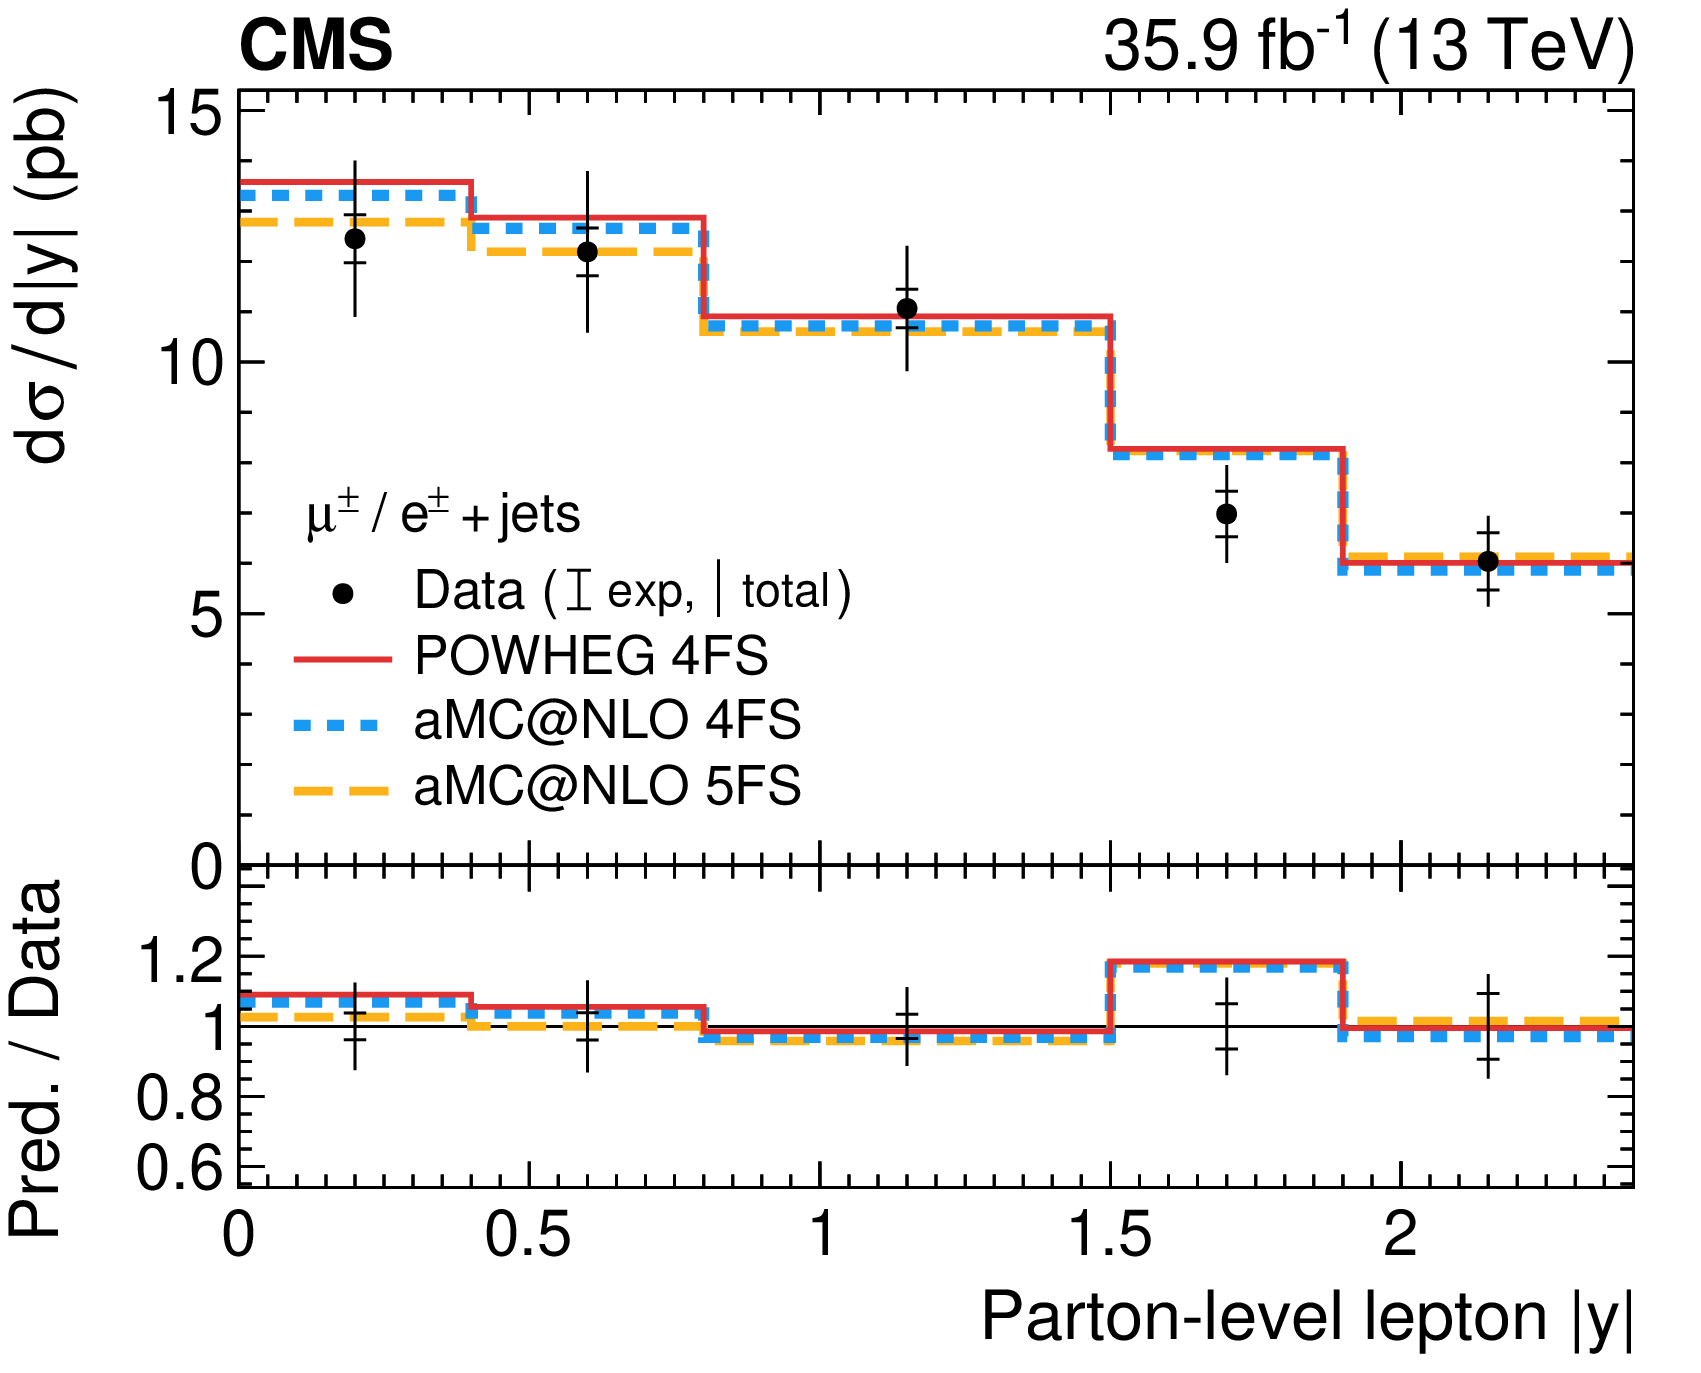
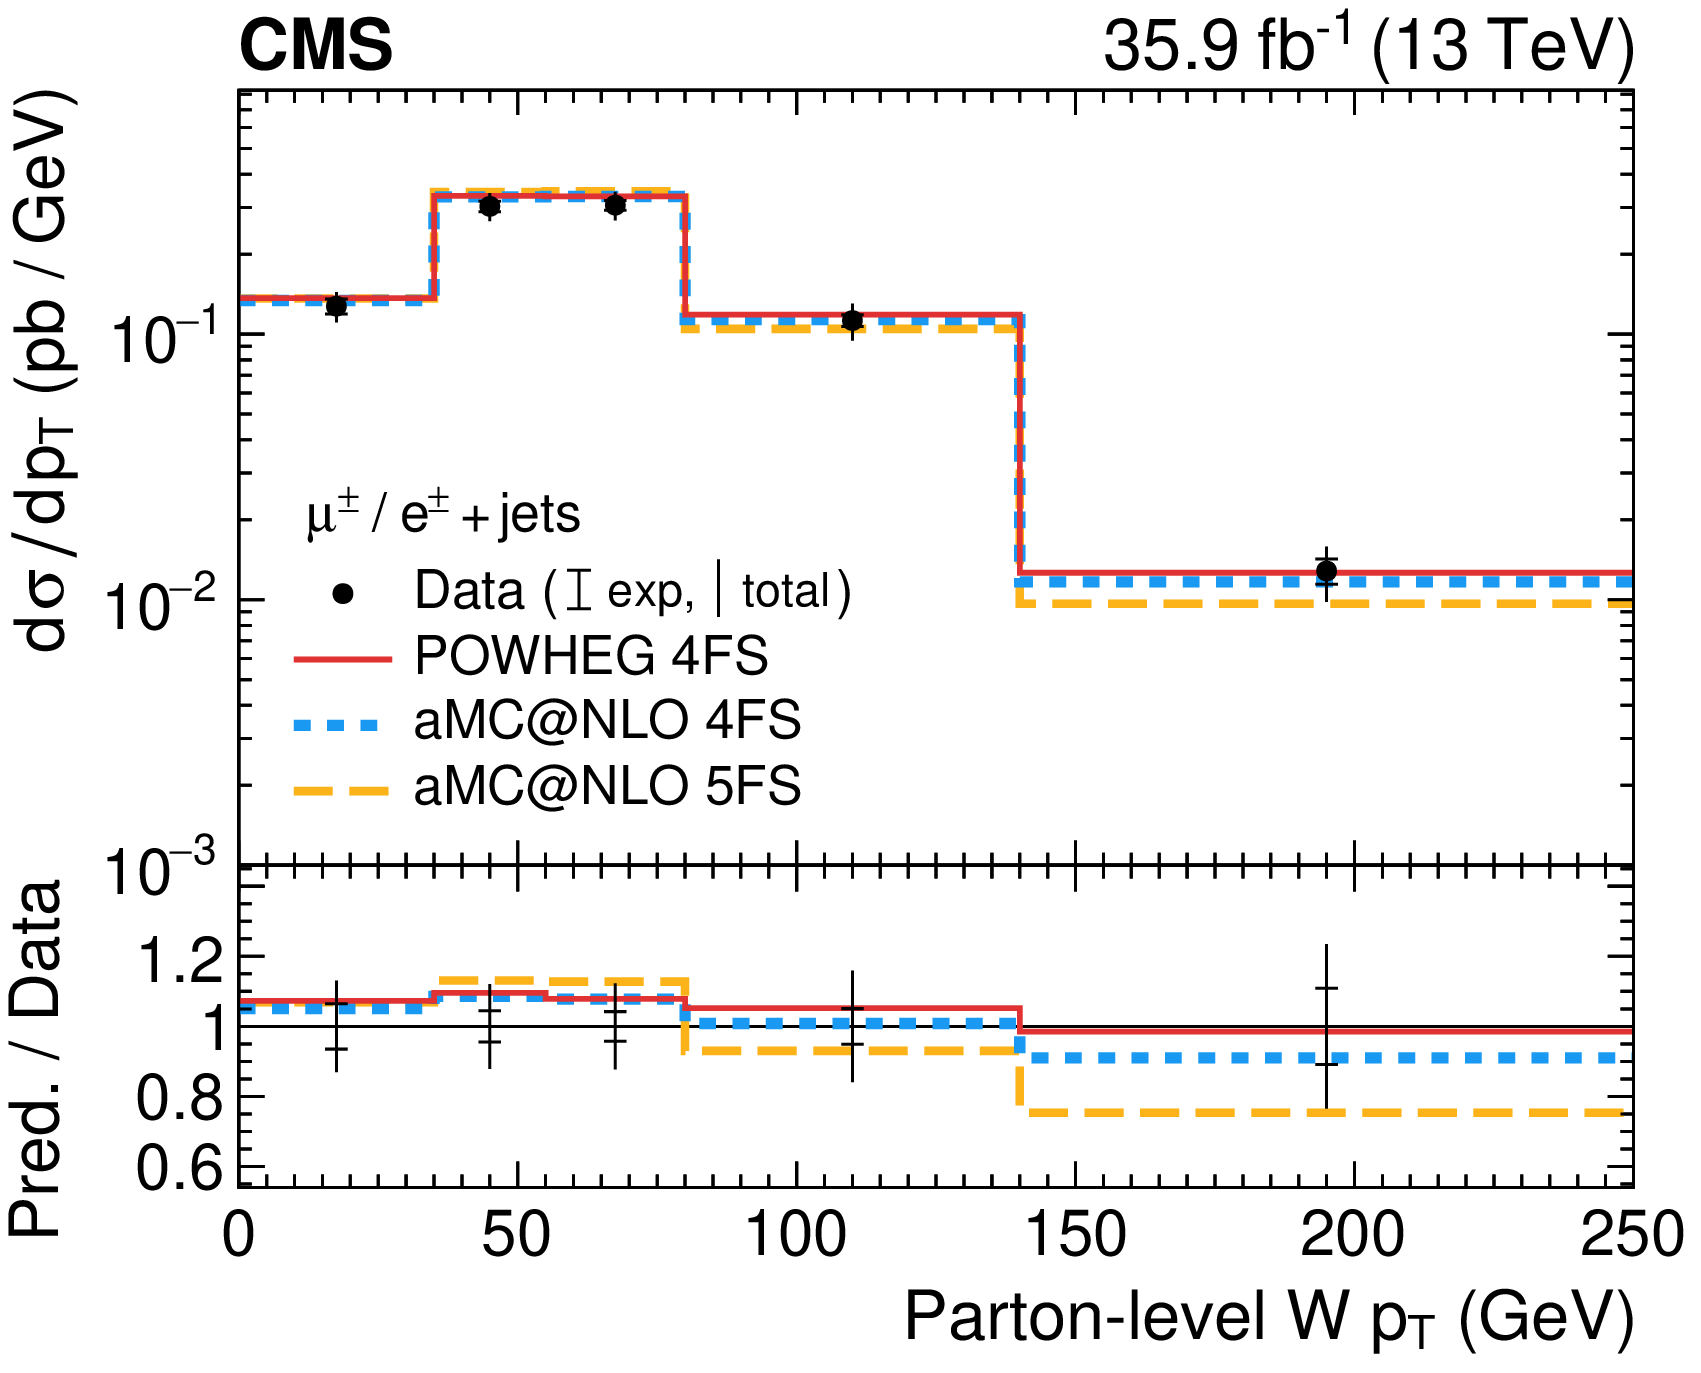
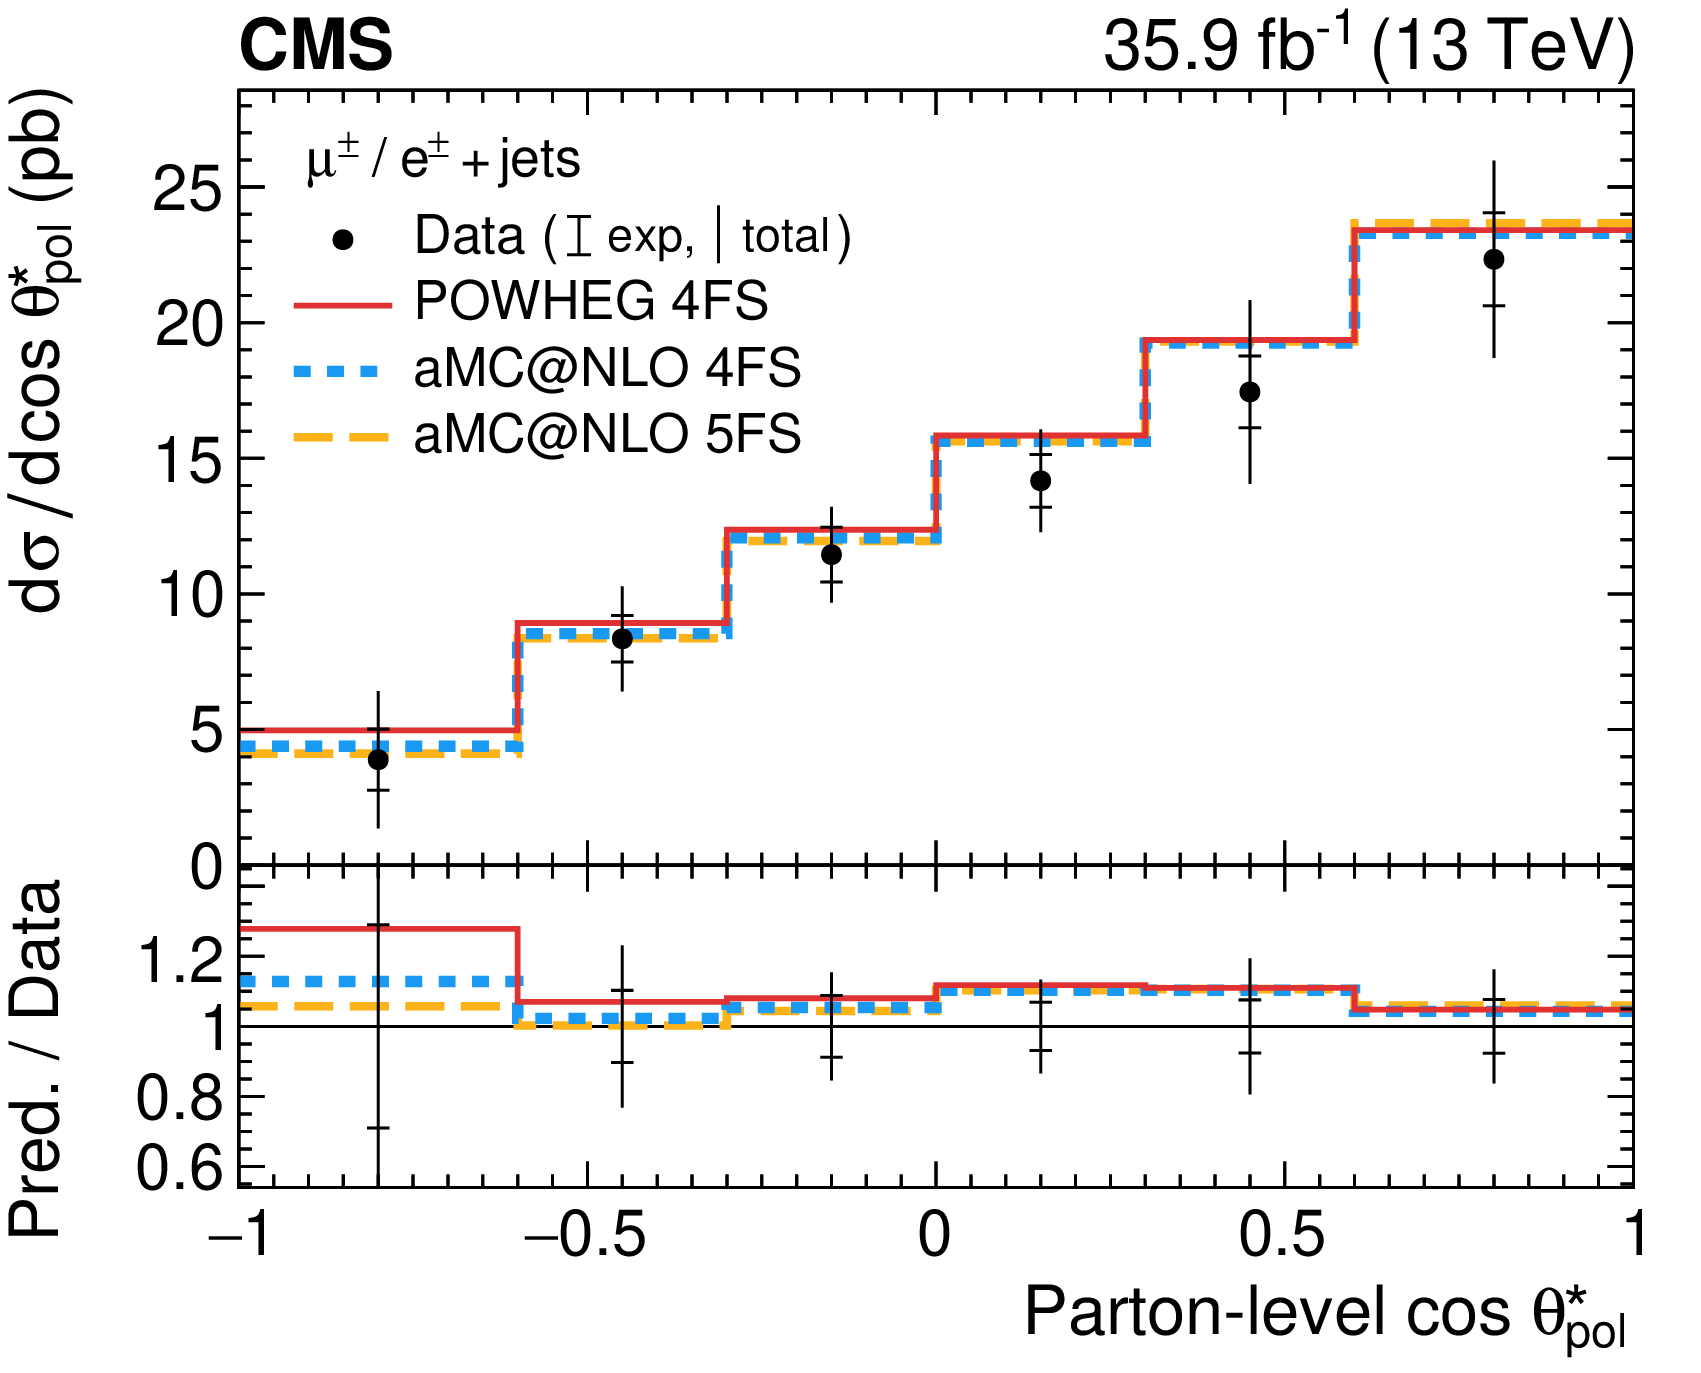
Differential cross sections for the sum of $t$-channel single top quark and antiquark production at the parton level: (upper row) top quark ${p_{\mathrm {T}}}$ and rapidity; (middle row) charged lepton ${p_{\mathrm {T}}}$ and rapidity; (lower left) W boson ${p_{\mathrm {T}}}$; (lower right) cosine of the top quark polarisation angle. The total uncertainty is indicated by the vertical lines, while horizontal bars indicate the statistical and experimental uncertainties, which have been profiled in the ML fit, and thus exclude the uncertainties in the theoretical modelling and the luminosity. Three different predictions from event generators are shown by the solid, dashed, and dotted lines. The lower panels show the ratios of the predictions to the data. |

png pdf |
Figure 7-a:
Differential cross sections for the sum of $t$-channel single top quark and antiquark production at the parton level: top quark ${p_{\mathrm {T}}}$.The total uncertainty is indicated by the vertical lines, while horizontal bars indicate the statistical and experimental uncertainties, which have been profiled in the ML fit, and thus exclude the uncertainties in the theoretical modelling and the luminosity. Three different predictions from event generators are shown by the solid, dashed, and dotted lines. The lower panel shows the ratios of the predictions to the data. |
png pdf |
Figure 7-b:
Differential cross sections for the sum of $t$-channel single top quark and antiquark production at the parton level: top quark rapidity. The total uncertainty is indicated by the vertical lines, while horizontal bars indicate the statistical and experimental uncertainties, which have been profiled in the ML fit, and thus exclude the uncertainties in the theoretical modelling and the luminosity. Three different predictions from event generators are shown by the solid, dashed, and dotted lines. The lower panel shows the ratios of the predictions to the data. |
png pdf |
Figure 7-c:
Differential cross sections for the sum of $t$-channel single top quark and antiquark production at the parton level: charged lepton ${p_{\mathrm {T}}}$. The total uncertainty is indicated by the vertical lines, while horizontal bars indicate the statistical and experimental uncertainties, which have been profiled in the ML fit, and thus exclude the uncertainties in the theoretical modelling and the luminosity. Three different predictions from event generators are shown by the solid, dashed, and dotted lines. The lower panel shows the ratios of the predictions to the data. |
png pdf |
Figure 7-d:
Differential cross sections for the sum of $t$-channel single top quark and antiquark production at the parton level: charged lepton rapidity. The total uncertainty is indicated by the vertical lines, while horizontal bars indicate the statistical and experimental uncertainties, which have been profiled in the ML fit, and thus exclude the uncertainties in the theoretical modelling and the luminosity. Three different predictions from event generators are shown by the solid, dashed, and dotted lines. The lower panel shows the ratios of the predictions to the data. |
png pdf |
Figure 7-e:
Differential cross sections for the sum of $t$-channel single top quark and antiquark production at the parton level: W boson ${p_{\mathrm {T}}}$. The total uncertainty is indicated by the vertical lines, while horizontal bars indicate the statistical and experimental uncertainties, which have been profiled in the ML fit, and thus exclude the uncertainties in the theoretical modelling and the luminosity. Three different predictions from event generators are shown by the solid, dashed, and dotted lines. The lower panel shows the ratios of the predictions to the data. |
png pdf |
Figure 7-f:
Differential cross sections for the sum of $t$-channel single top quark and antiquark production at the parton level: cosine of the top quark polarisation angle. The total uncertainty is indicated by the vertical lines, while horizontal bars indicate the statistical and experimental uncertainties, which have been profiled in the ML fit, and thus exclude the uncertainties in the theoretical modelling and the luminosity. Three different predictions from event generators are shown by the solid, dashed, and dotted lines. The lower panel shows the ratios of the predictions to the data. |
png pdf |
Figure 8:
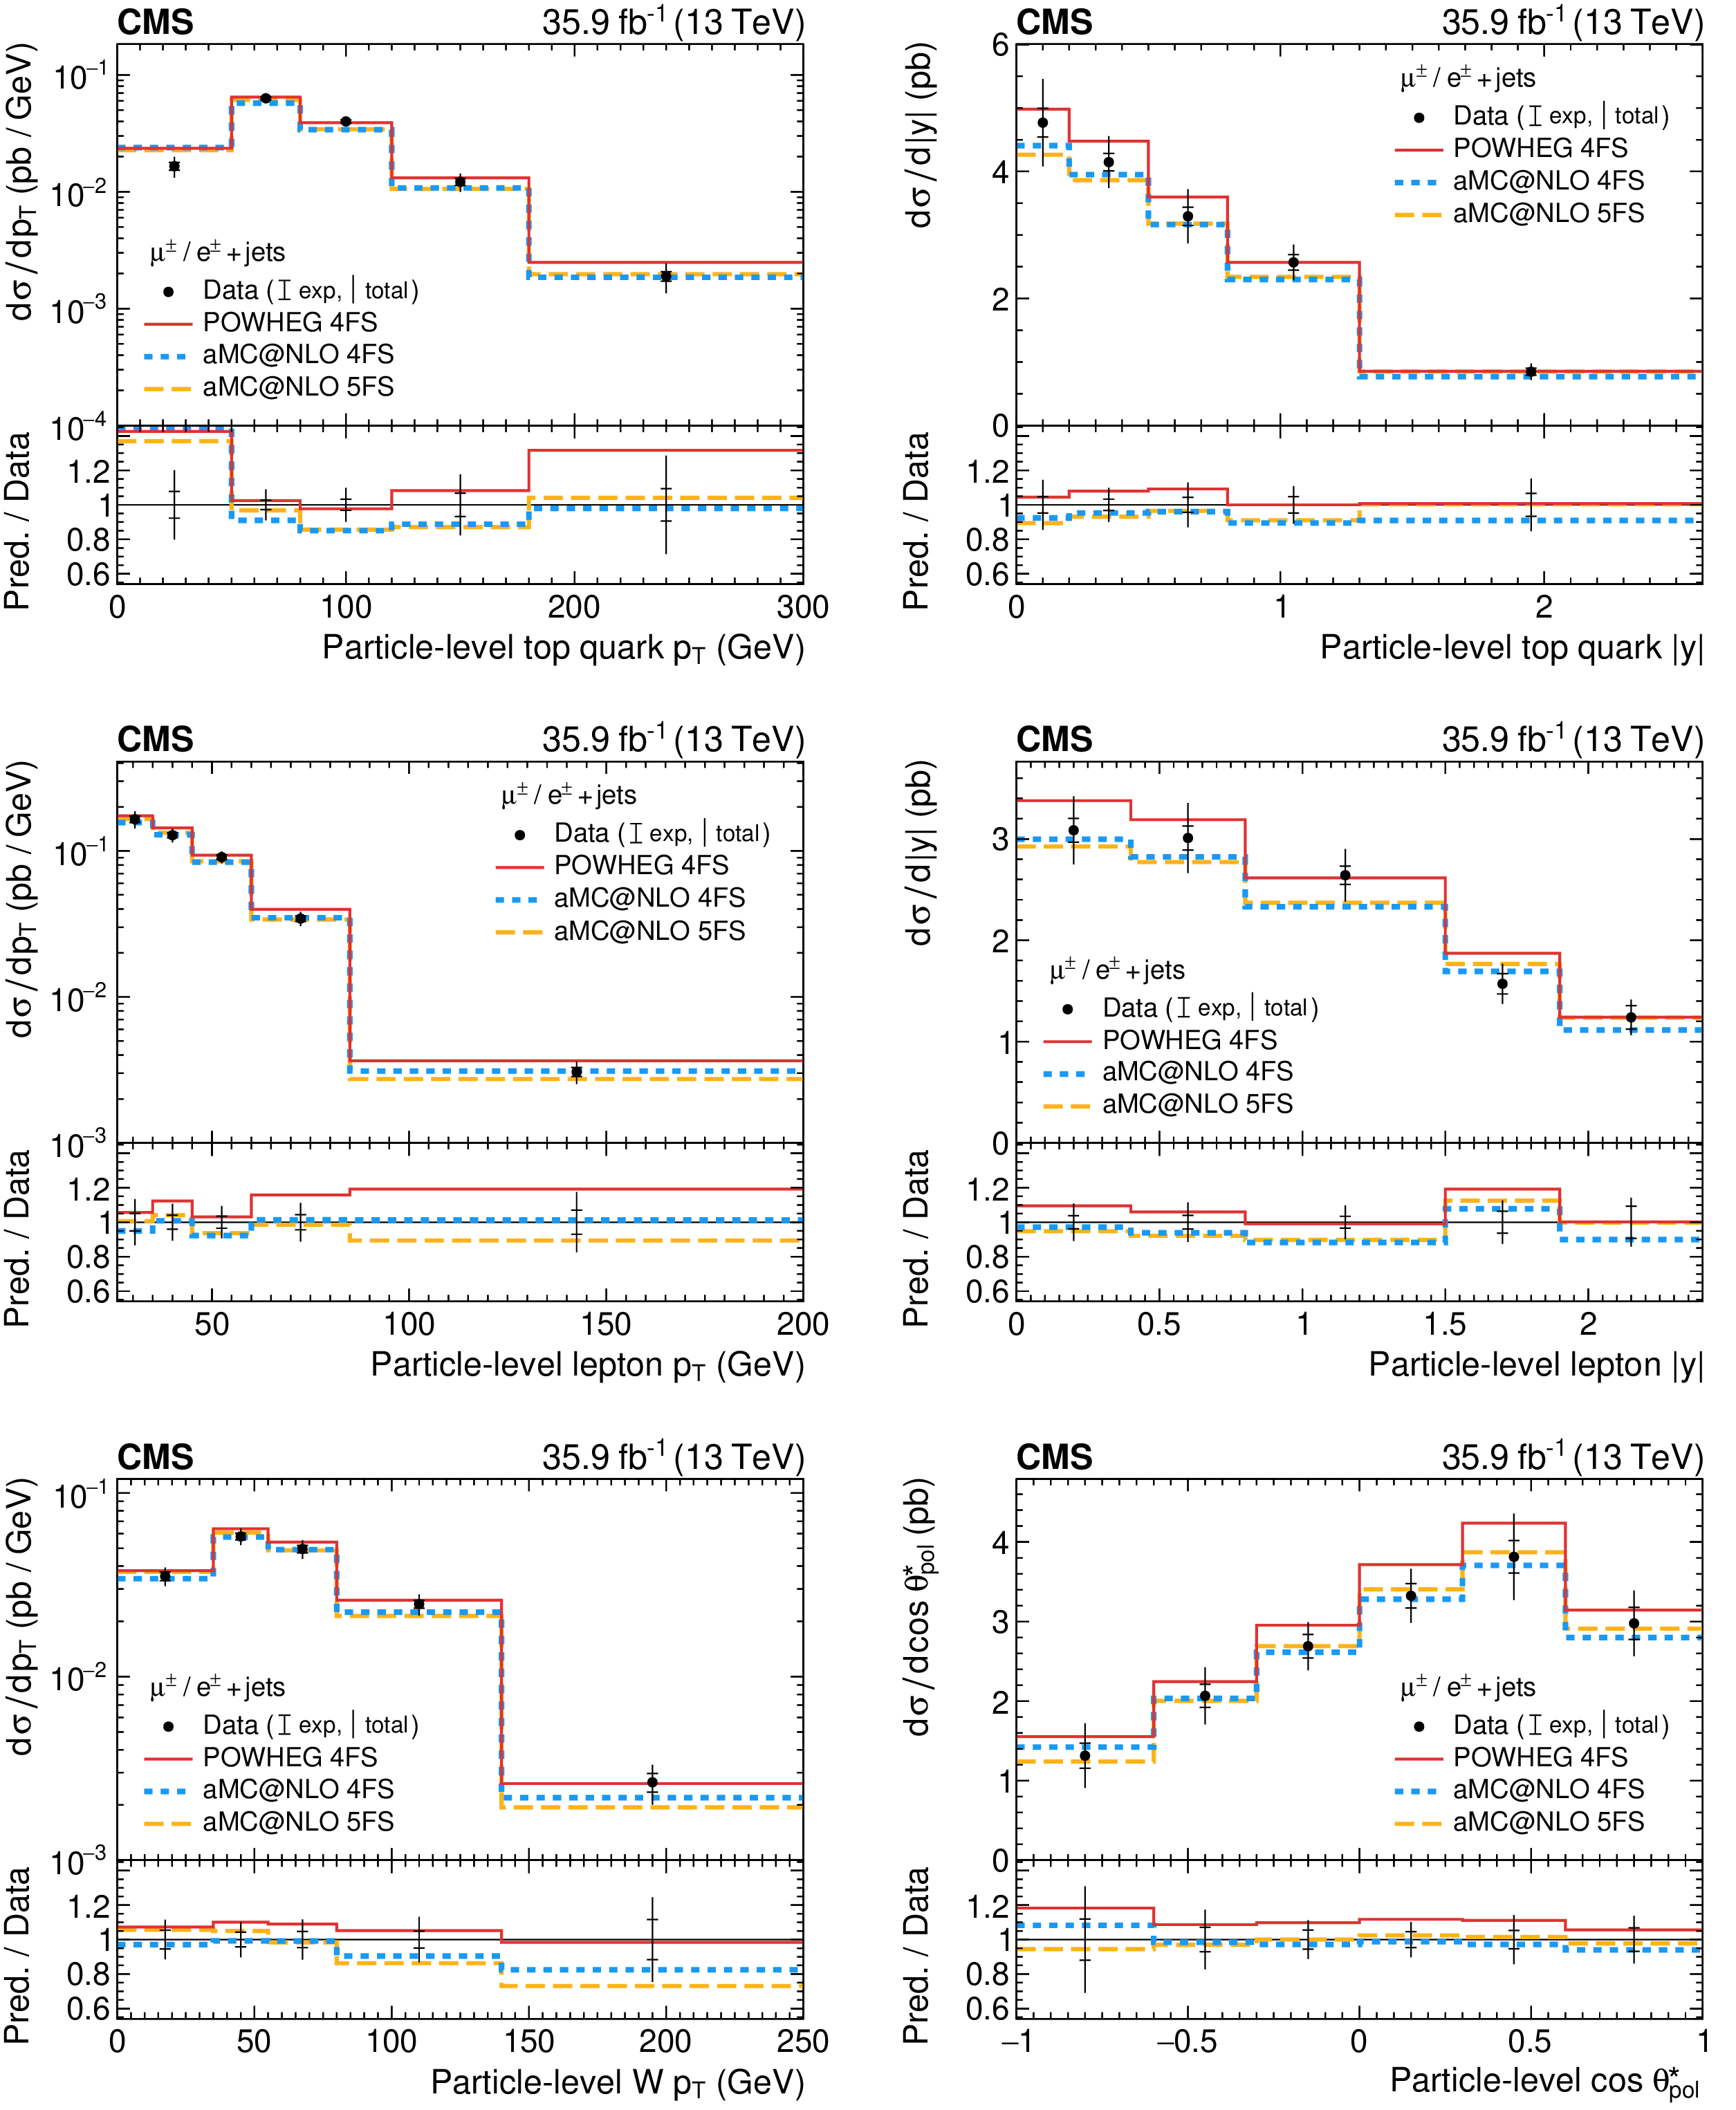
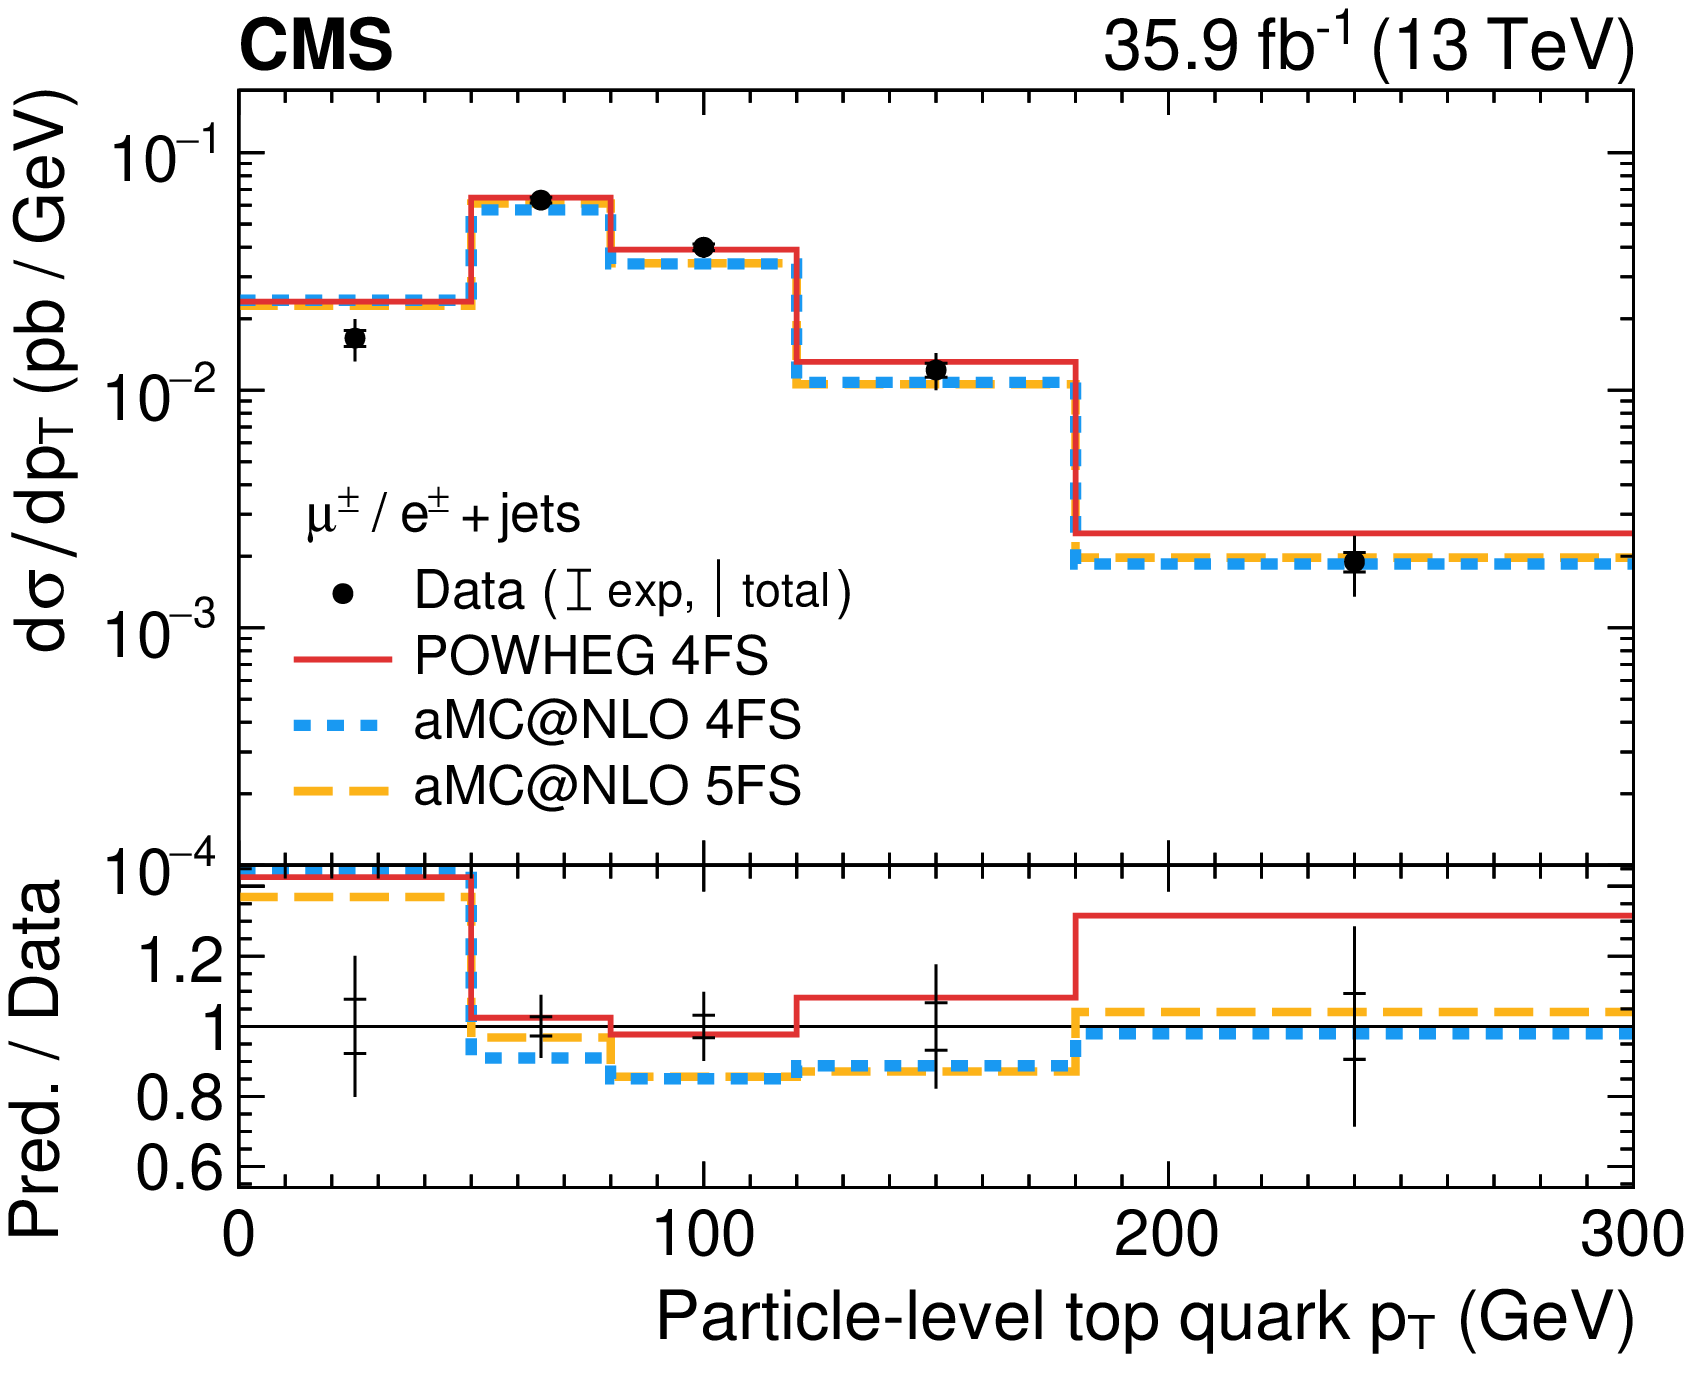
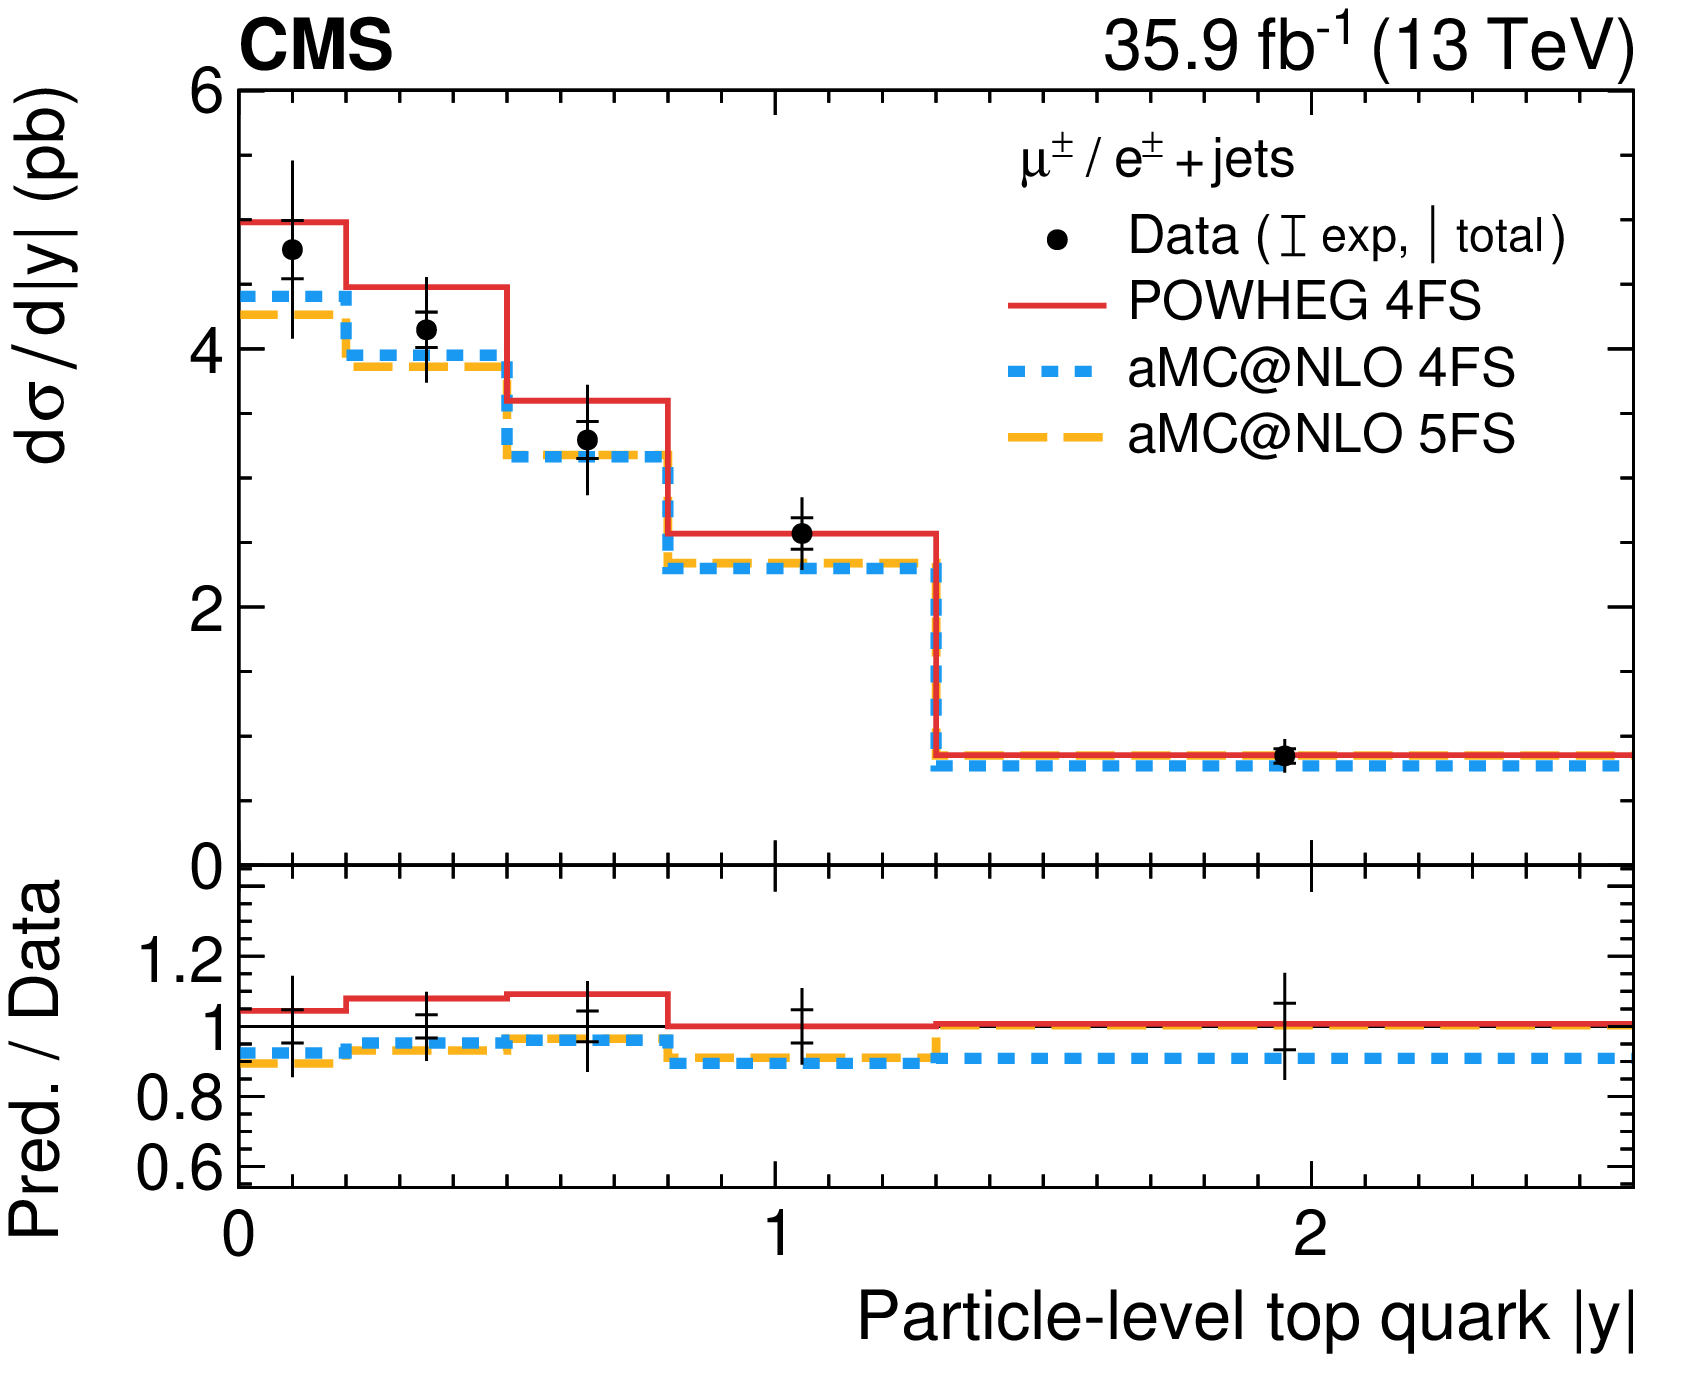
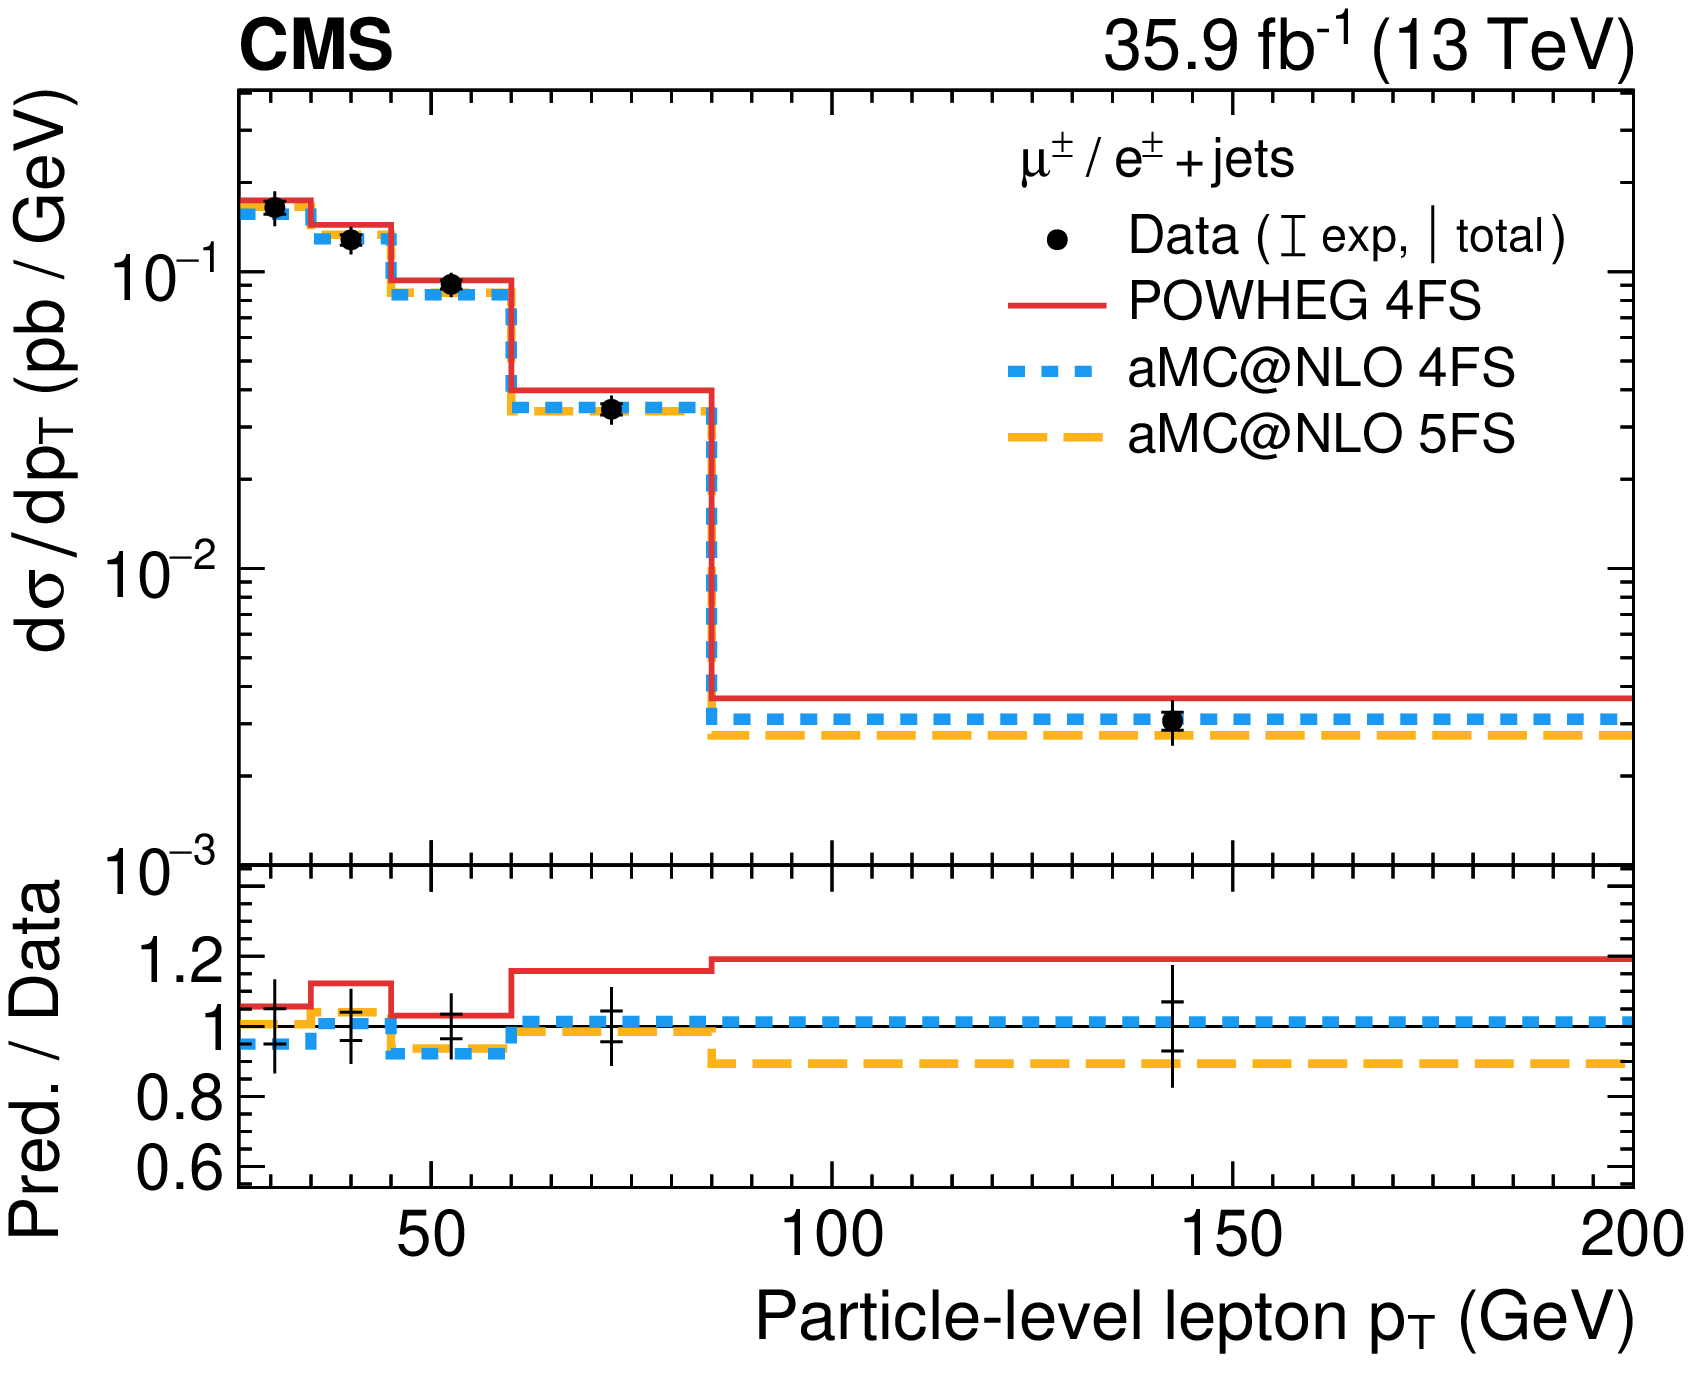
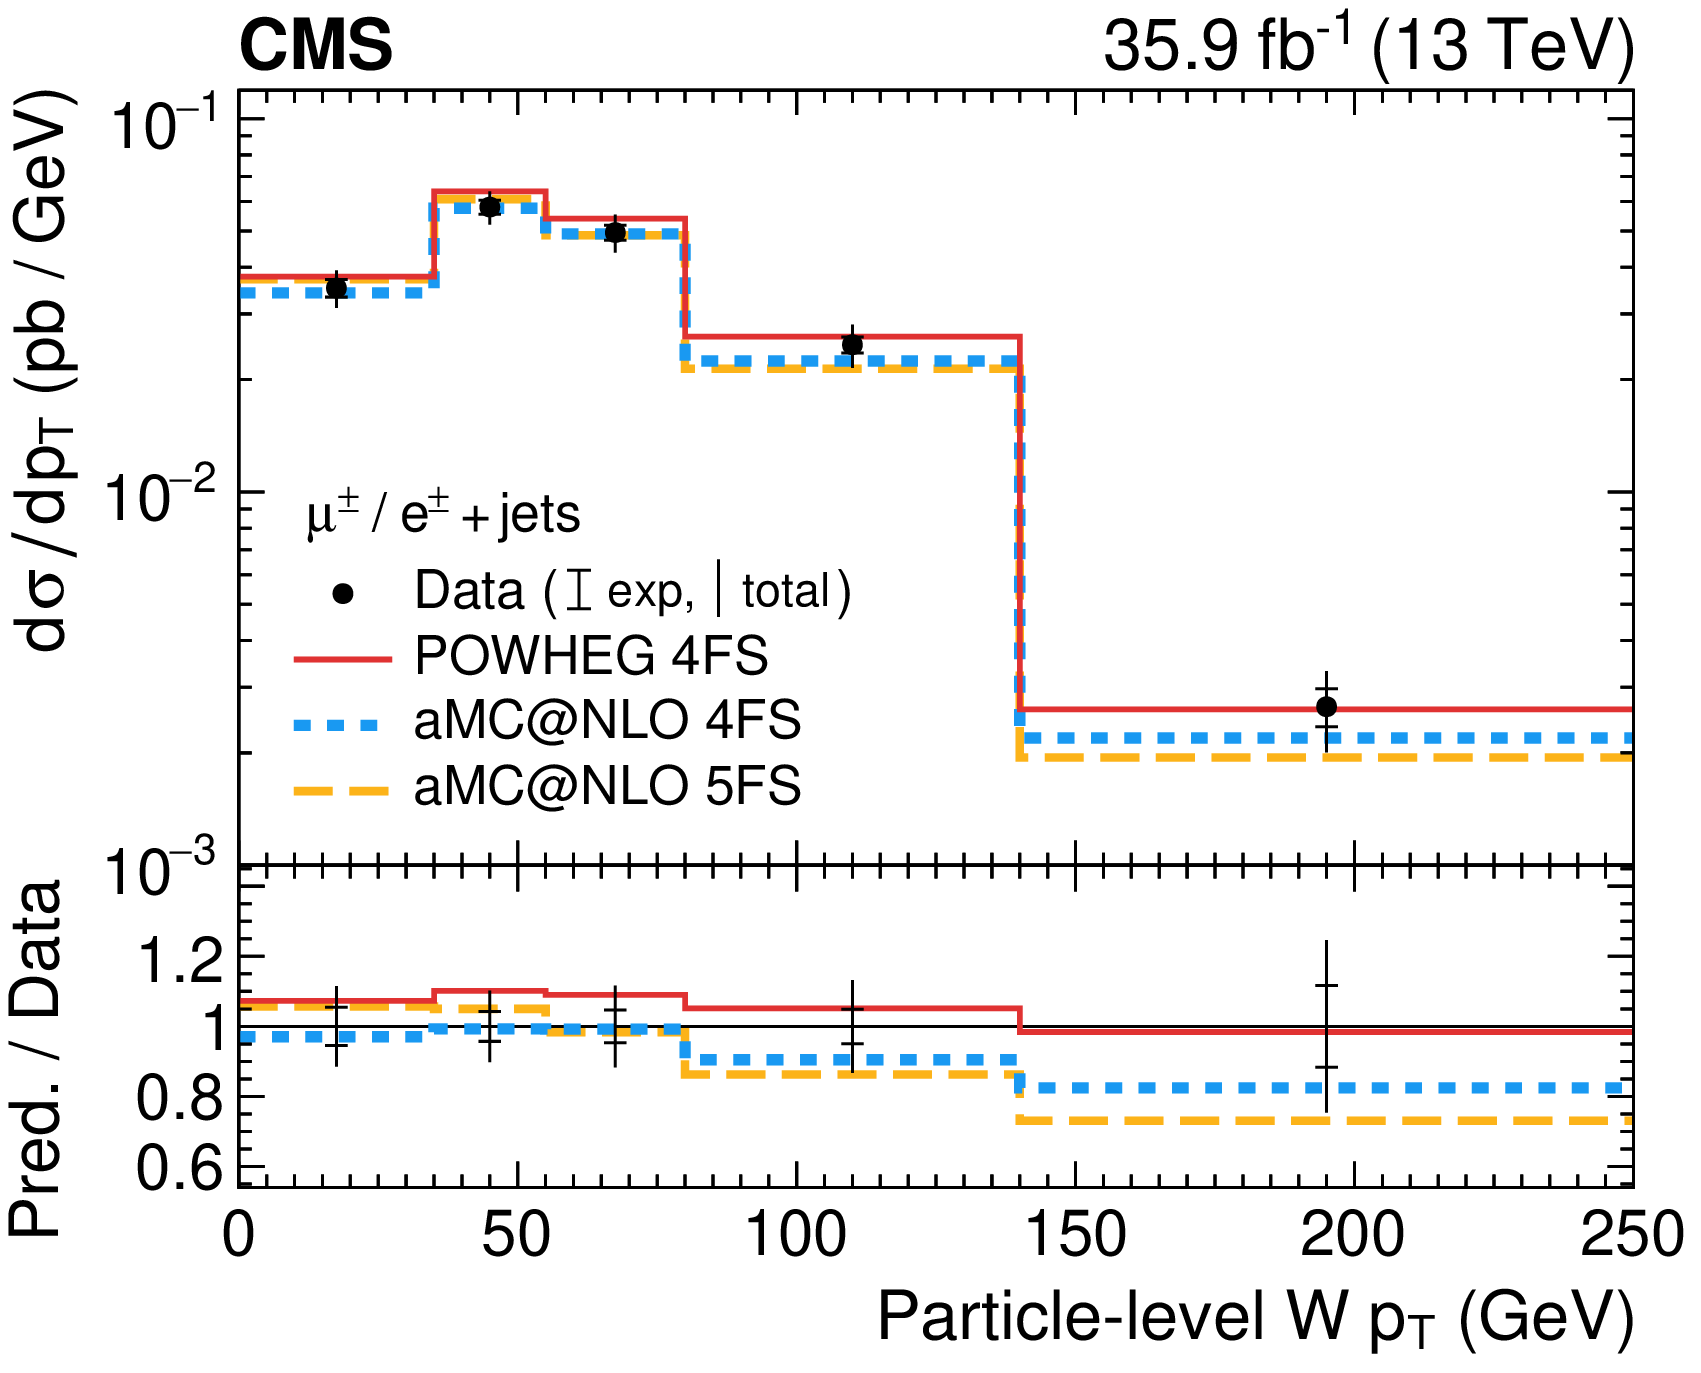
Differential cross sections for the sum of $t$-channel single top quark and antiquark production at the particle level: (upper row) top quark ${p_{\mathrm {T}}}$ and rapidity; (middle row) charged lepton ${p_{\mathrm {T}}}$ and rapidity; (lower left) W boson ${p_{\mathrm {T}}}$; (lower right) cosine of the top quark polarisation angle. The total uncertainty is indicated by the vertical lines, while horizontal bars indicate the statistical and experimental uncertainties, which have been profiled in the ML fit, and thus exclude the uncertainties in the theoretical modelling and the luminosity. Three different predictions from event generators are shown by the solid, dashed, and dotted lines. The lower panels show the ratios of the predictions to the data. |
png pdf |
Figure 8-a:
Differential cross sections for the sum of $t$-channel single top quark and antiquark production at the particle level: top quark ${p_{\mathrm {T}}}$. The total uncertainty is indicated by the vertical lines, while horizontal bars indicate the statistical and experimental uncertainties, which have been profiled in the ML fit, and thus exclude the uncertainties in the theoretical modelling and the luminosity. Three different predictions from event generators are shown by the solid, dashed, and dotted lines. The lower panel shows the ratios of the predictions to the data. |
png pdf |
Figure 8-b:
Differential cross sections for the sum of $t$-channel single top quark and antiquark production at the particle level: top quark rapidity. The total uncertainty is indicated by the vertical lines, while horizontal bars indicate the statistical and experimental uncertainties, which have been profiled in the ML fit, and thus exclude the uncertainties in the theoretical modelling and the luminosity. Three different predictions from event generators are shown by the solid, dashed, and dotted lines. The lower panel shows the ratios of the predictions to the data. |
png pdf |
Figure 8-c:
Differential cross sections for the sum of $t$-channel single top quark and antiquark production at the particle level: charged lepton ${p_{\mathrm {T}}}$. The total uncertainty is indicated by the vertical lines, while horizontal bars indicate the statistical and experimental uncertainties, which have been profiled in the ML fit, and thus exclude the uncertainties in the theoretical modelling and the luminosity. Three different predictions from event generators are shown by the solid, dashed, and dotted lines. The lower panel shows the ratios of the predictions to the data. |

png pdf |
Figure 8-d:
Differential cross sections for the sum of $t$-channel single top quark and antiquark production at the particle level: charged lepton rapidity. The total uncertainty is indicated by the vertical lines, while horizontal bars indicate the statistical and experimental uncertainties, which have been profiled in the ML fit, and thus exclude the uncertainties in the theoretical modelling and the luminosity. Three different predictions from event generators are shown by the solid, dashed, and dotted lines. The lower panel shows the ratios of the predictions to the data. |
png pdf |
Figure 8-e:
Differential cross sections for the sum of $t$-channel single top quark and antiquark production at the particle level: W boson ${p_{\mathrm {T}}}$. The total uncertainty is indicated by the vertical lines, while horizontal bars indicate the statistical and experimental uncertainties, which have been profiled in the ML fit, and thus exclude the uncertainties in the theoretical modelling and the luminosity. Three different predictions from event generators are shown by the solid, dashed, and dotted lines. The lower panel shows the ratios of the predictions to the data. |
png pdf |
Figure 8-f:
Differential cross sections for the sum of $t$-channel single top quark and antiquark production at the particle level: cosine of the top quark polarisation angle. The total uncertainty is indicated by the vertical lines, while horizontal bars indicate the statistical and experimental uncertainties, which have been profiled in the ML fit, and thus exclude the uncertainties in the theoretical modelling and the luminosity. Three different predictions from event generators are shown by the solid, dashed, and dotted lines. The lower panel shows the ratios of the predictions to the data. |

png pdf |
Figure 9:
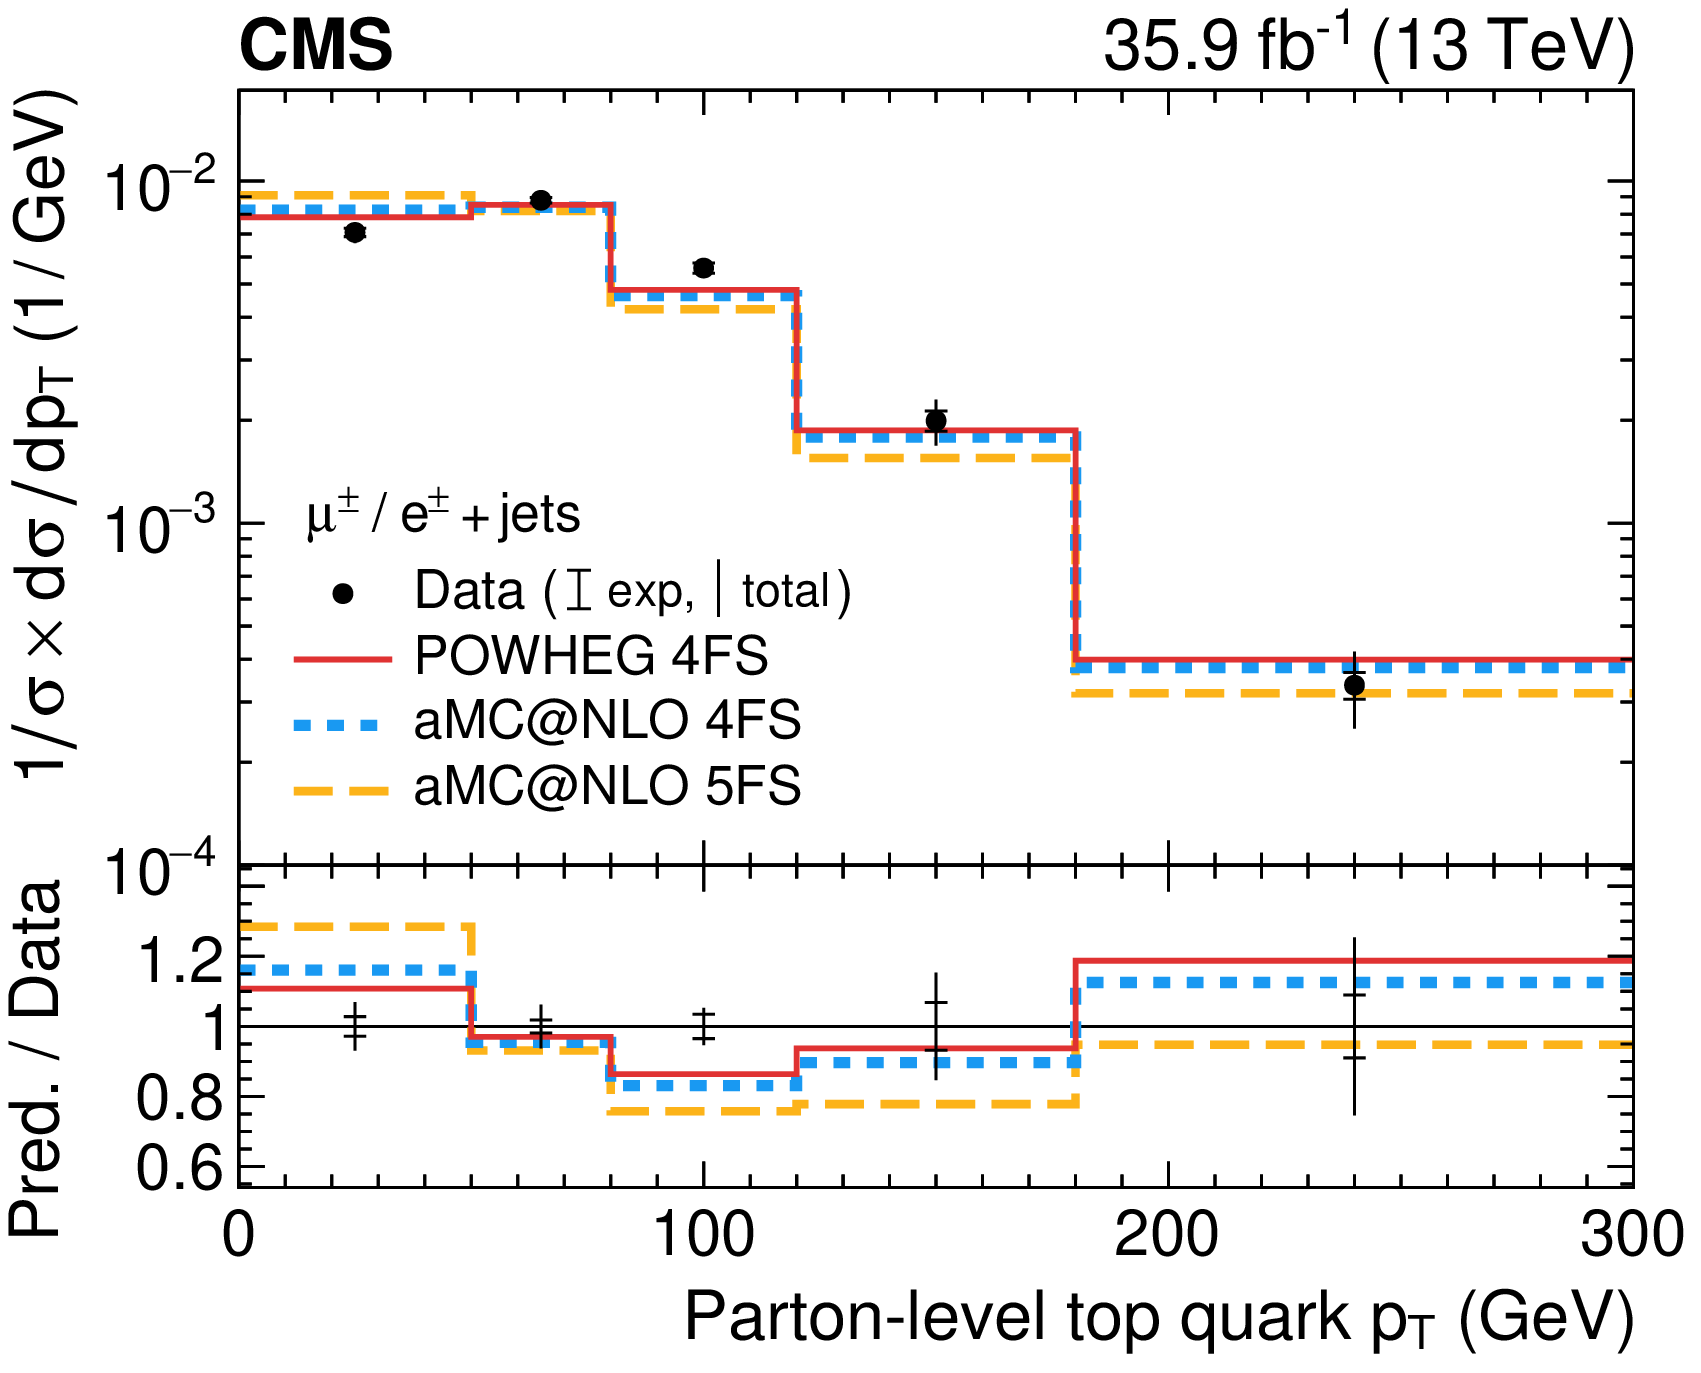
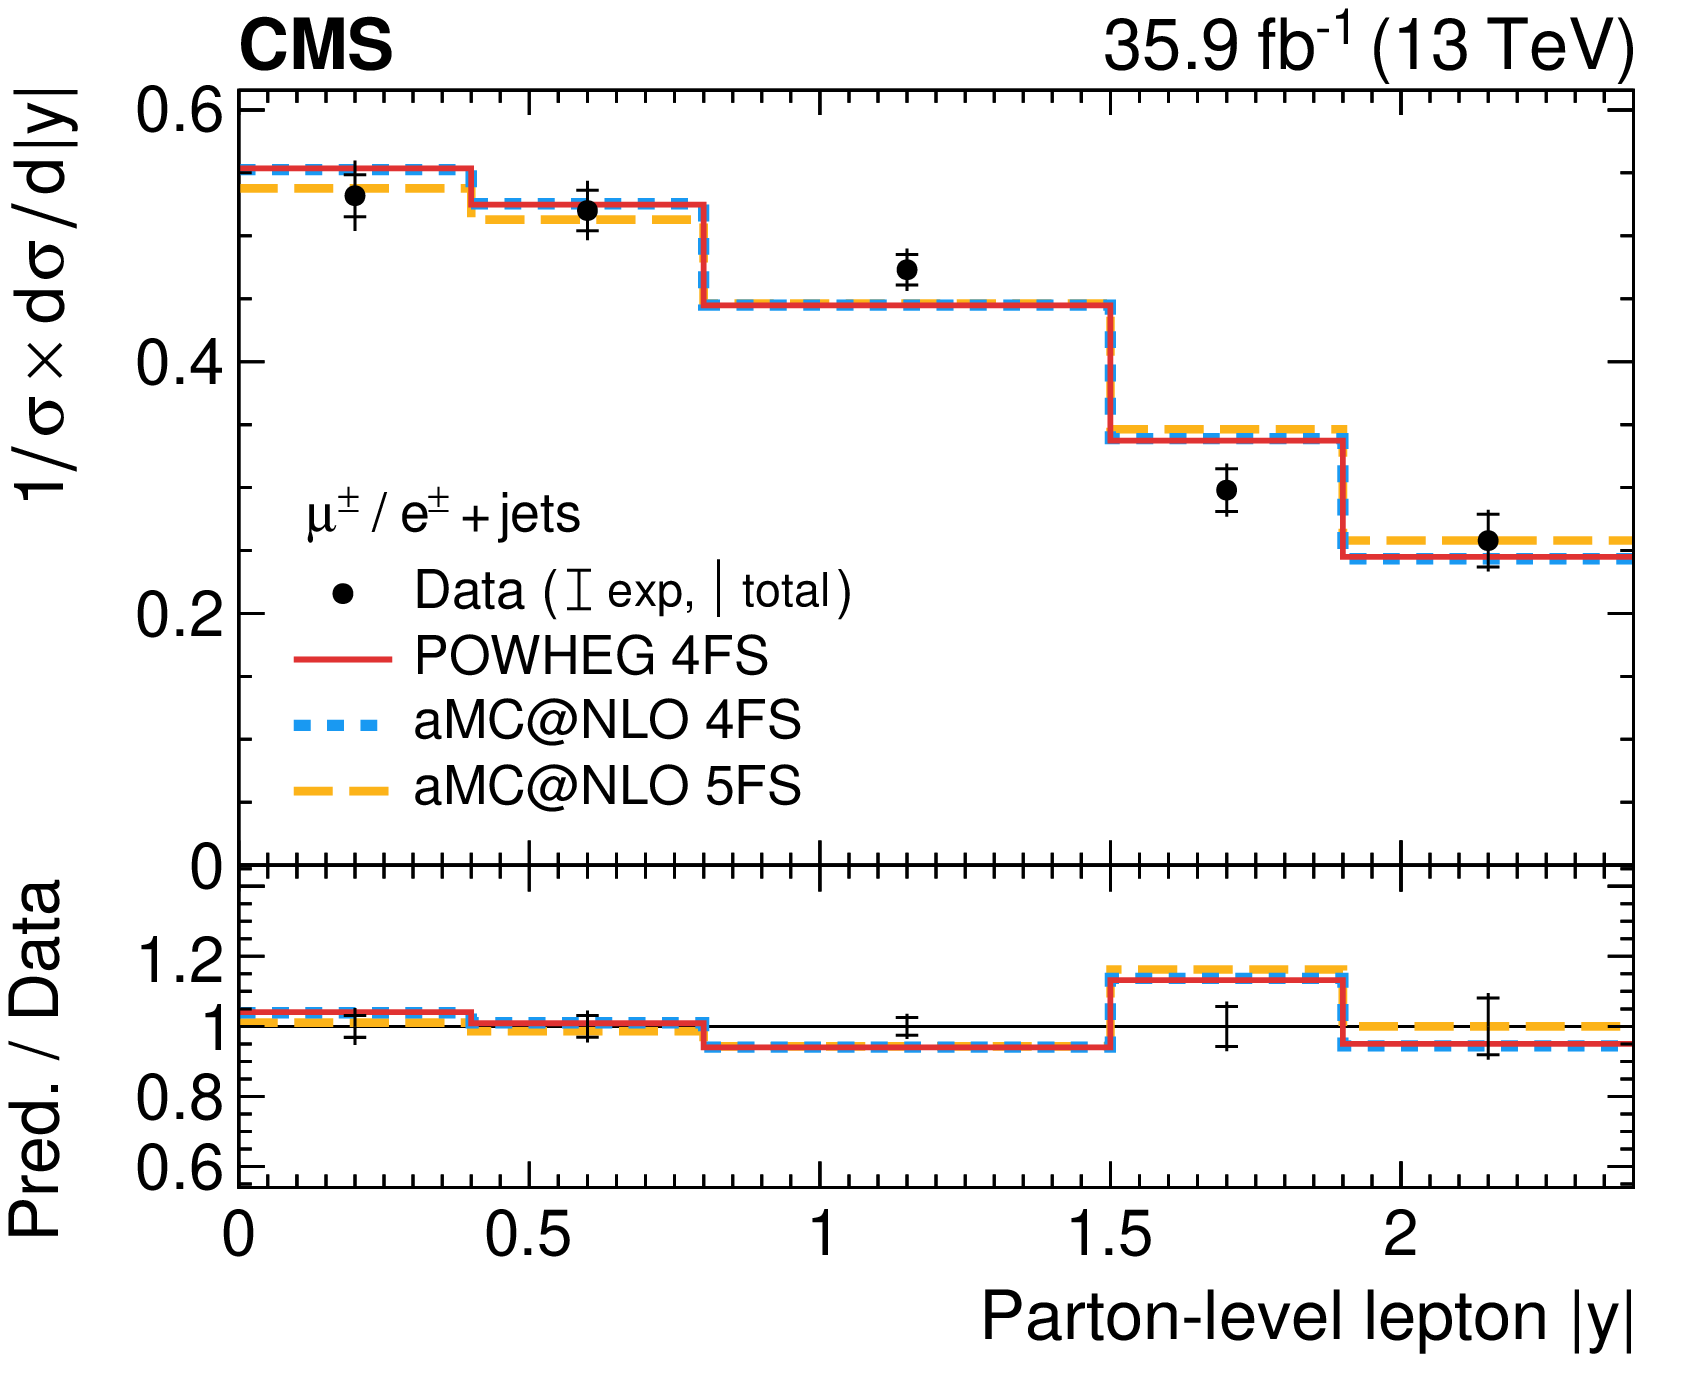
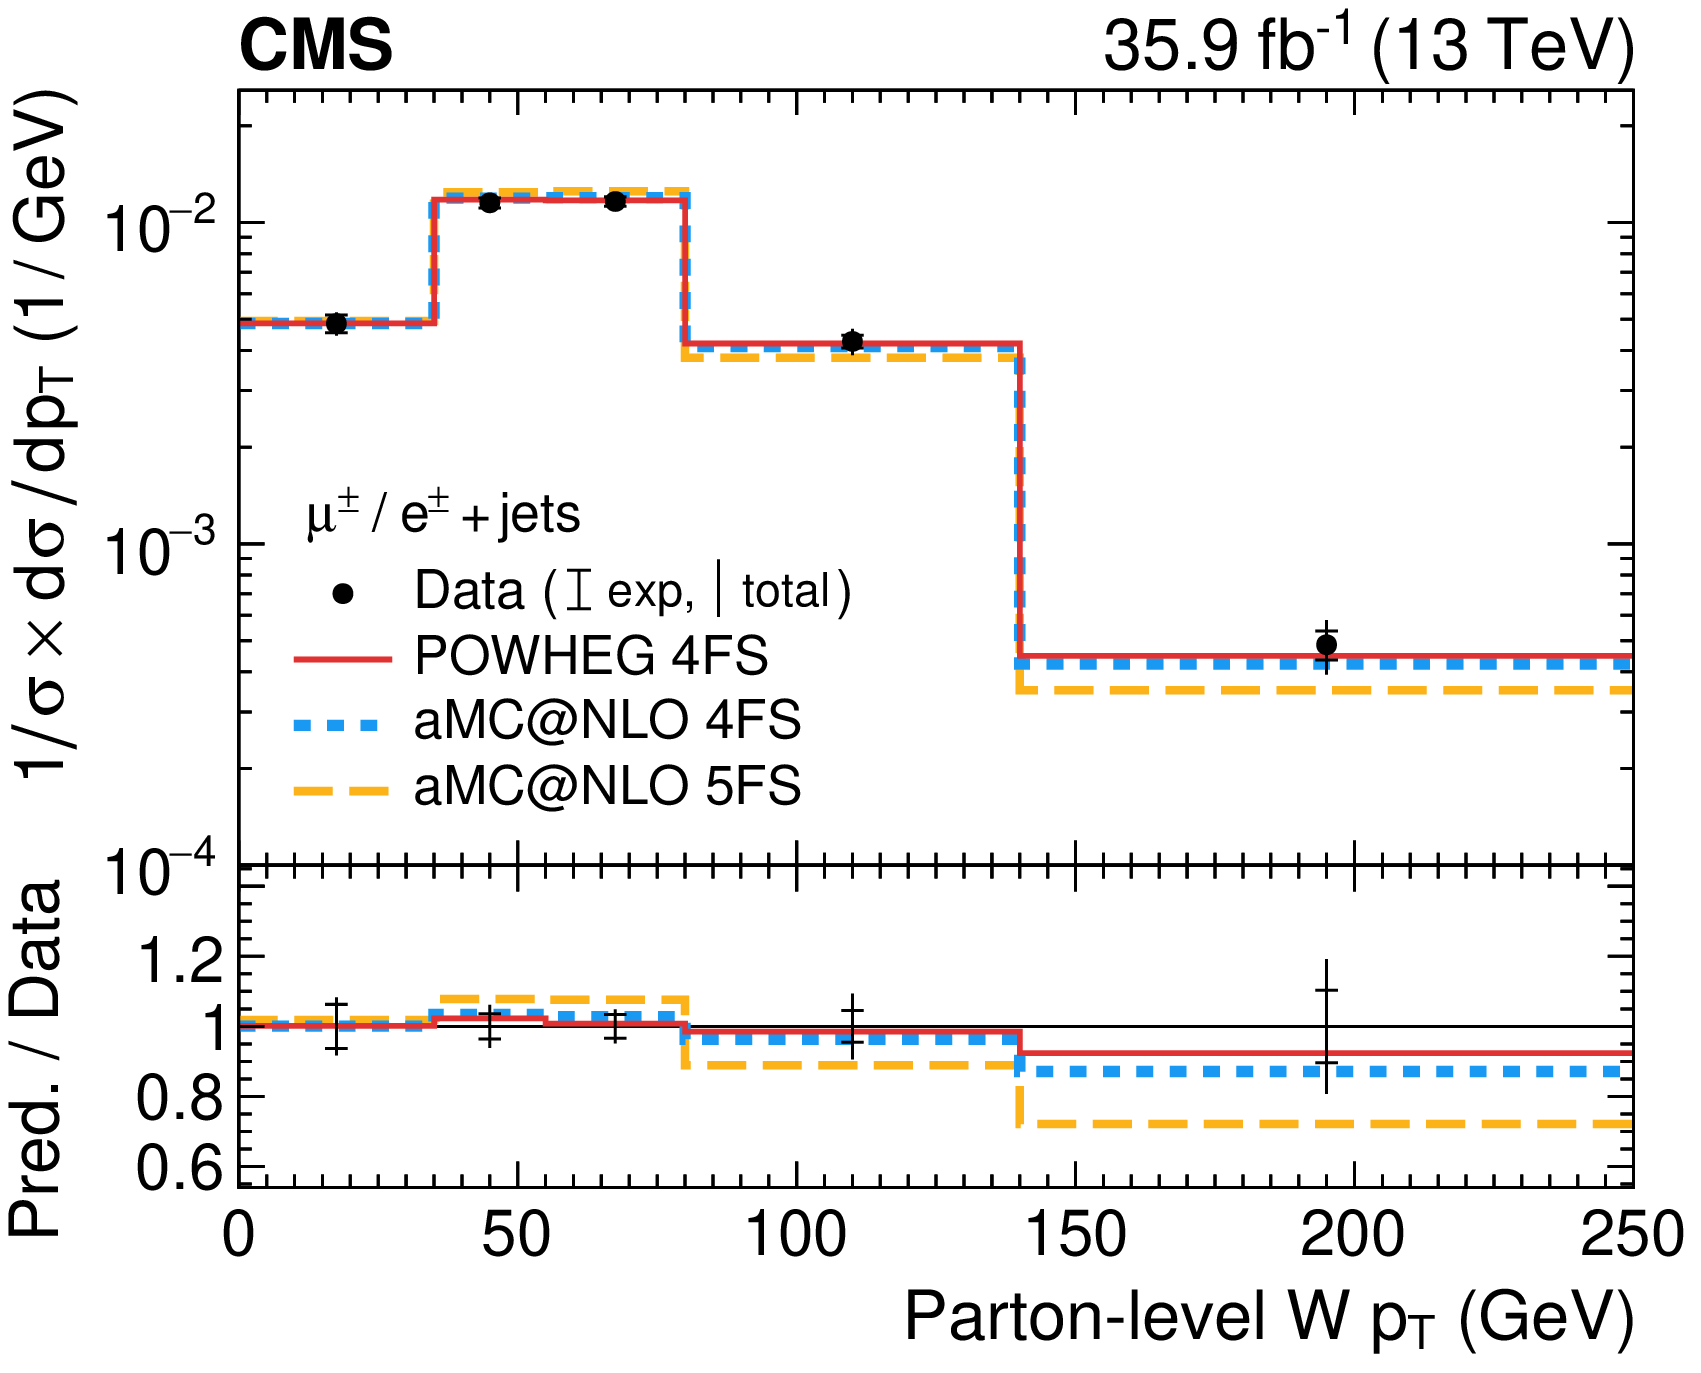
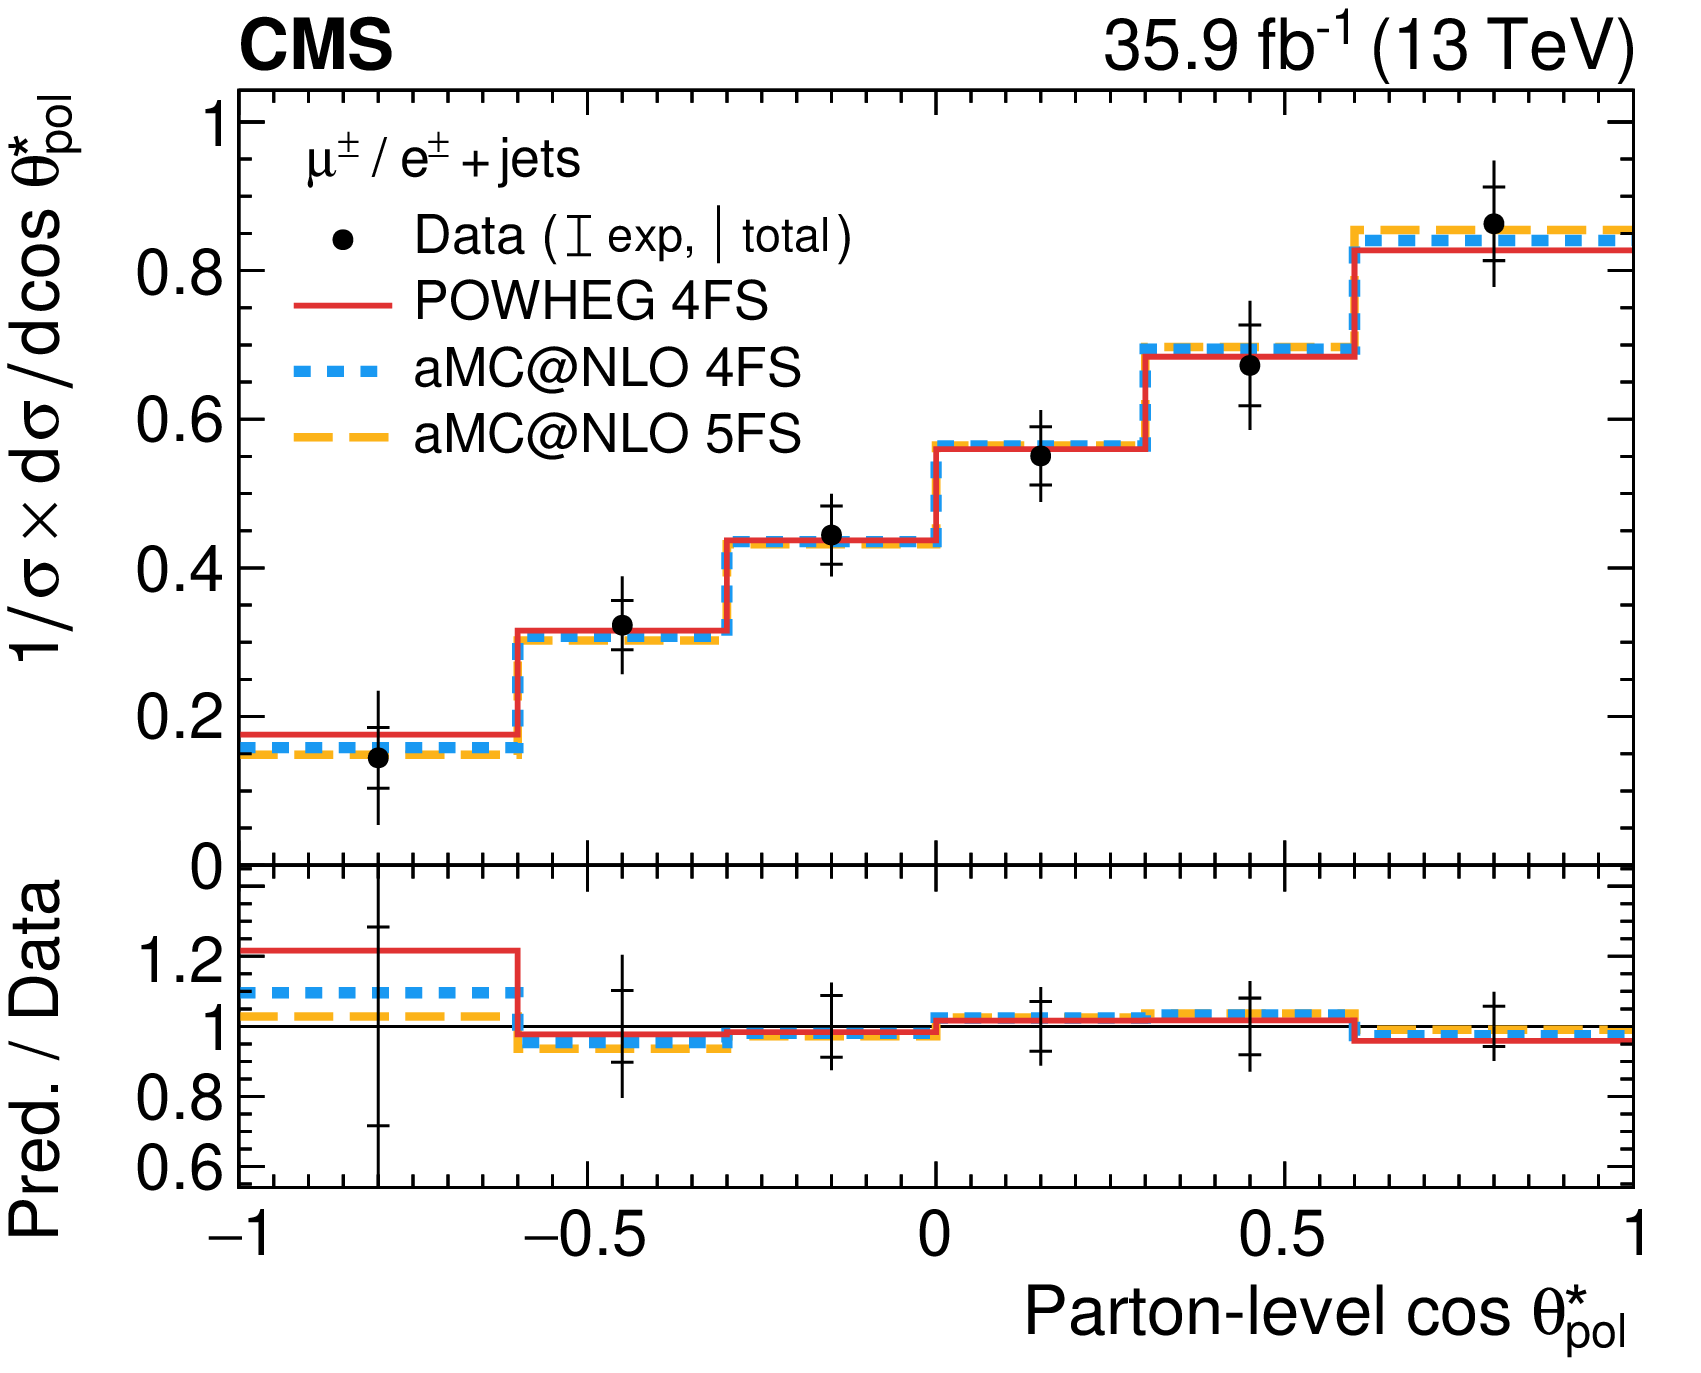
Normalised differential cross sections for the sum of $t$-channel single top quark and antiquark production at the parton level: (upper row) top quark ${p_{\mathrm {T}}}$ and rapidity; (middle row) charged lepton ${p_{\mathrm {T}}}$ and rapidity; (lower left) W boson ${p_{\mathrm {T}}}$; (lower right) cosine of the top quark polarisation angle. The total uncertainty is indicated by the vertical lines, while horizontal bars indicate the statistical and experimental uncertainties, which have been profiled in the ML fit, and thus exclude the uncertainties in the theoretical modelling. Three different predictions from event generators are shown by the solid, dashed, and dotted lines. The lower panels show the ratios of the predictions to the data. |
png pdf |
Figure 9-a:
Normalised differential cross sections for the sum of $t$-channel single top quark and antiquark production at the parton level: top quark ${p_{\mathrm {T}}}$. The total uncertainty is indicated by the vertical lines, while horizontal bars indicate the statistical and experimental uncertainties, which have been profiled in the ML fit, and thus exclude the uncertainties in the theoretical modelling. Three different predictions from event generators are shown by the solid, dashed, and dotted lines. The lower panel shows the ratios of the predictions to the data. |
png pdf |
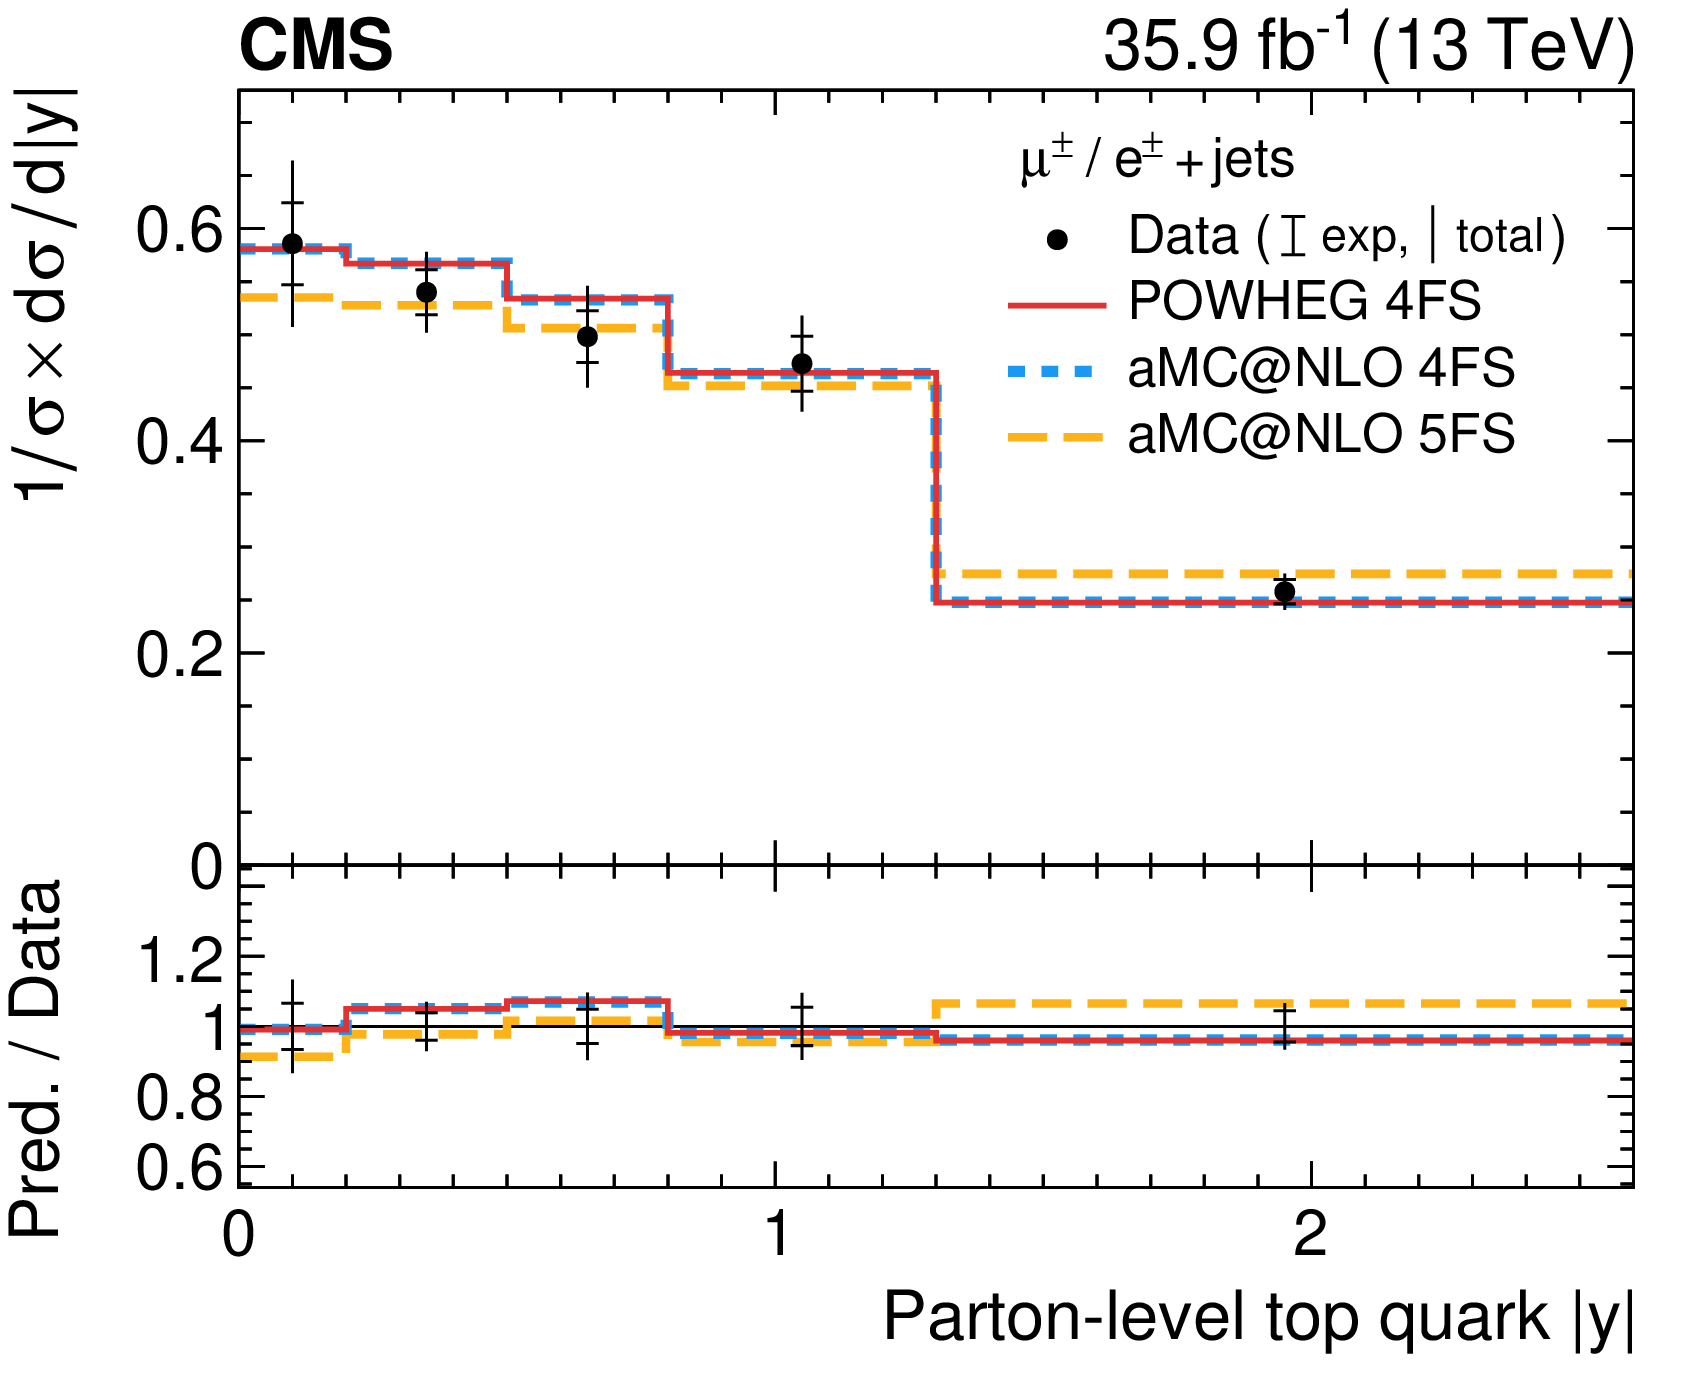
Figure 9-b:
Normalised differential cross sections for the sum of $t$-channel single top quark and antiquark production at the parton level: top quark rapidity. The total uncertainty is indicated by the vertical lines, while horizontal bars indicate the statistical and experimental uncertainties, which have been profiled in the ML fit, and thus exclude the uncertainties in the theoretical modelling. Three different predictions from event generators are shown by the solid, dashed, and dotted lines. The lower panel shows the ratios of the predictions to the data. |
png pdf |
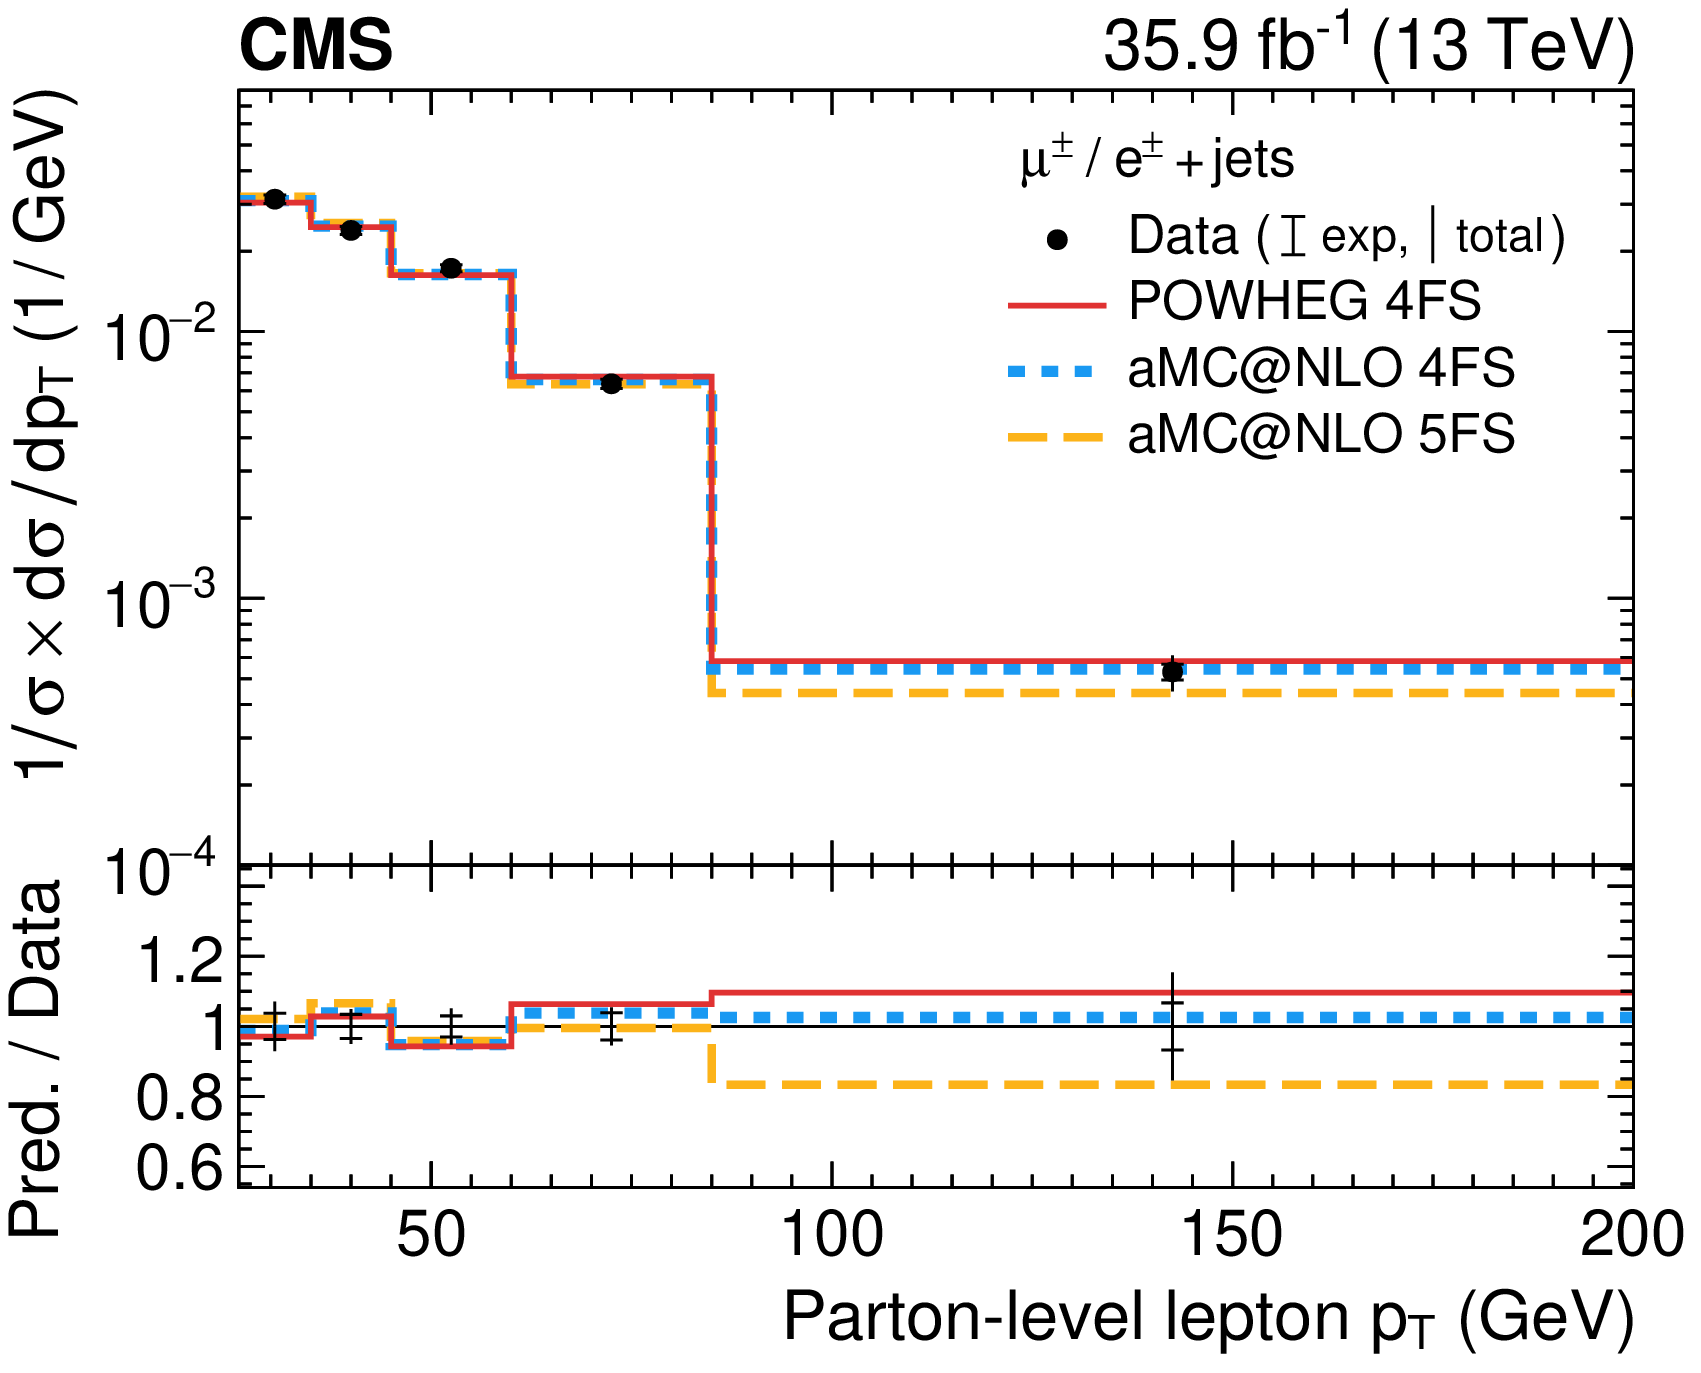
Figure 9-c:
Normalised differential cross sections for the sum of $t$-channel single top quark and antiquark production at the parton level: charged lepton ${p_{\mathrm {T}}}$. The total uncertainty is indicated by the vertical lines, while horizontal bars indicate the statistical and experimental uncertainties, which have been profiled in the ML fit, and thus exclude the uncertainties in the theoretical modelling. Three different predictions from event generators are shown by the solid, dashed, and dotted lines. The lower panel shows the ratios of the predictions to the data. |
png pdf |
Figure 9-d:
Normalised differential cross sections for the sum of $t$-channel single top quark and antiquark production at the parton level: charged lepton rapidity. The total uncertainty is indicated by the vertical lines, while horizontal bars indicate the statistical and experimental uncertainties, which have been profiled in the ML fit, and thus exclude the uncertainties in the theoretical modelling. Three different predictions from event generators are shown by the solid, dashed, and dotted lines. The lower panel shows the ratios of the predictions to the data. |
png pdf |
Figure 9-e:
Normalised differential cross sections for the sum of $t$-channel single top quark and antiquark production at the parton level: W boson ${p_{\mathrm {T}}}$. The total uncertainty is indicated by the vertical lines, while horizontal bars indicate the statistical and experimental uncertainties, which have been profiled in the ML fit, and thus exclude the uncertainties in the theoretical modelling. Three different predictions from event generators are shown by the solid, dashed, and dotted lines. The lower panel shows the ratios of the predictions to the data. |
png pdf |
Figure 9-f:
Normalised differential cross sections for the sum of $t$-channel single top quark and antiquark production at the parton level: cosine of the top quark polarisation angle. The total uncertainty is indicated by the vertical lines, while horizontal bars indicate the statistical and experimental uncertainties, which have been profiled in the ML fit, and thus exclude the uncertainties in the theoretical modelling. Three different predictions from event generators are shown by the solid, dashed, and dotted lines. The lower panel shows the ratios of the predictions to the data. |
png pdf |
Figure 10:
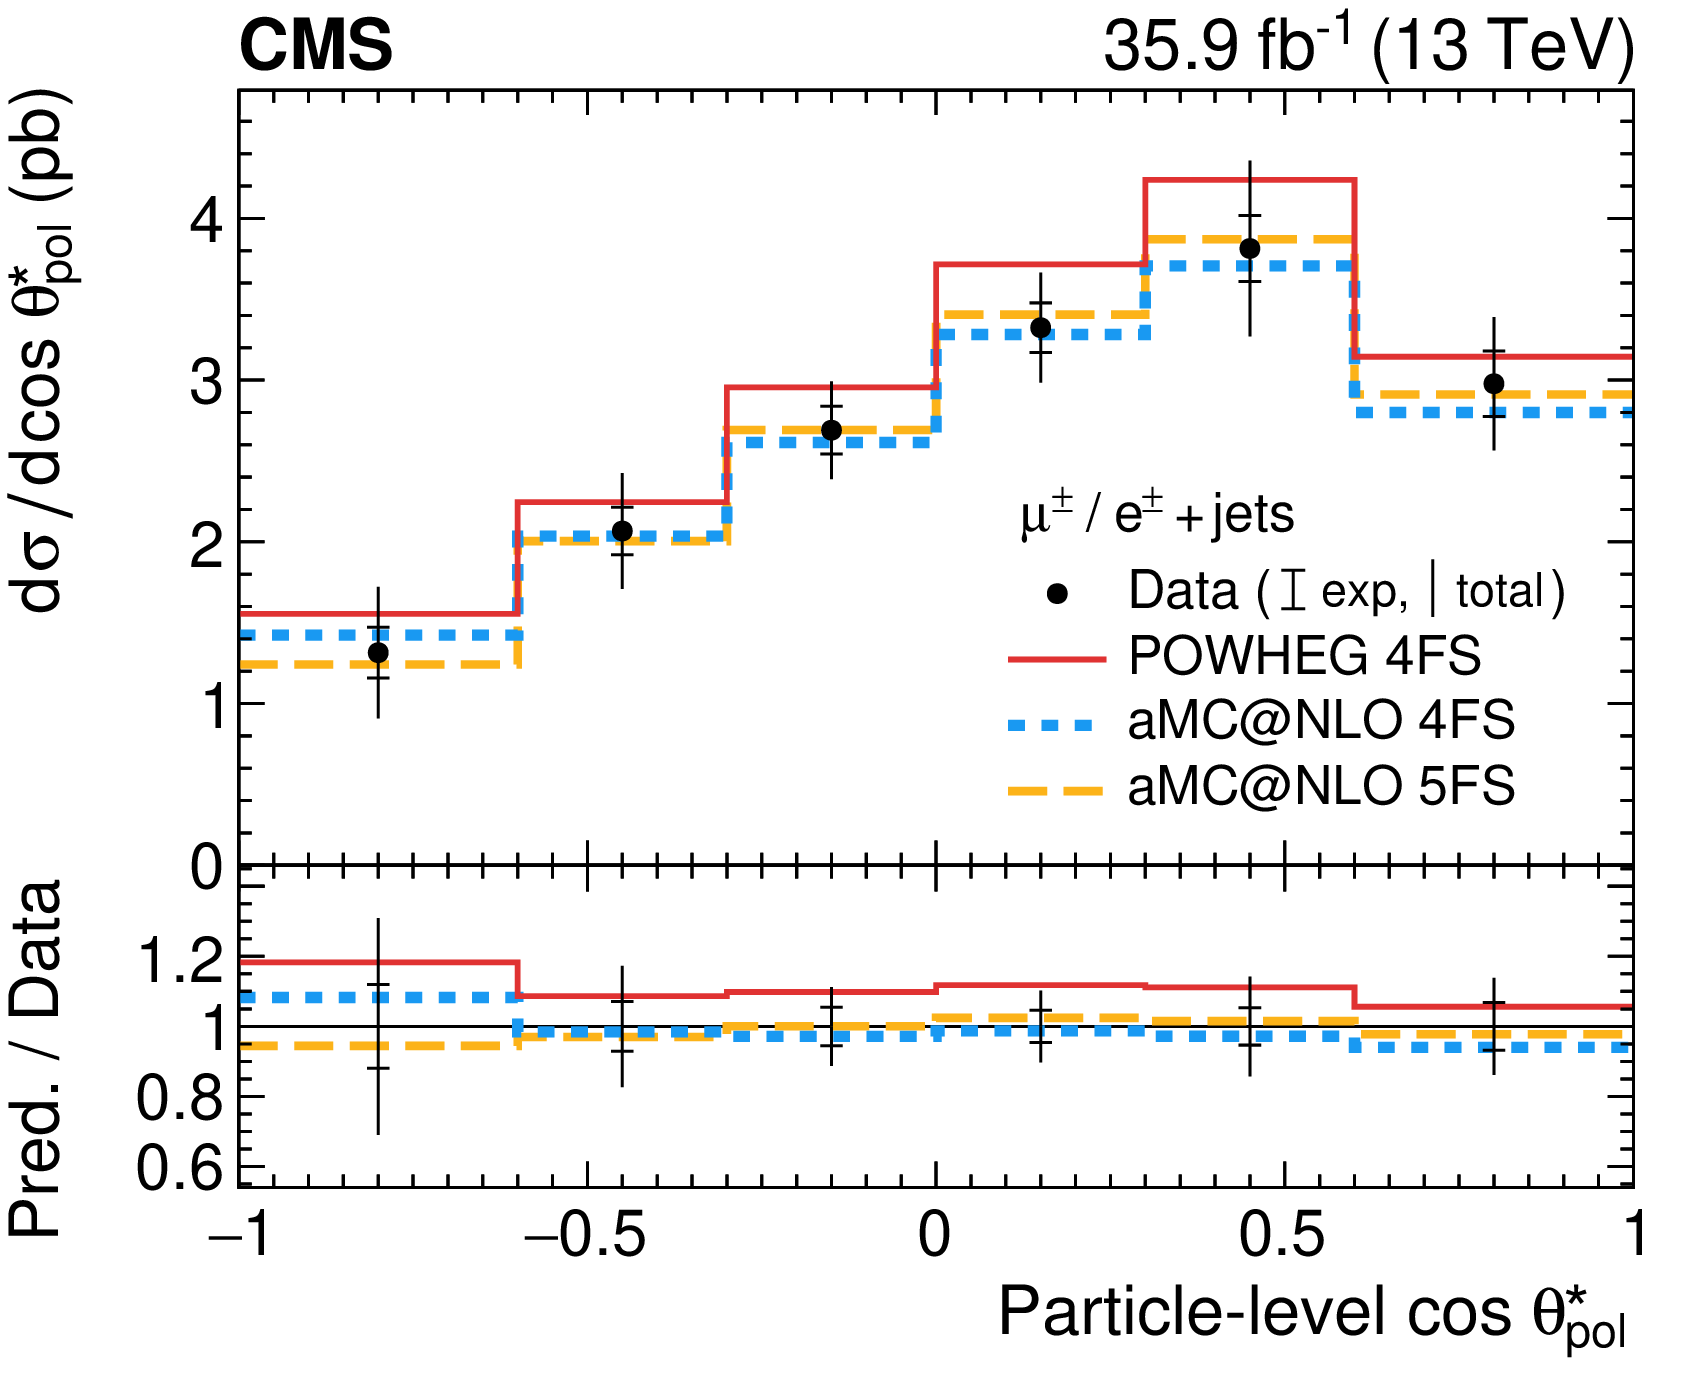
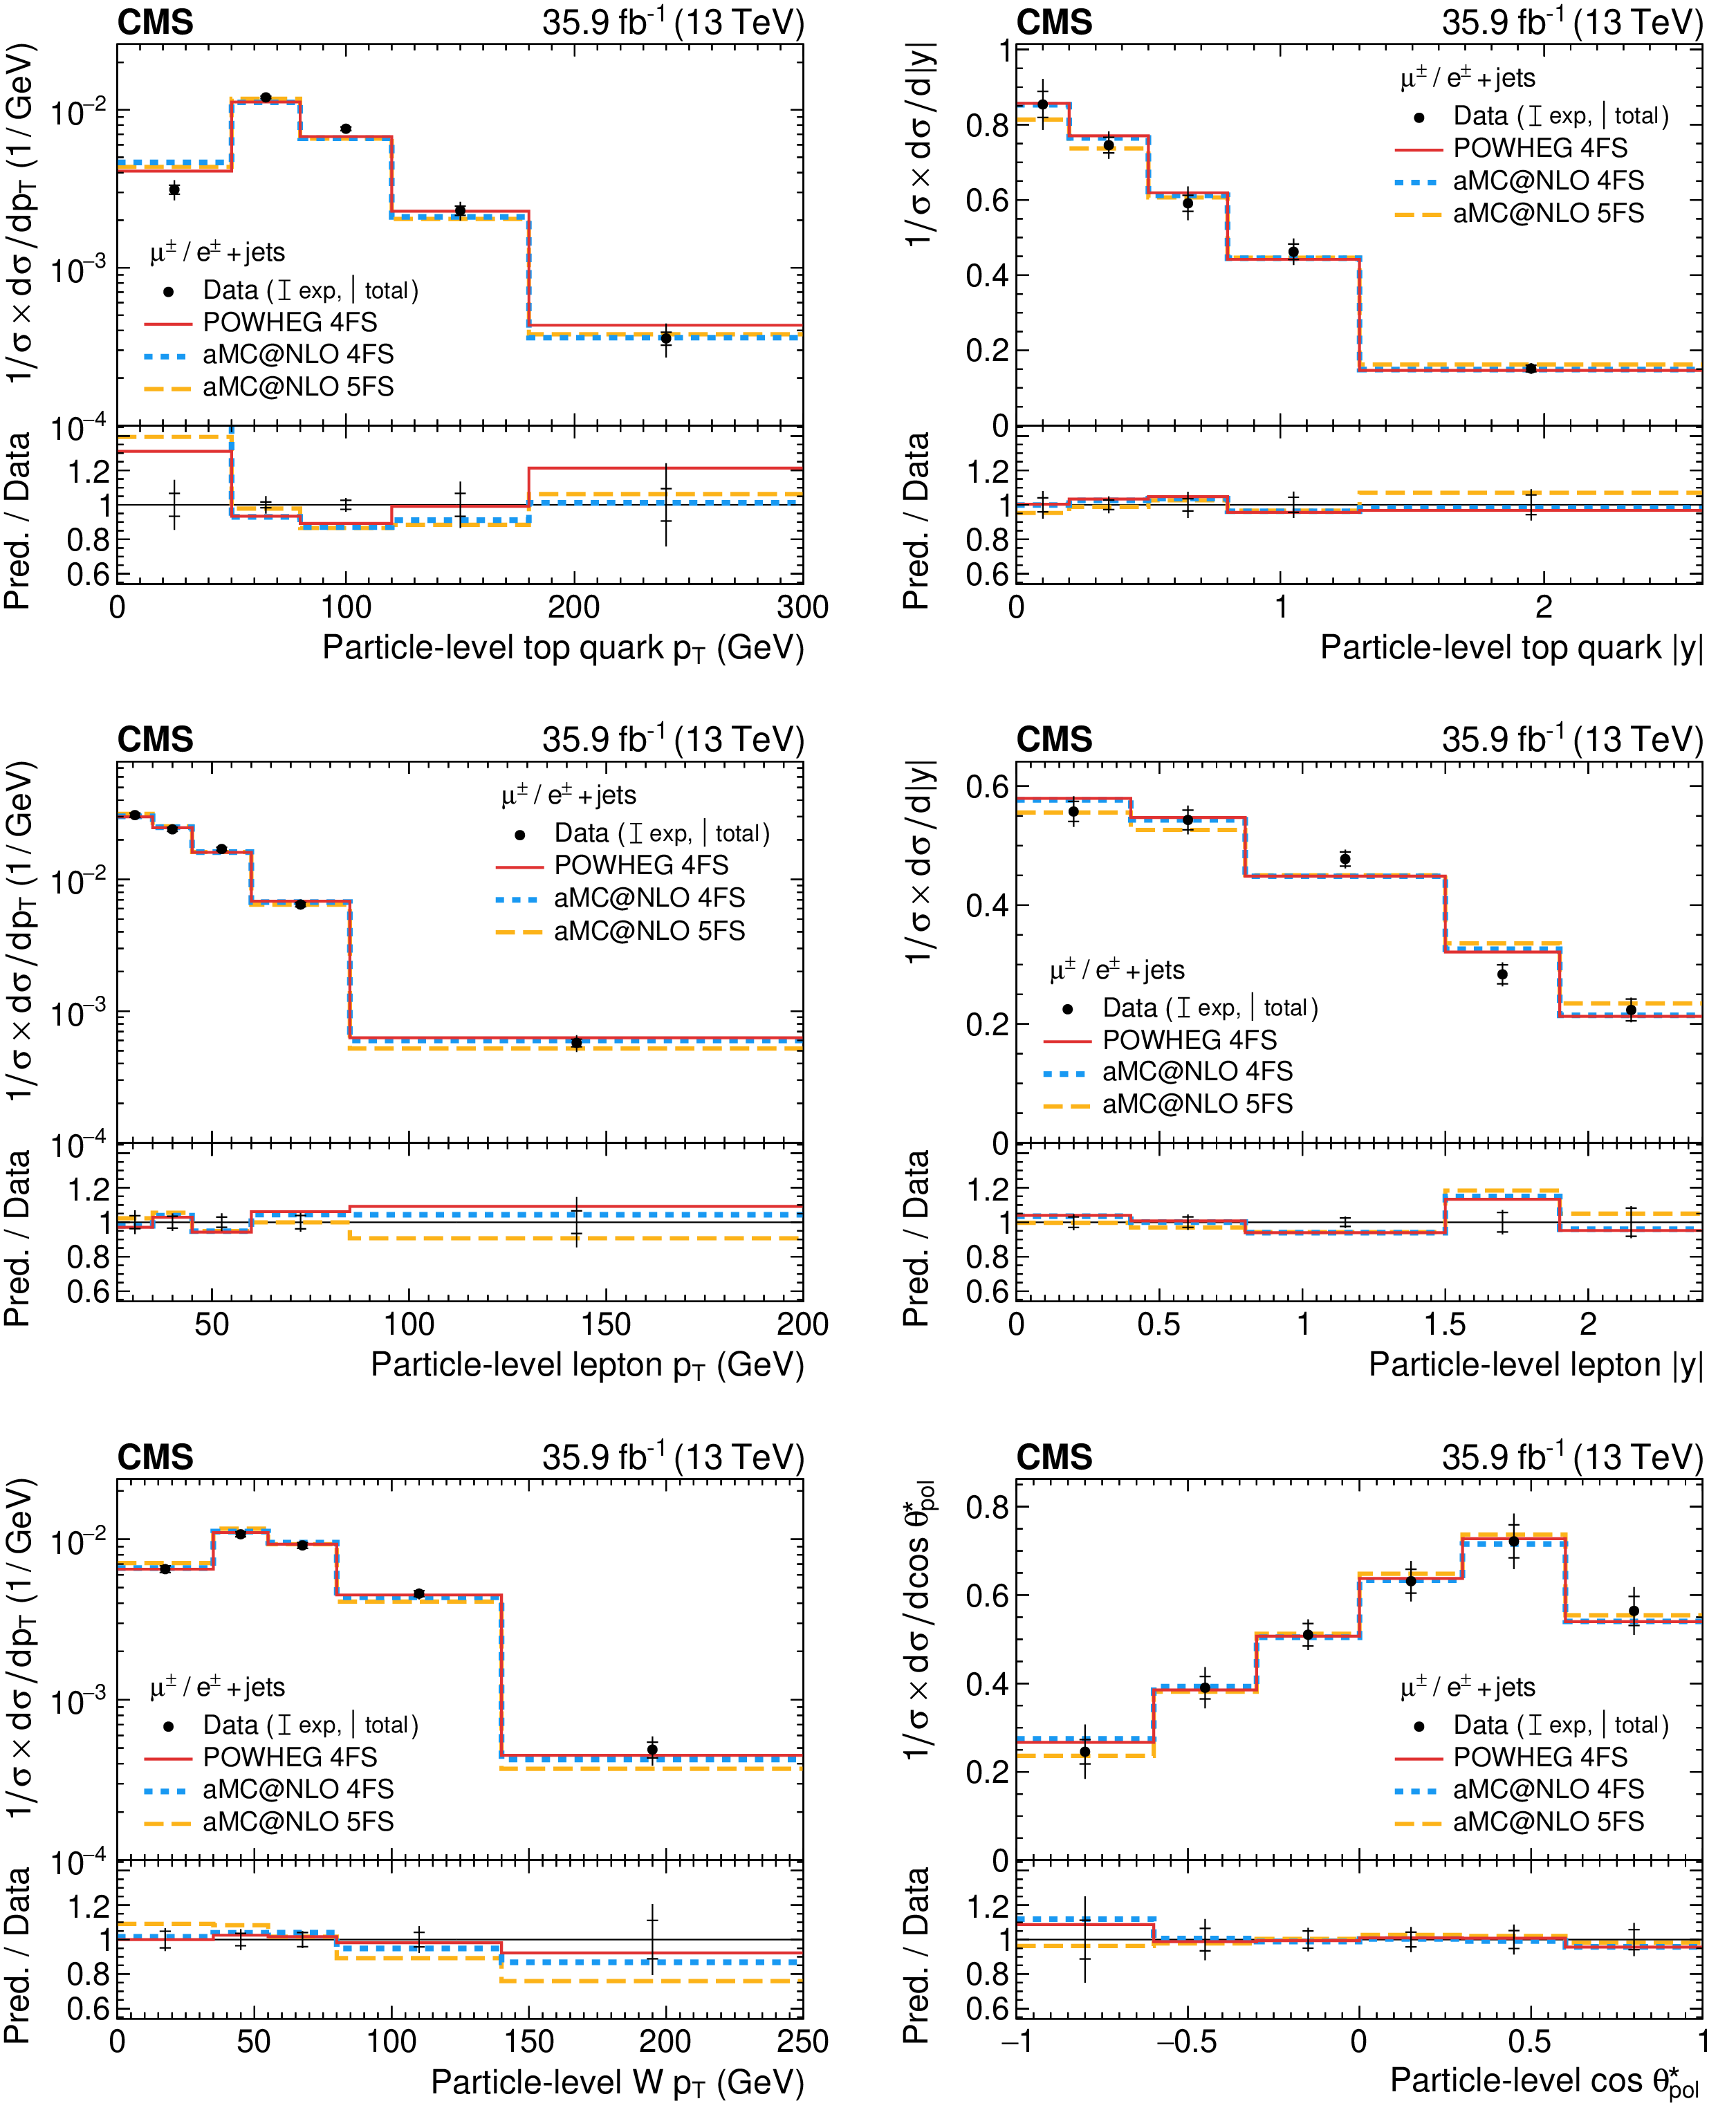
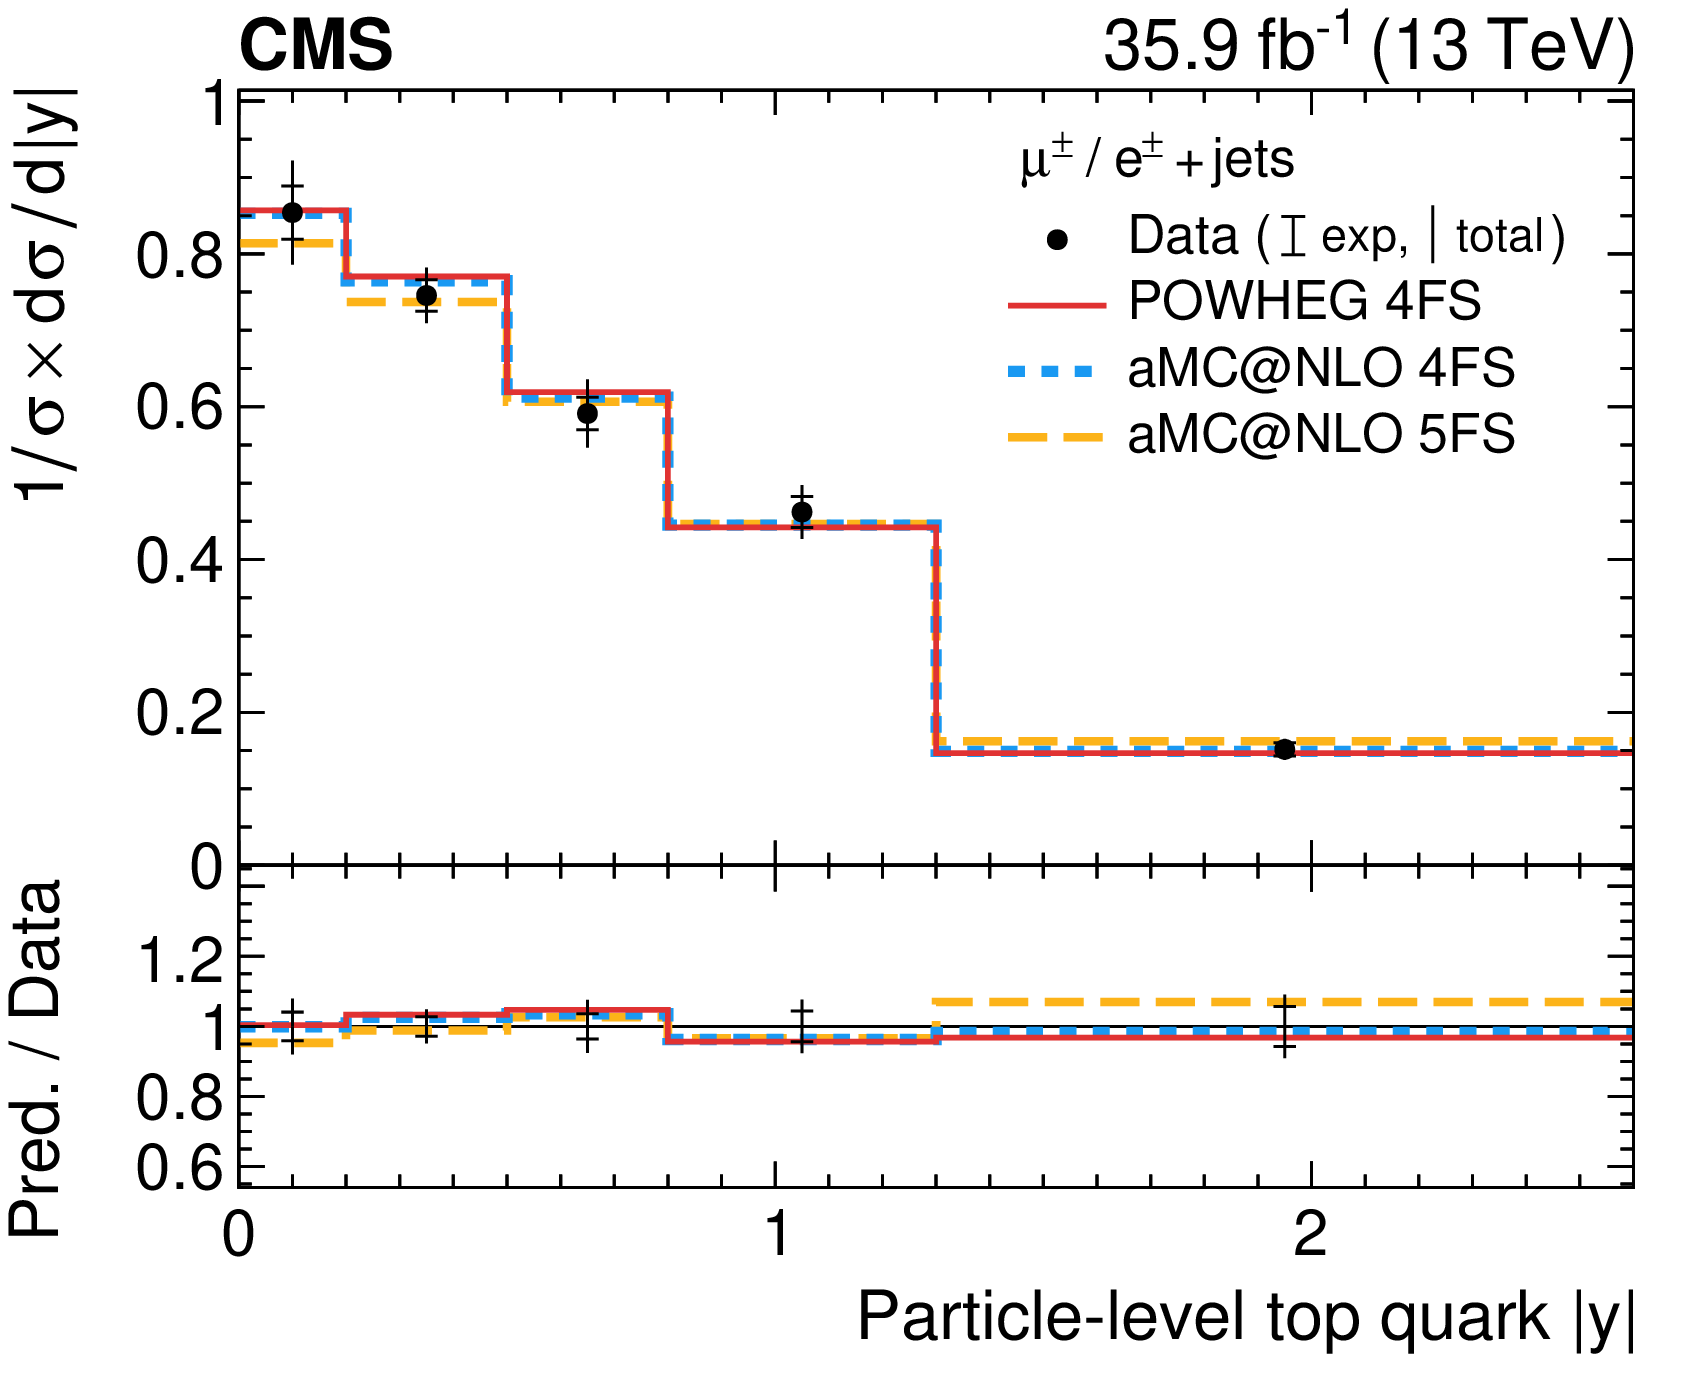
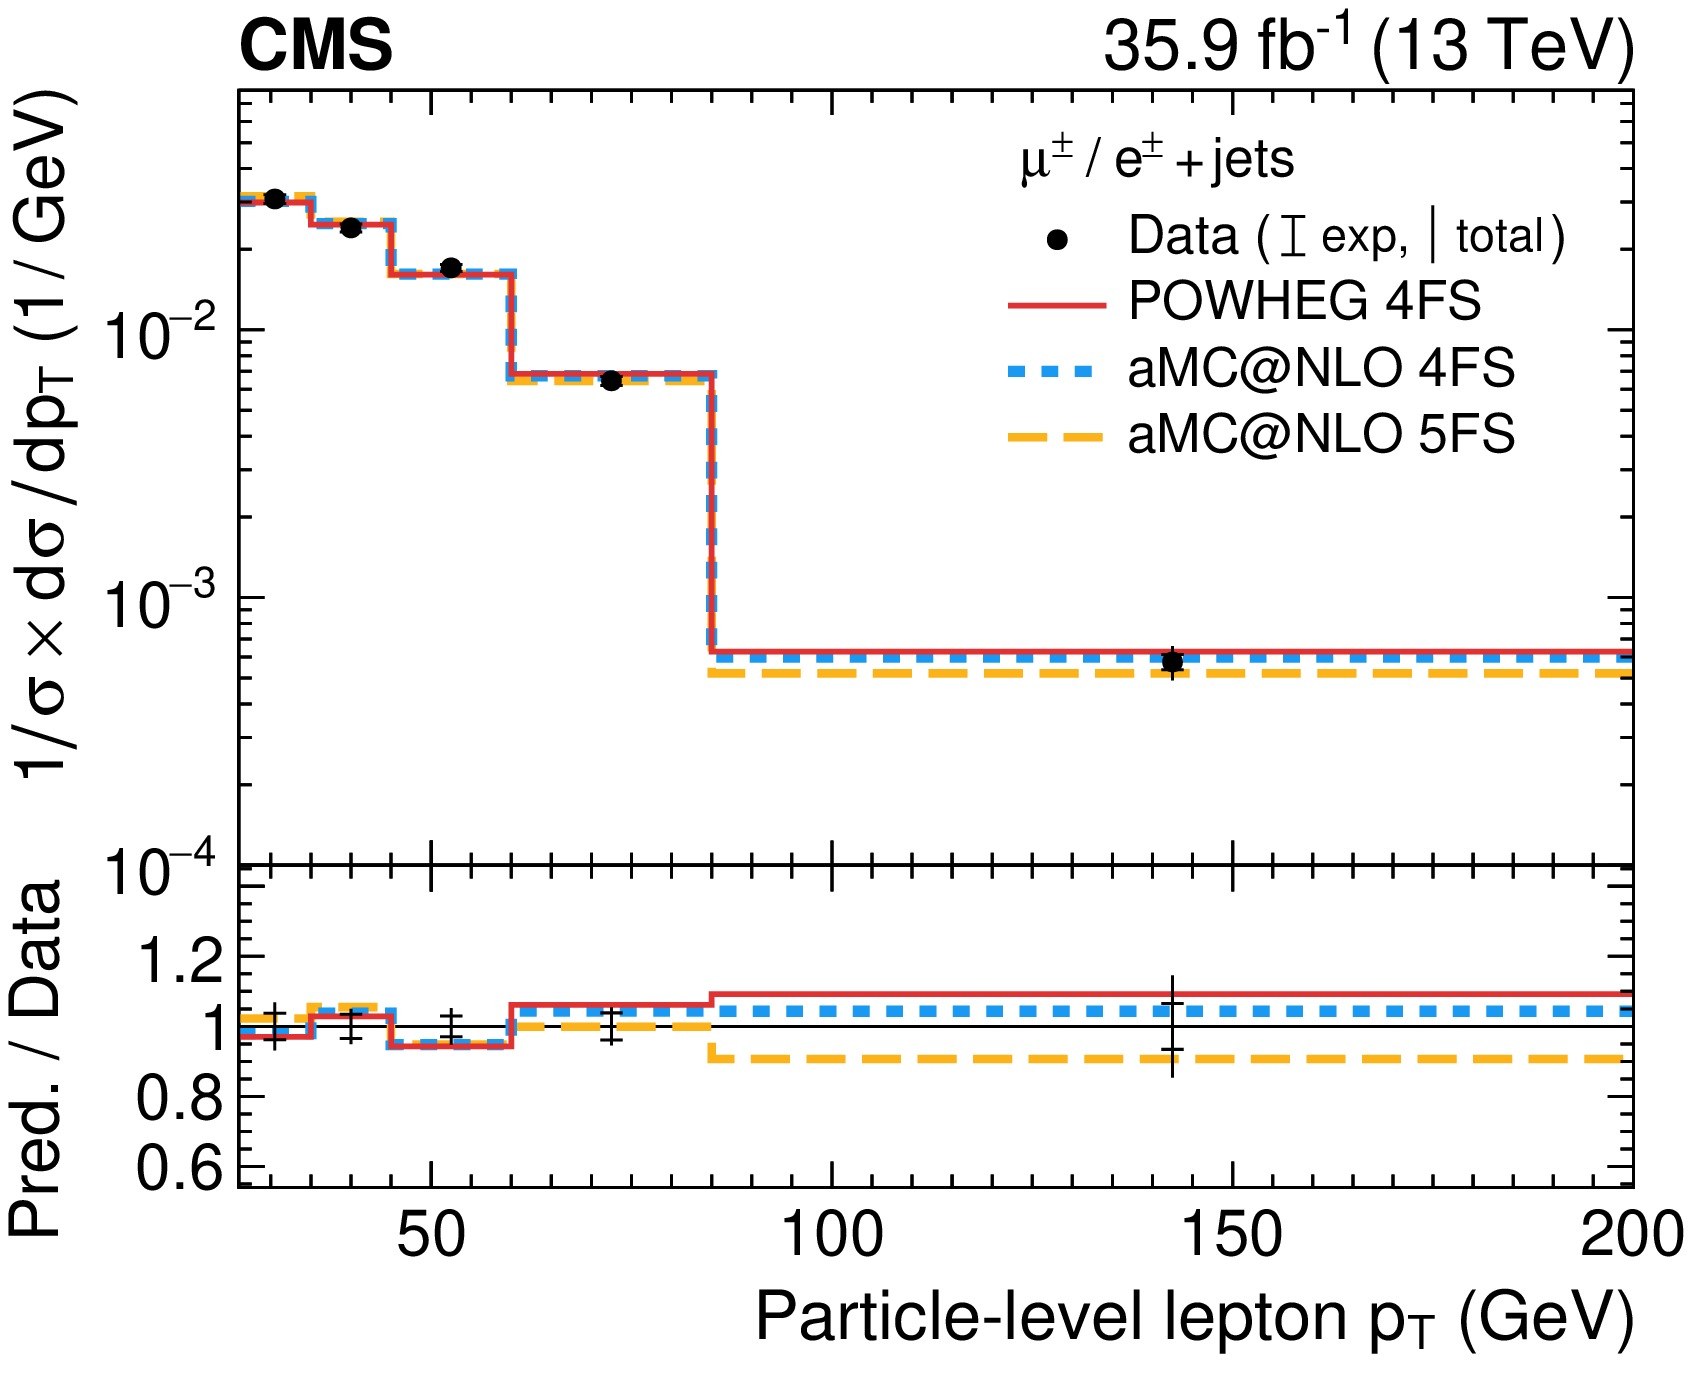
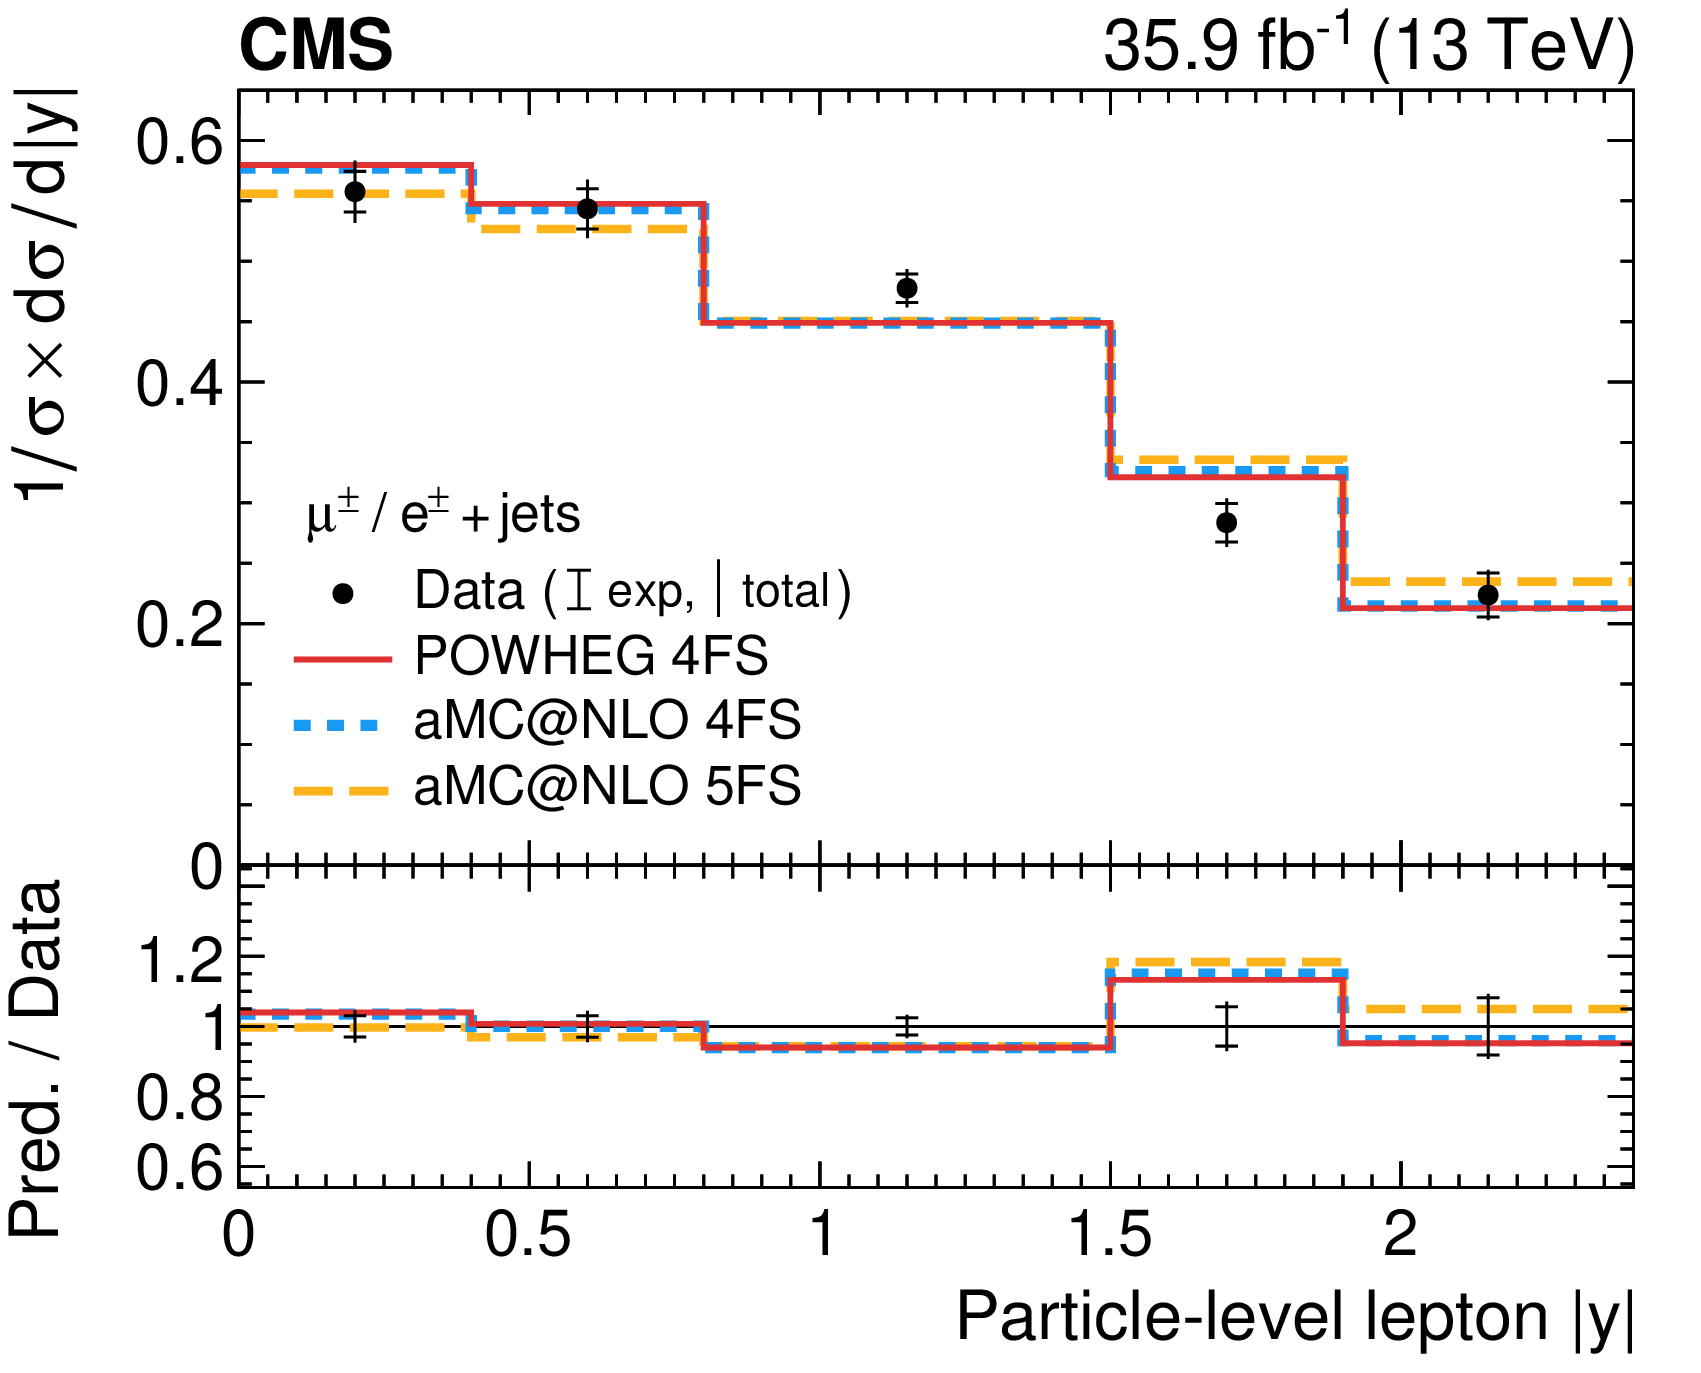
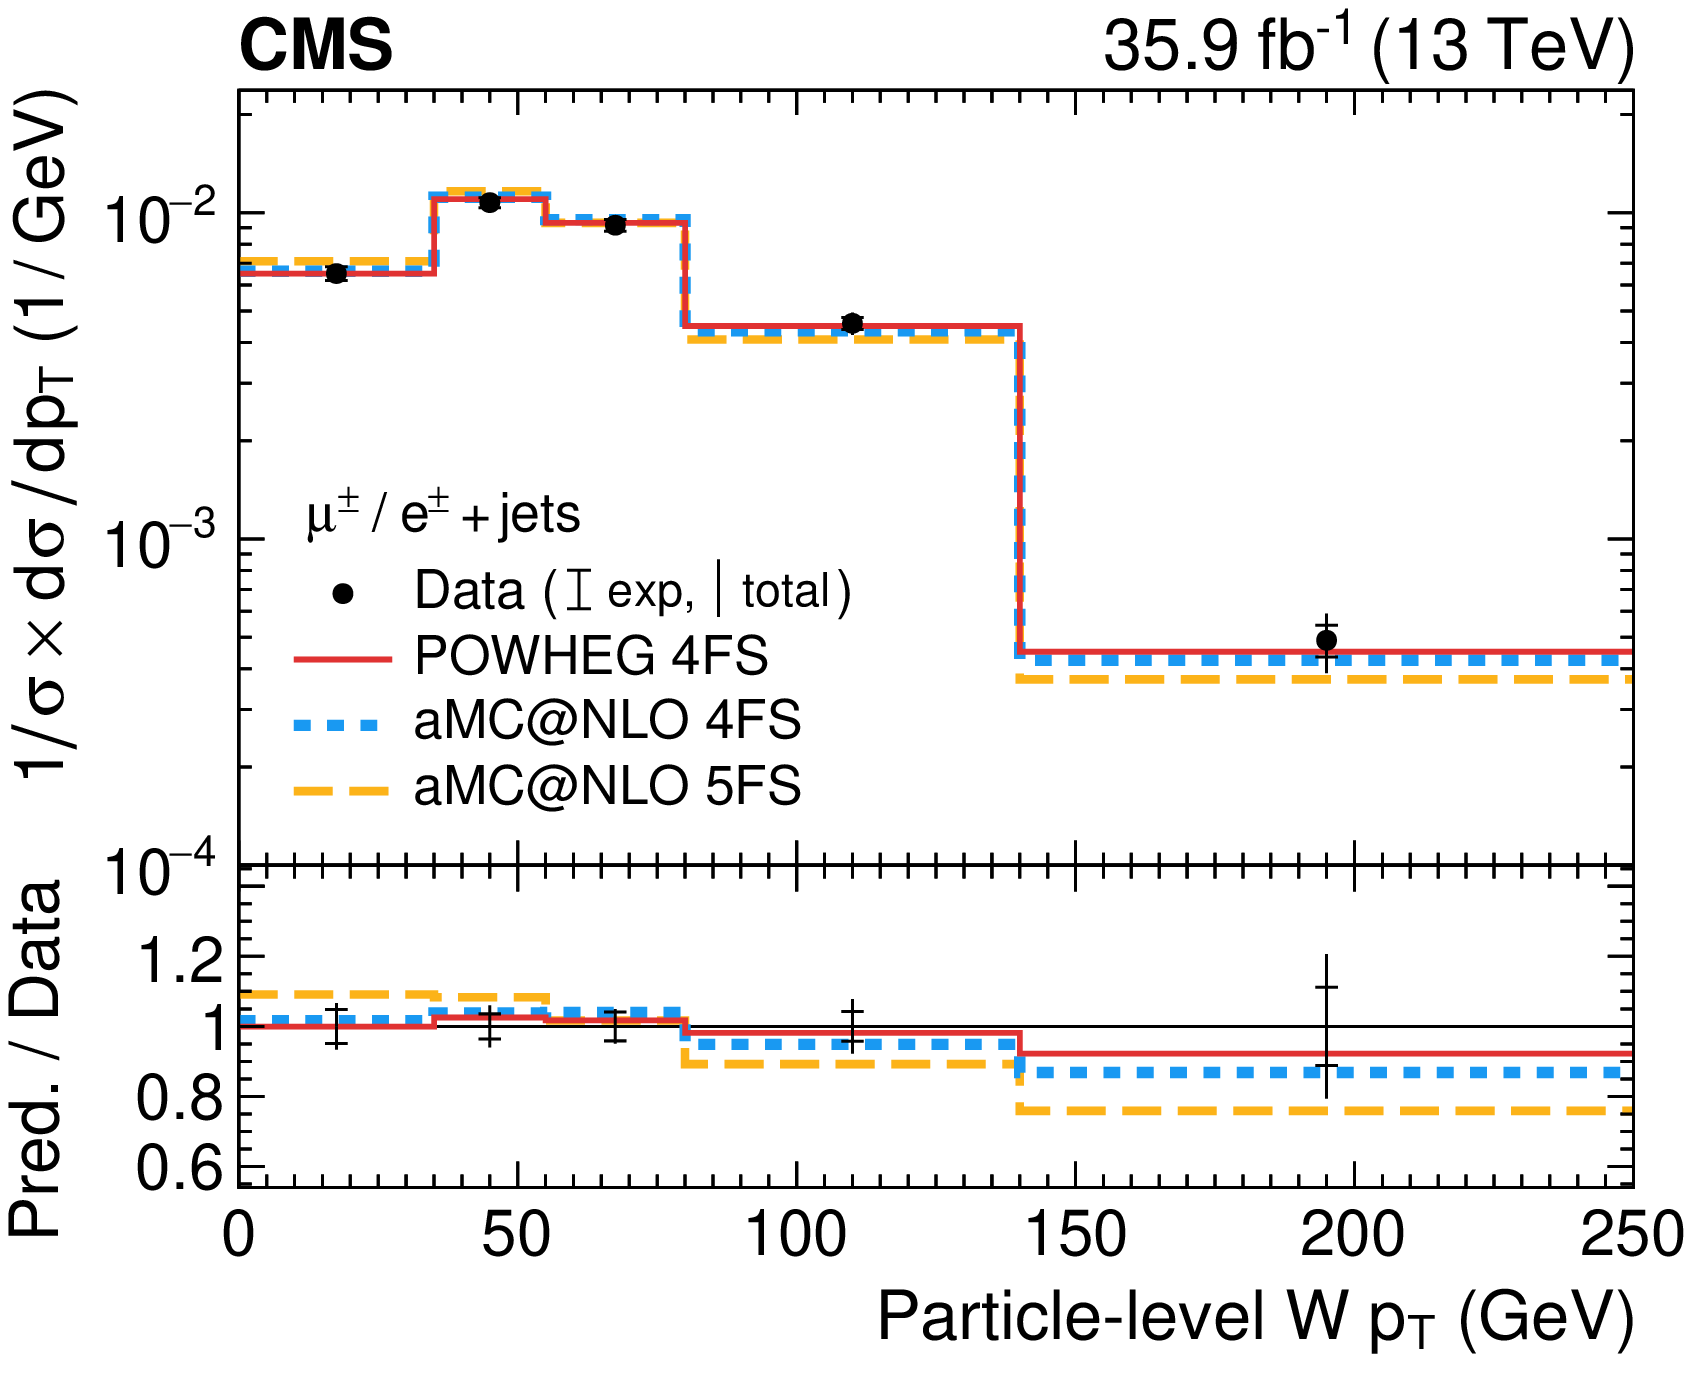
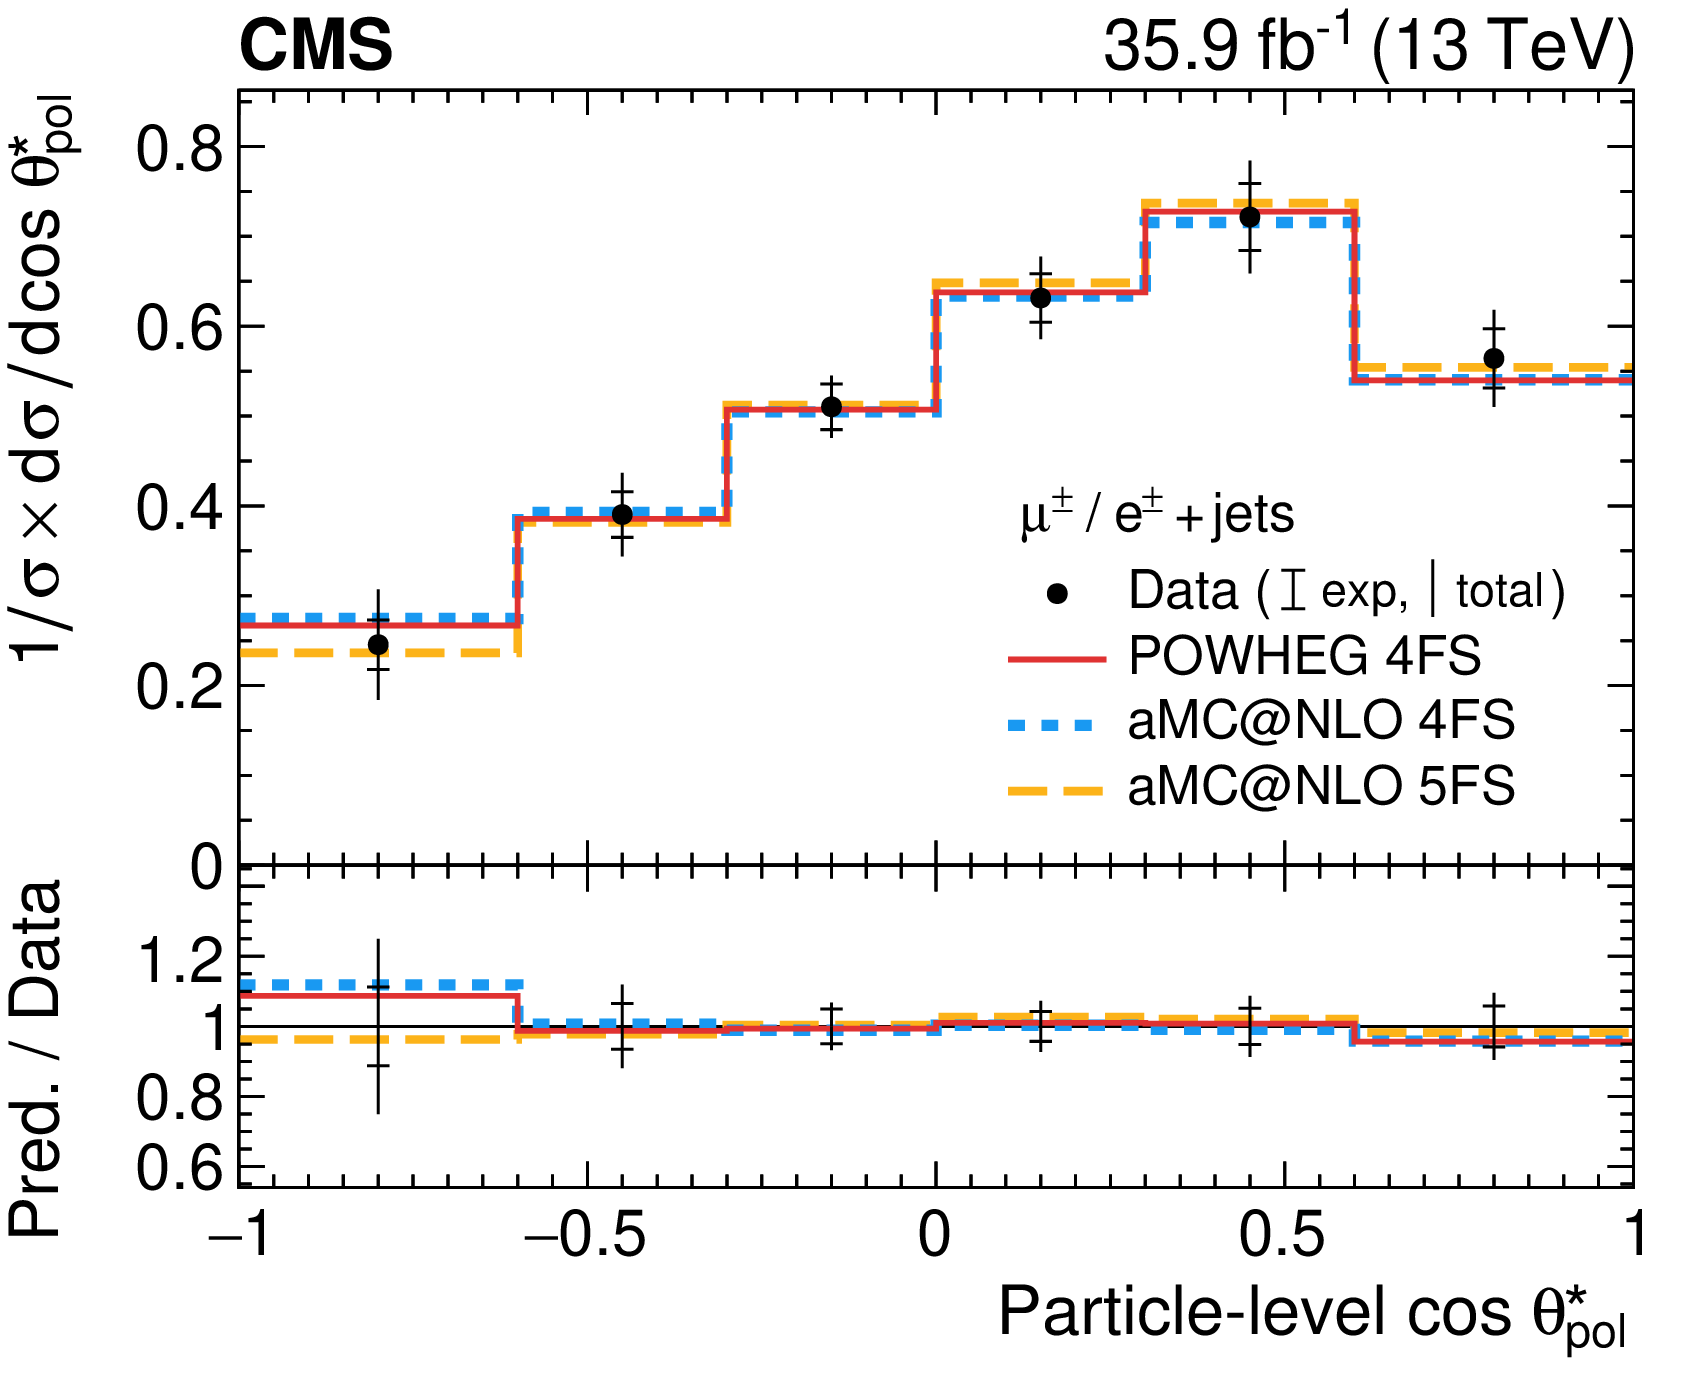
Normalised differential cross sections for the sum of $t$-channel single top quark and antiquark production at the particle level: (upper row) top quark ${p_{\mathrm {T}}}$ and rapidity; (middle row) charged lepton ${p_{\mathrm {T}}}$ and rapidity; (lower left) W boson ${p_{\mathrm {T}}}$; (lower right) cosine of the top quark polarisation angle. The total uncertainty is indicated by the vertical lines, while horizontal bars indicate the statistical and experimental uncertainties, which have been profiled in the ML fit, and thus exclude the uncertainties in the theoretical modelling. Three different predictions from event generators are shown by the solid, dashed, and dotted lines. The lower panels show the ratios of the predictions to the data. |

png pdf |
Figure 10-a:
Normalised differential cross sections for the sum of $t$-channel single top quark and antiquark production at the particle level: top quark ${p_{\mathrm {T}}}$. The total uncertainty is indicated by the vertical lines, while horizontal bars indicate the statistical and experimental uncertainties, which have been profiled in the ML fit, and thus exclude the uncertainties in the theoretical modelling. Three different predictions from event generators are shown by the solid, dashed, and dotted lines. The lower panel shows the ratios of the predictions to the data. |
png pdf |
Figure 10-b:
Normalised differential cross sections for the sum of $t$-channel single top quark and antiquark production at the particle level: top quark rapidity. The total uncertainty is indicated by the vertical lines, while horizontal bars indicate the statistical and experimental uncertainties, which have been profiled in the ML fit, and thus exclude the uncertainties in the theoretical modelling. Three different predictions from event generators are shown by the solid, dashed, and dotted lines. The lower panel shows the ratios of the predictions to the data. |
png pdf |
Figure 10-c:
Normalised differential cross sections for the sum of $t$-channel single top quark and antiquark production at the particle level: charged lepton ${p_{\mathrm {T}}}$.The total uncertainty is indicated by the vertical lines, while horizontal bars indicate the statistical and experimental uncertainties, which have been profiled in the ML fit, and thus exclude the uncertainties in the theoretical modelling. Three different predictions from event generators are shown by the solid, dashed, and dotted lines. The lower panel shows the ratios of the predictions to the data. |
png pdf |
Figure 10-d:
Normalised differential cross sections for the sum of $t$-channel single top quark and antiquark production at the particle level: charged lepton rapidity. The total uncertainty is indicated by the vertical lines, while horizontal bars indicate the statistical and experimental uncertainties, which have been profiled in the ML fit, and thus exclude the uncertainties in the theoretical modelling. Three different predictions from event generators are shown by the solid, dashed, and dotted lines. The lower panel shows the ratios of the predictions to the data. |
png pdf |
Figure 10-e:
Normalised differential cross sections for the sum of $t$-channel single top quark and antiquark production at the particle level: W boson ${p_{\mathrm {T}}}$. The total uncertainty is indicated by the vertical lines, while horizontal bars indicate the statistical and experimental uncertainties, which have been profiled in the ML fit, and thus exclude the uncertainties in the theoretical modelling. Three different predictions from event generators are shown by the solid, dashed, and dotted lines. The lower panel shows the ratios of the predictions to the data. |
png pdf |
Figure 10-f:
Normalised differential cross sections for the sum of $t$-channel single top quark and antiquark production at the particle level: cosine of the top quark polarisation angle. The total uncertainty is indicated by the vertical lines, while horizontal bars indicate the statistical and experimental uncertainties, which have been profiled in the ML fit, and thus exclude the uncertainties in the theoretical modelling. Three different predictions from event generators are shown by the solid, dashed, and dotted lines. The lower panel shows the ratios of the predictions to the data. |
png pdf |
Figure 11:
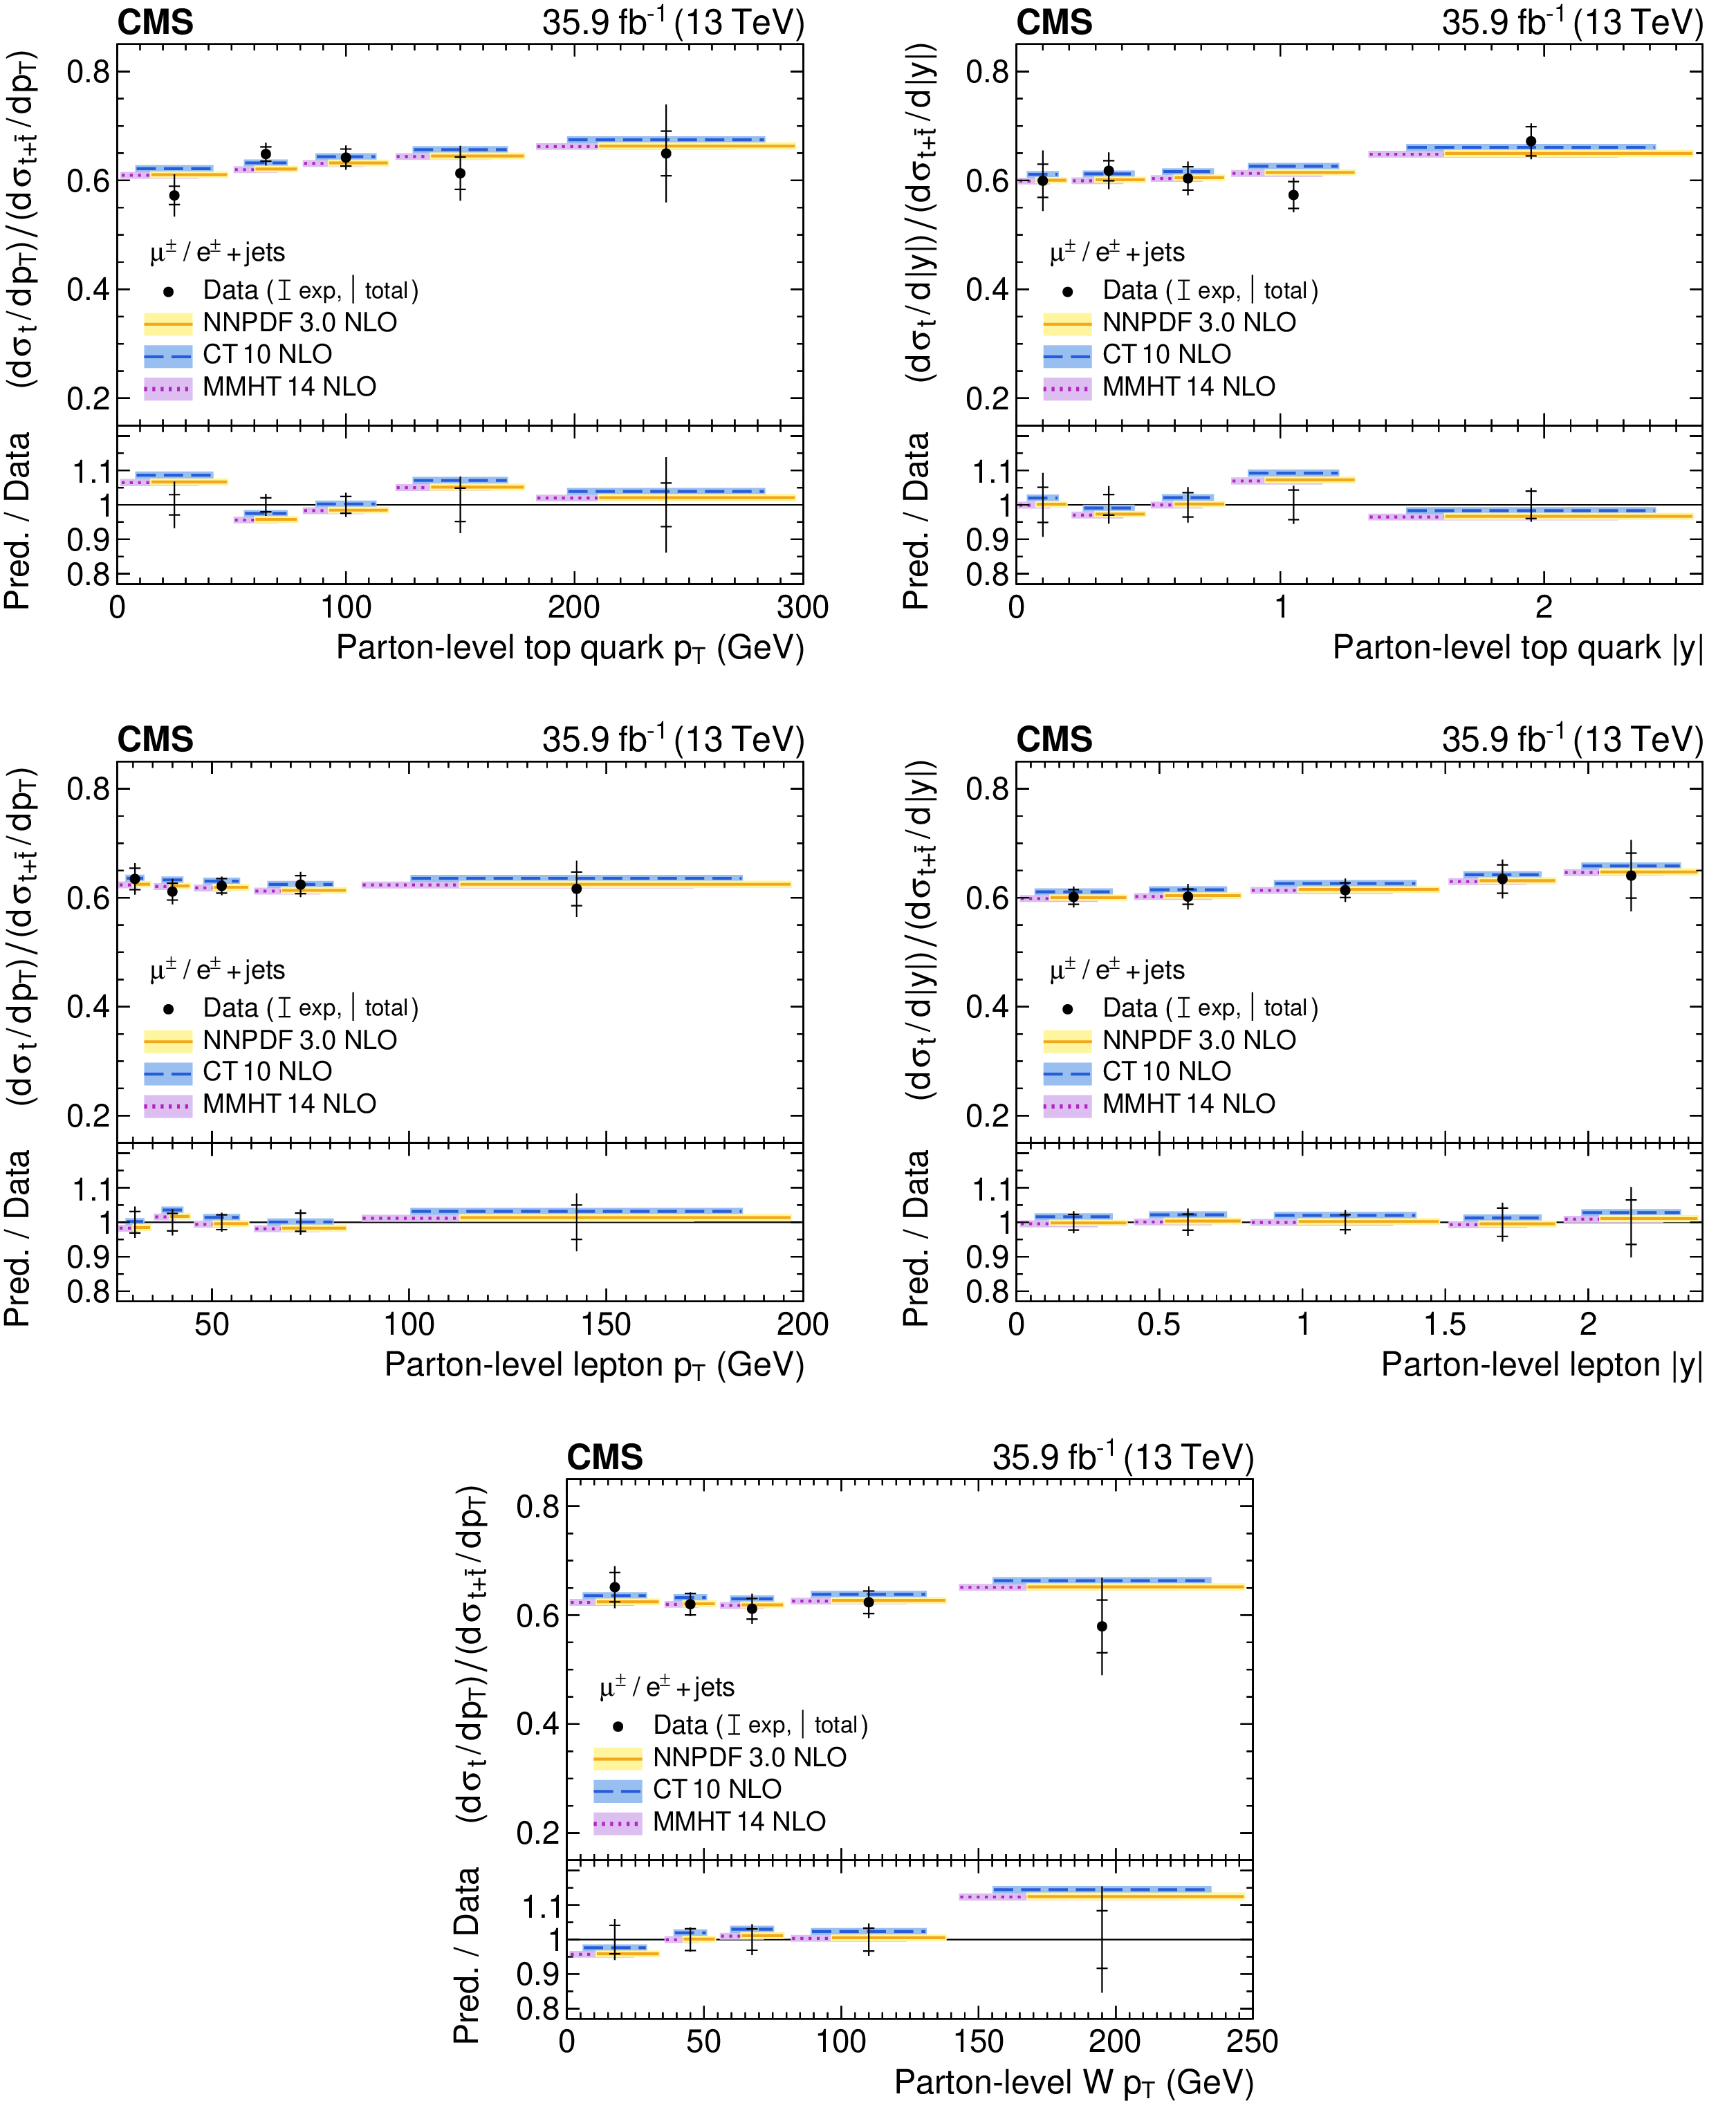
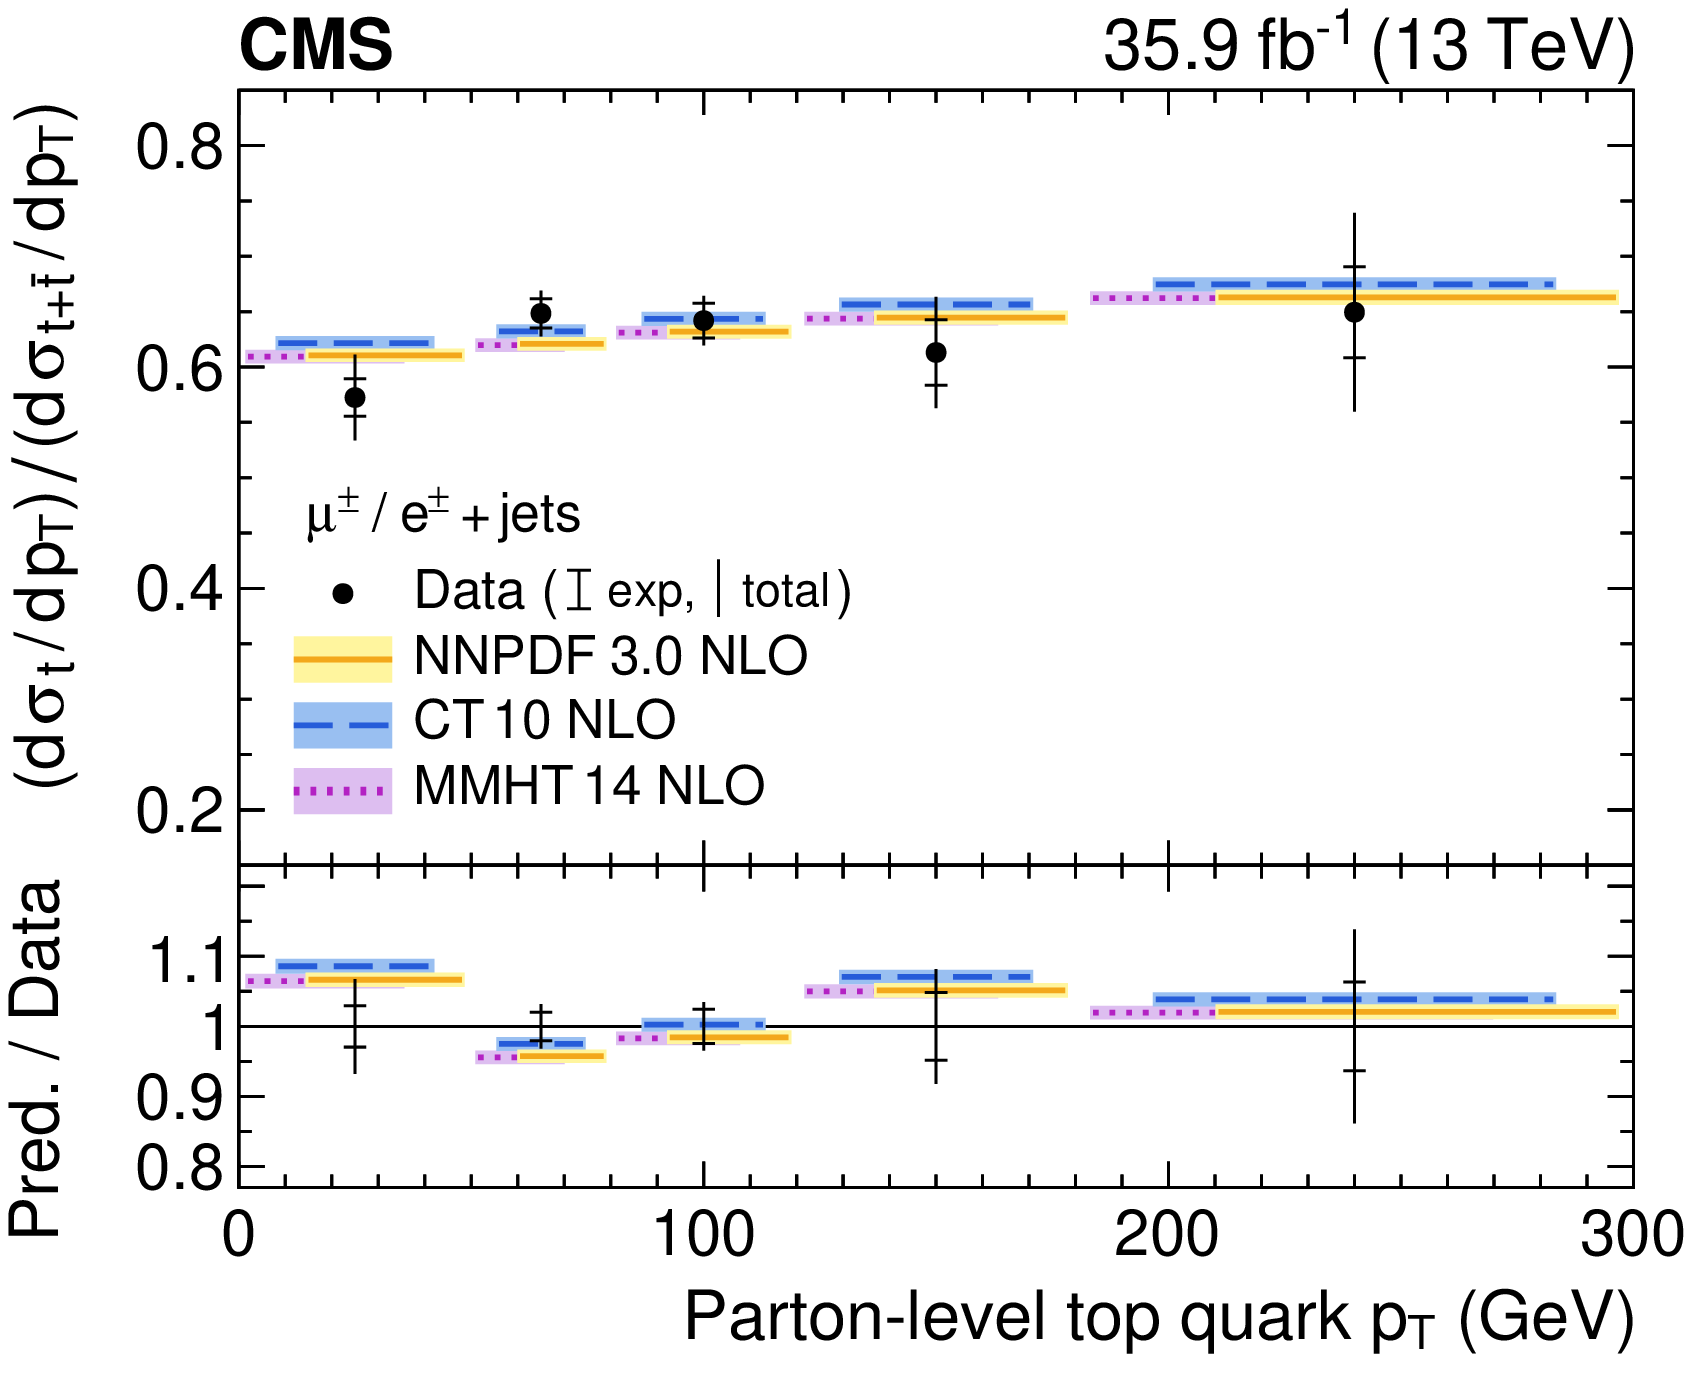
Ratio of the top quark to the sum of the top quark and antiquark $t$-channel differential cross section at the parton level: (upper row) top quark ${p_{\mathrm {T}}}$ and rapidity; (middle row) charged lepton ${p_{\mathrm {T}}}$ and rapidity; (lower row) W boson ${p_{\mathrm {T}}}$. The total uncertainty is indicated by the vertical lines, while horizontal bars indicate the statistical and experimental uncertainties, which have been profiled in the ML fit, and thus exclude the uncertainties in the theoretical modelling. Predictions from three different PDF sets are shown by the solid, dashed, and dotted lines. The lower panels show the ratios of the predictions to the data. |
png pdf |
Figure 11-a:
Ratio of the top quark to the sum of the top quark and antiquark $t$-channel differential cross section at the parton level: top quark ${p_{\mathrm {T}}}$. The total uncertainty is indicated by the vertical lines, while horizontal bars indicate the statistical and experimental uncertainties, which have been profiled in the ML fit, and thus exclude the uncertainties in the theoretical modelling. Predictions from three different PDF sets are shown by the solid, dashed, and dotted lines. The lower panel shows the ratios of the predictions to the data. |

png pdf |
Figure 11-b:
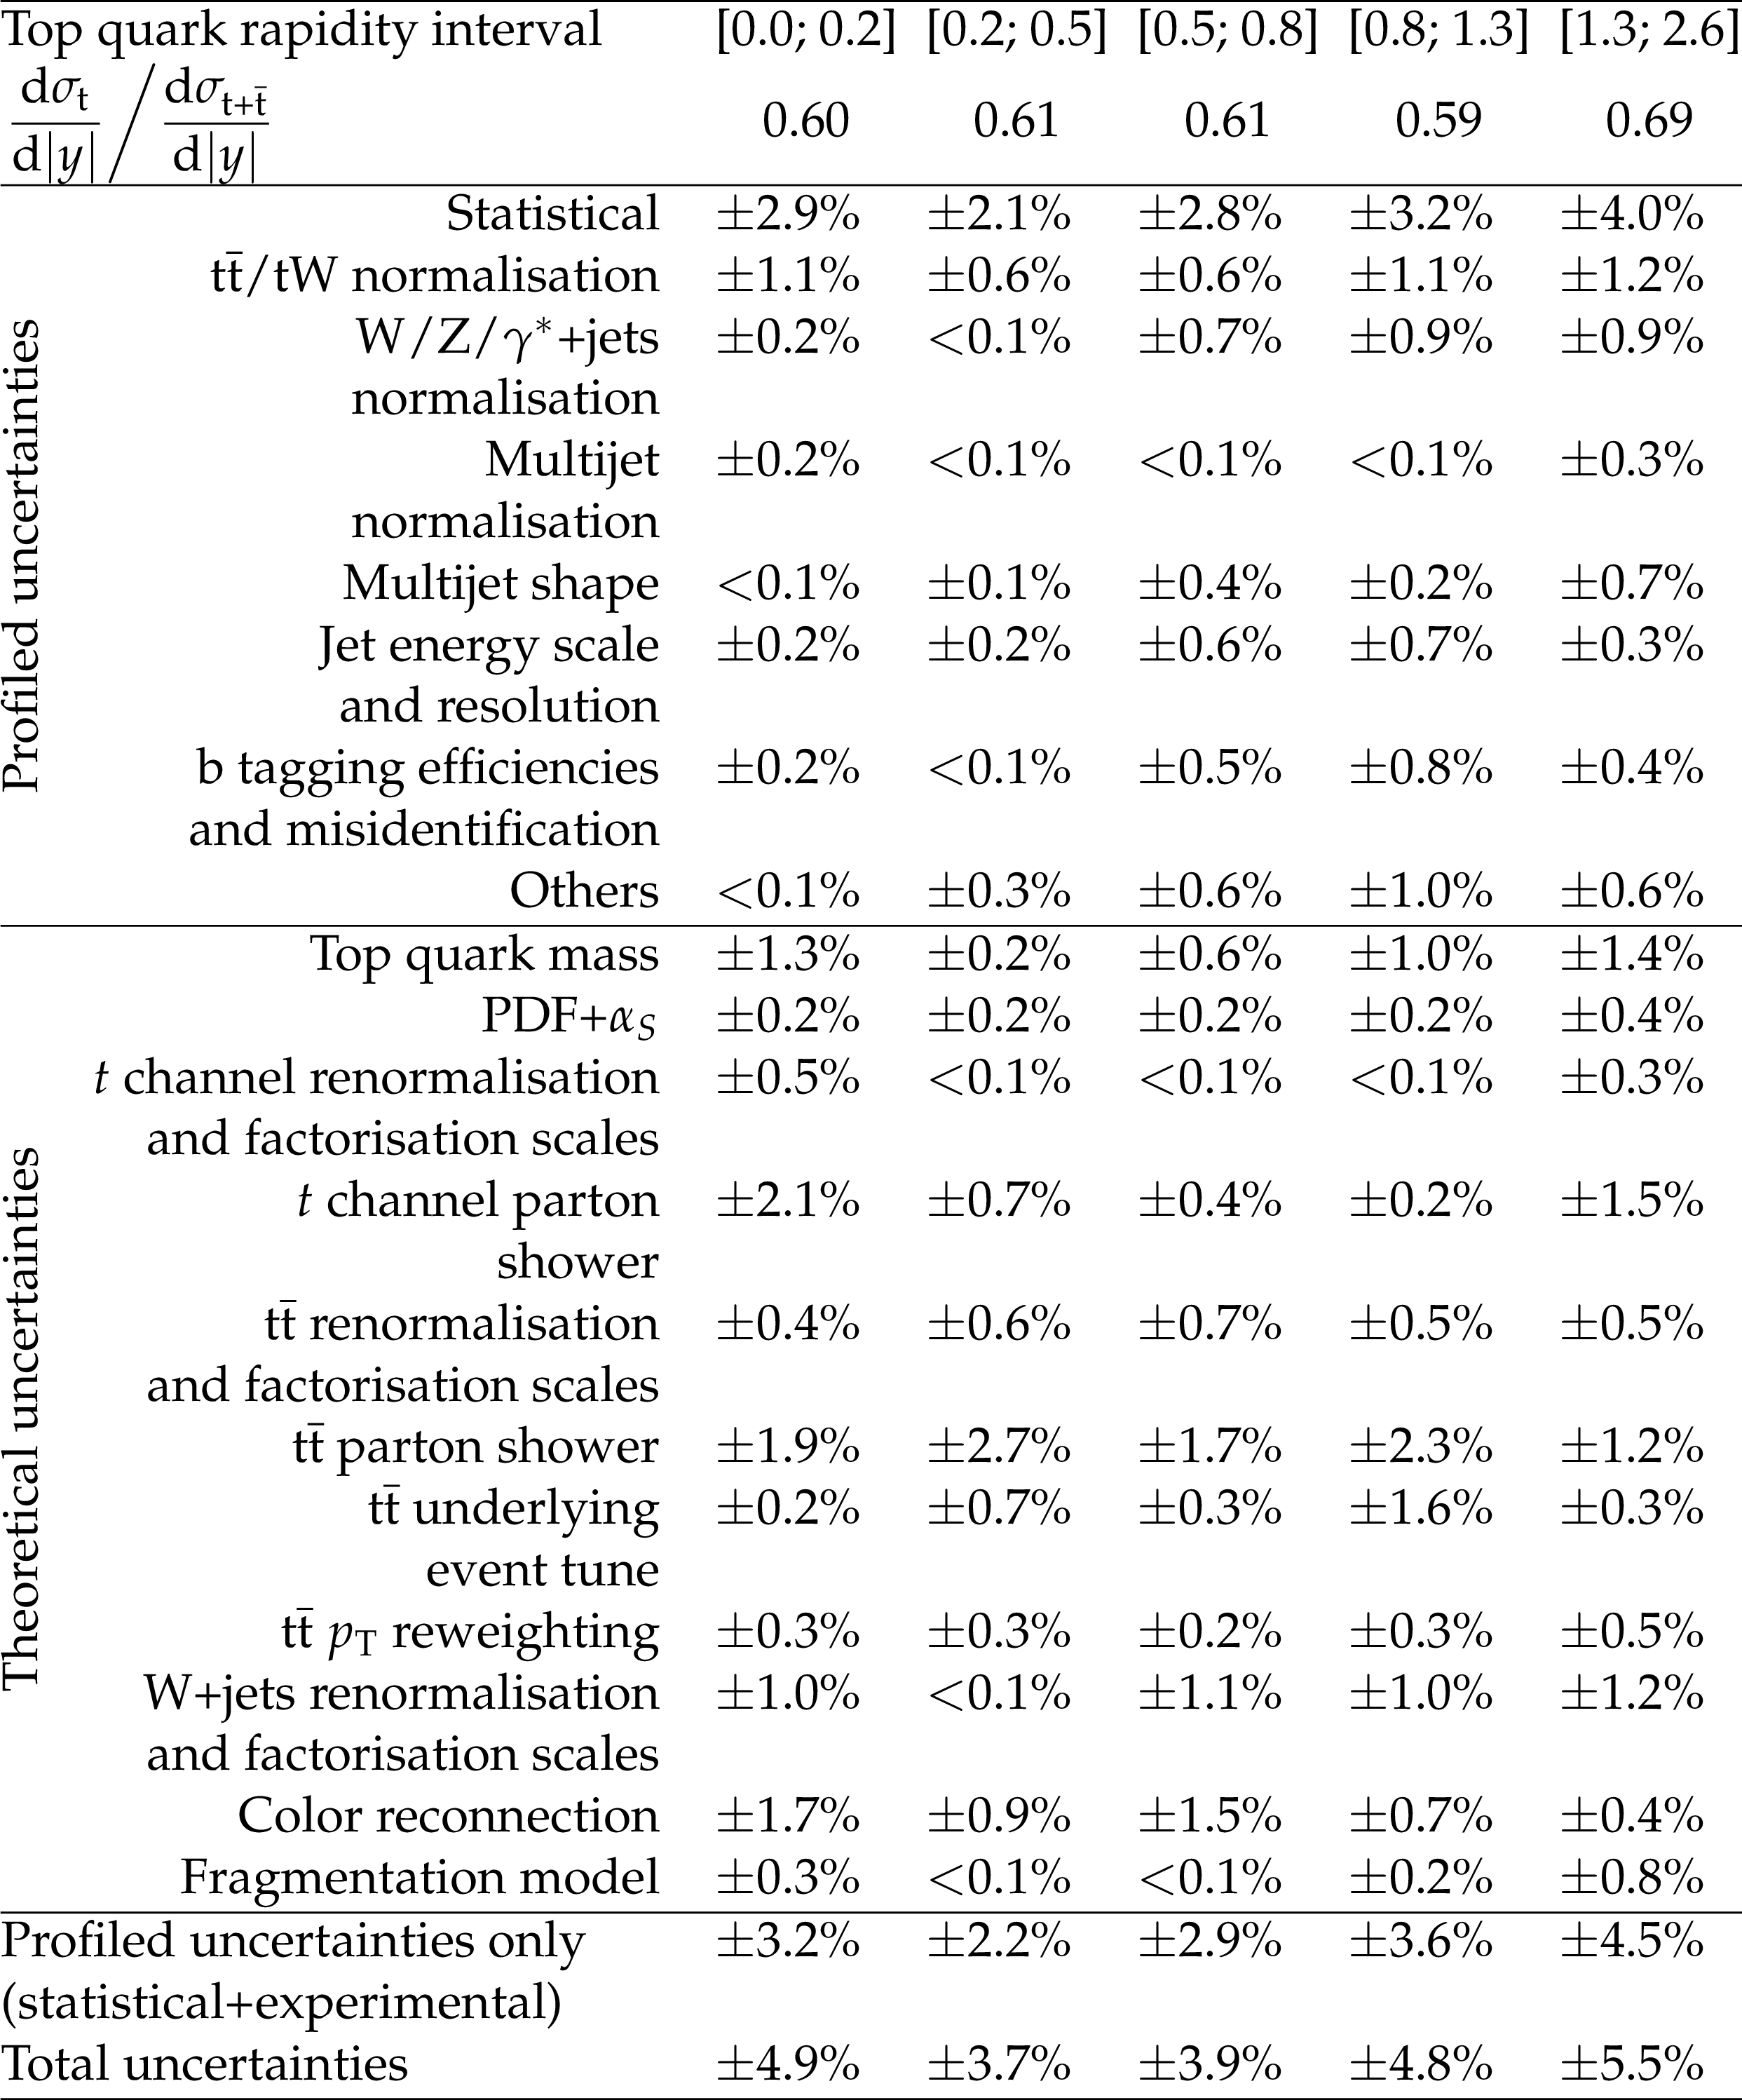
Ratio of the top quark to the sum of the top quark and antiquark $t$-channel differential cross section at the parton level: top quark rapidity. The total uncertainty is indicated by the vertical lines, while horizontal bars indicate the statistical and experimental uncertainties, which have been profiled in the ML fit, and thus exclude the uncertainties in the theoretical modelling. Predictions from three different PDF sets are shown by the solid, dashed, and dotted lines. The lower panel shows the ratios of the predictions to the data. |
png pdf |
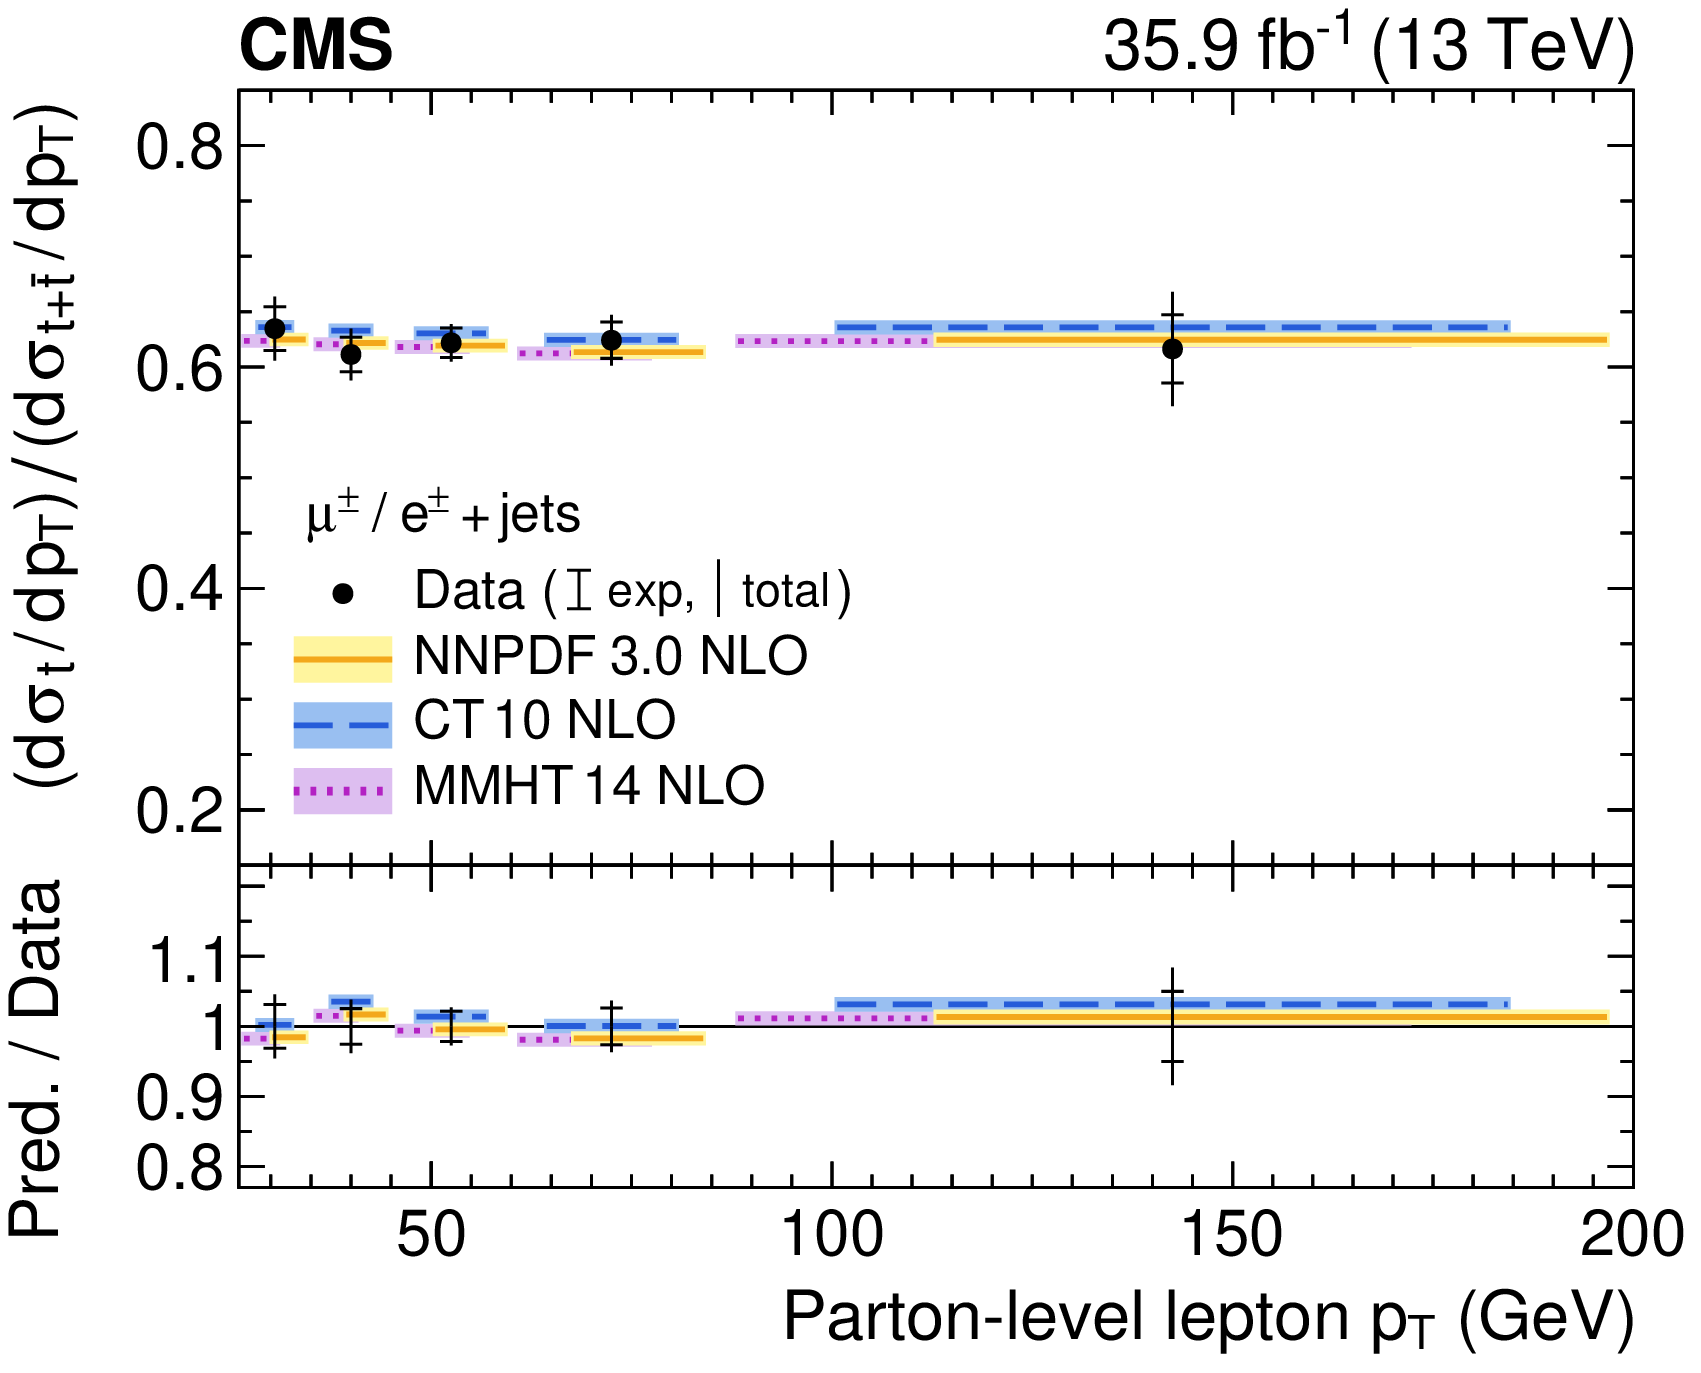
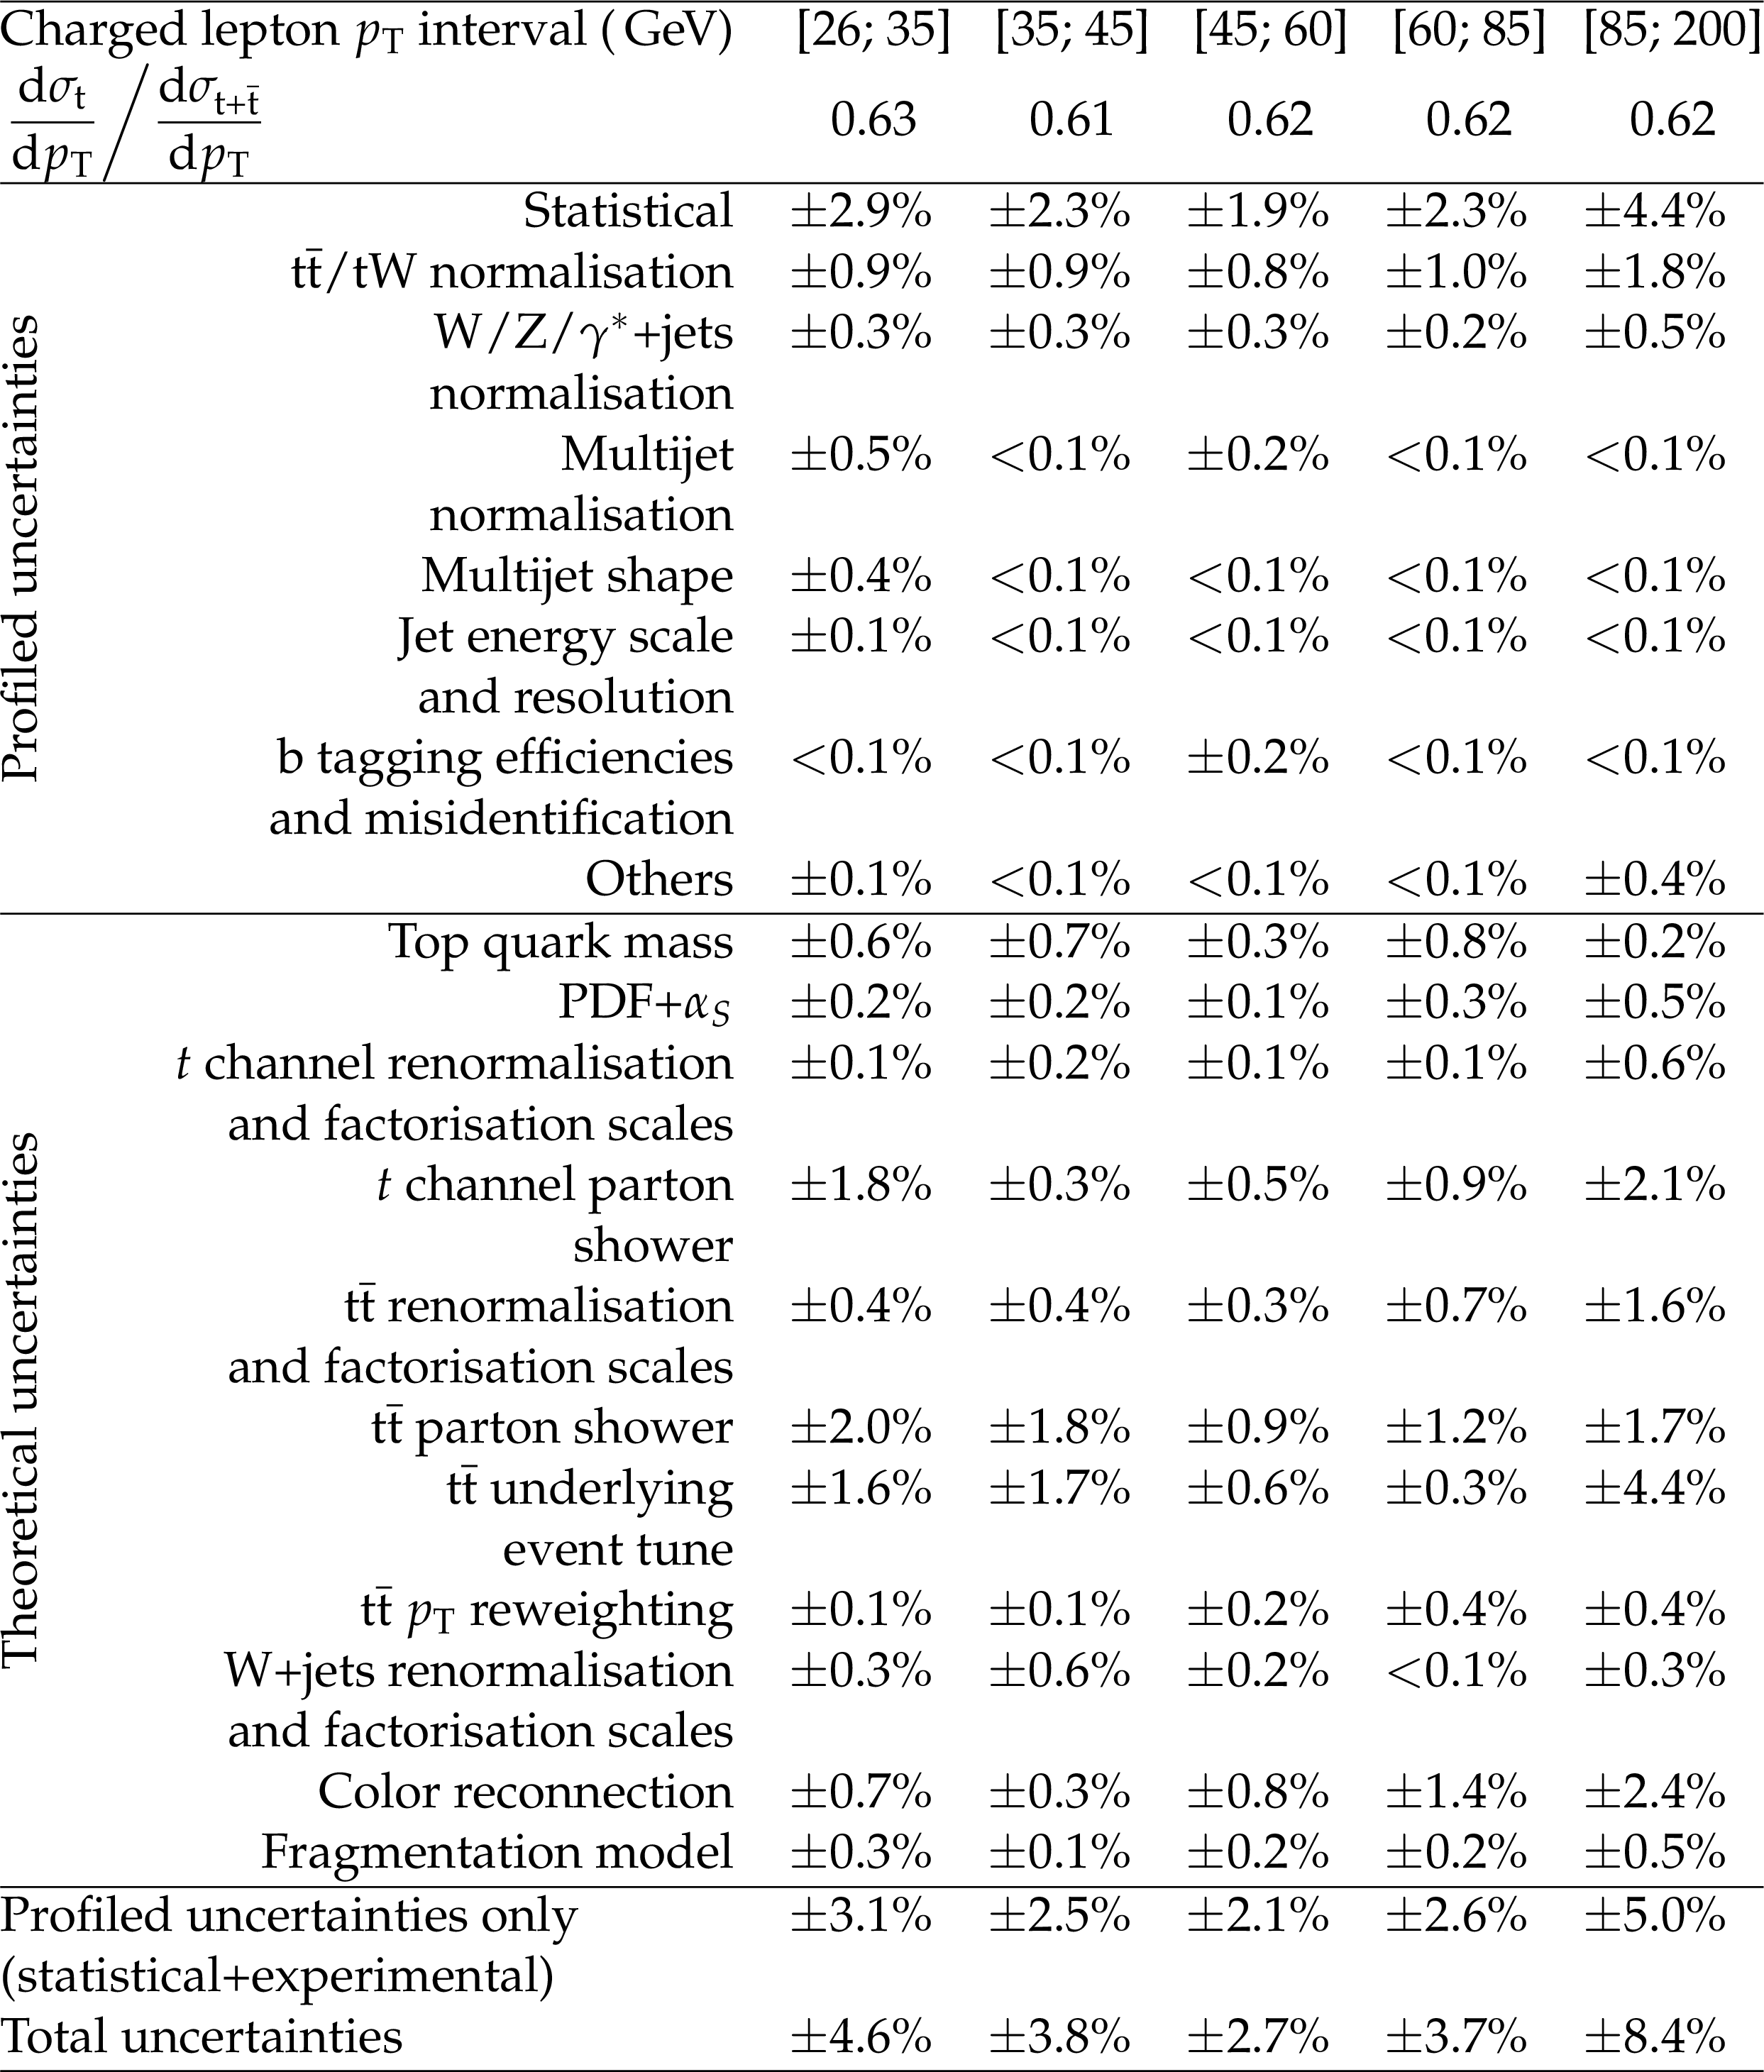
Figure 11-c:
Ratio of the top quark to the sum of the top quark and antiquark $t$-channel differential cross section at the parton level: charged lepton ${p_{\mathrm {T}}}$. The total uncertainty is indicated by the vertical lines, while horizontal bars indicate the statistical and experimental uncertainties, which have been profiled in the ML fit, and thus exclude the uncertainties in the theoretical modelling. Predictions from three different PDF sets are shown by the solid, dashed, and dotted lines. The lower panel shows the ratios of the predictions to the data. |

png pdf |
Figure 11-d:
Ratio of the top quark to the sum of the top quark and antiquark $t$-channel differential cross section at the parton level: charged lepton rapidity. The total uncertainty is indicated by the vertical lines, while horizontal bars indicate the statistical and experimental uncertainties, which have been profiled in the ML fit, and thus exclude the uncertainties in the theoretical modelling. Predictions from three different PDF sets are shown by the solid, dashed, and dotted lines. The lower panel shows the ratios of the predictions to the data. |
png pdf |
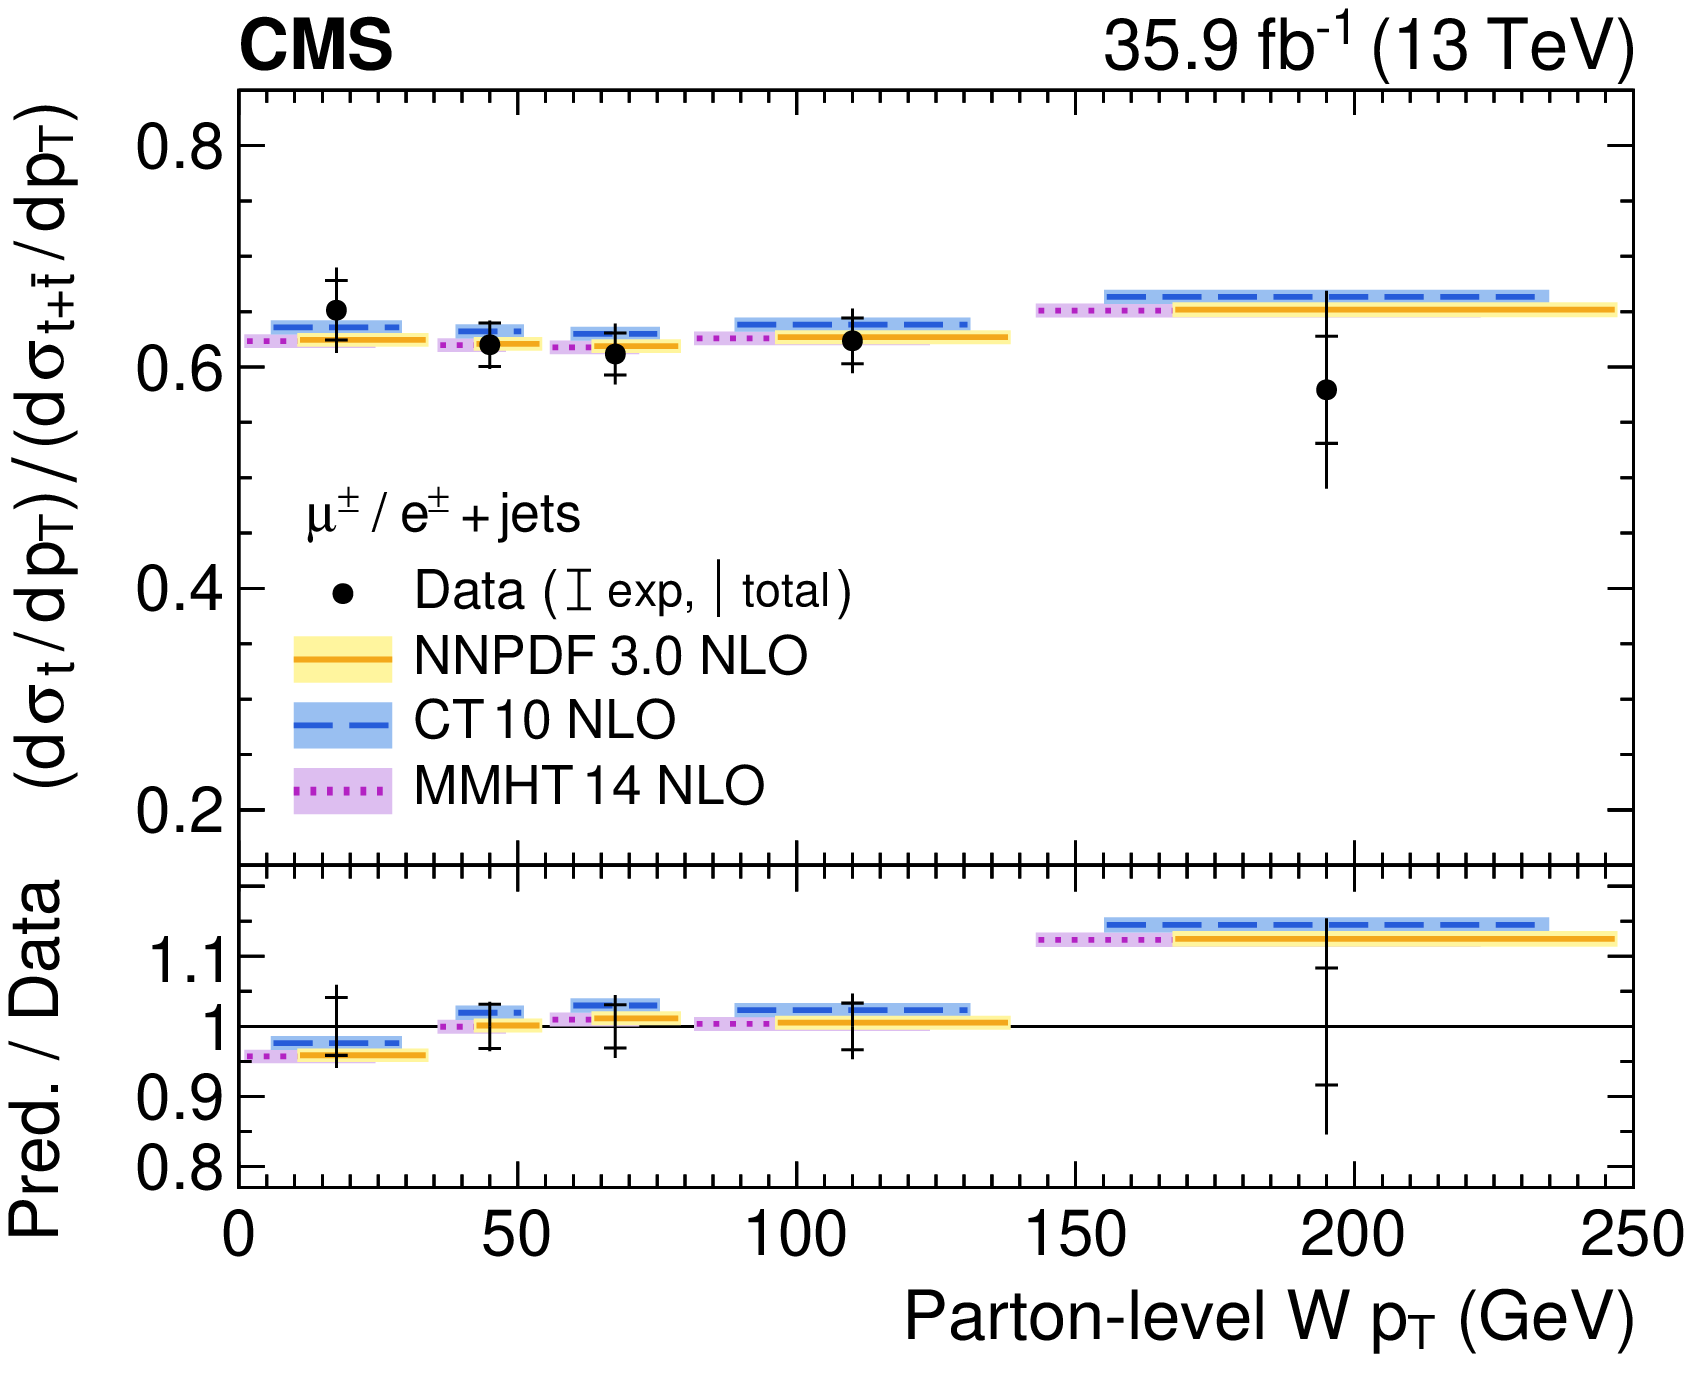
Figure 11-e:
Ratio of the top quark to the sum of the top quark and antiquark $t$-channel differential cross section at the parton level: W boson ${p_{\mathrm {T}}}$. The total uncertainty is indicated by the vertical lines, while horizontal bars indicate the statistical and experimental uncertainties, which have been profiled in the ML fit, and thus exclude the uncertainties in the theoretical modelling. Predictions from three different PDF sets are shown by the solid, dashed, and dotted lines. The lower panel shows the ratios of the predictions to the data. |

png pdf |
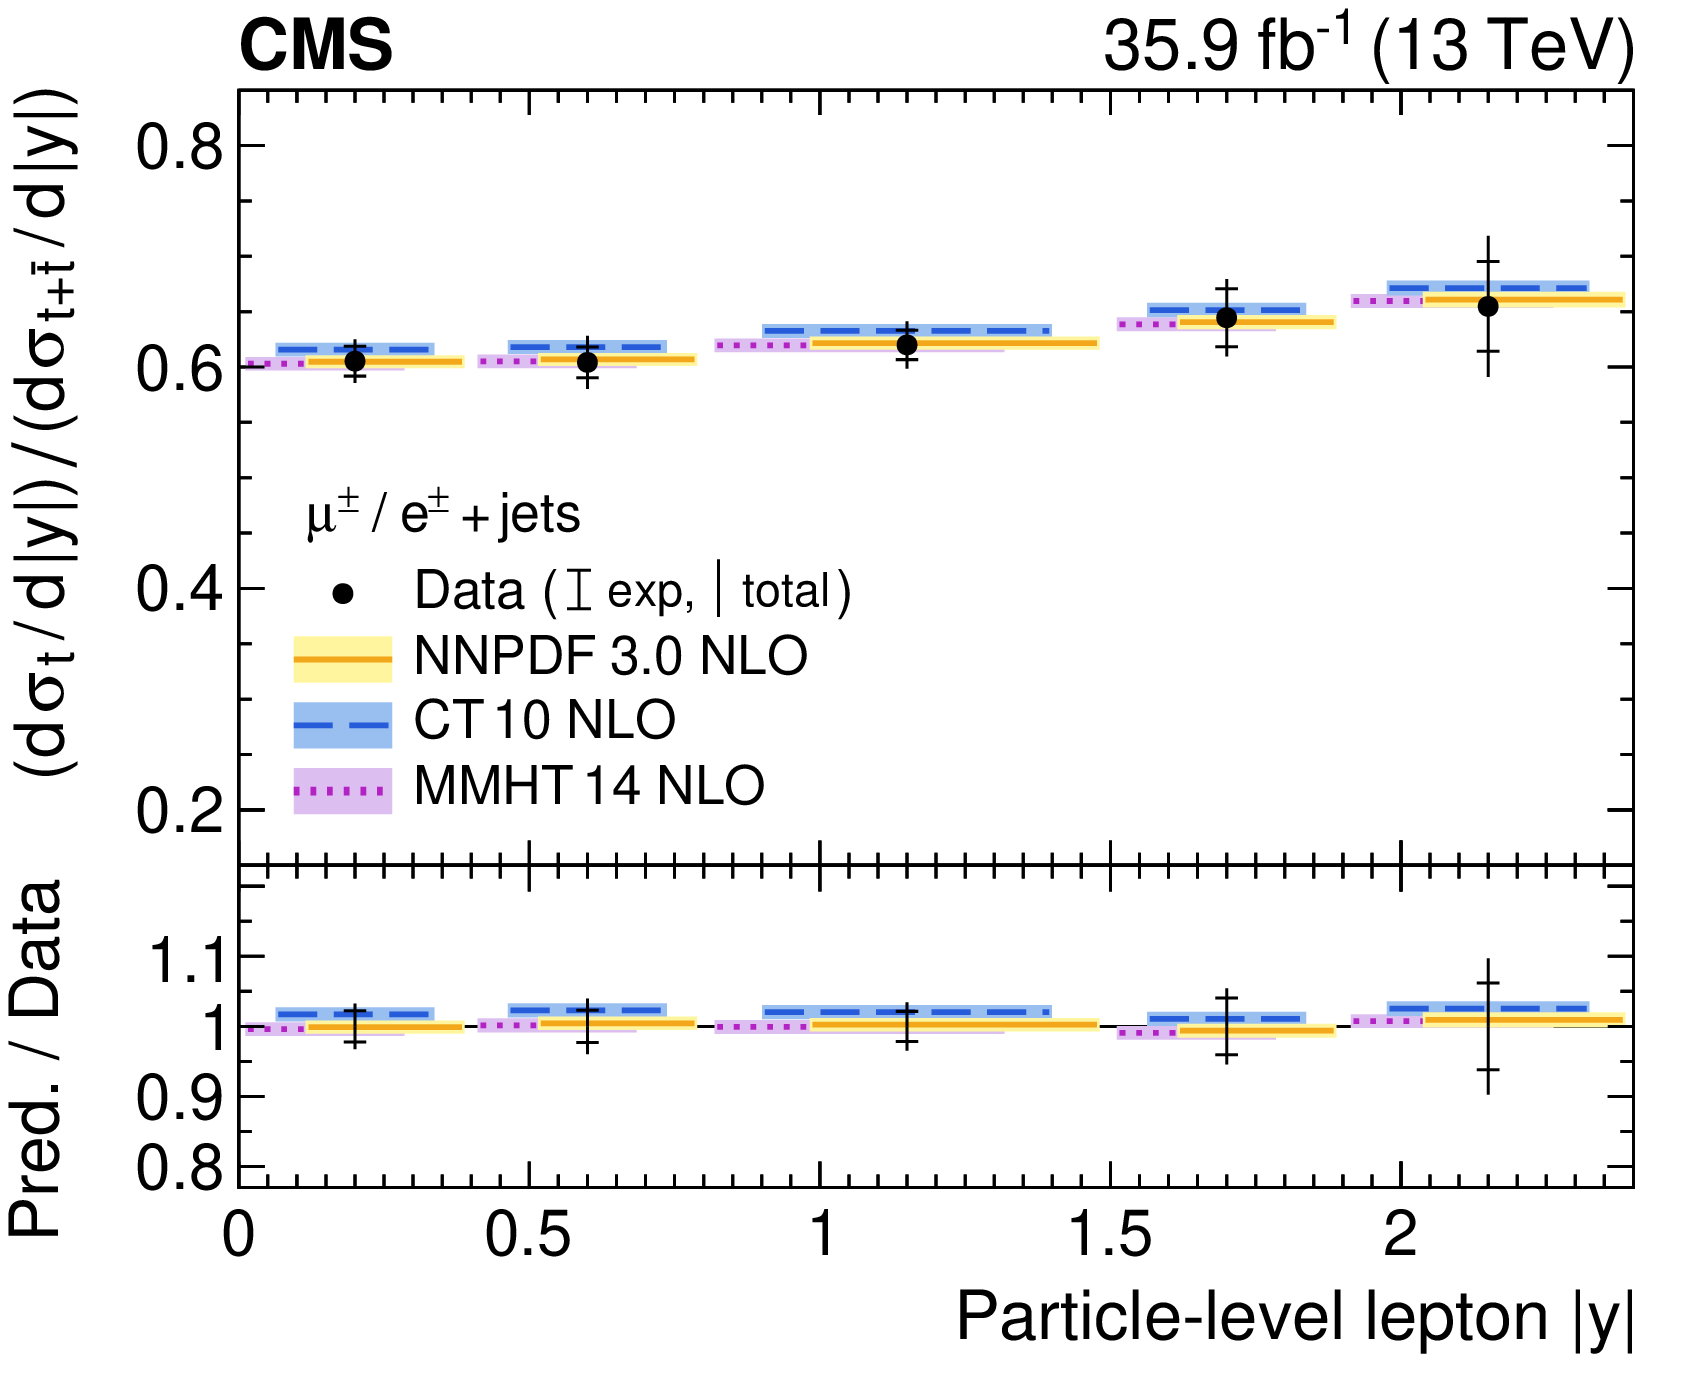
Figure 12:
Ratio of the top quark to the sum of the top quark and antiquark $t$-channel differential cross section at the particle level: (upper row) top quark ${p_{\mathrm {T}}}$ and rapidity; (middle row) charged lepton ${p_{\mathrm {T}}}$ and rapidity; (lower row) W boson ${p_{\mathrm {T}}}$. The total uncertainty is indicated by the vertical lines, while horizontal bars indicate the statistical and experimental uncertainties, which have been profiled in the ML fit, and thus exclude the uncertainties in the theoretical modelling. Predictions from three different PDF sets are shown by the solid, dashed, and dotted lines. The lower panels show the ratios of the predictions to the data. |
png pdf |
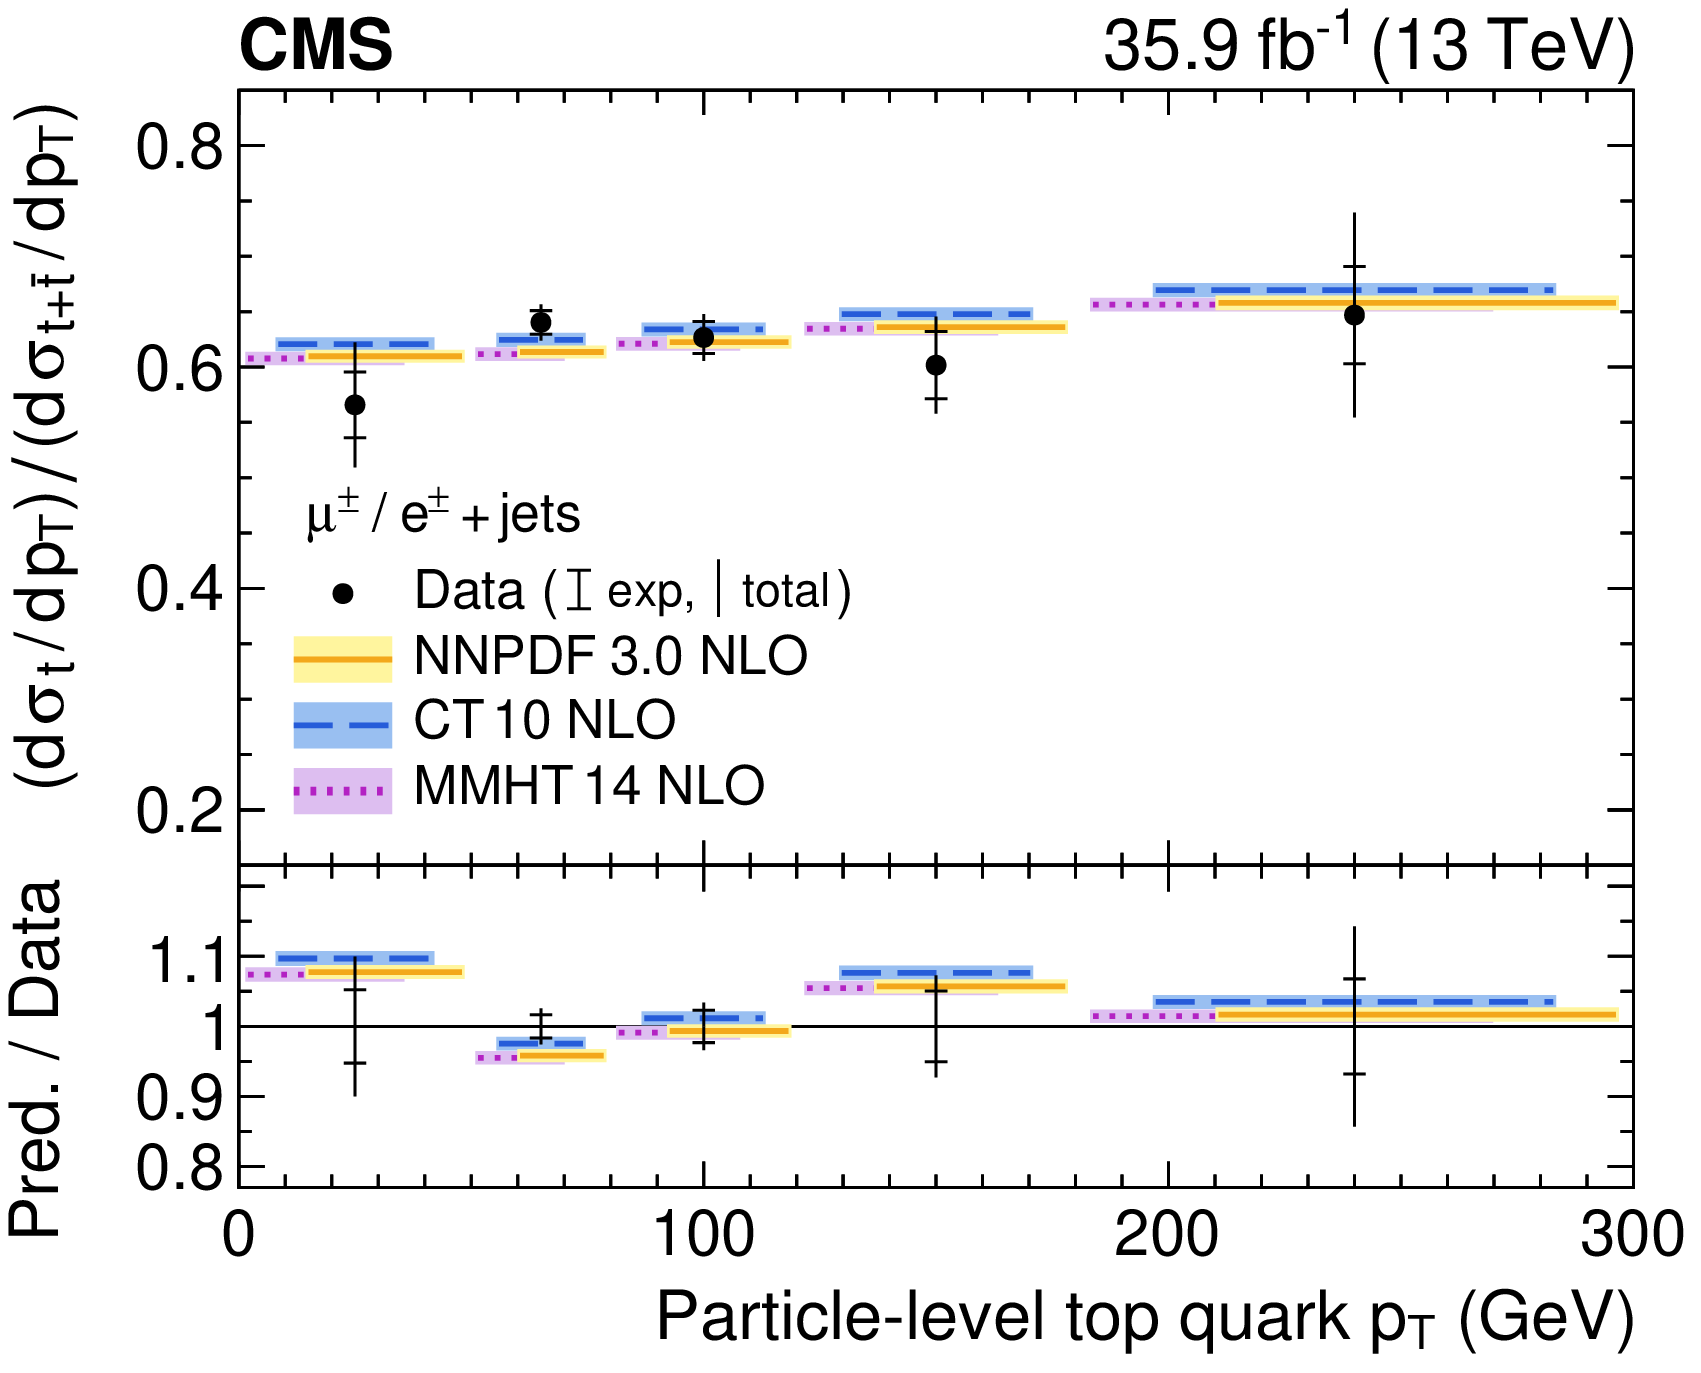
Figure 12-a:
Ratio of the top quark to the sum of the top quark and antiquark $t$-channel differential cross section at the particle level: top quark ${p_{\mathrm {T}}}$. The total uncertainty is indicated by the vertical lines, while horizontal bars indicate the statistical and experimental uncertainties, which have been profiled in the ML fit, and thus exclude the uncertainties in the theoretical modelling. Predictions from three different PDF sets are shown by the solid, dashed, and dotted lines. The lower panel shows the ratios of the predictions to the data. |
png pdf |
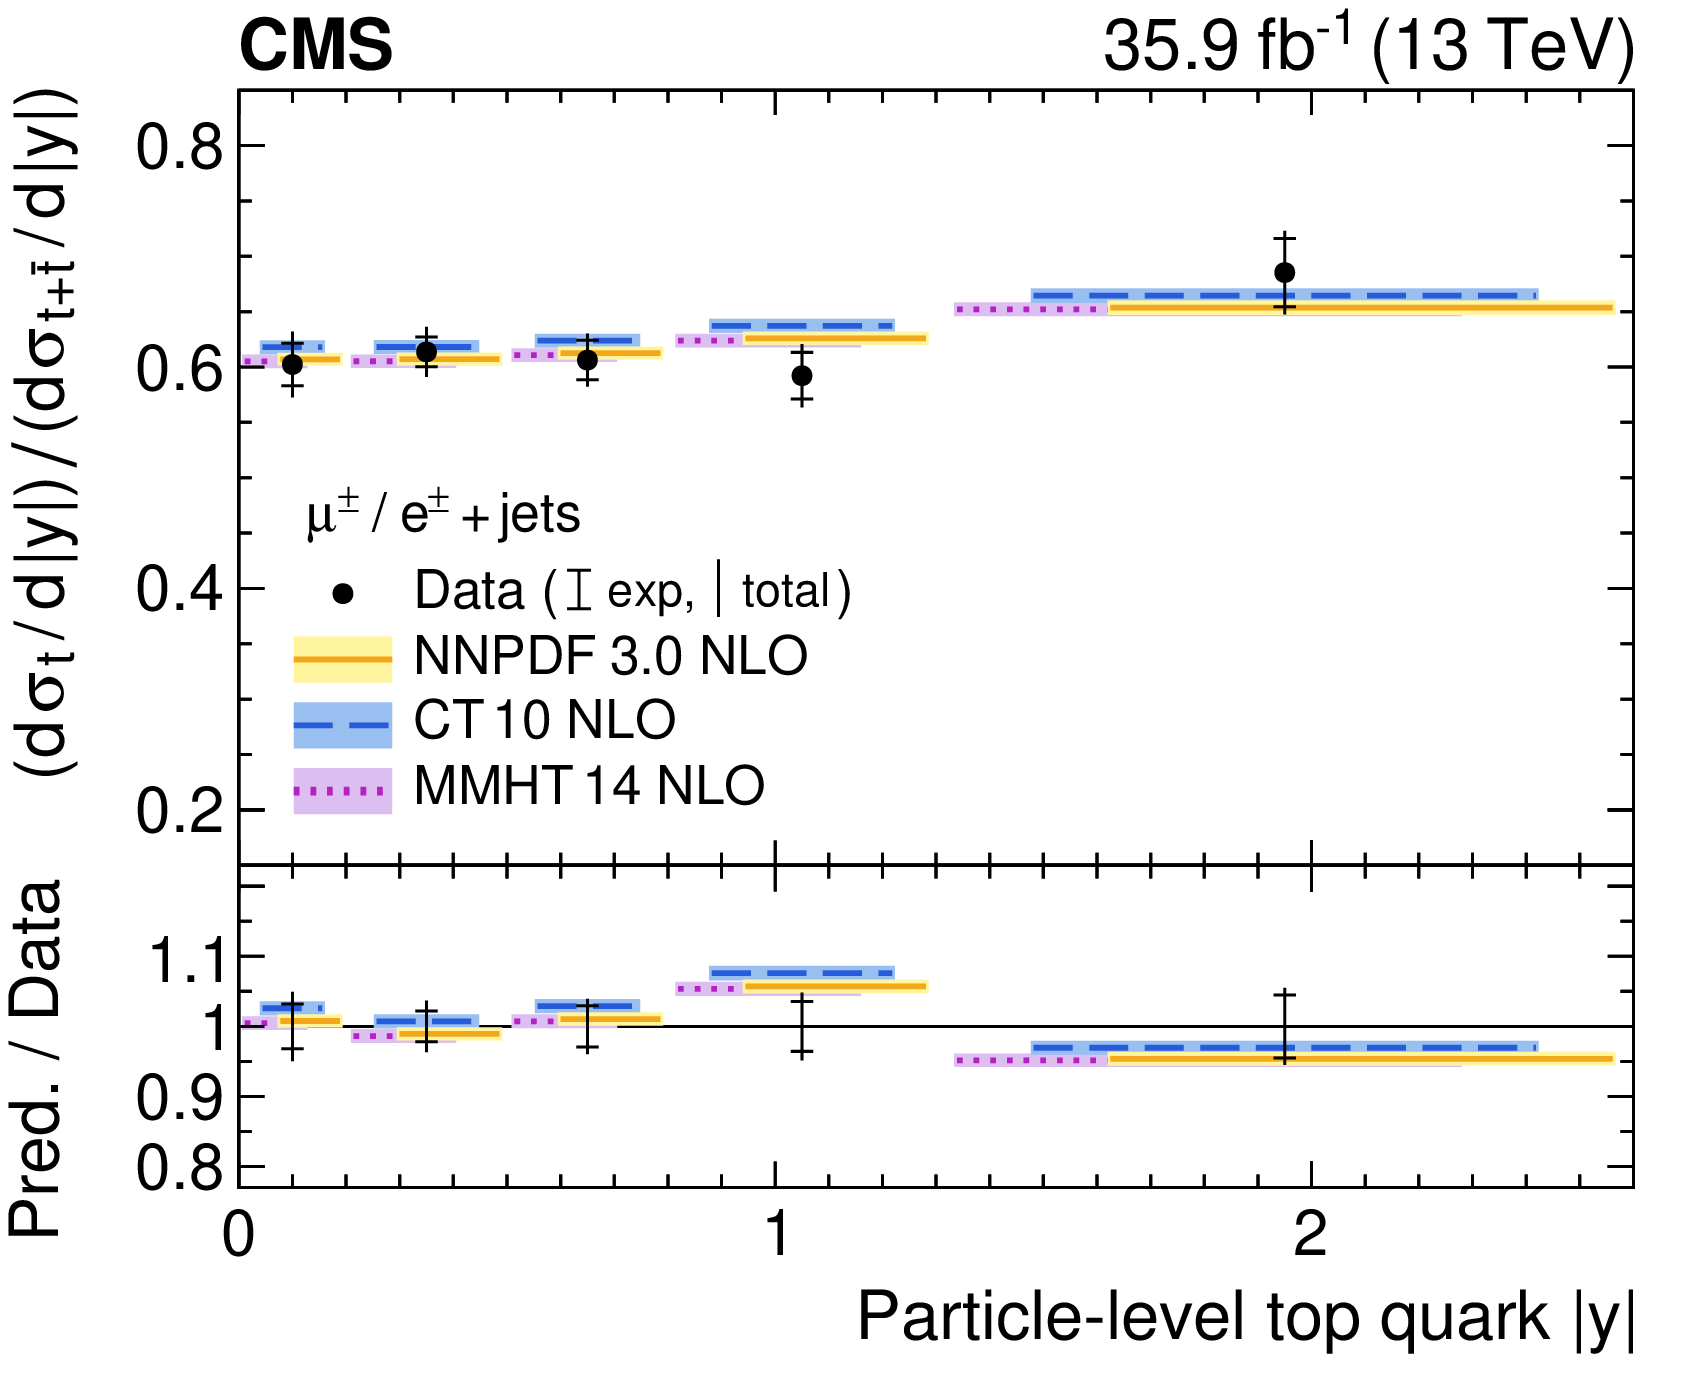
Figure 12-b:
Ratio of the top quark to the sum of the top quark and antiquark $t$-channel differential cross section at the particle level: top quark rapidity. The total uncertainty is indicated by the vertical lines, while horizontal bars indicate the statistical and experimental uncertainties, which have been profiled in the ML fit, and thus exclude the uncertainties in the theoretical modelling. Predictions from three different PDF sets are shown by the solid, dashed, and dotted lines. The lower panel shows the ratios of the predictions to the data. |
png pdf |
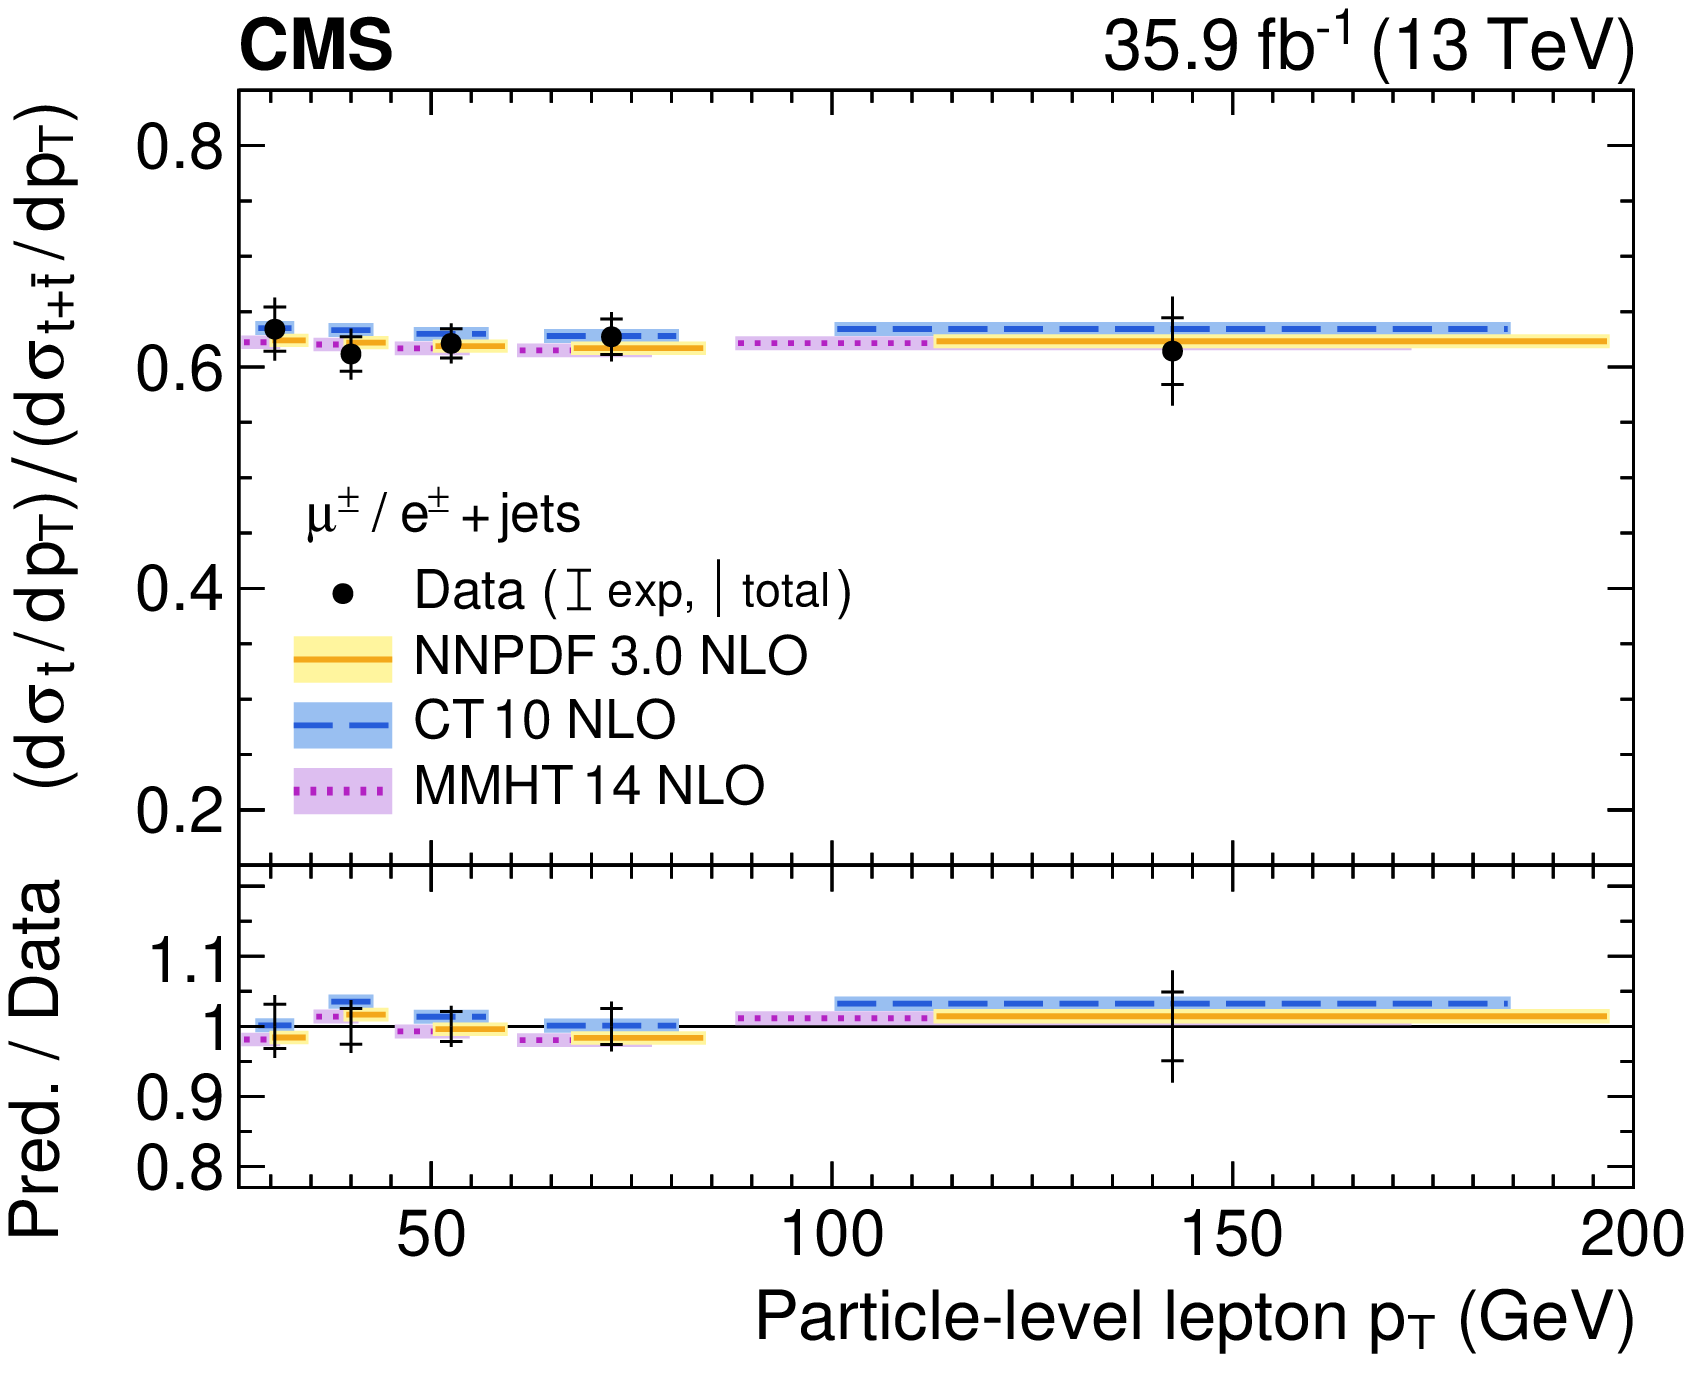
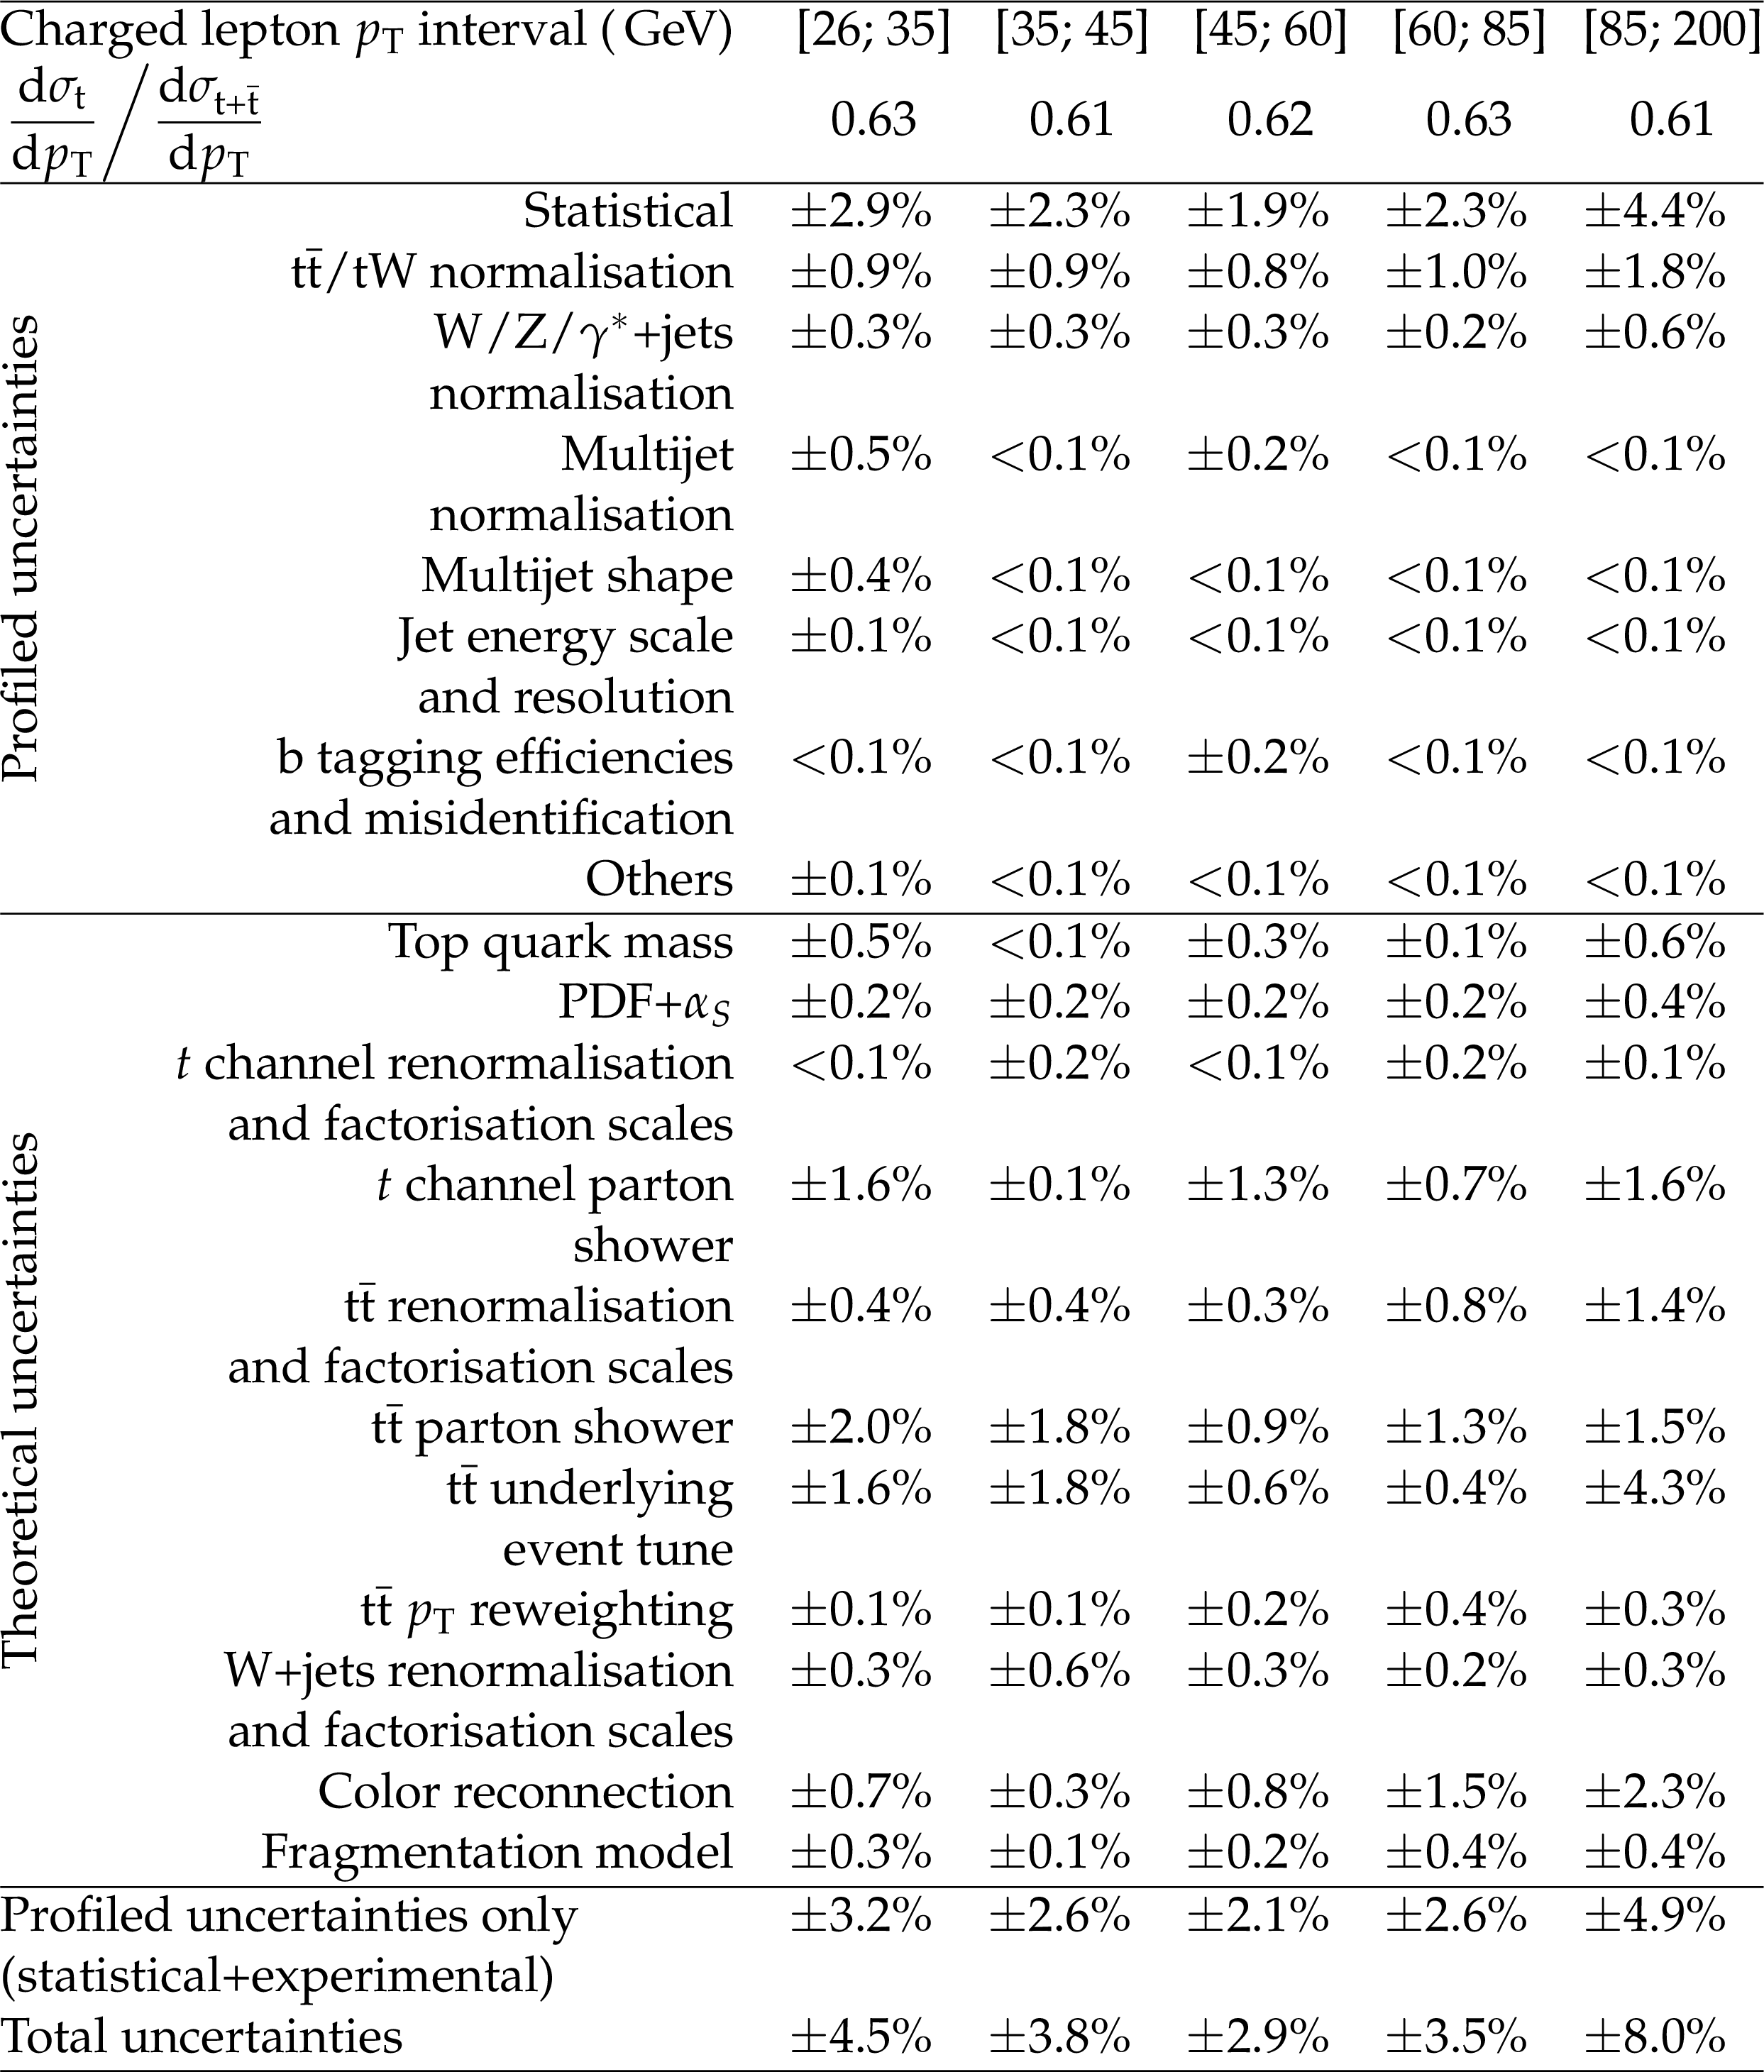
Figure 12-c:
Ratio of the top quark to the sum of the top quark and antiquark $t$-channel differential cross section at the particle level: charged lepton ${p_{\mathrm {T}}}$. The total uncertainty is indicated by the vertical lines, while horizontal bars indicate the statistical and experimental uncertainties, which have been profiled in the ML fit, and thus exclude the uncertainties in the theoretical modelling. Predictions from three different PDF sets are shown by the solid, dashed, and dotted lines. The lower panel shows the ratios of the predictions to the data. |
png pdf |
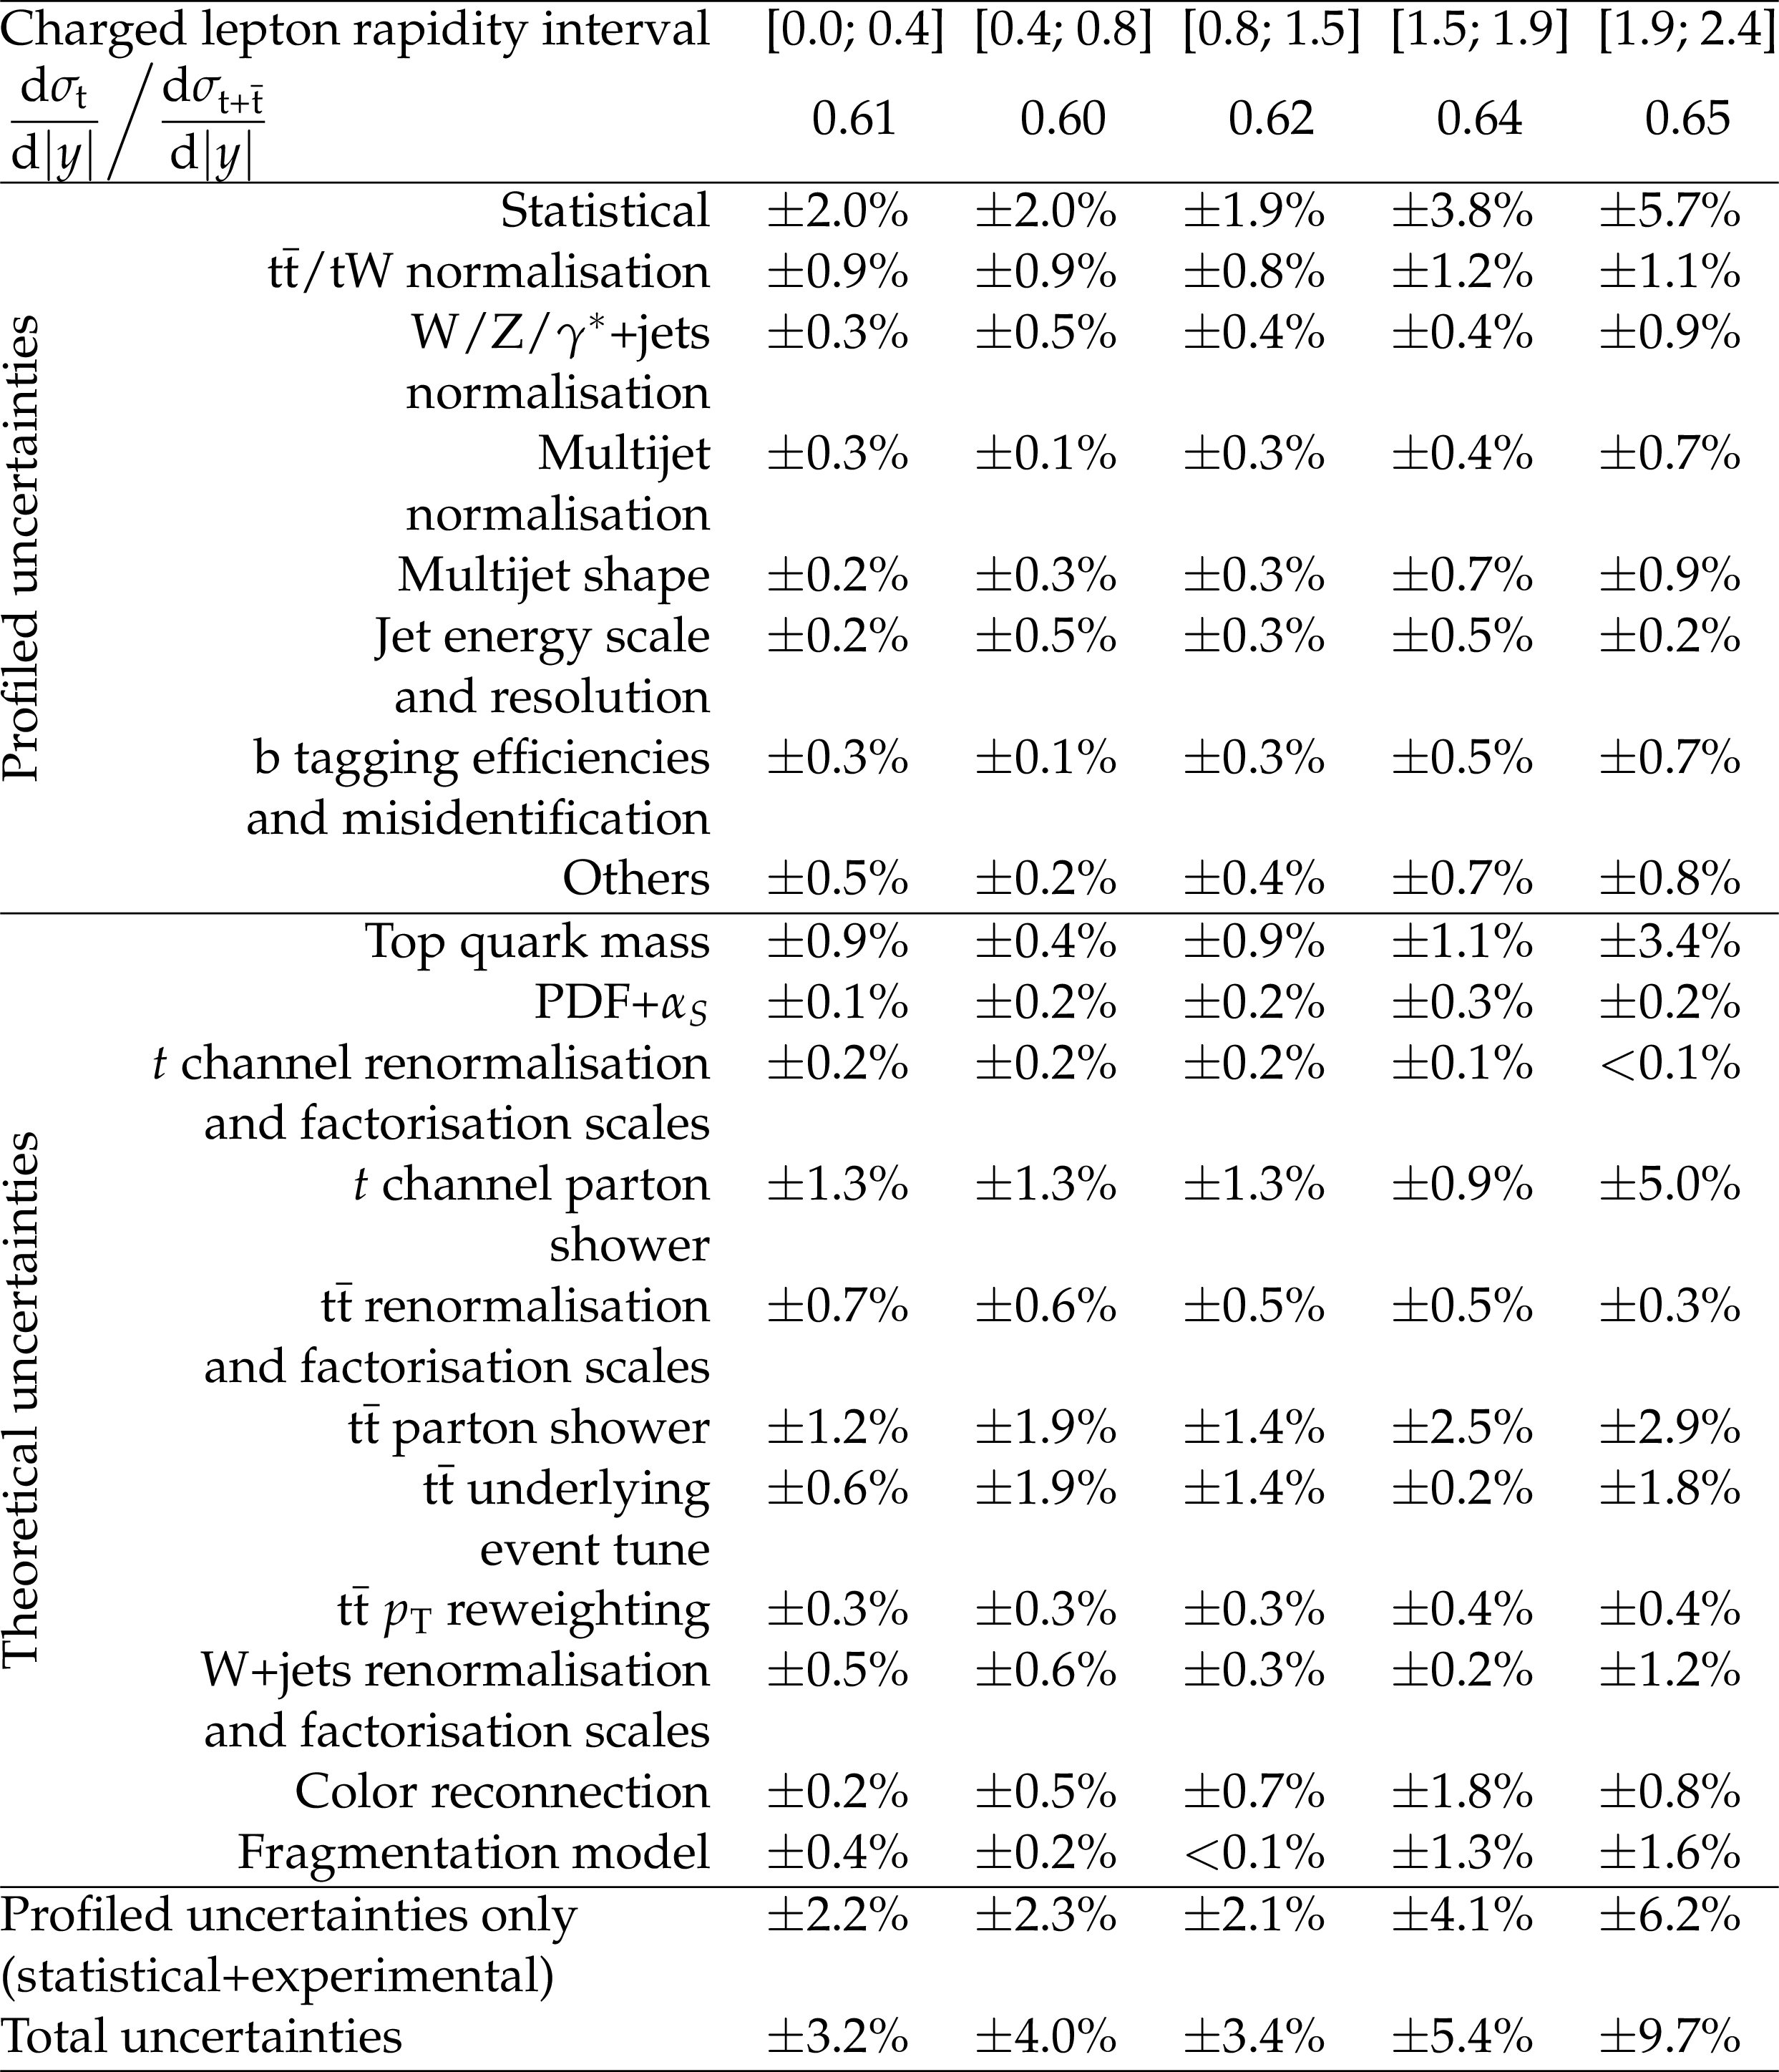
Figure 12-d:
Ratio of the top quark to the sum of the top quark and antiquark $t$-channel differential cross section at the particle level:charged lepton rapidity. The total uncertainty is indicated by the vertical lines, while horizontal bars indicate the statistical and experimental uncertainties, which have been profiled in the ML fit, and thus exclude the uncertainties in the theoretical modelling. Predictions from three different PDF sets are shown by the solid, dashed, and dotted lines. The lower panel shows the ratios of the predictions to the data. |

png pdf |
Figure 12-e:
Ratio of the top quark to the sum of the top quark and antiquark $t$-channel differential cross section at the particle level: W boson ${p_{\mathrm {T}}}$. The total uncertainty is indicated by the vertical lines, while horizontal bars indicate the statistical and experimental uncertainties, which have been profiled in the ML fit, and thus exclude the uncertainties in the theoretical modelling. Predictions from three different PDF sets are shown by the solid, dashed, and dotted lines. The lower panel shows the ratios of the predictions to the data. |
| Tables | |
png pdf |
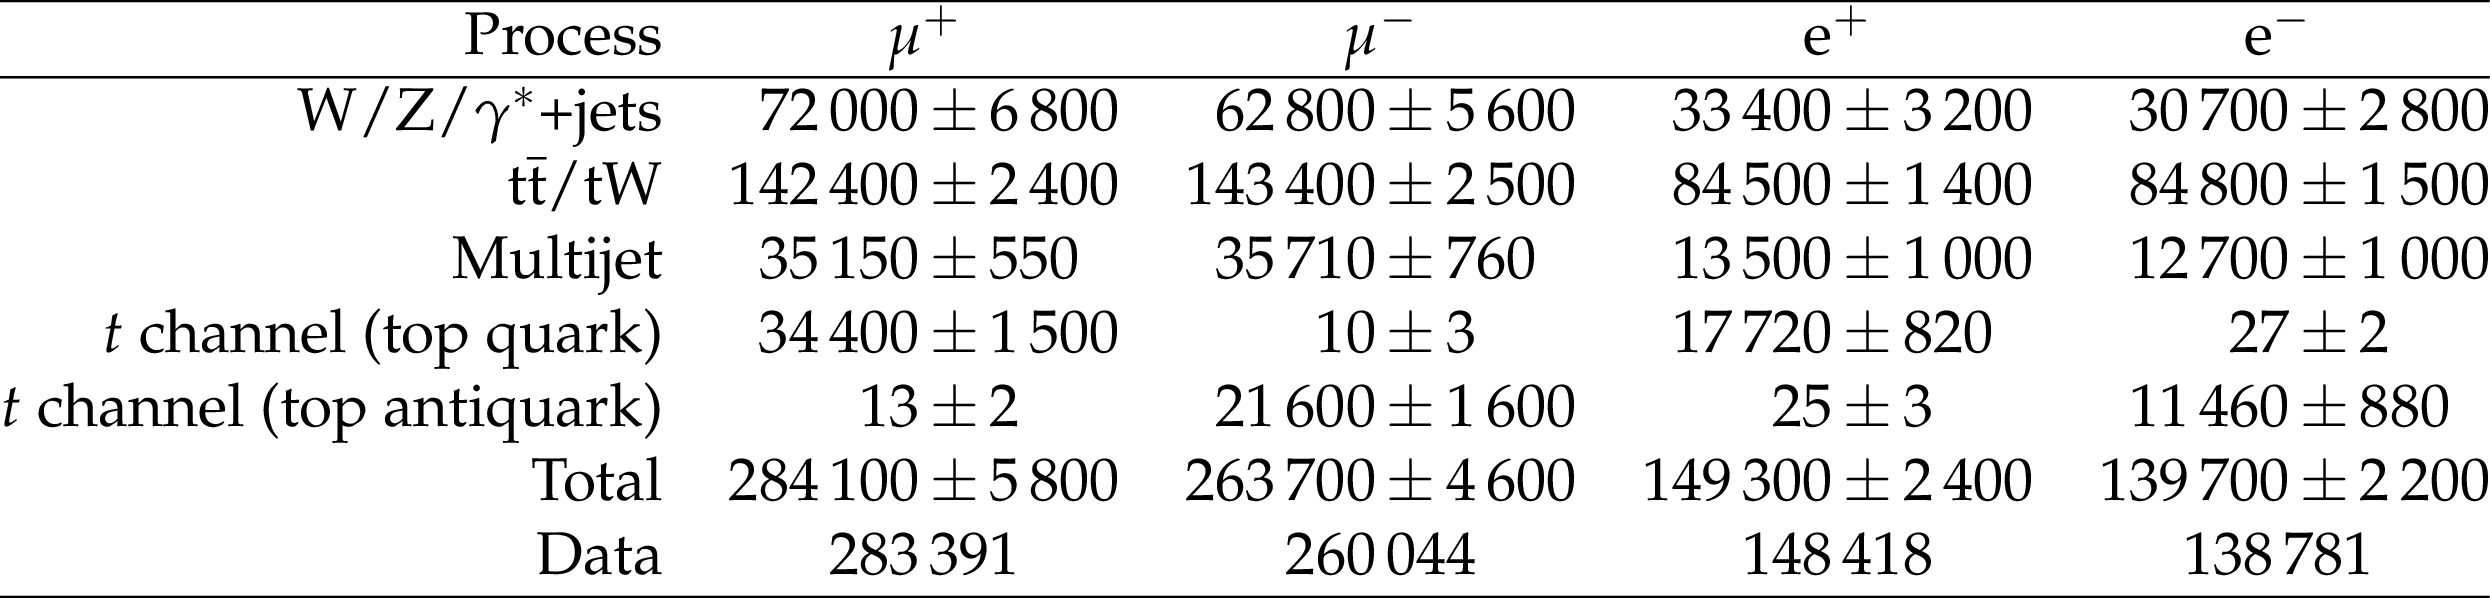
Table 1:
Measured and observed event yields in the 2j1b category for each lepton channel and charge. The uncertainties in the yields are the combination of statistical and experimental systematic uncertainties. |
png pdf |
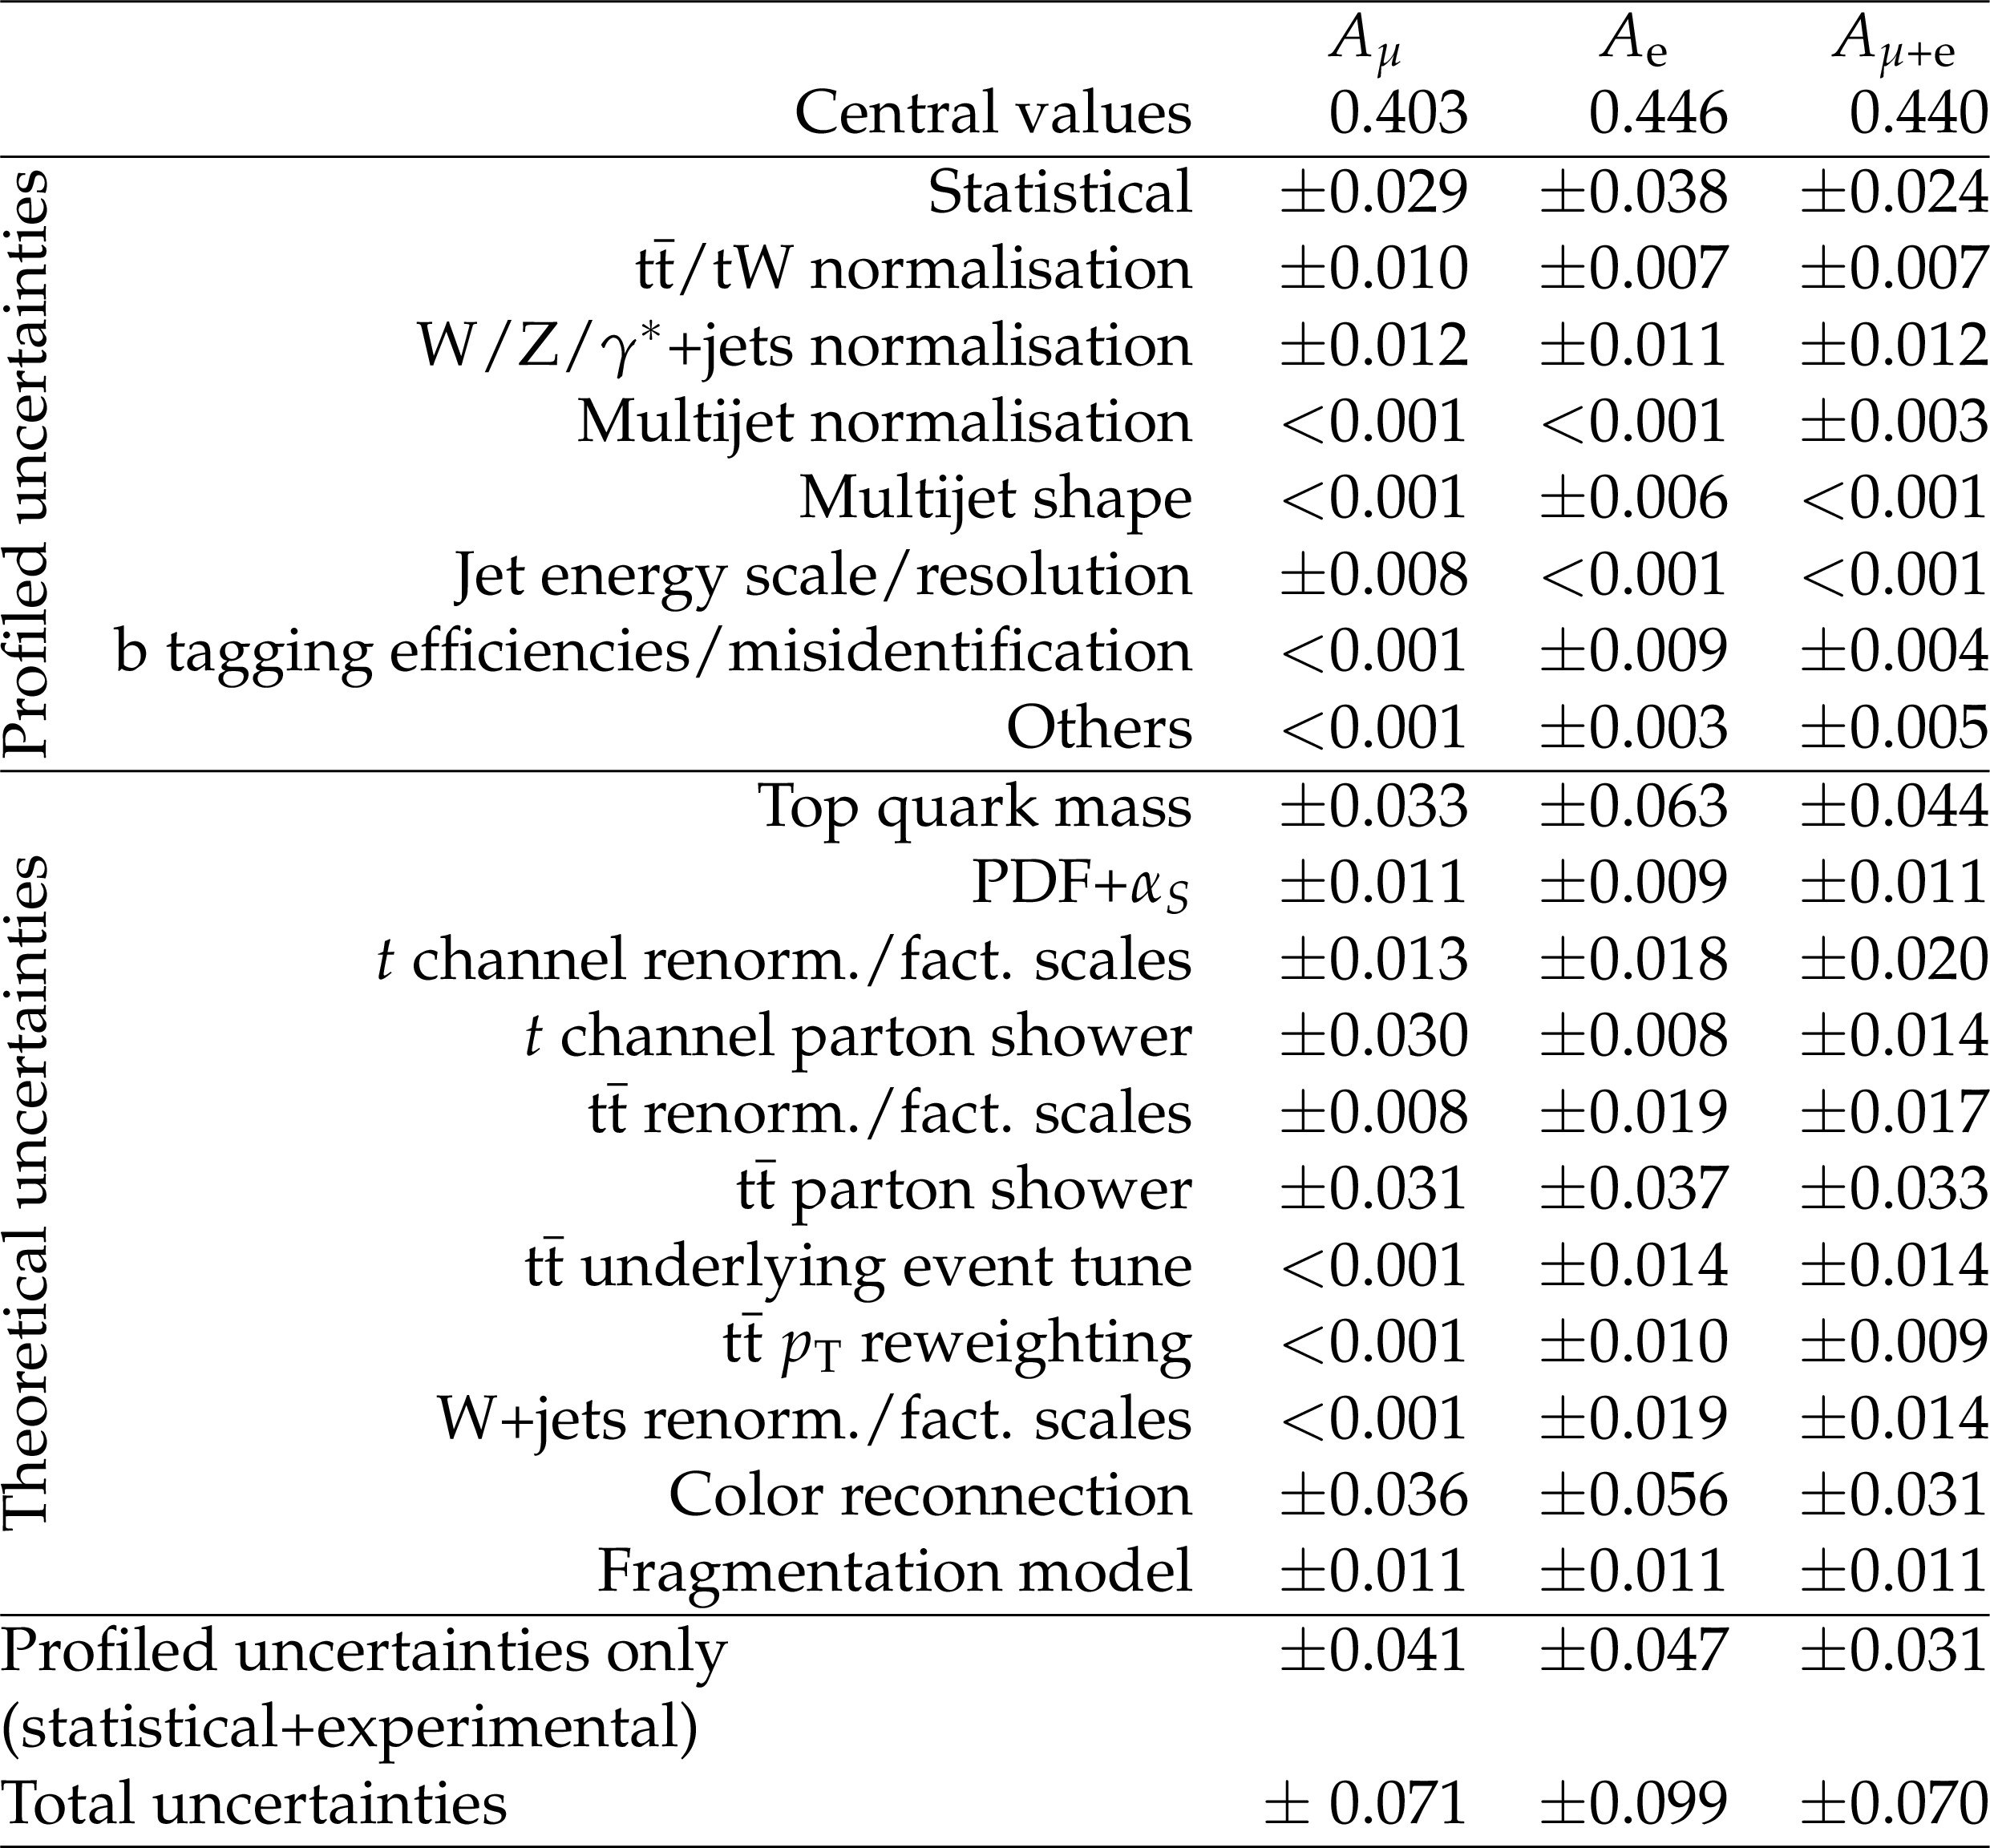
Table 2:
The measured spin asymmetry in the muon and electron channel and their combination. A breakdown of the systematic uncertainties is also provided. Minor systematic uncertainties (lepton efficiencies, pileup, and unclustered energy) have been grouped into the "Others'' category. |
| Summary |
|
Differential cross sections for $t$-channel single top quark and antiquark production in proton-proton collisions at $\sqrt{s}=$ 13 TeV have been measured by the CMS experiment at the LHC using a sample of proton-proton collision data, corresponding to an integrated luminosity of 35.9 fb$^{-1}$. The cross sections are determined as a function of the top quark transverse momentum (${p_{\mathrm{T}}}$), rapidity, and polarisation angle, the charged lepton ${p_{\mathrm{T}}}$ and rapidity, and the ${p_{\mathrm{T}}}$ of the W boson from the top quark decay. In addition, the charge ratio has been measured as a function of the top quark, charged lepton, and W boson kinematic observables. Events containing one muon or electron and two or three jets are used. The single top quark and antiquark yields are determined through maximum-likelihood fits to the data distributions. The differential cross sections are then obtained at the parton and particle levels by unfolding the measured signal yields. The results are compared to various next-to-leading-order predictions, and found to be in good agreement. Furthermore, the top quark spin asymmetry, which is sensitive to the top quark polarisation, has been measured using the differential cross section as a function of the top quark polarisation angle at the parton level. The resulting value of 0.440 $\pm$ 0.070 is in good agreement with the standard model prediction. These results demonstrate a good understanding of the underlying electroweak production mechanism of single top quarks at $\sqrt{s}=$ 13 TeV and in particular of the electroweak vector$-$axial-vector coupling predicting highly polarized top quarks. Lastly, the differential charge ratios, sensitive to the ratio of the up to down quark content of the proton, are found to be consistent with the predictions by various sets of parton distribution functions. |
| Additional Figures | |
png pdf |
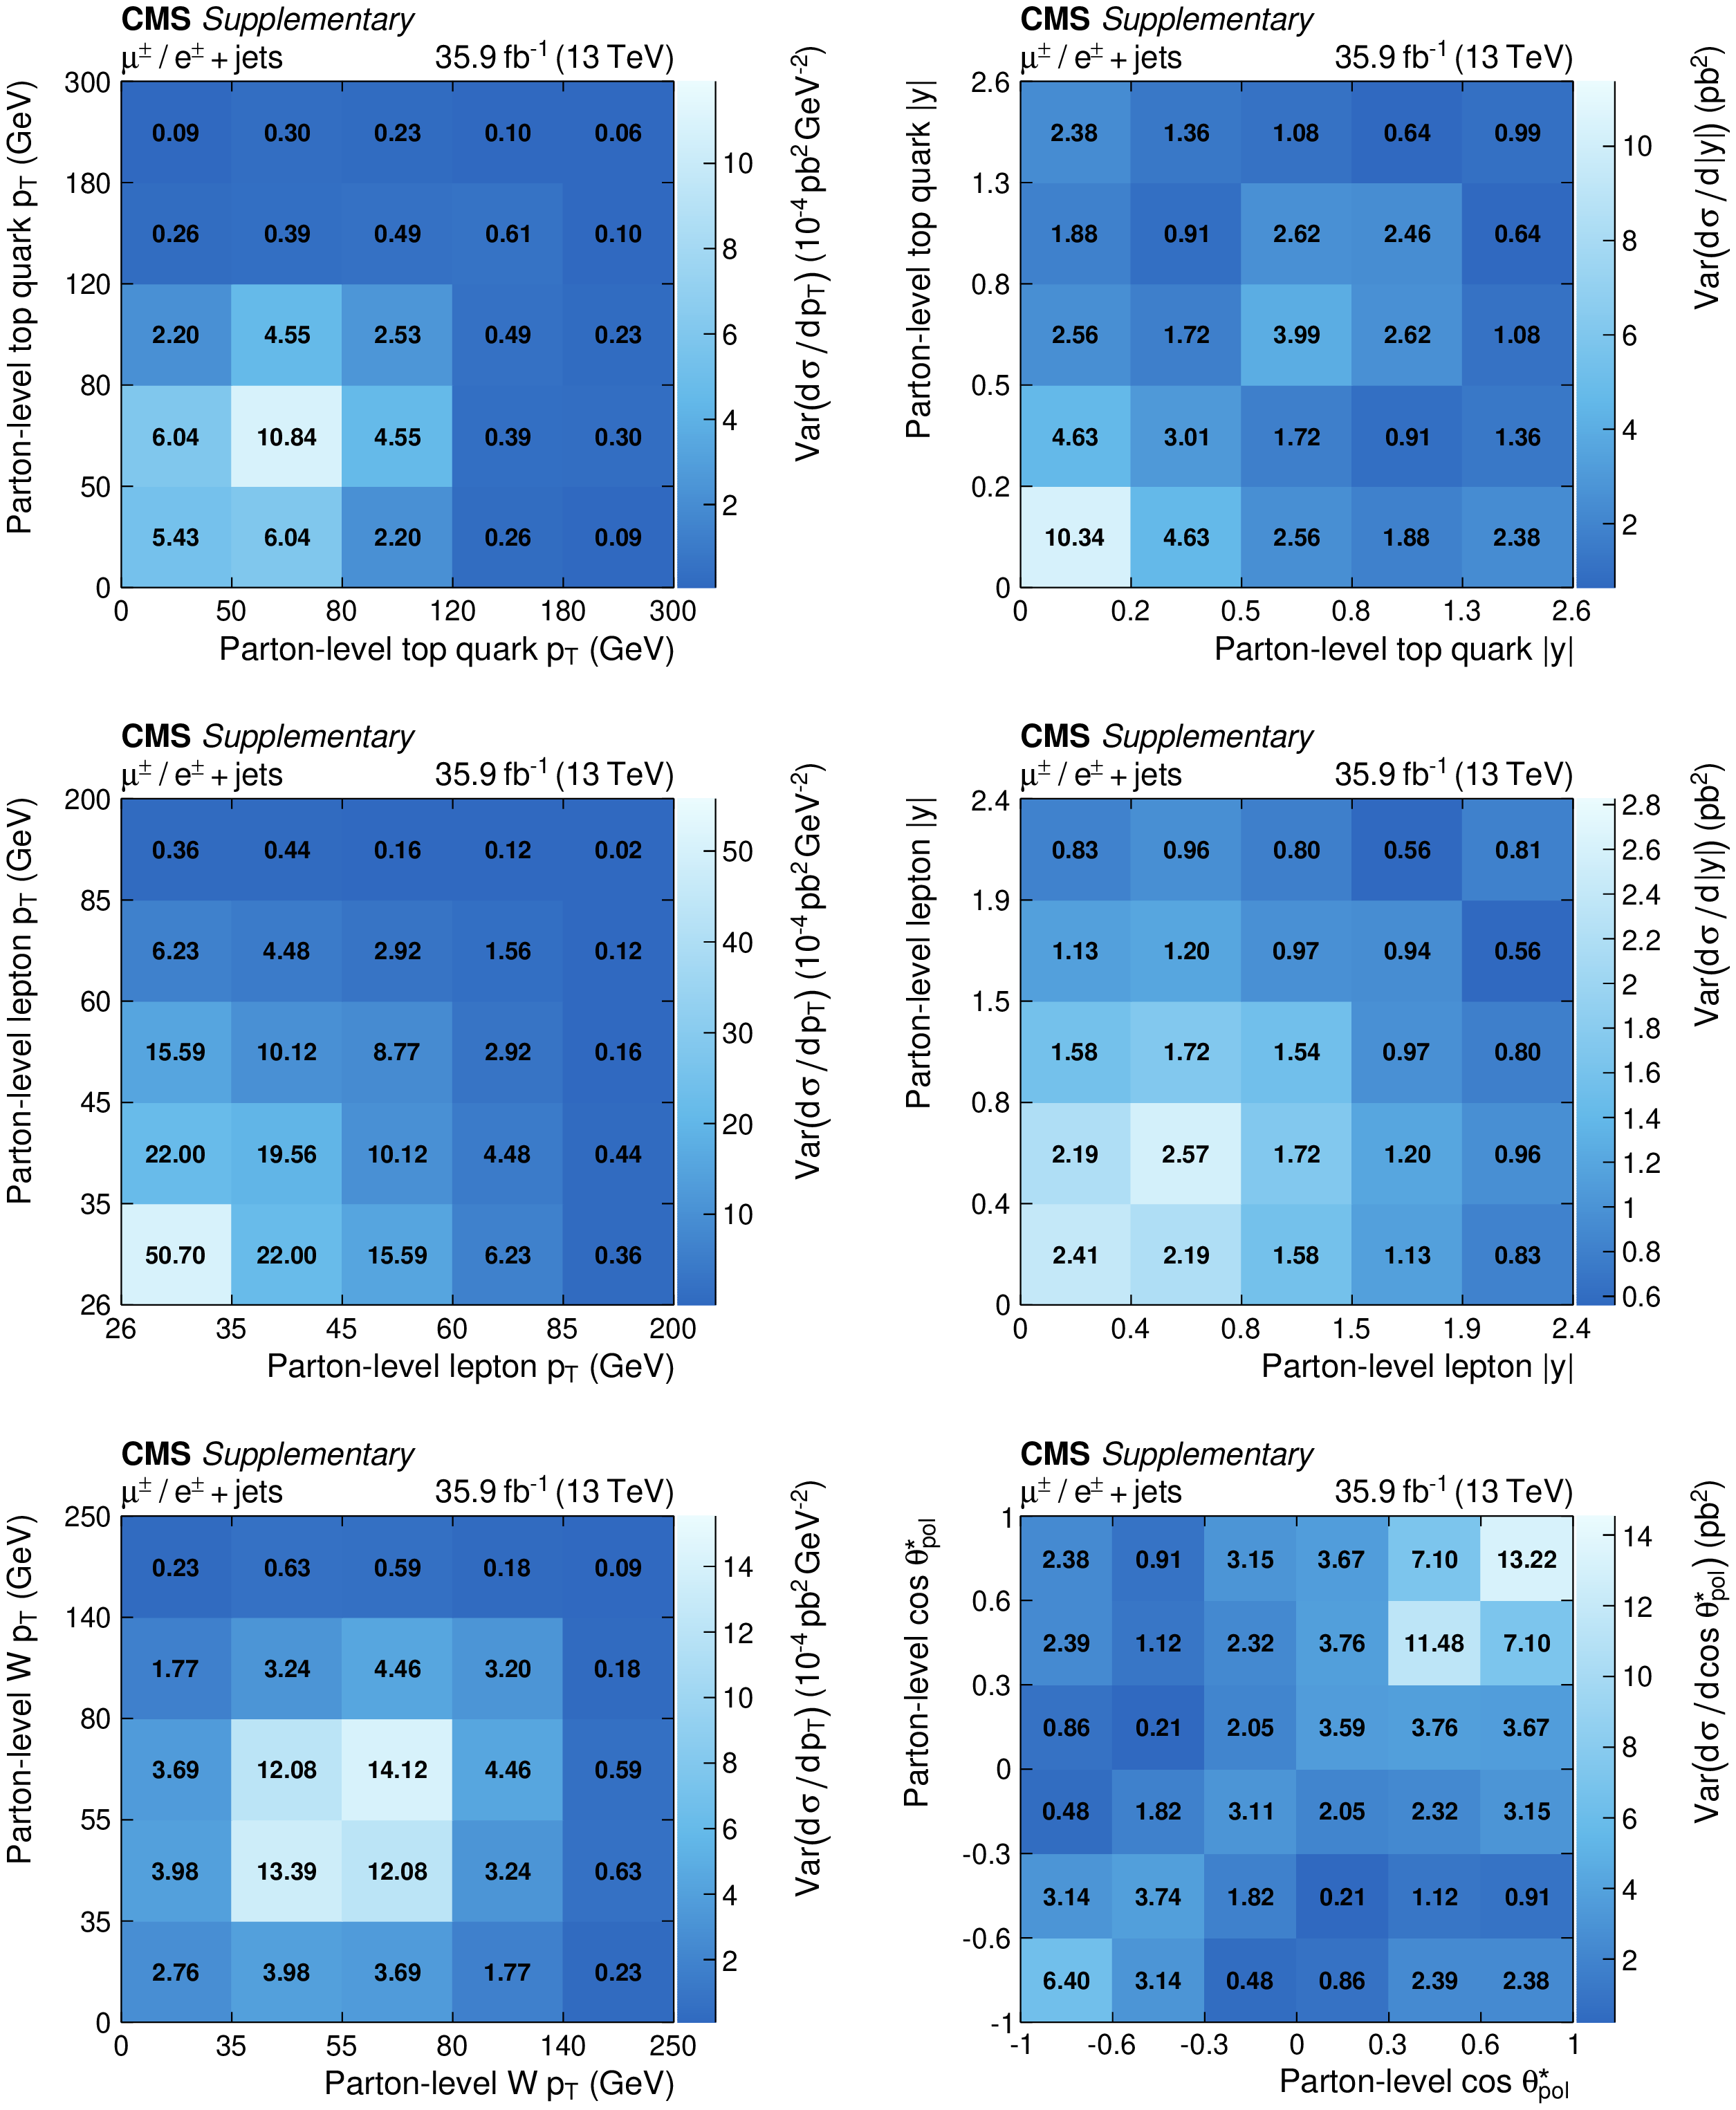
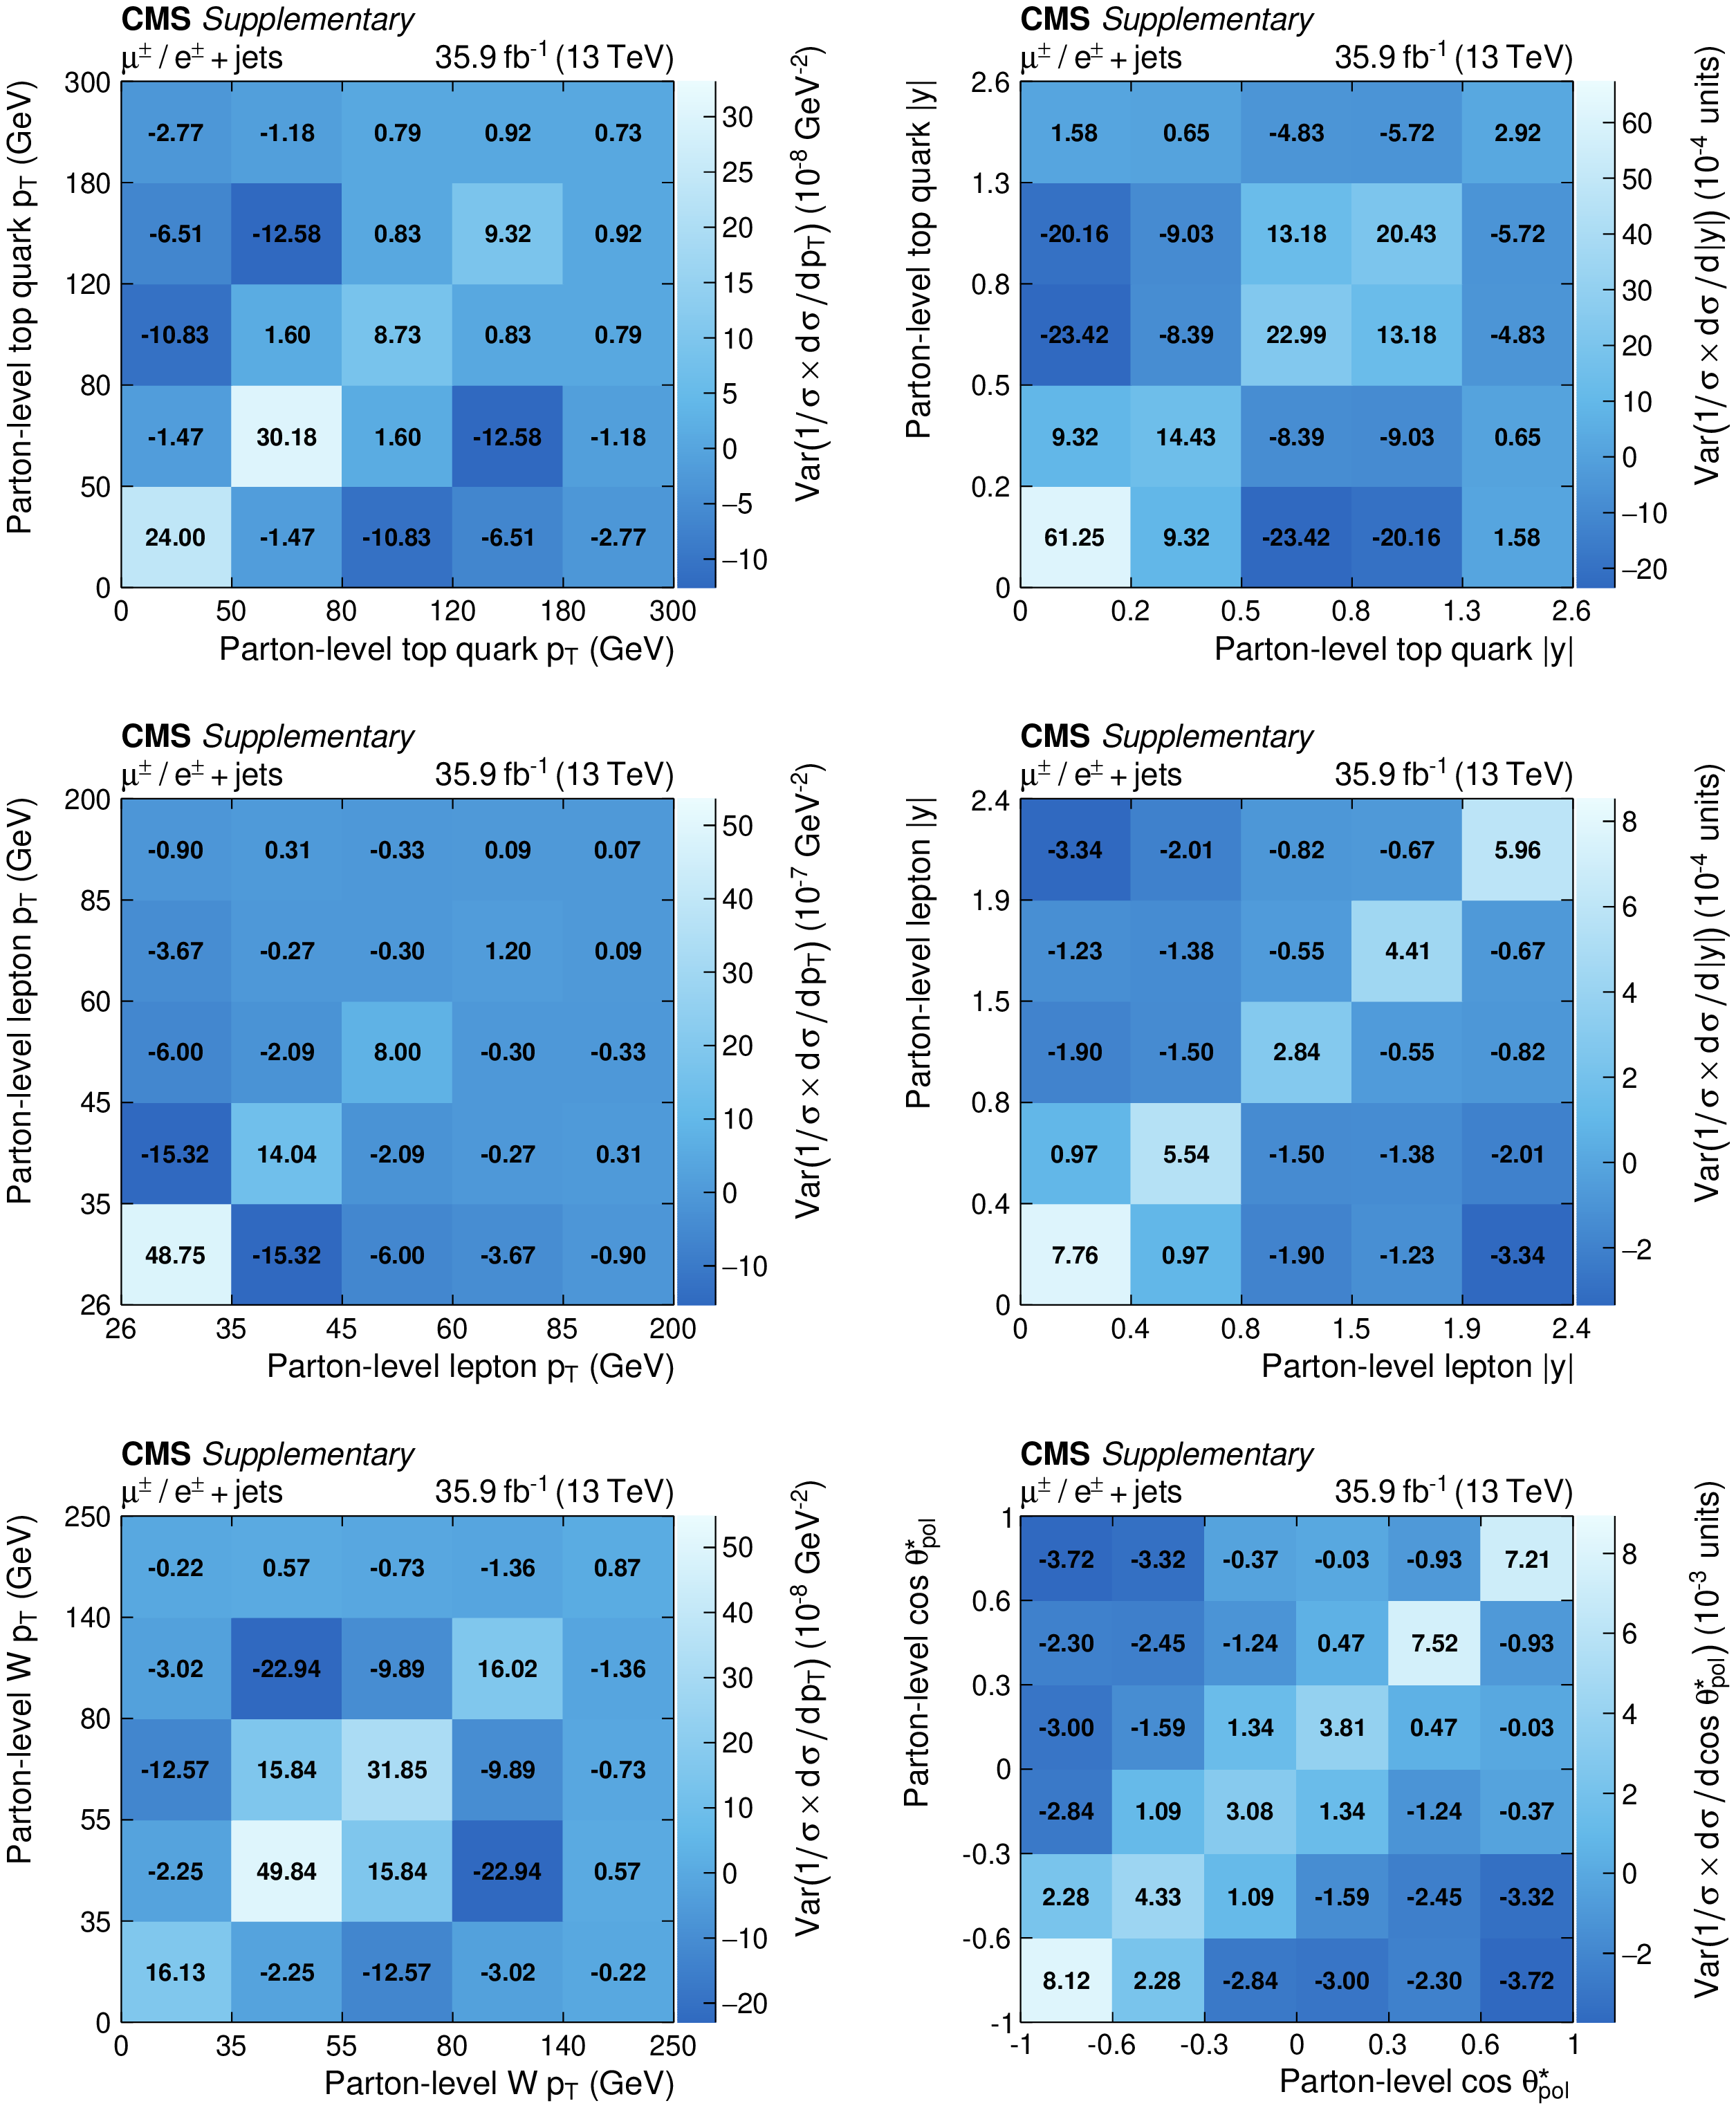
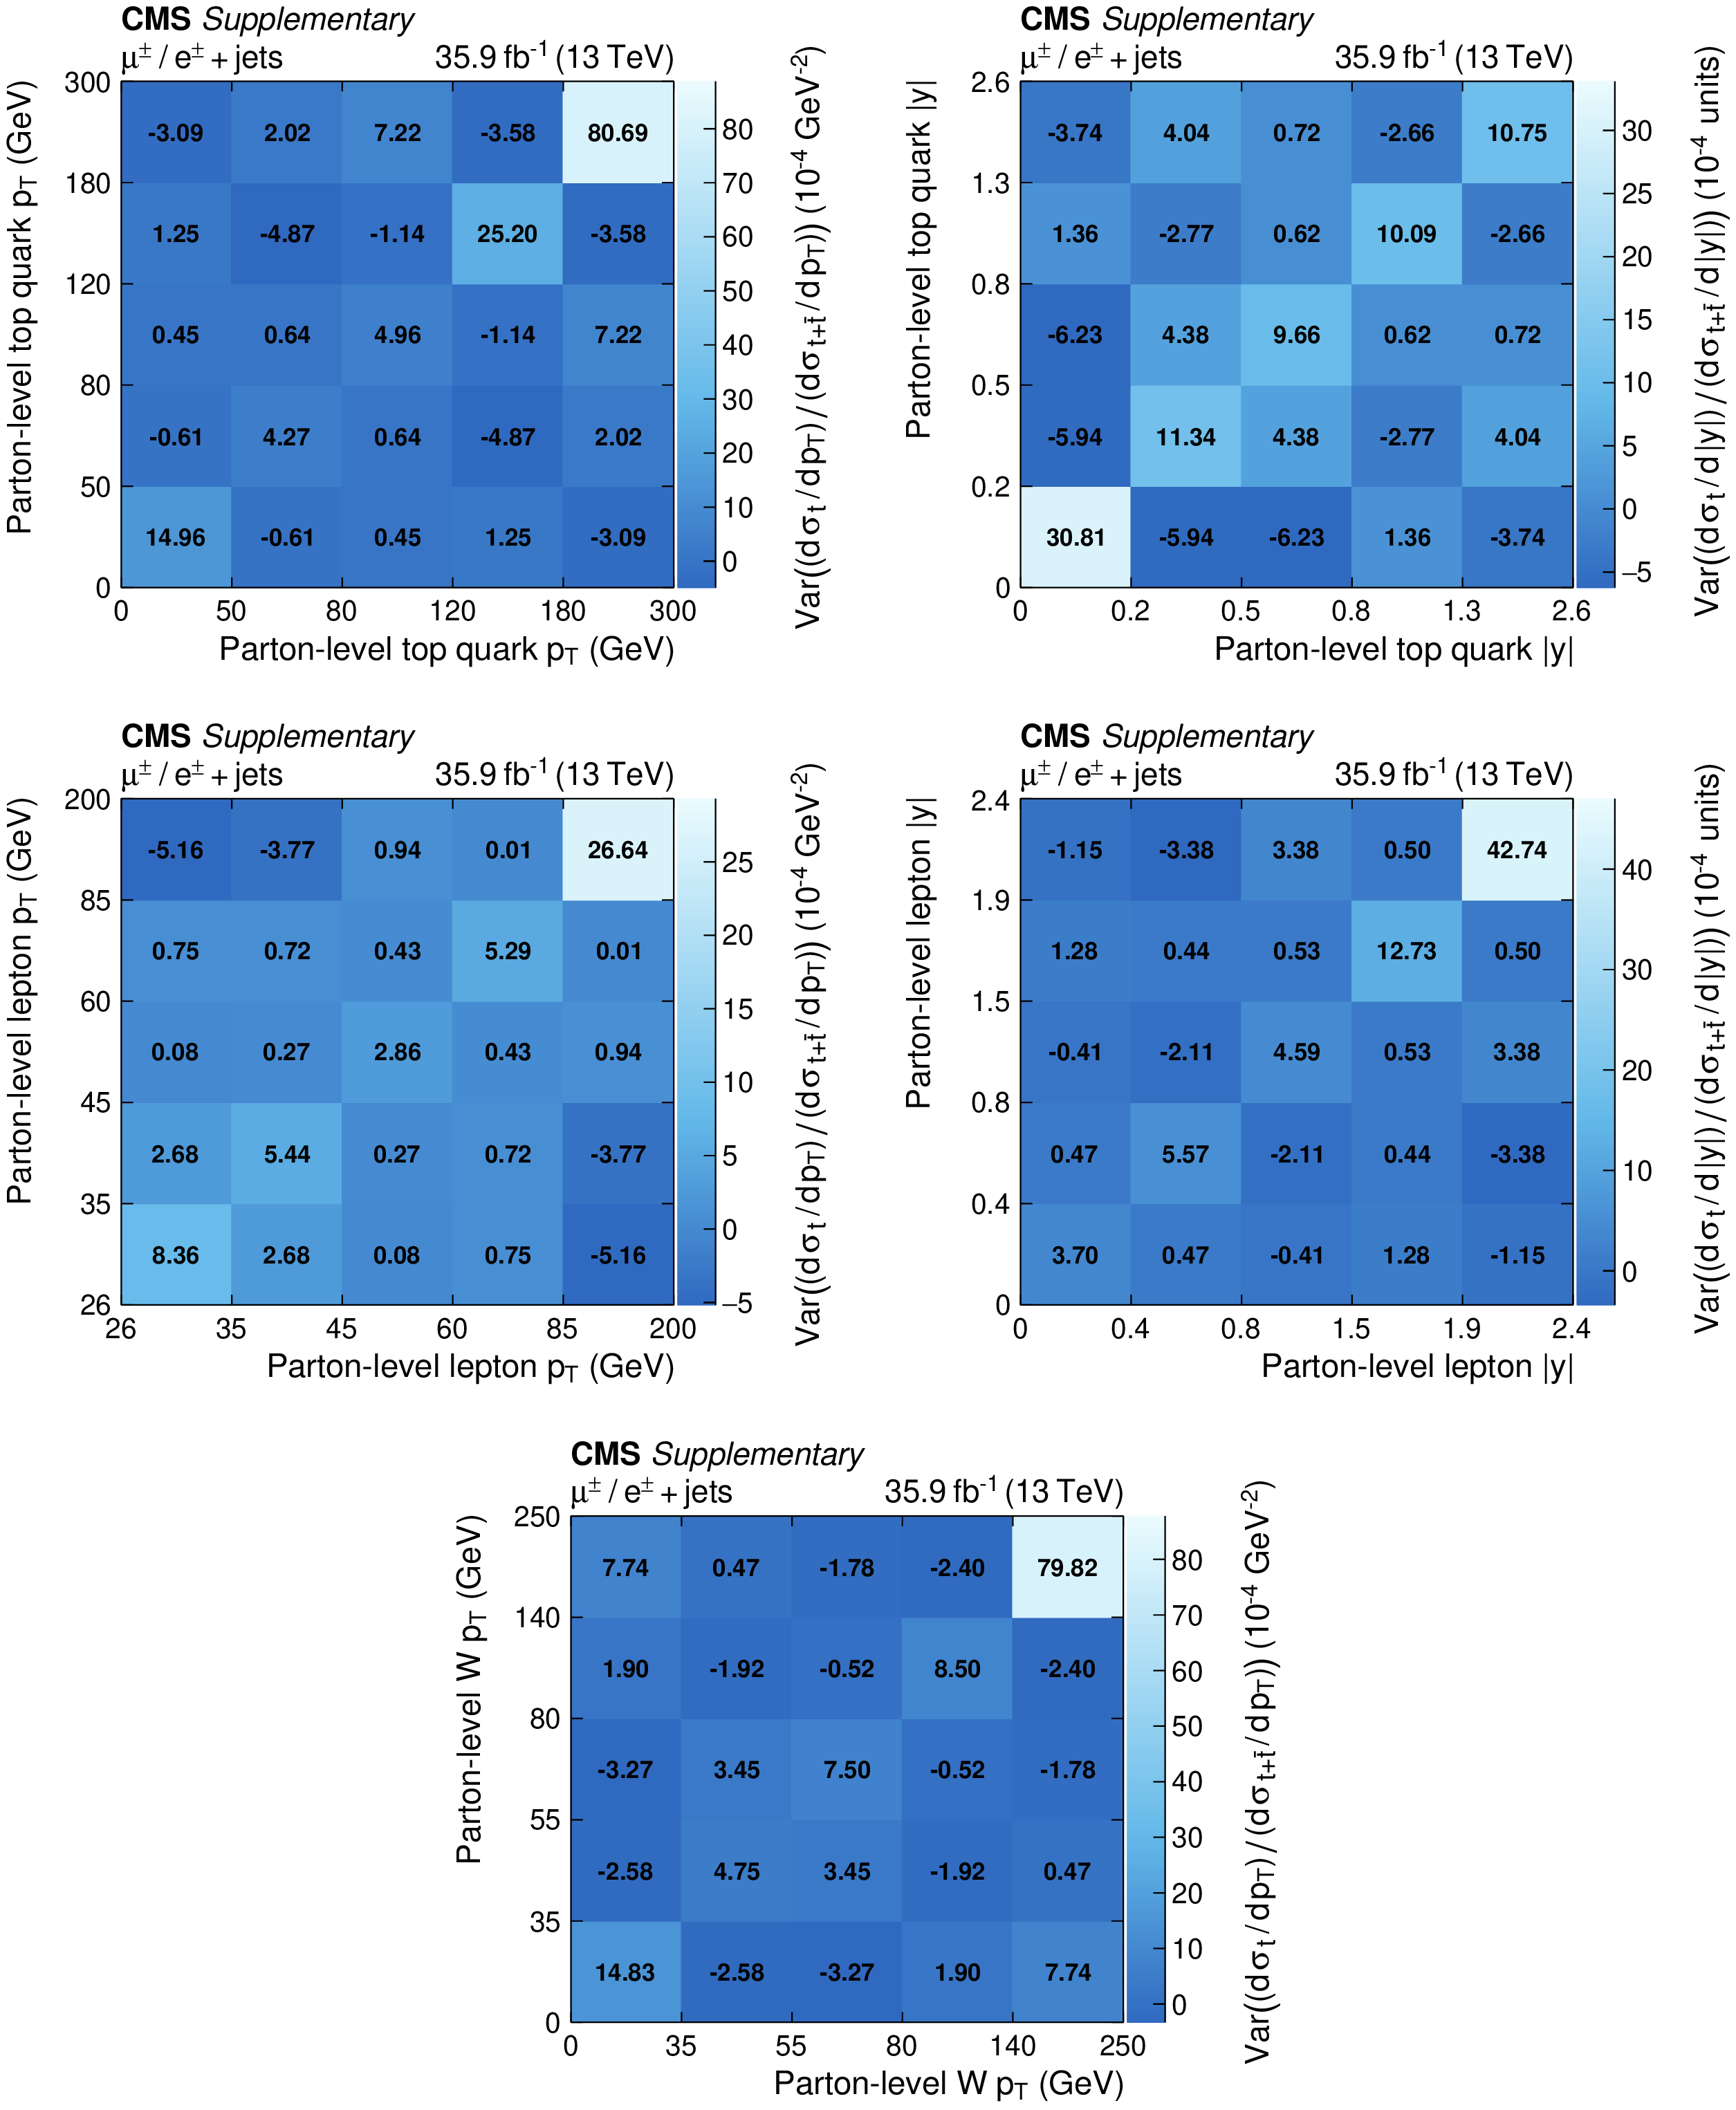
Additional Figure 1:
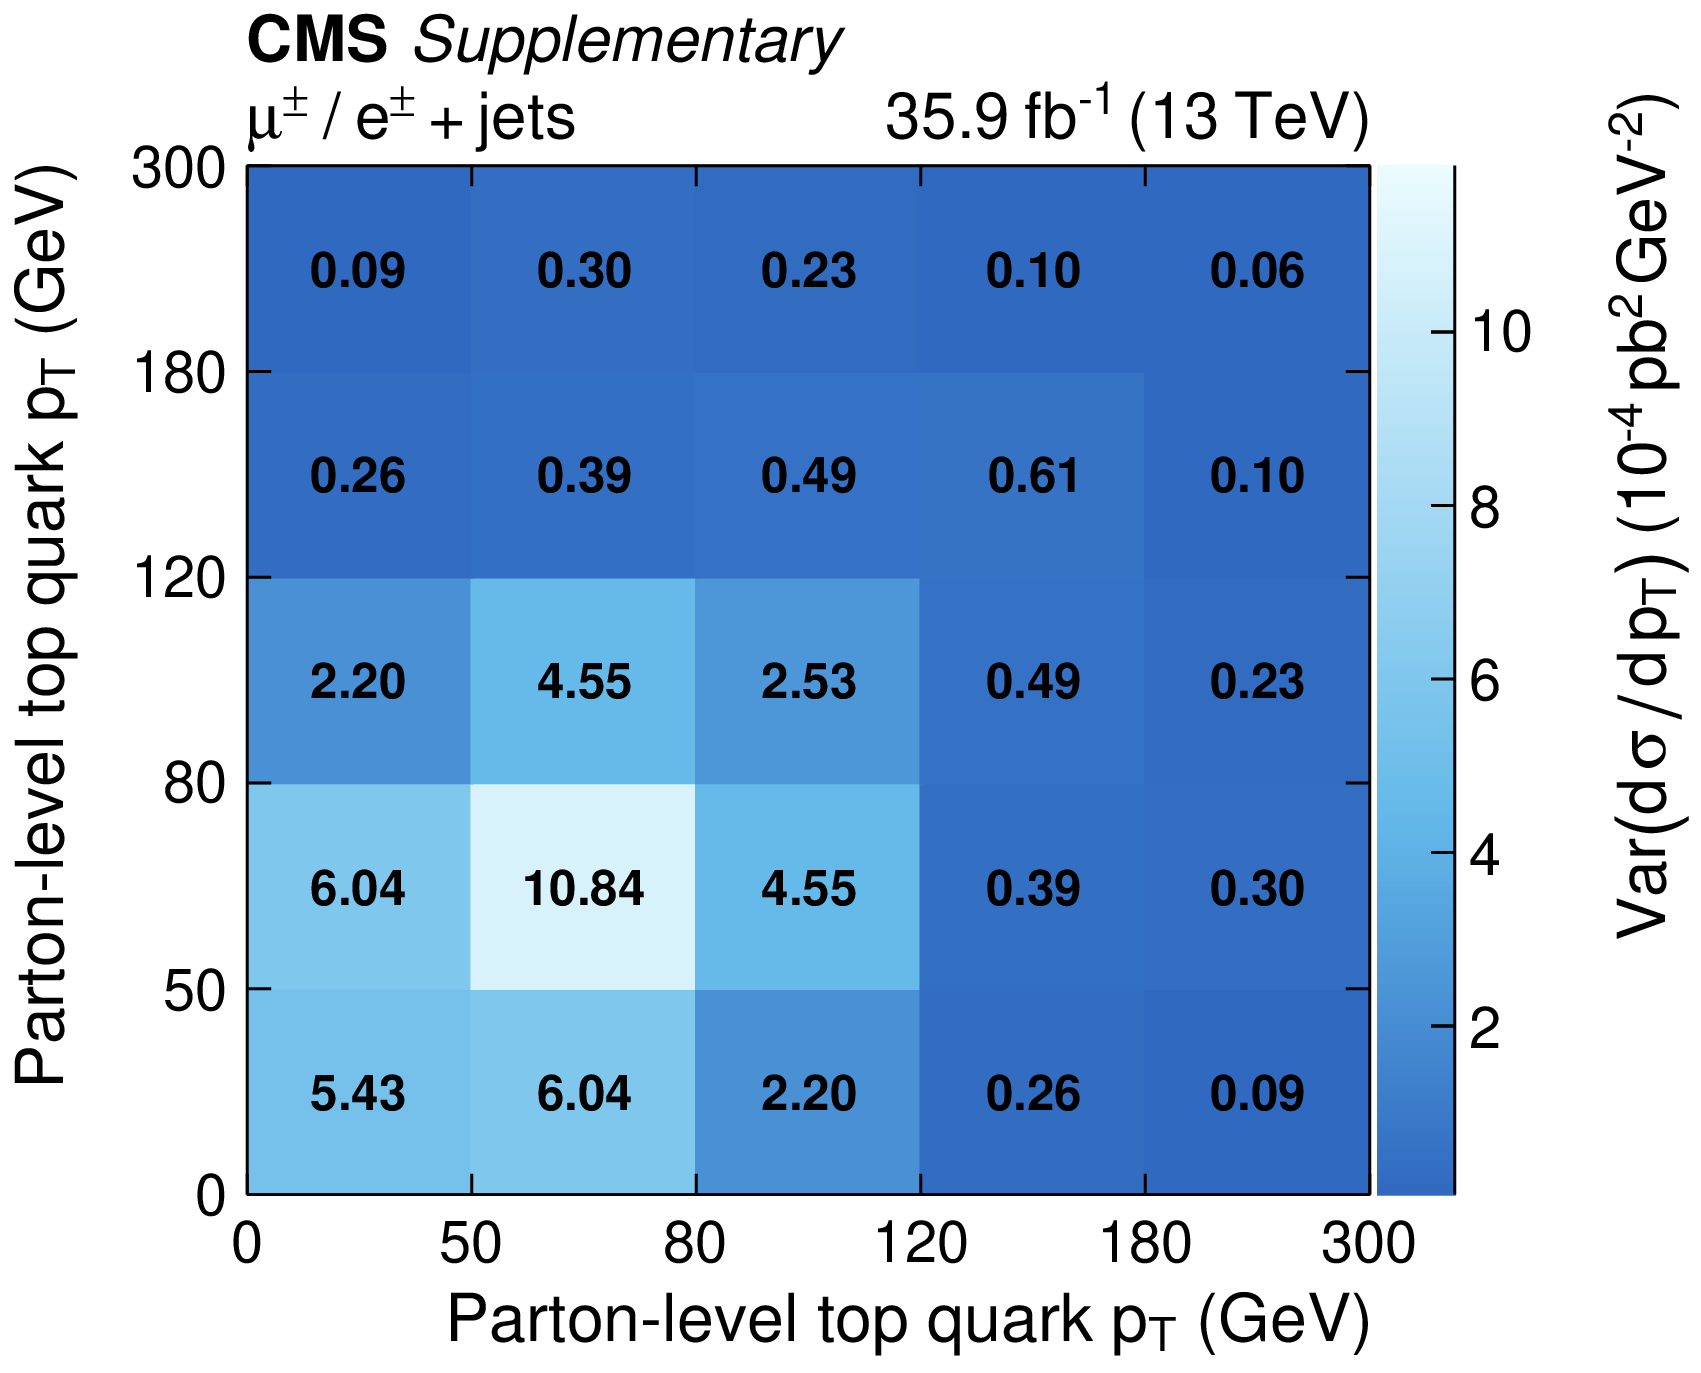
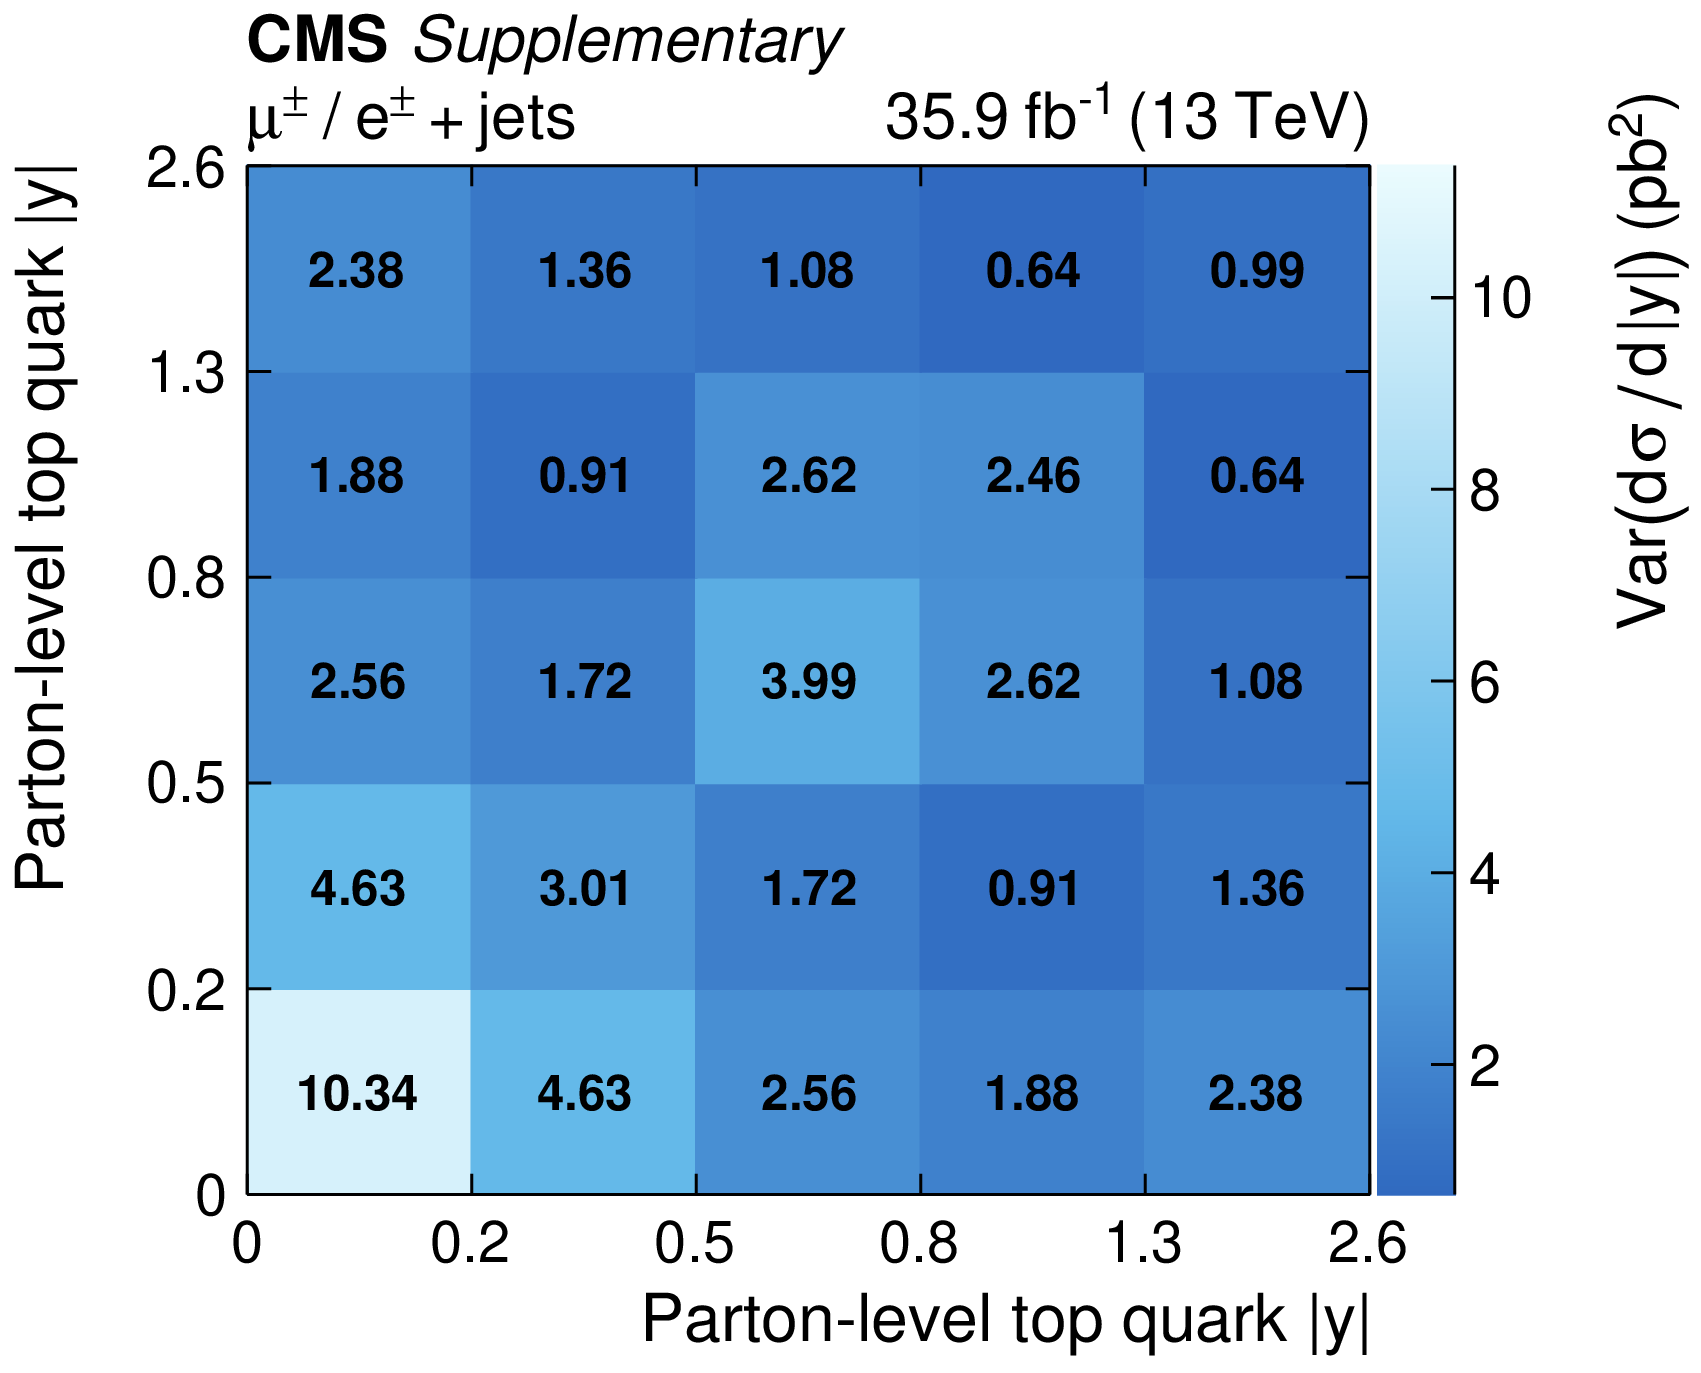
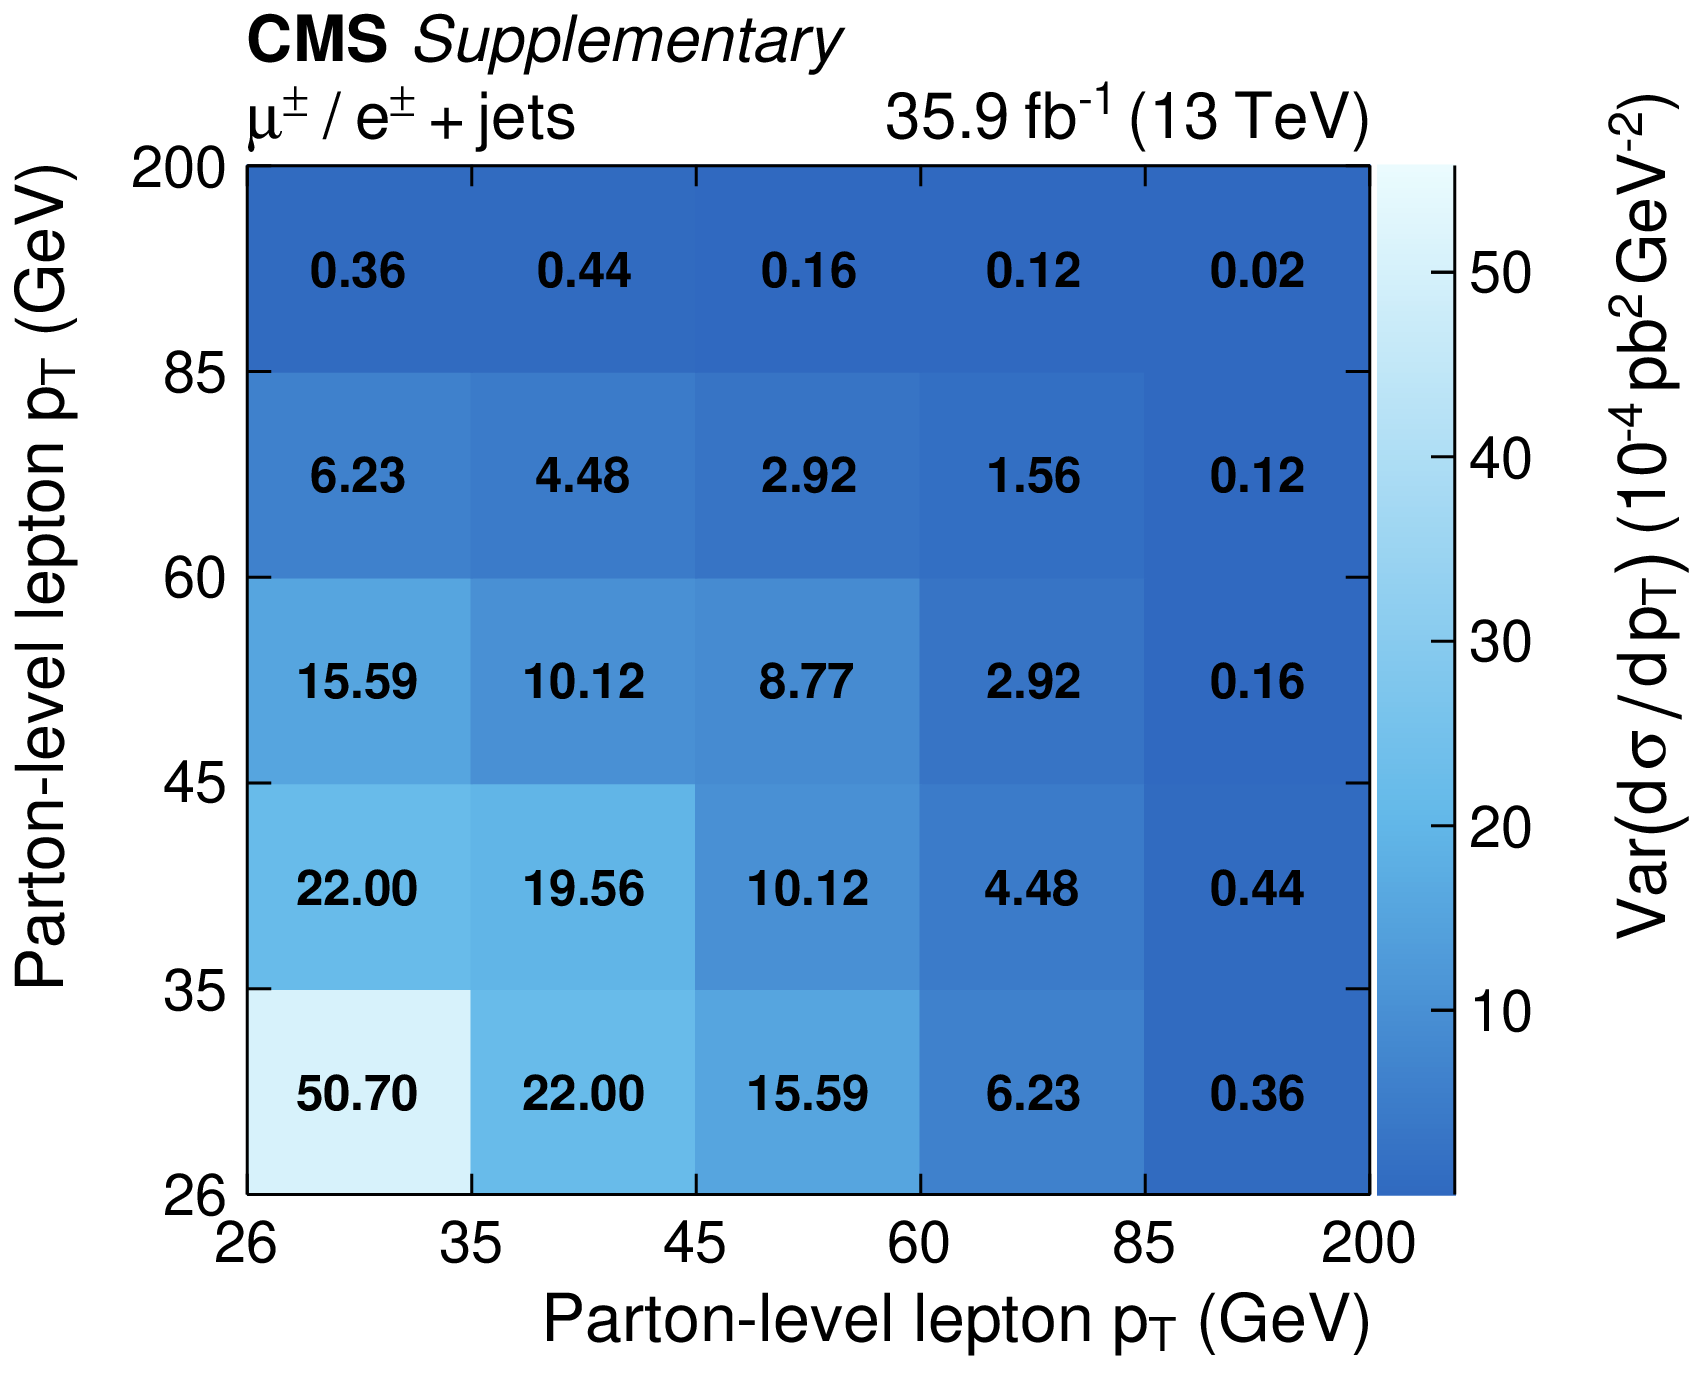
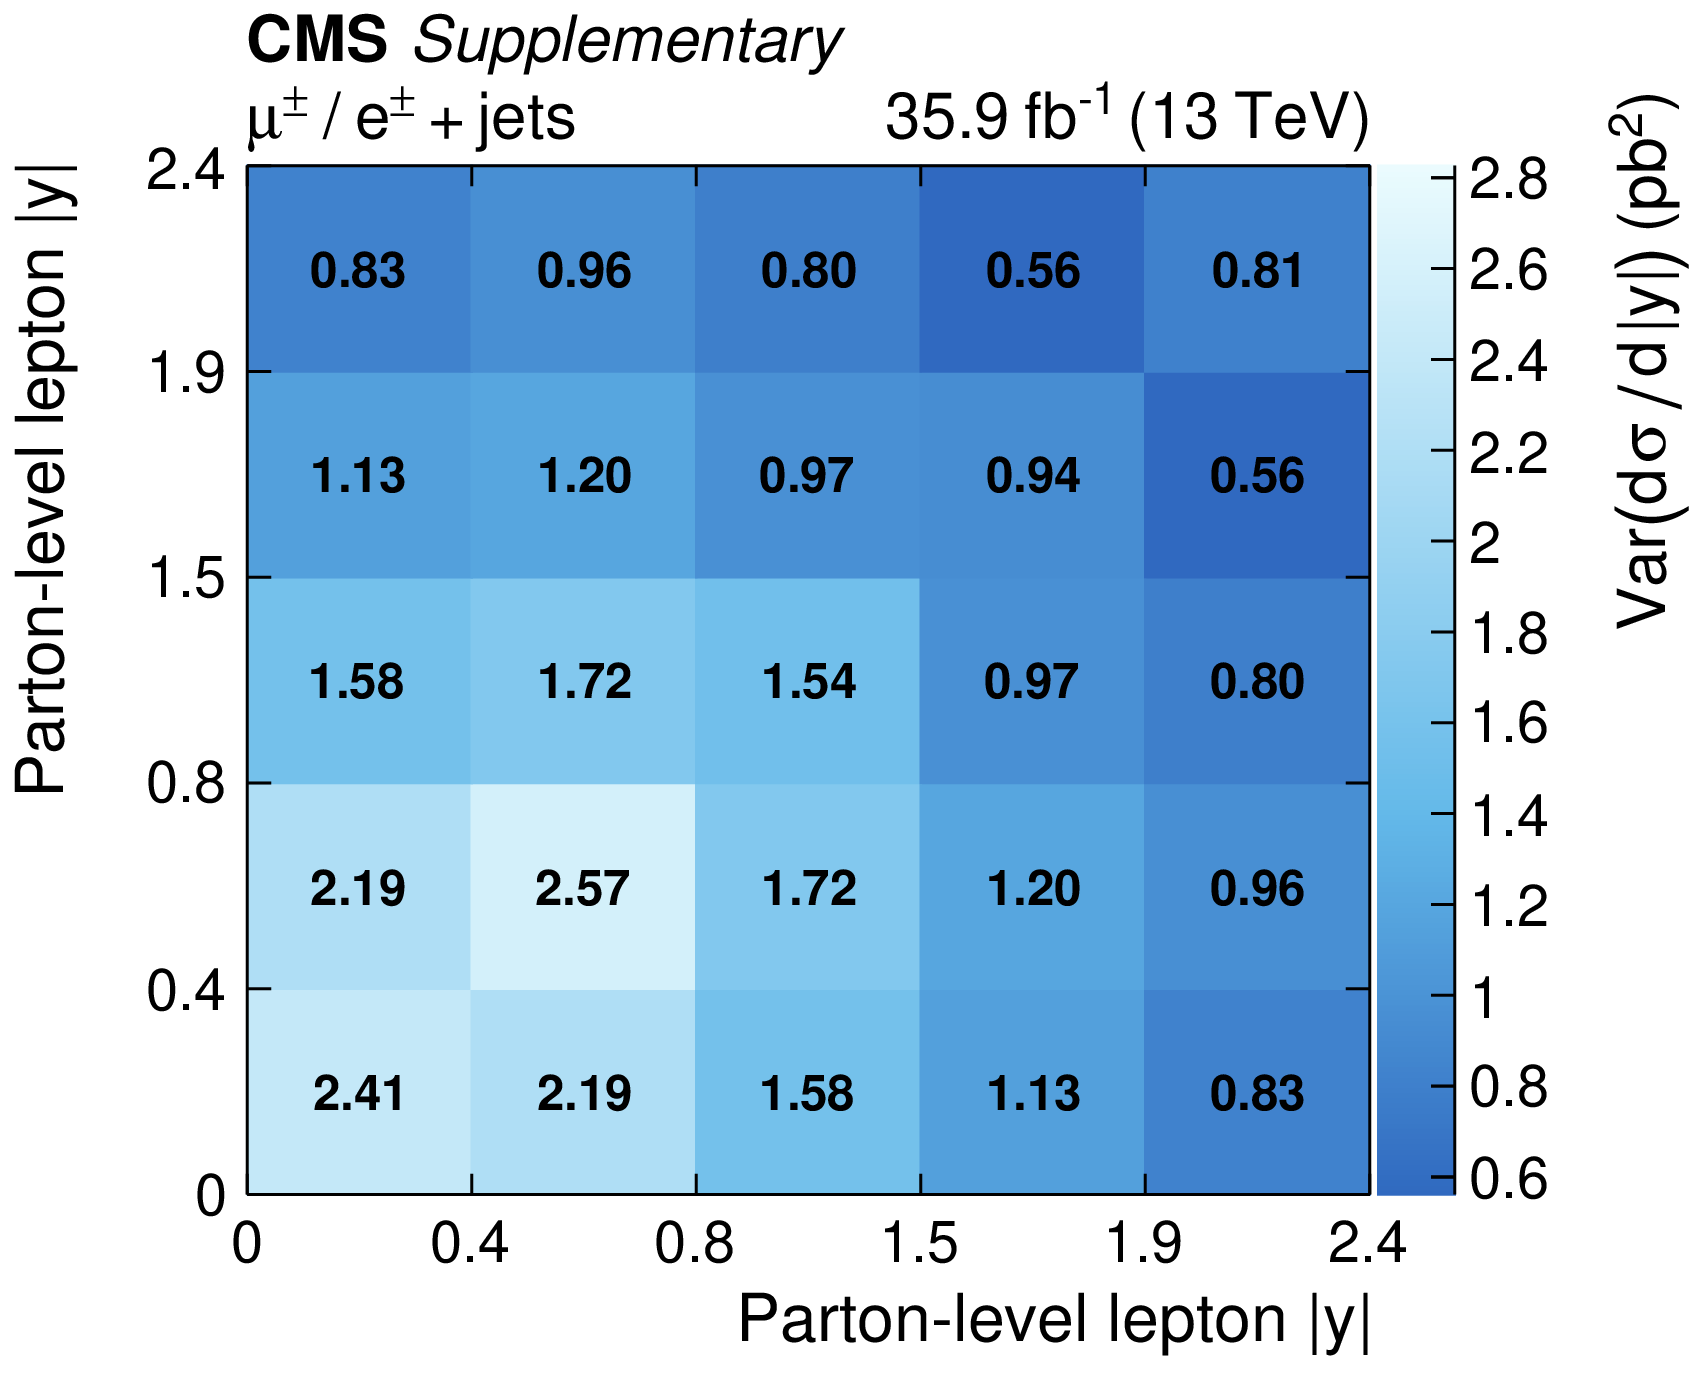
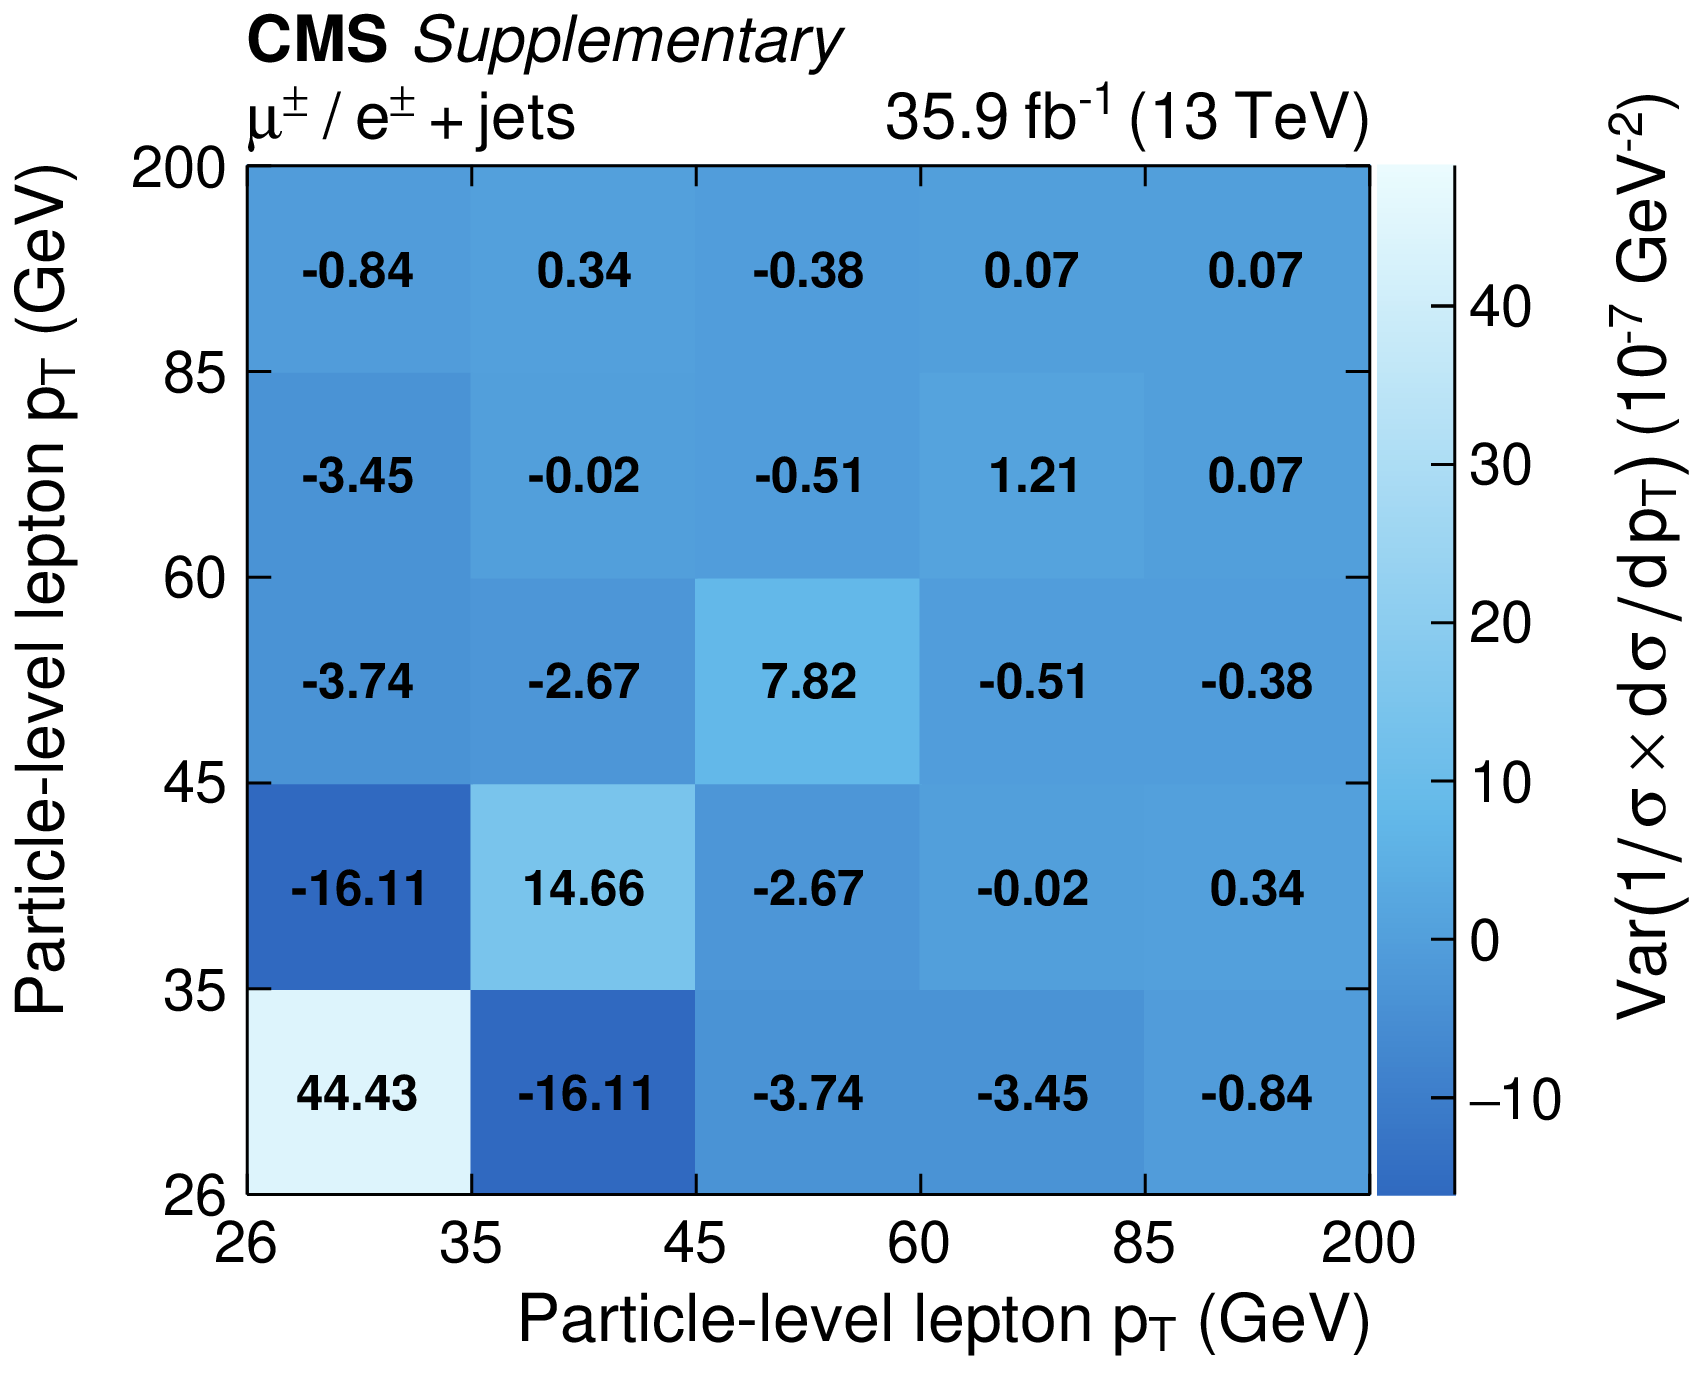
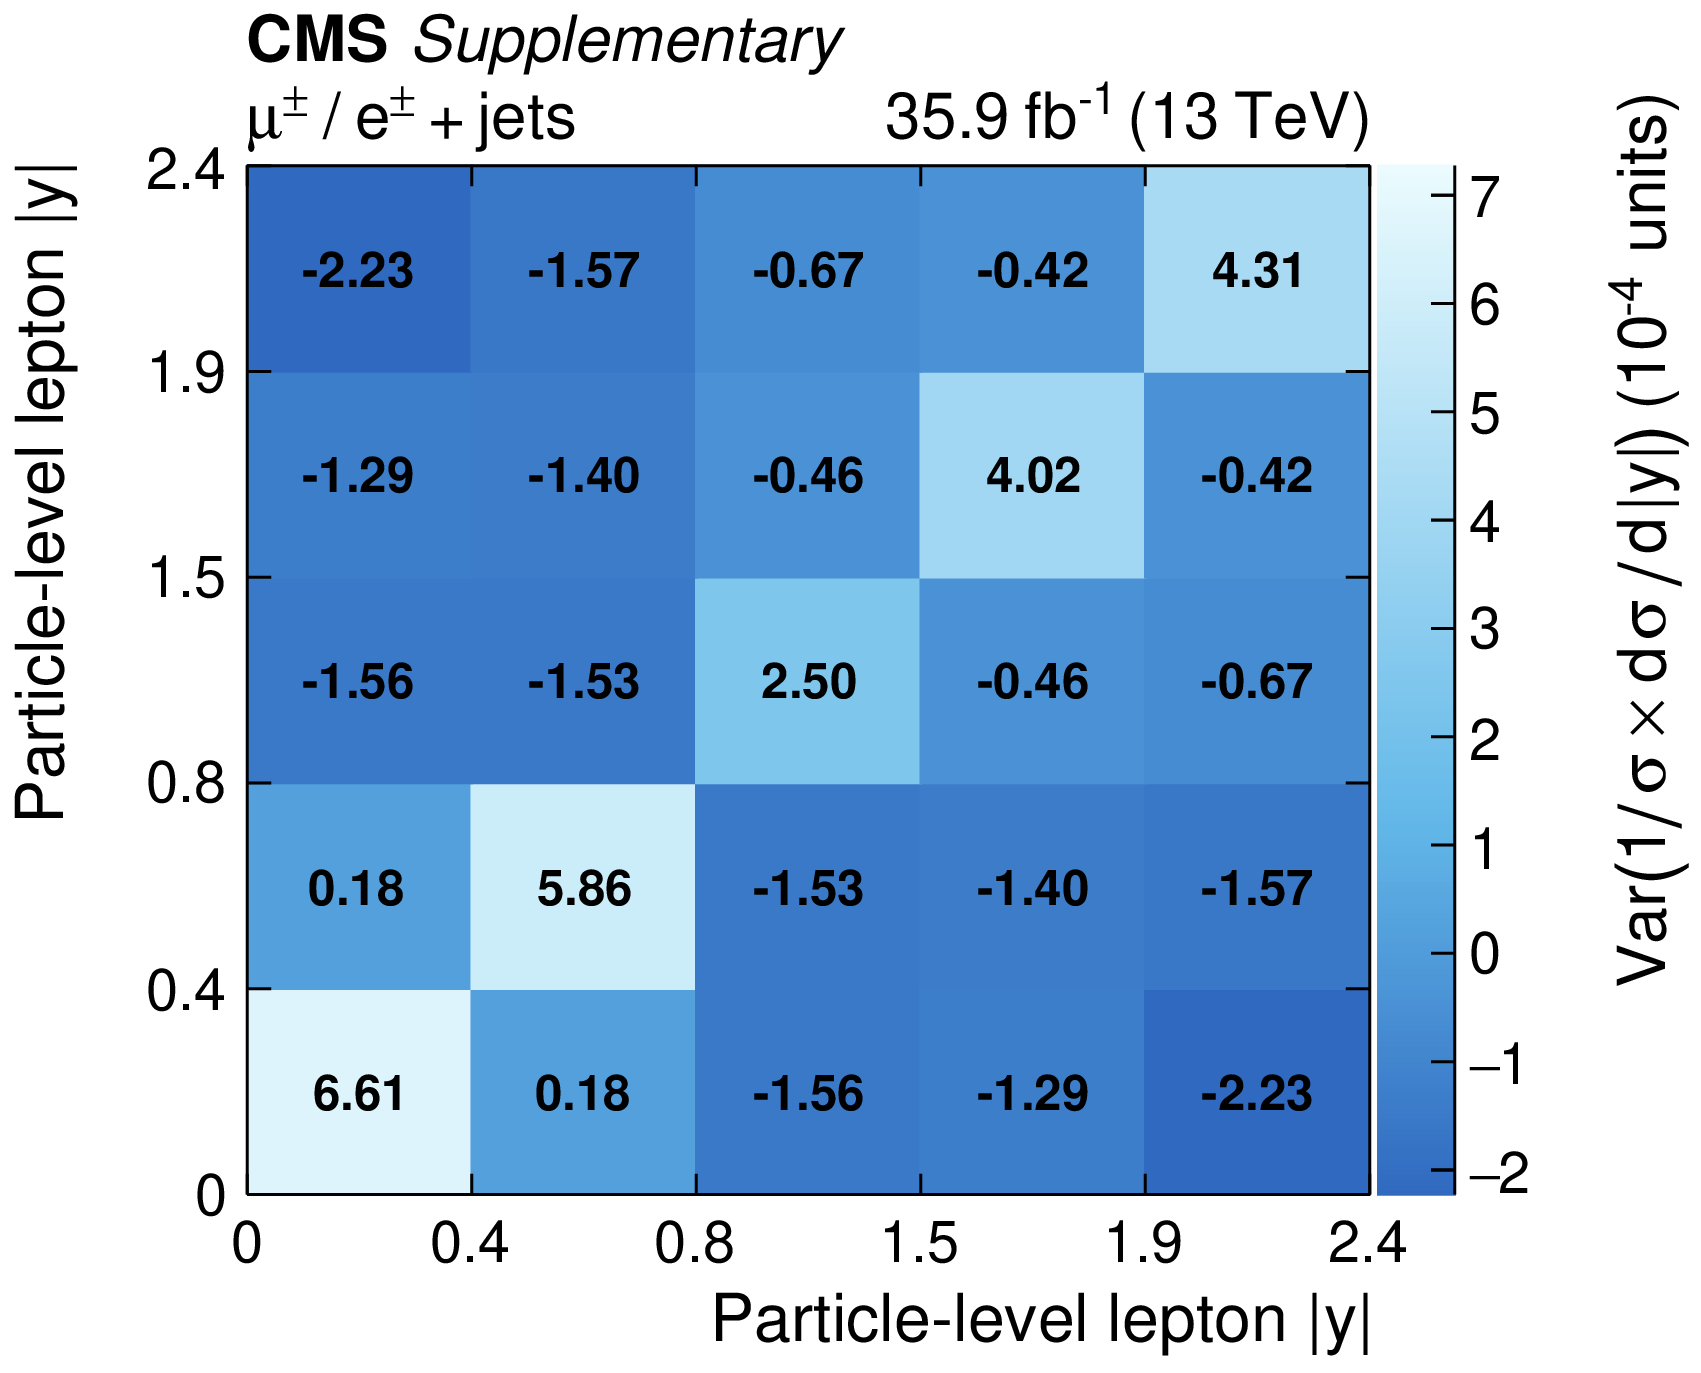
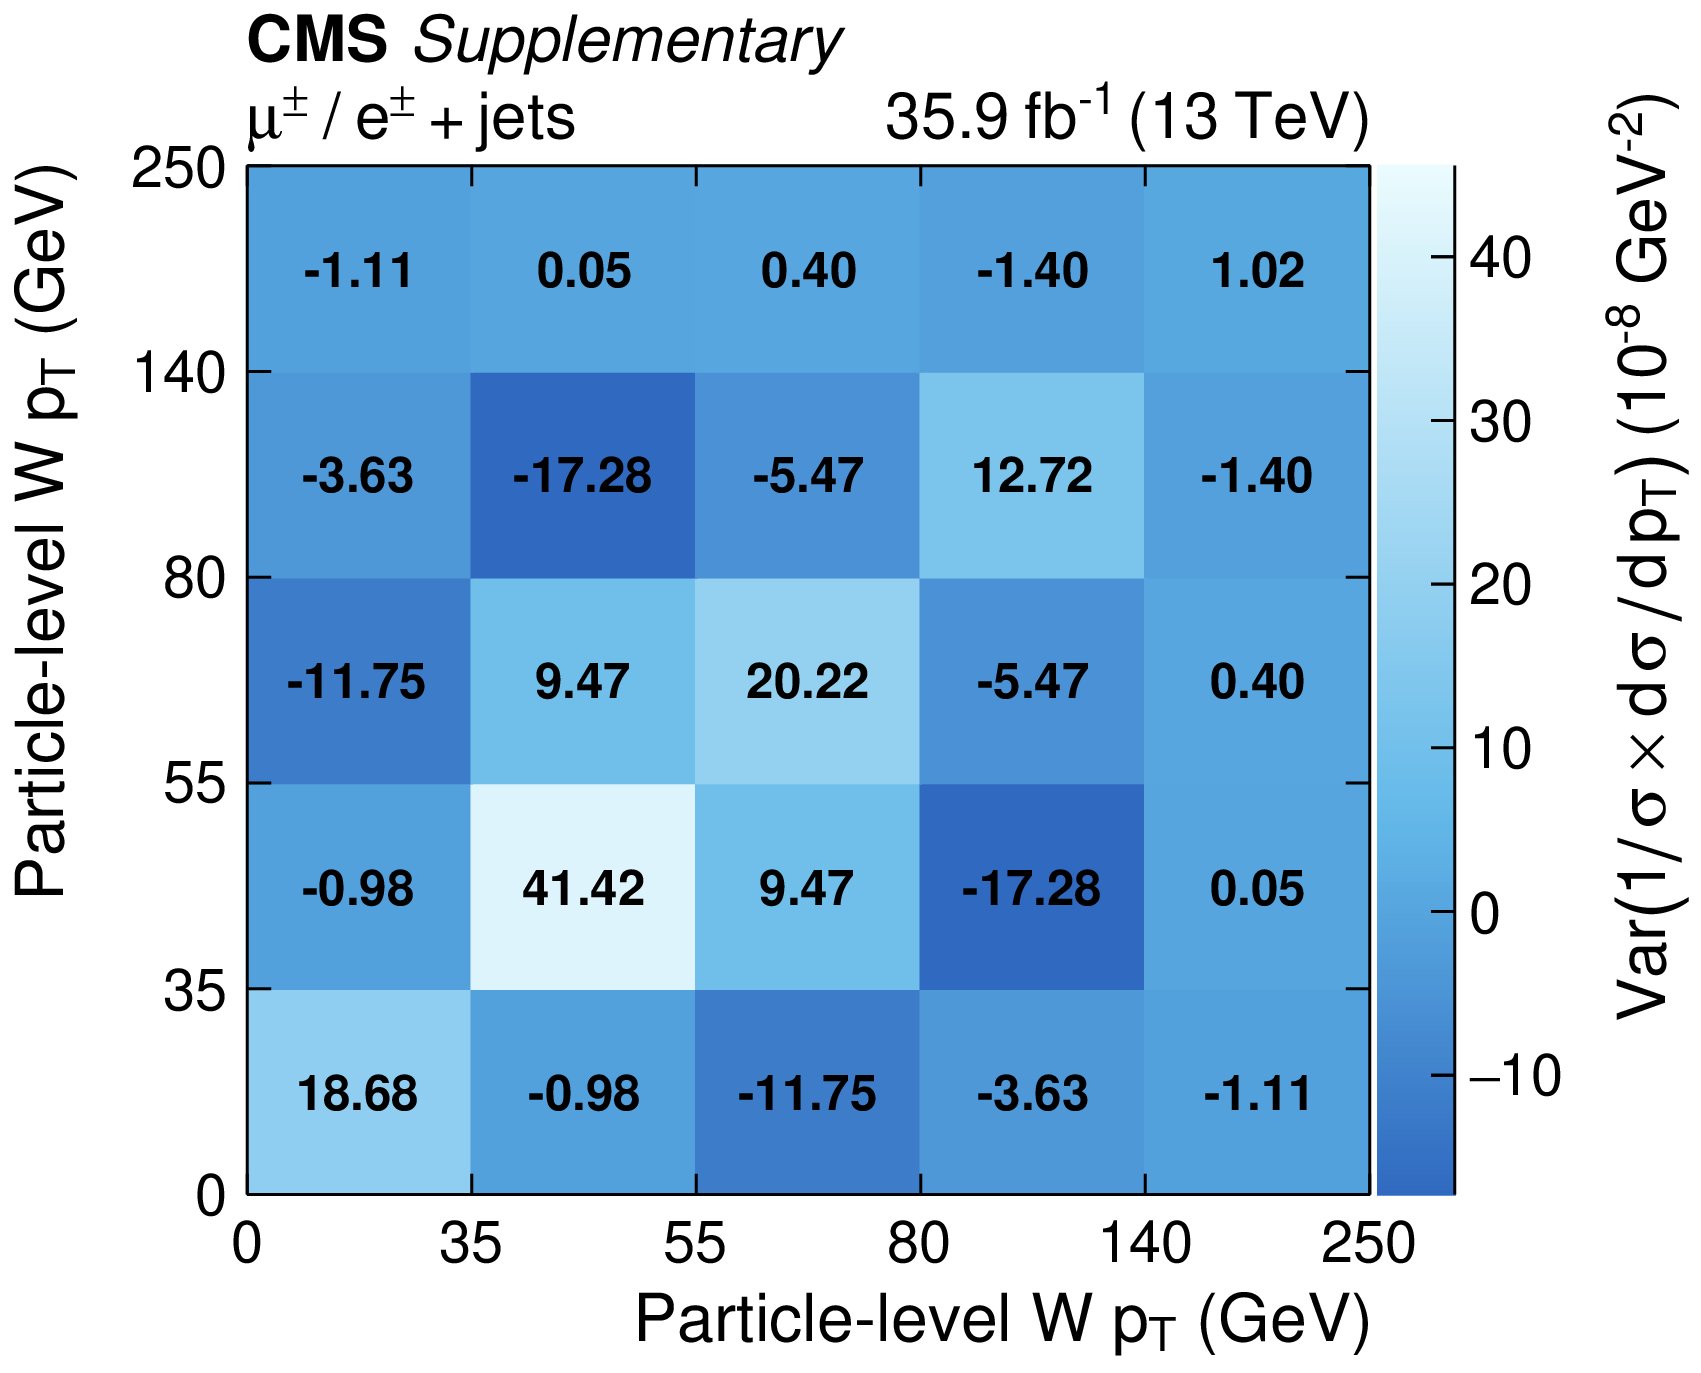
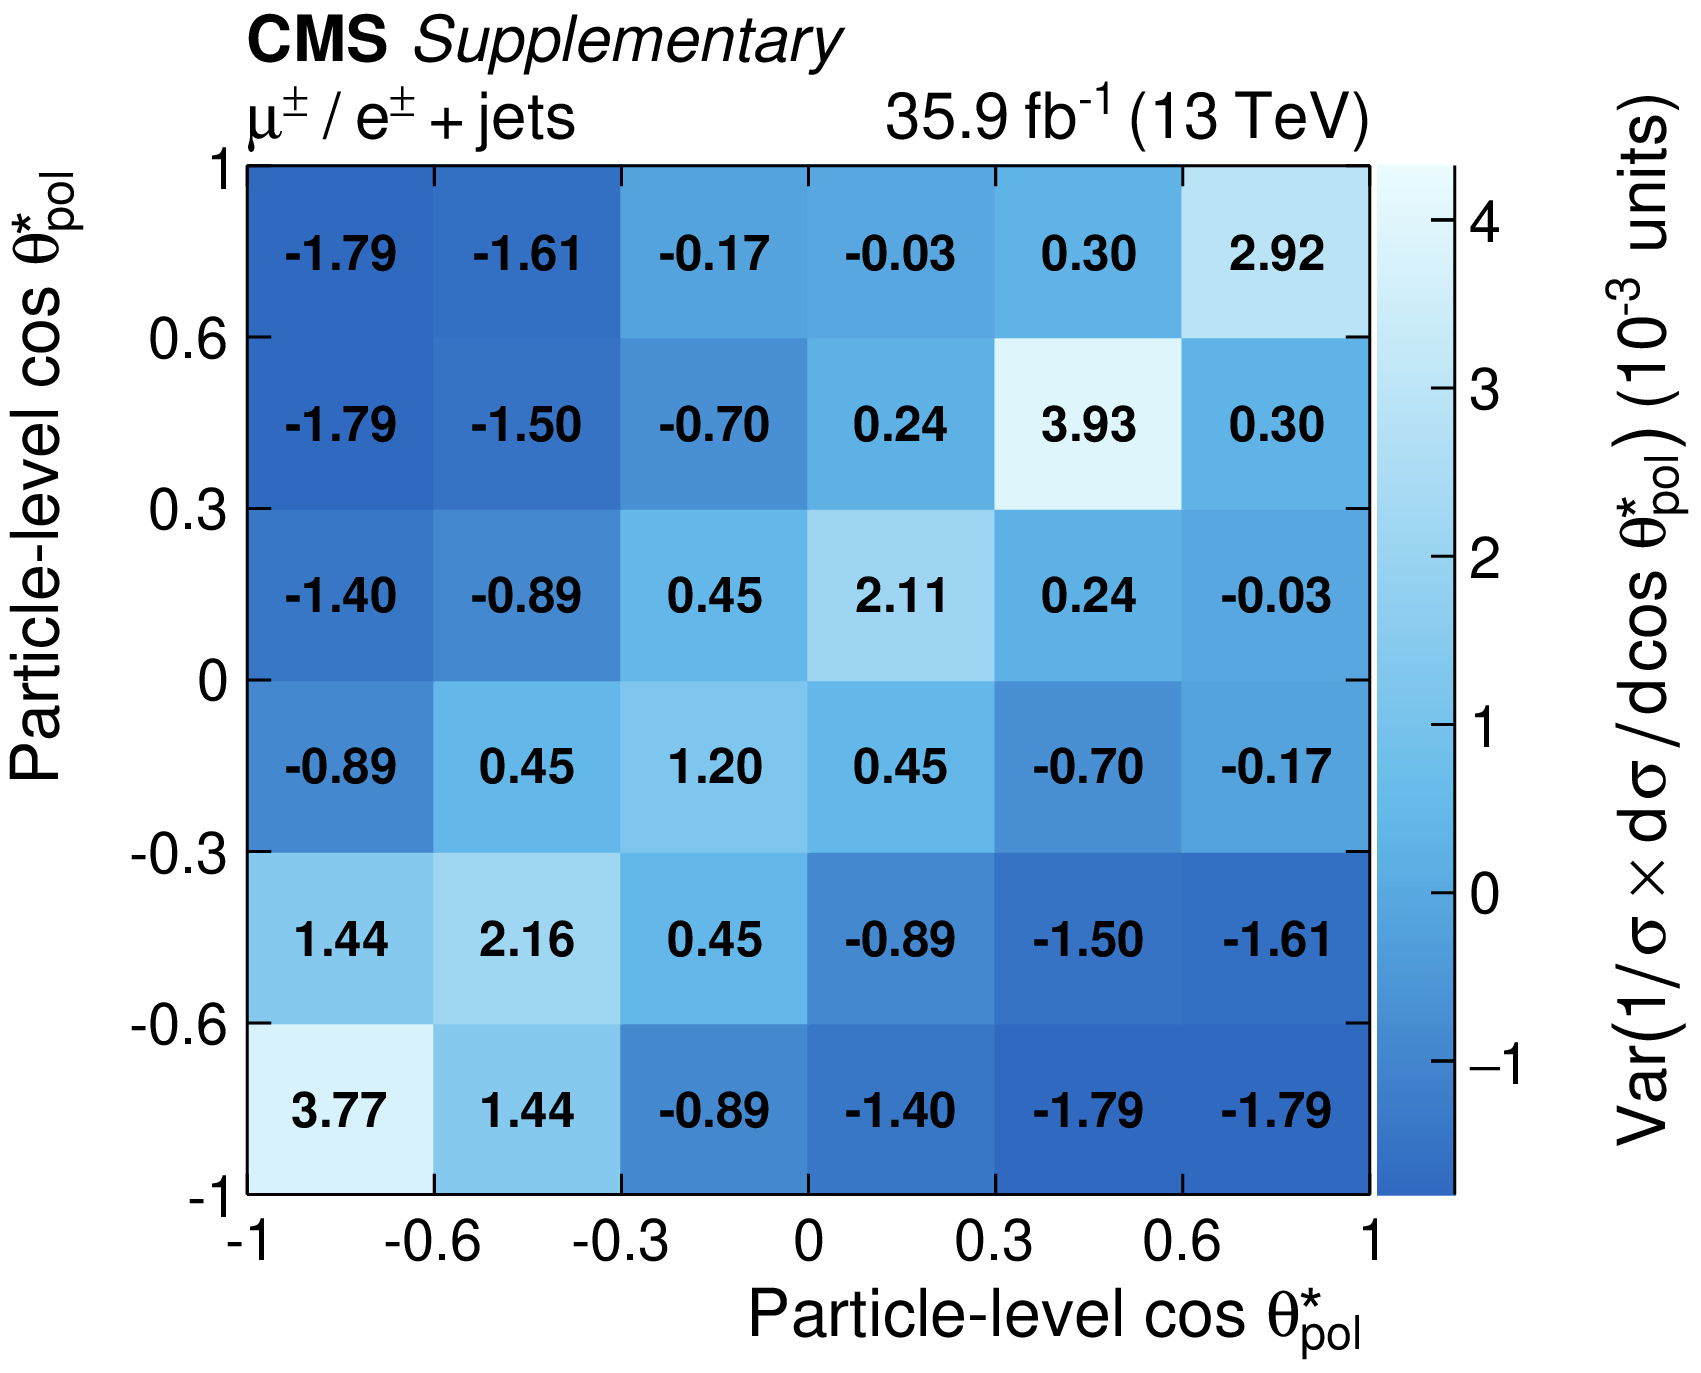
Covariance ("Var'') of the total uncertainty for the measured absolute differential $t$-channel single top quark cross sections at the parton level: top quark ${p_{\mathrm {T}}}$ (a) and rapidity (b); charged lepton ${p_{\mathrm {T}}}$ (c) and rapidity (d); W boson ${p_{\mathrm {T}}}$ (e); cosine of the top quark polarisation angle (f). The labels on the $x$ and $y$ axes denote the bin edges. |
png pdf |
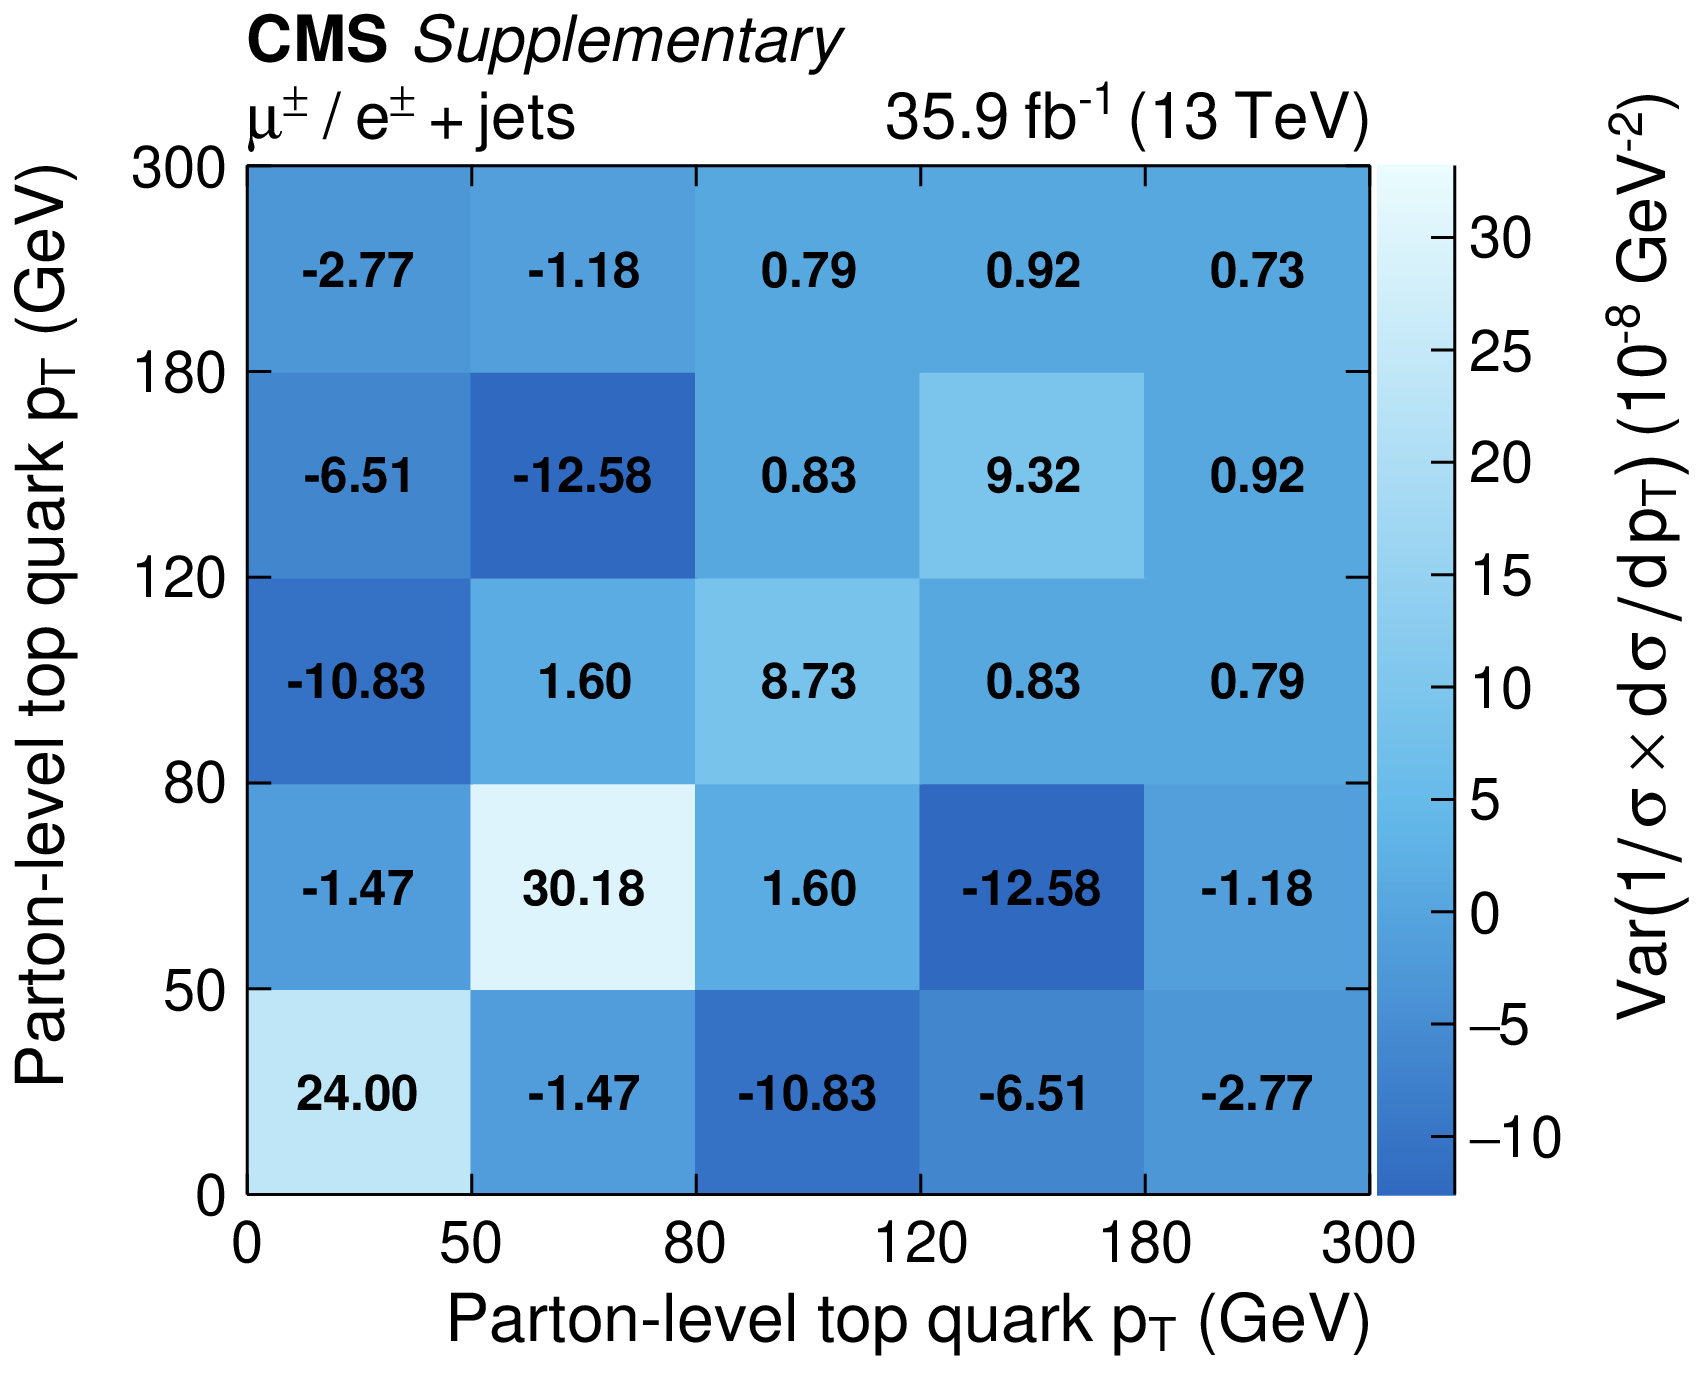
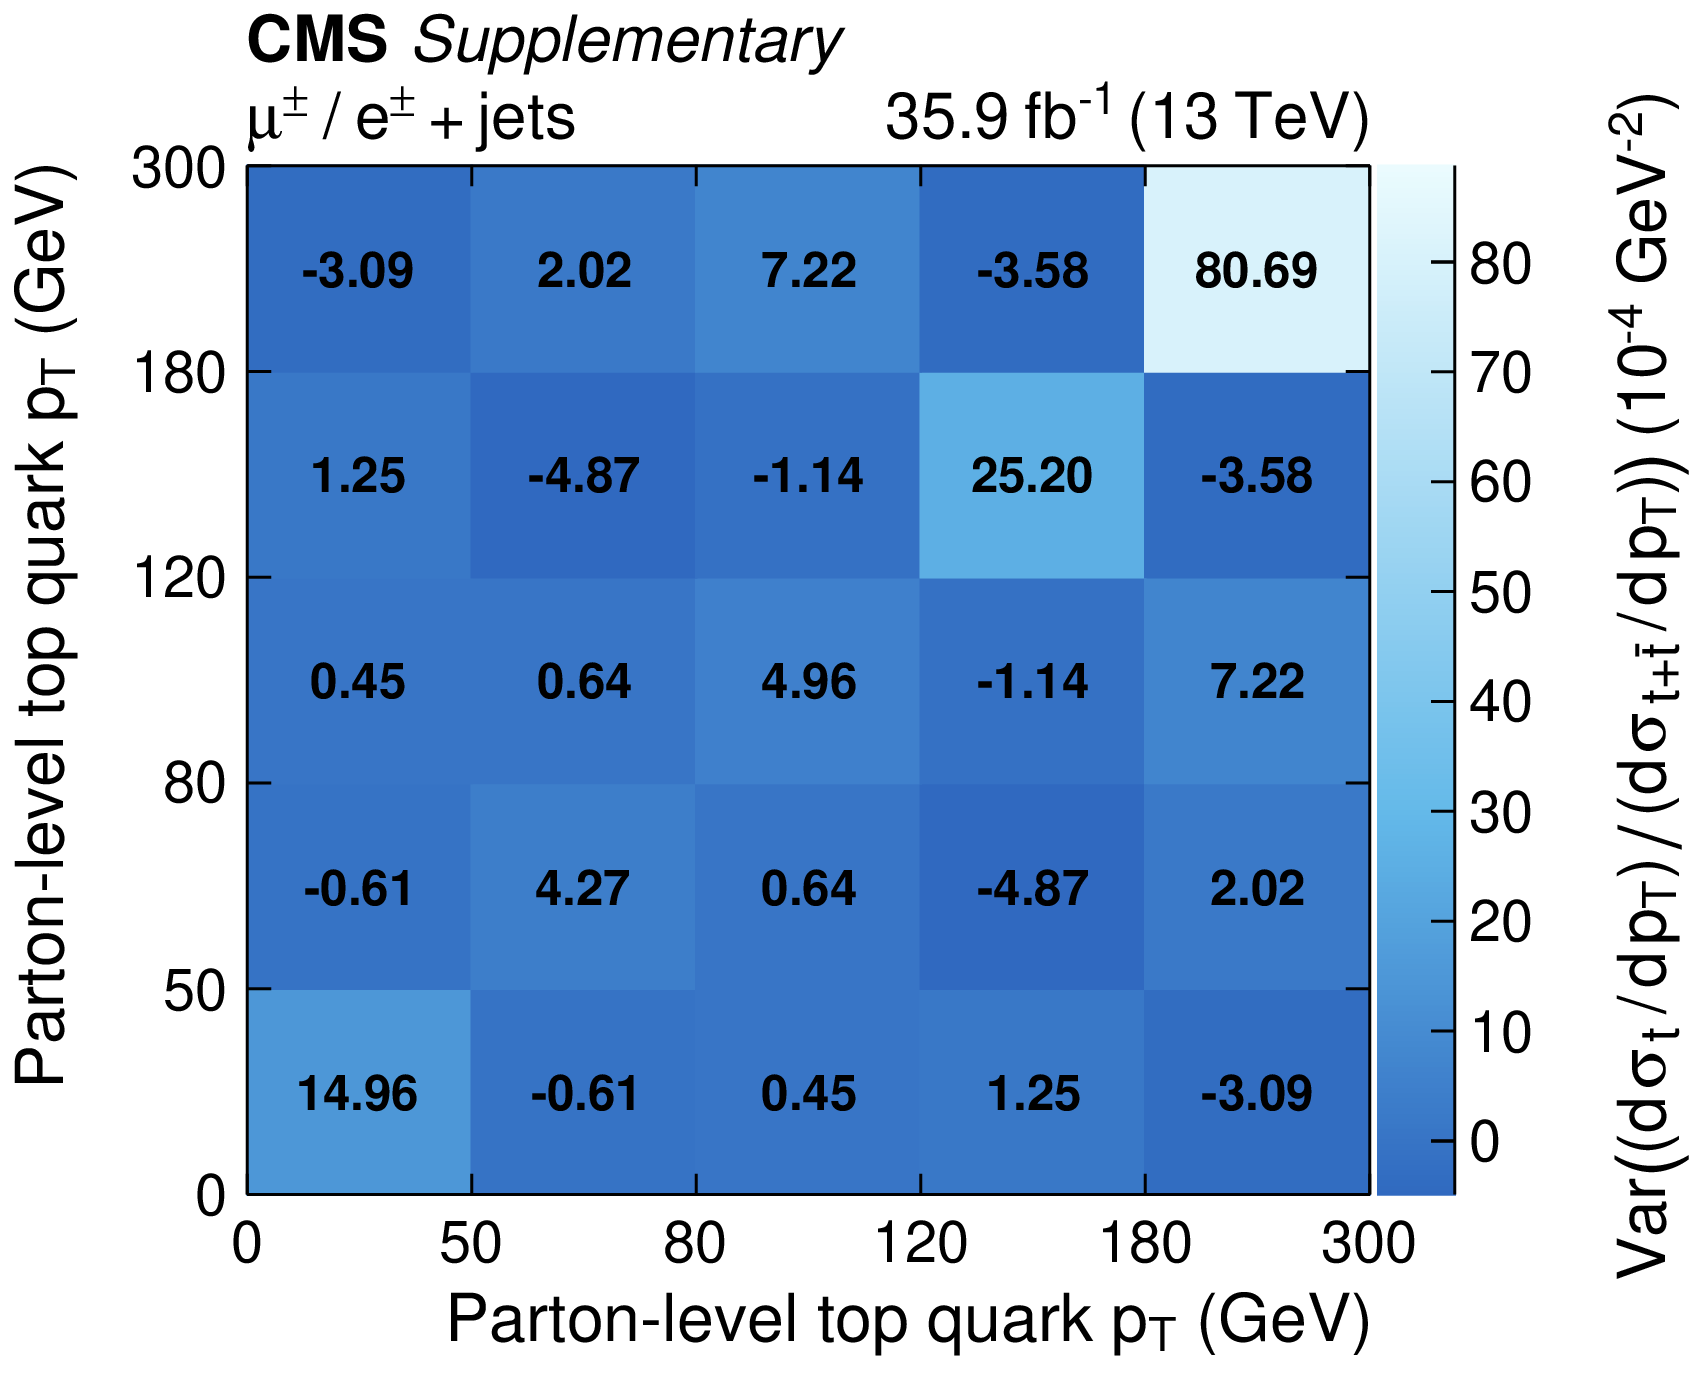
Additional Figure 1-a:
Covariance ("Var'') of the total uncertainty for the measured absolute differential $t$-channel single top quark cross sections at the parton level: top quark ${p_{\mathrm {T}}}$. The labels on the $x$ and $y$ axes denote the bin edges. |
png pdf |
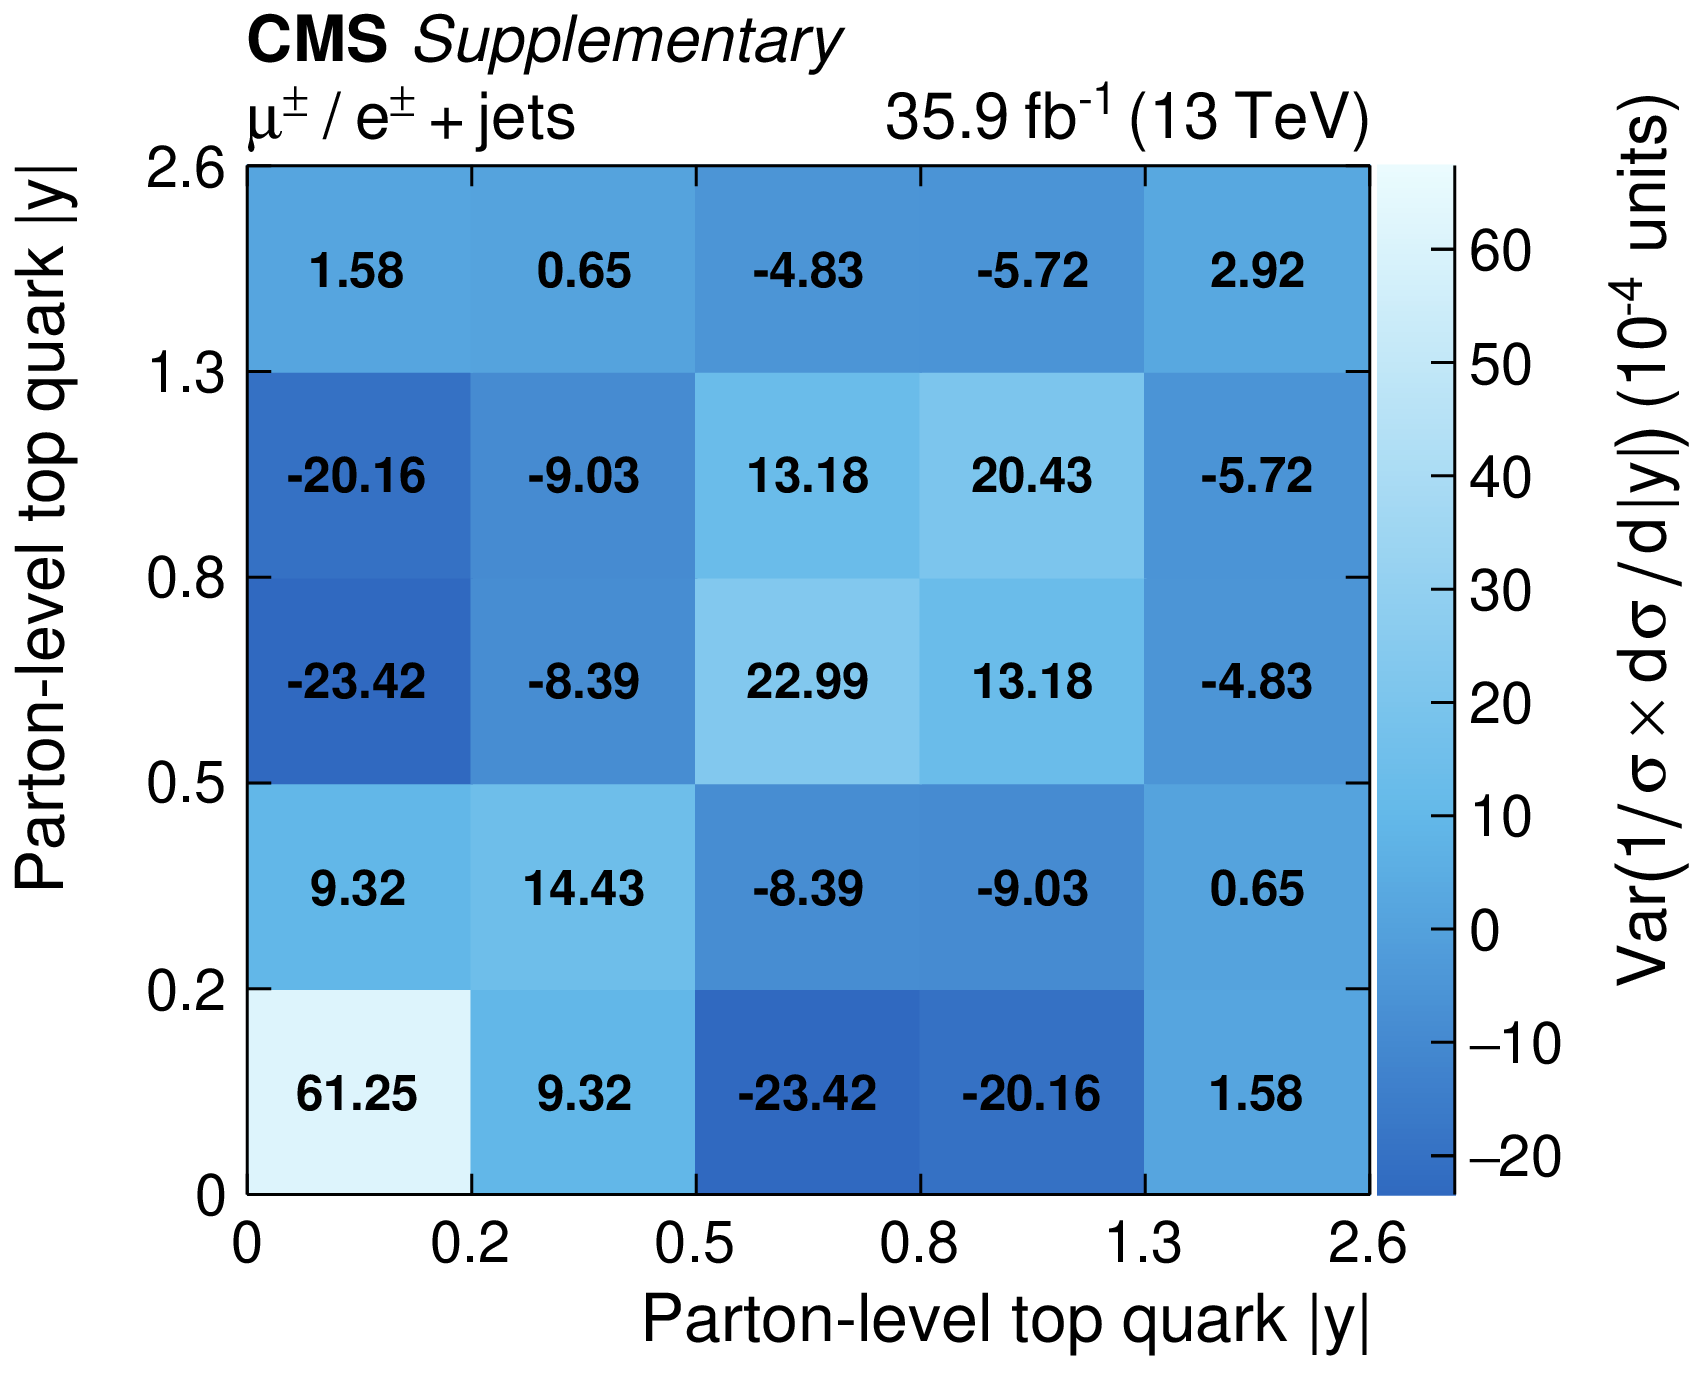
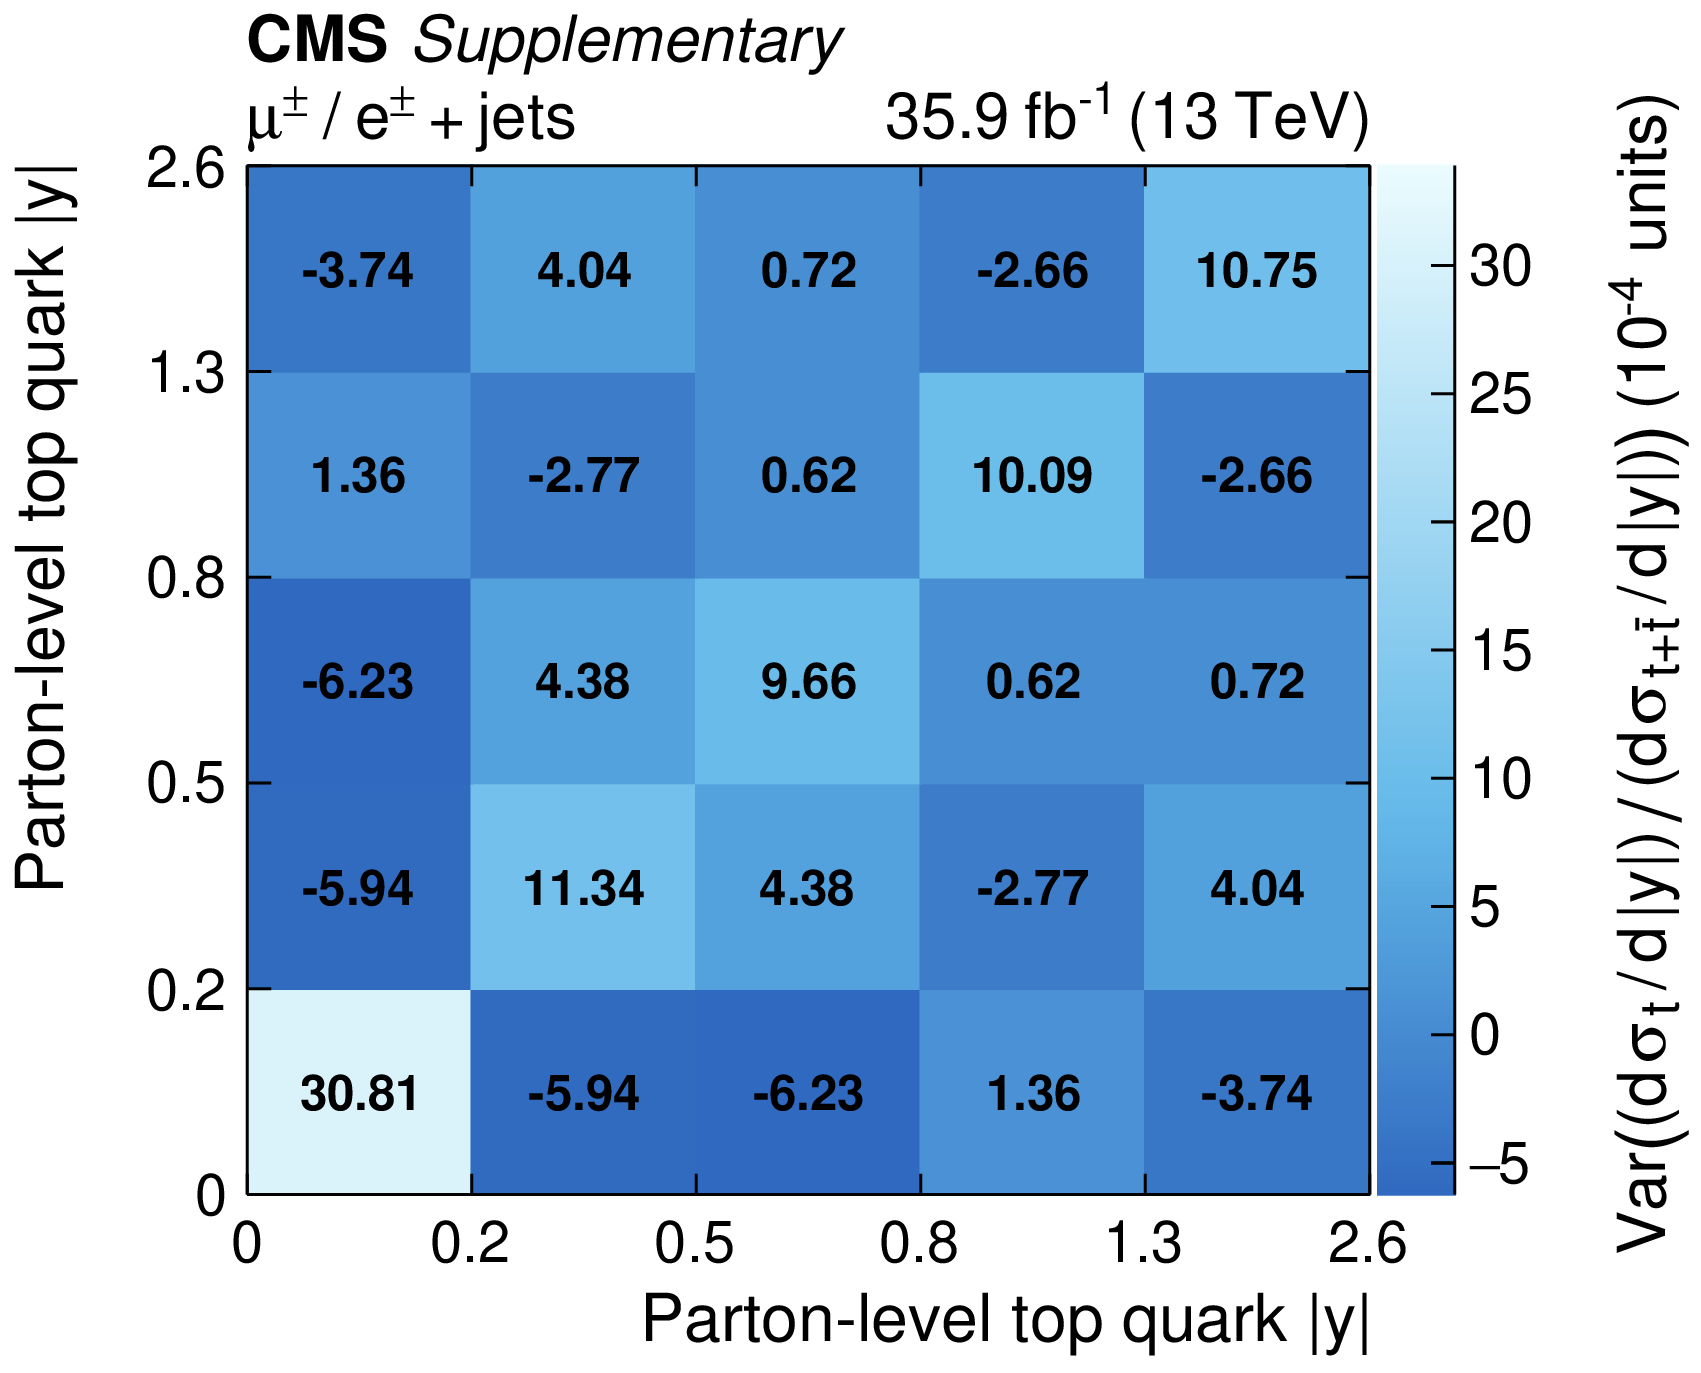
Additional Figure 1-b:
Covariance ("Var'') of the total uncertainty for the measured absolute differential $t$-channel single top quark cross sections at the parton level: top quark rapidity. The labels on the $x$ and $y$ axes denote the bin edges. |
png pdf |
Additional Figure 1-c:
Covariance ("Var'') of the total uncertainty for the measured absolute differential $t$-channel single top quark cross sections at the parton level: charged lepton ${p_{\mathrm {T}}}$. The labels on the $x$ and $y$ axes denote the bin edges. |
png pdf |
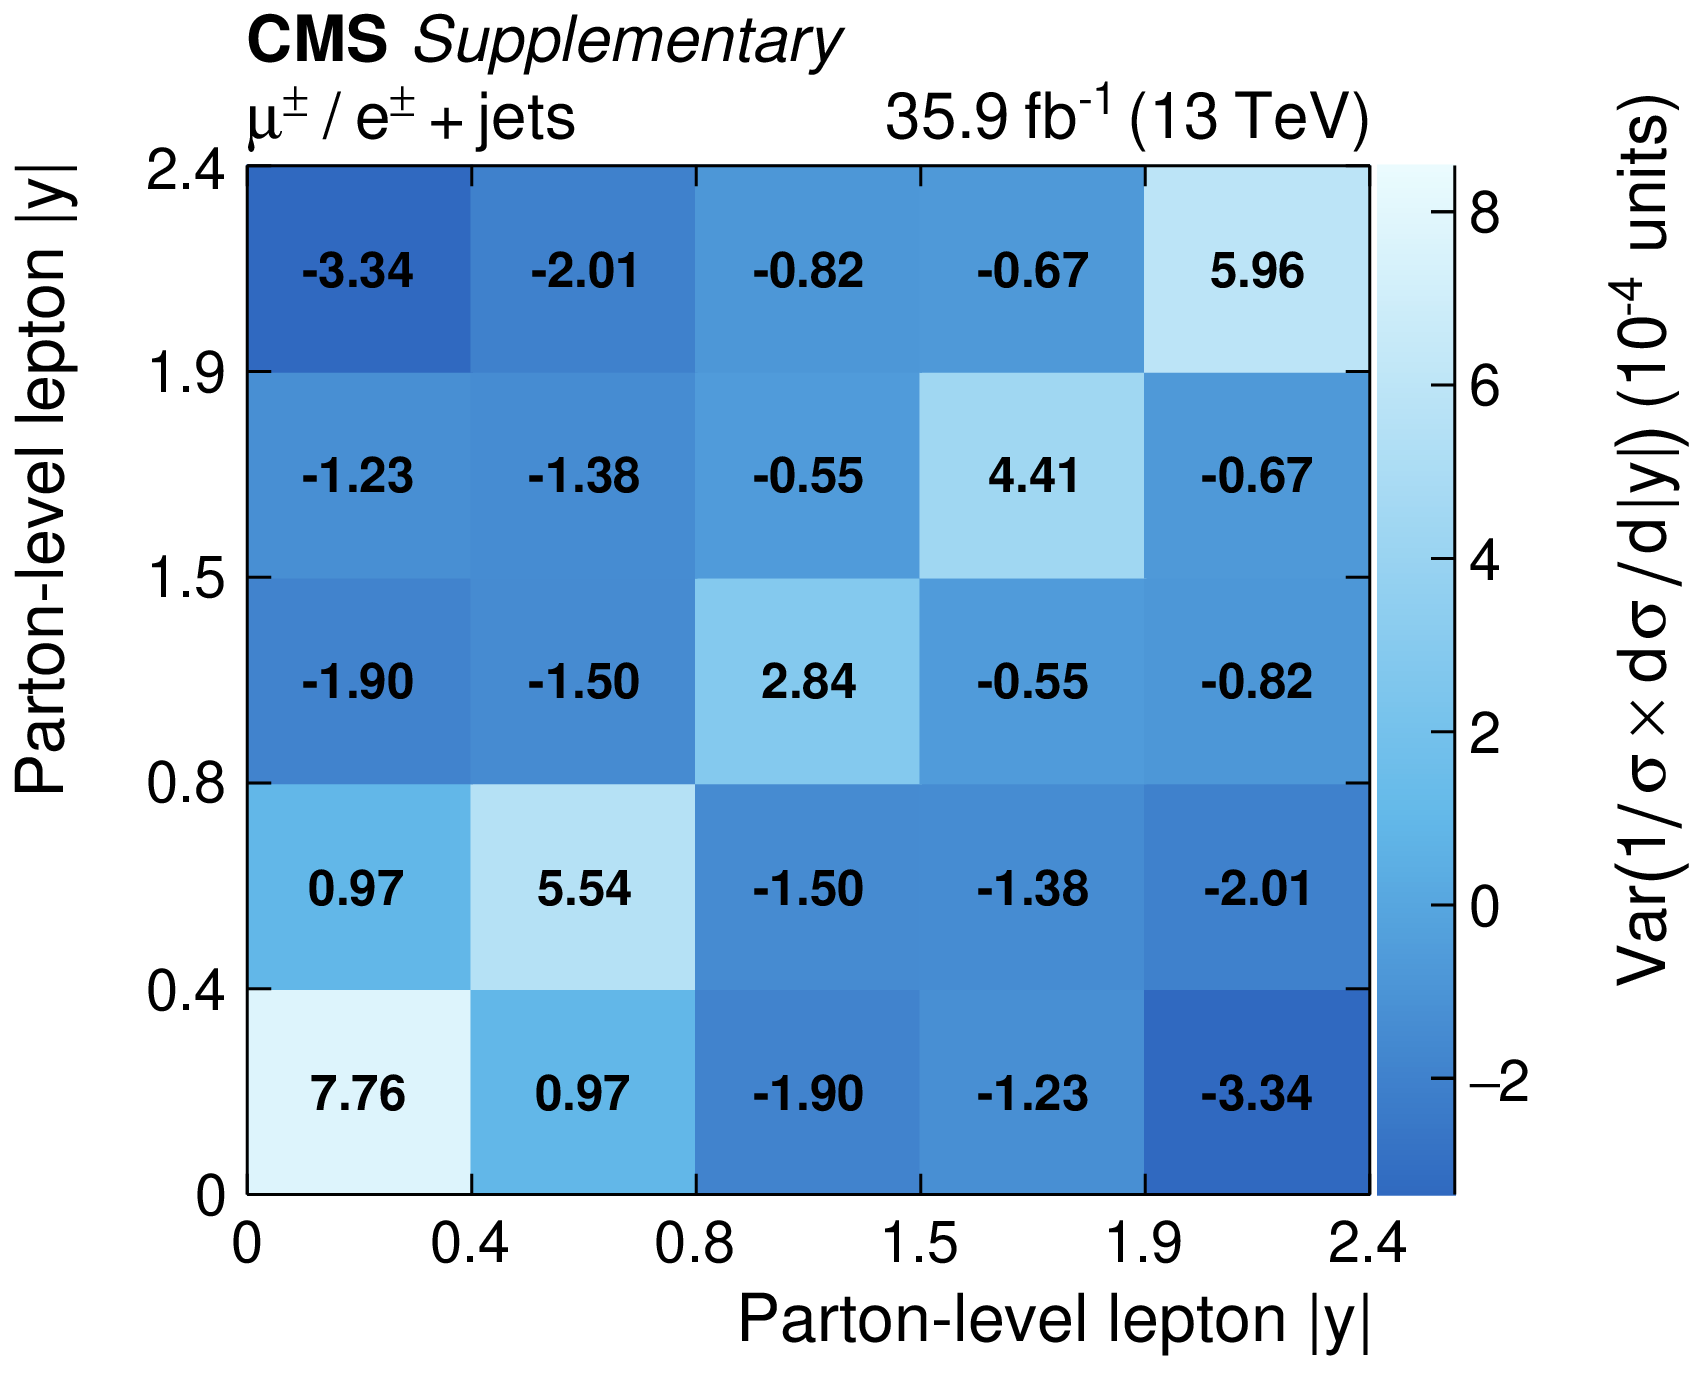
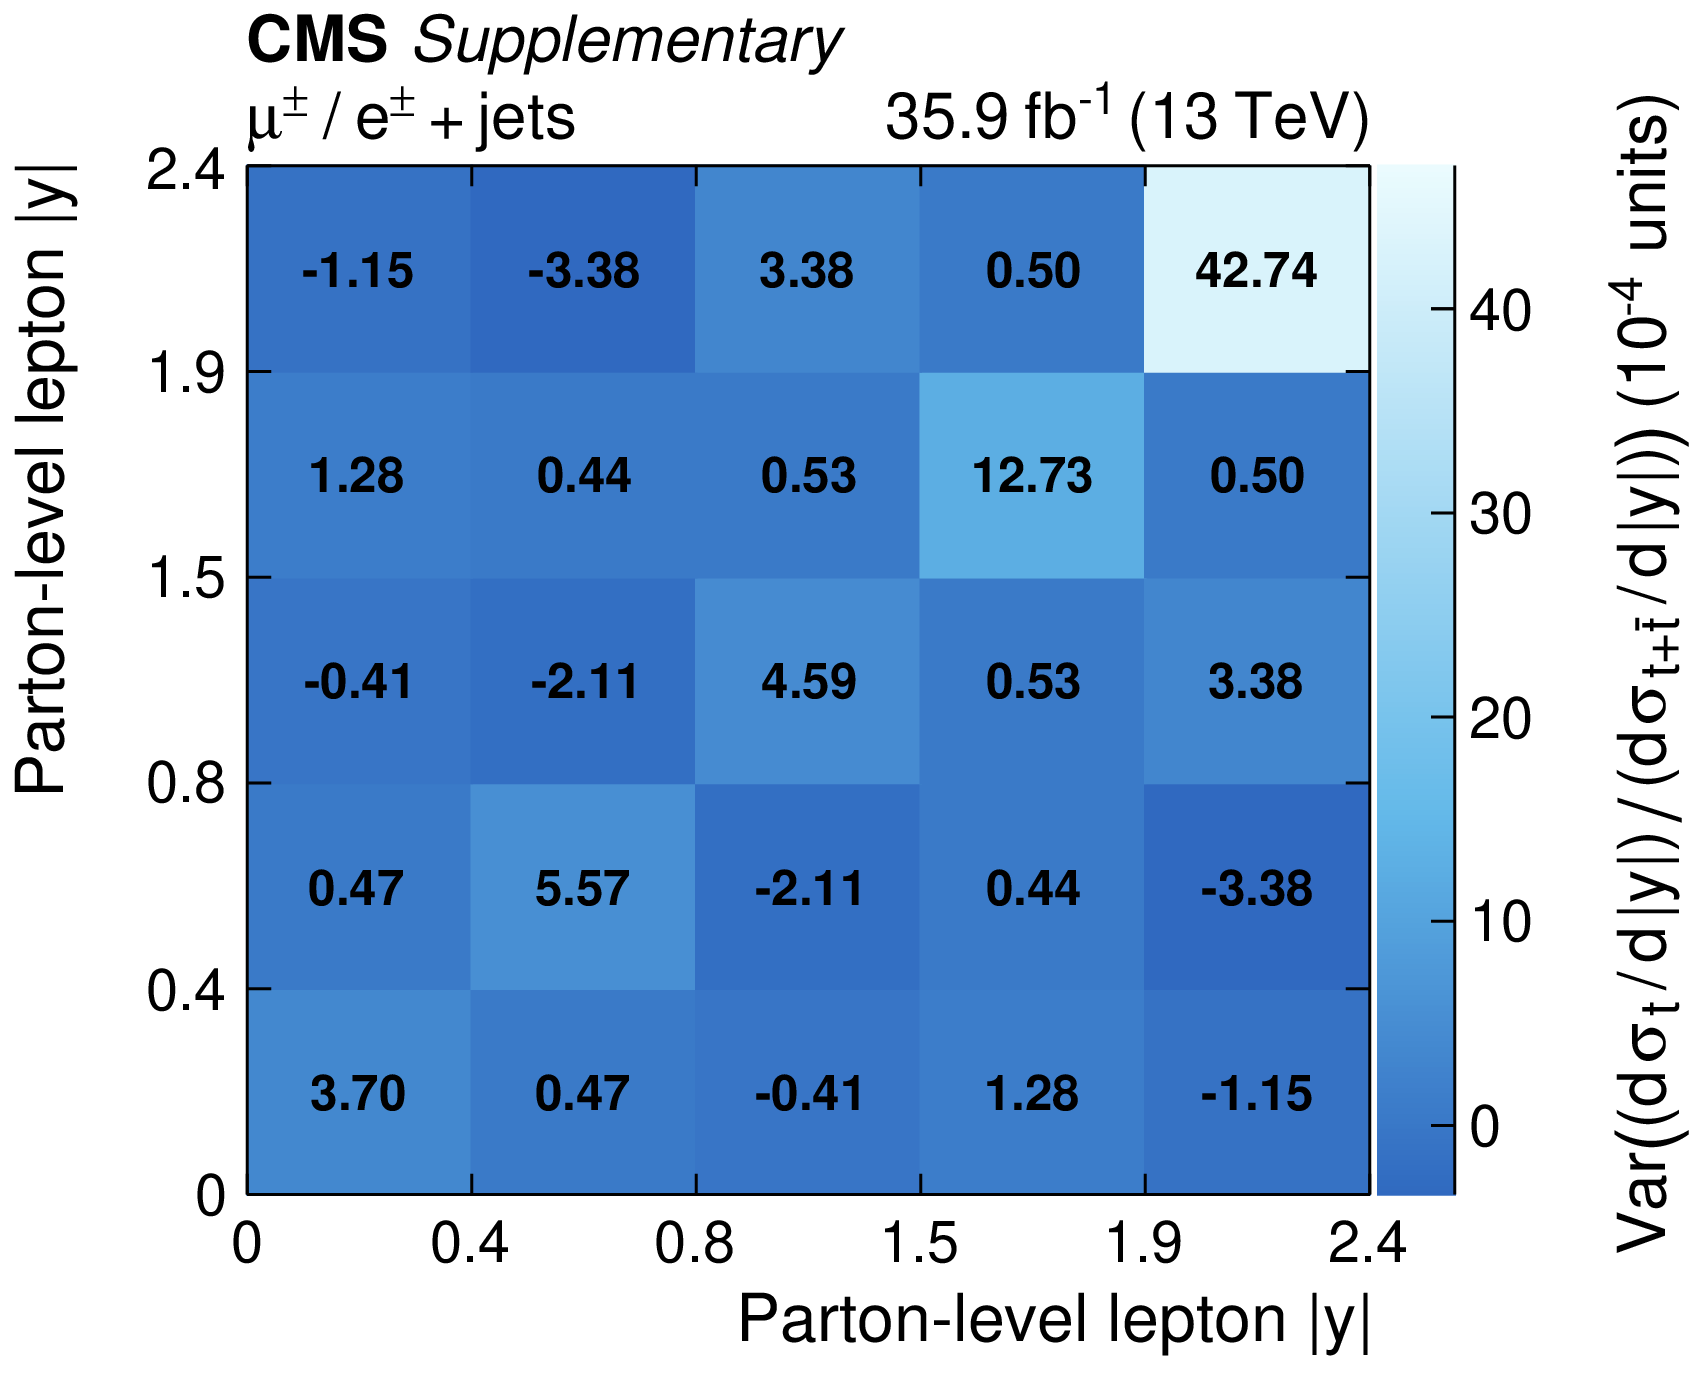
Additional Figure 1-d:
Covariance ("Var'') of the total uncertainty for the measured absolute differential $t$-channel single top quark cross sections at the parton level: charged lepton rapidity. The labels on the $x$ and $y$ axes denote the bin edges. |
png pdf |
Additional Figure 1-e:
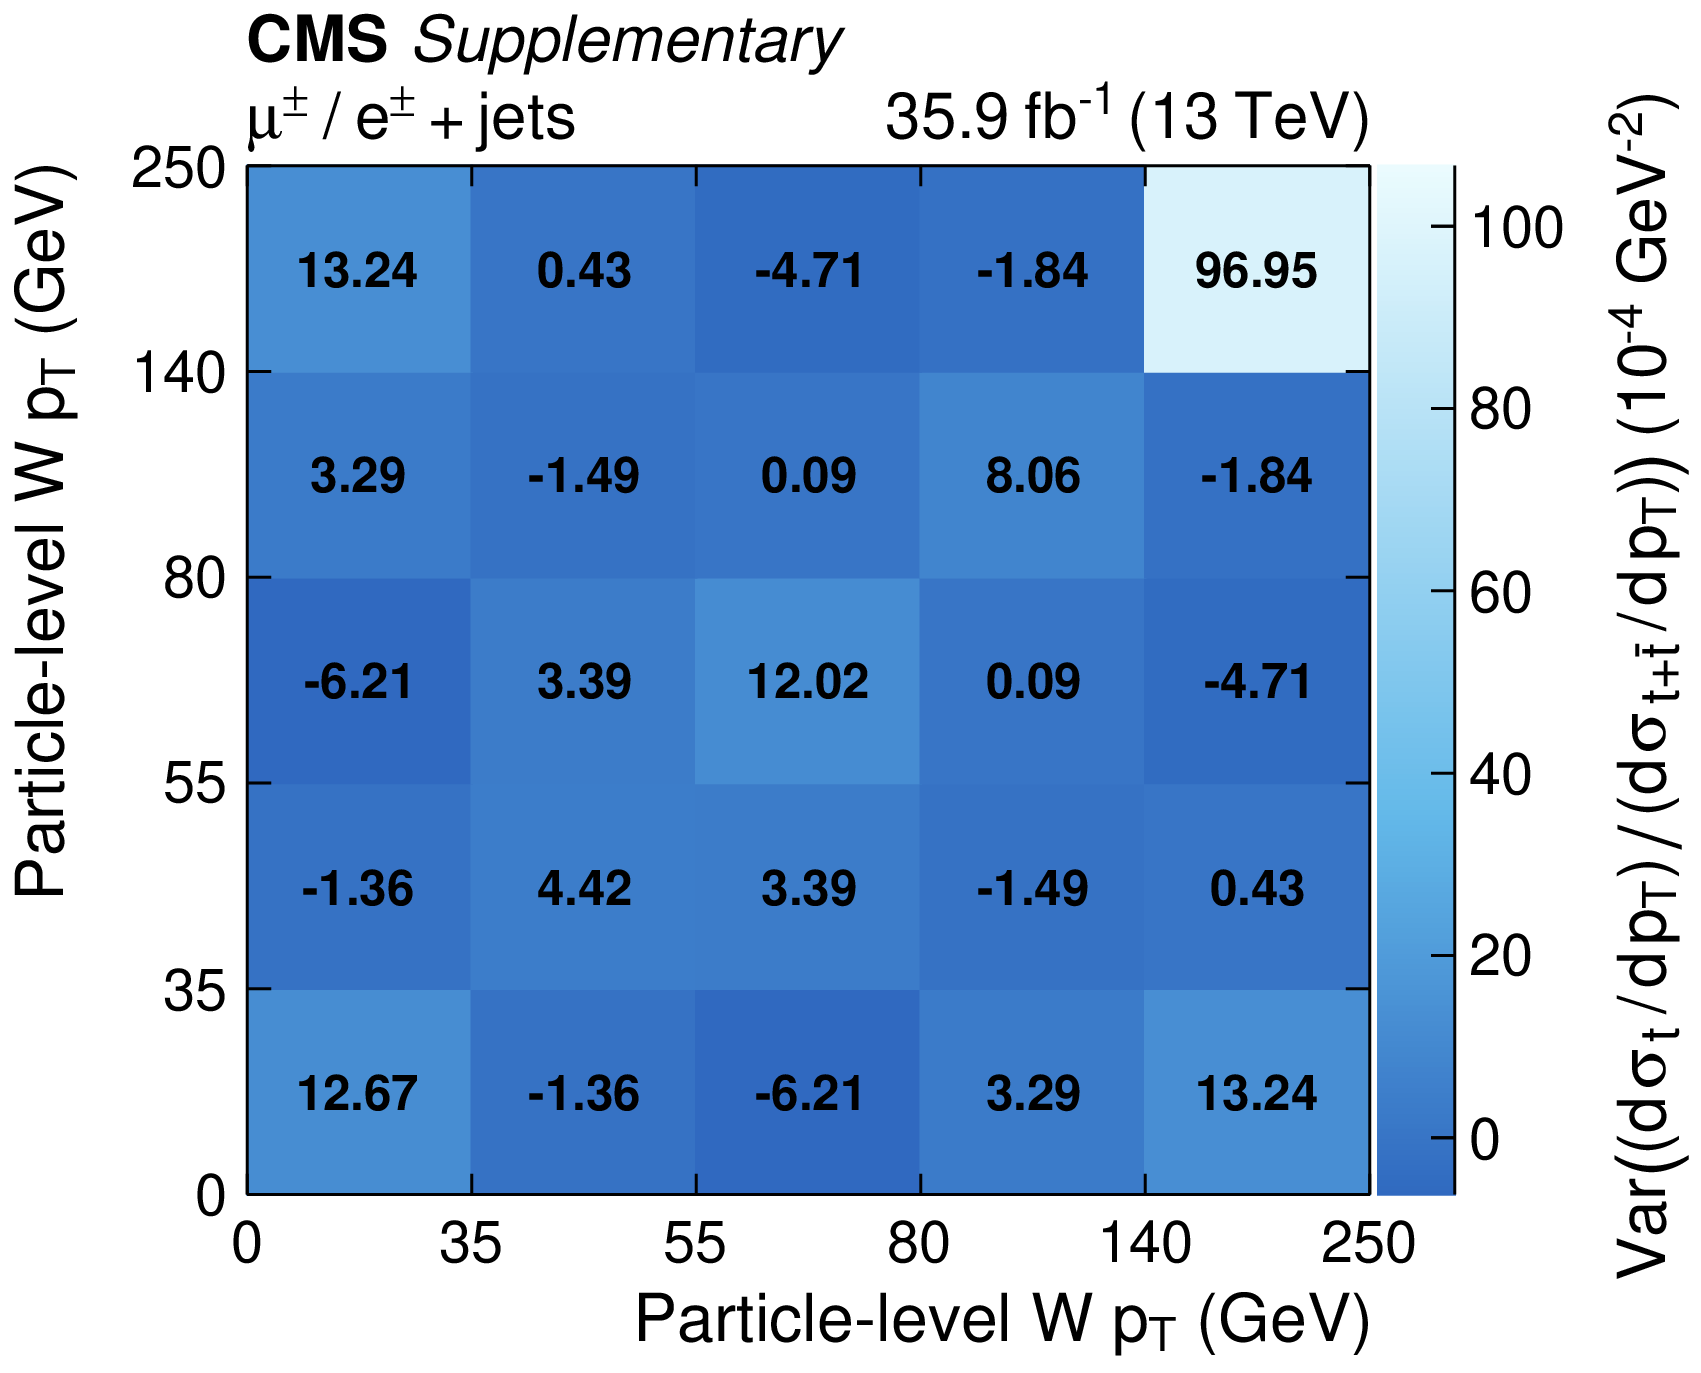
Covariance ("Var'') of the total uncertainty for the measured absolute differential $t$-channel single top quark cross sections at the parton level: W boson ${p_{\mathrm {T}}}$. The labels on the $x$ and $y$ axes denote the bin edges. |
png pdf |
Additional Figure 1-f:
Covariance ("Var'') of the total uncertainty for the measured absolute differential $t$-channel single top quark cross sections at the parton level: cosine of the top quark polarisation angle. The labels on the $x$ and $y$ axes denote the bin edges. |
png pdf |
Additional Figure 2:
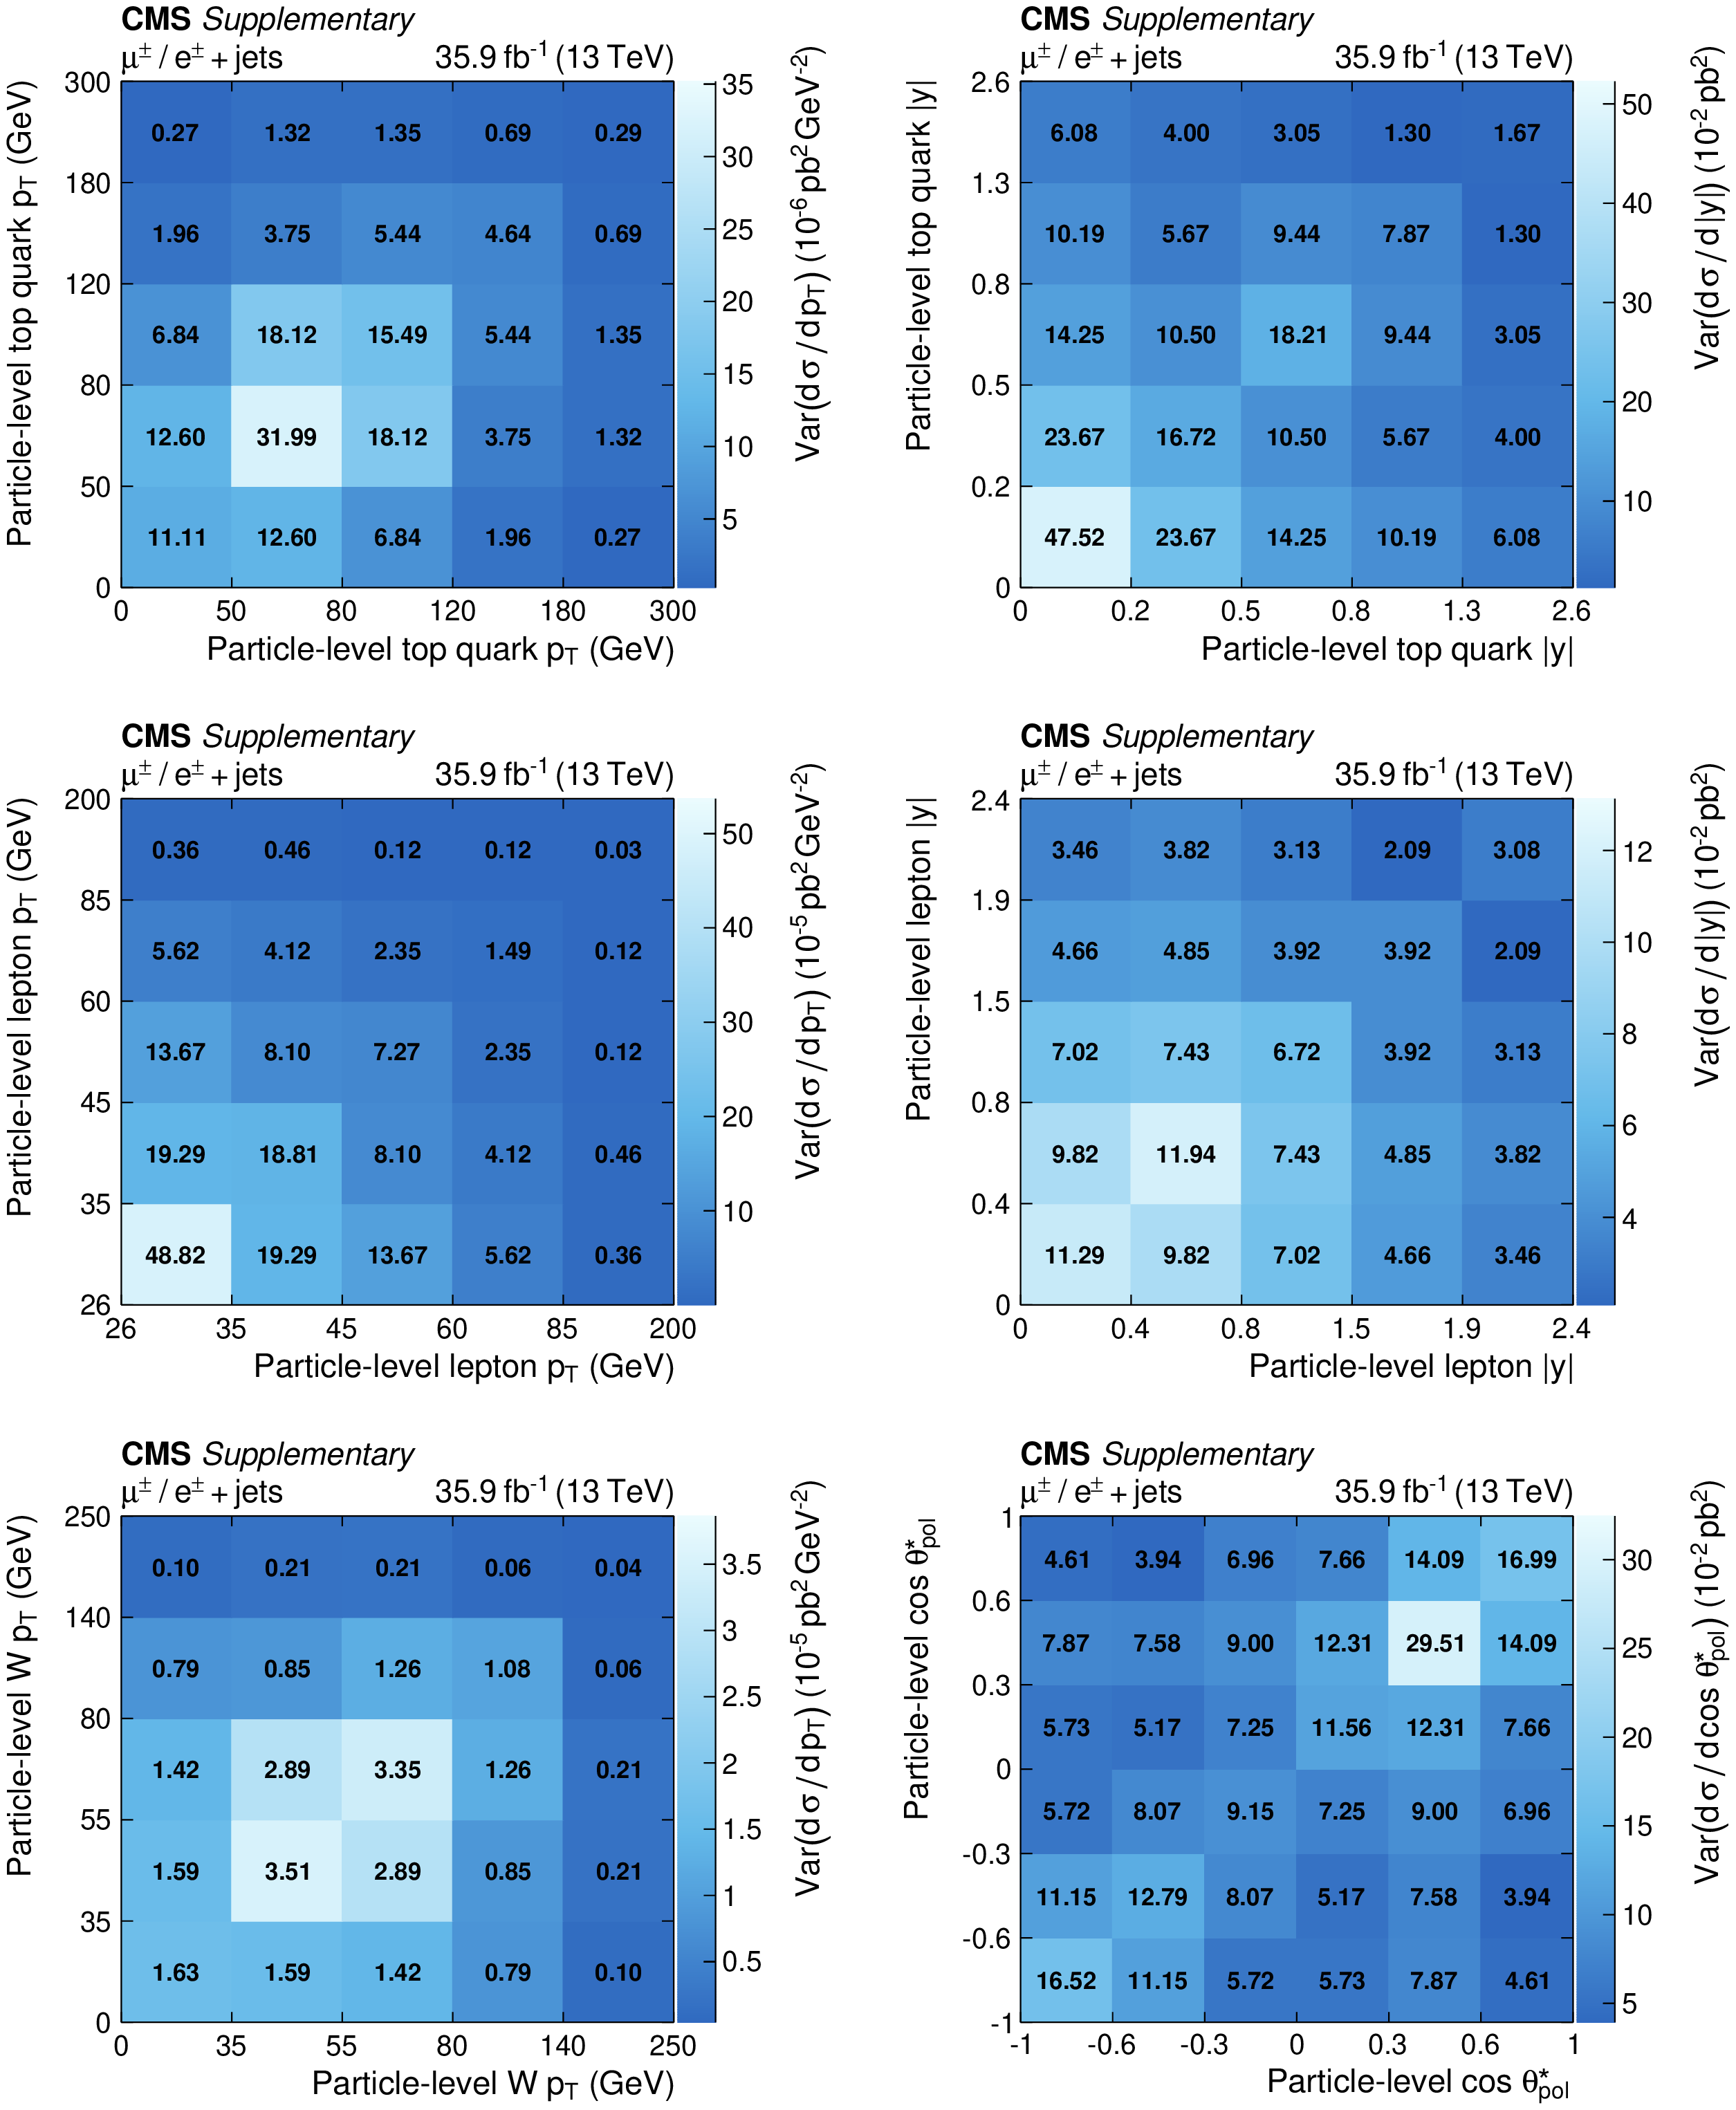
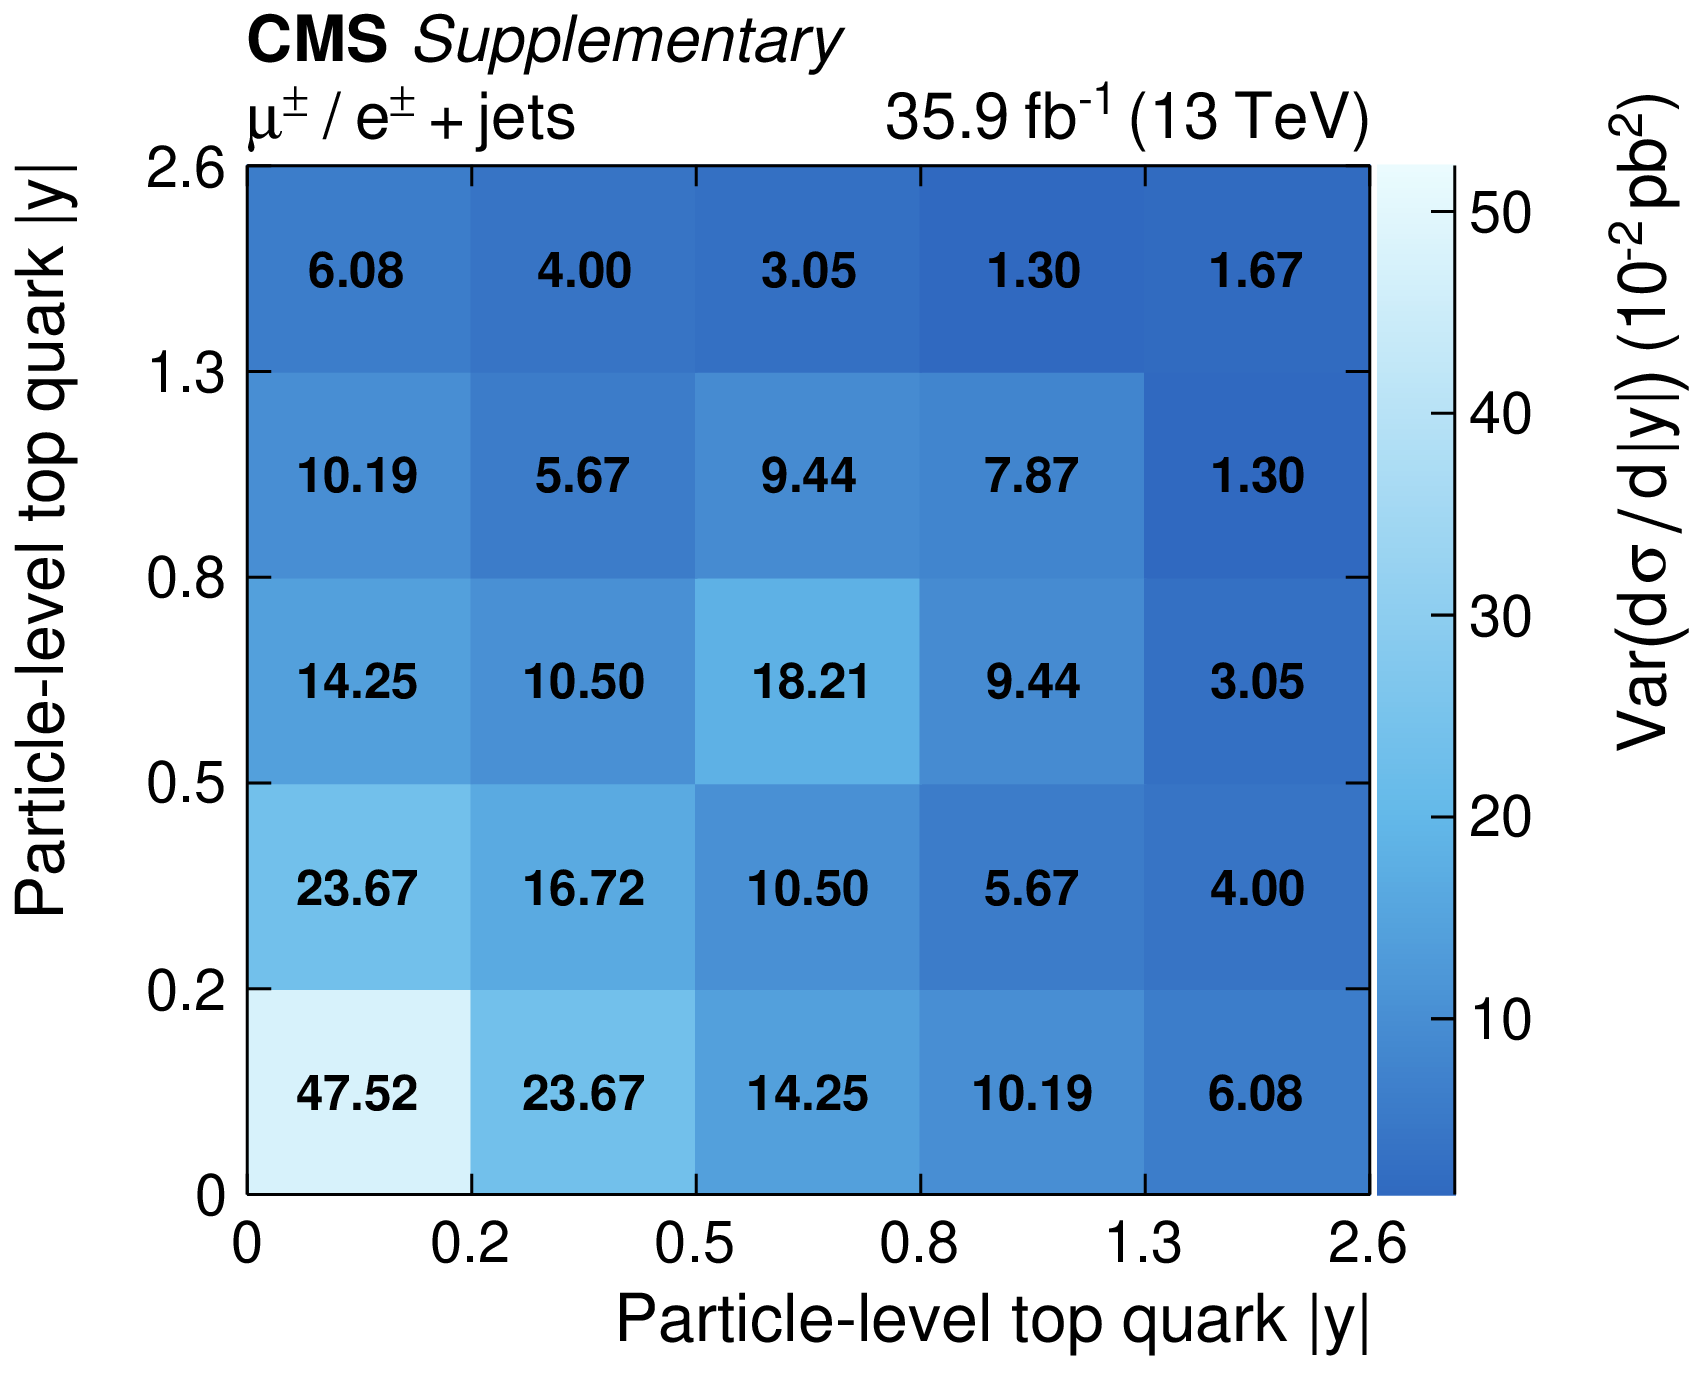
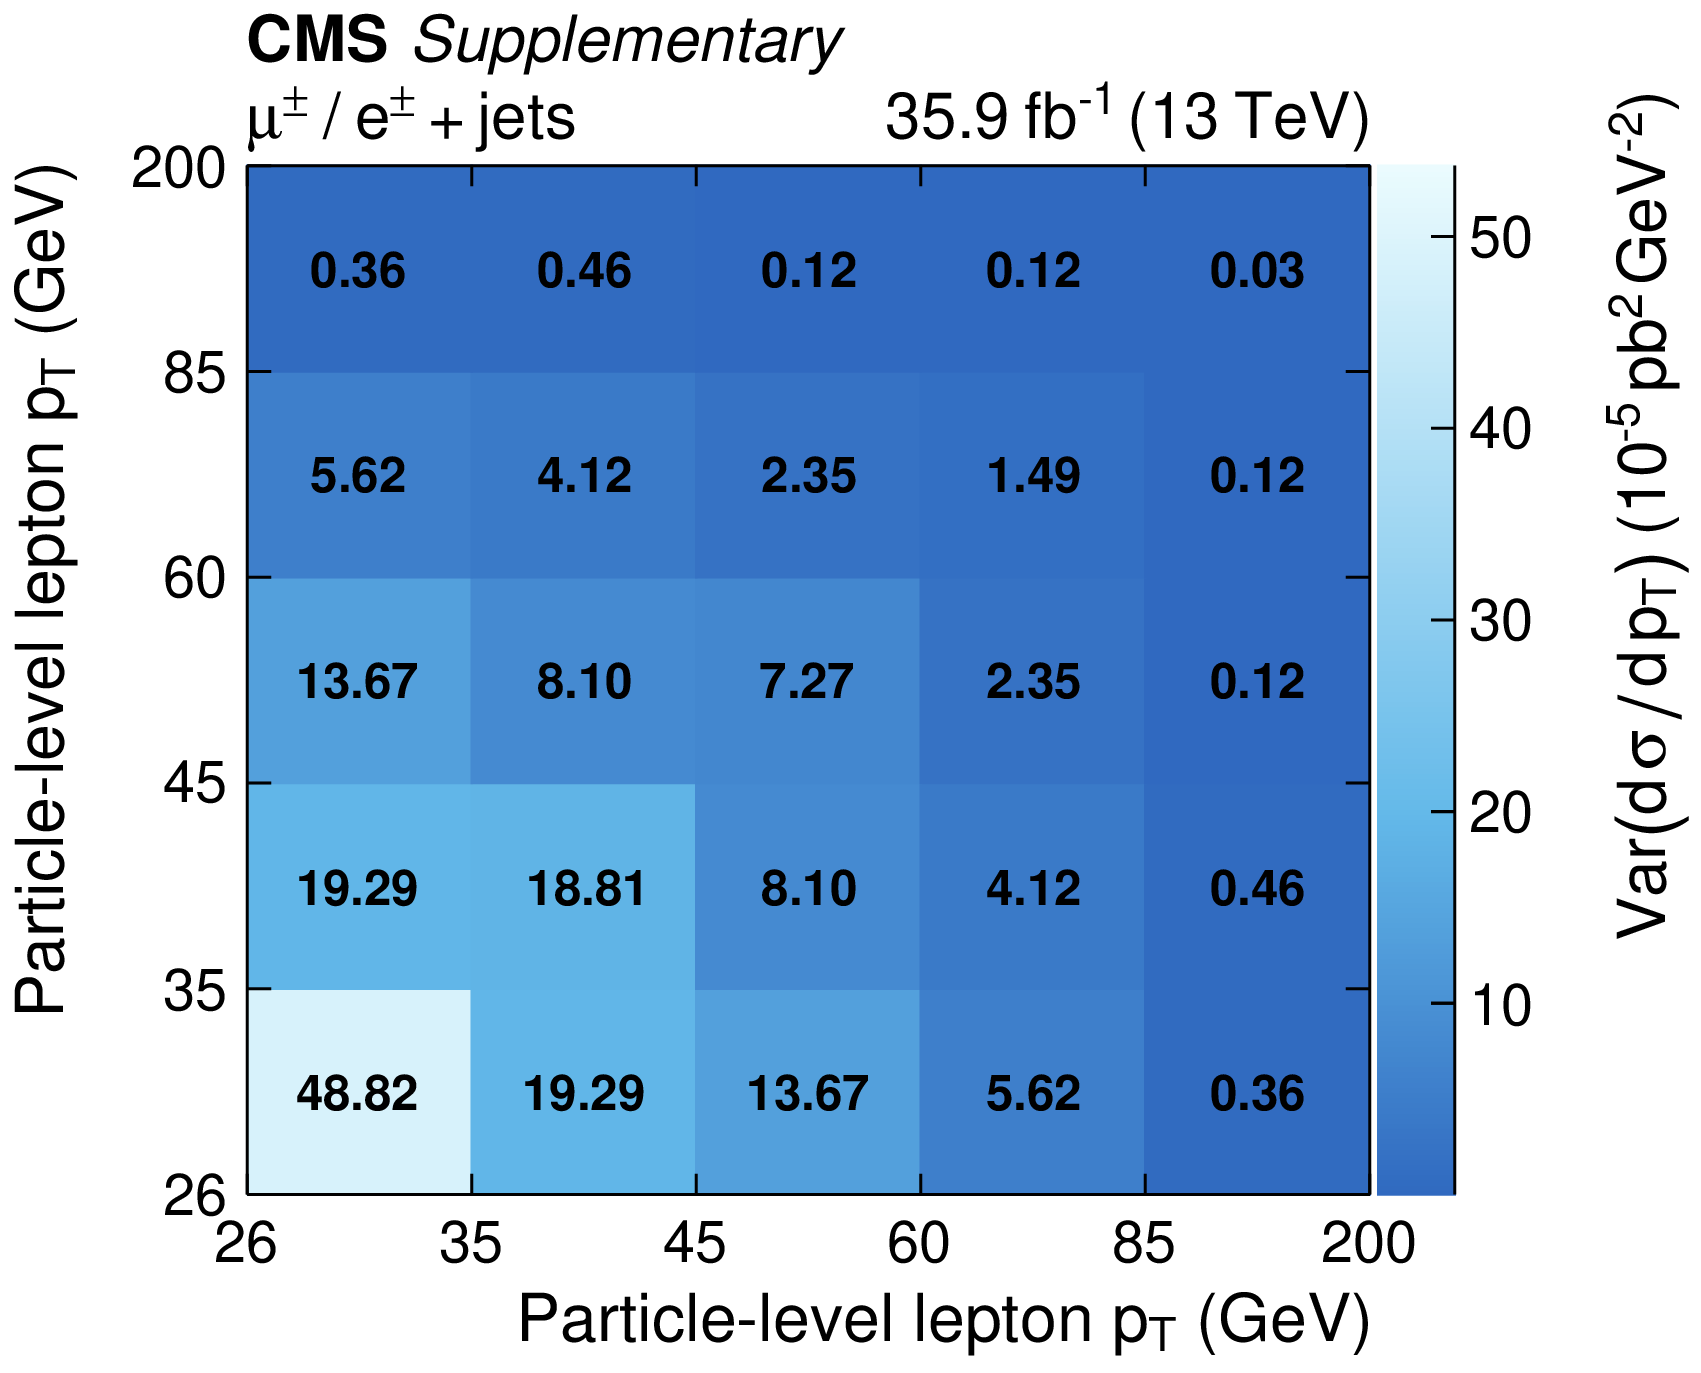
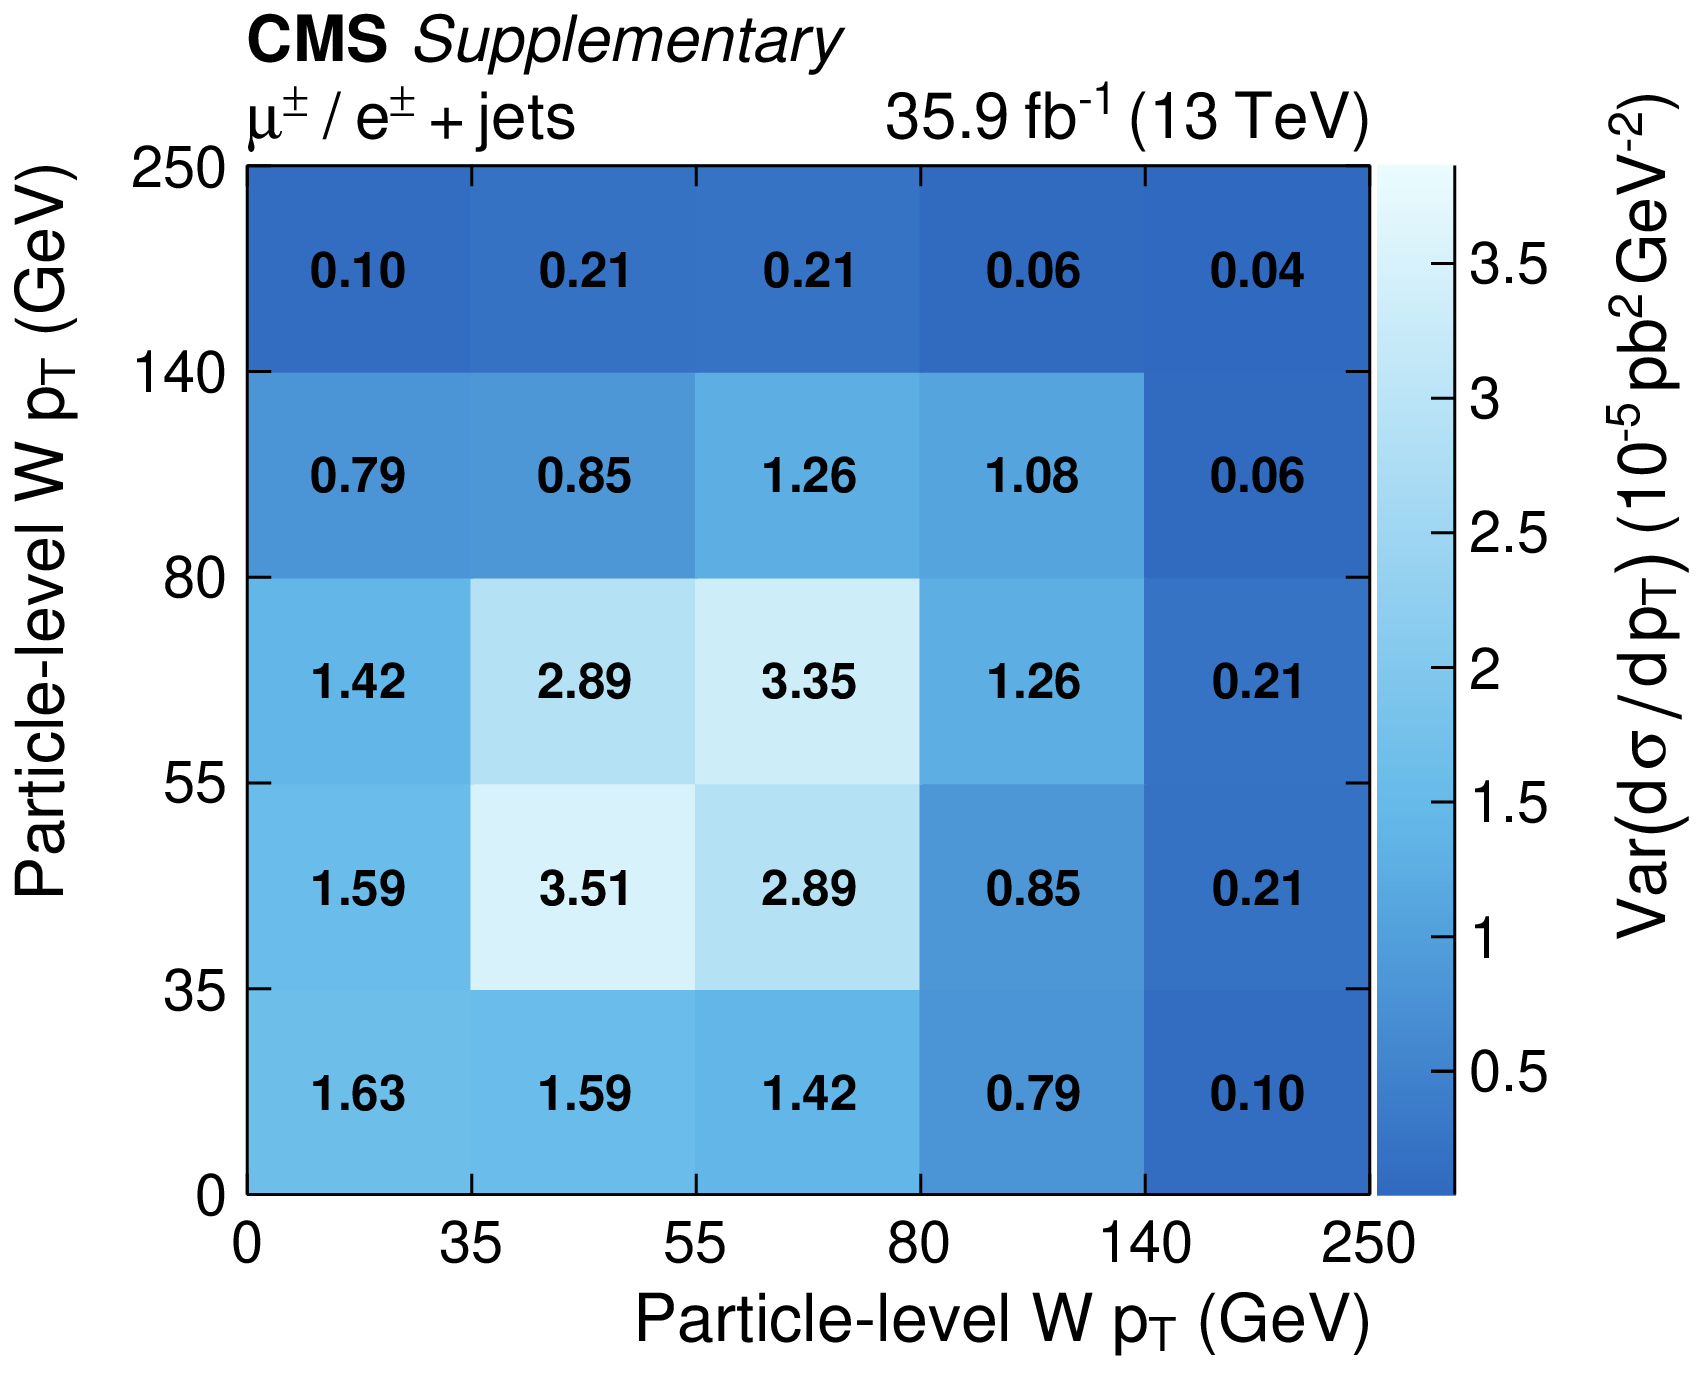
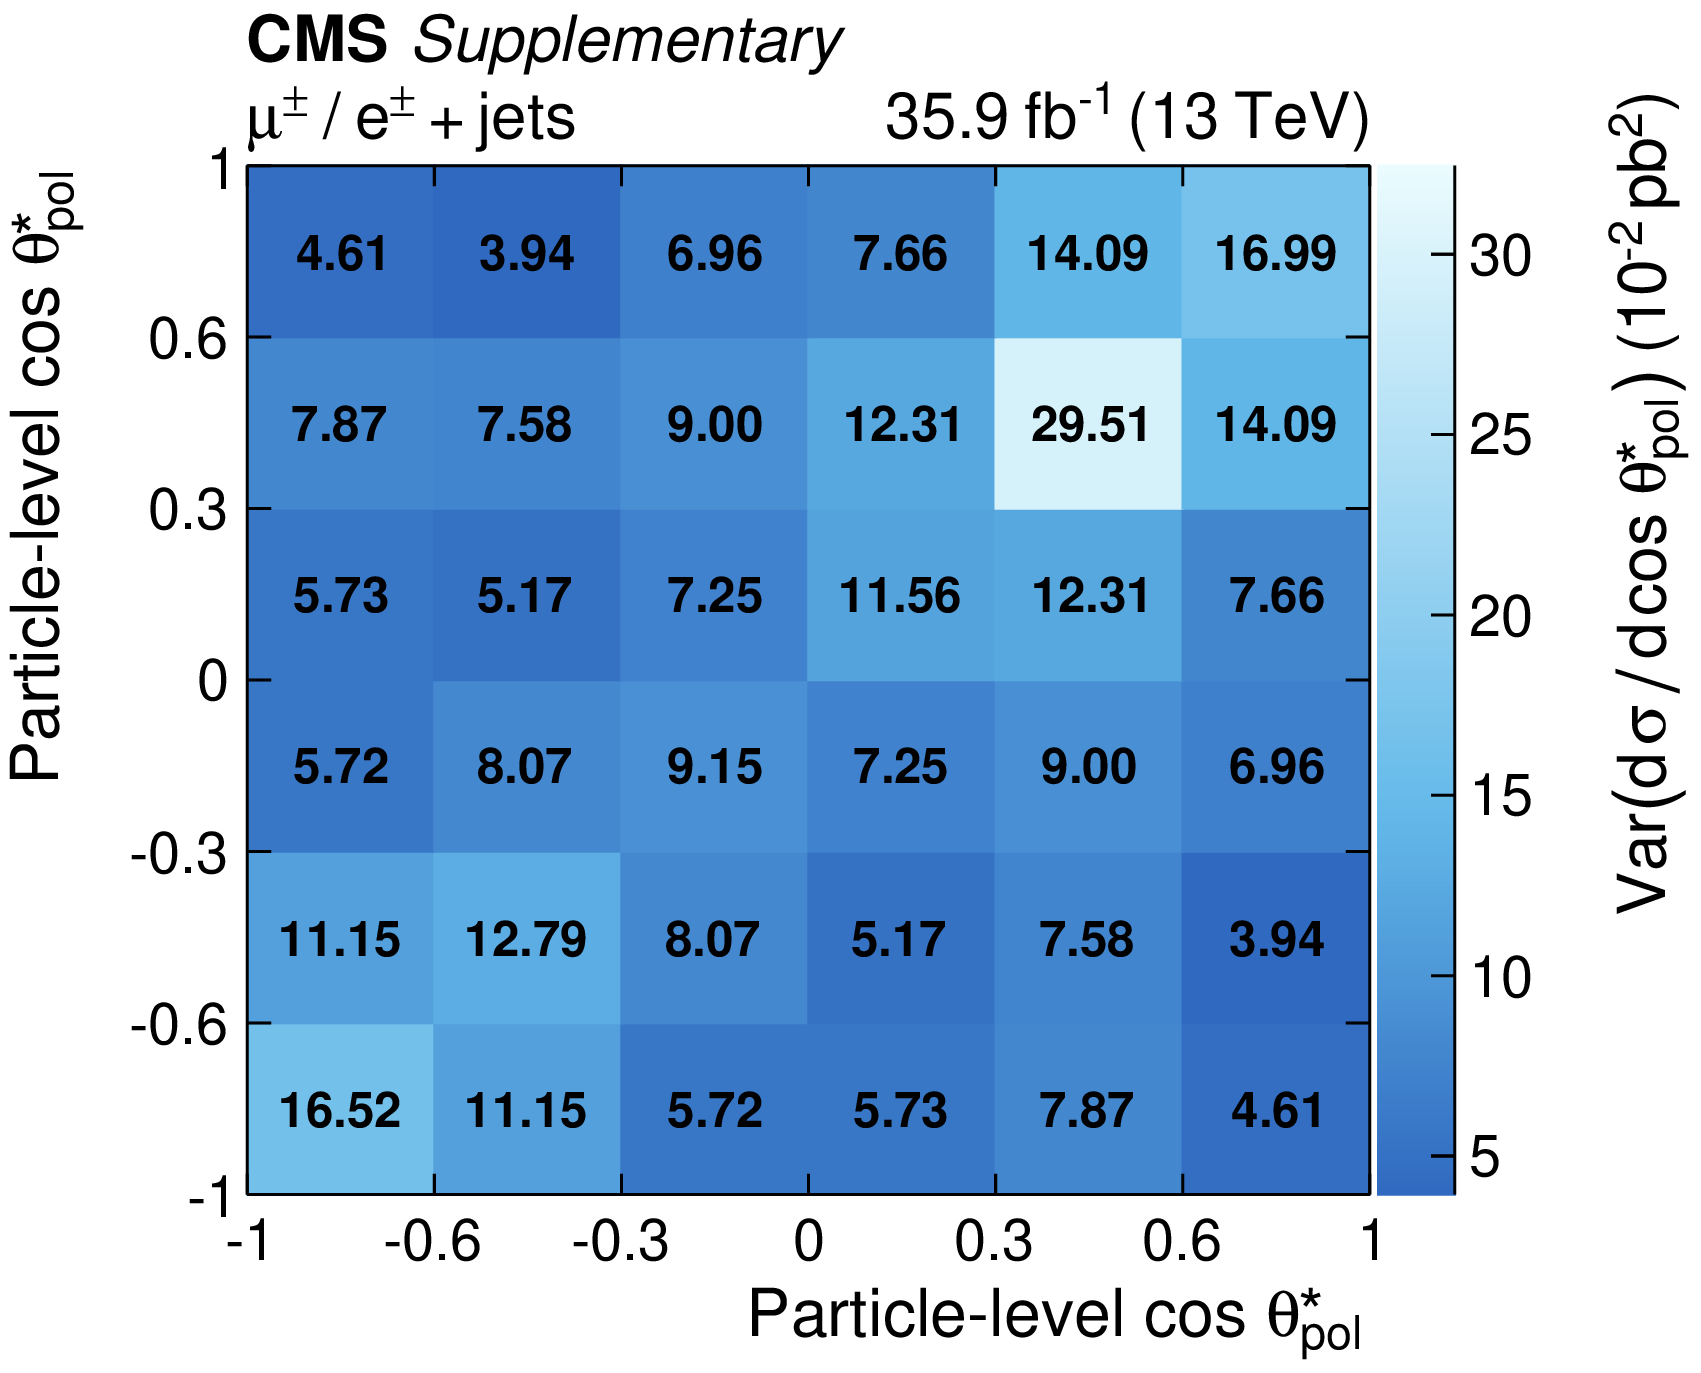
Covariance ("Var'') of the total uncertainty for the measured absolute differential $t$-channel single top quark cross sections at the particle level: top quark ${p_{\mathrm {T}}}$ (a) and rapidity (b); charged lepton ${p_{\mathrm {T}}}$ (c) and rapidity (d); W boson ${p_{\mathrm {T}}}$ (e); cosine of the top quark polarisation angle (f). The labels on the $x$ and $y$ axes denote the bin edges. |
png pdf |
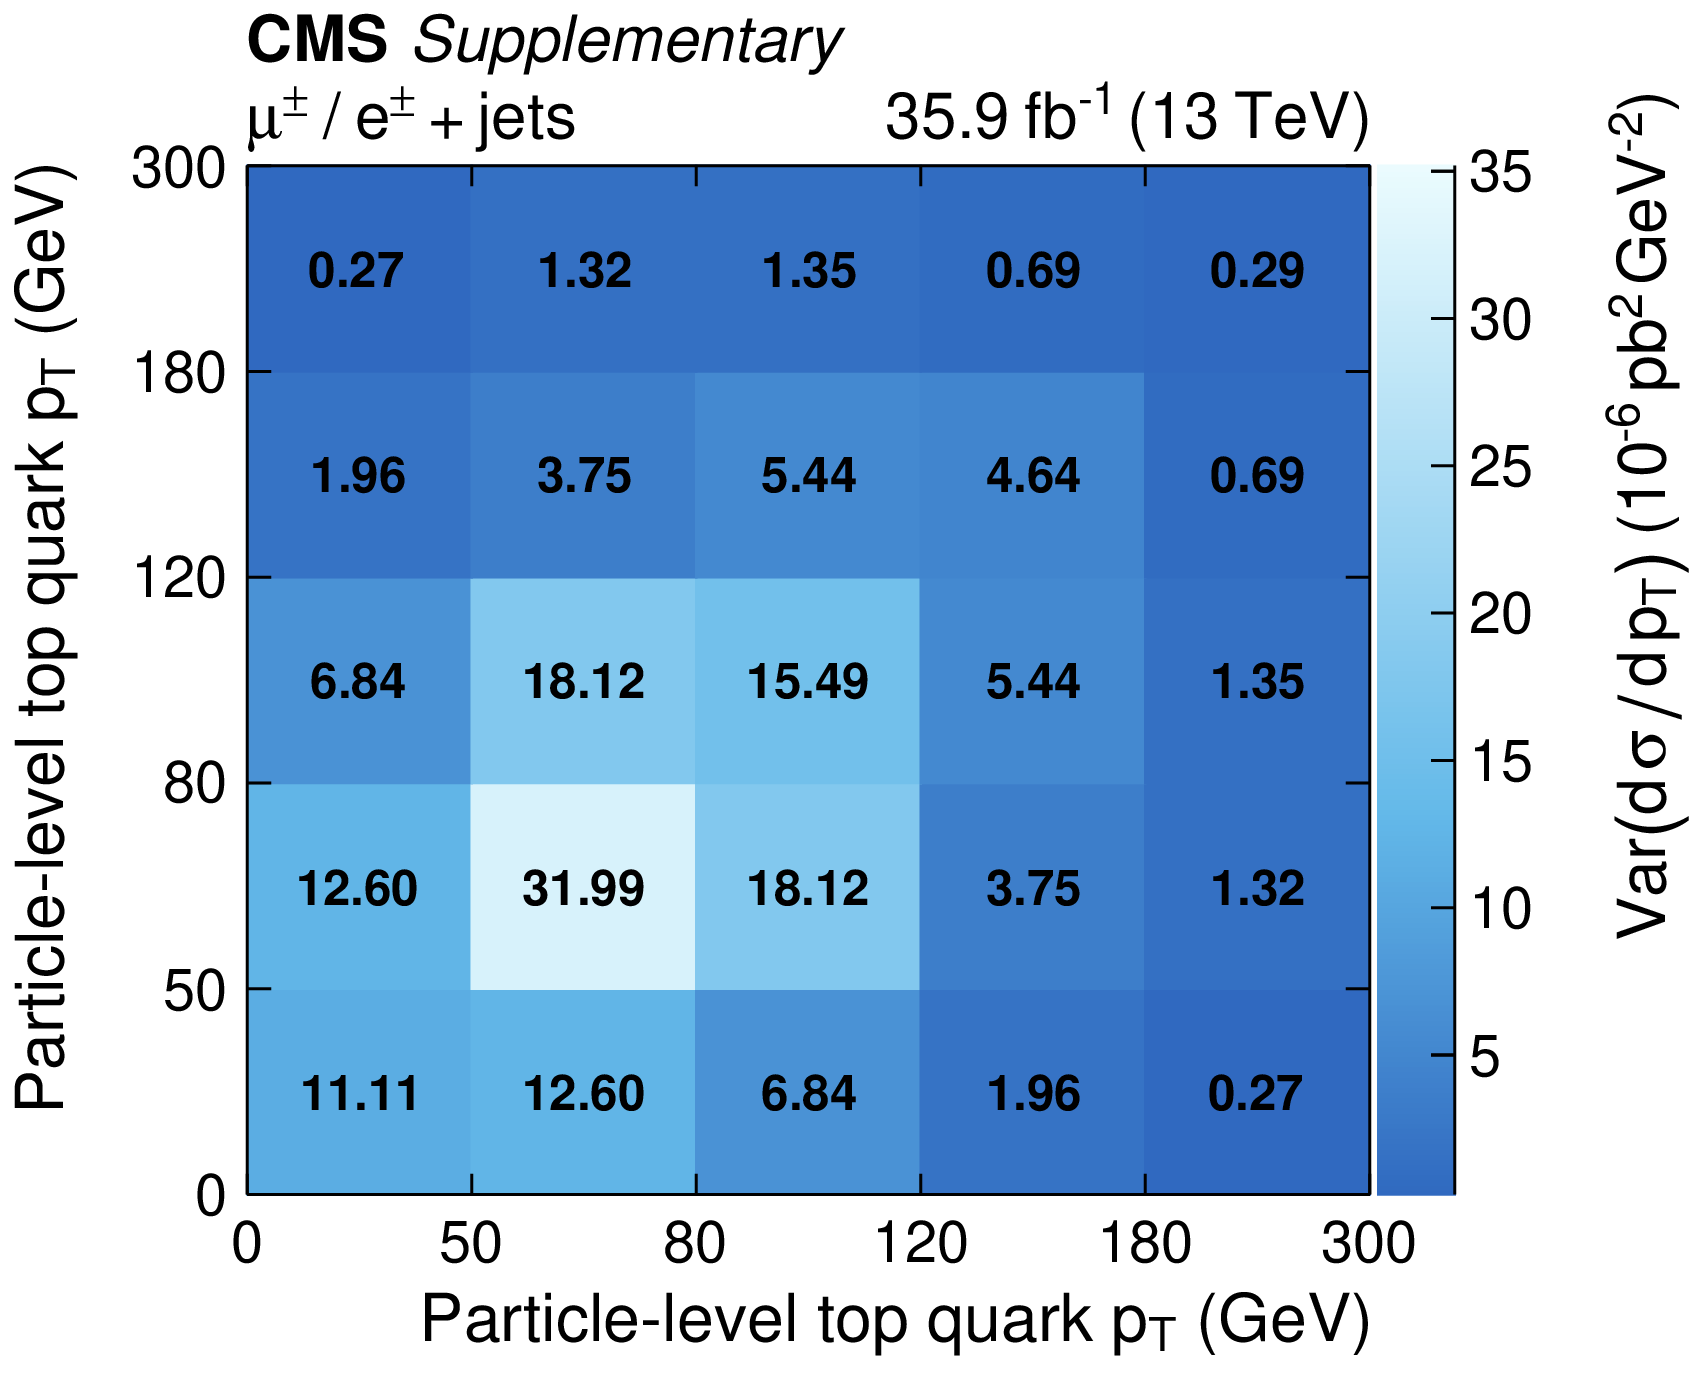
Additional Figure 2-a:
Covariance ("Var'') of the total uncertainty for the measured absolute differential $t$-channel single top quark cross sections at the particle level: top quark ${p_{\mathrm {T}}}$. The labels on the $x$ and $y$ axes denote the bin edges. |
png pdf |
Additional Figure 2-b:
Covariance ("Var'') of the total uncertainty for the measured absolute differential $t$-channel single top quark cross sections at the particle level: top quark rapidity. The labels on the $x$ and $y$ axes denote the bin edges. |
png pdf |
Additional Figure 2-c:
Covariance ("Var'') of the total uncertainty for the measured absolute differential $t$-channel single top quark cross sections at the particle level: charged lepton ${p_{\mathrm {T}}}$. The labels on the $x$ and $y$ axes denote the bin edges. |

png pdf |
Additional Figure 2-d:
Covariance ("Var'') of the total uncertainty for the measured absolute differential $t$-channel single top quark cross sections at the particle level: charged lepton rapidity. The labels on the $x$ and $y$ axes denote the bin edges. |
png pdf |
Additional Figure 2-e:
Covariance ("Var'') of the total uncertainty for the measured absolute differential $t$-channel single top quark cross sections at the particle level: W boson ${p_{\mathrm {T}}}$. The labels on the $x$ and $y$ axes denote the bin edges. |
png pdf |
Additional Figure 2-f:
Covariance ("Var'') of the total uncertainty for the measured absolute differential $t$-channel single top quark cross sections at the particle level: cosine of the top quark polarisation angle. The labels on the $x$ and $y$ axes denote the bin edges. |
png pdf |
Additional Figure 3:
Covariance ("Var'') of the total uncertainty for the measured normalised differential $t$-channel single top quark cross sections at the parton level: top quark ${p_{\mathrm {T}}}$ (a) and rapidity (b); charged lepton ${p_{\mathrm {T}}}$ (c) and rapidity (d); W boson ${p_{\mathrm {T}}}$ (e); cosine of the top quark polarisation angle (f). The labels on the $x$ and $y$ axes denote the bin edges. |
png pdf |
Additional Figure 3-a:
Covariance ("Var'') of the total uncertainty for the measured normalised differential $t$-channel single top quark cross sections at the parton level: top quark ${p_{\mathrm {T}}}$. The labels on the $x$ and $y$ axes denote the bin edges. |
png pdf |
Additional Figure 3-b:
Covariance ("Var'') of the total uncertainty for the measured normalised differential $t$-channel single top quark cross sections at the parton level: top quark rapidity. The labels on the $x$ and $y$ axes denote the bin edges. |

png pdf |
Additional Figure 3-c:
Covariance ("Var'') of the total uncertainty for the measured normalised differential $t$-channel single top quark cross sections at the parton level: charged lepton ${p_{\mathrm {T}}}$. The labels on the $x$ and $y$ axes denote the bin edges. |
png pdf |
Additional Figure 3-d:
Covariance ("Var'') of the total uncertainty for the measured normalised differential $t$-channel single top quark cross sections at the parton level: charged lepton rapidity. The labels on the $x$ and $y$ axes denote the bin edges. |
png pdf |
Additional Figure 3-e:
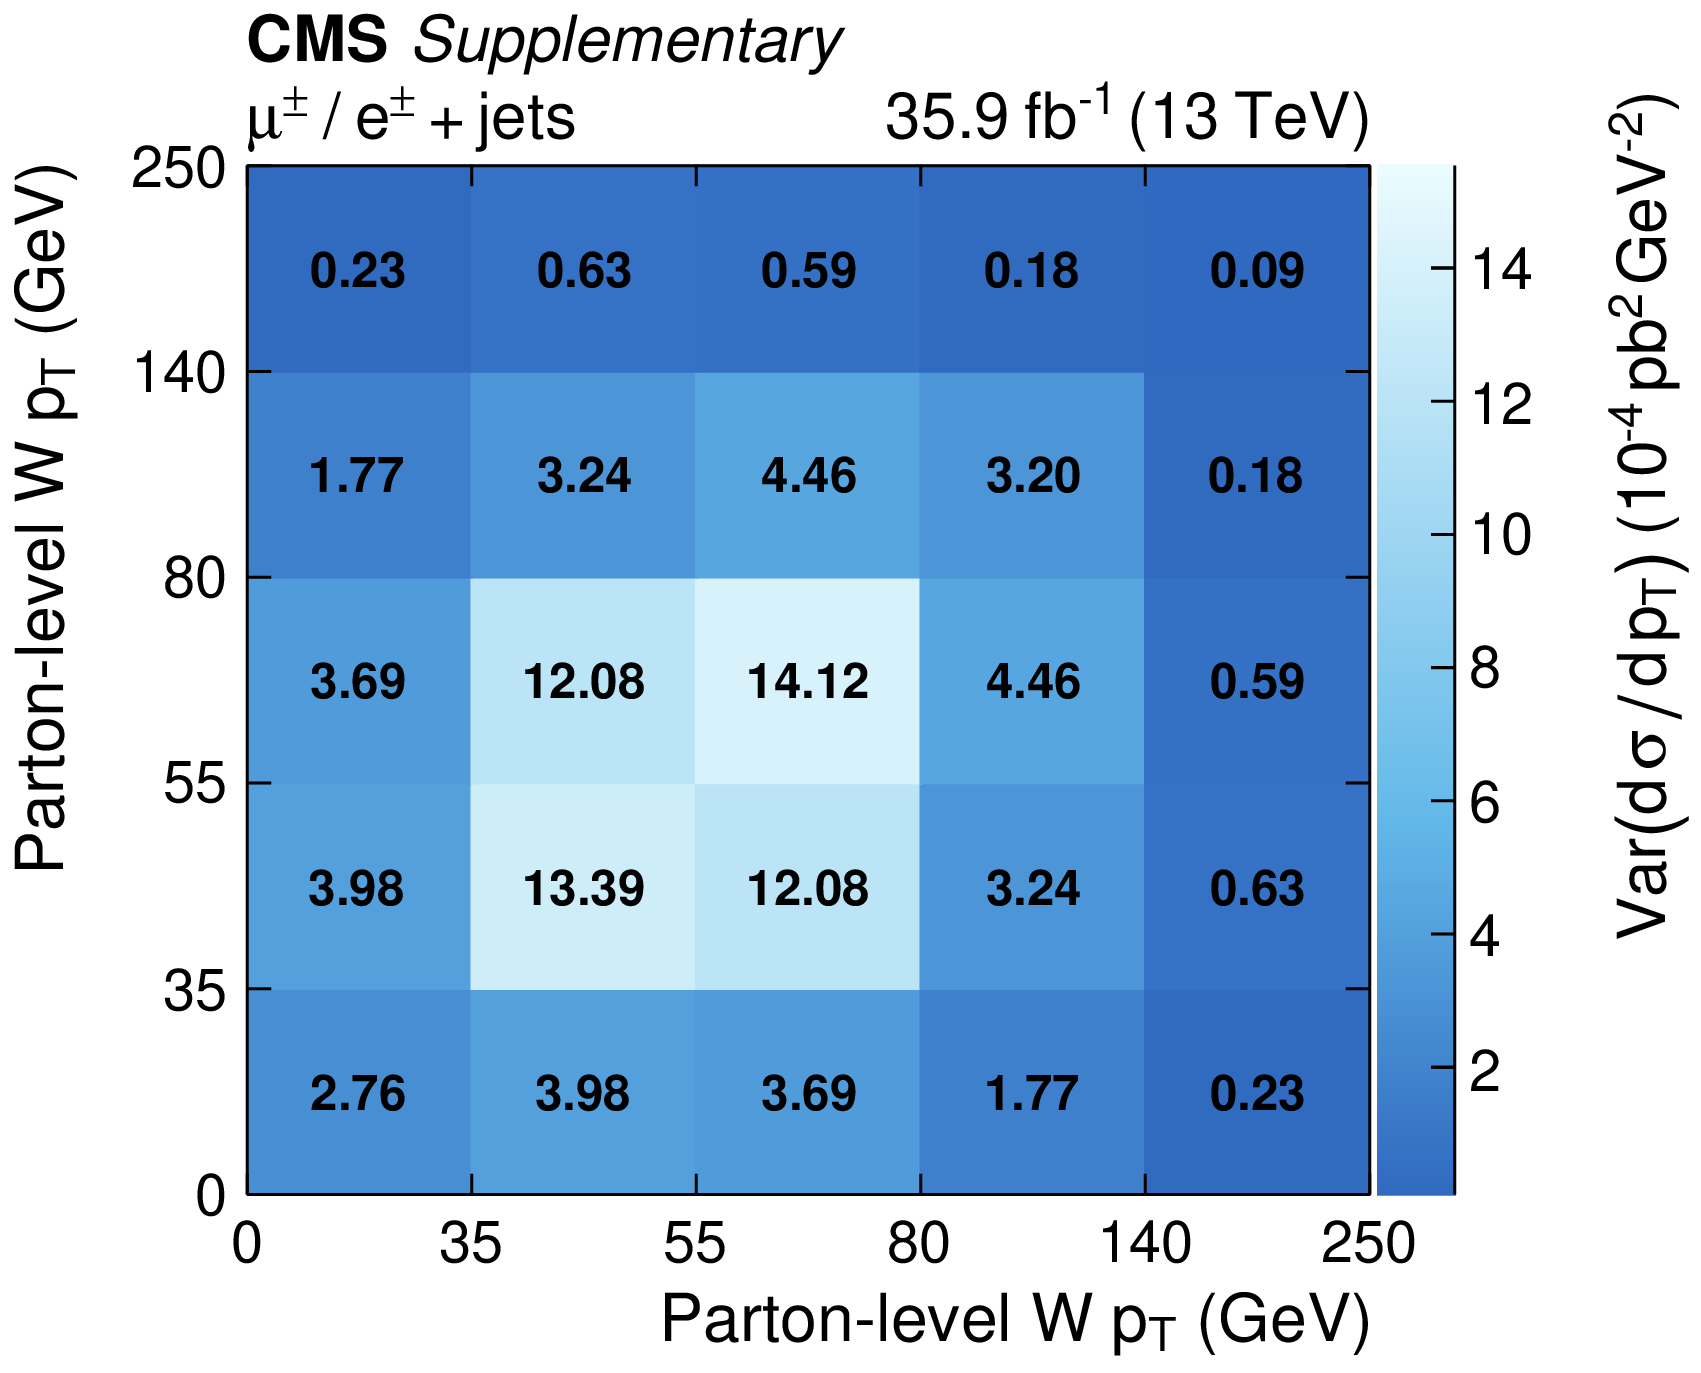
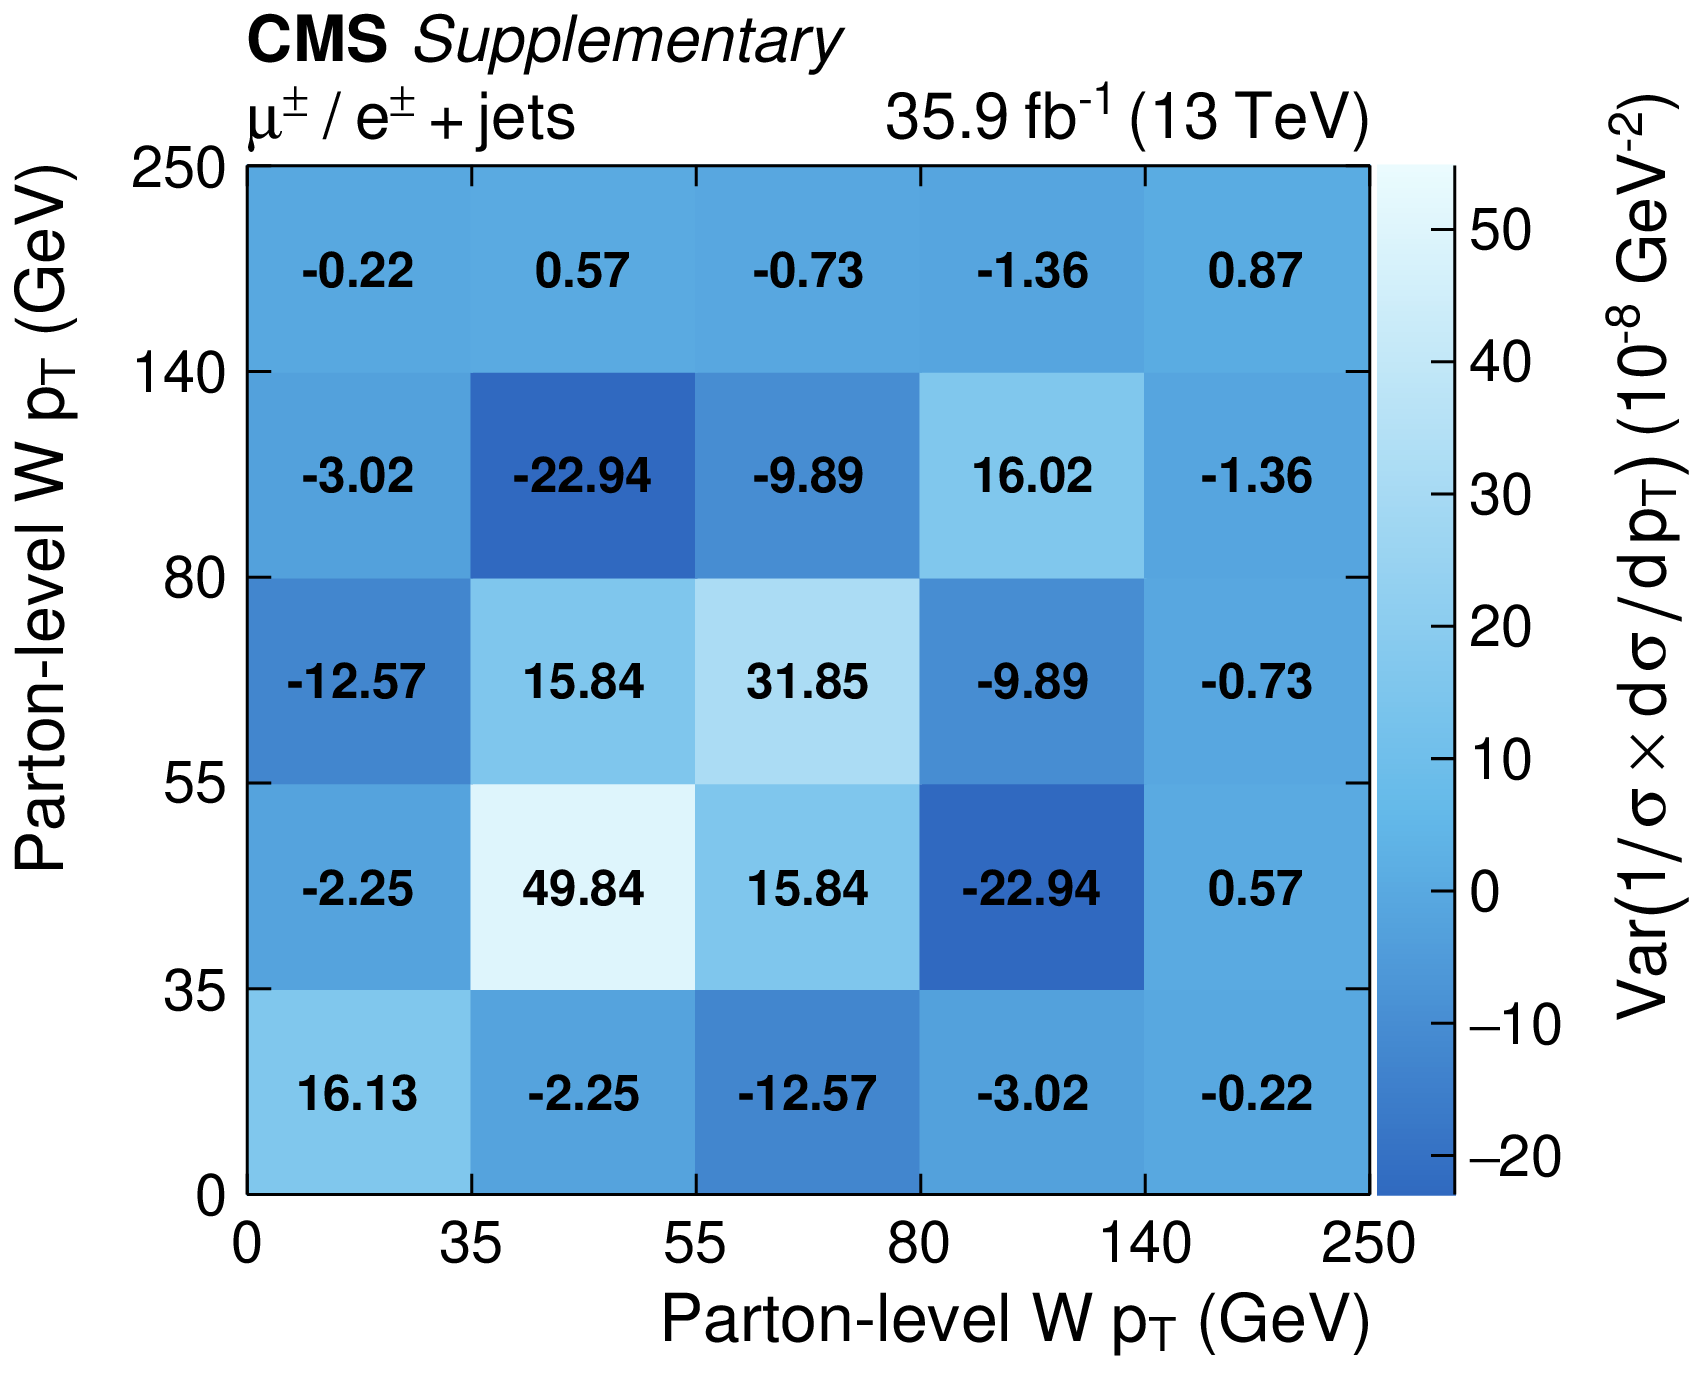
Covariance ("Var'') of the total uncertainty for the measured normalised differential $t$-channel single top quark cross sections at the parton level: W boson ${p_{\mathrm {T}}}$. The labels on the $x$ and $y$ axes denote the bin edges. |
png pdf |
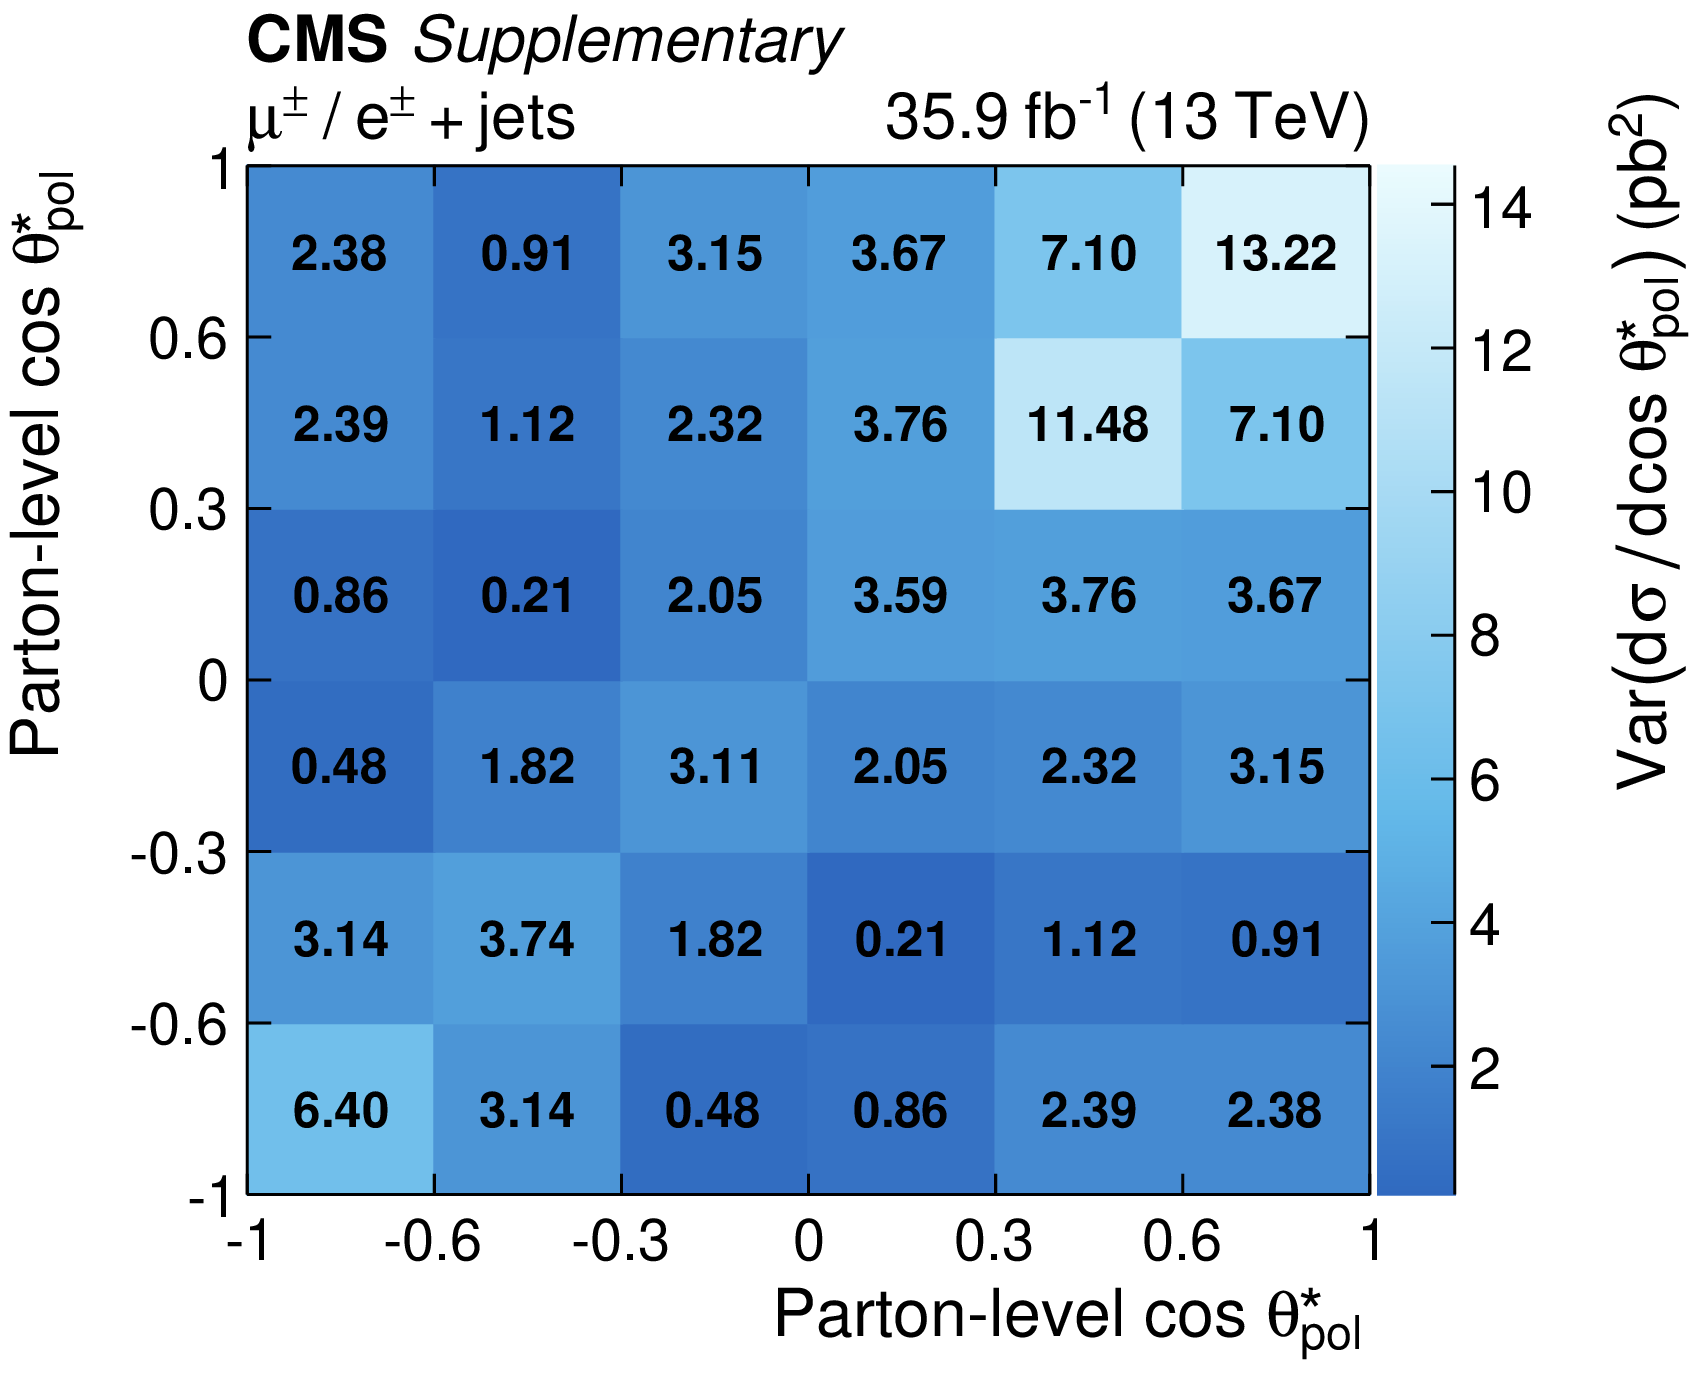
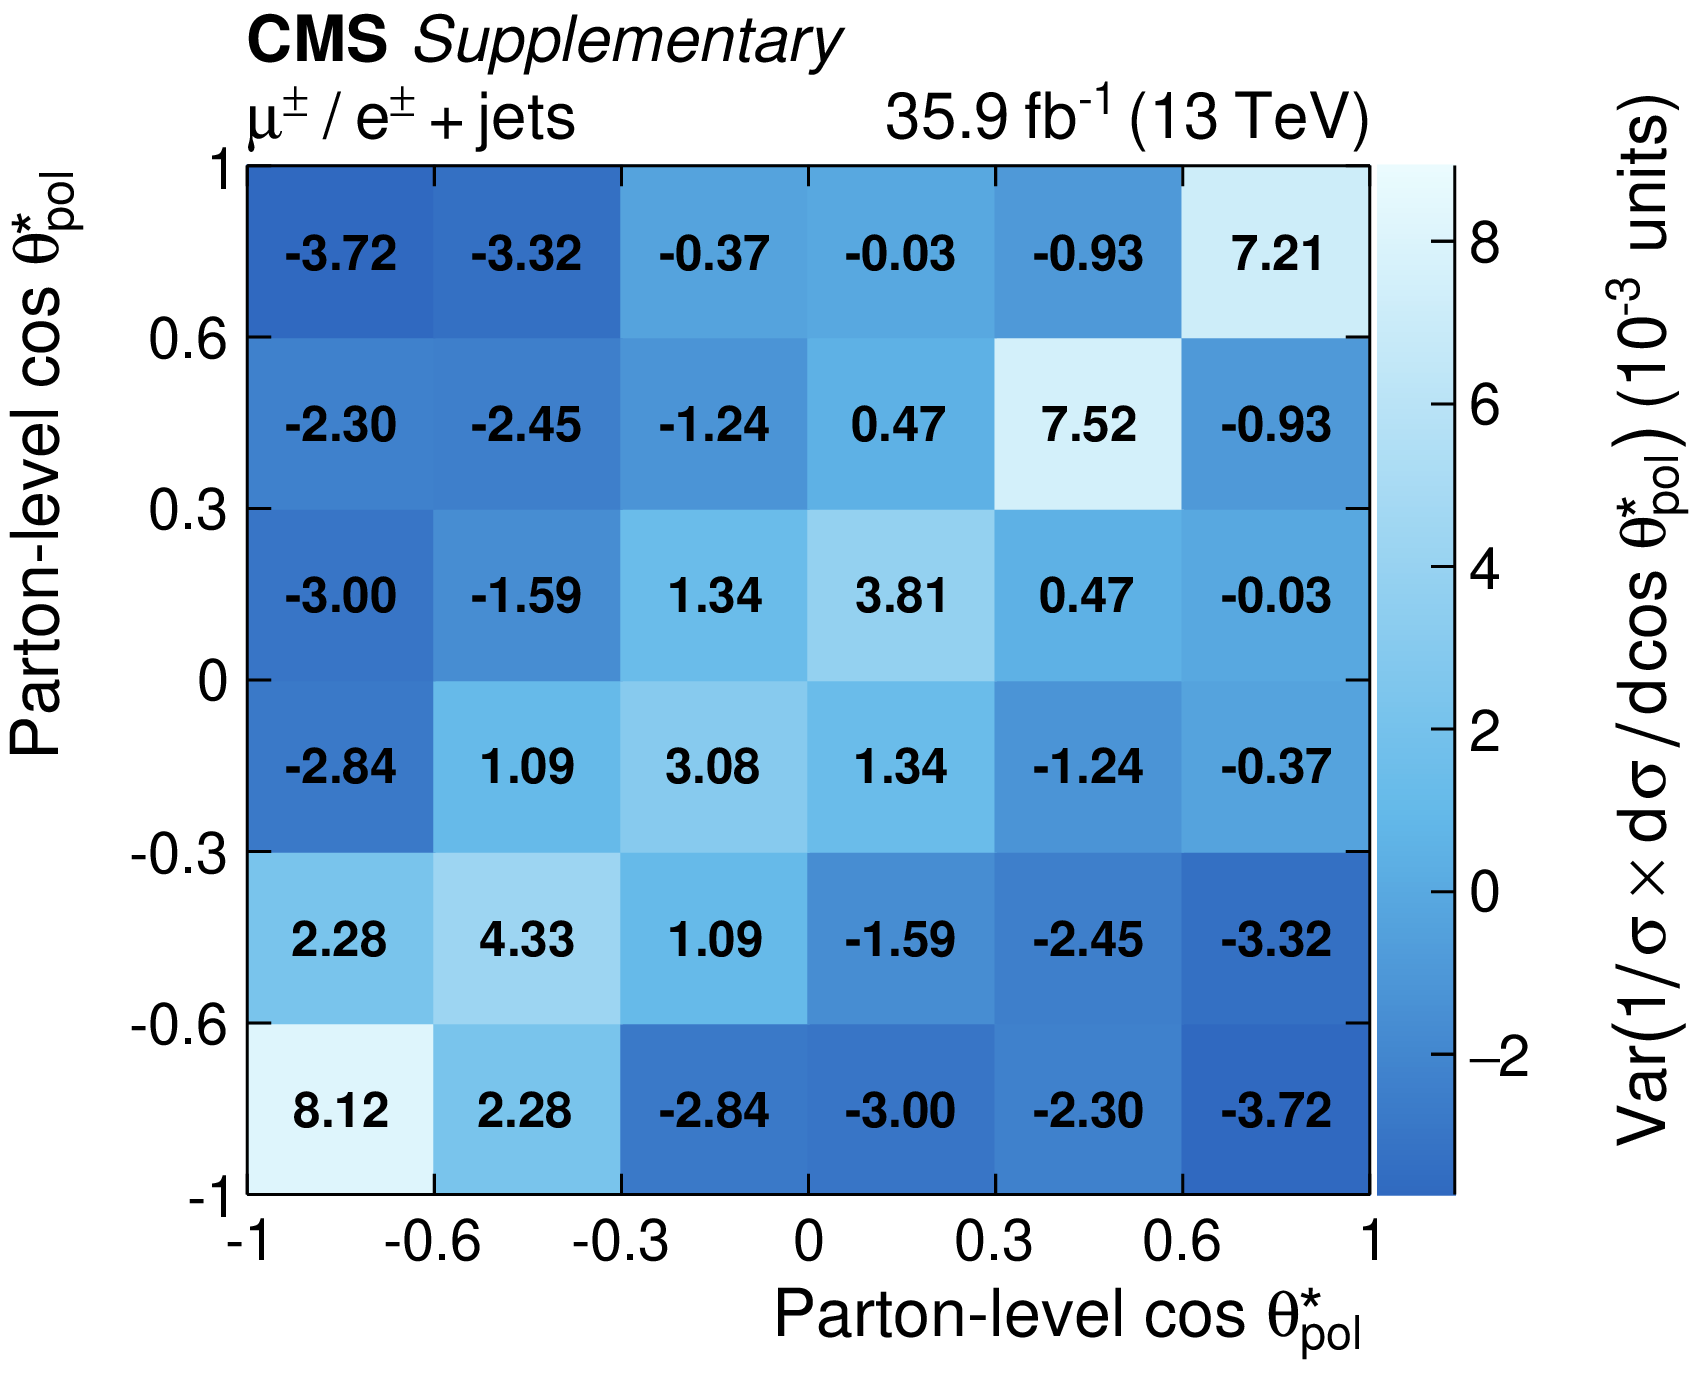
Additional Figure 3-f:
Covariance ("Var'') of the total uncertainty for the measured normalised differential $t$-channel single top quark cross sections at the parton level: cosine of the top quark polarisation angle. The labels on the $x$ and $y$ axes denote the bin edges. |

png pdf |
Additional Figure 4:
Covariance ("Var'') of the total uncertainty for the measured normalised differential $t$-channel single top quark cross sections at the particle level: top quark ${p_{\mathrm {T}}}$ (a) and rapidity (b); charged lepton ${p_{\mathrm {T}}}$ (c) and rapidity (d); W boson ${p_{\mathrm {T}}}$ (e); cosine of the top quark polarisation angle (f). The labels on the $x$ and $y$ axes denote the bin edges. |
png pdf |
Additional Figure 4-a:
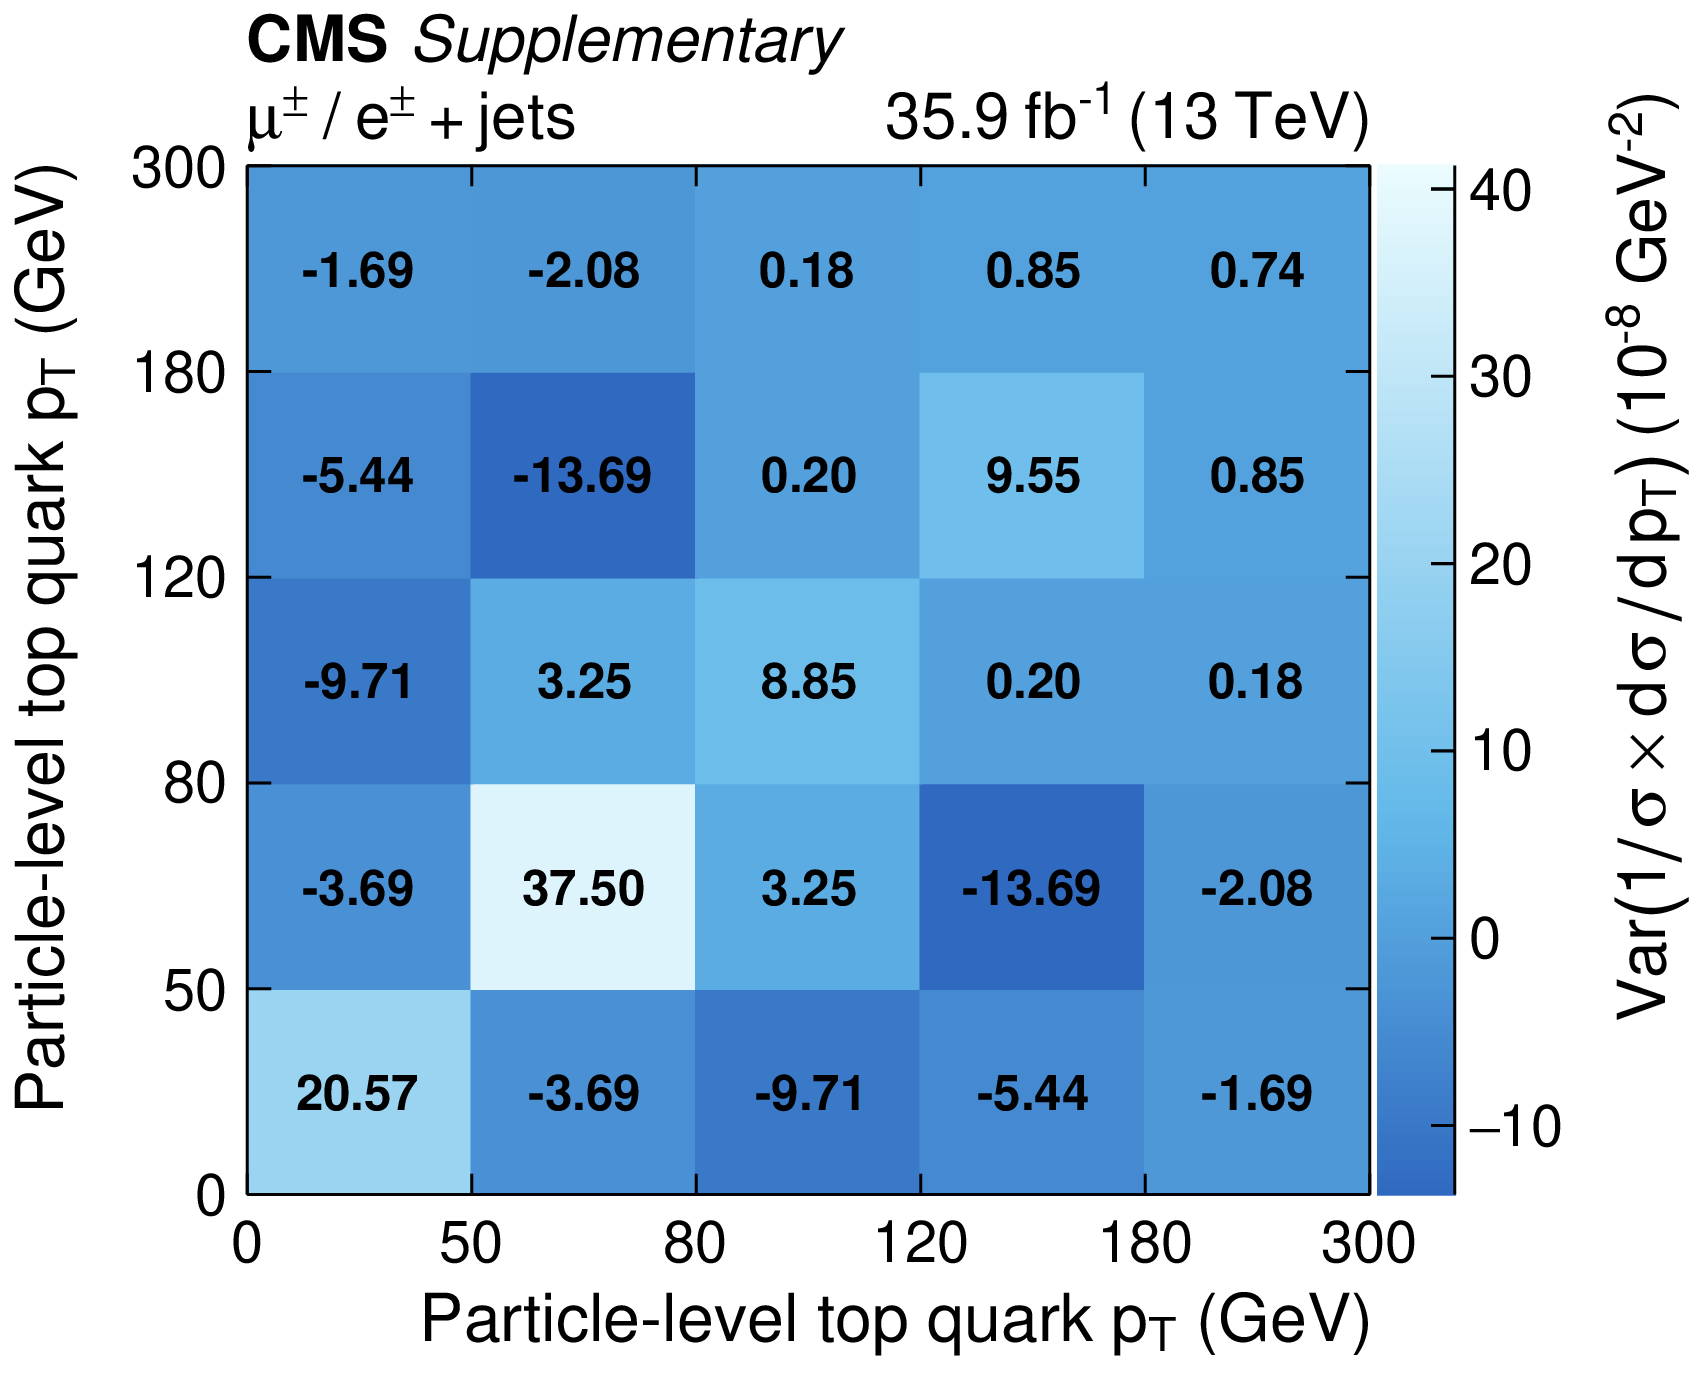
Covariance ("Var'') of the total uncertainty for the measured normalised differential $t$-channel single top quark cross sections at the particle level: top quark ${p_{\mathrm {T}}}$. The labels on the $x$ and $y$ axes denote the bin edges. |
png pdf |
Additional Figure 4-b:
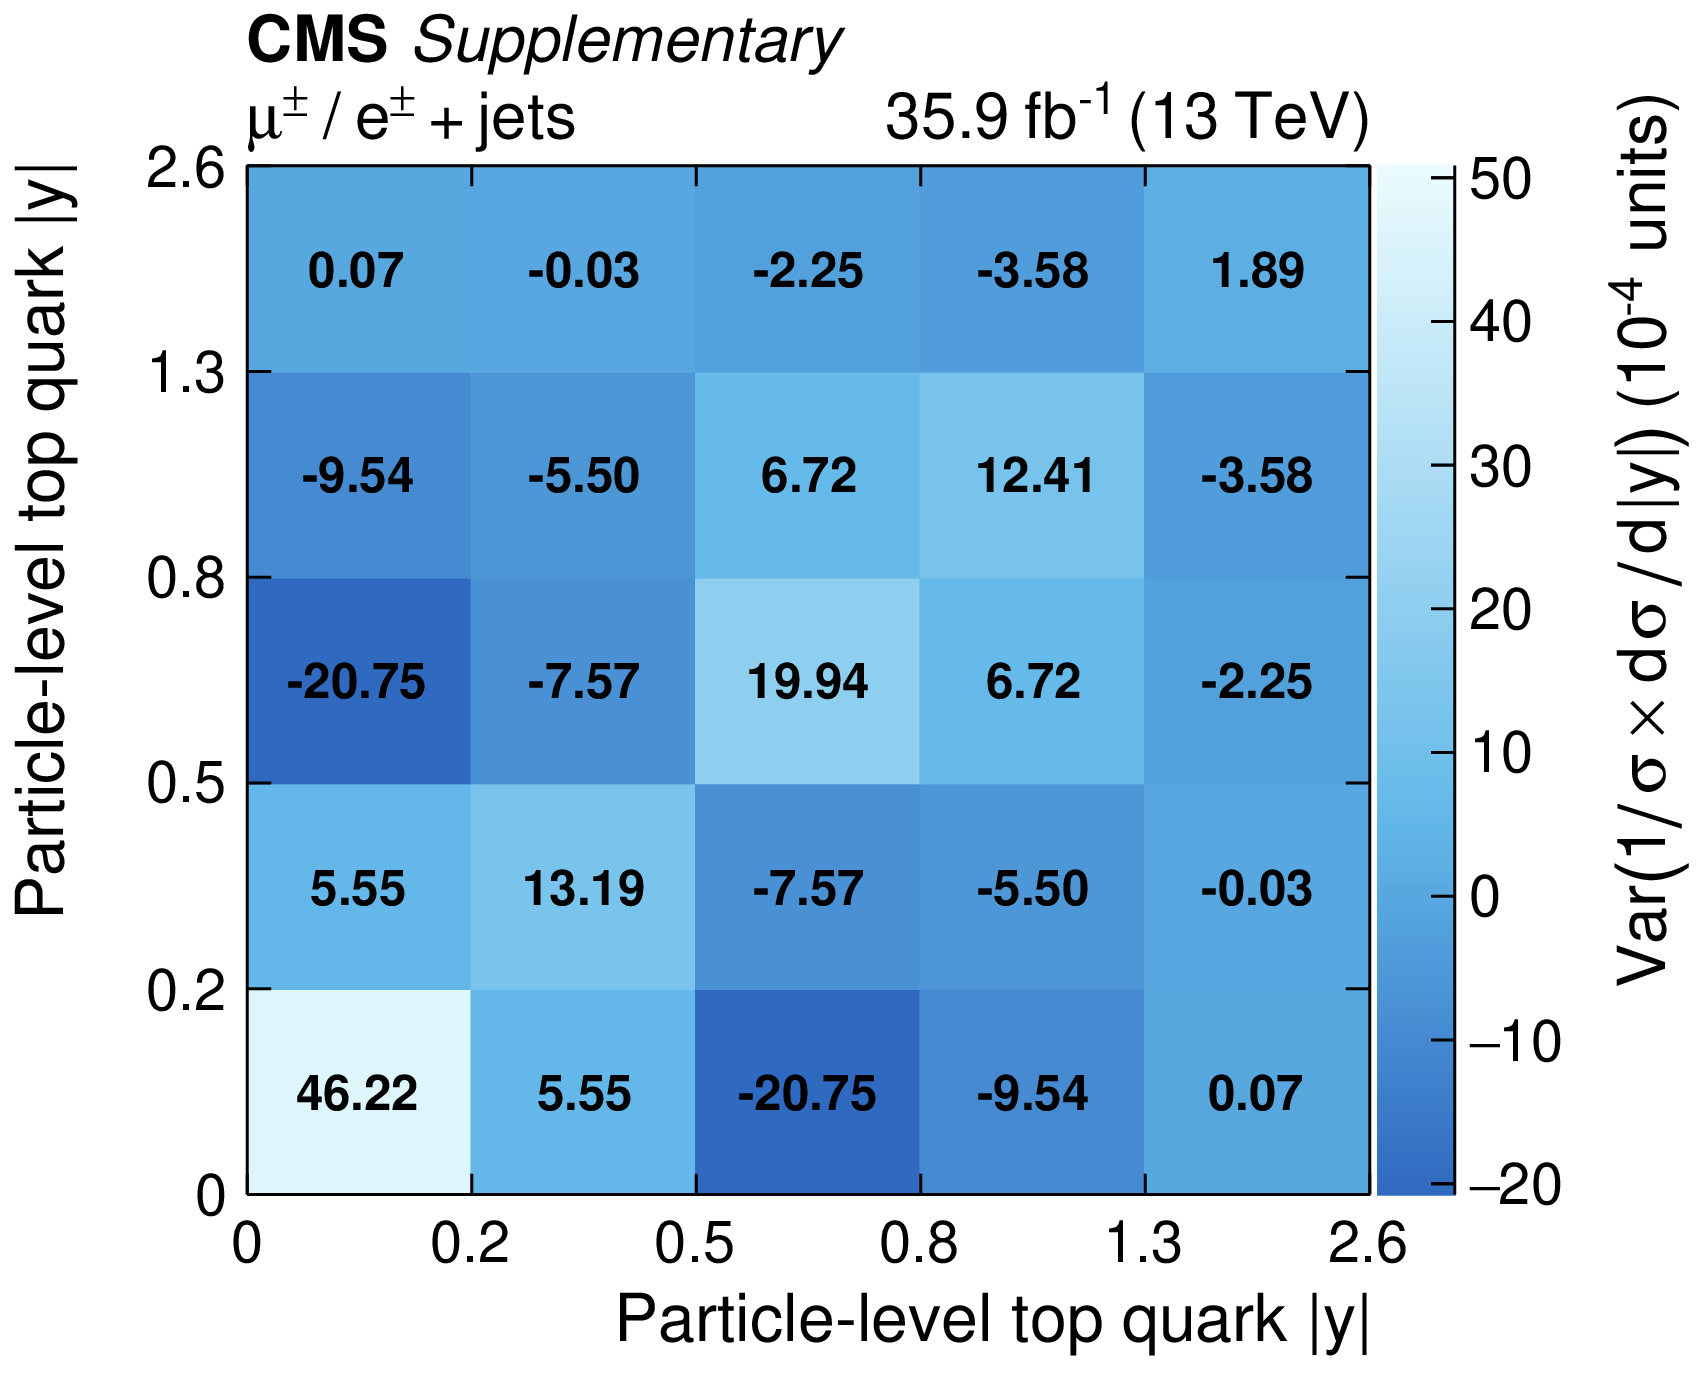
Covariance ("Var'') of the total uncertainty for the measured normalised differential $t$-channel single top quark cross sections at the particle level: top quark rapidity. The labels on the $x$ and $y$ axes denote the bin edges. |
png pdf |
Additional Figure 4-c:
Covariance ("Var'') of the total uncertainty for the measured normalised differential $t$-channel single top quark cross sections at the particle level: charged lepton ${p_{\mathrm {T}}}$. The labels on the $x$ and $y$ axes denote the bin edges. |
png pdf |
Additional Figure 4-d:
Covariance ("Var'') of the total uncertainty for the measured normalised differential $t$-channel single top quark cross sections at the particle level: charged lepton rapidity. The labels on the $x$ and $y$ axes denote the bin edges. |
png pdf |
Additional Figure 4-e:
Covariance ("Var'') of the total uncertainty for the measured normalised differential $t$-channel single top quark cross sections at the particle level: W boson ${p_{\mathrm {T}}}$. The labels on the $x$ and $y$ axes denote the bin edges. |
png pdf |
Additional Figure 4-f:
Covariance ("Var'') of the total uncertainty for the measured normalised differential $t$-channel single top quark cross sections at the particle level: cosine of the top quark polarisation angle. The labels on the $x$ and $y$ axes denote the bin edges. |
png pdf |
Additional Figure 5:
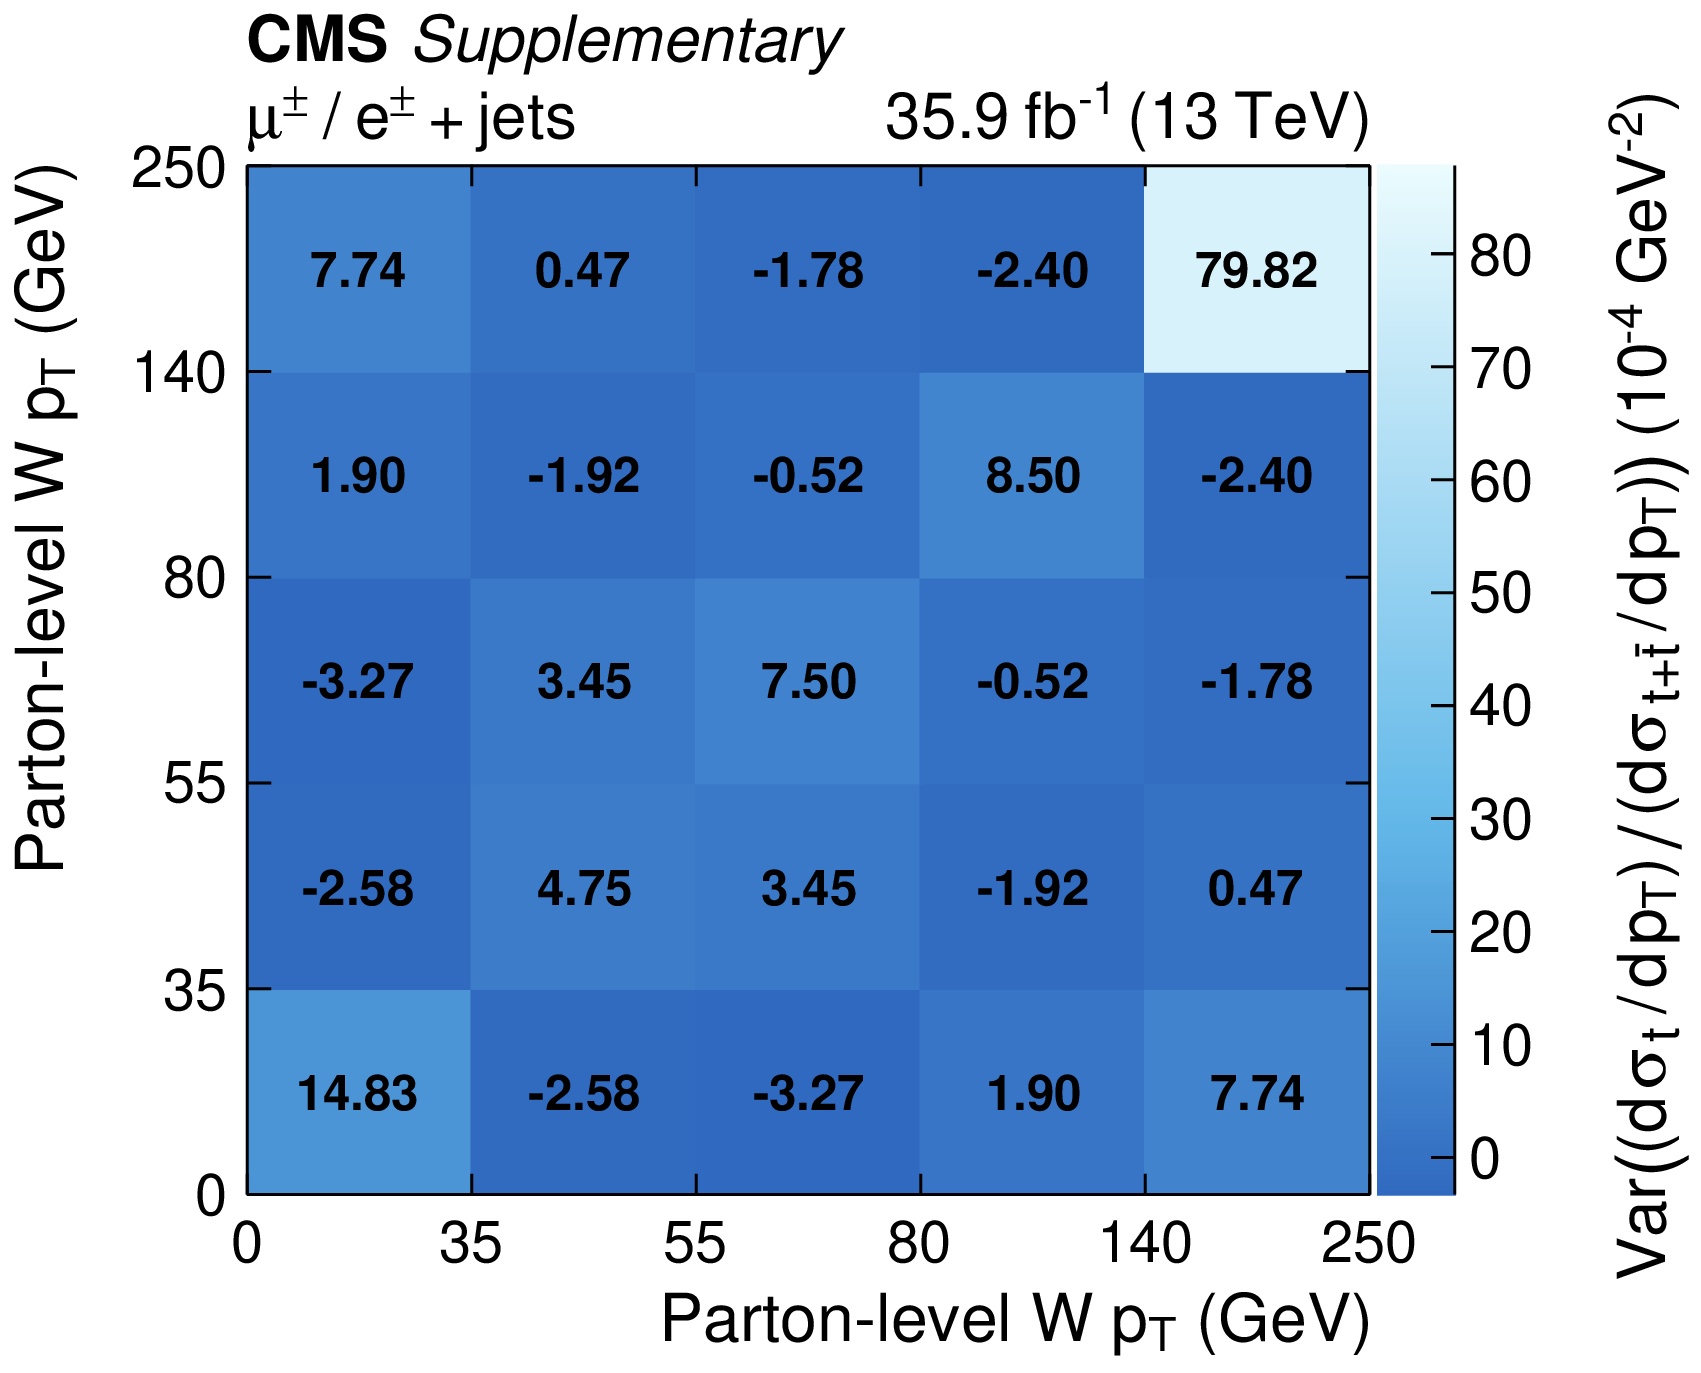
Covariance ("Var'') of the total uncertainty for the measured differential $t$-channel single top quark charge ratios at the parton level: top quark ${p_{\mathrm {T}}}$ (a) and rapidity (b); charged lepton ${p_{\mathrm {T}}}$ (c) and rapidity (d); W boson ${p_{\mathrm {T}}}$ (e). The labels on the $x$ and $y$ axes denote the bin edges. |
png pdf |
Additional Figure 5-a:
Covariance ("Var'') of the total uncertainty for the measured differential $t$-channel single top quark charge ratios at the parton level: top quark ${p_{\mathrm {T}}}$. The labels on the $x$ and $y$ axes denote the bin edges. |
png pdf |
Additional Figure 5-b:
Covariance ("Var'') of the total uncertainty for the measured differential $t$-channel single top quark charge ratios at the parton level: top quark rapidity. The labels on the $x$ and $y$ axes denote the bin edges. |

png pdf |
Additional Figure 5-c:
Covariance ("Var'') of the total uncertainty for the measured differential $t$-channel single top quark charge ratios at the parton level: charged lepton ${p_{\mathrm {T}}}$. The labels on the $x$ and $y$ axes denote the bin edges. |
png pdf |
Additional Figure 5-d:
Covariance ("Var'') of the total uncertainty for the measured differential $t$-channel single top quark charge ratios at the parton level: charged lepton rapidity. The labels on the $x$ and $y$ axes denote the bin edges. |
png pdf |
Additional Figure 5-e:
Covariance ("Var'') of the total uncertainty for the measured differential $t$-channel single top quark charge ratios at the parton level: W boson ${p_{\mathrm {T}}}$. The labels on the $x$ and $y$ axes denote the bin edges. |
png pdf |
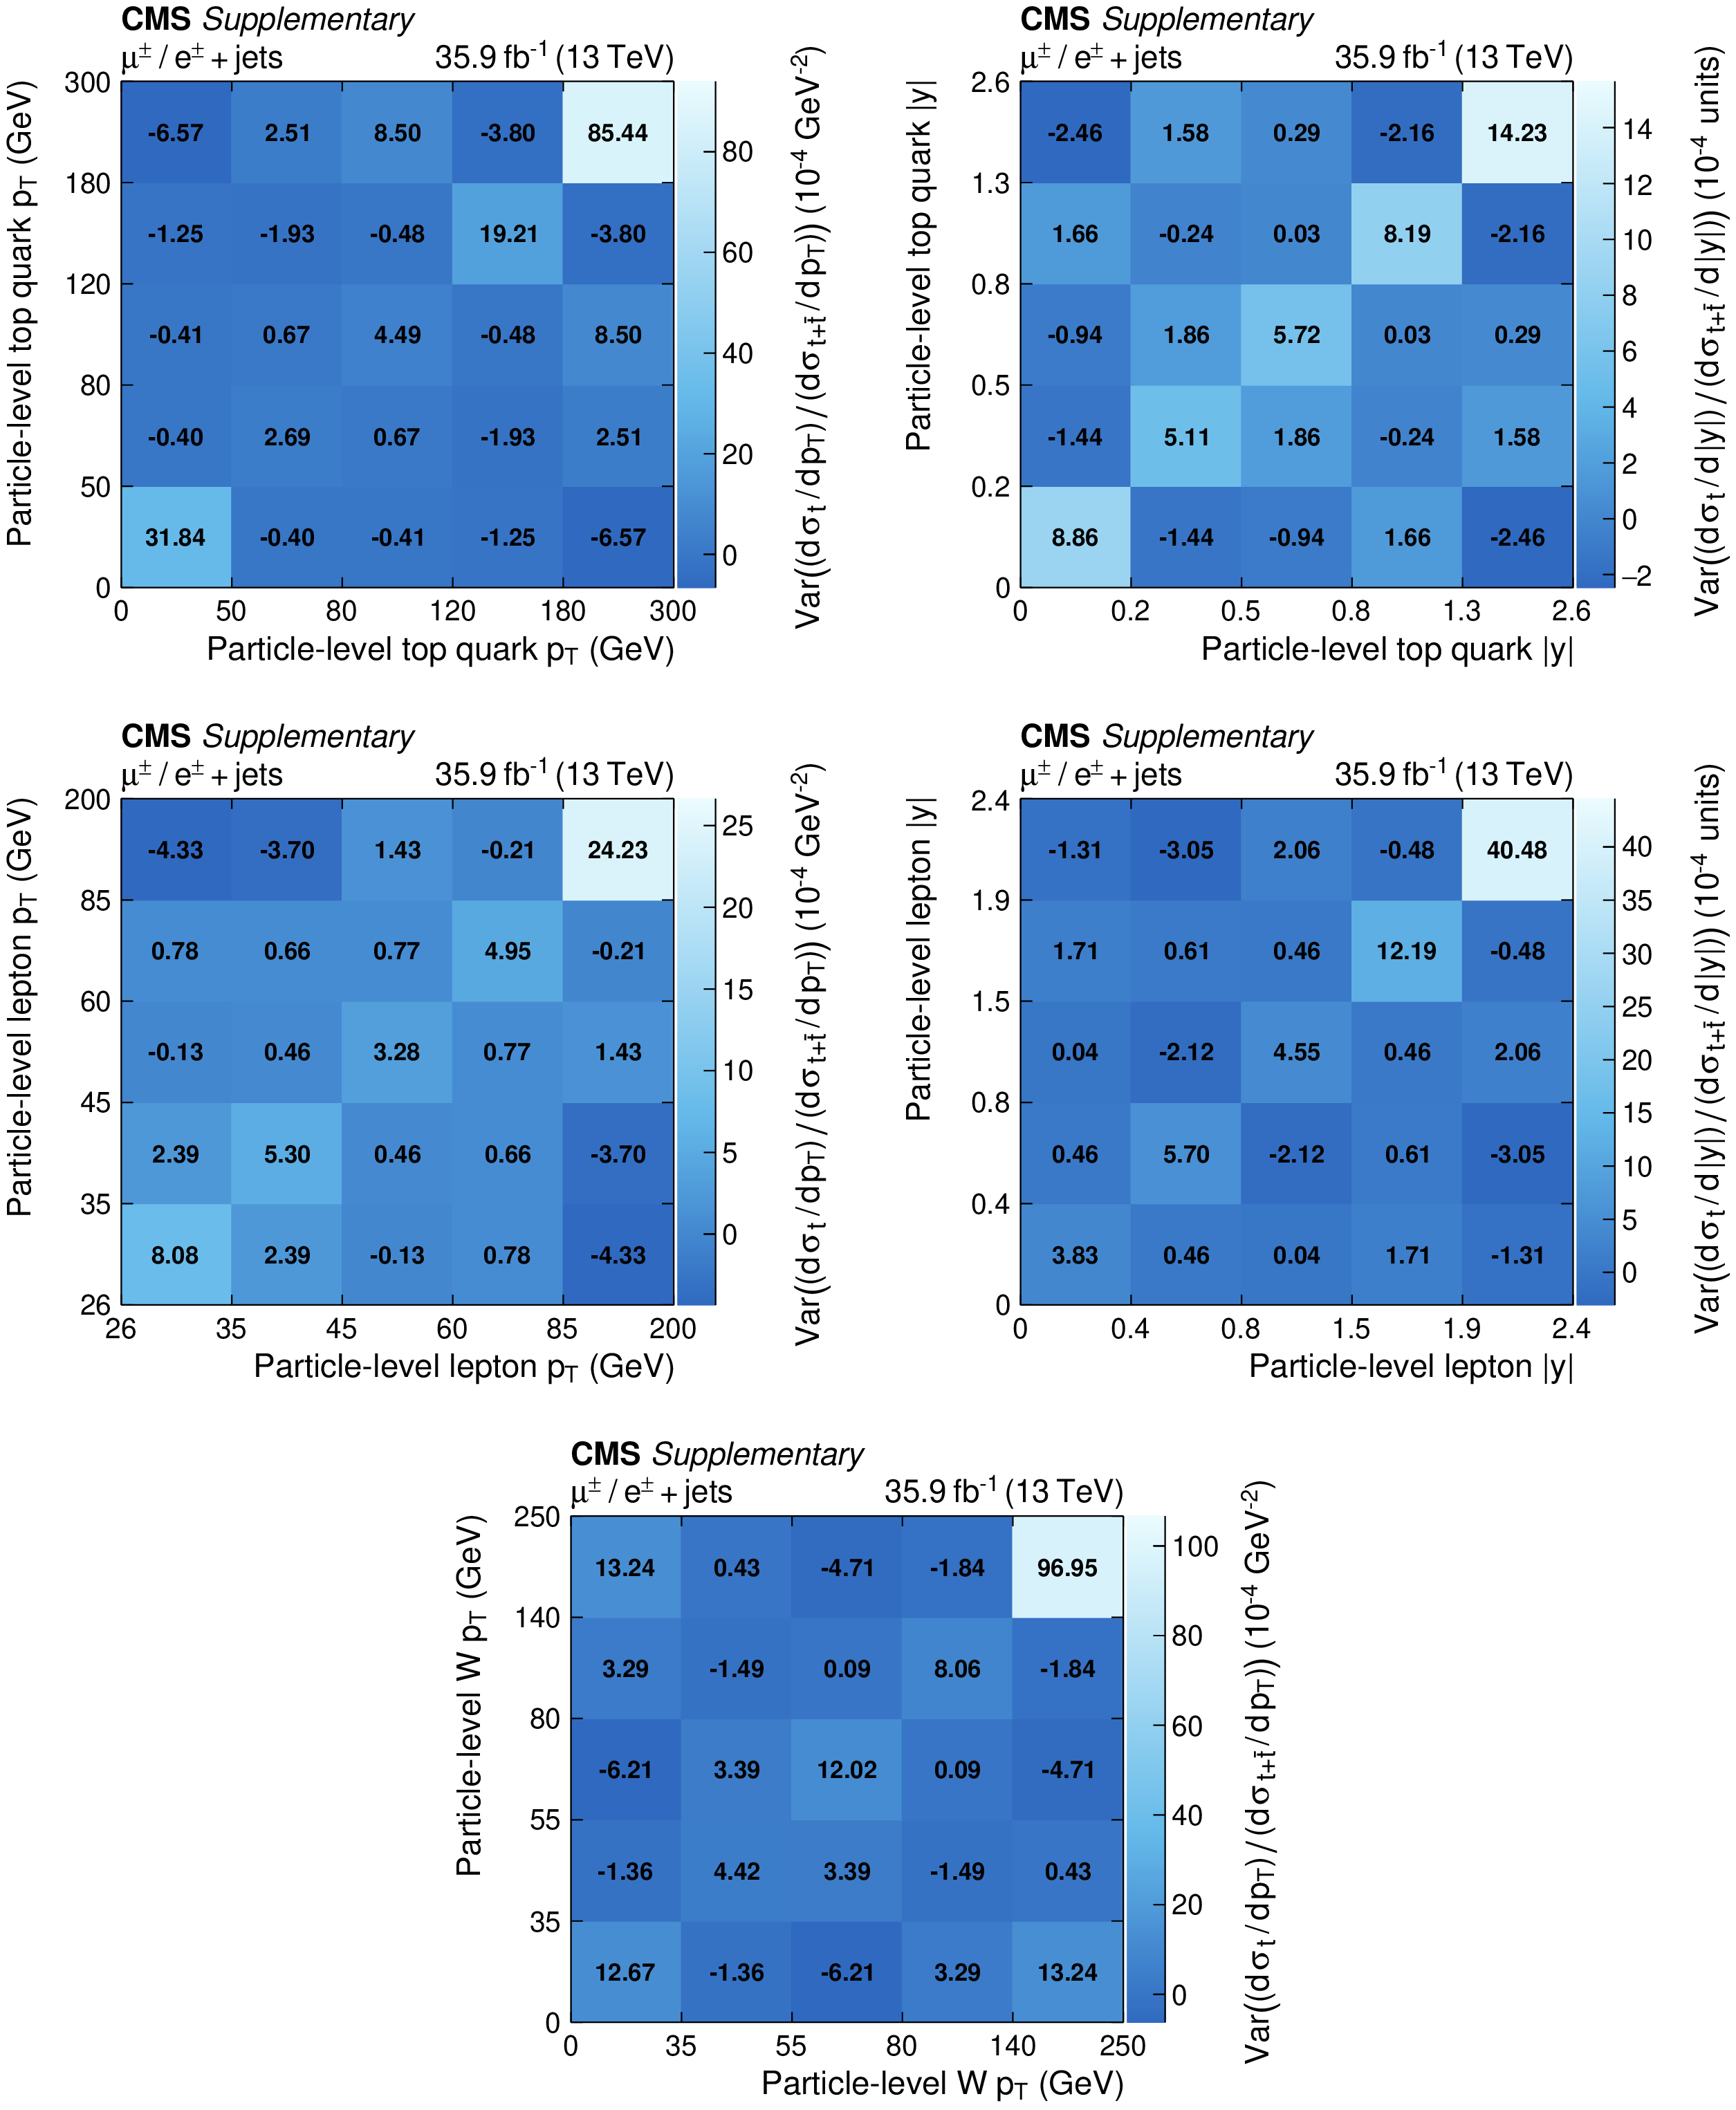
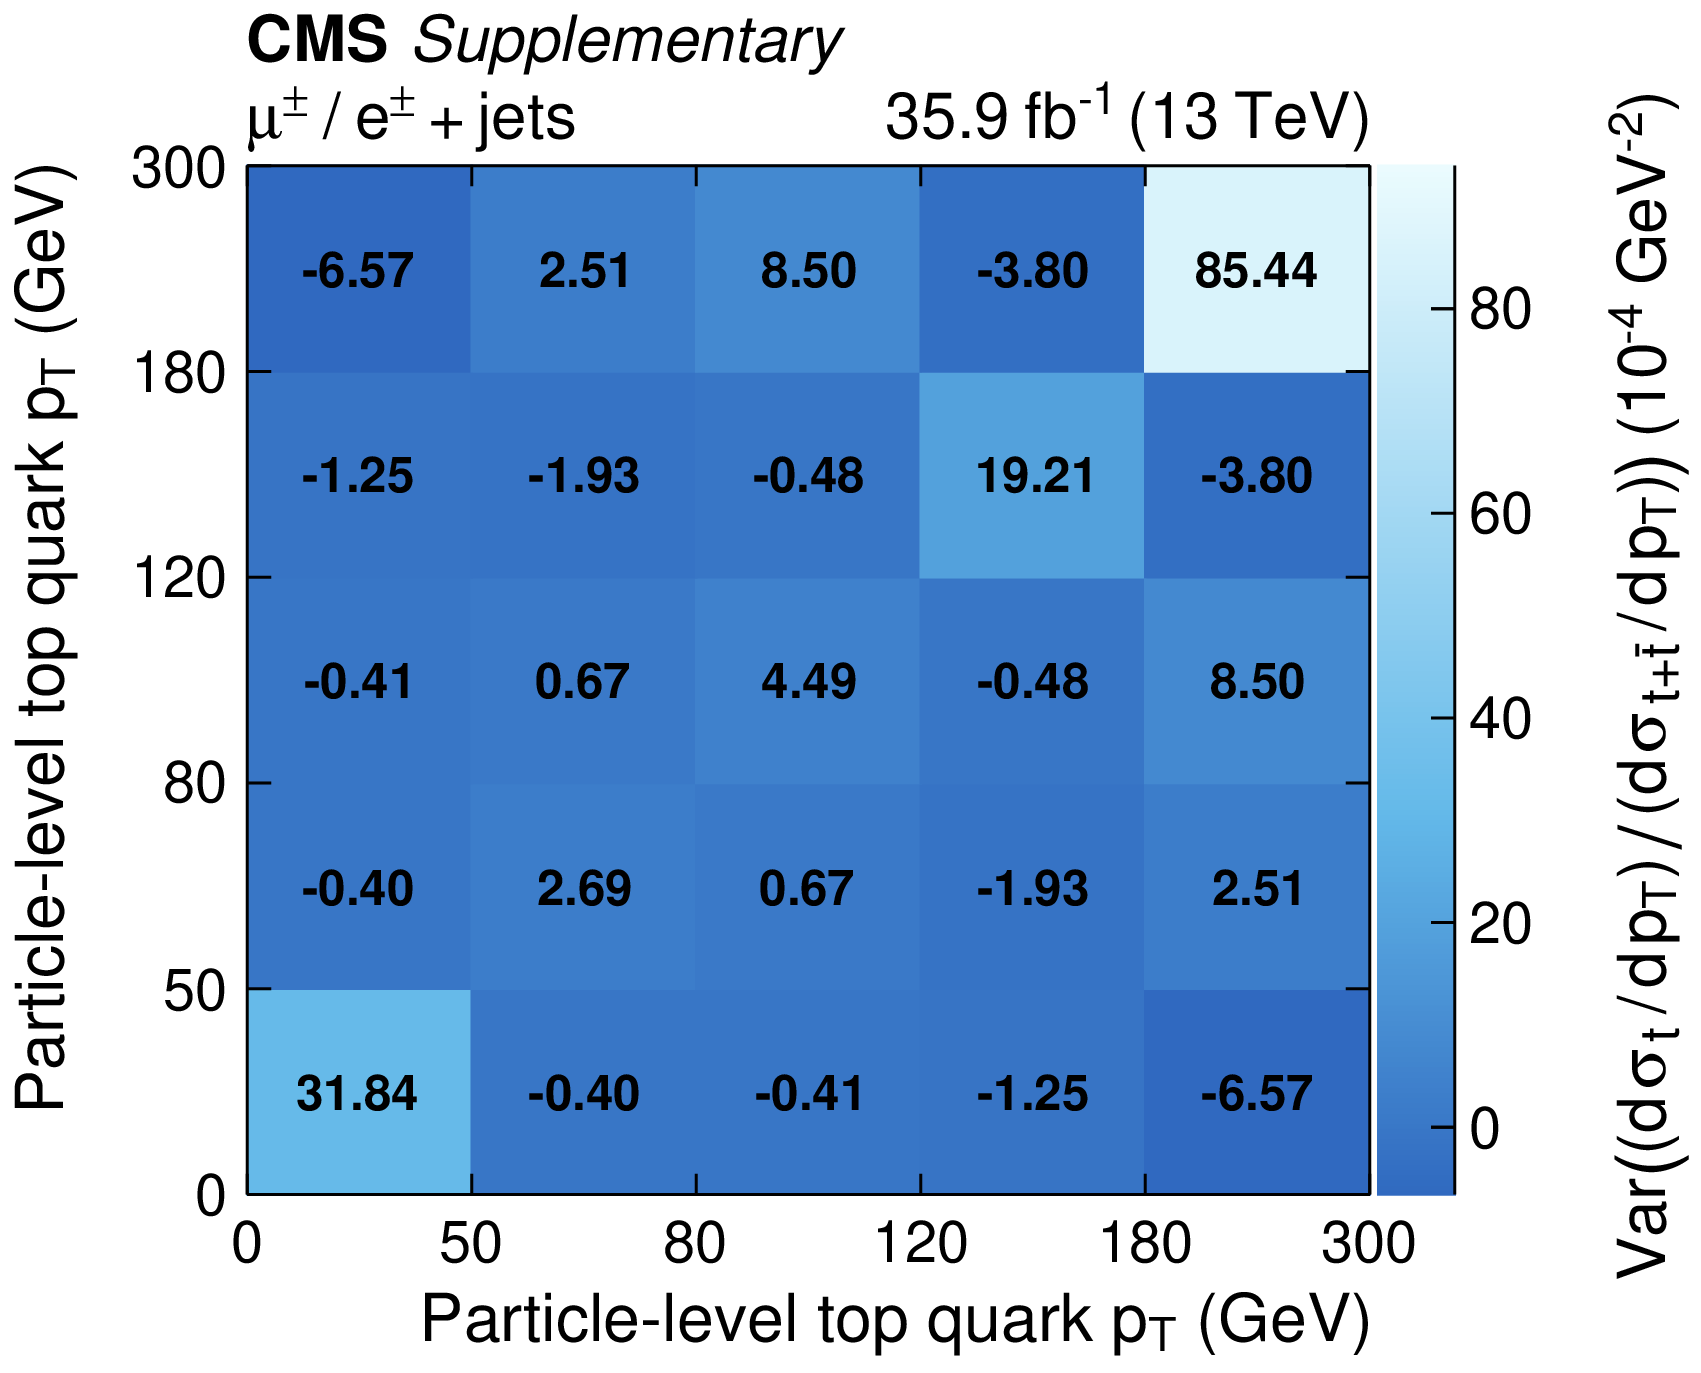
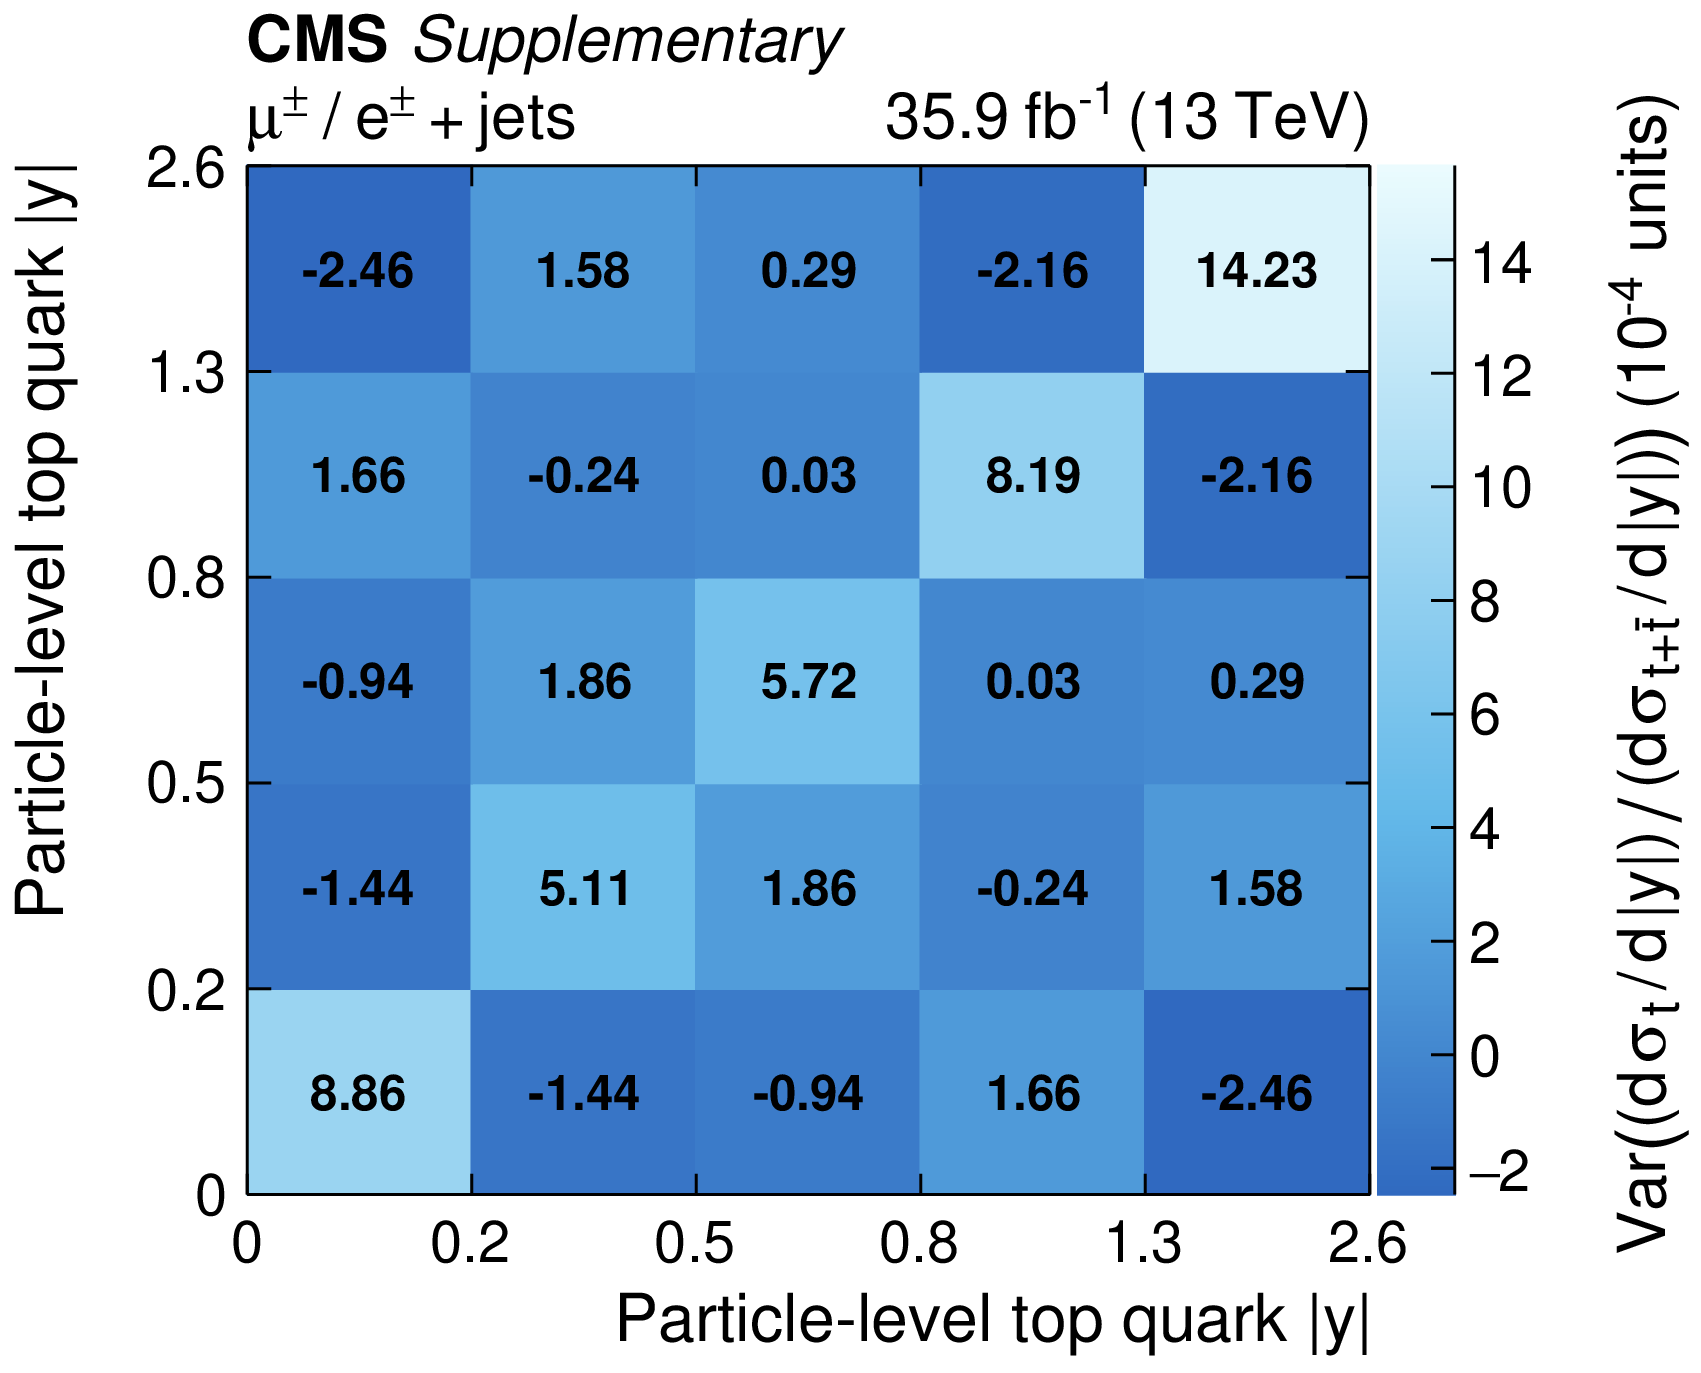
Additional Figure 6:
Covariance ("Var'') of the total uncertainty for the measured differential $t$-channel single top quark charge ratios at the particle level: top quark ${p_{\mathrm {T}}}$ (a) and rapidity (b); charged lepton ${p_{\mathrm {T}}}$ (c) and rapidity (d); W boson ${p_{\mathrm {T}}}$ (e). The labels on the $x$ and $y$ axes denote the bin edges. |
png pdf |
Additional Figure 6-a:
Covariance ("Var'') of the total uncertainty for the measured differential $t$-channel single top quark charge ratios at the particle level: top quark ${p_{\mathrm {T}}}$. The labels on the $x$ and $y$ axes denote the bin edges. |
png pdf |
Additional Figure 6-b:
Covariance ("Var'') of the total uncertainty for the measured differential $t$-channel single top quark charge ratios at the particle level: top quark rapidity. The labels on the $x$ and $y$ axes denote the bin edges. |

png pdf |
Additional Figure 6-c:
Covariance ("Var'') of the total uncertainty for the measured differential $t$-channel single top quark charge ratios at the particle level: charged lepton ${p_{\mathrm {T}}}$. The labels on the $x$ and $y$ axes denote the bin edges. |

png pdf |
Additional Figure 6-d:
Covariance ("Var'') of the total uncertainty for the measured differential $t$-channel single top quark charge ratios at the particle level: charged lepton rapidity. The labels on the $x$ and $y$ axes denote the bin edges. |
png pdf |
Additional Figure 6-e:
Covariance ("Var'') of the total uncertainty for the measured differential $t$-channel single top quark charge ratios at the particle level: W boson ${p_{\mathrm {T}}}$. The labels on the $x$ and $y$ axes denote the bin edges. |
| Additional Tables | |

png pdf |
Additional Table 1:
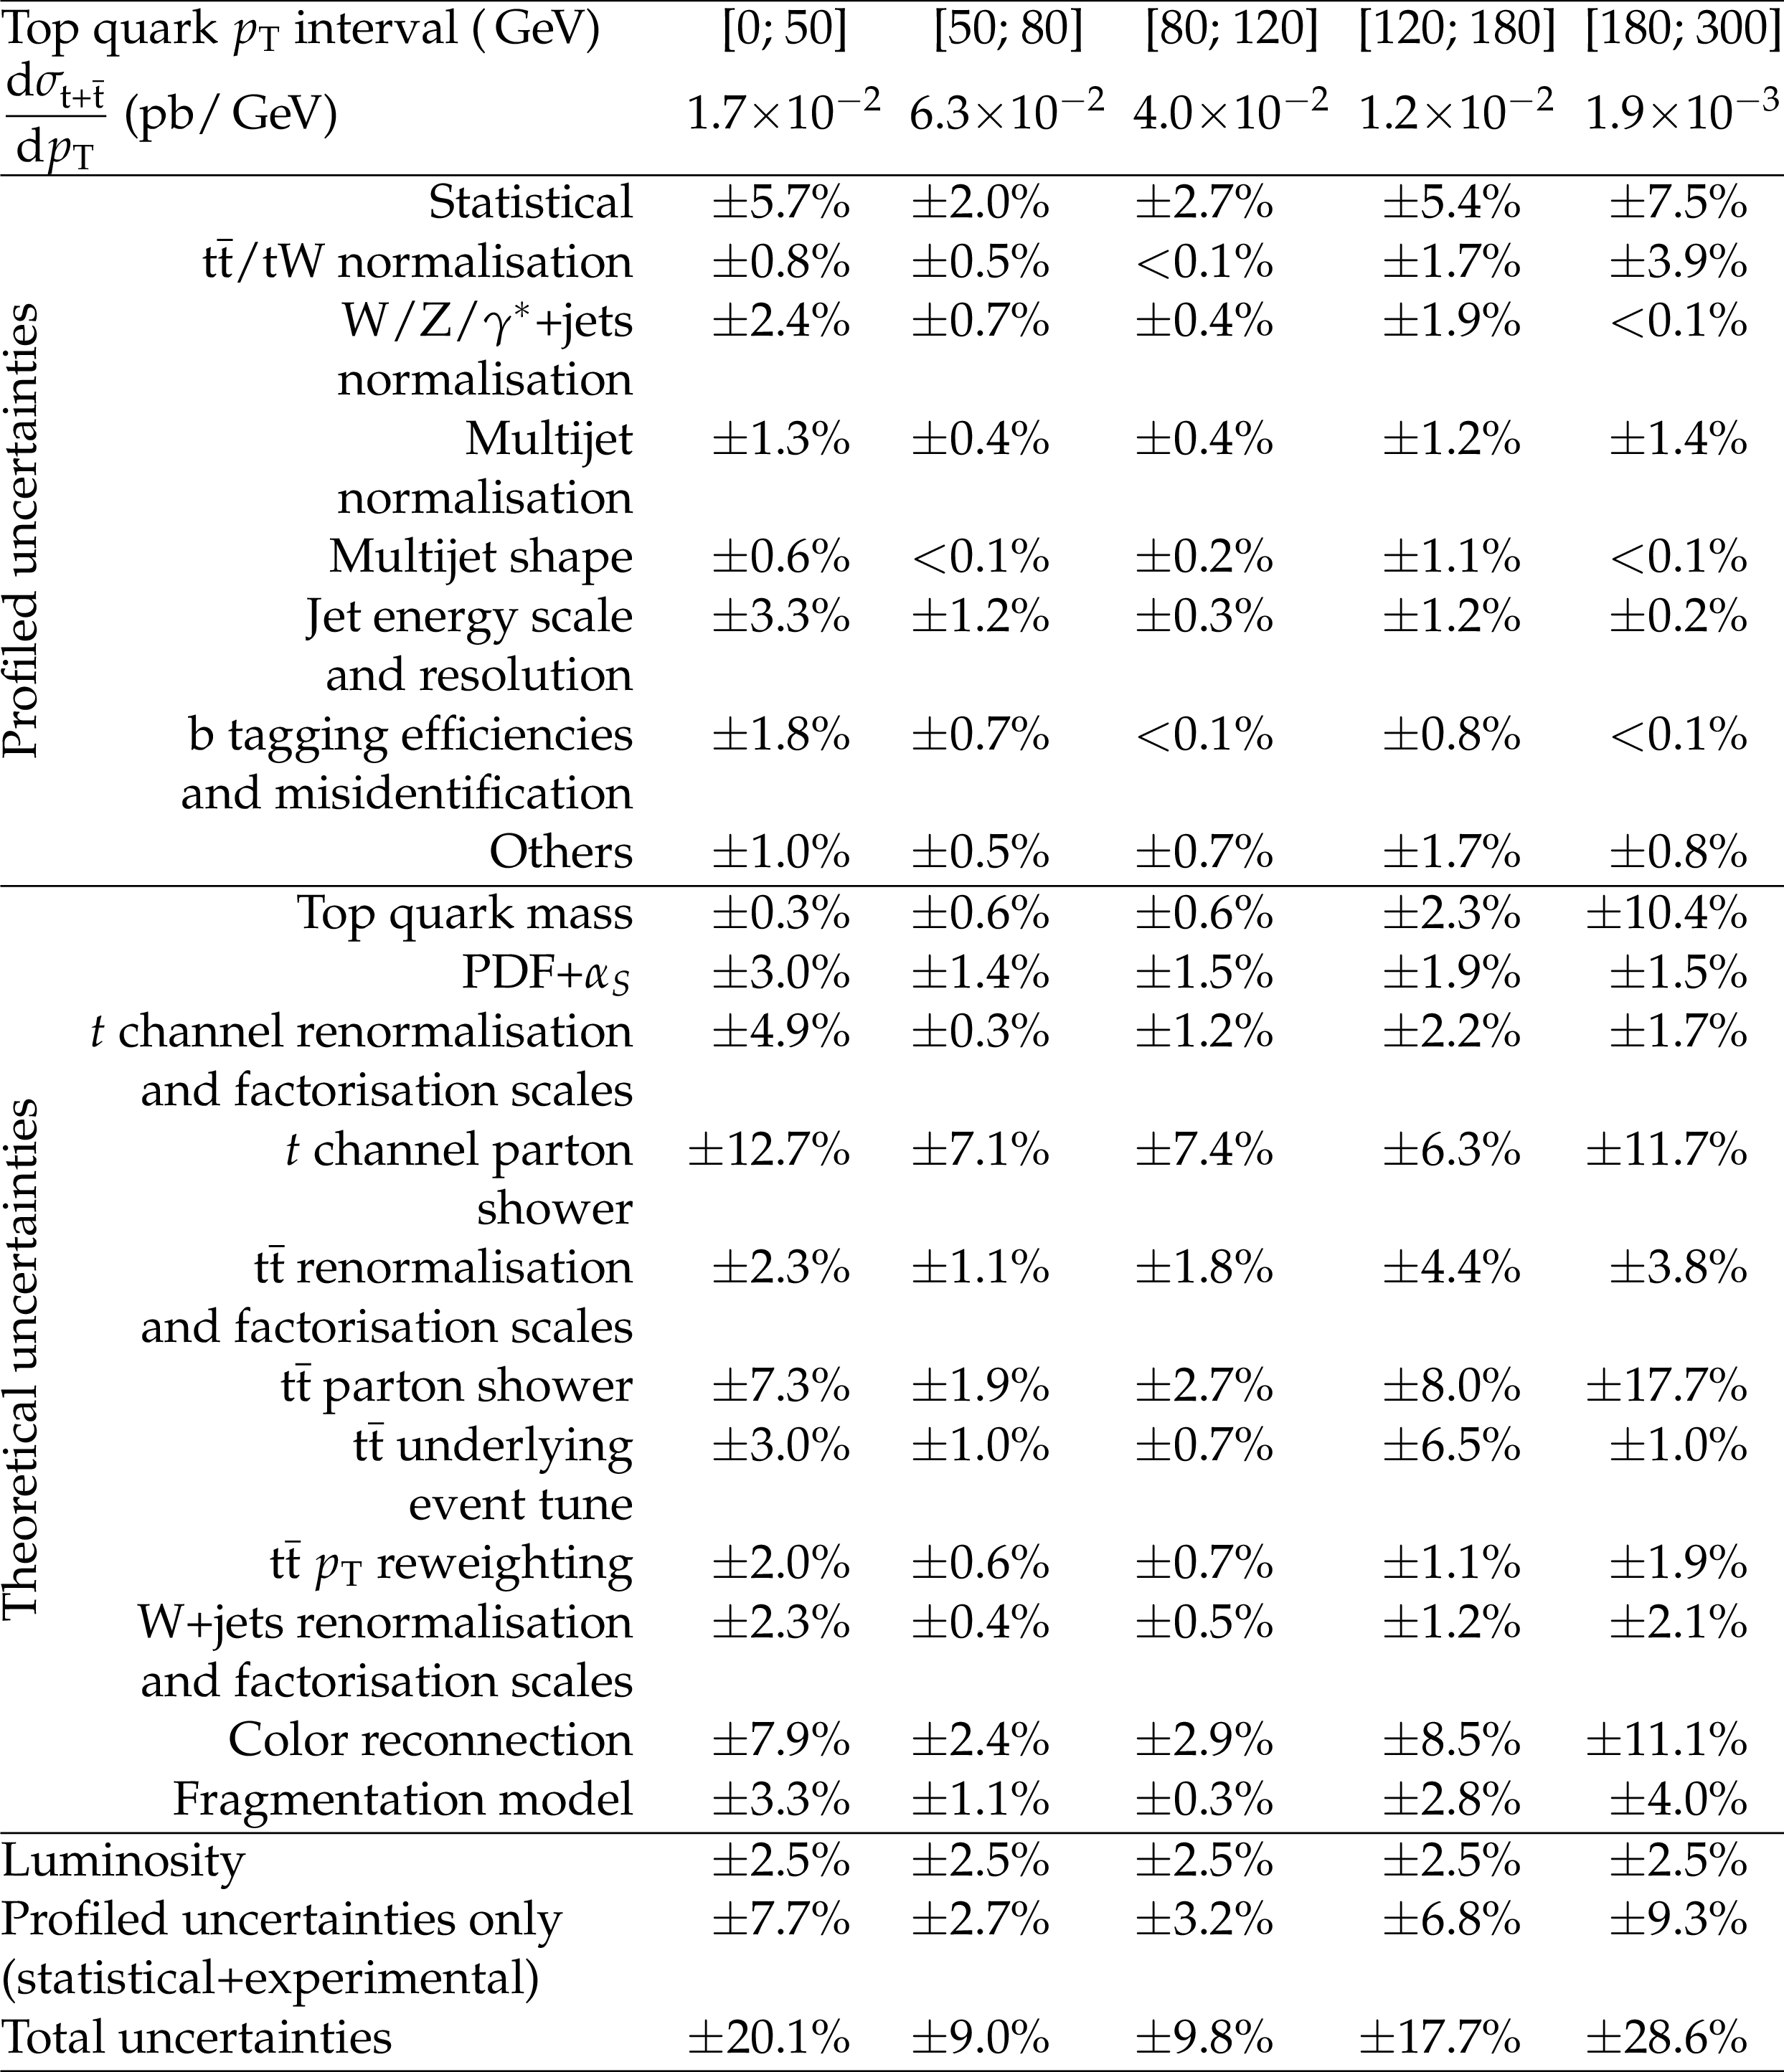
The measured differential absolute cross section in intervals of the top quark ${p_{\mathrm {T}}}$ at the parton level. A breakdown of the systematic uncertainties is given as well. Minor uncertainties (lepton efficiencies, pileup, and unclustered energy) have been grouped into the "Others'' category. |
png pdf |
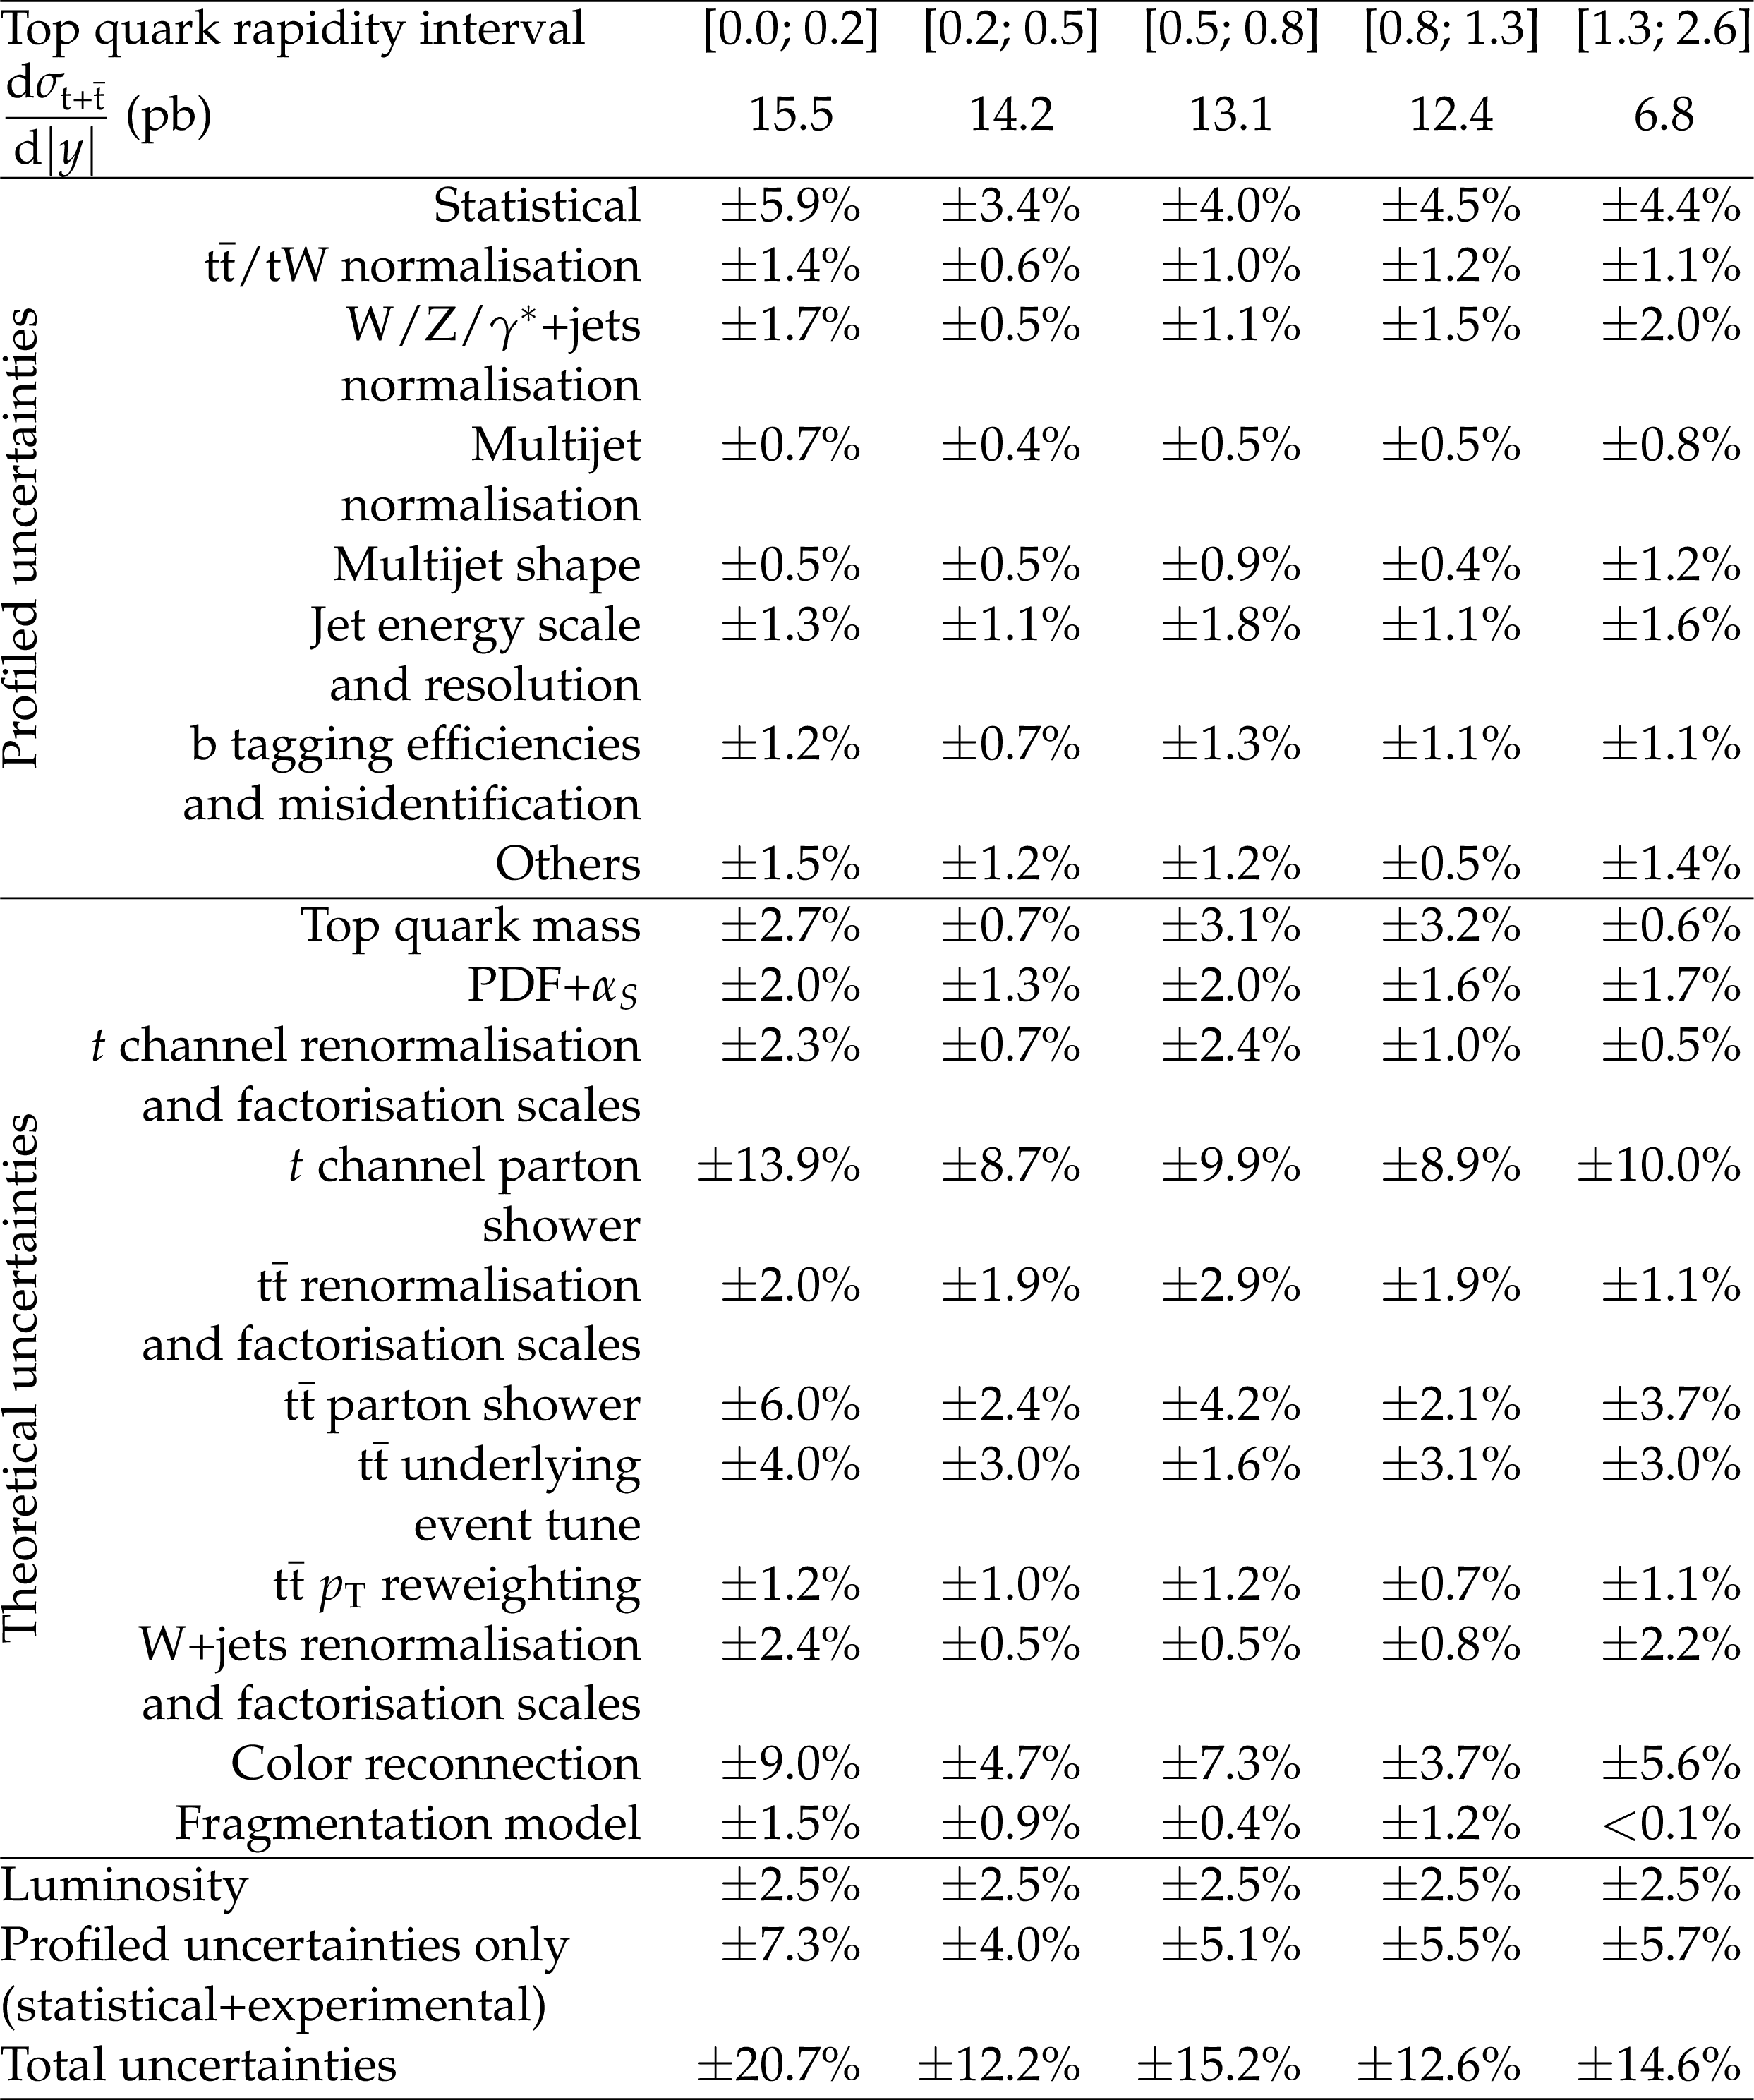
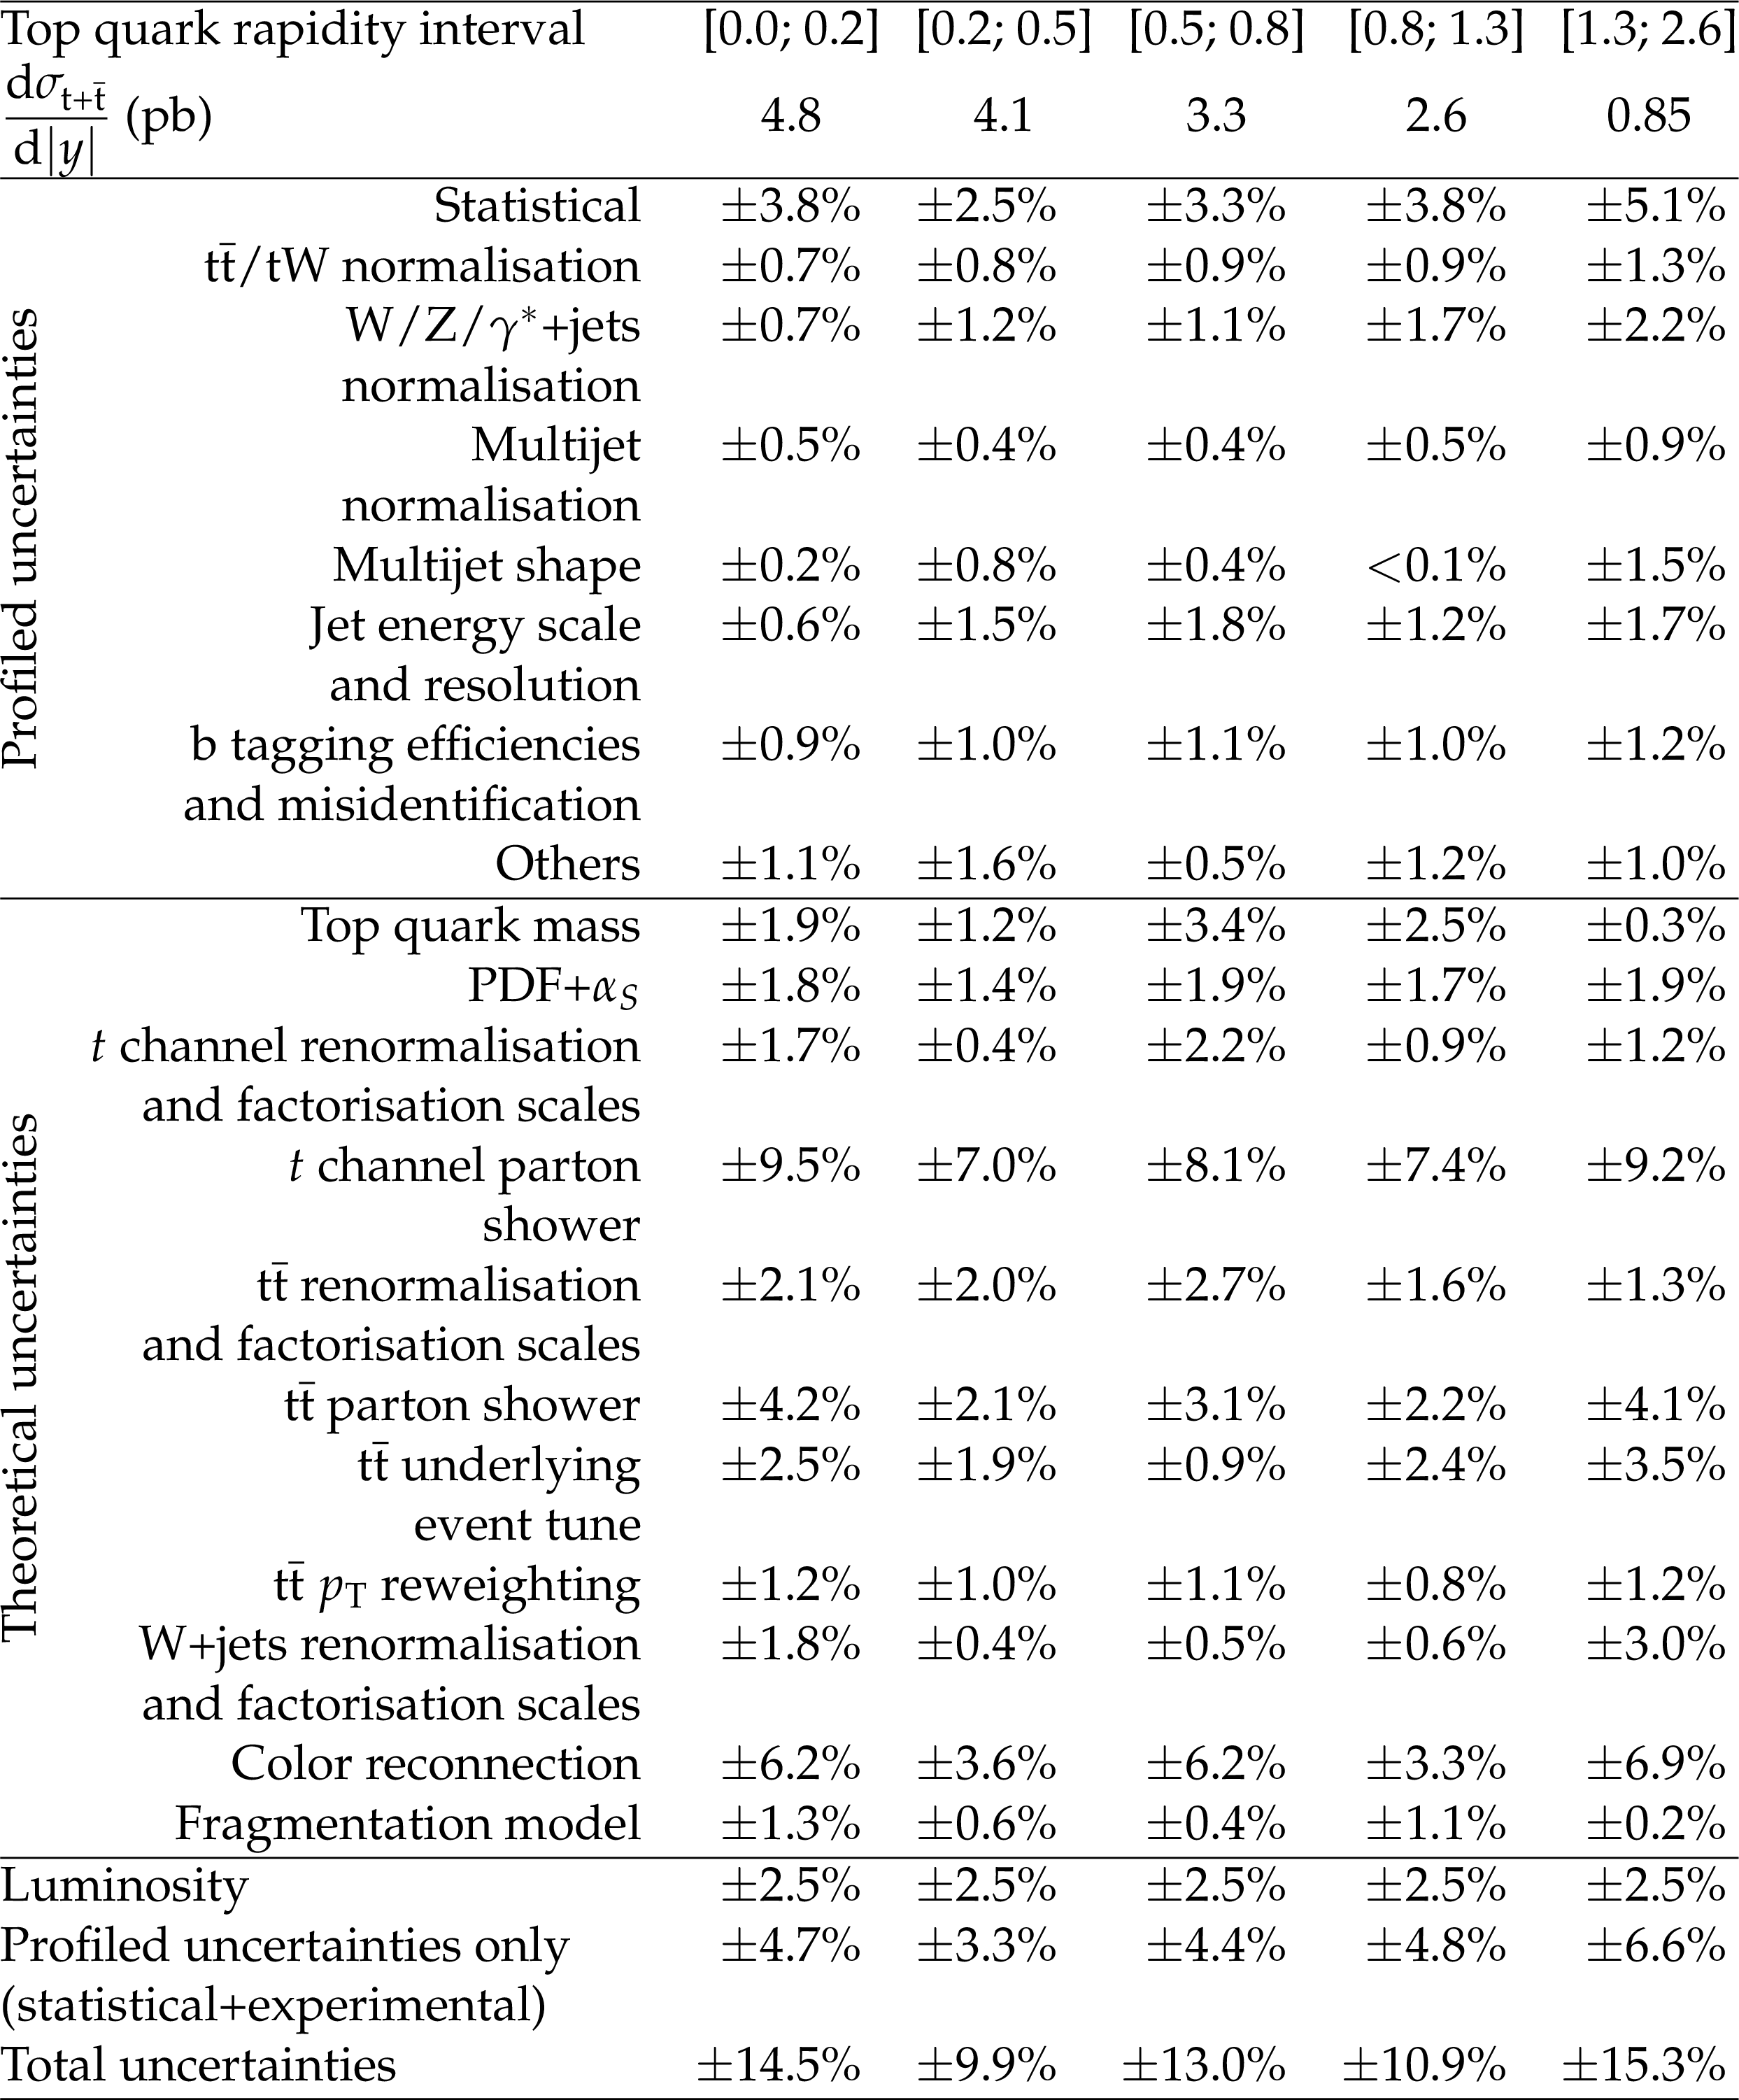
Additional Table 2:
The measured differential absolute cross section in intervals of the top quark rapidity at the parton level. A breakdown of the systematic uncertainties is given as well. Minor uncertainties (lepton efficiencies, pileup, and unclustered energy) have been grouped into the "Others'' category. |
png pdf |
Additional Table 3:
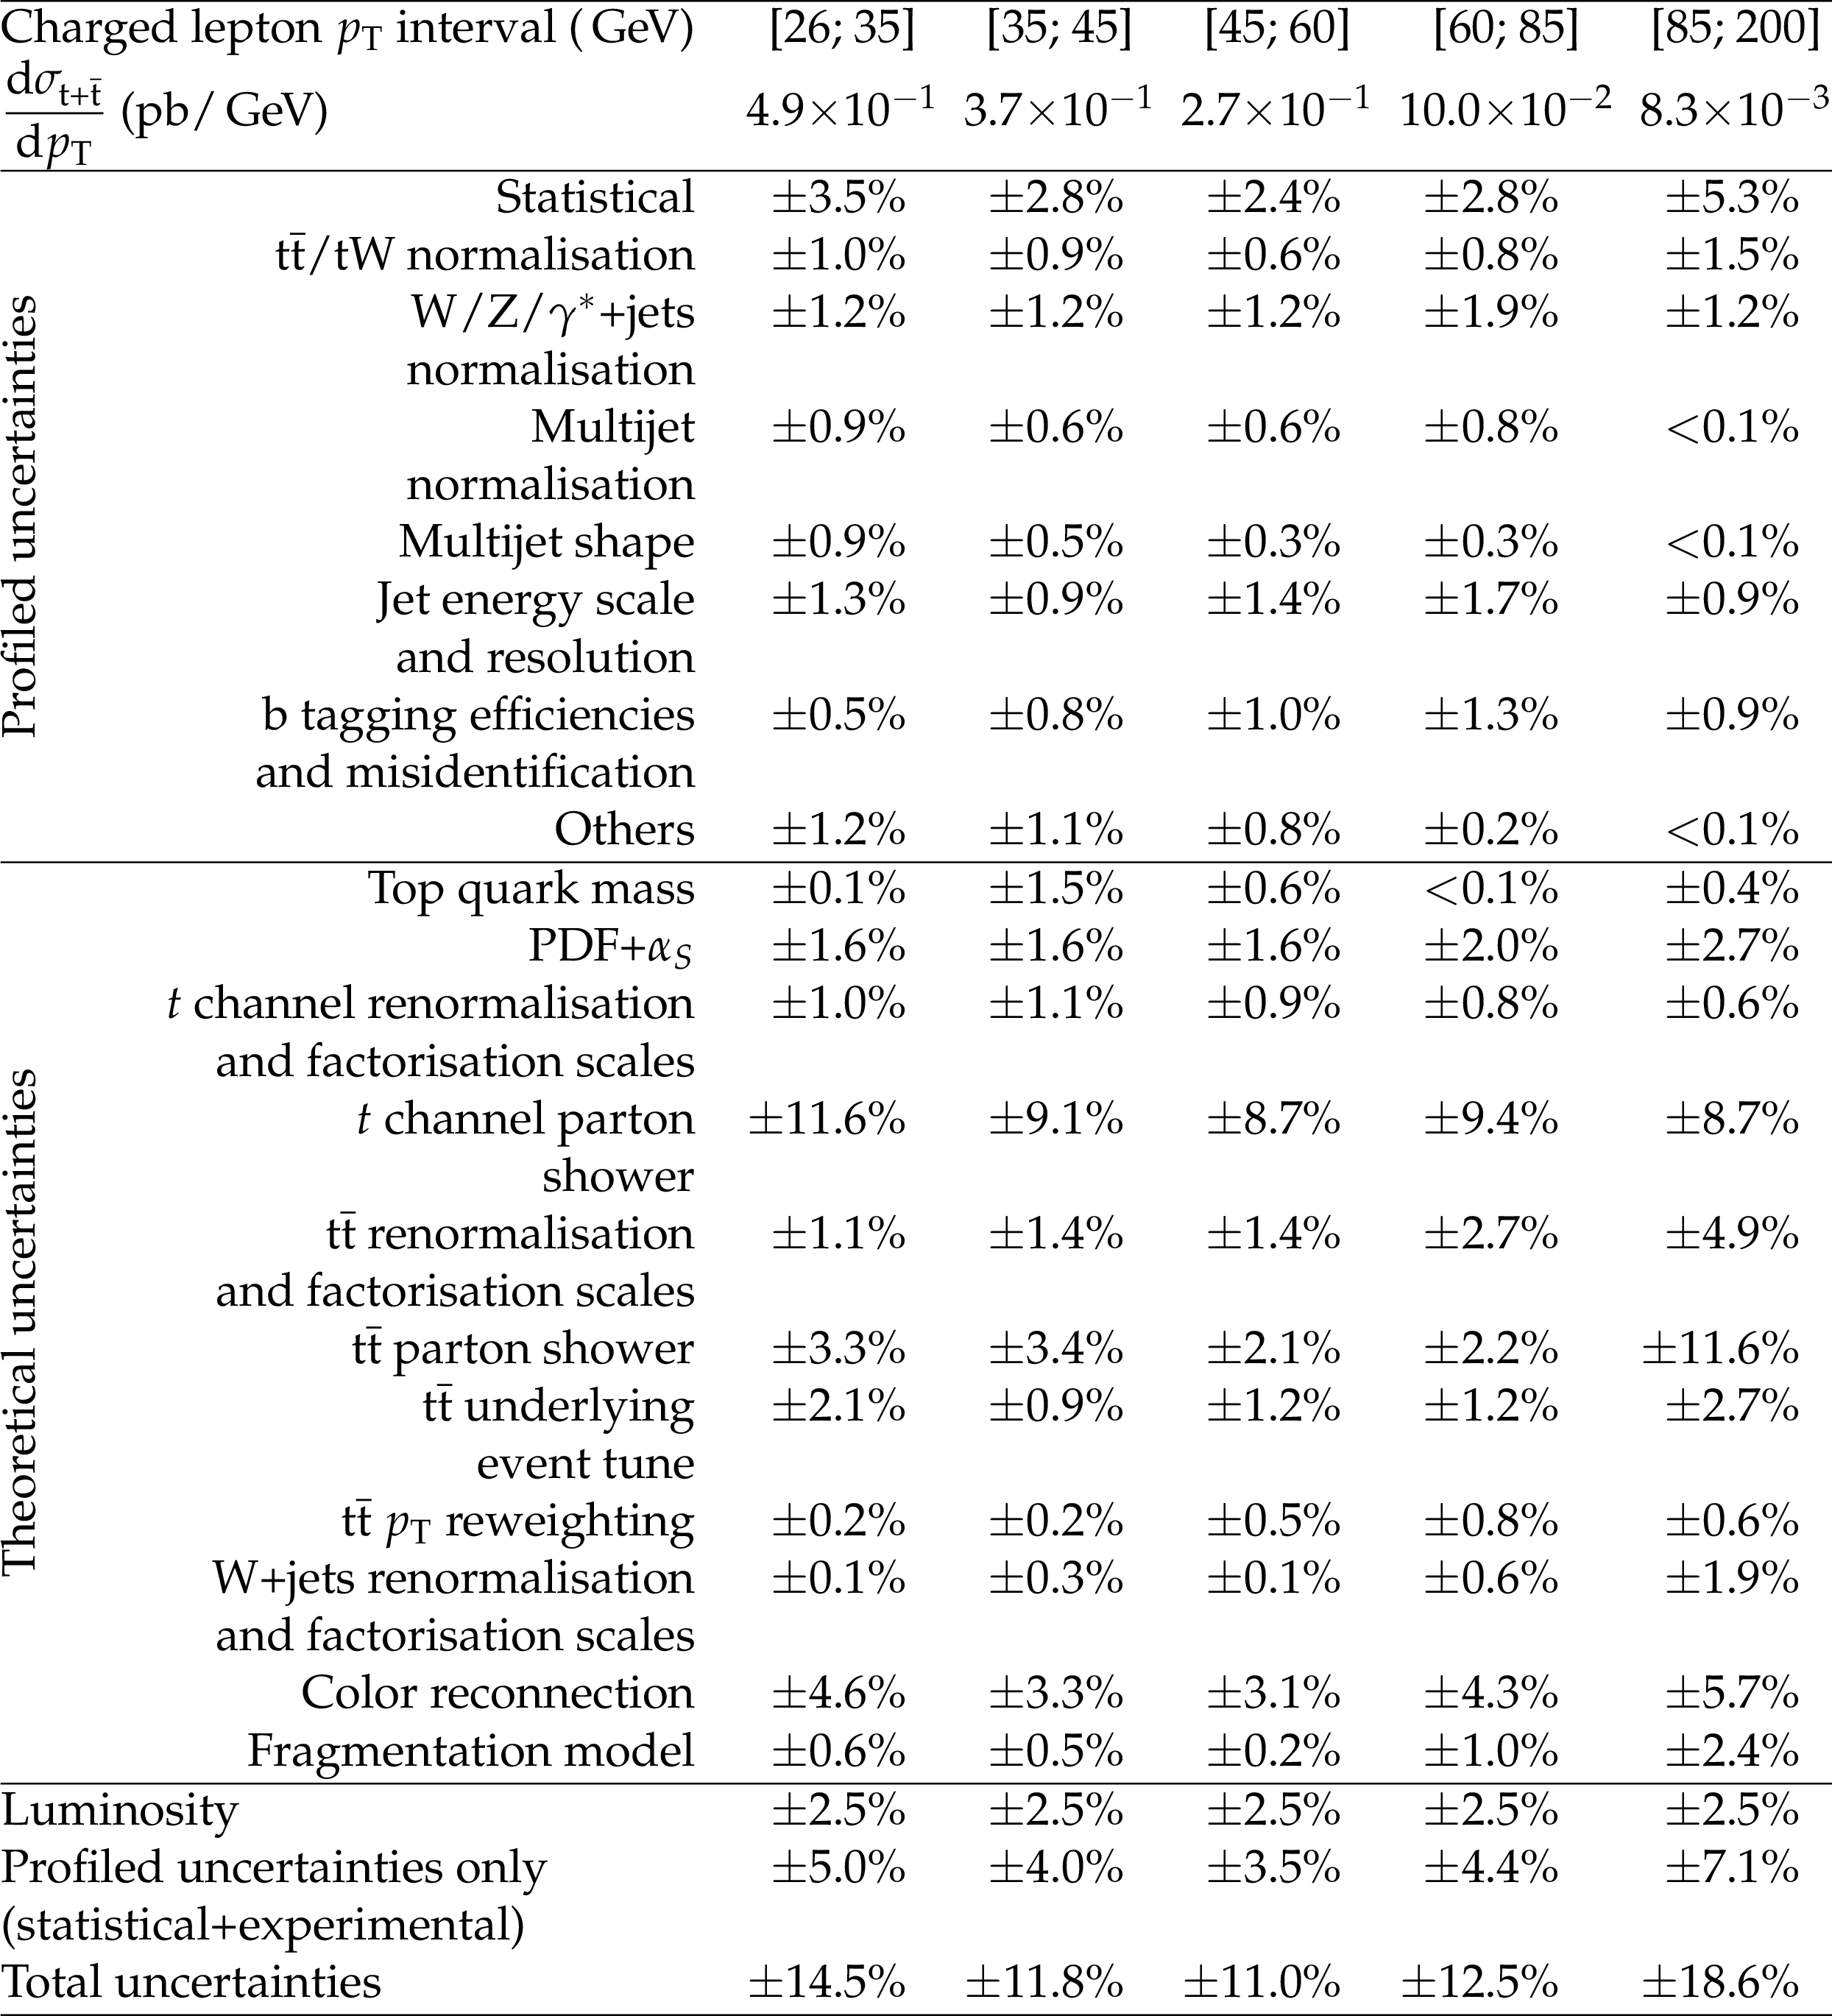
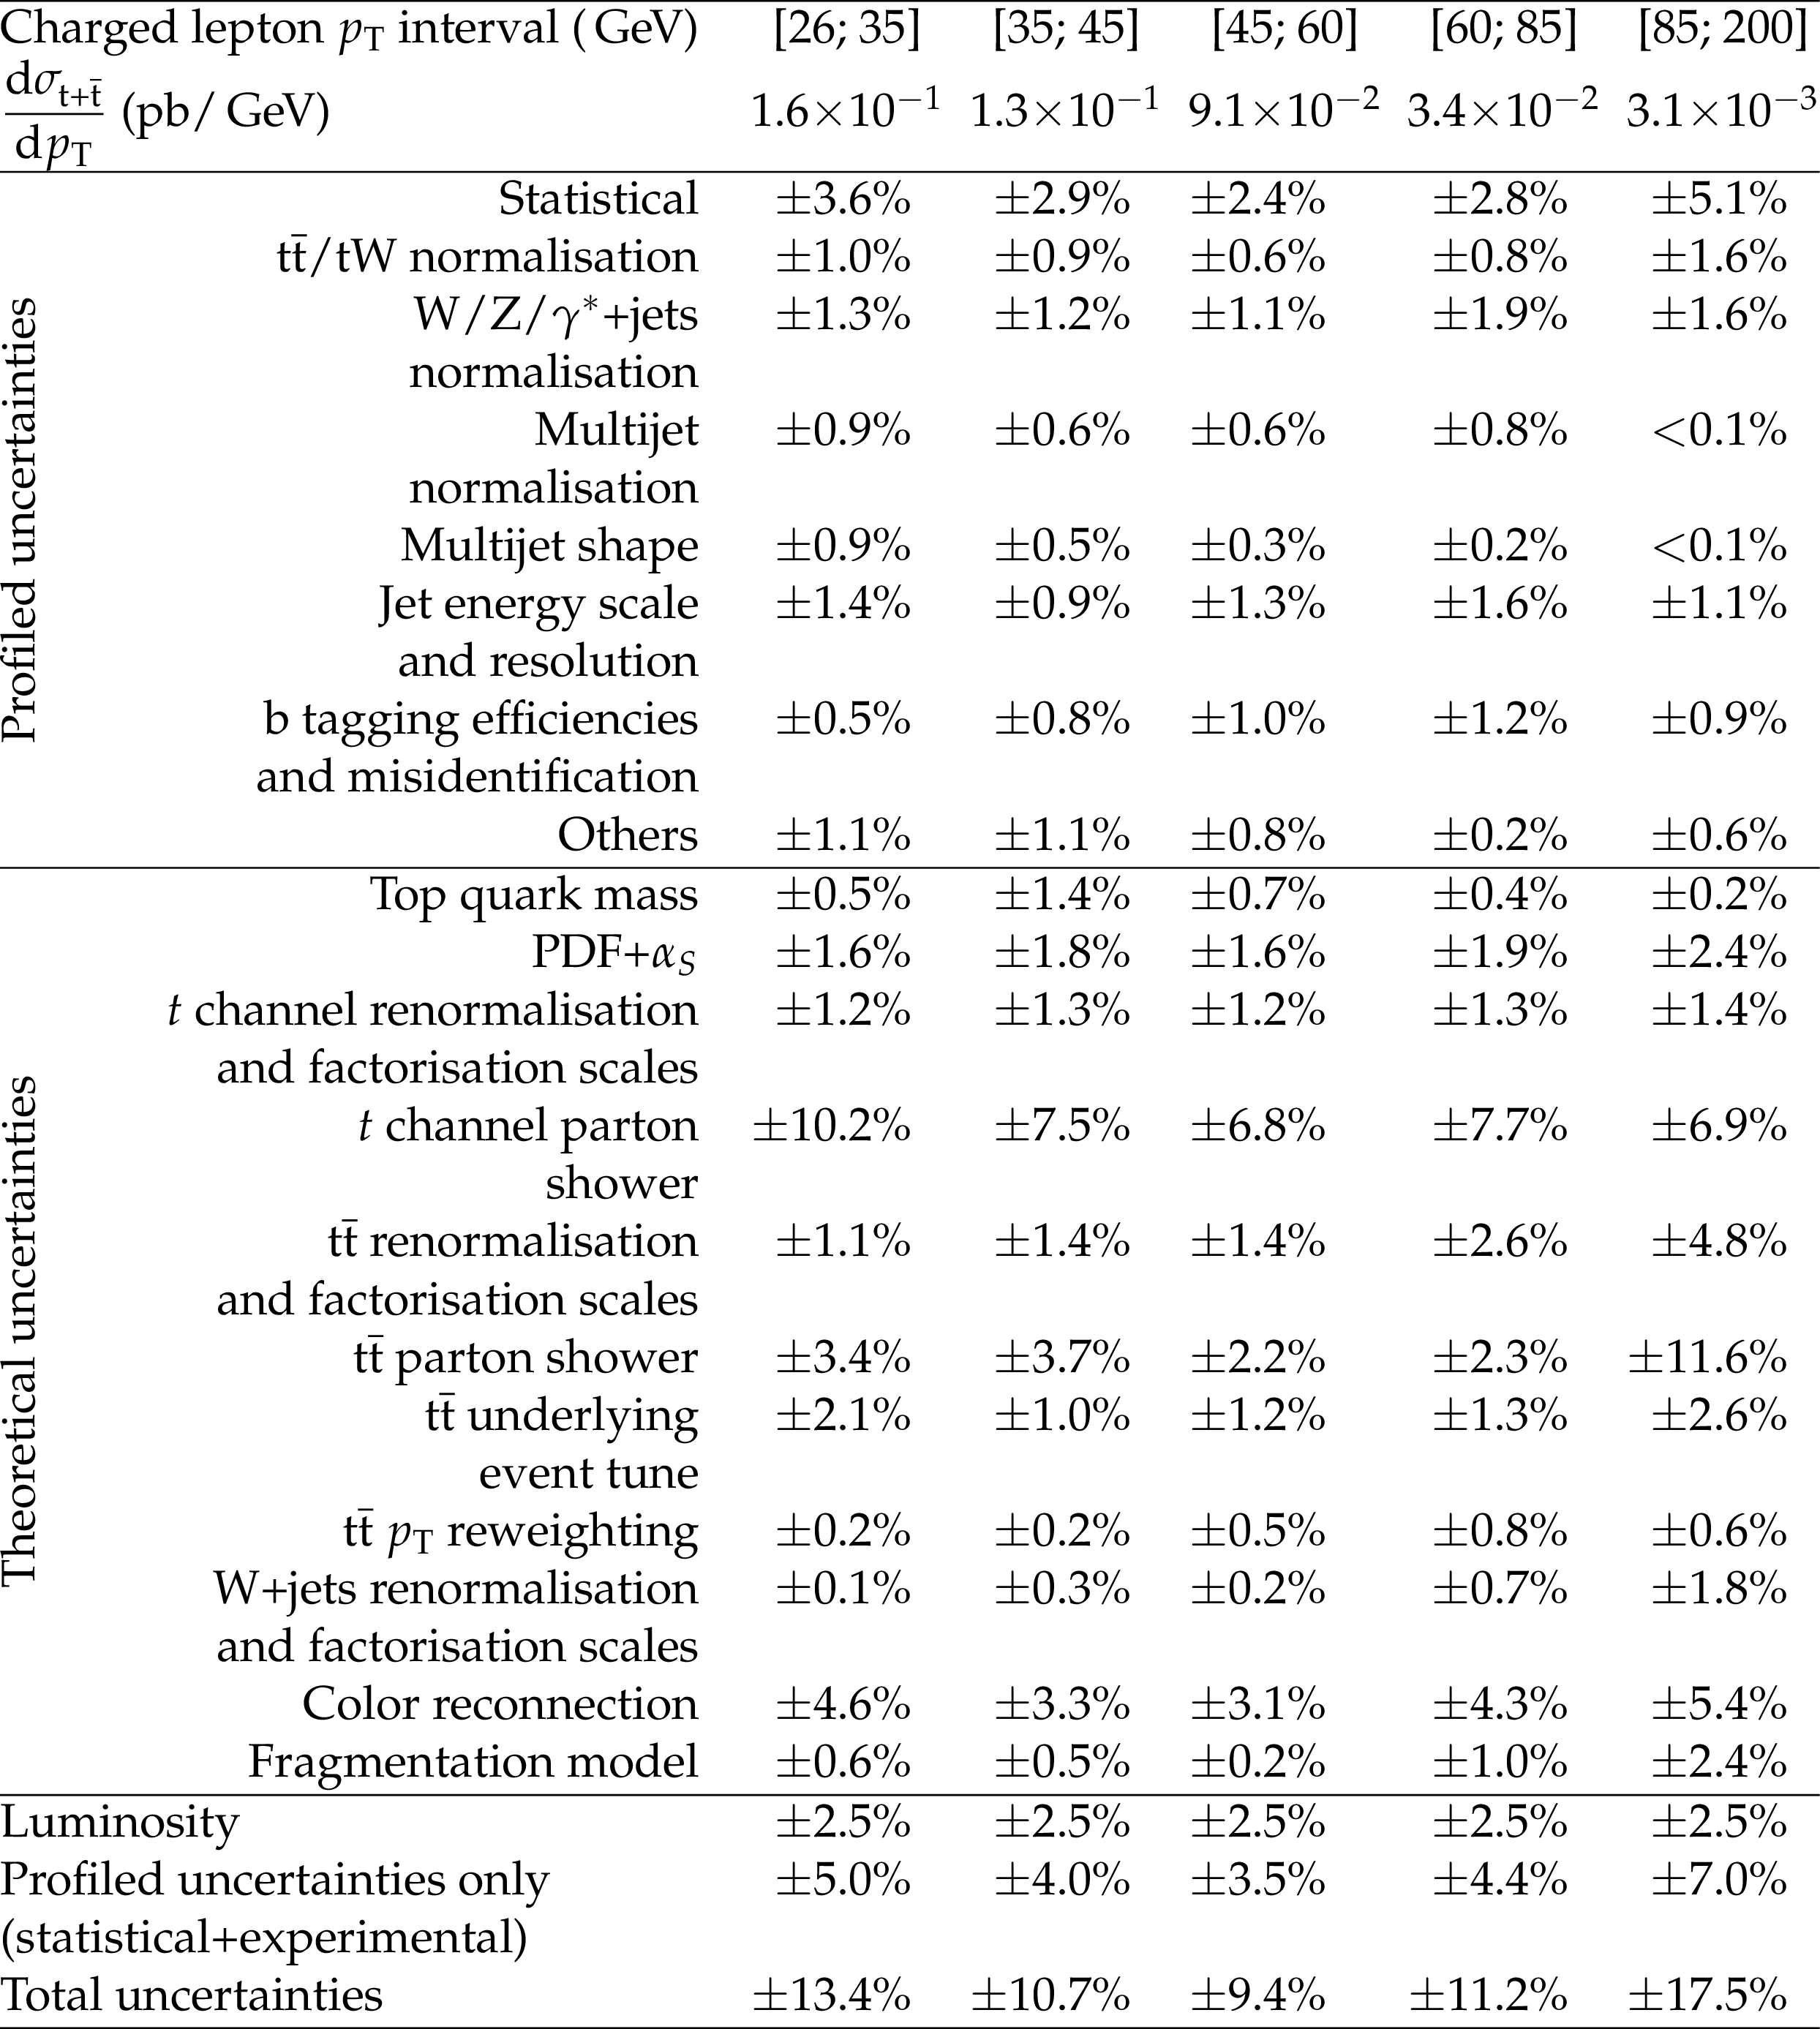
The measured differential absolute cross section in intervals of the charged lepton ${p_{\mathrm {T}}}$ at the parton level. A breakdown of the systematic uncertainties is given as well. Minor uncertainties (lepton efficiencies, pileup, and unclustered energy) have been grouped into the "Others'' category. |

png pdf |
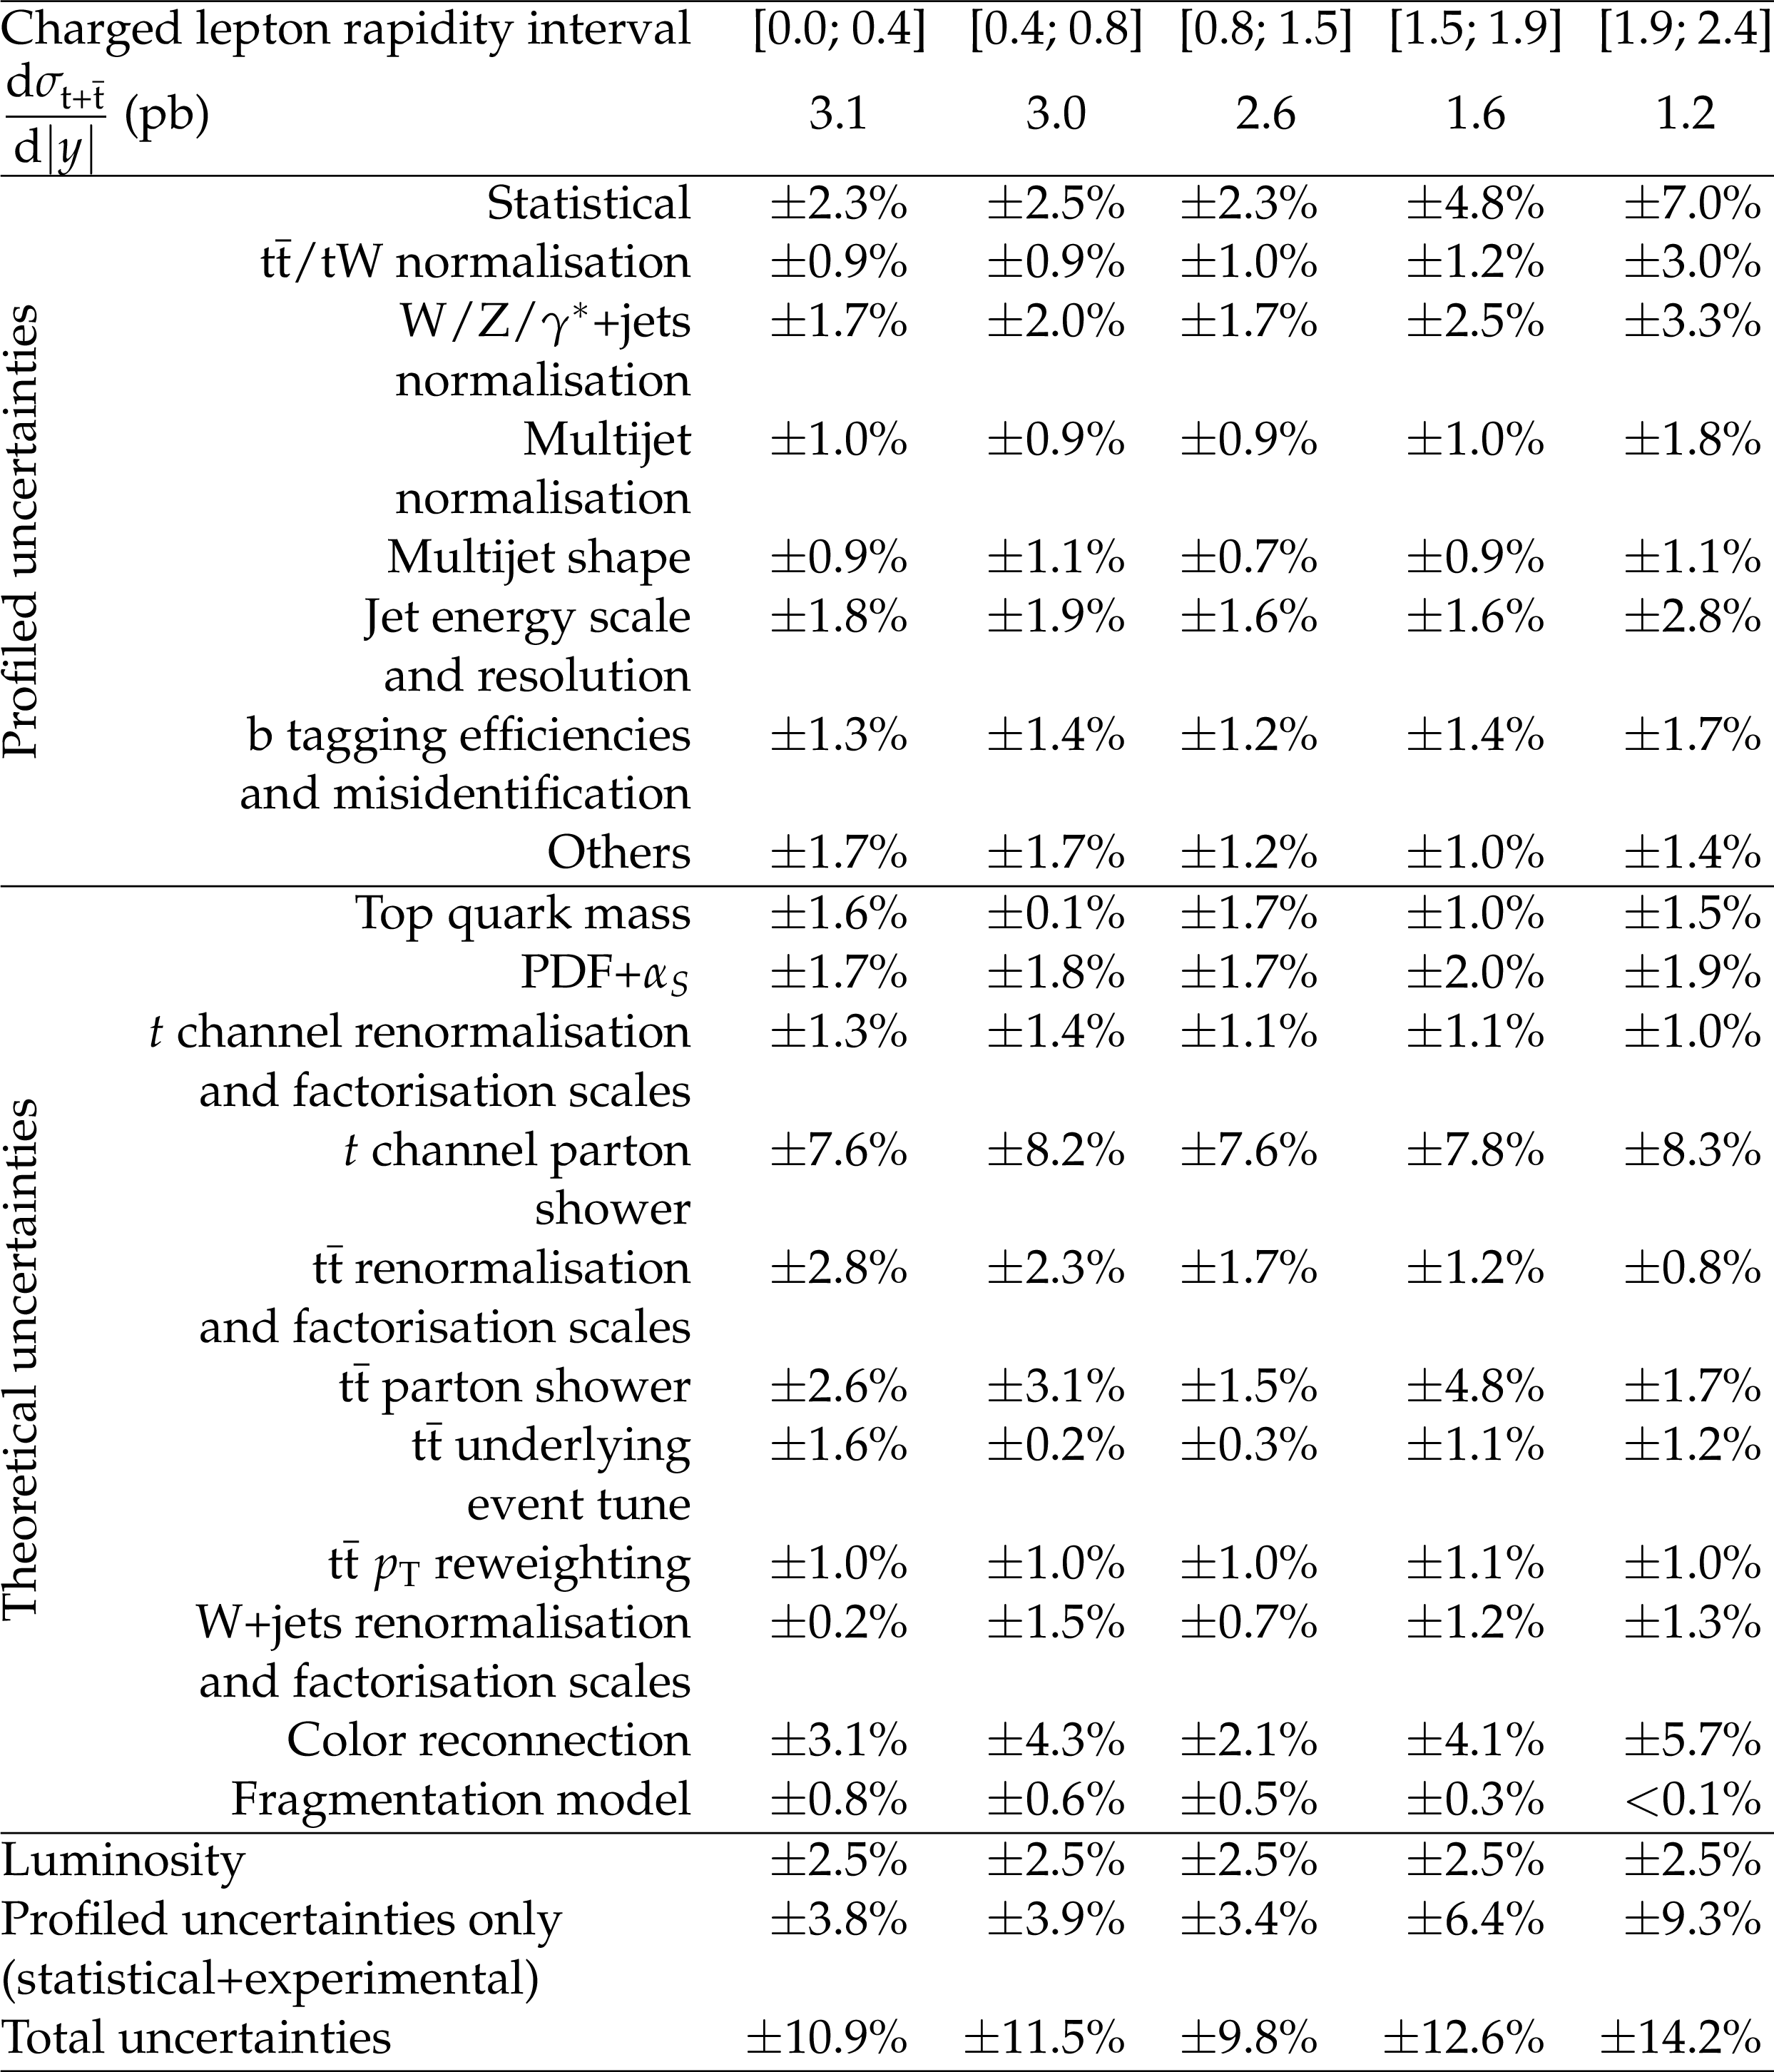
Additional Table 4:
The measured differential absolute cross section in intervals of the charged lepton rapidity at the parton level. A breakdown of the systematic uncertainties is given as well. Minor uncertainties (lepton efficiencies, pileup, and unclustered energy) have been grouped into the "Others'' category. |

png pdf |
Additional Table 5:
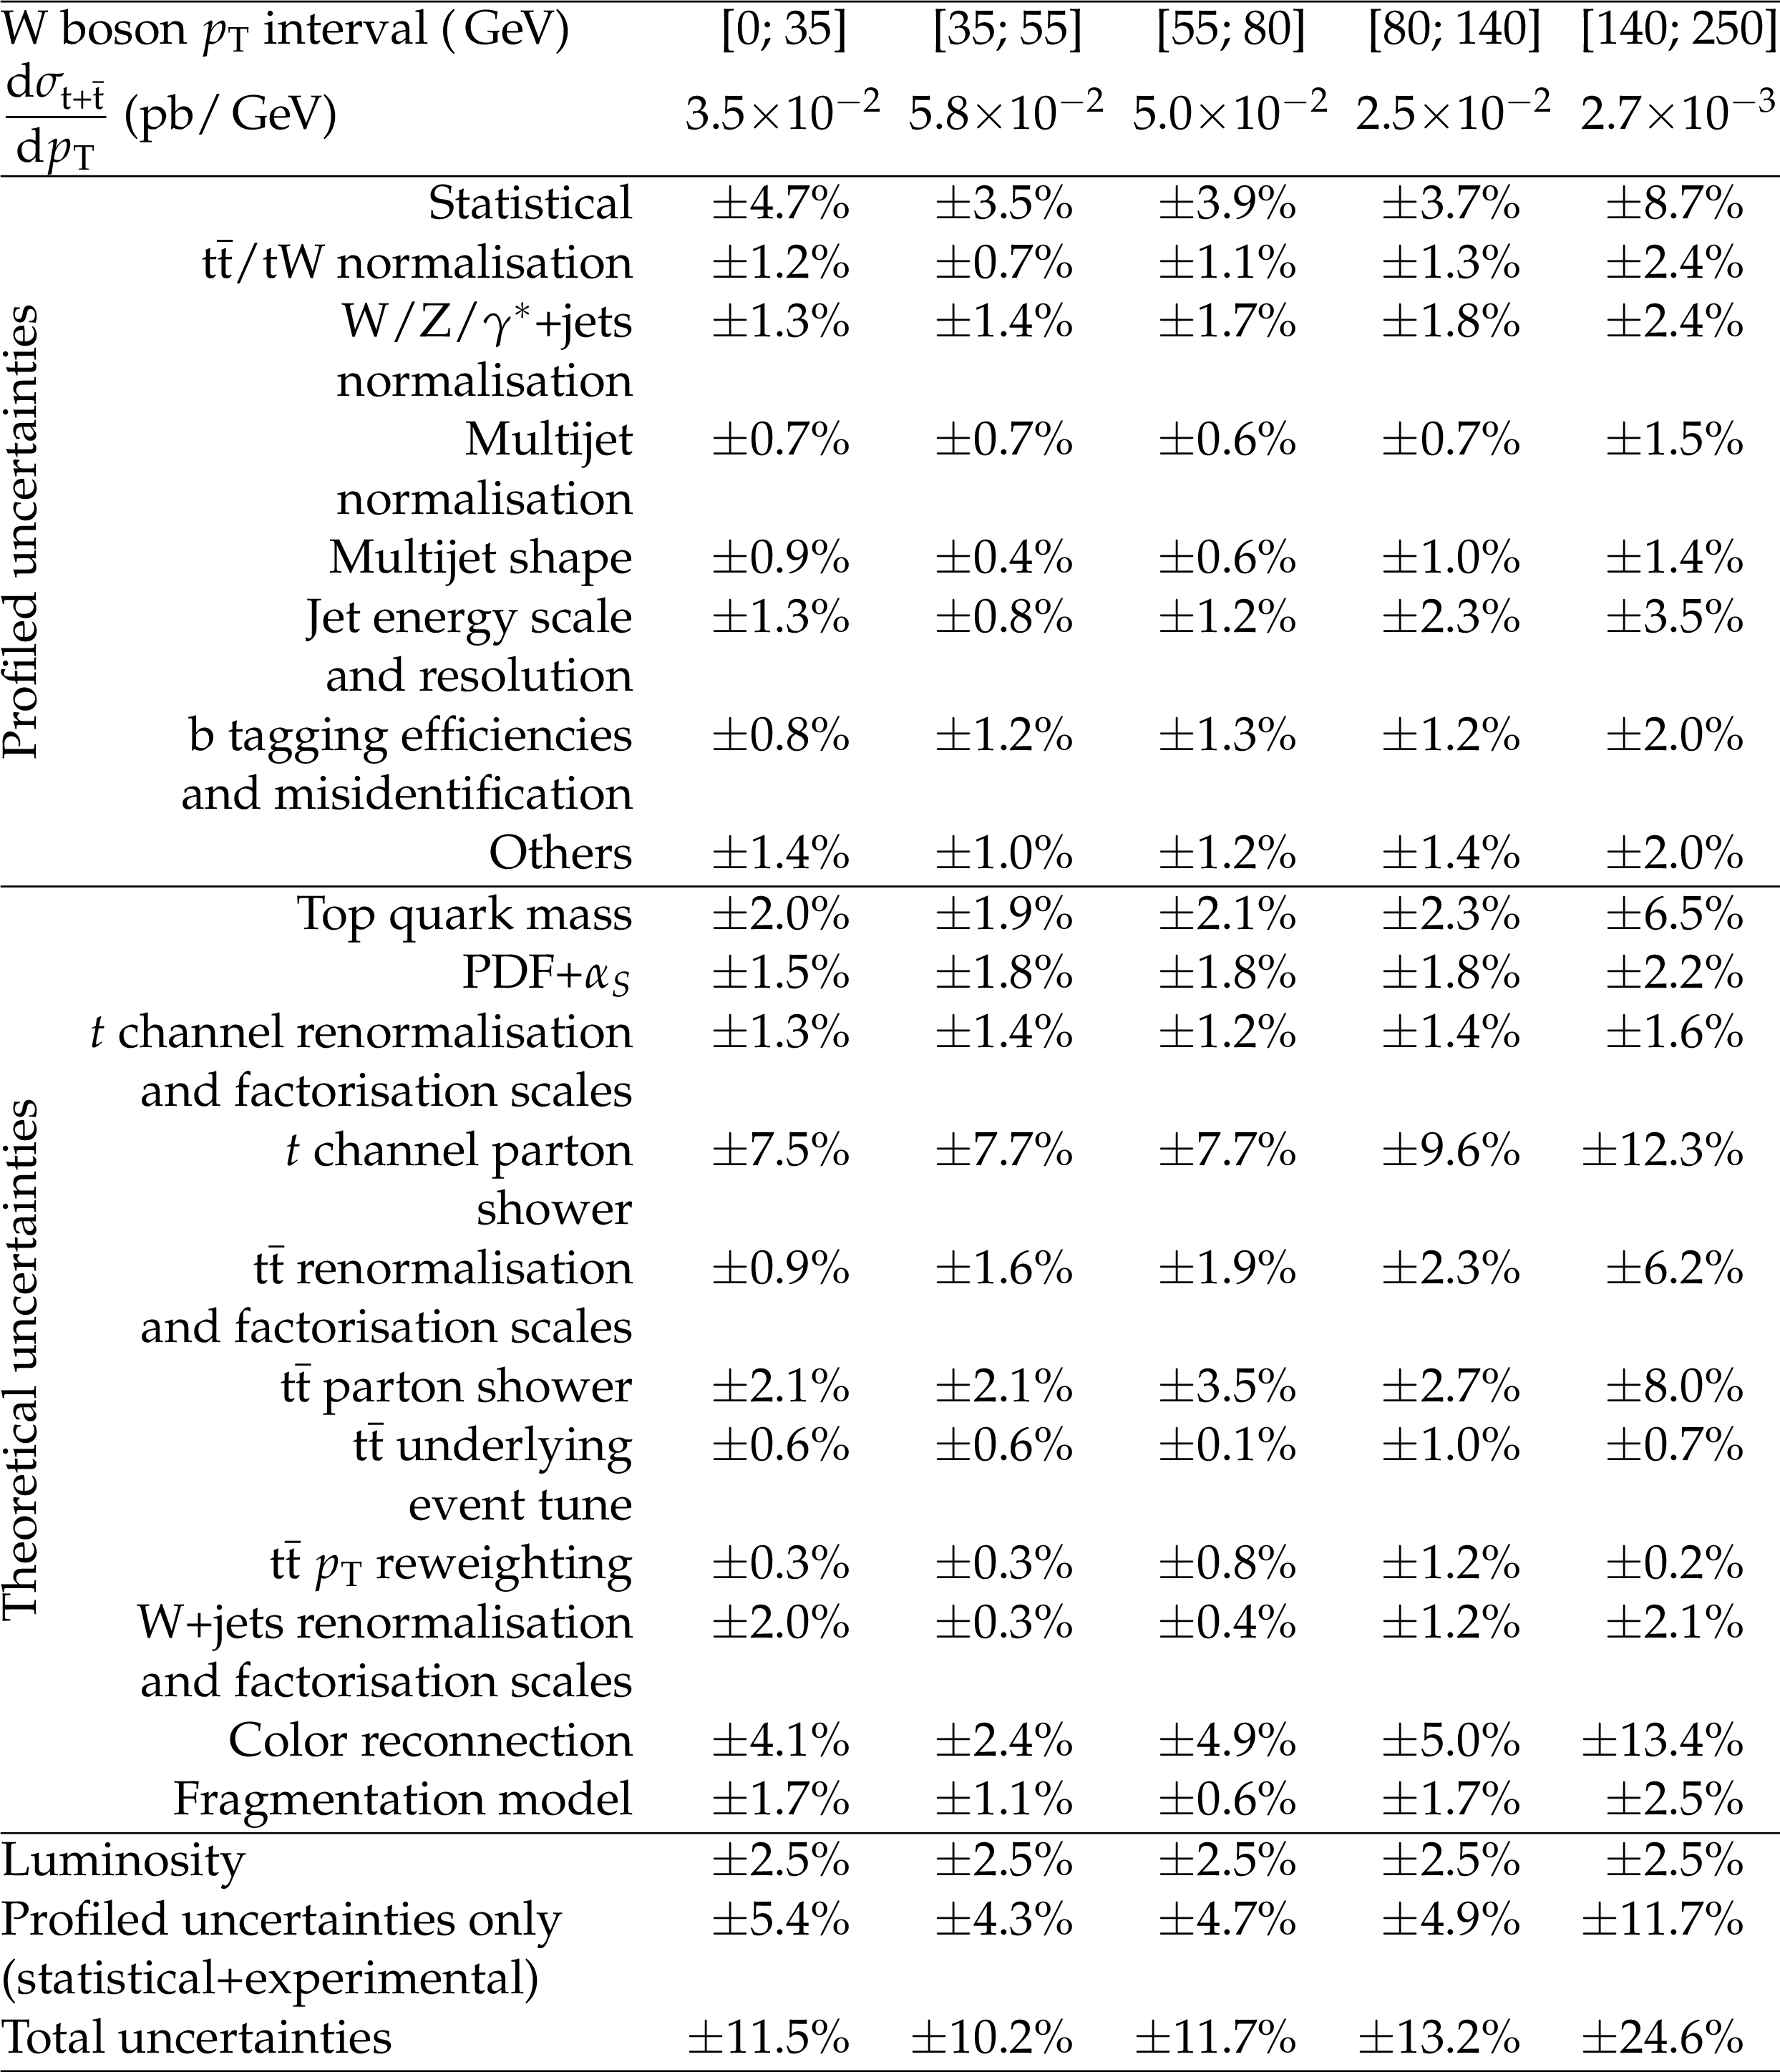
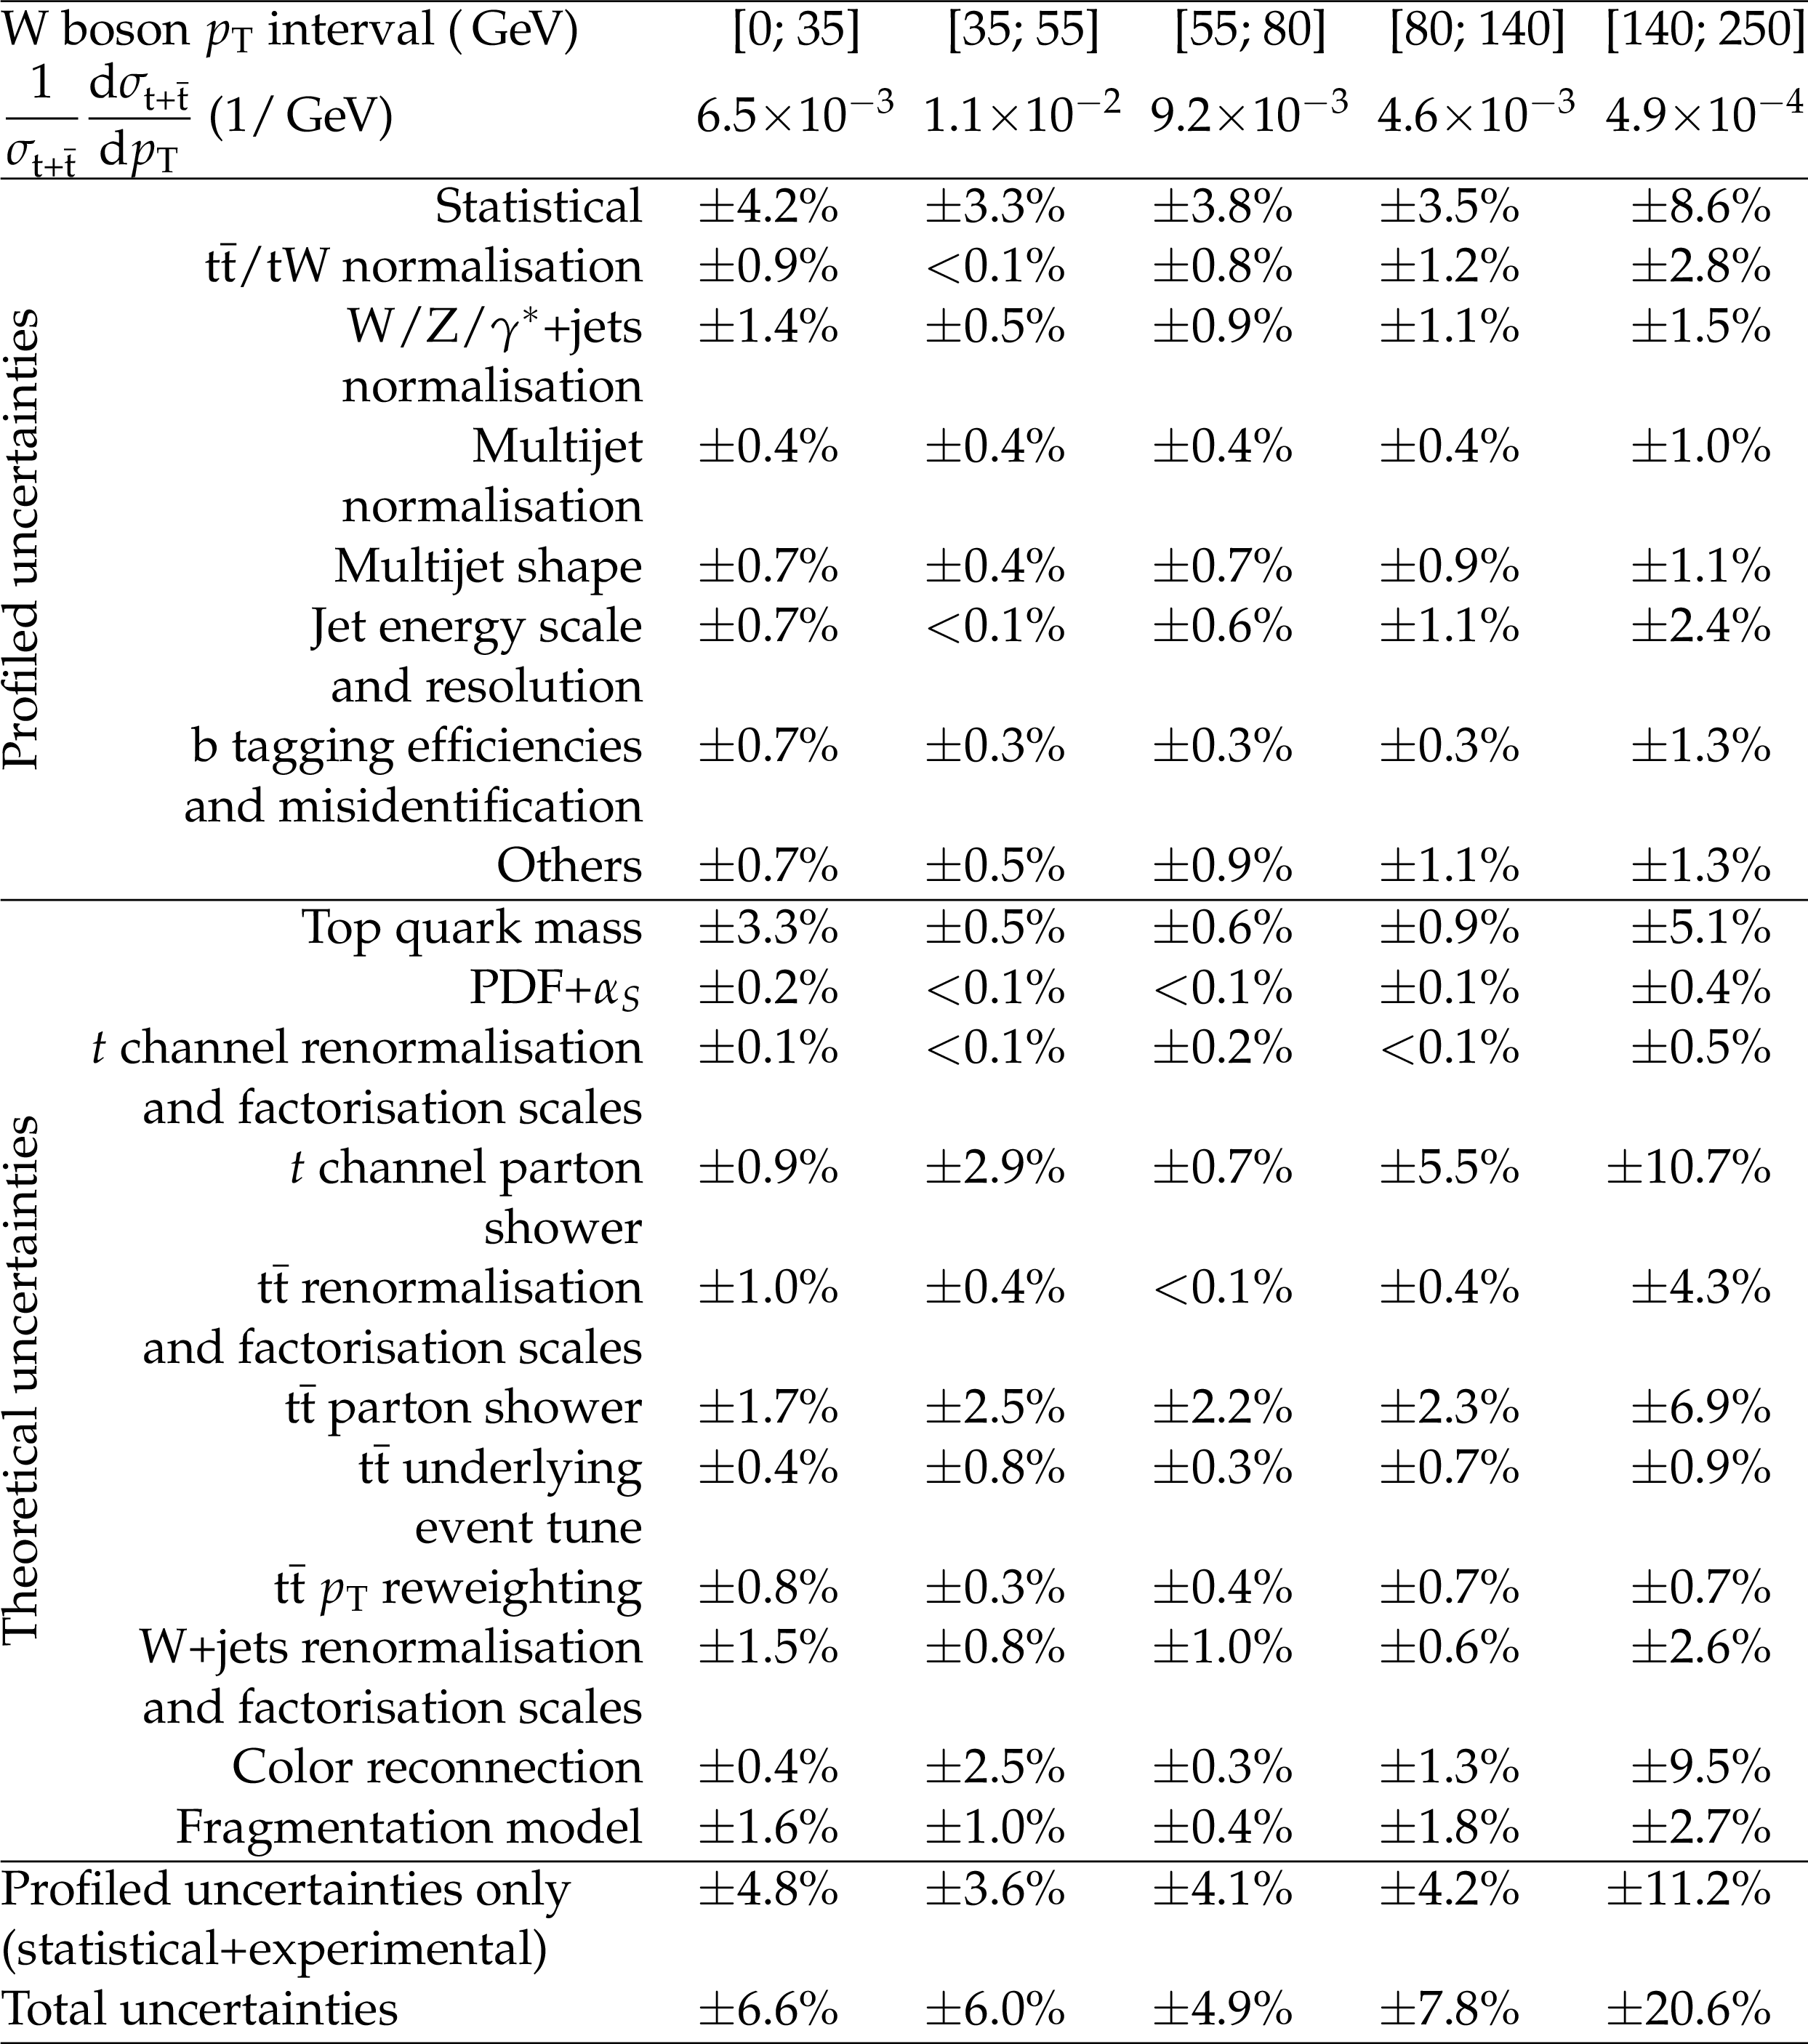
The measured differential absolute cross section in intervals of the W boson ${p_{\mathrm {T}}}$ at the parton level. A breakdown of the systematic uncertainties is given as well. Minor uncertainties (lepton efficiencies, pileup, and unclustered energy) have been grouped into the "Others'' category. |
png pdf |
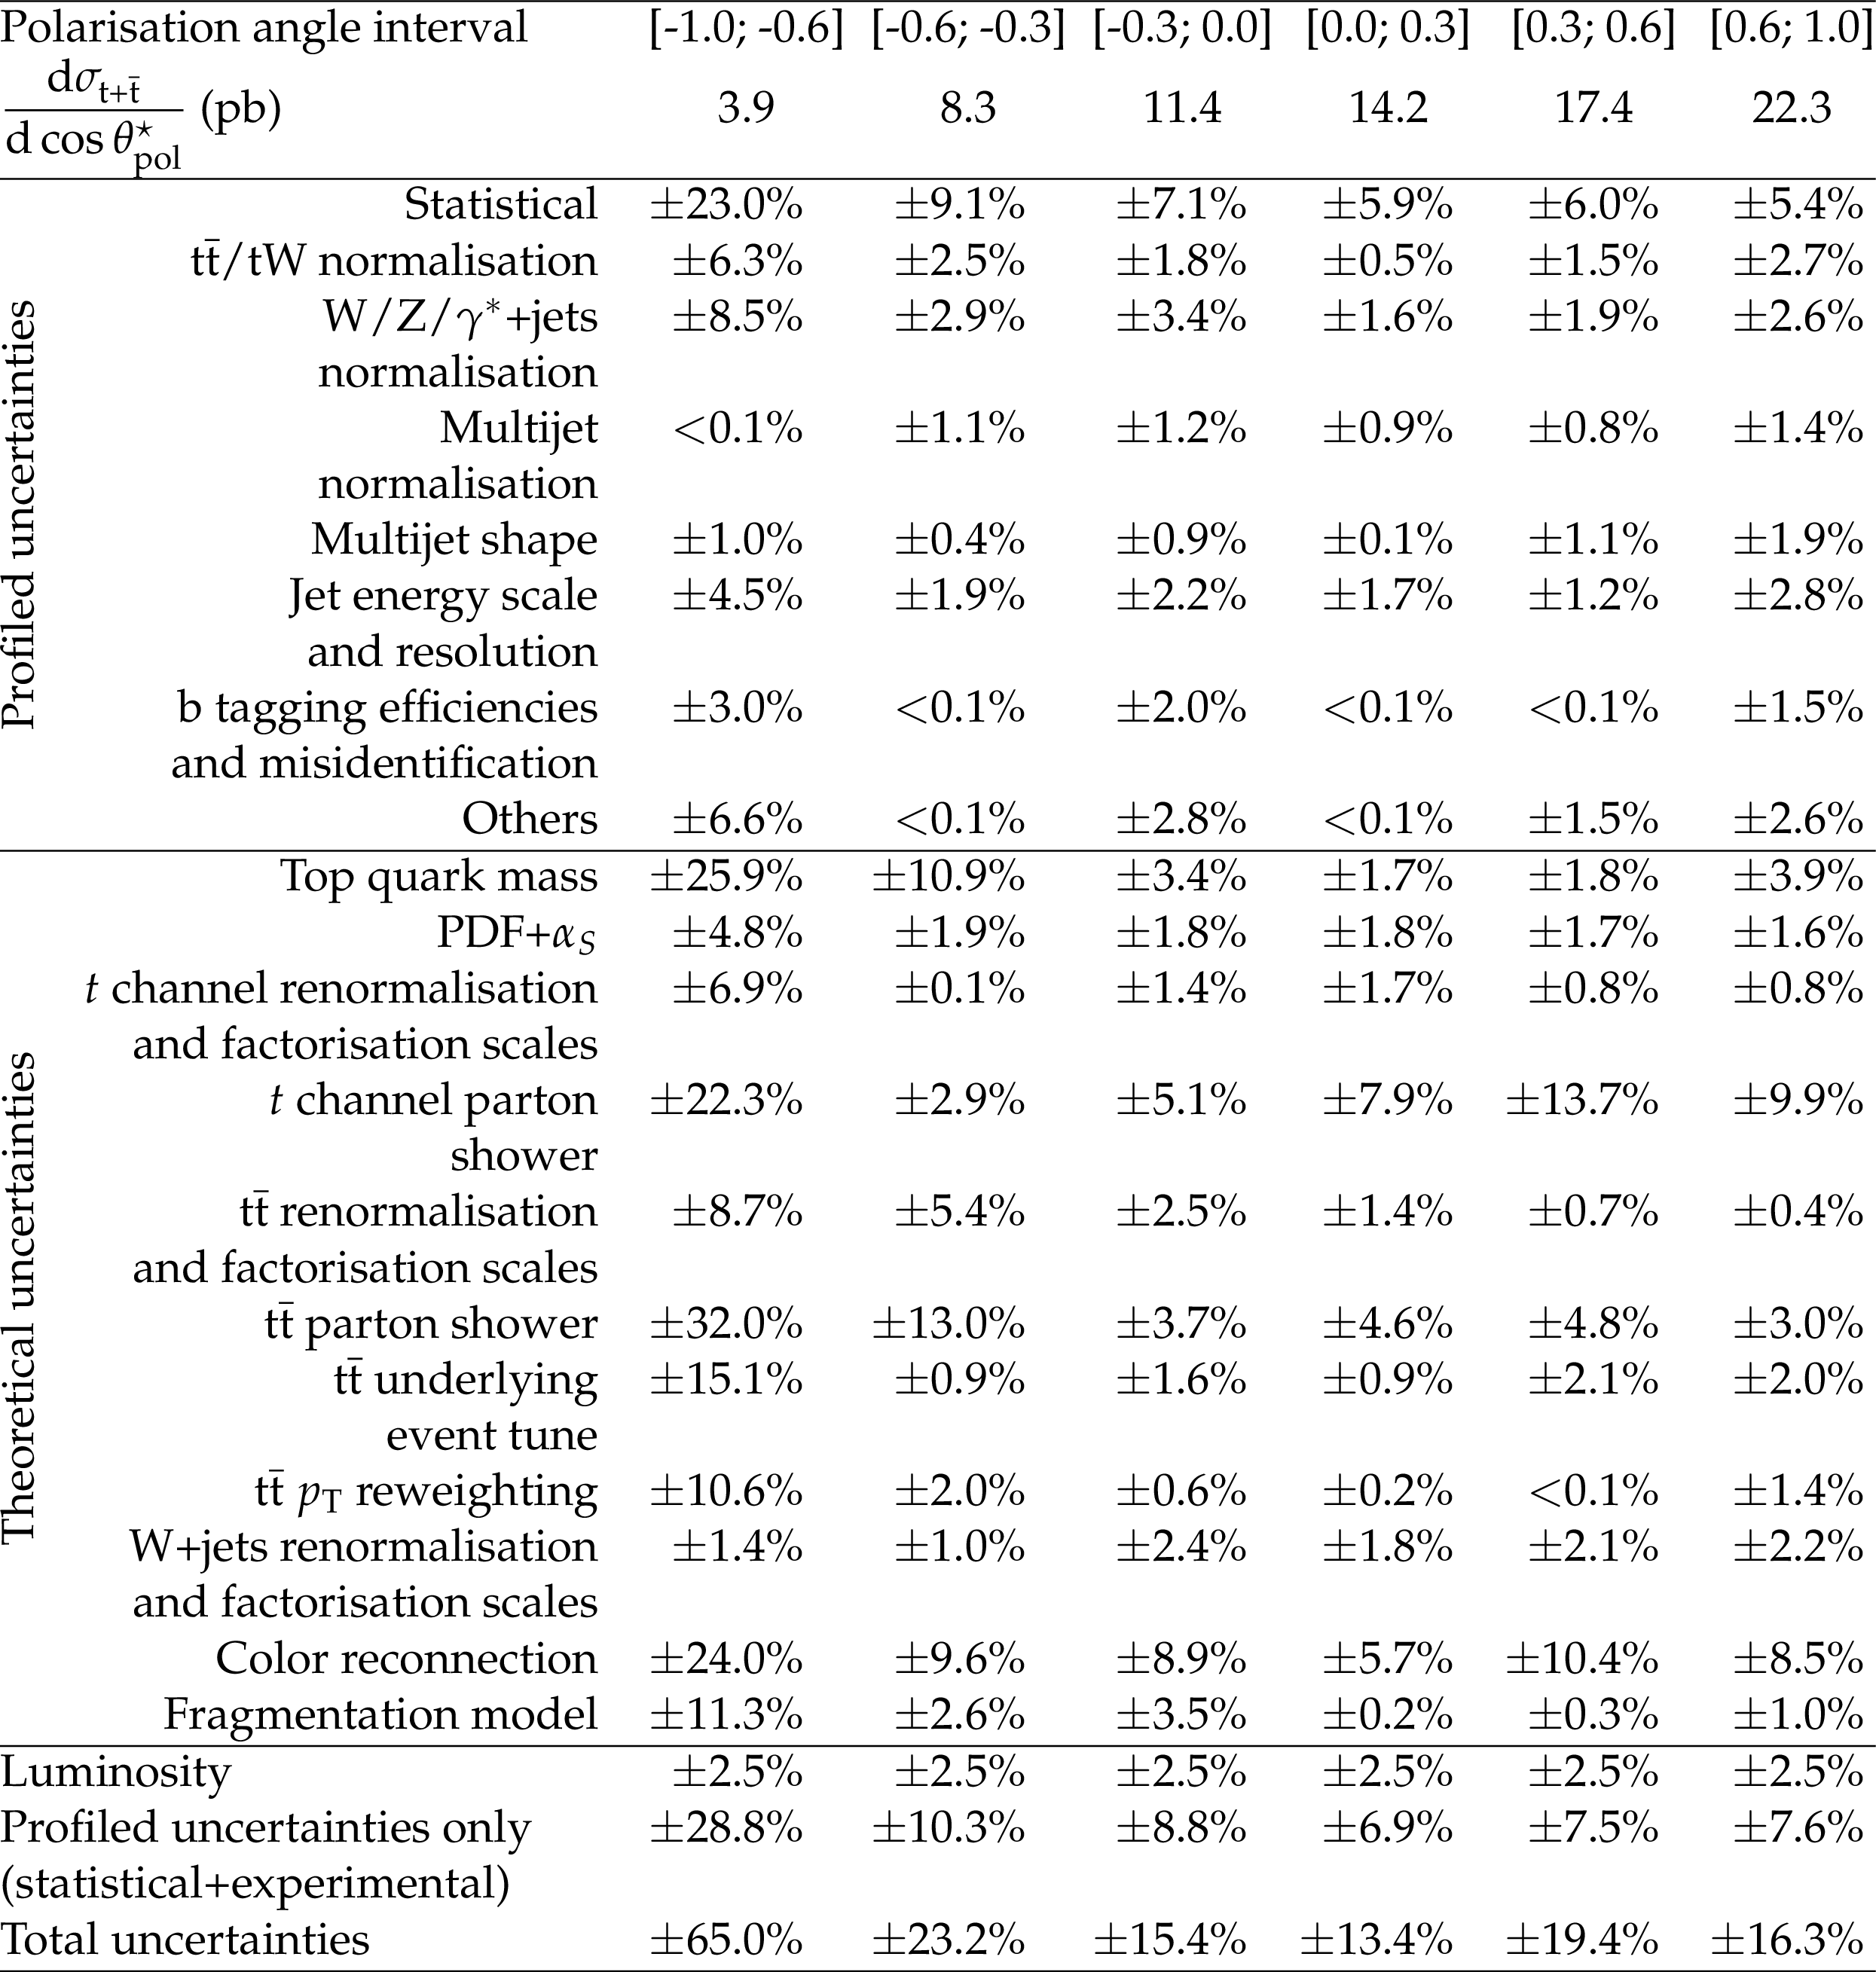
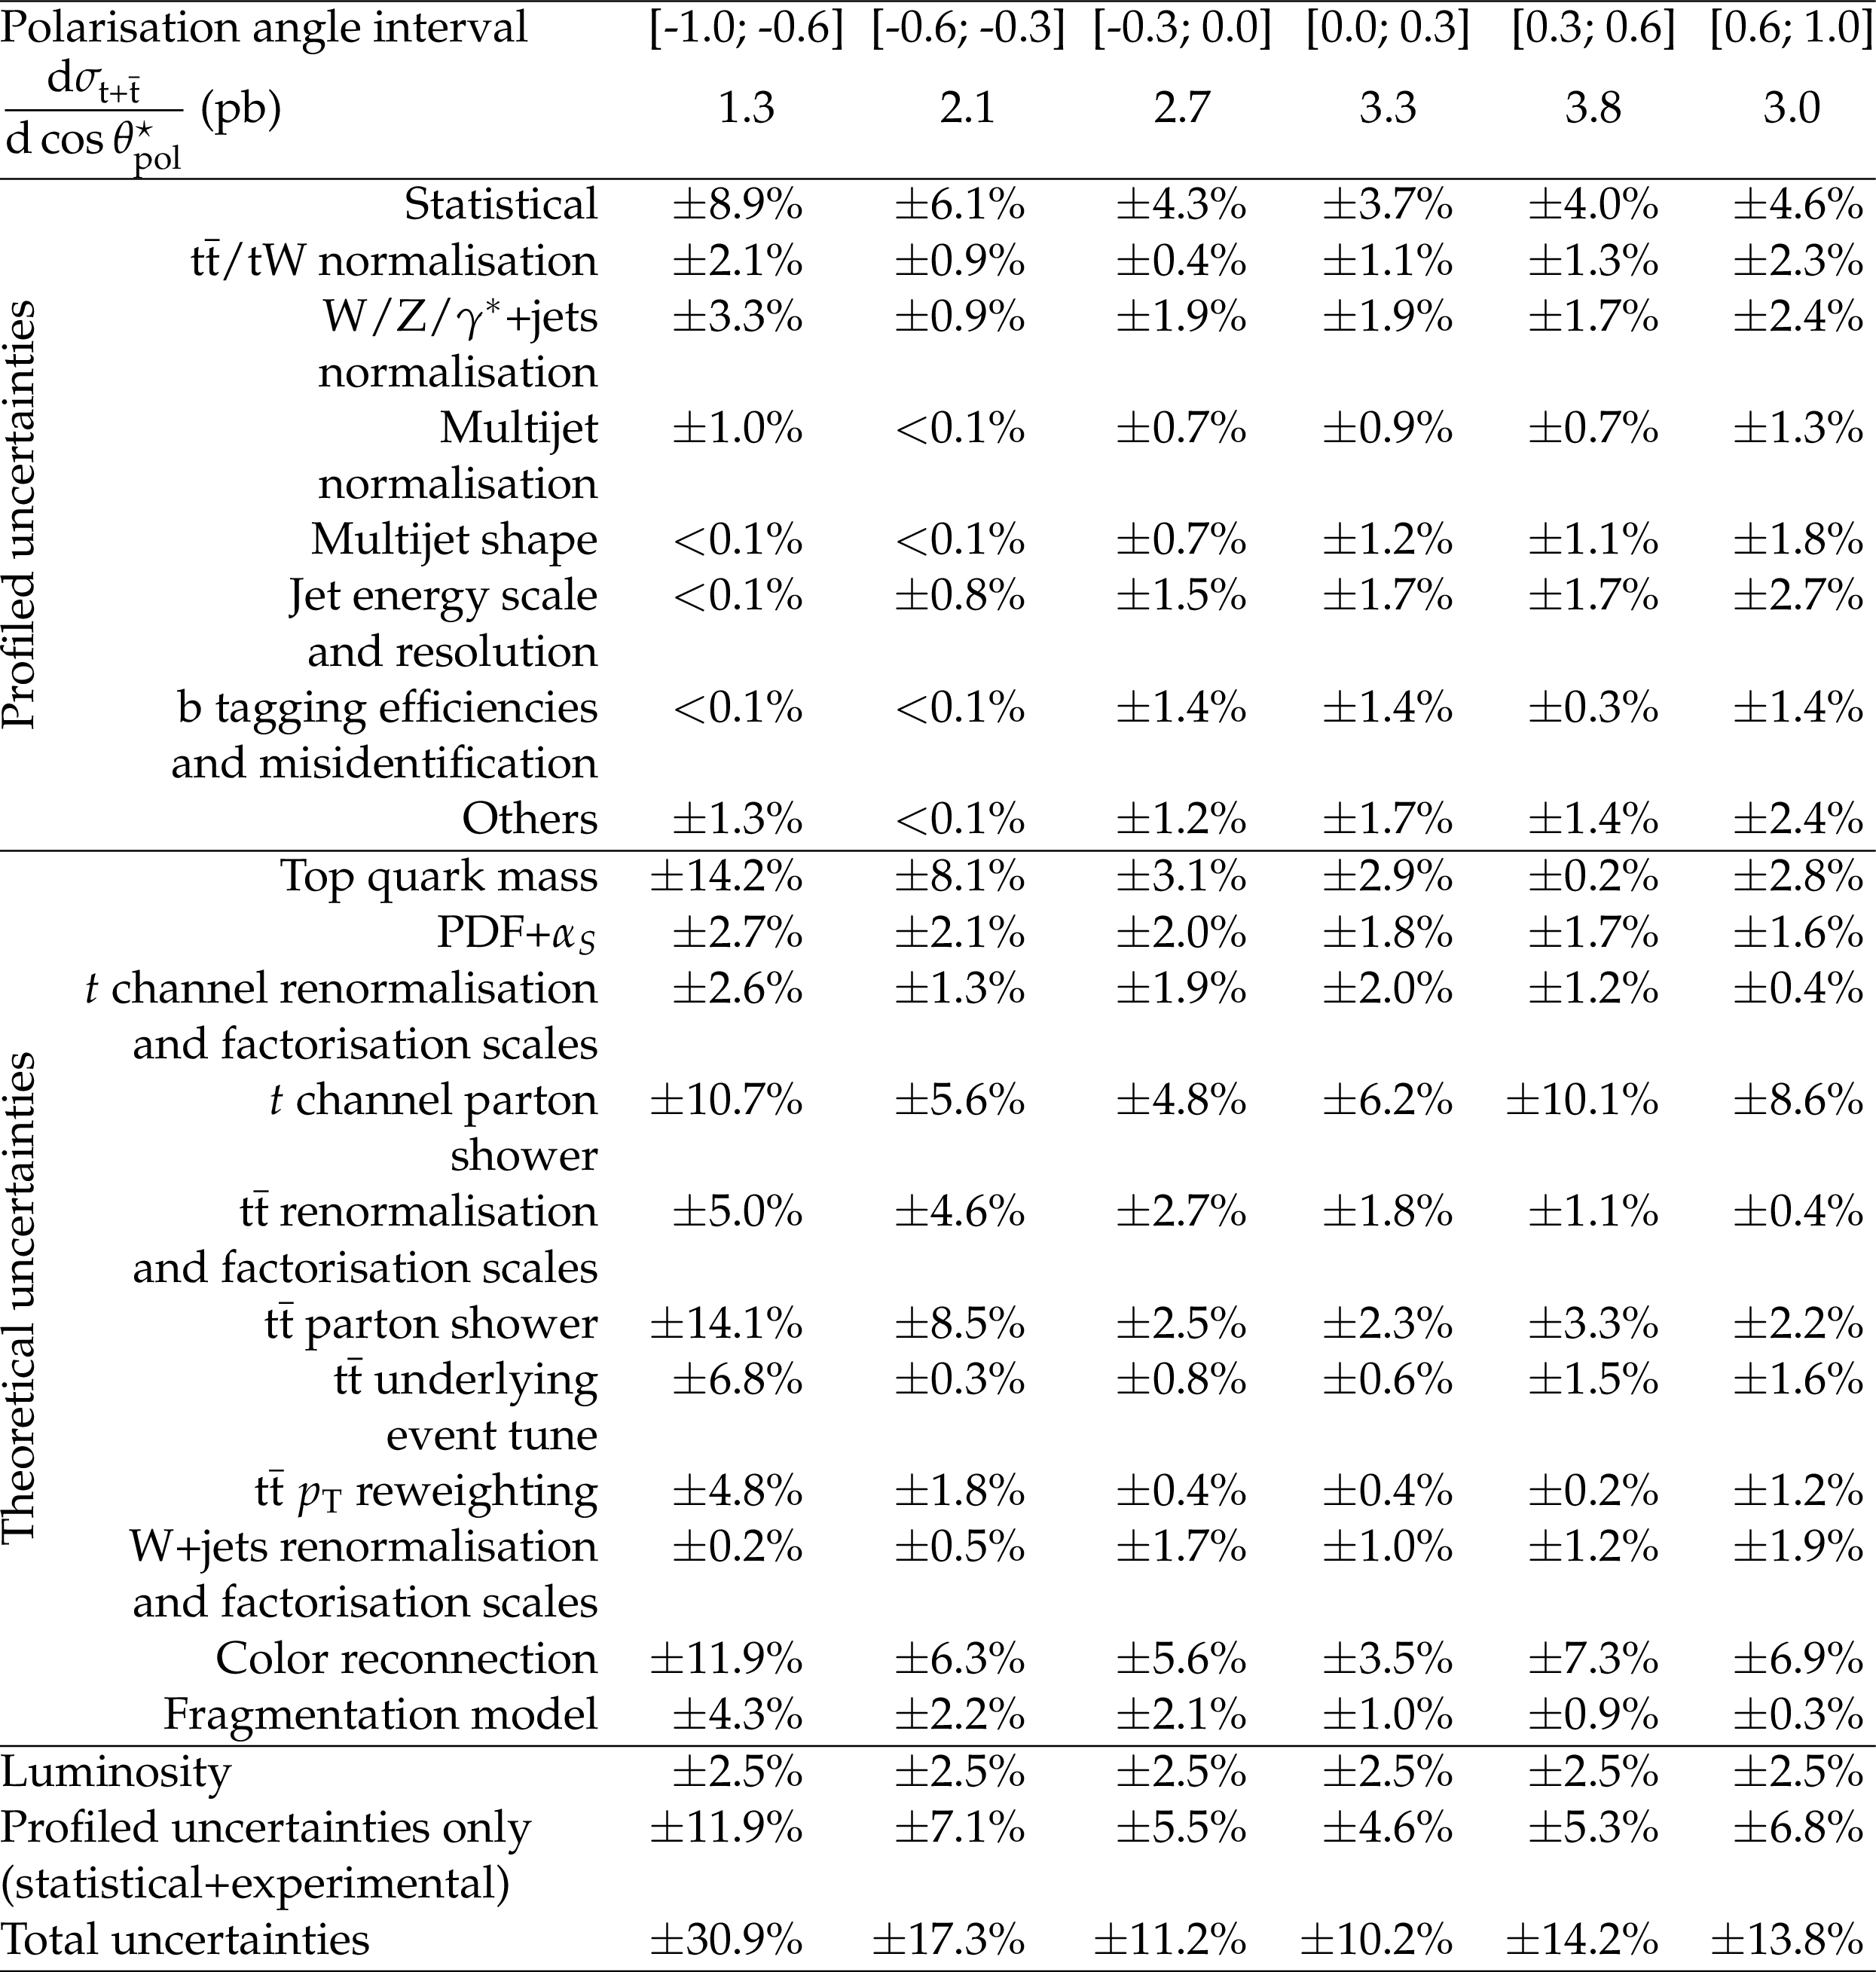
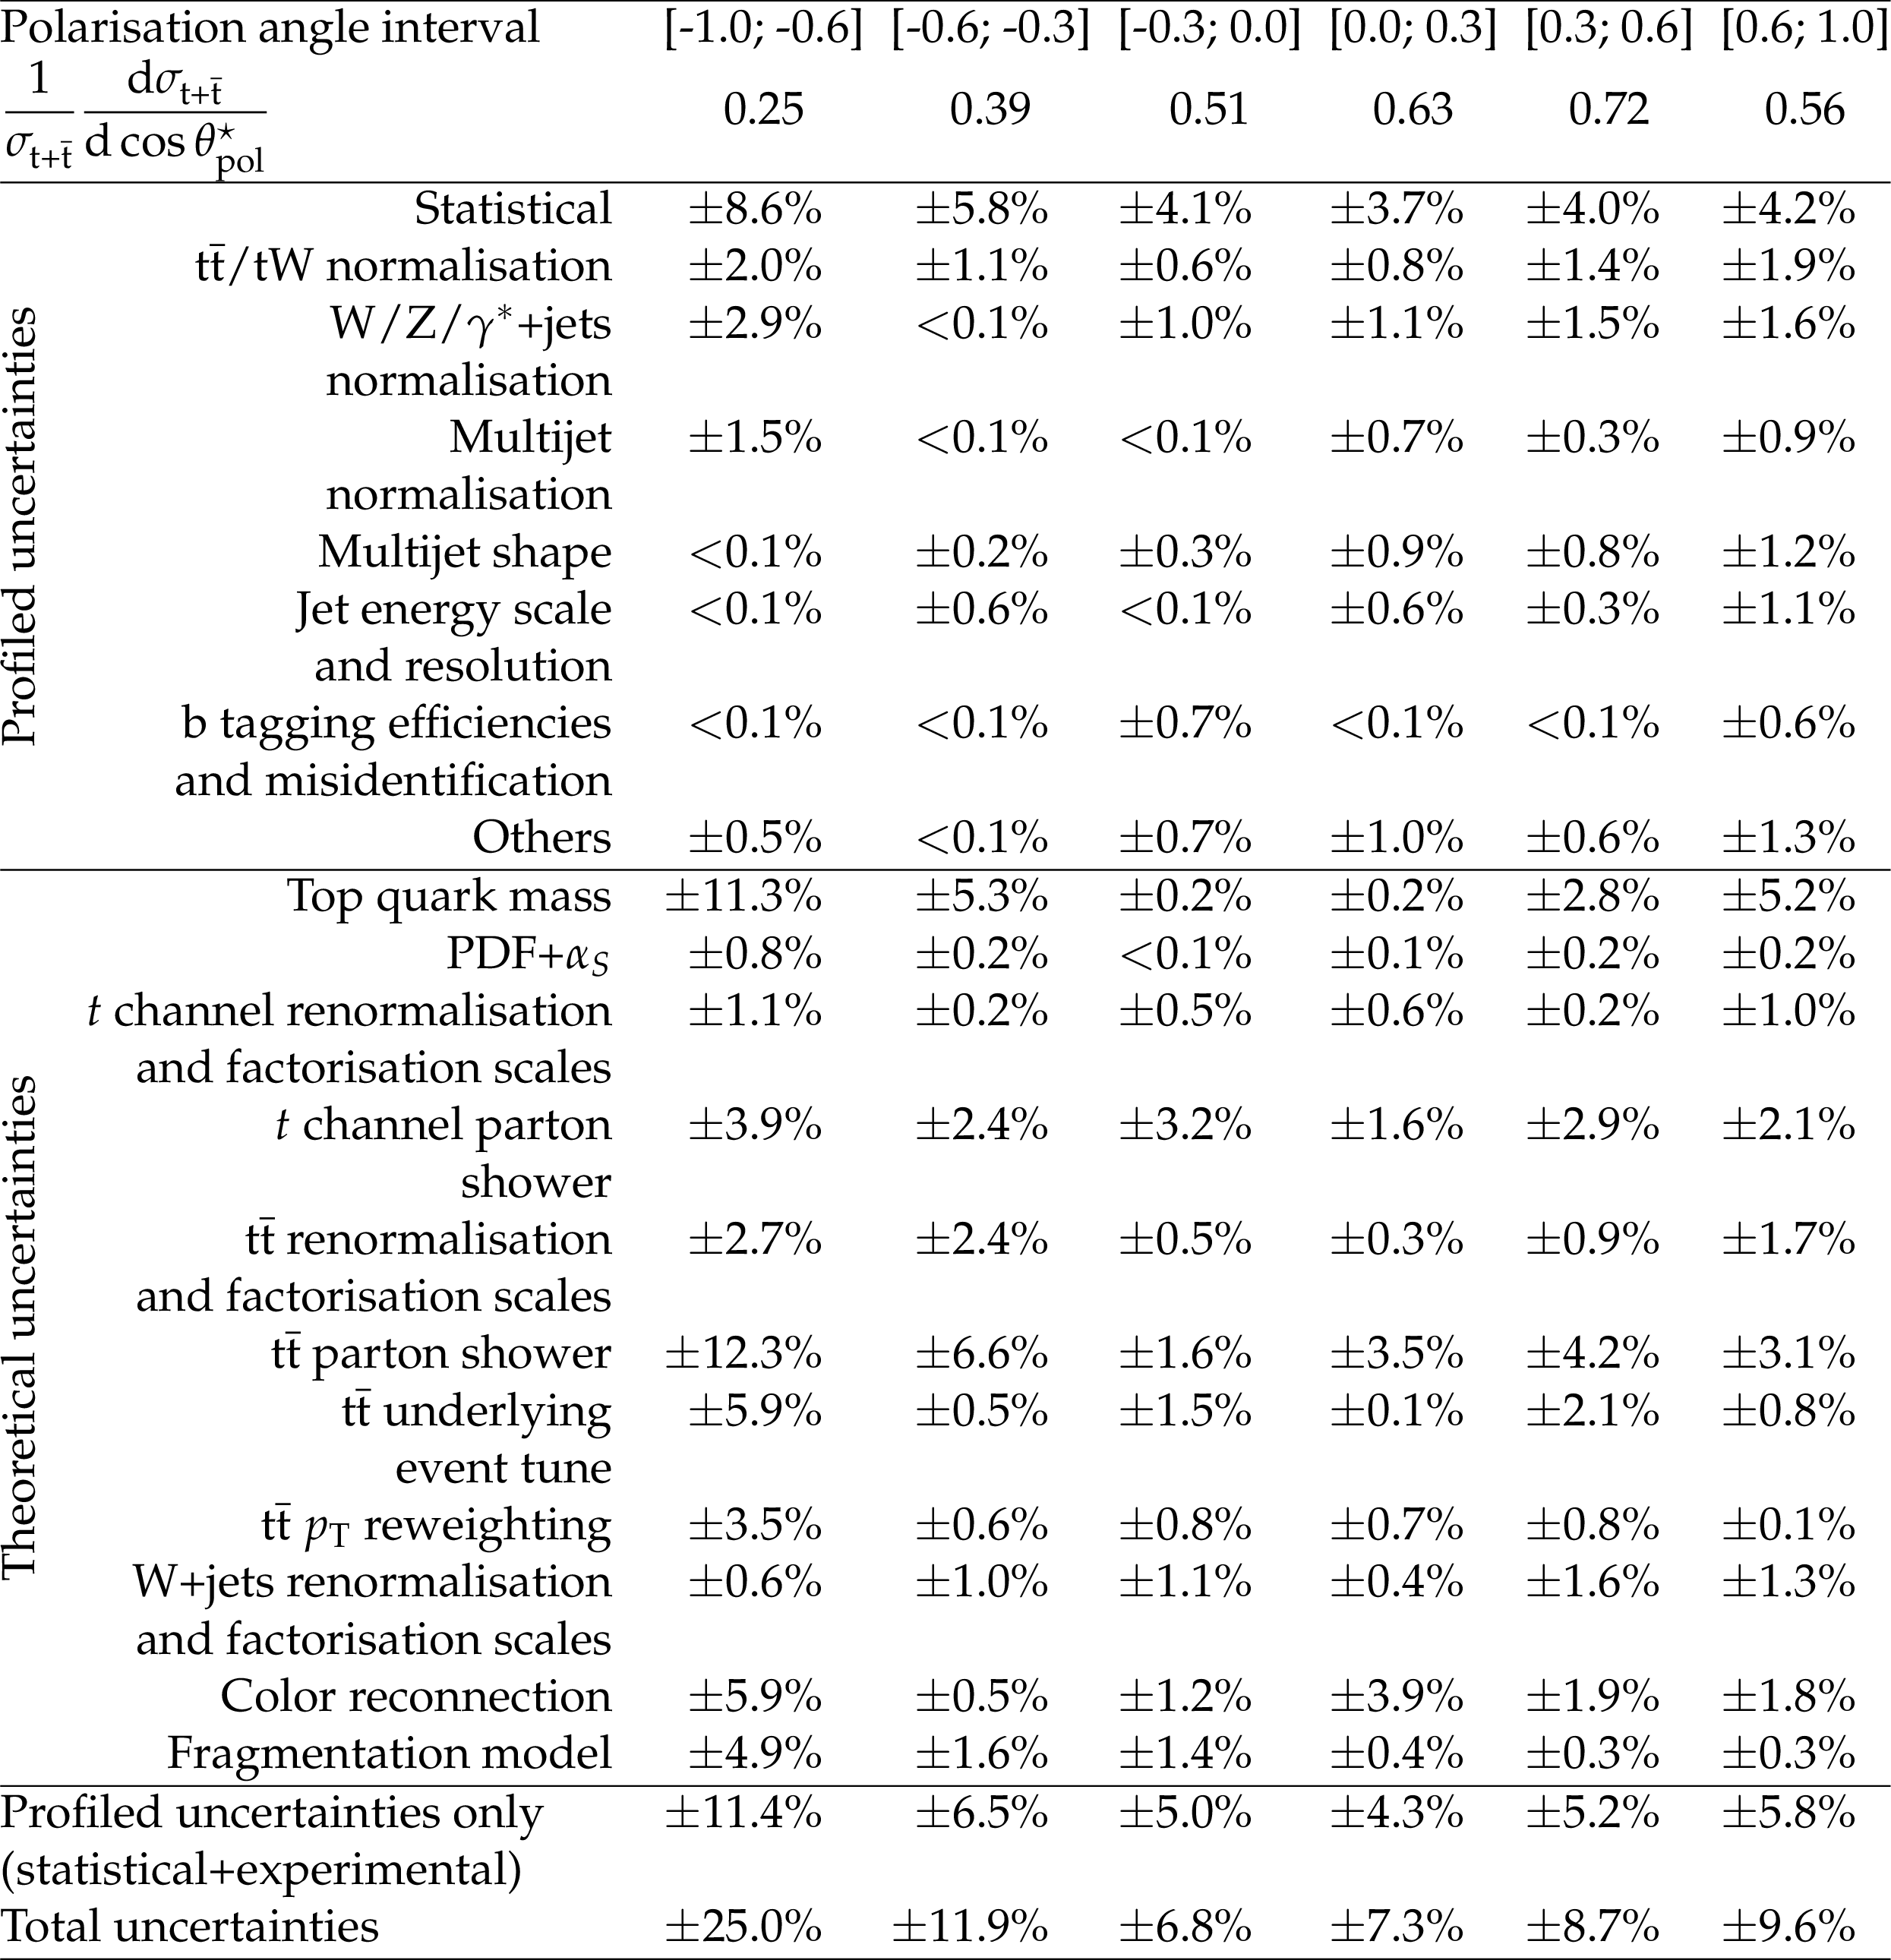
Additional Table 6:
The measured differential absolute cross section in intervals of the polarisation angle at the parton level. A breakdown of the systematic uncertainties is given as well. Minor uncertainties (lepton efficiencies, pileup, and unclustered energy) have been grouped into the "Others'' category. |
png pdf |
Additional Table 7:
The measured differential absolute cross section in intervals of the top quark ${p_{\mathrm {T}}}$ at the particle level. A breakdown of the systematic uncertainties is given as well. Minor uncertainties (lepton efficiencies, pileup, and unclustered energy) have been grouped into the "Others'' category. |
png pdf |
Additional Table 8:
The measured differential absolute cross section in intervals of the top quark rapidity at the particle level. A breakdown of the systematic uncertainties is given as well. Minor uncertainties (lepton efficiencies, pileup, and unclustered energy) have been grouped into the "Others'' category. |
png pdf |
Additional Table 9:
The measured differential absolute cross section in intervals of the charged lepton ${p_{\mathrm {T}}}$ at the particle level. A breakdown of the systematic uncertainties is given as well. Minor uncertainties (lepton efficiencies, pileup, and unclustered energy) have been grouped into the "Others'' category. |
png pdf |
Additional Table 10:
The measured differential absolute cross section in intervals of the charged lepton rapidity at the particle level. A breakdown of the systematic uncertainties is given as well. Minor uncertainties (lepton efficiencies, pileup, and unclustered energy) have been grouped into the "Others'' category. |
png pdf |
Additional Table 11:
The measured differential absolute cross section in intervals of the W boson ${p_{\mathrm {T}}}$ at the particle level. A breakdown of the systematic uncertainties is given as well. Minor uncertainties (lepton efficiencies, pileup, and unclustered energy) have been grouped into the "Others'' category. |
png pdf |
Additional Table 12:
The measured differential absolute cross section in intervals of the polarisation angle at the particle level. A breakdown of the systematic uncertainties is given as well. Minor uncertainties (lepton efficiencies, pileup, and unclustered energy) have been grouped into the "Others'' category. |
png pdf |
Additional Table 13:
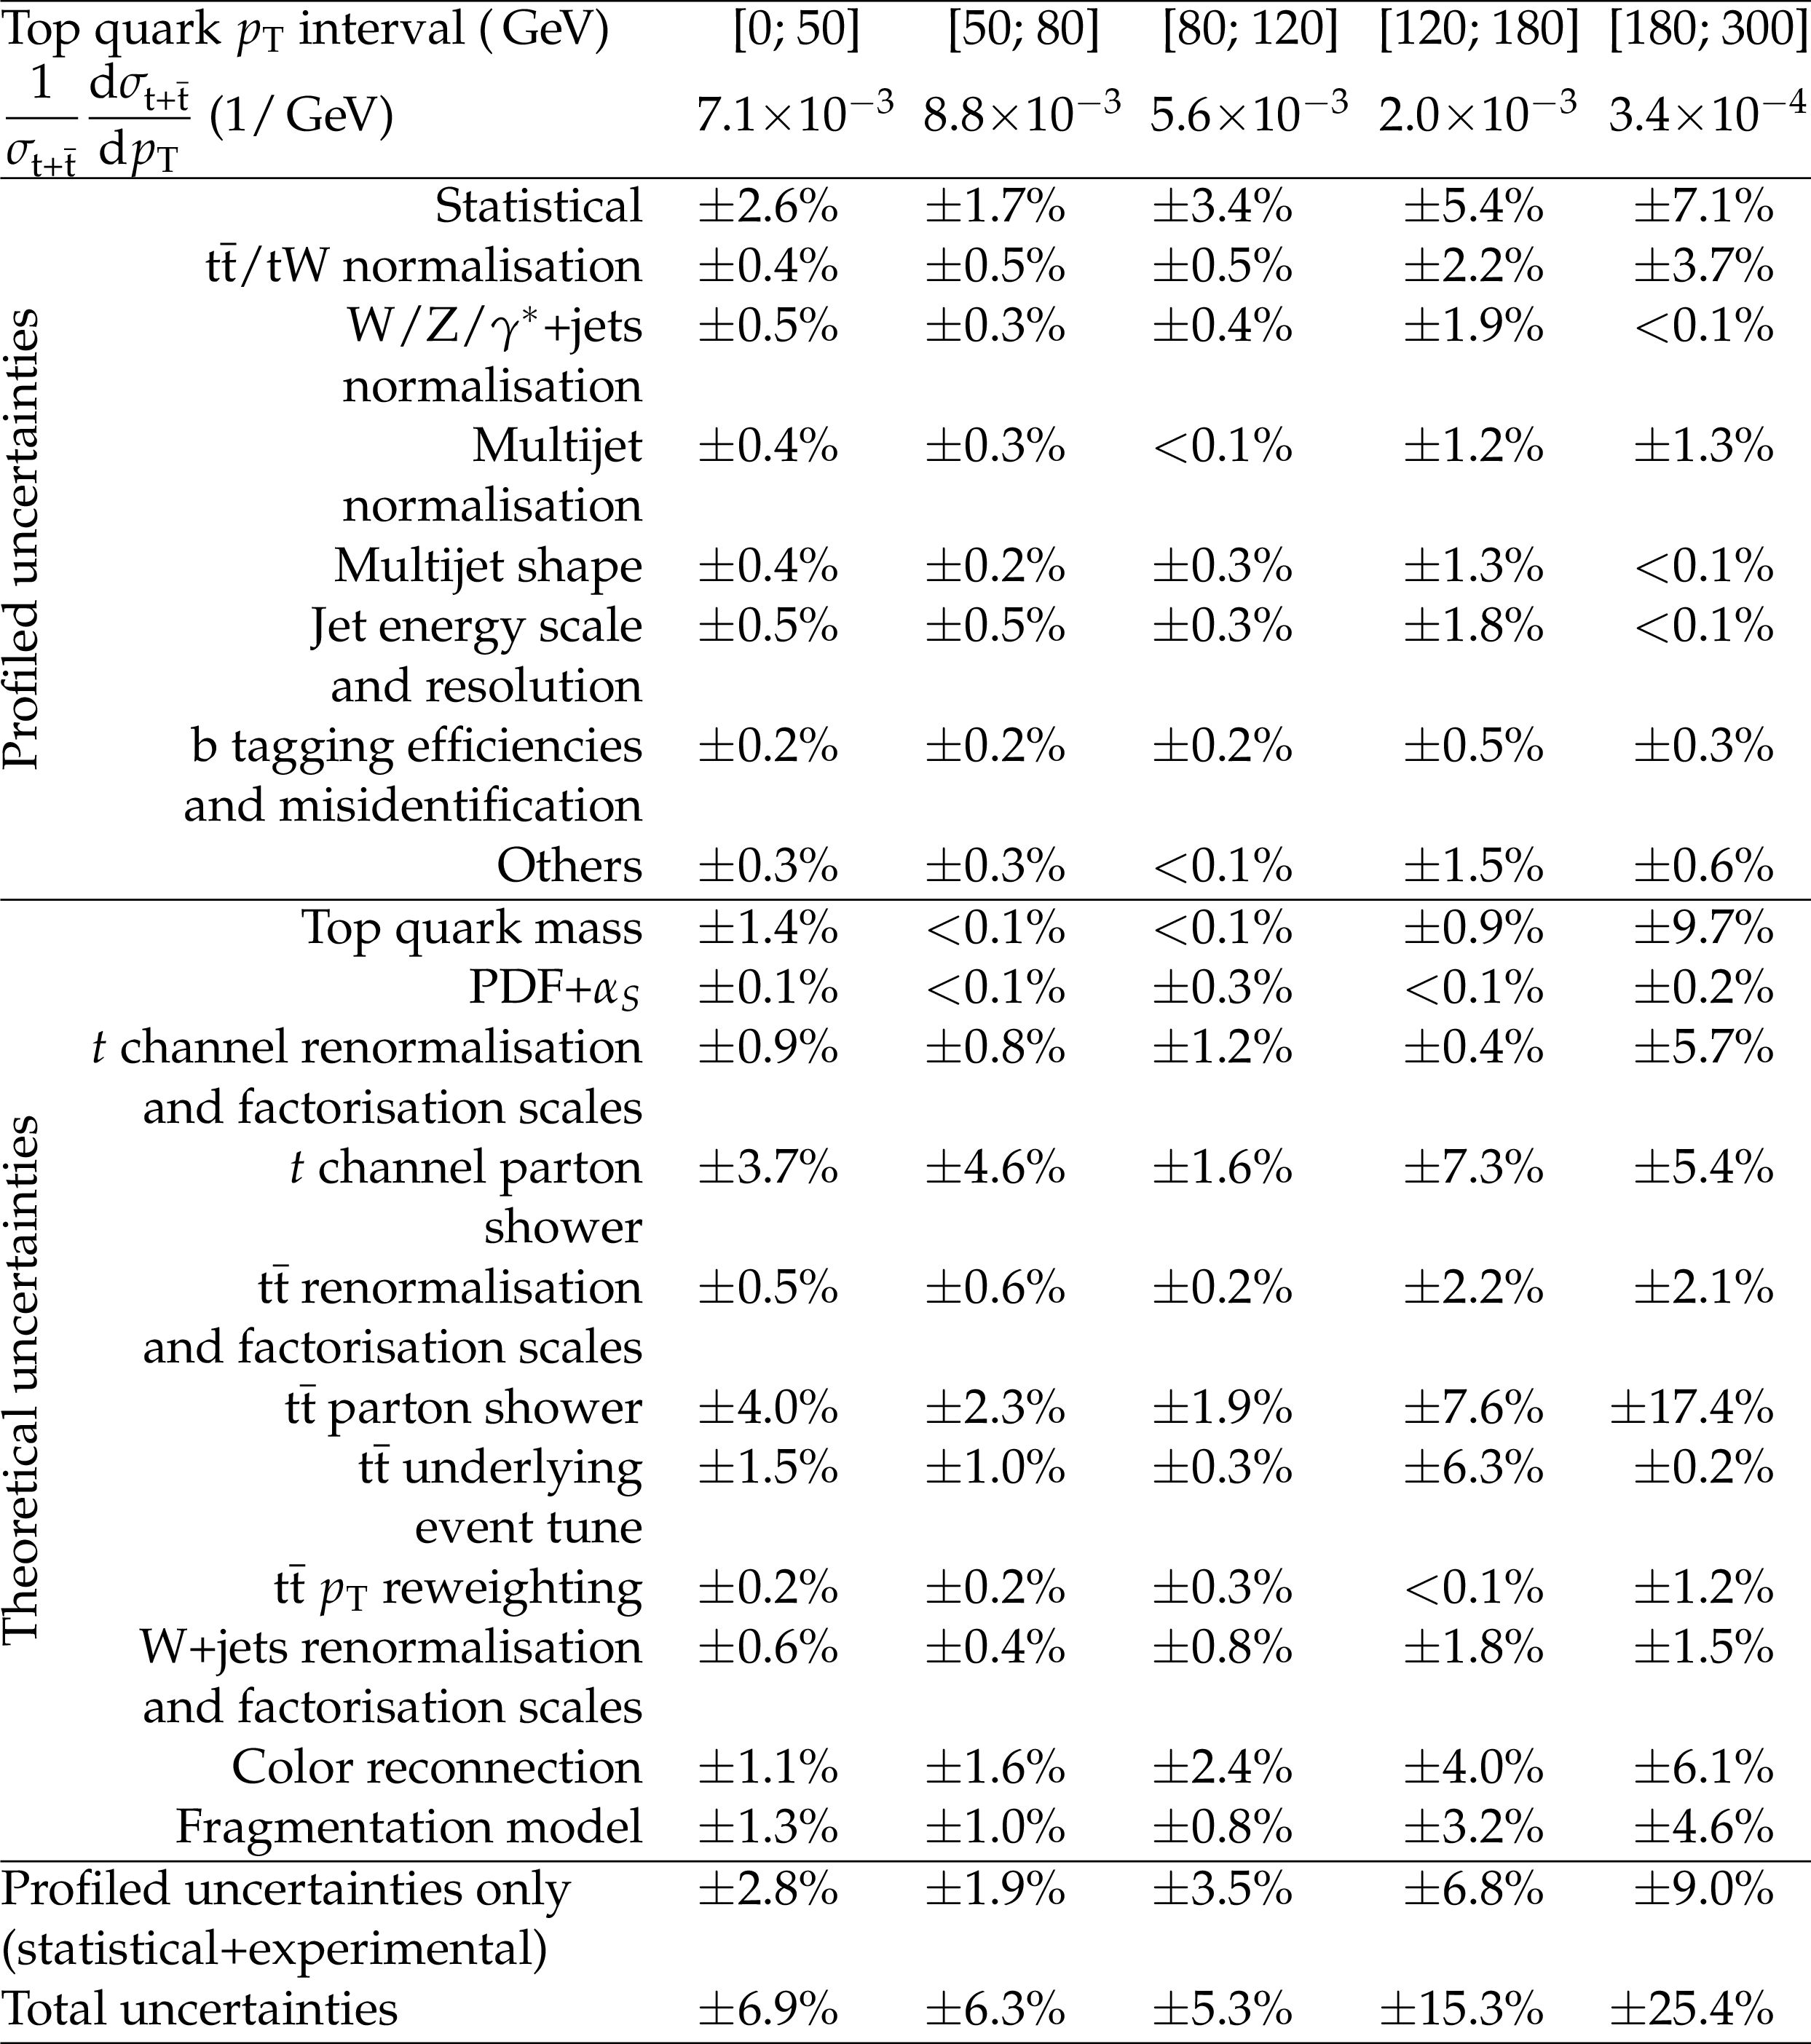
The measured differential normalised coss section in intervals of top quark ${p_{\mathrm {T}}}$ at the parton level. A breakdown of the systematic uncertainties is given as well. Minor uncertainties (lepton efficiencies, pileup, and unclustered energy) have been grouped into the "Others'' category. |
png pdf |
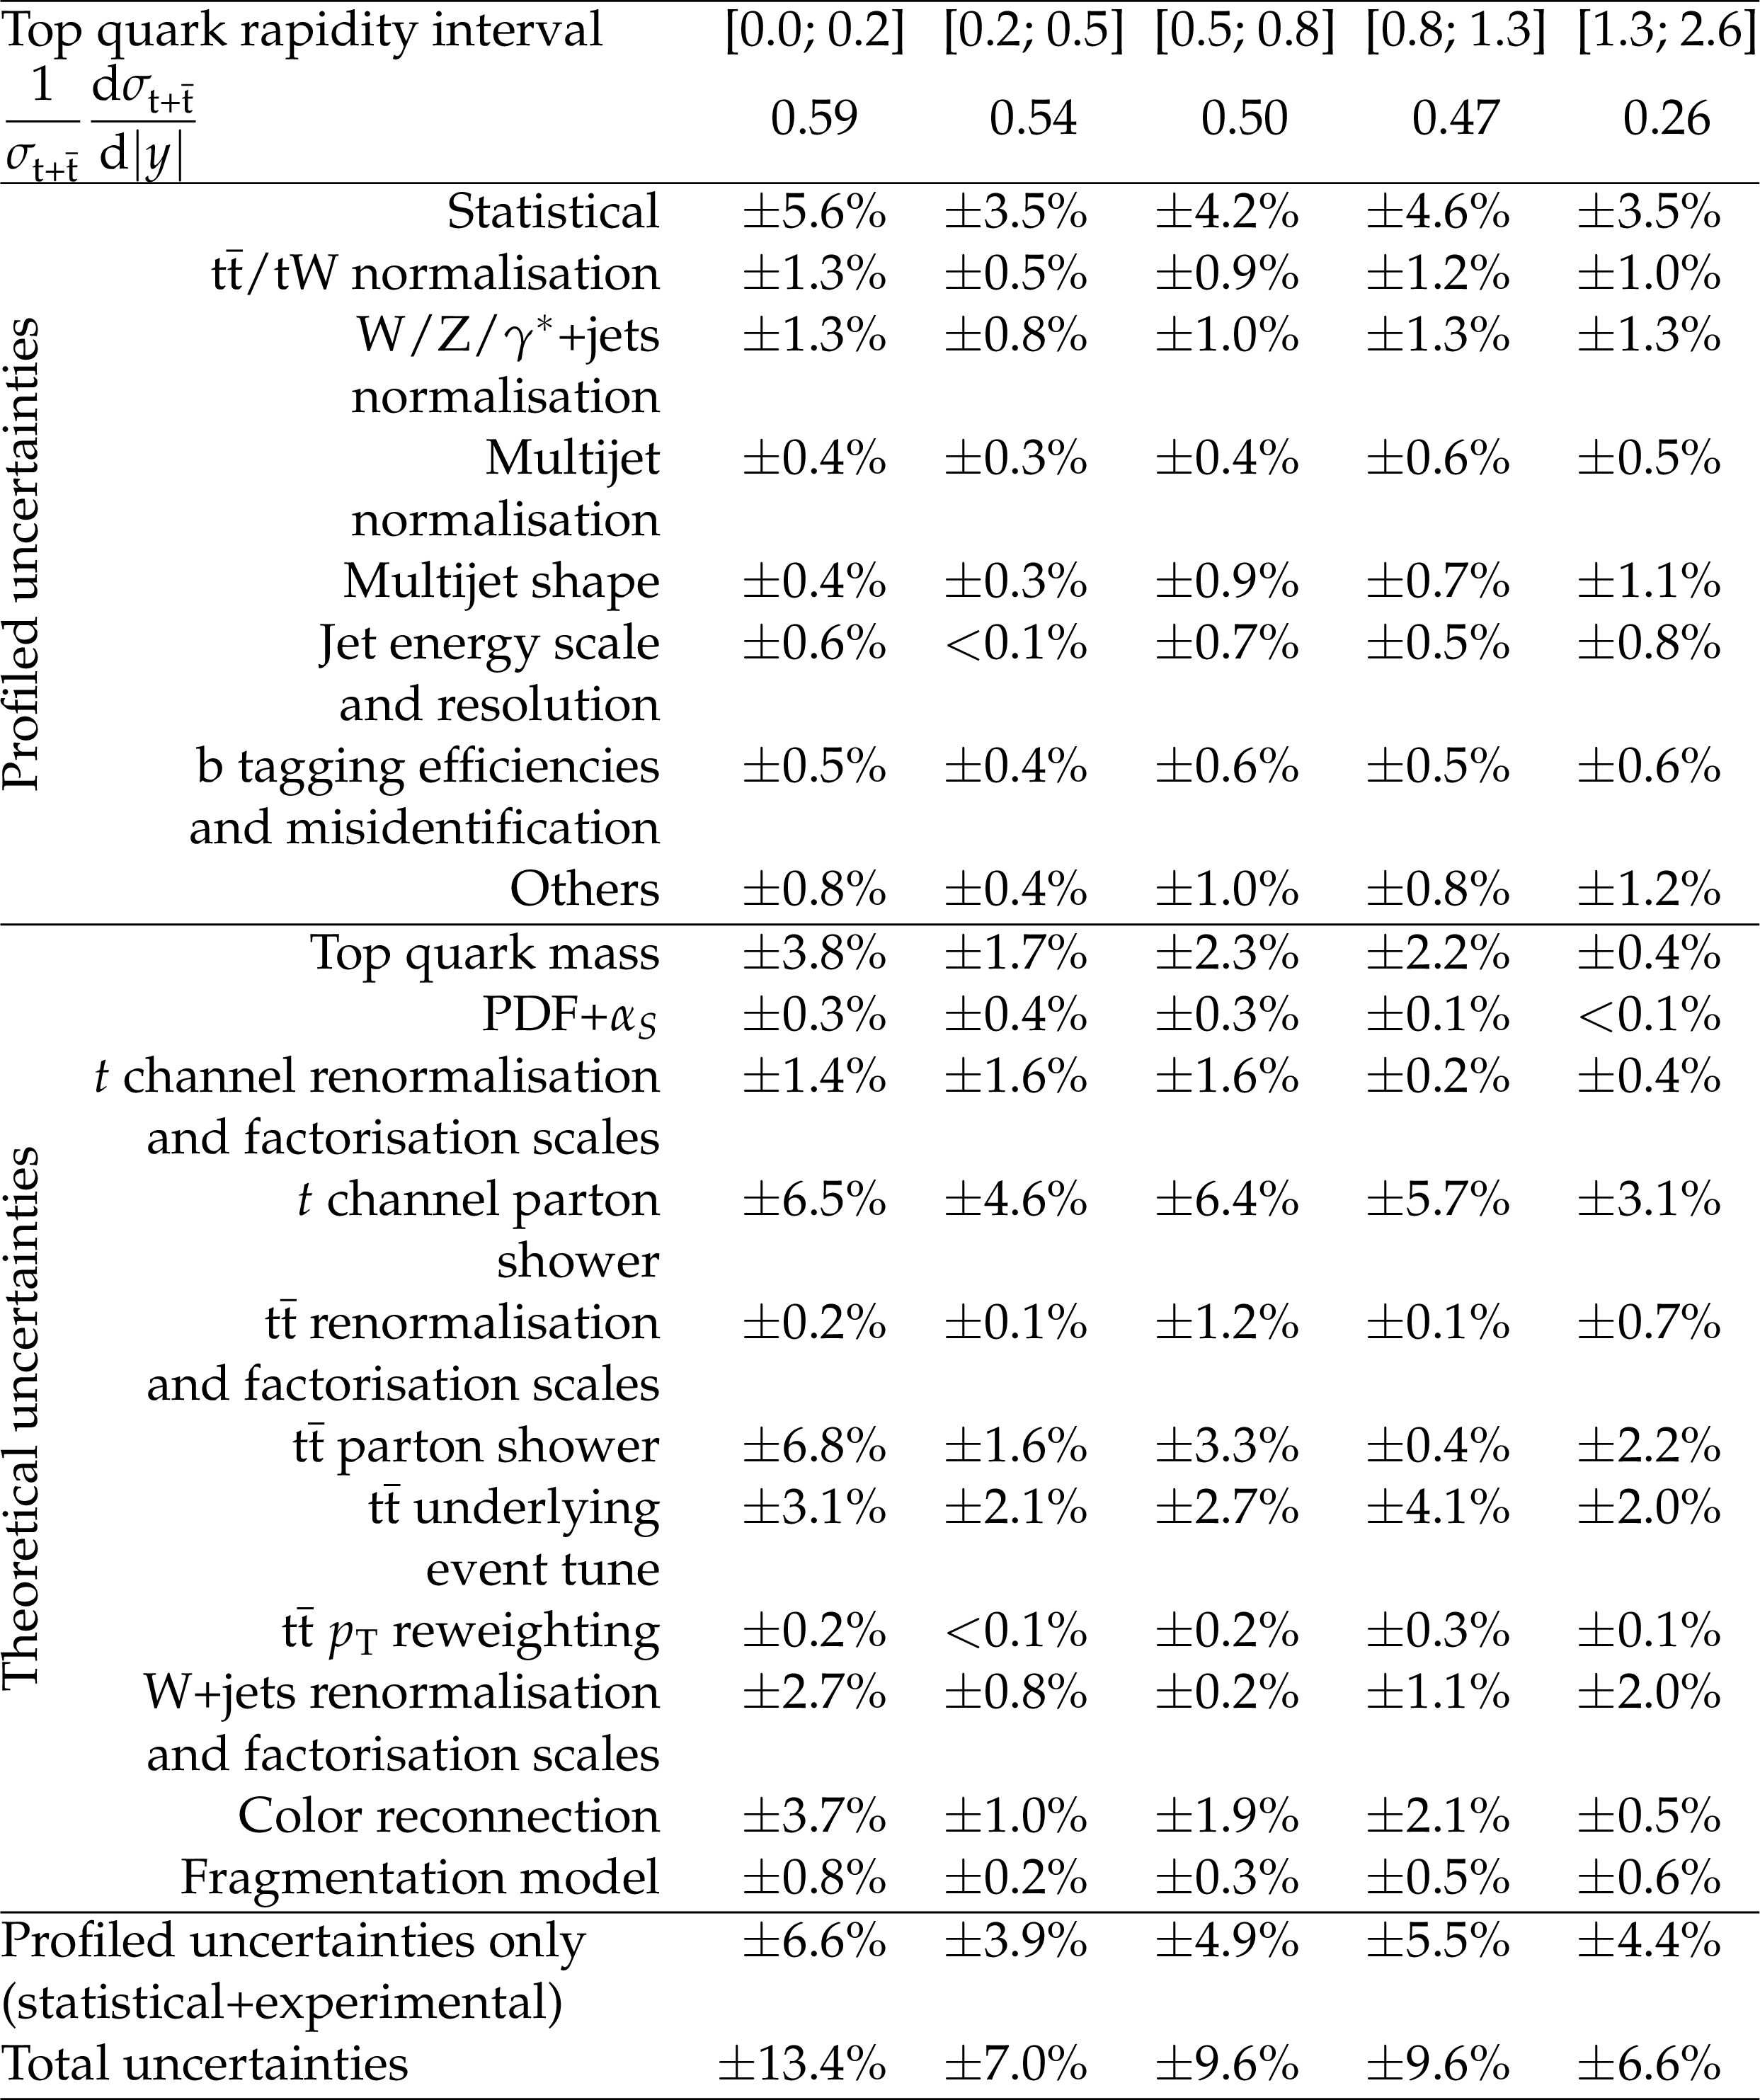
Additional Table 14:
The measured differential normalised coss section in intervals of top quark rapidity at the parton level. A breakdown of the systematic uncertainties is given as well. Minor uncertainties (lepton efficiencies, pileup, and unclustered energy) have been grouped into the "Others'' category. |
png pdf |
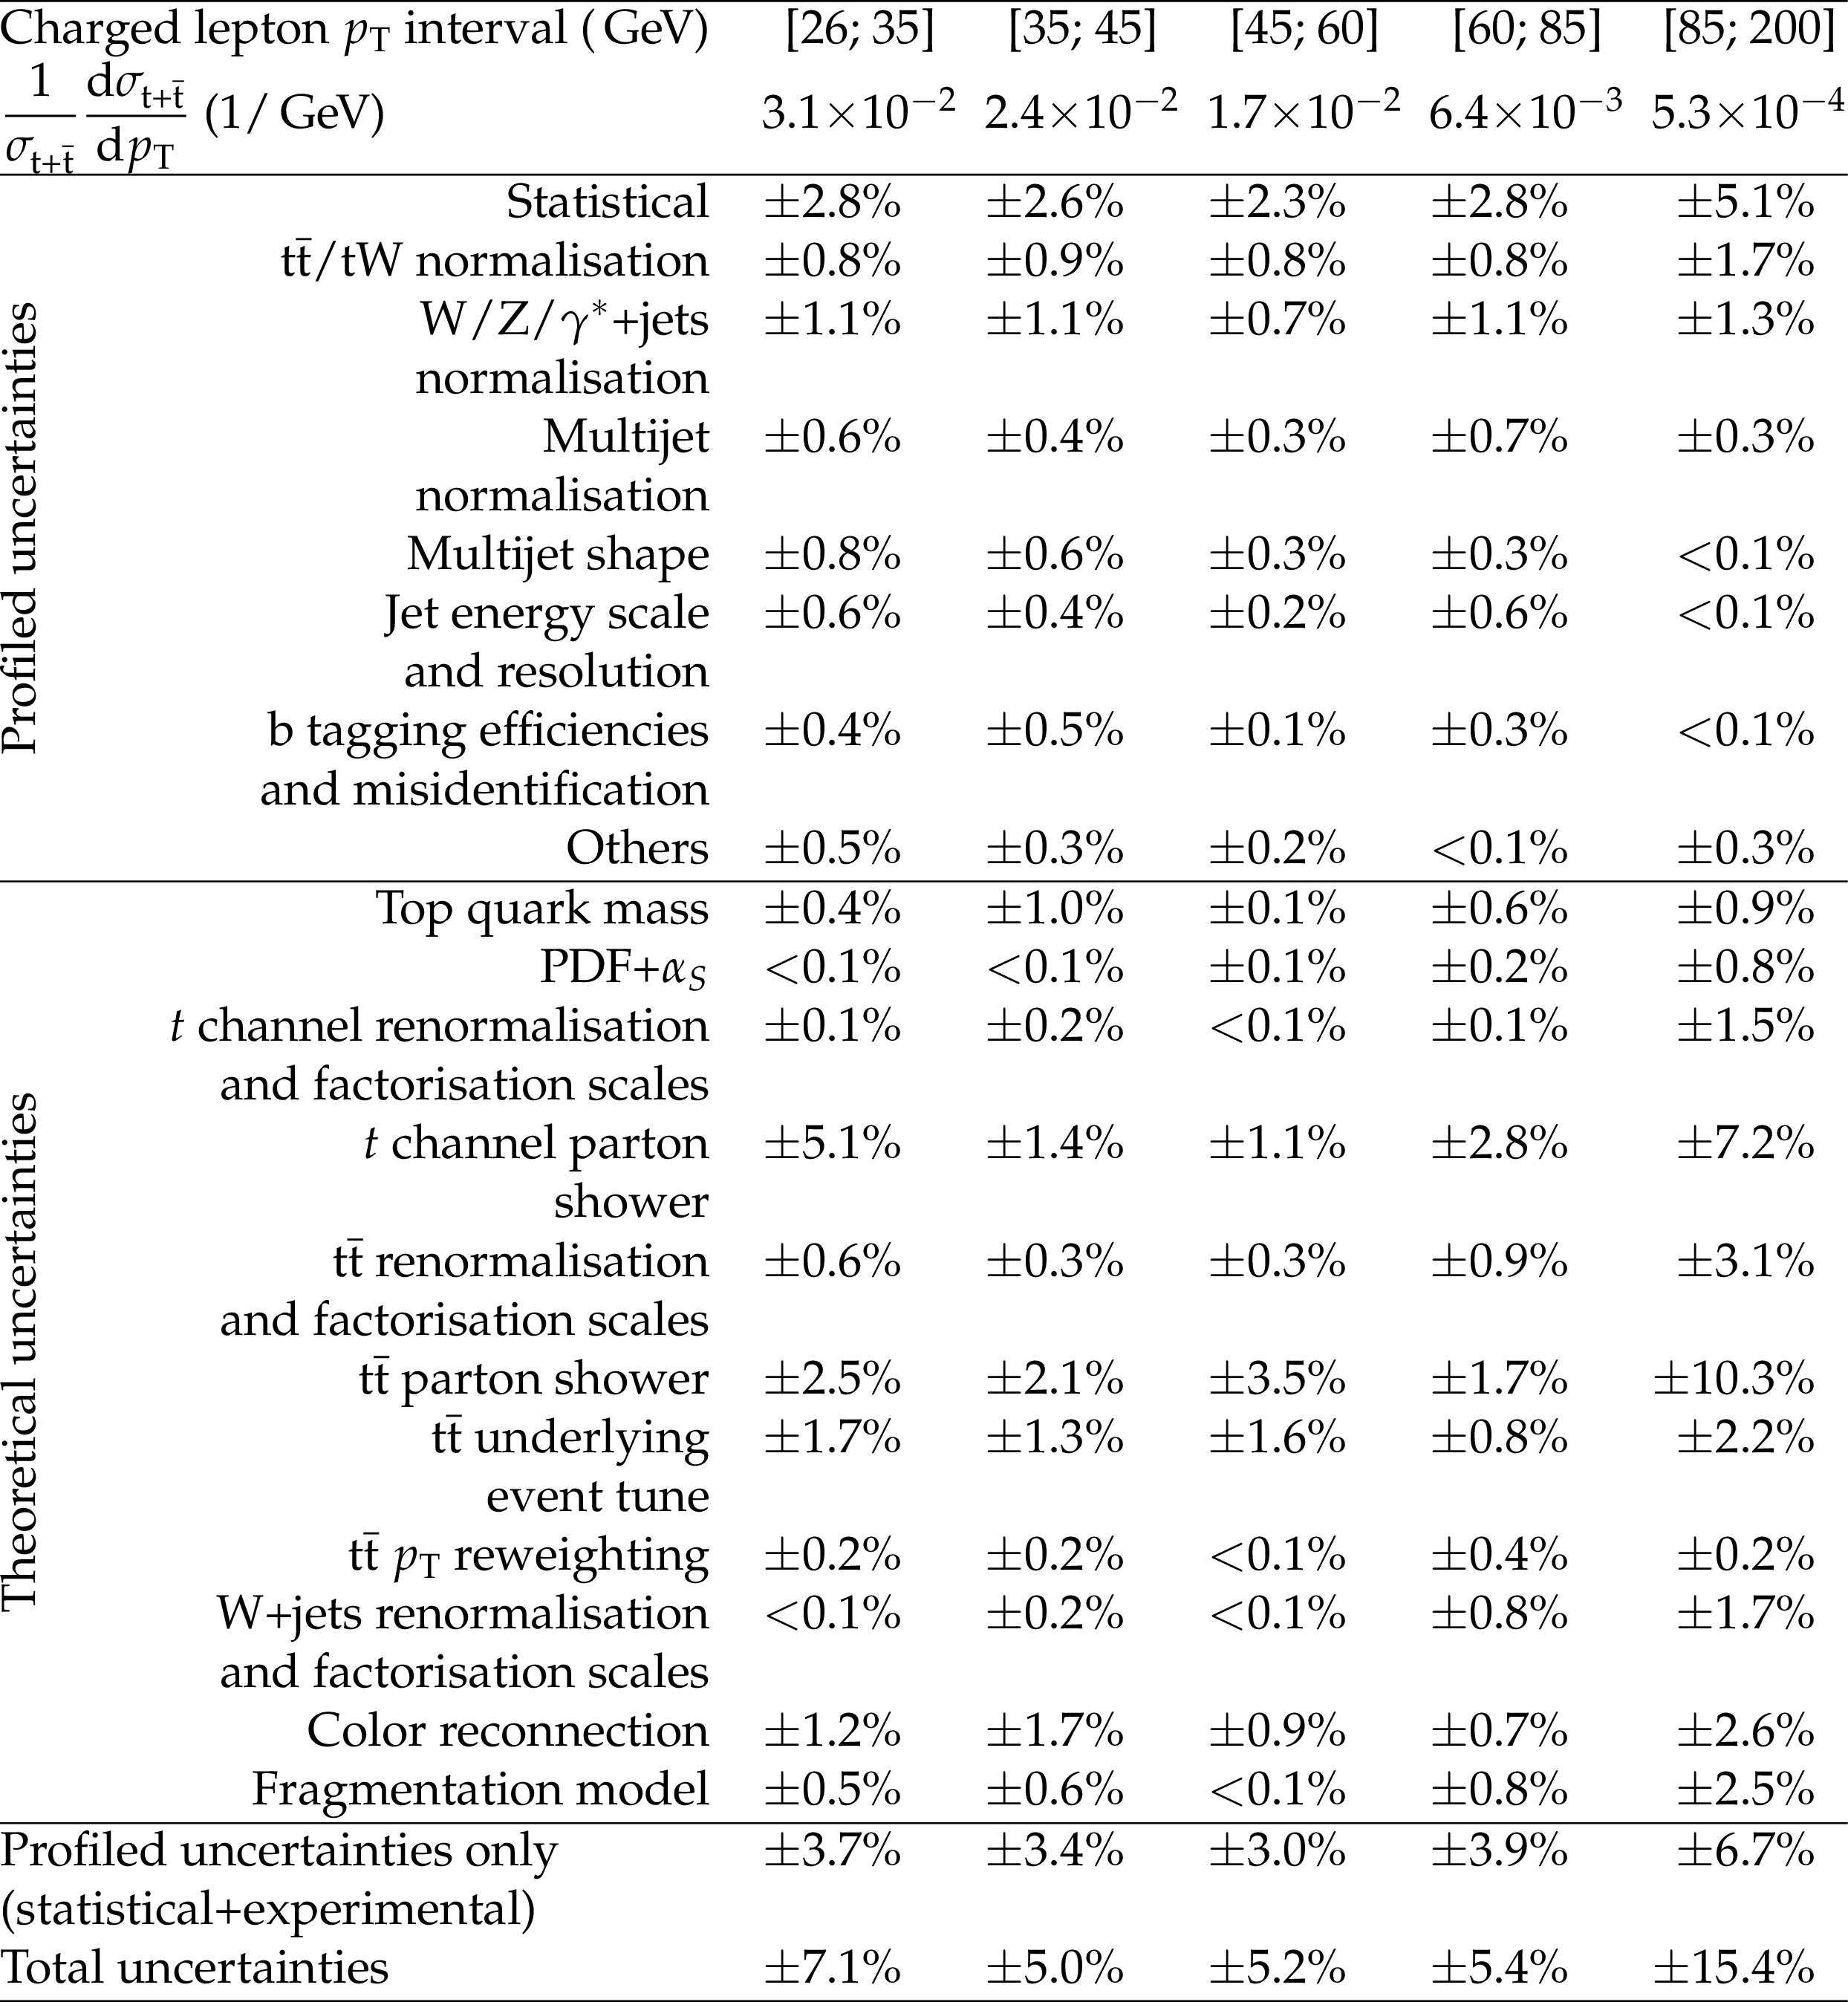
Additional Table 15:
The measured differential normalised coss section in intervals of charged lepton ${p_{\mathrm {T}}}$ at the parton level. A breakdown of the systematic uncertainties is given as well. Minor uncertainties (lepton efficiencies, pileup, and unclustered energy) have been grouped into the "Others'' category. |
png pdf |
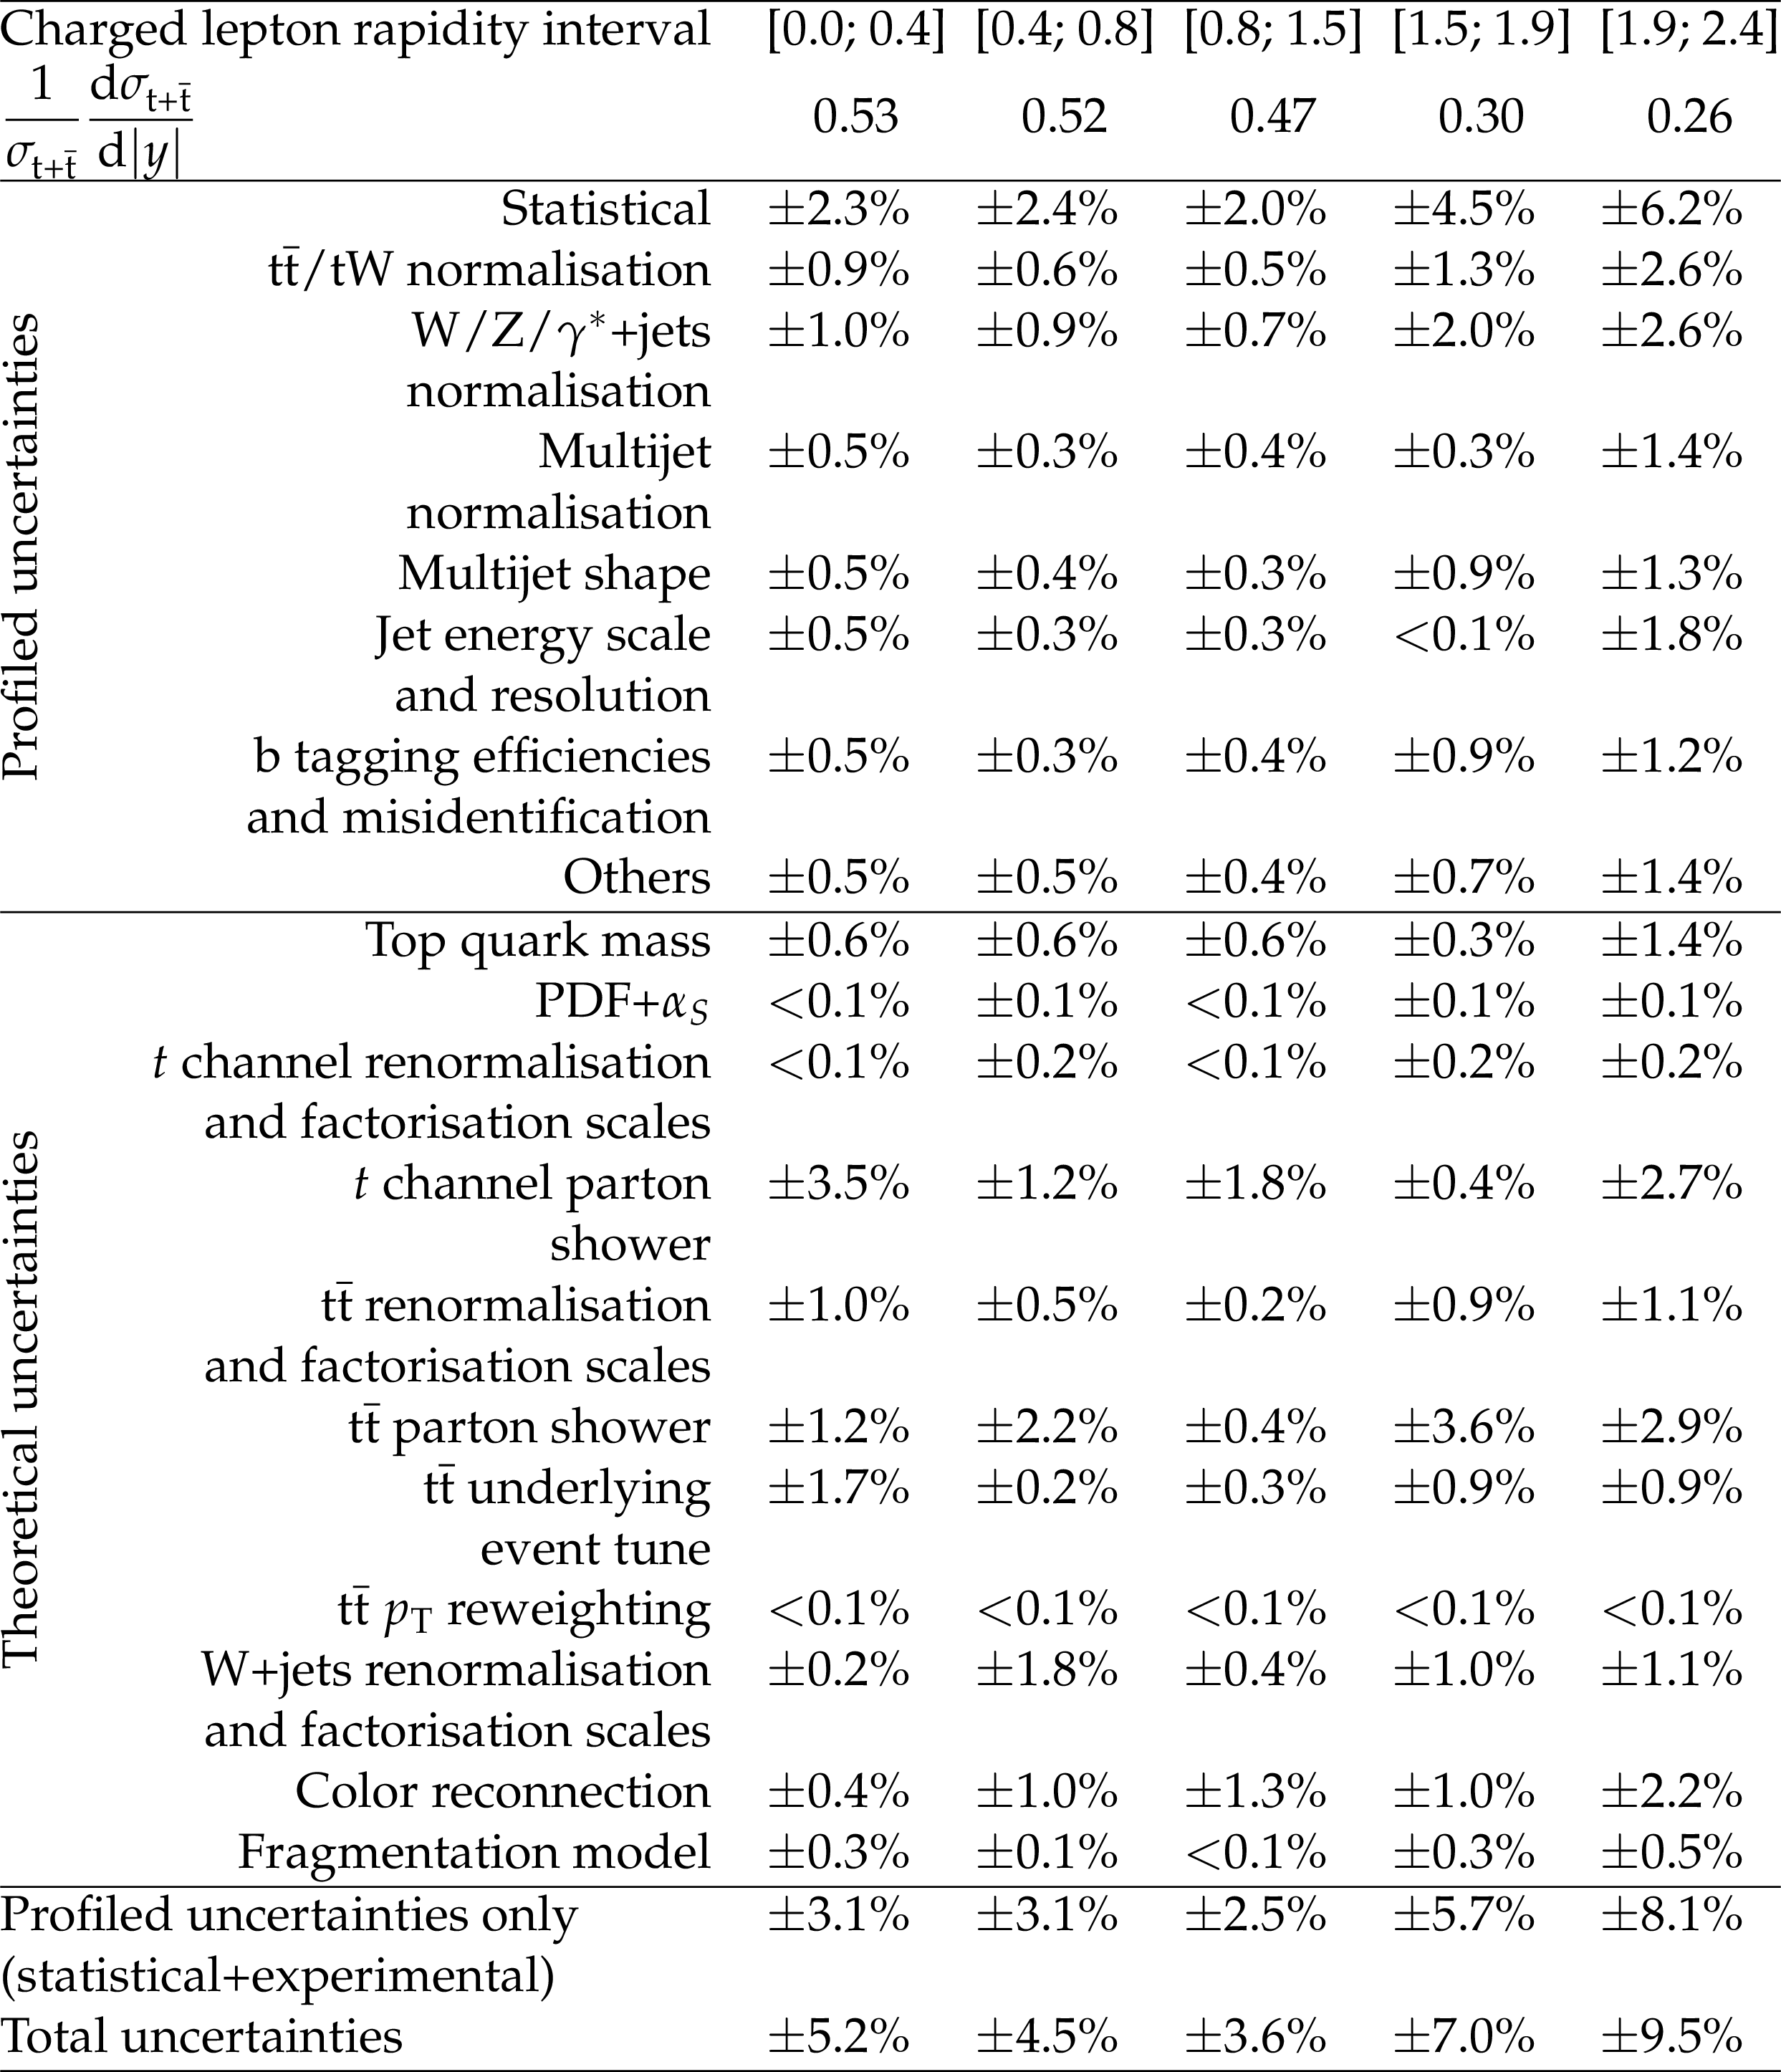
Additional Table 16:
The measured differential normalised coss section in intervals of charged lepton rapidity at the parton level. A breakdown of the systematic uncertainties is given as well. Minor uncertainties (lepton efficiencies, pileup, and unclustered energy) have been grouped into the "Others'' category. |

png pdf |
Additional Table 17:
The measured differential normalised coss section in intervals of W boson ${p_{\mathrm {T}}}$ at the parton level. A breakdown of the systematic uncertainties is given as well. Minor uncertainties (lepton efficiencies, pileup, and unclustered energy) have been grouped into the "Others'' category. |
png pdf |
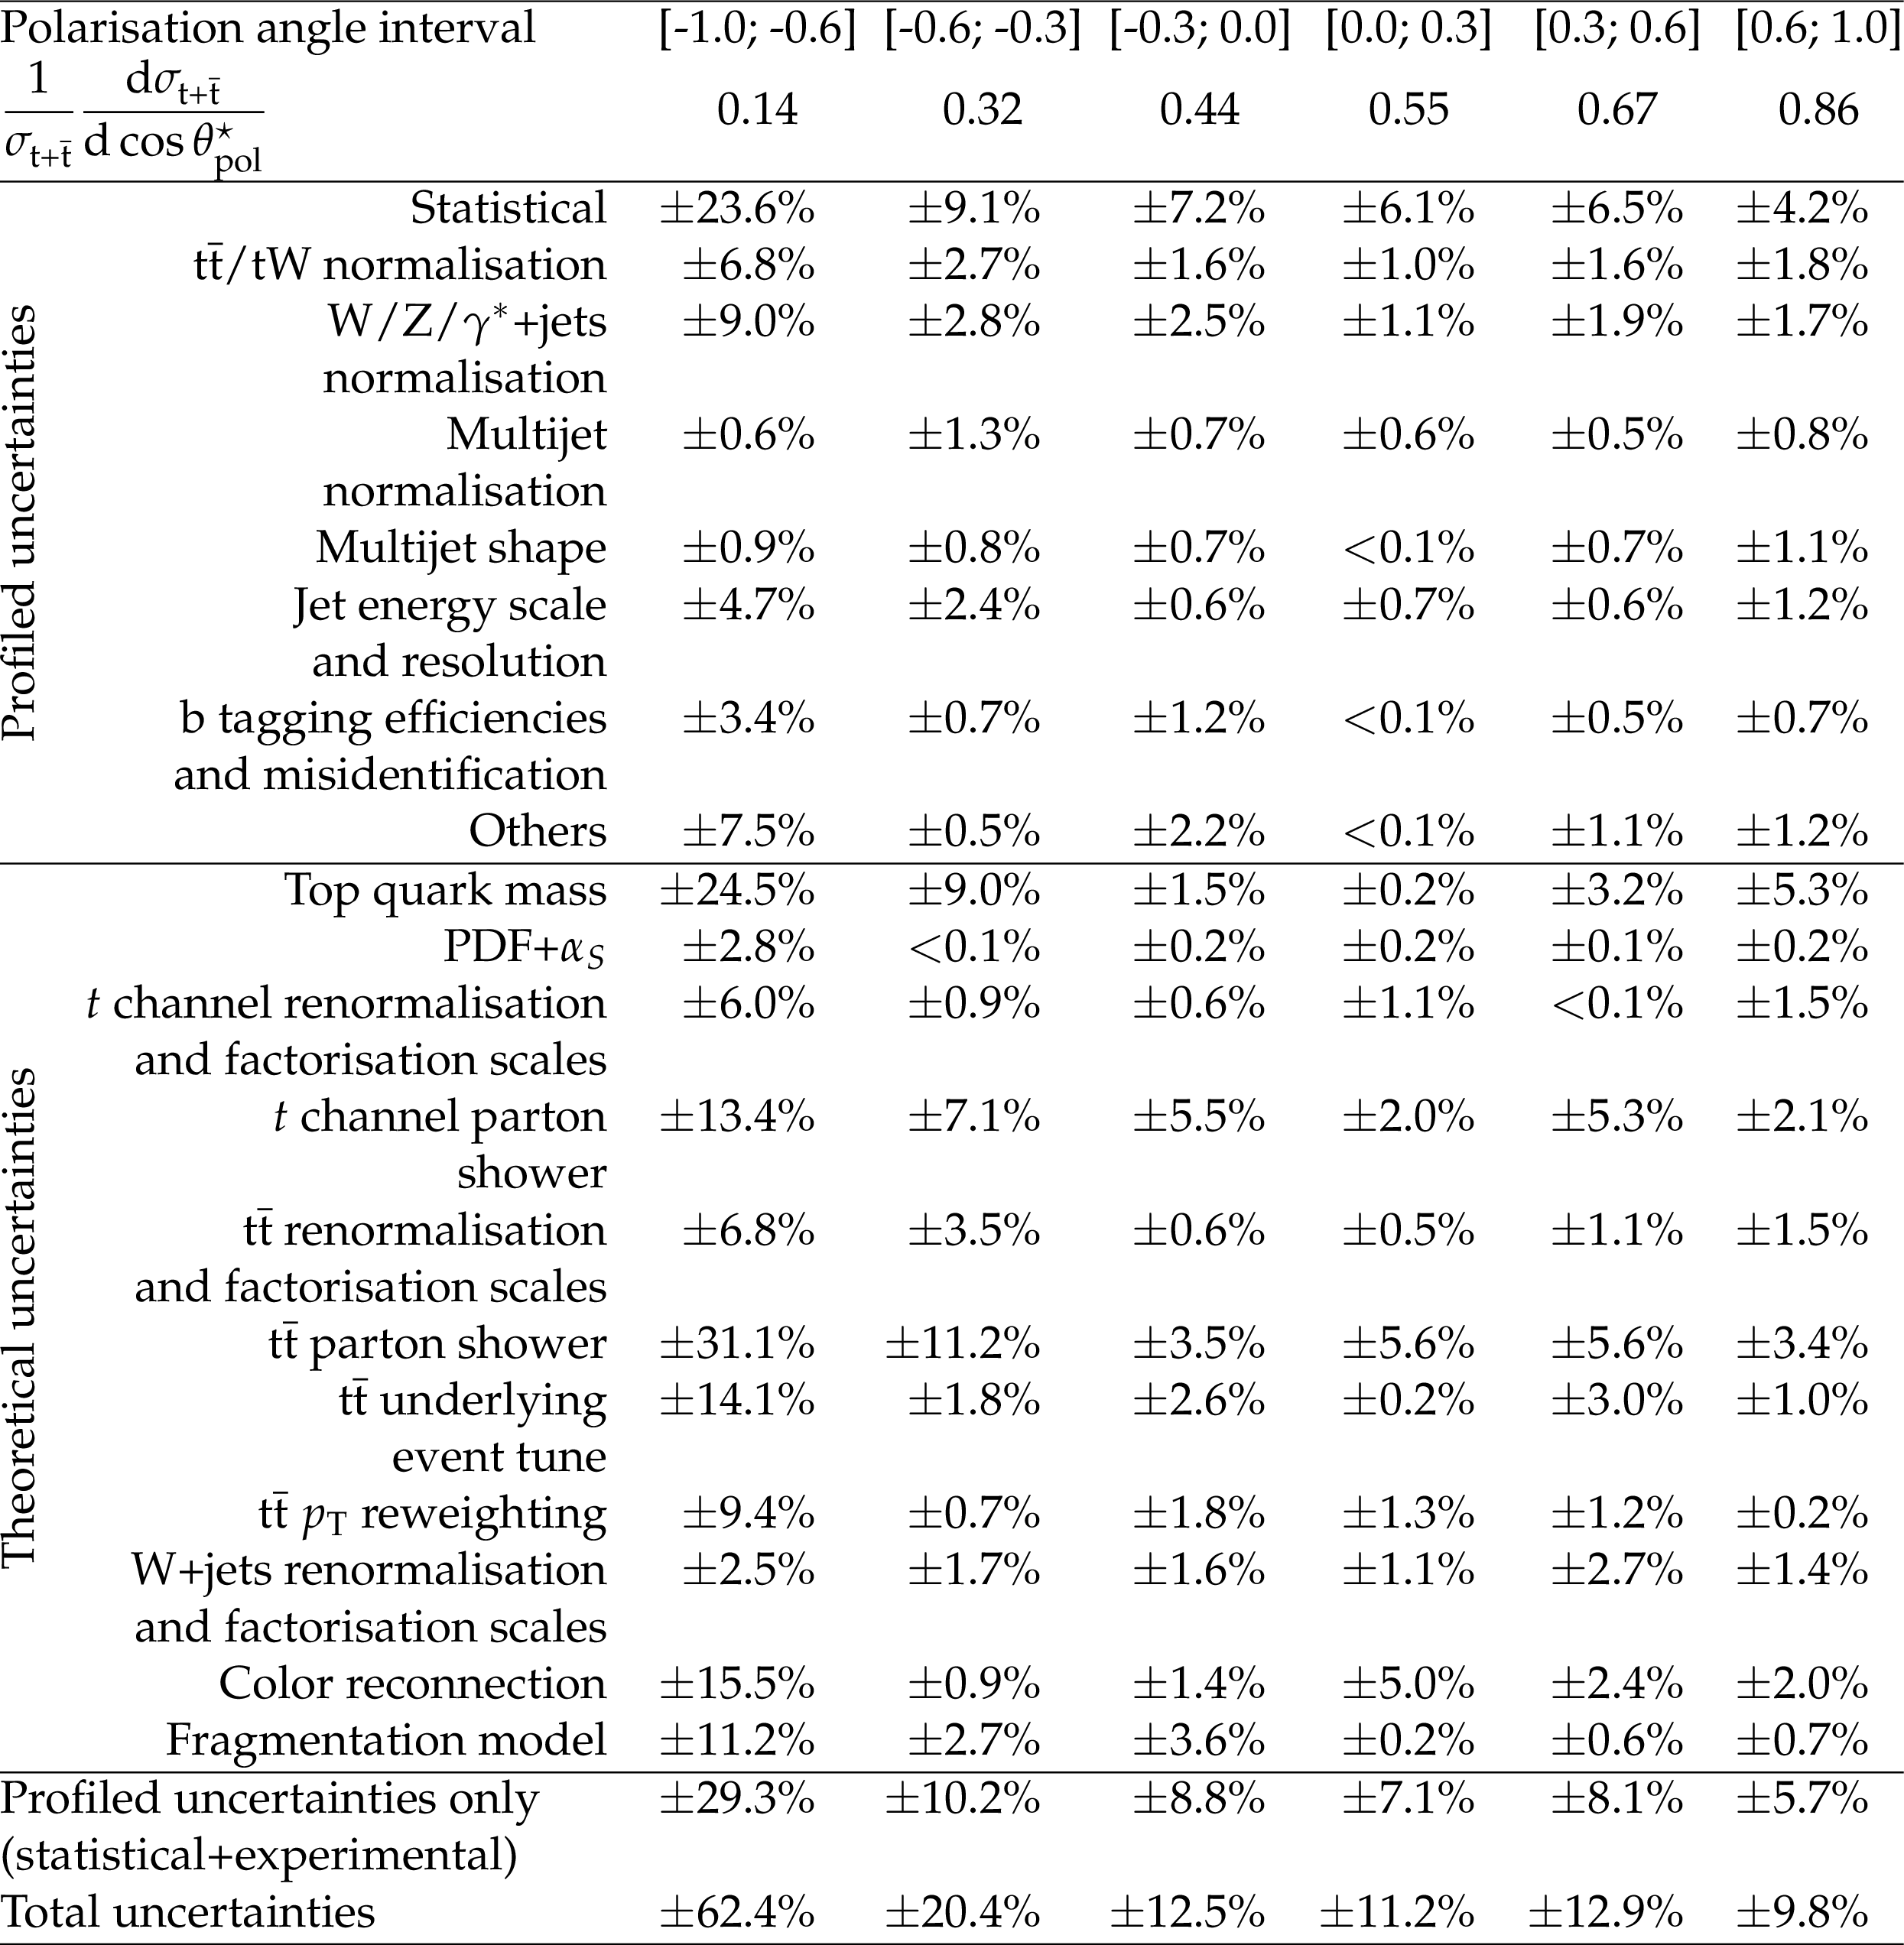
Additional Table 18:
The measured differential normalised coss section in intervals of polarisation angle at the parton level. A breakdown of the systematic uncertainties is given as well. Minor uncertainties (lepton efficiencies, pileup, and unclustered energy) have been grouped into the "Others'' category. |

png pdf |
Additional Table 19:
The measured differential normalised coss section in intervals of top quark ${p_{\mathrm {T}}}$ at the particle level. A breakdown of the systematic uncertainties is given as well. Minor uncertainties (lepton efficiencies, pileup, and unclustered energy) have been grouped into the "Others'' category. |

png pdf |
Additional Table 20:
The measured differential normalised coss section in intervals of top quark rapidity at the particle level. A breakdown of the systematic uncertainties is given as well. Minor uncertainties (lepton efficiencies, pileup, and unclustered energy) have been grouped into the "Others'' category. |
png pdf |
Additional Table 21:
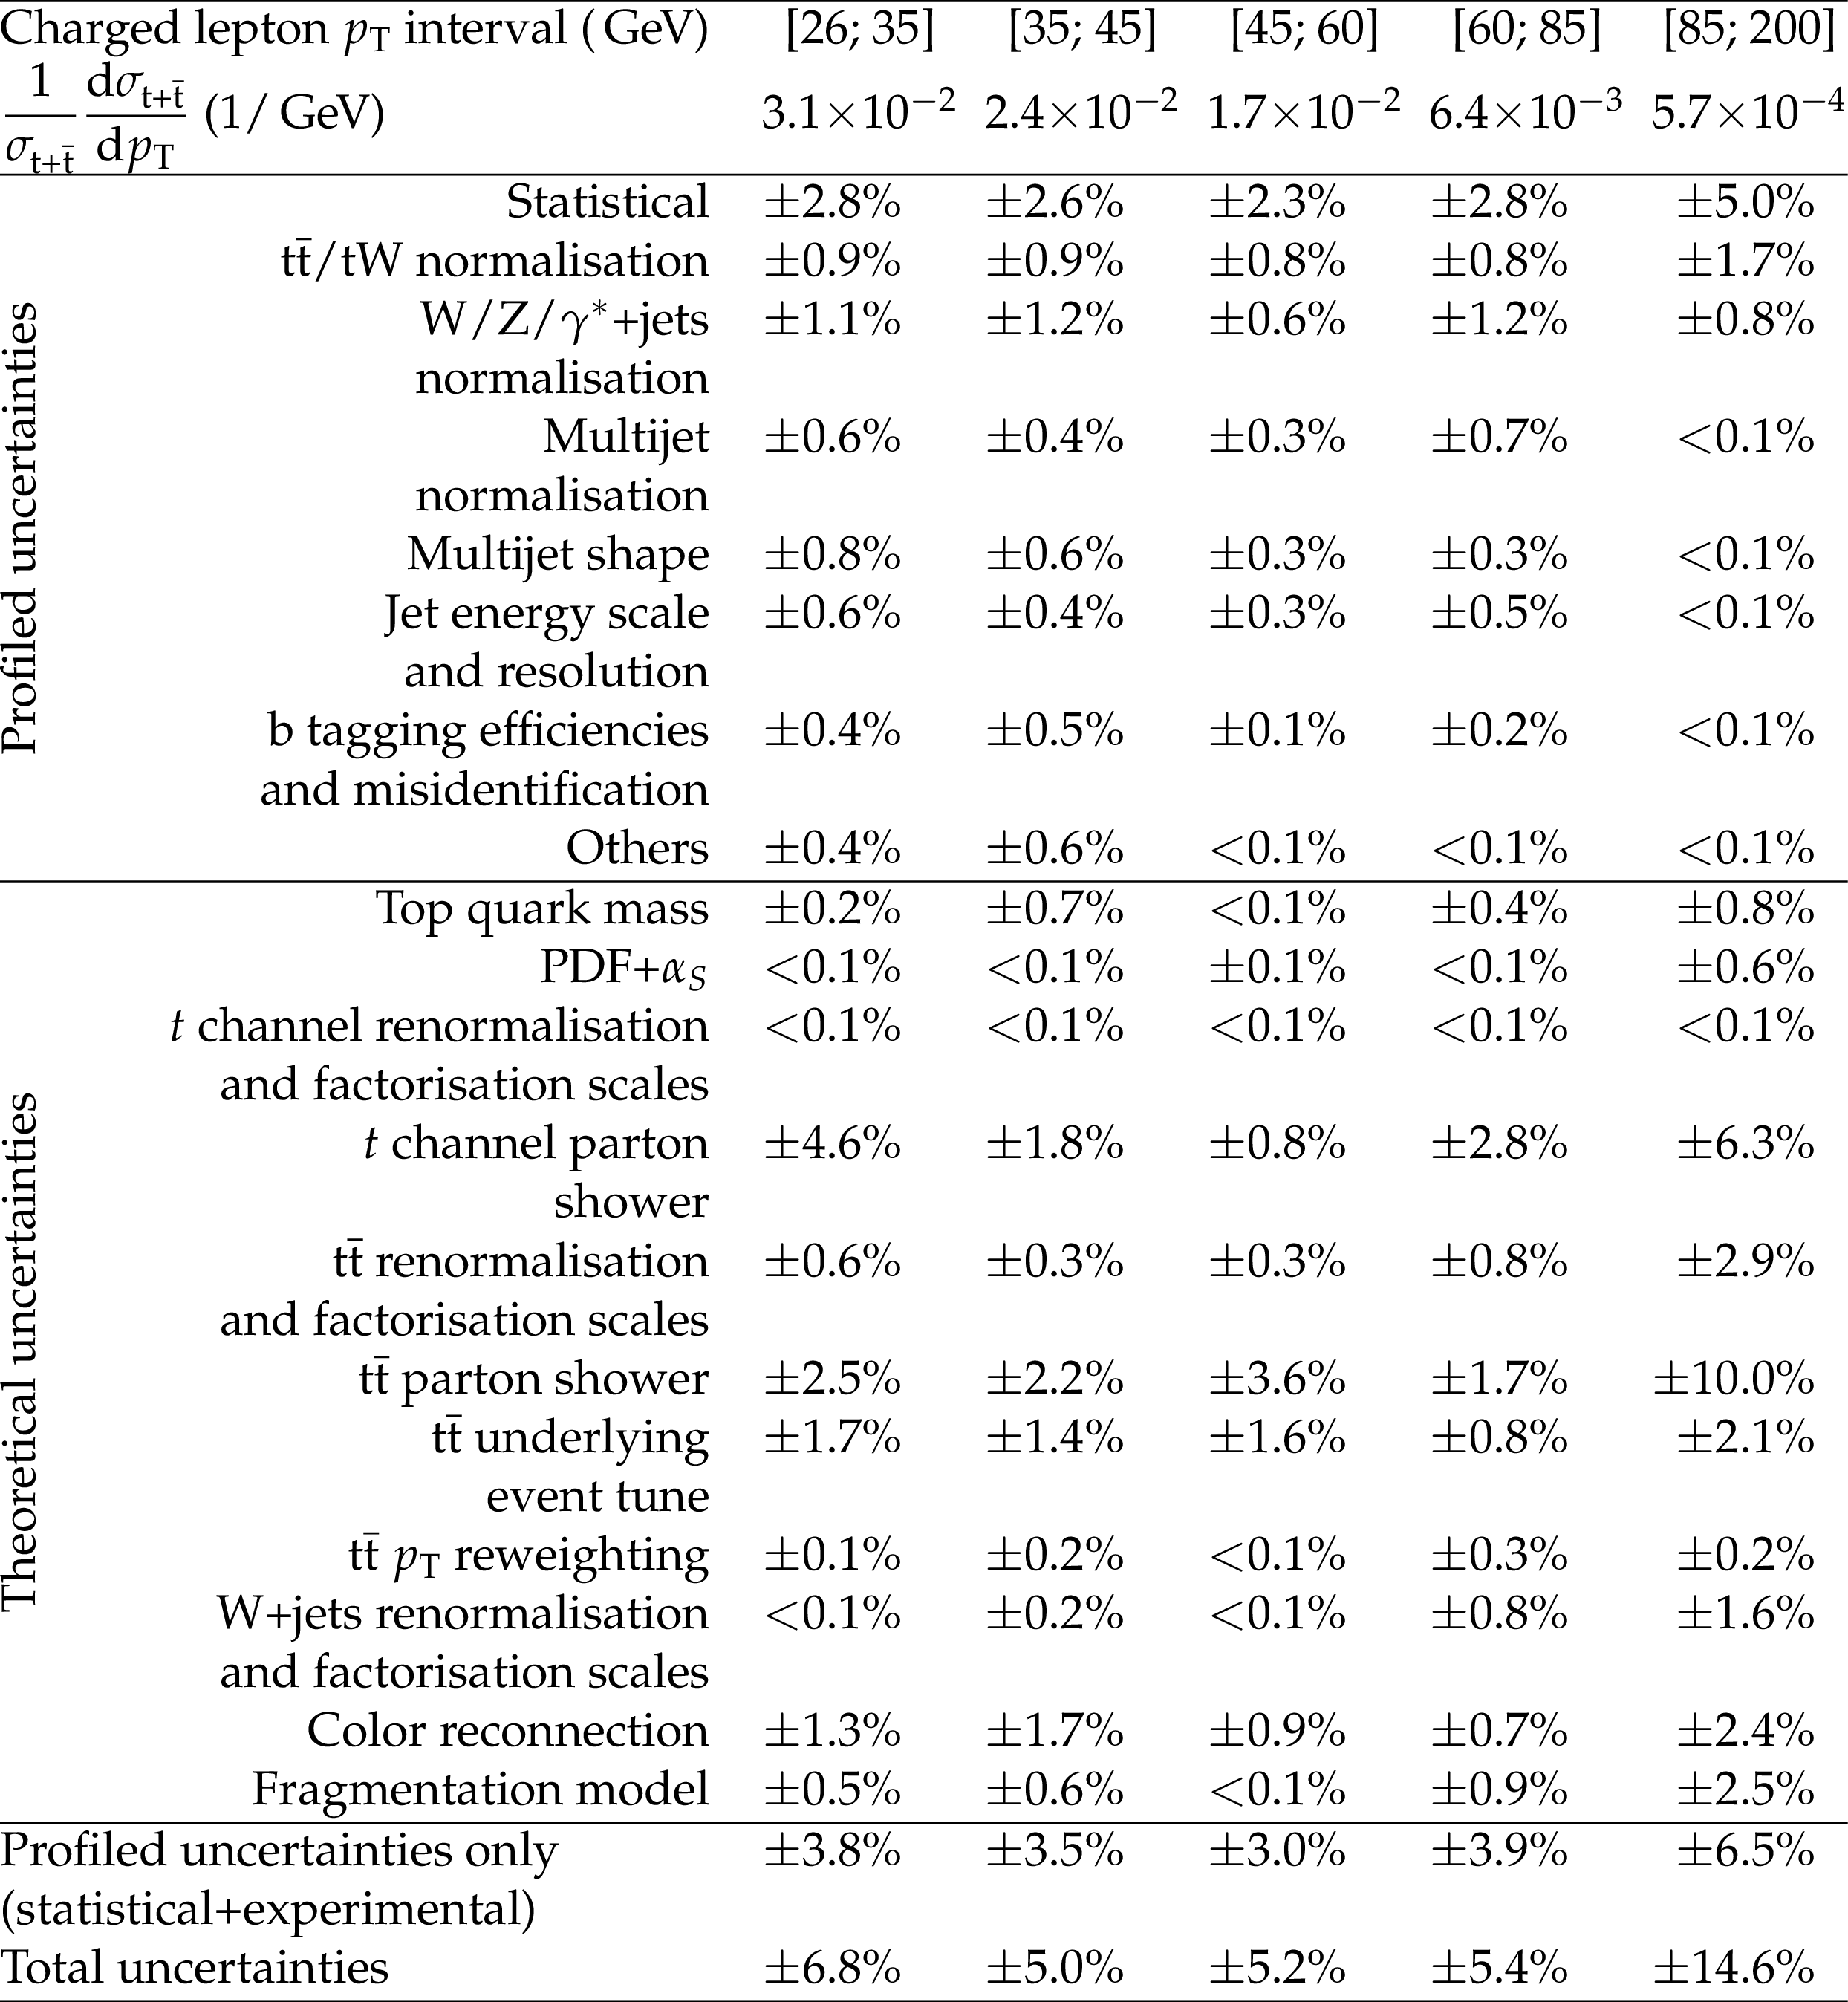
The measured differential normalised coss section in intervals of charged lepton ${p_{\mathrm {T}}}$ at the particle level. A breakdown of the systematic uncertainties is given as well. Minor uncertainties (lepton efficiencies, pileup, and unclustered energy) have been grouped into the "Others'' category. |

png pdf |
Additional Table 22:
The measured differential normalised coss section in intervals of charged lepton rapidity at the particle level. A breakdown of the systematic uncertainties is given as well. Minor uncertainties (lepton efficiencies, pileup, and unclustered energy) have been grouped into the "Others'' category. |
png pdf |
Additional Table 23:
The measured differential normalised coss section in intervals of W boson ${p_{\mathrm {T}}}$ at the particle level. A breakdown of the systematic uncertainties is given as well. Minor uncertainties (lepton efficiencies, pileup, and unclustered energy) have been grouped into the "Others'' category. |
png pdf |
Additional Table 24:
The measured differential normalised coss section in intervals of polarisation angle at the particle level. A breakdown of the systematic uncertainties is given as well. Minor uncertainties (lepton efficiencies, pileup, and unclustered energy) have been grouped into the "Others'' category. |
png pdf |
Additional Table 25:
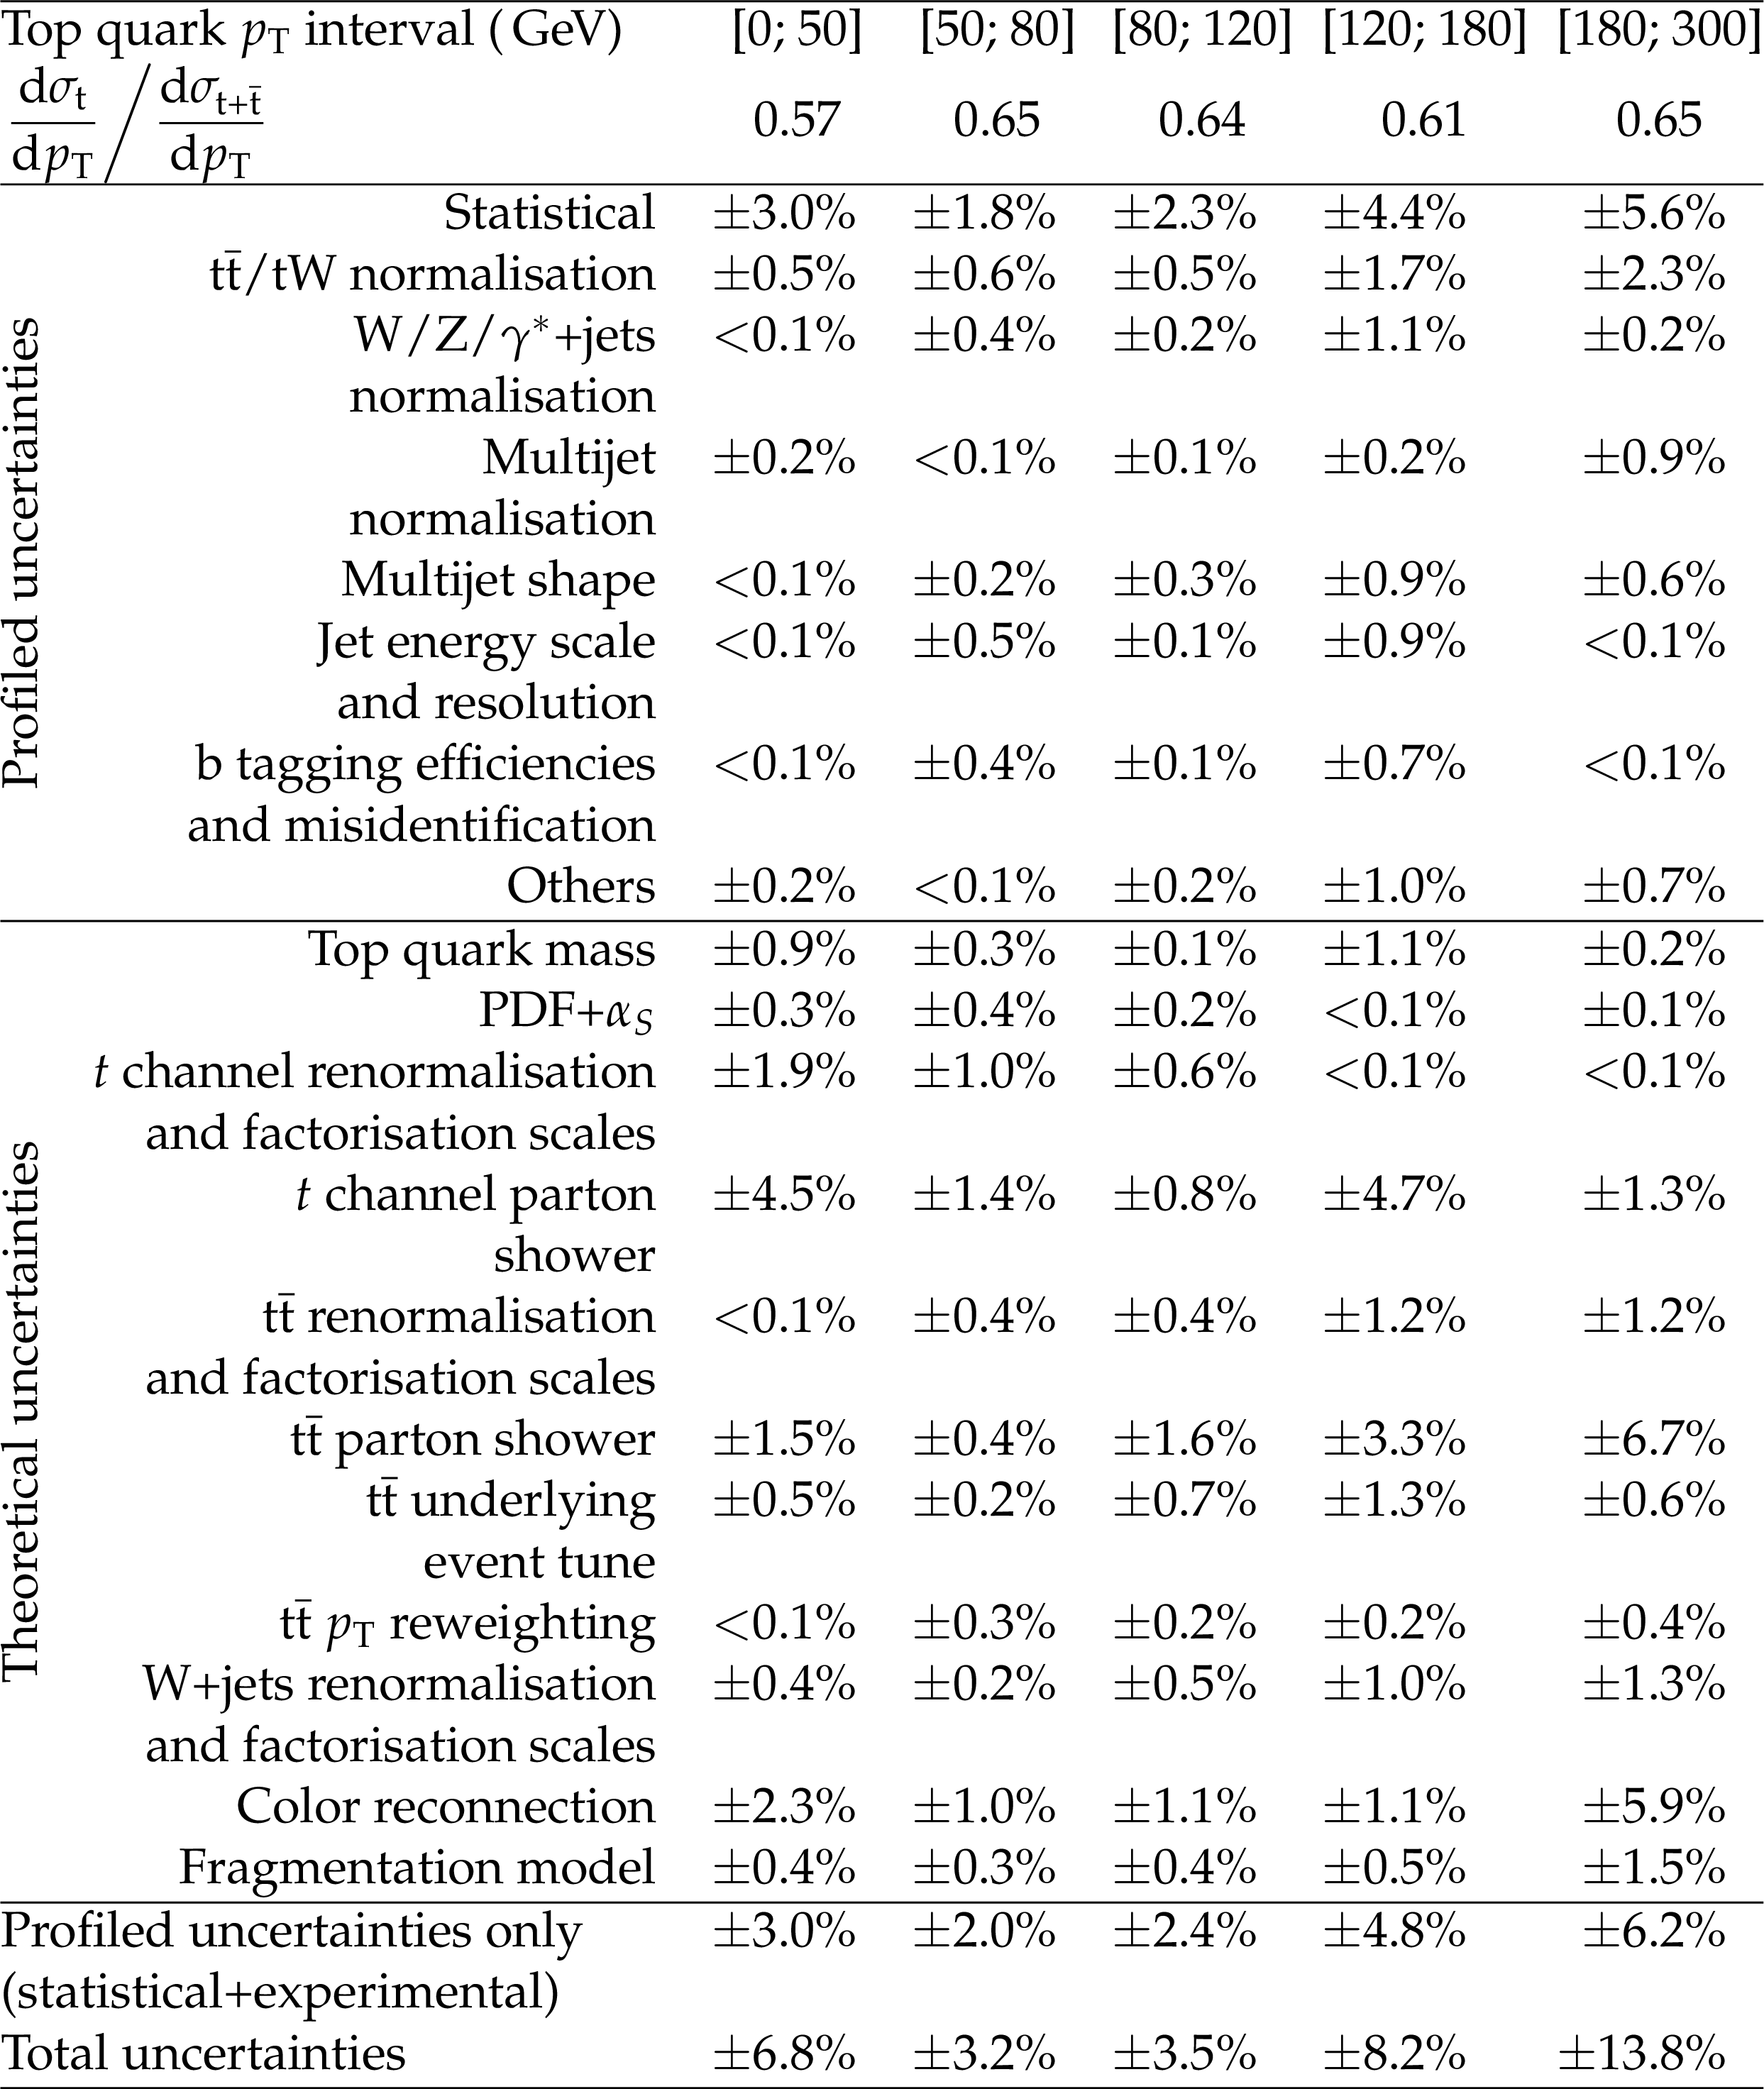
The measured differential charge ratio in intervals of the top quark ${p_{\mathrm {T}}}$ at the parton level. A breakdown of the systematic uncertainties is given as well. Minor uncertainties (lepton efficiencies, pileup, and unclustered energy) have been grouped into the "Others'' category. |
png pdf |
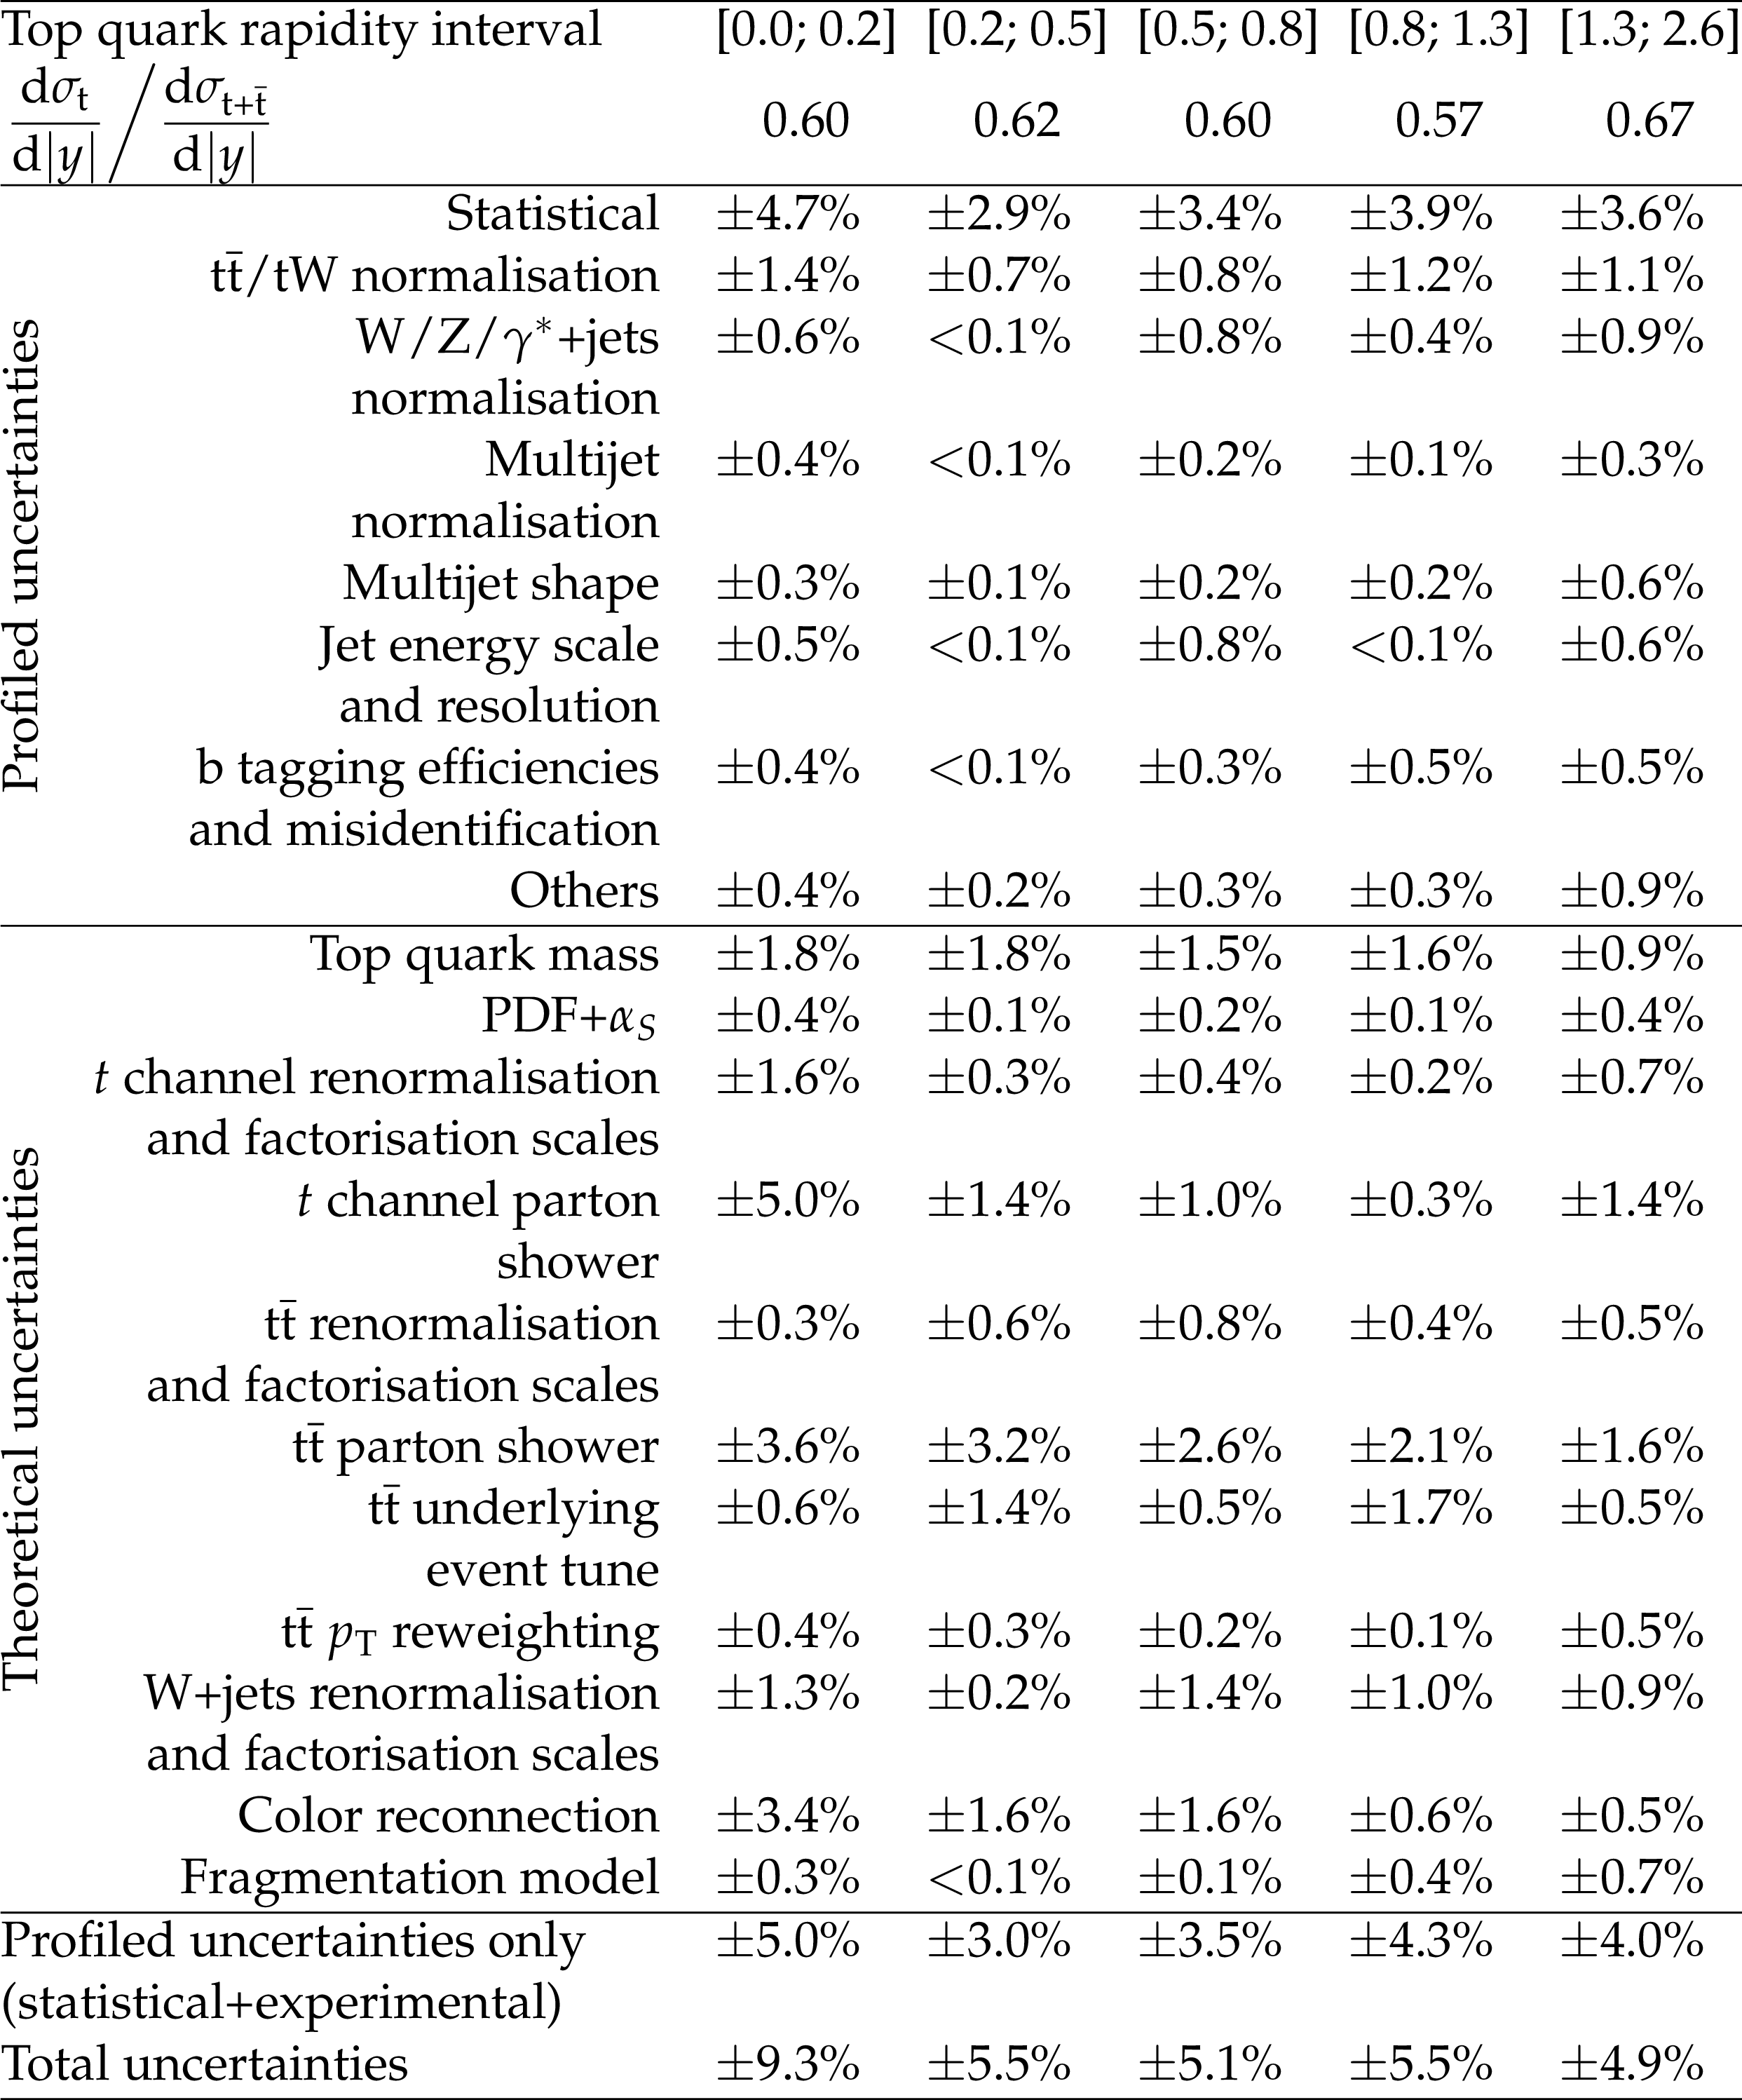
Additional Table 26:
The measured differential charge ratio in intervals of the top quark rapidity at the parton level. A breakdown of the systematic uncertainties is given as well. Minor uncertainties (lepton efficiencies, pileup, and unclustered energy) have been grouped into the "Others'' category. |
png pdf |
Additional Table 27:
The measured differential charge ratio in intervals of the charged lepton ${p_{\mathrm {T}}}$ at the parton level. A breakdown of the systematic uncertainties is given as well. Minor uncertainties (lepton efficiencies, pileup, and unclustered energy) have been grouped into the "Others'' category. |

png pdf |
Additional Table 28:
The measured differential charge ratio in intervals of the charged lepton rapidity at the parton level. A breakdown of the systematic uncertainties is given as well. Minor uncertainties (lepton efficiencies, pileup, and unclustered energy) have been grouped into the "Others'' category. |

png pdf |
Additional Table 29:
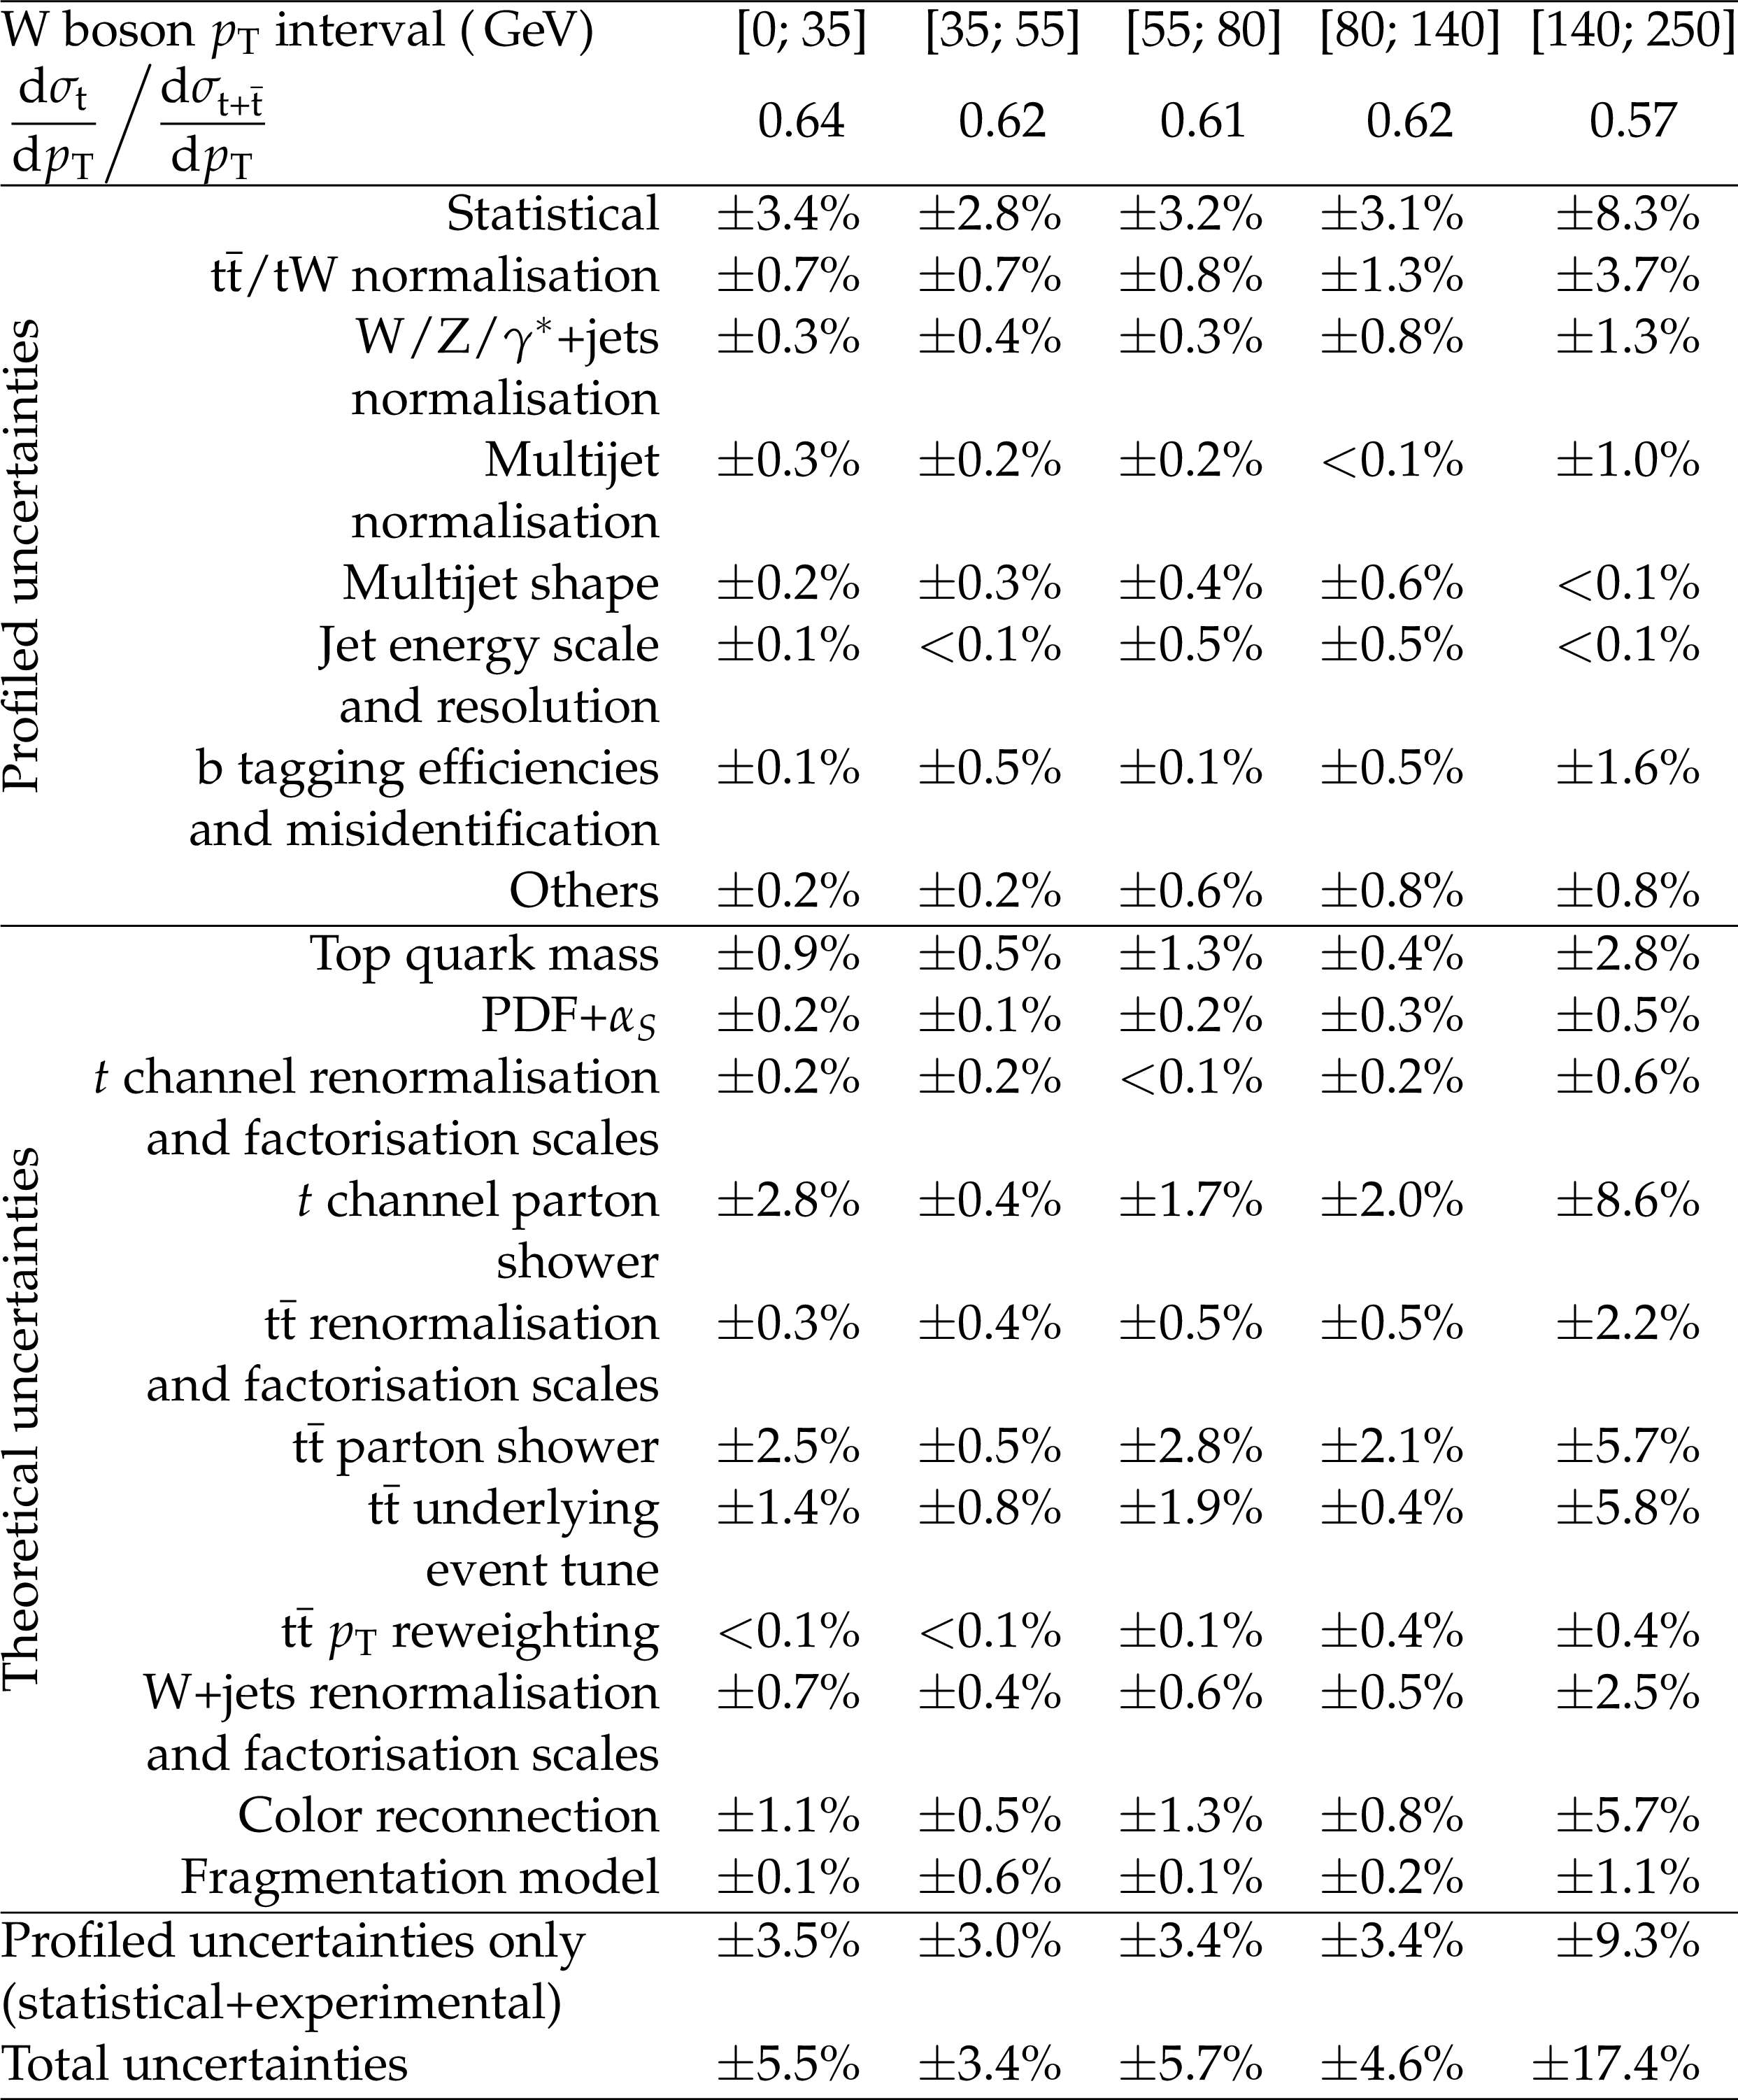
The measured differential charge ratio in intervals of the W boson ${p_{\mathrm {T}}}$ at the parton level. A breakdown of the systematic uncertainties is given as well. Minor uncertainties (lepton efficiencies, pileup, and unclustered energy) have been grouped into the "Others'' category. |

png pdf |
Additional Table 30:
The measured differential charge ratio in intervals of the top quark ${p_{\mathrm {T}}}$ at the particle level. A breakdown of the systematic uncertainties is given as well. Minor uncertainties (lepton efficiencies, pileup, and unclustered energy) have been grouped into the "Others'' category. |
png pdf |
Additional Table 31:
The measured differential charge ratio in intervals of the top quark rapidity at the particle level. A breakdown of the systematic uncertainties is given as well. Minor uncertainties (lepton efficiencies, pileup, and unclustered energy) have been grouped into the "Others'' category. |
png pdf |
Additional Table 32:
The measured differential charge ratio in intervals of the charged lepton ${p_{\mathrm {T}}}$ at the particle level. A breakdown of the systematic uncertainties is given as well. Minor uncertainties (lepton efficiencies, pileup, and unclustered energy) have been grouped into the "Others'' category. |
png pdf |
Additional Table 33:
The measured differential charge ratio in intervals of the charged lepton rapidity at the particle level. A breakdown of the systematic uncertainties is given as well. Minor uncertainties (lepton efficiencies, pileup, and unclustered energy) have been grouped into the "Others'' category. |
png pdf |
Additional Table 34:
The measured differential charge ratio in intervals of the W boson ${p_{\mathrm {T}}}$ at the particle level. A breakdown of the systematic uncertainties is given as well. Minor uncertainties (lepton efficiencies, pileup, and unclustered energy) have been grouped into the "Others'' category. |
png pdf |
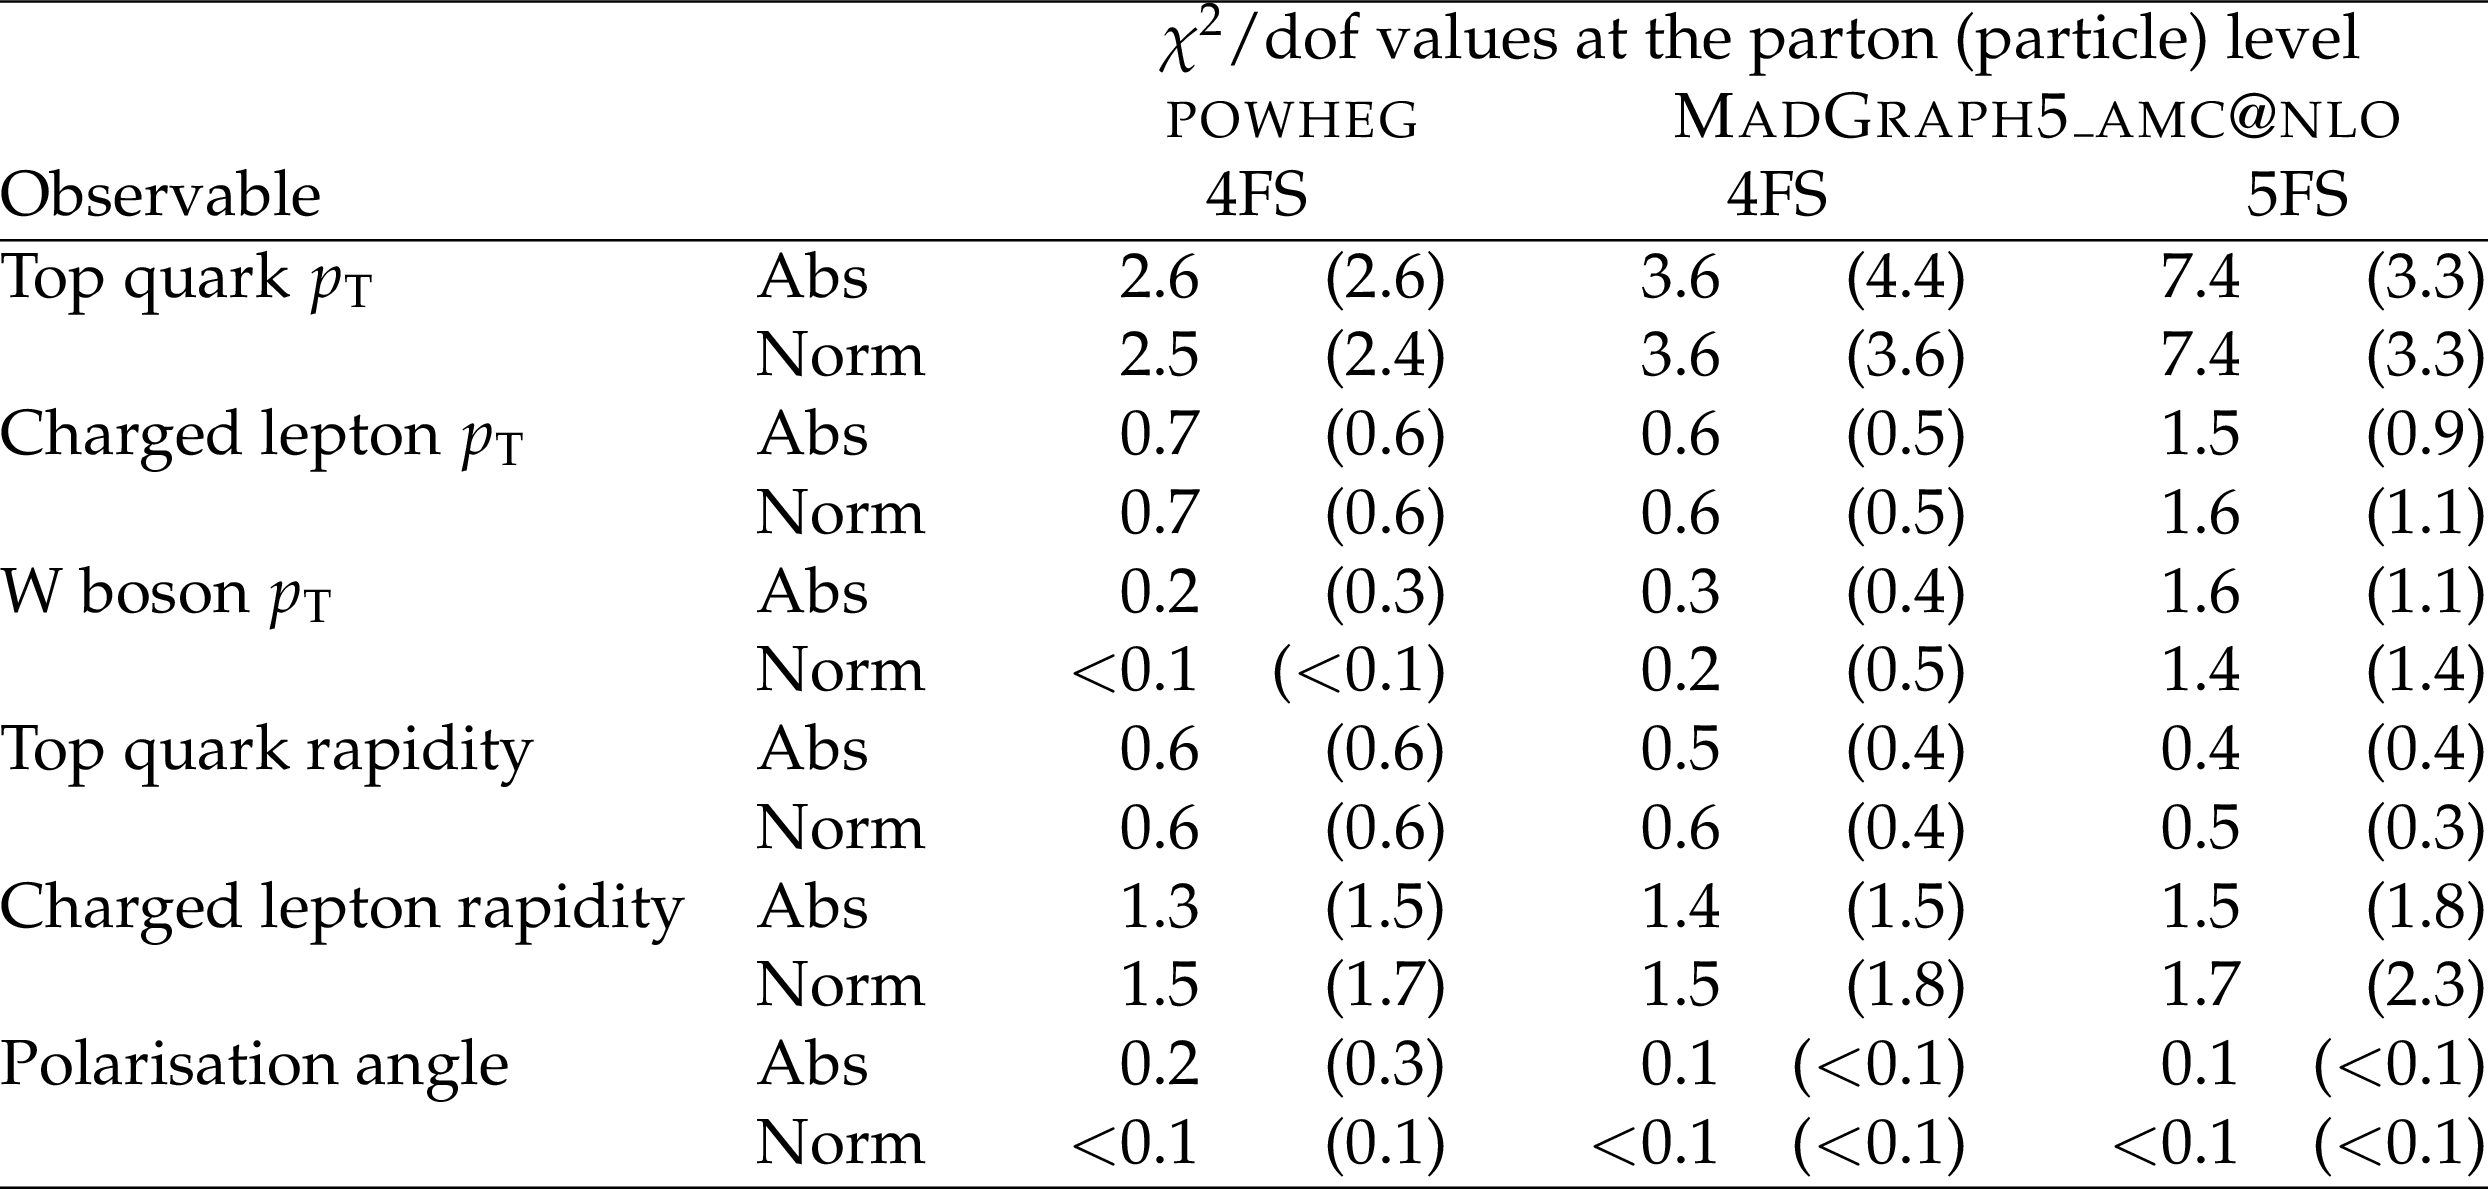
Additional Table 35:
The $\chi ^{2}$/dof values quantifying the agreement between three predictions from event generators and the measured differential absolute ("Abs'') and normalised ("Norm'') cross sections. |
png pdf |
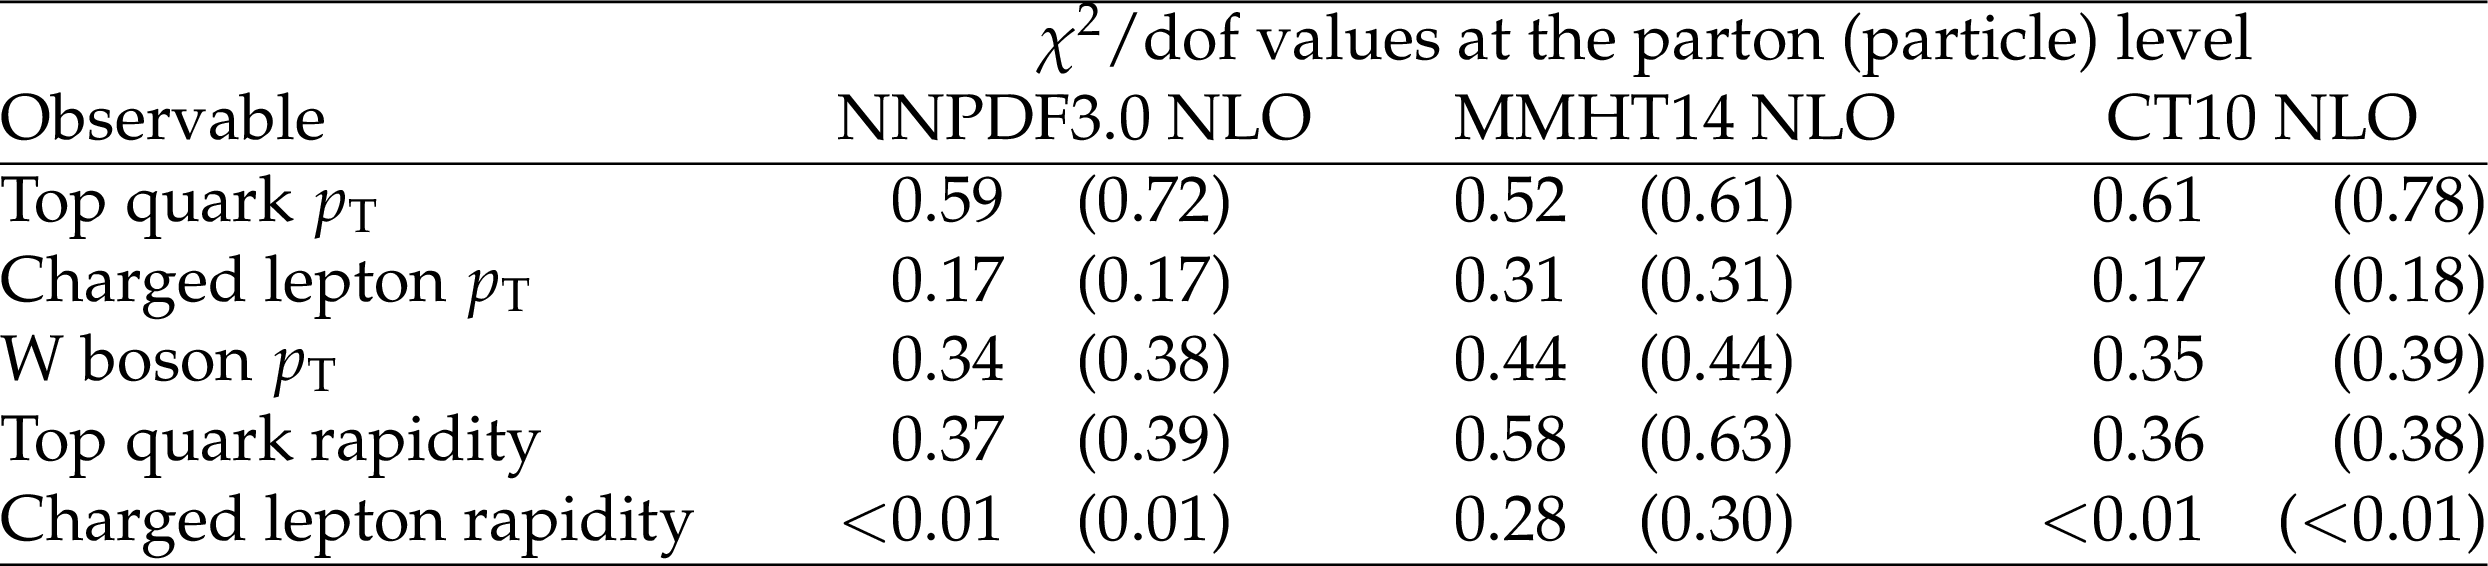
Additional Table 36:
The $\chi ^{2}$/dof values quantifying the agreement between predictions from three PDF sets and the measured differential charge ratios. |
| References | ||||
| 1 | D0 Collaboration | Observation of single top quark production | PRL 103 (2009) 092001 | 0903.0850 |
| 2 | CDF Collaboration | First observation of electroweak single top quark production | PRL 103 (2009) 092002 | 0903.0885 |
| 3 | CMS Collaboration | Measurement of the $ t $-channel single top quark production cross section in pp collisions at $ \sqrt{s} = $ 7 TeV | PRL 107 (2011) 091802 | CMS-TOP-10-008 1106.3052 |
| 4 | ATLAS Collaboration | Comprehensive measurements of $ t $-channel single top quark production cross sections at $ \sqrt{s} = $ 7 TeV with the ATLAS detector | PRD 90 (2014) 112006 | 1406.7844 |
| 5 | CMS Collaboration | Measurement of the single top quark $ t $-channel cross section in pp collisions at $ \sqrt{s}= $ 7 TeV | JHEP 12 (2012) 035 | CMS-TOP-11-021 1209.4533 |
| 6 | ATLAS Collaboration | Fiducial, total and differential cross section measurements of $ t $-channel single top quark production in pp collisions at 8~TeV using data collected by the ATLAS detector | EPJC 77 (2017) 531 | 1702.02859 |
| 7 | CMS Collaboration | Cross section measurement of $ t $-channel single top quark production in pp collisions at $ \sqrt{s}= $ 13 TeV | PLB 772 (2017) 752 | CMS-TOP-16-003 1610.00678 |
| 8 | ATLAS Collaboration | Measurement of the inclusive cross sections of single top quark and top antiquark $ t $-channel production in pp collisions at $ \sqrt{s}= $ 13 TeV with the ATLAS detector | JHEP 04 (2017) 086 | 1609.03920 |
| 9 | CMS Collaboration | Measurement of the single top quark and antiquark production cross sections in the $ t $ channel and their ratio in proton-proton collisions at $ \sqrt{s}= $ 13 TeV | Submitted to PLB | CMS-TOP-17-011 1812.10514 |
| 10 | CMS Collaboration | Measurement of top quark polarisation in $ t $-channel single top quark production | JHEP 04 (2016) 073 | CMS-TOP-13-001 1511.02138 |
| 11 | N. P. Hartland et al. | A Monte Carlo global analysis of the standard model effective field theory: The top quark sector | JHEP 04 (2019) 100 | 1901.05965 |
| 12 | P. Kant et al. | HATHOR for single top-quark production: Updated predictions and uncertainty estimates for single top-quark production in hadronic collisions | CPC 191 (2015) 74 | 1406.4403 |
| 13 | E. L. Berger, J. Gao, C. P. Yuan, and H. X. Zhu | NNLO QCD corrections to $ t $-channel single top quark production and decay | PRD 94 (2016) 071501 | 1606.08463 |
| 14 | S. Alekhin, J. Blumlein, S. Moch, and R. Placakyte | Parton distribution functions, $ \alpha_S $, and heavy-quark masses for LHC Run II | PRD 96 (2017) 014011 | 1701.05838 |
| 15 | G. Mahlon and S. J. Parke | Single top quark production at the LHC: Understanding spin | PLB 476 (2000) 323 | hep-ph/9912458 |
| 16 | E. E. Boos and A. V. Sherstnev | Spin effects in processes of single top quark production at hadron colliders | PLB 534 (2002) 97 | hep-ph/0201271 |
| 17 | J. A. Aguilar-Saavedra and J. Bernabeu | W polarisation beyond helicity fractions in top quark decays | NPB 840 (2010) 349 | 1005.5382 |
| 18 | ATLAS Collaboration | Probing the Wtb vertex structure in $ t $-channel single-top-quark production and decay in pp collisions at $ \sqrt{s}= $ 8 TeV with the ATLAS detector | JHEP 04 (2017) 124 | 1702.08309 |
| 19 | ATLAS Collaboration | Analysis of the Wtb vertex from the measurement of triple-differential angular decay rates of single top quarks produced in the $ t $-channel at $ \sqrt{s}= $ 8 TeV with the ATLAS detector | JHEP 12 (2017) 017 | 1707.05393 |
| 20 | CMS Collaboration | The CMS experiment at the CERN LHC | JINST 3 (2008) S08004 | CMS-00-001 |
| 21 | CMS Collaboration | Particle-flow reconstruction and global event description with the CMS detector | JINST 12 (2017) P10003 | CMS-PRF-14-001 1706.04965 |
| 22 | CMS Collaboration | The CMS trigger system | JINST 12 (2017) P01020 | CMS-TRG-12-001 1609.02366 |
| 23 | CMS Collaboration | CMS luminosity measurements for the 2016 data taking period | CMS-PAS-LUM-17-001 | CMS-PAS-LUM-17-001 |
| 24 | CMS Collaboration | Performance of electron reconstruction and selection with the CMS detector in proton-proton collisions at $ \sqrt{s}= $ 8 TeV | JINST 10 (2015) P06005 | CMS-EGM-13-001 1502.02701 |
| 25 | S. Alioli, P. Nason, C. Oleari, and E. Re | A general framework for implementing NLO calculations in shower Monte Carlo programs: the POWHEG BOX | JHEP 06 (2010) 043 | 1002.2581 |
| 26 | R. Frederix, E. Re, and P. Torrielli | Single top $ t $-channel hadroproduction in the four-flavour scheme with POWHEG and aMC@NLO | JHEP 09 (2012) 130 | 1207.5391 |
| 27 | T. Sjostrand et al. | An introduction to PYTHIA 8.2 | CPC 191 (2015) 159 | 1410.3012 |
| 28 | CMS Collaboration | Event generator tunes obtained from underlying event and multiparton scattering measurements | EPJC 76 (2016) 155 | CMS-GEN-14-001 1512.00815 |
| 29 | P. Artoisenet, R. Frederix, O. Mattelaer, and R. Rietkerk | Automatic spin-entangled decays of heavy resonances in Monte Carlo simulations | JHEP 03 (2013) 015 | 1212.3460 |
| 30 | J. Alwall et al. | The automated computation of tree-level and next-to-leading order differential cross sections, and their matching to parton shower simulations | JHEP 07 (2014) 079 | 1405.0301 |
| 31 | CMS Collaboration | Investigations of the impact of the parton shower tuning in Pythia~8 in the modelling of $ \mathrm{t\bar{t}} $ at $ \sqrt{s}= $ 8 and 13~TeV | CMS-PAS-TOP-16-021 | CMS-PAS-TOP-16-021 |
| 32 | E. Re | Single top Wt-channel production matched with parton showers using the POWHEG method | EPJC 71 (2011) 1547 | 1009.2450 |
| 33 | S. Frixione et al. | Single top hadroproduction in association with a W~boson | JHEP 07 (2008) 029 | 0805.3067 |
| 34 | R. Frederix and S. Frixione | Merging meets matching in MC@NLO | JHEP 12 (2012) 061 | 1209.6215 |
| 35 | J. Alwall et al. | Comparative study of various algorithms for the merging of parton showers and matrix elements in hadronic collisions | EPJC 53 (2008) 473 | 0706.2569 |
| 36 | NNPDF Collaboration | Parton distributions for the LHC Run~II | JHEP 04 (2015) 040 | 1410.8849 |
| 37 | GEANT4 Collaboration | GEANT4 --- a simulation toolkit | NIMA 506 (2003) 250 | |
| 38 | M. Aliev et al. | HATHOR: HAdronic Top and Heavy quarks crOss section calculatoR | CPC 182 (2011) 1034 | 1007.1327 |
| 39 | S. Alekhin et al. | The PDF4LHC working group interim report | 1101.0536 | |
| 40 | M. Botje et al. | The PDF4LHC working group interim recommendations | 1101.0538 | |
| 41 | A. D. Martin, W. J. Stirling, R. S. Thorne, and G. Watt | Parton distributions for the LHC | EPJC 63 (2009) 189 | 0901.0002 |
| 42 | A. D. Martin, W. J. Stirling, R. S. Thorne, and G. Watt | Uncertainties on $ \alpha_S $ in global PDF analyses and implications for predicted hadronic cross sections | EPJC 64 (2009) 653 | 0905.3531 |
| 43 | H.-L. Lai et al. | New parton distributions for collider physics | PRD 82 (2010) 074024 | 1007.2241 |
| 44 | R. D. Ball et al. | Parton distributions with LHC data | NPB 867 (2013) 244 | 1207.1303 |
| 45 | M. Cacciari, G. P. Salam, and G. Soyez | The anti-$ {k_{\mathrm{T}}} $ jet clustering algorithm | JHEP 04 (2008) 063 | 0802.1189 |
| 46 | M. Cacciari, G. P. Salam, and G. Soyez | FastJet user manual | EPJC 72 (2012) 1896 | 1111.6097 |
| 47 | CMS Collaboration | Performance of the CMS muon detector and muon reconstruction with proton-proton collisions at $ \sqrt{s}= $ 13 TeV | JINST 13 (2018) P06015 | CMS-MUO-16-001 1804.04528 |
| 48 | M. Cacciari and G. P. Salam | Pileup subtraction using jet areas | PLB 659 (2008) 119 | 0707.1378 |
| 49 | CMS Collaboration | Pileup removal algorithms | CMS-PAS-JME-14-001 | CMS-PAS-JME-14-001 |
| 50 | CMS Collaboration | Identification of heavy-flavour jets with the CMS detector in pp collisions at 13~TeV | JINST 13 (2018) P05011 | CMS-BTV-16-002 1712.07158 |
| 51 | CMS Collaboration | Performance of CMS muon reconstruction in pp collision events at $ \sqrt{s}= $ 7 TeV | JINST 7 (2012) P10002 | CMS-MUO-10-004 1206.4071 |
| 52 | S. Kallweit et al. | NLO QCD+EW predictions for V+jets including off-shell vector-boson decays and multijet merging | JHEP 04 (2016) 021 | 1511.08692 |
| 53 | F. R. Anger, F. Febres Cordero, H. Ita, and V. Sotnikov | NLO QCD predictions for $ \mathrm{W}\mathrm{b}\overline{\mathrm{b}} $ production in association with up to three light jets at the LHC | PRD 97 (2018) 036018 | 1712.05721 |
| 54 | R. Barlow and C. Beeston | Fitting using finite Monte Carlo samples | CPC 77 (1993) 219 | |
| 55 | S. Schmitt | TUnfold: An algorithm for correcting migration effects in high energy physics | JINST 7 (2012) T10003 | 1205.6201 |
| 56 | A. Tikhonov | Solution of incorrectly formulated problems and the regularization method | Soviet Math. Dokl. 5 (1963) 1035 | |
| 57 | V. Blobel | An unfolding method for high energy physics experiments | in Advanced statistical techniques in particle physics, Proceedings, Conference, Durham, UK, 2002 | hep-ex/0208022 |
| 58 | CMS Collaboration | Object definitions for top quark analyses at the particle level | CDS | |
| 59 | CMS Collaboration | Determination of jet energy calibration and transverse momentum resolution in CMS | JINST 6 (2011) P11002 | CMS-JME-10-011 1107.4277 |
| 60 | CMS Collaboration | Performance of the CMS missing transverse momentum reconstruction in pp data at $ \sqrt{s}= $ 8 TeV | JINST 10 (2015) P02006 | CMS-JME-13-003 1411.0511 |
| 61 | CMS Collaboration | Measurement of the inelastic proton-proton cross section at $ \sqrt{s}= $ 13 TeV | JHEP 07 (2018) 161 | CMS-FSQ-15-005 1802.02613 |
| 62 | CMS Collaboration | Measurement of the differential cross section for top quark pair production in pp collisions at $ \sqrt{s} = $ 8 TeV | EPJC 75 (2015) 542 | CMS-TOP-12-028 1505.04480 |
| 63 | CMS Collaboration | Measurement of differential cross sections for top quark pair production using the lepton+jets final state in proton-proton collisions at 13~TeV | PRD 95 (2017) 092001 | CMS-TOP-16-008 1610.04191 |
| 64 | CMS Collaboration | Measurement of the top quark mass using proton-proton data at $ \sqrt{s}= $ 7 and 8~TeV | PRD 93 (2016) 072004 | CMS-TOP-14-022 1509.04044 |
| 65 | A. Kalogeropoulos and J. Alwall | The SysCalc code: A tool to derive theoretical systematic uncertainties | 1801.08401 | |
| 66 | L. A. Harland-Lang, A. D. Martin, P. Motylinski, and R. S. Thorne | Parton distributions in the LHC era: MMHT 2014 PDFs | EPJC 75 (2015) 204 | 1412.3989 |
|
|
Compact Muon Solenoid LHC, CERN |
|

|

|

|

|

|