

Compact Muon Solenoid
LHC, CERN
| CMS-B2G-17-001 ; CERN-EP-2017-184 | ||
| Search for massive resonances decaying into WW, WZ, ZZ, qW, and qZ with dijet final states at $ \sqrt{s} = $ 13 TeV | ||
| CMS Collaboration | ||
| 17 August 2017 | ||
| Phys. Rev. D 97 (2018) 072006 | ||
| Abstract: Results are presented from a search in the dijet final state for new massive narrow resonances decaying to pairs of W andZ bosons or to a W/Z boson and a quark. Results are based on data recorded in proton-proton collisions at $ \sqrt{s} = $ 13 TeV with the CMS detector at the CERN LHC. The data correspond to an integrated luminosity of 35.9 fb$^{-1}$. The mass range investigated extends upwards from 1.2 TeV. No excess is observed above the estimated standard model background and limits are set at 95% confidence level on cross sections, which are interpreted in terms of various models that predict gravitons, heavy spin-1 bosons, and excited quarks. In a heavy vector triplet model, W' and Z' resonances with masses below 3.6 and 2.7 TeV, respectively, are excluded at 95% confidence level. Similarly, excited quark resonances, $\mathrm{ q }^*$, decaying to qW and qZ with masses less than 5.0 and 4.8 TeV, respectively, are excluded. In a narrow-width bulk graviton model, upper limits are set on cross sections ranging from 0.6 fb for high resonance masses of 4.1 TeV, to 37.1 fb for low resonance masses of 1.3 TeV. This search sets the most stringent mass limits to date on a $\mathrm{ q }^*$ resonance in the qW and qZ decay mode, as well as on a W' or Z' resonance in the diboson decay mode. | ||
| Links: e-print arXiv:1708.05379 [hep-ex] (PDF) ; CDS record ; inSPIRE record ; CADI line (restricted) ; | ||
| Figures & Tables | Summary | Additional Figures | References | CMS Publications |
|---|
| Figures | |

png pdf |
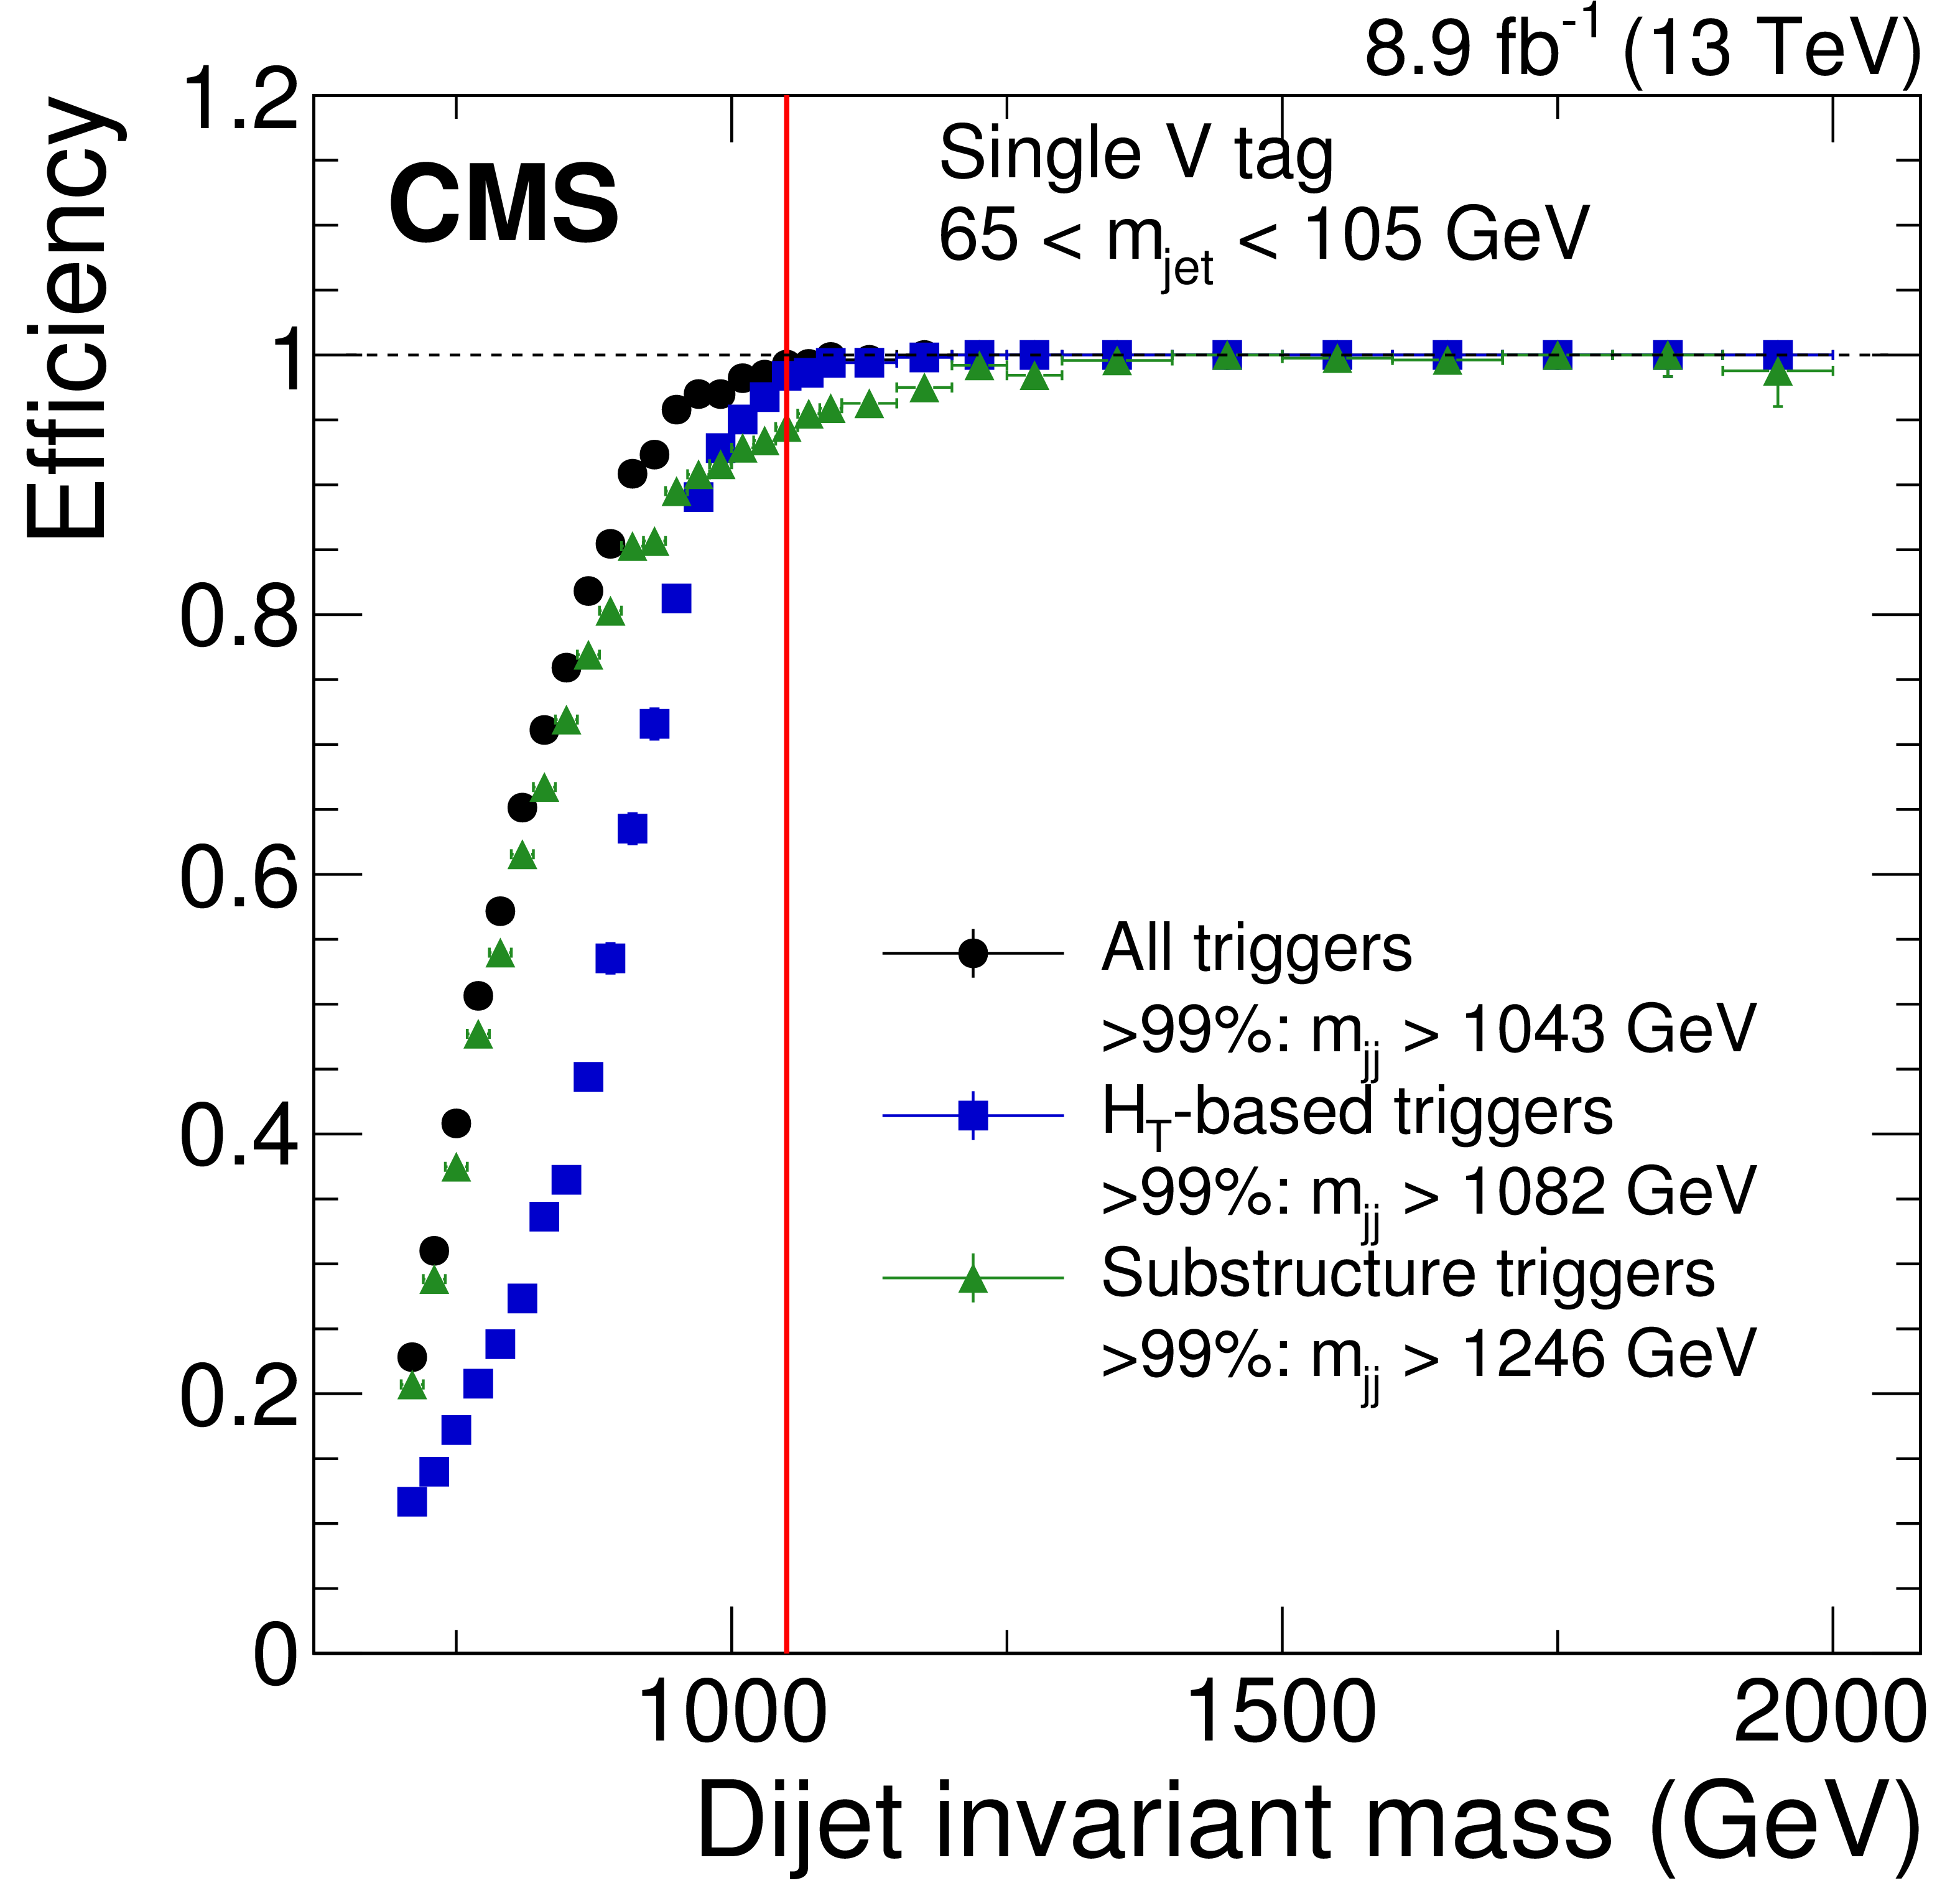
Figure 1:
Trigger efficiencies for jets passing the inclusive triggers (black), the ${H_{\mathrm {T}}}$ triggers (blue) or the substructure triggers only (green) as a function of dijet mass for the data-taking period with the highest trigger thresholds. Events are required to contain one jet (left) or two jets (right) with a soft-drop mass within the signal window of the analysis. The vertical red line marks the selected threshold value. |
png pdf |
Figure 1-a:
Trigger efficiencies for jets passing the inclusive triggers (black), the ${H_{\mathrm {T}}}$ triggers (blue) or the substructure triggers only (green) as a function of dijet mass for the data-taking period with the highest trigger thresholds. Events are required to contain one jet with a soft-drop mass within the signal window of the analysis. The vertical red line marks the selected threshold value. |

png pdf |
Figure 1-b:
Trigger efficiencies for jets passing the inclusive triggers (black), the ${H_{\mathrm {T}}}$ triggers (blue) or the substructure triggers only (green) as a function of dijet mass for the data-taking period with the highest trigger thresholds. Events are required to contain two jets with a soft-drop mass within the signal window of the analysis. The vertical red line marks the selected threshold value. |
png pdf |
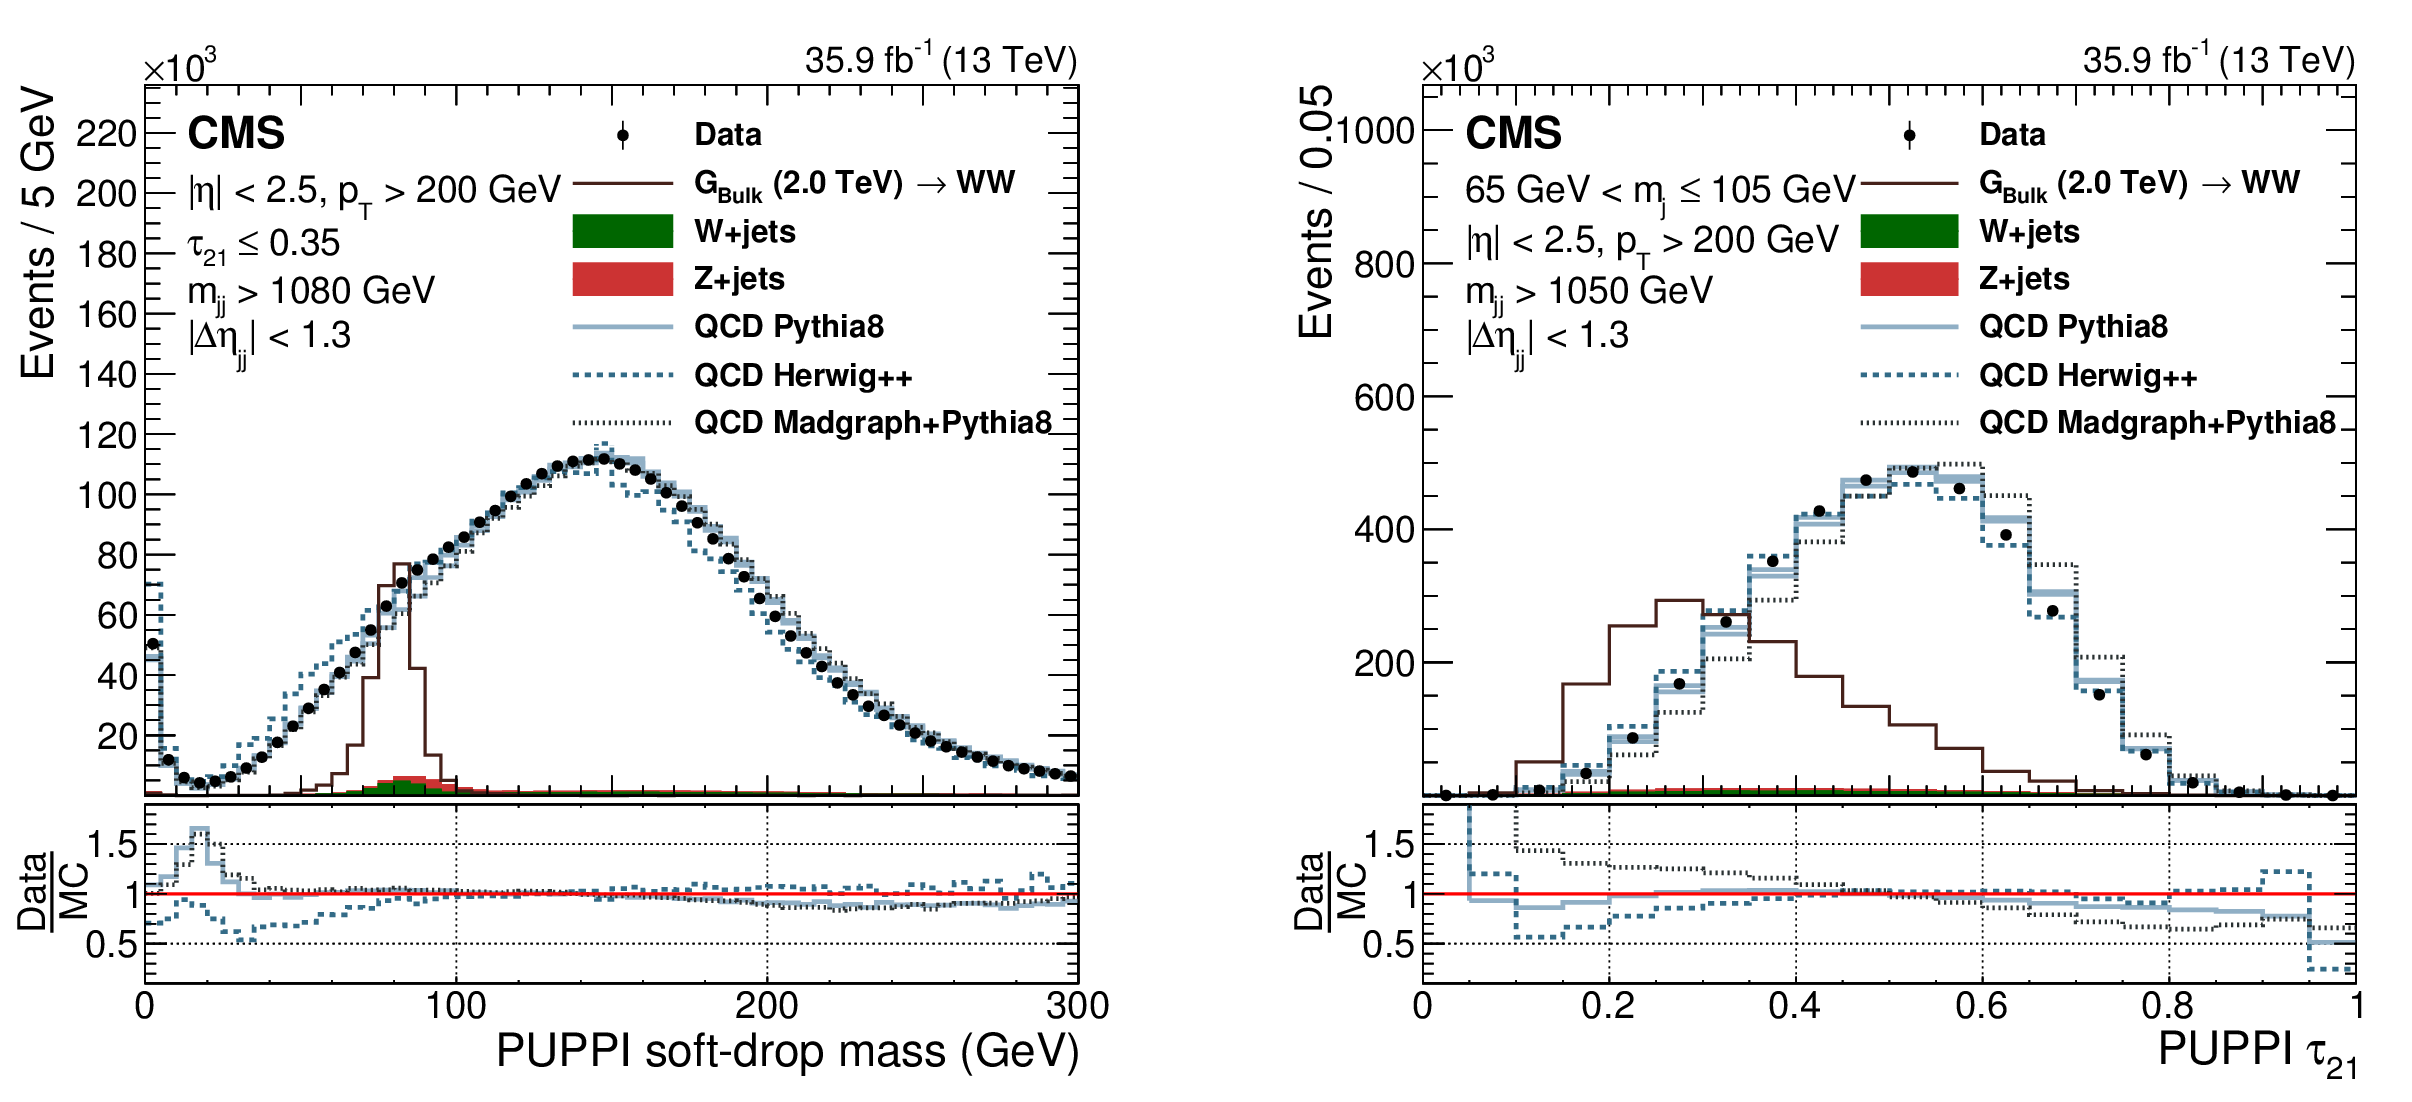
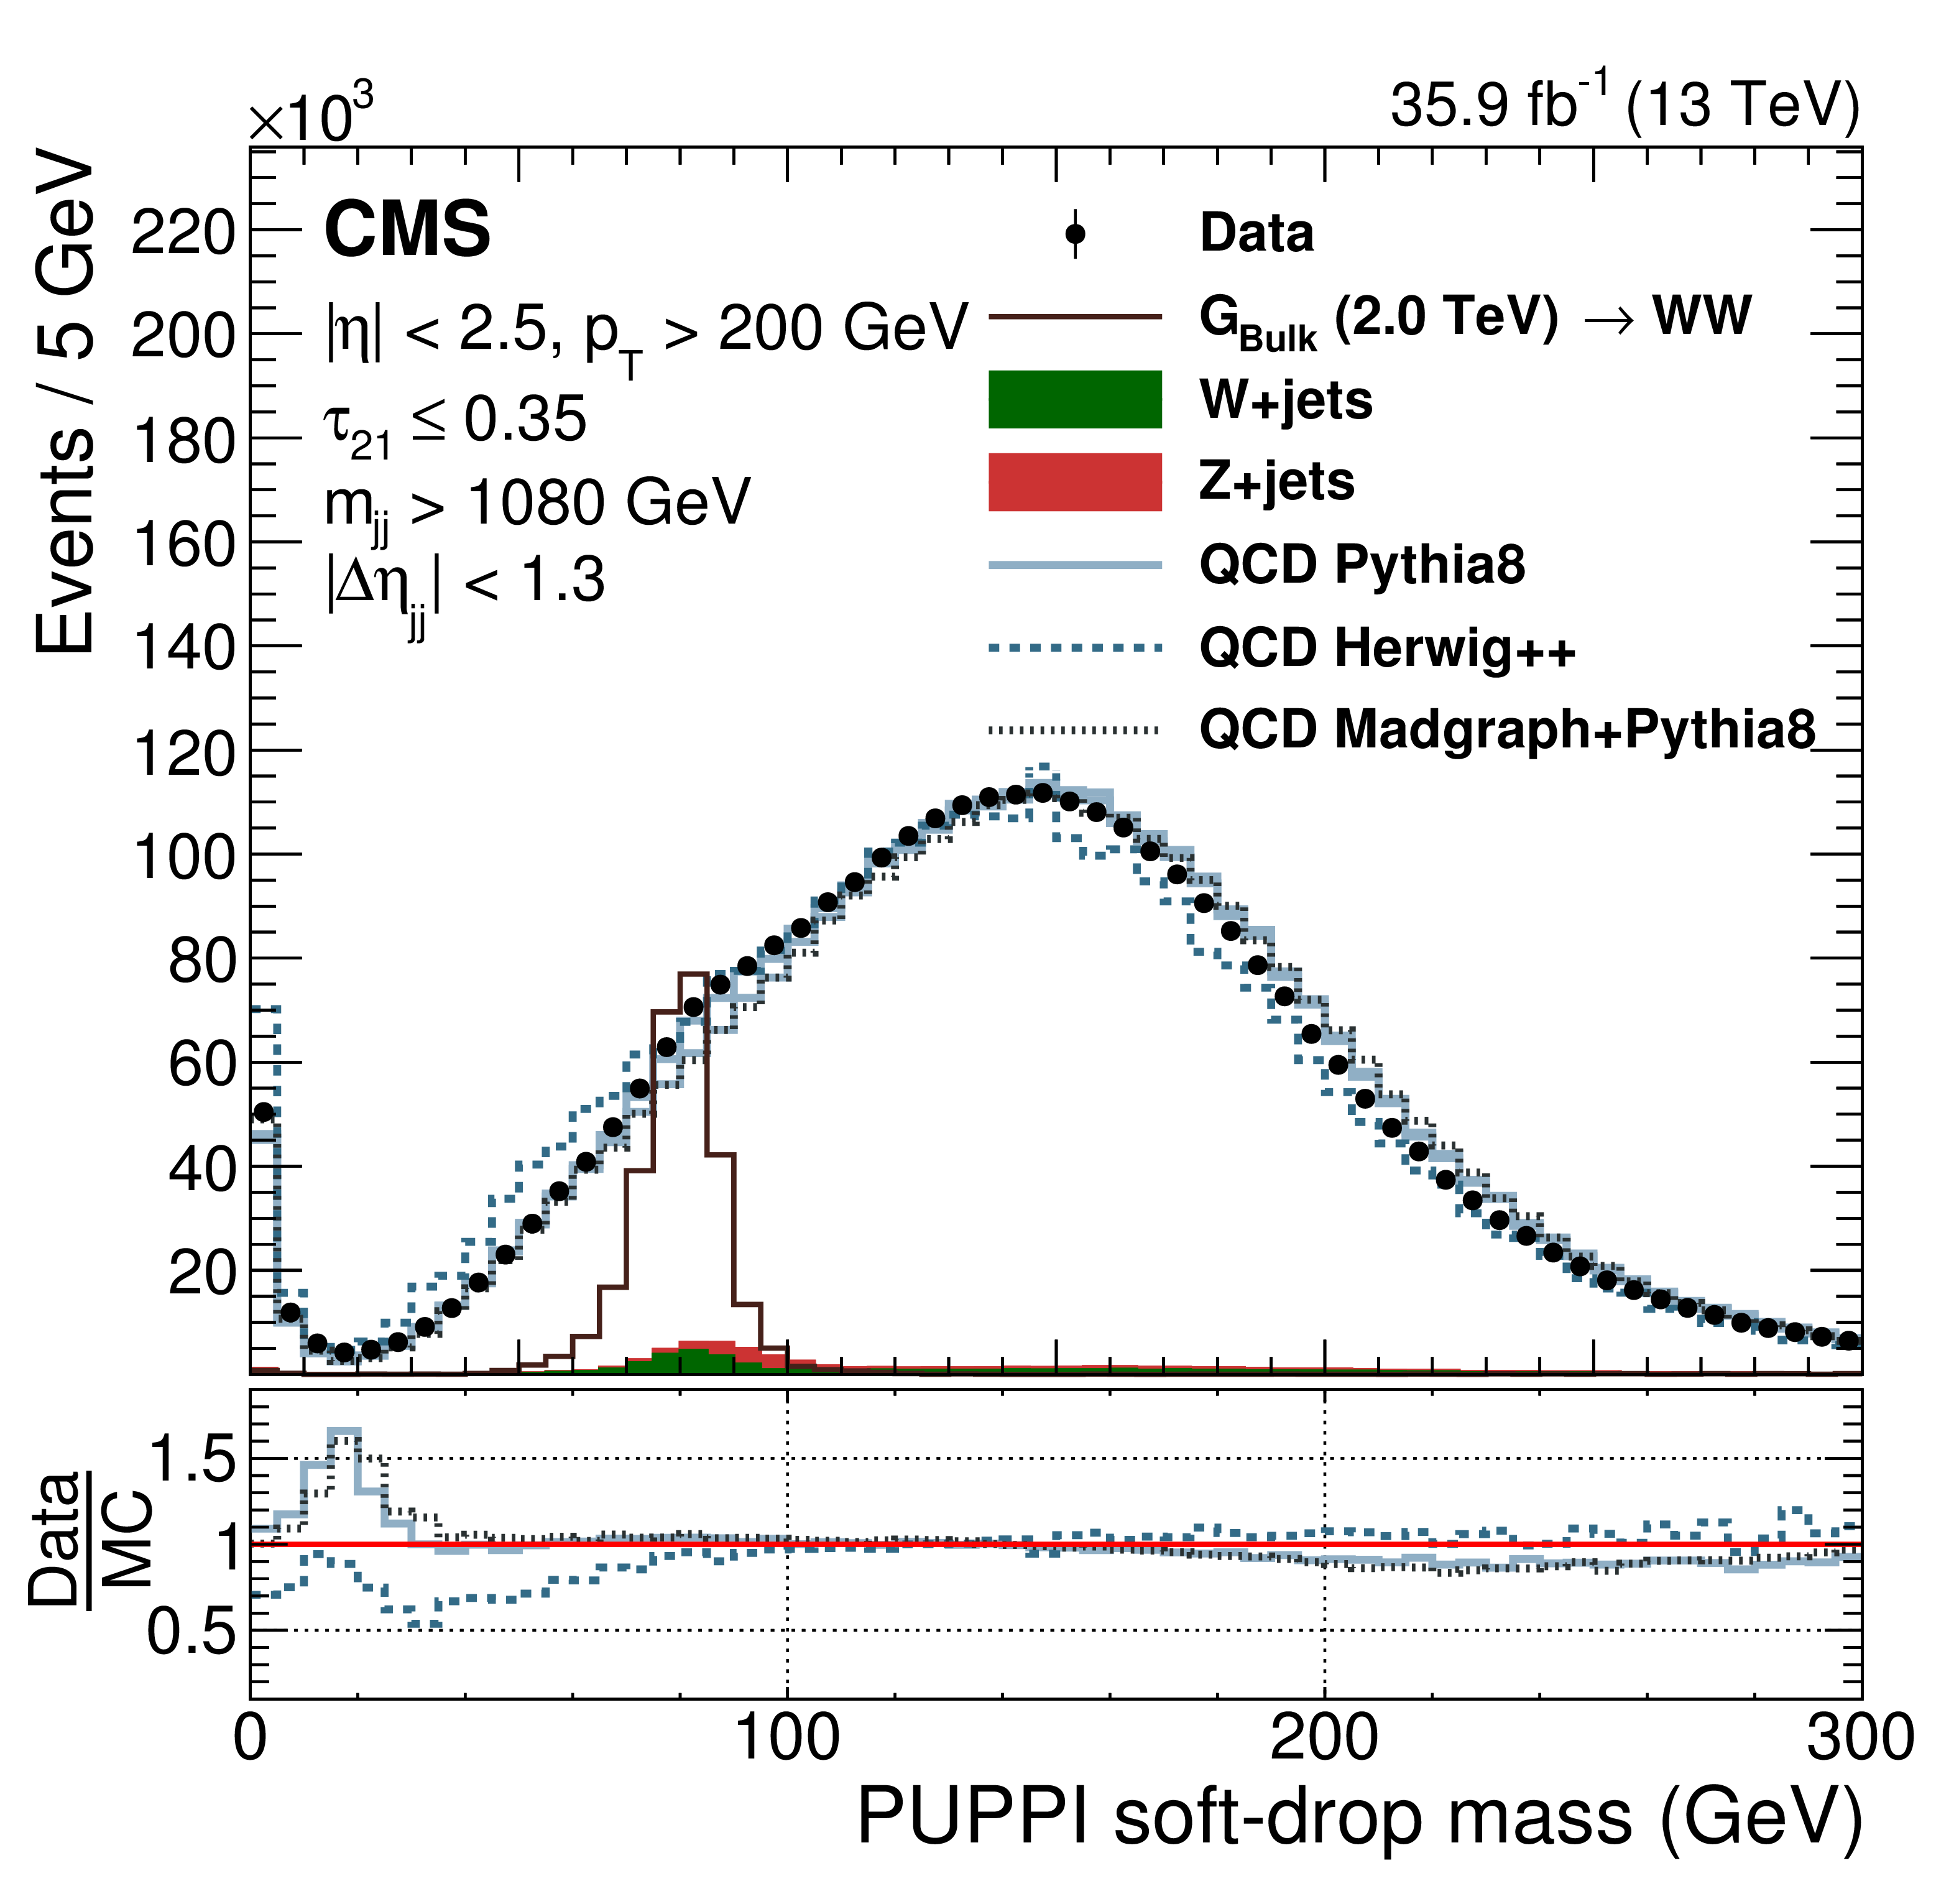
Figure 2:
The PUPPI soft-drop jet mass distribution (left) after preselecting and requiring $ {\tau _{21}}< $ 0.35, and the PUPPI N-subjettiness $ {\tau _{21}}$ distribution (right) for data and simulated samples after preselection and requiring a soft-drop mass of 65 $ \leq {m_{\text {jet}}}\leq $ 105 GeV. The multijet production is shown for three different event generators. The W+jets and Z+jets events are stacked on top of the multijet sample generated with PYTHIA 8. For the PUPPI soft-drop jet mass distribution, the ${m_\mathrm {jj}}{}$ requirement has been raised from the analysis threshold of 1050 GeV to 1080 GeV, since no requirements on the jet mass are applied. The lower subplots show the data over simulation ratio per bin. |
png pdf |
Figure 2-a:
The PUPPI soft-drop jet mass distribution after preselecting and requiring $ {\tau _{21}}< $ 0.35. The multijet production is shown for three different event generators. The W+jets and Z+jets events are stacked on top of the multijet sample generated with PYTHIA 8. For the PUPPI soft-drop jet mass distribution, the ${m_\mathrm {jj}}{}$ requirement has been raised from the analysis threshold of 1050 GeV to 1080 GeV, since no requirements on the jet mass are applied. The lower subplots show the data over simulation ratio per bin. |

png pdf |
Figure 2-b:
The PUPPI N-subjettiness $ {\tau _{21}}$ distribution (right) for data and simulated samples after preselection and requiring a soft-drop mass of 65 $ \leq {m_{\text {jet}}}\leq $ 105 GeV. The multijet production is shown for three different event generators. The W+jets and Z+jets events are stacked on top of the multijet sample generated with PYTHIA 8. For the PUPPI soft-drop jet mass distribution, the ${m_\mathrm {jj}}{}$ requirement has been raised from the analysis threshold of 1050 GeV to 1080 GeV, since no requirements on the jet mass are applied. The lower subplots show the data over simulation ratio per bin. |
png pdf |
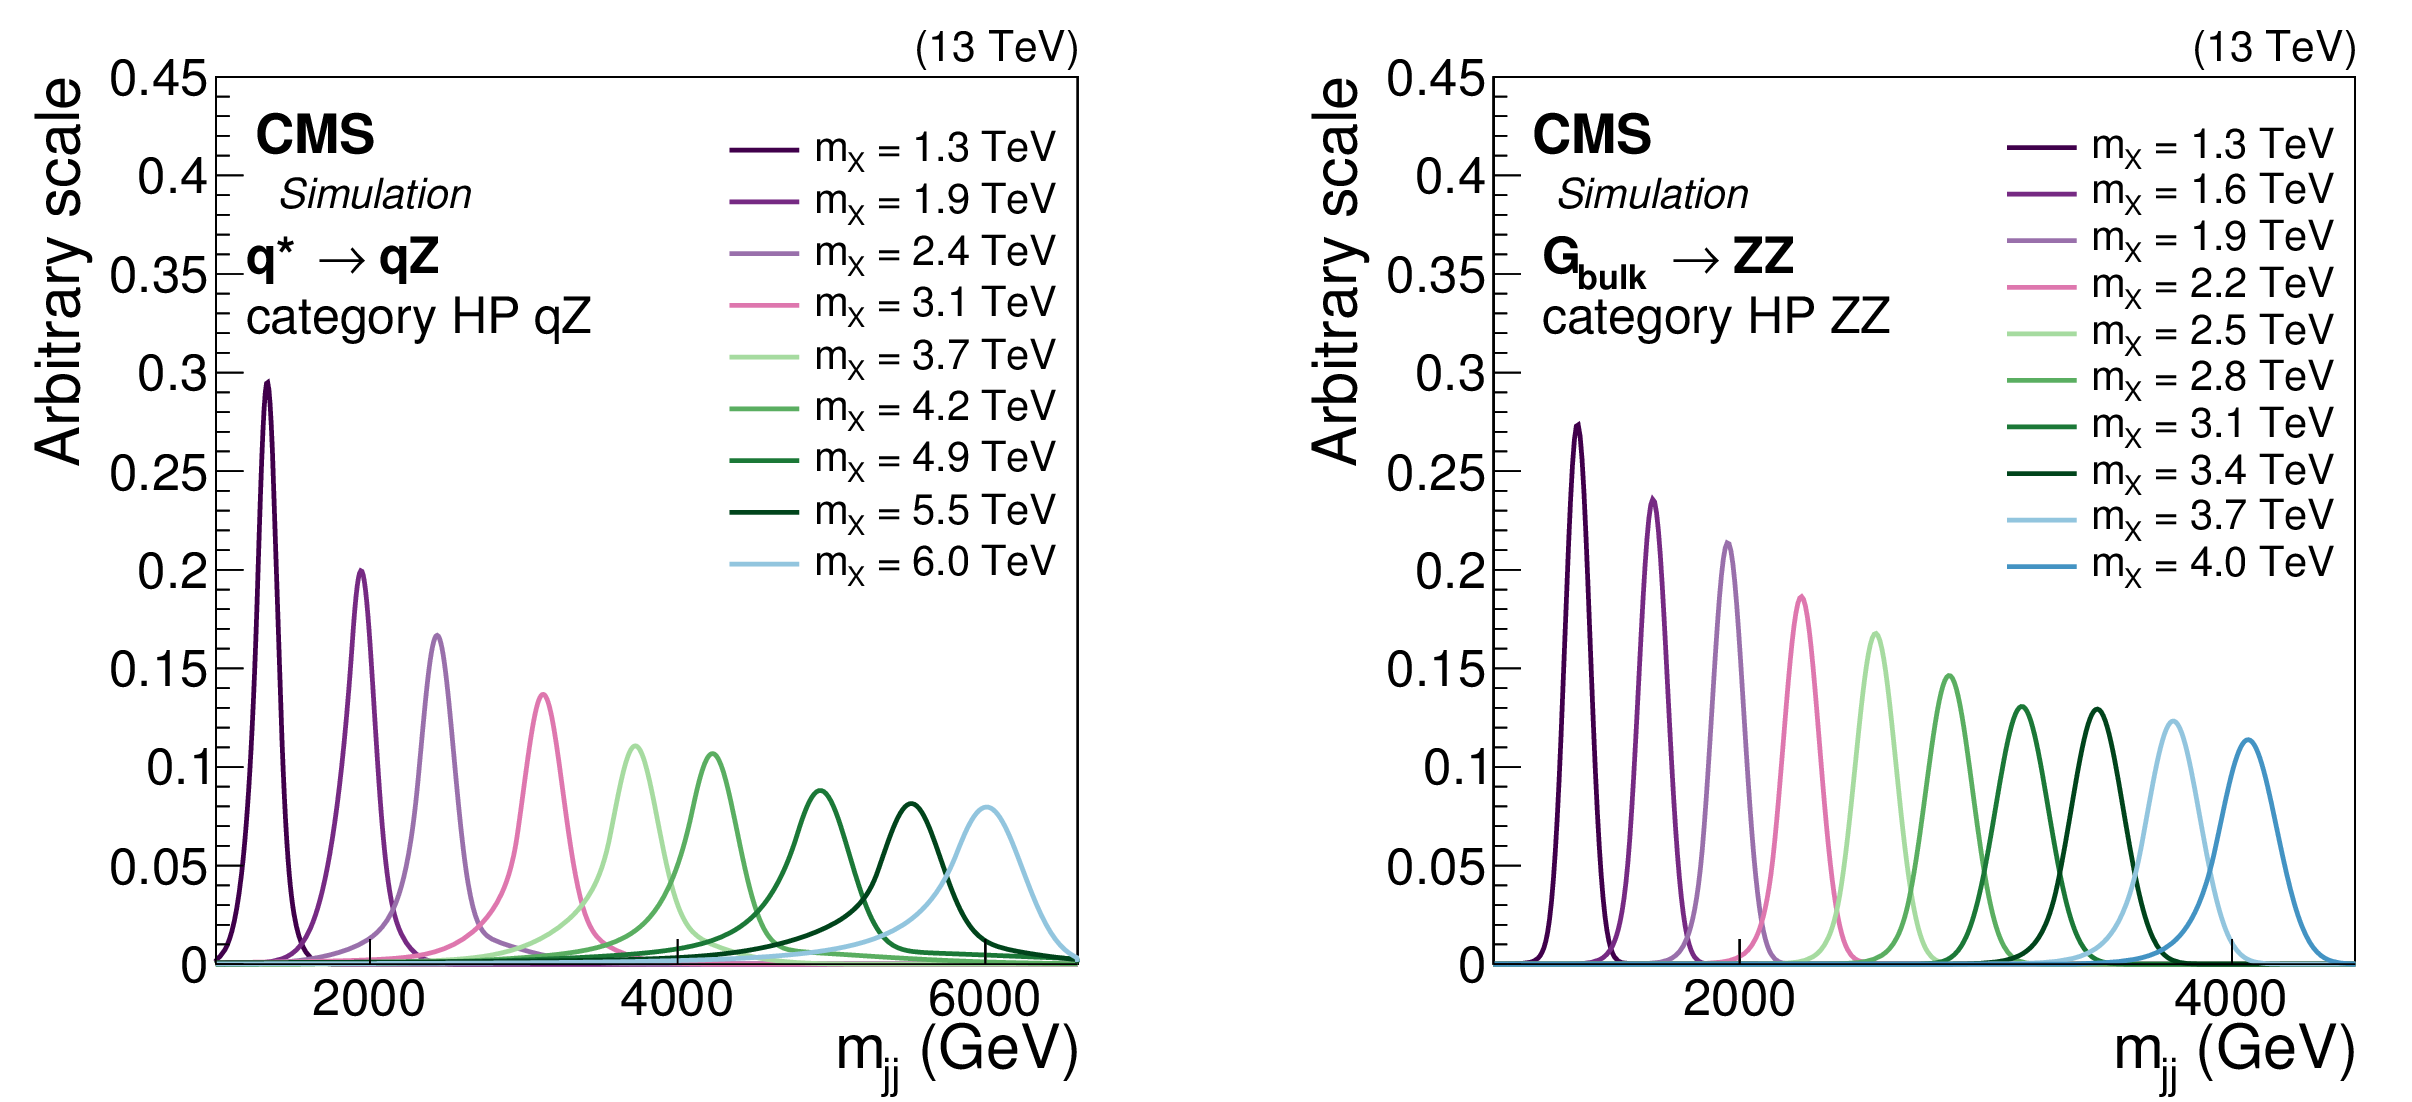
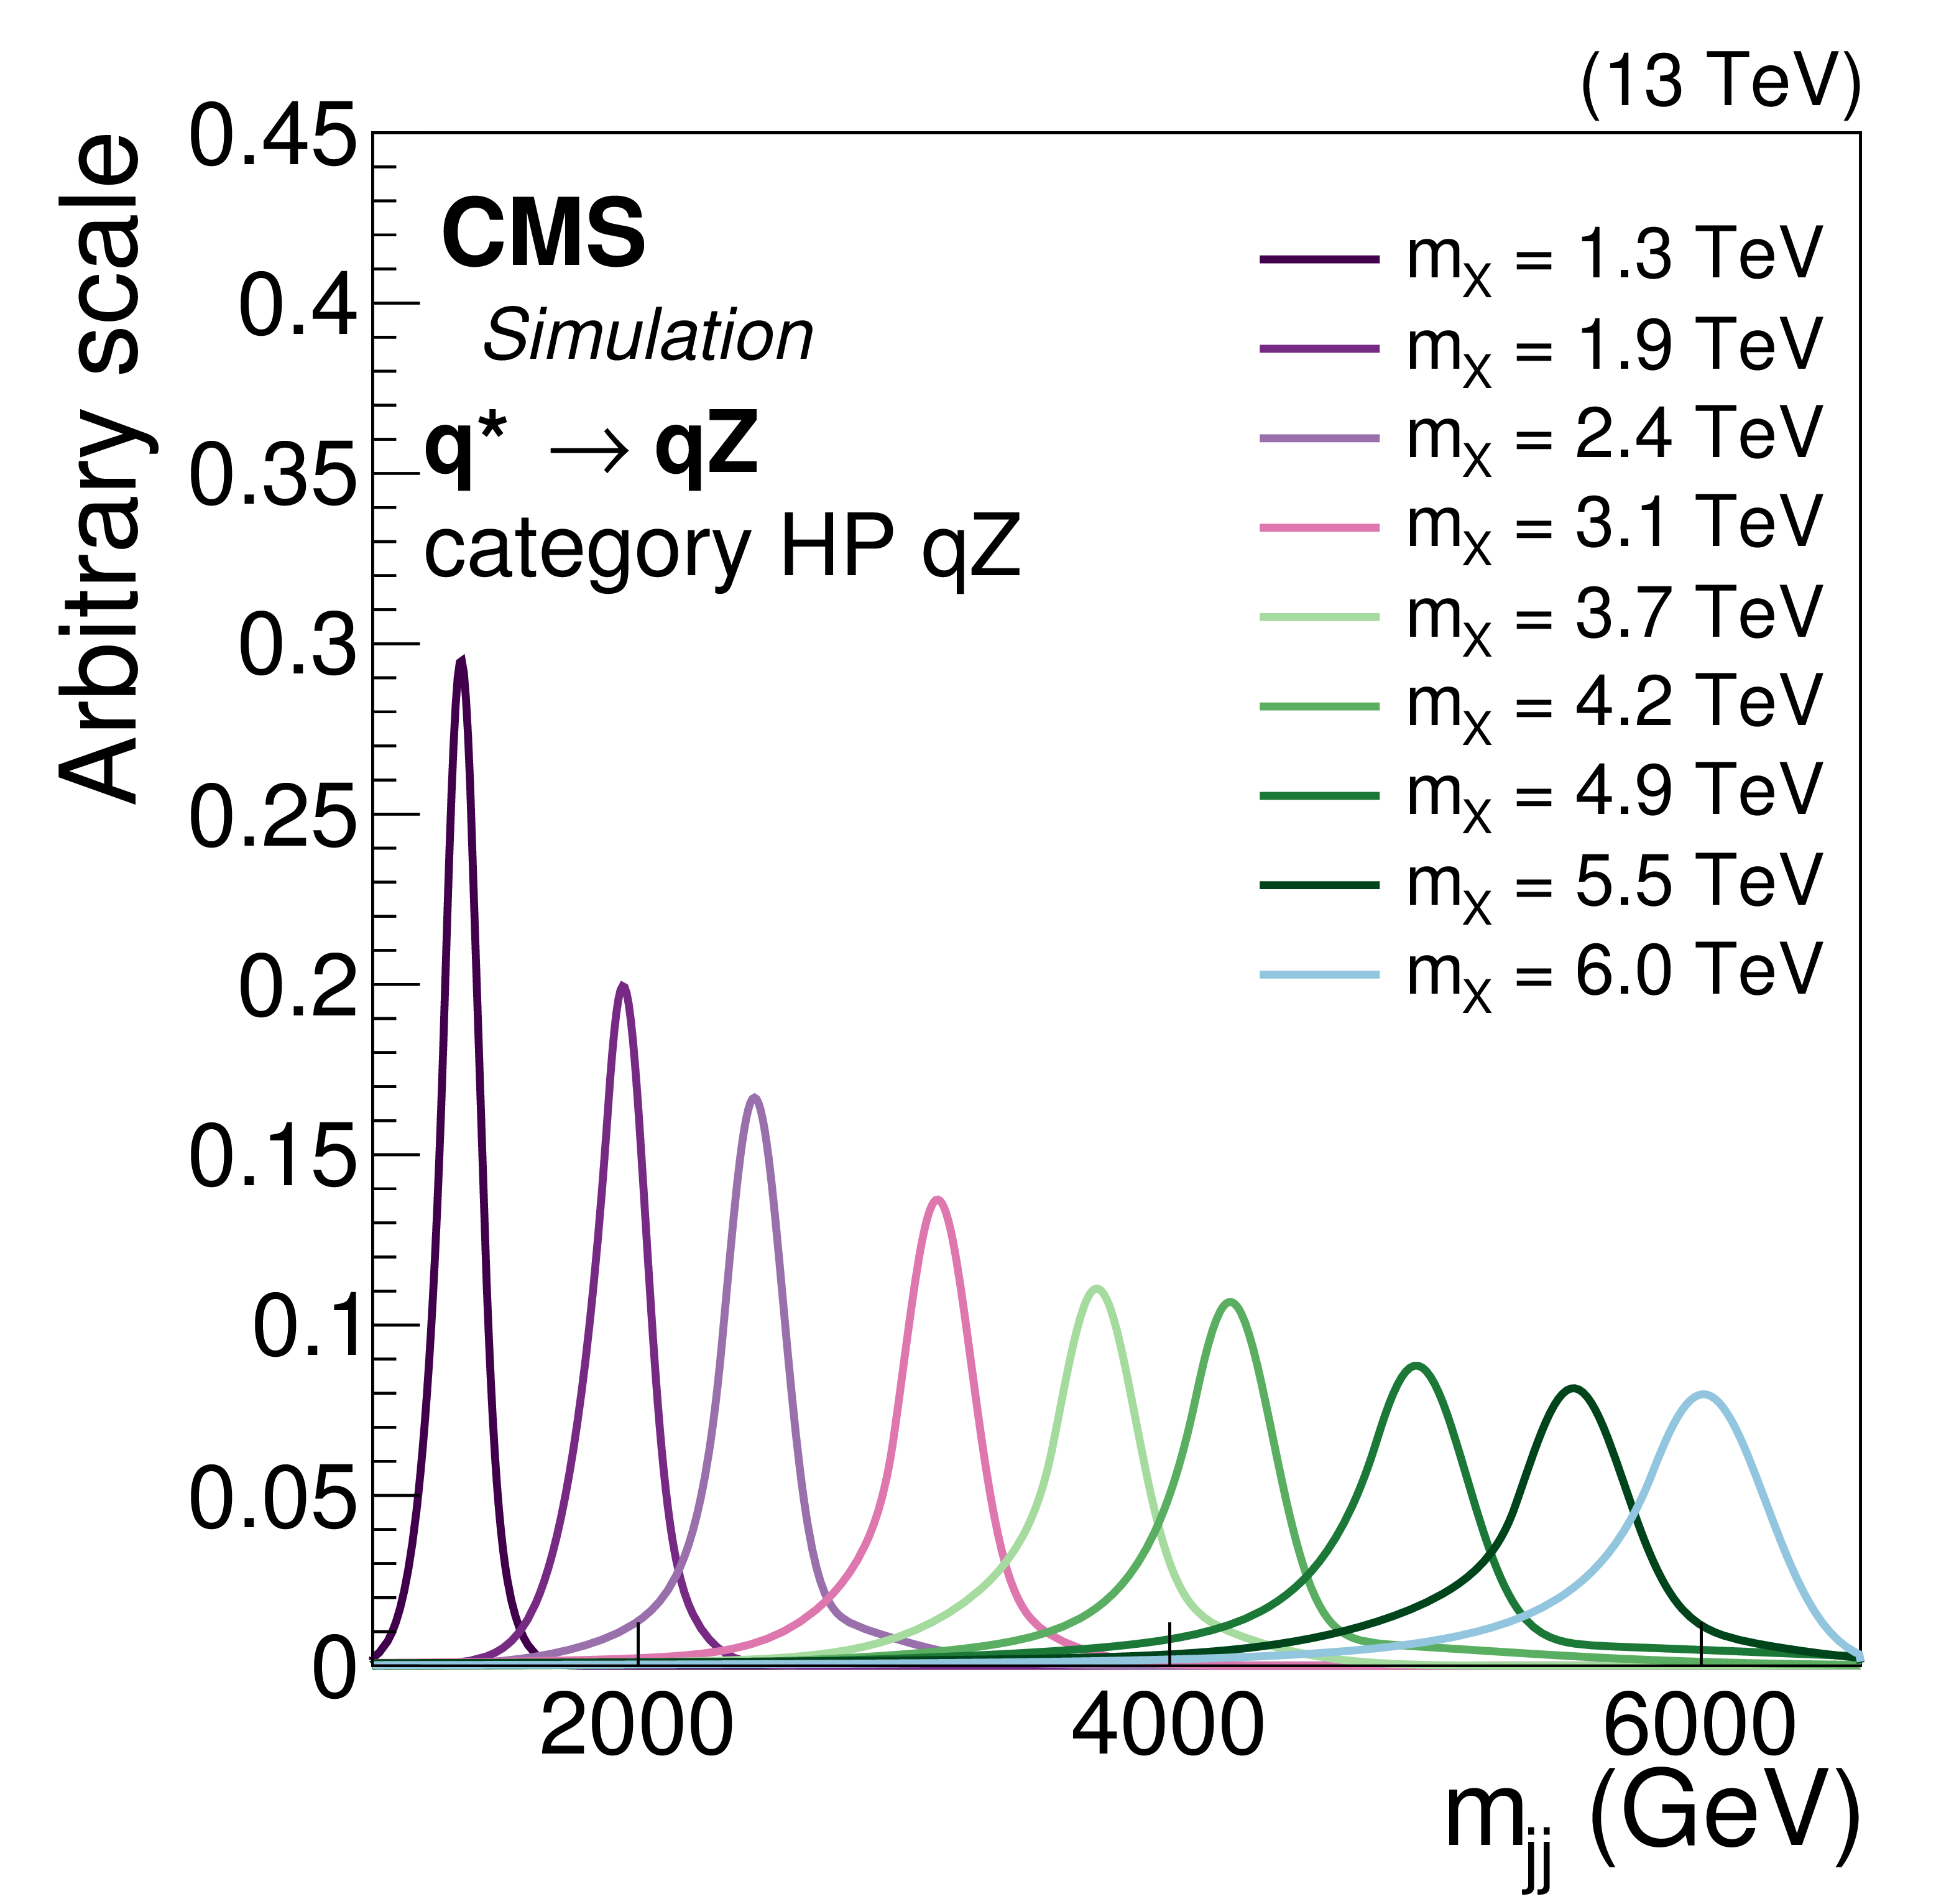
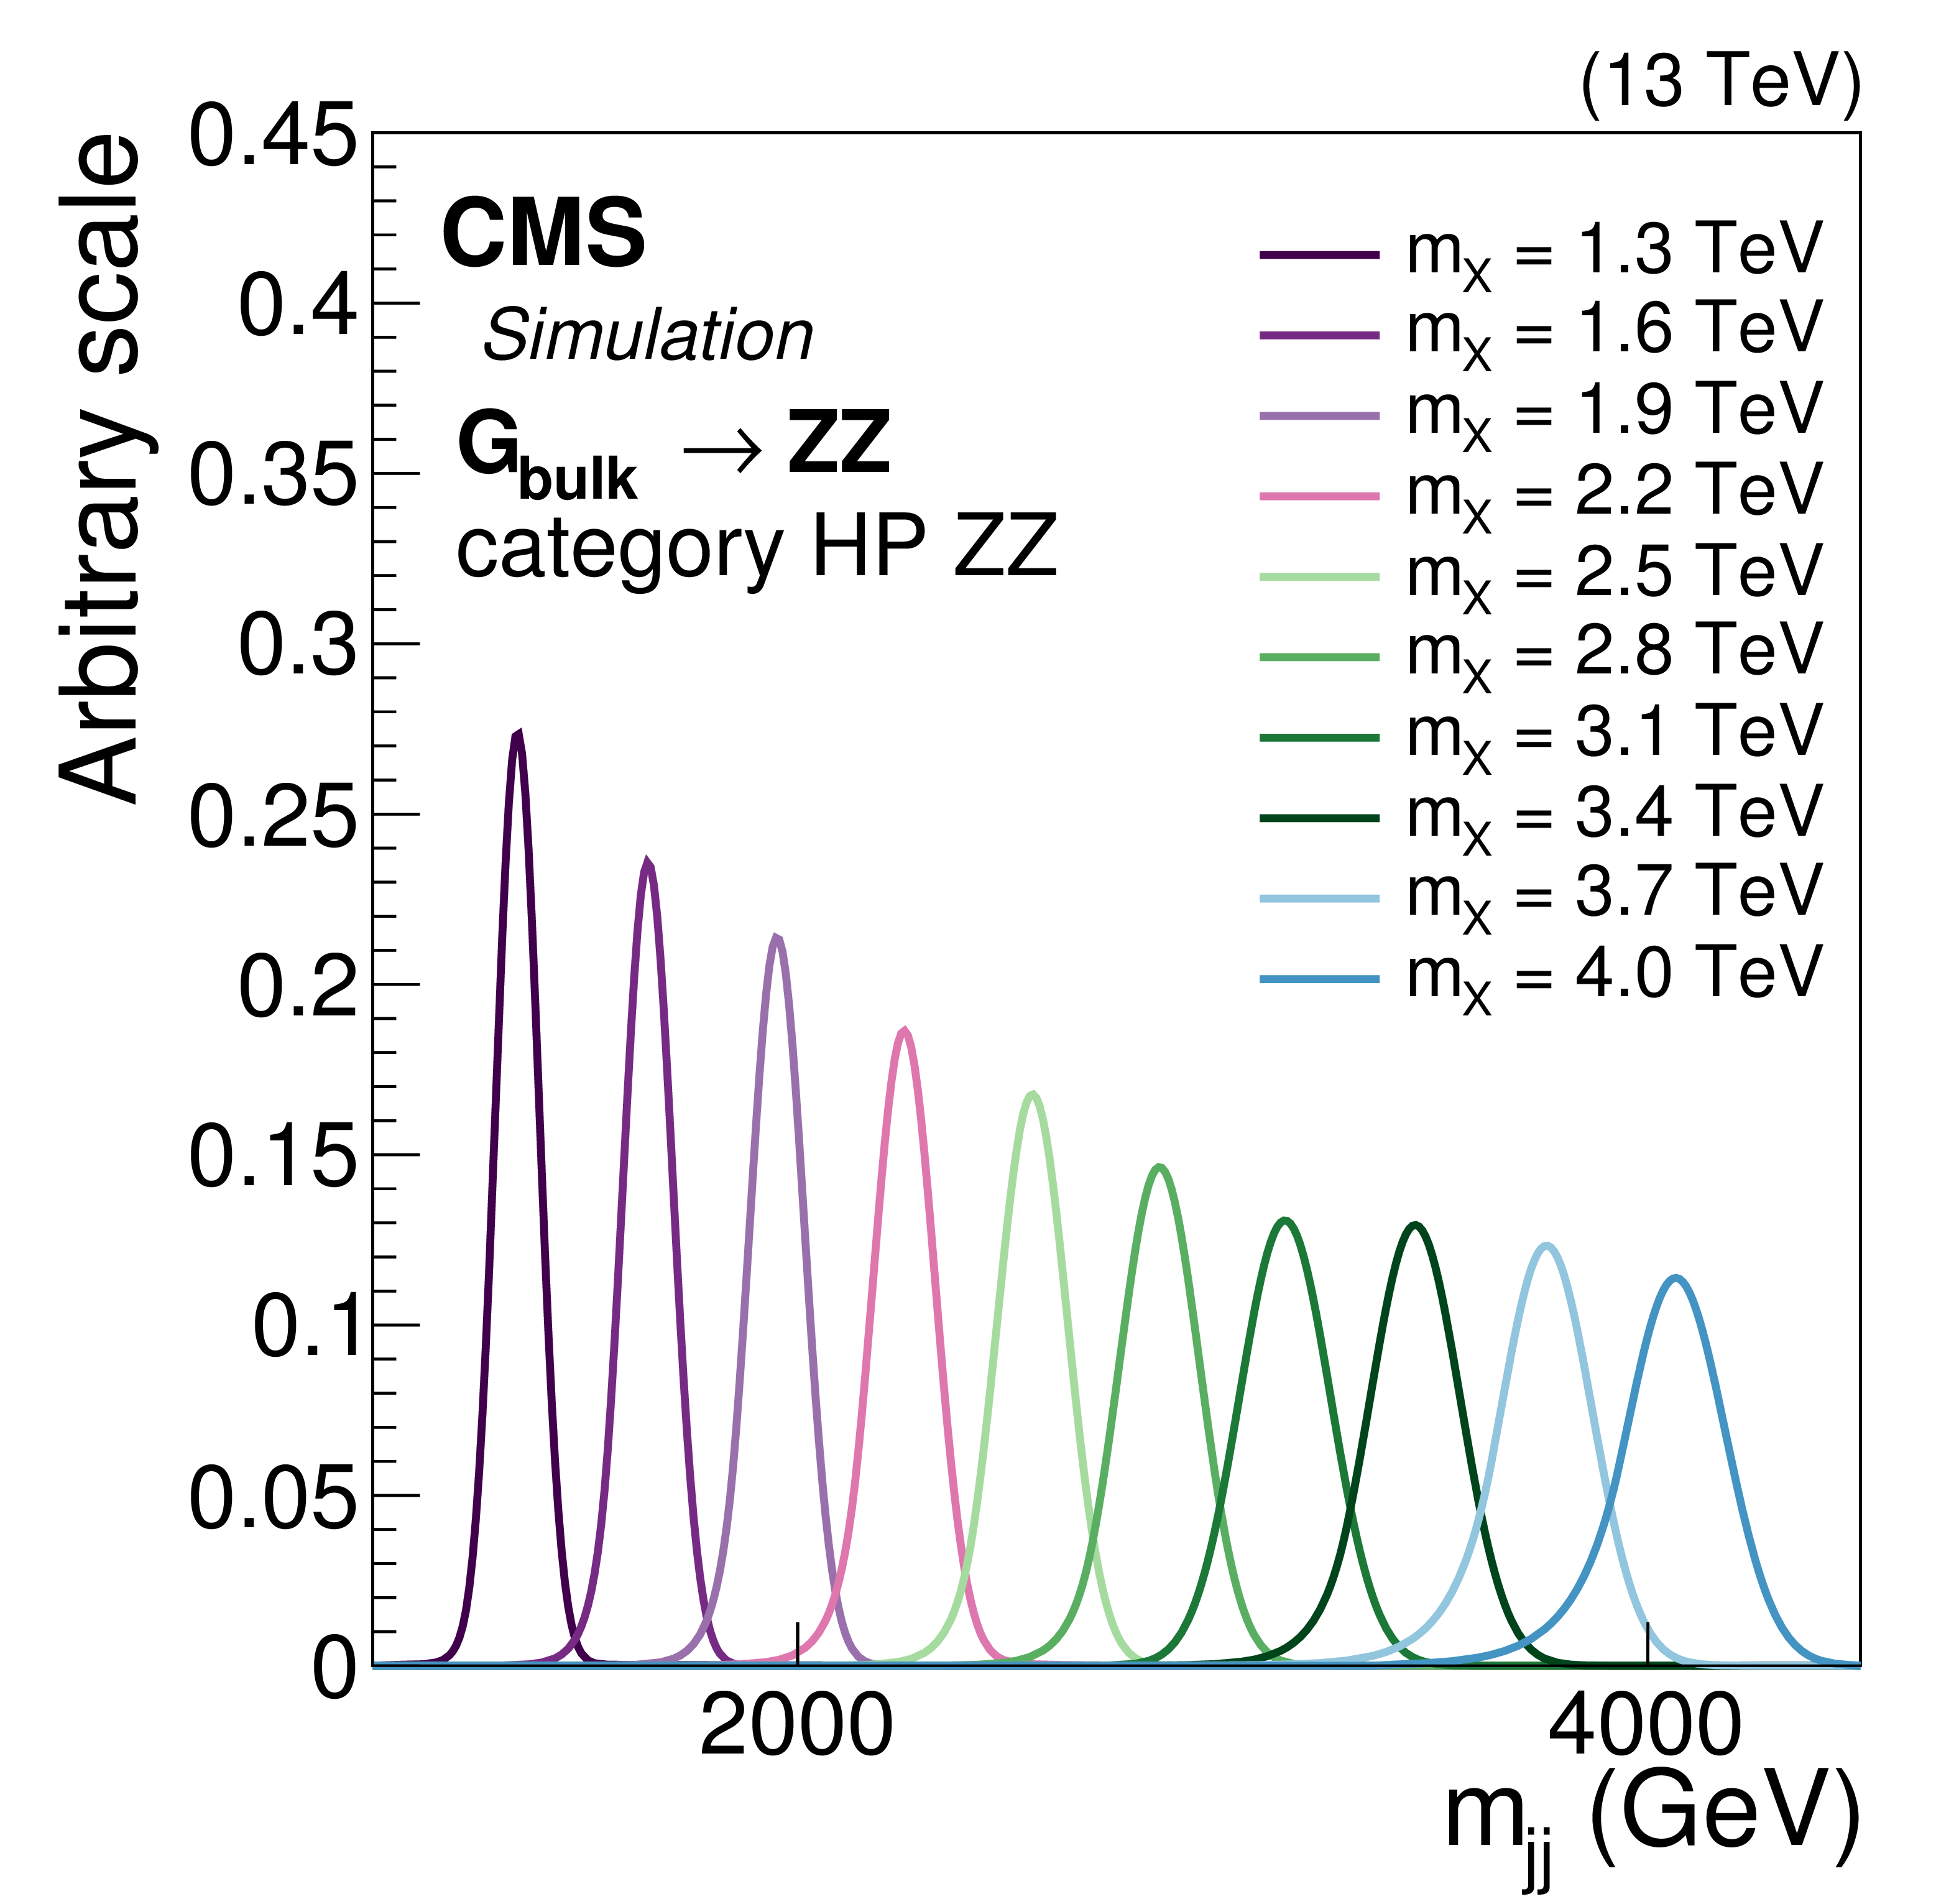
Figure 3:
Dijet invariant mass distribution for different signal mass hypotheses of the $\mathrm{ q } ^*\rightarrow \mathrm {q}\mathrm{ Z } $ model (left) and the bulk graviton decaying to a pair of $\mathrm{ Z } $ bosons (right) used to extract the signal shape in the HP category. |
png pdf |
Figure 3-a:
Dijet invariant mass distribution for different signal mass hypotheses of the $\mathrm{ q } ^*\rightarrow \mathrm {q}\mathrm{ Z } $ model. |
png pdf |
Figure 3-b:
Dijet invariant mass distribution for different signal mass hypotheses of the bulk graviton decaying to a pair of $\mathrm{ Z } $ bosons. |
png pdf |
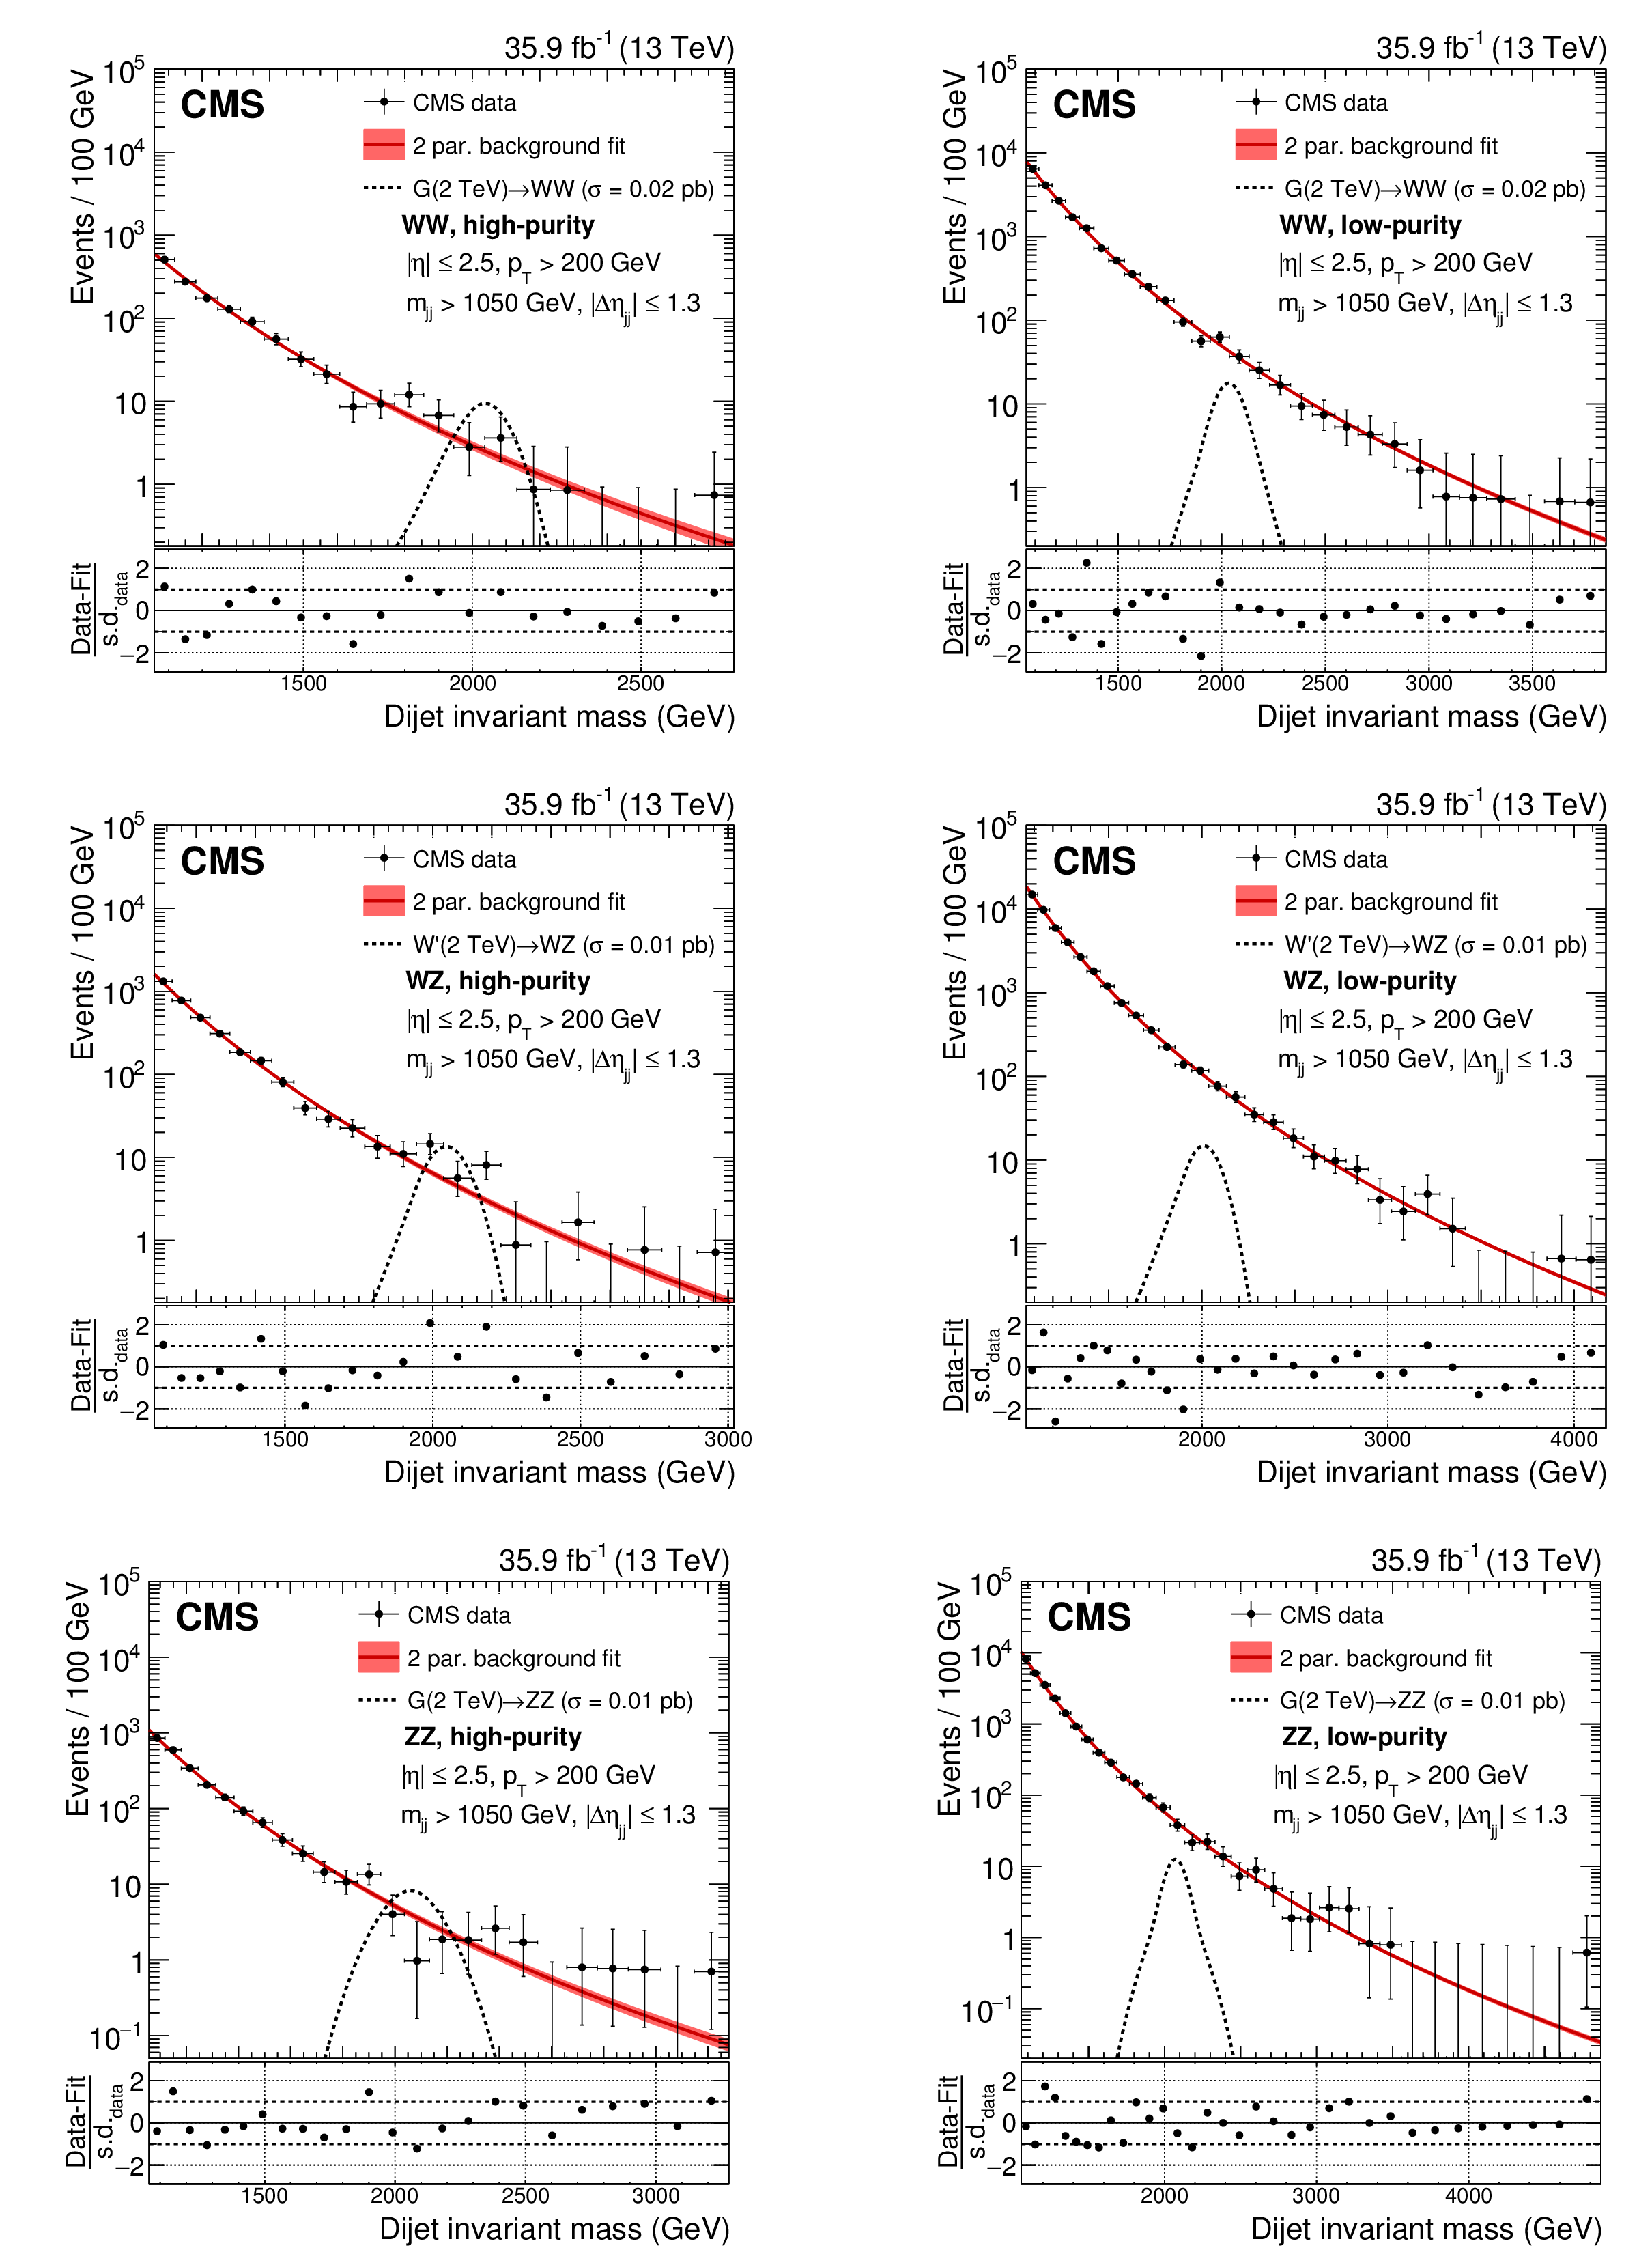
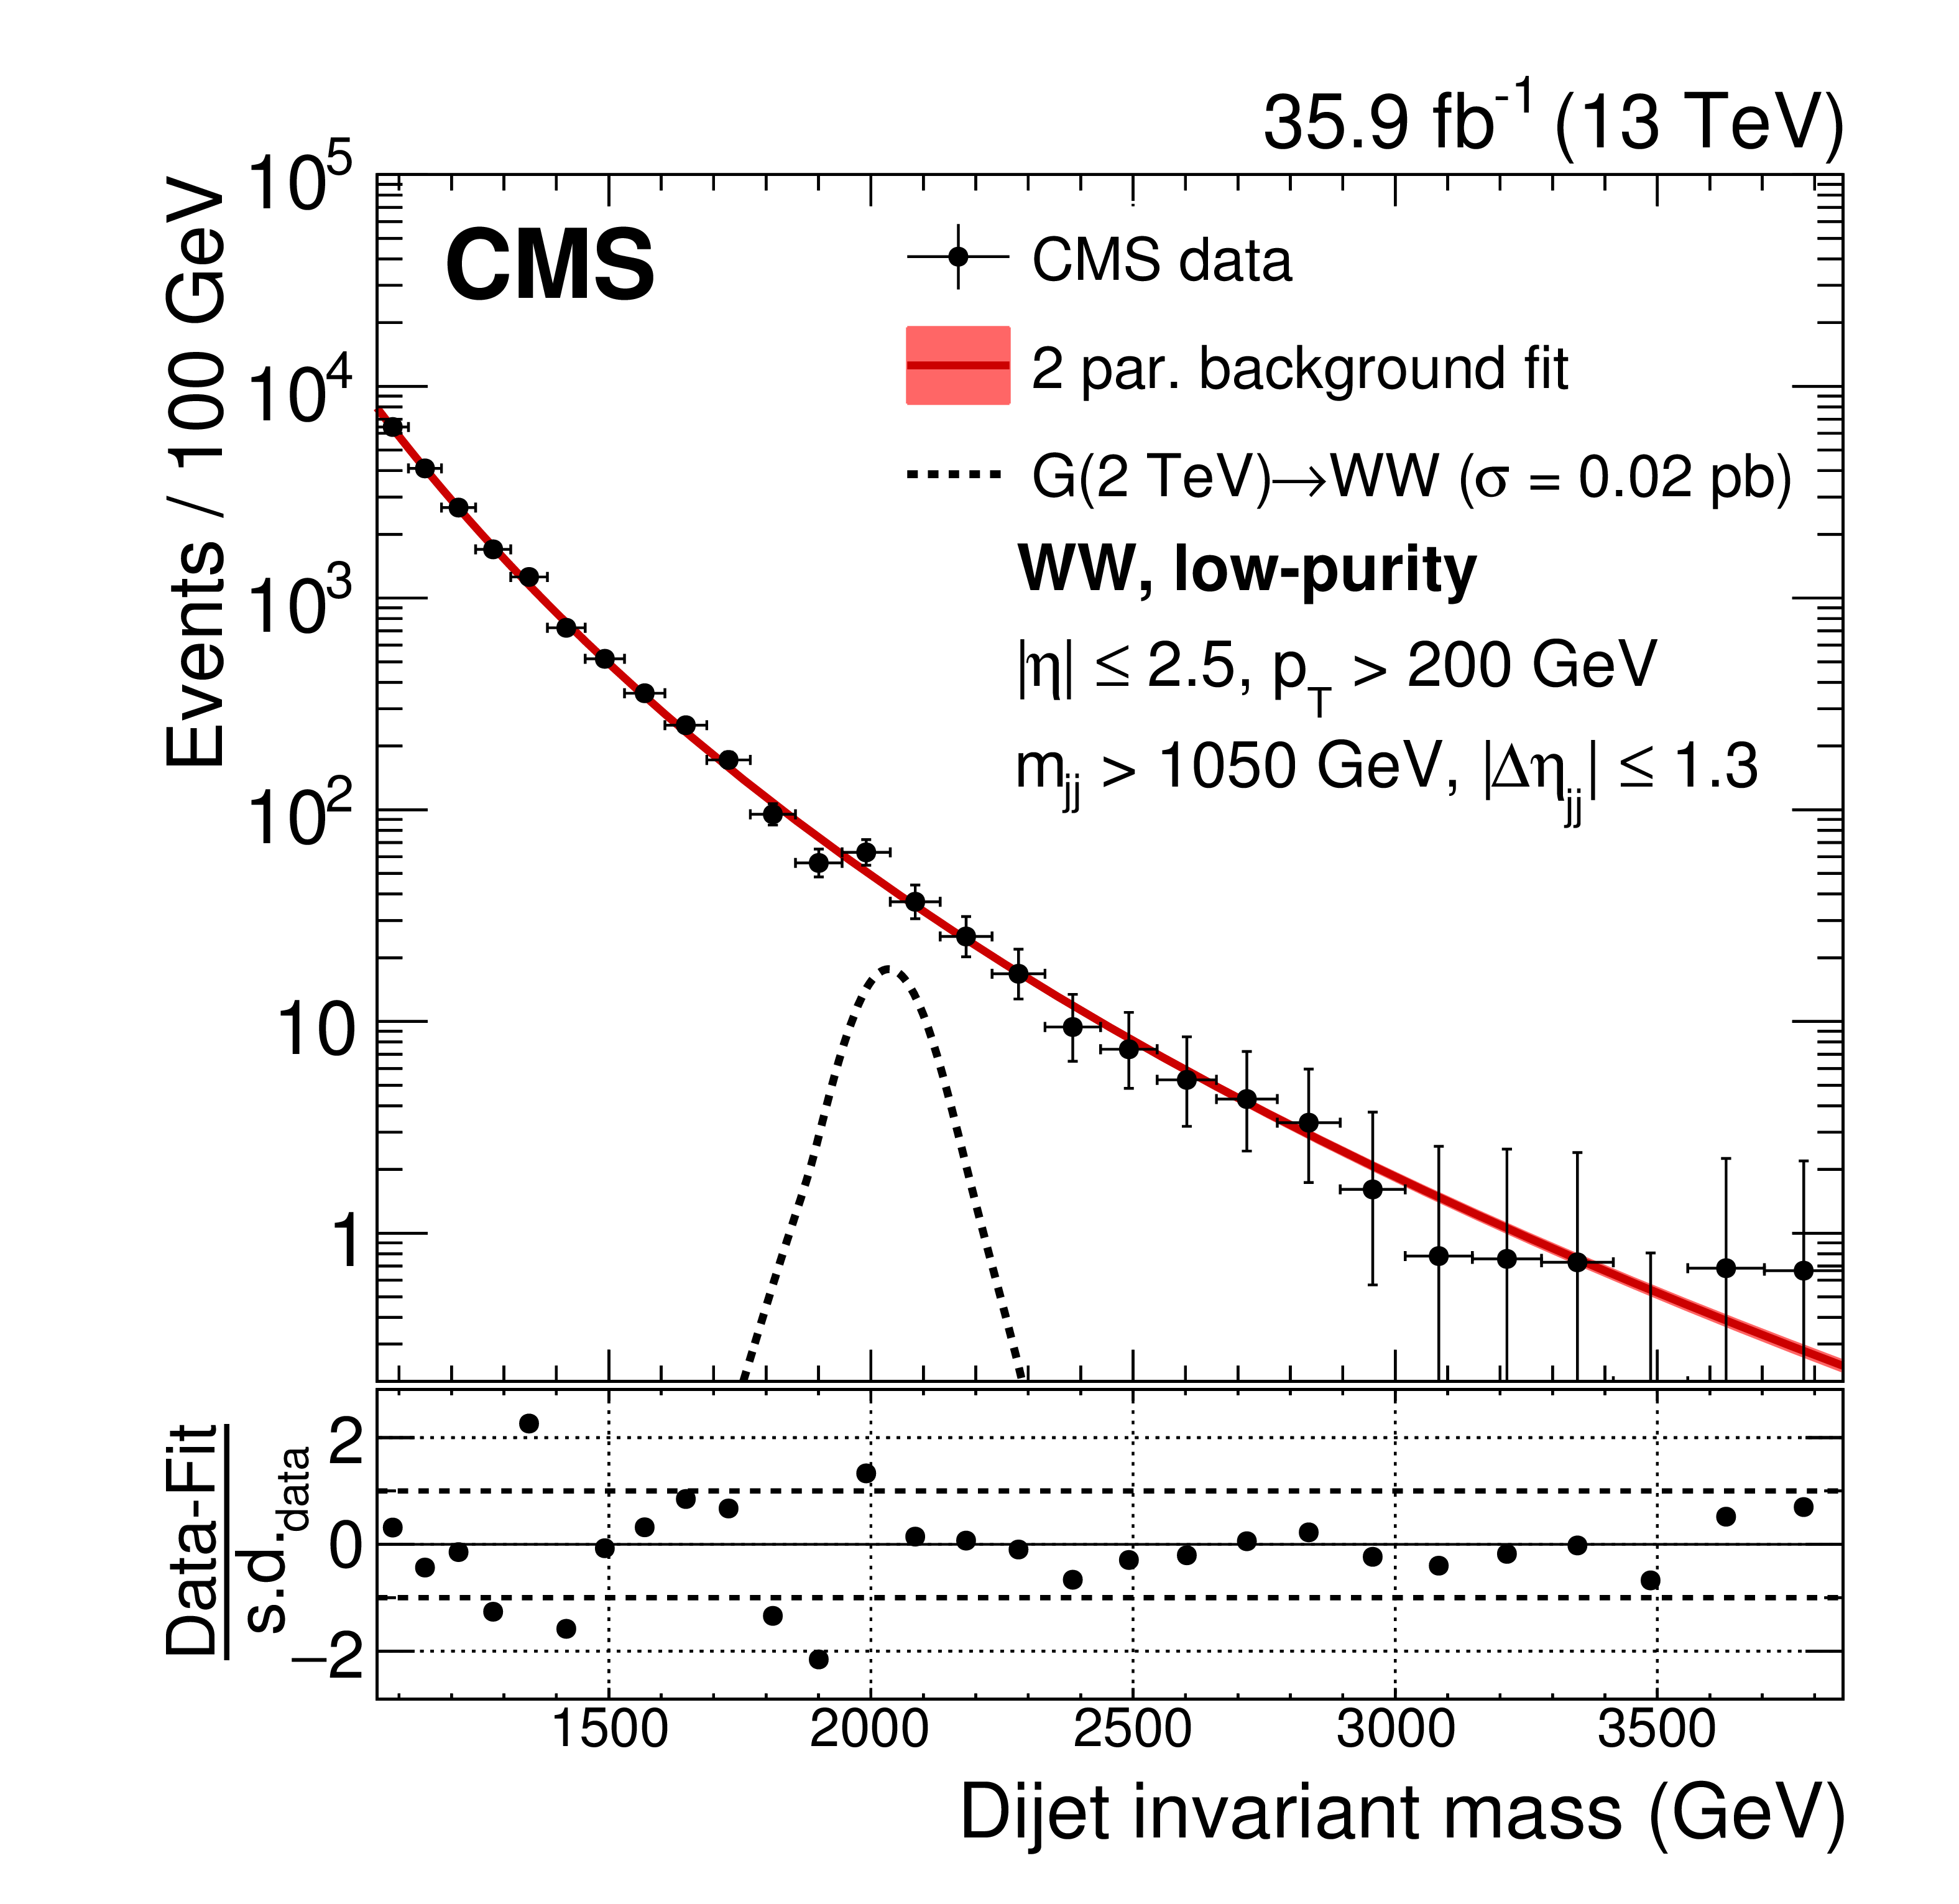
Figure 4:
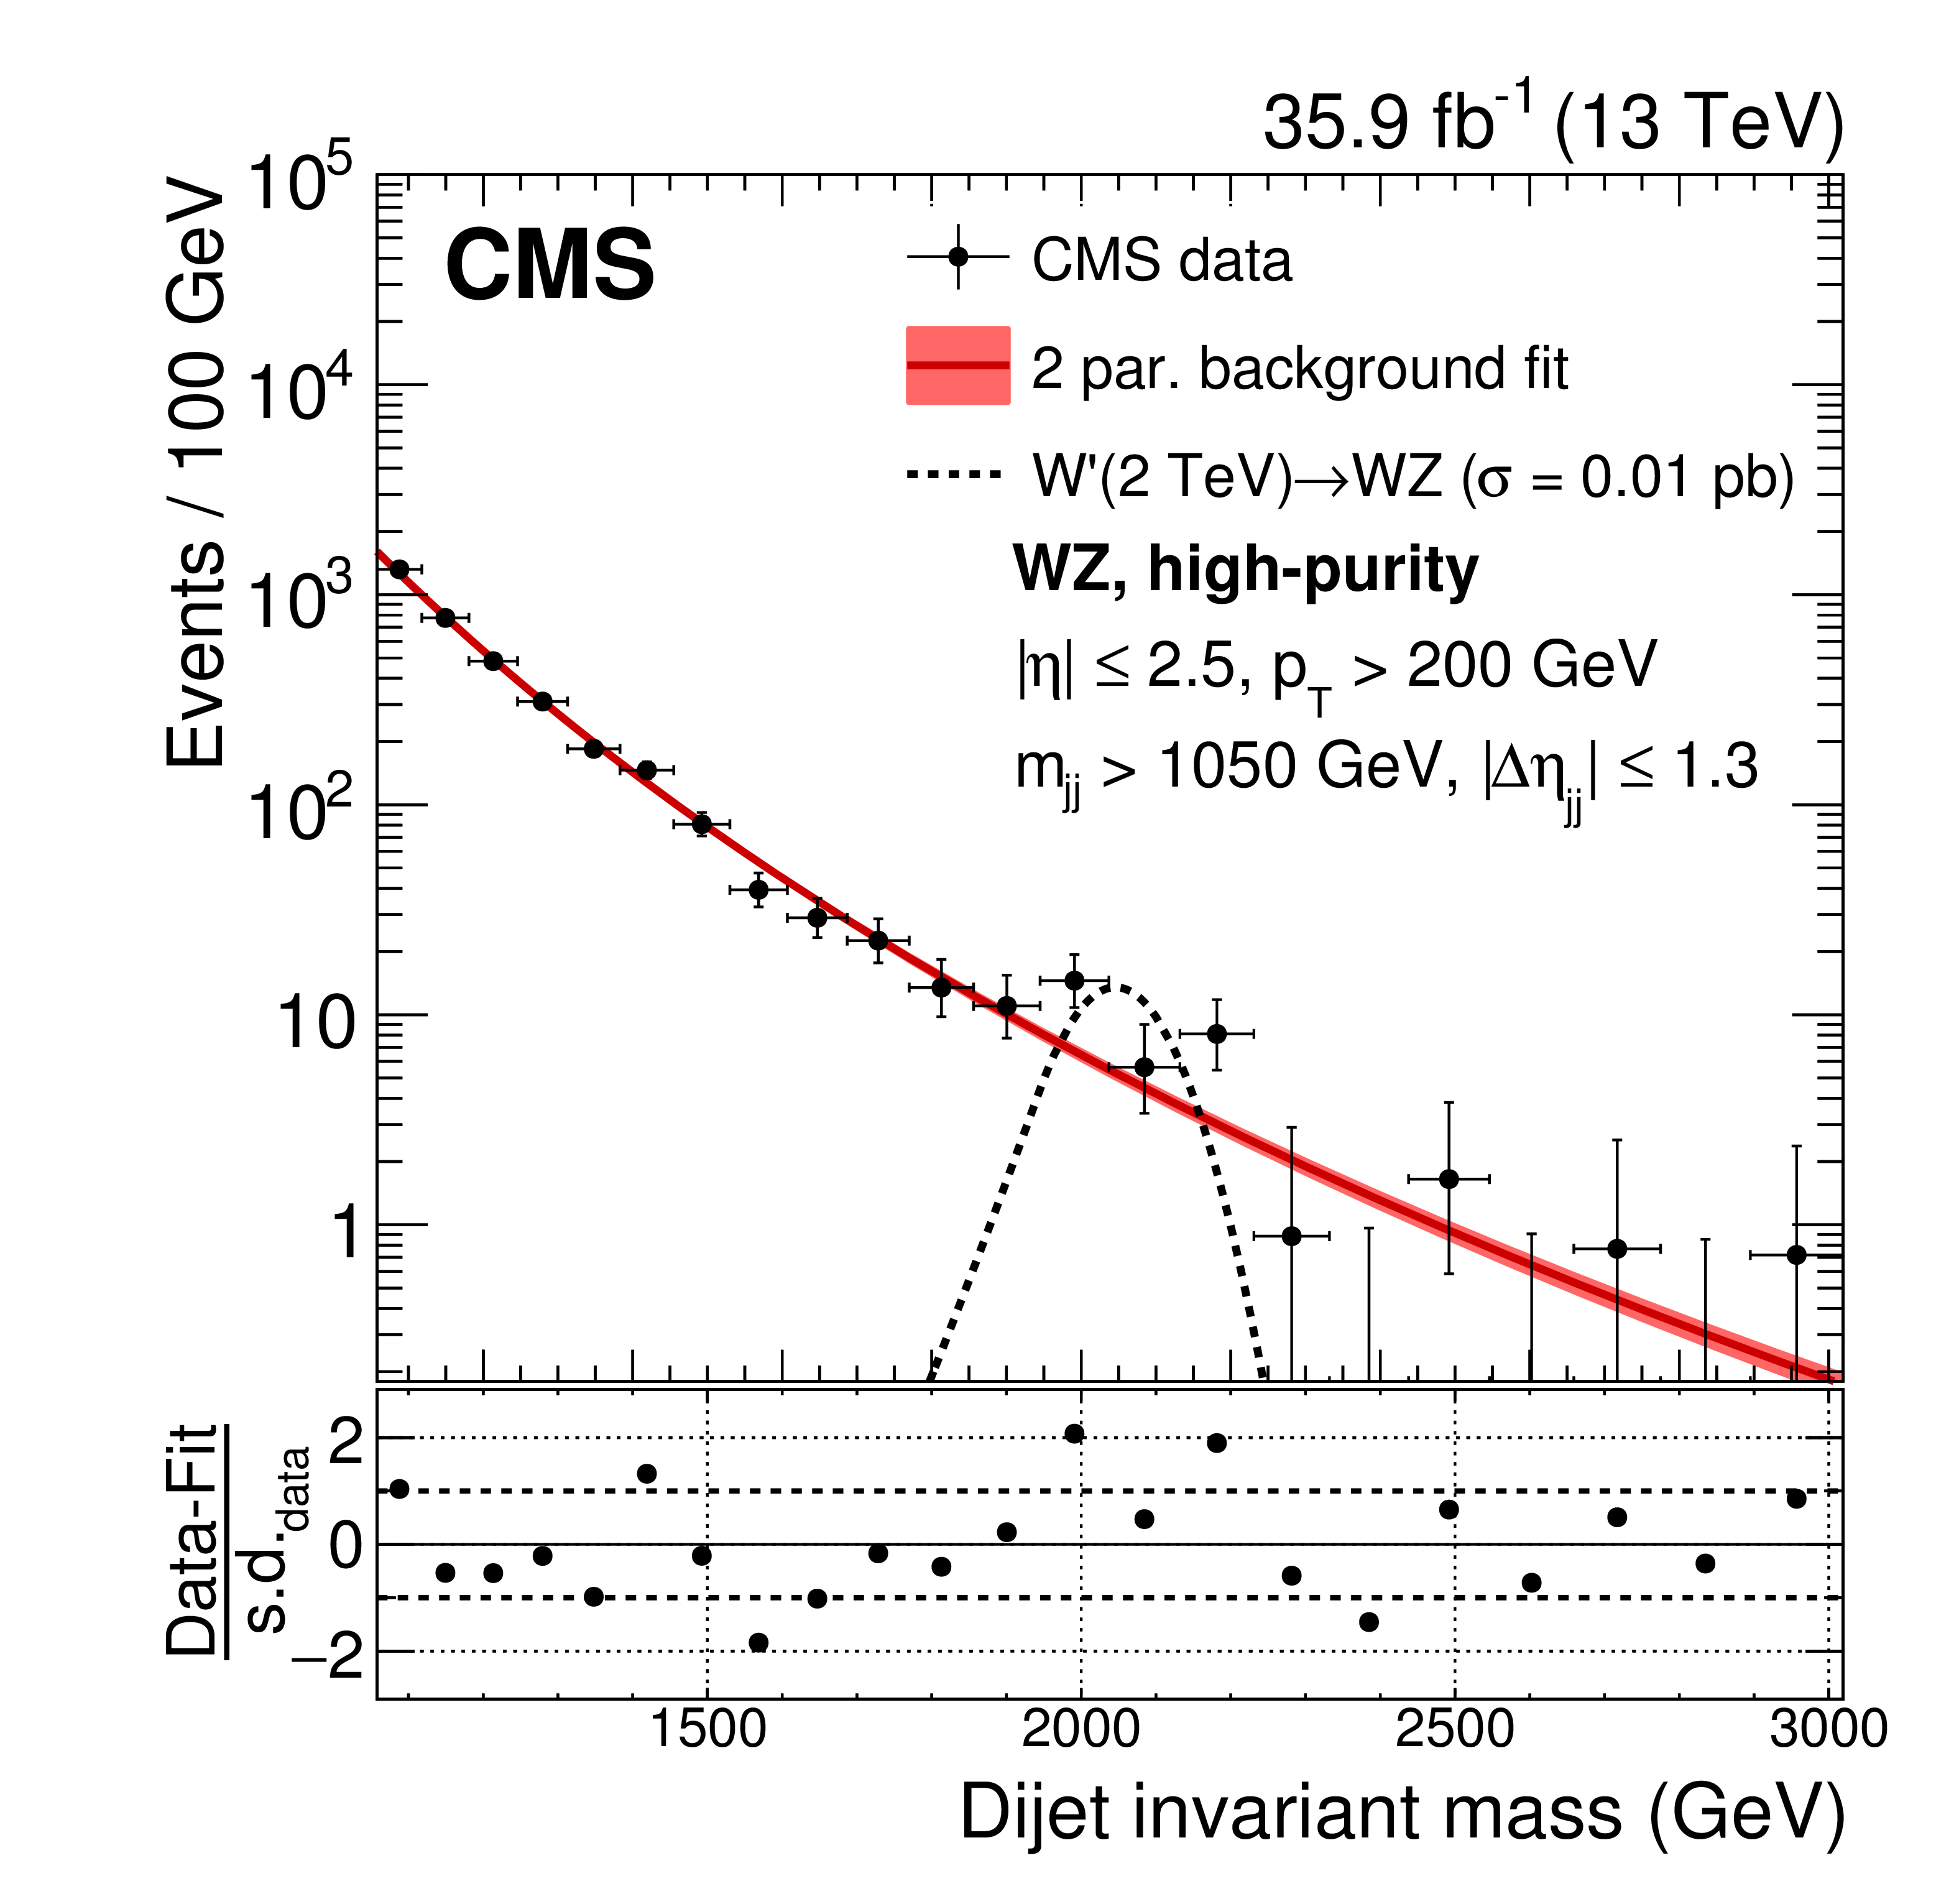
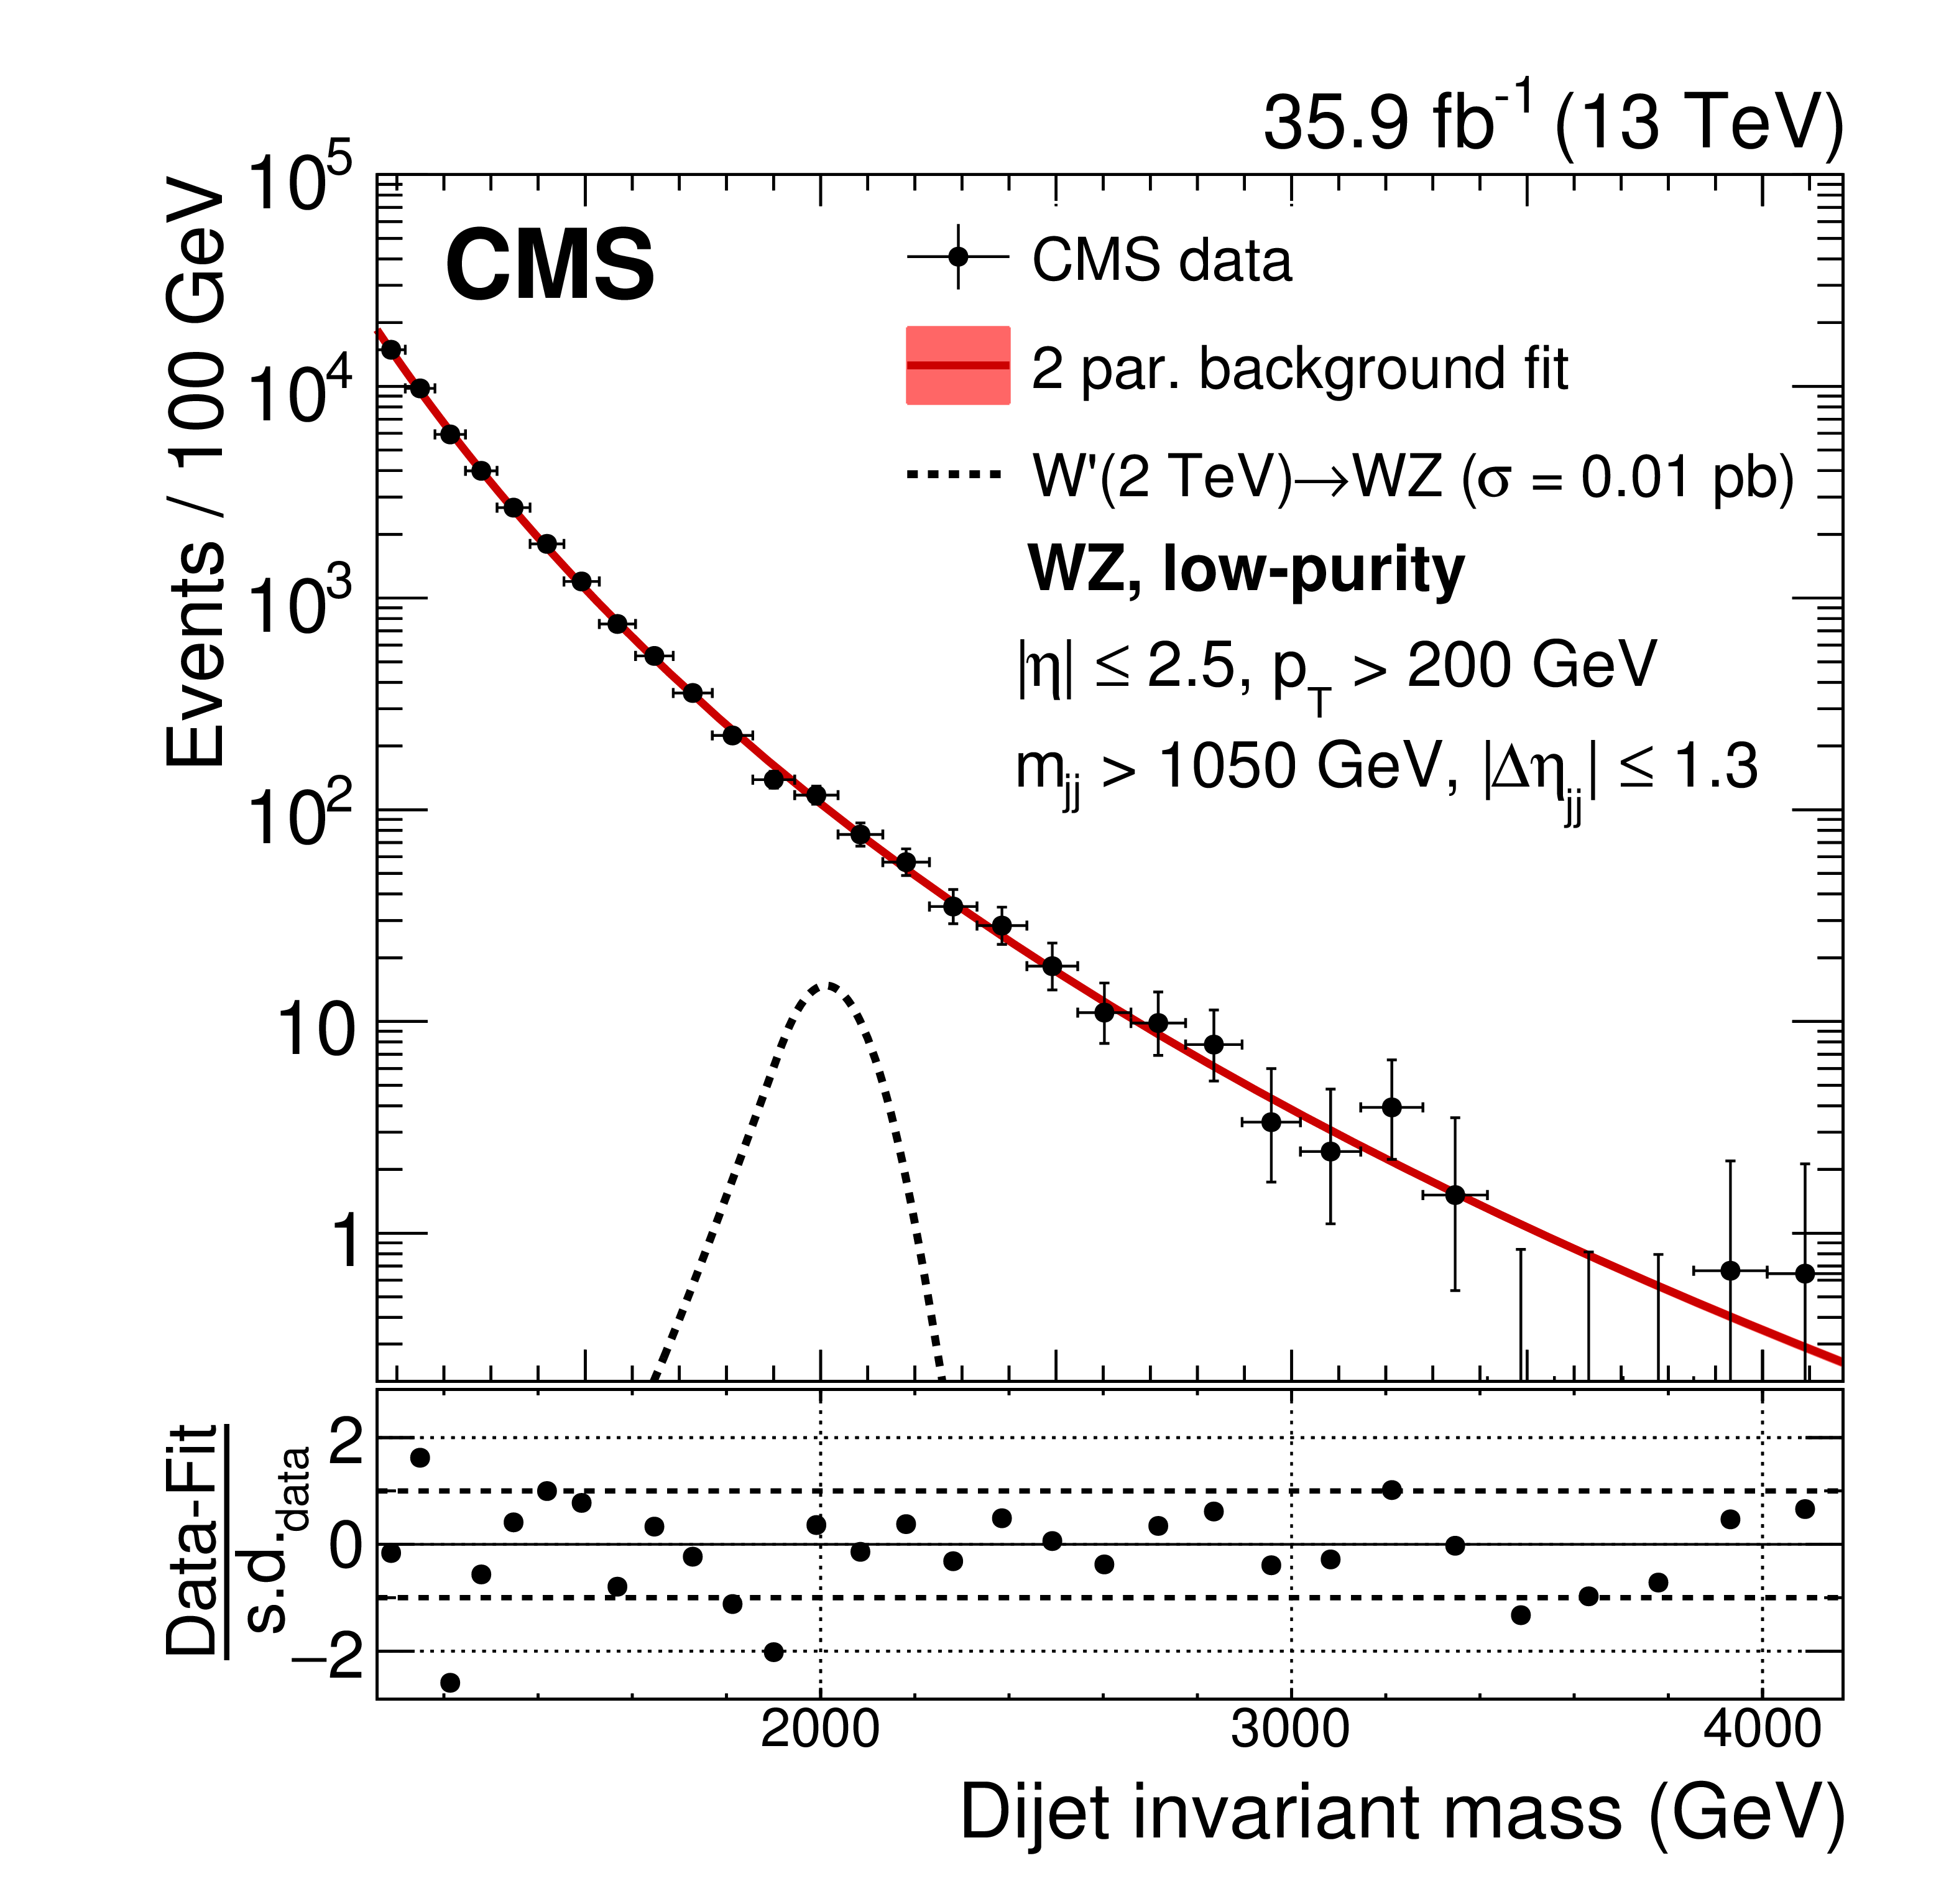
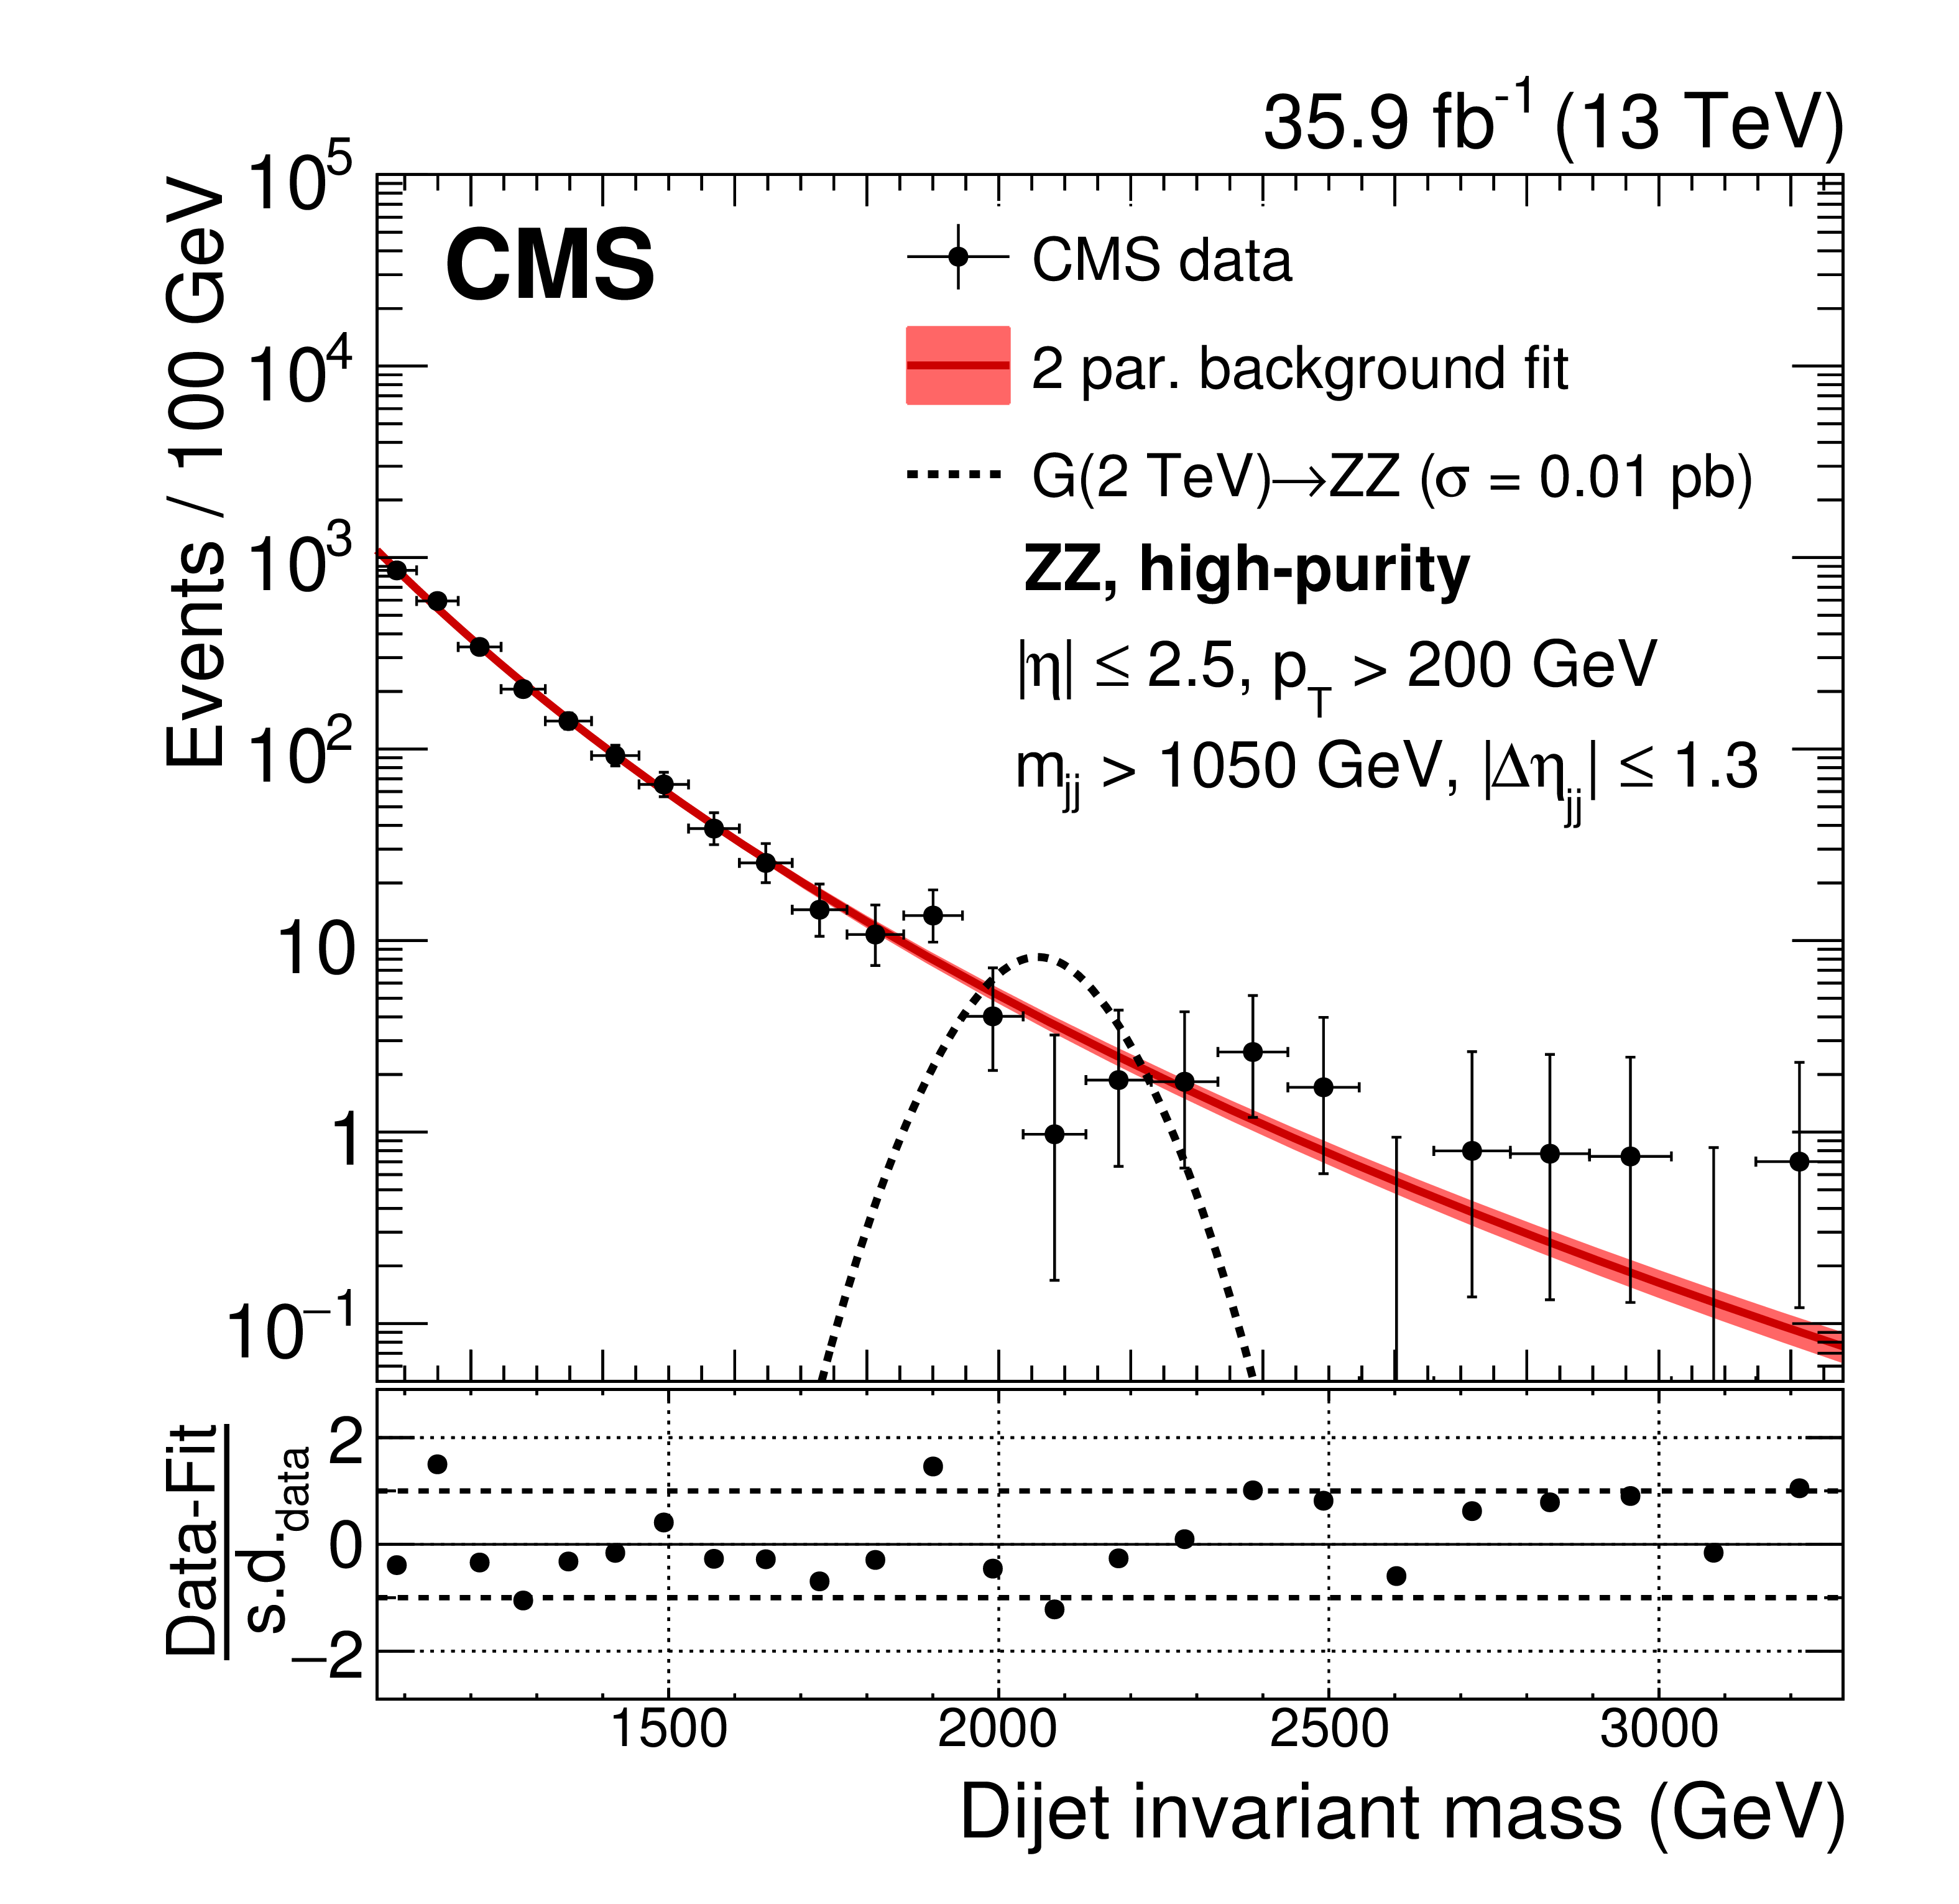
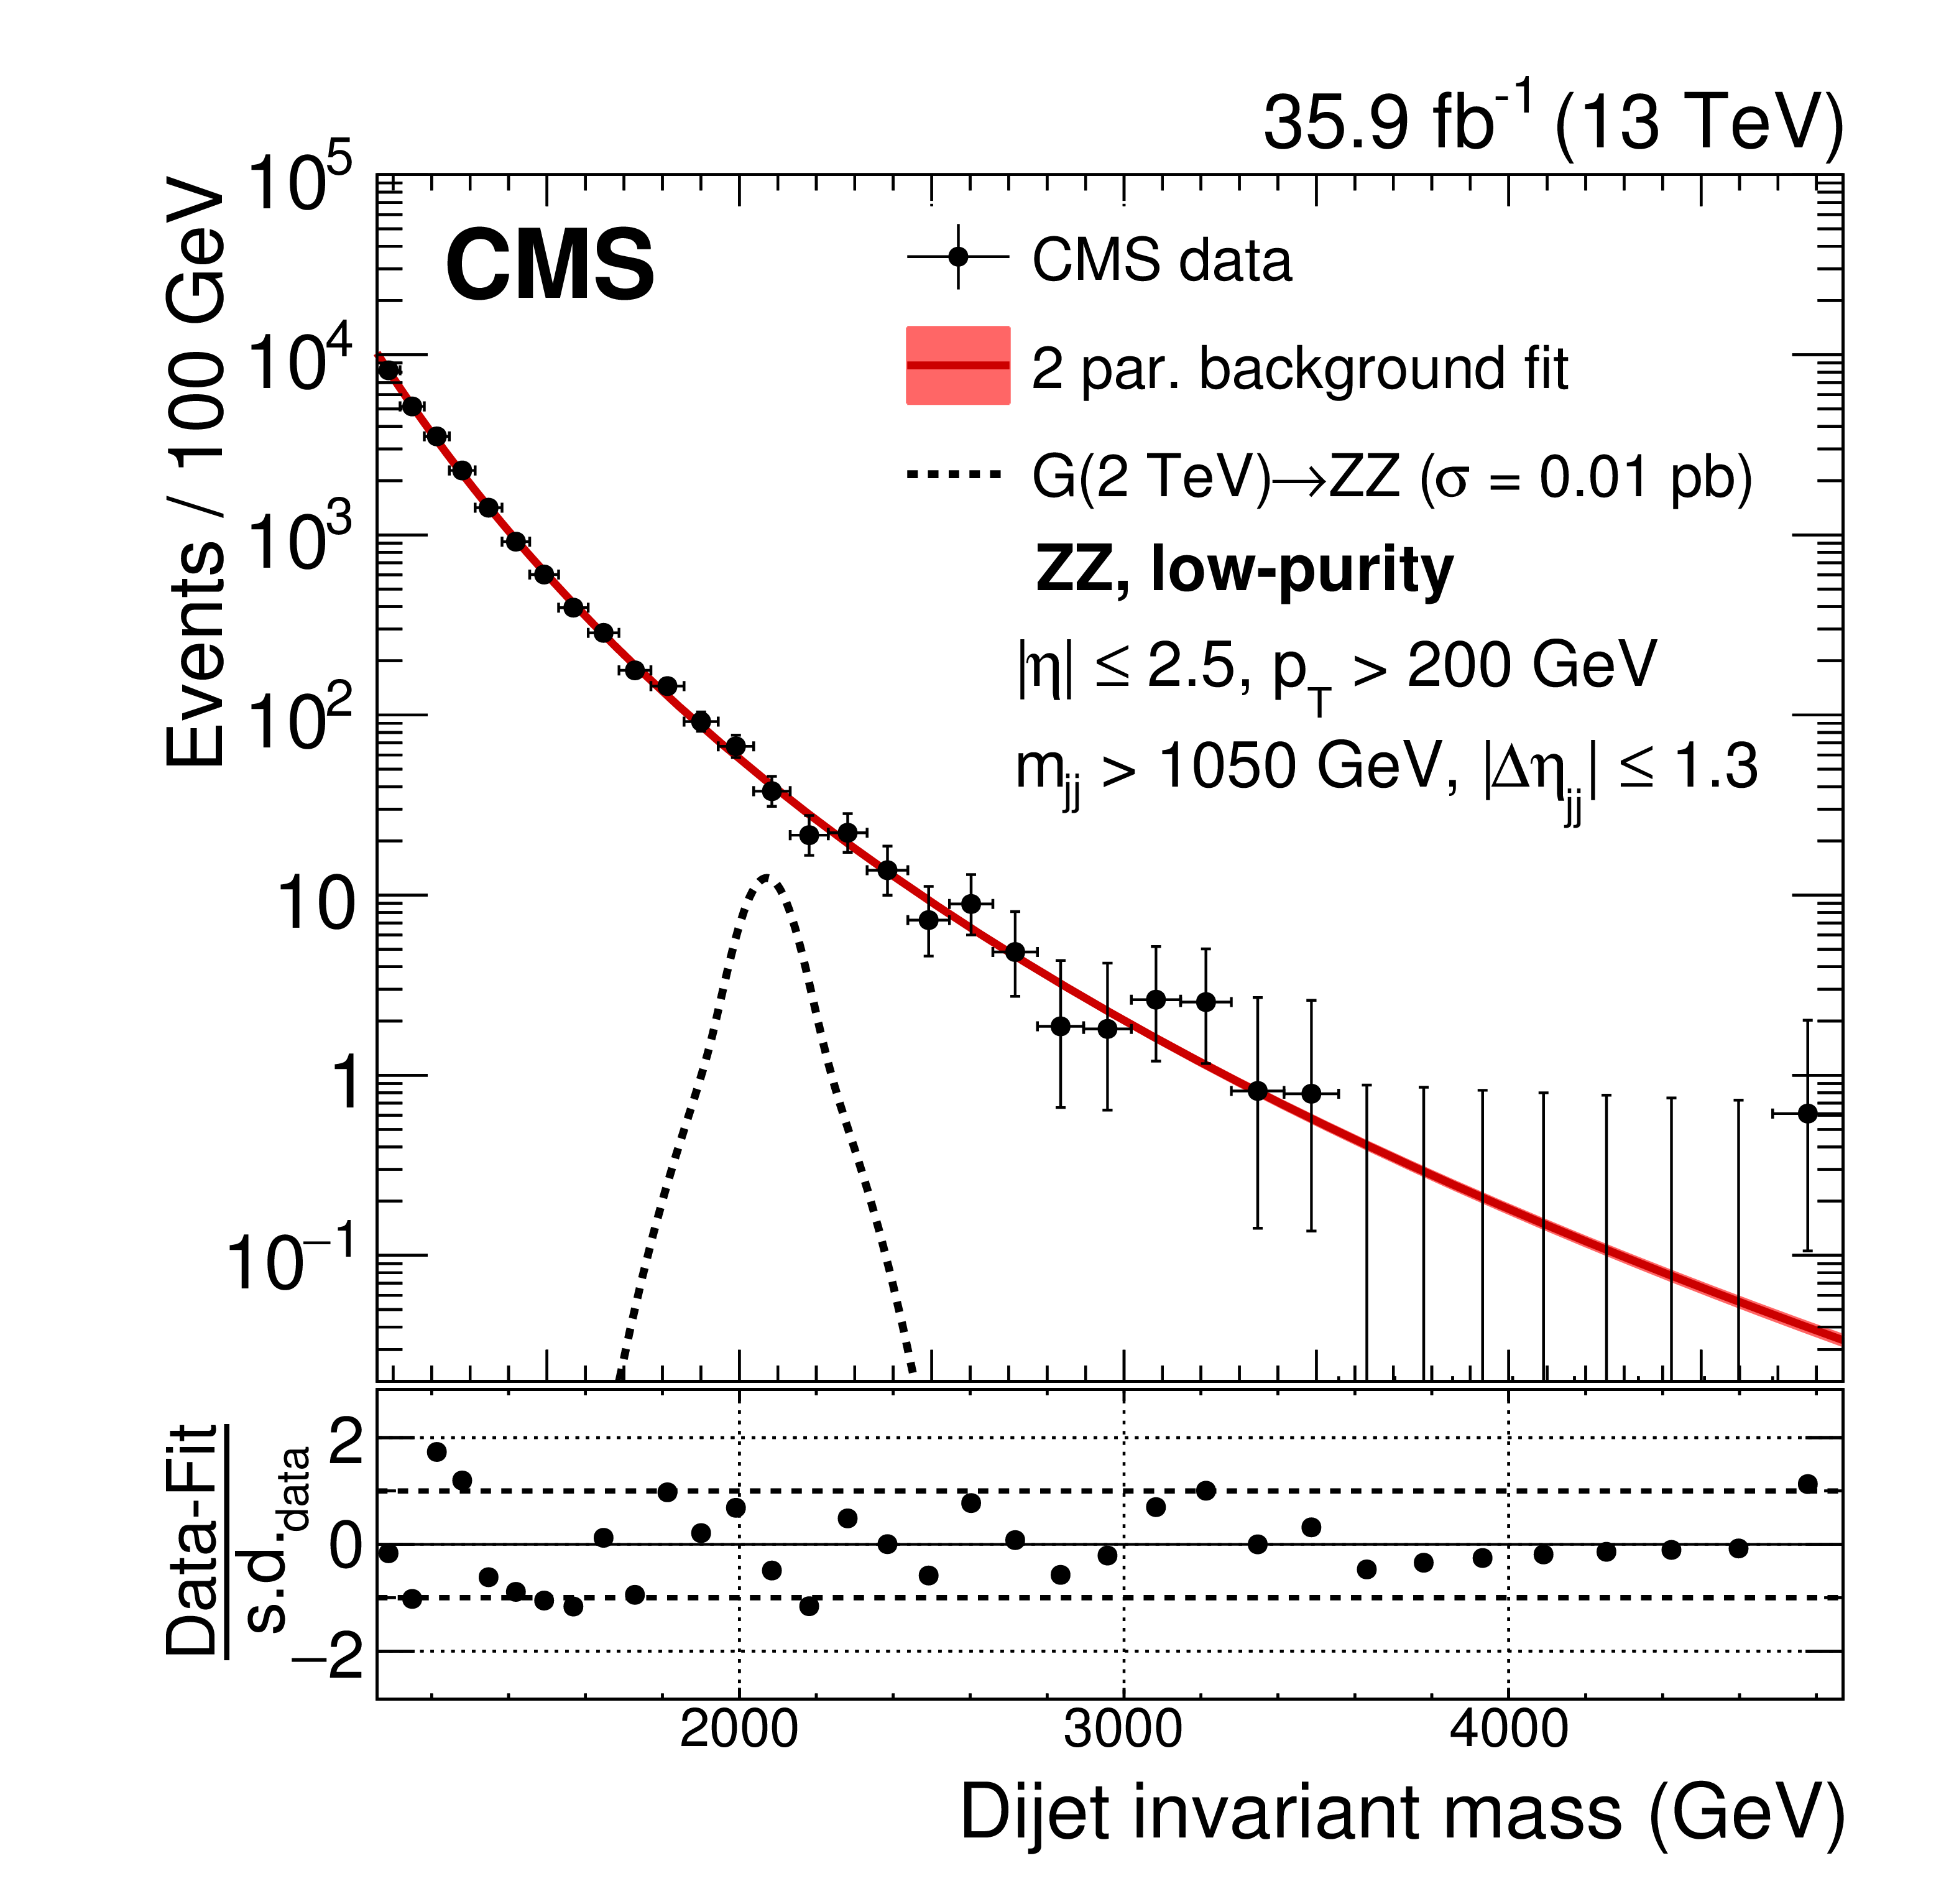
The dijet invariant mass distribution ${m_\mathrm {jj}} $ in data. On the left, the HP, and on the right, the LP categories are shown for the WW, WZ, and ZZ categories, from upper to lower. The solid curve represents a background-only fit to the data distribution where the red shaded area corresponds to the one standard deviation statistical uncertainty of the fit. The dashed line shows the signal shape for a bulk Graviton or W' of mass 2 TeV. The lower panels show the corresponding pull distributions, quantifying the agreement between a background-only fit and the data. Note that these fits do not represent the best fit hypotheses used in the statistical analysis where signal-plus-background fits are performed. |

png pdf |
Figure 4-a:
The dijet invariant mass distribution ${m_\mathrm {jj}} $ in data, for the HP WW category. The solid curve represents a background-only fit to the data distribution where the red shaded area corresponds to the one standard deviation statistical uncertainty of the fit. The dashed line shows the signal shape for a bulk Graviton or W' of mass 2 TeV. The lower panel shows the corresponding pull distributions, quantifying the agreement between a background-only fit and the data. Note that these fits do not represent the best fit hypotheses used in the statistical analysis where signal-plus-background fits are performed. |
png pdf |
Figure 4-b:
The dijet invariant mass distribution ${m_\mathrm {jj}} $ in data, for the LP WW category. The solid curve represents a background-only fit to the data distribution where the red shaded area corresponds to the one standard deviation statistical uncertainty of the fit. The dashed line shows the signal shape for a bulk Graviton or W' of mass 2 TeV. The lower panel shows the corresponding pull distributions, quantifying the agreement between a background-only fit and the data. Note that these fits do not represent the best fit hypotheses used in the statistical analysis where signal-plus-background fits are performed. |
png pdf |
Figure 4-c:
The dijet invariant mass distribution ${m_\mathrm {jj}} $ in data, for the HP WZ category. The solid curve represents a background-only fit to the data distribution where the red shaded area corresponds to the one standard deviation statistical uncertainty of the fit. The dashed line shows the signal shape for a bulk Graviton or W' of mass 2 TeV. The lower panel shows the corresponding pull distributions, quantifying the agreement between a background-only fit and the data. Note that these fits do not represent the best fit hypotheses used in the statistical analysis where signal-plus-background fits are performed. |
png pdf |
Figure 4-d:
The dijet invariant mass distribution ${m_\mathrm {jj}} $ in data, for the LP WZ category. The solid curve represents a background-only fit to the data distribution where the red shaded area corresponds to the one standard deviation statistical uncertainty of the fit. The dashed line shows the signal shape for a bulk Graviton or W' of mass 2 TeV. The lower panel shows the corresponding pull distributions, quantifying the agreement between a background-only fit and the data. Note that these fits do not represent the best fit hypotheses used in the statistical analysis where signal-plus-background fits are performed. |
png pdf |
Figure 4-e:
The dijet invariant mass distribution ${m_\mathrm {jj}} $ in data, for the HP ZZ category. The solid curve represents a background-only fit to the data distribution where the red shaded area corresponds to the one standard deviation statistical uncertainty of the fit. The dashed line shows the signal shape for a bulk Graviton or W' of mass 2 TeV. The lower panel shows the corresponding pull distributions, quantifying the agreement between a background-only fit and the data. Note that these fits do not represent the best fit hypotheses used in the statistical analysis where signal-plus-background fits are performed. |
png pdf |
Figure 4-f:
The dijet invariant mass distribution ${m_\mathrm {jj}} $ in data, for the LP ZZ category. The solid curve represents a background-only fit to the data distribution where the red shaded area corresponds to the one standard deviation statistical uncertainty of the fit. The dashed line shows the signal shape for a bulk Graviton or W' of mass 2 TeV. The lower panel shows the corresponding pull distributions, quantifying the agreement between a background-only fit and the data. Note that these fits do not represent the best fit hypotheses used in the statistical analysis where signal-plus-background fits are performed. |
png pdf |
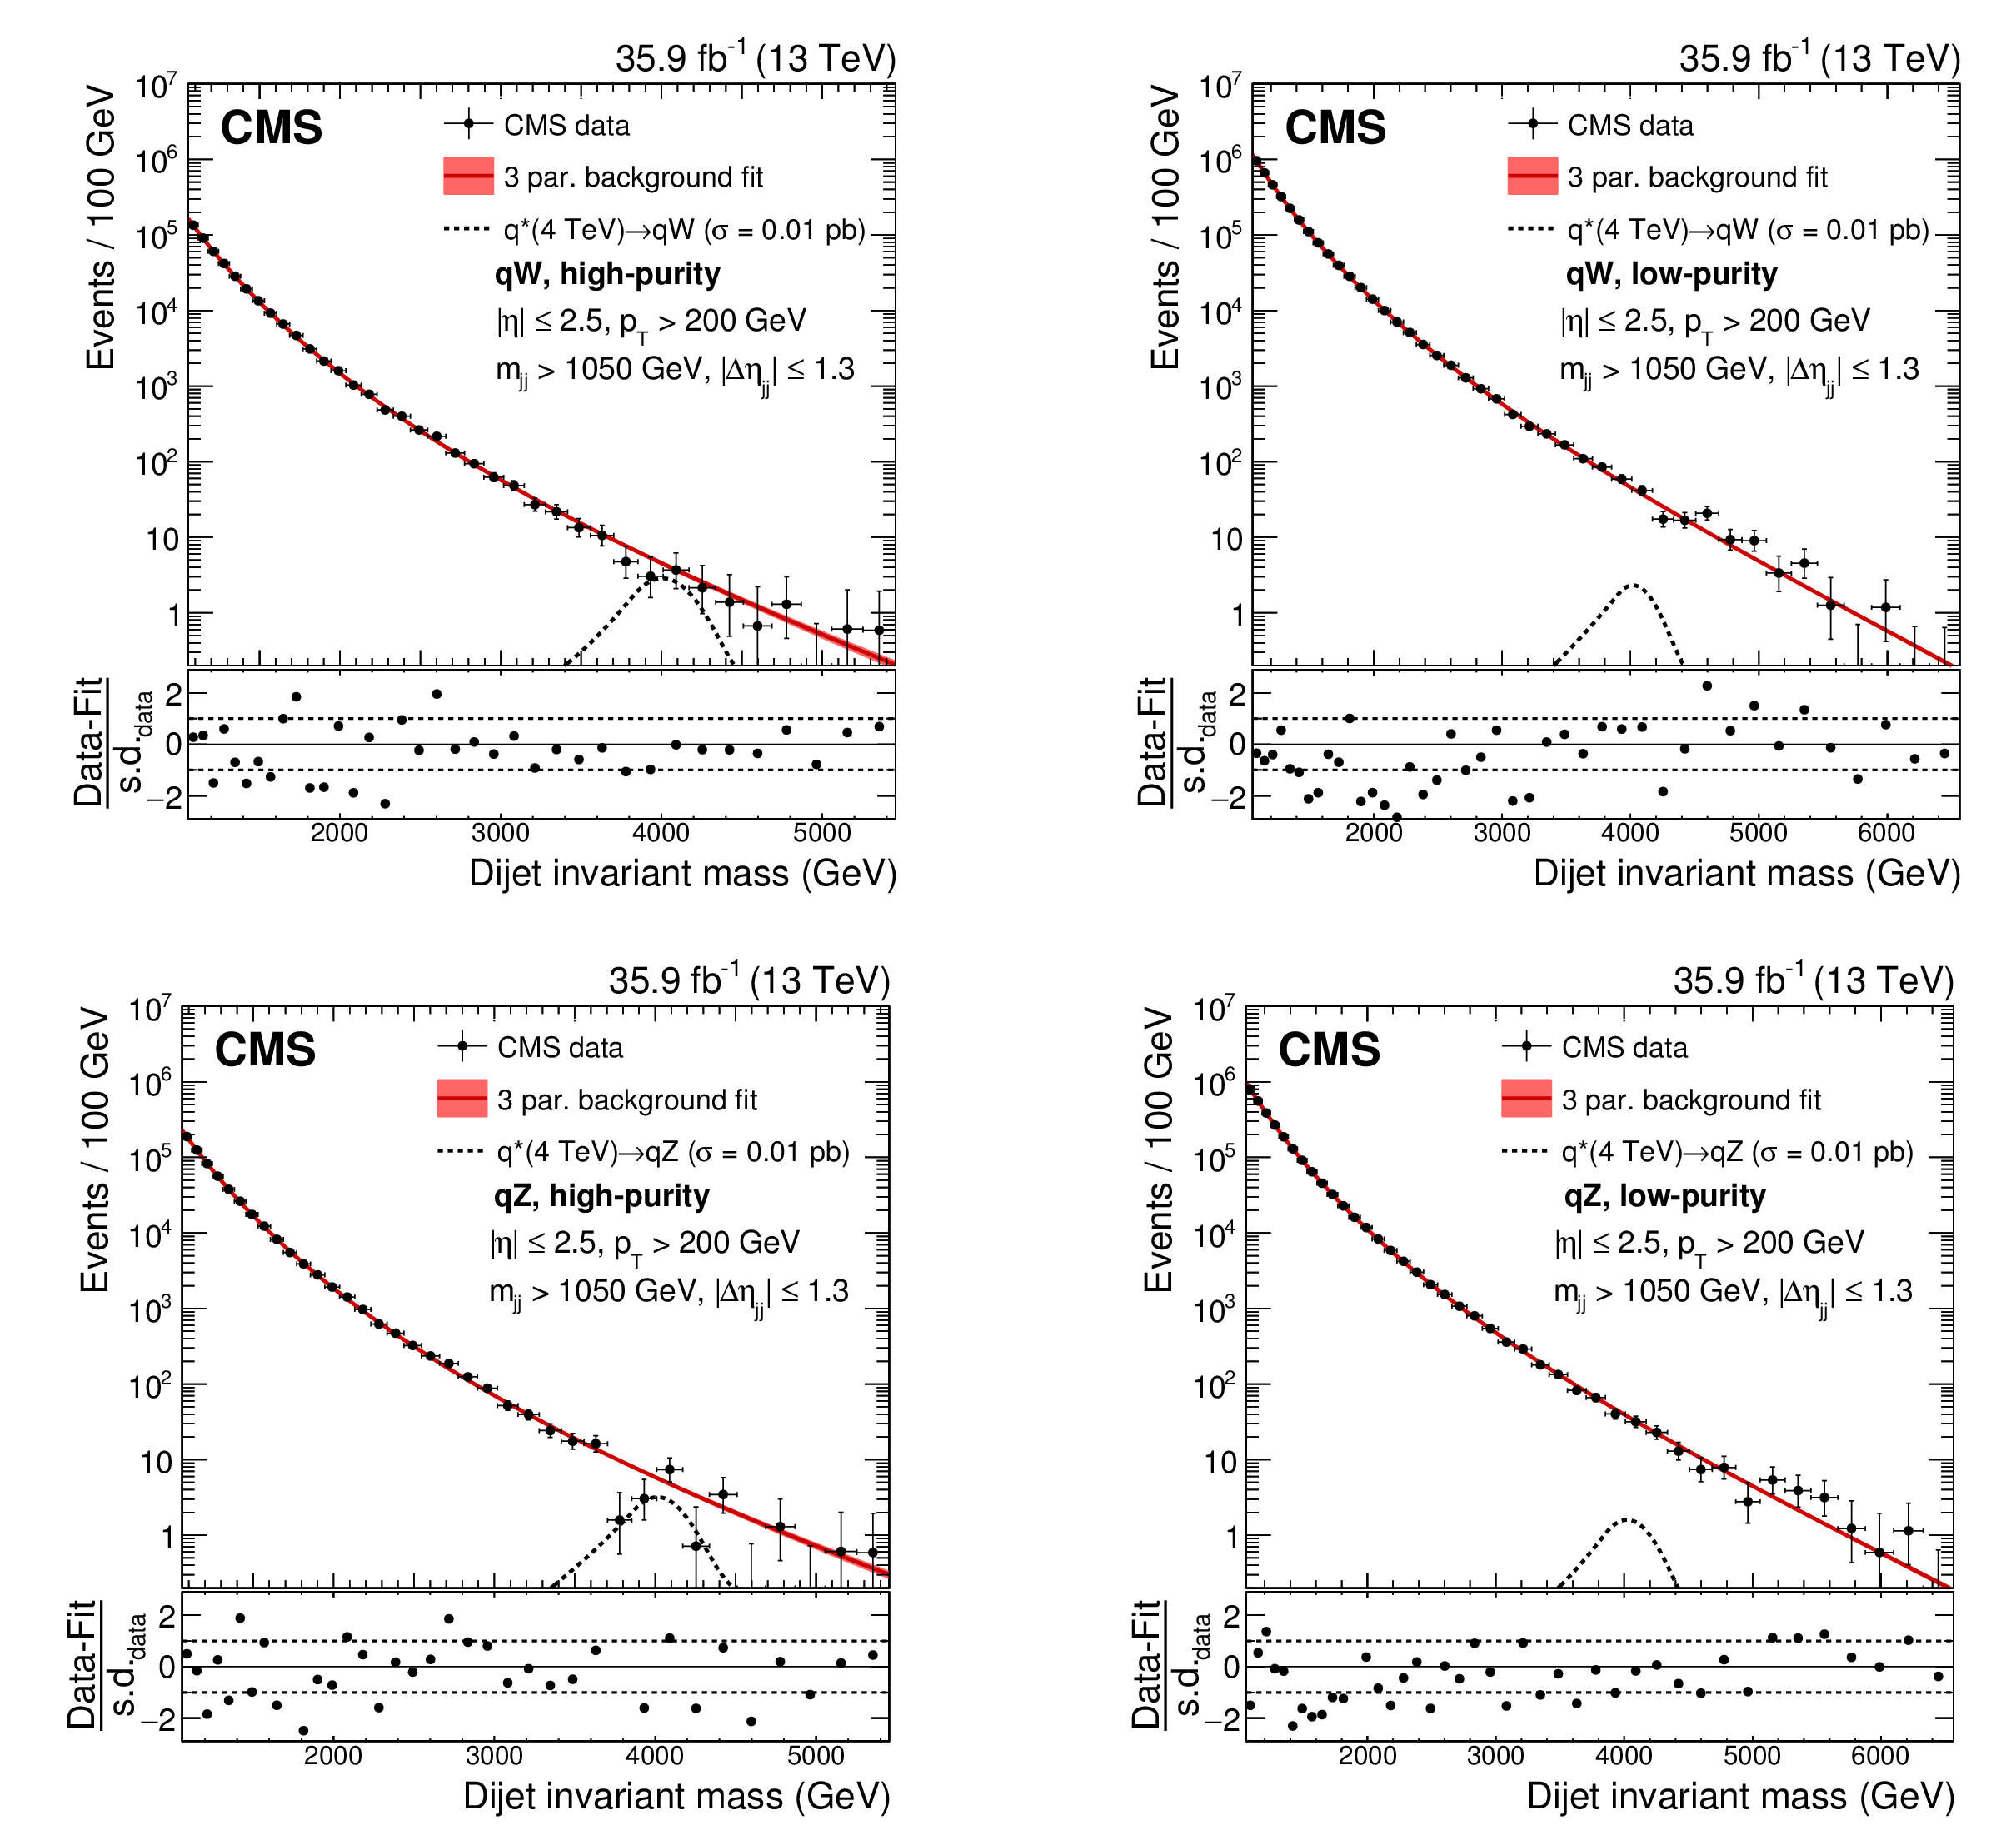
Figure 5:
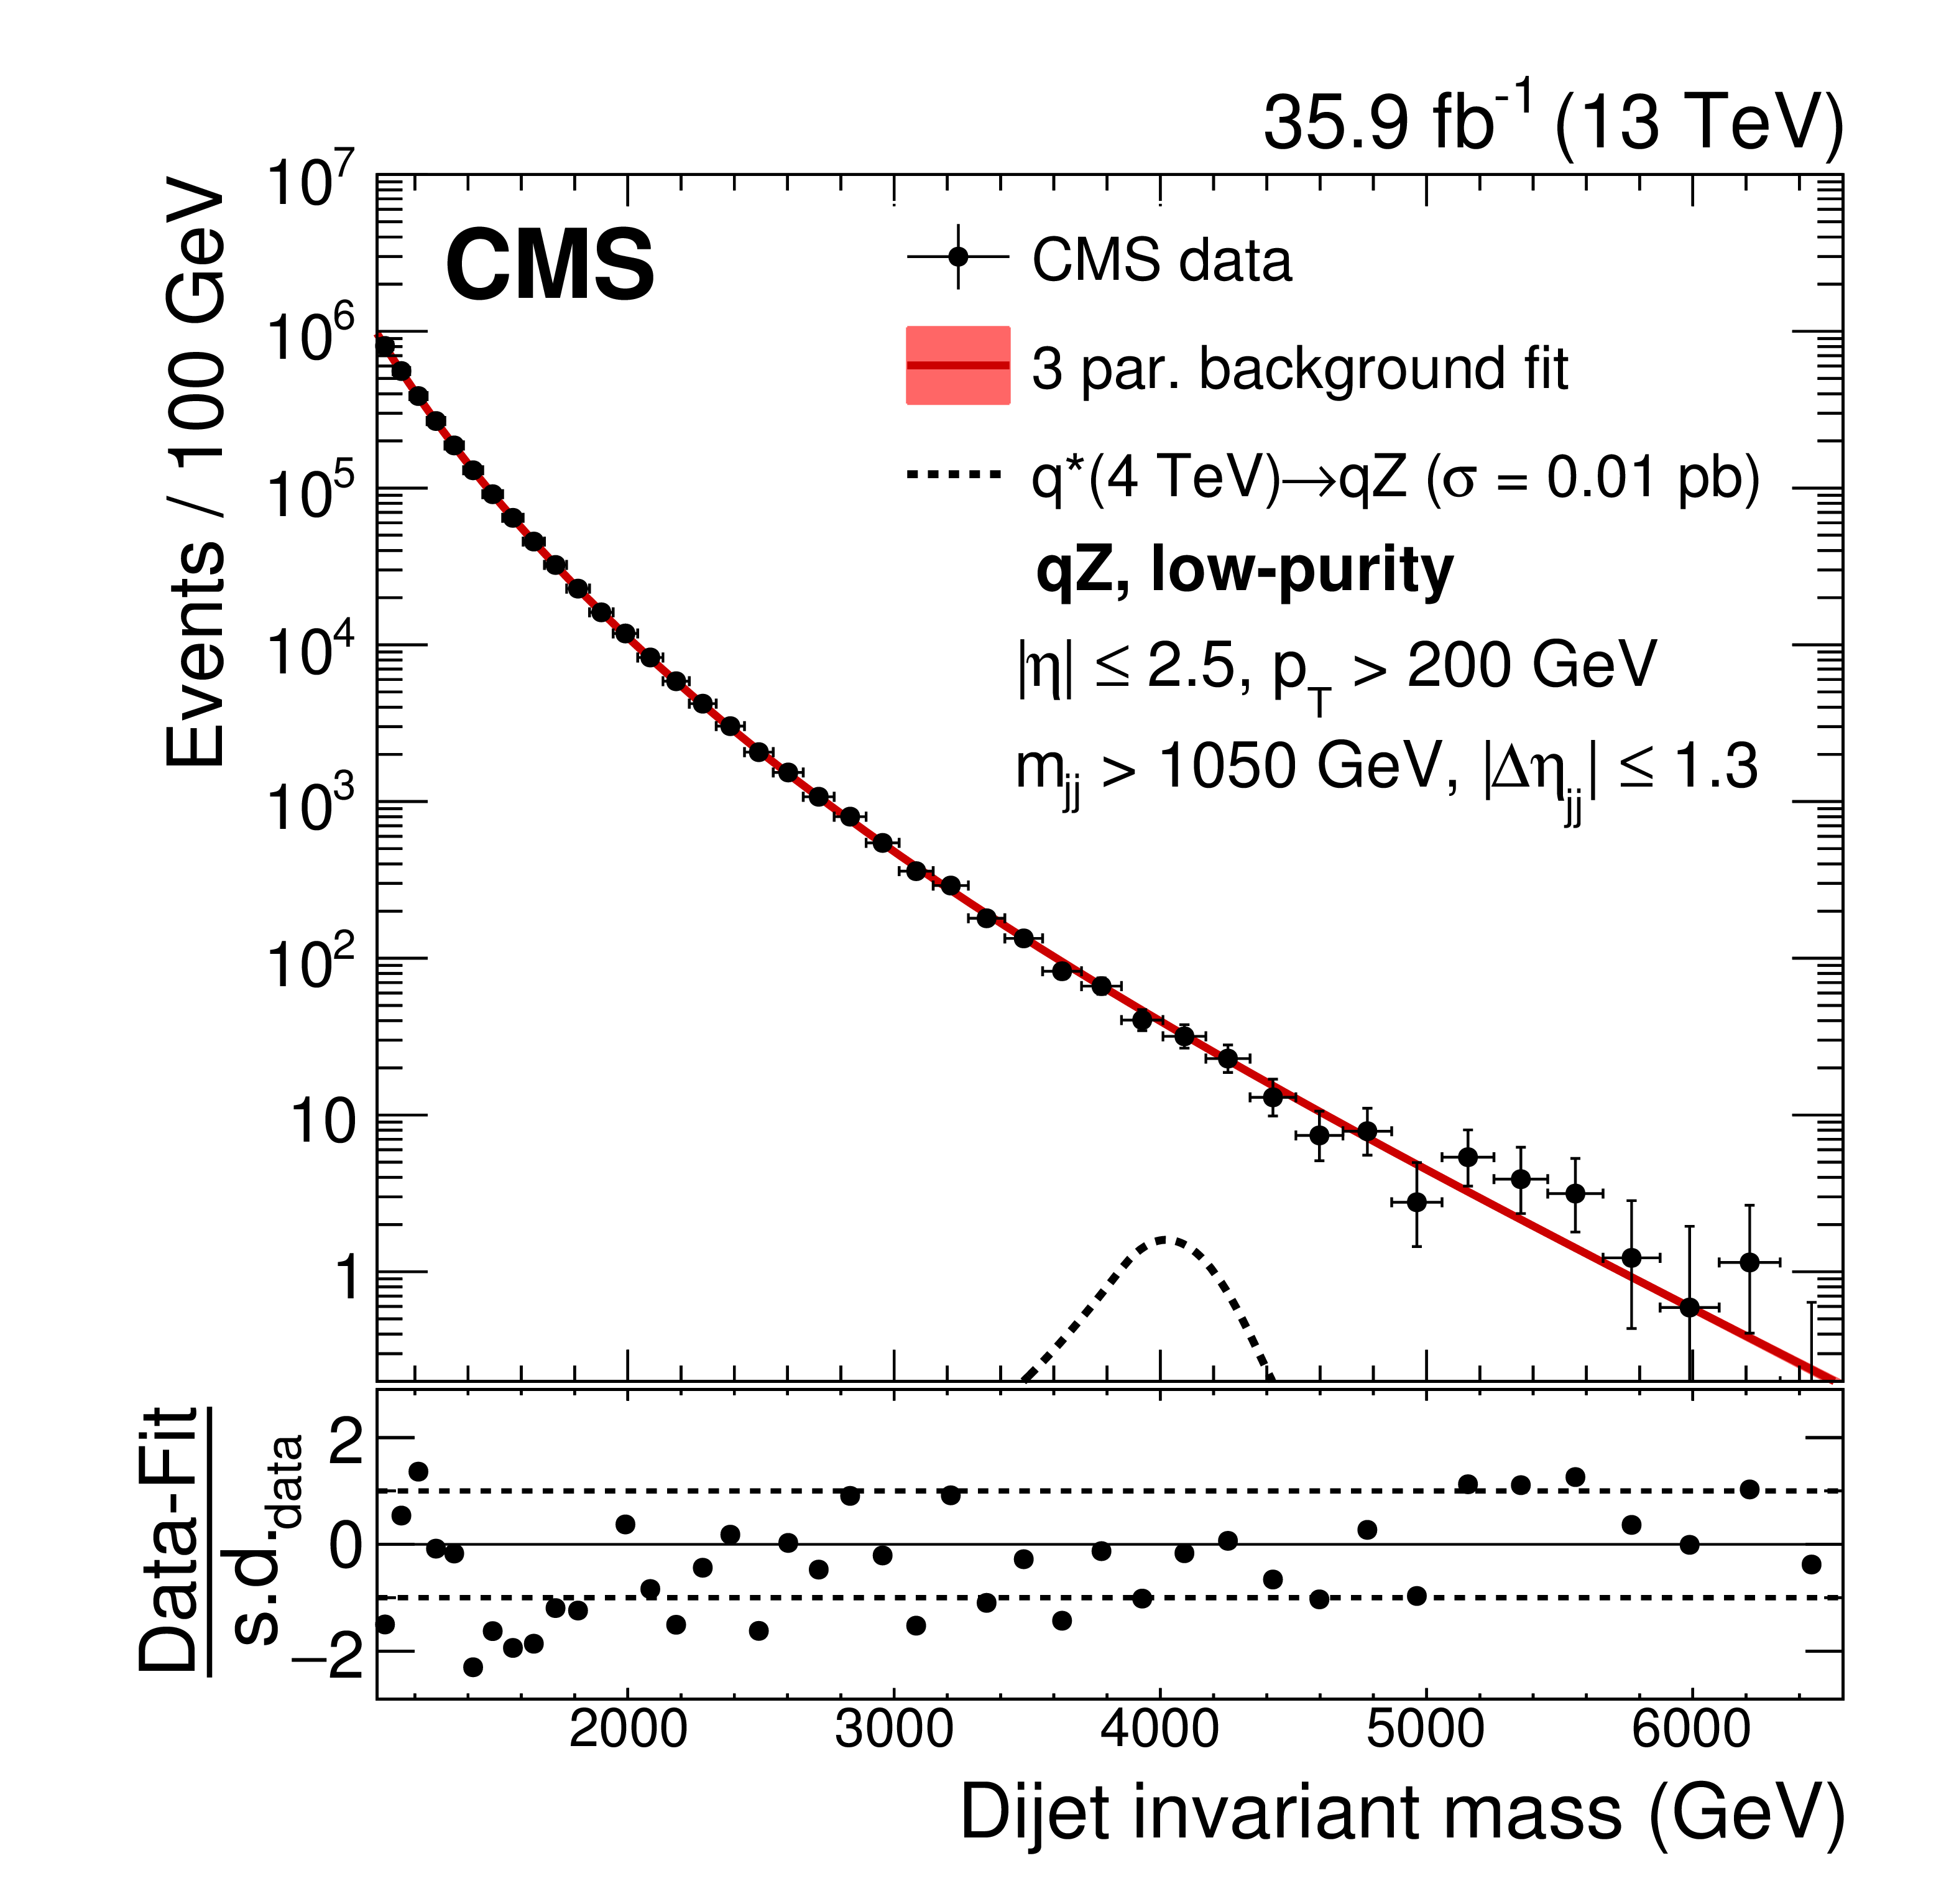
The dijet invariant mass distribution ${m_\mathrm {jj}} $ in data. On the left, the HP, and on the right, the LP categories are shown for the qW and qZ categories, from upper to lower. The solid curve represents a background-only fit to the data distribution where the red shaded area corresponds to the one standard deviation statistical uncertainty of the fit. The dashed line shows the signal shape for a $\mathrm{ q } ^*$ with a mass of 4 TeV. The lower panels show the corresponding pull distributions, quantifying the agreement between a background-only fit and the data. Note that these fits do not represent the best-fit hypotheses used in the statistical analysis where signal-plus-background fits are performed. |
png pdf |
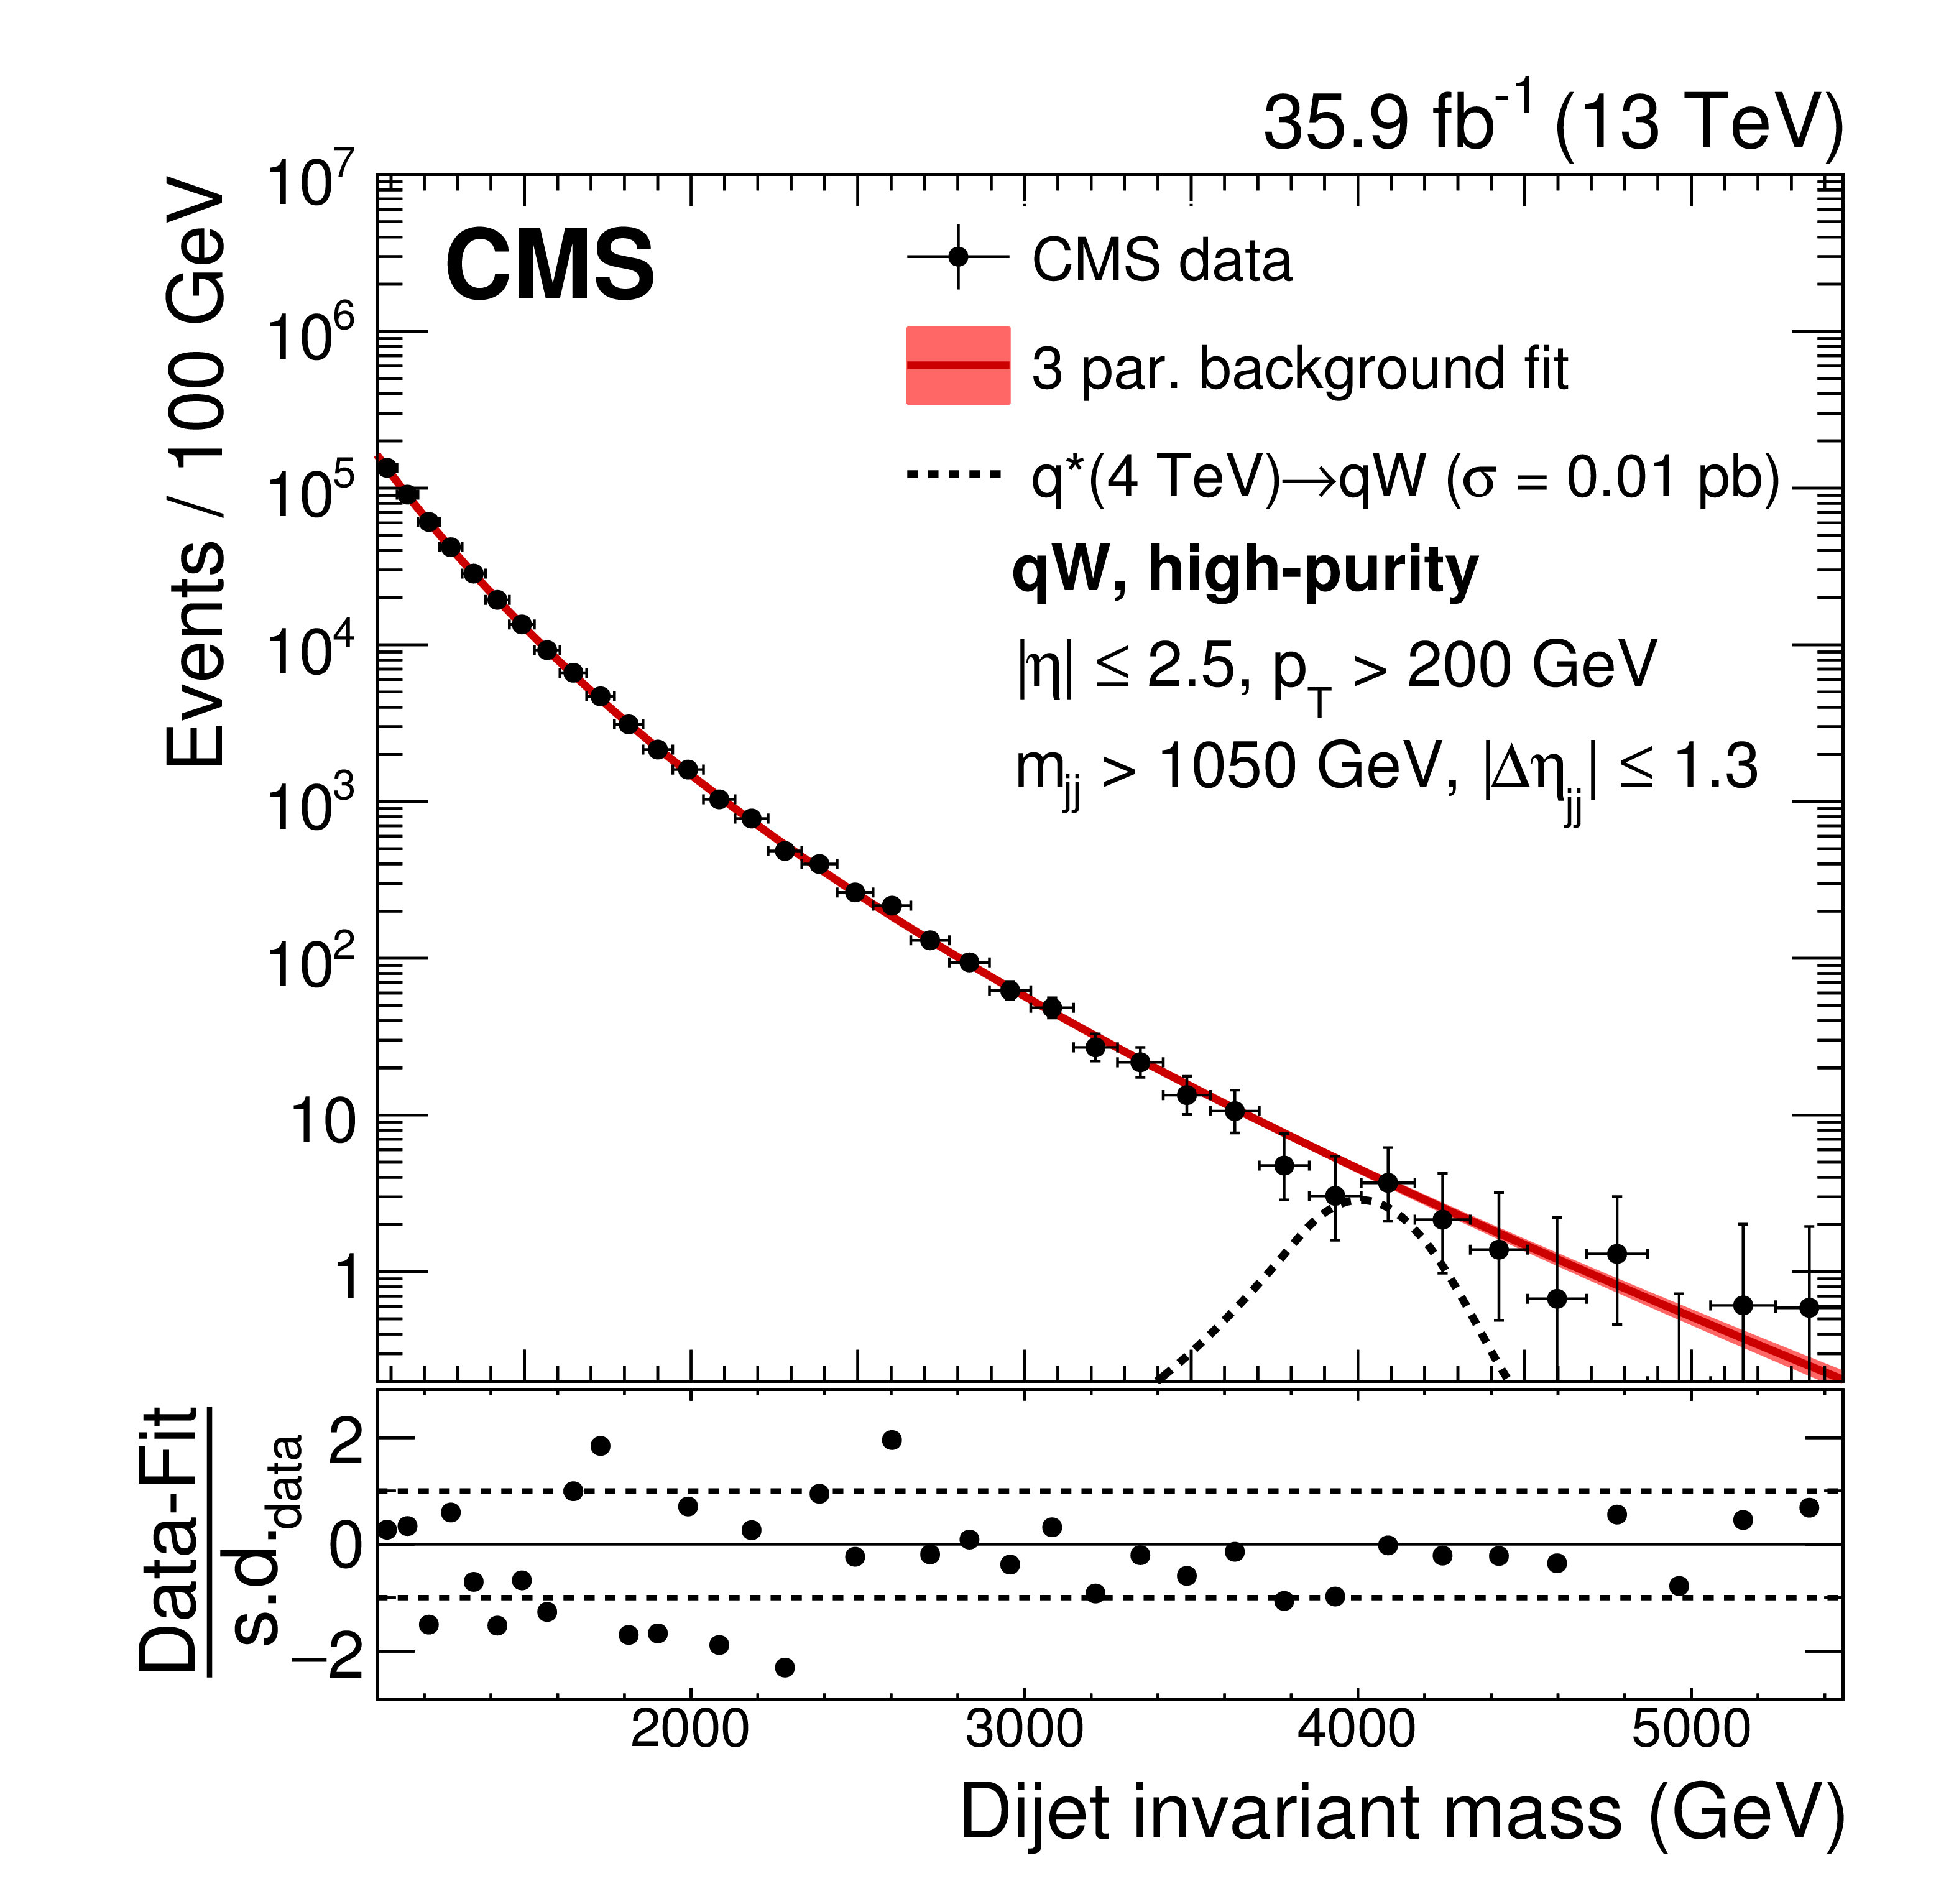
Figure 5-a:
The dijet invariant mass distribution ${m_\mathrm {jj}} $ in data, for the HP qW category. The solid curve represents a background-only fit to the data distribution where the red shaded area corresponds to the one standard deviation statistical uncertainty of the fit. The dashed line shows the signal shape for a $\mathrm{ q } ^*$ with a mass of 4 TeV. The lower panel shows the corresponding pull distributions, quantifying the agreement between a background-only fit and the data. Note that these fits do not represent the best-fit hypotheses used in the statistical analysis where signal-plus-background fits are performed. |
png pdf |
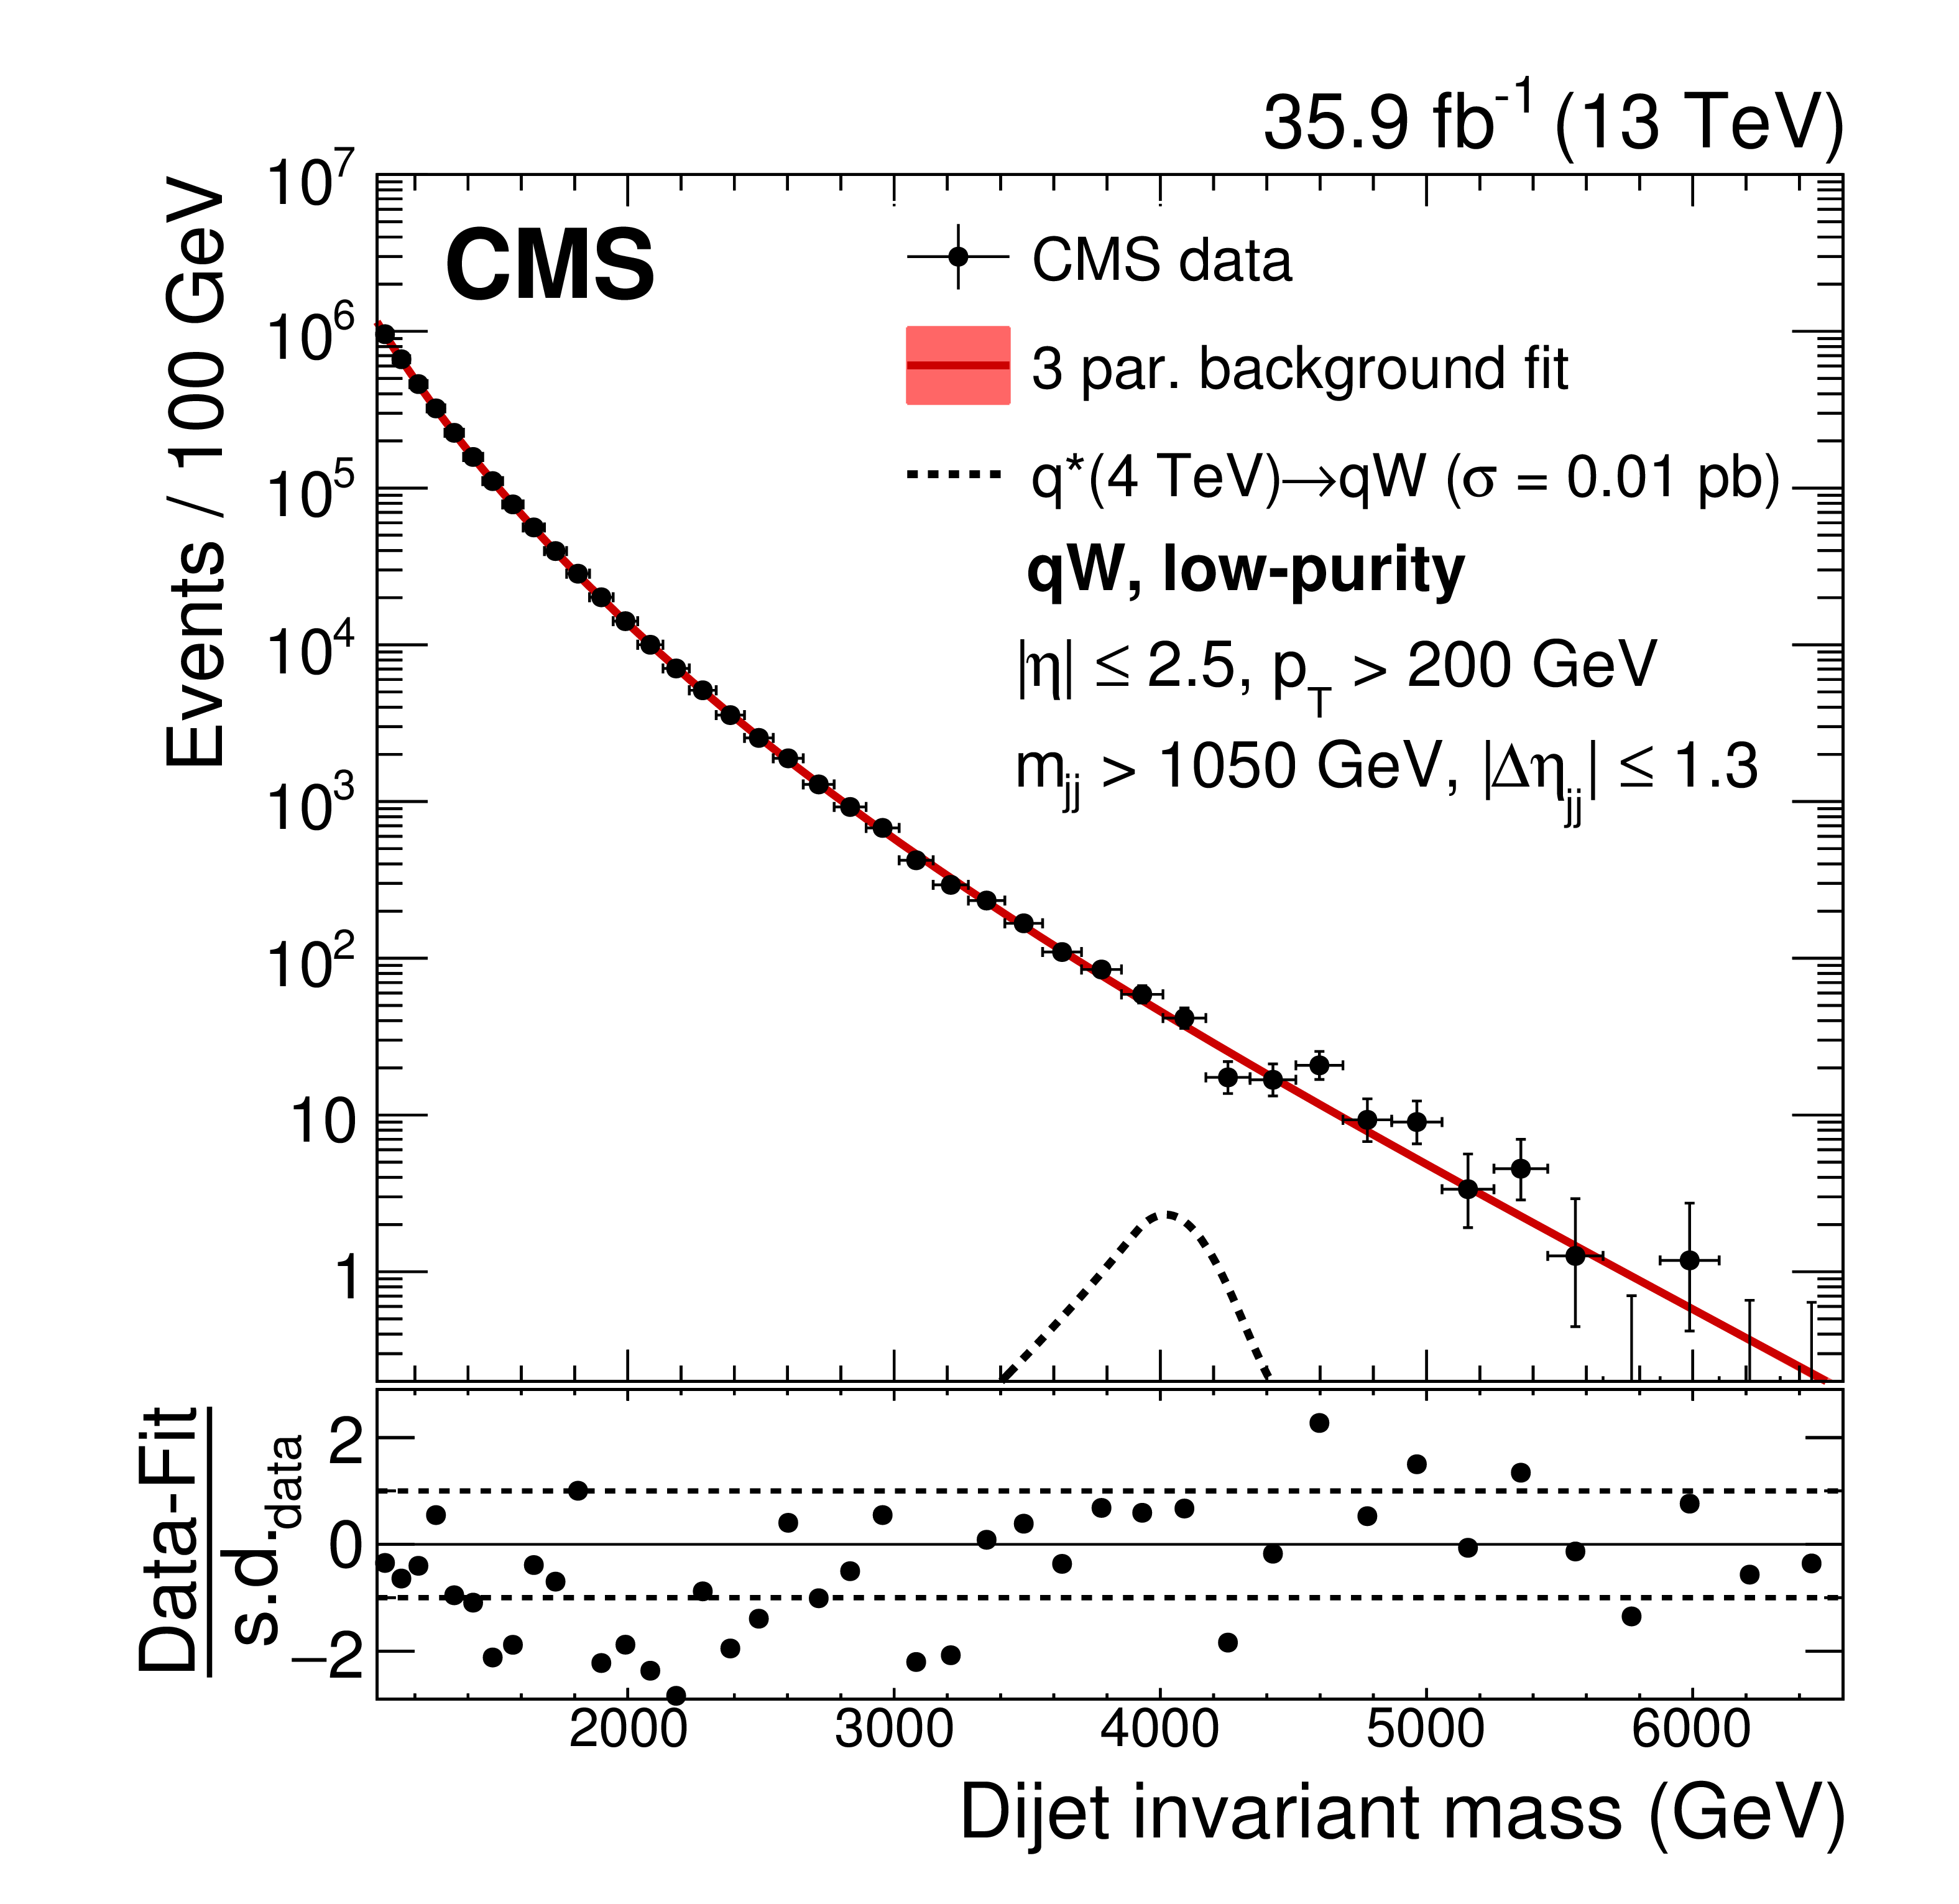
Figure 5-b:
The dijet invariant mass distribution ${m_\mathrm {jj}} $ in data, for the LP qW category. The solid curve represents a background-only fit to the data distribution where the red shaded area corresponds to the one standard deviation statistical uncertainty of the fit. The dashed line shows the signal shape for a $\mathrm{ q } ^*$ with a mass of 4 TeV. The lower panel shows the corresponding pull distributions, quantifying the agreement between a background-only fit and the data. Note that these fits do not represent the best-fit hypotheses used in the statistical analysis where signal-plus-background fits are performed. |
png pdf |
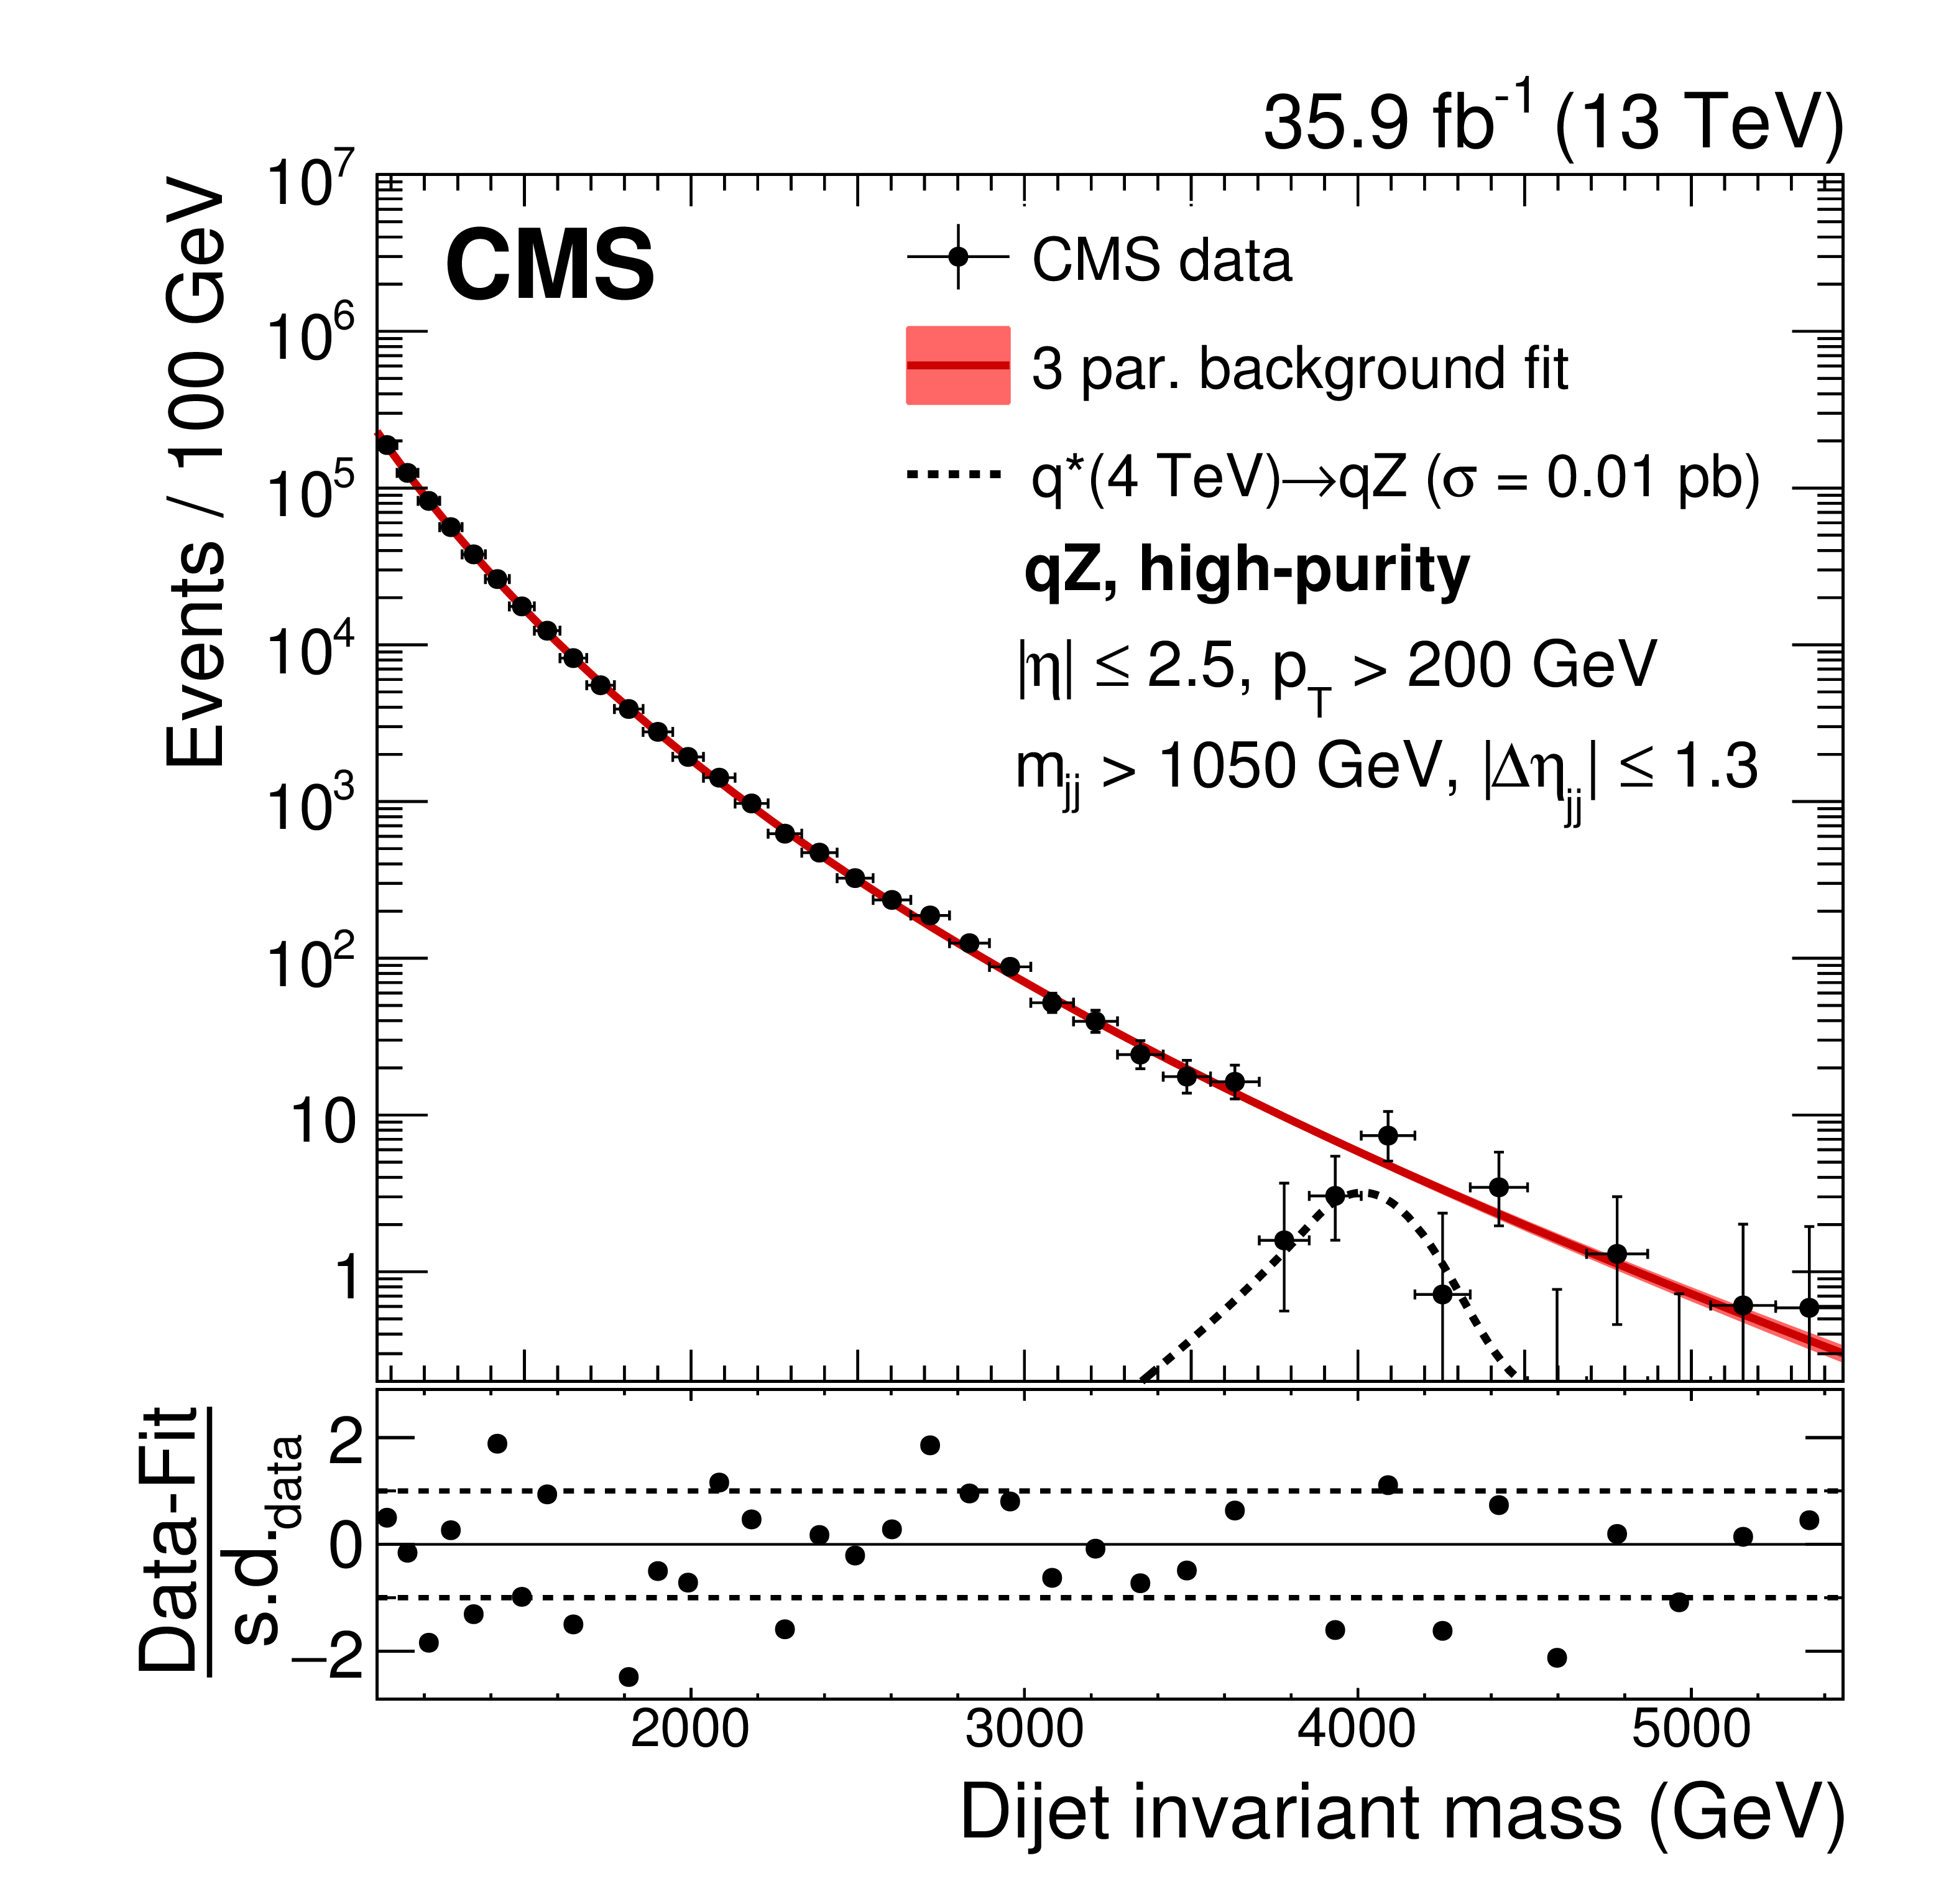
Figure 5-c:
The dijet invariant mass distribution ${m_\mathrm {jj}} $ in data, for the HP qZ category. The solid curve represents a background-only fit to the data distribution where the red shaded area corresponds to the one standard deviation statistical uncertainty of the fit. The dashed line shows the signal shape for a $\mathrm{ q } ^*$ with a mass of 4 TeV. The lower panel shows the corresponding pull distributions, quantifying the agreement between a background-only fit and the data. Note that these fits do not represent the best-fit hypotheses used in the statistical analysis where signal-plus-background fits are performed. |
png pdf |
Figure 5-d:
The dijet invariant mass distribution ${m_\mathrm {jj}} $ in data, for the LP qZ category. The solid curve represents a background-only fit to the data distribution where the red shaded area corresponds to the one standard deviation statistical uncertainty of the fit. The dashed line shows the signal shape for a $\mathrm{ q } ^*$ with a mass of 4 TeV. The lower panel shows the corresponding pull distributions, quantifying the agreement between a background-only fit and the data. Note that these fits do not represent the best-fit hypotheses used in the statistical analysis where signal-plus-background fits are performed. |

png pdf |
Figure 6:
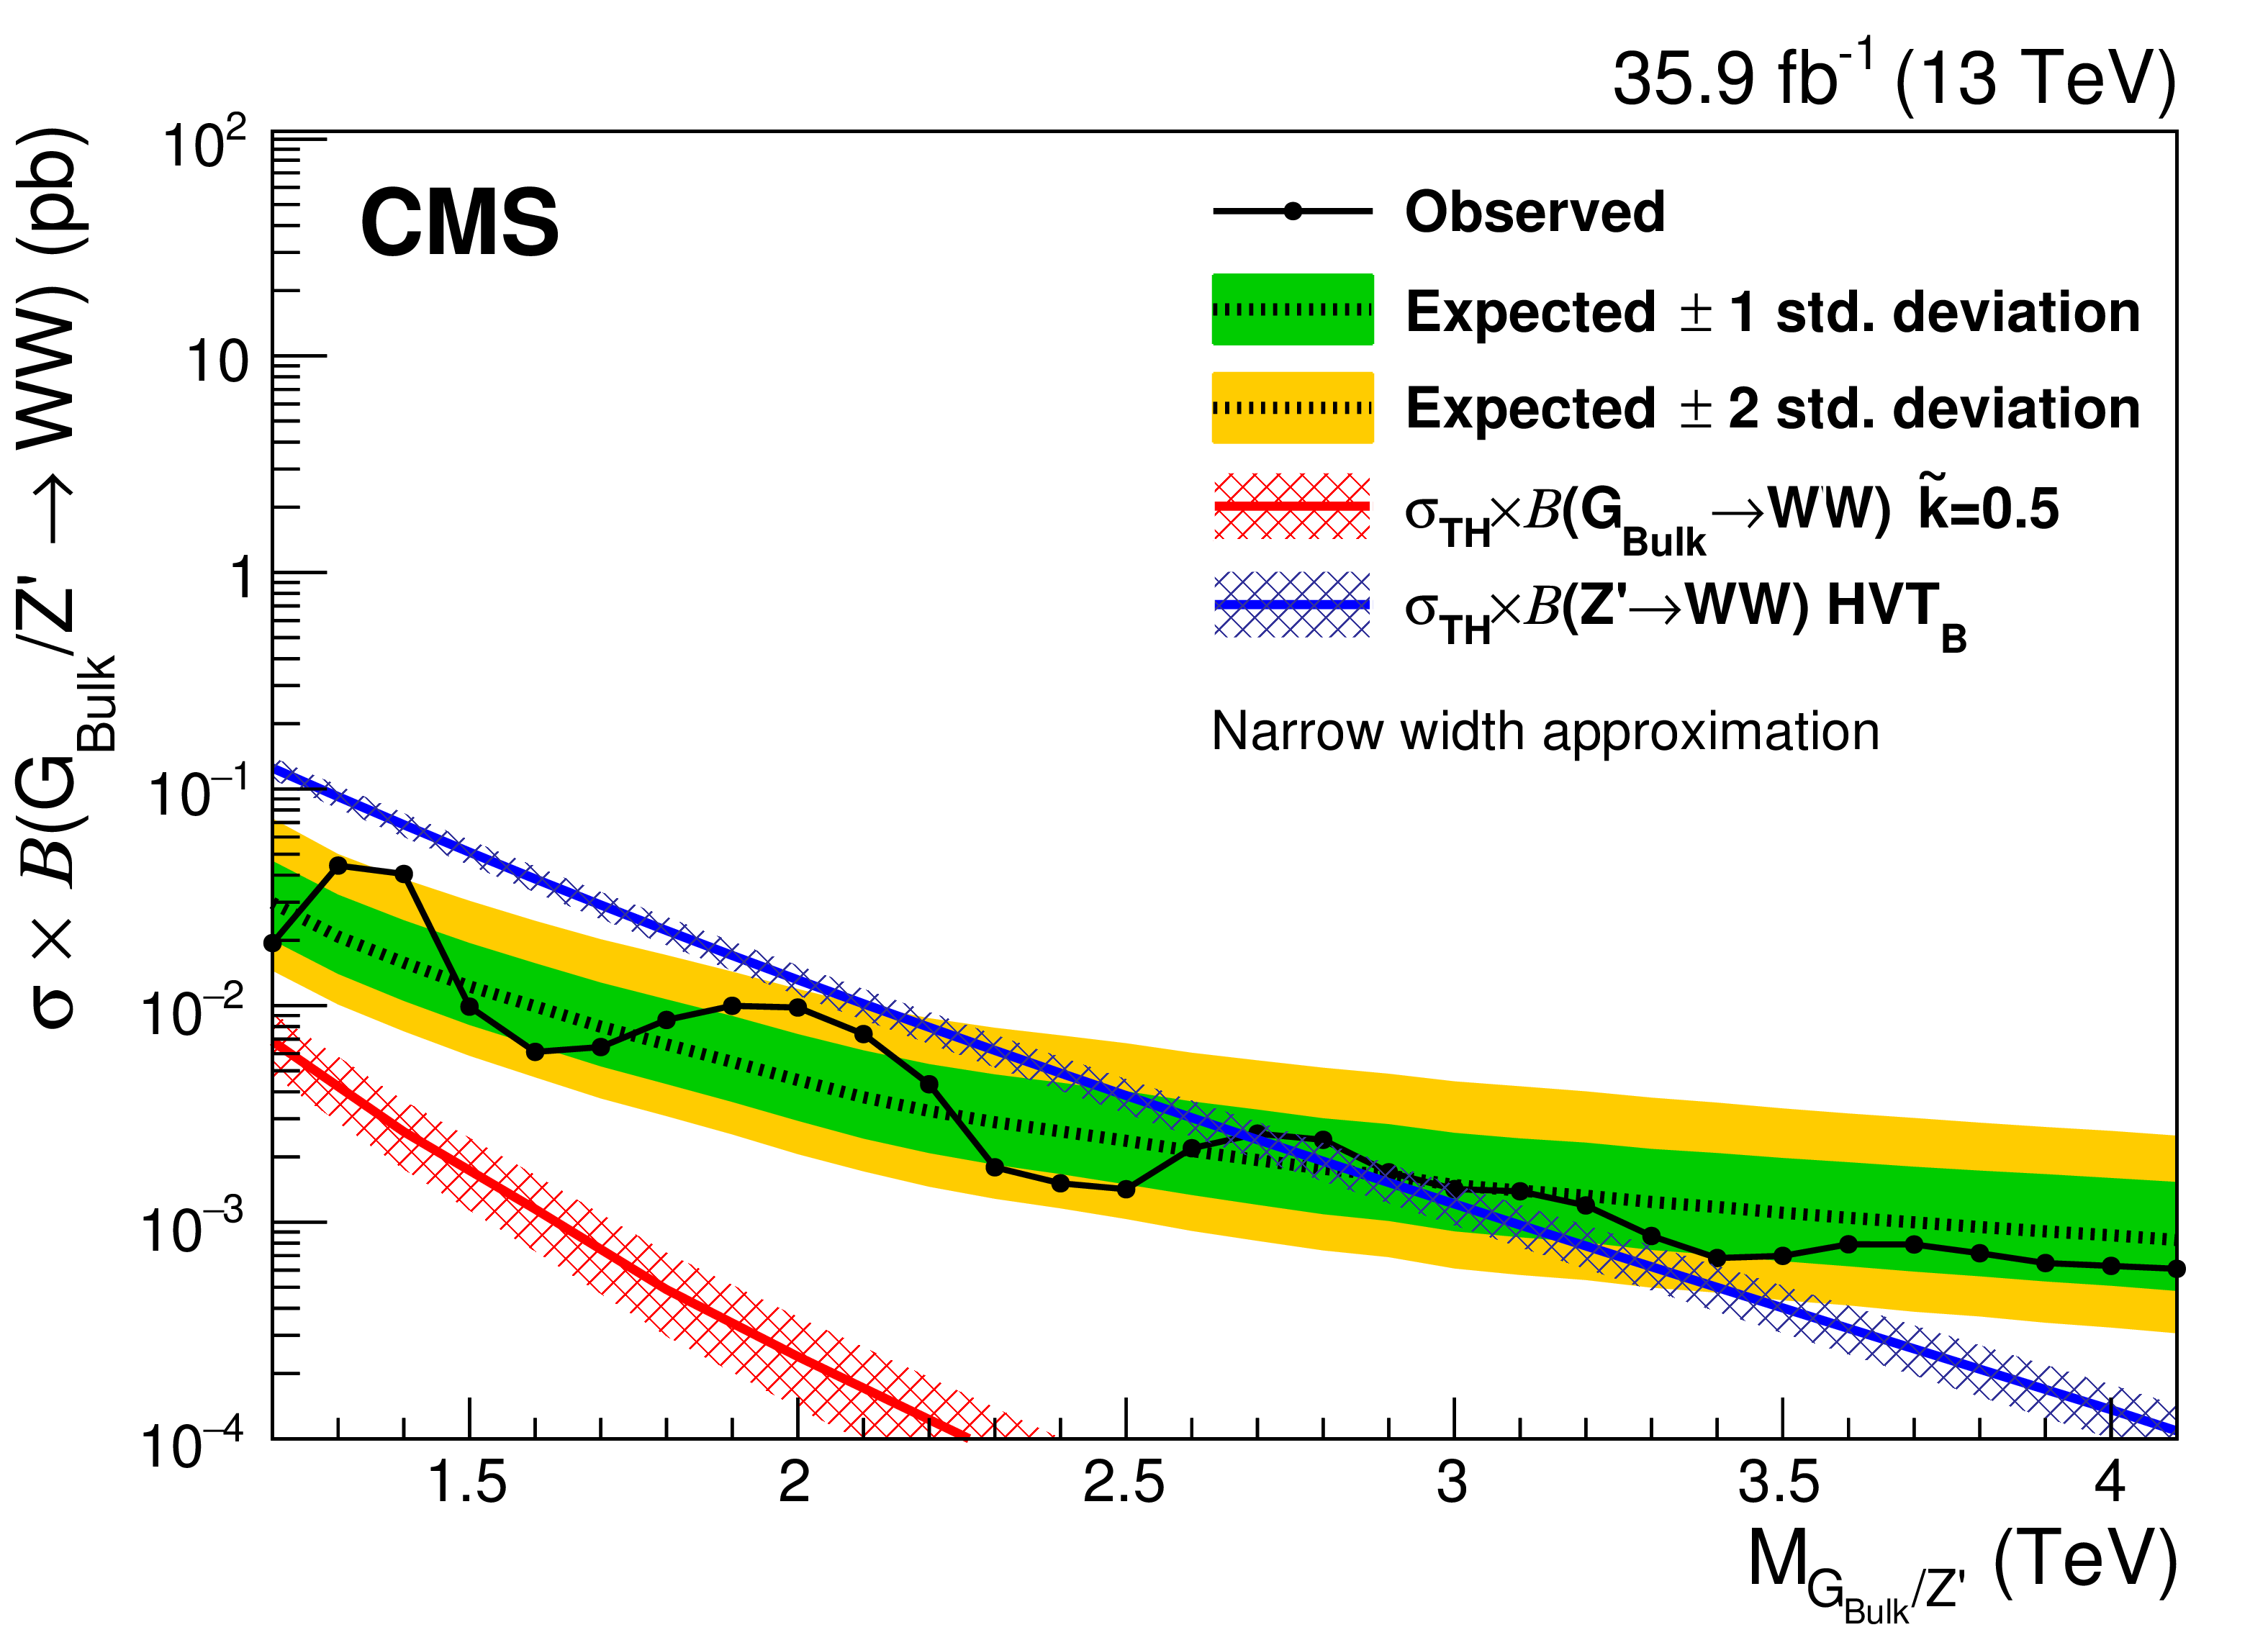
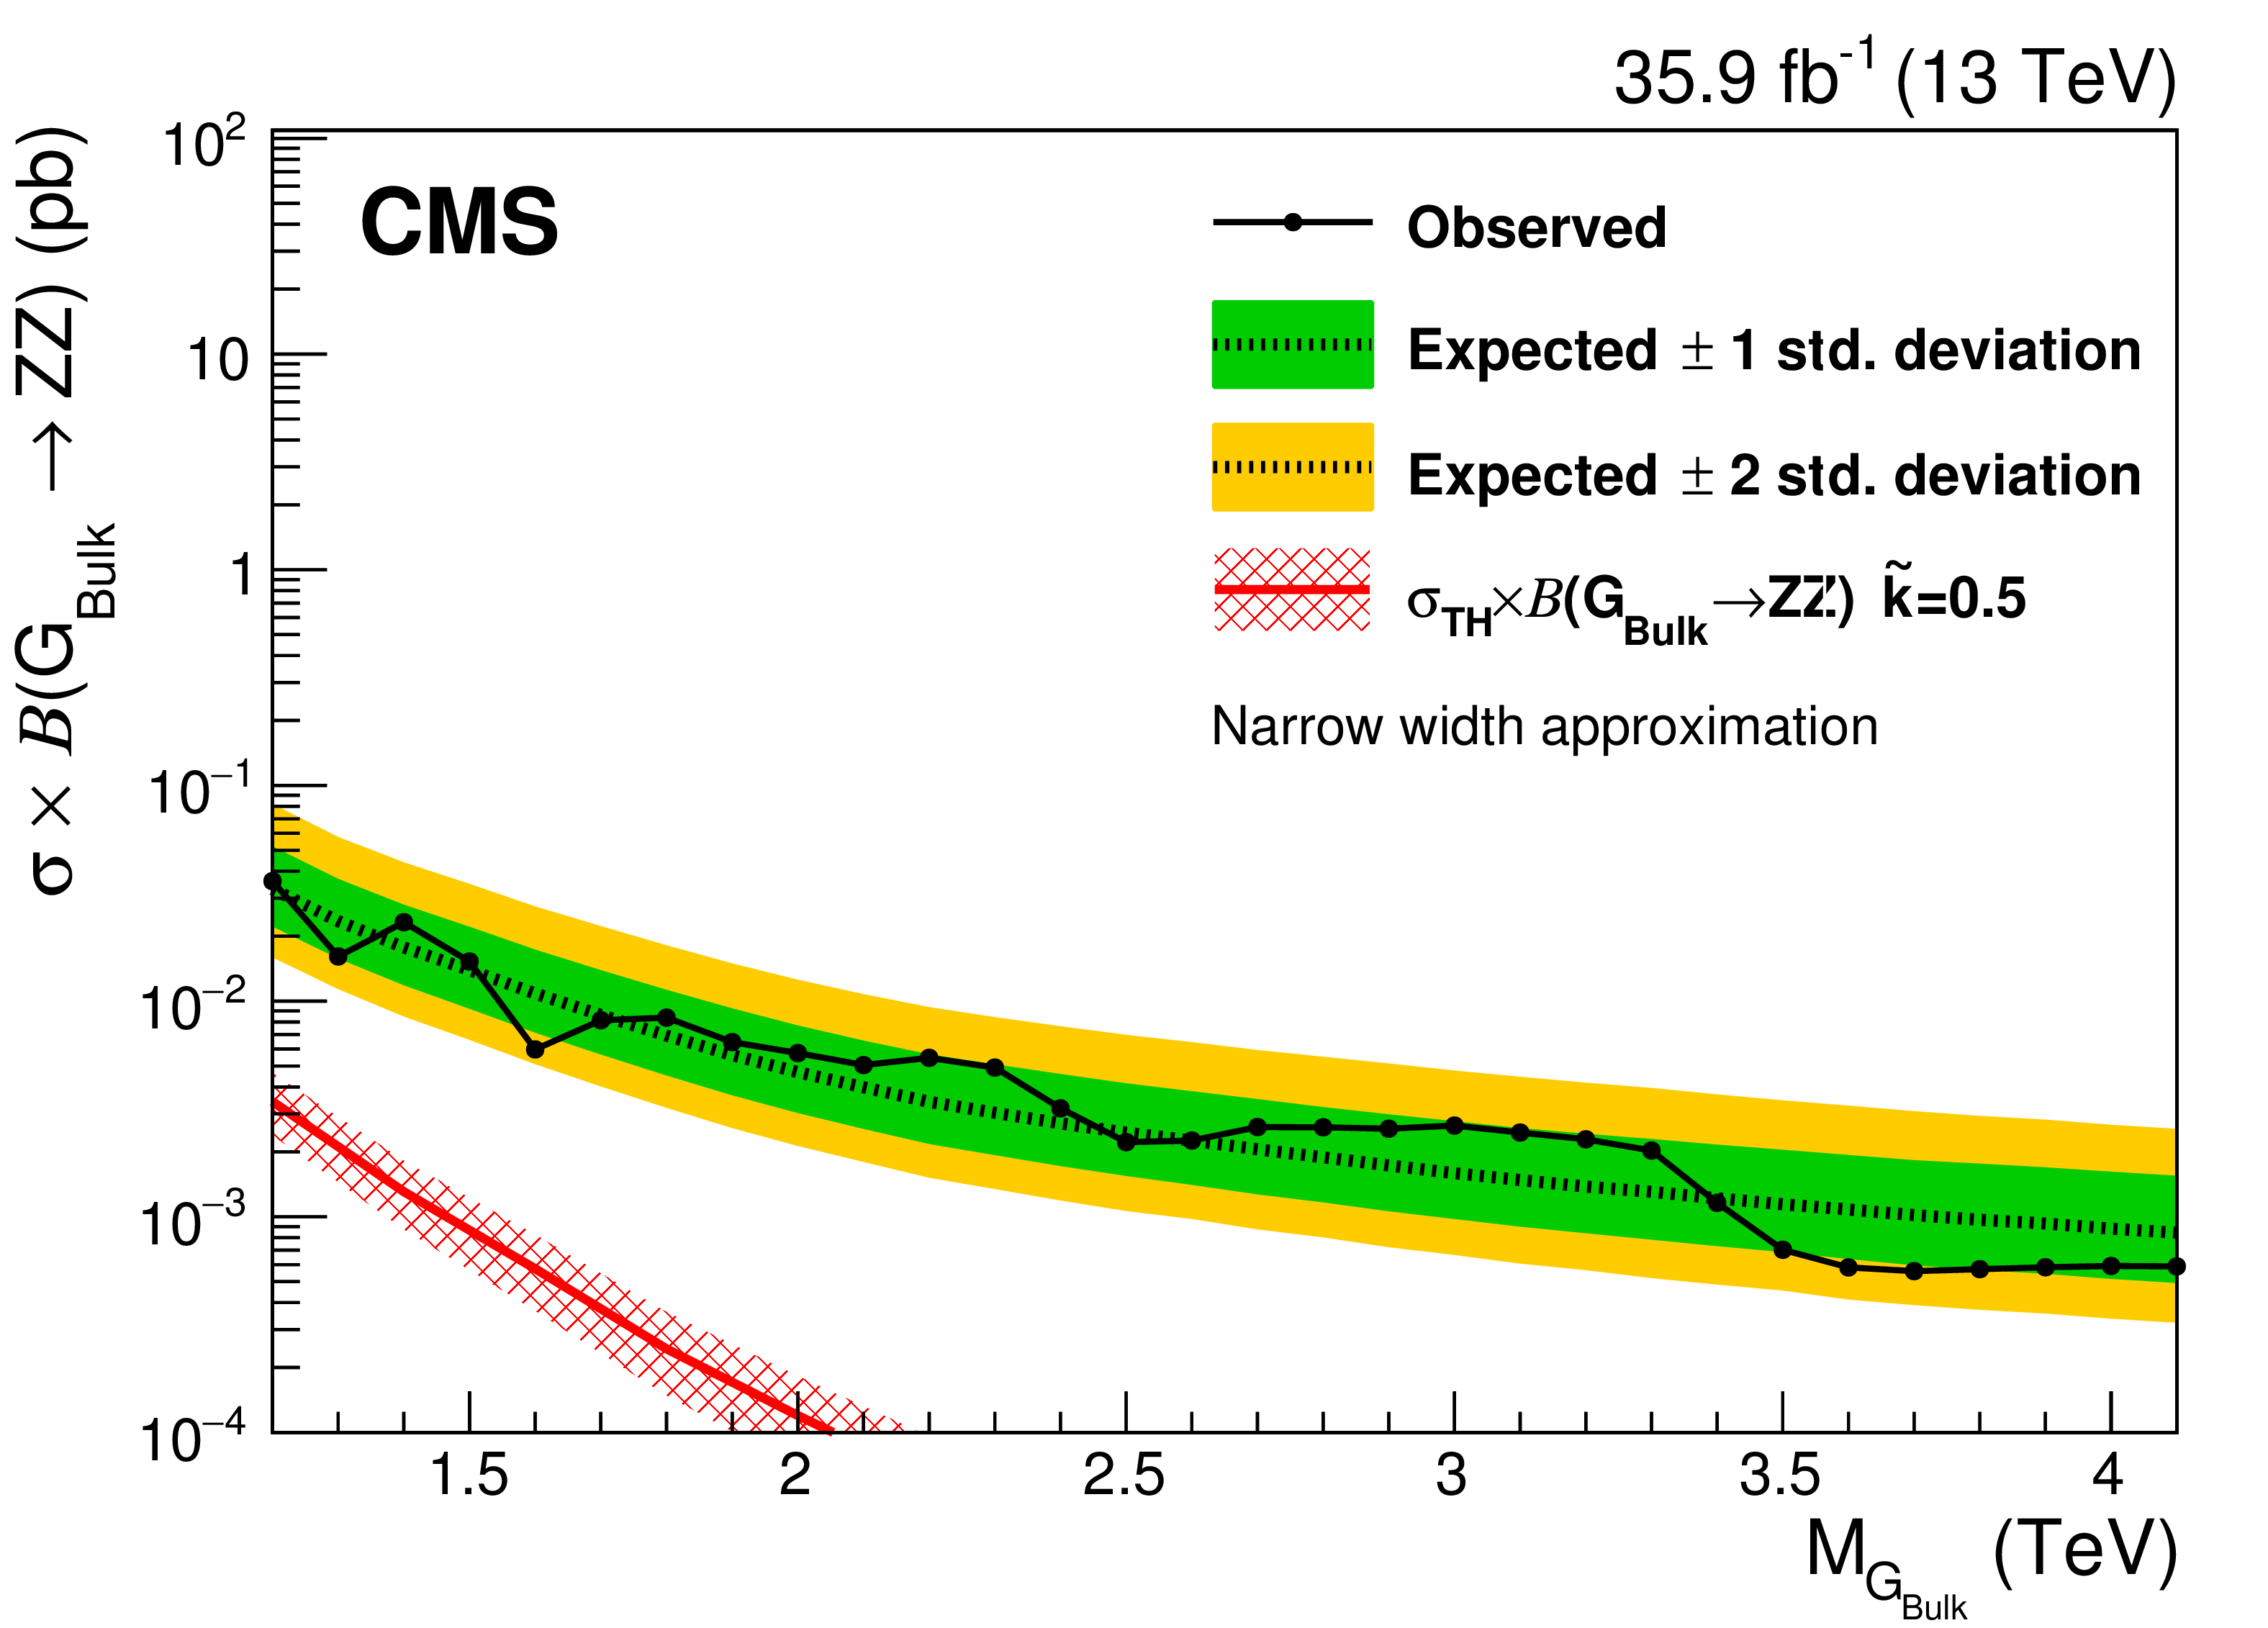
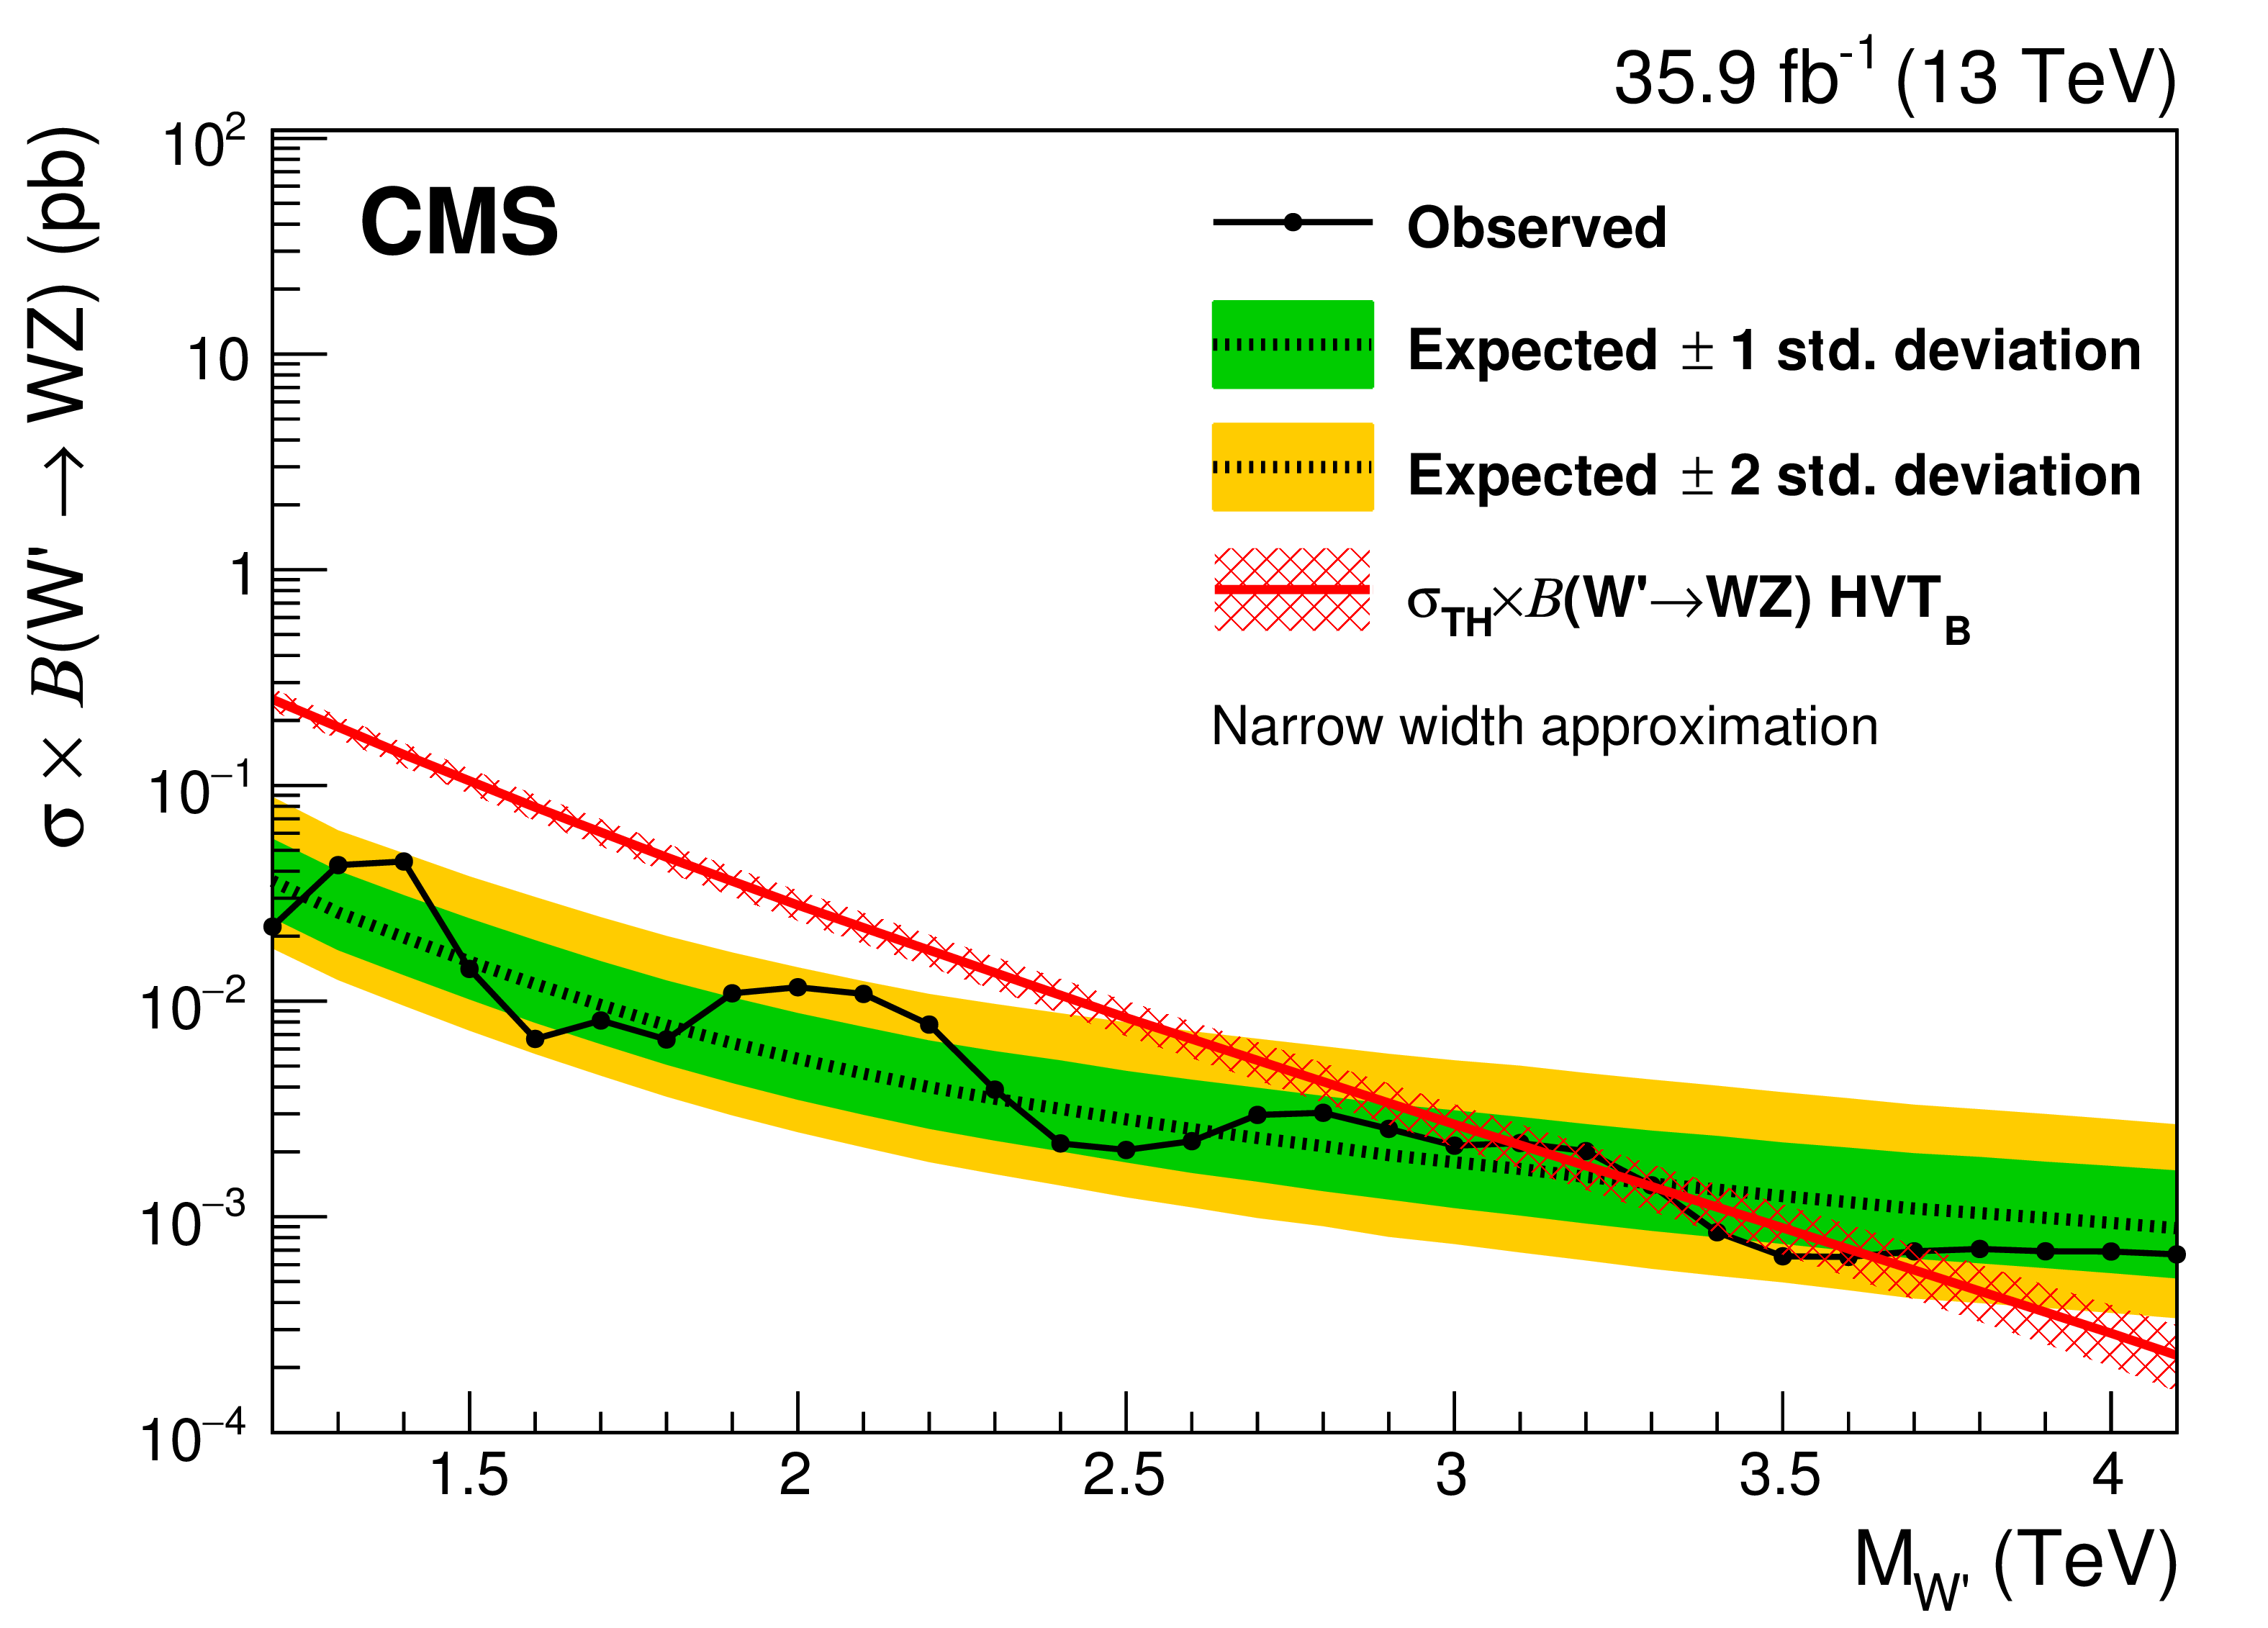
Observed (black solid) and expected (black dashed) 95% C.L. upper limits on the production cross section of a narrow-width resonance decaying to a pair of vector bosons for different signal hypotheses. Limits are set (upper left plot) on a spin-1 neutral Z' and a spin-2 resonance decaying into WW, and compared with the prediction of the HVT model B (blue line) and a bulk graviton model with $ {\tilde{k}} = $ 0.5 (red line). Limits are also set in the context of a bulk graviton decaying into ZZ (upper right) with $ \tilde{k} = $ 0.5 and a spin-1 charged resonance decaying into WZ (lower left) and compared with the predictions of the models. Signal cross section uncertainties are displayed as cross-hatched bands. The plot on the lower right shows the 95% exclusion bounds on the signal strength for the triplet hypothesis of the HVT model B. |
png pdf |
Figure 6-a:
Observed (black solid) and expected (black dashed) 95% C.L. upper limits on the production cross section of a narrow-width resonance decaying to a pair of vector bosons for different signal hypotheses. Limits are set on a spin-1 neutral Z' and a spin-2 resonance decaying into WW, and compared with the prediction of the HVT model B (blue line) and a bulk graviton model with $ {\tilde{k}} = $ 0.5 (red line). |
png pdf |
Figure 6-b:
Observed (black solid) and expected (black dashed) 95% C.L. upper limits on the production cross section of a narrow-width resonance decaying to a pair of vector bosons for different signal hypotheses. Limits are set in the context of a bulk graviton decaying into |
png pdf |
Figure 6-c:
Observed (black solid) and expected (black dashed) 95% C.L. upper limits on the production cross section of a narrow-width resonance decaying to a pair of vector bosons for different signal hypotheses. Limits are set in the context of a bulk graviton decaying into a spin-1 charged resonance decaying into WZ and compared with the predictions of the models. Signal cross section uncertainties are displayed as cross-hatched bands. |

png pdf |
Figure 6-d:
The plot shows the 95% exclusion bounds on the signal strength for the triplet hypothesis of the HVT model B. |
png pdf |
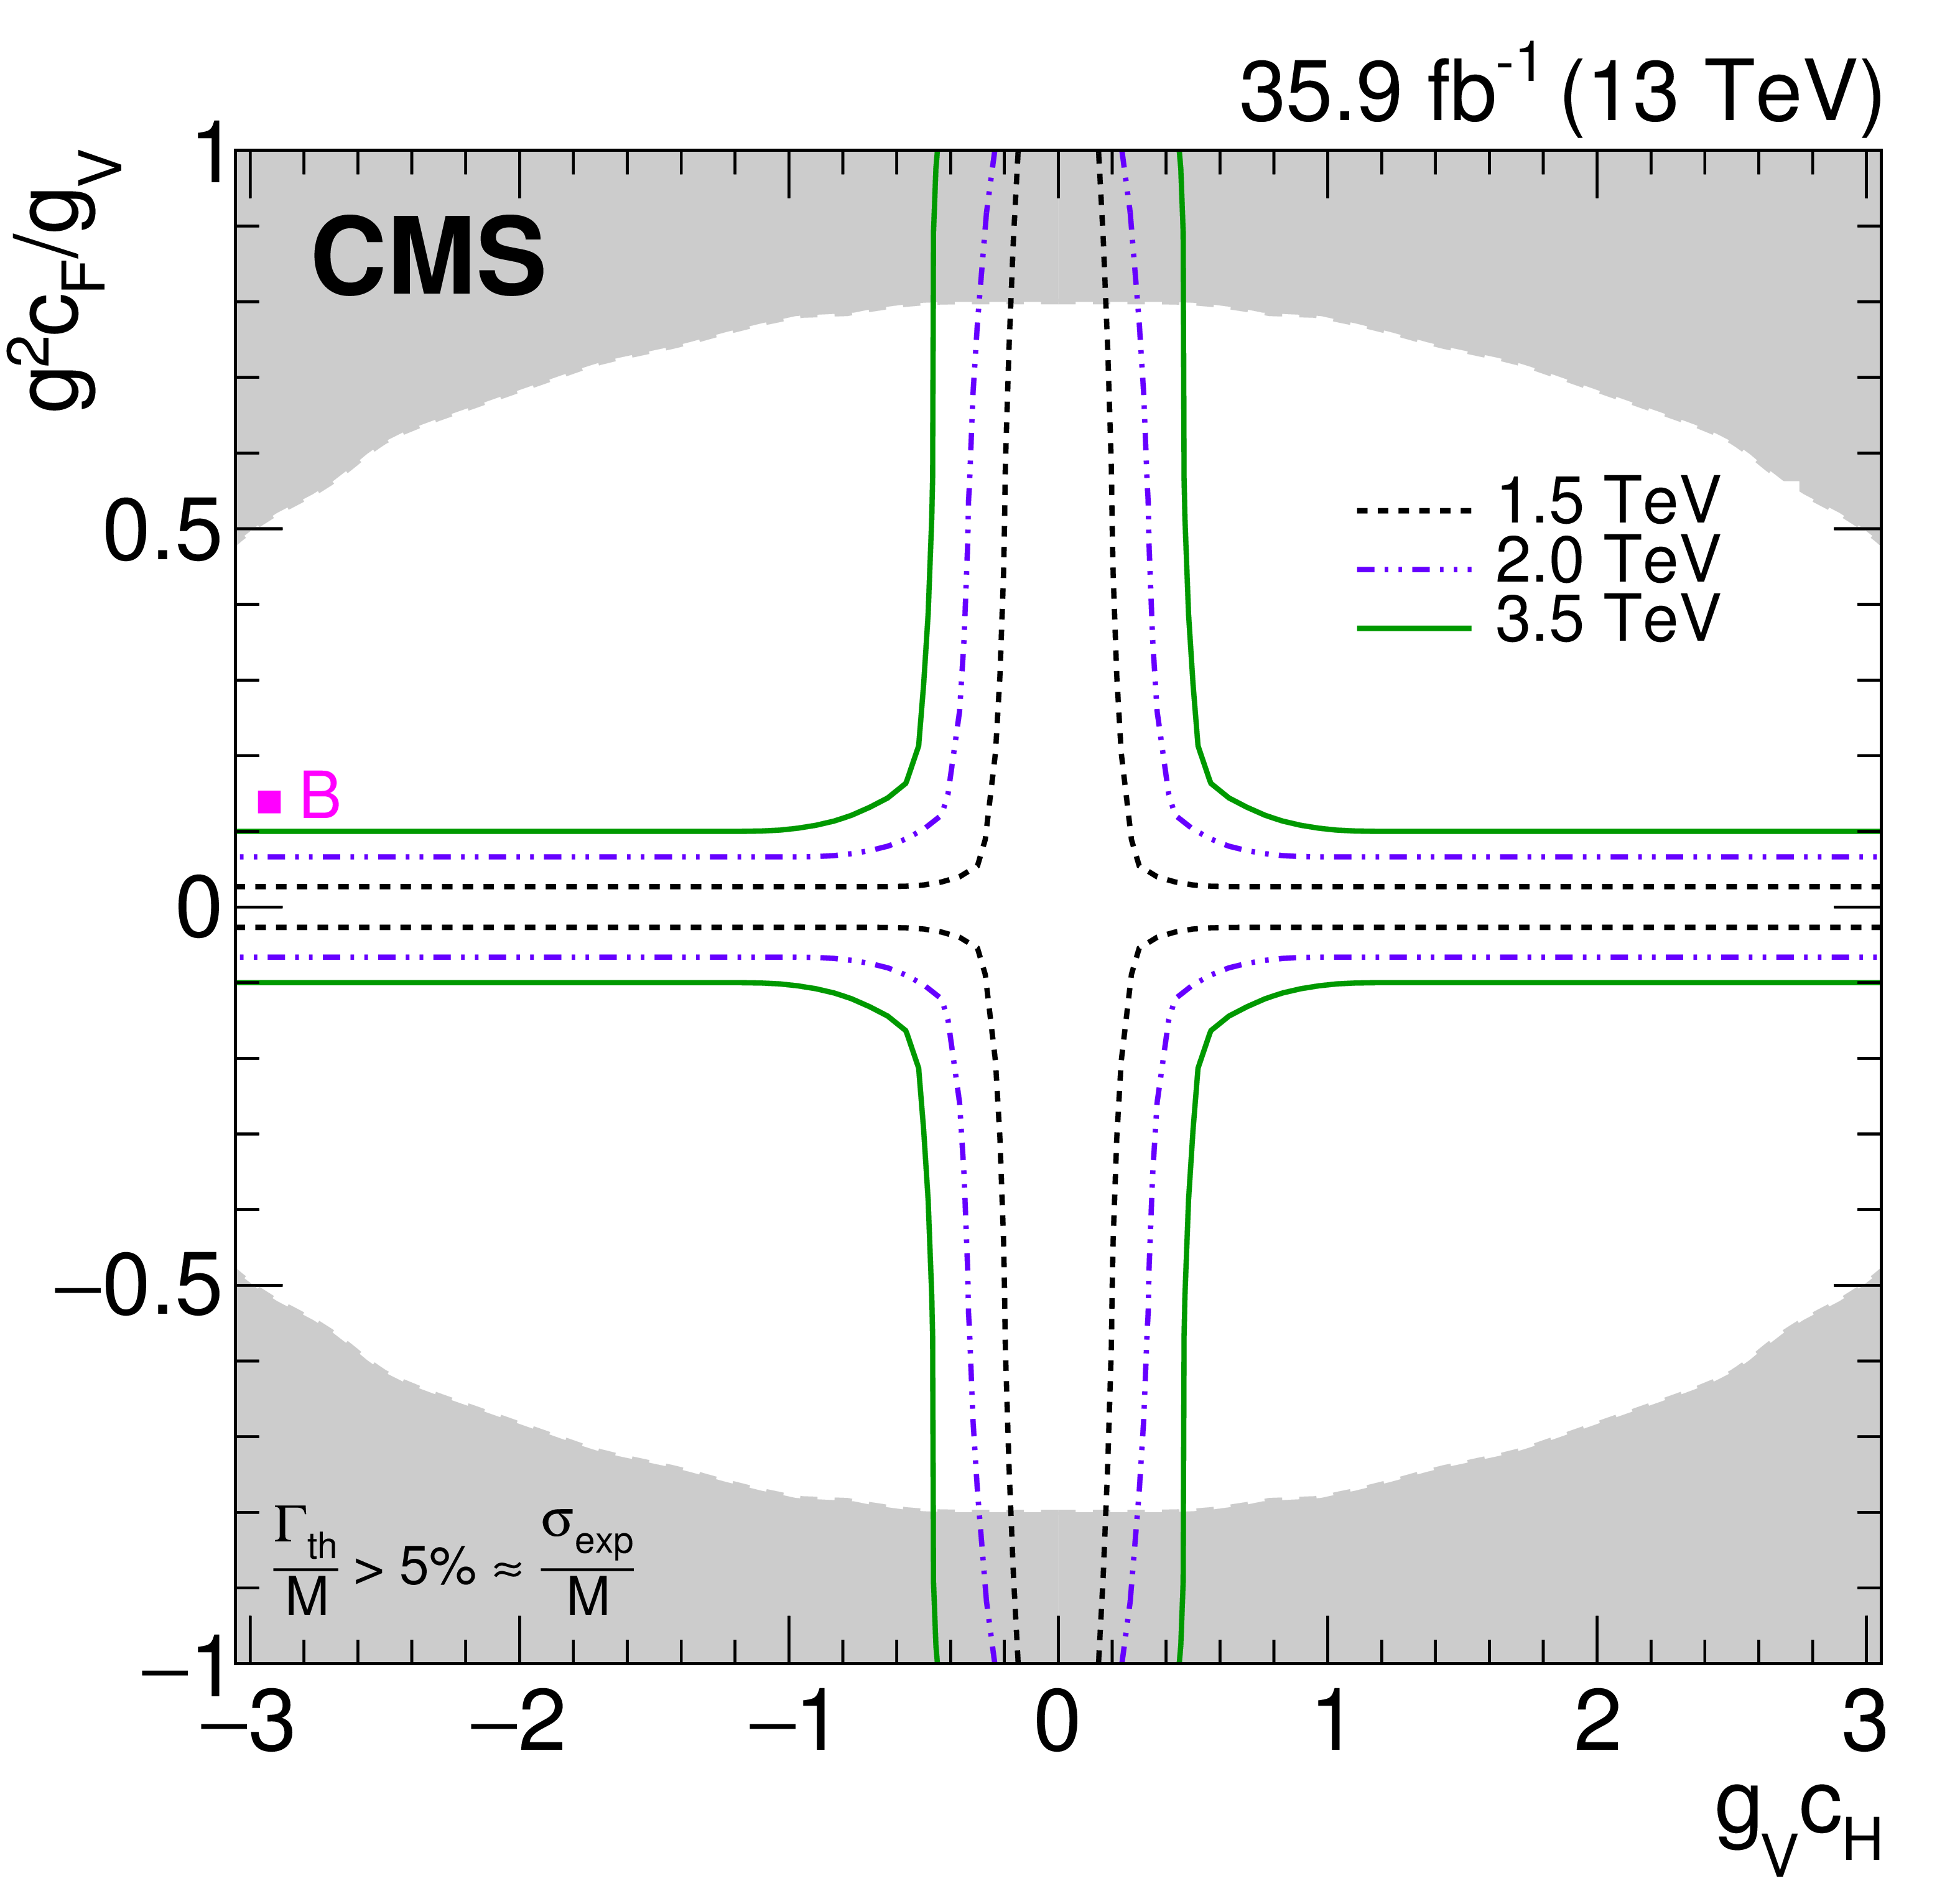
Figure 7:
Exclusion regions in the plane of the HVT model couplings for three resonance masses of 1.5, 2, and 3.5 TeV. The point B indicates the values of the coupling parameters used in the benchmark model. The regions of the plane excluded by this search lie outside of the boundaries indicated by the solid and dashed lines. The areas indicated by the solid shading correspond to regions where the theoretical width is larger than the experimental resolution of the present search and the narrow-resonance assumption is therefore not satisfied. |
png pdf |
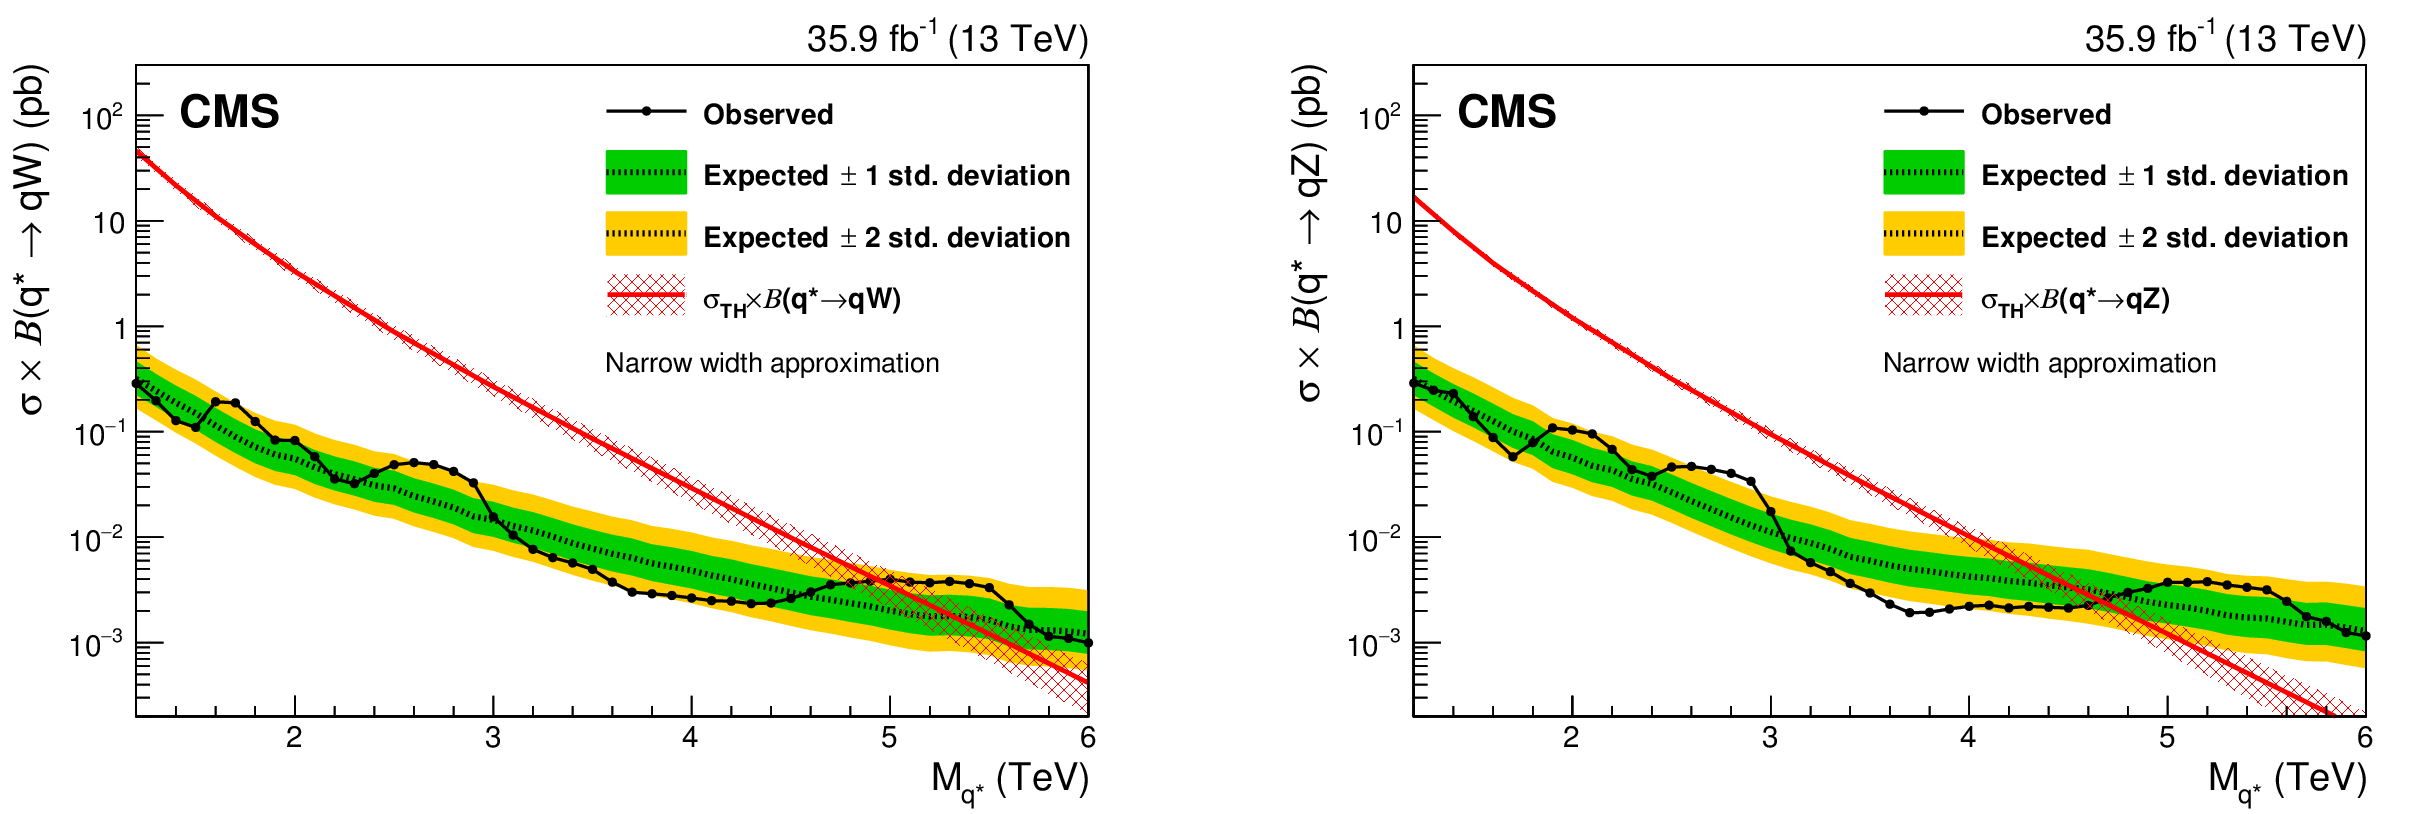
Figure 8:
Observed (black solid) and expected (black dashed) 95% CL upper limits on the production of an excited quark resonance decaying into qW (left) or qZ (right) as a function of resonance mass. Signal cross section uncertainties are displayed as red cross-hatched bands. |
png pdf |
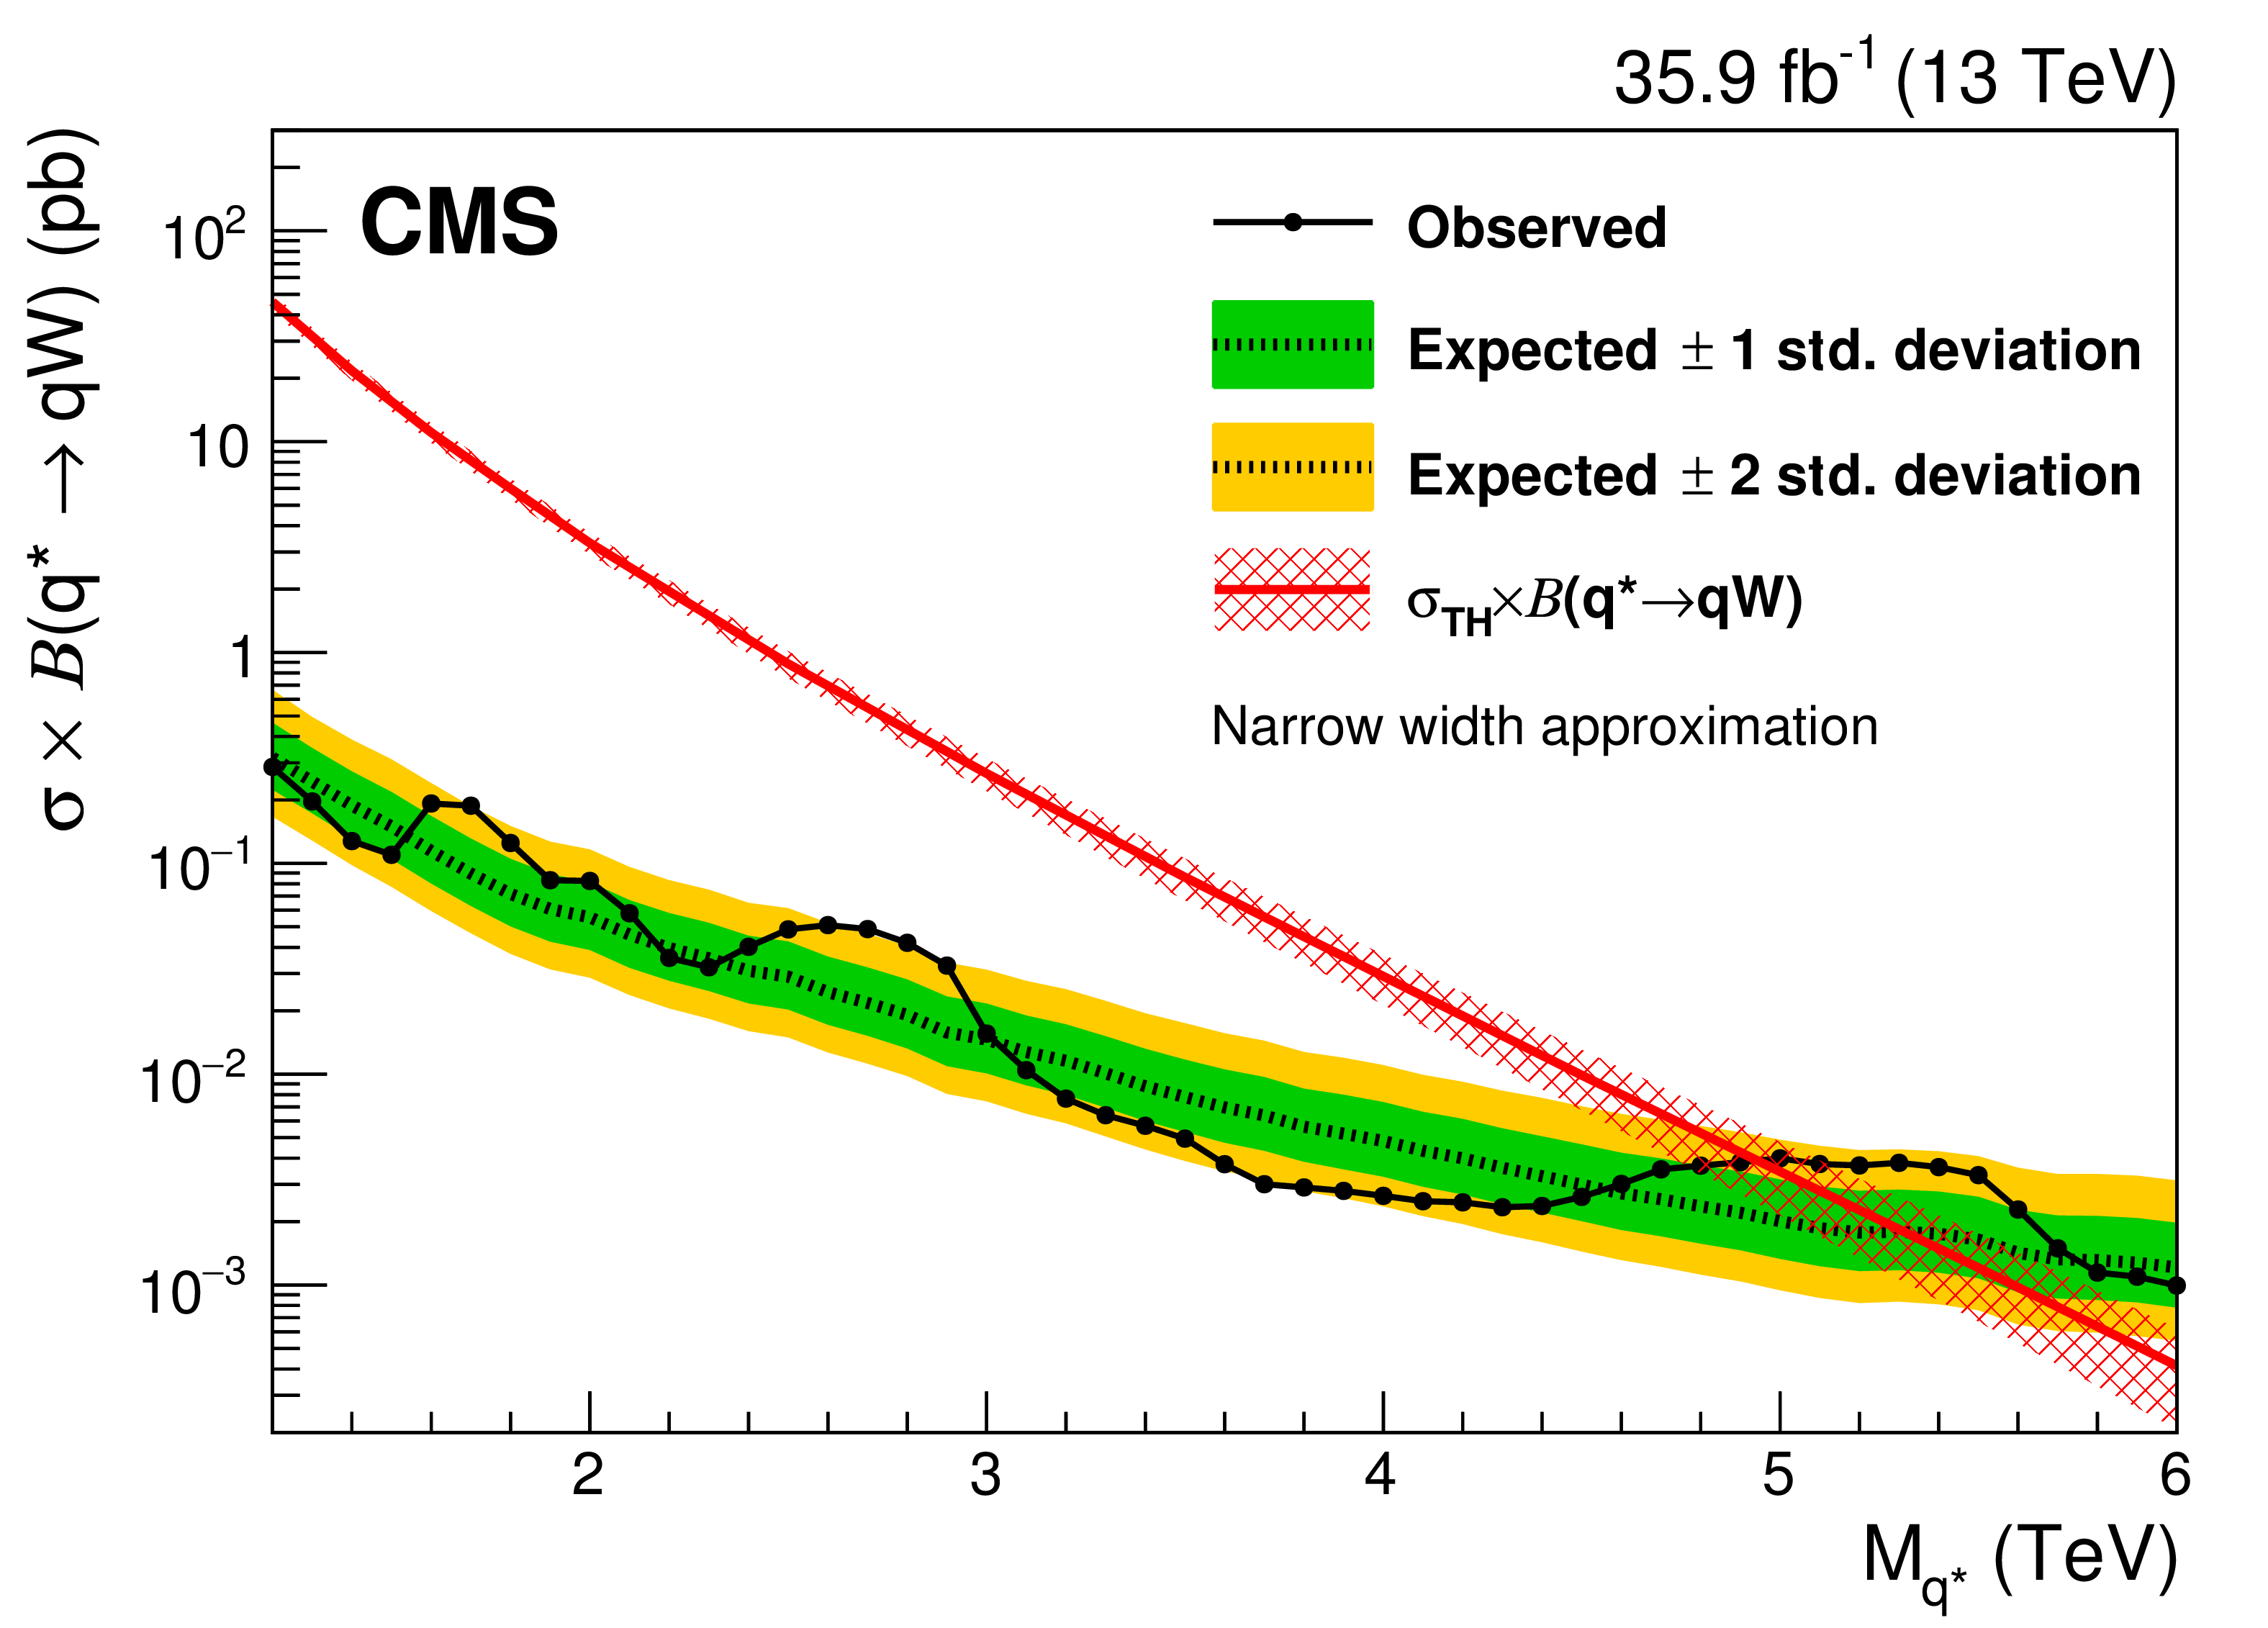
Figure 8-a:
Observed (black solid) and expected (black dashed) 95% CL upper limits on the production of an excited quark resonance decaying into qW as a function of resonance mass. Signal cross section uncertainties are displayed as red cross-hatched bands. |
png pdf |
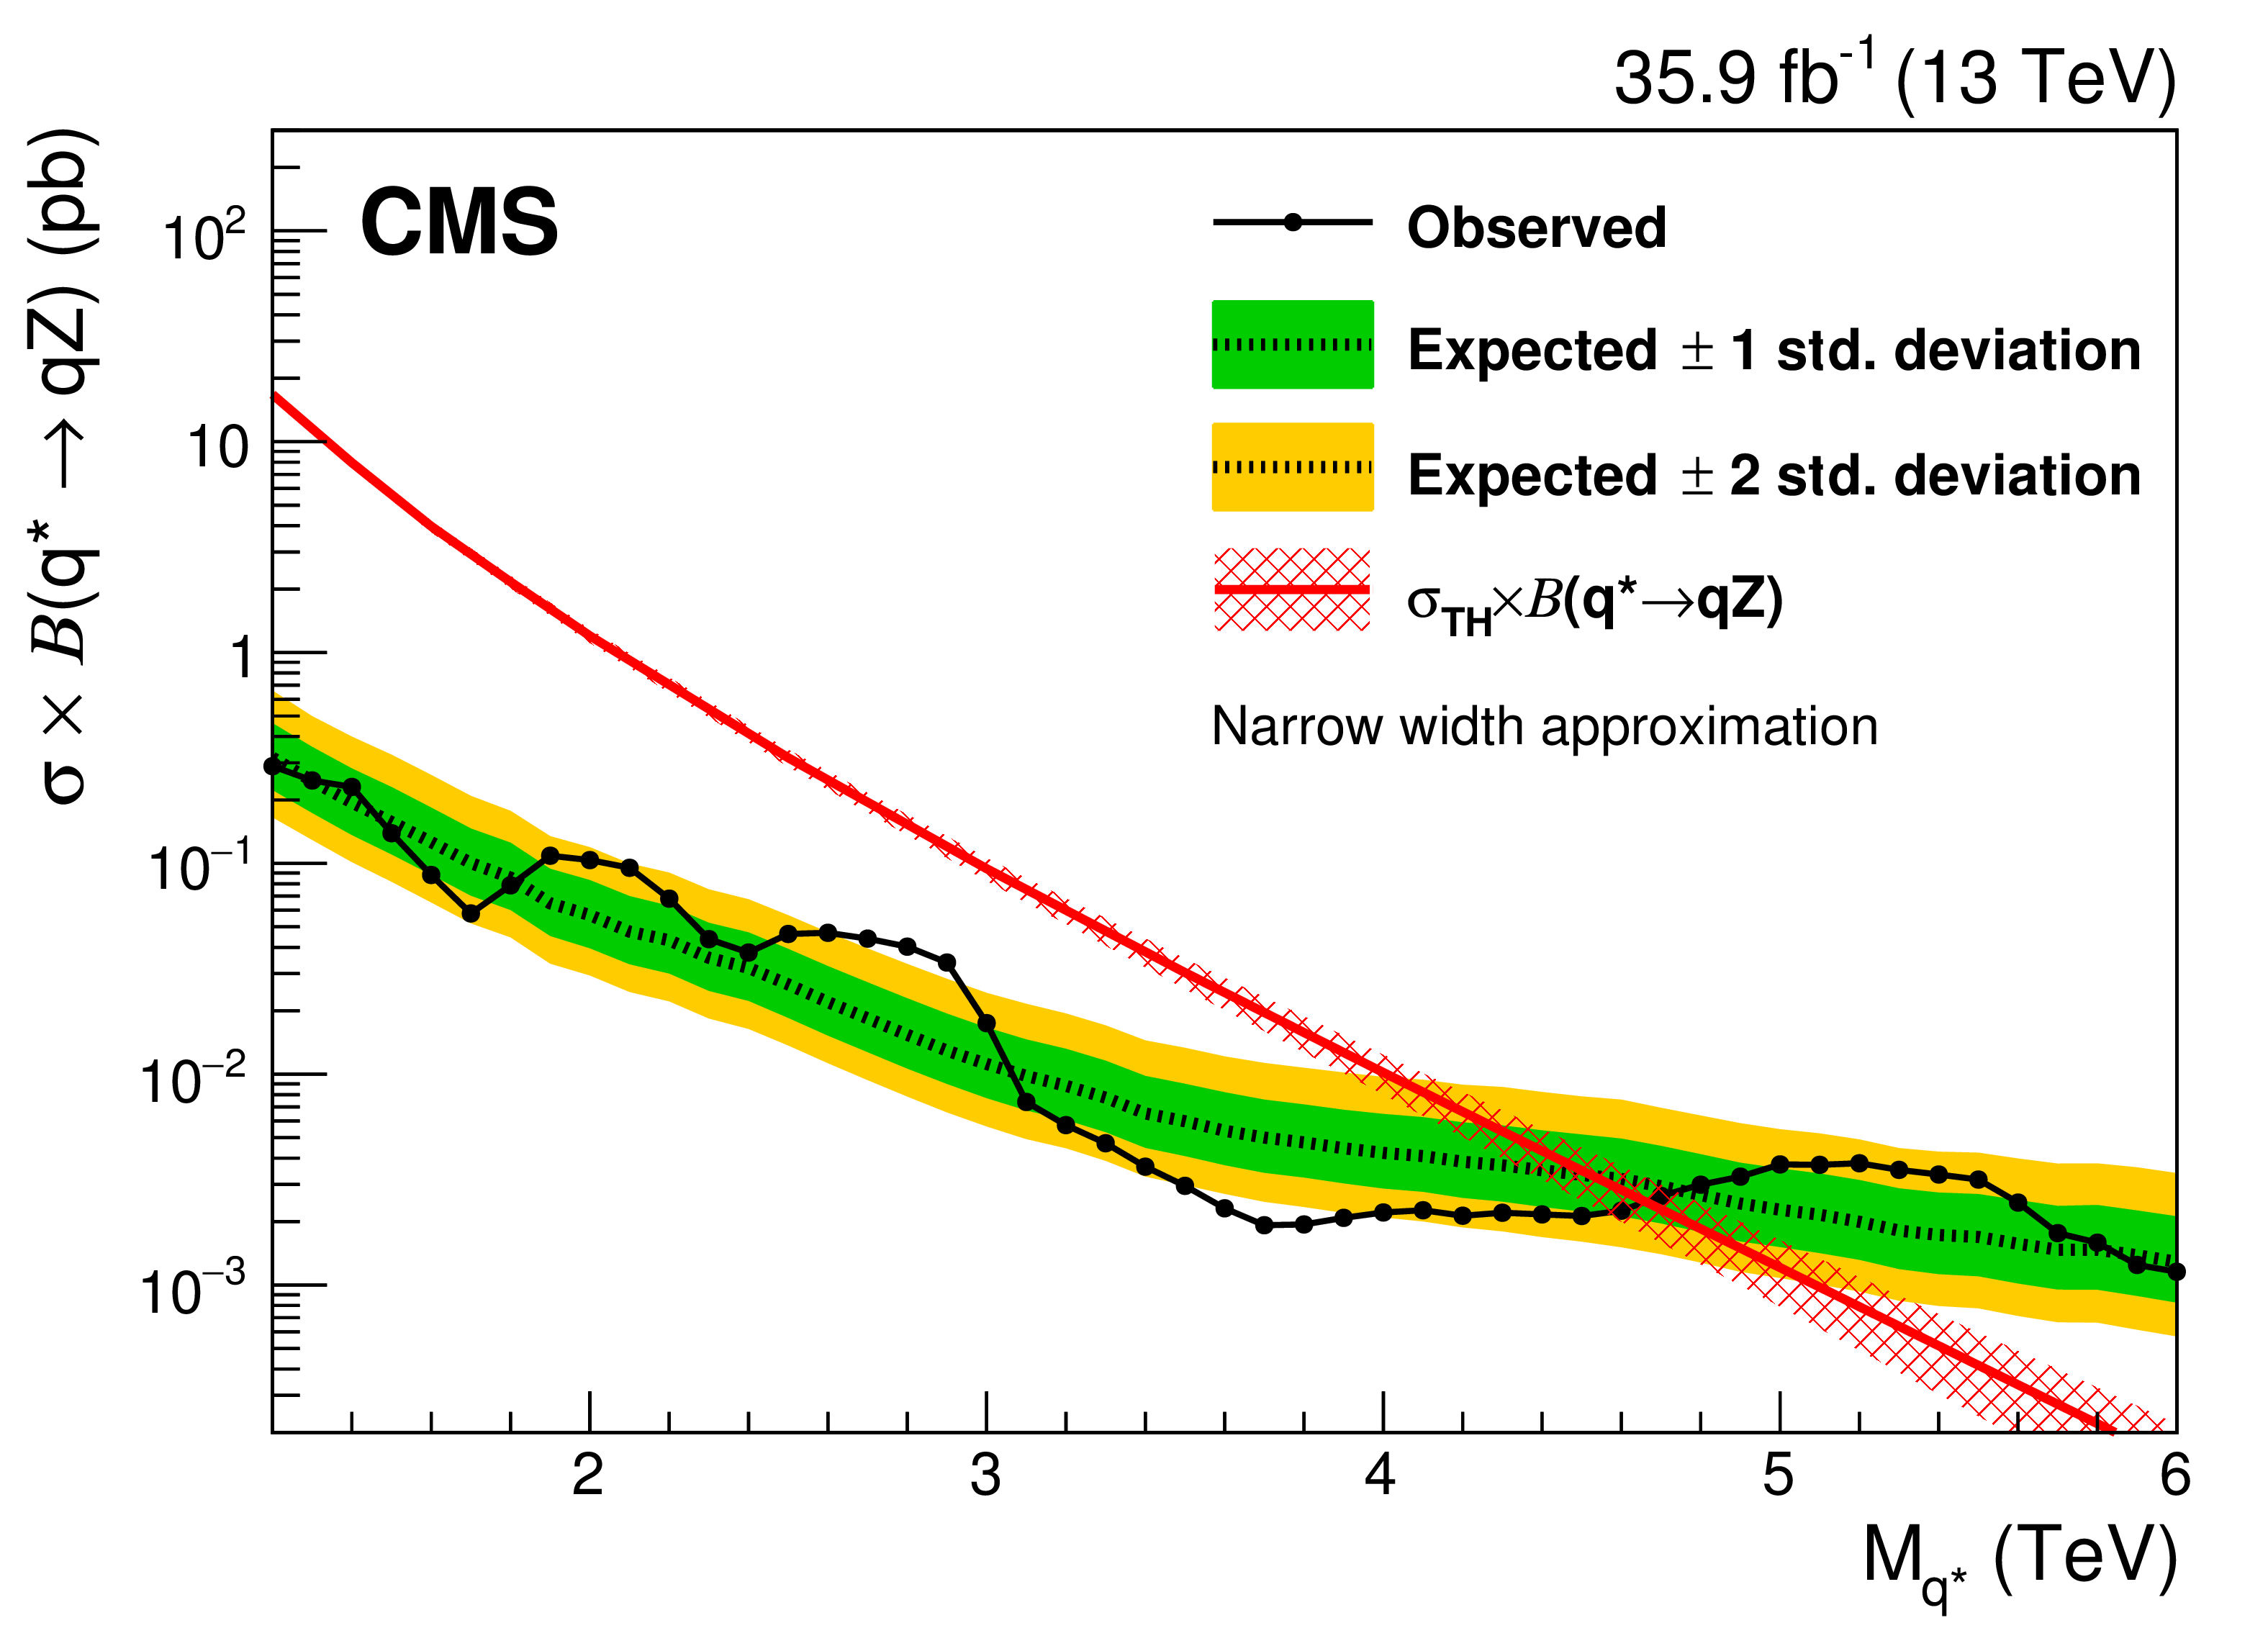
Figure 8-b:
Observed (black solid) and expected (black dashed) 95% CL upper limits on the production of an excited quark resonance decaying into qZ as a function of resonance mass. Signal cross section uncertainties are displayed as red cross-hatched bands. |
| Tables | |
png pdf |
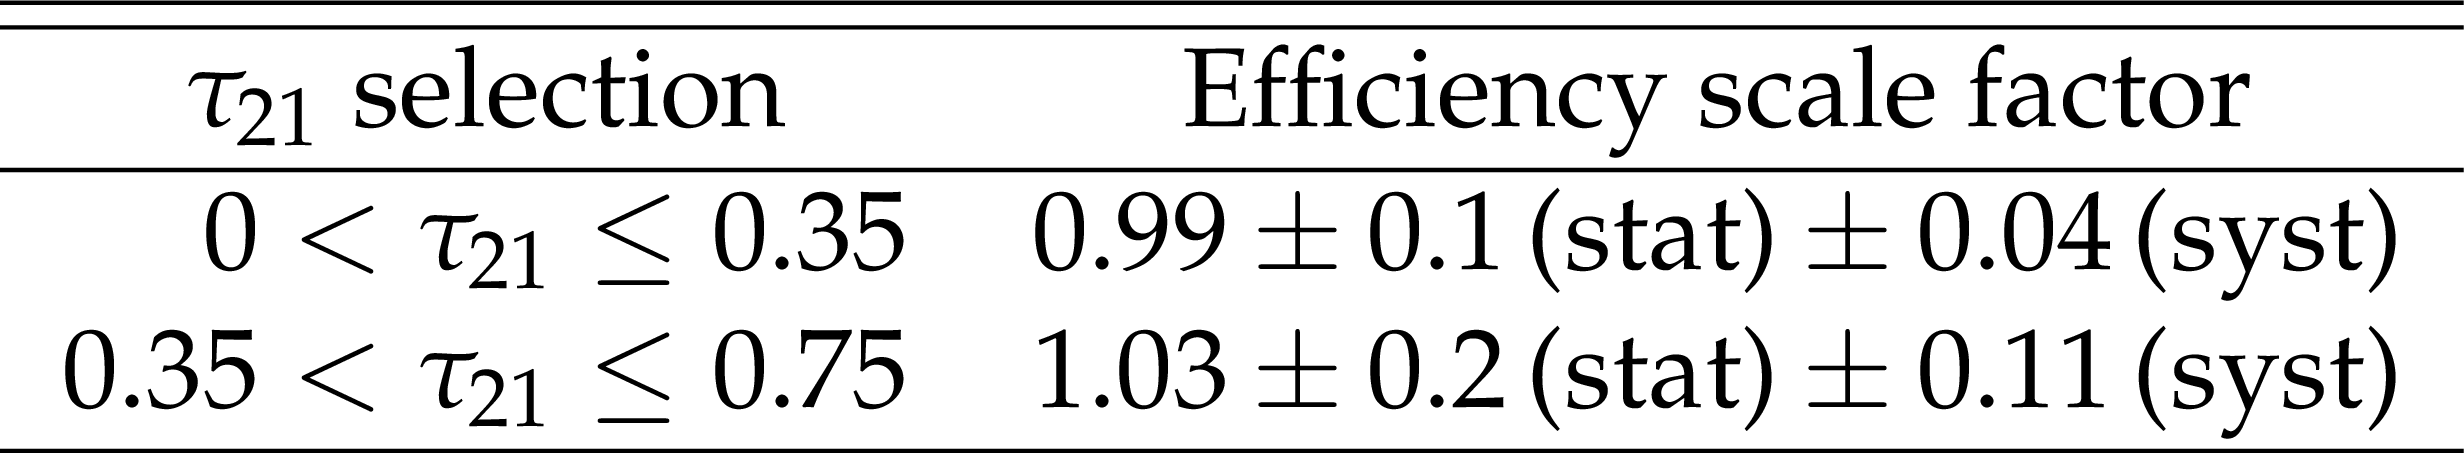
Table 1:
Data versus simulation scale factors for the efficiency of the ${\tau _{21}}{} $ selection used in this analysis, as extracted from a top quark enriched data sample and from simulation. |
png pdf |
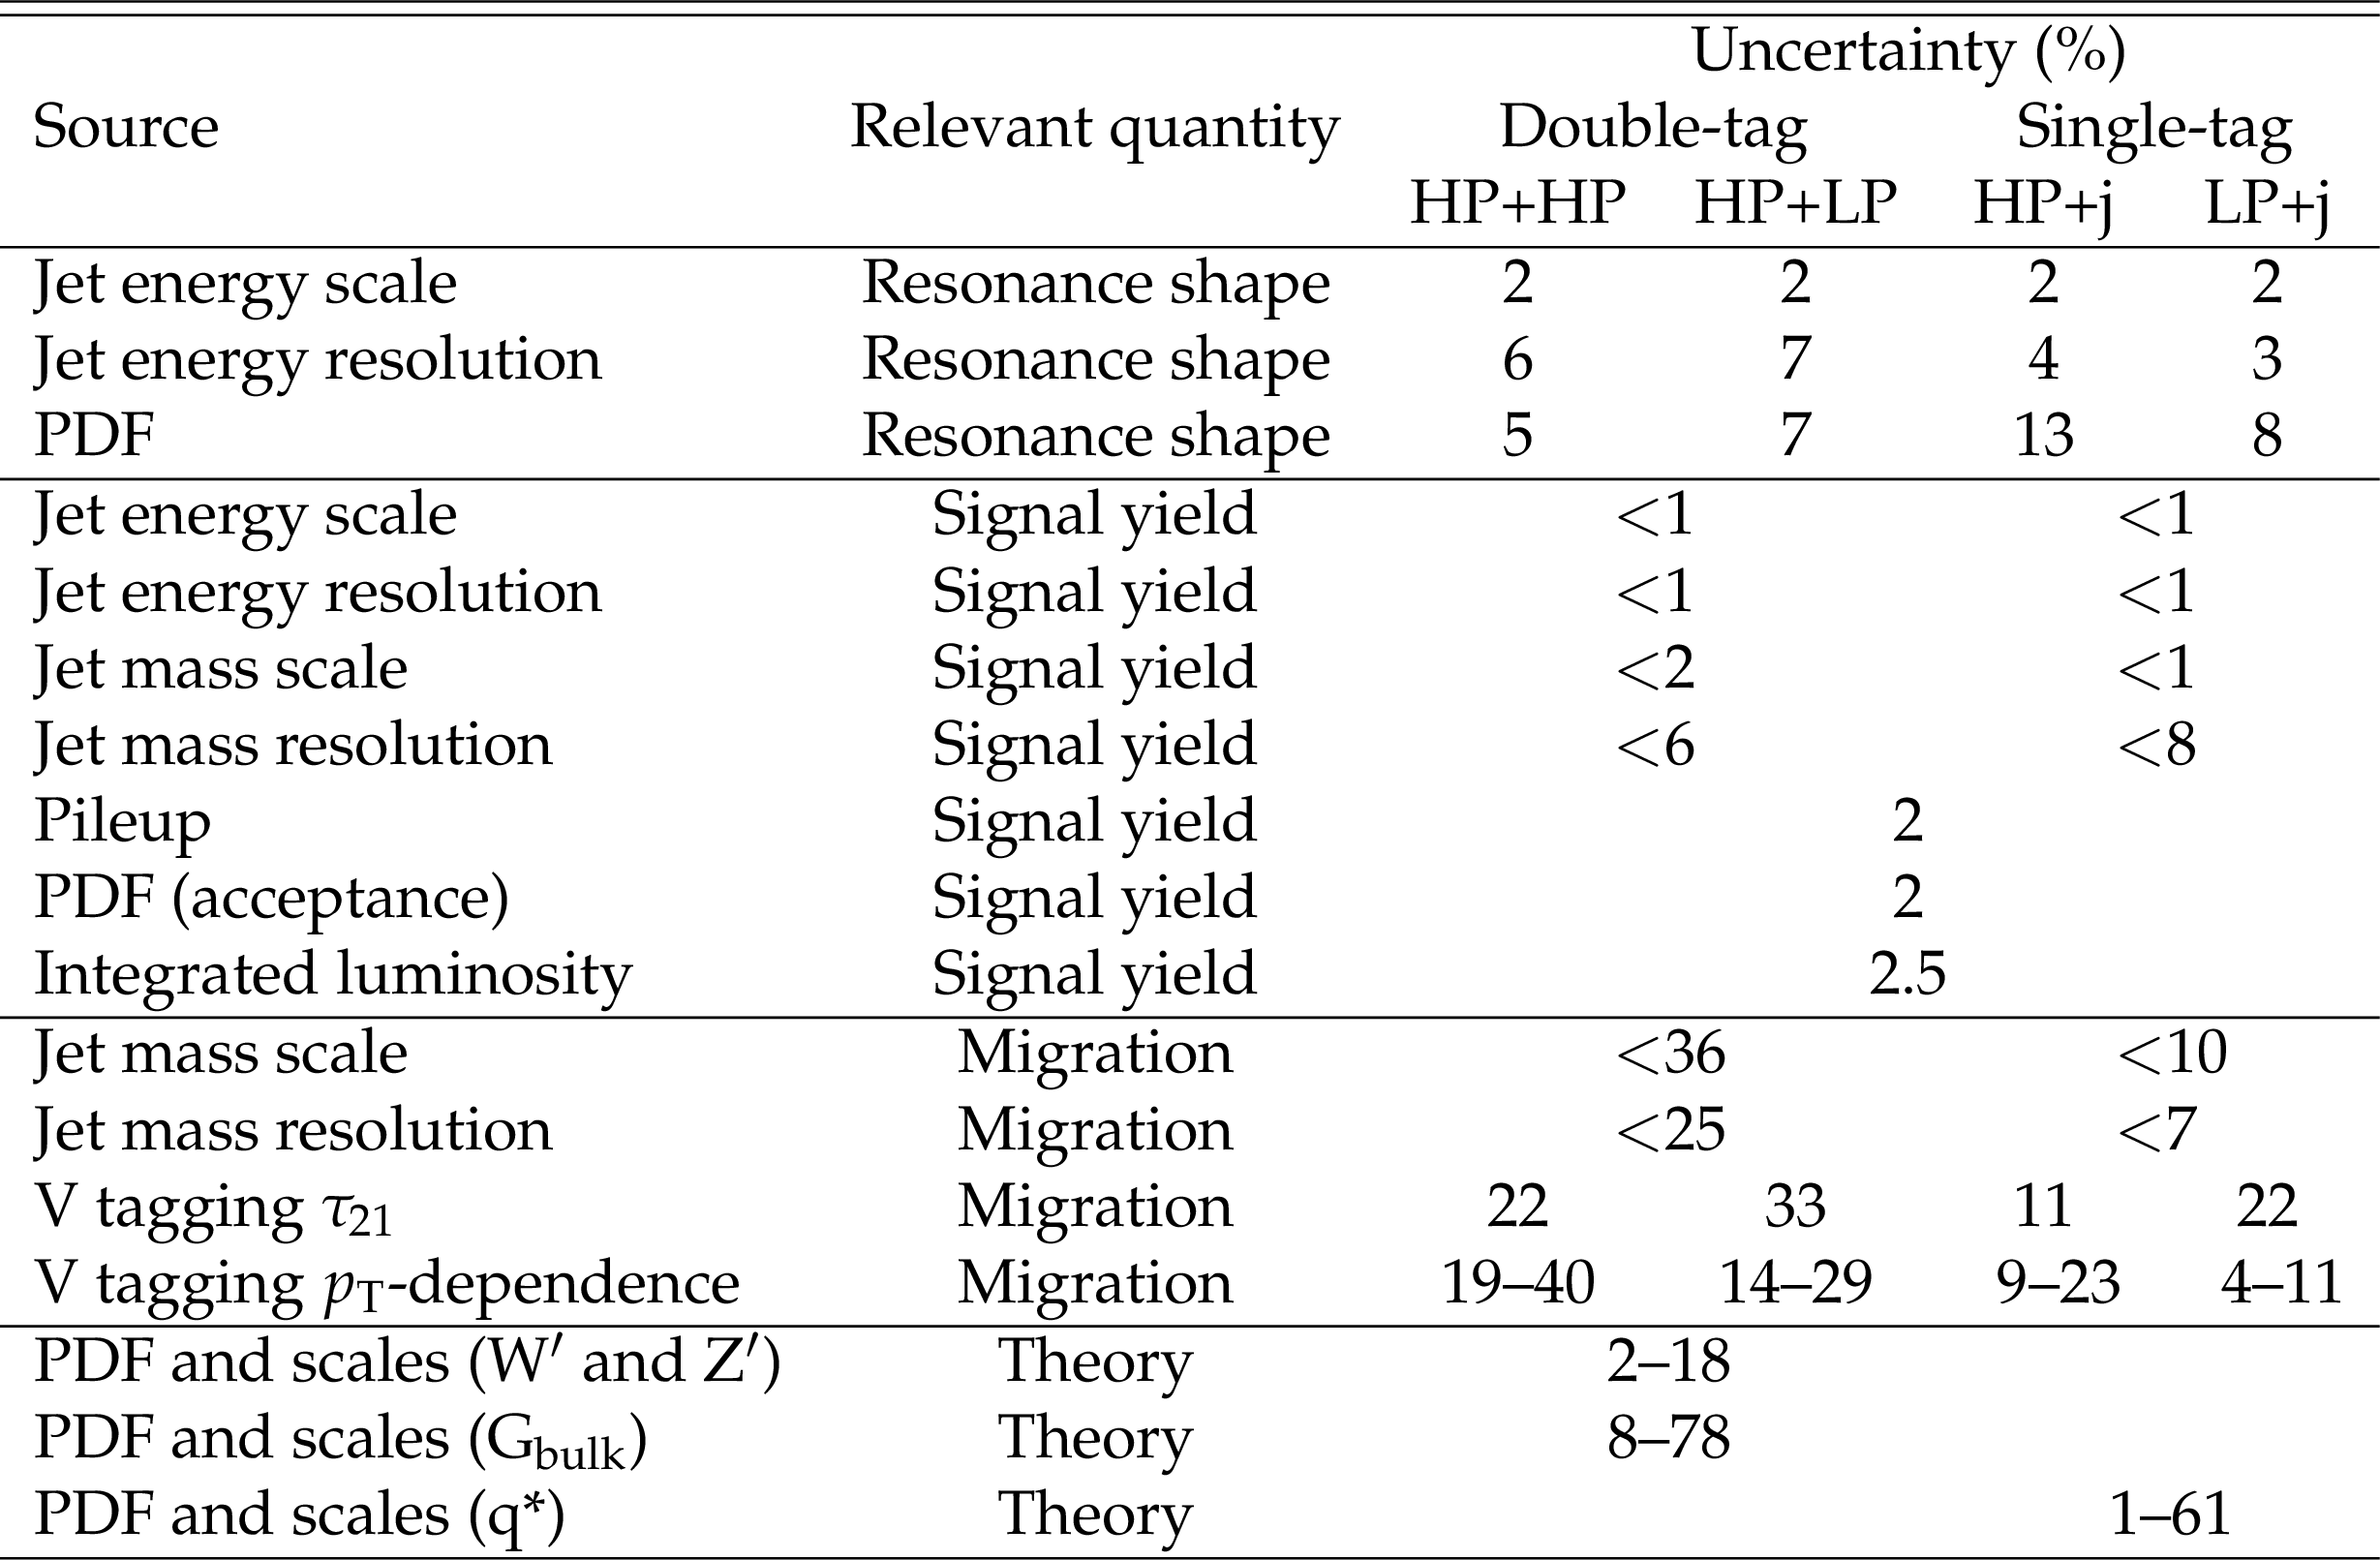
Table 2:
Summary of the signal systematic uncertainties for the analysis and their impact on the event yield in the signal region and on the reconstructed ${m_\mathrm {jj}}$ shape (mean and width). The jet mass and V tagging uncertainties result in migrations between event categories. The effects of the PDF and scale uncertainties in the signal cross section are not included as nuisance parameters in the limit setting procedure, but are assigned to the theory predictions. |
| Summary |
| A search is presented for new massive narrow resonances decaying to WW, ZZ, WZ, qW, or qZ, in which the bosons decay hadronically into dijet final states. Hadronic W and Z boson decays are identified by requiring a jet with mass compatible with the W or Z boson mass, respectively. Additional information from jet substructure is used to reduce the background from multijet production. No evidence is found for a signal and upper limits on the resonance production cross section are set as function of the resonance mass. The results are interpreted in the context of the bulk graviton model, heavy vector triplet W' and Z' resonances, and excited quark resonances $\mathrm{ q }^*$. For the heavy vector triplet model B, we exclude W' and Z' resonances with masses below 3.6 and 2.7 TeV, respectively. In the narrow-width bulk graviton model, production cross sections are excluded in the range from 37.1 fb for a resonance mass of 1.3 TeV, to the most stringent limit of 0.6 fb for high resonance masses above 4.0 TeV. Exclusion limits are set at 95% confidence level on the production of excited quark resonances $\mathrm{ q }^*$ decaying to qW and qZ for masses less than 5.0 and 4.8 TeV, respectively. This search sets the most stringent mass limits to date on a $\mathrm{ q }^*$ resonance that decays to qW and qZ, as well as on a W' or Z' resonance that decays to two vector bosons. |
| Additional Figures | |
png pdf |
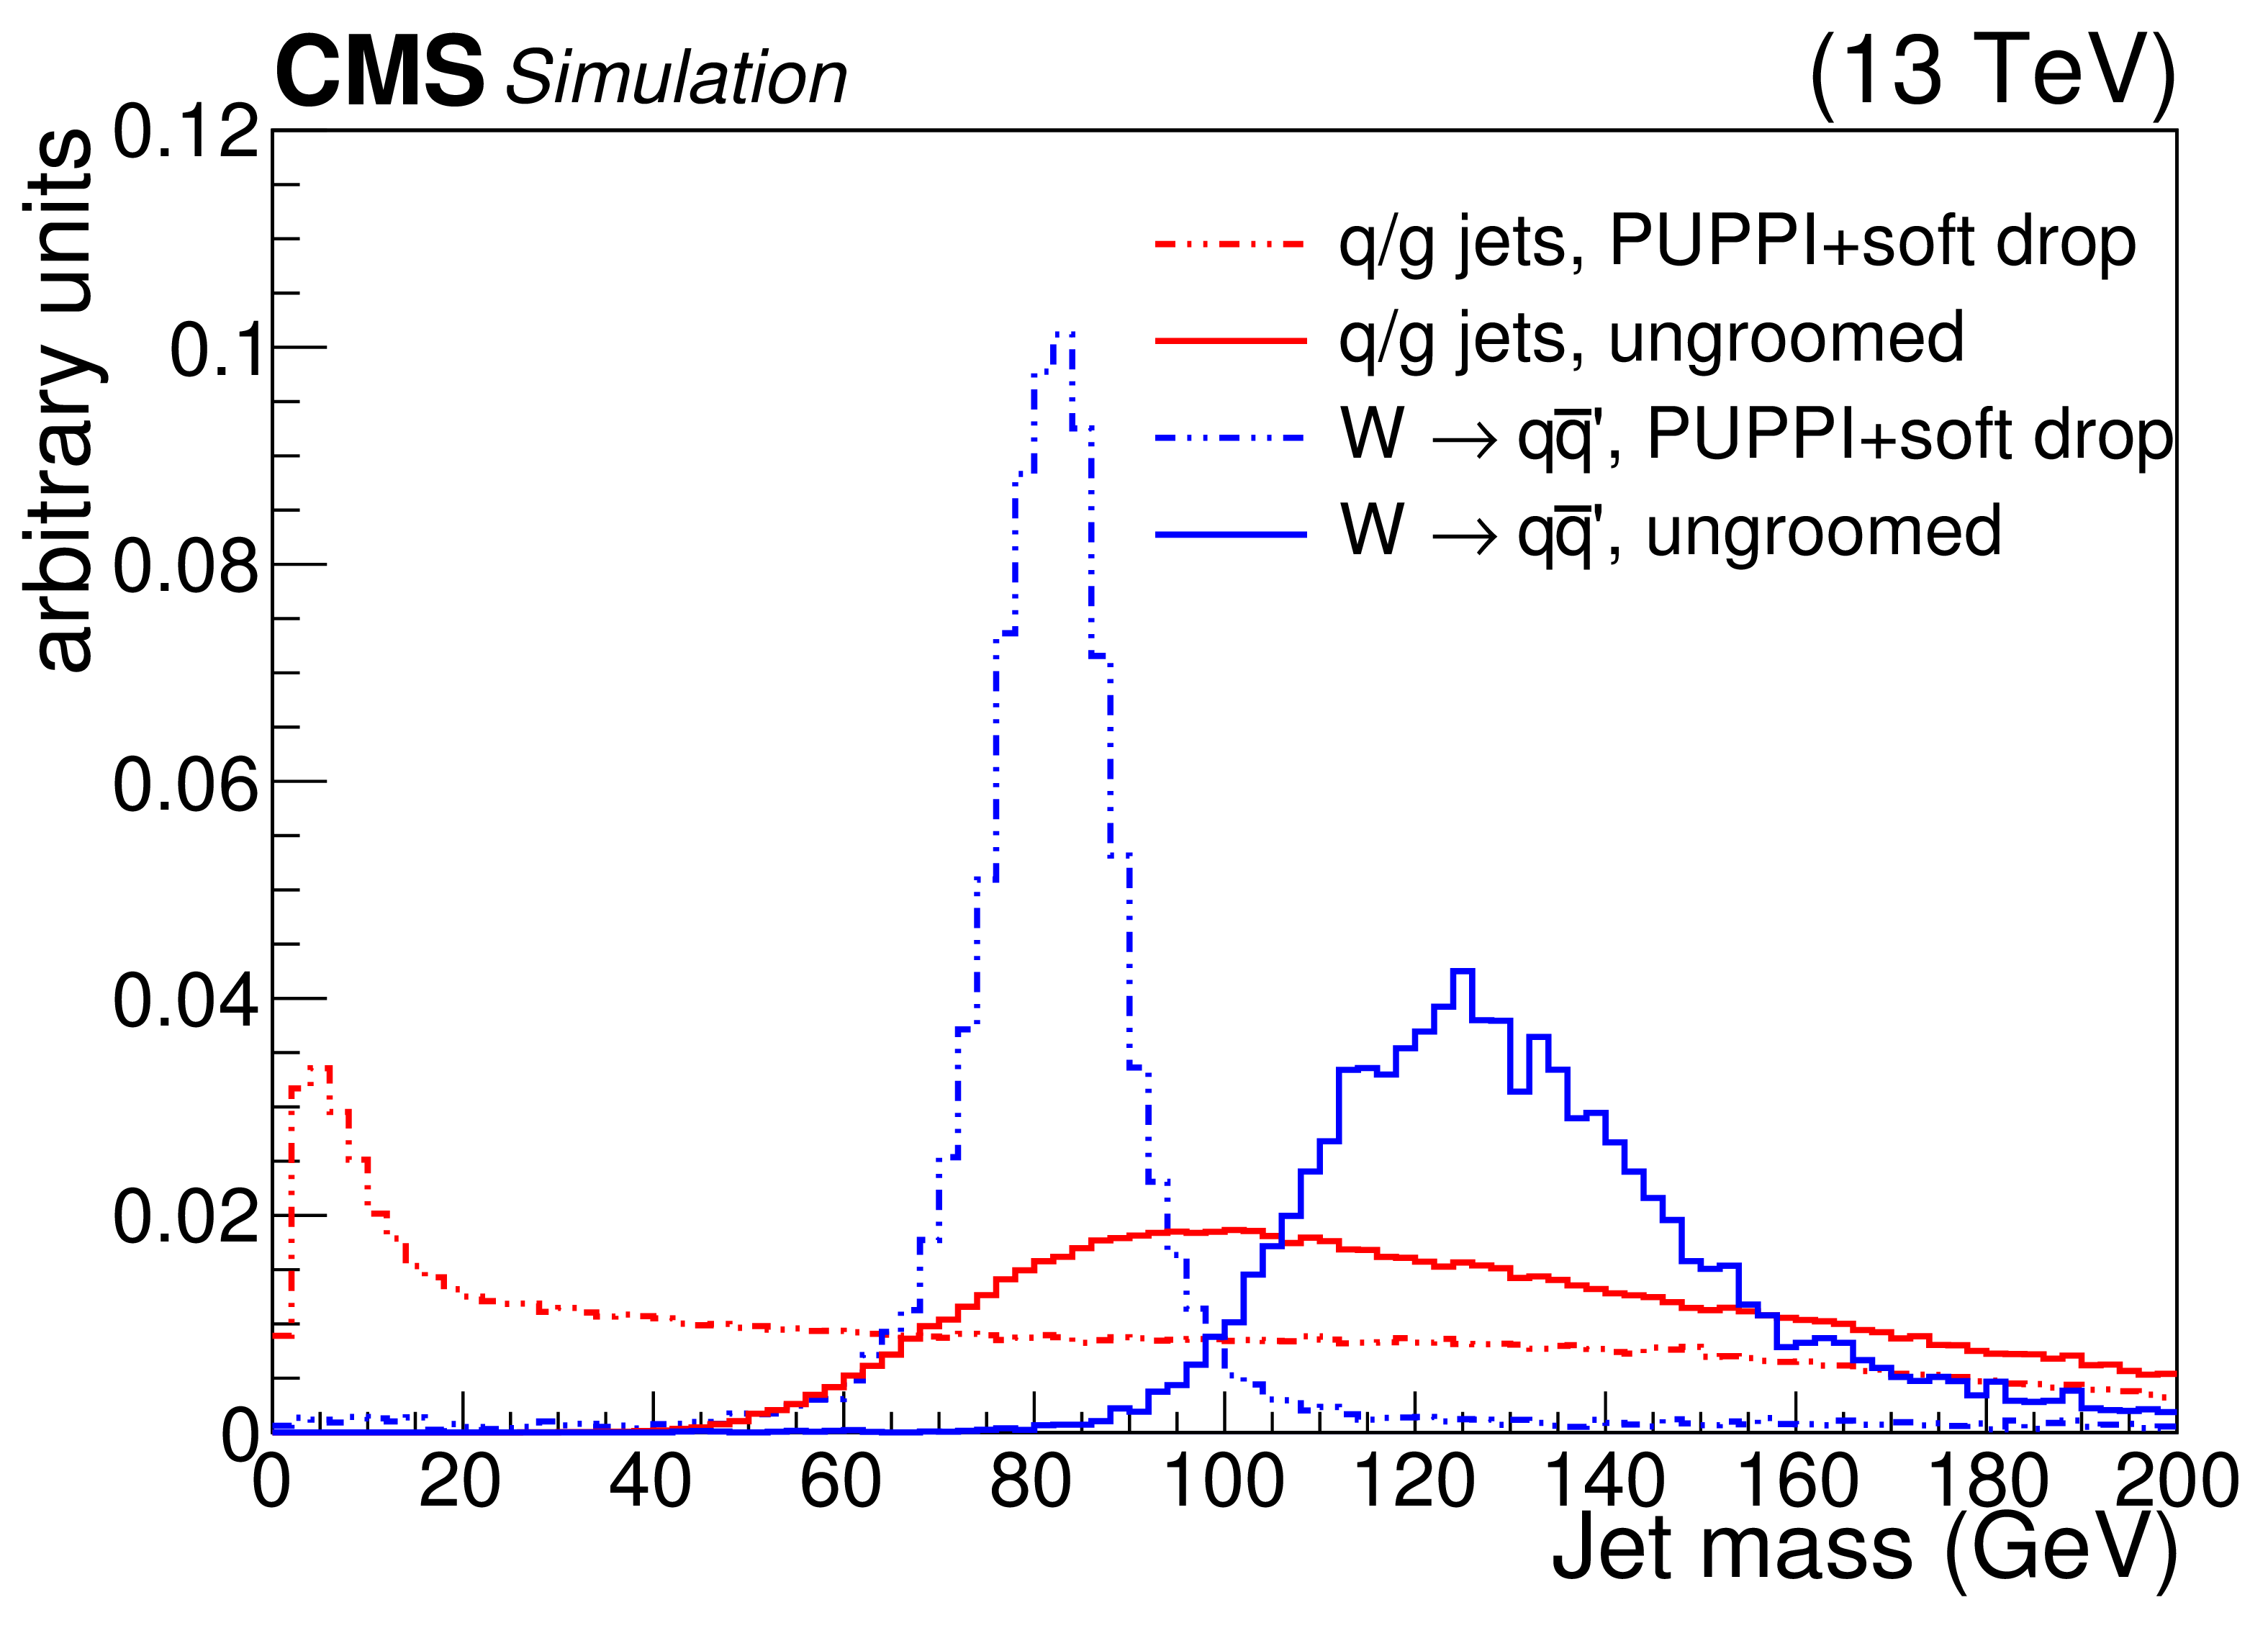
Additional Figure 1:
Comparison between ungroomed and softdop jet masses in MC simulation. |

png pdf |
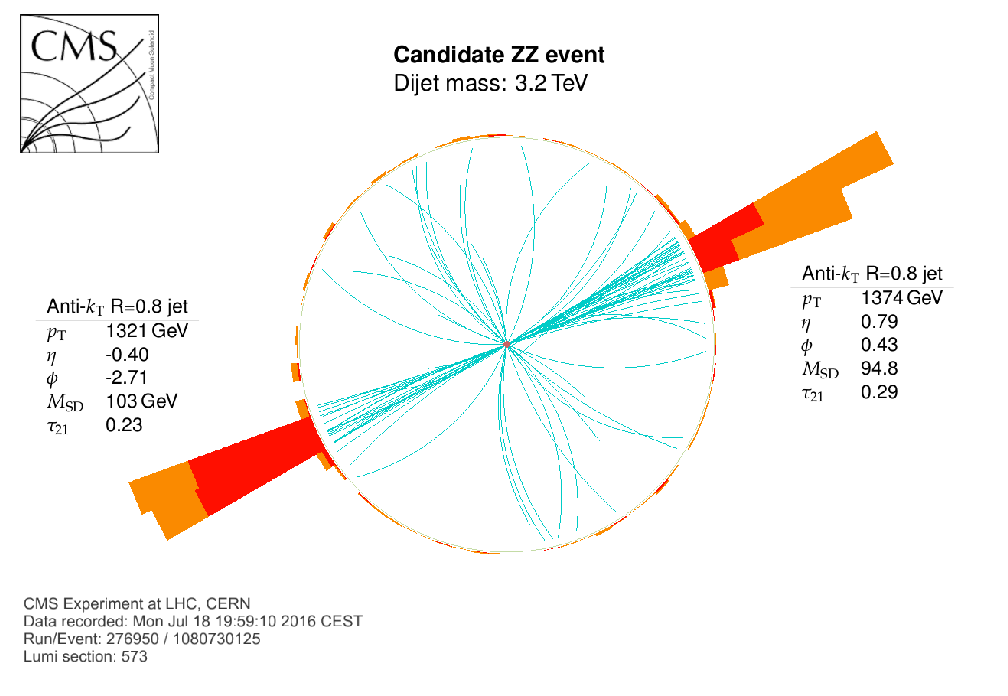
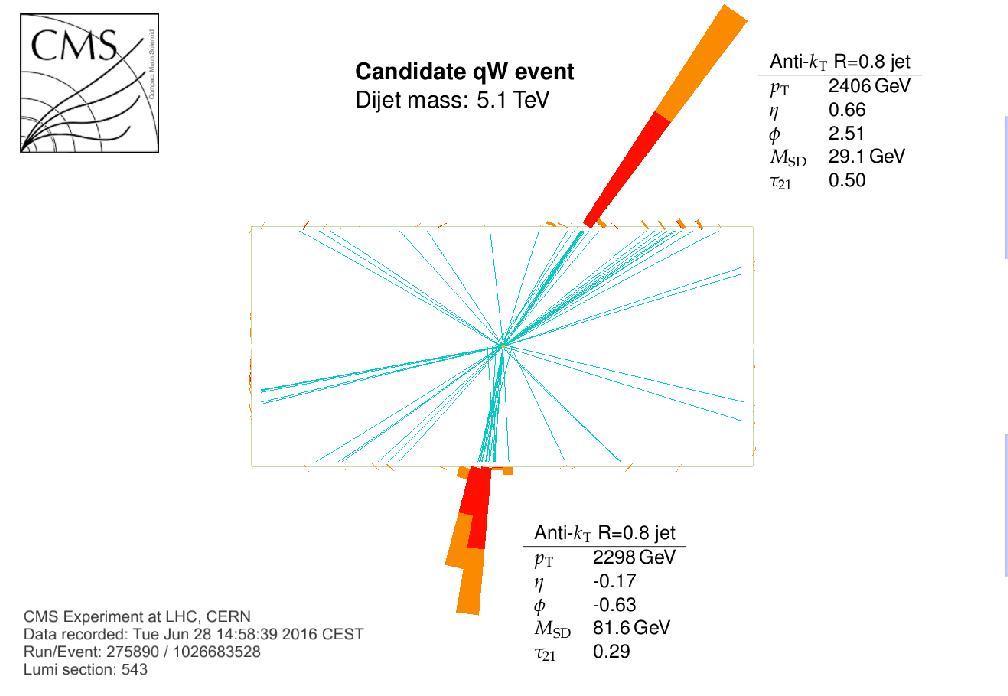
Additional Figure 2:
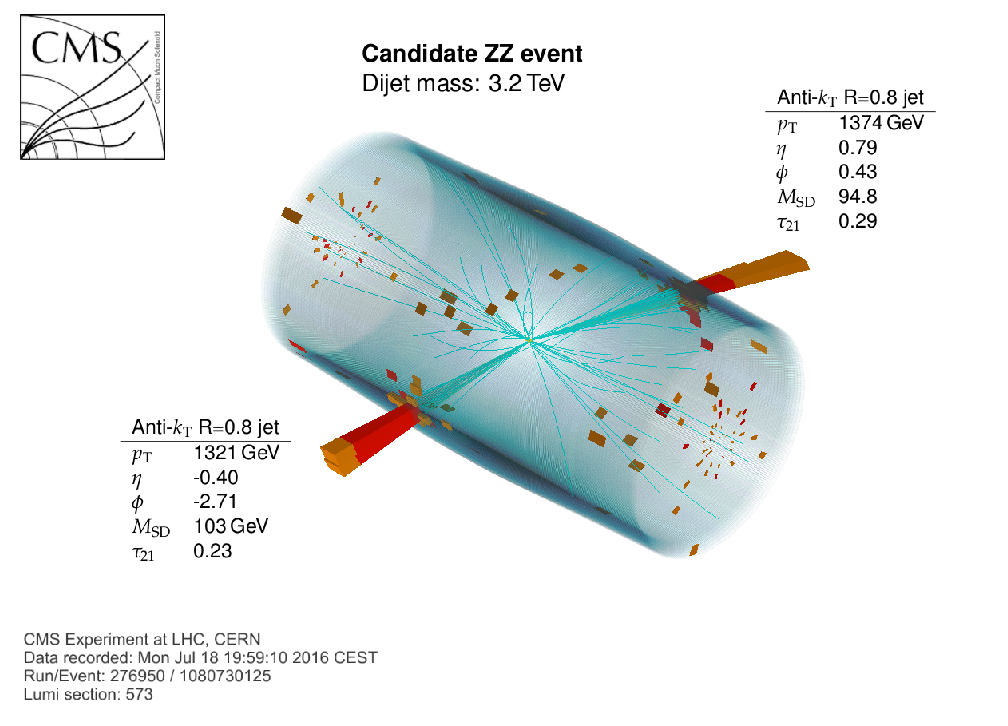
Event display for a VV candidate in the ZZ high-purity category. |
png pdf |
Additional Figure 3:
Event display for a VV candidate in the ZZ high-purity category. |
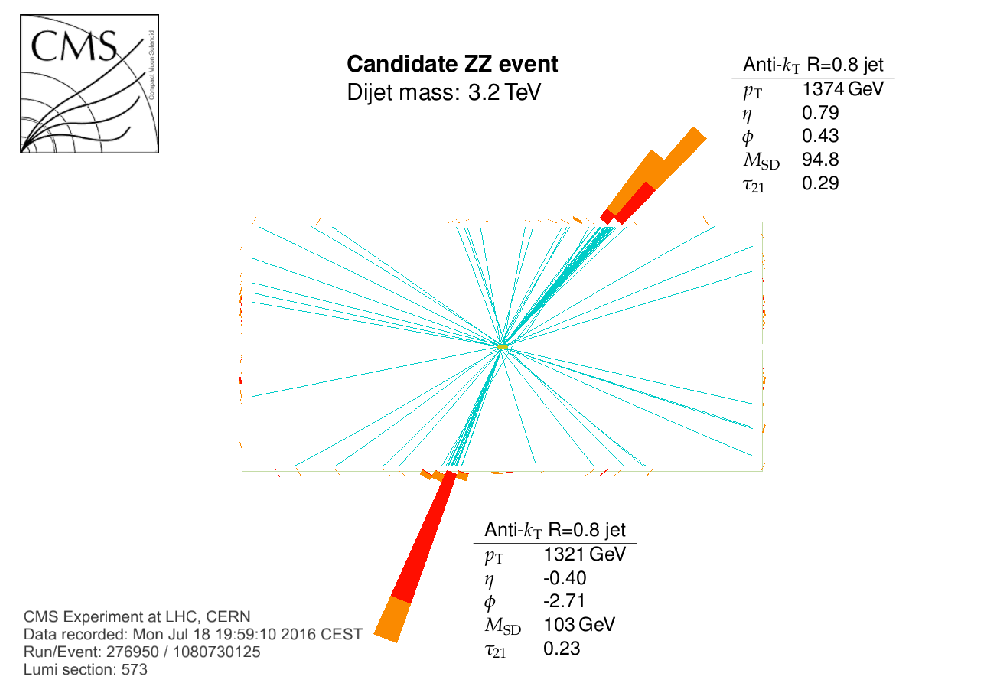
png pdf |
Additional Figure 4:
Event display for a VV candidate in the ZZ high-purity category. |
png pdf |
Additional Figure 5:
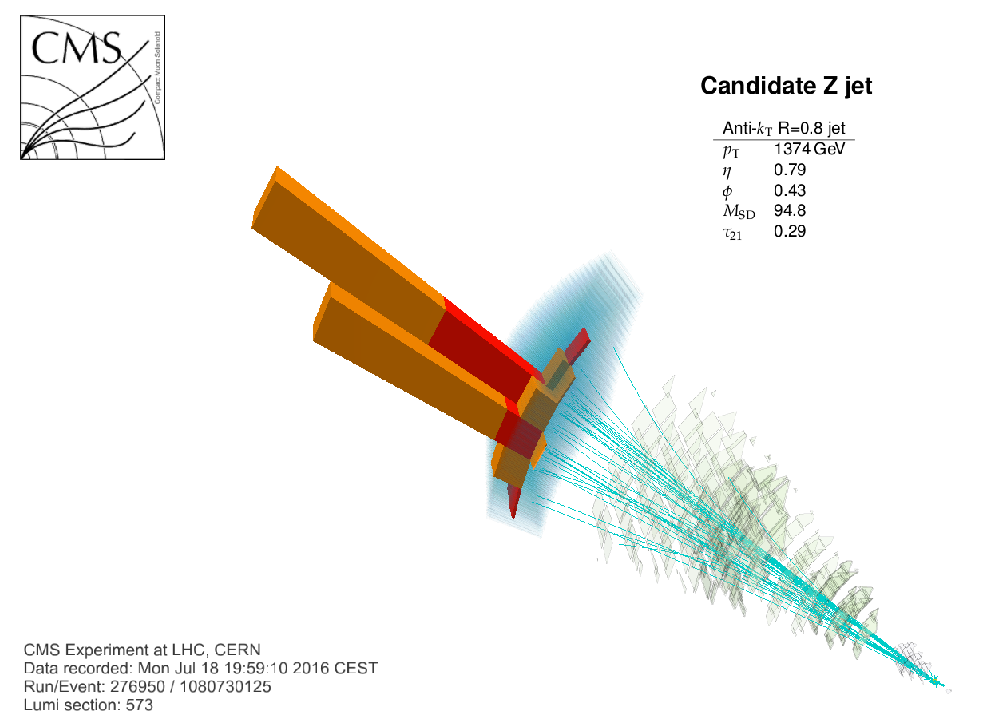
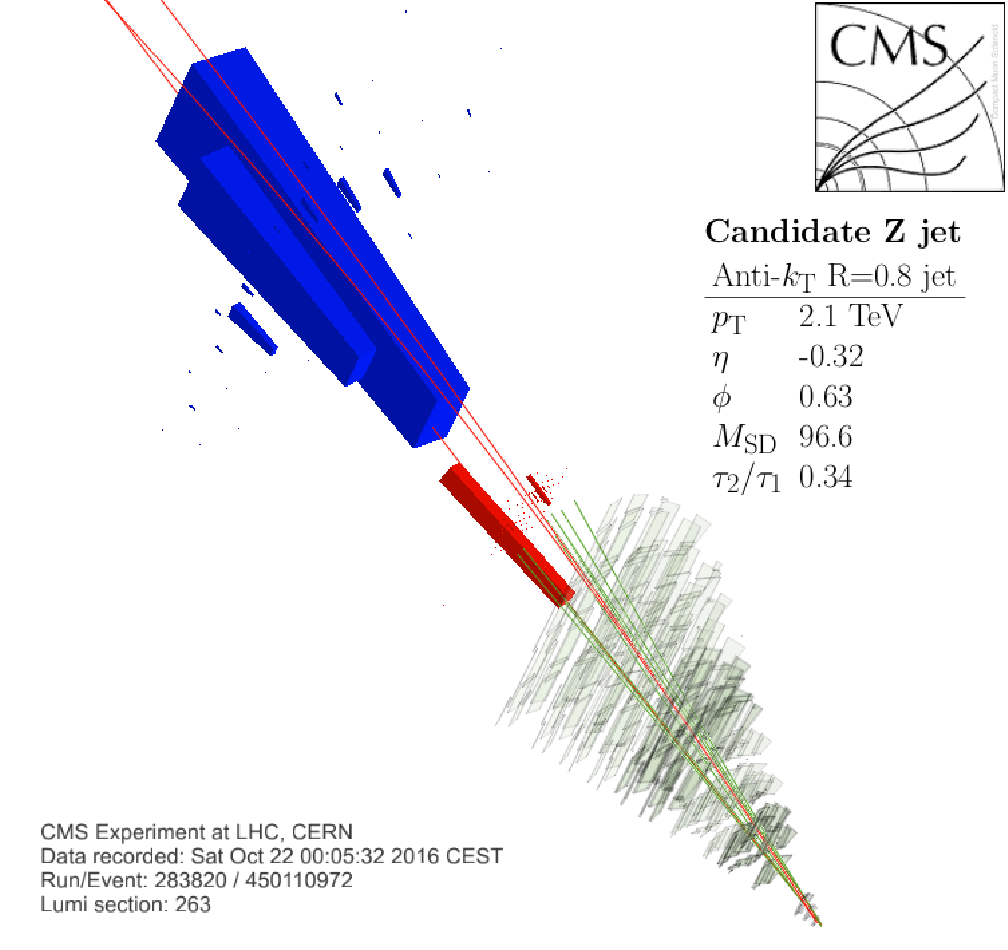
Event display for a jet from the high-purity Z category. |
png pdf |
Additional Figure 6:
Event display for a jet from the high-purity Z category. |
png pdf |
Additional Figure 7:
Event display for a VV candidate in the ZZ high-purity category. |
png pdf |
Additional Figure 8:
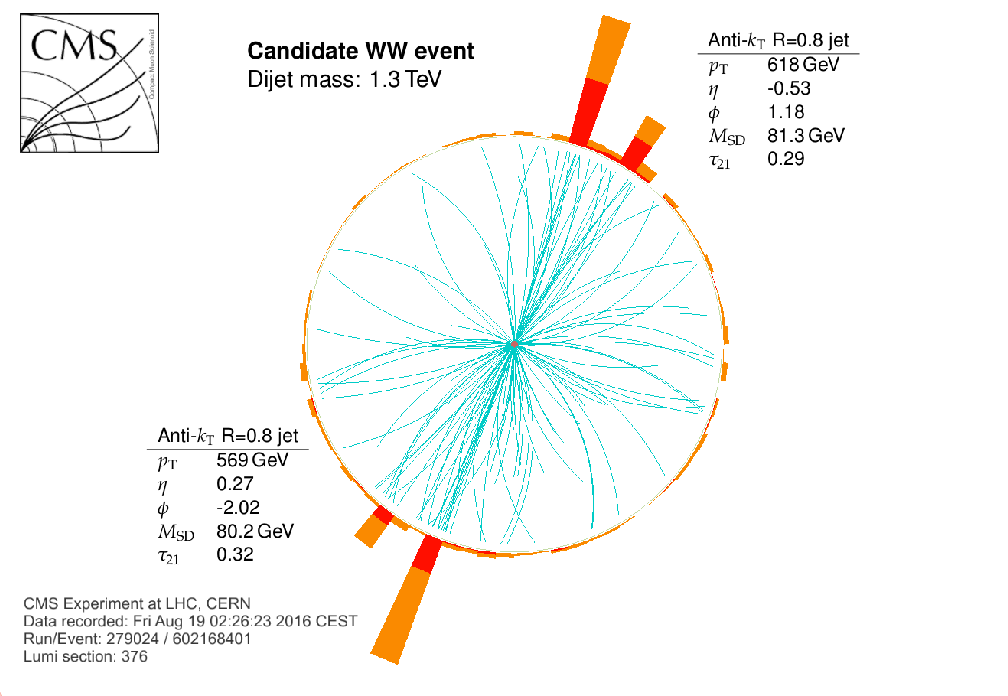
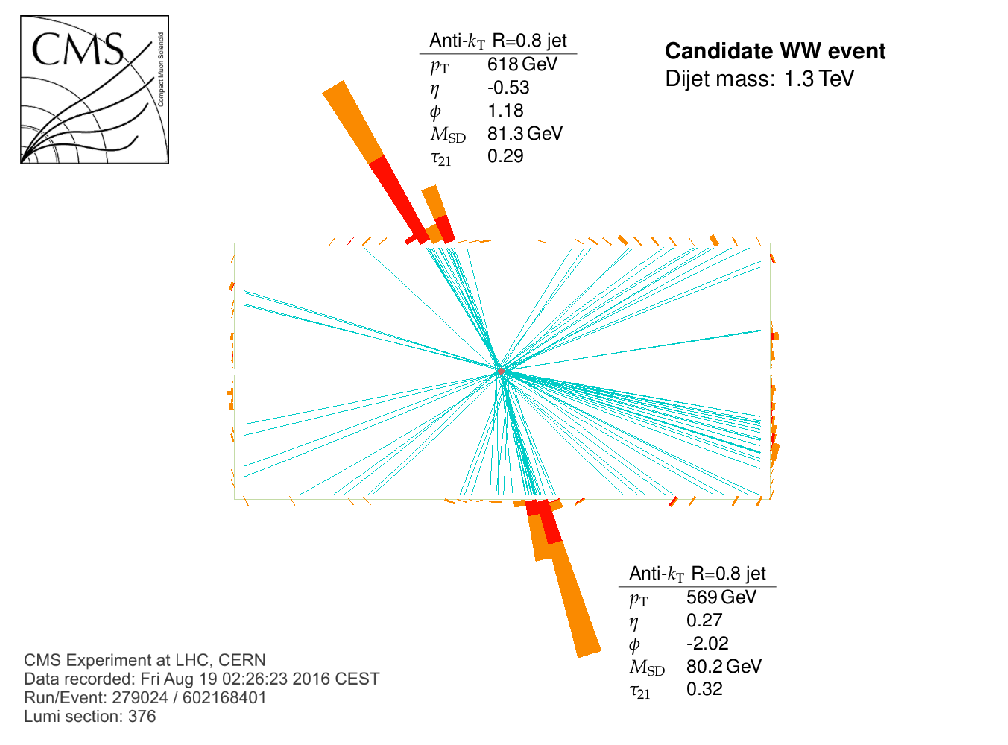
Event display for a VV candidate in the WW high-purity category. |
png pdf |
Additional Figure 9:
Event display for a VV candidate in the WW high-purity category. |
png pdf |
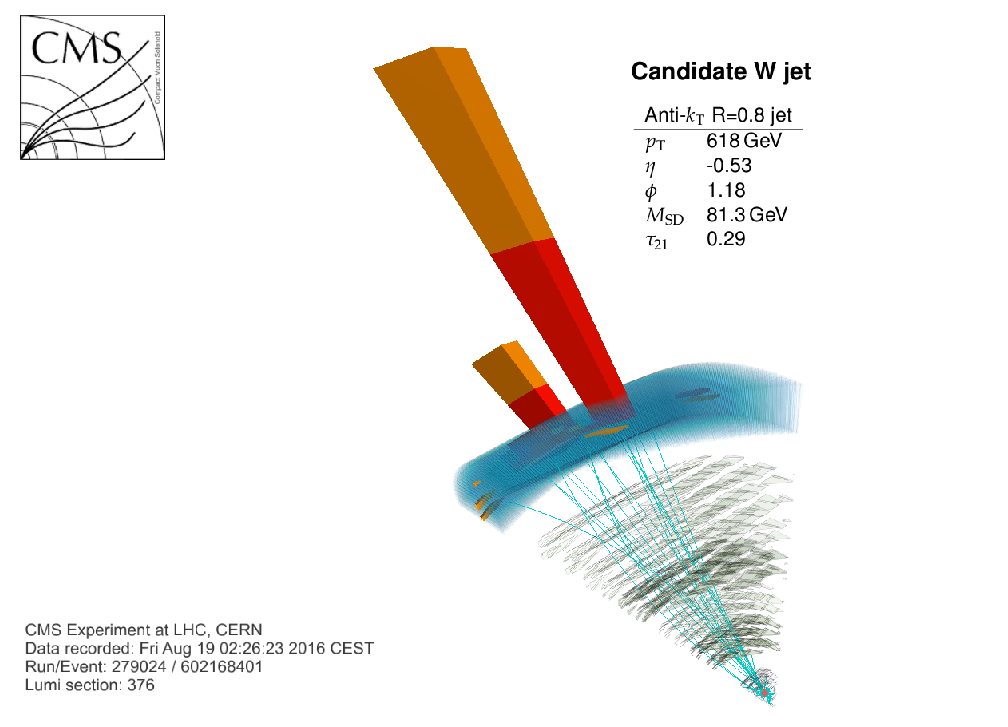
Additional Figure 10:
Event display for a jet from the high-purity W category. |

png pdf |
Additional Figure 11:
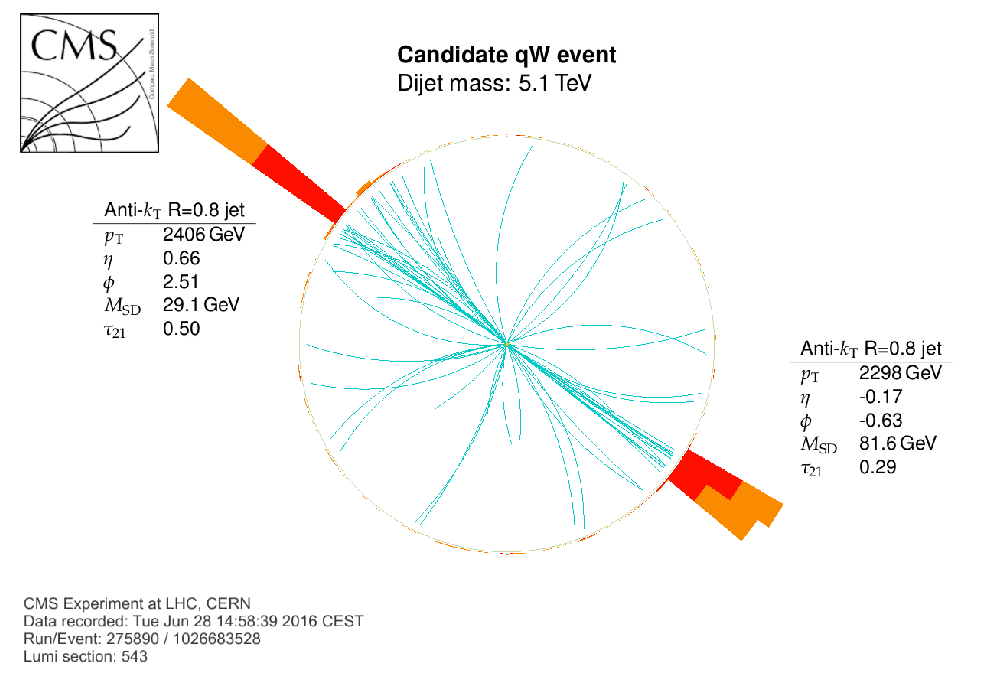
Event display for a qV candidate in the qW high-purity category. |
png pdf |
Additional Figure 12:
Event display for a qV candidate in the qW high-purity category. |
png pdf |
Additional Figure 13:
Event display for a qV candidate in the qW high-purity category. |

png pdf |
Additional Figure 14:
Tagging efficiency for a bulk graviton decaying to WW. |
png pdf |
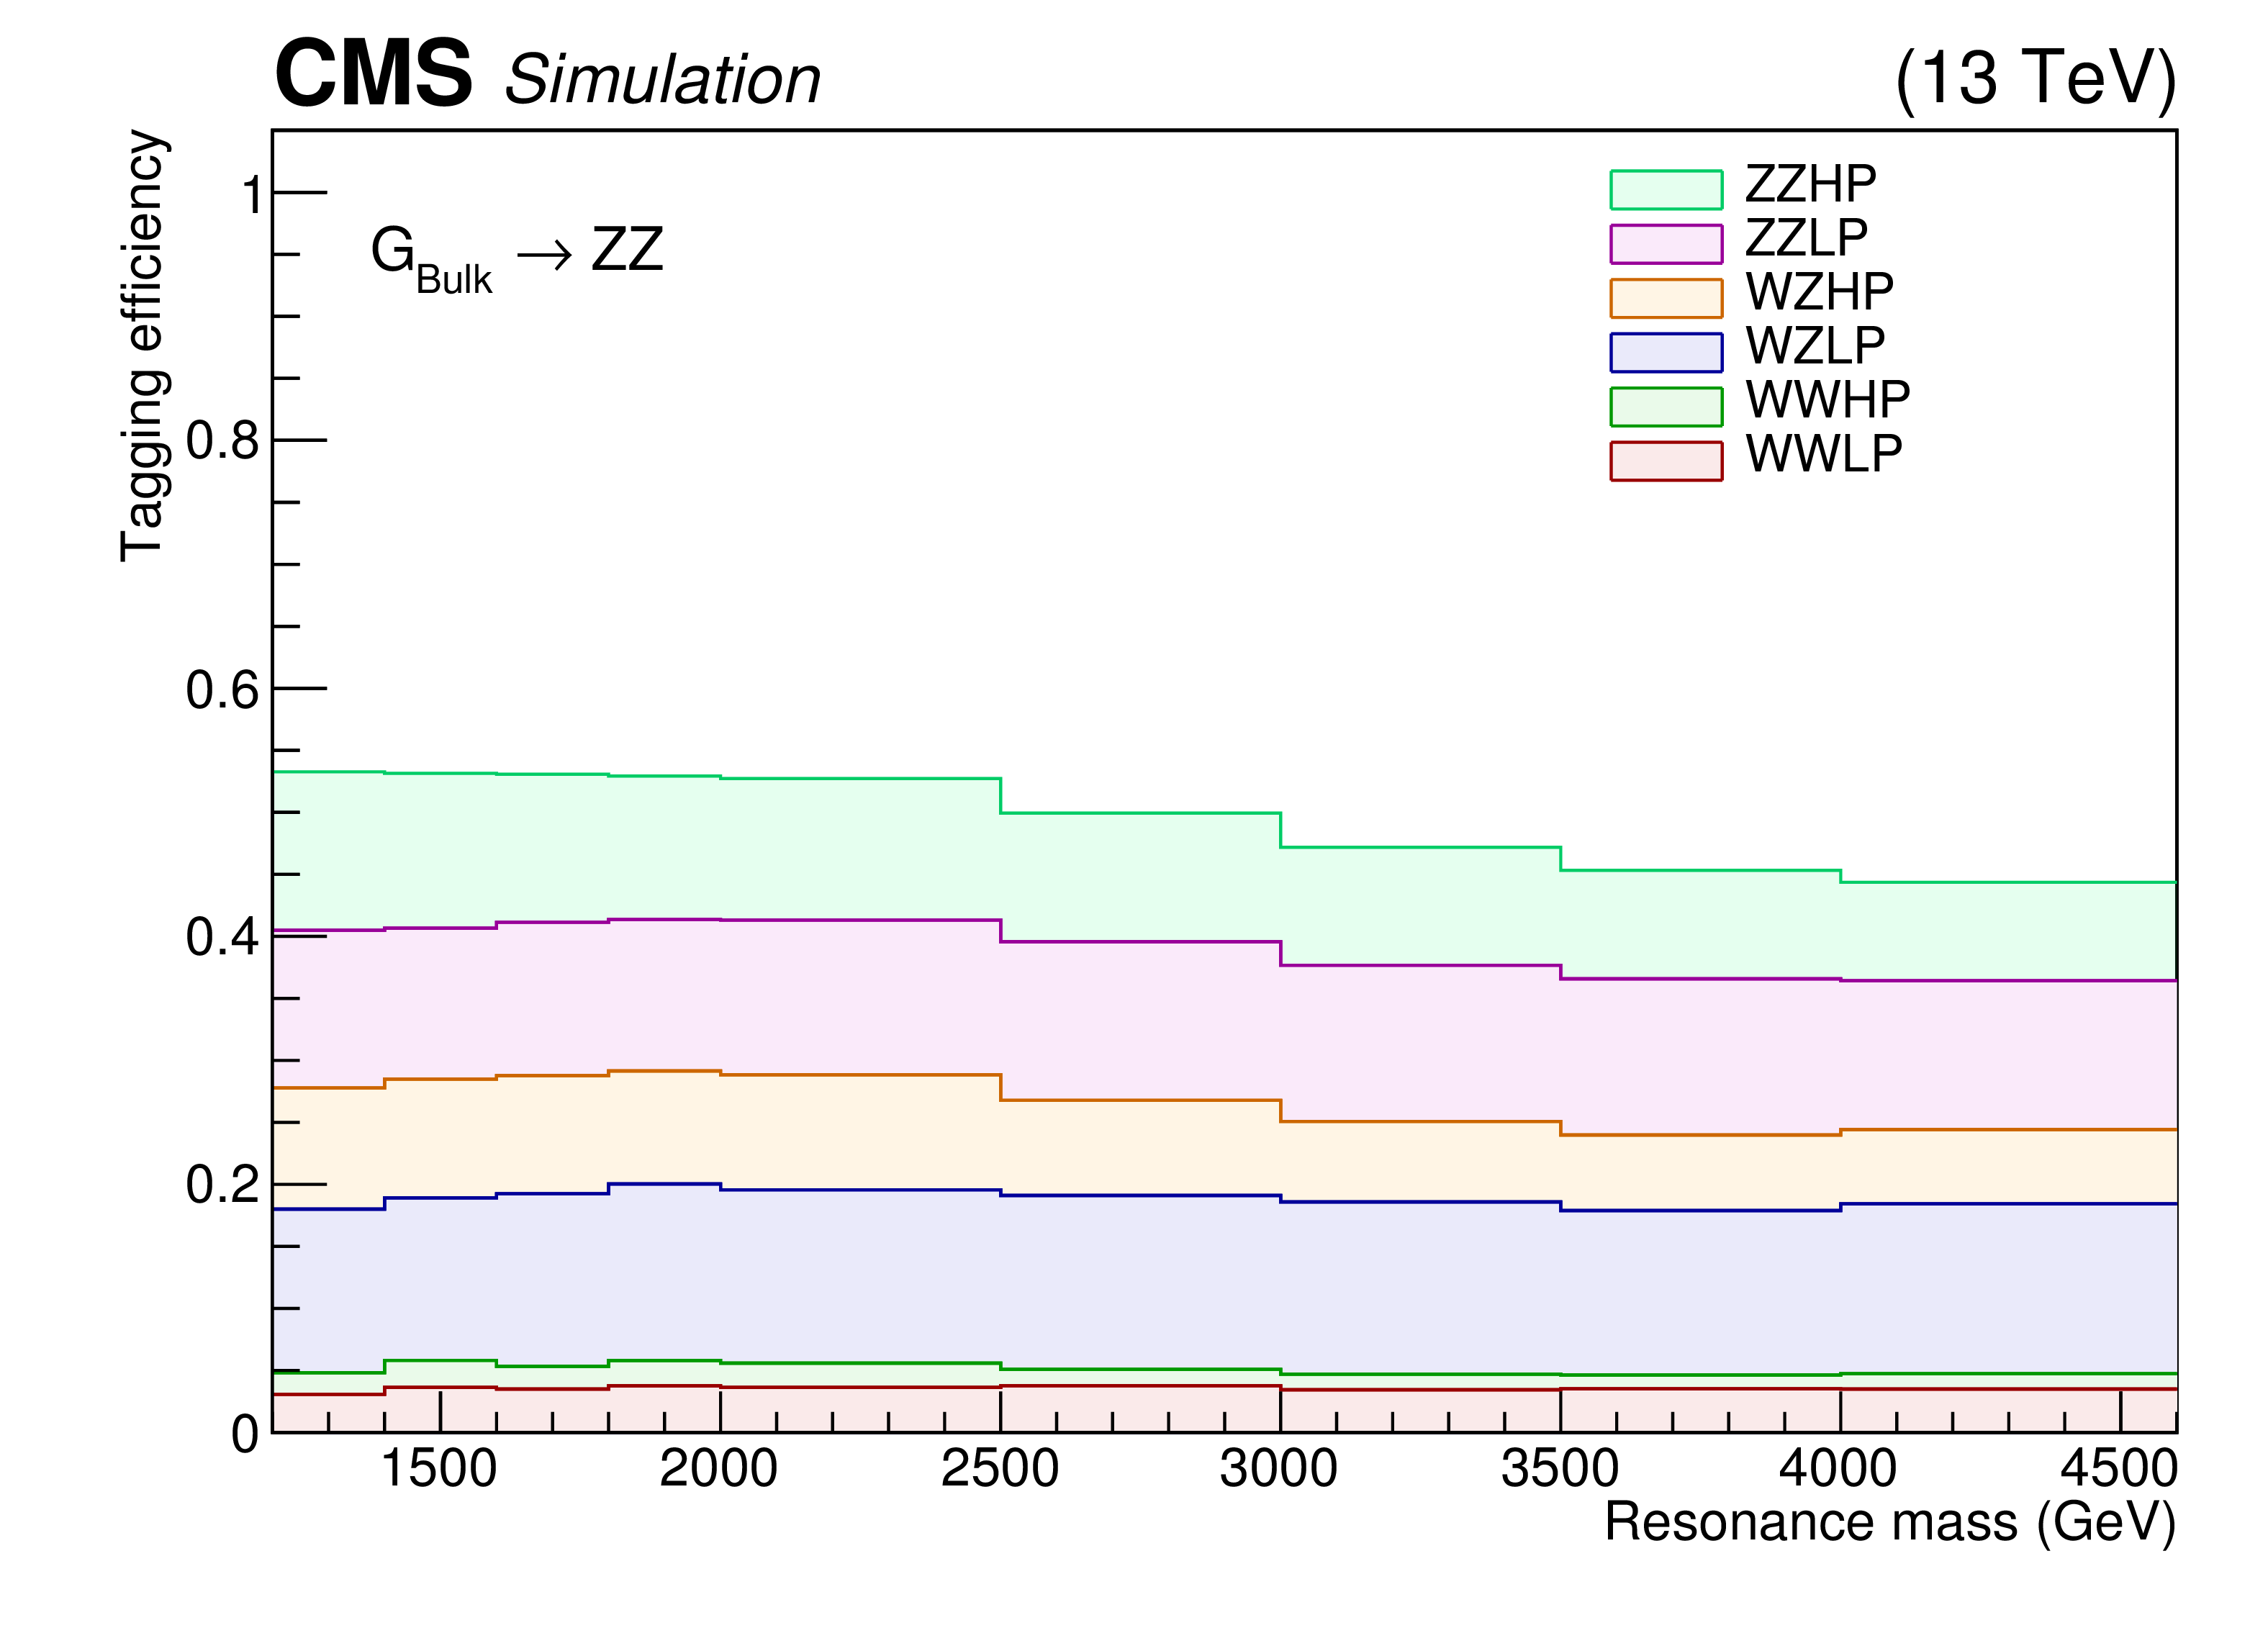
Additional Figure 15:
Tagging efficiency for a bulk graviton decaying to ZZ. |
png pdf |
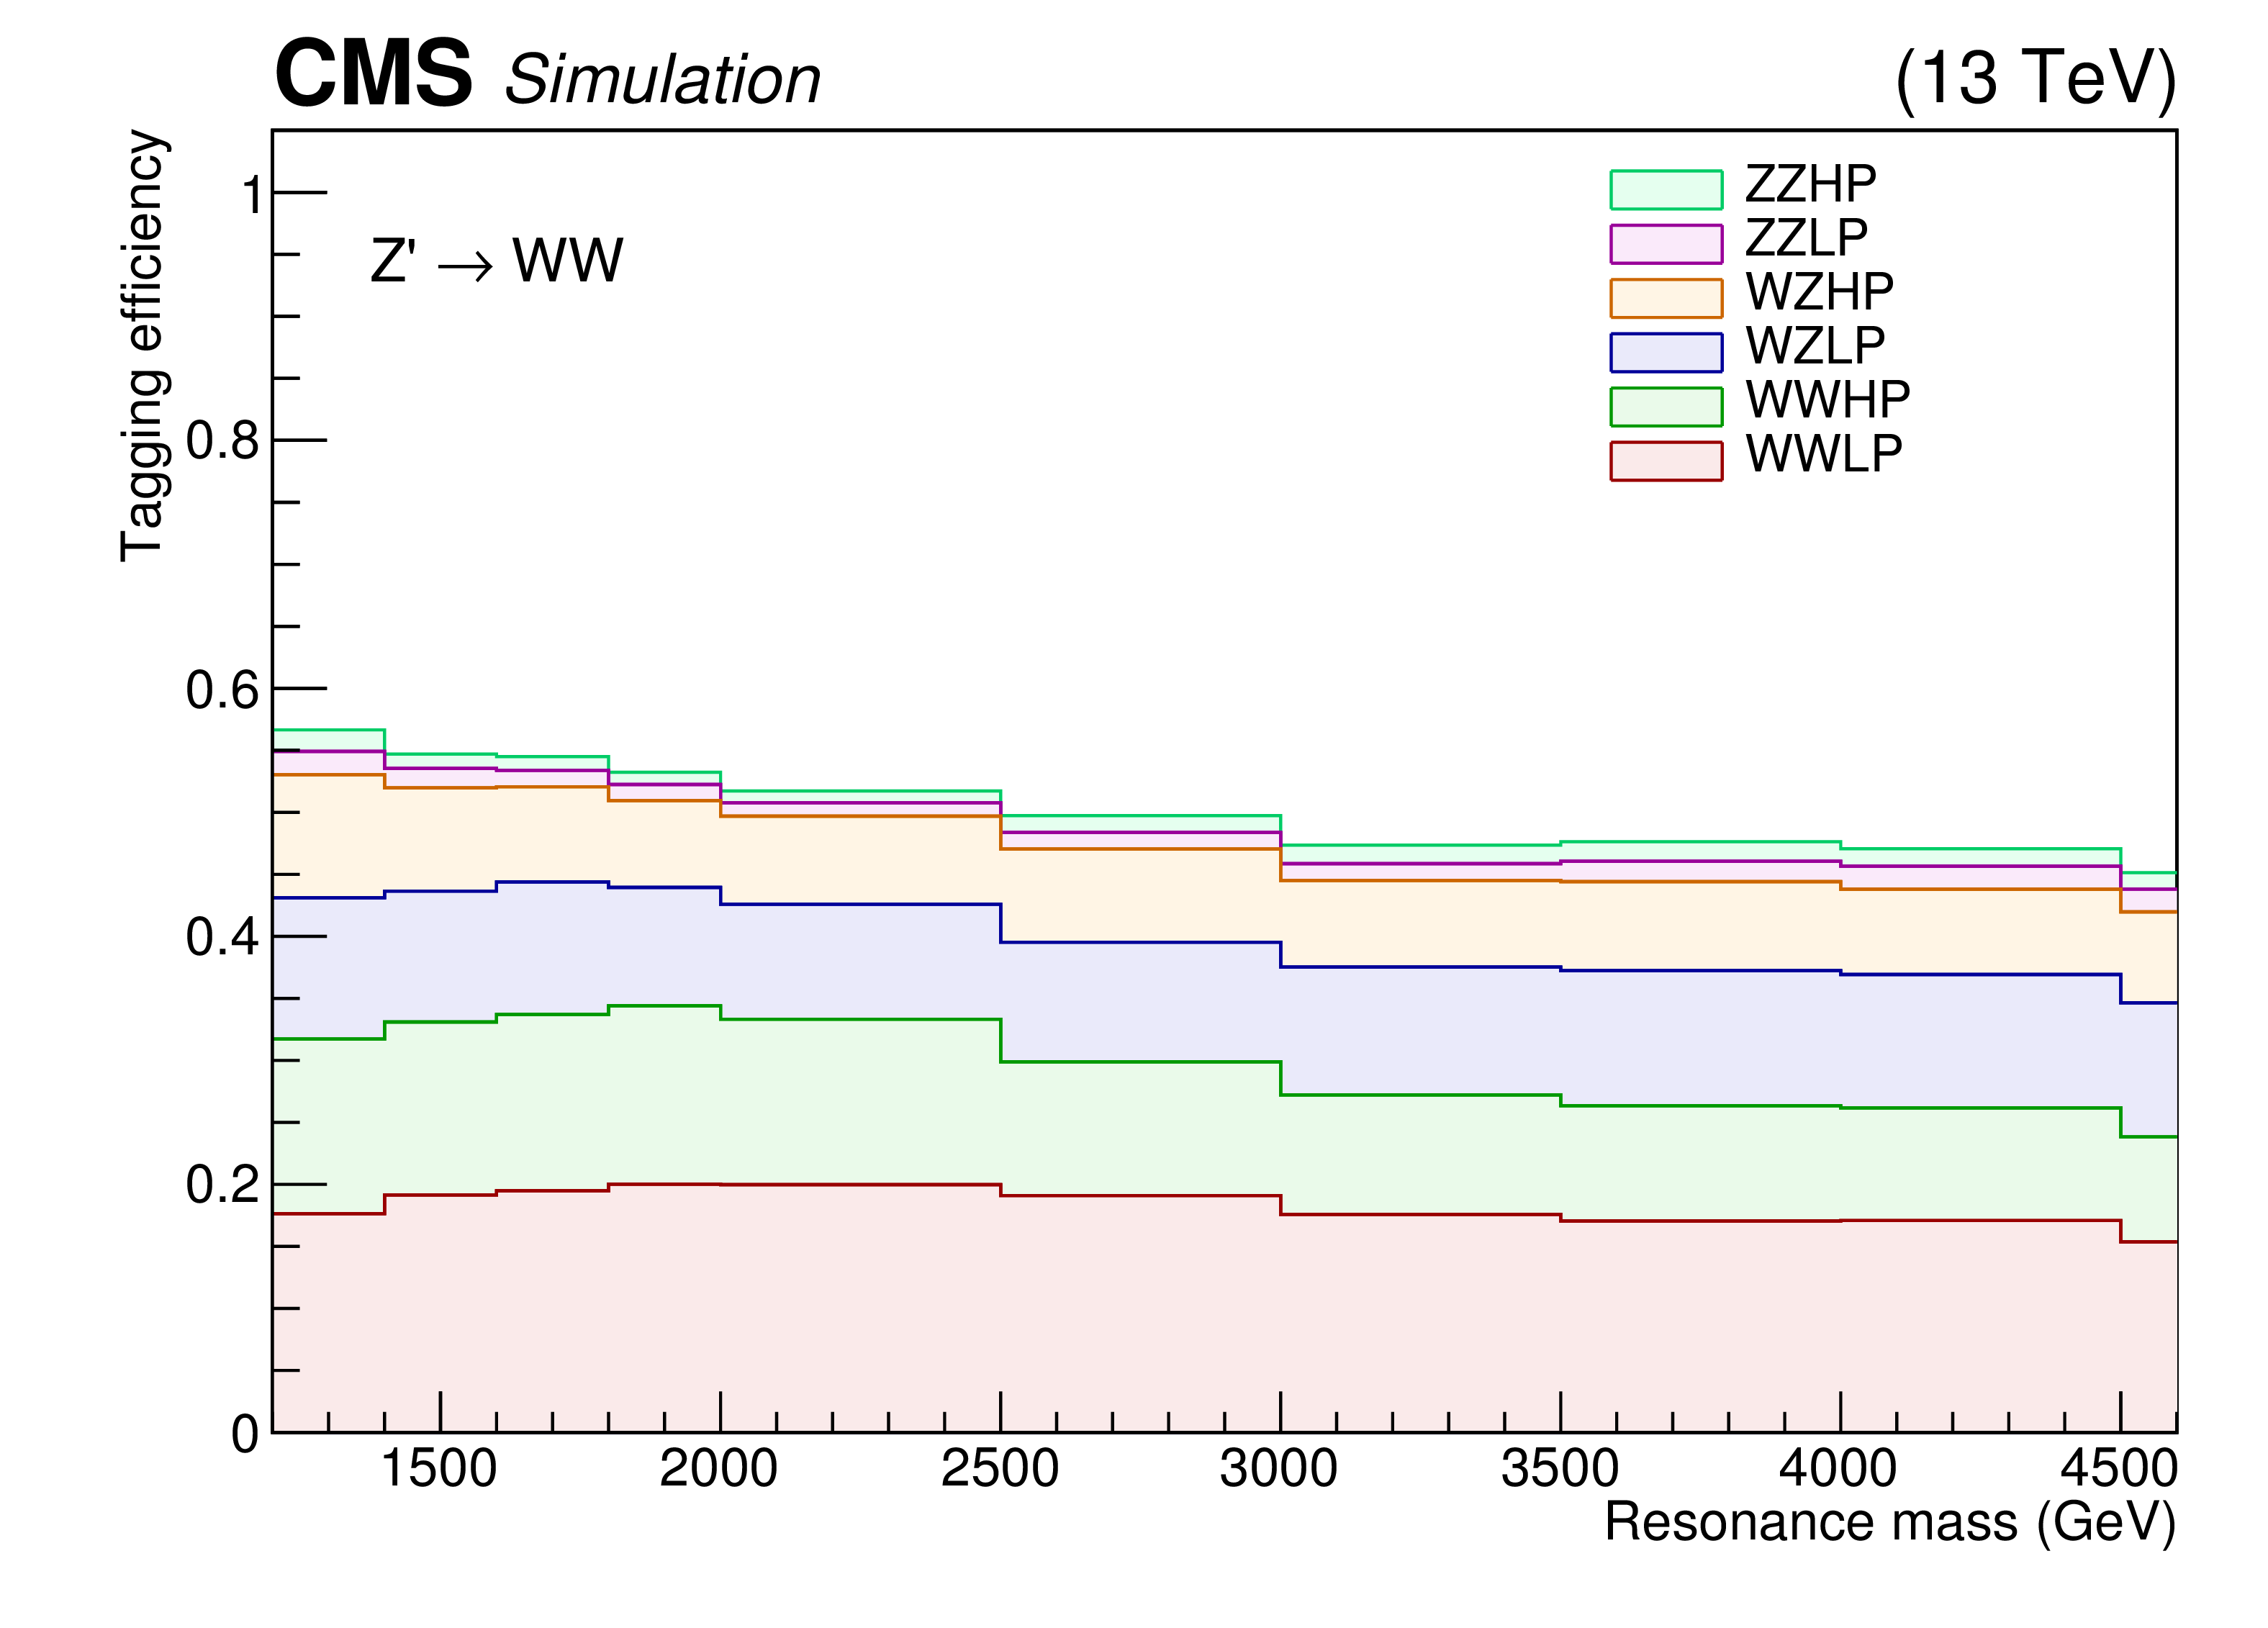
Additional Figure 16:
Tagging efficiency for $\mathrm{ Z' \rightarrow WW }$. |
png pdf |
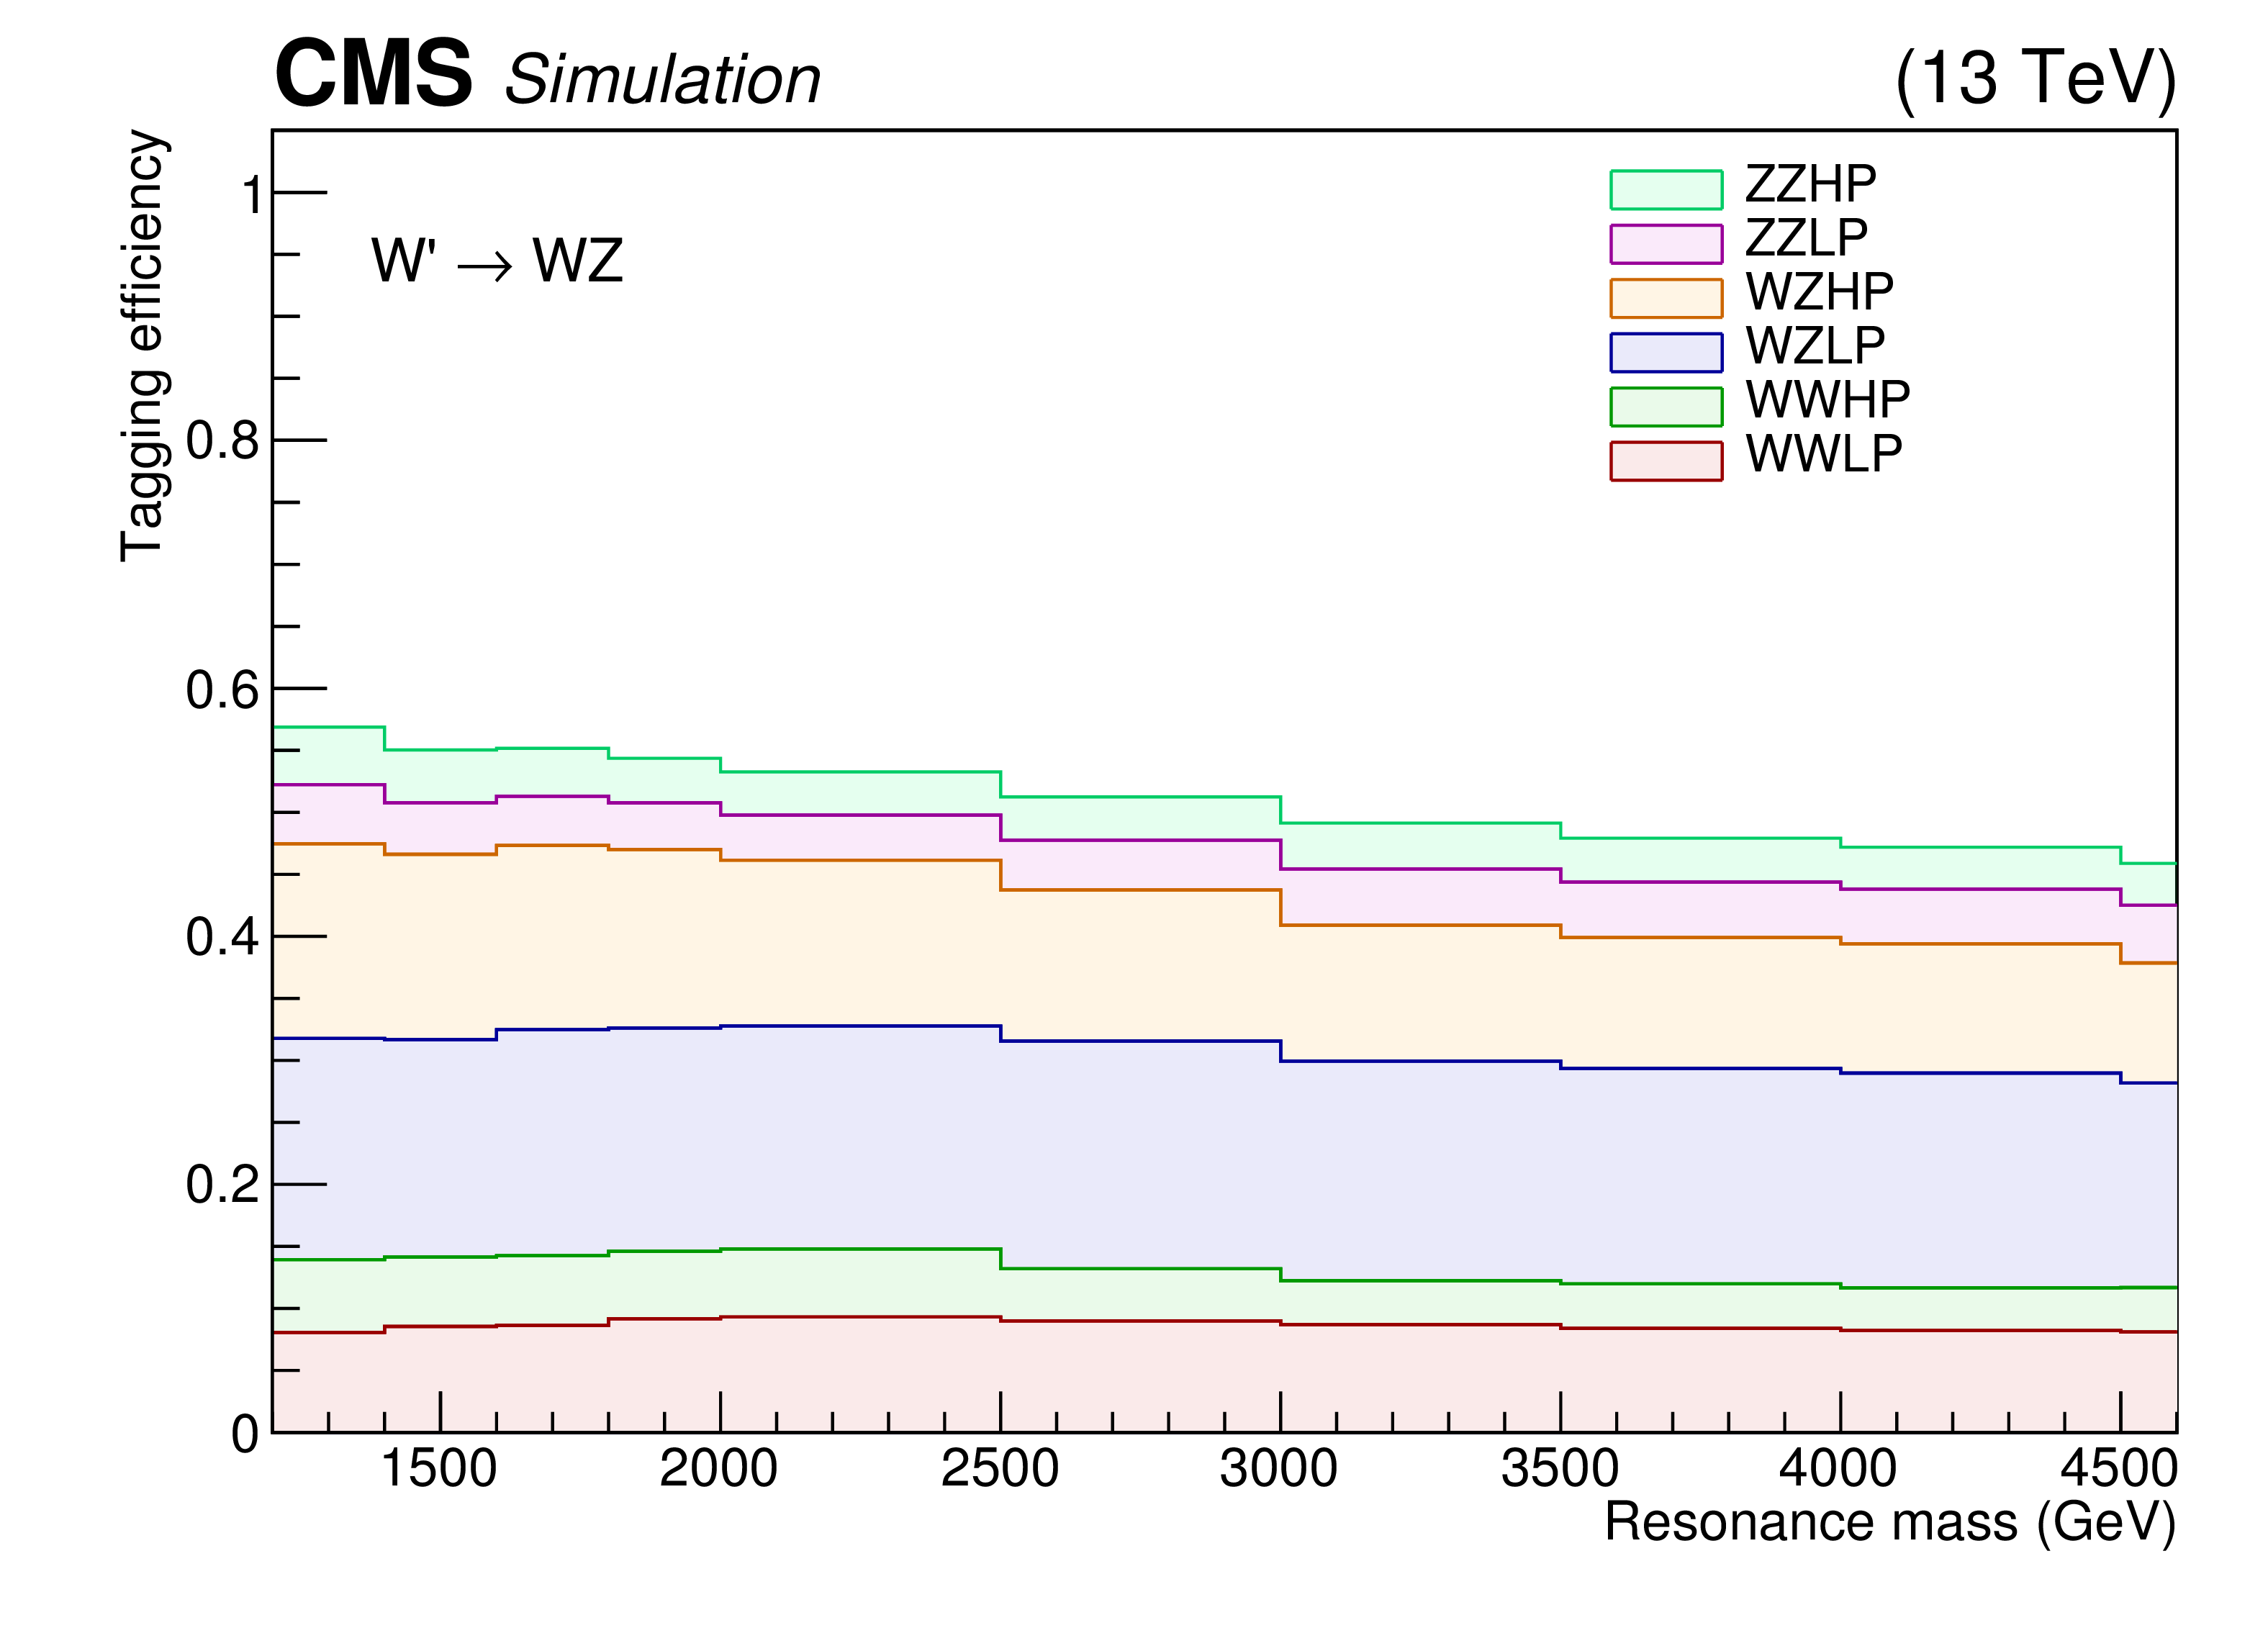
Additional Figure 17:
Tagging efficiency for $\mathrm{ W' \rightarrow WZ }$. |
png pdf |
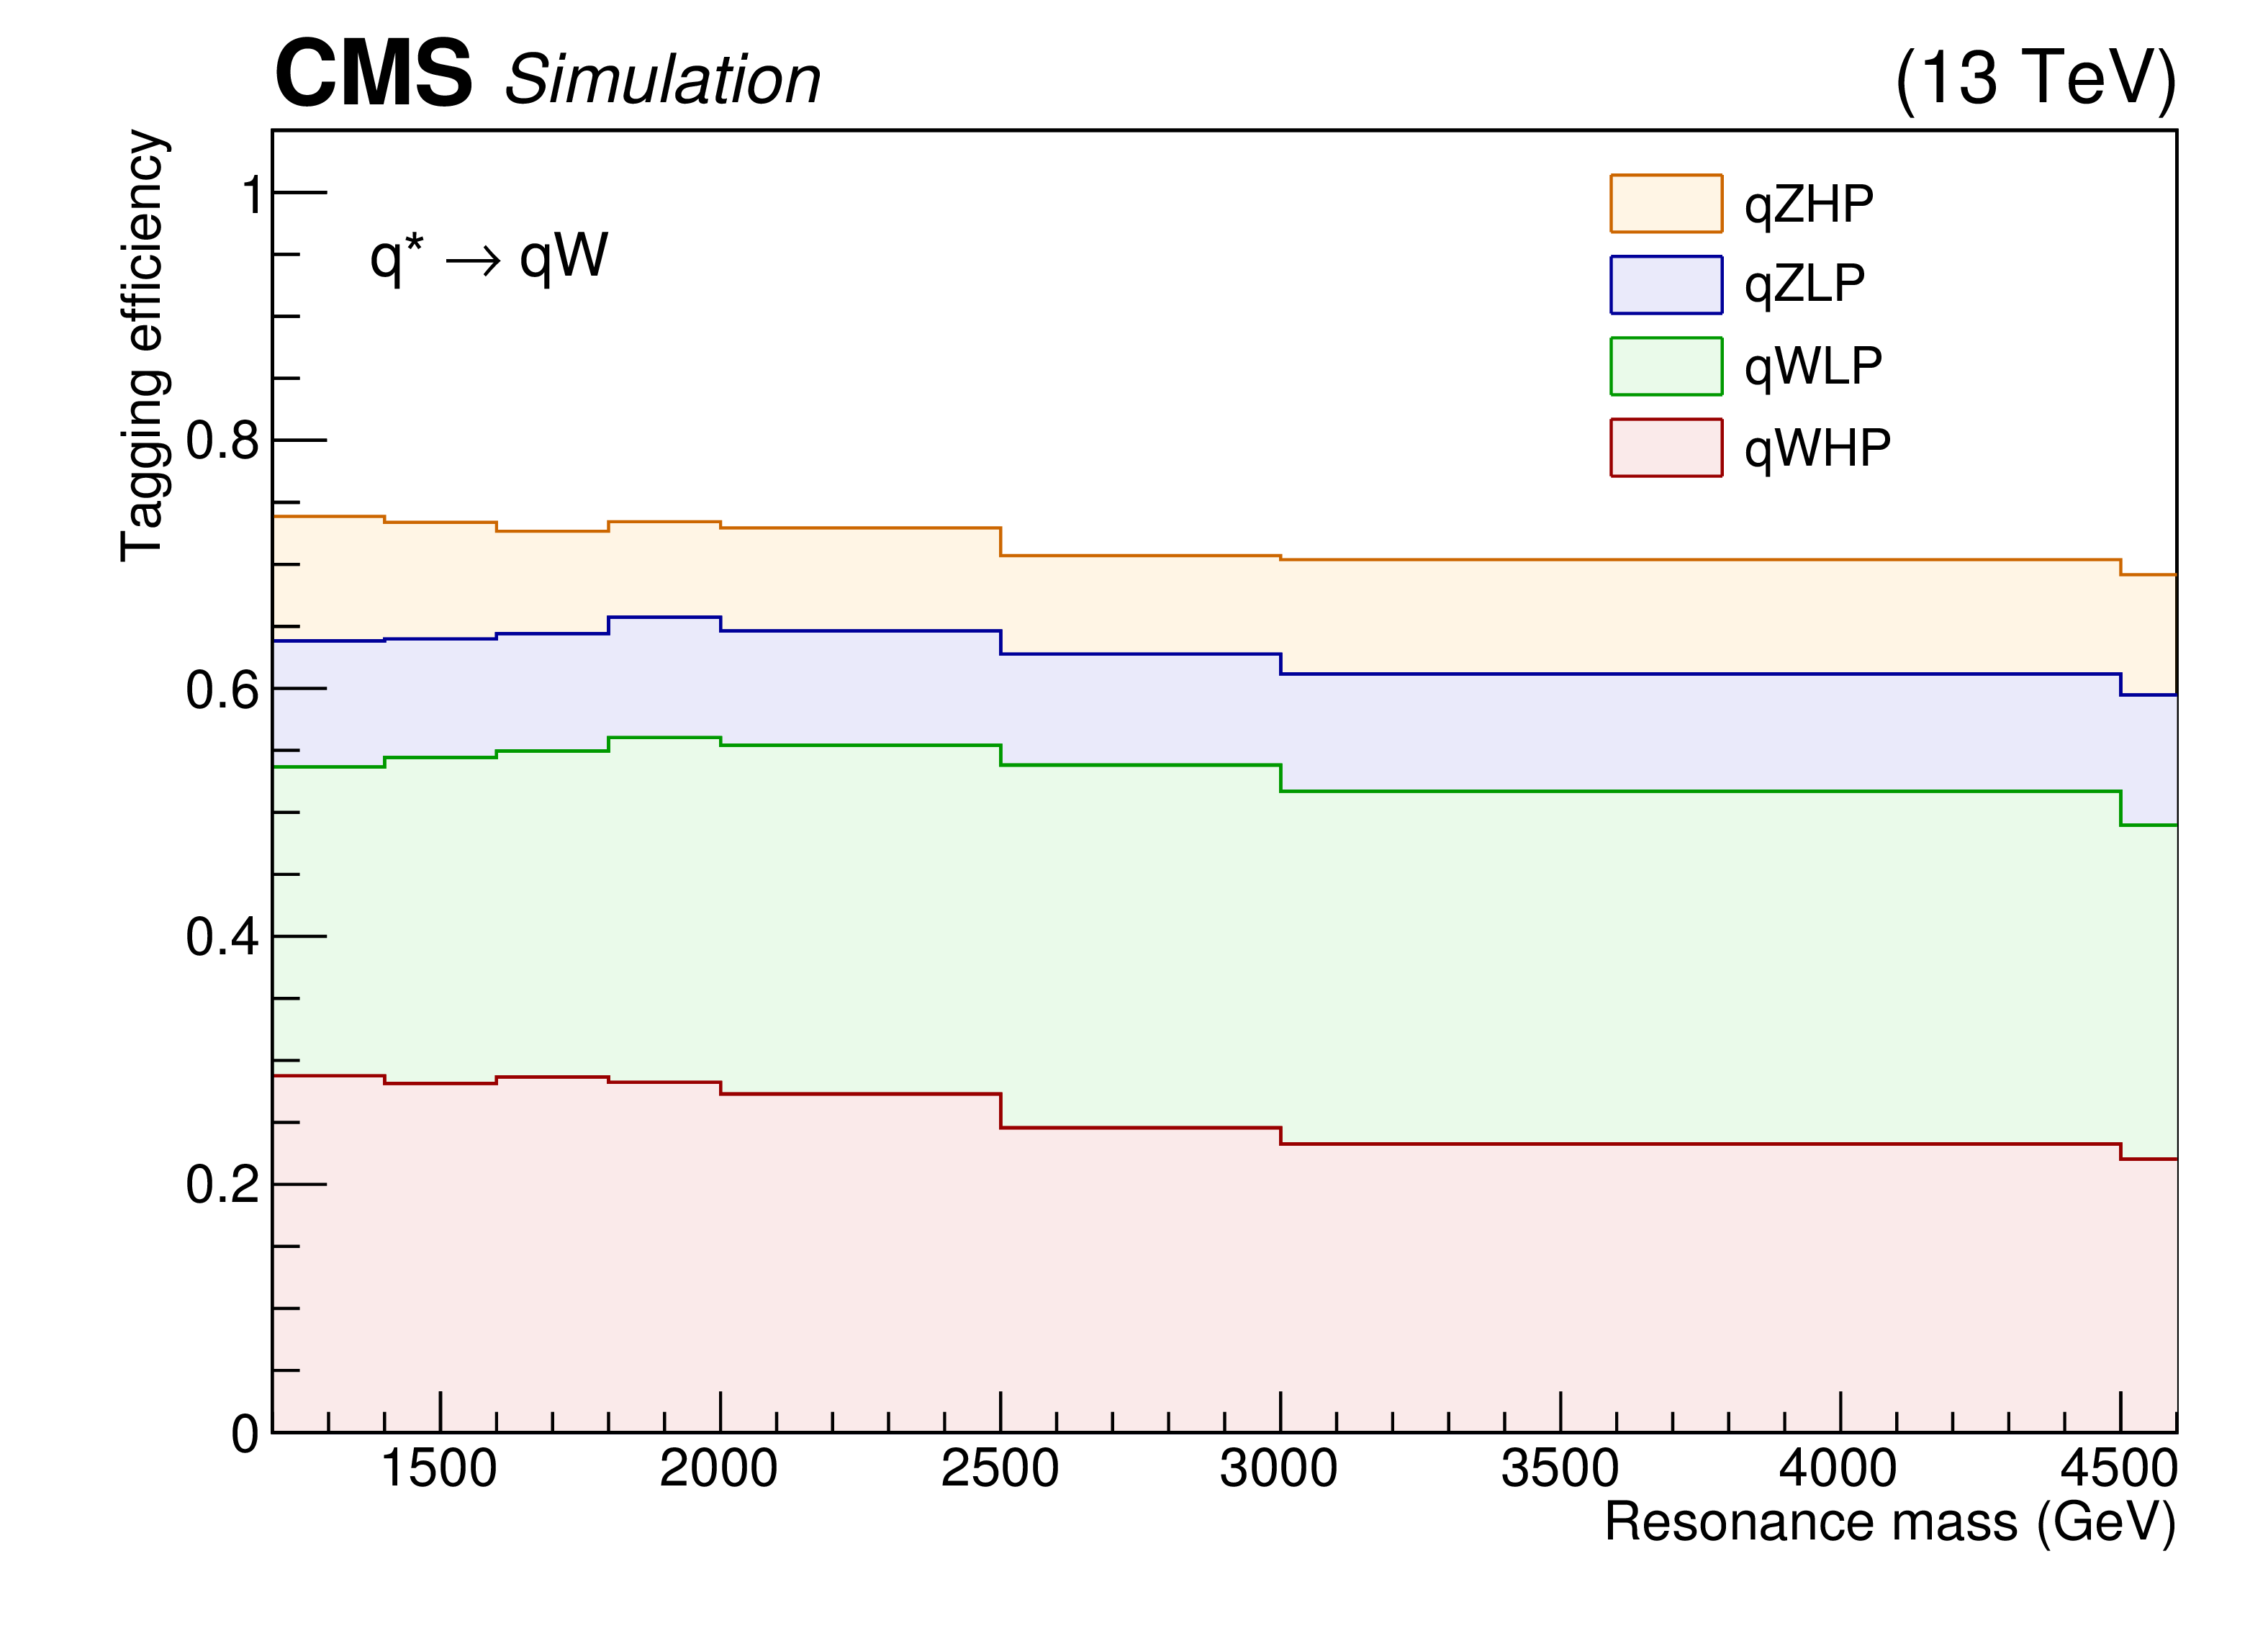
Additional Figure 18:
Tagging efficiency for $\mathrm{ q{^*} \rightarrow qW }$. |
| References | ||||
| 1 | CMS Collaboration | Search for massive resonances in dijet systems containing jets tagged as W or Z boson decays in pp collisions at $ \sqrt{s} = $ 8 TeV | JHEP 08 (2014) 173 | CMS-EXO-12-024 1405.1994 |
| 2 | CMS Collaboration | Search for massive resonances decaying into pairs of boosted bosons in semi-leptonic final states at $ \sqrt{s} = $ 13 TeV | JHEP 08 (2014) 174 | CMS-EXO-13-009 1405.3447 |
| 3 | ATLAS Collaboration | Search for $ W\!Z $ resonances in the fully leptonic channel using pp collisions at $ \sqrt{s} = $ 8 TeV with the ATLAS detector | PLB 737 (2014) 223 | 1406.4456 |
| 4 | CMS Collaboration | Search for new resonances decaying via WZ to leptons in proton-proton collisions at $ \sqrt{s} = $ 13 TeV | PLB 740 (2015) 83 | CMS-EXO-12-025 1407.3476 |
| 5 | CMS Collaboration | Search for narrow high-mass resonances in proton-proton collisions at $ \sqrt{s} = $ 8 TeV decaying to a Z and a Higgs boson | PLB 748 (2015) 255 | CMS-EXO-13-007 1502.04994 |
| 6 | CMS Collaboration | Search for heavy resonances that decay into a vector boson and a Higgs boson in hadronic final states at $ \sqrt{s} = $ 13 TeV | Submitted to EPJC | CMS-B2G-17-002 1707.01303 |
| 7 | CMS Collaboration | Search for heavy resonances decaying into a vector boson and a Higgs boson in final states with charged leptons, neutrinos, and b quarks | PLB 768 (2017) 137 | CMS-B2G-16-003 1610.08066 |
| 8 | ATLAS Collaboration | Search for production of $ WW/W\!Z $ resonances decaying to a lepton, neutrino and jets in $ pp $ collisions at $ \sqrt{s} = $ 8 TeV with the ATLAS detector | EPJC 75 (2015) 209 | 1503.04677 |
| 9 | ATLAS Collaboration | Search for a new resonance decaying to a $ W $ or $ Z $ boson and a Higgs boson in the $ \ell \ell / \ell \nu / \nu \nu + b \bar{b} $ final states with the ATLAS detector | EPJC 75 (2015) 263 | 1503.08089 |
| 10 | ATLAS Collaboration | Search for high-mass diboson resonances with boson-tagged jets in proton-proton collisions at $ \sqrt{s} = $ 8 TeV with the ATLAS detector | JHEP 12 (2015) 055 | 1506.00962 |
| 11 | CMS Collaboration | Search for a massive resonance decaying into a Higgs boson and a W or Z boson in hadronic final states in proton-proton collisions at $ \sqrt{s} = $ 8 TeV | JHEP 02 (2016) 145 | CMS-EXO-14-009 1506.01443 |
| 12 | F. Dias et al. | Combination of Run-1 exotic searches in diboson final states at the LHC | JHEP 04 (2016) 155 | 1512.03371 |
| 13 | CMS Collaboration | Search for massive WH resonances decaying into the $ \ell \nu \mathrm{b} \overline{\mathrm{b}} $ final state at $ \sqrt{s} = $ 8 TeV | EPJC 76 (2016) 237 | CMS-EXO-14-010 1601.06431 |
| 14 | CMS Collaboration | Search for heavy resonances decaying to two Higgs bosons in final states containing four b quarks | EPJC 76 (2016) 371 | CMS-EXO-12-053 1602.08762 |
| 15 | ATLAS Collaboration | Searches for heavy diboson resonances in $ pp $ collisions at $ \sqrt{s} = $ 13 TeV with the ATLAS detector | JHEP 09 (2016) 173 | 1606.04833 |
| 16 | CMS Collaboration | Search for massive resonances decaying into WW, WZ or ZZ bosons in proton-proton collisions at $ \sqrt{s} = $ 13 TeV | JHEP 03 (2017) 162 | CMS-B2G-16-004 1612.09159 |
| 17 | ATLAS Collaboration | Search for new resonances decaying to a $ W $ or $ Z $ boson and a Higgs boson in the $ \ell^+ \ell^- b\bar b $, $ \ell \nu b\bar b $, and $ \nu\bar{\nu} b\bar b $ channels with $ pp $ collisions at $ \sqrt{s} = $ 13 TeV with the ATLAS detector | PLB 765 (2017) 32 | 1607.05621 |
| 18 | U. Baur, I. Hinchliffe, and D. Zeppenfeld | Excited quark production at hadron colliders | Int. J. Mod. Phys. A 2 (1987) 1285 | |
| 19 | U. Baur, M. Spira, and P. M. Zerwas | Excited-quark and -lepton production at hadron colliders | PRD 42 (1990) 815 | |
| 20 | CMS Collaboration | Search for narrow resonances using the dijet mass spectrum in pp collisions at $ \sqrt{s} = $ 8 TeV | PRD 87 (2013) 114015 | CMS-EXO-12-016 1302.4794 |
| 21 | ATLAS Collaboration | ATLAS search for new phenomena in dijet mass and angular distributions using $ pp $ collisions at $ \sqrt{s} = $ 7 TeV | JHEP 01 (2013) 029 | 1210.1718 |
| 22 | CMS Collaboration | Search for dijet resonances in proton-proton collisions at $ \sqrt{s} = $ 13 TeV and constraints on dark matter and other models | PLB 769 (2017) 520 | CMS-EXO-16-032 1611.03568 |
| 23 | R. M. Harris and K. Kousouris | Searches for dijet resonances at hadron colliders | Int. J. Mod. Phys. A 26 (2011) 5005 | 1110.5302 |
| 24 | ATLAS Collaboration | Search for new phenomena in photon+jet events collected in proton-proton collisions at $ \sqrt{s} = $ 8 TeV with the ATLAS detector | PLB 728 (2014) 562 | 1309.3230 |
| 25 | ATLAS Collaboration | Search for new phenomena with photon+jet events in proton-proton collisions at $ \sqrt{s} = $ 13 TeV with the ATLAS detector | JHEP 03 (2016) 041 | 1512.05910 |
| 26 | CMS Collaboration | Search for excited quarks in the $ \gamma {+} \text{jet} $ final state in proton-proton collisions at $ \sqrt{s} = $ 8 TeV | PLB 738 (2014) 274 | CMS-EXO-13-003 1406.5171 |
| 27 | CMS Collaboration | Search for heavy resonances in the W/Z-tagged dijet mass spectrum in pp collisions at 7 TeV | PLB 723 (2013) 280 | CMS-EXO-11-095 1212.1910 |
| 28 | CMS Collaboration | Search for anomalous production of highly boosted Z bosons decaying to $ \mu^+ \mu^- $ in proton-proton collisions at $ \sqrt{s} = $ 7 TeV | PLB 722 (2013) 28 | CMS-EXO-11-025 1210.0867 |
| 29 | CMS Collaboration | Identification techniques for highly boosted W bosons that decay into hadrons | JHEP 12 (2014) 017 | CMS-JME-13-006 1410.4227 |
| 30 | CMS Collaboration | V tagging observables and correlations | CMS-PAS-JME-14-002 | CMS-PAS-JME-14-002 |
| 31 | CMS Collaboration | Jet algorithms performance in 13 TeV data | CMS-PAS-JME-16-003 | CMS-PAS-JME-16-003 |
| 32 | CMS Collaboration | Particle-flow reconstruction and global event description with the CMS detector | Submitted to JINST | CMS-PRF-14-001 1706.04965 |
| 33 | CMS Collaboration | The CMS experiment at the CERN LHC | JINST 3 (2008) S08004 | CMS-00-001 |
| 34 | K. Agashe, H. Davoudiasl, G. Perez, and A. Soni | Warped gravitons at the CERN LHC and beyond | PRD 76 (2007) 036006 | hep-ph/0701186 |
| 35 | A. L. Fitzpatrick, J. Kaplan, L. Randall, and L.-T. Wang | Searching for the Kaluza-Klein graviton in bulk RS models | JHEP 09 (2007) 013 | hep-ph/0701150 |
| 36 | O. Antipin, D. Atwood, and A. Soni | Search for RS gravitons via W(L)W(L) decays | PLB 666 (2008) 155 | 0711.3175 |
| 37 | L. Randall and R. Sundrum | Large Mass Hierarchy from a Small Extra Dimension | PRL 83 (1999) 3370 | hep-ph/9905221 |
| 38 | L. Randall and R. Sundrum | An Alternative to Compactification | PRL 83 (1999) 4690 | hep-th/9906064 |
| 39 | D. Pappadopulo, A. Thamm, R. Torre, and A. Wulzer | Heavy vector triplets: bridging theory and data | JHEP 09 (2014) 060 | 1402.4431 |
| 40 | C. Grojean, E. Salvioni, and R. Torre | A weakly constrained W' at the early LHC | JHEP 07 (2011) 002 | 1103.2761 |
| 41 | E. Salvioni, G. Villadoro, and F. Zwirner | Minimal Z' models: present bounds and early LHC reach | JHEP 11 (2009) 068 | 0909.1320 |
| 42 | A. Carvalho | Gravity particles from Warped Extra Dimensions, predictions for LHC | 1404.0102 | |
| 43 | B. Bellazzini, C. Csaki, and J. Serra | Composite Higgses | EPJC 74 (2014) 2766 | 1401.2457 |
| 44 | R. Contino, D. Marzocca, D. Pappadopulo, and R. Rattazzi | On the effect of resonances in composite Higgs phenomenology | JHEP 10 (2011) 081 | 1109.1570 |
| 45 | D. Marzocca, M. Serone, and J. Shu | General composite Higgs models | JHEP 08 (2012) 013 | 1205.0770 |
| 46 | D. Greco and D. Liu | Hunting composite vector resonances at the LHC: naturalness facing data | JHEP 12 (2014) 126 | 1410.2883 |
| 47 | K. Lane and L. Pritchett | The light composite Higgs boson in strong extended technicolor | JHEP 06 (2017) 140 | 1604.07085 |
| 48 | M. Schmaltz and D. Tucker-Smith | Little Higgs review | Ann. Rev. Nucl. Part. Sci. 55 (2005) 229 | hep-ph/0502182 |
| 49 | N. Arkani-Hamed, A. G. Cohen, E. Katz, and A. E. Nelson | The littlest Higgs | JHEP 07 (2002) 034 | hep-ph/0206021 |
| 50 | J. Alwall et al. | The automated computation of tree-level and next-to-leading order differential cross sections, and their matching to parton shower simulations | JHEP 07 (2014) 079 | 1405.0301 |
| 51 | T. Sjostrand, S. Mrenna, and P. Z. Skands | A brief introduction to PYTHIA 8.1 | CPC 178 (2008) 852 | 0710.3820 |
| 52 | J. Alwall et al. | Comparative study of various algorithms for the merging of parton showers and matrix elements in hadronic collisions | EPJC 53 (2008) 473 | 0706.2569 |
| 53 | NNPDF Collaboration | Parton distributions for the LHC Run II | JHEP 04 (2015) 040 | 1410.8849 |
| 54 | GEANT4 Collaboration | GEANT4---a simulation toolkit | NIMA 506 (2003) 250 | |
| 55 | M. Cacciari, G. P. Salam, and G. Soyez | FastJet user manual | EPJC 72 (2012) 1896 | 1111.6097 |
| 56 | M. Cacciari, G. P. Salam, and G. Soyez | The anti-$ k_t $ jet clustering algorithm | JHEP 04 (2008) 063 | 0802.1189 |
| 57 | CMS Collaboration | Jet energy scale and resolution in the CMS experiment in pp collisions at 8 TeV | JINST 12 (2017) P02014 | CMS-JME-13-004 1607.03663 |
| 58 | D. Bertolini, P. Harris, M. Low, and N. Tran | Pileup per particle identification | JHEP 10 (2014) 059 | 1407.6013 |
| 59 | CMS Collaboration | Studies of jet mass in dijet and W/Z+jet events | JHEP 05 (2013) 090 | CMS-SMP-12-019 1303.4811 |
| 60 | M. Dasgupta, A. Fregoso, S. Marzani, and G. P. Salam | Towards an understanding of jet substructure | JHEP 09 (2013) 029 | 1307.0007 |
| 61 | J. M. Butterworth, A. R. Davison, M. Rubin, and G. P. Salam | Jet substructure as a new Higgs search channel at the LHC | PRL 100 (2008) 242001 | 0802.2470 |
| 62 | A. J. Larkoski, S. Marzani, G. Soyez, and J. Thaler | Soft drop | JHEP 05 (2014) 146 | 1402.2657 |
| 63 | M. Dasgupta, A. Fregoso, S. Marzani, and A. Powling | Jet substructure with analytical methods | EPJC 73 (2013) 2623 | 1307.0013 |
| 64 | S. D. Ellis, C. K. Vermilion, and J. R. Walsh | Techniques for improved heavy particle searches with jet substructure | PRD 80 (2009) 051501 | 0903.5081 |
| 65 | S. D. Ellis, C. K. Vermilion, and J. R. Walsh | Recombination algorithms and jet substructure: pruning as a tool for heavy particle searches | PRD 81 (2010) 094023 | 0912.0033 |
| 66 | S. Catani, \relax Yu. L. Dokshitzer, M. H. Seymour, and B. R. Webber | Longitudinally invariant $ K_t $ clustering algorithms for hadron hadron collisions | NPB 406 (1993) 187 | |
| 67 | M. Wobisch and T. Wengler | Hadronization corrections to jet cross-sections in deep inelastic scattering | in Monte Carlo generators for HERA physics. Proceedings, Workshop, Hamburg 1998 | hep-ph/9907280 |
| 68 | D. Krohn, J. Thaler, and L.-T. Wang | Jet trimming | JHEP 02 (2010) 084 | 0912.1342 |
| 69 | S. D. Ellis and D. E. Soper | Successive combination jet algorithm for hadron collisions | PRD 48 (1993) 3160 | hep-ph/9305266 |
| 70 | J. Thaler and K. Van Tilburg | Identifying boosted objects with N-subjettiness | JHEP 03 (2011) 015 | 1011.2268 |
| 71 | CMS Collaboration | Description and performance of track and primary-vertex reconstruction with the CMS tracker | JINST 9 (2014) P10009 | CMS-TRK-11-001 1405.6569 |
| 72 | M. Bahr et al. | Herwig++ physics and manual | EPJC 58 (2008) 639 | 0803.0883 |
| 73 | CMS Collaboration | Search for narrow resonances in dilepton mass spectra in proton-proton collisions at $ \sqrt{s} = $ 13 TeV and combination with 8 TeV data | PLB 768 (2017) 57 | CMS-EXO-15-005 1609.05391 |
| 74 | M. J. Oreglia | A study of the reactions $\psi' \to \gamma\gamma \psi$ | PhD thesis, Stanford University, 1980 SLAC Report SLAC-R-236, see Appendix D | |
| 75 | R. G. Lomax and D. L. Hahs-Vaughn | Statistical concepts: a second course | Routledge Academic, London | |
| 76 | CMS Collaboration | Search for Dijet Resonances in 7 TeV pp Collisions at CMS | PRL 105 (2010) 211801 | CMS-EXO-10-010 1010.0203 |
| 77 | CMS Collaboration | CMS luminosity measurements for the 2016 data taking period | CMS-PAS-LUM-17-001 | CMS-PAS-LUM-17-001 |
| 78 | M. Cacciari et al. | The $ \mathrm{ t \bar{t} } $ cross-section at 1.8 TeV and 1.96$ TeV: $ a study of the systematics due to parton densities and scale dependence | JHEP 04 (2004) 068 | hep-ph/0303085 |
| 79 | S. Catani, D. de Florian, M. Grazzini, and P. Nason | Soft gluon resummation for Higgs boson production at hadron colliders | JHEP 07 (2003) 028 | hep-ph/0306211 |
| 80 | A. L. Read | Presentation of search results: the $ \rm CL_s $ technique | JPG 28 (2002) 2693 | |
| 81 | T. Junk | Confidence level computation for combining searches with small statistics | NIMA 434 (1999) 435 | hep-ex/9902006 |
| 82 | G. Cowan, K. Cranmer, E. Gross, and O. Vitells | Asymptotic formulae for likelihood-based tests of new physics | EPJC 71 (2011) 1554 | 1007.1727 |
|
|
Compact Muon Solenoid LHC, CERN |
|

|

|

|

|

|