

Compact Muon Solenoid
LHC, CERN
| CMS-B2G-17-006 ; CERN-EP-2018-182 | ||
| Search for heavy resonances decaying into two Higgs bosons or into a Higgs boson and a W or Z boson in proton-proton collisions at 13 TeV | ||
| CMS Collaboration | ||
| 3 August 2018 | ||
| JHEP 01 (2019) 051 | ||
| Abstract: A search is presented for massive narrow resonances decaying either into two Higgs bosons, or into a Higgs boson and a W or Z boson. The decay channels considered are $\mathrm{H}\mathrm{H} \to {\mathrm{b\bar{b}}}\tau^{+}\tau^{-}$ and $\mathrm{V}\mathrm{H} \to {\mathrm{q\bar{q}}}\tau^{+}\tau^{-}$, where H denotes the Higgs boson, and V denotes the W or Z boson. This analysis is based on a data sample of proton-proton collisions collected at a center-of-mass energy of 13 TeV by the CMS Collaboration, corresponding to an integrated luminosity of 35.9 fb$^{-1}$. For the TeV-scale mass resonances considered, substructure techniques provide ways to differentiate among the hadronization products from vector boson decays to quarks, Higgs boson decays to bottom quarks, and quark- or gluon-induced jets. Reconstruction techniques are used that have been specifically optimized to select events in which the tau lepton pair is highly boosted. The observed data are consistent with standard model expectations and upper limits are set at 95% confidence level on the product of cross section and branching fraction for resonance masses between 0.9 and 4.0 TeV. Exclusion limits are set in the context of bulk radion and graviton models: spin-0 radion resonances are excluded below a mass of 2.7 TeV at 95% confidence level. In the spin-1 heavy vector triplet framework, mass-degenerate W' and Z'resonances with dominant couplings to the standard model gauge bosons are excluded below a mass of 2.8 TeV at 95% confidence level. There are the first limits for these decay channels at $\sqrt{s} = $ 13 TeV. | ||
| Links: e-print arXiv:1808.01365 [hep-ex] (PDF) ; CDS record ; inSPIRE record ; HepData record ; CADI line (restricted) ; | ||
| Figures | |
png pdf |
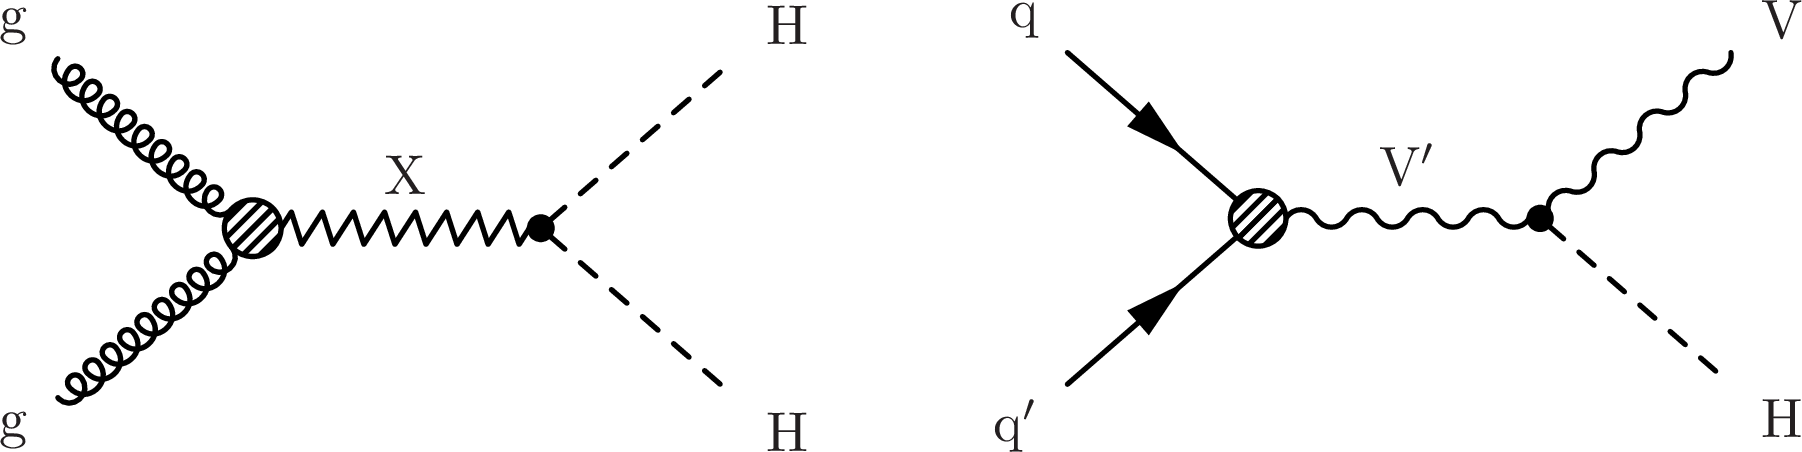
Figure 1:
Feynman diagrams for the production of a spin-0 radion or a spin-2 graviton X that decays to two Higgs bosons (left), and the production of a heavy vector boson V' (W' or Z') that decays to a vector boson and a Higgs boson (right). |
png pdf |
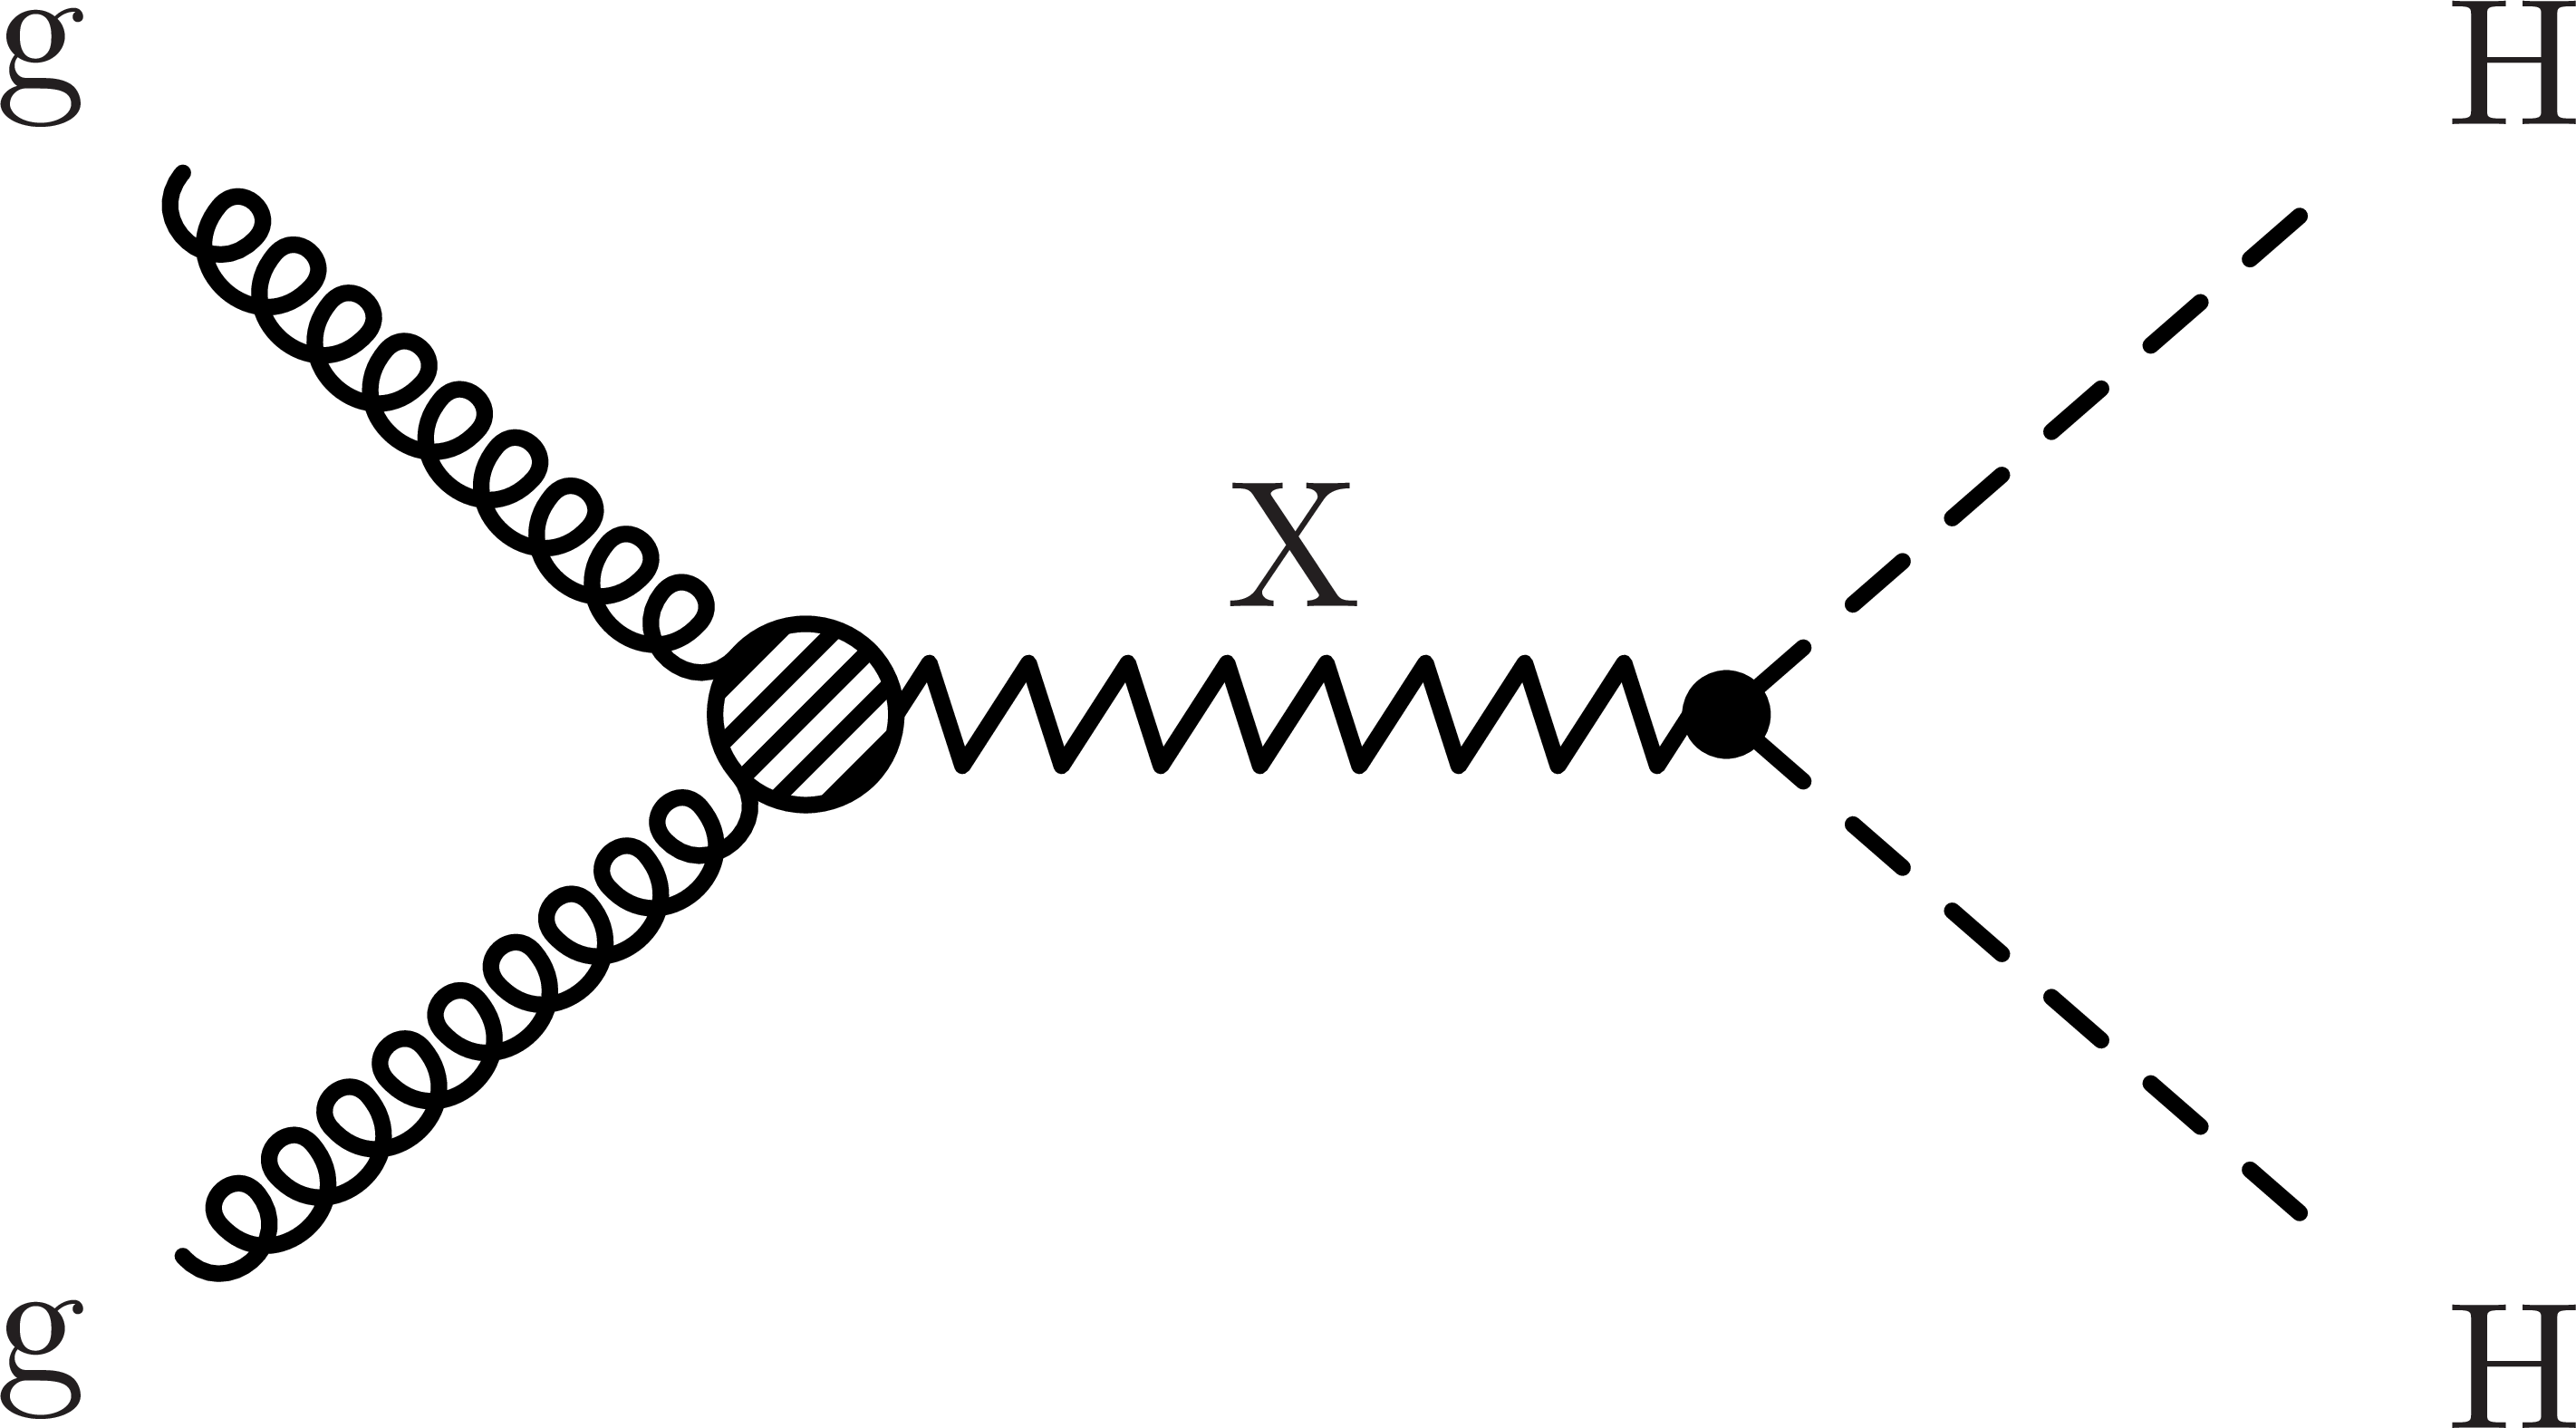
Figure 1-a:
Feynman diagram for the production of a spin-0 radion or a spin-2 graviton X that decays to two Higgs bosons. |
png pdf |
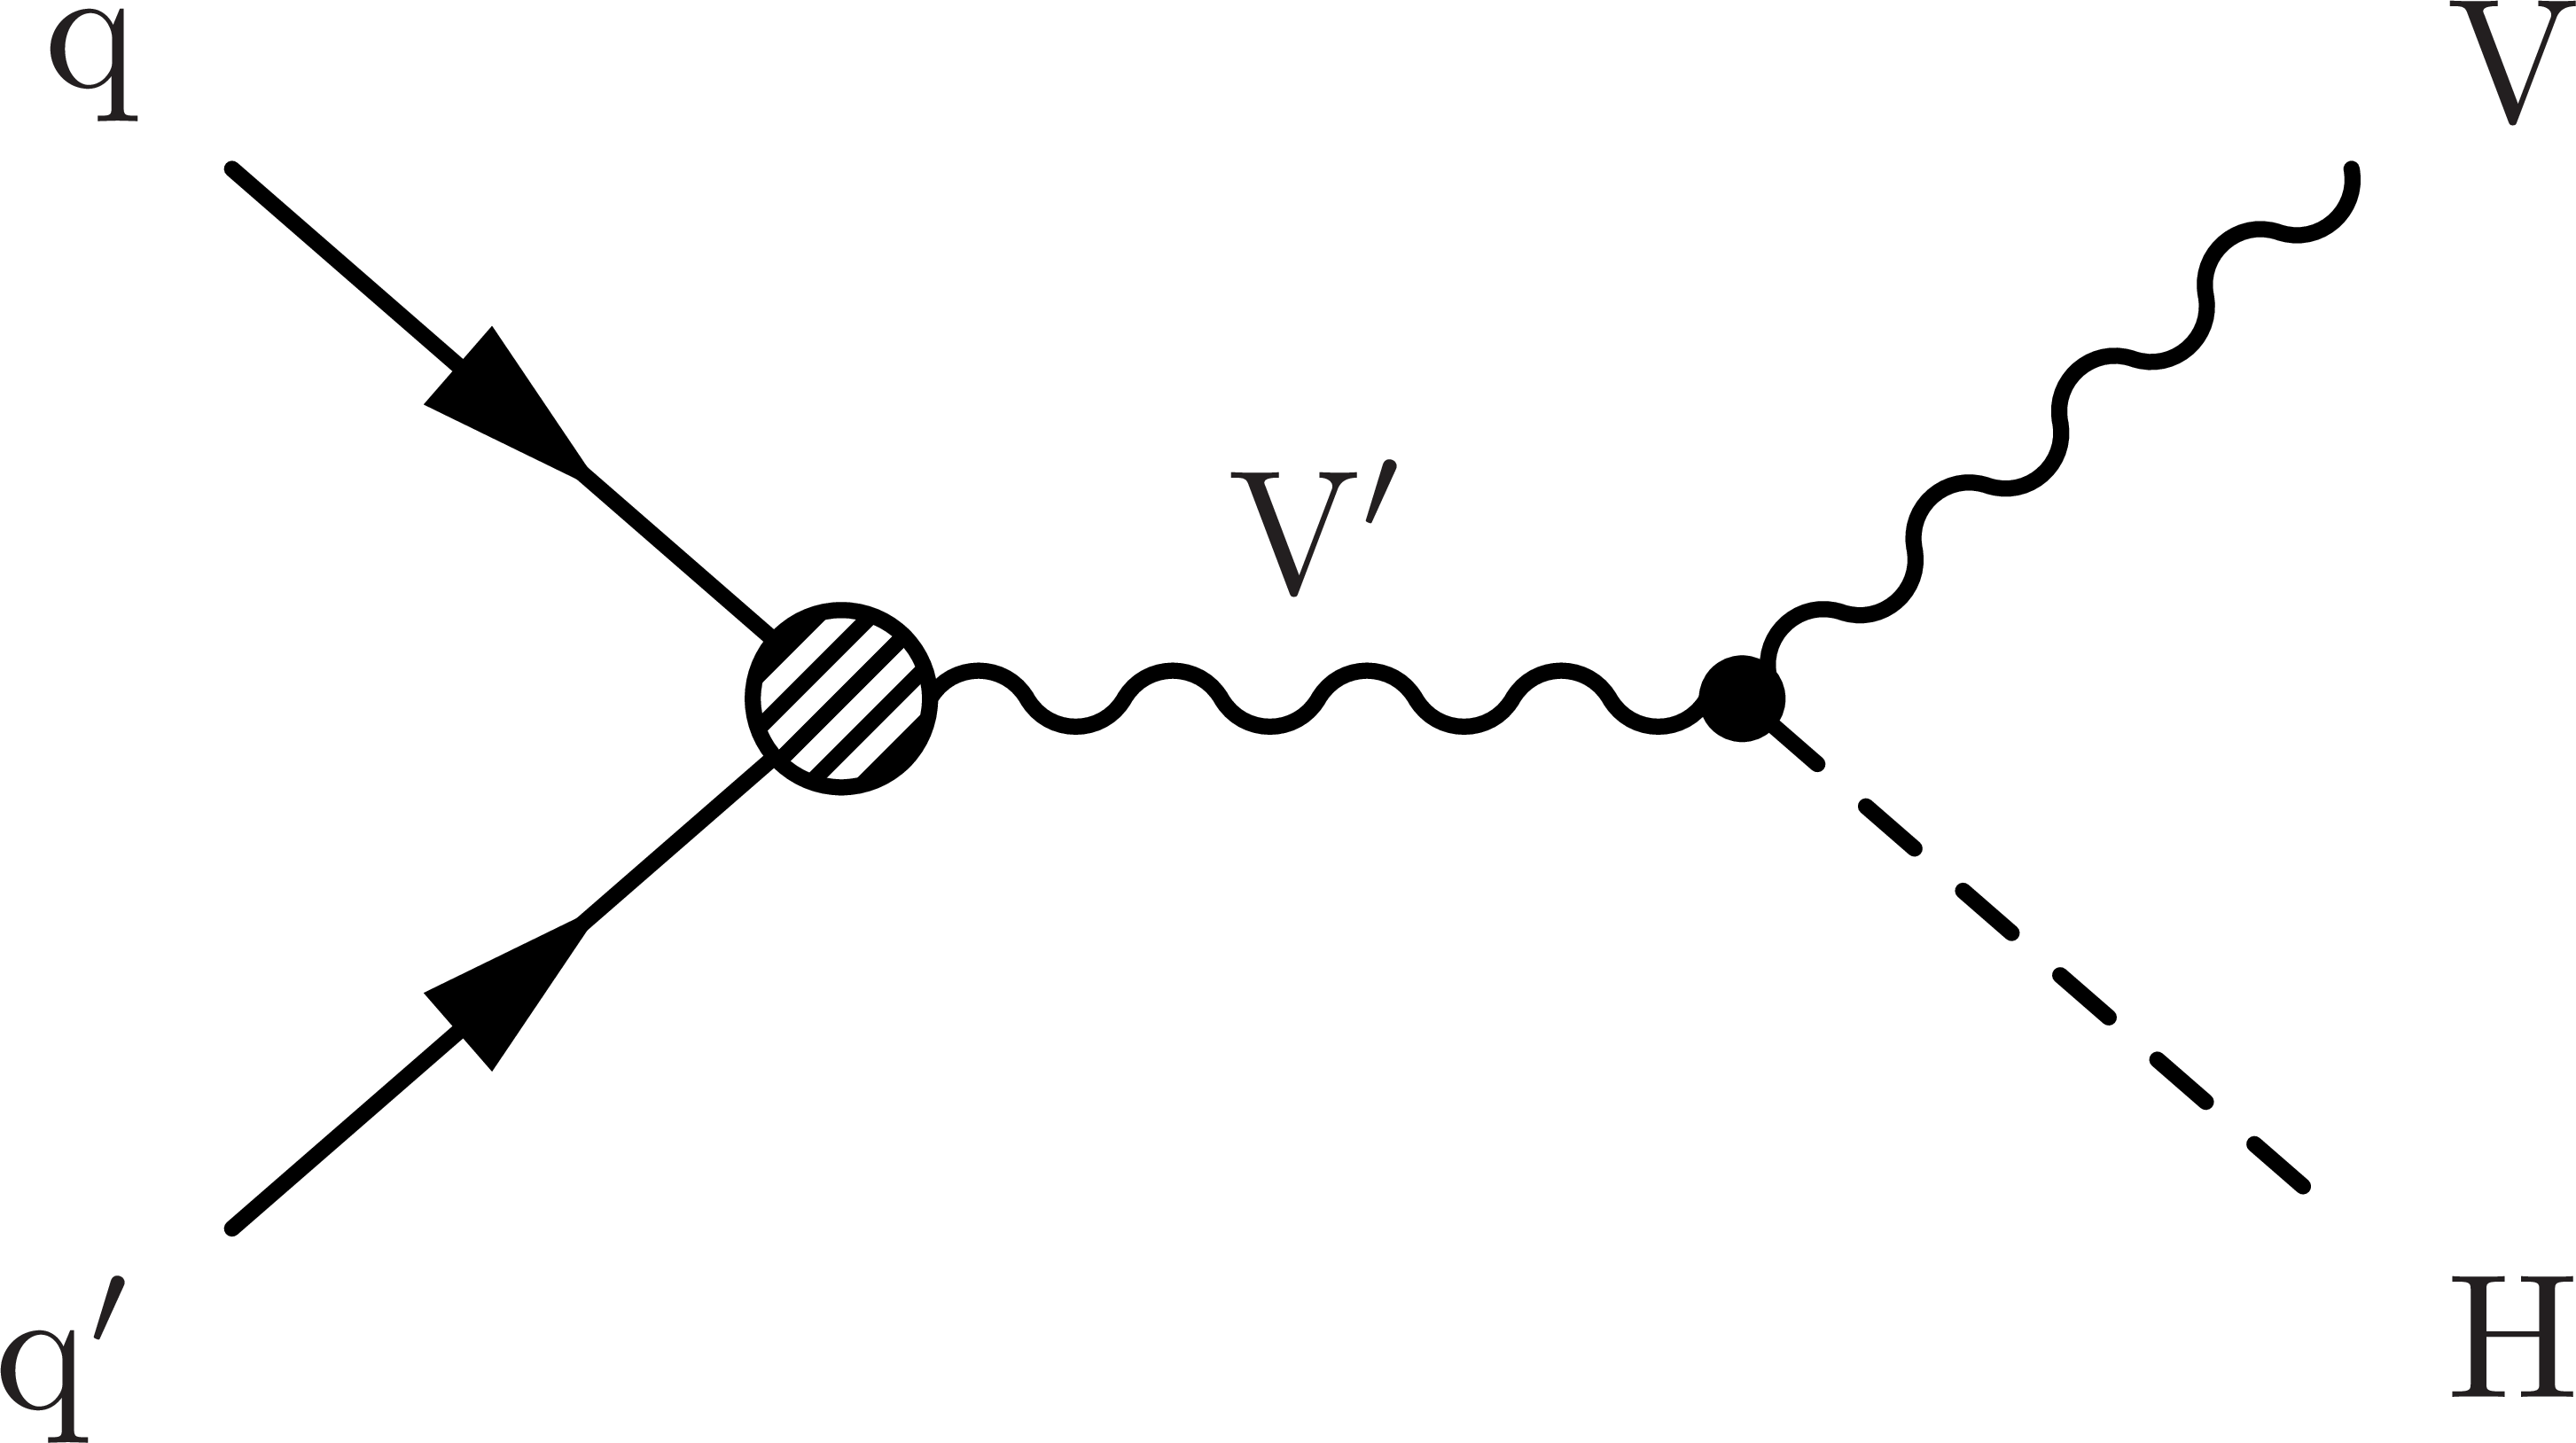
Figure 1-b:
Feynman diagram for the production of a heavy vector boson V' (W' or Z') that decays to a vector boson and a Higgs boson. |
png pdf |
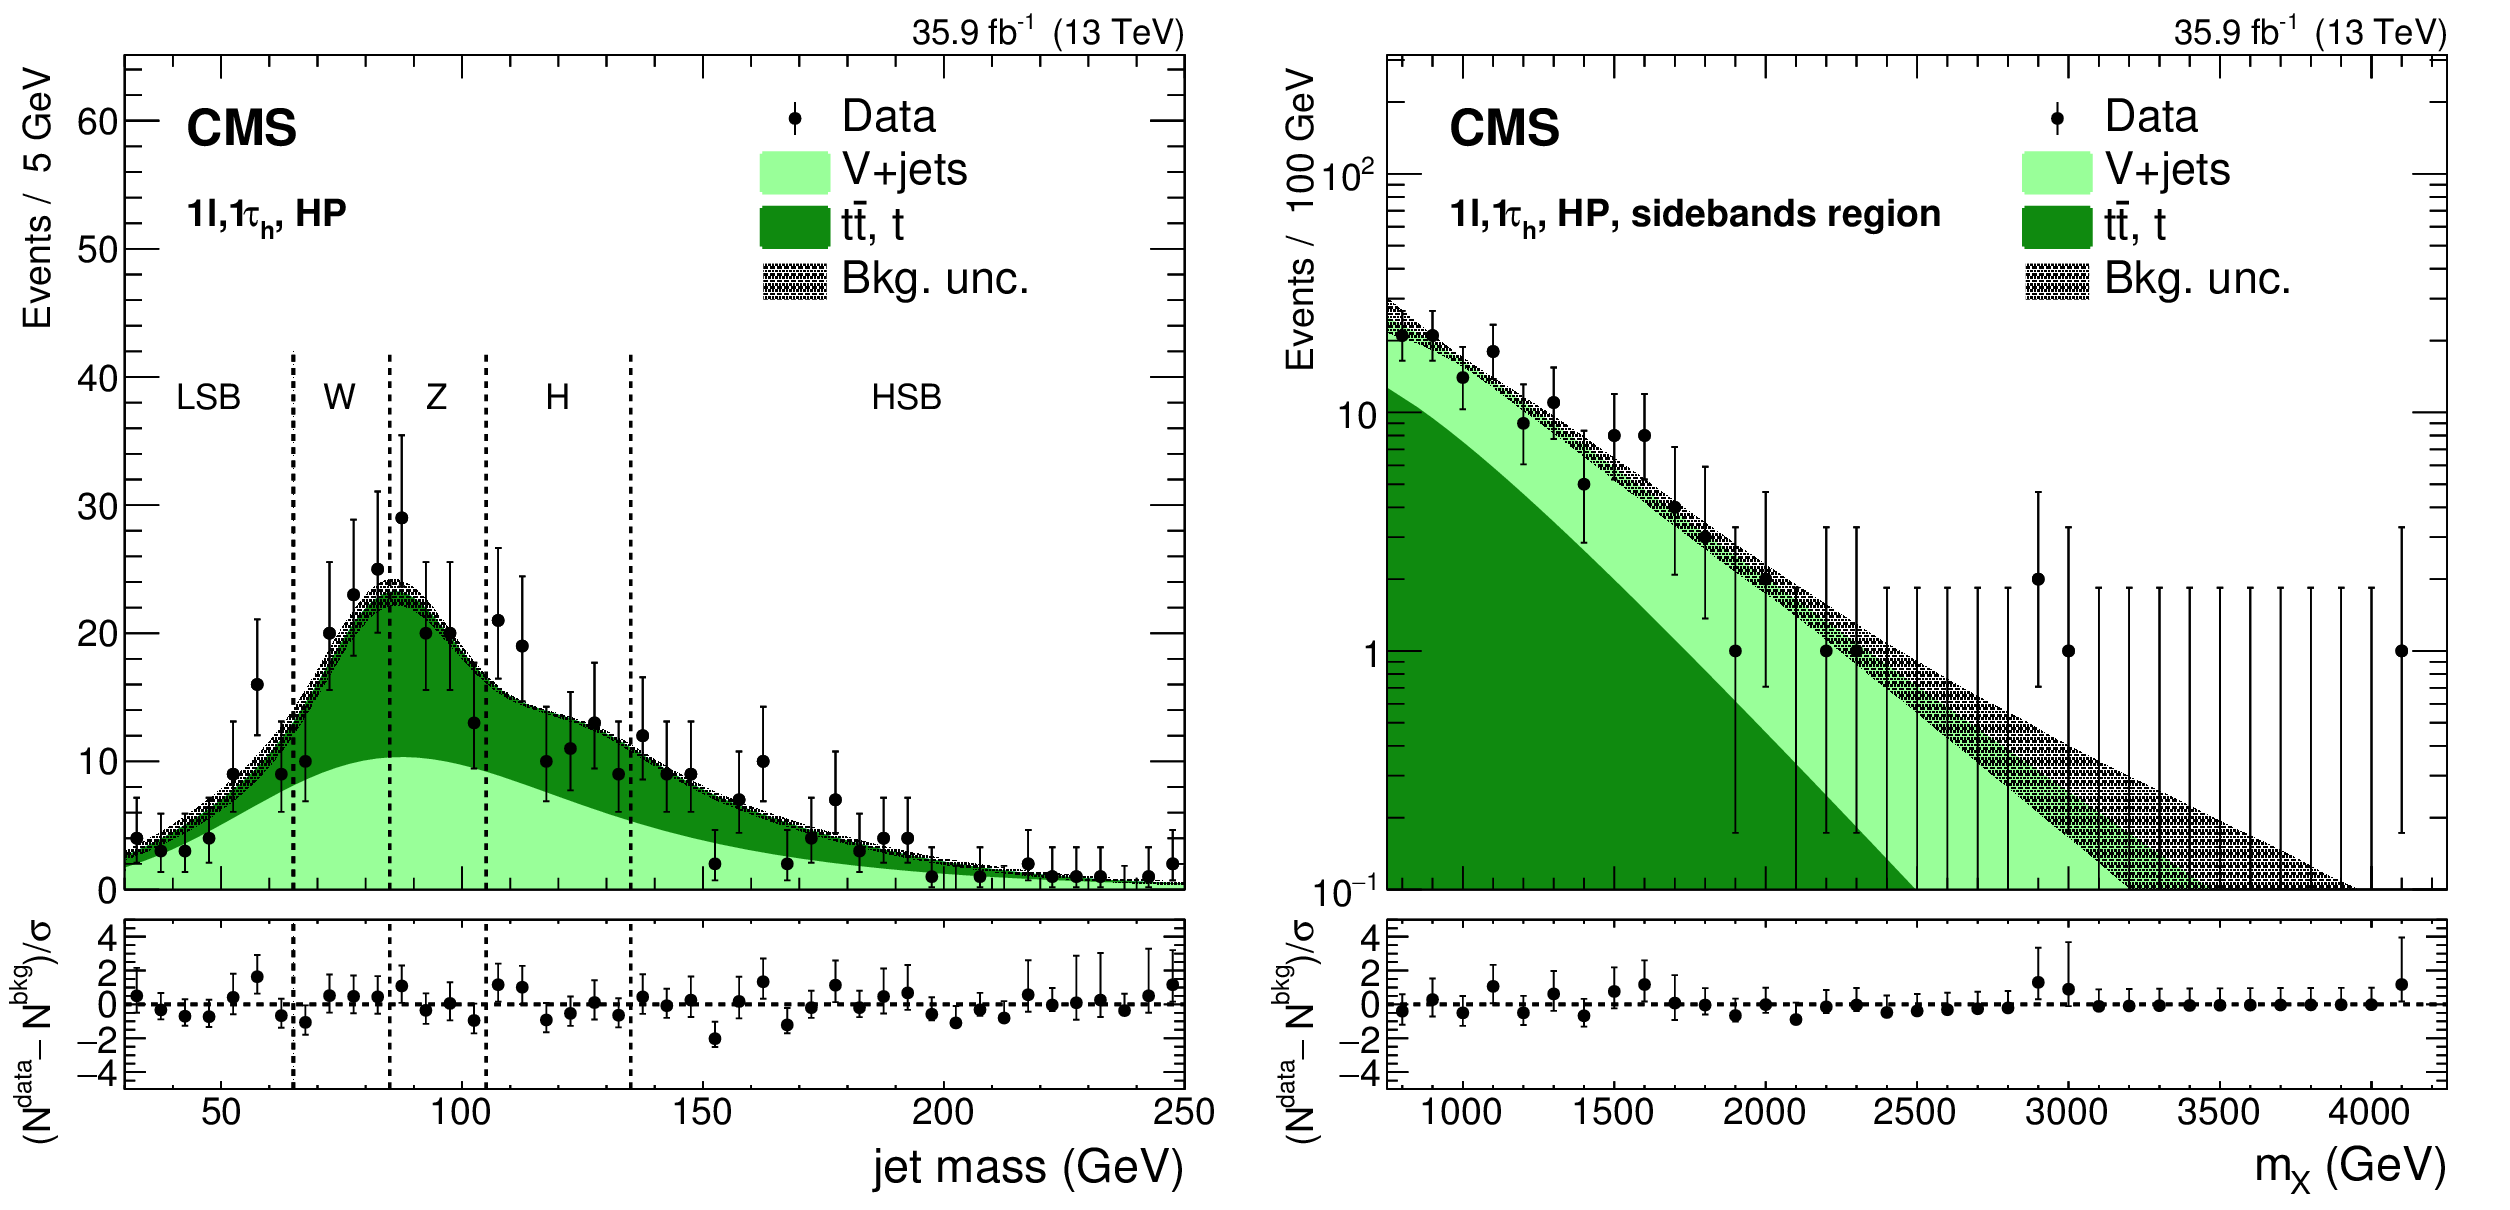
Figure 2:
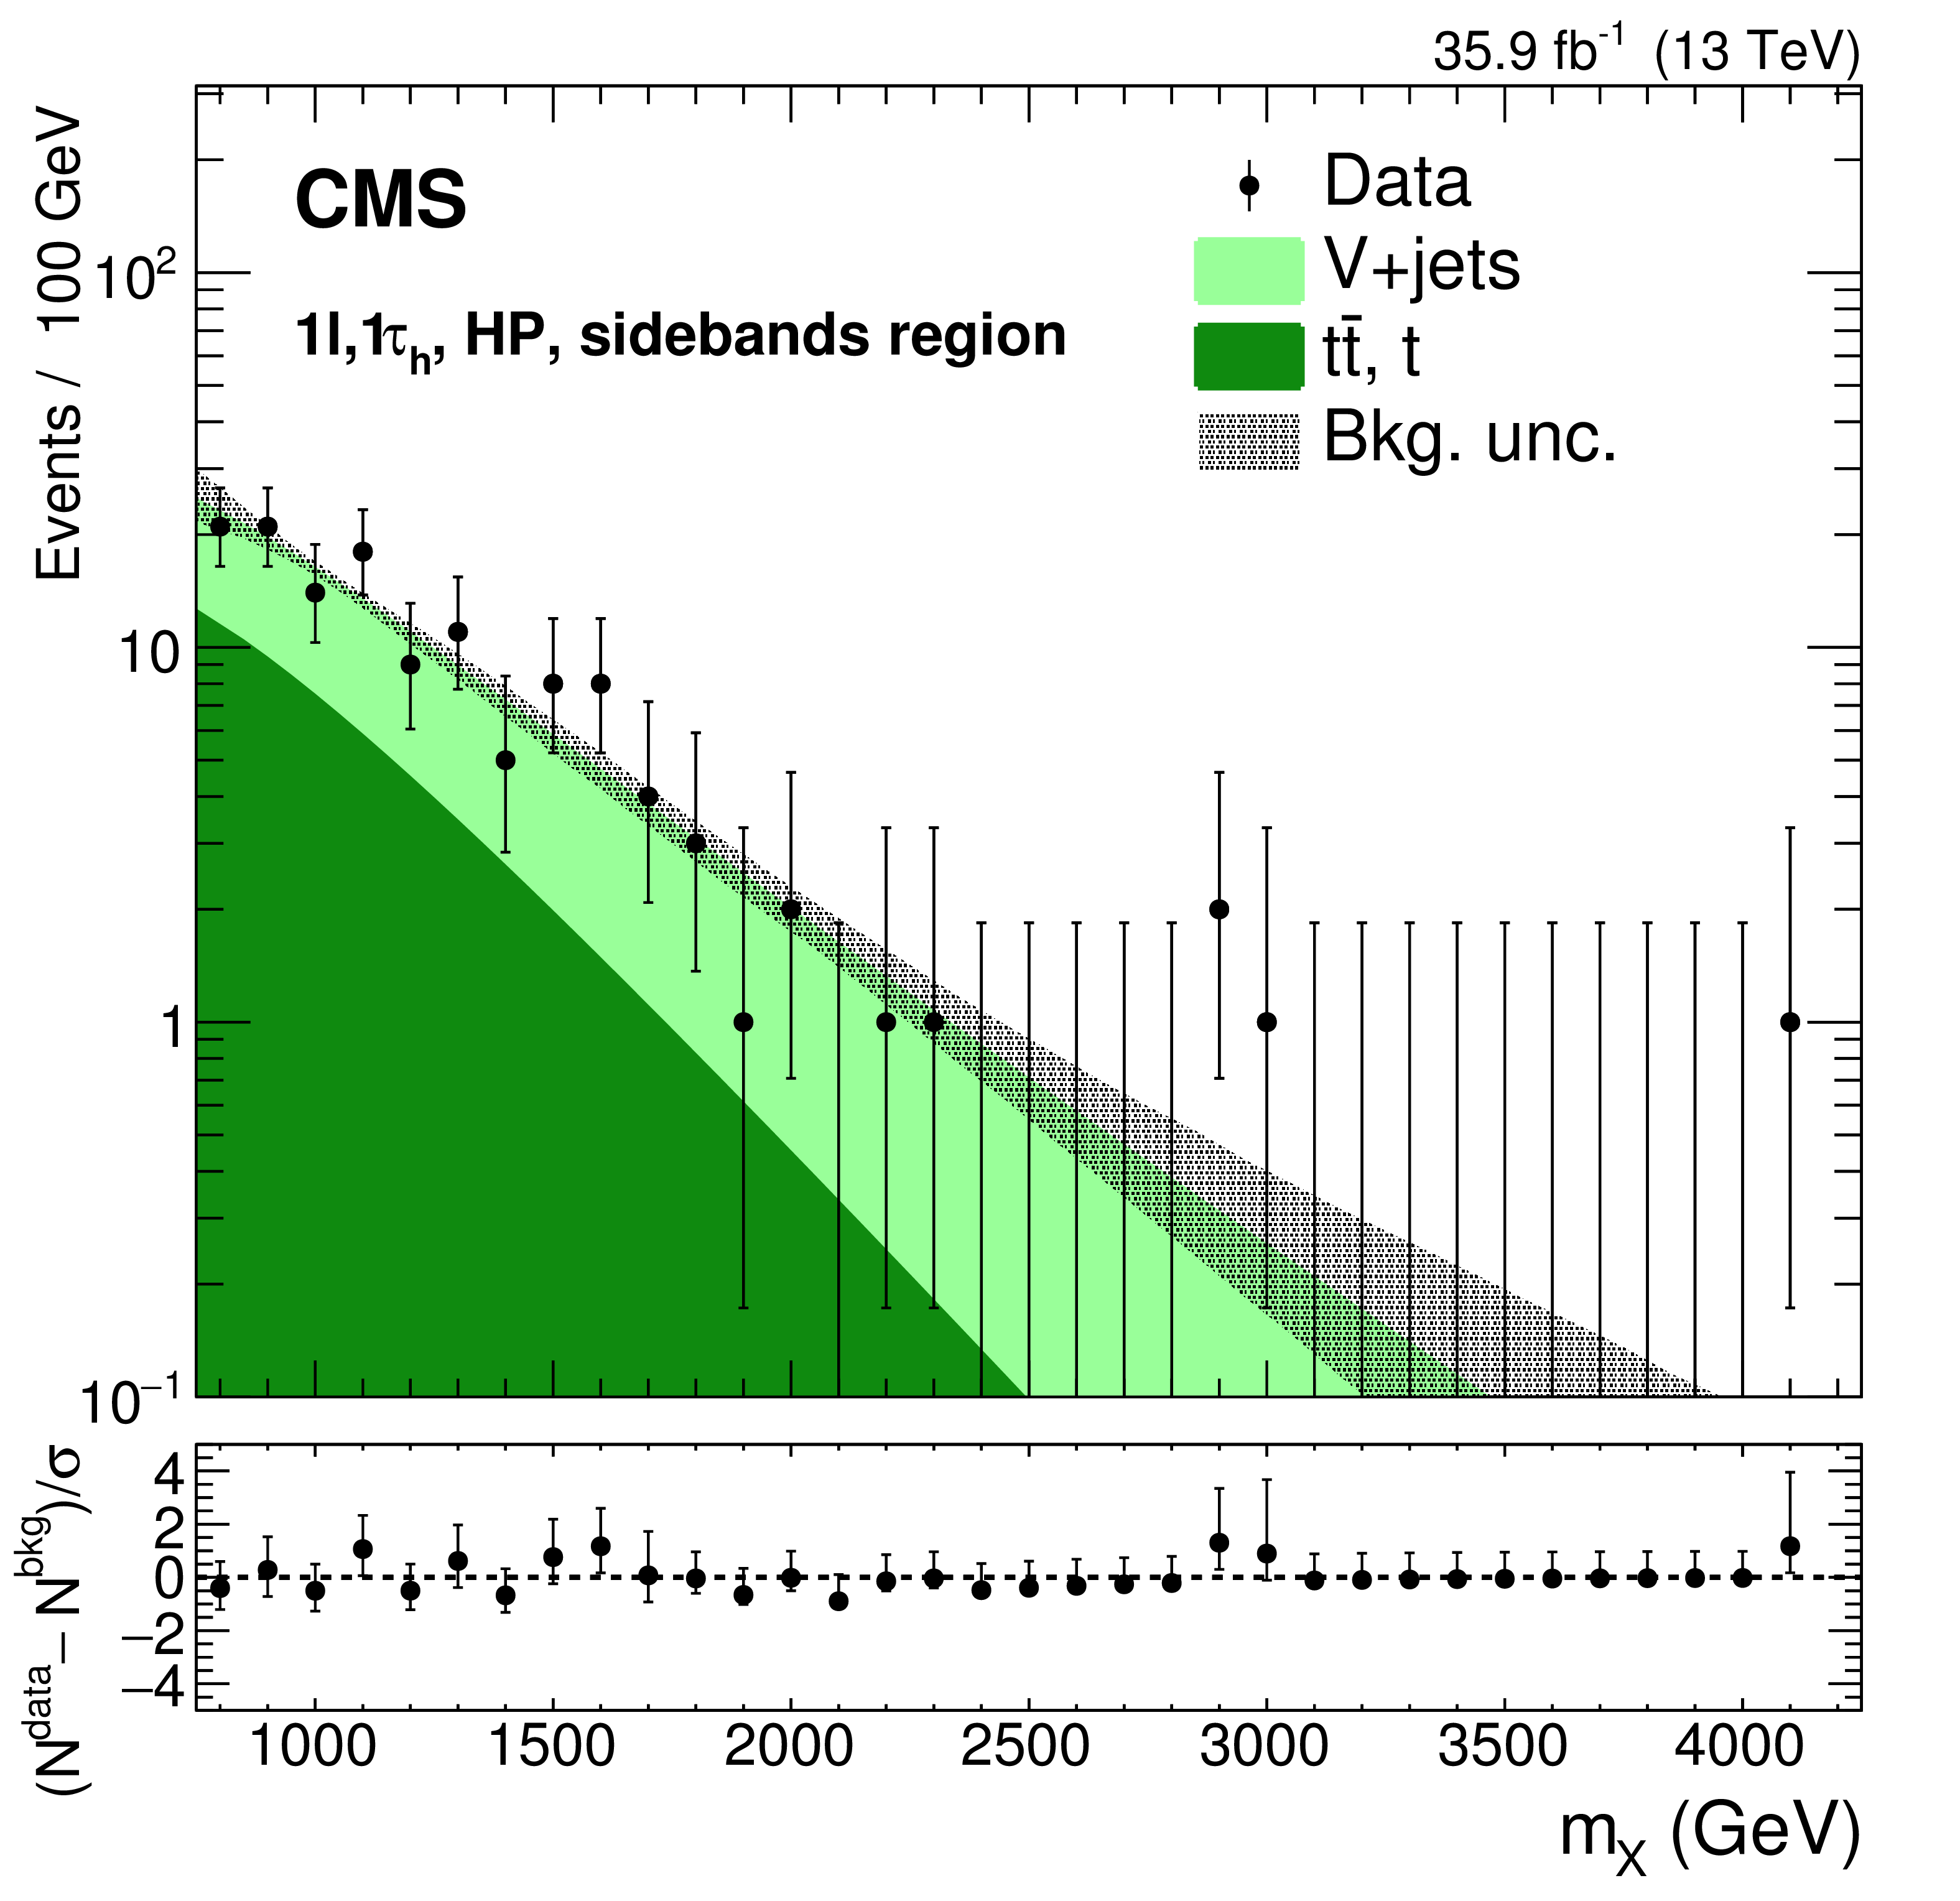
Soft-drop jet mass distribution in data in the HP $\ell {{\tau} _\mathrm {h}} $ category, together with the background prediction (fitted to the data as explained in the text)(left). Spectrum of the resonance mass in data events in the SBs (right) used for the estimation of the V+jets distribution in the SR. The lower panels depict the pulls in each bin, $(\mathrm {N}_{\mathrm {data}} - \mathrm {N}_{\mathrm {bkg}})/\sigma $, where $\sigma $ is the statistical uncertainty in data, as given by the Garwood interval [63]. |

png pdf |
Figure 2-a:
Soft-drop jet mass distribution in data in the HP $\ell {{\tau} _\mathrm {h}} $ category, together with the background prediction (fitted to the data as explained in the text). The lower panel depicts the pulls in each bin, $(\mathrm {N}_{\mathrm {data}} - \mathrm {N}_{\mathrm {bkg}})/\sigma $, where $\sigma $ is the statistical uncertainty in data, as given by the Garwood interval [63]. |
png pdf |
Figure 2-b:
Spectrum of the resonance mass in data events in the SBs used for the estimation of the V+jets distribution in the SR. The lower panel depicts the pulls in each bin, $(\mathrm {N}_{\mathrm {data}} - \mathrm {N}_{\mathrm {bkg}})/\sigma $, where $\sigma $ is the statistical uncertainty in data, as given by the Garwood interval [63]. |
png pdf |
Figure 3:
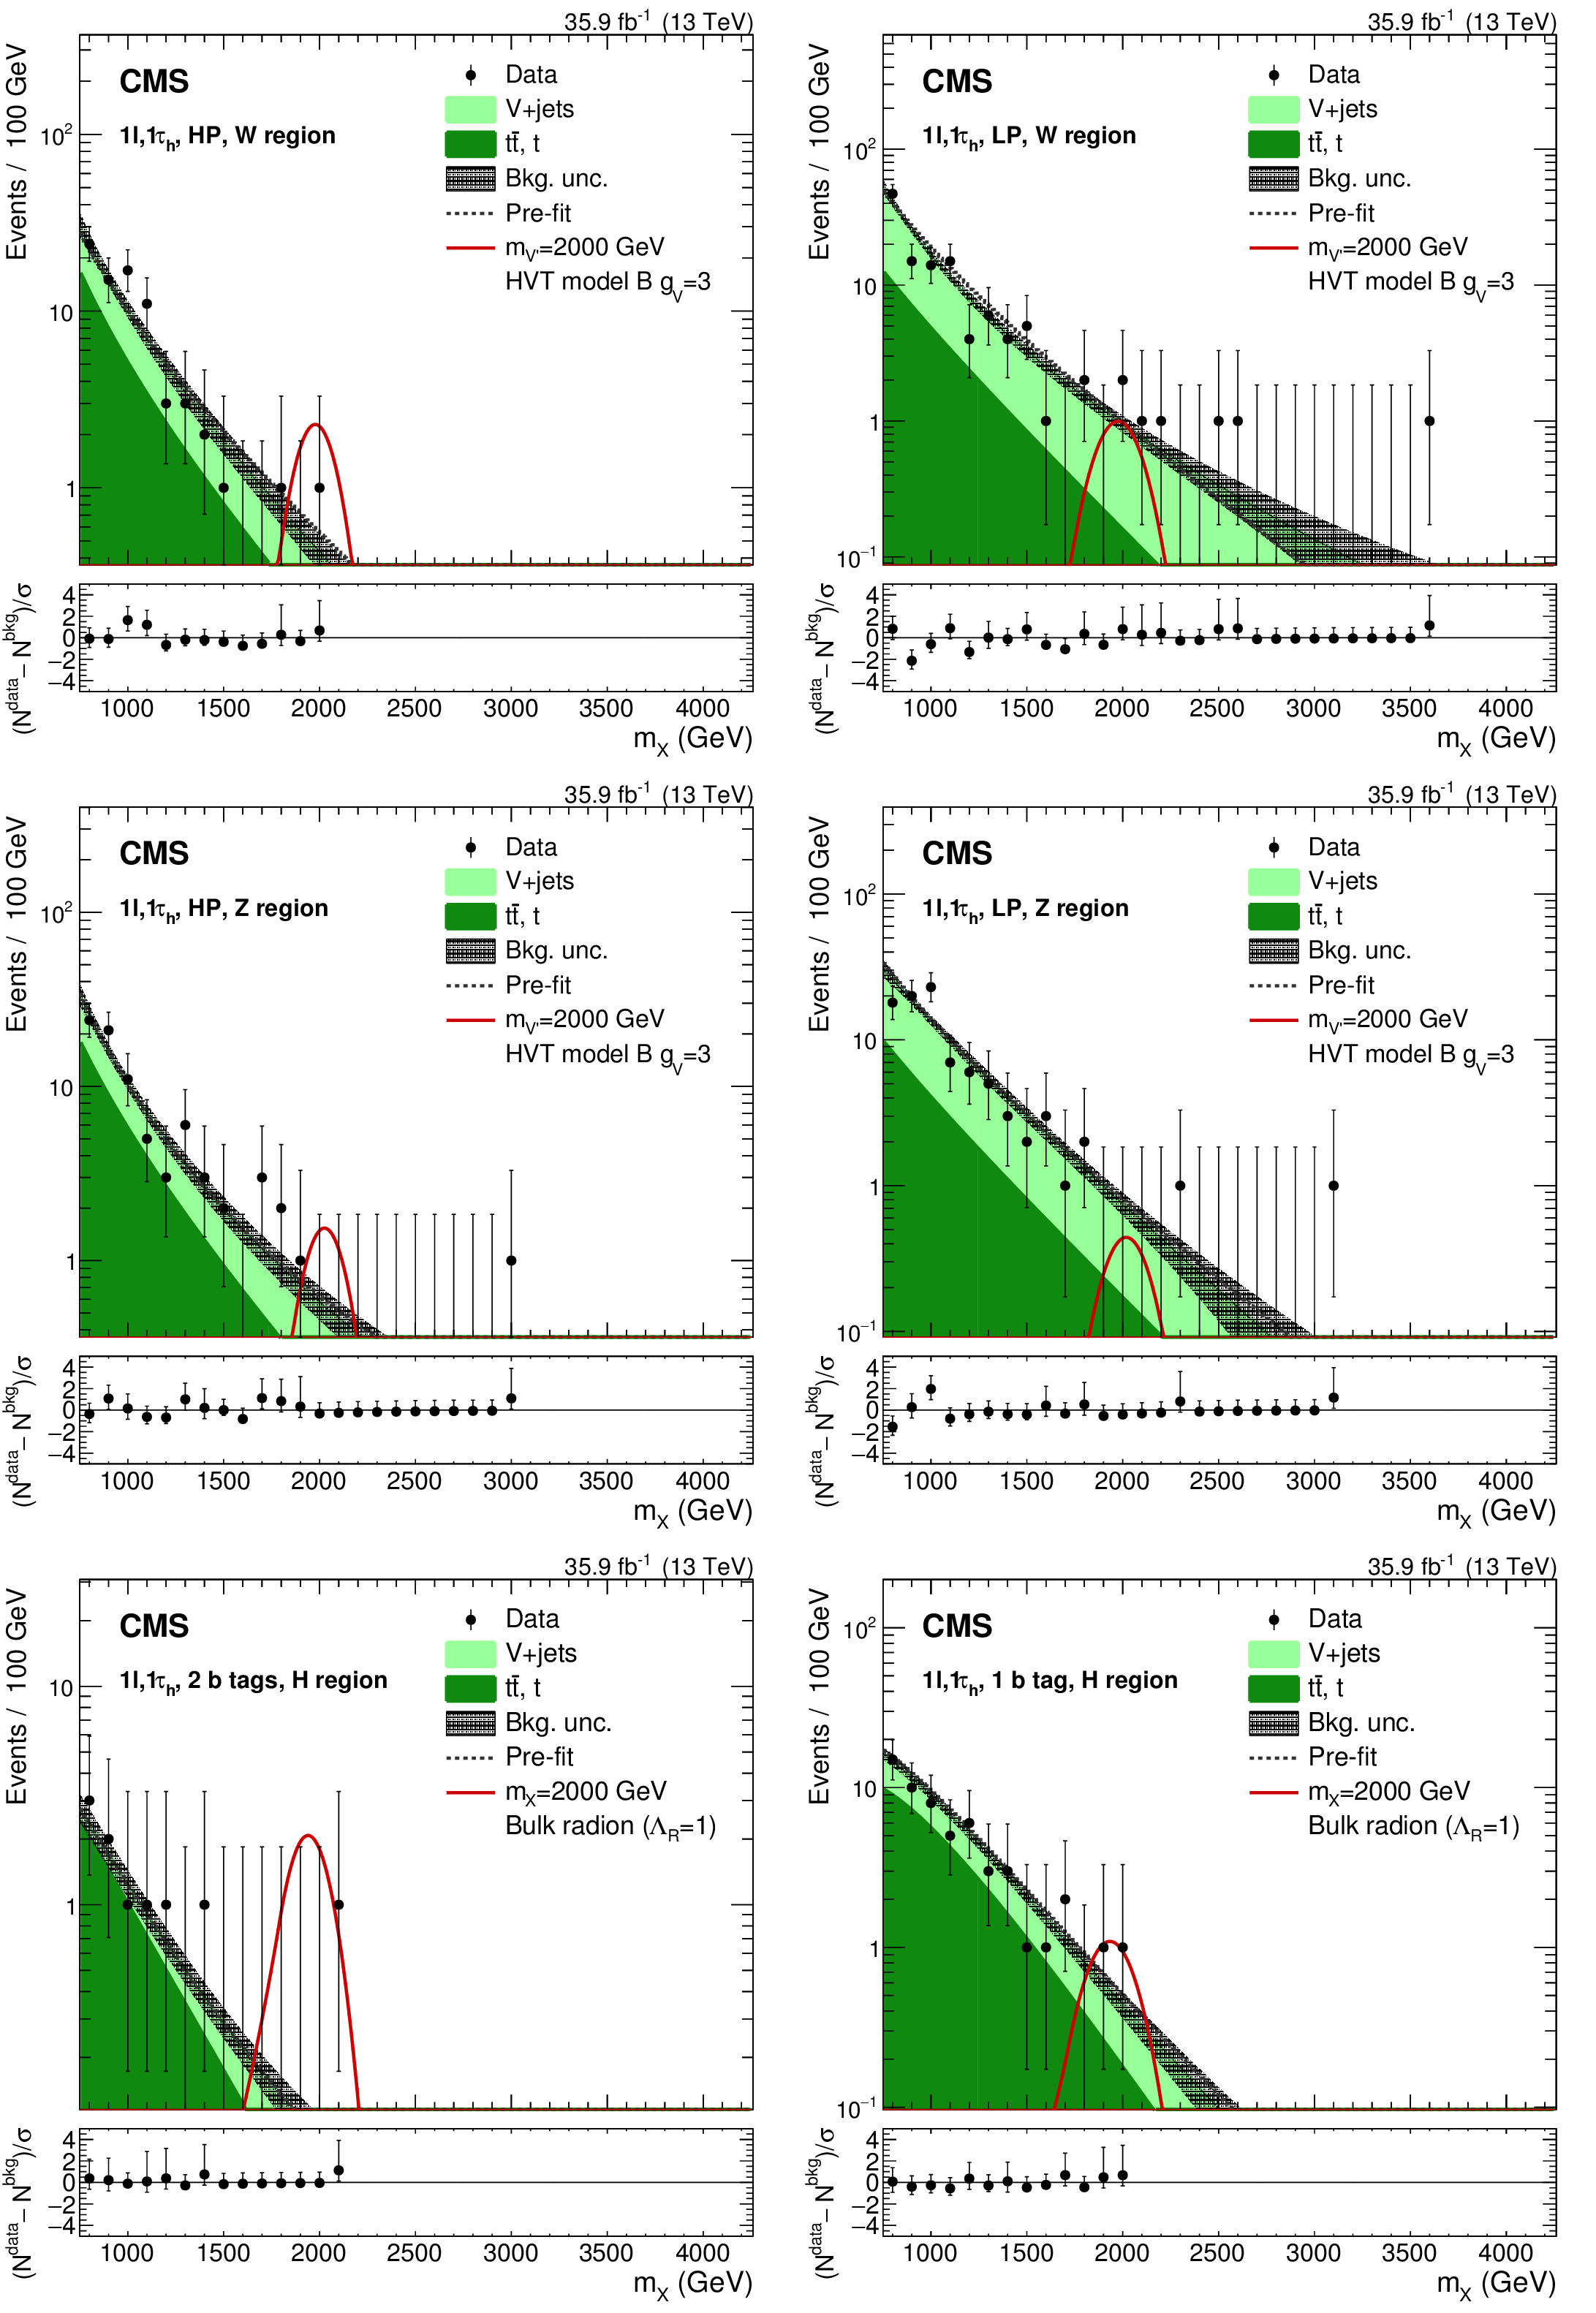
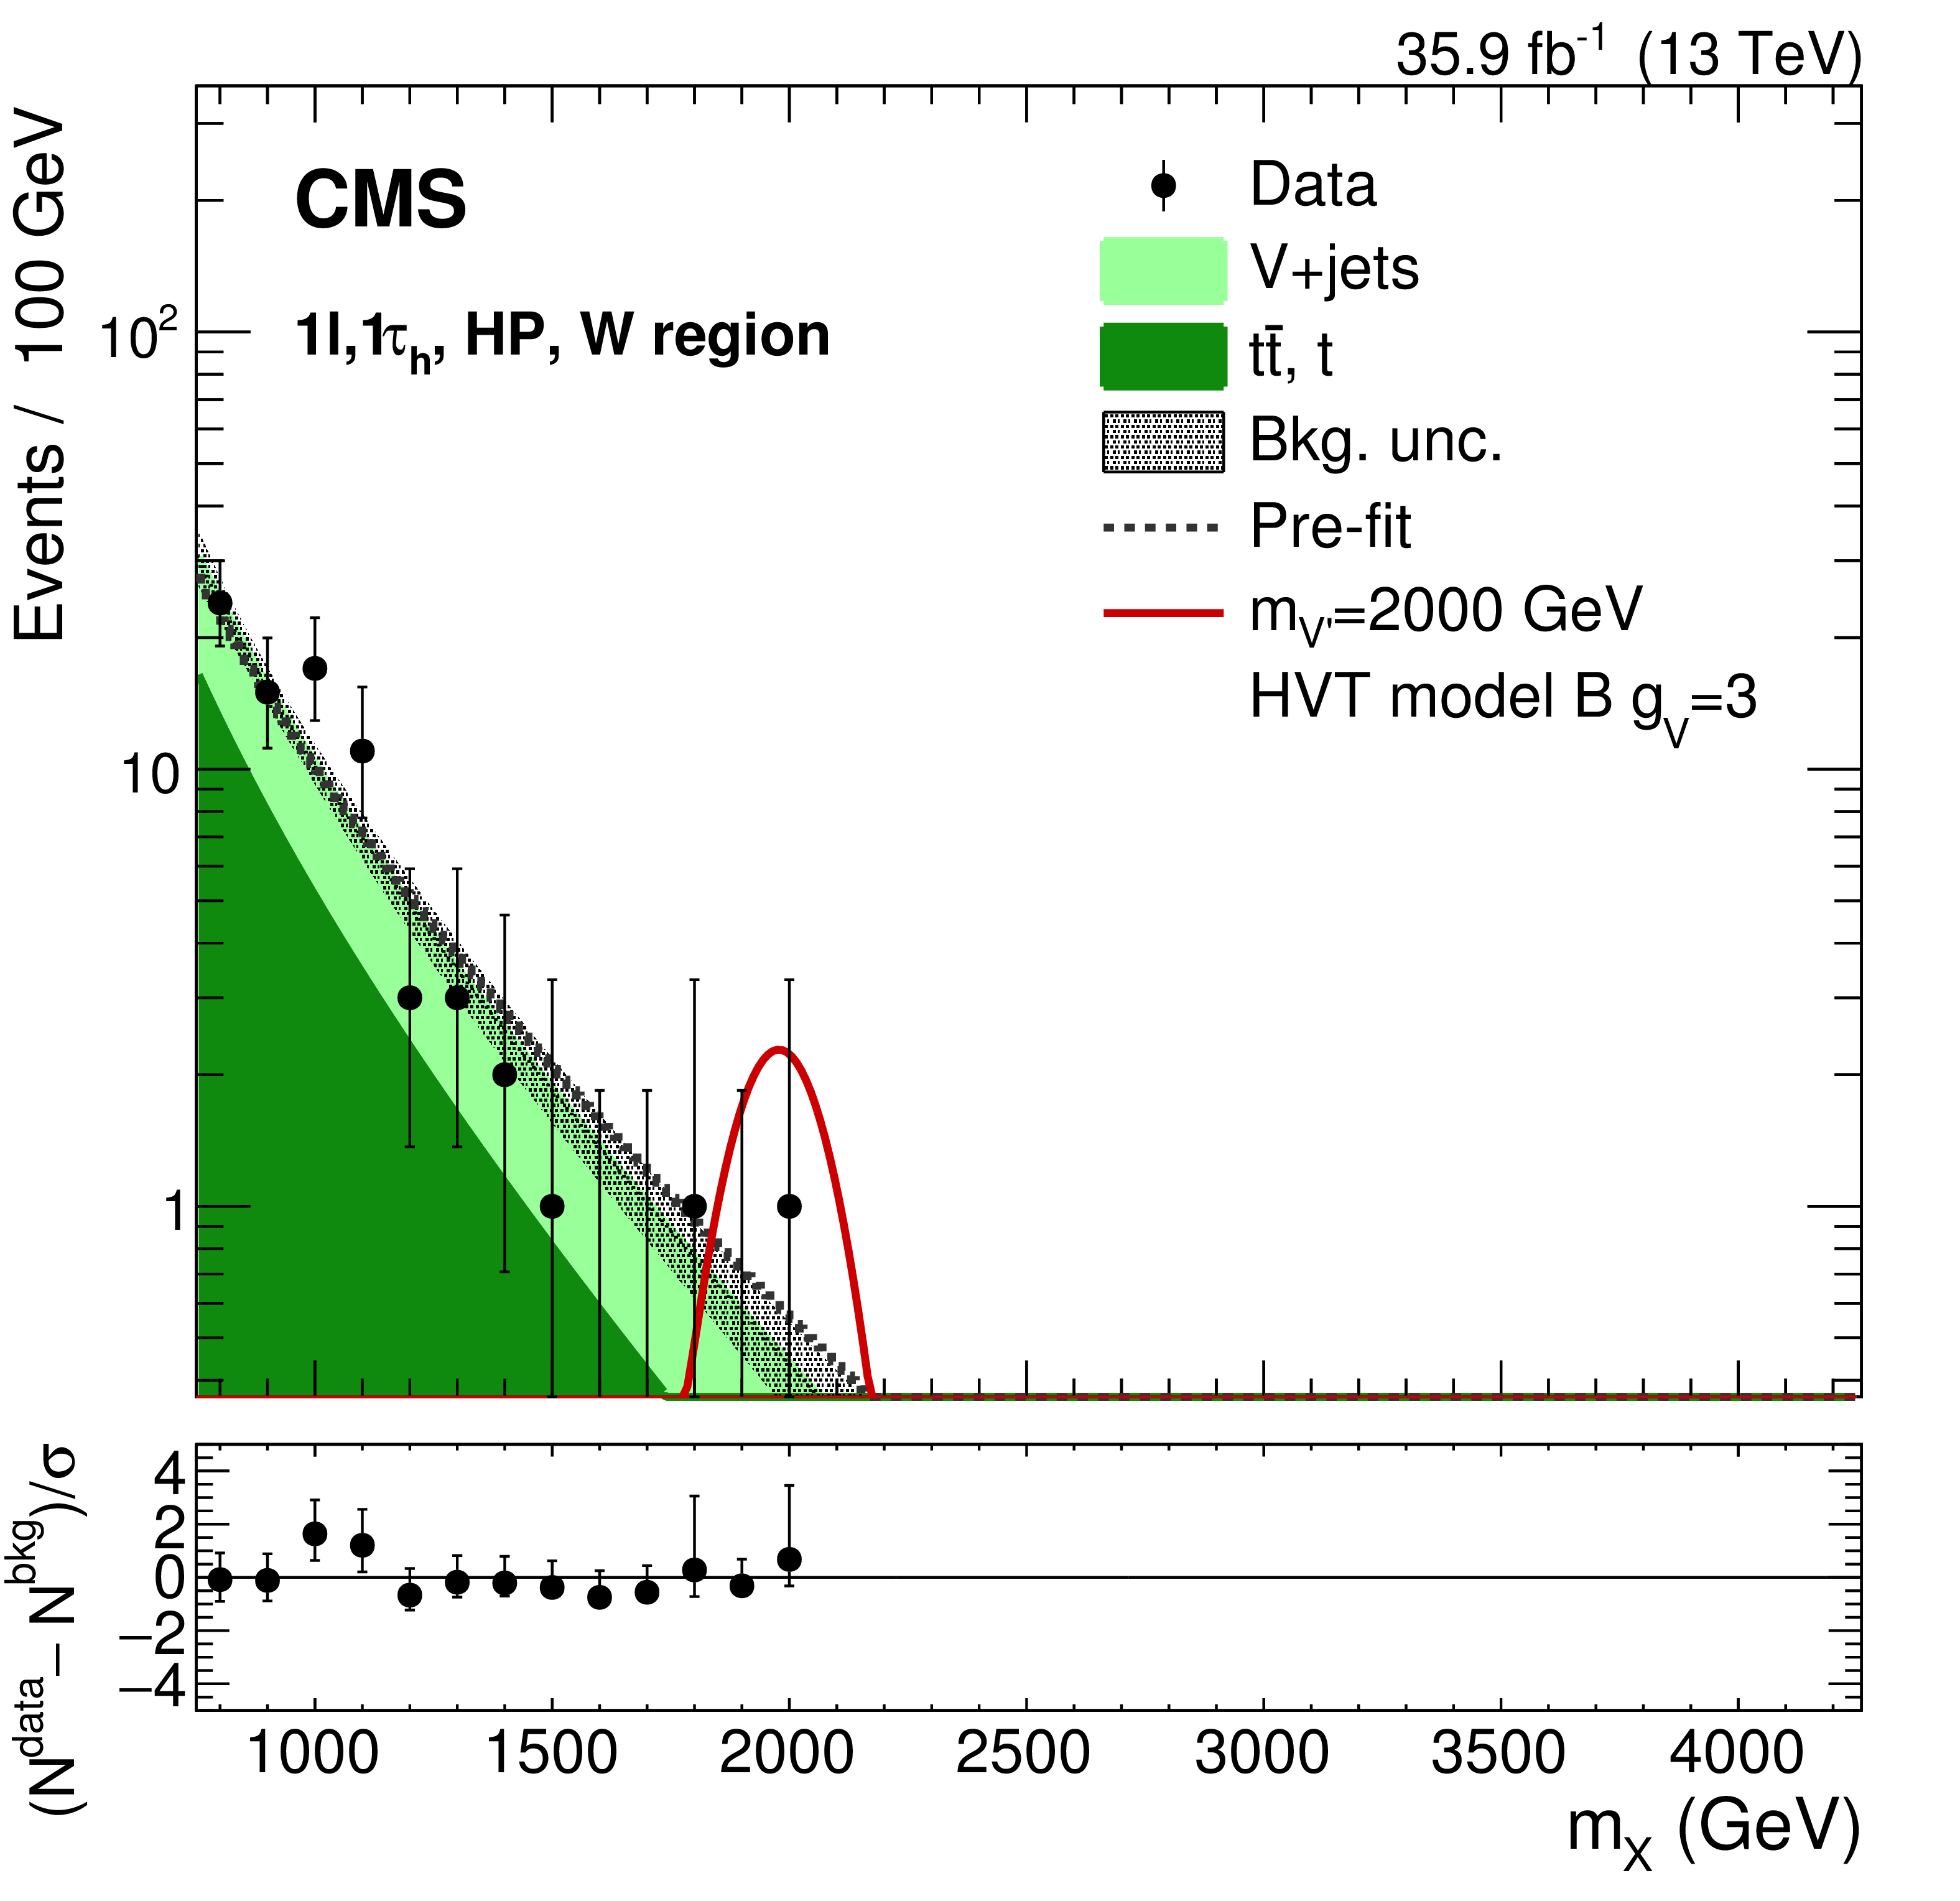
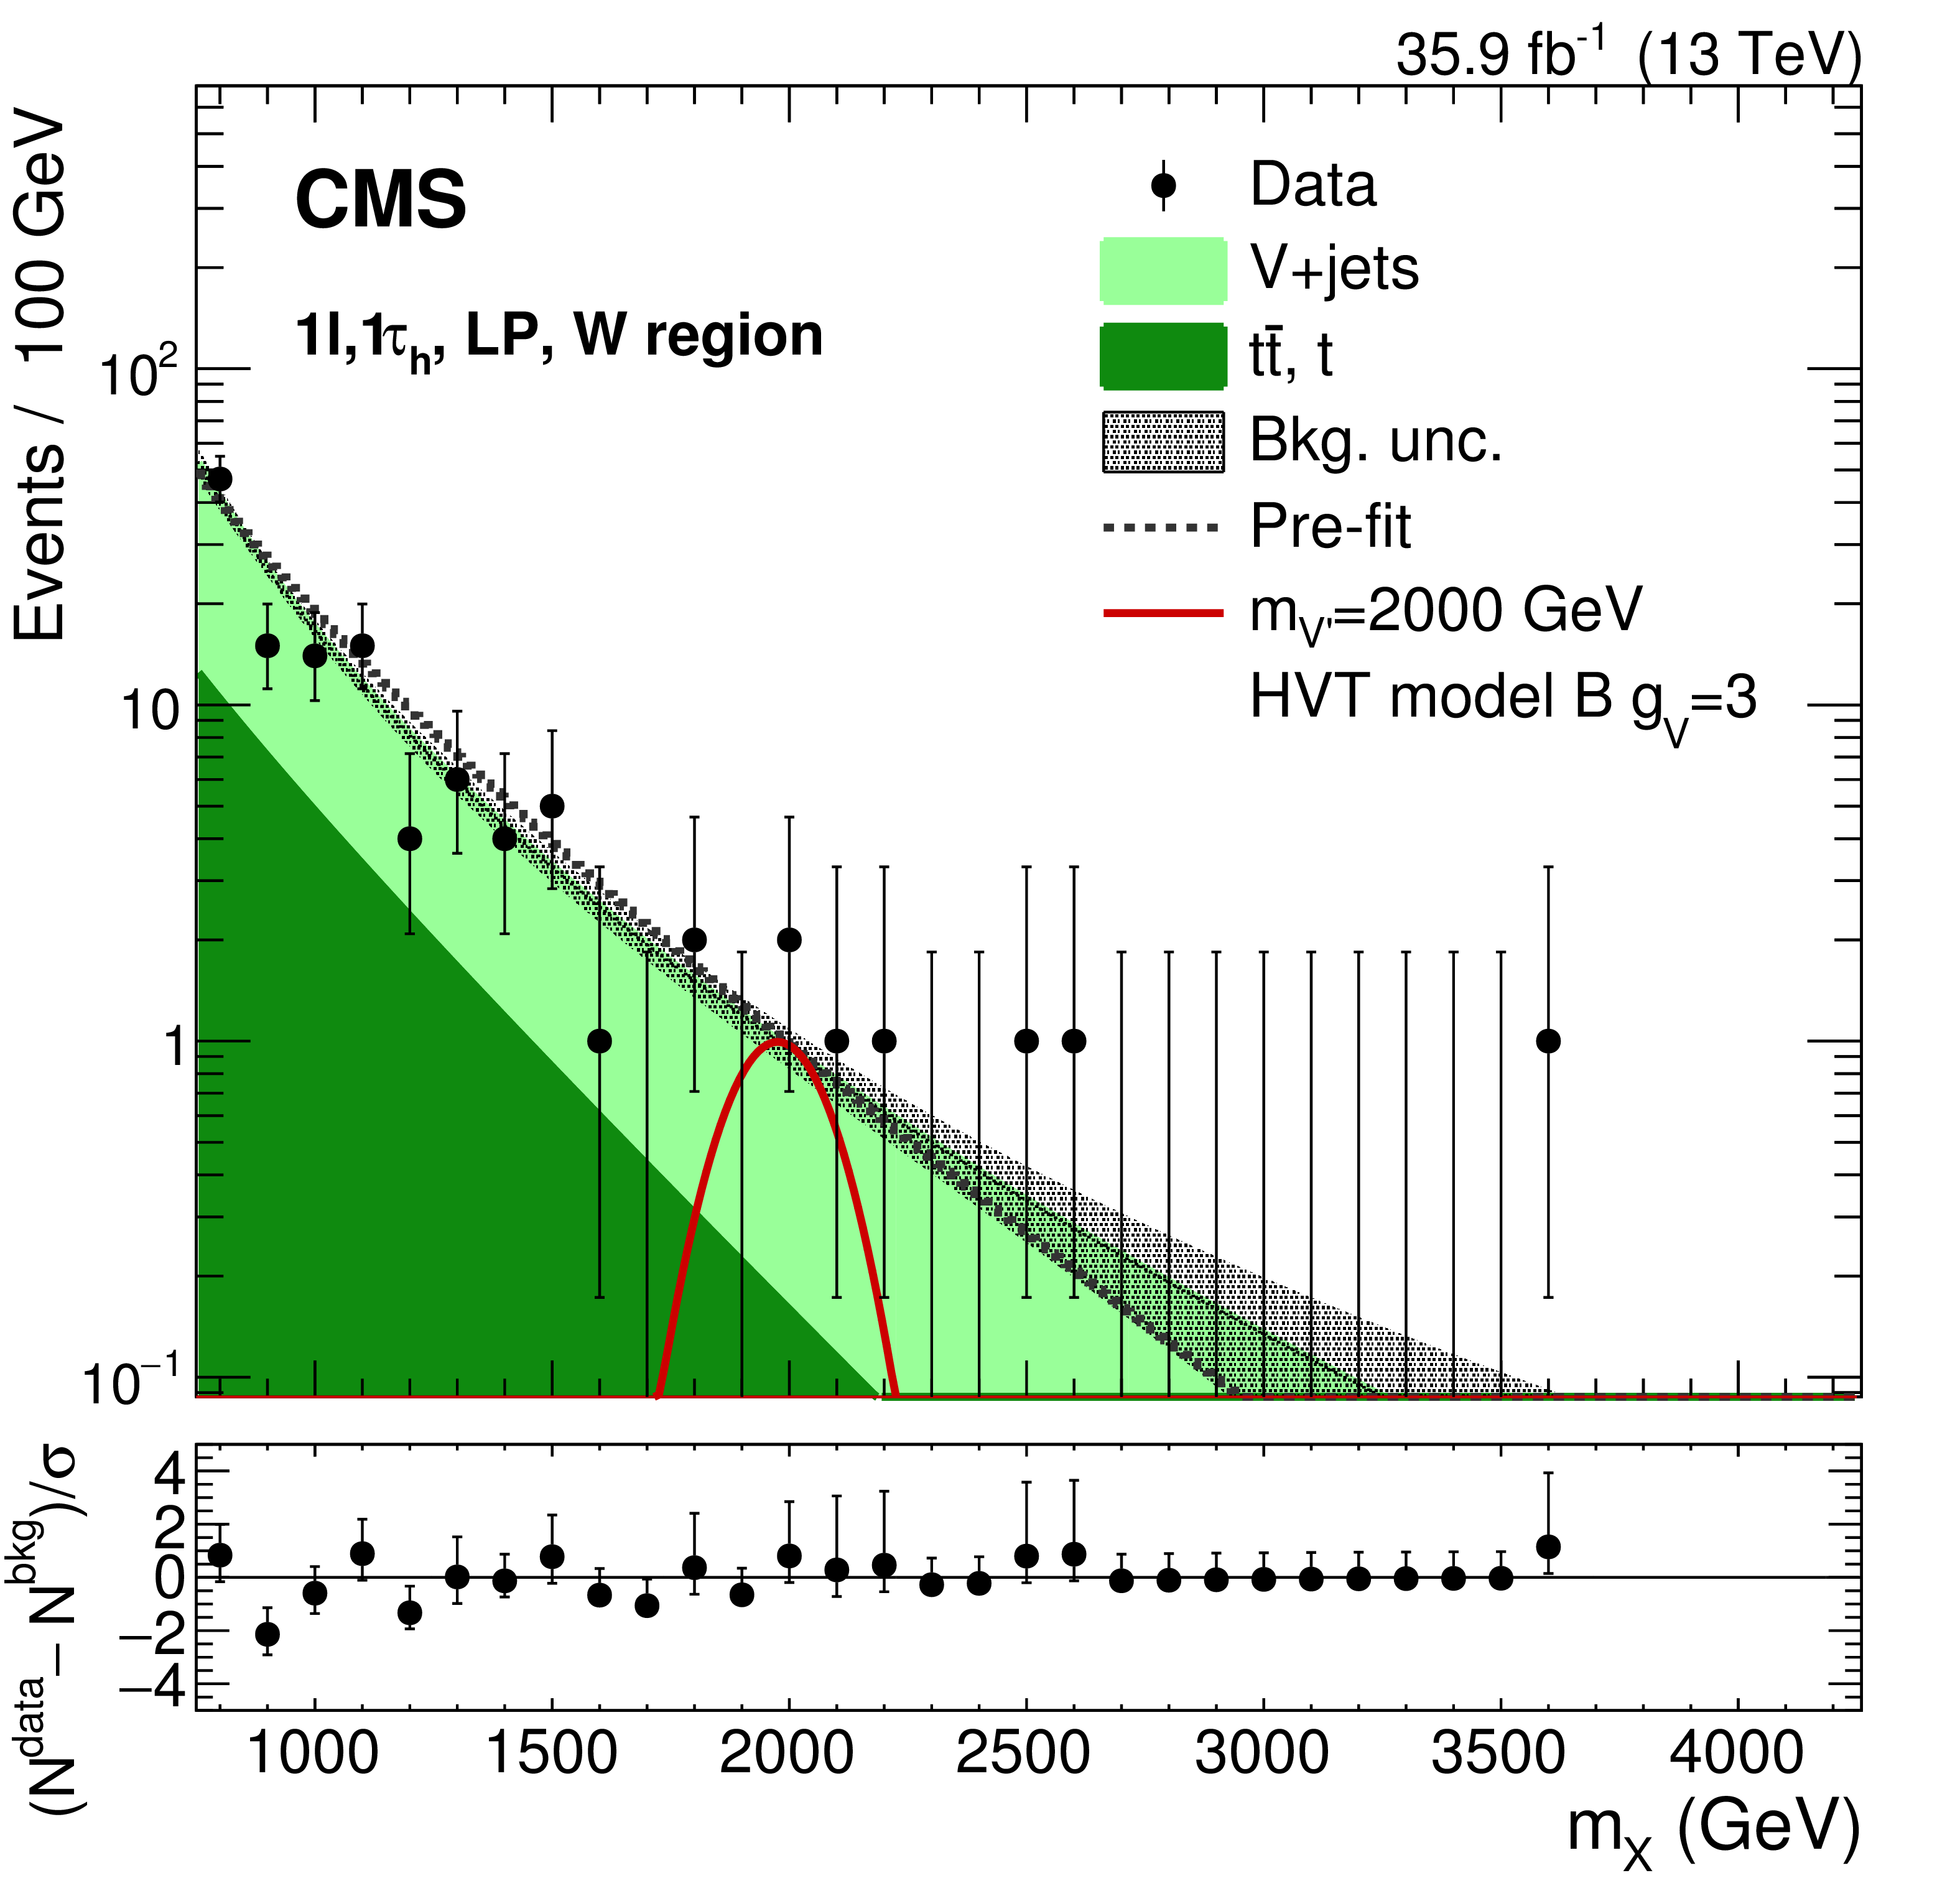
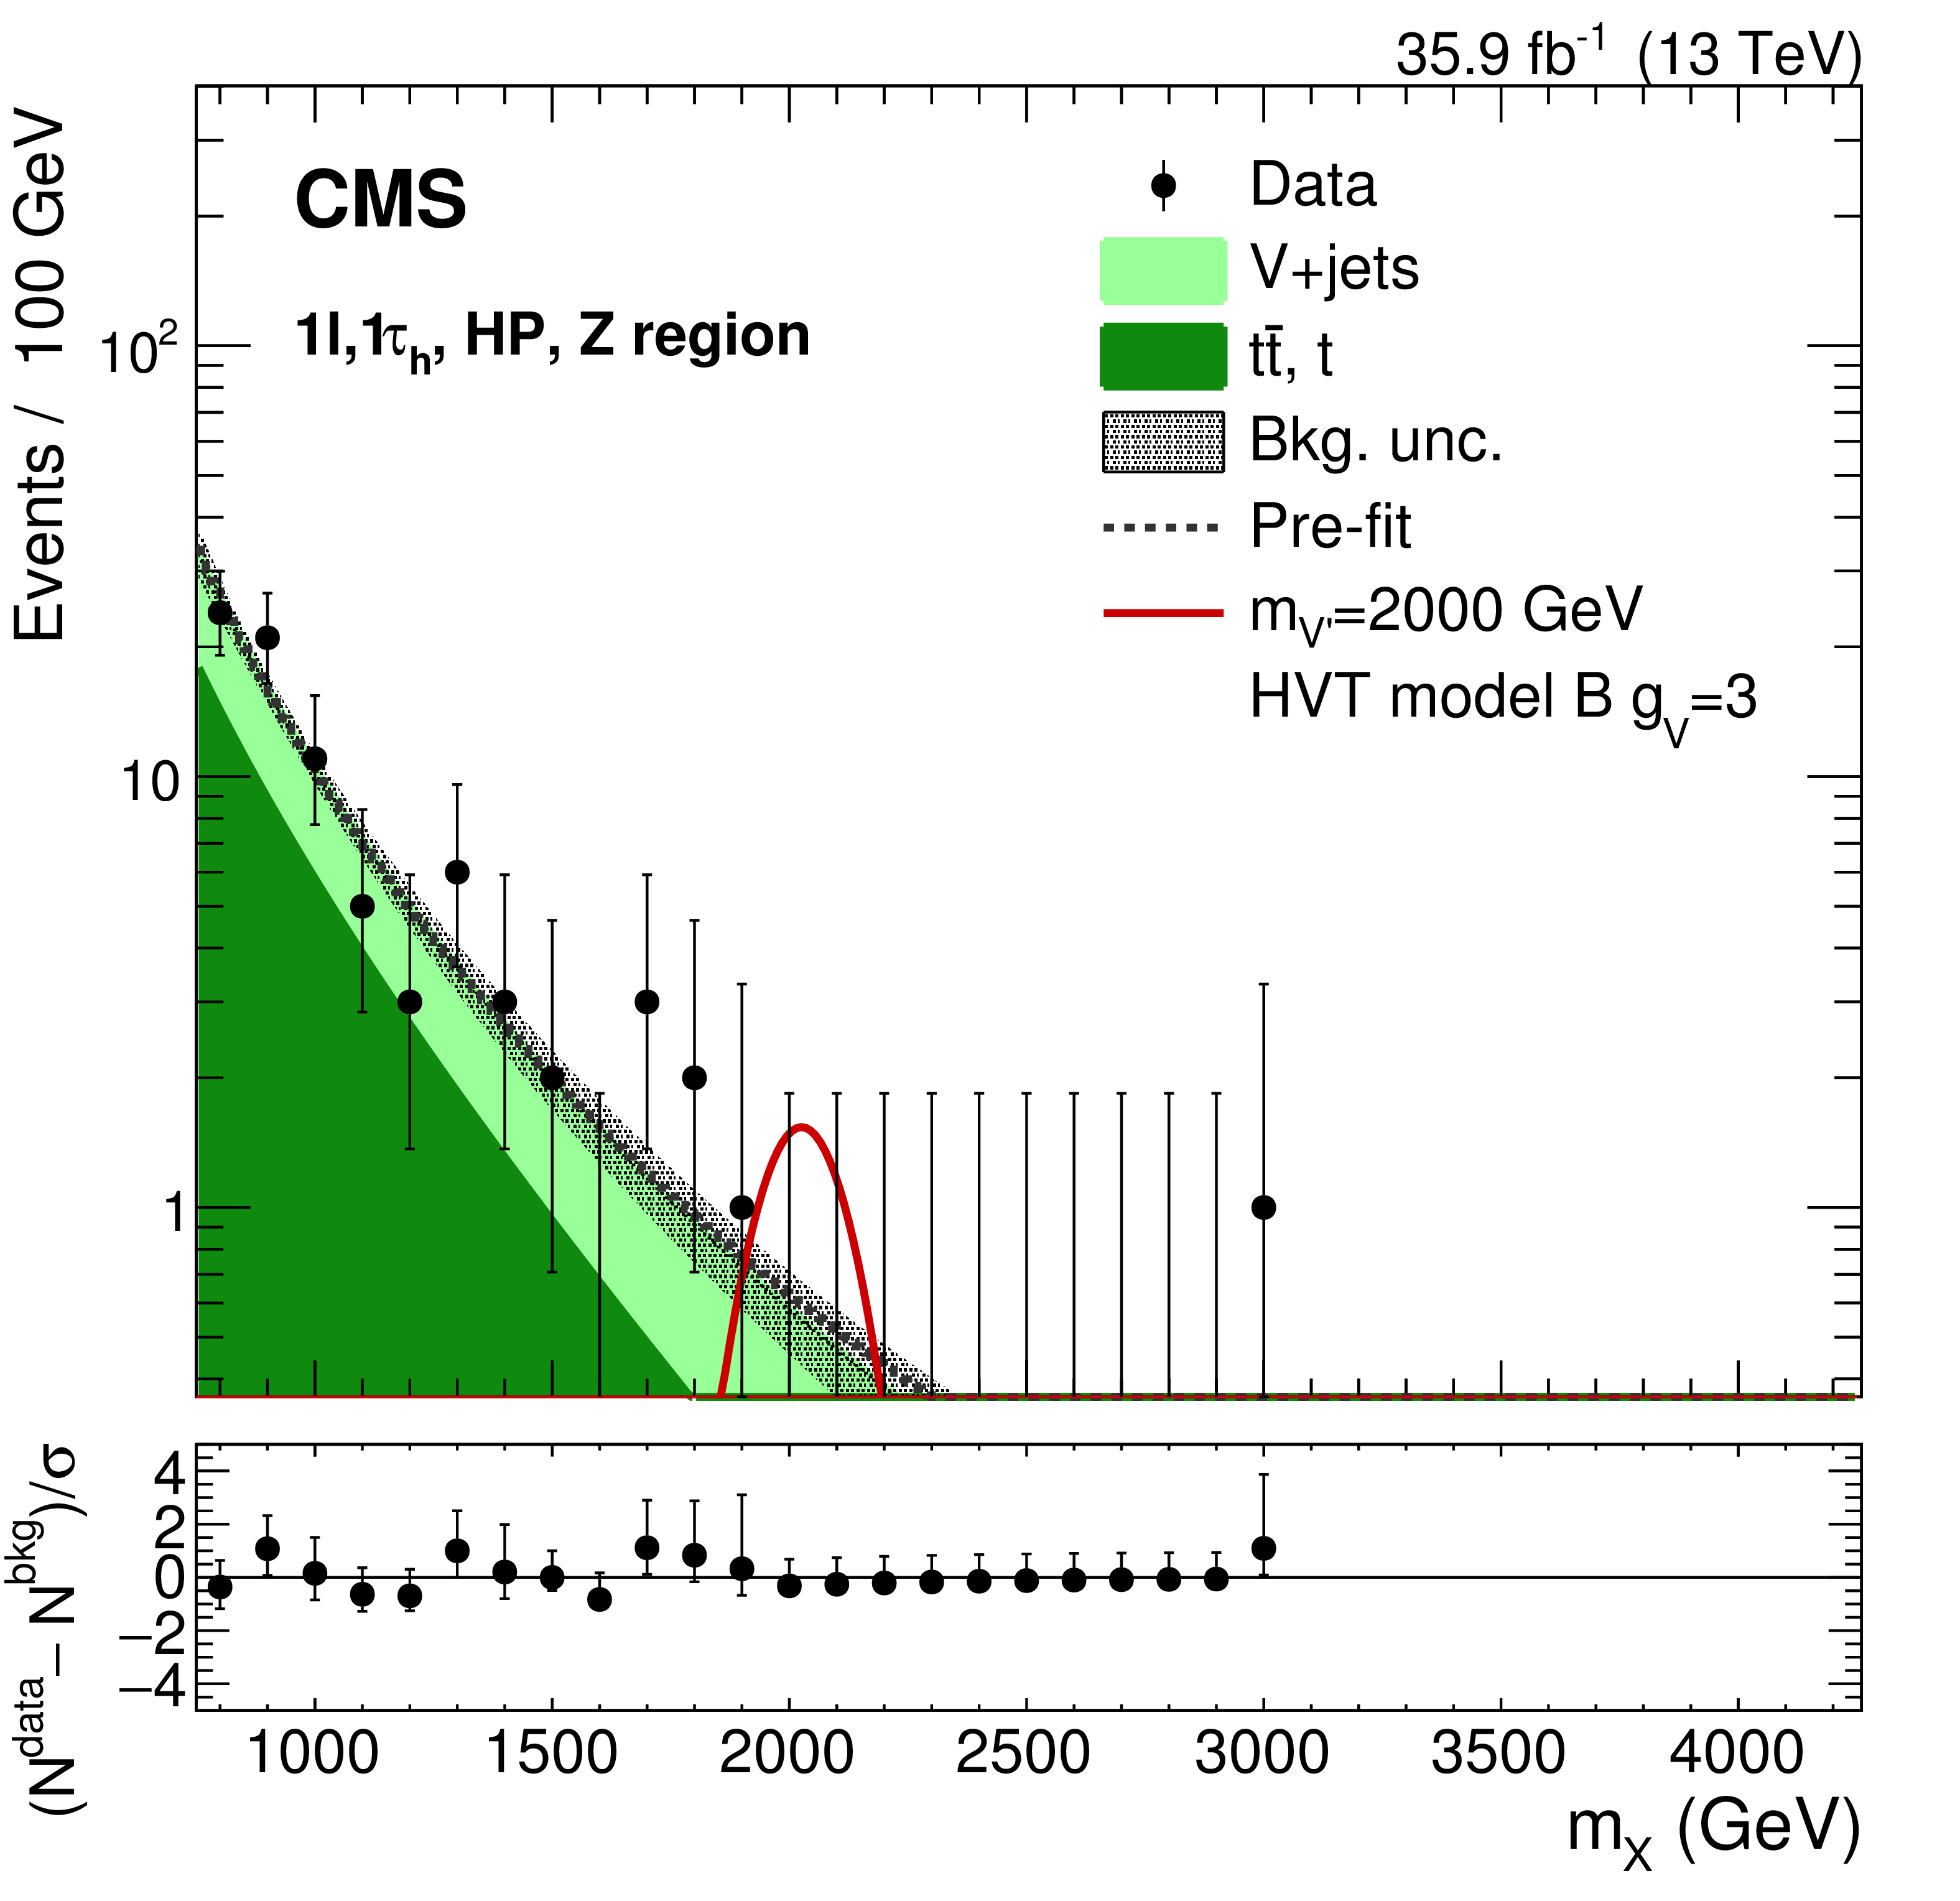
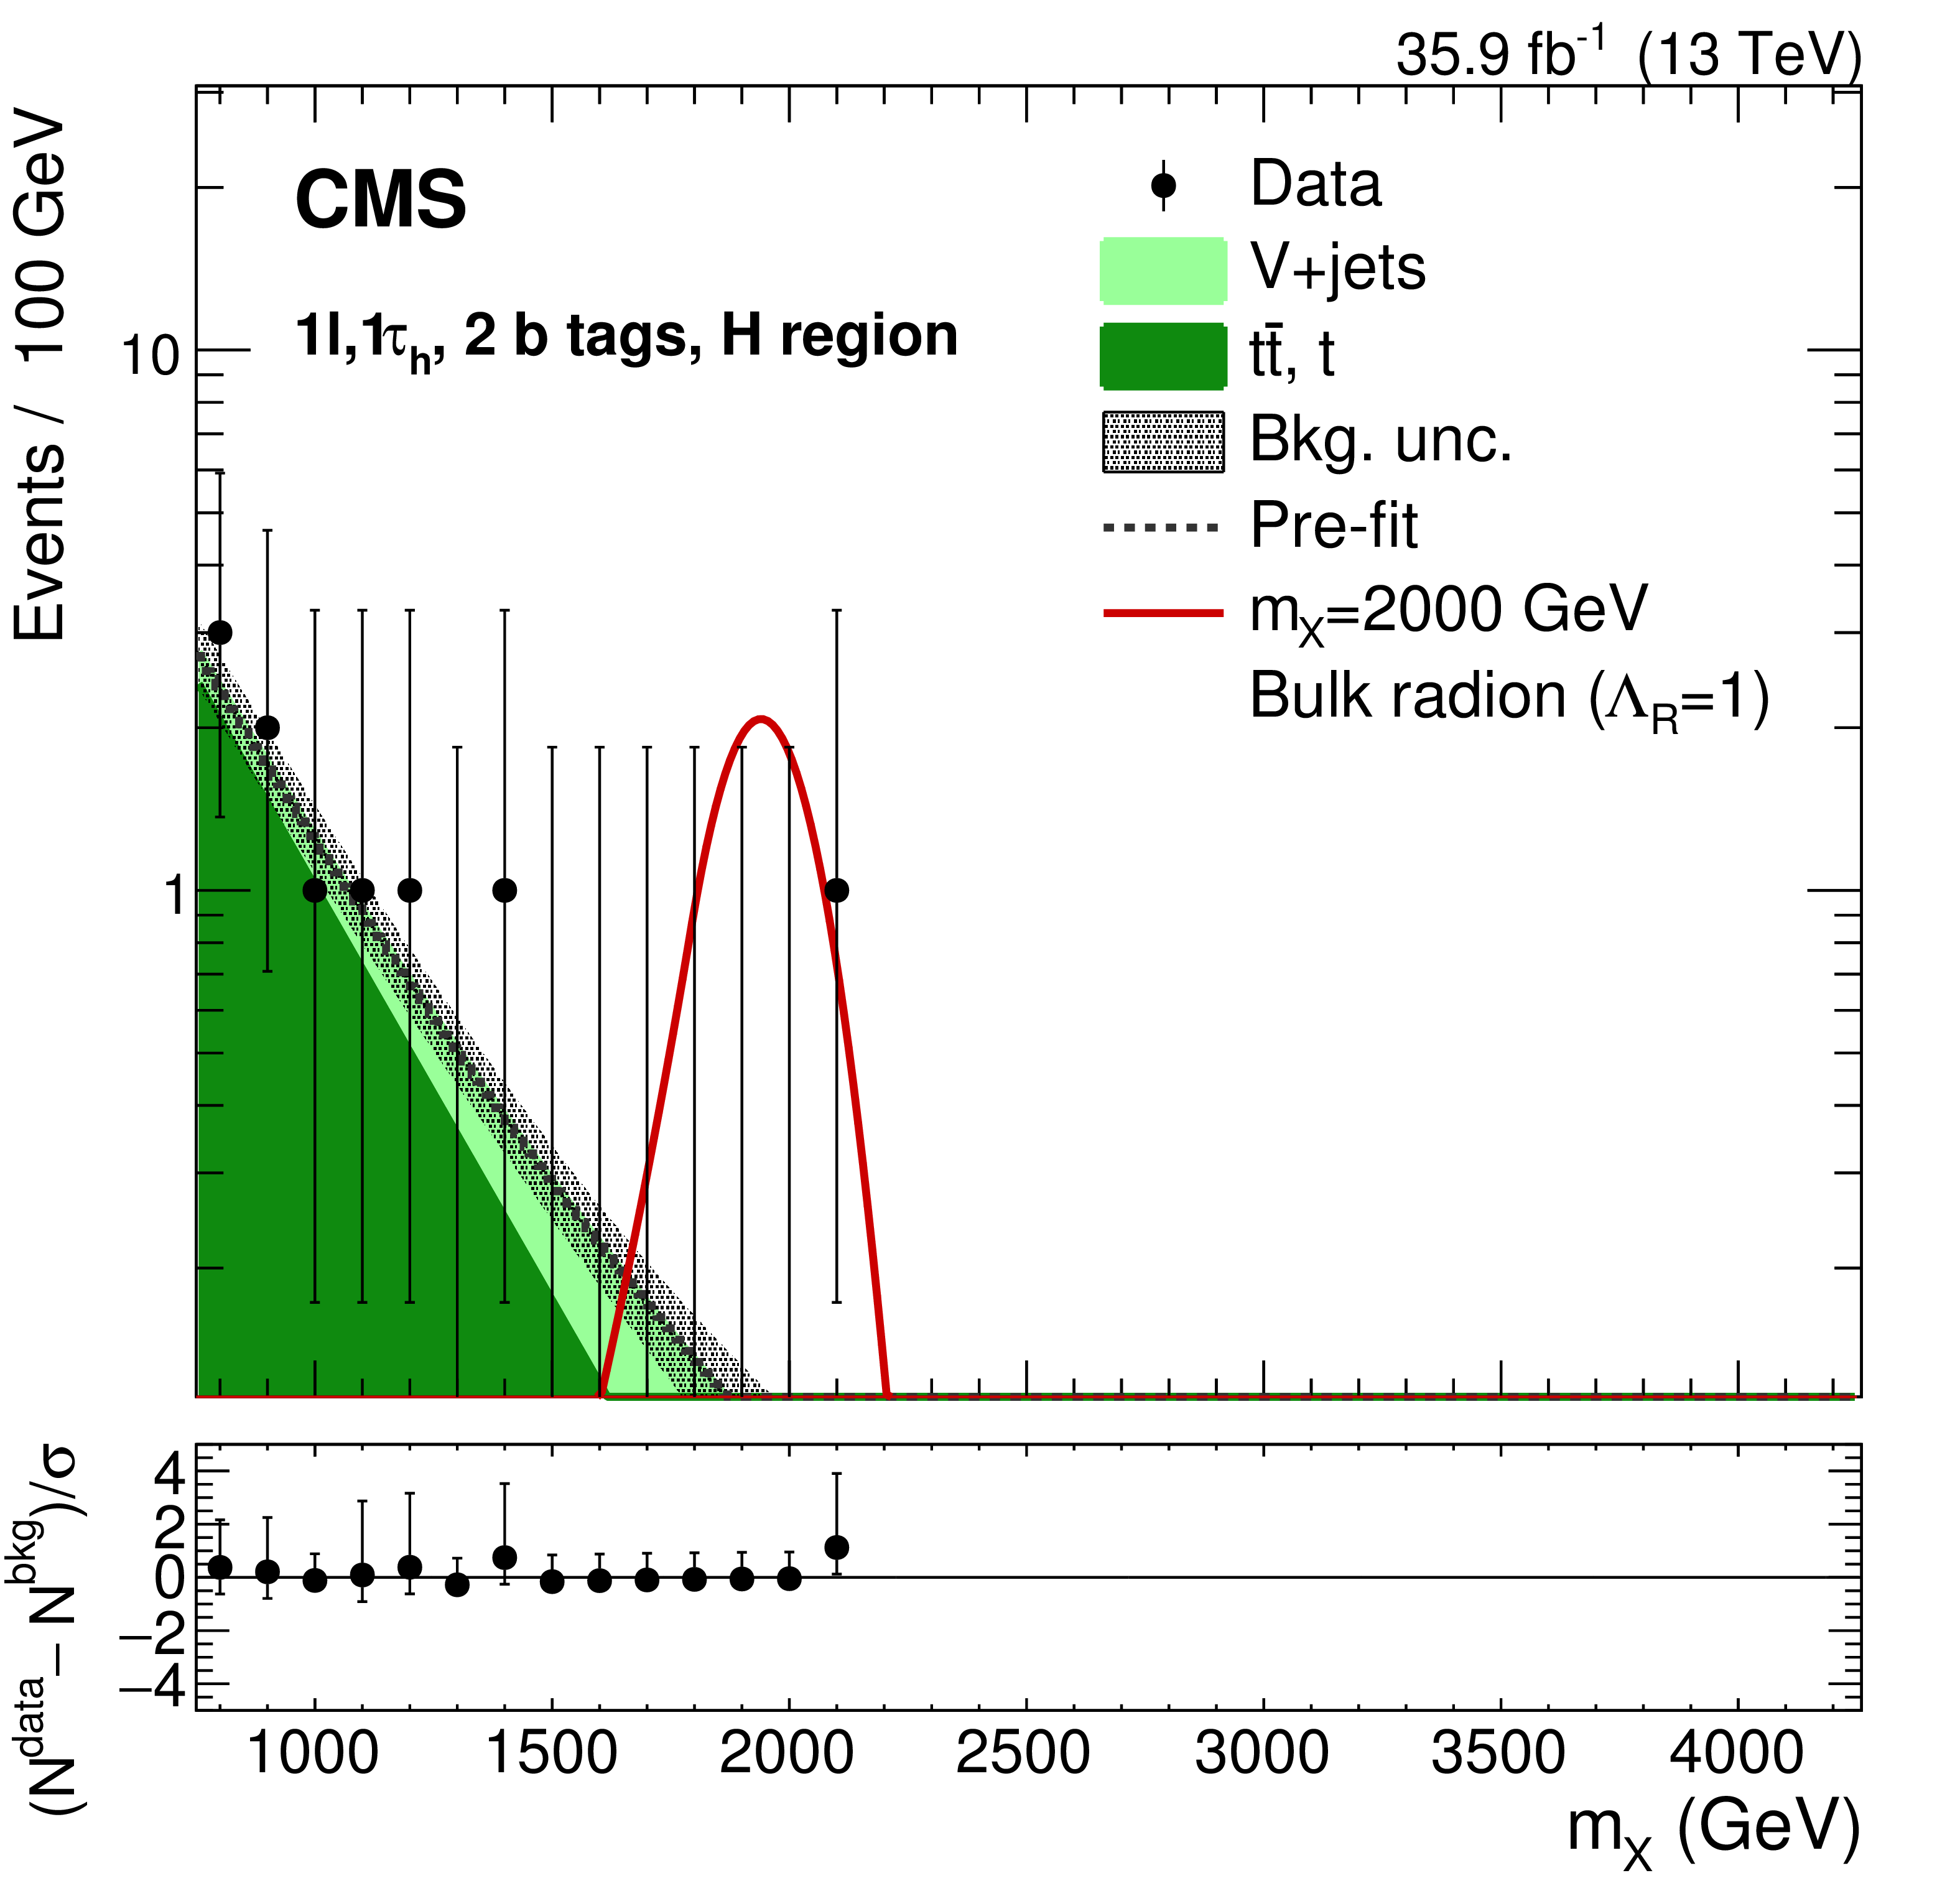
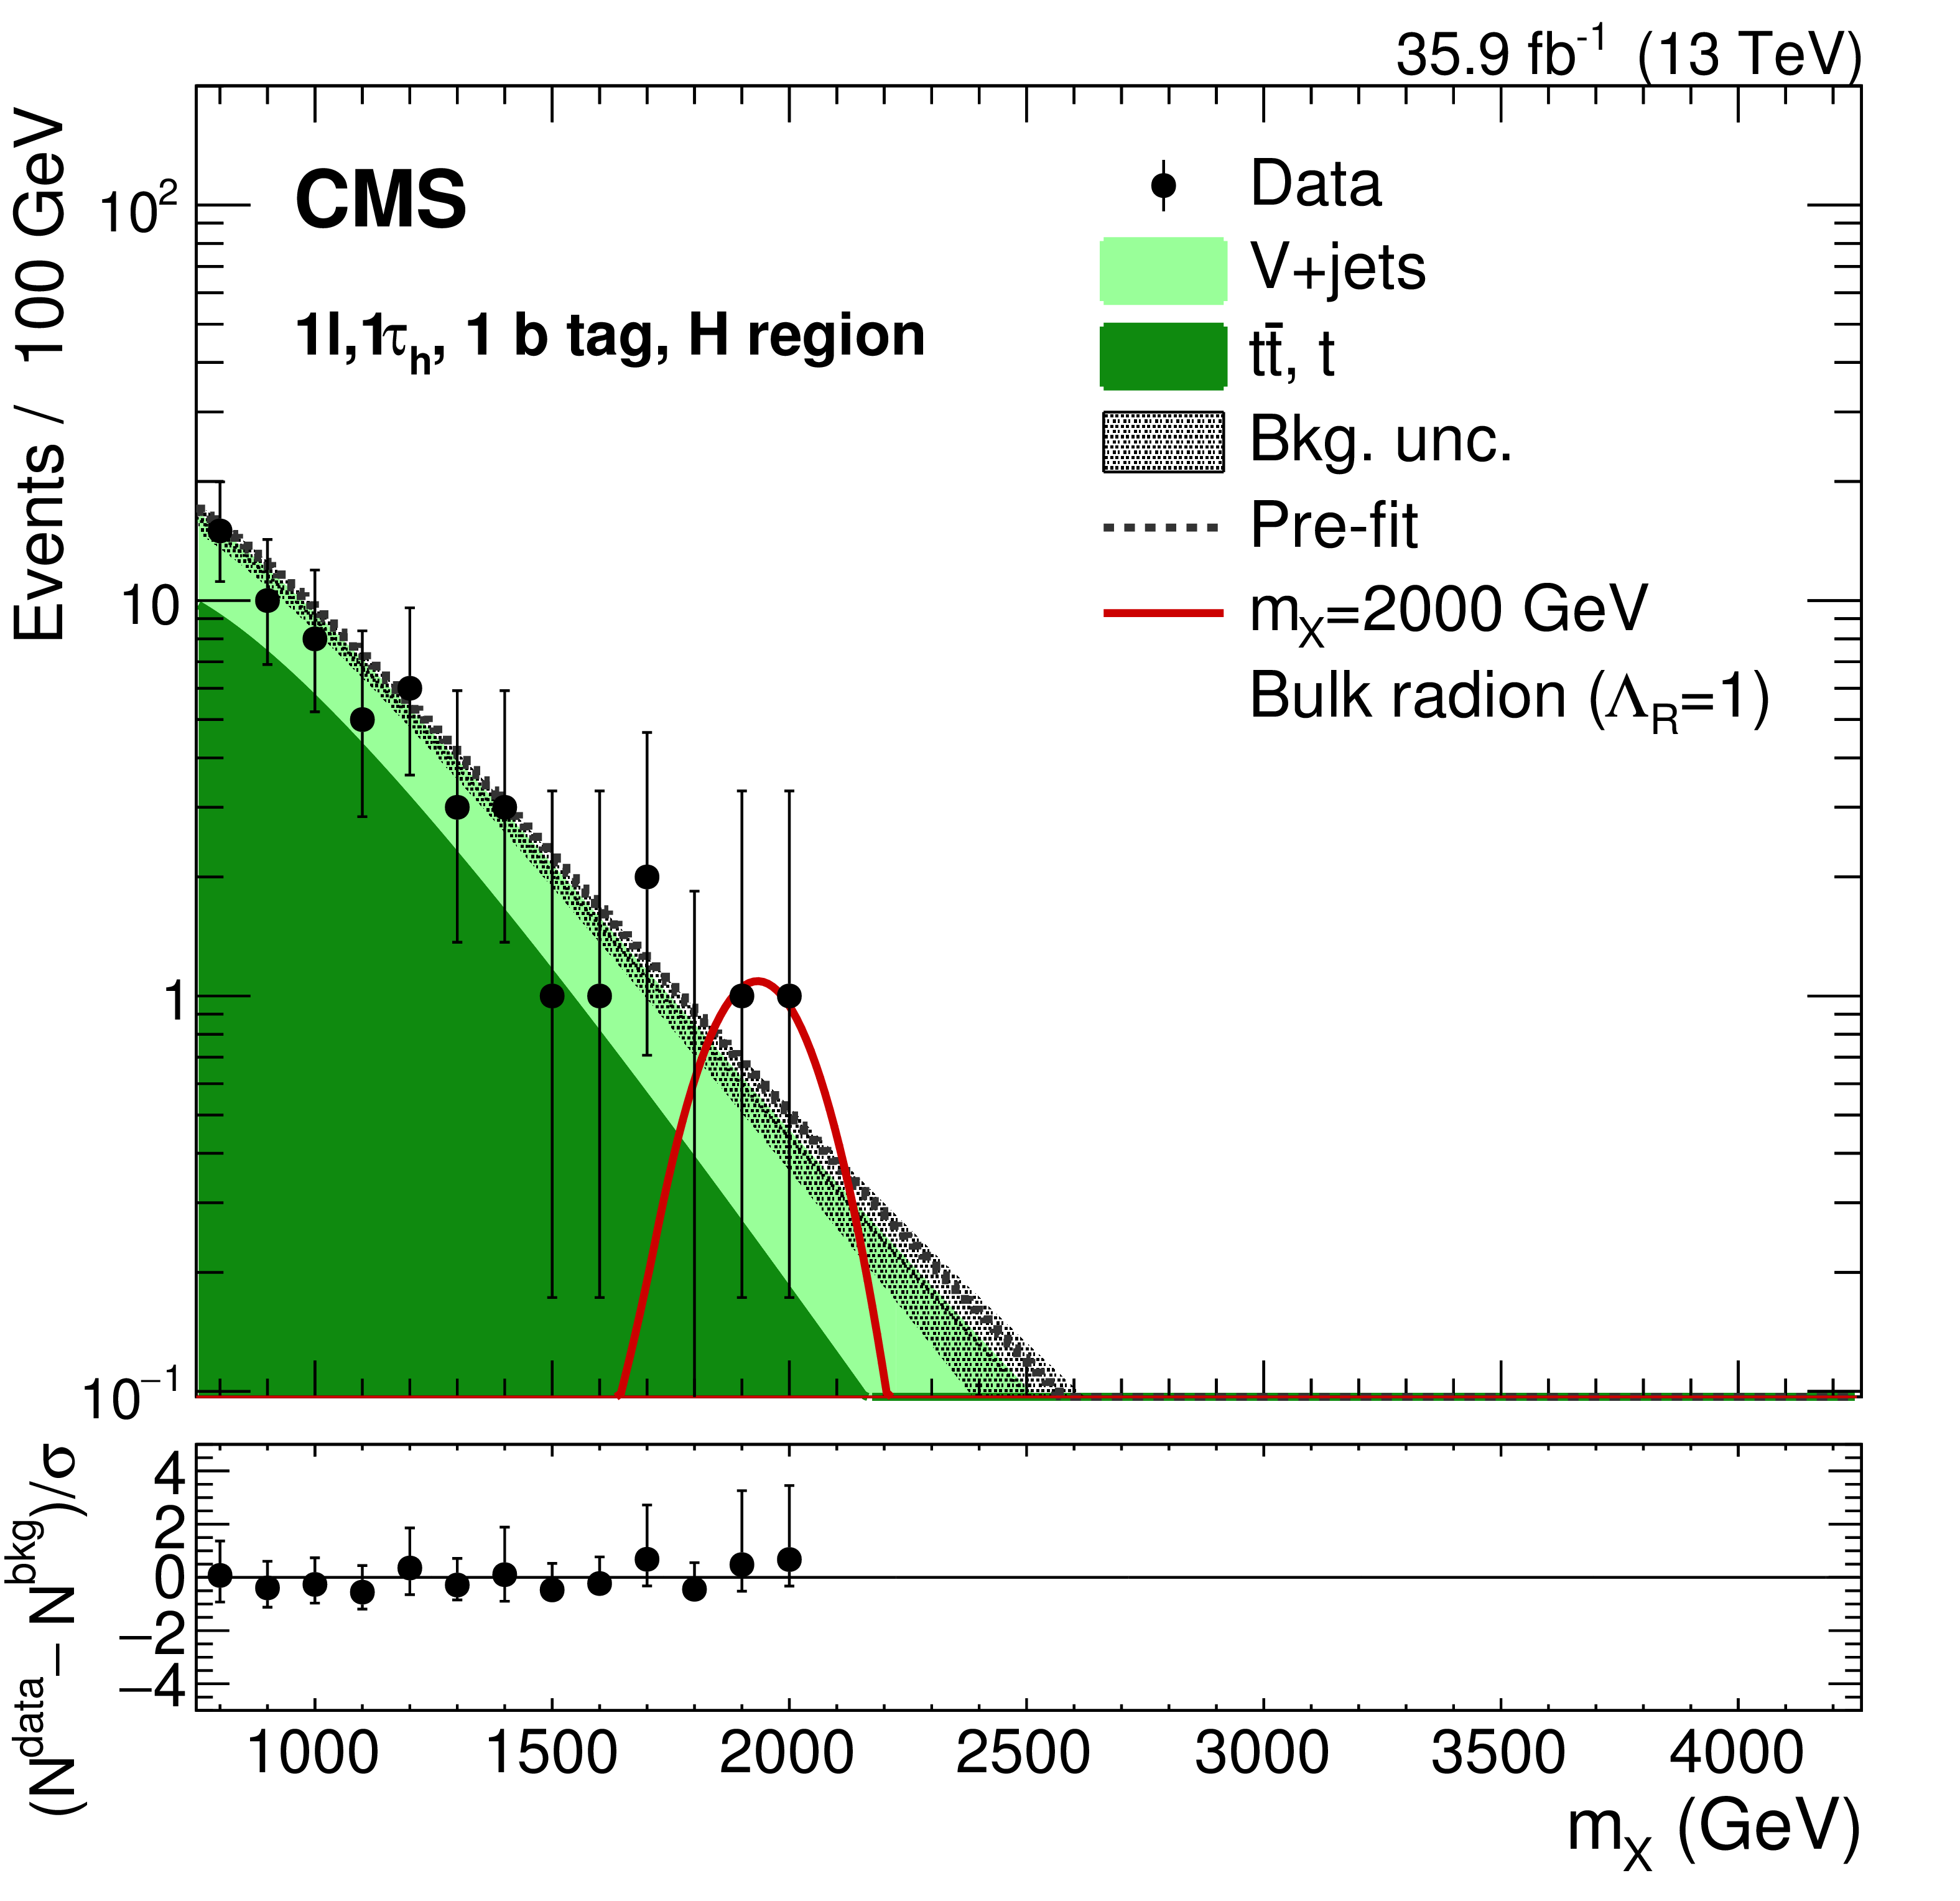
Data and expected backgrounds in the $\ell {{\tau} _\mathrm {h}} $ channel. The W mass window is shown in the HP (upper left) and LP (upper right) categories, the Z mass window for the HP (middle left) and LP (middle right) categories, and the H mass window for the two b-tagged subjet (lower left) and one b-tagged subjet (lower right) categories. The lower panels depict the pulls in each bin, $(\mathrm {N}_{\mathrm {data}} - \mathrm {N}_{\mathrm {bkg}})/\sigma $, where $\sigma $ is the statistical uncertainty in data, as given by the Garwood interval [63], and provide estimates of the goodness of fit. Signal contributions are shown, assuming benchmark HVT model B for the V' and $\lambda _{\mathrm {R}}=$ 1 for the radion. |
png pdf |
Figure 3-a:
Data and expected backgrounds in the $\ell {{\tau} _\mathrm {h}} $ channel. The W mass window is shown for the HP category. The lower panel depicts the pulls in each bin, $(\mathrm {N}_{\mathrm {data}} - \mathrm {N}_{\mathrm {bkg}})/\sigma $, where $\sigma $ is the statistical uncertainty in data, as given by the Garwood interval [63], and provides estimate of the goodness of fit. Signal contributions are shown, assuming benchmark HVT model B for the V' and $\lambda _{\mathrm {R}}=$ 1 for the radion. |
png pdf |
Figure 3-b:
Data and expected backgrounds in the $\ell {{\tau} _\mathrm {h}} $ channel. The W mass window is shown for the LP category. The lower panel depicts the pulls in each bin, $(\mathrm {N}_{\mathrm {data}} - \mathrm {N}_{\mathrm {bkg}})/\sigma $, where $\sigma $ is the statistical uncertainty in data, as given by the Garwood interval [63], and provides estimate of the goodness of fit. Signal contributions are shown, assuming benchmark HVT model B for the V' and $\lambda _{\mathrm {R}}=$ 1 for the radion. |
png pdf |
Figure 3-c:
Data and expected backgrounds in the $\ell {{\tau} _\mathrm {h}} $ channel. The Z mass window is shown for the HP category. The lower panel depicts the pulls in each bin, $(\mathrm {N}_{\mathrm {data}} - \mathrm {N}_{\mathrm {bkg}})/\sigma $, where $\sigma $ is the statistical uncertainty in data, as given by the Garwood interval [63], and provides estimate of the goodness of fit. Signal contributions are shown, assuming benchmark HVT model B for the V' and $\lambda _{\mathrm {R}}=$ 1 for the radion. |

png pdf |
Figure 3-d:
Data and expected backgrounds in the $\ell {{\tau} _\mathrm {h}} $ channel. The Z mass window is shown for the LP category. The lower panel depicts the pulls in each bin, $(\mathrm {N}_{\mathrm {data}} - \mathrm {N}_{\mathrm {bkg}})/\sigma $, where $\sigma $ is the statistical uncertainty in data, as given by the Garwood interval [63], and provides estimate of the goodness of fit. Signal contributions are shown, assuming benchmark HVT model B for the V' and $\lambda _{\mathrm {R}}=$ 1 for the radion. |
png pdf |
Figure 3-e:
Data and expected backgrounds in the $\ell {{\tau} _\mathrm {h}} $ channel. The H mass window is shown for the two b-tagged subjet category. The lower panel depicts the pulls in each bin, $(\mathrm {N}_{\mathrm {data}} - \mathrm {N}_{\mathrm {bkg}})/\sigma $, where $\sigma $ is the statistical uncertainty in data, as given by the Garwood interval [63], and provides estimate of the goodness of fit. Signal contributions are shown, assuming benchmark HVT model B for the V' and $\lambda _{\mathrm {R}}=$ 1 for the radion. |
png pdf |
Figure 3-f:
Data and expected backgrounds in the $\ell {{\tau} _\mathrm {h}} $ channel. The H mass window is shown for the one b-tagged subjet category. The lower panel depicts the pulls in each bin, $(\mathrm {N}_{\mathrm {data}} - \mathrm {N}_{\mathrm {bkg}})/\sigma $, where $\sigma $ is the statistical uncertainty in data, as given by the Garwood interval [63], and provides estimate of the goodness of fit. Signal contributions are shown, assuming benchmark HVT model B for the V' and $\lambda _{\mathrm {R}}=$ 1 for the radion. |
png pdf |
Figure 4:
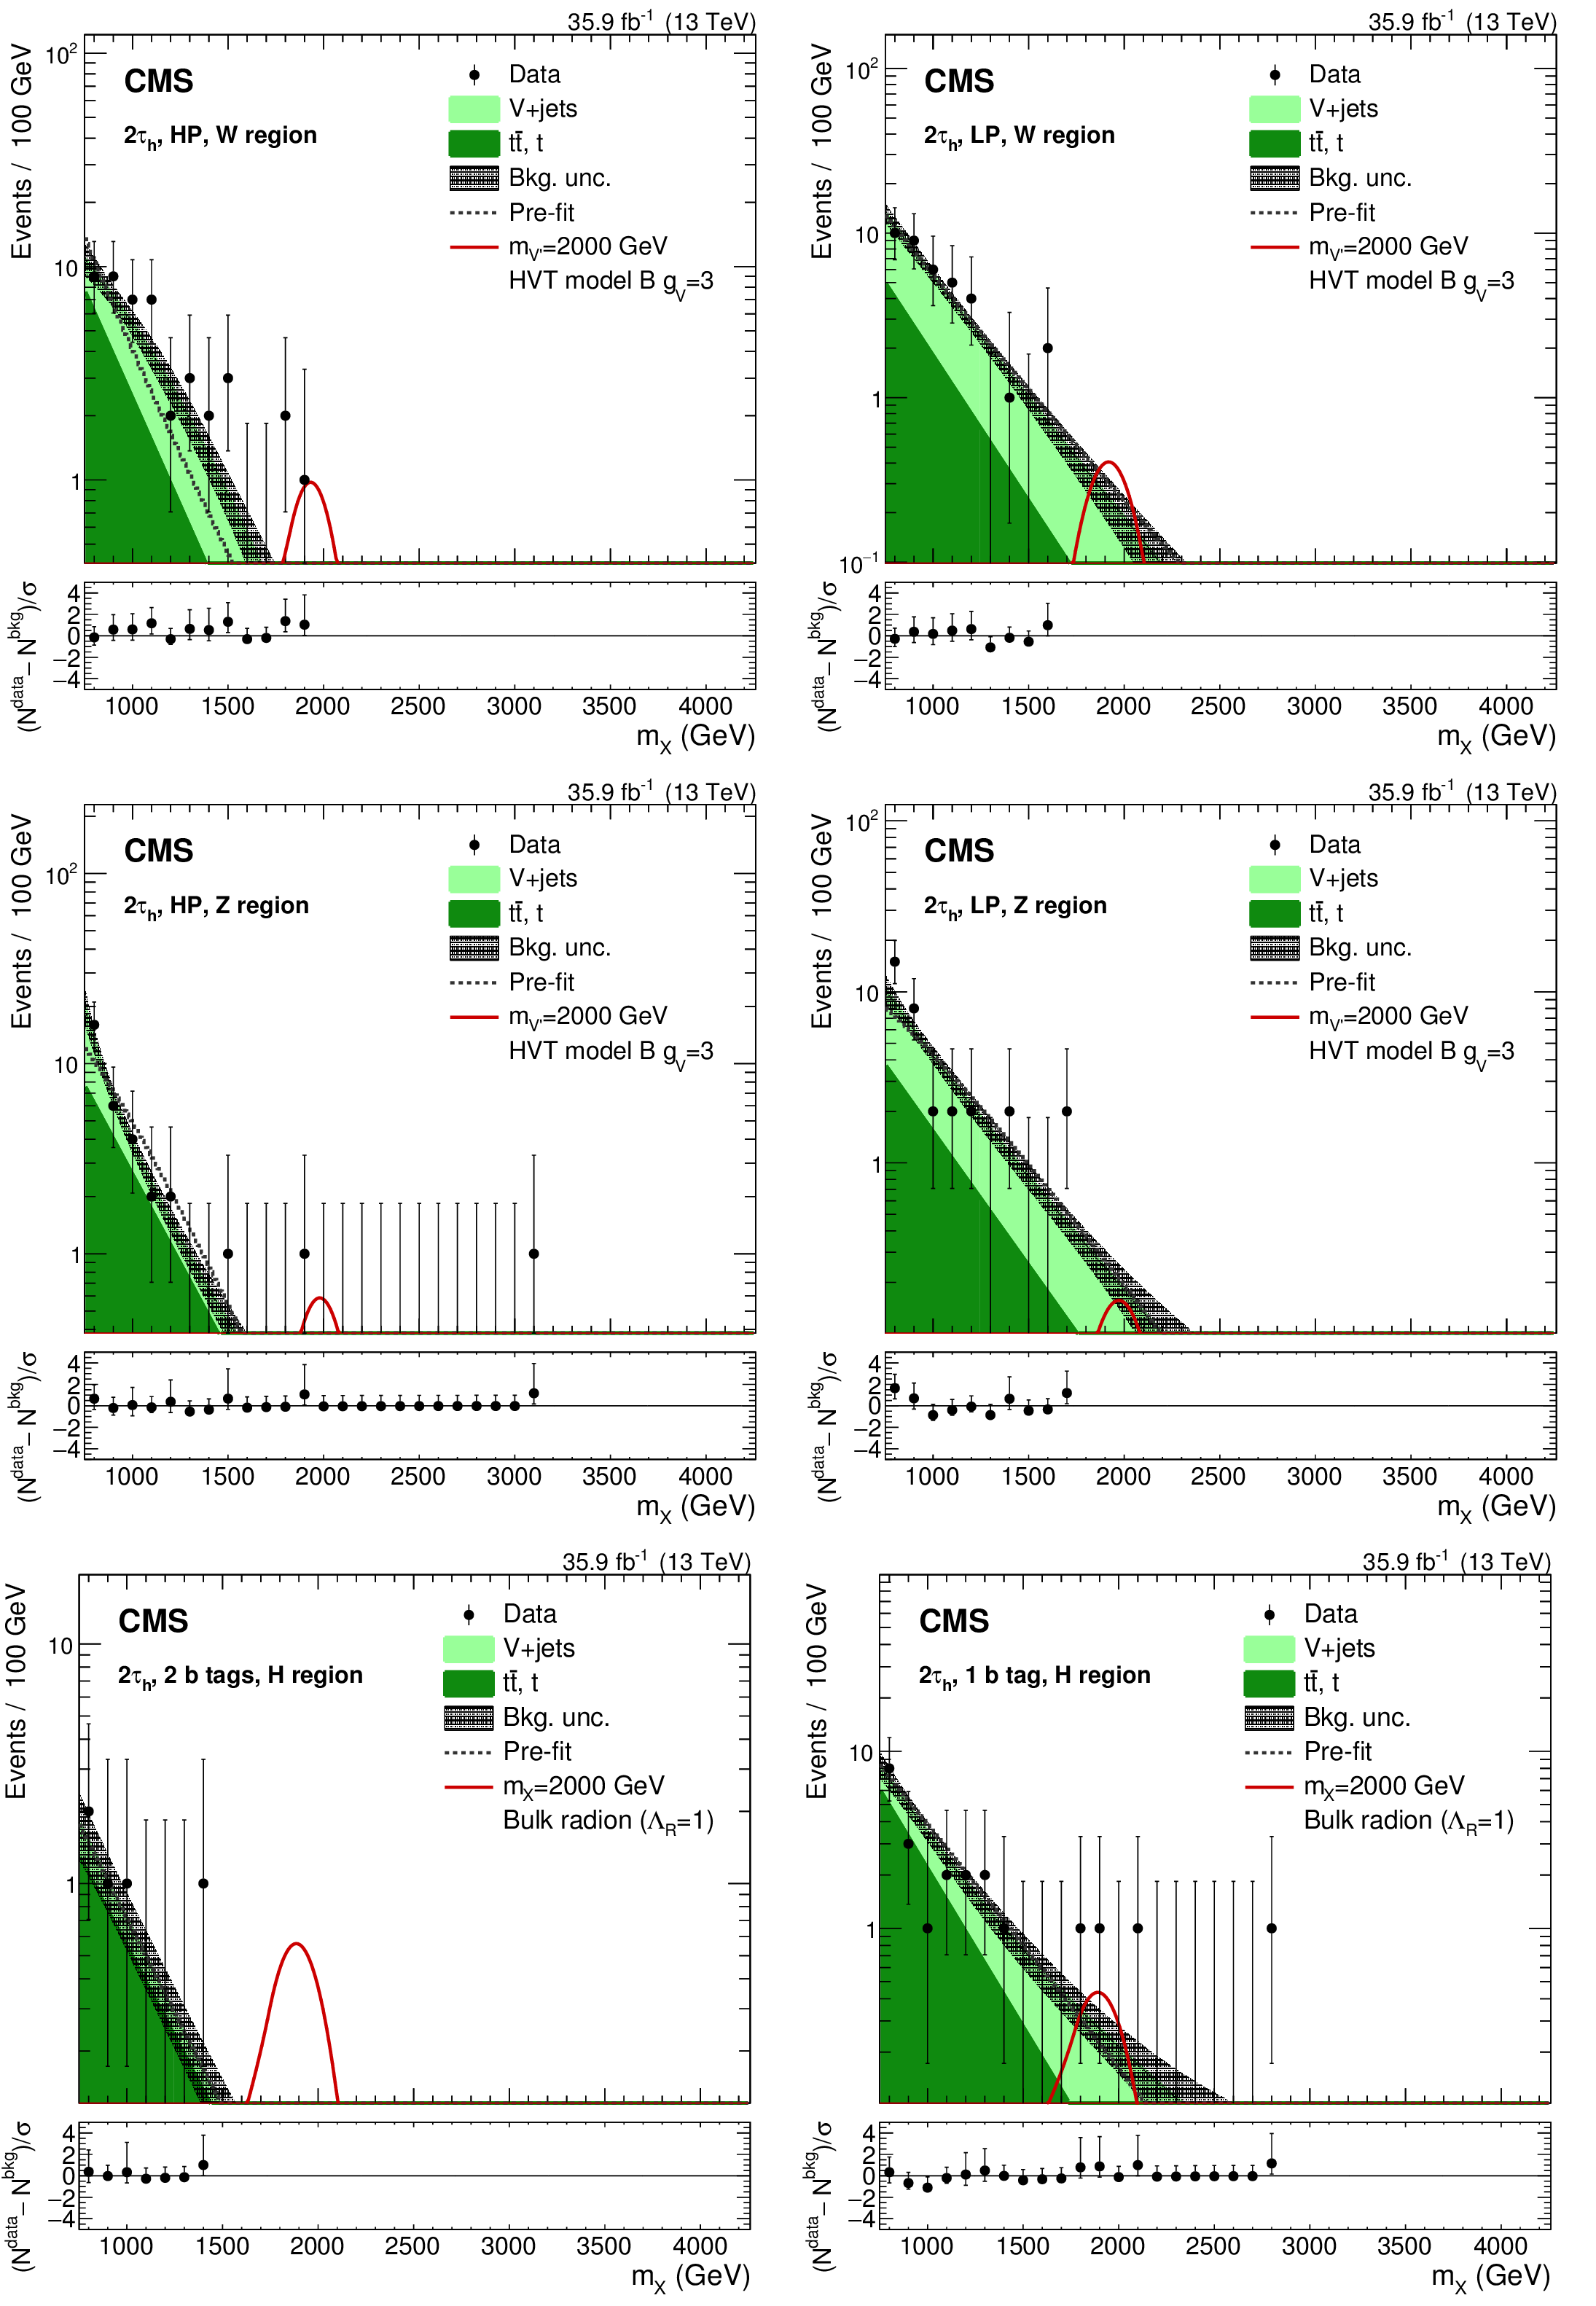
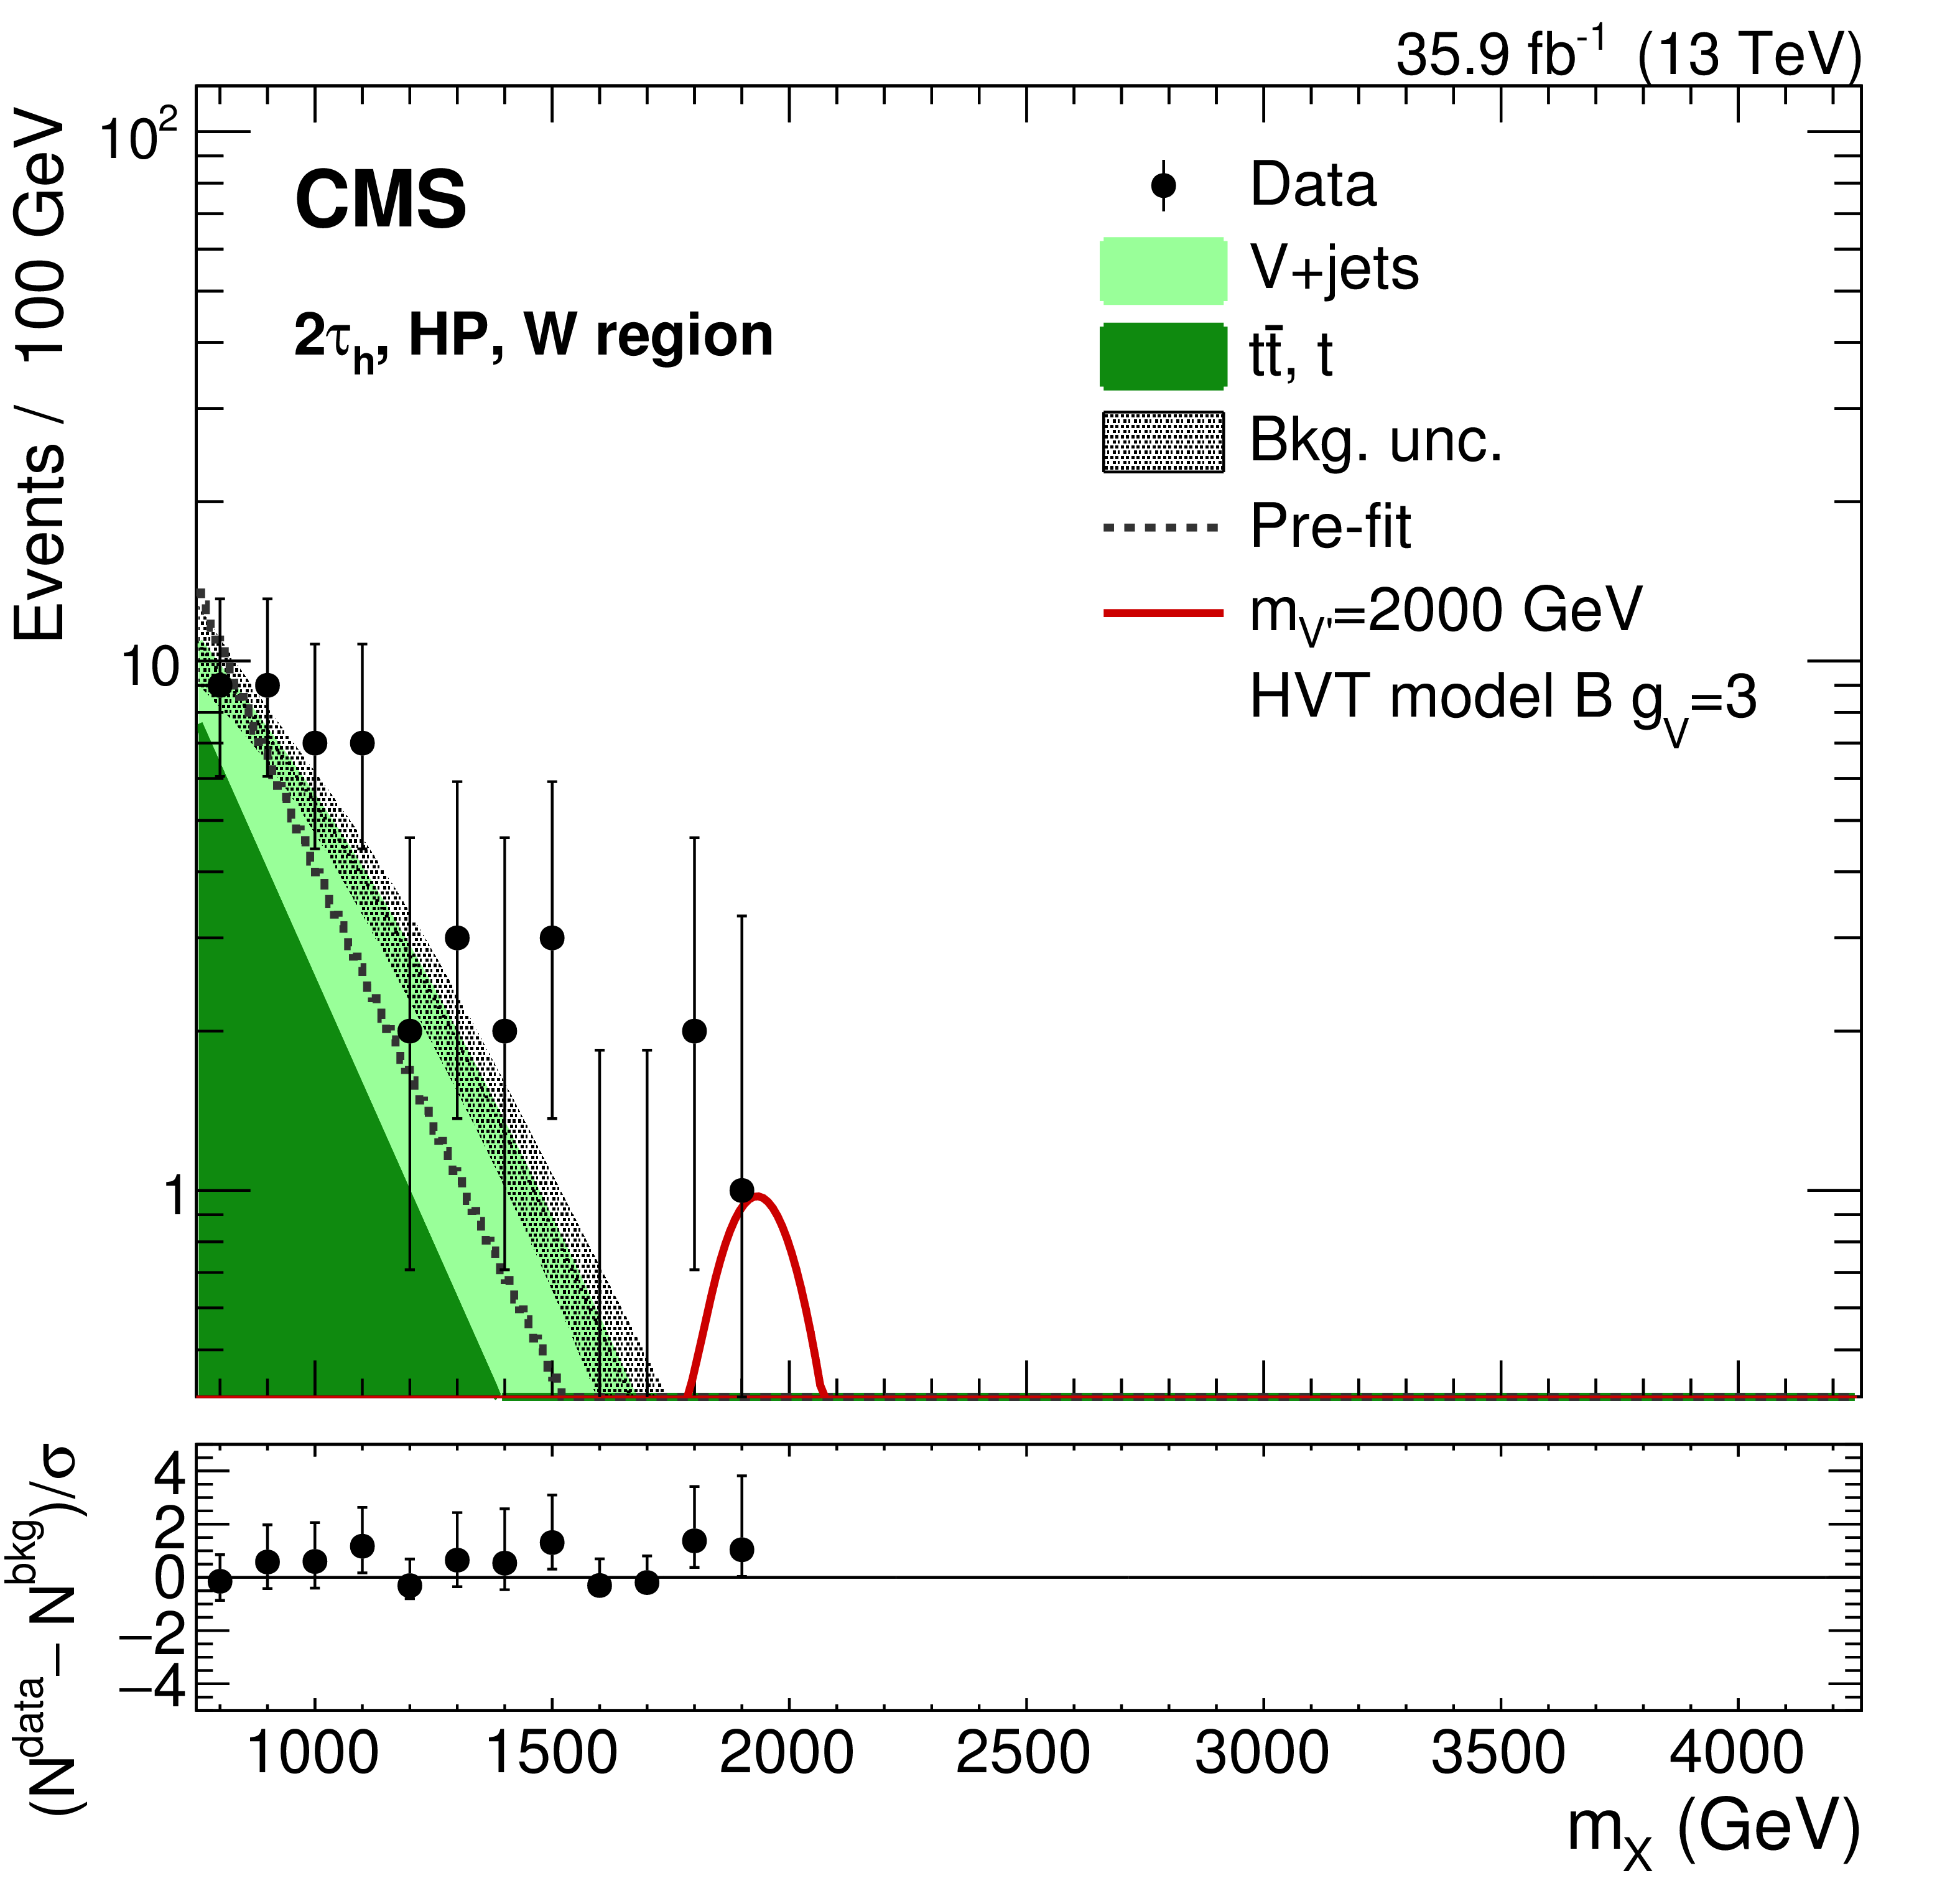
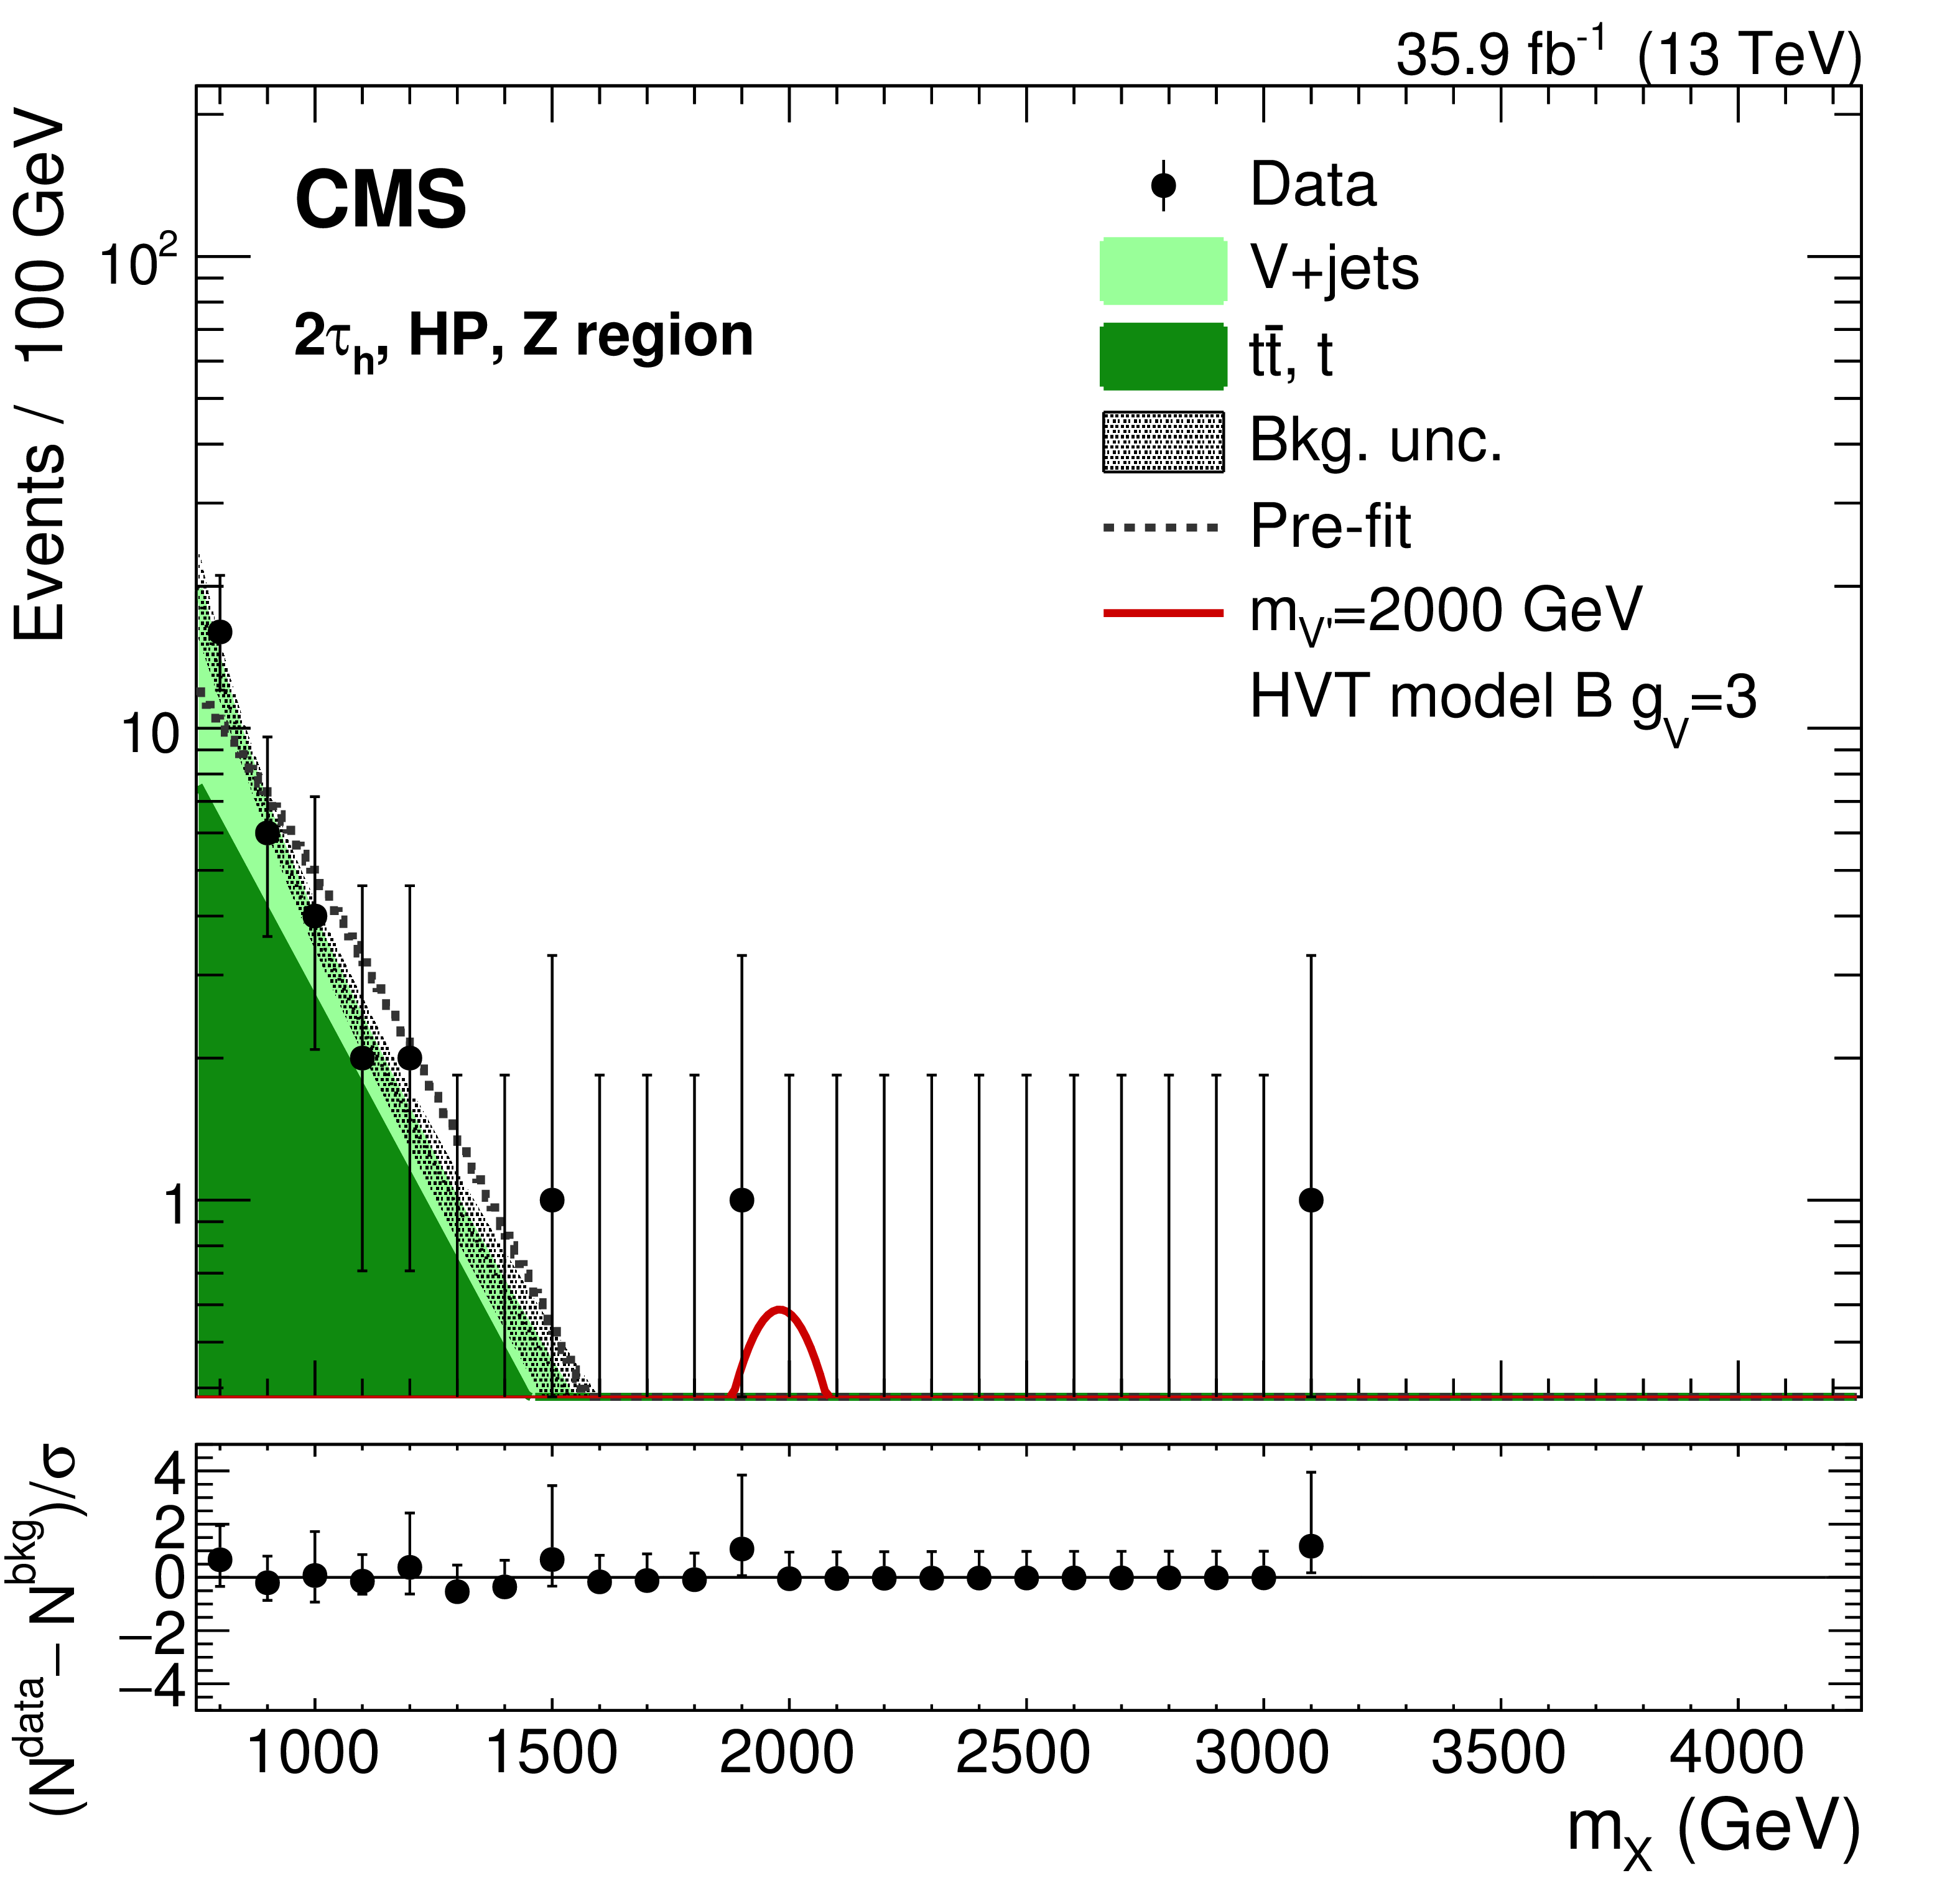
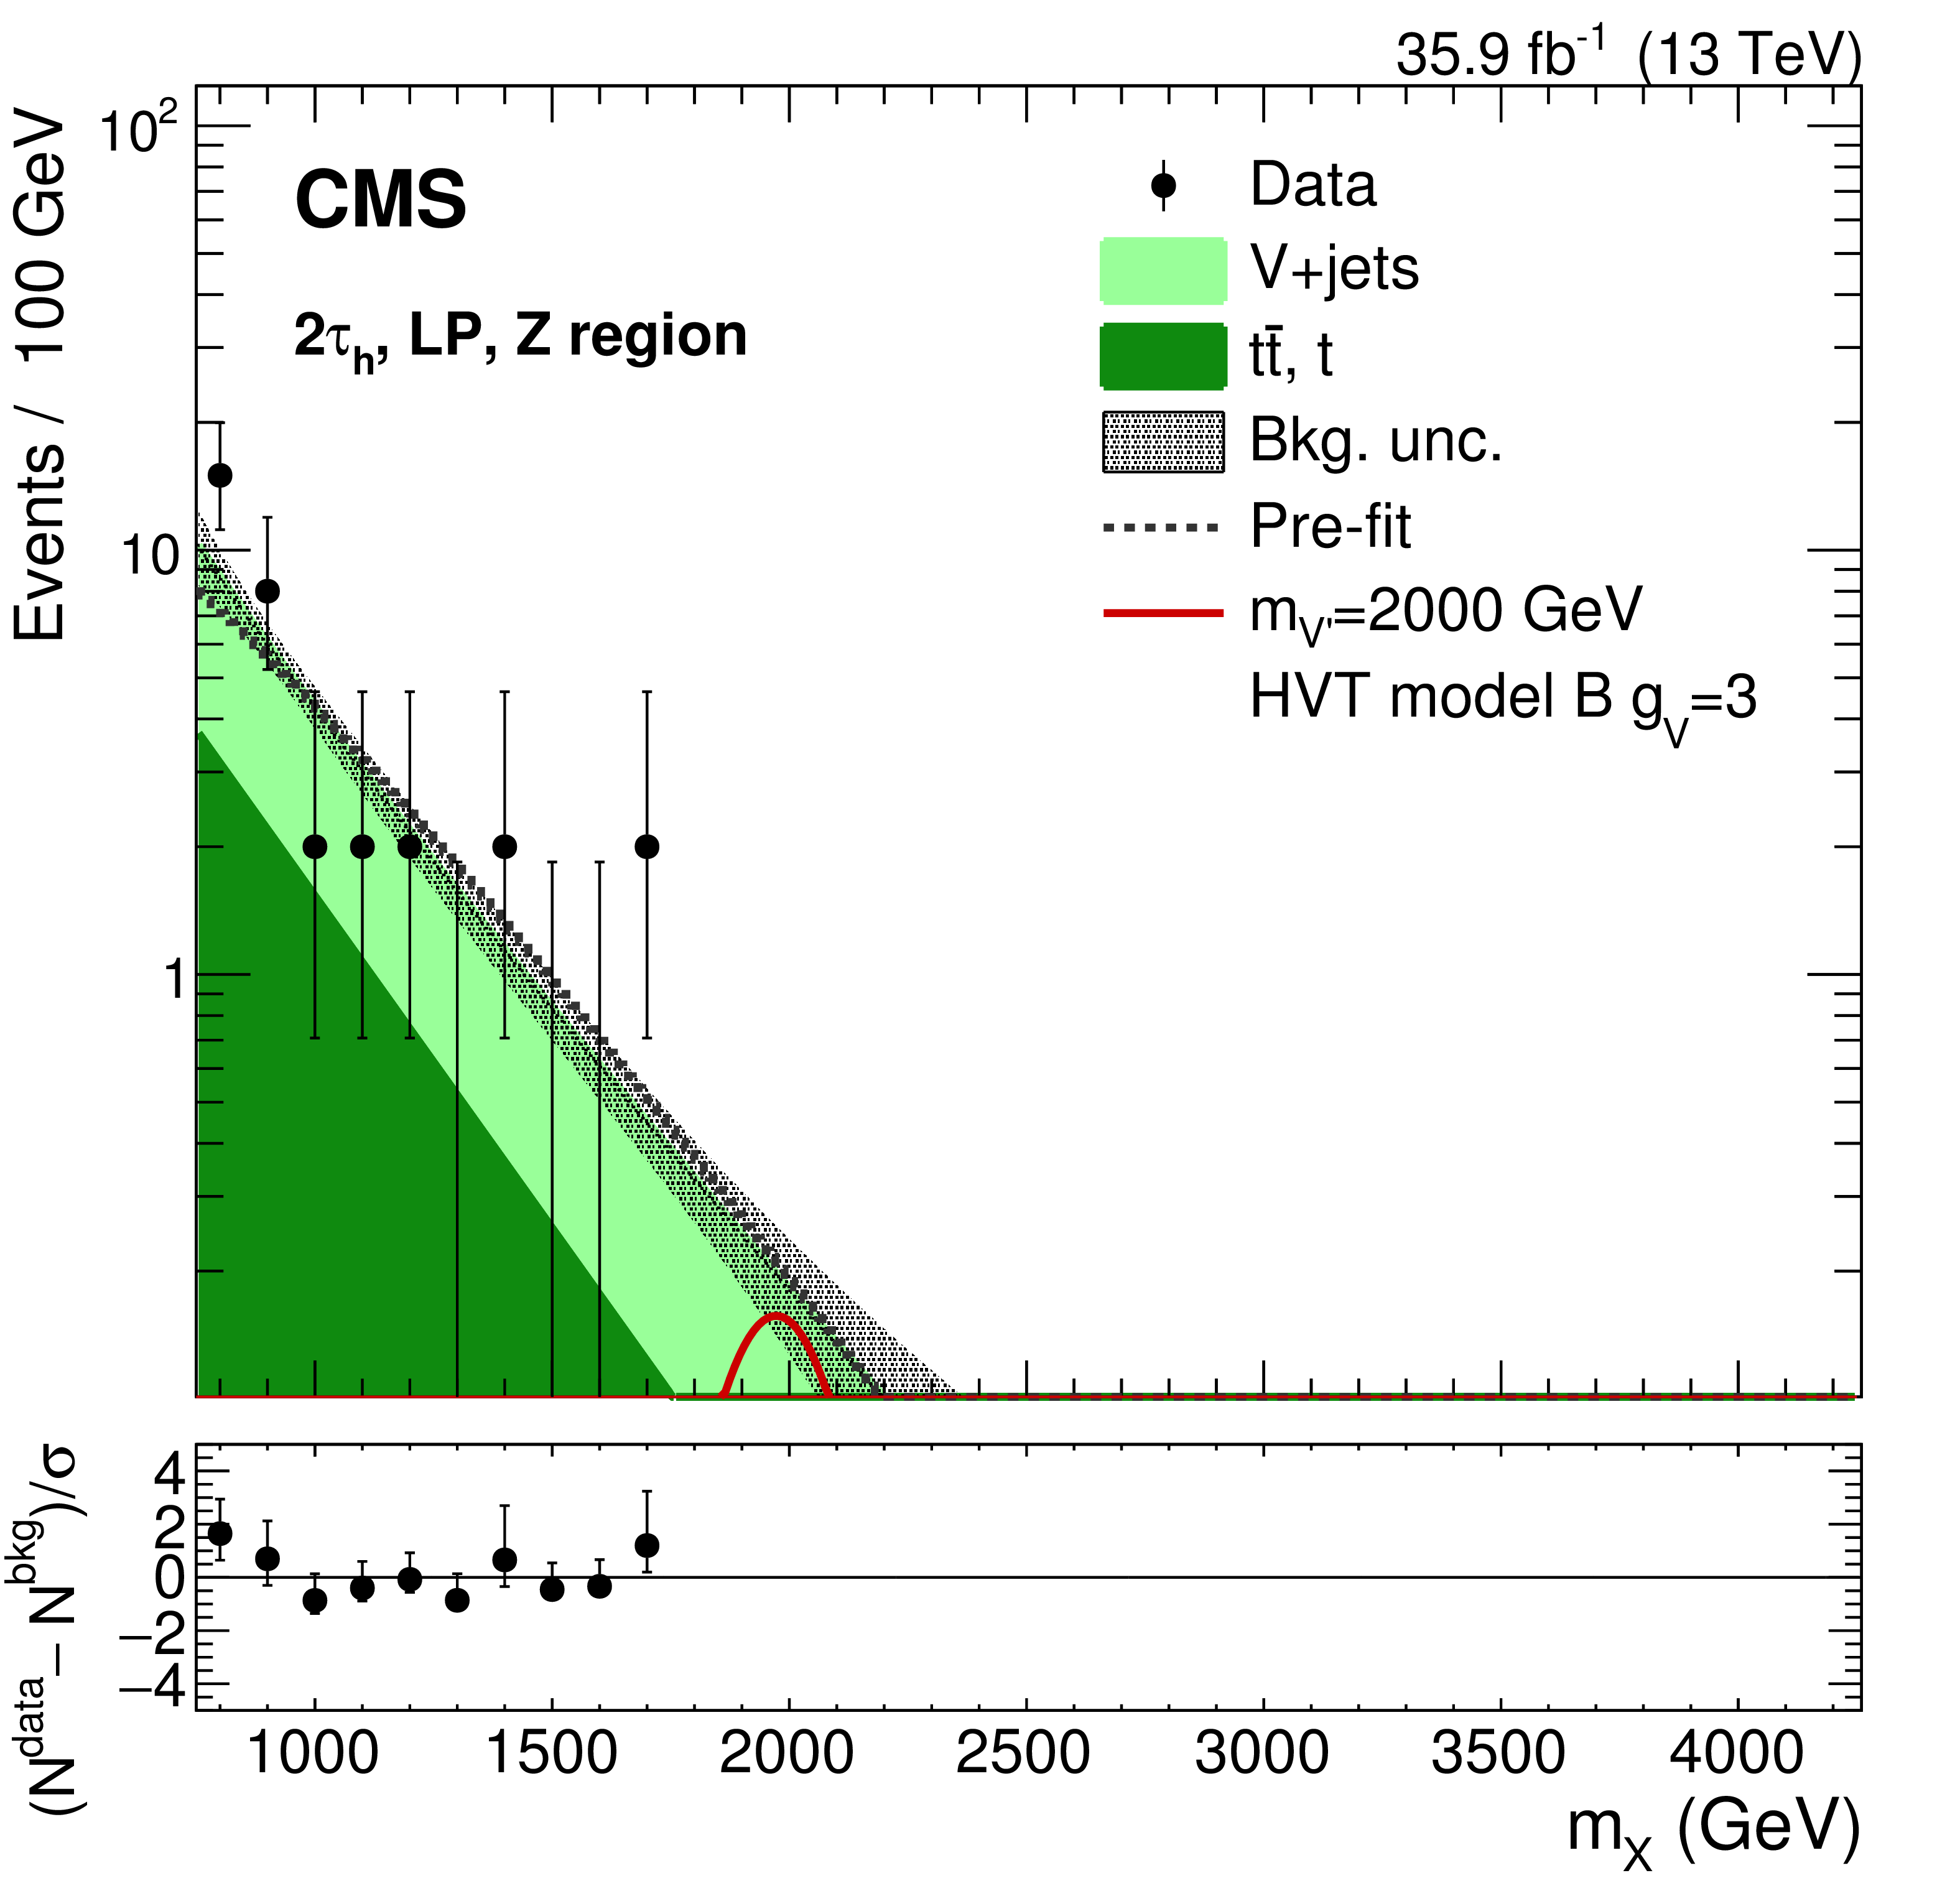
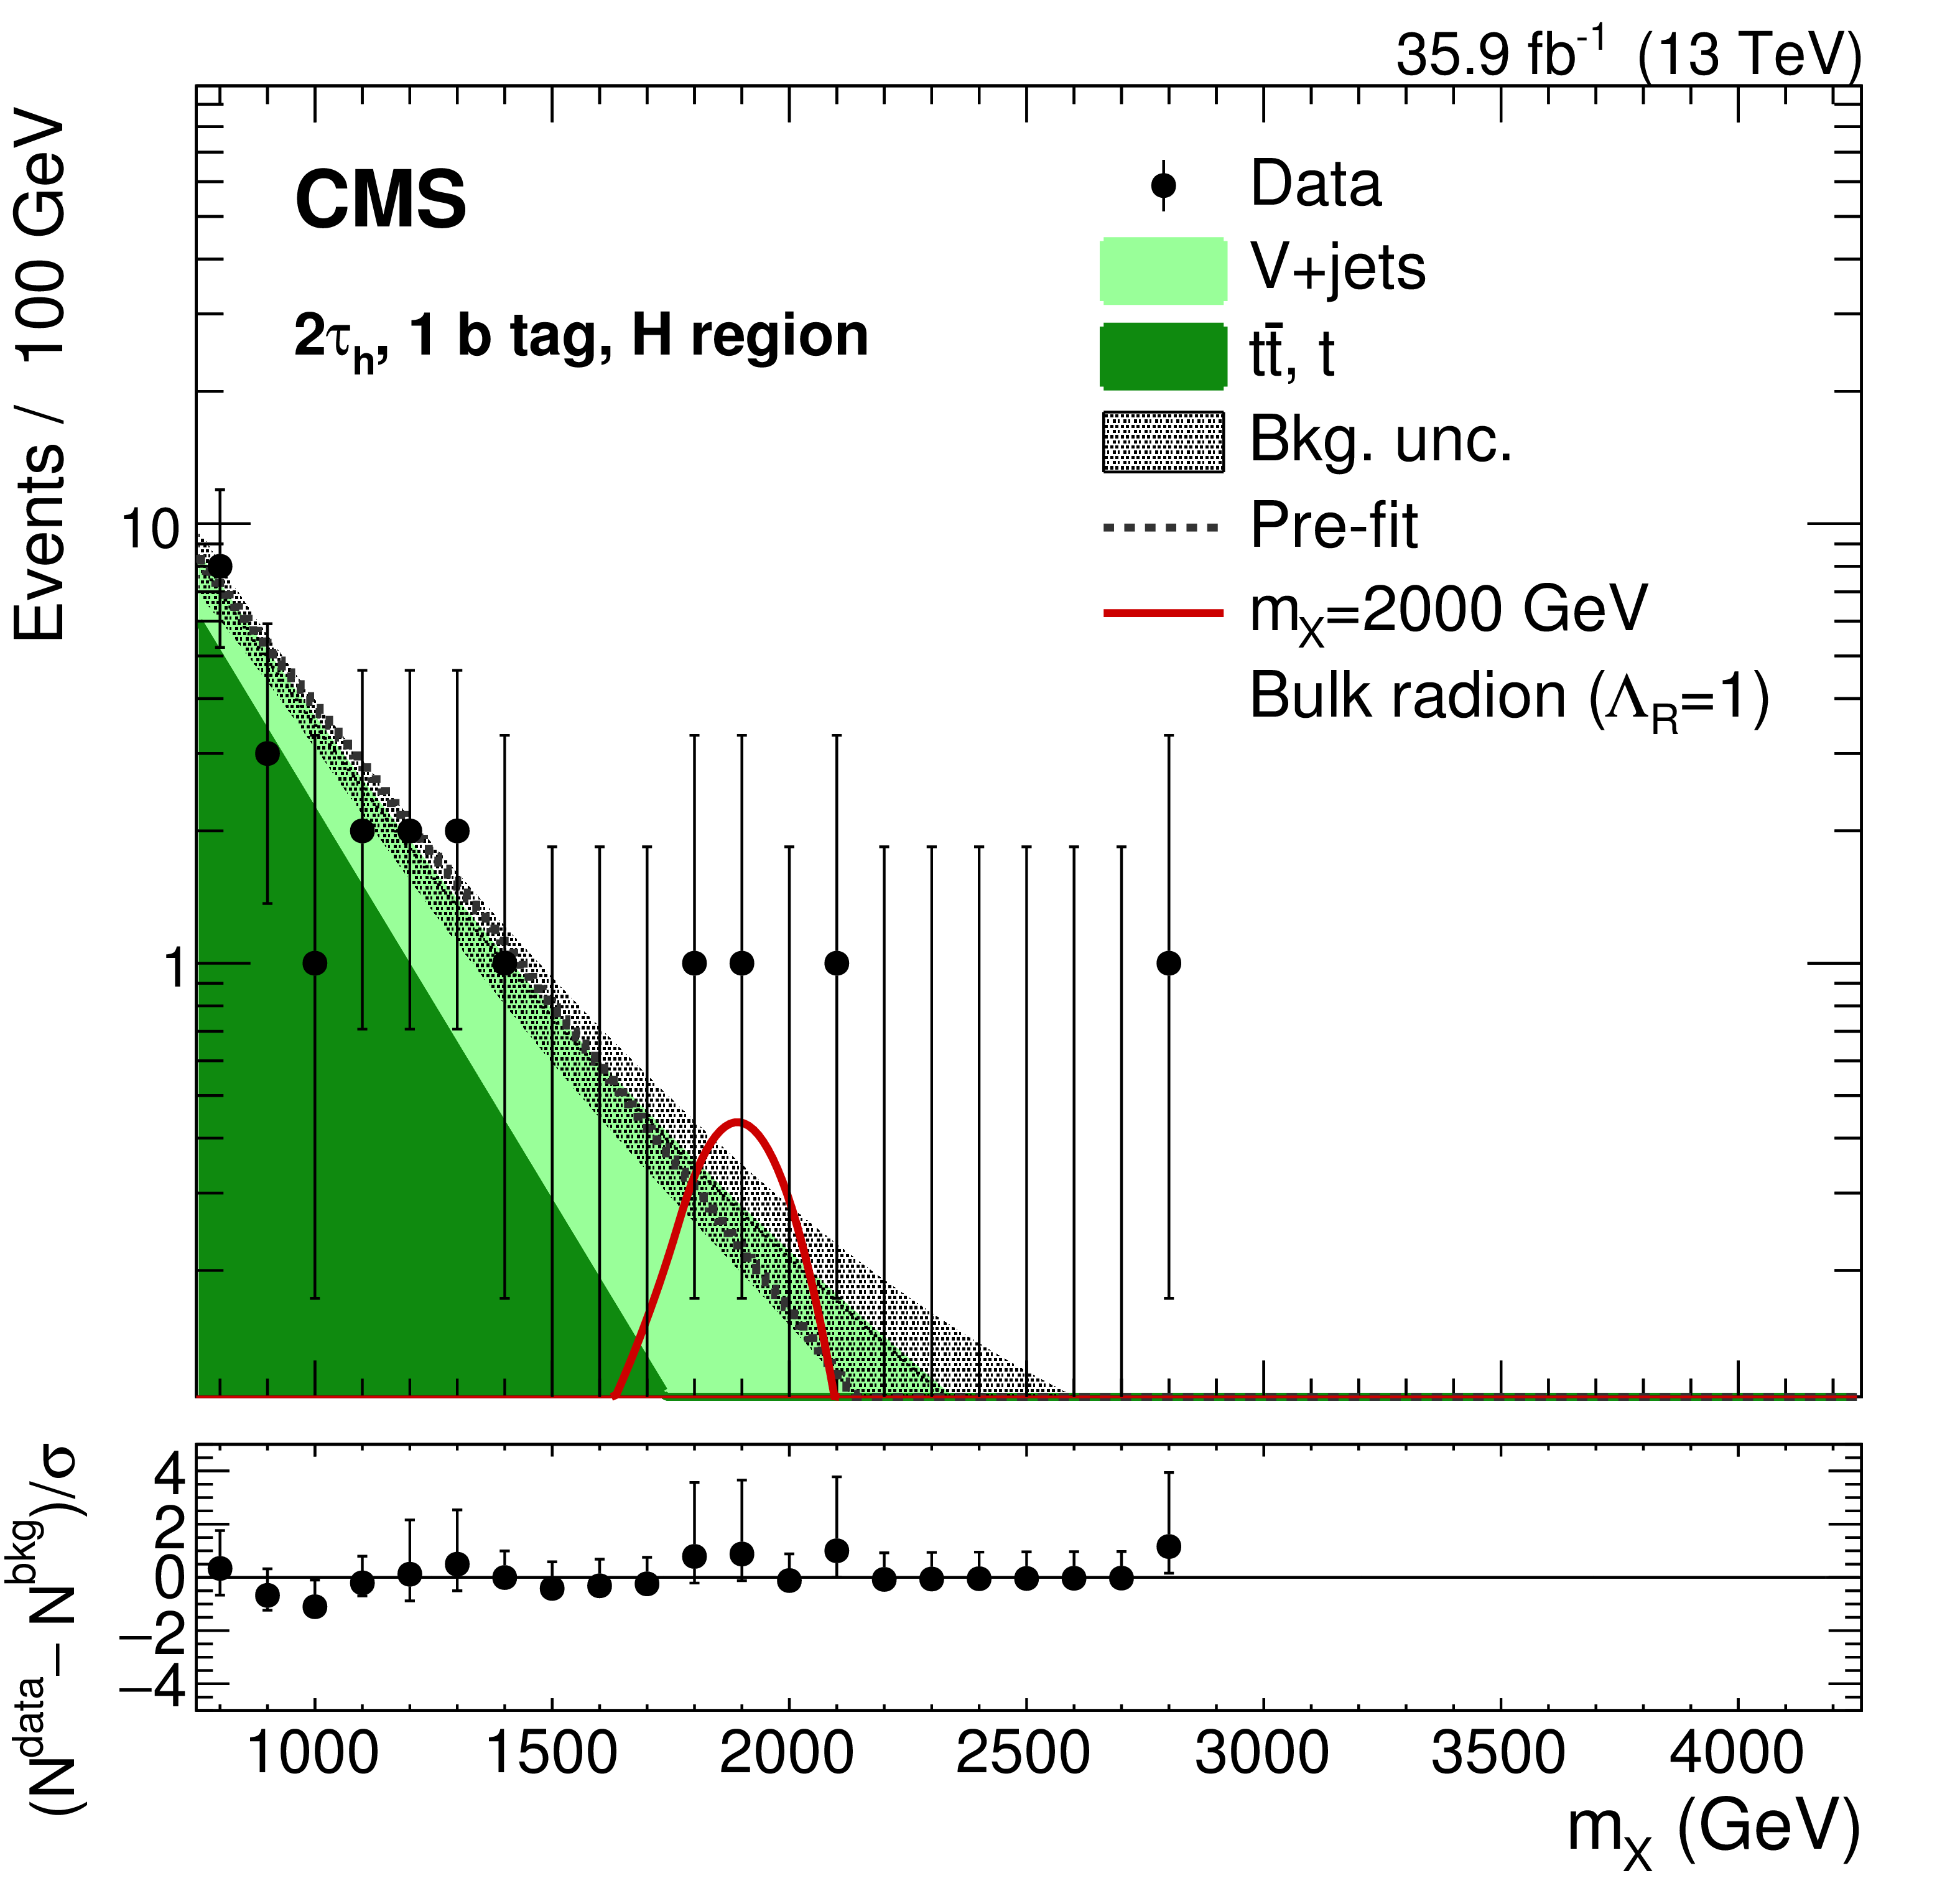
Data and expected backgrounds in the $ {{\tau} _\mathrm {h}} {{\tau} _\mathrm {h}} $ channel. The W mass window is shown in the HP (upper left) and LP (upper right) categories, the Z mass window for the HP (middle left) and LP (middle right) categories, and the H mass window for the two b-tagged subjet (lower left) and one b-tagged subjet (lower right) categories. The lower panels depict the pulls in each bin, $(\mathrm {N}_{\mathrm {data}} - \mathrm {N}_{\mathrm {bkg}})/\sigma $, where $\sigma $ is the statistical uncertainty in data, as given by the Garwood interval [63], and provide estimates of the goodness of fit. Signal contributions are shown, assuming benchmark HVT model B for the V' and $\lambda _{\mathrm {R}}=$ 1 for the radion. |
png pdf |
Figure 4-a:
Data and expected backgrounds in the $ {{\tau} _\mathrm {h}} {{\tau} _\mathrm {h}} $ channel. The W mass window is shown for the HP category. The lower panel depicts the pulls in each bin, $(\mathrm {N}_{\mathrm {data}} - \mathrm {N}_{\mathrm {bkg}})/\sigma $, where $\sigma $ is the statistical uncertainty in data, as given by the Garwood interval [63], and provides estimate of the goodness of fit. Signal contributions are shown, assuming benchmark HVT model B for the V' and $\lambda _{\mathrm {R}}=$ 1 for the radion. |

png pdf |
Figure 4-b:
Data and expected backgrounds in the $ {{\tau} _\mathrm {h}} {{\tau} _\mathrm {h}} $ channel. The W mass window is shown for the LP category. The lower panel depicts the pulls in each bin, $(\mathrm {N}_{\mathrm {data}} - \mathrm {N}_{\mathrm {bkg}})/\sigma $, where $\sigma $ is the statistical uncertainty in data, as given by the Garwood interval [63], and provides estimate of the goodness of fit. Signal contributions are shown, assuming benchmark HVT model B for the V' and $\lambda _{\mathrm {R}}=$ 1 for the radion. |
png pdf |
Figure 4-c:
Data and expected backgrounds in the $ {{\tau} _\mathrm {h}} {{\tau} _\mathrm {h}} $ channel. The Z mass window is shown for the HP category. The lower panel depicts the pulls in each bin, $(\mathrm {N}_{\mathrm {data}} - \mathrm {N}_{\mathrm {bkg}})/\sigma $, where $\sigma $ is the statistical uncertainty in data, as given by the Garwood interval [63], and provides estimate of the goodness of fit. Signal contributions are shown, assuming benchmark HVT model B for the V' and $\lambda _{\mathrm {R}}=$ 1 for the radion. |
png pdf |
Figure 4-d:
Data and expected backgrounds in the $ {{\tau} _\mathrm {h}} {{\tau} _\mathrm {h}} $ channel. The Z mass window is shown for the LP category. The lower panel depicts the pulls in each bin, $(\mathrm {N}_{\mathrm {data}} - \mathrm {N}_{\mathrm {bkg}})/\sigma $, where $\sigma $ is the statistical uncertainty in data, as given by the Garwood interval [63], and provides estimate of the goodness of fit. Signal contributions are shown, assuming benchmark HVT model B for the V' and $\lambda _{\mathrm {R}}=$ 1 for the radion. |

png pdf |
Figure 4-e:
Data and expected backgrounds in the $ {{\tau} _\mathrm {h}} {{\tau} _\mathrm {h}} $ channel. The H mass window is shown for the two b-tagged subjet category. The lower panel depicts the pulls in each bin, $(\mathrm {N}_{\mathrm {data}} - \mathrm {N}_{\mathrm {bkg}})/\sigma $, where $\sigma $ is the statistical uncertainty in data, as given by the Garwood interval [63], and provides estimate of the goodness of fit. Signal contributions are shown, assuming benchmark HVT model B for the V' and $\lambda _{\mathrm {R}}=$ 1 for the radion. |
png pdf |
Figure 4-f:
Data and expected backgrounds in the $ {{\tau} _\mathrm {h}} {{\tau} _\mathrm {h}} $ channel. The H mass window is shown for the one b-tagged subjet category. The lower panel depicts the pulls in each bin, $(\mathrm {N}_{\mathrm {data}} - \mathrm {N}_{\mathrm {bkg}})/\sigma $, where $\sigma $ is the statistical uncertainty in data, as given by the Garwood interval [63], and provides estimate of the goodness of fit. Signal contributions are shown, assuming benchmark HVT model B for the V' and $\lambda _{\mathrm {R}}=$ 1 for the radion. |

png pdf |
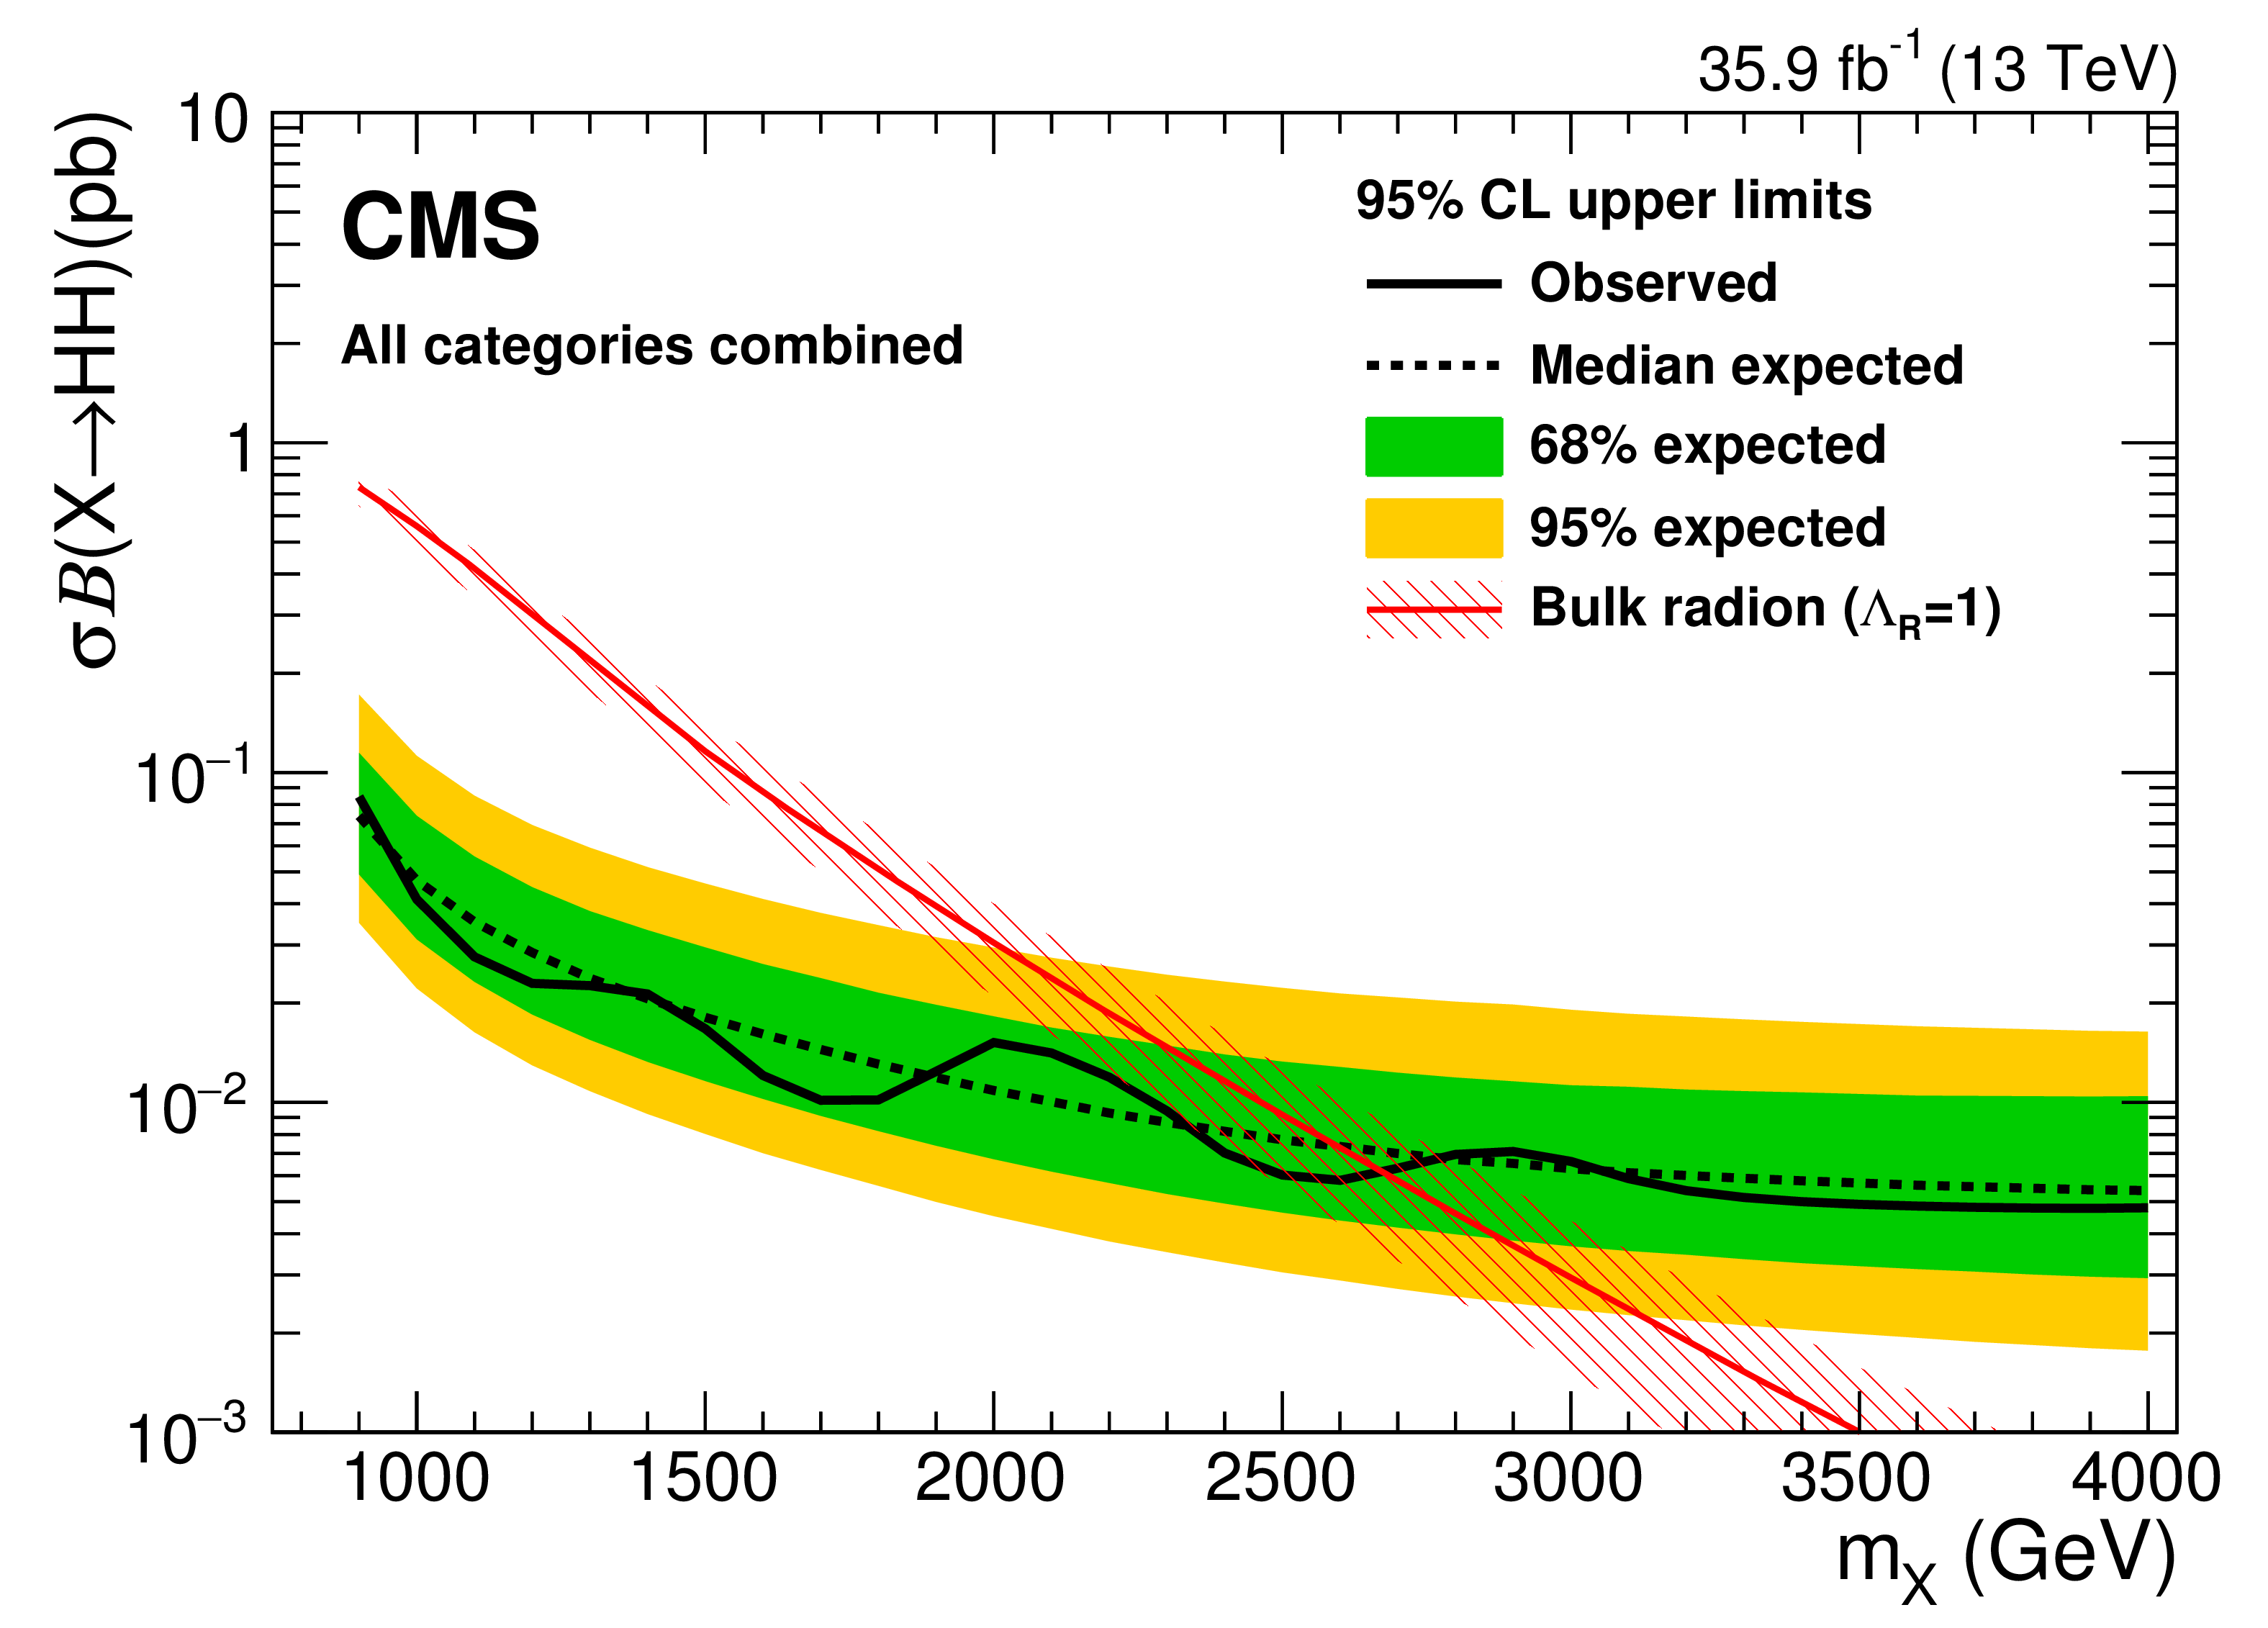
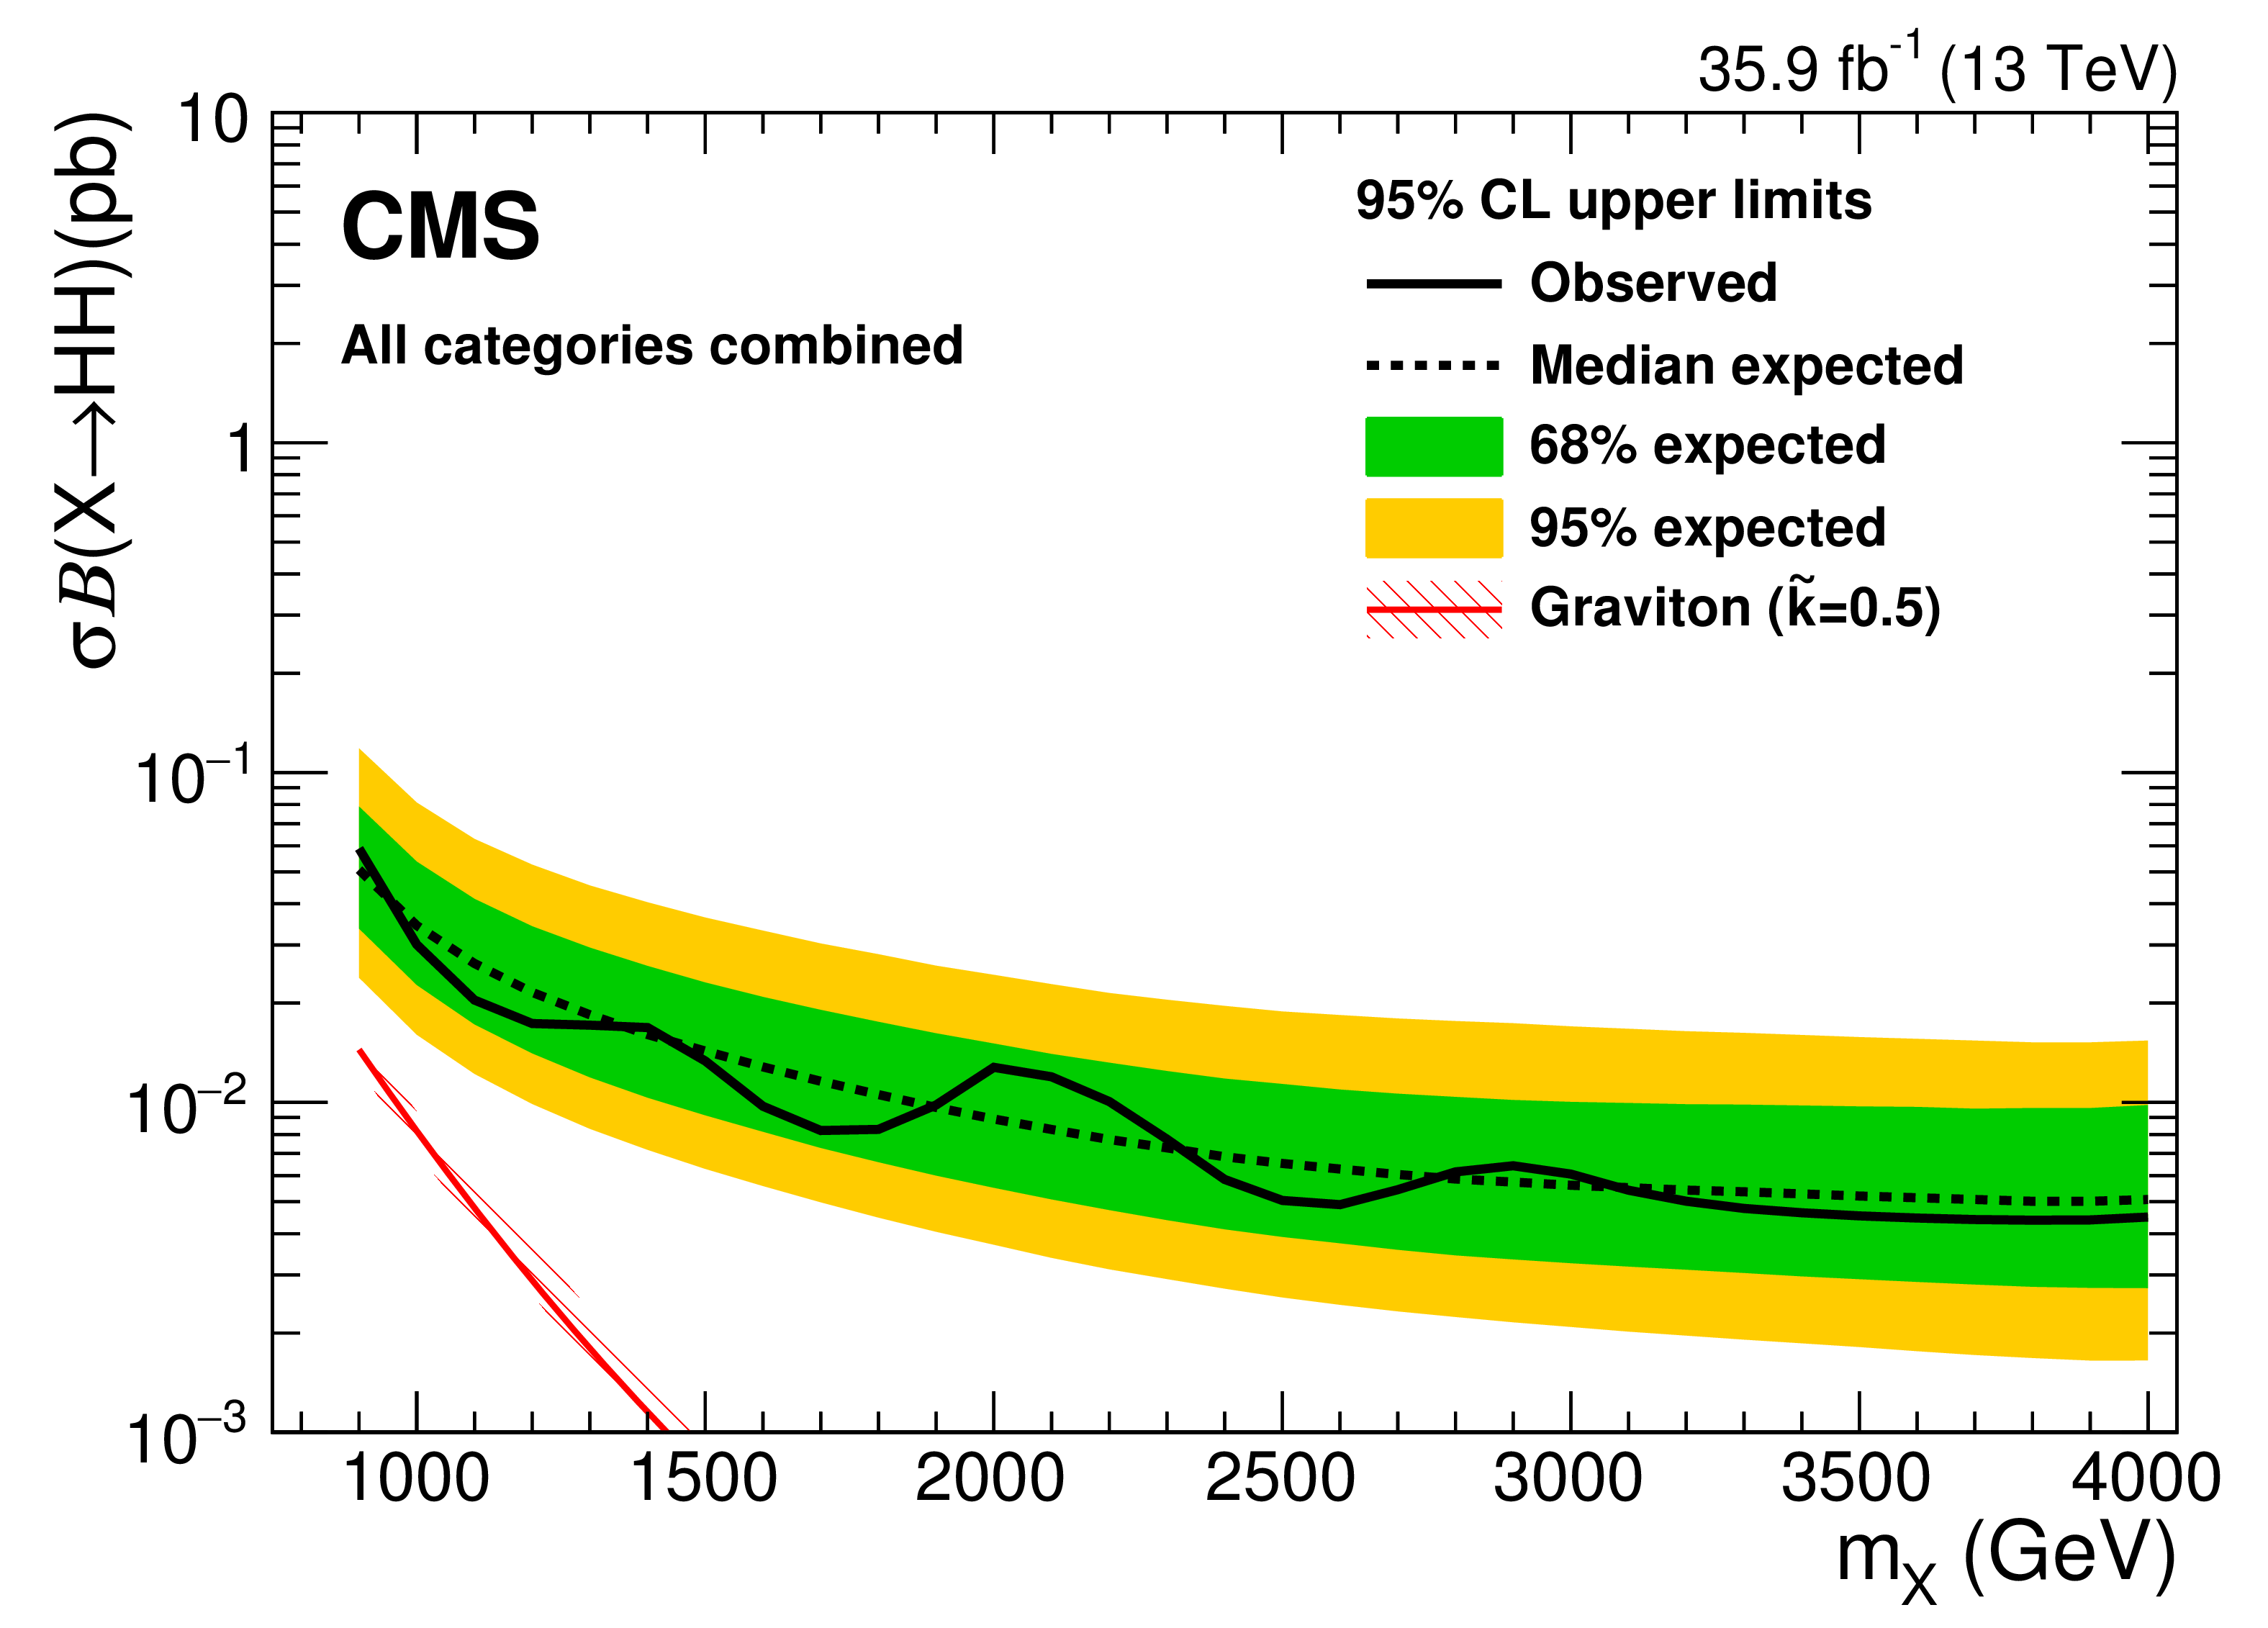
Figure 5:
Observed 95% CL upper limits on $\sigma \mathcal {B} ( \mathrm{X}\text{(spin-0)}\to {\mathrm {H}} {\mathrm {H}} )$ (left) and $\sigma \mathcal {B} ( \mathrm{X}\text{(spin-2)}\to {\mathrm {H}} {\mathrm {H}} )$ (right). Expected limits are shown with $\pm $1 and $\pm $2 standard deviation uncertainty bands. The $\ell {{\tau} _\mathrm {h}} $ and $ {{\tau} _\mathrm {h}} {{\tau} _\mathrm {h}} $ final states, and the one and two b-tagged sub-jet categories are combined, to obtain the limits. The solid red lines and the red dashed areas correspond to the cross sections predicted by the bulk radion and graviton and their corresponding uncertainties, as reported in Table 5. |
png pdf |
Figure 5-a:
Observed 95% CL upper limits on $\sigma \mathcal {B} ( \mathrm{X}\text{(spin-0)}\to {\mathrm {H}} {\mathrm {H}} )$. Expected limits are shown with $\pm $1 and $\pm $2 standard deviation uncertainty bands. The $\ell {{\tau} _\mathrm {h}} $ and $ {{\tau} _\mathrm {h}} {{\tau} _\mathrm {h}} $ final states, and the one and two b-tagged sub-jet categories are combined, to obtain the limits. The solid red lines and the red dashed areas correspond to the cross sections predicted by the bulk radion and graviton and their corresponding uncertainties, as reported in Table 5. |
png pdf |
Figure 5-b:
Observed 95% CL upper limits on $\sigma \mathcal {B} ( \mathrm{X}\text{(spin-2)}\to {\mathrm {H}} {\mathrm {H}} )$. Expected limits are shown with $\pm $1 and $\pm $2 standard deviation uncertainty bands. The $\ell {{\tau} _\mathrm {h}} $ and $ {{\tau} _\mathrm {h}} {{\tau} _\mathrm {h}} $ final states, and the one and two b-tagged sub-jet categories are combined, to obtain the limits. The solid red lines and the red dashed areas correspond to the cross sections predicted by the bulk radion and graviton and their corresponding uncertainties, as reported in Table 5. |
png pdf |
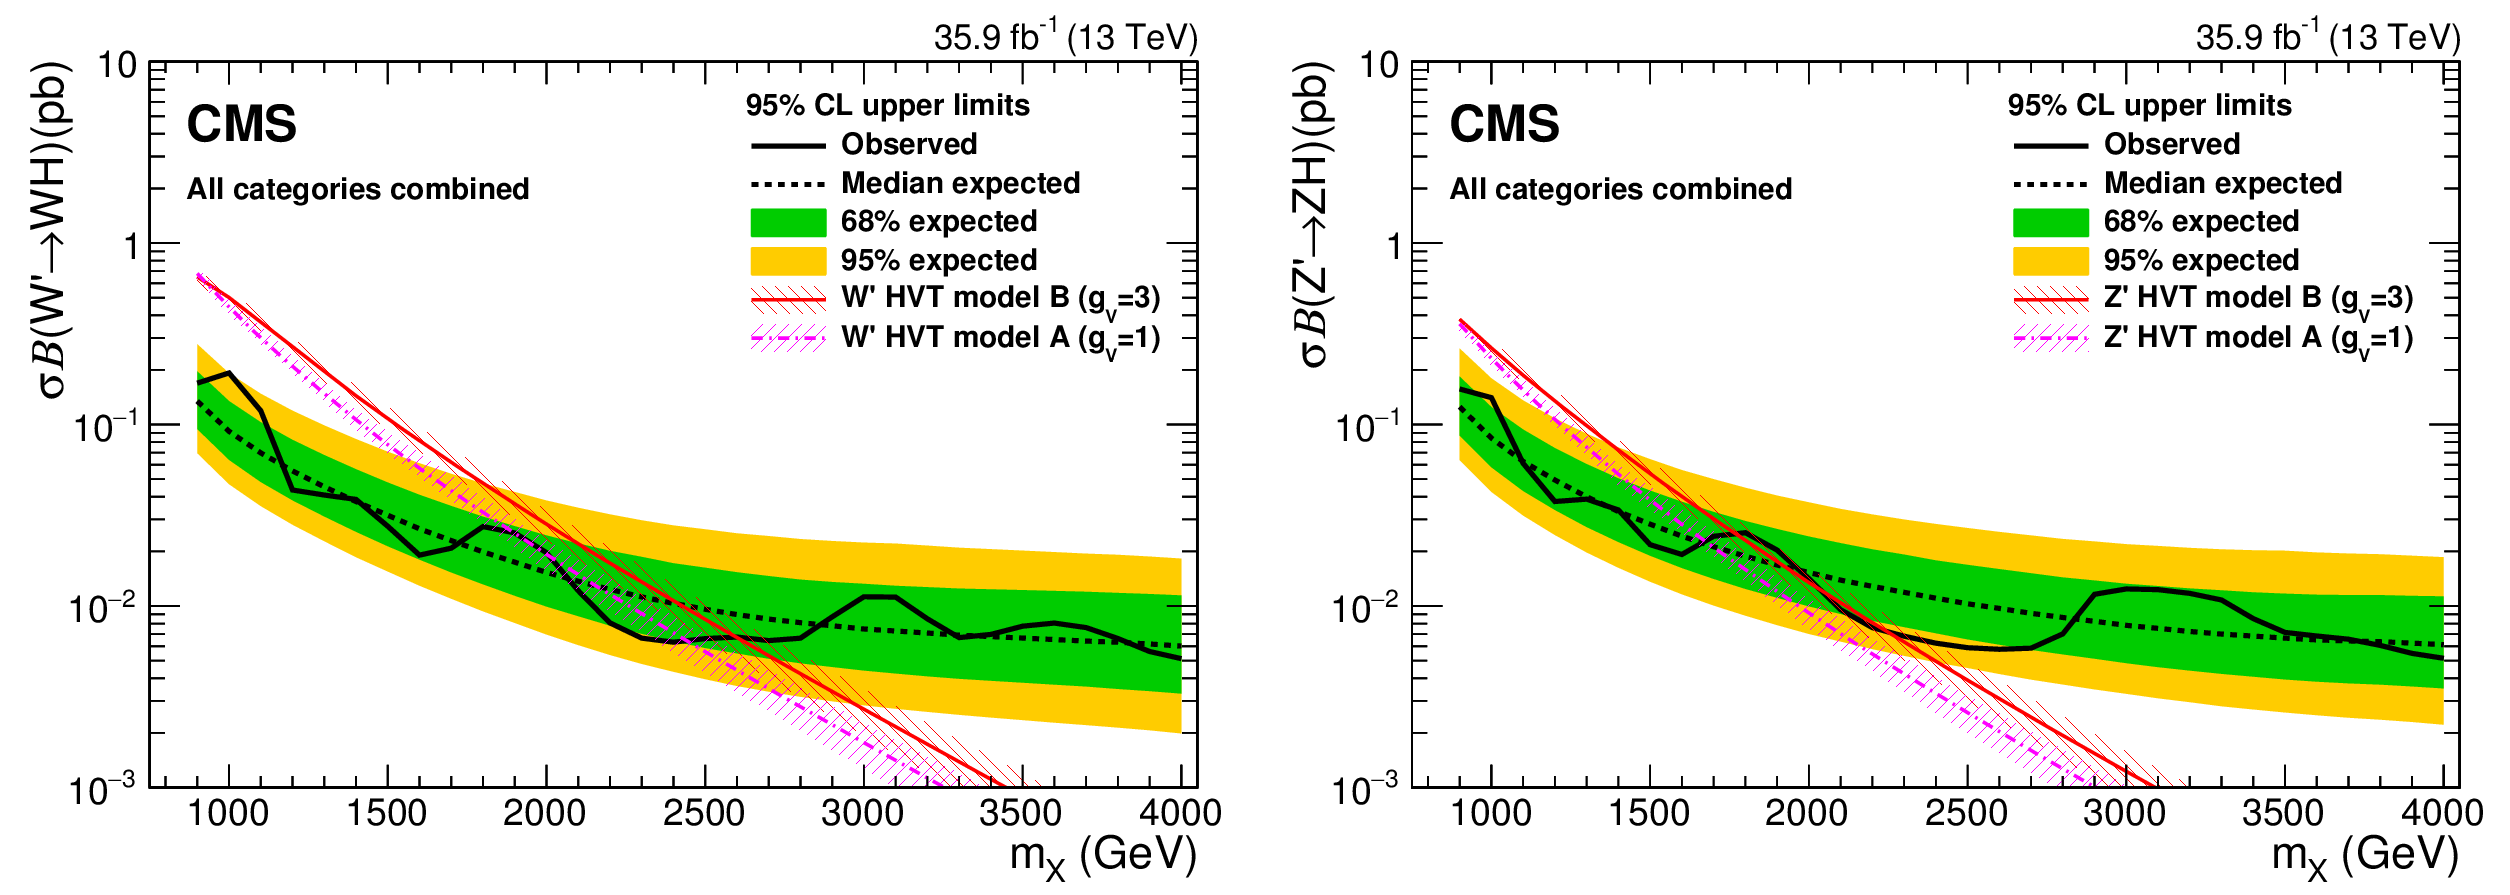
Figure 6:
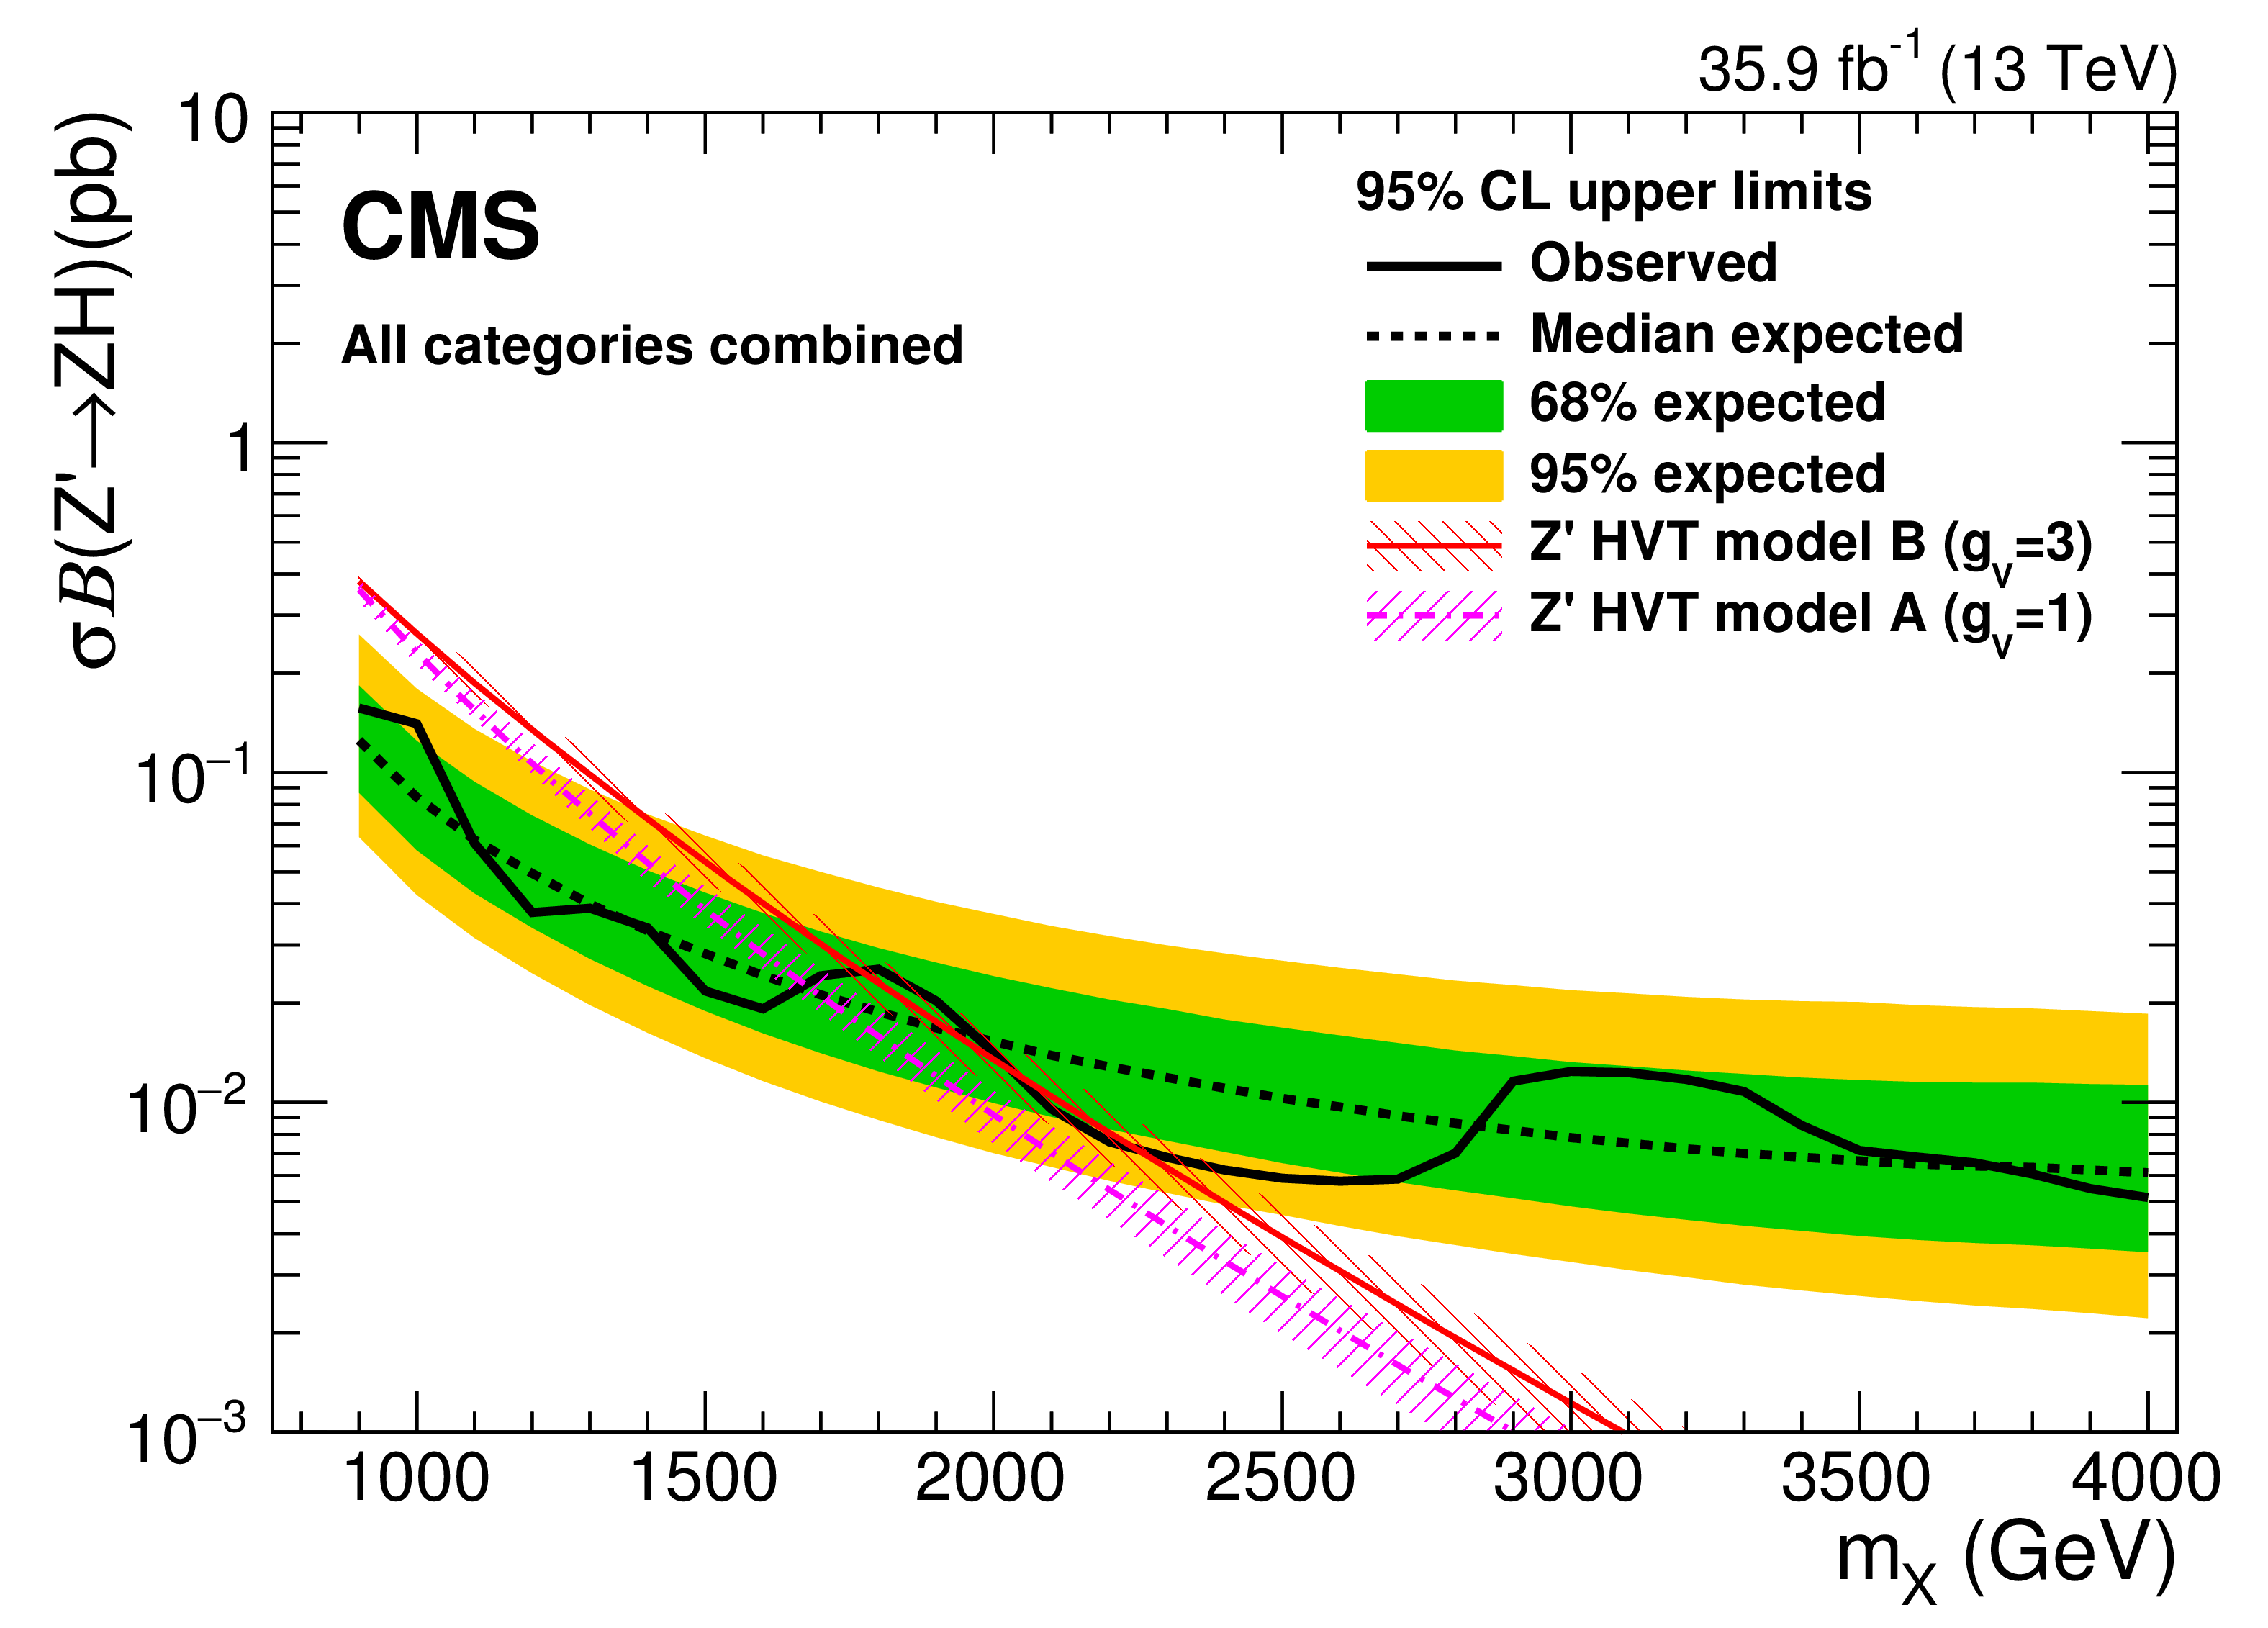
Observed 95% CL upper limits on $\sigma \mathcal {B} ( {\mathrm {W}'} \to {\mathrm {W}} {\mathrm {H}} )$ (left) and $\sigma \mathcal {B}( {\mathrm {Z}'} \to {\mathrm {Z}} {\mathrm {H}} )$ (right). Expected limits are shown with $\pm $1 and $\pm $2 standard deviation uncertainty bands. The $\ell {{\tau} _\mathrm {h}} $ and $ {{\tau} _\mathrm {h}} {{\tau} _\mathrm {h}} $ final states, for the HP and LP $\tau _{21}$ categories, and the W and Z boson mass signal regions are combined, to obtain the limits. The solid lines and the relative dashed areas in magenta and red correspond to the cross sections predicted by the HVT models A and B, respectively, and their corresponding uncertainties, as reported in Table 5. |
png pdf |
Figure 6-a:
Observed 95% CL upper limits on $\sigma \mathcal {B} ( {\mathrm {W}'} \to {\mathrm {W}} {\mathrm {H}} )$. Expected limits are shown with $\pm $1 and $\pm $2 standard deviation uncertainty bands. The $\ell {{\tau} _\mathrm {h}} $ and $ {{\tau} _\mathrm {h}} {{\tau} _\mathrm {h}} $ final states, for the HP and LP $\tau _{21}$ categories, and the W and Z boson mass signal regions are combined, to obtain the limits. The solid lines and the relative dashed areas in magenta and red correspond to the cross sections predicted by the HVT models A and B, respectively, and their corresponding uncertainties, as reported in Table 5. |
png pdf |
Figure 6-b:
Observed 95% CL upper limits on $\sigma \mathcal {B}( {\mathrm {Z}'} \to {\mathrm {Z}} {\mathrm {H}} )$. Expected limits are shown with $\pm $1 and $\pm $2 standard deviation uncertainty bands. The $\ell {{\tau} _\mathrm {h}} $ and $ {{\tau} _\mathrm {h}} {{\tau} _\mathrm {h}} $ final states, for the HP and LP $\tau _{21}$ categories, and the W and Z boson mass signal regions are combined, to obtain the limits. The solid lines and the relative dashed areas in magenta and red correspond to the cross sections predicted by the HVT models A and B, respectively, and their corresponding uncertainties, as reported in Table 5. |
png pdf |
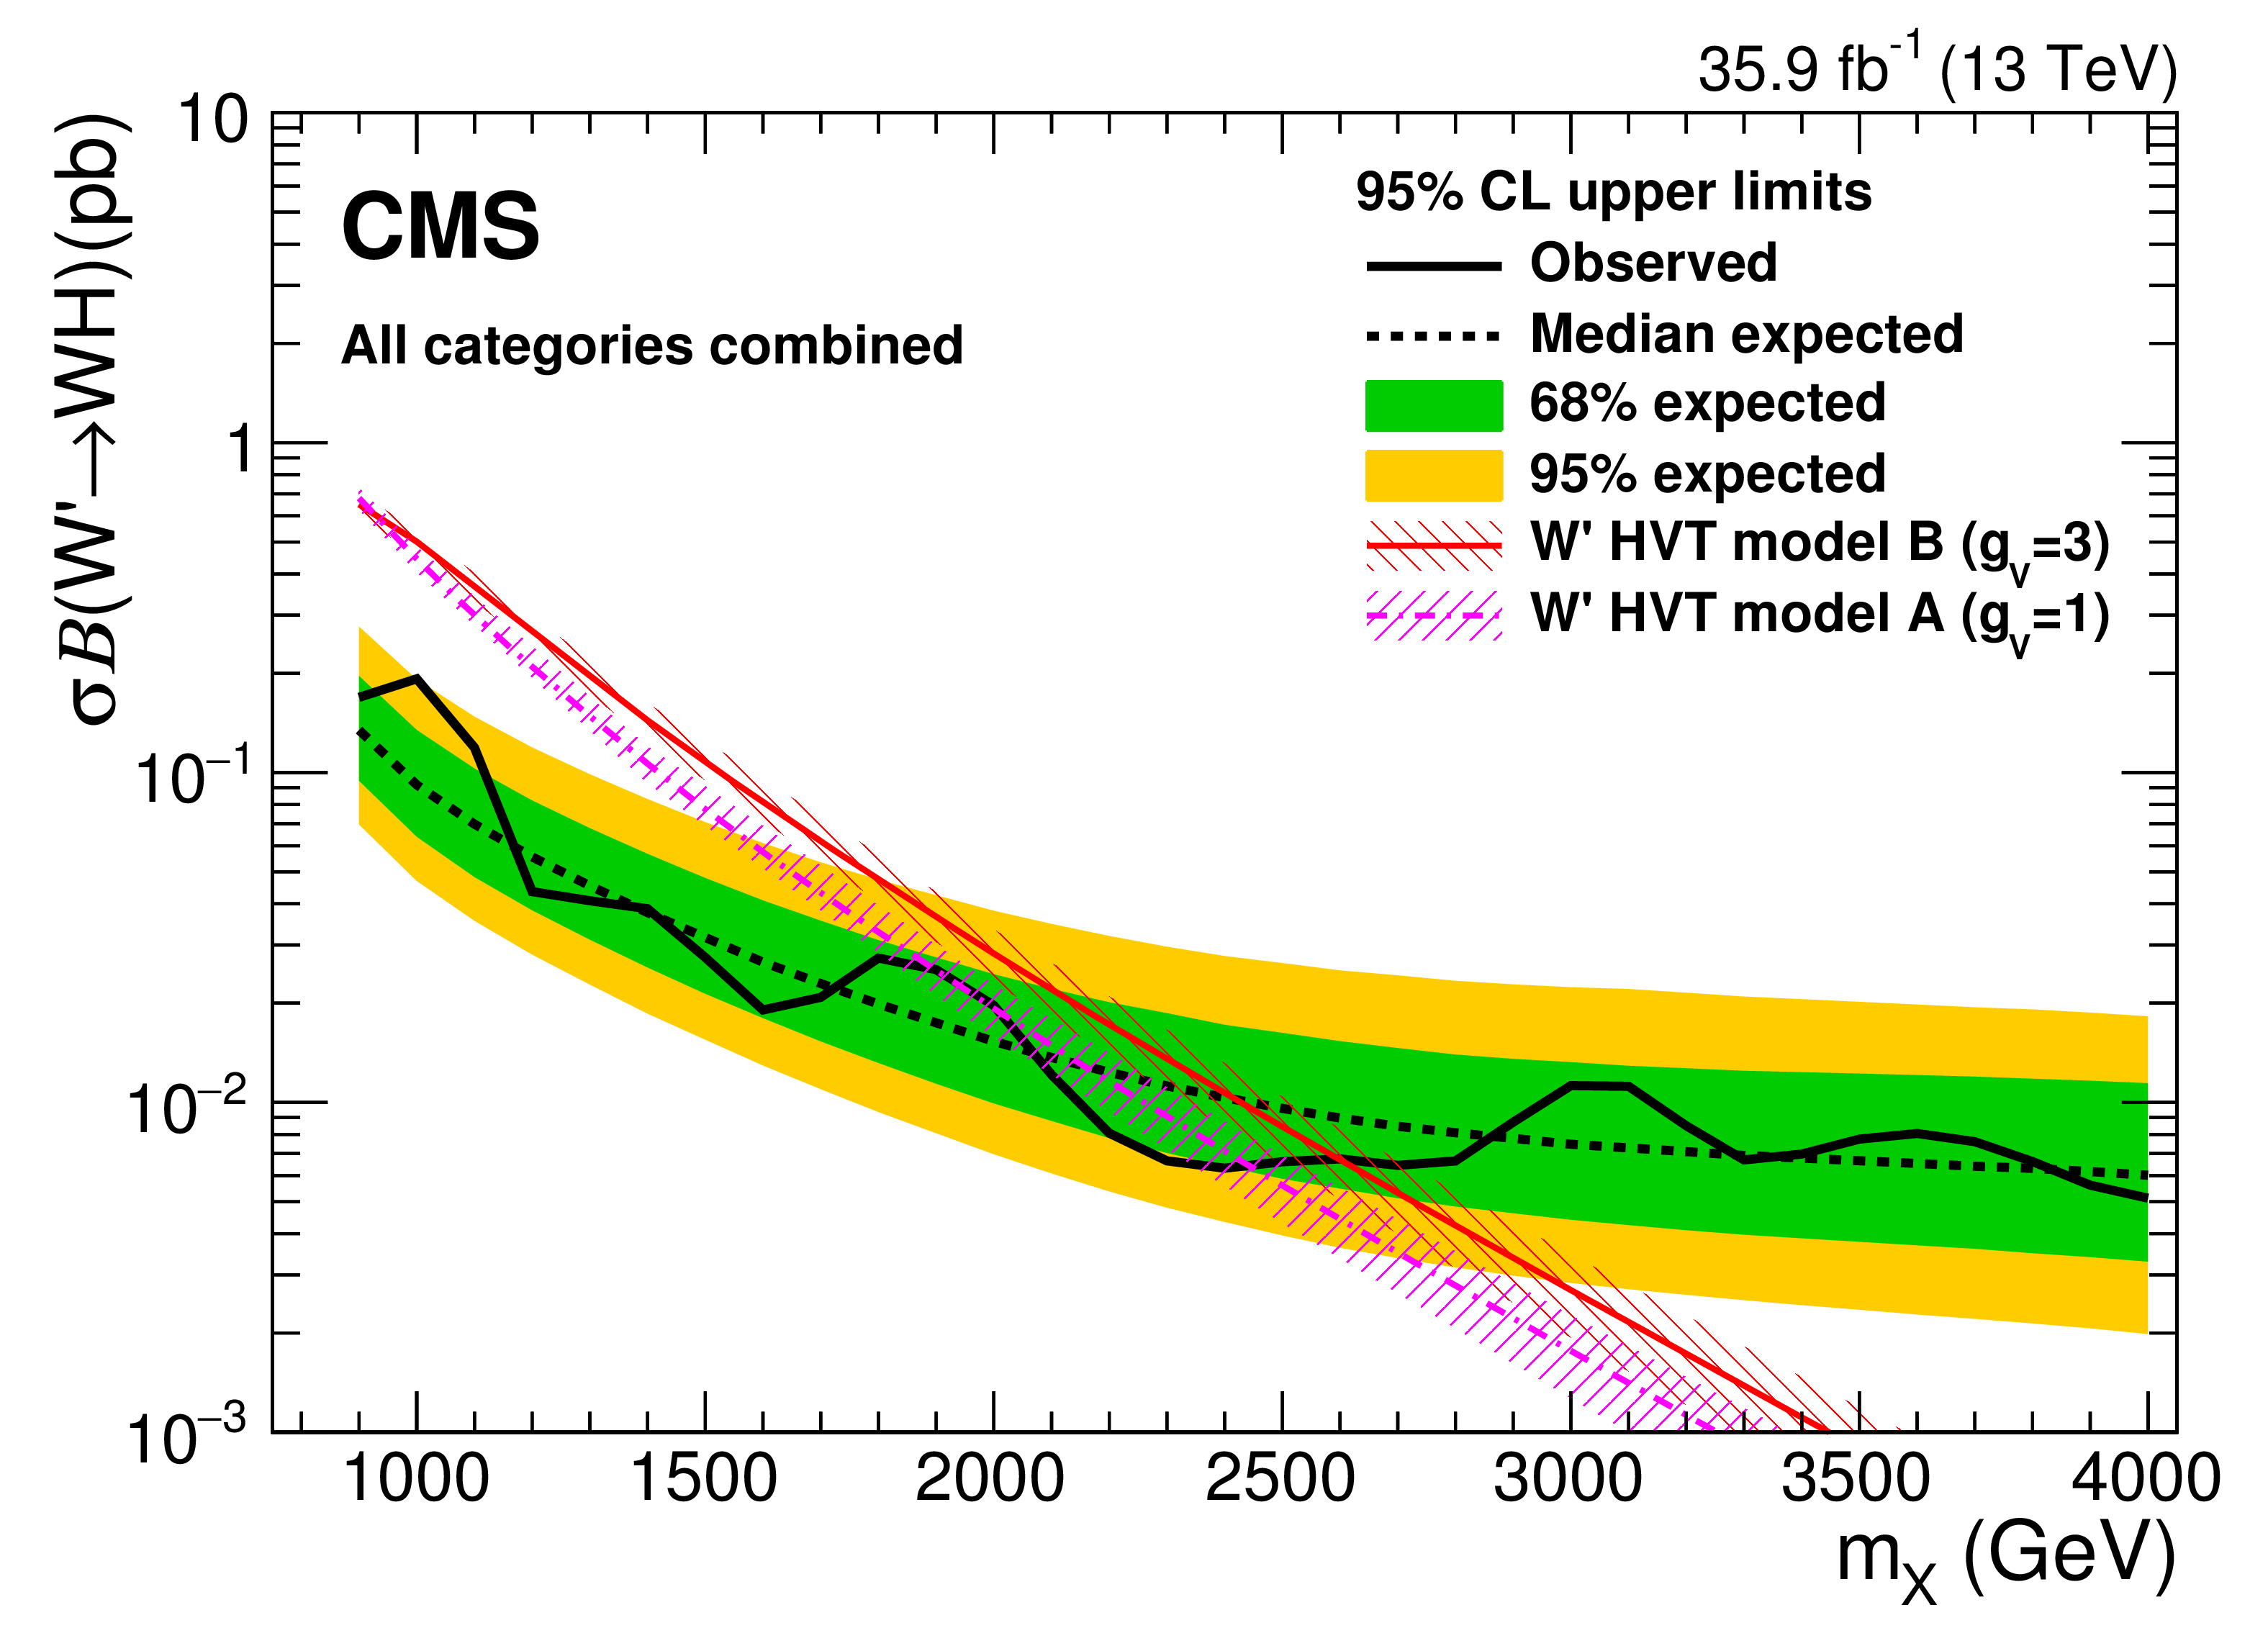
Figure 7:
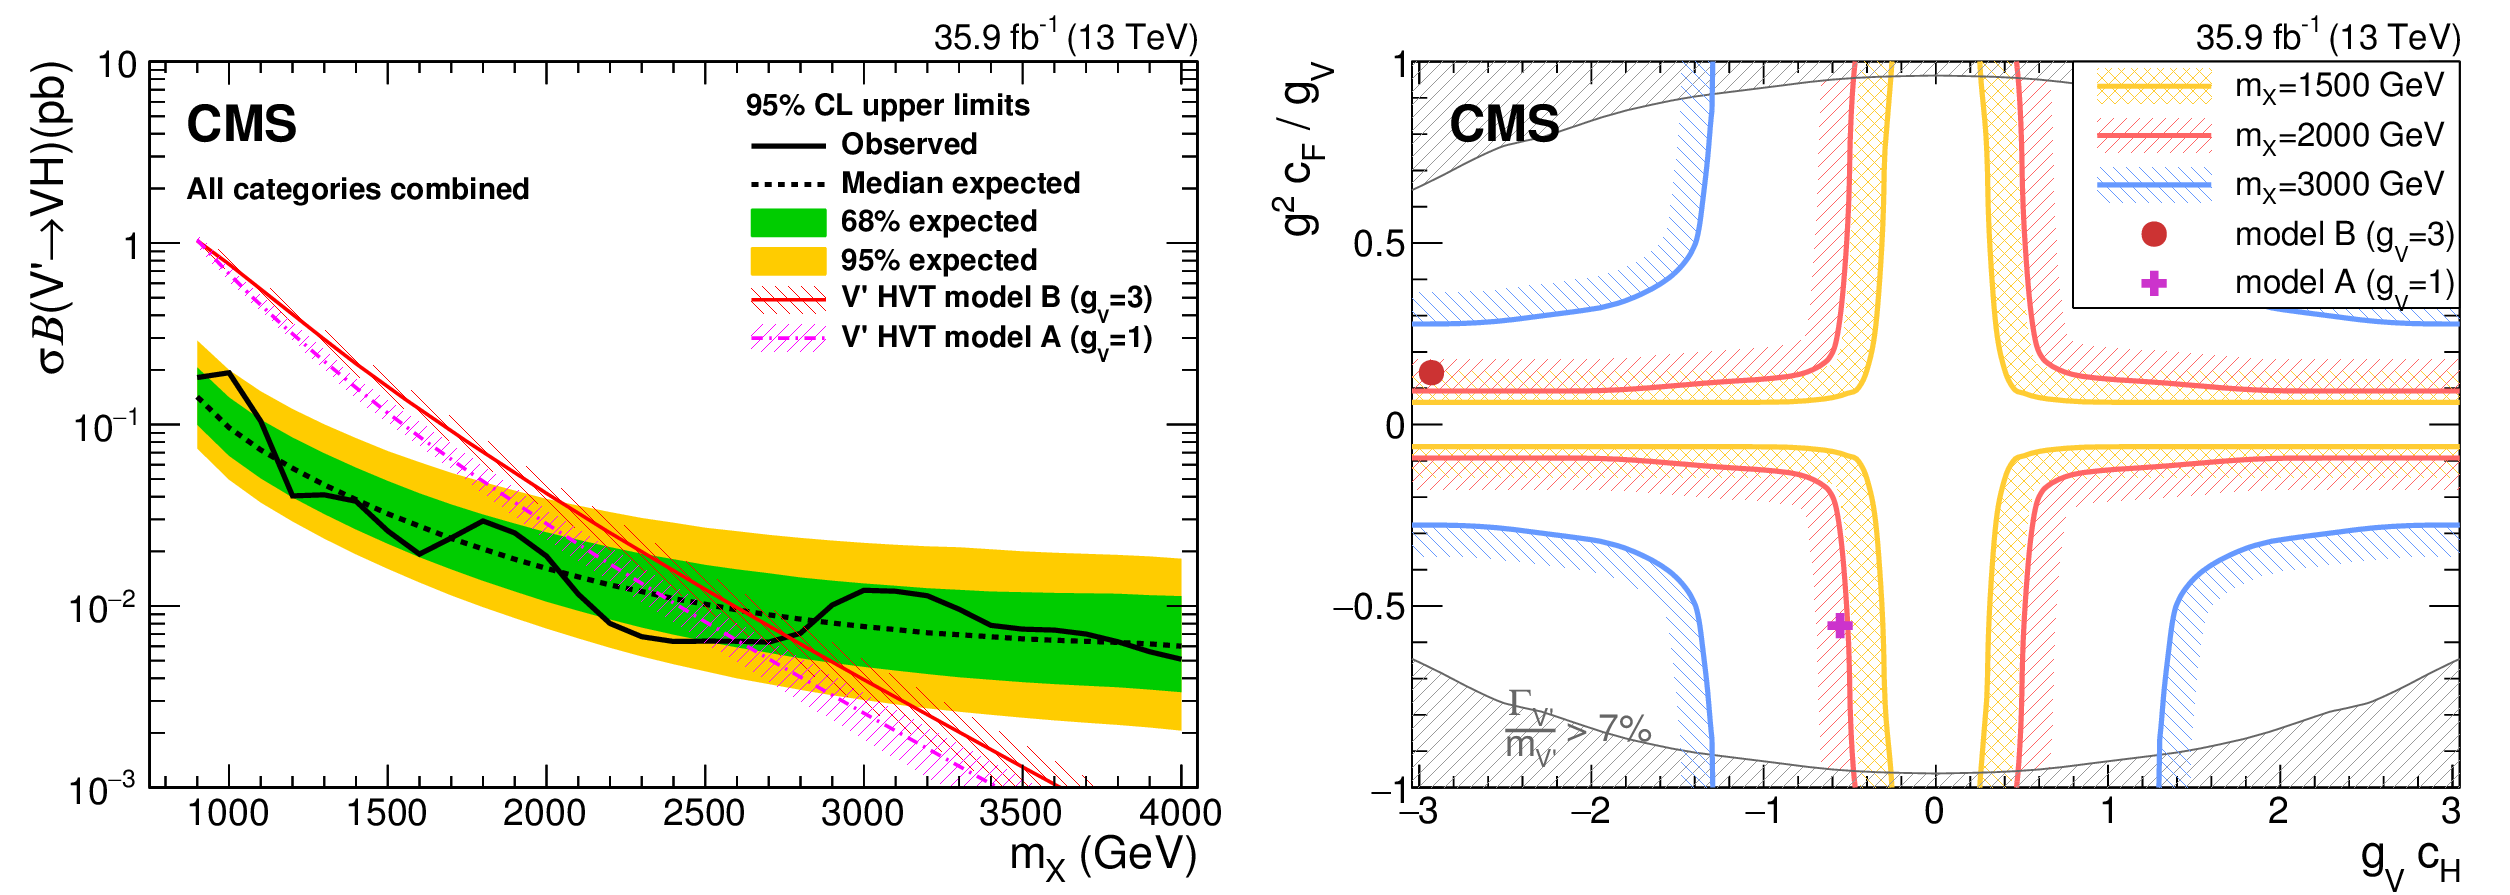
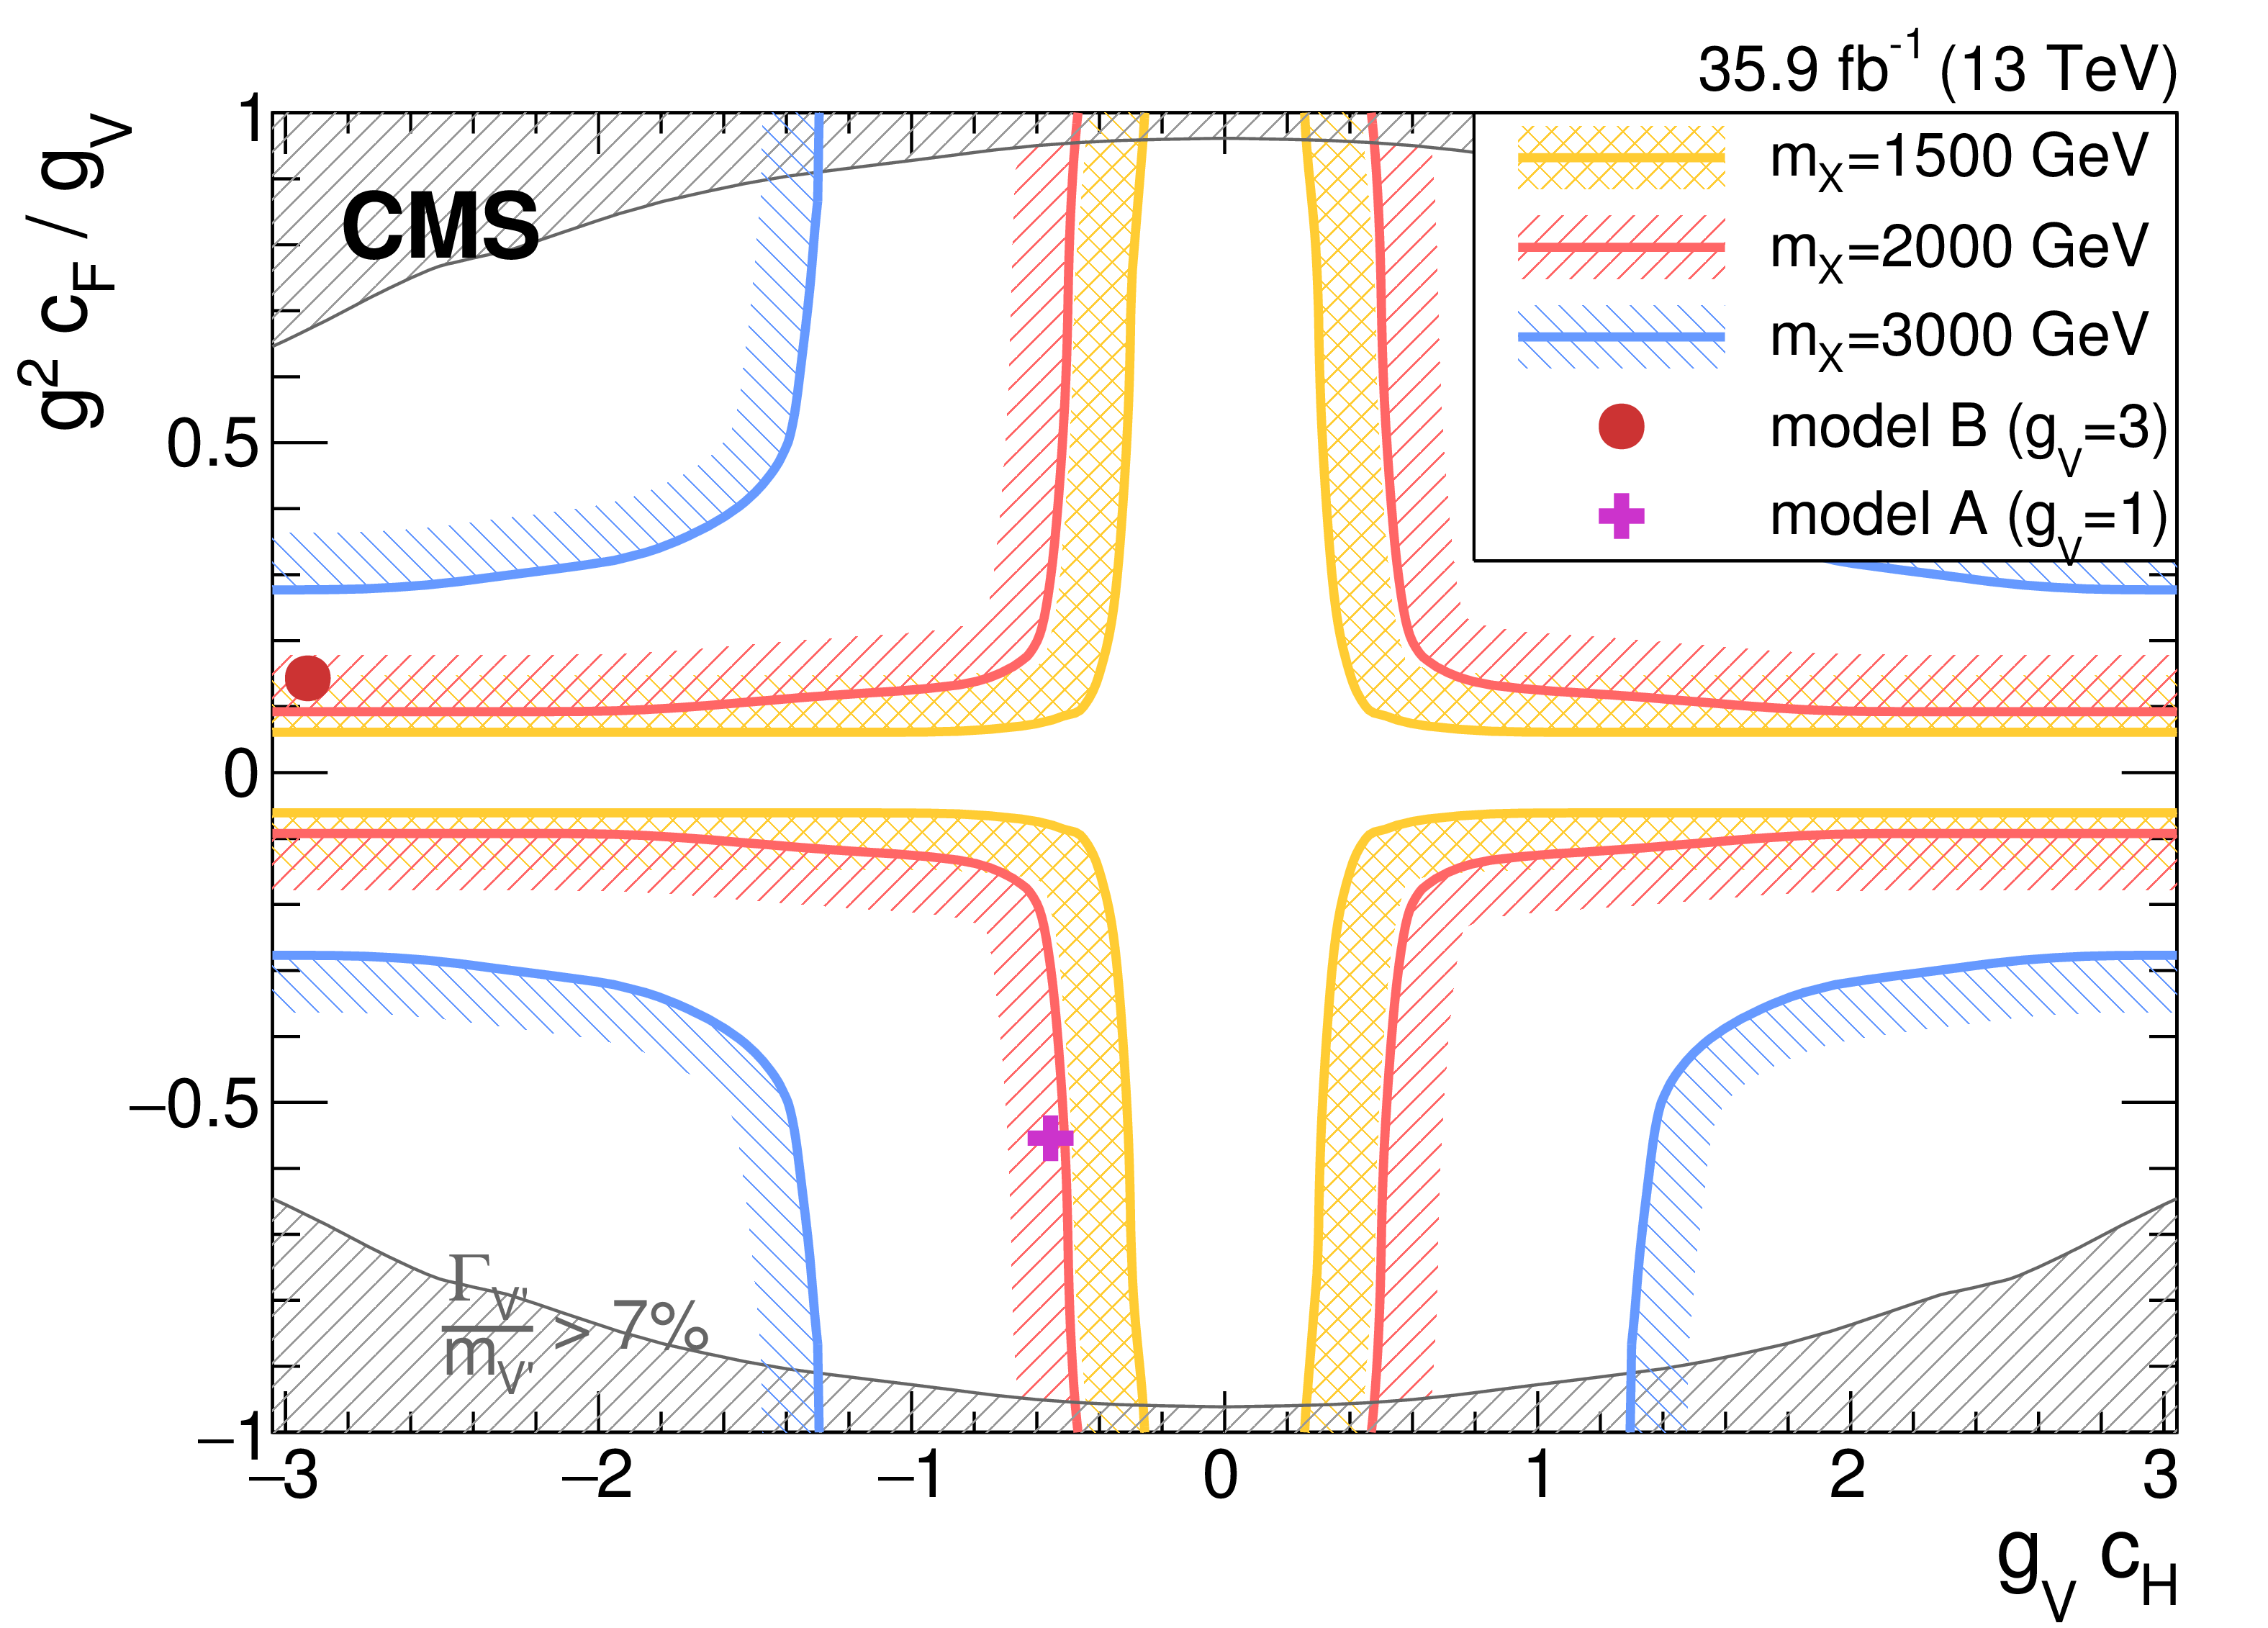
Expected and observed 95% CL upper limit on $\sigma \mathcal {B}( {\mathrm {V}'} \to {\mathrm {V}} {\mathrm {H}} )$ with $\pm $1 and $\pm $2 standard deviation uncertainty bands (left) in the $\ell {{\tau} _\mathrm {h}} $ and $ {{\tau} _\mathrm {h}} {{\tau} _\mathrm {h}} $, $\tau _{21}$ HP and LP categories, with the W and Z boson mass signal regions combined. Observed exclusion limit (right) in the space of the HVT model parameters $[ g_{{\mathrm {V}}} c_{{\mathrm {H}}}, g^2 c_{\mathrm {F}}/g_{{\mathrm {V}}}]$, described in the text, for three different mass hypotheses of 1.5, 2.0, and 3.0 TeV. The region of parameter space where the natural resonance width is larger than the typical experimental resolution of 7%, for which the narrow width assumption is not valid, is shaded in grey. |

png pdf |
Figure 7-a:
Expected and observed 95% CL upper limit on $\sigma \mathcal {B}( {\mathrm {V}'} \to {\mathrm {V}} {\mathrm {H}} )$ with $\pm $1 and $\pm $2 standard deviation uncertainty bands in the $\ell {{\tau} _\mathrm {h}} $ and $ {{\tau} _\mathrm {h}} {{\tau} _\mathrm {h}} $, $\tau _{21}$ HP and LP categories, with the W and Z boson mass signal regions combined. |
png pdf |
Figure 7-b:
Observed exclusion limit in the space of the HVT model parameters $[ g_{{\mathrm {V}}} c_{{\mathrm {H}}}, g^2 c_{\mathrm {F}}/g_{{\mathrm {V}}}]$, described in the text, for three different mass hypotheses of 1.5, 2.0, and 3.0 TeV. The region of parameter space where the natural resonance width is larger than the typical experimental resolution of 7%, for which the narrow width assumption is not valid, is shaded in grey. |
| Tables | |

png pdf |
Table 1:
Normalization scale factors for top quark production for different event categories, depending on the V tagging and H tagging requirement applied. Uncertainties are due to the limited number of events in the control regions and the uncertainty in the b tagging efficiency. |
png pdf |
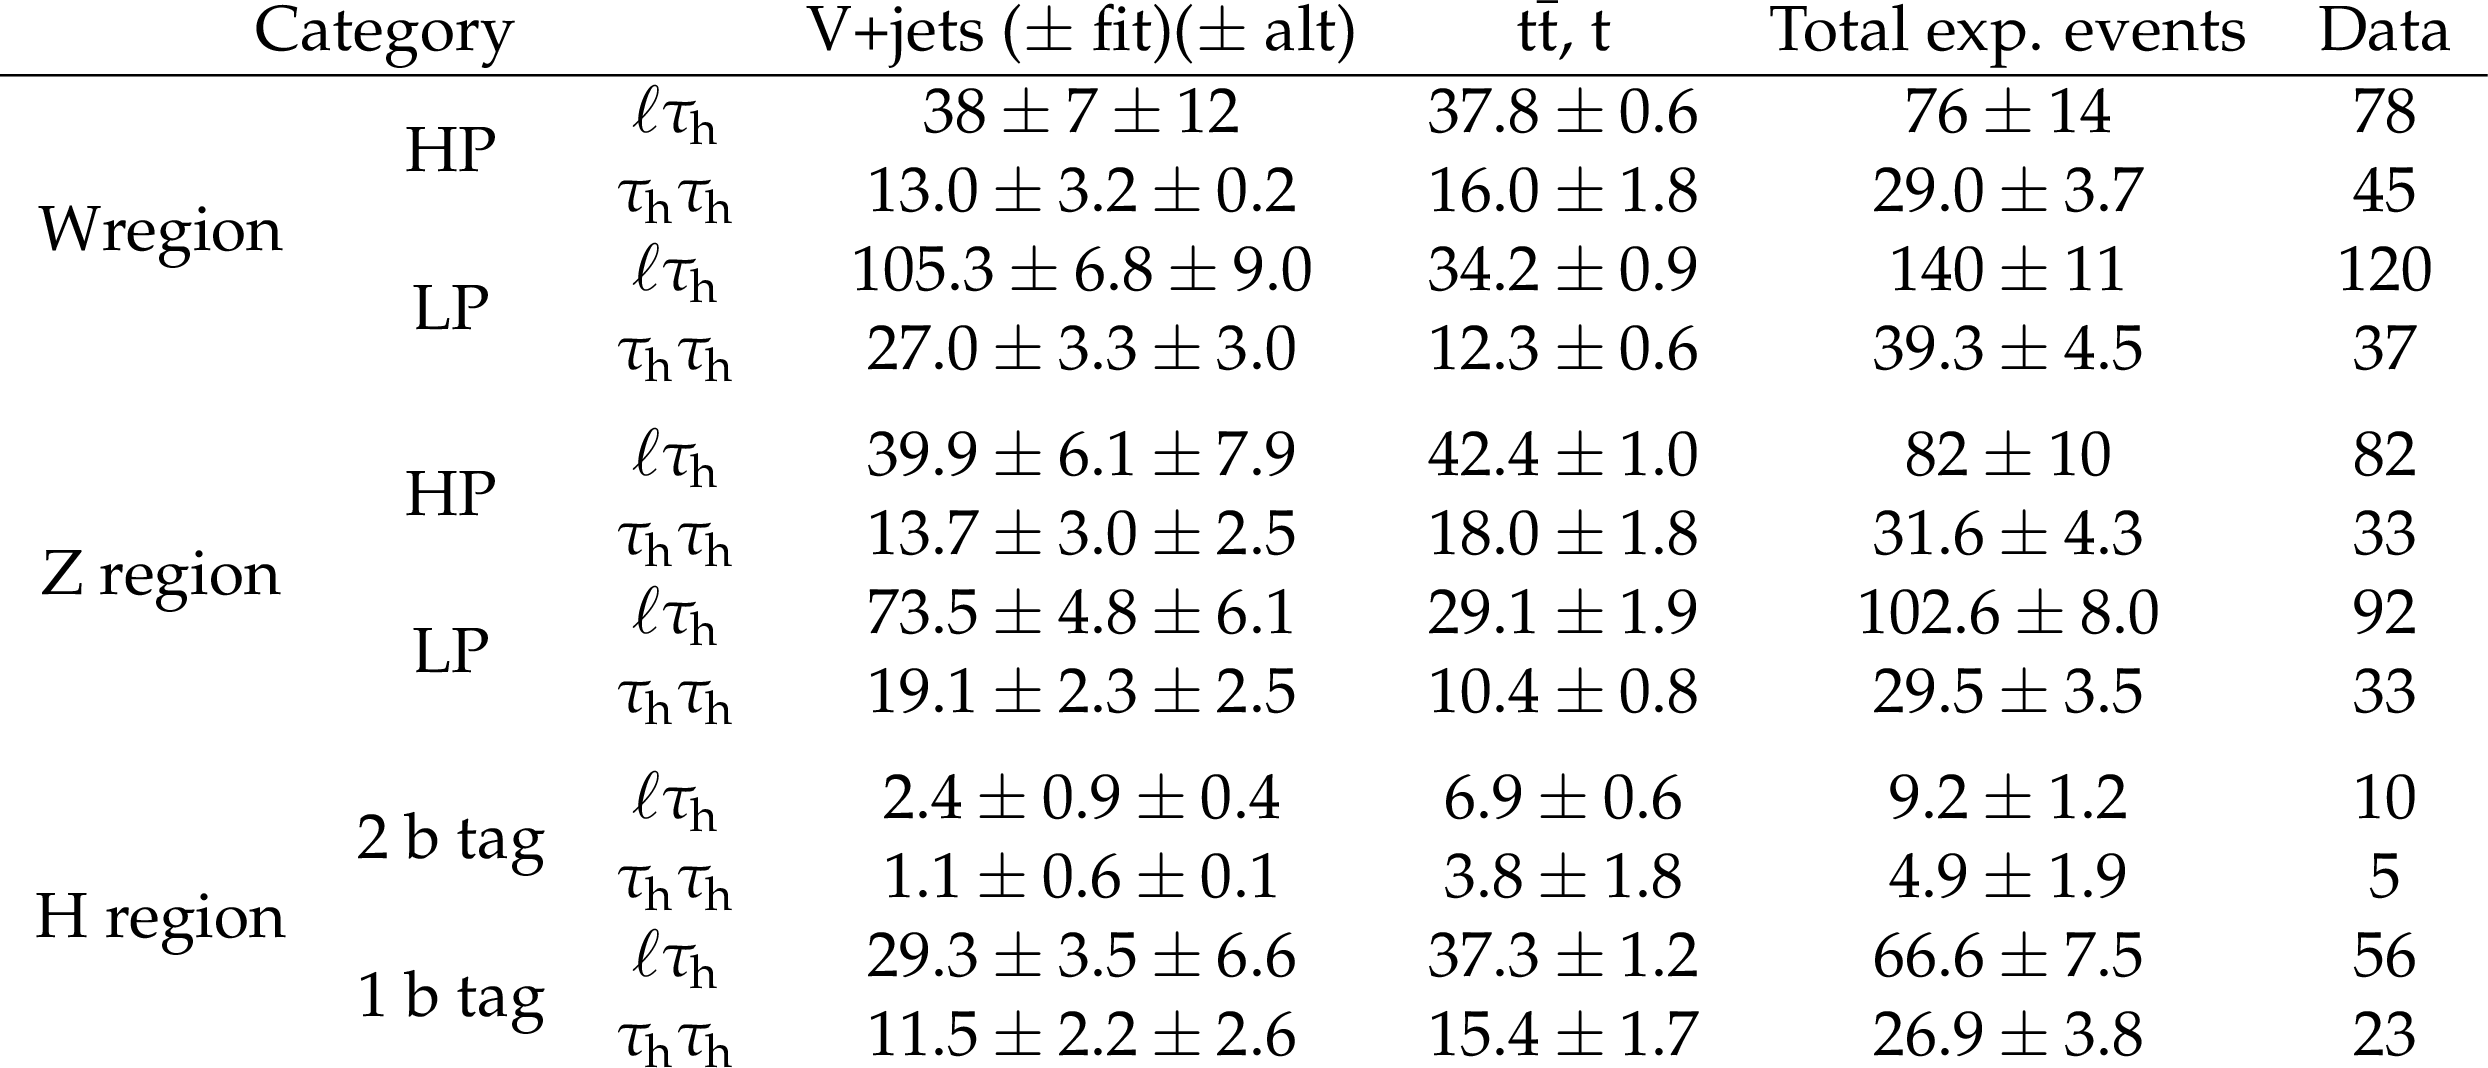
Table 2:
Predicted number of background events and the observed number in the signal region, for all event categories. The regions denoted by W, Z and H are intervals in the jet soft-drop mass distribution that range from 65 to 85 GeV, from 85 to 105 GeV, and from 105 to 135 GeV, respectively. Separate sources of uncertainty in the expected number are reported as the statistical uncertainty in the V+jets contribution from the fitting procedure (fit), the difference between the nominal and alternative function form chosen for the fit (alt), and the uncertainty in the background from top quarks from the fit to the simulated jet mass spectrum. |
png pdf |
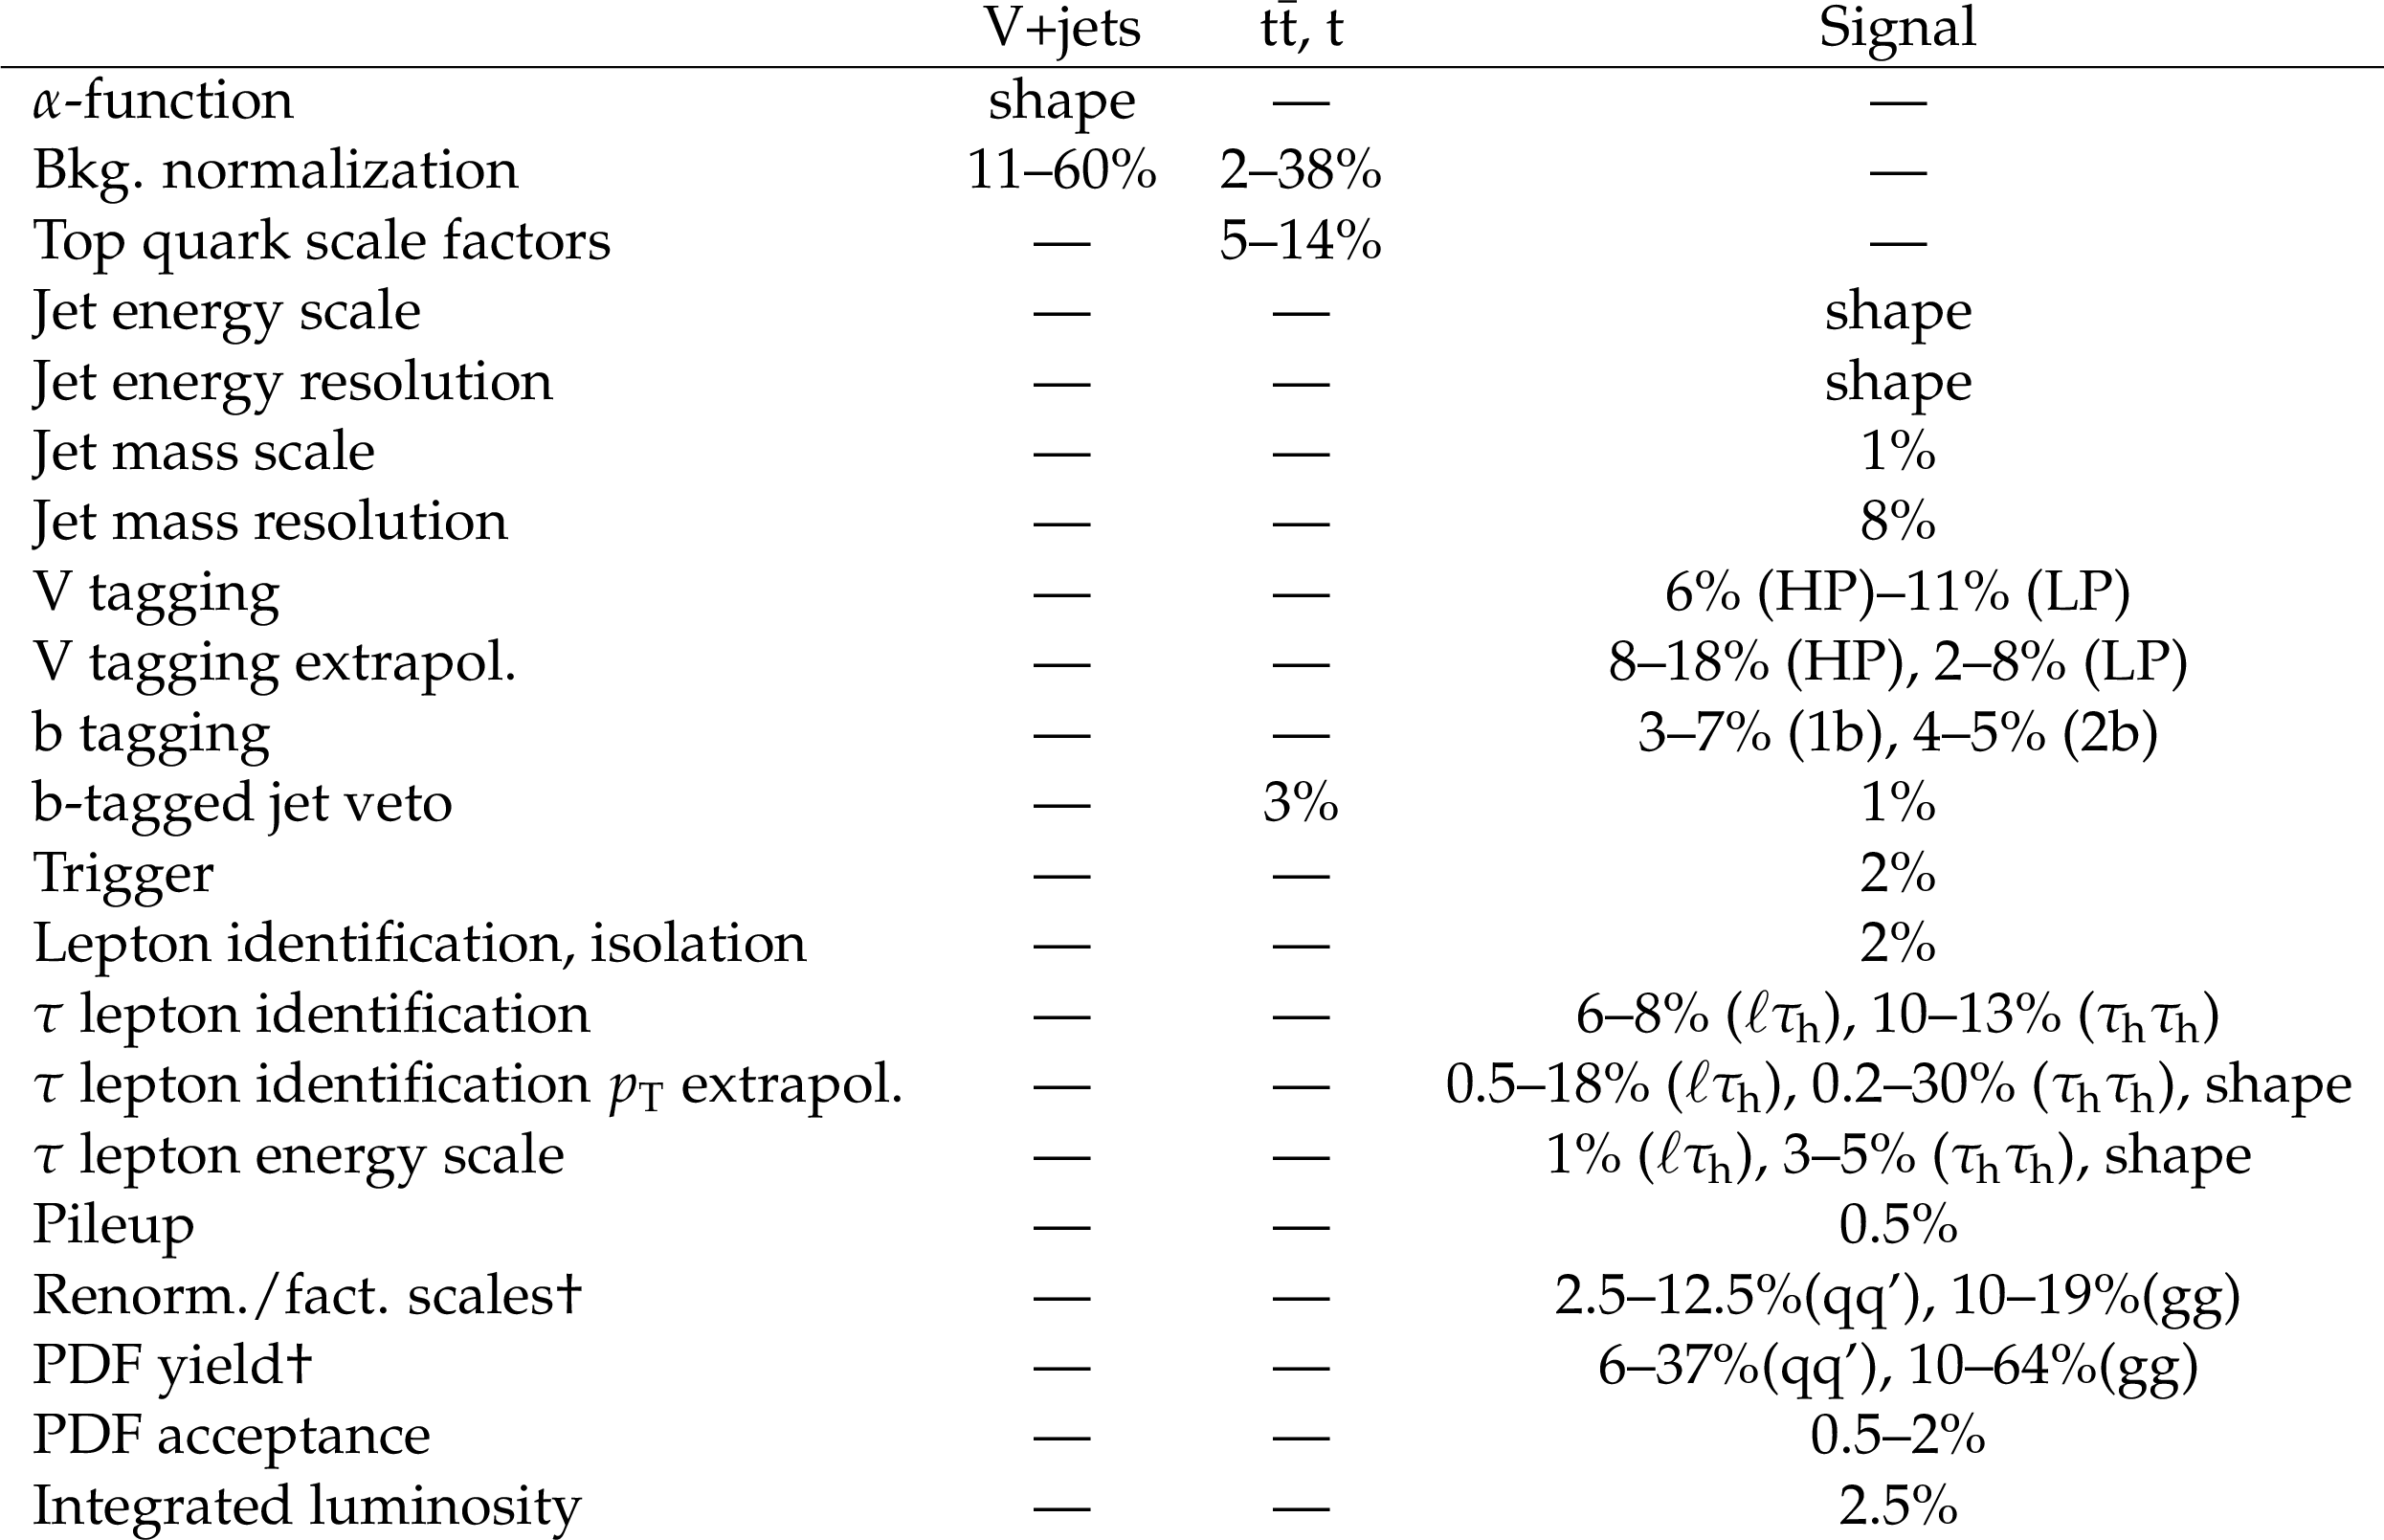
Table 3:
Summary of systematic uncertainties for the background and signal events. Uncertainties marked with "shape'' are propagated also to the shape of the distributions, and those marked with $\dagger $ are not included in the limit bands, but instead reported in the theory band. The dash symbol is reported where the uncertainty is not applicable to a certain signal or background. The symbols qq' and gg refer to quark-initiated and gluon-initiated processes, respectively. |
| Summary |
| A search has been conducted for heavy resonances that decay to two bosons, one of which is a W, Z, or Higgs boson that decays to a pair of quarks, and the other is a Higgs boson that decays to a pair of $\tau$ leptons. The analyzed data are collected by the CMS experiment at $\sqrt{s} = $ 13 TeV, corresponding to an integrated luminosity of 35.9 fb$^{-1}$. Reconstruction techniques have been developed to select events in which the $\tau$ lepton pair is highly boosted. The data are consistent with the standard model expectations and upper limits at 95% confidence level are set on the product of cross section and branching fraction for resonance masses between 0.9 and 4.0 TeV. This search yields the first results at $\sqrt{s} = $ 13 TeV in the considered mass range and final states. Assuming the ultraviolet cutoff of the theory $\lambda_{\mathrm{R}}=$ 1, Kaluza-Klein excitations of spin-0 radions with mass smaller than 2.7 TeV are excluded at 95% confidence level. In the heavy vector triplet model B context, a mass-degenerate vector triplet V' resonance with mass below 2.8 TeV is excluded at 95% confidence level. |
| References | ||||
| 1 | W. D. Goldberger and M. B. Wise | Modulus stabilization with bulk fields | PRL 83 (1999) 4922 | hep-ph/9907447 |
| 2 | O. DeWolfe, D. Z. Freedman, S. S. Gubser, and A. Karch | Modeling the fifth-dimension with scalars and gravity | PRD 62 (2000) 046008 | hep-th/9909134 |
| 3 | C. Cs\'aki, M. Graesser, L. Randall, and J. Terning | Cosmology of brane models with radion stabilization | PRD 62 (2000) 045015 | hep-ph/9911406 |
| 4 | L. Randall and R. Sundrum | A large mass hierarchy from a small extra dimension | PRL 83 (1999) 3370 | hep-ph/9905221 |
| 5 | L. Randall and R. Sundrum | An alternative to compactification | PRL 83 (1999) 4690 | hep-th/9906064 |
| 6 | K. Agashe, H. Davoudiasl, G. Perez, and A. Soni | Warped gravitons at the LHC and beyond | PRD 76 (2007) 036006 | hep-ph/0701186 |
| 7 | A. L. Fitzpatrick, J. Kaplan, L. Randall, and L.-T. Wang | Searching for the Kaluza-Klein graviton in bulk RS Models | JHEP 09 (2007) 013 | hep-ph/0701150 |
| 8 | O. Antipin, D. Atwood, and A. Soni | Search for RS gravitons via W$ _L $ W$ _L $ decays | PLB 666 (2008) 155 | 0711.3175 |
| 9 | B. Bellazzini, C. Cs\'aki, and J. Serra | Composite Higgses | EPJC 74 (2014) 2766 | 1401.2457 |
| 10 | R. Contino, D. Marzocca, D. Pappadopulo, and R. Rattazzi | On the effect of resonances in composite Higgs phenomenology | JHEP 10 (2011) 081 | 1109.1570 |
| 11 | D. Marzocca, M. Serone, and J. Shu | General composite Higgs models | JHEP 08 (2012) 013 | 1205.0770 |
| 12 | D. Greco and D. Liu | Hunting composite vector resonances at the LHC: naturalness facing data | JHEP 12 (2014) 126 | 1410.2883 |
| 13 | M. Schmaltz and D. Tucker-Smith | Little Higgs review | Ann. Rev. Nucl. Part. Sci. 55 (2005) 229 | hep-ph/0502182 |
| 14 | N. Arkani-Hamed, A. G. Cohen, E. Katz, and A. E. Nelson | The littlest Higgs | JHEP 07 (2002) 034 | hep-ph/0206021 |
| 15 | G. Altarelli, B. Mele, and M. Ruiz-Altaba | Searching for new heavy vector bosons in $ \rm p\bar{p} $ colliders | Z. Phys. C 45 (1989) 109 | |
| 16 | D. Pappadopulo, A. Thamm, R. Torre, and A. Wulzer | Heavy vector triplets: bridging theory and data | JHEP 09 (2014) 060 | 1402.4431 |
| 17 | M. Gouzevitch et al. | Scale-invariant resonance tagging in multijet events and new physics in Higgs pair production | JHEP 07 (2013) 148 | 1303.6636 |
| 18 | ATLAS Collaboration | Search for new resonances decaying to a $ W $ or $ Z $ boson and a Higgs boson in the $ {\rm \ell^+ \ell^- b\bar b} $, $ {\rm \ell} \nu {\rm b\bar b} $, and $ \nu\bar{\nu} {\rm b\bar b} $ channels with $ {\rm pp} $ collisions at $ \sqrt s = $ 13 TeV with the ATLAS detector | PLB 765 (2017) 32 | 1607.05621 |
| 19 | CMS Collaboration | Search for heavy resonances decaying into a vector boson and a Higgs boson in final states with charged leptons, neutrinos, and b quarks | PLB 768 (2017) 137 | CMS-B2G-16-003 1610.08066 |
| 20 | CMS Collaboration | Search for heavy resonances that decay into a vector boson and a Higgs boson in hadronic final states at $ \sqrt{s} = $ 13 TeV | EPJC 77 (2017) 636 | CMS-B2G-17-002 1707.01303 |
| 21 | ATLAS Collaboration | Searches for heavy diboson resonances in pp collisions at $ \sqrt{s}= $ 13 TeV with the ATLAS detector | JHEP 09 (2016) 173 | 1606.04833 |
| 22 | CMS Collaboration | Search for new resonances decaying via WZ to leptons in proton-proton collisions at $ \sqrt s = $ 8 TeV | PLB 740 (2015) 83 | CMS-EXO-12-025 1407.3476 |
| 23 | CMS Collaboration | Search for massive resonances decaying into pairs of boosted bosons in semi-leptonic final states at $ \sqrt{s} = $ 8 TeV | JHEP 08 (2014) 174 | CMS-EXO-13-009 1405.3447 |
| 24 | CMS Collaboration | Search for massive resonances in dijet systems containing jets tagged as W or Z boson decays in pp collisions at $ \sqrt{s} = $ 8 TeV | JHEP 08 (2014) 173 | CMS-EXO-12-024 1405.1994 |
| 25 | CMS Collaboration | Search for massive WH resonances decaying into the $ \ell \nu \mathrm{b} \overline{\mathrm{b}} $ final state at $ \sqrt{s}= $ 8 TeV | EPJC 76 (2016) 237 | CMS-EXO-14-010 1601.06431 |
| 26 | CMS Collaboration | Search for a massive resonance decaying into a Higgs boson and a W or Z boson in hadronic final states in proton-proton collisions at $ \sqrt{s}= $ 8 TeV | JHEP 02 (2016) 145 | CMS-EXO-14-009 1506.01443 |
| 27 | CMS Collaboration | Search for narrow high-mass resonances in proton-proton collisions at $ \sqrt{s} = $ 8 TeV decaying to a Z and a Higgs boson | PLB 748 (2015) 255 | CMS-EXO-13-007 1502.04994 |
| 28 | ATLAS Collaboration | Search for high-mass diboson resonances with boson-tagged jets in proton-proton collisions at $ \sqrt{s} = $ 8 TeV with the ATLAS detector | JHEP 12 (2015) 055 | 1506.00962 |
| 29 | ATLAS Collaboration | Search for production of $ WW/WZ $ resonances decaying to a lepton, neutrino and jets in $ pp $ collisions at $ \sqrt{s}= $ 8 TeV with the ATLAS detector | EPJC 75 (2015) 209 | 1503.04677 |
| 30 | ATLAS Collaboration | Search for WZ resonances in the fully leptonic channel using pp collisions at $ \sqrt{s} = $ 8 TeV with the ATLAS detector | PLB 737 (2014) 223 | 1406.4456 |
| 31 | ATLAS Collaboration | Search for a new resonance decaying to a W or Z boson and a Higgs boson in the $ {\rm \ell \ell / \ell}\nu / \nu \nu + {\rm b \bar{b}} $ final states with the ATLAS detector | EPJC 75 (2015) 263 | 1503.08089 |
| 32 | F. Dias et al. | Combination of Run-1 exotic searches in diboson final states at the LHC | JHEP 04 (2016) 155 | 1512.03371 |
| 33 | CMS Collaboration | The CMS trigger system | JINST 12 (2017) P01020 | CMS-TRG-12-001 1609.02366 |
| 34 | CMS Collaboration | The CMS experiment at the CERN LHC | JINST 3 (2008) S08004 | CMS-00-001 |
| 35 | J. Alwall et al. | The automated computation of tree-level and next-to-leading order differential cross sections, and their matching to parton shower simulations | JHEP 07 (2014) 079 | 1405.0301 |
| 36 | P. Nason | A new method for combining NLO QCD with shower Monte Carlo algorithms | JHEP 11 (2004) 040 | hep-ph/0409146 |
| 37 | S. Frixione, P. Nason, and C. Oleari | Matching NLO QCD computations with Parton Shower simulations: the POWHEG method | JHEP 11 (2007) 070 | 0709.2092 |
| 38 | S. Alioli, P. Nason, C. Oleari, and E. Re | A general framework for implementing NLO calculations in shower Monte Carlo programs: the POWHEG BOX | JHEP 06 (2010) 043 | 1002.2581 |
| 39 | S. Alioli, S.-O. Moch, and P. Uwer | Hadronic top-quark pair-production with one jet and parton showering | JHEP 01 (2012) 137 | 1110.5251 |
| 40 | T. Sjostrand et al. | An Introduction to PYTHIA 8.2 | CPC 191 (2015) 159 | 1410.3012 |
| 41 | N. Davidson et al. | Universal interface of TAUOLA technical and physics documentation | CPC 183 (2012) 821 | 1002.0543 |
| 42 | GEANT4 Collaboration | $ GEANT4--a $ simulation toolkit | NIMA 506 (2003) 250 | |
| 43 | CMS Collaboration | Particle-flow reconstruction and global event description with the CMS detector | JINST 12 (2017) P10003 | CMS-PRF-14-001 1706.04965 |
| 44 | M. Cacciari, G. P. Salam, and G. Soyez | The anti-$ {k_{\mathrm{T}}} $ jet clustering algorithm | JHEP 04 (2008) 063 | 0802.1189 |
| 45 | M. Cacciari, G. P. Salam, and G. Soyez | FastJet user manual | EPJC 72 (2012) 1896 | 1111.6097 |
| 46 | CMS Collaboration | Jet energy scale and resolution in the CMS experiment in pp collisions at 8 TeV | JINST 12 (2017) P02014 | CMS-JME-13-004 1607.03663 |
| 47 | CMS Collaboration | Performance of missing energy reconstruction in 13 TeV pp collision data using the CMS detector | CDS | |
| 48 | D. Bertolini, P. Harris, M. Low, and N. Tran | Pileup per particle identification | JHEP 10 (2014) 059 | 1407.6013 |
| 49 | M. Dasgupta, A. Fregoso, S. Marzani, and G. P. Salam | Towards an understanding of jet substructure | JHEP 09 (2013) 029 | 1307.0007 |
| 50 | A. J. Larkoski, S. Marzani, G. Soyez, and J. Thaler | Soft drop | JHEP 05 (2014) 146 | 1402.2657 |
| 51 | J. Thaler and K. Van Tilburg | Identifying boosted objects with N-subjettiness | JHEP 03 (2011) 015 | 1011.2268 |
| 52 | CMS Collaboration | Jet algorithms performance in 13 TeV data | CMS-PAS-JME-16-003 | CMS-PAS-JME-16-003 |
| 53 | CMS Collaboration | Identification of heavy-flavour jets with the CMS detector in pp collisions at 13 TeV | JINST 13 (2018) P05011 | CMS-BTV-16-002 1712.07158 |
| 54 | CMS Collaboration | Tau identification in boosted topologies | CDS | |
| 55 | M. Wobisch and T. Wengler | Hadronization corrections to jet cross-sections in deep inelastic scattering | in Monte Carlo generators for HERA physics. Proceedings, Workshop, Hamburg, Germany, 1998-1999, p. 270 1998 | hep-ph/9907280 |
| 56 | CMS Collaboration | Performance of tau-lepton reconstruction and identification in CMS | JINST 7 (2012) P01001 | CMS-TAU-11-001 1109.6034 |
| 57 | T. Hastie, R. Tibshirani, and J. Friedman | The elements of statistical learning : data mining, inference, and prediction | Springer Series in Statistics. Springer | |
| 58 | CMS Collaboration | Performance of electron reconstruction and selection with the CMS detector in proton-proton collisions at $ \sqrt{s} = $ 8 TeV | JINST 10 (2015) P06005 | CMS-EGM-13-001 1502.02701 |
| 59 | CMS Collaboration | Performance of CMS muon reconstruction in $ {\rm pp} $ collision events at $ \sqrt{s} = $ 7 TeV | JINST 7 (2012) P10002 | CMS-MUO-10-004 1206.4071 |
| 60 | CMS Collaboration | Search for neutral MSSM Higgs bosons decaying to tau pairs in $ pp $ collisions at $ \sqrt{s} = $ 7 TeV | PRL 106 (2011) 231801 | CMS-HIG-10-002 1104.1619 |
| 61 | L. Bianchini, J. Conway, E. K. Friis, and C. Veelken | Reconstruction of the Higgs mass in H$ \rightarrow\tau\tau $ events by dynamical likelihood techniques | in 20th Int. Conf. on Computing in High Energy and Nuclear Physics (CHEP2013) Institute of Physics, Amsterdam, Journal of Physics 513 (2014) 022035 | |
| 62 | L. Bianchini et al. | Reconstruction of the Higgs mass in events with Higgs bosons decaying into a pair of $ \tau $ leptons using matrix element techniques | NIMA 862 (2017) 54 | 1603.05910 |
| 63 | F. Garwood | Fiducial limits for the poisson distribution | Biometrika 28 (1936) 437 | |
| 64 | M. Bahr et al. | Herwig++ physics and manual | EPJC 58 (2008) 639 | 0803.0883 |
| 65 | CMS Collaboration | CMS luminosity measurement for the 2016 data taking period | CDS | |
| 66 | A. L. Read | Presentation of search results: the CLs technique | JPG 28 (2002) 2693 | |
| 67 | G. Cowan, K. Cranmer, E. Gross, and O. Vitells | Asymptotic formulae for likelihood-based tests of new physics | EPJC 71 (2011) 1554 | 1007.1727 |
| 68 | T. Junk | Confidence level computation for combining searches with small statistics | NIMA 434 (1999) 435 | hep-ex/9902006 |
| 69 | ATLAS and CMS Collaborations, LHC Higgs Combination Group | Procedure for the LHC Higgs boson search combination in Summer 2011 | CMS-NOTE-2011-005 | |
|
|
Compact Muon Solenoid LHC, CERN |
|

|

|

|

|

|